1
Regional Air Quality Analyses for Ozone, PM2.5, and Regional Haze:
Final Technical Support Document (Supplement), September 12, 2008
The purpose of this paper is to summarize a new modeling analysis performed by the Lake
Michigan Air Directors Consortium (LADCO) to address the effect of the recent court decision
vacating EPA’s Clean Air Interstate Rule (CAIR). This new modeling is intended to supplement
the LADCO Technical Support Document (“Regional Air Quality Analyses for Ozone, PM2.5,
and Regional Haze: Final Technical Support Document”, April 25, 2008), which summarizes the
air quality analyses conducted by LADCO and its contractors to support the development of
State Implementation Plans for ozone, PM2.5, and regional haze in the States of Illinois,
Indiana, Michigan, Ohio, and Wisconsin.
Compared to the previous LADCO modeling (Round 5.1), the new modeling shows similar
results for ozone, but much more nonattainment for PM2.5 and higher visibility levels for
regional haze. Specifically, the new modeling shows:
Ozone:
Attainment of the 0.08 ppm standard by 2009 everywhere in the region, except
Holland, MI, and nonattainment of the 0.075 ppm standard through at least 2018.
PM2.5
: Widespread nonattainment of annual (15 ug/m
3
) and daily (35 ug/m
3
) standards.
Haze:
Higher visibility levels on the 20% worst visibility days in 2018 in Class I areas in
the eastern U.S., resulting in most areas being above the glide path.
Background
: On July 11, 2008, the U.S. Court of Appeals for D.C. Circuit vacated EPA’s CAIR
rule (cite). The reductions in NOx and SO2 emissions associated with this rule were a key part
of the LADCO States’ attainment demonstrations for ozone and PM2.5 and the reasonable
progress determinations for regional haze. LADCO’s previous modeling (Round 5.1) relied on
EGU emission projections from EPA’s IPM3.0 analysis, which assumed implementation of
Phases I and II of CAIR. For this new modeling, alternative EGU emission projections were
developed, which did not rely on CAIR (or IPM).
Model Set-Up:
The new modeling was performed consistent with LADCO’s previous modeling
(Round 5.1):
Model Version: CAMx v4.50beta_deposition
Future Years: 2009, 2012, 2018
Runs:
(a) Ozone: Summer 2005 meteorology with 12 km grids
(b) PM2.5 and haze: Full year 2005 meteorology with 36 km grids
Emission Scenarios:
The new modeling assumed the same set of “on the books” controls as
in LADCO’s previous modeling (Round 5.1) for all sectors, except EGUs. In light of the CAIR
decision, three new EGU scenarios were prepared:
Electronic Filing - Received, Clerk's Office, January 21, 2009
2
Scenario A: 2007 CEM-based emissions were projected for all states in the modeling domain
based on EIA growth rates by state (NERC region) and fuel type. The assumed growth rates for
the Midwest States were: MAIN (IL, IA, MO, WI): 8.8% (2007-2018); ECAR (IN, KY, MI, OH):
13.5% (2007-2018); and MAPP (MN): 15.1% (2007-2018). No control was applied. The annual
emissions were temporalized based on profiles derived from 2004-2006 CEM data. (Note, these
are the same temporal profiles used in Round 5.1.)
Scenario B. Scenario A emissions for the LADCO States and select neighboring states (e.g.,
MN, IA, MO, KY, TN, and WV) were adjusted by applying legally enforceable controls (i.e.,
emission reductions required by a Consent Decree, state rule, or permit). Only those legally
enforceable controls identified (and justified) by the States were applied. The States also
supplied the appropriate control factors. A table summarizing the Scenario B controls is provided
in Appendix I.
Scenario C. For the years 2009 and 2012, Scenario A emissions for all states were adjusted by
applying all planned SO2 and NOx controls based on the July 10 CAMD list (i.e., 90% reduction
for scrubbers, 95% reduction for SCRs). Because the July 10 CAMD list only includes controls
generally out to 2011, additional SO2 and NOx controls for the year 2018 were assumed for all
BART-eligible EGUs in the five LADCO State plus MN, IA, MO, KY, TN, and MO list (i.e., 90%
reduction for scrubbers, 95% reduction for SCRs).
1
All Scenario B controls were included in
Scenario C. A table summarizing the Scenario C controls is provided in Appendix II.
Table 1 and Figure 1 provide a summary of the 5-state regional NOx and SO2 emissions for
each scenario and future year. (Note, the CAIR emissions included here are based on EPA’s
IPM3.0 modeling.) Several comments on the emissions should be noted:
Summer NOx
•
There is llittle difference between the three alternative scenarios and CAIR. This
suggests that summer ozone concentrations for the alternative scenarios are
likely to be similar to those predicted with CAIR (i.e., Round 5.1).
Annual NOx:
•
There is a significant change in emissions between scenarios, mostly during the
non-summer months.
•
Scenario B reflects application of NOx controls in several states (e.g., IL,OH,WI).
•
Because there are relatively few SCRs (in the LADCO States) on the CAMD list,
Scenario C results in only a small emissions decrease compared to Scenario B.
•
Assumed BART controls result in a significant emissions decrease.
Annual SO2
•
There is a significant change in emissions between scenarios.
•
Scenario B reflects application of SO2 controls in several states (e.g., IL,OH,WI).
•
Because there are several FGDs (in the LADCO States) on the CAMD list,
Scenario C results in a large emissions decrease compared to Scenario B.
•
Assumed BART controls result in a significant emissions decrease (i.e., even
lower emissions than the IPM-estimated CAIR emissions).
1
A subsequent analysis was conducted with the following inventory changes: (a) 95% reduction for
scrubbers, 90% redcuction for SCRs (consistent with EPA’s default assumptions for IPM), and (b)
revisions provided for a few plants in Indiana and Minnesota. The changes resulted in a relatively small
difference in the regioinal NOx and SO2 emissions (e.g., about a 2% NOx increase and about a 1-2%
decrease in SO2). To assess the impact of the changes, PM2.5 modleing was conducted with the new
Scenario B and Scenario C emissions for 2012. The modeling showed little change in the predicted
PM2.5 concentrations.
Electronic Filing - Received, Clerk's Office, January 21, 2009
3
Figure 1. Regional NOx and SO2 Emissions
Summer NOx Emissions
0
500
1,000
1,500
2,000
2,500
3,000
2005
2007
200
9A
200
9B
200
9C
200
9
C
AIR
201
2A
201
2B
201
2C
201
2
C
AIR
201
8A
201
8B
201
8C
201
8BART
201
8
C
AIR
Annual NOx Emissions
0
200,000
400,000
600,000
800,000
1,000,000
2005
2007
200
9A
200
9B
200
9C
200
9
C
AIR
201
2A
201
2B
201
2C
201
2
C
AIR
201
8A
201
8B
201
8C
201
8BART
201
8
C
AIR
Annual SO2 Emissions
0
500,000
1,000,000
1,500,000
2,000,000
2,500,000
3,000,000
2005
2007
200
9A
200
9B
200
9C
200
9
C
AIR
201
2A
201
2B
201
2C
201
2
C
AIR
201
8A
201
8B
201
8C
201
8BART
201
8
C
AIR
Electronic Filing - Received, Clerk's Office, January 21, 2009
4
Table 1. Regional NOx and SO2 Emissions
Summer NOx Emissions (TPD)
2005
2007
2009 A
2009 B
2009 C
2010
CAIR
2012 A
2012 B
2012 C
2012
CAIR
2018 A
2018 B
2018 C
2018 C-
BART
2018
CAIR
IL
305
305
311
311
311
275
340
236
236
266
333
227
227
219
224
IN
393
393
376
376
374
384
393
393
390
368
410
386
383
292
264
MI
393
393
350
350
350
242
366
366
366
229
377
377
377
260
243
OH
408
408
395
355
335
285
423
351
351
290
431
366
366
230
290
WI
413
413
167
160
160
238
184
170
170
177
183
168
168
168
177
1,912
1,912
1,599
1,552
1,530
1,424
1,706
1,516
1,513
1,330
1,734
1,524
1,521
1,169
1,198
Annual NOx Emissions (TPY)
2005
2007
2009 A
2009 B
2009 C
2010
CAIR
2012 A
2012 B
2012 C
2012
CAIR
2018 A
2018 B
2018 C
2018 C-
BART
2018
CAIR
IL
126,786
121,006
124,917
124,917
124,917
83,224
137,438
81,989
81,989
82,248
135,983
79,771
79,771
63,590
69,958
IN
214,727
203,493
203,776
203,776
201,947
133,188
212,790
212,790
210,877
125,541
221,950
212,805
210,810
177,027
90,415
MI
120,332
112,484
112,478
112,478
112,478
83,117
117,621
117,621
117,621
77,897
122,447
122,447
122,447
89,444
79,543
OH
255,554
240,351
240,016
173,071
164,911
94,346
251,065
172,514
172,514
97,679
261,644
179,737
179,737
125,762
95,678
WI
71,414
54,582
56,540
54,065
54,065
53,032
62,266
57,759
57,759
56,480
61,812
56,952
56,952
56,952
56,158
788,812
731,917
737,727
668,307
658,317
446,908
781,179
642,673
640,760
439,845
803,837
651,712
649,717
512,774
391,752
Annual SO2 Emissions (TPY)
2005
2007
2009 A
2009 B
2009 C
2010
CAIR
2012 A
2012 B
2012 C
2012
CAIR
2018 A
2018 B
2018 C
2018 C-
BART
2018
CAIR
IL
326,598
273,467
281,028
281,028
281,028
295,516
309,209
196,238
194,746
267,110
305,364
106,638
105,152
82,351
275,716
IN
866,964
722,301
721,252
721,252
619,486
374,335
754,323
754,323
558,567
379,144
786,551
764,065
559,945
426,695
359,915
MI
350,694
343,487
343,140
343,140
315,326
227,296
358,879
358,879
301,062
233,204
373,964
373,964
313,677
178,680
242,853
OH
1,100,510
960,820
959,466
959,466
693,438
427,145 1,003,633
897,099
572,807
370,532 1,045,945
819,770
481,623
333,740
315,560
WI
181,426
137,562
142,007
142,007
133,738
139,181
156,659
144,818
133,592
139,203
155,818
144,027
132,849
77,214
127,073
2,826,192
2,437,638
2,446,892
2,446,892
2,043,017 1,463,473 2,582,703 2,351,356 1,760,775 1,389,192 2,667,641 2,208,463 1,593,245 1,098,679 1,321,116
Electronic Filing - Received, Clerk's Office, January 21, 2009
5
Modeling Results:
Several tables summarizing the modeling results are provided:
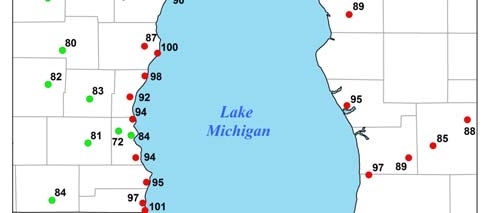
Table 2 - future year ozone and PM2.5 concentrations for key monitors in the
LADCO region
Table 3 - number of monitoring sites greater than the National Ambient Air Quality
Standards (NNAQS)
Table 4 – visibility levels for Class I areas in the eastern U.S.
Note, given that Scenario B and BART controls were only applied in an 11-state Midwest
region, the validity of the results for other Class I areas in the eastern U.S. may be
questionable. The Scenario C controls, on the other hand, cover all states and are, thus,
likely valid in other Class I areas.
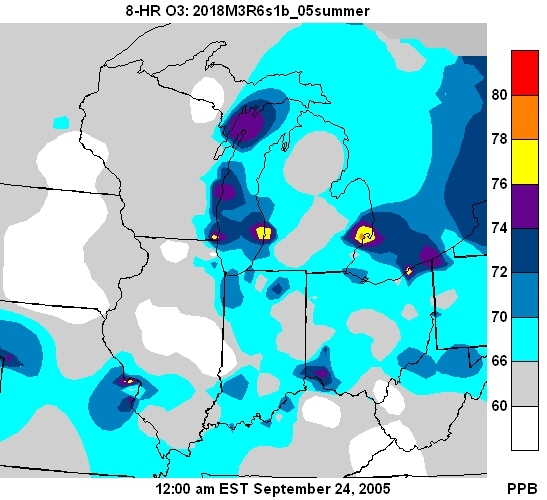
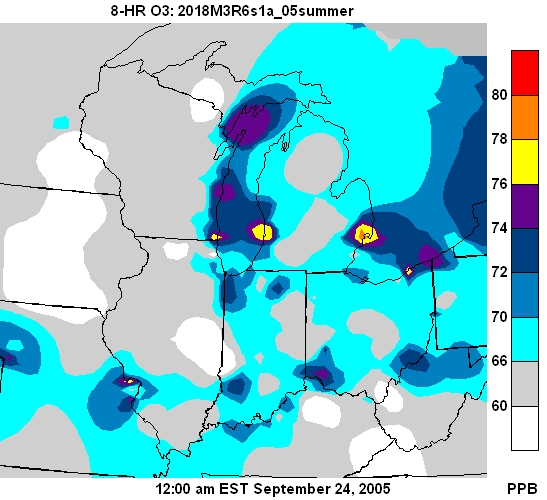
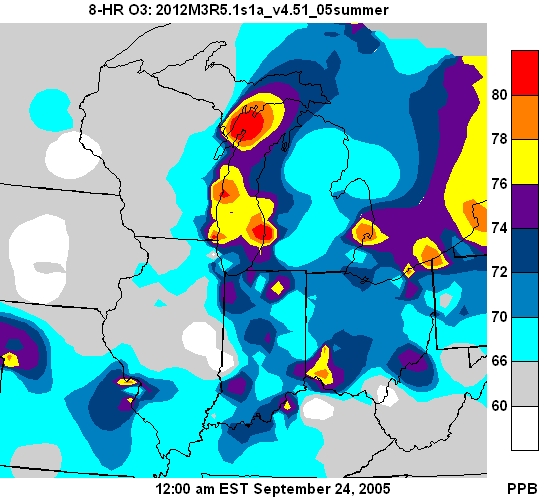
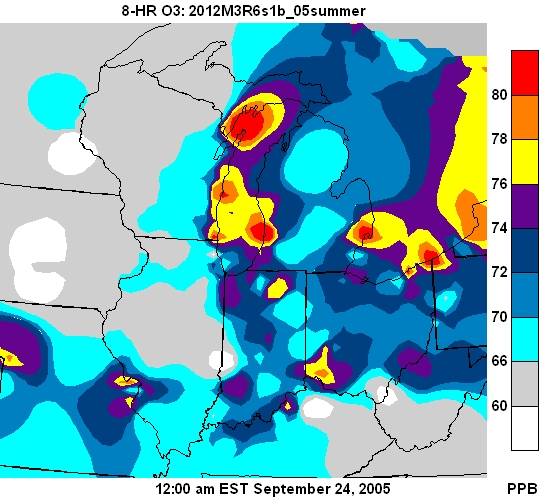
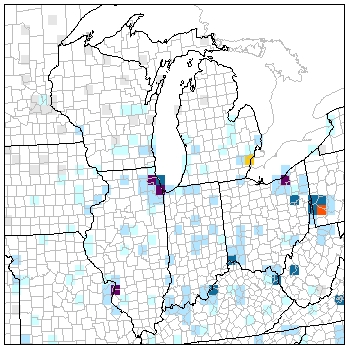
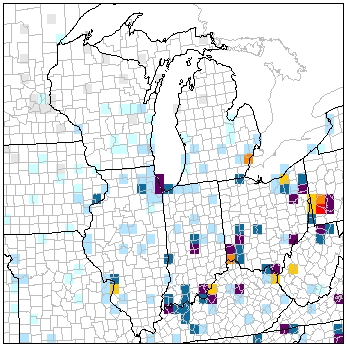
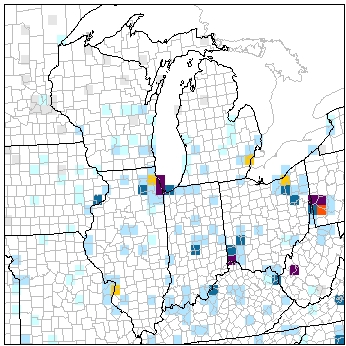
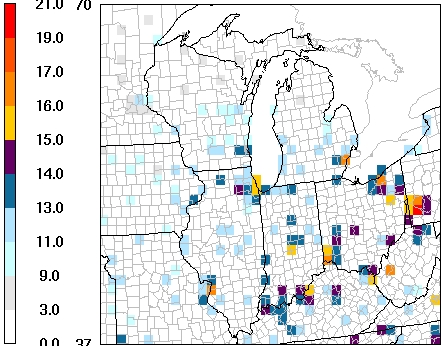
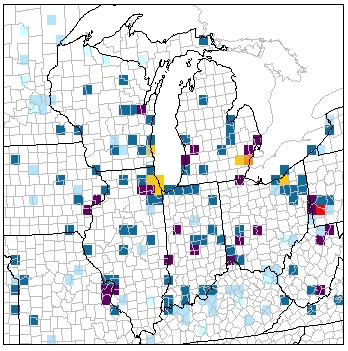
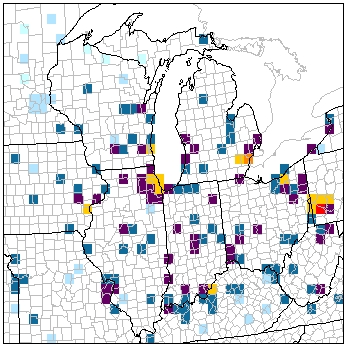
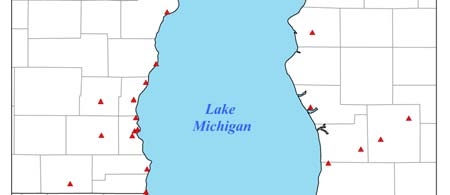
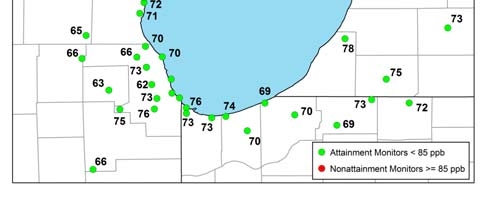
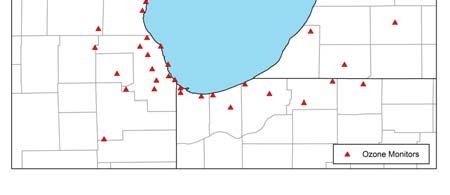
Spatial plots of the future year ozone and PM2.5 concentrations are provided in Figures 2 – 4.
Based on these results, the following key findings should be noted:
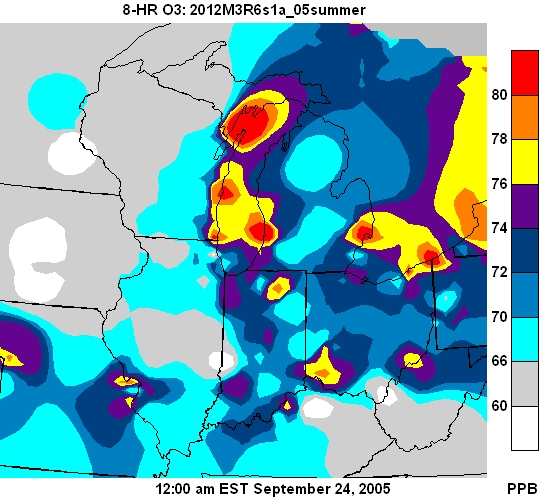
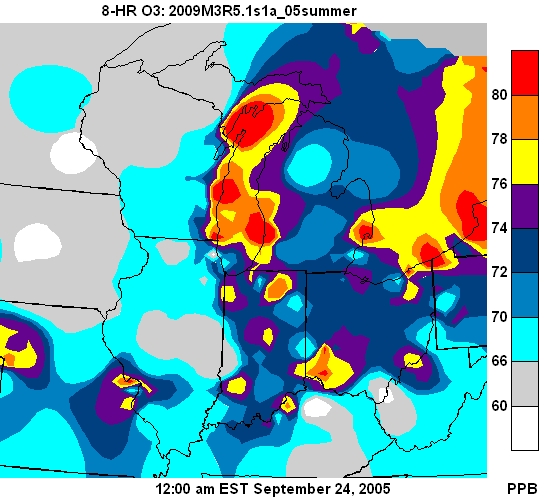
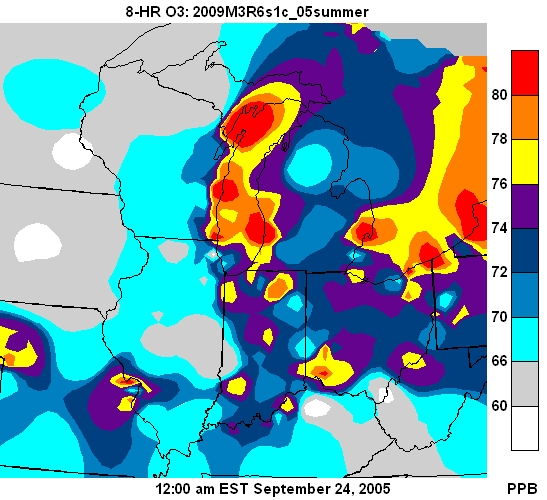
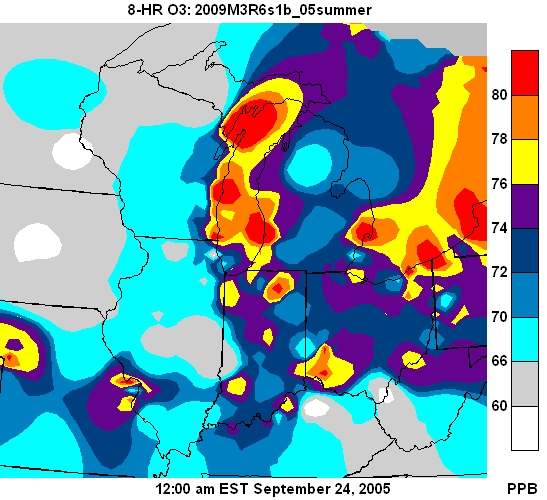
Ozone
•
There is little change from the previous LADCO modeling (Round 5.1 with CAIR)
•
The modeling shows attainment of the 0.08 ppm (85 ppb) standard by 2009,
except Holland. (Note, Holland does meet this standard by 2012.)
•
The modeling shows nonattainment of the 0.075 ppm (75 ppb) standard through
2018.
PM2.5 - Annual
•
There is a significant change from the previous LADCO modeling (Round 5.1
with CAIR)
•
The modeling shows extensive nonattainment of the annual standard.
PM2.5 - Daily
•
There is a significant change from the previous LADCO modeling (Round 5.1
with CAIR)
•
The modeling shows extensive nonattainment of the daily standard.
Haze
•
There is a significant change from the previous LADCO modeling (Round 5.1
with CAIR)
•
The modeling shows higher visibility levels in 2018 for the 20% worst visibility
days (average about 0.5 deciviews for the northern Class I areas). The resulting
visibility levels in the northern Class I areas (except Voyageurs) are above the
glide path.
Electronic Filing - Received, Clerk's Office, January 21, 2009
2005
Round 5
with CAIR
Round 5
with CAIR
Round 5
with CAIR
Site
Site ID
Base Year
Scen. A Scen. B Scen.C
Scen. A Scen. B Scen.C
Scen. A Scen. B Scen.C
Scen.C-BART
Lake Michigan Area
Chiwaukee
550590019
84.7
82.2
82.2
82.0
82.3
81.1
80.8
80.6
80.9
77.2
77.2
77.0
76.0
76.2
Racine
551010017
80.3
77.8
77.8
77.5
77.5
76.6
76.2
76.1
76.1
72.9
72.3
72.1
71.1
71.2
Milwaukee-Bayside
550890085
82.7
79.9
79.9
79.7
79.8
78.5
78.0
78.0
78.0
74.3
73.6
73.4
72.4
72.7
Harrington Beach
550890009
83.3
80.1
80.1
79.9
80.1
78.6
78.1
78.0
78.3
73.9
73.2
73.1
72.2
72.5
Manitowoc
550710007
85.0
80.8
80.8
80.7
80.8
79.0
78.5
78.4
78.6
73.9
73.2
73.1
72.0
72.5
Sheboygan
551170006
88.0
84.1
84.0
83.9
84.0
82.2
81.7
81.5
81.8
76.9
76.0
75.9
74.8
75.4
Kewaunee
550610002
82.7
78.2
78.2
78.0
78.1
76.4
75.9
75.7
75.9
71.3
70.7
70.5
69.4
69.9
Door County
550290004
88.7
84.1
84.1
83.9
83.9
82.0
81.4
81.3
81.5
76.5
75.6
75.5
74.2
74.7
Hammond
180892008
77.7
76.2
76.2
76.0
75.4
75.6
75.3
75.2
74.6
73.2
72.7
72.6
71.7
71.6
Whiting
180890030
79.3
77.8
77.8
77.7
77.0
77.2
76.9
76.8
76.2
74.8
74.3
74.2
73.2
73.1
Michigan City
180910005
77.0
74.5
74.5
74.3
73.9
73.3
72.9
72.8
72.5
69.7
69.2
69.1
68.1
68.1
Ogden Dunes
181270020
78.3
76.3
76.3
76.2
75.6
75.5
75.1
75.0
74.5
72.9
72.3
72.1
71.2
70.8
Holland
260050003
90.0
85.7
85.7
85.5
85.3
83.5
83.1
82.9
82.8
78.2
77.5
77.3
76.0
76.1
Jenison
261390005
82.0
76.8
76.8
76.7
76.0
75.1
74.6
74.5
74.5
70.2
69.6
69.5
67.9
68.7
Muskegon
261210039
85.0
80.6
80.6
80.5
80.5
78.6
78.2
78.1
78.0
73.5
72.8
72.8
71.5
71.9
Indianapolis Area
Noblesville
189571001
82.7
78.3
78.3
78.1
78.1
76.1
75.9
75.7
75.6
70.2
69.9
69.8
68.9
68.7
Fortville
180590003
78.0
74.1
74.1
73.9
73.9
71.9
71.8
71.7
71.4
66.7
66.5
66.3
65.4
65.1
Fort B. Harrison
180970050
78.7
75.4
75.3
75.2
75.1
73.8
73.6
73.6
73.2
70.6
70.3
70.2
69.3
69.1
Detroit Area
New Haven
260990009
86.0
82.4
82.3
82.1
81.4
81.4
81.2
81.1
80.2
78.1
77.8
77.7
76.5
76.1
Warren
260991003
84.0
82.4
82.3
82.2
81.3
82.1
81.8
81.7
80.7
79.7
79.4
79.3
78.0
77.6
Port Huron
261470005
82.7
78.2
78.2
78.1
77.5
76.5
76.3
76.2
75.5
72.6
72.5
72.3
70.9
70.9
Cleveland Area
Ashtabula
390071001
89.0
84.2
84.1
83.9
83.4
82.0
81.8
81.6
81.0
76.8
76.5
76.4
74.8
75.1
Geauga
390550004
79.3
75.8
75.8
75.6
74.7
74.0
73.8
73.7
72.7
69.5
69.2
69.1
67.6
67.3
Eastlake
390850003
86.3
83.1
83.1
82.9
81.9
81.8
81.6
81.5
80.5
78.2
78.0
77.8
76.5
76.2
Akron
391530020
83.7
79.1
79.1
79.0
78.1
76.9
76.7
76.6
75.6
70.9
70.6
70.4
68.7
68.7
Cincinnati Area
Wilmington
390271002
82.3
77.3
77.4
77.1
77.5
75.3
75.2
74.8
74.9
70.1
69.9
69.5
67.1
68.3
Sycamore
390610006
84.7
81.5
81.4
81.1
81.9
80.4
80.2
79.8
80.3
76.4
76.0
75.7
73.5
74.6
Lebanon
391650007
87.7
82.8
82.8
82.4
83.0
80.8
80.7
80.3
80.7
75.4
75.1
74.8
72.6
74.2
Columbus Area
London
390970007
79.7
75.0
75.0
74.8
75.0
73.0
72.8
72.7
72.6
68.1
67.8
67.6
65.9
66.3
New Albany
390490029
86.3
82.1
82.1
81.9
81.8
80.2
80.0
79.9
79.6
74.7
74.3
74.2
73.3
73.0
Franklin
290490028
80.3
76.7
76.6
76.5
75.9
75.1
74.9
74.8
74.1
70.5
70.2
70.1
70.2
69.0
St. Louis Area
W. Alton (MO)
291831002
86.3
81.1
81.2
81.1
81.0
80.0
79.9
79.9
78.6
76.9
76.8
76.7
74.2
74.9
Orchard (MO)
291831004
87.0
82.1
82.1
82.0
82.0
80.9
80.8
80.7
80.0
77.7
77.6
77.4
75.2
76.2
Sunset Hills (MO)
291890004
82.3
79.2
79.2
79.1
78.7
78.3
78.1
78.1
77.1
75.3
75.2
75.1
73.0
73.9
Arnold (MO)
290990012
82.3
77.8
77.8
77.7
77.2
76.7
76.6
76.5
75.6
73.6
73.4
73.4
71.3
72.0
Margaretta (MO)
295100086
83.0
79.8
79.8
79.7
79.3
78.8
78.7
78.6
77.9
75.7
75.6
75.5
73.7
74.4
Maryland Heights (MO)
291890014
87.3
85.4
85.4
85.3
84.0
84.3
84.1
84.0
81.7
81.1
80.9
80.8
78.4
78.1
Round 5 without CAIR
Round 5 without CAIR
Round 5 without CAIR
Table 2a. Ozone Modeling Results
2009
2012
2018
Electronic Filing - Received, Clerk's Office, January 21, 2009
2005
Round 5
with CAIR
Round 5
with CAIR
Round 5
with CAIR
Site
Site ID
Base Year
Scen. A Scen. B Scen.C
Scen. A Scen. B Scen.C
Scen. A Scen. B Scen.C
Scen.C-BART
Illinois
Chicago - Washington HS
170310022
15.2
14.9
14.8
14.5
14.1
14.8
14.7
14.2
14.0
15.0
14.6
14.2
13.7
13.9
Chicago - Mayfair
170310052
15.8
15.1
15.1
14.8
14.4
15.1
14.9
14.5
14.2
15.1
14.7
14.3
13.7
13.9
Chicago - Springfield
170310057
15.0
14.6
14.6
14.3
13.9
14.6
14.4
14.0
13.8
14.8
14.4
14.0
13.4
13.7
Chicago - Lawndale
170310076
14.9
14.5
14.5
14.2
13.8
14.5
14.3
13.9
13.7
14.7
14.3
13.9
13.3
13.6
Blue Island
170312001
14.8
14.4
14.4
14.0
13.7
14.4
14.2
13.8
13.6
14.5
14.1
13.7
13.2
13.4
Summit
170313301
15.2
14.9
14.9
14.6
14.2
14.9
14.7
14.3
14.0
15.0
14.6
14.3
13.7
13.9
Cicero
170316005
15.5
15.1
15.1
14.8
14.4
15.1
14.9
14.5
14.3
15.2
14.9
14.4
13.9
14.2
Granite City
171191007
16.7
16.3
16.2
15.9
15.1
16.1
16.0
15.3
14.9
15.9
15.6
14.9
14.2
14.3
E. St. Louis
171630010
15.6
15.2
15.2
14.8
14.1
15.0
14.9
14.3
13.9
14.9
14.6
14.0
13.3
13.4
Indiana
Jeffersonville
180190005
16.4
15.8
15.7
14.8
13.8
15.8
15.6
14.5
13.7
16.0
15.5
14.3
13.7
13.4
Jasper
180372001
15.2
14.3
14.2
13.4
12.4
14.2
14.0
13.0
12.2
14.3
13.9
12.8
12.1
11.8
Gary
180890031
15.6
13.9
13.9
13.5
13.0
13.8
13.6
13.1
12.8
13.7
13.4
12.9
12.3
12.4
Indy-Washington Park
180970078
15.3
14.4
14.4
13.6
12.8
14.3
14.2
13.2
12.6
14.3
13.9
12.9
12.2
12.0
Indy-W 18th Street
180970081
16.0
15.1
15.1
14.3
15.0
14.9
13.9
15.0
14.6
13.5
12.8
Indy- Michigan Street
180970083
15.9
15.0
15.0
14.2
13.4
14.9
14.8
13.8
13.1
14.9
14.5
13.5
12.8
12.6
Michigan
Allen Park
261630001
14.5
11.0
14.0
13.5
13.0
14.0
13.8
13.2
12.8
13.9
13.6
13.0
12.4
12.4
Southwest HS
261630015
15.9
15.3
15.3
14.8
14.2
15.2
15.0
14.4
13.9
15.1
14.8
14.1
13.5
13.5
Linwood
261630016
14.6
14.1
14.1
13.6
13.1
14.0
13.9
13.3
12.8
13.9
13.6
13.0
12.5
12.5
Dearborn
261630033
17.5
17.0
17.0
16.4
15.8
16.9
16.7
16.0
15.5
16.8
16.4
15.7
15.1
15.1
Wyandotte
261630036
14.7
14.2
14.1
13.6
13.1
14.1
13.9
13.3
12.8
14.0
13.7
13.0
12.4
12.5
Ohio
Middletown - Bonita
390170003
16.2
15.3
15.2
14.3
13.5
15.2
15.0
13.9
13.2
15.2
14.8
13.7
13.0
12.8
Fairfield
390170016
15.8
15.1
15.0
14.1
13.1
15.1
14.9
13.7
12.9
15.2
14.7
13.5
12.8
12.5
Cleveland-28th Street
390350027
15.4
14.9
14.9
14.3
13.5
14.7
14.5
13.9
13.2
14.6
14.2
13.5
12.8
12.7
Cleveland-St. Tikhon
390350038
17.4
16.7
16.7
16.0
15.2
16.5
16.3
15.6
14.8
16.3
16.0
15.2
14.4
14.3
Cleveland-Broadway
390350045
16.5
15.9
15.8
15.2
14.4
15.6
15.5
14.8
14.0
15.5
15.1
14.4
13.6
13.5
Cleveland-GT Craig
390350060
17.1
16.5
16.4
15.8
15.0
16.3
16.1
15.4
14.6
16.1
15.7
15.0
14.2
14.1
Newburg Hts - Harvard Ave
390350065
16.0
15.4
15.3
14.7
14.0
15.2
15.0
14.3
13.6
15.1
14.7
14.0
13.2
13.1
Columbus - Fairgrounds
390490024
15.3
14.6
14.5
13.7
12.9
14.4
14.1
13.2
12.6
14.2
13.8
12.8
12.2
12.0
Columbus - Ann Street
390490025
15.1
14.4
14.3
13.5
12.7
14.2
13.9
13.1
12.4
14.1
13.6
12.6
12.0
11.9
Cincinnati - Seymour
390610014
17.3
16.6
16.5
15.5
14.5
16.5
16.3
15.1
14.3
16.6
16.2
14.9
14.2
13.8
Cincinnati - Taft Ave
390610040
15.5
14.8
14.7
13.8
12.8
14.8
14.6
13.4
12.6
14.9
14.5
13.2
12.5
12.2
Cincinnati - 8th Ave
390610042
16.9
12.0
16.1
15.0
14.0
16.1
15.9
14.7
13.8
16.2
15.7
14.4
13.7
13.4
Sharonville
390610043
15.6
14.9
14.8
13.9
12.9
14.9
14.7
13.5
12.7
14.9
14.5
13.3
12.6
12.3
Norwood
390617001
16.2
15.5
15.4
14.4
13.4
15.4
15.2
14.0
13.2
15.5
15.1
13.8
13.1
12.8
St. Bernard
390618001
17.6
16.8
16.7
15.7
14.7
16.7
16.5
15.3
14.4
16.8
16.4
15.1
14.3
14.0
Steubenville
390810016
15.8
14.5
14.4
13.5
12.8
14.3
14.2
13.1
12.5
14.8
14.5
13.3
12.9
12.7
Mingo Junction
390811001
16.5
15.2
15.2
14.3
13.5
15.0
14.9
13.8
13.2
15.6
15.2
14.0
13.6
13.4
Ironton
390870010
15.2
14.8
14.6
13.6
12.8
14.6
14.4
13.2
12.5
14.8
14.1
12.8
12.4
12.3
Dayton
391130032
15.5
14.9
14.8
14.0
13.2
14.8
14.6
13.6
12.9
14.8
14.3
13.3
12.6
12.4
New Boston
391450013
14.7
12.0
14.0
13.0
12.1
14.1
13.8
12.5
11.9
14.2
13.6
12.2
11.7
11.6
Canton - Dueber
391510017
16.3
15.7
15.6
14.8
14.0
15.5
15.3
14.4
13.6
15.4
14.9
14.0
13.3
13.3
Canton - Market
391510020
14.6
11.0
14.1
13.3
12.6
13.9
13.7
12.9
12.3
13.9
13.5
12.6
12.0
11.9
Akron - Brittain
391530017
15.1
14.6
14.5
13.8
13.0
14.4
14.2
13.4
12.7
14.3
13.8
13.0
12.3
12.3
Akron - W. Exchange
391530023
14.3
13.7
13.7
13.0
12.3
13.6
13.3
12.6
12.0
13.4
13.0
12.2
11.6
11.5
Round 5 without CAIR
Round 5 without CAIR
Round 5 without CAIR
2009
2012
2018
Electronic
Table
Filing
2b. PM
- Received,
2.5
Modeling
Clerk's
Results
Office, January
(Annual)
21, 2009
2005
Round 5
with CAIR
Round 5
with CAIR
Round 5
with CAIR
Key Site
County
Site ID
Base Year
Scen. A Scen. B Scen.C
Scen. A Scen. B Scen.C
Scen. A Scen. B Scen.C
Scen. C - BART
Illinois
Chicago - Washington HS
Cook
170310022
36.6
36
36
36
36
36
36
37
36
37
36
37
37
35
Chicago - Mayfair
Cook
170310052
40.3
37
37
37
36
37
36
37
36
38
37
37
37
36
Chicago - Springfield
Cook
170310057
37.4
34
34
33
32
35
34
33
32
36
34
33
33
31
Chicago - Lawndale
Cook
170310076
38.1
35
35
35
35
36
35
36
35
36
35
36
36
34
McCook
Cook
170311016
43.0
39
39
39
39
40
39
40
39
40
40
41
40
38
Blue Island
Cook
170312001
37.7
35
35
35
34
36
35
36
34
36
35
36
36
33
Schiller Park
Cook
170313103
41.6
40
40
40
39
40
40
40
39
41
40
40
39
39
Summit
Cook
170313301
40.2
38
38
39
38
39
38
39
38
39
38
39
39
37
Maywood
Cook
170316005
39.2
38
38
38
38
38
38
39
38
39
38
39
39
37
Granite City
Madison
171191007
39.2
36
36
35
33
36
35
34
33
36
35
35
33
32
E. St. Louis
St. Clair
171630010
33.7
31
31
30
28
31
30
29
28
31
30
30
29
28
Indiana
Jeffersonville
Clark
180190005
38.4
35
33
31
29
35
34
32
31
37
35
34
33
31
Jasper
Dubois
180372001
36.2
32
32
30
28
32
32
30
29
33
31
31
30
28
Gary - IITRI
Lake
180890022
39.0
35
35
35
34
35
34
35
34
36
36
36
35
35
Gary - Burr School
Lake
180890026
39.0
34
34
34
33
34
34
35
34
34
34
34
34
32
Gary
Lake
180890031
35.2
29
28
26
24
28
28
24
24
29
28
27
27
27
Indy-West Street
Marion
180970043
38.0
34
34
33
33
35
35
34
33
36
35
34
34
33
Indy-English Avenue
Marion
180970066
38.0
34
34
32
32
35
34
33
32
35
34
33
33
32
Indy-Washington Park
Marion
180970078
36.6
33
33
32
31
33
33
32
31
34
33
32
32
32
Indy-W 18th Street
Marion
180970081
38.3
33
33
31
31
33
33
32
31
34
33
32
32
31
Indy- Michigan Street
Marion
180970083
36.0
32
32
29
28
32
31
29
28
32
31
29
29
29
Michigan
Luna Pier
Monroe
261150005
38.9
34
34
32
32
34
34
32
32
34
33
32
31
31
Oak Park
Oakland
261250001
39.9
38
38
37
36
38
37
37
36
38
37
37
36
35
Port Huron
St. Clair
261470005
39.6
36
35
35
34
35
35
35
34
35
35
34
33
33
Ypsilanti
Washtenaw 261610008
39.5
37
37
36
35
37
36
36
35
37
36
36
35
34
Allen Park
Wayne
261630001
38.6
36
36
36
35
36
35
35
34
36
35
35
34
33
Southwest HS
Wayne
261630015
40.1
36
36
36
35
36
35
35
35
36
35
35
34
33
Linwood
Wayne
261630016
43.0
40
40
40
39
40
40
40
39
40
39
39
39
38
E 7 Mile
Wayne
261630019
41.0
39
39
39
38
39
39
39
38
39
38
38
38
37
Dearborn
Wayne
261630033
43.9
41
41
41
40
41
41
41
40
41
40
40
40
39
Wyandotte
Wayne
261630036
37.2
36
36
36
35
35
35
35
35
35
35
35
35
34
Newberry
Wayne
261630038
42.7
39
39
39
38
39
38
38
37
39
38
38
37
36
FIA
Wayne
261630039
39.7
35
34
34
33
35
34
34
33
35
34
33
33
31
Ohio
Middleton
Butler
390170003
39.3
33
32
29
28
33
33
29
28
34
32
29
28
27
Fairfield
Butler
390170016
37.1
32
31
29
27
31
30
28
28
32
30
29
28
27
Butler
390170017
40.8
33
32
30
29
33
33
30
29
33
32
30
29
28
Cleveland-28th Street
Cuyahoga 390350027
36.9
34
34
33
32
34
33
33
32
34
33
33
31
31
Cleveland-St. Tikhon
Cuyahoga 390350038
44.2
40
40
37
36
40
39
36
35
40
38
36
35
34
Cleveland-Broadway
Cuyahoga 390350045
38.8
35
35
33
31
35
34
32
30
35
34
31
29
29
Cleveland-GT Craig
Cuyahoga 390350060
42.1
39
39
38
37
39
38
38
37
39
38
37
36
35
Newburg Hts - Harvard Ave Cuyahoga 390350065
38.9
35
35
33
31
35
34
32
30
36
35
32
31
30
Columbus - Fairgrounds
Franklin
390490024
38.5
34
34
33
33
34
33
32
32
34
34
33
32
31
Columbus - Ann Street
Franklin
390490025
38.5
34
33
31
31
33
33
31
31
34
33
31
31
30
Cincinnait
Hamilton
390610006
40.6
33
33
30
27
33
32
29
28
34
32
29
28
27
Round 5 without CAIR
Round 5 without CAIR
Round 5 without CAIR
2009
2012
2018
Electronic
Table
Filing
2c.
- Received,
PM
2.5
Modeling
Clerk's Office,
Results
January
(Daily)
21, 2009
2005
Round 5
with CAIR
Round 5
with CAIR
Round 5
with CAIR
Key Site
County
Site ID
Base Year
Scen. A Scen. B Scen.C
Scen. A Scen. B Scen.C
Scen. A Scen. B Scen.C
Scen. C - BART
Round 5 without CAIR
Round 5 without CAIR
Round 5 without CAIR
2009
2012
2018
Table 2c. PM
2.5
Modeling Results (Daily)
Cincinnati - Seymour
Hamilton
390610014
38.4
33
33
28
26
33
32
27
25
33
31
29
25
24
Cincinnati - Taft Ave
Hamilton
390610040
36.7
31
30
26
24
31
30
26
24
32
29
26
24
23
Cincinnati - 8th Ave
Hamilton
390610042
37.3
32
32
30
28
32
31
29
28
33
31
29
28
27
Sharonville
Hamilton
390610043
36.0
32
31
30
28
32
31
29
28
32
31
29
28
27
Norwood
Hamilton
390617001
38.8
34
33
32
30
33
33
31
30
34
33
31
30
29
St. Bernard
Hamilton
390618001
40.6
35
35
32
30
35
34
31
30
35
33
32
31
29
Steubenville
Jefferson
390810016
40.7
36
35
32
29
35
34
30
28
37
35
31
29
28
Mingo Junction
Jefferson
390811001
42.0
37
37
33
30
37
36
32
30
38
36
32
30
30
Dayton
Montgomery 391130032
37.8
34
33
31
30
33
33
31
30
34
33
31
31
30
Canton - Dueber
Stark
391510017
38.6
33
32
30
28
33
31
30
28
33
30
29
28
27
Akron - Brittain
Summit
391530017
38.1
33
33
31
30
33
32
31
30
33
32
30
29
29
Wisconsin
Green Bay - Est High
Brown
550090005
37.1
35
34
35
35
34
35
35
34
33
33
33
32
32
Madison
Dane
550250047
36.4
33
33
32
32
33
32
32
31
32
31
30
29
29
Milwaukee-Health Center
Milwaukee 550790010
38.7
35
35
35
35
35
35
35
34
35
34
34
34
33
Milwaukee-SER Hdqs
Milwaukee 550790026
37.4
34
34
34
34
34
34
34
34
34
34
34
34
33
Milwaukee-Virginia FS
Milwaukee 550790043
39.9
37
37
37
36
37
36
37
36
36
36
37
36
36
Milwaukee- Fire Dept Hdqs Milwaukee 550790099
37.8
34
34
33
33
34
33
33
32
34
33
33
33
32
Waukesha
Waukesha 551330027
35.5
32
32
32
31
32
32
32
31
32
31
31
30
29
Electronic Filing - Received, Clerk's Office, January 21, 2009
10
Table 3. Modeling Results: Number of Sites > NAAQS
Ozone (85 ppb)
Round 5 without CAIR
Round 5 w/ CAIR
2009
Baseyear
Scen. A
Scen. B
Scen. C
Scen. C-BART
IL
0
0
0
0
----
0
IN
0
0
0
0
----
0
MI
3
1
1
1
----
1
OH
4
0
0
0
----
0
WI
2
0
0
0
----
0
Total
9
1
1
1
1
2012
IL
0
0
0
0
----
0
IN
0
0
0
0
----
0
MI
3
0
0
0
----
0
OH
4
0
0
0
----
0
WI
2
0
0
0
----
0
Total
9
0
0
0
0
2018
IL
0
0
0
0
0
0
IN
0
0
0
0
0
0
MI
3
0
0
0
0
0
OH
4
0
0
0
0
0
WI
2
0
0
0
0
0
Total
9
0
0
0
0
0
Ozone (75 ppb)
Round 5 without CAIR
Round5 w/ CAIR
2009
Baseyear
Scen. A
Scen. B
Scen. C
Scen. C-BART
IL
12
6
6
6
----
4
IN
26
10
9
8
----
5
MI
21
12
12
12
----
12
OH
45
27
25
24
----
21
WI
12
10
10
10
----
10
Total
116
65
62
60
----
52
2012
IL
12
3
3
3
----
1
IN
26
5
4
4
----
3
MI
21
9
8
8
----
6
OH
45
18
14
12
----
11
WI
12
10
9
9
----
9
Total
116
45
38
36
30
2018
IL
12
0
0
0
0
0
IN
26
0
0
0
0
0
MI
21
3
3
3
3
3
OH
45
3
3
2
1
1
WI
12
3
2
1
1
1
Total
116
9
8
6
5
5
Electronic Filing - Received, Clerk's Office, January 21, 2009
11
PM2.5 - Annual
Round 5 without CAIR
Round 5 w/ CAIR
2009
Baseyear
Scen. A
Scen. B
Scen. C
Scen. C-BART
IL
7
4
4
1
----
1
IN
6
2
2
0
----
0
MI
2
2
2
1
----
1
OH
26
13
12
5
----
1
WI
0
0
0
0
----
0
Total
41
21
20
7
3
2012
IL
7
3
1
1
----
0
IN
6
1
1
0
----
0
MI
2
2
1
1
----
1
OH
26
12
9
4
----
0
WI
0
0
0
0
----
0
Total
41
18
12
6
1
2018
IL
7
3
1
0
0
0
IN
6
1
1
0
0
0
MI
2
2
1
1
1
1
OH
26
13
8
2
0
0
WI
0
0
0
0
0
0
Total
41
19
11
3
1
1
PM2.5 - Daily
Round 5 without CAIR
Round 5 w/ CAIR
2009
Baseyear
Scen. A
Scen. B
Scen. C
Scen. C-BART
IL
16
7
7
6
----
6
IN
13
0
0
0
----
0
MI
14
10
9
9
----
5
OH
31
4
3
2
----
2
WI
8
1
1
1
----
1
Total
82
22
20
18
----
14
2012
IL
16
9
6
8
----
6
IN
13
0
0
0
----
0
MI
14
8
6
6
----
5
OH
31
3
3
2
----
1
WI
8
1
1
1
----
1
Total
82
21
16
17
13
2018
IL
16
10
6
8
8
5
IN
13
4
1
1
0
0
MI
14
8
6
6
5
4
OH
31
5
3
2
1
0
WI
8
1
1
1
1
1
Total
82
28
17
18
15
10
Electronic Filing - Received, Clerk's Office, January 21, 2009
12
Table 4. Modeling Results: Future Year Visibility Levels
Worst 20%
2018
Round 5 without CAIR
Round 5 w/ CAIR
Site
Baseline
(2000-2004)
2018 URP
Scen. A
Scen. B
Scen. C
Scen. C-
BART
BOWA1
19.86
17.94
19.09
18.87
18.54
18.02
17.94
VOYA2
19.48
17.75
18.60
18.44
18.17
17.77
17.63
SENE1
24.38
21.64
24.02
23.58
23.03
22.38
22.59
ISLE1
21.59
19.43
21.05
20.86
20.62
20.22
20.09
ISLE9
21.59
19.43
20.83
20.58
20.38
19.84
19.84
HEGL1
26.75
23.13
26.24
25.83
24.87
24.23
24.22
MING1
28.15
24.27
27.51
26.98
25.81
24.93
24.74
CACR1
26.36
22.91
25.32
24.80
23.57
22.97
22.44
UPBU1
26.27
22.82
25.31
24.79
23.50
22.79
22.59
MACA1
31.37
26.64
30.11
29.08
27.06
26.24
26.10
DOSO1
29.05
24.69
27.88
26.96
24.36
23.74
23.00
SHEN1
29.31
25.12
28.38
27.65
25.24
24.69
23.92
JARI1
29.12
24.91
28.06
27.21
25.00
24.48
24.06
BRIG1
29.01
25.05
28.10
28.07
26.57
26.25
25.21
LYBR1
24.45
21.48
24.06
23.86
22.58
22.30
21.14
ACAD1
22.89
20.45
22.88
22.76
22.31
22.16
21.49
Best 20%
2018
Round 5 without CAIR
Round 5 w/ CAIR
Site
Baseline
(2000-2004)
2018 Max
Scen. A
Scen. B
Scen. C
Scen. C-
BART
BOWA1
6.42
6.42
6.20
6.17
6.16
6.12
6.14
VOYA2
7.09
7.09
6.87
6.83
6.81
6.78
6.75
SENE1
7.14
7.14
7.80
7.78
7.81
7.77
7.71
ISLE1
6.75
6.75
6.77
6.76
6.72
6.67
6.60
ISLE9
6.75
6.75
6.63
6.61
6.58
6.53
6.52
HEGL1
12.84
12.84
12.17
12.20
12.07
11.63
11.66
MING1
14.46
14.46
13.78
13.77
13.70
13.37
13.28
CACR1
11.24
11.24
10.94
10.99
10.97
10.78
10.52
UPBU1
11.71
11.71
11.18
11.23
11.18
10.96
10.73
MACA1
16.51
16.51
16.32
16.21
15.76
15.34
15.25
DOSO1
12.28
12.28
12.02
11.84
11.27
11.03
11.00
SHEN1
10.93
10.93
10.98
10.91
10.25
10.16
9.91
JARI1
14.21
14.21
14.19
13.98
13.42
13.21
13.14
BRIG1
14.33
14.33
14.32
14.46
14.22
14.17
13.92
LYBR1
6.37
6.37
6.39
6.38
6.31
6.28
6.14
ACAD1
8.78
8.78
8.97
8.96
8.90
8.89
8.82
Electronic Filing - Received, Clerk's Office, January 21, 2009
13
Figure 2. Ozone Modeling Results
2009
Round 5 – Scen. A
Round 5 – Scen. B
Round 5 – Scen. C
Round 5 - CAIR
2012
Round 5 – Scen. A
Round 5 – Scen. B
Round 5 – Scen. C
Round 5 - CAIR
2018
Round 5 – Scen. A
Round 5 – Scen. B
Round 5 – Scen. C
Round 5 - CAIR
Electronic Filing - Received, Clerk's Office, January 21, 2009
14
Figure 3. PM2.5 Annual Modeling Results
2009
Round 5 – Scen. A
Round 5 – Scen. B
Round 5 – Scen. C
Round 5 - CAIR
2012
Round 5 – Scen. A
Round 5 – Scen. B
Round 5 – Scen. C
Round 5 - CAIR
2018
Round 5 – Scen. A
Round 5 – Scen. B
Round 5 – Scen. C
Round 5 - CAIR
Electronic Filing - Received, Clerk's Office, January 21, 2009
15
Figure 4. PM2.5 Daily Modeling Results
2009
Round 5 – Scen. A
Round 5 – Scen. B
Round 5 – Scen. C
Round 5 - CAIR
2012
Round 5 – Scen. A
Round 5 – Scen. B
Round 5 – Scen. C
Round 5 - CAIR
2018
Round 5 – Scen. A
Round 5 – Scen. B
Round 5 – Scen. C
Round 5 - CAIR
Electronic Filing - Received, Clerk's Office, January 21, 2009
Appendix I
Scenario B (Legally Enforceable) Controls
Electronic Filing - Received, Clerk's Office, January 21, 2009
NOx – 2009
Point Source Grown and Controlled Emissions by facility for NOX r6s1b_2009
Base Year = 2002
Future Year = 2009
STID=17 CYID=57 fcid=057801AAA name=AES DUCK CREEK
Base Yr
Grown Controlled Base Year Future Year
STID CYID
fcid
stkid dvid prid
scc
polid Tons/Day Tons/Day Tons/Day Control EF Control EF ctrltype
ctrldes
17 57 057801AAA 0001 0001 01
10100202 NOX
0.8147
0.8416
0.8416
0.00
0.00
SCR
SCR added by LADCO
STID=17 CYID=143 fcid=143805AAG name=AES ED EDWARDS STATION
Base Yr
Grown Controlled Base Year Future Year
STID CYID
fcid
stkid dvid prid
scc
polid Tons/Day Tons/Day Tons/Day Control EF Control EF ctrltype
ctrldes
17 143 143805AAG 0001 0001 01
10100202 NOX
3.0515
3.1522
3.1522
0.00
0.00
lnb
LNB added by LADCO
17 143 143805AAG 0001 0003 01
10100202 NOX
6.9419
7.1708
7.1708
0.00
0.00
lnb
LNB added by LADCO
17 143 143805AAG 0002 0004 01
10100202 NOX
2.1310
2.2013
2.2013
0.00
0.00
lnb
LNB added by LADCO
----
-------- -------- ----------
fcid
12.1244 12.5243
12.5243
cyid
12.1244 12.5243
12.5243
stid
12.9392 13.3659
13.3659
STID=39 CYID=1 fcid=0701000007 name="DP&L, J.M. STUART GENERATING STATION"
Base Yr
Grown Controlled Base Year Future Year
STID CYID
fcid
stkid dvid prid
scc
polid Tons/Day Tons/Day Tons/Day Control EF Control EF ctrltype
ctrldes
39
1 0701000007 R1
B001 B001P1 10100202 NOX
6.9860
6.9756
2.3252
0.85
0.95
SCR
SCR added by LADCO
39
1 0701000007 R2
B002 B002P1 10100202 NOX
3.6327
3.6273
1.2091
0.85
0.95
SCR
SCR added by LADCO
39
1 0701000007 R3
B003 B003P1 10100202 NOX
5.0133
5.0058
1.6686
0.85
0.95
SCR
SCR added by LADCO
39
1 0701000007 R4
B004 B004P1 10100202 NOX
7.8493
7.8376
2.6125
0.85
0.95
SCR
SCR added by LADCO
----
-------- -------- ----------
fcid
23.4814 23.4464
7.8155
cyid
23.4814 23.4464
7.8155
STID=39 CYID=167 fcid=0684000000 name=MUSKINGUM RIVER POWER PLANT
Base Yr
Grown Controlled Base Year Future Year
STID CYID
fcid
stkid dvid prid
scc
polid Tons/Day Tons/Day Tons/Day Control EF Control EF ctrltype
ctrldes
39 167 0684000000 R1
B001 B001P1 10200501 NOX
0.0017
0.0017
0.0001
0.00
0.95
SCR
SCR added by LADCO
39 167 0684000000 R2
B002 B002P1 10100201 NOX
5.8167
5.8080
0.2904
0.00
0.95
SCR
SCR added by LADCO
39 167 0684000000 R2
B002 B002P2 10100501 NOX
0.0000
0.0000
0.0000
0.00
0.95
SCR
SCR added by LADCO
39 167 0684000000 R3
B003 B003P1 10100201 NOX
7.9017
7.8899
0.3945
0.00
0.95
SCR
SCR added by LADCO
39 167 0684000000 R3
B003 B003P2 10100501 NOX
0.0000
0.0000
0.0000
0.00
0.95
SCR
SCR added by LADCO
39 167 0684000000 R4
B004 B004P1 10100203 NOX
7.8775
7.8657
0.3933
0.00
0.95
SCR
SCR added by LADCO
39 167 0684000000 R4
B004 B004P2 10100501 NOX
0.0000
0.0000
0.0000
0.00
0.95
SCR
SCR added by LADCO
39 167 0684000000 R6
B006 B006P1 10100202 NOX
3.8586
3.8528
0.1926
0.00
0.95
SCR
SCR added by LADCO
39 167 0684000000 R6
B006 B006P2 10100501 NOX
0.0000
0.0000
0.0000
0.00
0.95
SCR
SCR added by LADCO
----
-------- -------- ----------
fcid
25.4561 25.4182
1.2709
cyid
25.4561 25.4182
1.2709
stid
48.9375 48.8646
9.0864
STID=55 CYID=79 fcid=241007800 name=WIS ELECTRIC POWER VALLEY STATION
Base Yr
Grown Controlled Base Year Future Year
Electronic Filing - Received, Clerk's Office, January 21, 2009
STID CYID
fcid
stkid dvid prid
scc
polid Tons/Day Tons/Day Tons/Day Control EF Control EF ctrltype
ctrldes
55 79 241007800 S11
B21 01
10100202 NOX
2.7972
2.8895
1.6470
0.00
0.43
SCR
SCR added by LADCO
55 79 241007800 S11
B22 01
10100202 NOX
2.9073
3.0032
1.7118
0.00
0.43
SCR
SCR added by LADCO
55 79 241007800 S12
B23 01
10100202 NOX
2.3270
2.4038
1.2740
0.00
0.47
SCR
SCR added by LADCO
55 79 241007800 S12
B24 01
10100202 NOX
2.3427
2.4199
1.2826
0.00
0.47
SCR
Scrubber added by LADCO
----
-------- -------- ----------
fcid
10.3742 10.7164
5.9154
cyid
10.3742 10.7164
5.9154
STID=55 CYID=117 fcid=460033090 name=WP & L Alliant Energy - Edgewater Gen Station
Base Yr
Grown Controlled Base Year Future Year
STID CYID
fcid
stkid dvid prid
scc
polid Tons/Day Tons/Day Tons/Day Control EF Control EF ctrltype
ctrldes
55 117 460033090 S11
B23 01
10100203 NOX
1.6197
1.6731
1.0038
0.00
0.40
SCR
SCR added by LADCO
55 117 460033090 S11
B24 01
10100203 NOX
4.1072
4.2426
3.4789
0.00
0.18
SCR
SCR added by LADCO
55 117 460033090 S12
B25 01
10100221 NOX
5.6804
5.8677
4.9876
0.00
0.15
SCR
SCR added by LADCO
----
-------- -------- ----------
fcid
11.4072 11.7834
9.4703
cyid
11.4072 11.7834
9.4703
stid
21.7814 22.4997
15.3857
======== ======== ==========
83.6581 84.7302
37.8380
Electronic Filing - Received, Clerk's Office, January 21, 2009
NOx - 2012
Point Source Grown and Controlled Emissions by facility for NOX r6s1b_2012
Base Year = 2002
Future Year = 2012
STID=17 CYID=33 fcid=033801AAA name=AMEREN ENERGY GENERATING CO
Base Yr
Grown Controlled Base Year Future Year
STID CYID
fcid
stkid dvid prid
scc
polid Tons/Day Tons/Day Tons/Day Control EF Control EF ctrltype
ctrldes
17 33 033801AAA 0005 0005 01
10100202 NOX
1.642
1.871
0.9357
0.00
0.500
SCR
SCR added by LADCO
17 33 033801AAA 0006 0006 01
10100202 NOX
2.116
2.413
1.2063
0.00
0.500
SCR
SCR added by LADCO
----
-------- -------- ----------
fcid
3.758
4.284
2.1420
cyid
3.758
4.284
2.1420
STID=17 CYID=57 fcid=057801AAA name=AES DUCK CREEK
Base Yr
Grown Controlled Base Year Future Year
STID CYID
fcid
stkid dvid prid
scc
polid Tons/Day Tons/Day Tons/Day Control EF Control EF ctrltype
ctrldes
17 57 057801AAA 0001 0001 01
10100202 NOX
0.815
0.929
0.9288
0.00
0.000
SCR
SCR added by LADCO
STID=17 CYID=79 fcid=079808AAA name=AMEREN ENERGY GENERATING CO
Base Yr
Grown Controlled Base Year Future Year
STID CYID
fcid
stkid dvid prid
scc
polid Tons/Day Tons/Day Tons/Day Control EF Control EF ctrltype
ctrldes
17 79 079808AAA 0003 0003 01
10100202 NOX
6.735
7.678
7.6780
0.00
0.000
SCR
SCR added by LADCO
17 79 079808AAA 0012 0013 01
10100501 NOX
5.936
5.378
5.3781
0.00
0.000
SCR
SCR added by LADCO
----
-------- -------- ----------
fcid
12.671
13.056
13.0561
cyid
12.671
13.056
13.0561
STID=17 CYID=97 fcid=097190AAC name=MIDWEST GENERATION LLC
Base Yr
Grown Controlled Base Year Future Year
STID CYID
fcid
stkid dvid prid
scc
polid Tons/Day Tons/Day Tons/Day Control EF Control EF ctrltype
ctrldes
17 97 097190AAC 0016 0031 02
10100401 NOX
0.000
0.000
0.0000
0.00
0.999
SHUTDOWN SCR added by LADCO
STID=17 CYID=137 fcid=137805AAA name=AMEREN ENERGY GENERATING CO
Base Yr
Grown Controlled Base Year Future Year
STID CYID
fcid
stkid dvid prid
scc
polid Tons/Day Tons/Day Tons/Day Control EF Control EF ctrltype
ctrldes
17 137 137805AAA 0003 0003 01
10100202 NOX
5.356
6.106
6.1058
0.00
0.000
LNB
LNB added by LADCO
STID=17 CYID=143 fcid=143805AAG name=AES ED EDWARDS STATION
Base Yr
Grown Controlled Base Year Future Year
STID CYID
fcid
stkid dvid prid
scc
polid Tons/Day Tons/Day Tons/Day Control EF Control EF ctrltype
ctrldes
17 143 143805AAG 0001 0001 01
10100202 NOX
3.052
3.479
3.4789
0.00
0.000
lnb
LNB added by LADCO
17 143 143805AAG 0001 0003 01
10100202 NOX
6.942
7.914
7.9141
0.00
0.000
lnb
LNB added by LADCO
17 143 143805AAG 0002 0004 01
10100202 NOX
2.131
2.429
2.4294
0.00
0.000
lnb
LNB added by LADCO
----
-------- -------- ----------
fcid
12.124
13.822
13.8224
cyid
12.124
13.822
13.8224
Electronic Filing - Received, Clerk's Office, January 21, 2009
STID=17 CYID=167 fcid=167120AAO name=CITY WATER LIGHT & POWER
Base Yr
Grown Controlled Base Year Future Year
STID CYID
fcid
stkid dvid prid
scc
polid Tons/Day Tons/Day Tons/Day Control EF Control EF ctrltype
ctrldes
17 167 167120AAO 0010 0012 01
10100203 NOX
6.527
7.441
0.0074
0.00
0.999
SHUTDOWN SHUTDOWN added by LADCO
17 167 167120AAO 0010 0013 01
10100203 NOX
2.646
3.017
0.0030
0.00
0.999
SHUTDOWN SHUTDOWN added by LADCO
----
-------- -------- ----------
fcid
9.173
10.458
0.0105
cyid
9.173
10.458
0.0105
STID=17 CYID=179 fcid=179801AAA name=MIDWEST GENERATION LLC
Base Yr
Grown Controlled Base Year Future Year
STID CYID
fcid
stkid dvid prid
scc
polid Tons/Day Tons/Day Tons/Day Control EF Control EF ctrltype
ctrldes
17 179 179801AAA 0018 0029 01
10100203 NOX
22.429
25.570
1.2785
0.00
0.950
SCR
SCR added by LADCO
17 179 179801AAA 0018 0031 01
10100203 NOX
38.993
44.454
2.2227
0.00
0.950
SCR
SCR added by LADCO
----
-------- -------- ----------
fcid
61.422
70.024
3.5012
cyid
61.422
70.024
3.5012
STID=17 CYID=197 fcid=197809AAO name=MIDWEST GENERATION LLC
Base Yr
Grown Controlled Base Year Future Year
STID CYID
fcid
stkid dvid prid
scc
polid Tons/Day Tons/Day Tons/Day Control EF Control EF ctrltype
ctrldes
17 197 197809AAO 0032 0033 02
10100604 NOX
0.000
0.000
0.0000
0.00
0.800
SCR
SCR added by LADCO
STID=17 CYID=197 fcid=197810AAK name=MIDWEST GENERATION LLC
Base Yr
Grown Controlled Base Year Future Year
STID CYID
fcid
stkid dvid prid
scc
polid Tons/Day Tons/Day Tons/Day Control EF Control EF ctrltype
ctrldes
17 197 197810AAK 0011 0016 02
10100222 NOX
5.731
6.534
3.9203
0.00
0.400
SCR
SCR added by LADCO
17 197 197810AAK 0011 0016 03
10100501 NOX
0.000
0.000
0.0000
0.00
0.400
SCR
SCR added by LADCO
17 197 197810AAK 0013 0010 02
10100223 NOX
8.598
9.802
0.0098
0.00
0.999
SHUTDOWN SCR added by LADCO
17 197 197810AAK 0013 0010 03
10100501 NOX
0.000
0.000
0.0000
0.00
0.999
SHUTDOWN SCR added by LADCO
17 197 197810AAK 0007 0012 02
10100223 NOX
10.974
12.511
0.0125
0.00
0.999
SHUTDOWN SCR added by LADCO
17 197 197810AAK 0007 0012 03
10100501 NOX
0.000
0.000
0.0000
0.00
0.999
SHUTDOWN SCR added by LADCO
----
-------- -------- ----------
fcid
25.303
28.847
3.9426
cyid
25.303
28.847
3.9426
stid
130.622 147.527
43.5096
STID=27 CYID=61 fcid=2706100004 name=Minnesota Power Inc - Boswell Energy Ctr
Base Yr
Grown Controlled Base Year Future Year
STID CYID
fcid
stkid dvid prid
scc
polid Tons/Day Tons/Day Tons/Day Control EF Control EF ctrltype
ctrldes
27 61 2706100004 SV003 EU003 001
10100226 NOX
13.661
14.142
2.8284
0.00
0.800
SCR
SCR added by LADCO
27 61 2706100004 SV003 EU003 002
10100501 NOX
0.000
0.000
0.0000
0.00
0.800
SCR
SCR added by LADCO
----
-------- -------- ----------
fcid
13.661
14.142
2.8284
cyid
13.661
14.142
2.8284
STID=27 CYID=109 fcid=2710900011 name=Rochester Public Utilities - Silver Lake
Base Yr
Grown Controlled Base Year Future Year
STID CYID
fcid
stkid dvid prid
scc
polid Tons/Day Tons/Day Tons/Day Control EF Control EF ctrltype
ctrldes
Electronic Filing - Received, Clerk's Office, January 21, 2009
27 109 2710900011 SV003 EU004 001
10100202 NOX
2.079
2.152
1.2911
0.00
0.400
SNCR
SCR added by LADCO
----
-------- -------- ----------
stid
15.739
16.294
4.1195
STID=39 CYID=1 fcid=0701000007 name="DP&L, J.M. STUART GENERATING STATION"
Base Yr
Grown Controlled Base Year Future Year
STID CYID
fcid
stkid dvid prid
scc
polid Tons/Day Tons/Day Tons/Day Control EF Control EF ctrltype
ctrldes
39
1 0701000007 R1
B001 B001P1 10100202 NOX
6.986
7.296
2.4319
0.85
0.950
SCR
SCR added by LADCO
39
1 0701000007 R2
B002 B002P1 10100202 NOX
3.633
3.794
1.2646
0.85
0.950
SCR
SCR added by LADCO
39
1 0701000007 R3
B003 B003P1 10100202 NOX
5.013
5.235
1.7452
0.85
0.950
SCR
SCR added by LADCO
39
1 0701000007 R4
B004 B004P1 10100202 NOX
7.849
8.197
2.7324
0.85
0.950
SCR
SCR added by LADCO
----
-------- -------- ----------
fcid
23.481
24.522
8.1740
cyid
23.481
24.522
8.1740
STID=39 CYID=31 fcid=0616000000 name=CONESVILLE POWER PLANT
Base Yr
Grown Controlled Base Year Future Year
STID CYID
fcid
stkid dvid prid
scc
polid Tons/Day Tons/Day Tons/Day Control EF Control EF ctrltype
ctrldes
39 31 0616000000 R4
B004 B004P1 10100212 NOX
20.852
21.776
1.0888
0.00
0.950
SCR
SCR added by LADCO
STID=39 CYID=167 fcid=0684000000 name=MUSKINGUM RIVER POWER PLANT
Base Yr
Grown Controlled Base Year Future Year
STID CYID
fcid
stkid dvid prid
scc
polid Tons/Day Tons/Day Tons/Day Control EF Control EF ctrltype
ctrldes
39 167 0684000000 R1
B001 B001P1 10200501 NOX
0.002
0.002
0.0001
0.00
0.950
SCR
SCR added by LADCO
39 167 0684000000 R2
B002 B002P1 10100201 NOX
5.817
6.074
0.3037
0.00
0.950
SCR
SCR added by LADCO
39 167 0684000000 R2
B002 B002P2 10100501 NOX
0.000
0.000
0.0000
0.00
0.950
SCR
SCR added by LADCO
39 167 0684000000 R3
B003 B003P1 10100201 NOX
7.902
8.252
0.4126
0.00
0.950
SCR
SCR added by LADCO
39 167 0684000000 R3
B003 B003P2 10100501 NOX
0.000
0.000
0.0000
0.00
0.950
SCR
SCR added by LADCO
39 167 0684000000 R4
B004 B004P1 10100203 NOX
7.877
8.227
0.4113
0.00
0.950
SCR
SCR added by LADCO
39 167 0684000000 R4
B004 B004P2 10100501 NOX
0.000
0.000
0.0000
0.00
0.950
SCR
SCR added by LADCO
39 167 0684000000 R6
B006 B006P1 10100202 NOX
3.859
4.030
0.2015
0.00
0.950
SCR
SCR added by LADCO
39 167 0684000000 R6
B006 B006P2 10100501 NOX
0.000
0.000
0.0000
0.00
0.950
SCR
SCR added by LADCO
----
-------- -------- ----------
fcid
25.456
26.584
1.3292
cyid
25.456
26.584
1.3292
stid
69.789
72.882
10.5920
STID=55 CYID=79 fcid=241007690 name=WIS ELECTRIC POWER OAK CREEK STATION
Base Yr
Grown Controlled Base Year Future Year
STID CYID
fcid
stkid dvid prid
scc
polid Tons/Day Tons/Day Tons/Day Control EF Control EF ctrltype
ctrldes
55 79 241007690 S13
B25
01
10100202 NOX
4.755
5.421
3.0898
0.00
0.430
SCR
SCR added by LADCO
55 79 241007690 S13
B26
01
10100202 NOX
3.277
3.736
2.2045
0.00
0.410
SCR
SCR added by LADCO
55 79 241007690 S14
B27
01
10100212 NOX
3.333
3.800
2.8499
0.00
0.250
SCR
SCR added by LADCO
55 79 241007690 S14
B28
01
10100212 NOX
3.384
3.857
2.9316
0.00
0.240
SCR
SCR added by LADCO
----
-------- -------- ----------
fcid
14.749
16.814
11.0757
STID=55 CYID=79 fcid=241007800 name=WIS ELECTRIC POWER VALLEY STATION
Electronic Filing - Received, Clerk's Office, January 21, 2009
Base Yr
Grown Controlled Base Year Future Year
STID CYID
fcid
stkid dvid prid
scc
polid Tons/Day Tons/Day Tons/Day Control EF Control EF ctrltype
ctrldes
55 79 241007800 S11
B21
01
10100202 NOX
2.797
3.189
1.8177
0.00
0.430
SCR
SCR added by LADCO
55 79 241007800 S11
B22
01
10100202 NOX
2.907
3.314
1.8893
0.00
0.430
SCR
SCR added by LADCO
55 79 241007800 S12
B23
01
10100202 NOX
2.327
2.653
1.4061
0.00
0.470
SCR
SCR added by LADCO
55 79 241007800 S12
B24
01
10100202 NOX
2.343
2.671
1.4155
0.00
0.470
SCR
Scrubber added by LADCO
----
-------- -------- ----------
fcid
10.374
11.827
6.5285
cyid
25.123
28.641
17.6042
STID=55 CYID=117 fcid=460033090 name=WP & L Alliant Energy - Edgewater Gen Station
Base Yr
Grown Controlled Base Year Future Year
STID CYID
fcid
stkid dvid prid
scc
polid Tons/Day Tons/Day Tons/Day Control EF Control EF ctrltype
ctrldes
55 117 460033090 S11
B23
01
10100203 NOX
1.620
1.846
1.1079
0.00
0.400
SCR
SCR added by LADCO
55 117 460033090 S11
B24
01
10100203 NOX
4.107
4.682
3.8395
0.00
0.180
SCR
SCR added by LADCO
55 117 460033090 S12
B25
01
10100221 NOX
5.680
6.476
5.5045
0.00
0.150
SCR
SCR added by LADCO
----
-------- -------- ----------
fcid
11.407
13.005
10.4519
cyid
11.407
13.005
10.4519
stid
36.530
41.646
28.0562
======== ======== ==========
252.681 278.349
86.2773
Electronic Filing - Received, Clerk's Office, January 21, 2009
NOx 2018
Point Source Grown and Controlled Emissions by facility for NOX r6s1b_2018
Base Year = 2002
Future Year = 2018
STID=17 CYID=31 fcid=031600AIN name=MIDWEST GENERATION LLC
Base Yr
Grown Controlled Base Year Future Year
STID CYID fcid
stkid dvid prid
scc
polid Tons/Day Tons/Day Tons/Day Control EF Control EF ctrltype
ctrldes
17 31 031600AIN 0010 0013 01
10100226 NOX
2.283
2.592
1.5550
0.00
0.400
SCR
SCR added by LADCO
17 31 031600AIN 0010 0013 02
10100601 NOX
0.000
0.000
0.0000
0.00
0.400
SCR
SCR added by LADCO
17 31 031600AIN 0012 0016 01
10100226 NOX
3.991
4.531
2.7184
0.00
0.400
SCR
SCR added by LADCO
17 31 031600AIN 0012 0016 02
10100601 NOX
0.000
0.000
0.0000
0.00
0.400
SCR
SCR added by LADCO
----
-------- -------- ----------
fcid
6.274
7.122
4.2734
cyid
6.274
7.122
4.2734
STID=17 CYID=33 fcid=033801AAA name=AMEREN ENERGY GENERATING CO
Base Yr
Grown Controlled Base Year Future Year
STID CYID fcid
stkid dvid prid
scc
polid Tons/Day Tons/Day Tons/Day Control EF Control EF ctrltype
ctrldes
17 33 033801AAA 0005 0005 01
10100202 NOX
1.642
1.863
0.9317
0.00
0.500
SCR
SCR added by LADCO
17 33 033801AAA 0006 0006 01
10100202 NOX
2.116
2.402
1.2012
0.00
0.500
SCR
SCR added by LADCO
----
-------- -------- ----------
fcid
3.758
4.266
2.1329
cyid
3.758
4.266
2.1329
STID=17 CYID=57 fcid=057801AAA name=AES DUCK CREEK
Base Yr
Grown Controlled Base Year Future Year
STID CYID fcid
stkid dvid prid
scc
polid Tons/Day Tons/Day Tons/Day Control EF Control EF ctrltype
ctrldes
17 57 057801AAA 0001 0001 01
10100202 NOX
0.815
0.925
0.9249
0.00
0.000
SCR
SCR added by LADCO
STID=17 CYID=79 fcid=079808AAA name=AMEREN ENERGY GENERATING CO
Base Yr
Grown Controlled Base Year Future Year
STID CYID fcid
stkid dvid prid
scc
polid Tons/Day Tons/Day Tons/Day Control EF Control EF ctrltype
ctrldes
17 79 079808AAA 0003 0003 01
10100202 NOX
6.735
7.645
7.6453
0.00
0.000
SCR
SCR added by LADCO
17 79 079808AAA 0012 0013 01
10100501 NOX
5.936
3.984
3.9838
0.00
0.000
SCR
SCR added by LADCO
----
-------- -------- ----------
fcid
12.671
11.629
11.6291
cyid
12.671
11.629
11.6291
STID=17 CYID=97 fcid=097190AAC name=MIDWEST GENERATION LLC
Base Yr
Grown Controlled Base Year Future Year
STID CYID fcid
stkid dvid prid
scc
polid Tons/Day Tons/Day Tons/Day Control EF Control EF ctrltype
ctrldes
17 97 097190AAC 0016 0031 02
10100401 NOX
0.000
0.000
0.0000
0.00
0.999
SHUTDOWN SCR added by LADCO
STID=17 CYID=137 fcid=137805AAA name=AMEREN ENERGY GENERATING CO
Base Yr
Grown Controlled Base Year Future Year
STID CYID fcid
stkid dvid prid
scc
polid Tons/Day Tons/Day Tons/Day Control EF Control EF ctrltype
ctrldes
17 137 137805AAA 0003 0003 01
10100202 NOX
5.356
6.080
6.0798
0.00
0.000
LNB
LNB added by LADCO
Electronic Filing - Received, Clerk's Office, January 21, 2009
STID=17 CYID=143 fcid=143805AAG name=AES ED EDWARDS STATION
Base Yr
Grown Controlled Base Year Future Year
STID CYID fcid
stkid dvid prid
scc
polid Tons/Day Tons/Day Tons/Day Control EF Control EF ctrltype
ctrldes
17 143 143805AAG 0001 0001 01
10100202 NOX
3.052
3.464
3.4641
0.00
0.000
lnb
LNB added by LADCO
17 143 143805AAG 0001 0003 01
10100202 NOX
6.942
7.880
7.8804
0.00
0.000
lnb
LNB added by LADCO
17 143 143805AAG 0002 0004 01
10100202 NOX
2.131
2.419
2.4191
0.00
0.000
lnb
LNB added by LADCO
----
-------- -------- ----------
fcid
12.124
13.764
13.7636
cyid
12.124
13.764
13.7636
STID=17 CYID=167 fcid=167120AAO name=CITY WATER LIGHT & POWER
Base Yr
Grown Controlled Base Year Future Year
STID CYID fcid
stkid dvid prid
scc
polid Tons/Day Tons/Day Tons/Day Control EF Control EF ctrltype
ctrldes
17 167 167120AAO 0010 0012 01
10100203 NOX
6.527
7.410
0.0074
0.00
0.999
SHUTDOWN SHUTDOWN added by LADCO
17 167 167120AAO 0010 0013 01
10100203 NOX
2.646
3.004
0.0030
0.00
0.999
SHUTDOWN SHUTDOWN added by LADCO
----
-------- -------- ----------
fcid
9.173
10.414
0.0104
cyid
9.173
10.414
0.0104
STID=17 CYID=179 fcid=179801AAA name=MIDWEST GENERATION LLC
Base Yr
Grown Controlled Base Year Future Year
STID CYID fcid
stkid dvid prid
scc
polid Tons/Day Tons/Day Tons/Day Control EF Control EF ctrltype
ctrldes
17 179 179801AAA 0018 0029 01
10100203 NOX
22.429
25.462
1.2731
0.00
0.950
SCR
SCR added by LADCO
17 179 179801AAA 0018 0031 01
10100203 NOX
38.993
44.265
2.2132
0.00
0.950
SCR
SCR added by LADCO
----
-------- -------- ----------
fcid
61.422
69.726
3.4863
cyid
61.422
69.726
3.4863
STID=17 CYID=197 fcid=197809AAO name=MIDWEST GENERATION LLC
Base Yr
Grown Controlled Base Year Future Year
STID CYID fcid
stkid dvid prid
scc
polid Tons/Day Tons/Day Tons/Day Control EF Control EF ctrltype
ctrldes
17 197 197809AAO 0032 0033 02
10100604 NOX
0.000
0.000
0.0000
0.00
0.800
SCR
SCR added by LADCO
STID=17 CYID=197 fcid=197810AAK name=MIDWEST GENERATION LLC
Base Yr
Grown Controlled Base Year Future Year
STID CYID fcid
stkid dvid prid
scc
polid Tons/Day Tons/Day Tons/Day Control EF Control EF ctrltype
ctrldes
17 197 197810AAK 0011 0016 02
10100222 NOX
5.731
6.506
3.9036
0.00
0.400
SCR
SCR added by LADCO
17 197 197810AAK 0011 0016 03
10100501 NOX
0.000
0.000
0.0000
0.00
0.400
SCR
SCR added by LADCO
17 197 197810AAK 0013 0010 02
10100223 NOX
8.598
9.760
0.0098
0.00
0.999
SHUTDOWN SCR added by LADCO
17 197 197810AAK 0013 0010 03
10100501 NOX
0.000
0.000
0.0000
0.00
0.999
SHUTDOWN SCR added by LADCO
17 197 197810AAK 0007 0012 02
10100223 NOX
10.974
12.458
0.0125
0.00
0.999
SHUTDOWN SCR added by LADCO
17 197 197810AAK 0007 0012 03
10100501 NOX
0.000
0.000
0.0000
0.00
0.999
SHUTDOWN SCR added by LADCO
----
-------- -------- ----------
fcid
25.303
28.724
3.9258
cyid
25.303
28.724
3.9258
stid
136.896 152.649
46.2263
Electronic Filing - Received, Clerk's Office, January 21, 2009
STID=18 CYID=147 fcid=00020 name=INDIANA MICHIGAN POWER-ROCKPORT
Base Yr
Grown Controlled Base Year Future Year
STID CYID fcid
stkid dvid
prid
scc
polid Tons/Day Tons/Day Tons/Day Control EF Control EF ctrltype
ctrldes
18 147 00020
1
001
01
10100222 NOX
23.226
25.291
1.2646
0.00
0.950
SCR
SCR added by LADCO
18 147 00020
1
001
02
10100501 NOX
0.000
0.000
0.0000
0.00
0.950
SCR
SCR added by LADCO
----
-------- -------- ----------
fcid
23.226
25.291
1.2646
cyid
23.226
25.291
1.2646
stid
23.226
25.291
1.2646
STID=27 CYID=61 fcid=2706100004 name=Minnesota Power Inc - Boswell Energy Ctr
Base Yr
Grown Controlled Base Year Future Year
STID CYID fcid
stkid dvid prid
scc
polid Tons/Day Tons/Day Tons/Day Control EF Control EF ctrltype
ctrldes
27 61 2706100004 SV003 EU003 001
10100226 NOX
13.661
15.733
3.1466
0.00
0.800
SCR
SCR added by LADCO
27 61 2706100004 SV003 EU003 002
10100501 NOX
0.000
0.000
0.0000
0.00
0.800
SCR
SCR added by LADCO
----
-------- -------- ----------
fcid
13.661
15.733
3.1466
cyid
13.661
15.733
3.1466
STID=27 CYID=109 fcid=2710900011 name=Rochester Public Utilities - Silver Lake
Base Yr
Grown Controlled Base Year Future Year
STID CYID fcid
stkid dvid prid
scc
polid Tons/Day Tons/Day Tons/Day Control EF Control EF ctrltype
ctrldes
27 109 2710900011 SV003 EU004 001
10100202 NOX
2.079
2.394
1.4363
0.00
0.400
SNCR
SCR added by LADCO
----
-------- -------- ----------
stid
15.739
18.127
4.5830
STID=39 CYID=1 fcid=0701000007 name="DP&L, J.M. STUART GENERATING STATION"
Base Yr
Grown Controlled Base Year Future Year
STID CYID fcid
stkid dvid prid
scc
polid Tons/Day Tons/Day Tons/Day Control EF Control EF ctrltype
ctrldes
39
1 0701000007 R1
B001 B001P1 10100202 NOX
6.986
7.607
2.5358
0.85
0.950
SCR
SCR added by LADCO
39
1 0701000007 R2
B002 B002P1 10100202 NOX
3.633
3.956
1.3186
0.85
0.950
SCR
SCR added by LADCO
39
1 0701000007 R3
B003 B003P1 10100202 NOX
5.013
5.459
1.8197
0.85
0.950
SCR
SCR added by LADCO
39
1 0701000007 R4
B004 B004P1 10100202 NOX
7.849
8.547
2.8491
0.85
0.950
SCR
SCR added by LADCO
----
-------- -------- ----------
fcid
23.481
25.570
8.5232
cyid
23.481
25.570
8.5232
STID=39 CYID=31 fcid=0616000000 name=CONESVILLE POWER PLANT
Base Yr
Grown Controlled Base Year Future Year
STID CYID fcid
stkid dvid prid
scc
polid Tons/Day Tons/Day Tons/Day Control EF Control EF ctrltype
ctrldes
39 31 0616000000 R4
B004 B004P1 10100212 NOX
20.852
22.706
1.1353
0.00
0.950
SCR
SCR added by LADCO
STID=39 CYID=167 fcid=0684000000 name=MUSKINGUM RIVER POWER PLANT
Base Yr
Grown Controlled Base Year Future Year
STID CYID fcid
stkid dvid prid
scc
polid Tons/Day Tons/Day Tons/Day Control EF Control EF ctrltype
ctrldes
39 167 0684000000 R1
B001 B001P1 10200501 NOX
0.002
0.002
0.0001
0.00
0.950
SCR
SCR added by LADCO
Electronic Filing - Received, Clerk's Office, January 21, 2009
39 167 0684000000 R2
B002 B002P1 10100201 NOX
5.817
6.334
0.3167
0.00
0.950
SCR
SCR added by LADCO
39 167 0684000000 R2
B002 B002P2 10100501 NOX
0.000
0.000
0.0000
0.00
0.950
SCR
SCR added by LADCO
39 167 0684000000 R3
B003 B003P1 10100201 NOX
7.902
8.604
0.4302
0.00
0.950
SCR
SCR added by LADCO
39 167 0684000000 R3
B003 B003P2 10100501 NOX
0.000
0.000
0.0000
0.00
0.950
SCR
SCR added by LADCO
39 167 0684000000 R4
B004 B004P1 10100203 NOX
7.877
8.578
0.4289
0.00
0.950
SCR
SCR added by LADCO
39 167 0684000000 R4
B004 B004P2 10100501 NOX
0.000
0.000
0.0000
0.00
0.950
SCR
SCR added by LADCO
39 167 0684000000 R6
B006 B006P1 10100202 NOX
3.859
4.202
0.2101
0.00
0.950
SCR
SCR added by LADCO
39 167 0684000000 R6
B006 B006P2 10100501 NOX
0.000
0.000
0.0000
0.00
0.950
SCR
SCR added by LADCO
----
-------- -------- ----------
fcid
25.456
27.720
1.3860
cyid
25.456
27.720
1.3860
stid
69.789
75.996
11.0445
STID=54 CYID=39 fcid=0006 name=APPALACHIAN POWER - KANAWHA RIVER PLANT
Base Yr
Grown Controlled Base Year Future Year
STID CYID fcid
stkid dvid prid
scc
polid Tons/Day Tons/Day Tons/Day Control EF Control EF ctrltype
ctrldes
54 39 0006
012
001
99
10100202 NOX
4.829
5.258
2.6291
0.00
0.500
SCR
Scrubber added by LADCO
54 39 0006
012
002
99
10100202 NOX
4.921
5.359
2.6794
0.00
0.500
SCR
Scrubber added by LADCO
----
-------- -------- ----------
fcid
9.750
10.617
5.3085
cyid
9.750
10.617
5.3085
stid
9.750
10.617
5.3085
STID=55 CYID=79 fcid=241007690 name=WIS ELECTRIC POWER OAK CREEK STATION
Base Yr
Grown Controlled Base Year Future Year
STID CYID fcid
stkid dvid prid
scc
polid Tons/Day Tons/Day Tons/Day Control EF Control EF ctrltype
ctrldes
55 79 241007690 S13
B25
01
10100202 NOX
4.755
5.398
3.0766
0.00
0.430
SCR
SCR added by LADCO
55 79 241007690 S13
B26
01
10100202 NOX
3.277
3.720
2.1951
0.00
0.410
SCR
SCR added by LADCO
55 79 241007690 S14
B27
01
10100212 NOX
3.333
3.784
2.8378
0.00
0.250
SCR
SCR added by LADCO
55 79 241007690 S14
B28
01
10100212 NOX
3.384
3.841
2.9191
0.00
0.240
SCR
SCR added by LADCO
----
-------- -------- ----------
fcid
14.749
16.743
11.0285
STID=55 CYID=79 fcid=241007800 name=WIS ELECTRIC POWER VALLEY STATION
Base Yr
Grown Controlled Base Year Future Year
STID CYID fcid
stkid dvid prid
scc
polid Tons/Day Tons/Day Tons/Day Control EF Control EF ctrltype
ctrldes
55 79 241007800 S11
B21
01
10100202 NOX
2.797
3.175
1.4289
0.00
0.550
SCR
SCR added by LADCO
55 79 241007800 S11
B22
01
10100202 NOX
2.907
3.300
1.4852
0.00
0.550
SCR
SCR added by LADCO
55 79 241007800 S12
B23
01
10100202 NOX
2.327
2.642
1.1887
0.00
0.550
SCR
SCR added by LADCO
55 79 241007800 S12
B24
01
10100202 NOX
2.343
2.659
1.1967
0.00
0.550
SCR
SCR added by LADCO
----
-------- -------- ----------
fcid
10.374
11.777
5.2995
cyid
25.123
28.519
16.3281
STID=55 CYID=117 fcid=460033090 name=WP & L Alliant Energy - Edgewater Gen Station
Base Yr
Grown Controlled Base Year Future Year
STID CYID fcid
stkid dvid prid
scc
polid Tons/Day Tons/Day Tons/Day Control EF Control EF ctrltype
ctrldes
55 117 460033090 S11
B23
01
10100203 NOX
1.620
1.839
1.1032
0.00
0.400
SCR
SCR added by LADCO
Electronic Filing - Received, Clerk's Office, January 21, 2009
55 117 460033090 S11
B24
01
10100203 NOX
4.107
4.662
3.8232
0.00
0.180
SCR
SCR added by LADCO
55 117 460033090 S12
B25
01
10100221 NOX
5.680
6.448
5.4811
0.00
0.150
SCR
SCR added by LADCO
----
-------- -------- ----------
fcid
11.407
12.949
10.4074
cyid
11.407
12.949
10.4074
stid
36.530
41.469
26.7355
======== ======== ==========
291.931 324.149
95.1624
Electronic Filing - Received, Clerk's Office, January 21, 2009
SO2 – 2009
Point Source Grown and Controlled Emissions by facility for SO2 r6s1b_2009
1
Base Year = 2002
Future Year = 2009
STID=19 CYID=115 fcid=58-07-001 name=MIDAMERICAN ENERGY CO. - LOUISA STATION
Base Yr
Grown Controlled Base Year Future Year
STID CYID fcid
stkid dvid
prid
scc
polid Tons/Day Tons/Day Tons/Day Control EF Control EF ctrltype
ctrldes
19 115 58-07-001 117487 147281 99
10100222 SO2
33.664
34.774
3.4774
0.0
0.90
SCRUBBER Scrubber added by LADCO
STID=21 CYID=161 fcid=2116100009 name=EAST KY POWER COOP
Base Yr
Grown Controlled Base Year Future Year
STID CYID fcid
stkid dvid
prid
scc
polid Tons/Day Tons/Day Tons/Day Control EF Control EF ctrltype
ctrldes
21 161 2116100009 1
001
99
10100202 SO2
42.166
42.103
4.2103
0.0
0.90
SCRUBBER Scrubber added by LADCO
21 161 2116100009 2
002
99
10100212 SO2
55.385
55.303
5.5303
0.0
0.90
SCRUBBER Scrubber added by LADCO
----
-------- -------- ----------
fcid
97.551
97.406
9.7406
cyid
97.551
97.406
9.7406
stid
97.551
97.406
9.7406
STID=27 CYID=141 fcid=2714100004 name=NSP - Sherburne Generating Plant
Base Yr
Grown Controlled Base Year Future Year
STID CYID fcid
stkid dvid
prid
scc
polid Tons/Day Tons/Day Tons/Day Control EF Control EF ctrltype
ctrldes
27 141 2714100004 SV001 EU001 001 10100222 SO2
16.765
16.987
3.6401
0.3
0.85
SCRUBBER Scrubber added by LADCO
27 141 2714100004 SV001 EU002 001 10100222 SO2
22.549
22.848
4.8959
0.3
0.85
SCRUBBER Scrubber added by LADCO
----
-------- -------- ----------
fcid
39.314
39.834
8.5360
cyid
39.314
39.834
8.5360
stid
39.314
39.834
8.5360
STID=54 CYID=51 fcid=0005 name=OHIO POWER - MITCHELL PLANT
Base Yr
Grown Controlled Base Year Future Year
STID CYID fcid
stkid dvid
prid
scc
polid Tons/Day Tons/Day Tons/Day Control EF Control EF ctrltype
ctrldes
54 51 0005
012
001
99
10100202 SO2
17.775
17.748
1.7748
0.0
0.90
SCRUBBER Scrubber added by LADCO
54 51 0005
012
002
99
10100202 SO2
5.689
5.680
0.5680
0.0
0.90
SCRUBBER Scrubber added by LADCO
----
-------- -------- ----------
fcid
23.463
23.428
2.3428
cyid
23.463
23.428
2.3428
STID=54 CYID=53 fcid=0009 name=APPALACHIAN POWER - MOUNTAINEER PLANT
Base Yr
Grown Controlled Base Year Future Year
STID CYID fcid
stkid dvid
prid
scc
polid Tons/Day Tons/Day Tons/Day Control EF Control EF ctrltype
ctrldes
54 53 0009
001
001
99
10100202 SO2
11.196
11.179
1.1179
0.0
0.90
SCRUBBER Scrubber added by LADCO
STID=54 CYID=79 fcid=0006 name=APPALACHIAN POWER - JOHN E AMOS PLANT
Base Yr
Grown Controlled Base Year Future Year
STID CYID fcid
stkid dvid
prid
scc
polid Tons/Day Tons/Day Tons/Day Control EF Control EF ctrltype
ctrldes
Electronic Filing - Received, Clerk's Office, January 21, 2009
54 79 0006
012
001
99
10100202 SO2
79.635
79.516
7.9516
0.0
0.90
SCRUBBER Scrubber added by LADCO
54 79 0006
003
003
99
10100202 SO2
139.377 139.169
13.9169
0.0
0.90
SCRUBBER Scrubber added by LADCO
----
-------- -------- ----------
fcid
219.012 218.685
21.8685
cyid
219.012 218.685
21.8685
stid
253.671 253.293
25.3293
======== ======== ==========
424.200 425.307
47.0832
Electronic Filing - Received, Clerk's Office, January 21, 2009
SO2 – 2012
Point Source Grown and Controlled Emissions by facility for SO2 r6s1b_2012
1
Base Year = 2002
Future Year = 2012
STID=17 CYID=31 fcid=031600AMI name=MIDWEST GENERATION LLC
Base Yr
Grown Controlled Base Year Future Year
STID CYID fcid
stkid dvid
prid
scc
polid Tons/Day Tons/Day Tons/Day Control EF Control EF ctrltype
ctrldes
17 31 031600AMI 0007
0010
01
10100226 SO2
16.13
18.39
1.839
0.0
0.900
SCRUBBER Scrubber added by LADCO
STID=17 CYID=97 fcid=097190AAC name=MIDWEST GENERATION LLC
Base Yr
Grown Controlled Base Year Future Year
STID CYID fcid
stkid dvid
prid
scc
polid Tons/Day Tons/Day Tons/Day Control EF Control EF ctrltype
ctrldes
17 97 097190AAC 0018
0033
01
10100226 SO2
24.14
27.52
2.752
0.0
0.900
SCRUBBER Scrubber added by LADCO
17 97 097190AAC 0021
0036
01
10100226 SO2
19.23
21.92
2.192
0.0
0.900
SCRUBBER Scrubber added by LADCO
17 97 097190AAC 0016
0031
01
10100203 SO2
4.59
5.24
0.005
0.0
0.999
SHUTDOWN Scrubber added by LADCO
----
-------- -------- ----------
fcid
47.96
54.68
4.950
cyid
47.96
54.68
4.950
STID=17 CYID=125 fcid=125804AAB name=DYNEGY MIDWEST GENERATION INC
Base Yr
Grown Controlled Base Year Future Year
STID CYID fcid
stkid dvid
prid
scc
polid Tons/Day Tons/Day Tons/Day Control EF Control EF ctrltype
ctrldes
17 125 125804AAB 0019
0023
01
10100202 SO2
22.34
25.47
3.821
0.0
0.850
SCRUBBER Scrubber added by LADCO
STID=17 CYID=127 fcid=127855AAC name=ELECTRIC ENERGY INC
Base Yr
Grown Controlled Base Year Future Year
STID CYID fcid
stkid dvid
prid
scc
polid Tons/Day Tons/Day Tons/Day Control EF Control EF ctrltype
ctrldes
17 127 127855AAC 0001
0001
01
10100222 SO2
11.83
13.48
13.482
0.0
0.000
LNB
LNB added by LADCO
17 127 127855AAC 0001
0002
01
10100222 SO2
11.48
13.09
13.085
0.0
0.000
LNB
LNB added by LADCO
17 127 127855AAC 0002
0003
01
10100222 SO2
10.25
11.68
11.680
0.0
0.000
LNB
LNB added by LADCO
17 127 127855AAC 0002
0004
01
10100222 SO2
12.04
13.73
13.731
0.0
0.000
LNB
LNB added by LADCO
17 127 127855AAC 0003
0006
01
10100222 SO2
12.68
14.46
14.456
0.0
0.000
LNB
LNB added by LADCO
----
-------- -------- ----------
fcid
58.27
66.43
66.435
cyid
58.27
66.43
66.435
STID=17 CYID=135 fcid=135803AAA name=AMEREN ENERGY GENERATING CO
Base Yr
Grown Controlled Base Year Future Year
STID CYID fcid
stkid dvid
prid
scc
polid Tons/Day Tons/Day Tons/Day Control EF Control EF ctrltype
ctrldes
17 135 135803AAA 0001
0001
01
10100203 SO2
32.99
37.61
3.761
0.0
0.900
SCRUBBER Scrubber added by LADCO
17 135 135803AAA 0001
0003
01
10100203 SO2
72.92
83.13
8.313
0.0
0.900
SCRUBBER Scrubber added by LADCO
----
-------- -------- ----------
fcid
105.91
120.74
12.074
cyid
105.91
120.74
12.074
Electronic Filing - Received, Clerk's Office, January 21, 2009
STID=17 CYID=157 fcid=157851AAA name=DYNEGY MIDWEST GENERATION INC
Base Yr
Grown Controlled Base Year Future Year
STID CYID fcid
stkid dvid
prid
scc
polid Tons/Day Tons/Day Tons/Day Control EF Control EF ctrltype
ctrldes
17 157 157851AAA 0001
0001
01
10100203 SO2
25.14
28.66
4.299
0.0
0.850
SCRUBBER Scrubber added by LADCO
17 157 157851AAA 0002
0002
01
10100203 SO2
25.79
29.41
4.411
0.0
0.850
SCRUBBER Scrubber added by LADCO
17 157 157851AAA 0013
0013
01
10100202 SO2
27.79
31.68
4.752
0.0
0.850
SCRUBBER Scrubber added by LADCO
----
-------- -------- ----------
fcid
78.72
89.75
13.462
cyid
78.72
89.75
13.462
STID=17 CYID=167 fcid=167120AAO name=CITY WATER LIGHT & POWER
Base Yr
Grown Controlled Base Year Future Year
STID CYID fcid
stkid dvid
prid
scc
polid Tons/Day Tons/Day Tons/Day Control EF Control EF ctrltype
ctrldes
17 167 167120AAO 0010
0012
01
10100203 SO2
44.20
50.39
0.050
0.0
0.999
SHUTDOWN Scrubber added by LADCO
17 167 167120AAO 0010
0013
01
10100203 SO2
16.40
18.70
0.019
0.0
0.999
SHUTDOWN Scrubber added by LADCO
----
-------- -------- ----------
fcid
60.61
69.10
0.069
cyid
60.61
69.10
0.069
STID=17 CYID=179 fcid=179801AAA name=MIDWEST GENERATION LLC
Base Yr
Grown Controlled Base Year Future Year
STID CYID fcid
stkid dvid
prid
scc
polid Tons/Day Tons/Day Tons/Day Control EF Control EF ctrltype
ctrldes
17 179 179801AAA 0018
0029
01
10100203 SO2
25.35
28.90
2.890
0.0
0.900
SCRUBBER Scrubber added by LADCO
17 179 179801AAA 0018
0031
01
10100203 SO2
41.57
47.39
4.739
0.0
0.900
SCRUBBER Scrubber added by LADCO
----
-------- -------- ----------
fcid
66.91
76.29
7.629
cyid
66.91
76.29
7.629
STID=17 CYID=197 fcid=197810AAK name=MIDWEST GENERATION LLC
Base Yr
Grown Controlled Base Year Future Year
STID CYID fcid
stkid dvid
prid
scc
polid Tons/Day Tons/Day Tons/Day Control EF Control EF ctrltype
ctrldes
17 197 197810AAK 0013
0010
03
10100501 SO2
0.00
0.00
0.000
0.0
0.999
SHUTDOWN Scrubber added by LADCO
17 197 197810AAK 0007
0012
02
10100223 SO2
15.33
17.48
0.017
0.0
0.999
SHUTDOWN Scrubber added by LADCO
17 197 197810AAK 0007
0012
03
10100501 SO2
0.00
0.00
0.000
0.0
0.999
SHUTDOWN Scrubber added by LADCO
----
-------- -------- ----------
fcid
15.33
17.48
0.017
cyid
15.33
17.48
0.017
stid
472.19
538.32
110.295
STID=19 CYID=115 fcid=58-07-001 name=MIDAMERICAN ENERGY CO. - LOUISA STATION
Base Yr
Grown Controlled Base Year Future Year
STID CYID fcid
stkid dvid
prid
scc
polid Tons/Day Tons/Day Tons/Day Control EF Control EF ctrltype
ctrldes
19 115 58-07-001 117487 147281 99
10100222 SO2
33.66
38.38
3.838
0.0
0.900
SCRUBBER Scrubber added by LADCO
STID=21 CYID=161 fcid=2116100009 name=EAST KY POWER COOP
Base Yr
Grown Controlled Base Year Future Year
STID CYID fcid
stkid dvid
prid
scc
polid Tons/Day Tons/Day Tons/Day Control EF Control EF ctrltype
ctrldes
Electronic Filing - Received, Clerk's Office, January 21, 2009
21 161 2116100009 1
001
99
10100202 SO2
42.17
44.03
4.403
0.0
0.900
SCRUBBER Scrubber added by LADCO
21 161 2116100009 2
002
99
10100212 SO2
55.39
57.84
5.784
0.0
0.900
SCRUBBER Scrubber added by LADCO
----
-------- -------- ----------
fcid
97.55
101.87
10.187
cyid
97.55
101.87
10.187
stid
97.55
101.87
10.187
STID=27 CYID=61 fcid=2706100004 name=Minnesota Power Inc - Boswell Energy Ctr
Base Yr
Grown Controlled Base Year Future Year
STID CYID fcid
stkid dvid
prid
scc
polid Tons/Day Tons/Day Tons/Day Control EF Control EF ctrltype
ctrldes
27 61 2706100004 SV003 EU003 001
10100226 SO2
33.99
35.19
15.081
0.3
0.700
SCRUBBER Scrubber added by LADCO
27 61 2706100004 SV003 EU003 002
10100501 SO2
0.00
0.00
0.000
0.3
0.700
SCRUBBER Scrubber added by LADCO
----
-------- -------- ----------
fcid
33.99
35.19
15.081
cyid
33.99
35.19
15.081
STID=27 CYID=109 fcid=2710900011 name=Rochester Public Utilities - Silver Lake
Base Yr
Grown Controlled Base Year Future Year
STID CYID fcid
stkid dvid
prid
scc
polid Tons/Day Tons/Day Tons/Day Control EF Control EF ctrltype
ctrldes
27 109 2710900011 SV003 EU004 001
10100202 SO2
7.86
8.13
1.220
0.0
0.850
SCRUBBER Scrubber added by LADCO
STID=27 CYID=141 fcid=2714100004 name=NSP - Sherburne Generating Plant
Base Yr
Grown Controlled Base Year Future Year
STID CYID fcid
stkid dvid
prid
scc
polid Tons/Day Tons/Day Tons/Day Control EF Control EF ctrltype
ctrldes
27 141 2714100004 SV001 EU001 001
10100222 SO2
16.76
17.36
3.719
0.3
0.850
SCRUBBER Scrubber added by LADCO
27 141 2714100004 SV001 EU002 001
10100222 SO2
22.55
23.34
5.002
0.3
0.850
SCRUBBER Scrubber added by LADCO
----
-------- -------- ----------
fcid
39.31
40.70
8.721
cyid
39.31
40.70
8.721
stid
81.16
84.02
25.023
STID=39 CYID=13 fcid=0607130015 name=R. E. BURGER PLANT
Base Yr
Grown Controlled Base Year Future Year
STID CYID fcid
stkid dvid
prid
scc
polid Tons/Day Tons/Day Tons/Day Control EF Control EF ctrltype
ctrldes
39 13 0607130015 R6
B011
B011P1 10100202 SO2
29.83
31.15
3.115
0.0
0.900
SCRUBBER Scrubber added by LADCO
39 13 0607130015 R7
B012
B012P1 10100202 SO2
34.77
36.31
3.631
0.0
0.900
SCRUBBER Scrubber added by LADCO
----
-------- -------- ----------
fcid
64.60
67.46
6.746
cyid
64.60
67.46
6.746
STID=39 CYID=31 fcid=0616000000 name=CONESVILLE POWER PLANT
Base Yr
Grown Controlled Base Year Future Year
STID CYID fcid
stkid dvid
prid
scc
polid Tons/Day Tons/Day Tons/Day Control EF Control EF ctrltype
ctrldes
39 31 0616000000 R4
B004
B004P1 10100212 SO2
316.00
330.00
33.000
0.0
0.900
SCRUBBER Scrubber added by LADCO
----
-------- -------- ----------
stid
380.60
397.46
39.746
STID=47 CYID=1 fcid=0009 name=TVA BULL RUN FOSSIL PLANT
Electronic Filing - Received, Clerk's Office, January 21, 2009
Base Yr
Grown Controlled Base Year Future Year
STID CYID fcid
stkid dvid
prid
scc
polid Tons/Day Tons/Day Tons/Day Control EF Control EF ctrltype
ctrldes
47
1 0009
S-1
001
99
10100212 SO2
130.81
133.01
13.301
0.0
0.900
SCRUBBER Scrubber added by LADCO
STID=47 CYID=73 fcid=0007 name=TVA JOHN SEVIER FOSSIL PLANT
Base Yr
Grown Controlled Base Year Future Year
STID CYID fcid
stkid dvid
prid
scc
polid Tons/Day Tons/Day Tons/Day Control EF Control EF ctrltype
ctrldes
47 73 0007
S-1A
001
99
10100212 SO2
20.15
20.49
2.049
0.0
0.900
SCRUBBER Scrubber added by LADCO
47 73 0007
S-1B
002
99
10100212 SO2
20.25
20.59
2.059
0.0
0.900
SCRUBBER Scrubber added by LADCO
47 73 0007
S-2A
003
99
10100212 SO2
19.62
19.95
1.995
0.0
0.900
SCRUBBER Scrubber added by LADCO
47 73 0007
S-2B
004
99
10100212 SO2
18.93
19.25
1.925
0.0
0.900
SCRUBBER Scrubber added by LADCO
----
-------- -------- ----------
fcid
78.95
80.28
8.028
cyid
78.95
80.28
8.028
STID=47 CYID=85 fcid=0011 name=TVA JOHNSONVILLE FOSSIL PLANT
Base Yr
Grown Controlled Base Year Future Year
STID CYID fcid
stkid dvid
prid
scc
polid Tons/Day Tons/Day Tons/Day Control EF Control EF ctrltype
ctrldes
47 85 0011
S1-01 001
99
10100212 SO2
17.06
17.35
1.735
0.0
0.900
SCRUBBER Scrubber added by LADCO
47 85 0011
S1-04 004
99
10100212 SO2
19.85
20.18
2.018
0.0
0.900
SCRUBBER Scrubber added by LADCO
47 85 0011
S1-05 005
99
10100212 SO2
24.11
24.52
2.452
0.0
0.900
SCRUBBER Scrubber added by LADCO
----
-------- -------- ----------
fcid
61.02
62.04
6.204
cyid
61.02
62.04
6.204
STID=47 CYID=145 fcid=0013 name=TVA KINGSTON FOSSIL PLANT
Base Yr
Grown Controlled Base Year Future Year
STID CYID fcid
stkid dvid
prid
scc
polid Tons/Day Tons/Day Tons/Day Control EF Control EF ctrltype
ctrldes
47 145 0013
S-1
001
99
10100202 SO2
12.68
12.89
1.289
0.0
0.900
SCRUBBER Scrubber added by LADCO
47 145 0013
S-1
002
99
10100202 SO2
14.00
14.24
1.424
0.0
0.900
SCRUBBER Scrubber added by LADCO
47 145 0013
S-1
003
99
10100202 SO2
13.80
14.04
1.404
0.0
0.900
SCRUBBER Scrubber added by LADCO
47 145 0013
S-1
004
99
10100202 SO2
12.24
12.44
1.244
0.0
0.900
SCRUBBER Scrubber added by LADCO
47 145 0013
S-1
005
99
10100202 SO2
19.57
19.90
1.990
0.0
0.900
SCRUBBER Scrubber added by LADCO
47 145 0013
S-2
006
99
10100202 SO2
18.92
19.24
1.924
0.0
0.900
SCRUBBER Scrubber added by LADCO
47 145 0013
S-2
007
99
10100202 SO2
21.30
21.66
2.166
0.0
0.900
SCRUBBER Scrubber added by LADCO
47 145 0013
S-2
008
99
10100202 SO2
18.54
18.85
1.885
0.0
0.900
SCRUBBER Scrubber added by LADCO
47 145 0013
S-2
009
99
10100202 SO2
20.72
21.07
2.107
0.0
0.900
SCRUBBER Scrubber added by LADCO
----
-------- -------- ----------
fcid
151.77
154.33
15.433
cyid
151.77
154.33
15.433
STID=47 CYID=165 fcid=0025 name=TVA GALLATIN FOSSIL PLANT
Base Yr
Grown Controlled Base Year Future Year
STID CYID fcid
stkid dvid
prid
scc
polid Tons/Day Tons/Day Tons/Day Control EF Control EF ctrltype
ctrldes
47 165 0025
S-01
001
99
10100212 SO2
13.91
14.14
1.414
0.0
0.900
SCRUBBER Scrubber added by LADCO
47 165 0025
S-01
002
99
10100212 SO2
14.87
15.12
1.512
0.0
0.900
SCRUBBER Scrubber added by LADCO
47 165 0025
S-02
003
99
10100212 SO2
16.33
16.60
1.660
0.0
0.900
SCRUBBER Scrubber added by LADCO
47 165 0025
S-02
004
99
10100212 SO2
20.39
20.73
2.073
0.0
0.900
SCRUBBER Scrubber added by LADCO
----
-------- -------- ----------
Electronic Filing - Received, Clerk's Office, January 21, 2009
fcid
65.49
66.59
6.659
cyid
65.49
66.59
6.659
stid
488.04
496.25
49.625
STID=54 CYID=51 fcid=0005 name=OHIO POWER - MITCHELL PLANT
Base Yr
Grown Controlled Base Year Future Year
STID CYID fcid
stkid dvid
prid
scc
polid Tons/Day Tons/Day Tons/Day Control EF Control EF ctrltype
ctrldes
54 51 0005
012
001
99
10100202 SO2
17.77
18.56
1.856
0.0
0.900
SCRUBBER Scrubber added by LADCO
54 51 0005
012
002
99
10100202 SO2
5.69
5.94
0.594
0.0
0.900
SCRUBBER Scrubber added by LADCO
----
-------- -------- ----------
fcid
23.46
24.50
2.450
cyid
23.46
24.50
2.450
STID=54 CYID=53 fcid=0009 name=APPALACHIAN POWER - MOUNTAINEER PLANT
Base Yr
Grown Controlled Base Year Future Year
STID CYID fcid
stkid dvid
prid
scc
polid Tons/Day Tons/Day Tons/Day Control EF Control EF ctrltype
ctrldes
54 53 0009
001
001
99
10100202 SO2
11.20
11.69
1.169
0.0
0.900
SCRUBBER Scrubber added by LADCO
STID=54 CYID=79 fcid=0006 name=APPALACHIAN POWER - JOHN E AMOS PLANT
Base Yr
Grown Controlled Base Year Future Year
STID CYID fcid
stkid dvid
prid
scc
polid Tons/Day Tons/Day Tons/Day Control EF Control EF ctrltype
ctrldes
54 79 0006
012
001
99
10100202 SO2
79.63
83.16
8.316
0.0
0.900
SCRUBBER Scrubber added by LADCO
54 79 0006
012
002
99
10100202 SO2
100.33
104.78
10.478
0.0
0.900
SCRUBBER Scrubber added by LADCO
54 79 0006
003
003
99
10100202 SO2
139.38
145.55
14.555
0.0
0.900
SCRUBBER Scrubber added by LADCO
----
-------- -------- ----------
fcid
319.35
333.50
33.350
cyid
319.35
333.50
33.350
stid
354.00
369.69
36.969
STID=55 CYID=79 fcid=241007690 name=WIS ELECTRIC POWER OAK CREEK STATION
Base Yr
Grown Controlled Base Year Future Year
STID CYID fcid
stkid dvid
prid
scc
polid Tons/Day Tons/Day Tons/Day Control EF Control EF ctrltype
ctrldes
55 79 241007690 S13
B25
01
10100202 SO2
12.75
14.54
3.490
0.0
0.760
SCRUBBER Scrubber added by LADCO
55 79 241007690 S13
B26
01
10100202 SO2
8.68
9.89
2.473
0.0
0.750
SCRUBBER Scrubber added by LADCO
55 79 241007690 S14
B27
01
10100212 SO2
10.97
12.51
2.876
0.0
0.770
SCRUBBER Scrubber added by LADCO
55 79 241007690 S14
B28
01
10100212 SO2
11.28
12.86
2.958
0.0
0.770
SCRUBBER Scrubber added by LADCO
----
-------- -------- ----------
fcid
43.68
49.80
11.797
cyid
43.68
49.80
11.797
stid
43.68
49.80
11.797
======== ======== ==========
1950.90 2075.80
287.480
Electronic Filing - Received, Clerk's Office, January 21, 2009
SO2 – 2018
Point Source Grown and Controlled Emissions by facility for SO2 r6s1b_2018
1
Base Year = 2002
Future Year = 2018
STID=17 CYID=31 fcid=031600AIN name=MIDWEST GENERATION LLC
Base Yr
Grown Controlled Base Year Future Year
STID CYID fcid
stkid dvid
prid
scc
polid Tons/Day Tons/Day Tons/Day Control EF Control EF ctrltype
ctrldes
17 31 031600AIN 0010
0013
01
10100226 SO2
10.92
12.39
1.239
0.0
0.900
SCRUBBER Scrubber added by LADCO
17 31 031600AIN 0012
0016
01
10100226 SO2
17.69
20.08
2.008
0.0
0.900
SCRUBBER Scrubber added by LADCO
----
-------- -------- ----------
fcid
28.61
32.48
3.248
STID=17 CYID=31 fcid=031600AMI name=MIDWEST GENERATION LLC
Base Yr
Grown Controlled Base Year Future Year
STID CYID fcid
stkid dvid
prid
scc
polid Tons/Day Tons/Day Tons/Day Control EF Control EF ctrltype
ctrldes
17 31 031600AMI 0007
0010
01
10100226 SO2
16.13
18.31
1.831
0.0
0.900
SCRUBBER Scrubber added by LADCO
----
-------- -------- ----------
cyid
44.74
50.79
5.079
STID=17 CYID=79 fcid=079808AAA name=AMEREN ENERGY GENERATING CO
Base Yr
Grown Controlled Base Year Future Year
STID CYID fcid
stkid dvid
prid
scc
polid Tons/Day Tons/Day Tons/Day Control EF Control EF ctrltype
ctrldes
17 79 079808AAA 0003
0003
01
10100202 SO2
36.35
41.27
4.127
0.0
0.900
SCRUBBER Scrubber added by LADCO
17 79 079808AAA 0012
0013
01
10100501 SO2
28.99
19.46
1.946
0.0
0.900
SCRUBBER Scrubber added by LADCO
----
-------- -------- ----------
fcid
65.34
60.72
6.072
cyid
65.34
60.72
6.072
STID=17 CYID=97 fcid=097190AAC name=MIDWEST GENERATION LLC
Base Yr
Grown Controlled Base Year Future Year
STID CYID fcid
stkid dvid
prid
scc
polid Tons/Day Tons/Day Tons/Day Control EF Control EF ctrltype
ctrldes
17 97 097190AAC 0018
0033
01
10100226 SO2
24.14
27.40
2.740
0.0
0.900
SCRUBBER Scrubber added by LADCO
17 97 097190AAC 0021
0036
01
10100226 SO2
19.23
21.83
2.183
0.0
0.900
SCRUBBER Scrubber added by LADCO
17 97 097190AAC 0016
0031
01
10100203 SO2
4.59
5.22
0.005
0.0
0.999
SHUTDOWN Scrubber added by LADCO
----
-------- -------- ----------
fcid
47.96
54.45
4.928
cyid
47.96
54.45
4.928
STID=17 CYID=125 fcid=125804AAB name=DYNEGY MIDWEST GENERATION INC
Base Yr
Grown Controlled Base Year Future Year
STID CYID fcid
stkid dvid
prid
scc
polid Tons/Day Tons/Day Tons/Day Control EF Control EF ctrltype
ctrldes
17 125 125804AAB 0019
0023
01
10100202 SO2
22.34
25.36
3.805
0.0
0.850
SCRUBBER Scrubber added by LADCO
STID=17 CYID=127 fcid=127855AAC name=ELECTRIC ENERGY INC
Base Yr
Grown Controlled Base Year Future Year
STID CYID fcid
stkid dvid
prid
scc
polid Tons/Day Tons/Day Tons/Day Control EF Control EF ctrltype
ctrldes
Electronic Filing - Received, Clerk's Office, January 21, 2009
17 127 127855AAC 0002
0003
01
10100222 SO2
10.25
11.63
11.630
0.0
0.000
LNB
LNB added by LADCO
17 127 127855AAC 0002
0004
01
10100222 SO2
12.04
13.67
13.673
0.0
0.000
LNB
LNB added by LADCO
17 127 127855AAC 0001
0001
01
10100222 SO2
11.83
13.42
1.342
0.0
0.900
SCRUBBER Scrubber added by LADCO
17 127 127855AAC 0001
0002
01
10100222 SO2
11.48
13.03
1.303
0.0
0.900
SCRUBBER Scrubber added by LADCO
17 127 127855AAC 0003
0005
01
10100222 SO2
11.72
13.31
1.331
0.0
0.900
SCRUBBER Scrubber added by LADCO
17 127 127855AAC 0003
0006
01
10100222 SO2
12.68
14.39
1.439
0.0
0.900
SCRUBBER Scrubber added by LADCO
----
-------- -------- ----------
fcid
70.00
79.46
30.719
cyid
70.00
79.46
30.719
STID=17 CYID=135 fcid=135803AAA name=AMEREN ENERGY GENERATING CO
Base Yr
Grown Controlled Base Year Future Year
STID CYID fcid
stkid dvid
prid
scc
polid Tons/Day Tons/Day Tons/Day Control EF Control EF ctrltype
ctrldes
17 135 135803AAA 0001
0001
01
10100203 SO2
32.99
37.45
3.745
0.0
0.900
SCRUBBER Scrubber added by LADCO
17 135 135803AAA 0001
0003
01
10100203 SO2
72.92
82.77
8.277
0.0
0.900
SCRUBBER Scrubber added by LADCO
----
-------- -------- ----------
fcid
105.91
120.22
12.022
cyid
105.91
120.22
12.022
STID=17 CYID=143 fcid=143805AAG name=AES ED EDWARDS STATION
Base Yr
Grown Controlled Base Year Future Year
STID CYID fcid
stkid dvid
prid
scc
polid Tons/Day Tons/Day Tons/Day Control EF Control EF ctrltype
ctrldes
17 143 143805AAG 0002
0004
01
10100202 SO2
15.28
17.34
1.734
0.0
0.900
SCRUBBER Scrubber added by LADCO
STID=17 CYID=157 fcid=157851AAA name=DYNEGY MIDWEST GENERATION INC
Base Yr
Grown Controlled Base Year Future Year
STID CYID fcid
stkid dvid
prid
scc
polid Tons/Day Tons/Day Tons/Day Control EF Control EF ctrltype
ctrldes
17 157 157851AAA 0001
0001
01
10100203 SO2
25.14
28.54
4.281
0.0
0.850
SCRUBBER Scrubber added by LADCO
17 157 157851AAA 0002
0002
01
10100203 SO2
25.79
29.28
4.392
0.0
0.850
SCRUBBER Scrubber added by LADCO
17 157 157851AAA 0013
0013
01
10100202 SO2
27.79
31.54
4.732
0.0
0.850
SCRUBBER Scrubber added by LADCO
----
-------- -------- ----------
fcid
78.72
89.36
13.404
cyid
78.72
89.36
13.404
STID=17 CYID=167 fcid=167120AAO name=CITY WATER LIGHT & POWER
Base Yr
Grown Controlled Base Year Future Year
STID CYID fcid
stkid dvid
prid
scc
polid Tons/Day Tons/Day Tons/Day Control EF Control EF ctrltype
ctrldes
17 167 167120AAO 0010
0012
01
10100203 SO2
44.20
50.18
0.050
0.0
0.999
SHUTDOWN Scrubber added by LADCO
17 167 167120AAO 0010
0013
01
10100203 SO2
16.40
18.62
0.019
0.0
0.999
SHUTDOWN Scrubber added by LADCO
----
-------- -------- ----------
fcid
60.61
68.80
0.069
cyid
60.61
68.80
0.069
STID=17 CYID=179 fcid=179801AAA name=MIDWEST GENERATION LLC
Base Yr
Grown Controlled Base Year Future Year
STID CYID fcid
stkid dvid
prid
scc
polid Tons/Day Tons/Day Tons/Day Control EF Control EF ctrltype
ctrldes
17 179 179801AAA 0018
0029
01
10100203 SO2
25.35
28.77
2.877
0.0
0.900
SCRUBBER Scrubber added by LADCO
17 179 179801AAA 0018
0031
01
10100203 SO2
41.57
47.19
4.719
0.0
0.900
SCRUBBER Scrubber added by LADCO
----
-------- -------- ----------
Electronic Filing - Received, Clerk's Office, January 21, 2009
fcid
66.91
75.96
7.596
cyid
66.91
75.96
7.596
STID=17 CYID=197 fcid=197809AAO name=MIDWEST GENERATION LLC
Base Yr
Grown Controlled Base Year Future Year
STID CYID fcid
stkid dvid
prid
scc
polid Tons/Day Tons/Day Tons/Day Control EF Control EF ctrltype
ctrldes
17 197 197809AAO 0006
0009
01
10100203 SO2
15.89
18.04
1.804
0.0
0.900
SCRUBBER Scrubber added by LADCO
17 197 197809AAO 0016
0031
01
10100202 SO2
27.43
31.13
3.113
0.0
0.900
SCRUBBER Scrubber added by LADCO
17 197 197809AAO 0017
0033
01
10100202 SO2
23.13
26.26
2.626
0.0
0.900
SCRUBBER Scrubber added by LADCO
----
-------- -------- ----------
fcid
66.45
75.44
7.544
STID=17 CYID=197 fcid=197810AAK name=MIDWEST GENERATION LLC
Base Yr
Grown Controlled Base Year Future Year
STID CYID fcid
stkid dvid
prid
scc
polid Tons/Day Tons/Day Tons/Day Control EF Control EF ctrltype
ctrldes
17 197 197810AAK 0009
0014
02
10100222 SO2
11.64
13.21
1.321
0.0
0.900
SCRUBBER Scrubber added by LADCO
17 197 197810AAK 0011
0016
02
10100222 SO2
25.67
29.14
2.914
0.0
0.900
SCRUBBER Scrubber added by LADCO
17 197 197810AAK 0013
0010
03
10100501 SO2
0.00
0.00
0.000
0.0
0.999
SHUTDOWN Scrubber added by LADCO
17 197 197810AAK 0007
0012
02
10100223 SO2
15.33
17.40
0.017
0.0
0.999
SHUTDOWN Scrubber added by LADCO
17 197 197810AAK 0007
0012
03
10100501 SO2
0.00
0.00
0.000
0.0
0.999
SHUTDOWN Scrubber added by LADCO
----
-------- -------- ----------
fcid
52.64
59.75
4.252
cyid
119.09
135.19
11.796
stid
696.90
777.66
97.225
STID=18 CYID=147 fcid=00020 name=INDIANA MICHIGAN POWER-ROCKPORT
Base Yr
Grown Controlled Base Year Future Year
STID CYID fcid
stkid dvid
prid
scc
polid Tons/Day Tons/Day Tons/Day Control EF Control EF ctrltype
ctrldes
18 147 00020
1
001
01
10100222 SO2
66.42
72.32
7.232
0.0
0.900
SCRUBBER Scrubber added by LADCO
18 147 00020
1
001
02
10100501 SO2
0.00
0.00
0.000
0.0
0.900
SCRUBBER Scrubber added by LADCO
----
-------- -------- ----------
fcid
66.42
72.32
7.232
cyid
66.42
72.32
7.232
stid
66.42
72.32
7.232
STID=19 CYID=115 fcid=58-07-001 name=MIDAMERICAN ENERGY CO. - LOUISA STATION
Base Yr
Grown Controlled Base Year Future Year
STID CYID fcid
stkid dvid
prid
scc
polid Tons/Day Tons/Day Tons/Day Control EF Control EF ctrltype
ctrldes
19 115 58-07-001 117487 147281 99
10100222 SO2
33.66
38.22
3.822
0.0
0.900
SCRUBBER Scrubber added by LADCO
STID=21 CYID=127 fcid=2112700003 name=KENTUCKY POWER CO
Base Yr
Grown Controlled Base Year Future Year
STID CYID fcid
stkid dvid
prid
scc
polid Tons/Day Tons/Day Tons/Day Control EF Control EF ctrltype
ctrldes
21 127 2112700003 2
002
99
10100202 SO2
104.52
113.82
11.382
0.0
0.900
SCRUBBER Scrubber added by LADCO
STID=21 CYID=161 fcid=2116100009 name=EAST KY POWER COOP
Base Yr
Grown Controlled Base Year Future Year
STID CYID fcid
stkid dvid
prid
scc
polid Tons/Day Tons/Day Tons/Day Control EF Control EF ctrltype
ctrldes
Electronic Filing - Received, Clerk's Office, January 21, 2009
21 161 2116100009 1
001
99
10100202 SO2
42.17
45.92
4.592
0.0
0.900
SCRUBBER Scrubber added by LADCO
21 161 2116100009 2
002
99
10100212 SO2
55.39
60.31
6.031
0.0
0.900
SCRUBBER Scrubber added by LADCO
----
-------- -------- ----------
fcid
97.55
106.23
10.623
cyid
97.55
106.23
10.623
stid
202.07
220.04
22.004
STID=27 CYID=61 fcid=2706100004 name=Minnesota Power Inc - Boswell Energy Ctr
Base Yr
Grown Controlled Base Year Future Year
STID CYID fcid
stkid dvid
prid
scc
polid Tons/Day Tons/Day Tons/Day Control EF Control EF ctrltype
ctrldes
27 61 2706100004 SV003 EU003 001
10100226 SO2
33.99
39.15
16.778
0.3
0.700
SCRUBBER Scrubber added by LADCO
27 61 2706100004 SV003 EU003 002
10100501 SO2
0.00
0.00
0.000
0.3
0.700
SCRUBBER Scrubber added by LADCO
----
-------- -------- ----------
fcid
33.99
39.15
16.778
cyid
33.99
39.15
16.778
STID=27 CYID=109 fcid=2710900011 name=Rochester Public Utilities - Silver Lake
Base Yr
Grown Controlled Base Year Future Year
STID CYID fcid
stkid dvid
prid
scc
polid Tons/Day Tons/Day Tons/Day Control EF Control EF ctrltype
ctrldes
27 109 2710900011 SV003 EU004 001
10100202 SO2
7.86
9.05
1.357
0.0
0.850
SCRUBBER Scrubber added by LADCO
STID=27 CYID=141 fcid=2714100004 name=NSP - Sherburne Generating Plant
Base Yr
Grown Controlled Base Year Future Year
STID CYID fcid
stkid dvid
prid
scc
polid Tons/Day Tons/Day Tons/Day Control EF Control EF ctrltype
ctrldes
27 141 2714100004 SV001 EU001 001
10100222 SO2
16.76
19.31
4.138
0.3
0.850
SCRUBBER Scrubber added by LADCO
27 141 2714100004 SV001 EU002 001
10100222 SO2
22.55
25.97
5.565
0.3
0.850
SCRUBBER Scrubber added by LADCO
----
-------- -------- ----------
fcid
39.31
45.28
9.703
cyid
39.31
45.28
9.703
stid
81.16
93.48
27.838
STID=39 CYID=13 fcid=0607130015 name=R. E. BURGER PLANT
Base Yr
Grown Controlled Base Year Future Year
STID CYID fcid
stkid dvid
prid
scc
polid Tons/Day Tons/Day Tons/Day Control EF Control EF ctrltype
ctrldes
39 13 0607130015 R6
B011
B011P1 10100202 SO2
29.83
32.48
3.248
0.0
0.900
SCRUBBER Scrubber added by LADCO
39 13 0607130015 R7
B012
B012P1 10100202 SO2
34.77
37.86
3.786
0.0
0.900
SCRUBBER Scrubber added by LADCO
----
-------- -------- ----------
fcid
64.60
70.34
7.034
cyid
64.60
70.34
7.034
STID=39 CYID=31 fcid=0616000000 name=CONESVILLE POWER PLANT
Base Yr
Grown Controlled Base Year Future Year
STID CYID fcid
stkid dvid
prid
scc
polid Tons/Day Tons/Day Tons/Day Control EF Control EF ctrltype
ctrldes
39 31 0616000000 R4
B004
B004P1 10100212 SO2
316.00
344.11
34.411
0.0
0.900
SCRUBBER Scrubber added by LADCO
STID=39 CYID=167 fcid=0684000000 name=MUSKINGUM RIVER POWER PLANT
Base Yr
Grown Controlled Base Year Future Year
STID CYID fcid
stkid dvid
prid
scc
polid Tons/Day Tons/Day Tons/Day Control EF Control EF ctrltype
ctrldes
Electronic Filing - Received, Clerk's Office, January 21, 2009
39 167 0684000000 R2
B002
B002P1 10100201 SO2
65.07
70.85
7.085
0.0
0.900
SCRUBBER Scrubber added by LADCO
39 167 0684000000 R2
B002
B002P2 10100501 SO2
0.00
0.00
0.000
0.0
0.900
SCRUBBER Scrubber added by LADCO
39 167 0684000000 R3
B003
B003P1 10100201 SO2
94.58
103.00
10.300
0.0
0.900
SCRUBBER Scrubber added by LADCO
39 167 0684000000 R3
B003
B003P2 10100501 SO2
0.00
0.00
0.000
0.0
0.900
SCRUBBER Scrubber added by LADCO
39 167 0684000000 R4
B004
B004P1 10100203 SO2
81.64
88.90
8.890
0.0
0.900
SCRUBBER Scrubber added by LADCO
39 167 0684000000 R4
B004
B004P2 10100501 SO2
0.00
0.00
0.000
0.0
0.900
SCRUBBER Scrubber added by LADCO
39 167 0684000000 R5
B005
B005P1 10100203 SO2
97.22
105.87
10.587
0.0
0.900
SCRUBBER Scrubber added by LADCO
39 167 0684000000 R5
B005
B005P2 10100501 SO2
0.00
0.00
0.000
0.0
0.900
SCRUBBER Scrubber added by LADCO
39 167 0684000000 R6
B006
B006P1 10100202 SO2
113.96
124.10
12.410
0.0
0.900
SCRUBBER Scrubber added by LADCO
39 167 0684000000 R6
B006
B006P2 10100501 SO2
0.00
0.00
0.000
0.0
0.900
SCRUBBER Scrubber added by LADCO
----
-------- -------- ----------
fcid
452.48
492.72
49.272
cyid
452.48
492.72
49.272
stid
833.08
907.16
90.716
STID=47 CYID=1 fcid=0009 name=TVA BULL RUN FOSSIL PLANT
Base Yr
Grown Controlled Base Year Future Year
STID CYID fcid
stkid dvid
prid
scc
polid Tons/Day Tons/Day Tons/Day Control EF Control EF ctrltype
ctrldes
47
1 0009
S-1
001
99
10100212 SO2
130.81
136.82
13.682
0.0
0.900
SCRUBBER Scrubber added by LADCO
STID=47 CYID=73 fcid=0007 name=TVA JOHN SEVIER FOSSIL PLANT
Base Yr
Grown Controlled Base Year Future Year
STID CYID fcid
stkid dvid
prid
scc
polid Tons/Day Tons/Day Tons/Day Control EF Control EF ctrltype
ctrldes
47 73 0007
S-1A
001
99
10100212 SO2
20.15
21.07
2.107
0.0
0.900
SCRUBBER Scrubber added by LADCO
47 73 0007
S-1B
002
99
10100212 SO2
20.25
21.18
2.118
0.0
0.900
SCRUBBER Scrubber added by LADCO
47 73 0007
S-2A
003
99
10100212 SO2
19.62
20.52
2.052
0.0
0.900
SCRUBBER Scrubber added by LADCO
47 73 0007
S-2B
004
99
10100212 SO2
18.93
19.80
1.980
0.0
0.900
SCRUBBER Scrubber added by LADCO
----
-------- -------- ----------
fcid
78.95
82.57
8.257
cyid
78.95
82.57
8.257
STID=47 CYID=85 fcid=0011 name=TVA JOHNSONVILLE FOSSIL PLANT
Base Yr
Grown Controlled Base Year Future Year
STID CYID fcid
stkid dvid
prid
scc
polid Tons/Day Tons/Day Tons/Day Control EF Control EF ctrltype
ctrldes
47 85 0011
S1-01 001
99
10100212 SO2
17.06
17.84
1.784
0.0
0.900
SCRUBBER Scrubber added by LADCO
47 85 0011
S1-04 004
99
10100212 SO2
19.85
20.76
2.076
0.0
0.900
SCRUBBER Scrubber added by LADCO
47 85 0011
S1-05 005
99
10100212 SO2
24.11
25.22
2.522
0.0
0.900
SCRUBBER Scrubber added by LADCO
----
-------- -------- ----------
fcid
61.02
63.82
6.382
cyid
61.02
63.82
6.382
STID=47 CYID=145 fcid=0013 name=TVA KINGSTON FOSSIL PLANT
Base Yr
Grown Controlled Base Year Future Year
STID CYID fcid
stkid dvid
prid
scc
polid Tons/Day Tons/Day Tons/Day Control EF Control EF ctrltype
ctrldes
47 145 0013
S-1
001
99
10100202 SO2
12.68
13.26
1.326
0.0
0.900
SCRUBBER Scrubber added by LADCO
47 145 0013
S-1
002
99
10100202 SO2
14.00
14.65
1.465
0.0
0.900
SCRUBBER Scrubber added by LADCO
Electronic Filing - Received, Clerk's Office, January 21, 2009
47 145 0013
S-1
003
99
10100202 SO2
13.80
14.44
1.444
0.0
0.900
SCRUBBER Scrubber added by LADCO
47 145 0013
S-1
004
99
10100202 SO2
12.24
12.80
1.280
0.0
0.900
SCRUBBER Scrubber added by LADCO
47 145 0013
S-1
005
99
10100202 SO2
19.57
20.47
2.047
0.0
0.900
SCRUBBER Scrubber added by LADCO
47 145 0013
S-2
006
99
10100202 SO2
18.92
19.79
1.979
0.0
0.900
SCRUBBER Scrubber added by LADCO
47 145 0013
S-2
007
99
10100202 SO2
21.30
22.28
2.228
0.0
0.900
SCRUBBER Scrubber added by LADCO
47 145 0013
S-2
008
99
10100202 SO2
18.54
19.39
1.939
0.0
0.900
SCRUBBER Scrubber added by LADCO
47 145 0013
S-2
009
99
10100202 SO2
20.72
21.68
2.168
0.0
0.900
SCRUBBER Scrubber added by LADCO
----
-------- -------- ----------
fcid
151.77
158.75
15.875
cyid
151.77
158.75
15.875
STID=47 CYID=165 fcid=0025 name=TVA GALLATIN FOSSIL PLANT
Base Yr
Grown Controlled Base Year Future Year
STID CYID fcid
stkid dvid
prid
scc
polid Tons/Day Tons/Day Tons/Day Control EF Control EF ctrltype
ctrldes
47 165 0025
S-01
001
99
10100212 SO2
13.91
14.54
1.454
0.0
0.900
SCRUBBER Scrubber added by LADCO
47 165 0025
S-01
002
99
10100212 SO2
14.87
15.56
1.556
0.0
0.900
SCRUBBER Scrubber added by LADCO
47 165 0025
S-02
003
99
10100212 SO2
16.33
17.08
1.708
0.0
0.900
SCRUBBER Scrubber added by LADCO
47 165 0025
S-02
004
99
10100212 SO2
20.39
21.32
2.132
0.0
0.900
SCRUBBER Scrubber added by LADCO
----
-------- -------- ----------
fcid
65.49
68.50
6.850
cyid
65.49
68.50
6.850
stid
488.04
510.46
51.046
STID=54 CYID=39 fcid=0006 name=APPALACHIAN POWER - KANAWHA RIVER PLANT
Base Yr
Grown Controlled Base Year Future Year
STID CYID fcid
stkid dvid
prid
scc
polid Tons/Day Tons/Day Tons/Day Control EF Control EF ctrltype
ctrldes
54 39 0006
012
001
99
10100202 SO2
19.45
21.18
10.591
0.0
0.500
SCRUBBER Scrubber added by LADCO
54 39 0006
012
002
99
10100202 SO2
20.94
22.80
11.399
0.0
0.500
SCRUBBER Scrubber added by LADCO
----
-------- -------- ----------
fcid
40.39
43.98
21.990
cyid
40.39
43.98
21.990
STID=54 CYID=51 fcid=0005 name=OHIO POWER - MITCHELL PLANT
Base Yr
Grown Controlled Base Year Future Year
STID CYID fcid
stkid dvid
prid
scc
polid Tons/Day Tons/Day Tons/Day Control EF Control EF ctrltype
ctrldes
54 51 0005
012
001
99
10100202 SO2
17.77
19.36
1.936
0.0
0.900
SCRUBBER Scrubber added by LADCO
54 51 0005
012
002
99
10100202 SO2
5.69
6.19
0.619
0.0
0.900
SCRUBBER Scrubber added by LADCO
----
-------- -------- ----------
fcid
23.46
25.55
2.555
STID=54 CYID=51 fcid=0006 name=OHIO POWER - KAMMER PLANT
Base Yr
Grown Controlled Base Year Future Year
STID CYID fcid
stkid dvid
prid
scc
polid Tons/Day Tons/Day Tons/Day Control EF Control EF ctrltype
ctrldes
54 51 0006
013
001
99
10100203 SO2
47.06
51.25
5.125
0.0
0.900
SCRUBBER Scrubber added by LADCO
54 51 0006
013
002
99
10100203 SO2
47.66
51.90
5.190
0.0
0.900
SCRUBBER Scrubber added by LADCO
54 51 0006
013
003
99
10100203 SO2
41.94
45.67
4.567
0.0
0.900
SCRUBBER Scrubber added by LADCO
Electronic Filing - Received, Clerk's Office, January 21, 2009
----
-------- -------- ----------
fcid
136.67
148.82
14.882
cyid
160.13
174.37
17.437
STID=54 CYID=53 fcid=0001 name=APPALACHIAN POWER CO.-PHILIP SPORN PLANT
Base Yr
Grown Controlled Base Year Future Year
STID CYID fcid
stkid dvid
prid
scc
polid Tons/Day Tons/Day Tons/Day Control EF Control EF ctrltype
ctrldes
54 53 0001
014
001
99
10100202 SO2
18.65
20.31
2.031
0.0
0.900
SCRUBBER Scrubber added by LADCO
54 53 0001
014
002
99
10100202 SO2
15.87
17.28
1.728
0.0
0.900
SCRUBBER Scrubber added by LADCO
54 53 0001
014
003
99
10100202 SO2
21.46
23.36
2.336
0.0
0.900
SCRUBBER Scrubber added by LADCO
54 53 0001
014
004
99
10100202 SO2
20.53
22.36
2.236
0.0
0.900
SCRUBBER Scrubber added by LADCO
54 53 0001
005
005
99
10100202 SO2
46.82
50.98
5.098
0.0
0.900
SCRUBBER Scrubber added by LADCO
----
-------- -------- ----------
fcid
123.33
134.30
13.430
STID=54 CYID=53 fcid=0009 name=APPALACHIAN POWER - MOUNTAINEER PLANT
Base Yr
Grown Controlled Base Year Future Year
STID CYID fcid
stkid dvid
prid
scc
polid Tons/Day Tons/Day Tons/Day Control EF Control EF ctrltype
ctrldes
54 53 0009
001
001
99
10100202 SO2
11.20
12.19
1.219
0.0
0.900
SCRUBBER Scrubber added by LADCO
----
-------- -------- ----------
cyid
134.53
146.49
14.649
STID=54 CYID=79 fcid=0006 name=APPALACHIAN POWER - JOHN E AMOS PLANT
Base Yr
Grown Controlled Base Year Future Year
STID CYID fcid
stkid dvid
prid
scc
polid Tons/Day Tons/Day Tons/Day Control EF Control EF ctrltype
ctrldes
54 79 0006
012
001
99
10100202 SO2
79.63
86.72
8.672
0.0
0.900
SCRUBBER Scrubber added by LADCO
54 79 0006
012
002
99
10100202 SO2
100.33
109.26
10.926
0.0
0.900
SCRUBBER Scrubber added by LADCO
54 79 0006
003
003
99
10100202 SO2
139.38
151.77
15.177
0.0
0.900
SCRUBBER Scrubber added by LADCO
----
-------- -------- ----------
fcid
319.35
347.75
34.775
cyid
319.35
347.75
34.775
stid
654.39
712.59
88.851
STID=55 CYID=79 fcid=241007690 name=WIS ELECTRIC POWER OAK CREEK STATION
Base Yr
Grown Controlled Base Year Future Year
STID CYID fcid
stkid dvid
prid
scc
polid Tons/Day Tons/Day Tons/Day Control EF Control EF ctrltype
ctrldes
55 79 241007690 S13
B25
01
10100202 SO2
12.75
14.48
3.475
0.0
0.760
SCRUBBER Scrubber added by LADCO
55 79 241007690 S13
B26
01
10100202 SO2
8.68
9.85
2.462
0.0
0.750
SCRUBBER Scrubber added by LADCO
55 79 241007690 S14
B27
01
10100212 SO2
10.97
12.45
2.864
0.0
0.770
SCRUBBER Scrubber added by LADCO
55 79 241007690 S14
B28
01
10100212 SO2
11.28
12.81
2.945
0.0
0.770
SCRUBBER Scrubber added by LADCO
----
-------- -------- ----------
fcid
43.68
49.59
11.746
cyid
43.68
49.59
11.746
stid
43.68
49.59
11.746
======== ======== ==========
3099.41 3381.52
400.481
Electronic Filing - Received, Clerk's Office, January 21, 2009
Appendix II
Scenario C Controls (CAMD List)
Electronic Filing - Received, Clerk's Office, January 21, 2009
1
NOx Controls (SCRs, 2007 – 2013))
Plant Name
UniqueID_Final
State Name
County
Capacity
MW
On Line
Year
SCR
Online
Year
Chesterfield
3797_B_4
Virginia
Chesterfield
166
1960
2013
Chesterfield
3797_B_5
Virginia
Chesterfield
310
1964
2012
Scherer
6257_B_3
Georgia
Monroe
875
1987
2011
Chesterfield
3797_B_6
Virginia
Chesterfield
658
1969
2011
Sandow No 4
6648_B_4
Texas
Milam
545
1981
2011
Beech Hollow Power Project
82704_B_1
Pennsylvania
Washington
272
2011
2011
Longview Power
82702_B_1
West Virginia
Monongalia
695
2011
2011
Cliffside
2721_B_6
North Carolina
Cleveland
800
2011
2011
AES Westover
2526_B_11
New York
Broome
22
1943
2010
AES Westover
2526_B_12
New York
Broome
22
1943
2010
AES Westover
2526_B_13
New York
Broome
84
1951
2010
Iatan 2
6065_B_2
Missouri
Platte
850
2010
2010
Southwest
6195_B_2
Missouri
Greene
300
2010
2010
Trimble Station (LGE)
6071_B_2
Kentucky
Trimble
732
2010
2010
Elm Road Generating Station
56068_B_2
Wisconsin
Milwaukee
615
2010
2010
Clay Boswell
1893_B_3
Minnesota
Itasca
350
1973
2009
Asheville
2706_B_2
North Carolina
Buncombe
184
1971
2009
Conesville
2840_B_4
Ohio
Coshocton
780
1973
2009
Marshall
2727_B_3
North Carolina
Catawba
657
1969
2009
St Johns River Power Park
207_B_1
Florida
Duval
626
1987
2009
Ghent
1356_B_2
Kentucky
Carroll
469
1977
2009
Chalk Point LLC
1571_B_1
Maryland
Prince George's
341
1964
2009
Chalk Point LLC
1571_B_2
Maryland
Prince George's
342
1965
2009
San Juan
2451_B_2
New Mexico
San Juan
320
1973
2009
Big Bend
645_B_BB01
Florida
Hillsborough
411
1970
2009
Big Bend
645_B_BB02
Florida
Hillsborough
391
1973
2009
Big Bend
645_B_BB03
Florida
Hillsborough
414
1976
2009
Nebraska City Unit 2
6096_B_2
Nebraska
Otoe
663
2009
2009
Cross
130_B_4
South Carolina
Berkeley
652
2009
2009
Springerville
8223_B_4
Arizona
Apache
400
2009
2009
Sandow 5
82010_B_5
Texas
Milam
600
2009
2009
Oak Grove
82011_B_1
Texas
Robertson
800
2009
2009
Oak Grove
82011_B_2
Texas
Robertson
800
2009
2009
TS Power Plant
82013_B_1
Nevada
Eureka
200
2009
2009
Plum Point Energy
82014_B_1
Arkansas
Mississippi
665
2009
2009
Comanche
470_B_3
Colorado
Pueblo
750
2009
2009
Elm Road Generating Station
56068_B_1
Wisconsin
Milwaukee
615
2009
2009
Two Elk Generating Station
55360_B_1
Wyoming
Campbell
300
2009
2009
J K Spruce
7097_B_BLR2
Texas
Bexar
750
2009
2009
Dallman
963_B_34
Illinois
Sangamon
200
2009
2009
AES Greenidge LLC
2527_B_4
New York
Yates
27
1950
2008
AES Greenidge LLC
2527_B_5
New York
Yates
27
1950
2008
AES Greenidge LLC
2527_B_6
New York
Yates
106
1953
2008
Charles R Lowman
56_B_2
Alabama
Washington
238
1979
2008
Charles R Lowman
56_B_3
Alabama
Washington
238
1980
2008
Barry
3_B_5
Alabama
Mobile
750
1971
2008
St Johns River Power Park
207_B_2
Florida
Duval
626
1988
2008
Morgantown Generating Plant
1573_B_2
Maryland
Charles
620
1971
2008
Electronic Filing - Received, Clerk's Office, January 21, 2009
2
Bailly
995_B_7
Indiana
Porter
160
1962
2008
San Juan
2451_B_1
New Mexico
San Juan
322
1976
2008
San Juan
2451_B_3
New Mexico
San Juan
495
1979
2008
Weston
4078_B_4
Wisconsin
Marathon
519
2008
2008
AES Deepwater
10670_B_AAB001 Texas
Harris
140
1986
2007
La Cygne
1241_B_1
Kansas
Linn
724
1973
2007
Morgantown Generating Plant
1573_B_1
Maryland
Charles
624
1970
2007
PSEG Hudson Generating Station
2403_B_2
New Jersey
Hudson
583
1967
2007
San Juan
2451_B_4
New Mexico
San Juan
506
1982
2007
Big Bend
645_B_BB04
Florida
Hillsborough
457
1985
2007
Cross
130_B_3
South Carolina
Berkeley
620
2007
2007
Wygen II
55479_B_4
Wyoming
Campbell
90
2007
2007
Council Bluffs
1082_B_4
Iowa
Pottawattamie
790
2007
2007
SO2 Controls (FGDs, 2007 – 2012)
Plant Name
UniqueID_Final State Name
County
Capacity
MW
On Line
Year
Scrubber
Online
Year
James H Miller Jr
6002_B_1
Alabama
Jefferson
684
1978
2011
James H Miller Jr
6002_B_2
Alabama
Jefferson
687
1985
2011
James H Miller Jr
6002_B_3
Alabama
Jefferson
687
1989
2011
James H Miller Jr
6002_B_4
Alabama
Jefferson
688
1991
2011
Cape Fear
2708_B_5
North Carolina
Chatham
143
1956
2011
Baldwin Energy Complex
889_B_1
Illinois
Randolph
624
1970
2011
Baldwin Energy Complex
889_B_2
Illinois
Randolph
629
1973
2011
Baldwin Energy Complex
889_B_3
Illinois
Randolph
629
1975
2011
Scherer
6257_B_3
Georgia
Monroe
875
1987
2011
Milton R Young
2823_B_B1
North Dakota
Oliver
250
1970
2011
W H Sammis
2866_B_6
Ohio
Jefferson
630
1969
2011
W H Sammis
2866_B_7
Ohio
Jefferson
630
1971
2011
PSEG Hudson Generating Station
2403_B_2
New Jersey
Hudson
583
1967
2011
John Sevier
3405_B_1
Tennessee
Hawkins
176
1955
2011
John Sevier
3405_B_2
Tennessee
Hawkins
176
1955
2011
John Sevier
3405_B_3
Tennessee
Hawkins
176
1956
2011
John Sevier
3405_B_4
Tennessee
Hawkins
176
1957
2011
Beech Hollow Power Project
82704_B_1
Pennsylvania
Washington
272
2011
2011
Longview Power
82702_B_1
West Virginia
Monongalia
695
2011
2011
Cliffside
2721_B_6
North Carolina
Cleveland
800
2011
2011
AES Greenidge LLC
2527_B_4
New York
Yates
27
1950
2010
AES Greenidge LLC
2527_B_5
New York
Yates
27
1950
2010
Barry
3_B_5
Alabama
Mobile
750
1971
2010
E C Gaston
26_B_5
Alabama
Shelby
861
1974
2010
Warrick
6705_B_4
Indiana
Warrick
300
1970
2010
Coffeen
861_B_01
Illinois
Montgomery
340
1965
2010
Coffeen
861_B_02
Illinois
Montgomery
560
1972
2010
Cardinal
2828_B_3
Ohio
Jefferson
630
1977
2010
Brandon Shores
602_B_1
Maryland
Anne Arundel
643
1984
2010
Brandon Shores
602_B_2
Maryland
Anne Arundel
643
1991
2010
Monroe
1733_B_4
Michigan
Monroe
775
1974
2010
Cliffside
2721_B_5
North Carolina
Cleveland
550
1972
2010
Crystal River
628_B_4
Florida
Citrus
720
1982
2010
Bowen
703_B_1BLR
Georgia
Bartow
713
1971
2010
Electronic Filing - Received, Clerk's Office, January 21, 2009
3
Crist
641_B_6
Florida
Escambia
302
1970
2010
Crist
641_B_7
Florida
Escambia
477
1973
2010
Clifty Creek
983_B_1
Indiana
Jefferson
217
1955
2010
Clifty Creek
983_B_2
Indiana
Jefferson
217
1955
2010
Clifty Creek
983_B_3
Indiana
Jefferson
217
1955
2010
Clifty Creek
983_B_4
Indiana
Jefferson
217
1955
2010
Clifty Creek
983_B_5
Indiana
Jefferson
217
1955
2010
Clifty Creek
983_B_6
Indiana
Jefferson
217
1956
2010
Chalk Point LLC
1571_B_1
Maryland
Prince George's
341
1964
2010
Chalk Point LLC
1571_B_2
Maryland
Prince George's
342
1965
2010
Dickerson
1572_B_1
Maryland
Montgomery
182
1959
2010
Dickerson
1572_B_2
Maryland
Montgomery
182
1960
2010
Dickerson
1572_B_3
Maryland
Montgomery
182
1962
2010
R E Burger
2864_B_7
Ohio
Belmont
156
1955
2010
R E Burger
2864_B_8
Ohio
Belmont
156
1955
2010
Kyger Creek
2876_B_1
Ohio
Gallia
217
1955
2010
Kyger Creek
2876_B_2
Ohio
Gallia
217
1955
2010
Kyger Creek
2876_B_3
Ohio
Gallia
217
1955
2010
Kyger Creek
2876_B_4
Ohio
Gallia
217
1955
2010
Kyger Creek
2876_B_5
Ohio
Gallia
217
1955
2010
Cheswick
8226_B_1
Pennsylvania
Allegheny
580
1970
2010
PSEG Mercer Generating Station
2408_B_1
New Jersey
Mercer
315
1960
2010
PSEG Mercer Generating Station
2408_B_2
New Jersey
Mercer
310
1961
2010
Silver Lake
2008_B_4
Minnesota
Olmsted
61
1969
2010
Kingston
3407_B_1
Tennessee
Roane
135
1954
2010
Kingston
3407_B_2
Tennessee
Roane
135
1954
2010
Kingston
3407_B_3
Tennessee
Roane
135
1954
2010
Kingston
3407_B_4
Tennessee
Roane
135
1954
2010
Kingston
3407_B_5
Tennessee
Roane
177
1955
2010
Kingston
3407_B_6
Tennessee
Roane
177
1955
2010
Kingston
3407_B_7
Tennessee
Roane
177
1955
2010
Kingston
3407_B_8
Tennessee
Roane
177
1955
2010
Kingston
3407_B_9
Tennessee
Roane
178
1955
2010
Sioux
2107_B_1
Missouri
St. Charles
497
1967
2010
Sioux
2107_B_2
Missouri
St. Charles
497
1968
2010
Chesterfield
3797_B_5
Virginia
Chesterfield
310
1964
2010
Yorktown
3809_B_1
Virginia
York
159
1957
2010
AES Westover
2526_B_11
New York
Broome
22
1943
2010
AES Westover
2526_B_12
New York
Broome
22
1943
2010
AES Westover
2526_B_13
New York
Broome
84
1951
2010
Iatan 2
6065_B_2
Missouri
Platte
850
2010
2010
Southwest
6195_B_2
Missouri
Greene
300
2010
2010
Trimble Station (LGE)
6071_B_2
Kentucky
Trimble
732
2010
2010
Elm Road Generating Station
56068_B_2
Wisconsin
Milwaukee
615
2010
2010
Cholla
113_B_3
Arizona
Navajo
271
1980
2009
Mayo
6250_B_1A
North Carolina
Person
362
1983
2009
Mayo
6250_B_1B
North Carolina
Person
362
1983
2009
Conesville
2840_B_4
Ohio
Coshocton
780
1973
2009
G G Allen
2718_B_1
North Carolina
Gaston
162
1957
2009
G G Allen
2718_B_2
North Carolina
Gaston
162
1957
2009
G G Allen
2718_B_3
North Carolina
Gaston
260
1959
2009
Electronic Filing - Received, Clerk's Office, January 21, 2009
4
G G Allen
2718_B_4
North Carolina
Gaston
275
1960
2009
G G Allen
2718_B_5
North Carolina
Gaston
265
1961
2009
H L Spurlock
6041_B_1
Kentucky
Mason
315
1977
2009
Crystal River
628_B_5
Florida
Citrus
717
1984
2009
Deerhaven Generating Station
663_B_B2
Florida
Alachua
228
1981
2009
Bowen
703_B_2BLR
Georgia
Bartow
718
1972
2009
Wansley
6052_B_2
Georgia
Heard
892
1978
2009
E W Brown
1355_B_1
Kentucky
Mercer
94
1957
2009
E W Brown
1355_B_2
Kentucky
Mercer
160
1963
2009
E W Brown
1355_B_3
Kentucky
Mercer
422
1971
2009
Ghent
1356_B_2
Kentucky
Carroll
469
1977
2009
Fayette Power Project
6179_B_1
Texas
Fayette
598
1979
2009
Fayette Power Project
6179_B_2
Texas
Fayette
598
1980
2009
Morgantown Generating Plant
1573_B_1
Maryland
Charles
624
1970
2009
Morgantown Generating Plant
1573_B_2
Maryland
Charles
620
1971
2009
PPL Brunner Island
3140_B_1
Pennsylvania
York
321
1961
2009
PPL Brunner Island
3140_B_2
Pennsylvania
York
378
1965
2009
Keystone
3136_B_1
Pennsylvania
Armstrong
850
1967
2009
Keystone
3136_B_2
Pennsylvania
Armstrong
850
1968
2009
Bull Run
3396_B_1
Tennessee
Anderson
881
1967
2009
Bay Shore
2878_B_4
Ohio
Lucas
215
1968
2009
Hatfields Ferry Power Station
3179_B_1
Pennsylvania
Greene
530
1969
2009
Hatfields Ferry Power Station
3179_B_2
Pennsylvania
Greene
530
1970
2009
Hatfields Ferry Power Station
3179_B_3
Pennsylvania
Greene
530
1971
2009
Nebraska City Unit 2
6096_B_2
Nebraska
Otoe
663
2009
2009
Cross
130_B_4
South Carolina
Berkeley
652
2009
2009
Springerville
8223_B_4
Arizona
Apache
400
2009
2009
Sandow 5
82010_B_5
Texas
Milam
600
2009
2009
Oak Grove
82011_B_1
Texas
Robertson
800
2009
2009
Oak Grove
82011_B_2
Texas
Robertson
800
2009
2009
TS Power Plant
82013_B_1
Nevada
Eureka
200
2009
2009
Plum Point Energy
82014_B_1
Arkansas
Mississippi
665
2009
2009
Comanche
470_B_3
Colorado
Pueblo
750
2009
2009
Elm Road Generating Station
56068_B_1
Wisconsin
Milwaukee
615
2009
2009
Two Elk Generating Station
55360_B_1
Wyoming
Campbell
300
2009
2009
J K Spruce
7097_B_BLR2
Texas
Bexar
750
2009
2009
Dallman
963_B_34
Illinois
Sangamon
200
2009
2009
Charles R Lowman
56_B_1
Alabama
Washington
86
1969
2008
John E Amos
3935_B_1
West Virginia
Putnam
800
1971
2008
John E Amos
3935_B_2
West Virginia
Putnam
800
1972
2008
Cholla
113_B_4
Arizona
Navajo
380
1981
2008
Roxboro
2712_B_1
North Carolina
Person
369
1966
2008
Roxboro
2712_B_3A
North Carolina
Person
341
1973
2008
Roxboro
2712_B_3B
North Carolina
Person
341
1973
2008
Miami Fort
2832_B_7
Ohio
Hamilton
500
1975
2008
Miami Fort
2832_B_8
Ohio
Hamilton
500
1978
2008
Cogentrix Virginia Leasing Corp
10071_B_2A
Virginia
Portsmouth
19
1988
2008
Cogentrix Virginia Leasing Corp
10071_B_2B
Virginia
Portsmouth
19
1988
2008
Cogentrix Virginia Leasing Corp
10071_B_2C
Virginia
Portsmouth
19
1988
2008
J M Stuart
2850_B_1
Ohio
Adams
585
1971
2008
J M Stuart
2850_B_2
Ohio
Adams
597
1970
2008
Electronic Filing - Received, Clerk's Office, January 21, 2009
5
J M Stuart
2850_B_3
Ohio
Adams
597
1972
2008
J M Stuart
2850_B_4
Ohio
Adams
597
1974
2008
Monroe
1733_B_3
Michigan
Monroe
795
1973
2008
Belews Creek
8042_B_1
North Carolina
Stokes
1,115
1974
2008
Belews Creek
8042_B_2
North Carolina
Stokes
1,115
1975
2008
Bowen
703_B_3BLR
Georgia
Bartow
902
1974
2008
Bowen
703_B_4BLR
Georgia
Bartow
929
1975
2008
Hammond
708_B_1
Georgia
Floyd
112
1954
2008
Hammond
708_B_2
Georgia
Floyd
112
1954
2008
Hammond
708_B_3
Georgia
Floyd
112
1955
2008
Hammond
708_B_4
Georgia
Floyd
510
1970
2008
Wansley
6052_B_1
Georgia
Heard
891
1976
2008
Harding Street
990_B_70
Indiana
Marion
435
1973
2008
Cogentrix Hopewell
10377_B_1A
Virginia
Hopewell (city)
18
1987
2008
Cogentrix Hopewell
10377_B_1B
Virginia
Hopewell (city)
18
1987
2008
Cogentrix Hopewell
10377_B_1C
Virginia
Hopewell (city)
18
1987
2008
Ghent
1356_B_4
Kentucky
Carroll
478
1984
2008
Council Bluffs
1082_B_3
Iowa
Pottawattamie
690
1978
2008
PPL Brunner Island
3140_B_3
Pennsylvania
York
749
1969
2008
PPL Montour
3149_B_1
Pennsylvania
Montour
774
1972
2008
PPL Montour
3149_B_2
Pennsylvania
Montour
766
1973
2008
Comanche
470_B_1
Colorado
Pueblo
366
1973
2008
Comanche
470_B_2
Colorado
Pueblo
370
1975
2008
Cayuga
1001_B_2
Indiana
VermilIon
473
1972
2008
Winyah
6249_B_1
South Carolina
Georgetown
295
1975
2008
Winyah
6249_B_2
South Carolina
Georgetown
295
1977
2008
Winyah
6249_B_3
South Carolina
Georgetown
295
1980
2008
Chesterfield
3797_B_6
Virginia
Chesterfield
658
1969
2008
Brayton Point
1619_B_1
Massachusetts
Bristo
243
1963
2008
Brayton Point
1619_B_2
Massachusetts
Bristo
244
1964
2008
Weston
4078_B_4
Wisconsin
Marathon
519
2008
2008
Gorgas
8_B_10
Alabama
Walker
690
1972
2007
Gorgas
8_B_8
Alabama
Walker
165
1956
2007
Gorgas
8_B_9
Alabama
Walker
175
1958
2007
John E Amos
3935_B_3
West Virginia
Putnam
1,300
1973
2007
Mountaineer
6264_B_1
West Virginia
Mason
1,300
1980
2007
Cardinal
2828_B_1
Ohio
Jefferson
600
1967
2007
Cardinal
2828_B_2
Ohio
Jefferson
600
1967
2007
Roxboro
2712_B_2
North Carolina
Person
639
1968
2007
Roxboro
2712_B_4A
North Carolina
Person
343
1980
2007
Roxboro
2712_B_4B
North Carolina
Person
343
1980
2007
Cogentrix Virginia Leasing Corp
10071_B_1A
Virginia
Portsmouth
19
1988
2007
Cogentrix Virginia Leasing Corp
10071_B_1B
Virginia
Portsmouth
19
1988
2007
Cogentrix Virginia Leasing Corp
10071_B_1C
Virginia
Portsmouth
19
1988
2007
Killen Station
6031_B_2
Ohio
Adams
615
1982
2007
Marshall
2727_B_2
North Carolina
Catawba
378
1966
2007
Marshall
2727_B_3
North Carolina
Catawba
657
1969
2007
Cogentrix Hopewell
10377_B_2A
Virginia
Hopewell (city)
18
1987
2007
Cogentrix Hopewell
10377_B_2B
Virginia
Hopewell (city)
18
1987
2007
Cogentrix Hopewell
10377_B_2C
Virginia
Hopewell (city)
18
1987
2007
Ghent
1356_B_3
Kentucky
Carroll
478
1981
2007
Electronic Filing - Received, Clerk's Office, January 21, 2009
6
Louisa
6664_B_101
Iowa
Louisa
700
1983
2007
Allen S King
1915_B_1
Minnesota
Washington
571
1968
2007
Mitchell
3948_B_1
West Virginia
Marshall
800
1971
2007
Gibson
6113_B_1
Indiana
Gibson
630
1975
2007
Gibson
6113_B_2
Indiana
Gibson
628
1975
2007
Winyah
6249_B_4
South Carolina
Georgetown
270
1981
2007
Pleasant Prairie
6170_B_2
Wisconsin
Kenosha
617
1985
2007
Cross
130_B_3
South Carolina
Berkeley
620
2007
2007
Wygen II
55479_B_4
Wyoming
Campbell
90
2007
2007
Council Bluffs
1082_B_4
Iowa
Pottawattamie
790
2007
2007
Assumed BART Facilities and Units
State
County
Fac ID
Facility Name
Unit ID
MI
Bay
B2840
CE - KARN/WEADOCK
EU00036
MI
Bay
B2840
CE - KARN/WEADOCK
EU00037
MI
Eaton
B4001
LAN. BW&L ERICKSON
EU00007
MI
Houghton
B6553
UP POWER CO / PORTAGE
EU00008
MI
Huron
B2815
DTE - HARBOR BEACH
EU00009
MI
Ingham
B2647
LAN. BW&L Eckert
RG00023
MI
Ingham
B2647
LAN. BW&L Eckert
RG00023
MI
Ingham
B2647
LAN. BW&L Eckert
RG00023
MI
Ingham
B2647
LAN. BW&L Moores Park
RG00021
MI
Marquette
B4261
WE-ENERGIES
EU00029
MI
Marquette
B4261
WE-ENERGIES
EU00030
MI
Marquette
B4261
WE-ENERGIES
EU00031
MI
Marquette
B4261
WE-ENERGIES
EU00032
MI
Marquette
B4261
WE-ENERGIES
EU00033
MI
Monroe
B2816
DTE - MONROE
EU00062
MI
Monroe
B2816
DTE - MONROE
EU00068
MI
Monroe
B2816
DTE - MONROE
EU00063
MI
Monroe
B2816
DTE - MONROE
EU00064
MI
Ottawa
B2835
CE – CAMPBELL
EU00062
MI
Ottawa
B2835
CE – CAMPBELL
EU00061
MI
Saint Clair
B2796
DTE - ST. CLAIR / BELLE RIVER
EU00111
MI
Saint Clair
B6145
DTE – GREENWOOD
EU00009
MI
Wayne
B2132
WYANDOTTE
EU00036
MI
Wayne
B2185
DETROIT PLD, MISTERSKY
EU00014
MI
Wayne
B2811
DTE – TRENTON
EU00035
OH
Lake
0243160009
CEI., EASTLAKE PLANT
B005
OH
0247030013
Orion Power Midwest
B012
OH
0285010188
Dept of Public Utilities, City of Orrville
B001
OH
0285010188
Dept of Public Utilities, City of Orrville
B004
OH
0448020006
Toledo Edison Co., Bay Shore
B003
OH
0448020006
Toledo Edison Co., Bay Shore
B004
OH
0616000000
Conesville Power Plant
B003
OH
0616000000
Conesville Power Plant
B004
OH
0616000000
Conesville Power Plant
B007
OH
0641050002
Cardinal Power Plant
B001
OH
0641050002
Cardinal Power Plant
B002
Electronic Filing - Received, Clerk's Office, January 21, 2009
7
OH
0641050002
Cardinal Power Plant
B003
OH
0641050002
Cardinal Power Plant
B004
OH
0641050002
Cardinal Power Plant
B008
OH
0641050002
Cardinal Power Plant
B009
OH
0641050002
Cardinal Power Plant
B009
OH
Jefferson
0641160017
W. H. SAMMIS PLANT
B011
OH
Jefferson
0641160017
W. H. SAMMIS PLANT
B012
OH
Jefferson
0641160017
W. H. SAMMIS PLANT
B013
OH
0684000000
Muskingum River Power Plant
B006
OH
Adams
0701000007
DP&L, J.M. Stuart Generating Station
B001
OH
Adams
0701000007
DP&L, J.M. Stuart Generating Station
B002
OH
Adams
0701000007
DP&L, J.M. Stuart Generating Station
B003
OH
Adams
0701000007
DP&L, J.M. Stuart Generating Station
B004
OH
0701000060
DP&L, Killen Station
B001
OH
1409040243
City of Hamilton Dept of Public Utilities
B002
OH
1409040243
City of Hamilton Dept of Public Utilities
B008
OH
1409040243
City of Hamilton Dept of Public Utilities
B009
OH
1413100008
CG&E W. C. BECKJORD
B005
OH
1413100008
CG&E W. C. BECKJORD
B006
OH
1431350093
CG&E MIAMI FORT STATION
B015
IL
Peoria
856
Ameren – Edwards
2
IL
Sangamon
963
CWLP – Dallman
31
IL
Sangamon
963
CWLP – Dallman
32
IL
Christian
876
Dominion – Kincaid
1
IL
Christian
876
Dominion – Kincaid
2
WI
COLUMBIA
111003090
Alliant Energy-Columbia Generating
B20
WI
COLUMBIA
111003090
Alliant Energy-Columbia Generating
B21
WI
COLUMBIA
111003090
Alliant Energy-Columbia Generating
B22
WI
GRANT
122014530
Alliant Energy, Nelson Dewey
B22 (unit 2)
WI
MILWAUKEE
241007690
We Energies-Oak Creek Station
B26 (Unit 6)
WI
MILWAUKEE
241007690
We Energies-Oak Creek Station
B27 (Unit 7)
WI
MILWAUKEE
241007690
We Energies-Oak Creek Station
B28
WI
MILWAUKEE
241007800
We Energies-Valley Station
B21
WI
MILWAUKEE
241007800
We Energies-Valley Station
B23
WI
MILWAUKEE
241007800
We Energies-Valley Station
B24
WI
BROWN
405031990
WI Public Service Corp - JP Pulliam
B27 (unit 8)
WI
SHEBOYGAN
460033090
WP & L Alliant Energy – Edgewater
B24
WI
BUFFALO
606034110
Dairyland Power Coop Alma Station
(J.P. Madgett boilers)
B25 (+B26)
WI
BUFFALO
606034110
Dairyland Power Coop Alma Station
B27
WI
VERNON
663020930
Dairyland Power Coop Genoa Station
B20
WI
VERNON
663020930
Dairyland Power Coop Genoa Station
B25
IN
Porter
995
Bailly
7
IN
Porter
995
Bailly
8
IN
Vermillion
1001
Cayuga
1
IN
Vermillion
1001
Cayuga
2
IN
Montgomery
1024
Crawfordsville
6
IN
Warrick
1012
Culley
2
Electronic Filing - Received, Clerk's Office, January 21, 2009
8
IN
Warrick
1012
Culley
3
IN
Gibson
6113
Gibson
1
IN
Gibson
6113
Gibson
2
IN
Cass
1032
Logansport
6
IN
Sullivan
6213
Merom
1
IN
Sullivan
6213
Merom
2
IN
LaPorte
997
Michigan City
12
IN
Lake
996
Mitchell
11
IN
Pike
994
Petersburg
1
IN
Pike
994
Petersburg
2
IN
Pike
994
Petersburg
3
IN
Pike
1043
Ratts
1
IN
Pike
1043
Ratts
2
IN
Wayne
7335
RPL
2
IN
Jasper
6085
Schahfer
14
IN
Jasper
6085
Schahfer
15
IN
Lake
981
Stateline
4
IN
Marion
990
Stout
70
IN
Dearborn
988
Tanners Creek
4
IN
Vigo
1010
Wabash River
6
IN
Warrick
6705
Warrick
4
IA
07-02-005
Cedar Falls Utilities
Unit #7 (EU10.1A)
IA
88-01-004
Central Iowa Power Cooperative
(CIPCO) – Summit Lake Station
CombTurbines (EU
1/1G, EU2/2G)
IA
70-08-003
Central Iowa Power Cooperative
(CIPCO) – Fair Station
Unit # 2 (EU 2 &
EU 2G)
IA
85-01-006
City of Ames - Steam Electric Plant
Boiler #7 (EU 2)
IA
29-01-013
Interstate Power & Light - Burlington
Main Plant Boiler.
IA
03-03-001
Interstate Power & Light - Lansing
Boiler #4. Sixteen
units in total.
IA
23-01-014
Interstate Power & Light - ML Kapp
Boiler #2. Six units
in total.
IA
57-01-042
Interstate Power & Light - Prairie Creek
Boiler #4. Fourteen
units in total.
IA
78-01-026
MidAmerican Energy Co - Council Bluffs
Boiler #3 (EU003)
IA
97-04-010
MidAmerican Energy Co - Neal North
Boilers #1-3
(EU001 - EU003)
IA
97-04-011
MidAmerican Energy Co - Neal South
Boiler #4 (EU003)
IA
70-01-011
Muscatine Power and Water
Boiler #8
IA
63-02-005
Pella Municipal Power Plant
Boilers #6-8
MN
2709900001
Austin Utilities NE Power Station
EU001
MN
2713700027
Hibbing Public Utilities
EU003
MN
2703100001
MN Power, Taconite Harbor
EU003
MN
2706100004
MN Power, Boswell Energy Center
EU003
MN
2701500010
New Ulm Public Utilities
EU003 - Boiler 4
MN
2711100002
Otter Tail Power Hoot Lake
EU003
MN
2710900011
Rochester Public Utilities, Silver Lake
EU003
MN
2710900011
Rochester Public Utilities, Silver Lake
EU004
MN
2713700028
Virginia Public Utilities
EU003 - Boiler 9
MN
2714100004
Xcel Energy, Sherco
EU001, EU002
MN
2716300005
Xcel Energy, Allen S King
EU001 - Boiler 1
Electronic Filing - Received, Clerk's Office, January 21, 2009
9
MN
2705300015
Xcel Energy, Riverside
EU003 - Boiler 8
MO
290710003
Ameren -Labadie
B1, B2, B3, B4
MO
291830001
Ameren - Sioux
B1, B2
MO
290990016
Ameren - Rush Island
B1, B2
MO
290950031
Auila - Sibley
B3 - 5C
MO
291430004
Assoc. Electric - New Madrid
B1(EP-01), B2
(EP-02)
MO
290770039
City Utilities Springfield - Southwest
B1 (E09)
MO
290770005
City Utilities Springfield - James River
EO7, EO8
MO
290970001
Empire Distric Electric - Asbury
B7
MO
290830001
KC Power and Light - Montrose
EP08
MO
290210004
Aqula - Lake Road
EP06
MO
291750001
Assoc. Electric - Thomas Hill
EP01, EP02
MO
290950021
Trigen - Kansas City
B1A
MO
290190002
City of Columbia Municipal Power Plant
EP02
MO
291950010
Marshall Munipal Utilities
EP05
MO
290950050
Independence Power & Light-Blue Valley B3 (EP05)
WV
3943
Fort Martin
WV
6004
Pleasants
WV
3948
Mitchell
WV
3935
Amos
WV
6264
Mountaineer
WV
3944
Harrison
TN
3396
TVA Bull Run
TN
3399
TVA Cumberland
KY
1363
Cane Run
KY
1364
Mill Creek
KY
6041
Spurlock
KY
1384
John Sherman Cooper
KY
1353
Big Sandy
KY
1356
Ghent
KY
1355
Brown
KY
1374
Owensboro Municipal
KY
1372
Henderson Municipal
KY
1378
Paradise
KY
1361
Coleman
KY
1382
Reid/Henderson 2
KY
6639
Green
Electronic Filing - Received, Clerk's Office, January 21, 2009
ILLINOIS ENVIRONMENTAL PROTECTION AGENCY
Notice of Public Hearing for State Implementation Plan (SIP) Submittals
For the Chicago, Illinois Ozone Nonattainment Area
The Illinois Environmental Protection Agency (Illinois EPA) will hold a public hearing on
December 16, 2008 at 9:00 a.m. in Room 9-031 at the James R. Thompson Center, 100 West
Randolph Street, Chicago, Illinois.
The public hearing will be held by the Illinois EPA Bureau of Air for the purpose of gathering
public comments on two draft SIPs related to the 1997 8-hour ozone National Ambient Air
Quality Standard (NAAQS). The Illinois EPA is seeking comments on the draft Attainment
Demonstration, the draft Maintenance Plan, and associated draft motor vehicle emissions
budgets, all of which the Illinois EPA proposes to submit to the United States Environmental
Protection Agency (U.S. EPA) as SIP revisions to meet the requirements of the federal Clean Air
Act (CAA). The Attainment Demonstration contains the State’s plan for attaining the 1997 8-
hour ozone NAAQS in the Chicago, Illinois nonattainment area. The Illinois EPA intends to
request that U.S. EPA redesignate the Chicago area to attainment of the 1997 8-hour ozone
NAAQS based on ambient monitoring data from 2006 through 2008. The draft Maintenance
Plan contains the State’s plan for maintaining the 8-hour ozone NAAQS for at least 10 years
after U.S. EPA redesignates the area to attainment. The SIP revisions will also establish new
motor vehicle emissions budgets for the years 2009 and 2020 for the nonattainment area. The
hearing will satisfy the requirements of Section 110(l) of the CAA (42. U.S.C. 7401(l) (public
notice for SIP submittals)). The Illinois EPA will also be taking comments on establishing
boundaries for the nonattainment area to be established pursuant to the 2008 ozone NAAQS
revision.
Copies of these draft SIP submittals for the Chicago, Illinois nonattainment area may be viewed
by the public prior to the hearing during regular business hours (Monday through Friday 8:30
a.m. until 4:30 p.m., except for State holidays) at the Illinois EPA’s offices at 9511 West
Harrison Street in Des Plaines, Illinois, as well as on Illinois EPA’s website at
http://www.epa.state.il.us. No walk-in requests for copies of this material will be
accommodated. Requests and public inquiries should be directed to Rachel Doctors at the
address below.
The hearing will be held under the provisions of the Illinois EPA’s “Procedures for Information
and Quasi-Legislative Public Hearings” (35 Ill. Adm. Code 164). Any questions about the
hearing procedures, requests for copies of the hearing rules, or requests for special need
interpreters should be directed to the address below. Requests for special needs interpreters must
be made by December 1, 2008.
Closure of the Hearing Record. The Hearing Record will close on January 15, 2009. Comments
need not be notarized, but must be postmarked by midnight January 15, 2009, and mailed to
Rachel Doctors, Illinois EPA, 1021 North Grand Avenue East, P.O. Box 19276, Springfield,
Illinois 62794-9276, telephone number 217/782-5544 or TDD 217.782-9143.
Electronic Filing - Received, Clerk's Office, January 21, 2009
DRAFT
Maintenance Plan for the
Illinois Portion of the
Chicago Ozone Nonattainment Area
For the 1997 8-Hour Ozone Standard
AQPSTR 08-08
November 15, 2008
Illinois Environmental Protection Agency
1021 North Grand Avenue East
Springfield, Illinois 62794-9276
Electronic Filing - Received, Clerk's Office, January 21, 2009
i
TABLE OF CONTENTS
Page
LIST OF TABLES
.
.
.
.
.
.
.
.
.
iii
LIST OF FIGURES
.
.
.
.
.
.
.
.
.
iv
EXECUTIVE SUMMARY
.
.
.
.
.
.
.
.
5
1.0
INTRODUCTION
.
.
.
.
.
.
.
.
6
1.1
Regulatory Background
.
.
.
.
.
.
6
1.2
Status of Air Quality .
.
.
.
.
.
.
8
2.0
REDESIGNATION AND MAINTENANCE PLAN REQUIREMENTS
9
3.0
OZONE MONITORING
.
.
.
.
.
.
.
11
3.1
Monitored Design Values
.
.
.
.
.
.
11
3.2
Quality Assurance
.
.
.
.
.
.
.
13
3.3
Continued Monitoring
.
.
.
.
.
.
13
4.0
EMISSION INVENTORY
.
.
.
.
.
.
.
14
4.1
Attainment Year Inventory – 2006 .
.
.
.
.
14
4.2
Air Quality Improvements and Emission Controls .
.
.
15
4.3
Emission Projections .
.
.
.
.
.
.
16
4.4
Demonstration of Maintenance
.
.
.
.
.
17
4.5
Provisions for Future Updates
.
.
.
.
.
18
5.0
CONTROL MEASURES AND REGULATIONS
.
.
.
19
5.1
Attainment Demonstration Control Measures
.
.
.
19
5.2
Reasonable Further Progress
.
.
.
.
20
5.3
Reasonably Available Control Technology (RACT) .
.
.
21
5.4
Controls to Remain in Effect .
.
.
.
.
.
22
5.5
Provisions for Permitting New or Modified Emission Sources
.
22
5.6
Transportation Conformity .
.
.
.
.
.
22
6.0
CONTINGENCY MEASURES
.
.
.
.
.
.
24
6.1
Contingency Measures
.
.
.
.
.
.
24
6.2
Commitment to Revise Plan .
.
.
.
.
.
26
6.3
Public Participation .
.
.
.
.
.
.
27
6.4
Legal Authority to Implement and Enforce .
.
.
.
27
7.0
CONCLUSIONS
.
.
.
.
.
.
.
.
28
TABLE OF CONTENTS (Continued)
Electronic Filing - Received, Clerk's Office, January 21, 2009
ii
APPENDIX A
Summary of Ambient Air Monitoring Data (2006-2008)
APPENDIX B
Transportation Conformity
Electronic Filing - Received, Clerk's Office, January 21, 2009
iii
LIST OF TABLES
Page
Table 4.1
2006 Chicago Ozone Nonattainment Area
VOM and NOx Emissions
.
.
.
.
.
.
14
Table 4.2
2002 Chicago Ozone Nonattainment Area
VOM and NOx Emissions
.
.
.
.
.
.
15
Table 4.3
2013 Chicago Ozone Nonattainment Area
VOM and NOx Emissions
16
Table 4.4
2020 Chicago Ozone Nonattainment Area
VOM and NOx Emissions
17
Table 4.5
Comparison of 2006, 2013, and 2020 Emission Estimates
Chicago Nonattainment Area .
.
.
.
.
.
17
Table 4.6
Estimated NOx Emission Reductions from Utility Boilers
Resulting from Implementation of Illinois’ Multi-Pollutant Standards.
18
Table 5.1
Proposed Chicago NAA Year 2020
Motor Vehicle Emissions Budgets
…23
Table 6.1
Contingency Plan for the Chicago 8-Hour Ozone
Nonattainment Area
…25
Electronic Filing - Received, Clerk's Office, January 21, 2009
iv
LIST OF FIGURES
Page
Figure 1.1
Map of the Lake Michigan Nonattainment Areas
.
.
.
7
Figure 3.1
Ozone Monitors in the Lake Michigan Area .
.
.
.
11
Figure 3.2
Comparison of 8-Hour Ozone Design Values for the
Lake Michigan Region Between 2001-2003 and 2006-2008 .
.
12
Electronic Filing - Received, Clerk's Office, January 21, 2009
5
EXECUTIVE SUMMARY
This document describes Illinois’ Maintenance Plan for the Illinois portion of the Chicago ozone
nonattainment area. A Maintenance Plan is required before the area can be redesignated from
nonattainment to attainment of the 8-hour ozone National Ambient Air Quality Standard
(NAAQS) promulgated in 1997. This document also provides technical information required to
support a redesignation request. Illinois intends to submit such a request to the U. S.
Environmental Protection Agency (U.S. EPA). The Illinois Environmental Protection Agency
(Illinois EPA) has prepared this plan in consultation with the Indiana Department of
Environmental Management (IDEM), the Wisconsin Department of Natural Resources (WDNR),
and the Michigan Department of Environmental Quality (MDEQ), the Lake Michigan Air
Directors Consortium (LADCO), and U.S. EPA. The IDEM is preparing a similar plan for the
Indiana portion of the Chicago nonattainment area.
Ozone air quality has dramatically improved in the Lake Michigan region as a result of
implementation of State and Federal control measures since the designation of the Chicago area
as nonattainment in 2004. With the exception of Holland, Michigan, the entire Lake Michigan
region, including the Chicago nonattainment area, has at least three years of complete, quality
assured ambient air quality monitoring data for 2006-2008 that demonstrates compliance with
the 1997 8-hour ozone NAAQS. These air quality improvements are due to permanent and
enforceable emission control measures.
This Maintenance Plan provides for the continued attainment of the 8-hour ozone air quality
standard for the Chicago nonattainment area for a period of ten years after U.S. EPA has
formally redesignated the area to attainment. The Plan also provides assurances that, even if
there is a subsequent violation of the air quality standard, measures listed in the Plan will prevent
any future occurrences through contingency measures that would be triggered upon such an
occurrence.
Electronic Filing - Received, Clerk's Office, January 21, 2009
6
1.0
INTRODUCTION
This document describes Illinois’ Maintenance Plan for the Illinois portion of the Chicago ozone
nonattainment area. A maintenance plan is required before the area can be redesignated from
nonattainment to attainment of the 8-hour ozone National Ambient Air Quality Standard
(NAAQS) promulgated by the U. S. Environmental Protection Agency (U.S. EPA) in 1997.
Illinois intends to submit such a request to the U.S. EPA in conjunction with this Maintenance
Plan. The Illinois EPA has prepared this plan in consultation with the Indiana Department of
Environmental Management (IDEM), the Wisconsin Department of Natural Resources (WDNR),
and the Michigan Department of Environmental Quality (MDEQ), the Lake Michigan Air
Directors Consortium (LADCO), and U.S. EPA. The IDEM is preparing a similar plan for the
Indiana portion of the Chicago nonattainment area. With the exception of Holland, Michigan,
the entire Lake Michigan region, including the Chicago area, has at least three years of complete,
quality assured ambient air quality monitoring data for 2006-2008, demonstrating attainment
with the 8-hour ozone NAAQS.
This document also provides the technical information needed to support a request to redesignate
the Chicago area to attainment of the 8-hour ozone NAAQS. Section 107 of the Clean Air Act
(CAA) establishes specific requirements to be met in order for a nonattainment area to be
considered for redesignation. Before an area can be reclassified to attainment, U.S. EPA must
make a determination that the area has attained the 8-hour ozone NAAQS based on at least three
complete years of ambient monitoring data. U.S. EPA must have approved a State
Implementation Plan (SIP) for the area under Section 110 and Part D of the CAA. The state
must demonstrate that the improvement in air quality is due to permanent and enforceable
reductions in emissions resulting from implementation of the SIP and other federal requirements.
Finally, the state must submit, and U.S. EPA must approve, a maintenance plan under Section
175(A) of the CAA, including provisions for contingency measures that will be implemented if
future violations of the 8-hour ozone NAAQS are measured.
This Maintenance Plan provides for the continued attainment of the 8-hour ozone NAAQS for
the Chicago nonattainment area (NAA) for a period of ten years after U.S. EPA has formally
redesignated the area to attainment. The Plan also provides assurances that even if a subsequent
violation of the ozone NAAQS occurs, provisions in the Plan will prevent any future occurrences
through contingency measures that would be triggered upon such occurrence.
This document addresses the maintenance plan requirements established by the CAA and U.S.
EPA, and includes additional information to support continued compliance with the 8-hour
ozone NAAQS.
1.1
Regulatory Background
The CAA, as amended in 1990, requires areas that fail to meet the NAAQS for ozone to develop
SIPs to expeditiously attain and maintain the NAAQS. Historically, exceedances of the ozone
NAAQS have been monitored in Cook and Lake Counties in Illinois, and in portions of
Wisconsin, Indiana, and Michigan immediately downwind of the Chicago, Gary, and Milwaukee
metropolitan areas.
Electronic Filing - Received, Clerk's Office, January 21, 2009
7
The Chicago NAA, which includes Lake and Porter Counties in northwest Indiana, was
originally designated as nonattainment in 2004 pursuant to the 1997 revisions to the ozone
National Ambient Air Quality Standard. Several counties in eastern Wisconsin, and one county
in western Michigan adjacent to Lake Michigan were also designated as nonattainment of the 8-
hour ozone NAAQS, although these areas are separate from the Chicago NAA. Figure 1.1
depicts the current NAAs in the Lake Michigan region.
Figure 1.1
Map of the Lake Michigan Ozone Nonattainment Areas
The following is a list of the counties, and portions thereof, contained in the Chicago 8-hour
ozone severe nonattainment area:
•
Cook County, IL
•
Lake County, IL
•
DuPage County, IL
•
McHenry County, IL
•
Kane County, IL
•
Will County, IL
Electronic Filing - Received, Clerk's Office, January 21, 2009
8
•
Grundy County, IL (Aux Sable and Goose Lake Townships)
•
Kendall County, IL (Oswego Township)
•
Lake County, IN
•
Porter County, IN
As a result of the designation as nonattainment and the accompanying classification as moderate,
these areas were subject to new requirements, including development of a plan demonstrating
that the area would meet the federal 8-hour NAAQS for ozone by June 15, 2010.
Recognizing the need for a regional solution, the States of Illinois, Indiana, Michigan, Ohio, and
Wisconsin worked cooperatively, under the auspices of the Lake Michigan Air Directors
Consortium (LADCO), to jointly develop and evaluate an effective regional attainment strategy
to enable the Lake Michigan region to attain the 8-hour ozone NAAQS. The attainment strategy
recognizes the importance of both locally generated ozone precursor emissions and the need for
significant reductions of incoming (transported) ozone and ozone precursor emissions (including
oxides of nitrogen, or NOx) to allow the States to attain the NAAQS. The emission reductions
needed to attain the 8-hour ozone NAAQS include both State and Federal measures that have
reduced ozone precursor emissions both locally and regionally. These measures have allowed
the Chicago nonattainment area to attain the 8-hour ozone standard by the attainment deadline
established by the U.S. EPA.
1.2
Status of Air Quality
Ozone monitoring data for the most recent three-year period, 2006 through 2008, demonstrates
that air quality has met the NAAQS for the 8-hour ozone NAAQS in the entire Lake Michigan
region, including the Chicago nonattainment area, with the exception of Holland, Michigan.
Modeling performed by LADCO shows that Holland, MI will attain the ozone NAAQS by 2012.
Electronic Filing - Received, Clerk's Office, January 21, 2009
9
2.0
REDESIGNATION AND MAINTENANCE PLAN REQUIREMENTS
Sections 107 and 110 of the CAA list a number of requirements that must be met by
nonattainment areas prior to consideration for redesignation to attainment. One of those
requirements is the maintenance plan, which reflects a state’s plan for maintaining the NAAQS
for a ten-year period after redesignation to attainment. U.S. EPA has published guidance for the
preparation of maintenance plans and redesignation requests. This guidance is contained in a
document entitled “Procedures for Processing Requests to Redesignate Areas to Attainment”
(September 4, 1992).
Before a redesignation to attainment can be promulgated, U.S. EPA must:
•
Determine that the NAAQS for ozone, as published in 40 CFR 50.4, has been attained.
Ozone monitoring data must show that violations of the ambient NAAQS are no longer
occurring. This showing must rely on three consecutive years of data. The ambient air
monitoring data must be quality assured in accordance with 40 CFR 58.10, recorded in
U.S. EPA’s Air Quality System (AQS) data base, and is available to the public.
•
Approve the state’s plan for demonstrating attainment. The attainment plan, which is
based on air quality modeling, must contain enforceable control measures and must be
submitted as a revision to the state’s SIP after a public hearing.
•
Determine that the improvement in air quality between the year violations occurred and
the year that attainment was achieved is based on permanent and enforceable emission
reductions.
•
Approve the state’s maintenance plan. The requirements for the maintenance plan are
discussed below.
•
Determine that all other requirements applicable to nonattainment areas have been met.
A maintenance plan provides for the continued attainment of the 8-hour ozone NAAQS for a
nonattainment area for a period of ten years after U.S. EPA has formally redesignated the area to
attainment. The plan also provides assurances that even if a subsequent violation of the NAAQS
occurs, provisions in the plan will prevent any future occurrences through contingency measures
that would be triggered upon such occurrence. To be approvable, the state is required to have a
public hearing on the maintenance plan prior to adoption. The maintenance plan must contain
the following elements:
•
A comprehensive emission inventory of the precursors of ozone completed for the
“attainment year”;
Electronic Filing - Received, Clerk's Office, January 21, 2009
10
•
A projection of the emission inventory forward to a year at least ten years after
redesignation and a demonstration that the projected level of emissions is sufficient to
maintain the ozone NAAQS;
•
A commitment that, once redesignated, the state will continue to operate an appropriate
monitoring network to verify maintenance of the attainment status;
•
A demonstration of legal authority to implement and enforce all control measures
contained in the SIP;
•
Provisions for future updates of the inventory to enable tracking of emission levels,
including an annual emission statement from major sources;
•
Motor vehicle emissions budgets for transportation conformity for the ten-year
maintenance period;
•
A commitment to submit a revised maintenance plan eight years after redesignation;
•
A commitment to enact and implement additional contingency control measures
expeditiously in the event that future violations of the NAAQS occur;
•
A list of potential contingency measures that would be implemented in such an event.
Illinois’ Maintenance Plan has been prepared in accordance with the requirements specified in
U.S. EPA’s guidance document and additional guidance received from U.S. EPA staff.
The following sections of this document describe how U.S. EPA’s requirements have been met.
Electronic Filing - Received, Clerk's Office, January 21, 2009
11
3.0
OZONE MONITORING
U.S. EPA’s published guidance document, “Procedures for Processing Requests to Redesignate
Areas to Attainment” (September 4, 1992), details specific requirements regarding the collection
and use of ambient air monitoring data needed to support a redesignation request. Before the
Chicago NAA can be redesignated, Illinois must demonstrate that the NAAQS for ozone, as
published in 40 CFR 50.4, has been attained. Ozone monitoring data must show that violations
of the NAAQS are no longer occurring within the nonattainment area. This showing must rely
on three complete, consecutive calendar years of quality assured data. Further, the air
monitoring data must be quality assured in accordance with 40 CFR 58.10, recorded in U.S.
EPA’s AQS data base, and made available to the public. Finally, Illinois must commit to
continue to operate an appropriate monitoring network to verify the maintenance of the
attainment status, once the area has been redesignated.
The following subsections describe how each of these requirements has been addressed.
3.1
Monitored Design Values
Currently there are 55 ozone monitors located in the nonattainment counties in the Lake
Michigan region; 9 are located in northwestern Indiana, 17 in northeastern Illinois, 13 in western
Michigan, and 16 in eastern Wisconsin.
Figure 3.1 Ozone Monitors in the Lake Michigan Area
Electronic Filing - Received, Clerk's Office, January 21, 2009
12
To determine whether the NAAQS is being exceeded, the design value must be calculated. The
current U.S. EPA method for calculating the ozone design value is to average the 4
th
highest
daily maximum 8-hour value for each year over the 3-year period. The calculated 8-hour ozone
design values for the monitors in the Lake Michigan region for 2006-2008 are included as
Appendix A of this report. Figure 3.2 compares the design values for the 2001-2003 period for
monitoring stations in the Lake Michigan region to the corresponding design values from 2006-
2008. The data demonstrate that ozone air quality has improved dramatically throughout the
Lake Michigan region and that the NAAQS for ozone has been attained for the 2006-2008 period
at all locations except Holland, Michigan.
Figure 3.2
Comparison of 8-Hour Ozone Design Values for the Lake Michigan Region
Between 2001-2003 and 2006-2008*
2001-2003
2006-2008*
* Data for 2008 are preliminary and subject to final verification.
3.2
Quality Assurance
Electronic Filing - Received, Clerk's Office, January 21, 2009
13
Illinois EPA has quality assured all data shown in Appendix A in accordance with 40 CFR
58.10 and the Illinois EPA ’s Quality Assurance Plan, which describes Illinois EPA’s standard
operating procedures for operating the ambient monitoring network and validating the data.
Illinois EPA has recorded the data in the U.S. EPA’s AQS database, which is available to the
public.
3.3
Continued Monitoring
Illinois commits to continue monitoring ozone levels according to a U.S. EPA approved
monitoring plan, as required to ensure maintenance of the ozone NAAQS. Should changes in the
location of an ozone monitor become necessary, Illinois EPA will work with U.S. EPA to ensure
the adequacy of the monitoring network. Illinois EPA will continue to quality assure the
monitoring data to meet the requirements of 40 CFR 58. Illinois EPA will continue to enter all
data into AQS on a timely basis in accordance with federal guidelines.
Electronic Filing - Received, Clerk's Office, January 21, 2009
14
4.0
EMISSIONS INVENTORY
A redesignation request must contain a demonstration that the improvement in air quality
between the year that violations occurred and the year that attainment was achieved is based on
permanent and enforceable emission reductions. As described previously in Section 3.0, a three-
year monitoring period is used to evaluate whether attainment has been achieved. In this
Section, the “attainment year” refers to the first year (2006) of the three-year period (2006-2008)
used to demonstrate attainment. The request should also include a projection of the emission
inventory to a year at least 10 years following redesignation, a demonstration that the projected
level of emissions is sufficient to maintain the ozone NAAQS, and a commitment to provide
future updates of the inventory to enable tracking of emission levels during the 10-year
maintenance period.
4.1
Attainment Year Inventory, 2006
Illinois EPA has prepared a comprehensive emissions inventory for the Illinois portion of the
Chicago nonattainment area, including point, area, and on-road and off-road mobile sources for
precursors of ozone (VOM and NOx) for the attainment year, 2006. This inventory is based on
Illinois EPA’s SIP submittal entitled, “Illinois Base Year Ozone Inventory for 2002”, (June
2006). Point source information was compiled from 2006 annual emission reports submitted to
the Illinois EPA by emission sources and the U.S. EPA’s Clean Air Markets Division database
for electric utilities. Area source emissions were “grown” from 2002 activity levels appropriate
for each source category. Biogenic emissions are not included in these summaries. On-road
mobile source emissions were calculated using U.S. EPA’s MOBILE6 emissions model with
vehicle miles traveled (VMT) data provided by the Illinois Department of Transportation
(IDOT). Non-road mobile source emissions were calculated using U.S. EPA’s NONROAD
emissions model.
Table 4.1 summarizes the 2006 emissions estimates for the Chicago ozone nonattainment area.
Table 4.1
2006 Chicago Ozone Nonattainment Area
VOM and NOx Emissions
(Emissions stated in tons per ozone season weekday)
Source Category
VOM
NOx
Point Sources
61.20
194.03
Area Sources
281.43
35.64
On-Road Mobile Sources
130.03
302.43
Off-Road Mobile Sources
152.90
279.95
Total
625.56
812.05
Electronic Filing - Received, Clerk's Office, January 21, 2009
15
4.2
Air Quality Improvement and Emission Controls
The Chicago area was designated nonattainment in 2004, based on ozone air quality monitoring
data collected between 2001 and 2003. Since that time, permanent and enforceable reductions of
ozone precursor emissions have contributed to improvements in ozone air quality and to the
attainment of the ozone NAAQS. Some of these emission reductions were due to the application
of tighter federal emission standards on motor vehicles and fuels, and some due to the
requirements of the federal NOx SIP Call. Section 5.0 of this report describes these reductions
in more detail, along with an explanation of their regulatory status. In this subsection, the
emission levels from 2006 are compared to emission levels estimated in 2002 when the Chicago
area was first proposed for a nonattainment classification for the 1997 8-hour ozone standard.
U.S. EPA’s 8-hour ozone Implementation Rule required that states with ozone nonattainment
areas prepare and submit a 2002 base year anthropogenic inventory of sources of ozone
precursor emissions. The base year inventory included emissions from point, area, on-road
mobile and off-road mobile emissions. Illinois EPA prepared and submitted this inventory in
June 2006. Table 4.2 summarizes 2002 emissions by major source category and by pollutant for
the Illinois portion of the Chicago nonattainment area.
Table 4.2
2002 Chicago Ozone Nonattainment Area
VOM and NOx Emissions
(Emissions stated in tons per ozone season weekday)
Source Category
VOM
NOx
Point Sources
76.62
307.73
Area Sources
273.33
42.93
On-Road Mobile Sources
168.63
408.88
Off-Road Mobile Sources
233.77
326.65
Total
752.35
1086.19
Comparing the 2002 inventory to that for 2006 indicates that total VOM emissions in the
Chicago area decreased by about 126 tons per day (tpd), due largely to reductions from on-road
and off-road mobile sources. NOx emissions in the Chicago NAA decreased significantly, about
274 tpd, during the same time period. Statewide, NOx emissions decreased by almost 145 tpd,
from 468 tpd in 2002 to 323 tpd in 2006. These sizeable emission reductions in ozone precursor
emissions resulted in a substantial improvement in ozone air quality in the Chicago area,
ultimately resulting in attainment of the 8-hour ozone NAAQS.
Electronic Filing - Received, Clerk's Office, January 21, 2009
16
4.3
Emission Projections
A maintenance plan must contain a demonstration that the level of emissions projected for the
ten-year period following redesignation are sufficient to maintain the ozone NAAQS.
Accordingly, Illinois EPA has projected VOM and NOx emissions for the Illinois portion of the
Chicago nonattainment area for 2020. Illinois EPA has also projected emissions to 2013, to
represent a midpoint during the ten-year maintenance period. Emissions for these two projection
years are compared to emission levels in 2006 to determine if emissions are sufficient to
maintain the NAAQS during this period.
Chicago area point source emissions for 2013 and 2020 were estimated using the 2002 base year
inventory and growth factors appropriate for each source category. Area source emissions were
projected by applying category-specific growth factors to estimates contained in the 2002 base
year inventory. County population projections for 2007 and 2012 were used to estimate
emissions for categories which rely on a per capita emissions factors. Off-road emissions
projections were also developed using the 2002 inventory and growth factors contained in U.S.
EPA’s NONROAD model. On-road motor vehicle emissions were estimated using U.S. EPA’s
MOBILE6 motor vehicle emissions model. The figures assume the continued use of
reformulated gasoline, the continued phase-in of the Tier 2 motor vehicle emissions standards,
and operation of an enhanced vehicle inspection and maintenance program. Total vehicle miles
of travel (VMT) for 2013 and 2020 were assumed to increase at a rate of 1.27 percent per year
from 2002.
Tables 4.3 and 4.4 include the VOM and NOx emissions estimates for the years 2013 and 2020,
respectively, for the Illinois portion of the Chicago nonattainment area.
Table 4.3
2013 Chicago Ozone Nonattainment Area
VOM and NOx Emissions
(Emissions stated in tons per ozone season weekday)
Source Category
VOM
NOx
Point Sources
70.27
155.02
Area Sources
266.33
37.58
On-Road Mobile Sources
77.58
148.78
Off-Road Mobile Sources
122.82
249.28
Total
537.00
590.66
Electronic Filing - Received, Clerk's Office, January 21, 2009
17
Table 4.4
2020 Chicago Ozone Nonattainment Area
VOM and NOx Emissions
(Emissions stated in tons per ozone season weekday)
Source Category
VOM
NOx
Point Sources
81.43
153.12
Area Sources
293.25
39.62
On-Road Mobile Sources
56.07
79.09
Off-Road Mobile Sources
129.15
246.54
Total
559.90
511.37
4.4
Demonstration of Maintenance
Table 4.5 demonstrates that the level of emissions projected for the ten-year period following
redesignation is sufficient to maintain the ozone NAAQS. As shown in the table, both VOM and
NOx emissions within the nonattainment area are expected to decrease significantly between
2006 and 2020. Projected VOM and NOx emissions for the mid-point year, 2013, are also less
than the emission levels in 2006. Based on these emission trends it is expected that air quality
will continue to meet the 8-hour ozone NAAQS throughout the maintenance period.
In addition to the overall emission reductions projected to occur within the nonattainment area,
significant reductions of statewide NOx emissions resulting from implementation of Illinois’
multi-pollutant standards affecting electric utilities by 2012, will also help to ensure continued
attainment of the 8-hour ozone NAAQS. Table 4.6 provides a summary of the expected
reductions of NOx emissions resulting from implementation of Illinois’ multi-pollutant
standards.
TABLE 4.5
Comparison of 2006, 2013 and 2020 Emission Estimates
Chicago Nonattainment Area
(Emissions stated in tons per ozone season weekday)
2006
2013
2020
VOM
625.56
537.00
559.90
Electronic Filing - Received, Clerk's Office, January 21, 2009
18
NOx
812.05
590.66
518.37
Table 4.6
Estimated NOx Emission Reductions From Utility Boilers
Resulting from Implementation of Illinois’ Multi-Pollutant Standards
(Emissions stated in tons per ozone season weekday)
2006 NOx Emissions
323
2012 NOx Emissions
163
Net reduction
160
4.5
Provisions for Future Updates
As required by Section 175A(b) of the CAA, Illinois commits to submit to U.S. EPA, eight years
after redesignation, a revised version of this Maintenance Plan. The revision will contain
Illinois’ plan for maintaining the 8-hour ozone NAAQS for ten years beyond the first 10-year
period after redesignation.
Electronic Filing - Received, Clerk's Office, January 21, 2009
19
5.0
CONTROL MEASURES AND REGULATIONS
This section provides specific information on the control measures implemented in the Chicago
nonattainment area, including the measures that were part of Illinois’ Attainment Demonstration,
Reasonable Further Progress (RFP) demonstration, CAA requirements, and other state and
federal measures. The control measures required in past ozone SIP revisions have been fully
implemented, and other, more recent control programs will continue to provide emission
reductions in future years. Illinois EPA commits to keep these measures in effect after
redesignation, or to provide equivalent emissions levels using alternate measures. Illinois’ SIP
contains acceptable provisions to provide for preconstruction review of new emission sources.
After redesignation to attainment, Prevention of Significant Deterioration (PSD) requirements
will apply to the construction of new major sources and to significant modifications of existing
sources. Illinois has accepted delegation from U.S. EPA of this program. Illinois further
commits to continue to require that all future transportation plans in the Chicago area conform
with the SIP.
5.1
Attainment Demonstration Control Measures
Illinois’ attainment demonstration for the Chicago nonattainment area identifies control
measures that have been promulgated at either the state or federal level that are sufficient to
allow the Lake Michigan region, with the exception of Holland, MI, to meet the 1997 8-hour
ozone NAAQS by the required attainment date. The demonstration is described in the Illinois
EPA’s document: “Attainment Demonstration for the 1997 8-Hour Ozone National Ambient Air
Quality for the Chicago Nonattainment Area” (Report Number AQPSTR 08-07, November 15,
2008). The primary emission reduction measures for demonstrating attainment of the ozone
standard are as follows:
o NOx SIP Call
o New Source Performance Standards (NSPS) and National Emission Standards for
Hazardous Air Pollutants (NESHAPS)/Maximum Achievable Control
Technology (MACT) Standards
o VOM Solvent Categories: Aerosol Coatings, Architectural and Industrial
Maintenance (AIM) Coatings, Consumer Solvents
o Enhanced Vehicle Inspection & Maintenance Program
o Reformulated Gasoline
o Tier 2 Motor Vehicle Emissions Standards and Gasoline Sulfur Control
Requirements
o On-Highway Heavy-Duty Engine and Vehicle Standards and Highway Diesel
Fuel Sulfur Control Requirements
Electronic Filing - Received, Clerk's Office, January 21, 2009
20
o Federal Control Programs Incorporated into NONROAD Model (e.g., Nonroad
Diesel Rule), plus Evaporative Large Spark Ignition and Recreational Vehicle
Standards
o Tier 4 Nonroad Diesel Engine Standards and Diesel Fuel Sulfur Content
Restrictions
o Marine Compression-Ignition Engine Standards and Locomotive Engine
Standards
o Consent Decrees---Dynegy Midwest Generation, ConocoPhillips, CITGO,
Exxon-Mobil, Marathon Ashland, Archer Daniels Midland
5.2
Reasonable Further Progress (RFP)
Since the Chicago region is classified as a moderate nonattainment area for the 8-hour ozone
standard, a 15 percent net reduction in VOM emissions from 2002 levels is required by 2008 in
order to meet the RFP requirement. The Illinois EPA has not relied on NOx substitution to meet
its 15 percent RFP reduction, relying solely on VOM emission reductions.
Reductions in VOM emissions are primarily achieved through implementation of the control
measures listed in Section 5.1.
The RFP demonstration is contained in Illinois EPA’s document: “Chicago Nonattainment Area
8-Hour Ozone and Annual PM2.5 Reasonable Further Progress Demonstration”, (Report
Number AQPSTR 08-06, November 2008). The control measures identified in the RFP
document, including those listed above, will result in a 20.0 percent reduction in VOM emissions
from 2002 emissions levels by the year 2008. In addition, continuing reductions in 2009 and
2010 are estimated to result in year 2010 VOM emissions at 23.85 percent below 2002 levels.
These emission reductions easily achieve the 15% RFP target for the Chicago nonattainment
area.
Electronic Filing - Received, Clerk's Office, January 21, 2009
21
5.3
Reasonably Available Control Technology (RACT)
Pursuant to Sections 172, 182(b) and (f) of the CAA, RACT is required for all existing major
sources of the applicable criteria pollutant and its precursors (VOM and NOx) located in NAAs.
U.S. EPA defines RACT as the lowest emission limitation that a particular source is capable of
meeting by the application of control technology that is reasonably available considering
technological feasibility and economic reasonableness (70
FR
71612; November 29, 2005). The
major source threshold for moderate NAAs is defined as 100 tpy. A source generally consists of
several units that emit pollutants. The sum of emissions from all units at the source determines if
a unit is major and thus subject to RACT requirements.
RACT is not a new requirement under the CAA. Illinois previously addressed RACT
requirements in the Chicago area in developing attainment plans for the 1-hour ozone standard.
The RACT requirement for NOx was previously waived under the 1-hour ozone standard, and
Illinois must adopt new regulations to implement NOx RACT in the NAA. However, Illinois
has previously adopted RACT requirements for VOM emissions in the NAA. (See 35 Ill. Adm.
Code Part 219) The Illinois EPA has evaluated the previously adopted regulations to determine
if the RACT requirement is still being met for 8-hour ozone.
Sections 172, 182(b)(2), and 182(f) of the CAA require implementation of RACT for sources
that are subject to Control Techniques Guidelines (CTGs) that are promulgated by U.S. EPA.
The U.S. EPA has issued CTGs defining RACT for those categories of sources that emit the
greatest amounts of VOM emissions. Illinois EPA will soon be proposing regulations to
implement the revised CTGs issued by the U.S. EPA in 2006. Other than the 2006 CTGs,
Illinois has adopted applicable rules addressing all CTGs published by U.S. EPA for which there
are existing sources in the Chicago NAA.
Non-CTG sources are defined as major VOM sources which are not subject to CTGs, but for
which RACT is required. All major sources of ozone precursors located in the ozone NAA that
are not subject to individual RACT rules are subject to a generic RACT rule. These rules apply
to non-CTG sources that have the potential to emit 100 tons or more per year of VOM. Thus,
Illinois has met the obligation to implement RACT on non-CTG VOM sources in the NAA.
It should be noted that other regulatory requirements also affect VOM emission sources within
the Chicago ozone NAA. These include Maximum Achievable Control Technology (MACT),
federal New Source Performance Standards (NSPS), and National Emission Standards for
Hazardous Air Pollutants (NESHAPS). These programs satisfy the RACT requirements for
specific source categories because these rules are more stringent than RACT.
It is concluded from this review that Illinois’ existing VOM RACT rules fulfill U.S. EPA’s
RACT requirements for VOM sources in the NAA. As mentioned previously, however, the
RACT requirement for NOx was previously waived under the 1-hour ozone NAAQS. With
respect to the 8-hour ozone NAAQS, Illinois will not pursue the NO
x
waiver, so Illinois must
adopt new regulations to implement NOx RACT in the NAA. The Illinois Pollution Control
Board (Illinois PCB) is now considering a regulatory proposal prepared by the Illinois EPA. The
Electronic Filing - Received, Clerk's Office, January 21, 2009
22
Illinois EPA will submit Illinois’ NO
x
RACT rules as a SIP revision once these requirements
have been adopted by the Illinois PCB.
5.4
Controls to Remain in Effect
Illinois will maintain all of the control measures listed in this Section to ensure maintenance of
the 8-hour ozone NAAQS. Any revisions to the control measures included as part of the
Maintenance Plan will be submitted as a SIP revision to U.S. EPA for approval, and will be
accompanied by a showing that such changes will not interfere with maintenance of the NAAQS.
Illinois EPA has the necessary resources to enforce any violations of its rules or permit
provisions. After redesignation, it intends to continue enforcing all rules that relate to the
emission of ozone precursors in the Chicago nonattainment area.
5.5
Provisions for Permitting New or Modified Emission Sources
Illinois has longstanding and fully implemented programs for the review of new major sources
and significant modifications of existing sources. The Prevention of Significant Deterioration
(PSD) program, which includes requirements for Best Available Control Technology (BACT) on
major new sources or significant modifications of existing sources, will be applicable in the
Chicago area once the area has been redesignated to attainment. Illinois has been delegated full
authority to implement the PSD program by U.S. EPA.
5.6
Transportation Conformity
The purpose of this section is to describe and establish the Chicago nonattainment area motor
vehicle emissions budgets associated with the 8-hour ozone Maintenance Plan SIP. Average
summer weekday motor vehicle emissions budgets are being proposed for the final year of the
Maintenance Plan, 2020, and for the precursor pollutants VOM and NOx. These budgets were
developed consistent with the motor vehicle activity assumptions and emissions control
strategies incorporated into the 8-hour ozone attainment demonstration analysis. The budgets
reflect an emissions level determined using motor vehicle VMT and fleet mix provided by the
Chicago Metropolitan Agency for Planning (CMAP) and are consistent with the emission levels
used in the attainment demonstration.
A motor vehicle emissions budget is that portion of the total allowable emissions allocated to
highway and transit vehicle use that are defined in the SIP for a certain year. The rules
governing transportation conformity require certain transportation activities to be consistent with
motor vehicle emissions budgets contained in control strategy implementation plans (40 CFR §
93.118). Section 93.101 of the rule defines a “control strategy [State] implementation plan
revision” as a “plan which contains specific strategies for controlling the emissions and reducing
ambient levels of pollutants in order to satisfy CAA requirements of reasonable further progress
and attainment.” In order to demonstrate conformity to the motor vehicle emissions budget,
emissions from the implementation of a transportation plan or a transportation improvement
Electronic Filing - Received, Clerk's Office, January 21, 2009
23
program must be less than or equal to the budget level (40 CFR § 93.118(a)).
The motor vehicle emissions budgets established and described herein were developed consistent
with the methodology and control strategy assumptions used in the 8-hour ozone attainment
demonstration. The effects of motor vehicle control measures are incorporated into the
emissions factors produced by the U.S. EPA’s MOBILE6 model. These control measures
include motor vehicle emissions standards, the operation of a vehicle inspection and
maintenance (I/M) program, and the required use of reformulated gasoline and low sulfur
gasoline and diesel fuel.
Using the above VMT and control program assumptions and methodology, following are the
year 8-hour ozone motor vehicle emissions budgets, stated in tons per ozone season weekday, for
the Chicago NAA for use in determining transportation conformity.
Table 5.1:
Proposed Chicago NAA Year 2020
Motor Vehicle Emissions Budgets
8-Hour Ozone
(tons per ozone season weekday)
Pollutant
VOM
56.07
NOx
79.09
Complete detail on the derivation of the motor vehicle emissions budgets, including discussion
of the MOBILE6 model inputs and assumptions is included in Appendix B of this report.
Electronic Filing - Received, Clerk's Office, January 21, 2009
24
6.0
CONTINGENCY MEASURES
6.1
Contingency Measures
Section 175(A) of the CAA specifies the requirements for maintenance plans, including
provisions for contingency measures that will be implemented if violations of the 8-hour ozone
NAAQS are measured after redesignation to attainment. A list of potential contingency
measures that would be implemented in such an event should also be included in the
Maintenance Plan. Finally, the plan should provide a commitment to submit a revised
maintenance plan eight years after redesignation to ensure continued maintenance for the next
ten-year maintenance period.
Contingency measures are intended to provide further emission reductions in the event that
violations of the 8-hour ozone NAAQS occur after redesignation to attainment. While these
measures do not need to be fully adopted by the IPCB prior to the occurrence of NAAQS
violations, the contingency plan should ensure that the contingency measures are adopted
expeditiously once they are triggered. The Maintenance Plan must identify the triggers that
determine when contingency measures will be adopted, and the measures that the state will
consider.
Illinois EPA’s contingency plan for the Chicago NAA is described in Table 6.1. Consistent with
this plan, Illinois agrees to adopt and implement, as expeditiously as is practicable, the necessary
corrective actions in the event that violations of the 8-hour ozone NAAQS occur within the
Chicago maintenance area after redesignation to attainment. Further, Illinois commits to
continue to implement the control measures identified in the attainment demonstration and RFP
demonstration. As described in Section 5.0 of this report, Illinois has adopted and is continuing
to implement a range of control measures that will greatly reduce precursor emissions, both
locally and statewide. The contingency plan anticipates that these emission reductions will be
sufficient to mitigate exceedances or violations of the NAAQS that may occur in the coming
years without further regulatory action.
The contingency plan provides for different levels of corrective responses should ambient 8-hour
ozone levels exceed the NAAQS in any year, if emissions in the NAA increase significantly
above current attainment levels, or if the NAAQS is violated. A Level I response would occur in
the event that: 1) the 8-hour ozone design value at any monitoring site in the Chicago NAA
exceeds 84 ppb in any year, or 2) if VOM or NOx emissions increase more than 5% above the
levels contained in the attainment year (2006) emissions inventory. It should be noted that U.S.
EPA does not require a state to implement contingency measures when occasional exceedances
are recorded. IEPA’s voluntary commitment to initiate a Level I response is intended to prevent
future violations of the NAAQS from ever occurring.
Illinois commits to compiling VOM and NOx emissions inventories every three years for the
duration of the Maintenance Plan to facilitate the emissions trends analysis included in the
contingency plan under Level I. Illinois will coordinate with LADCO and other Lake Michigan
Electronic Filing - Received, Clerk's Office, January 21, 2009
25
Table 6.1
Contingency Plan for the Chicago 8-Hour Ozone Nonattainment Area
Contingency Measure
Trigger
Action to be Taken
List of Potential Contingency Measures
Level I Trigger
•
Monitored ambient
ozone design value
exceeding 84 ppb in
any year at any
monitoring station in
the Chicago
maintenance area.
•
The Chicago
maintenance area’s
NOx or VOM
emissions inventories
increase more than
5% above the levels
included in the 2006
emissions inventories.
IL will evaluate air quality, or
determine if adverse emissions trends
are likely to continue. If so, IL will
determine what and where controls may
be required, as well as level of
emissions reductions needed, to avoid a
violation of the NAAQS. The study
shall be completed within 9 months. If
necessary, control measures shall be
adopted within 18 months of
determination and implemented as
expeditiously as practicable, taking into
consideration the ease of
implementation and the technical and
economic feasibility of the selected
measures.
Point Source Measures
•
IL Multi-Pollutant Program for
electric generating units
•
Reinstate requirements for Offsets
and/or LAER
•
Apply RACT to smaller existing
sources
•
Tighten RACT for existing
sources covered by US EPA
CTGs.
•
Expanded geographic coverage of
NOx RACT
•
MACT controls for industrial
sources
•
Other measures to be identified
Mobile Source Measures
•
Tier 2 Vehicle Standards and Low
Sulfur Fuel
•
Heavy Duty Diesel Standards and
Low Sulfur Diesel Fuel
•
High-enhanced I/M (OBDII)
•
California Engine Standards
•
Other measures to be identified
Area Source Measures
•
Architectural/Industrial
Maintenance (AIM) Coatings
•
Commercial and Consumer
Products
•
Aerosol coatings
•
Broader geographic applicability
of existing measures
•
Other measures to be identified
Level II Trigger
•
A violation of the
NAAQS at any
monitoring station in
the Chicago
maintenance area.
IL will conduct a thorough analysis to
determine appropriate measures to
address the cause of the violation.
Analysis shall be completed within 6
months. Selected measures shall be
implemented within 18 months of a
violation.
states to evaluate the causes of high ozone levels or the emissions trends and to determine
appropriate control measures needed to assure continued attainment of 8-hour ozone NAAQS.
Under Level I, measures that could be implemented in a short time would be selected so as to be
in place quickly after the Illinois EPA is aware that corrective measures have been triggered.
Control measures selected under Level I will be adopted in most cases within 18 months after a
determination is made, and implemented, generally, within 24 months of adoption by the IPCB.
Electronic Filing - Received, Clerk's Office, January 21, 2009
26
A Level II response would be implemented in the event that a violation of the 8-hour ozone
NAAQS were to be measured at a monitoring site within the Chicago maintenance area. In order
to select appropriate corrective measures, Illinois will work with LADCO and other Lake
Michigan States to conduct a comprehensive study to determine the causes of the violation and
the control measures necessary to mitigate the problem. The analysis will examine the following
factors:
•
the number, location, and severity of the ambient ozone concentrations;
•
the weather patterns contributing to ozone levels;
•
potential, contributing emissions sources;
•
the geographic applicability of possible contingency measures;
•
emissions trends, including timeliness of implementation of scheduled control measures;
•
current and recently identified control technologies;
•
air quality contributions from outside the maintenance area.
Contingency measures will be selected from those listed in Table 6.1 or from any other measure
deemed appropriate and effective at the time the selection is made. This list of contingency
measures is comprehensive, and it is expected that only a few of these measures would be
required. The selection between measures will be based upon cost-effectiveness, emission
reduction potential, economic and social considerations, ease and timing of implementation, or
other appropriate factors. Implementation of necessary controls in response to a Level II trigger
will take place as expeditiously as possible, but in no event later than 18 months after Illinois
makes a determination, based on quality-assured ambient data, that a violation of the NAAQS
has occurred.
Adoption of additional control measures is subject to necessary administrative and legal
processes. Illinois EPA will solicit input from all interested and affected persons in the area
prior to selecting appropriate control measures. No contingency measure will be implemented
without providing the opportunity for full public participation. This process will include
publication of notices, an opportunity for public hearing, and other measures required by Illinois
law.
Should additional control measures be necessary, such rules would be adopted pursuant to
Section 28.5 of the Illinois Environmental Protection Act, Illinois’ provisions for fast-track
rulemaking (415 ILCS 5/28.5). Section 28.5 enables such rules to be adopted within twelve
months of proposal to the Illinois Pollution Control Board.
6.2
Commitment to Revise Plan
As noted in Section 4.5 above, Illinois commits to review its Maintenance Plan eight years after
redesignation, as required by Section 175(A) of the CAA
.
The Maintenance Plan revision is
intended to ensure continued attainment of the 8-hour ozone NAAQS for an additional ten-year
period.
Electronic Filing - Received, Clerk's Office, January 21, 2009
27
6.3
Public Participation
In accordance with Section 110(a)(2) of the CAA, Illinois is required to hold a public hearing
prior to adoption of this Maintenance Plan and submittal to U.S. EPA. Public participation in the
SIP process is provided for as follows:
•
Notice of availability of the Maintenance Plan document and the time and date of the
public hearing was published in the local papers for the Chicago nonattainment area on
November 15, 2008.
•
The public hearing to receive comments on the Maintenance Plan is currently scheduled
for December 16, 2008. A summary of the comments received and Illinois EPA’s
responses thereto will be included as part of the submittal to U.S. EPA.
6.4
Legal Authority to Implement and Enforce
The Maintenance Plan must contain a demonstration that the State of Illinois has the necessary
legal authority to implement and enforce the measures relied upon to attain and maintain the
NAAQS. Illinois has the legal authority to implement and enforce the requirements of this SIP
submittal pursuant to the Illinois Environmental Protection Act.
Electronic Filing - Received, Clerk's Office, January 21, 2009
28
7.0
CONCLUSIONS
The Chicago nonattainment area has attained the 8-hour ozone NAAQS and complied with the
applicable provisions of the Clean Air Act required of severe ozone nonattainment areas. Illinois
has submitted, and U.S. EPA has approved, an attainment demonstration, that was based on air
quality modeling and contains enforceable control measures. Illinois has performed an analysis
that demonstrates that the Chicago NAA has attained the 8-hour ozone NAAQS and believes the
air quality improvements are due to permanent and enforceable control measures. Supporting
documentation is contained herein.
Illinois has prepared a Maintenance Plan that meets the requirement of the Clean Air Act. This
Maintenance Plan provides for the continued attainment of the 8-hour ozone NAAQS for a
period of ten years after U.S. EPA has formally redesignated the area to attainment. This
Maintenance Plan provides adequate contingency measures for potential, additional emission
reductions in the event that future violations of the 8-hour ozone NAAQS are observed in the
area. Illinois has prepared a comprehensive emission inventory of the precursors of ozone
completed for the “attainment” year 2006, and has prepared a projection of the emission
inventory to a year at least 10 years following redesignation. These projections indicate that
emissions levels in the Chicago nonattainment area will continue to decrease, thereby
maintaining the ozone NAAQS in future years. Illinois commits to continue to operate an
appropriate monitoring network to verify the maintenance of the attainment status once the area
has been redesignated. Illinois EPA has the legal authority to implement and enforce all control
measures.
This Maintenance Plan has been prepared in accordance with the requirements specified in U.S.
EPA’s guidance document, and additional guidance received from U.S. EPA staff.
Electronic Filing - Received, Clerk's Office, January 21, 2009
29
APPENDIX A
Summary of Ambient Air Monitoring Data
(2006-2008)
Electronic Filing - Received, Clerk's Office, January 21, 2009
Electronic Filing - Received, Clerk's Office, January 21, 2009
Table A.1
2006-2008 8-hour Ozone Design Values
for Monitors in the Lake Michigan Region*
State of Illinois
County
AQS Code
Site Name
Design Value
4th High 2006
4th High 2007
4th High 2008
Cook
170310001
Alsip
76
78
85
66
Cook
170310032
Chicago (SWFP)
74
75
82
67
Cook
170310064
Chicago (U. of Chicago)
70
70
79
63
Cook
170310072
Chicago (Jardine)
67
65
75
63
Cook
170310076
Chicago (ComED)
73
75
80
66
Cook
170311003
Chicago (Taft)
73
77
79
64
Cook
170311601
Lemont
75
70
85
71
Cook
170314002
Cicero
62
60
68
60
Cook
170314007
Des Plaines
66
65
78
57
Cook
170314201
Northbrook
70
68
76
66
Cook
170317002
Evanston
70
72
80
58
DuPage
170436001
Lisle
63
62
72
57
Kane
170890005
Elgin
66
62
75
61
Lake
170971002
Waukegan
71
71
81
63
Lake
170971007
Zion
72
68
80
69
McHenry
171110001
Cary
65
57
74
65
Will
171971011
Braidwood
66
68
71
60
State of Indiana
County
AQS Code
Site Name
Design Value
4th High 2006
4th High 2007
4th High 2008
Elkhart
180390007
Bristol
72
67
82
68
Lake
180890022
Gary
73
73
85
62
Lake
180890030
Whiting
76
81
88
61
Lake
180892008
Hammond
73
75
77
68
La Porte
180910005
Michigan City
69
75
73
59
La Porte
180910010
La Porte
70
69
78
65
Porter
181270026
Valparaiso
70
71
80
61
St. Joseph
181410010
Potato Creek St Park
69
69
75
63
St. Joseph
181411007
Granger
73
70
82
69
* All data for 2008 are preliminary and subject to final verification. Fourth high values for 2008 valid thru 10/14/08 for Illinois, 9/24/08 for Indiana, 9/30/08 for Michigan, and 9/29/08 for Wisconsin.
Electronic Filing - Received, Clerk's Office, January 21, 2009
32
State of Michigan
County
AQS Code
Site Name
Design Value
4th High 2006
4th High 2007
4th High 2008
Allegan
260050003
Holland
86
91
94
73
Benzie
260190003
Frankfort/Benzonia
76
80
82
66
Berrien
260210014
Coloma
78
76
86
73
Cass
260270003
Cassopolis
75
73
83
71
Kalamazoo
260770008
Kalamazoo
73
68
81
70
Kent
260810020
Grand Rapids
77
82
84
66
Kent
260810022
Evans/Oakfield
78
81
85
69
Leelanau
260890001
Peshawbestown
71
73
79
62
Mason
261050007
Scottville
75
76
83
68
Missaukee
261130001
Houghton Lake
71
73
76
66
Muskegon
261210039
Muskegon
82
90
86
72
Ottawa
261390005
Jenison
79
83
88
67
Schoolcraft
261530001
Seney
75
76
85
64
State of Wisconsin
County
AQS Code
Site Name
Design Value
4th High 2006
4th High 2007
4th High 2008
Brown
550090026
Green Bay
70
66
82
63
Door
550290004
Newport Beach
80
79
92
69
Kenosha
550590019
Chiwaukee
78
79
85
72
Kewaunee
550610002
Kewaunee
75
77
85
65
Manitowoc
550710007
Manitowoc (Two Rivers)
76
78
85
65
Milwaukee
550790010
Milwaukee (16th St.)
63
64
67
60
Milwaukee
550790026
DNR SE Region
68
68
75
63
Milwaukee
550790041
Milwaukee (UWM-North)
72
73
78
65
Milwaukee
550790085
Milwaukee (Bayside)
75
73
83
69
Ozaukee
550890008
Grafton
72
71
82
64
Ozaukee
550890009
Harrington Beach
74
72
84
67
Racine
551010017
Racine
71
71
77
65
Sheboygan
551170006
Sheboygan
82
83
88
75
Walworth
551270005
Lake Geneva
70
72
75
64
Washington
551310009
Slinger
65
66
71
60
Waukesha
551330027
Waukesha
66
67
72
60
* All data for 2008 are preliminary and subject to final verification. Fourth high values for 2008 valid thru 10/14/08 for Illinois, 9/24/08 for Indiana, 9/30/08 for Michigan, and 9/29/08 for Wisconsin.
Electronic Filing - Received, Clerk's Office, January 21, 2009
APPENDIX B
Transportation Conformity
Electronic Filing - Received, Clerk's Office, January 21, 2009
Transportation Conformity
This section describes the development of the Chicago nonattainment area motor vehicle
emissions budgets associated with the Maintenance Plan for the redesignation request for
the 1997 8-hour NAAQS. An average summer weekday motor vehicle emissions budget
is being proposed for the year 2020 for the precursor pollutants volatile organic material
(“VOM”) and oxides of nitrogen (“NOx”). These budgets were developed consistent
with the motor vehicle activity assumptions (e.g., fleet mix, registration distribution…)
and emissions control strategies incorporated into the 8-hour ozone attainment
demonstration analysis.
Background
Section 176(c)(4) of the Clean Air Act Amendments of 1990 requires that transportation
plans, programs, and projects which are funded or approved under Title 23 USC must be
determined to conform with State or Federal air implementation plans. A motor vehicle
emissions budget is that portion of the total allowable emissions allocated to highway and
transit vehicle use that are defined in the SIP for a certain year. Section 93.101 of the
rule defines a “control strategy [State] implementation plan revision” as a “plan which
contains specific strategies for controlling the emissions and reducing ambient levels of
pollutants in order to satisfy Clean Air Act (“CAA”) requirements of reasonable further
progress and attainment.” In order to demonstrate conformity to the motor vehicle
emissions budget, emissions from the implementation of a transportation plan or a
transportation improvement program (“TIP”) must be less than or equal to the budget
level (40 CFR § 93.118(a)).
Transportation conformity will be based on these submitted on road motor vehicle
emissions budgets after the U.S. Environmental Protection Agency (“USEPA”)
determines that the budgets meet the adequacy criteria of the transportation conformity
rule under §93.118(e). The motor vehicle emissions budgets in this submittal are
adequate as each of the six criteria under §93.118(e) is satisfied. These six criteria
include:
Electronic Filing - Received, Clerk's Office, January 21, 2009
1. The submitted control strategy implementation plan revision or maintenance plan was
endorsed by the Governor (or his or her designee) and was subject to a State public
hearing.
2. Before the control strategy implementation plan or maintenance plan was submitted
to EPA, consultation among federal, State, and local agencies occurred: full
implementation plan documentation was provided to [US]EPA; and [US]EPA’s
stated concerns, if any, were addressed;
3. The motor vehicle emissions budgets(s) is clearly identified and precisely quantified;
4. The motor vehicle emissions budget(s), when considered together with all other
emission sources, is consistent with all applicable requirements for reasonable further
progress, attainment, or maintenance (whichever is relevant to the given
implementation plan submission);
5. The motor vehicle emissions budget(s) is consistent with and clearly related to the
emissions inventory and the control measures in the submitted control strategy
implementation plan revision or maintenance plan, and
6. Revisions to previously submitted control strategy implementation plans explain and
document any changes to previously submitted budgets and control measures,
impacts on point and area source emissions; any changes to established safety
margins; and reasons for the changes (including the basis for any changes related to
emission factors or estimates of vehicle miles traveled).
This State Implementation Plan and the associated motor vehicle emissions budgets have
been developed by the Illinois EPA, the designated air quality agency for the State of
Illinois. The required public hearing to accept public comment on the proposed motor
vehicle emissions inventory will be held at 9:00 AM, on December 16, 2008 in Room 9-
031 of the James R. Thompson Center in downtown Chicago. Notification of this
hearing was printed in the Chicago Sun Times on November 15, 2008. Comments on
the proposed attainment demonstration and motor vehicle emissions budgets will be
accepted for 30 days after the public hearing. A “Responsiveness Summary” which
Electronic Filing - Received, Clerk's Office, January 21, 2009
addresses the written comments received will be prepared and included in the final
submission
In compliance with adequacy criterion #2, a Tier 2 Conformity Consultation Team
meeting has been requested to discuss the proposed Maintenance Plan and associated
motor vehicle emissions budgets. The consultation Team includes representatives from
the Federal Highway Administration, Federal Transit Authority, U.S. EPA, Chicago
Metropolitan Agency for Planning, Illinois Department of Transportation, Regional
Transportation Authority, and the Illinois EPA. In addition, the development of the
Maintenance Plan was discussed at length by the LADCO Project Team, which includes
a representative from the U.S. EPA Region V office. The draft Maintenance Plan is also
being forwarded to the Region V representative for his review and comment.
Compliance with the remaining adequacy criteria is contained within the narrative of the
attainment demonstration document and this transportation conformity section.
The 8-Hour Ozone Maintenance Plan
As previously described, air quality monitoring results from 2006 to 2008 in the lower
Lake Michigan area indicates that the Chicago nonattainment area has attained the 8-hour
ozone standard promulgated in 1997. This draft Maintenance Plan includes
nonattainment area emissions estimates for all emissions sectors for the attainment year,
2006 and for the last year of the proposed maintenance year 2020. The Maintenance Plan
must demonstrate that emissions throughout the Maintenance plan time frame are less
than emissions in the attainment year. The motor vehicle emissions estimate in the final
year of the maintenance plan is also established as a cap, or “budget”, for us in the
transportation conformity process.
The motor vehicle emissions budgets established and described herein were developed
consistent with the methodology and control strategy assumptions used in the 8-hour
ozone Attainment Demonstrations as well as the 8-hour ozone RFP plan. The effects of
these controls are incorporated into the emissions factors produced by the USEPA’s
MOBILE6 model. Following is a discussion of the inputs and assumptions incorporated
Electronic Filing - Received, Clerk's Office, January 21, 2009
into the development of the proposed Maintenance Plan motor vehicle emissions budgets.
Vehicle Miles Traveled
The RFP plan described in Attainment Demonstration incorporates county-level base
year 2002 average daily vehicle miles traveled (ADVMT) levels from the Illinois
Department of Transportation (IDOT). The 2002 ADVMT total for the 6-county-3-
township Chicago NAA was approximately 160.8 million miles. This total was projected
to the attainment year 2009 using an area-wide vehicle miles traveled (VMT) growth rate
of 1.27 percent per year, determined through consultation between the Illinois EPA,
CMAP, and LADCO. This growth rate has also been applied to project year 2020 VMT.
Using this growth rate, the projected 2020 ADVMT level for the Chicago NAA was
201.8 million miles. To account for ozone season weekday traffic, the average daily
VMT estimates were multiplied by Chicago area and facility type -specific Average-
Daily-to-Average Summer Weekday conversion factors supplied by IDOT. Applying
these factors resulted in an average summer weekday VMT *(ASWVMT) that is 11.3
percent greater than the average daily VMT. Applying this 11.3 percent factor yields a
year 2020 ASWVMT total of 224.6 million. Following is a summary of the information
and MOBILE6 model assumptions used included in the development of the draft motor
vehicle emissions budgets.
Year:
VMT estimates and motor vehicle emissions factors were developed
representative of summer 2020
Typical Ozone Season Weekday:
The 2002 Chicago Area ozone precursor emissions
inventory, which established the baseline for the CAA-required RFP emissions
reductions, is based on activity on a typical ozone season weekday. The primary
parameters affected by this choice of temporal time frame are the temperature and the
adjustment of VMT to account for increased travel during the summer.
Temperature:
U.S. EPA guidance for the use of the MOBILE6 model calls for
Electronic Filing - Received, Clerk's Office, January 21, 2009
the use of representative summer daily temperatures. For future years, the representative
summer temperatures are the National Weather Service’s climatological average
minimum and maximum temperatures at Chicago’s O’Hare Airport for the summer
months of June, July, and August. Those are 61
o
F and 81
o
F, respectively.
Absolute Humidity:
U.S. EPA guidance calls for the use of the lowest absolute
humidity on days corresponding to the summer climatological temperatures in the region
as calculated from local climatological data published by the National Weather Service.
A climatological average summer weekday absolute humidity value of 97 grains of water
(vapor) per pound of dry air was calculated for O’Hare Airport.
Motor Vehicle Emission Controls:
The primary motor vehicle emission control
programs that will be in place in the Chicago NAA in 2020 are (1) an OBD-II-based
vehicle emissions testing program, and the requirement that gasoline sold in the area be
“reformulated gasoline”, fuel that is specially formulated to reduce emissions.
Inspection and Maintenance (I/M):
The I/M program in effect since
2007 requires biennial On-Board Diagnostics (OBD) testing on all model year
(MY) 1996 and newer (MY96+) light duty gasoline vehicles, and biennial exhaust
idle and gas cap testing on MY96+ heavy duty gasoline vehicles including
gasoline-powered buses, registered in the I/M area (the “testable area”). The
program includes a 4 year grace period for new vehicles. This post-2007 I/M
program was established after the Illinois legislature amended the Illinois Vehicle
Inspection law in 2005 to (a) drop dynamometer testing of vehicles, (b) require an
OBD-based program beginning in February 2007, and (c) remove the requirement
for testing compliant pre-MY-1996 vehicles. (Motorcycles and diesel vehicles
are not subject to I/M.)
The Chicago testable area is based upon urbanized areas and includes all of Cook,
DuPage, and Lake Counties, and parts of Kane, McHenry, Will, and Kendall
Counties. Some of the VMT in the Chicago testable area is generated by vehicles
Electronic Filing - Received, Clerk's Office, January 21, 2009
that come from outside the testable area and are therefore not required to undergo
I/M testing. Conversely, some VMT in an area without I/M (such as Grundy
County’s NAA townships) may be generated by I/M vehicles from a neighboring
testable area. The VMT estimates used when calculating I/M emission credits for
a county or township must be adjusted to reflect VMT from vehicles subject to
I/M only. This is done using I/M coverage factors derived ultimately from
transportation modeling outputs. (I/M Credits are subtracted from emissions
calculated assuming no I/M to give Net Emissions with I/M.) The coverage
factors are 98% for Cook and DuPage Counties (that is, 98% of the gasoline-
vehicle VMT in the county is from vehicles subject to I/M) , 95% for Lake
County, 81% for Kendall County’s NAA township, 65% for Will County, 60%
for Kane County, 50% for McHenry County, and 25% for Grundy County’s NAA
townships.
Fuels:
Reformulated gasoline (RFG) has been required in the Chicago NAA
since 1995. The attainment demonstration and RFP plan both assume all gasoline sold in
the Chicago NAA since 1995 is “Northern” RFG, and that this will continue through and
beyond 2008 and 2009. Although a small amount of non-RFG fuel comes into the NAA
in the fuel tanks of vehicles from outside the area, it is assumed that the use of non-
reformulated gasoline fuel in the Chicago area is negligible.
Gasoline Sulfur:
Gasoline sulfur levels were assumed to be 30 parts per million
(ppm) in 2020 in accordance with the federal Tier 2 gasoline regulations which
required the 30 ppm level beginning in 2006.
Diesel Sulfur:
Diesel sulfur levels were assumed to be 15 parts per million in
2020 in accordance with the U.S. EPA’s Highway Diesel Rule which was
finalized in January 2001. This regulation required the sale of on-road diesel fuel
with no greater than 15 ppm of sulfur beginning in June 2006.
Electronic Filing - Received, Clerk's Office, January 21, 2009
Speeds:
For the Chicago area, the Illinois EPA assumed an area-specific vehicle
speed distribution that appears in the VMT-by-Speed-Bin external file SVMTCH07.DEF,
which is described in more detail later in this document. The speed distribution in this
file is for freeways and arterials only (local roads and ramps have a fixed speed in
MOBILE6), and was based on transportation model output (modeled speeds on links of
various classes of roads by modeling period) from CMAP (CATS) for the year 2007 (the
most recent available). This speed distribution is assumed valid for 2020 as well.
VMT Mix:
The regional VMT mix inputs used for 2020 were based on Chicago-area-
specific 2005 VMT-by-vehicle-type data supplied by IDOT, modified to reflect expected
changes in the ratio of cars to light trucks. This information is used in the MOBILE
model to compute the average emission factors for certain combined vehicle classes, and
the all-vehicle emission rate.
Registration Distribution:
A Chicago-area-specific vehicle registration distribution
profile based upon 2003-04 information data was supplied by Illinois EPA’s Division of
Mobile Source Programs from data provided by the Illinois Secretary of State’s
Department of Motor Vehicles.
Emissions Computation:
Illinois EPA calculates emissions budgets using the following
formula:
1.
No-I/M County Emissions by vehicle type (VT) and functional class (FC)
= (County ASWVMT by FC) * (VMT Mix by VT and FC) * No-I/M emission factors
(EF) by pollutant, VT, and FC) * 1.102 (grams to ton conversion factor). For areas
without I/M, this is the only calculation.
2.
I/M Credits by VT and FC = (County ASWVMT by FC) * (VMT Mix by
VT and FC) * (No-I/M EF – I/M EF [both by pollutant, VT, and FC]) * I/M coverage
factor * 1.102. This is for areas with I/M only.
Electronic Filing - Received, Clerk's Office, January 21, 2009
3.
Net County Emissions by VT and FC = (I/M County Emissions by VT and
FC) - I/M Credits by VT and FC. This is for areas with I/M only.
The Illinois EPA performs these above calculations on a multi-page spreadsheet which
automatically calculates emissions and I/M credits by county or township for each
pollutant, VT, and FC, sums them by VT and FC, and aggregates them into area totals.
Attachment A of this section provides additional details on the MOBILE6 model inputs
used in the development of the 2020 Chicago NAA motor vehicle emissions budgets.
Motor Vehicle Emissions Budgets
Using the above VMT and control program assumptions and methodology, following are
the 8-hour ozone motor vehicle emissions budgets for the Chicago area for use in
determining transportation conformity.
Proposed Chicago Area Maintenance Plan
2020 Motor Vehicle Emissions Budgets
(tons per ozone season weekday)
Pollutant
Emissions
VOM
56.07
NOx
79.09
Electronic Filing - Received, Clerk's Office, January 21, 2009
Attachment A
Transportation Conformity
External MOBILE6.2 Inputs:
In the examples of external files shown below, the actual command lines are
boldfaced
;
the unbolded lines represent comments. The actual text files have no such distinction in
typefaces. The unbolded lines have been “commented out” and have no effect on the
MOBILE model. They may therefore be omitted, but it is suggested that they remain in
the files for documentation, and to make the files easier for the user to read and
understand.
The comments and other text in the External Files have been shown in the Courier
New typeface. Actual command lines—the inputs that MOBILE actually uses—are
shown in
Courier New Bold
In certain cases (especially the VMT-by-Speed-Bin files) the typeface has been reduced
in size so that the lines would fit within the margins of the page. This makes them easier
to read.
Vehicle Inspection and Maintenance (I/M) Program
The External I/M files giving the inputs used in the MOBILE6 model in this exercise
were ILLOBDIM.D (for 2002 and through 2006) and IM07ON.D (for 2007 and later
years). When evaluating I/M credits for 2008, the residual effect of the ILLOBDIM
program in the summer of ’08 is taken into account by assuming that 75% of the vehicle
fleet subject to I/M has been tested under the IM07ON program by that time, and that the
other 25% have been tested under the ILLOBDIM in late 2006 and have not yet come up
for retesting under IM07ON by summer 2008 (both programs are biennial). By summer
2009, all vehicles subject to I/M will have been tested under IM07ON, so this question
does not arise: the I/M emission rate is simply that for the IM07ON program.
The IM07ON.D File
, used for the 2020 target year inventory
The external I/M file IM07ON.D is described below. It represents an I/M program with
four components, chief of which is an OBD (on-board diagnostics) test for vehicles of
model year (MY) 1996 and newer. The order in which the components appear in the
external file is not significant, but they must be numbered consecutively. Illinois EPA
begins IM07ON.D with identifying comments, and adds other comment lines or blank
Electronic Filing - Received, Clerk's Office, January 21, 2009
lines to make the file easier to read and understand. Programs after the first need
comparatively few comments because the commands are largely self-descriptive.
* Illinois ENHANCED I/M DESCRIPTION
* Filename: IM07ON.D
* External input file for Illinois' OBD-only I/M program
* from 2007 on.
* OBD-only applies to light-duty vehicles only; HDVs still get
* an Idle Test & Gas Cap Check.
* All program start years set to 1986 per U.S. EPA guidance in
* "Frequently Asked Questions on MOBILE6" from U.S. EPA/OTAQ.
* This represents the NEW I/M program in which only 1996 &
* newer vehicles are tested with an OBD test; and the OBD test
* applies only to LDVs.
* This program came into effect in February 2007.
*-------------------------------------------------
* Program description for post MY'96 LDV OBD I/M
*=================================================
* FIRST I/M program--"Evaporative]" OBD for MY 1996+ LDVs
*-------------------------------------------------
I/M PROGRAM
: 1 1986 2050 2 T/O EVAP OBD
I/M MODEL YEARS : 1 1996 2050
I/M VEHICLES
: 1 22222 11111111 1
I/M STRINGENCY : 1 20.0
I/M COMPLIANCE : 1 95.0
I/M WAIVER RATES : 1 0.5 2.2 '01 data
I/M EXEMPTION AGE : 1 25
I/M GRACE PERIOD : 1 4
In each case, the first number after the colon refers to the I/M program’s
component number.
I/M PROGRAM
: 1 1986 2050 2 T/O EVAP OBD
Testing began in 1986 and runs into the indefinite future (2050). The program
is a biennial test-only (2 T/O, here and in other program components) program,
in this case an Evaporative On-Board Diagnostics (OBD) test. The On-Board
Diagnostic program in a vehicle’s engine computer records information from
sensors in the engine and fuel system. Indications of malfunctions or out-of-
specification operations of the engine or fuel and evaporative emission control
systems are stored in the engine computer as “fault codes”. An OBD test
consists of plugging a special scanner into an output jack from vehicle’s engine
computer. The scanner queries the computer and records any fault codes that
the computer’s OBD system has saved. OBD tests are quick, dependable, and
clean, and, if a vehicle fails an OBD test, the fault codes that the scanner
displays help mechanics diagnose the problem.
Electronic Filing - Received, Clerk's Office, January 21, 2009
I/M MODEL YEARS : 1 1996 2050
This program component covers only vehicles manufactured between model
year (MY) 1996 (start year) and the indefinite future (MY 2050, the end year).
More and more vehicles are becoming subject to this test as new vehicles are
bought and older (pre-MY-1996) ones are scrapped vehicles.
I/M VEHICLES
: 1 22222 11111111 1
Only the five light-duty vehicle types (cars [LDGVs], and light trucks [LDGTs
1, 2, 3, and 4]) are covered by this program component (22222). Heavy-duty
gasoline trucks (eight types) and gasoline buses are not covered by this program
component (11111111 1), but rather by Programs 3 and 4, described below.
I/M STRINGENCY : 1 20.0
Stringency (exhaust inspection failure rate) is 20%. A Stringency entry is necessary for
an Exhaust test, but not an Evaporative test, so this entry can be omitted or “commented
out”. In this Evap test case, it will be ignored by the model, but is included for
reference.
I/M COMPLIANCE : 1 95.0
Compliance rate (tested vehicles as percent of all vehicles subject to I/M) is
95%
I/M WAIVER RATES : 1 0.5 2.2
'01 data
The Waiver Rate is the fraction of tested vehicles that get a waiver—i.e., do not
pass the I/M test but, because repairs cost more than a specified amount, get a
certificate of compliance. Waiver rate is 0.5% for MY 1980 and earlier vehicles
(irrelevant now that pre-MY-96 vehicles are not tested), and 2.2% for MY 1981
and later vehicles. These figures are from VIM’s actual 2001 waiver statistics,
and have been representative of the last few years.
I/M EXEMPTION AGE : 1 25
Vehicles older than 25 years are not subject to this program. This will not
happen until at least 2021. The default is 25, and the model does not calculate
benefits for vehicles older than 25 years, so in essence this command has no
effect. It could be omitted, but is included for completeness.
I/M GRACE PERIOD : 1 4
Vehicles less than 4 model years old are exempt from I/M testing.
Most of the inputs to the second and subsequent program components are the
same as those for the first program, so the description of the components will be
abbreviated and summarized as below, rather than after each command line as
above.
Electronic Filing - Received, Clerk's Office, January 21, 2009
* Second I/M program--"Exhaust" OBD for MY 1996+ LDVs
*----------------------------------------------------
I/M PROGRAM
: 2 1986 2050 2 T/O OBD I/M
I/M MODEL YEARS : 2 1996 2050
I/M VEHICLES
: 2 22222 11111111 1
I/M STRINGENCY : 2 20.0
I/M COMPLIANCE : 2 95.0
I/M WAIVER RATES : 2 0.5 2.2
'01 data
I/M EXEMPTION AGE : 2 25
I/M GRACE PERIOD : 2 4
*
The second program component is a biennial, test-only Exhaust OBD test for
MY 1996 and later LDGVs and LDGTs. In this OBD test, the scanner queries
the vehicle’s computer for fault codes concerning exhaust emissions.
Stringency, Compliance, Waiver Rates, Exemption Age, and Grace Period are
the same as in the first program. An entry for I/M STRINGENCY (20%) is
required for an Exhaust I/M program.
*------------------------------------------------------
* Program description for post MY'96 HDV Idle & GC I/M
*======================================================
* Third I/M program--HDV IDLE for MY 1996+ HDVs
*-------------------------------------------
I/M PROGRAM
: 3 1986 2050 2 T/O IDLE
-----
I/M MODEL YEARS : 3 1996 2050
I/M VEHICLES
: 3 11111 22222222 2
I/M STRINGENCY : 3 20.0
I/M COMPLIANCE : 3 95.0
I/M WAIVER RATES : 3 1.2 1.5
'01 data
I/M EXEMPTION AGE : 3 25
I/M GRACE PERIOD : 3 4
The third program component is a biennial, test-only Idle test for MY 1996 and
later HDGVs and Gas Buses (22222222 2). Light-duty vehicles are not subject
to this component (11111), but rather to components 1 and 2. Stringency,
Compliance, Exemption Age, and Grace Period are the same as in component 1,
but the pre- and post-MY 1981 Waiver Rates (1.2% and 1.5%, respectively), are
slightly different from those in components 1 and 2. HDGVs are few in
number, and most of them are commercial vehicles.
* Fourth I/M program--Gas Cap Check for MY 1996+ HDVs
*----------------------------------------------------
Electronic Filing - Received, Clerk's Office, January 21, 2009
I/M PROGRAM
: 4 1986 2050 2 T/O GC
I/M MODEL YEARS : 4 1996 2050
I/M VEHICLES
: 4 11111 22222222 2
I/M COMPLIANCE : 4 95.0
I/M WAIVER RATES : 4 1.2 1.5
'01 data
I/M EXEMPTION AGE : 4 25
I/M GRACE PERIOD : 4 4
The fourth program component is a biennial, test-only Gas Cap Check for MY
1996 and later HDVs. Compliance, Waiver Rates, Exemption Age, and Grace
Period are the same as in the third program. Since a Gas Cap Check is an
evaporative I/M test, the I/M STRINGENCY command is not necessary and is
not included here.
Illinois EPA includes further notes and comments in the I/M file to document it
further, as shown below:
* NOTES
* This is a standard Illinois I/M input, describing the I/M
* program with OBD Only as it is supposed to exist after
* January 2007. It is the file to be used for regular M6
* I/M runs for 2007 and future years.
*
* This file was originally SB397.D, supplied 24.viij.05.
* Original SB397.D has been slightly revised by
* the addition of comments such as this one. The actual
* inputs have not been changed. This was done to put the two
* LDV OBD programs (exhaust and evaporative) together, and the
* two HDV programs together too. The order of the programs in
* the I/M file is not significant and has no effect in M6, but
* the programs must be numbered sequentially.
* DVIM verified that this file as shown is correctly describes the
* I/M program planned for introduction in January '07.
* ----------------
* COMPARISON WITH ILLOBDIM.D:
* The first three programs in ILLOBDIM.D, covering the idle
* test for MY'68-'81 LDVs, IM240 for '81-'95 LDVs, and gas
* cap check for MY'68-'95 LDVs have been eliminated from
* IM07ON; and the two HDV programs now refer only to MY'96
* and later.
There is no “MYCUTS.D” file associated with IM07ON.D, as there was in the previous
ILLOBDIM.D file. The old ILLOBDIM.D file is not included here.
The Registration Distribution
The Registration Distribution (RD) for a vehicle type is an indication of the fraction of
the vehicle fleet of that type that is made up of vehicles of a given age.
The following is based on 2003 registration data from the Illinois Secretary of State’s
office (ISOS). It and its contents are described in detail in the comments to the file. This
Electronic Filing - Received, Clerk's Office, January 21, 2009
file contains data (commented out so not used) from the 2001 RD file (CHIRD01) for
historical and reference purposes. As noted above, those data may be deleted.
REG DIST
*
* This file CHIRD03.D is derived from REGDATA.D, the default MOBILE6 RD file.
* This file was created 22.ij.06 by SSL and revised on 10.iv.06. The values
* shown for LDVs and LDTs are from 2003 ISOS registration data, as given in
* RD03ERG.xls. In the 22.ij. version, only LDGV RDs were changed from the
* 2002 values, but in the 10.iv. version, the RDs for the four LDT types were
* changed to those given in RD03ERG.xls for the Chicago area.
*
* This file contains Registration Distribution fractions for the 16 vehicle
* classes by age for July of any calendar year for the Chicago NAA, based on
* 2003/41 gasoline-vehicle age distribution data supplied to IEPA by ISOS, just
* as the CHRD01.D file came from I/M test data supplied by DVIM.
* (See C:\SSLFILES\INVEN\RDAGE01.XLS.) Age distribution fractions have been
* rounded to 4 decimal places, and some of the RDs from for late years
* (typically in the last line--entries 21-25) have at times been modified by
* +/- 0.0001 or so as necessary to make the RDs add up to 1.0000.
*
* The user is referred to REGDATA.D and to M6 Users Guide Section 2.8.7.1
* p. 63 ff) for more detailed information about the nature of RD files. See
* also Section 5.3.2 (p. 169 ff) for information on converting M5b RDs to M6
* RDs. See also \SOURCE\BD20.FOR for default RDs.
*
* In this file, the first number in each distribution is an integer that
* indicates which of the 16 M6 vehicle classes are represented by the RD in
* question. That number is followed by 25 age fractions arranged in two rows
* of 10 values followed by a row with the last 5 values. (This is similar to
* the format used in M5b for RDs.)
*
* RDs for all vehicle classes are given in this file. This is for completeness
* even though only those vehicle classes whose RDs were changed from the
* REGDATA defaults need to be included in this file. Those that were not
* changed, are so noted.
*
* It is assumed that the RDs for diesel vehicles are the same as the RDs for
* the corresponding gasoline vehicles; in particular, LDDV and LDDT RDs are
* assumed the same as LDGV and LDGT RDs. Since the (default) HDV RDs are
* based more on diesel vehicles to start with, and HDGVs are many fewer than
* HDDVs, especially in the higher weight classes, we feel the HDV RDs
* represent both HDGV and HDDV reasonably well.
*
* Default RDs assumed for the various HDV classes. Good area-specific
* HDV age distribution data are lacking--RD03ERG covered only LDVs--and
* besides, much Chicago-area HDV VMT is from vehicles registered outside the
* Chicago area. The best choice, then, was to go with the HDV defaults; and
* similarly with MCs.
*
* ---SL
*
*
* M6 LDV = M5 LDV (Light-duty Vehicles--passenger cars--from
* RD03ERG.XLS for Chicago
1 0.0603 0.0804 0.0805 0.0818 0.0845 0.0773 0.0673 0.0670 0.0574 0.0620
0.0493 0.0449 0.0388 0.0331 0.0280 0.0233 0.0169 0.0122 0.0089 0.0067
0.0045 0.0025 0.0014 0.0009 0.0101
* The following, commented out, are the CHIRD01 values.
*1 0.0548 0.0870 0.0798 0.0735 0.0751 0.0668 0.0775 0.0655 0.0609 0.0565
* 0.0530 0.0505 0.0472 0.0399 0.0295 0.0241 0.0174 0.0114 0.0062 0.0033
* 0.0023 0.0024 0.0030 0.0021 0.0103
*
* M6 LDT1 = M5 LDT1 from RD03ERG.xls for Chicago
2 0.0796 0.1061 0.1062 0.0532 0.0365 0.0331 0.0358 0.0331 0.0546 0.0569
Electronic Filing - Received, Clerk's Office, January 21, 2009
0.0676 0.0520 0.0396 0.0516 0.0443 0.0444 0.0300 0.0282 0.0188 0.0103
0.0052 0.0026 0.0021 0.0016 0.0066
* The following, commented out, are the CHIRD01 values
* 2 0.0746 0.1128 0.1041 0.1055 0.0886 0.0737 0.0719 0.0694 0.0572 0.0451
* 0.0437 0.0329 0.0333 0.0289 0.0202 0.0140 0.0092 0.0053 0.0024 0.0015
* 0.0011 0.0006 0.0008 0.0006 0.0026
*
* M6 LDT2 = LDT2 from RD03ERG.xls for Chicago
3 0.0767 0.1023 0.1024 0.1053 0.1024 0.0893 0.0920 0.0766 0.0563 0.0517
0.0434 0.0348 0.0237 0.0157 0.0082 0.0061 0.0061 0.0015 0.0014 0.0010
0.0009 0.0005 0.0003 0.0002 0.0012
* The following, commented out, are the CHIRD01 values
* 3 0.0746 0.1128 0.1041 0.1055 0.0886 0.0737 0.0719 0.0694 0.0572 0.0451
* 0.0437 0.0329 0.0333 0.0289 0.0202 0.0140 0.0092 0.0053 0.0024 0.0015
* 0.0011 0.0006 0.0008 0.0006 0.0026
*
* M6 LDT3 = LDT3 from RD03ERG.xls for Chicago
4 0.0674 0.0899 0.0900 0.0830 0.0867 0.1041 0.0614 0.0594 0.0433 0.0571
0.0479 0.0391 0.0303 0.0218 0.0232 0.0236 0.0185 0.0130 0.0092 0.0066
0.0049 0.0031 0.0017 0.0005 0.0143
* The following, commented out, are the CHIRD01 values
* 4 0.0629 0.1095 0.1300 0.0889 0.0835 0.0624 0.0725 0.0611 0.0455 0.0388
* 0.0300 0.0348 0.0387 0.0313 0.0236 0.0225 0.0161 0.0123 0.0076 0.0034
* 0.0017 0.0032 0.0074 0.0049 0.0074
*
* M6 LDT4 = LDT2 from RD03ERG.xls for Chicago
5 0.0695 0.0926 0.0927 0.1167 0.1127 0.1290 0.0953 0.0753 0.0561 0.0505
0.0405 0.0135 0.0137 0.0049 0.0065 0.0041 0.0035 0.0024 0.0042 0.0029
0.0017 0.0010 0.0003 0.0002 0.0102
* The following, commented out, are the CHIRD01 values
* 5 0.0629 0.1095 0.1300 0.0889 0.0835 0.0624 0.0725 0.0611 0.0455 0.0388
* 0.0300 0.0348 0.0387 0.0313 0.0236 0.0225 0.0161 0.0123 0.0076 0.0034
* 0.0017 0.0032 0.0074 0.0049 0.0074
*
* HDV2B (Heavy-duty vehicles 2B--M6 Default RDs)
6 0.0503 0.0916 0.0833 0.0758 0.0690 0.0627 0.0571 0.0519 0.0472 0.0430
0.0391 0.0356 0.0324 0.0294 0.0268 0.0244 0.0222 0.0202 0.0184 0.0167
0.0152 0.0138 0.0126 0.0114 0.0499
* HDV3 (Heavy-duty vehicles3, same RD as HDV2B, M6 Default RDs)
7 0.0503 0.0916 0.0833 0.0758 0.0690 0.0627 0.0571 0.0519 0.0472 0.0430
0.0391 0.0356 0.0324 0.0294 0.0268 0.0244 0.0222 0.0202 0.0184 0.0167
0.0152 0.0138 0.0126 0.0114 0.0499
* HDV4 (Heavy-duty vehicles 4, M6 default RDs)
8 0.0388 0.0726 0.0679 0.0635 0.0594 0.0556 0.0520 0.0486 0.0455 0.0425
0.0398 0.0372 0.0348 0.0326 0.0304 0.0285 0.0266 0.0249 0.0233 0.0218
0.0204 0.0191 0.0178 0.0167 0.0797
* HDV5 (Heavy-duty vehicles 5, same RD as HDV4, M6 Default)
9 0.0388 0.0726 0.0679 0.0635 0.0594 0.0556 0.0520 0.0486 0.0455 0.0425
0.0398 0.0372 0.0348 0.0326 0.0304 0.0285 0.0266 0.0249 0.0233 0.0218
0.0204 0.0191 0.0178 0.0167 0.0797
* HDV6 (Heavy-duty vehicles 6, same RD as HDV4, M6 Default)
10 0.0388 0.0726 0.0679 0.0635 0.0594 0.0556 0.0520 0.0486 0.0455 0.0425
0.0398 0.0372 0.0348 0.0326 0.0304 0.0285 0.0266 0.0249 0.0233 0.0218
0.0204 0.0191 0.0178 0.0167 0.0797
* HDV7 (Heavy-duty vehicles 7, same RD as HDV4, M6 Default)
11 0.0388 0.0726 0.0679 0.0635 0.0594 0.0556 0.0520 0.0486 0.0455 0.0425
0.0398 0.0372 0.0348 0.0326 0.0304 0.0285 0.0266 0.0249 0.0233 0.0218
0.0204 0.0191 0.0178 0.0167 0.0797
* HDV8A (Heavy-duty vehicles 8A same RD as HDV4, M6 Default)
12 0.0388 0.0726 0.0679 0.0635 0.0594 0.0556 0.0520 0.0486 0.0455 0.0425
0.0398 0.0372 0.0348 0.0326 0.0304 0.0285 0.0266 0.0249 0.0233 0.0218
0.0204 0.0191 0.0178 0.0167 0.0797
* HDV8B (Heavy-duty vehicles 8B,same RD as HDV4, M6 Default)
Electronic Filing - Received, Clerk's Office, January 21, 2009
13 0.0388 0.0726 0.0679 0.0635 0.0594 0.0556 0.0520 0.0486 0.0455 0.0425
0.0398 0.0372 0.0348 0.0326 0.0304 0.0285 0.0266 0.0249 0.0233 0.0218
0.0204 0.0191 0.0178 0.0167 0.0797
* HDBS (HDV School buses; this M6 RD default is assumed)
14 0.0393 0.0734 0.0686 0.0641 0.0599 0.0559 0.0522 0.0488 0.0456 0.0426
0.0398 0.0372 0.0347 0.0324 0.0303 0.0283 0.0264 0.0247 0.0231 0.0216
0.0201 0.0188 0.0176 0.0165 0.0781
* HDBT (HDV Transit buses; this M6 RD default is assumed)
15 0.0307 0.0614 0.0614 0.0614 0.0614 0.0614 0.0614 0.0614 0.0614 0.0613
0.0611 0.0607 0.0595 0.0568 0.0511 0.0406 0.0254 0.0121 0.0099 0.0081
0.0066 0.0054 0.0044 0.0037 0.0114
* Motorcycles (this M6 default RD is the same as M5a/b's default RD)
16 0.1440 0.1680 0.1350 0.1090 0.0880 0.0700 0.0560 0.0450 0.0360 0.0290
0.0230 0.0970 0.0000 0.0000 0.0000 0.0000 0.0000 0.0000 0.0000 0.0000
0.0000 0.0000 0.0000 0.0000 0.0000
*
External MOBILE6.2 Activity File Inputs: VMT by Facility Type, VMT
by Hour, VMT by Speed Bin
.
The following files were used in the 2002 base year and the 2008 and 2009 future year
estimates.
VMT by Facility Type
The M6.2 default file is FVMT.D, provided with the MOBILE6 model. The Chicago-
area-specific VMT-by-facility-type file is FVMTCH07.D, shown below. It based on the
most recent complete data from CMAP on VMT by hour by vehicle class. This is a very
long file —about 750 lines—so for the purposes of this Attachment, only the data for
vehicle types 1, 6, 11, 13, 24 (LDGV, HDGV2b, HDGV7, HDGV13, and MC) are
shown; the others are omitted. See the second paragraph of the introduction to the file.
VMT BY FACILITY
*
* This is [F:\]AREASPEC\CHNAA\FVMTCH07.DEF, an FVMT file, which was
* developed from CATS 2007 transportation model output
* as given in his MF13.XLS file as sent to and recalculated by
* SL. 13.xj.02.
*
* VMT fractions are listed for 28 vehicle classes for each hour of
* the day starting at 6AM, as follows
* Classes 1-5 (LDGV, LDGT1, LDGT2, LDGT3, and LDGT4), and
* Classes 14, 15, and 28 (LDDV, LDDT12, LDDT34) were all assumed
* to have the "Light-duty Vehicle" distribution on page "SL VMT
* by vtype reedited" of the MF13 file.
* Classes 6-10 and 16-20 (HDGV2b-HDGV6 and HDDV2b-HDDV6) were assumed
* to have the "LTRK" (light HDV) distribution on that page.
* Classes 11 & 12 and 21 & 22 (HDGV7 & HDGV8a, and HDDV7 & HDDV8a) were
* assumed to have the "MTRK" (medium HDV) distribution on that page.
* Classes 13 and 23 (HDGV8b and HDDV8b) were assumed to have the
* "HTRK" (heavy HDV) distribution on that page
* Classes 24 and 25-27 (Motorcycles and the three bus classes [HDGB,
* HDDBT and HDDBS]) were assumed to have the default distribution
* for those types in FVMT.DEF.
Electronic Filing - Received, Clerk's Office, January 21, 2009
*
* The four values in each line represent the VMT distribution on
* freeway, arterial, local and ramps--in that order--as shown.
*
* See M6UG 2.8.5.1.f., p. 49, or CLASLIST.TXT for further info.
* (The CLASLIST file describes the vehicle classes.)
*
* Veh Int& Arts& Local
*Class Fwys Colls Rd/St Ramps
*----- ---- ----- ----- -----
*
1 0.3341 0.5393 0.1105 0.0161
0.2604 0.6106 0.1160 0.0130
0.2604 0.6106 0.1160 0.0130
0.2669 0.5831 0.1365 0.0135
0.2576 0.5823 0.1468 0.0133
0.2576 0.5823 0.1468 0.0133
0.2576 0.5823 0.1468 0.0133
0.2576 0.5823 0.1468 0.0133
0.2683 0.5830 0.1354 0.0133
0.2683 0.5830 0.1354 0.0133
0.2646 0.5911 0.1315 0.0128
0.2646 0.5911 0.1315 0.0128
0.2825 0.5568 0.1468 0.0139
0.2825 0.5568 0.1468 0.0139
0.3363 0.5122 0.1358 0.0157
0.3363 0.5122 0.1358 0.0157
0.3363 0.5122 0.1358 0.0157
0.3363 0.5122 0.1358 0.0157
0.3363 0.5122 0.1358 0.0157
0.3363 0.5122 0.1358 0.0157
0.3363 0.5122 0.1358 0.0157
0.3363 0.5122 0.1358 0.0157
0.3363 0.5122 0.1358 0.0157
0.3363 0.5122 0.1358 0.0157
.
[Data for Vehicle Types 2 through 5 omitted]
.
6 0.3836 0.5157 0.0827 0.0180
0.3045 0.5985 0.0822 0.0148
0.3045 0.5985 0.0822 0.0148
0.3589 0.5412 0.0829 0.0170
0.3791 0.5203 0.0826 0.0180
0.3791 0.5203 0.0826 0.0180
0.3791 0.5203 0.0826 0.0180
0.3791 0.5203 0.0826 0.0180
0.3606 0.5397 0.0827 0.0170
0.3606 0.5397 0.0827 0.0170
0.3581 0.5432 0.0816 0.0171
0.3581 0.5432 0.0816 0.0171
0.4101 0.4884 0.0815 0.0200
0.4101 0.4884 0.0815 0.0200
0.4312 0.4663 0.0818 0.0207
0.4312 0.4663 0.0818 0.0207
0.4312 0.4663 0.0818 0.0207
0.4312 0.4663 0.0818 0.0207
0.4312 0.4663 0.0818 0.0207
0.4312 0.4663 0.0818 0.0207
0.4312 0.4663 0.0818 0.0207
0.4312 0.4663 0.0818 0.0207
0.4312 0.4663 0.0818 0.0207
0.4312 0.4663 0.0818 0.0207
.
Electronic Filing - Received, Clerk's Office, January 21, 2009
[Data for Vehicle Types 7 through 11 omitted]
.
11 0.4158 0.4904 0.0752 0.0186
0.3337 0.5763 0.0749 0.0151
0.3337 0.5763 0.0749 0.0151
0.3905 0.5165 0.0755 0.0175
0.4111 0.4952 0.0752 0.0185
0.4111 0.4952 0.0752 0.0185
0.4111 0.4952 0.0752 0.0185
0.4111 0.4952 0.0752 0.0185
0.3928 0.5144 0.0753 0.0175
0.3928 0.5144 0.0753 0.0175
0.3896 0.5185 0.0742 0.0177
0.3896 0.5185 0.0742 0.0177
0.4423 0.4630 0.0743 0.0204
0.4423 0.4630 0.0743 0.0204
0.4619 0.4425 0.0745 0.0211
0.4619 0.4425 0.0745 0.0211
0.4619 0.4425 0.0745 0.0211
0.4619 0.4425 0.0745 0.0211
0.4619 0.4425 0.0745 0.0211
0.4619 0.4425 0.0745 0.0211
0.4619 0.4425 0.0745 0.0211
0.4619 0.4425 0.0745 0.0211
0.4619 0.4425 0.0745 0.0211
0.4619 0.4425 0.0745 0.0211
.
[Data for Vehicle Types 7 through 12 omitted]
.
13 0.6106 0.3299 0.0430 0.0165
0.5563 0.3937 0.0367 0.0133
0.5563 0.3937 0.0367 0.0133
0.6241 0.3235 0.0376 0.0148
0.6260 0.3178 0.0403 0.0159
0.6260 0.3178 0.0403 0.0159
0.6260 0.3178 0.0403 0.0159
0.6260 0.3178 0.0403 0.0159
0.6561 0.2957 0.0340 0.0142
0.6561 0.2957 0.0340 0.0142
0.6029 0.3414 0.0401 0.0156
0.6029 0.3414 0.0401 0.0156
0.5776 0.3523 0.0508 0.0193
0.5776 0.3523 0.0508 0.0193
0.5737 0.3512 0.0547 0.0204
0.5737 0.3512 0.0547 0.0204
0.5737 0.3512 0.0547 0.0204
0.5737 0.3512 0.0547 0.0204
0.5737 0.3512 0.0547 0.0204
0.5737 0.3512 0.0547 0.0204
0.5737 0.3512 0.0547 0.0204
0.5737 0.3512 0.0547 0.0204
0.5737 0.3512 0.0547 0.0204
0.5737 0.3512 0.0547 0.0204
.
[Data for Vehicle Types 14 through 23 omitted]
.
24 0.392 0.457 0.117 0.034
0.344 0.497 0.129 0.030
0.338 0.497 0.135 0.029
0.349 0.492 0.129 0.030
0.346 0.497 0.127 0.030
0.333 0.509 0.129 0.029
Electronic Filing - Received, Clerk's Office, January 21, 2009
0.324 0.516 0.132 0.028
0.334 0.506 0.131 0.029
0.334 0.506 0.131 0.029
0.320 0.519 0.134 0.028
0.330 0.506 0.135 0.029
0.312 0.521 0.140 0.027
0.295 0.538 0.141 0.026
0.310 0.527 0.137 0.027
0.329 0.510 0.133 0.029
0.343 0.497 0.131 0.030
0.381 0.460 0.126 0.033
0.405 0.437 0.123 0.035
0.426 0.418 0.118 0.037
0.443 0.403 0.115 0.039
0.457 0.394 0.110 0.040
0.461 0.391 0.107 0.040
0.453 0.400 0.108 0.039
0.418 0.434 0.112 0.036
[Data for Vehicle Types 25 through 28 omitted; the file ends after Vehicle Type 28.]
VMT by Hour of the Day
The MOBILE6.2 default file is HVMT.D. The most current Chicago-area-specific file is
HVMTCH7R.SL, shown below, derived from 2007 modeling output from CMAP.
Again, this file contains “commented-out” data from previous files for comparison
purposes.
VMT BY HOUR
* Fraction of all vehicle miles traveled by hour of the day.
* First hour is 6 a.m. These data are for the Chicago NAA for
* 2007, derived from CMAP VbyHr07.def file based
* upon his run iepa07 300_20070830, VMT for 2007.
*
* This file is HVMTCH7R.SL representing SL's estimate of VMT by hour.
* IEPA estimates are based on CMAP data, but assume VMT in multi-hour
* modeling periods is distributed as the default is distributed across
* the hours in question. Calculations made from VbyHr07.def
* in accordance with USEPA guidance on the subject. See M6 Technical Guidance
* Document (Jan '02) Section 4.3.3 for details.
0.03358 0.07039 0.06240 0.07658 0.05870 0.06327
0.06609 0.06207 0.06693 0.07118 0.07991 0.07507
0.05924 0.04599 0.02160 0.01851 0.01360 0.01010
0.00757 0.00603 0.00568 0.00561 0.00687 0.01304
* Here are RP's original fractions from VbyHr07.def
* 0.033579 0.066392 0.066392 0.076578 0.062532 0.062532
* 0.062532 0.062532 0.069056 0.069056 0.077490 0.077490
* 0.052616 0.052616 0.010861 0.010861 0.010861 0.010861
* 0.010861 0.010861 0.010861 0.010861 0.010861 0.010861
* These following are the default values from HVMT.DEF
* supplied for comparison.
*
0.0569 0.0740 0.0655 0.0555 0.0540 0.0582
*
0.0608 0.0571 0.0598 0.0636 0.0777 0.0730
*
0.0501 0.0389 0.0308 0.0264 0.0194 0.0144
*
0.0108 0.0086 0.0081 0.0080 0.0098 0.0186
Electronic Filing - Received, Clerk's Office, January 21, 2009
*
* Following are SL's original HVMTCH07 fractions based upon DE's '07 model
* runs made in 2002 (for information).
*
0.0443 0.0851 0.0755 0.0577 0.0541 0.0583
*
0.0609 0.0572 0.0659 0.0701 0.0818 0.0769
*
0.0576 0.0447 0.0219 0.0188 0.0138 0.0102
*
0.0077 0.0061 0.0058 0.0057 0.0070 0.0132
All these Hourly-VMT files show similar profiles, with morning and afternoon peaks, a
noontime dip, and a minimum about 3AM - 4AM, which is to be expected.
VMT by Speed Bin
The MOBILE6.2 default file is SVMT.D. The Chicago-area-specific Speed-bin file is
SVMTCH07.DEF, shown below. It represents 2007 CMAP transportation model output.
SPEED VMT
1 1 0.0053 0.0044 0.0088 0.0299 0.0300 0.0484 0.0641 0.0632 0.0709 0.0801 0.0981 0.2160 0.1953
0.0857
1 2 0.0135 0.0570 0.0859 0.0790 0.0766 0.0954 0.0681 0.0704 0.0722 0.1018 0.0761 0.1084 0.0524
0.0432
1 3 0.0135 0.0570 0.0859 0.0790 0.0766 0.0954 0.0681 0.0704 0.0722 0.1018 0.0761 0.1084 0.0524
0.0432
1 4 0.0017 0.0054 0.0027 0.0159 0.0331 0.0451 0.0702 0.0761 0.0892 0.1259 0.1164 0.2390 0.0989
0.0805
1 5 0.0017 0.0047 0.0109 0.0329 0.0238 0.0300 0.0439 0.0582 0.0740 0.1160 0.1244 0.2584 0.1237
0.0975
1 6 0.0017 0.0047 0.0109 0.0329 0.0238 0.0300 0.0439 0.0582 0.0740 0.1160 0.1244 0.2584 0.1237
0.0975
1 7 0.0017 0.0047 0.0109 0.0329 0.0238 0.0300 0.0439 0.0582 0.0740 0.1160 0.1244 0.2584 0.1237
0.0975
1 8 0.0017 0.0047 0.0109 0.0329 0.0238 0.0300 0.0439 0.0582 0.0740 0.1160 0.1244 0.2584 0.1237
0.0975
1 9 0.0072 0.0093 0.0142 0.0382 0.0420 0.0478 0.0654 0.0898 0.0849 0.1104 0.1195 0.2126 0.0722
0.0866
1 10 0.0072 0.0093 0.0142 0.0382 0.0420 0.0478 0.0654 0.0898 0.0849 0.1104 0.1195 0.2126 0.0722
0.0866
1 11 0.0081 0.0325 0.0434 0.0683 0.0493 0.0530 0.0780 0.0803 0.0773 0.0953 0.1179 0.1443 0.0875
0.0648
1 12 0.0081 0.0325 0.0434 0.0683 0.0493 0.0530 0.0780 0.0803 0.0773 0.0953 0.1179 0.1443 0.0875
0.0648
1 13 0.0016 0.0013 0.0059 0.0137 0.0237 0.0247 0.0391 0.0556 0.0479 0.0729 0.0904 0.2202 0.2979
0.1049
1 14 0.0016 0.0013 0.0059 0.0137 0.0237 0.0247 0.0391 0.0556 0.0479 0.0729 0.0904 0.2202 0.2979
0.1049
1 15 0.0011 0.0002 0.0000 0.0000 0.0000 0.0038 0.0101 0.0178 0.0386 0.0660 0.0981 0.1509 0.5215
0.0919
1 16 0.0011 0.0002 0.0000 0.0000 0.0000 0.0038 0.0101 0.0178 0.0386 0.0660 0.0981 0.1509 0.5215
0.0919
1 17 0.0011 0.0002 0.0000 0.0000 0.0000 0.0038 0.0101 0.0178 0.0386 0.0660 0.0981 0.1509 0.5215
0.0919
1 18 0.0011 0.0002 0.0000 0.0000 0.0000 0.0038 0.0101 0.0178 0.0386 0.0660 0.0981 0.1509 0.5215
0.0919
1 19 0.0011 0.0002 0.0000 0.0000 0.0000 0.0038 0.0101 0.0178 0.0386 0.0660 0.0981 0.1509 0.5215
0.0919
1 20 0.0011 0.0002 0.0000 0.0000 0.0000 0.0038 0.0101 0.0178 0.0386 0.0660 0.0981 0.1509 0.5215
0.0919
1 21 0.0011 0.0002 0.0000 0.0000 0.0000 0.0038 0.0101 0.0178 0.0386 0.0660 0.0981 0.1509 0.5215
0.0919
1 22 0.0011 0.0002 0.0000 0.0000 0.0000 0.0038 0.0101 0.0178 0.0386 0.0660 0.0981 0.1509 0.5215
0.0919
1 23 0.0011 0.0002 0.0000 0.0000 0.0000 0.0038 0.0101 0.0178 0.0386 0.0660 0.0981 0.1509 0.5215
0.0919
1 24 0.0011 0.0002 0.0000 0.0000 0.0000 0.0038 0.0101 0.0178 0.0386 0.0660 0.0981 0.1509 0.5215
0.0919
Electronic Filing - Received, Clerk's Office, January 21, 2009
2 1 0.0000 0.0004 0.0017 0.0041 0.0160 0.0461 0.1311 0.1952 0.1835 0.2385 0.0665 0.1170 0.0000
0.0000
2 2 0.0021 0.0328 0.0517 0.0618 0.0924 0.1181 0.1447 0.1449 0.1170 0.1185 0.0457 0.0704 0.0000
0.0000
2 3 0.0021 0.0328 0.0517 0.0618 0.0924 0.1181 0.1447 0.1449 0.1170 0.1185 0.0457 0.0704 0.0000
0.0000
2 4 0.0001 0.0007 0.0025 0.0068 0.0232 0.0572 0.1470 0.2077 0.1791 0.2034 0.0682 0.1041 0.0000
0.0000
2 5 0.0000 0.0008 0.0029 0.0074 0.0224 0.0565 0.1435 0.1985 0.1862 0.2044 0.0681 0.1093 0.0000
0.0000
2 6 0.0000 0.0008 0.0029 0.0074 0.0224 0.0565 0.1435 0.1985 0.1862 0.2044 0.0681 0.1093 0.0000
0.0000
2 7 0.0000 0.0008 0.0029 0.0074 0.0224 0.0565 0.1435 0.1985 0.1862 0.2044 0.0681 0.1093 0.0000
0.0000
2 8 0.0000 0.0008 0.0029 0.0074 0.0224 0.0565 0.1435 0.1985 0.1862 0.2044 0.0681 0.1093 0.0000
0.0000
2 9 0.0002 0.0028 0.0064 0.0149 0.0423 0.0779 0.1620 0.1879 0.1732 0.1734 0.0644 0.0947 0.0000
0.0000
2 10 0.0002 0.0028 0.0064 0.0149 0.0423 0.0779 0.1620 0.1879 0.1732 0.1734 0.0644 0.0947 0.0000
0.0000
2 11 0.0017 0.0151 0.0292 0.0423 0.0720 0.1030 0.1538 0.1654 0.1429 0.1415 0.0511 0.0821 0.0000
0.0000
2 12 0.0017 0.0151 0.0292 0.0423 0.0720 0.1030 0.1538 0.1654 0.1429 0.1415 0.0511 0.0821 0.0000
0.0000
2 13 0.0000 0.0003 0.0018 0.0039 0.0140 0.0369 0.1146 0.1939 0.1865 0.2383 0.0751 0.1348 0.0000
0.0000
2 14 0.0000 0.0003 0.0018 0.0039 0.0140 0.0369 0.1146 0.1939 0.1865 0.2383 0.0751 0.1348 0.0000
0.0000
2 15 0.0003 0.0000 0.0002 0.0008 0.0008 0.0042 0.0749 0.1565 0.1661 0.3285 0.0786 0.1890 0.0000
0.0000
2 16 0.0003 0.0000 0.0002 0.0008 0.0008 0.0042 0.0749 0.1565 0.1661 0.3285 0.0786 0.1890 0.0000
0.0000
2 17 0.0003 0.0000 0.0002 0.0008 0.0008 0.0042 0.0749 0.1565 0.1661 0.3285 0.0786 0.1890 0.0000
0.0000
2 18 0.0003 0.0000 0.0002 0.0008 0.0008 0.0042 0.0749 0.1565 0.1661 0.3285 0.0786 0.1890 0.0000
0.0000
2 19 0.0003 0.0000 0.0002 0.0008 0.0008 0.0042 0.0749 0.1565 0.1661 0.3285 0.0786 0.1890 0.0000
0.0000
2 20 0.0003 0.0000 0.0002 0.0008 0.0008 0.0042 0.0749 0.1565 0.1661 0.3285 0.0786 0.1890 0.0000
0.0000
2 21 0.0003 0.0000 0.0002 0.0008 0.0008 0.0042 0.0749 0.1565 0.1661 0.3285 0.0786 0.1890 0.0000
0.0000
2 22 0.0003 0.0000 0.0002 0.0008 0.0008 0.0042 0.0749 0.1565 0.1661 0.3285 0.0786 0.1890 0.0000
0.0000
2 23 0.0003 0.0000 0.0002 0.0008 0.0008 0.0042 0.0749 0.1565 0.1661 0.3285 0.0786 0.1890 0.0000
0.0000
2 24 0.0003 0.0000 0.0002 0.0008 0.0008 0.0042 0.0749 0.1565 0.1661 0.3285 0.0786 0.1890 0.0000
0.0000
*
*
Speed Bins:
*
2.5 5.0 10.0 15.0 20.0 25.0 30.0 35.0 40.0
45.0 50.0 55.0 60.0 65.0+
*
* Speed bins extend 2.5 mph on either side of the bin name (i.e., the
30 mph speed bin encompasses
speeds from 27.5 to 32.5 mph), except for
the 2.5 mph bin (0 to 2.5 mph) and the 65+ mph bin (62.5 mph or above)
*
* This is SVMTCH07.DEF.
*
* These data come from a spreadsheet page titled "[DE] spdvmt" in the
Excel file MF13.XLS, supplied to IEPA by CATS, in October '02, being VMT
output from C
ATS's transportation model aggregated into the
various speed bins by county and M6 road type for the 8 CATS time
periods. SL
* slightly modified and reformatted the page, and verified that DE's
vmt-by-speed-bin calculations
were correct. See also CATS's file
titled VBYSPD.DEF
*
* The information in this file strictly speaking represents a speed
Electronic Filing - Received, Clerk's Office, January 21, 2009
55
distribution for 2007, but this is assumed (after discussion with
CATS) reasonably valid throughout the 2000-2020 period.
*
* The above data are for the Chicago NAA, and for Freeways and
Arterials only.
*
* See M6 User's Guide Sec. 2.8.8.2.c and Appendix B, Table 5: "Average
Speed Ranges for Speed Bins
* (SPEED VMT Command)" for further information about this file and its
use.
*
* The first number in each line is roadway type: 1 = Freeways; 2 =
Arterials. Locals and Ramps have a fixed speed in M6, and therefore are
not affected by this file.
* The second number is the hour of the day, hour 1 being [hour
beginning at] 6 AM, and hour 24 being [hour beginning at] 5 AM the next
day.
* The third and subsequent numbers are the fractions of VMT in that
hour that occurs within the specified speed bins. These fractions were
calculated from DE's file,
which gave estimates of VMT assigned to each
of the 8 CATS modeling periods.
*
* Note that, for Freeways, most VMT is in the 45-50-55-60-mph speed
bins, with lower speeds more common during Peak hours (which is
reasonable). Much the same holds for Arterials
, where most VMT is in
the 30-35-40-45 mph speed bins (also reasonable).
*
* See also the default VMT-by-speed file SVMT.DEF for more information
and comments.
*
* --SL, 25.xj.02
*
Revisions:
*
7.ix.06...Small changes made to text of these comments by SL;
no changes to numerical data.
Electronic Filing - Received, Clerk's Office, January 21, 2009