ENVIRONMENTAL ASSESSMENT
for
the
proposed
INCREASE
IN
TOTAL
DISSOLVED SOLIDS
DISCHARGE
from
the
THORN
CREEK BASIN
SANITARY
DISTRICT
Prepared
by:
James
E.
Huff,
PE.
Sean
D. Laflieu,
P.E.
November,
2000
TABLE OF CONTENTS
Page
INTRODUCTION
1-1
2.
BACKGROUND
INFORMATION
2-1
2.1
Site Description
2-1
2.2
Thorn Creek Description
2-3
2.3
Description of Thorn Creek
Basin Wastewater
Treatment
Plant
2-5
2.4
Ground Water
and Softening
Activities
2-6
2.5
Description of Rhodia
2-8
2.6
Description of
Proposed Silica Process
2-8
2.7
Applicable
Regulations
2-11
2.8
Previously Obtained Adjusted Standard for Deer Creek and a
Portion
of Thorn Creek
2-13
3.
THORN CREEK BASIN
SANITARY DISTRICT
EXISTING
CONDITIONS
3-1
3.1
Water Quality Database
3-1
3.2
Influent and Effluent Quality
3-1
3.3
Existing
Rhodia Silica Plant Effluent Quality
3-7
3.4
Effect of Elevated TDS and Sulfates on the Thorn Creek Basin
WWTP
3-7
3.4.1 Nitrification
3-7
3.4.2 Anaerobic Digestion
3-9
3.4.3
Biomass
Solids Separation
3-13
4.
THORN
CREEK AND TRIBUTARY WATER QUALITY
4-1
4.1
Introduction
4-1
4.2
Thorn Creek
Monitoring Database
4-1
4.3
Tributary
Monitoring Database
4-4
4.4
Thorn Creek
and Tributary Flow Rates
4-5
4.5
Water Quality Data
4-9
5.
TOXICITY OF TOTAL
DISSOLVED
SOLIDS AND SODIUM SULFATE
5-1
5.1
Introduction
5-1
5.2
Acute
Toxicity of TDS
5-1
5.3
Acute Toxicity of
Sulfate
5-6
5.4
Chronic Toxicity
5-11
6.
BIOLOGICAL QUALITY OF THORN CREEK LITTLE
CALUMET
RIVER
6-1
6.1
Introduction
6-1
6.2
Sampling Locations
6-3
TOC-
1
6.3
Previous Studies
6-5
6.4
Methodology
6-11
6.4.1 Macroinvertebrate Sampling
6-11
6.4.2
Fish
Sampling
6-13
6.4.3 Water
Samples
6-14
6.5
Benthic Macroinvertebrate Results
6-14
6.6
Fish Electroshocking Results
6-18
6.7
Water Quality
Results
6-21
6.8
Biological Quality of Little Calumet River
6-22
6.9
Discussion
6-23
7.
PROJECTED IMPACT
ON
THORN CREEK ANT) THE LITTLE CALUMET
RIVER FROM PROPOSED EXPANSION
7-1
7.1
Introduction
7-1
7.2
Flow Curves for
Stream
Reaches
7-1
7.3
Projected TDS Levels
7-4
7.3.1 TDS Frequency
Distribution
7-4
7.3.2 Daily Maximum TDS Levels
7-6
7.4
Projected Sulfate
Levels
7-11
7.4.1 Annual Average Sulfate Levels
7-11
7.4.2 Daily Maximum Sulfate Levels
7-15
7.5
Crop Irrigation and Ground Water Impacts
7-17
7.6
Calumet-Sag Channel
7-17
7.7
Model
Sensitivity
7-17
7.8
Summary
7-18
8.
SUMMARY AND CONCLUSION
8-1
REFERENCES
R-1
LIST OF TABLES
TABLE
2-1:
THORN CREEK BASIN SANITARY DISTRICT,
NPDES EFFLUENT LIMITS
2-1
TABLE 2-2:
THORN
CREEK RIVER MILES
2-5
TABLE 2-3:
EXISTING AND PROJECTED LOADING FROM RHODIA
SILICA PLANT
2-9
TABLE
2-4
ADJUSTED STANDARDS
FOR THORN CREEK BASIN
SANITARY
DISTRICT
2-11
TOC-2
TABLE 3-1:
TABLE 3-2:
TABLE
3-3:
TABLE
3-4:
TABLE 3-5:
TABLE
4-1:
TABLE
4-2:
TABLE 4-3:
TABLE 4-4:
TABLE
4-5:
TABLE 4-6:
TABLE 5-1:
TABLE 5-2:
TABLE 5-3:
TABLE 6-1:
TABLE 6-2:
TABLE 6-3:
MONTHLY
AVERAGE EFFLUENT FLOW RATES, THORN CREEK
BASIN SANITARY
DISTRICT WWTP EFFLUENT
3-2
INFLUENT AND
EFFLUENT TDS LEVELS BEFORE THE
SILICA
PLANT
IS
ONLINE
3-3
THORN
CREEK
BASIN SANITARY DISTRICT EFFLUENT
TOTAL
DISSOLVED
SOLIDS AND SULFATES AFTER SILICA PLANT
IS ONLINE
3-4
RHODIA EFFLUENT
DATA, TOTAL DISSOLVED
SOLIDS AND
SULFATE
3-8
ANAEROBIC DIGESTER GAS ANALYSIS FOR
HYDROGEN
SULFIDE
3-11
SUMMARY
OF THORN CREEK AND
TRIBUTARY GAGING
STATIONS
4-3
TRIBUTARY MONITORING
LOCATIONS
4-4
USGS
GAGING
STATIONS
AVERAGE FLOW RATES, mgd
4-6
SUMMARY OF FLOW
DATA
FOR THORN
CREEK
USGS
STATIONS
4-5
TDS AND
SULFATE DATA- THORN CREEK AT JOE
ORR RD
4-10
INORGANICS
AT
USGS
STATION
05536275 AT THORNTON
AFTER
RHODIA SILICA
PLANT
IS
ONLINE
4-11
ACUTE TOXICITY OF
SODIUM SULFATE TO FISH
5-6
ACUTE TOXICITY
OF SULFATE TO FISH
5-7
CHRONIC
TOXICITY TESTS BASED ON PROJECTED
MAXIMUM
SULFATE LEVEL OF 1,350 mg/L
5-11
SUMMARY OF USE SUPPORT ASSESSMENT
CRITERIA FOR
ILLINOIS
STREAMS
6-3
STREAM
ECOLOGY
6-6
HISTORICAL NUMBER OF BENTHIC ORGANISMS BY YEAR
6-8
TOC-3
TABLE 6-4:
HISTORICAL
NUMBER OF
BENTHIC
SPECIES BY YEAR
6-9
TABLE 6-5:
HISTORICAL MBI VALUES BY YEAR
6-10
TABLE 6-6:
BENTHIC MACROINVERTEBRATE SAMPLE COLLECTION
6-15
TABLE 6-7:
FISH
SURVEY RESULTS
6-20
TABLE 6-8:
SUMMARY
OF BENTHIC
MACROINVERTEBRATES
SAMPLE COLLECTION
6-24
TABLE
6-9:
COMPARISON OF MBI SAMPLING RESULTS
6-26
TABLE
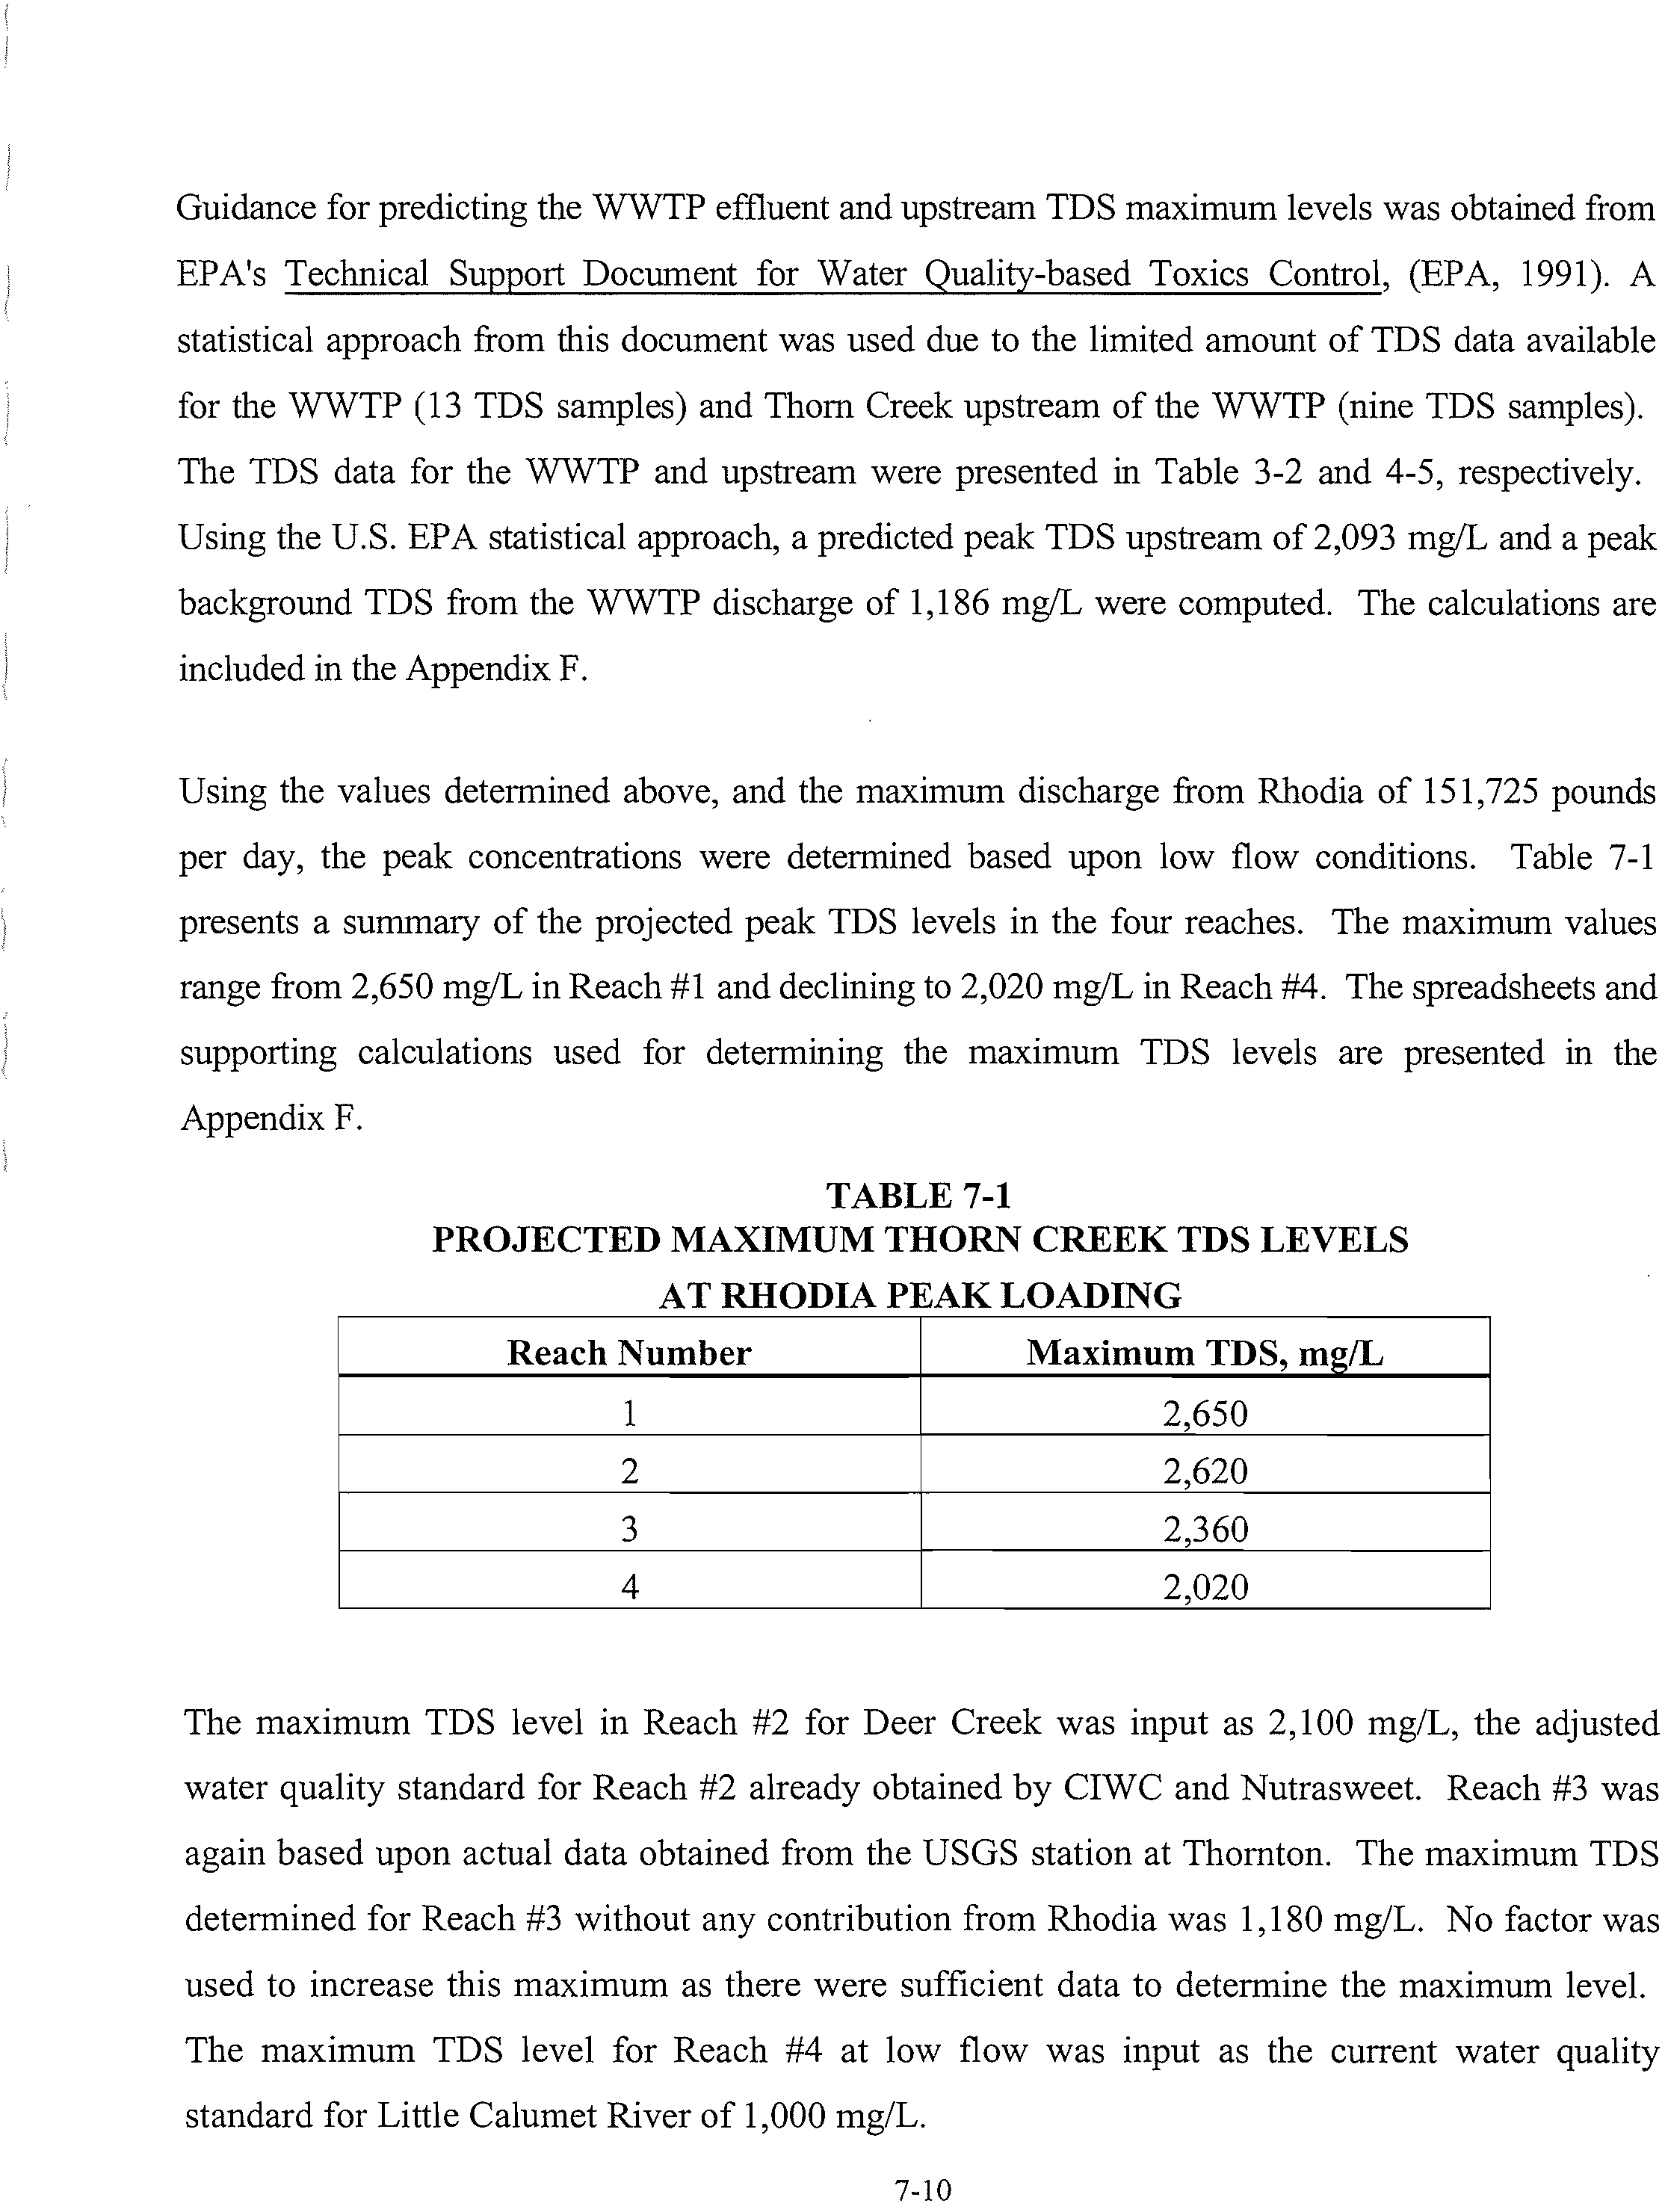
7-1:
PROJECTED MAXIMUM THORN CREEK TDS LEVELS
7-10
TABLE
7-2:
PROJECTED MAXIMUM THORN CREEK SULFATE LEVELS
7-15
TABLE 7-3:
SUMMARY
OF WATER QUALITY
MODELING
RESULTS
PREDICTED PEAK
CONCENTRATIONS, mg!L
7-19
TABLE 8-1:
CURRENT REQUESTED WATER QUALITY STANDARDS
8-3
LIST
OF
FIGURES
FIGURE
2-1:
SITE LOCATION MAP
2-2
FIGURE 2-2:
THORN CREEK SYSTEM
2-4
FIGURE 2-3:
FLOW DIAGRAM
THORN CREEK BASIN
SANITARY
DISTRICT
2-7
FIGURE 2-4:
BLOCK
FLOW
DIAGRAM SILICA PRODUCTION
2-10
FIGURE 4-1:
MONITORING
LOCATIONS
4-2
FIGURE 4-2:
REACH #1—PER CENT
TIME
FLOW RATE IS
NOT EXCEEDED
4-8
FIGURE 5-1:
ACUTE TOXICITY CURVE
FOR CHANNEL CATFISH
(TDS-SO
4)
5-3
TOC-4
FIGURE 5-2:
ACUTE
TOXICITY CURVE
FOR
LARGEMOUTH BASS
(TDS-SO
4
)
5-4
FIGURE 5-3:
ACUTE TOXICITY
CURVE
FOR BLUEGILL
(TDS-S0
4
=)
5-5
FIGURE
5-4:
ACUTE TOXICITY
CURVE
FOR CHAEL CATFISH
(S04)
5-8
FIGURE 5-5:
ACUTE
TOXICITY
CURVE FOR LARGEMOUTH
BASS
(S04)
5-9
FIGURE
5-6:
ACUTE TOXICITY
CURVE
FOR BLUEGILL
(S0
4)
5-10
FIGURE
6-1:
BIOLOGICAL
STREAMS
SAMPLING
LOCATION
MAP
6-4
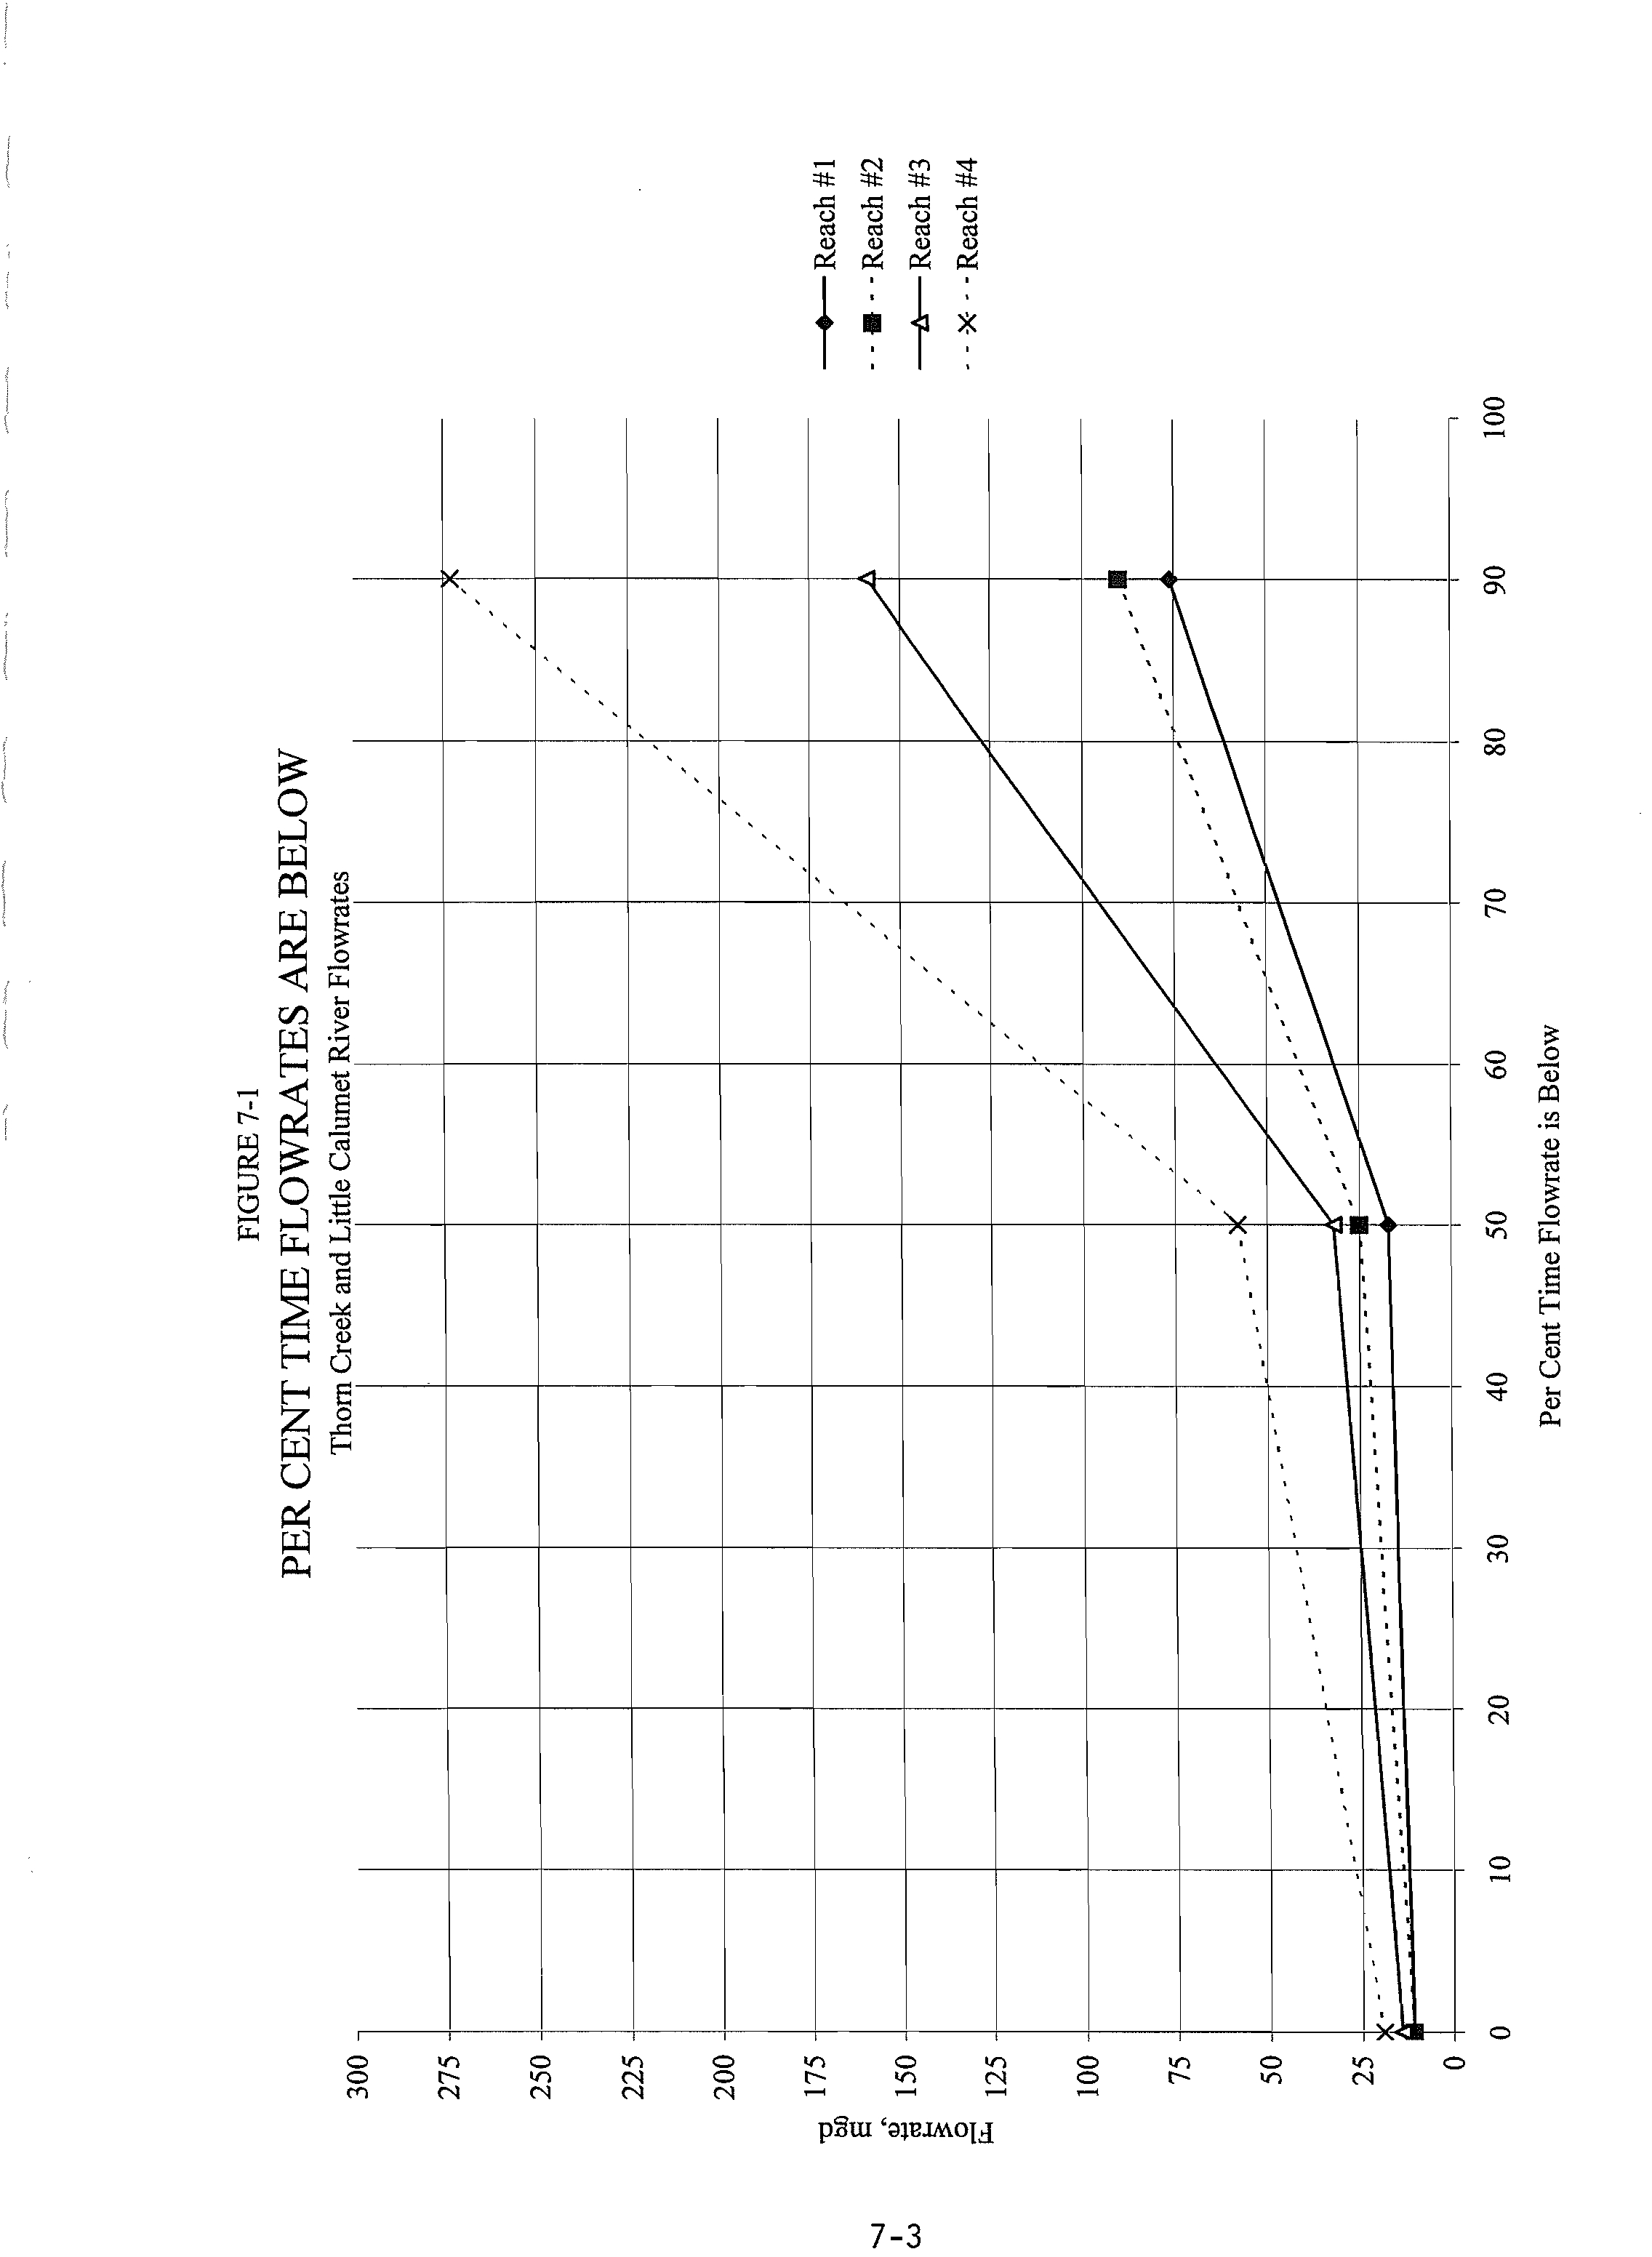
FIGURE 7-1:
PERCENT
TIME
FLOW
RATES
ARE
BELOW
7-3
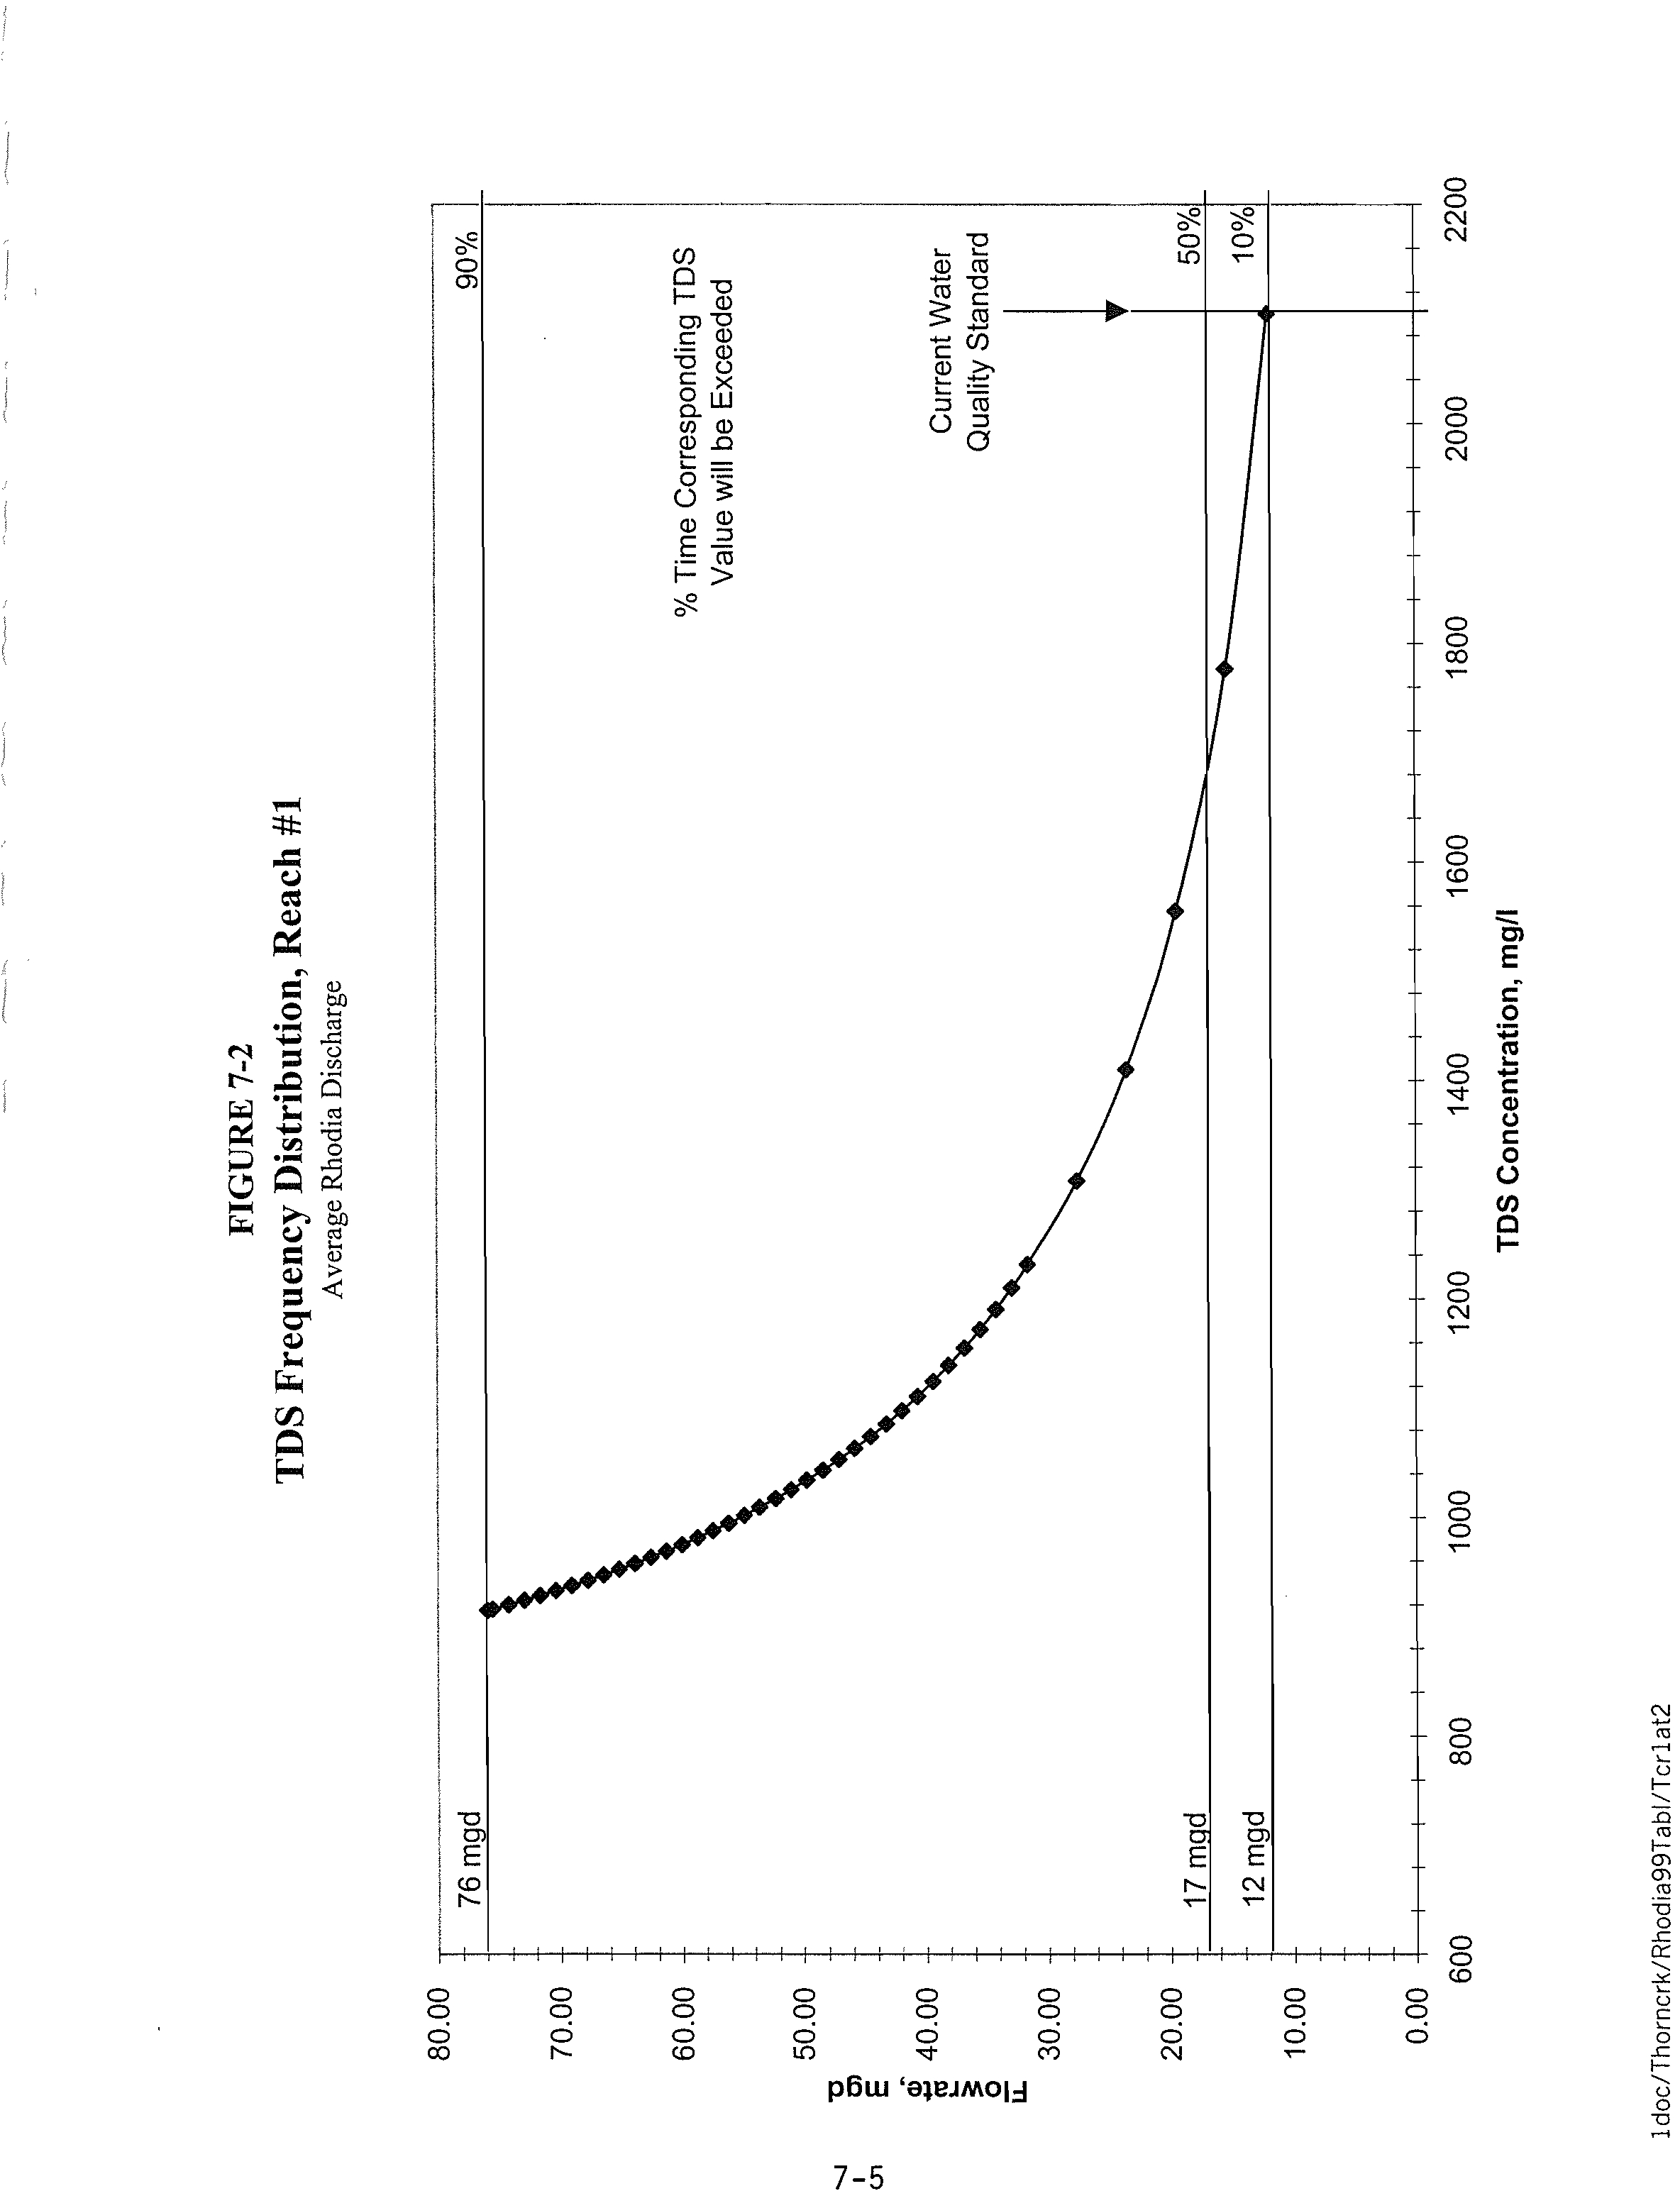
FIGURE
7-2:
TDS
FREQUENCY
DISTRIBUTION
- REACH #1
7-5
FIGURE
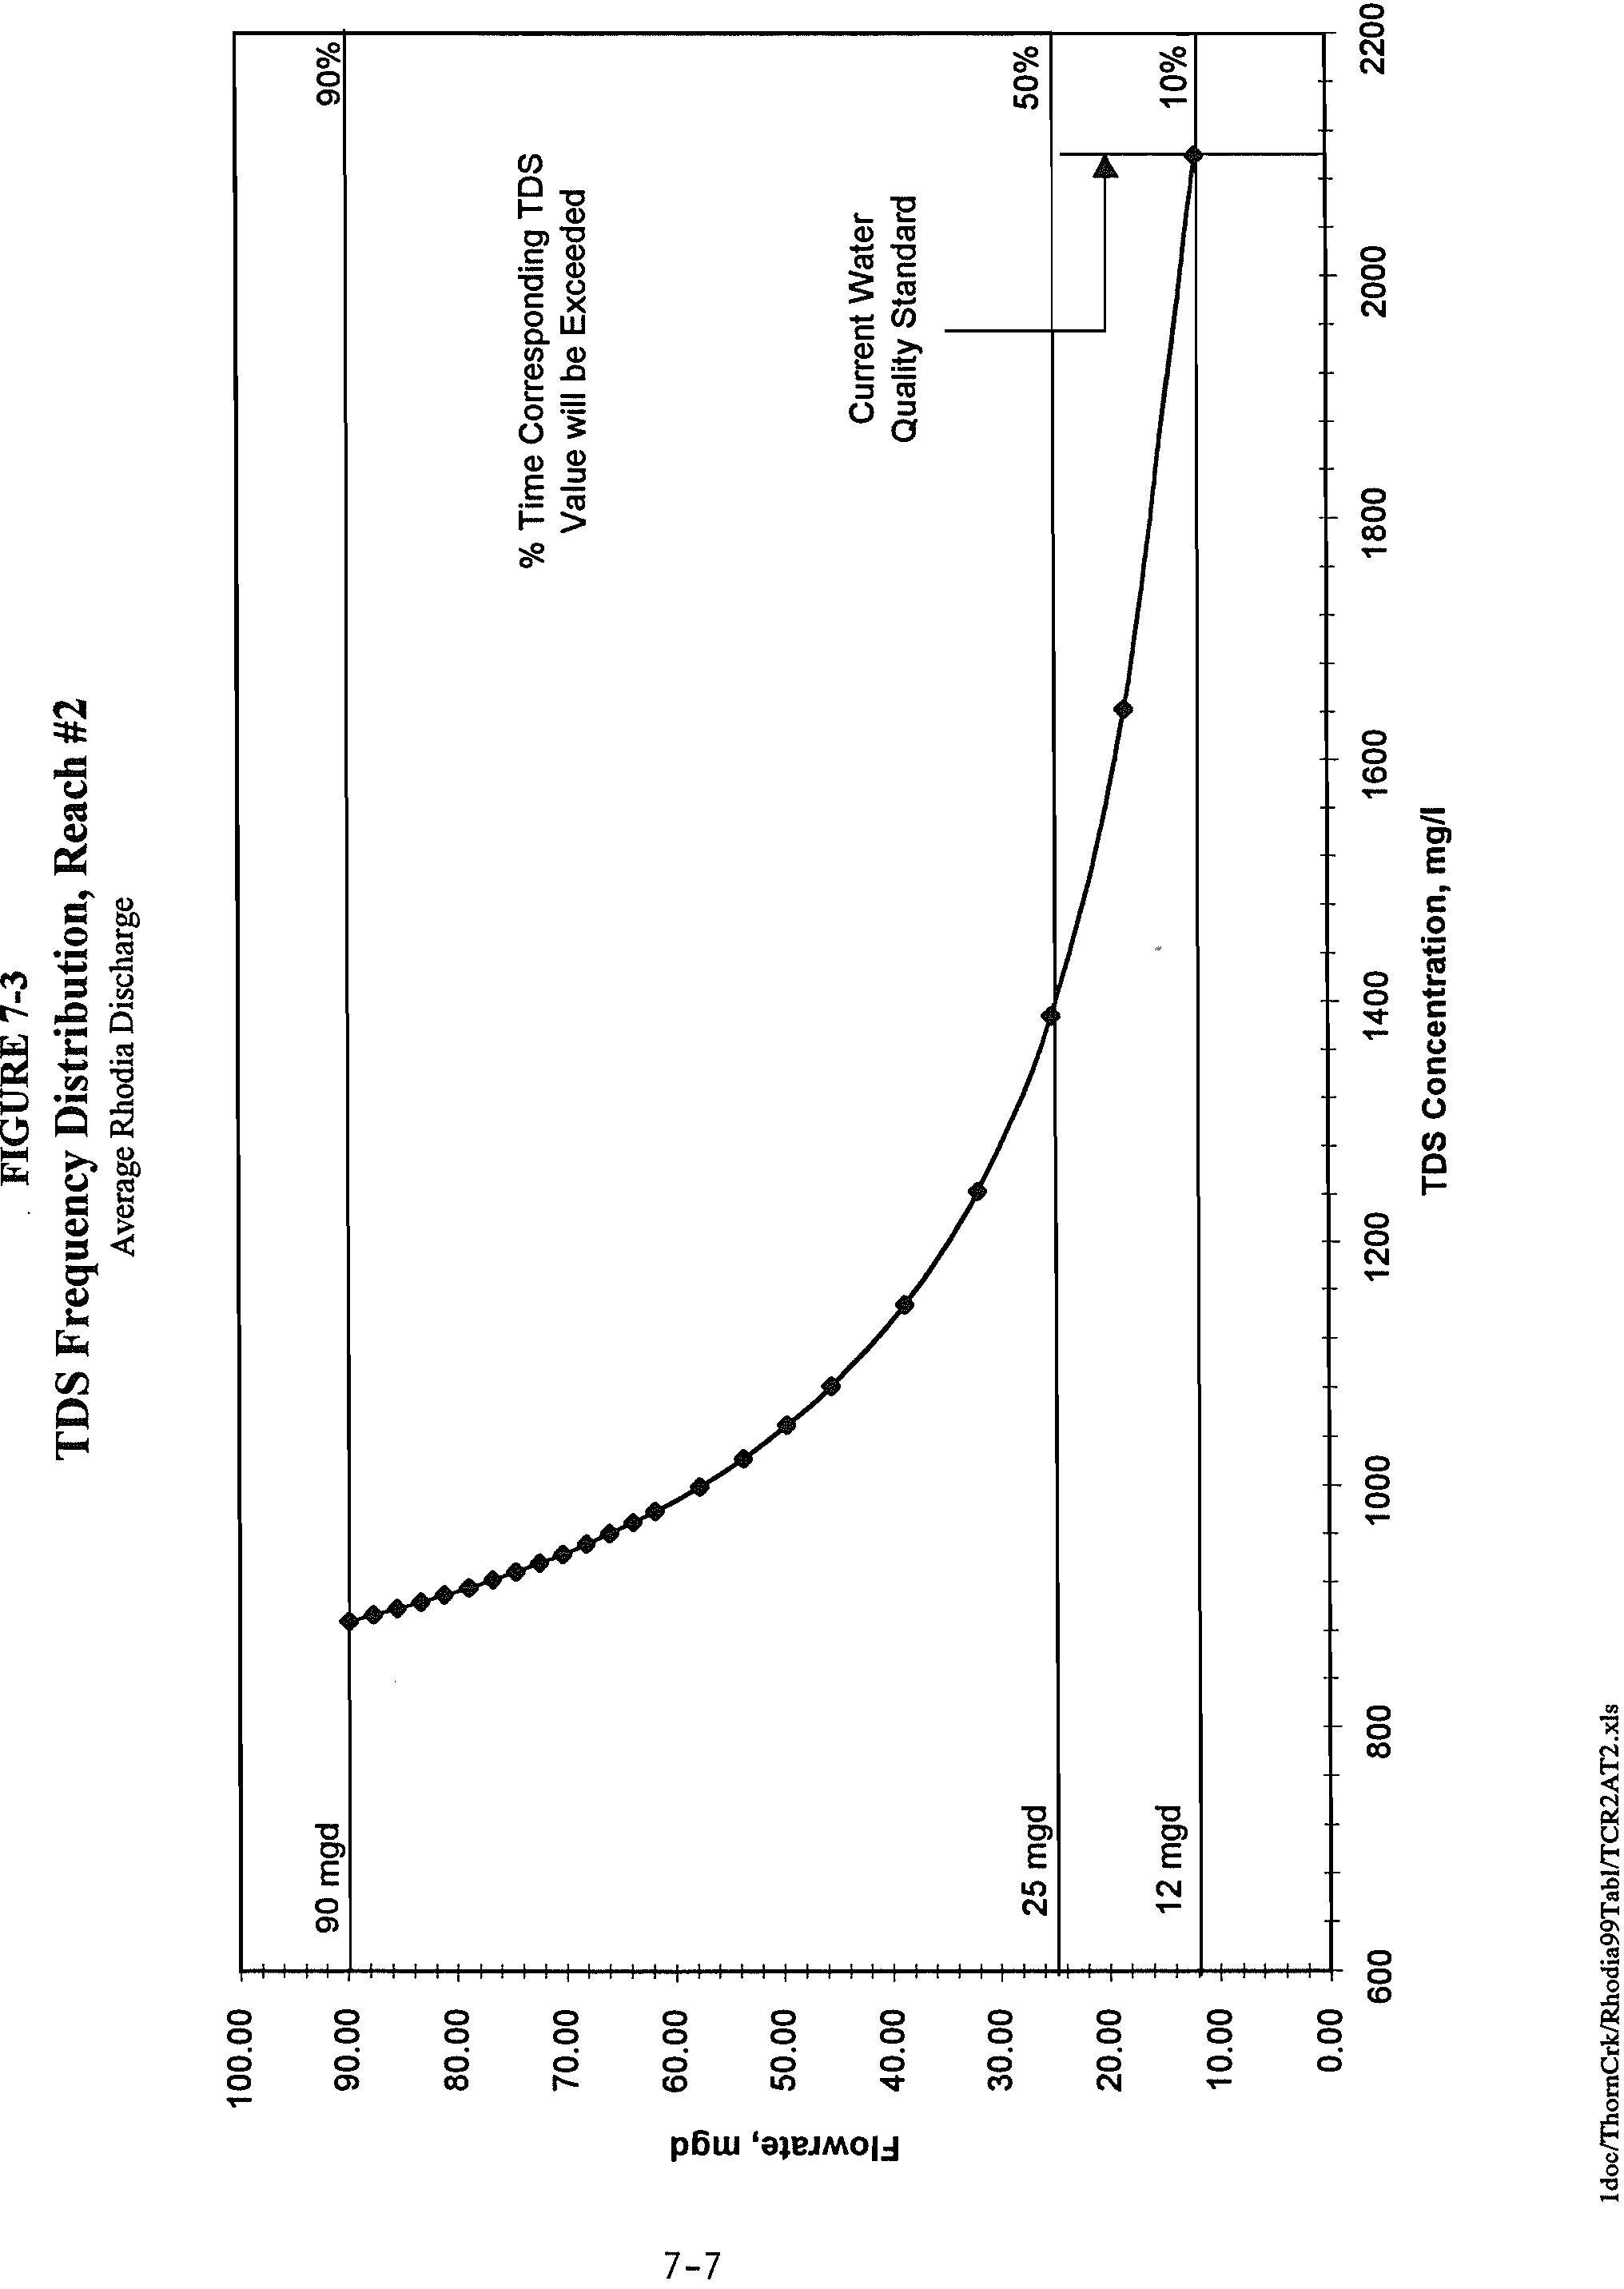
7-3:
TDS
FREQUENCY
DISTRIBUTION
- REACH
#2
7-7
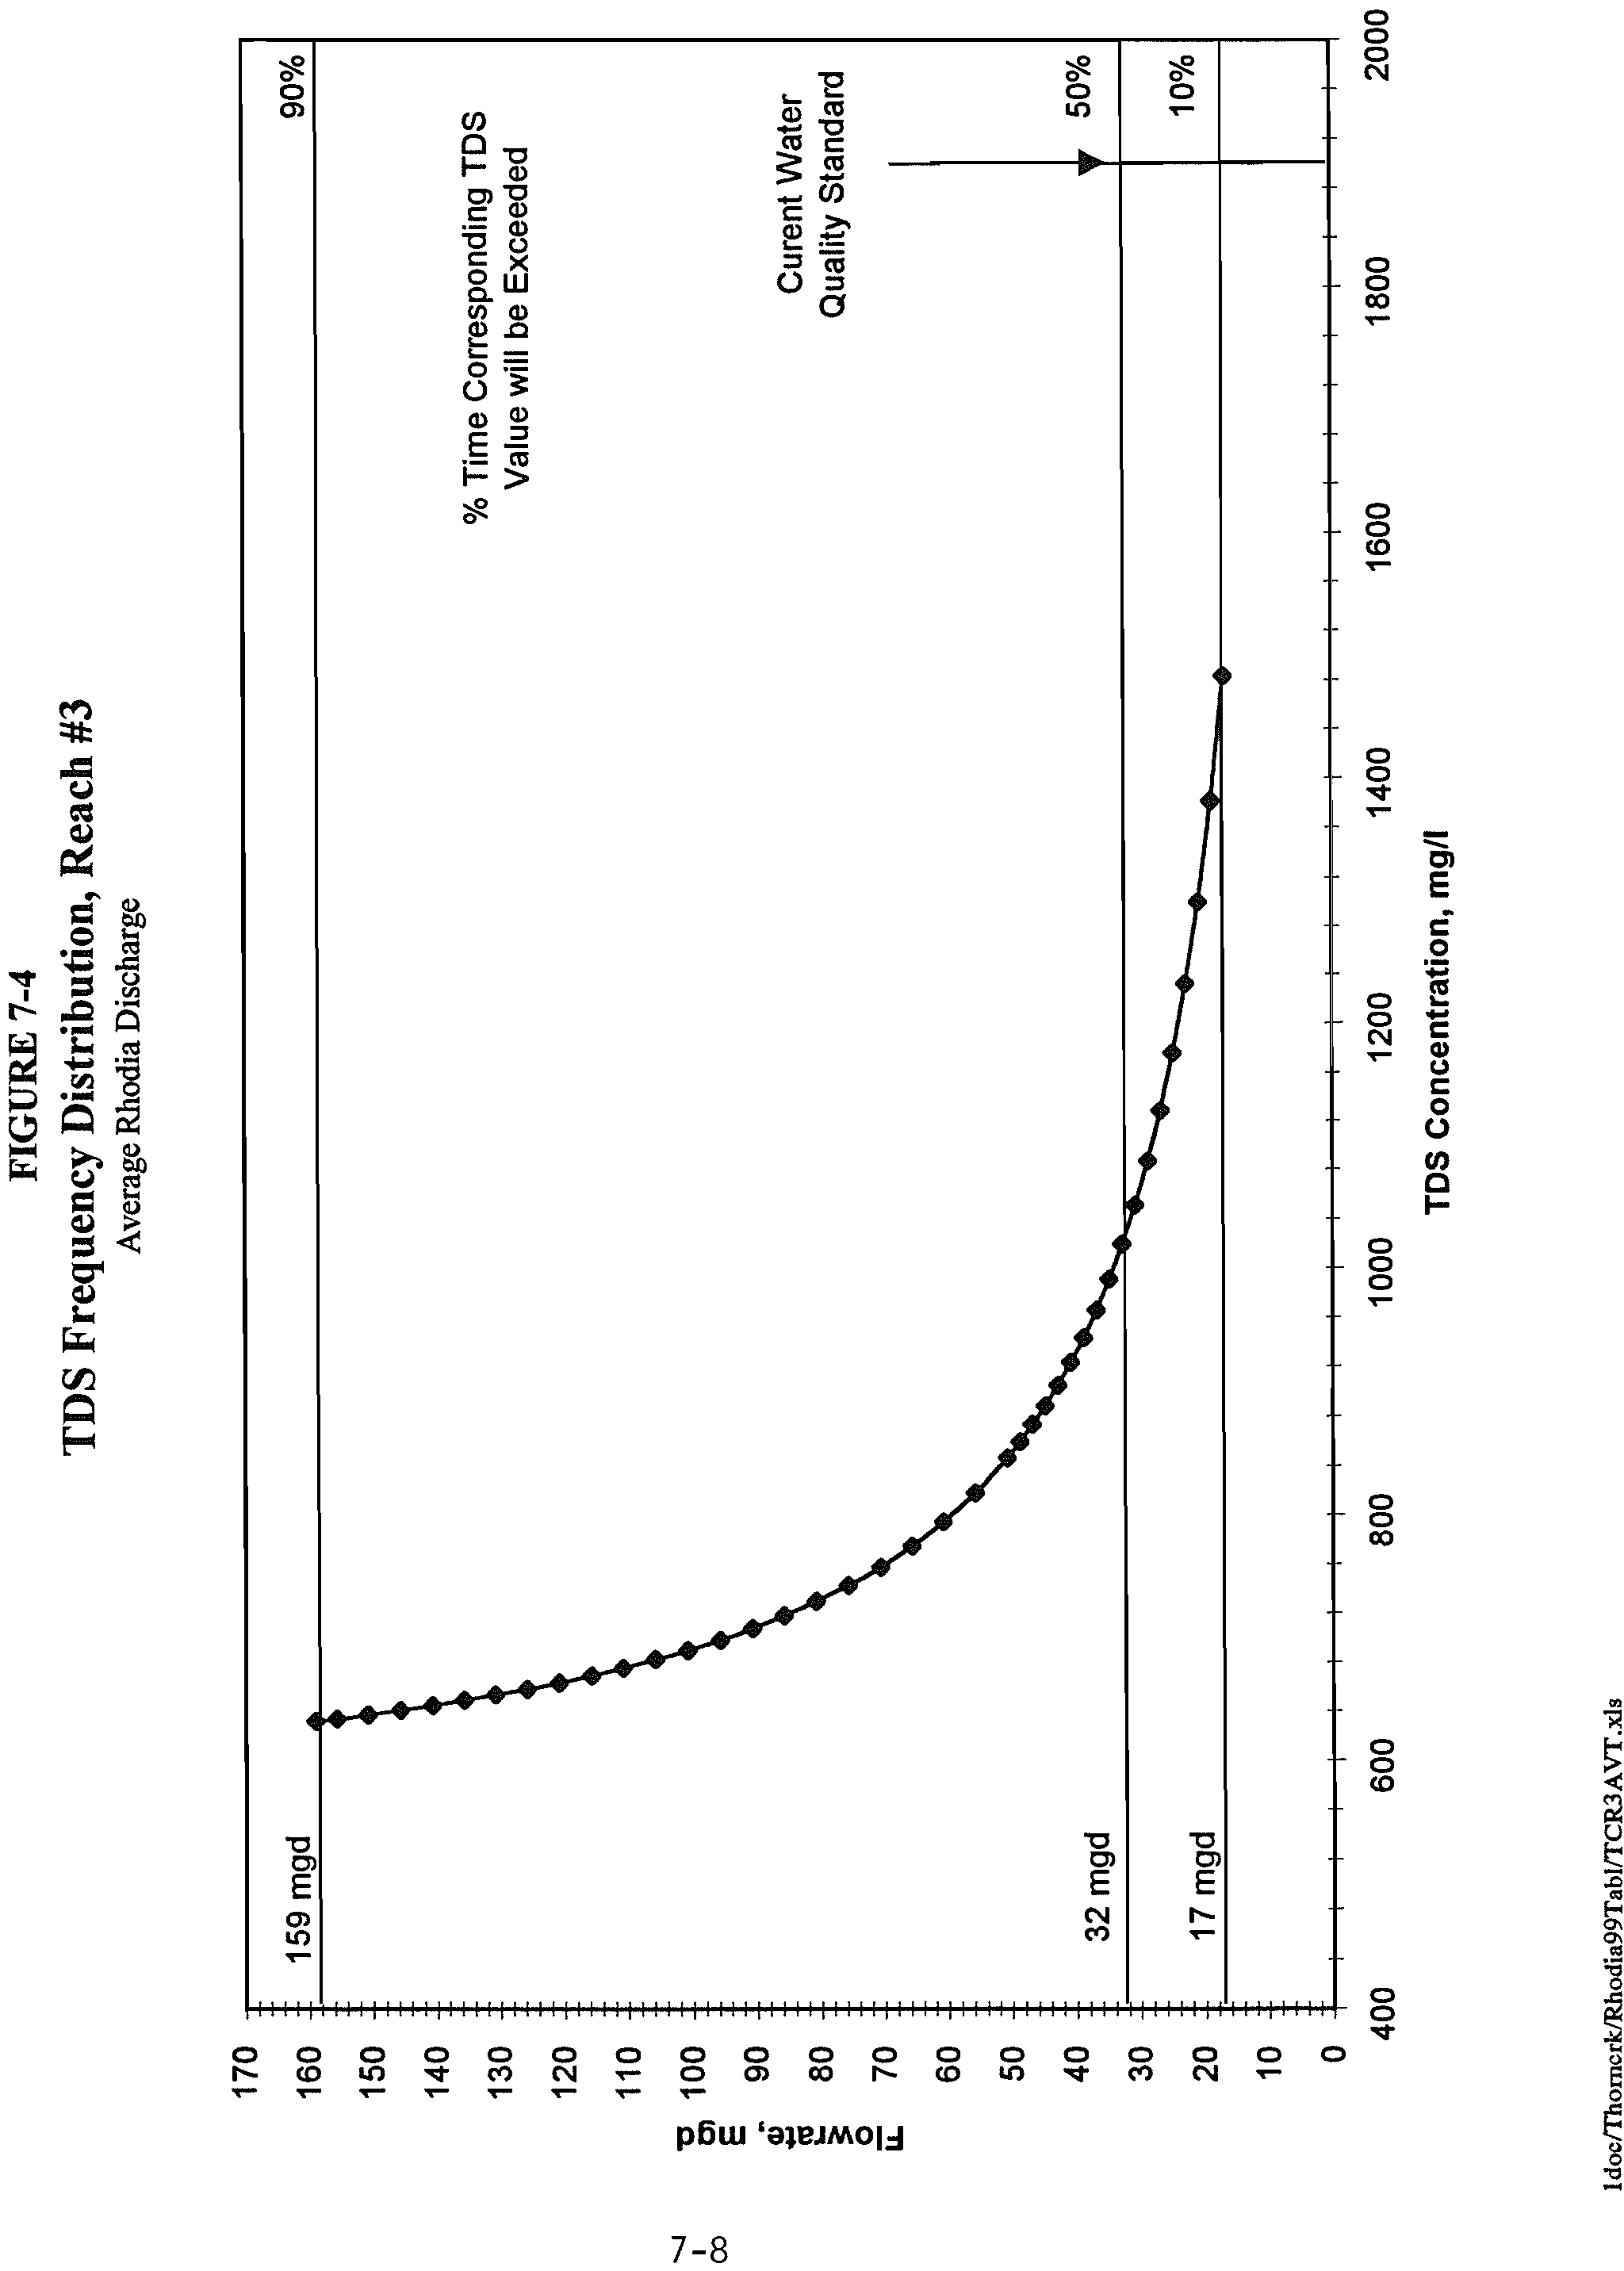
FIGURE
7-4:
TDS
FREQUENCY DISTRIBUTION
- REACH
#3
7-8
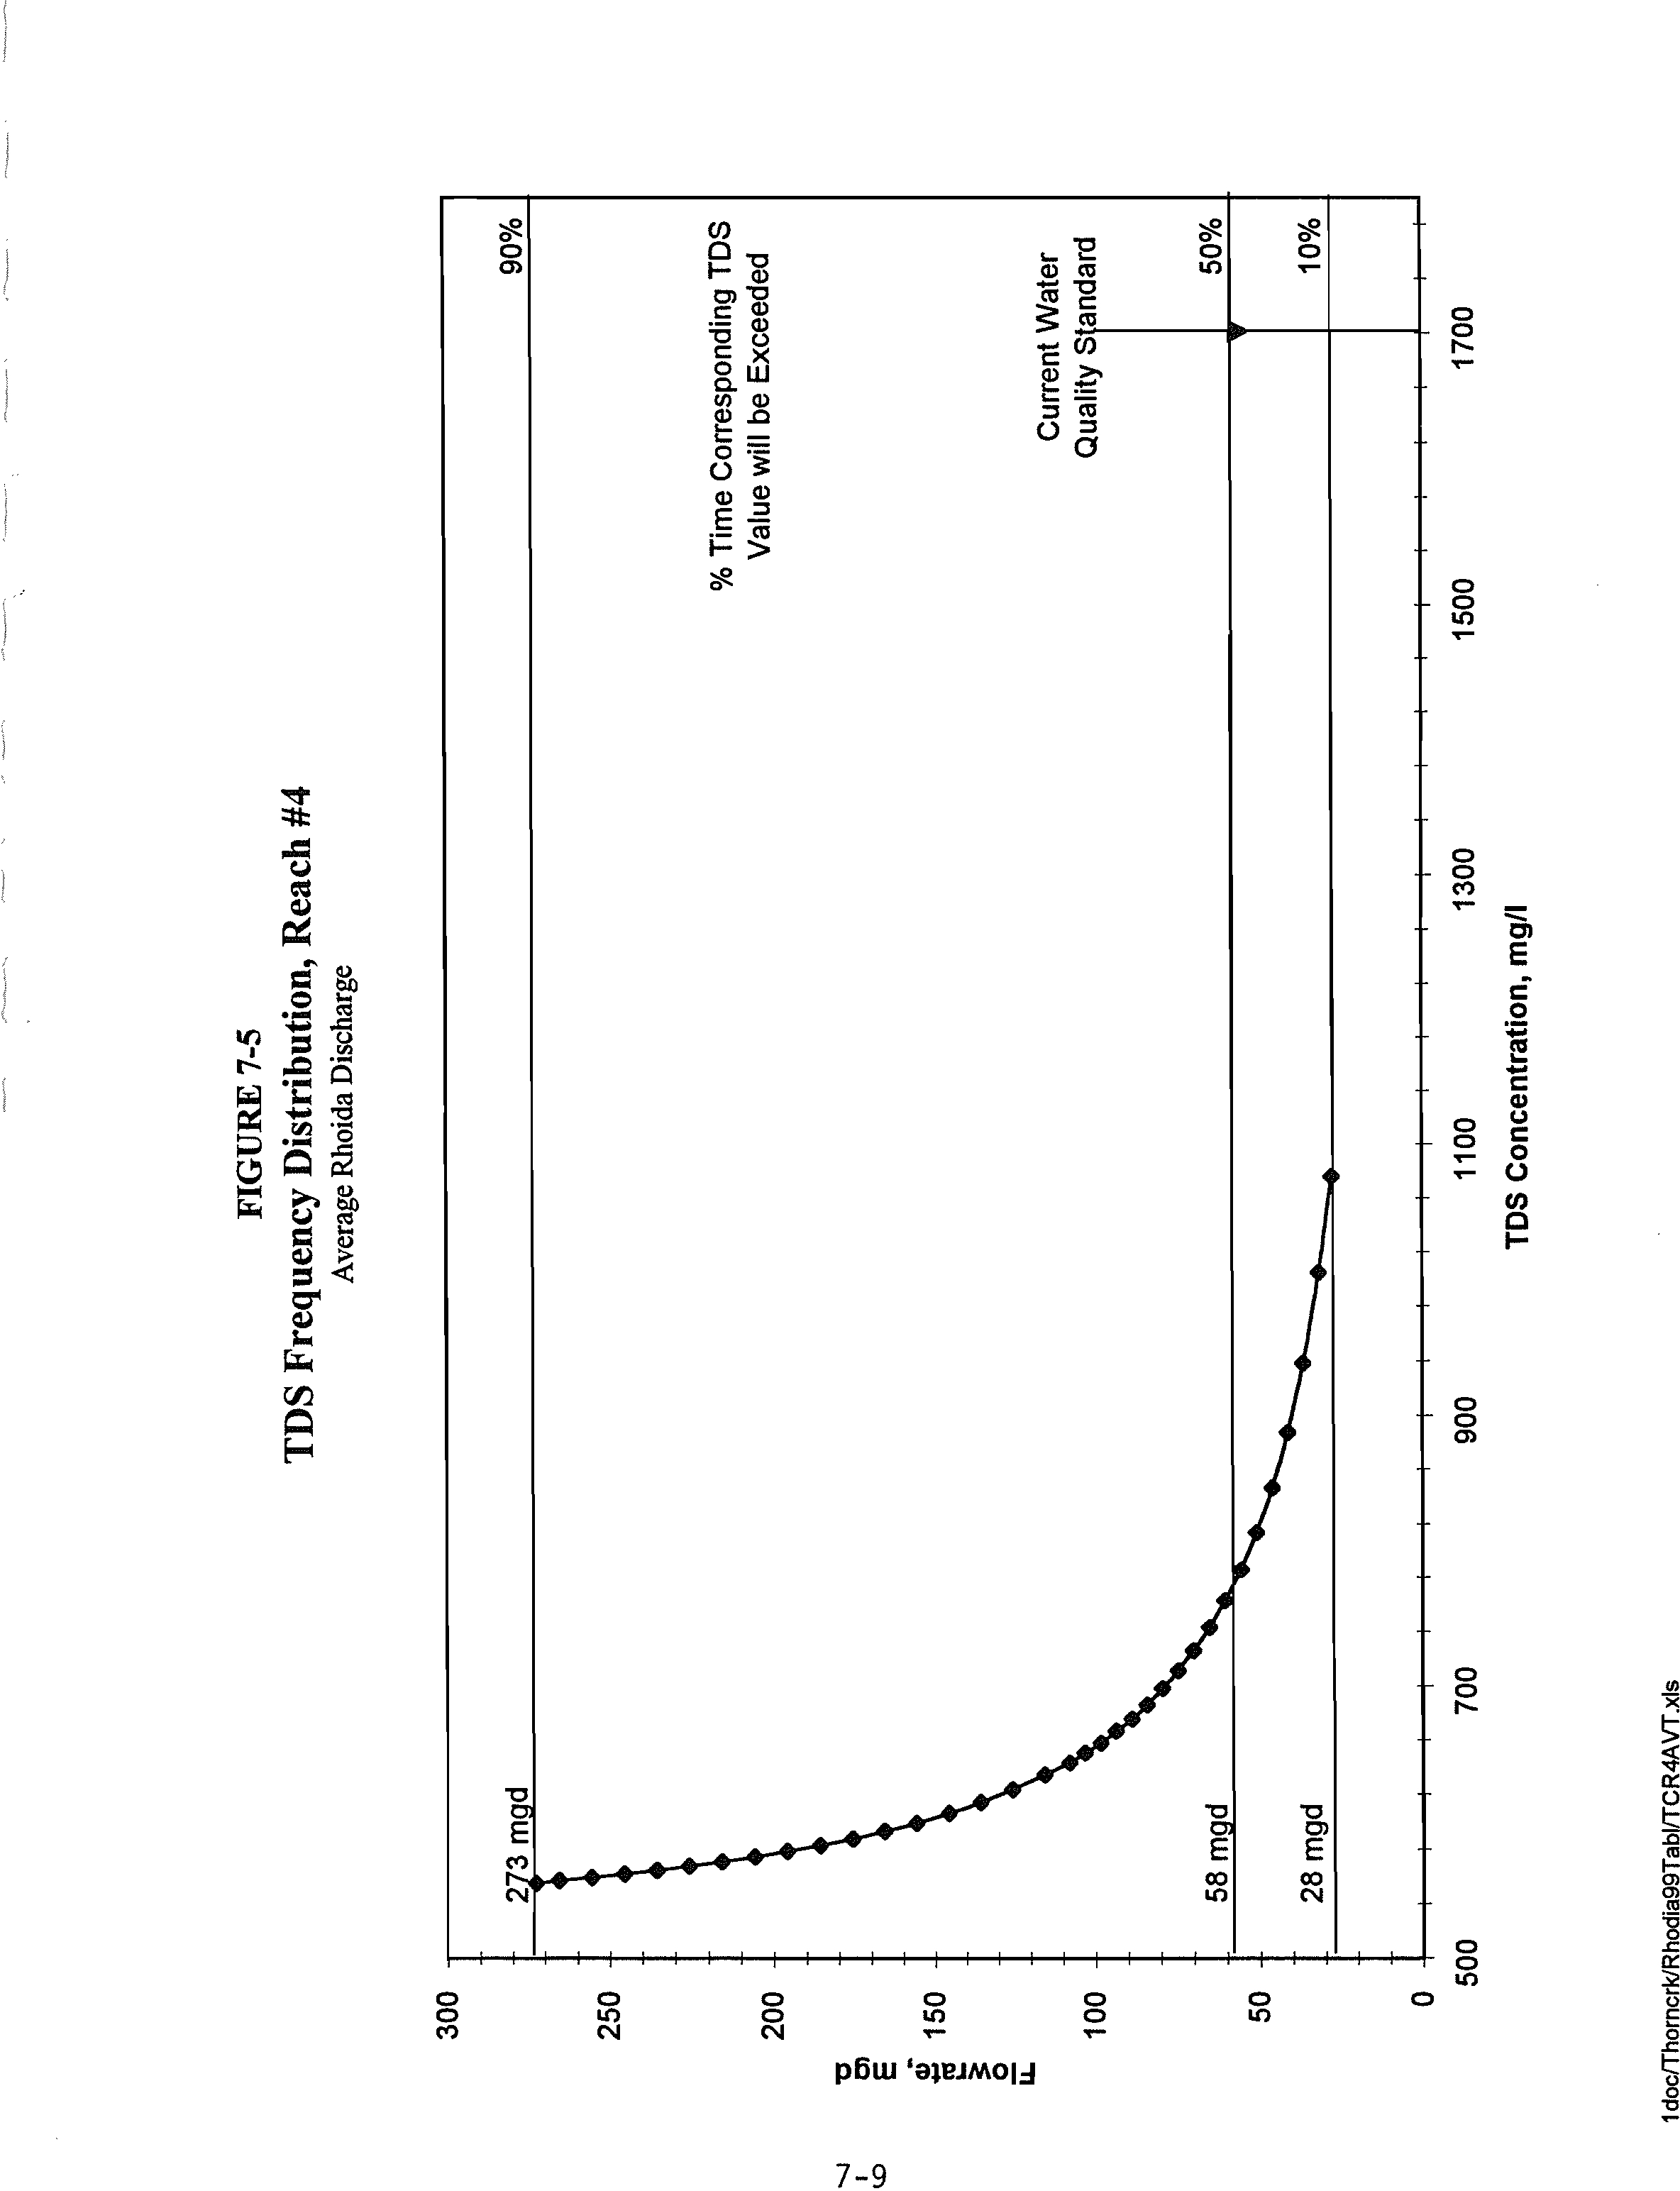
FIGURE 7-5:
TDS
FREQUENCY
DISTRIBUTION
- REACH #4
7-9
FIGURE 7-6:
SULFATE
FREQUENCY
DISTRIBUTION - REACH
#1
7-12
FIGURE 7-7:
SULFATE
FREQUENCY
DISTRIBUTION
- REACH
#2
7-13
FIGURE
7-8:
SULFATE
FREQUENCY
DISTRIBUTION
- REACH
#3
7-14
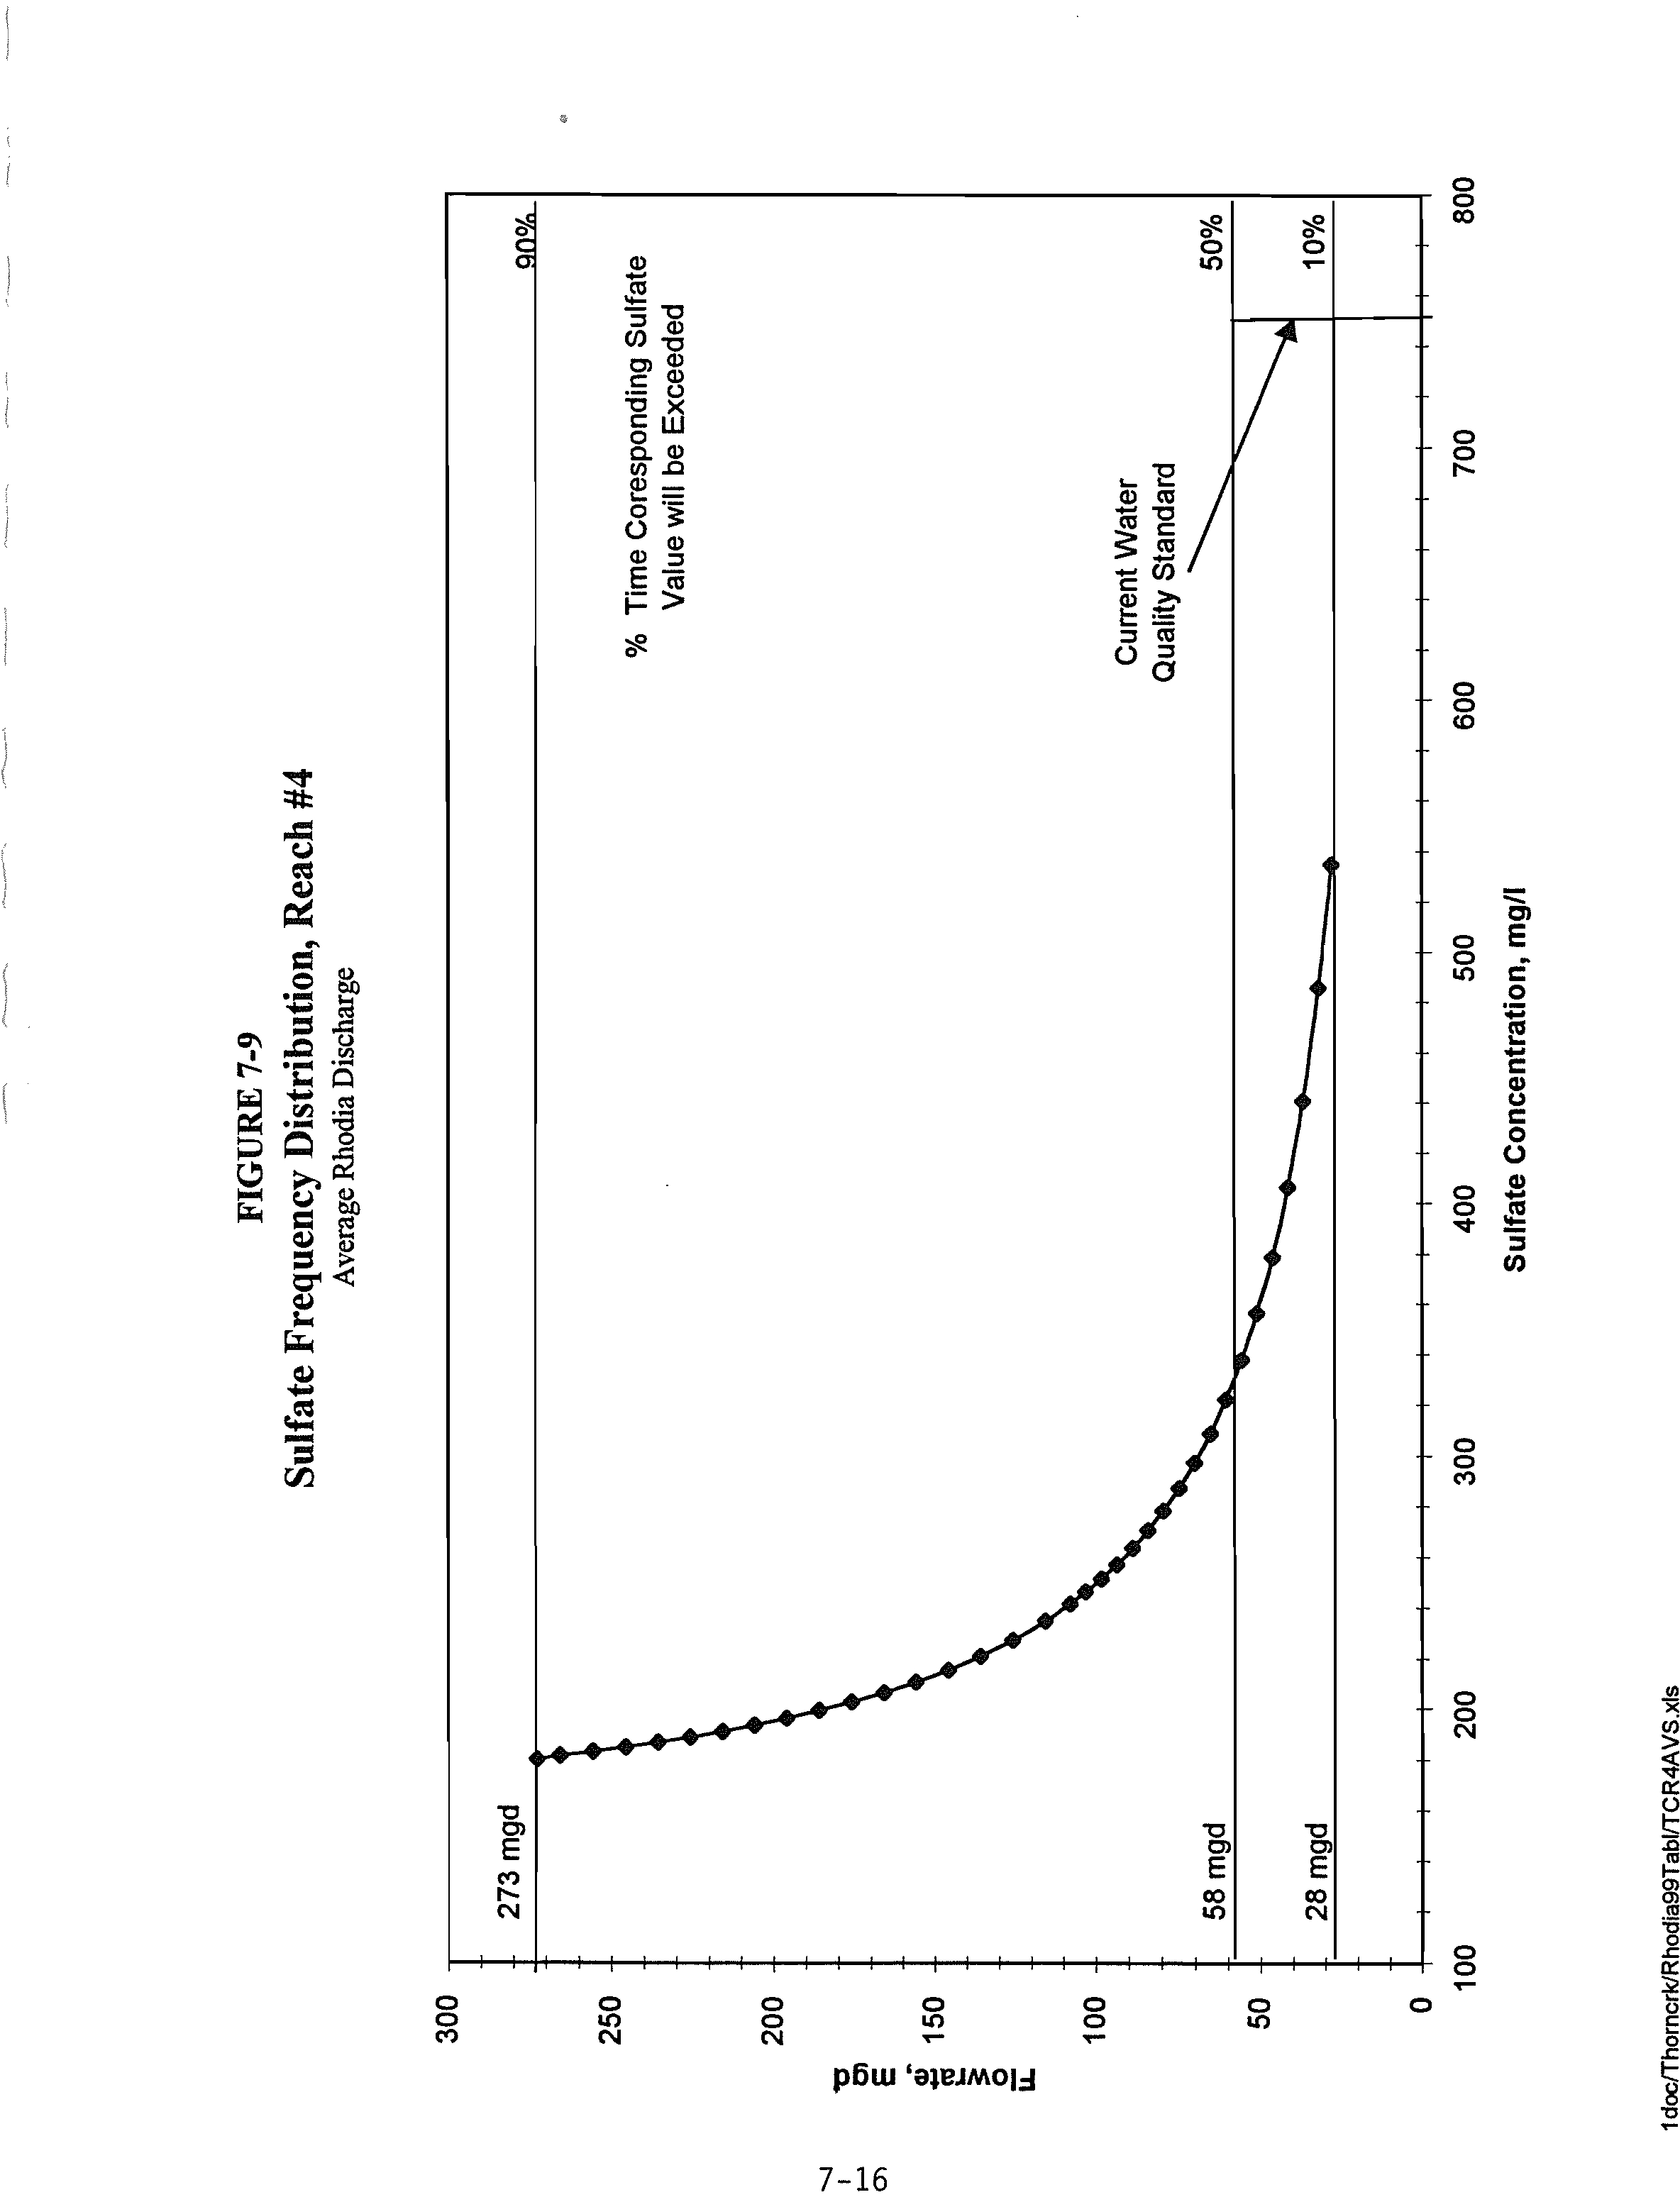
FIGURE 7-9:
SULFATE
FREQUENCY
DISTRIBUTION - REACH
#4
7-16
APPENDICES
A. Thom
Creek Basin
Sanitary District
and Silica Plant Data
B.
Calculations
and Mass
Balances
C. Thom
Creek
Data
D. Chronic
Toxicity Bioassay
E. Benthic and
Fish Data
F,
Model Output
TOC-5
LIST
OF
ACRONYMS
7Q10
7-day, 10-year low flow
AS
Adjusted Standard
BSC
Biological
Stream Characterization
CBOD
Carbonaceous
Biological Oxygen Demand
CIWC
Consumers Illinois
Water
Company
District
Thorn Creek
Basin Sanitary
District
FeS
Iron Sulfide
F:M
Food-to-Microorganism
FRSS
Facility Related Stream Surveys
IBI
Index of Biotic Integrity
IEPA
Illinois Environmental Protection Agency
IPCB
Illinois Pollution
Control Board
ISWS
Illinois
State Water Survey
lbs/day
pounds
per day
LC
50
Median Lethal
Concentration
LOEC
Lowest Observed Effect Concentration
MBI
Macroinvertebrate
Biotic Index
mgd
million gallons per
day
mg/L
milligrams per liter
MIC
Microbiologically
Influenced
Corrosion
NaC1
Sodium
Chloride
NOAEL
No
Observed
Acute
Effect Level
NOEC
No
Observed
Effect
Concentration
NPDES
National Pollution
Discharge Elimination System
ppm(V)
parts
per million by volume
SO4
Sulfate
SRB
Sulfate Reducing
Bacteria
TCBSD
Thorn Creek Basin Sanitary District
TDS
Total Dissolved Solids
TSS
Total Suspended Solids
USGS
United States Geological Survey
WQ
Water Quality
WWTP
Wastewater Treatment
Plant
TOC-6
1.
INTRODUCTION
The Thom Creek
Basin
Sanitary
District
(District)
operates a
municipal wastewater
treatment plant
(WWTP)
in
Chicago Heights,
Illinois. The
WWTP has a design
average
flow of
15.9 mgd and a
design maximum
flow of 40.25
mgd.
The District
serves Chicago Heights,
Park Forest,
Homewood,
South Chicago
Heights,
Steger and
Crete
communities.
The combined
population
served
by
the
District is over
100,000
people. Effluent from
the
treatment
plant
is
discharged
into Thom Creek,
the largest subbasin
of
the Little
Calumet
River
System (Dames &
Moore,
1982).
The municipal
service
area
contains
numerous
industrial users,
including
Rhodia,
Inc. (Rhodia),
formerly known
as
Rhône-Poulenc
Basic
Chemical Company,
located
in Chicago Heights,
Illinois.
Rhodia is
a
manufacturer
of
inorganic
chemicals,
primarily
phosphate
products, sodium
bicarbonate
and silica. The
Rhodia
silica
plant
currently
discharges approximately
840,000
gallons
per
day (0.84
mgd)
based
on
an average
month to the
District’s sanitary sewer.’
The existing
silica
plant
went
on-line
in October of 1995.
Rhodia has proposed
an expansion
to the
existing
silica plant at its
Chicago Heights
plant as it is
ideally located relative
to
both
the
raw
materials
necessary
for the
silica
process
and
the receiving
market. The
silica manufacturing
process
generates
sodium
sulfate
in
an aqueous waste stream.
Rhodia has
approached the
Thom
Creek Basin
Sanitary
District
regarding
the feasibility of
the District accepting
additional dissolved
solids loading
attributable
to the
additional
sodium sulfate
that would be generated.
•This environmental
assessment
study was
undertaken
to determine
the overall impact
the
additional
dissolved
solids
will
have on the
receiving stream,
Thom Creek as
well
as
the WWTP.
Prior
to
addressing
any potential
environmental
impact,
background
information
is
presented
on
the process,
existing
total dissolved
solids (TDS)
and
sulfate
loadings,
and existing
water quality.
The
incremental
change
in TDS and
sulfate in the receiving
stream due to the
silica
process
are
then
modeled
and the
toxicity levels
of both parameters
are discussed, including
biomonitoring
results
using
water
from
Thom
Creek.
This report will
serve as a basis for
defining the
projected
environmental
impact
should the proposed
expansion
proceed.
This
includes
approximately
240,000
gallons per day
from
phosphate
production
and 600,000
gallons
per day
from silica
production.
Silica discharges range
from 100,000 gallons
per
day to 1,000,000 gallons
per day
depending
on silica on-stream
time.
1—1
3.
THORN
CREEK BASIN SANITARY
DISTRICT EXISTING
CONDITONS
3.1
Water Quality Database
The Thom
Creek
Basin
WWTP
monitors
the
influent and
effluent
quality as required
by
its NPDES
permit. The
parameters monitored are as follows:
Parameter
Influent
Effluent
Flow
X
X
pH
X
Suspended Solids
X
X
CBOD5
X
X
Chlorine Residual
X
Fecal
Coliform
X
Ammonia Nitrogen
X
These
parameters are reported as monthly averages
and daily
maximums on the Discharge
Monitoring Reports.
In addition, the District has monitored
total dissolved solids (TDS) on
both
the
influent
and effluent
and sulfates on the effluent. The data
generated on TDS and sulfates
are
presented in the
Section 3.2.
3.2
Influent
and Effluent
Quality
The District
monitors the plant effluent flow rates
on
a
daily basis. Daily flow rates from April 21,
1996 to
June 24, 1999
are provided in Appendix A. The
monthly average flow
data for the period of
May
1996 to May
1999 are summarized in Table 3-1. During
this period,
36 days were recorded
with flow rates
over 40.25 mgd. These excess flow days range
from 40.33 mgd
to
84.41
mgd.
3-1
TABLE 3-1
MONTHLY AVERAGE EFFLUENT
FLOW RATES
THORN
CREEK BASIN SANITARY DISTRICT WWTP
EFFLUENT
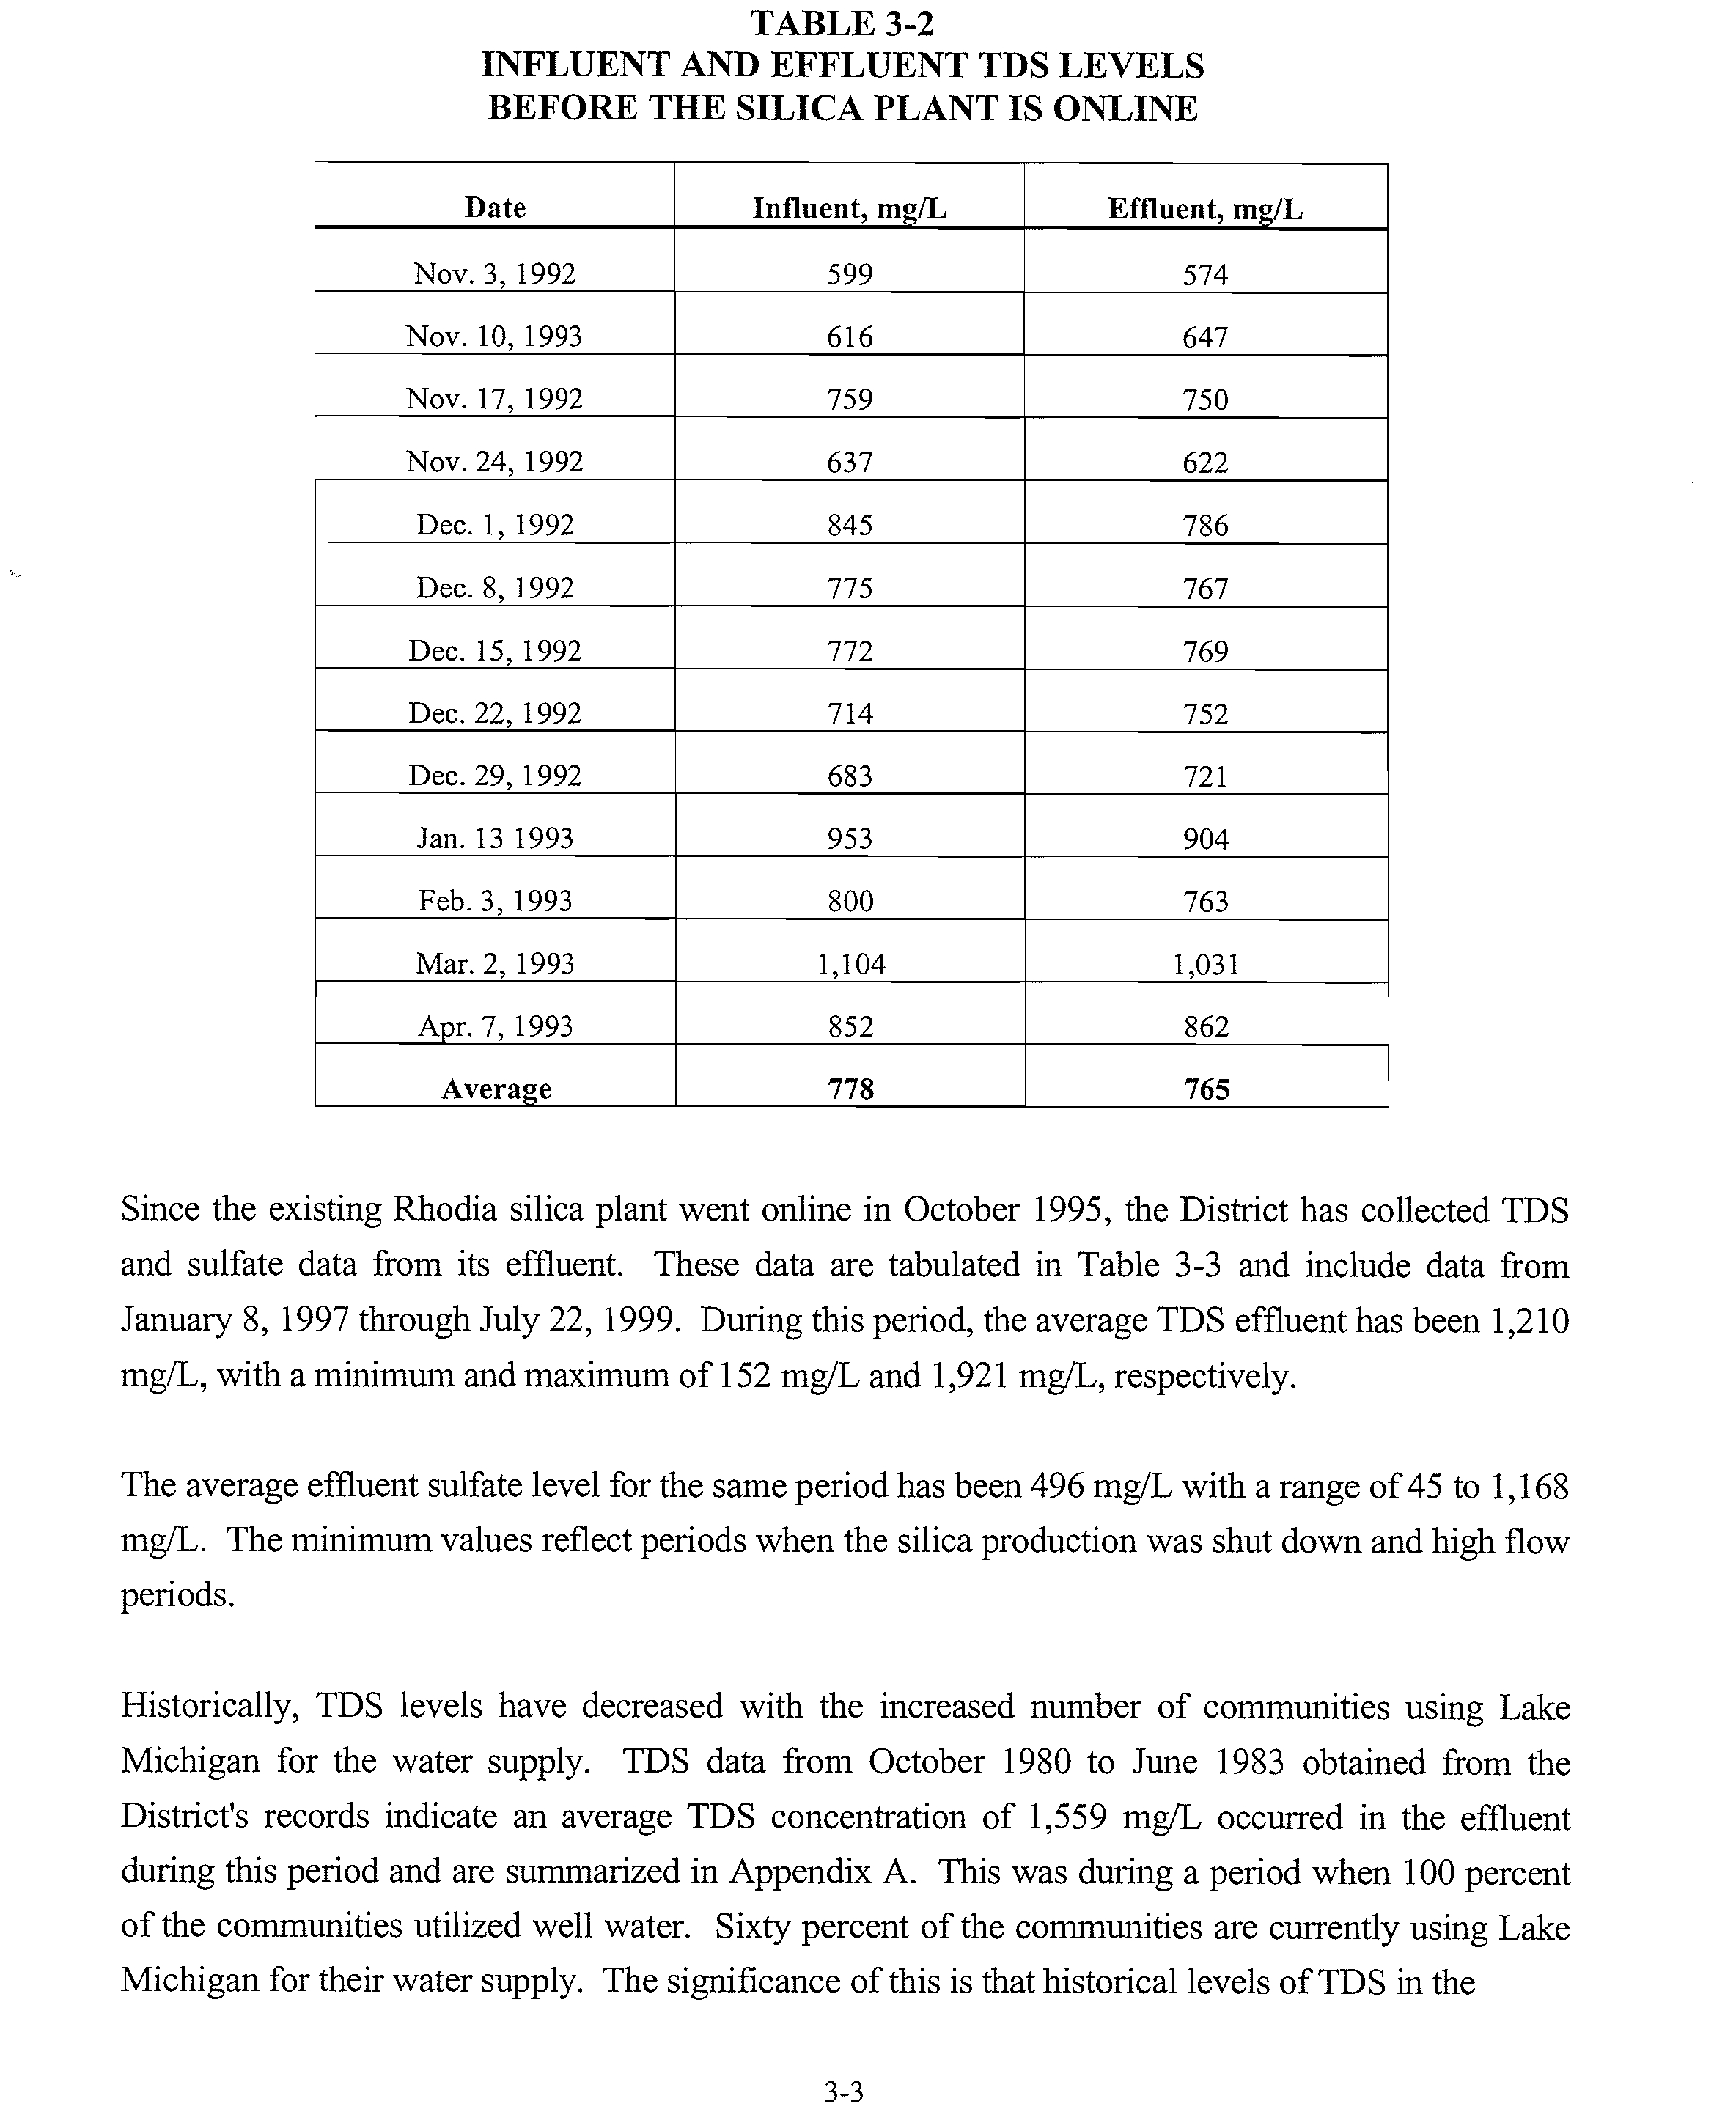
Influent
and
effluent TDS data generated
prior
to the
silica plant going online are tabulated in Table
3-2.
The average
TDS influent
concentration
is 778 mg!L for
the months of
November
1992
through April 1993,
with a range of 599 mg!L to
1,104
mg/L. The
average effluent TDS
concentration for the same time period is 765 mg/L
with
a
range
of
574 mg/L to 1,031 mg/L.
As
would
be
expected, there is little
change
in TDS in comparison of the
influent and
effluent
concentrations.
Month
Avg.
Flow, mgd
May- 1996
28.16
June
19.96
July
18.91
August
12.11
September
11.84
October
12.36
November
13.65
December
17.10
January- 1997
17.01
February
27.11
March
19.22
April
14.75
May
15.73
June
16.29
July
12.16
August
14.71
September
10.87
October
11.11
November
11.39
December
14.12
Month
Avg.
Flow,
mgd
January-
1998
21.09
February
21.70
March
31.70
April
22.20
May
19.22
June
15.01
July
14.07
August
15.57
September
11.89
October
11.33
November
11.71
December
12.04
January
—1999
20.71
February
15.64
March
17.91
April
26.81
May
16.42
June
1-24
17.68
Overall Average
16.75
3-2
TABLE
3-2
INFLUENT AND
EFFLUENT
TDS
LEVELS
BEFORE
THE
SILICA
PLANT IS
ONLINE
Date
Influent, mgIL
Effluent,
mg/L
Nov.
3,
1992
599
574
Nov. 10,
1993
616
647
Nov.
17, 1992
759
750
Nov. 24, 1992
637
622
Dec.
1, 1992
845
786
Dec. 8,
1992
775
767
Dec.
15, 1992
772
769
Dec. 22,
1992
714
752
Dec. 29,
1992
683
721
Jan. 13 1993
953
904
Feb.
3, 1993
800
763
Mar. 2, 1993
1,104
1,031
Apr.
7,
1993
852
862
Average
778
765
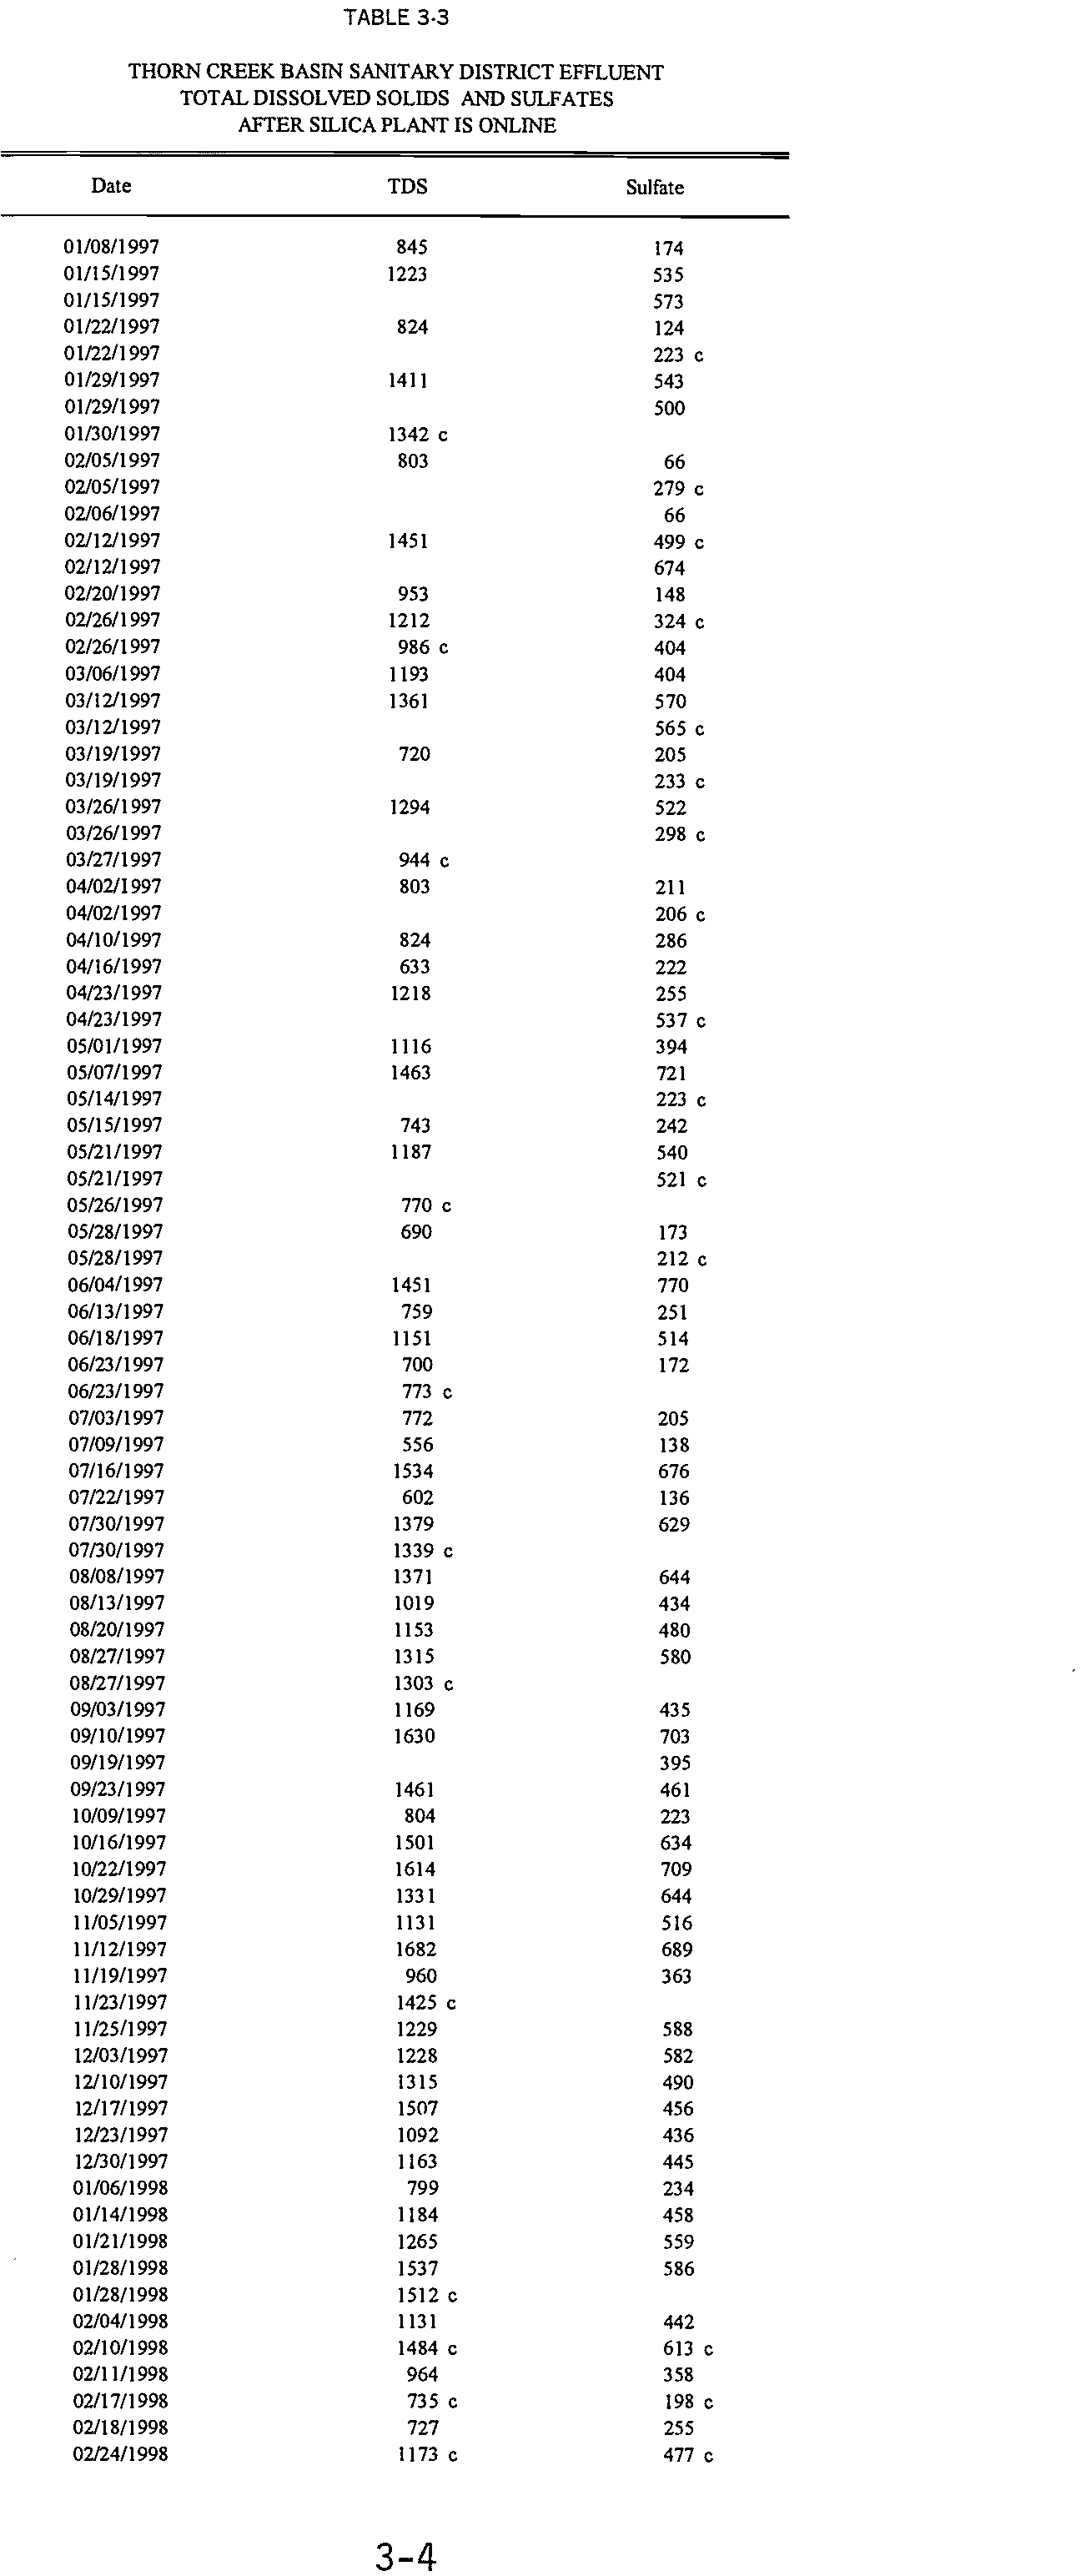
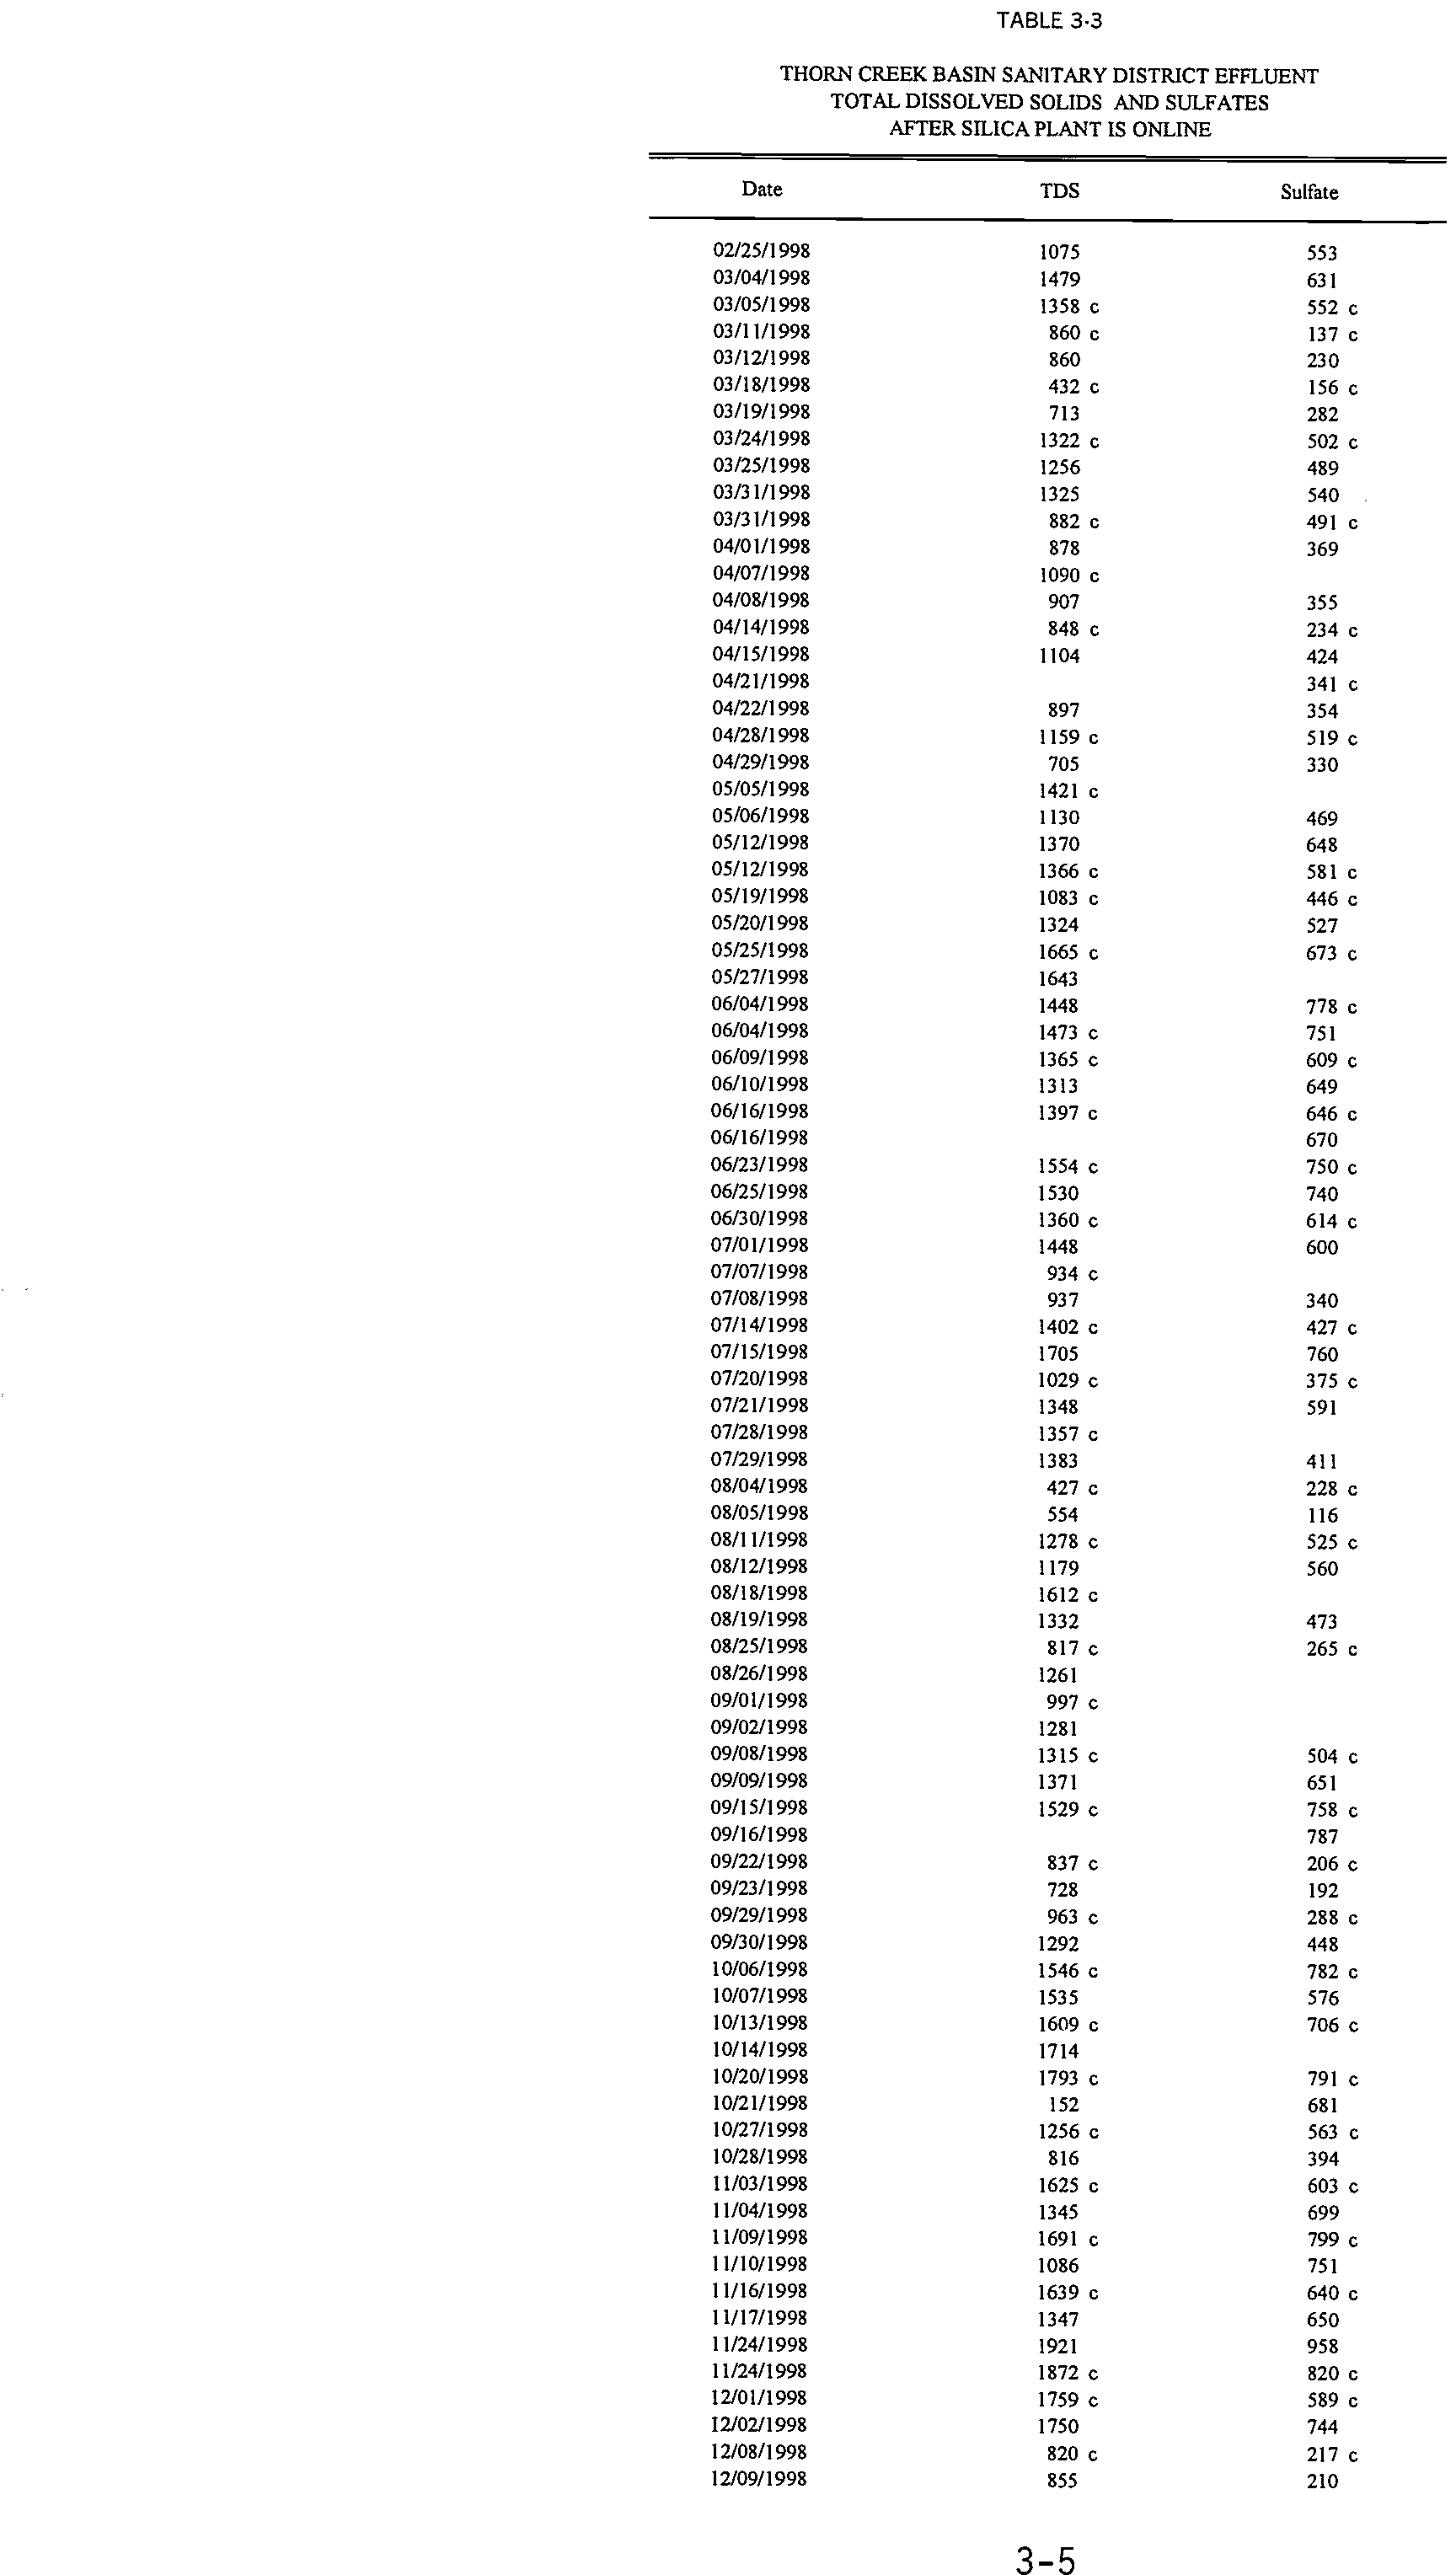
Since the existing
Rhodia silica plant
went online
in October 1995, the
District
has
collected
TDS
and
sulfate data
from its effluent.
These data
are tabulated in Table
3-3 and include
data
from
January
8,
1997
through July
22, 1999. During
this period, the
average TDS effluent
has been 1,210
mg/L,
with
a
minimum
and maximum of
152 mg!L
and
1,921
mg/L, respectively.
The
average effluent sulfate
level for the
same period
has been 496 mg/L with
a
range of
45 to
1,168
mg/L.
The minimum values
reflect
periods
when the silica production
was
shut
down
and
high flow
periods.
Historically, TDS
levels
have
decreased with the increased
number
of
communities
using
Lake
Michigan
for the water supply.
TDS
data
from October 1980
to June
1983
obtained from
the
District’s
records indicate an average
TDS
concentration of 1,559
mg/L
occurred
in the
effluent
during
this
period and are summarized
in Appendix
A. This was
during
a period
when
100
percent
of the communities
utilized
well
water.
Sixty percent
of the communities
are
currently
using
Lake
Michigan
for their water
supply. The
significance of
this is
that
historical
levels
of TDS in the
3-3
TABLE 33
THORN CREEK BASIN SANITARY
DISTRICT EFFLUENT
TOTAL DISSOLVED
SOLIDS
AND SULFATES
AFTER SILICA PLANT
IS ONLINE
Date
TDS
Sulfate
01/01/1997
845
174
01115/1997
1223
535
01/1511997
573
01/22/1997
824
124
01/22/1997
223
01/29/1997
1411
543
01/29/1997
500
01/30/1997
1342
02/05/1997
803
66
02/05/1997
279
02/06/1997
66
02)12/1997
1451
499 a
02/12/1997
674
02/20/1997
953
148
02126/1997
1212
324
02/26/1997
986
c
404
03/06/1997
1193
404
03/12/1997
1361
570
03/12/1997
565
03/19/1997
720
205
03/19/1997
233 a
03/26/1997
1294
522
03/26/1997
298
03/27/1997
944
04/02/1997
803
211
04/02/1997
206
04/10/1997
824
286
04/16/1997
633
222
04)23/1997
1218
255
04/23/1997
537
c
05/01/1997
1116
394
05/07/1997
1463
721
05/14)1997
223
05/15/1997
743
242
05/21/1997
1187
540
05/21/1997
521 a
05/26/1997
770 a
05/28/1997
690
173
05/28/1997
212
06/04/1997
1451
770
06/13/1997
759
251
06/18/1997
1151
514
06/23/1997
700
172
06/23/1997
773
a
07)03/1997
772
205
07/09/1997
556
138
07/16/1997
1534
676
07/22/1997
602
136
07/30/1997
1379
629
07/36/1997
1339 a
08/08/1997
1371
644
08/13/1997
1019
434
08/20/1997
1153
480
08/27)1997
1315
580
08/27/1997
1303
09/03/1997
1169
435
09/10/1997
1630
703
09/19/1997
395
09/23/1997
1461
461
10/09/1997
804
223
10/16/1997
1501
634
10/22/1997
1614
709
10/29/1997
1331
644
11/05/1997
1131
516
11/12/1997
1682
689
11/19/1997
960
363
11/23/1997
1425
11/25)1997
1229
588
12/03/1997
1228
582
12)10/1997
1315
490
12/17/1997
1507
456
12)23/1997
1092
436
12/30/1997
1163
445
01/06/1998
799
234
01/14/1998
1184
458
01/21/1998
1265
559
01/28/1998
1537
586
01/28/1998
1512 a
02/04/1998
1131
442
02/10/1998
1484 a
613 a
02/11/1998
964
358
02/17/1998
735 a
198 a
02/18)1998
727
255
02/24/1998
1173
a
477
a
3-4
TABLE
33
THORN CREEK
BASIN
SANITARY DISTRICT
EFFLUENT
TOTAL
DISSOLVED
SOLIDS AND
SULFATES
AFTER
SILICA
PLANT IS ONLINE
Date
TDS
Sulfate
02/25/1998
1075
553
03/04/1998
1479
631
03/05/1998
1358 c
552
03/11/1998
860
c
137
03/12/1998
860
230
03/18/1998
432
c
156
03/19/1998
713
282
03/24/1998
1322
c
502
03/25/1998
1256
489
03/31/1998
1325
540
03/31/1998
882 c
491
04/01/1998
878
369
04/07/1998
1090
04/08/1998
907
355
04/14/1998
848
C
234
04/15/1998
1104
424
04/21/1998
341
04/22/1998
897
354
04/28/1998
1159 c
519
C
04/29/1998
705
330
05/05/1998
1421
05/06/1998
1130
469
05/12/1998
1370
648
05/12/1998
1366 c
581
05/19/1998
1083 c
446 C
05/20/1998
1324
527
05/25/1998
1665
c
673
05/27/1998
1643
06/04/1998
1448
778
06/04/1998
1473
c
751
06/09/1998
1365 c
609
06/10/1998
1313
649
06/16/1998
1397 c
646
06/16/1998
670
06/23/1998
1554
c
750
06/25/1998
1530
740
06/30/1998
1360
o
614
07/01/1998
1448
600
07/07/1998
934
c
07/08/1998
937
340
07/14/1998
1402 c
427
07/15/1990
1705
760
07/20/1998
1029
c
375
C
07/21/1998
1348
591
07/28/1998
1357 c
07/29/1998
1383
411
08/04/1
998
427 c
228 c
08/05/1998
554
116
08/11/1998
1278 c
525
C
08/12/1998
1179
560
08/18/1998
1612 c
08/19/1998
1332
473
08/25/1998
817
o
265
08/26/1998
1261
09/01/1998
997
c
09/02/1998
1281
09/08/1998
1315 c
504
09/09/1998
1371
651
09/15/1998
1529 c
758
09/16/1998
787
09/22/1998
837
c
206
c
09/23/1998
728
192
09/29/1 998
963
c
288
09/30/1998
1292
448
10/06/1998
1546 c
782
10/07/1998
1535
576
10/13/1998
1609
a
706
C
10/14/1998
1714
10/20/1998
1793
C
791
c
10/21/1998
152
681
10/27/1998
1256 c
563
10/28/1998
816
394
11/03/1998
1625 c
603 C
11/04/1998
1345
699
11/09/1998
1691
c
799
11/10/1998
1086
751
11/16/1998
1639 a
640
11/17/1998
1347
650
11/24/1998
1921
958
11/24/1998
1872
C
820 C
12/01/1998
1759
c
589
12/02/1998
1750
744
12/08/1998
820
c
217
C
12/09/1998
855
210
3-5
TABLE 3-3
THORN CREEK
BASTN SANITARY
DISTRICT EFFLUENT
TOTAL
DISSOLVED
SOLIDS AND SULFATES
AFTER
SILICA PLANT
IS ONLINE
Date
TDS
Sulfate
12/15/1998
464 c
12/16/1998
1479
399
12/2111998
1577 c
784
12/22/1998
1448
684
12/29/1998
1539 c
819
12/30/1998
1834
702
01/05/1999
1169
a
147
a
01/06/1999
1011
631
01/12/1999
1217 a
715 C
01/13/1999
1380
01/19/1999
1559 c
521 c
01/20/1999
1634
661
01/26/1999
1231 a
453 c
01/27/1999
1366
533
02/02/1999
1254
a
498
C
02/03/1999
1168
589
02/09/1999
1426
C
639
c
02/10/1999
1517
708
02/16/1999
1244 a
530
02/17/1999
1327
680
02/23/1999
1673
a
858
a
02/24/1999
1682
818
03/02/1999
1092
03/03/1999
1086
735
03/03/1999
710
03/09/1999
1318
c
590
03/10/1999
1580
691
03/17/1999
1166
c
223 c
03/18/1999
958
341
03/24/1999
1387
a
03/25/1999
1424
03/30/1999
1200
a
279
a
03/31/1999
1292
369
04/06/1999
1569 c
333 a
04/07/1999
1484
421
04/13/1999
1220 a
576
04/14/1999
1293
718
04/20/1999
1285
c
1002
04/21/1999
1249
1168
04/27/1999
917
a
961
04/28/1999
622
228
05/04/1999
1318
a
951
a
05/05/1999
1475
466
05/12/1999
755 a
83
a
05/12/1999
721
45
05/18/1999
1108
05/19/1999
1231
434
05/25/1999
700
a
236
05/26/1999
1350
688
06/02/1999
756
a
256
06/03/1999
1014
417
06/08/1999
1030
a
480 a
06/09/1 999
859
269
06/15/1999
1296
a
625
a
06/16/1999
1411
730
06/21/1999
1722 a
144 a
06/22/1999
1529
748
06/22/1999
06/28/1999
1488
a
802
a
06/29/1999
1445
604
07/07/1999
842
a
255
a
07/08/1999
1310
07/08/1999
07/13/1999
1025
a
517
07/14/1999
123
289
07/21/1999
1574
07/22/1999
1014
Average
1210
496
Minimum
152
45
Maximum
1921
1168
\Vmlxu\a\I0OC\Thomark’Rhodi99Tbl4TCl-FinatEffluuax1I1DS
NOTE: a
indicates
a 24-hoar composite
sample
3—6
Thorn
Creek
exceed the
current
TDS effluent
levels
with the
existing
silica
plant
online.
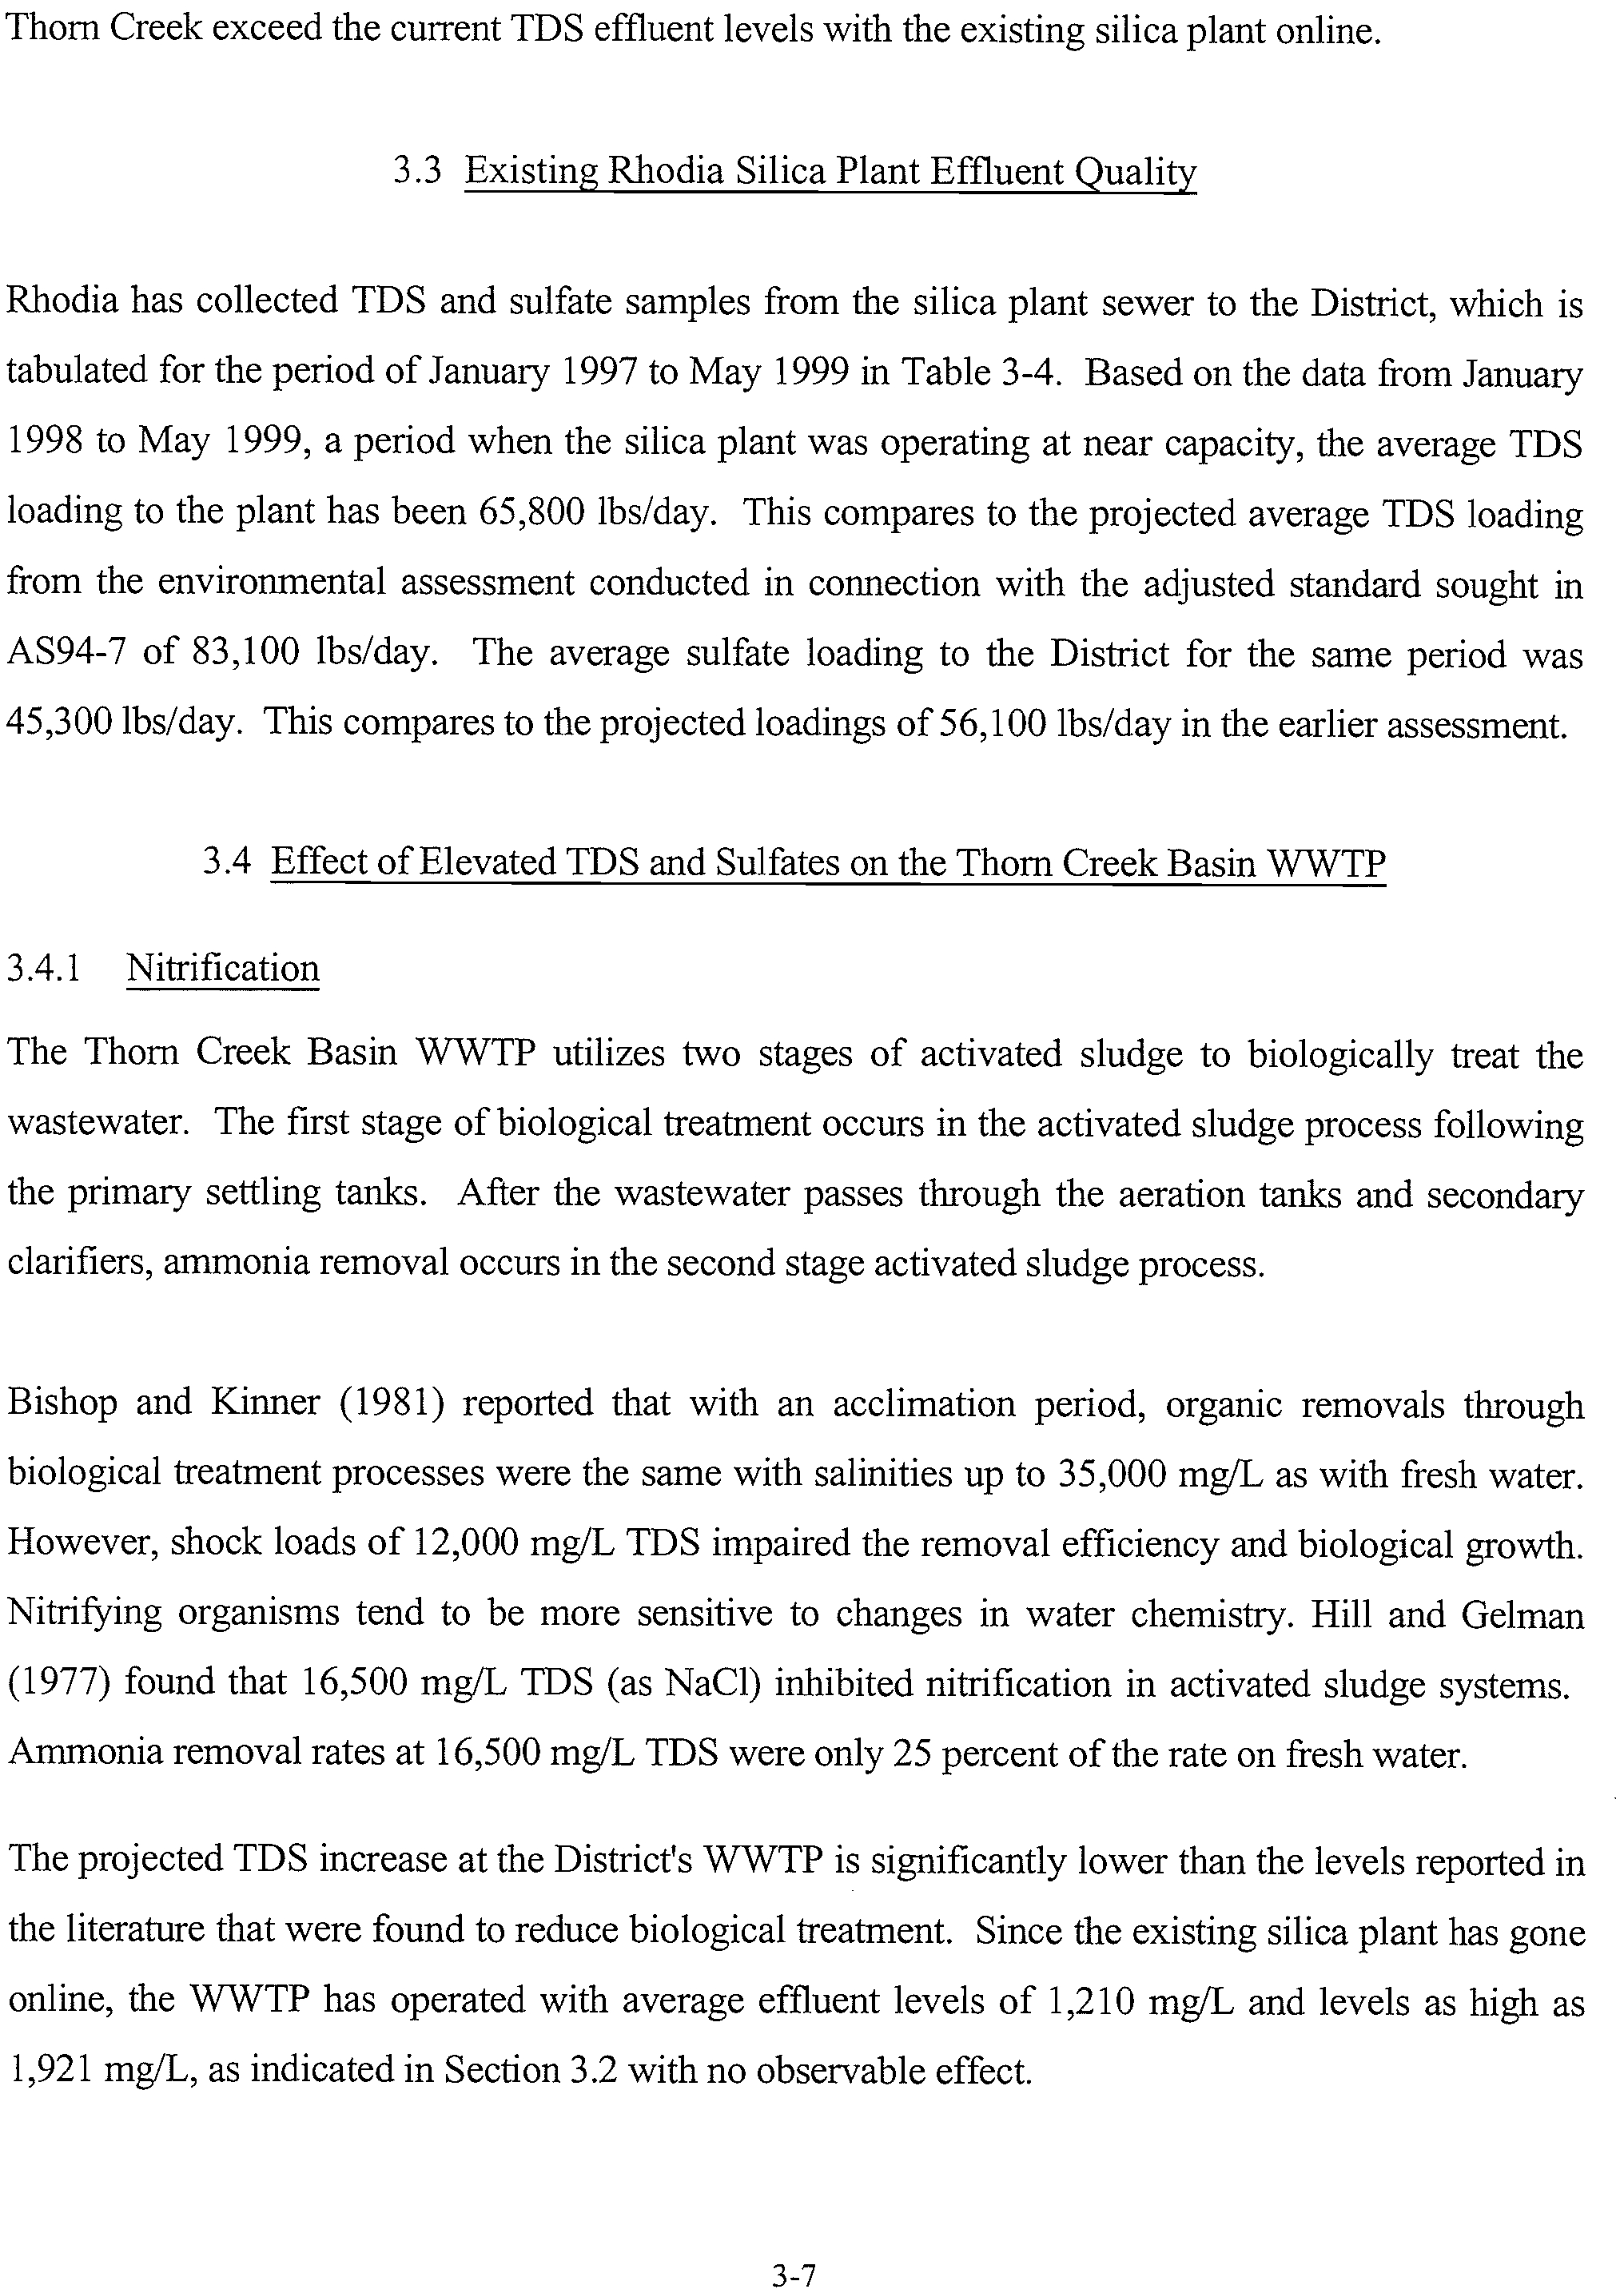
3.3
Existing Rhodia
Silica
Plant
Effluent
Quality
Rhodia
has collected
TDS
and sulfate
samples
from
the silica
plant
sewer
to the District,
which
is
tabulated
for
the
period of
January
1997 to May
1999 in
Table
3-4. Based
on the data
from
January
1998
to May 1999,
a
period
when
the silica
plant
was
operating
at near
capacity,
the average
TDS
loading
to
the
plant has
been
65,800 lbs/day.
This
compares
to the
projected
average
TDS
loading
from
the
environmental
assessment
conducted
in
connection
with
the adjusted
standard
sought
in
AS94-7
of
83,100
lbs/day.
The average
sulfate
loading
to the District
for the
same
period
was
45,300
lbs/day. This
compares
to
the projected
loadings
of 56,100 lbs/day
in the
earlier
assessment.
3.4
Effect of Elevated
TDS
and
Sulfates
on the
Thom Creek
Basin
WWTP
3.4.1
Nitrification
The Thom
Creek
Basin
WWTP
utilizes
two stages
of activated
sludge
to
biologically
treat
the
wastewater.
The first stage
of biological
treatment
occurs
in the
activated
sludge
process
following
the primary
settling
tanks.
After
the wastewater
passes
through
the
aeration
tanks
and secondary
clarifiers,
ammonia
removal
occurs
in the second
stage activated
sludge process.
Bishop
and
Kinner (1981)
reported
that
with
an
acclimation
period,
organic
removals
through
biological
treatment processes
were
the
same
with salinities
up to 35,000
mg/L
as
with fresh
water.
However,
shock loads
of
12,000
mg!L TDS
impaired
the removal
efficiency
and biological
growth.
Nitrifying
organisms
tend
to be
more
sensitive
to changes
in water chemistry.
Hill
and
Gelman
(1977)
found
that
16,500
mg/L
TDS (as
NaC1) inhibited
nitrification
in
activated
sludge
systems.
Ammonia
removal
rates
at 16,500
mg/L
TDS
were only
25 percent
of the
rate on fresh
water.
The
projected
TDS increase
at
the District’s
WWTP
is
significantly
lower
than
the
levels
reported
in
the
literature
that
were
found
to
reduce
biological
treatment.
Since
the existing
silica
plant
has
gone
online,
the WWTP
has
operated
with average
effluent
levels of
1,210
mg/L
and
levels
as high
as
1,921
mg/L,
as
indicated
in Section
3.2 with
no observable
effect.
3-7
TABLE
3-4
RHODIA
EFFLUENT
DATA
TOTAL
DISSOLVED
SOLIDS
and
SULFATE
January
1997
to May
1999
Month
Flow,
mgd
TDS,
lbs/day
Sulfate,
lbs/day
Monthly
Avg.
Daily
Max.
Monthly
Avg.
Daily
Max.
1997
January
555589
28370
98954
34863
65729
February
591310
47658
99378
37469
65750
March
429734
40390
87857
29392
65106
April
419576
31808
88702
21647
65325
May
423213
44564
94391
30117
75815
June
411823
47659
107972
32971
71019
July
317994
31281
95345
25467
75680
August
415896
55760
79872
38574
58329
September
475801
40340
94426
26920
62564
October
515872
64200
97532
43628
61720
November
536760
57880
114334
36448
58721
December
486345
52044
90512
33628
61252
1998
January
517786
49807
118893
34091
103640
February
543214
59287
96263
41002
70714
March
520481
60017
96879
40486
58779
April
551217
55699
96572
40975
65578
May
527735
66772
146853
43221
66670
June
625932
75701
96702
47154
69611
July
524860
58787
133208
37029
60216
August
498331
49354
78770
30058
51555
September
529624
56566
100601
40136
79328
October
660747
74338
99220
53456
75321
November
763847
79330
117963
59538
83485
December
709039
62602
114265
46091
73497
1999
January
649012
69098
105168
54269
78375
February
658442
81001
122758
56929
79888
March
583437
64734
108831
48242
73778
April
644614
84951
112578
54375
65386
May
536855
70378
116516
43767
69747
Average
1997-1999
538796
57254
103838
40067
69399
Average 1998-1999
590893
65790
109532
45342
72092
Maximum
1997-1999
763847
84951
146853
59538
103640
Maximum
1998-1999
763847
84951
146853
59538
103640
aI Speculative
data
as TDS
was
also
79328
\\Darlene\c\l
DOC\Thomcrk\Rhodia99Tabl\[RhodEff.xlsjSheetl
3-8
3.4.2 Anaerobic
Digestion
Toxicity
of
Sulfides
to Anaerobic
Sludges
Elevated sulfate
concentrations
have
been
identified as a cause
of scaling
in boilers and heat-
exchangers,
and can
serve
as a
substrate for
organisms
implicated
in
bio-corrosion (Maree,
et al.,
1987).
Dissimilatory
anaerobic
sulfate
reduction is
a
process
where Sulfate
Reducing Bacteria
(SRB) use
sulfate
as
an electron
acceptor
in the
oxidation
of
organic matter
(Eis,
et
al, 1983). Sulfur is in
the 6
oxidation
state
in sulfate
compounds.
The reduction
of sulfate
yields
hydrogen
sulfide (Hilton and
Oleszkiewicz, 1987),
where
sulfur
is in the 2
oxidation state. The
blackening of
wastewater sludge
is
frequently due to
the reaction of
hydrogen sulfide
and
iron to
produce a black iron
sulfide (FeS)
compound
(WEF
Manual
of
Practice
8, 1992).
In an
anaerobic
reactor,
desulfovibrio and
desulfotomaculum
are
the two major genera
of
sulfate
reducing
bacteria
(Hilton
and
Oleszkiewicz,
1987).
Acid
forming
desulfovibrio
SRB
incompletely
oxidize C
3
compounds to
acetate and hydrogen
in the
reduction of S
46 to
2
Desulfotomaculum
completely
oxidize
acetate
to 2
CO in
the reduction of
46
to
2•
Methanogens
compete
with
SRB for
acetate
and
hydrogen
produced by the
acetoclastic bacteria
to
form
methane.
The H
2
S
evolved from
biological
activity ionizes in water
and
follows
an equilibrium system:
H
2
S
4
H
+ HS
2W
+
The
equilibrium between
H
2
S
and
HS is pH dependent
according to
the
following
relationship:
H
2
S = (1 + 1.02
*
1O71
As
depicted
below,
the
percentage of un-ionized
H
2
S drops
from
90
percent
at pH 6.0 to 50
percent
at pH
7.0
to 10 percent at
pH 8.0. In
anaerobic
treatment,
these variations
are significant
because the
pH is
maintained between
6.0 and 8.0.
The optimal
pH
range
for methanogens
is
between
6.8 and
7.5.
3-9
Effect of pH on hydrogen sulfide-sulfide
equilibrium
(1O molar solution, 32
mg H2
S/L)
Studies of sulfide toxicity to anaerobic cultures in treatment
processes
have shown
complete
inhibition
of methanogenisis at
concentrations
of 200 mg/L un-ionized H
2
S. A decrease in methane
production can occur at a hydrogen sulfide concentration of
50
mg/L.
Using lactose as an electron donor,
experiments
were conducted on the effect of sulfide upon
lactose
utilization in the pH range of 6.0 to 8.0. Lactose was converted
to acetic acid by acid forming
bacteria. Results indicated that for sulfides at concentrations higher
than 100 mg S
2
1L, lactose
uptake was most rapid at pH 8.0 and lowest at pH
6.0
(Hilton and Oleszkiewicz, 1987).
The
induction period decreased with increased pH. At
a sulfide concentration of 1,000 mg S
2
/L, lactose
uptake was completed in ten hours at the pH of
8.0, and lactose uptake was not complete after 200
hours at pH
6.2. This
experiment
implies
that
sulfide
toxicity can be reduced
by
increasing
reactor
pH
(Hilton and Oleszkiewicz, 1987) or that un-ionized
hydrogen sulfide is the toxic form.
Experiments also show
that
lactose utilization was
inhibited specifically
by H
2
S concentration,
and
not total sulfide concentration (Hilton and Oleszkiewicz,
1987). For a total sulfide concentration
of
500
mg/L,
100 percent lactose
uptake
was
reported
in eight hours. However,
only 40 percent
of
lactose uptake was achieved for an H
25 concentration
of 450 mg/L after ten hours.
If glycolysis is
inhibited, the complex carbohydrates fed to an anaerobic
treatment reactor
will
not be
broken
down
into a substrate that sulfate reducing bacteria and
methanogens can derive energy
from.
pH
3-10
Microbiologically
Influenced
Corrosion (MIC)
Corrosion occurs in cooling systems when two dissimilar surfaces cause an electric potential. The
oxidation of the
metal is
caused by the reduction
of another compound.
Dissolved solids and
dissolved
oxygen
increase the electrical conductivity of
the
solution and
accelerate corrosion.
Almost all Microbiologically Influenced Corrosion (MIC) is due to the growth and metabolic
activities of
microbial communities
on the surface of a
metal or alloy
(WEF
Manual of Practice
8,
1992). Thus MIC may appear as localized crevices or pitting
corrosion,
and advanced MIC almost
always looks
like pitting corrosion.
Studies have
traditionally emphasized
the
role of SRB
as the
most
important cause of MIC. More recent studies indicate that the extent of MIC cannot be entirely
accounted
for
by
the activities and
levels of SRB.
Instead, MIC seems to
correlate
with
the
presence
of microbial
communities
composed of many different kinds of bacteria. Acid forming bacteria that
convert organic
materials
into organic acids, such as acetic acid and lactic acid, were found to be of
particular importance to the occurrence of MIC. Acids can cause active corrosion of many alloys,
and also
serve as nutrients for other SRB. MIC is caused by under-deposit acid attack and can occur
internally
or externally on metal alloys.
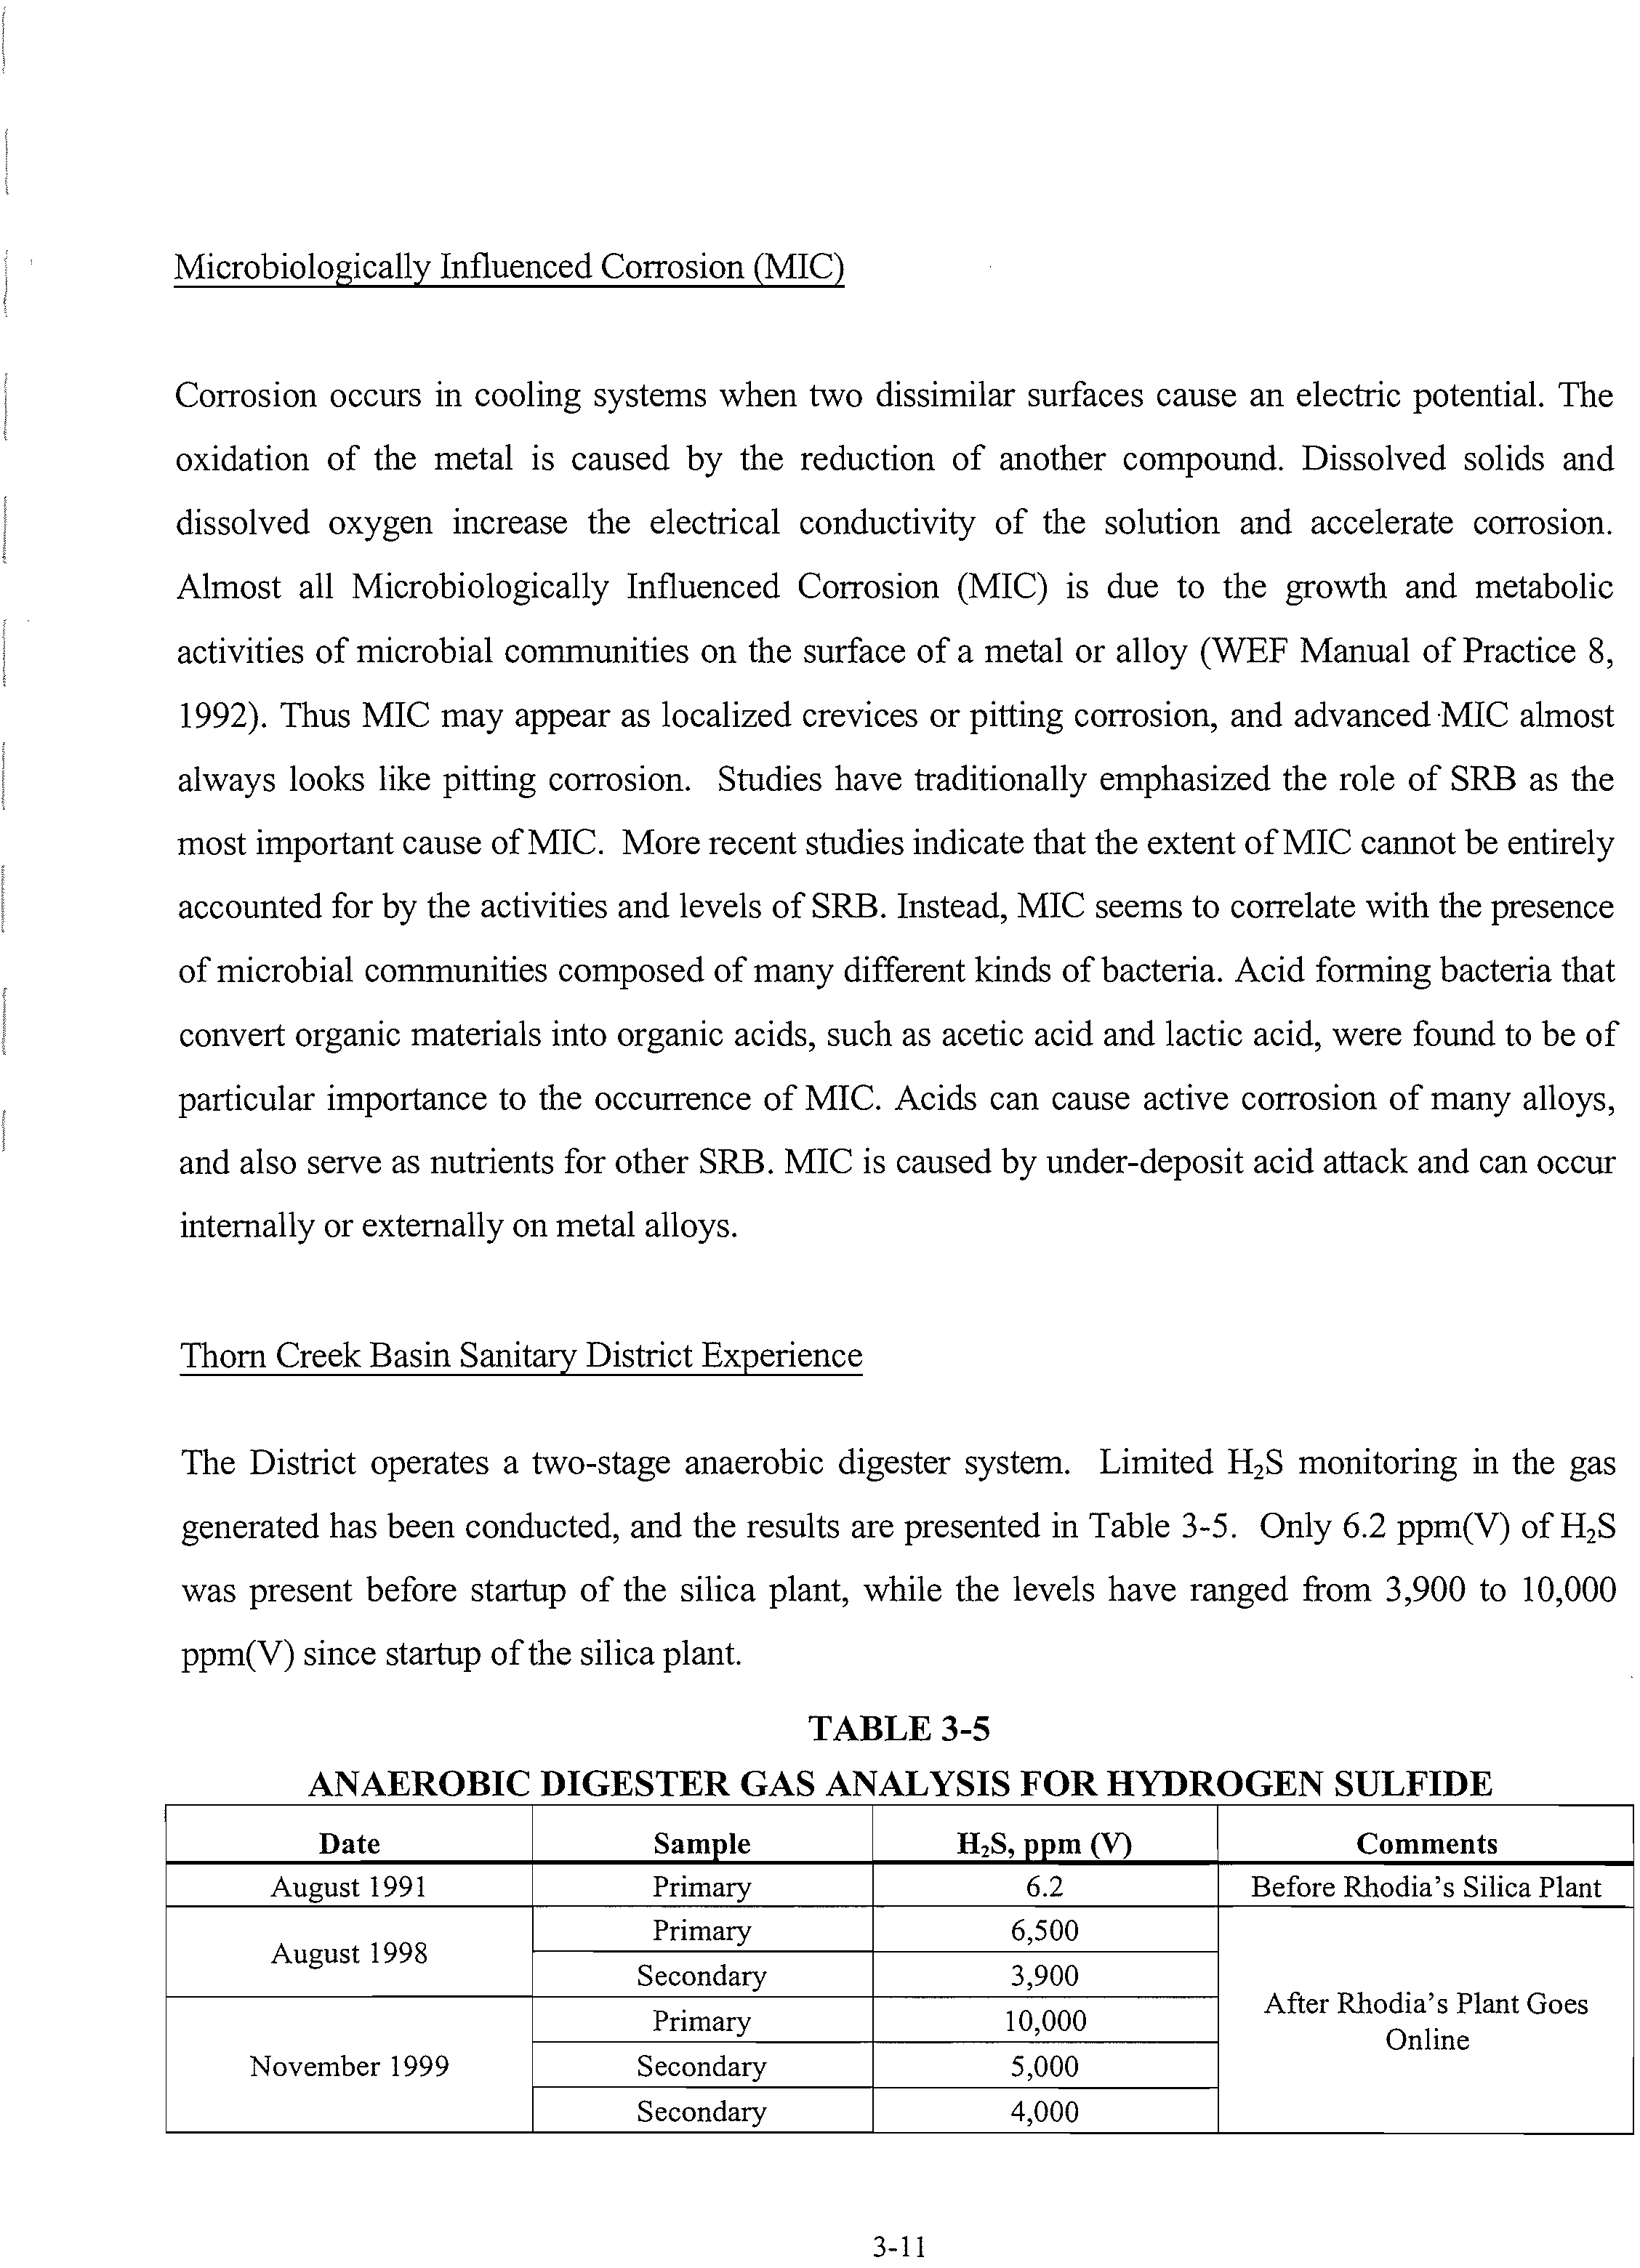
Thorn Creek Basin
Sanitary District
Experience
The District operates a two-stage anaerobic digester
system. Limited H
2
S monitoring in
the gas
generated has
been conducted, and the results are presented in Table
3-5.
Only 6.2 ppm(V)
of H
25
was present before startup of the silica plant, while the
levels have ranged
from 3,900 to 10,000
ppm(V)
since startup of the silica plant.
TABLE 3-5
ANAEROBIC DIGESTER
GAS ANALYSIS FOR HYDROGEN SULFIDE
Date
Sample
H2
5, ppm (V)
Comments
August 1991
Primary
6.2
Before Rhodia’s Silica
Plant
Primary
6,500
August 1998
Secondary
3,900
After Rhodia’s Plant Goes
Primary
10,000
Online
November 1999
Secondary
5,000
Secondary
4,000
3-11
At 3 0°C,
the solubility of
H
2
S is approximately
3,000 mg/L (Merck
Index, II Ed, 1989).
The
measured soluble
sulfide
(assumed
to
be the H
2
S
both un-ionized plus
ionized S)
2
H in the sludge
is
13
mg!L.
The total
sulfides
in
the anaerobic sludge
has
been measured at
260 mg/L. The District
has seen
no
deterioration in
methane production
since acceptance of
the silica plant
wastewater
was
initiated,
nor would
deterioration
be
expected
at 13 mg/L
2
H
S.
The
measured 2
H
S in the
offgas
checks
reasonably
well with the measured
liquid soluble
sulfides, based on
the Henry’s law constant
for
H
2
S (See
Appendix
B).
While
inhibition has not
been
experienced
in
the District’s
digester, an increase
in cleaning of the
gas handling system
due
to
fouling has been experienced.
White
deposits
have been
experienced
in
both
the gas
compressors
and
heaters where
the
digester
gas
in burned. Cleaning
of the equipment
has
increased from quarterly
to
monthly
since Rhodia’s silica
operation came on-line.
This
level of
cleaning
can be expected to
increase proportionally
with the
increase
in
sulfates
from Rhodia.
Currently
the
majority
of the sulfides in
the
digester
are in
a
precipitated form.
However, with
the
expansion
it is
reasonable
to assume no further
cations are
available to react
with
the soluble
sulfides,
and
therefore all of
the additional sulfur
will form H
2
S. The
soluble sulfides
will approach
100 mg/L
in the digester, and
the H
2
S
concentration
in the off gas
will reach 1.5 to
1.6
percent,
approximately
50
percent higher
than the present
levels. The
calculations on the sulfur
balance
are
presented
in Appendix B.
Based on
the literature, soluble
sulfide
levels
of
100
mg/L
will not
be inhibitory. The
H
2
S in the
offgas
of 15,000
ppm is a concern and
sulfur removal
will
be
necessary
before burning the methane
gas.
This
will also
reduce the fouling
experienced
in
the
gas
compressors
and heaters. As
the
WWTP
uses
the digestor
gas for mixing,
consideration
should be
given
to
putting
the H
2
S removal
system
on this internal
mixing stream.
Such an approach would
drastically
lower
the H
2
S in
the
liquid phase, which would
provide
assurance
that
gas
production
will
not be
impacted
and will
reduce
fouling throughout
the digester
system.
3-12
3.4.3 Biomass Solids Separation
Elevated
sodium
levels
have been
reported to result in the development of poorer settling
solids in
activated sludge processes (Higgins, J.M. and
J.T. Novak, 1997). One theory is that the monovalent
ions (e.g.
sodium) displace the
divalent
ions (e.g. calcium and magnesium) within
the biomass
floc.
Flocculation is know to improve
with the valency of the cations, often referred
to as the Schultze
Hardy Rule. This theory states
that
divalent
ions are 30 to
60
times more effective
than
monovalent
ions,
and trivalent ions
are 700 to 1,000 times more effective
than monovalent ions (AWWA,
1971).
Recent research has found that at sodium
to divalent cation ratios above 2:1,
a deterioration in
settling and dewatering
characteristics
can occur (Higgins, M.J.
and J.T. Novack, 1997).
This
research indicated that deteriorations
in settling can occur after approximately
ten days of elevated
sodium levels, with
a
similar
lag when the sodium-to-divalent ratio
was
lowered.
Higgins et
al., (1999) evaluated
the effect
of
the
monovalent-to-divalent ratio on the
Sludge Volume
Index (SVI) and effluent total suspended
solids (TSS). At ratios up to 2.5:1
(monovalent-to
divalent), no impact was discerned. The next
ratio studied was 6:1, and TSS and
SVIs increased.
Data
between
these
two
ratios (2.5:1 and 6:1) were not
generated.
Deterioration in
effluent TSS can
be
counteracted
by maintaining a low
food-to-microorganism
(F:M) ratio, (or
by
carrying
a
higher
biomass
population
in
the activated sludge
system). Thom
Creek already operates with low F:M
ratios
to maintain nitrification.
Therefore increases
in the
sodium concentration would
not
be expected to occur until higher
monovalent-to-divalent
ratios
exist. Based on the existing loadings
from Rhodia, and limited
calcium, magnesium,
and potassium
effluent data, the current average
monovalent-to-divalent
ratio is
1.3:1, below any level
where
poor
settling
would
be
anticipated.
Assuming with the
proposed expansion the
average sodium
increases
by the
same ratio
as
the
projected peak production
by Rhodia, the
monovalent-to-divalent
ratio will
increase to 2.6:1. At this level,
little or no deterioration
in performance
would be expected.
However, if peak
production occurs for
a sustained
period
of time
(e.g. greater
than ten days),
poorer
settling
solids
could develop, with
ratios of the
monovalent-to-divalent
cations up to
3.5:1.
3-13
Thom
Creek
currently
has
an excellent settling biomass,
with typical
effluent suspended solids
(before filtration)
of less than two to
four
mg/L. Since 1998,
there
have
been 13
periods of effluent
sulfate
levels between 700
and
960
mg/L for periods
ranging from
4
to 21 days. A regression
analysis of
the effluent
TSS
versus sulfate revealed a
poor correlation (R
2
=0.
12) between these
two
variables. Assuming a linear relationship, for every 140 mg/L increase in sulfates, the effluent
TSS
can
be expected to increase one mg/L.
Appendix
B contains this analysis.
Thom Creek has tertiary filters, so
any increase
in TSS will
be
significantly offset by the filtration.
However, more
frequent
backwashing will
be
necessary.
During periods of
higher
effluent
suspended
solids
when
the
filter is down or during higher
flows, a flocculant (e.g. a trivalent cation
such as alum or ferric chloride) may be
necessary,
if the settleability deteriorates more than the
linear regression predicts.
In summary, some deterioration in solids settling and effluent
suspended
solids may result from
the
proposed Rhodia expansion,
especially
during
periods
of peak production. This
deterioration
is not
expected to be
sufficient
to
create compliance issues with
suspended
solids, especially with
the
tertiary filters. If the deterioration becomes higher than predictable, long sludge ages or a coagulant
added between
the aeration tank and secondary clarifier
would
have
to be
implemented.
3-14
4. THORN
CREEK
AND
TRIBUTARY
WATER
QUALITY
4.1 Introduction
Thorn
Creek
is classified
a general
use
water
under Title
35 Of
the State
of Illinois
rules
and
regulations
as
described in
Section 2.7
of this
report.
The
existing
adjusted
standard
limits range
from
2,100
mg/L to
1,700
mg!L
for
TDS
and
1,000
mg/L
to
750 mg/L
for sulfate
for
the
four
reaches
identified
along
Thorn
Creek
and the
Little Calurnet
River.
Before
discussing
the
impact
of
Rhodia’s
proposed
silica
plant
expansion
on
Thorn Creek,
the
existing
water
quality of Thorn
Creek
and its
tributaries
is described
herein.
4.2
Thorn
Creek
Monitoring
Database
Flow
and
chemical
monitoring
on
Thorn
Creek
was
routinely
conducted
by the
United
States
Geological
Survey
(USGS)
at
two
stations on
Thom Creek,
one
at
Glenwood
(Station
05536215)
and
one
at
Thornton
(Station
05536275).
Recent
monitoring
at these stations
by the
USGS
is limited
to flow.
The IEPA
has
continued
to
collect water
quality data
at the
Thornton
Station and
these
data
have
been
obtained for
the
period
of
1990
to
1998.
Both the Glenwood
station
and the
Thornton
station
are
located
downstream
of the
Thom
Creek
Basin
WWTP
outfall
as depicted
in
Figure 4-1
at
river miles
9.2
and
4.2,
respectively.
The
Glenwood
station is
located
prior to
(upstream
of) the
Deer Creek
merger
and is sensitive
to
water quality
fluctuations
from
the
District’s
WWTP
discharge.
The
Thornton Station
is located
downstream
of
the three
tributary
mergers
with
Thorn Creek,
and is
therefore
affected
by
all
three
creeks.
Flow data
recorded
since 1977
have been
obtained from
the USGS.
TDS
and
sulfates
have
also
been
analyzed
and obtained
from
the
station at Thornton
by
the USGS,
but
not at
the
Glenwood
Station.
The
USGS
also
has three
monitoring
stations located
upstream
of the
Thom Creek
Basin
WWTP;
one near
Chicago
Heights
(Station
05536210),
one at Chicago
Heights
(Station
05536204)
and one
at
Park
Forest
(Station
05536201).
Flow data
from
1974
to
1978
are
available
for the
station near
Chicago
Heights,
but
the
USGS
since
then
has
stopped reporting
flow
data. No
TDS or sulfate
data
4-1
5000’
I
5000
LITTLE
CALU
MET
STATION
#05536290
KEY—SAMPLING
LOCATIONS
THORN
CREEK
S
USGS
STATIONS
THORN
CREEK
BASIN
WWTP
SAMPLE
LOCATIONS
10.3
7Q10
FLOW,
mgd
(Isws
CONTRACT
REPORT
545
(1993))
STATION
#05536275
WAMPUM
LAKE
z
BUTTERFIELD
CREEK
11.8
THORN
CREEK
BASIN
SANITARY
DISTRICT
WWTP
C)
H,,
rr9
NORTH
CREEK
.
PARK
FOREST
CHICAGO
HEIGHTS
EER
LAKE
PINE
LAKE
‘CIWC
WWTP
FIGURE
4—1
MONITORING
LOCATIONS
THORN
CREEK
BASIN
SANITARY
DISTRICT
CHICAGO
HEIGHTS,
ILLINOIS
w
0
STATION
#05536255
STATION
#05536235
THIRD
CREEK
CADFILE:THORN—8
are available
from the USGS
at this
station.
USGS
water
resources
reports do
not
contain any
data
for the
remaining
two stations.
Table
4-1 summarizes
the
river mile locations
for key
points along
Thom
Creek.
The District
has
sampled
Thom
Creek
at
Joe Off
Road for
purposes
of
monitoring
the
TDS
and
sulfate
levels since
the
Silica plant
has gone
online.
TABLE
4-1
SUMMARY
OF THORN
CREEK
AND
TRIBUTARY
GAGING
STATIONS
Description
River
Mile
Distance
from
WWTP
Outfall, miles
Confluence
with
Little Calumet
River
0.0
10.1
USGS
05536275
at Thomton
4.2
5.9
Confluence
with North
Creek
4.5
5.6
B&O
RR
(formerly
C&EI
RR)
6.3
3.8
Confluence
with Butterfield
Creek
7.5
2.6
B&O
RR
(formerly
C&EI
RR)
b/
76
2.5
Confluence
with
Deer
Creek
8.1
2.0
USGS
05536215
at Glenwood
b/
9.2
0.9
Joe
Off
Road
b/
9.9
0.2
WWTP
Outfall
a!
10.1
0.0
Haisted
Street
a!b/
10.7
-0.6
USGS
05536210
nr.
Chicago
Heights
10.8
-0.7
Chicago
Road
11.4
-1.3
Headwaters
19.5
-9.4
Source:
Healy, 1979
a!
Estimated from
topographic
map
b/Thom
Creek WWTP
sampling
locations
4-3
4.3
Tributary
Monitoring
Database
Thom
Creek
is
influenced
by
three
main
tributaries;
Deer
Creek,
Butterfield
Creek
and
North
Creek.
The
USGS
has five
monitoring
stations
on Deer
Creek,
but since
1974
the USGS
only
maintains
flow
data
at the station
near
Chicago
Heights
(Station
05536235).
There
are four
USGS
stations
on
Butterfield
Creek,
but since
1974,
the
USGS
only
maintains
flow
data
at
the
station
at
Flossmoor
(Station
05536255).
There
is
one USGS
station
on North
Creek
near
Lansing
(Station
0553670)
that
the
USGS
maintained
up
to
1978. TDS
and
sulfate
are
not monitored
at
any
of these
stations.
The
locations
of
these stations
are summarized
in Table
4-2.
TABLE
4-2
TRIBUTARY
MONITORING
LOCATIONS
Description
Waterway
Dist.
above Thorn
Creek
Merger
USGS
05536235
near
Chicago
Heights
Deer Creek
2.8
USGS
05536255
at Flossmor
Butterfield
Creek
1.2
USGS
05536270
near
Lansing
North Creek
5.1
USGS
Station
05536195
at
Munster,
IN
Little
Calumet
River
4.6
b/
USGS
05536290
at
South
Holland
Little Calumet
River
0.4
Cl
USGS
River
Miles
Distance
upstream
of
Little
Calumet
River and
Thorn
Creek merger
C!
Distance
downstream
of
Little Calumet
River
and Thorn
Creek
merger
The
USGS
has
maintained
a gaging
station
(Station
05536195)
on
the Little
Calumet
River
at
Munster,
Indiana
since
1978.
This gaging
station
is located
4.6
miles
upstream
of the
Thom
Creek
merger
and
0.4
miles
upstream
of the
Illinois
and
Indiana
state
line. Data
have
been
collected
for
flow
and chemical
analysis.
There
are
no major
waterways
that
merge
with
Little
Calumet
River
between
the Munster
gaging
station
and
the Thom
Creek
confluence.
The
water
quality
data
obtained
from
this
station
would,
therefore,
be
indicative
of
upstream
water
quality.
The
USGS
also
maintains
a monitoring
station
on
the
Little
Calumet
River
at
South
Holland
(Station
05536290),
0.4
miles
downstream
of
the Thom
Creek
confluence.
The
USGS
has
only
collected
flow data
at this
station.
No TDS
or sulfate
data
have
been
collected.
4-4
4.4 Thorn
Creek and Tributary Flow Rates
Annual average
flow
rates
of the various waterways
for the years 1977 to 1996 are
summarized
in
Table 4-3. The
average flow
rate at
the
Thornton
USGS
gaging station (river mile 4.2) is
74 mgd
for
this time period. The average flow
rate at the
USGS
Glenwood
station (river mile 9.2)
located
upstream of the
Deer Creek merger
was 29 mgd
for the same time period. Based upon
the available
flow data on
the other tributaries,
the following
average
contributions
to the flow at Thornton
were
calculated:
Percent
of
Flow
at
Thornton Station
Thorn Creek up to
Deer
Creek Merger
39
Deer Creek
19
Butterfield
Creek
18
North Creek
11
Thorn Creek between Deer Creek
and
Thornton
13
TOTAL
100
Table
4-4 summarizes the flow data for the
two Thorn Creek gaging
stations, for
the period
of 1949
to 1997 for
the Glenwood station and
1948 to 1997 for the Thornton station, indicating
the flow
regime for the stream.
TABLE 4-4
SUMMARY OF FLOW DATA FOR THORN CREEK
USGS
STATIONS
Flow
Characteristic
USGS 05536215 at Glenwood
USGS
05536275
atThornton
Period of Record
(Water Years)
1949-1997
1948-1997
Annual
Mean
26 mgd
68 mgd
Highest Annual
Mean
44
mgd (1993)
129 mgd (1993)
Lowest Annual
Mean
16 mgd (1954)
33 mgd (1963)
Highest
Daily Mean
969 mgd (1968, 1996)
2,460 mgd (1990)
Lowest Daily
Mean
4
mgd (1949)
3 mgd (1949)
The USGS, as part
of the statistical
analysis of Thorn Creek, has determined flow values
for the
10th, 5 0th, and
90th percentiles, indicating
the percent of time
a
flow rate will
be
exceeded
in
Thorn
Creek.
These values can be used for predicting
the effect a change
in the
TDS concentration
4-5
TABLE
4-3
USGS
GAGING
STATION
AVERAGE
FLOVATES,
mgd
Deer
Butterfield
North
Thorn
Creek
Creek
Creek
Creek
Year
a!
05536210
05536215
05536275
05536235
05536255
05536270
nr
Chicago
Hts.
at
Glenwood
at
Thornton
nr
Chicago
Hts.
at
Flossmoor
nr
Lansing
1977
7
23
55
9
9
8
1978
9
25
59
12
11
9
1979
33
80
18
15
1980
25
60
11
8
1981
27
69
13
13
1982
36
94
16
20
1983
26
74
11
13
1984
25
72
14
II
1985
28
76
16
12
1986
20
54
9
8
1987
22
68
10
11
1988
22
58
9
9
1989
25
65
10
9
1990
37
107
21
18
1991
36
101
23
16
1992
22
56
8
7
1993
45
130
29
27
1994
30
64
11
12
1995
30
61
13
11
1996
38
82
14
18
Average
8
29
74
14
13
8
River
Mile
10.8
9.2
4.2
Miles
from
-0.7
0.9
5.9
2.0
bI
2.6
b/
5.6
bI
WWTP
Outfall
a!
Average
for
calendar
year
(opposed
to
water
year)
b/
Distance
to
confluence
with
Thorn
Creek
SOURCE:
USGS
Water-Data
Reports
IL-79-2
through
IL-97-2
\\Darlene\c\lDOC\ThorncrkRhodia99Tabl\[TCTB43.x1sjA
of
Thorn Creek Basin plant’s discharge
will have on the receiving water. The
values have
been
reversed
to
represent the
percent
time
a
flow
rate will be less than the value indicated,
as depicted
in
Figure 4-2 for
Reach #1. For example,
90 percent
of the time,
the Thorn Creek flow
rate is below
76
mgd, while 50
percent of the time
the flow is below
17 mgd.
These are based
on the 1996 calendar
year USGS data
for the station at
Glenwood.
In considering the
environmental
impact
of
loadings
on
a waterway, the worst case
conditions
caused by a
loading will occur at low
flow periods. The ISWS analyzes low flow
conditions
in
the
waterways throughout
Illinois.
Figure 4-1 includes the
7-day, 1
0-year (7Q1
0)
low
flow values
as
determined by the
ISWS (1993).
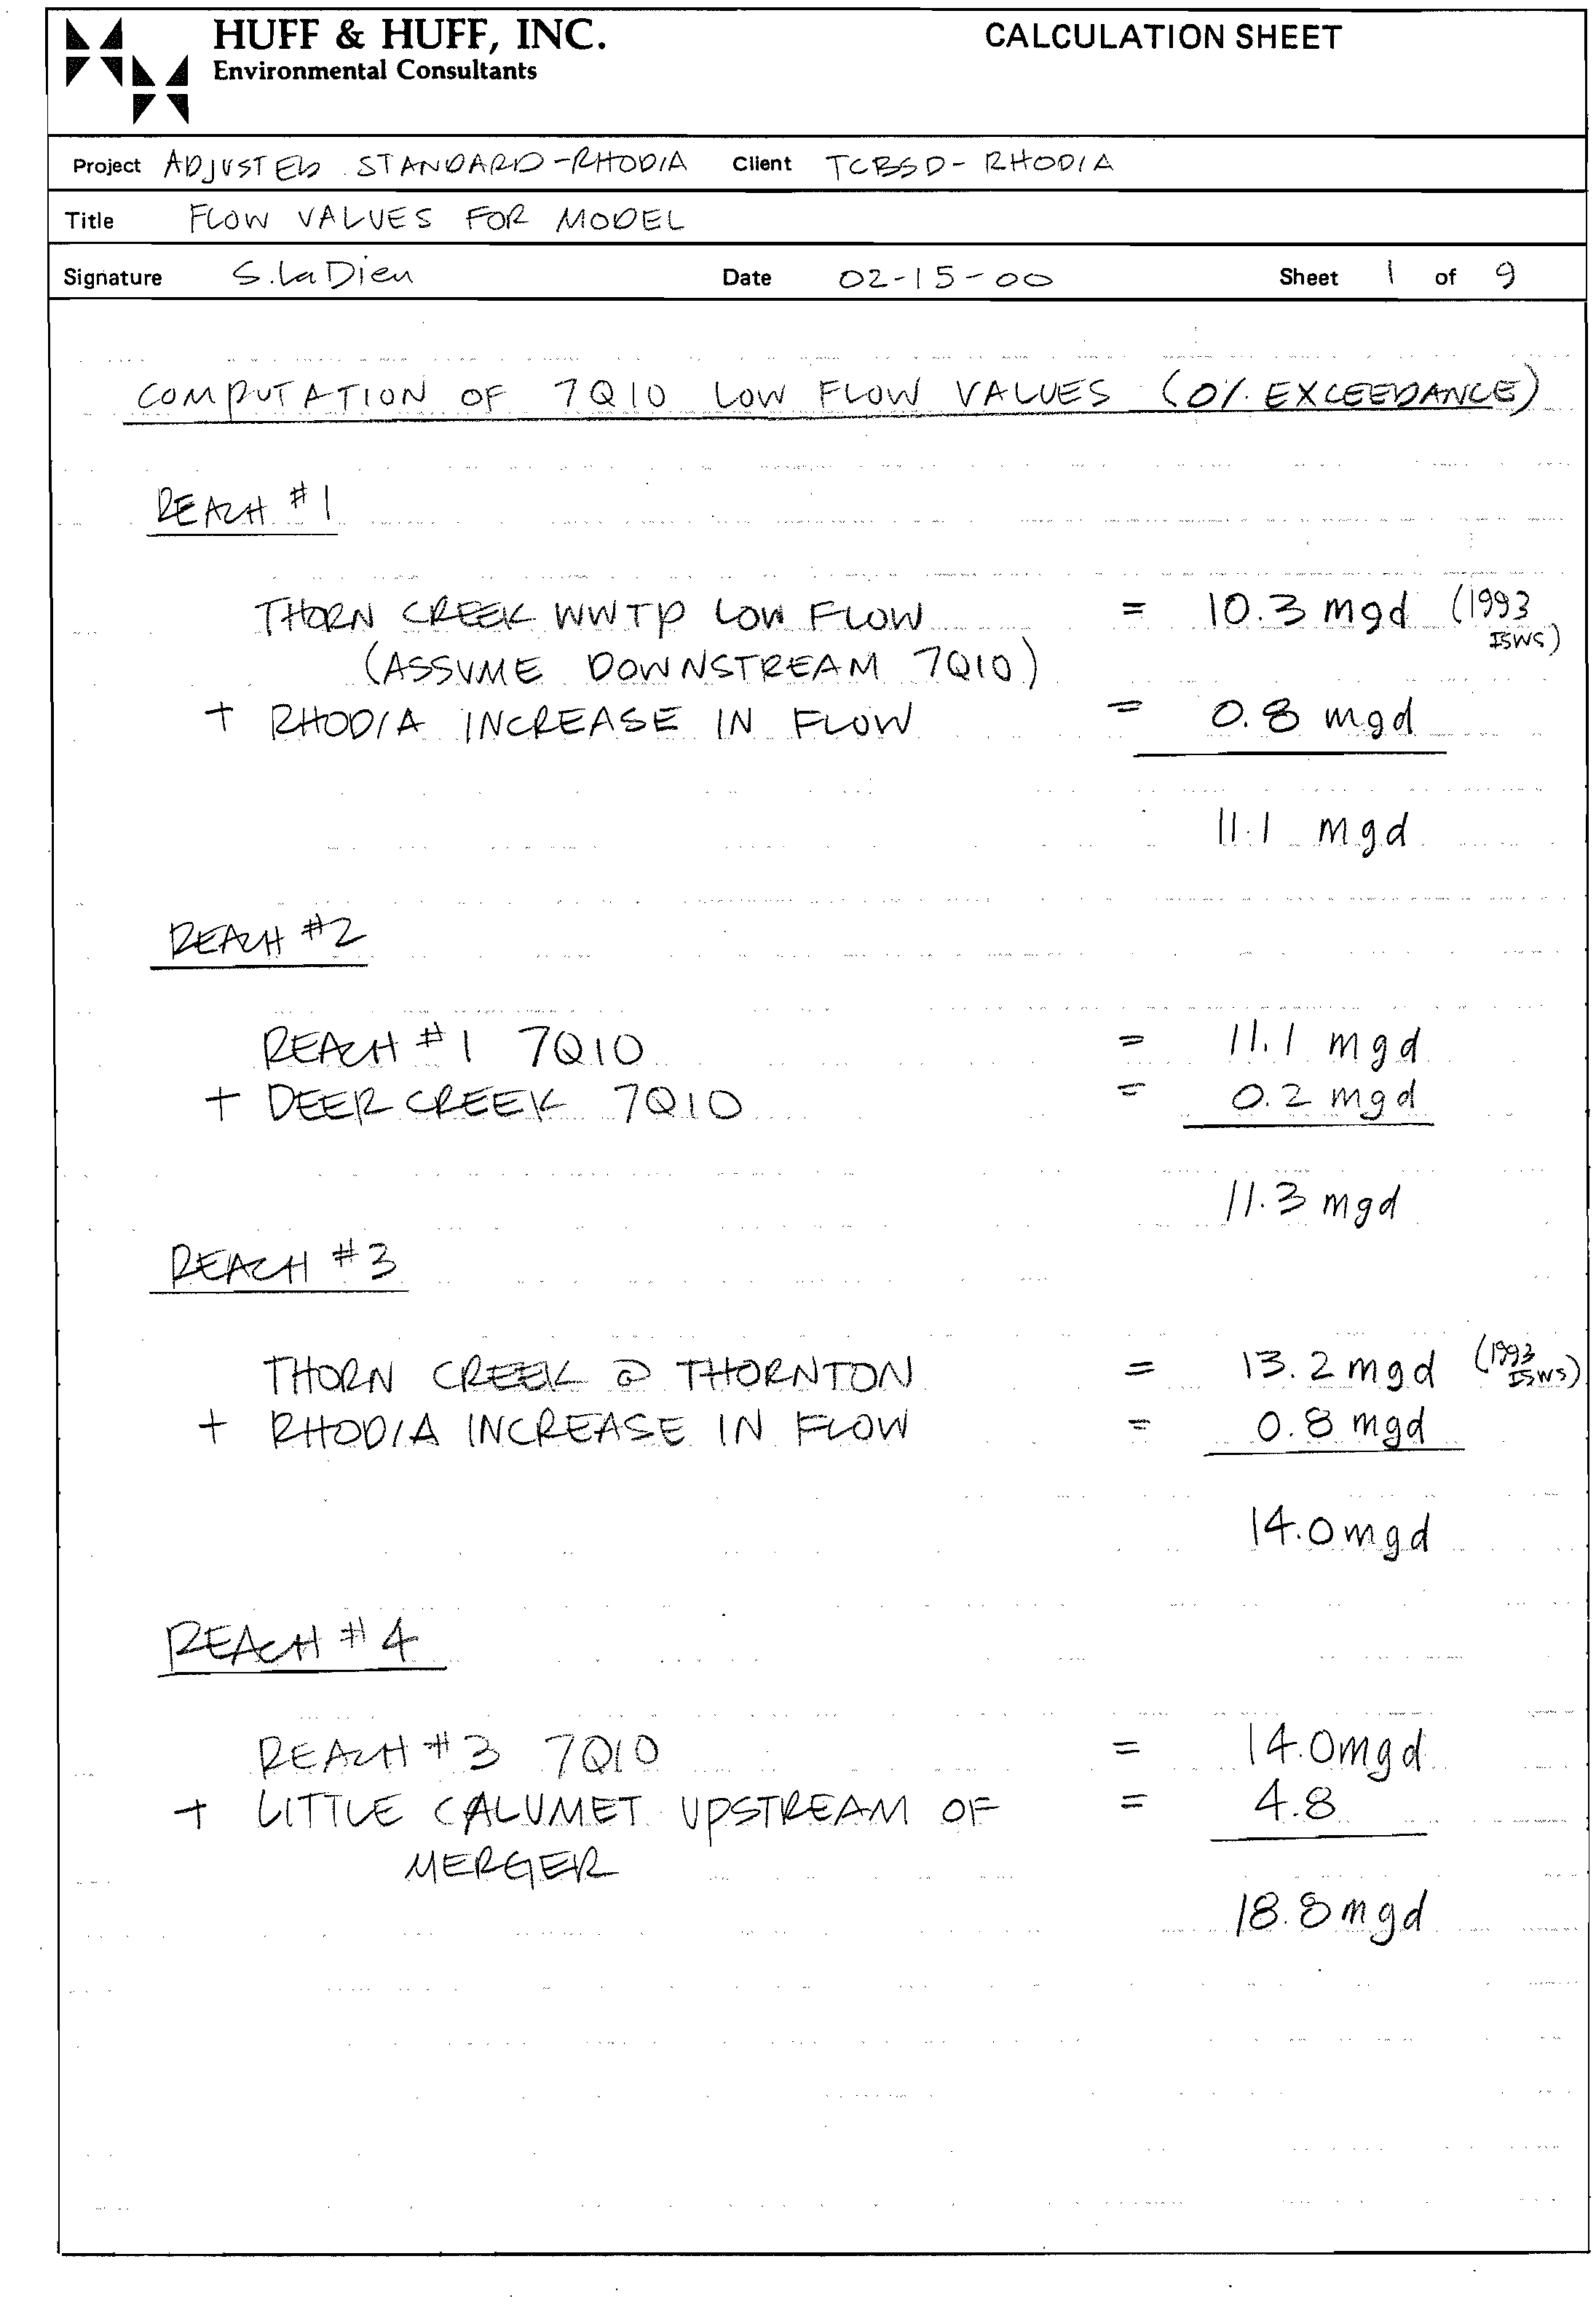
The 7Q10 flow
at
the Thornton gaging station (start
of Reach
# 3)
is reported as
13.2 mgd. The distribution
of this flow from the various
tributaries
is as follows:
Stream
Segment
7Q10, mgd
Thorn Creek
up to Deer Creek
10.3
Deer Creek
0.2
Butterfield
Creek
0.0
North
Creek
1.1
Thorn
Creek between
Deer Creek and Thornton
1.6
FLOW AT
THORNTON
13.2
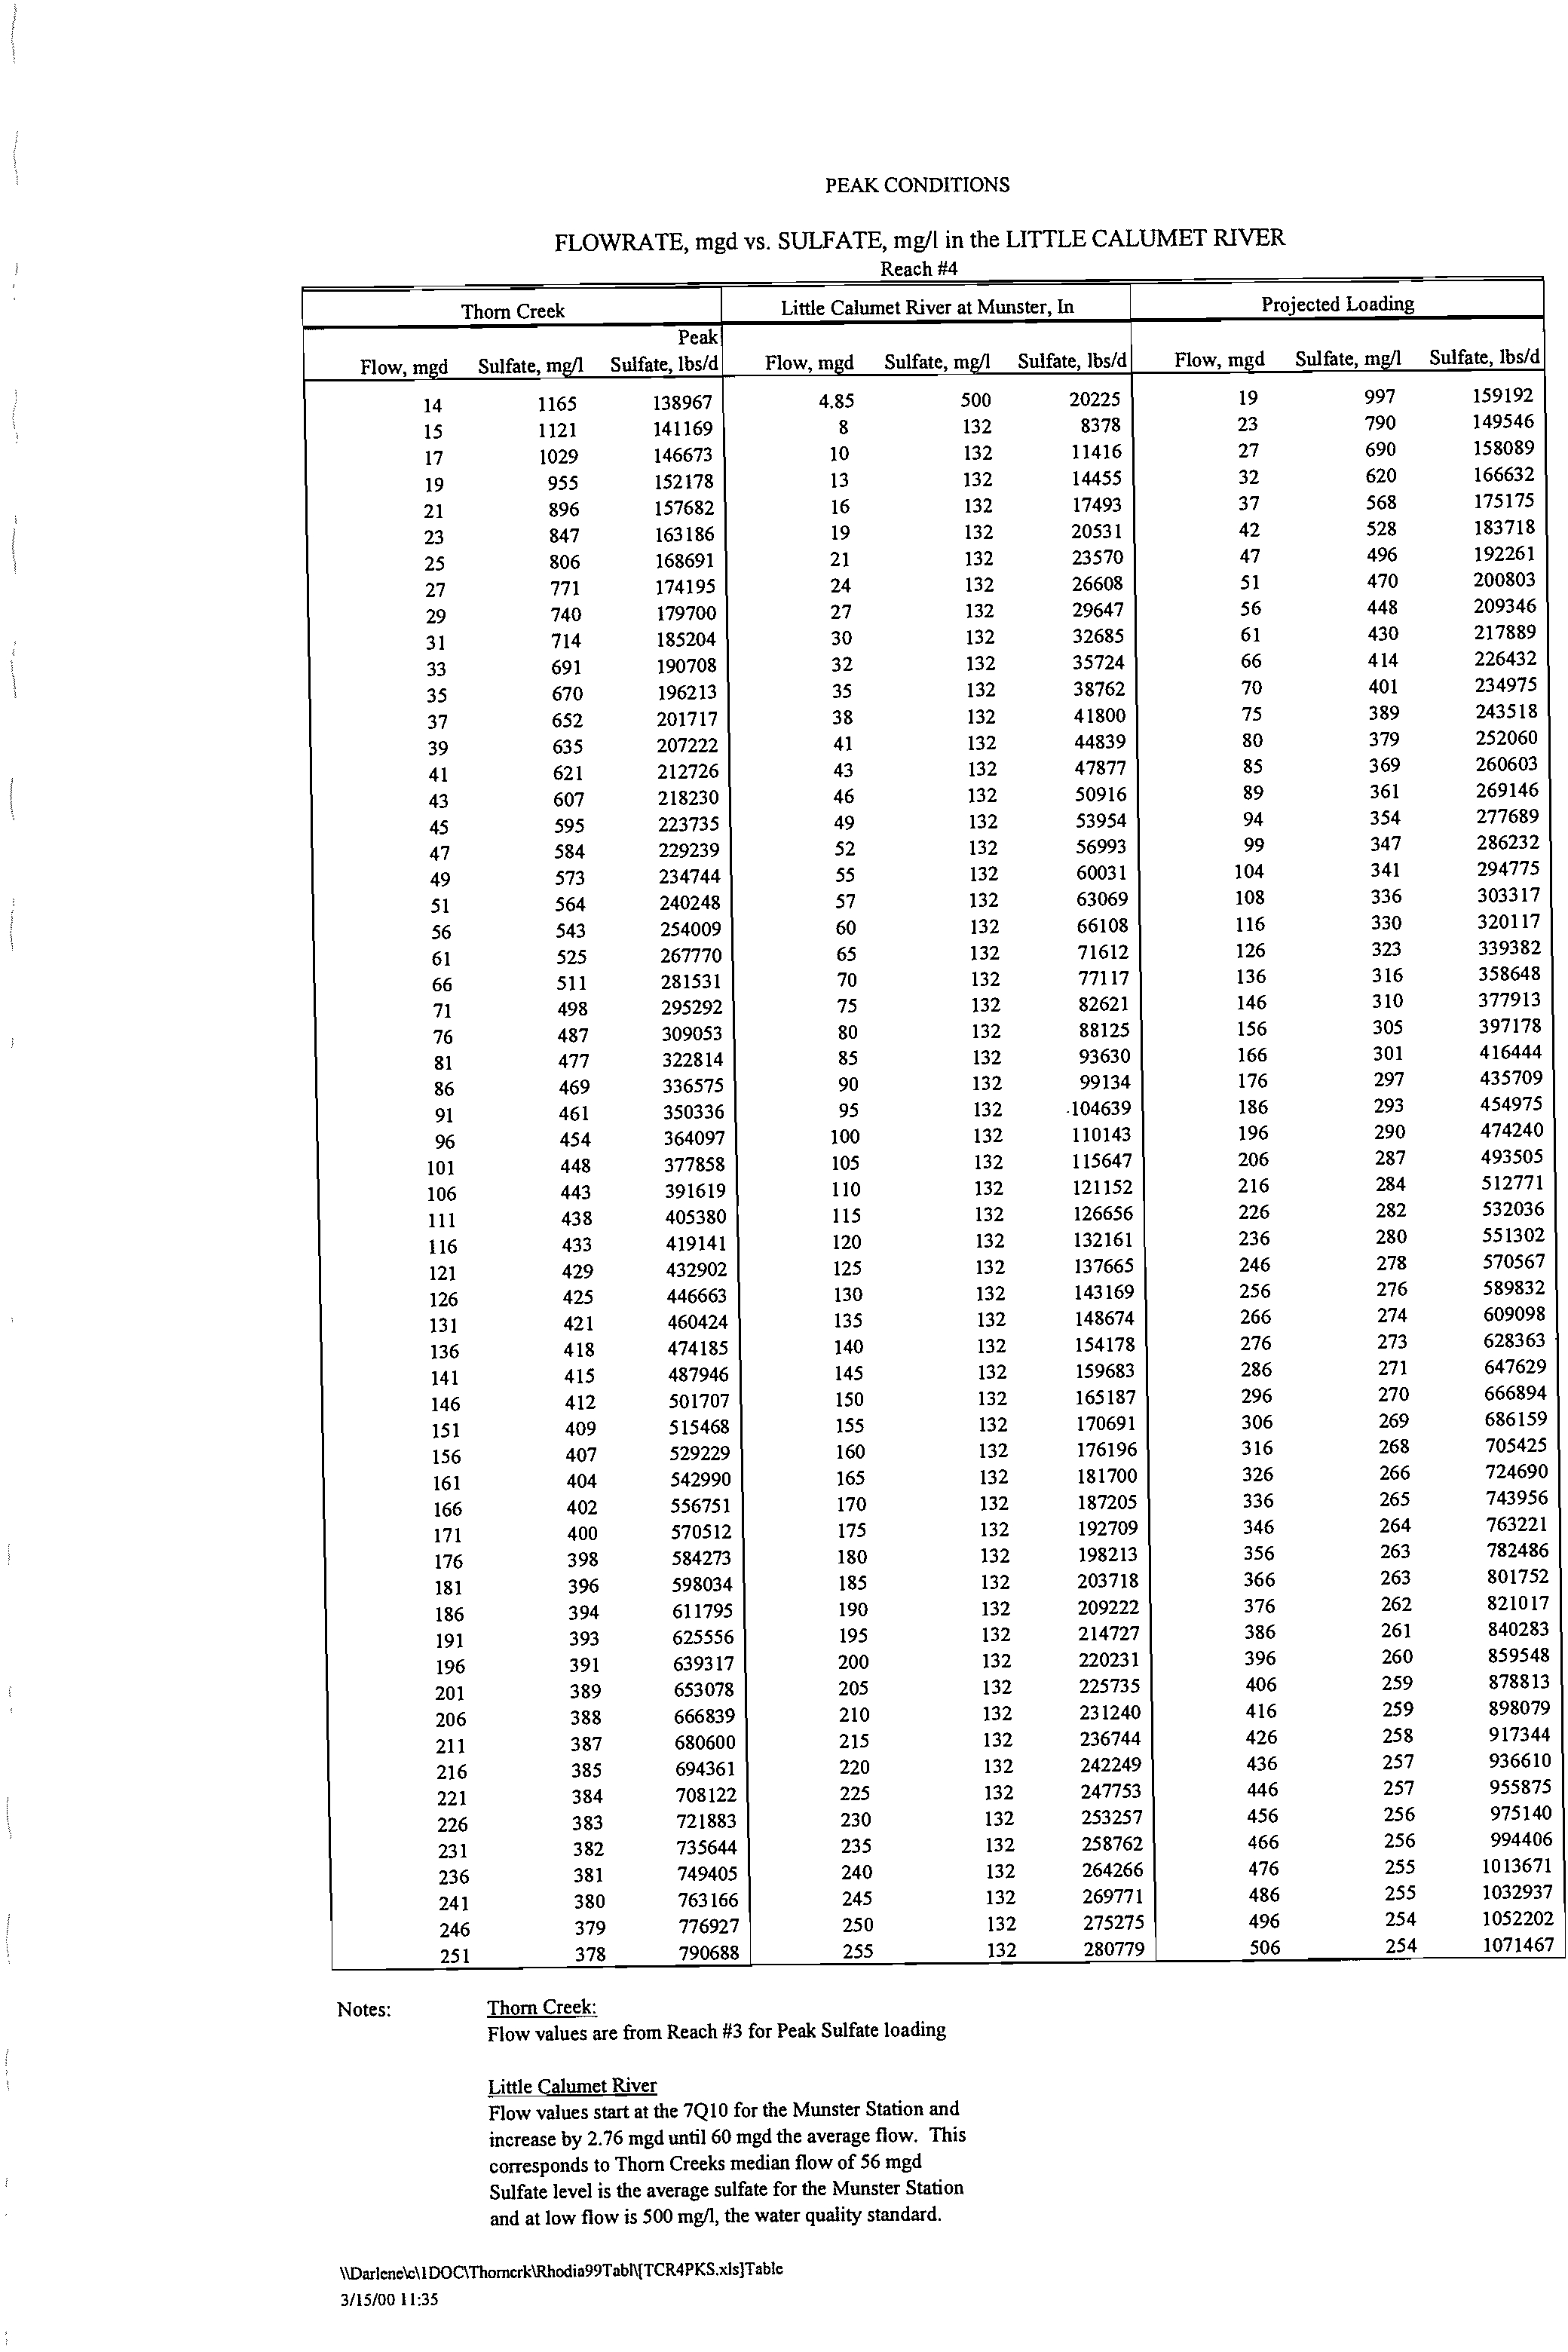
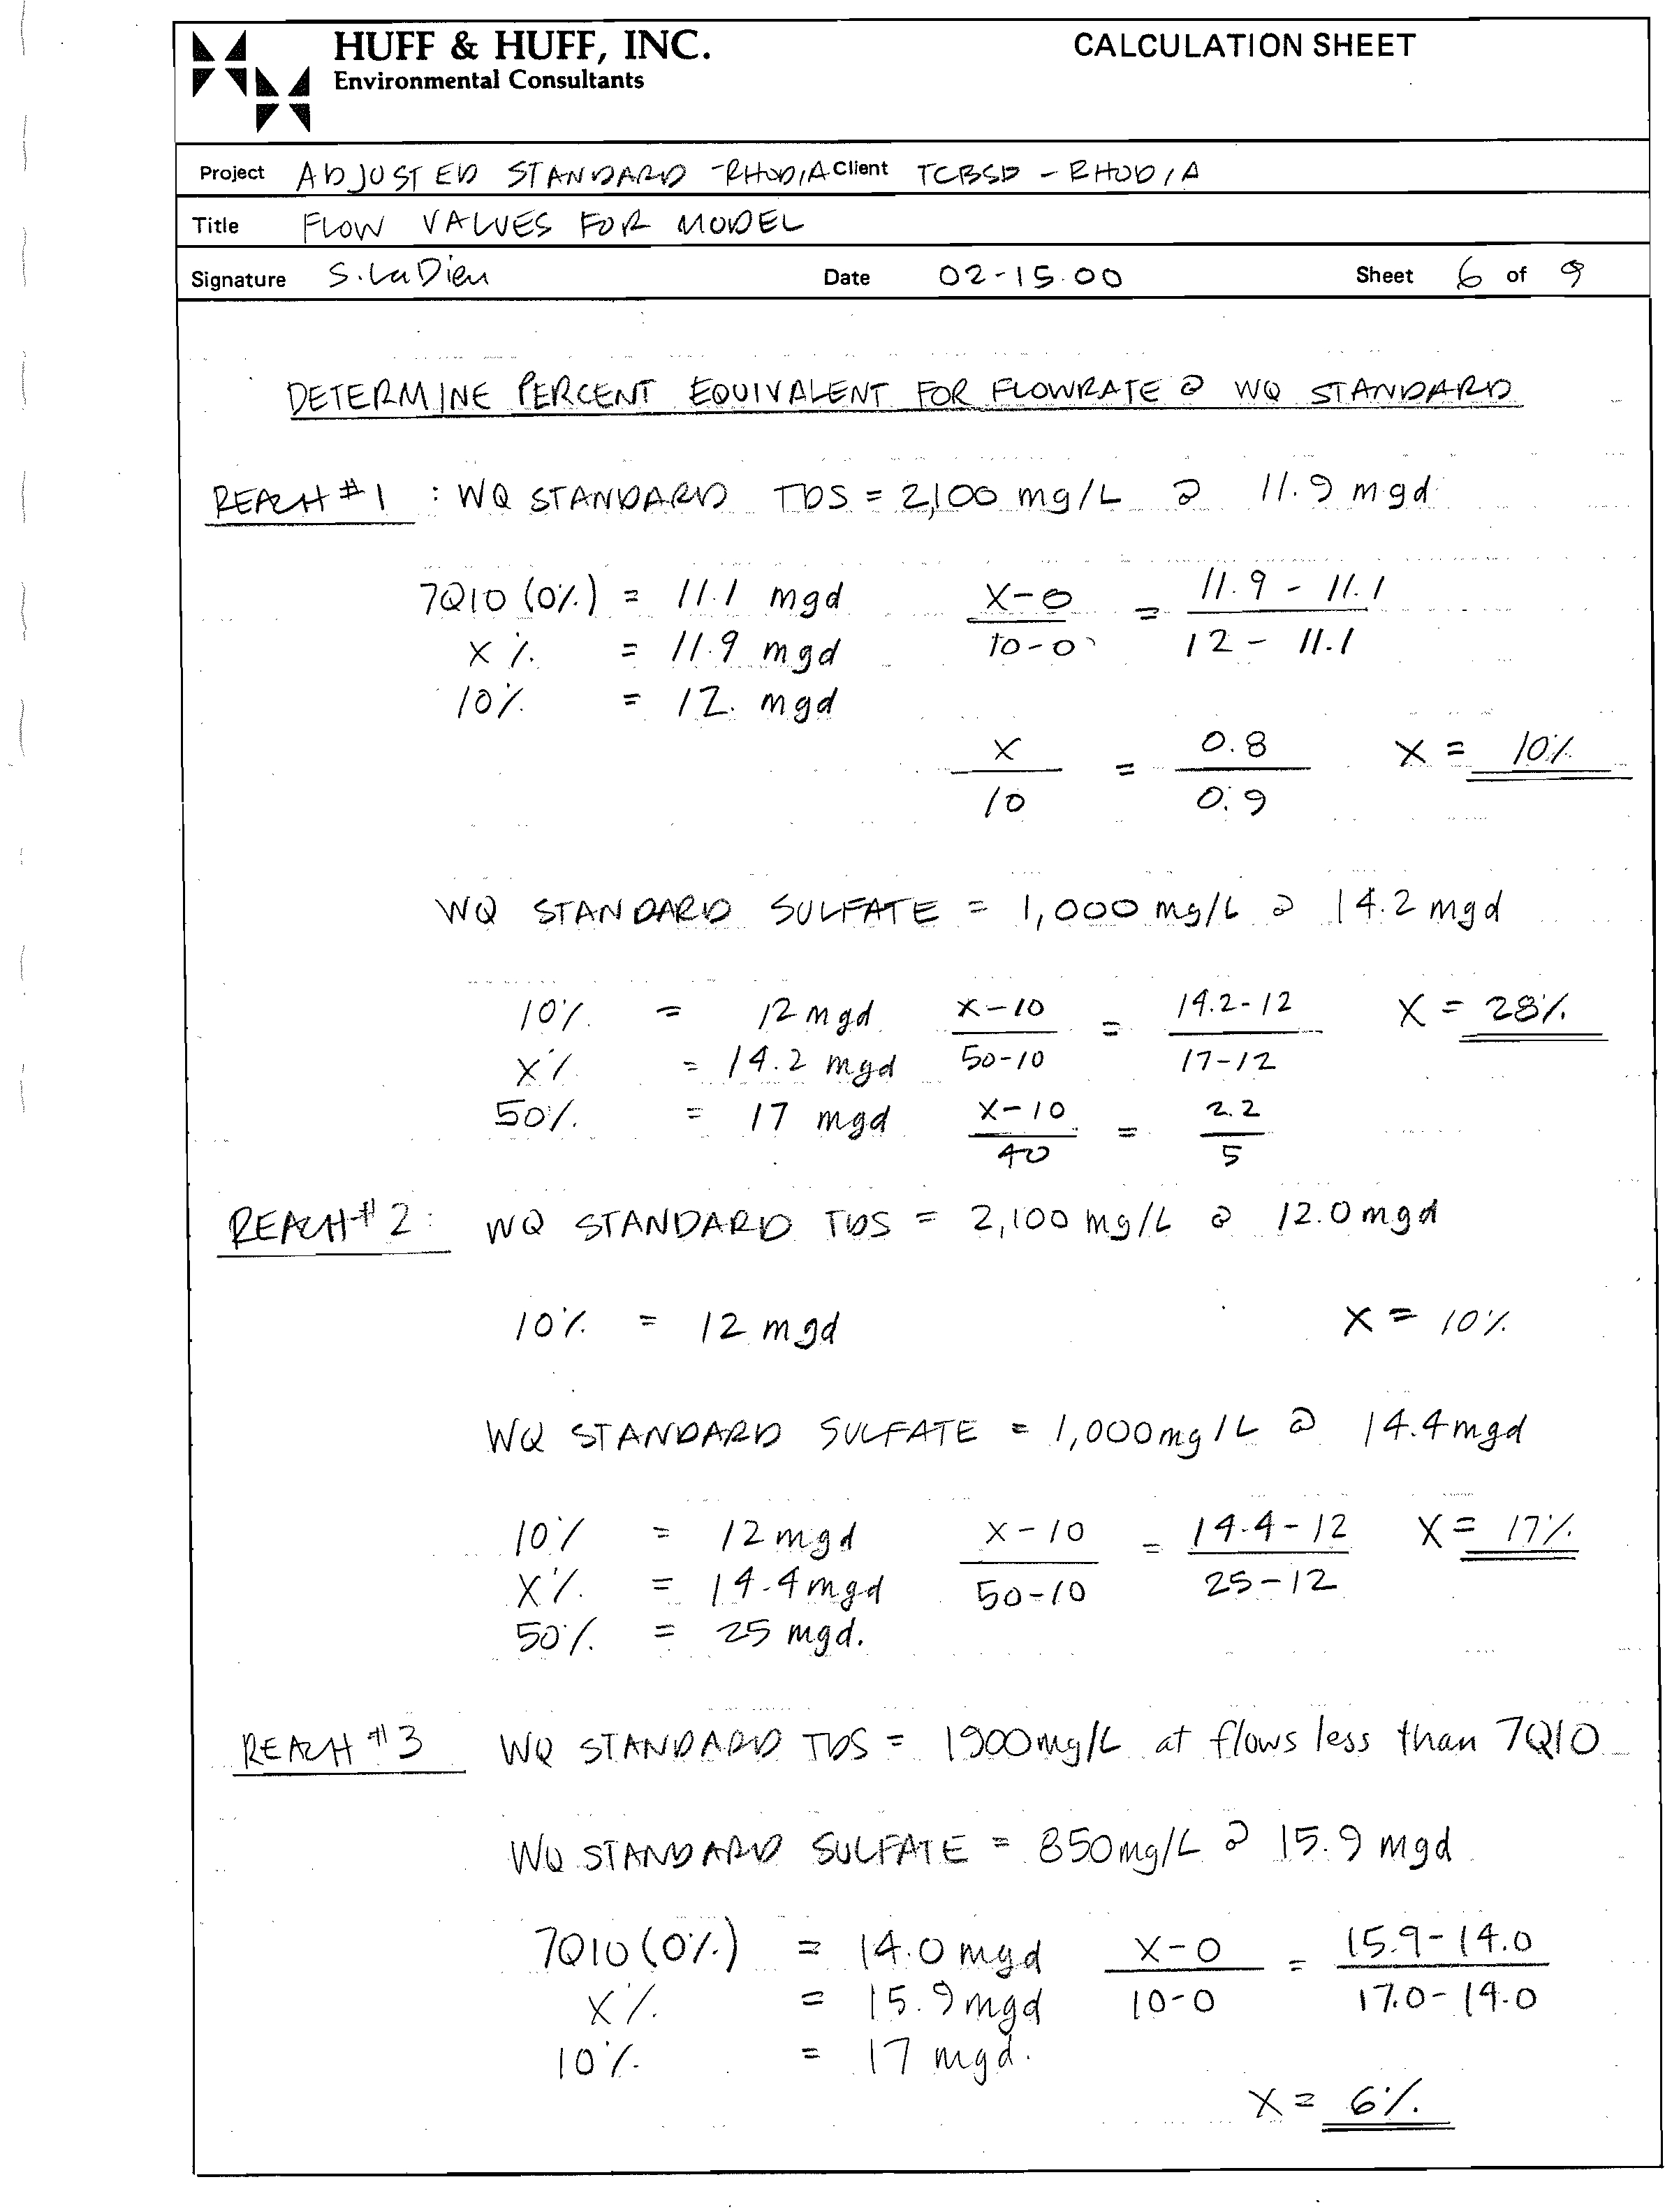
A 7Q10 of 11.1 mgd
(10.3
+ 0.8 mgd) can
be
assumed for the stretch of Thom
Creek between
the
Deer Creek merger and
the Thornton
Station, Reach #2,
as
Butterfield Creek has
a zero
7Q10
and
the North
Creek merger is only
0.3 miles from the Thornton
Station.
Low flow values
will
be
increased
for the purposes of modeling
Thorn Creek due to the average flow from
Rhodia’s
silica
plant of 0.8 mgd.2
The 7Q10 reported by
the
ISWS
of Thom
Creek approximately
0.2
miles before the
confluence
with
the
Little Calumet River is 13.6 mgd,
only
0.4 mgd greater than 7Q10 at the Thornton
Station.
The
2
The average Silica plant
flow
rate is predicted
to be 0.84 to 0.94 mgd. For modeling purposes,
0.84 mgd was
used
for conservative estimates of TDS and
sulfate levels in Thorn Creek.
4-7
100
FIGURE
4-2
REACH
#1
-
PER
CENT
TIME
FLOWRATE
IS
NOT
EXCEEDED
C
co
U
1)
90
80
70
60
50
40
30
20
10
0
‘p
____
0%
fib
rate
is
7Q10
dow
stream
of
WWTP
I
(10.3)
ndRhodiaincreas
(0.8)
1,-,
IL,
I
1.1
0
10
20
30
40
50
60
70
80
Flowrate,
mgd
7Q10 of
the Little
Calumet River upstream of
the Thom
Creek confluence is 4.85 mgd..
Downstream
of the Thom
Creek and Little Calumet
River
confluence, the 7Q10 is 18.7 mgd.
4.5 Water
Quality
Data
There are limited
data available on
TDS
and sulfates in the
Thom Creek Basin.
Table 4-5
summarizes TDS data
collected by the District after the silica plant
went online from
January 2,
1997 to June 9,
1999. Historic
water
quality data
is
used to
develop the models for the water
quality
predictions
and have been included
in Appendix
C.
The
District
data
collected for
Thom Creek
at Joe Off Road
represent water quality data collected
after the Rhodia
silica plant went online. Samples are collected
weekly
from this location.
The
average
Thom Creek TDS and
sulfate concentrations
during
this period were 1,068 mg!L and
361
mg/L,
respectively, and the
maximum concentrations
were 1,698
mg/L and 703 mgIL, respectively.
These
maximum levels are
below the
adjusted standards of
2,100 mg!L
for
TDS and 1,000 mg/L
for
sulfate.
Table 4-6 is a summary
of the major cations and
anions
monitored at the USGS Station in Thomton
from 1997 to
1998. This represents
water
quality at the
Thornton station as monitored
by
the
USGS
after the silica plant
went online. Comparison of historical data
collected from the same
USGS
station before the
silica
plant went
online
indicates an increase
in the average sulfate level from
149
mg/L to 419 mg/L,
while the
remaining ions
remain relatively
unchanged. The maximum
sulfate
level
detected during
this period is
742
mg!L, below the adjusted
water quality standard
of
850
mg/L. (The adjusted
water quality standard changes from 1,000 mg/L to
850 mg/L
at the Thornton
station. Both standards
have been consistently achieved.)
4-9
TABLE 4-5
TDS and SULFATE DATA
THORN CREEK
AT JOE ORR ROAD
DATE
TDS,
mg/L
S04, mg/L
DATE
TDS, mg/L
SO4, mg/L
01/02/1997
845
199
11/12/1997
1606
672
01/08/1997
824
152
11/19/1997
1004
342
01/15/1997
1294
498
11/25/1997
1385
586
01/22/1997
808
117
12/03/1997
1259
539
01/29/1997
1365
421
12/10/1997
1409
493
02/05/1997
704
14
12/17/1997
1517
423
02/12/1997
1307
489
12/23/1997
977
341
02/20/1997
781
193
12/30/1997
1117
395
02/26/1997
1060
312
01/06/1998
526
144
03/06/1997
1019
352
01/14/1998
1085
391
03/12/1997
1175
477
01/21/1998
1244
505
03/19/1997
728
149
01/28/1998
1597
575
03/26/1997
1125
475
02/04/1998
939
338
04/02/1997
826
222
02/11/1998
218
04/10/1997
845
273
02/18/1998
158
04/16/1997
640
186
02/25/1998
518
04/23/1997
1183
214
03/04/1998
537
05/01/1997
986
317
03/12/1998
202
05/07/1997
1402
598
03/19/1998
165
05/15/1997
818
234
03/25/1998
363
05/21/1997
923
369
03/31/1998
1044
419
05/28/1997
630
161
04/01/1998
558
227
06/04/1997
1423
703
04/08/1998
270
06/13/1997
579
184
04/15/1998
355
06/18/1997
871
341
05/06/1998
674
251
06/23/1997
747
174
06/10/1998
1180
501
07/03/1997
856
224
07/08/1998
563
227
07/09/1997
522
127
08/19/1998
1297
441
07/16/1997
1588
658
09/09/1998
1111
478
07/22/1997
467
125
10/07/1998
1344
494
07/30/1997
1476
625
11/04/1998
1315
483
08/08/1997
1235
512
12/09/1998
696
200
08/13/1997
868
360
01/20/1999
1698
555
08/20/1997
1040
403
02/03/1999
806
487
08/27/1997
1274
545
03/10/1999
1565
455
09/03/1997
1238
423
04/14/1999
1416
619
09/10/1997
1650
668
05/12/1999
624
156
09/16/1997
806
193
06/09/1999
895
282
09/19/1997
325
09/23/1 997
1466
408
OVERALL
09/24/1997
1202
508
Average
1068
361
10/09/1997
576
178
Minimum
467
14
10/16/1997
1441
177
Maximum
1698
703
10/22/1997
1621
673
10/29/1997
1164
130
WQStandard
2100
1000
11/05/1997
1164
463
\\Darlene\c\1DOC\Thomcrk’Rhodia99Tabl\[JoeOrrRd.xls]Sheetl
4-10
TABLE
4-6
INORGANICS
at
USGS
Station
05536275
at
Thornton
AFTER
RHODIASILICAL
PLANT
IS
ONLINE
DATE
Calcium,
diss.
Magnesium,
diss.
Sodium,
diss.
Potassium,
diss.
Sulfate,
total
Chloride,
total
Sum
of
Ions,
%
Sulfate
mg/L
mg/L
mg/L
mg/L
mg/L
mg/L
mg/L
02/10/97
83
36
190
5
319
209
759
42
03/25/97
84
38
160
5.7
296
199
699
42
05/07/97
85
39
210
6.3
503
189
947
53
06/16/97
31
12
75
3.5
113
66
270
42
07/15/97
77
41
320
8.6
742
195
1307
57
09/23/97
78
36
390
9.7
622
161
1219
51
11/20/97
84
41
250
10
431
244
976
44
01/27/98
95
45
330
8.3
376
391
1150
33
03/02/98
95
42
180
6.1
327
198
753
43
04/13/98
87
38
130
5.1
160
123
456
35
05/27/98
97
56
270
8.6
561
204
1100
51
06/24/98
89
42
300
8.7
574
173
1098
52
08/07/98
41
17
35
4.9
57
0
09/15/98
87
41
300
8.3
150
499
0
10/30/98
63
30
130
7.9
243
92
503
48
12/03/98
82
4Q
ll
Average
79
37
225
7
419
183
807
40
Maximum
97
56
390
10
742
391
1307
57
4S
I-
I—i
\\Darlene\c\1DOC\Thomcrk\Rhodia99Tabl\[DATAxls}Sheet2
7.
PROJECTED IMPACT
ON THORN CREEK AND
THE
LITTLE CALUMET RIVER
FROM PROPOSED EXPANSION
7.1 Introduction
As described in
previous chapters, Thorn Creek
and the Little Calumet River can be divided
into
four stream reaches for
analysis purposes:
Reach #1
Thorn
Creek
Basin
Sanitary
District
Outfall
to
Confluence with Deer Creek
(2.0 miles)
Reach
#2
Confluence with Deer Creek
to
Thornton
USGS
Gaging Station
(3.9 miles)
Reach #3
USGS Gaging Station at Thornton
to Confluence with
the Little Calumet River
(4.2 miles)
Reach #4
Thorn Creek Confluence with
the
Little
Calumet
River to the Little Calumet Confluence
with the Calumet-Sag
Channel
(8.8 miles)
In this chapter, the projected TDS and sulfate
water quality levels for each reach are presented.
Both
maximum
and average
levels are presented
herein.
7.2 Flow
Curves for
Stream Reaches
In order
to estimate
water quality
concentrations, flow curves on
each stream were first developed.
Figure 7-1 presents the
projected
flow curves for
the four Thorn Creek/Little Calumet
River reaches,
each starting
at
the 7-day, 10-year low flow
value (adjusted to include
0.84 mgd from Rhodia
4
).
For
modeling
purposes,
the 7Q10 value
used for the Thorn
Creek
WWTP was taken
as 10.3 mgd,
the
7Q10
at the
Glenwood gauging
station, one mile downstream.
This assumes
that
The average Silica plant flow rate is predicted
to be 0.84 to 0.94
mgd.
For modeling
purposes, 0.84 mgd was
used
for conservative estimates of average TDS and sulfate
levels in Thom Creek.
7-1
all flow at
this
station during 7Q10
conditions is from the WWTP. The curves were developed
from
USGS flow data. The 7Q10
values were obtained from the ISWS Contract Report 545 (1993)
for
7Q10
low flow values for northeastern Illinois. The 10 percent, 50 percent and 90 percent flow rate
values were obtained from USGS data
for calendar year 1996, the most recent calendar year
available.
For
Reach #2, the flow curve was derived
based upon the drainage area for Thorn Creek to the Deer
Creek
confluence plus the drainage
area in Deer Creek, as a fraction of the overall drainage basin
at
the USGS
Station at Thornton. This approach results
in
a
conservative
flow value
for
much of the
reach, as
the flow contribution from Butterfield
Creek and North Creek are excluded. Reach
#3 was
based on
the current flow regime at the
Thornton
USGS
Station. This station is at the beginning
of
this reach,
therefore, the calculated concentrations
are also
conservative
for this reach
as
the
flow
increases (TDS and sulfate concentration decreases)
as the stream approaches the Little Calumet
River.
The 7Q10 on the Little Calumet
River,
upstream of the Thorn Creek confluence, is
4.8
mgd. This,
combined with
14
mgd of Reach #3
(which includes the
0.84
mgd from Rhodia),
yields
a 7Q10 of
18.8 mgd
for
Reach
#4. Figure 2-1 in Chapter
2 depicted the different reaches. From Figure
7-1 and
the
above information, the following flow
values were derived, rounded to the closest 1 mgd.
Reach Number
7Q10,
mgd
Median
Flow, mgd
90% Flow, mgd
1
11
17
76
2
11
25
90
3
14
32
159
4
19
58
273
Low flows in Reach #1 and #2 are
similar, while the median flow in Reach #2 increases
to
25
mgd
from 17 mgd in Reach #1.
7-2
300
275
250
225
200
FIGURE
7-1
PER
CENT
TIME
FLOWRATES
ARE
BELOW
-
175
150
C
125
100
75
50
25
0
100
•
Reach#1
----Reach#2
—&—Reach
#3
Reach#4
0
10
20
30
40
50
60
70
80
90
Per
Cent
Time
Flowrate
is
Below
7.3
Projected
TDS
Levels
Using
the
water
quality from Thom Creek
before
the existing silica plant
was online and the
projected
loadings from Rhodia,
the resulting
water quality in each
reach can be
determined.
The
water
quality
database for some of the
reaches is
limited since Rhodia started
the silica operation,
so
the earlier
water
quality (data
from
the
first
environmental
assessment, (Huff
&
Huff, 1993)) using
the total
Rhodia loading
provided a more accurate
estimate
of the projected impact
of the proposed
expansion.
As
presented
in Chapter
2, average
and
maximum
TDS
levels
discharged from
Rhodia to the
WWTP were projected
based upon 365
days
per year
and used
in the
model
as
follows:
Total TDS Loading
from
Rhodia Silica Plant
Annual
Average
137,375
lbs/day
Daily
Maximum
151,725 lbs/day
The
annual average TDS discharge
by
Rhodia was
utilized to
prepare frequency
distribution
curves
of the
expected
TDS levels. The
maximum
TDS discharge by
Rhodia
was used to
predict
the peak
expected water
quality
TDS
levels for
each
reach.
The
results
of both
of these
projections
are
presented
herein.
7.3.1
TDS
Frequency
Distributions
Figure 7-2 presents
the
frequency
distribution
of
TDS
levels projected
for
Reach
#1
with
the
Rhodia
expansion. The average
TDS level
of
689
mg/L based
on
data
collected
before
the
Rhodia
silica
plant
went
online
was
utilized as the Thom
Creek
upstream
base
level.
The treatment
plant effluent
TDS is similarly based
upon the average TDS
effluent level
of 765 mg/L before
the
existing silica
plant
was
online.
Based upon Rhodia’s
projected
average
TDS loading,
ten percent
of the time the
TDS will be above 2,100
mg!L, the existing
adjusted water
quality standard.
7-4
80.00
70.00
60.00
50.00
(.T1
E
40.00
0
U-
30.00
20.00
10.00
0.00
FIGURE
7-2
TDS
Frequency
Distribution,
Reach
#1
Average
Rhodia
Discharge
76mcid
-
90%
17
mcid
%
Time
Corresponding
TDS
Value
will
be
Exceeded
CurrentWater
Quality
Standard
50%
l2mgd
—
10%
I
I
I
I
I
I
I
I
I
I
I
I
I
I
I
I
I
I
I
I
I
I
600
800
1000
1200
TDS
Concentration,
mg/I
1400
1600
1800
2000
2200
1
doc/Thorncrk/Rhodiag9Tabl/Tcrl
at2
Figure
7-3
presents the TDS
frequency
distribution
projected for Reach #2
at
average
loadings. A
background
TDS level
of 689 mg!L was used as Deer
Creek’s background
TDS level, the TDS level
obtained from Thom Creek upstream of the WWTP. Using Rhodia’s projected average discharge
of
137,375 pounds per day, ten percent of the time, the TDS will be above
2,100
mg/L, which is also
the
adjusted water quality standard for this reach.
Using current TDS concentrations and flow data from the
USGS
Station
at Thomton (presented in
Chapter 4), Rhodia’s projected average incremental loading of 137,375 pounds
per day
was
modeled
for Reach #3 and is presented in Figure
7-4.
The TDS
level in
Reach #3 will exceed 1,480 mg/L ten
percent of the time. This TDS level is below the current adjusted water quality standard of 1,900
mg!L which
will not
be
exceeded in this reach
under average conditions.
The
projected average TDS loading expected from Thom Creek was also utilized
to model Reach
#4,
the
portion of the Little
Calumet River
between
Thom
Creek and the Calumet-Sag Channel.
Figure 7-5
depicts the
TDS frequency
distribution in Reach #4. A
TDS level of 1,080 mg/L is
expected to be exceeded ten percent
of
the time. This is below the existing
adjusted
water
quality
standard
of 1,700 mg!L, which will not be exceeded in this reach under average conditions.
7.3.2 Daily Maximum TDS Levels
The
peak projected TDS levels
were
calculated
to
establish
a basis for setting water quality
standards for
the impacted reaches,
as
water quality standards are typically
based upon a not to
be
exceeded basis. The peak TDS levels will occur during periods of low flow and maximum
Rhodia
loading. The daily maximum TDS loading from Rhodia is 151,725 pounds per
day at a
flow rate
of
1.1 mgd (in Chapter 2). The maximum projected TDS levels in
the
impacted
reaches
would occur
when
the treatment plant
and upstream TDS levels are also at a maximum.
7-6
100.00
90.00
80.00
70.00
a
60.00
50.00
0
Li..
40.00
30.00
20.00
10.00
0.00
600
FIGURE
7-3
TDS
Frequency
Distribution,
Reach
#2
Average
Rhodia
Discharge
90
mgd
90%
%
Time
Corresponding
TDS
Value
will
be
Exceeded
Current
Water
Quality
Standard
25
mgd
50%
l2mgd
10%
I
I
I
I
I
I
I
I
I
800
1000
1200
1400
1600
1800
2000
2200
TDS
Concentration,
mg/I
ldoc/ThornCrkfRhodja99Tabl/TCR2AT2.xls
FIGURE
7-4
TDS
Frequency
Distribution,
Reach
#3
Average
Rhodia
Discharge
170
160
150
140
130
120
110
;J
90
80
70
60
50
40
30
20
10
0
159
mgd
90%
%
Time
Corresponding
TDS
Value
will
be
Exceeded
Curent
Water
Quality
Standard
32mgd
‘
50%
l7mgd
10%
I
I
I
I
I
I
I
I
I
I
I
I
I
I
I
I
I
I
I
I
I
I
I
I
I
I
I
400
600
800
1000
1200
1400
1600
1800
2000
TDS
Concentration,
mg/I
ldoc/ThorncrkjRhodja99Tabl/TCR3AVT.xJs
FIGURE
7-5
TDS
Frequency
Distribution,
Reach
#4
Average
Rhoida
Discharge
300
250
200
E
150
0
LL.
100
50
0
2
3mgd
90%
%
Time
Corresponding
TDS
Value
will
be
Exceeded
Current
Water
Quality
S
andard
58
mgd
50%
28mgd
10%
500
700
900
1100
1300
1500
1700
TDS
Concentration,
mgIl
I
doclThomcrk/RhodIa99TabIITCR4AVT.xls
Guidance for predicting the WWTP effluent and upstream TDS
maximum levels was obtained
from
EPA’s Technical Support Document for Water Quality-based Toxics Control,
(EPA, 1991). A
statistical approach from
this
document was
used
due to
the limited
amount of TDS data available
for the WWTP (13 TDS samples) and Thom Creek upstream of the WWTP (nine
TDS
samples).
The TDS data for the WWTP and upstream were presented in Table 3-2 and 4-5,
respectively.
Using the U.S.
EPA
statistical approach, a predicted peak TDS upstream
of
2,093
mg/L and a peak
background TDS
from
the
WWTP discharge of
1,186 mg/L
were computed. The calculations
are
included in
the Appendix
F.
Using the values determined
above, and
the maximum discharge
from Rhodia of 151,725 pounds
per day, the peak concentrations were determined based upon low flow conditions.
Table 7-1
presents
a
summary of the projected peak TDS levels in the four
reaches. The maximum values
range from 2,650 mg!L in Reach #1 and declining to 2,020 mg/L in
Reach #4. The spreadsheets and
supporting calculations used for determining the
maximum
TDS levels are presented in
the
Appendix F.
TABLE 7-1
PROJECTED MAXIMUM THORN CREEK TDS LEVELS
AT
RIIODIA PEAK LOADING
Reach
Number
Maximum
TDS, mg/L
1
2,650
2
2,620
3
2,360
4
2,020
The
maximum
TDS level in Reach #2 for Deer
Creek
was input
as
2,100 mg/L,
the adjusted
water quality standard for Reach #2 already
obtained
by CIWC and Nutrasweet.
Reach #3 was
again
based upon
actual
data
obtained from the USGS station at Thornton. The maximum
TDS
determined for Reach
#3 without any
contribution from
Rhodia was 1,180 mg/L.
No factor was
used to
increase this maximum
as there were
sufficient
data to determine the
maximum level.
The maximum TDS level
for
Reach
#4
at low
flow
was input
as the current
water quality
standard for Little Calumet River of 1,000 mg/L.
7-10
7.4 Projected
Sulfate
Levels
The
same
procedure
was followed
for the
projected
sulfate water
quality
levels,
as
was used
for the
TDS projected
levels.
Existing
water quality
levels
were utilized
with Rhodia’s
sulfate
contribution
at
average
and
maximum
loadings.
The
sulfate levels
used
in the model
are as
follows:
Total Sulfate
Loading
From
Rhodia Silica
Plant
Annual
Average
92,750
lbs/day
Daily
Maximum
102,640
lbs/day
7.4.1
Annual
Average
Sulfate
Levels
The
sulfate
loading
from
Rhodia
of 92,750
pounds
per day
was
modeled
to depict
the
sulfate
frequency
distribution
for
Thom
Creek.
Figure
7-6
depicts the
projected sulfate
levels
for Reach
#1
based
upon Rhodia’s
average
loading.
The existing
average sulfate
levels
of 186 mg/L
and 207
rng/L are
27 percent
of
the
measured
existing
upstream
Thorn
Creek TDS
and WWTP
TDS
levels,
respectively.
(The
27 percent
sulfate
is
based
on
USGS
Thornton
station
water quality
data for
1991.)
Based upon
these
modeled TDS
loadings,
ten
percent
of the time,
the
sulfate
level
will
be
above 1,130
mg/L, and
28
percent
of the time
will exceed
the existing
adjusted
sulfate
water
quality
standard
of 1,000
mg/L.
Figure
7-7
depicts
the
Rhodia
sulfate
frequency
distribution
for Reach
#2. A
sulfate
level of
1,130
mg/L
will
be
exceeded
ten percent
of the time.
The adjusted
sulfate water
quality
standard in
Reach
#2
of 1,000
mg/L
will
be
exceeded
17 percent
of the
time.
Projected
sulfate
loadings
in Reach
#3
were
modeled
using
existing
sulfate
concentrations
and flow
data
obtained
from
the
USGS
station
at
Thornton.
Rhodia’s
maximum
incremental
average
loading
was
input
into
the
model
and
the
results
are
depicted
in
Figure 7-8.
Based upon
the
model,
a
sulfate level
of
800
mg/L
will
be exceeded
ten
percent
of the time.
The
adjusted
water
quality
standard
of
850
mg/L will
be
exceeded
six
percent
of the
time.
7-11
-
FIGURE
7-6
Sulfate
Frequency
Distribution,
Reach
#1
Average
Rhodia
Discharge
80.00
76
mgd
90%
70.00
60.00
%
Time
Corresponding
Sulfate
Value
will
be
Exceeded
50.00
E
N)
40.00
30.00
Current
Water
Quality
Standard
20.00
l7mgd
50%
1:.::
l2rngd
I
I
I
I
I
I
I
I
I
I
I
I
I
I
I
I
I
I
I
IIIIIIIIII
200
300
400
500
600
700
800
900
1000
1100
1200
Sulfate
Concentraion,
mg/I
ldocfrhorncrk/Jthodja99TabI/TCRIAVS.xjs
.—J
.
a,
4-
0
Li.
FIGURE
7-7
Sulfate
Frequency
Distribution,
Reach
#2
Average
Rhodia
Discharge
100
90
80
70
60
50
40
30
20
10
0
90
mgd
90%
\
%
Time
Corresponding
Sulfate
Value
will
be
Exceeded
Current
Water
Quality
Standard
25
mcjd
50%
12
mgd
10%
I
I
I
I
I
I
I
I
I
I
I
I
I
I
I
I
I
I
I
I
I
I
I
I
-I
I
200
300
400
500
600
700
800
900
1000
1100
1200
Sulfate
Concentration,
mg/I
ldoc/ThonCrklRhodja99Tabl/TCR2AVS.x]s
•a
a)
E
100
0
g8o
FIGURE
7-8
Sulfate
Frequency
Distribution,
Reach
#3
Average
Rhodia
Discharge
180
160
140
120
159
mgd
90%
%
Time
Corresponding
Sulfate
Value
will
be
Exceeded
Current
Water
Quality
Standard
32
mgd
50%
17
mgd
10%
I
I
I
I
I
I
I
I
I
I
I
I
I
I
I
I
I
I
I
I
I
60
40
20
0
100
200
300
400
500
600
700
800
900
Sulfate
Concentration,
mg!l
ldocfThorncrkJjthodja99Tabl/TCR3AVS.xjs
Figure
7-9
projects
the sulfate
loading
on
the
Little
Calumet
River,
designated
as
Reach
#4.
Sulfate
levels
start
at the
general
use
water
quality
standard
of 500
mg/L
at
low
flow,
and
then
use the
average
sulfate
concentrations
based
upon
USGS
station
05536195
sampling
data.
The
model
projects
that
a
sulfate
level
of
220
mg/L
will
be
exceeded
10 percent
of the
time
while
the
adjusted
water
quality
standard
of
750
mgfL
will
be exceeded
one
percent
of
the
time
under
average
conditions.
7.4.2
Daily
Maximum
Sulfate
Levels
The
peak
projected
sulfate
levels
were
determined
for
purposes
of
establishing
a
basis
for
setting
water
quality
standards
for
the
impacted
reaches.
Similar
to
the TDS
levels,
peak
sulfate
levels
will
occur
during
low
flow
conditions,
maximum
Rhodia
loading,
and maximum upstream
and
WWTP
sulfate
levels.
The
maximum
daily
sulfate
loading
from
Rhodia
is
102,640
pounds
per
day
at
a
flow
rate
of
1.1
mgd
(presented
in
Chapter
2).
Maximum
sulfate
levels
existing
for
the
treatment
plant
and
upstream were
determined
again
using
the
EPA
Technical
Support
Document
(EPA,
1991).
Maximum
sulfate
levels
for
Reaches
#2,
#3,
and
#4
were
prepared
consistent
with
the
maximum
TDS
levels
for
the respective
reaches.
Table
7-2
presents
the projected
maximum
sulfate
levels.
For
Reach
#1,
the
maximum
projected
sulfate
level
will
be
1,350
mg/L,
declining
to
1,000
mg/L
by
Reach
#4.
TABLE
7-2
PROJECTED
MAXIMUM
THORN
CREEK
SULFATE
LEVELS
AT
RHODIA
PEAK
LOADING
Reach
Number
Maximum
Sulfate,
mgIL
1
1,350
2
1,340
3
1,160
4
1,000
7-15
300
250
200
C)
E
150
0
U-
FIGURE
7-9
Sulfate
Frequency
Distribution,Reach
#4
Average
Rhodia
Discharge
0
100
200
300
400
500
Sulfate
Concentration,
mg/I
600
700
800
273
mgd
%
Time
Coresponding
Sulfate
.
Value
will
be
Exceeded
Current
Water
Quality
Standard
58
mgd
50%
28mgd
10%
100
50
I
doc/ThorncrklRhodja997abl/TCR4AVSxls
7.5 Crop Irrigation and
Ground Water Impacts
The areas surrounding Thorn Creek from the District’s
outfall
to the
merger with
the Little Calumet
River
are
limited
to
forest preserves
and developed areas.
No commercial crops are grown,
and no
evidence of water withdrawal for irrigation
of crops was observed during
the stream study.
Communities along Thorn Creek downstream
of the District’s
outfall, all derive their water
supply
from Lake Michigan. Communities including
Chicago Heights,
Flossmoor, Harvey,
Glenwood,
Homewood,
South
Holland,
Thornton, Calumet City, Dolton,
and
Lansing were all contacted
and
confirmed that each municipal water
supply system currently
uses
Lake Michigan
water. Most
water
supply wells have been capped and taken
out
of
service in these communities. Based
upon this
investigation, Rhodia’s proposed project will not increase
the TDS in any public water supply.
7.6 Calumet-Sag Channel
The Little Calumet River section designated
as
Reach
#4 merges with the
Calumet-Sag
Channel
as
depicted in Figure
2-2. The Calumet-Sag
Channel is
a
secondary contact waterway
and receives
effluent from the
Calumet WWTP.
The water quality standard for TDS on
the Calumet-Sag
Channel
is 1,500
mgfL, and no standard
exists for sulfate. Included in Appendix F
for reference
are
the
projected levels of TDS in Calumet-Sag
Channel. Under maximum Rhodia loading,
the
projected
maximum TDS and sulfate levels
for the Calumet-Sag Channel is projected
to be 1,370
mg/L,
below the water quality standards.
7.7 Model Sensitivity
Thorn Creek
upstream and treatment plant
effluent TDS data used in the model were obtained
from
a limited database.
The
upstream TDS levels
were measured nine times in the months of
November
and December while the TDS
WWTP
effluent
levels were measured 13 times in the
months of
November to
April. Due
to
the limited
database, uncertainty of the model output is inherently
present. The average
effluent TDS concentration before
the existing silica plant was online was
765
7-17
mg/L
and
the
average
upstream
TDS
concentration
was 689
mgJL
for
the average
conditions
model.
The peak
TDS
effluent
and
upstream
levels
were
1,186
mgJL and
2,093 mg/L,
respectively.
These
TDS
levels
were determined
based upon
the EPA method
presented
in the
EPA Technical
Support
Document
(EPA,
1991).
The upstream
and
treatment
plant
TDS levels
were increased
by
one
percent
each and modeled
for
Reach
#1
under average
conditions
to
evaluate
the
sensitivity
of
the model
to changes
in
the
TDS
levels.
Reach #1 was
used
as this
is the
most
impacted
of the Thom
Creek reaches.
A one percent
increase
in
the
upstream
TDS
level
did
not
change
the
downstream
TDS level,
while
a
one
percent
increase
in
the treatment
plant
TDS increases
the
downstream
TDS
by
seven
mg/L.
The
model is
therefore
more
sensitive
to
WWTP
TDS levels.
A
similar procedure
was
used for the
sulfate levels
on Reach
#1. A
one
percent
increase in
upstream
sulfate
levels
increases downstream
sulfate levels
one mg/L
and a one
percent
increase in
WWTP
sulfate
increases
the downstream
sulfate
by
two
mg/L. Again,
the
model is more
sensitive
to
WWTP
levels.
7.8
Summary
Presented
in Table
7-3
is
a
summary
of the
projected
water
quality
if
Rhodia
is
to
proceed
with the
proposed
silica plant
expansion.
From
Table
7-3,
it is apparent
that
the
proposed
process
will
increase the
TDS
and
sulfate
levels above
the current
water quality
standards,
at peak
loadings
and
low
flow
conditions
in the four
stream
reaches,
totaling
19 river
miles.
This is
the basis
behind
seeking
an adjusted
standard.
7-18
TABLE
7-3
SUMMARY OF
WATER
QUALITY
MODELING
RESULTS
PREDICTED
PEAK
CONCENTRATIONS,
mg/L
Parameter
Reach
#1
Reach
#2
Reach
#3
Reach
#4
Average
TDS
2,160
2,130
1,670
1,500
Peak
TDS
2,650
2,620
2,360
2,020
Existing
Adjusted
TDS
WQ
Standard
2,100
2,100
1,900
1,700
Average
Sulfate
1,170
1,150
930
820
Peak
Sulfate
1,350
1,340
1,160
1,000
Existing
Adjusted
Sulfate
WQ
Standard
1,000
1,000
850
750
Under
low
flow
conditions and
the
maximum
Rhodia
loading,
the
TDS
water
quality
will
be above
the current
adjusted
standard
in all
four
reaches,
with
a
projected
maximum
level
of
2,650
mg/L
in
Reach
#1.
Sulfate
levels
will
be
above
the existing
adjusted standard
under
low
flow
conditions
in
all
four
reaches,
with
the
maximum value
of 1,350
mg!L
projected in
Reach
#1.
Chronic
toxicity
tests
conducted
at and
above
these
levels
demonstrated
the
absence
of
any
aquatic
toxicity.
7-19
8.
SUMMARY AND
CONCLUSION
Rhodia has approached the District with
a
request to expand its existing
silica
manufacturing
process
at its Chicago Heights plant. The
process, which
produces silica
(Si0
2
),generates
an aqueous waste
stream
high in sodium
sulfate. An average of 137,375 pounds per
day and a maximum
of 151,725
pounds per day of sodium
sulfate will be generated by the silica process,
in an annual average
flow
of
840,000
to
940,000 gallons
per day. This waste stream will consequently
be
discharged
to
the
District’s WWTP, which has
sufficient hydraulic capacity to handle the
additional loading.
The District’s WWTP cannot
accept
the proposed waste stream from the
silica process without
exceeding
the existing adjusted
water quality limits for
total
dissolved solids
(TDS)
and sulfates on
the
receiving stream, Thorn
Creek, and subsequently the Little Calumet
River. There are three
reaches on Thorn Creek that
will be impacted by
the
proposed expansion,
and a potential fourth
reach on the Little Calumet
River under peak loading and
low
flow conditions.
Reach #1
is from
the WWTP to the merger with Deer Creek. Reach
#2 continues from the merger
with Deer
Creek
to the USGS
Station at
Thornton, while Reach
#3 is from the
USGS
Station
to the
merger with the Little Calumet
River. The fourth reach is from the Thorn
Creek
confluence, with
the
Little
Calumet
River
to the
confluence of
the Little Calumet
River and the Calumet-Sag
Channel. TDS levels, under
the worst case scenario
(low flow
and peak loading)
will increase
to
2,650 mg!L in Reach #1, 2,620
mg!L
in Reach
#2, declining
to
2,360
mg/L in Reach
#3.
The
peak
TDS
level projected
under the worst case scenario for Reach #4 is 2,020
mg/L.
Sulfates will increase to 1,350
mg/L in Reach
#1 under
the
worst
case scenario,
declining to 1,160
mg/L
by
Reach
#3.
The
peak sulfate level for the worst case scenario
in Reach #4 will be 1,000
mg/L.
Thorn Creek flows 19.5 miles from
its
headwaters in
Monee, Illinois to
the Little Calumet River. In
addition
to
numerous
wastewater
treatment
plant outfalls on
Thorn Creek
and its tributaries, the
creek
receives
considerable storrnwater
runoff from urban and rural
areas. TDS levels
upstream of
the
Thorn Creek WWTP
outfall currently
exceed
the 1,000
mg/L
water quality standard.
A
8-1
biological
survey
on Thom Creek,
including
fish and
benthic
organisms,
was conducted
to
determine
the current aquatic
quality.
Thom
Creek,
from
upstream
of the District’s outfall
to
downstream
of
the Butterfield
Creek
confluence
is
classified
as
a Limited Aquatic Resource,
a
common
classification
for urban streams.
Based
on the Huff &
Huff
stream surveys, the
IBI
and MBI
values have not
significantly
changed
after the
increase in TDS discharge.
Pre-elevated
TDS discharge
MBI
values indicated that
Thom
Creek
was
“fair” quality
and a moderate
aquatic resource.
The
pre-elevated TDS discharge
IBI
values
indicated that
Thom Creek
was also
“fair”
quality;
however,
this rating indicates
a limited
aquatic
resource.
The
post-elevated
TDS discharge
MBI
values
indicated
that
Thom
Creek
was “fair” quality
and
a
limited
aquatic
resource
upstream
of the discharge
and “fair”
quality and
a moderate
aquatic
resource
downstream of the discharge.
The
post-elevated
TDS discharge
]BI values indicated
that
Thom Creek
was also “fair”
quality and
a
limited
aquatic
resource both upstream
and
downstream
of the discharge.
Both
upstream
and
downstream
stations,
as well as, pre-
and post-elevated
TDS
discharge
stream
quality
ratings
indicate that
Thom Creek is
a “fair” quality
stream. The
small fluctuation
between
a
limited
aquatic
resource and
a moderate aquatic
resource
is
suggestive
of the normal
fluctuation
due
to other
factors
such
as a
precipitation
and
ambient
temperatures.
Given
its proximity
to urban areas,
there is limited
potential
for future improvements
in
the
aquatic
community
in
Thom Creek. Similar
conclusions
were
drawn
by
Michael Ander
of Dames
& Moore
(1990)
during an
environmental impact
study of Deer
Creek. Deer
Creek, a
tributary
of
Thom
Creek
was identified as
having limited
potential
uses
due
to the
limited amount of water
and
habitat
available.
The JEPA
noted a similar
water
quality classification
in its annual
water
quality
report
(IEPA, 2000)
for
Thom Creek
and the Little
Calumet
River
which
were
characterized
as
partial
support for
overall
use
and
aquatic life use.
A biological
assessment
done in
support
of the
NutraSweet!CIWC
petition
in AS
89-3
concluded
a
8-2
TDS water quality
level
of 3,000 mg/L would not
cause any undue stress to the aquatic life
(Dames
& Moore, 1981).
This
opinion was supported
by the Illinois EPA (Studer, 1990).
A toxicity
investigation by Reed and Evans (1981) concluded that
water quality sulfate levels
of 1,000 mg/L
would
not
be
harmful to the
aquatic biota.
To confirm the previous findings and
to specifically address any potential chronic
toxicity
associated
with
the
levels
of
sodium
sulfate anticipated, bioassay
tests
were
conducted using water from
Thom
Creek. Sulfate and TDS levels
up to 1,380 mg!L and 2,790 mg/L, respectively,
were evaluated. No
chronic
(or acute) toxicity was
observed in any of the tests using water fleas and
fathead
minnows.
The maximum levels tested
are greater than 100 percent of the peak levels
projected
by the models
in Thom Creek, thus providing
a “safety factor” with respect to any chronic
toxicity concem. Based
on the
assessment
of Thom Creek and
the projection of Thom Creek water quality
with the proposed
silica plant expansion, the TDS
and
sulfide levels projected and the
requested water quality
standards are summarized in Table 8-1.
TABLE
8-1
CURRENT
REQUESTED
WATER
QUALITY
STANDARDS
Reach Number
Current
WQ
Requested WQ
Standard, mg/L
Standard,
mg/L
TDS
#1
2,100
2,650
#2
2,100
2,620
#3
1,900
2,360
#4
1,700
2,020
Sulfate
#1
1,000
1,350
#2
1,000
1,340
#3
850
1,160
#4
750
1,000
8-3
Based upon
the
findings
in this study,
relief from
the TDS and sulfate
water
quality standards
on
Thom
Creek
and
the Little
Calumet River will not
have
any
impact on
the aquatic
community
in
these
streams. No other
environmental
impacts were
identified
herein.
In
summary,
based upon the
findings of this study;
granting
the changes
in the water quality
standard on
the two waterways
identified
would
allow Rhodia to
expand the existing
silica plant
at
its
Illinois facility
in Chicago
Heights. No adverse
environmental
effects from
the
sodium sulfate
discharge
were
identified
in this
study.
The economic
benefits
to this
local
community and
to
the State of
Illinois from the proposed
silica
manufacturing
facility
warrants
consideration
of adapting
the proposed
water quality
TDS
and sulfate limits.
The
request
for
an adjusted
standard
to allow
Rhodia to
expand the
silica
plant
at
its
Chicago
Heights
facility is
consistent
with historical
water quality
levels, existing
(adjusted)
water
quality
limits
on a portion
of Thom Creek, and
will not
result
in degrading the
quality of aquatic
community
in
Thom
Creek.
8-4
REFERENCES
American Public Works Association (APWA),
Water Pollution Aspects of Urban
Runoff,
January, 1969.
Ander, M.,
Dames & Moore,
IPCB Testimony, AS89-3, 1990.
Becker, G.C.,
Fishes of
Wisconsin, University of Wisconsin Press,
1983.
Bertrand, B., Des Plaines
River
Basin
Fisheries
Assessment, Illinois
Department of
Conservation,
Division
of
Fish
and Wildlife
Resources, 1984.
Bishop, P.L. and N.E. Kinner,
“Rotating Biological Contractor Treatment
of Hypersaline
Wastes,”
Proceedings of the 36th Industrial
Waste
Conference,
Purdue University,
Ann Arbor
Science, 1981.
Cunningham, Lee, IPCB
Petition, AS89-3, 1990.
Dames &
Moore, Stream
Survey of Deer
Creek,
Park Forest
South, Searle Chemicals,
Inc., 1982.
Dames & Moore, Final Report,
Evaluation of Potential Groundwater
Impacts, Deer Creek Basin,
Will and Cook Counties,
Illinois, 1986.
Dames & Moore, Final Report, Irrigation
Survey
of
Portions of Deer
and Thom Creek
Basins, Will
and Cook Counties,
Illinois, 1989.
Dames
&
Moore, Final
Report, Investigation of Total Dissolved Solids
Levels in Deer and
Thorn
Creeks,
Cook and Will Counties, Illinois,
1989.
Daugherty,
J.L., Survey of Uses of
Thom Creek, May, 1989.
Dowden, B.F. and H.J. Bennett,
“Toxicity of Selected
Chemical
to Certain Animals,”
JWPCF, Vol. 37, No.
9, 1965.
Eis, B. J.,
Ferguson,
J. F., Benjamin,
M. M.
The
Fate
and Effect of Bisulfate
in Anaerobic
Treatment.
Journal WPCF.
Volume
55.
Number 11. PP 1355-1365.
Environmental Protection Agency
(EPA), Technical Support Document
for Water
Quality-
based
Toxics Control,
EPA!505/2-90-1 1, March, 1991.
Higgins, M.J., L.A. Miller,
and D. Sobeck, “Improving Industrial
Wastewater Treatment
Using
Divalent
Cation Addition”,
Water Environmental Federation, WEFTEC
99,
New Orleans,
LA, 1999.
R-
1
Hill, D.O.
and S.R. Gelman, “Effects
of Chloride on
Nitrification Rates
in
Activated Sludge
Systems,” Proceedings
of the 32nd
Industrial Waste
Conference, Purdue
University,
Ann
Arbor
Science,
1977.
Hilton,
B. L., Oleszkiewicz,
J. A.,
“Toxicity
of Sulfides
to The Anaerobic Treatment
Process”.
Purdue
University Industrial
Waste
Conference
Proceedings.
Volume 42. PP739-747.
Hilsenhoff,
W.L., The Aquatic
Insects of
Wisconsin,
Natural
History
Council, 1981.
Hockenbury,
M.R.
D. Burstein,
and E.S. Jamro,
“Total Dissolved
Solids
Effects
on Biological
Treatment, “Proceedings
of the 32nd
Industrial Waste
Conference,
Purdue
University,
Ann
Arbor Science,
1977.
Huff&
Huff,
Inc. Environmental
Assessment
for the Proposed
Total Dissolved Solids
Discharged
from the Thom Creek
Basin
Sanitary
District,
1993.
Huff&
Huff, Inc. Biological
Survey of Thom
Creek, 1994.
Huff&
Huff, Inc. Biological
Survey of Thom Creek
Late Summer,
1997,
1997.
Illinois Environmental
Protection Agency
(IEPA),
Illinois
Water
Quality Report,
IEPA/WPC
184-024,
1984.
Illinois
Environmental
Protection Agency
(IEPA),
Illinois
Water
Quality
Report, 1990-1991,
IEPA/WPC/92-05
5,
1992.
Illinois
Environmental
Protection Agency
(IEPA), Biological
and
Water Quality Survey
of Thom
Creek (HBD) in the
Vicinity of the Thom
Creek Basin
Sanitary
District
Sewage Treatment
Plant,
Cook County, Illinois,
Staff Report, 1988.
Illinois
Environmental Protection
Agency
(IEPA), Stream
Characterization
(BSC): A Biological
Assessment
of
Illinois Stream Quality,
Special
Report
#13 of
the Illinois State Water
Plan
Task Force,
IEPAIWPC/89-275,
1989.
Illinois Environmental
Protection Agency (IEPA),
W. Matsunuga,
telephone
conversation,
January, 1993.
Illinois Environmental
Protection Agency, Illinois
Water Quality
Report,
1992-1993,
IEPAIWPC/94-
160, 1994.
Illinois Environmental
Protection Agency, Illinois
Water Quality
Report,
1994-1995,
IEPA!BOW/96-060a,
1996.
Illinois
Environmental
Protection Agency, Illinois
Water
Quality Report,
2000, IEPAfBOW/00-005,
April
2000.
R-2
Loomis,
K.S.
and
J.E. Huff,
Biological
Survey
of North
Kent
Creek,
Huff&
Huff, Inc.,
1988.
Maree,
J. P.,
Gerber,
A.,
Hill,
E. “An
Intergrated
Process
For
Biological
Treatment
Of
Sulfate-
Containing
Industrial
Effluents”.
Journal
WPCF.
Volume
59.
Number
12.
PP
1069-1074.
McCafferty,
W.
Patrick,
Aquatic
Entomology,
Science
Books
International,
1981.
Merritt,
R. W.
and
K.
W. Cummins,
(eds.),
An
Introduction
to
Aquatic
Insects,
KendalllHunt
Publishing
Co.,
1984.
Middleton,
A.
C.,
Lawrence,
A. W.,
“Kinetics
of
Microbial
Sulfate
Reduction”.
Journal
WPCF.
1966.
PP1659-1670.
Pennak,
R.
W., Freshwater
Invertebrates
of the
United
States:
Protozoa
to Mollusca,
John
Wiley
&
Sons, Inc.,
1989.
Pollution
Control
Board
- Opinion
and
Order
of
the
Board
(by D.
Anderson);
PBC83-73,
G.D.
Searle,
et
al., v IEPA,
December
29,
1983.
Pope,
D.H
et
al. “Microbiologically
Influenced
Corrosion
and
Hydrogen
Sulfide
Production
in
Gas Industry
Facilities”.
American
Gas
Association
Operating
Section
Proceedings
1989
Reed,
P. and
R.
Evans,
Acute
Toxicity
of
Chlorides,
Sulfates,
and Total
Dissolved
Solids
to
Some
Fishes
of
Illinois,
SWS
Contract
Report
283, September,
1981.
Schmeelk,
W.G.,
S.G.
Dennison,
P.
O’Brien,
1983
Annual
Summary
Report,
Water
Quality
Within
the
Waterways
System
of the Metropolitan
Sanitary
District
of
Greater
Chicago,
Vol
2, Biological,
Report
85-23-B,
MSDGC,
1986.
Smith,
P. W.,
The
Fishes
of
Illinois,
University
of
Illinois
Press, 1979.
Studer,
D.,
Agency
Testimony,
AS89-3,
1990.
Tchobanoglous,
G., Burton,
F.
G.,
Metcalf
&
Eddy,
Inc.
“Wastewater
Engineering
Treatment,
Disposal,
and
Reuse
3
rd
Edition”.
McGraw-Hill
Publishing
Company.
New
York.
1991.
Tokuz,
R.Y.
and
W.W.
Eckenfelder,
“The
Effect
of
F!M
Ratio on
Activated
Sludge
System
Treating
High
Salinity
Wastewater”,
Proceeding
of
the 23
Industrial
Waste
Conference,
Purdue
University,
May
1978.
Trama,
F.B.,
“The
Acute
Toxicity
of
Some
Common
Salts
of Sodium,
Potassium,
and
Calcium
to
the
Common
Bluegill,”
Proceedings
of
the
Academy
of
Natural
Sciences
of
Philadelphia,
Vol. 106,
1954.
R-3
Uberoi,
V.,
Bhattacharya,
S.
K.
“Sulfate-Reducing
Bacteria
In
Anaerobic
PropionateSystems”.
Journal
of
Environmental
Engineering.
July
1997.
PP
675-682.
U.S.
Geological
Survey
(USGS),
River
Mileages
and
Drainage
Areas
for
Illinois
Streams
-
Volume
2,
Illinois
River
Basin,
USGS
Water-Resources
frivestigation,
79-111,
1979.
United
States
Environmental
Protection
Agency,
Macroinvertebrate
Field
and
Laboratory
Methods
for
Evaluating
the
Biological
Integrity
of Surface
Water,
EPA/600/4-90/030,
1990
Von
Ende,
Carl
N.
and
Darryl
J.
Beckett, Biological
Survey
of
Thorn
Creek
for
Huff
&
Huff,
Inc.,
1993
Wallen,
I.E.,
W.C.
Greer,
and
R.
Lasater, “Toxicity
to
Gambusia
affinis
of
Certain
Pure
Chemical
in
Turbid
Waters,”
Sewage
and
Industrial
Wastes,
Vol.
29,
No.6,
1957.
WEF
Manual
of Practice
No.
8.
ASCE
Manual
and
Report
on
Engineering
Practice
No.
76.
Design
of
Municipal
Wastewater
Treatment
Plants
Volume
I: Chapters
1-12.
R-4
AVERAGE
CONDITIONS
FLOWRATE
vs.
TDS
CONCENTRATION
at
THORNTON
STATION
Reach
#2
Thorn
Creek
Deer
Creek
Thorn
Creek
(at
Sta.
05536275)
Flow,
mgd
TDS,
mg/I
TDS,
lbs/d
Flow,
mgd
TDS,
mg/I
TDS,
lbs/Il
Flow,
mgd
TDS,
mg/i
TDS,
lbs/d
11.4
2156
204433
0.20
689
1149
11,57
2131
205583
15.4
1777
228564
3
689
23175
18
1642
251739
19.5
1555
252695
6
689
39009
25
1388
291704
23.5
1410
276826
8
689
54843
32
1242
331669
27.6
1308
300957
11
689
70677
39
1148
371634
31.7
1231
325087
14
689
86511
46
1082
411598
32.9
1210
332512
17
689
102345
50
1050
434857
34.2
1190
339936
19
689
118179
54
1022
458115
35.5
1172
347360
22
689
134014
58
999
481373
36.8
1155
354784
25
689
149848
62
979
504632
38.1
1139
362208
26
689
154173
64
969
516381
39.4
1125
369632
27
689
159189
66
960
528821
40.7
1111
377057
27
689
164205
68
952
541262
42.0
1098
384481
28
689
169222
70
944
553702
43.3
1086
391905
29
689
174238
73
936
566143
44.6
1074
399329
30
689
179254
75
929
578583
45.9
1063
406753
31
689
184271
77
922
591024
47.2
1053
414177
32
689
189287
79
916
603464
48.5
1043
421602
33
689
194303
81
910
615905
49.7
1034
429026
34
689
199320
83
904
628345
51.0
1025
436450
34
689
204336
86
898
640786
52.3
1017
443874
35
689
209352
88
893
653226
53.6
1009
451298
36
689
214369
90
888
665667
54.9
1002
458722
37
689
219385
92
884
678107
56.2
994
466147
38
689
224401
94
879
690548
57.5
988
473571
39
689
229418
96
875
702988
58.8
981
480995
40
689
234434
99
871
715429
60.1
975
488419
41
689
239450
101
867
727869
61.4
969
495843
41
689
244467
103
863
740310
62.7
963
503267
42
689
249483
105
860
752750
64.0
957
510692
43
689
254499
107
856
765191
65.2
952
518116
44
689
259516
109
853
777631
66.5
947
525540
45
689
264532
Ill
850
790072
67.8
942
532964
46
689
269548
114
847
802512
69,1
937
540388
47
689
274565
116
844
814953
70.4
933
547812
48
689
279581
118
841
827393
71,7
928
555237
48
689
284597
120
838
839834
73.0
924
562661
49
689
289614
122
835
852274
74.3
920
570085
50
689
294630
124
833
864715
75.6
916
577509
51
689
299646
127
830
877155
76.9
912
584933
52
689
304662
129
828
889596
78.2
909
592357
53
689
309679
131
826
902036
79.5
905
599782
54
689
314695
133
824
914477
80.8
902
607206
55
689
319711
135
821
926917
82.0
898
614630
55
689
324728
137
819
939358
83.3
895
622054
56
689
329744
140
817
951798
84,6
892
629478
57
689
334760
142
815
964239
85.9
889
636902
58
689
339777
144
813
976679
87.2
886
644327
59
689
344793
146
812
989120
88.5
883
651751
60
689
349809
148
810
1001560
89.8
880
659175
61
689
354826
150
808
1014001
91.1
877
666599
62
689
359842
153
806
1026441
92.4
875
674023
62
689
364858
155
805
1038882
93.7
872
681447
63
689
369875
157
803
1051322
95.0
870
688872
64
689
374891
159
802
1063763
96.3
867
696296
65
689
379907
161
800
1076203
97.5
865
703720
66
689
384924
163
799
1088644
98.8
863
711144
67
689
389940
166
797
1101084
100,1
860
718568
68
689
394956
168
796
1113525
101.4
858
725992
69
689
399973
170
794
1125965
102.7
856
733417
69
689
404989
172
793
1138406
104.0
854
740841
70
689
410005
174
792
1150846
Deer
Creek
loading
calculated
from
Deer
Creek
flow
less
average
CIWC
discharge
and
689
mg/I
(avg.
Thorn
Cr.
TDS
upstream
of
Thorn
Cr.
WWTP)
plus
average
CIWC
loading
(13,374
lbs/d).
Thorn
Creek
values
from
Reach
#1
model
for
average
Rhodia
TDS
loadings
\\Darlene\c\1
DOC\Thorncrk\Rhodia99Tabl\[TCR2AT2.xlsjTable
03/15/2000
10:47
AVERAGE
CONDITIONS
FLOWRATE,mgd
vs.
TDS,
mg/I
BEYOND
THORNTON
STATION
Reach
#3
Thom
Creek
Rhodia
Projected
Loadings
Average
Average
Average
Average
Flow,
mgd
TDS,
mg/I
TDS,
Ibs/d
Flow,
mgd
TDS,
mg/I
TDS,
lbs/d
Flow,
mgd
TDS,
mg/I
TOS,
lbs/d
13.2
531
58457
0.84
19614
137375
14
1672
195832
14
531
62000
0.84
19614
137375
15
1611
199375
16
531
70857
0.84
19614
137375
17
1483
208232
18
531
79714
0.84
19614
137375
19
1382
217089
20
531
88571
0.84
19614
137375
21
1300
225946
22
531
97428
0.84
19614
137375
23
1233
234803
24
531
106285
0.84
19614
137375
25
1176
243660
26
531
115142
0.84
19614
137375
27
1128
252517
28
531
123999
0.84
19614
137375
29
1087
261374
30
531
132856
0.84
19614
137375
31
1051
270231
32
531
141713
0.84
19614
137375
33
1019
279088
34
531
150570
0.84
19614
137375
35
991
287945
36
531
159427
0.84
19614
137375
37
966
296802
38
531
168285
0.84
19614
137375
39
944
305660
40
531
177142
0.84
19614
137375
41
923
314517
42
531
185999
0.84
19614
137375
43
905
323374
44
531
194856
0.84
19614
137375
45
888
332231
46
531
203713
0.84
19614
137375
47
873
341088
48
531
212570
0.84
19614
137375
49
859
349945
50
531
221427
0.84
19614
137375
51
846
358802
55
531
243570
0.84
19614
137375
56
818
380945
60
531
265712
0.84
19614
137375
61
794
403087
65
531
287855
0.84
19614
137375
66
774
425230
70
531
309998
0.84
19614
137375
71
757
447373
75
531
332141
0.84
19614
137375
76
742
469516
80
531
354283
0.84
19614
137375
81
729
491658
85
531
376426
0.84
19614
137375
86
718
513801
90
531
398569
0.84
19614
137375
91
707
535944
95
531
420711
0.84
19614
137375
96
698
558086
100
531
442854
0.84
19614
137375
101
690
580229
105
531
464997
0.84
19614
137375
106
682
602372
110
531
487139
0.84
19614
137375
111
676
624514
115
531
509282
0.84
19614
137375
116
669
646657
120
531
531425
0.84
19614
137375
121
664
668800
125
531
553568
0.84
19614
137375
126
658
690943
130
531
575710
0.84
19614
137375
131
653
713085
135
531
597853
0.84
19614
137375
136
649
735228
140
531
619996
0.84
19614
137375
141
645
757371
145
531
642138
0.84
19614
137375
146
641
779513
150
531
664281
0.84
19614
137375
151
637
801656
155
531
686424
0.84
19614
137375
156
634
823799
160
531
708566
0.84
19614
137375
161
631
845941
165
531
730709
0.84
19614
137375
166
628
868084
170
531
752852
0.84
19614
137375
171
625
890227
175
531
774995
0.84
19614
137375
176
622
912370
180
531
797137
0.84
19614
137375
181
620
934512
185
531
819280
0.84
19614
137375
186
617
956655
190
531
841423
0.84
19614
137375
191
615
978798
195
531
863565
0.84
19614
137375
196
613
1000940
200
531
885708
0.84
19614
137375
201
611
1023083
205
531
907851
0.84
19614
137375
206
609
1045226
210
531
929993
0.84
19614
137375
211
607
1067368
215
531
952136
0.84
19614
137375
216
605
1089511
220
531
974279
0.84
19614
137375
221
604
1111654
225
531
996422
0.84
19614
137375
226
602
1133797
230
531
1018564
0.84
19614
137375
231
600
1155939
235
531
1040707
0.84
19614
137375
236
599
1178082
240
531
1062850
0.84
19614
137375
241
598
1200225
245
531
1084992
0.84
19614
137375
246
596
1222367
L
250
531
1107135
0.84
19614
137375
251
595
1244510
\\Drlene\c\1
DOC\Thewrk\Rhodia99Tab1\lTCR3AVT.sIslTab1e
03/t5/2000
1052
Notes:
Thom
Creek
Flow
values
start
at
7Q10
(13.2
mgd)
and
increase
by
2
until
50
mgd
where
values
increase
by
5
mgd.
TDS
concentration
is
average
summation
of
major
ions
currently
in
Thom
Creek
(Obtained
from
USGS
1991
Water
year
Thornton
station
data)
Rhodia
Rhodia
values
are
annual
average
values
AVERAGE
CONDITIONS
14
1672
195832
15
1611
199375
17
1483
208232
19
1382
217089
21
1300
225946
23
1233
234803
25
1176
243660
27
1128
252517
29
1087
261374
31
1051
270231
33
1019
279088
35
991
287945
37
966
296802
39
944
305660
41
923
314517
43
905
323374
45
888
332231
47
873
341088
49
859
349945
51
846
358802
56
818
380945
61
794
403087
66
774
425230
71
757
447373
76
742
469516
81
729
491658
86
718
513801
91
707
535944
96
698
558086
101
690
580229
106
682
602372
111
676
624514
116
669
646657
121
664
668800
126
658
690943
131
653
713085
136
649
735228
141
645
757371
146
641
779513
151
637
801656
156
634
823799
161
631
845941
166
628
868084
171
625
890227
176
622
912370
181
620
934512
186
617
956655
191
615
978798
196
613
1000940
201
611
1023083
206
609
1045226
211
607
1067368
216
605
1089511
221
604
1111654
226
602
1133797
231
600
1155939
236
599
1178082
241
598
1200225
246
596
1222367
251
595
[244510
4.85
1000
40449
8
464
29449
10
464
40129
13
464
50810
16
464
61490
19
464
72171
21
464
82852
24
464
93532
27
464
104213
30
464
114893
32
464
125574
35
464
136254
38
464
146935
41
464
157615
43
464
168296
46
464
178976
49
464
189657
52
464
200337
55
464
211018
57
464
221699
60
464
232379
65
464
251728
70
464
271077
75
464
290425
80
464
309774
85
464
329123
90
464
348472
95
464
367821
100
464
387169
105
464
406518
110
464
425867
115
464
445216
120
464
464565
125
464
483913
130
464
503262
135
464
522611
140
464
541960
145
464
561309
150
464
580657
155
464
600006
160
464
619355
165
464
638704
170
464
658053
175
464
677401
180
464
696750
185
464
716099
190
464
735448
195
464
754797
200
464
774145
205
464
793494
210
464
812843
215
464
832192
220
464
851541
225
464
870889
230
464
890238
235
464
909587
240
464
928936
245
464
948285
250
464
967633
255
464
986982
19
1500
236281
22
1222
228823
27
1094
248361
32
1005
267899
37
938
287436
41
887
306974
46
846
326512
51
813
346049
56
786
365587
61
763
385124
65
743
404662
70
726
424200
75
711
443737
80
698
463275
84
686
482812
89
676
502350
94
667
521888
99
658
541425
103
651
560963
108
644
580501
116
635
613324
126
624
654815
136
614
696307
146
606
737798
156
599
779290
166
593
820781
176
588
862273
186
583
903764
196
579
945256
206
575
986747
216
571
1028239
226
568
1069730
236
565
1111222
246
562
1152713
256
560
1194205
266
557
1235696
276
555
1277188
286
553
1318679
296
551
1360171
306
549
1401662
316
548
1443154
326
546
1484645
336
545
1526137
346
543
1567628
356
542
1609120
366
541
1650611
376
540
1692103
386
539
1733594
396
538
1775086
406
537
1816577
416
536
1858069
426
535
1899560
436
534
1941052
446
533
1982543
456
532
2024035
466
532
2065526
476
531
2107018
486
530
2148509
496
530
2190001
506
529
2231492
Notes:
Thorn
Creek:
Flow
and
TDS
values
are
from
Reach
#3
for
Average
TDS
loadiog
Little
Caiwnet
River
Flow
values
start
at
the
7Q10
for
the
Munster
Station
and
increase
by
2.76
mgd
until
60
mgd,
the
average
flow.
This
corresponds
to
Thorn
Creeks
median
flow
of
56
mgd.
TDS
level
is
the
average
TDS
for
the
Munster
Station
and
at
low
flow
is
1000
mg/I,
the
water
quality
standard.
FLOWRATE,
mgd
vs.
TDS,
mg/l
in
the
LIITLE
CALUMET
RIVER
Reach
#4
Thorn
Creek
Little
Calumet
River
at
Munster,
In
Projected
Loading
Average
Average
Flow,
mgd
TDS,
mg/l
TDS,
lbs/d
Flow,
mgd
TDS,
mg/l
TDS,
lbs/d
Flow,
mgd
TDS,
mg/l
TDS,
lbs/d
\\Darlene\c\IDOC\Thorncrk\Rhodie99Tabl\[1CR4AVT.xlslTable
03/15/200010:53
AVOS1AGE
CONDI1IONS
Flowrate,
mgd
vs.
Sulfate,
mg/I
R..ob
NI
Up.9%m
r...w0,oP30
-
Rbod
U30SSt4oo
A0.ng.
Avg.
Av9%.
Ao.g.
Ao0.
AOW.
930w.
wd
P30w,
of,
8.304.,
../I
OoIf,a,
lb.M
P30w,
wod
P30w,
of,
SooSSa.
mo/I
3651,1.,
46.00
930w,
mod
F30w,
of.
8.0464.,
mo/I
8.1461.,
46th’
P30w.
mod
F30w,
of.
5.310...
.r&1
8.1461.,
16./’
0.19
0.3
486
301
10.34
46
207
47844
084
1.3
13343
92730
41.37
10
1169
140894
2.96
5
186
4390
11.63
10
207
20074
0.84
1.3
13243
92750
13.43
24
913
117414
5.72
9
186
8079
12.92
20
207
22303
0.84
1.3
13243
92750
19.41
30
763
123933
8.49
13
196
13160
14.21
22
201
24535
0.84
1.3
13243
92150
23.34
36
664
430433
11.23
17
184
17457
45.30
24
201
26766
0.84
4.3
23243
92730
27.60
43
595
136972
14.02
22
186
24746
46.82
26
201
21996
0.84
4.3
13243
92750
34.63
49
544
143492
15.01
24
486
23150
16.90
36
207
2*996
0.84
4.3
15243
92150
32.95
34
550
145496
*6.60
26
496
23734
16.82
26
207
2*996
0.84
4.3
43243
92730
54.24
53
317
147300
41.80
28
186
27130
16.80
26
207
2*996
0.84
1.3
13243
92730
55.53
35
505
149504
19.19
30
186
29762
16.80
26
207
21996
0.84
1.3
13243
92750
36.82
57
493
154509
20.4*
32
486
34767
16.86
26
201
21996
0.84
1.3
43243
92750
30.11
59
413
153545
21.77
34
184
33774
16.80
25
207
28996
0.34
4.3
13243
92730
39,41
61
473
155541
23.06
36
4*6
33775
46.86
26
207
28996
0.84
4.3
13243
92730
40.70
63
464
157224
24.53
30
284
31779
16.80
26
201
2*996
0.84
4.3
13245
92750
41.99
65
456
159525
25.65
40
184
39783
16.80
25
307
2*996
0.84
4.5
*3245
92730
43.28
67
447
161350
26.94
42
284
4118*
26.96
26
207
21996
0.84
1.3
13245
92730
44.57
69
440
463534
21.23
44
106
43793
46.80
24
207
2*996
0.84
1.3
13243
92750
45.87
71
433
165530
29.32
46
186
43796
46.80
26
207
2*996
0.84
1.5
15245
92150
47.16
73
425
167342
30.84
48
486
47800
46.80
26
207
2*996
0.84
1.5
43243
92750
40.45
75
420
469346
32.41
50
186
49004
46.93
26
207
289%
0.84
4.3
15243
92750
49.74
77
444
171551
31.40
52
196
51809
46.80
26
267
20996
0.84
1.3
43245
92750
52.03
79
408
173553
34.69
54
496
53043
46.80
35
207
2*996
0.84
4.3
13243
92750
52.33
01
402
113359
35.90
56
496
33817
46.80
25
207
209%
0.84
4.3
15245
92750
33.62
*3
397
177563
31.27
30
184
57804
16.80
26
207
2*996
0.84
1.3
43243
92750
34.94
85
592
479568
38.57
60
180
59825
46.10
24
207
289%
0.84
1.3
13245
92730
36.20
87
307
181572
39.86
63
186
61030
46.00
26
207
29996
0.84
1.3
43243
92730
31.49
89
383
185576
44.15
64
106
63034
46.80
26
207
20996
0.84
1.3
15243
92130
50.79
91
379
185380
42.44
66
186
63030
46.80
26
207
2*996
0.84
1.3
43243
92750
60.00
93
374
187504
4373
68
106
67842
46.00
26
267
20996
0.84
4.3
13243
92730
61.37
93
370
189389
45.03
70
184
69846
16.80
26
207
28996
0.84
4.3
43245
92750
62.66
97
367
494505
46.32
72
4*6
71834
46.80
36
207
219%
0.84
4.3
43243
92730
63.93
99
363
193397
47.64
74
486
73033
16.93
26
207
21996
0.86
4.3
13243
92730
63.23
401
339
195601
48.90
76
186
73039
46.90
25
307
20996
0.86
4.3
13249
92750
66.54
103
356
497605
30.19
18
406
77063
46.80
24
207
20996
0.84
1.5
43245
92730
67.83
105
353
199610
54.49
00
186
79*67
16.80
26
207
2.8996
0.84
1.3
13243
92756
69.12
101
330
201644
52.78
83
486
84872
46.90
26
207
21996
0.84
4.3
13243
92750
10.41
109
347
205618
54.07
84
186
83876
16.80
26
207
21996
0.84
4.3
45243
92750
71.71
III
344
205622
35.36
86
496
85090
46.80
36
207
28996
0.84
1.3
15245
92136
71.00
413
344
201625
56.63
88
1*6
87884
26.89
26
207
2*996
0.84
1.3
43243
92750
74.29
113
330
209631
57.95
90
484
89880
46.80
26
207
28996
0.84
4.3
15243
92750
75.3*
147
336
211655
39.24
92
284
9*893
46.90
26
207
299%
0.84
2.3
43243
92730
76.87
119
533
243639
6053
94
186
93*91
*6.83
26
201
28996
0.84
4.3
13245
92730
78.47
III
334
245645
64.82
96
186
95901
16.80
26
207
28996
0.04
4.3
43243
92730
79.46
123
320
217647
63.11
98
196
97903
16.80
26
207
2*996
0.84
1.3
13243
92750
*6.73
125
326
219632
64.41
100
186
99909
46.90
26
207
28996
0.84
1.3
43243
92750
*2.04
12.7
324
221656
63.70
102
*06
101914
16.90
26
207
21996
0.84
4.3
43243
92750
03.53
129
322
223660
66.99
404
106
103910
46.80
26
207
28996
0.94
4.3
13243
92730
84.63
431
320
225664
61.28
*06
180
403922
46.90
25
537
21996
0.84
4.3
43243
92730
85.92
453
348
237668
69.37
408
186
407936
16.90
25
307
23996
0.84
4.3
45343
92.750
87.31
455
316
229613
70.87
119
106
409930
46.93
26
207
3*996
0.84
1.3
13343
93750
88.50
137
314
231677
72.16
112
186
111935
16.83
26
207
219%
0.84
4.3
43243
92150
89.79
139
312
253601
73.45
114
106
113939
46.80
26
207
38996
0.84
4.3
43243
92150
91.09
141
340
235683
74.74
4*6
486
115943
16.00
26
207
20996
0.84
1.3
13243
92730
92.30
143
309
237619
76.95
118
186
117947
46.06
36
201
289%
0.84
1.3
13243
92750
95.67
245
307
23*694
77.33
129
484
119951
46.00
36
307
29996
9.84
1.5
43243
92750
94.96
447
305
244690
78.62
422
186
124956
46.83
26
207
2*996
0.84
1.3
13243
92750
96.25
449
394
243102
79.91
124
486
423960
46.80
36
207
29996
0.84
4.3
45243
92750
97.33
134
302
243106
84.20
126
484
425964
16.00
26
207
28996
0.84
1.3
*5245
92750
98.84
233
501
2477*0
82.49
429
486
127968
16.85
26
307
21996
0.84
1.3
13243
92150
*60.43
455
299
249745
83.19
150
186
429973
46.80
26
207
209%
0.84
1.3
13243
92750
104.42
137
298
231119
85.08
133
106
131977
16.80
26
207
28996
0.84
1.3
13243
92750
192.71
159
296
253723
86.37
134
186
133981
46.80
35
207
28996
0.84
1.5
43243
92750
104.01
161
295
255727
0101001509
>404..
F30w
,.
fo
p66mm
.84t
0mm
1Q10
(0.3
of.)
.ml
9,
.omop
(22.7
of.).
Av.mg.
9(09mm
4300900000.
990993090.0.3y
9099191909
Thom
Cmok
*6o).
WWTP
430w
(25.9
of.).
P30w.
8m
9100.90
1
2
of..
S.160.9,..21%
TOO
P30w
9939..
.84tfrmo7Ql0
3009130w
.04091080...
433135.0911,..
‘1611
..,.m..
ao.d
do.o.0bo.m
130w
404.g
30w
1kw
,.,o430ow.
(p.11o
9,
Rmo’4w.koo
.ddl*oool
430w)
81,0..
A.
4630
d,4
,.
r.d300m
dow..*,mm
ooml30,..
dw.iag
9091g0
am0m66
ph*6
9
09f00988000,
00
46.
ow...
0
.
130w
(23.9
of.)..
r..c6o4,
6..
bo4.
00.0110..
9.51.4.
akwo..27%
TDS
R3od11
630w..
46.4k...
(4.300,)
40ñ.g
46.
o.
kmd11
(92,75046.30).
3611...
9,k
..68%
TDS
(4(25
100%
Fm..
.od30,.
..*6a)
Up66o...
...I
tm.10909
9
30oLTDS/S.1âIo
,.ko.fro..
‘Thou.
Coodo
B..).
68..300.i.g
(NOV.92
APR.
93)
Up.9mo.
mol
UmtmmS
pk.rL
1Q40
00300.0.0..
ISWS
4993
mpoot
23(094.91..
.mw.
430..
.t83i..d
f,wm
USGS
1979
W66r
Rmmoo.
409
TomImlU
pkw
.vm.
130w
0mm
4992
DM8.
B3om.POwlmo
9930..
.m
.1
w.g.
km.
AVERAGE
CONDiTIONS
FLOWRATE
vs.
SULFATE
CONCENTRATION
at
THORNTON
STATION
Reach
#2
Deer
Creek
7Q10
sulfate
concentration
Set
at
500
mg/i
water
quality
standard
Loadings
for
flows
higher
than
7Q10
calculated
from
Deer
Creek
flow
less
average
CIWC
flow
(1.25
mgd)
and
186
mg/i
sulfate
(27%
of
upstream
TDS
concentration
of
689
mg/I)
plus
average
CIWC
sulfate
loading
of
3611
lbs/day
(27%
of
average
TDS
loading
of
13374
ibs/d)
Thom
Creek
values
from
Reach
#1
model
for
average
Rhodia
sulfateloadings.
Thorn
Creek
Deer
Creek
Thom
Creek
(at
Sta.
05536275)
Flow,
mgd
Sulfate,
mg/i
Sulfate,
ibs/d
Flow,
mgd
Sulfate,
mg/i
Sulfate,
lbs/d
Flow,
mgd
Sulfate,
mg/i
Sulfate,
lbs/
d
11.37
1169
110894
15.43
913
117414
19.48
763
123933
23.54
664
130453
27.60
595
136972
31.65
544
143492
32.95
530
145496
34.24
517
147500
35.53
505
149504
36.82
493
151509
38.11
483
153513
39.41
473
155517
40.70
464
157521
41.99
456
159525
43.28
447
161530
44.57
440
163534
45.87
433
165538
47.16
426
167542
48.45
420
169546
49.74
414
171551
51.03
408
173555
52.33
402
175559
53.62
397
177563
54.91
392
179568
56.20
387
181572
57.49
383
183576
58.79
379
185580
60.08
374
187584
61.37
370
189589
62.66
367
191593
63.95
363
193597
65.25
359
195601
66.54
356
197605
67.83
353
199610
69.12
350
201614
70.41
347
203618
71.71
344
205622
73.00
341
207626
74.29
338
209631
75.58
336
211635
76.87
333
213639
78.17
331
215643
79.46
328
217647
80.75
326
219652
82.04
324
221656
83.33
322
223660
84.63
320
225664
85.92
318
227668
87.21
316
229673
88.50
314
231677
89.79
312
233681
91.09
310
235685
92.38
309
237689
93.67
307
239694
94.96
305
241698
96.25
304
243702
97.55
302
245706
98.84
301
247710
100.13
299
249715
101.42
298
251719
102.71
296
253723
10401
295
255727
0.20
106
177
3
106
6257
6
106
10531
8
106
14806
11
106
19080
14
106
23355
17
106
27629
19
106
31904
22
106
36178
25
106
40453
26
106
41621
27
106
42975
27
106
44329
28
106
45683
29
106
47037
30
106
48391
31
106
49746
32
106
51100
33
106
52454
34
106
53808
34
106
55162
35
106
56517
36
106
57871
37
106
59225
38
106
60579
39
106
61933
40
106
63288
41
106
64642
41
106
65996
42
106
67350
43
106
68704
44
106
70059
45
106
71413
46
106
72767
47
106
74121
48
106
75475
48
106
76829
49
106
78184
50
106
79538
51
106
80892
52
106
82246
53
106
83600
54
106
84955
55
106
86309
55
106
87663
56
106
89017
57
106
90371
58
106
91726
59
106
93080
60
106
94434
61
106
95788
62
106
97142
62
106
98496
63
106
99851
64
106
101205
65
106
102559
66
106
103913
67
106
105267
68
106
106622
69
106
107976
69
106
109330
70
106
110684
11.57
1151
111071
18
807
123671
25
640
134465
32
544
145259
39
482
156053
46
438
166847
50
418
173125
54
400
179404
58
385
185683
62
372
191962
64
366
195133
66
360
198492
68
355
201850
70
350
205209
73
345
208567
75
340
211925
77
336
215284
79
332
218642
81
328
222001
83
324
225359
86
321
228717
88
317
232076
90
314
235434
92
311
238793
94
308
242151
96
306
245509
99
303
.243868
101
300
252226
103
298
255584
105
296
258943
107
293
262301
109
291
265660
111
289
269018
114
287
272376
116
285
275735
118
284
279093
120
282
282452
122
280
285810
124
279
289168
127
277
292527
129
275
295885
131
274
299244
133
273
302602
135
271
305960
137
270
309319
140
268
312677
142
267
316036
144
266
319394
146
265
322752
148
264
326111
150
263
329469
153
261
332827
155
260
336186
157
259
339544
159
258
342903
161
257
346261
163
256
349619
166
256
352978
168
255
356336
170
254
359695
172
253
363053
174
252
366411
\\
Darlene\c\100C\Therncrk\Rhadia99Tabl\[TCR2AVS.sls]Table
03/15/2000
10:57
AVERAGE
CONDITIONS
FLOWRATE,mgd
vs
SULFATE,
mg/i
BEYOND
THORNTON
STATION
Reach
#3
Thorn
Creek
Rhodia
Projected
Loadings
Average
Average
Flow,
mgd
Sulfate,
mg/I
Sulfate,
Ibs/d
Flow,
mgd
Sulfate,
mg/i
Sulfate,
ibs/d
Flow,
mgd
Sulfate,
mg/i
Sulfate,
ibs/d
13.2
149
16403
0.84
13243
92750
14
932
109153
14
149
17397
0.84
13243
92750
15
890
110147
16
149
19883
0.84
13243
92750
17
802
112633
18
149
22368
0.84
13243
92750
19
733
115118
20
149
24853
0.84
13243
92750
21
677
117603
22
149
27339
0.84
13243
92750
23
630
120089
24
149
29824
0.84
13243
92750
25
592
122574
26
149
32309
0.84
13243
92750
27
559
125059
28
149
34794
0.84
13243
92750
29
530
127544
30
149
37280
0.84
13243
92750
31
506
130030
32
149
39765
0.84
13243
92750
33
484
132515
34
149
42250
0.84
13243
92750
35
465
135000
36
149
44736
0.84
13243
92750
37
447
137486
38
149
47221
0.84
13243
92750
39
432
139971
40
149
49706
0.84
13243
92750
41
418
142456
42
149
52192
0.84
13243
92750
43
406
144942
44
149
54677
0.84
13243
92750
45
394
147427
46
149
57162
0.84
13243
92750
47
384
149912
48
149
59648
0.84
13243
92750
49
374
152398
50
149
62133
0.84
13243
92750
51
365
154883
55
149
68346
0.84
13243
92750
56
346
161096
60
149
74560
0.84
13243
92750
61
330
167310
65
149
80773
0.84
13243
92750
66
316
173523
70
149
86986
0.84
13243
92750
71
304
179736
75
149
93200
0.84
13243
92750
76
294
185950
80
149
99413
0.84
13243
92750
81
285
192163
85
149
105626
0.84
13243
92750
86
277
198376
90
149
111839
0.84
13243
92750
91
270
204589
95
149
118053
0,84
13243
92750
96
264
210803
100
149
124266
0.84
13243
92750
101
258
217016
105
149
130479
0.84
13243
92750
106
253
223229
110
149
136693
0.84
13243
92750
111
248
229443
115
149
142906
0.84
13243
92750
116
244
235656
120
149
149119
0.84
13243
92750
121
240
241869
125
149
155333
0.84
13243
92750
126
236
248083
130
149
161546
0.84
13243
92750
131
233
254296
135
149
167759
0.84
13243
92750
136
230
260509
140
149
173972
0.84
13243
92750
141
227
266722
145
149
180186
0.84
13243
92750
146
224
272936
150
149
186399
0.84
13243
92750
151
222
279149
155
149
192612
0.84
13243
92750
156
220
285362
160
149
198826
0.84
13243
92750
161
217
291576
165
149
205039
0.84
13243
92750
166
215
297789
170
149
211252
0.84
13243
92750
171
213
304002
175
149
217466
0.84
13243
92750
176
212
310216
180
149
223679
0.84
13243
92750
181
210
316429
185
149
229892
0.84
13243
92750
186
208
322642
190
149
236105
0.84
13243
92750
191
207
328855
195
149
242319
0.84
13243
92750
196
205
335069
200
149
248532
0.84
13243
92750
201
204
341282
205
149
254745
0.84
13243
92750
206
202
347495
210
149
260959
0.84
13243
92750
211
201
353709
215
149
267172
0.84
13243
92750
216
200
359922
220
149
273385
0.84
13243
92750
221
199
366135
225
149
279599
0.84
13243
92750
226
198
372349
230
149
285812
0.84
13243
92750
231
197
378562
235
149
292025
0.84
13243
92750
236
196
384775
240
149
298238
0.84
13243
92750
241
195
390988
245
149
304452
0.84
13243
92750
246
194
397202
250
149
310665
0.84
13243
92750
251
193
403415
\\Darlene\c\100C\Thorncrk\Rhodiat9Tabt\fl’CR3AVSidsITable
03/15/2000
10:59
Notes:
Thom
Creek
Flow
values
start
at
7Q10
(13.2
mgd)
and
increase
by
2
until
50
mgd
where
values
increase
by
5
mgd.
Sulfate
concentration
is
average
of
sulfate
ion
concentrations.
(Obtained
from
USGS
1991
water
year
Thornton
station
data)
Rhodia
Rhodia
values
are
annual
average
values
Sulfate
is
taken
as
68%
of
average
TDS
loading
based
on
molecular
weight
(11)5
is
100%
from
sodium
sulfate)
AVERAGE
CONDITIONS
FLOWRATE,
mgd
vs.
SULFATE,
mg/I
in
the
LITTLE
CALUMET
RIVER
14
932
15
890
17
802
19
733
21
677
23
630
25
592
27
559
29
530
31
506
33
484
35
465
37
447
39
432
41
418
43
406
45
394
47
384
49
374
51
365
56
346
61
330
66
316
71
304
76
294
81
285
86
277
91
270
96
264
101
258
106
253
111
248
116
244
121
240
126
236
131
233
136
230
141
227
146
224
151
222
156
220
161
217
166
215
171
213
176
212
181
210
186
208
191
207
196
205
201
204
206
202
211
201
216
200
221
199
226
198
231
197
236
196
241
195
246
194
251
193
109153
110147
112633
115118
117603
120089
122574
125059
127544
130030
132515
135000
137486
139971
142456
144942
147427
149912
152398
154883
161096
167310
173523
179736
185950
192163
198376
204589
210803
217016
223229
229443
235656
241869
248083
254296
260509
266722
272936
279149
285362
291576
297789
304002
310216
316429
322642
328855
335069
341282
347495
353709
359922
366135
372349
378562
384775
390988
397202
403415
19
821
129378
22
633
118525
27
547
124049
32
486
129572
37
441
135096
41
406
140620
46
379
146144
51
357
151667
56
338
157191
61
322
162715
65
309
168239
70
297
173762
75
287
179286
80
278
184810
84
271
190334
89
264
195857
94
257
201381
99
252
206905
103
246
212429
108
242
217952
116
235
227204
126
228
238922
136
221
250640
146
216
262357
156
211
274075
166
207
285793
176
203
297510
186
199
309228
196
196
320946
206
194
332663
216
191
344381
226
189
356099
236
187
367817
246
185
379534
256
183
391252
266
182
402970
276
180
414687
286
179
426405
296
178
438123
306
176
449840
316
175
461558
326
174
473276
336
173
484994
346
172
496711
356
171
508429
366
170
520147
376
170
531864
386
169
543582
396
168
555300
406
168
567017
416
167
578735
426
166
590453
436
166
602171
446
165
613888
456
165
625606
466
164
637324
476
164
649041
486
163
660759
496
163
672477
506
162
684194
Notes:
Thom
Creek:
Flow
values
are
from
Reach
#3
for
Average
Sulfate
loading
Little
Caluntet
River
Flow
values
start
at
the
7Q10
for
the
Munster
Station
and
increase
by
2.76
mgd
until
60
mgd
the
average
flow.
This
corresponds
to
Thom
Creeks
median
flow
of
56
nigd
Sulfate
level
is
the
average
sulfate
for
the
Munster
Station
and
at
low
flow
is
500
mg/I,
the
water
quality
standard.
Reach
#4
Thom
Creek
Little
Calumet
River
at
Monster,
In
Projected
Loading
Average
Average
Flow,
mgd
Sulfate,
mg/I
Sulfate,
lbs/d
Flow,
mgd
Sulfate,
mg/I
Sulfate,
lbs/d
Flow,
mgd
Sulfate,
mg/I
Sulfate,
lbs/d
4.85
500
20225
8
132
8378
10
132
11416
13
132
14455
16
132
17493
19
132
20531
21
132
23570
24
132
26608
27
132
29647
30
132
32685
32
132
35724
35
132
38762
38
132
41800
41
132
44839
43
132
47877
46
132
50916
49
132
53954
52
132
56993
55
132
60031
57
132
63069
60
132
66108
65
132
71612
70
132
77117
75
132
82621
80
132
88125
85
132
93630
90
132
99134
95
132
104639
100
132
110143
105
132
115647
110
132
121152
115
132
126656
120
132
132161
125
132
137665
130
132
143169
135
132
148674
140
132
154178
145
132
159683
150
132
165187
155
132
170691
160
132
176196
165
132
181700
170
132
187205
175
132
192709
180
132
198213
185
132
203718
190
132
209222
195
132
214727
200
132
220231
205
132
225735
210
132
231240
215
132
236744
220
132
242249
225
132
247753
230
132
253257
235
132
258762
240
132
264266
245
132
269771
250
132
275275
255
132
280779
\Datlese\u\IDOC\Thsmestr\.Rhodia99Tabt\ITCR4AVS.xlslTable
PEAK
CONDITIONS
fDlm.’C1D0CThoomkwboO1’664TCR1Pfld4F.bo
3110.861253
Flowrate,
mgd
vs.
TDS,
mg/i
Rmd,#l
Flowvolum
fop.lrc.m
680
from
7QlO
(0.3
of.)
.d
inooou.oto
.ou.go
(21.7
of.).
Avwo€o
op,lrom.
flow
ocmr.
.b.wllow.o..ly
with
.v.ngomom
C5cá
B....
v.WFP
flow
(25.9
of6).
Flow.
Ibm
ioormmby
2
of..
2.5)3
Cooo66o8im
..m..doo,mTDS
mmomsd
(l308ol)
nwlLipIi.dby
a
fuotoc
(1.6)
from
EFAD0c.
(85’A/5O5/2-90-O0I)
Tfrmlm..i
Pl88
Flow
v.0...
480
from
7Q10
low
flow
8
dosomuomo
USGS
.tuLio.
ml.
momomlh8
all
do.omlomo
flow
thwb,
low
flowoonditiom
oiLo
Rhono.Foolow
aMilioml
flow)
i.
from
Ir08mw8
p188.
A.
hi.
n,oddI.
pmthdivg
dowomr...o
cond6ion.
okaing
..w.o
I
om*
plow
po.fom.owo
on..
II..
.vow€v
flow
(23.9
of.).
rmoh.d.
it,.
bald
C808L
2.5)5
Cononur8ion
I.
nomio..mSDS
nwonur.d
(1031
.mJl)
.whipliod
by
•
factor
(1.51)
from
85’A
Do
(EFA/505/2-90-00I)
a..
Rliodi.
flow
lath.
flow
(1.7
of.)
dosing
lb.m
loading
(151.725
bold).
Up.Irono
ond
1r08m66
plow
11)3
valum
f,o.o
Thom
Q.do
B....
Moallo.ing4ov.
92-
Aw.
93)
Up66ono
acd
U08ow.6
plow
7Q10
v.1...
from
ISWS
1993
rq.o.1
I.Jputreao
avom.
flow
oblainod
from
USGS
3979
W6or
Rmomo.di.
Trmun68p186
.v..90v
flow
from
1992
DM8.
Rhom.Foalmo
v.1,..
from
.acxm000
boding
v.1......
c.lml86d
by
Rbon.-Poola.c.
Upotron..
Trmlm.oO
Flow
Rhodi.
USGS
SloOoo
Ave.
9
.
Avw.90
P.9.
P.9.
-
Flow,
o,d
Flow,
of.
1135,
.ngfl
1135.
Ibil.I
Flow.
.ngd
Plow,
of.
1115.
o181
1115.
lbo,hl
Flow.
od
Flow,
of.
TDS.
troll
‘lOS.
Ibold
Flow.
.ngd
Flow,
of.
11)S.
m9/l
1DS,
lb.ld
0.19
2.96
5.72
8.49
11.25
14.02
15.31
16.60
17.89
19.19
20.48
23.77
2306
24.35
23.65
26,94
28.23
29.52
30.81
32.11
33.40
34.69
33.98
37.27
38.57
39.86
41.15
42.44
43.73
45.03
46.32
47.61
48.90
5019
31.49
52.78
34.07
35.36
56.65
57.95
59.24
60.53
63.82
63.13
64.41
65.70
66.99
68.28
69.57
70.87
72.16
73.45
74.74
76.05
77.33
78.62
79.93
81.20
82.49
83.79
85.03
0057
0.3
2093
3383
3
2093
51646
9
2093
99908
13
2093
148171
17
2093
196434
22
2093
244696
24
2093
267249
26
2093
289302
28
2093
312554
30
2093
334907
32
2093
357460
34
2093
380012
36
2093
402565
38
2093
425118
40
2093
447670
42
2.093
470223
44
2093
492776
46
2093
513328
48
2093
537081
30
2093
560434
52
2093
502986
54
2093
605539
36
2093
623092
30
2093
650644
60
2093
673197
62
2093
695750
64
2093
738302
66
2093
740855
68
2093
765408
70
2093
785960
72
2093
000513
74
2093
831066
76
2093
853618
78
2093
876171
80
2093
898724
82
2093
921276
64
2093
943829
86
2093
966382
88
2093
980534
90
2093
1011487
92
2093
1034640
94
2093
1056592
96
2093
1079145
98
2093
1101697
300
2093
1124250
302
2093
1146803
104
2093
1169355
106
2093
1191908
108
2093
1214461
130
2093
1237613
112
2093
1259566
114
2093
1202119
116
2093
1304671
118
2093
1327224
120
2093
3349777
322
2093
1372329
124
2093
3394882
126
2093
1417435
328
2093
1439987
330
2093
1462540
132
2093
1415093
114
2095
1507645
10.34
13.63
32.92
14.21
15.50
16.80
16.80
16.80
16.80
16,80
16.80
16.80
16.80
16.80
16.80
16,80
16.80
16.80
16.80
36.80
16.80
16.80
16.80
16.80
16.80
16.80
16.80
16.80
16.80
16.00
16.80
16.80
16.80
16.80
16.80
36.80
16.00
16.80
16.80
16.80
16.80
16.80
16.00
36.80
16,80
16,80
16.80
16.80
16.80
36.60
16,00
16.00
16.80
16.80
16.80
16.80
36.80
16.80
16,80
36.80
16.80
16.80
16
1366
102236
18
1386
135015
20
1386
327795
22
1186
140574
24
1186
353354
26
1186
166133
26
1186
166133
26
1186
166133
26
1186
166133
26
3186
166133
26
1386
166133
26
1386
166133
26
3186
166133
26
1186
166133
26
1186
166133
26
1186
166133
26
1186
166333
26
1186
166133
26
1186
166133
26
1166
166133
26
1186
166333
26
1166
366153
26
1186
166133
26
1186
166133
26
1186
166333
26
1186
166133
26
1186
166133
26
1106
166133
26
1186
166333
26
1186
166133
26
1186
166133
26
1186
166133
26
1186
166133
26
1186
166133
26
1186
166133
26
1186
166133
26
1186
166133
26
1186
166133
26
1186
166133
26
1186
166133
26
1386
166133
26
1186
166133
26
1166
366133
26
1186
366133
26
1186
166133
26
3186
166133
26
1186
166133
26
1386
166133
26
1186
166333
26
1186
166133
26
1186
166153
26
1186
166133
26
1186
166133
26
1186
366133
26
1386
166133
26
1186
166133
26
1186
166133
26
1386
166133
26
1306
166133
26
1186
166333
26
1186
166133
26
1186
166133
1.10
3.7
36566
15172)
1.10
1.7
16566
151723
3.10
1.7
16566
131725
1.10
1.7
16566
1)1723
1.10
1.7
16566
151725
1.10
3.7
16566
351725
1.10
1.7
36566
153725
1.30
1.7
16566
131725
1.10
1.7
16566
151723
1.10
3.7
16566
151725
1.10
1.7
16566
151725
1.10
3.7
16566
151725
1.10
1.7
16566
151725
1.10
3.7
16566
151725
1.10
1.7
16566
151725
1.10
3.7
16566
151725
1.10
3.7
16566
151725
1.10
1.7
36566
151725
1.10
1.7
36566
351725
1.30
1.7
16566
351725
3.10
3.7
16566
151725
1,10
1.7
16566
151725
1.10
1.7
16566
351725
1.10
1.7
16566
151725
1.10
1.7
16566
151725
3,10
3.7
16566
151725
1.10
1.7
16566
151725
1.10
1.7
36566
151725
1.19
3.7
16566
351725
1.10
1.7
16566
151725
1.10
1.7
16566
151725
1,10
1.7
16566
351725
1.10
1.7
16566
351725
3.10
3.7
36566
151725
1.30
1.7
36566
151725
1.30
1.7
16566
151725
1.10
1.7
16566
151725
1.10
1.7
36566
151725
1.10
1.7
16566
151725
1.10
1.7
16566
151725
1.10
1.7
16566
151725
1.10
1.7
16566
151725
1.10
1.7
16566
151725
1.10
3.7
36566
151725
1.10
1.7
16566
151725
1.10
1.7
16566
151725
1.10
1.7
16566
151725
1.10
1.7
36566
151725
1.10
1.7
16566
351725
1.10
1.7
16566
151725
1,10
3.7
16566
151725
1.10
1.7
36566
151725
1.10
1.7
16566
151725
1.10
1.7
16566
151723
1.10
1.7
16566
151725
1.10
1.7
16566
153725
1.10
1.7
36566
151725
1.10
3.7
16566
151725
1.10
1.7
16566
151725
1.10
1.7
16366
151725
1.10
1.7
16566
151725
I
10
13
16566
151723
11.63
15.68
19.74
23.80
27.86
31.91
53.20
34.50
35.79
37.08
38.37
39.66
40.96
42,25
43.54
44.83
46.12
4742
48.71
50.00
51.29
52.58
53.88
55.17
56.46
57.75
59.04
60.34
61.63
62.92
64.21
65.50
6680
68.09
69.38
70.67
73.96
73.26
74.55
75.84
77.13
78.42
79.72
81.01
82.30
83.59
84.88
86.18
87.47
88.76
90.05
93.34
92.64
93.95
95.22
96.51
97.60
99.10
100.39
101.68
102.97
10426
18
2654
257344
24
2434
318386
31
2305
379420
57
2219
440470
43
2159
501512
49
2114
562555
51
2113
585307
33
2112
607660
55
2111
650213
57
2111
652765
59
2110
675318
61
2110
697871
63
2109
720423
65
2109
742976
67
2108
765529
69
2108
789083
71
2107
810664
73
2107
833187
75
2107
855739
77
2106
878292
79
2106
900845
81
2306
923397
83
2105
945930
85
2105
968505
87
2305
991055
89
2104
1015608
91
2104
1036161
93
2104
1058713
95
2104
1081266
97
2305
1103819
99
2103
1126371
101
2303
3148924
103
2105
1173476
105
2103
1194029
307
2103
1216582
309
2102
1239134
III
2102
1261637
113
2102
3284240
115
2102
1306792
317
2102
1329345
119
2102
1351898
121
2101
1574450
123
2101
1397003
125
2101
1419556
327
2103
1442108
129
2101
1464661
131
2101
1487214
133
2101
1509766
335
2301
1532319
137
2100
3)54372
339
2100
1577424
141
2100
1599977
143
2100
1622530
145
2100
1645902
147
2100
1667635
149
2100
1690188
151
2100
1712740
153
2300
1735293
155
2100
1757646
157
2099
1780393
159
2099
1802951
101
2099
1815504
Noto.
PEAK
CONDITIONS
FLOWRATE
vs.
TDS
CONCENTRATION
at
THORNTON
STATION
Reach
#2
Thorn
Creek
Deer
Creek
Thom
Creek
(at
Sta.
05536275)
Flow,
mgd
TDS,
mg/I
TDS,
Ibs/d
Flow,
mgd
TDS,
mg/I
TDS,
Ibs/d
Flow,
mgd
TDS,
mg/I
TDS,
lbsld
11.63
2654
257344
0.20
689
1149
11.83
2620
258493
15.68
2434
318386
3
689
23175
19
2197
341560
19.74
2305
379428
6
689
39009
25
1971
418437
23.80
2219
440470
8
689
54843
32
1841
495313
27.86
2159
501512
11
689
70677
39
1756
572189
31.91
2114
562555
14
689
86511
46
1696
649066
33.20
2113
585107
17
689
102345
50
1651
687453
34.50
2112
607660
19
689
118179
54
1612
725839
35.79
2111
630213
22
689
134014
58
1579
764226
37.08
2111
652765
25
689
149848
62
1550
802613
38.37
2110
675318
26
689
155176
64
1549
830494
39.66
2110
697871
27
689
160192
66
1548
858063
40.96
2109
720423
28
689
165209
69
1547
885632
42.25
2109
742976
29
689
170225
71
1547
913201
43.54
2108
765529
29
689
175241
73
1546
940770
44.83
2108
788081
30
689
180258
75
1546
968339
46.12
2107
810634
31
689
185274
77
1545
995908
47.42
2107
833187
32
689
190290
79
1545
1023477
48.71
2107
855739
33
689
195307
82
1544
1051046
50.00
2106
878292
34
689
200323
84
1544
1078615
51.29
2106
900845
35
689
205339
86
1543
1106184
52.58
2106
923397
36
689
210356
88
1543
1133753
53.88
2105
945950
36
689
215372
90
1542
1161322
55.17
2105
968503
37
689
220388
92
1542
1188891
56.46
2105
991055
38
689
225405
95
1542
1216460
57.75
2104
1013608
39
689
230421
97
1541
1244029
59.04
2104
1036161
40
689
235437
99
1541
1271598
60.34
2104
1058713
41
689
240454
101
1541
1299167
61.63
2104
1081266
42
689
245470
103
1540
1326736
62.92
2103
1103819
43
689
250486
105
1540
1354305
64.21
2103
1126371
43
689
255503
108
1540
1381874
65.50
2103
1148924
44
689
260519
110
1540
1409443
66.80
2103
1171476
45
689
265535
112
1539
1437012
68.09
2103
1194029
46
689
270551
114
1539
1464581
69.38
2103
1216582
47
689
275568
116
1539
1492150
70.67
2102
1239134
48
689
280584
118
1539
1519719
71.96
2102
1261687
49
689
285600
121
1538
1547288
73.26
2102
1284240
49
689
290617
123
1538
1574857
74.55
2102
1306792
50
689
295633
125
1538
1602426
75.84
2102
1329345
51
689
300649
127
1538
1629995
77.13
2102
1351898
52
689
305666
129
1538
1657564
78.42
2101
1374450
53
689
310682
131
1538
1685133
79.72
2101
1397003
54
689
315698
134
1537
1712702
81.01
2101
1419556
55
689
320715
136
1537
1740270
82.30
2101
1442108
56
689
325731
138
1537
1767839
83.59
2101
1464661
56
689
330747
140
1537
1795408
84.88
2101
1487214
57
689
335764
142
1537
1822977
86.18
2101
1509766
58
689
340780
144
1537
1850546
87.47
2101
1532319
59
689
345796
147
1536
1878115
88.76
2100
1554872
60
689
350813
149
1536
1905684
90.05
2100
1577424
61
689
355829
151
1536
1933253
91.34
2100
1599977
62
689
360845
153
1536
1960822
92.64
2100
1622530
63
689
365862
155
1536
1988391
93.93
2100
1645082
63
689
370878
157
1536
2015960
95.22
2100
1667635
64
689
375894
160
1536
2043529
96.51
2100
1690188
65
689
380911
162
1536
2071098
97.80
2100
1712740
66
689
385927
164
1535
2098667
99.10
2100
1735293
67
689
390943
166
1535
2126236
100.39
2100
1757846
68
689
395960
168
1535
2153805
101.68
2099
1780398
69
689
400976
170
1535
2181374
102.97
2099
1802951
70
689
405992
173
1535
2208943
104.26
2099
1825504
70
689
411009
175
3
2236512
Deer
Creek
loading
calculated
from
Deer
Creek
flow
less
average
CIWC
discharge
(1.25
mgd)
and
689
mg/I
(avg.
Thom
Cr.
TDS
upstream
of
Thom
Cr.
WWTP)
plus
avemge
CIWC
loading
(13374
lbs/d).
Thorn
Creek
valuea
from
Reach
#1
model
for
peak
Rhodia
TDS
loadings.
\\Darlene\c\IDOC\Thorncrk\RliodiaSSTaN\ITCR2PT2x)slTable
3/15/00
11:21
PEAK
CONDITIONS
FLOWRATE,mgd
vs.
TDS,
mg/i
BEYOND
THORNTON
STATION
Reach
#3
Thorn
Creek
Peak
Flow,
mgd
TDS,
mg/i
TDS,
ibs/d
Rhodia
Projected
Loadings
Peak
Flow,
mgd
TDS,
mg/i
TDS,
ibs/d
Flow,
mgd
TDS,
mg/i
TDS,
lbs/d
13,2
1183
1.10
16566
151725
14
2364
281959
14
1183
1.10
16566
151725
15
2302
289852
16
1183
1,10
16566
151725
17
2171
309555
18
1183
1.10
16566
151725
19
2068
329317
20
1183
1.10
16566
151725
21
1984
349049
22
1183
1.10
16566
151725
23
1914
368782
24
1183
1.10
16566
151725
25
1856
388514
26
1183
1.10
16566
151725
27
1806
408247
28
1183
1.10
16566
151725
29
1764
427979
30
1183
1.10
16566
151725
31
1726
447712
32
1183
1.10
16566
151725
33
1693
467444
34
1183
1.10
16566
151725
35
1664
487176
36
1183
1.10
16566
151725
37
1638
506909
38
1183
1.10
16566
151725
39
1615
526641
40
1183
1.10
16566
151725
41
1594
546374
42
1183
1.10
16566
151725
43
1575
566106
44
1183
1.10
16566
151725
45
1558
585839
46
1183
1.10
16566
151725
47
1542
605571
48
1183
1.10
16566
151725
49
1527
625304
50
1183
1.10
16566
151725
51
1514
645036
55
1183
1.10
16566
151725
56
1484
694367
60
1183
1.10
16566
151725
61
1459
743698
65
1183
1.10
16566
151725
66
1439
793029
70
1183
1.10
16566
151725
71
1421
842360
75
1183
1.10
16566
151725
76
1405
891692
80
1183
1.10
16566
151725
81
1391
941023
85
1183
1.10
16566
151725
86
1379
990354
90
1183
1.10
16566
151725
91
1368
1039685
95
1183
1.10
16566
151725
96
1359
1089016
100
1183
1.10
16566
151725
101
1350
1138347
105
1183
1.10
16566
151725
106
1342
1187678
110
1183
1.10
16566
151725
111
1335
1237009
115
1183
1.10
16566
151725
116
1329
1286340
120
1183
1.10
16566
151725
121
1323
1335671
125
1183
1.10
16566
151725
126
1317
1385003
130
1183
1.10
16566
151725
131
1312
1434334
135
1183
1.10
16566
151725
136
1307
1483665
140
1183
1.10
16566
151725
141
1303
1532996
145
1183
1.10
16566
151725
146
1299
1582327
150
1183
1.10
16566
151725
151
1295
1631658
155
1183
1.10
16566
151725
156
1291
1680989
160
1183
1.10
16566
151725
161
1288
1730320
165
1183
1.10
16566
151725
166
1285
1779651
170
1183
1.10
16566
151725
171
1282
1828982
175
1183
1.10
16566
151725
176
1279
1878314
180
1183
1.10
16566
151725
181
1276
1927645
185
1183
1.10
16566
151725
186
1274
1976976
190
1183
1.10
16566
151725
191
1271
2026307
195
1183
1.10
16566
151725
196
1269
2075638
200
1183
1.10
16566
151725
201
1267
2124969
205
1183
1.10
16566
151725
206
1265
2174300
210
1183
1.10
16566
151725
211
1263
2223631
215
1183
1.10
16566
151725
216
1261
2272962
220
1183
1.10
16566
151725
221
1259
2322293
225
1183
1.10
16566
151725
226
1258
2371625
230
1183
1.10
16566
151725
231
1256
2420956
235
1183
1.10
16566
151725
236
1255
2470287
240
1183
1.10
16566
151725
241
1253
2519618
245
1183
1.10
16566
151725
246
1252
2568949
250
1183
1.10
16566
151725
251
1250
2618280
\\Darlene\c\IDOC\Thorncrk\Rhodia99Tabl\[I’CR3PKT.xlsjTable
3/15/co
11:24
Notes:
Thorn
Creek
Flow
values
start
at
7Q10
(13.2
mgd)
and
increase
by
2
until
50
mgd
where
values
increase
by
5
mgd.
TDS
concentration
is
maximum
summation
of
major
ions
currently
in
Thorn
Creek
(Obtained
from
USGS
1991
water
year
Thornton
station
data)
No
factor
was
used
from
EPA
Dec
(EPA!
505/2-90-001)
as
the
number
of
data
was
greater
than
20.
130234
138127
157860
177592
197324
217057
236789
256522
276254
295987
315719
335451
355184
374916
394649
414381
434114
453846
473579
493311
542642
591973
641304
690635
739967
789298
838629
887960
937291
986622
1035953
1085284
1134615
1183946
1233278
1282609
1331940
1381271
1430602
1479933
1529264
1578595
1627926
1677257
1726589
1775920
1825251
1874582
1923913
1973244
2022575
2071906
2121237
2170568
2219900
2269231
2318562
2367893
2417224
2466555
Rhodia
Rhodia
values
are
peak
daily
values
PEAK
CONDITIONS
14
2364
281959
15
2302
289852
17
2171
309585
19
2068
329317
21
1984
349049
23
1914
368782
25
1856
388514
27
1806
408247
29
1764
427979
31
1726
447712
33
1693
467444
35
1664
487176
37
1638
506909
39
1615
526641
41
1594
546374
43
1575
566106
45
1558
585839
47
1542
605571
49
1527
625304
51
1514
645036
56
1484
694367
61
1459
743698
66
1439
793029
71
1421
842360
76
1405
891692
81
1391
941023
86
1379
990354
91
1368
1039685
96
1359
1089016
101
1350
1138347
106
1342
1187678
111
1335
1237009
116
1329
1286340
121
1323
1335671
126
1317
1385003
131
1312
1434334
136
1307
1483665
141
1303
1532996
146
1299
1582327
151
1295
1631658
156
1291
1680989
161
1288
1730320
166
1285
1779651
171
1282
1828982
176
1279
1878314
181
1276
1927645
186
1274
1976976
191
1271
2026307
196
1269
2075638
201
1267
2124969
206
1265
2174300
211
1263
2223631
216
1261
2272962
221
1259
2322293
226
1258
2371625
231
1256
2420956
236
1255
2470287
241
1253
2519618
246
1252
2568949
251
1250
2618280
Notes:
Thorn
Creek:
Flow
and
TDS
values
are
from
Reach
#3
for
Peak
TDS
loading
Little
Calumet
River
Flow
values
start
at
the
7Q10
for
the
Munster
Station
and
increase
by
2.76
mgd
until
60
mgd,
the
average
flow.
This
corresponds
to
Thorn
Creeks
median
flow
of
56
mgd.
TDS
level
is
the
average
TDS
for
the
Munster
Station
and
at
low
flow
is
1000
mg/i,
the
water
quality
standard.
19
2019
322408
23
1686
319301
27
1527
349714
32
1414
380127
37
1331
410540
42
1266
440953
47
1215
471366
51
1174
501779
56
1139
532192
61
1110
562605
66
1085
593018
70
1063
623431
75
1044
653844
80
1028
684257
85
1013
714670
89
1000
745083
94
988
775496
99
977
805909
104
968
836322
108
959
866735
116
957
926746
126
946
995426
136
937
1064106
146
929
1132786
156
923
1201466
166
917
1270146
176
911
1338826
186
907
1407505
196
902
1476185
206
899
1544865
216
895
1613545
226
892
1682225
236
889
1750905
246
886
1819585
256
884
1888265
266
882
1956945
276
880
2025625
286
878
2094304
296
876
2162984
306
874
2231664
316
872
2300344
326
871
2369024
336
870
2437704
346
868
2506384
356
867
2575064
366
866
2643744
376
865
2712424
386
864
2781103
396
863
2849783
406
862
2918463
416
861
2987143
426
860
3055823
436
859
3124503
446
858
3193183
456
857
3261863
466
857
3330543
476
856
3399223
486
855
3467902
496
855
3536582
506
854
3605262
FLOWRATE,
mgd
vs.
TDS,
mg/i
in
the
LIHLE
CALUMET
RIVER
Reach
#4
Thorn
Creek
Little
Calumet
River
at
Munster,
In
Projected
Loading
Peak
Flow,
mgd
TDS,
mg/I
TDS,
lbs/d
Flow,
mgd
TDS,
mg/I
TDS,
Ibs/d
Flow,
mgd
TDS,
mg/i
TDS,
lbs/d
4.85
8
10
13
16
19
21
24
27
30
32
35
38
41
43
46
49
52
55
57
60
65
70
75
80
85
90
95
100
105
110
115
120
125
130
135
140
145
150
155
160
165
170
175
180
185
190
195
200
205
210
215
220
225
230
235
240
245
250
255
1000
40449
464
29449
464
40129
464
50810
464
61490
464
72171
464
82852
464
93532
464
104213
464
114893
464
125574
464
136254
464
146935
464
157615
464
168296
464
178976
464
189657
464
200337
464
211018
464
221699
464
232379
464
251728
464
271077
464
290425
464
309774
464
329123
464
348472
464
367821
464
387169
464
406518
464
425867
464
445216
464
464565
464
483913
464
503262
464
522611
464
541960
464
561309
464
580657
464
600006
464
619355
464
638704
464
658053
464
677401
464
696750
464
716099
464
735448
464
754797
464
774145
464
793494
464
812843
464
832192
464
851541
464
870889
464
890238
464
909587
464
928936
464
948285
464
967633
464
986982
\\DrIene\c\1DOC\Thorncrk\Rhodia99Thbl\[TCR4PKI.x1slA
03/15/2000
fl:25
P06K
C0000mONO
Flowrate,
mgd
vs.
Sulfate,
mg/I
R8.th
#1
Up60..
Tr,06.o*
P8.oL
06.41
UO3S
58466.
Pk
P..k
P
P,.k
Pw,
.04
P8..,,
of.
3.18.8.,
m&1
5.11.8.,
Ib.14
f1o,
,,4
P84w,
of,
3.11.1.,
089
3,3.34,
18.I
F8.w.
d
P84w,
of.
5.163.,
/I
5.11.1.,
IWd
P84w.
w04
F84w.
of.
9.160.,
woIl
5.061.,
ll.If
0.89
0.3
565
983
10.34
16
323
27100
8.80
1.1
11206
102638
11.63
18
1334
131551
2.96
3
565
13931
11.65
II
123
31213
1.10
1.7
81206
802638
85.68
24
1136
147830
5.72
9
565
26960
12.92
20
325
34750
1.10
1.7
11206
802638
19.74
38
998
164349
8.49
83
565
39984
14.28
22
323
sms
1.10
1.7
11206
882638
33.80
37
911
180549
11.25
17
365
53000
13.50
24
323
41700
1.10
i.7
11206
132638
27.86
43
649
197346
84.02
22
565
66032
16.10
26
323
43175
1.10
1.7
11206
802638
31.91
49
803
213845
15.31
24
565
72888
16.83
26
323
43175
1.10
1.7
11206
802638
33.20
51
794
219931
86.60
26
565
78204
16.83
26
325
45175
1.10
1.7
11206
882638
34.50
55
786
226017
87.89
28
563
84219
16.80
26
323
43173
8.19
1.7
11206
102638
15.79
53
779
232103
19.19
50
565
90375
16.83
26
525
45875
1.10
1.7
11206
182638
37.08
57
770
258889
20.49
32
565
96461
86.86
26
523
45175
1.10
8.7
11206
802638
38.37
59
763
244275
21.77
34
365
102547
16.80
26
323
45875
1.10
1.7
11206
802638
39.66
61
757
250360
23.06
36
565
100633
86.80
36
323
45875
1.10
1.7
11206
102638
40.96
63
758
256446
24.35
38
363
114719
86.93
36
323
45173
1.10
1.7
11206
802638
42.23
65
745
262532
25.65
44
565
120803
86.80
36
323
43873
1.80
1.7
11206
882638
43.34
67
740
268618
26.94
42
565
126891
16.80
36
323
45875
1.10
1.7
11206
802638
44.83
69
735
274704
21.25
44
563
832976
86.80
26
523
45175
1.10
1.7
18206
163638
46.12
71
750
286790
29.32
46
565
839062
16.80
26
323
43875
1.10
1.7
11206
802638
47.42
73
725
286876
50.81
48
365
145148
86.80
26
323
43875
1.10
1.7
18206
802638
41.71
75
728
292962
32.11
50
563
151234
86.80
26
523
43173
1.10
1.7
81206
802638
50.00
77
717
299047
13.40
32
563
157320
86.80
36
523
43173
1.10
1.7
11206
163638
31.29
79
783
305833
34.69
34
565
165466
86.80
36
523
43873
1.10
1.7
81206
882635
32.38
81
710
311219
35.90
36
363
869432
84.86
26
523
43875
1.10
1.7
81206
802638
33.88
83
706
187305
37.27
38
565
875578
16.80
26
523
43875
1.80
1.7
11206
102631
55.17
85
703
523398
38.57
60
565
181663
86.83
26
323
45175
1.10
8.7
11166
802638
56.46
67
700
329477
39.86
62
565
187749
16.80
26
323
45875
1.10
1.1
11206
102638
57.75
99
697
333563
48.83
64
563
193833
16.80
26
323
43875
1.10
1.7
11206
102638
59.04
91
694
348649
42.44
64
365
199921
14.80
36
525
43875
1.10
1.7
18206
802638
60.34
93
698
347734
43.73
68
565
206007
86.80
26
523
45875
8.10
8.7
11206
802631
61.63
95
688
333820
45.03
70
365
212093
16.80
26
323
45173
1.80
1.7
11206
102638
62.92
97
686
359906
46.32
72
565
218179
14.80
36
323
45873
1.80
1.7
11206
102630
64.21
99
603
365992
47.61
74
565
224265
16.80
26
323
45875
1.80
8.7
11306
102638
65.50
101
688
372078
48.90
76
565
230350
16.80
20
323
45875
8.10
8.7
11206
10263$
66.50
103
679
578164
50.19
78
563
236436
86.80
36
523
45873
1.10
1.7
11206
102638
68.09
105
677
384250
58.49
83
363
242522
16.80
26
323
45175
1.10
8.7
11206
802631
69.38
807
673
390336
52.78
82
565
248608
16.80
26
523
43175
1.10
1.1
11206
102638
70.67
109
673
396421
34.07
84
565
254694
86.86
26
323
45875
1.10
8.7
11206
102631
71.96
III
671
402507
55.36
86
565
260783
16.80
26
323
45875
1.10
1.7
11266
802638
75.26
113
669
408593
56.65
80
563
266066
86.80
26
333
43873
1.80
8.7
11206
102638
74.53
815
667
484679
57.95
94
363
272932
86.80
20
323
43873
1.80
1.7
11206
102638
73.84
187
665
420765
59.24
92
365
279038
16.80
36
123
43875
1.10
1.7
11206
102631
77.13
189
664
426158
60.53
94
565
205823
86.80
26
523
45875
8.80
8.7
11206
802638
78.41
121
662
432937
68.82
96
565
291209
16.93
26
325
45873
1.80
8.7
11206
102638
79.72
123
660
439023
63.11
98
565
297295
16.80
26
323
45175
1.10
1.7
11206
102630
81.01
125
659
445109
64.41
807
565
305311
16.80
26
323
45175
1.88
1.7
11206
802638
82.30
127
657
451194
63.70
802
565
309467
86.80
26
323
45875
1.10
1.7
11206
102638
83.59
829
656
457286
66.99
104
363
385333
86.80
26
323
43873
1.10
1.7
81206
802631
84.88
131
655
463366
68.20
806
363
328639
16.83
26
323
45173
1.10
1.7
11206
801638
86.88
153
653
469452
69.57
808
565
327725
86.80
26
523
45873
1.80
1.7
11206
102635
87.47
135
652
475538
70.67
110
565
533510
16.80
36
523
45875
1.10
1.7
11206
882638
83.76
137
651
488624
72.86
lIZ
565
339896
16.86
36
323
45875
1.10
1.7
18206
102638
90.05
839
649
417710
73.45
114
565
345982
86.86
36
123
43875
1.10
1.7
11206
102638
98.14
148
648
493796
74.74
116
565
352968
16.80
26
323
43175
1.10
1.7
11206
802430
92.64
145
647
499888
76.03
188
565
358154
84.80
26
525
43175
1.10
8.7
18206
802630
93.93
145
646
505967
77.33
120
365
364240
86.80
26
323
45875
8.10
8.7
11206
102638
95.22
147
645
512053
78.62
132
565
570326
16.80
26
323
45875
8.10
8.7
11206
102638
96.58
149
644
518139
79.91
824
563
576412
16.80
26
323
43875
1.10
1.7
18206
802638
97.80
131
643
524223
11.20
826
563
362497
16.80
36
523
45873
1.10
1.7
18206
102638
99.10
153
642
530511
82.49
828
563
580583
86.10
36
323
43175
1.10
1.7
11206
802630
100.39
155
641
336397
83.79
150
365
594669
86.80
26
325
45173
8.10
1.7
11206
802638
101.68
857
640
542483
85.00
832
565
400755
16.80
26
523
45173
8.10
8.7
11206
802635
102.97
159
639
340560
86.37
134
565
406048
16.95
26
323
45873
1.10
1.7
11206
102630
804.26
161
638
354654
0408w
115868806
Flow
o.k..
fooop.04..
8340
(005.
1Q80
(0.3
.0.)
804834084084
8048800
(21.7
of,).
60.5.0.
3p8848.5.
flow
oo....
.k.obow,..
w06
.o.g.
Tho.,.
Ck
Bo.1.
WWIP
flow
(23.9
of.).
8
bow..
by
2
of..
966.1.
Coo.bo.
I.
obow
.08f.Iod6o.04
(355
.,19
.flip06d
by.
18.8.0(8.6)
bow
EPA
Do..
(EPAISOS/2-90-00l)
3.3.1.b8484Z7%.fTDS
Flow
o.k..
.8401
1m8.
7Q1
0
low
(00w
.Odow5.b5...
93933.84668.
784.
,ow.
8.1
.0
do.8o.m
flow
do.bg
low
flow
.05.16k..
(r84
Rh005.PO.1,.w
.ddko..1
flow)
0
f’ow
6,006680h8..
A.
566
08
8.prdl
60
dow.s.u..o.
ooo.0b..
4.193
8’
p56p..fo,wo.w.,
oo..
8.898484.
flow
(23.9
of.)
84
owdo.d,
..
84.64605.84.1.
3.868.
Cow..owlw.
4.
ow.
.0001.
dotoowbd
(27896/15.006844.4
by
•
18oOor(l.16)
1....
EPA
1)00.
(EPA/503/2.90001)
9.11.8.
84634
80
27%
of
TDS
66.484
flow
8.8.
flow
(8.7
of.)
d’f°8
8......
6.44.8(102,638
81./4).
3.008.
1884
8468%
TI)S
(TDS
84800%
1108.
40440.
8.11.80)
Up60o.
.04
0
8456TDS!S.11.l.
04845.1,08.
Tho..
C...k
86.1
(NOV.
92-6196.
93)
Up.lo.ow
.04
4.4806pb567Ql0
o.ko.
f,os.
ISWS
8993
o.9
Up40.v...g.
184*068480.4
low.
93955
8979
W.1
R..o,w.
40.
TowOo46
pb11.0.og,
flow
f,o..
1992
DM6,
Rbo...16,ko.
o.k..
1...
owo......
lodiOg
o.k...,
0384.84106)9
Rbow.Poolow.
PEAK
CONDITIONS
FLOWRATE
vs.
SULFATE
CONCENTE.ATION
at
ThORNTON
STATION
Reach
#2
Thom
Creek
Deer
Creek
Thom
Creek
(at
Sta.
05536275)
Flow,
mgd
Sulfate,
mg/i
Sulfate,
lbs/d
Flow,
mgd
Sulfate,
mg/i
Sulfate,
ibs/d
Flow,
mgd
Sulfate,
mg/i
Sulfate,
ibs/d
11.63
1354
131351
0.20
186
310
11.83
1335
131661
15.68
1130
147850
3
186
6257
19
991
154107
19.74
998
164349
6
186
10531
25
824
174880
2.3.80
911
180848
8
186
14806
32
727
195653
27.86
849
197346
11
186
19080
39
664
216427
31.91
803
213845
14
186
23355
46
620
237200
33.20
794
219931
17
186
27629
50
594
247560
34.50
786
226017
19
186
31904
54
573
257921
35.79
778
232103
22
186
36178
58
554
268281
37.08
770
238189
25
186
40453
62
538
278642
38.37
763
244275
26
186
41891
64
534
286166
39.66
757
250360
27
186
43246
66
530
293606
40.96
751
256446
28
186
44600
69
526
301046
42.25
745
262532
29
186
45954
71
522
308486
43.54
740
268618
29
186
47308
73
519
315926
44.83
735
274704
30
186
48662
75
516
323366
46.12
730
280790
31
186
50017
77
513
330806
47.42
725
286876
32
186
51371
79
510
338246
48.71
721
292962
33
186
52725
82
508
345686
50.00
717
299047
34
186
54079
84
505
353127
51.29
713
305133
35
186
55433
86
503
360567
52.58
710
311219
36
186
56787
88
501
368007
53.88
706
317305
36
186
58142
90
499
375447
55.17
703
323391
37
186
59496
92
497
382887
56.46
700
329477
38
186
60850
95
495
390327
57.75
697
335563
39
186
62204
97
493
397767
59.04
694
341649
40
186
63558
99
491
405207
60.34
691
347734
41
186
64913
101
489
412647
61.63
688
353820
42
186
66267
103
488
420087
62.92
686
359906
43
186
67621
105
486
427527
64.21
683
365992
43
186
68975
108
485
434967
65.50
681
372078
44
186
70329
110
483
442407
66.80
679
378164
45
186
71684
112
482
449847
68.09
677
384250
46
186
73038
114
481
457287
69.38
675
390336
47
186
74392
116
479
464728
70.67
673
396421
48
186
75746
118
478
472168
71.96
671
402507
49
186
77100
121
477
479608
73.26
669
408593
49
186
78454
123
476
487048
74.55
667
414679
50
186
79809
125
475
494488
75.84
665
420765
51
186
81163
127
474
501928
77.13
664
426851
52
186
82517
129
473
509368
78.42
662
432937
53
186
83871
131
472
516808
79.72
660
439023
54
186
85225
134
471
524248
81.01
659
445109
55
186
86580
136
470
531688
82.30
657
451194
56
186
87934
138
469
539128
83.59
656
457280
56
186
89288
140
468
546568
84.88
655
463366
57
186
90642
142
467
554008
86.18
653
469452
58
186
91996
144
466
561448
87.47
652
475538
59
186
93351
147
465
568888
88.76
651
481624
60
186
94705
149
465
576329
90.05
649
487710
61
186
96059
151
464
583769
91.34
648
493796
62
186
97413
153
463
591209
92.64
647
499881
63
186
98767
155
462
598649
93.93
646
505967
63
186
100122
157
462
606089
95.22
645
512053
64
186
101476
160
461
613529
96.51
644
518139
65
186
102830
162
460
620969
97,80
643
524225
66
186
104184
164
460
628409
99.10
642
530311
67
186
105538
166
459
635849
100.39
641
536397
68
186
106892
168
459
643289
101.68
640
542483
69
186
108247
170
458
650729
102.97
639
548568
70
186
109601
173
457
658169
104.26
638
554654
70
186
110955
175
457
665609
Deer
Creek
7Q10
sulfate
concentration
set
at
500
mg/i
water
quality
standard
Loadings
for
flows
higher
than
7Q10
calculated
from
Deer
Creek
flow
less
average
CIWC
flow
(1.25
mgd)
and
186
mg/i
sulfate
(27%
of
upstream
TDS
concentration
of
689
mg/I)
plus
average
CIWC
sulfate
loading
of
3611
lbs/day
(27%
of
average
TDS
loading
of
13374
ibs/d)
Thom
Creek
values
from
Reach
#1
model
for
peak
Rhodia
sulfate
loadings.
\\llarlene\c\IDOC\Thomcrk\Rhodia99Tabl\(TCR2PKS.xlslTable
3/15/00
11:37
PEAK
COND]TIONS
FLOWRATE,mgd
vs.
SULFATE,
mg/i
BEYOND
THORNTON
STATION
Reach
#3
Thorn
Creek
Rhodia
Projected
Loadings
Peak
Peak
Flow,
mgd
Sulfate,
mg/i
Sulfate,
lbs/d
Flow,
mgd
Sulfate,
mg/i
Sulfate,
lbs/cl
Flow,
mgd
Sulfate,
mg/i
Sulfate,
ibs/d
13.2
330
36329
1.10
11208
102638
14
1165
138967
14
330
38531
1.10
11208
102638
15
1121
141169
16
330
44035
1.10
11208
102638
17
1029
146673
18
330
49540
1.10
11208
102638
19
955
152178
20
330
55044
1.10
11208
102638
21
896
157682
22
330
60548
1.10
11208
102638
23
847
163186
24
330
66053
1.10
11208
102638
25
806
168691
26
330
71557
1.10
11208
102638
27
771
174195
28
330
77062
1.10
11208
102638
29
740
179700
30
330
82566
1.10
11208
102638
31
714
185204
32
330
88070
1.10
11208
102638
33
691
190708
34
330
93575
1.10
11208
102638
35
670
196213
36
330
99079
1.10
11208
102638
37
652
201717
38
330
104584
1.10
11208
102638
39
635
207222
40
330
110088
1.10
11208
102638
41
621
212726
42
330
115592
1.10
11208
102638
43
607
218230
44
330
121097
1.10
11208
102638
45
595
223735
46
330
126601
1.10
11208
102638
47
584
229239
48
330
132106
1.10
11208
102638
49
573
234744
50
330
137610
1.10
11208
102638
51
564
240248
55
330
151371
1.10
11208
102638
56
543
254009
60
330
165132
1.10
11208
102638
61
525
267770
65
330
178893
1.10
11208
102638
66
511
281531
70
330
192654
1.10
11208
102638
71
498
295292
75
330
206415
1.10
11208
102638
76
487
309053
80
330
220176
1.10
11208
102638
82
477
322814
85
330
233937
1.10
11208
102638
86
469
336575
90
330
247698
1.10
11208
102638
91
461
350336
95
330
261459
1.10
11208
102638
96
454
364097
100
330
275220
1.10
11208
102638
101
448
377858
105
330
288981
1.10
11208
102638
106
443
391619
110
330
302742
1.10
11208
102638
111
438
405380
115
330
316503
1.10
11208
102638
116
433
419141
120
330
330264
1.10
11208
102638
121
429
432902
125
330
344025
1.10
11208
102638
126
425
446663
130
330
357786
1.10
11208
102638
131
421
460424
135
330
371547
1.10
11208
102638
136
418
474185
140
330
385308
1.10
11208
102638
141
415
487946
145
330
399069
1.10
11208
102638
146
412
501707
150
330
412830
1.10
11208
102638
151
409
515468
155
330
426591
1.10
11208
102638
156
407
529229
160
330
440352
1.10
11208
102638
161
404
542990
165
330
454113
1.10
11208
102638
166
402
556751
170
330
467874
1.10
11208
102638
171
400
570512
175
330
481635
1.10
11208
102638
176
398
584273
180
330
495396
1.10
11208
102638
181
396
598034
185
330
509157
1.10
11208
102638
186
394
611795
190
330
522918
1.10
11208
102638
191
393
625556
195
330
536679
1.10
11208
102638
196
391
639317
200
330
550440
1.10
11208
102638
201
389
653078
205
330
564201
1.10
11208
102638
206
388
666839
210
330
577962
1.10
11208
102638
211
387
680600
215
330
591723
1.10
11208
102638
216
385
694361
220
330
605484
1.10
11208
102638
221
384
708122
225
330
619245
1.10
11208
102638
226
383
721883
230
330
633006
1.10
11208
102638
231
382
735644
235
330
646767
1.10
11208
102638
236
381
749405
240
330
660528
1.10
11208
102638
241
380
763166
245
330
674289
1.10
11208
102638
246
379
776927
250
330
688050
1.10
11208
102638
251
378
790688
\\Dorjene\e\IDOC\Thorecrk\Rhodia99Tnbl\iTCR3?KS.slslTabie
3/15/0011:34
Notes:
Thorn
Creek
Flow
values
start
at
7Q10
(13.2
mgd)
and
increase
by
2
until
50
mgd
where
values
increase
by
5
mgd.
Sulfate
concentration
is
maximum
sulfate
ion
concentrations.
(Obtained
from
USGS
1991
water
year
Thornton
station
data)
No
factor
was
used
from
EPA
Doc.
(EPA/SOS!
2-90-001)
as
the
number
of
data
was
greater
than
20.
Rhodia
Rhodia
values
are
peak
daily
values
Sulfate
is
taken
as
68%
of
peak
TDS
loading
based
on
molecular
weight
(T125
is
100%
from
sodium
sulfate)
PEAK
CONDITIONS
FLOWRATE,
mgcl
vs.
SULFATE,
mg/i
in
the
LITTLE
CALUMET
RIVER
Reach
#4
Thom
Creek
Little
Calumet
River
at
Munster,
In
Projected
Loading
Peak
Flow,
mgd
Sulfate,
mg/I
Sulfate,
lbs/d
Flow,
mgd
Sulfate,
mg/I
Sulfate,
lbs/d
Flow,
mgd
Sulfate,
mg/I
Sulfate,
lbs/d
14
1165
138967
4.85
500
20225
19
997
159192
15
1121
141169
8
132
8378
23
790
149546
17
1029
146673
10
132
11416
27
690
158089
19
955
152178
13
132
14455
32
620
166632
21
896
157682
16
132
17493
37
568
175175
23
847
163186
19
132
20531
42
528
183718
25
806
168691
21
132
23570
47
496
192261
27
771
174195
24
132
26608
51
470
200803
29
740
179700
27
132
29647
56
448
209346
31
714
185204
30
132
32685
61
430
217889
33
691
190708
32
132
35724
66
414
226432
35
670
196213
35
132
38762
70
401
234975
37
652
201717
38
132
41800
75
389
243518
39
635
207222
41
132
44839
80
379
252060
41
621
212726
43
132
47877
85
369
260603
43
607
218230
46
132
50916
89
361
269146
45
595
223735
49
132
53954
94
354
277689
47
584
229239
52
132
56993
99
347
286232
49
573
234744
55
132
60031
104
341
294775
51
564
240248
57
132
63069
108
336
303317
56
543
254009
60
132
66108
116
330
320117
61
525
267770
65
132
71612
126
323
339382
66
511
281531
70
132
77117
136
316
358648
71
498
295292
75
132
82621
146
310
377913
76
487
309053
80
132
88125
156
305
397178
81
477
322814
85
132
93630
166
301
416444
86
469
336575
90
132
99134
176
297
435709
91
461
350336
95
132
-104639
186
293
454975
96
454
364097
100
132
110143
196
290
474240
101
448
377858
105
132
115647
206
287
493505
106
443
391619
110
132
121152
216
284
512771
111
438
405380
115
132
126656
226
282
532036
116
433
419141
120
132
132161
236
280
551302
121
429
432902
125
132
137665
246
278
570567
126
425
446663
130
132
143169
256
276
589832
131
421
460424
135
132
148674
266
274
609098
136
418
474185
140
132
154178
276
273
628363
141
415
487946
145
132
159683
286
271
647629
146
412
501707
150
132
165187
296
270
666894
151
409
515468
155
132
170691
306
269
686159
156
407
529229
160
132
176196
316
268
705425
161
404
542990
165
132
181700
326
266
724690
166
402
556751
170
132
187205
336
265
743956
171
400
570512
175
132
192709
346
264
763221
176
398
584273
180
132
198213
356
263
782486
181
396
598034
185
132
203718
366
263
801752
186
394
611795
190
132
209222
376
262
821017
191
393
625556
195
132
214727
386
261
840283
196
391
639317
200
132
220231
396
260
859548
201
389
653078
205
132
225735
406
259
878813
206
388
666839
210
132
231240
416
259
898079
211
387
680600
215
132
236744
426
258
917344
216
385
694361
220
132
242249
436
257
936610
221
384
708122
225
132
247753
446
257
955875
226
383
721883
230
132
253257
456
256
975140
231
382
735644
235
132
258762
466
256
994406
236
381
749405
240
132
264266
476
255
1013671
241
380
763166
245
132
269771
486
255
8032937
246
379
776927
250
132
275275
496
254
1052202
251
378
790688
255
132
280779
506
254
1071467
Notes:
Thom
Creek:
Flow
values
are
from
Reach
#3
for
Peak
Sulfate
loading
Little
Calunset
River
Flow
values
start
at
the
7Q10
for
the
Munster
Station
and
increase
by
2.76
mgd
until
60
mgd
the
average
flow.
This
corresponds
to
Thom
Creeks
median
flow
of
56
mgd
Sulfate
level
is
the
average
sulfate
for
the
Monster
Station
and
at
low
flow
is
500
mg/I,
the
water
quality
standard.
\\Darien#rtIDOC\Thornerk\Rhsdia99Tabt\[TCR4PKS.xlslTsbIc
3/15/0011:35
h
A
HUFF
&
HUFF,
INC.
CALCULATION
SHEET
r
h
A
Environmental
Consultants
Project
jf
AHZ/A
client
Tc9-
r2-1A
Title
‘JA1-’jEc
fb(
2
-
MotL
Signature
‘.
L-t
1J
Date
l-
5
—
Sheet
of
0
o
7Qo
uoW
=
\O.3
(I
wc)
(sM
VoiAM
-
F-QI,&
(Nc4-/\
(N
Il.,
rid
7Qo
ill
kHO(
-
c4-v-
7Q
/1.3
n31
TRo
c(L
+
IA
tic
tr)
o.rvt
rOv9c
7(O
4-.Ov
-
1L’€
(L-iMf
T/-AA
4E
/A
E4-
/ab’njd
h1
A
HUFF
&
HUFF,
INC.
CALCULATION
SHEET
r
‘h
A
Environmental
Consultants
Project
AOJk’
4itoi,4
Client
—
o
24
Title
\
2
1,OVV
VALA/Es
FO-
(A
O
-
Signature
Date
0
-
t
0
Sheet
2
of
O)
off
oY
&/:lD/
LOV
7.
USS
WI
Q?#C
:PA
R.ow
vuiyi
td7
4
jE
/VAI
o7
(c4(o1
YiJY
Y).
(2-
‘7
7
Thjeiiwoc
32
ThT1av
i73.
4
5oi
((
s
1cljTci
DZAlNAE
(E
F’OW
•o’
oru
c’w
wTç
CTvlc1
iO
-PcJs
PL’)e.
Q7
iNO)
z’zz)
&
Ac-t
°-L
QO•
&
QOLI
&
&.
(.
f’W
si
Z.LLI
(=
0O1?}
Lo
&
PV
1
)DGwoog)
151)
,O1A
L’il
0001
1cI’z
L’lI
o
&M7SI
Li-Liz
pw
b)l
fLQ11
,i-isu
p-/jJ
7JQ2
O’Z
1S
3,C4
)1
[
c
Af
V)
M
W
(w
3
L
4
)
frO1
NI?id
NI
9rJ3
-O
MO1
0
VI
J\A
OV’i
4-OWJç
1.5
NJQ
(V%3
QL
Q2LI
ooo1
0001
OOQ1
Q04
0O}
0001
OQ)
0071
1
ij
M
-
c
c-Vv
pJI
J\/\
fr7J1O
NS
fV\
A
‘ o
x-
•
I
aea
‘—‘vZ
IQ
)F’)
eJneu6iS
o1
4Ue!ID
- WSS
SUflSUOJ
TWWUOtI3
r
‘h.
A
±33HS
NOLLV1flD1V3
JNII
‘&IflH
2
S’
&IflH
hA
HUFF
&
HUFF,
INC.
CALCULATION
SHEET
r
h
A
Environmental
Consultants
Project
MjUSr
j’2-a.
Client
T-L2-
t/i&
Title
LOW
VAAIc
Q—6’1
Signature
Date
Y7-
Sheet
4
of
jNgpcE.
-
‘S
17i
7
wcL
‘Z-I
2O
J
1
Lci
4Q,
O-oI
d/
13TW5
Y79
-
Jov
—
O
(1
131
o.1b
vd
z,oo
j/i
‘AIQ
Si
OJL2-9
5
IJ
v’
T
7QIo
W
lOOn.
WjI’.-
vc
c
/
-
L
ooO
-
I
1
-
O.c
(,M--27
d______
E
1
z-’t
2
I
°7
i&.cjIL
(OOQ,/
Z7
M-4
igo(
1
I151d
8
oL)
tVl4
i3’’oO3I
o4o3
tt1.wd+
OL(Q3
A
HUFF
&
HUFF,
INC.
CALCULATION
SHEET
P
!h
A
Environmental
Consultants
Project
A,vsT
S
W43•-
client
Title
,O\N
VAt-VS
POv
MO3ç
Signature
Date
7Z
Sheet
5
of
R€kzA
2-c4
IL
7’o&-
-
1-7o/
ik
o.o1
oI
T
J&
opA-re,rvd
2
I2o
3
4
h
A
HUFF
&
HUFF,
INC.
CALCULATION
SHEET
r
A
Environmental
Consultants
Project
A
kJ0
5f
5Tfrw
vi2/
-,Client
_l2
-
frh2
/
Title
L-o’N
F4—
AcO
Signature
5
tzt4
9
IA
Date
0
-
0
Sheet
of
‘
MINE
MC
w
2V)
ft23,
2,tP/L-
//
!19d:
7
ID
O/)
//
/
d
-
1/
-
1/
/
//
fld
Jo-o
/2—
//1
/1
,d
_)(
-
0.6
-
\\((
ir2
)
4
/c2
-
Jifid
/4.2-
I’ui<,1
17-/1
/7
L2
2,too
/2.0
vof
/0/
flrnjd
/1-’13t8(
-z-td.
x-f
0
tô-1O
/&/
WQ
TtctJv2—2
-ic
1
£lowS
fRovt
7Qft)
I•
Mj(
7Qtu(O/)
<—o
tt
10-0
10/
c
/
<
/o/
)K
‘l4
/0/
TAr
/,ooo/
4-jz
X=
/7/
7Qto
WQ
TVV2
7p(o)
=
1-19
)<
7
I
0
-/9
/c27
ii”j
AV—’(
2LNr
[j
vIQ
rq22A2
S
—
hA
HUFF
&
HUFF,
INC.
CALCULATION
SHEET
r
‘h
A
Environmental
Consultants
Project
pq
f2
Client
R’
c
c
-
o
íA
Title
(/Ov
A-5
-
ovL
Signature
Date
Qj
.
Sheet
7
of
9
-ro
12d
43
jot
I
0/.
0/
0/.
I
A
HUFF
&
HUFF,
INC.
CALCULATION
SHEET
r
‘h
A
Environmental
Consultants
F,’
Project
Q
Client
-
-Mc
/4
Title
ft,3çpj
A-AJ
—A/ID
L
Signature
\‘)
Date
_
7
0
0
Sheet
of
nQs
€
;ouA-1-e
L-a-c
v2-
2iS-1777/t
iS;:
V777w&L.
_99
k2OM
(2.o-Jg7O
/‘
on(
=
10/
—
(d
=
Z)
0
c-
W\1-i
I
Q\
S
oy
i,oi
I
2
M(
?
P’1
t
p/.
Jrd
TS
U
3O
‘/
tOv’J
7
(
?
s
o
/.
-
I
=7
$
-
=
5Q/
(OW
-
T
65
/1-
c)I
5
/L
335
jJL
1oo
/
1J2-
(L
2
kO
/t
h
A
HUFF
&
HUFF,
INC.
CALCULATION
SHEET
P
h
A
Environmental
Consultants
Project
Client
-
Title
PD’N
\fALV
—M
03cL
Signature
‘L
Q
Date
‘2—
I
7
00
Sheet
9
of
U
rvt
‘uc,cic
Soz
/-
1-5
1,035
rvJL
i-c
,31
/L
-l8
/t
5o7
Ovq
1,O7
c3L
v1-j/-
777
‘332
j/
fr/L..
Ibo
V/ZAi
2tIOIS
7Q0
L/Ov’\J
1
ivt
(0•7.
-02;
2
3
4-
ri_ow
‘N
CcWt
1.3
14o
I
3
1
/t
Ic?’
I
oo
Is
I
4.
(2.
12
(7
Iz
f’2
17
-/Do
2-OD
I
Io_7
(
112-9
1C
ro
H777
i7
58
17
2-9
7
qo
157’
7’
‘10
‘9:.,
73
5S
32
21
(o
hA
HUFF
&
HUFF,
INC.
CALCULATION
SHEET
P
h
A
Environmental
Consultants
Project
AcJ
‘I
2
STJQA/--
Client
?-
-
(
1+0
r
./.
Title
c4cT7Z
Av
.
.jeiJr
WS
Signature
Date
Sheet
(
of
WT
(N
MA
oc
1
Mj/
1O.4
/rV
1ost/
1
sr..
2O&?2
‘4-fto”J
‘145
cT
i.
9
AS/
o
-os’
AflDi_PZ2
t
tc
f
9
)(
FtL)
1)1
8G
<293
A
HUFF
&
HUFF,
INC.
CALCULATION
SHEET
r
h
4
Environmental
Consultants
r’
Project
tc}9
ju
‘
I
é
lg
f,M/3.IJ)
Client
Title
/Kl.,
SA-c
Signature
ç
(k
iv)
Date
(
6,,/
0
Sheet
of
Ot\I
orv,z
½
-
t2
S
<)
11L
(N
CA
.•
A4MvM
1
VM
47
i4A4(’)r\J
A44
v-
y2-,&
f-
(c
i,i
1
2-o
L
/
4-7
I).
4
7Q
TbT14
(-o
1
a(
f,
N
-
(_4-(_
/
HrtJ
(i2.
1s/c
1
/L
-
1G
(277A)
(s4)