Electronic Filing - Received, Clerk's Office, December 15, 2008
* * * * * PCB 2009-038 * * * * *
Electronic Filing - Received, Clerk's Office, December 15, 2008
* * * * * PCB 2009-038 * * * * *
Electronic Filing - Received, Clerk's Office, December 15, 2008
* * * * * PCB 2009-038 * * * * *
Electronic Filing - Received, Clerk's Office, December 15, 2008
* * * * * PCB 2009-038 * * * * *
Electronic Filing - Received, Clerk's Office, December 15, 2008
* * * * * PCB 2009-038 * * * * *
Electronic Filing - Received, Clerk's Office, December 15, 2008
* * * * * PCB 2009-038 * * * * *
Electronic Filing - Received, Clerk's Office, December 15, 2008
* * * * * PCB 2009-038 * * * * *
Electronic Filing - Received, Clerk's Office, December 15, 2008
* * * * * PCB 2009-038 * * * * *
Electronic Filing - Received, Clerk's Office, December 15, 2008
* * * * * PCB 2009-038 * * * * *
Electronic Filing - Received, Clerk's Office, December 15, 2008
* * * * * PCB 2009-038 * * * * *
Electronic Filing - Received, Clerk's Office, December 15, 2008
* * * * * PCB 2009-038 * * * * *
Electronic Filing - Received, Clerk's Office, December 15, 2008
* * * * * PCB 2009-038 * * * * *
Electronic Filing - Received, Clerk's Office, December 15, 2008
* * * * * PCB 2009-038 * * * * *
Electronic Filing - Received, Clerk's Office, December 15, 2008
* * * * * PCB 2009-038 * * * * *
Electronic Filing - Received, Clerk's Office, December 15, 2008
* * * * * PCB 2009-038 * * * * *
Electronic Filing - Received, Clerk's Office, December 15, 2008
* * * * * PCB 2009-038 * * * * *
Electronic Filing - Received, Clerk's Office, December 15, 2008
* * * * * PCB 2009-038 * * * * *
Electronic Filing - Received, Clerk's Office, December 15, 2008
* * * * * PCB 2009-038 * * * * *
Electronic Filing - Received, Clerk's Office, December 15, 2008
* * * * * PCB 2009-038 * * * * *
Electronic Filing - Received, Clerk's Office, December 15, 2008
* * * * * PCB 2009-038 * * * * *
Electronic Filing - Received, Clerk's Office, December 15, 2008
* * * * * PCB 2009-038 * * * * *
Electronic Filing - Received, Clerk's Office, December 15, 2008
* * * * * PCB 2009-038 * * * * *
Electronic Filing - Received, Clerk's Office, December 15, 2008
* * * * * PCB 2009-038 * * * * *
Electronic Filing - Received, Clerk's Office, December 15, 2008
* * * * * PCB 2009-038 * * * * *
Electronic Filing - Received, Clerk's Office, December 15, 2008
* * * * * PCB 2009-038 * * * * *
Electronic Filing - Received, Clerk's Office, December 15, 2008
* * * * * PCB 2009-038 * * * * *
Electronic Filing - Received, Clerk's Office, December 15, 2008
* * * * * PCB 2009-038 * * * * *
Electronic Filing - Received, Clerk's Office, December 15, 2008
* * * * * PCB 2009-038 * * * * *
Electronic Filing - Received, Clerk's Office, December 15, 2008
* * * * * PCB 2009-038 * * * * *
Electronic Filing - Received, Clerk's Office, December 15, 2008
* * * * * PCB 2009-038 * * * * *
Electronic Filing - Received, Clerk's Office, December 15, 2008
* * * * * PCB 2009-038 * * * * *
Electronic Filing - Received, Clerk's Office, December 15, 2008
* * * * * PCB 2009-038 * * * * *
Electronic Filing - Received, Clerk's Office, December 15, 2008
* * * * * PCB 2009-038 * * * * *
Electronic Filing - Received, Clerk's Office, December 15, 2008
* * * * * PCB 2009-038 * * * * *
Electronic Filing - Received, Clerk's Office, December 15, 2008
* * * * * PCB 2009-038 * * * * *
Electronic Filing - Received, Clerk's Office, December 15, 2008
* * * * * PCB 2009-038 * * * * *
Electronic Filing - Received, Clerk's Office, December 15, 2008
* * * * * PCB 2009-038 * * * * *
Electronic Filing - Received, Clerk's Office, December 15, 2008
* * * * * PCB 2009-038 * * * * *
Electronic Filing - Received, Clerk's Office, December 15, 2008
* * * * * PCB 2009-038 * * * * *
Electronic Filing - Received, Clerk's Office, December 15, 2008
* * * * * PCB 2009-038 * * * * *
Electronic Filing - Received, Clerk's Office, December 15, 2008
* * * * * PCB 2009-038 * * * * *
Electronic Filing - Received, Clerk's Office, December 15, 2008
* * * * * PCB 2009-038 * * * * *
Electronic Filing - Received, Clerk's Office, December 15, 2008
* * * * * PCB 2009-038 * * * * *
Electronic Filing - Received, Clerk's Office, December 15, 2008
* * * * * PCB 2009-038 * * * * *
Electronic Filing - Received, Clerk's Office, December 15, 2008
* * * * * PCB 2009-038 * * * * *
Electronic Filing - Received, Clerk's Office, December 15, 2008
* * * * * PCB 2009-038 * * * * *
Electronic Filing - Received, Clerk's Office, December 15, 2008
* * * * * PCB 2009-038 * * * * *
Electronic Filing - Received, Clerk's Office, December 15, 2008
* * * * * PCB 2009-038 * * * * *
Electronic Filing - Received, Clerk's Office, December 15, 2008
* * * * * PCB 2009-038 * * * * *
Electronic Filing - Received, Clerk's Office, December 15, 2008
* * * * * PCB 2009-038 * * * * *
Electronic Filing - Received, Clerk's Office, December 15, 2008
* * * * * PCB 2009-038 * * * * *
Electronic Filing - Received, Clerk's Office, December 15, 2008
* * * * * PCB 2009-038 * * * * *
Electronic Filing - Received, Clerk's Office, December 15, 2008
* * * * * PCB 2009-038 * * * * *
Electronic Filing - Received, Clerk's Office, December 15, 2008
* * * * * PCB 2009-038 * * * * *
Electronic Filing - Received, Clerk's Office, December 15, 2008
* * * * * PCB 2009-038 * * * * *
Electronic Filing - Received, Clerk's Office, December 15, 2008
* * * * * PCB 2009-038 * * * * *
Electronic Filing - Received, Clerk's Office, December 15, 2008
* * * * * PCB 2009-038 * * * * *
Electronic Filing - Received, Clerk's Office, December 15, 2008
* * * * * PCB 2009-038 * * * * *
Electronic Filing - Received, Clerk's Office, December 15, 2008
* * * * * PCB 2009-038 * * * * *
Electronic Filing - Received, Clerk's Office, December 15, 2008
* * * * * PCB 2009-038 * * * * *
Electronic Filing - Received, Clerk's Office, December 15, 2008
* * * * * PCB 2009-038 * * * * *
Electronic Filing - Received, Clerk's Office, December 15, 2008
* * * * * PCB 2009-038 * * * * *
Electronic Filing - Received, Clerk's Office, December 15, 2008
* * * * * PCB 2009-038 * * * * *
Electronic Filing - Received, Clerk's Office, December 15, 2008
* * * * * PCB 2009-038 * * * * *
Electronic Filing - Received, Clerk's Office, December 15, 2008
* * * * * PCB 2009-038 * * * * *
Electronic Filing - Received, Clerk's Office, December 15, 2008
* * * * * PCB 2009-038 * * * * *
Electronic Filing - Received, Clerk's Office, December 15, 2008
* * * * * PCB 2009-038 * * * * *
Electronic Filing - Received, Clerk's Office, December 15, 2008
* * * * * PCB 2009-038 * * * * *
Electronic Filing - Received, Clerk's Office, December 15, 2008
* * * * * PCB 2009-038 * * * * *
Electronic Filing - Received, Clerk's Office, December 15, 2008
* * * * * PCB 2009-038 * * * * *
Electronic Filing - Received, Clerk's Office, December 15, 2008
* * * * * PCB 2009-038 * * * * *
Electronic Filing - Received, Clerk's Office, December 15, 2008
* * * * * PCB 2009-038 * * * * *
Electronic Filing - Received, Clerk's Office, December 15, 2008
* * * * * PCB 2009-038 * * * * *
Electronic Filing - Received, Clerk's Office, December 15, 2008
* * * * * PCB 2009-038 * * * * *
DNR
Rod R. Blagojevich, Governor
DNR Links
IDNR Home
Agency Offices
Disabled Outdoors
Freedom of Information
Get Involved
Grant Info
Kids & Education
Law Enforcement
Mandatory Safety
Programs
Lodges / Leasing
More Links
Outdoor Recreation
Parks & Recreation
Publications
State Museums
Endangered Species
State Links
News
Illinois Facts
Living
Health & Wellness
Working
Visiting
Learning
Business
Public Safety
Technology
Government
Help
Home
Search
DNR
Illinois
[IL Search Tips]
Coffeen Lake
- State Fish and Wildlife Area
West-Central Region
15084 N. 4th Avenue
P.O. Box 517
Coffeen, IL 62017
217.537.3351
E-mail
Site Map
Directions
Lake
Boating
Fishing | Tournament
Schedule
Natural Features
Camping
History
Picnicking
Concession
Hunting
Trapping
Update:
04/30/08
- Watch the Bald Eagles at Coffeen Lake at the Eagle Cam Link
Coffeen Lake is an attractive site with history of providing anglers and hunters success.
The site was opened in 1986 and currently operates under a long term lease and
management agreement between the Illinois Dept. of Natural Resources and Ameren
Energy Generating Company. This agreement grants authority to the State to open the
lake and certain lands to the public for recreational activities such as fishing, boating,
picnicking and hunting.
History
The original power company built a 75-foot high earthen dam on a branch of the east
Fork of Shoal Creek in 1963. The lake was completely filled by 1966 and now serves as
cooling water for the coal-fired Coffeen Power Station. The power station has a
generating capacity of 945 megawatts of electricity, with the first unit coming into
operation in 1965 and the larger, second unit in 1972. The heated discharge affects 73%
of the surface water. The cooling loop is 4.1 miles.
Natural Features
The oak-hickory
forests surrounding
Coffeen Lake are
representative of
the native cover
found within the
Southern Till Plain
Natural Division of
central and
southern Illinois.
Soils are of loess
and till, rather light
Parks & Recreation
State Parks
- Northwest
- R1
- Northeast - R2
- East-Central - R3
- West-Central - R4
- South - R5
- All Regions
Recreation
- Biking(Mountain Biking)
- Birding
- Boating
- Camping
- Canoe/Kayak
- Equestrian
- Fishing
- Geocaching
- Grand Illinois Trail
- Hand Trap/Archery
- Hiking
- Hunting
- Interpretive programs
- Rock Climbing
- Shelter Reservations
- Skiing
- Snowmobiling
. About
. Code of Ethics
. Illinois Laws
. About the ISAC
- Swimming (Beaches)
Programs
- Game Breeding & Hunting
Preserve Areas
- Field Trials
- Sporting Dog Training
- Wingshooting Clinics
Regulations
- Camping
- Firewood Collection
- Use of State Parks
Contact Us
Illinois Dept.of Natural
Resources
Office of Land Management
One Natural Resources Way
Springfield, IL 62702
E-mail
Becoming an Outdoors Woman
Interpretive Programs
Website Map
FAQ's
Visitor Comment Card
Recreation.gov
http://dnr.state.il.us/lands/landmgt/PARKS/R4/COFFEEN.HTM (1 of 3) [12/11/2008 3:05:54 PM]
Electronic Filing - Received, Clerk's Office, December 15, 2008
* * * * * PCB 2009-038 * * * * *
DNR
and a
characteristic "claypan" can be found. Pre-settlement vegetation was a mixture of 60 %
forest to 40% prairie and wetlands. A variety of trees, woodland and prairie plants cover
the slopes of the stream valley. Visitors may also find a diverse wildlife community.
Muskrats, turtles, herons and mussels are seen in or near the water. Red-tailed hawk,
blue jay or a dragonfly might be seen in the air. Bobwhite, coyote, white-tailed deer and
black rat snake are common to the area. The opportunity to observe and enjoy the
area's rich wildlife heritage is available.
Lake
Coffeen Lake boasts an excellent largemouth bass and channel catfish population.
Twenty-two species of fish are present in the lake, but most anglers seek largemouth
bass, white crappie, channel catfish and striped bass. The lake is deeper than most
Illinois lakes, averaging nearly 19 feet with a maximum depth of 59 feet. Coffeen Lake
has nearly 50 miles of shoreline. Power plant operation noticeably influences fish activity
and fishing success. Fish growth appears to be faster than in many other lakes, however.
Facilities
Boating
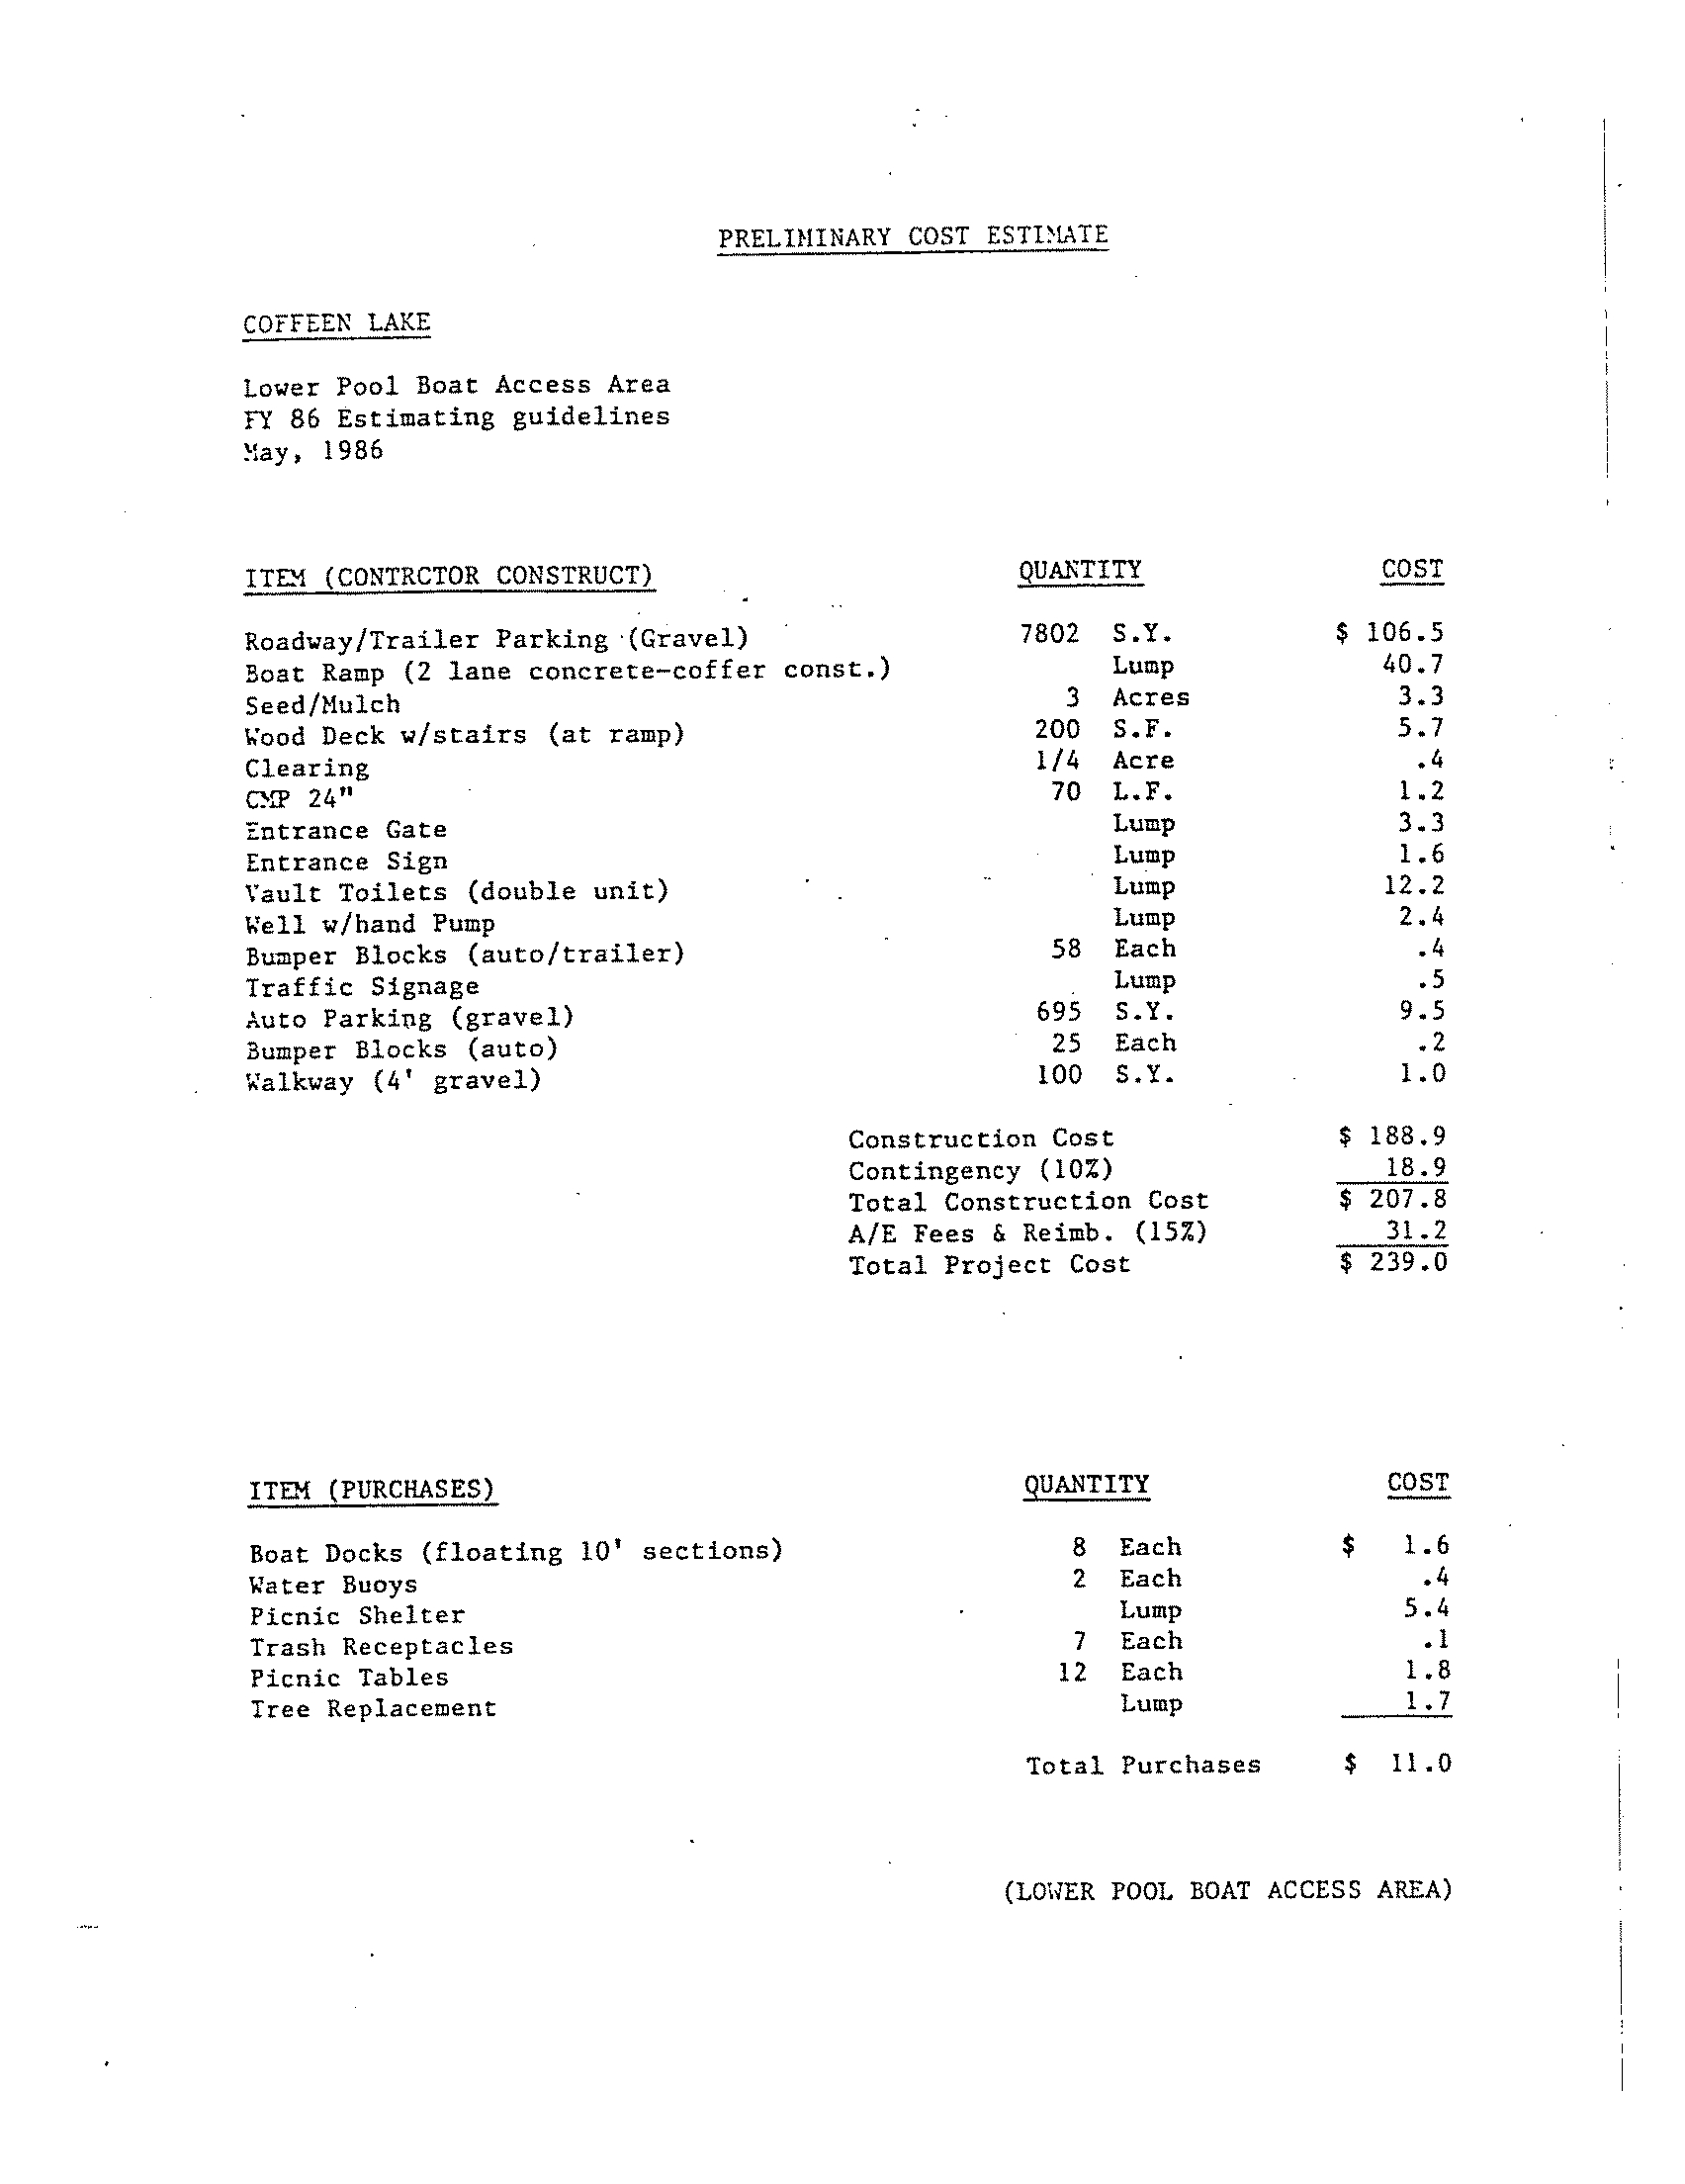
The Main Access (lower pool) provides a two lane ramp and a newly constructed parking
lot with a handicap accessible loading platform and reserved handicap parking stalls.
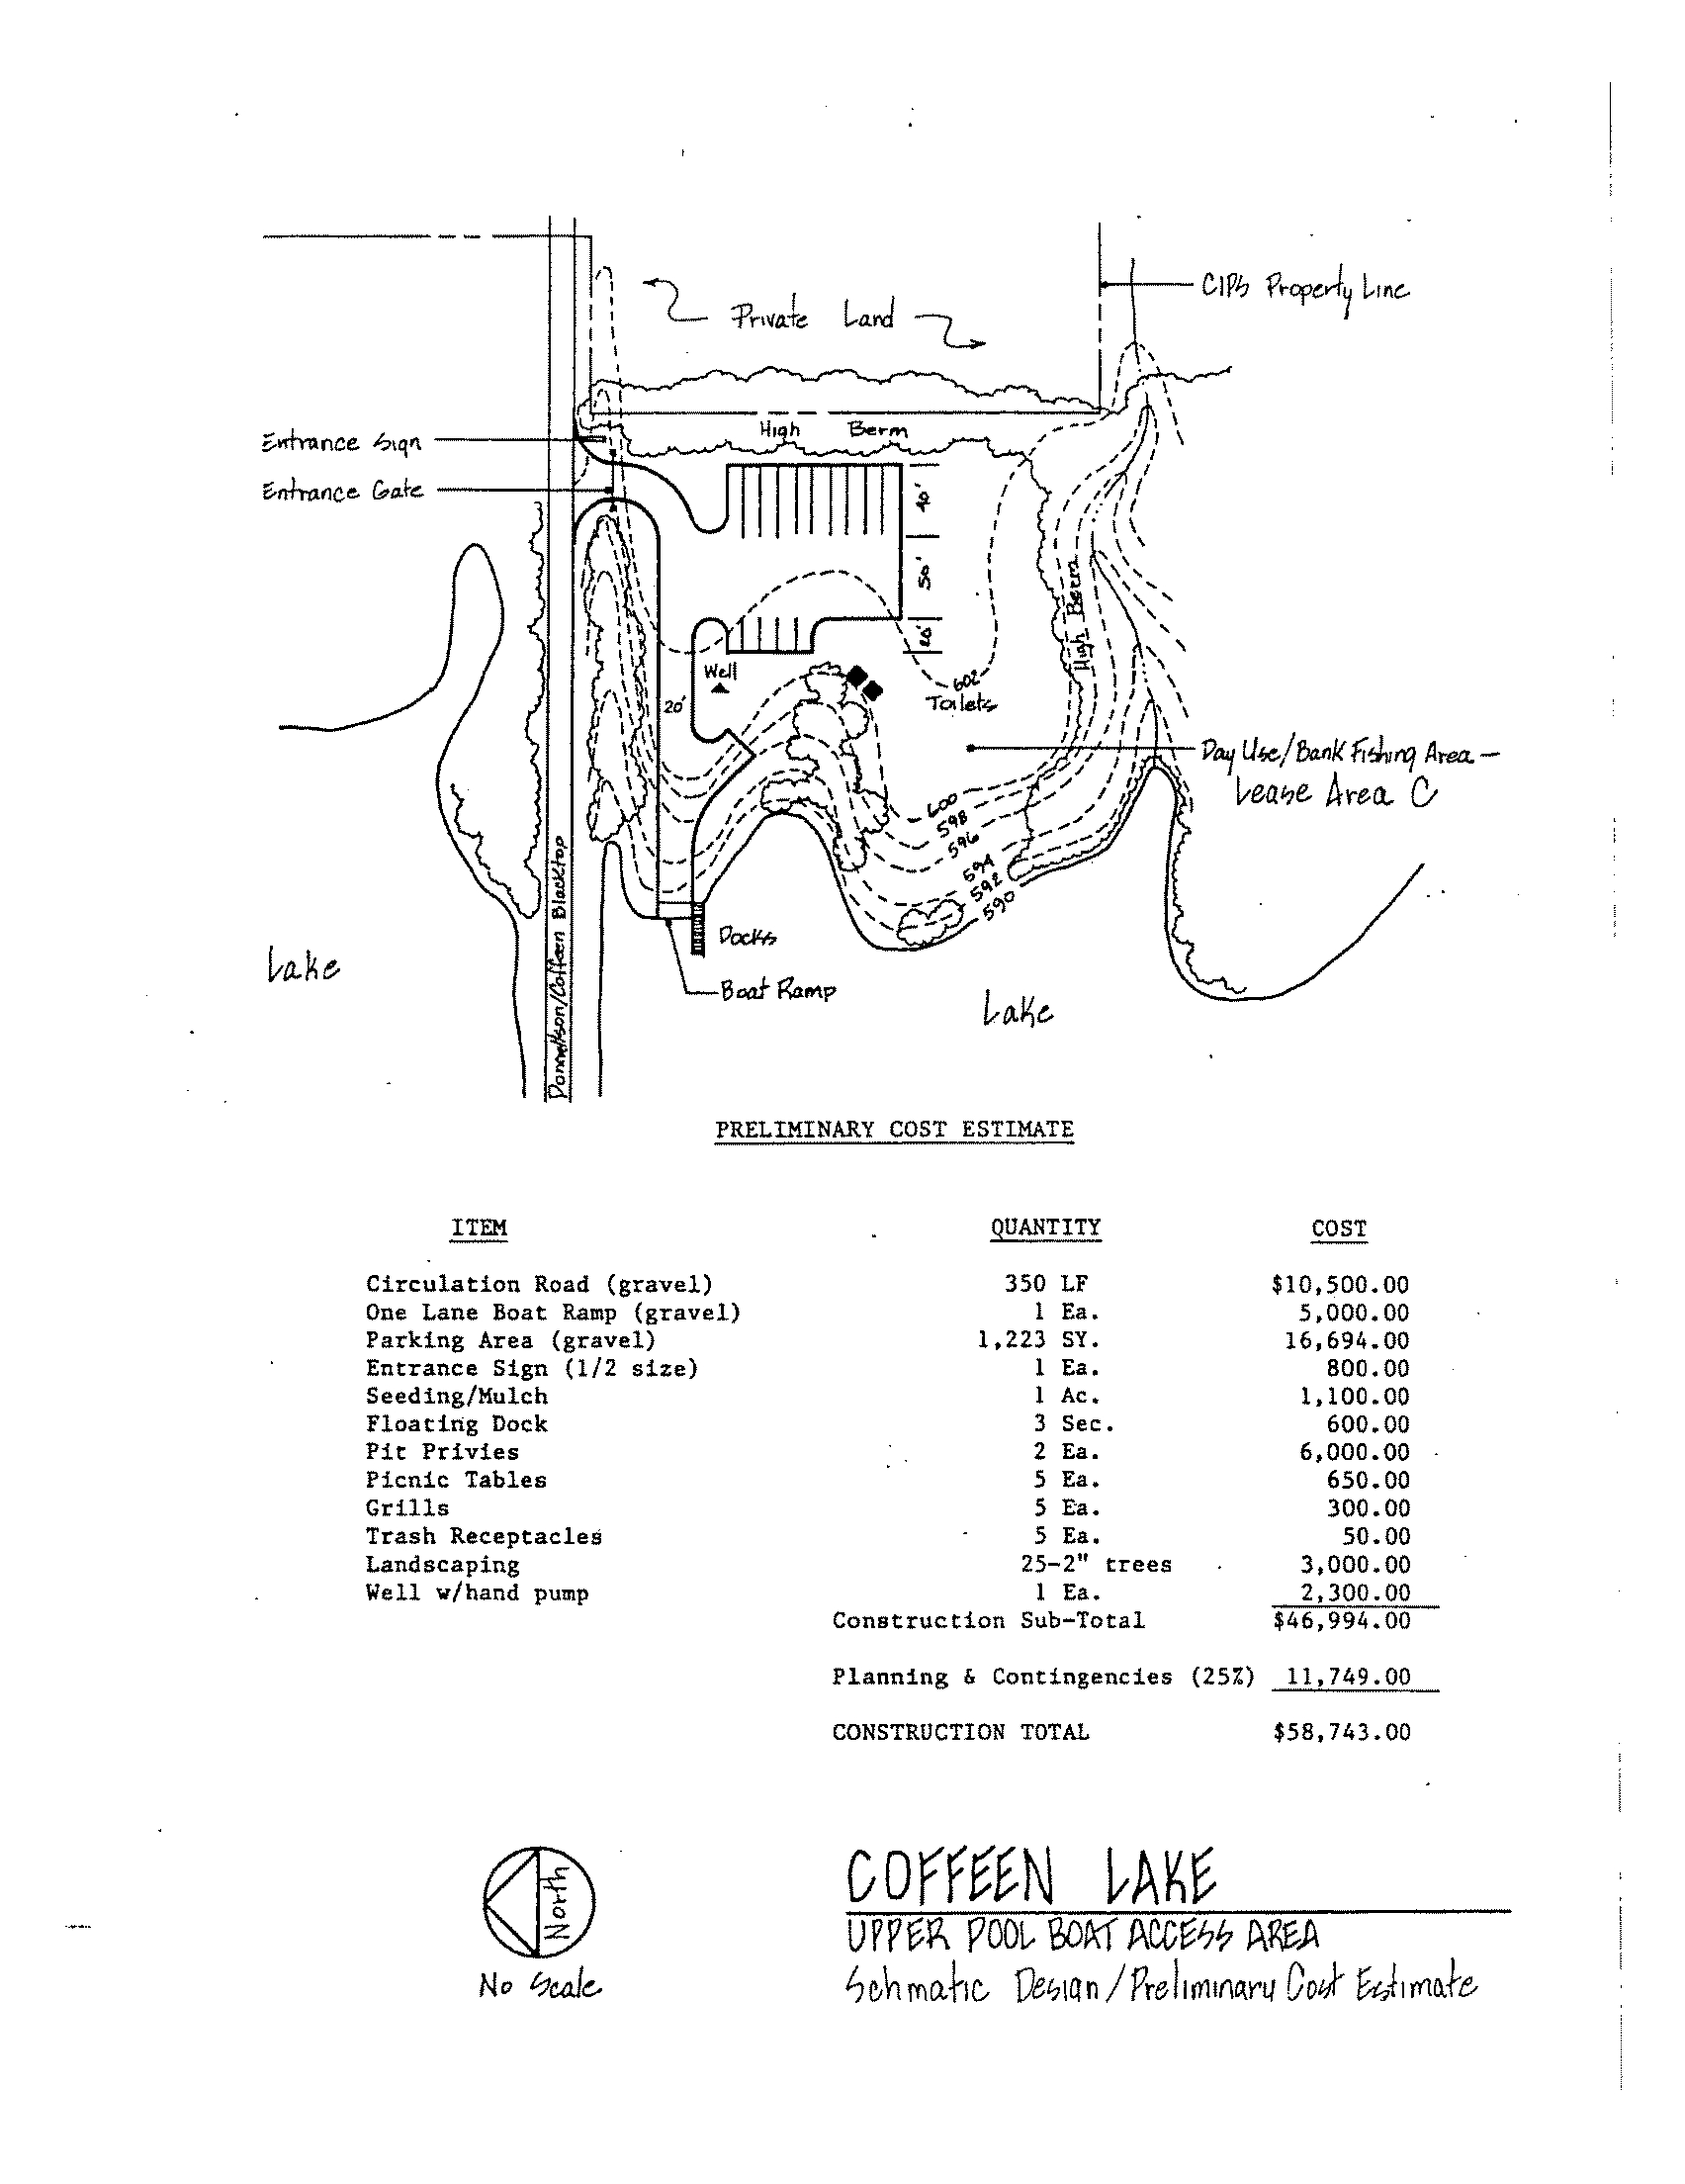
The North Access (upper pool) provides a newly constructed single lane ramp and a
handicap accessible courtesy dock and parking lot.
Motors of 25 horsepower or less are allowed to operate on the lake. Boats with motors
larger than 25 horsepower are allowed on the lake, but are restricted to trolling motor
operation only. However, motors larger than the 25 horsepower can be used for loading
and unloading a trailered watercraft, provided the watercraft over the horsepower limit is
operated at a no-wake speed within 150 feet of the loading ramp itself.
Fishing
Bank fishing is
available at all boat
access area.
Considerable acreage
is open for bank
fishing where parking
is present. Posted site
specific regulations for
bass and crappie are
enforced. All fishing
tournaments must be
scheduled through the
site office.
Fishing
Tournament Schedule
Picnicking, Camping & Concessions
Toilets, drinking water and picnic facilities are available at the main access area. A
private campground is located just to the north of the main access area. Bait, supplies
and food can be obtained there.
Hunting
Deer, squirrel, turkey, coyote and waterfowl hunting are allowed on site. Check site
specific regulations at site office. Site permits are required.
Hunter Fact Sheet
Trapping
http://dnr.state.il.us/lands/landmgt/PARKS/R4/COFFEEN.HTM (2 of 3) [12/11/2008 3:05:54 PM]
Electronic Filing - Received, Clerk's Office, December 15, 2008
* * * * * PCB 2009-038 * * * * *
DNR
A controlled aquatic furbearer trapping program allows the harvest of a valued
renewable resource. A public drawing is held for site trapping permits the last Saturday
of October prior to each trapping season.
Trapping Regs
Please
do you part in maintaining a clean area. Place all litter in the nearest trash
container. If you need help or have a question, contact site personnel.
Location/Directions
Located in Montgomery County approximately 3 miles east northeast of Donnellson,
Illinois and State HWY 127. Approximately 2 miles west southwest of Coffeen, Illinois
and State Highway 185.
From Springfield, IL take I 55 South to Hwy 127 south to Hillsboro, IL. Take Hwy 185
east to E. 14th Road, south to N. 4th Avenue, east to Main Access and Office.
From St. Louis, MO take I 70 east to Greenville, IL exit Hwy 127, north to Donnellson.
Just north of Donnellson take N. 3rd Avenue, east to Buckeye Trail, north to N. 4th
Avenue, east to Main Access and Office.
From Effingham, IL take I 70 west to Vandalia exit, Hwy 185 west to Coffeen, IL, west to
Hwy 185 east to E. 14th Road, south to N. 4th Avenue, east to Main Access and Office.
From Decatur, IL take Hwy 48 south to Raymond, IL Hwy 127 south to Hillsboro, IL, Hwy
185 east to E. 14th Road, south to N. 4th Avenue, east to Main Access and Office.
●
While groups of 25 or more are welcome and encouraged to use the park's
facilities, they are required to register in advance with the site office to avoid
crowding or scheduling conflicts.
●
At least one responsible adult must accompany each group of 15 minors.
●
Pets must be kept on leashes at all times.
●
Actions by nature can result in closed roads and other facilities. Please call ahead
to the park office before you make your trip.
●
We hope you enjoy your stay. Remember, take only memories, leave only
footprints.
●
For more information on tourism in Illinois, call the Illinois Department of
Economic Opportunity, Bureau of Tourism at 1-800-2Connect.
●
Telecommunication Device for Deaf and Hearing Impaired Natural Resources
Information
(217) 782-9175 for TDD only
Relay Number
800-526-0844.
Copyright © 2008 Department of Natural Resources
Privacy
Kids Privacy Web Accessibility
FAQs Contact
http://dnr.state.il.us/lands/landmgt/PARKS/R4/COFFEEN.HTM (3 of 3) [12/11/2008 3:05:54 PM]
Electronic Filing - Received, Clerk's Office, December 15, 2008
* * * * * PCB 2009-038 * * * * *
Electronic Filing - Received, Clerk's Office, December 15, 2008
* * * * * PCB 2009-038 * * * * *
Electronic Filing - Received, Clerk's Office, December 15, 2008
* * * * * PCB 2009-038 * * * * *
Electronic Filing - Received, Clerk's Office, December 15, 2008
* * * * * PCB 2009-038 * * * * *
Electronic Filing - Received, Clerk's Office, December 15, 2008
* * * * * PCB 2009-038 * * * * *
Electronic Filing - Received, Clerk's Office, December 15, 2008
* * * * * PCB 2009-038 * * * * *
Electronic Filing - Received, Clerk's Office, December 15, 2008
* * * * * PCB 2009-038 * * * * *
Electronic Filing - Received, Clerk's Office, December 15, 2008
* * * * * PCB 2009-038 * * * * *
Electronic Filing - Received, Clerk's Office, December 15, 2008
* * * * * PCB 2009-038 * * * * *
Electronic Filing - Received, Clerk's Office, December 15, 2008
* * * * * PCB 2009-038 * * * * *
Electronic Filing - Received, Clerk's Office, December 15, 2008
* * * * * PCB 2009-038 * * * * *
Electronic Filing - Received, Clerk's Office, December 15, 2008
* * * * * PCB 2009-038 * * * * *
Electronic Filing - Received, Clerk's Office, December 15, 2008
* * * * * PCB 2009-038 * * * * *
Electronic Filing - Received, Clerk's Office, December 15, 2008
* * * * * PCB 2009-038 * * * * *
Electronic Filing - Received, Clerk's Office, December 15, 2008
* * * * * PCB 2009-038 * * * * *
Electronic Filing - Received, Clerk's Office, December 15, 2008
* * * * * PCB 2009-038 * * * * *
Electronic Filing - Received, Clerk's Office, December 15, 2008
* * * * * PCB 2009-038 * * * * *
Electronic Filing - Received, Clerk's Office, December 15, 2008
* * * * * PCB 2009-038 * * * * *
Electronic Filing - Received, Clerk's Office, December 15, 2008
* * * * * PCB 2009-038 * * * * *
Electronic Filing - Received, Clerk's Office, December 15, 2008
* * * * * PCB 2009-038 * * * * *
Electronic Filing - Received, Clerk's Office, December 15, 2008
* * * * * PCB 2009-038 * * * * *
EVALUATION OF POTENTIAL ADVERSE IMPACTS FROM
REVISED SITE-SPECIFIC THERMAL STANDARDS IN MAY
AND OCTOBER FOR COFFEEN LAKE
Prepared for:
Ameren Corporation
One Ameren Plaza
1901 Chouteau Avenue
St. Louis, MO 63166-6149
Prepared by:
ASA Analysis & Communication, Inc.
5 Fairlawn Drive, Suite 205
Washingtonville, NY 10992
March 2008
Electronic Filing - Received, Clerk's Office, December 15, 2008
* * * * * PCB 2009-038 * * * * *
Thermal Limits Petition Support Document - Coffeen Power Station
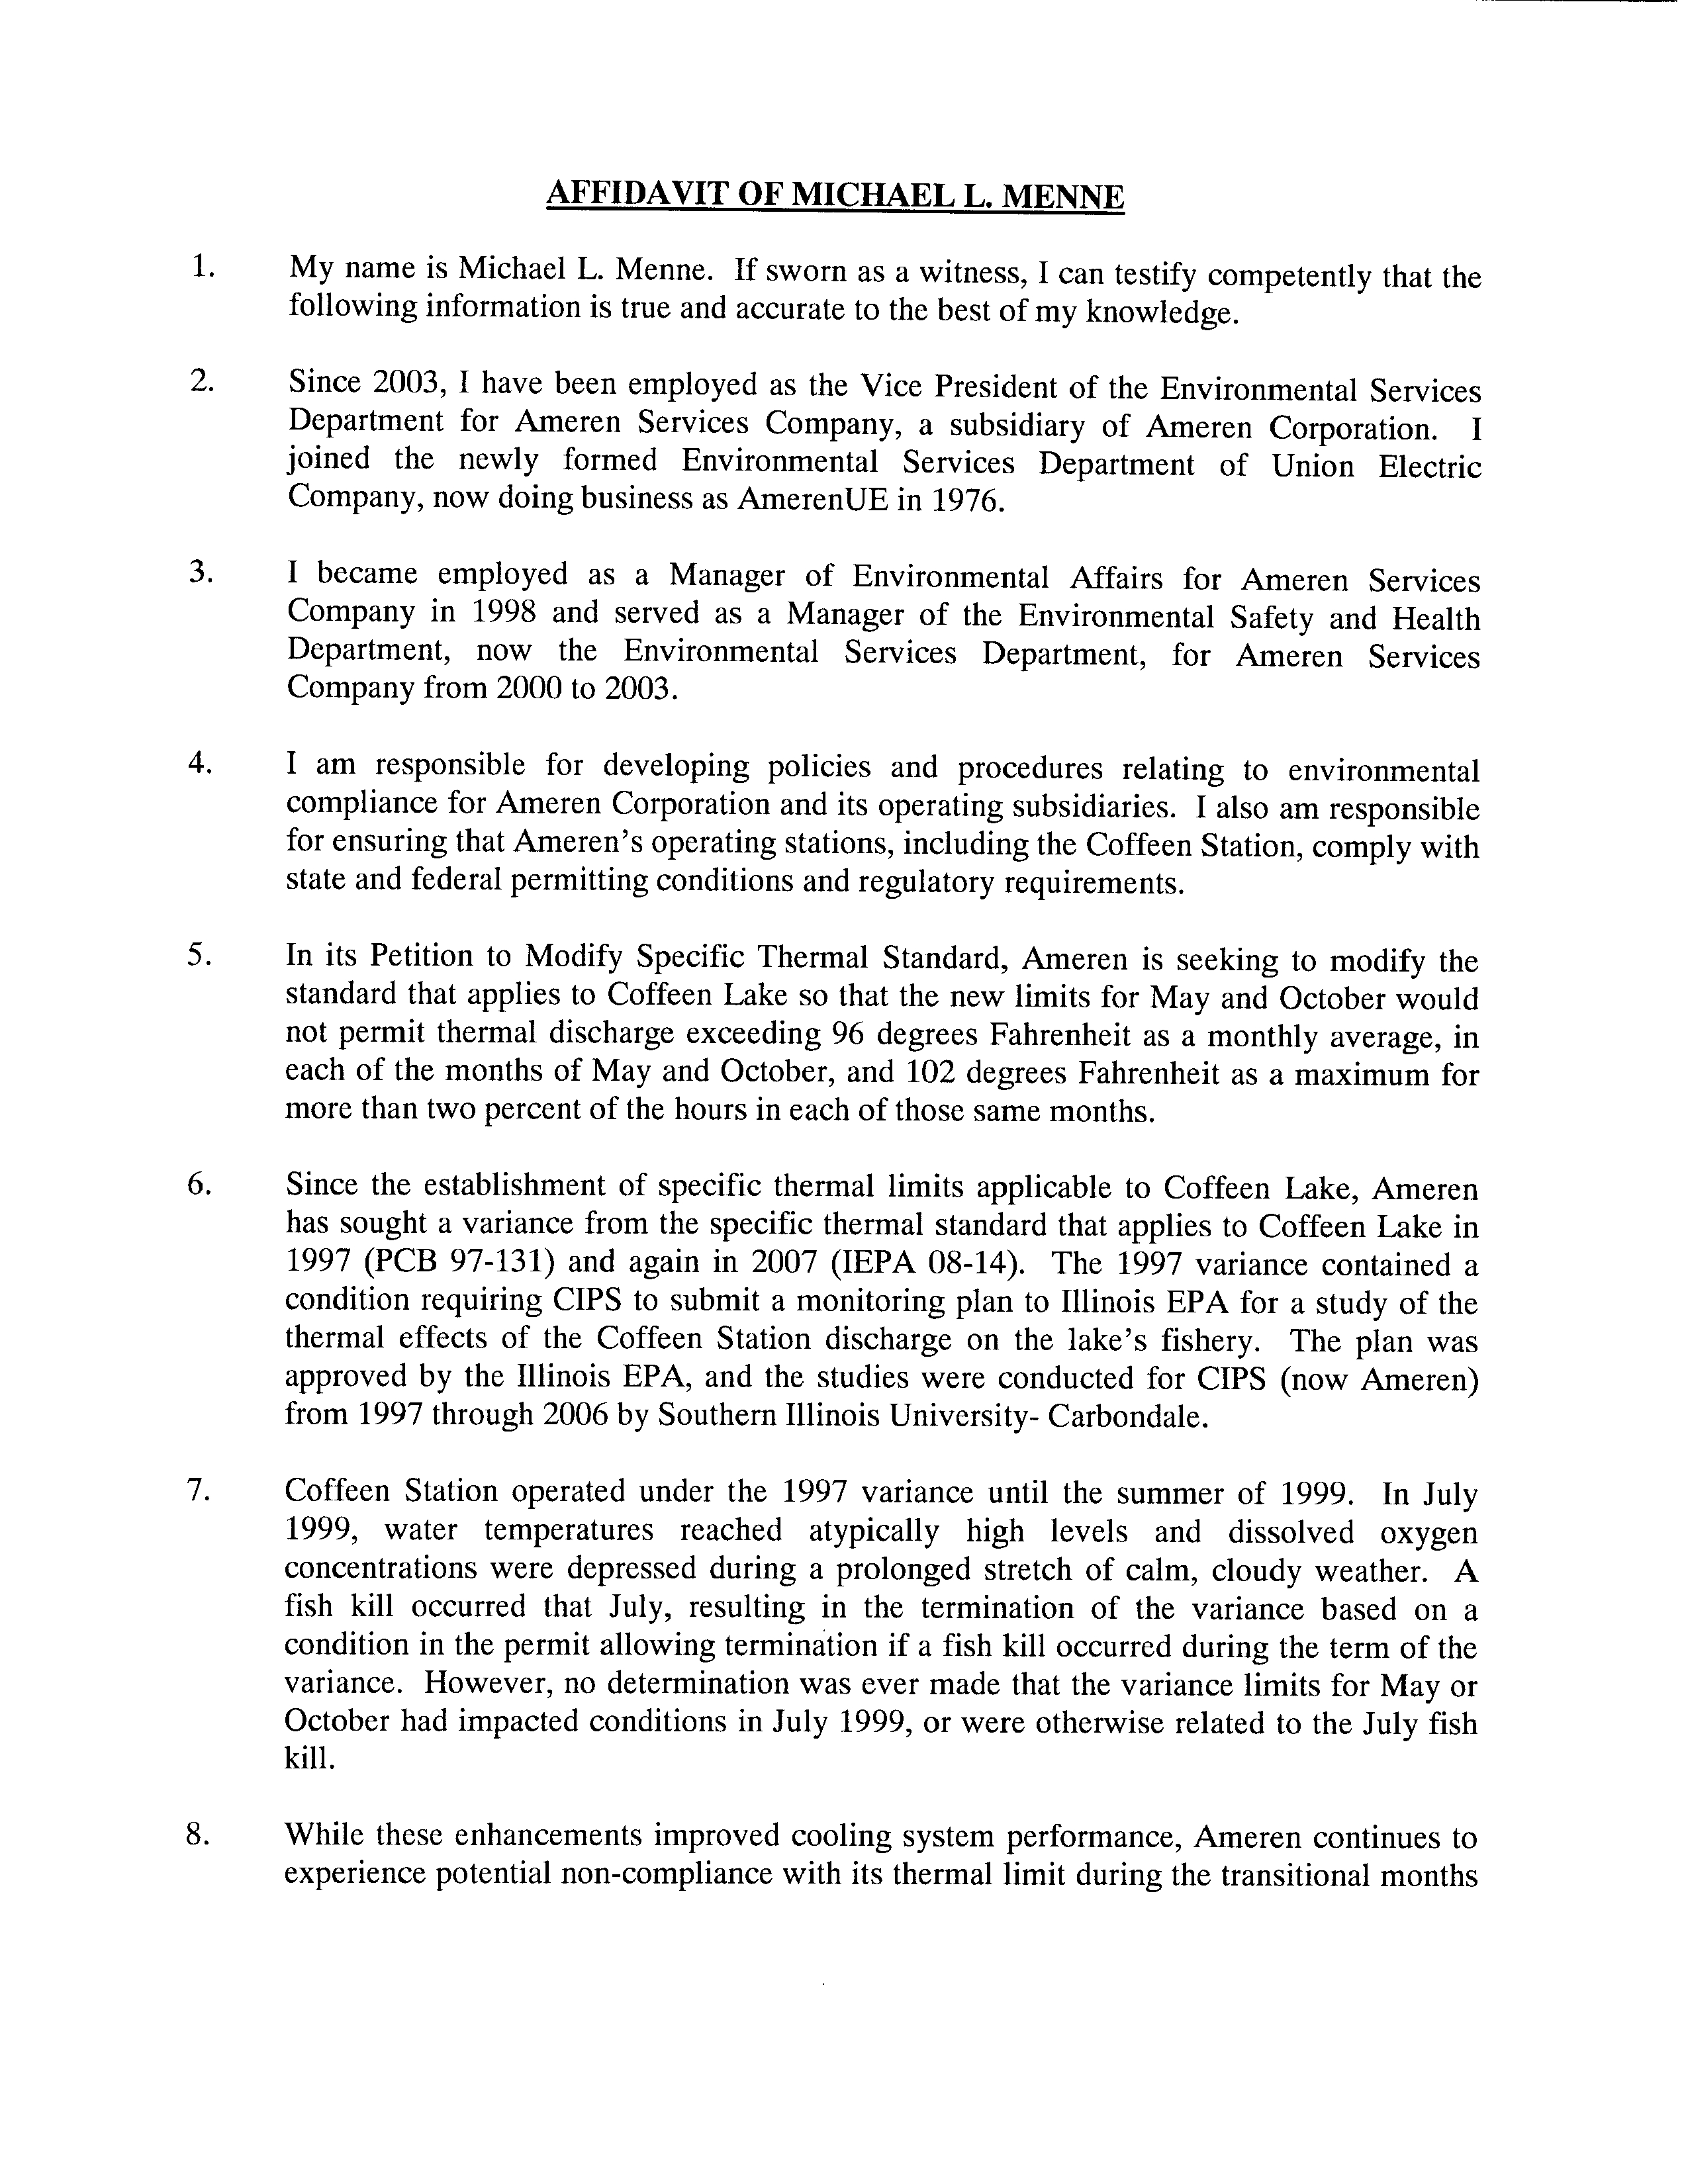
EXECUTIVE SUMMARY
This report provides an evaluation of the potential for adverse ecological impacts from proposed
modifications to current site-specific thermal standards in Coffeen Lake for the months of May
and October. Coffeen Lake is the source for cooling water for the 945-MW Coffeen Power
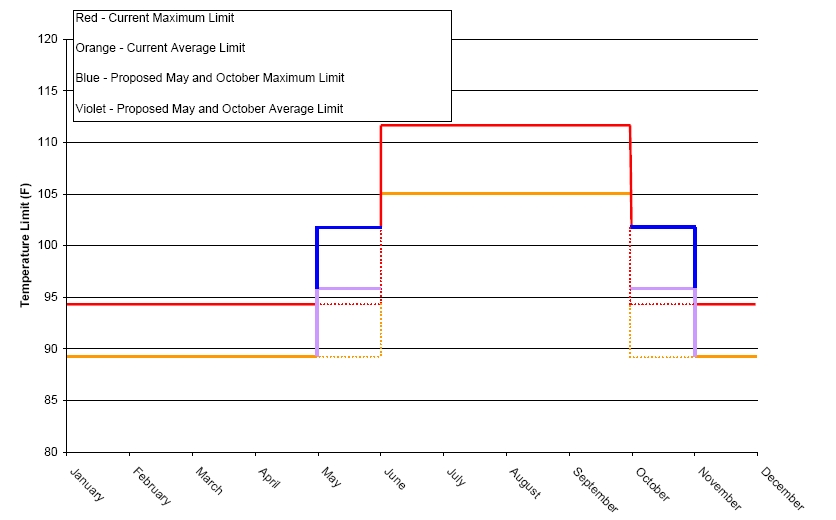
Station in Montgomery County, Illinois. Under current thermal standards for May and October,
thermal discharges from Coffeen Power Station may not result in water temperatures that
exceed:
•
89
o
F as a monthly average, or
•
94
o
F as a maximum for greater than 2 percent of the hours during that period,
as measured at the boundary of a 26-acre mixing zone. In recent years, the station has reduced
electric generation in May and October to comply with the above thermal standards. The results
of extensive research conducted on the aquatic community of Coffeen Lake, particularly the
sport fish populations, indicate that the existing thermal standards for these months are
unnecessarily strict. Proposed revised standards for the months of May and October are as
follows:
•
96
o
F as a monthly average, and
•
102
o
F as a maximum for more than 2 percent of the hours during that period.
In this report, the potential effects of raising the May and October thermal standards are
evaluated by (1) a retrospective assessment, which applies the results of studies on the status of
the lake’s fish populations to determine whether or how they have adapted to the recent thermal
environment in the lake; and (2) a prospective assessment, which predicts how the lake’s thermal
environment during May and October might be altered under the proposed revised standards.
Conclusions derived from these assessments are:
1. The revised standards realistically reflect a natural thermal environment, where
temperature increases or decreases occur more gradually than the abrupt change inherent
in the existing site-specific standards.
2. If raised thermal standards resulted in higher water temperatures in the mixing zone in
May, warmer temperatures would not be expected to carry over throughout the remainder
of the summer season.
3. Stable, higher water temperatures in late winter and spring promote earlier spawning and
improved survival and growth or development of early life stages of fish, particularly
largemouth bass.
4. Warmer temperatures result in a prolonged growing season, faster growth and earlier
attainment of a size permitting a fish diet, and improved overwinter survival for young
largemouth bass.
ES-1
EXECUTIVE SUMMARY
Alden/ASA/12-Mar-08/Rev 0
Electronic Filing - Received, Clerk's Office, December 15, 2008
* * * * * PCB 2009-038 * * * * *
Thermal Limits Petition Support Document - Coffeen Power Station
5. At any time, there are areas in the eastern and western arms of Coffeen Lake that can
provide water temperatures approaching optimal levels or that can serve as either a
nursery for young fish or a thermal refuge for older fish.
6. No significant relationship was found between the thermal regime in the lake (in terms of
degree-days accumulated from May through August) and annual recruitment of
largemouth bass year classes, or the growth and condition of largemouth bass, bluegill, or
channel catfish.
7. Recent monitoring of the fish populations in Coffeen Lake indicates that they have
adapted, and in the case of largemouth bass even prospered, in terms of growth rates,
condition, and standing crop levels compared to other regional and national populations,
at water temperatures that annually exceed the proposed limits for May and October.
8. Fish kills are unlikely to result from revised thermal standards for May and October,
since water temperatures and dissolved oxygen levels that have been associated with past
fish kills would not occur during these two months.
ES-2
EXECUTIVE SUMMARY
Alden/ASA/12-Mar-08/Rev 0
Electronic Filing - Received, Clerk's Office, December 15, 2008
* * * * * PCB 2009-038 * * * * *
Thermal Limits Petition Support Document - Coffeen Power Station
i
Alden/ASA/12-Mar-08/Rev 0
CONTENTS
1
INTRODUCTION...........................................................................................................................1-1
1.1 REPORT PURPOSE .............................................................................................................1-1
1.2 REGULATORY BACKGROUND ..........................................................................................1-2
1.3 REPORT ORGANIZATION ..................................................................................................1-2
2
STATION OPERATIONS AND THERMAL HISTORY...........................................................2-1
2.1 STATION AND LAKE DESCRIPTIONS.................................................................................2-1
2.2 STATION OPERATIONS AND MONITORING .......................................................................2-1
2.3 TEMPERATURE AND DISSOLVED OXYGEN IN COFFEEN LAKE.........................................2-2
2.3.1. Diel Cycles ..............................................................................................................2-3
2.3.2. Vertical Stratification ..............................................................................................2-3
2.3.3. Cumulative Water Temperatures ............................................................................2-4
3
RETROSPECTIVE ASSESSMENT .............................................................................................3-1
3.1 EVIDENCE OF THERMAL ADAPTATIONS ..........................................................................3-1
3.2 LARGEMOUTH BASS (
MICROPTERUS SALMOIDES
) ............................................................3-2
3.2.1. Largemouth Bass Recruitment ................................................................................3-3
3.2.2. Largemouth Bass Growth and Condition................................................................3-5
3.3 BLUEGILL (
LEPOMIS MACROCHIRUS
)................................................................................3-6
3.3.1. Bluegill Growth and Condition ...............................................................................3-7
3.4 CHANNEL CATFISH (
ICTALURUS PUNCTATUS
) ..................................................................3-8
3.4.1. Channel Catfish Growth and Condition ..................................................................3-8
3.5 FISH STANDING CROPS ....................................................................................................3-9
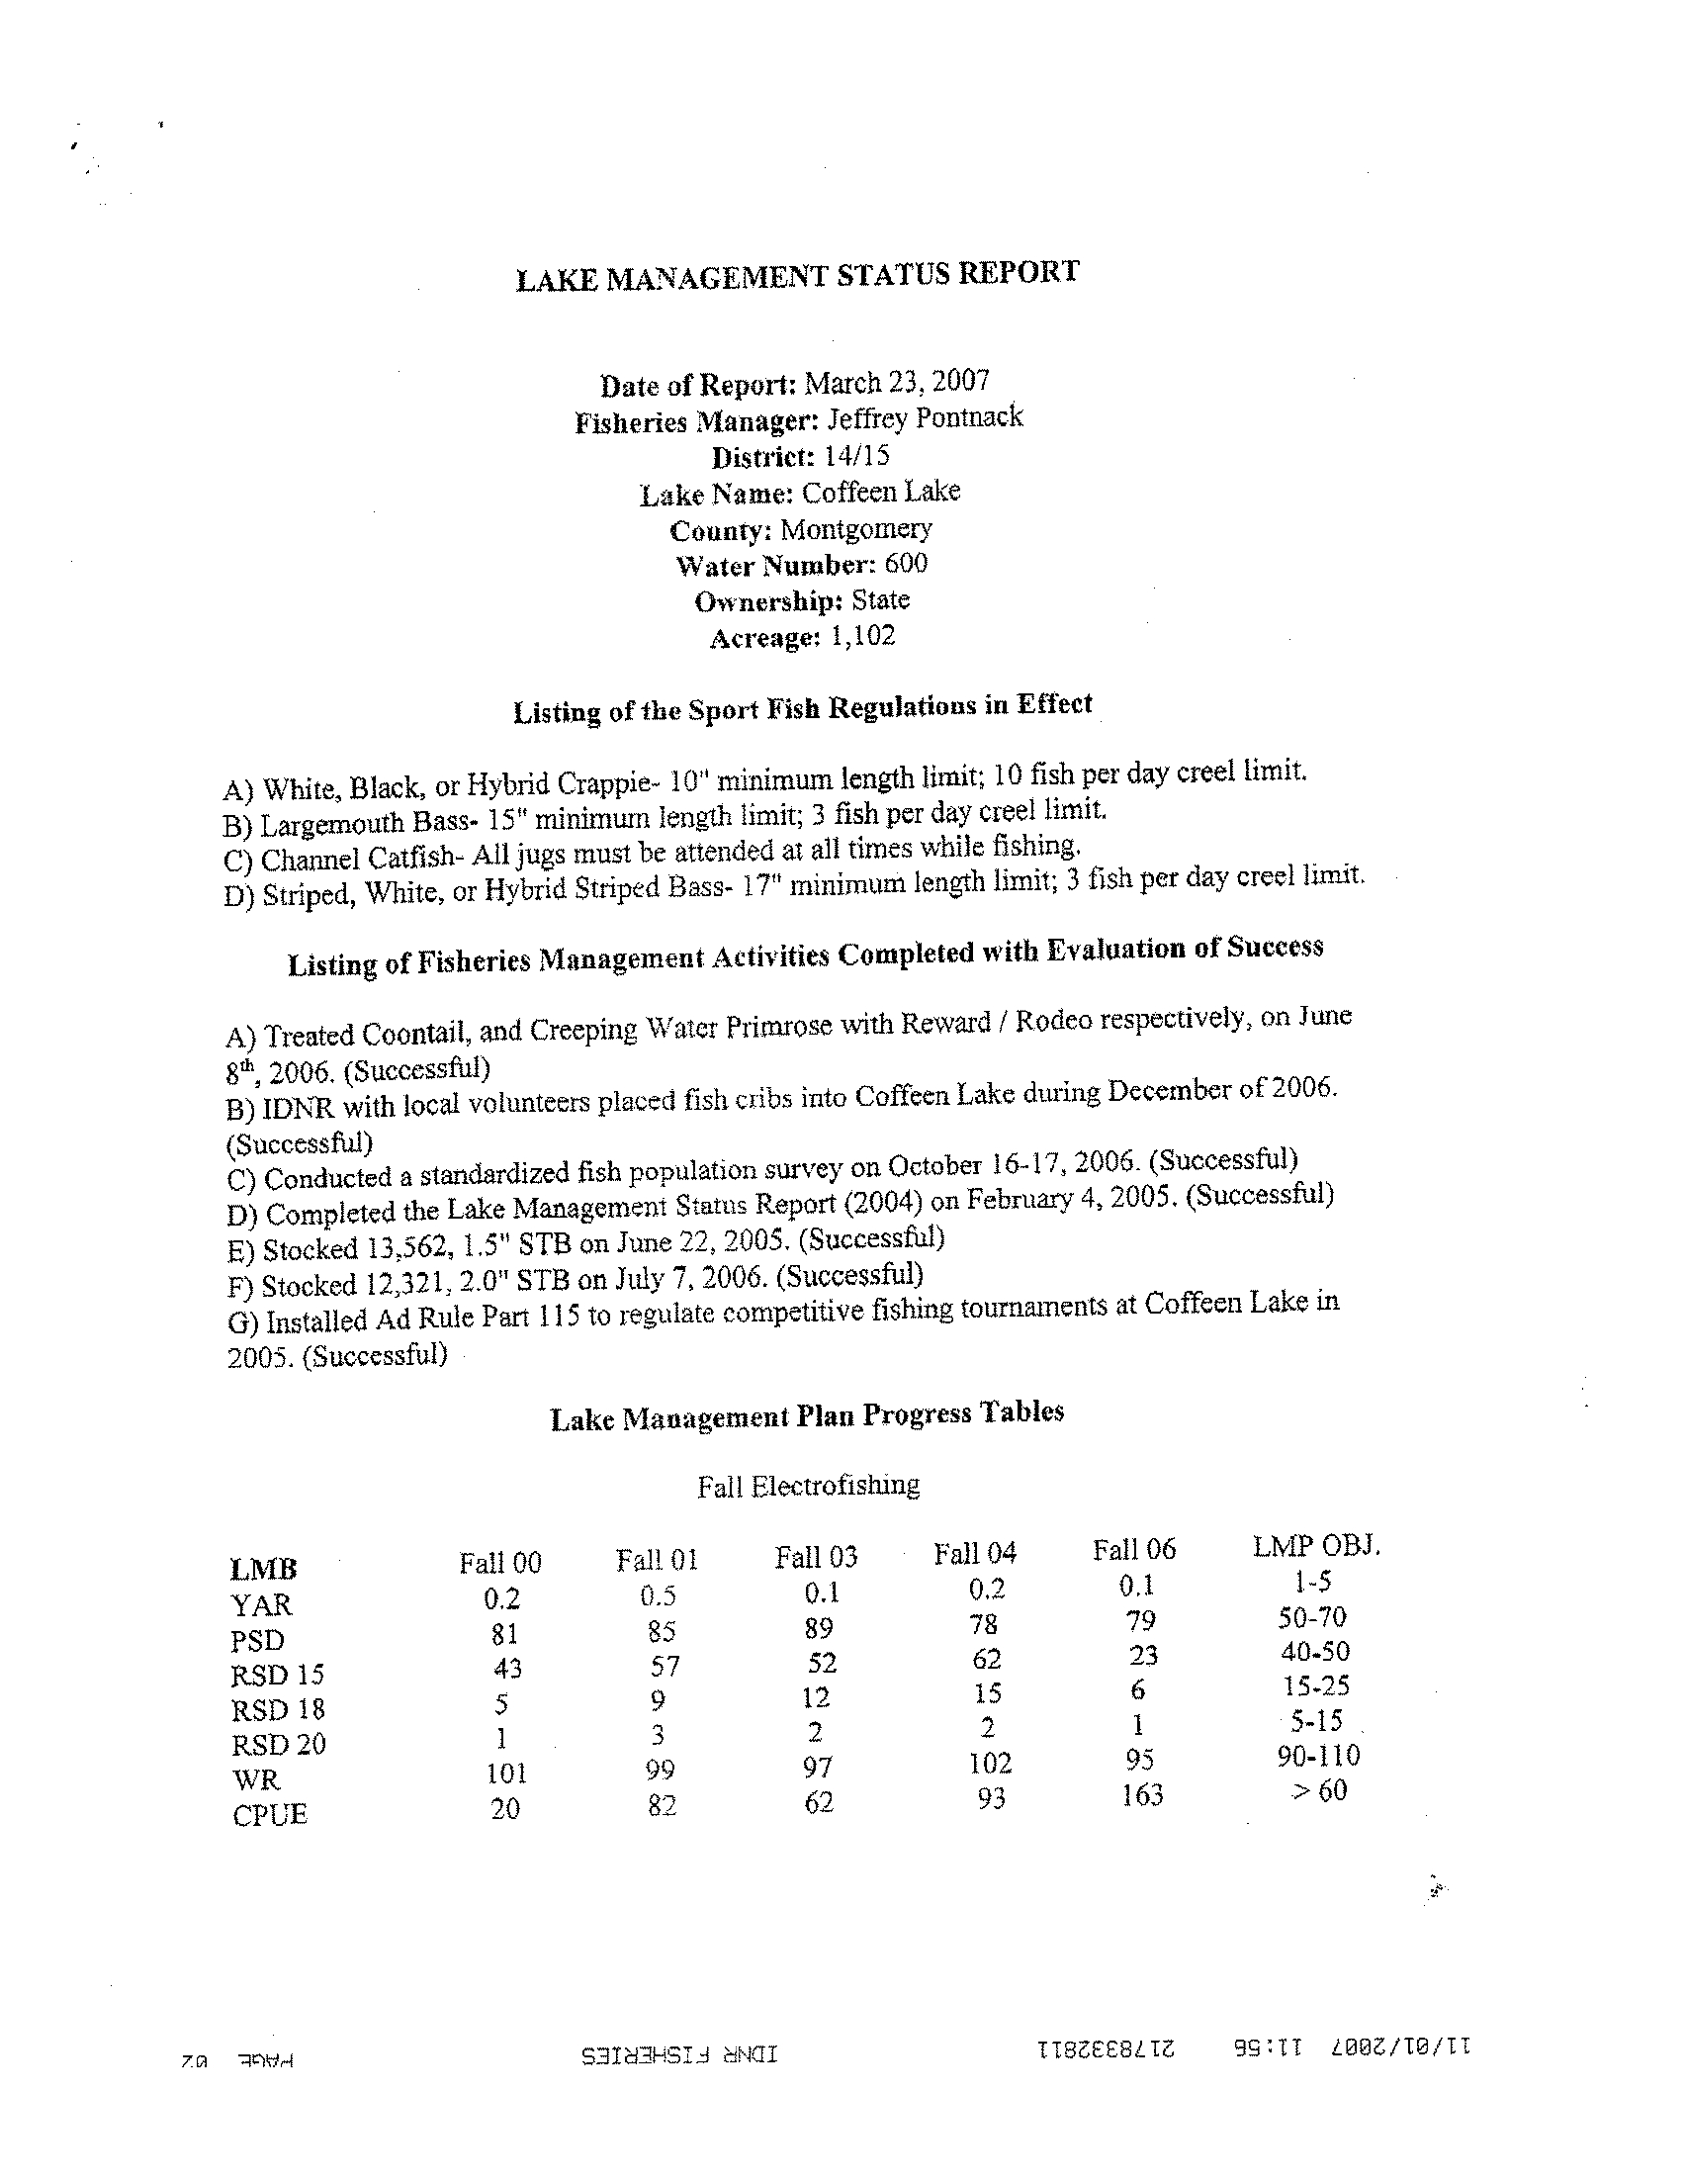
3.6 RECENT IDNR SURVEY RESULTS ....................................................................................3-9
3.7 HABITAT CONDITIONS DURING PREVIOUS FISH KILLS .................................................3-10
4
PROSPECTIVE ASSESSMENT ...................................................................................................4-1
4.1 MAY AND OCTOBER TEMPERATURE TOLERANCE ...........................................................4-1
4.2 THERMAL MODELING ......................................................................................................4-2
5
DISCUSSION AND CONCLUSIONS...........................................................................................5-1
5.1 REVISIONS LIMITED TO MAY AND OCTOBER...................................................................5-1
5.2 MINIMAL EFFECTS ON THE CURRENT THERMAL REGIME ...............................................5-1
5.3 WARM MAY AND OCTOBER TEMPERATURES PROMOTE SURVIVAL AND GROWTH........5-1
5.4 NO EVIDENCE OF DETRIMENTAL EFFECTS OF CURRENT TEMPERATURES ON RECRUITMENT,
GROWTH, AND CONDITION .......................................................................................................5-2
5.5 EVIDENCE OF THERMAL ADAPTATIONS BY FISH POPULATIONS .....................................5-2
5.6 FISH KILLS UNLIKELY TO RESULT...................................................................................5-3
6
REFERENCES CITED ..................................................................................................................6-1
Electronic Filing - Received, Clerk's Office, December 15, 2008
* * * * * PCB 2009-038 * * * * *
Thermal Limits Petition Support Document - Coffeen Power Station
ii
Alden/ASA/12-Mar-08/Rev 0
LIST OF FIGURES
Figure 1-1. Map of Location of Coffeen Power Station ............................................................. 1-4
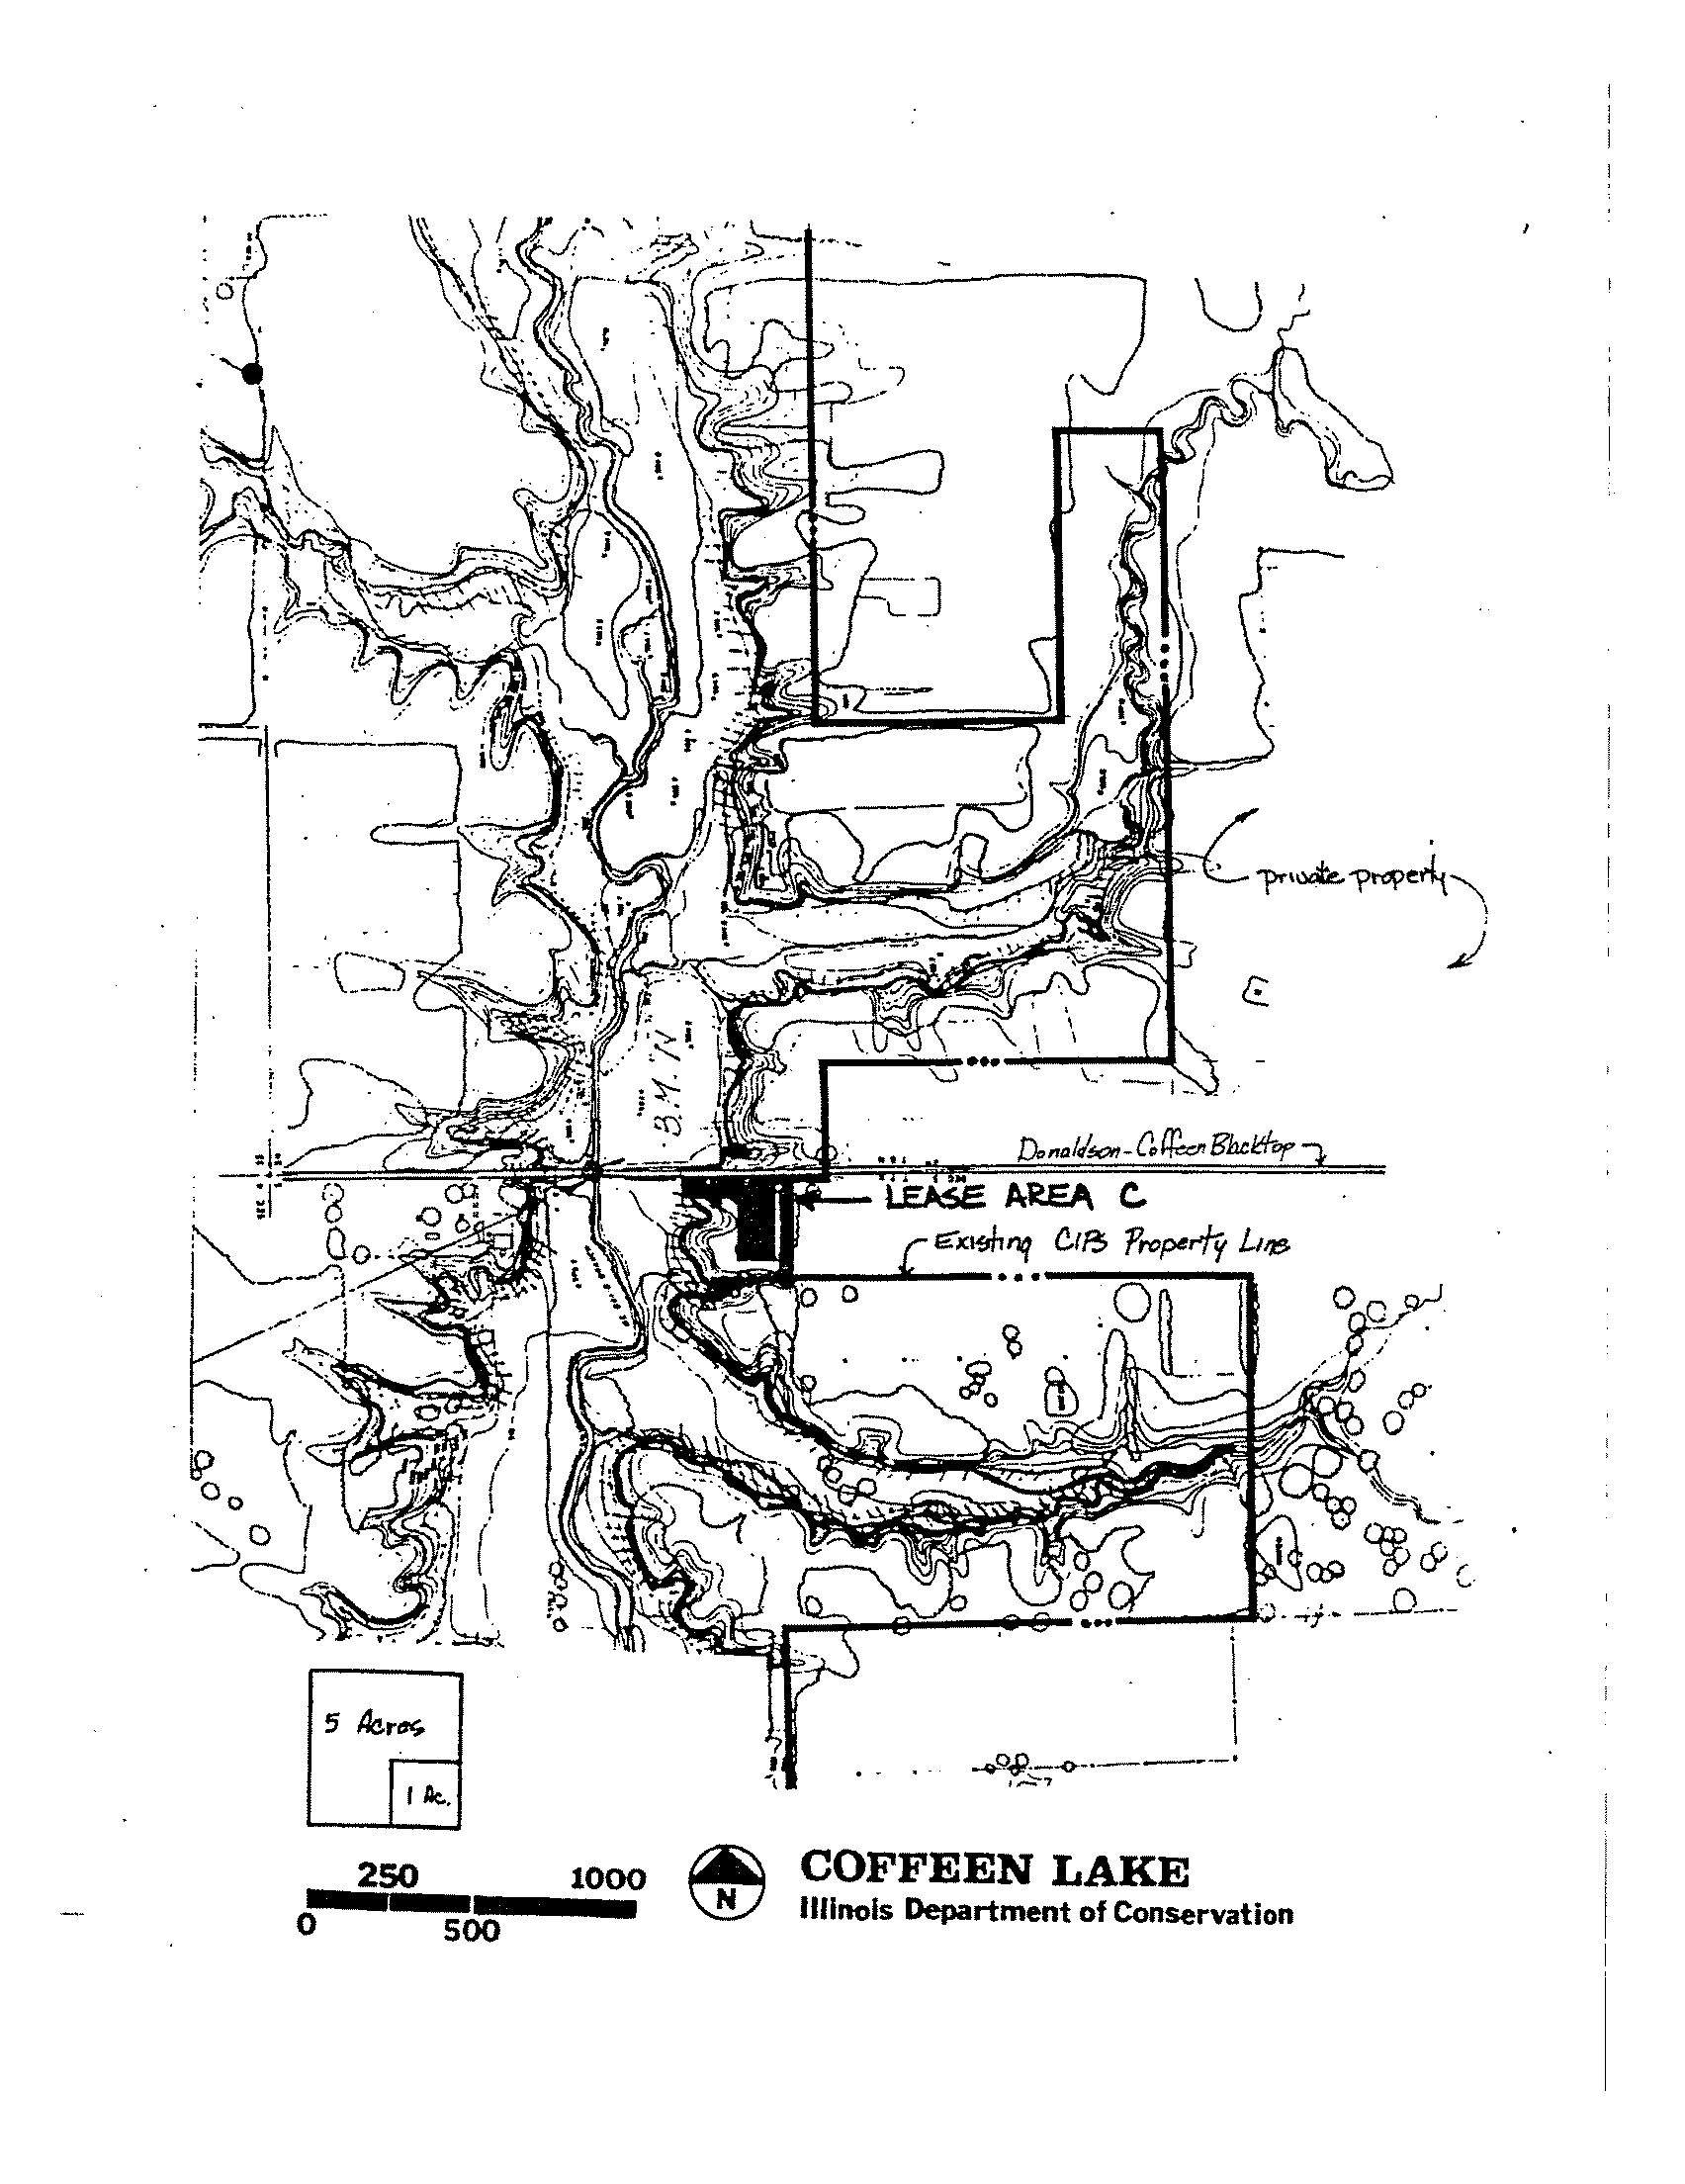
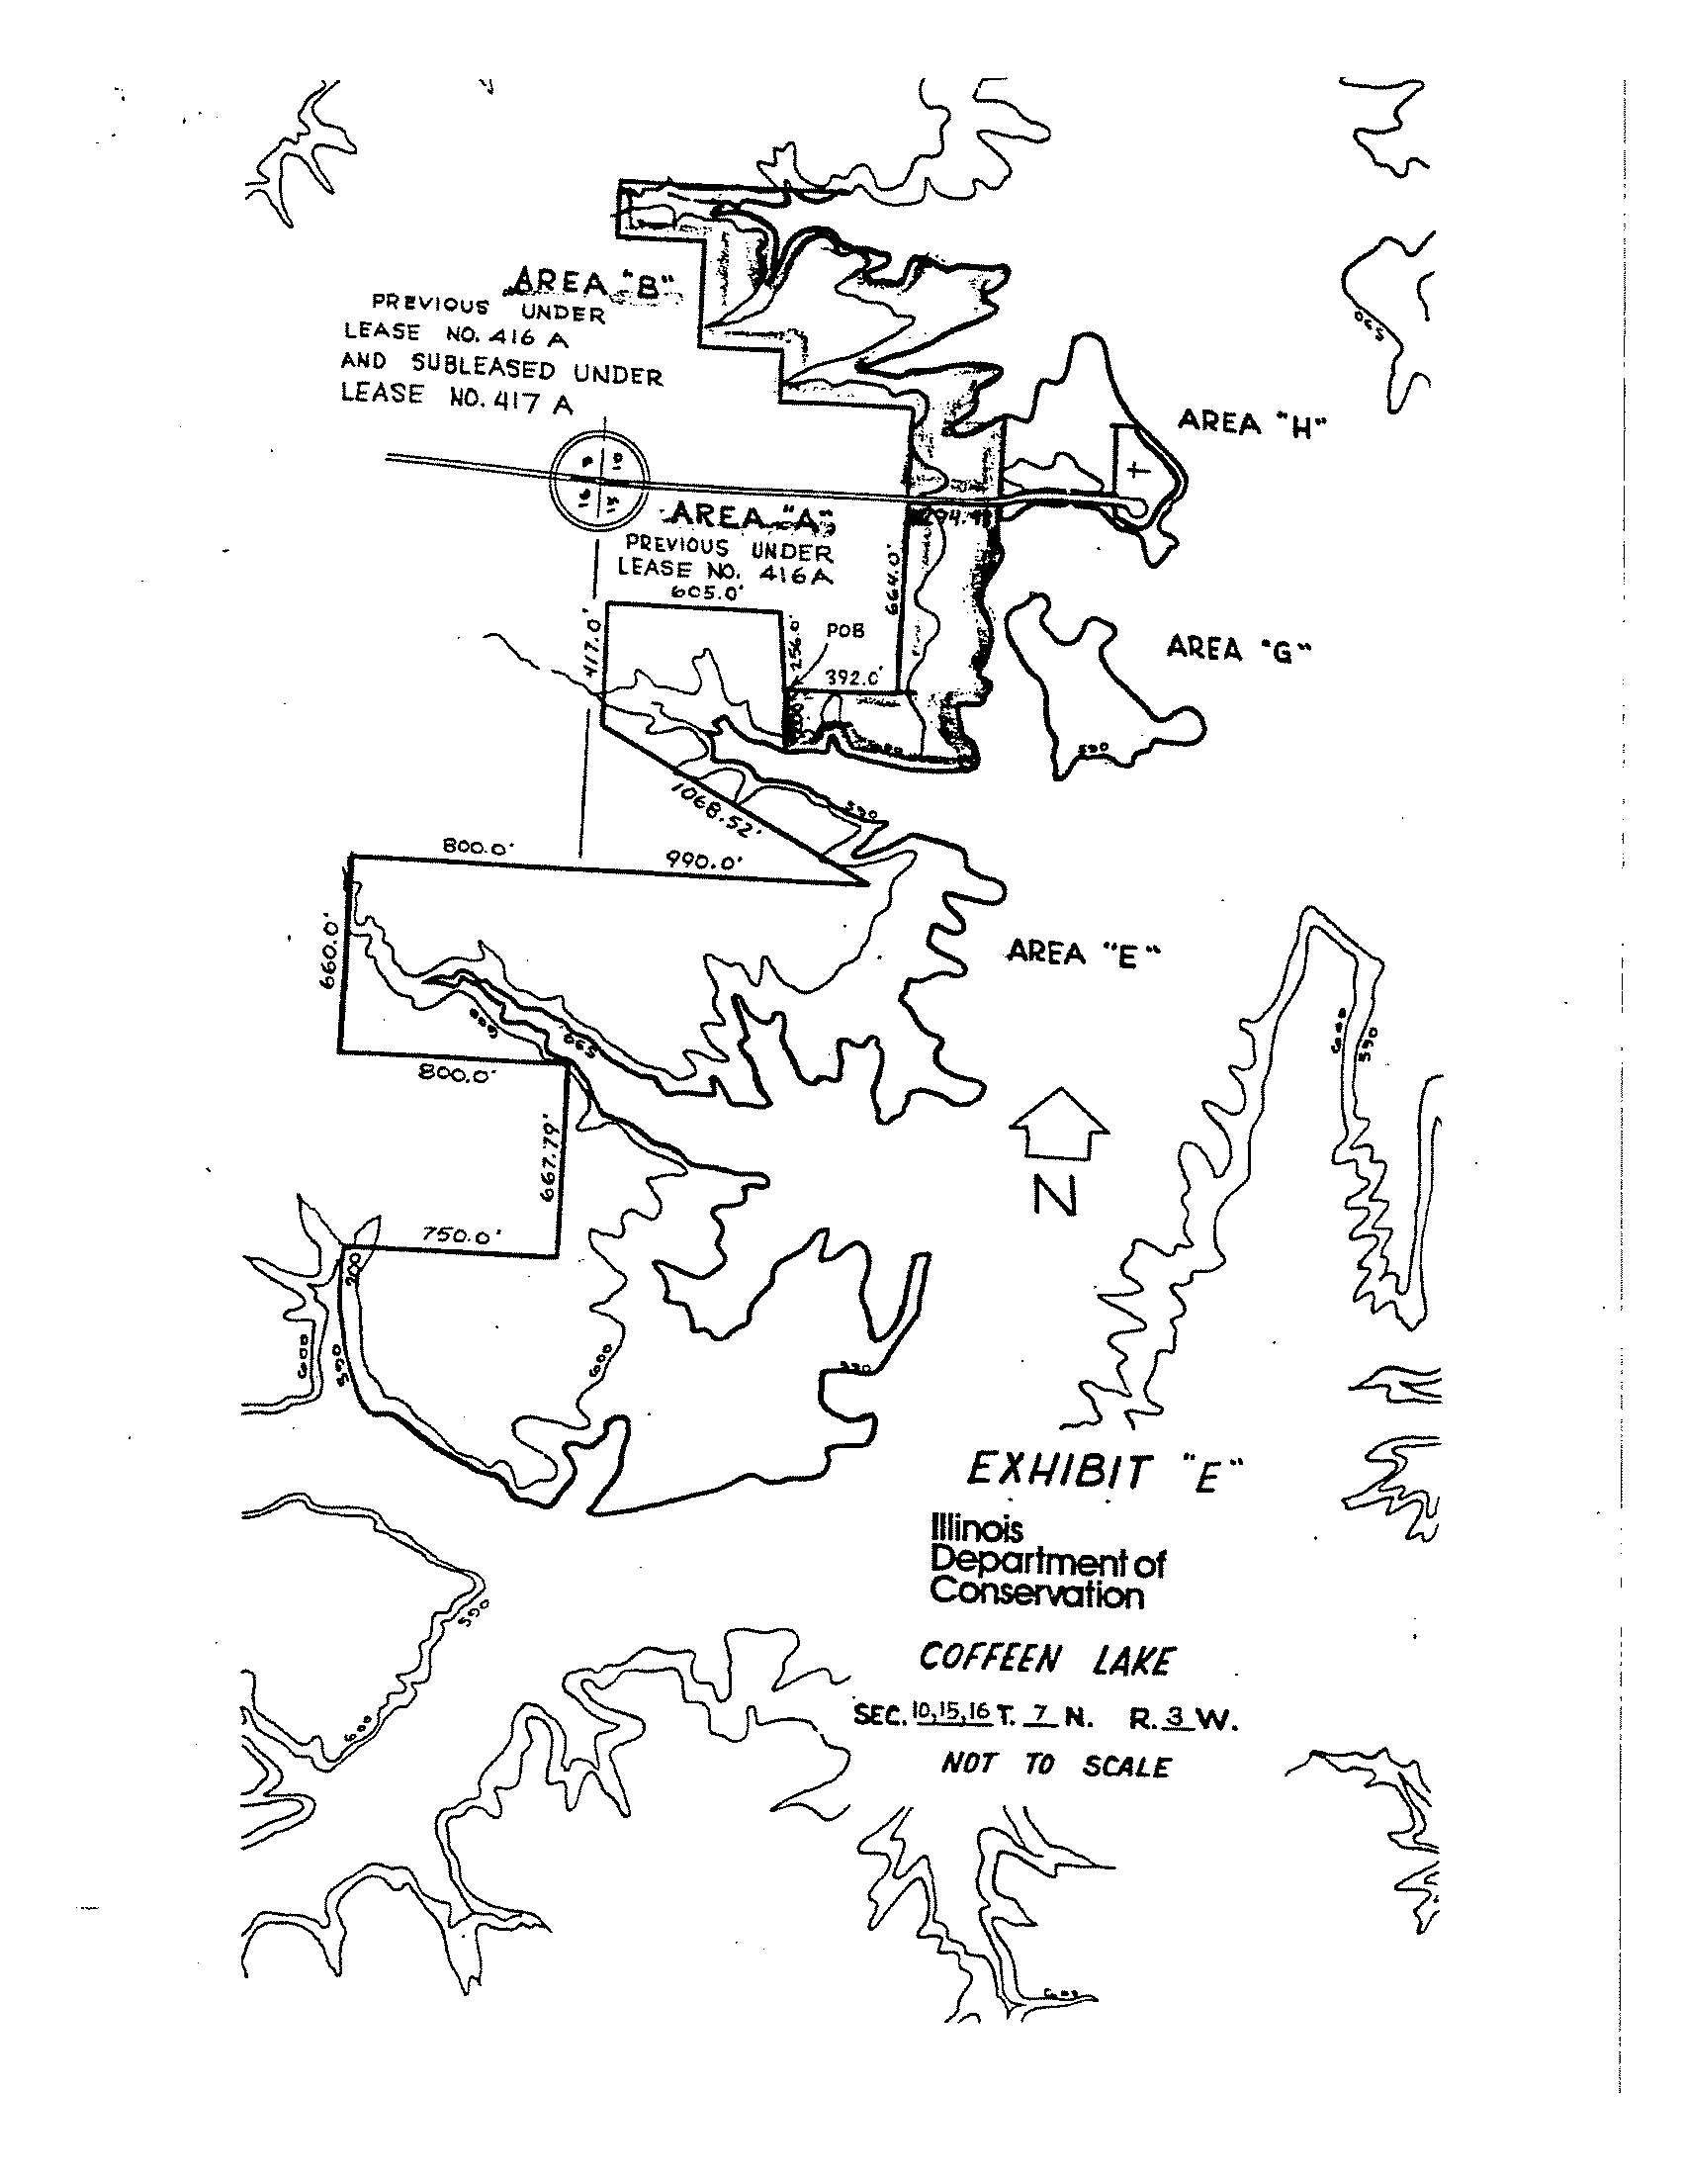
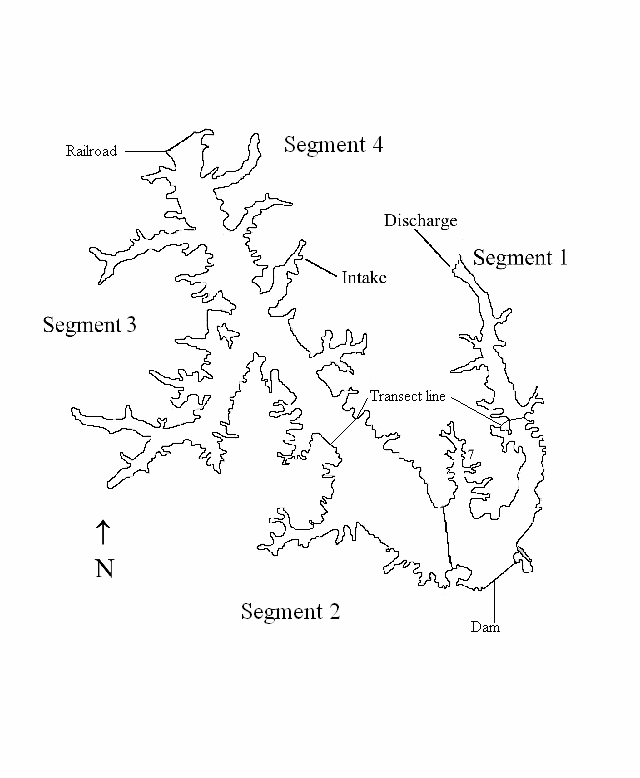
Figure 2-1. Map of Coffeen Lake ............................................................................................... 2-5
Figure 2-2. Coffeen Power Station Thermal Discharge Area Showing the 70-acre Cooling Basin
(Upper Left) and 48-Cell Helper Tower (Right).................................................................. 2-6
Figure 2-3. Mean Hourly Generation Rates (MW/h) for Coffeen Power Station during 1997
through October 2007 .......................................................................................................... 2-7
Figure 2-4. Map of Four Lake Segments Used by SIUC for Sampling Water Temperature and
Dissolved Oxygen Concentrations (from Brooks and Heidinger 2006). Sampling Station
Locations Depicted by Numerals 1-5. ................................................................................. 2-8
Figure 2-5. Daily Average Water Temperatures Measured Near-Surface at the Mixing Zone
Boundary, April 1997 through 11 November 2007 ............................................................. 2-9
Figure 2-6. Mean Monthly Intake Surface Water Temperature as a Function of Mean Monthly
Discharge Temperature Measured Near-Surface at the Boundary of the Mixing Zone, Based
on May-October, 2004-2007.............................................................................................. 2-10
Figure 2-7. Range of Daily Average Surface Water Temperatures at the Coffeen Power Station
Intake, 2004-2007 .............................................................................................................. 2-11
Figure 2-8. Range of Daily Average Near-Surface Water Temperatures at the Mixing Zone
Boundary during 1997-2007 Relative to 96
o
F ................................................................... 2-12
Figure 2-9. Range of Daily Maximum Near-Surface Water Temperatures at the Mixing Zone
Boundary during 1997-2007 Relative to 102
o
F ................................................................. 2-13
Figure 2-10. Hourly Near-Surface Water Temperatures at the Intake and Mixing Zone
Boundary, 12-31 May 2007 ............................................................................................... 2-14
Figure 2-11. Hourly Near-Surface Water Temperatures at the Intake and Mixing Zone
Boundary, 1-31 July 2007.................................................................................................. 2-15
Figure 2-12. Hourly Near-Surface Water Temperatures at the Intake and Mixing Zone
Boundary, 1-31 October 2007............................................................................................ 2-16
Figure 2-13. Vertical Profiles of Water Temperature on 4 May,25 May, and 28 September 2006
and 17 October 2000.......................................................................................................... 2-17
Figure 2-14. Vertical Profiles of Dissolved Oxygen (DO) on 2 May, 25 May, and 28 September
2006 and 17 October 2000................................................................................................. 2-18
Figure 2-15. Regression of Accumulated Degree-Days at the Mixing Zone Boundary
(Discharge) vs. at the Coffeen Intake (Inlet) for May-October of 2004-2007................... 2-19
Figure 2-16. Degree-Days Accumulated Monthly at the Mixing Zone Boundary during May-
October, 1997-2007 ........................................................................................................... 2-20
Figure 2-17. Plot of Total Degree-Days Accumulated during May and during the Subsequent
June-October, 1997-2007................................................................................................... 2-21
Figure 2-18. Regression of Accumulated Degree-Days at the Mixing Zone Boundary in October
vs. during the Previous May-September, 1997-2007......................................................... 2-22
Figure 3-1. Life Stage Presence by Month for Three Fish Species in the Discharge Arm of
Coffeen Lake...................................................................................................................... 3-12
Figure 3-2. Life Stage Presence by Month for Three Fish Species in the Intake Arm of Coffeen
Lake.................................................................................................................................... 3-13
Figure 3-3. Plot of Total Degree-Days during May-August vs. Two Indices (SIUC and IDNR) of
Mean Catch-per-Hour of Young-of-Year Largemouth Bass during the Fall, 1997-2004 . 3-14
Electronic Filing - Received, Clerk's Office, December 15, 2008
* * * * * PCB 2009-038 * * * * *
Thermal Limits Petition Support Document - Coffeen Power Station
iii
Alden/ASA/12-Mar-08/Rev 0
Figure 3-4. Plot of Total Degree-Days during May-August vs. Mean Total Length of Young-of-
Year Largemouth Bass during the Fall, 1997-2004........................................................... 3-15
Figure 3-5. Plot of Total Degree-Days during April-June vs. Mean Total Length of Young-of-
Year Largemouth Bass during the Fall, 1997-2004........................................................... 3-16
Figure 3-6. Plot of Total Degree-Days during May-August of First Year of Life vs. Mean Total
Length of Age-1 Largemouth Bass, 1999-2003 ................................................................ 3-17
Figure 3-7. Plot of Total Degree-Days during May-August vs. Two Indices (SIUC and IDNR) of
Mean Relative Weight for Juvenile and Adult Largemouth Bass during the Fall, 1997-2004
............................................................................................................................................ 3-18
Figure 3-8. Plot of Total Degree-Days during May-August of First Year of Life vs. Mean Total
Length of Age-1 Bluegill, 1999-2003................................................................................ 3-19
Figure 3-9. Plot of Total Degree-Days during May-August vs. Two Indices (SIUC and IDNR) of
Mean Relative Weight for Juvenile and Adult Bluegill during the Fall, 1997-2004......... 3-20
Figure 3-10. Plot of Total Degree-Days during May-August vs. Two Indices (SIUC and IDNR)
of Mean Relative Weight for Juvenile and Adult Channel Catfish during the Fall, 1997-
2004.................................................................................................................................... 3-21
Figure 3-11. Regression of Accumulated Degree-Days at the Mixing Zone Boundary during
May-August vs. IDNR Mean Catch-per-Hour of Juvenile and Adult Bluegill, 1997-2004.. 3-
22
Figure 3-12. Mean Daily Near-Surface Water Temperature at the Mixing Zone Boundary, April-
October 1999 and Dates of Observed Fish Kills as Indicated by Arrows (Number of Fish
Recovered Shown Above Arrows) .................................................................................... 3-23
Figure 3-13. Mean Daily Near-Surface Water Temperature at the Mixing Zone Boundary, April-
October 2000 and Dates of Observed Fish Kills as Indicated by Arrows (Number of Fish
Recovered Shown Above Arrows) .................................................................................... 3-24
Figure 3-14. Mean Daily Near-Surface Water Temperature at the Mixing Zone Boundary, April-
October 2001 and Dates of Observed Fish Kills as Indicated by Arrows (Number of Fish
Recovered Shown Above Arrows) .................................................................................... 3-25
Figure 3-15. Mean Daily Near-Surface Water Temperature at the Mixing Zone Boundary, April-
October 2002 and Dates of Observed Fish Kills as Indicated by Box (Number of Fish
Recovered Shown Above Box).......................................................................................... 3-26
Figure 4-1. Cumulative Frequency of Predicted Water Temperatures at Three Locations in
Coffeen Lake under Existing and Proposed Temperature Limits during May using 1987
Meteorological Conditions................................................................................................... 4-4
Figure 4-2. Cumulative Frequency of Predicted Water Temperatures at Three Locations in
Coffeen Lake under Existing and Proposed Temperature Limits during October using 1987
Meteorological Conditions................................................................................................... 4-5
Figure 4-3. Predicted Temperature Increases under Proposed Thermal Permit Limits as a
Function of Distance from the Edge of the Mixing Zone in Coffeen Lake using 1987
Meteorological Conditions................................................................................................... 4-6
Figure 4-4. Predicted Mean Daily Near-Surface Water Temperatures at the Mixing Zone
Boundary under Current and Proposed Thermal Standards for May and October using 1987
Meteorological Conditions................................................................................................... 4-7
Electronic Filing - Received, Clerk's Office, December 15, 2008
* * * * * PCB 2009-038 * * * * *
Thermal Limits Petition Support Document - Coffeen Power Station
iv
Alden/ASA/12-Mar-08/Rev 0
LIST OF TABLES
Table 2-1. Monthly Mean Cooling Water Flow Rate and Percentage of Maximum Design
Generation and Flow Rate at Coffeen, 2002-2006 ............................................................ 2-23
Table 2-2. Total Degree-Days Accumulated at the Mixing Zone Boundary during May and
June-October 1997-2007 and Their Annual Rankings ...................................................... 2-24
Table 3-1. Statistical Results of Regression Analysis of Coffeen Lake Fish Population
Parameters on Degree-Days during May-August .............................................................. 3-27
Table 3-2. Mean Total Length of Young-of-Year Largemouth Bass in Northern and Central
Illinois Reservoirs .............................................................................................................. 3-28
Table 3-3. Mean Backcalculated Length (mm TL) at Age for Largemouth Bass Populations
from Coffeen and Newton lakes and from 24 States* ....................................................... 3-29
Table 3-4. Mean Total Length (mm) at Age for Bluegill at Various Locations....................... 3-30
Table 3-5. Mean Total Length (mm) at Age for Channel Catfish in Selected Lakes, Rivers, and
Reservoirs .......................................................................................................................... 3-31
Table 3-6. Mean Standing Crop Estimates (kg/ha) of Fish Species from Three Illinois Reservoirs
and Other U.S. Reservoirs (adapted from Perry and Tranquilli 1981)* ............................ 3-32
Table 3-7. IDNR and SIUC Electrofishing Indices of Relative Abundance (Catch-per-Hour) of
Juvenile and Adult Largemouth Bass, Bluegill, and Channel Catfish in Coffeen Lake, 1997-
2004.................................................................................................................................... 3-32
Table 4-1. Upper Thermal Tolerance Limits and Optimal Temperatures by Fish Species and Life
Stage (Literature Sources in Appendix A)........................................................................... 4-8
Electronic Filing - Received, Clerk's Office, December 15, 2008
* * * * * PCB 2009-038 * * * * *
Thermal Limits Petition Support Document - Coffeen Power Station
1 INTRODUCTION
1.1
Report Purpose
This report provides an evaluation of the potential for adverse ecological impacts from proposed
modifications to current site-specific thermal standards in Coffeen Lake for the months of May
and October. Coffeen Lake is a 1,100-acre reservoir constructed as the source for steam
condenser cooling water for the 945-MW Coffeen Power Station (Coffeen or the "Station"),
located in Montgomery County in central Illinois, approximately 1 mile south of the city of
Coffeen, Illinois and 50 miles northeast of St. Louis, Missouri (Figure 1-1).
Current thermal standards for Coffeen Lake specify that the months of May and October fall
within an 8-month “winter” period extending from October through May. During this 8-month
period, thermal discharges from Coffeen Power Station may not result in water temperatures that
exceed:
•
89
o
F as a monthly average, or
•
94
o
F as a maximum for greater than 2 percent of the hours during that period,
as measured at the boundary of a 26-acre mixing zone.
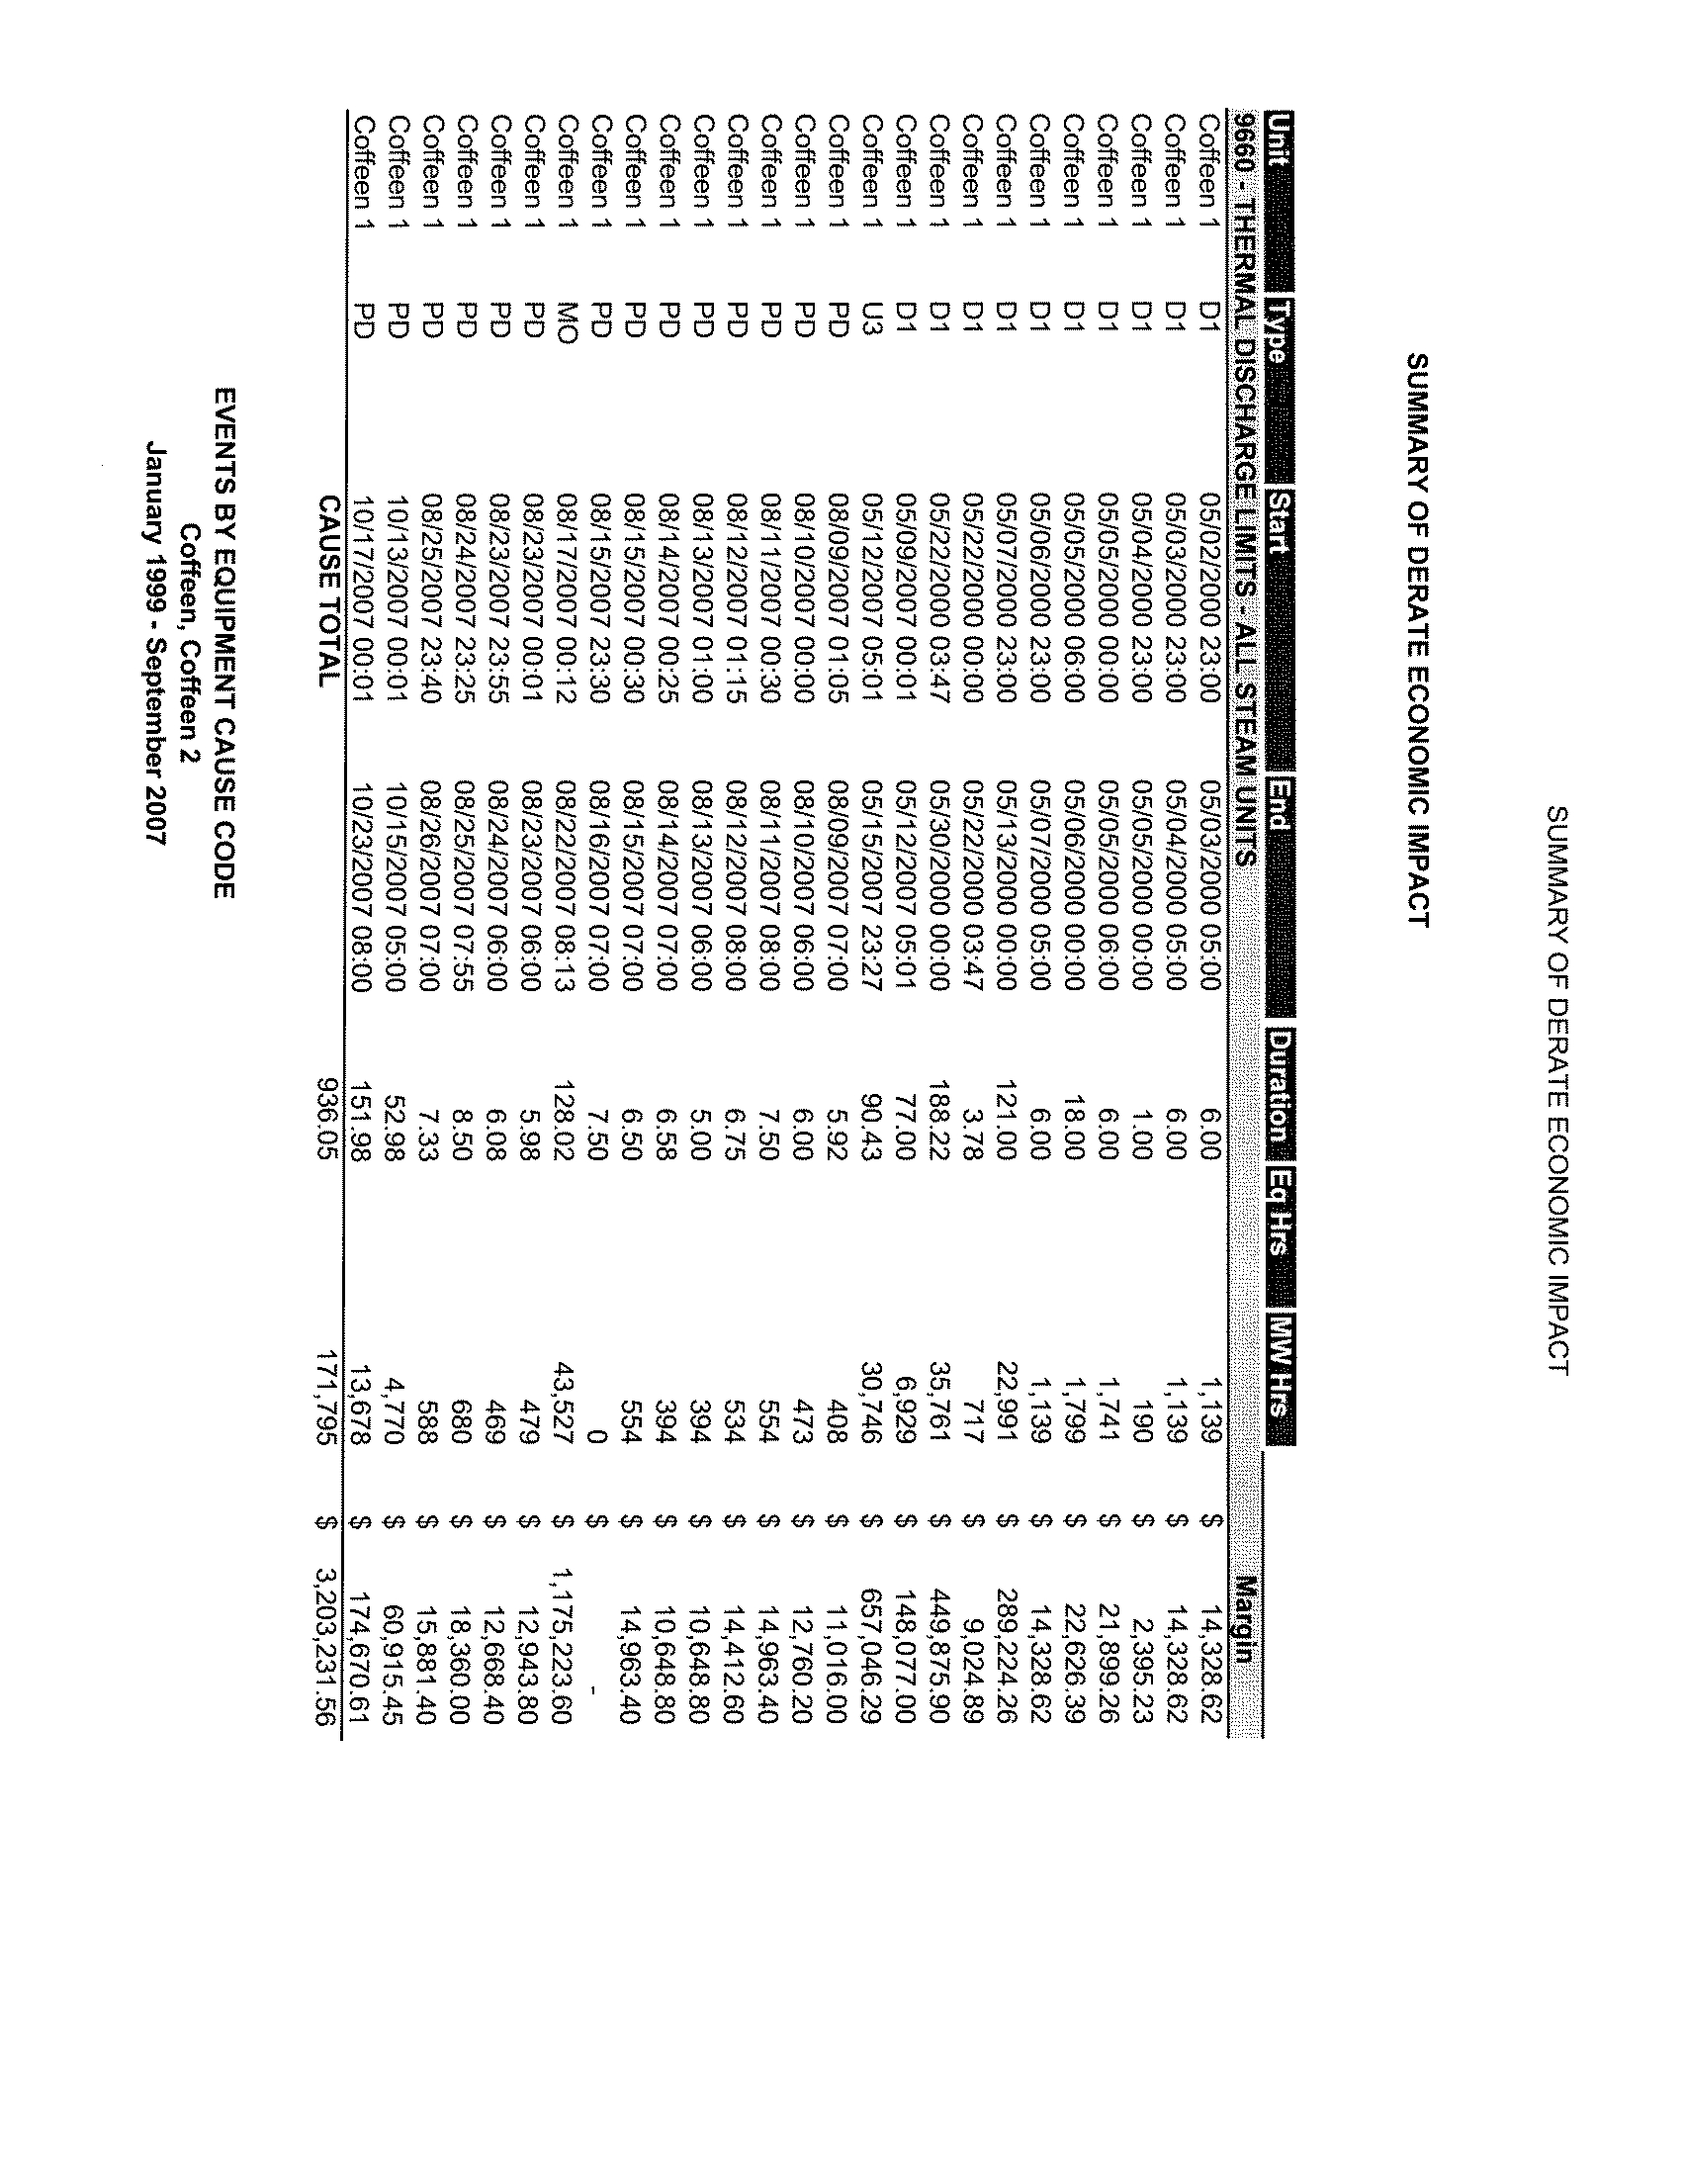
Abnormally warm temperatures and low precipitation in recent years have resulted in instances,
particularly during late May and early October, when Coffeen Power Station has had to reduce
electric generation (derate) in order to comply with the above thermal standards. The existing
limits of 89
o
F and 94
o
F were not established on the basis of definitive thermal requirements for
the aquatic community and fish populations of Coffeen Lake during these two months. Rather,
they were set as assurance that thermal limits set for the “summer” months of June through
September (105
o
F mean or 112
o
F maximum for greater than 3 percent of the hours) were not
applied year-round.
This report shows that the existing thermal standards for the months of May and October are
unnecessarily strict, as demonstrated by the results of extensive research conducted on the
aquatic community, particularly the sport fish populations, of Coffeen Lake. The petitioner,
Ameren Energy Generating Company (Ameren), proposes relief in the form of the following
revised standards for the months of May and October:
•
96
o
F as a monthly average, and
•
102
o
F as a maximum for more than 2 percent of the hours during that period.
This report presents an overview of the evidence supporting the conclusion that raising the
thermal limits for the months of May and October presents minimal additional risk to fish
populations in the lake.
INTRODUCTION
ASA/12-Mar-08/Rev 0
1-1
Electronic Filing - Received, Clerk's Office, December 15, 2008
* * * * * PCB 2009-038 * * * * *
Thermal Limits Petition Support Document - Coffeen Power Station
1.2
Regulatory Background
On 21 February 1997 Central Illinois Public Service Company (CIPS) petitioned the Illinois
Pollution Control Board (Board) for a five-year variance from existing site-specific thermal
standards for Coffeen Lake. The petition requested that the months of May and October be
placed under the existing summer standards of 105
o
F monthly mean and 112
o
F maximum, while
leaving June-September under the summer standards and November-April under the winter
standards of 89
o
F monthly mean and 94
o
F maximum. The need for a variance became apparent
when Coffeen converted from a 12-month maintenance schedule to an 18-month schedule in
order to reduce ratepayers' costs. Under the previous 12-month schedule, maintenance for Units
1 and 2 occurred during unit outages in May and October (one unit per month), resulting in a
much reduced heat loading to Coffeen Lake during these two months. Under the 18-month
maintenance schedule, such reductions in heat loading are no longer realized for May and
October.
The variance was granted by the Board on 5 June 1997 for the five-year period from that date to
5 June 2002. As a condition of the variance, CIPS (now Ameren) was required to submit a
monitoring plan to the Illinois Environmental Protection Agency (IEPA) to study, along with the
Illinois Department of Natural Resources (IDNR), the thermal effects of the Coffeen discharge
on the fishery of Coffeen Lake. Another condition of the variance was that the thermal standards
could revert to their original levels if IEPA or IDNR determined that the variance resulted in
adverse impact to the lake, such as a fish kill. This plan was accepted and the studies were
conducted for Ameren during 1997-2005 by Southern Illinois University-Carbondale (SIUC).
Coffeen was operated under the five-year variance granted in June 1997 until a fish kill occurred
during July 1999, when water temperatures reached atypically high levels and dissolved oxygen
(DO) concentrations were minimal over a period of prolonged calm, cloudy weather. As the
result of this fish kill, the variance was suspended and the thermal standards for May and
October reverted to the previous winter limits (89
o
F and 94
o
F). The variance was suspended
without evidence of a relationship between May and October water temperatures and the
conditions experienced during July 1999. Coffeen continues to operate under these site-specific
standards. In addition to relying on operational constraints in order to comply with the thermal
standards, in recent years Coffeen has installed and employed a 70-acre cooling basin and a 48-
cell helper cooling tower structure to reduce effluent temperatures prior to discharge to Coffeen
Lake.
1.3
Report Organization
In this report, the effects of May and October water temperatures on the fish populations of
Coffeen Lake are evaluated using two types of assessments: (1) a “retrospective” assessment that
examines biological data collected during the 1997-2004 SIUC studies to evaluate whether the
thermal environment of Coffeen Lake is adversely affecting populations of three key recreational
fish species—largemouth bass, bluegill, and channel catfish; and (2) a “prospective” assessment
that predicts how the lake’s thermal environment during May and October might be altered under
the proposed revised standards and how fish might adapt to these changes..
A brief description of the design and operation of the Coffeen Power Station is provided in
Section 2, along with a general description of the thermal environment in the lake, with emphasis
INTRODUCTION
ASA/12-Mar-08/Rev 0
1-2
Electronic Filing - Received, Clerk's Office, December 15, 2008
* * * * * PCB 2009-038 * * * * *
Thermal Limits Petition Support Document - Coffeen Power Station
on conditions during the months of May and October. The potential for higher water
temperatures during May to affect subsequent summer temperatures is evaluated using data from
1997 to 2007. The relationship between summer temperatures and subsequent October
temperatures also is examined.
The retrospective assessment presented in Section 3 applies the results of the SIUC studies on
the status of the lake’s largemouth bass, bluegill, and channel catfish populations to evaluate how
the populations have adapted to the recent thermal environment in the lake. In many respects, a
retrospective assessment provides the strongest evidence of the effects of existing and proposed
thermal standards in that it integrates all aspects of the thermal environment on the life cycle for
the fish species and the various trophic levels in the lake, expressed at the uppermost consumer
levels. Section 3 also assesses the risk of a fish kill resulting from higher water temperatures
during May and October. Temperature and DO conditions during previous fish kills on Coffeen
Lake are examined and related to conditions likely to occur under the proposed May and October
thermal limits.
The prospective assessment presented in Section 4 predicts how the lake’s thermal environment
during May and October might be altered under the proposed revised standards under conditions
of warmer than average ambient temperatures, and maximum station generation and heat
loading. Thermal tolerances and requirements of the three key recreational species in Coffeen
Lake (largemouth bass, bluegill, and channel catfish) are presented for the life stages likely to
occur during these two months.
Finally, Section 5 summarizes and integrates the multiple lines of investigation presented in the
previous sections in order to characterize the actual risk for adverse impact occurring from
revisions to the thermal standards for May and October.
INTRODUCTION
ASA/12-Mar-08/Rev 0
1-3
Electronic Filing - Received, Clerk's Office, December 15, 2008
* * * * * PCB 2009-038 * * * * *
Thermal Limits Petition Support Document - Coffeen Power Station
Figure 1-1. Map of Location of Coffeen Power Station
INTRODUCTION
ASA/12-Mar-08/Rev 0
1-4
Electronic Filing - Received, Clerk's Office, December 15, 2008
* * * * * PCB 2009-038 * * * * *
Thermal Limits Petition Support Document - Coffeen Power Station
2 STATION OPERATIONS AND THERMAL HISTORY
2.1
Station and Lake Descriptions
Coffeen Power Station consists of two coal generating units. Unit 1 has a generating capacity of
350 MW (gross) and began commercial operation in 1965. Unit 2 has a generating capacity of
595 MW (gross) and began commercial operation in 1972. Both units use once-through
condenser cooling and draw cooling water from Coffeen Lake. At the total design capacity of
945 MW, a maximum of 4,357 million BTU/h of waste heat is generated by the station. After
passing through steam condensers, the cooling water is discharged to the eastern arm of Coffeen
Lake (Figure 2-1) through a 17-ft diameter pipe which empties into an open 0.6-mile long flume.
A 70-acre supplemental cooling basin was installed in the spring of 2000, and a 48-cell industrial
helper tower structure was installed in the spring of 2002 (Figure 2-2). The cooling basin and
helper towers are located downstream of a “drop structure” (modified during Spring 2000) at the
terminus of the discharge canal and upstream of a permitted 26-acre mixing zone in Coffeen
Lake. Together, the cooling basin and helpers towers condition the cooling water discharge
temperature, as necessary, to meet the permitted mixing zone temperatures. When operating
simultaneously, the cooling basin and helper towers can draw up to 90 percent of the maximum
plant discharge flow.
Coffeen Lake was created in 1963 by impounding the flow of McDavid Branch of the East Fork
Shoal Creek and by pumping water from East Fork Shoal Creek downstream of the dam
spillway. The spillway crest elevation is at 590 ft elevation. The gross surface area and volume
of Coffeen Lake are 1,100 acres and 16,650 acre-ft, respectively. Currently the effective surface
area and volume are 560 acres and 12,200 acre-ft. The drainage area is approximately 17.2
square miles. When it was created, the maximum depth was 52 to 58 ft and the average depth
was 18.3 ft. The lake was originally designed to provide cooling capacity sufficient for a 1000-
MW facility with a 70 percent capacity factor.
The station’s cooling water intake structure is located at the end of a cove near the midpoint of
the western arm of Coffeen Lake (Figure 2-1). Water depth at the intake originally was 40 ft.
The configuration of the intake and discharge on the lake’s two arms causes water to flow in a
clockwise direction from the eastern arm to the western arm of the lake over a distance of
approximately 4.1 miles.
2.2
Station Operations and Monitoring
During 2002 through 2006, the average annual net generation from the Station was 66 percent of
its design capacity (Table 2-1). Since 1997, annual mean hourly generation rates have increased
from 460 gross MW/h to 709 MW/h in 2006 and 689 gross MW/h in January-October 2007
(Figure 2-3). Hourly generation rates specifically for the 6-month interval from May through
October followed a similar pattern of increase, from 388 gross MW/h in 1997 to 772 gross
MW/h in 2007. The biggest increase for both the annual and May-October rates occurred
between 2001 and 2002 (Figure 2-3). After 2001, the annual mean generation has fluctuated
between 56 percent and 74 percent of maximum design capacity (Table 2-1).
STATION OPERATIONS AND THERMAL HISTORY
ASA/12-Mar-08/Rev 0
2-1
Electronic Filing - Received, Clerk's Office, December 15, 2008
* * * * * PCB 2009-038 * * * * *
Thermal Limits Petition Support Document - Coffeen Power Station
Water temperatures are routinely monitored at seven locations in the cooling loop: the
downstream end of the discharge flume; the cooling pond inlet, midpoint, and outlet; the outer
edge of the mixing zone (includes a primary temperature probe and a back-up probe); the dam;
and the intake. The temperature probe at the edge of the mixing zone, where compliance with
thermal standards is determined, is on an anchored buoy at a depth approximately 28 in. below
the water surface. Temperature is recorded every 5 minutes.
From 1997 through 2006, Southern Illinois University-Carbondale (SIUC) monitored water
temperatures and dissolved oxygen (DO) concentrations at various depths in Coffeen Lake
(Heidinger et al. 2000, 2001, 2002; Brooks 2004, 2005; Brooks and Heidinger 2006, 2007).
Temperature and DO measurements were made at weekly intervals from May or June through
September or October annually during this period. Measurements were taken at four locations
and at 0.5-m intervals from water surface to within 0.5 m of the lake bottom. The sampling
locations and sampling time interval (afternoon) were repeated every year for consistency and to
facilitate yearly comparisons. The four locations consisted of a station near the midpoint of each
of four segments of the lake (Figure 2-4). Data from these surveys provided information on the
thermal and DO stratification of the lake.
SIUC also used temperature loggers programmed to measure water temperatures every 2 minutes
at 1.5-m depth intervals (surface, 1.5 m, 3.0 m, and 4.5 m) in the mixing zone, near the dam, near
the intake, and recently on an IDNR buoy near the railroad bridge in the upper portion of the
western arm of the lake (Figure 2-4).
2.3
Temperature and Dissolved Oxygen in Coffeen Lake
Mean daily water temperature during 1997 to 2007, as measured near the surface (28-inch depth)
at the edge of the thermal mixing zone in the eastern arm of Coffeen Lake, has followed a
regular seasonal pattern, occasionally exceeding 100
o
F during July or August and reaching lows
of approximately 44-55
o
F in January (Figure 2-5). Temperatures at the mixing zone boundary
represent the warmest temperatures to which fish and other organisms would be exposed, other
than within the mixing zone itself. For example, mean monthly surface temperatures recorded at
the intake in the western arm of the lake during May through October 2004-2007 were
consistently 10
o
F to 15
o
F lower than at the mixing zone boundary, as shown by Figure 2-6. This
relationship between the discharge and intake temperatures was statistically significant
(P<0.001).
There can be considerable year-to-year variation in water temperatures in Coffeen Lake. In
Figure 2-7, the maximum, mean, and minimum values for average daily temperatures recorded
during 2004-2007 near the surface at the intake are plotted for each calendar date. Winter
temperatures (December-March) show the greatest variation, with a single date’s temperature
ranging as much as 25
o
F among the four years. From 2004 through mid-November 2007, the
warmest daily mean temperature recorded at the intake surface was 97
o
F and the coldest was
41
o
F (Figure 2-7).
Since 1997, daily average water temperatures at the edge of the mixing zone in May and October
rarely have exceeded 96
o
F (Figure 2-8), and maximum temperatures have not exceeded 102
o
F
(Figure 2-9). Typically, daily average temperatures in these months have been 80-90
o
F and
maximum temperatures have been in the 90s.
STATION OPERATIONS AND THERMAL HISTORY
ASA/12-Mar-08/Rev 0
2-2
Electronic Filing - Received, Clerk's Office, December 15, 2008
* * * * * PCB 2009-038 * * * * *
Thermal Limits Petition Support Document - Coffeen Power Station
2.3.1. Diel Cycles
Often a diel cycle is apparent in the water temperatures recorded in the mixing zone and at the
intake. Data from May, July, and October 2007 are used as an example. Near-surface water
temperatures recorded hourly at the edge of the mixing zone were in the mid to upper 80s (
o
F)
during 12-15 May and a diel cycle was evident, with lowest temperatures occurring just before
noon and the warmest temperatures (up to 3-4
o
F higher) occurring in late afternoon to early
evening (Figure 2-10). During this time, a similar diel cycle was observed at the intake where
water temperatures were in the lower 80s, but the difference between the maximum and
minimum hourly records during each day was less (1-3
o
F). The diel cycle at both locations was
masked somewhat as water temperatures declined during 16-17 May and increased during 22-25
May. After 22 May, temperatures increased more rapidly in the mixing zone than at the intake,
resulting in temperatures at the intake being 7 to 14
o
F less than at the mixing zone boundary.
In July 2007, when water temperatures were near the warmest for the year, diel cycles were
strongly expressed at both the mixing zone and the intake (Figure 2-11). For example, hourly
temperatures in the mixing zone on 16 July and 25 July increased approximately 9
o
F during the
24-hour period, and diel temperature increases of approximately 4
o
F were typical on other dates.
Intake temperatures cycled daily in a similar pattern but with temperatures ranging only 2-3
o
F
during the day. Intake temperatures were approximately 9
o
F to 14
o
F less at the intake than at the
mixing zone.
In October 2007 water temperatures declined steadily at the intake from the upper 80s to the
lower 70s, while temperatures at the mixing zone boundary declined from the mid and upper 90s
to the lower 80s (Figure 2-12). As temperatures declined, diel cycles became less pronounced,
especially at the intake.
2.3.2. Vertical Stratification
Recent vertical profiles of water temperature and DO concentrations are available from the
weekly surveys conducted by SIUC during 2006 for the four segments of Coffeen Lake shown in
Figure 2-4. Of greatest interest is the vertical distribution of temperatures and DO during the
months of May and October. In 2006, Coffeen Lake had become thermally stratified by 4 May
(Figure 2-13). On this date, epilimnetic temperatures were in the mid 80s (
o
F) in Segment 1 (the
eastern arm near the thermal discharge) and the upper 70s in Segment 2 (the lower half of the
western arm of the lake), with a difference in surface temperatures of approximately 8
o
F. Below
the thermocline depth (approximately 9 ft in Segment 1 and 16 ft in Segment 2), temperatures
declined to 68
o
F in Segment 1 and 60
o
F in Segment 2 at the lake bottom (Figure 2-13). As the
month progressed, temperatures gradually rose and the thermocline dropped to lower depths but
remained most pronounced in Segment 1 (see 25 May in Figure 2-13). Near-bottom depths in
Segments 1 and 2 were anaerobic or nearly so, but DO concentrations remained 4 mg/L or higher
at other depths within the hypolimnion and in Segments 3 and 4 (Figure 2-14).
This pattern of stratification in the deeper lake segments (1 and 2) and less pronounced thermal
stratification in the shallower segments (3 and 4) continued throughout the summer months,
while hypolimnetic depths became progressively depleted of DO (Brooks and Heidinger 2007).
By 28 September 2006, the thermal stratification had broken down as temperatures cooled and
vertical mixing occurred (Figure 2-13). DO concentrations throughout the water column were 4
STATION OPERATIONS AND THERMAL HISTORY
ASA/12-Mar-08/Rev 0
2-3
Electronic Filing - Received, Clerk's Office, December 15, 2008
* * * * * PCB 2009-038 * * * * *
Thermal Limits Petition Support Document - Coffeen Power Station
STATION OPERATIONS AND THERMAL HISTORY
2-4
ASA/12-Mar-08/Rev 0
mg/L or higher. SIUC did not conduct a survey in October 2006. However, during some years
the water column may remain stratified during October, especially in Segment 1, as shown by
survey results from 17 October 2000 (Figures 2-13 and 2-14).
2.3.3. Cumulative Water Temperatures
Changing meterological conditions and variable heat loadings from the station’s thermal
discharge result in year-to-year differences in the thermal environment of Coffeen Lake. These
annual differences can have biological significance. The concept of degree-days is commonly
used to reflect longer term, cumulative effects of temperatures. Daily mean near-surface water
temperature recorded at the mixing zone boundary were used as an index of the thermal
environment of the lake. Monthly and seasonal degree-days were determined by computing the
difference between mean daily temperatures and 60
o
F (15.6
o
C) and summing these differences
over the desired period of time, i.e., individual month or season (e.g., May-October). A
threshold temperature of 60
o
F was chosen because it represents the minimum temperature for
largemouth bass spawning (Heidinger 1975) and a reasonable, if not conservative, lower limit for
growth. Degree-days accumulated at the mixing zone boundary should be a reliable index of the
thermal environment of much of the lake, as shown by a significant correlation (r
2
=0.9464,
P<0.001) with degree-days accumulated at the intake during May-October 2004-2007 (Figure 2-
15).
Total degree-days are plotted by month (May-October) and year (1997-2007) in Figure 2-16. As
expected, accumulated degree-days were greatest in July and August and least during May and
October. However, there was greater annual variability in total degree-days during the months of
May, June, and September than during July and August.
Based on degree-days, May and June in 1997 and 2001 were especially cool, and May and June
2007 were especially warm. During these three years, the lower or higher temperatures in the
spring tended to carry over throughout the entire 6-month season. In other years, warm May or
June temperatures were followed by relatively cooler July-September temperatures, as in 1998
and 2000. May 1998 was ranked the warmest and May 1997 was ranked the coolest (Table 2-2).
These were two of the three years (1997-1999) when the 1997 thermal variance for May was in
effect.
Using the 1997-2007 data, there are indications that raising water temperatures in the mixing
zone during May via higher thermal standards will not necessarily result in warmer temperatures
throughout the remainder of the season. Simple linear regression analysis indicated there was
not a statistically significant relationship (r
2
=0.1634; P=0.21) between May temperatures
(degree-days) and the degree-days accumulated over the subsequent five months, June-October
(Figure 2-17). Warmer temperatures during May-September, on the other hand, tend to
influence October temperatures, as indicated by a significant positive relationship between
degree-days accumulated during May-September and October degree-days (r
2
=0.8607, P<0.001;
Figure 2-18). This relationship might be expected if it takes longer in October to dissipate heat
loadings from earlier months during the warmest years, e.g., 2004-2007.
Electronic Filing - Received, Clerk's Office, December 15, 2008
* * * * * PCB 2009-038 * * * * *
Thermal Limits Petition Support Document - Coffeen Power Station
Figure 2-1. Map of Coffeen Lake
STATION OPERATIONS AND THERMAL HISTORY
ASA/12-Mar-08/Rev 0
2-5
Electronic Filing - Received, Clerk's Office, December 15, 2008
* * * * * PCB 2009-038 * * * * *
Thermal Limits Petition Support Document - Coffeen Power Station
Figure 2-2. Coffeen Power Station Thermal Discharge Area Showing the 70-acre Cooling Basin (Upper Left) and 48-Cell
Helper Tower (Right)
STATION OPERATIONS AND THERMAL HISTORY
ASA/12-Mar-08/Rev 0
2-6
Electronic Filing - Received, Clerk's Office, December 15, 2008
* * * * * PCB 2009-038 * * * * *
Thermal Limits Petition Support Document - Coffeen Power Station
STATION OPERATIONS AND THERMAL HISTORY
Figure 2-3. Mean Hourly Generation Rates (MW/h) for Coffeen Power Station during 1997 through October 2007
1997 1998 1999 2000 2001 2002 2003 2004 2005 2006 2007
0
100
200
300
400
500
600
700
800
900
1000
Coffeen Plant Ops
Mean MwHr
Year
Annual
May - Oct
ASA/12-Mar-08/Rev 0
2-7
Electronic Filing - Received, Clerk's Office, December 15, 2008
* * * * * PCB 2009-038 * * * * *
Figure 2-4. Map of Four Lake Segments Used by SIUC for Sampling Water Temperature
and Dissolved Oxygen Concentrations (from Brooks and Heidinger 2006).
Sampling Station Locations Depicted by Numerals 1-5.
ASA/12-Mar-08/Rev 0
4
2
1
3
5
Thermal Limits Petition Support Document - Coffeen Power Station
2-8
STATION OPERATIONS AND THERMAL HISTORY
Electronic Filing - Received, Clerk's Office, December 15, 2008
* * * * * PCB 2009-038 * * * * *
Thermal Limits Petition Support Document - Coffeen Power Station
40
50
60
70
80
90
100
110
120
4/23/1997 4/23/1998 4/23/1999 4/23/2000 4/23/2001 4/23/2002 4/23/2003 4/23/2004 4/23/2005 4/23/2006 4/23/2007
Daily Average Temperature (
O
F)
Figure 2-5. Daily Average Water Temperatures Measured Near-Surface at the Mixing Zone Boundary, April 1997 through 11
November 2007
STATION OPERATIONS AND THERMAL HISTORY
ASA/12-Mar-08/Rev 0
2-9
Electronic Filing - Received, Clerk's Office, December 15, 2008
* * * * * PCB 2009-038 * * * * *
Thermal Limits Petition Support Document - Coffeen Power Station
70
75
80
85
90
95
80
85
90
95
100
105
110
Average Discharge Temperature (
O
F)
Average Inlet Temperature (
O
F)
Inlet
Predicted Inlet
y = 0.880477x - 0.20651
r
2
= 0.942327
Figure 2-6. Mean Monthly Intake Surface Water Temperature as a Function of Mean Monthly Discharge Temperature
Measured Near-Surface at the Boundary of the Mixing Zone, Based on May-October, 2004-2007
STATION OPERATIONS AND THERMAL HISTORY
ASA/12-Mar-08/Rev 0
2-10
Electronic Filing - Received, Clerk's Office, December 15, 2008
* * * * * PCB 2009-038 * * * * *
Thermal Limits Petition Support Document - Coffeen Power Station
Jan Feb Mar Apr May Jun Jul Aug Sep Oct Nov Dec
40
50
60
70
80
90
100
110
120
Mean
Maximum
Minimum
Daily Average Intake Temperature (
o
F) (2004-2007)
Figure 2-7. Range of Daily Average Surface Water Temperatures at the Coffeen Power Station Intake, 2004-2007
STATION OPERATIONS AND THERMAL HISTORY
ASA/12-Mar-08/Rev 0
2-11
Electronic Filing - Received, Clerk's Office, December 15, 2008
* * * * * PCB 2009-038 * * * * *
Thermal Limits Petition Support Document - Coffeen Power Station
Jan Feb Mar Apr May Jun Jul Aug Sep Oct Nov Dec
40
50
60
70
80
90
100
110
120
Mean
Maximum
Minimum
Daily Average Temperature (
o
F) (1997-2007)
Figure 2-8. Range of Daily Average Near-Surface Water Temperatures at the Mixing Zone Boundary during 1997-2007
Relative to 96
o
F
STATION OPERATIONS AND THERMAL HISTORY
ASA/12-Mar-08/Rev 0
2-12
Electronic Filing - Received, Clerk's Office, December 15, 2008
* * * * * PCB 2009-038 * * * * *
Thermal Limits Petition Support Document - Coffeen Power Station
Jan Feb Mar Apr May Jun Jul Aug Sep Oct Nov Dec
40
50
60
70
80
90
100
110
120
Mean
Maximum
Minimum
Daily Maximum Temperature (
o
F) (1997-2007)
Figure 2-9. Range of Daily Maximum Near-Surface Water Temperatures at the Mixing Zone Boundary during 1997-2007
Relative to 102
o
F
STATION OPERATIONS AND THERMAL HISTORY
ASA/12-Mar-08/Rev 0
2-13
Electronic Filing - Received, Clerk's Office, December 15, 2008
* * * * * PCB 2009-038 * * * * *
Thermal Limits Petition Support Document - Coffeen Power Station
12
16
20
24
28
74
76
78
80
82
84
86
88
90
92
94
96
98
100
Temperature (
O
F)
May 2007
Intake
Mixing Zone
Figure 2-10. Hourly Near-Surface Water Temperatures at the Intake and Mixing Zone Boundary, 12-31 May 2007
STATION OPERATIONS AND THERMAL HISTORY
ASA/12-Mar-08/Rev 0
2-14
Electronic Filing - Received, Clerk's Office, December 15, 2008
* * * * * PCB 2009-038 * * * * *
Thermal Limits Petition Support Document - Coffeen Power Station
1
6
11
16
21
26
31
88
90
92
94
96
98
100
102
104
106
108
110
112
Temperature (
O
F)
July 2007
Intake
Mixing Zone
Figure 2-11. Hourly Near-Surface Water Temperatures at the Intake and Mixing Zone Boundary, 1-31 July 2007
STATION OPERATIONS AND THERMAL HISTORY
ASA/12-Mar-08/Rev 0
2-15
Electronic Filing - Received, Clerk's Office, December 15, 2008
* * * * * PCB 2009-038 * * * * *
Thermal Limits Petition Support Document - Coffeen Power Station
1
8
15
22
29
68
70
72
74
76
78
80
82
84
86
88
90
92
94
96
98
Temperature (
O
F)
October 2007
Intake
Mixing Zone
Figure 2-12. Hourly Near-Surface Water Temperatures at the Intake and Mixing Zone Boundary, 1-31 October 2007
STATION OPERATIONS AND THERMAL HISTORY
ASA/12-Mar-08/Rev 0
2-16
Electronic Filing - Received, Clerk's Office, December 15, 2008
* * * * * PCB 2009-038 * * * * *
Thermal Limits Petition Support Document - Coffeen Power Station
40
35
30
25
20
15
10
5
0
60 62 64 66 68 70 72 74 76 78 80 82 84 86 88 90
40
35
30
25
20
15
10
5
0
60 62 64 66 68 70 72 74 76 78 80 82 84 86 88 90
40
35
30
25
20
15
10
5
0
60 62 64 66 68 70 72 74 76 78 80 82 84 86 88 90
40
35
30
25
20
15
10
5
0
60 62 64 66 68 70 72 74 76 78 80 82 84 86 88 90
40
35
30
25
20
15
10
5
0
60 62 64 66 68 70 72 74 76 78 80 82 84 86 88 90
40
35
30
25
20
15
10
5
0
60 62 64 66 68 70 72 74 76 78 80 82 84 86 88 90
40
35
30
25
20
15
10
5
0
60 62 64 66 68 70 72 74 76 78 80 82 84 86 88 90
40
35
30
25
20
15
10
5
0
60 62 64 66 68 70 72 74 76 78 80 82 84 86 88 90
40
35
30
25
20
15
10
5
0
60 62 64 66 68 70 72 74 76 78 80 82 84 86 88 90
40
35
30
25
20
15
10
5
0
60 62 64 66 68 70 72 74 76 78 80 82 84 86 88 90
40
35
30
25
20
15
10
5
0
60 62 64 66 68 70 72 74 76 78 80 82 84 86 88 90
40
35
30
25
20
15
10
5
0
60 62 64 66 68 70 72 74 76 78 80 82 84 86 88 90
40
35
30
25
20
15
10
5
0
60 62 64 66 68 70 72 74 76 78 80 82 84 86 88 90
Depth (Ft)
May 04, 2006
40
35
30
25
20
15
10
5
0
60 62 64 66 68 70 72 74 76 78 80 82 84 86 88 90
May 25, 2006
40
35
30
25
20
15
10
5
0
60 62 64 66 68 70 72 74 76 78 80 82 84 86 88 90
Water Temperature (F)
Sep 28, 2006
40
35
30
25
20
15
10
5
0
60 62 64 66 68 70 72 74 76 78 80 82 84 86 88 90
Segment 1
Oct 17, 2000
Segment 2
Segment 3
Segment 4
Figure 2-13. Vertical Profiles of Water Temperature on 4 May,25 May, and 28 September 2006 and 17 October 2000
STATION OPERATIONS AND THERMAL HISTORY
ASA/12-Mar-08/Rev 0
2-17
Electronic Filing - Received, Clerk's Office, December 15, 2008
* * * * * PCB 2009-038 * * * * *
Thermal Limits Petition Support Document - Coffeen Power Station
40
35
30
25
20
15
10
5
0
02
4
6
8
10
40
35
30
25
20
15
10
5
0
02
4
6
8
10
40
35
30
25
20
15
10
5
0
02
4
6
8
10
40
35
30
25
20
15
10
5
0
02
4
6
8
10
40
35
30
25
20
15
10
5
0
02
4
6
8
10
40
35
30
25
20
15
10
5
0
02
4
6
8
10
40
35
30
25
20
15
10
5
0
02
4
6
8
10
40
35
30
25
20
15
10
5
0
02
4
6
8
10
40
35
30
25
20
15
10
5
0
02
4
6
8
10
40
35
30
25
20
15
10
5
0
02
4
6
8
10
40
35
30
25
20
15
10
5
0
02
4
6
8
10
40
35
30
25
20
15
10
5
0
02
4
6
8
10
40
35
30
25
20
15
10
5
0
02
4
6
8
10
Depth (Ft)
May 04, 2006
40
35
30
25
20
15
10
5
0
02
46
8
10
May 25, 2006
40
35
30
25
20
15
10
5
0
02
4
6
8
10
Dissolved Oxygen Concentration (mg/
l
)
Sep 28, 2006
40
35
30
25
20
15
10
5
0
02
4
6
8
10
Segment 1
Oct 17, 2000
Segment 2
Segment 3
Segment 4
Figure 2-14. Vertical Profiles of Dissolved Oxygen (DO) on 2 May, 25 May, and 28 September 2006 and 17 October 2000
STATION OPERATIONS AND THERMAL HISTORY
ASA/12-Mar-08/Rev 0
2-18
Electronic Filing - Received, Clerk's Office, December 15, 2008
* * * * * PCB 2009-038 * * * * *
Thermal Limits Petition Support Document - Coffeen Power Station
300
400
500
600
700
800
900
1000
1100
600
700
800
900
1000
1100
1200
1300
1400
1500
Discharge Degree Days > 60
O
F
Inlet Degree Days > 60
O
F
Inlet
Predicted Inlet
y = 0.897474x - 244.966
r
2
= 0.946365
Figure 2-15. Regression of Accumulated Degree-Days at the Mixing Zone Boundary (Discharge) vs. at the Coffeen Intake
(Inlet) for May-October of 2004-2007
STATION OPERATIONS AND THERMAL HISTORY
ASA/12-Mar-08/Rev 0
2-19
Electronic Filing - Received, Clerk's Office, December 15, 2008
* * * * * PCB 2009-038 * * * * *
Thermal Limits Petition Support Document - Coffeen Power Station
May
Jun
Jul
Aug
Sep
Oct
0
100
200
300
400
500
600
700
800
900
1,000
1,100
1,200
1,300
1,400
1,500
Degree days above 60
O
F
1997
1998
1999
2000
2001
2002
2003
2004
2005
2006
2007
Figure 2-16. Degree-Days Accumulated Monthly at the Mixing Zone Boundary during May-October, 1997-2007
STATION OPERATIONS AND THERMAL HISTORY
ASA/12-Mar-08/Rev 0
2-20
Electronic Filing - Received, Clerk's Office, December 15, 2008
* * * * * PCB 2009-038 * * * * *
Thermal Limits Petition Support Document - Coffeen Power Station
4000
4500
5000
5500
6000
6500
500
550
600
650
700
750
800
850
900
950
1000
Total Degree Days for May (1997-2007)
Total Degree Days for
June through October (1997-2007)
1997
2002
2001
2005
2003
1999
2006
2000
2004
2007
1998
Figure 2-17. Plot of Total Degree-Days Accumulated during May and during the Subsequent June-October, 1997-2007
STATION OPERATIONS AND THERMAL HISTORY
ASA/12-Mar-08/Rev 0
2-21
Electronic Filing - Received, Clerk's Office, December 15, 2008
* * * * * PCB 2009-038 * * * * *
Thermal Limits Petition Support Document - Coffeen Power Station
4,000
4,500
5,000
5,500
6,000
6,500
0
100
200
300
400
500
600
700
800
900
1,000
Total Degree Days for October (1997-2007)
Total Degree Days for
May through September (1997-2007)
May-Sep
Predicted May-Sep
y = 1.9611x + 4237.426
r
2
= 0.8607
2001
1998
2002
2000
1997
2003
1999
20052004
2006
2007
Figure 2-18. Regression of Accumulated Degree-Days at the Mixing Zone Boundary in October vs. during the Previous May-
September, 1997-2007
STATION OPERATIONS AND THERMAL HISTORY
ASA/12-Mar-08/Rev 0
2-22
Electronic Filing - Received, Clerk's Office, December 15, 2008
* * * * * PCB 2009-038 * * * * *
Thermal Limits Petition Support Document - Coffeen Power Station
STATION OPERATIONS AND THERMAL HISTORY
Percentage of Maximum Generation (900 MW)
Year
Jan
Feb
Mar
Apr
May
Jun
Jul
Aug
Sep
Oct
Nov
Dec
Annual
2002
67%
73%
67%
70%
68%
78%
87%
79%
74%
34%
54%
53%
67%
2003
86%
78%
24%
60%
63%
70%
88%
77%
61%
9%
66%
62%
62%
2004
83%
84%
37%
52%
69%
84%
82%
86%
85%
59%
78%
85%
74%
2005
30%
4%
23%
37%
52%
70%
89%
82%
85%
57%
63%
77%
56%
2006
49%
80%
67%
64%
77%
67%
82%
73%
63%
93%
76%
88%
73%
Average
63%
64%
43%
57%
66%
74%
86%
80%
74%
50%
68%
73%
66%
Actual Plant Flow Rate (MGD)
Year
Jan
Feb
Mar
Apr
May
Jun
Jul
Aug
Sep
Oct
Nov
Dec
Annual
2002
540
495
540
568
646
659
659
659
659
467
432
406
561
2003
405
329
210
446
574
579
628
611
531
410
422
405
463
2004
329
373
197
381
581
602
616
616
616
560
514
605
499
2005
179
58
255
335
497
529
629
611
618
528
529
487
438
2006
326
333
291
325
575
553
623
614
555
616
561
431
484
Average
356
318
299
411
574
584
631
622
596
516
492
467
489
Percentage of Maximum Flow Rate (890 CFS or 575 MGD)
Year
Jan
Feb
Mar
Apr
May
Jun
Jul
Aug
Sep
Oct
Nov
Dec
Annual
2002
94%
86%
94%
99%
112%
115%
115%
115%
115%
81%
75%
71%
97%
2003
70%
57%
36%
78%
100%
101%
109%
106%
92%
71%
73%
70%
80%
2004
57%
65%
34%
66%
101%
105%
107%
107%
107%
97%
89%
105%
87%
2005
31%
10%
44%
58%
86%
92%
109%
106%
107%
92%
92%
85%
76%
2006
57%
58%
51%
56%
100%
96%
108%
107%
97%
107%
98%
75%
84%
Average
62%
55%
52%
71%
100%
102%
110%
108%
104%
90%
85%
81%
85%
Table 2-1. Monthly Mean Cooling Water Flow Rate and Percentage of Maximum Design Generation and Flow Rate at
Coffeen, 2002-2006
2-23
ASA/12-Mar-08/Rev 0
Electronic Filing - Received, Clerk's Office, December 15, 2008
* * * * * PCB 2009-038 * * * * *
Thermal Limits Petition Support Document - Coffeen Power Station
Table 2-2. Total Degree-Days Accumulated at the Mixing Zone Boundary during May and
June-October 1997-2007 and Their Annual Rankings
Year
May
Rank
Jun-Oct
Rank
1997
548
11
4,831
10
1998
952
1
5,228
8
1999
819
6
5,333
7
2000
869
4
5,103
9
2001
769
8
4,544
11
2002
687
10
5,431
6
2003
816
7
5,518
5
2004
880
3
5,888
2
2005
736
9
5,853
3
2006
857
5
5,778
4
2007
894
2
6,114
1
STATION OPERATIONS AND THERMAL HISTORY
ASA/12-Mar-08/Rev 0
2-24
Electronic Filing - Received, Clerk's Office, December 15, 2008
* * * * * PCB 2009-038 * * * * *
Thermal Limits Petition Support Document - Coffeen Power Station
3 RETROSPECTIVE ASSESSMENT
3.1
Evidence of Thermal Adaptations
The Coffeen Power Station has been operating for over 40 years, and water temperatures at or
above the proposed site-specific thermal standards (96
o
F and 102
o
F) have occurred repeatedly.
A retrospective assessment provides the strongest evidence of the long-term effects of
periodically higher water temperatures in that it integrates all aspects of the thermal environment
on the life cycle for the fish species and the lower trophic levels in the lake, such as
phytoplankton, epiphyton, macrophytes, zooplankton, and benthos.
In an assessment of the potential influence of elevated water temperatures on the biota of a
cooling lake such as Coffeen Lake, it is general practice to select species for detailed analysis
which (1) are important because of their societal or ecological value, and (2) can adequately
represent other species not studied to the same extent. These selected species are usually
referred to as “representative important species” or RIS. Following extensive studies on the
thermal impacts of Coffeen Power Station on the biota of Coffeen Lake conducted during 1978-
1981 (Tranquilli and Larimore 1981) and 1997-1999 (Heidinger et al. 2000), three fish species
were selected to be monitored on an annual basis thereafter to comply with the requirements of
the thermal standard variance issued by the Illinois Pollution Control Board on 5 July 1997 (see
Section 1.2). These three species— largemouth bass, bluegill, and channel catfish — are
primary components of the recreational fishery of Coffeen Lake.
The RIS populations in Coffeen Lake were studied annually from 1997 to 2004, including the
period (June 1997-July 1999) when the June 1997 variance was in effect, and for the more than
seven years that followed (Heidinger et al. 2000, 2001, 2002; Brooks 2004, 2005). Data
collected by the SIUC field studies were supplemented by data collected during the same years
by the Illinois Department of Natural Resources (IDNR). Among other things, the SIUC studies
tracked the recruitment of individual year classes of largemouth bass; and the growth, condition,
and mortality of all three RIS. The results from these annual studies provide information on the
welfare of the populations, the response of population parameters to annual variations in water
temperatures, and possible adaptations to the artificially heated thermal environment.
The Coffeen Lake populations for all three species are maintained by natural reproduction.
Therefore, all life stages from eggs to adults can be influenced by the effects of the thermal
discharge from Coffeen Power Station. However, not all life stages may be present during May
and October, the months for which thermal standard revisions are being considered. The
presence or absence of the early life stages, especially eggs, larvae and juveniles (i.e., young-of-
the-year or YOY), during May is dependent on the spawning dates for each species. Spawning
dates are influenced by water temperature which along with photoperiod, controls gonad
maturation of spawning adults and serves as an external cue for spawning.
Fish spawning dates and ichthyoplankton have been investigated in the past on Coffeen Lake
(Perry 1981; Tranquilli and Perry 1981; Newman 1981a, 1981b; Ackerson 2000). Data from
these previous studies and from other sources can be used to estimate the monthly occurrence of
each life stage for the three RIS with respect to exposure to water temperatures during May and
ASA/12-Mar-08/Rev 0
RETROSPECTIVE ASSESSMENT
3-1
Electronic Filing - Received, Clerk's Office, December 15, 2008
* * * * * PCB 2009-038 * * * * *
Thermal Limits Petition Support Document - Coffeen Power Station
October. Monthly water temperatures that prevailed at the time of these studies may have since
been modified, e.g., warmer temperatures now may occur earlier in the spring, possibly
accelerating the time of spawning and early life stage development.
The occurrence of each life stage (spawning, egg or embryo, larva, juvenile, and adult) for each
of the three RIS was estimated for each month from March through October in the eastern
(discharge) arm and in the western arm (intake) in Figures 3-1 and 3-2. These charts were
derived using either documented monthly occurrence of each life stage or, in cases where life-
stages were not collected, by inference based on water temperatures and life stage duration
values derived from published scientific literature. In the case of largemouth bass and bluegill,
information from the two sources (documented and inference) is superimposed for some life
stages to test their validity.
3.2
Largemouth Bass (
Micropterus salmoides
)
The largemouth bass is the most important sport fish in Coffeen Lake, where the fishery for it is
considered to be exceptional. During the 2001 creel survey by the Illinois Natural History
Survey (INHS), it was among the three most frequently caught and harvested fish species in
Coffeen Lake, along with channel catfish and white crappie. Largemouth bass was the species
targeted by 41 percent of all interviewed anglers during the 2001 creel survey.
There is evidence that largemouth bass spawning occurs earlier in Coffeen Lake than in other
regional lakes not receiving thermal effluents. Optimal spawning temperatures for largemouth
bass range from 60 to 75
o
F (Heidinger 1975). Normally, these temperatures regionally might
occur in May and June (Smith 2002). However, during 2004-2007 this temperature range has
occurred during March and April in the eastern arm of Coffeen Lake (Figure 3-1) and during
March-May in the western arm (Figure 3-2).
In 1979, Tanquilli and Perry (1981) used the maturation stage of the gonads of female
largemouth bass, as well as their gonadosomatic index or GSI (gonad weight relative to total
body weight), to estimate spawning dates in Coffeen Lake. They found that largemouth bass in
the heated, eastern arm of the lake began spawning in mid or late March, but did not begin
spawning in the western arm until late April or May. Water temperatures in the western arm
may be warmer now than in 1979, possibly causing spawning to occur even earlier than observed
in 1979.
Early spawning by largemouth bass has been documented in other regional lakes that receive
thermal effluents. Lake Sangchris, also located in central Illinois, receives thermal effluent from
the Kincaid Generating Station (Tranquilli et al. 1981). During 1975-1977, spawning in Lake
Sangchris occurred at 15-21
o
C (59-70
o
F) in early April to mid-May in the heated area of the lake
and late April to mid-May in other areas. Tanquilli and Perry (1981) concluded that largemouth
bass spawned earlier in Coffeen Lake than in Lake Sangchris because of the warmer
temperatures in Coffeen Lake.
At Thomas Hill Reservoir in Missouri, Witt et al. (1970, in Tranquilli et al. 1981) also found
gonad development and the timing of spawning for largemouth bass to be accelerated by a
thermal discharge. While not detecting a difference in the GSI of largemouth bass in heated and
unheated areas of Par Pond, South Carolina, Bennett and Gibbons (1975) speculated that thermal
ASA/12-Mar-08/Rev 0
RETROSPECTIVE ASSESSMENT
3-2
Electronic Filing - Received, Clerk's Office, December 15, 2008
* * * * * PCB 2009-038 * * * * *
Thermal Limits Petition Support Document - Coffeen Power Station
effluent from the Savannah River Plant accelerated gonad development of largemouth bass,
where spawning started in March and continued through April. Largemouth bass in two other
power plant cooling reservoirs in Illinois, Newton Lake and Lake of Egypt, apparently spawn
from late March to mid-May based on estimated hatching dates (Ackerson 2000).
At 60-67
o
F, largemouth bass eggs hatch in 3 to 4 days (Kramer and Smith 1960). Life stage
duration for the larval stage (6-16 mm length; Tin 1982) at 66.7
o
F is 19 days
(http://www.fishbase.com
). Therefore, juvenile largemouth bass 16 mm total length (TL) or
larger should be found within approximately 3-4 weeks of the date of spawning. The months
when largemouth bass life stages are predicted to be present in the eastern and western arms of
Coffeen Lake, as shown in Figures 3-1 and 3-2, are derived from this information. Largemouth
bass larvae, juveniles, and adults should be the dominant life stages present in the eastern,
discharge arm during May, whereas spawning and largemouth bass embryos may still be present
in the cooler, western arm in May. In October, only juveniles (YOY) and adults are present
throughout the lake.
3.2.1. Largemouth Bass Recruitment
Stroud and Clepper (1975) made the generalization that power plant effluents favor largemouth
bass. Several studies prior to and after their statement appear to support this view, especially in
terms of first-year survival and growth and subsequent establishment of the strength of
individual year classes. Elevated water temperatures have been shown to improve the production
of largemouth bass year classes through various mechanisms, such as earlier spawning;
improved survival and growth of embryos, fry,and juveniles; earlier attainment of sizes allowing
piscivory; and improved overwinter survival. Although each of these mechanisms can be
influenced by factors other than water temperature (e.g., wind-driven currents, fluctuating water
levels, and availability of prey), temperature appears to be a dominant factor.
Several researchers have concluded that recruitment of YOY largemouth bass and year class
strength are determined by the influence of water temperatures during the earliest life stages, i.e.,
timing of spawning, embryo development, and growth of fry or larvae. Kramer and Smith
(1960, 1962) determined that year class strength for largemouth bass in Lake George, Minnesota
was set during the period from egg deposition to 2-week old fingerlings. They found that egg
survival and nest success was directly and positively related to mean daily water temperatures.
The length that YOY attained by early August was directly related to the total temperature
experience to that date, expressed as degree-days over 50
o
F. Jackson and Noble (2000) found
year class abundance of 50-mm largemouth bass in Jordon Lake, North Carolina to be
significantly correlated with air temperatures in late winter and early spring. They hypothesized
that year class strength is determined by the success of early spawners under the conditions of
stable, warm temperatures and shorter egg incubation times.
Earlier spawning can impart benefits that last throughout the first year of life. In Lake Sangchris,
areas heated by the effluent from the Kincaid Generating Station resulted in earlier spawning.
Early spawning provided a head start on growth of YOY largemouth bass, which was maintained
throughout the growing season and resulted in a prolonged growing season (Tranquilli et al.
1981, Sule 1981). Young produced by earlier spawning had a competitive advantage over young
produced later, and their development was not out of phase with their prey base as the result of
the warmer temperatures. Tranquilli et al. (1981) also proposed that the thermal effluent
ASA/12-Mar-08/Rev 0
RETROSPECTIVE ASSESSMENT
3-3
Electronic Filing - Received, Clerk's Office, December 15, 2008
* * * * * PCB 2009-038 * * * * *
Thermal Limits Petition Support Document - Coffeen Power Station
stabilized temperatures, thus avoiding potential temperature declines that could retard or
terminate egg incubation. The differing thermal regimes (heated vs. unheated) in Lake Sangchris
provided a diversity of spawning conditions and timing, thus helping to maintain a consistent
production of year classes over time (Tranquilli et al. 1981). Jackson and Noble (2000) also
found variations in year class strength in Jordan Lake, North Carolina to be determined largely
by early spring water temperatures which controlled egg survival.
Miller and Storck (1984) observed that young largemouth bass reaching the swim-up fry stage
earlier (late May) in Lake Shelbyville, Illinois maintained a faster subsequent growth rate than
those reaching swim-up later (mid-June). The faster growth rate allowed them an earlier
transition to a fish diet, which ultimately created a bimodal length distribution (piscivorous vs.
non-piscivorous individuals). Earlier transition to piscivory decreases competition with other
species that are planktivorous or insectivorous, and decreases predation on the young largemouth
bass due to their increased growth rates and size (Garvey et al. 2002). Sule (1981) found
piscivory in Lake Sangchris to begin at approximately 90 mm length.
Early spawning and faster growth rates may increase year class production by increasing
survival, particularly over the winter in temperate regions. Earlier spawning resulting in faster
growth and earlier transition to piscivory will lead to larger individuals, which survive the winter
months better than smaller individuals (Miller and Storck 1984, Jackson and Noble 2000).
Overwinter survival is promoted by less depletion of energy stores, greater resistance to disease,
and reduced predation (Gutreuter and Anderson 1985, Fullerton et al. 2000, Garvey et al. 2002).
Miranda and Hubbard (1994) found that largemouth bass >126 mm in length had greater
overwinter survival rates than smaller individuals. Furthermore, the relatively warm
temperatures in Coffeen Lake during the winter may permit young largemouth bass to continue
feeding and assimilating energy for growth as long as prey are available. Age-0 largemouth bass
will continue to feed at 6
o
F and warmer, which can offset loss of fat reserves during winter
months (Fullerton et al. 2000, Garvey et al. 2002).
From these historical studies, it is apparent that elevated water temperatures in Coffeen Lake
should benefit the largemouth bass population overall in terms of reproduction, growth, and
survival. Whether annual variations in the thermal environment of Coffeen Lake have
influenced recruitment of individual year classes can be investigated using the results of the
SIUC and IDNR studies in 1997-2004. Recruitment of YOY and yearling bass was monitored
by electrofishing surveys conducted in the fall (Brooks 2005). SIUC and IDNR produced
independent indices of annual abundance expressed in terms of catch-per-hour (CPUE). These
annual index values were regressed against the total degree-days
1
accumulated during May-
August in the same year.
The IDNR CPUE indices for YOY (age-0) largemouth bass in 1997-2004 were consistently
higher than the SIUC indices (Figure 3-3), but there was not a significant relationship (α=0.05)
with total May-August degree-days for either set of indices (Table 3-1). The highest abundance
of YOY according to the IDNR index occurred during 1997 and 2004, which represented both
the warmest (2004) and the coolest (1997) growing seasons. The SIUC index showed five years
1
see Section 2.3.3 for the derivation of degree-days
ASA/12-Mar-08/Rev 0
RETROSPECTIVE ASSESSMENT
3-4
Electronic Filing - Received, Clerk's Office, December 15, 2008
* * * * * PCB 2009-038 * * * * *
Thermal Limits Petition Support Document - Coffeen Power Station
(1997, 1999, 2001, 2002, and 2004) to be nearly equal and higher than the other three years
(1998, 2000, and 2003).
The results of this analysis suggest that annual variation in recruitment of YOY largemouth bass
was influenced by factors other than accumulated water temperatures within the temperature
range existing during the eight years of data collection. However, the range of index values was
relatively small from year to year, particularly for the SIU index, suggesting fairly consistent
recruitment annually.
3.2.2. Largemouth Bass Growth and Condition
The growth advantage of YOY largemouth bass in Coffeen Lake is readily demonstrated by
comparison of mean total lengths reached over the summer and early fall growing seasons
compared to other lakes and reservoirs in Illinois. Mean total length in Coffeen Lake by late
October or mid-November has ranged from 140 to 206 mm (Table 3-2). These lengths are
approximately 50-90 mm greater than the lengths reached in nine other locations, which include
both unheated waters and heated waters (Lake Sangchris). First year growth in Newton Lake,
another power plant cooling reservoir, was similar but slightly less than in Coffeen Lake (Table
3-2).
The first year growth advantage in Coffeen Lake is maintained in subsequent years of life. This
is illustrated by a comparison of mean total length at the age of annulus formation, as determined
by backcalculation methods, for Coffeen Lake and the state-wide means of sampled populations
from 24 states (Table 3-3). Through age-4, Coffeen Lake largemouth bass are larger than from
any other location except Newton Lake. Typically, freshwater fish species grow faster at lower
latitudes because of a prolonged growing season. This phenomenon is evident in that most of the
states ranked near the top in Table 3-3 are southern states such as Florida, Louisiana, Alabama,
Tennessee, North Carolina, and Arkansas. However, bass in Coffeen Lake are even larger than
in these southern states.
The mean total length reached by YOY largemouth bass in Coffeen Lake by late-October or
mid-November did not appear to be significantly (α=0.05; Table 3-1) related to their thermal
history, expressed as accumulated degree-days from May through August. However, there was
an apparent trend of increasing size with increasing temperatures (Figure 3-4) in that the largest
mean lengths occurred in recent years (2000, 2002-2004) when the total degree-days were
average or higher. The year 1998, which was among the warmest, was an obvious exception to
this trend. When the months of accumulated degree-days were changed from May-August to
April-June, a significant (P=0.036) positive relationship with mean total length of YOY bass was
found (Figure 3-5). From these results, it appears that the thermal history during the earliest
period of growth (i.e., April through June) had the greatest influence on annual growth rates for
YOY largemouth bass.
A positive relationship between temperatures and growth also was found when mean lengths of
age-1 fish were estimated by backcalculation for the time of the first annulus formation (Figure
3-6). However, this relationship was not statistically significant at
α=0.05
(Table 3-1).
Relative weight (W
r
) is an index that is commonly used by fisheries scientists to evaluate the
physical condition or plumpness of fish. Relative weight is the ratio of the observed weight of a
ASA/12-Mar-08/Rev 0
RETROSPECTIVE ASSESSMENT
3-5
Electronic Filing - Received, Clerk's Office, December 15, 2008
* * * * * PCB 2009-038 * * * * *
Thermal Limits Petition Support Document - Coffeen Power Station
fish to a length-specific standard weight determined by length-weight regression for the species
as a whole, including multiple populations from regions throughout the species’ range (Murphy
et al. 1991). The ratio is multiplied by 100 to express it as a percentage, where 100 represents a
better than average condition, equivalent to a management goal.
Mean relative weight values were available for largemouth bass juveniles and adults caught by
SIUC and IDNR in Coffeen Lake during 1997-2004 (Brooks 2005). These values were
regressed on total accumulated degree-days for May-August to determine whether there was a
relationship between fish condition and annual temperatures as measured near the surface at the
mixing zone boundary. Separate analyses were conducted from SIUC and IDNR data. Neither
data set showed a significant relationship at
α=0.05
(Table 3-1), but annual rankings did appear
consistent between the two data sets (Figure 3-7). Annual differences in relative weight
appeared to be influenced by factors other than the thermal environment of each year. Overall,
mean W
r
was 100 or greater, indicating a very healthy, robust largemouth bass population
throughout the eight-year period.
3.3
Bluegill (
Lepomis macrochirus
)
The bluegill is a panfish species that is highly prized by anglers and is also ecologically
important as a forage species. Bluegills serve as prey to many game species such as largemouth
bass, and occur in all habitats but most frequently are found near vegetation and woody debris.
Bluegill are reported to spawn from late May through August in the region, at water temperatures
of 67 to 80
o
F (Cornish and Welke 2004). A prolonged spawning season is also evident in
Coffeen Lake. Based on the timing of capture and size of larval fish belonging to the genus
Lepomis
, Ackerman (2000) concluded that hatching occurred from late April to mid-October in
1998 and from early May to mid September in 1999 in the eastern arm of Coffeen Lake. In the
cooler western arm, hatching occurred from mid-May to early October in 1998 and early May to
mid-September in 1999. Peak hatching, based on relative abundance of larvae, occurred in mid-
to late June in the eastern arm and mid-July to mid-August in the western arm.
Bluegill eggs hatch in approximately 48 h at 77
o
F (Merriner 1971). The larval stage lasts 30
days at 74.3
o
F (
http://www.fishbase.com
). In 1980, larval
Lepomis
2
were caught as early as late
April in the eastern arm and late May in the western arm, and were present when sampling
concluded in late August (Newman 1981a). In the late 1990s, larval and early juvenile
Lepomis
4-20 mm in length were captured by tow nets and light traps from mid-April to mid-October in
1998, and mid-May to mid-September in 1999 (Ackerson 2000). Sampling ended in mid-
October in 1998 and mid-September in 1999.
Based solely on water temperatures and literature information that spawning can begin at 67
o
F,
bluegill spawning could begin in Coffeen Lake as early as March in the eastern, discharge arm
(Figure 3-1). However, the 1998-1999 studies did not indicate spawning or the presence of
larval
Lepomis
prior to late April (Ackerman 2000). Therefore, spawning and eggs (embryos)
most likely occur from April to October in the eastern arm (Figure 3-1) and May to October in
2
No distinction was made between larval and early juvenile fish based on morphometrics or length.
ASA/12-Mar-08/Rev 0
RETROSPECTIVE ASSESSMENT
3-6
Electronic Filing - Received, Clerk's Office, December 15, 2008
* * * * * PCB 2009-038 * * * * *
Thermal Limits Petition Support Document - Coffeen Power Station
the western arm (Figure 3-2). Juveniles would follow in approximately 1 month. Adults are
present year-round.
3.3.1. Bluegill Growth and Condition
Although bluegill growth is influenced by temperature, growth differences among populations
typically originate from intraspecific and interspecific competition for food resources (Spotte
2007). Predation rates on bluegills and competing species in turn influence the degree of food
competition. The abundance of food resources usually is correlated with the amount of
vegetation and the size of the littoral area within a lake or reservoir. Growth rates can vary
greatly among lakes in the same vicinity and experiencing the same climatic conditions.
There is evidence that competition for food is limiting growth of bluegills in Coffeen Lake,
resulting in a stunted population. Heidinger et al. (2000) and Brooks (2005) observed that the
bluegill population in Coffeen Lake consisted of very few individuals of quality sportfish size
(e.g., >160 mm TL), but instead were forage-size fish that would be available to largemouth bass
and other piscivores. A similar stunted population was found in Lake Sangchris, another power
plant cooling reservoir (Joy and Tranquilli 1979, in Tranquilli et al. 1981). Coffeen Lake has an
abundance of submerged macrophytes, as well as other sunfish species (especially redear
sunfish,
Lepomis microlophus
), gizzard shad (
Dorosoma cepedianum
), and now threadfin shad
(
Dorosoma petense
). The availability of macrophytes as refuge from predation may be
increasing the survival of small fish. In addition, the presence of several competitors such as
other sunfish and shad species likely has increased intraspecific and interspecific competition for
food resources.
The degree to which bluegill growth has been stunted in Coffeen Lake is shown by a comparison
of mean total length at age with other regional bluegill populations (Table 3-4). At age-1, the
mean length of Coffeen Lake bluegills (64 mm) is well within the range of age-1 lengths in other
regional lake, reservoir, and river populations (56-76 mm). By age-2, Coffeen Lake bluegills are
beginning to be slightly smaller, and by ages 3 and 4 are 17 to 108 mm smaller, with the
exception of some Indiana lake populations (Table 3-4).
The influence of water temperatures on bluegill growth in Coffeen Lake is unclear. Optimal
temperatures for growth are 27.2-32.3
o
C (81-90
o
F) (Coutant 1977). This temperature range
exists throughout the summer in many locations in Coffeen Lake (Section 2). There was no
significant relationship (α=0.05; Table 3-1) between total accumulated degree-days during May-
August in 1999-2003 (i.e., initial year of growth for the 1999-2003 year classes) and the mean
total length of each corresponding year class as determined by backcalculation at the formation
of the first annulus (Figure 3-8). Therefore, within the range of temperatures experienced in
Coffeen Lake during this five-year period, the thermal environment appeared to have no effect
on first year growth rates.
The mean relative weight (W
r
) of juvenile and adult bluegill in Coffeen Lake has been less than
100 (ranging 80-89 in IDNR annual surveys and 76-96 in SIUC annual surveys). These
relatively low values are consistent with the hypothesis of competition for food resources
stunting growth in the lake. A plot of mean annual W
r
values for the two data sources vs. degree-
days clearly shows a lack of correlation for either data set (Figure 3-9 and Table 3-1), suggesting
ASA/12-Mar-08/Rev 0
RETROSPECTIVE ASSESSMENT
3-7
Electronic Filing - Received, Clerk's Office, December 15, 2008
* * * * * PCB 2009-038 * * * * *
Thermal Limits Petition Support Document - Coffeen Power Station
food competition or some other factor, rather than temperature, influences the condition of
bluegills.
3.4
Channel Catfish (
Ictalurus punctatus
)
The channel catfish is a very important recreational fish species in Illinois and in Coffeen Lake.
During the 2001 creel survey by INHS, it was the most frequently harvested fish species in
Coffeen Lake. Adults may be found in many habitats, but prefer habitat with woody debris,
bank cavities and moderate currents. In daylight they seek depths with cover and current. At
night they feed in shallower depths.
Channel catfish have been found to spawn at water temperatures ranging from 21 to 28
o
C (69.8-
82.4
o
F) in the spring (Hubert 1999). Eggs take 6-10 days to hatch at temperatures of 16-26
o
C
(60.8-78.8
o
F) (Hubert 1999) and 3-8 days at 27-28
o
C (80.6-82.4
o
F). The larval stage lasts 12-16
days (http://www.fishbase.com
).
Surveys conducted on Coffeen Lake have not collected channel catfish eggs or larvae except for
entrainment studies at the Coffeen intake in 1980, when larvae appeared in collections from 9
June to 30 June (Newman 1981b). Eggs and larvae would be expected to be uncommon in
ichthyoplankton collections because channel catfish build and tend nests, thus protecting young
from being dislodged or lost. Therefore, predicting the monthly occurrence of early life stages
for channel catfish depends heavily on the relationship of spawning to water temperatures.
Stable water temperatures in the range of 70-82
o
F occur in April and May in the eastern,
discharge arm of Coffeen Lake (Figure 3-1) and in May and June in the western arm (Figure 3-
2), and that is likely when channel catfish spawn. The occurrence of larval channel catfish in
June 1980 entrainment collections from the western arm appears to corroborate this prediction.
Allowing for approximately 1 week for hatching and 2 weeks for larval development (life stage
duration), larvae would be present during the same months and shortly thereafter, i.e., April-June
in the eastern arm and May-July in the western arm (Figures 3-1 and 3-2). Regarding the two
months of interest, juveniles would occur in May in the eastern arm but not in the western arm,
and would occur throughout the lake in October.
3.4.1. Channel Catfish Growth and Condition
Available data do not show a clear effect of water temperatures on the growth and condition of
channel catfish in Coffeen Lake. The length at age for channel catfish in Coffeen Lake falls
within the range of values for other channel catfish populations studied in rivers, lakes, and other
reservoirs in the Midwest or South (Table 3-5). The mean relative weight of juveniles and adults
in Coffeen Lake during 1997-2004 has approached 100 in some years (84-93 in IDNR annual
surveys and 80-98 in SIUC annual surveys). There was no significant (α=0.05) relationship
annually between mean relative weights and degree-days accumulated from May through August
for either the IDNR or SIUC data sets (Figure 3-10 and Table 3-1), indicating that annual
changes in the thermal environment had no effect on the condition of channel catfish in Coffeen
Lake.
ASA/12-Mar-08/Rev 0
RETROSPECTIVE ASSESSMENT
3-8
Electronic Filing - Received, Clerk's Office, December 15, 2008
* * * * * PCB 2009-038 * * * * *
Thermal Limits Petition Support Document - Coffeen Power Station
3.5
Fish Standing Crops
Perry and Tranquilli (1981) sampled Coffeen Lake using cove-rotenone techniques to estimate
the standing crops of fish species in the lake at that time, and to compare the estimates to other
heated and unheated reservoirs in Illinois and elsewhere. They concluded that largemouth bass
standing crops in Coffeen Lake during 1979-1980 were intermediate among the mean values for
standing crops for Lake Sangchris, a heated reservoir in Illinois; Lake Shelbyville, an unheated
flood control reservoir in Illinois; Midwestern lakes, and lakes in the mid-south (Table 3-6).
Channel catfish and bluegill standing crops were considerably higher than in the other lakes and
reservoirs, as were all species combined except for Lake Shelbyville.
While fish abundance data for Coffeen Lake in the intervening years between 1980 and 1997 are
not available, fall electrofishing catch per hour data are available from both the IDNR and SIUC
surveys for the three RIS for the eight years from 1997 to 2004 as a measure of relative
abundance (Table 3-7). The relative abundance indices from both data sources were variable but
showed no sustained trend.
Available data are not definitive concerning the abundance of fish through the years. However,
they do indicate that midway during the existence of Coffeen Lake (1979-1980) the fish
population sizes for the three RIS compared favorably with other midwestern and southern
populations. Recent data suggest the populations are relatively stable with no consistent trend,
suggesting that Coffeen populations still compare favorably to those in the other locations.
When mean catch-per-hour values from the IDNR surveys of 1997-2004 were regressed on
degree-days for May-August, a significant negative relationship (r
2
=0.5271, P=0.0414; Figure 3-
11) was found for juveniles and adult bluegills, but not for largemouth bass or channel catfish or
for SIUC indices for bluegill (Table 3-1). This relationship was greatly influenced by the data
point for 1997, when catch rates were high and degree-days were lowest (Figure 3-11). Since
there is no other evidence of a declining trend in abundance, these results might reflect a direct or
indirect relationship between temperatures and the susceptibility of bluegills to capture by
electrofishing.
3.6
Recent IDNR Survey Results
IDNR periodically produces reports on the status of its lake management plan for Coffeen Lake.
The most recent report (Pontnack 2007) summarizes the current status of game species in
Coffeen Lake based on results from annual fall electrofishing programs over the period from
2000 to 2006.
With regard to largemouth bass, the population is described as being “solid”, although fish
ranging from 15 to 19 inches in length appeared to be declining in abundance, while the numbers
of fish >20 inches remained stable. Relative weight (W
r
) declined from 102 in 2004 to 95 in
2006, raising a concern that additional forage fish might be needed. However, W
r
remained
within the plan’s objective range of 90 to 110. Proportional stock density (PSD or the
percentage of stock fish equal to or exceeding quality length) values of 78-89 were consistently
higher than the objective of 50-70, signifying a high quality fishery for large bass.
ASA/12-Mar-08/Rev 0
RETROSPECTIVE ASSESSMENT
3-9
Electronic Filing - Received, Clerk's Office, December 15, 2008
* * * * * PCB 2009-038 * * * * *
Thermal Limits Petition Support Document - Coffeen Power Station
The bluegill population was characterized as being dominated by young, small fish. While mean
catch rates have increased since 2004, they were near the overall mean for the period but below
the targeted value. Mean relative weights (82-89) were below the target range of 90-110.
The abundance of channel catfish has increased approximately three-fold since 2003 as indicated
by catch-per-effort, but relative weight decreased since 2003 from 90 to 85. Mean W
r
values in
2000 (93) and 2001 (94) were well within the targeted range of 90-110. Based on the
electrofishing catch, the PSD for the channel catfish population (7-35) is below the plan’s
objective of 40-60, indicating a dominance of fish smaller than quality size. However, a size
bias may exist if larger fish are not as vulnerable to capture by electrofishing because of their
preference for the deepest portions of the lake.
White crappie (
Pomoxis annularis
), while not one of the three RIS, is an important and popular
game species in Coffeen Lake. Catch rates declined in 2006 from values that previously were
consistently near the plan objective. Relative weights declined from targeted values >90 to 87 in
2004 and 85 in 2006. PSD (73-100) remained well above the objective of 40-60, indicating an
abundance of large crappie. The abundance of white crappie was noted to be cyclical throughout
its geographic range, so cycles may be expected to occur in Coffeen Lake as a function of year
class production.
3.7
Habitat Conditions During Previous Fish Kills
As is evident from the stated conditions for the variance granted in June 1997 and the subsequent
suspension of the variance in 1999 (Section 1.2), thermally-related fish kills are of greatest
concern when considering higher thermal limits for Coffeen Lake. Fish kills in Coffeen Lake are
infrequent, especially ones that involve more than a few fish. Larger fish kills (up to a few
hundred fish) tend to be associated with extraordinary meteorological conditions that, together
with maximum summer temperatures, have reduced the amount of available habitat containing
adequate dissolved oxygen and temperatures that could be tolerated for an extended period of
time (Brooks 2004, 2005; Brooks and Heidinger 2006, 2007). In particular, sudden major
increases in temperature or prolonged periods of hot humid weather with extensive cloud cover
have been suggested as the causes of these incidents (Brooks 2005). Rapid temperature
increases can entrap small pockets of fish leaving no route of passage to more thermally suitable
habitat elsewhere in the lake. Extensive cloud cover limits photosynthetic production of oxygen,
potentially reducing the habitat containing suitable levels of both temperature and oxygen.
Nevertheless even these fish kills have been shown to have had no adverse ecological effect on
the fishery (Brooks 2004, 2005; Brooks and Heidinger 2006, 2007). Minor kills involving just a
few fish have been attributed to mortalities of angler-released fish or temporary loss of localized
cool-water refuges as heated currents circulate in the lake. Kills on a somewhat larger scale (i.e.,
179-223 fish found) have occurred in the summers of 1999 and 2001. By investigating the
conditions prevailing at the time of these larger kills, the relative risk of fish kills during May
and October under revised thermal standards can be evaluated.
Fish kills were more prevalent in Coffeen Lake during the period from 1999 to 2002 (Brooks and
Heidinger 2006, 2007). This period was used as a source of information on conditions prevailing
during the fish kills. The fish kills were documented as part of the weekly lake surveys
conducted by SIUC during these years. The surveys recorded the number of carcasses of each
ASA/12-Mar-08/Rev 0
RETROSPECTIVE ASSESSMENT
3-10
Electronic Filing - Received, Clerk's Office, December 15, 2008
* * * * * PCB 2009-038 * * * * *
ASA/12-Mar-08/Rev 0
Thermal Limits Petition Support Document - Coffeen Power Station
RETROSPECTIVE ASSESSMENT
3-11
species found and the locations where they were found. Since the surveys only occurred on one
day per week, the actual dates that fish succumbed and the actual localized temperature and
dissolved oxygen conditions leading up to their deaths could not be determined definitively.
However, some patterns are evident that might be useful for predicting whether fish kills could
occur during May and October under revised thermal standards.
The dates on which dead fish were found by SIUC sampling crews during April-October 1999-
2002 are indicated by arrows superimposed on daily plots of mean water temperatures recorded
near the surface at the mixing zone boundary (Figures 3-12 through 3-15). Water temperatures
at this location are indicative of the relative heat loading in the lake on each date (see Section 2.3
and Figure 2-6), but generally are higher than existing elsewhere in the lake.
Most notably, the fish kills during 1999-2002 occurred almost exclusively from late June to early
August, at the peak of summer water temperatures. The one exception was a minor fish kill
documented on 9 April 1999 (Figure 3-12), involving two channel catfish and one carp. The
cause of mortality for these few fish is unknown, but their discovery followed an increase in
mean daily mixing zone temperature from 74
o
F on 24 March to 92
o
F on 7 April (Figure 3-12).
Such a sudden rise in temperatures at this time is highly unusual, and this instance equaled the
maximum temperatures recorded in early April during 1997-2007 (Figure 2-8). Whether this
temperature rise contributed to the mortality of these fish cannot be substantiated.
The three largest fish kills were recorded on 27-28 July 1999 (179 fish counted), 10 July 2001
(223 fish counted), and 24 June-4 July 2002 (124 fish counted). The 27-28 July 1999 event
corresponded in time to the warmest mean daily water temperature recorded during the year
(112
o
F; Figure 3-12). Water temperatures had increased steadily from approximately 88-90
o
F in
the mixing zone in late June to this peak 112
o
F temperature on 30 July. Brooks (2005) observed
that this fish kill coincided with high ambient temperatures, in combination with elevated
discharge temperatures and prolonged periods of calm, cloudy weather. The meteorological
phenomenon of high ambient temperatures and prolonged calm, cloudy weather that occurred on
these dates also resulted in fish kills in other, non-heated lakes in this region such as East Fork
Lake near Olney, Illinois.
The 10 July 2001 fish kill also followed a period of increasing temperatures, from approximately
91
o
F in late June to 103.5
o
F near the surface at the mixing zone boundary on 10 July (Figure 3-
14). Mean daily temperatures at this location continued above 100
o
F for the remainder of the
month without apparently causing another fish kill of this magnitude (Figure 3-14). During the
week of 24 June to 4 July 2002, 124 fish carcasses were counted (Figure 3-15). This event also
occurred when mean daily water temperatures recorded at the mixing zone boundary rose over a
period of time to exceed 100
o
F. Mean daily water temperatures had risen from approximately
88
o
F in mid-June to 104.8
o
F on 26 June, after which remained near or above 100
o
F until late
September but no subsequent kills occurred (Figure 3-15).
Electronic Filing - Received, Clerk's Office, December 15, 2008
* * * * * PCB 2009-038 * * * * *
Thermal Limits Petition Support Document - Coffeen Power Station
Mar
Apr
May
Jun
Jul
Aug
Sep
Oct
Mix zone mean temperature (2004-2007)
69.5
80.2
87.2
101.4
102.9
102.5
100.3
86.1
Mix zone mean temperature range (
o
F)
44-89
63-92
74-97
88-108
94-110
95-108
75-108
76-100
Largemouth bass spawning
αα
Largemouth bass embryos
αα
Largemouth bass larvae
αα
Largemouth bass juveniles
α
αααααα
Largemouth bass adults
Bluegill spawning
#
#
##
#*
#*
#
#
Bluegill embryos
#
#
##
#*
#*
#
#
Bluegill larvae
#
#
##
#*
#*
#
#
Bluegill juveniles
#
#
##
#
#
#
Bluegill adults
Channel catfish spawning
Channel catfish embryos
Channel catfish larvae
Channel catfish juveniles
Channel catfish adults
α
- spawning based on gonadosomatic index in 1979 and subsequent life stage durations (Tranquilli and Perry 1981)
# - observed occurrence during 1998-1999 using hatch dates and life stage durations (Ackerman 2000)
## - month of peak occurrence in 1998-1999 using hatch dates and life stage durations (Ackerman 2000)
* - temporally absent in warm temperatures of 1999 using hatch dates and life stage durations (Ackerman 2000)
shaded - predicted occurrence based on water temperature and life stage duration
Figure 3-1. Life Stage Presence by Month for Three Fish Species in the Discharge Arm of Coffeen Lake
RETROSPECTIVE ASSESSMENT
3-12
Electronic Filing - Received, Clerk's Office, December 15, 2008
* * * * * PCB 2009-038 * * * * *
Thermal Limits Petition Support Document - Coffeen Power Station
Mar
Apr
May
Jun
Jul
Aug
Sep
Oct
Intake mean temperature (2004-2007)
56.7
65.5
77.1
86.1
91.7
91.5
86.7
74.7
Intake mean temperature range (
o
F)
43-73
53-76
65-84
69-96
86-100
85-98
73-92
63-86
Largemouth bass spawning
αα
Largemouth bass embryos
αα
Largemouth bass larvae
αα
Largemouth bass juveniles
αααααα
Largemouth bass adults
Bluegill spawning
#
#
##*
##*
##
Bluegill embryos
#
#
##*
##*
##
Bluegill larvae
#
#
##*
##*
##
Bluegill juveniles
Bluegill adults
Channel catfish spawning
Channel catfish embryos
Channel catfish larvae
e
Channel catfish juveniles
Channel catfish adults
α
- spawning based on gonadosomatic index in 1979 and subsequent life stage durations (Tranquilli and Perry 1981)
# - observed occurrence during 1998-1999 using hatch dates and life stage durations (Ackerman 2000)
## - month of peak occurrence in 1998-1999 using hatch dates and life stage durations (Ackerman 2000)
* - absent in warm temperatures of 1999 using hatch dates and life stage durations (Ackerman 2000)
shaded - predicted occurrence based on water temperature and life stage duration
e - collected in 1980 entrainment samples (Newman 1981b)
Figure 3-2. Life Stage Presence by Month for Three Fish Species in the Intake Arm of Coffeen Lake
RETROSPECTIVE ASSESSMENT
3-13
Electronic Filing - Received, Clerk's Office, December 15, 2008
* * * * * PCB 2009-038 * * * * *
Thermal Limits Petition Support Document - Coffeen Power Station
3,600
3,800
4,000
4,200
4,400
4,600
4,800
5,000
0
5
10
15
20
25
30
35
2000
1999
IDNR
SIU
Largemouth bass Fall Electrofishing
CPUE (1997-2004)
Degree Days (May - August)
1997
2001
2002
2004
2003
1998
1999
2000
1997
2001
2002
2003
1998
2004
Figure 3-3. Plot of Total Degree-Days during May-August vs. Two Indices (SIUC and IDNR) of Mean Catch-per-Hour of
Young-of-Year Largemouth Bass during the Fall, 1997-2004
RETROSPECTIVE ASSESSMENT
3-14
Electronic Filing - Received, Clerk's Office, December 15, 2008
* * * * * PCB 2009-038 * * * * *
Thermal Limits Petition Support Document - Coffeen Power Station
3,800
4,000
4,200
4,400
4,600
4,800
140
160
180
200
220
2000
1997
1998
2003
1999
2004
2002
2001
Largemouth bass Mean TL (mm)
for Fall Age 0 (1997-2004)
Degree Days (May - August)
Figure 3-4. Plot of Total Degree-Days during May-August vs. Mean Total Length of Young-of-Year Largemouth Bass during
the Fall, 1997-2004
RETROSPECTIVE ASSESSMENT
3-15
Electronic Filing - Received, Clerk's Office, December 15, 2008
* * * * * PCB 2009-038 * * * * *
Thermal Limits Petition Support Document - Coffeen Power Station
100
150
200
250
1,200
1,400
1,600
1,800
2,000
2,200
2,400
2,600
2,800
Degree Days (April - June)
Largemouth bass Fall Mean Length (mm)
for Age-0 (1997-2004)
Age-0 Total Length
Predicted Age-0 Total Length
y = 0.0464x + 65.383
r
2
= 0.546
1997
1998
2001
1999
2004
2002 2003
2000
Figure 3-5. Plot of Total Degree-Days during April-June vs. Mean Total Length of Young-of-Year Largemouth Bass during
the Fall, 1997-2004
RETROSPECTIVE ASSESSMENT
3-16
Electronic Filing - Received, Clerk's Office, December 15, 2008
* * * * * PCB 2009-038 * * * * *
Thermal Limits Petition Support Document - Coffeen Power Station
4,100
4,200
4,300
4,400
4,500
4,600
100
200
300
400
500
600
700
800
900
2002
2000
2003
1999
2001
Largemouth bass Mean TL (mm)
Age-1 (1999-2003)
Degree Days (May - August)
Figure 3-6. Plot of Total Degree-Days during May-August of First Year of Life vs. Mean Total Length of Age-1 Largemouth
Bass, 1999-2003
RETROSPECTIVE ASSESSMENT
3-17
Electronic Filing - Received, Clerk's Office, December 15, 2008
* * * * * PCB 2009-038 * * * * *
Thermal Limits Petition Support Document - Coffeen Power Station
3,800
4,000
4,200
4,400
4,600
4,800
96
98
100
102
104
106
108
2004
1998
2003
2000
2002
1999
2001
1997
2000
2003
1998
1999
2004
2002
2001
Largemouth bass Mean Relative Weight (Wr)
(1997-2004)
Degree Days (May - August)
IDNR
SIU
1997
Figure 3-7. Plot of Total Degree-Days during May-August vs. Two Indices (SIUC and IDNR) of Mean Relative Weight for
Juvenile and Adult Largemouth Bass during the Fall, 1997-2004
RETROSPECTIVE ASSESSMENT
3-18
Electronic Filing - Received, Clerk's Office, December 15, 2008
* * * * * PCB 2009-038 * * * * *
Thermal Limits Petition Support Document - Coffeen Power Station
4,100
4,200
4,300
4,400
4,500
4,600
80
100
120
140
160
180
200
220
240
260
280
2002
2000
2003
1999
2001
Bluegill Mean TL (mm) Age-1
(1999-2003)
Degree Days (May - August)
Figure 3-8. Plot of Total Degree-Days during May-August of First Year of Life vs. Mean Total Length of Age-1 Bluegill, 1999-
2003
RETROSPECTIVE ASSESSMENT
3-19
Electronic Filing - Received, Clerk's Office, December 15, 2008
* * * * * PCB 2009-038 * * * * *
Thermal Limits Petition Support Document - Coffeen Power Station
3,800
4,000
4,200
4,400
4,600
4,800
74
76
78
80
82
84
86
88
90
92
94
96
98
2004
1998
2003
2000
1999
2002
2001
1997
2000
1998
2003
1999
2004
2002
2001
Bluegill Mean Relative Weight (Wr)
(1997-2004)
Degree Days (May - August)
IDNR
SIU
1997
Figure 3-9. Plot of Total Degree-Days during May-August vs. Two Indices (SIUC and IDNR) of Mean Relative Weight for
Juvenile and Adult Bluegill during the Fall, 1997-2004
RETROSPECTIVE ASSESSMENT
3-20
Electronic Filing - Received, Clerk's Office, December 15, 2008
* * * * * PCB 2009-038 * * * * *
Thermal Limits Petition Support Document - Coffeen Power Station
3,800
4,000
4,200
4,400
4,600
4,800
78
80
82
84
86
88
90
92
94
96
98
100
2004
1998
2003
2000
1999
2002
2001
1997
2000
1998
2003
1999
2004
2002
2001
Channel catfish Mean Relative Weight (Wr)
(1997-2004)
Degree Days (May - August)
IDNR
SIU
1997
Figure 3-10. Plot of Total Degree-Days during May-August vs. Two Indices (SIUC and IDNR) of Mean Relative Weight for
Juvenile and Adult Channel Catfish during the Fall, 1997-2004
RETROSPECTIVE ASSESSMENT
3-21
Electronic Filing - Received, Clerk's Office, December 15, 2008
* * * * * PCB 2009-038 * * * * *
Thermal Limits Petition Support Document - Coffeen Power Station
0
50
100
150
200
250
3,800
3,900
4,000
4,100
4,200
4,300
4,400
4,500
4,600
4,700
4,800
Degree Days (May - August)
IDNR Bluegill Fall Electrofishing
CPUE (1997-2004)
CPUE
Predicted CPUE
y = - 0.135x + 700.243
r
2
= 0.527082
1997
2002
1999
1998
2001
2000
2003
2004
Figure 3-11. Regression of Accumulated Degree-Days at the Mixing Zone Boundary during May-August vs. IDNR Mean
Catch-per-Hour of Juvenile and Adult Bluegill, 1997-2004
RETROSPECTIVE ASSESSMENT
3-22
Electronic Filing - Received, Clerk's Office, December 15, 2008
* * * * * PCB 2009-038 * * * * *
Thermal Limits Petition Support Document - Coffeen Power Station
Apr
May
Jun
Jul
Aug
Sep
Oct
60
70
80
90
100
110
120
Daily Average Temperature (
O
F)
1999
179
3
1
22
Figure 3-12. Mean Daily Near-Surface Water Temperature at the Mixing Zone Boundary, April-October 1999 and Dates of
Observed Fish Kills as Indicated by Arrows (Number of Fish Recovered Shown Above Arrows)
RETROSPECTIVE ASSESSMENT
3-23
Electronic Filing - Received, Clerk's Office, December 15, 2008
* * * * * PCB 2009-038 * * * * *
Thermal Limits Petition Support Document - Coffeen Power Station
Apr
May
Jun
Jul
Aug
Sep
Oct
60
70
80
90
100
110
Daily Average Temperature (
O
F)
2000
4
1
Figure 3-13. Mean Daily Near-Surface Water Temperature at the Mixing Zone Boundary, April-October 2000 and Dates of
Observed Fish Kills as Indicated by Arrows (Number of Fish Recovered Shown Above Arrows)
RETROSPECTIVE ASSESSMENT
3-24
Electronic Filing - Received, Clerk's Office, December 15, 2008
* * * * * PCB 2009-038 * * * * *
Thermal Limits Petition Support Document - Coffeen Power Station
Apr
May
Jun
Jul
Aug
Sep
Oct
50
60
70
80
90
100
110
Daily Average Temperature (
O
F)
2001
223
2
4
Figure 3-14. Mean Daily Near-Surface Water Temperature at the Mixing Zone Boundary, April-October 2001 and Dates of
Observed Fish Kills as Indicated by Arrows (Number of Fish Recovered Shown Above Arrows)
RETROSPECTIVE ASSESSMENT
3-25
Electronic Filing - Received, Clerk's Office, December 15, 2008
* * * * * PCB 2009-038 * * * * *
Thermal Limits Petition Support Document - Coffeen Power Station
RETROSPECTIVE ASSESSMENT
Figure 3-15. Mean Daily Near-Surface Water Temperature at the Mixing Zone Boundary, April-October 2002 and Dates of
Observed Fish Kills as Indicated by Box (Number of Fish Recovered Shown Above Box)
Apr
May
Jun
Jul
Aug
Sep
Oct
60
70
80
90
100
110
Daily Average Temperature (
O
F)
2002
124
3-26
Electronic Filing - Received, Clerk's Office, December 15, 2008
* * * * * PCB 2009-038 * * * * *
ASA/12-Mar-08/Rev 0
Thermal Limits Petition Support Document - Coffeen Power Station
RETROSPECTIVE ASSESSMENT
3-27
Table 3-1. Statistical Results of Regression Analysis of Coffeen Lake Fish Population
Parameters on Degree-Days during May-August
r
2
Significance
F
Largemouth
IDNR Age 0
0.0971
0.4524
bass
SIU Age 0
0.1977
0.2697
Largemouth
IDNR
0.0108
0.8064
bass (All Ages)
SIU
0.0248
0.7094
Bluegill (All
IDNR
0.5271
0.0414
Ages)
SIU
0.0001
0.9823
IDNR
0.0510
0.5907
Fall Electrofishing
CPUE (1997-2004)
Channel catfish
(All Ages)
SIU
0.0623
0.5511
Fall Mean Total Length (TL)
(1997-2004)
Largemouth
bass
Age 0
0.1152
0.4108
Largemouth
Fall Backcalculated TL (mm)
bass
Age 1
0.5654
0.1427
Fall (1999-2003)
Bluegill Age-1
Age 1
0.0177
0.8312
Largemouth
IDNR
0.1890
0.2818
bass (All Ages)
SIU
0.0741
0.5141
Bluegill (All
IDNR
0.1788
0.2966
Ages)
SIU
0.0003
0.9656
IDNR
0.1826
0.2910
Mean Relative Weight (Wr)
(1997-2004)
Channel catfish
(All Ages)
SIU
0.1199
0.4008
Electronic Filing - Received, Clerk's Office, December 15, 2008
* * * * * PCB 2009-038 * * * * *
Thermal Limits Petition Support Document - Coffeen Power Station
RETROSPECTIVE ASSESSMENT
Lake
Type
Reservoir
Month
Years
Mean TL (mm)
Source
Coffeen Lake, IL
cooling
late Oct to mid-Nov
1997-2004
140-206
Brooks 2005
Newton Lake, IL
cooling
late Oct to mid-Nov
1997-2004
127-193
Brooks 2005
Lake Sangris, IL
cooling
mid-Oct to mid-Nov
1975
86-106*
Larimore and Tranquilli 1981
Apple Canyon Lake, IL non-cooling
late-Sep to early
Oct
1988-1991
79-117*
Fuhr et al. 2002
Shabonna Lake, IL
non-cooling
late-Sep to early
Oct
1988-1991
58-92*
Fuhr et al. 2002
Lake George, IL
non-cooling
late-Sep to early
Oct
1988-1991
83-120*
Fuhr et al. 2002
Lake Carleton, IL
non-cooling
late-Sep to early
Oct
1988-1991
71-95*
Fuhr et al. 2002
Pierce Lake, IL
non-cooling
late-Sep to early
Oct
1988-1991
92*
Fuhr et al. 2002
Johnson-Sauk Lake, IL non-cooling
late-Sep to early
Oct
1988-1991
82-96*
Fuhr et al. 2002
Le Aqua Na Lake, IL
non-cooling
late-Sep to early
Oct
1988-1991
76-133*
Fuhr et al. 2002
Lake Shelbyville, IL
non-cooling
Sep
1980-1981
53-140*
Miller and Storck 1984
*estimated from graphed value
Table 3-2. Mean Total Length of Young-of-Year Largemouth Bass in Northern and Central Illinois Reservoirs
3-28
Electronic Filing - Received, Clerk's Office, December 15, 2008
* * * * * PCB 2009-038 * * * * *
Thermal Limits Petition Support Document - Coffeen Power Station
Table 3-3. Mean Backcalculated Length (mm TL) at Age for Largemouth Bass
Populations from Coffeen and Newton lakes and from 24 States*
Age
Lake or State
N
1
2
3
4
5
6
7
Coffeen Lake**
1
203
341
392
412
413
444
457
Newton Lake**
1
191
330
406
439
465
450
479
Florida
14
175
276
335
384
424
471
502
Louisiana
18
175
279
346
377
405
454
473
Alabama
5
158
258
336
392
438
495
524
Tennessee
22
152
262
327
370
413
456
479
North Carolina
40
148
240
312
368
418
463
495
Maryland
5
147
252
320
363
406
428
463
Arkansas
13
145
243
315
370
413
441
433
California
26
145
256
344
403
458
508
517
Oklahoma
48
143
247
324
384
431
479
515
Kentucky
11
136
250
331
382
424
439
470
Mississippi
9
131
210
265
315
370
426
452
Texas
9
127
225
277
336
387
461
499
Illinois
24
120
234
303
356
414
454
469
Iowa
15
115
204
281
332
388
424
459
Missouri
45
109
199
265
316
352
401
419
New York
13
102
190
258
311
348
377
404
Connecticut
85
98
202
279
334
374
405
433
Michigan
10
98
177
237
294
331
360
388
Ohio
42
93
185
254
310
364
411
441
Idaho
40
87
170
233
286
331
370
409
Wisconsin
49
84
172
240
289
330
366
399
Rhode Island
48
84
195
273
324
360
396
428
Maine
3
82
188
266
326
370
388
418
Pennsylvania
5
63
155
227
284
321
339
378
N = number of sampled populations
* data for individual states from Beamsderfer and North (1995)
** data from Brooks (2005)
ASA/12-Mar-08/Rev 0
RETROSPECTIVE ASSESSMENT
3-29
Electronic Filing - Received, Clerk's Office, December 15, 2008
* * * * * PCB 2009-038 * * * * *
ASA/12-Mar-08/Rev 0
Thermal Limits Petition Support Document - Coffeen Power Station
RETROSPECTIVE ASSESSMENT
3-30
Table 3-4. Mean Total Length (mm) at Age for Bluegill at Various Locations
Age
1
2
3
4
Coffeen Lake
a
64
94
108
112
Newton Lake
a
70
107
127
129
Lake of Egypt
b
66
104
137
157
Pools 16 & 17 UMR
c
56
109
155
178
Mississippi River
d
76
135
168
185
Ohio River
e
68
98
131
152
Michigan lakes
f
62
95
130
150
Indiana lakes
g
na
50-116
65-175
80-220
Sandhill lakes, NE
h
na
105
150
170
Mining/borrow pits, NE
h
na
105
132
160
a
Brooks 2005
b
Heidinger et al. 2000
c
Cornish and Welke 2004 for Upper Mississippi River
d
Carlander 1977
e
Heidinger and Waddell 1989
f
Schneider 1999; statewide average from graph
g
Ricker 1942 (in Spotte 2007)
h
from graph in Porath and Hurley 2005
na=not available
Electronic Filing - Received, Clerk's Office, December 15, 2008
* * * * * PCB 2009-038 * * * * *
Thermal Limits Petition Support Document - Coffeen Power Station
RETROSPECTIVE ASSESSMENT
Age
1
2
3
4
5
6
7
Coffeen Lake
141
195
259
281
305
337
361
Newton Lake
104
214
257
274
301
297
331
Mississippi R. Pool 18
a
104
180
234
297
333
356
409
Mississippi R. Pool 24
b
132
188
224
259
297
368
411
Mississippi R. Pool 16
a
91
165
226
267
302
328
368
Missouri River
c
215-282
382-410
Ohio River
d
170-282
328-406
Lake of the Ozarks, MO
e
157
263
Pony Express Lake, MO
f
330
503
Kentucky Lake, KY
g
288
475
Fort Gibson Reservoir, OK
h
292
531
Norris Reservoir, TN
i
272
424
a
Heidinger and Brooks 2005
b
Pitlo et al. 2004
c
Hesse et al. 1982 (in Hubert 1999)
d
Schoumacher 1973 (in Hubert 1999)
e
Marzolf 1955 (in Hubert 1999)
f
Eder and McDannold 1987 (in Hubert 1999)
g
Freeze 1977 (in Hubert 1999)
h
Hancock 1957 (in Hubert 1999)
i
Carroll and Hall 1964 (in Hubert 1999)
Table 3-5. Mean Total Length (mm) at Age for Channel Catfish in Selected Lakes, Rivers, and Reservoirs
3-31
Electronic Filing - Received, Clerk's Office, December 15, 2008
* * * * * PCB 2009-038 * * * * *
Thermal Limits Petition Support Document - Coffeen Power Station
Table 3-6. Mean Standing Crop Estimates (kg/ha) of Fish Species from Three Illinois
Reservoirs and Other U.S. Reservoirs (adapted from Perry and Tranquilli
1981)*
Species
Coffeen
Lake
Lake
Sangchris
Lake
Shelbyville
Midwest
Mid-south
largemouth bass
267.5
275.3
294
204 (468)
92 (717)
bluegill
52.1
22.8
22.7
42 (180)
21 (87)
channel catfish
34.6
9.5
2.6
14 (57)
9 (110)
all fish species
437.8
360.9
449.6
398 (134)
202 (1000)
*maximum values shown in parentheses for range of lakes
Table 3-7. IDNR and SIUC Electrofishing Indices of Relative Abundance (Catch-per-
Hour) of Juvenile and Adult Largemouth Bass, Bluegill, and Channel Catfish in
Coffeen Lake, 1997-2004
largemouth bass
bluegill
channel catfish
Year
IDNR
SIU
Year
IDNR
SIU
Year
IDNR
SIU
1997
79
23
1997
196
54
1997
9
5
1998
43
14
1998
99
49
1998
12
1
1999
67
25
1999
127
163
1999
16
5
2000
20
16
2000
89
97
2000
3
7
2001
99
23
2001
86
66
2001
6
3
2002
93
39
2002
179
166
2002
11
13
2003
66
26
2003
71
67
2003
4
6
2004
100
22
2004
65
67
2004
13
13
ASA/12-Mar-08/Rev 0
RETROSPECTIVE ASSESSMENT
3-32
Electronic Filing - Received, Clerk's Office, December 15, 2008
* * * * * PCB 2009-038 * * * * *
Thermal Limits Petition Support Document - Coffeen Power Station
4 PROSPECTIVE ASSESSMENT
4.1
May and October Temperature Tolerance
The impacts of thermal effluents from power plants and other heat sources on fishes have been
studied primarily in the laboratory. These laboratory studies occurred primarily during the 1970s
and 1980s as a result of Clean Water Act §316(a) assessments or efforts to establish water
quality standards with respect to temperature (Bevelheimer and Coutant 2003). Appendix A
presents a summary of data thus obtained for the life stages of largemouth bass, bluegill, and
channel catfish, which are representative of the fish community in Coffeen Lake. Maximum
tolerated temperatures have been determined by a variety of methods, but typically involve
holding test fish at a predetermined temperature for acclimation, then testing them at higher
temperatures to determine levels that result in acute mortality of 50 percent of test subjects (e.g.,
LT50 or upper incipient lethal temperature, UILT) over a stated period of time (e.g. 48 or 96 h)
or when death is assured (critical thermal maximum or CTM). Typically, a 2
o
C “safety factor” is
applied to the UILT or CTM value to approximate the upper temperature that could be occupied
continuously with no lethality.
Predicting responses of individual fish life stages to the proposed thermal standard revisions is
difficult because of the complexity of the thermal environment in Coffeen Lake (i.e., area
differences and vertical stratification in the lake) and the ability of fish, particularly motile life
stages, to adapt to or avoid temperatures that could exceed their optimal or tolerance levels. The
proposed thermal limits of 96
o
F and 102
o
F apply to near-surface water temperatures at the
boundary of the 26-acre mixing zone. They represent the warmest temperatures to which fish
and other organisms would be exposed, other than within the mixing zone itself.
Water temperatures at other locations in the lake and at greater depths would be considerably
less than the proposed limits of 96
o
F and 102
o
F for May and October. For example,
temperatures recorded near the surface at the intake typically are 10
o
F to 15
o
F lower than at the
mixing zone boundary (Section 2.3 and Figure 2-6). Even at the mixing zone boundary in
Segment 1, near-surface water temperatures can be up to 18
o
F or more greater than near the
bottom, as shown by vertical profiles for May 2006 (Figure 2-13). When the lake is stratified in
October, near-bottom temperatures can be 13-14
o
F less than near-surface temperatures, as in
2000 (Figure 2-13). Thus, at times when water temperatures approach the thermal limits of 96
o
F
and 102
o
F in May and October, temperatures in many areas or depths of the lake would be in the
80s (
o
F) or lower, well within the range of temperatures tolerated by RIS life stages (Table 4-1).
There is evidence that juvenile and adult fish will avoid the highest temperatures in or near the
thermal plume in the eastern arm of the lake. Electrofishing was conducted in August 1995
when surface water temperatures in the eastern, discharge arm were 38-44
o
C (100.4-111.2
o
F)
(ESE 1995). No fish were caught where surface temperatures were 40
o
C (104
o
F) or above. Fish
began to be caught in areas at 38
o
C, and catches progressively increased as surface temperatures
declined to 36
o
C (96.8
o
F) where DO was sufficient. Gill net sampling and sonar indicated that
fish were present in the discharge arm at depths of 3-4 m (9.8-13.1 ft) where temperatures were
34-37
o
C (93.2-98.6
o
F) and DO concentrations were 2-5 mg/L. Using sonic transmitters, Rush
ASA/12-Mar-08/Rev 0
PROSPECTIVE ASSESSMENT
4-1
Electronic Filing - Received, Clerk's Office, December 15, 2008
* * * * * PCB 2009-038 * * * * *
Thermal Limits Petition Support Document - Coffeen Power Station
(2000) found that adult largemouth bass increased their movements in Coffeen Lake during the
summer, generally away from the discharge area.
Laboratory studies of temperature tolerance, such as those cited in Appendix A, measure
responses to rapid changes in temperature. As a result, their use tends to conservatively
underestimate thermal tolerance in the field. In reality, organisms can acclimate and adapt
physiologically or genetically to temperature regimes, recover from short-term thermal stress,
and utilize lower temperature areas of the waterbody as refuge from stressful temperatures when
necessary (Coutant 2003, Reash 2008, Bevelheimer 2008). Moreover, fish can utilize habitat
with temperatures exceeding their long-term thermal tolerance limits for feeding and other
functions, returning to more thermally suitable areas for recovery from thermal stress
(NAE/NAS 1973).
4.2
Thermal Modeling
Potential changes in the thermal regime of Coffeen Lake under the proposed site-specific thermal
standards can be explored through the use of thermal modeling. Sargent & Lundy, LLC
conducted such a modeling exercise as a means of evaluating alternatives for increasing the
cooling capacity of Coffeen Lake (S&L 2008). Their one-dimensional model was used to
predict lake temperatures expected to occur as the result of increases in electric power generation
and resulting heat loading to the lake. This exercise considered the current and proposed thermal
permit limits for May and October. S&L chose 1987 for background meteorological conditions
as an example of a year when ambient temperatures during May would be greater than average,
then superimposed the operation of the Coffeen Power Station to simulate lake conditions under
maximal station operation. Using maximum operation and heat discharge along with warmer
than average ambient temperatures allowed an evaluation of near worst-case conditions in terms
of temperature increases in the lake during the months of May and October under the revised
thermal standards.
The model output provides predicted mean hourly water temperatures along the axis of the
cooling loop in the lake from the mixing zone boundary to the station’s intake at 1,000-ft
intervals. The model first was run using the existing thermal standards for May and October,
then was rerun using the proposed thermal standards for those two months while maintaining
current standards for the remaining 10 months. Assumptions used in the modeling included
continuous operation of the cooling basin and intermittent operation (100 percent on or off) of
the cooling towers as discharge temperatures approached the month-specific thermal standards.
Cooling tower operation was the means for maintaining temperatures at the mixing zone
boundary near or below the thermal standards. While the one-dimensional model used for this
assessment is simplistic, the model results provide insight into probable temperature increases
and maximum temperatures under near-maximum station operation and warm ambient
temperatures.
To illustrate the expected temperatures under these conditions, three locations along the cooling
loop were examined: the edge of the mixing zone, the dam (9,000 ft from discharge), and the
intake (21,500 ft from discharge). The plots of cumulative frequency for predicted temperatures
at each location presented in Figures 4-1 and 4-2 indicate that maximal temperature increases at
the edge of the mixing zone under the proposed standards would be greater than at the dam and
ASA/12-Mar-08/Rev 0
PROSPECTIVE ASSESSMENT
4-2
Electronic Filing - Received, Clerk's Office, December 15, 2008
* * * * * PCB 2009-038 * * * * *
Thermal Limits Petition Support Document - Coffeen Power Station
intake, i.e., heat would be dissipated as distance from the discharge increases. According to the
model, the median temperature (50
th
percentile) at the edge of the mixing zone during May
would be approximately 95
o
F under the proposed standards compared to approximately 88
o
F
under the existing standards (Figure 4-1). Differences in temperature between existing and
proposed standards would be successively smaller at the dam and intake: 88
o
F vs. 84
o
F at the
dam and 81.5
o
F vs. 80
o
F at the intake. In October, the median temperatures would be
approximately 90
o
F and 86
o
F at the edge of the mixing zone (proposed vs. current), 82
o
F and
80
o
F at the dam, and 74
o
F and 73
o
F at the intake (Figure 4-2).
An alternative way to evaluate the temperature increases is presented in Figure 4-3 as a plot of
the distribution of predicted temperatures longitudinally from the edge of the mixing zone to the
intake. Shown in these plots are the predicted “worst case” median temperature increase,
minimum and maximum temperature increases, and 25
th
and 75
th
percentiles. As in Figures 4-1
and 4-2, the predicted temperature increase declines progressively along the cooling loop.
The S&L model accounts for heat retention through time and therefore provides additional
insight as to whether warmer lake temperature during May would carry over into summer
months. To illustrate this phenomenon, Figure 4-4 plots predicted mean daily water
temperatures at the edge of the mixing zone under maximum station operation from mid-April to
mid-June and from mid-September to mid-November under the existing and proposed thermal
standards for May and October, while keeping existing standards for adjacent months. As
expected, predicted mean daily temperatures increase at the start of May under the proposed
standards but quickly begin to converge again with the current temperatures after the end of May
and completely converge by mid-June (Figure 4-4). Likewise, at the start of October the
predicted mean daily temperatures increase under the proposed standards but converge again
with the current temperatures by early November.
Since the S&L model is one-dimensional, it does not account for vertical or horizontal
distributions of temperatures within the lake. Therefore, it cannot simulate the entire thermal
regime in the lake or the temperatures that individual fish might encounter throughout the lake.
However, it does provide additional perspective of potential temperature increases linearly
within the lake under near-worst case conditions of maximum operation and warm ambient
temperatures. Temperatures in other parts of the lake such as in coves or north of the station
intake may be cooler, providing thermal refuges when necessary.
ASA/12-Mar-08/Rev 0
PROSPECTIVE ASSESSMENT
4-3
Electronic Filing - Received, Clerk's Office, December 15, 2008
* * * * * PCB 2009-038 * * * * *
Thermal Limits Petition Support Document - Coffeen Power Station
70 72 74 76 78 80 82 84 86 88 90 92 94 96 98100
0.0
0.2
0.4
0.6
0.8
1.0
Current Permit
Proposed Permit
Temp
0.0
0.2
0.4
0.6
0.8
1.0
Cumulative Frequency
May 1987
0.0
0.2
0.4
0.6
0.8
1.0
Intake
Dam
Edge of Mixing Zone
Figure 4-1. Cumulative Frequency of Predicted Water Temperatures at Three Locations
in Coffeen Lake under Existing and Proposed Temperature Limits during May
using 1987 Meteorological Conditions
ASA/12-Mar-08/Rev 0
PROSPECTIVE ASSESSMENT
4-4
Electronic Filing - Received, Clerk's Office, December 15, 2008
* * * * * PCB 2009-038 * * * * *
Thermal Limits Petition Support Document - Coffeen Power Station
70 72 74 76 78 80 82 84 86 88 90 92 94 96 98100
0.0
0.2
0.4
0.6
0.8
1.0
Current Permit
Proposed Permit
Temp
0.0
0.2
0.4
0.6
0.8
1.0
Cumulative Frequency
Oct 1987
0.0
0.2
0.4
0.6
0.8
1.0
Intake
Dam
Edge of Mixing Zone
Figure 4-2. Cumulative Frequency of Predicted Water Temperatures at Three Locations
in Coffeen Lake under Existing and Proposed Temperature Limits during
October using 1987 Meteorological Conditions
ASA/12-Mar-08/Rev 0
PROSPECTIVE ASSESSMENT
4-5
Electronic Filing - Received, Clerk's Office, December 15, 2008
* * * * * PCB 2009-038 * * * * *
Thermal Limits Petition Support Document - Coffeen Power Station
5000
10000
15000
20000
0
2
4
6
8
10
5000
10000
15000
20000
0
2
4
6
8
10
5000
10000
15000
20000
0
2
4
6
8
10
5000
10000
15000
20000
0
2
4
6
8
10
5000
10000
15000
20000
0
2
4
6
8
10
5000
10000
15000
20000
0
2
4
6
8
10
Temp Under Future Permit - Temp Under Current Permit
Distance from Discharge (ft)
Oct 1987
Edge of
Mixing Zone
Intake
25
th
Percentile
75
th
Percentile
May 1987
Min
Median
Max
Figure 4-3. Predicted Temperature Increases under Proposed Thermal Permit Limits as a
Function of Distance from the Edge of the Mixing Zone in Coffeen Lake using
1987 Meteorological Conditions
ASA/12-Mar-08/Rev 0
PROSPECTIVE ASSESSMENT
4-6
Electronic Filing - Received, Clerk's Office, December 15, 2008
* * * * * PCB 2009-038 * * * * *
Thermal Limits Petition Support Document - Coffeen Power Station
Sep 15
Sep 29
Oct 13
Oct 27
Nov 10
80
82
84
86
88
90
92
94
96
98
100
102
Apr 15
Apr 29
May 13
May 27
Jun 10
80
82
84
86
88
90
92
94
96
98
100
102
Current
Proposed
Water Temperature (F)
Figure 4-4. Predicted Mean Daily Near-Surface Water Temperatures at the Mixing Zone
Boundary under Current and Proposed Thermal Standards for May and
October using 1987 Meteorological Conditions
ASA/12-Mar-08/Rev 0
PROSPECTIVE ASSESSMENT
4-7
Electronic Filing - Received, Clerk's Office, December 15, 2008
* * * * * PCB 2009-038 * * * * *
Thermal Limits Petition Support Document - Coffeen Power Station
Table 4-1. Upper Thermal Tolerance Limits and Optimal Temperatures by Fish Species
and Life Stage (Literature Sources in Appendix A)
Month
Species
Life Stage
Upper
Tolerance
- SF* (
o
F)
May
Largemouth bass
Larva
86
Juvenile
95.5
Adult
93.9
May
Bluegill
Spawning
89
Embryo
89
Larva
89.6
Juvenile
95
Adult
103.1
May
Channel catfish
Spawning
85
Embryo
83
Larva
83-85?
Juvenile
97.7
Adult
95-97.7
October
Largemouth bass
Juvenile
95.5
Adult
93.9
October
Bluegill
Spawning
89
Embryo
89
Larva
89.6
Juvenile
95
Adult
103.1
October
Channel catfish
Juvenile
97.7
Adult
95-97.7
*(UILT or CTM)-3.6
o
F(safety
factor)
ASA/12-Mar-08/Rev 0
PROSPECTIVE ASSESSMENT
4-8
Electronic Filing - Received, Clerk's Office, December 15, 2008
* * * * * PCB 2009-038 * * * * *
Thermal Limits Petition Support Document - Coffeen Power Station
5 DISCUSSION AND CONCLUSIONS
5.1
Revisions Limited to May and October
The proposed revisions to thermal standards for Coffeen Lake are limited to the months of May
and October, the two transition months between winter and summer thermal conditions. As
such, the revised standards would more realistically reflect a natural thermal environment, where
temperature increases or decreases occur more gradually than the abrupt change inherent in the
existing site-specific standards.
The purpose for petitioning a change in the thermal standards for these two months is to be able
to avoid instances where unusually warm weather, droughts, or other circumstances would cause
reductions or suspension of electricity generation simply to avoid overly restrictive thermal
standards for May and October alone.
5.2
Minimal Effects on the Current Thermal Regime
If raised thermal standards were to result in higher water temperatures in the mixing zone in
May, one need not expect warmer temperatures to carry over throughout the remainder of the
summer season. Historically, warm May temperatures often have been followed by relatively
cool temperatures during summer months and vice versa. Although heat can be retained in the
lake for a period of time, annual variability in meteorological conditions appears largely to have
controlled monthly water temperatures under past plant operating conditions.
5.3
Warm May and October Temperatures Promote Survival and Growth
Higher, stable water temperatures during late winter and early spring have been shown to
promote earlier spawning and improved survival and growth or development of early life stages
of fish, particularly largemouth bass. The largemouth bass fishery of Coffeen Lake appears to be
exceptional primarily due to warmer temperatures which have resulted in earlier spawning under
more stable thermal conditions, a prolonged growing season, faster growth and earlier attainment
of a size permitting a fish diet, and improved overwinter survival and possibly growth. While
eggs and larvae tend to be more temperature sensitive than juveniles and adults, early spawning
by largemouth bass has resulted in these life stages being completed by May in Coffeen Lake,
especially by late May when temperatures would be highest. In May, young largemouth bass
primarily would be juveniles, with tolerances for temperatures that more typically would be
experienced in summer months. The fact that juvenile largemouth bass have prospered under the
summer temperature regime in Coffeen Lake suggests that May temperatures approaching (but
less than) June temperatures would easily be tolerated.
Higher May temperatures should not adversely affect bluegills, which have successfully spawned
in late spring and throughout summer when temperatures are highest. Spawning success at these
temperatures has been demonstrated amply by an abundance of small bluegill in Coffeen Lake.
Higher October water temperatures might even prolong their spawning season, which in the past
has continued into September and October.
ASA/12-Mar-08/Rev 0
DISCUSSION AND CONCLUSIONS
5-1
Electronic Filing - Received, Clerk's Office, December 15, 2008
* * * * * PCB 2009-038 * * * * *
Thermal Limits Petition Support Document - Coffeen Power Station
Channel catfish probably have experienced earlier than normal spawning in Coffeen Lake caused
by warm water temperature during the spring months. Like largemouth bass, early spawning
would allow completion of egg and larval life stages prior to May (especially late May), leaving
juveniles which are much less temperature sensitive and have been shown to thrive through
summer temperatures much higher than those that they would experience in May under the
proposed revised thermal limits.
The diversity in the water temperatures existing in the eastern and western arms of Coffeen Lake
should be advantageous for all fish species. While water temperatures may be too warm or too
cool for a particular species and life stage at a particular location, there are areas elsewhere in the
lake where water temperatures will be closer to optimal. The northern portion of the western
arm, which is minimally influenced by thermal discharges from the plant, can serve as both a
nursery for young fish and a thermal refuge for older fish during the warmest times of the year.
5.4
No Evidence of Detrimental Effects of Current Temperatures on Recruitment,
Growth, and Condition
No significant relationship was found between the thermal history (in terms of degree-days
accumulated from May through August) and recruitment of YOY largemouth bass, or the growth
and condition of all three RIS. There was an indication that warmer temperatures could increase
the growth rates of largemouth bass during their first year of life, but this relationship was not
statistically significant. Since the range of temperatures occurring in the summer have not
influenced recruitment, growth, or relative weight for these three species annually, it is even less
likely that detrimental effects could result from temperatures that would be experienced in May
and October under the revised standards.
Recruitment, growth, and condition of fish are good indicators of the availability of an adequate
food supply supported by lower trophic levels in the lake community, i.e., primary producers
such as phytoplankton, epiphyton, and macrophytes, as well as primary and secondary
consumers such zooplankton, benthos, and phytomacrobenthos. The lack of evidence of
detrimental effects of water temperatures on fish recruitment, growth, and condition indicate that
these lower trophic levels also are adapted to the thermal environment of the lake and should not
be affected by revised standards for May and October.
5.5
Evidence of Thermal Adaptations by Fish Populations
Intensive monitoring of the fish populations in Coffeen Lake by Southern Illinois University-
Carbondale and the Illinois Department of Natural Resources (IDNR) has indicated that the fish
populations have adapted and thrived in the thermal environment of the lake.
Largemouth bass in their first three years of life in Coffeen Lake are larger than in other lakes
and reservoirs in Illinois, and in other midwestern and southern states. Overall, their mean
relative weight in recent years has been 100 or greater, indicating a population of very healthy,
robust largemouth bass. According to very recent IDNR data, proportional stock density (the
percentage of stock fish equal to or exceeding quality length) consistently has been higher than
that agency’s goal, indicating a high quality fishery for large bass.
ASA/12-Mar-08/Rev 0
DISCUSSION AND CONCLUSIONS
5-2
Electronic Filing - Received, Clerk's Office, December 15, 2008
* * * * * PCB 2009-038 * * * * *
Thermal Limits Petition Support Document - Coffeen Power Station
Average annual growth for bluegill at ages 0 and 1 in Coffeen Lake has been average when
compared to other regional bluegill populations, indicating that water temperatures likely are not
affecting early growth rates. However, growth at later ages has been stunted, probably due to
competition for food with other species such as redear sunfish, gizzard shad, and threadfin shad,
and not due to thermal effects. Relative weights for bluegill have been below management
goals, further indicating that food may be limiting.
Growth for channel catfish in Coffeen Lake, as determined by length at annulus formation, falls
within the range of values for other channel catfish populations in rivers, lakes, and other
reservoirs in the Midwest or South. Condition, as measured by relative weight, has been well
within the targeted range until very recently, coinciding with a three-fold increase in abundance
as shown by IDNR fall electrofishing surveys.
Standing crops in Coffeen Lake during 1979-1980 were either higher or intermediate among
mean values for standing crops in other lakes and reservoirs in Illinois, the Midwest, and mid-
south. Data are not available concerning the abundance of fish through all the years since 1980.
However, recent catch-per-effort data show that the populations are relatively stable with no
consistent trend, suggesting that Coffeen Lake populations still compare favorably to those in
other locations.
5.6
Fish Kills Unlikely to Result
Fish kills involving more than a few fish in Coffeen Lake in recent years have been restricted to
the warmest temperatures during summer months, especially when the lake is stratified and
dissolved oxygen (DO) concentrations have been depleted. These conditions would not be
expected to occur during either May or October, even under the proposed revisions to the
thermal standards. In 1999, 2001, and 2002 fish kills involving the recovery of more than 100
fish have occurred only after a rise in water temperatures to daily means of 100
o
F or more, as
measured near the surface at the boundary of the mixing zone in the eastern arm of the lake.
Proposed revisions to the May and October thermal standards will keep maximum hourly
temperatures of this magnitude to a very small fraction (<2 percent) of the hours and limit mean
temperatures to 96
o
F for the month.
In recent SIUC surveys of the lake, DO concentrations in May and October were 4 mg/L or
higher at depths other than very near the lake bottom in Segments 1 and 2, which are areas
nearest the discharge (see Section 2.3.2). Segments 3 and 4 were less stratified and generally
had cooler temperatures and higher DO concentrations that, if necessary, could serve as refuge
areas. Studies conducted in Coffeen Lake have provided evidence that fish have behaviorally
adapted to the warmest temperatures in the lake by avoiding them and seeking areas with cooler
temperatures, such as outside the eastern arm (see Section 3.2). The fact that fish kills in 2001
and 2002 did not continue after the initial temperature rise to 100
o
F or more in the mixing zone
suggests that fish avoided the warmest areas in the lake at this time and sought thermal refuges
where they would no longed be exposed to these temperatures or to depleted DO levels.
ASA/12-Mar-08/Rev 0
DISCUSSION AND CONCLUSIONS
5-3
Electronic Filing - Received, Clerk's Office, December 15, 2008
* * * * * PCB 2009-038 * * * * *
Thermal Limits Petition Support Document - Coffeen Power Station
6 REFERENCES CITED
Ackerson, J. 2000. Chapter 8, Ichthyoplankton. In: Heidinger, R., R. Brooks, and R. Sheehan.
2000. Ameren/CIPS Newton and Coffeen Lakes Research and Monitoring Project Status
Report. Fisheries & Illinois Aquaculture Center, Southern Illinois University at
Carbondale. November 2000.
Allen, K.O. and K. Strawn. 1971. Rate of acclimation of juvenile channel catfish, Ictalurus
punctatus, to high temperatures. Transactions of the American Fisheries Society
100(4):665-671.
Beamesderfer, R.C. and J.A. North. 1995. Growth, natural mortality, and predicted response to
fishing for largemouth bass and smallmouth bass populations in North America. North
American Journal of Fisheries Management 15:688-704.
Bennett, D.H. and J.W. Gibbons. 1975. Reproductive cycles of largemouth bass (
Micropterus
salmoides
) in a cooling reservoir. Transactions of the American Fisheries Society
104(1):77-82.
Bergmann, H. 1981. Distribution and abundance of larval fishes in Lake Sangchris (1976).
Pages 615-630 In: R.W. Larimore and J.A. Tranquilli (eds.). The Lake Sangchris Study:
case history of an Illinois Cooling Lake. Illinios Institute of Natural Resources, Natural
History Survey Division, Champagne, Illinois. Vol. 32(4). 1981.
Bevelheimer, Mark. 2007. Thermal Stress and Recovery in Fish Exposed Intermittently to Near-
Lethal Temperatures. The Second Thermal Ecology and Regulation Workshop, Denver,
CO. 2-3 October 2007.
Bevelheimer, M.S. and C.C Coutant. 2004. Assessing biological response of fish to extreme
temperatures: an update on the science. Chapter 6. In: Proceedings from the EPRI
Workshop on 316(a) Issues: Technical and Regulatory Considerations: October 16-17,
2003, EPRI, Palo Alto, CA, and American Electric Power Compary, Columbus, OH:
2004. 1008476.
Brooks, R. 2004. Ameren/CIPS Newton and Coffeen Lakes Research and Monitoring Draft
Report. Fisheries & Illinois Aquaculture Center, Southern Illinois University at
Carbondale. February 2004.
Brooks, R. 2005. Ameren/CIPS Newton and Coffeen Lakes Research and Monitoring Draft
Annual Report. Fisheries & Illinois Aquaculture Center, Southern Illinois University at
Carbondale. March 2005.
Brooks, R., and R. Heidinger. 2006. Ameren/CIPS Newton and Coffeen Lakes Research and
Monitoring Draft Annual Report. Fisheries & Illinois Aquaculture Center, Southern
Illinois University at Carbondale. March 2006.
ASA/12-Mar-08/Rev 0
REFERENCES CITED
6-1
Electronic Filing - Received, Clerk's Office, December 15, 2008
* * * * * PCB 2009-038 * * * * *
Thermal Limits Petition Support Document - Coffeen Power Station
Brooks, R., and R. Heidinger. 2007. Ameren/CIPS Newton and Coffeen Lakes Research and
Monitoring Draft Annual Report. Fisheries & Illinois Aquaculture Center, Southern
Illinois University at Carbondale. March 2007.
Carlander, K.D. 1977. Handbook of Freshwater Fisheries Biology. Volume 2. Life history data
on centrarchid fishes of the United States and Canada. The Iowa State University Press.
Ames, Iowa. 471 p.
Carlson, A.R. and R.E. Siefert. 1974. Effects of reduced oxygen on the embryos and larvae of
lake trout (
Salvelinus namaycush
) and largemouth bass (
Micropterus salmoides
). Journal
of the Fisheries Research Board of Canada 31:1393-1396.
Cornish, M. and K. Welke. 2004. Bluegill (
Lepomis macrochirus
).
In:
Pitlo, J.M. Jr. and J.L.
Rasmussen (
eds
.). UMRRC Fisheries Compendium. 3
rd
Edition. Upper Mississippi River
Conservation Committee. Rock Island, Illinois. January 2004. p. 177-180.
Coutant, C.C. 1977. Compilation of temperature preference data. Journal of the Fisheries
Research Board of Canada 34:739-745.
Coutant, Charles C. 2003. Proceedings from the EPRI Workshop on 316(a) Issues: Technical
and Regulatory Considerations. 16-17 October 2003.
Environmental Science & Engineering, Inc. (ES&E). 1995. Coffeen Lake 1995 aquatic biota
and water quality surveys. Prepared for Central Illinois Public Service. November 13,
1995. ES&E Project No. 5195-125-0400.
Fields, R., S.S. Lowe, C. Kaminski, G.S. Whitt, and D.P. Philipp. 1987. Critical and chronic
thermal maxima of northern and Florida largemouth bass and their reciprocal F
1
and F
2
hybrids. Transactions of the American Fisheries Society 116:856-863.
Fuhr, M.A., D.H. Wahl, and D.P. Philipp. 2002. Fall abundance of age-0 largemouth bass is
more important than size in determining age-1 year-class strength in Illinois. Pages 91-
100 In
: Tranquilli, J.A. and R.W. Larimore (eds). Final report to Central Illinois Public
Service Company. Part I: Environmental studies of Coffeen Lake, a thermally-altered
reservoir. Illinois Natural History Survey, Urbana, Illinois. July 1981.
Fullerton, A.H., J.E. Garvey, R.A. Wright, and R.A. Stein. 2000. Overwinter growth and
survival of largemouth bass: interactions among size, food, origin, and winter severity.
Transactions of the American Fisheries Society 129:1-12.
Garvey, J.E., R.A. Stein, R.A. Wright, and M.T. Bremigan. 2002. Exploring ecological
mechanisms underlying largemouth bass recruitment along environmental gradients.
Pages 2-24 Tranquilli, J.A. and R.W. Larimore (eds). Final report to Central Illinois
Public Service Company. Part I: Environmental studies of Coffeen Lake, a thermally-
altered reservoir. Illinois Natural History Survey, Urbana, Illinois. July 1981.
Gutreuter, S.J. and R.O. Anderson. 1985. Importance of body size to the recruitment process in
largemouth bass populations. Transactions of the American Fisheries Society 114(3):317-
327.
ASA/12-Mar-08/Rev 0
REFERENCES CITED
6-2
Electronic Filing - Received, Clerk's Office, December 15, 2008
* * * * * PCB 2009-038 * * * * *
Thermal Limits Petition Support Document - Coffeen Power Station
Heidinger, R.C. 1975. Life history and biology of the largemouth bass. Pages 11-20 In: R.H.
Stroud and H. Clepper (eds.). Black Bass Biology and Management. Sport Fishing
Institute, Washington, D.C.
Heidinger, R.C. and J.H. Waddell. 1989. Lower Ohio River Fisheries Study. Illinois Department
of Conservation. Final Report. 1 July 1986 through 30 June 1989. F-59-R. 349 p.
Heidinger, R., R. Sheehan, and R. Brooks (eds.). 2000. Ameren/CIPS Newton and Coffeen
Lakes Research and Monitoring Project Status Report. Fisheries & Illinois Aquaculture
Center, Southern Illinois University at Carbondale. November 2000.
Heidinger, R., R. Brooks, and R. Sheehan. 2001. Ameren/CIPS Newton and Coffeen Lakes
Research and Monitoring Project Draft Annual Report. Fisheries & Illinois Aquaculture
Center, Southern Illinois University at Carbondale. March 2001.
Heidinger, R., R. Brooks, T. Spier, and R. Sheehan. 2002. Ameren/CIPS Newton and Coffeen
Lakes Research and Monitoring Project Draft Report. Fisheries & Illinois Aquaculture
Center, Southern Illinois University at Carbondale. March 2002.
Hubert, W.A. 1999. Biology and management of channel catfish. Pages 3-22 In: E.R. Irwin,
W.A. Hubert, C.F. Rabeni, H.L. Schramm, Jr., and T. Coon (eds.). Catfish
2000:Proceedings of the International Ictalurid Symposium. American Fisheries Society,
Bethesda, Maryland.
Jackson, J.R. and R.L. Noble. 2000. Relationships between annual variations in reservoir
conditions and age-0 largemouth bass year-class strength. Transactions of the American
Fisheries Society 129:699-715.
Kramer, R.H. and L.L. Smith, Jr. 1960. First-year growth of the largemouth bass,
Micropterus
salmoides
(Lacepede), and some related ecological factors. Transactions of the American
Fisheries Society 89:222-233.
Kramer, R.H. and L.L. Smith, Jr. 1962. Formation of year classes in largemouth bass.
Transactions of the American Fisheries Society 91:29-41.
McCormick, J.H. and J.A. Wegner. 1981. Responses of largemouth bass from different latitudes
to elevated water temperatures. Transactions of the American Fisheries Society 110:417-
429.
Merriner, J.V. 1971. Development of intergenic centrarchid hybrid embryos. Transactions of the
American Fisheries Society 100(4):611-618.
Miranda, L.E. and W.D. Hubbard. 1994. Winer survival of age-0 largemouth bass relative to
size, predators, and shelter. North American Journal of Fisheries Management 14:790-
796.
Miller, S.J. and T. Storck. 1984. Temporal spawning distribution of largemouth bass and young-
of-year growth, determined from daily growth rings. Transactions of the American
Fisheries Society 113:571-578.
ASA/12-Mar-08/Rev 0
REFERENCES CITED
6-3
Electronic Filing - Received, Clerk's Office, December 15, 2008
* * * * * PCB 2009-038 * * * * *
Thermal Limits Petition Support Document - Coffeen Power Station
Moss, D.D. and D.C. Scott. 1961. Dissolved-oxygen requirements of three species of fish.
Transactions of the American Fisheries Society 90(4):377-393.
Murphy, B.R.,, D.W. Willis, and T.A. Springer. 1991. The relative weight index in fisheries
management: status and needs. Fisheries 16(2):30-38.
National Academy of Sciences and National Academy of Engineering (NAS/NAE). 1973. Water
Quality Criteria 1972. Prepared for U.S. Environmental Protection Agency. Washington,
D.C.
Newman, D.L. 1981a. Distributional ecology and relative abundance of ichthyoplankton.
Chapter 10 In
: Tranquilli, J.A. and R.W. Larimore (eds). Final report to Central Illinois
Public Service Company. Part I: Environmental studies of Coffeen Lake, a thermally-
altered reservoir. Illinois Natural History Survey, Urbana, Illinois. July 1981.
Newman, D.L. 1981b. Impingement and entrainment. Chapter 12, In
: Tranquilli, J.A. and R.W.
Larimore (eds). Final report to Central Illinois Public Service Company. Part I:
Environmental studies of Coffeen Lake, a thermally-altered reservoir. Illinois Natural
History Survey, Urbana, Illinois. July 1981.
Perry, L.G. 1981. Abundance of littoral fish larvae in Coffeen Lake as determined by light-
trapping. Chapter 11 In: Tranquilli, J.A. and R.W. Larimore (eds). Final report to Central
Illinois Public Service Company. Part I: Environmental studies of Coffeen Lake, a
thermally-altered reservoir. Illinois Natural History Survey, Urbana, Illinois. July 1981.
Perry, L.G. and J.A. Tranquilli. 1981. Standing crop estimates of Coffeen Lake fishes. Chapter
14. In: Tranquilli, J.A. and R.W. Larimore (eds). Final report to Central Illinois Public
Service Company. Part I: Environmental studies of Coffeen Lake, a thermally-altered
reservoir. Illinois Natural History Survey, Urbana, Illinois. July 1981.
Pitlo, J., K. Brummet, and M. Endris. 2004. Channel catfish (
Ictalurus punctatus
).
In:
Pitlo, J.M.
Jr. and J.L. Rasmussen (eds.). UMRRC Fisheries Compendium. 3
rd
Edition. Upper
Mississippi River Conservation Committee. Rock Island, Illinois. January 2004. pp. 151-
155.
Pontnack. J. 2007. Lake management status report. Coffeen Lake, Montgomery County. Illinois
Department of Natural Resources. 23 March 2007.
Porath, M.T. and K.L. Hurley. 2005. Effects of waterbody type and management actions on
bluegill growth rates. North American Journal of Fisheries Management 25:1041-1050.
Reash, Robert. 2007. Laboratory vs Field Tolerances: A Review and Mechanisms Explainig
Thermal Tolerance Plasticity. The Second Thermal Ecology and Regulation Workshop,
Denver, CO. 2-3 October 2007.
Rush, J.L. 2000. Movement of largemouth bass and channel catfish. Chapter 14 In
: Heidinger,
R., R. Sheehan, and R. Brooks (eds.). Ameren/CIPS Newton and Coffeen Lakes
Research and Monitoring Project Status Report. Fisheries & Illinois Aquaculture Center,
Southern Illinois University at Carbondale. November 2000.
ASA/12-Mar-08/Rev 0
REFERENCES CITED
6-4
Electronic Filing - Received, Clerk's Office, December 15, 2008
* * * * * PCB 2009-038 * * * * *
Thermal Limits Petition Support Document - Coffeen Power Station
Sargent & Lundy, LLC (S&L). 2008. Coffeen Units 1 and 2, Coffeen cooling system thermal
study. Report SL-009346. Prepared for Ameren Energy Generating. Project No. 10087-
073. January 2008. Chicago, Illinois.
Schneider, J.C. 1999. Dynamics of quality bluegill populations in two Michigan lakes with
dense vegetation. North American Journal of Fisheries Management 19:97-109.
Scott, W.B. and E.J. Crossman. 1973. Freshwater Fishes of Canada. Fisheries Research Board of
Canada Bulletin 184. 966 p.
Smith, P.W. 2002. The Fishes of Illinois. University of Illinois Press, Urbana and Chicago. 314
pp.
Spotte, S. 2007. Bluegills: biology and behavior. American Fisheries Society, Bethesda,
Maryland. 214 p.
Stroud, R.H. and H. Clepper (eds.). 1975. Black Bass Biology and Management. Sport Fishing
Institute, Washington, D.C.
Sule, M.J. 1981. First-year growth and feeding of largemouth bass in a heated reservoir. Pages
520-535 In: R.W. Larimore and J.A. Tranquilli (eds.). The Lake Sangchris Study: case
history of an Illinois Cooling Lake. Illinios Institute of Natural Resources, Natural
History Survey Division, Champagne, Illinois. Vol. 32(4). 1981.
Tin, H.T. 1982. Family Centrarchidae, sunfishes. pp. 524-580 In: N.A. Auer (ed.) 1982.
Identification of larval fishes of the Great Lakes basin with emphasis on the Lake
Midhigan drainage. Great Lakes Fishery Commission, Ann Arbor, MI 48105. Special
Pub. 82-83:744 pp.
Tranquilli, J.A. and R.W. Larimore (eds). 1981. Final report to Central Illinois Public Service
Company. Part I: Environmental studies of Coffeen Lake, a thermally-altered reservoir.
Illinois Natural History Survey, Urbana, Illinois. July 1981.
Tranquilli, J.A. and L.A. Perry. 1981. Spawning periodicity and fecundity of fishes inhabiting
heated and ambient areas of Coffeen Lake. Chapter 16 In: Tranquilli, J.A. and R.W.
Larimore (eds). Final report to Central Illinois Public Service Company. Part I:
Environmental studies of Coffeen Lake, a thermally-altered reservoir. Illinois Natural
History Survey, Urbana, Illinois. July 1981.
Tranquilli, J.A., R. Kocher, and J.M. McNurney. 1981. Population dynamics of the Lake
Sangchris fishery.
Pages 413-499 In: R.W. Larimore and J.A. Tranquilli (eds.). The Lake
Sangchris Study: case history of an Illinois Cooling Lake. Illinios Institute of Natural
Resources, Natural History Survey Division, Champagne, Illinois. Vol. 32(4). 1981.
Whitmore, C.M., C.E. Warren, and P. Doudoroff. 1960. Avoidance reactions of salmonid and
centrarchid fishes to low oxygen concentrations. Transactions of the American Fisheries
Society 89:17-26.
ASA/12-Mar-08/Rev 0
REFERENCES CITED
6-5
Electronic Filing - Received, Clerk's Office, December 15, 2008
* * * * * PCB 2009-038 * * * * *
ASA/12-Mar-08/Rev 0
Thermal Limits Petition Support Document - Coffeen Power Station
REFERENCES CITED
6-6
Wismer, D.A. and A.E. Christie. 1987. Temperature relationships of Great Lakes fishes: a data
compilation. Great Lakes Fishery Commission, Ann Arbor, Michigan. Special
Publication No. 87-3. July 1987. 165 p.
Electronic Filing - Received, Clerk's Office, December 15, 2008
* * * * * PCB 2009-038 * * * * *
Appendix A. Temperature (T) and Dissolved Oxygen (DO) Requirements for Coffeen Lake Target Species
Species
Life Stage
Maximum T
Source
Minimum DO
(mg/l)
Source
Largemouth bass spawning
20C
Lake Shelbyville, IL
(Miller and Storck
1984)
spawning
24C
Heidinger 1975
embryo
29.5C post-
fertilization;
32.3C pre-
hatching
TL50 (McCormick
and Wegener 1981)
3.0 for good
survival @ 20C
and 23C; sharply
decreased with
2.8 @25C, 2.0
@ 15-20C
Carlson and Siefert
1974
larvae
31.2C @ 20,
32.4C @
24C, 33.0C 2
27C, 31.7C
@ 30C
<24 hr old TL50
(McCormick and
Wegener 1981)
3.0 for good
survival @ 20C
and 23C; sharply
decreased with
2.8 @25C, 2.0
@ 15-20C
Carlson and Siefert
1974
larvae
33.7C @ 20C
11-12 days old (7
mm) TL50
(McCormick and
Wegener 1981)
juvenile
40.9+0.40C
CTM and
37.3C chronic
TM @32C
acclimation
50-60 mm TL
northern LMB
(Fields et al. 1987) <1.5
avoided
50-90 mmTL
(Whitmore et al.
1960)
juvenile
0.92 @ 25C,
1.19 @30C,
1.40 @ 35C
Critical DO; shock
expt. for 4-15 g fish
(Moss and Scott
1961)
Electronic Filing - Received, Clerk's Office, December 15, 2008
* * * * * PCB 2009-038 * * * * *
Species
Life Stage
Maximum T
Source
Minimum DO
(mg/l)
Source
juvenile
0.92 @ 25C,
1.19 @30C,
1.40 @ 35C
Critical DO; shock
expt. for 4-15 g fish
(Moss and Scott
1961)
adult
36.4C @ 30C
Brown 1974 (in
Wismer and
Christie 1987)
Bluegill
spawning
33.8C
Spotila et al. 1979
(in Wismer and
Christie 1987)
embryo
33.8C @ 26C Carlander 1977
larvae
34C @ 26C Carlander 1977
juvenile
37C @ 33C
EPA 1974 (in
Wismer and
Christie 1987)
0.75 @ 25C, 1.0
@ 30C, 1.23 @
35C
Critical DO shock
expt. for 5-20 g fish
(Moss and Scott
1961)
adult
41.5C
CTM (Carlander
1977)
adult
38.3C @
22.8C
CTM (Reutter and
Herdendorf 1976 in
Wismer and
Christie 1987)
Channel catfish
spawning
29.5C
Scott and
Crossman 1973
embryo
28.4C
Brown 1974 (in
Wismer and
Christie 1987)
juvenile
36.6C @
26C, 37.8C
@ 30C,
38.0C @ 34C
Brown 1974 (in
Wismer and
Christie 1987)
0.95 @ 25C,
1.03 @ 30C,
1.05-1.09 @
35C
Critical DO shock
expt. for 13-22 g
fish (Moss and
Scott 1961)
Electronic Filing - Received, Clerk's Office, December 15, 2008
* * * * * PCB 2009-038 * * * * *
Species
Life Stage
Maximum T
Source
Minimum DO
(mg/l)
Source
juvenile
38.5-40.0 @
26-34C
Allen and Strawn
1971
adult
32.8C @
20C, 33.5C
@ 25C
Brown 1974 (in
Wismer and
Christie 1987)
Electronic Filing - Received, Clerk's Office, December 15, 2008
* * * * * PCB 2009-038 * * * * *
Electronic Filing - Received, Clerk's Office, December 15, 2008
* * * * * PCB 2009-038 * * * * *
Electronic Filing - Received, Clerk's Office, December 15, 2008
* * * * * PCB 2009-038 * * * * *
Electronic Filing - Received, Clerk's Office, December 15, 2008
* * * * * PCB 2009-038 * * * * *
Electronic Filing - Received, Clerk's Office, December 15, 2008
* * * * * PCB 2009-038 * * * * *
Electronic Filing - Received, Clerk's Office, December 15, 2008
* * * * * PCB 2009-038 * * * * *
Electronic Filing - Received, Clerk's Office, December 15, 2008
* * * * * PCB 2009-038 * * * * *
Electronic Filing - Received, Clerk's Office, December 15, 2008
* * * * * PCB 2009-038 * * * * *
Electronic Filing - Received, Clerk's Office, December 15, 2008
* * * * * PCB 2009-038 * * * * *
Electronic Filing - Received, Clerk's Office, December 15, 2008
* * * * * PCB 2009-038 * * * * *
Electronic Filing - Received, Clerk's Office, December 15, 2008
* * * * * PCB 2009-038 * * * * *
Electronic Filing - Received, Clerk's Office, December 15, 2008
* * * * * PCB 2009-038 * * * * *
Electronic Filing - Received, Clerk's Office, December 15, 2008
* * * * * PCB 2009-038 * * * * *
Electronic Filing - Received, Clerk's Office, December 15, 2008
* * * * * PCB 2009-038 * * * * *
Electronic Filing - Received, Clerk's Office, December 15, 2008
* * * * * PCB 2009-038 * * * * *
Electronic Filing - Received, Clerk's Office, December 15, 2008
* * * * * PCB 2009-038 * * * * *
Electronic Filing - Received, Clerk's Office, December 15, 2008
* * * * * PCB 2009-038 * * * * *
Electronic Filing - Received, Clerk's Office, December 15, 2008
* * * * * PCB 2009-038 * * * * *
Electronic Filing - Received, Clerk's Office, December 15, 2008
* * * * * PCB 2009-038 * * * * *
Electronic Filing - Received, Clerk's Office, December 15, 2008
* * * * * PCB 2009-038 * * * * *
Electronic Filing - Received, Clerk's Office, December 15, 2008
* * * * * PCB 2009-038 * * * * *
D:\coffeen\SL-009346.DOC
COFFEEN UNITS 1 AND 2
COFFEEN COOLING SYSTEM THERMAL STUDY
Report SL-009346
Revision 0
Prepared for
Ameren Energy Generating
June, 2008
Project No. 10087-073
55 East Monroe Street
Chicago, IL 60603
Electronic Filing - Received, Clerk's Office, December 15, 2008
* * * * * PCB 2009-038 * * * * *
Electronic Filing - Received, Clerk's Office, December 15, 2008
* * * * * PCB 2009-038 * * * * *
Ameren Energy Generating
Coffeen Power Station Units 1 & 2
Coffeen Cooling System Thermal
Study
Report SL-009346
Project No. 10087-073
Date: June 9, 2008
D:\coffeen\SL-009346.DOC
TABLE OF CONTENTS
1.
INTRODUCTION ........................................................................................................................... 4
2.
METHODOLOGY .......................................................................................................................... 5
3.
EVALUATED OPTIONS ...............................................................................................................7
3.1
UTILIZE EXISTING SYSTEM ...................................................................................................... 8
3.2
AUGMENT EXISTING TOWERS WITH A NEW FIELD-ERECTED TOWER......................... 8
3.3
ADDITIONAL COOLING BASIN CAPACITY............................................................................ 9
3.4
CLOSED-CYCLE COOLING TOWER ......................................................................................... 9
3.5
AIR-COOLED CONDENSER ...................................................................................................... 10
3.6
UTILIZE ENTIRE LENGTH OF COFFEEN LAKE.................................................................... 10
4.
COST EVALUATION .................................................................................................................. 11
4.1
CAPITAL COSTS ......................................................................................................................... 11
5.
EVALUATION OF ALTERNATE NPDES PERMIT LIMITS ................................................... 12
6.
CONCLUSIONS ........................................................................................................................... 13
Electronic Filing - Received, Clerk's Office, December 15, 2008
* * * * * PCB 2009-038 * * * * *
Ameren Energy Generating
Coffeen Power Station Units 1 & 2
Coffeen Cooling System Evaluation
Report SL-009346
Project No. 10087-073
Date: June 9, 2008
Page 4 of 13
D:\coffeen\SL-009346.DOC
1.
INTRODUCTION
This report provides an engineering assessment for Ameren to compare various options to meet its thermal
discharge limitations for Coffeen Lake without affecting operational availability. Presently, Coffeen Station is
not able to consistently comply with the monthly average thermal limits at Coffeen Lake as set forth in
Ameren’s NPDES permit without de-rating its units or otherwise affecting operational availability. Ameren’s
forecasting of future demands for Coffeen Station indicates that electrical output is expected to increase to
1,026 MW with a 90% capacity factor within the next few years.
This report evaluates the performance of Coffeen Station’s cooling system based on the forecasted increases in
future gross electrical output and capacity factor using S&L’s thermal lake modeling software program. It
considers several alternatives to improve performance to meet the current thermal limits and evaluates whether
the alternatives are technically feasible. It also sets forth a cost estimate for each alternative that is considered
technically feasible per the S&L modeling. Finally, it sets forth an evaluation of an alternative thermal
limitation in Ameren’s NPDES permit for the months of May and October.
The existing Coffeen Station cooling system consists of Coffeen Lake, the cooling basin, and cooling towers as
shown in an aerial representation in Figure 1-1. Coffeen Lake is a 1,100-acre artificial impoundment created
to support the water needs of the Coffeen Station.
Figure 1-1
Aerial Representation of Current Coffeen Cooling System
The discharge temperature monthly average and peak limits at the edge of the "Mix Zone", which is the 26-
acre area in the lake adjacent to the plant discharge, are set forth in the station's NPDES permit and were
originally based on a 1,000 MW station operating at 70% capacity factor. These limits are shown in Table 1-1.
Electronic Filing - Received, Clerk's Office, December 15, 2008
* * * * * PCB 2009-038 * * * * *
Ameren Energy Generating
Coffeen Power Station Units 1 & 2
Coffeen Cooling System Evaluation
Report SL-009346
Project No. 10087-073
Date: June 9, 2008
Page 5 of 13
D:\coffeen\SL-009346.DOC
Table 1-1
NPDES Mix Zone Temperature Permit Limits
Months
Permit Monthly Average
Permit Monthly Peak
October through May
89°F
94°F
(1)
June through September
105°F
112°F
(2)
1. Temperature is allowed to exceed permit limit 2% of the hours in the month.
2. Temperature is allowed to exceed permit limit 3% of the hours in the month.
The station has periodically experienced loss of generation capacity to comply with the permit temperature
limits. The 70-acre supplemental cooling basin was installed in the spring of 2000 and helper cooling towers
were installed in the spring of 2002 in an effort to alleviate this problem. The station has the capability to
direct the warm station discharge flow to the basin, the cooling towers, directly to the mix zone, or a
combination of the three. Both the basin and the cooling towers are located upstream of the mix zone in order
to cool the discharge to meet the mix zone temperature limits.
Despite the foregoing efforts, the station continues to experience loss of generation capacity during periods of
high station power output and hot weather conditions, specifically during May and October, which correspond
to the first and last months of the non-summer thermal limits. Coffeen Lake was originally designed to
provide cooling capacity equivalent for operation of a 1,000 MW station with a 70% capacity factor. The
maximum plant gross electrical output is currently 950 MW. Future gross electrical output of the plant
including burning a higher percentage of Illinois coal and steam turbine and induced draft fan upgrades is
expected to be 1,026 MW. The station is currently run at 95% or greater capacity factors for a 24 hour period
as weather conditions and permit compliance allows and is currently averaging 82% capacity factor for 2008
(as of the date of this report), including a complete station outage lasting over 3 weeks. It is not possible to
maintain these capacity factors during periods of hot weather during May and October. The higher future
gross electrical output and capacity factors both increase the required cooling system capacity in order to meet
the NPDES permit limits and avoid station derates.
In an effort to quantify the current installed cooling system capability and evaluate options to maintain
compliance without resorting to de-rating, Ameren contracted Sargent & Lundy LLC (S&L) to perform a
detailed evaluation of the existing cooling system. This study assesses various alternative enhancements to the
existing cooling system, and the costs of such alternatives. The results provided input data for feasible system
modifications to Ameren's financial evaluation team for economic analysis.
2.
METHODOLOGY
The thermal performance of the Coffeen cooling system was evaluated using S&L’s thermal lake modeling
software program utilizing the following data:
¾
Historical hourly weather data
¾
Cooling water temperature rise across station
¾
Cooling water flowrates
¾
Cooling tower performance curve
¾
Lake and basin volume and surface area data
The model for the existing cooling system was benchmarked based on measured historical weather and
corresponding plant operating data. The results of this model benchmarking are illustrated in Figure 2-1. The
calculated mix zone temperature shown in black is overlaid on the actual measured mix zone temperature
shown in green.
Electronic Filing - Received, Clerk's Office, December 15, 2008
* * * * * PCB 2009-038 * * * * *
Ameren Energy Generating
Coffeen Power Station Units 1 & 2
Coffeen Cooling System Evaluation
Report SL-009346
Project No. 10087-073
Date: June 9, 2008
Page 6 of 13
D:\coffeen\SL-009346.DOC
Figure 2-1
Coffeen Main Lake Calibration Based on 2005 Station Data
Based on the model, the calculated mix zone temperature is typically within +/- 2
o
F compared to measured
station data. The estimation of theoretical station generation capability based on the model is accurate within
approximately +/- 5%.
Utilizing the model along with sets of historical weather data, theoretical plant operation at 1,026 MW and
90% capacity factor was modeled to determine the station capability for each evaluated year. The evaluations
supported a common observation that May and October often have periods of unseasonably warm weather,
closely resembling summer conditions. Furthermore, due to the time required for the water to circulate from
the mix zone back to the plant intake, the first week of October can be especially problematic as the water
arriving at the station intake may be near October's winter-permit temperature discharge limit. This occurs
after the end of an unseasonably warm September where the station has been operated at a high capacity factor
and there is insufficient capacity in the existing cooling system to adequately pre-cool the water before the
start of October. These conditions severely reduce the station's generation until the plant inlet temperature
drops due to reducing power output or the weather becomes cooler.
The evaluations identified the month of May as the most consistently limiting month per historical data. With
a projected future capacity factor of 90%, the minimum calculated generation shortfall (in percentage below
90% capacity factor) is shown in Figure 2-2 for the month of May considering historical weather data from
1980-2007.
Electronic Filing - Received, Clerk's Office, December 15, 2008
* * * * * PCB 2009-038 * * * * *
Ameren Energy Generating
Coffeen Power Station Units 1 & 2
Coffeen Cooling System Evaluation
Report SL-009346
Project No. 10087-073
Date: June 9, 2008
Page 7 of 13
D:\coffeen\SL-009346.DOC
Figure 2-2
Theoretical Trend in Lost Capacity Factor in May Based on 90% CF at 1026 MW
0.0
5.0
10.0
15.0
20.0
25.0
30.0
35.0
40.0
1978
1980
1982
1984
1986
1988
1990
1992
1994
1996
1998
2000
2002
2004
2006
2008
2010
Year
Lost Capacity (%)
2007
Notes
1. Trend Line shows gradual increase in average losses over time from 12% in 1980 to 21% in 2007.
2. Average 16% loss per year (including 2007) = 122,135 MWHrs/yr = $2,334,000 lost based on $19.11 per MWHr (2007
dollars).
3. 34% loss in 2007 = 259,537 MWHrs/yr = $4,959,750 lost based on $19.11 per MWHr (2007 dollars).
3.
EVALUATED OPTIONS
In an effort to identify technically feasible and economically-viable options to alleviate the need to de-rate its
units to maintain compliance with thermal standards, the following options were evaluated:
¾
Utilize existing system as-is and continue to artificially de-rate units.
¾
Install additional cooling towers
¾
Add cooling basin capacity
¾
Modify the station to utilize a closed-cycle cooling tower
¾
Modify the station to utilize an air-cooled condenser on one or both units
¾
Utilize the entire length of Coffeen Lake
Electronic Filing - Received, Clerk's Office, December 15, 2008
* * * * * PCB 2009-038 * * * * *
Ameren Energy Generating
Coffeen Power Station Units 1 & 2
Coffeen Cooling System Evaluation
Report SL-009346
Project No. 10087-073
Date: June 9, 2008
Page 8 of 13
D:\coffeen\SL-009346.DOC
3.1
Utilize Existing System Pursuant to Current NPDES Permit Limits
The current cooling system, as described in Section 1 above, consists of Coffeen Lake, the cooling basin, and
the helper cooling towers. Both Coffeen Lake and the cooling basin reject heat through radiation (>50%),
evaporation (<50%), and the remainder through convection and conduction. The helper tower primarily rejects
heat through evaporation during the hot summer months and therefore requires more water per unit of cooling
than the lake and basin. However, the helper tower performs better during hot periods than the lake and basin,
both of which absorb a substantial portion of solar radiation during the daytime. As temperature or humidity
rise, the cooling capacity of the Coffeen cooling system decreases and the cooling water enters the lake and
returns to the station at higher temperatures.
Considering a future gross electrical output of 1,026 MW and a projected average monthly capacity factor of
90% for Coffeen Station, the current cooling system installation is not sufficient to maintain compliance with
the existing thermal standard. Unit derating in May is significant for the majority of the evaluated years as
illustrated in Figure 2-2. For the purposes of the economic comparison, maximum annual generation was
calculated to be 88% annual capacity factor for 1992, which was a cooler year overall with relatively average
weather in May as shown in Figure 2-2. The 2% shortfall of 90% capacity factor for 1992 corresponds to an
average annual gross generation loss of 21 MW. The entire 2% loss was due to operation during the month of
May and highlights the substantial reduction in generation capacity experienced by the station to comply with
the current NDPES limits.
3.2
Augment Existing Towers with A New Field-Erected Tower
Three versions of an additional "helper" cooling tower, each having a different capacity, were added to the
model as shown schematically in Figure 3-1. The proposed helper towers provide additional cooling capacity
that may be utilized when the existing system capacity is insufficient.
Figure 3-1
Schematic Diagram of Coffeen Cooling System with Proposed New Helper Tower
Electronic Filing - Received, Clerk's Office, December 15, 2008
* * * * * PCB 2009-038 * * * * *
Ameren Energy Generating
Coffeen Power Station Units 1 & 2
Coffeen Cooling System Evaluation
Report SL-009346
Project No. 10087-073
Date: June 9, 2008
Page 9 of 13
D:\coffeen\SL-009346.DOC
Based on the models run for 1991, which was extremely hot and humid in May, the design parameters for a
tower to maintain compliance with the existing thermal standards were determined and are included in Table
3-1 along with the design parameters of the existing towers.
Table 3-1
Helper Tower Design Parameters
Parameter
Existing Towers
New Tower
Number of Tower Rows
6
1
Length of Each Row (ft.)
230
560
Total Number of Fans/Cells
48
14
Installed Fan Power/Total Power (hp)
75 / 3,600
250 / 3,500
Fill Type
Film
Splash
Design Flowrate (gpm)
200,000
175,000
Cooling Range (
o
F)
18
31
Wet Bulb Approach (
o
F)
23
10
Static Head Limitation (ft.)
NA
<35
The new 175,000 gpm helper tower identified in Table 3-1 above provides an additional 150% of the existing
tower cooling capacity based on 1991 conditions. Addition of a helper tower sized for the 1991 conditions
would maintain compliance without de-rating during extreme weather conditions.
However, due to the infrequent need for a tower designed based on such extreme weather, smaller 100,000
gpm and 130,000 gpm design flowrate towers were also evaluated. The 130,000 gpm tower size was chosen to
eliminate lost generation for all but one year out of a twenty-two year period (1980-2001) for which a detailed
evaluation was performed. Full capacity was required for seven years in this evaluation period. As a least-
capital cost option, the 100,000 gpm tower was considered and would result in 4% to 10% lost generation in
May for seven years in the evaluation period.
3.3
Additional Cooling Basin Capacity
The possibility of augmenting the current cooling system by expanding the current cooling basin was reviewed
to evaluate the feasibility of this option. At the initiation of this study, there was potentially an additional 96
acres of land available directly west and extending north of the current basin. However, the added basin
capacity proved to be equivalent to only 25,000 gpm of new helper cooling tower cooling capacity during
extreme weather conditions which would not result in compliance with thermal standards in May and
October without substantial de-rating of the units. Furthermore, the area that was initially available for the
expansion has been utilized for the new Wet Flue Gas Desulphurization (WFGD) project at the Coffeen
Station. Therefore, this alternative was not considered technically feasible.
3.4
Closed-Cycle Cooling Tower
The option for converting Coffeen Station from a once-through, lake-cooled system utilizing Coffeen Lake to a
closed-cycle cooling tower system was also considered. This major modification would remove the steam
condensing heat load on the lake which would eliminate mix zone temperature compliance issues while
marginally increasing overall station efficiency on an annual basis. In this configuration, the warm cooling
water would be cooled in the new tower and pumped around in a closed-cycle through the steam condensers.
A continuous blowdown stream of wastewater would require disposal to maintain the system chemistry.
While converting to a closed-cycle cooling tower is technically feasible, Coffeen Station was not
originally designed or arranged to support such a major modification. The condenser water boxes and
tubes are of particular concern as the design pressure would need to be increased by approximately 40% or
more above the original design values to accommodate the additional static head associated with the closed
cooling tower operation. Therefore, major upgrades to all of the main and auxiliary condensers and circulating
water expansion joints and valves to support the additional pressure are considered. Modifications to the water
boxes are further complicated by the condensers’ locations in
the station basement and would require extended
Electronic Filing - Received, Clerk's Office, December 15, 2008
* * * * * PCB 2009-038 * * * * *
Ameren Energy Generating
Coffeen Power Station Units 1 & 2
Coffeen Cooling System Evaluation
Report SL-009346
Project No. 10087-073
Date: June 9, 2008
Page 10 of 13
D:\coffeen\SL-009346.DOC
outages to perform the necessary modifications. The costs associated with a closed-cycle tower conversion are
estimated to be $75,000,000 to install the new system and upgrade the condenser and the circulating water
system components. This cost does not include financial losses due to plant outages.
An additional drawback to implementing a closed-cycle system includes the long length of circulating
water piping required to locate the new tower in an area that will not cause cold-weather icing on the
overhead transmission lines north of the station and to reach a suitable area to install the tower. Due to
this extensive length, the pipelines must be larger diameter to minimize pressure losses, which in turn
causes additional interferences with current underground utilities. There are numerous active
underground utilities and pipelines, such as the existing circulating water lines and electrical ductbanks
feeding the existing switchyard that must be relocated or rerouted to allow for installation of the piping
and therefore resulting in extended outage times for installation. For these reasons, installation of the new
closed-cycle tower system is high-risk in terms of unanticipated extensions of planned outages and
associated project cost.
The disposal of closed-cycle cooling tower blowdown is also problematic. While a small portion of the
blowdown may be able to be utilized in the new WFGD system, the majority would need to be discharged
into Coffeen Lake or evaporated using expensive and complicated wastewater treatment systems. Due to
the fact that a closed-cycle cooling tower at Coffeen will evaporate more water per year than the current
lake and cooling basin-assisted system that utilizes radiation for a significant portion of the cooling, the
average yearly lake level would decrease. Due to the extraordinary costs, probable impact to lake water
levels, substantial risks, and the extended outages associated with implementation of a closed-cycle tower,
this option was not considered technically feasible.
3.5
Air-Cooled Condenser
An air-cooled condenser operates in a similar manner to standard steam condensers where the steam from the
low pressure (LP) turbines and boiler feed pump drives is condensed in a water-cooled heat exchanger.
However, in an air-cooled condenser arrangement, the steam is directed into a very large radiator provided
with numerous fans to condense the steam using the ambient air. The condensed water is collected in a
collection tank and pumped back into the steam cycle.
In the same manner as the closed-cycle cooling tower, the station was not originally designed or arranged to
facilitate the installation of an air-cooled condenser on either one of the units. There is no suitable area for
installation near the existing condensers due to the location of the main switchyard and onsite coal pile
considering the space that would be required for a condenser adequately sized for 1,026 MW of generation
capacity. At a minimum, extensive and prohibitively expensive modifications to the plant infrastructure
including, but not limited to the LP turbines, boiler feed pump drive turbines, the plant auxiliary electrical
systems, turbine building foundations, condensate system, modifications to the steam line drains and turbine
startup system, and various other items would be required. In addition to these issues, operation with an air-
cooled condenser would lower the generation efficiency of the station and increase emissions, solid waste
production, and operating expenses. Because of the numerous issues regarding implementation, this option
was not considered technically feasible.
3.6
Utilize Entire Length of Coffeen Lake
The option of moving the station's cold water intake to the northern end of Coffeen Lake to allow the entire
lake to participate in the heat rejection was also evaluated with the cooling system model. Implementation of
this option would be challenging and costly because of the high pumping power necessary to circulate cool
water back to the intake, large pipeline diameters, and long distance from the station to the new intake. More
significantly, the results of the theoretical study showed negligible improvement in achieving compliance
without de-rating units, considering that the slight gain in net electrical output would be offset by the increased
pumping power that would be necessary to return the water to the station. Therefore this option was not
considered technically feasible.
Electronic Filing - Received, Clerk's Office, December 15, 2008
* * * * * PCB 2009-038 * * * * *
Ameren Energy Generating
Coffeen Power Station Units 1 & 2
Coffeen Cooling System Evaluation
Report SL-009346
Project No. 10087-073
Date: June 9, 2008
Page 11 of 13
D:\coffeen\SL-009346.DOC
4.
COST EVALUATION
4.1
Capital Costs
Table 4-1 summarizes the capital costs for the evaluated options that were considered technically feasible per
the detailed modeling as discussed in Section 3 above. These costs include direct costs, indirect costs,
available funds used during construction (AFUDC), and contingency.
Table 4-1
Fully Loaded Capital Cost Summary
Item
Option 1
Maintain Existing
System
Option 2A
New 175k gpm
Helper Tower
Option 2B
New 130k gpm
Helper Tower
Option 2C
New 100k gpm
Helper Tower
New Cooling System
Capital Cost
Note 1
$18,266,000
$15,283,000
$13,053,000
1. The entire existing tower would be replaced (like for like) in 2012 for a cost of $6,000,000 and again in
2022 for a cost of $8,700,000
Table 4-2 summarizes the additional annual average gross generation over a 22-year historical period for each
option.
Table 4-2
Additional Annual Average Gross Generation
Item
Option 1
Maintain Existing
System
Option 2A
New 175k gpm
Helper Tower
Option 2B
New 130k gpm Helper
Tower
Option 2C
New 100k gpm
Helper Tower
Additional Gross
Generation (MW)
Base
20.52
(1)
20.42
(2)
19.19
(3)
1.
Calculated based on 1992 weather with no lost generation over 22 years.
2.
Calculated based on one month limited to 87% CF over 22 years.
3.
Calculated based on six months limited to 86% CF and one month limited to 80% CF in 22 years.
O&M costs for maintenance of the towers were based on input from cooling tower suppliers. The following
methodology was applied based on a 30 year life of the tower:
¾
Structural components: (40% of tower capital cost) * 5% per year for years 25 - 30.
¾
Mechanical components: (25% of tower capital cost) * 2.5% per year for years 10 - 30.
¾
Tower Fill: (25% of tower capital cost) replaced in whole in year 15.
Electronic Filing - Received, Clerk's Office, December 15, 2008
* * * * * PCB 2009-038 * * * * *
Ameren Energy Generating
Coffeen Power Station Units 1 & 2
Coffeen Cooling System Evaluation
Report SL-009346
Project No. 10087-073
Date: June 9, 2008
Page 12 of 13
D:\coffeen\SL-009346.DOC
5.
SCHEDULE
The following schedule is considered for installation of a helper cooling tower:
¾
Prepare Permit Applications
2 months
– IEPA Air Pollution Control Construction Permit
– NPDES Operating Permit
– Water Pollution Control Construction Permit
¾
Agency Review
12 months
¾
Procurement
2 months
¾
Submit Drawings
1 month
¾
S&L Submittal Review
+1 month
¾
Release to Engineering for Bill of Material
+2 months
¾
Release of BOM, Start Construction, and
+4 months
Receipt of Material at Site
¾
Construction Completion
+6 months
Total Completion Schedule
30 months
6.
EVALUATION OF ALTERNATE NPDES PERMIT LIMITS
6.1.1
Subsequent to the evaluation of the potential cooling system modifications as summarized in Sections 3 and 4
above, an additional option of raising the NPDES permit limits in both May and October was requested to be
evaluated. In response, the model was modified to establish what increase would be required to allow 1,026
MW gross electrical generation at 90% capacity factor while utilizing the existing cooling system. Table 6-1
and Figure 6-1 summarize the proposed NPDES limits to eliminate lost generation in May and October.
Table 6-1
NPDES Mix Zone Temperature Permit Limits
Current Permit Limits
Proposed Permit Limits
Months
Average
Peak
Average
Peak
May and October
89°F
94°F
(1)
96
°
F
102
°
F
(1)
November through April
89°F
94°F
(1)
89°F
94°F
(1)
June through September
105°F
112°F
(2)
105°F
112°F
(2)
1. Temperature is allowed to exceed permit limit 2% of the hours in the month.
2. Temperature is allowed to exceed permit limit 3% of the hours in the month.
Electronic Filing - Received, Clerk's Office, December 15, 2008
* * * * * PCB 2009-038 * * * * *
Ameren Energy Generating
Coffeen Power Station Units 1 & 2
Coffeen Cooling System Evaluation
Report SL-009346
Project No. 10087-073
Date: June 9, 2008
Page 13 of 13
D:\coffeen\SL-009346.DOC
Figure 6-1
Current and Proposed Coffeen NPDES Permit Limits
As shown in Figure 6-1, the proposed NPDES limits for May and October provide an intermediate increase/decrease
permit level between the current winter and summer limits. The temperature changes are proposed to be taken in two
smaller steps with one month between in lieu of one larger instantaneous increment. This modification may be beneficial
to the Coffeen Lake ecosystem and will alleviate the required addition of cooling capacity for Coffeen Station.
7.
CONCLUSIONS
S&L evaluated performance of Coffeen Station’s cooling system over the past years and assessed
its ability to maintain compliance with current thermal limits under recent and historic weather
conditions at forecasted demand conditions. The evaluation showed a gradual increase in average
lost capacity over time. In 2007, Ameren experienced a 34% loss in capacity, which resulted in a
financial loss of $5,000,000 due to derating. The purpose of this study was to evaluate several
alternatives for improving cooling performance so that Coffeen Station would meet thermal limits
without requiring de-rating of its units. The capital costs associated with technically feasible
enhancements ranged from $13,053,000 to $18,266,000.
S&L also conducted an evaluation of potentially revising the NPDES permit limits for May and
October. S&L has determined that providing an intermediate increase in the permit limits for May
and October can accommodate the same rate of generation as cooling system modifications and would
also reduce the dramatic change in lake temperatures currently realized with the Coffeen Station
NPDES permit in its current form.
CH2\ 2611959.2
Electronic Filing - Received, Clerk's Office, December 15, 2008
* * * * * PCB 2009-038 * * * * *
Electronic Filing - Received, Clerk's Office, December 15, 2008
* * * * * PCB 2009-038 * * * * *
Coffeen Plant---August/September/October 2007
0.00
100.00
200.00
300.00
1
2501
5001
7501
10001
12501
15001
17501
20001
Date
LMP Price
0
100
200
300
400
500
600
700
800
900
1000
MW's
5 Min MISO Dispatch $
Avg Unit Cost $
Unit Net 1 MW's
Total Plant Output
Unit 2 Net MW's
Aug 2007
Sept 2007
08/01/07
09/01/
07
10/01/
07
Oct 2007
Electronic Filing - Received, Clerk's Office, December 15, 2008
* * * * * PCB 2009-038 * * * * *