Lorraine
Howerton,
Baker
Botts
LLP,
"Federal
Legislation:
What's
on
the
Horizon?"
PowerPoint
Presentation
at
Carbon
and
Climate
Change
Seminar
(April
24,
2008).
Electronic Filing - Received, Clerk's Office, October 1, 2008
* * * * * PCB 2009-021 * * * * *
Federal
Legislation:
Back to top
What's
on
the
Back to top
Horizon?
Lorraine
Howerton
202.639.7908
lorrai
ne.
howerton@bakerbotts.com
•
BAKER
8OITS".
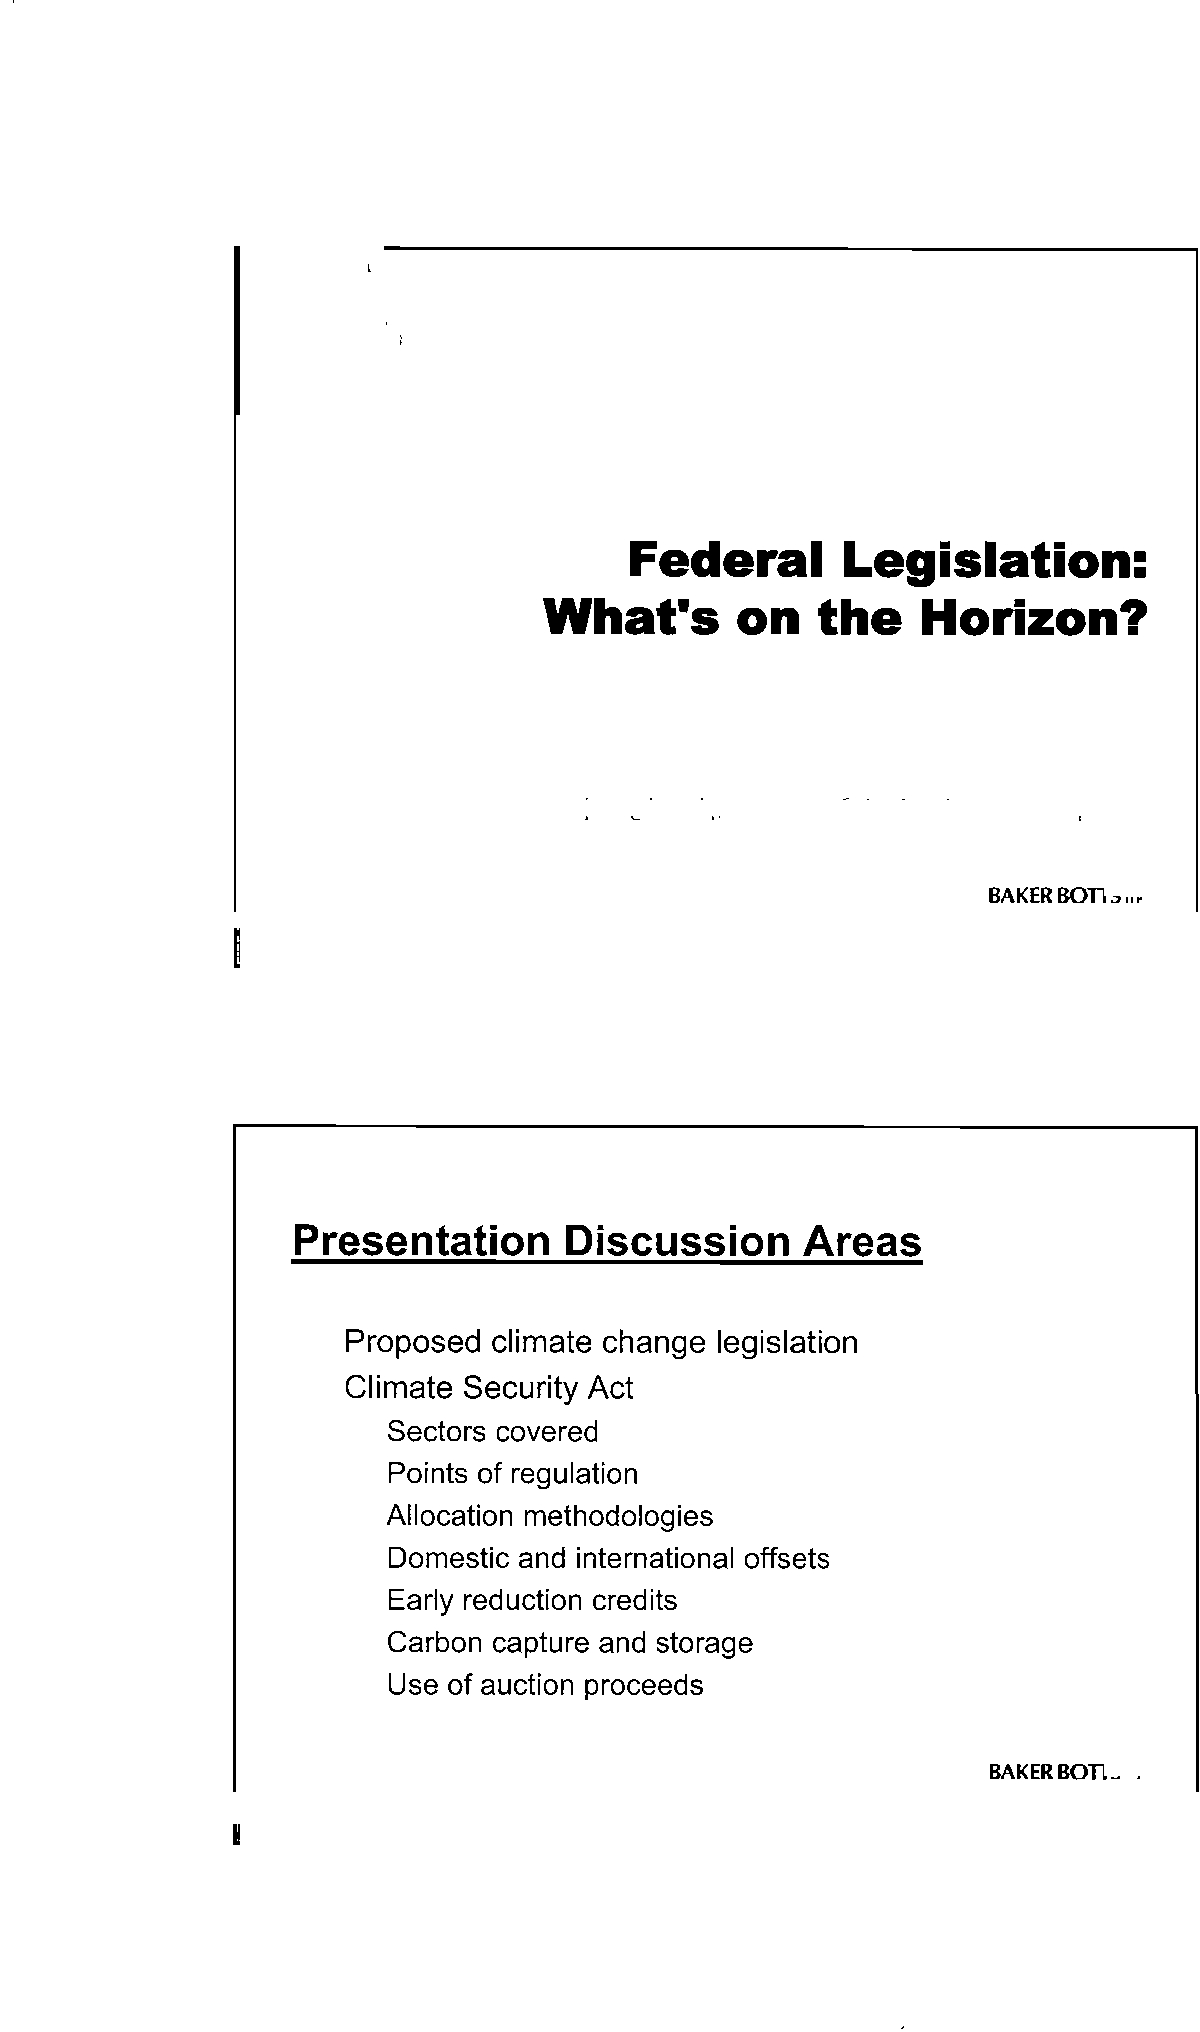
Presentation
Discussion
Areas
•
Proposed
climate
change
legislation
•
Climate
Security
Act
•
Sectors
covered
•
Points
of
regulation
•
Allocation
methodologies
•
Domestic
and
international
offsets
•
Early
reduction
credits
•
Carbon
capture
and
storage
•
Use
of
auction
proceeds
•
BAKER8OITS".
::-
•
-=-
-
~
-
-
--
--
--
--.;
~
---
~-.
~-
"';
-
.
-,
-.-
~-;
":
-
-
-
~
,
Electronic Filing - Received, Clerk's Office, October 1, 2008
* * * * * PCB 2009-021 * * * * *
---
::.:.'::"
-:.:....-
..
---
----
---,
--
==
___
u',-'"
-
,
-_
........
--
-~
..
-
_.
--
---
--
--
--
=:=-.:
=.--
-.
--
--_
..
=
~
-_
..
_.-..
-""
..
"
....
--
....
,..,.
..
lE.
---
--_.'~--
.....
__
.
----
,,_l"oo
__
•
-.
_
_
........
_,
-_
....
I.JolMrl!Iool
:::..:=~..=...~
~-"_.-
..
-
...
..-
~~-
~1~
__
--
._"'-
.....
...
<:Q,
-
:::..--
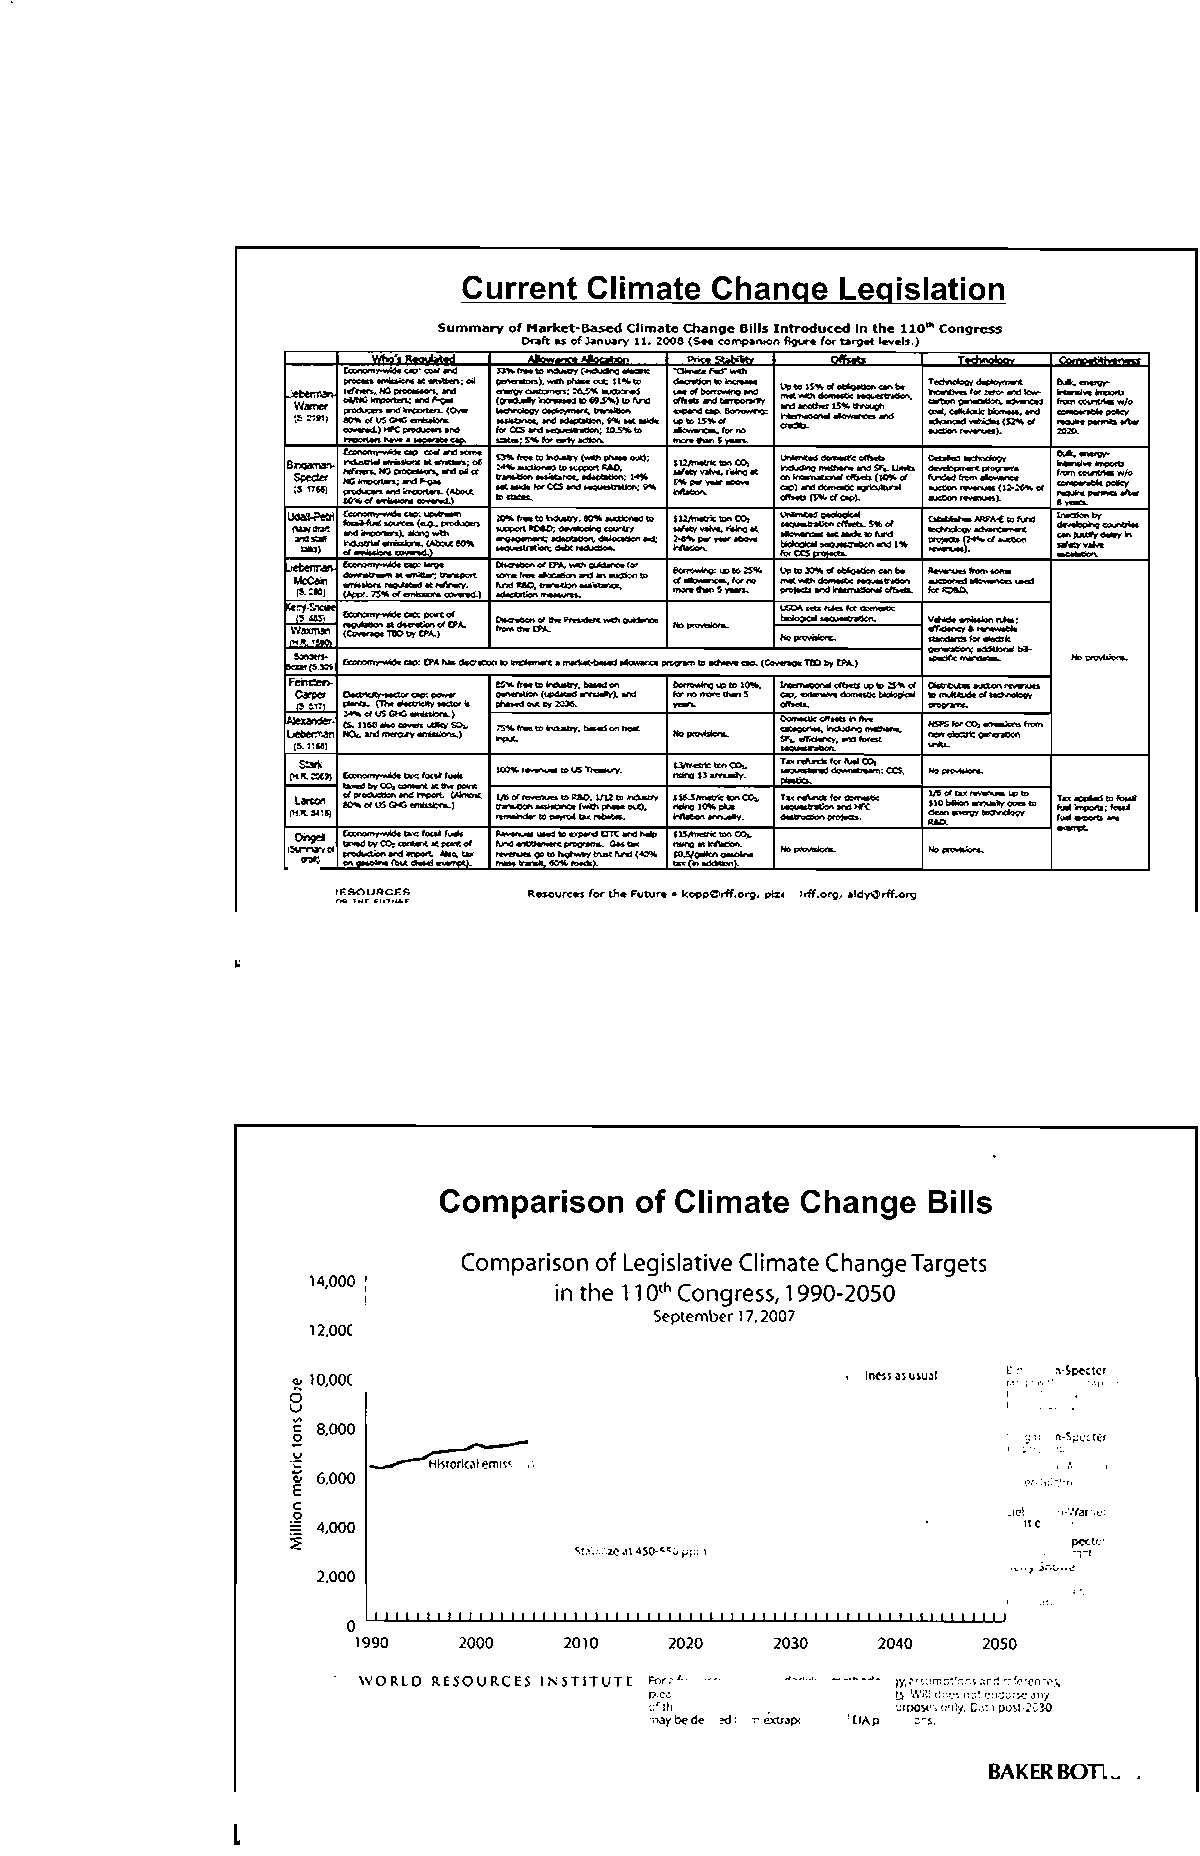
Comparison
of
Climate
Change
Bills
14,000
12.000
~
10,000
2
8.000
.:;:'
"
6.000
E
<
~
'.000
~
2.000
Comparison
of
Legislative
Climate
Change
Targets
in
the
110'"
Congress,
1990-2050
September
17,2007
2050
2040
2030
2020
2010
2000
OlllLU.LU.LU.LLLLLLLLLLLULLUu..uu..uu..uu..u~~-,-,-,-,-,-,.LU.LU.li.U
1990
.WORLD
RESOURCES
INSTITUTE
foo'
~
lull
cll«;u<t.l<I'I
of
u~¥<>9
_'l>Odolo9¥,~
.......
ptIOni
.""
refor<"""
...
pl~.~
"""
bttp'lJ
mi
nmil'y!jm..,d'moM'.
WRI
doe;
no'
~.-.r
all~~
Thb
IyIb~1oI
(OftlPOll~llwPUr~onIy,
D.lYPD\!..IDlO
may
~
<Iffiwd
"om
v;tt.pol,otlDn
r:/
lIA
prgjKtIonl..
•
BAKER
BOT15
".
:
.-
-
t
,-
'
••
~,,",~r.-,.
-;"~>;"'~'~
...---
....
-.
(i,>"T<'
-
-
.""
,
l
_
_~
~
~
-.:.
__
~
_':.__
_
_
I
Electronic Filing - Received, Clerk's Office, October 1, 2008
* * * * * PCB 2009-021 * * * * *
•
BAKER
uom
".
•
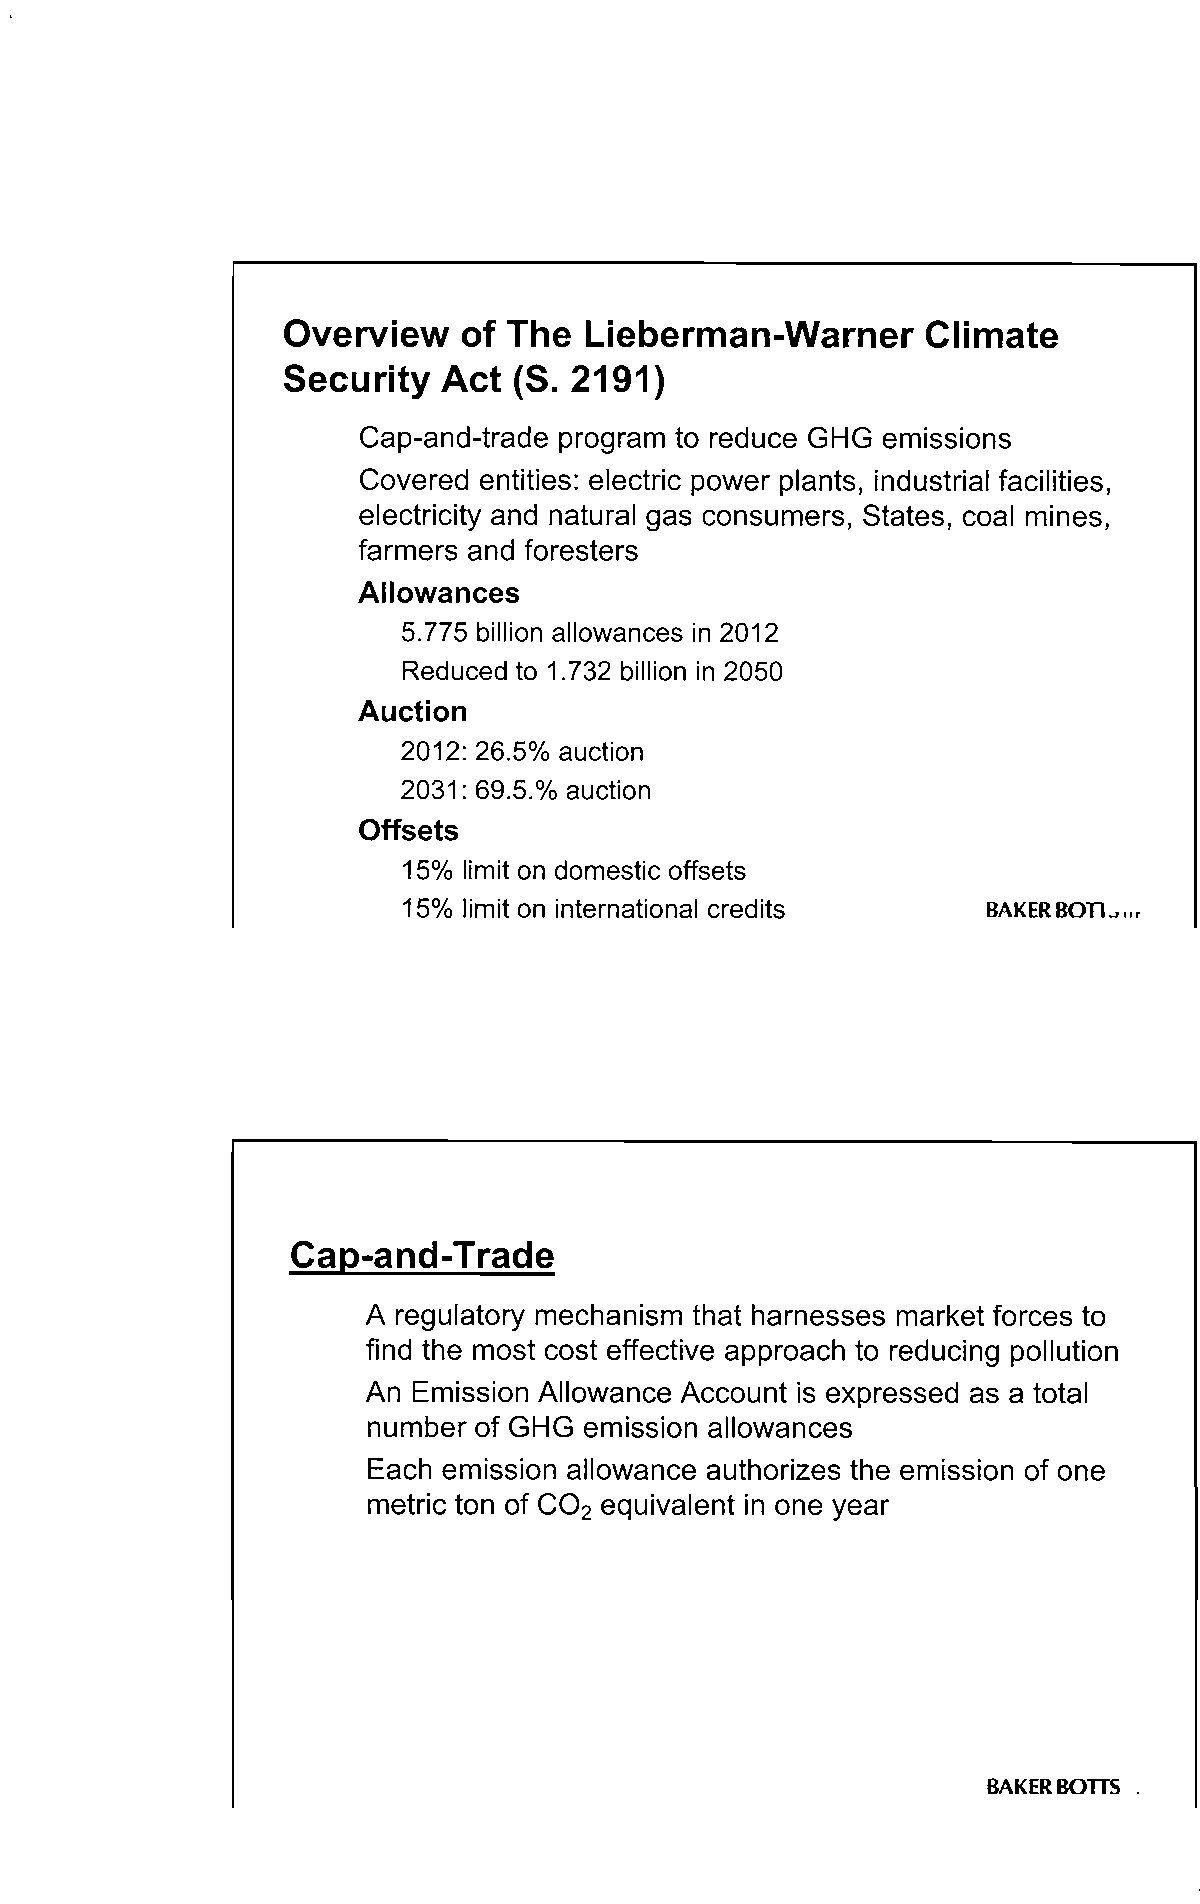
Cap-and-trade
program
to
reduce
GHG
emissions
•
Covered
entities:
electric
power
plants,
industrial
facilities,
electricity
and
natural
gas
consumers,
States,
coal
mines.
farmers
and
foresters
•
Allowances
•
5.775
billion
allowances
in
2012
•
Reduced
to
1.732
billion
in
2050
•
Auction
•
2012:
26.5%
auction
•
2031:69.5.%
auction
•
Offsets
•
15%
limit
on
domestic
offsets
•
15%
limit
on
international
credits
Cap-and-Trade
•A
regulatory
mechanism
that
harnesses
market
forces
to
find
the
most
cost
effective
approach
to
reducing
pollution
•
An
Emission
Allowance
Account
is
expressed
as
a
total
number
of
GHG
emission
allowances
•
Each
emission
allowance
authorizes
the
emission
of
one
metric
ton
of
CO
2
equivalent
in
one
year
•
BAKER
uom
".
Electronic Filing - Received, Clerk's Office, October 1, 2008
* * * * * PCB 2009-021 * * * * *
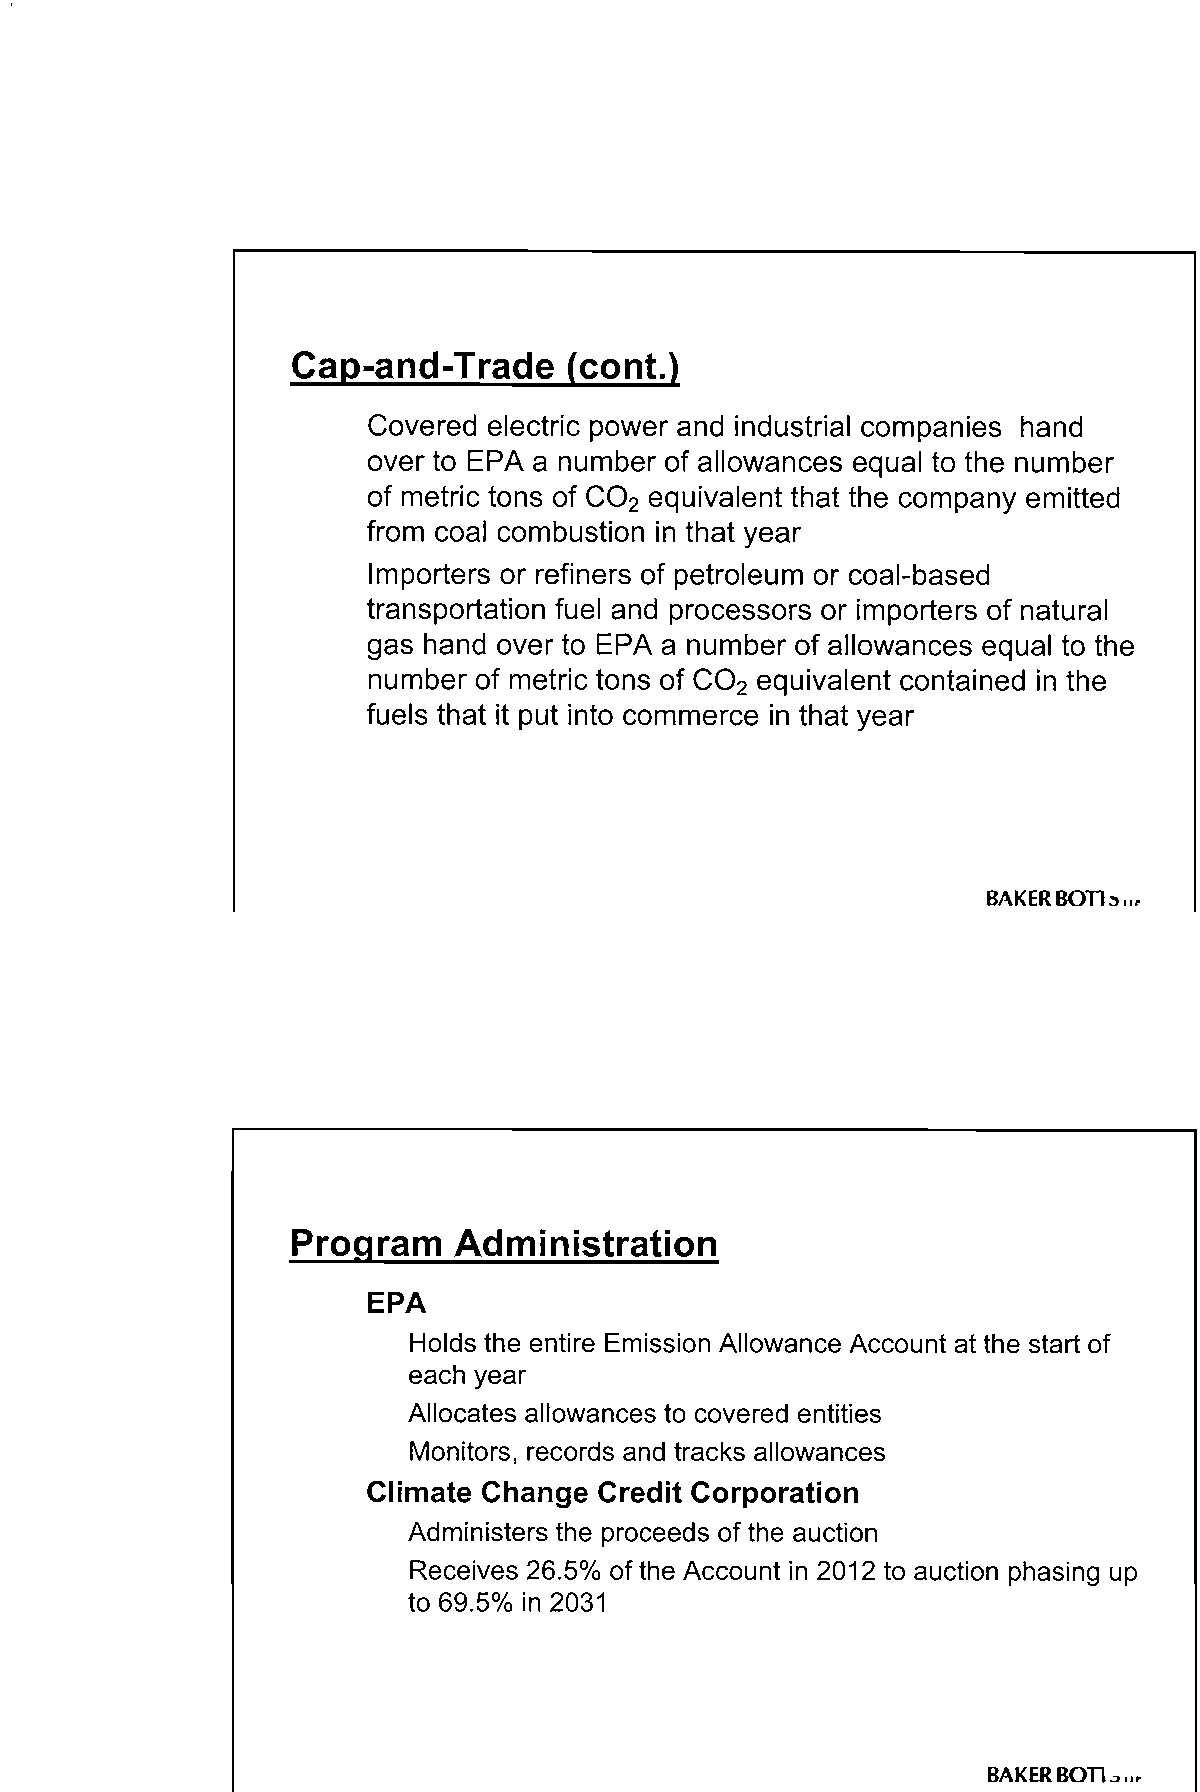
•
Covered
electric
power
and
industrial
companies
hand
over
to
EPA
a
number
of
allowances
equal
to
the
number
of
metric
tons
of
CO
2
equivalent
that
the
company
emitted
from
coal
combustion
in
that
year
•
Importers
or
refiners
of
petroleum
or
coal-based
transportation
fuel
and
processors
or
importers
of
natural
gas
hand
over
to
EPA
a
number
of
allowances
equal
to
the
number
of
metric
tons
of
CO
2
equivalent
contained
in
the
fuels
that
it
put
into
commerce
in
that
year
•
BAKER
oom
".
:~
.•
;;~~
.•
--;:c.'.
.-:'.
"':p1';";"''';'
'}"-~
Program
Administration
•
EPA
HDlds
the
entire
EmissiDn
AIiDwance
AccDunt
at
the
start
Df
each
year
AIiDcates
aliDwances
tD
cDvered
entities
MDnitDrs,
recDrds
and
tracks
aliDwances
•
Climate
Change
Credit
Corporation
•
Administers
the
prDceeds
Df
the
auctiDn
Receives
26.5%
Dfthe
AccDunt
in
2012
tD
auctiDn
phasing
up
tD
69.5%
in
2031
•
BAKERoom".
Electronic Filing - Received, Clerk's Office, October 1, 2008
* * * * * PCB 2009-021 * * * * *
•
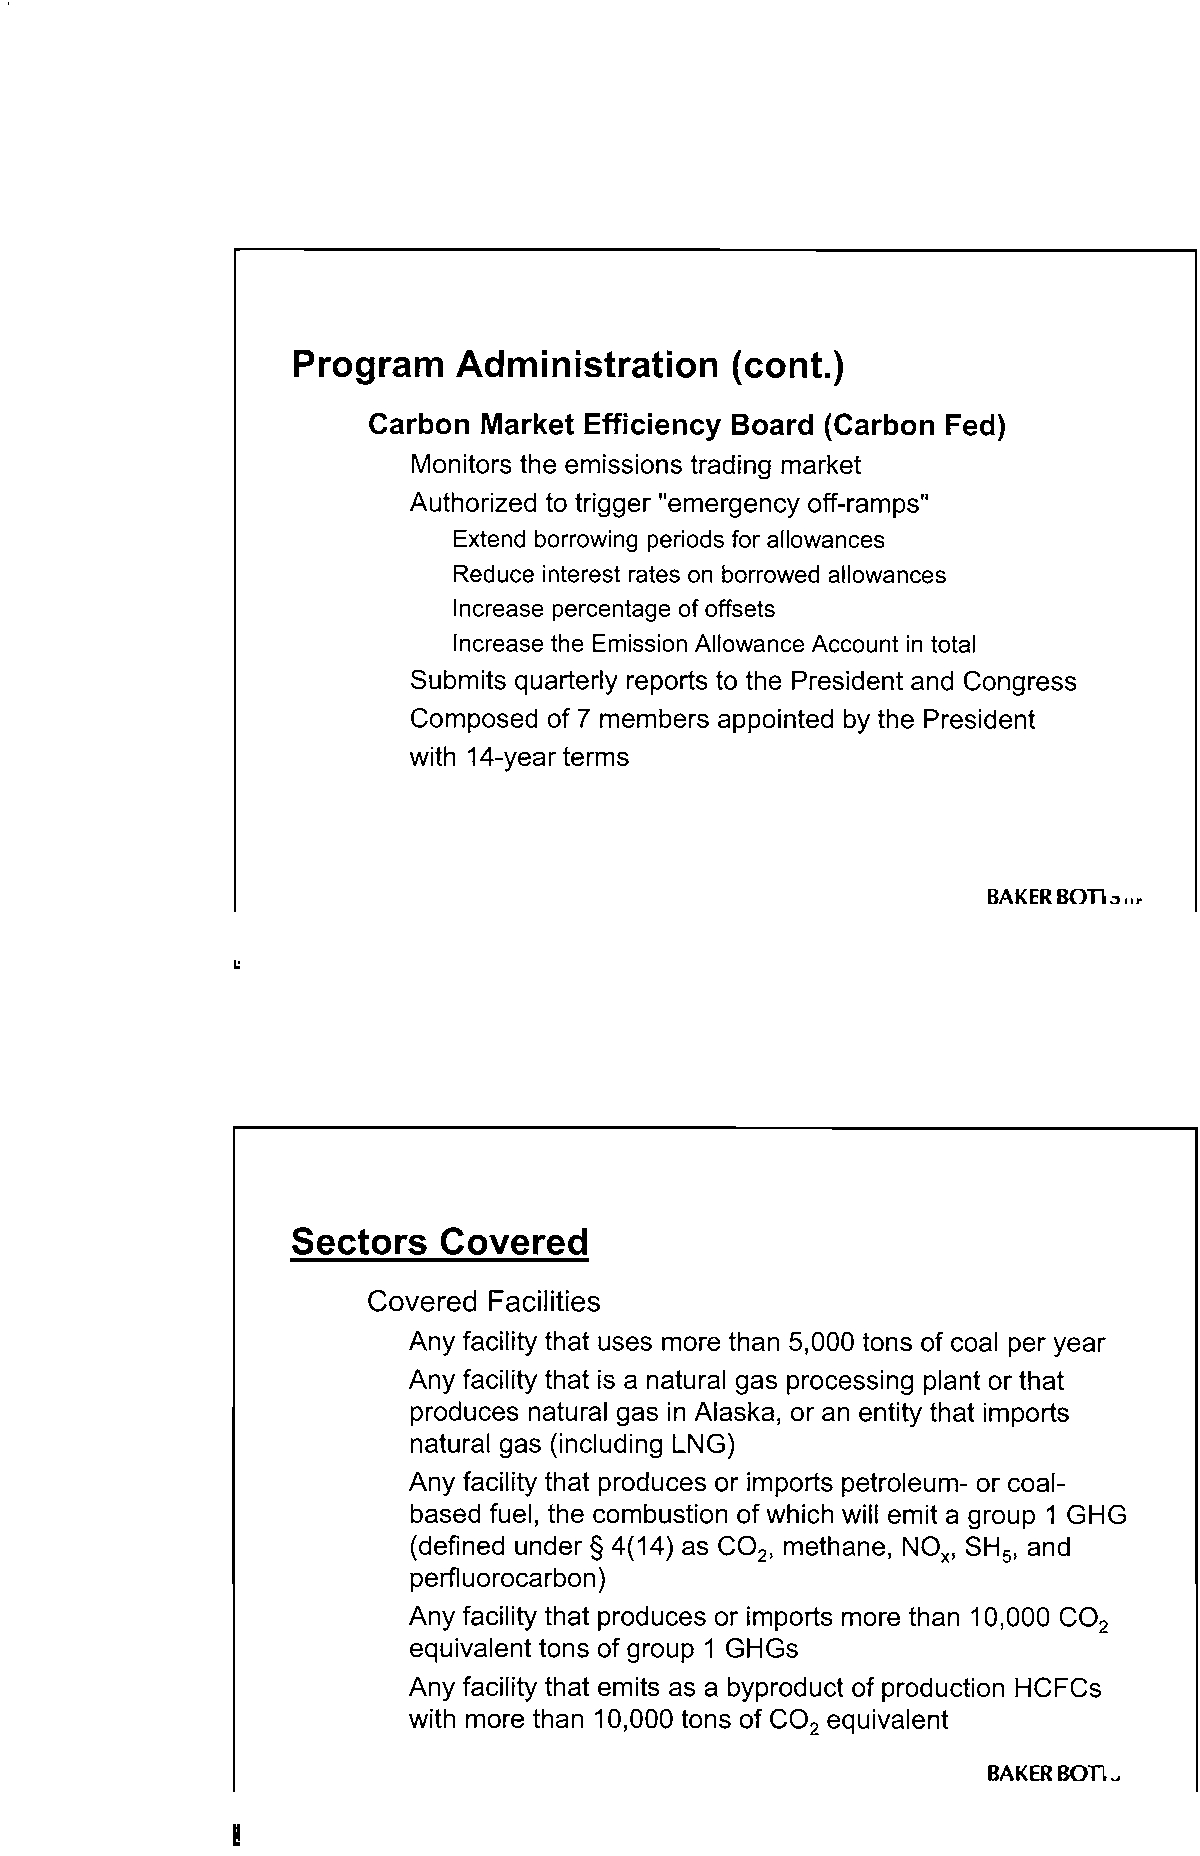
Carbon
Market
Efficiency
Board
(Carbon
Fed)
•
Monitors
the
emissions
trading
market
•
Authorized
to
trigger
"emergency
off-ramps"
Extend
borrowing
periods
for
allowances
Reduce
interest
rates
on
borrowed
allowances
Increase
percentage
of
offsets
Increase
the
Emission
Allowance
Account
in
total
•
Submits
quarterly
reports
to
the
President
and
Congress
•
Composed
of
7
members
appointed
by
the
President
with
14-year
terms
•
BAKER
BOT15
".
Sectors
Covered
•
Covered
Facilities
•
Any
facility
that
uses
more
than
5,000
tons
of
coal
per
year
•
Any
facility
that
is
a
natural
gas
processing
plant
or
that
produces
natural
gas
in
Alaska,
or
an
entity
that
imports
natural
gas
(including
LNG)
•
Any
facility
that
produces
or
imports
petroleum-
or
coal-
based
fuel,
the
combustion
of
which
will
emit
a
group
1
GHG
(defined
under
§
4(14)
as
CO"
methane,
NO"
SH
5
,
and
perfiuorocarbon)
•
Any
facility
that
produces
or
imports
more
than
10,000
CO,
equivalent
tons
of
group
1
GHGs
•
Any
facility
that
emits
as
a
byproduct
of
production
HCFCs
with
more
than
10,000
tons
of
CO,
equivalent
•
BAKERBOTI5".
Electronic Filing - Received, Clerk's Office, October 1, 2008
* * * * * PCB 2009-021 * * * * *
•
Direct
Regulation
of
Emission
Points
(Downstream)
•
Power
plants
•
Large
industrial
facilities
•
Upstream
Regulation
•
Transportation
fuels
(refinery
or
import
terminal
gate)
•
Natural
gas
(compressor
station)
•
BAKERHOTTS
...
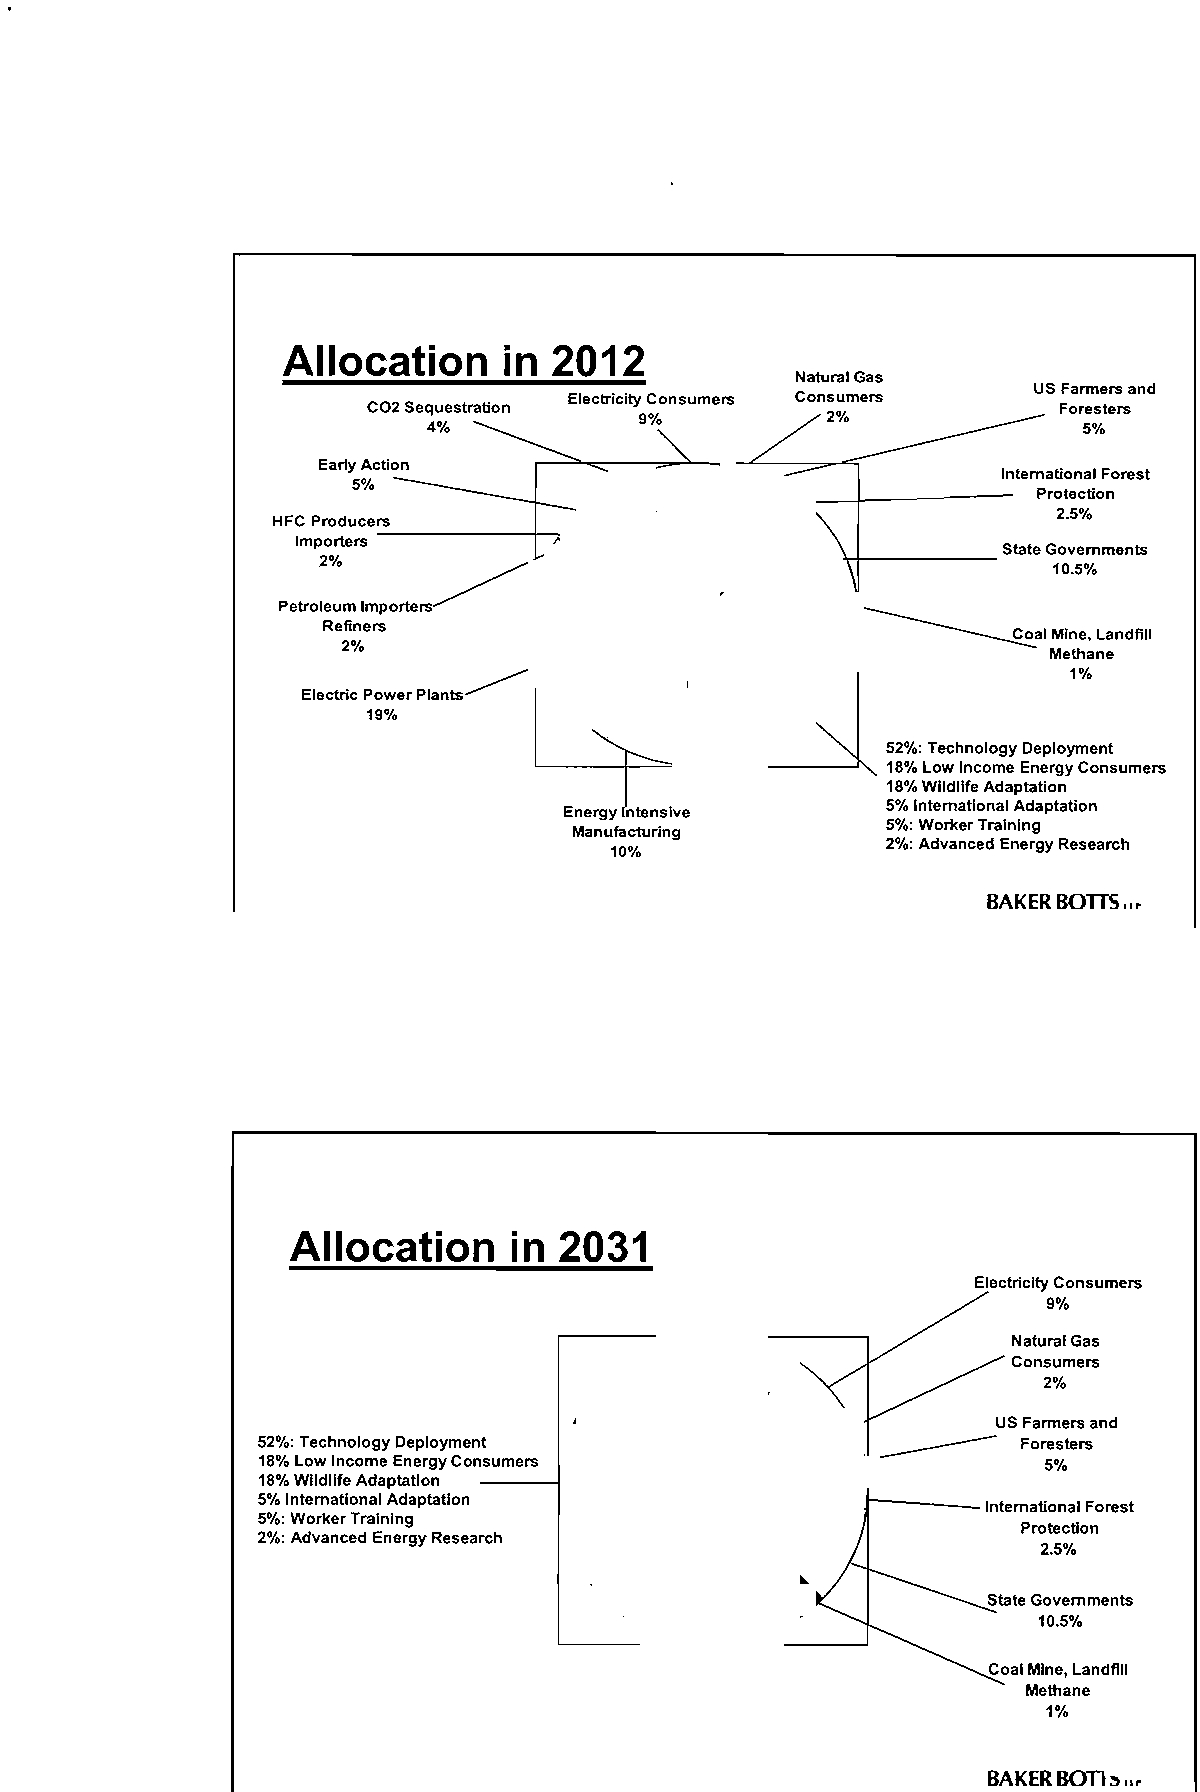
Allocation
vs.
Auction
•
Initial
Allocation
of
Allowances
Based
on
Historic
Emissions
of
Covered
Sources
•
Allocation
-
68%
--
Includes:
Energy
Intensive
industry
-
10%
Electric
power
sector
-
19%)
Electric
and
gas
distribution
entitles
-
9%
and
2%
Domestic
agriculture
and
forestry
-
5%
States
-
10.5%
Carbon
capture
and
sequestration
-
4%
International
forest
protection
-
2.5%
Rural
electric
cooperatives
-1
%
•
Auction
-
26.5%
Increased
to
69.5%
by
2031,
at
which
time
emitters
will
no
longer
receive
allowances
BAKER
BOrn
!I
"
.
~..
-:
..
.
.
-
,
"
:-,
.
.
.
.
_.
-
~
--
Electronic Filing - Received, Clerk's Office, October 1, 2008
* * * * * PCB 2009-021 * * * * *
5%
International
Forest
Protection
2.5%
Coal
Mine,
Landfill
Methane
1%
•
BAKER
BOffi
".
\-1------
State
Governments
10.5%
2%
52%:
Technology
Deployment
~------.:""
18%
Low
Income
Energy
Consumers
18%
Wildlife
Adaptation
5%
International
Adaptation
5%:
Wor1l.er
Training
2%:
Advanced
Energy
Research
9%
4%
Earty
Action
5%
Electric
Power
Plants
19%
Petroleum
Importers
Refiners
2%
HFC
PrOdUCe"~,---
--+---..IIl
Importers
2%
Allocation
in
2031
Electricity
Consumers
9%
52%:
Technology
Deployment
18%
Low
Income
Energy
Consumers
18%
Wildlife
Adaptation
5%
International
Adaptation
5%:
Worker
Training
2%:
Advanced
Energy
Research
Natural
Gas
Consumers
2%
us
Farmers
and
Foresters
5%
----J------Intemational
Forest
Protection
2.5%
State
Governments
10.5%
Coal
Mine,
Landfill
Methane
1%
•
BAKERBOffi".
:-
•
~
'I'<~
/
.'
<
•
-
(
-~
~
-
-
-
__
I
_
Electronic Filing - Received, Clerk's Office, October 1, 2008
* * * * * PCB 2009-021 * * * * *
•
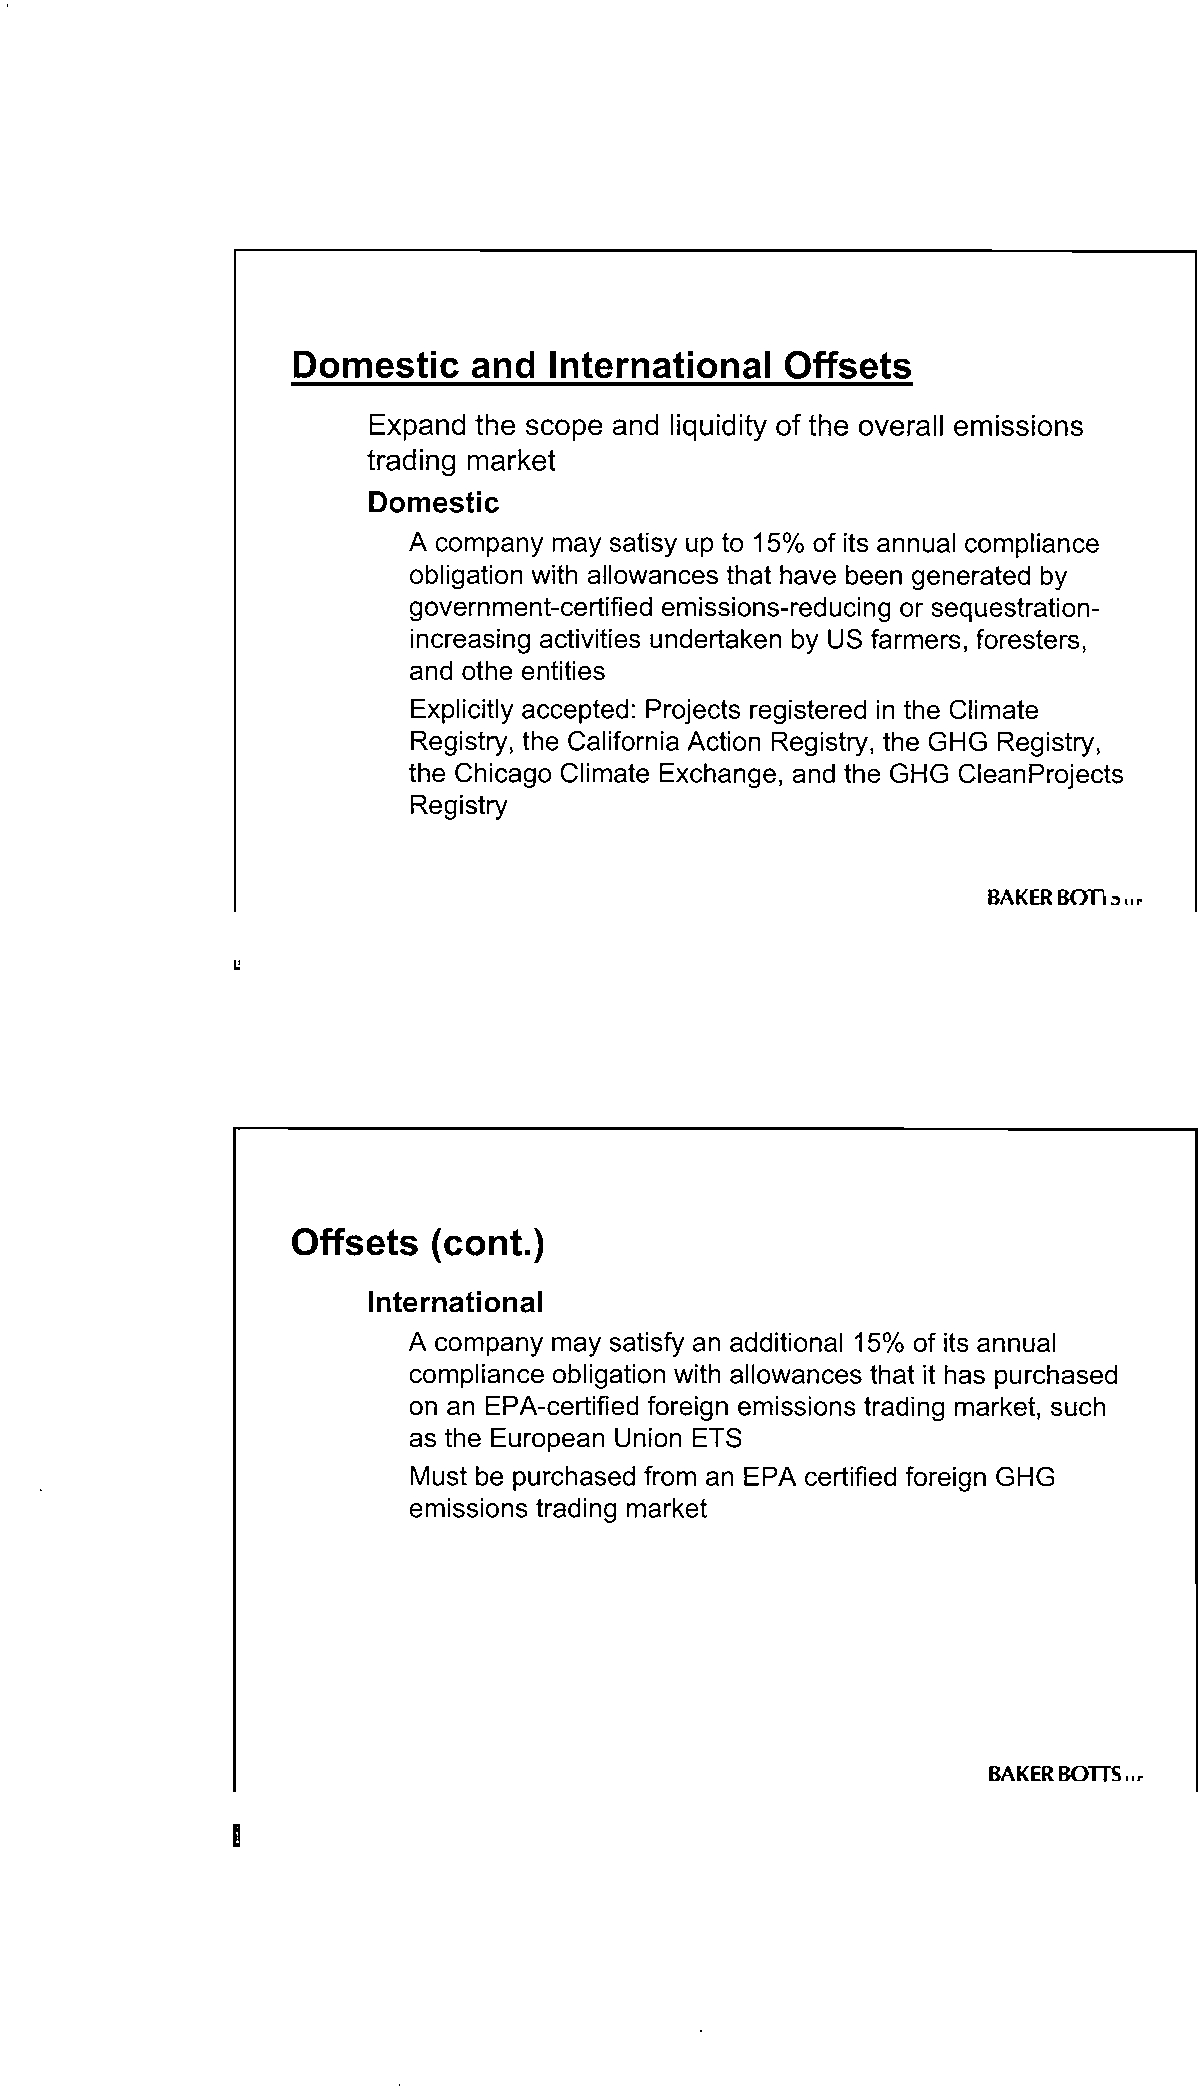
Expand
the
scope
and
liquidity
of
the
overall
emissions
trading
market
•
Domestic
•A
company
may
satisy
up
to
15%
of
its
annual
compliance
obligation
with
allowances
that
have
been
generated
by
government-certified
emissions-reducing
or
sequestration-
increasing
activities
undertaken
by
US
farmers,
foresters,
and
othe
entities
•
Explicitly
accepted:
Projects
registered
in
the
Climate
Registry,
the
California
Action
Registry,
the
GHG
Registry,
the
Chicago
Climate
Exchange,
and
the
GHG
CleanProjects
Registry
•
BAKER
BOTTS
".
Offsets
(cont.)
•
International
•A
company
may
satisfy
an
additional
15%
of
its
annual
compliance
obligation
with
allowances
that
it
has
purchased
on
an
EPA-certified
foreign
emissions
trading
market,
such
as
the
European
Union
ETS
•
Must
be
purchased
from
an
EPA
certified
foreign
GHG
emissions
trading
market
•
BAKER
BOTTS".
r-
..
-
.-.
-.
-.
1
l.
-
_
Electronic Filing - Received, Clerk's Office, October 1, 2008
* * * * * PCB 2009-021 * * * * *
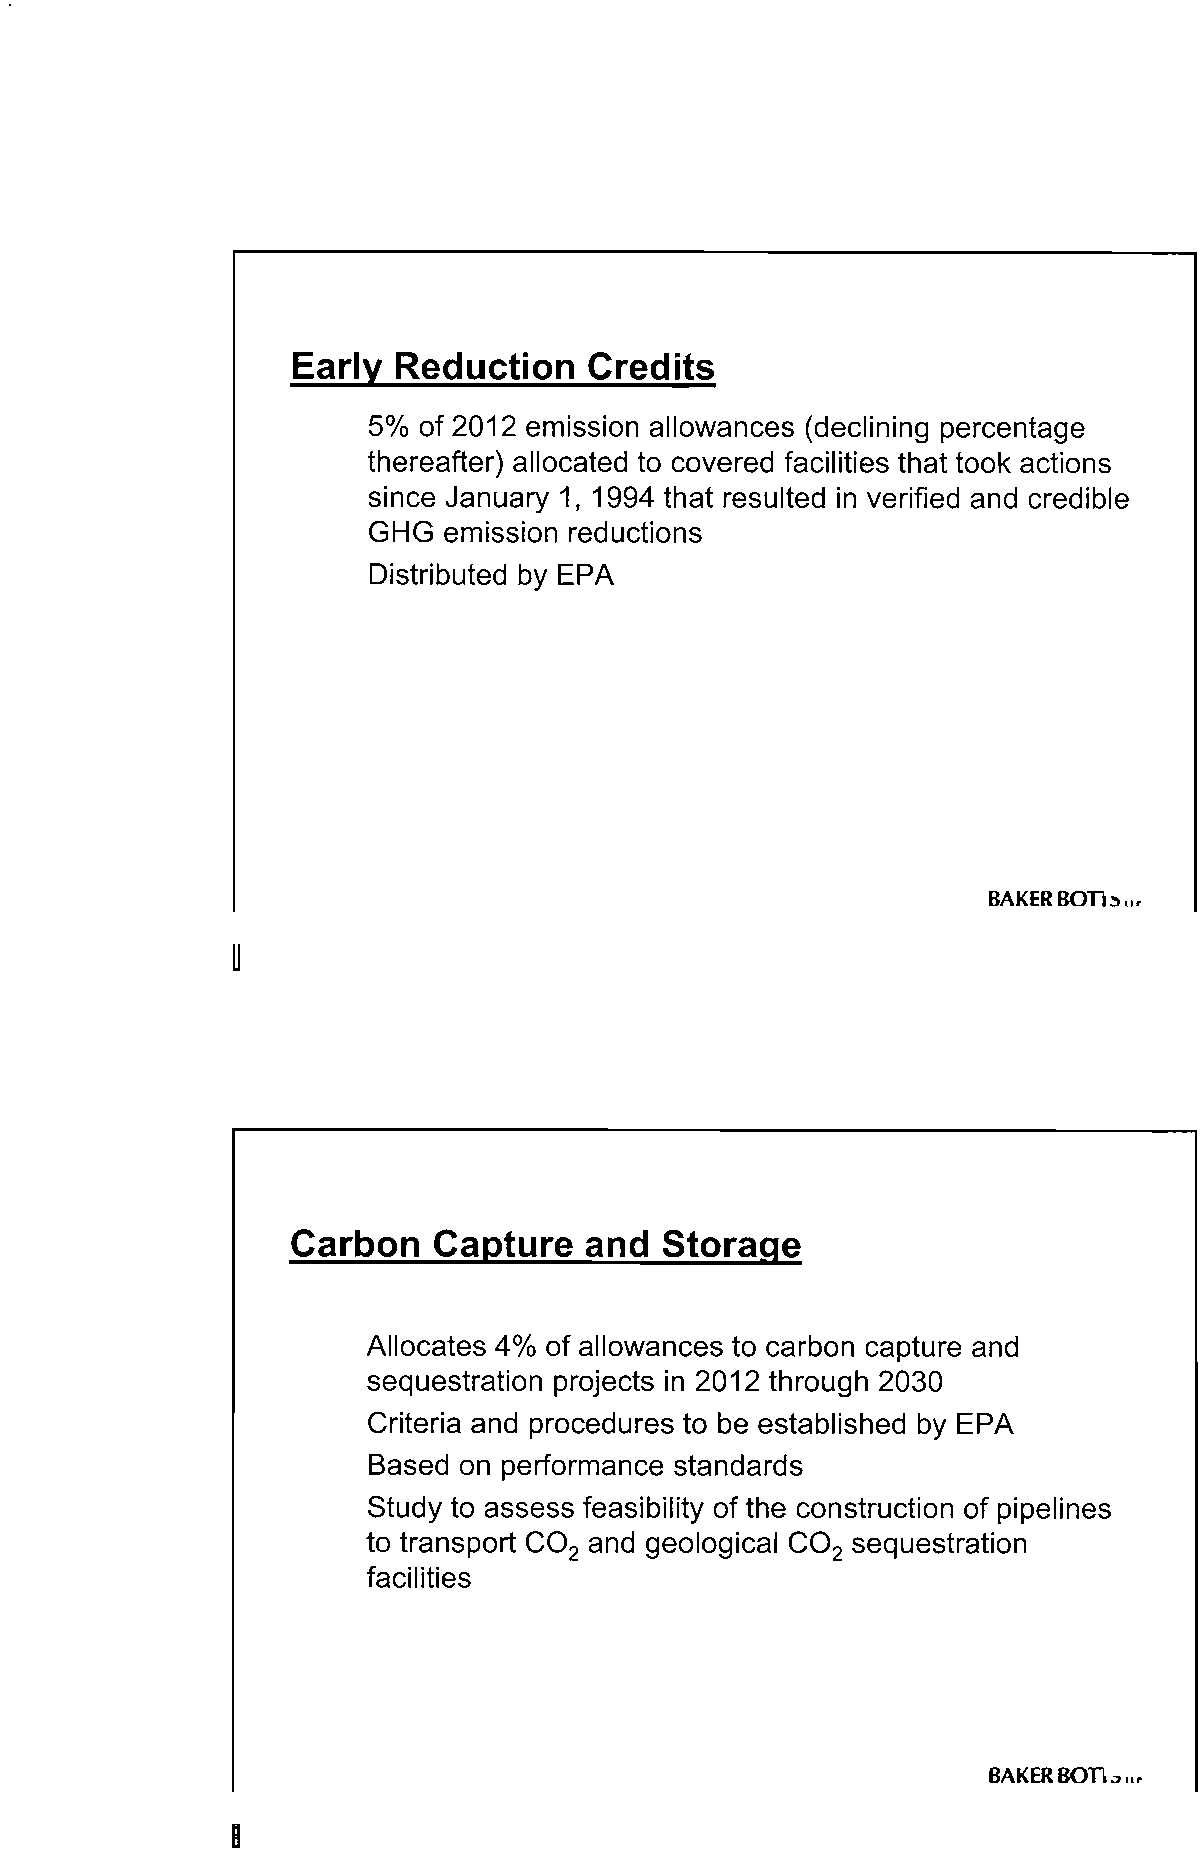
•
5%
of
2012
emission
allowances
(declining
percentage
thereafter)
allocated
to
covered
facilities
that
took
actions
since
January
1.
1994
that
resulted
in
verified
and
credible
GHG
emission
reductions
•
Distributed
by
EPA
•
BAKERBOm".
Carbon
Capture
and
Storage
•
Allocates
4%
of
allowances
to
carbon
capture
and
sequestration
projects
in
2012
through
2030
•
Criteria
and
procedures
to
be
established
by
EPA
•
Based
on
performance
standards
•
Study
to
assess
feasibility
of
the
construction
of
pipelines
to
transport
CO
2
and
geological
CO
2
sequestration
facilities
•
BAKERBOm".
I
.-
--:;'
~
,-,
i_
-
-
__
Electronic Filing - Received, Clerk's Office, October 1, 2008
* * * * * PCB 2009-021 * * * * *
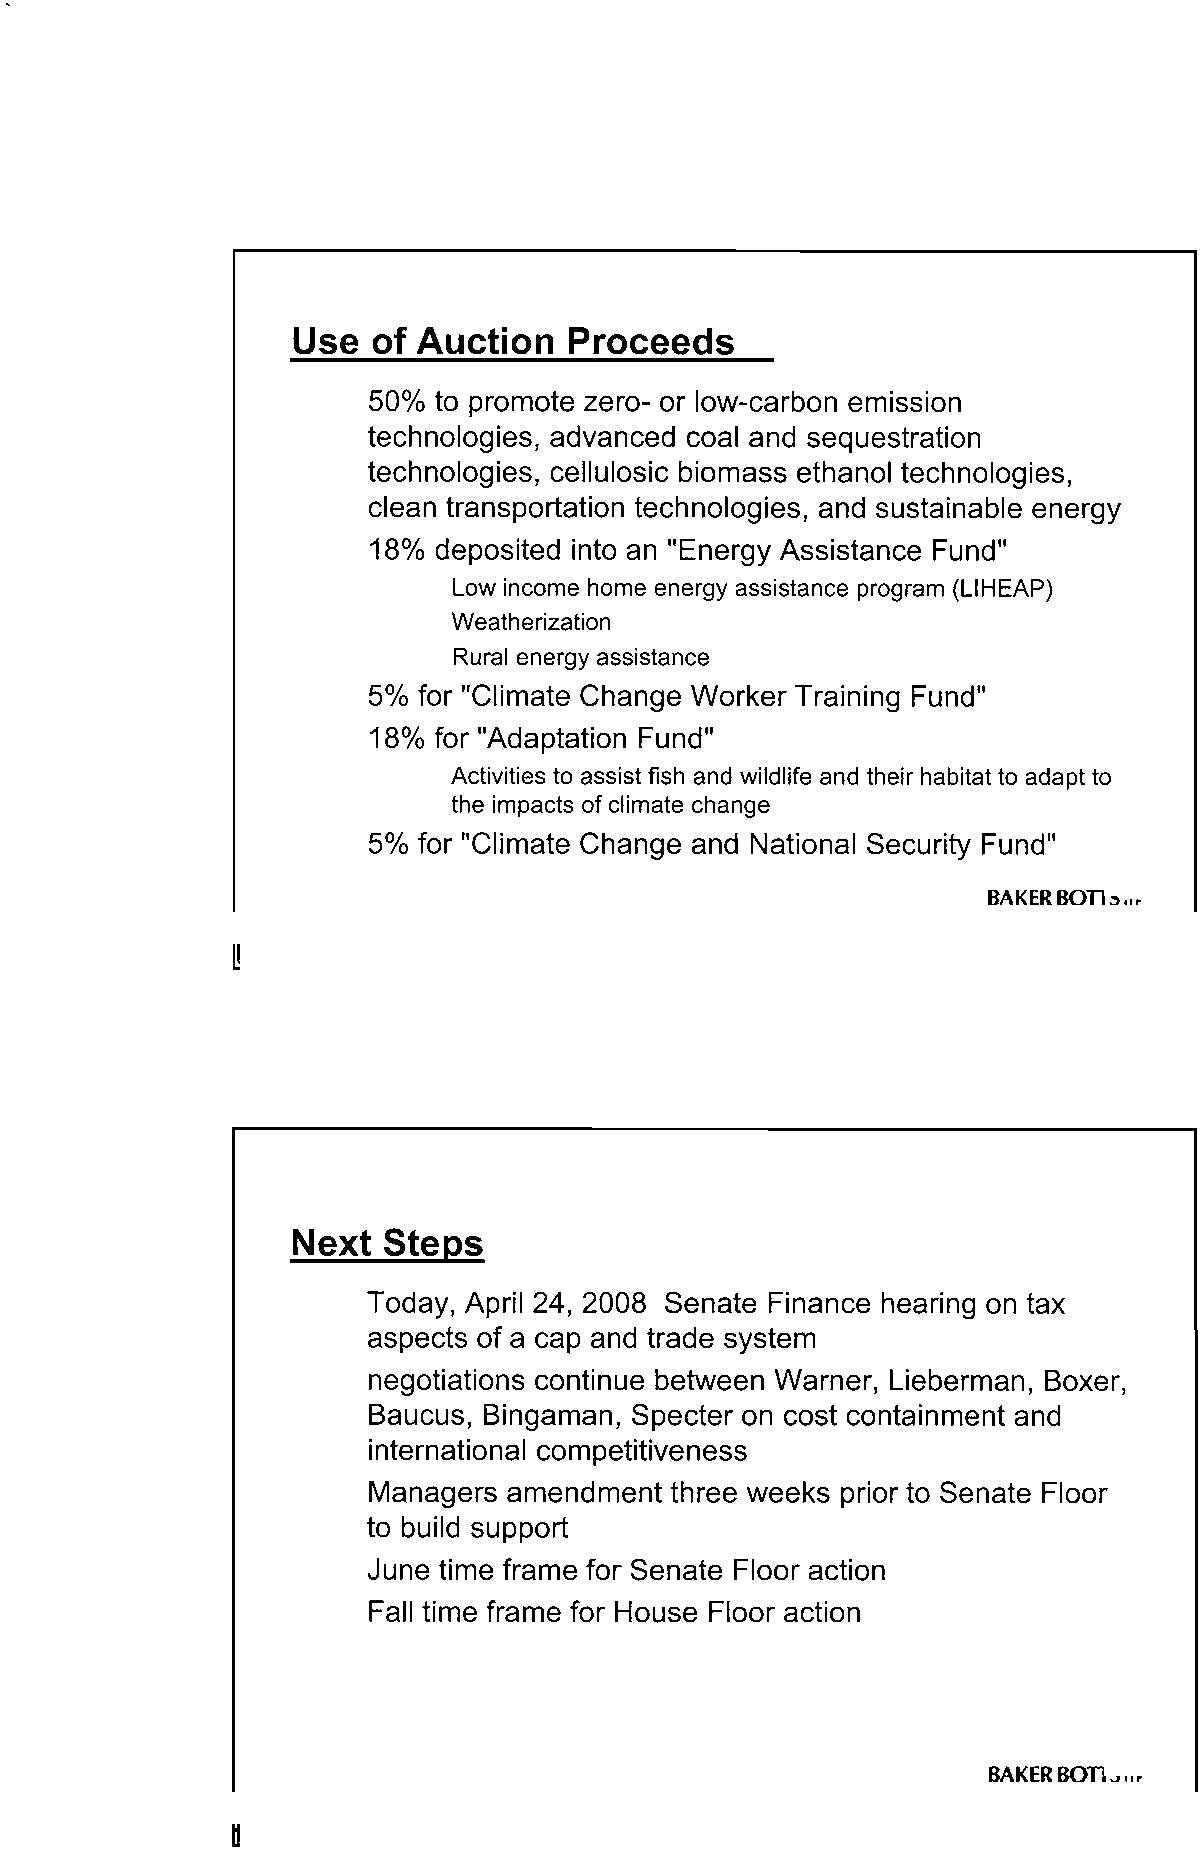
technologies,
advanced
coal
and
sequestration
technologies,
cellulosic
biomass
ethanol
technologies,
clean
transportation
technologies,
and
sustainable
energy
•
18%
deposited
into
an
"Energy
Assistance
Fund"
•
Low
income
home
energy
assistance
program
(L1HEAP)
•
Weatherization
•
Rural
energy
assistance
•
5%
for
"Climate
Change
Worker
Training
Fund"
•
18%
for
"AdaptationFund"
•
Activities
to
assist
fish
and
wildlife
and
their
habitat
to
adapt
to
the
impacts
of
climate
change
•
5%
for
"Climate
Change
and
National
Security
Fund"
•
BAKER
BOTTS",
Next
Steps
•
Today,
April
24,
2008
Senate
Finance
hearing
on
tax
aspects
of
a
cap
and
trade
system
•
negotiations
continue
between
Warner,
Lieberman,
Boxer,
Baucus,
Bingaman,
Specter
on
cost
containment
and
international
competitiveness
•
Managers
amendment
three
weeks
prior
to
Senate
Floor
to
build
support
•
June
time
frame
for
Senate
Floor
action
•
Fall
time
frame
for
House
Floor
action
•
BAKER
BOTTS",
t~
_'"'1
'-I
r
.~
"".
<
L
_
_.
__
.
Electronic Filing - Received, Clerk's Office, October 1, 2008
* * * * * PCB 2009-021 * * * * *
Pew
Center
on
Global
Climate
Change,
"Economy-wide
Cap-and-Trade
Proposals
in
the
110"
Congress:
Includes
Legislation
Introduced
as
of
May
30,
2008,
<
www.pewclimate.org/docUploads/Cap-and-Trade-Chart.
pdf
>.
Electronic Filing - Received, Clerk's Office, October 1, 2008
* * * * * PCB 2009-021 * * * * *
.&\~
CENTER
'''1
Glob'al
~~'AM"l~
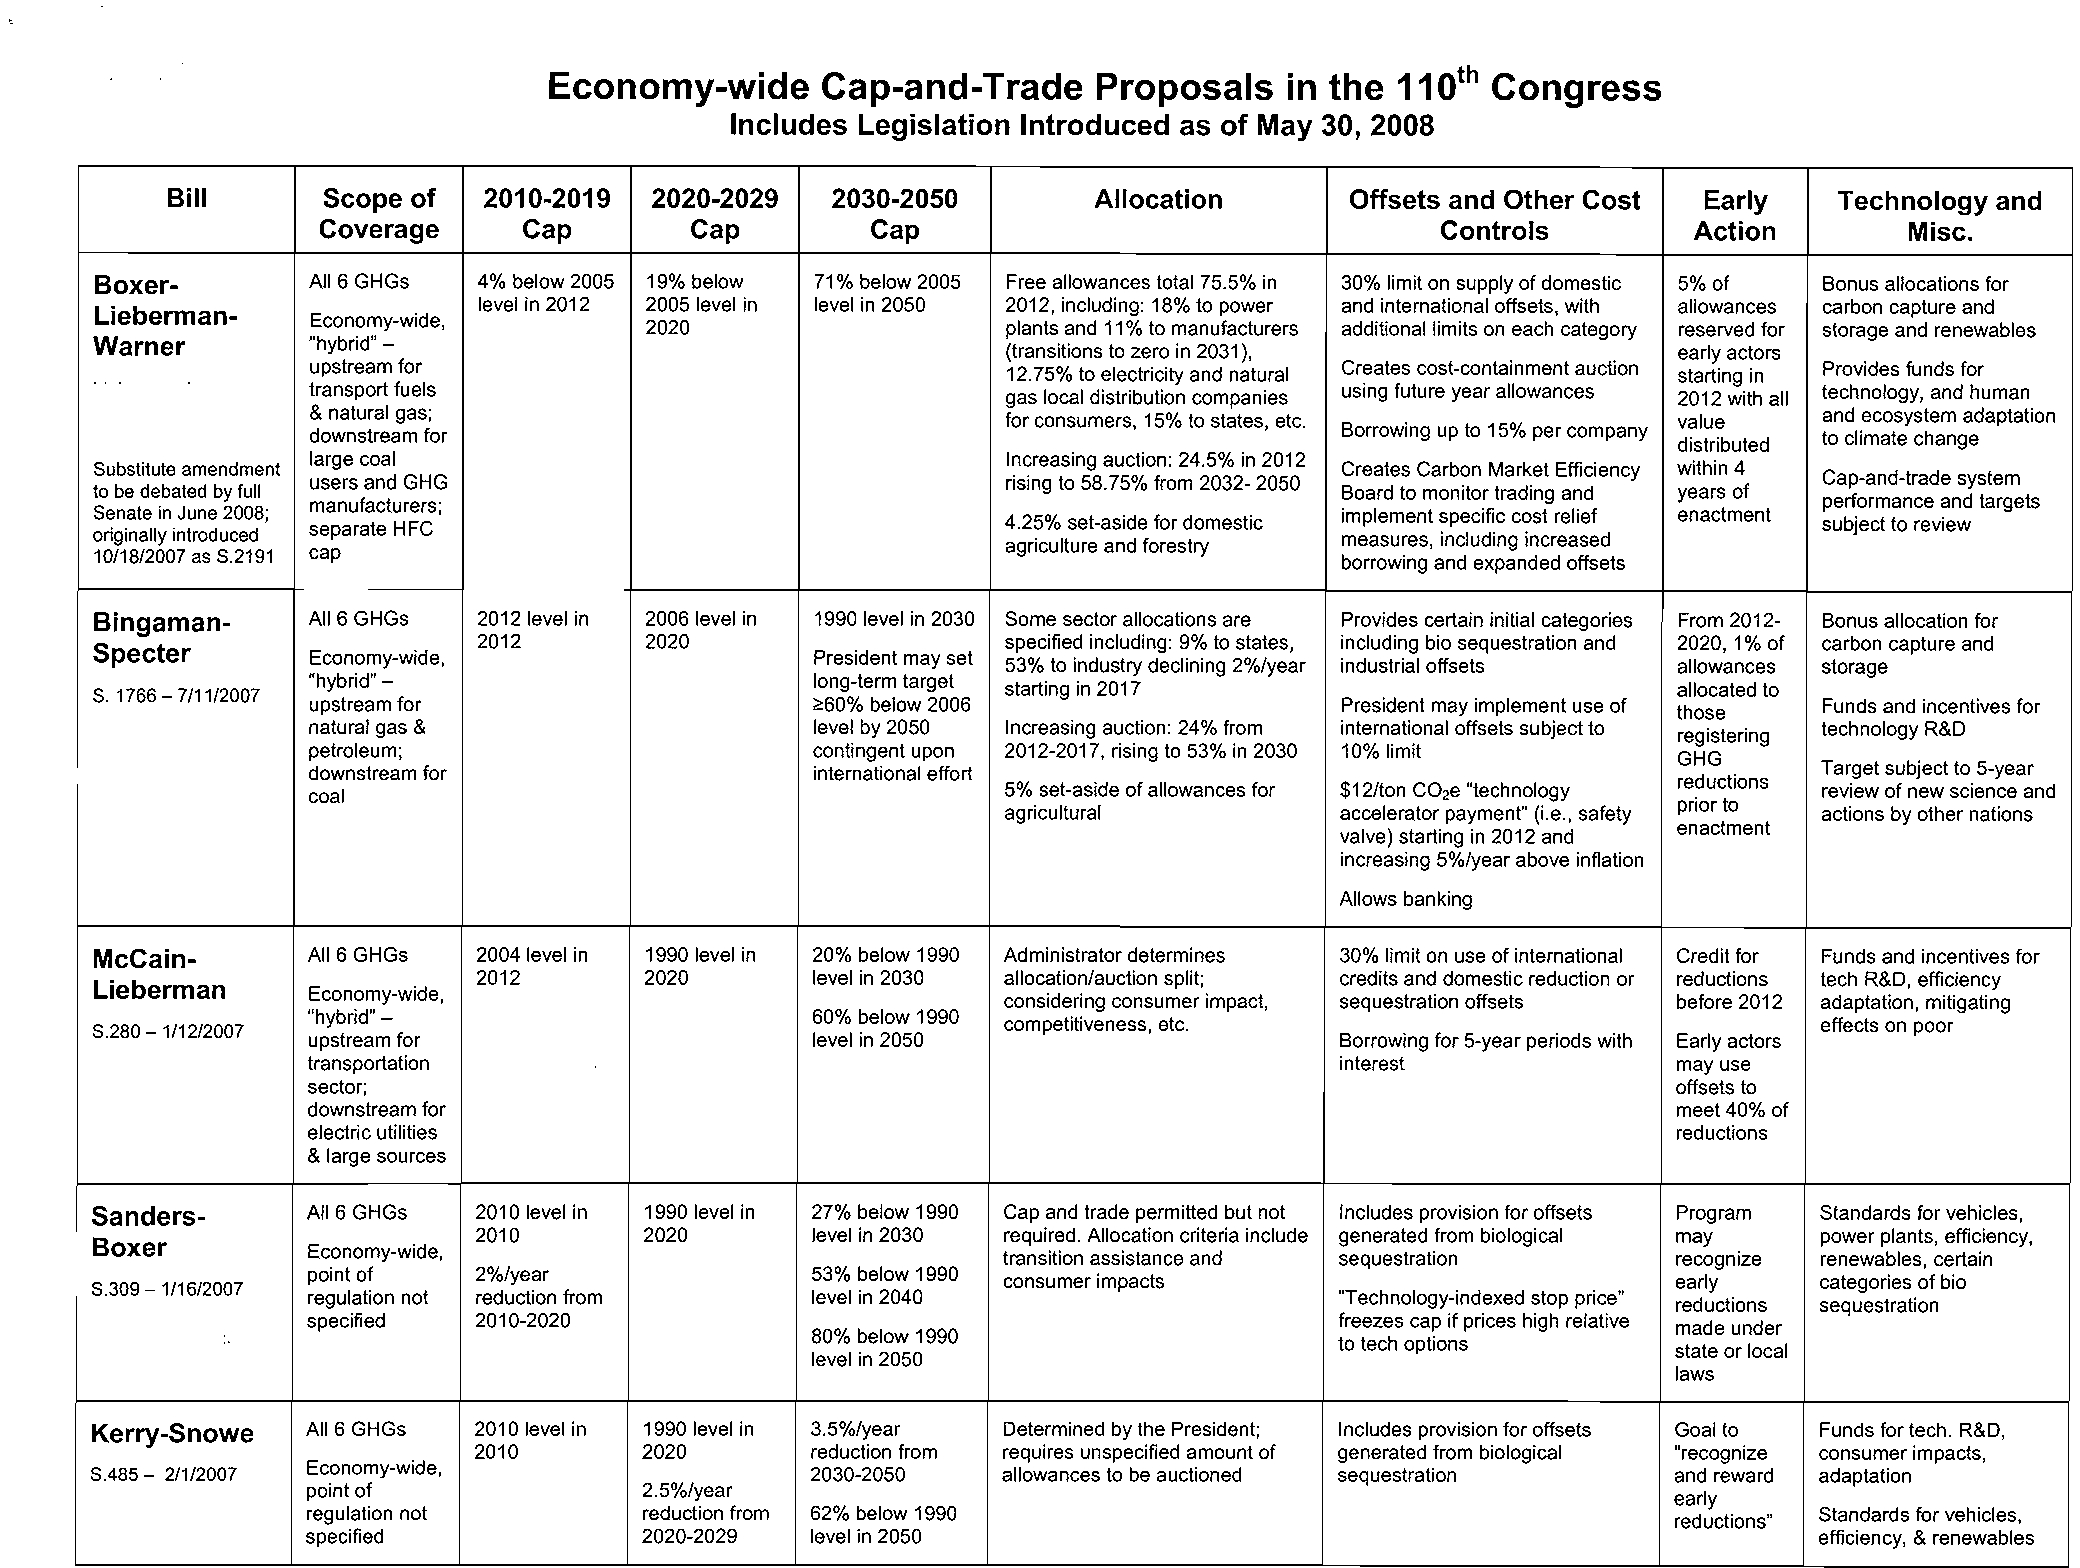
Economy-wide Cap-and-Trade Proposals in the 110
th
Congress
Includes Legislation Introduced as of May 30, 2008
Bill
Scope of
2010-2019
2020-2029
2030-2050
Allocation
Offsets and Other Cost
Early
Technology and
Coverage
Cap
Cap
Cap
Controls
Action
Misc.
Boxer.
All 6 GHGs
4% below 2005
19% below
71 % below 2005
Free allowances total 75.5% in
30% limit on supply of domestic
5%of
Bonus allocations for
Lieberman.
level in 2012
2005 level in
level in
2050
2012, including: 18% to power
and international offsets, with
allowances
carbon capture and
Economy-wide,
2020
plants and 11% to manufacturers
additional limits on each category
reserved for
storage and renewables
Warner
"hybrid" -
(transitions
to zero in 2031),
early actors
upstream for
12.75%
to
electricity and natural
Creates
cost-containment auction
starting in
Provides funds for
Lieberman-Warner
transport fuels
gas local distribution companies
using future year allowances
2012 with all
technology,
and human
Climate Security Act
& natural gas;
for consumers, 15% 10 states, etc.
Borrowing up to 15% per company
value
and ecosystem adaptation
of 2008
downstream for
distributed
to climate change
Substitute amendment
large coal
Increasing auction:
24.5% in 2012
Creates Carbon Market Efficiency
within 4
Cap-and-trade system
to be debated by full
users and GHG
rising to 58.75% from 2032- 2050
Board to monitor trading and
years
of
manufacturers;
performance and targets
Senate
in June 2008;
4.25% set-aside for domestic
implement specific cost relief
enactment
subject to review
originally introduced
separate HFC
agriculture and forestry
measures, including
increased
10/18/2007 as S.2191
cap
borrowing and expanded offsets
Bingaman-
All 6 GHGs
2012 level in
2006 level in
1990 level in 2030
Some sector allocations are
Provides certain initial categories
From 2012-
Bonus allocation for
Specter
2012
2020
specified including: 9% to states,
including bio sequestration and
2020,1% of
carbon capture and
Economy-wide,
President may set
53% to industry declining 2%/year
industrial offsets
allowances
storage
S. 1766 -
7/11/2007
"hybrid" -
long-term target
starting in 2017
allocated to
upstream for
~60%
below 2006
President may implement use of
those
Funds and incentives for
Low Carbon Economy
natural gas &
level by 2050
Increasing auction: 24% from
international offsets SUbject
to
registering
technology R&D
Act
petroleum;
contingent upon
2012-2017, rising to 53% in 2030
10% limit
GHG
downstream for
international effort
reductions
Target subject to 5-year
coal
5% set-aside of allowances for
$12/1on C0
2
e "technology
prior to
review of new science and
agricultural
accelerator payment" (i.e., safety
actions
by other nations
valve) starting in 2012 and
enactment
increasing S%/year above inflation
Allows banking
McCain.
All 6 GHGs
2004 level in
1990 level in
20% below 1990
Administrator determines
30% limit on use of international
Credit for
Funds and incentives for
Lieberman
2012
2020
level in 2030
allocation/auction split;
credits and domestic reduction or
reductions
tech R&D, efficiency
Economy-wide,
considering consumer impact,
sequestration offsets
before
2012
adaptation, mitigating
S.280
-1/1212007
"hybrid"upstream-
for
level60%
belowin
20501990
competitiveness, etc.
Borrowing for 5-year periods with
Early
actors
effects
on poor
Climate Stewardship
transportation
interest
may use
and Innovation Act
sector;
offsets to
downstream for
meet 40% of
electric utilities
reductions
& large
sources
Sanders-
AU6 GHGs
2010 level in
1990 level in
27% below 1990
Cap and trade permitted but not
Includes provision for offsets
Program
Standards for vehicles,
Boxer
2010
2020
level in 2030
required. Allocation criteria include
generated from biological
may
power plants, efficiency,
Economy-wide,
transition assistance and
sequestration
recognize
renewables, certain
S.309
-1/16/2007
pointregulation
of
not
reduction
2%/year
from
level53%
below
in 2040
1990
consumer impacts
"Technology-indexed stop price"
early
categories of bio
reductions
sequestration
Global Warming
specified
2010-2020
80% below 1990
freezes cap if prices high relative
made under
Pollution Reduction
to tech
options
state or local
Act
level in
2050
laws
Kerry-Snowe
All 6 GHGs
2010 level in
1990 level in
3.5%/year
Determined by the President;
Includes provision for offsets
Goal to
Funds for tech. R&D,
2010
2020
reduction from
requires unspecified amount of
generated from biological
"recognize
consumer impacts,
S.485 -
211/2007
Economy-wide,
2030-2050
allowances to be auctioned
sequestration
and reward
adaptation
point of
2.5%/year
early
Global Warming
regulation
not
reduction from
62% below 1990
reductions"
Standards for vehicles,
Reduction Act
specified
2020-2029
level in 2050
efficiency, & renewables
Electronic Filing - Received, Clerk's Office, October 1, 2008
* * * * * PCB 2009-021 * * * * *
~~
CENTER
'.1 Glob'al
~~'AM"J~
Economy-wide Cap-and-Trade Proposals in the 11 oth Congress
Includes legislation Introduced as of May 30, 2008
Bill
Scope of
2010-2019
2020-2029
2030-2050
Allocation
Offsets and Other Cost
Early
Technology and
Coverage
Cap
Cap
Cap
Controls
Action
Misc.
Olver-
All 6 GHGs
2004 level in
1990 level in
22% below 1990
Administrator determines
15% limit on use of international
Credit for
Funds and incentives for
Gilchrest
2012
2020
level in 2030
allocation/auction split;
credits
and domestic reduction or
reductions
tech R&D, efficiency
Economy-wide,
considering consumer impact,
sequestration offsets
before 2012
adaptation, mitigating
H.R. 620 -
1{22/2007
"hybrid"
upstream
-
for
level70%
belowin
20501990
competitiveness, etc.
Borrowing for 5-year periods with
Early actors
effects
on poor
Climate Stewardship
transportation
interest
may use
Act
sector;
offsets to
downstream for
meet 35% of
electric utilities
reductions
& large sources
Waxman
All 6 GHGs
2009 level in
1990 levels in
5%/year reduction
Determined by the President;
Not specified
Goal to
Standards for vehicles,
2010
2020
from 2030-2050
requires unspecified amount of
"recognize
efficiency, renewabJes
H.R.1590 -
3/20/2007
Economy-wide,
allowances to be auctioned
and reward
point of
2%/year
5%/year
80% below 1990
early
Safe Climate Act of
regulation not
reduction from
reduction from
levels in 2050
reductions"
2007
specified
2011-2020
2020-2029
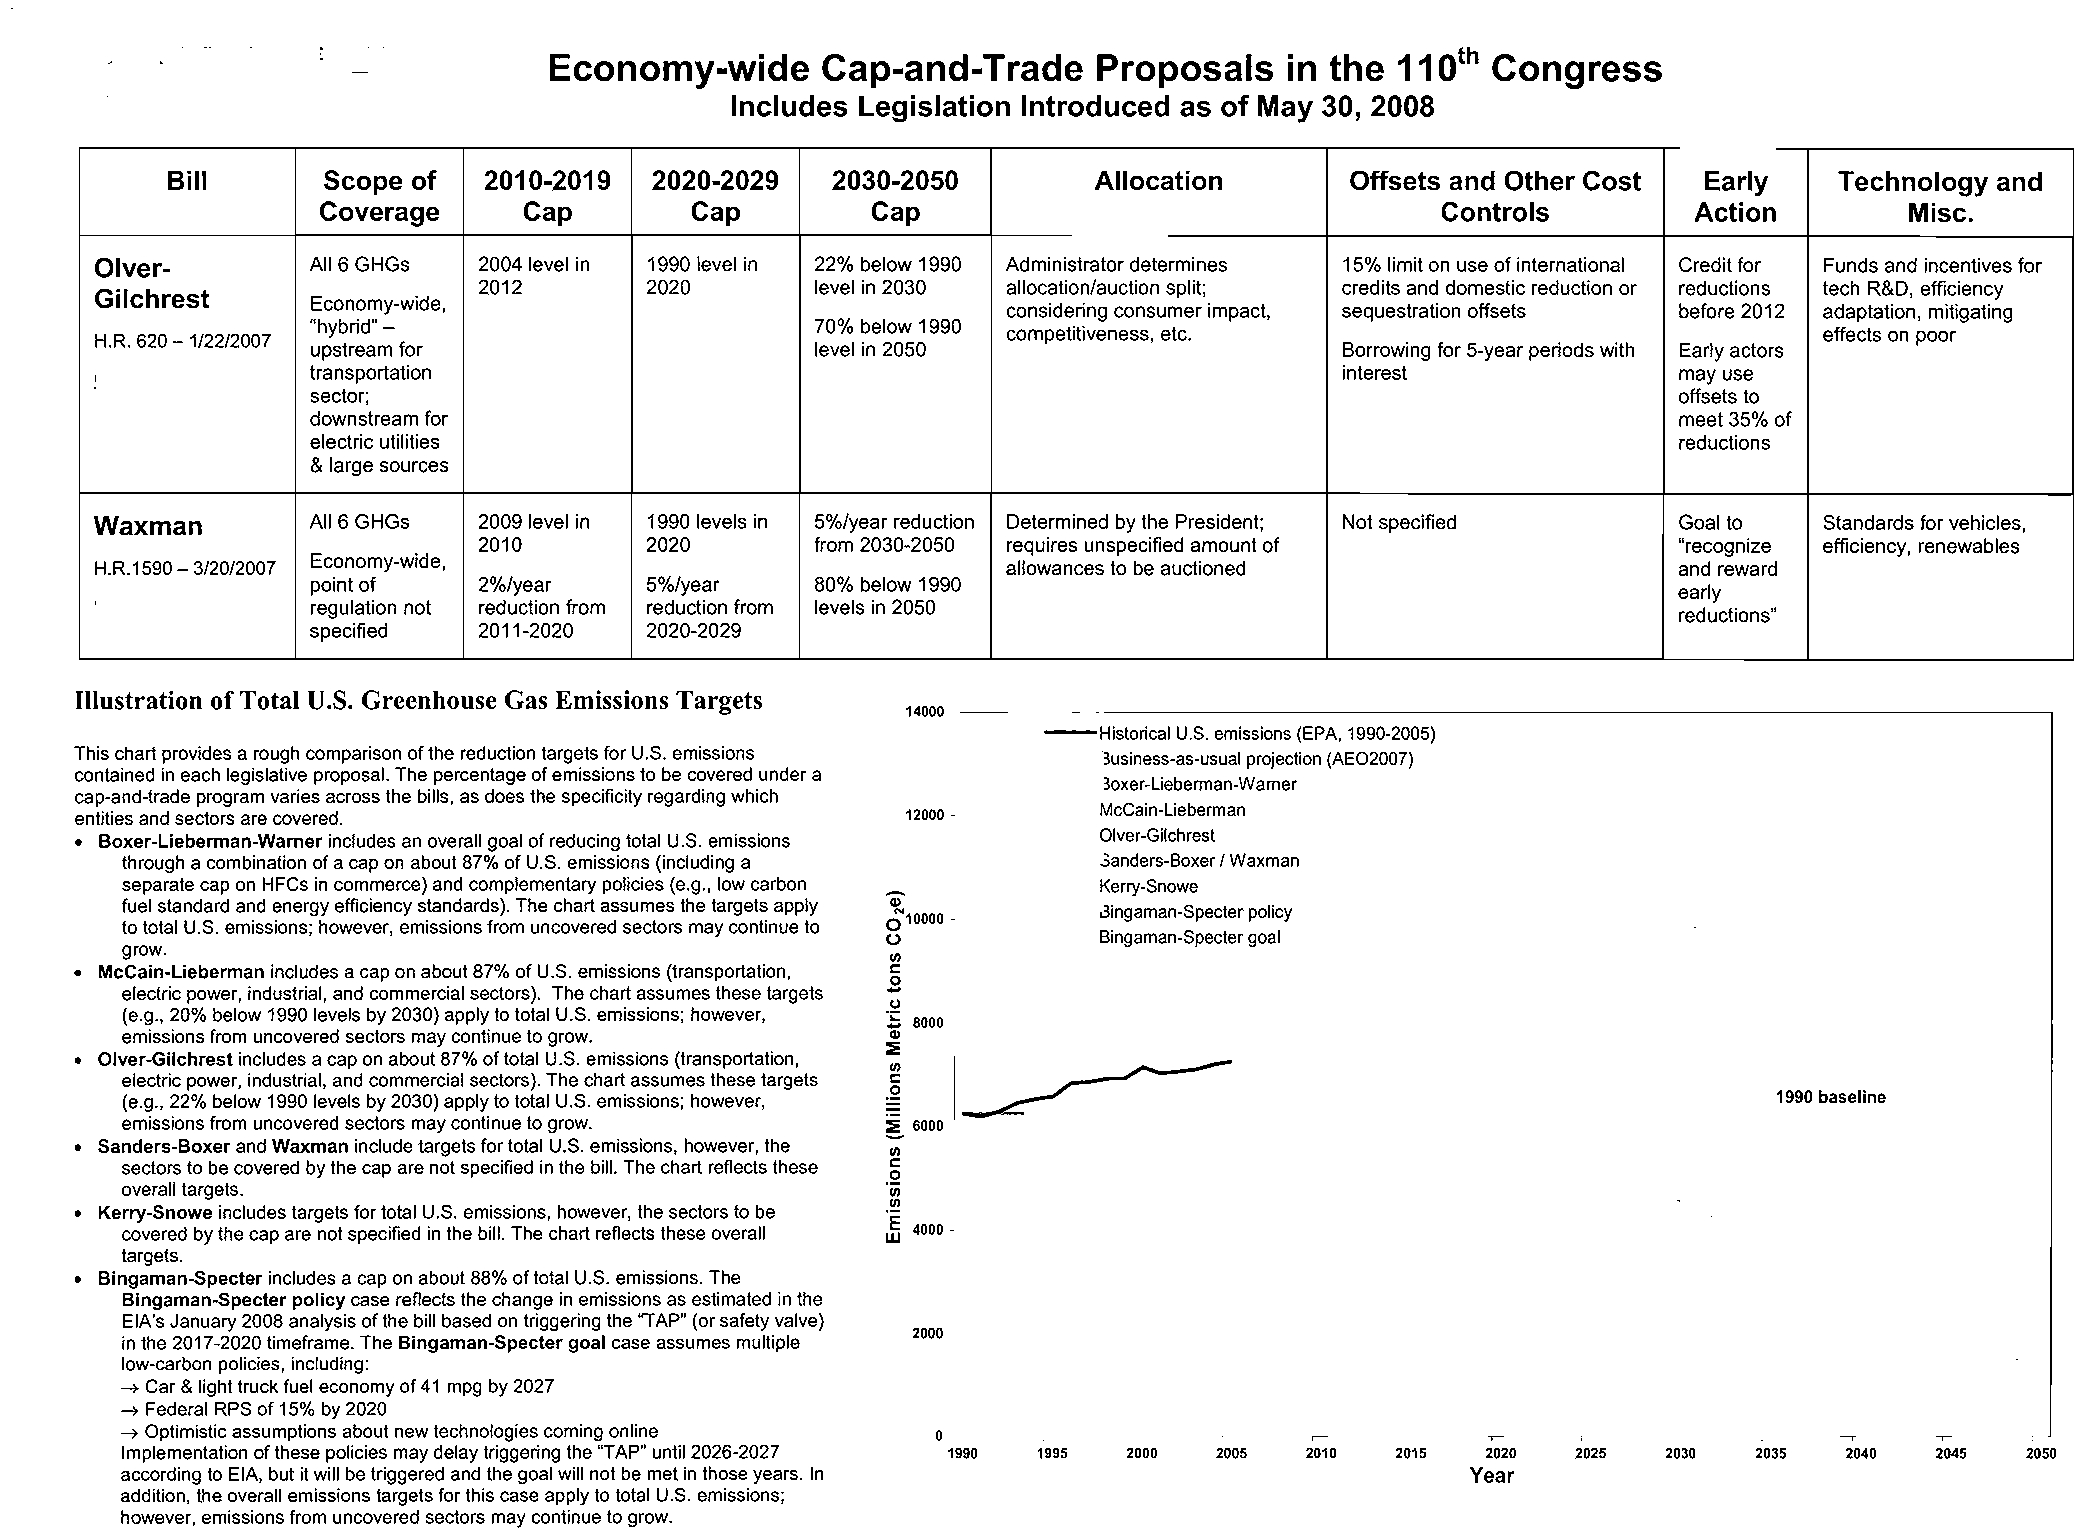
Illustration of Total U.S. Greenhouse Gas Emissions Targets
14000 I
I
o
1-1
--~--~--~--~--~--~--~--~--~--~--~--~
1990
1995
2000
200S
2010
201S
2020
2025
2030
203S
2040
204S
2050
Year
This chart provides a rough comparison of the reduction targets for U.S. emissions
contained in each legislative proposal. The percentage of emissions to be covered under a
cap-and-trade program varies across the bills.
as does the specificity regarding which
entities and sectors are covered.
Boxer-lieberman-Warner includes an overall goal of reducing total U.S. emissions
through a combination
of a cap on about 87% of U.S. emissions (including a
separate cap on HFCs in commerce) and complementary policies (e.g., low carbon
fuel standard and energy efficiency standards). The chart assumes the targets apply
to total U.S. emissions; however, emissions from uncovered sectors may continue to
grow.
McCain-lieberman includes a cap on about 87% of U.S. emissions (transportation,
electric power. industrial. and commercial sectors).
The chart assumes these targets
(e.g., 20% below 1990 levels by 2030) apply to total U.S. emissions; however,
emissions from uncovered sectors may continue to grow.
Olver-Gilchrest includes a cap on about 87% of total U.S. emissions (transportation,
electric power, industrial, and commercial sectors). The chart assumes these targets
(e.g., 22% below 1990 levels by 2030) apply to total U.S. emissions; however,
emissions from uncovered sectors may continue to grow.
Sanders-Boxer and Waxman include targets for total U.S. emissions, however, the
sectors to be covered
by the cap are not specified in the bill. The chart reflects these
overall targets.
Kerry-Snowe includes targets for total U.S. emissions, however, the sectors to be
covered
by the cap are not specified in the bill. The chart reflects these overall
targets.
Bingaman-Specter includes a cap on about 88% of total U.S. emissions. The
Bingaman-Specter policy case reflects the change in emissions as estimated in the
EIA's January 2008 analysis of the bill based on triggering the "TAP" (or safety valve)
in the 2017-2020 timeframe.
The Bingaman-Specter goal case assumes multiple
low-carbon policies, including:
-jo Car & light truck fuel economy of 41 mpg by 2027
-jo Federal RPS of 15% by 2020
-jo Optimistic assumptions about new technologies coming online
Implementation of these policies may delay triggering the "TAP" until 2026-2027
according to EIA, but
it will be triggered and the goal will not be met in those years. In
addition, the overall emissions targets for this case apply to total U.S. emissions;
however, emissions from uncovered sectors may continue to grow.
12000
~10000
U
•
c
2
."
~
8000
"
•
c
~
~
6000
•
c
o
.~
]
4000
2000
--Historical U.S. emissions (EPA. 1990-2005)
--Business-as-usual projection (AE02007)
--Boxer-lieberman-Warner
--McCain-lieberman
--Olver-Gilchrest
--Sanders-Boxer
{
Waxman
--Kerry-Snowe
--Bingaman-Specter policy
Bingaman-Specter goal
1990
baseline
Electronic Filing - Received, Clerk's Office, October 1, 2008
* * * * * PCB 2009-021 * * * * *