| | - TECHNICAL SUPPORT DOCUMENT FOR SITE-SPECIFIC BORON STANDARD FOR THE
- SPRINGFIELD METRO SANITARY DISTRICT SPRING CREEK PLANT
- TABLE OF CONTENTS
- Section Page
- TABLE OF CONTENTS
- (Continued)
- Section Page
- TABLE OF CONTENTS
- (Continued)
- LIST OF TABLES
- Table Title Page
- LIST OF FIGURES
- Figure Title Page
- TABLE OF CONTENTS
- (Continued)
- EXECUTIVE SUMMARY
- SECTION 1.0
- PURPOSE AND SCOPE
- SECTION 1.0
- PURPOSE AND SCOPE
- 1.1 Purpose
- 1.2 Scope
- SECTION 2.0
- FACILITY INFORMATION
- SECTION 2.0
- FACILITY INFORMATION
- 2.1 CWLP Plant Description
- 2.2 CWLP Plant Operation
- TABLE 2-1
- CITY WATER, LIGHT AND POWER MONTHLY COAL USAGE 2002 - 2007
- (in tons)
- 2002 2003 2004 2005 2006 2007
- Total 1,098,242 1,084,158 1,151,239 1,260,355 1,121,764
- TABLE 2-2
- CITY WATER, LIGHT AND POWER MONTHLY SEED CORN FIRED 2003 - 2007
- (in tons)
- 2003 2004 2005 2006 2007
- Total 6,176 14,473 12,040 15,074
- TABLE 2-3
- CITY WATER, LIGHT AND POWER MONTHLY OIL USAGE 2002 - 2007
- (in gallons)
- 2002 2003 2004 2005 2006 2007
- Total 305,612 706,693 344,434 614,110 338,318
- TABLE 2-4
- CITY WATER, LIGHT AND POWER MONTHLY GROSS GENERATION 2002 - 2007
- (in megawatt hours)
- 2002 2003 2004 2005 2006 2007
- Total 2,236,129 2,211,386 2,361,297 2,579,723 2,264,660
- TABLE 2-5
- CITY WATER, LIGHT AND POWER
- MONTHLY GROSS THERMAL EFFICIENCY 2002 - 2007
- (in percent)
- 2002 2003 2004 2005 2006 2007
- Annual 32.83 32.83 32.96 32.50 32.08
- 2.3 CWLP Existing Outfall and Discharge Description
- 2.4 Proposed CWLP Discharge to SMSD
- 2.5 Spring Creek Wastewater Plant Description
- 2.6 Spring Creek Wastewater Plant Operation
- TABLE 2-6
- SPRING CREEK WASTEWATER TREATMENT PLANT FLOWS 2004 - 2007
- Year Daily Average Flow
- (MGD)
- Maximum Daily Flow
- (MGD)
- 2004-2007 20.09 50
- TABLE 2-7
- NPDES PERMIT NO. IL0021989
- 2.7 Anticipated Spring Creek Plant Discharge
- TABLE 2-8
- SPRING CREEK WASTEWATER TREATMENT PLANT
- AVERAGE DISCHARGE PARAMETERS
- Discharge Parameter Permitted Value Average Value (2006)
- SECTION 3.0
- RESOURCES OF THE SANGAMON RIVER
- SECTION 3.0
- RESOURCES OF THE SANGAMON RIVER
- 3.1 Sangamon River Basin
- 3.1.1 Geology and Physiography
- 3.1.2 Sangamon River
- 3.2 Sangamon River Environmental Quality
- 3.2.1 Water Uses
- TABLE 3-1
- ILLINOIS RIVER
- NPDES
- Facility Name Outfalls Average Design
- Flow (MGD)
- 3.2.2 Water Quality
- 3.2.3 Primary Productivity, Plankton, and Aquatic Macroinvertebrates
- TABLE 3-2
- ILLINOIS GUIDELINES FOR USING BIOLOGICAL INFORMATION FOR
- ASSESSING AQUATIC LIFE USE IN STREAMS
- No Impairment Moderate Impairment Severe Impairment
- Biological
- Indicator
- Fully Supporting Aquatic Life Use (Good Resource Quality)
- Not Supporting
- Aquatic Life Use (Fair Resource Quality)
- Not Supporting
- Aquatic Life Use (Poor Resource Quality)
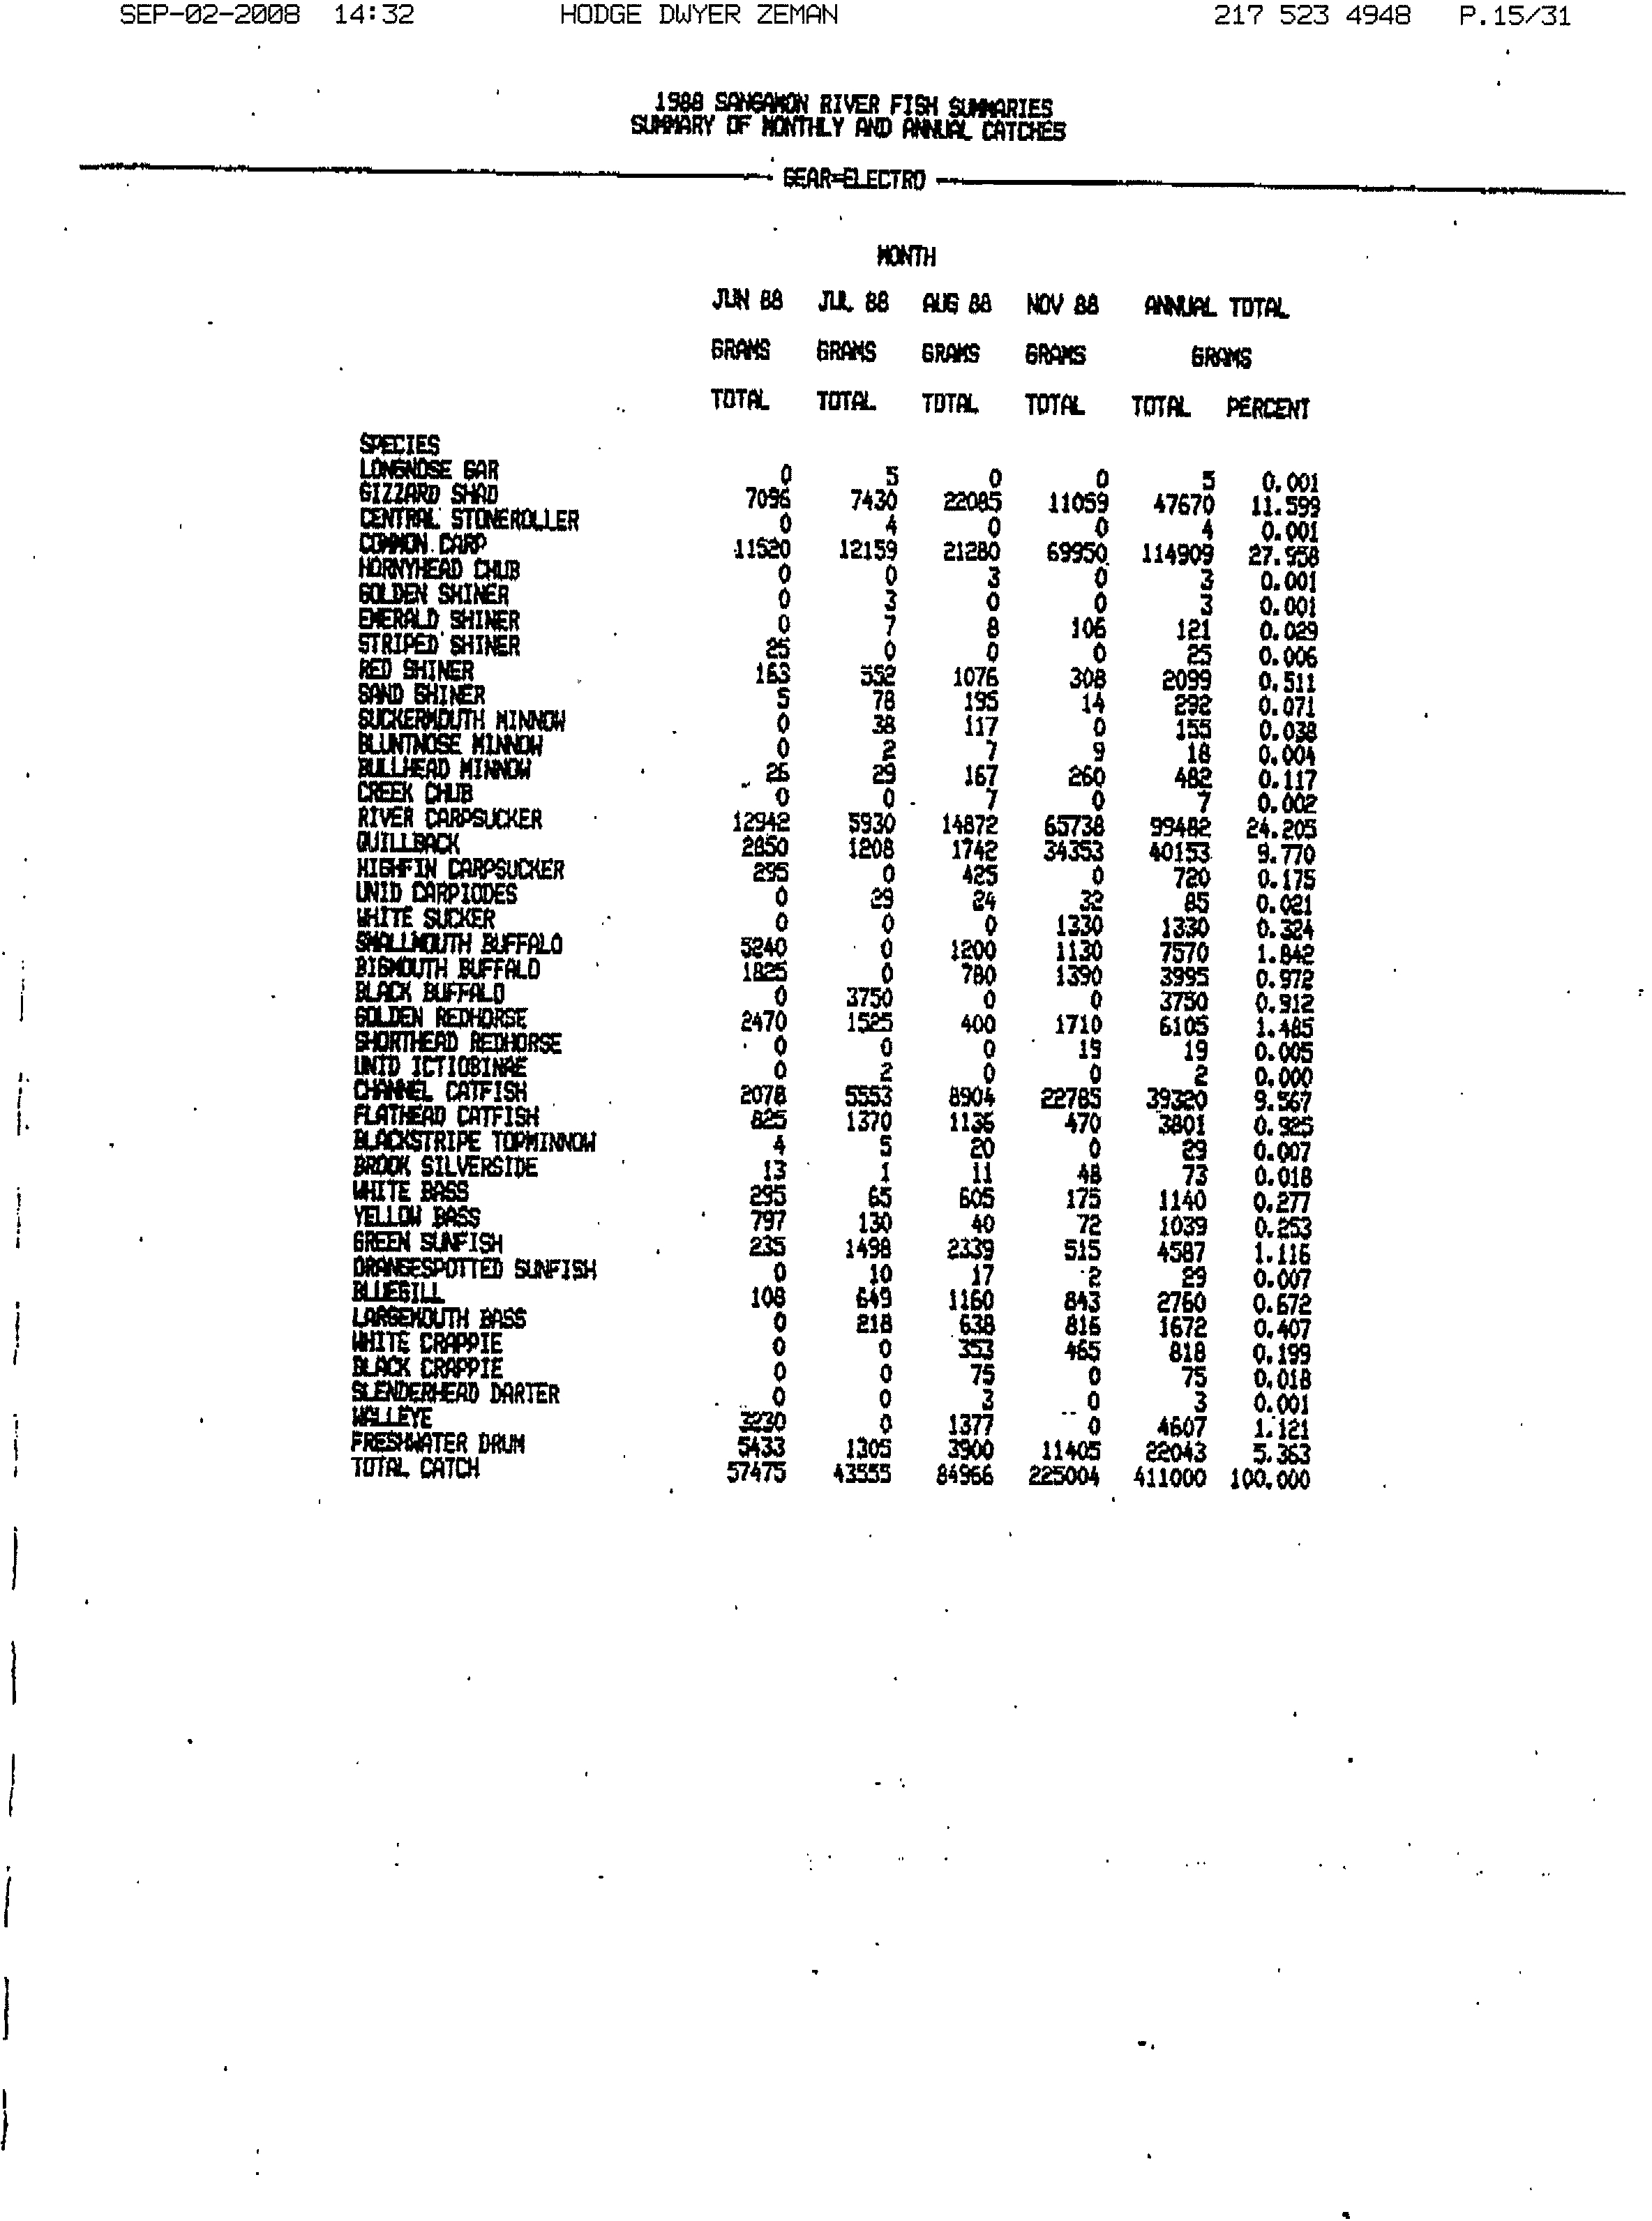
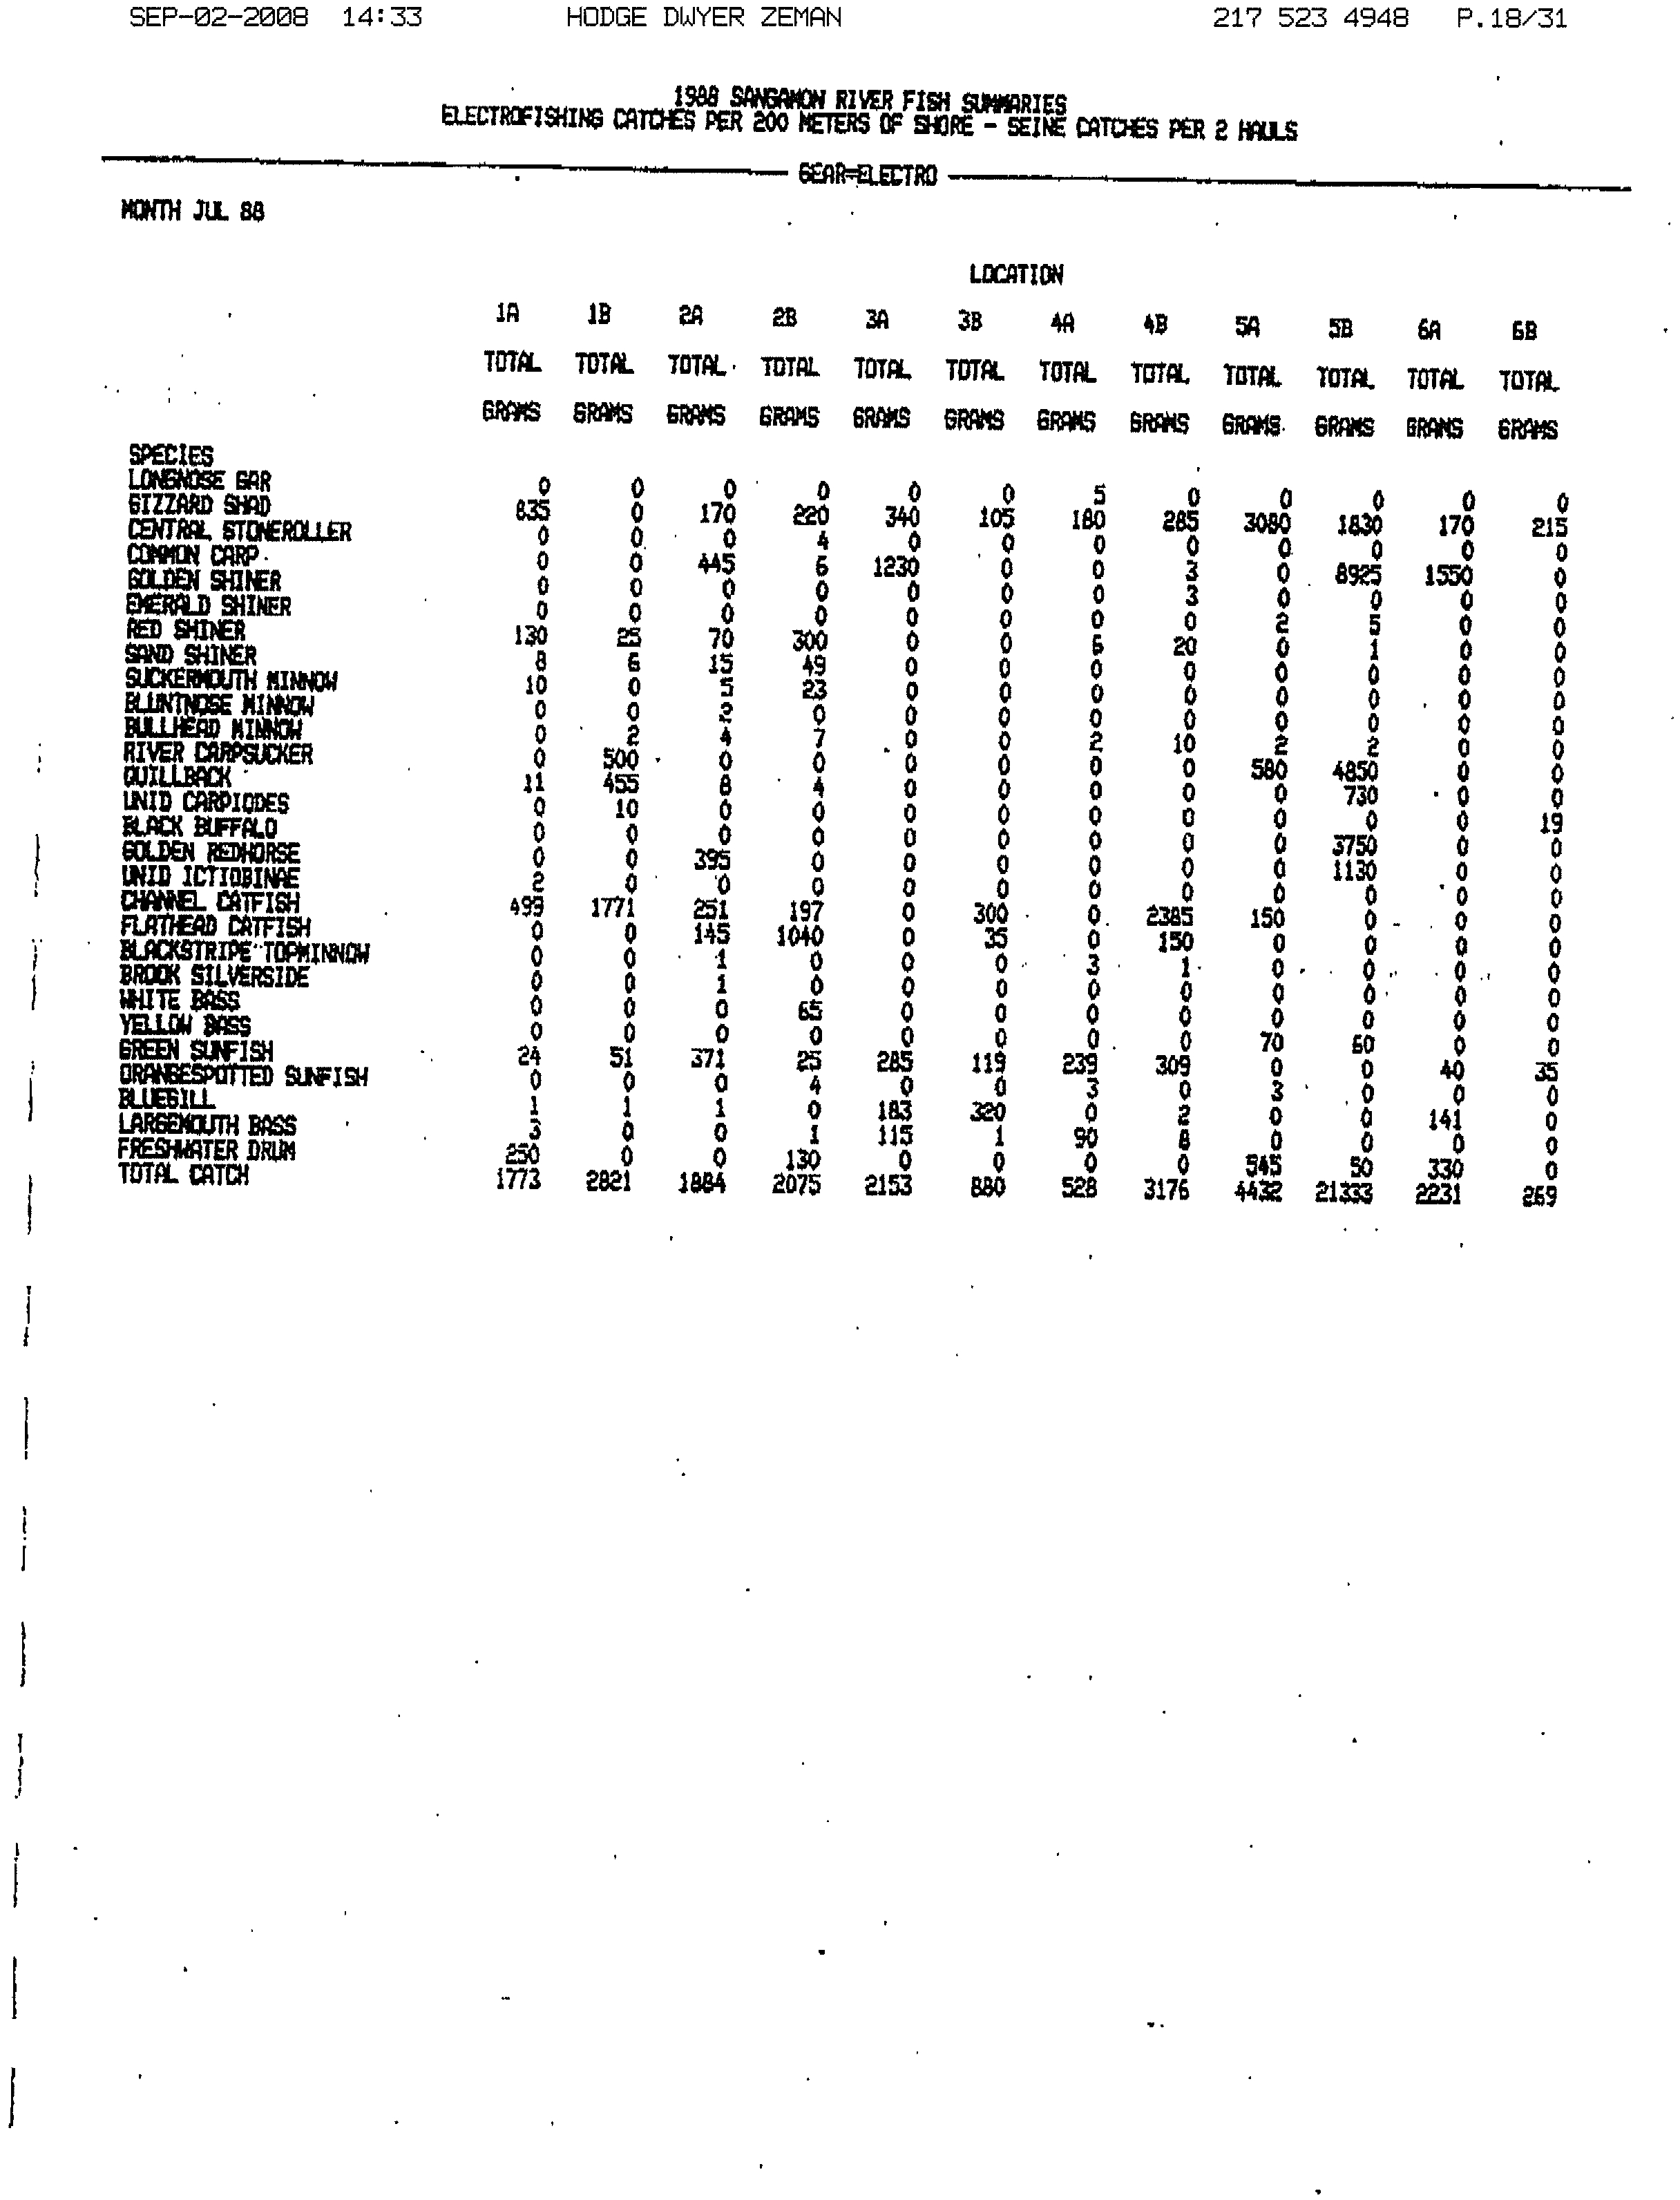
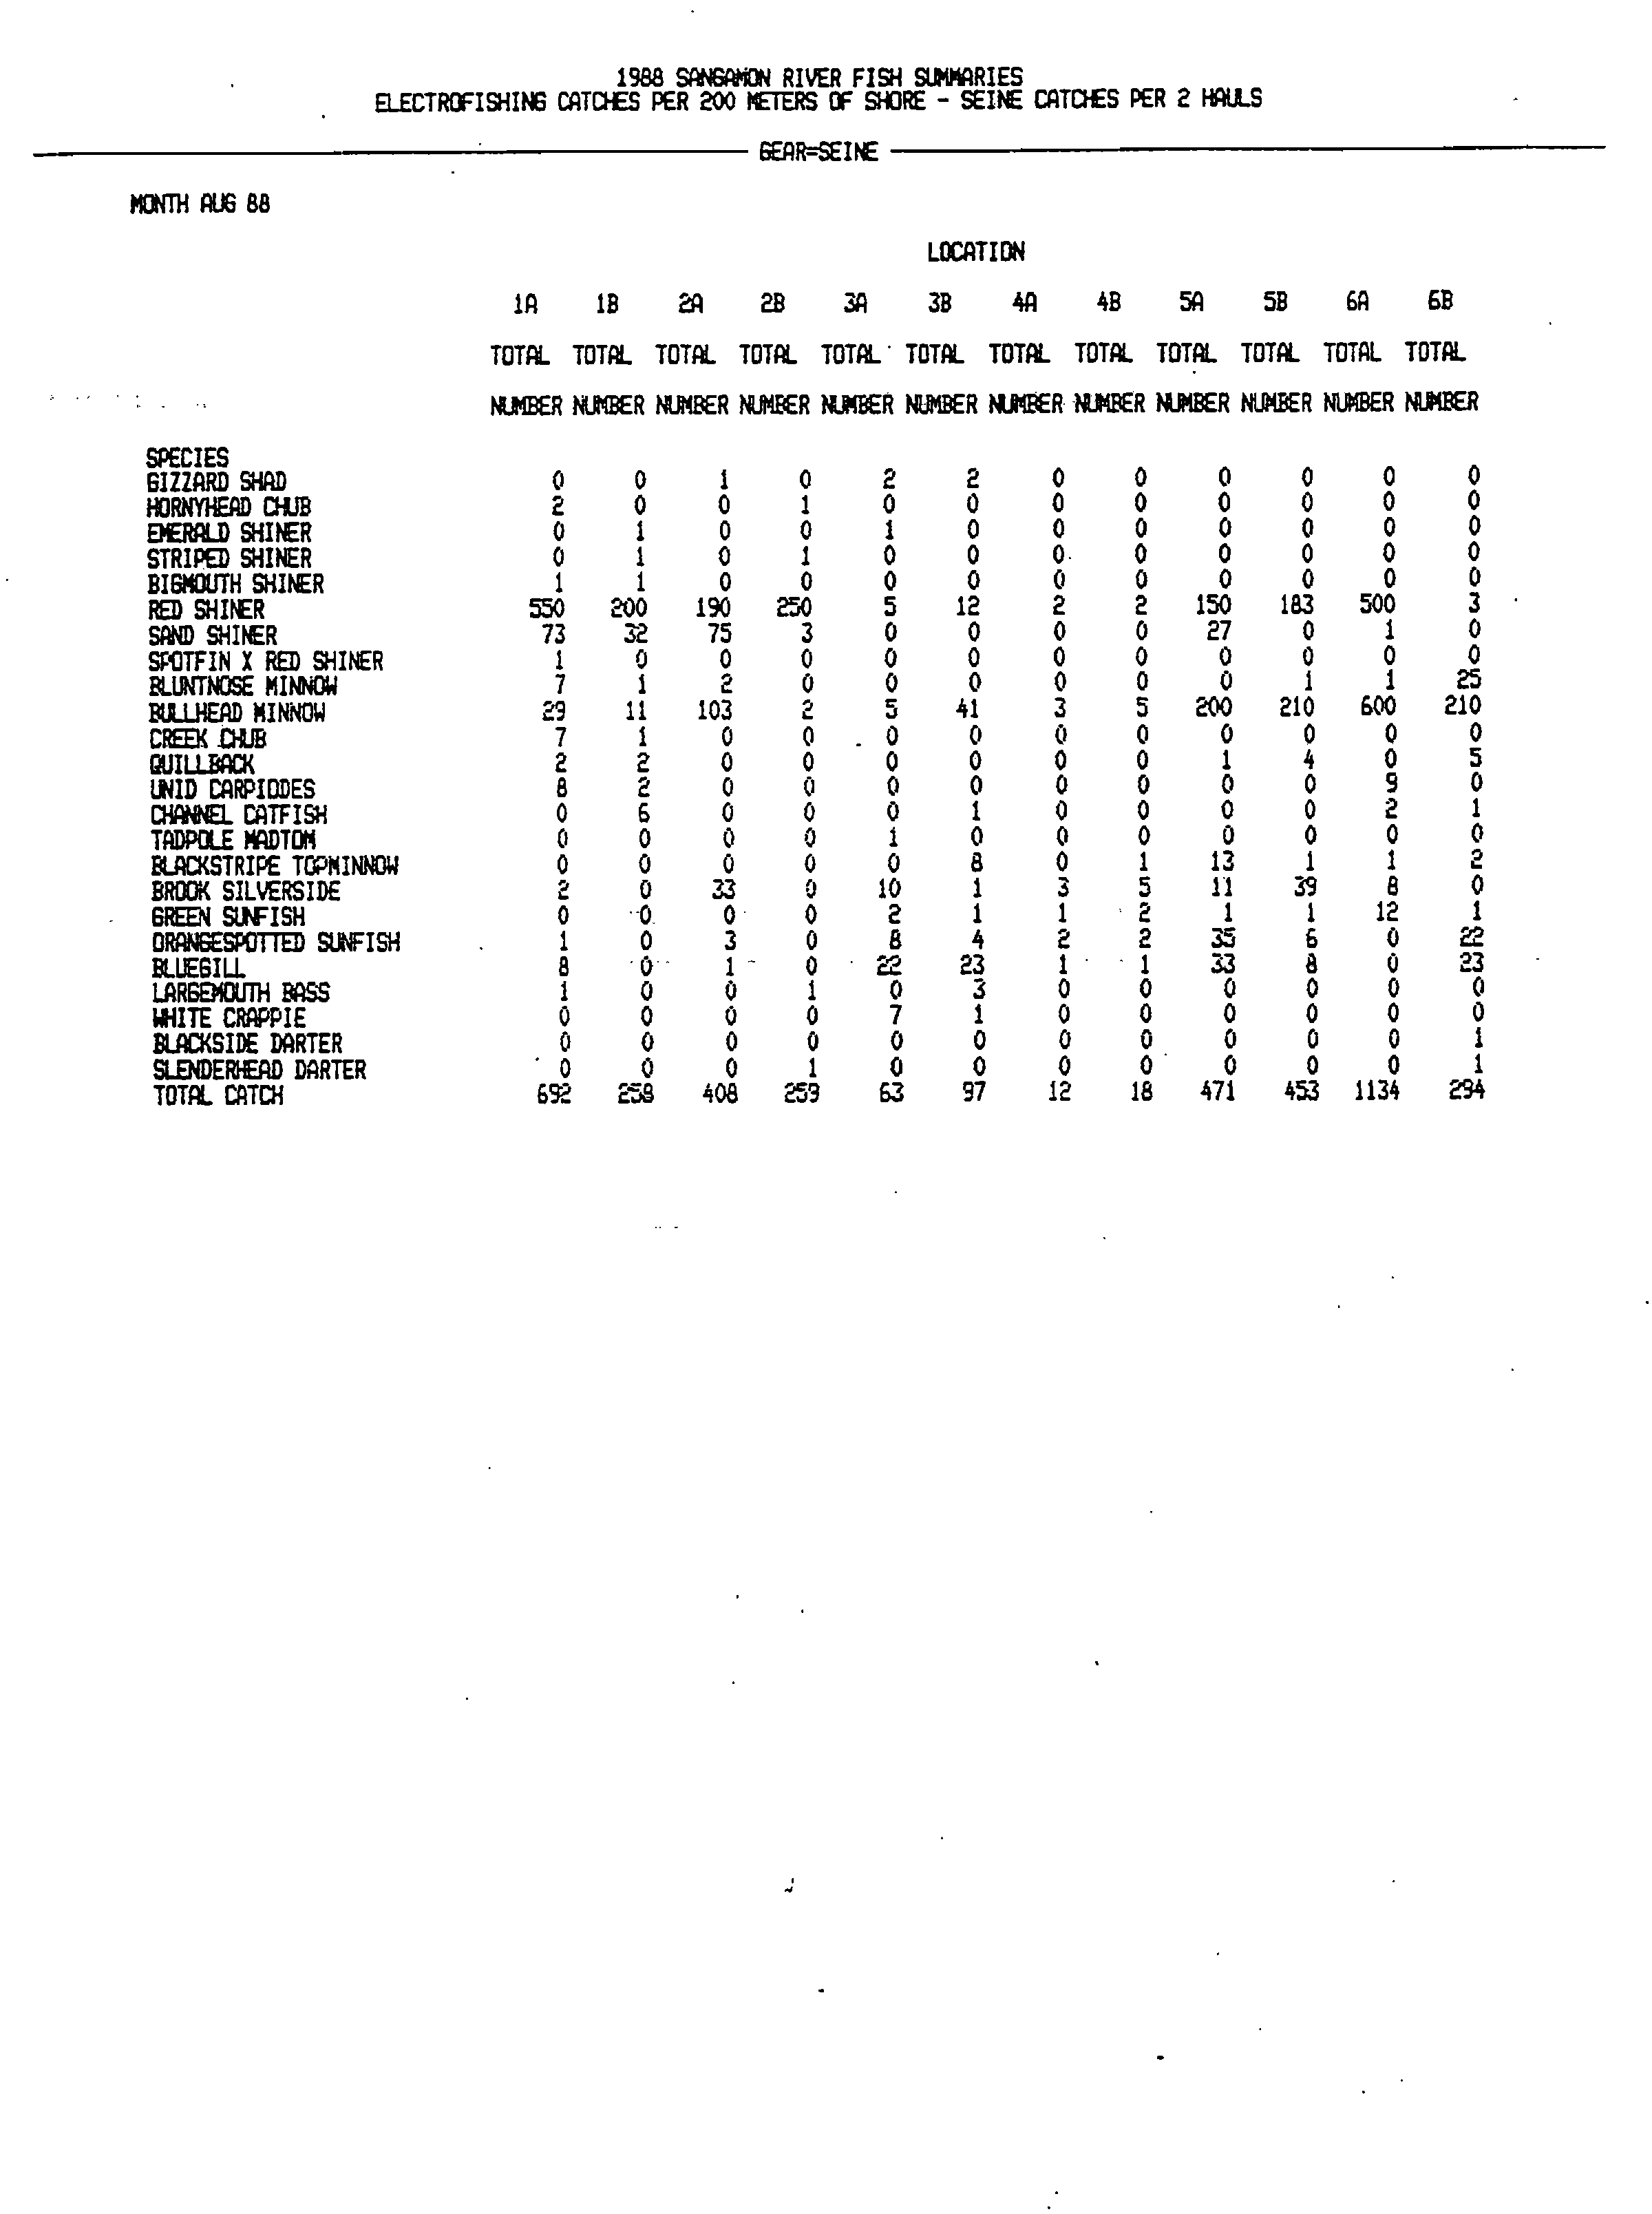
- 3.2.4 Fisheries
- TABLE 3-3
- MACROINVERTEBRATE SPECIES COLLECTED FROM THE SANGAMON
- RIVER
- TABLE 3-4
- FISH SPECIES COLLECTED FROM THE SANGAMON RIVER -
- 1996 AND 2003
- Fish Species E-16
- E-50/26 Springfield/Riverton
- E-24
- Petersburg
- E-25
- Oakford
- 2003 1996 2003 1996 2003 1996 2003
- Fish Species E-16
- E-50/26 Springfield/Riverton
- E-24
- Petersburg
- E-25
- Oakford
- 2003 1996 2003 1996 2003 1996 2003
- TABLE 3-5
- IBI COMPARISON IN THE SANGAMON RIVER FOR 1981-82, 1996 AND 2003
- WITH REVISED IBI COMPARISONS BETWEEN 1996 AND 2003
- Year E-50/26 Springfield/Riverton
- E-24
- Petersburg
- E-25
- Oakford
- IBI RIBI IBI RIBI IBI RIBI
- 3.2.5 Threatened and Endangered Species and Natural Areas
- SECTION 4.0
- ISSUE OF CONCERN
- SECTION 4.0
- ISSUE OF CONCERN
- 4.1 Proposed Site-Specific Standard for Boron
- 4.2 Boron Concentrations in Receiving Waters
- 4.2.1 Historic Boron Levels
- Figure 4-1
- Illinois EPA Boron Data - Station E-26
- (Sangamon River at Riverton)
- Total Boron (mg/L)
- Stream Discharge (cfs)
- Figure 4-2
- Illinois EPA Boron Data - Station E-24
- (Sangamon River at Petersburg)
- Total Boron (mg/L)
- Figure 4-3
- Illinois EPA Boron Data - Station E-25
- (Sangamon River at Oakford)
- 0.000
- 0.100
- 0.200
- 0.300
- 0.400
- 0.500
- 0.600
- 0.700
- Total Boron (mg/L)
- 10000
- 12000
- 14000
- 16000
- Stream Discharge
- (cfs)
- TABLE 4-1
- SEPTEMBER AND OCTOBER 2007
- Total Boron
- (mg/L)
- Stream Discharge
- (cfs)
- Date Sangamon River at IL Route 29 Bridge
- (Downstream)
- Sangamon River at Riverside Park
- (Upstream)
- Sangamon River at
- Riverton
- 4.2.2 Predicted Boron Levels
- SECTION 5.0
- ENVIRONMENTAL EFFECTS OF BORON
- SECTION 5.0
- ENVIRONMENTAL EFFECTS OF BORON
- 5.1 Distribution and Uses of Boron
- 5.2 Toxicological Effects of Boron
- 5.2.1 Effects in Humans
- 5.2.2 Effects in Other Mammals and Birds
- 5.2.3 Effects in Fish and Amphibians
- 5.2.4 Effects in Invertebrates
- TABLE 5-1
- Species Life Stage Type of Test
- Boron
- Compound
- Used
- Water Source
- Boron
- Concentration
- (mg B/L)
- Test Response Reference
- VERTEBRATES
- INVERTEBRATES
- Species Life Stage Type of Test
- Boron
- Compound
- Used
- Water Source
- Boron
- Concentration
- (mg B/L)
- Reference
- AQUATIC PLANTS
- 5.2.5 Effects in Plants
- 5.2.6 Effects in Aquatic Organisms
- 5.3 Environmental Effects of Current Boron Levels
- 5.4 Predicted Effects of the Proposed Site-Specific Boron Standard
- SECTION 6.0
- EVALUATION OF WATER TREATMENT ALTERNATIVES
- SECTION 6.0
- EVALUATION OF WATER TREATMENT ALTERNATIVES
- 6.1 Alternate Coal Source
- 6.2 Dry Ash Systems
- 6.2.1 Dry Fly Ash
- TABLE 6-1
- TONAGE AND SOURCE OF COAL USED BY ILLINOIS UTILITIES IN 2005
- Name of Operating Company and
- Power Plant
- State where Coal Mined
- 2005 Coal (Thousand Tons)
- 6.2.2 Dry Bottom Ash
- 6.3 Treatment Alternatives
- 6.3.1 Brine Concentrator followed by Spray Dryer
- 6.3.2 Reverse Osmosis followed by Crystallizer and Spray Dryer
- 6.3.3 Electrocoagulation
- 6.3.4 Comparison of Treatment Alternatives
- TABLE 6-2
- COST OF TREATMENT ALTERNATIVES FOR THE REMOVAL OF BORON
- Treatment Process Capital Cost
- Annual O&M
- Present Value
- Present Value per Electric Service
- Brine Concentrator followed by Spray Dryer
- 8,222,000 798,539 22,100,000 333
- Reverse Osmosis
- followed by Crystallizer and Spray Dryer
- 6,120,000 1,118,649 25,600,000 385
- 6.3.5 Boron Pilot Project
- 6.4 Pretreatment of Water Proposed for Transfer to SMSD
- SECTION 7.0
- CONCLUSIONS AND RECOMMENDATIONS
- SECTION 7.0
- CONCLUSIONS AND RECOMMENDATIONS
- SECTION 8.0
- REFERENCES
- SECTION 8.0
- REFERENCES
- APPENDIX A
- SPRING CREEK PLANT NPDES PERMIT
- APPENDIX B
- CWLP NPDES PERMIT
- APPENDIX C
- IDNR CORRESPONDENCE
- APPENDIX D
- BORON WATER QUALITY DATA FOR THE SANGAMON RIVER – 1999-2004
- Boron Water Quality Data for the Sangamon RiverJanuary 1999 to February 2004
- Illinois EPA Ambient Water Quality Monitoring Network
- APPENDIX E
- BORON ANAYLTICAL RESULTS - SEPTEMBER 2007 AND OCTOBER 2007
|

Electronic Filing - Received, Clerk's Office, August 29, 2008
* * * * * R2009-008 * * * * *
Final, 8-13-08
TECHNICAL SUPPORT DOCUMENT FOR THE
SITE-SPECIFIC BORON STANDARD FOR THE
SPRINGFIELD METRO SANITARY DISTRICT SPRING CREEK PLANT
SANGAMON COUNTY, ILLINOIS
Prepared for:
CITY OF SPRINGFIELD OFFICE OF PUBLIC UTILITIES
Springfield, Illinois
Prepared by:
HANSON PROFESSIONAL SERVICES INC.
1525 South Sixth Street
Springfield, Illinois 62703
August 2008
Copyright
©
2008 by Hanson Professional Services Inc. All rights reserved. This document is intended solely for the use of the
individual or the entity to which it is addressed. The information contained in this document shall not be duplicated, stored
electronically, or distributed, in whole or in part, without the express written permission of Hanson Professional Services Inc., 1525 S.
Sixth St., Springfield, IL 62703, (217) 788-2450, www.hanson-inc.com
. Unauthorized reproduction or transmission of any part of this
document is a violation of federal law.
Electronic Filing - Received, Clerk's Office, August 29, 2008
* * * * * R2009-008 * * * * *
TECHNICAL SUPPORT DOCUMENT FOR
SITE-SPECIFIC BORON STANDARD FOR THE
SPRINGFIELD METRO SANITARY DISTRICT SPRING CREEK PLANT
TABLE OF CONTENTS
Section
Page
EXECUTIVE SUMMARY ................................................................................................. i
1.0
PURPOSE AND SCOPE..................................................................................... 1-1
1.1
Purpose..................................................................................................... 1-1
1.2
Scope........................................................................................................ 1-2
2.0
FACILITY INFORMATION .............................................................................. 2-1
2.1
CWLP Plant Description.......................................................................... 2-1
2.2
CWLP Plant Operation ............................................................................ 2-3
2.3
CWLP Existing Outfall and Discharge Description ................................ 2-9
2.4
Proposed CWLP Discharge to SMSD ................................................... 2-12
2.5
Spring Creek Wastewater Plant Description.......................................... 2-12
2.6
Spring Creek Wastewater Plant Operation ............................................ 2-15
2.7
Anticipated Spring Creek Plant Discharge ............................................ 2-19
3.0
RESOURCES OF THE SANGAMON RIVER .................................................. 3-1
3.1
Sangamon River Basin............................................................................. 3-1
3.1.1 Geology and Physiography .......................................................... 3-1
3.1.2 Sangamon River........................................................................... 3-2
3.2
Sangamon River Environmental Quality ................................................. 3-6
3.2.1 Water Uses ................................................................................... 3-6
3.2.2 Water Quality............................................................................... 3-9
3.2.3 Primary Productivity, Plankton, and Aquatic ........................... 3-11
Macroinvertebrates
3.2.4 Fisheries ..................................................................................... 3-13
3.2.5 Threatened and Endangered Species and Natural Areas ........... 3-22
4.0
ISSUE OF CONCERN ........................................................................................ 4-1
4.1
Proposed Site-Specific Standard for Boron ............................................. 4-1
4.2
Boron Concentrations in Receiving Waters............................................. 4-2
4.2.1 Historic Boron Levels .................................................................. 4-2
4.2.2 Predicted Boron Levels................................................................ 4-9
Electronic Filing - Received, Clerk's Office, August 29, 2008
* * * * * R2009-008 * * * * *
TABLE OF CONTENTS
(Continued)
Section
Page
5.0
ENVIRONMENTAL EFFECTS OF BORON .................................................... 5-1
5.1
Distribution and Uses of Boron ............................................................... 5-1
5.2
Toxicological Effects of Boron................................................................ 5-2
5.2.1 Effects in Humans........................................................................ 5-2
5.2.2 Effects in Other Mammals and Birds........................................... 5-3
5.2.3 Effects in Fish and Amphibians................................................... 5-4
5.2.4 Effects in Invertebrates ................................................................ 5-6
5.2.5 Effects in Plants ........................................................................... 5-9
5.2.6 Effects in Aquatic Organisms .................................................... 5-12
5.3
Environmental Effects of Current Boron Levels ................................... 5-13
5.4
Predicted Effects of the Proposed Site-Specific Boron Standard .......... 5-15
6.0
EVALUATION OF WATER TREATMENT ALTERNATIVES ...................... 6-1
6.1
Alternate Coal Source .............................................................................. 6-1
6.2
Dry Ash Systems...................................................................................... 6-3
6.2.1 Dry Fly Ash.................................................................................. 6-3
6.2.2 Dry Bottom Ash........................................................................... 6-5
6.3
Treatment Alternatives............................................................................. 6-6
6.3.1 Brine Concentrator followed by Spray Dryer.............................. 6-6
6.3.2 Reverse Osmosis followed by Crystallizer and Spray Dryer....... 6-7
6.3.3 Electrocoagulation ....................................................................... 6-9
6.3.4 Comparison of Treatment Alternatives...................................... 6-10
6.3.5 Boron Pilot Project..................................................................... 6-12
6.4
Pretreatment of Water Proposed for Transfer to SMSD........................ 6-13
7.0
CONCLUSIONS AND RECOMMENDATIONS .............................................. 7-1
8.0
REFERENCES .................................................................................................... 8-1
Electronic Filing - Received, Clerk's Office, August 29, 2008
* * * * * R2009-008 * * * * *
TABLE OF CONTENTS
(Continued)
LIST OF TABLES
Table
Title
Page
2-1
CWLP Monthly Coal Usage 2002-2007.................................................. 2-4
2-2
CWLP Monthly Seed Corn Fired 2003-2007 .......................................... 2-5
2-3
CWLP Monthly Oil Usage 2002-2007 .................................................... 2-6
2-4
CWLP Monthly Gross Generation 2002-2007 ........................................ 2-7
2-5
CWLP Monthly Gross Thermal Efficiency 2002-2007........................... 2-8
2-6
Spring Creek Wastewater Treatment Plant Flows 2004-2007............... 2-16
2-7
NPDES Permit No. IL0021989.............................................................. 2-17
2-8
Spring Creek Wastewater Treatment Plant Average Discharge ............ 2-20
Parameters
3-1
NPDES Permitted Discharges to the Sangamon River from the ............ 3-7
Confluence of the South Fork of the Sangamon River to the
Illinois River
3-2
Illinois Guidelines for Using Biological Information for Assessing .... 3-12
Aquatic Life Use in Streams
3-3
Macroinvertebrate Species Collected from the Sangamon River .......... 3-14
3-4
Fish Species Collected from the Sangamon River 1996 and 2003 ........ 3-18
3-5
IBI Comparison in the Sangamon River for 1981-82, 1996, and .......... 3-20
2003, with Revised IBI Comparisons between 1996 and 2003
4-1
Sangamon River Boron Concentrations Upstream and Downstream of . 4-8
the SMSD Spring Creek Plant Discharge September and October 2007
5-1
Referenced Effects of Boron on Freshwater Aquatic Life Applicable.....5-7
Applicable To the Sangamon River and the Illinois River
6-1
Tonnage and Source of Coal Used by Illinois Utilities in 2005 .............. 6-4
6-2
Cost of Treatment Alternatives for the Removal of Boron.................... 6-11
LIST OF FIGURES
Figure
Title
Page
1-1
Area of Study ........................................................................................... 1-3
2-1
CWLP Complex Water Flow Schematic ............................................... 2-10
2-2
Springfield Metro Sanitary District Treatment Plant ............................ 2-14
3-1
Major River Basins of Illinois.................................................................. 3-3
3-2
Sangamon River Watershed..................................................................... 3-4
3-3
NPDES Permit Discharges ...................................................................... 3-8
3-4
Illinois EPA Stream Segments............................................................... 3-10
4-1
Illinois EPA Boron Data – Station E-26 .................................................. 4-3
4-2
Illinois EPA Boron Data – Station E-24 .................................................. 4-4
4-3
Illinois EPA Boron Data – Station E-25 .................................................. 4-5
Electronic Filing - Received, Clerk's Office, August 29, 2008
* * * * * R2009-008 * * * * *
TABLE OF CONTENTS
(Continued)
APPENDIX A
– Spring Creek Plant NPDES Permit
APPENDIX B
– CWLP NPDES Permit
APPENDIX C
– IDNR Correspondence
APPENDIX D
– Boron Water Quality Data for the Sangamon River – 1999-2004
APPENDIX E
– Boron Analytical Results – September 2007 and October 2007
Electronic Filing - Received, Clerk's Office, August 29, 2008
* * * * * R2009-008 * * * * *
I\07jobs\07E0039\Admin\14 Reports\Tech. Support Doc
i
EXECUTIVE SUMMARY
The City of Springfield, City Water Light and Power (CWLP) and the Springfield
Metro Sanitary District (SMSD) are requesting a site-specific water quality standard for
boron in the Sangamon River and the Illinois River as a result of proposed discharge
from the Springfield Metro Sanitary District (SMSD) Spring Creek Plant. Operation of
the air pollution control systems at the CWLP power plant causes elevated concentrations of
boron in a plant effluent stream that is proposed to be transferred to the SMSD Spring Creek
Wastewater Plant. The CWLP power plant is a critical power supply for Springfield and
surrounding communities; the site-specific boron water quality standard is necessary to
allow CWLP to continue to operate the power plant in compliance with its existing
National Pollutant Discharge Elimination System (NPDES) permit and State and Federal
air pollution regulations.
The NPDES Permit No. IL0021989 issued on June 24, 2004 for the SMSD Spring
Creek Plant does not require monitoring of boron in discharges from Outfall 007 to the
Sangamon River. However, the Illinois General Use water quality standard for boron is
1.0 mg/L set forth in 35 Illinois Administrative Code (IAC) 302.208(g). CWLP and
SMSD intend to file a petition to the Illinois Pollution Control Board (IPCB) to request a
site-specific water quality standard for boron, which would include an area of dispersion
with boron concentrations ranging between 4.5 and 11.0 mg/L from SMSD Spring Creek
Plant 007 STP Outfall to 182 yards downstream in the Sangamon River; 4.5 mg/L in the
Sangamon River from 182 yards downstream of SMSD Outfall 007 to the confluence of
the Sangamon River with Salt Creek, a distance of 39.0 river miles; 1.6 mg/L in the
Sangamon River from the confluence of the Sangamon River with Salt Creek to the
confluence of the Sangamon River with the Illinois River, a distance of 36.1 river miles;
and 1.3 mg/L in the Illinois River from the confluence of the Illinois River with the
Sangamon River to 100 yards downstream of the confluence of the Illinois River with the
Sangamon River. This site-specific standard is based on a 7Q10 low-flow of 54.8 cfs
having a boron concentration of 2.0 mg/L in the Sangamon River upstream of Spring
Electronic Filing - Received, Clerk's Office, August 29, 2008
* * * * * R2009-008 * * * * *
I\07jobs\07E0039\Admin\14 Reports\Tech. Support Doc
ii
Creek and an SMSD Spring Creek Plant effluent flow of 17.5 cfs having a boron
concentration of 11.0 mg/L based on the 7-day low flow from the plant. For the most
part, the increase in the Sangamon River flow at Spring Creek is due to the discharge
from the SMSD Spring Creek Plant.
This technical support document considers existing water quality data and
biological studies that were obtained from several agencies including the Illinois
Environmental Protection Agency (Illinois EPA), the Illinois Department of Natural
Resources (IDNR) and the Illinois Natural History Survey (INHS). Stream flow
information from the Illinois State Water Survey (ISWS) was used to predict boron levels
in the Sangamon River. The discussion of possible toxicological effects of boron is
based on existing published literature and from studies and technical documents produced
for City Water, Light and Power (CWLP) of Springfield and for Central Illinois Light
Company (CILCO) of Peoria in support of petitions for adjusted water quality standards
for boron and a variance to an adjusted water quality standard for boron.
Four technical alternatives for complying with the Illinois General Use water
quality standard for boron were evaluated. One alternate operating procedure was
considered; three water treatment processes for the removal of boron were investigated.
Conversion to a dry ash system has been studied by CWLP; however the particular waste
stream that is the subject of this technical support document is generated by the air
pollution control system and would not be eliminated by modifying the power plant ash
handling system. It is notable that there are currently no known commercial processes
being utilized to remove boron concentrations of this magnitude. Because treatment to
remove the boron has been demonstrated to be infeasible, CWLP proposes to pretreat the
boron-laden waste stream with conventional treatment processes for solids removal and
then transfer the wastewater to the SMSD Spring Creek Plant. Boron tends to associate
with small particulate matter; therefore the pretreatment process is designed to remove
particulates from the waste stream.
Electronic Filing - Received, Clerk's Office, August 29, 2008
* * * * * R2009-008 * * * * *
I\07jobs\07E0039\Admin\14 Reports\Tech. Support Doc
iii
It is not anticipated that the SMSD plant treatment process will substantially
reduce the total boron in the waste stream, estimated to have an average flow rate of 187
gpm and a boron concentration of 450 mg/L. Reduction of the boron concentration in the
wastewater stream anticipated for discharge by SMSD, in comparison to the
concentration in CWLP’s discharge, will not make its removal by SMSD any more
feasible or economically reasonable than the removal alternatives studied by CWLP.
It was concluded that no technically feasible and economically reasonable
alternative was available to CWLP or SMSD to meet the Illinois General Use water
quality standard for boron. In contrast, lesser costs are associated with seeking a site-
specific water quality standard for boron.
The site-specific boron water quality standard is justified because the Sangamon
River is not used, nor is it expected to be used, for several purposes intended to be
protected by the General Use water quality standard such as agricultural use, stock
watering, or public and food processing water supply. In addition, the present General
Use water quality standard for boron is unnecessarily stringent for the current use of the
Sangamon River and the protection of aquatic life and wildlife, and no adverse impacts
are expected from the proposed site-specific water quality standard for boron.
Electronic Filing - Received, Clerk's Office, August 29, 2008
* * * * * R2009-008 * * * * *
I\07jobs\07E0039\Admin\14 Reports\Tech. Support Doc
SECTION 1.0
PURPOSE AND SCOPE
Electronic Filing - Received, Clerk's Office, August 29, 2008
* * * * * R2009-008 * * * * *
I\07jobs\07E0039\Admin\14 Reports\Tech. Support Doc
1-1
SECTION 1.0
PURPOSE AND SCOPE
1.1
Purpose
CWLP and the SMSD are requesting a site-specific water quality standard for
boron in the Sangamon River and the Illinois River as a result of proposed discharge
from the Springfield Metro Sanitary District (SMSD) Spring Creek Plant. The CWLP
power plant in Springfield operates selective catalytic reduction (SCR) air pollution
control systems for nitrous oxide removal and flue gas desulfurization systems (FGDS)
for sulfur dioxide removal as required by its air operating permit. Apparently, SCR
operations result in increased leaching of boron and/or increased boron solubility in the
FGDS effluent water generated during gypsum dewatering. Operation of the air pollution
control systems causes elevated concentrations of boron in the plant effluent stream that is
proposed to be transferred to the SMSD Spring Creek Wastewater Plant. The CWLP power
plant is a critical power supply for Springfield and surrounding communities; the site-
specific boron water quality standard is necessary to allow CWLP to continue to operate
the power plant in compliance with its existing NPDES permit and State and Federal air
pollution regulations.
It is not anticipated that the SMSD Spring Creek plant treatment process will
substantially reduce the total boron in the waste stream, estimated to have an average
flow rate of 187 gpm and a boron concentration of 450 mg/L. However, the boron
concentration discharged from the Spring Creek Plant will be equal to or less than 11.0
mg/L. Reduction of the boron concentration in the wastewater stream anticipated for
discharge by SMSD, in comparison to the concentration in CWLP’s discharge, will not
make its removal by SMSD any more feasible or economically reasonable than the
removal alternatives studied by CWLP.
Electronic Filing - Received, Clerk's Office, August 29, 2008
* * * * * R2009-008 * * * * *
I\07jobs\07E0039\Admin\14 Reports\Tech. Support Doc
1-2
Hanson Professional Services Inc. (Hanson) has conducted an evaluation of
potential ecological and water quality impacts of boron discharged into the Sangamon
River and prepared this Technical Support Document to support approval of the site-
specific boron water quality standard intended to accommodate the proposed effluent
from the SMSD Spring Creek Plant.
1.2
Scope
The National Pollutant Discharge Elimination System (NPDES) Permit No.
IL0021989 issued on June 24, 2004 for the SMSD Spring Creek Plant does not require
monitoring of boron in discharges from Outfall 007 to the Sangamon River. However,
the Illinois General Use water quality standard for boron is 1.0 mg/L set forth in 35
Illinois Administrative Code (IAC) 302.208(g). CWLP and SMSD intend to file a
petition to the Illinois Pollution Control Board (IPCB) to request a site-specific water
quality standard for boron, which would include an area of dispersion with boron
concentrations ranging between 4.5 and 11.0 mg/L from SMSD Spring Creek Plant 007
STP Outfall to 182 yards downstream in the Sangamon River; 4.5 mg/L in the Sangamon
River from 182 yards downstream of SMSD Outfall 007 to the confluence of the
Sangamon River with Salt Creek, a distance of 39.0 river miles; 1.6 mg/L in the
Sangamon River from the confluence of the Sangamon River with Salt Creek to the
confluence of the Sangamon River with the Illinois River, a distance of 36.1 river miles;
and 1.3 mg/L in the Illinois River from the confluence of the Illinois River with the
Sangamon River to 100 yards downstream of the confluence of the Illinois River with the
Sangamon River. This site-specific standard is based on a 7Q10 low-flow of 54.8 cfs
having a boron concentration of 2.0 mg/L in the Sangamon River upstream of Spring
Creek and an SMSD Spring Creek Plant effluent flow of 17.5 cfs having a boron
concentration of 11.0 mg/L based on the 7-day low flow from the plant. For the most
part, the increase in the Sangamon River flow at Spring Creek is due to discharge from
the SMSD Spring Creek Plant. The study area is shown in Figure 1-1.
Electronic Filing - Received, Clerk's Office, August 29, 2008
* * * * * R2009-008 * * * * *
Hanson Professional Services Inc.
AREA OF
S
TUDY
FOR T
H
E
SI
TE-
SP
EC
I
F
I
C BORON
S
TANDARD
FOR T
H
E
S
M
S
D
SP
R
I
NG CREEK
P
LANT
SP
R
I
NGF
I
ELD,
I
LL
I
NO
IS
JOB NO
.
07E0039
F
I
GURE 1-1
TEC
H
N
I
CAL
S
U
PP
ORT DOCUMENT
1-3
Electronic Filing - Received, Clerk's Office, August 29, 2008
* * * * * R2009-008 * * * * *
I\07jobs\07E0039\Admin\14 Reports\Tech. Support Doc
1-4
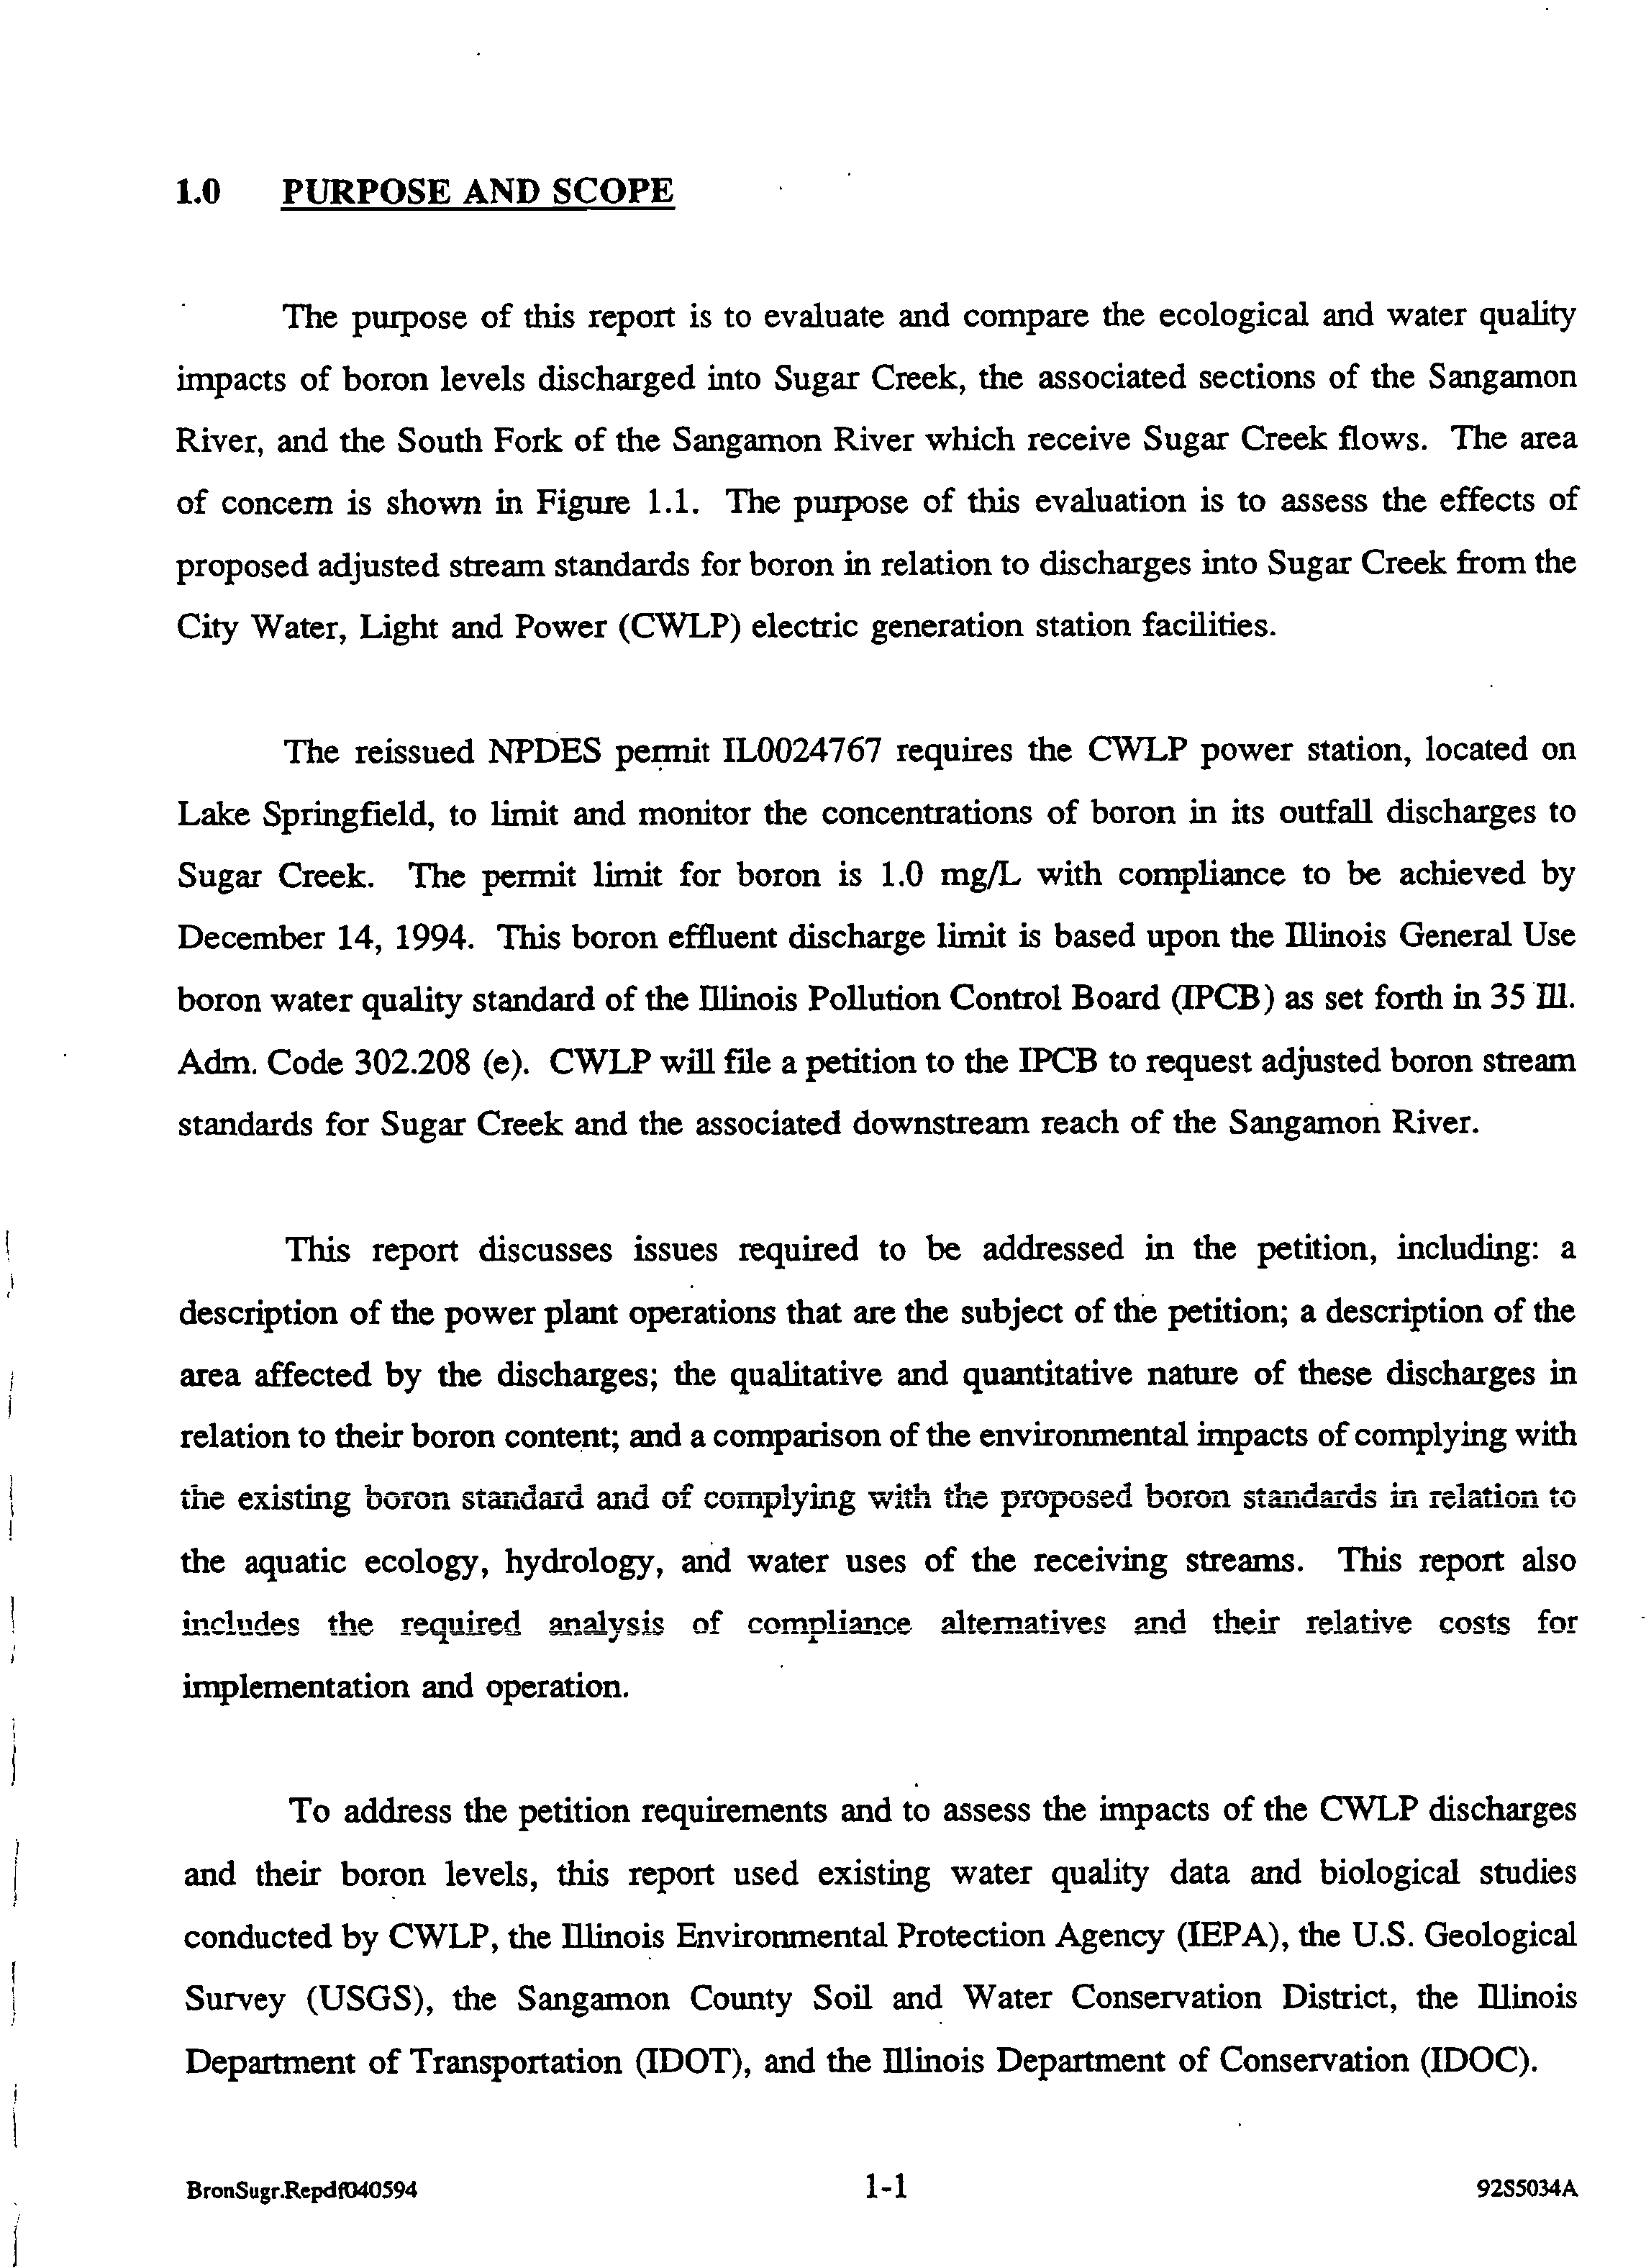
This report addresses issues required for the petition, including: a description of
the power plant operations that are the subject of the petition; a description of the
wastewater treatment plant operations that are the subject of the petition; the qualitative
and quantitative nature of the discharges from the power plant to the wastewater
treatment plant in relation to their boron content; the qualitative and quantitative nature of
the discharges from the wastewater treatment plant in relation to their boron content; a
description of the area affected by the discharges; and a comparison of the environmental
impacts of complying with the existing boron standard and of complying with the
proposed site-specific boron water quality standard in relation to the aquatic ecology,
hydrology, and water uses of the receiving stream. This report also includes an analysis
of the compliance alternatives and their relative costs for implementation and operation to
reduce boron concentrations in the effluent stream as well as a description of the
proposed pretreatment system.
To address the petition requirements and to assess the impacts of the boron in the
proposed SMSD discharge, Hanson reviewed existing water quality data and biological
studies that were obtained from several agencies including the Illinois Environmental
Protection Agency (Illinois EPA), the Illinois Department of Natural Resources (IDNR)
and the Illinois Natural History Survey (INHS). Stream flow information from the
Illinois State Water Survey (ISWS) was used to predict boron levels in the Sangamon
River. The discussion of possible toxicological effects of boron is based on existing
published literature and from studies and technical documents produced for CWLP of
Springfield and for Central Illinois Light Company of Peoria in support of petitions for
adjusted water quality standards for boron and a variance to an adjusted water quality
standard for boron.
Electronic Filing - Received, Clerk's Office, August 29, 2008
* * * * * R2009-008 * * * * *
I\07jobs\07E0039\Admin\14 Reports\Tech. Support Doc
SECTION 2.0
FACILITY INFORMATION
Electronic Filing - Received, Clerk's Office, August 29, 2008
* * * * * R2009-008 * * * * *
I\07jobs\07E0039\Admin\14 Reports\Tech. Support Doc
2-1
SECTION 2.0
FACILITY INFORMATION
2.1
CWLP Plant Description
City Water, Light and Power (CWLP) owns and operates the V. Y. Dallman
Power Station and the Lakeside Power Station at 3100 Stevenson Drive, Springfield,
Sangamon County, Illinois. CWLP also operates a potable water treatment plant (filter
plant) at this site. These plants generate electricity for the residents and businesses in
Springfield and provide potable water to Springfield and surrounding communities.
Approximately 186 people are employed at the power generating stations and an
additional 19 people are employed at the water treatment plant. The facilities are staffed
24 hours per day, seven days per week.
The Dallman Power Station has an electric generating capacity of 352 megawatts
and is comprised of three coal-fired units: Units 31, 32, and 33. The Dallman units were
placed into service in 1968, 1972, and 1978, respectively. Units 31 and 32 are identical,
each having 80 megawatts of generating capacity. The cyclone boilers in Units 31 and 32
operate at 1,250 psig and 950ºF. Unit 33 includes a tangentially-fired boiler and has a
generating capacity of 192 megawatts. Unit 33 operates at 2,400 psig and 1,000ºF.
Each of the three Dallman units is equipped with a flue gas desulfurization system
(FGDS) that removes an average of 95 percent of the sulfur dioxide from the unit’s flue
gases and a selective catalytic reduction (SCR) air pollution control system for nitrous
oxide removal. The SCRs are currently operated from May 1 through September 30.
The SCRs will begin year round operation in 2009. The SCRs associated with units 31
and 32 remove about 89 percent of the nitrous oxides from the flue gases; the SCR
associated with Unit 33 removes about 80 percent of the nitrous oxides from the flue gas.
The Lakeside Power Station began operation in 1935. Originally, there were
eight boilers and seven turbine generators at the Lakeside plant. Only two boilers and
Electronic Filing - Received, Clerk's Office, August 29, 2008
* * * * * R2009-008 * * * * *
I\07jobs\07E0039\Admin\14 Reports\Tech. Support Doc
2-2
two turbine generators are still in operation. Boilers 7 and 8 are identical 33-megawatt
cyclone coal-fired units. Boiler 7-Turbine 6 went into operation in 1959 and Boiler 8-
Turbine 7 began operation in 1964. Both units operate at 850 psig and 900ºF. The
Lakeside Power Station is slated to be retired in the near future.
Coal consumption at the CWLP facility is in excess of one million tons per year.
The ash handling practices at CWLP are typical for a coal-fired power plant. Bottom ash
and fly ash from all existing units are sluiced to ash ponds. The raw lake water used for
sluicing is obtained from the once-through cooling water systems for the generator
condensers. Three separate ash transport systems serve Dallman Units 31 and 32,
Dallman Unit 33, and Lakeside.
A new electric generating unit referred to as Dallman Unit 4 is currently under
construction. The Dallman Unit 4 will include a coal-fired boiler with a rated capacity of
about 2,440 million Btu/hour and a steam turbine-generator with a nominal capacity of
250 megawatts. The new boiler will be equipped with low-NO
x
combustion technology
and the following air pollution control systems: selective catalytic reduction, a fabric
filter, wet flue gas desulfurization, and a wet electrostatic precipitator. Bottom and fly
ash from Dallman Unit 4 will be transported via dry ash handling systems as opposed to
the sluice systems used at Dallman Units 31 and 32, Dallman Unit 33, and Lakeside.
The water treatment plant has a capacity of 48 million gallons per day (MGD). A
conventional lime-softening/filtration/disinfection process is employed to produce
potable water. Five clarifiers and 12 filters in the treatment process remove sediment and
particulate matter from the raw lake water. Thickened sludge from the clarifiers and
backwash water from the filters is discharged to the ash ponds located north of Spaulding
Dam. The volume of sludge and backwash water discharged to the ash pond system
varies and is dependent upon production volume and raw water characteristics. During
periods of warm weather, powdered activated carbon (PAC) is added to the incoming
lake water for control of various pesticides and herbicides. The PAC also assists with
Electronic Filing - Received, Clerk's Office, August 29, 2008
* * * * * R2009-008 * * * * *
I\07jobs\07E0039\Admin\14 Reports\Tech. Support Doc
2-3
taste and odor control. The majority of the PAC is removed in the clarifiers and disposed
in the ash ponds.
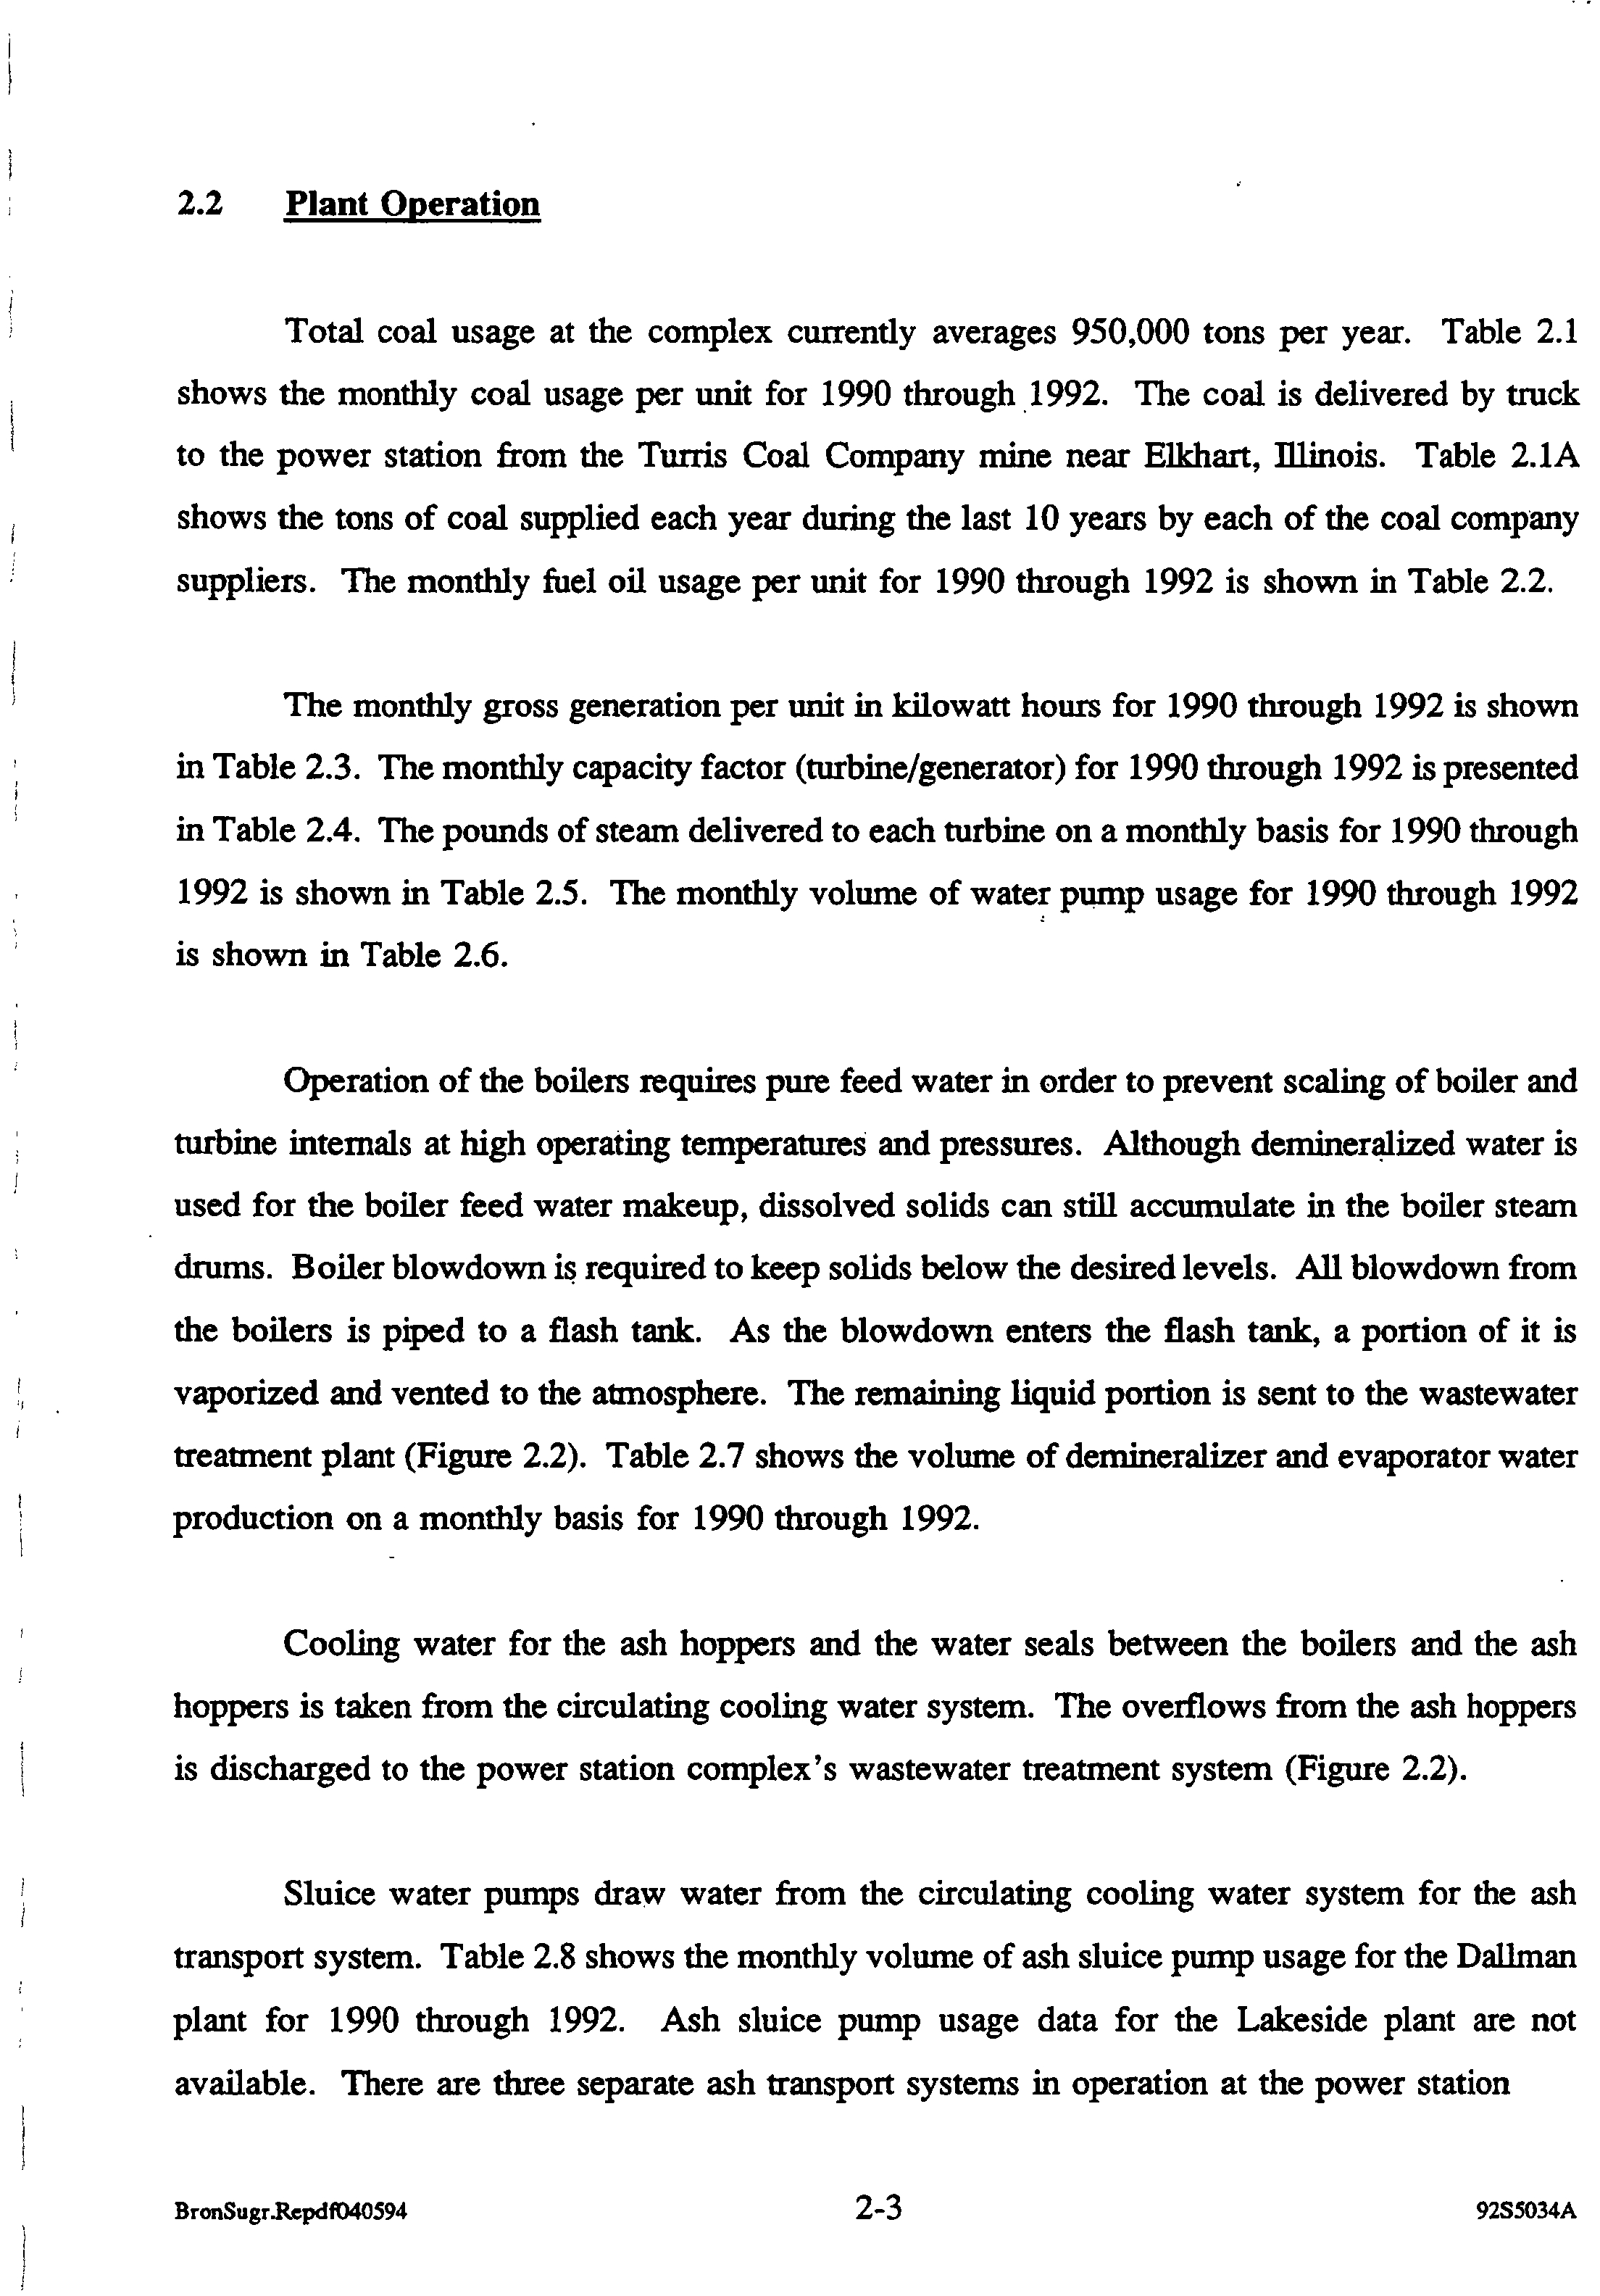
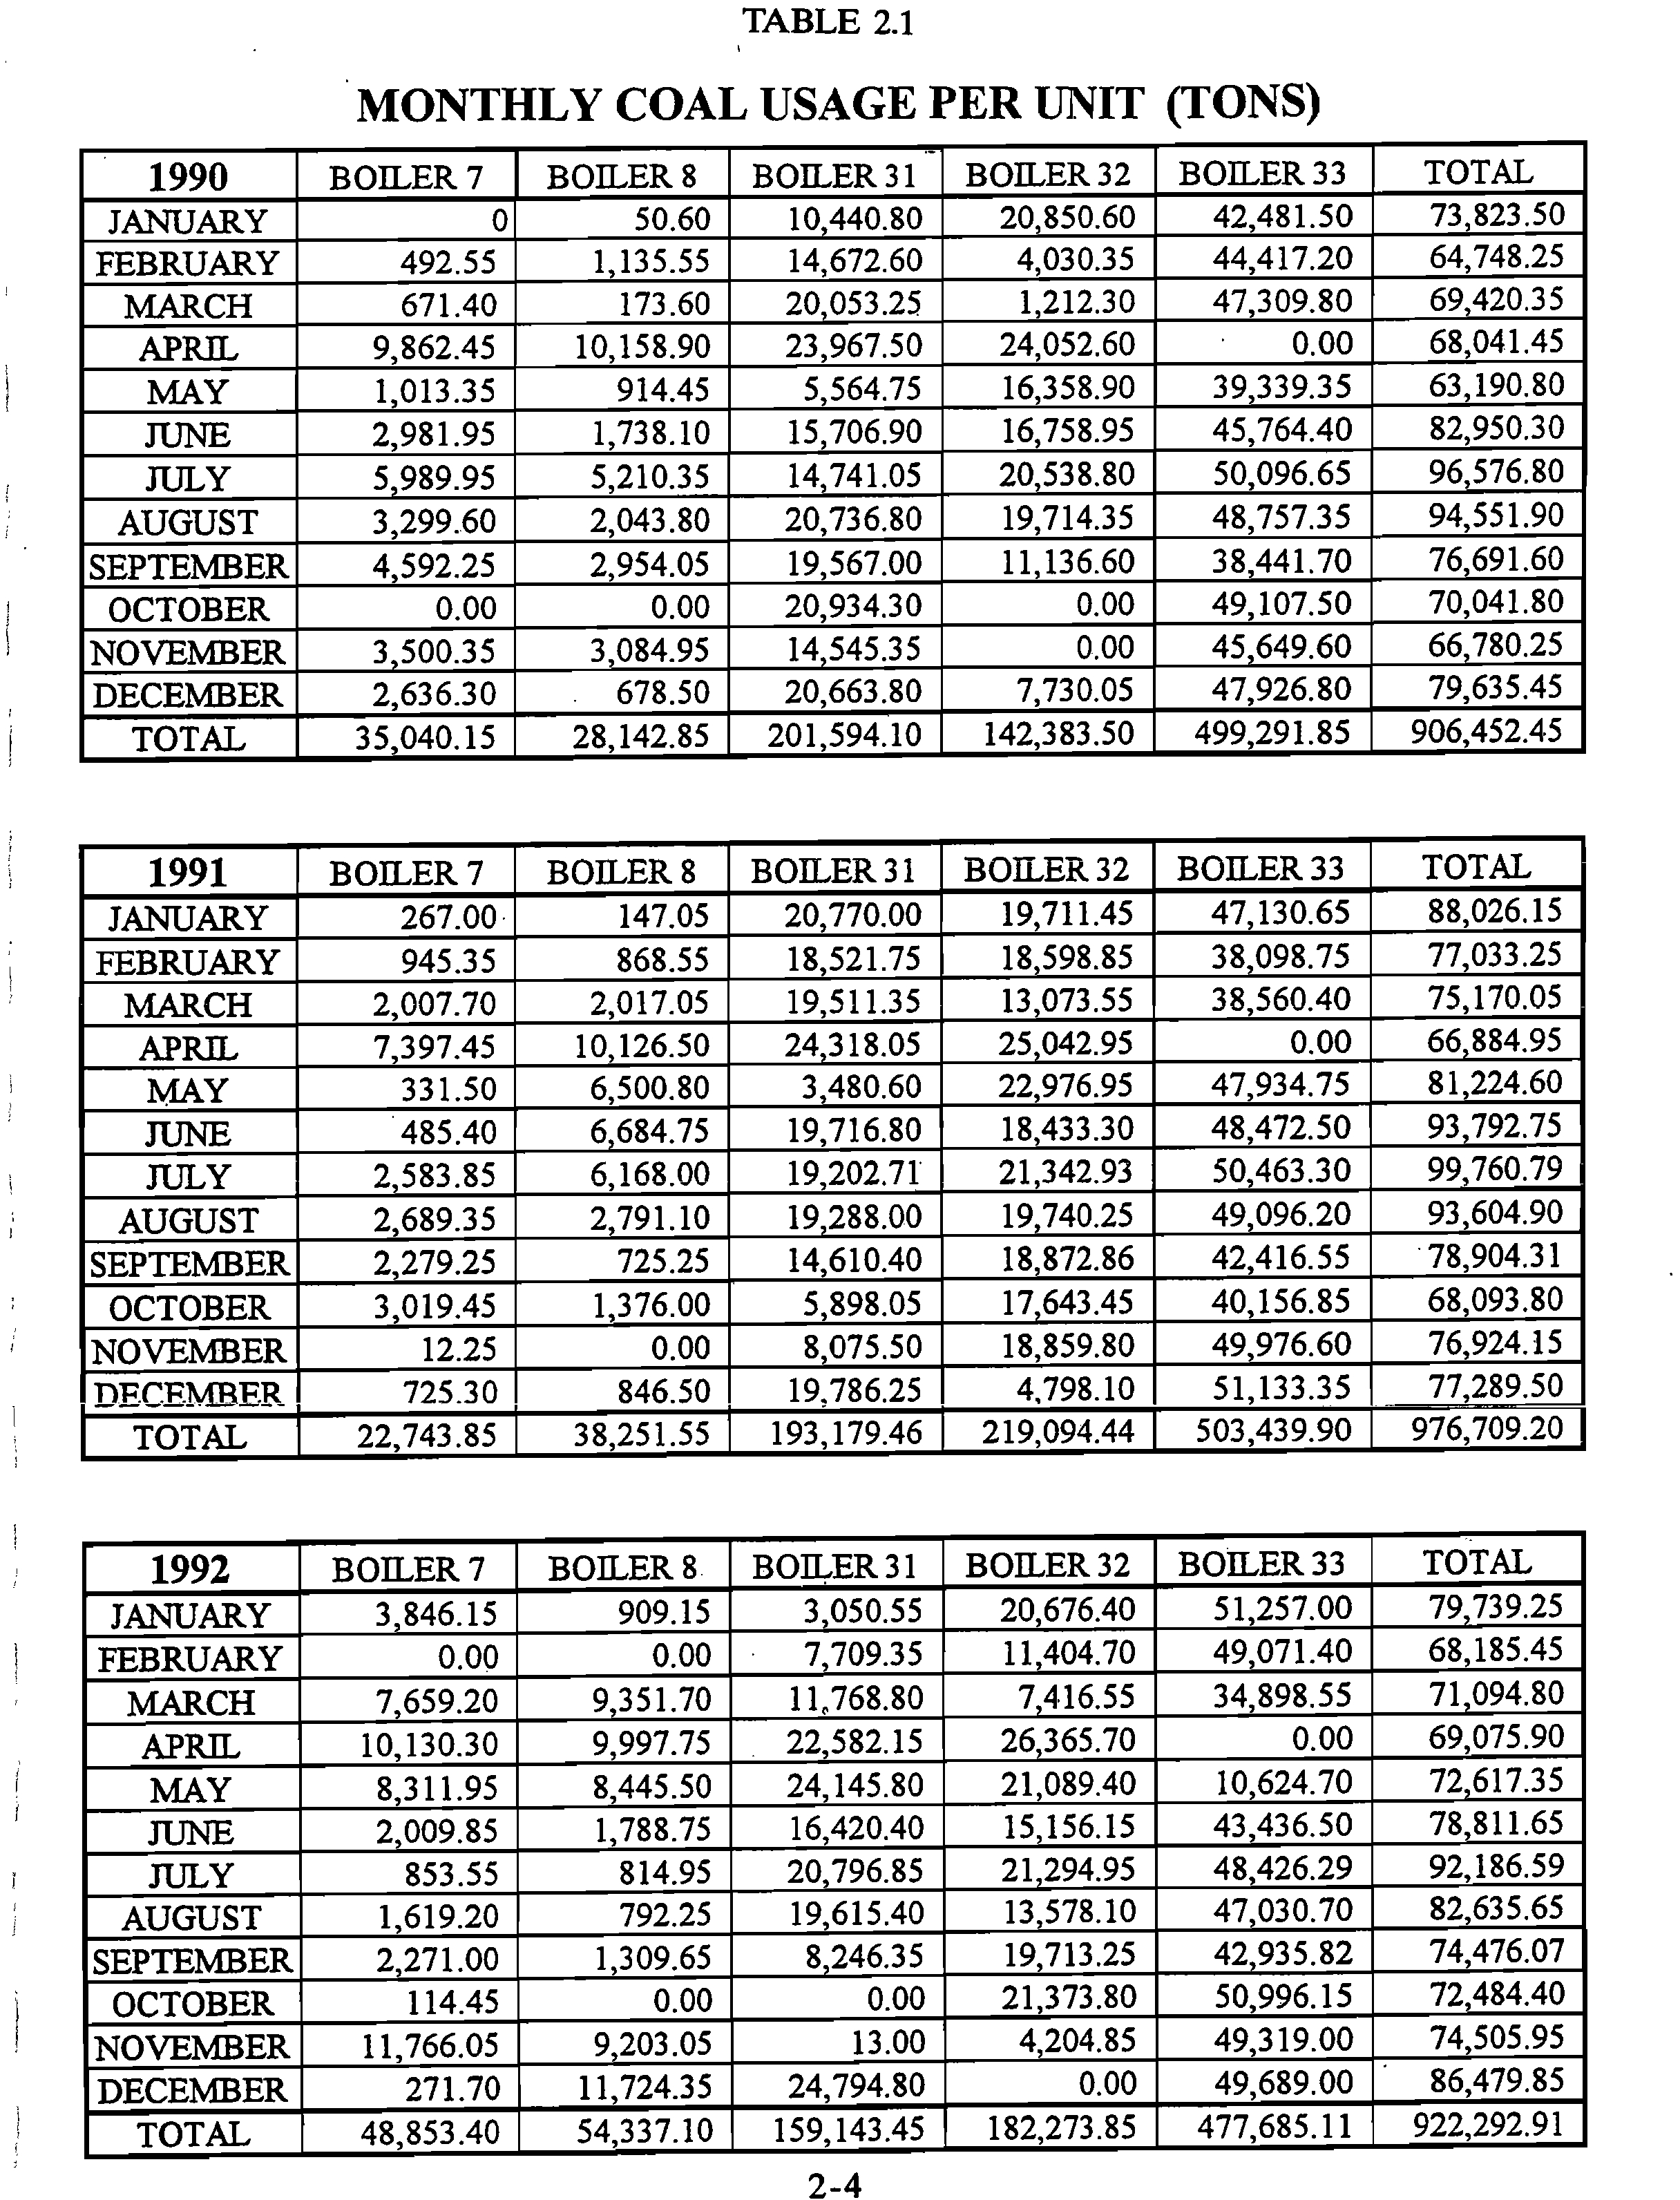
2.2
CWLP Plant Operation
Total coal usage at the CWLP complex averages 1.1 million tons per year. Table
2-1 details monthly coal usage from 2002 through 2007. The coal is delivered by truck
from the International Coal Group Viper Mine near Elkhart, Illinois. Seed corn past the
expiration date for planting is also burned at the CWLP facility. The monthly seed corn
fired between 2003 and 2007 is shown in Table 2-2. Fuel oil is burned during boiler
startup and during low-load operation. The monthly fuel oil usage for 2002 through 2007
is summarized in Table 2-3. The monthly gross generation in megawatt hours for 2002
through 2007 is presented in Table 2-4. The monthly gross thermal efficiency for this
period is detailed in Table 2-5.
Cooling water at the CWLP complex is supplied by Lake Springfield. The lake is
also the primary source of potable water for the City of Springfield and surrounding
communities. Lake Springfield is a 4,224-acre reservoir constructed in 1934 by
impoundment of Sugar Creek with Spaulding Dam. The two major streams flowing into
the lake are Sugar Creek and Lick Creek, which drain into the upper end of the lake.
Makeup of water lost by evaporation and other consumptive uses comes from the 265
square mile watershed. The watershed area is primarily a level to gently-sloping plain
that is incised in the lower portions by the valleys of Sugar Creek and Lick Creek.
Raw water is withdrawn from Lake Springfield for cooling via four cooling water
pumps for Dallman Units 31 and 32, two cooling water pumps for Dallman Unit 33, and
two cooling water pumps for the Lakeside Station. These units utilize a once-through
cooling water system, and thus there is no consumptive loss of the lake water for
condenser cooling. Sluice water pumps draw water from the circulating cooling water
system for the ash transport system and the FGDS. Cooling water for the ash hoppers
Electronic Filing - Received, Clerk's Office, August 29, 2008
* * * * * R2009-008 * * * * *
I\07jobs\07E0039\Admin\14 Reports\Tech. Support Doc
2-4
TABLE 2-1
CITY WATER, LIGHT AND POWER
MONTHLY COAL USAGE 2002 - 2007
(in tons)
2002
2003
2004
2005
2006
2007
January
94,866
90,771
114,169
119,746
115,679
103,912
February
78,733
89,426
106,839
97,188
103,368
115,417
March
67,325
80,817
90,970
102,075
67,553
106,017
April
76,325
66,958
77,042
69,361
65,752
62,796
May
72,265
81,580
97,478
100,534
73,677
98,991
June
110,183
83,529
94,567
110,420
105,296
109,777
July
126,323
119,039
107,286
117,390
107,946
105,956
August
121,674
120,803
98,249
114,034
114,090
111,873
September
103,000
89,139
96,670
110,323
100,401
October
78,877
75,741
75,790
81,164
78,376
November
78,967
85,773
87,606
110,263
85,879
December
89,704
100,582
104,573
127,857
103,747
Total
1,098,242
1,084,158
1,151,239
1,260,355 1,121,764
Electronic Filing - Received, Clerk's Office, August 29, 2008
* * * * * R2009-008 * * * * *
I\07jobs\07E0039\Admin\14 Reports\Tech. Support Doc
2-5
TABLE 2-2
CITY WATER, LIGHT AND POWER
MONTHLY SEED CORN FIRED 2003 - 2007
(in tons)
2003
2004
2005
2006
2007
January
0
1,619
376
1,359
2,808
February
367
1,129
248
2,187
2,350
March
92
1,633
259
2,417
873
April
188
1,555
1,484
1,506
856
May
434
1,283
585
1,083
0
June
128
1,708
721
305
860
July
1,078
1,470
1,470
885
252
August
1,643
1,721
1,573
1,581
1,251
September
0
1,099
644
0
October
440
305
997
1,931
November
636
373
2,331
1,820
December
1,171
578
1,352
0
Total
6,176
14,473
12,040
15,074
Electronic Filing - Received, Clerk's Office, August 29, 2008
* * * * * R2009-008 * * * * *
I\07jobs\07E0039\Admin\14 Reports\Tech. Support Doc
2-6
TABLE 2-3
CITY WATER, LIGHT AND POWER
MONTHLY OIL USAGE 2002 - 2007
(in gallons)
2002
2003
2004
2005
2006
2007
January
10,424
107,790
16,628
9,474
12,622
25,313
February
15,261
56,279
16,001
9,121
25,703
17,846
March
36,251
116,401
13,327
18,760
17,049
24,568
April
61,586
40,752
24,801
34,637
7,227
33,912
May
47,053
34,413
14,075
17,824
66,632
19,765
June
23,526
51,644
156,016
40,005
28,243
18,780
July
20,528
71,237
21,424
288,986
72,727
15,309
August
25,591
114,348
13,261
12,685
11,462
38,684
September
19,670
44,190
6,694
26,050
12,549
October
20,287
37,190
29,886
110,954
46,430
November
6,553
19,884
11,465
27,119
4,240
December
18,882
12,565
20,856
18,495
33,434
Total
305,612
706,693
344,434
614,110
338,318
Electronic Filing - Received, Clerk's Office, August 29, 2008
* * * * * R2009-008 * * * * *
I\07jobs\07E0039\Admin\14 Reports\Tech. Support Doc
2-7
TABLE 2-4
CITY WATER, LIGHT AND POWER
MONTHLY GROSS GENERATION 2002 - 2007
(in megawatt hours)
2002
2003
2004
2005
2006
2007
January
190,682
185,468
229,724
242,159
235,588
210,480
February
157,371
182,561
213,339
198,165
210,588
231,853
March
128,007
158,853
182,017
208,851
132,097
211,048
April
158,203
128,044
152,437
141,525
124,999
121,011
May
152,375
164,989
203,832
209,137
143,775
203,572
June
224,235
175,753
199,838
227,651
214,444
221,682
July
258,319
245,122
222,244
248,769
224,846
212,911
August
245,841
249,655
205,110
232,510
226,314
219,247
September
209,937
185,355
201,207
223,803
205,451
October
163,899
154,026
156,304
167,107
162,345
November
162,985
175,524
180,804
225,444
176,045
December
184,275
206,036
214,441
254,602
208,168
Total
2,236,129
2,211,386
2,361,297
2,579,723
2,264,660
Electronic Filing - Received, Clerk's Office, August 29, 2008
* * * * * R2009-008 * * * * *
I\07jobs\07E0039\Admin\14 Reports\Tech. Support Doc
2-8
TABLE 2-5
CITY WATER, LIGHT AND POWER
MONTHLY GROSS THERMAL EFFICIENCY 2002 - 2007
(in percent)
2002
2003
2004
2005
2006
2007
January
32.62
33.16
32.40
32.76
32.78
32.34
February
32.15
32.97
32.26
32.92
32.57
32.22
March
30.77
31.71
31.93
32.78
30.94
32.26
April
32.56
31.02
31.67
31.34
30.28
31.01
May
34.05
32.83
33.40
33.38
30.89
33.36
June
33.09
34.00
33.45
32.68
32.91
32.19
July
32.73
32.65
33.32
32.11
32.21
32.66
August
32.33
32.79
33.59
31.77
31.14
31.41
September
32.94
33.71
33.39
32.33
33.41
October
33.71
32.84
33.39
32.93
32.88
November
33.59
33.18
33.48
32.68
32.79
December
33.40
33.07
33.23
32.27
32.16
Annual
32.83
32.83
32.96
32.50
32.08
Electronic Filing - Received, Clerk's Office, August 29, 2008
* * * * * R2009-008 * * * * *
I\07jobs\07E0039\Admin\14 Reports\Tech. Support Doc
2-9
and the water seals between the boilers and the ash hoppers is also taken from the
circulating cooling water system.
The majority of the consumptive use of lake water for the facility is ash sluicing water,
which accounts for about 3.9 million gallons of lake water usage per day.
The ash
transport systems discharge to two settling ponds (ash ponds). The ash ponds also
receive wastewater treatment plant sludge, leachate collected from the scrubber sludge
landfill, lime sludge from the filter plant, and miscellaneous water streams from the
Dallman Power Station including the FGDS effluent water. The supernatant from these
two ash ponds flows into a clarification pond. Combining wastewater from the various
sources provides for settling and neutralization in the Clarification Pond. The ash sluice
waters are typically acidic with suspended solids; the filter plant wastes are normally
alkaline with excess lime availability; and the wastewater plant sludge contains polymer
and coagulants for flocculation. The discharge from the Clarification Pond normally
flows into Sugar Creek through CWLP’s NPDES Outfall 004.
2.3
CWLP Existing Outfall and Discharge Description
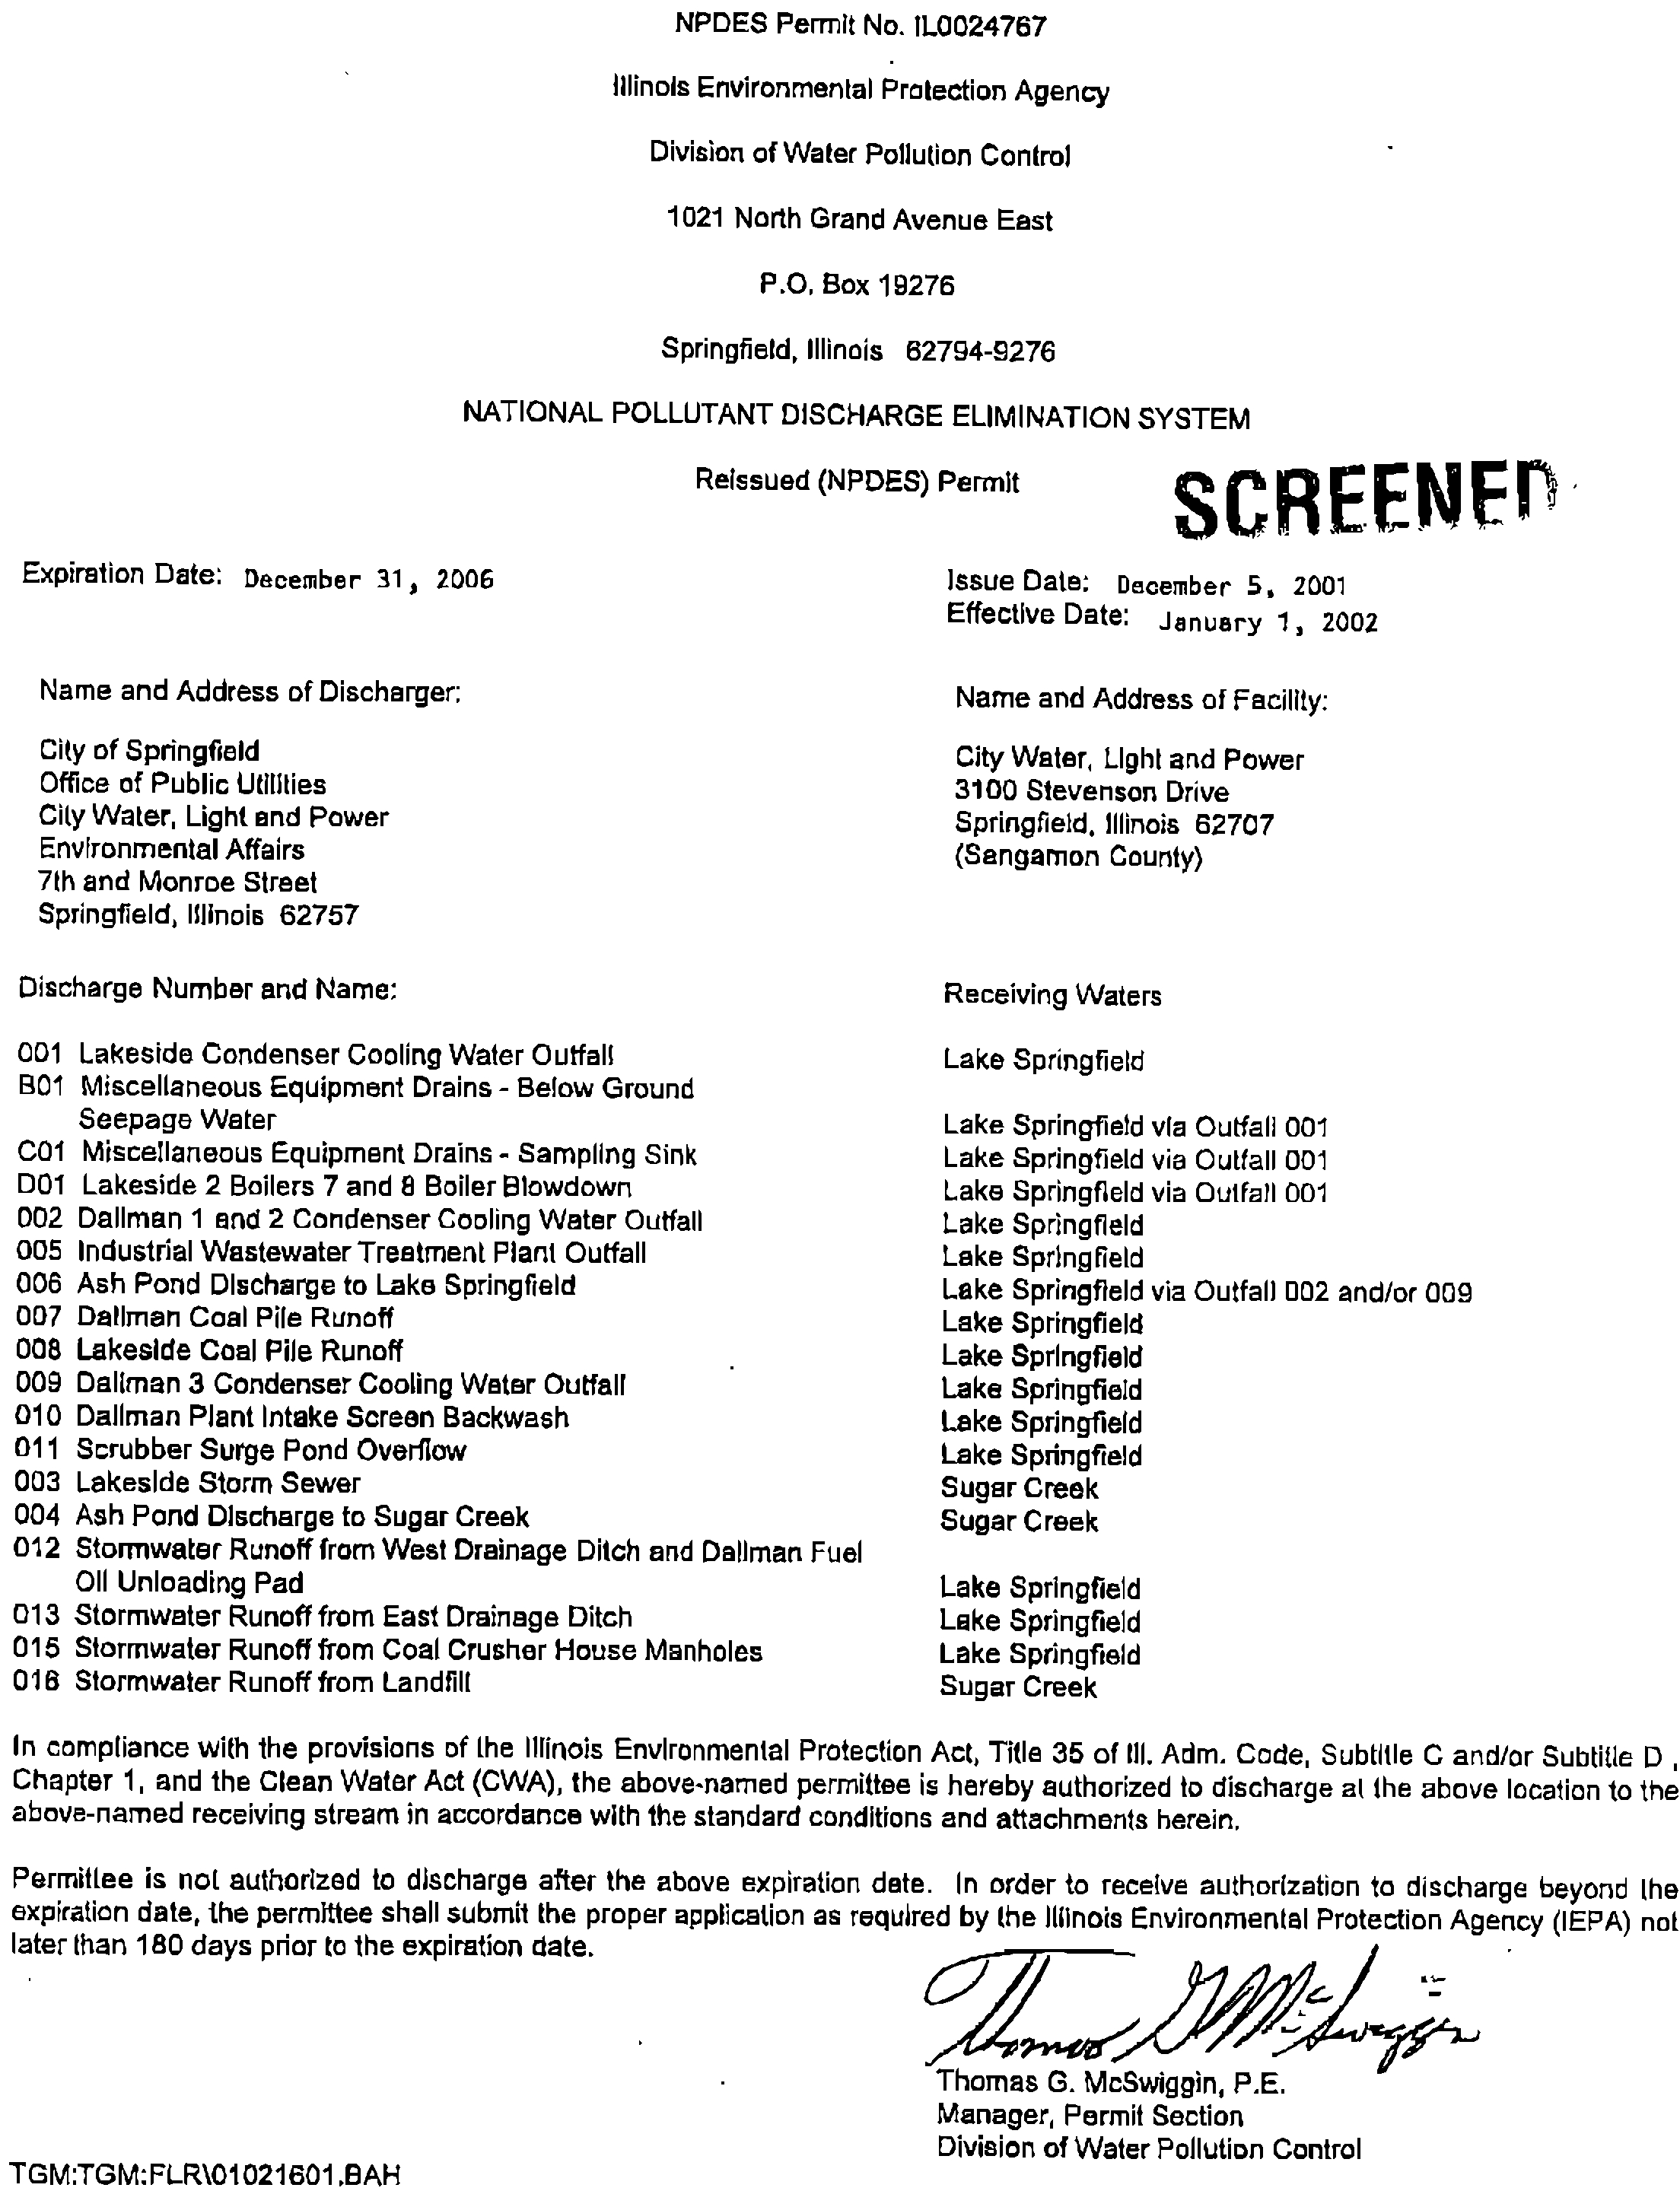
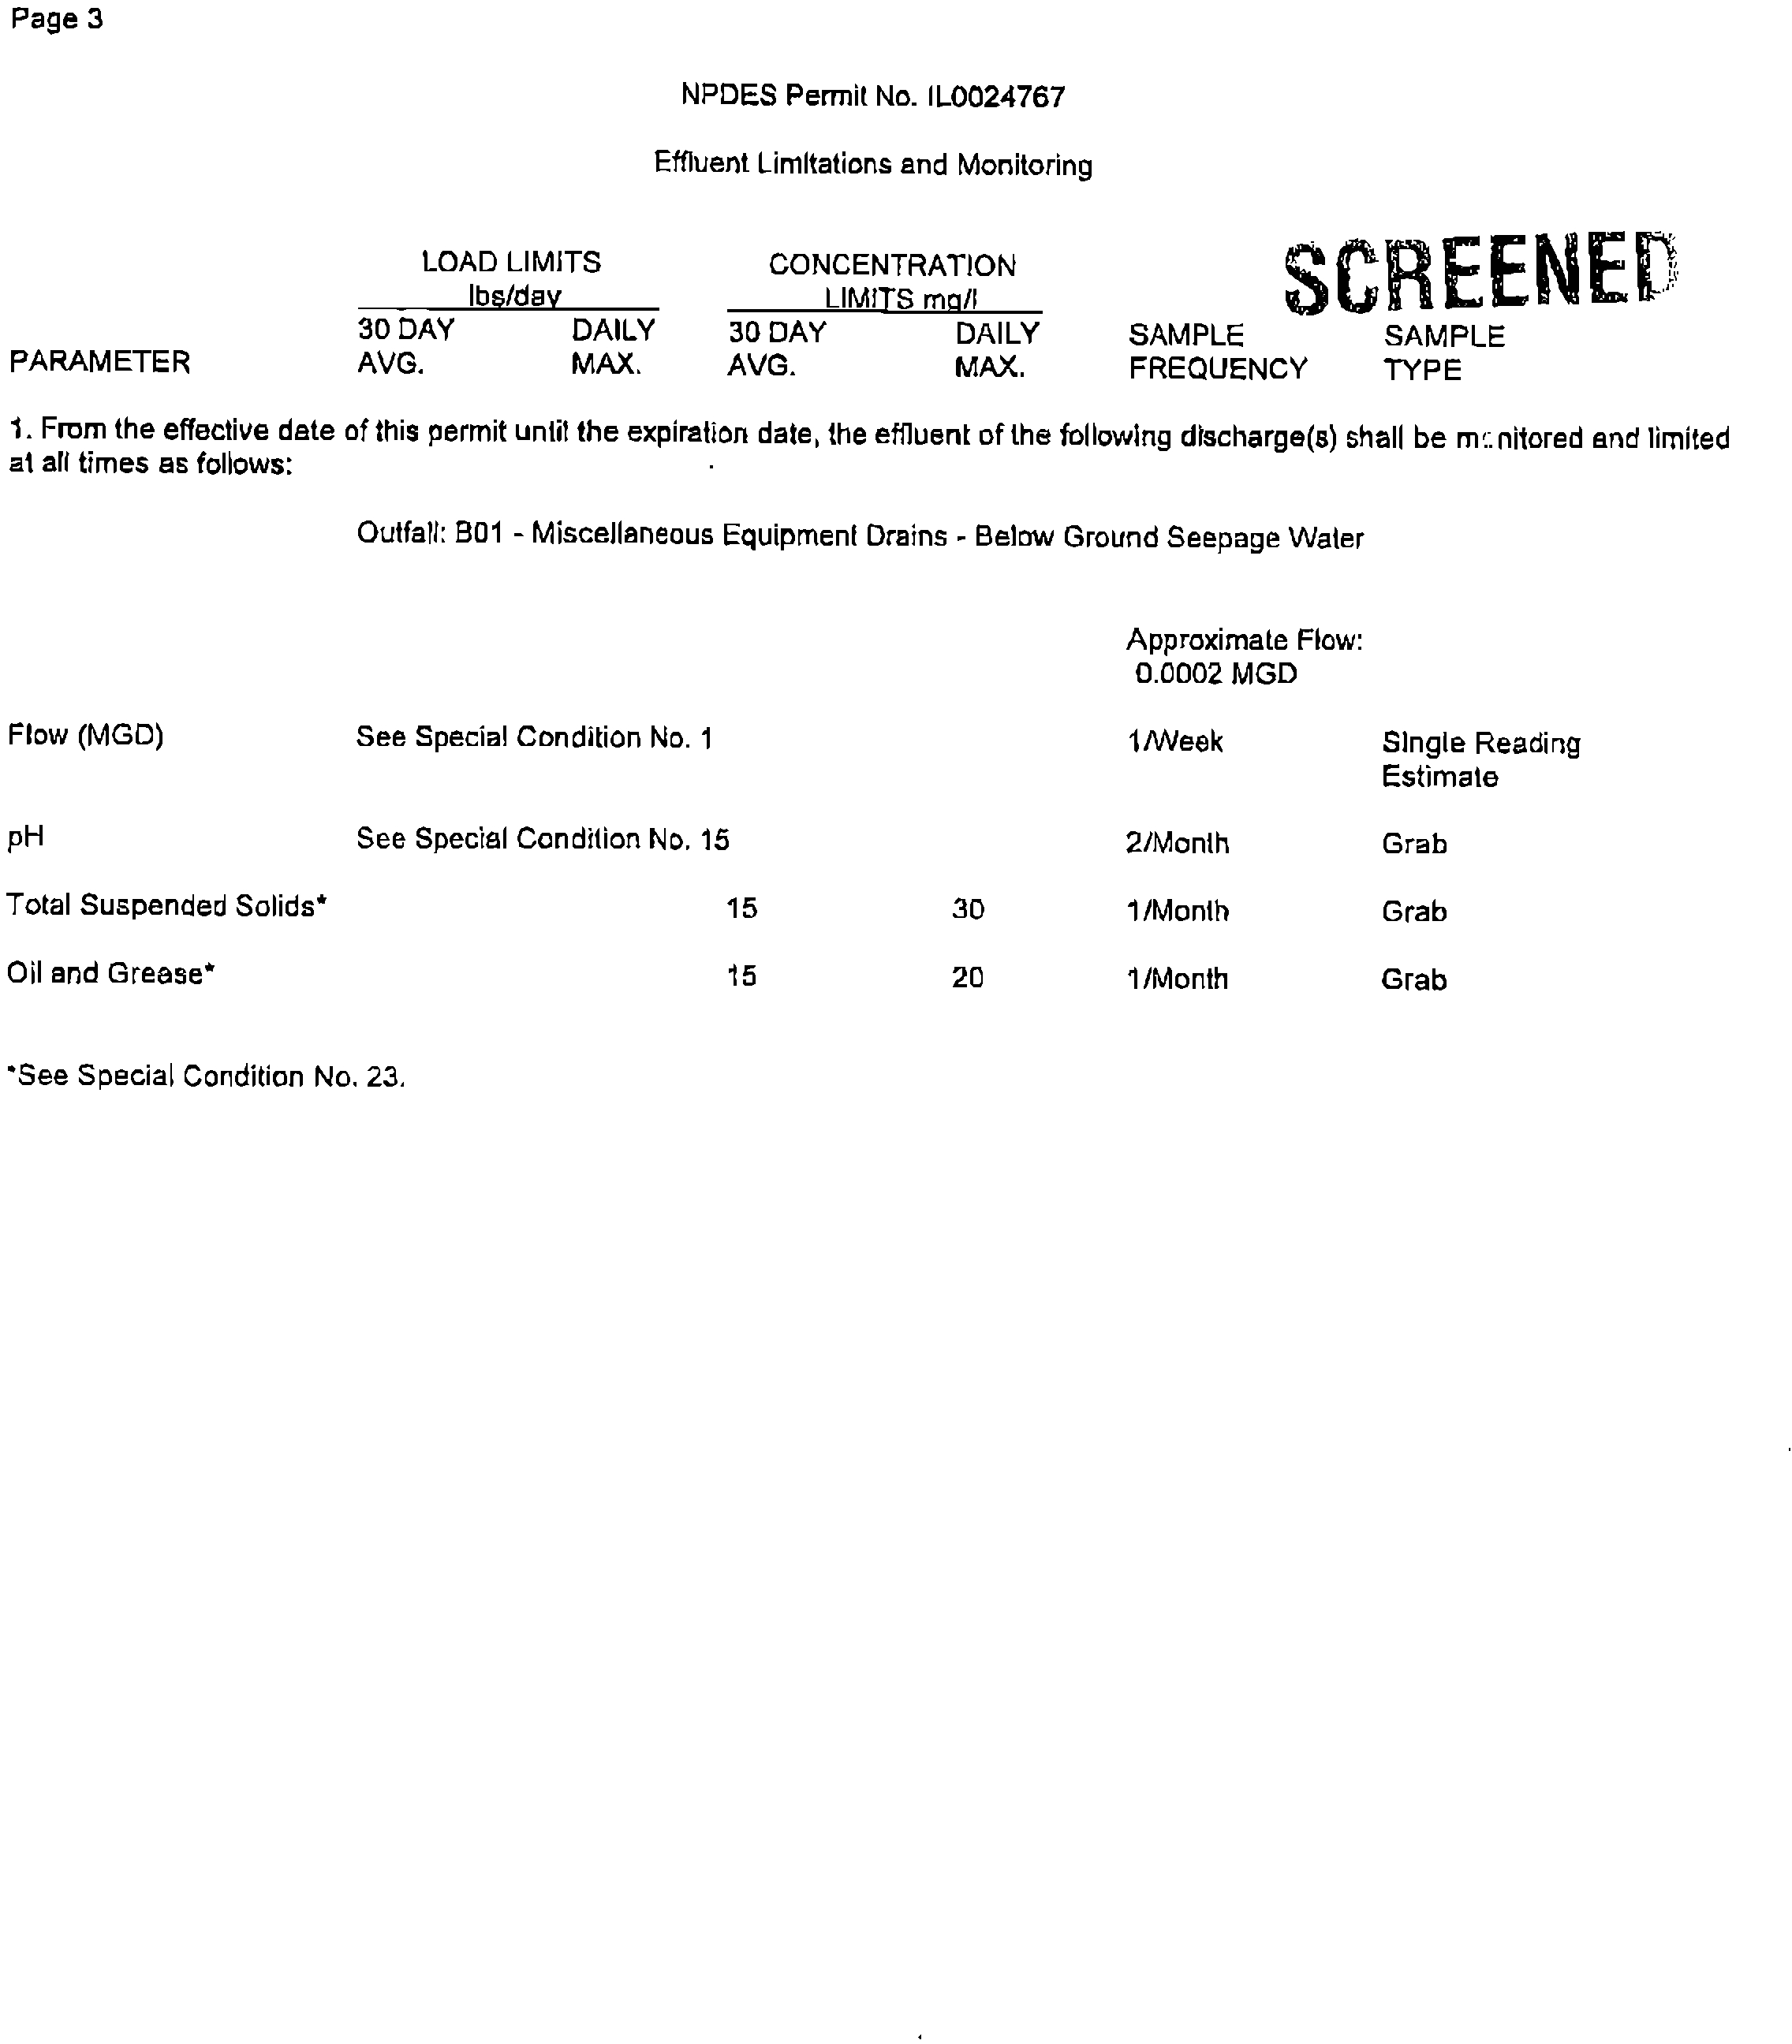
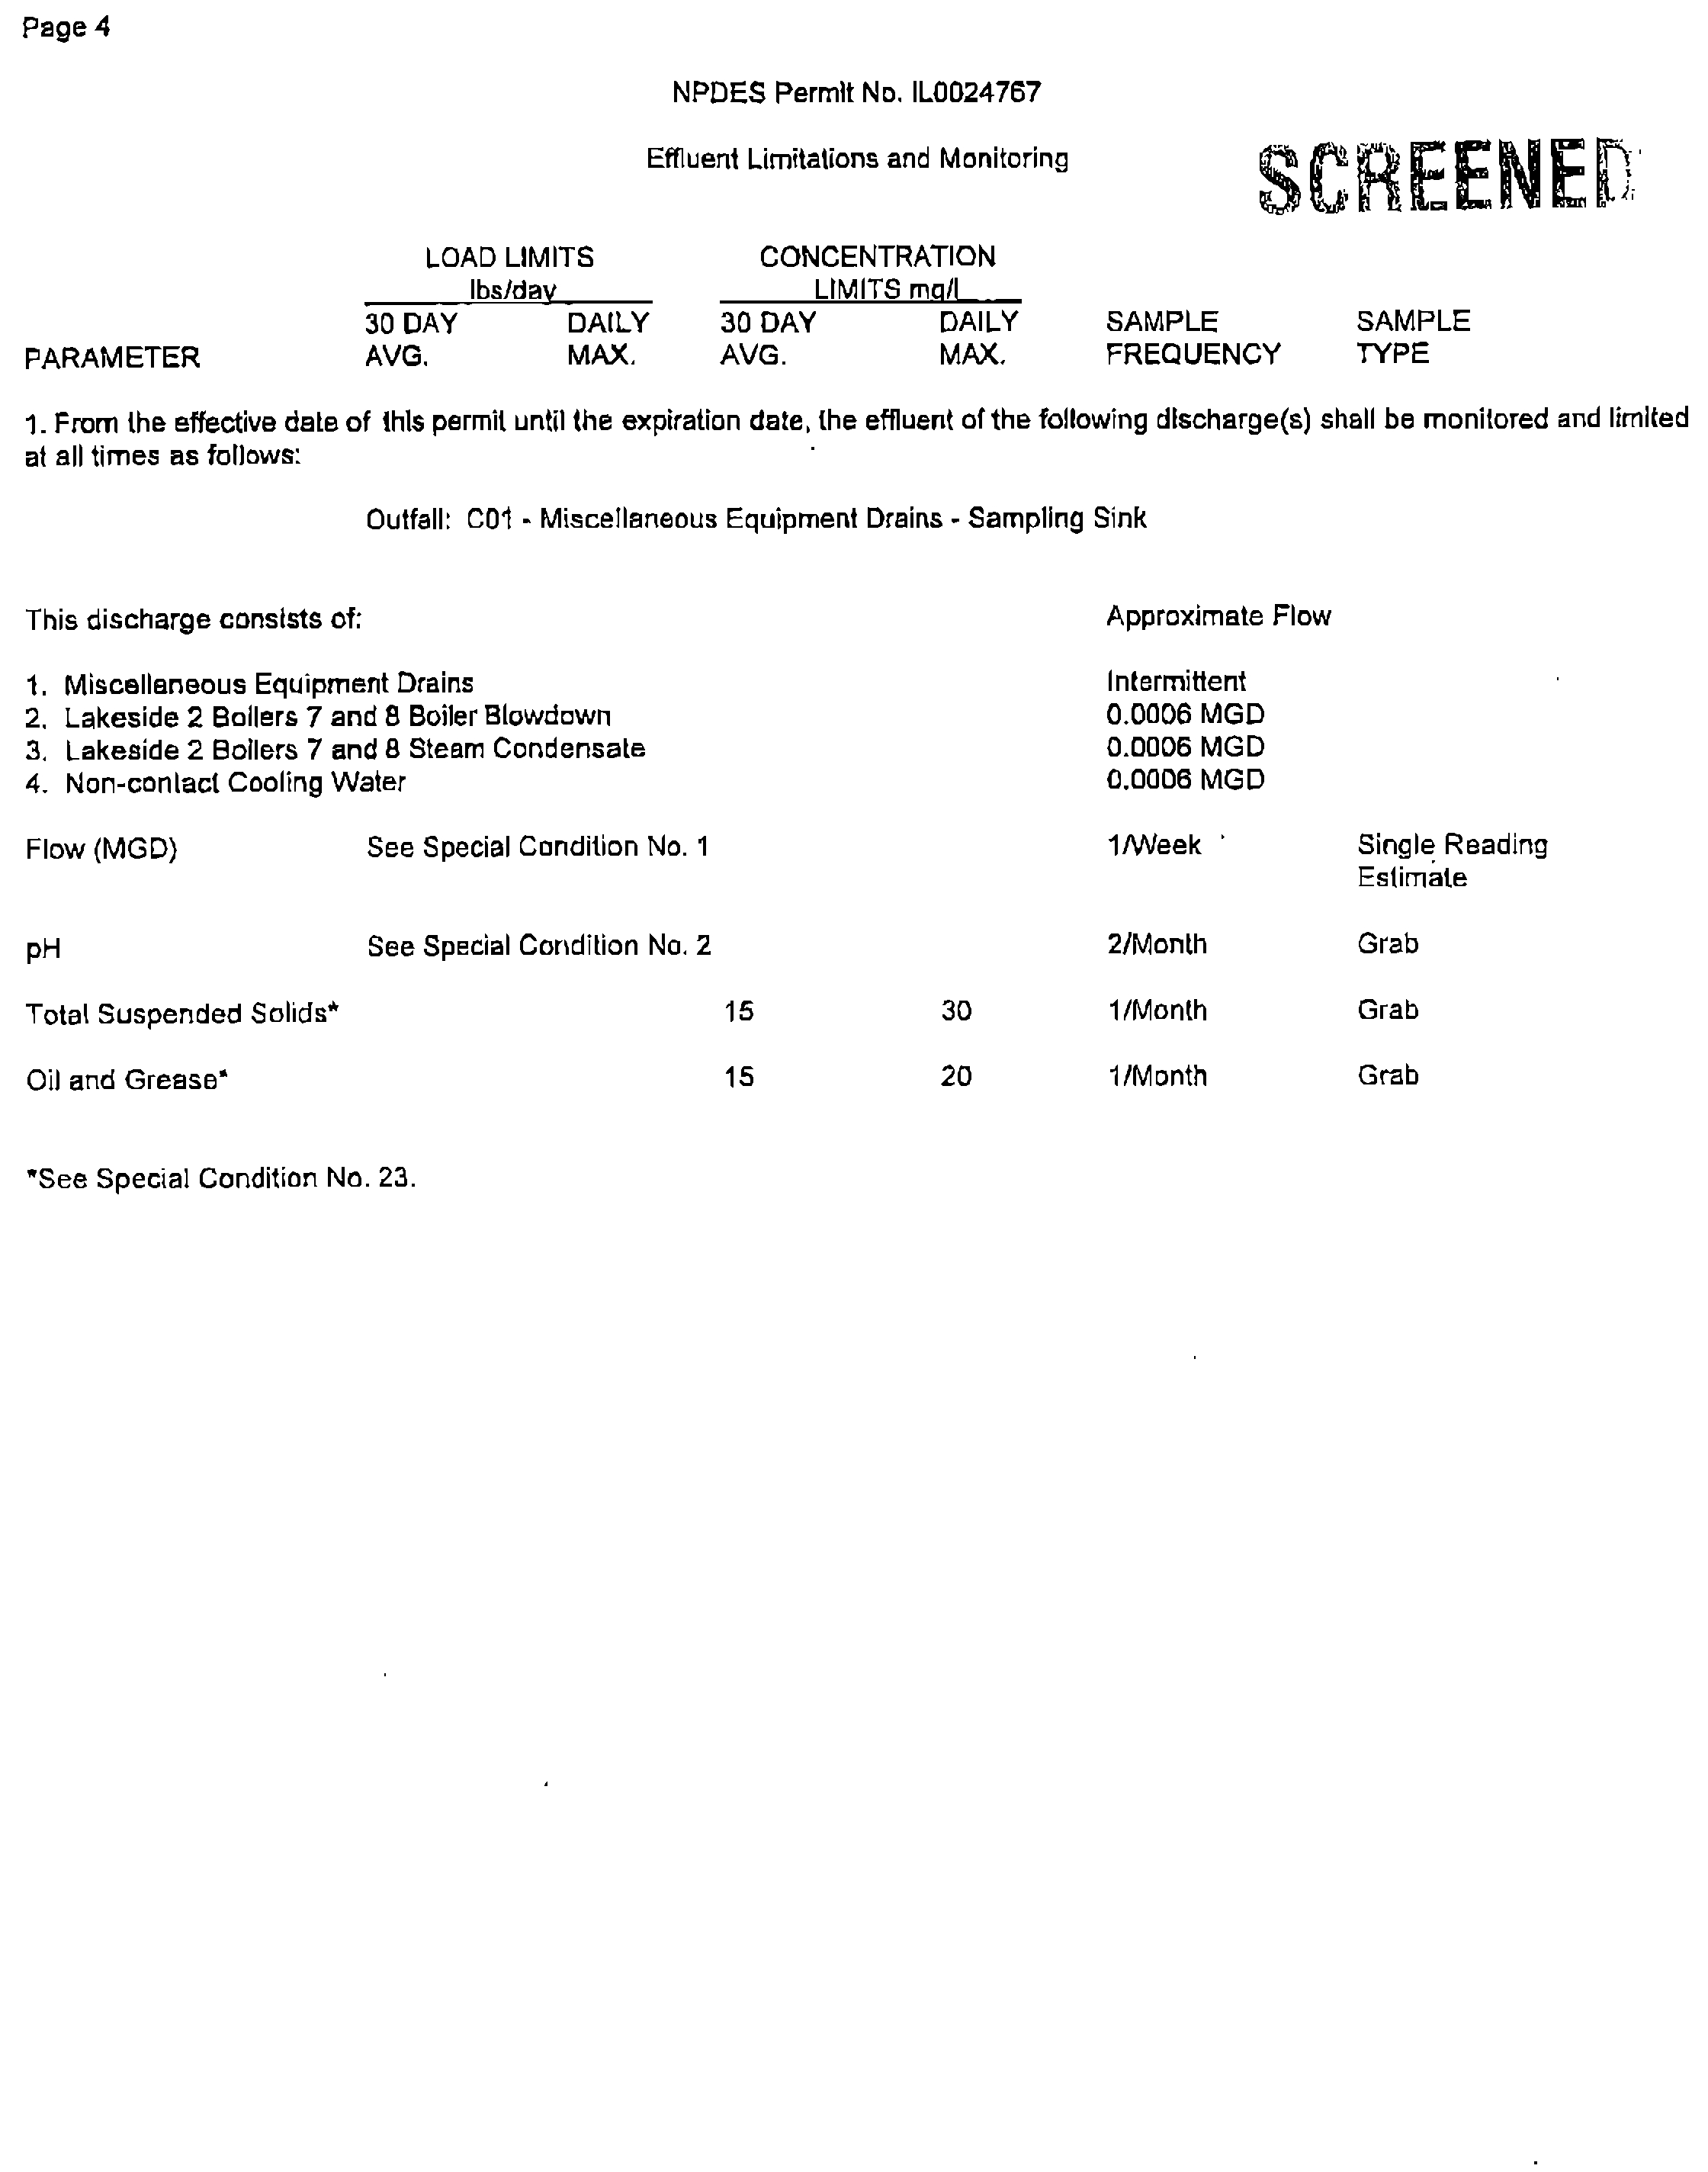
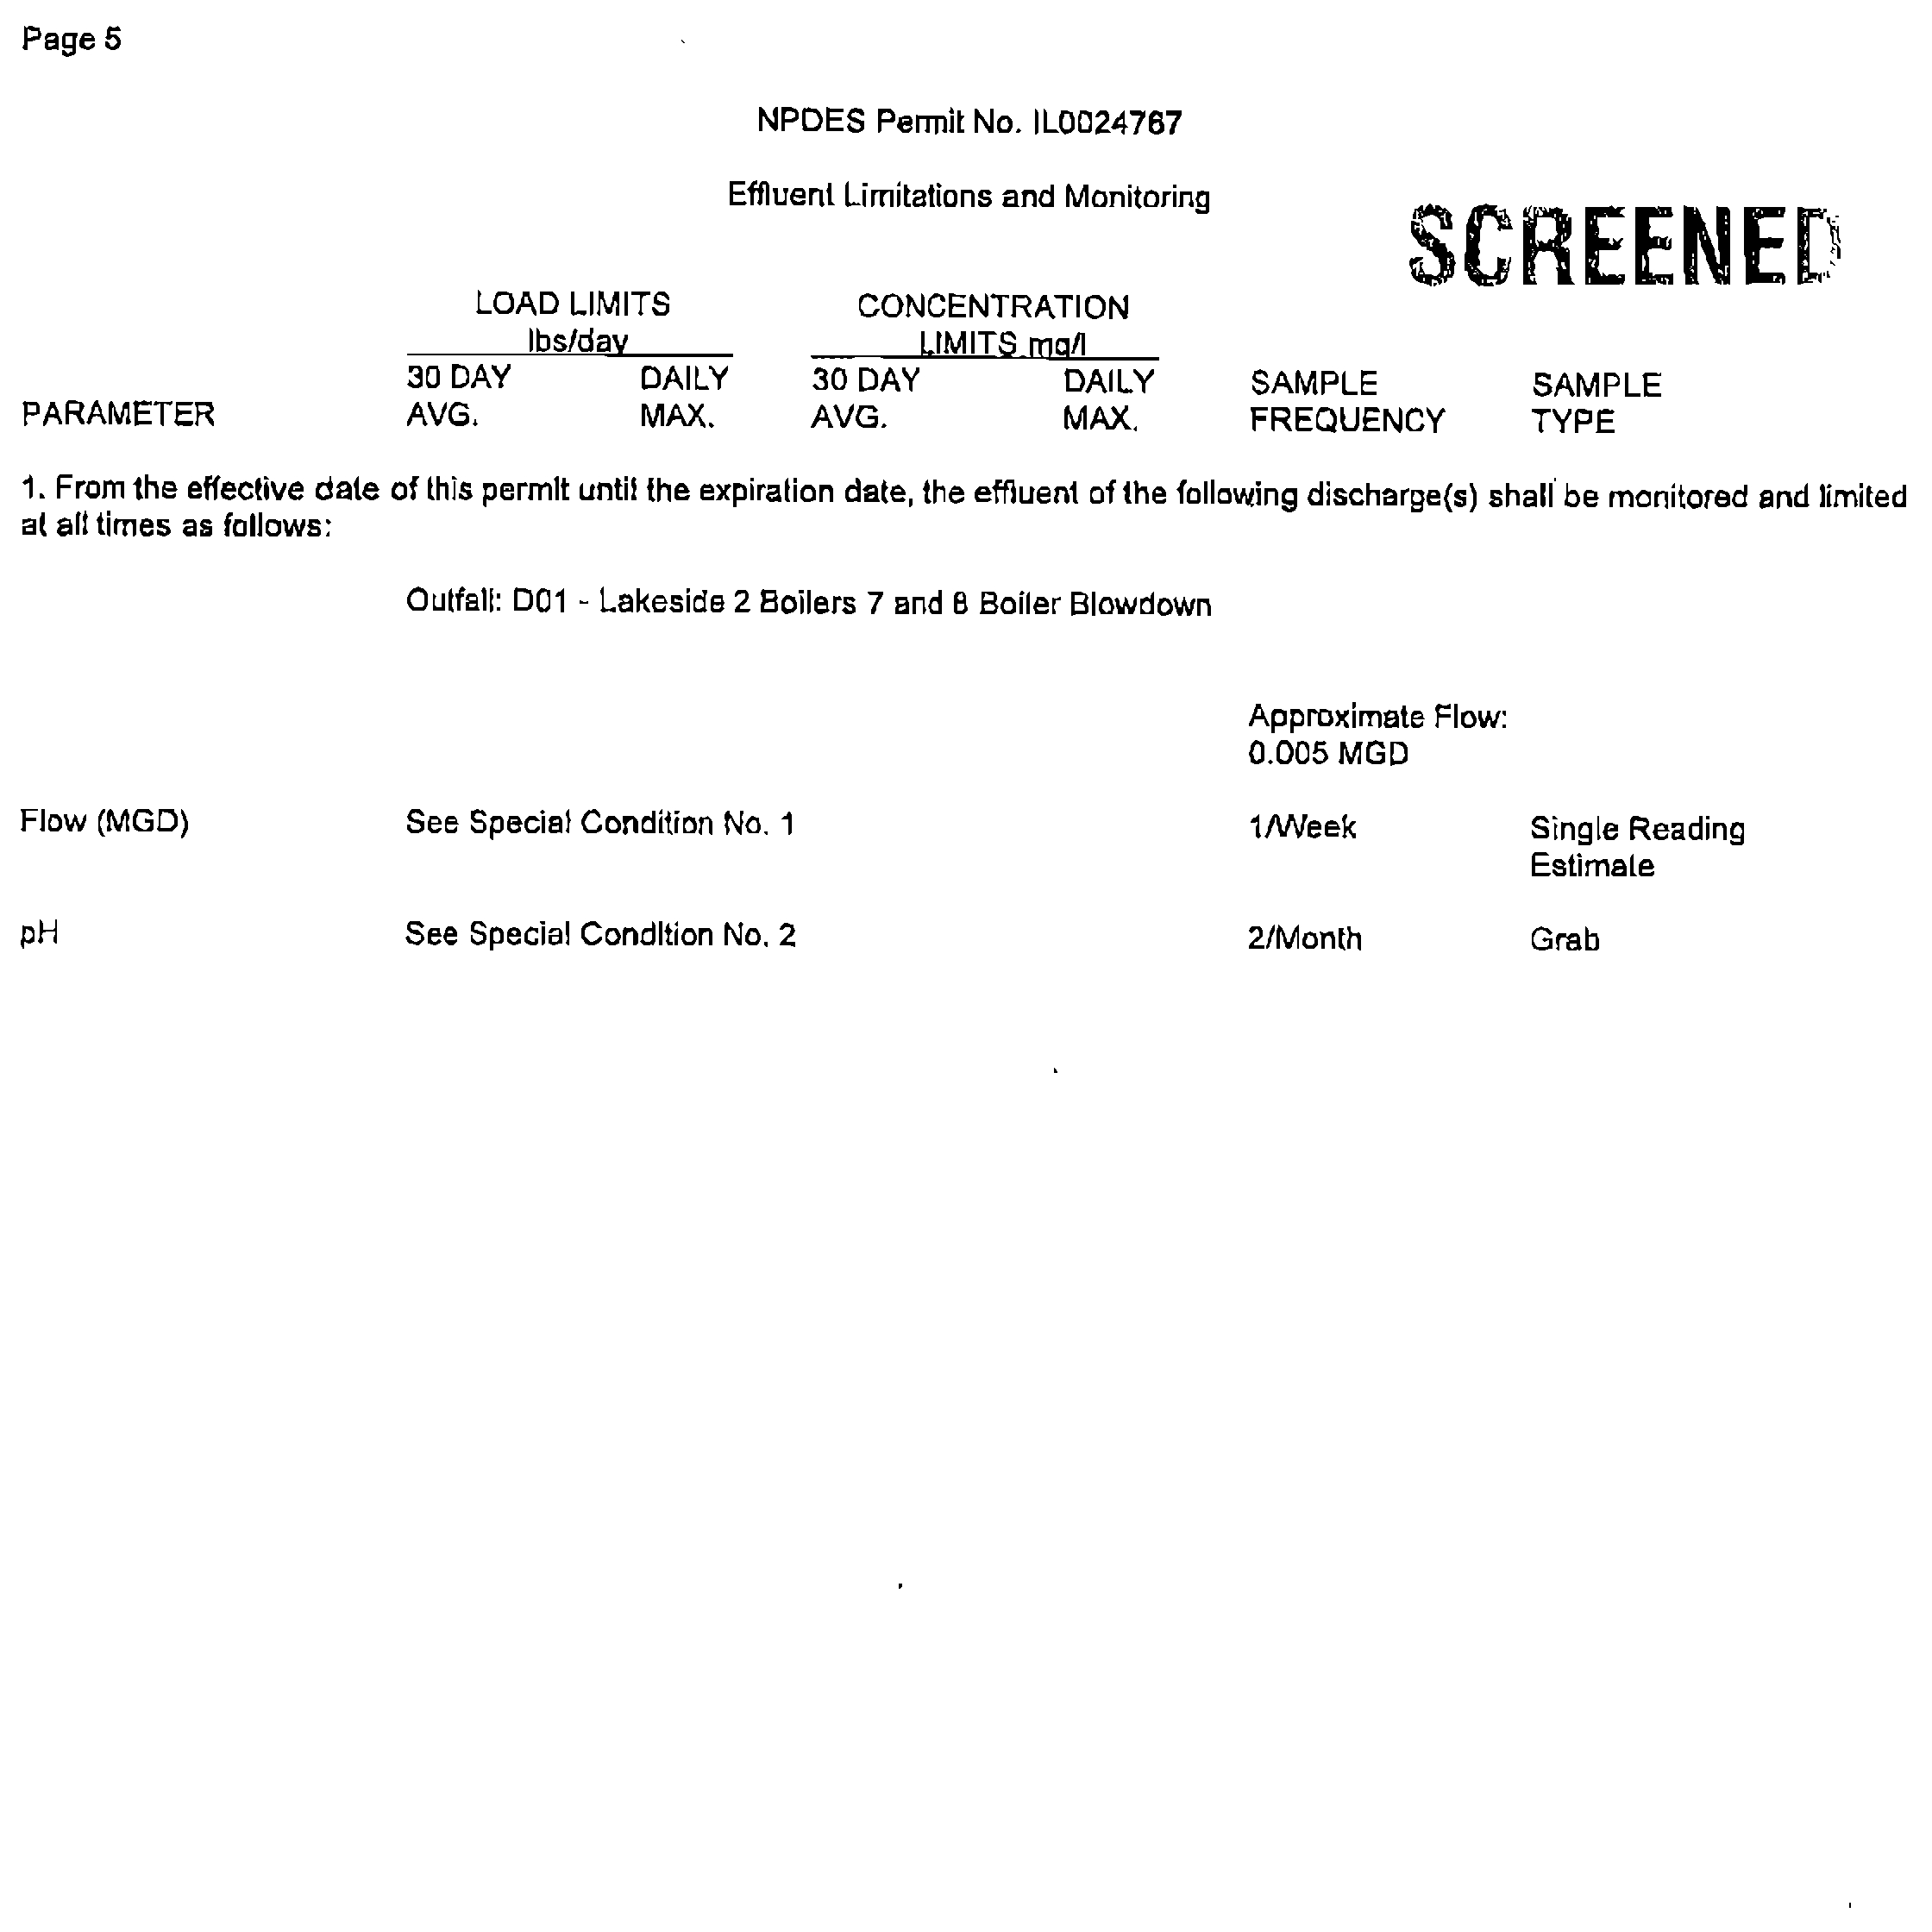
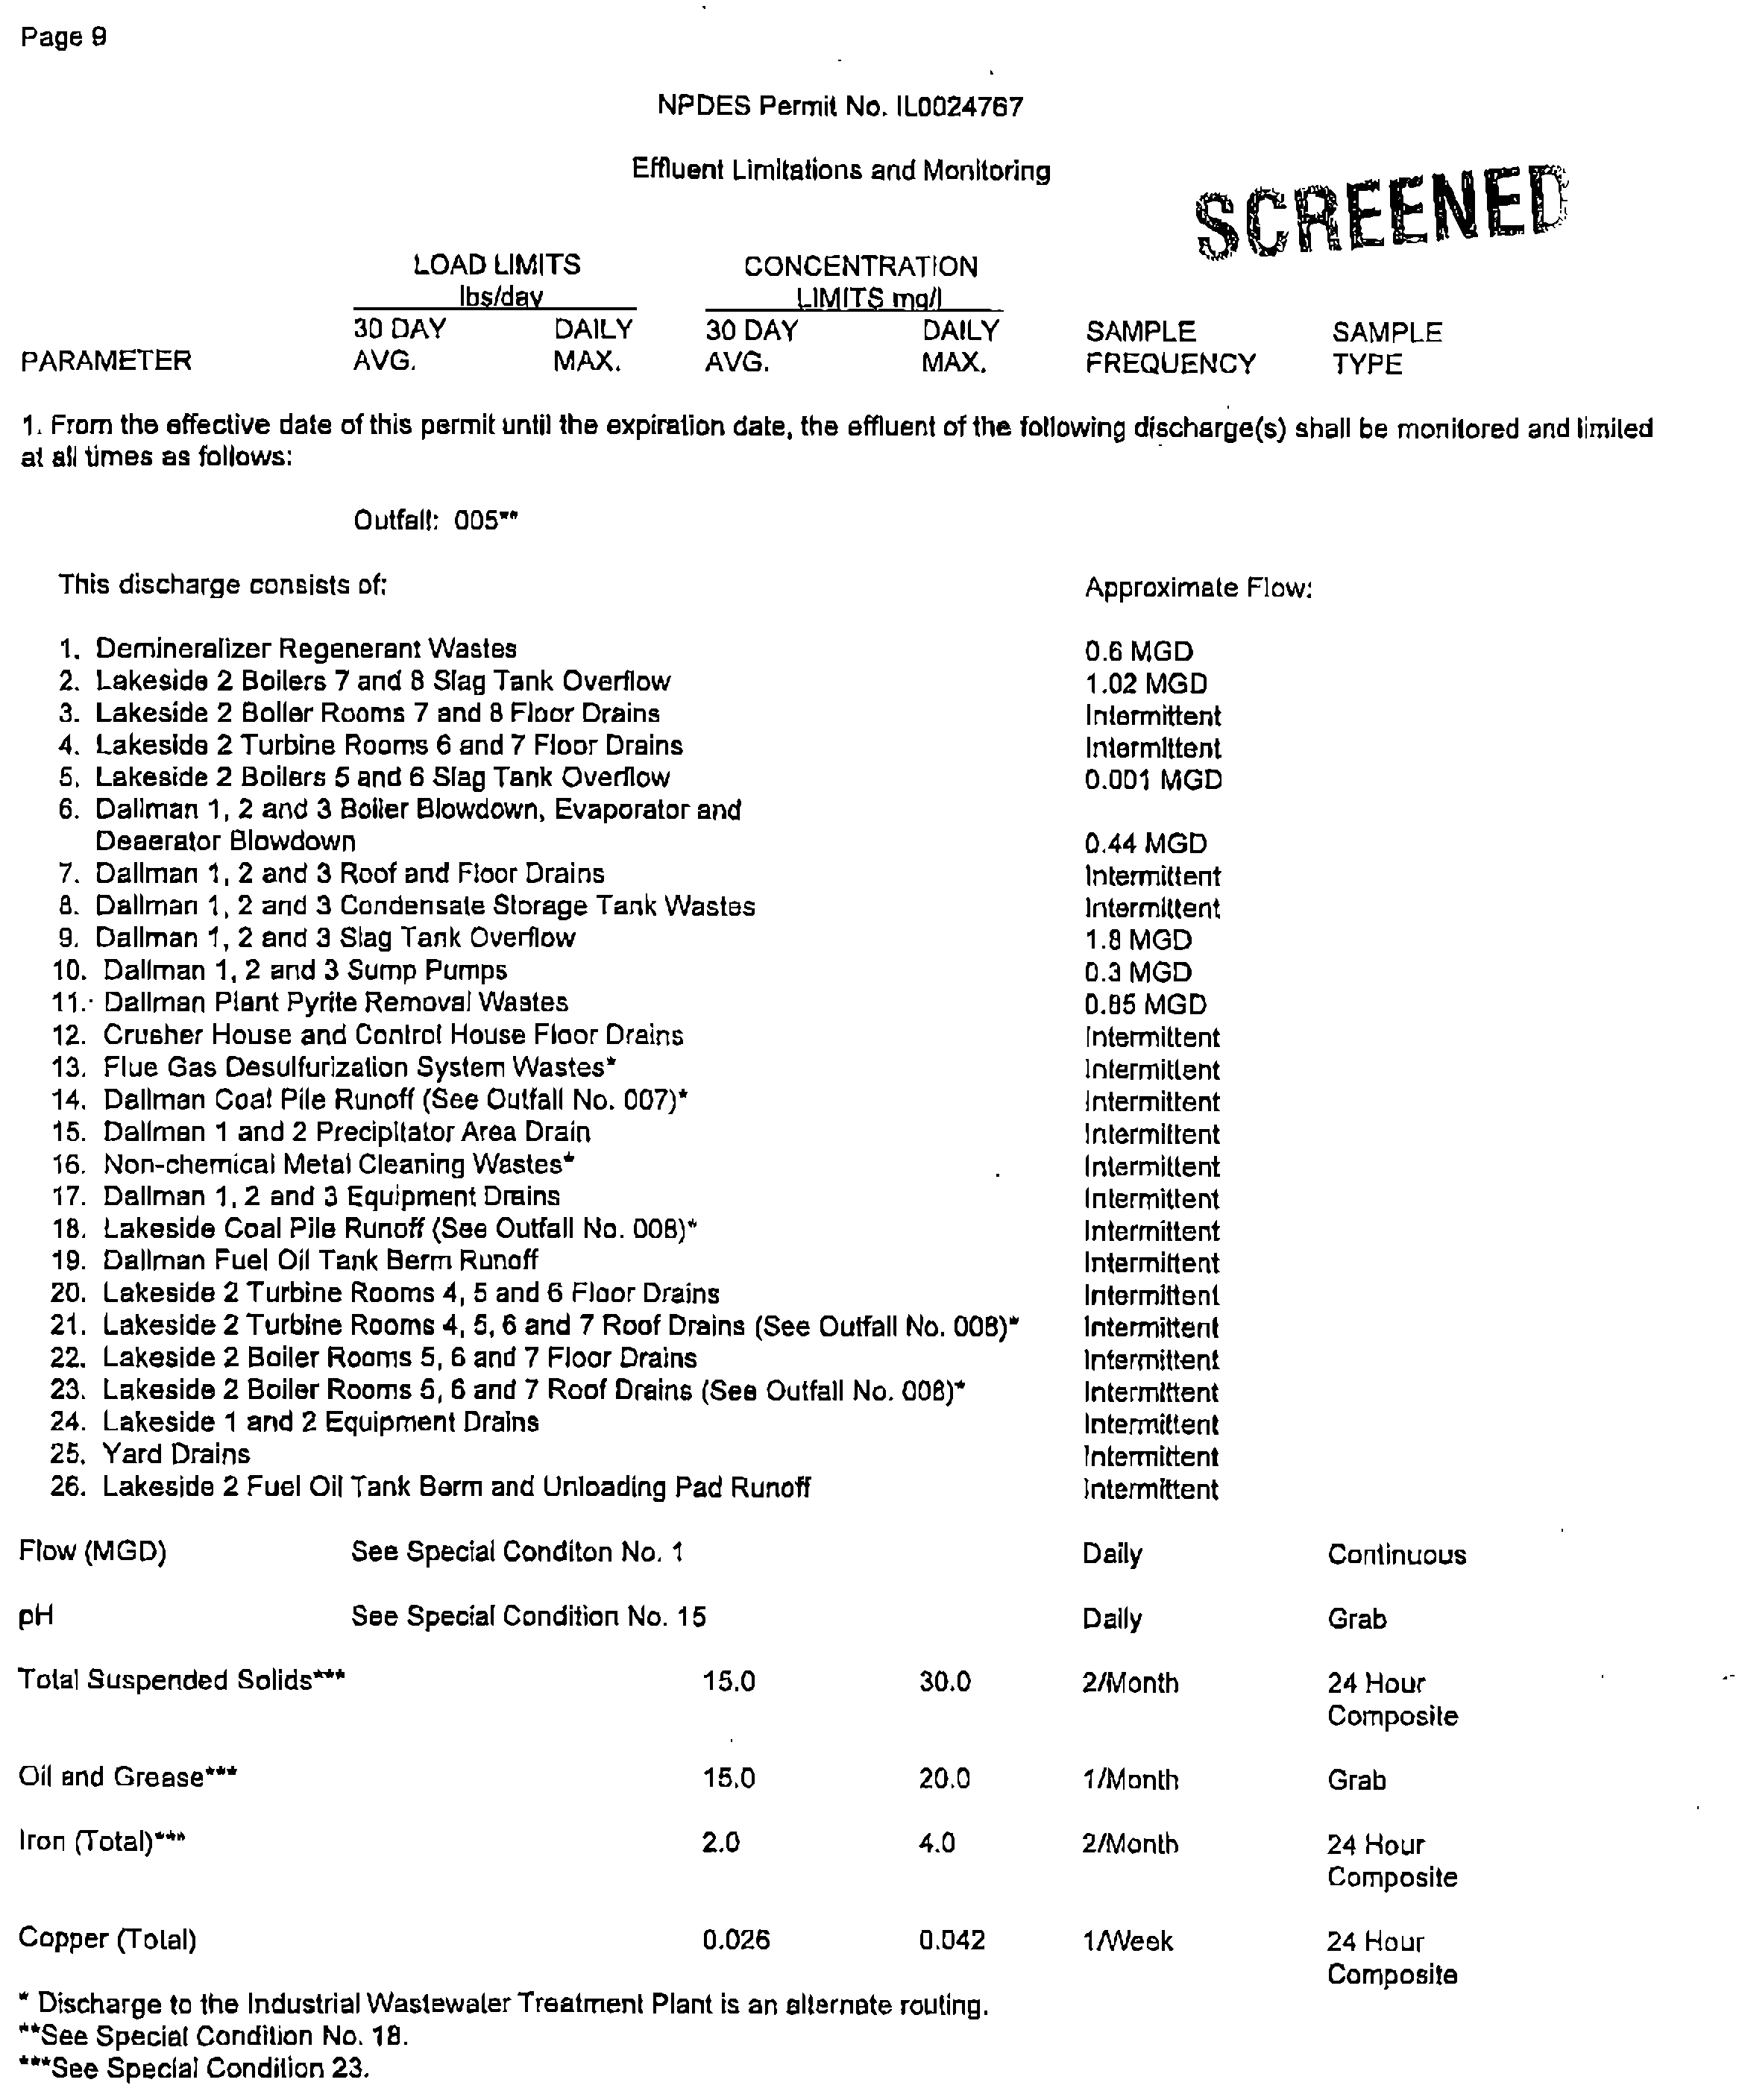
CWLP's NPDES permit IL0024767, issued December 5, 2001, regulates discharges
from 16 outfalls at the CWLP facility. Outfall numbers 001 through 011 apply to process
discharges at the facility and are shown in Figure 2-1. Outfall numbers 012 through 016
apply to storm water runoff from the industrial site. Outfalls 003, 004, and 016 discharge
into Sugar Creek; all of the other outfalls discharge into Lake Springfield. Discharge from
Outfall 003 consists mainly of potable water and raw water collected from various
equipment drains, floor drains, and roof drains at the Lakeside Power Station. The drainage
is routed from the power plant through an underground pipe that outfalls into the Sugar
Creek channel near the east side of the spillway at Spaulding Dam. Discharge from Outfall
003 has been identified as containing high concentration of boron, the result of contact with
accumulations of ash in the discharge area. Effluent from the Ash Clarification Pond
discharges into Sugar Creek through Outfall 004. This discharge also contains a high
concentration of boron.
Electronic Filing - Received, Clerk's Office, August 29, 2008
* * * * * R2009-008 * * * * *
FOR THE SITE-SPECIFIC BORON STANDARD
FOR THE SMSD SPRING CREEK PLANT
SPRINGFIELD, ILLINOIS
HANSON NO. 07E0039
FIGURE 2-1
TECHNICAL SUPPORT DOCUMENT
2-10
Electronic Filing - Received, Clerk's Office, August 29, 2008
* * * * * R2009-008 * * * * *
I\07jobs\07E0039\Admin\14 Reports\Tech. Support Doc
2-11
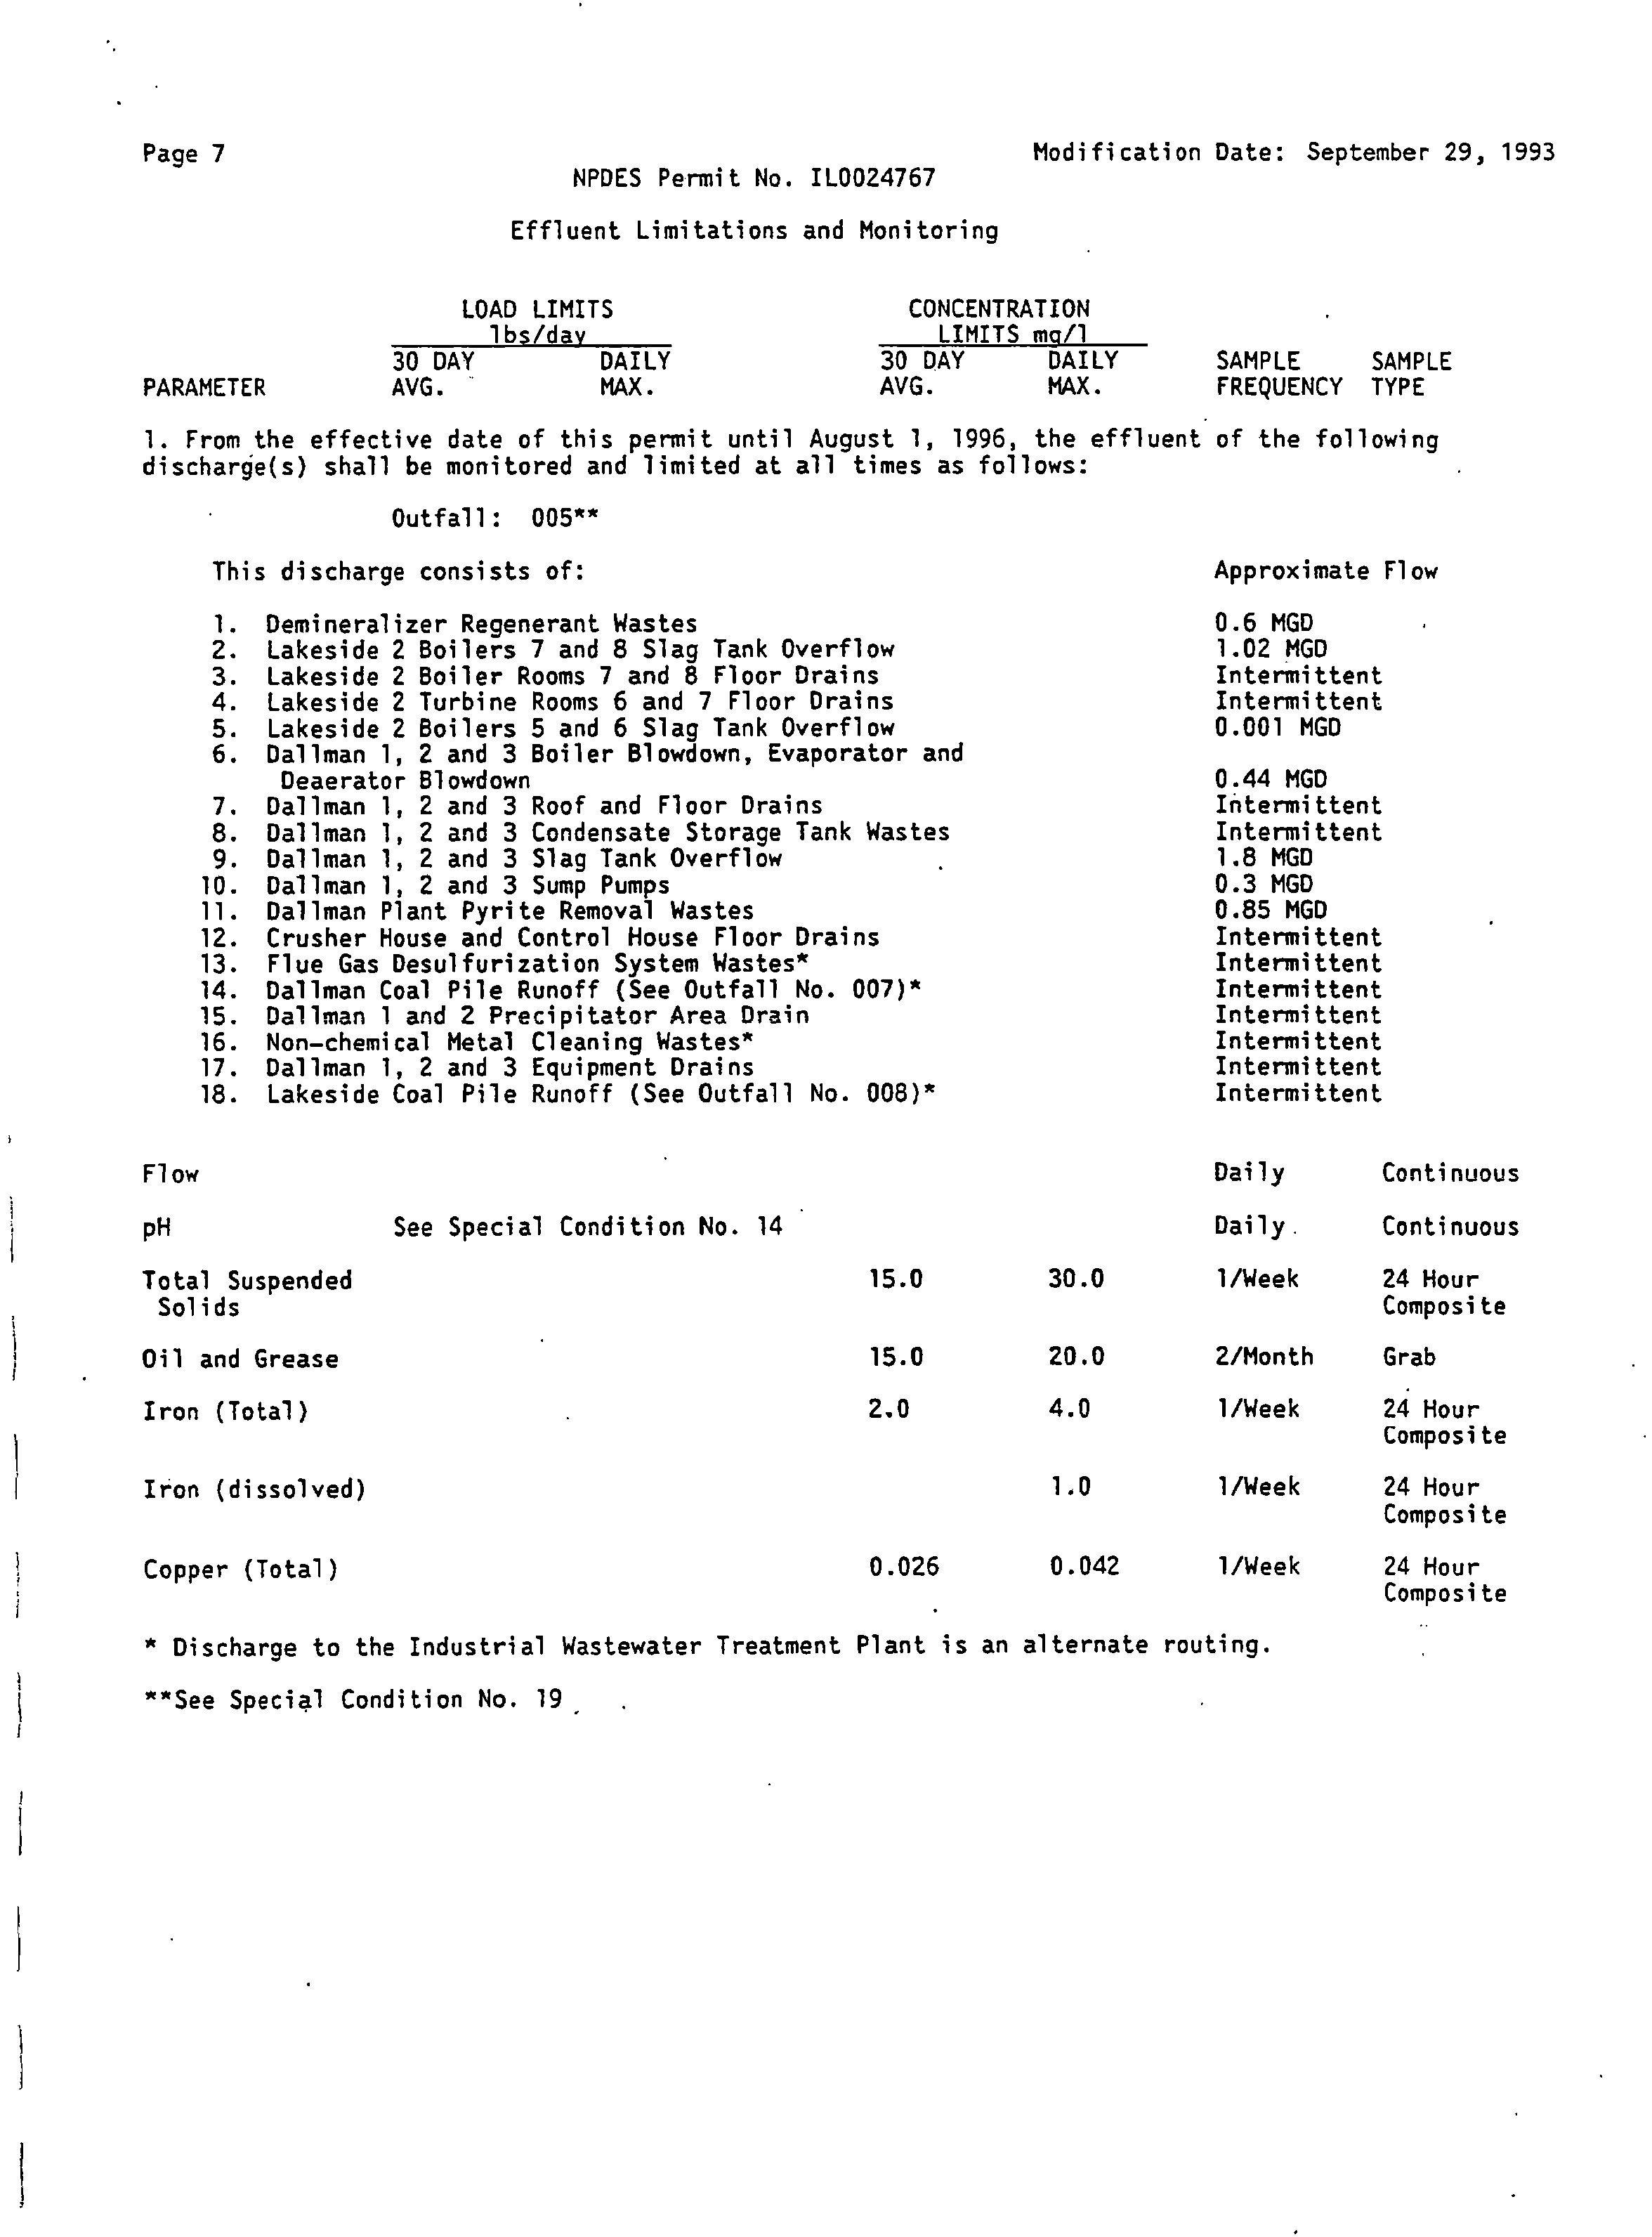
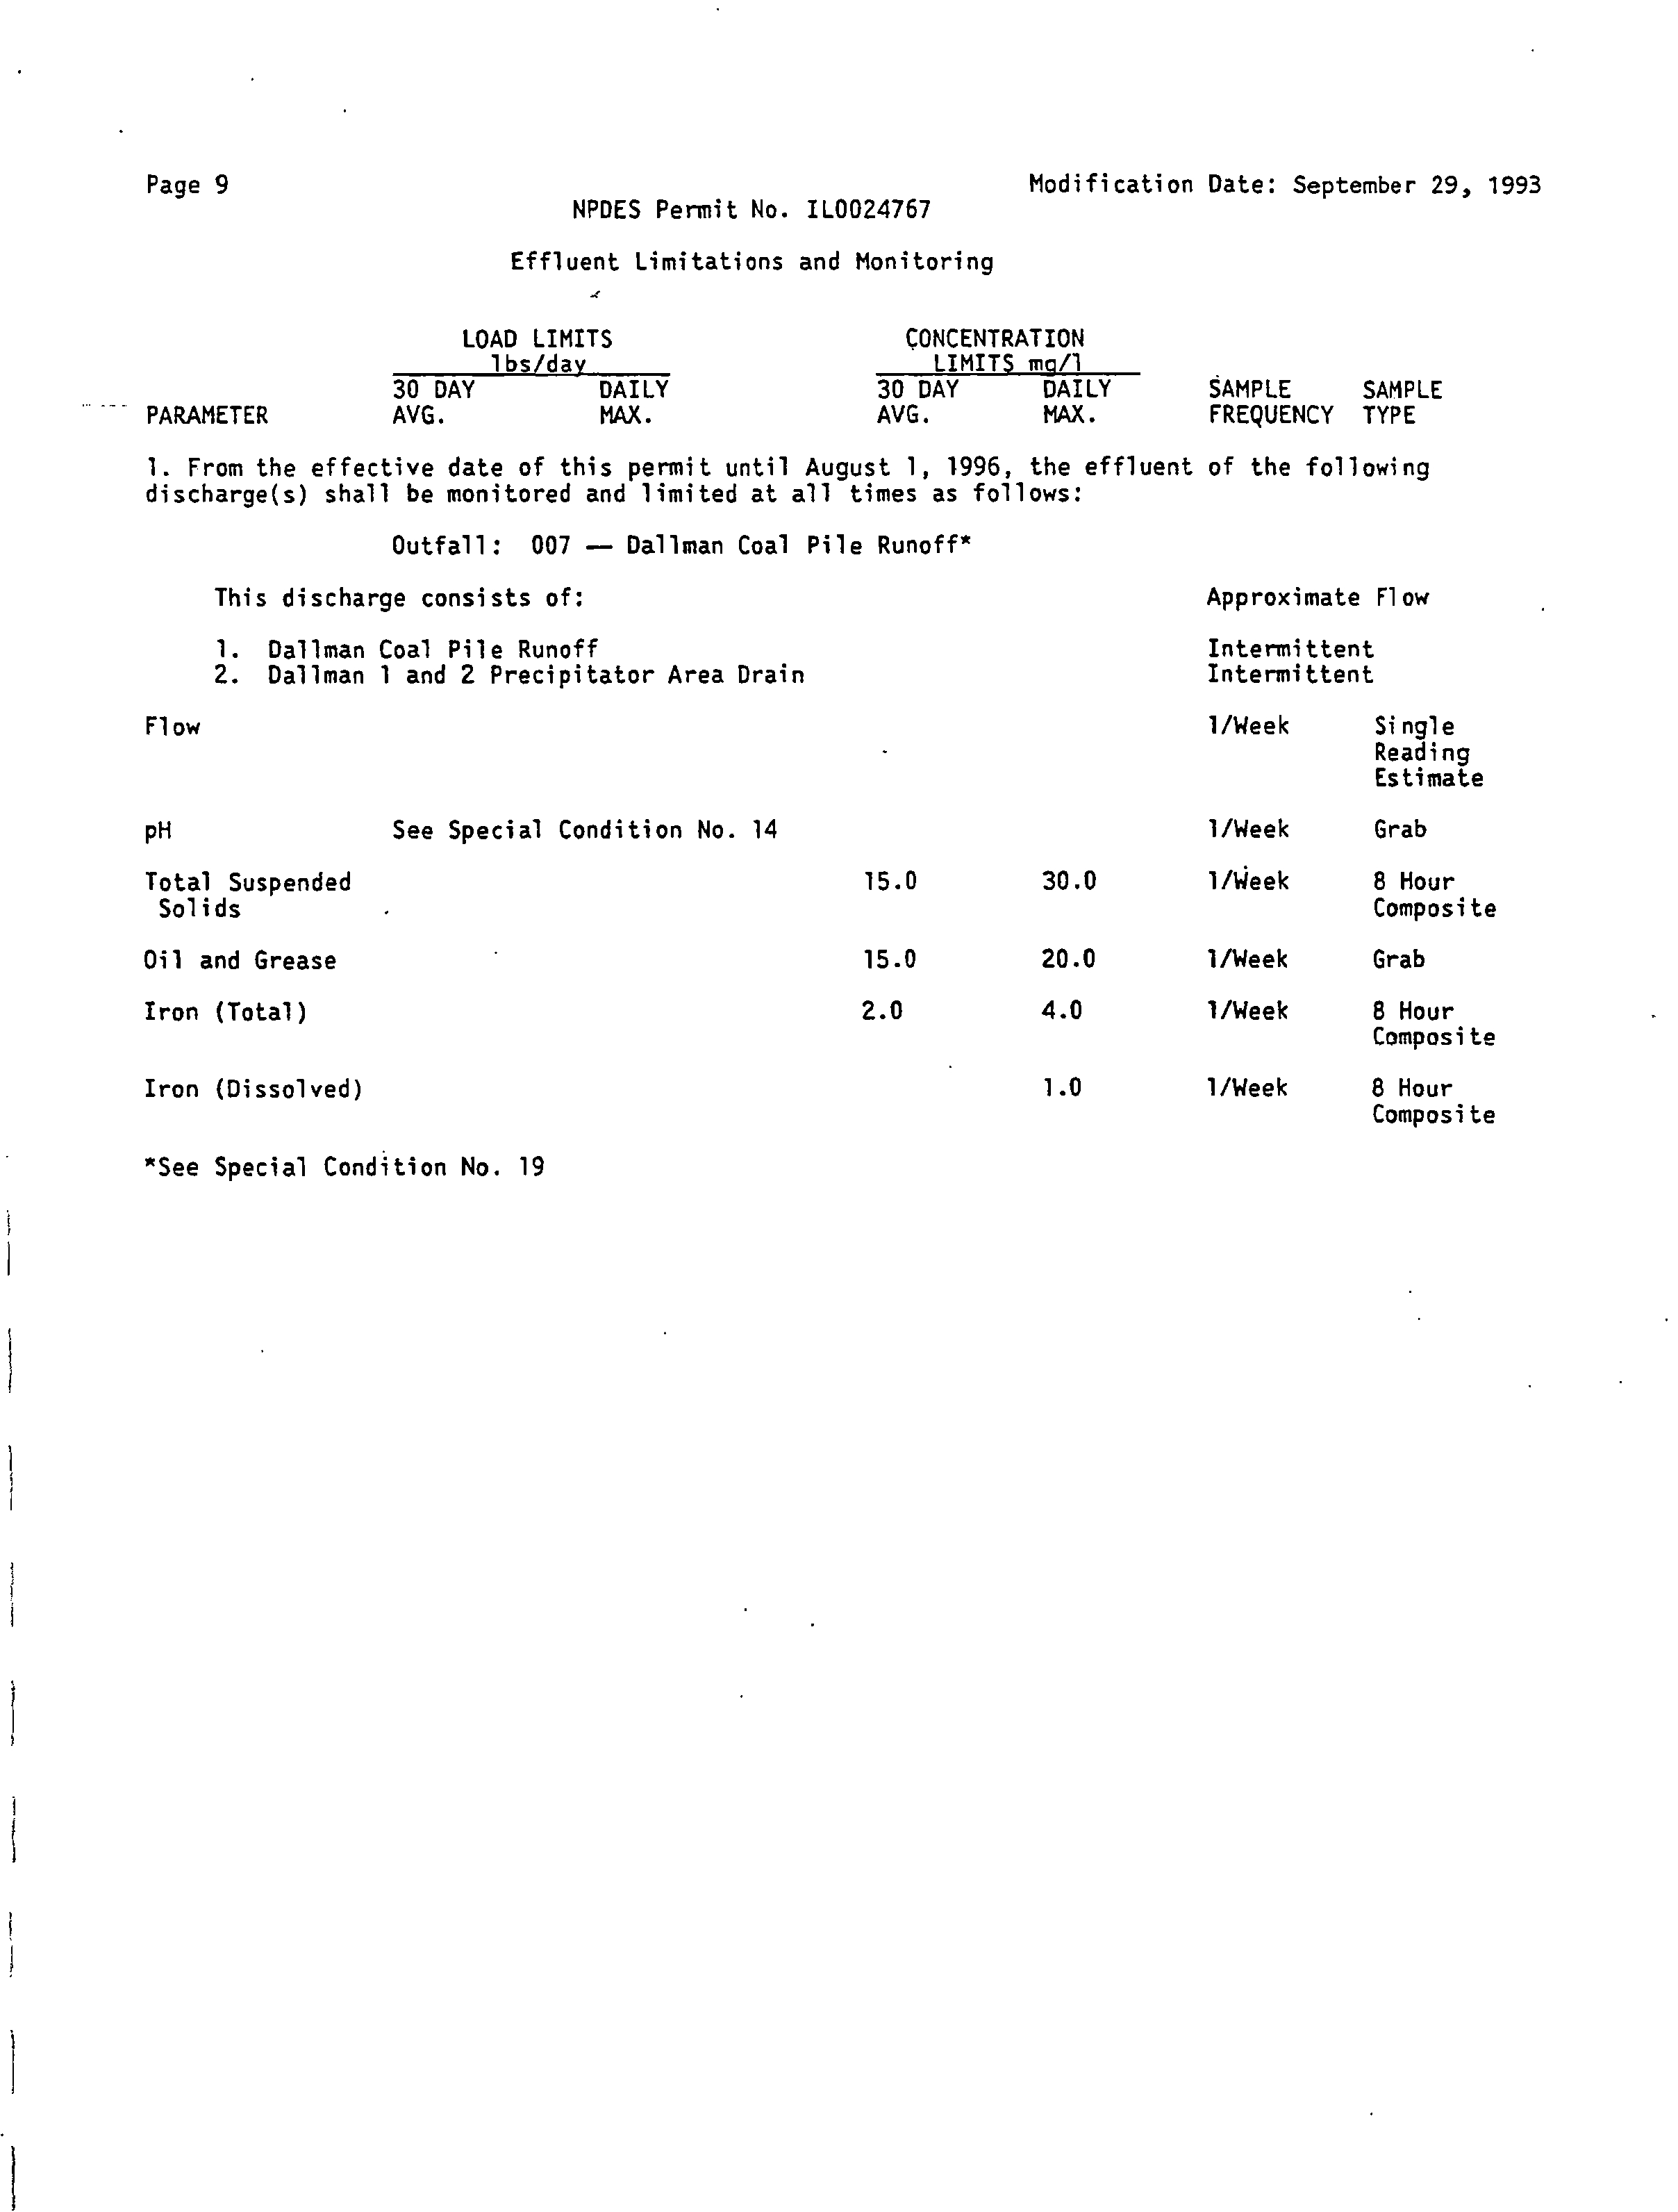
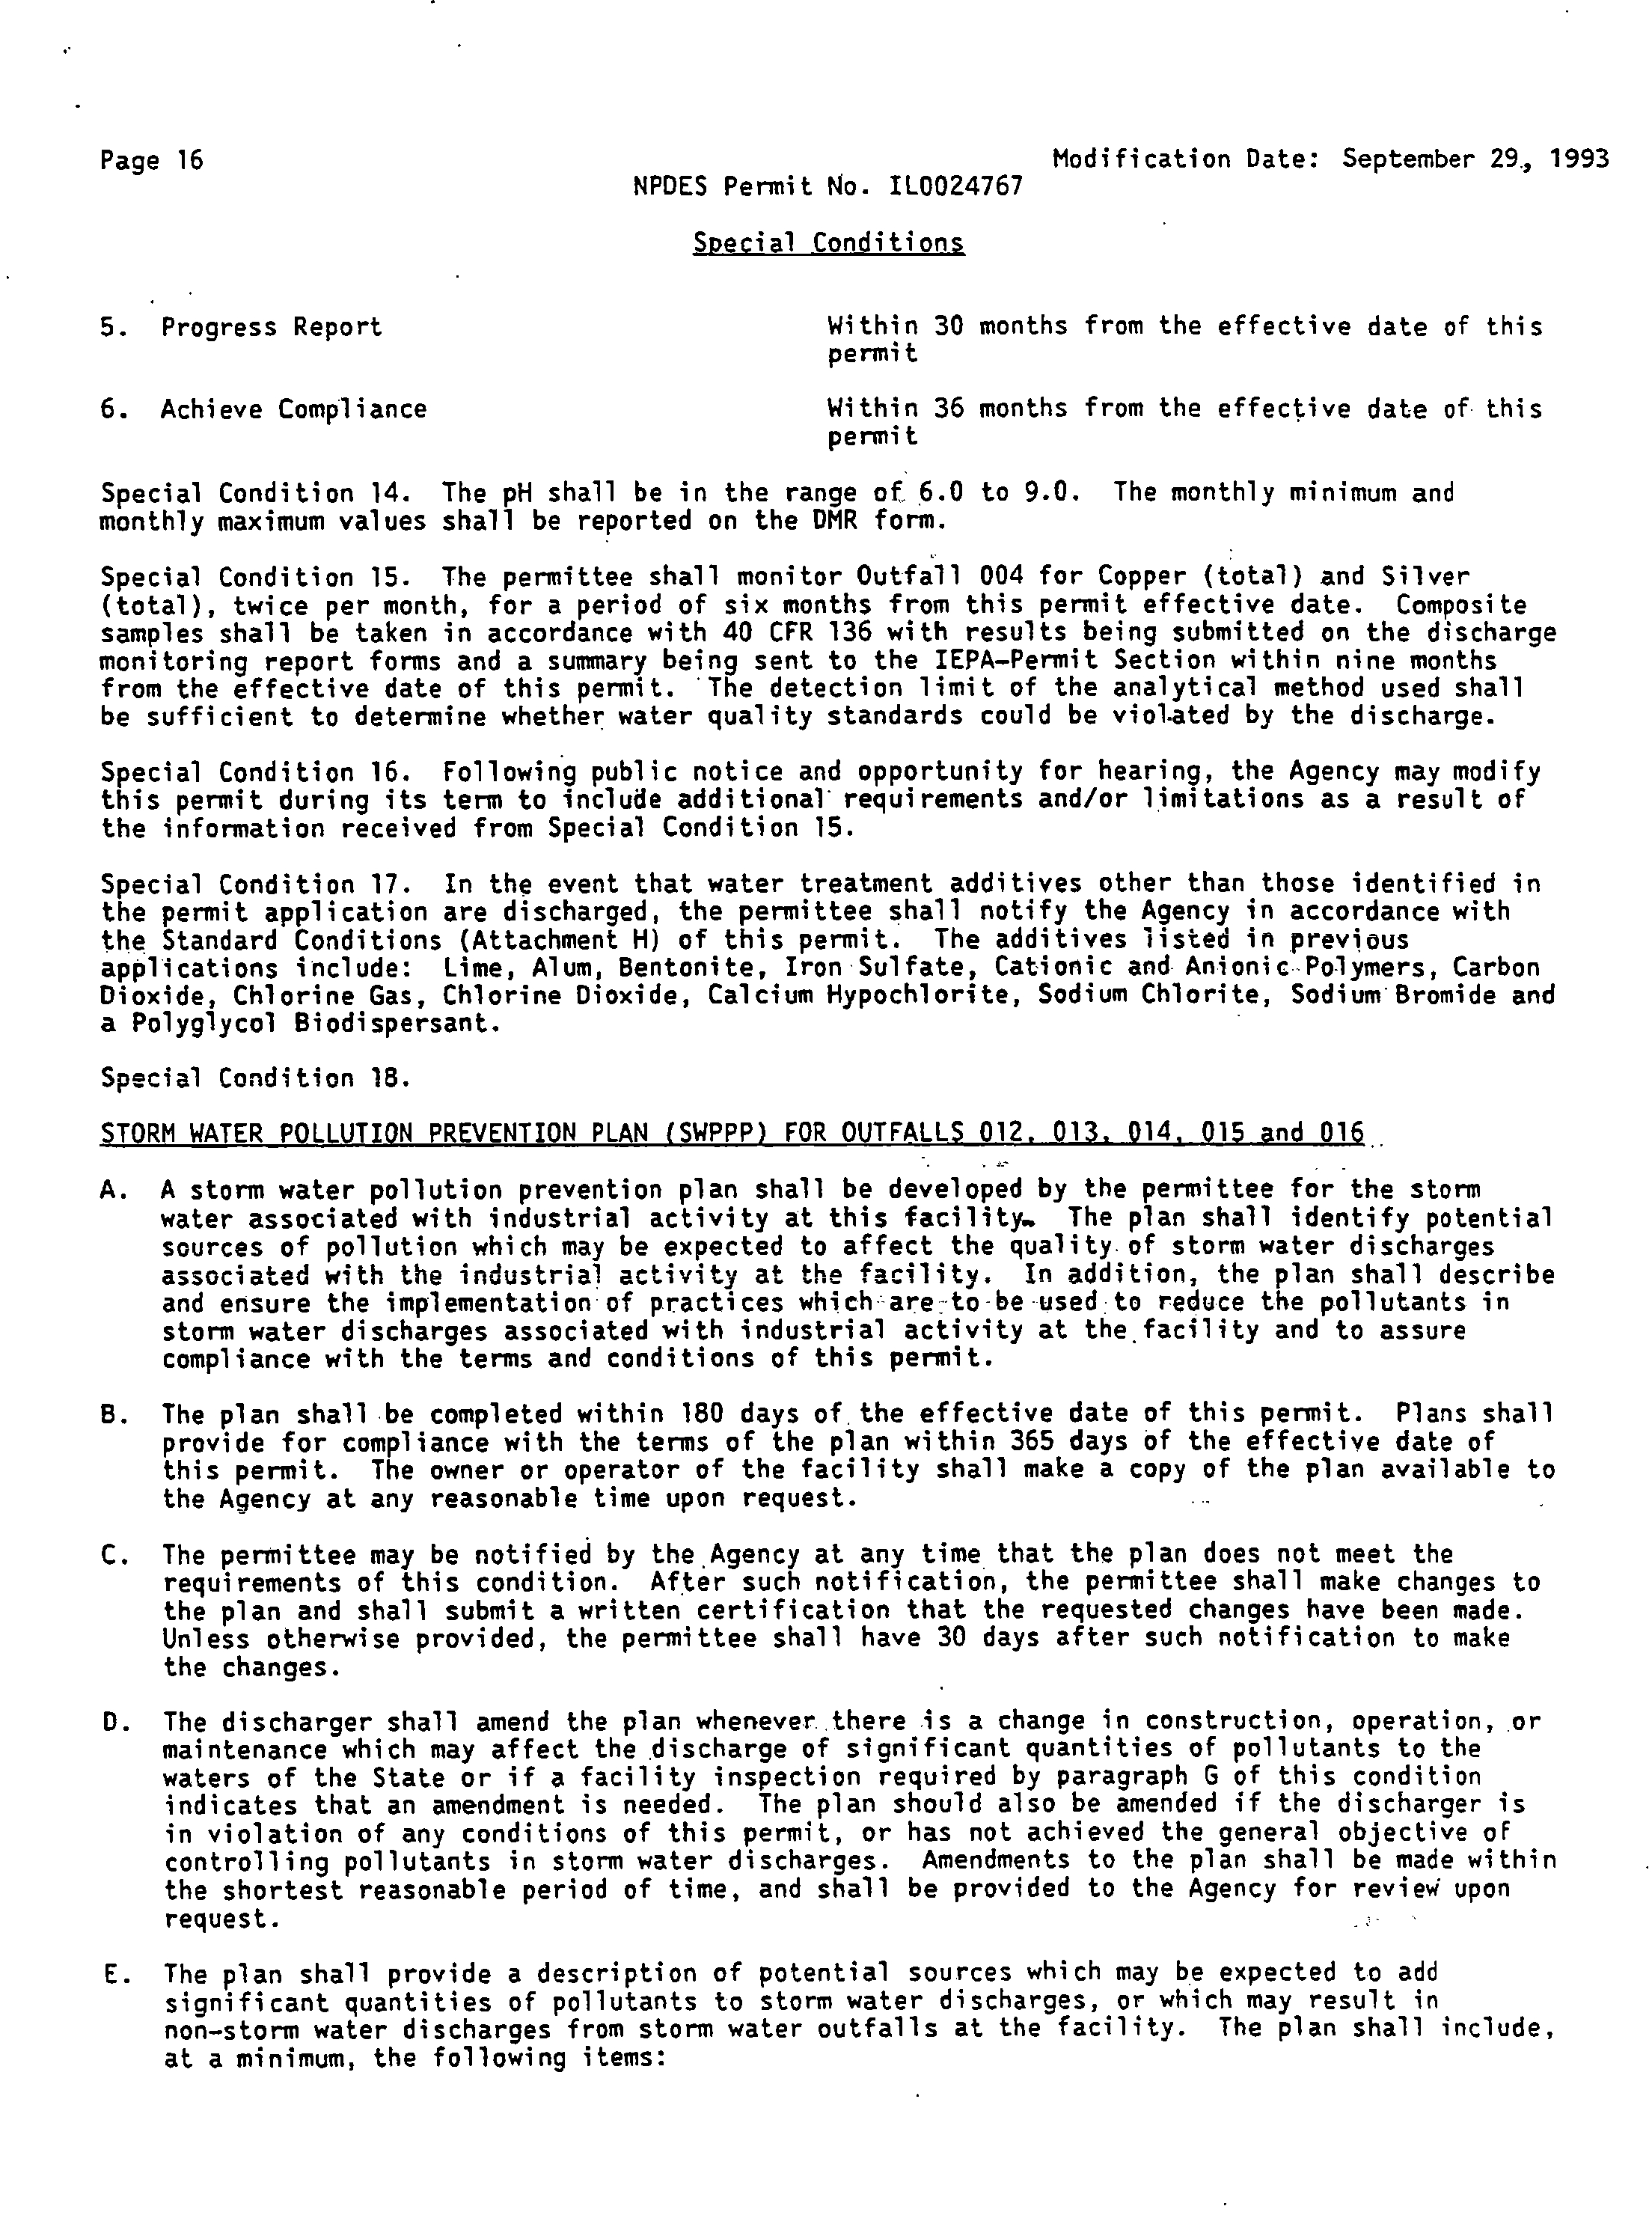
The former NPDES permit IL0024767, issued September 29, 1993, required CWLP
to limit and monitor the concentrations of boron in Outfall 003 and Outfall 004 discharges to
Sugar Creek. The permit limit for boron was 1.0 mg/L, with compliance to be achieved by
December 14, 1994. In response to the issuance of this permit, CWLP commissioned a
study to evaluate the ecological and water quality impacts of boron levels discharged into
Sugar Creek and associated sections of the Sangamon River and the South Fork of the
Sangamon River (
Technical Support Document for Petition for Adjusted Boron Standards
for Sugar Creek and the Sangamon River
, Hanson Engineers Incorporated, March 1994).
Ultimately, CWLP petitioned the Illinois Pollution Control Board and was granted an
adjusted standard for boron. The following adjusted standard for boron is now applicable:
11.0 mg/L from CWLP's Outfall 003 at Spaulding Dam on Sugar Creek to its confluence
with SMSD’s Sugar Creek Plant Outfall 008; 5.5 mg/L from SMSD's Outfall 008 to its
confluence with the South Fork of the Sangamon River; and 2.0 mg/L from the confluence
of Sugar Creek and the South Fork of the Sangamon River to 100 yards downstream of the
confluence of the Sangamon River with Spring Creek, a total distance of approximately 20
river miles.
Historically, CWLP has been able to operate while meeting the adjusted boron
standard in Sugar Creek. During normal plant operation, boron concentrations at Outfall
004 have been within the adjusted standard despite high boron concentrations in the FGDS
effluent water stream generated during gypsum dewatering (FGDS blowdown). This FGDS
blowdown, combined with seal water from the FGDS pumps, is mixed with the Water
Treatment Plant sludge and transferred to the ash pond system. However since selective
catalytic reduction (SCR) air pollution control systems for nitrous oxide removal were
added to the three Dallman Units in 2003, CWLP has had difficulty complying with the
adjusted standard for boron in Sugar Creek when the SCRs have been in operation. The
SCRs operate during the ozone season, from May 1 through September 30. Apparently,
trace ammonia concentrations from SCR operation results in increased leaching of boron
and/or increased boron solubility in the Dallman ash pond, increasing boron levels to the
clarification pond. The increased boron levels from the Dallman ash pond are below the
adjusted standard, but when the boron content of the FGDS blowdown is added to the
Electronic Filing - Received, Clerk's Office, August 29, 2008
* * * * * R2009-008 * * * * *
I\07jobs\07E0039\Admin\14 Reports\Tech. Support Doc
2-12
clarification pond, the boron concentration at Outfall 004 exceeds the adjusted standard in
Sugar Creek. Although trace ammonia concentrations are also found in the gas stream to
the FGDS, the effect on the boron concentration in the FGDS blowdown can not be
quantified because operational variables within the FGDS process result in a wide range of
boron levels in the FGDS blowdown. It is notable that conversion to a dry fly ash system
will not eliminate this high boron FGDS effluent water stream since it is generated by the air
pollution control equipment and is not associated with the fly ash disposal system.
2.4
Proposed CWLP Discharge to SMSD
CWLP proposes that, in lieu of discharging the FGDS effluent water to the ash
pond system, the wastewater be collected, pretreated, and pumped to the SMSD Spring
Creek Plant for treatment. This waste stream is estimated to have an average flow rate of
187 gallons per minute (gpm) or about 270,000 gallons per day (gpd) and a boron
concentration of 450 mg/L. This estimated average flow includes FGDS effluent water
from the Dallman Units 31 and 32, Dallman Unit 33, and Dallman Unit 4. Specifically,
CWLP proposes constructing two 250,000 gallon holding tanks and a ClariCone™ solids
contact clarifier with a 240 gpm capacity to pretreat the waste stream prior to pumping
the water to the Spring Creek Plant for treatment. The ClariCone™ is designed to allow
mixing, flocculation, and sedimentation to take place within a completely hydraulically
driven vessel. The conically shaped concentrator maximizes the FGDS blowdown
discharge concentration and allows plant personnel to visually monitor FGDS blowdown
discharge.
The pretreatment is not expected to significantly reduce the boron
concentration, but will significantly reduce solids sent to the Spring Creek Plant. The
ClariCone™ will recycle solids back to the FGD process.
2.5
Spring Creek Wastewater Plant Description
The Springfield Metro Sanitary District owns and operates the Spring Creek and
Sugar Creek wastewater treatment plants. The Sugar Creek plant was put into service in
Electronic Filing - Received, Clerk's Office, August 29, 2008
* * * * * R2009-008 * * * * *
I\07jobs\07E0039\Admin\14 Reports\Tech. Support Doc
2-13
1973 and treats wastewater and storm water from the southeast and eastern sections of
Springfield and adjacent service areas. The Spring Creek plant was constructed in 1928
with major improvements in the 1930s. It handles wastewater and storm water flows
from the southwest, west and northern parts of Springfield and surrounding service areas.
The last major improvements to increase the capacity of the Spring Creek plant were
constructed in 1973.
The population served by the Spring Creek WWTP from 2000 U.S. Census data
was 90,300 and has increased just over one percent per year on average for the previous
ten years. It is an activated sludge treatment plant that provides from treatment and
removal of biological oxygen demand (BOD), total suspended solids (TSS), ammonia
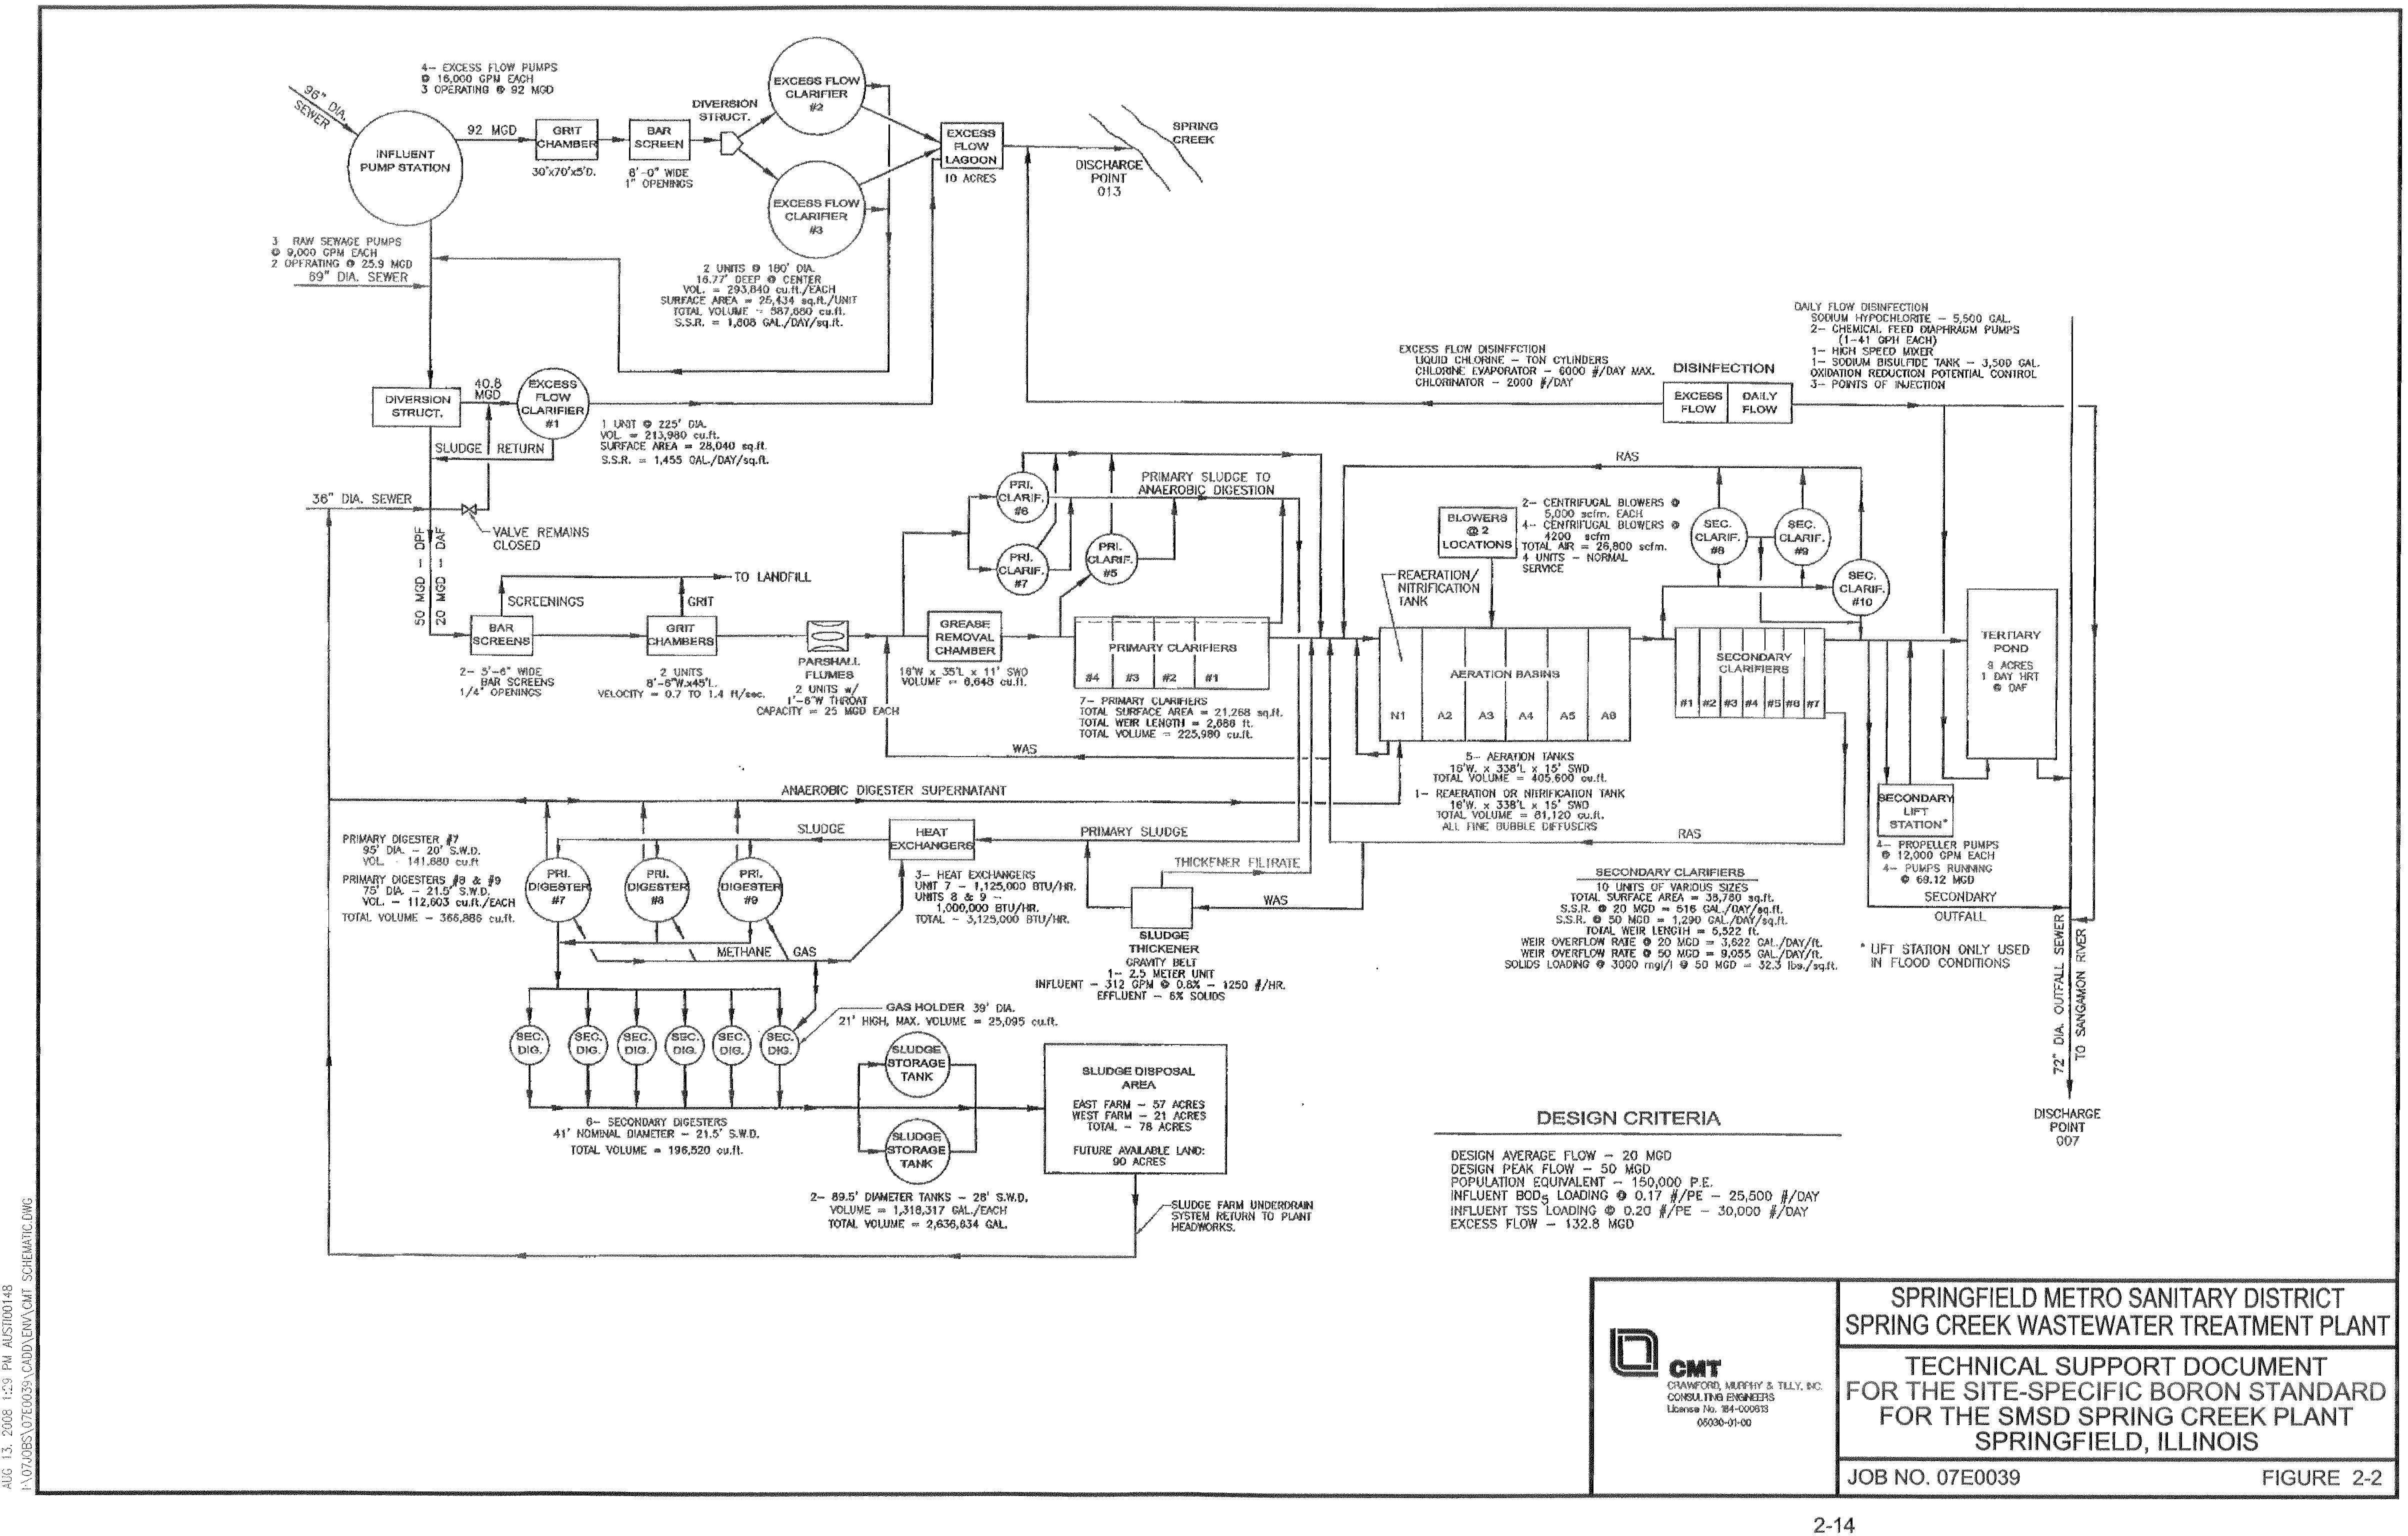
and bacteria. The treatment plant consists of the following main unit processes as shown
in Figure 2-2.
1. Screening for large solids removal,
2. Grit removal for removing heavier sand and grit particles
3. Primary clarifiers remove solids and biological matter
4. Aeration tanks are the main biological treatment process
5. Secondary clarifiers remove the remaining fine solids particles and activated
sludge is returned from these clarifiers to the aeration tanks
6. Disinfection is performed on a seasonal basis from May through October
7. Anaerobic sludge digestion is used to stabilize primary and secondary waste
sludge which is then stored and biosolids are land applied when weather
permits
8. Excess flow clarifiers provide primary treatment during high flow storm
events
The Spring Creek WWTP discharges its effluent into the Sangamon River at the
confluence of Spring Creek and the river. The discharge from the treatment plant flows
into a 72-inch diameter concrete pipe and is conveyed approximately 5,990 ft before
Electronic Filing - Received, Clerk's Office, August 29, 2008
* * * * * R2009-008 * * * * *
Electronic Filing - Received, Clerk's Office, August 29, 2008
* * * * * R2009-008 * * * * *
I\07jobs\07E0039\Admin\14 Reports\Tech. Support Doc
2-15
discharging into the river. The 72-inch outfall sewer was constructed in 1973. The 7-day
10-year low flow in the Sangamon River upstream of the Spring Creek discharge is 54.8
cubic feet per second (cfs) or 35.4 MGD. The Spring Creek WWTP has a seasonal
disinfection exemption that only requires disinfection for the months of May through
October.
2.6
Spring Creek Wastewater Plant Operation
The Spring Creek wastewater plant operates 24 hours per day, seven days per
week. The plant is staffed by 7 full-time operators from 7 a.m. to 11 p.m. There is a
separate maintenance crew on site 8 hours per day, 5 days per week.
The Spring Creek plant has an average design capacity of 20 MGD. The average
and maximum flows for 2004 through 2006 are detailed in Table 2-6.
Monthly flows in these three years have ranged from 11.8 MGD to a peak flow
over 50 MGD. The design maximum flow of the plant is currently 50 MGD, which is
greater than the 2005 peak of 49 MGD, but 49 MGD puts the plant at 98 percent of its
rated maximum capacity.
On average the plant discharge is less than the 7-day 10-year low flow of the
receiving stream, the Sangamon River which is 54.8 cfs or 35.4 MGD. A Spring Creek
plant 7-day low flow of 11.31 MGD will be used for the calculation of the boron
concentration under the proposed scenario. This flow rate is based on the 7-day low flow
presented on the 2002 ISWS map. However, daily effluent flows as low as 9.29 MGD
were observed in September 2007.
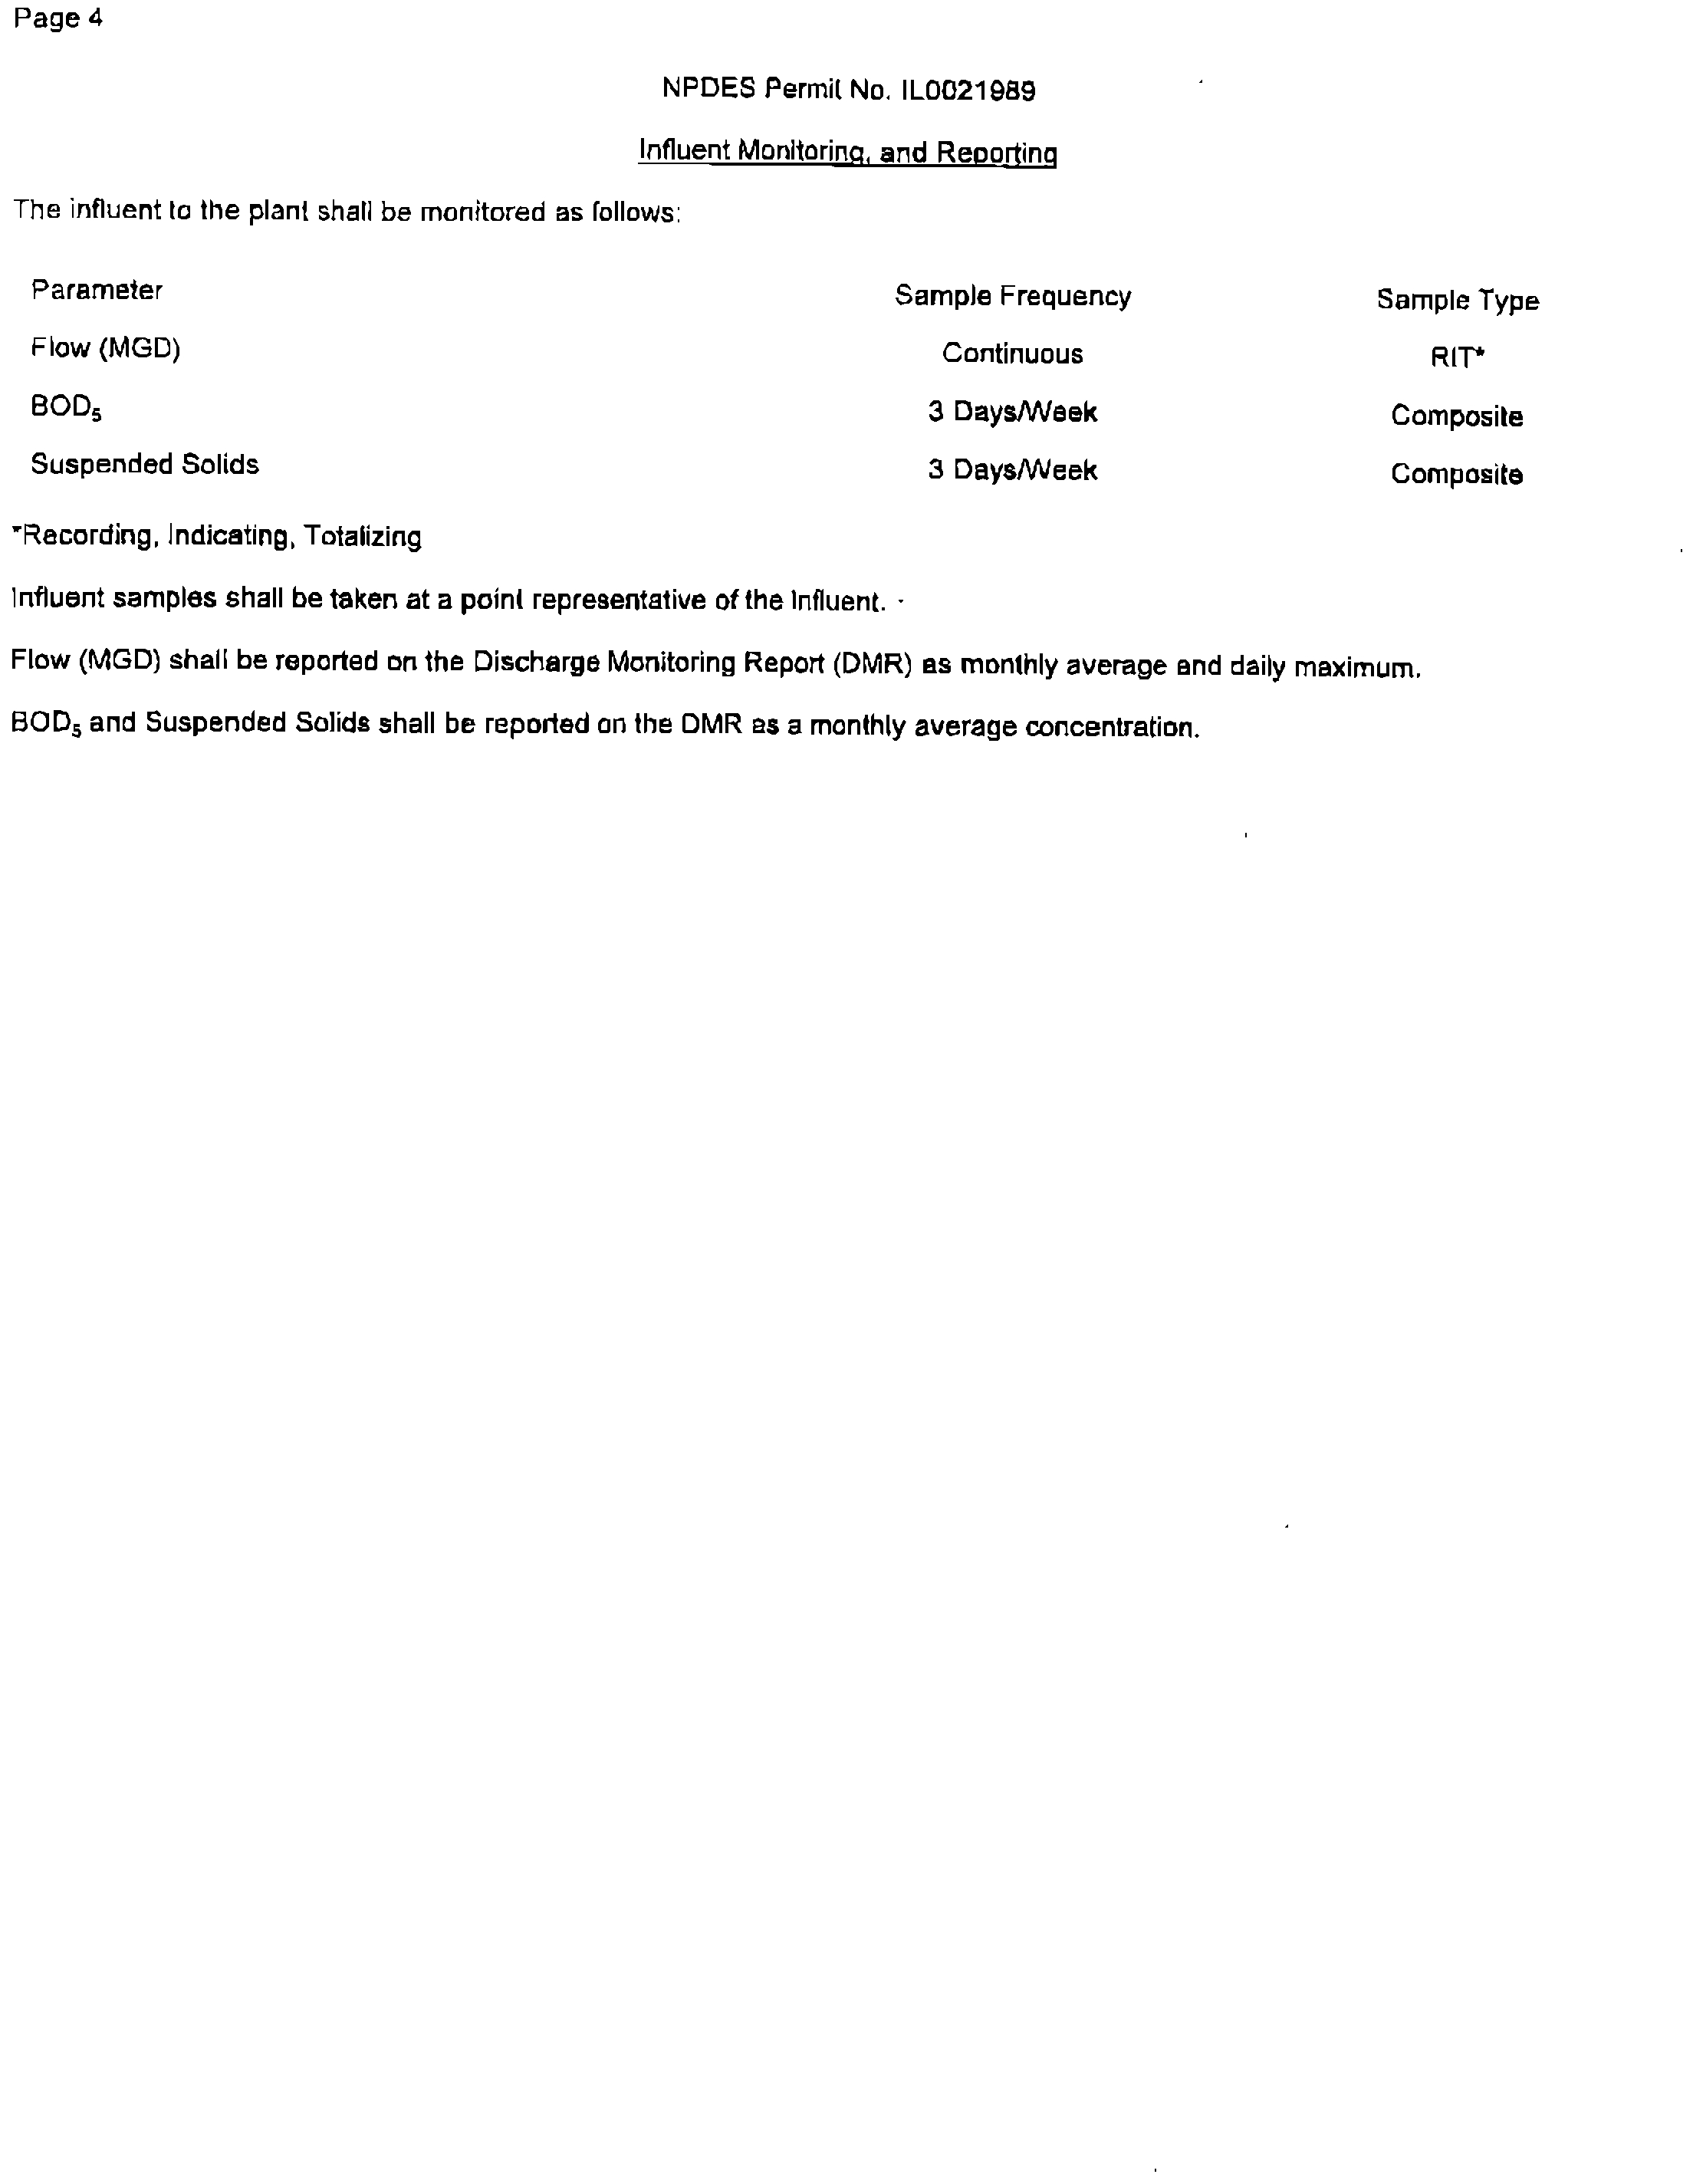
The requirements for complete treatment of flows to the Spring Creek WWTP as
required by NPDES Permit No. IL0021989 are detailed in Table 2-7. SMSD anticipates
there will be changes in the current NPDES permit after it expires July 31, 2009. At that
Electronic Filing - Received, Clerk's Office, August 29, 2008
* * * * * R2009-008 * * * * *
I\07jobs\07E0039\Admin\14 Reports\Tech. Support Doc
2-16
TABLE 2-6
SPRING CREEK WASTEWATER TREATMENT PLANT FLOWS 2004 - 2007
Year
Daily Average Flow
(MGD)
Maximum Daily Flow
(MGD)
2004
20.72
50
2005
20.39
49
2006
20.11
48
2007
19.12
48
2004-2007
20.09
50
Electronic Filing - Received, Clerk's Office, August 29, 2008
* * * * * R2009-008 * * * * *
I\07jobs\07E0039\Admin\14 Reports\Tech. Support Doc
2-17
TABLE 2-7
NPDES PERMIT NO. IL0021989
Effective Date: August 1, 2004
Expiration Date: July 31, 2009
Receiving Stream: Sangamon River
Discharge Number and Name: 007 STP Outfall
Design Average Flow (DAF):........................................................... 20.0 MGD
Design Maximum Flow (DMF): ....................................................... 50.0 MGD
Carbonaceous Biochemical Oxygen Demand (CBOD5):................. 10 mg/L (mo. avg.)
20 mg/L (daily max.)
Total Suspended Solids (TSS): ......................................................... 12 mg/L (mo. avg.)
24 mg/L (daily max.)
Ammonia Nitrogen (March): ............................................................ 4.4 mg/L (mo. avg.)
10.1 mg/L (daily max.)
Ammonia Nitrogen (April, May, Sept., Oct.): .................................. 3.3 mg/L (mo. avg.)
6.4 mg/L (daily max.)
Ammonia Nitrogen (June-Aug.): ...................................................... 2.0 mg/L (mo. avg.)
6.4 mg/L (daily max.)
Ammonia Nitrogen (Nov.-Feb.): ...................................................... 7.9 mg/L (mo. avg.)
14.4 mg/L (daily max.)
Fecal Coliform (May-Oct.): .............................................................. 400 cfu/100 mL (daily max.)
Chlorine Residual (May-Oct.): ......................................................... 0.05 mg/L (daily max.)
Electronic Filing - Received, Clerk's Office, August 29, 2008
* * * * * R2009-008 * * * * *
I\07jobs\07E0039\Admin\14 Reports\Tech. Support Doc
2-18
time, construction should be underway for expansion of the treatment plant which will
require NPDES permit modifications due to increased hydraulic capacity. The SMSD
has given consideration to ammonia nitrogen and total phosphorus requirements for the
future as discussed in more detail later in this report.
Based upon the 2006 plant influent data, the carbonaceous BOD
5
concentration
ranges from 157 to 214 milligrams per liter (mg/L) with an average of 172 mg/L. The
CBOD
5
removal after primary, secondary and tertiary treatment is about 98 percent, for
an average effluent CBOD
5
of approximately 3 mg/L.
The total suspended solids (TSS) concentration has a range from 132 to 307 mg/L
with an average of 198 mg/L for 2006. With a removal rate of over 96 percent, the
discharge to the receiving stream had only 7.3 mg/L of TSS on average.
Although not designed for nitrification, through operational adjustments to the
plant the SMSD has been able to meet their seasonal NPDES requirements for ammonia
nitrogen. Data from 2006 shows a reduction of ammonia from an influent value of 12
mg/L to 1.38 mg/L in the tertiary effluent, which is over 88 percent removal. At the
present time, ammonia nitrogen loading is at the plant’s maximum capacity.
Recommended wastewater treatment plant improvements will be designed to provide
ammonia nitrogen removal.
Total phosphorus removal is not currently regulated by Spring Creek’s discharge
permit, so influent and effluent data values are not available.
Plant expansion
recommendations will take into account phosphorus removal requirements that are
expected in the next permit renewal cycle.
Electronic Filing - Received, Clerk's Office, August 29, 2008
* * * * * R2009-008 * * * * *
I\07jobs\07E0039\Admin\14 Reports\Tech. Support Doc
2-19
2.7
Anticipated Spring Creek Plant Discharge
The temperature of the wastewater leaving the plant varied from a low of 50ºF to
a high of 78ºF in 2006. Effluent leaves the plant on average at a pH between 6.4 and
8.0.
A current plant influent boron concentration of 0.25 mg/L was used as
background to calculate the new concentration with the FGDS wastewater included in the
flow stream. Based on the 7-day low effluent flow of 11.31 MGD combined with the
FGDS wastewater at 0.27 MGD of added flow and a boron concentration of 450 mg/L,
the wastewater treatment plant effluent would have a maximum boron concentration of
11.0 mg/L. It is anticipated that the boron will not be significantly affected by nor
adversely affect the plant’s treatment processes and therefore the effluent boron
concentration is expected to mirror the influent concentration. The plant consistently
meets NPDES regulated parameters as detailed in Table 2-8. Subsequently, the plant’s
effluent maximum boron concentration is estimated to be 11.0 mg/L. The boron
concentration downstream in the Sangamon River is estimated to be 4.5 mg/L under this
scenario.
In summary, pumping the CWLP FGDS wastewater to the SMSD Spring Creek
Wastewater Treatment Plant is not expected to have any effect on the wastewater plant
other than the increase in boron concentration in the effluent. The only reduction would
be to bring CWLP back to compliant levels with NPDES Permit No. IL0024767 in Sugar
Creek as was typical prior to SCR operation.
Electronic Filing - Received, Clerk's Office, August 29, 2008
* * * * * R2009-008 * * * * *
I\07jobs\07E0039\Admin\14 Reports\Tech. Support Doc
2-20
TABLE 2-8
SPRING CREEK WASTEWATER TREATMENT PLANT
AVERAGE DISCHARGE PARAMETERS
Discharge Parameter
Permitted Value
Average Value (2006)
CBOD
5
(oxygen demand)
10 mg/L
3.2 mg/L
TSS (total suspended solids)
12 mg/L
7.3 mg/L
Ammonia Nitrogen
Varies from 2.0 to 7.9 mg/L
1.38 mg/L
Fecal Coliform (May-Oct.)
400 cfu/100 ml sample
98 cfu/100 ml
Chlorine Residual (May-Oct.)
0.05 mg/L
0.024 mg/L
Dissolved Oxygen
6.0 mg/L minimum
7.2 mg/L
pH
6 to 9 units
6.5 to 8.0 units
Electronic Filing - Received, Clerk's Office, August 29, 2008
* * * * * R2009-008 * * * * *
I\07jobs\07E0039\Admin\14 Reports\Tech. Support Doc
SECTION 3.0
RESOURCES OF THE SANGAMON RIVER
Electronic Filing - Received, Clerk's Office, August 29, 2008
* * * * * R2009-008 * * * * *
I\07jobs\07E0039\Admin\14 Reports\Tech. Support Doc
3-1
SECTION 3.0
RESOURCES OF THE SANGAMON RIVER
3.1
Sangamon River Basin
3.1.1 Geology and Physiography
The Sangamon River Basin is located in the Springfield Plain subsection of the
Till Plains section of the Central Lowland Physiographic Province. The topography of
the Springfield Plain is a relatively flat-lying glacial till plain moderately dissected by
dendritic drainage systems. Elevations range from about 600 ft on uplands to 520 ft
within the Sugar Creek, Sangamon River, and South Fork River Valleys.
Geologic mapping of the area indicates the Wisconsinan-aged loess deposits
(predominantly silts of the Peoria Loess and Roxana Silt Formations) comprise the upper
8 to 12 ft of surficial material. A modern soil horizon has developed within the upper
few feet of loess. The loess is often absent within stream valleys due to erosion.
Roughly 50 ft of glacial deposits (e.g., diamictons and alluvium) underlies the
loess. The glacial deposits are commonly a poorly sorted mixture of clay, silt, and sand
with lesser amounts of gravel, cobbles, and boulders. The thicknesses of the glacial
deposits vary greatly due to variation in bedrock topography and surficial erosion.
The uppermost bedrock in the Sangamon River Valley is Pennsylvanian-aged
sedimentary rock. The bedrock consists of cyclic sequences of sandstone, siltstone,
shale, limestone, and coal. Bedrock outcrops are not uncommon along the Sangamon
River and its tributaries.
Electronic Filing - Received, Clerk's Office, August 29, 2008
* * * * * R2009-008 * * * * *
I\07jobs\07E0039\Admin\14 Reports\Tech. Support Doc
3-2
3.1.2 Sangamon River
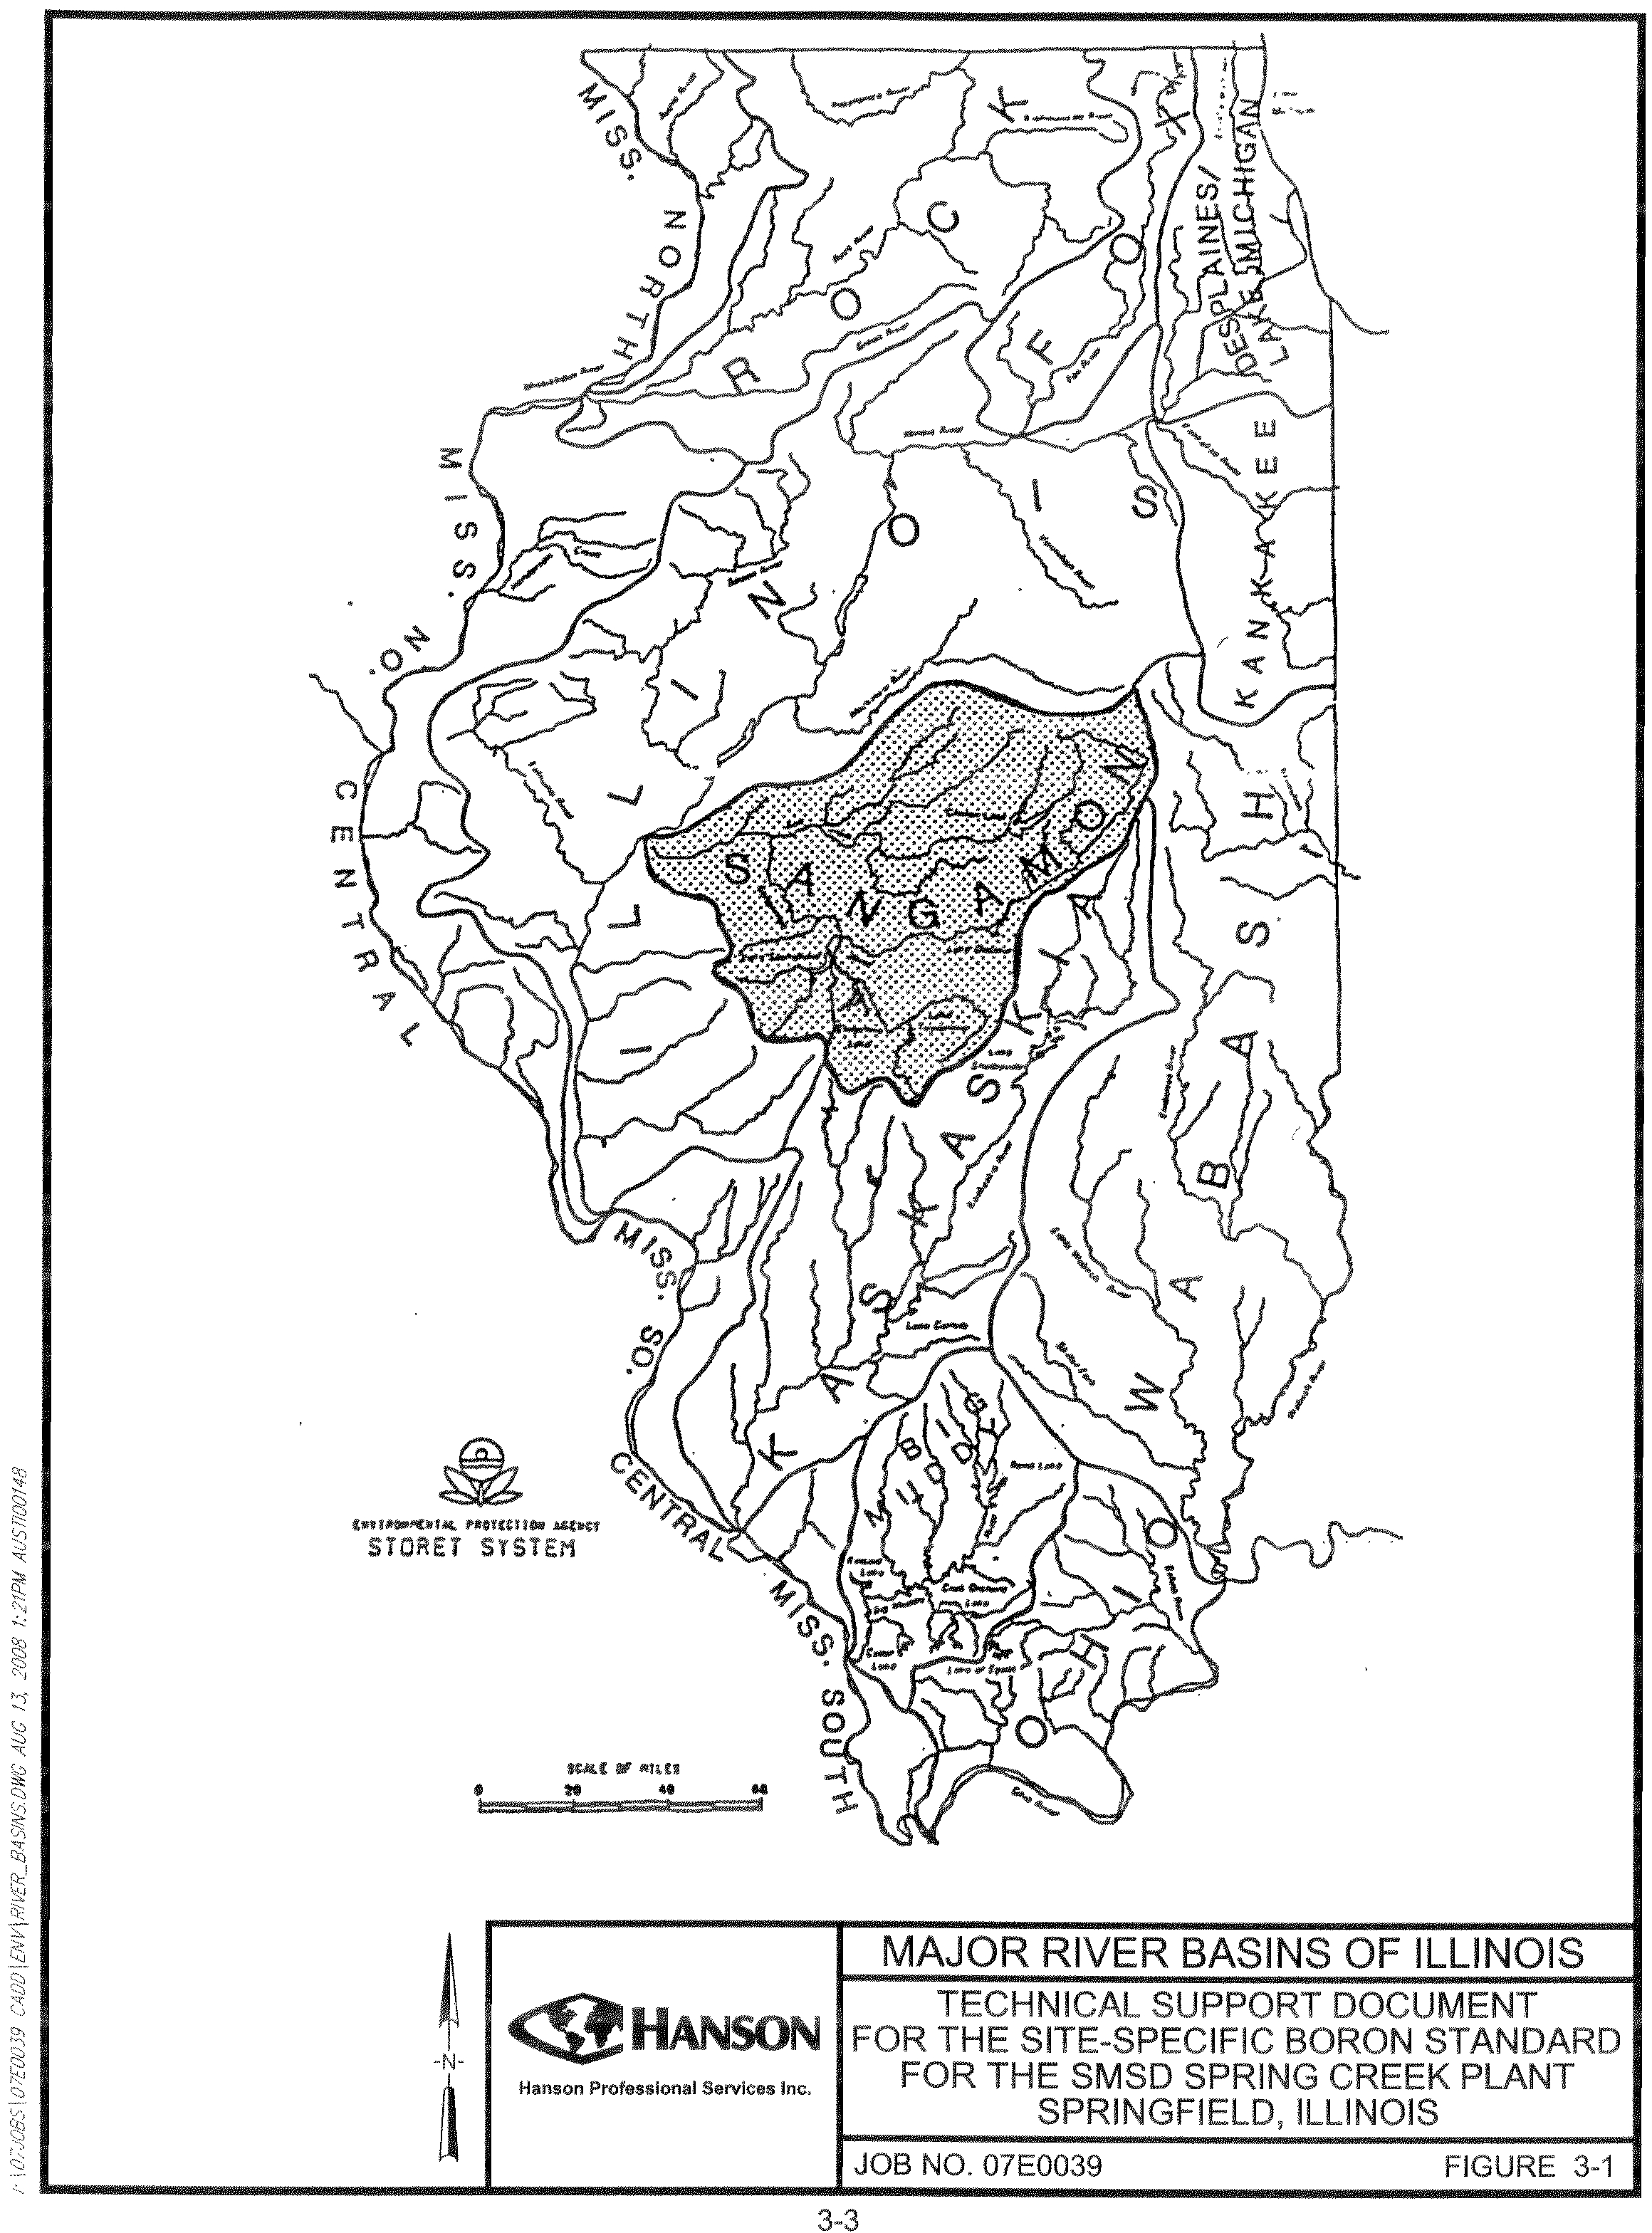
The watershed of the Sangamon River comprises about 5,419 square miles, all of
which lie in the central part of Illinois (see Figures 3-1 and 3-2). The Sangamon River is
within the Lower Illinois River Basin watershed. It includes either all or the major
portions of McLean, Piatt, DeWitt, Macon, Logan, Sangamon, Christian, Menard,
Mason, and Cass Counties, and minor portions of Tazewell, Ford, Champaign, Shelby,
Montgomery, Macoupin, and Morgan Counties. Practically all of the area is tillable and,
for the most part, is cultivated.
The Sangamon River originates in the central portion of McLean County at a
point about 12 miles east of Bloomington and flows southeasterly for about 35 miles,
then southwesterly about 110 miles. From Roby, the stream takes a northwesterly course
for 64 miles to River Mile 34.5 where the Sangamon River is joined by Salt Creek, its
largest tributary. At Mile 34.5, the Sangamon River makes a sharp right-angled turn to
the west, flowing in a general westerly direction and joins the Illinois River near Mile 89
of that stream about 8 miles north of Beardstown. The total length of the Sangamon
River is about 250 miles, while the length of the valley it occupies is about 170 miles.
At its source, the Sangamon River is about 850 ft above sea level. The total fall
of the river from its source to its mouth is about 420 ft. In the upper 10 miles, the fall is
120 ft, or an average of 12 ft per mile, and for the remaining 240 miles of the river the
fall is 300 ft, or an average of 1.25 ft per mile.
The Sangamon River’s low water width varies from 80 to 240 ft, with the average
being 150 ft. The high water average width is about three-fourths of a mile.
The whole length of the Sangamon River is characterized by a series of pools and
shoals; the latter, on the average, are about a mile apart. Average depths of these pools
and shoals are 4 ft and 1 ft, respectively. There are five major impoundments within the
Electronic Filing - Received, Clerk's Office, August 29, 2008
* * * * * R2009-008 * * * * *
Electronic Filing - Received, Clerk's Office, August 29, 2008
* * * * * R2009-008 * * * * *
3-4
Electronic Filing - Received, Clerk's Office, August 29, 2008
* * * * * R2009-008 * * * * *
I\07jobs\07E0039\Admin\14 Reports\Tech. Support Doc
3-5
basin: Lake Decatur (which is the only lake located directly on the Sangamon River),
Lake Springfield, Lake Taylorville, Sangchris Lake, and Clinton Lake. Lake Decatur is
the deepest portion of the river, with low water pool at a depth of 17 ft. The extreme
flood stage varies from a minimum of 6 ft above low water at Decatur Dam to a
maximum of 29 ft above low water just above Riverton. The average high water
increment for the reach between Decatur and the mouth of the river is about 24 ft.
Hanson conducted a field survey on October 30, 2007 to characterize the general
features of the Sangamon River downstream of the CWLP power plant discharge. Three
areas were visited including: Riverside Park in Springfield; Petersburg at Illinois Route
123; and Oakford at Illinois Route 97. The river flow was low during the field visit with
an approximate 70 cfs discharge at the Riverton U.S. Geological Survey (USGS) Gage
Station.
The river through this section is a low gradient, meandering stream with an
incised channel of about 15 ft below the adjacent landscape. The river width ranged from
about 80 to 100 ft at Springfield to about 300 ft at Oakford. A major tributary, Salt Creek,
empties into the Sangamon River about 8 miles upstream of Oakford. This lower section,
below the confluence of Salt Creek, appears to have been channelized in the past and has
scoured out a wider floodway in the sandier soils of this reach.
A few structures were observed: a former dam immediately upstream of the
Spring Creek confluence in Springfield, and two rock check dams within a few hundred
yards upstream and downstream of Illinois Route 123 in Petersburg. These structures
have created riffle areas that are a source of oxygenation for the river during low flow.
The sediments of the river substrate graded from a silt and sand mix to a totally sandy
substrate at Oakford. Sandbars were much more frequent further downstream near
Oakford giving the riverbed almost a braided stream appearance in the low flow period.
Most of the riparian corridor of this segment is wooded with typical floodplain
forest species consisting primarily of silver maple, box elder, sycamore, and cottonwood.
The trees appeared more mature on the upstream portion near Springfield with average
Electronic Filing - Received, Clerk's Office, August 29, 2008
* * * * * R2009-008 * * * * *
I\07jobs\07E0039\Admin\14 Reports\Tech. Support Doc
3-6
ages around 40 to 50 years old. The forested areas near Petersburg and Oakford appeared
much younger with early successional trees around 10 to 20 years old. The downstream
area south of Petersburg also exhibited areas with more apparent agricultural use up to
the river bank with very little to no riparian habitat.
According to the Illinois Streamflow Assessment Model (ISWS, 2007), the mean
flow at the confluence with Spring Creek was 2,120 cfs for the base period from 1948 to
1997. During high flow periods, stream discharge can exceed 7,000 cfs at this location.
3.2
Sangamon River Environmental Quality
3.2.1 Water Uses
The types of water use and the extent of these uses were investigated for the
Lower Sangamon River from its confluence with the South Fork of the Sangamon River
at Riverton, Illinois to its confluence with the Illinois River near Beardstown, Illinois.
The following organizations and agencies were contacted for information on known
water uses for this reach of the Sangamon River: the Illinois State Water Survey (ISWS);
the Illinois State Geological Survey (ISGS); the Illinois EPA; the Illinois Department of
Natural Resources (IDNR), Office of Water Resources; the Illinois Department of
Agriculture; the U.S. Army Corps of Engineers Rock Island District; and the Soil and
Water Conservation Districts and the University of Illinois Extension Offices for
Sangamon, Menard, Mason, and Cass Counties.
The Illinois EPA and ISWS reported several NPDES permitted discharges to the
Sangamon River from Riverton to Beardstown. Table 3-1 lists the NPDES permitted
discharges to this reach of the Sangamon River, and Figure 3-3 depicts the location of
these discharges.
Other generally known uses of the Sangamon River include aquatic life habitat
and recreation (boating, fishing, swimming). See Section 3.2.2 for further information
Electronic Filing - Received, Clerk's Office, August 29, 2008
* * * * * R2009-008 * * * * *
I\07jobs\07E0039\Admin\14 Reports\Tech. Support Doc
3-7
TABLE 3-1
NPDES PERMITTED DISCHARGES TO THE SANGAMON RIVER FROM THE
CONFLUENCE OF THE SOUTH FORK OF THE SANGAMON RIVER TO THE
ILLINOIS RIVER
NPDES
Permit No.
Facility Name
Outfalls
Average Design
Flow (MGD)
IL0026611
Clear Lake Sand and
Gravel Co.
001-Surface water runoff
002-Surface water runoff
003-Surface water runoff
3
IL0062651
Lincoln Place Mobile
Home Park
001- Sewage treatment plant
discharge
0.053
IL0021041
Riverton Sewage
Treatment Plant
001-Sewage treatment plant
discharge, excess flow
A01-Excess flow
0.529
Intermittent
ILG551034
Illinois DOT I-55
Sangamon Co. North
001-Sewage treatment plant
discharge
0.01
IL0021989
Springfield Metro
Sanitary District –
Spring Creek
007-Sewage treatment plant
discharge
20
IL0049824
Pleasant Plains Water
Treatment Plant
001-Water treatment plant
discharge
0.0003
IL0022233
Petersburg Sewage
Treatment Plant
001-Sewage treatment plant
discharge
0.5
IL0077691
Petersburg Water
Treatment Plant
001-Water treatment plant
discharge
0.089
Source: Illinois EPA, 2007 and ISWS, 2007
Electronic Filing - Received, Clerk's Office, August 29, 2008
* * * * * R2009-008 * * * * *
3-8
Electronic Filing - Received, Clerk's Office, August 29, 2008
* * * * * R2009-008 * * * * *
I\07jobs\07E0039\Admin\14 Reports\Tech. Support Doc
3-9
regarding these uses. It is understood that irrigation is a protected use; however, use of
this reach of the Sangamon River at issue for irrigation of agricultural land, golf courses,
nurseries, etc., were not reported by the aforementioned contacts.
3.2.2 Water Quality
The Illinois EPA’s
2006 Illinois Integrated Water Quality Report and Section
303(d) List
provides information on the condition of surface waters in the State of Illinois
and provides a list of waters where uses are impaired, the Section 303(d) list.
Information on four stream segments of the Sangamon River was used for this report.
These stream segments include the Sangamon River from the South Fork of the
Sangamon River to Spring Creek (E-26), the Sangamon River from Spring Creek to
Richland Creek (E-04), the Sangamon River from Richland Creek to Salt Creek (E-24),
and the Sangamon River from Salt Creek to the Illinois River (E-25) (see Figure 3-4).
All four stream segments are included on the 2006 Section 303(d) list.
Stream segment E-26 of the Sangamon River is identified as impaired for the
designated uses of aquatic life, fish consumption, and primary contact recreation
(swimming). Potential causes of aquatic life impairment are boron, nitrogen, phosphorus,
silver, total dissolved solids, and total suspended solids. Potential sources of these causes
are industrial point source discharges, on-site treatment systems, runoff, municipal point
source discharges, crop production, dams or impoundments, channelization, and
streambank modifications/destabilization.
A potential cause of fish consumption
impairment is polychlorinated biphenyls from an unknown source. A potential cause of
impairment of primary contact recreation is fecal coliform from an unknown source.
Stream segment E-04 of the Sangamon River is identified as impaired for the
designated use of fish consumption. A potential cause of fish consumption impairment is
polychlorinated biphenyls from an unknown source.
Electronic Filing - Received, Clerk's Office, August 29, 2008
* * * * * R2009-008 * * * * *
Hanson Professional Services Inc.
I
LL
I
NO
IS
E
P
A
S
TREAM
S
EGMENT
S
FOR T
H
E
SI
TE-
SP
EC
I
F
I
C BORON
S
TANDARD
FOR T
H
E
S
M
S
D
SP
R
I
NG CREEK
P
LANT
SP
R
I
NGF
I
ELD,
I
LL
I
NO
IS
H
AN
S
ON NO
.
07E0039
F
I
GURE 3-4
TEC
H
N
I
CAL
S
U
PP
ORT DOCUMENT
3-10
Electronic Filing - Received, Clerk's Office, August 29, 2008
* * * * * R2009-008 * * * * *
I\07jobs\07E0039\Admin\14 Reports\Tech. Support Doc
3-11
Stream segments E-24 and E-25 of the Sangamon River are identified as impaired
for the designated use of fish consumption and primary contact recreation. A potential
cause of fish consumption impairment is polychlorinated biphenyls from an unknown
source, and a potential cause of impairment of primary contact recreation is fecal
coliform from an unknown source.
3.2.3 Primary Productivity, Plankton, and Aquatic Macroinvertebrates
Previously conducted surveys of primary productivity or plankton surveys of the
Sangamon River from Riverton to Beardstown have not been identified.
Aquatic macroinvertebrates are animals without backbones which are visible to
the unaided eye and live at least part of their life cycles within or upon available aquatic
substrates. Invertebrates in this group include annelids, macrocrustaceans, aquatic
insects, and mollusks. Assessments of the ecological health of streams, rivers, and lakes
are often determined by the composition of the aquatic macroinvertebrate communities
(Barbour et al., 1999 and U.S. EPA, 2007).
Macroinvertebrate data are generally interpreted by an examination of community
attributes: community structure, taxa richness, and use of the Macroinvertebrate Biotic
Index (MBI). The MBI is the average of the summation of tolerance values assigned to
each taxon collected and is weighted by their abundance. Low values indicate good
stream conditions and water quality, and high values indicate a degraded stream and
reduced water quality. The Illinois EPA guidelines for using biological information for
assessing aquatic life use in streams are provided in Table 3-2.
The Illinois EPA in cooperation with the IDNR conducted Intensive Basin
Surveys of the Lower Sangamon River basin in 1996 and 2003. Intensive Basin Surveys
are a major source of information for assessments of aquatic life use. Macroinvertebrate
sampling was conducted in selected stream segments of the Lower Sangamon River
Electronic Filing - Received, Clerk's Office, August 29, 2008
* * * * * R2009-008 * * * * *
I\07jobs\07E0039\Admin\14 Reports\Tech. Support Doc
3-12
TABLE 3-2
ILLINOIS GUIDELINES FOR USING BIOLOGICAL INFORMATION FOR
ASSESSING AQUATIC LIFE USE IN STREAMS
No Impairment
Moderate Impairment
Severe Impairment
Biological
Indicator
Fully Supporting
Aquatic Life Use
(Good Resource Quality)
Not Supporting
Aquatic Life Use
(Fair Resource Quality)
Not Supporting
Aquatic Life Use
(Poor Resource Quality)
Macroinvertebrate
Biotic Index (MBI)
MBI
≤
5.9
5.9 < MBI
≤
8.9
MBI > 8.9
Index of Biotic
Integrity (IBI)
IBI
≥
41
20 < IBI < 41
IBI
≤
20
Source: Illinois EPA, 2006.
Electronic Filing - Received, Clerk's Office, August 29, 2008
* * * * * R2009-008 * * * * *
I\07jobs\07E0039\Admin\14 Reports\Tech. Support Doc
3-13
Basin including Stations E-50 (Riverside Park at Springfield), E-26 (Riverton), E-24
(Petersburg) and E-25 (Oakford). Illinois EPA conducted sampling at the Sangamon
River near Riverside Park (E-50) in 1996, and changed the sampling location to Riverton
(E-26) in 2003. Table 3-3 provides the macroinvertebrate species from the Sangamon
River stations during the surveys. Macroinvertebrate data from Station E-16 located at
Roby, Illinois are also provided for a comparison to a location upstream of the South
Fork/Sugar Creek confluence with the Sangamon River.
Due to different sampling methodology for the 1996 and 2003 surveys,
community comparisons between the years are not reliable (Illinois EPA, personal
communication, 2007). Illinois EPA used a qualitative hand-picking method in 1996,
and calculated MBIs using their modified Hilsenhoff MBI. In 2001, Illinois EPA
switched to 20-jab macroinvertebrate sampling linked to an 11-transect habitat method.
However, Hester-Dendy plate samplers were used to sample macroinvertebrates in the
Sangamon River since the 20-jab sampling is not applicable to larger streams.
Based on the 1996 and 2003 MBI scores, all four Illinois EPA stations of the
Sangamon River fully supported aquatic life, except for Station E-16 at Roby in 2003
which had an MBI of 6.1, indicating moderate impairment of aquatic life use. Station E-
50 (Riverton) in 1996 had the lowest MBI score of 4.5 (highest quality) of the four
stations surveyed.
3.2.4 Fisheries
Fisheries data are widely used to assess the biotic integrity of water resources.
The Index of Biotic Integrity (IBI) was developed by Karr (1981) for use in small
warmwater streams in central Illinois and Indiana. The original version included 12
metrics that reflected fish species richness and composition, number and abundance of
indicator species, trophic organization and function, reproductive behavior, fish
abundance, and condition of individual fish.
Electronic Filing - Received, Clerk's Office, August 29, 2008
* * * * * R2009-008 * * * * *
I\07jobs\07E0039\Admin\14 Reports\Tech. Support Doc
3-14
TABLE 3-3
MACROINVERTEBRATE SPECIES COLLECTED FROM THE SANGAMON
RIVER
E-16
Roby
E-50/26
Riverside Park/
Riverton
E-24
Petersburg
E-25
Macroinvertebrate Species
Oakford
2003
1996
2003
1996
2003
1996
2003
Oligochaeta
2
Decapoda
Cambaridae
1
Ephemeroptera
Oligoneuriidae
Isonychia sp.
1
7
3
19
2
7
Baetidae
Labiobaetis longipalpus
2
2
Baetis intercalaris
6
1
1
1
13
Baetis propinquus
3
Callibaetis sp.
1
1
12
Centroptilum sp.
7
Heptageniidae
Heptagenia pulla
1
Heptagenia diabasia
1
Stenonema sp.
7
Stenonema integrum
1
7
4
38
1
1
Stenonema pulchellum
1
1
Stenonema terminatum
4
5
Tricorythidae
Tricorythodes sp.
2
31
2
22
1
55
1
Caenidae
Caenis sp.
88
8
Caenis hilaris
3
28
Caenis punctata
1
1
Odonata
Gomphidae
Dromogomphus spinosus
1
Erpetogomphus
1
Gomphurus hybridus
1
2
Gomphus sp.
1
Coenagrionidae
Argia sp.
3
Argia moesta
1
Argia tibialis
3
7
1
Electronic Filing - Received, Clerk's Office, August 29, 2008
* * * * * R2009-008 * * * * *
I\07jobs\07E0039\Admin\14 Reports\Tech. Support Doc
3-15
E-16
Roby
E-50/26
Riverside Park/
Riverton
E-24
Petersburg
E-25
Macroinvertebrate Species
Oakford
2003
1996
2003
1996
2003
1996
2003
Megaloptera
Corydalidae
Corydalus cornutus
2
3
3
Trichoptera
Hydropsychidae
24
7
47
Cheumatopsyche sp.
1
18
22
7
Hydropsyche betteni
1
Hydropsyche bidens
1
75
4
163
21
67
Hydropsyche orris
35
1
Hydropsyche simulans
11
34
25
22
6
57
Potamyia flava
3
41
8
53
7
96
Leptoceridae
Nectopsyche candida
4
1
1
2
1
Polycentropidae
Cyrnellus sp.
1
Cyrnellus fraternus
3
6
3
Coleoptera
Dryopidae
Helichus lithophilus
2
1
Elmidae
Dubiraphia sp.
1
Macronychus glabratus
1
1
Stenelmis sp.
1
1
Stenelmis vittipennis
3
2
Scirtidae
Scirtes sp.
1
Diptera
Tipulidae
Hexatoma sp.
1
Simulidae
Simulium sp.
1
2
Tanypodinae
1
Ablabesmyia mallochi
6
Ablabesmyia parajanta
1
Larsia sp.
2
Paramerina sp.
1
Procladius sp.
12
Thienemannimyia group
2
2
3
1
1
Orthocladiinae
Cricotopus sp.
1
1
Electronic Filing - Received, Clerk's Office, August 29, 2008
* * * * * R2009-008 * * * * *
I\07jobs\07E0039\Admin\14 Reports\Tech. Support Doc
3-16
E-16
Roby
E-50/26
Riverside Park/
Riverton
E-24
Petersburg
E-25
Macroinvertebrate Species
Oakford
2003
1996
2003
1996
2003
1996
2003
Cricotopus bicinctus
3
Nanocladius sp.
1
1
Rheocricotopus sp.
1
2
Chironomini
134
Chironomus sp.
1
1
5
Cryptochironomus sp.
1
Cryptotendipes sp.
1
Dicrotendipes sp.
1
1
Dicrotendipes neomodestus
9
Endochironomus nigricans
1
Glyptotendipes sp.
13
36
5
65
6
7
Phaenopsectra sp.
1
Polypedilum sp.
1
6
4
6
Polypedilum convictum
2
1
Polypedium illinoense
3
2
4
4
Polypedilum scalaenum
2
Tanytarsini
Paratanytarsus sp.
10
2
Rheotanytarsus sp.
12
4
1
11
Tanytarsus sp.
4
2
Empididae
Hemerodromia sp.
1
1
Gastropoda
Physidae
Physa sp.
3
Physella sp.
1
Pelecypoda
Unionidae
9
9
Sphaeriidae
Sphaerium sp.
9
Corbiculidae
Corbicula fluminae
2
Pisidiidae
2
Total abundance
312
140
295
171
348
183
332
Number of taxa
27
20
24
30
15
27
17
MBI
6.1
4.5
5.6
4.8
5.9
5.2
5.0
Source: Illinois EPA biological data from Intensive Basin Surveys, 1996 & 2003.
1) Station E-16 (Roby) was not surveyed for macroinvertebrates in 1996.
Electronic Filing - Received, Clerk's Office, August 29, 2008
* * * * * R2009-008 * * * * *
I\07jobs\07E0039\Admin\14 Reports\Tech. Support Doc
3-17
To provide an IBI scoring system more applicable to Illinois streams, the IBI
scoring system used by the Illinois EPA and IDNR was revised based on years of
sampling data in Illinois. Scores calculated using the new metrics are designated as
Revised IBI (RIBI). According to IDNR and Illinois EPA (personal communication
2007), the RIBI was designed for smaller streams in Illinois, and a RIBI specifically for
larger streams like the Sangamon River has not been completed. Therefore, use of the
RIBIs to assess the quality of Sangamon River is limited.
Fisheries surveys of the Lower Sangamon River Basin were conducted by the
IDNR in 1996 and 2003 as part of the Intensive Basin Surveys program (IDNR, 2004).
Sampling was conducted in selected stream segments of the Lower Sangamon River
Basin including Stations E-50 (Riverside Park at Springfield), E-26 (Riverton), E-24
(Petersburg) and E-25 (Oakford). As explained in Section 3.2.3, IDNR and Illinois EPA
changed the sampling location to Riverton (E-26) in 2003. Fish data from Station E-16
located at Roby, Illinois are also provided for a comparison to fisheries quality of a
location upstream of the South Fork/Sugar Creek confluence with the Sangamon River.
Table 3-4 lists the fish species collected from each of the sampling locations shown in
Figure 3-4, and also provides the number of species and designated IBI/RIBI scores.
The fish species collected at the Sangamon River stations were common for
midwestern streams relative to stream size, and none are present on the state or federal
endangered or threatened species list. The total number of fish and the number of fish
species collected at the river stations were relatively equal. Station E-26 at Riverton had
the lowest IBI/RIBI at 32/25, while the farthest downstream station, E-25 at Oakford, had
the highest IBI/RIBI at 42/41.
The IDNR compared the 2003 IBI and RIBI scores with those calculated from
previous sampling conducted in 1981-82 and 1996 (see Table 3-5). Based on the IBI
scores, the three Sangamon River stations were relatively equal in 1981-82 and 2003
sampling dates. Station E-50/26 at Springfield/Riverton had a somewhat lower IBI of 32
than E-24 at Petersburg and E-25 at Oakford (IBIs of 40 and 38 respectively) in 1996.
Electronic Filing - Received, Clerk's Office, August 29, 2008
* * * * * R2009-008 * * * * *
I\07jobs\07E0039\Admin\14 Reports\Tech. Support Doc
3-18
TABLE 3-4
FISH SPECIES COLLECTED FROM THE SANGAMON RIVER -
1996 AND 2003
Fish Species
E-16
Roby
(1)
E-50/26
Springfield/Riverton
E-24
Petersburg
E-25
Oakford
2003
1996
2003
1996
2003
1996
2003
Shortnose gar
0
0
0
3
0
1
0
Longnose gar
0
1
0
2
1
0
1
Bowfin
0
0
0
0
1
0
0
Gizzard shad
26
49
39
60
48
27
41
Goldeye
0
0
0
1
0
0
0
Mooneye
0
0
0
0
0
1
0
Grass carp
0
0
0
0
2
0
1
Carp
8
14
12
21
11
16
5
Suckermouth minnow
0
0
0
0
0
1
0
Red shiner
398
41
90
104
26
107
12
Spotfin shiner
2
0
0
0
0
0
0
Sand shiner
48
0
5
0
0
8
1
Steelcolor shiner
1
0
0
0
0
0
0
Emerald shiner
0
0
0
0
0
1
0
Bluntnose minnow
10
0
1
0
1
0
0
Bullhead minnow
2
9
5
21
10
8
4
Bigmouth buffalo
1
0
1
1
3
0
1
Smallmouth buffalo
0
13
11
16
30
23
21
Black buffalo
1
0
2
0
1
0
2
Quillback
1
2
0
2
0
5
3
River carpsucker
7
4
3
15
16
19
17
Highfin carpsucker
0
0
0
2
0
0
0
White sucker
0
0
0
1
0
0
0
Shorthead redhorse
2
4
2
13
3
20
18
Electronic Filing - Received, Clerk's Office, August 29, 2008
* * * * * R2009-008 * * * * *
I\07jobs\07E0039\Admin\14 Reports\Tech. Support Doc
3-19
Fish Species
E-16
Roby
(1)
E-50/26
Springfield/Riverton
E-24
Petersburg
E-25
Oakford
2003
1996
2003
1996
2003
1996
2003
Golden redhorse
0
0
0
4
0
3
3
Silver redhorse
0
0
0
0
0
3
3
Channel catfish
38
6
22
12
7
7
10
Flathead catfish
2
5
5
5
8
2
4
Freckled madtom
3
0
0
0
0
0
0
Mosquitofish
1
0
0
0
0
0
0
Brook silverside
0
0
1
0
0
1
0
White bass
1
0
0
6
7
5
2
Black crappie
0
0
1
0
0
0
0
Largemouth bass
0
0
1
3
3
0
0
Smallmouth bass
0
0
0
0
0
0
1
White crappie
1
1
0
5
0
0
0
Green sunfish
2
2
1
1
0
0
0
Orangespotted sunfish
0
1
0
0
0
0
0
Bluegill
1
0
3
6
4
0
2
Walleye
0
1
0
0
0
0
0
Sauger
0
0
0
1
1
0
1
Slenderhead darter
0
0
0
0
5
0
0
Freshwater drum
17
4
4
22
21
26
32
Red shiner x spotfin
hybrid
12
0
0
0
0
0
0
Striped x white bass
hybrid
0
2
0
0
0
0
0
Total number fish
585
159
211
327
211
284
185
Total number species
22
16
20
23
22
20
22
IBI
32
40
40
38
38
42
Revised IBI (RIBI)
27
24
25
36
32
32
41
Sources:
Lower Sangamon Basin Survey, 2003, Data Summary
, Doug Carney, IDNR, 2004.
Illinois EPA biological data from Intensive Basin Surveys, 1996 and 2003.
1) Station E-16 (Roby) was not surveyed for fish in 1996.
Electronic Filing - Received, Clerk's Office, August 29, 2008
* * * * * R2009-008 * * * * *
I\07jobs\07E0039\Admin\14 Reports\Tech. Support Doc
3-20
TABLE 3-5
IBI COMPARISON IN THE SANGAMON RIVER FOR 1981-82, 1996 AND 2003
WITH REVISED IBI COMPARISONS BETWEEN 1996 AND 2003
Year
E-50/26
Springfield/Riverton
E-24
Petersburg
E-25
Oakford
IBI
RIBI
IBI
RIBI
IBI
RIBI
1981-82
30
-
-
-
29
-
1996
32
24
40
36
38
32
2003
40
25
38
32
42
41
Change since 1996
+8
+1
-2
-4
+4
+9
Source: Carney, 2005.
Electronic Filing - Received, Clerk's Office, August 29, 2008
* * * * * R2009-008 * * * * *
I\07jobs\07E0039\Admin\14 Reports\Tech. Support Doc
3-21
The Illinois EPA guidelines for using IBI information for assessing aquatic life
use in streams is provided in Table 3-2. Based on the 1996 and 2003 RIBI scores,
Stations E-16, E-50/26, and E-24 of the Sangamon River were moderately impaired for
aquatic life use (fair quality fisheries). Station E-25 at Oakford in 2003 had an RIBI of
41, indicating full support of aquatic life use and good resource quality. The two
upstream stations, E-50/26 (Riverside Park/Riverton) and E-16 (Roby), had lower RIBI
scores than the other downstream stations surveyed. However, IBI scores for all stations
except E-16, which was not surveyed, were relatively identical in 2003.
Subsequently, the IBI was adapted for use in Illinois through the Biological
Stream Characterization (BSC) Work Group, consisting of the Illinois EPA, the IDNR,
and the INHS. The Biological Stream Characterization (BSC) is a five-category stream
quality classification based primarily on the attributes of lotic fish communities. The
BSC classification scale ranges from a Unique Aquatic Resource (Class A) to a
Restricted Aquatic Resource (Class E). The predominant stream quality indicator used in
this process is the IBI, which forms a basis for describing the health or integrity of the
fish community. When available fishery data are insufficient for calculating an IBI
value, BSC criteria allow the use of sport fish information or macroinvertebrate data to
rate streams.
Based on the latest publication of the BSC (Illinois EPA, 1996), the reach of the
Sangamon River located in Sangamon, Menard, Mason, and Cass Counties were
classified as Moderate Aquatic Resources (Class C streams). The BSC defines a
Moderate Aquatic Resource as a fishery consisting of predominantly bullheads, sunfish,
and carp. The species diversity and number of intolerant fish are reduced. Also, the
trophic structure is skewed with an increased frequency of omnivores, green sunfish or
tolerant species.
The IDNR conducted a catfish survey of the Lower Sangamon River in 2003 to
assess channel catfish and flathead catfish populations (Carney, 2005). The Sangamon
River provides an important commercial and recreational resource through catfish
Electronic Filing - Received, Clerk's Office, August 29, 2008
* * * * * R2009-008 * * * * *
I\07jobs\07E0039\Admin\14 Reports\Tech. Support Doc
3-22
fishing. Sample locations included Riverton (E-26), Riverside Park in Springfield (E-50),
Petersburg (E-24) and Oakford (E-25). Totals of 269 channel catfish and 96 flathead
catfish were collected during this sampling effort. Upstream sites at Riverside Park and
Riverton, where a total of 234 channel catfish and 73 flathead catfish, were more
productive than the Petersburg and Oakford sites, where a total of 35 channel catfish and
23 flathead catfish were collected. Possible explanations provided by Carney for the
upstream versus downstream population differences may involve population limiting
parameters of habitat availability and fishing pressure. Based on this survey, both
channel catfish and flathead catfish appear to maintain very good populations, in both
numbers of fish and size ranges.
Based on the results of the 2003 IDNR fisheries and catfish surveys of the Lower
Sangamon River and the BSC rankings, the Sangamon River in the Lower Sangamon
River Basin appears to be moderate aquatic resource. The latest fisheries survey
conducted by the IDNR collected similar number of species and total number of fish from
the three stream stations located in the Lower Sangamon River Basin; although the
lowest RIBI scores occurred at the Riverton station. However, RIBIs were developed for
streams smaller in size than the Sangamon River. Also, the 2003 catfish survey
determined that channel and flathead catfish populations were robust, especially at the
Riverside Park/Riverton section of the Sangamon River.
3.2.5 Threatened and Endangered Species and Natural Areas
The IDNR, Division of Ecosystems and Environment was contacted for
information on aquatic threatened and endangered species and natural areas of the
Sangamon River from its confluence with the South Fork of the Sangamon River to the
Illinois River (see correspondence in Appendix C). The Illinois Natural Heritage
Database listed observed occurrences of the lake sturgeon (
Acipenser fulvescens
) and the
redspotted sunfish (
Lepomis miniatus
) in the Sangamon River.
Electronic Filing - Received, Clerk's Office, August 29, 2008
* * * * * R2009-008 * * * * *
I\07jobs\07E0039\Admin\14 Reports\Tech. Support Doc
3-23
The lake sturgeon is a state endangered fish which inhabits large lakes and rivers.
This species has occasionally been taken in the Illinois River mainstem by commercial
fishermen, but was never common in the Illinois River basin. The only record for the
Sangamon River was one individual taken in Menard County in 1996. The lake sturgeon
does not reproduce in the Sangamon River (IDNR, 2000 and 2001).
The redspotted sunfish is a state threatened fish which is found in Illinois only in
well-vegetated bottomland lakes and swamps in extreme southern Illinois and in
bottomland lakes and streams in the sand region of Mason, Cass and Tazewell Counties.
The redspotted sunfish was observed in the Sangamon River at its confluence with the
Illinois River in Cass County. It is extremely rare in the Lower Sangamon River basin
area, and appears to have been isolated from other populations of its species for a long
period (IDNR, 2000 and 2001).
The Illinois Natural Heritage Database listed the Sangamon River from Richland
Creek to Petersburg in Menard County as an Illinois Natural Areas Inventory (INAI) site.
This reach of the Sangamon River was recognized as a Biologically Significant Stream
because it supports a high diversity of native mussel species (Page et al., 1992).
Electronic Filing - Received, Clerk's Office, August 29, 2008
* * * * * R2009-008 * * * * *
I\07jobs\07E0039\Admin\14 Reports\Tech. Support Doc
SECTION 4.0
ISSUE OF CONCERN
Electronic Filing - Received, Clerk's Office, August 29, 2008
* * * * * R2009-008 * * * * *
I\07jobs\07E0039\Admin\14 Reports\Tech. Support Doc
4-1
SECTION 4.0
ISSUE OF CONCERN
4.1
Proposed Site-Specific Standard for Boron
A site-specific water quality standard for boron is requested to allow the
Springfield Metro Sanitary District (SMSD) Spring Creek Plant to accept a pretreated
industrial effluent stream from the City Water, Light and Power (CWLP) power plant.
The stream to be pumped to the SMSD Spring Creek Plant from the CWLP facility is
expected to have an average flow rate of 187 gpm and a boron concentration of 450
mg/L. A flow of 187 gpm is equivalent to 0.4166 cubic feet per second (cfs). Assuming
that the typical municipal waste stream influent has a boron concentration of 0.25 mg/L,
the maximum anticipated boron concentration in the SMSD plant effluent would be based
on a 7-day low-flow period through the SMSD Spring Creek Plant of 17.5 cfs. A flow of
17.5 cfs is equivalent to 11.3 MGD.
Assuming complete mixing in the SMSD Spring Creek Plant, the boron
concentration from the effluent stream can be calculated as follows:
Q
SMSD
(C
SMSD
) + Q
CWLP
(C
CWLP
)
C
eff
=
Q
SMSD
+ Q
CWLP
where:
C
eff
= the boron concentration in mg/L of the resultant Spring Creek Plant effluent
after the proposed CWLP stream addition.
Q
SMSD
= the water flow through the Spring Creek Plant in cfs not including the CWLP
stream.
C
SMSD
= the boron concentration in mg/L of the typical waste stream influent to the
Spring Creek Plant not including the CWLP stream.
Q
CWLP
= the anticipated flow from the proposed CWLP stream in cfs.
C
CWLP
= the anticipated boron concentration of the proposed CWLP stream in mg/L.
Electronic Filing - Received, Clerk's Office, August 29, 2008
* * * * * R2009-008 * * * * *
I\07jobs\07E0039\Admin\14 Reports\Tech. Support Doc
4-2
After acceptance of the proposed pretreated industrial effluent CWLP waste stream, the
maximum Spring Creek Plant effluent boron concentration is calculated to be 10.7 mg/L,
using the 7-day low-flow of 17.5 cfs (11.3 MGD) per the 2002 ISWS map.
4.2
Boron Concentrations in Receiving Waters
4.2.1 Historic Boron Levels
Water quality data for the Sangamon River were requested from the Illinois EPA
to determine boron levels during the recent past. Data were available for Illinois EPA
Stations E-26 at Riverton, E-24 at Petersburg, and E-25 at Oakford from 1999 to 2004.
These monitoring data are collected by the Illinois EPA as part of the Ambient Water
Quality Monitoring Network (AWQMN) sampling program. Figures 4-1, 4-2, and 4-3
display the total boron concentrations at these three stream stations of the Sangamon
River from 1999 to 2004. Data were not available from the Illinois EPA from March
2004 to present. The boron data are also provided in tabular format in Appendix D.
Stream discharge volumes are also provided for Stations E-26 and E-25 for reference.
Stream discharge volumes in cfs were obtained from the USGS National Water
Information System (NWIS). Stream discharge information from 1999 to 2004 was not
available for Station E-24 (the Sangamon River at Petersburg).
Station E-26 at Riverton had the highest total boron concentrations over the four year
period, which is expected since this station is the closest downstream of the CWLP
NPDES discharge locations. The Illinois General Use Water Quality Standard for total
boron of 1.0 mg/L was exceeded four out of 44 sampling events at this station within the
five year period, or about nine percent. However, no boron value exceeded the adjusted
standard of 2.0 mg/L of boron. The highest boron concentration of 1.40 mg/L occurred
in January 2003. The mean boron concentration at Riverton was 0.394 mg/L over the
five year period from 1999 to 2004.
Electronic Filing - Received, Clerk's Office, August 29, 2008
* * * * * R2009-008 * * * * *
I:\07jobs\07E0039\Admin\10 Reference Data\Illinois EPA Ambient Monitoring Data\E24E26EL01_BoronOnly_StationCharts.xls
8/5/2008
Figure 4-1
Back to top
Illinois EPA Boron Data - Station E-26
Back to top
(Sangamon River at Riverton)
0.000
0.200
0.400
0.600
0.800
1.000
1.200
1.400
1.600
Jan-99
Apr-99
Jul-99
Oct-99
Jan-00
Apr-00
Jul-00
Oct-00
Jan-01
Apr-01
Jul-01
Oct-01
Jan-02
Apr-02
Jul-02
Oct-02
Jan-03
Apr-03
Jul-03
Oct-03
Jan-04
Date
Back to top
Total Boron (mg/L)
0
2000
4000
6000
8000
10000
12000
14000
16000
Back to top
Stream Discharge (cfs)
Total Boron (mg/L)
Stream Discharge (cfs)
4-3
Electronic Filing - Received, Clerk's Office, August 29, 2008
* * * * * R2009-008 * * * * *
I:\07jobs\07E0039\Admin\10 Reference Data\Illinois EPA Ambient Monitoring Data\E24E26EL01_BoronOnly_StationCharts.xls
8/5/2008
Figure 4-2
Back to top
Illinois EPA Boron Data - Station E-24
Back to top
(Sangamon River at Petersburg)
0.000
0.200
0.400
0.600
0.800
1.000
1.200
Jan-99
Apr-99
Jul-99
Oct-99
Jan-00
Apr-00
Jul-00
Oct-00
Jan-01
Apr-01
Jul-01
Oct-01
Jan-02
Apr-02
Jul-02
Oct-02
Jan-03
Apr-03
Jul-03
Oct-03
Jan-04
Date
Back to top
Total Boron (mg/L)
Total Boron (mg/L)
4-4
Electronic Filing - Received, Clerk's Office, August 29, 2008
* * * * * R2009-008 * * * * *
I:\07jobs\07E0039\Admin\10 Reference Data\Illinois EPA Ambient Monitoring Data\E24E26EL01_BoronOnly_StationCharts.xls
8/5/2008
Figure 4-3
Back to top
Illinois EPA Boron Data - Station E-25
Back to top
(Sangamon River at Oakford)
Back to top
0.000
Back to top
0.100
Back to top
0.200
Back to top
0.300
Back to top
0.400
Back to top
0.500
Back to top
0.600
Back to top
0.700
Jan-99
Apr-99
Jul-99
Oct-99
Jan-00
Apr-00
Jul-00
Oct-00
Jan-01
Apr-01
Jul-01
Oct-01
Jan-02
Apr-02
Jul-02
Oct-02
Jan-03
Apr-03
Jul-03
Oct-03
Jan-04
Date
Back to top
Total Boron (mg/L)
0
2000
4000
6000
8000
Back to top
10000
Back to top
12000
Back to top
14000
Back to top
16000
Back to top
Stream Discharge
Back to top
(cfs)
Total Boron (mg/L)
Stream Discharge (cfs)
4-5
Electronic Filing - Received, Clerk's Office, August 29, 2008
* * * * * R2009-008 * * * * *
I\07jobs\07E0039\Admin\14 Reports\Tech. Support Doc
4-6
The total boron concentrations in the Sangamon River at Petersburg (Station E-
24) ranged from 0.044 mg/L to 1.10 mg/L from 1999 to 2004. The highest concentration
of 1.10 mg/L recorded in February 2000 was the only exceedance of the General Use
standard for boron of the 44 sampling events. The mean boron concentration at
Petersburg was 0.269 mg/L over the five year sampling period.
The total boron concentrations in the Sangamon River at Oakford (Station E-25)
ranged from 0.034 mg/L to 0.620 mg/L and never exceeded the General Use standard for
boron within the five year sampling period. The mean boron concentration at Station E-
25 was 0.141 mg/L from 1999 to 2004.
Figures 4-1 and 4-3 illustrate the inverse relationship between boron
concentration and stream discharge, which is expected. Boron concentrations were
always higher during periods of low flow, and lower when stream levels were high. The
average daily mean flows of the 44 sampling days were 1,641 cfs at Riverton and 3,088
cfs at Oakford. Lowest recorded flows were 63 cfs at Riverton and 300 cfs at Oakford.
Highest recorded flows of the 44 sampling days were 13,600 cfs at Riverton and 15,000
cfs at Oakford.
In addition to reviewing Illinois EPA water quality data, Hanson sampled the
Sangamon River on September 10, 17 and 24, 2007, and October 1, 2007 to determine
recent boron concentrations upstream and downstream of the Spring Creek confluence
during low stream flow conditions. A downstream sample at the Illinois Route 29 bridge
(Site S-1) and upstream sample at Riverside Park (Site S-2) were collected on each date,
as well as a sample from Spring Creek at the SMSD Plant. A blind duplicate sample was
typically taken each week at either the upstream or downstream location for a quality
control check.
Prairie Analytical Systems, Incorporated analyzed the stream samples. Prairie
Analytical Systems is accredited by the Illinois EPA Laboratory Accreditation Program
(IL ELAP). The results are summarized in Table 4-1 and provided in Appendix E. The
Electronic Filing - Received, Clerk's Office, August 29, 2008
* * * * * R2009-008 * * * * *
I\07jobs\07E0039\Admin\14 Reports\Tech. Support Doc
4-7
Illinois General Use Water Quality Standard for total boron of 1.0 mg/L was exceeded
three of the four sampling dates at Riverside Park and the Illinois Route 29 bridge.
However, only one sampling date at Riverside Park exceeded the adjusted standard of 2.0
mg/L of boron. Stream flow was extremely low during the sample month, which
contributed to the higher boron concentrations. According to the USGS AWQMN, the
mean discharge at the Riverton gaging station for the month of September during the last
10 years of record is 236 cfs.
The City of Springfield, Office of Public Utilities, City Water, Light and Power
petitioned the Illinois Pollution Control Board and was granted an adjusted standard on
December 1, 1994 for boron from Outfall 003 on Sugar Creek to 100 yards downstream
of the confluence of the Sangamon River with Spring Creek in the Northeast Quarter of
Section 10, in Springfield Township, Sangamon County. Pursuant to this grant, 35 IAC
304.105 does not apply to discharges from Outfalls 003 and 004 as regards boron
concentrations that are less than or equal to:
1. 11.0 mg/L for boron from CWLP’s Outfall 003 at Spaulding Dam on
Sugar Creek to its confluence with the discharge of the Springfield
Metropolitan Sanitary District’s Sugar Creek Plant Outfall 008 in the
Northeast Quarter of Section 31, Clear Lake Township, Sangamon
County;
2. 5.5 mg/L for boron from the discharge of said sanitary district plant outfall
on Sugar Creek to its confluence with the South Fork of the Sangamon
River; and
3. 2.0 mg/L for boron from the confluence of Sugar Creek and the South
Fork of the Sangamon Rivers to 100 yards downstream of the confluence
of the Sangamon River with Spring Creek in the Northeast Quarter of
Section 10, Springfield Township, Sangamon County.
The model presented in the
Technical Support Document for Petition for Adjusted
Boron Standards for Sugar Creek and the Sangamon River
(Hanson Engineers
Incorporated, March 1994) was reviewed to determine if the flows and/or boron
concentrations utilized in the model could be updated to reduce the background boron
Electronic Filing - Received, Clerk's Office, August 29, 2008
* * * * * R2009-008 * * * * *
I\07jobs\07E0039\Admin\14 Reports\Tech. Support Doc
4-8
TABLE 4-1
SANGAMON RIVER BORON CONCENTRATIONS UPSTREAM AND
DOWNSTREAM OF THE SMSD SPRING CREEK PLANT DISCHARGE
SEPTEMBER AND OCTOBER 2007
Total Boron
(mg/L)
Stream Discharge
(cfs)
Date
Sangamon River at
IL Route 29 Bridge
(Downstream)
Sangamon River at
Riverside Park
(Upstream)
Sangamon River at
Riverton
9/10/2007
1.16
1.18
90
9/17/2007
1.15
1.12
1.35
55
9/24/2007
0.466
0.514
0.587
50
10/1/2007
1.43
1.43
2.14
48
Electronic Filing - Received, Clerk's Office, August 29, 2008
* * * * * R2009-008 * * * * *
I\07jobs\07E0039\Admin\14 Reports\Tech. Support Doc
4-9
concentration in the Sangamon River upstream from the confluence with Spring Creek.
It was determined that the boron concentration presented in the 1994 model, 2.0 mg/L,
was appropriate for use as the boron concentration in the Sangamon River for purposes of
determining a site-specific boron standard after the addition of the proposed pretreated
industrial effluent CWLP stream to the SMSD Spring Creek Plant.
4.2.2 Predicted Boron Levels
Assuming complete mixing of the Sangamon River and the SMSD Spring Creek
Plant effluent, the boron concentration in the Sangamon River downstream from the
confluence with Spring Creek can be calculated as follows:
Q
upstream
(C
upstream
) + Q
eff
(C
eff
)
C
downstream
=
Q
upstream
+ Q
eff
where:
C
downstream
= the boron concentration in mg/L of the Sangamon River downstream
from the confluence with Spring Creek after the addition of the
proposed CWLP stream to the SMSD Spring Creek Plant.
Q
upstream
= the water flow in the Sangamon River upstream from the confluence
with Spring Creek in cfs.
C
upstream
= the boron concentration in the Sangamon River upstream from the
confluence with Spring Creek in mg/L.
Q
eff
= the flow from the SMSD Sugar Creek Plant after the addition of the
proposed CWLP waste stream cfs.
C
eff
= the boron concentration of the SMSD Sugar Creek Plant after the
addition of the proposed CWLP waste stream in mg/L.
Using the 7Q10 low-flow per the 2002 ISWS map of 54.8 cfs and a boron
concentration of 2.0 mg/L in the Sangamon River upstream of the confluence with Spring
Creek and an anticipated effluent flow of 17.5 cfs and a boron concentration of 11.0
mg/L from the Spring Creek Plant 7-day low flow, after complete dispersion in the
Sangamon River, the maximum boron concentration in the Sangamon River downstream
from Spring Creek is calculated to be 4.2 mg/L. In order to allow margin for fluctuation,
a site-specific water quality standard for boron of 4.5 mg/L is requested for the
Electronic Filing - Received, Clerk's Office, August 29, 2008
* * * * * R2009-008 * * * * *
I\07jobs\07E0039\Admin\14 Reports\Tech. Support Doc
4-10
Sangamon River from 182 yards downstream of the SMSD Spring Creek Plant 007 STP
Outfall to the confluence of the Sangamon River with Salt Creek. This implies that boron
concentration in the Sangamon River the entire width of the river will be between 4.5
mg/L and 11.0 mg/L in the area between SMSD Outfall 007 and 182 yards downstream
of Outfall 007.
Assuming a boron concentration of 0.25 mg/L from the Athens and the Petersburg
wastewater treatment plants, the anticipated boron concentration of the Sangamon River
at the confluence with Salt Creek will be 1.6 mg/L under minimum flow conditions. A
maximum boron concentration of 1.3 mg/L is anticipated at the confluence of the
Sangamon River and the Illinois River. The Illinois General Use water quality standard
for boron of 1.0 mg/L is expected to be reached in the Illinois River 100 yards
downstream from the confluence with the Sangamon River.
Electronic Filing - Received, Clerk's Office, August 29, 2008
* * * * * R2009-008 * * * * *
I\07jobs\07E0039\Admin\14 Reports\Tech. Support Doc
SECTION 5.0
ENVIRONMENTAL EFFECTS OF BORON
Electronic Filing - Received, Clerk's Office, August 29, 2008
* * * * * R2009-008 * * * * *
I\07jobs\07E0039\Admin\14 Reports\Tech. Support Doc
5-1
SECTION 5.0
ENVIRONMENTAL EFFECTS OF BORON
Boron is a dark brown element that is widespread in the environment but occurs
naturally only in combined form, usually as borax, colemanite, boronatrocalcite, and
boracite.
Boron exists in natural sediments as borosilicates, which are considered
biologically inert. Boron is typically released to the environment slowly and at low
concentrations by natural weathering processes. Most of the natural boron compounds
usually degrade or are transformed by natural weathering of rocks to borates or boric acid,
which are the main boron compounds of ecological significance (Sprague, 1972).
5.1
Distribution and Uses of Boron
Proven commercial deposits of sodium tetraborate, from which borax is prepared,
are concentrated in the Mojave Desert of California where ancient lakes or marshes have
evaporated under arid conditions. The United States supplies 70 percent of the annual world
demand for boron compounds. Boron is used in the production of glass and glass products,
such as insulating fiberglass. It is also used in the manufacture of textiles, enamels, and
glazes used as coatings on household and industrial products. Other products that include
boron are: herbicides, insecticides, soaps, cleansers, cosmetics, antifreeze, high energy
fuels, flame-proof compounds, corrosion inhibitors, and antiseptics.
Boron is widely distributed in surface water and ground water. The average surface
water concentration for boron in the United States is about 0.1 mg/L, but concentrations
vary greatly, depending on boron content of local geologic formations and anthropogenic
sources of boron (Butterwick, et al., 1989). A survey of United States surface waters
detected boron in 98 percent of 1,577 samples at concentrations ranging from 0.001 mg/L to
5.0 mg/L. Mean concentrations calculated for the 15 main geologic drainage basins in the
continental United States ranged from 0.019 mg/L in the Western Great Lakes Basin to
0.289 mg/L in the Western Gulf Basin (Butterwick, et al., 1989). The concentration of
Electronic Filing - Received, Clerk's Office, August 29, 2008
* * * * * R2009-008 * * * * *
I\07jobs\07E0039\Admin\14 Reports\Tech. Support Doc
5-2
boron in sea water is about 4.5 mg/L to 5.5 mg/L, varying with the local salinity
(Butterwick, et al., 1989).
Most boron that occurs in the fresh water aquatic environment is due to the relatively
high water solubility of all boron compounds, especially boron-containing laundry products
and sewage (U.S. EPA, 1975). Another, although very localized, source of boron to the
aquatic environment is coal ash. Many commercially-mined coal seams contain significant
concentrations of boron. Of the total boron in coal, as much as 71 percent may be lost to the
atmosphere upon combustion; however, more than 50 percent of the boron found in coal ash
is readily water soluble (Pagenkopf and Connolly, 1982). The release of boron from coal fly
ash to leachate water is dependent on the ash to water ratio: at 1 gm of ash/L, up to 90
percent of the boron is soluble; at 50 gm/L, only 40 percent is soluble: at 100 gm/L, less
than 30 percent is soluble (Eisler, 1990).
5.2
Toxicological Effects of Boron
There is a large literature base documenting boron’s effects on plants, especially
crop plants, and a smaller literature base documenting boron’s effects on animals. The
following discussion focuses primarily on boron’s effects on organisms associated with
freshwater systems. The toxicology of boron to freshwater biota is most applicable since
one use of the Sangamon River is supporting aquatic life, in addition to receiving permitted
NPDES discharges and recreation.
5.2.1 Effects in Humans
The U.S. EPA classifies boron as a Group D element, meaning that there is no
human and animal evidence of boron carcinogenicity.
Papachristou et al. (1987)
demonstrated that ingestion of water with 20 to 30 mg/L of boron can be considered to have
no adverse effects on human health. However, boron has been reported to cause toxic
effects in humans following oral, inhalation, and dermal exposures. Inhalation exposures to
14.4 mg/m
3
of borax dust have resulted in upper respiratory tract irritation, dryness of the
mouth, nose, and throat, as well as irritation of the eye, but a level of 1.1 mg/m
3
produced no
Electronic Filing - Received, Clerk's Office, August 29, 2008
* * * * * R2009-008 * * * * *
I\07jobs\07E0039\Admin\14 Reports\Tech. Support Doc
5-3
symptoms (Garabrant et al., 1984). One study (Gupta and Parrish, 1984) demonstrated
toxicosis in adults at a dermal exposure of 645 grams of boric acid.
Oral doses of 15 to 20 grams of boric acid, equivalent to 0.25 to 0.3 g per kg of body
weight, have been shown to be lethal to adults (U.S.EPA, 1975, and Eisler, 1990). Oral
doses of 5 to 6 grams of borates have shown to be fatal to infants (from Eisler, 1990).
Specific symptoms associated with oral doses include nausea, persistent vomiting, diarrhea,
colicky abdominal pain, liver effects (jaundice), kidney disease, and dermatitis. In addition,
oral exposures have been reported to cause headaches, tremors, restlessness, convulsions,
weakness, and coma (ATSDR, 1992).
5.2.2 Effects in Other Mammals and Birds
In mammals, exposure to excessive boron may result in a reduced growth rate, loss
of body weight, decreased sexual activity, and eye irritation. Reduced growth has been
reported in cattle, dogs, rabbits, and rats (Eisler, 1990). However, Green and Weeth (1977)
and Weeth et al. (1981, from Butterwick et al., 1989) found no overt signs of toxicosis in
heifers exposed to 120 mg/L of boron and that 300 mg/L of boron is not acutely toxic to this
species when consumed via drinking water. Brockman et al. (1985) found ingestion of 100
to 300 grams of boron, equivalent to 200 to 600 mg of boron per kg of body weight, to be
lethal to cattle (from Eisler, 1990). Dogs were found to tolerate ingestion of 350 mg of
boron per kg of feed for two years, but showed symptoms of toxicosis when fed 1,170 mg of
boron per kg of feed after 38 weeks (Weir and Fisher, 1972). Rabbits showed growth
retardation when fed 800 to 1,000 mg of borates per kg of body weight daily for four days.
Rats exposed to drinking water containing boron concentrations of 150 to 300 mg/L had
body weights 7.8 percent and 19.8 percent less than the control group (Seal and Weeth,
1980, from Moss and Nagpal, 2003).
Toxic effects of boron in birds have been exclusively studied in ducks and chickens.
Results of chronic feeding studies using mallards demonstrate that diets containing 13 mg of
boron per kg of feed weight produce no adverse effects, but those diets containing 1,000
mg/kg of boron are fatal (from Eisler, 1990). Stanley et al. (1996, from Moss and Nagpal,
Electronic Filing - Received, Clerk's Office, August 29, 2008
* * * * * R2009-008 * * * * *
I\07jobs\07E0039\Admin\14 Reports\Tech. Support Doc
5-4
2003) found significant adverse reproductive effects in mallards fed 900 mg of boron per kg
of dry feed. Pendleton et al. (1995, from U.S. Department of the Interior, 1998) reported
extremely rapid accumulation and elimination of boron in mallard tissues. Adult male
mallards fed a diet containing 1,600 mg of boron per kg accumulated equilibrium levels of
boron in liver tissue and blood within 2 to 15 days. After boron was removed from the
mallards’ diet, it was completely cleansed from the liver and blood within one day.
5.2.3 Effects in Fish and Amphibians
The following studies demonstrate tolerance ranges for some species of fish:
•
Mann (1973) studied the effects of sodium perborate, boric acid, and borax
upon eel fry, amphipods, rainbow trout, tubificid worms, and guppies. These
boron (B) compounds were determined to be relatively non-toxic using 24-
hour bioassay procedures. Detrimental effects occurred with exposure to
concentrations of more than 250 mg/L (17 mg B/L) of sodium perborate,
5,000 mg/L (875 mg B/L) of boric acid, and 2,500 mg/L (282 mg B/L) of
borax;
•
Wallen, et al. (1957) studied mosquito fish (
Gambusia affinis)
, which are
native to Illinois, using 96-hour bioassay procedures. No mortalities were
observed in concentrations of boric acid up to 1,800 mg/L (315 mg B/L);
•
Birge and Black (1977) studied the effects of boron exposures to channel
catfish (
Ictalurus punctatus
) embryos and fry using a 9-day bioassay
procedure. A median lethal concentration (LC
50
) value of 155 mg B/L in
soft water was determined for both borax and boric acid. In hard water, LC
50
values were 71 and 22 mg B/L for borax and boric acid, respectively. The
lowest-observed-effect concentrations (LOEC) for embryo-larval stages of
the channel catfish ranged from 1.0 to 25.9 mg B/L, depending on water
Electronic Filing - Received, Clerk's Office, August 29, 2008
* * * * * R2009-008 * * * * *
I\07jobs\07E0039\Admin\14 Reports\Tech. Support Doc
5-5
hardness and the boron compound administered (from Butterwick et al.,
1989);
•
Eisler (1990) indicated that 30 and 33 mg/L of boron are "safe" levels for
game fish species such as the largemouth bass and bluegill;
•
Turnball et al. (1954, from Butterwick et al., 1989) reported a 24-hour LC
50
of 2,389 mg B/L for bluegill sunfish (
Lepomis macrochirus
);
•
Birge and Black (1981) reported an 11-day LOEC of 12.17 mg B/L for
freshly fertilized eggs of largemouth bass (
Micropterus salmoides
) (from
Butterwick et al., 1989);
•
Sensitive fish species such as freshwater coho (which are not present in the
Sangamon River basin) show adverse effects with exposure to 113 mg B/L
(Thompson, et al., 1976);
•
The 6-hour minimum lethal dose level for minnows ranged from 3,145 to
3,407 mg B/L in a boric acid solution (NAS, 1973; and McKee and Wolf,
1963, from Butterwick et al., 1989); and
•
Tests on the fathead minnow (
Pimeohales promelas
) egg-fry indicate a 30-
day LOEC (reduction in growth) at 24 mg B/L and a 60-day LOEC
(reduction in fry survival) at 88 mg B/L (Proctor & Gamble, 1979
(unpublished), from Butterwick et al., 1989).
The following studies have found amphibians to respond to boron at concentrations
similar to those for fish:
•
Boron compounds were found to be more toxic to embryos and larvae than
to adult amphibians (Birge and Black, 1977);
Electronic Filing - Received, Clerk's Office, August 29, 2008
* * * * * R2009-008 * * * * *
I\07jobs\07E0039\Admin\14 Reports\Tech. Support Doc
5-6
•
Developmental abnormalities have been observed in toads exposed to boron
concentrations above 130 mg B/L (Eisler, 1990);
•
Birge and Black (1977) found that no effects occurred on embryos of
Fowler’s toad (
Bufo fowleri
) until a concentration of 53 mg B/L in the form
of boric acid was applied; and
•
Birge and Black (1977) found that leopard frog (
Rana pipiens
) embryos
suffered 100 percent lethality or teratogenesis in water treated with borax
and boric acid at levels of 200 and 300 mg B/L, respectively. Post-hatched
LC
50
values for boric acid were 130 mg B/L in soft water and 135 mg B/L in
hard water. In bioassays with borax, these values were 47 mg B/L and 54
mg B/L. The LOEC for embryo-larval stages of the leopard frog ranged
from 9.60 to 86.0 mg B/L, depending on water hardness and the boron
compound administered (from Butterwick et al., 1989).
The effects of boron on freshwater aquatic vertebrates applicable to the Sangamon
River and the Illinois River are summarized in Table 5-1.
5.2.4 Effects in Invertebrates
The following studies show tolerance ranges to boron exposures for some aquatic
invertebrates:
•
According to Eisler (1990), aquatic fauna can usually tolerate up to 10 mg
B/L in water for extended periods of time without adverse effects;
Electronic Filing - Received, Clerk's Office, August 29, 2008
* * * * * R2009-008 * * * * *
I\07jobs\07E0039\Admin\14 Reports\Tech. Support Doc
5-7
TABLE 5-1
REFERENCED EFFECTS OF BORON ON FRESHWATER AQUATIC LIFE
APPLICABLE TO THE SANGAMON RIVER AND THE ILLINOIS RIVER
Species
Life Stage
Type of Test
Boron
Compound
Used
Water Source
Boron
Concentration
(mg B/L)
Test Response
Reference
VERTEBRATES
Bufo fowleri
(Fowler’s toad)
Embryo-larval
stages
Flow-through
Boric acid
Reconstituted
53.5 – 96.0
(1)
7-day LOEC
Birge and Black (1977) in Moss and Nagpal (2003)
Gambusia afinis
(mosquito fish)
Adult females
Static
Boric acid
<314
No mortalities in 96-hr
Wallen et al. (1957)
Ictalurus punctatus
(channel catfish)
Embryo-larval
stages
Flow-through
Borax
Reconstituted
1.04 – 25.9
(1)
71 - 155
9-day LOEC
9-day LC
50
Birge and Black (1977); Birge and Black (1981) in
Butterwick et al. (1989)
Ictalurus punctatus
(channel catfish)
Embryo larval
stages
Flow-through
Boric acid
Reconstituted
1.0 – 5.42
(1)
22 - 155
9-day LOEC
9-day LC
50
Birge and Black (1977); Birge and Black in Butterwick et
al. (1989)
Lepomis macrochirus
(bluegill sunfish)
Average size 7
cm, 5 g
Static
Boron trifluoride Tap
2,389
24-hr TLm
Turnball et al. (1954) in Butterwick et al. (1989)
Micropterus salmoides
(largemouth bass)
Freshly
fertilized eggs
Flow-through
Boric acid
Reconstituted
12.17
11-day LOEC
Birge and Black (1981) in Butterwick et al. (1989)
Minnow
Boric acid
Distilled & hard
3,145 – 3,407
6-hr minimum lethal dose
NAS (1973), McKee and Wolf (1963) in Butterwick et al.
(1989)
Pimeohales promelas
(fathead minnow)
Eggs and fry
Flow-through
Boric acid
Well
24
88
30-day LOEC (reduction in growth)
60-day LOEC (reduction in fry survival)
Proctor & Gamble (1979) (unpublished) in Butterwick et
al. (1989)
Rana pipiens
(leopard frog)
Embryo-larval
stages
Flow-through
Borax
Reconstituted
9.6 – 10.5
(1)
47 - 54
7-day LOEC
7.5-day LC
50
Birge and Black (1977); Birge and Black (1981) in
Butterwick et al. (1989)
Rana pipiens
(leopard frog)
Embryo-larval
stages
Flow-through
Boric acid
Reconstituted
47.5 – 86.0
(1)
130 - 135
7-day LOEC
7.5-day LC
50
Birge and Black (1977); Birge and Black (1981) in
Butterwick et al. (1989)
INVERTEBRATES
Chironomus decorus
(midge)
Fourth instar
48-hr acute
toxicity
96-hr chronic
toxicity
Sodium
tetraborate
Reconstituted
1,376
20
48-hr LC
50
96-hr significantly decreased growth rate
Maier and Knight (1991)
Electronic Filing - Received, Clerk's Office, August 29, 2008
* * * * * R2009-008 * * * * *
I\07jobs\07E0039\Admin\14 Reports\Tech. Support Doc
5-8
Species
Life Stage
Type of Test
Boron
Compound
Used
Water Source
Boron
Concentration
(mg B/L)
Test Response
Reference
Daphnia magna
Straus
(water flea)
Static
Boric acid
Lake Huron
133
13.6
48-hr LC
50
21-day LOEC
Gersich (1984)
Daphnia magna
Straus
(water flea)
<24 hr
48-hr static
acute
21-day static
renewal chronic
Boric acid
Carbon filtered
226
13
48-hr L C
50
21-day LOEC
Lewis and Valentine (1981)
Tubifex
sp.
(tubificid worms)
24-hr toxicity
Borax
85
227
24-hr NOEC
24-hr LC
100
Mann (1973)
Tubifex
sp.
(tubificid worms)
24-hr toxicity
Boric acid
1,311
1,748
24-hr NOEC
24-hr LC
100
Mann (1973)
AQUATIC PLANTS
Anacystis nidulans
(blue green alga)
Boric acid
50
75
100
No effect on growth or organic constituents
Significantly decreased growth and chlorophyll content
Decrease in protein content causing inhibition in nitrate and
nitrate reductase activity. Decreased chlorophyll content and
photosynthesis inhibition within 72 hrs.
Martinez et al. (1986) in Eisler (1990)
Chlorella pyrenoidosa
(green alga)
10
>100
No effect on growth or cell composition after 7 days
Totally inhibitory for cell division and biomass synthesis in 72
hrs
Fernandez et al. (1984) and Maeso et al. (1985) in Eisler
(1990)
Lemna minor
(duckweed)
Boric acid
20
Growth inhibited after 7 days at pH 7.0
Frick (1985) in U.S. Department of the Interior (1998)
Lemna minor
(duckweed)
Boron
100
Growth inhibited
Wang (1986)
Selenastrum
capricornutum
(green alga)
4 – 7 days old
72-hr static
Reconstituted
12.3
72-hr LOEC
Moss and Nagpal (2003)
(1)
Dependent upon water hardness. See Sections 5.2.6 and 5.4 for a discussion of the potential effects to the Sangamon and Illinois Rivers in consideration of the low concentration toxicity levels reported in
the Birge and Black studies (1977 and 1981).
Electronic Filing - Received, Clerk's Office, August 29, 2008
* * * * * R2009-008 * * * * *
5-9
I:\07jobs\07E0039\Admin\14 Reports\TECHNICAL SUPPORT DOCUMENT, Final 8-13-08.doc
•
The 48-hour LC
50
of the freshwater midge
Chironomus decorus
was 1,376
mg B/L when exposed to waterborne sodium tetraborate (Maier and Knight,
1991).
Growth rate by
C. decorus
larvae significantly decreased at
concentrations of 20 mg B/L and greater;
•
Sea urchin embryos showed normal development with exposure to 37 mg
B/L and lethality at 75 mg B/L (Kobayashi, 1971);
•
A 48-hour LC
50
value of 133 mg B/L was calculated for the cladoceran
(
Daphnia magna
) to boric acid (Gersich, 1984). A boron concentration of
13.6 mg/L was shown to cause sublethal effects on
D. magna
in a 21-day
study (Gersich, 1984);
•
Lewis and Valentine (1981) similarly determined a 48-hour LC
50
exposure
value for boric acid of 226 mg B/L with a 21 day sublethal exposure level of
13.0 mg B/L for
D. magna
.
The effects of boron on freshwater aquatic invertebrates applicable to the
Sangamon River and the Illinois River are summarized in Table 5-1.
5.2.5 Effects in Plants
Boron is essential for the growth of plants. Boron soil concentrations for optimum
plant growth reportedly range from 0.1 to 0.5 mg/kg for several plant species (Butterwick et
al., 1989). However, excess boron is known to be phytotoxic (Eisler, 1990). There is a
small range between boron deficiency and boron toxicity in plants (Parks and Edwards,
2005). Boron toxicity has been reported in grasses, fruits, vegetables, grains, trees, and
other terrestrial plants. Boron toxicity in plants is characterized by stunted growth, leaf
malformation, browning and yellowing, chlorosis, necrosis, increased sensitivity to mildew,
wilting, and inhibition of pollen germination and pollen tube growth. There is some
Electronic Filing - Received, Clerk's Office, August 29, 2008
* * * * * R2009-008 * * * * *
5-10
I:\07jobs\07E0039\Admin\14 Reports\TECHNICAL SUPPORT DOCUMENT, Final 8-13-08.doc
evidence (Graham et al., 1987) that boron may accumulate to toxic levels in plants,
particularly in the presence of a high phosphorus and low zinc environment.
The following studies demonstrate tolerance ranges to levels of boron exposure for
some terrestrial plants:
•
Toxic effects in plants, including leaf injury, were observed in 26 percent of
plants at or below substrate concentrations that resulted in greatest growth,
indicating considerable overlap between injurious and beneficial effects of
boron in plants (Eaton, 1944);
•
In general, deficiency effects in plants were evident when boron
concentrations in soil solution were less than 2 mg B/L; optimal growth
occurred at 2 to 5 mg B/L; and toxic effects were evident at 5 to 12 mg B/L.
Sensitive species are known to include citrus, stone fruits, and nut trees;
semitolerant species include cotton, tubers, cereals, grains, and olives;
tolerant species usually include most vegetables (Gupta et al., 1985);
•
Biggar and Fireman (1960) showed that, with neutral and alkaline soils of
high absorption capacities, water containing 2 mg B/L might be used for
some time without injury to sensitive plants; and
•
Four species of turfgrass, Kentucky bluegrass, creeping bent, alta fescue, and
colonial bent, were irrigated with water containing 4.8 mg B/L. These
species of turfgrass were found to show excellent tolerance to higher levels
of boron in soil solution, when the practice of frequent mowing is employed
(Oertli et al., 1961).
Toxic effects observed in aquatic plants include inhibition of growth and reduced
photosynthesis (Frick, 1985; Antia and Cheng, 1975; Rao, 1981) at various concentrations
Electronic Filing - Received, Clerk's Office, August 29, 2008
* * * * * R2009-008 * * * * *
5-11
I:\07jobs\07E0039\Admin\14 Reports\TECHNICAL SUPPORT DOCUMENT, Final 8-13-08.doc
above 10 mg B/L and below 100 mg B/L. The following studies demonstrate tolerance
ranges to levels of boron exposure for some aquatic plants:
•
The blue green alga, (
Anacystis nidulans
), exhibits no adverse effects with
respect to cell growth or organic constituents at 50 mg B/L and significant
adverse effects at greater than 100 mg B/L over a 72-hour exposure (Eisler,
1990 based on Martinez et al., 1986). Martinez et al. (1986 in Eisler, 1990)
found that a concentration of 75 mg B/L significantly decreased growth and
chlorophyll content in this species;
•
The green alga, (
Chlorella pyrenoidosa
), showed no effects on growth or
cell composition after a 7-day exposure to 10 mg B/L and adverse effects at
greater than 100 mg B/L in 72 hours (Fernandez et al., 1984 and Maeso et
al., 1985 in Eisler, 1990);
•
Duckweed, (
Lemna minor
), showed normal growth in 10 mg B/L and 20 mg
B/L exposures and growth inhibitions at 100 mg B/L exposures (Wang,
1986); however, Frick (1985 in U.S. Department of the Interior, 1998) found
that a concentration of 20 mg B/L was sufficient to inhibit the growth of
duckweed at pH 7.0;
•
Nineteen species of marine algae showed no effects from a 60-day exposure
to 10 mg B/L and growth inhibition in 12 of 19 species at 100 mg B/L (Antia
and Cheng, 1975).
The effects of boron on freshwater aquatic plants applicable to the Sangamon
River and the Illinois River are summarized in Table 5-1.
Electronic Filing - Received, Clerk's Office, August 29, 2008
* * * * * R2009-008 * * * * *
5-12
I:\07jobs\07E0039\Admin\14 Reports\TECHNICAL SUPPORT DOCUMENT, Final 8-13-08.doc
5.2.6 Effects in Aquatic Organisms
The above studies, done on a diverse list of aquatic organisms, demonstrate the
response to boron of three aquatic trophic levels: plant, invertebrate, and vertebrate (fish
and amphibians). Boron effects on aquatic life are highly species specific and vary
depending on the organism’s life stage and environment. Based on previous studies, early
stages are more sensitive to boron than later ones. Most aquatic organism toxicity studies
have focused on the evaluation of lethal concentrations; however, other toxic effects have
been reported.
While most laboratory toxicity studies are based on reconstituted water as the
experimental medium, studies have shown that administering boron in natural water is less
toxic than when administered in reconstituted water in the laboratory. Of all the species and
life stages investigated in aquatic toxicity studies, the early life stages of rainbow trout
(
Oncorhyncus mykiss
) appear to be most sensitive to boron. Initial studies in reconstituted
water indicated a LOEC of 0.1 mg B/L. Procter and Gamble (unpublished, from Butterwick
et al., 1989) found that when trout embryo-larval stages were exposed to boron in natural
water courses, it was found to be substantially less toxic. Bingham (1982 in U. S.
Department of Interior, 1998) reported finding wild, healthy trout in surface waters
containing as much as 13 mg B/L. Black et al. (1993, from Moss and Nagpal, 2003)
reported a 20-day NOEC (no-observed-effect concentration) of 18 mg B/L as boric acid for
rainbow trout embryos. Therefore, the low-level effects observed in reconstituted laboratory
water may not accurately predict the much higher first effect levels under natural water
exposure conditions.
According to the Agency for Toxic Substances and Disease Registry (U.S. Public
Health Service, 1992), it is unlikely that boron is bioconcentrated significantly by organisms
in water. Other sources suggest that aquatic environments are not likely to experience boron
bioaccumulation or biomagnifications (Wren et al., 1983; Butterwick et al., 1989).
Electronic Filing - Received, Clerk's Office, August 29, 2008
* * * * * R2009-008 * * * * *
5-13
I:\07jobs\07E0039\Admin\14 Reports\TECHNICAL SUPPORT DOCUMENT, Final 8-13-08.doc
Thompson et al. (1976) found no evidence of active bioaccumulation of boron in sockeye
salmon (
Oncorhynchus nerka
) tissues or Pacific oyster (
Crassostrea gigas
).
City Water, Light and Power (CWLP) of Springfield was granted an adjusted stream
standard for boron in 1994. The
Technical Support Document for Petition for Adjusted
Boron Standards for Sugar Creek and the Sangamon River
(Hanson Engineers
Incorporated, March 1994) presented scientific evidence showing no detectable degradation
to Sugar Creek receiving discharges having boron levels as high as 18 mg/L (see in the
matter of: Petition of the City of Springfield, Office of Public Utilities, for an Adjusted
Standard from 35 Illinois Administrative Code 302.208(e), AS94-9.) The CWLP of
Springfield study and the above-referenced studies demonstrate the toxicological effects of
boron at varying concentrations on the biological community of an aquatic ecosystem.
Overall, the results indicate that the Sangamon River biological community would not be
observably affected by the anticipated maximum boron concentration of 4.5 mg/L
downstream of the initial area of dispersion, or by the maximum boron concentration of 11.0
mg/L in the area of dispersion The Illinois River biological community would not be
observably affected by the anticipated maximum boron concentration of 1.3 mg/L.
5.3
Environmental Effects of Current Boron Levels
Characterization of the water and biological quality of the Sangamon River in the
Lower Sangamon River watershed is based on the 2006 Illinois Water Quality Report,
Intensive Basin Survey results from 1996 and 2003, water quality data from the Ambient
Water Quality Monitoring Network (AWQMN) from 1999 to 2004, and water sampling
of the Sangamon River conducted in September and October 2007 by Hanson. Based on
the water analyses, boron levels in the Lower Sangamon River were generally highest in
stream segment E-26 (Riverton), followed by stream segment E-24 (Petersburg), and
lowest in stream segment E-25 (Oakford). Boron concentrations in the Sangamon River
have ranged from 0.029 mg/L to 2.14 mg/L. Mean concentrations at each station based
on the Illinois EPA’s AWQMN data were 0.394, 0.269, and 0.141 mg/L at Stations E-26,
E-24, and E-25, respectively.
Electronic Filing - Received, Clerk's Office, August 29, 2008
* * * * * R2009-008 * * * * *
5-14
I:\07jobs\07E0039\Admin\14 Reports\TECHNICAL SUPPORT DOCUMENT, Final 8-13-08.doc
Based on the macroinvertebrate surveys in 1996 and 2003, the stream quality of
the Sangamon River fully supports aquatic life use in all stream segments in the Lower
Sangamon River watershed. The highest quality MBI score was at Station E-26
(Riverton) in 1996. The stream station upstream of the confluence of the South Fork of
the Sangamon River and CWLP’s discharges, E-16 at Roby, had a MBI value in 2003 of
6.1 indicating moderate impairment of aquatic life use. Therefore, current boron levels
do not appear to be adversely affecting aquatic life in the Lower Sangamon River based
on the MBI assessment, especially considering the lower quality score reported for the
Roby location.
The results of the fisheries surveys conducted in 1996 and 2003 also do not reflect
adverse effects from current boron levels in the Sangamon River. Although Stations E-
50 and E-26, which are the closest downstream stations to the CWLP discharges, had the
lowest IBIs/RIBIs of the three Lower Sangamon River stations, the IBI/RIBI scores of all
three stations reflect fair resource quality, or moderate impairment for aquatic life use.
Also, the RIBI reported for Station E-26 (Riverton) in 2003 is not substantially different
from the RIBI reported for Station E-16 (Roby) (25 and 27 respectively).
To
reemphasize, use of the RIBI scores to assess the quality of the Sangamon River is
limited since the RIBI was designed for smaller streams in Illinois. Raw IBI scores for
all Lower Sangamon River stations were relatively identical in 2003.
The 2003 catfish survey of the Sangamon River by the IDNR determined that
channel and flathead catfish populations were robust, especially at the Riverside
Park/Riverton section. In light of the Birge and Black (1977) laboratory study which
determined that the LC
1
value at 4 days posthatching ranged from 0.2 to 5.5 mg B/L for
channel catfish (
Ictalurus punctatus
) fry subjected to varying boron compounds and
water hardness concentrations, current boron levels do not appear to be adversely
affecting the catfish populations.
Electronic Filing - Received, Clerk's Office, August 29, 2008
* * * * * R2009-008 * * * * *
5-15
I:\07jobs\07E0039\Admin\14 Reports\TECHNICAL SUPPORT DOCUMENT, Final 8-13-08.doc
5.4
Predicted Effects of the Proposed Site-Specific Boron Standard
To determine the potential for adverse effects of the proposed site-specific boron
standard to the aquatic environment of the Sangamon River from the Spring Creek
confluence to the Illinois River confluence, the conclusions of previous studies on boron
toxicology (as summarized in Section 4.0) and CWLP’s previous
Technical Support
Document for Petition for Adjusted Boron Standards for Sugar Creek and the Sangamon
River
(Hanson Engineers Incorporated, March 1994) were reviewed.
The freshwater fish species most sensitive to boron identified thus far is the
rainbow trout (
Oncorhyncus mykiss
), although this cold-water species is not found in the
Sangamon River. Initial studies indicated a LOEC of 0.1 mg B/L in reconstituted water
(Butterwick et al, 1989; Parks and Edwards, 2005). However, while most laboratory
toxicity studies have administered boron compounds using reconstituted water as the
experimental medium, subsequent tests using boron in natural waters found that the
LOEC for rainbow trout ranged from 1.1 to 1.73 mg B/L (Parks and Edwards, 2005).
Other sources have reported that when trout embryo-larval stages were exposed to boron
in natural waters, boron was found to be substantially less toxic (Black et al., 1993 in
Moss and Nagpal, 2003; Butterwick et al., 1989; Loewengart, 2001).
Butterwick et al. (1989) concluded that early life stages of nonsalmonid fish
species appear relatively resistant to aqueous exposure to boron. Species which have
been studied and are known to be present in the Sangamon River include the fathead
minnow (
Pimeohales promelas
) egg-fry (30-day LOEC of reduction in growth of 24 mg
B/L), channel catfish (
Ictalurus punctatus
) embryo-larval stages (9-day LOEC of 1.04 to
25.9 mg B/L), and largemouth bass (
Micropterus salmoides
) eggs (11-day LOEC of
12.17 mg B/L). Again, boron involved with these studies was not administered using
natural waters.
Electronic Filing - Received, Clerk's Office, August 29, 2008
* * * * * R2009-008 * * * * *
5-16
I:\07jobs\07E0039\Admin\14 Reports\TECHNICAL SUPPORT DOCUMENT, Final 8-13-08.doc
The Ministry of Water, Land and Air Protection of British Columbia conducted
an exhaustive review of available boron toxicology studies to establish ambient water
quality guidelines for boron (Moss and Nagpal, 2003). The report discussed the
consistently low concentration toxicity levels found by Birge and Black studies (1977 and
1981, and Black et al., 1993) for a variety of aquatic species, and stated that these results
cannot be reproduced by other studies using similar conditions and species. Therefore,
the British Columbia researchers considered the Birge and Black studies as outliers and
did not consider them in the development of the British Columbia guideline. The British
Columbia Ministry of Environment, Lands and Parks (1997 in Moss and Nagpal, 2003)
found a LOEL for growth of inhibition on the green algae (
Selenastrum capricornutum
)
of 12.3 mg B/L. The Ministry of Water, Land and Air Protection used this concentration
with a safety factor of 0.1 to derive the interim guideline for freshwater aquatic life of 1.2
mg/L.
The United States Department of the Interior also conducted an extensive
literature review of the biological effects of boron on the aquatic environment in the
Guidelines for Interpretation of the Biological Effects of Selected Constituents in Biota,
Water, and Sediment
(USDI, 1998). This report provided tentative predictions of boron
effect levels for aquatic plants, aquatic invertebrates, fish, and amphibians. Predictions of
no effect to toxicity threshold for these organisms were 0.5 to 10 mg B/L for aquatic
plants, 6 to 13 mg B/L for aquatic invertebrates, 5 to 25 mg B/L for fish, and a toxicity
threshold of less than 200 mg B/L for amphibians.
The
Technical Support Document for Petition for Adjusted Boron Standards for
Sugar Creek and the Sangamon River
(Hanson Engineers Incorporated, 1994)
demonstrated that the boron concentrations in the CWLP outfall discharges to Sugar
Creek and consequently the South Fork and Sangamon River, which have been receiving
outfall discharges as high as 18 mg/L of boron from the CWLP power plant since the
1960s, had no adverse effect on the aquatic communities being exposed to these boron
levels. These boron levels, on occasion up to 8 mg/L in Sugar Creek, can be nearly twice
as high as the site-specific standard of 4.5 mg/L for the Sangamon River 182 yards
Electronic Filing - Received, Clerk's Office, August 29, 2008
* * * * * R2009-008 * * * * *
5-17
I:\07jobs\07E0039\Admin\14 Reports\TECHNICAL SUPPORT DOCUMENT, Final 8-13-08.doc
downstream of the Spring Creek Plant discharge proposed in this document. The 1994
Technical Support Document for Petition for Adjusted Boron Standards for Sugar Creek
and the Sangamon River
reported that the Sugar Creek Station EOA-01, located just
downstream of the CWLP discharges, had MBI value ratings of very good to excellent
and fish IBI values similar to Station E-16 of the Sangamon River at Roby, which is
located upstream of the South Fork confluence. The overall stream quality of the various
sampling locations of the South Fork, Sangamon River, or Sugar Creek did not show any
pattern of degradation attributable to boron concentrations.
The predicted maximum boron concentration of 11.0 mg/L in the area of
dispersion is not anticipated to adversely affect the aquatic communities in the Sangamon
River. During a 7Q10 low flow, the worst case discharge boron concentration of 11.0
mg/L from the Spring Creek Plant is predicted to reach at least 4.5 mg/L within a
distance of 182 yards in the Sangamon River. This location of the Sangamon River does
not contain known endangered species habitat or important life habitat, intake structures
of public or food processing water supplies, points of withdrawal for irrigation, or public
access areas. The
Technical Support Document for Petition for Adjusted Boron
Standards for Sugar Creek and the Sangamon River
(Hanson Engineers Incorporated,
1994) reported boron concentrations as high as 18 mg/L in the CWLP’s Outfall 003
discharging into Sugar Creek and demonstrated that the Sugar Creek biological
community would not be adversely affected at or below a boron concentration of 11.0
mg/L.
Based on the reviews of existing toxicity studies, documents and reports, no
adverse effects are anticipated to the biological components of the Sangamon River or the
Illinois River as a result of the site-specific standard for boron (up to 11.0 mg/L).
Electronic Filing - Received, Clerk's Office, August 29, 2008
* * * * * R2009-008 * * * * *
I\07jobs\07E0039\Admin\14 Reports\Tech. Support Doc
SECTION 6.0
EVALUATION OF WATER TREATMENT ALTERNATIVES
Electronic Filing - Received, Clerk's Office, August 29, 2008
* * * * * R2009-008 * * * * *
I\07jobs\07E0039\Admin\14 Reports\Tech. Support Doc
6-1
SECTION 6.0
EVALUATION OF WATER TREATMENT ALTERNATIVES
Over the past decade, CWLP has reviewed numerous alternatives to comply with
the General Water Quality Standard for boron in wastewater discharged from their
Springfield Power Plant. Alternatives applicable to the pretreatment of the FGDS waste
stream, expected to have an average flow rate of 187 gpm and a boron concentration of
450 mg/L, are discussed below. It is notable that there are currently no known
commercially-demonstrated processes for treating a waste stream with a similar boron
concentration.
6.1
Alternate Coal Source
The
Phase II SO
2
Compliance Study Report
(Burns & McDonnell, October 1998)
evaluated switching the CWLP coal supply from Illinois coal to Power River Basin
(PRB) coal, which is mined in the western United States. PRB coal is low-sulfur, low-
boron coal as compared to coal mined in Illinois. The study noted that CWLP does not
have any reliable way to receive rail delivered coal to the power plant and that the plant
site is not large enough for unit train coal deliveries. However, with major modifications,
limited rail unloading could be restored at the Dallman plant for delivery of PRB coals.
Under this scenario, the PRB “unit trains” would be delivered to a Springfield railyard
and then broken up for delivery to the Dallman plant. Two alternatives to on-site rail
delivery were also identified by CWLP during this study. Both alternatives involved
unloading the trains at an off-site facility and trucking the coal to the CWLP power plant.
Existing hammer mills would have to be retrofitted to accommodate the finer
grade PRB coal and dust control systems would have to be installed. Additionally, truck
dump operations would need to be enclosed to reduce dust emissions during unloading
operations. CWLP test burns demonstrated the need for the addition of limestone to
Electronic Filing - Received, Clerk's Office, August 29, 2008
* * * * * R2009-008 * * * * *
I\07jobs\07E0039\Admin\14 Reports\Tech. Support Doc
6-2
blend in the coal for use in the cyclone boilers which would require installation of a
limestone storage silo and feed system. Further, the Burns & McDonnell study identified
13 areas of concern for operation of existing equipment and systems to burn PRB coal:
forced draft fan capacity, induced draft fan capacity, coal feeder capacity, bowl mill
capacity, exhauster capacity, coal pipe size, addition of mill inerting systems for
prevention of fire and explosion, addition of mill wash nozzles, cyclone modifications,
addition of cyclone slag flux agent, addition of a CO
2
inerting system to coal storage
bunkers, addition of furnace cleaning lances, and modifications to the ash handling
systems.
The Burns & McDonnell evaluation further noted that factors associated with
PRB coal combustion such as increased gas flow, elevated precipitator inlet temperature,
ash particle size, and fly ash/bottom ash split have significant influence on precipitator
performance. It may not be possible for CWLP to achieve continuous air compliance
under all operating conditions burning PRB coal in the existing power plant.
After considering the
Phase II SO
2
Compliance Study Report
, CWLP made a
decision to add a FGDS to Dallman Units 31 and 32. Factors cited by CWLP in support
of this decision:
Lowest cost long term solution;
Economic benefits for Springfield and the State of Illinois;
• Burn Illinois coal
- 100 coal mine related jobs
- $10M+ in annual coal sales
• 200 to 250 construction related jobs
CWLP has successfully operated and maintained a FGDS on Unit 33
for 19 years;
Gypsum byproduct sales would be $3,000,000/year; and
The State of Illinois has budgeted $12.5M in Cost Sharing Funds to
benefit Illinois jobs.
Electronic Filing - Received, Clerk's Office, August 29, 2008
* * * * * R2009-008 * * * * *
I\07jobs\07E0039\Admin\14 Reports\Tech. Support Doc
6-3
Further, CWLP cited the following disadvantages of using PRB Coal:
Over $10M leaving Illinois annually;
Shipping delays;
Major railway modifications;
Boiler modifications; and
Concerns about explosive dust.
CWLP’s decision to continue to burn Illinois coal is atypical of the utility
industry. According to
The Illinois Coal Industry: Report of the Office of Coal
Development
(Illinois Department of Commerce and Economic Opportunity, June 2006),
although Illinois has an abundance of bituminous coal, only 13.5 percent, or 7.5 million
tons, of the coal used by Illinois utilities and industrial users in 2005 was mined in
Illinois. Illinois coal is used by the following utilities in Illinois: AmerenEnergy
Generating’s Coffeen and Meredosia plants, Springfield City Water, Light and Power,
Southern Illinois Power Cooperative, and AmerenEnergy Resources’ Duck Creek plant.
Lower priced, lower-sulfur and lower-boron coals, primarily from the Powder River
Basin of Wyoming, continue to make inroads in Midwestern and Eastern power plant
markets. Table 6-1 details the tonnage and source of coal used by Illinois Utilities in
2005.
6.2
Dry Ash Systems
Conversion to a dry ash system has been studied by CWLP; however the
particular waste stream that is the subject of this technical support document is generated
by the air pollution control system and would not be eliminated by modifying the power
plant ash handling system. It should however be acknowledged that conversion to a dry
ash system could eventually reduce the total boron load to the Sangamon River. The new
Dallman Unit 4 will include dry fly ash and bottom ash handling systems.
6.2.1 Dry Fly Ash
Conversion to a dry fly ash system has been considered by CWLP several times
for water conservation purposes and for boron mitigation at the ash ponds. The report
Electronic Filing - Received, Clerk's Office, August 29, 2008
* * * * * R2009-008 * * * * *
I\07jobs\07E0039\Admin\14 Reports\Tech. Support Doc
6-4
TABLE 6-1
TONAGE AND SOURCE OF COAL USED BY ILLINOIS UTILITIES IN 2005
Name of Operating Company and
Power Plant
State where
Coal Mined
2005 Coal
(Thousand Tons)
Ameren Energy Resources
Duck Creek
Illinois
869
Ameren Energy Resources
Edwards Station
Illinois
Wyoming
51
2,810
Ameren Energy Resources
Coffeen
Illinois
Wyoming
2,274
27
Ameren Energy Resources
Hutsonville
Indiana
403
Ameren Energy Resources
Meredosia
Illinois
Wyoming
149
592
Ameren Energy Resources
Newton
Wyoming
4,269
Dynegy Midwest Generation
Baldwin
Wyoming
5,900
Dynegy Midwest Generation
Havana
Colorado
Wyoming
10
1,271
Dynegy Midwest Generation
Hennepin
Wyoming
933
Dynegy Midwest Generation
Vermillion
Illinois
Indiana
15
228
Dynegy Midwest Generation
Wood River
Wyoming
1,718
Electric Energy, Inc.
Joppa
Wyoming
5,195
Kincaid Generation, LLC
Kincaid
Wyoming
4,785
Midwest Generation
Joliet 9
Wyoming
1,188
Midwest Generation
Crawford
Wyoming
1,530
Midwest Generation
Fisk
Wyoming
774
Midwest Generation
Joliet 29
Wyoming
2,400
Midwest Generation
Powerton
Wyoming
Illinois
4,834
29
Midwest Generation
Waukegan
Wyoming
2,391
Midwest Generation
Will County
Wyoming
2,782
Southern Illinois Power Cooperative
Marion
Illinois
Wyoming
1,063
242
Springfield City Water, Light and Power
Dallman
Illinois
1,116
Springfield City Water, Light and Power
Lakeside
Illinois
113
Electronic Filing - Received, Clerk's Office, August 29, 2008
* * * * * R2009-008 * * * * *
I\07jobs\07E0039\Admin\14 Reports\Tech. Support Doc
6-5
Water Study
(Burns and McDonnell, February 2005) estimated that the installed
equipment cost of converting all existing Dallman Units to dry fly ash would be
$10,200,000. The report noted that the added equipment (ash silos, unloading equipment,
dust control, truck traffics) would add significant operating cost to the total plant
operating budget. The operating costs include disposal cost for the collected ash which
CWLP is not currently paying for. Burns and McDonnell calculated the 2005 net present
value of this conversion as $19,500,000. Assuming an interest rate of 8 percent, that
equates to a 2008 net present value of $24,500,000 or, considering 66,489 electric
services, a cost of $368 per electric service.
6.2.2 Dry Bottom Ash
The report
Water Conservation Study
(Sargent & Lundy, April 2004) investigated
the use of a completely dry bottom ash handing system at the CWLP Dallman Power
Station. The report noted that the Unit 31 and Unit 32 boilers produce a molten slag,
requiring a water impounded tank to quench the slag and form smaller particles for
disposal. Therefore, it was concluded that a dry bottom ash system was not feasible for
Unit 31 and Units 32 boilers. Technically, a bottom ash system could be used for Unit
33. However, Sargent & Lundy stated in the report that the cost was significant, and the
experience with this technology in the United States was limited. Therefore, Sargent &
Lundy concluded that a dry bottom ash system for Unit 33 was not feasible. Burns &
McDonnell concurred with this opinion in the report
Water Study
, stating that only
Dallman Unit 33 is suitable for conversion to dry bottom ash due to existing equipment
and space limitations. However it was stated that the cost-benefit ratio of switching Unit
33 to a dry bottom ash system is expected to be unfavorable, and industry experience
with this type of system is limited. Thus, switching Unit 33 to dry bottom ash was not
considered a favorable option.
Electronic Filing - Received, Clerk's Office, August 29, 2008
* * * * * R2009-008 * * * * *
I\07jobs\07E0039\Admin\14 Reports\Tech. Support Doc
6-6
6.3
Treatment Alternatives
The report
Water Study
(Burns & McDonnell, February 2005) compared
treatment options for the removal of boron from FGDS wastewater. Burns & McDonnell
noted that the FGDS wastewater contains extremely high concentrations of dissolved
solids (including chlorides) and suspended solids that would make it difficult to use many
less-expensive options to remove boron. This is because materials of construction would
need to be corrosion resistant; certain processes such as reverse osmosis would have poor
recovery due to the limitation on osmotic pressure, and the high suspended solids content
would require pretreatment.
Furthermore, according to Burns & McDonnell, due to the high boron
concentrations in the wastewater stream, the application of selective media, such as ion
exchange resin or activated carbon, would require frequent regeneration or media change-
out and would not be a realistic alternative. Also, chemical precipitation or co-
precipitation of boron is not expected to be effective because of the relatively low
concentration of boron in the wastewater compared to its solubility.
Burns & McDonnell concluded that general total dissolved solids (TDS) methods
such as Reverse Osmosis (RO) and mechanical evaporation are the only proven
technologies applicable for boron removal for the application at CWLP.
6.3.1 Brine Concentrator followed by Spray Dryer
Brine concentrators are mechanical evaporators that separate and recover water
from the wastewater solution. According to Burns & McDonnell, the most commonly
used brine concentrators are called falling film seeded slurry brine concentrators and
most of these units use a vapor compressor to provide self-sufficient supply of steam to
heat up the wastewater slurry. The heated wastewater evaporates and generates steam
that is compressed and used for heating up the wastewater slurry again. The slurry is
Electronic Filing - Received, Clerk's Office, August 29, 2008
* * * * * R2009-008 * * * * *
I\07jobs\07E0039\Admin\14 Reports\Tech. Support Doc
6-7
recirculated in a vertically mounted tube bundle (falling film heat exchanger), with the
steam on the shell side. Due to the high concentrations of TDS and chlorides, the wetted
materials are normally made from high-grade stainless steels and the tubes from titanium.
These types of brine concentrators are very expensive. In addition, the vapor compressor
and the slurry recirculation pumps consume a significant amount of electricity.
The concentrated bleed from the mechanical evaporator would be fed to a spray
dryer where it is completely dried to a solid form for disposal. A typical spray dryer
atomizes the wastewater slurry in a drying chamber where hot air containing combusted
natural gas is injected. When the hot air meets the atomized wastewater, all the moisture
in the slurry is vaporized, leaving behind the solids.
The report
Water Study
(Burns & McDonnell, February 2005) concluded that to
accommodate periodic maintenance, and possible variation in the incoming wastewater
flow rate, it would be desirable to have dual trains of the brine concentrator/spray dryer
units, each designed for 50 percent of the maximum capacity required. The report
Water
Study
(Burns & McDonnell, February 2005) presented an opinion that boron removal in
FGDS water using a dual train brine concentrators followed by dual train spray dryers
had a capital cost of $8,222,000 and an annual operating cost of $798,539.
6.3.2 Reverse Osmosis followed by Crystallizer and Spray Dryer
The report
Water Study
(Burns & McDonnell, February 2005) considered an RO
process as an alternative to the first stage treatment with mechanical evaporation to
concentrate the wastewater. However, due to the high concentrations of dissolved
constituents in the FGDS blowdown stream, high recovery of an RO system is impossible
due to the osmotic pressure and the pressure limitation of commercially available RO
membranes. Burns & McDonnell concluded that because the FGDS blowdown contains
very high concentration of sparingly soluble salts such as calcium (Ca), magnesium (Mg),
sulfate, and silica, as well as high suspended solids (gypsum particles), it must be
Electronic Filing - Received, Clerk's Office, August 29, 2008
* * * * * R2009-008 * * * * *
I\07jobs\07E0039\Admin\14 Reports\Tech. Support Doc
6-8
pretreated to reduce or replace those constituents before the water could be treated by an
RO system.
An effective treatment to remove hardness (Ca and Mg) from water is a lime/soda
softener, where lime and soda ash (also known as sodium carbonate or Na
2
CO
3
) are
added to the water stream. The use of soda ash will add alkalinity necessary for the
calcium and magnesium to precipitate. Essentially, the sodium ions (Na) present in the
soda ash will replace the calcium and magnesium that is present.
The silica concentration will not be affected by the lime/soda softener as much as
the calcium and magnesium. In fact, when concentrated in the RO system at neutral or
acid pH, silica concentrations may exceed its solubility and cause a scaling problem on
the RO membranes. At neutral or acid pH, boron may crystallize to form boric acid,
which is a waxy substance that could also foul up the RO membranes. A high-pH RO
system effectively solves this problem. Thus, following the lime soda softener, Burns &
McDonnell considered a HERO system (a patented high-pH RO system design) RO
system. A HERO is still a RO system, so its recovery is limited by the osmotic pressure.
Due to the limitation of the recovery of the HERO, the size of the crystallizer is
much larger and more expensive than the spray dryer included after the brine
concentrator. However, the cost of the HERO is generally less than that of a brine
concentrator and it consumes less electricity. Compared to the brine concentrator/spray
dryer design, the HERO design has some disadvantages. The brine concentrator option is
more favorable than the HERO because it involves fewer components to operate. Also,
the chemical consumption as well as solids removal (requiring disposal) of the lime/soda
softener is significant. Finally, the energy consumption of the crystallizer is much higher
that of the spray dryer. The report
Water Study
(Burns & McDonnell, February 2005)
presented an opinion that boron removal in FGDS water using a lime/soda softener
followed by dual train HERO systems had a capital cost of $6,120,000 and an annual
operating cost of $1,118,649.
Electronic Filing - Received, Clerk's Office, August 29, 2008
* * * * * R2009-008 * * * * *
I\07jobs\07E0039\Admin\14 Reports\Tech. Support Doc
6-9
6.3.3 Electrocoagulation
In response to a request from the Illinois EPA, CWLP commissioned Burns &
McDonnell to evaluate boron removal using electrocoagulation (EC). EC is a method of
treating wastewater with electricity and sacrificial metal plates to cause contaminants in
wastewater to become destabilized and precipitate. The EC reactor consists of metallic
electrode plates separated by thin annular spaces. Wastewater in the annular space
conducts electricity which dissolves the electrodes. The dissolved metal ions react with
contaminants creating precipitates that are removed by filtration. The metal plates can be
made from several materials, aluminum representing the most effective material in boron
removal.
Contaminant reduction occurs via two mechanisms: flocculation/precipitation
and adsorption. Adsorption occurs when contaminants electrostatically adhere to the
flocculated solids and are removed along with the precipitates. The adsorption of boron
on aluminum flocculants has been reported to be no greater than 20 percent of available
boron when adsorption is not inhibited by other contaminants such as chlorides and
sulfates, both of which exist in the FGDS wastewater in high concentrations.
Targeting boron specifically for removal by EC in the FGDS wastewater is more
difficult because boron is known to exist in at least six pH dependent species in water.
The predominant forms are boric acid [H
3
BO
3
] and borate [B(OH)
4
-
]. Boric acid
predominates at pH ranges below 4, whereas borate predominates at pH ranges above 12.
Boric acid is a form that is difficult to remove by most available technologies. FGDS
wastewater is in the 6.5 to 7.0 pH range; therefore 50 to 65 percent of the boron will be in
the boric acid form.
Additionally, competing reactions from other FGDS wastewater constituents with
lower activation energies may dramatically lower boron removal. Several chemical
species such as chlorides and sulfates are present in large quantities in the FGD
Electronic Filing - Received, Clerk's Office, August 29, 2008
* * * * * R2009-008 * * * * *
I\07jobs\07E0039\Admin\14 Reports\Tech. Support Doc
6-10
wastewater and have lower activation energies than boron. The aluminum ion would
naturally react with these other chemical species before boron.
In their May 18, 2007 letter report evaluating boron removal using EC, Burns &
McDonnell presented a capital cost for removal of boron in FGDS wastewater of
$9,207,000 and annual operating costs of $14,074,000. Burns & McDonnell concluded
that economically, EC is not recommended for FGDS wastewater due to high capital and
operating costs relative to low boron removal efficiencies. Additionally these high
operating costs are based on assumptions extrapolated from studies performed on
wastewaters with characteristics much different the FGDS wastewater. While EC is
technically feasible for boron removal from the FGDS wastewater, boron removal
efficiency cannot be predicted due to lack of verified boron removal efficiencies in high
boron and high TDS wastewaters.
Boron removal efficiency is expected to be
dramatically decreased from theoretical estimates due to competing reactions in the EC
process.
6.3.4 Comparison of Treatment Alternatives
The costs presented for the three treatment alternatives for removal of boron
discussed above are shown in Table 6-2. According to the Burns & McDonnell 2005
report
Water Study
and the 2007 letter report evaluating electrocoagulation, capital costs
for the three water treatment alternatives for the removal of boron from the FGDS waste
stream presented in section 6.2 of this technical support document ranges from $6.1
million to $9.2 million. The annual operating and maintenance cost of these three
alternatives ranges from $0.80 million per year to $14 million per year. Assuming a
power plant life of 30 years and an interest rate of 8 percent, the present value of the three
water treatment alternatives was calculated to range from $22 million to $254 million.
Electronic Filing - Received, Clerk's Office, August 29, 2008
* * * * * R2009-008 * * * * *
I\07jobs\07E0039\Admin\14 Reports\Tech. Support Doc
6-11
TABLE 6-2
COST OF TREATMENT ALTERNATIVES FOR THE REMOVAL OF BORON
Treatment Process
Capital Cost
1
($)
Annual O&M
1
($)
Present Value
2
($)
Present Value per
Electric Service
3
($)
Brine Concentrator
followed by Spray Dryer
8,222,000
798,539
22,100,000
333
Reverse Osmosis
followed by Crystallizer
and Spray Dryer
6,120,000
1,118,649
25,600,000
385
Electrocoagulation
9,207,000
14,074,000
254,000,000
3,822
1
Costs from Burns and McDonald reports cited in sections 6.2.1, 6.2.2 and 6.2.3 of this report.
2
Present Value calculated assuming Annual O & M Costs escalate by $40,000/year for the Brine
Concentrator; $56,000/year for Reverse Osmosis; and $700,000/year for the Electrocoagulation
process. Calculation also assumes power plant life of 30 years and an interest rate of 8 percent.
3.
Cost based on 66,489 electric services (58,443 residential electric customers and 8,046 commercial
electric customers)
Electronic Filing - Received, Clerk's Office, August 29, 2008
* * * * * R2009-008 * * * * *
I\07jobs\07E0039\Admin\14 Reports\Tech. Support Doc
6-12
6.3.5 Boron Pilot Project
In December 2005, CWLP entered into a contract with Aquatech International
Corporation to provide a Zero Liquid Discharge (ZLD) plant for the treatment of FGDS
wastewater. The system to be provided consisted of two brine concentrators followed by
spray dryers to treat the blowdown form the FDGS system at the power plant. However,
as detailed design progressed, it became apparent that the use of a brine
concentrator/spray dryer system to treat the FGDS blowdown was a unique application of
this technology. The relative inexperience in this application translated into design
changes as engineering of the system progressed. Additionally, the original scope of
work and the associated cost increased several times. Finally, the costs became too high
to proceed with the proposed brine concentrator system. At the time the system was
abandoned, the capital cost had risen to $40 million and the annual operating and
maintenance cost had risen to $3.7 million.
Assuming the annual operation and
maintenance cost will escalated by $185,00 per year, a treatment system life of 30 years,
and an interest rate of 8 percent, this equates to a present value of $104,500,000 (a
present value per electric service of $1,570). The question of how to dispose of large
quantities of solid waste generated by the treatment system was never resolved; therefore
the cost of waste disposal from the treatment process was not included in the
aforementioned present value.
It is interesting to note that in the
Milliken Clean Coal Demonstration Project: A
DOE Assessment
, which had a goal of achieving a zero-wastewater discharge, the brine
concentration system did not work satisfactorily at any time during the demonstration.
Construction of the Milliken Station began in April 1993 and ended in June 1995.
Operations were initiated in January 1995 and completed in November 1998. The U.S.
Department of Energy (DOE) dubbed the project a success except that the brine
concentrator system never became fully operational. It is not surprising that CWLP has
struggled with the same problem that the U.S. DOE failed to resolve.
Electronic Filing - Received, Clerk's Office, August 29, 2008
* * * * * R2009-008 * * * * *
I\07jobs\07E0039\Admin\14 Reports\Tech. Support Doc
6-13
6.4
Pretreatment of Water Proposed for Transfer to SMSD
SMSD has entered into a contract with CWLP to accept the FGDS wastewater
stream for a price of $100,000/month provided that acceptance of this wastewater does
not upset normal Spring Creek Plant operations. The stream to be pumped to the SMSD
Spring Creek Plant from the CWLP facility is expected to have an average flow rate of
187 gpm and a boron concentration of 450 mg/L.
CWLP intends to treat the FGDS waste stream with conventional treatment
processes for solids removal prior to pumping the wastewater to the SMSD Spring Creek
Plant. Boron tends to associate with small particulate matter; therefore the pretreatment
process will attempt to remove particulates from the waste stream. Laboratory jar tests
have shown in some instances that up to ten percent of the boron in the wastewater can be
removed with solids settling. Unfortunately, the jar test results have not been consistent
and therefore, CWLP is not claiming any boron removal for purposes of calculating
boron concentrations in this document.
CWLP proposes collecting the FGDS waste stream in a 250,000 gallon influent
holding tank. This tank will provide about 22 hours of holding time for the waste stream,
anticipated to be approximately 187 gpm. Wastewater collected in the influent holding
tank will be fed to a ClariCone
TM
solids contact clarifier with a 240 gpm capacity.
Operation of the patented ClariCone
TM
has been demonstrated at over 300
installations nationwide. Mixing, tapered flocculation and sedimentation all take place
within a completely hydraulically driven vessel. The ClariCone
TM
maintains a dense,
suspended, rotating slurry blanket that provides solids contact, accelerated floc formation
and solids capture. The conically shaped concentrator maximizes the slurry discharge
concentration and allows plant personnel to visually monitor slurry discharge. The large
mass of retained slurry and unique helical flow pattern in the ClariCone
TM
prevent short-
circuiting and resists process upsets.
Electronic Filing - Received, Clerk's Office, August 29, 2008
* * * * * R2009-008 * * * * *
I\07jobs\07E0039\Admin\14 Reports\Tech. Support Doc
6-14
Supernatant from the ClariCone
TM
will be collected in a second 250,000 gallon
holding tank and pumped to the SMSD Spring Creek Plant. The pumps to be used for
transferring the wastewater from the effluent holding tank to the Spring Creek Plant will
be centrifugal with a variable frequency drive. One or more chemical feed system(s)
will also be installed, operated and maintained by CWLP at locations immediately after
the pretreatment system and/or on the SMSD collection system to mitigate odors and
corrosion resulting from the FGDS wastewater.
The estimated capital cost of the pretreatment system including the pipeline to
transfer the pretreated FGDS wastewater and chemical feed system(s) to control odor to
the SMSD Spring Creek Plant is $15.5 million. The annual operating and maintenance
cost, including the monthly payment to SMSD is $1.6 million. Assuming that the
monthly payment to SMSD will remain fixed and other annual operating and
maintenance costs will escalate by $10,000 per year, a pretreatment system life of 30
years, and an interest rate of 8 percent, this equates to a present value of $36,100,000 (a
present value per electric service of $544).
Electronic Filing - Received, Clerk's Office, August 29, 2008
* * * * * R2009-008 * * * * *
I\07jobs\07E0039\Admin\14 Reports\Tech. Support Doc
SECTION 7.0
CONCLUSIONS AND RECOMMENDATIONS
Electronic Filing - Received, Clerk's Office, August 29, 2008
* * * * * R2009-008 * * * * *
I\07jobs\07E0039\Admin\14 Reports\Tech. Support Doc
7-1
SECTION 7.0
CONCLUSIONS AND RECOMMENDATIONS
CWLP and the SMSD are requesting a site-specific water quality standard for
boron in the Sangamon River and the Illinois River as a result of proposed discharge
from the Springfield Metro Sanitary District (SMSD) Spring Creek Plant. The CWLP
power plant in Springfield operates selective catalytic reduction (SCR) air pollution
control systems for nitrous oxide removal and flue gas desulfurization systems (FGDS)
for sulfur dioxide removal as required by its air operating permit. Apparently, trace
ammonia concentration from SCR operation results in increased leaching of boron and/or
increased boron solubility in the FGDS effluent water generated during gypsum dewatering.
Operation of the air pollution control systems causes elevated concentration of boron in the
plant effluent stream that is proposed to be transferred to the SMSD Spring Creek
Wastewater Plant. The site-specific standard for boron is necessary to allow CWLP to
continue to operate the power plant in compliance with its existing NPDES permit and State
and Federal air pollution regulations.
The General Use water quality standard for boron of 1.0 mg/L was established by
the Illinois Pollution Control Board for the protection of aquatic life. The standard was
based, in part, on boron toxicity to sensitive irrigated crops, such as citrus. This technical
support document considers existing water quality data and biological studies that were
obtained from several agencies including the Illinois Environmental Protection Agency
(Illinois EPA), the Illinois Department of Natural Resources (IDNR) and the Illinois
Natural History Survey (INHS). Stream flow information from the Illinois State Water
Survey (ISWS) was used to predict boron levels in the Sangamon River. The discussion
of possible toxicological effects of boron is based on existing published literature and
from studies and technical documents produced for City Water, Light and Power
(CWLP) of Springfield and for Central Illinois Light Company (CILCO) of Peoria in
support of petitions for adjusted water quality standards for boron and a variance to an
adjusted water quality standard for boron.
Electronic Filing - Received, Clerk's Office, August 29, 2008
* * * * * R2009-008 * * * * *
I\07jobs\07E0039\Admin\14 Reports\Tech. Support Doc
7-2
Four alternatives for complying with the General Use water quality standard for
boron were evaluated for the plant effluent stream that is proposed to be transferred to the
SMSD Spring Creek Plant. The FGDS waste stream is expected to have a flow rate of
187 gpm and a boron concentration of 450 mg/L. It is notable that there are currently no
known commercially-demonstrated processes for treating a waste stream with a similar
boron concentration.
The least expensive technologically feasible alternative for
reducing boron in the FGDS water would require a capital investment of $40 million,
annual operating expenses of $3.7 million, and additional costs for infrastructure
improvements and waste product disposal. In contrast, lesser costs are associated with
CWLP and SMSD’s proposed approach of pretreating the FGDS waste stream with a
conventional treatment processes for solids removal prior to pumping the wastewater to
the SMSD Spring Creek Plant and seeking a site-specific standard for boron in the
Sangamon River. It is estimated that the selected approach has a capital cost of $15.5
million and an annual operating cost of $400,000 in addition to the $100,000 per month
that CWLP has agreed to pay SMSD for additional expenses associated with accepting
the FGDS waste stream.
CWLP and SMSD propose that the water quality standard for boron set forth in
35 IAC 302.208(g) shall not apply to waters of the state that receive discharge from
SMSD Outfall 007 of the Spring Creek Plant located at 3017 North 8
th
Street,
Springfield, Illinois, owned by the Springfield Metro Sanitary District. Boron levels in
such waters must meet the water quality standard for boron as set forth below.
1. 11.0 mg/L in an area of dispersion within the Sangamon River from SMSD
Outfall 007 to 182 yards downstream from the confluence of Spring Creek with
the Sangamon River;
2. 4.5 mg/L from 182 yards downstream of the confluence of Spring Creek with the
Sangamon river to the confluence of Salt Creek with the Sangamon River, a
distance of 39.0 river miles;
3. 1.6 mg/L from the confluence of Salt Creek with the Sangamon River to the
confluence of the Sangamon River with the Illinois River, a distance of 36.1 river
miles; and
Electronic Filing - Received, Clerk's Office, August 29, 2008
* * * * * R2009-008 * * * * *
I\07jobs\07E0039\Admin\14 Reports\Tech. Support Doc
7-3
4. 1.3 mg/L in the Illinois River from the confluence of the Illinois River with the
confluence of the Sangamon River to 100 yards downstream of the confluence of
the Illinois River with the Sangamon River.
The site-specific boron standard is justified because the current basis for the
General Use Water Quality Standard (agricultural irrigation, stock watering, and drinking
water) is not relevant to the Sangamon River downstream for the confluence with Spring
Creek and, as previously discussed, are unnecessarily stringent for the protection of
aquatic life. Based on the reviews of existing toxicity studies, documents and reports,
and the previous
Technical Support Document for Petition for Adjusted Boron Standards
for Sugar Creek and the Sangamon River
(Hanson Engineers Incorporated, 1994), no
adverse effects are anticipated to the aquatic life of the Sangamon River or the Illinois
River as a result of the proposed site-specific standard. The CWLP power plant is a
critical power supply for Springfield and surrounding communities; the site-specific
boron standard would allow the power plant to continue to operate in compliance with its
NPDES permit and State and Federal air pollution regulations.
Electronic Filing - Received, Clerk's Office, August 29, 2008
* * * * * R2009-008 * * * * *
I\07jobs\07E0039\Admin\14 Reports\Tech. Support Doc
SECTION 8.0
REFERENCES
Electronic Filing - Received, Clerk's Office, August 29, 2008
* * * * * R2009-008 * * * * *
I\07jobs\07E0039\Admin\14 Reports\Tech. Support Doc
8-1
SECTION 8.0
REFERENCES
Agency for Toxic Substances and Disease Registry (ATSDR), Toxicological Profile for
Boron and Compounds, U.S. Department of Health and Human Services, 1992.
Antia, N.J., and J.Y. Cheng, Culture Studies on the Effects from Borate Pollution on the
Growth of Marine Phytoplankton, Journal of the Fish Research Board of Canada,
32:2487-2494, 1975.
Barbour, Michael T., J. Gerritsen, B. Snyder, and J. Stribling, Rapid Bioassessment
Protocols for Use in Streams and Wadeable Rivers:
Periphyton, Benthic
Macroinvertebrates, and Fish, Second Edition, EPA 841-B-99-002, U.S.
Environmental Protection Agency, Office of Water, Washington, D.C., 1999.
Biggar, J.W., and M. Fireman, Boron Absorption and Release by Soils, Soil Sci. Soc. Amer.
Proc., 24: 115, 1960.
Biological Stream Characterization Work Group, Biological Stream Characterization
(BSC): Biological Assessment of Illinois Stream Quality through 1993, Illinois
Environmental Protection Agency, IEPA/BOW/96-058, 1996.
Birge, W.J. and J.A. Black, Sensitivity of Vertebrate Embryos to Boron Compounds, U.S.
Environmental Protection Agency Report 560/1-76-008, 66 pp, 1977.
Boyd, C.E., Water Quality in Warmwater Fish Ponds, Auburn University, Auburn,
Alabama, 1979.
Burns and McDonnell Engineering Co., New Generation Project Water Study, Kansas City,
Missouri, 2005.
Burns and McDonnell Engineering Co., Boron Mitigation
, Kansas City, Missouri, 2007a.
Burns and McDonnell Engineering Co., Letter to Douglas Brown, CWLP about Boron
Removal using Electrocoagulation (EC), May 18, 2007.
Butterwick, L., N. De Oude, and K. Raymond, Safety Assessment of Boron in Aquatic and
Terrestrial Environments, Ecotoxicology and Environmental Safety, 17:339-371,
1989.
Carney, D., Lower Sangamon Basin Survey, 2003 – Data Summary, Illinois Department of
Natural Resources, Division of Fisheries, 2004.
Carney, D., Catfish Survey of the Lower Sangamon River, 2003, Illinois Department of
Natural Resources, Division of Fisheries, 2005.
Electronic Filing - Received, Clerk's Office, August 29, 2008
* * * * * R2009-008 * * * * *
I\07jobs\07E0039\Admin\14 Reports\Tech. Support Doc
8-2
City Water, Light and Power, Lake Springfield Ecology and Management: A Leaseholder
and Community Guide, Springfield, Illinois, 1992.
Department of Commerce and Economic Opportunity, Office of Coal Development, The
Illinois Coal Industry, Springfield, Illinois June 2006.
Dunham, R., Boron Compliance Alternatives, Southern Illinois Power Cooperative, Marion
Power Station, April 1992.
Eaton, F.M., Deficiency, Toxicity, and Accumulation of Boron in Plants, J. Agric. Res.,
69:237-277, 1944.
Eisler, R., Contaminant Hazard Reviews, Boron Hazards to Fish, Wildlife, and
Invertebrates: A Synoptic Review, U.S. Fish and Wildlife Service, Biol. Rep. 85
(1.20), Washington, D.C. 32 pp, 1990.
Frick, H., Boron Tolerance and Accumulation in the Duckweed,
Lemna Minor,
Journal of
Plant Nutrition, 8:1123-1129. 1985.
Garabrant, D.H., L. Bernstein, J.M. Peters, and T.J. Smith, Respiratory and Eye Irritation
from Boron Oxide and Boric Acid Dusts, Journal of Occupational Medicine,
26:584-586, 1984.
Gersich, F.M., Evaluation of a Static Renewal Chronic Toxicity Test Method for
Daphnia
Magna
(Straus) using Boric Acid, Environmental Toxicology and Chemistry, Vol. 3,
No. 1, Pergamon Press, New York, New York, p 89, 1984.
Graham, R.D., R.M. Welch, D.L. Grimes, E.E. Cary, and W.A. Norvell, Effect of Zinc
Deficiency on the Accumulation of Boron and Other Mineral Nutrients in Barley,
Journal of the Soil Science Society of America, 51:652-657, 1987.
Gupta, A.P., and M.D. Parrish, Effectiveness of a New Boric Acid Bait (Roach Killer
Cream) on German Cockroach
(Blattella Germanica)
Populations in Urban
Dwellings, Uttar Pradesh J. Zool, 4:51-56, 1984.
Gupta, U.C., Y.W. Jame, C.A. Campbell, A.J. Leyshon, and W. Nicholaichuk, Boron
Toxicity and Deficiency: a Review, Canadian Journal of Soil Science, Vol. 65, pp.
381-409, 1985.
Hanson Engineers Incorporated, 1994. Technical Support Document for Petition for
Adjusted Boron Standards for Sugar Creek and the Sangamon River, March 1994.
Hanson Engineers Incorporated, 1996. Technical Support Document for Adjusted Water
Quality Standard for Boron, Duck Creek Station, Fulton County, Illinois, January
1996.
Electronic Filing - Received, Clerk's Office, August 29, 2008
* * * * * R2009-008 * * * * *
I\07jobs\07E0039\Admin\14 Reports\Tech. Support Doc
8-3
Hanson Engineers Incorporated, 1998. Technical Support Document for Petition for
Boron Variance, Duck Creek Station, Fulton County, Illinois, July 1998.
Hanson Engineers Incorporated, 1998. Evaluation of Impacts Associated with Recycle of
Treated Wastewater Effluents, August 1998.
Hanson Professional Services Inc., 2004. Investigation of Mitigation Strategies for
Boron Increase at Outfall 004, March 2004.
Hart, Jr., C.W., and S.L.H. Fuller, (eds.), Pollution Ecology of Freshwater Invertebrates,
Academic Press, Inc., New York, New York, 1974.
Illinois Department of Commerce and Economic Opportunity, 2006. The Illinois Coal
Industry: Report of the Office of Coal Development June 2006, Springfield, Illinois,
2006.
Illinois Department of Natural Resources, Lower Sangamon River Area Assessment,
Volumes 1-4, Illinois Department of Natural Resources, Office of Scientific
Research and Analysis, State Geological Survey Division, Champaign, Illinois, 2000
and 2001.
Illinois Department of Natural Resources, personal communication, 2007.
Illinois Environmental Protection Agency, electronic files of Sangamon River 1996 and
2003 biological and habitat data.
Illinois Environmental Protection Agency, electronic files of water quality data of the
Sangamon River from 1999 to 2004.
Illinois Environmental Protection Agency, Illinois Integrated Water Quality Report and
Section 303(d) List -2006, IEPA/BOW/06-002, Illinois Environmental Protection
Agency, Bureau of Water, 2006.
Illinois Environmental Protection Agency, personal communication, 2007.
Karr, J.R., Ecological Perspective on Water Quality Goals, Environmental Mangagement,
5:55-68, 1981.
Kobayashi, N., Fertilized Sea Urchin Eggs as an Indicatory Material for Marine Pollution
Bioassay, Preliminary Experiments, Publ. Seto Mar. Biol. Lab. 18:379-406, 1971.
Lewis, M.A., and L.C. Valentine, Acute and Chronic Toxicities of Boric Acid to
Daphnia
Magna
Straus, Bulletin of Environmental Contamination and Toxicology, 27:309-
315, 1981.
Electronic Filing - Received, Clerk's Office, August 29, 2008
* * * * * R2009-008 * * * * *
I\07jobs\07E0039\Admin\14 Reports\Tech. Support Doc
8-4
Loewengart, G., Toxicity of Boron to Rainbow Trout:
a Weight-of–the-Evidence
Assessment, Environ. Toxicol. Chem., Vol. 20 (4), pp. 796-803, 2001.
Maier, K. J., and Knight, A. W., The Toxicity of Waterborne Boron to
Daphnia Magna
and
Chironomus Decorus
and the Effects of Water Hardness and Sulfate on Boron
Toxicity, Arch. Environ. Contam. Toxicol., Vol. 20, pp. 282-287, 1991.
Mann, H., Untersuchungen Über Die Wirkung von Borverbindungen Auf Fische und Einige
Andere Wasserorganismen, Archiv für Fischereiwissenshaft Braunschweig, 24: 171-
175, 1973.
Moss, S. A., and Nagpal, N. K., Ambient Water Quality Guidelines for Boron, British
Columbia Ministry of Water, Land and Air Protection, Water Protection Section,
2003 <http://www.env.gov.bc.ca/wat/wq/BCguidelines/boron/boron.pdf>.
Oertli, J.J., O.R. Lunt, and V.B. Younger, Boron Toxicity in Several Turfgrass Species,
Agronomy Journal, Vol. 53. pp. 262-265, 1961.
Page, L.M., K. Cummings, C. Mayer, S. Post, and M. Retzer, Biologically Significant
Illinois Streams – An Evaluation of the Streams of Illinois Based on Aquatic
Biodiversity, Technical Report 1992(1), Illinois Natural History Survey,
Champaign, Illinois, 1992.
Pagenkopf, G.K., and J.M. Connolly, Retention of Boron by Coal Ash, Environmental
Science and Technology, 16:609-613, 1982.
Papachristou, E., R. Tsitouridou, and B. Kabasakalis, Boron Levels in Some Ground Water
of Halkidiki, Chemosphere, Vol. 16, No.s 1/3. Great Britain, pp 419-427, 1987.
Parks, J. and M. Edwards, Boron in the Environment, Critical Reviews in Environmental
Science and Technology, Vol. 35 (2): 81-114, 2005.
Rao, D.V.S., Effect of Boron on Primary Production of Nanoplankton
, Canadian Journal of
Fisheries and Aquatic Science, 38:52-58, 1981.
Sargent and Lundy, LLC, City Water Light & Power Dallman & Lakeside Station Water
Conservation Study, Chicago, Illinois, 2004.
Schultz-Benker, P., and B.J. Mathis, Macroinvertebrate Populations in a Thermally
Impacted Reservoir, Transactions of the Illinois Academy of Science, Volume 78, 1
and 2, 1985.
Smith, P.W., The Fishes of Illinois,
University of Illinois Press, Urbana, Illinois, 1979.
Sprague, R.W., The Ecological Significance of Boron
, United States Borax and Chemical
Corp., Los Angeles, CA, 58 pp., 1972.
Electronic Filing - Received, Clerk's Office, August 29, 2008
* * * * * R2009-008 * * * * *
I\07jobs\07E0039\Admin\14 Reports\Tech. Support Doc
8-5
Thompson, J.A.J., J.C. Davis, and R.E. Drew, Toxicity, Uptake and Survey Studies of
Boron in the Marine Environment, Water Res. 10: 869-875, 1976.
Twait, R.M., and B.J. Mathis, Primary Productivity and Community Metabolism in a Power
Plant Cooling Reservoir, Bradley University, 1983.
U.S. Department of the Army, Corps of Engineers (USCOE), Illinois River Basin, Duck
Creek Reservoir Dam, Fulton County, Illinois, ACOE, Inventory Number 01229,
Chicago, IL, 62p., April 1981.
U.S. Department of Energy, National Energy Technology Laboratory, Milliken Clean Coal
Demonstration Project: A DOE Assessment, Morgantown, West Virginia and
Pittsburgh, Pennsylvania, August 2001.
U.S. Department of the Interior, Guidelines for Interpretation of the Biological Effects of
Selected Constituents in Biota, Water, and Sediment, National Irrigation Water
Quality Program Information Report No. 3, 1998.
U.S. Environmental Protection Agency, Preliminary Investigation of Effects on the
Environment of Boron, Indium, Nickel, Selenium, Tin, Vanadium, and Their
Compounds, Vol. 1, Boron, Report No. 56/2-75-005A, 1975.
U.S. Environmental Protection Agency, Biological Indicators of Watershed Health, 2007
<http://www.epa.gov/bioindicators/index.html>.
Wallen, I.E., W.C. Greer, and R. Lasater, Toxicity to
Gambusia Affinis
of Certain Pure
Chemicals in Turbid Waters, Sew. Ind. Wastes 29, 695-711, 1957.
Wang, W., Toxicity Tests of Aquatic Pollutants by using Common Duckweed,
Environmental Pollution Series B, Peoria, Illinois, 1986.
WAPORA, Inc., Thermal and Biological Investigations of Duck Creek Reservoir, 1980,
Final report submitted to Central Illinois Light Company, 1981.
Weir, R.J., Jr., and R.S. Fisher, Toxicologic Studies on Borax and Boric Acid
, Toxicol.
Appl. Pharmocol, 23:351-364, 1972.
Willman, H.B., E.B. Atherton, C. Collinson, J.C. Frye, M.E. Hopkins, J.A. Lineback, J.A.
Simon, Handbook of Illinois Stratigraphy, Ill. GS B 95, 261p., 1975.
Willman, H.B., and J.C. Frye, Pleistocene Stratigraphy of Illinois
, Ill. GS B 94, 204p., 1970.
Wren, C. D., H. R. Maccrimmon and B. R. Loescher, Examination of Bioaccumulation and
Biomagnification of Metals in a Precambrian Shield Lake, Water Air Soil Pollut. 19:
277-291, 1983.
Electronic Filing - Received, Clerk's Office, August 29, 2008
* * * * * R2009-008 * * * * *
I\07jobs\07E0039\Admin\14 Reports\Tech. Support Doc
APPENDIX A
SPRING CREEK PLANT NPDES PERMIT
Electronic Filing - Received, Clerk's Office, August 29, 2008
* * * * * R2009-008 * * * * *
Electronic Filing - Received, Clerk's Office, August 29, 2008
* * * * * R2009-008 * * * * *
Electronic Filing - Received, Clerk's Office, August 29, 2008
* * * * * R2009-008 * * * * *
Electronic Filing - Received, Clerk's Office, August 29, 2008
* * * * * R2009-008 * * * * *
Electronic Filing - Received, Clerk's Office, August 29, 2008
* * * * * R2009-008 * * * * *
Electronic Filing - Received, Clerk's Office, August 29, 2008
* * * * * R2009-008 * * * * *
Electronic Filing - Received, Clerk's Office, August 29, 2008
* * * * * R2009-008 * * * * *
Electronic Filing - Received, Clerk's Office, August 29, 2008
* * * * * R2009-008 * * * * *
Electronic Filing - Received, Clerk's Office, August 29, 2008
* * * * * R2009-008 * * * * *
Electronic Filing - Received, Clerk's Office, August 29, 2008
* * * * * R2009-008 * * * * *
Electronic Filing - Received, Clerk's Office, August 29, 2008
* * * * * R2009-008 * * * * *
Electronic Filing - Received, Clerk's Office, August 29, 2008
* * * * * R2009-008 * * * * *
Electronic Filing - Received, Clerk's Office, August 29, 2008
* * * * * R2009-008 * * * * *
Electronic Filing - Received, Clerk's Office, August 29, 2008
* * * * * R2009-008 * * * * *
Electronic Filing - Received, Clerk's Office, August 29, 2008
* * * * * R2009-008 * * * * *
Electronic Filing - Received, Clerk's Office, August 29, 2008
* * * * * R2009-008 * * * * *
Electronic Filing - Received, Clerk's Office, August 29, 2008
* * * * * R2009-008 * * * * *
I\07jobs\07E0039\Admin\14 Reports\Tech. Support Doc
APPENDIX B
CWLP NPDES PERMIT
Electronic Filing - Received, Clerk's Office, August 29, 2008
* * * * * R2009-008 * * * * *
Electronic Filing - Received, Clerk's Office, August 29, 2008
* * * * * R2009-008 * * * * *
Electronic Filing - Received, Clerk's Office, August 29, 2008
* * * * * R2009-008 * * * * *
Electronic Filing - Received, Clerk's Office, August 29, 2008
* * * * * R2009-008 * * * * *
Electronic Filing - Received, Clerk's Office, August 29, 2008
* * * * * R2009-008 * * * * *
Electronic Filing - Received, Clerk's Office, August 29, 2008
* * * * * R2009-008 * * * * *
Electronic Filing - Received, Clerk's Office, August 29, 2008
* * * * * R2009-008 * * * * *
Electronic Filing - Received, Clerk's Office, August 29, 2008
* * * * * R2009-008 * * * * *
Electronic Filing - Received, Clerk's Office, August 29, 2008
* * * * * R2009-008 * * * * *
Electronic Filing - Received, Clerk's Office, August 29, 2008
* * * * * R2009-008 * * * * *
Electronic Filing - Received, Clerk's Office, August 29, 2008
* * * * * R2009-008 * * * * *
Electronic Filing - Received, Clerk's Office, August 29, 2008
* * * * * R2009-008 * * * * *
Electronic Filing - Received, Clerk's Office, August 29, 2008
* * * * * R2009-008 * * * * *
Electronic Filing - Received, Clerk's Office, August 29, 2008
* * * * * R2009-008 * * * * *
Electronic Filing - Received, Clerk's Office, August 29, 2008
* * * * * R2009-008 * * * * *
Electronic Filing - Received, Clerk's Office, August 29, 2008
* * * * * R2009-008 * * * * *
Electronic Filing - Received, Clerk's Office, August 29, 2008
* * * * * R2009-008 * * * * *
Electronic Filing - Received, Clerk's Office, August 29, 2008
* * * * * R2009-008 * * * * *
Electronic Filing - Received, Clerk's Office, August 29, 2008
* * * * * R2009-008 * * * * *
Electronic Filing - Received, Clerk's Office, August 29, 2008
* * * * * R2009-008 * * * * *
Electronic Filing - Received, Clerk's Office, August 29, 2008
* * * * * R2009-008 * * * * *
Electronic Filing - Received, Clerk's Office, August 29, 2008
* * * * * R2009-008 * * * * *
Electronic Filing - Received, Clerk's Office, August 29, 2008
* * * * * R2009-008 * * * * *
Electronic Filing - Received, Clerk's Office, August 29, 2008
* * * * * R2009-008 * * * * *
Electronic Filing - Received, Clerk's Office, August 29, 2008
* * * * * R2009-008 * * * * *
Electronic Filing - Received, Clerk's Office, August 29, 2008
* * * * * R2009-008 * * * * *
I\07jobs\07E0039\Admin\14 Reports\Tech. Support Doc
APPENDIX C
IDNR CORRESPONDENCE
Electronic Filing - Received, Clerk's Office, August 29, 2008
* * * * * R2009-008 * * * * *
Electronic Filing - Received, Clerk's Office, August 29, 2008
* * * * * R2009-008 * * * * *
Electronic Filing - Received, Clerk's Office, August 29, 2008
* * * * * R2009-008 * * * * *
I\07jobs\07E0039\Admin\14 Reports\Tech. Support Doc
APPENDIX D
BORON WATER QUALITY DATA
FOR THE SANGAMON RIVER – 1999-2004
Electronic Filing - Received, Clerk's Office, August 29, 2008
* * * * * R2009-008 * * * * *
Boron Water Quality Data for the Sangamon River
January 1999 to February 2004
Illinois EPA Ambient Water Quality Monitoring Network
Station E-26
Station E-24
Station E-25
Riverton, IL
Petersburg, IL
Oakford, IL
Date
Total Boron
(mg/L)
Date
Total Boron
(mg/L)
Date
Total Boron
(mg/L)
01/27/99
0.083
01/21/99
0.320
01/21/99
0.320
03/01/99
0.110
02/22/99
0.066
02/22/99
0.054
04/06/99
0.080
03/25/99
0.094
03/25/99
0.092
05/13/99
0.081
05/11/99
0.083
05/11/99
0.053
06/14/99
0.130
06/15/99
0.072
06/15/99
0.067
08/09/99
0.780
09/07/99
0.630
09/07/99
0.620
09/14/99
0.640
10/05/99
0.550
10/05/99
0.320
10/28/99
1.100
11/16/99
0.710
11/16/99
0.290
11/29/99
1.000
12/20/99
0.720
12/20/99
0.310
12/27/99
0.620
02/01/00
1.100
02/01/00
0.440
02/07/00
0.970
05/03/00
0.150
05/03/00
0.075
03/23/00
0.130
06/21/00
0.110
06/21/00
0.034
05/25/00
0.250
08/01/00
0.300
08/01/00
0.100
08/14/00
0.550
09/06/00
0.570
09/06/00
0.220
09/11/00
0.960
10/05/00
0.250
10/05/00
0.160
10/11/00
0.079
11/30/00
0.096
11/30/00
0.140
12/11/00
0.270
01/10/01
0.210
01/10/01
0.130
01/11/01
0.210
02/08/01
0.044
02/08/01
0.039
02/26/01
0.048
03/22/01
0.067
03/22/01
0.050
03/27/01
0.079
04/23/01
0.055
04/23/01
0.045
04/24/01
0.047
05/21/01
0.096
05/21/01
0.054
05/23/01
0.095
06/27/01
0.120
06/27/01
0.099
07/18/01
0.580
08/07/01
0.250
08/07/01
0.160
10/22/01
0.260
10/17/01
0.110
10/17/01
0.100
11/26/01
0.160
11/14/01
0.240
11/14/01
0.150
01/15/02
0.160
01/03/02
0.080
01/03/02
0.060
02/13/02
0.180
02/07/02
0.048
02/07/02
0.049
04/08/02
0.100
04/01/02
0.052
04/01/02
0.051
05/21/02
0.029
04/24/02
0.064
04/24/02
0.057
07/01/02
0.053
07/02/02
0.057
07/02/02
0.078
08/13/02
0.250
08/06/02
0.190
08/06/02
0.070
09/24/02
0.220
09/19/02
0.220
09/19/02
0.240
11/07/02
1.100
10/31/02
0.360
10/31/02
0.110
12/19/02
0.440
12/10/02
0.790
12/10/02
0.280
01/30/03
1.400
01/15/03
0.710
01/15/03
0.120
03/11/03
0.690
03/03/03
0.480
03/03/03
0.120
04/21/03
0.170
04/16/03
0.150
04/16/03
0.050
05/22/03
0.120
05/20/03
0.120
05/20/03
0.087
07/07/03
0.400
07/01/03
0.130
07/01/03
0.110
08/12/03
0.550
08/07/03
0.280
08/07/03
0.073
09/18/03
0.980
09/15/03
0.370
09/15/03
0.170
11/06/03
0.800
10/30/03
0.550
10/30/03
0.180
12/11/03
0.270
12/02/03
0.110
12/02/03
0.082
02/04/04
0.130
02/09/04
0.075
02/09/04
0.110
I:\07jobs\07E0039\Admin\14 Reports\Appendix_C_IEPA_Boron_Data.xls
8/5/2008
Electronic Filing - Received, Clerk's Office, August 29, 2008
* * * * * R2009-008 * * * * *
I\07jobs\07E0039\Admin\14 Reports\Tech. Support Doc
APPENDIX E
BORON ANAYLTICAL RESULTS -
SEPTEMBER 2007 AND OCTOBER 2007
Electronic Filing - Received, Clerk's Office, August 29, 2008
* * * * * R2009-008 * * * * *
Electronic Filing - Received, Clerk's Office, August 29, 2008
* * * * * R2009-008 * * * * *
Electronic Filing - Received, Clerk's Office, August 29, 2008
* * * * * R2009-008 * * * * *
Electronic Filing - Received, Clerk's Office, August 29, 2008
* * * * * R2009-008 * * * * *
Electronic Filing - Received, Clerk's Office, August 29, 2008
* * * * * R2009-008 * * * * *
Electronic Filing - Received, Clerk's Office, August 29, 2008
* * * * * R2009-008 * * * * *
Electronic Filing - Received, Clerk's Office, August 29, 2008
* * * * * R2009-008 * * * * *
Electronic Filing - Received, Clerk's Office, August 29, 2008
* * * * * R2009-008 * * * * *
Electronic Filing - Received, Clerk's Office, August 29, 2008
* * * * * R2009-008 * * * * *
Electronic Filing - Received, Clerk's Office, August 29, 2008
* * * * * R2009-008 * * * * *
Electronic Filing - Received, Clerk's Office, August 29, 2008
* * * * * R2009-008 * * * * *
Electronic Filing - Received, Clerk's Office, August 29, 2008
* * * * * R2009-008 * * * * *
Electronic Filing - Received, Clerk's Office, August 29, 2008
* * * * * R2009-008 * * * * *
Electronic Filing - Received, Clerk's Office, August 29, 2008
* * * * * R2009-008 * * * * *
Electronic Filing - Received, Clerk's Office, August 29, 2008
* * * * * R2009-008 * * * * *
Electronic Filing - Received, Clerk's Office, August 29, 2008
* * * * * R2009-008 * * * * *
Electronic Filing - Received, Clerk's Office, August 29, 2008
* * * * * R2009-008 * * * * *
TECHNICAL SUPPORT
DOCUýTIFNT FOR
PETITION
FOR ADJUSTED
BORON
STANDARDS
FOR 'S.UGIAIR CREEK
AND THE
S A N GAMON
RIVER
P REPARED
FOR
`ý
I
po?.,vpr
i
P REPARED
BY
H ANS
E
O G6omffommA4ev
NGINEERS
a
Electronic Filing - Received, Clerk's Office, August 29, 2008
* * * * * R2009-008 * * * * *
TECHNICAL
SUPPORT
DOCUMENT FOR
PE=ON FOR
A DJUSTED BORON STANDARDS FOR-SUGAR
CREEK AND THE SANGAMON RIVER
P
repared for
CITY WATER, LIGHT AND POWER
Springfield, Illinois
Prepared
by
Dan W. Jones
HANSON ENGINEERS INCORPORATED
1525 South Sixth Street
Springfield, Illinois 62703
MARCH 1994
BronSugr.Repd1040594
92S5034A
Electronic Filing - Received, Clerk's Office, August 29, 2008
* * * * * R2009-008 * * * * *
TECHNICAL SUPPORT
DOCUMENT FOR
PETITION FOR ADJUSTED
BORON STANDARDS
FOR SUGAR CREEK
AND THE SANGAMON RIVER
TABLE OF CONTENTS
Section
Page
EXECUTIVE SUMMARY
1.0 Purpose
and
Scope
2.0 Facility Information
2.1 Plant Description
2.2 Plant Operation
2 .3
Outfall
and Discharge Description
2.3.1 Outfall
003
2.3.2 Outfall004
2.3.3 Outfall006
3.0 Resources of Sugar Creek and Associated
Sangamon River
3 .1
Natural Features
3.1.1 Sangamon River Basin
3.1.2 Sangamon
River
3 .1.3 South Fork of the Sangamon
River
3.1.4
Sugar Creek
3.1.5
Lake Springfield
3 .2 Environmental Quality
3.2.1 Water Uses
3.2.2
Analytical Water Quality
3.2.3
Aquatic
Macroinvertebrates
3.2.4 Fisheries
3.3 Ill. Water Quality Report Status
3.3.1 Assessment Methods
3.3.2 Sangamon River
Basin
3.3.3 Sangamon
River
3.3.4 South Fork of the Sangamon River
3.3.5 Sugar Creek
i
1-1
2-1
2-1
2 -3
2 -15
2-15
2-16
2-16
3 -1
3-1
3-1
3-1
3-4
3-4
3-5
3-8
3-8
3-11
3-14
3-18
3-26
3-26
3-27
3-34
3-37
3-39
B ronSugrRepdf040594
92S5034A
Electronic Filing - Received, Clerk's Office, August 29, 2008
* * * * * R2009-008 * * * * *
TABLE OF CONTENTS
(Continued)
Section
4.0
Issue
of
Concern
4.1 Proposed Adjusted
Water Quality
Standard for Boron
4.2 Boron Characteristics
4.2.1 Properties
4.2.2 Distribution
and Uses
4.2.3 Toxicology
4.3 Boron Concentrations
in Receiving
Waters
4.3.1 Historic Boron Levels
4.3.2
Predicted Low-Flow
Boron Levels
5.0 Environmental
Effects of Boron
Page
4-1
4-1
4-2
4-2
4-3
4-4
4-8
4-8
4-14
5-1
5 .1
Environmental Effects of
Present and Past Boron
Levels
5-1
5.2 Predicted Effects
of Achieving the General
Use Water
5-3
Quality Standard
5.3
Predicted Effects of
the Proposed Adjusted
Water
Quality Standard
6.0 Evaluation of Alternatives
for Complying
with NPDES
Pe-rm;r Boron
Limit
6.1 Selective Ion
Exchange
6.2 Reverse Osmosis/Mechanical
Evaporators
6.3 Dry Fly Ash
Conversion
6.4 Alternative
Coal
6.5 Economics
of Alternatives
7.0 Conclusions
and Recommendations
8.0 References
5 -4
6-1
6-1
6-3
6-3
6-5
6-7
7-1
8-1
B ronSugr.Repd1040594
92S5034A
Electronic Filing - Received, Clerk's Office, August 29, 2008
* * * * * R2009-008 * * * * *
TABLE
OF CONTENTS
(Continued)
APPENDICES
A
IEPA
Aquatic Macroinvertebrate
Studies of Sugar
Creek
B
CWLP Fisheries Study
of Sugar Creek, South
Fork, and Sangamon
River
C NPDES
Permit for CWLP
D Summary
of IEPA Toxicity Test
of CWLP Outfall
Discharges
LIST OF
TABLES
Table
Page
2 .1 Monthly Coal Usage
per Unit
2-4
2 .1A Coal Suppliers
2-5
2.2 Monthly Oil Usage
per Unit
2-6
2 .3 Monthly Gross
Generation per Unit
2-7
2.4 Capacity
Factor (Turbine/Generator)
2-8
2.5
Monthly
Steam
Delivered
to Turbines
2-9
2.6
Monthly Circulating
Water Pump Usage
2-10
2.7 Demineralizer and
Evaporator Production
2-12
2.8 Monthly Ash Sluice
Pump Usage
2-13
2.9 Clarification Pond Recirculating
Water Production
- Outfall 006
2-17
3 .1 Lake Springfield
Watershed Land Uses
3-7
1 TTTf[ý
I- ý.
N
ý .2
1 Vr1 Jk'T S
Dischar1 ges t o S ugar (
-"r eek and
Saiigai°
`ot`i
R iver,
S
pauldi..g
D am
to
Spring
Creek
3-9'
3.3 Water Quality
Data
3-13
3.4 Macroinvertebrate
Biotic
Index Values For Sugar
Creek
3-16
3.5
Index of Biotic Integrity
Metrics Used to Assess
Fish Communities
in Illinois
Streams
3-20
3.6
Fish Species Collected
From Sugar Creek,
South Fork, and Sangamon
River
3-22
3.7 Fisheries Data and
Indices for Stream Sampling
Stations
3-25
3.8 Biological Stream
Characterization Summary
3-28
3.9 Summary
of
Use
Support Assessment
Criteria for Illinois Streams
3-29
3.10 Criteria
for Assessing CWA Fishable
Goal
3-30
Attainment
in Rivers and Streams
3.11 Criteria
for Assessing CWA
Swimmable Goal
3-31
Attainment
in Rivers and Streams
B ronSugrRepdftkl0594
92S5034A
Electronic Filing - Received, Clerk's Office, August 29, 2008
* * * * * R2009-008 * * * * *
TABLE OF CONTENTS
(Continued)
LIST OF TABLES
(Continued)
T able Title
Page
3 .12
Designated
Use Support for the Sangamon River
Basin
3-32
3.13
Attainment
of CWA Goals for the Sangamon
River Basin
3-33
3.14 Total Sizes of Waters Not Fully Supporting
Uses Affected by
3-35
Various Cause Categories for
the
Sangamon
River Basin
3.15 Total Sizes of Waters Not Fully
Supporting Uses Affected By
3-36
Various Source Categories
For The Sangamon River
3.16
Stream
Condition Status
3-38
4.1 Total Boron Concentrations for Monitoring Stations
4-9
4.2
Boron Concentrations
and Flow Rates
4-17
6.1 Adjusted Standard Alternatives Economic
Analysis
6-6
L IST OF. FIGURES
Fi
ure
Title
Page
1 .1
Area of Study
1-2
2.1
CWLP Discharge
Outfalls
2-2
2.2
Water Flow Schematic CWLP Power Plant Complex
2-11
3.i
iviajor River Basins of Illinois
3 2
3.2
Lake Springfield Watershed
3-6
3.3
NPDES Discharge Points
3-10
3.4
Area of Study with Sampling Stations
3-12
3.5
Sugar Creek Macroinvertebrate Sampling
Stations
3-17.
3.6
Fisheries Sampling Locations
3-24
4.1
Locations for Calculated Boron Values
4-16
6.1
Diagram of Selective Ion Exchange
6-2
6.2
Diagram of Reverse Osmosis/Mechanical
Evaporators
6-4
B ronSugr.Repdt040594
92S5034A
Electronic Filing - Received, Clerk's Office, August 29, 2008
* * * * * R2009-008 * * * * *
EXECUTIVE SUMMARY
The reissued NPDES permit
IL0024767 requires the
City Water, Light and Power
(CWLP) electric generation station,
located on Lake Springfield,
to limit and monitor the
concentrations
of boron
in its outfall discharges
to Sugar Creek. The permit limit for boron
is
1.0 mg/L with compliance to be achieved by
December 14, 1994. This boron effluent discharge
limit is based upon the Illinois
General Use boron water
quality
stream
standard of the Illinois
Pollution Control Board (IPCB)
as set forth in 35 M.
Adm. Code 302.208(e). Historical data on
the concentrations of boron in the existing
discharges suggest that noncompliance
with the
effluent limitation in the permit will
occur frequently.
Therefore, an upward adjustment
for boron for the stream limitation is recommended.
The recommended adjusted stream standards for
boron are: 11.0 mg/L from CWLP outfall 003
to Springfield Metropolitan Sanitary District's (SMSD)
Sugar Creek station outfall 008; 5.5
mg/L
from outfall 008 to the confluence of Sugar
Creek with the South Fork and the Sangamon
River;
and 2.0 mg/L from this
confluence to 100 yds downstream
of the confluence of the Sangamon
River with Spring Creek,
which receives the SMSD's Spring
Creek station 007 outfall discharge.
This report evaluates and
compares the ecological and
water quality impacts of boron levels
discharged into Sugar Creek,
the associated sections of
the Sangamon River, and the South Fork
of the
Sangamon
River which receive Sugar
Creek flows. This evaluation assesses
the
effects
of proposed adjusted standards
for boron levels in Sugar Creek
and
the
Sangamon River resulting
from
discharges
into Sugar Creek from the CWLP
electric generation station facilities.
The IEPA
operates an Ambient Water Quality
Monitoring Network (AWQMN) consisting
of 208 fixed
stations.
Data from four
of the
AWQMN
sampling stations were
used in
this
report.
Station E16, near Roby, is about 11 riles
upstream of the confluence of the South Fork
and
Sugar
Creek
with the Sangamon River.
Station E26, near Riverton,
is 2.2 miles downstream
from the confluence of the South
Fork and Sugar Creek with
the
Sangamon.
Site EO-01 is
located on the South Fork at
the Illinois Route 29 bridge and
is about 4.7 miles upstream from
B ronSugr.Repdft140594
i
92S5034A
Electronic Filing - Received, Clerk's Office, August 29, 2008
* * * * * R2009-008 * * * * *
its confluence with
Sugar
Creek and the Sangamon. Station EOA-01 is located on Sugar Creek
at the Illinois Route 29 bridge about one mile southeast of Springfield.
Results
of
chemical water analyses for all four stations were within the federal and state
guidelines. Sugar Creek appears to have had somewhat higher overall water
quality
during
the
1987 USGS Water Year than the stretches of
the
South
Fork and the Sangamon Rivers discussed
in this report.
The
percentage
of
samples
with boron levels above the General Water Use standard of
1.0 mg/L was calculated for each monitoring station.
Lake Springfield and the upstream South
Fork and Sangamon River stations had no samples with boron
levels
above 1.0 mg/L. Only
2.5
percent
of the SMSD sewage treatment
plant outfall 008 discharges into Sugar Creek exceeded
1.0 mg/L boron, whereas 74.5 percent of the samples from the Sugar Creek station were above
the 1.0 mg/L boron standard. The CWLP outfall discharges
into Sugar Creek appear to be the
primary
sources of boron flowing from Sugar Creek
into the Sangamon River and subsequently
influencing
the boron levels observed at
the downstream Riverton station.
When comparing the maximum boron levels from the sampling locations to the proposed
boron stream standards, only the CWLP Sugar Creek outfall 003
had
samples above the proposed
standard. However, except for very infrequent events, the CWLP outfall discharges would
normally be in compliance with the recommended adjusted boron stream standard.
A mass
balance
of boron concentrations was calculated for several locations in Sugar
Creek and the Sangamon River. The purpose of the cal_cullations
was to provide boron values
that
might be expected during critical low stream
flow conditions (7Q10). A worst-case scenario was
developed using a set of hypothetical
criteria, which included high effluent boron concentrations
and
low
stream and effluent
flow rates.
This
scenario suggests
that with present effluent flows and boron concentrations, boron
levels
in Sugar Creek and
the
Sangamon
River as far downstream as 100 yds below Spring Creek
would
not be expected
to fall below the 1.0 mg/L General Use standard during 7Q10 flows.
BronSupRepdl040594
ii
92S5034A
Electronic Filing - Received, Clerk's Office, August 29, 2008
* * * * * R2009-008 * * * * *
Even though
the Sangamon River
may show boron levels
below 1.0 mg/L during periods
of
"average"
flow volume due to dilution
factors, Sugar Creek
would still be expected
to have boron
concentrations
above 1.0 mg/L.
However, this scenario also suggests
that the requested
boron
stream standards,
would be met
at all locations.
Macroinvertebrate Biotic
Index values are included
in the 1985 and
the 1989 stream
studies
on Sugar Creek conducted
by the IEPA to assess
and monitor the effects
of the
Springfield
Sanitary District's
Sugar Creek sewage
treatment plant effluents
on the condition of
the receiving stream.
Both studies concluded
that the sewage
treatment plant was having a slight
to moderate
impact on Sugar Creek.
A 1987-88 fisheries survey
done for CWLP
included closely associated portions
of the
South Fork, the Sangamon
River, and Sugar Creek.
Based on fish species
diversity, it appears
the Sangamon
River is not being
negatively influenced by Sugar
Creek or the South Fork.
Several referenced
toxicity studies, done on
a diverse list of aquatic organisms,
demonstrate
the response to
boron of three aquatic
trophic levels: plant,
invertebrate, and
vertebrate (fish). The
results indicate that the Sugar
Creek-Sangamon River
biological
community would not be significantly
affected at
the
proposed
boron stream standards..
A study
on boron toxicity
to turfgrass species, commonly
used on golf courses,
from irrigation waters was
referenced.
The study suggests
toxicity problems would
not be anticipated at the proposed
adjusted standard should irrigation
of golf courses
be done from the Sangamon
River. A direct
investigation of potential
toxicity of the CWLP
discharges was
conducted by the IEPA in August
1988, A bioassay
was performed with effluent
water samples on
the invertebrate Ceriodaphnia
dubia and on fathead
minnows. No significant
acute toxicity
was observed for either species.
The impairments
observed in
overall stream quality for
the four sampling stations are not
attributable
to documented concentrations
of boron within
the stream reaches in question.
There
are several
known causes and sources
for these impairments
to stream quality. These elements
include: siltation
from agriculture;
organic enrichment
from agriculture and municipal sewage
treatment plants; and habitat
degradation and siltation
from stream channelization. In
addition
B ronSugr.Repdf040594
iii
92S5034A
Electronic Filing - Received, Clerk's Office, August 29, 2008
* * * * * R2009-008 * * * * *
to these impairment
factors, an
additional cause of stream
quality limitation
for Sugar Creek is
the disruption to the aquatic
habitat from flow regulation
by Spaulding
Dam.
As required
in the process of petitioning
for the adjusted
stream standards, several
compliance alternatives
were considered. Two
treatment alternatives were evaluated
for boron
removal to meet the effluent
discharge standard.
The selective
ion exchange process employs
a commercially available
ion exchange resin
that can be used for removing
boron. Reverse
osmosis is a process where
moderate pressures
are used to force
water through semi-peimeable
membranes, which
are relatively impervious
to passage of
various ions including boron.
Two
alternative operating
procedures
were also evaluated:
conversion of the fly ash handling
system
to a dry method, and
the use of a low boron coal.
The present-worth
values for these alternatives
range from $19,750,000
to $99,800,000.
The least expensive
alternative appears to be selective
ion exchange
at a present worth of $19,750,000.
The assessment
of the stream ecosystems
presented in this
document indicates that the
boron concentrations
in the CWLP
outfall discharges have
had no adverse effect on the aquatic
communities being
exposed to these
boron levels. Impacts
to resident biota are not anticipated
from the proposed
adjusted water
quality standards
for boron because the discharged boron
concentrations
will not change from
the
present
concentrations.
The designated stream
use of Sugar Creek
of support of
aquatic
life is enhanced by the
additional
flow
velocity and discharge
augn.entation of creek flow
b y w ater discharged corn the
CWLP power station
during low flow
months.
The existing
discharges especially augment
m ovement
of
S?!Pcies
whose passage
may
be blocked
in l ow flow periods and s'»sta,
,-. deeper
water pools to accommodate
pool species.
There are
no known irrigation or potable
water uses of Sugar
Creek. No future uses
of
Sugar Creek are
anticipated that would benefit
from achieving
the General Use water quality
standard for boron.
There are no known
future plans to use Sugar
Creek as a potable water
.supply
or for
any other withdrawal purpose
such as irrigation.
No impacts to any known
current
activities due
to the water quality of Sugar
Creek have
occurred; therefore, none
would be
anticipated
from alignment of the
regulatory standard
with the present concentrations.
B
ronSugr.Repdf040594
iv
92SS034A
Electronic Filing - Received, Clerk's Office, August 29, 2008
* * * * * R2009-008 * * * * *
1.0 PURPOSE AND SCOPE
The purpose of this
report is to evaluate and compare the ecological and water quality
impacts of boron levels discharged
into
Sugar
Creek, the associated sections of the Sangamon
River, and the South Fork of the Sangamon River
which receive Sugar Creek flows. The area
of concern is shown in Figure 1.1.
The
purpose
of this evaluation is to assess the effects
of
proposed
adjusted stream standards
for boron in relation to discharges into Sugar Creek
from the
City Water, Light and Power (CWLP) electric generation station
facilities.
The reissued NPDES pennit
IL0024767 requires the CWLP power station, located on
Lake
Springfield, to
limit and monitor the concentrations of boron in its outfall discharges to
Sugar Creek. The permit limit for boron is 1.0
mg/L with compliance to be achieved by
December 14, 1994. This boron effluent discharge
limit is based upon the Illinois General Use
boron water quality standard
of the Illinois Pollution Control Board (IPCB) as set forth in 35 Ill.
Adm. Code 302.208 (e). CWLP
will file
a petition
to the IPCB to request adjusted boron stream
standards for Sugar Creek and the associated downstream
reach of the Sangamon River.
This report discusses issues required to be addressed
in the petition, including: a
description of the power plant operations that are the subject of
the
petition;
a
description of
the
area affected by the discharges;
the qualitative and quantitative nature of these discharges in
relation to their boron content; and a comparison of the environmental
impacts
of
complying with
the existing boron standard and
of complying with the proposed boron standards in ?elation tv
the aquatic ecology, hydrology, and water uses of the
receiving
streams.
This
report
also
includes the
required
analysis
of
comnliariCe
alternatives and
their
relative
costs
_for
implementation and
operation.
To address the petition requirements and to assess the impacts
of
the CWLP discharges
and their boron levels, this report used existing water quality data and biological studies
conducted by CWLP, the Illinois Environmental Protection Agency (IEPA),
the
U.S. Geological
Survey (USGS), the Sangamon County Soil and
Water Conservation District, the Illinois
Department of Transportation (IDOT), and
the
Illinois
Department of Conservation (IDOL).
BronSuSr.Repdt040594
1-1
92S5034A
Electronic Filing - Received, Clerk's Office, August 29, 2008
* * * * * R2009-008 * * * * *
(I
11
1
44
0
0
S
h
a
a
l
"'edro
3 S
5ýf
1
Rd
1.5
0
1.5
3
.ý
RIVER
I
AREA OF STUDY
TECHNICAL SUPPORT DOCUMENT
FOR
PETITION
FOR ADJUSTED BORON
STANDARDS
FOR SUGAR CREEK
AND THE SANGAMON
Job No. 9255034A
Figure
1.1
Scale In Miles
to
1 -2
Electronic Filing - Received, Clerk's Office, August 29, 2008
* * * * * R2009-008 * * * * *
Stream flow information from
the Illinois State Water Survey (ISWS)
was
used
to predict
possible boron levels during projected low flow (7Q10) periods for Sugar
Creek and the
downstream Sangamon River. The discussion of possible
toxicological effects of boron are based
on published studies and a bioassay done
on
a
CWLP discharge by the IEPA.
B ronSugnRepdf040594
1 -3
92S5034A
Electronic Filing - Received, Clerk's Office, August 29, 2008
* * * * * R2009-008 * * * * *
2.0 FACILITY INFORMATION
2.1
Plant Description
The V.Y. Dallman Power Station at 3 100 Stevenson Drive is located at the
southeast
edge
of the City of Springfield, Illinois, adjacent to Lake Springfield and the
Stevenson
Drive
interchange
on Interstate Route 55 (Figure 2.1). The station is of the indoor type. Units 1 and 2
are identical
80
megawatt cyclone coal-fired units.
Unit 1
went
into service in 1968, and Unit 2
in 1972. Each unit operates at 1,250
psig and 950°F.
Unit 3 went into service in 1978. The unit operates at 2,400
psig
and 1,000°F.
Unit
3
is a 192 megawatt pulverized coal-fired
unit. As part of the effort to reduce air emissions from
the
power plant, a flue gas desulfurization system for Unit 3 went into
service
in 1980. This
scrubber removes
over 80 percent of the sulphur dioxide from the unit's flue gases. The flue gas
desulfurization
system is a wet limestone forced oxidation system. The system is equipped with
two absorber towers.
The
Lakeside Power Station is also located at 3 100 Stevenson Drive next to the Dallman
plant.
Originally, there were eight boilers and seven turbine generators at Lakeside.
The first
unit at Lakeside went
into operation in 1935. Only two boilers and two turbine generators are
still in operation. Boilers 7 and
8
are identical
33
megawatt
cyclone coal-feed boilers. Boiler
7-Turbine 6 went into operation in 1959 and Boiler 8-Turbine
7
in 1964.
Each unit operates at
850 psig and
900°F.
There are approximately 220 people employed at the Dallman
and Lakeside power
complex..
The facility is staffed 24 hours per day, seven days per week.
B ronSugr.Repd1040594
2-1
92S5034A
Electronic Filing - Received, Clerk's Office, August 29, 2008
* * * * * R2009-008 * * * * *
/.' ýORAWINGS ý 9255034 ý 010. DWG 03/23/94 16.56
HWG
Approximate Scale in Feet
5 00
0
500
1000
U
MANS®N
E1dGIM14 0
TECHNICAL SUPPORT
DOCUMENT FOR
PETITION FOR
ADJUSTED
BORON
STANDARDS
FOR SUGAR CREEK
AND THE
SANGAMON
RIVER
Electronic Filing - Received, Clerk's Office, August 29, 2008
* * * * * R2009-008 * * * * *
2.2
Plant Operation
Total coal usage at the complex currently averages
950,000
tons per year. Table 2.1
shows
the monthly coal usage per unit for 1990 through.1992. The coal is delivered by truck
to the power station from the Turris Coal Company mine near Elkhart, Illinois. Table 2.1A
shows the tons of coal supplied each year during the last 10 years by each of the coal company
suppliers.
The monthly fuel oil usage per unit for 1990 through 1992 is shown in Table 2.2.
The
monthly gross generation per unit in kilowatt hours for 1990 through 1992 is shown
in Table 2.3.
The
monthly capacity factor (turbine/generator) for 1990 through
1992 is presented
in Table 2.4. The pounds of steam delivered to each turbine on a monthly basis for 1990 through
1992 is shown in Table 2.5. The monthly volume of water pump usage for 1990 through 1992
is shown
in
Table
2.6.
Operation of the boilers requires
pure
feed water in order to prevent
scaling
of boiler and
turbine
intemals at high operating temperatures and pressures. Although demineralized water is
used for the
boiler
feed water makeup,
dissolved solids
can
still
accumulate
in
the
boiler steam
drums. Boiler blowdown is required to keep solids below the desired levels. All blowdown from
the boilers is piped to a flash tank. As the blowdown enters the flash tank, a portion of it is
vaporized
and
vented to the atmosphere.
The remaining liquid portion is sent to the
wastewater
treatment plant (Figure 2.2). Table 2.7
shows
the volume of
demineralizer
and
evaporator
water
production on a monthly basis for 1990 through 1992.
Cooling water for the ash hoppers and the water seals between the boilers and the ash
hoppers is taken from the circulating cooling water system. The overflows from the ash hoppers
is discharged to the power station complex's wastewater treatment system (Figure 2.2).
Sluice water pumps draw water from the circulating cooling water system for the ash
transport system. Table 2.8 shows the monthly volume of ash sluice pump usage for the Dallman
plant for 1990 through 1992. Ash sluice pump usage data for the Lakeside plant are not
available. There are three separate ash transport systems in operation at the power station
B ronSugr.Repd1040594
2-3
92S5034A
Electronic Filing - Received, Clerk's Office, August 29, 2008
* * * * * R2009-008 * * * * *
TABLE
2.1
M
ONTHLY
COAL
USAGE
PER
UNIT
(TONS)
1
990
BOILER 7 B OILER
8 B
OILER
31 BOILER 32 BOILER
33 TOTAL
JANUARY
0
50.60
10 440.80
20,850.60
42,481.50 73,823.50
FEBRUARY
492.55
1,135.55
14,672.60
4,030.35
44,417.20
64,748.25
MARCH
671.40
173.60
20 053.25
1,212.30
47,309.80
69,420.35
APRIL
9,862.45 10,158.90
23,967.50 24,052.60
0.00
68,041.45
MAY
1,013.35
914.45
5,564.75
16,358.90
39,339.35
63,190.80
JUNE
2,981.95
1,738.10
15,706.90
16,7.55 88-955
45,764.40
82,950.30
JULY
.5
,989.95
5,210.35
14,741.05
20,538.80
50,096.65
96,576.80
AUGUST
3,299.60
2,043.80 20,736.80
19,714.35
48,757.35
94,551.90
SEPTEMBER
4,592.25
2,954.05
19,567.00
11,136.60
38,4
1.70
76,691.60
OCTOBER
0.00
0.00 20,934.30
0.00 49,107.50
70,041.80
NOVEMBER
3,500.35
3,084.95
1-4,545.35
0.00
45 649.60
66 780.25
DECEMBER
_
2,636.30
6 78.50
20,663.80
7,730.05
47,926.80
79,635.45
TOTAL
35,040.15
28,142.85 201,594.10
142,383.50 499,291.85
906,452.45
1 991
BOILER 7
BOILER 8 BOILER 31
BOTLER 32 BOILER 33 TOTAL
JANUARY
267.00
147.05
20,770.00
19,711.45
47,130.65
88,026.15
FEBRUARY
945.35
868.55
18,521.75
18,598.85
38 098.75
77,033.25
MARCH
2,007.70
2,017.05
19,511.35
13,073.55
38,560.40
75,170.05
APRLI,
7 ,397.45
10,126.50
24 318.05
25 042.95
0.00
66
884.95
MAY
331.50
6,500.80
3,480.60
22,976.95 47,934.75
81,224.60
J UNE
485.40
6 ,684.75
19,716.80
18,433.30
48,472.50
93
792.75
J ULY
2,583.85
6,168.00 19,202.71 21,342.93
50,463.30
99,7 0.79
AUGUST
2,689.35
2,791.10 19 288.00
19 740.25
49,096.20 93,604.90
SEPTEMBER
2,279.25
725.25
14,610.40
18,872.86
42,416.55
78,904.31
OCTOBER
3,019.45
1,376.00
5,898.05
1716-4-3.4-5
40,156.85
68,093.80
NOVEMBER
12.25
0.00
8,075.50
18,859.80
49,976.60
76,924.15
DFfE
ER I
725.30 I
846.50 I
19,786.25
I
4,798.10
51,133.35 ý- 77,289.5C
TOTAL
22_743.85
38,251.55
193,179.46 219,094.44
503,439.90 976,709.20 1
1
992
BOILER
7 BOILER 8 BOILER
31
.
BOILER 32 BOILER
33 TOTAL
JANUARY
3,846.15
909.15
3 050.55
20,676.40 51,257.00
79
739.25
FEBRUARY
0.00
0.00
7,709.35
11,404.70
49,071.40
68,185.45
MARCH
7,659.20
9,351.70
11768.80
7,416.55
34,898.55
71 094.80
APRLI,
1
0,130.30
9,997.75
22,582.15 26 365.70
0.00
69,075.90
MAY
8,311.95
8,445.50
24,145.80 21,089.40 10,624.70
72 617.35
JUNE
2,009.85
1,788.75
16,420.40
15,156.15
43,436.50
78,811.65
JULY
853.55
814.95
20,796.85 21 294.95
48,426.29 92,186.59
AUGUST
1,619.20
792.25
19,615.40
13,578.10
47,030.70
82,635.65
SEPTEMBER
2,271.00
1,309.65
8,246.35
19,713.25
42 935.82
74,476.07
OCTOBER
114.45
0.00
0.00
21,373.80 50,996.15
72,484.40
NOVEMBER
11,766.05
9,203.05
13.00
4,204.85
49,319.00
74,505.95
D ECEMBER
271.70
11,724.35
24,794.80
0.00
49,689.00
86,479.85
TOTAL
48,853.40 54,337.10
159,143.45
182,273.85 477,685.11 922,292.91
2 -4
Electronic Filing - Received, Clerk's Office, August 29, 2008
* * * * * R2009-008 * * * * *
TABLE 2.1A
COAL SUPPLIERS (TONS)
T URRIS
MONTEREY
#1 FREEMAN
CROWN
H ZIEGLER MURDOCH
1983
525,752
0
164,675
88,990
1984
759,382
20,083
0
0
1985
701,312
0
0
0
1986
791,662
0
0
0
1987
840,292
0
0
0
1988
896,395
0
0
0
1989
906,649
0
0
0
1990
907,094
5,000
0
0
1991
988,593
0
0
0
1992
933,105
0
0
0
1993
1,019,802
0
0
0
B ronSugr.RcpdfD40594
2_§
92S5034A
Electronic Filing - Received, Clerk's Office, August 29, 2008
* * * * * R2009-008 * * * * *
TABLE
2.2
MONTHLY OIL USAGE PER UNIT (GALLONS)
1 990 BOILER 7 BOILER 8 BOILER
31 BOILER 32 BOILER 33 TOTAL
J ANUARY
0
9,107
368
2,765
755
12,995
FEBRUARY
4,244
5,167
4,062
3,986
7,597
25,056
MARCH
5,089
4,077
1,095
3,359
9,427
23,047
APRIL
2,662
982
1,148
4,787
0
9,579
MAY
146
23
959
5,412
12,670
19,210
JUNE
4,601
4,001
11,851
12,754
8,592
41,799
JULY
9,294
9,886
7,116
3,835
6,029
36,160
AUGUST
5,202
5,118
1,250
5,981
4,483
22,034
SEPTEMBER
56
1,324
1,908
1,309
16,309
20,906
OCTOBER
0
2,350
1,704
24
2,702
6,780
NOVEMBER
5,146
3 845
5,072
0
1,757
15,820
DECEMBER
765
331
1,742
7,623
18,305
28,766
TOTAL
37,205
46,211
38,275
51,835
88,626 262,152
1991 BOILER 7 BOILER 8 BOILER
31 BOILER 32 BOILER 33 TOTAL
JANUARY
1
3 ,503
4,857
1,901
5,864
23,498
39,623
FEBRUARY
2,238
2,718
1,398
1173
10,553
18,080
MARCH
2,703
1,856
1,165
5.,746
14,723
26,193
APRII.
1 ,199
179
2,286
963
2,820
7,447
MAY
1,627
1,996
4,919
2,028
13,724
24,294
JUNE
7,624
7,162
1,290
9,311
3,993
29,380
JULY
8,614
4,319
2,409
1,495
3,503
20,340
AUGUST
5,470
7,209
3,516
4,335
5,460
25,990
SEPTEMBER
3,622
4,749
3,044
4,649
3,146
19,210
OCTOBER
1,043
592
1,904
1264
12,493
17,296
NOVEMBER
2,815
0
1,041
3,364
5,210
12,430
D ECEMBER
6 5904
7_000
2;333
212
535
16;984
TOTAL
47,362
42,637
27,206
40,404
99,658 257,267
1992 BOILER
7 BOILER
8 BOILER 31 BOILER 32 BOILER 33 TOTAL
J ANUARY
5,454
1,676
4,187
3,092
1,966
16,375
FEBRUARY
0
0
2,534
4,849
1,093
8,476
MARCH
5,207
2,505
8,291
4,506
4,351
24,860
APRIL
239
288
6,451
2,627
0
9,605
MAY
2,534
4,107
1,437
5,768
74,512
88,358
JUNE
4,901
1,730
5,511
4,925
17,963
35,030
JULY
3,719
5,402
699
7,501
5,633
22,954
AUGUST
4,863
4,511
936
11,539
13,313
35,162
SEPTEMBER
2,708
5,531
730
5,707
15,834
30,510
OCTOBER
1,668
4
0
3,774
4,545
9,991
NOVEMBER
3,995
3,221
4,166
293
7,489
19,164
DECEMBER
2,540
2,203
2,352
0
3,876
10,971
1 TOTAL
37,82 8 31,178
37,294
54,581
150,575 311,456
2
-6
Electronic Filing - Received, Clerk's Office, August 29, 2008
* * * * * R2009-008 * * * * *
TABLE
2.3
M
ONTHLY
GROSS
GENERATION
PER
UNIT
(KILOWATT
HOURS)
1 990 TURBINE 6 TURBINE 7 GEN. 31 GEN. 32
GEN. 33
TOTAL
JANUARY
0
56,168 19,879,500 40,602,000 89,673 000 150,210,668
FEBRUARY
798,100 1,833,622 27,800,700
7,813,200 94,108,000 132,353,622
MARCH
1,031,000
274,000 38,312,300 2,342
800 99 368,500 141,328,600
APRIL
17,310,000 17,603,900 45,996,400 46,631,100
0 127,541,400
MAY
1,717,500
1,549,900
10,606,100 30 959,900 84,826,000 129,659,400
JUNE
5,186,600 2,927,500 30,204,400 31,842,000 99,208,000 169,368,500
JULY
10,582,000 8,787,700 28,312
500 39,407,100 106,322,000 193,411,300_
AUGUST
5,593,400 3,437,900
39,423,000 37,557,000 102,999,000 189,010,300
S EPTEMBER 7,896,400 5,017,600 37,576 200 21,434,800
81,322
000
153,247 000
OCTOBER
0
0 40,584,300
0 104,874,000 145,458,3 00
NOVEMBER 5,946,600 5,287,000
27,616,700
0 97 463,000 136,313,300
DECEMBER 4,532,400 1,181,200 39,810,000 14,946,000 102,888,000 163,357,600
TOTAL
60,594,000
47,956,490 386,122,100 273,535,900 1,063,051,500 1,831,259,990
1 991 TURBINE
6
TURBINE
7 GEN. 31
GEN. 32
GEN. 33
TOTAL
JANUARY
464,800 207,800
38,934,600 37 546,200 99,458 000 176,611,400
FEBRUARY 1,661 200 1,475,200 35,166,600 35
697,300
80,235 000 154,235,300
MARCH
3,453,900 3,412,700 37,222,900
25102,000 81463,000 150,654,500
APRIL
12,528,900 17,236,300 46,021,300
47,304,100
0 123,090,600
MAY
563,100 11,177,000
6,579,000 43,481,400 101,189,600 162,990,100
JUNE
825,500 11,111,000
37,684,300 35,267,000 102,815 000 187,702,800
JULY
4,418,700 10,288,600 36,407,500 40,549,500 106,705,000
198,369,300
AUGUST
4,565 100 4,632,600
36,679 200 37,368,500 103,760,000 187 005,400
SEPTEMBER 3,899,400
1,168,700 27,866,000 35,983,000 89,537,000 158,454,100
OCTOBER
5,146,200 2,359 900 11 182200.
33,468,000 84,303,000 136X91300
NOVEMBER
6,100
0
15,319,200
35,859,000 104,813,000. 155,997,300
DECEMBER
1,209,000. 1,415,100 37,550, 00
9,178,800 107,679,000 157,032,500
TOTAL
3 8,741,900 1 64,484,900
366,613,400 416,804,800 1 1,061,957,600 1 1,948,602,600 1
1
992 TURBINE 6 TURBINE 7 GEN. 31
GEN. 32
GEN.
33
TOTAL
JANUARY 6,524,000 1,542,500
5,697 000 39 402,600 107 793,000 160,959,100
FEBRUARY
0
0 14,689,000 21,612,200 103,530,000 139,831,200
MARCH
12,948,200 15,823,300
22,161,700 14 014,400 73,898,900 138,846,500
APRIL
17,151,500 16,829,900
42,695,100 49,610,000
0 126,286,500
MAY
14,082,800 13,937,000
45,767,500 39,840,900 21,621,300 135,249,500
JUNE
3,408,900 2,935,000
31,039,700 28,651,100 91,017,000 157,051,700
JULY
1,428,100 1,320,100
39,606 300 40,387,000 101,742 000 184,483,500
AUGUST
2,760,300 1,226,400 37,170,600 25,888,200
98,513,000 165,558,500
SEPTEMBER 3,841,600
2,222,500 15,631,700 37383,300
89,710 0.00 148,789,100
OCTOBER
188,200
0
0 40,468,500 106,423,000 147,079,700
NOVEMBER 19,942,900
15,619 000
0
8,048,200
103$313)000
146,923,100
DECEMBER
449,700 20,041,000 46,857, 00
0 105,231,000 172,579,500
TOTAL
82,726,200 91,496,700 301,316,400
345,306,400 1,002,792,200 1,823,637,900
2-7
Electronic Filing - Received, Clerk's Office, August 29, 2008
* * * * * R2009-008 * * * * *
TABLE
2.4
CAPACITY FACTOR (TURBINE/GENERATOR)
1 990
UNIT 7 UNIT 8 UNIT 31
UNIT 32 UNIT 33
J ANUARY
0.000
0.000
0.285
0.584
0.566
FEBRUARY
0.014
0.054
0.437
0.123
0.664
MARCH
0 .018
0.000
0.545
0.034
0.632
A PRIL
0.553
0.564
0.682
0.697
0.000
MAY
0.042
0.042
0.149
0.437
0.537
JUNE
0.155
0.088
0.442
0.468
0.651
JULY
0.319
0.267
0.402
0.556
0.675
AUGUST
0.162
0.101
0.560
0.533
0.651
SEPTEMBER 0.244
0.156
0.549
0.318
0.529
OCTOBER
0.000
0.000
0.575
0.000
0.667
NOVEMBER
0.182
0.165
0.400
0.000
0.640
DECEMBER
0.130
0.032 - 0.561
0.213
0.653
1 991
UNIT 7 UNIT 8 UNIT 31
UNIT
32
UNIT 33
JANUARY
0.004
0.000
0.552
0.538
0.628
FEBRUARY
0.048
0.046
0.554
0.568
0.559
M
ARCH
0.098
0.101
0.526
0.361
0.532
APRIL
0.399
0.553
0.683
0.708
0.000
MAY
0.009
0.340
0.094
0.615
0.643
JUNE
0.016
0.349
0.551
0.520
0.676
J ULY
0.129
0.314
0.516
0.578
0.679
AUGUST
0.132
0.137
0.518
0.533
0.659
S EPTEMBER 0.116
0.031
0.408
0.527
0.587
O CTOBER
0.153
0.069
0.159
0.470
0.533
NOVEMBER
0.000
0.000
0.224
0.525
0.689
DECEMBER I 0 .025
0.0371
0.5301
0.11
0.68 7
1 992
UNIT 7 UNIT 8 UNIT 31 UNIT 32 UNIT 33
JANUARY
0.194
0.043
0.080
0.554
0.688
FEBRUARY
0.000
0.000
0.222
0.326
0.706
MARCH
0.400
0.490
0.310
0.200
0.469
APRIL
6.552
0.539
0.633
0.743
0.000
MAY
0.436
0.429
0.653
0.574
0.130
JUNE
0.103
0.089
0.452
0.419
0.598
JULY
0.037
0.033
0.563
0.576
0.646
AUGUST
0.078
0.032
0.524
0.369
0.624
SEPTEMBER 0.110
0.062
0.227
0.544
0.588
OCTOBER
0.000
0.000
0.000
0.573
0.678
NOVEMBER
0.637
0.503
0.000
0.112
0.680
DECEMBER 0.010
0.607
0.662
0.000
0.672
2-8
Electronic Filing - Received, Clerk's Office, August 29, 2008
* * * * * R2009-008 * * * * *
TABLE
2.5
MONTHLY
STEAM
DELIVERED
TO TURBINES
(POUNDS)
1 990
TURBINE 31
TURBINE 32 TURBINE
33
TOTAL
J ANUARY
167,220,000
315,140,000
529,858,000
1,012,218,000
FEBRUARY
232,800,000
89,263,926
560,490,000
882,5
3,926
MARCH
315,130,000
12 610,000
603,218,000
930,958 000
APRIL
397,030,000
396,890,000
5,500
793,925,500
MAY
87,880,000
250,650,000
541,676,000
880,206,000
JUNE
252,590,000
249,790,000
608,412,000
1,110,792,000
JULY
232 460,000
312 640,000
641,248
000
1,186,348,000
AUGUST
330,450,000
305,200;000
614,033,000
1,249,683,000
SEPTEMBER 314,570,000
182,660,000
484,711,000
981941,000
OCTOBER
334,820,000
0
630,421,000
965,241,000
NOVEMBER
227,930,000
0
579,149,000
807,079
000
DECEMBER
336,170,000
108,500,000
621,108,000
1,065,778,000
TOTAL
3,229,050,000 2,223,343,926
6 ,414,329.500
11-866-723,426
1991
TURBINE 31 TURBINE
32 TURBINE 33
TOTAL
JANUARY
1
3 31,530,000
262,530
000
597,286,000
1,191,346,000
FEBRUARY
292,700,000
257,140,000
482,935,000
1,032,775,000
MARCH
305,240,000
185,240,000
486,227,000
976,707,000
APRIL
400,010
000
403, 50,296
0
803,760,296
MAY
53,980,000
348,684,803
686,240,000
1,088,904,803
JUNE
311050,000
301,533,915
689,283 000
1,301,866,915
JULY
284,070,000
334,550,405
714,097,000
1,332,717,405
AUGUST
294,600 000
309,083,251
696,917 000
1,300 600,251
SEPTEMBER 232,350,000
281,732,793
608,948,000
1,123,030,793
O CTOBER
95,540,000
224,958
582
568,303,000
888,801,582
NOVEMBER 129,830,000
231,117,111
714,638,000
1,075,585,111
DECEMBER 315,290,000
62,840,000
729,340,000
1,107,470,000
1 TOTAL
3,046,190,000 3,203,161,157
6,974,214,000
13,223,565,157
1992
TURBINE 31 TURBINE 32 TURBINE
33
TOTAL
JANUARY
47,930,000
289,720,000
724,215,000 1,061
865 000
FEBRUARY
126,860,000
180,225,696
691,828 000
998,913,696
MARCH
194,520,000
124,982,292
495,190,000
814,692,292
APRLI.
3 72,870,000
436,001,533
0
808,871,533
MAY
388,410,000
347,651049
119,704,000
855,765,049
JUNE
270,390,000
256,170,785
532,323,000 1,058,883,785
JULY
330,970,000
343,913,723
600
956,000
1,275,839,723
AUGUST
278,700,000
213,612,849
574,795,000
1,067,107,849
SEPTEMBER
143,120,000
318 594,176
533,155,000
994 869,176
OCTOBER
0
322,610,270
631,422,000
954,032,270
NOVEMBER
0
61,151 765
631,332,000
692
483,765
DECEMBER
395,530,000
0
638,752,000 1,034,282,000
TOTAL 1 2,549,300,000 2,894,634,138
6,173,672,000 11,617,606,138
2-9
Electronic Filing - Received, Clerk's Office, August 29, 2008
* * * * * R2009-008 * * * * *
TABLE 2.6
M
ONTHLY
CIRCULATING
WATER
PUMP
USAGE (GALLONS)
1 990
UNIT
31
&
32
UNIT 33
TOTAL
JANUARY
2,394,630,000
2,901,600,000
5,296,230,000
FEBRUARY
1,451,940,000 1,184,820 000
2,636,760,000
MARCH
1,944,810,000
3,881,670,000
5,826,480,000
APRIL
4,581,150,000
0
4,581,150,000
MAY
3,232,110,000
5,050,110,000
8,282,220,000
JUNE
4,959,150,000 5,428,410,000
10,387,560,000
JULY
5,599,860,000
5,616,000,000
11,215,860,000
AUGUST
5,973,450,000
5,596,890,000 11,570,340,000
SEPTEMBER
:4,332,300,000
4,096,950,000
8,429,250,000
OCTOBER
3,024,000,000 3,456,570,000
6,480,570,000
NOVEMBER
2,417,940,000 2,780,700,000
5,198,640,000
DECEMBER
2,378,040,000 3,370,380,000
5,748,420,000
[ TOTAL
42,289,380,000 43,364,100,000
85,653,480,000
Jan.
1990 (Unit 33) Estimated
1 991
UNIT 31 & 32
UNIT 33
TOTAL
JANUARY
3,025 260,000 2,883 660,000
5,908,920,000
FEBRUARY
2,720,970,000
2,527,980,000 5,248,950,000
MARCH
2,535,330,000
3,969,030,000 6,504,360,000
A PRIL
4 ,092,270,000
12,480,000 4,104,750,000
MAY
3,240,930,000 5,362 500,000
8,603,430,000
JUNE
5,465,670,000 5,432,310,000
10,897,980,000
JULY
5,986 260,000
5,620,290,000
11,606,550,000
AUGUST
5,802,090,000 5,612,100,000
11,414,190,000
SEPTEMBER
4,779,180,000
5,226,780,000 10 005,960,000
OCTOBER
3,241,140,000 5,174,520,000.
8,415,660,000
NOVEMBER
2,684,430,000
555525430,000 8,236,860,000
DECEMBER
1,771,350,000
2,807,220,000 4,578,570,000
TOTAL
45,344,880,000
1 50,181,300,000
95,526,180,000
1 992
UNIT 31 & 32
UNIT 33
TOTAL
JANUARY
1,806,210,000
2,806,830,000
4,613,040,000
FEBRUARY
1,407 630,000
3,004,560,000 4,412,190,000
MARCH
1,335,600,000
4,095,780,000
5,431,380,000
APRIL
3,597,300,000
`
0
3,597,300,000
MAY
4,875,360,000 2,336,880,000 7,212,240;000
JUNE
4,374,510,000 5,272,410 000
9,646,920,000
JULY
4 ,536,420,000
5,607,030,000 10,143,450,000
AUGUST
4,218,480,000 5,615,610,000
9,834,090 000
SEPTEMBER
4,344,480,000 5,616,000,000 9,960,480,000
OCTOBER
3,372,600,000 5,438,160,000
8,810,760,000
NOVEMBER
1,142190,000
5,429,580,000
6,571,770,000
D ECEMBER
1,503,810,000
3,648,060,000
5,151,870000
L TOTAL
36,514,590,000 48,870,900,000
85,385490000
2-10
Electronic Filing - Received, Clerk's Office, August 29, 2008
* * * * * R2009-008 * * * * *
/.- 1ORANNG5192550410
09TWO OJ12JI94 12.-0 0 HWC
0 11 Emergency Overflow
Water
Purification
P lant
0 02 121.9 MGD Cooling Water
Emergency Overflow
- -
I
' 29.0 MGI
I
0 08 Emergeng
Overflow
(
-
P
--------------
Lakeside Power Plant
001
A
jý-20 MGD
Ash Scrubbe
Pond Sludge
I
Disposal
Site
C
larification
Pond
W WTP
.01 MGD
0 06 Ash Pond Pumped 10 MGD When Used
WATER FLOW SCHEMATIC CWLP POWER PLANT
COMPLEX TECHNICAL
SUPPORT
DOCUMENT
FOR
PETITION
FOR ADJUSTED
BORON
STANDARDS
FOR SUGAR CREEK
AND
THE
SANGAMON
RIVER
Electronic Filing - Received, Clerk's Office, August 29, 2008
* * * * * R2009-008 * * * * *
TABLE 2.7
D
EMINERALIZER AND EVAPORATOR PRODUCTION (GALLONS)
1 990
EAST
DENIIN. WEST DEMIN. EVAPORATOR
TOTAL
JANUARY
1,421,800
1,035 100
146,550
2,603,450
FEBRUARY
832,500
1,127,000
466,360
2,425,860
MARCH
1,144 600
960,100
375,660
2,480,360
APRIL
1,391,500
1,073,400
119,940
2,584,840
MAY
1,116,700
995,400
283,910
2,396,010
JUNE
1,269,500
1,106,000
310,090
2,685,590
JULY
1,632,100
1,145,700
310,590
3,088 390
AUGUST
1,513,600
975,200
195,850
2,684,650
SEPTEMBER
1,522,300
1,325,600
263,250
3,111,150
OCTOBER
1,128,200
698,600
0
1,826,800
NOVEMBER
1,176 100
825,100
0
2,001,200
DECEMBER
1;477,300
1,126,300
0
2,603,600
TOTAL
15,626,200
12,393,500
2,472,200
30,491,900
1 991
EAST DEMIN. WEST DEMIN. EVAPORATOR
TOTAL
J
ANUARY
1,214,700
1,380,000
80,910
2,675,610
FEBRUARY
1,130,100
1,305,400
125,820
2,561,320
MARCH
1,125,100
1,462,000
306,050
2,893,150
A
PRIL
9 91,60.0
466,500
543,670
2,001,770
MAY
1,088,300
904,300
693,800
2,686,400
J UNE
1,216,300
153,900
867,560
2,237,760
J ULY
1,326100
1,202,900
744,010
3,273,010
AUGUST
1,123,800 .
1,260,600
394,950
2,779,350
S EPTEMBER
1,289,100
946,500
125,580
2,361,180
OCTOBER
1,303,100
880,800
71,190
2,255,090
NOVEMBER
1,394,100
1,104,600
0
2,498,700
DECEMBER
806,900
1,438,900
423,150
2,668,950
TOTAL 1
14,009,200 1
12,506,400
4,376,690 1
30,892,290
1 992
EAST DEMIN. WEST DEMIN. EVAPORATOR
TOTAL
JANUARY
824,800
1,195,700
515,800
2,536,300
FEBRUARY
1,444,000
1,102,200
65,570
2,611,770
MARCH
1,881,800
994,300
190,560
3,066,660
APRIL
1,151 600
1,094,500
0
2,246,100
MAY
1,794,100
1,768,000
547,920
4,110,020
JUNE
1,081,800
1,537,400
515170
3,134,370
JULY
866,700
1,489,100
355,920
2,711,720
AUGUST
1,250,400
1,621,700
313,150
3,185,250
SEPTEMBER
1,557 200
965,600
531,000
3,053,800
OCTOBER
1,306,700
1,034,500
33,750
2,374,950
NOVEMBER
1,963,900
1,162,000
83,800
3,209,700
DECEMBER
1,737,000
898,200
967,900
3,603,100
TOTAL
16,860,000
14,863,200
4,120,540
35,843,7401
2-12
Electronic Filing - Received, Clerk's Office, August 29, 2008
* * * * * R2009-008 * * * * *
TABLE 2.8
MONTHLY ASH SLUICE PUMP
USAGE
(GALLONS)
1 990
UNIT 31 & 32
UNIT 33
TOTAL
JANUARY
115,
731,
000
181,656,000
297,387,000
F
EBRUARY
8,676
000
119,916,000
128,592,000
MARCH
25,830,000
129,582,000
155,412,000
APRIL
123,678 000
29 520,000
153,198,000
MAY
62,442,000
118,404,000
180,846,000
JUNE
105 048,000
124,020,000
229,068,000
JULY
124,830,000
126,018,000
250,848,000
AUGUST
121,608 000
127,476,000
249,084 000
S EPTEMBER
91,422,000
129,132,000
220,554,000
O CTOBER
58140,000
85,032,000
143,172,000
NOVEMBER
25,470,000
123,876,000
149,346,000
DECEMBER
85,338,000
129,132,000
214,470,000.
TOTAL
948,213,0001 -
r,423,764,000
2,371,977,000
Jan. 1990 (Unit 31 & 32) Estimated
1991
UNIT 31 & 32
UNIT 33
TOTAL
JANUARY
128 808,000
129,636,000
258,444,000
FEBRUARY
106,524-1000
107,496,000
214,020,000
MARCH
122,706,000
107,136 000
229,842 000
A
PRLI,
1
16,784,000
24,300,000
141,084,000
MAY
123,246,000
124,236,000
247,482,000
JUNE
96,156,000
124,164,000
220,320,000
JULY
125,532,000
129,420,000
254,952 000
AUGUST
123 462,000
124,740,000
248,202,000
SEPTEMBER
100,962 000
122,634 000
223,596 000
O CTOBER
107,856,000
103,716,000
211,572,000
NOVEMBER
101,502 000
121,770,000
223,272 000
DECEMBER
__
119,592,000 . 127,998,000
247,590,000
TOTAL
1,373,130,000 1,347,246,000
2,720,376,000
1992
UNIT 31 & 32
UNIT 33
TOTAL
JANUARY
102,654,000
129,438,000
232,092,000
FEBRUARY
79,416,000
118,638,000
198,054,000
MARCH
58,932,000
96,390,000
155,322,000
APRIL
122,256,000
0
122,256,000
MAY
128,412,000
65,934,000
194,346,000
J UNE
116,622,000
116,946 000
233,568,000
J ULY
127,620,000
127,926,000
255,546,000
AUGUST
125,064,000
126,198,000
251,262,000
SEPTEMBER
122,688,000
121,680,000
244,368,000
OCTOBER
69,894 000
125,874,000
195,768,000
NOVEMBER
2,106,000
124,812,000
126,918,000
DECEMBER
126,252,000
126,612,000
252,864,000
TOTAL
1,181,916,000
1,280,448,000 2,462,364,000
2-13
Electronic Filing - Received, Clerk's Office, August 29, 2008
* * * * * R2009-008 * * * * *
complex. They are: Dallman
Units 1 and 2, Dallman Unit 3, and Lakeside: All three systems
are used to transport both bottom ash and fly ash from their respective
boilers. The ash transport
systems
all
discharge to
the
power station's ash ponds (Figure 2.2). Bottom ash and fly ash are
deposited in the ash pond system through
settling of suspended solids. On average,
approximately 6'.5 million gallons of water
are discharged from the ash transport system to the
ash ponds each day.
Sludge from the filter
plant, scrubber, and ash from the two power
stations are
contained
in two settling ponds
north of Spaulding Dam near Sugar Creek. Effluent from these two
settling
ponds flows into a clarification pond. The discharge
stream from the clarification ash pond is
made up from the following wastewater
sources:
Lakeside Plant Fly Ash and
Bottom Ash
Dallman Plant Fly Ash and Bottom Ash
Non-Chemical Metal Cleaning Wastes
Lime
Sludge from the City Water Purification Plant
Flue
Gas Desulfurization System Wastes
Industrial
Wastewater Treatment Plant Sludge
Water Treatment Plant Yard Drains
Scrubber Disposal Wastes (Leachate)
2.66 MGD
4.32 MGD
Intermittent
0.33 MGD
Intennittent
0.19 MGD
Intermittent
Intermittent
The
fly ash and bottom ash sluice waters from Lakeside are pumped
into
the
Lakeside
ash pond, and
the supernatant then discharges into the clarification pond.
The Dallman fly ash
and bottom
ash sluice waters and the wastewater plant sludge are pumped through ash
lines
to
the Dallman ash pond, where the
supernatant goes into the clarification pond. The wastewaters
from the filter plant are pumped to Lakeside
ash
pond with
the supernatant discharging into the
clarification pond. The
flow rates from these waste sources vary
depending
upon the
number of
generating units
in service.
Dallman
ash pond was put into service in 1978 and has
received bottom and fly ash from
Dallman
Units 31, 32, and 33. Bottom and fly ash from Lakeside's
Units 6 and 7 started to be
transported
several years later. Approximately 70 percent
of
the
original Dallman pond volume
has been used.
B ronSugr.Repdf040594
2-14
92S5034A
Electronic Filing - Received, Clerk's Office, August 29, 2008
* * * * * R2009-008 * * * * *
The
discharge from
the clarification
ash pond normally goes into
Sugar
Creek
at outfall
004, shown
in Figure
2.1.
However, during low lake level periods when
water
conservation
is
necessary, the
discharge can be pumped back into Lake Springfield (outfall 006). Flow
from
outfall 004 is controlled by a rectangular weir and gates. Water levels in the clarification pond
vary depending on ash removal in the Dallman pond.
The treatment of these wastewater sources is a unique settling and neutralizing system.
The
ash sluice
waters
are normally
acidic
with
floating
suspended solids;
the water
plant
wastes
are normally basic with excess lime available; and the wastewater plant sludge contains polymer
and other coagulants
for flocculation.
When
all of
these
waste streams are blended
together in
the clarification
ash pond, neutralization and settling takes place naturally
without
additional
chemicals being fed.
The
CO2
feed
system was installed to keep the pH between 6 and 9 as required by IEPA.
This feed system is located inside
of
the outfall
structure building
and is fed from a
storage
tank
outside of the building.
Total ash production is primarily a function of the coal source, combustion process, unit
operational procedures,
and total coal usage.
2.3 OUTFALL AND DISCHARGE DESCRIPTION
2.3.1
Outfall 003 -
Lakeside
Plant Storm Sewer
The source of this discharge is storm water runoff from the Lakeside
Power
Plant. The
effluent is routed from the power plant by an underground pipe, which discharges
into
the Sugar
Creek channel near the east side of the Spaulding Dam Spillway (Figures 2.1 and 2.2). Sampling
of the
outfall 003 discharge is conducted at
this
point
before it
enters
the creek channel. This
outfall may be picking up boron from inside the Lakeside Power Plant and from the actual
discharge area where bottom ash was deposited from slag tank overflow during past discharges.
B ronSugr.Repdtb40594
2-15
92S5034A
Electronic Filing - Received, Clerk's Office, August 29, 2008
* * * * * R2009-008 * * * * *
2.3.2
Outfall 004 - Ash Pond Discharge
Outfall 004 discharges
into Sugar Creek from a clarification
pond, which receives effluent
from the
Lakeside and Dallman Power
Plants' ash and lime sludge
ponds (Figures 2.1 and 2.2).
Outfall
004
is
sampled before it enters
Sugar Creek. The Lakeside
and Dallman ash ponds
contribute
boron to the discharge
from this outfall.
2.3.3
Outfa11006 - Ash Pond Discharge
Outfall
006 is the same discharge (waste stream)
as outfall 004, but is directed
back to
Lake
Springfield at a maximum
rate of 10 mgd during times
of low lake levels (Figures
2.1
and 2.2).
Under normal circumstances,
outfall 004 is the preferred discharge
point. Outfall 006
has only been used
during periods of low lake levels
as a supplement to pumping
from the South
Fork pumping
station. Records
show that since 1976, outfall
006 has been used 19 months in
four episodes
where low lake level conditions
existed. Table 2.9
shows pumpage rates from
these time periods
for outfall 006.
B ronSugnRepdf040594
2-16
92S5034A
Electronic Filing - Received, Clerk's Office, August 29, 2008
* * * * * R2009-008 * * * * *
TABLE 2.9
CLARIFICATION POND RECIRCULATING WATER PRODUCTION-OUTFALL 006
MILLIONS OF GALLONS
1976
1977
1978
1979
1980
1981
1982
1983
1984
1985
1986
1987
1988
1989 1990 1991
1992 Totals
Jan.
0
0
0
0
111
45
0
0
0
0
0
0
0
175
144
0
0
475
Feb.
0
0
0
0
0
81
0
0
. 0
0
0
0
0
191
111
0
0
383
Mar.
0
0
0
0
0
155
0
0
0
0
0
0
0
47
52
0
0
254
Apr.
0
0
0
0
0
0
0
0
0
0
0
0
0
0
0
0
0
0
May 0
0
0
0
0
0
0
0
0
0
0
0
0
0
0
0
0
0
Jun.
0.
0
0
0
0
0
0
0
0
0
0
0
0
0
0
0
0
0
Jut.
0
0
0
0
0
0
0
0
0
0
0
0
0
0
0
0
0
0
A ug.
0
0
0
0
0
0
0
0
0
0
0
0
0
0
0
0
0
0
S ep.
0
0
0
0
0
0
0
0
0
0
0
0
0
0
0
0
0
0
Oct.
0
0
0
0
72
0
0
0
0
0
0
0
53
0
0
0
0 , 125
Nov.
0
0
0
90
157
0
0
0
0
0
0
0
89
0
0
0
0
336
Dec.
0
0
0
68
216
0
0
0
0
0
0
0
182
201
0
0
0
667
---------------------------------------------------------------------------------------------------------------------------------
0
0
0
158
.556
281
0
0
0
0
0
0
324 614
307
0
0
2240
B ronSugr.Repdf040594
2-17
92S5034A
Electronic Filing - Received, Clerk's Office, August 29, 2008
* * * * * R2009-008 * * * * *
3.0 RESOURCES
OF SUGAR CREEK AND ASSOCIATED
SANGAMON RIVER
3.1 Natural Features
3.1.1
Sam amon River Basin
The Sangamon River Basin
(see Figure 3.1) is located in the
Springfield Plain Division
of the
Central Lowland Physiographic Province. The
surrounding topography is a
relatively
flat-
lying glacial till
plain moderately dissected by dendritic drainage
systems. Elevations range from
about 580 ft on uplands to 520 ft within the
Sugar Creek, Sangamon River, and South
Fork
River
Valleys.
Geologic mapping of the
area indicates the Wisconsinan-aged windblown
loess
(predominantly
silt of the Peoria Loess and Roxana
Silt formations) comprises the upper 100 to
150 in. of
suri"icial material. Modem soils have developed
within the upper few feet of loess
material.
The loess is often absent within
stream valleys due to erosion.
Roughly
50 ft of glacial till underlies
the loess. The glacial tills are commonly
an
unsorted mixture
of compact clay, silt, and sand with
lesser amounts of gravel, cobbles,
and
boulders. The thickness of the
glacial till varies greatly due to variations
in bedrock topography
and
stream erosion.
The uppermost
bedrock is Pennsylvanian-aged sedimentary
rock. The bedrock consists
of cyclic
sequences of sandstone, siltstone,
shale, limestone, and coal. Bedrock outcrops
are not
uncommon along the
Sangamon River and South Fork stream
valleys.
3 .1.2 Sangamon
R
iver
The watershed of the
Sangamon River comprises about 5,419
square miles, all of which
lie in the central part
of Illinois (Figure 3.1). It includes
either all or the major portions
of
McLean, Piatt, DeWitt,
Macon, Logan, Sangamon,
Christian, Menard, Mason, and Cass counties,
B ronSugr.Repdft140594
3-1
92S5034A
Electronic Filing - Received, Clerk's Office, August 29, 2008
* * * * * R2009-008 * * * * *
a.trarat.t roottetta
ACL&CI
STOREY
SYSTEM
e
text
a A lLtl
to
ýo
MAJOR
RIVER
BASINS
OF ILLINOIS
HANSON
ENGINEERS
l "C"9PC."* I .
TECHNICAL
SUPPORT
DOCUMENT
FOR
PETITION
FOR
ADJUSTED
BORON
STANDARDS
FOR SUGAR
CREEK
AND
THE SANGAMON
RIVER
i
J ob No.
92S5034A
Figure
3.1
3 -2
Electronic Filing - Received, Clerk's Office, August 29, 2008
* * * * * R2009-008 * * * * *
and minor
portions of Tazewell, Ford, Champaign,
Shelby, Montgomery, Macoupin,
and Morgan
counties. Practically
all
of the
area is tillable and, for the
most part, is cultivated.
The
Sangamon River originates in the central
portion of McLean
County at a point about
12 miles east of Bloomington
and flows southeasterly
for about 35 miles, then
southwesterly
about 110
miles. From Roby, the stream
takes a northwesterly course
for 64 miles to Mile 34.5
where
the Sangamon River is joined
by Salt Creek, its largest tributary.
At Mile 34.5, the
Sangamon River makes
a sharp right-angled turn to the
west, flowing in a general westerly
direction and joins the
Illinois River near Mile 89
of that stream about 8 miles
above
Beardstown.
The total length of the
Sangamon River is about 250
miles, while the length of the
valley
it occupies is about 170 miles.
At its source, the Sangamon
River is about 850 ft above
sea level. The total fall of the
river from
its source to its mouth is about 420
ft. In the upper 10 miles, the fall is
120 ft, or an
average of 12 ft per
mile, and for the remaining 240
miles of the river the
fall is 300 ft, or an
average of 1.25 ft per
mile.
The
Sangamon River's low water width varies
from 80 to 240 ft, with
the average being
150 ft. The high
water average width is about three-fourths
of a mile.
The whole length of the
Sangamon River is characterized
by a series of pools and
shoals;
the latter, on
the average, are about a mile
apart. Average depths of these
pools and shoals are
4 ft and
1 ft. respectively. There are five major impoundments
within the basin,
including: Lake
Decatur (which is the only lake
located directly on the Sangamon
River), Lake Springfield,
Lake
Taylorville,
Sangchris Lake, and
Clinton Lake.. Lake Decatur is the
deepest portion of the river,
with low water
pool at a depth of 17 ft. The extreme
flood stage varies from a minimum
of 6ft
above low water
at Decatur Dam to a maximum
of 29 ft above low water just above
Riverton.
The average high
water increment for the reach between
Decatur and the mouth of the
river is
about 24 ft.
B ronSugr.Repdt040594
3-3
92S5034A
Electronic Filing - Received, Clerk's Office, August 29, 2008
* * * * * R2009-008 * * * * *
At Riverton, the
Sangamon River
can
have bank-full discharges up to 6,000 cubic ft per
second
(cfs).
In 1991 (USGS, 1991), the annual mean flow at
Riverton was 2,299 cfs.
3.1.3 South Fork
of the Sangamon River
The South Fork is the second largest tributary
of
the
Sangamon River. The South Fork
is
about 88 miles long and drains an area of
885 square miles, which comprises 16 percent of
the total Sangamon River watershed.
The South Fork originates in Christian County and
flows northwest for 48 miles before
entering
the southeastern part of Sangamon County. It flows into
a meander of the Sangamon
River, which also receives
flow from Sugar Creek about 4 miles east of Springfield.
The stream
has been
dammed in Christian County to form Lake Taylorville (1,286
acres). The stream banks
are lined with
timber. Several riffle areas are present along the
stream. Brush piles are very
numerous in the
stream, and there are few sand and gravel bars.
Silt is the predominant bottom
type, but some
sand, gravel, and rubble are present. Most of the watershed
is cropland.
T he average
width of
the South Fork -is 68 ft. The
slope of the stream is very flat, with
an average
fall of less than
1 ft per mile. In 1991, the mean annual flow
at Rochester was 774
cfs (USGS, 1991).
3.1.4
Sugar C reek
Sugar Creek originates in the
extreme southwestem corner of Sangamon
County and then
swings south into Macoupin County for 6 miles before
it turns north and again enters Sangamon
County. The stream
then meanders northeast for 15 more miles before
entering Lake Springfield.
Below the dam, the
stream continues flowing northeast for 7
miles before emptying into the
South Fork about 4 miles
east of Springfield. At this point, the South Fork is combined
with
flow from a meander of the Sangamon
River. Sugar Creek is a fifth order tributary
to the South
Fork.
B ronSugr.Repdft140594
3-4
92S5034A
Electronic Filing - Received, Clerk's Office, August 29, 2008
* * * * * R2009-008 * * * * *
The creek has an overall average width of
about 20 ft with a gradient of 3.8 ft per mile.
Stream width from Lake Springfield to the South
Fork varies from 35 to 70 ft with a mean depth
of 1.8 ft. The substrate is very soft
and comprised primarily of silt/mud (26.7 percent), plant
detritus
(20 percent)
and submerged logs (13.3 percent). Some sand
and gravel is also present.
Sugar Creek is a series of pools and
riffles with a thin band of timber along the banks.
Brush piles are numerous in the stream. Sugar Creek flow
is
primarily
controlled by the outflow
from Lake Springfield.
3 .1.5 Lake Springfield
Lake Springfield is the largest
municipally owned lake in Illinois, covering 6.6 square
miles and encompassing 52,200 acre-ft (17 billion gallons) of storage
in 1984 (at normal pool
elevation
of 559 ft
msl). The deepest point is 30 ft with a mean depth of 12.5 ft. The lake is
the primary
source
of potable water for the City of Springfield. It was constructed
in 1934 by
impoundment of Sugar Creek by the Spaulding Dam at the southeastern edge
of
Springfield.
The lake and its watershed are located south
of Springfield in Sangamon, Morgan, and
Macoupin Counties (Figure 3.2). The
two major streams flowing into the lake are Sugar Creek
and Lick
Creek,
which join at the upper end of the lake.
The watershed area
covers 265
square
miles and is primarily a level to gently-sloping
plain which is incised in the lower portions by the valleys of Sugar and
Lick
Creeks.
The
streams in the upper portions of the watershed are shallow
and less
pronounced.
Elevations vary
from 700 ft msl at Waverly, Illinois,
to 559 ft msl at Spaulding Dam.
The soils
of the watershed formed in loess deposits up to 8 ft thick, which are underlain
by Illinoisan drift. As shown in Table 3.1, the land use has been estimated
as
88 percent
cropland, 8 percent pasture, 1 percent woodland, and 3 percent other (Lee and
Stall,
1977).
B
ronSugr.Repdt040594
3-5
92S5034A
Electronic Filing - Received, Clerk's Office, August 29, 2008
* * * * * R2009-008 * * * * *
0
1 2
3
t S
I L ýSE
) ZO-cewpin Cownff
X! A -r
rN
T y.mil
E nmSnl'ELJ
BOUNDARY
-
D lýERNON
C.
sq
P ump
?
STATION
-N
LAKE
SPRINGFIELD WATERSHED
TECHNICAL SUPPORT
DOCUMENT
FOR
0
e
Cy
W AVERLY
1
u
N EW
BERLIN
LOAMI
I
CK1ýc
i"sa
RIVft10N
! C C
cc
O
F
s
Z
O
S OUTH
I
F
ORK
c'
D AM
2
h
ý '
r-44-CA
A!lrOCHESTER
S PRINGFIELD
4
Gt,S C R.
4r.
I'
ýnAln.T
G
P
vtN
ý
o
Aft ý£R
eý?fir
_..../ý:A G _ T °cý
.h
C
HANSON
ENGINEERS
l icalao/Alas
S
O
f Oý
C URRAN
PETITION
FOR ADJUSTED
BORON
STANDARDS
FOR SUGAR CREEK
AND
THE SANGAMON
RIVER
lJob No. 92S5034A
Figure 3.2
3-6
A UBURN
PAWNEE
Cam,.
S ongomon Counly
_
_ý
V IRDEN
I
Electronic Filing - Received, Clerk's Office, August 29, 2008
* * * * * R2009-008 * * * * *
TABLE 3.1
LAKE SPRINGFIELD WATERSHED LAND
USES
Land
Area
Percent
Use
(Acres)
C ropland
145,522
88
Pasture
13,229
8
Woodland
1,654
1
Other
4,961
3
Total
165,366
100
( From
CWLP, 1987)
B ronSugr.Repdf040594
3-7
92S5034A
Electronic Filing - Received, Clerk's Office, August 29, 2008
* * * * * R2009-008 * * * * *
3.2 ENVIRONMENTAL
OUALTTY
3.2.1
Water Uses
The types of water use and the extent of
these uses were investigated for: Sugar Creek
from Spaulding Dam to
where it meets the South Fork of the
Sangamon River, the lower half
of the South Fork;
and the Sangamon River from Roby to its confluence with
Spring Creek just
north of Springfield. The following
organizations and agencies were contacted
for information
on known
water uses for these stream reaches; the Illinois
Department of Transportation, the
Illinois State Water Survey, the Illinois
Department-of Energy and Natural
Resources, the Illinois
Environmental Protection Agency (state
and regional offices), the Illinois
Department of
Agriculture,
the Sangamon County Soil and Water
Conservation District, the Sangamon County
Cooperative
Extension Service of the University of Illinois,
and Springfield City Water, Light
and Power.
There are no permitting requirements for water
withdrawal from Illinois streams
(e.g.,
crop irrigation),
unless there is a stream modification involved
(e.g., channelization, dam
construction). According to the
agencies contacted, there are no such permitted
water uses on
these stream reaches. The only public
water supply in this area is
Lake Springfield, which
supplies
the City of Springfield. None of the agencies
contacted had any record or knowledge
of any other present water withdrawal
within these stream reaches.
However, on October 1,
1993, public notice was given concerning an
application for a construction permit for
an intake
and
pumping station for irrigation water withdrawal
from the Sangamon River
north of
Springfield, to
supply the Rail Golf Course. As of this writing,
no permit has been issued.
The primary permitted
use of Sugar Creek from below
Lake Springfield and the
Sangamon River from its confluence with
Sugar Creek and the South Fork
downstream to its
confluence with Spring Creek, north of
Springfield, is receiving NPDES permitted
discharges.
Table
3.2 lists the NPDES permitted discharges for these receiving
streams. Figure 3.3 shows
the locations of these
discharges. The City Water, Light and Power
outfalls and the Springfield
Metropolitan
Sanitary District's (SMSD) Sugar Creek plant outfalls
discharge into Sugar Creek.
B ronSugr.Repdt040594
3-8
92S5034A
Electronic Filing - Received, Clerk's Office, August 29, 2008
* * * * * R2009-008 * * * * *
TABLE 3.2
NPDES DISCHARGES TO SUGAR CREEK AND
SANGAMON RIVER, SPAULDING DAM TO SPRING CREEK
Design
Average
Permit
Flow
Permit
Holder
I.D. No.
Outfall
C ity Water, Light &
IL0024767 003-Lakeside plant
storm 0.40
Power
sewer
MGD(intermittent)
004-Ash pond discharge
7.54 MGD
Clear Lake Sand &
IL0026611
001-Surface
water
runoff
Gravel, Inc.
002-Surface water runoff
003-Surface water runoff
River Oaks Village
IL0062651 001-Sewage treatment
0.053 MGD
Mobile Home
Park
plant discharge
Riverton
Sewage
IL0021041 001-Sewage treatment
0.30
MGD
Treatment Plant
plant discharge
H ospital Sisters St.
IL0049565
001-Sewage
treatment
0.135 MGD
Francis
plant
discharge
Mother House and
Convent
S pringfield Metro.
IL0021971 008-Sewage treatment
10.0 MGD
Sanitary District-Sugar
plant discharge
Creek
010-Excess flow
25-100 MGD
rýnnd nv rflnw
r---_
----
..
S pringfield Metro.Sanitary
IL0021989 007-Sewage treatment
13.9 MGD
District-Spring
Creek
plant
discharge
(From IEPA, January 1993)
B ronSugr.Repdl040594
3-9
92S5034A
Electronic Filing - Received, Clerk's Office, August 29, 2008
* * * * * R2009-008 * * * * *
Electronic Filing - Received, Clerk's Office, August 29, 2008
* * * * * R2009-008 * * * * *
The SMSD's Spring Creek plant outfall discharges into
Spring Creek at its
confluence with the
Sangamon River. The rest of the outfalls listed in Table 3.2 discharge into the Sangamon River
between its confluences with
the South Fork and Spring Creek.
3.2.2
Analytical Water Ouality
The IEPA operates an
Ambient Water Quality Monitoring Network (AWQMN) consisting
of 208 fixed stations. This monitoring program is designed to
establish baselines of water
quality
and characterize
and define trends in the physical, chemical, and biological condition of the
State's surface waters. Data
from four of the AWQMN sampling stations were used in this
report. Figure 3.4 shows the locations of the four
stations
within
the area of study. Station
E16,
near
Roby, is about 11 miles upstream of the confluence of the South Fork and Sugar Creek with
the Sangamon
River. Station E26, near Riverton, is 2.2 miles downstream from the confluence
of the South Fork and
Sugar Creek with the Sangamon River. Site EO-01 is located on the
South Fork at the Illinois Route
29 bridge and is about 4.7 miles upstream from its confluence
with Sugar
Creek and the Sangamon River. Station EOA-01 is located on Sugar Creek at the
Illinois Route 29 bridge about
one
mile
southeast of Springfield.
Table 3.3 shows analytical
data for the four AWQMN sampling stations. The 1987 Water
Year
Data Report was the last USGS publication with analytical
data for station EOA-O1. The
values presented in Table
3.3 are calculated averages for samples taken during the period of
October 1986 through September 1987. Analytical results
for all four stations were within the
federal and state guidelines listed in Table
3.3.
Of all
four stations, EOA-01 on Sugar Creek had the lowest values for
specific
conductance, turbidity; chemical oxygen
demand, total suspended solids, total volatile solids,
nitrogen, and total iron. EOA-01 had a
slightly
higher
average temperature than the other
stations, possibly due to thermal influence
from the upstream CWLP power station cooling
operations
in Lake Springfield near Spaulding Dam. The
slightly
higher values
at
EOA-01
for
hardness, calcium,
and sulfates could be due to the CWLP discharges, which are located
about
B ronSugr1;tepdl040594
3- 11
92S5034A
Electronic Filing - Received, Clerk's Office, August 29, 2008
* * * * * R2009-008 * * * * *
=,'P
1 .5
riampip
stuff
° N ý
1 1
AREA
OF STUDY WITH
SAMPLING
STATIONS
S cale In Miles
" N-
0
1.5
3
TECHNICAL SUPPORT DOCUMENT FOR
PETITION
FOR
ADJUSTED BORON
STANDARDS FOR SUGAR CREEK
AND THE SANGAMON RIVER
Job
No. 92S5034A
F igure 3.4
3 -12
Electronic Filing - Received, Clerk's Office, August 29, 2008
* * * * * R2009-008 * * * * *
TABLE 3.3
WATER QUALITY
DATA()
Maximum
Allowable
Sangamon R. .
Sugar
Level
or
Sangamon R.
Riverton South Fork
Creek
Parameter")
Range
Roby
(E16)
(E26)
(EO-O1) (EOA-O1)
Specific Conductance (umhos/cm)
835
731
573
672
pH
(std. units)
6.5-9.0(3'
7.79
7.58
7.32
7.73
Temperature (°C)
13.4
13.8
13.1
14.1
Turbidity (NTU)
4.6
5.3
6.0
4.2
Dissolved Oxygen (mg/L)
>5.013,
9.6
9.6
8.9
9.0
Chemical Oxygen Demand (mg/L)
21
20
14.6
13.6
Hardness
(mg/L as CaC03)
300
296
252
324
Calcium,
total (mg/L)
_ 66
67
58
82
Magnesium, total (mg/L)
34
33
27
30
Sodium,
total (mg/L)
85
67
23
17
Potassium, total (mg/L)
3.8
3.8
2.6
3.4
Alkalinity
(mg/Las CaCo3)
233
209
169
Sulfate
(mg/L)
500
82
86
63
155
Suspended
Solids, total (mg/L)
39
58
53
26
Volatile
Solids,
total (mg/L)
7.0
7.4
6.6
4.1
Nitrogen (No2+NO3) (mg/L)
10.0(4'
4.86
4.10
3.49
1.12
Nitrogen,
(total ammonia) (mg/L)
15.0(3'
<1.026
<0.470
<0.138
<0.102
Aluminum, total (ug/L)
428
1088
1089
580
Barium,
total (ug/L)
5000"'
62
76
89
62
Beryllium, total (ug/L)
4.0(4'
<0.5
<0.8
<0.5
<0.5
Cadmium, total (ug/L)
50(3)
<3
<3
<3
<3
Chromium,
total (ug/L)
16(3)
<5.3
<5.6
<5.4
<7.7
Cobalt,
total (ug/L)
<7.8
<5.3
<6.7
<6.7
Copper,
total (ug/L)
20(3)
<6.1
<5.6
<5.9
<5.2
I ron, total (ug/L)
(dissg00d)(j,
777
1657
1722
736
Lead, total (ug/L)
100(3
<50
<61
<56
<56
Manganese, total (ug%L)
1000(3)
285
357
254
130
Mercury,
total
(ug/L)
0.5(3)
<0.08
<0.05
<0.06
Nickel, total (ug/L)
1000(3)
<5.9
<7.6
<7.2
13.7
Silver, total (ug/L)
5.0(3'
<3.0
<3.3
<3.0
<3.0
Strontium, total (ug/L)
131
146
150
196
Vanadium, total (ug/L)
<5.4
<6.3
<5.3
17.4
Zinc, total (ug/L)
1000(3)
<56
<50
<61
<61
(1)
( 2)
(3
(4)
F
rom USGS Illinois Water
Resources Data Water Year 1987,
Volume 2. Water year 1987 is the last USG :3
publication
with analytical data for
Sugar creek Station EOA-O1.
Data listed are tabulated annual averages
for
samples taken from the period of October
1986 through
September 1987.
Illinois Administrative Code,. Title 35: Subtitle
C, 1990.
USEPA National Primary Drinking Water Regulations,
40
CFR
141, 1992.
BrunSugr.RepdM40594
3 -13
9 2S5034A
Electronic Filing - Received, Clerk's Office, August 29, 2008
* * * * * R2009-008 * * * * *
3.5 stream miles upstream. Relatively higher
values of these three parameters are commonly
associated with discharges from coal
mining
and
coal ash operations (Jones, et al., 1985). EOA-
01 values for nitrite + nitrate nitrogen and for
total ammonia nitrogen were well below the
regulatory guideline limits and significantly below the values for the other three stations.
The
higher levels of nitrogen at the other three stations,
especially for E16, could be due to influences
from agricultural runoff.
Considering the parameter values presented in Table 3.3, Sugar Creek
appears to have had
somewhat higher overall water quality during the
1987
USGS
Water Year than the stretches of
the South Fork and the Sangamon River discussed here.
3.2.3 Aquatic Macroinvertebrates
Aquatic
macroinvertebrates
are invertebrates large enough to be seen by the unaided eye,
which can be retained by a U.S. Standard
No.
30 sieve
(0.595 mm), and live at least part of their
life cycles within or upon available aquatic substrates (Weber, 1973). Invertebrates
in this
group
typically
include annelids, macrocrustaceans,
aquatic insects, and mollusks (Isom, 1978).
Although macroinvertebrates were not routinely used in freshwater bioassays in the past, they
have been extremely useful in water quality monitoring through studies of
community
diversity
and as indicator organisms (Resh and Unzicker, 1975). Some of the characteristics of
.
macroinvertebrates that make them advantageous for assessments
of environmental - impacts
include:
Limited mobility;
Relatively long life cycles;
Important members of aquatic food
chains;
Sensitivity to a wide range of
pollutants;
Known environmental requirements for key indicator groups;
Ubiquitous distribution (occur where fish may not be present);
Ease of collection.
BronSugr.Repdf040594
3 -14
92S5034A
Electronic Filing - Received, Clerk's Office, August 29, 2008
* * * * * R2009-008 * * * * *
Macroinvertebrate data are generally interpreted by an examination
of conununity
attributes: community structure, taxa richness, and use
of
the
Macroinvertebrate Biotic Index
(IEPA,
1990). Macroinvertebrate Biotic Index (MBI) is calculated by the following
equation:
M
ACROINVERTEBRATE BIOTIC INDEX
MBI = E (ni ti)/N
where:
ni =
No. individuals in each taxon
ti
=
Tolerance value for taxon
N =
Total no. individuals
The MBI is a summation
or average of tolerance values assigned to each taxon
collected
and is
weighted by their abundance. Low values indicate good stream conditions
or good water
quality, and high values indicate a degraded stream or reduced
water quality. According to
present
assessment methods,
MBI values measure stream quality, on the following scale:
x.5.0
excellent
5.0-6.0
very good
6.1-7.5
good/fair
7.6-10.0
poor
>10.0
very poor
MBI
values
are
included in two Sugar Creek stream studies by the IEPA, which are
provided in Appendix A. The April 1985 study and
the
July
1989 study were both conducted
on the reach of Sugar Creek from the Illinois Route 29 bridge (equivalent
to AWQMN EOA-01)
to about 3.9 miles downstream
of this
station.
The studies were performed to assess and monitor
the effects of the Springfield Sanitary District's Sugar Creek sewage treatment
plant (STP)
effluents on the
condition
of
the receiving
stream.
Water quality and macroinvertebrate samples
were obtained from the same seven stations, which included
the three main channel locations A-
1, C-1, and C-2 (see Figure 3.5). Other similar studies
for Sugar Creek from 1977, 1981, and
1988 are
referenced
in the 1985 and 1989 studies. Table 3.4 summarizes MBI values for the
three main channel stations on Sugar Creek by year.
B ronSugr.Rep&040594
3 -15
9 2S5034A
Electronic Filing - Received, Clerk's Office, August 29, 2008
* * * * * R2009-008 * * * * *
TABLE 3.4
M
ACROINVERTEBRATE BIOTIC
INDEX
VALUES
FOR SUGAR
CREEK
Sampling
Location
MBI Values by Year
1
977
1981
1985
1988
1989
A-1 (AWQMN EOA-O1)
5.7
5.1
4.9
6.5
C-1
7.2
6.7
4.9
5.9
9.0
C-2
6.8
6.7-
4.2
7.7
( From IEPA Stream Studies)
B ronSugr.Repdt040594
3 -16
9 ZS5034A
Electronic Filing - Received, Clerk's Office, August 29, 2008
* * * * * R2009-008 * * * * *
t
,I41010.ONG
03/23/94 15."57
HNG
ý
!ýý `k
ý ,a Me ,ý-- ý:
36
It 1 i4CI901
T 1V l'
r
riepý::,
^ 'ti7l:r
:
ra
yýY
C il
.cam
m
f h°?r,r,
...v.-w,
IOW FEET
i
--
ýtaln sea
S
UGAR C M WROMVERTEBRATE
SMPIMG
S TITIONS
TECHNICAL
SUPPORT
DOCUMENT
FOR
P ETITION
FOR ADJUSTED
BORON
STANDARDS
FOR SUGAR
CREEK
AND THE
SANGAMON
RIVER
i
NEW c lre a All.
w
»
a.l.
i
Scale
in Feet
-A
.
1
+ý$lpSdQi! " y
2500
0
2500
5000
J ob
No. 92S5034A
Figure 3.5
Electronic Filing - Received, Clerk's Office, August 29, 2008
* * * * * R2009-008 * * * * *
Location A-1 (EOA-01)
serves
as the upstream
control station for these IEPA
monitoring
surveys. Location A-1 had a lower (higher quality) MBI value than the locations
downstream
of the STP for each year studied except 1985 when all stations had excellent rating values. The
1985
and the 1989 studies both concluded that the STP was having a slight to moderate impact
on this reach of
Sugar Creek. This
conclusion
was based upon the MBI values as well as water
quality data. The 1985 study states a provisional characterization of
Sugar
Creek
as
a moderate
aquatic resource
while the 1989 study rates Sugar Creek as partially supporting designated
aquatic life uses with moderate impairment. These ratings are
discussed in Section 3.3 (see
Tables 3.9 and 3.16).
Table 3.16 contains MBI values for the upstream Sangamon location at Roby (E16), the
downstream
Sangamon
River location at Riverton (E26),
and
the
South Fork location (EO-O1).
MBI values were not provided for Sugar Creek (EOA-O1) in the 1988-89 Illinois Water Quality
Report. The MBI values
shown
in Table
3.4 for A-1 (EOA-O1) were measured upstream of
influence from the
primary 008 Sugar Creek STP discharge and downstream of the CVWLP
discharges. The MBI quality range for A-1 was excellent to good. These values compare
favorably with
the MBI values for the South Fork and the Sangamon River given in Table 3.16.
The average for the A-1 values listed
in
Table
3.4 is 5.6 which is in the very good MBI category.
This value is slightly better (than the
1988-89 MBI for E26 downstream at Riverton and
substantially better than for the upstream location E16 at Roby.
3.2.4 Fisheries
Of the more than 180 species of fish that have
been
recorded
in Illinois (Smith, 1979),
a majority
inhabit lotic environments. They occupy upper levels of aquatic food chains and are
directly and indirectly
affected by chemical and physical changes in their environment. While
use of aquatic
macroinvertebrates and water chemistry are integral components in the assessment
of water quality and
documentation of constituents causing impairment, the condition of the
fishery is the most meaningful index of stream quality to the general public (Weber,
1973).
B ronSugr.Repdf040594
3 -18
92S5034A
Electronic Filing - Received, Clerk's Office, August 29, 2008
* * * * * R2009-008 * * * * *
Use of fish to assess biotic integrity of water resources has
received increased emphasis
in recent years by a
number
of investigators
(Karr,
1981; Hocutt, 1981; Stauffer, et al., 1976;
Karr, et al., 1986). Karr (1981) listed several advantages for using fish as indicator organisms
in monitoring programs:
Life-history information is
extensive
for, most
species;
Fish communities
generally
include a range of
species
that represent a variety of
trophic levels;
Fish are relatively easy to identify;
Both acute toxicity and stress effects
can
be evaluated;
Fish
are
typically present,
even in
the
smallest
streams and in all but the most
polluted waters; and
R
esults
of fish
studies
can be
directly
related to the fishable
waters mandate of the
Clean Water Act (discussed in Section 3.3).
The Index of Biotic Integrity (IBI) was designed to include a range of attributes of fish
populations. Its twelve
measures, or metrics (Table 3.5), fall
into
three broad
categories:
species
composition, trophic composition, and fish abundance and condition. Data are obtained for each
of these metrics at a given site and compared to expected conditions at an unimpacted or
relatively unimpacted site located in a similar geographical region and on a stream of comparable
size.
A number
rating is then assigned
to
each metric based on whether its evaluation deviates
strongly from, deviates somewhat from, or approximates expectations. The sum of the twelve
ratings yields an overall site score. The strength of IBI is its ability to integrate information from
individual, population, community, zoogeographic, and ecosystem
levels into
a single
ecologically-based index of the quality of a water resource (Karr, et al., 1986).
When information is lacking on disease (metric 12), an Alternate Index of Biotic. Integrity
(AIBI) value may be calculated for fish samples. Calculation of the AIBI is accomplished in a
manner identical to the method discussed above, except the disease metric score is derived from
the average value of the preceding eleven metrics.
B
ronSugr.Repdf040594
3-19
92S5034A
Electronic Filing - Received, Clerk's Office, August 29, 2008
* * * * * R2009-008 * * * * *
TABLE 3.5
INDEX OF BIOTIC INTEGRITY (IBI) METRICS USED
TO ASSESS
FISH COMMUNITIES IN ILLINOIS STREAMS
Category
Metric
Scoring Criteria
5
3
1
Species richness 1. Total
number of fish species
Expectations for metrics 1-5 vary
and composition
with stream size and region.
2 . Number and identity of darter
species
3 . Number and identity of
sunfish species
4. Number
and identity of sucker
species
5 . Number and identity
of
intolerant
species
6 . Proportion of individuals as
<5%
5-20%
>20%
green sunfish
Trophic
7. Proportion of individuals as
<20%
20-45% >45%
composition
omnivores
8 . Proportion of individuals
as
>45%
45-20%
<20%
insectivorous cyprinids
9. Proportion of individuals as
<5%
5-1%
<1%
piscivores (top carnivores)
Fish abundance
10. Number of individuals
in
Expectations for metric 10 vary
and
condition
sample
with stream size and other factors
11. Proportion of individuals as
0%
>0-1%
>1%
hybrids
12. Proportion of individuals
0-2%
>2-5%
>5%
with disease, tumors, fin
damage, and skeletal anomalies
(from Karr, et al.,
1986)
B ronSugr.Repdf040594
3-20
92S5034A
Electronic Filing - Received, Clerk's Office, August 29, 2008
* * * * * R2009-008 * * * * *
Table
3.6 lists the fish species collected from each of the three
streams.
The
species list
was compiled from a
fisheries study done for CWLP in December 1987 through November 1988
(Appendix B).
CWLP sampling locations are shown in Figure
3.6. Station 5 from the CWLP
study correlates with AWQMN
sampling station E26 at Riverton (see Figure 3.4). The CWLP
study represents
the most recent and complete fisheries data
available for the areas of interest
within these
streams.
The number of fish
species collected at the Sugar Creek and Sangamon River
stations was
relatively
average for midwestem streams while that for the
South Fork is slightly low for a
stream of its size. The
species listed in Table 3.6 are common for Illinois streams (Smith,
1979)
and none are present on the
state or federal endangered or threatened species lists (Herkert,
1992). The
number of fish species collected was highest
at the
three
Sangamon River stations
with station 2 having the
highest with 34 species. This station was immediately below the
confluence
with the South Fork. Station 5, located
downstream at Riverton (E26), had only one
less
species with 33. Based on fish
species diversity, it appears the Sangamon is not being
negatively
influenced by Sugar Creek or the
South
Fork.
Station 1 (upstream) had fewer species
(29) than either
of the downstream Stations. The number of
species collected at station 1 was
not
significantly different than the number
of species observed from Sugar Creek station 4 (27
species).
Table
3.7 contains a compilation of fisheries data and
indices. The IBI/AIBI values are
very
similar for each station. No value for this
parameter was available for station E16 at Roby.
However, a value
was available from IDOC (personal communication)
for AWQMN station E-05
which is five miles
southeast of Niantic on the Sangamon River downstream of Lake Decatur.
The station E-05 AIBI of 29.4
is similar to that of the other stations. As shown in Tables
3.8
and 3.9 (Section 3.3), these IBj/AIBI
values put all four stream study stations in the
second
lowest category for stream quality. This
is in contrast to the PIBI values, which rate all
stations
but EO-01
on. the South Fork (no PIBI available)
as
having
a potential stream quality value in
the second highest
category. In even greater contrast, the Water Quality Index (WQI)
value for
the Sugar
Creek station EOA-01 (Table 3.16, Section 3.3) places
it in the highest stream quality
category.
B ronSusrRepd1040594
3-21
92S5034A
Electronic Filing - Received, Clerk's Office, August 29, 2008
* * * * * R2009-008 * * * * *
TABLE 3.6
FISH
SPECIES
COLLECTED FROM
SUGAR
CREEK,
SOUTH FORK, AND SANGAMON RIVER
S TATION
Fish
1
2
3
4
5
Species
Sangamon R. Sangamon R.
South
Sugar
Sangamon
R.
upstream
downstream
Fork
Creek downstream
(E26)
Longnose gar
X
X
Gizzard shad
X
X
X
X
X
Central stoneroller
X
Common
carp
X
X
Hornyhead chub
X
X
X
X
Golden shiner
X
Emerald shiner
X
X
X
X
X
Striped shiner
X
X
X
B igmouth shiner
X
Red shiner
X
X
X
X
X
Sand shiner
X
X
x
X
X
Redfin shiner
X
Suckermouth minnow
X
X
X
Bluntnose minnow
X
X
X
X
I Bullhead minnow
X
X
X
X
Creek chub
X
X
f River carpsucker
X
X
X
X
X
Quillback
X
X
X
X
X
Highfin
carpsucker
X
X
White sucker
X
X
X
a
Smallmouth buffalo
X
X
B
igmouth buffalo
X
X
Black buffalo
X
` Golden redhorse
X
X
X
1 Shorthead redhorse
X
X
X
' Channel catfish
X
X
X
X
X
Flathead catfish
X
X
X
X
1
Tadpole madtom
X
X
B ronSugr.RopM40594
3-22
92S5034A
Electronic Filing - Received, Clerk's Office, August 29, 2008
* * * * * R2009-008 * * * * *
TABLE 3.6,
FISH
SPECIES
COLLECTED FROM SUGAR CREEK,
SOUTH FORK, AND
SANGAMON
RIVER
(Continued)
STATION
Fish
Species
Blackstripe topminnow
Brook
silverside
White bass
Y ellow
bass
Green sunfish
Orangespotted
sunfish
Bluegill
Largemouth
bass
White
crappie
Black crappie
Blackside
darter
Slenderhead darter
Walleye
Freshwater drum
No.
spp:
1
2
3
4
5
S
angamon
R. Sangamon R.
South
Sugar
Sangamon R.
upstream
downstream
Fork
Creek downstream (E26)
X
X
X
X
X
X
X
X
X
X
X
X
X
X
X
X
X
X
X
X
X
X
X
X
X
X
X
X
X
X
X
X
X
X
X
X
X
X
X
X
X
X
X
X
X
X
X
X
X
X
X
X
X
X
X
X.
29
34
22
27
33
42 Species Total for
all methods and all stations.
(from CWLP
Study 1987-88).
B ronSugr.Repd1040594
3 -23
9 2S5034A
Electronic Filing - Received, Clerk's Office, August 29, 2008
* * * * * R2009-008 * * * * *
.. l la; 7-* s t
r1 .
r .F.
5 32
R hiferton
'
e`rfi-p
k
U "
F ISHERIES SAMPLING
LOCATIONS
S cale
in Feet
TECHNICAL
SUPPORT
DOCUMENT FOR
PETITION
FOR ADJUSTED BORON
STANDARDS
FOR SUGAR
CREEK
AND
THE SANGAMON
RIVER
Electronic Filing - Received, Clerk's Office, August 29, 2008
* * * * * R2009-008 * * * * *
TABLE 3.7
FISHERIES DATA
AND
INDICES FOR
STREAM
SAMPLING STATIONS
Sangamon River
Sangamon
River. South
Fork
Sugar Creek
Upstream at Downstream at
(EO-O1)
(EOA-O1)
Roby (E16)
Riverton (E26)
No. of Species
29(t)
33(2)
22(3)
27(4)
IBI
30(5)
30.3(5)
29.5(")
AIBI
29.4(8)
29(7)
AIBI (E-05)
29.4(')
PIBI
45.5(5)
48.3(5)
42(6)
(1) Immediately upstream of confluence with South Fork, from CWLP 1987-88, Appendix B
(2) From CWLP Study 1987-88, Appendix B
( 3) Immediately upstream of confluence with Sugar Creek, from CWLP 1987-88, Appendix B
(4)
Immediately upstream of confluence with South Fork, from CWLP 1987-88, Appendix B
(5) IEPA 1988-89 Water Quality Report, Table 3.16
i
(6) IEPA STP Study, 1989
(7) From 1982 Data, Personal Communication IDOC
j
(8) From 1990 Data, Personal Communication IDOC
L
(9)
From 1990 Data, Personal
Communication IDOC,
Location E-05 below Lake Decatur on Sangamon River
B ionSugr.RepdtD40594
3 -25
9
285034A
Electronic Filing - Received, Clerk's Office, August 29, 2008
* * * * * R2009-008 * * * * *
3.3 Illinois
Water Quality Report
Status
3 .3.1. Assessment Methods
The 1972 Federal Clean
Water Act (CWA) sets goals of
fishability and swimmability for
the
nation's water resources. The
fishable goal of the CWA is defined as
a level of water quality
consistent
with protection and propagation
of balanced populations of
shellfish, fish, and wildlife.
The swimmable
goal of the CWA is defined as providing
a level of water quality which allows
for recreational
activities in and on
the water. Attainment of these
CWA
goals
is expressed in
terms of meeting,
partially meeting, or not
meeting each goal.
Section
305 of the Clean Water Act requires
assessment of the degree to which
CWA
fishable/swimmable
goals have
been attained. These goals are considered
separate and
independent
criteria from the degree of
designated use support (USEPA
Guidelines, 1989). The
degree
of designated use support is described
in terms of full support of uses, full
but threatened
support, partial
support with minor impairment, partial
support with moderate impairment,
or
nonsupport.
Use support assessments
for rivers and streams are based
on ability to support
aquatic
life. The 1988-89 Illinois Water
Quality Reports, prepared by the
IEPA, was referenced
to
assess the water quality status of
Sugar Creek and the associated portions of
the Sangamon
and the
South Fork of the Sangamon
River.
.
The determination of the
degree to which Illinois streams
support designated uses is based
on a combination of biotic
and abiotic data, intensive
surveys, field observations, and professional
judgment.
Because aquatic life protection
is considered the best indicator
of Clean Water Act
goals of fishable
and swimmable waters, the use
support process focuses on biotic
data.
Biotic data consist
of fishery and macroinvertebrate
data. These data have been evaluated
by the IEPA using the Index of
Biotic Integrity (IBI) and the IEPA Macroinvertebrate
Biotic
Index (MBI). Biological
Stream Characterization (BSC) is a five-tiered
stream classification
system based largely on IBI values and other fish
community attributes (Table 3.8).
Because the
BSC rating process
uses both fish and macroinvertebrate
data, BSC categories closely
resemble
B ronSugr.Repdt040594
3 -26
9
2S5034A
Electronic Filing - Received, Clerk's Office, August 29, 2008
* * * * * R2009-008 * * * * *
levels of use support. The general relationship of the five BSC categories, general
water quality
conditions, and other assessment indices to CWA use support
assessment levels is shown in Table
3.9. The criteria. for assessment of the fishable goal are shown
in Table
3.10.
Abiotic data include water chemistry, fish tissue analysis, sediment
chemistry, and
physical habitat. Stream habitat data include depth, velocity, substrate
and instream cover. These
data have been used by the IEPA to predict biotic potential
(PIBI).
Water
chemistry data were
evaluated through the use of a Water Quality
Index (WQI), which compares physical and
chemical water quality data with established criteria and reports the results as a single
value.
The USEPA (1989) defines waters
that
are
swimmable as having both chemical and
bacteriological quality
sufficient to
provide primary contact recreation. The IEPA uses both the
Water
Quality Index (WQI) and fecal colifonn bacteria
levels to assess rivers and
streams
for
attainment of the swimmable goal, (Table 3.11). The Illinois Pollution Control Board bacterial
water quality standard for general use and primary contact for fecal coliforms is 200 colonies/100
ml for the months of May through October.
3 .3.2 Sangamon River Basin
A total of 1009.5 stream miles in the Sangamon River basin
were
assessed for designated
.
aquatic life use
support. Of
these, 16.8 miles (1.7 percent) were nonsupportive of aquatic life;
89.0 miles (8.8 percent) had partial support/moderate impairment; 639.1 miles (63.3 percent) had
partial support/minor impairment; and 264.6 miles (26.2
percent) were
fully supportive of
the
aquatic
life use (Table 3.12).
Attainment of the CWA fishable and swimmable goals is summarized in Table 3.13. Of
1009.5
stream
miles
assessed,
841.1 (83.3 percent) miles met the fishable goal. A total of 437.
3 stream miles were assessed on swimmable criteria; of these, 28.8 (6.6 percent) miles met the
goal, while 311.5 (71.2 percent) partially met the goal, and 34.0 miles (7.8 percent) did not meet
the swimmable goal. A total of 63 miles (14.4
percent) were considered to be not attainable as
a result of disinfection exemptions.
BronSugr.Repd1040594
3-27
92S5034A
Electronic Filing - Received, Clerk's Office, August 29, 2008
* * * * * R2009-008 * * * * *
TABLE 3.8
'
BIOLOGICAL STREAM CHARACTERIZATION (BSC) SUMMARY
Stream
IBI
MBI
C lass BSC Category
Range Range Stream Quality
Description
A
Unique Aquatic Resource 51-60 N/A
EXCELLENT.
Comparable
to
the best situations without
human disturbance;
threatened
and/or endangered species may
be present.
B
Highly Valued
Aquatic
41-50
N/A
GOOD. Good fishery for
Resource
important gamefish species;
species richness may be
somewhat below expectations
for stream size or geographic
region.
C
Moderate
Aquatic
31-40 N/A
FAIR. Fishery consists
Resource
predominantly of bullhead,
sunfish, and carp. Species
diversity and number of
intolerant fish reduced. Trophic
structure skewed with increased
frequency
of omnivores, green
sunfish and/or tolerant
species.
D
Limited
Aquatic
21-30 7.5-10.0 POOR. Fishery predominately
?ý-esou
..e-
.
-f-m-Ca-p;-fsh-c
onur&LY
-
dominated by omnivores and
tolerant forms.
E
Restricted.Aquatic
VERY POOR. Few
fish of any
Resource
S 20
>_ 10.0 species -present; no
sport fishery
exists.
(from
Mmois Water Quality Report
-
B ronSugr.Repdf040594
3-28
92S5034A
Electronic Filing - Received, Clerk's Office, August 29, 2008
* * * * * R2009-008 * * * * *
TABLE 3.9
SUMMARY OF USE SUPPORT
ASSESSMENT CRITERIA
FOR ILLINOIS
STREAMS
PARTIAL SUPPORT NON-
FULL
SUPPORT
MINOR
MODERATE SUPPORT
USEPA
GENERAL
Excellent
Very Good
Fair-
Poor
Very
STREAM/WATER
Good
Poor
QUALITY CONDITION
IEPA/IIDOC BIOLOGICAL
A
B
C
D
E
STREAM
Unique
Highly
Moderate
Limited
Restricted
CHARACTERIZATION
(BSC)
Aquatic
Valued
Aquatic
Aquatic
Aquatic
R esource
Resource
Resource
Resource
Resource
FISH/Index of Biotic Integrity
51-60
41-50
31-40
21-30
QO
(IBI/AIBI)
BENTHOS/Macroinvertebrate
<5.0
5.0-6.0
6.0-7.5
7.5-10.0
>10.0
Biotic Index (1tBI)
WATER STORET
Water
0-10
10-30
30-50
50-70
>70
CHEMIISTRY/Quality
Index
(WQI)
.
WATER Total Suspended
Solids
<10
10-25
25-80
80-400
>400
CHEMISTRY/(TSS/mg/1)
ST'REA?Ootential
Index
of
51-60
41-50
HABITAT/Biotic
Integrity (PIBI)
31-40
STREAM
IEPA Stream Sediment Nonelevated
Nonelevated-
Slightly
Elevated-
Extreme
SEDIMENT/Classification
Slightly
Elevated
Highly
Elevated
Elevated
(From Illinois Water Quality Report,
1988-89)
B ronSugr.Repdf040594
3-29
92S5034A
"J
Electronic Filing - Received, Clerk's Office, August 29, 2008
* * * * * R2009-008 * * * * *
TABLE 3.10
C RITERIA FOR ASSESSING CWA FISHABLE
GOAL ATTAINMENT IN RIVERS AND
STREAMS
Partially
Not
Not
Fishable
Fishable
Fishable
Attainable
IBI 31-60
IBI
21-30
IBI
< 20
None
o r
or
or
If
IBI
is
not
If IBI is not
existing fish
available, then Full
available,
then
advisory
Partial/Minor
Partial/Moderate
or
If IBI is not
available,
then nonsupport
( From Illinois Water Quality Report, 1988-89.)
B ronSugr.Repdfa40594
3 -30
9 2S5034A
Electronic Filing - Received, Clerk's Office, August 29, 2008
* * * * * R2009-008 * * * * *
TABLE 3.11
C
RITERIA
FOR ASSESSING CWA SWIMMABLE
GOAL
ATTAINMENT IN RIVERS AND STREAMS
Partially
Not
Not
Swimmable
Swimmable
Swimmable
Attainable
WQI
<50
WQI
<50
WQI >50
Secondary
and
and
and
Contact
fecal coliform
fecal coliform
fecal coliform
mean <200
mean >200
mean >200
or
WQI >50
and
fecal coliform
mean <200
(From
Illinois Water Quality Report, 1988-89.)
U nprotected by
disinfection
exemptions
B ronSugr.Repdf040594
3 -31
9 2S5034A
Electronic Filing - Received, Clerk's Office, August 29, 2008
* * * * * R2009-008 * * * * *
TABLE
3.12
DESIGNATED USE SUPPORT FOR THE SANGAMON RIVER BASIN
D egree of
Total Assessed
Use Support
(stream miles)
Fully supporting
264.6
Full but
threatened support
0
Partial
support with minor
639.1
impairment
P artial support with moderate
89.0
impairment
Not supporting
16.8
T OTAL
1009.5
Report.- 198-9--89) -
B ronSugr.Repdt040594
3 -32
9 2SS034A
Electronic Filing - Received, Clerk's Office, August 29, 2008
* * * * * R2009-008 * * * * *
TABLE 3.13
ATTAINMENT OF CLEAN WATER ACT GOALS FOR
THE
SANGAMON
RIVER BASIN
Fishable Goal
Swimmable Goal
Goal Attainment
(stream miles)
(stream miles)
M eeting
841.1
28.8
Partially meeting
159.1
311.5
Not
meeting
9.2
34.0
Not attainable
0
63.0
Not assessed
0
572.2
TOTAL
1009.5
1009.5
(from Illinois Water Quality Report 1988-89)
B ronSuSr.Repdf040594
3 -33
9 2S5034A
Electronic Filing - Received, Clerk's Office, August 29, 2008
* * * * * R2009-008 * * * * *
Causes and
sources
resulting in less than
full support
within
the Sangamon River basin
are listed in Tables 3.14 and 3.15.
3.3.3 Sangamon River
The Sangamon River can be divided into three distinct segments:
the lower Sangamon
from the confluence with South Fork to the Illinois River; the middle Sangamon
River
between
the South Fork and Lake Decatur; and the upper Sangamon River
above Lake Decatur. The
lower
Sangamon River is affected by extensive stream channelization, removal
of riparian
vegetation
and agricultural runoff. Several municipal wastewa'ler treatment facilities and urban
runoff from
Springfield also impact the lower Sangamon River. These various
sources
of
pollution contribute to the partial support of aquatic life with minor impairment
found throughout
the lower
Sangamon River.
Upstream of Lake Decatur, the Sangamon River is less channelized with more riparian
vegetation present.
However,
there
is still considerable agricultural nonpoint runoff resulting in
elevated levels of nutrients and siltation. Several
small
municipal wastewater
treatment facilities
also contribute to the nutrient load. As a result of these impacts, the upper Sangamon
River was
rated
as providing partial support of the designated use with minor impairments.
The primary source of pollution within the middle reach of the Sangamon River is
Decatur Sanitary District discharge, and
storm and
combined
sewer overflows from Decatur.
During dry weather, the impact from these point sources is compounded
by the lack of water
discharged
from
the
Lake Decatur dam. Because of these factors, 16.8 miles of the Sangamon
River have been rated
as
nonsupportive
of aquatic life uses. Below this stretch, the middle
Sangamon River improves to
partial support
with
moderate impairment.
Table 3.16 summarizes the stream quality index ratings from the
1988-89 IEPA Illinois
Water Quality Report for the four AWQMN survey stations. The NMI and PIBI (habitat
assessment)
index values both indicate higher quality conditions for site E26 than for site E16
upstream.
The
causes
listed for
water quality
limitations for
the
two sites are the same; nutrient
B ronSugr.Repdf040594
3 -34
92S5034A
Electronic Filing - Received, Clerk's Office, August 29, 2008
* * * * * R2009-008 * * * * *
TABLE 3.14
TOTAL SIZES
OF WATERS NOT FULLY
SUPPORTING USES
AFFECTED
BY VARIOUS
CAUSE CATEGORIES
FOR THE SANGAMON
RIVER BASIN
Major Impact
Moderate/Minor Impact
Cause Category
(stream
miles)
(stream miles)
Ammonia
22.8
N utrients
7 44.0
pH
1 6.4
Siltation
744.9
Organic enrichment/DO
16.8
171.9
Flow alteration
1.4
(from
Illinois
Water Quality Report 1988-89)
B ronSugr.Repdf040594
3 -35
9
2S5034A
Electronic Filing - Received, Clerk's Office, August 29, 2008
* * * * * R2009-008 * * * * *
TABLE 3.15
TOTAL SIZES OF WATERS
NOT FULLY SUPPORTING
USES
AFFECTED
BY VARIOUS SOURCE
CATEGORIES
FOR THE SANGAMON
RIVER BASIN
Major
Impact
Moderate/Minor
Source Category
(stream
miles)
Impact
(stream miles)
Point Sources
_
Industrial
52.4
Municipal
72.9
244.1
Combined sewer
overflows
85.6
62.4
Nonpoint sources
Agricultural
Nonirrigated crop production
22.0
650.1
Pasture land
543.2
Urban runoff/storm sewers
48.6
Resource extraction/exploration
development
16.4
Hydrologic/habitat
modification
Channelization
115.5
Flow regulation/modification
13.8
Removal of riparian
vegetation
61.1
Streambank modification/destabilization
44.5
(from Illinois
Water Quality Report 1988-89)
B ronSugr.Repdt040594
3 -36
9
2S5034A
Electronic Filing - Received, Clerk's Office, August 29, 2008
* * * * * R2009-008 * * * * *
loading, siltation,
and organic enrichment.
The level of effect from
each of these causes
is rated
the same except
for organic enrichment/dissolved
oxygen reduction,
which is rated as moderate
for the upstream
Roby site as compared
to slight for the downstream
Riverton site. The
sources
of these water quality limitations
are listed as the same
for both sites. However,
municipal point
sources
and combined sewer
overflows were both rated as
a more negative influence on
the water
quality at Roby than at Riverton.
Both sites were judged
as partially meeting
the fishable goal
but not meeting the swimmable
goals of the Clean
Water Act. Considering all
of the rating
factors and index
values, the downstream (E26)
site at Riverton
was rated as providing partial
support of the designated
aquatic life
use with moderate impairment.
The general water
quality
of the
Sangamon
- River showed
slight improvement
from upstream to
downstream in this
particular segment of the river.
3.3.4 South
Fork of the Sanuamon River
The South Fork
is generally impacted
by siltation and nutrients
from agricultural runoff.
Several municipal
wastewater treatment
facilities also contribute
to the nutrient load. As
a result
of these influences,
all but 17.9
miles were rated as providing
partial support
with minor
impairment
of the designated stream
use. The remaining stream
miles are on small tributaries
and were
rated as full support streams.
Site EO-01 (Figure
3.4)
is located on the
South Fork upstream
from the confluence with
- -- --------------
Sugar Creek
and the Sangamon River.
Ratings for this station
are summarized in Table 3.16.
Although
the WQI rating was fair
to
good
and the MBI rating
was excellent, the IBI
was poor,
correlating with a BSC rating
of D (limited aquatic resource).
Causes of
water quality limitations
in this part of the South
Fork are nutrient: loading,
siltation due
to non-irrigated agriculture,
and
channelization.
The fishable and swimmable
CWA goals are
both partially met at.
EO-01. Site
EO-01
is rated as providing partial
support of the designated
aquatic life use
with only minor
impairment.
B ronSugr.RepM40594
3 -37
9
2S5034A
Electronic Filing - Received, Clerk's Office, August 29, 2008
* * * * * R2009-008 * * * * *
TABLE 3.16
STREAM CONDITION STATUS
Predicted
Index
of
Biotic
Support of
Fishable/
Water
Macro- Index of
Integrity
Designated
Swimmable
Causes of
Sources of
Quality invertebrate Biotic
(PIBI)
Stream
Stream
Use Goal of Clean
Water Quality
Water Quality
Index Biotic Index Integrity
(Habitat
Location
(aquatic life)
Water Act
Limitations
Limitations
(WQI)
(MBI)
.
OBI)
Assessment)
Sangamon
River
partial with
partial/no
nutrieirt loading
(slight)
at
Roby
(1316)
moderate
siltation
(moderate)
impairment
organic enrichment-D.O.
(moderate)
municipal (high)
62.1
7.3
--
45.5
combined sewer (high)
non-irrigated crops (slight)
pasture (slight)
Sangamon River
partial with
partial/no
nutriegtt loading (S)
at Riverton (1326)
minor
siltatibn
(M)
impairment
organic enrichment-D.O. (S)
South Fork of
partial with
partial/partial nutrie(tt loading (S)
Sangamon River
minor
siltation (M)
(HO-01)
impairment
Sugar Creek
partial with
yes/partial
nutrie$tt loading (S)
(EOA-01)
minor
siltation
(TVI)
impairment
( from 1988-89 IEPA Water Quality Report)
municipal (S)
62.4
5.7
30.0
48.3
combined sewer (S)
non-irrigated crops (S)
pasture
(S)
non-irrigated
crops (S)
40.3
3.9
30.3
channelization (S)
municipal
(S)
16.5
combined
sewer
(S)
non-point sources (S)
urban/sewage treatment
plant (S)
channelization (S)
flow regulation/modification (S)
B ronSugrRepd1040594
3 -38
92S5034A
Electronic Filing - Received, Clerk's Office, August 29, 2008
* * * * * R2009-008 * * * * *
3.3.5 Sugar Creek
Site EOA-01 is located
on Sugar Creek at the Illinois Route 29 bridge southeast of
Springfield (Figure 3.4). MBI, IBI, and PIBI values for this sampling station were not provided
in the 1988-89 Illinois Water Quality Report. The WQI value of 16.5 indicates
that this reach
of Sugar Creek has very good stream and
water quality (Table 3.9). This WQI value correlates
with a BSC rating of B (highly valued resource) and a full support
rating for designated aquatic
life use. The causes
of
water quality limitations for Sugar Creek are slight nutrient loading and
moderate siltation. Several sources of water quality limitations are
listed. Non-point
sources
and
municipal point sources, primarily from the City -of Springfield, are all rated as having slight
effects on water quality. The Springfield Metropolitan Sanitary District Sugar Creek sewage
treatment plant is served by combined sanitary
and
storm
sewers and has two combined sewer
overflows (CSO) in the system.
The
first
is the Harvard Park CSO located in the southeast
comer of Springfield near the Bunn Park Golf Course (Figure 3.3). It discharges to an unnamed
tributary of Sugar Creek upstream from the Ill. Rt. 29 bridge.
The
second CSO is
located
at
the
head end of the Sugar Creek plant and discharges directly to Sugar
Creek when
storm
flows
exceed 100 mgd. The Harvard Park CSO discharge into Sugar Creek
is rated in Table 3.16 as
having a slight effect on nutrient loading. Channelization
is rated as a slight source of water
quality impairment. Creek
flow
regulation/modification
caused by the Spaulding Dam, which
impounds the original Sugar Creek channel, is rated as a slight source of water quality limitation.
In spite of all these causes and sources of water quality limitations,
the
WQI
rating is very good.
The fishable goal of the CWA is judged as being met for Sugar Creek
with the
swimmable
goal
being partially met. Considering all
factors, this reach of Sugar Creek was rated as providing
partial
support
of the designated aquatic life use with only minor impairment.
B ronSugr.Repdftk10594
3 -39
92S5034A
Electronic Filing - Received, Clerk's Office, August 29, 2008
* * * * * R2009-008 * * * * *
4.0
ISSUE OF CONCERN
4.1 Proposed. Adiusted Water Ouality
Standards for Boron
NPDES
Permit No. IL0024767 authorizes City Water, Light and Power to
discharge
effluent from their power station facility
to
Lake
Springfield and Sugar Creek. Ash-bearing
wastewater and miscellaneous low volume process wastewaters
from the power station are
discharged
to an on-site ash pond system for
solids
removal, wastewater
clarification, and, pH
adjustment.
The NPDES permit, effective December 14, 1991, requires CWLP to
monitor
the
concentration of boron, among other constituents,
in the ash pond discharge (004) and the
storm
sewer discharge (003) to Sugar
Creek.
Beginning
December 14, 1994,'the permit establishes,
for the
first time, an effluent limitation (1.0 mg/L, based on the Illinois
General Use stream
quality standard) for boron
as a daily maximum value not to be exceeded in grab
samples
collected
twice monthly from these discharges. A copy of NPDES
Permit Ii. 0024767 is attached
as Appendix
C.
Historical data on the concentrations
of boron in the existing discharges
(Section 4.3)
suggest that noncompliance with the
. effluent limitation in the permit will occur frequently.
Therefore, an upward
adjustment for boron for the stream limitation is recommended.
The
recommended adjusted stream standards for boron are: 11.0 mg/L
from CWLP outfall 003 to
SMSD
Sugar Creek station outfall 008; 5.5 mg/L form outfall
008 to the'confluence of Sugar
Creek with the
South Fork and the Sangamon River; and 2.0 mg/L form this confluence
to 100
yds downstream of the confluence
of the Sangamon River with Spring
Creek, north of
Springfield, which receives the SMSD Spring
Creek station 007 outfall discharge.
The Illinois General Use water quality
standard established by the Illinois Pollution
Control Board for
boron is 1.0 mg/L. The Board originally adopted the present
General Use
water quality standards as
part of Water Pollution Rule 203(f), by Order dated
March 1972, in
consolidated proceedings R70-8, R71-14 and R71-20
(Order, 3/7/72). The standards were
promulgated to implement the requirements of the Clean
Water Act, 33 U.S.C. 1251 et seq., and
BronSugrRep&040594
4-1
92S5034A
Electronic Filing - Received, Clerk's Office, August 29, 2008
* * * * * R2009-008 * * * * *
the State of Illinois NPDES program. Subsequently, the water quality standards were codified
in their present location in Title 35 of the Illinois Administrative Code, Section 302.208(e). The
numerical
value
of the boron standard has not changed from the initially-adopted value.
The present standard for boron is based on the USEPA's federal criterion, which is
protective
of sensitive
crops,
such as
citrus,
from
irrigation waters
high in boron. In adopting
this standard, the Board recognized that "100% irrigation is unlikely in Illinois," but that "the
uncontrolled discharge of large quantities of boron is clearly undesirable." (Order, 3/7/72). There
are presently no known withdrawals for agricultural purposes on the described reaches of these
streams.
However, in October
1993-
an
application
for
construction was-
submitted -to MOT
to
facilitate irrigation of the Rail Golf Course from the Sangamon River on the north
side
of
Springfield. As of this writing, no permit has been issued (Section 3.2.1). The most sensitive
users of these streams are the biological communities. Based upon the incidental exposure to
recreational
users and an evaluation of boron's effects on
various
plants and aquatic organisms
(Section 4.2.3), the use of the 1.0
mg/L limit is not
,supported.
Results
of
various
studies and
discussions presented in the following sections support the proposed adjusted stream standards
for boron.
4.2 Boron Characteristics
4.2.1
Properties
Boron is a dark brown element that is widespread in the environment but occurs naturally
only in combined form; usually as borax, colemanite, boronatrocalcite, and boracite. Boron exists
in sediments as borosilicates, which are considered biologically inert. It is released to the
environment very slowly and at very low concentrations by natural weathering processes. Most
of the natural boron compounds usually degrade or are transformed by natural weathering of
rocks to borates or boric acid, which are the main boron compounds of ecological significance
(Sprague, 1972).
B
ionSugr.RepdfD40594
4-2
92S5034A
Electronic Filing - Received, Clerk's Office, August 29, 2008
* * * * * R2009-008 * * * * *
4.2.2 Distribution and Uses
Proven commercial
deposits of sodium tetraborate from which borax is
prepared are
concentrated in the Mojave Desert
of California where ancient lakes or marshes have evaporated
under arid conditions. The United States
supplies 70 percent of the annual world demand for
boron compounds.
Boron is used in the production of glass and glass
products such as textiles
and insulating
fiberglass. It is also used in the manufacture of enamels and
glazes
used
as
coatings on household and industrial products.
Other products that include boron are: herbicides,
insecticides,
soaps, cleansers, cosmetics, antifreeze, high energy fuels, flame
proof compounds,
corrosion
inhibitors, and antiseptics.
Boron is widely distributed in surface water and ground water. The average
surface water
concentration
for boron in the United States is about 0.1 mg/L (Butterwick,- et al.,
1989),-but
concentrations
vary greatly, depending on boron content
of local geologic formations and
anthropogenic sources of boron (Butterwick,
et al., 1989). A survey of U.S. surface waters
detected
boron in 98 percent of 1,577 samples at concentrations -ranging from
0.001 mg/L
to
5..0
mg/L. Mean concentrations calculated
for
the
15 drainage basins in the continental United
States
ranged from 0.019 mg/L in
the
Western
Great Lakes Basin to 0.289 mg/L in the Western Gulf
Basin (Butterwick,
et al., 1989). The concentration of boron in sea water is about 4.5
mg/L to
5.5 mg/L, varying with the local
salinity
(Butterwick,
et al., 1989).
Most boron that occurs in the fresh water
aquatic
environment
is due to the relatively high
water solubility of all boron compounds, especially
boron-containing laundry products and
sewage (USEPA, 1975). Another, although very localized, source of boron to
the aquatic
environment is from coal ash.
Many
commercially-mined
coal seams contain
significant
concentrations of boron. Of the total boron in
coal, as much as 71 percent may be lost to the
atmosphere upon combustion; however, more than
50 percent of the boron found in coal ash is
readily water soluble (Pagenkopf and Connolly, 1982). The release
of boron from coal fly ash
to leachate water is dependent on the ash to water ratio: at 1 gm of
ash/L up to 90 percent of
the
boron is soluble: at 50 gm/L only 40 percent is released: at 100 gm/L less than
30 percent
is soluble
(Eisler, 1990).
B ronSugr.Repd1040594
4-3
92S5034A
Electronic Filing - Received, Clerk's Office, August 29, 2008
* * * * * R2009-008 * * * * *
4.2.3 Toxicology
E ffects in Humans
Boron has been reported to cause toxic effects
in humans following inhalation, oral, and
dermal
exposures.
Inhalation exposures to 14.4
mg/m3 of borax dust have resulted
in upper
respiratory tract irritation, dryness of
the mouth, nose, and throat as well as irritation of
the eye,
but a level of 1.1 mg/m3 produced
no
symptoms
(Garabrant, et al., 1984).
One study (Gupta and
Parrish, 1984)
demonstrated toxicosis in adults to a dermal exposure
of 645 gms of. boric acid.
Oral
doses of 15-20 gms of boric acid, equivalent
to
0.25-0.3
g/kg of body weight,
have
been shown to be lethal (USEPA,
1975, and Eisler, 1990). Oral doses
of 5-6 gms of borates
have shown
to be fatal to infants (from Eisler, 1990). Specific
symptoms associated with oral
doses include nausea, persistent
vomiting, diarrhea, colicky abdominal
pain, liver effects
(jaundice), kidney disease, and dermatitis.
In addition, oral exposures have been
reported to
cause.
headaches, tremors,
restlessness, convulsions,
weakness, and coma (ATSDR, 1990).
Papachristou et al. (1987) demonstrated that ingestion of
water with 20-30 mg/L of boron
can
be considered to have no adverse effects on
human health.
E ffects in Other Vertebrates
I n mammals, exposure
to excessive boron results in a reduced growth
rate, loss of body
weight, decreased sexual
activity, and eye irritation. Reduced growth
has been reported in cattle,
dogs,
rabbits, and rats (Eisler, 1990). An oral dose of 120
mg/L of boron as borax for 10 days
produces no overt signs of toxicosis in,
cattle. An oral dose of 150 mg/L of
boron as borax for
30 days did produce symptoms
of toxicosis in cattle. Ingestion of
100-300 gms of boron,
equivalent
to 200-600 mg of boron per kg of. body weight,
was found to be lethal to cattle (from
Eisler, 1990).
Dogs were found
to tolerate ingestion of 350 mg of boron
per kg of feed for two years
but showed symptoms
of toxicosis when fed 1,170 mg of boron
per kg of feed after 38 weeks
BronSugr.Repdf040594
4-4
92S5034A
Electronic Filing - Received, Clerk's Office, August 29, 2008
* * * * * R2009-008 * * * * *
(Weir and Fisher, 1972). Rabbits showed growth retardation when
fed
800-1,000
mg of borates
per kg of body weight daily for four days. Results of chronic
feeding
studies
using mallards
demonstrate that diets
containing 13 mg of boron per kg of feed weight produce no adverse
effects, but those diets containing 1,000 mg/kg of boron are fatal (from Eisler, 1990).
Effects
in Fish, Plants and Invertebrates
Boron is essential for the growth of higher plants. Boron
soil concentrations for optimum
plant growth reportedly range from 0.1 to 0.5 mg/kg for several plant species (Butterwick, et al.,
1989); however, excess boron is known to be phytotoxic (Eisler,
1990). Boron toxicity has been
reported in many species of grasses, fruits, vegetables, grains, trees, and other terrestrial
plants.
Boron toxicity in plants is' characterized by stunted growth,
leaf malformation, browning and
yellowing, chlorosis, necrosis, increased sensitivity-to-mildew, wilting, and inhibition of pollen
germination and pollen tube growth. There
is
some
evidence (Graham, et al., 1987) that boron
may accumulate to toxic levels in plants, particularly in
the presence of a high phosphorus and
low
zinc environment.
-
T he following studies demonstrate tolerance ranges
to
levels
of
boron exposure
for
some
terrestrial plants:
0
0
Toxic effect in plants-including leaf injury- were observed in
26
percent
of plants
at or
below substrate
concentrations that resulted in greatest growth, indicating
considerable overlap between injurious and beneficial effects of boron in plants
(Eaton, 1944);
I n general, deficiency effects in plants were evident
when boron concentrations in
soil solution were
<2
mg/L;
optimal growth occurred at 2 to 5 mg/L; and toxic
effects were evident at 5
to 12 mg/L. Sensitive species are known to include
citrus, stone fruits, and nut trees; semitolerant species include
cotton, tubers,
cereals,
grains,
and olives; tolerant species usually include most
vegetables
(Gupta,
et al., 1985);
BronSugr.RepdfD40594
4-5
92S5034A
Electronic Filing - Received, Clerk's Office, August 29, 2008
* * * * * R2009-008 * * * * *
0
0
B
iggar and Fireman (1960)
showed that with neutral
and alkaline soils of
high
absorption capacities,
water containing 2 mg/L
boron might be used
for some time
without injury to sensitive
plants;
Four species of turfgrass,
Kentucky bluegrass,
creeping bent, alta fescue,
and
colonial bent,
were irrigated with water
containing 4.8 mg/L of
boron. These
species of turfgrass
were found to show excellent
tolerance to
higher levels of
boron in soil
solution, when the practice
of frequent mowing
is employed (Oertli,
et al.,
1961).
Boron effects on aquatic life
are highly species specific.
Most aquatic organism
toxicity
studies have focused on
the evaluation of lethal
concentrations; however,
other toxic effects have
been reported.
Toxic effects observed
in aquatic plants
include inhibition of growth
and reduced
photosynthesis (Frick, 1985;
Antia and Cheng,
1975; Rao, 1981) at various
concentrations below
100 mg/L of boron.
Reproductive effects (i.e.,
reduction of number
of broods, total young
produced, mean
brood size, and mean size
of the young) have been
reported. for -the aquatic
invertebrate Daphnia
magna (Gerisch, 1984;
Lewis and Valentine,
1981). Developmental
abnormalities
have also been observed
in toads (130 mg/L) and
various fish following exposure
to boron (Eisler, 1990).
T he following studies demonstrate
tolerance ranges
to levels of boron exposure
for some
aquatic plants:
0
0
The blue green
alga, Anacystis nidulans,
exhibits no adverse effects
with respect
to cell growth or
organic constituents at 50
mg/L of boron and significant adverse
effects at
>100 mg/L over a 72-hour exposure
(Eisler, 1990);
.
.The
green
alga, Chlorella pyrenoidosa,
showed no effects
on growth or cell
composition after a 7-day exposure
to 10 mg/L of
boron and adverse effects at
>100 mg/L
boron (Eisler, 1990);
B ronSugrJRepdfO40594
4-6
92S5034A
Electronic Filing - Received, Clerk's Office, August 29, 2008
* * * * * R2009-008 * * * * *
0
0
Duckweed, Lemna minor, showed normal growth in 10 mg/L and 20 mg/L boron
exposures and growth inhibitions at 100 mg/L boron exposures (Wang,
1986);
N ineteen species of marine algae
showed
no
effects from a 60-day exposure to 10
mg/L of boron and growth inhibition in 12 of 19 species at 100 mg/L of boron
(Antis and Cheng,
1975).
The
following studies show tolerance ranges
to
boron exposures for some
aquatic
invertebrates:
0
0
0
0
Sea
urchin
embryos showed normal development
with exposure to
37
mg/L boron
and lethality at 75 mg/1- of boron. (Kobayashi,
1971);
A 48-hour LCso value of 133 mg/L as boron was calculated for Daphnia magna
to boric acid (Gersich, 1984);
Lewis and Valentine (1981)
similarly
determined a 48-hour LCso exposure value
for boric acid of 226 mg/L as boron with a sublethal exposure level of 13.0 mg/L
as boron for D. magna;
The lowest boron concentration
shown
to cause sublethal effects on the cladoceran
D. magna
in a 21-day study was 13.6 mg/L
(Gersich, 1984).
The following studies demonstrate tolerance ranges for some species of fish:
0
Mann (1973)
studied
the effects of
sodium
perborate, boric acid, and borax upon
eel fry, amphipods, rainbow trout, tubificid worms, and guppies. These boron
compounds were
determined
to
be
relatively non-toxic
using 24-hour bioassay
procedures. Detrimental
effects occurred
with
exposure
to concentrations
of more
than 250 mg/L of sodium perborate, 5,000 mg/L of boric acid, and 2,500 mg/L
of borax.
B ronSugr.Repd104o594
4 -7
92S5034A
Electronic Filing - Received, Clerk's Office, August 29, 2008
* * * * * R2009-008 * * * * *
0
0
0
0
W allen, et al. (1957)
studied mosquito fish (Gambusia affinis),
which are native
to Illinois,
using
96-hour
bioassay procedures.
No mortalities were observed in
concentrations of boric acid up to 1,800
mg/L (315 mg/L calculated as boron).
Birge and Black
(1977) studied the effects of boron exposures
to channel catfish
fry using a
9-day
bioassay procedure.
An LCso value of 155 mg/L was
determined for both borax
and boric acid.
Eisler (1990)
indicated that 30 and 33 mg/L of
boron are "safe" levels for game
fish species
such as the largemouth bass and
bluegill; and
Sensitive fish species such as
freshwater coho (which are not present
in the
Sangamon River
basin) show adverse effects with exposure
to 113 mg/L of boron
(Thompson, et al., 1976).
The above studies, done on a diverse
list of aquatic organisms, demonstrate
the response
to boron of three aquatic
trophic levels: plant, invertebrate, and vertebrate (fish).
Evaluation of
the overall effect of a
compound on a biological system must include
a study of the effects on
the lowest tier of the food chain. These studies demonstrate
that adverse effects on an aquatic
food chain, and consequently the biological
community structure of an aquatic ecosystem,
would
not be observed at or below
a boron concentration of 11.0 mg/L. Overall,
the results indicate
that
the Sugar Creek-Sangamon
River biological community
would not be significantly affected
by the 11.0 mg/L boron stream standard proposed
for the upper portion of Sugar Creek.
4.3 Boron Concentrations
in Receiving
Waters
4 .3.1 Historic
Boron Levels
Table 4.1 summarizes boron concentrations
at nine monitoring locations
within the local
drainage area of the Sangamon
River watershed (Figures 3.1, 3.3, and 3.4).
Monitoring data from
the Sugar Creek, South Fork, and
Sangamon River locations
are collected by the IEPA as part
B ronSugr.Repdft340594
4-8
92S5034A
Electronic Filing - Received, Clerk's Office, August 29, 2008
* * * * * R2009-008 * * * * *
C IORAWAVS(97550JI Iwo.OW 0/11/9/ 16.-0J EM
TABLE 4.1
Total;
Boron
Concentrations
hi/-I) For Monitoring Stations
Date
Lake
Sprlnplleld
Water Intake
CWL.P
Outfal
003
CWLP'
Outfall
004
Sugar Creek
o
At 29 Bridge (EOA-)i)
SMSD
Sprkq Oreek Sewsp
Treahsmt Plan( Wall - 007
' SMSD
Desk S ewsp
Tteebment b nt
ONfs1-
006
Sangamon River a
Riverton, IL (E28)
Sangamon
River
9
Roby,
IL (E16)
S fork o( Senpemon River
o Rt
29
Bridge
(E0-01)
1 /87
5.20
0.95
0.07
<0.05
0.06
2/87
4.60
3/87
6.20
0.93
0.07
<0.05
0.07
_
4 /87
2.7q
1.03
0.16
0.07
0.05
5/87
<0.05
2.40.
0.78
0.08
0.06
0.05
6/87
3.89
0.40
<0.05
0.16
7 /87
8/87
5.89
6.28
0.37
<0.05,
<0.05
9/87
8.37
7.50
1.20
0.20
<0.05
1 0/87
8.10
1
1/87
4.36
0.79
0.19
0.11
12/87
4.20
0.13
0.06
<0.05
1/88
6.20
0.06
<0.05
<0.05
2
/88
4.17
3/88
5 .8n
0 .38
<0.05
<0.05
<0.05
4 /88
3.95
0.2:8
<0.05
<0.05
<0.05
5/88
<0.05
5.31
3.90
0.20
<0.09
0.07
6/88
6.1a
5.46
1.12
0.14
0.08
7/88
'
8/88
7 .6i y
7 .80
1.82
0.20
0.15
9/88
1 0.1
7 .48
1.17
0.25
0.12
1 0/88
6.38
1.48-
0.20
11/88
5.54
0.60
0.24
0.10
12/88
6.49
1.97
0.23
0.21
0.05
1/89
6.0211
2.10
0.14
0.18
0.06
2/89.
7.31,1
1.22
0.19
0.15
0.10
3 /89
6.88
7.00
4 /89
7.52
5.46
1.12
0.38
0.08
<0.05
<0.05
'5/89
0.24
7.13
5.31
4.77
0.73
0.10
0.05
<0.05
6/89
9.69
7 .5i ?
5 .67
0.37
0.82
0.25
0.05
0.06
7/89
8.75
7.2.1
6.47
0.41
0.85
8/89
16.86
6.13
0.44
0.82
0.87
0.12
0.10
9/89
18.70
7.93
5.04
0.39
0.51
0.35
0.08
0.09
1
0/89
3.30
0.61
0.94
11/89
3.14
4.84
4.65
0.39
0.48
0.84
0.17
0.09
1 2/89
0.99
0.43
0.95
0.32
0.16
0.20
Electronic Filing - Received, Clerk's Office, August 29, 2008
* * * * * R2009-008 * * * * *
t JDRAWN05i
9L. 41005.91117 OJIII/94
16.22 £JM
TABLE 4.1 (Continued)
D ate
Lake SprYngflekl
Water Intake
CWLP
WON 003
CWLP
Outfall
Sugar Creek o
RL 29 Bridge (EOA-01)
SMSD Sprlp Croak Sewage
NOW
Mug OWal - 097
SMSO
SW Creek Sewage
Treatnent Plant Oullel - 008
Sangamon RW o
Rivertoq IL (E26)
Sangamon River o
Roby,11(E16)
S Fork of Sangamon River
o
RL 29 Bridge (E0-00
1/90
4.17
5.67,
1.74
0.87
1.51
0.36
0.15
0.16
2/90
2.17
.
9.63
0.41
0.56
3 /90
1.85
8.99
1.65
0.63
0.81
<0.05
<0.05
<0.05
4/90
3.58
4.85,
,
4.69
0.44
0.49
0.19
<0.05
0.08
5/90
0.03
4.31
4.08'
0.31
0.30
0.35
0.06
<0.05
<0.05
6/90
2.18
5.97
0.57
7/90
1
0.59
0.84
0.07
<0.05
0.07
6/90
0.01
0.48
6.90
3.60
0.32
0.30
0.21
<0.05.
<0.05
9 /90
4.84
0.39
0.36
0.68
0.15
0.08
1 0/90
. 1.60
8.60
0.35
0.34
1 1/90
5.21
0.34
0.33
0.08
0.06
0.07
12/90
0.90
7.70
0.43
0.30
0.05
<0.05
<0.05
1/91
'
0 .48
0.26
0.30
0.05
<0.05
0.08
2 /91
0.18
6.70
0.28
0.28
3/91
3.00.
3.66
0.20
0.26
0.10
<0.05
<0.05
4 /91
0.80
0.17
0.21
0.10
0.05
0.05
5 /91
<0.05
0.28
0.22
0.27
0.02
<0.05
<0.05
6 /91
0.44 '
7.30
0.24
0.25
7 /91
0.75
7.80
4.15
0.25
0.24
1.11
0.11
0.10
6/91
0.06
1.80
5.43
0.54
0.62
0.09
9/91
5.80
0.30
0.28
0.55
0.22
0.08
1
0/91
1.30
<0.05
0.32
0.31
0.99
11/91
0.26
0.31
0.18
1 2/91
4.70
0.31
0.33
0.10
0.07
1/92
0.53
7.10
4.40
0.30
0.28
0.15
0.07
2/92
0.33
0.29
3 /92
9.30
5.20
0.28
0.26
0.15
0.04
4 /92
0.44
4.70
0.28
0.28
5/92
6.90
0.26
0.26
6 /92
0.06
8.00
6.00,
0.23
0.22
7/92
1.90
6.70
0.22
0.20
8 /92
7.60
7.20,
0.26
9/92
7.10
6.30
0.23
10/92
5.50
0.23
Electronic Filing - Received, Clerk's Office, August 29, 2008
* * * * * R2009-008 * * * * *
L' IORAWNCSj 92SaUJ4
j006.OWC
OJIII/94 /6.-J4 ZEN
T ABLE 44-1 (Continued)
Totals
Lake Sprkqleld
Water Intake
CWLP
Outfal 003
CWLP.'
Outfall
Suger
Creek
o
RL 29 Bridge (EOA-M)
SMSD Sprirq Creek Satraps
Treehneat Red Mal " 001
SMSD &V Creek Srm
Treeheed Pkd Odd " 00E
Sangamon
River
o
Rivertor%
IL
(E26)
Sangemon
River
o
Roby, IL (E16)
S Fork of Sangamoo RNer
r+
Rt 29 Bridge (000
Average
<0.07
4.51
6.12
<3.38
0.34
0.47
<0.39
<0.10
<0.08
Mexlrrem
0 .24
18.70
10.13
7.80
0.87
1.51
1.82
0.25
0.20
Mkumlm
0.01
0,06
1.80,
<0.05
0.17
0.20
<0.05
<0.05
<0.05
NO. ofVek"
7
31
' 50
47
38
40
47
47
43
% d
Samples
Above LO myl
A
0
71
100
74.5
0
2.5
12.8
0
0
%
of Samples
Above 1l0
man
0
6.4
0
0
0
0
0
0
0
Electronic Filing - Received, Clerk's Office, August 29, 2008
* * * * * R2009-008 * * * * *
of the
Ambient Water
Quality Monitoring Network (AWQMN) sampling program. These data
are published in the annual U.S. Geological Survey Water Resource
Data Reports for Illinois.
The Lake Springfield boron data are collected annually
by CWLP as part of the city water supply
intake monitoring program. The boron data for the CWLP 003 and 004 outfalls (Figure 2.1)
and
Springfield Metropolitan Sanitary District (SMSD) Sugar Creek sewage
treatment plant (STP)
outfall 008 and the SMSD Spring Creek STP outfall 007
are collected as part of their required
NPDES permit monitoring (see Table 3.2). No boron
data are available for the CWLP 006
outfall which discharges into Lake Springfield.
The South Fork monitoring station (EO-0.1) at
the Illinois Route 29 bridge and the
Sangamon River station (E16) at Roby, Illinois serve
as upstream control locations to assess any
influence
on boron levels in
these
streams
from the stations shown in Table 4.1. These upstream
stations had average boron levels of 0.08 mg/L and 0.10
mg/L, respectively, and have never
exceeded the
General
Water Use.standard of 1.0 mg/L for boron during the period of
record
shown. The
maximum
boron level for the Sangamon River at Roby was 0.25 mg/L.
The CWLP outfalls show the highest levels of boron for all locations shown.
This is not
unexpected because coal and coal ash are well known sources
of naturally-occurring boron. For
the period shown, outfall 003 averaged 4.51 mg/L for boron.
Outfall 003 had a minimum
recorded boron level of 0.06 mg/L and a maximum
boron value of 18.70 mg/L in September
1989. Outfall 004 boron levels ranged from 1.80
mg/L to 10.19 mg/L and averaged 6.12 mg/L.
The maximum values for 004 occurred in September of 1988,
during an extended drought.
The only AWQMN sampling station on Sugar
Creek downstream of Spaulding Dam is
EOA-01 at the Illinois Route 29 bridge.
This
station
is about 3.4 stream miles downstream from
outfall 004. For
the
sampling
period shown, boron levels ranged from
<0.05
mg/L
to
7.80 mg/L.
The maximum
occurred
in August during the 1988 summer drought. Station
EOA-01 averaged
<338 mg/L for the reporting period. The average and
maximum boron values for EOA-01 are
significantly higher than for the upstream South Fork and
Sangamon River control stations. The
boron levels for the upstream Lake Springfield (average
<0.07 mg/L) could not be contributing
to the Sugar Creek boron levels observed at EOA-O1.
B ronSugr.Repdf040594
4-12
92S5034A
Electronic Filing - Received, Clerk's Office, August 29, 2008
* * * * * R2009-008 * * * * *
The Sangamon River station
E26 at Riverton is downstream
of all AWQMN stations
shown in Table 4.1. During
the sampling period shown, the
boron levels at E26 ranged from
<0.05
mg/L
to 1.82 mg/L. The maximum level occurred
in August during the 1988 summer
drought. The average boron
level of <0.39 mg/L at E26 is 3.9
times higher than the average
boron value for
the
upstream
Sangamon station E16 at Roby.
These two stations were sampled
in the same months during the same time span. Outfall
008 from the SMSD sewage treatment
plant
averages 0.47
mg/L boron in its discharge to Sugar
Creek. This butfall would contribute
only to a minor extent to the boron
levels seen at Riverton.
Table 4.1 shows the percentage of samples
-from each monitoring station that
had boron
levels above the General Water Use standard
of 1.0 mg/L. The upstream stations
E16 and EO-01
had no samples with boron
levels above 1.0 mg/L. Boron
levels for the Lake Springfield
samples were never above 1.0 mg/L.
Only 2.5 percent of the SMSD sewage treatment
plant
outfall 008 discharges into Sugar
Creek exceeded 1.0 mg/L boron,
whereas 74.5 percent of the
Sugar Creek samples from station
EOA-01 were above the 1.0 mg/L boron standard.
The boron
levels -at EOA-01 on Sugar Creek
are clearly influenced by CWLP outfall
discharges 003 and 004 into Sugar Creek.
These outfall discharges appear to be the
primary
sources of boron flowing from Sugar Creek
into the Sangamon River and subsequently
influencing the boron levels observed
at the Riverton station E26.
When
comparing the maximum boron levels
from the locations shown in Table
4.1
to
the
proposed boron stream standard of 11.0 mg/L
for the upper reach of Sugar Creek,
only the
CWLP outfall 003 had samples
above 11.0 mg/L. Outfall
003 had two samples (6.4 percent)
with
boron above
11.0 mg/L, with no other occurrences
since September 1989. Except for
very
infrequent events such as these, outfall discharges
003 and 004 would normally be in
compliance
with
adjusted
boron stream standards of 11.0 mg/L
for the upper reach of Sugar. Creek, 5.5
mg/L
for the lower reach of Sugar Creek, and
2.0 mg/L for the reach
of the Sangamon River in
question.
BionSugr.Repdf040594
4-13
9 2S5034A
Electronic Filing - Received, Clerk's Office, August 29, 2008
* * * * * R2009-008 * * * * *
4.3.2 Predicted Low-Flow
Boron Levels
A mass balance of boron concentrations
was calculated for several
locations in Sugar
Creek and the Sangamon River.
The purpose of the calculations
was to provide boron values
that
might be expected during critical low stream
flow conditions (7Q10).
The
7Q10
flow is the
lowest mean stream discharge for seven
consecutive days at the ten-year
recurrence interval.
The equation used in all
of these calculations is:
C ds = Qus (Cus) + Qeff (Ceff)
Qus + Qeff
where:
C ds =
Qus =
Cus =
Qeff =
Ceff =
the boron
concentration in mg/L downstream of the
confluence of the
effluent
and the receiving stream.
t he water flow
in cubic ft/sec. (cfs) upstream of
the effluent discharge
point.
the boron
concentration upstream of the effluent discharge
point in mg/L.
the flow in cfs
of the effluent discharge.
the boron
concentration (mg/L) of the effluent.
The following assumptions were made in determining
whether the boron concentration
in Sugar Creek and the ýangamon
ltiverwould fall below the 1.0
ingjL General U7se standard
0
0
0
T
he average of the maximum flows for
outfalls 003 and 004 for 1988
were
used.
This year was used due
to the hot weather, which
increased electricity
consumption and
water flow from the plant.
The design flow
of the outfall for St. Francis
Convent was used (Table 3.2).
For
the
Springfield
and Riverton wastewater
treatment plants, the average flows
of the lowest
three consecutive months within
the last two years were used.
B ronSugr.Repdt040594
4-14
9 2S5034A
Electronic Filing - Received, Clerk's Office, August 29, 2008
* * * * * R2009-008 * * * * *
0
0
The "effluent" was any stream or flow entering another stream or flow. For
example, the confluence of the South Fork, Sangamon River and
Sugar Creek
was
assumed
to
occur at
a
single point, necessitating expansion of the equation to
include three flows. The results are the same as if Sugar Creek and the South
Fork were first combined and then the Sangamon River was included.
Since the 7Q10 flow of Sugar Creek is 0.0 cfs, the flows from outfalls 003 and
004 were used as the only source of water in Sugar Creek. Under actual
conditions other than
7Q10, flow
may also be
derived
from
Lake Springfield.
This assumption is more conservative since it does not allow dilution of the boron
concentrations in Sugar Creek from flow from Lake Springfield.
T he average boron concentrations were used for all "effluents" other than outfalls
003 and 004.
Figure 4.1 shows NPDES effluent points and the locations for which predicted boron
concentrations were calculated. Table 4.2 gives the flow values and boron concentrations used
in
the calculations. The following predicted values present the most realistic worst-case
scenario
for boron concentrations in Sugar Creek and the Sangamon River.
L ocation (See Figure 4.1) Boron Concentration (mwL)
Flow cfs
A_
10.46.
_ 8,15-
B
5.06
17.75
C
1.53
61.45
D
1.53
61.66
E
1.52
61.91
F
1.22
83.41
The calculations suggest that with present effluent flows and boron concentrations, boron
levels in Sugar Creek and the Sangamon River as far downstream as location F would not be
expected to
fall below
the 1.0 mg/L
General Use standard during 7Q10
flows. Even
though the
Sangamon
River may show boron levels below
1.0
mg/L during
periods
of "average" flow
B ronSuSr.Repdf040594
4-15
92S5034A
Electronic Filing - Received, Clerk's Office, August 29, 2008
* * * * * R2009-008 * * * * *
Dent/ Farm
Radio
lower c
+,
3
Roche tgr
L OCATIONS FOR
CALCULATED
BORON
VALUES
T ECHNICAL SUPPORT
DOCUMENT
FOR
PETITION
FOR ADJUSTED
BORON
STANDARDS
FOR SUGAR
CREEK
AND
THE SANGAMON
RIVER
I
-N -
416
Electronic Filing - Received, Clerk's Office, August 29, 2008
* * * * * R2009-008 * * * * *
TABLE
4.2 '
BORON CONCENTRATIONS AND FLOW RATES
Location
South Sangamon
St.
Fork
River
Francis Riverton
003
004
007
008 (EO-01) (E16) Convent MSD
Q 0.26
7.89
21.5
9.6
1.1
42.6
0.21
0.25
C 18.70 10.19 0.34 0.47
0.08
0.1
0.40
0.40
Q = Flow value in cubic ft per second (cfs)
C =
Boron
concentration
in
mg/L
B rbnSugr.Repdt040594
4 -17
9 2S5034A
Electronic Filing - Received, Clerk's Office, August 29, 2008
* * * * * R2009-008 * * * * *
volume due to dilution factors,
Sugar Creek would still be expected to have boron concentrations
above
1.0 mg/L. Although the calculation for location F, downstream of the outfall 007 of
SMSD's
Spring Creek station, predicts a worst-case boron
concentration
of 1.22 mg/L, no
excursions above the 1.0 mg/L General Use standard have been recorded at the downstream
Petersburg sampling station. Overland flow and the contribution of small, intermittent, streams
between 007 and the Petersburg sampling point probably dilute the boron concentration below
the 1.0
mg/L standard.
Sampling at station E26 in the Sangamon River shows that excursions above the 1.0 mg/L
standard do occur. However, most of the excursions occurred in 1988, when CWLP was
operating
at higher than normal levels. The calculated
values
are
very
similar to the actual
sample values. At location D, the calculated boron value was 1.53 mg/L and the maximum
boron
sample concentration was 1.82 mg/L at E26 in August 1988.
As shown in Table 4.1, the percentage of samples with boron above 11.0 mg/L for
outfalls 003 and 004 was 6.4 and 0.0, respectively. The frequency of occurrence for location A
to reach the
calculated maximum boron level of 10.46 mg/L
would
be
very
low. The maximum
boron levels of 18.70 mg/L for outfall
003
and 10.19 mg/L for outfall 004 were used
in
the
calculations.
Only
the
18.70 mg/L sample and one other boron sample (16.86 mg/L) for outfall
003 were at such an elevated level. No values for 004 were above 11.0 mg/L. All other values
for 003 and 004 were below 9.7 mg/L, which would yield a. calculated boron value below 10.0
mg/L at location
A. Adding
to the
low
chances of occurrence of boron above
11.0 mg/L at
location A is the low probability
of outfalls 003 and
004 simultaneously discharging their
historic
maximum boron levels.
In light of these calculations, CWLP could normally comply with adjusted standards for
boron of: 11.0
mg/L from outfall 003
to
SMSD's
Sugar Creek station outfall 008; an adjusted
standard of
5.5
mg/L from outfall 008 to the confluence of Sugar Creek with the South Fork and
the Sangamon River; and an adjusted
standard
of 2.0 mg/L from this confluence to 100 yds
below the confluence of Spring Creek with the Sangamon River, north of Springfield.
B ronSugr.RcpdfD40594
4-18
92S5034A
Electronic Filing - Received, Clerk's Office, August 29, 2008
* * * * * R2009-008 * * * * *
5.0 ENVIRONMENTAL EFFECTS OF BORON
5 .1 Environmental Effects of Present and Past Boron Levels
As discussed
earlier,
the impairments observed in overall stream quality at sampling
stations E16, E26, EO-01, and EOA-01 are not attributable to documented concentrations of
boron within the stream reaches in question. Table 3.16 lists several known causes and sources
for these impairments to stream quality. These elements include: siltation from agriculture;
organic enrichment from agriculture and municipal sewage treatment plants; and habitat
degradation
and siltation
from
stream
channelization. In addition to these impairment factors,
an additional cause
of stream
quality limitation for Sugar Creek is the disruption to the aquatic
habitat from flow regulation by Spaulding Dam.
The presence of Spaulding Dam on Sugar Creek results in a 7Q10 low flow of 0.0 cfs for
Sugar Creek when no water is allowed over the dam. During moderate drought periods when
Sugar Creek has no flow, the CWLP outfall 003 and 004 discharges (average design flow up to
7.94 MGD) may be an advantage to the aquatic ecosystem by providing larger and deeper pools
in the creek
channel than would exist
without
the
discharges.
-
As discussed in Section 4.3.1, the predominant sources of boron in the stream sections .
being considered in this report are the CWLP outfalls 003 and 004. This is evident from the data
presented in Table 4.1. However, there are
no observable
detrimental
effects upon the
receiving
waters
from these boron
concentrations
based
on
the data presented in this report.
The Water Quality Index values from Table 3.16 place the upstream station on the
Sangamon River at Roby (E16) in the same. poor stream
quality
rating category (partial support
of designated stream use with moderate impairment) as the downstream station (E26) at Riverton,
which
receives
the
boron discharges
from Sugar Creek. The Sugar Creek station EOA-O1, just
downstream of the CWLP discharges,
was
given
the highest stream quality category rating of
excellent with full support of the designated stream use of aquatic life support.
B ronSugr.Repdf040594
5-1
92S5034A
Electronic Filing - Received, Clerk's Office, August 29, 2008
* * * * * R2009-008 * * * * *
Table 3.16 gives
a higher
quality-
Macroinvertebrate Biotic Index (MBI) rating of
very
good for the downstream station (E26) at Riverton than
for the upstream
station
(E16) at Roby,
which was only rated fair. Table 3.4
gives
an MBI
category rating of very good to excellent for
the first
three years
listed for the Sugar Creek station EOA-O1. The MBI
values were
better
for
EOA-01 than for the other two stations (C-1 and C-2)
for
all
four years of available data, except
for 1985 when all stations were rated excellent,
even though EOA-01 was closer to the CWLP
outfalls. The other two stations (C-1 and C-2)
were downstream from EOA-01 and from the
SMSD sewage treatment
plant's outfall 008. The IEPA studies (Appendix
A) concluded that the
sewage treatment plant discharges were having
a
slight
to moderate influence on the downstream
reaches of Sugar Creek. This
may account for the higher quality MBI value for the upstream
station EOA-O1.
As seen in Table 3.7,
the Index of Biotic Integrity (IBI and AIBI)
values
for all four
stations listed are in the second lowest rating category.
As shown in Table 3.9, this category has
a stream quality description of "poor," a Biological Stream
Characterization description of
"limited aquatic resource," and a USEPA rating as being
"partially supportive of the designated
stream use of support of
aquatic life, with moderate impairment." Table 3.6 shows the fish
species collected during
the 1987-88 fish survey done for CWLP.
The
location of-each .collection
area
is shown
in Figure 3.6 of this report and in Exhibit
23B
'of
that study (Appendix B).
Locations
2
and 5
of that
study
are both on the Sangamon downstream
of the confluence of
Sugar Creek and the South Fork. Sampling of
these two locations produced a higher number of
fish species than any of
the other locations. Location 2, with the highest number of species,
was
immediately downstream from the mouth of the South Fork
and would have a higher exposure
to Sugar Creek pollutants discussed
in
Section
3.2.2, including boron, than location 5 near
Riverton. The South Fork (location 3)
had the lowest number of fish species and also had
the
lowest boron levels of all stream
stations listed in Table
4.1.
.
The overall stream quality of the various sampling
locations discussed above do not show
any pattern of degradation attributable to boron concentrations.
No pattern of detrimental impacts
from observed boron levels in the South
Fork, Sangamon River, or Sugar Creek should be
expected. This conclusion is supported by
the evidence presented in the discussion on boron
toxicity in Section
4.2.3 and boron stream concentrations
in
Section
4.3:1.
BronSugrAepM40594
5-2
92S5034A
Electronic Filing - Received, Clerk's Office, August 29, 2008
* * * * * R2009-008 * * * * *
A
direct
investigation of potential toxicity of the CWLP discharges was conducted by the
IEPA in August 1988. A bioassay was performed with effluent water samples on the invertebrate
Ceriodaphnia dubia and on fathead minnows. No significant acute toxicity was observed for
either species (See Appendix D). Chronic toxicity results were not reported due to poor control
survival.
5.2
Predicted Effects of Achieving the General Use Water Quality Standard
No beneficial biological impacts
are
expected
if the existing
General Use water quality
stream standard for boron (1.0 mg/L) is achieved. Significant differences due to boron
concentrations
in various stream quality index values and in biological communities between the
downstream and
upstream IEPA and
AWQMN
sampling
stations
discussed in this report have
not been documented in surveys conducted by state agencies and CWLP. This suggests that the
past 25 years of
discharges
from the
CWLP power station
have not had
a negative impact on
aquatic life in Sugar
Creek
or the Sangamon River.
There may be
a
negative impact if flows from the outfalls are
reduced to achieve the
existing General Use boron water quality stream standard. Reduction could occur if fly ash-from
the
station were dry handled for disposal or if advanced physicochemical effluent treatment
systems, such as reverse osmosis and mechanical evaporation were employed. The outfall
discharges augment the flow in Sugar Creek, providing increased volume and flow
for sustaining
a more diverse fishery and biological community.
There are presently no known irrigation or
potable water
uses of Sugar Creek or the
Sangamon River in the
stream
reaches studied. No future uses of Sugar Creek are
anticipated
that would
benefit
from
achieving.the
General Use water quality stream
standard for boron.
There are no known future plans to use Sugar Creek as a potable water supply or for any other
withdrawal purpose such as irrigation. No impacts to any known current activities due to the
water quality
of Sugar Creek
have occurred; therefore, none would be anticipated
from alignment
of the
regulatory standard
with the present concentrations as proposed.
BronSugr.RepM40594
5-3
92S5034A
Electronic Filing - Received, Clerk's Office, August 29, 2008
* * * * * R2009-008 * * * * *
5.3 Predicted Effects of the
Proposed Adjusted Water Quality Standards
The assessment of the stream ecosystems presented
in this
document
indicate that the
boron concentrations in the CWLP outfall
discharges have had no adverse effect on the aquatic
communities being exposed
to these boron levels. Impacts to resident biota are not anticipated
from the proposed adjusted water quality stream standards
for boron because the discharged
boron concentrations will not change from the present
concentrations.
The designated stream
use of support of aquatic life of Sugar Creek is enhanced by
the
additional flow velocity and discharge augmentation of creek
flow by water discharged from the
CWLP power station during low
flow months. The existing discharges especially augment
movement of
species
whose passage may be blocked
in low flow periods and sustain deeper
w ater pools to accommodate pool species.
The proposed adjusted
water quality stream standards for boron are not expected to have
.any adverse impact on any known anticipated future uses of Sugar Creek or
the
Sangamon
River.
There is currently a potential for withdrawal
of water from the Sangamon River on the north side
of Springfield for irrigation of the Rail Golf Course
(Section
3.2.1). As
discussed in Section
4.2.3, research has shown that the turfgrass species
normally planted on golf courses in this area
have exhibited high tolerance
to boron levels of more than 4.8 mg/L in irrigation waters. Boron
toxicity problems are not anticipated in the event that irrigation
is
-us
ed.
.for
the golf course
tuifgrasses because the proposed adjusted
boron stream standard is 2.0 mg/L for this reach of the
Sangamon River. The proposed
adjusted standard of 2.0 mg/L was based on a worst-case
calculated maximum boron level of
<1.52
mg/L
(Section 4.3.2). No adverse impacts to any
known current activities based on the
water quality of Sugar Creek or the Sangamon River have
occurred;. therefore,
none would be anticipated from alignment of the regulatory standard
with
the actual current boron concentrations.
BronSugr.Repdf040594
5-4
92S5034A
Electronic Filing - Received, Clerk's Office, August 29, 2008
* * * * * R2009-008 * * * * *
6.0 EVALUATION OF
ALTERNATIVES FOR COMPLYING
WITH NPDES PERMIT
BORON LIIVIIT
The NPDES
Permit IL0024767 for the CWLP
power station, reissued on November 14,
1991, contains
a
boron effluent limitation
of 1.0 mg/L, which is to become effective
on
December 14, 1994. The average
boron concentrations of
the discharge from the CWLP outfalls
003 and 004 for the period
of January 1987 through October
1992 are 4.51 mg/L and 6.12 mg/L,
respectively, which are higher than the reissued
permit limitation.
As required in the process
of petitioning for an adjusted stream standard,
several
compliance alternatives were
considered. Two treatment alternatives
were evaluated for boron
removal to meet the effluent discharge limitation.
Two alternative operating procedures were also
evaluated; conversion of the fly
ash handling-system to a dry
method, and the use of a low boron
coal.
The two treatment systems were
based on treating 5,200 gpm. of
water
from the.ash pond
outfall No. 004, which is 95 percent
of the total discharge
volume for both 004 and 003
combined
(see NPDES permit, Appendix C).
6.1 Selective Ion Exchange
The selective ion exchange process
employs a commercially available
ion exchange resin.
Rohm & Haas Company manufactures
an ion exchange resin that
can
be
used for removing boron
(Rhom and Haas
Bulletin IE-153a, October 1989,
Amberlite IRA-743). The manufacturer
claims
a
90
percent boron removal rate for
the resin. The selective ion exchange system
would consist
of ion exchange vessels, sulfuric
or hydrochloric acid storage
tanks (for resin regeneration) and
chemical feed equipment (Figure 6.1).
Physical space limitations at the 003
and 004 discharge
points may make the installation
and operation of the equipment
impractical.
B ronSugr.Repd1040594
6-1
92S5034A
Electronic Filing - Received, Clerk's Office, August 29, 2008
* * * * * R2009-008 * * * * *
/.- IORAWNCS192550341008.O#U
OJ12JI94
l1.-01
HWG
D
IAGRAM OF SELECTIVE ION EXCHANGE
Backwash
(to ash ponds)
Regenorant
w asto
Evaporallon
C hemical
storage
Electronic Filing - Received, Clerk's Office, August 29, 2008
* * * * * R2009-008 * * * * *
Filters located upstream of
the ion exchange vessels are used to remove suspended solids
present in the ash pond discharge. When the resin is regenerated,
wastewater is
produced
with
a very high boron content. Cost estimates for this
alternative include an evaporator or spray
.dryer for concentrating
this wastewater or producing a dry waste product to facilitate disposal.
However, additional costs would be incurred for landfilling or other proper disposal of the
waste
product.
6.2 Reverse
Osmosis/Mechanical
Evaporators
Reverse osmosis (RO) is a process
where
moderate
pressures (e.g., -200 psi) are used to
force water through semi-permeable membranes,
which are relatively impervious to passage of
various ions
(Figure
6.2). The wastewater that does not pass
through the membranes
is
known
as RO reject and is--typically 20-30 percent
of the influent flow rate. A mechanical evaporator
and
spray dryer
would be used to concentrate the RO reject and evaporate the resulting
wastewater to
dryness.
The resulting dry product would then require landfilling or other suitable
disposal at additional cost. The RO system also requires pretreatment
with
media filters,
cartridge filters, and a scale inhibitor to minimize
fouling of the membranes. Reverse osmosis
will typically remove 60
to
98? percent
of the..
influent
boron over a pH range, of 5.0 to 9.0. As
with the selective ion exchange process,
the
physical
space limitations at the 003 and 004
discharge points may
make the installation and operation of the necessary equipment for this
alternative impractical.
-_
6 .3 Dry Fly Ash Conversion
The alternative for
dry removal of fly ash assumes that the contribution of boron in the
ash pond discharge from bottom ash is not significant.
Particle size and leaching characteristics
of bottom ash
tend to reduce the relative concentration of
boron in bottom ash
sluice
water
(Pagenkopf and Connolly, 1982; Sargent & Lundy,
1992). In this type of removal system, the
dry fly ash
is carried pneumatically to a storage silo.
The dry fly ash has a small amount of
moisture added as it is discharged
from the silo into trucks to improve handling characteristics.
It is then transported to a landfill.
BronSugrRepd1040594
6-3
92S5034A
Electronic Filing - Received, Clerk's Office, August 29, 2008
* * * * * R2009-008 * * * * *
/.-
J9RA#/N6a I92S5034 1 008.9#6 03/23/94 11'046
Ham'
Electronic Filing - Received, Clerk's Office, August 29, 2008
* * * * * R2009-008 * * * * *
The cost estimate for this alternative included the assumed
need for construction of three
separate landfill
cells
by CWLP
at 10
year
intervals over the anticipated 30 year plant life span.
6.4 Alternative Coal
The use of an alternate coal with a boron
content low enough to meet discharge standards
may be possible. The estimate for low boron
coal for this alternative is based on fuel studies
conducted by Illinois Power in 1990 (Sargent & Lundy, 1992) on a central Appalachian source
of low boron coal. Total
operating costs are based on an annual consumption of 900,000
tons
of coal per year. Calculations
were made based on-a low boron coal price of $28.50 per ton and
a current
high boron
coal price of $23.49 per ton.
Western
coal is a readily available source of alternative coal. Western
coal
is inherently
lower in boron content than midwestem coal and produces
fly ash significantly lower in boron
(Dunham, 1992). However, western coal typically
has a lower BTU value, which necessitates
the use of larger volumes of coal to produce equivalent
generating capacity as compared with
typical midwesiern coal. If additional
coal use to offset reduction in generating capacity is not
possible, then
the
purchase
of replacement capacity would be required. Western coal typically
produces
more
dust than the midwestern coal now being used which would require installation
of additional dust
suppression
equipment.
The cost figures used
in the estimate shown in Table 6.1 for,CWLP to use an alternative
low boron coal (e.g. western)
were calculated only from a per ton purchase price based on
current annual tonnage. Very significant
additional costs would be involved for the capital
investment required for boiler
modifications to facilitate use of a coal with different ash and BTU
characteristics from
the present rnidwestern coal being used, for
which the
boilers
were
designed.
Significant capital costs would
also be incurred for the additional dust suppression equipment
required for use with
low boron coal.
B ronSugr.Repd1040594
6-5
92S5034A
Electronic Filing - Received, Clerk's Office, August 29, 2008
* * * * * R2009-008 * * * * *
TABLE 6.1
'
ADJUSTED STANDARD
ALTERNATIVES
ECONOMIC
ANALYSIS
Annual
Capital
Operating
Present
Alternative
Cost
Cost
Value
1 .
Selective
Ion Exchange
$11,900,000
$380,000
$19,750,000("
2. Reverse
Osmosis/Mechanical
Evaporators $49}900,000 $2,410,000
$99,800,000(')
3. Dry Fly Ash Conversion
$11,905,000 $450,000
$20,175,000
4. Alternate Coal
N/A
$4,509,000 $93,200,000(2)
(')
= Cost does not include
additional costs for landfilling
or other proper disposal of
waste
product.
(2)
= Cost does
not include additional costs for hauling,
dust suppression, and boiler modification.
B ronSugr.RepdM40594
6-6
92S5034A
Electronic Filing - Received, Clerk's Office, August 29, 2008
* * * * * R2009-008 * * * * *
Additional
purchasing and transportation
costs would be incurred
if additional coal
volumes
were needed to offset the lower generating
capacity from use
of a coal with lower BTU
value. CWLP must
rely on truck transportation
for coal delivery due
to the absence of more
efficient and less costly railroad spurs
to their power station.
Significant
cost could also be incurred, additional
to the alternative
coal cost shown in
Table 6.1, if purchase
of replacement generating
capacity is required.
6.5 Economics
of Alternatives
The capital and annual
operating costs for the four
alternatives and their present minimum
worth are listed in Table 6.1.
Annual operating costs
are escalated at a rate of 7 percent
per year.
This rate includes
escalation for expected load growth
for the utility. A power
plant life of 30
years is used for economic
analysis.
The
present worth of annual operating
expenses is
calculated using a
cost of capital of 10 percent.
All costs are in 1993 dollars.
The present
minimum worth values for
these alternatives range from $19,750,000
to
$99,800,000.
The least
expensive alternative appears
to be selective ion
exchange at a present
minimum worth of $19,750,000.
However, due to the
variations in expected performance of
each
alternative and the uncertainties
associated with implementation
of each alternative,
there can be
no assurance that
compliance will be achieved
with any alternative method.
B ronSugr.Repdf040594
6-7
92S5034A
Electronic Filing - Received, Clerk's Office, August 29, 2008
* * * * * R2009-008 * * * * *
7.0
CONCLUSIONS
AND RECOMMENDATIONS
The
General Use stream
standard for boron of 1.0 mg/L was established by the Illinois
Pollution Control Board (IPCB) for the protection of aquatic life. This standard was based, in
part;-on known boron toxicity to sensitive irrigated
crops, such as citrus. The reissued NPDES
permit for the CWLP power station requires outfall discharges to meet the General Use standard
limit for
boron
by December 14, 1994. The boron concentrations in the discharges from outfalls
003 and 004 from January 1987 through October 1992 averaged
4.51 mg/L
and 6.12
mg/L,
respectively, which
exceeds
the General Use boron standard. Based on a number of boron
toxicity studies, these discharged boron levels are well below
concentrations
shown
to cause
detrimental effects to the types of organisms tested.
Studies of fish and macroinvertebrates within the Sugar Creek and associated South Fork
and Sangamon River ecosystems showed no
correlation between the quality of the populations
and boron concentrations. The IEPA, in their biennial
Illinois Water Quality Reports, attributed
observed impairments in biological condition and stream quality of Sugar Creek and the
Sangamon River
to
factors such
as
siltation,
channelization, sewer effluents, and flow
modification from Spaulding Dam.
Four alternatives for complying
with the NPDES permit boron limit were evaluated. It .
was found that no physically practical or economically reasonable alternative is,, available to
CWLP to comply with the permit limitation (and General Use water quality stream standard)
for
boron. The least expensive alternative for reducing boron discharge
concentrations will require
an
investment of
at
least $19,750,000, with additional costs for waste product disposal, without
assurance that compliance will be achieved. In contrast, minimal
costs
are associated
with
CWLP's
present approach of seeking adjusted stream standards, and no adverse environmental
or health impacts are anticipated.
The proposed adjusted
water quality stream standards for boron are: 11.0 mg/L from the
CWLP outfall 003
in
Sugar Creek,
near Spaulding Dam, to the SMSD Sugar Creek STP outfall
008; 5.5 mg/L from outfall 008
to the confluence of Sugar Creek with the South Fork and the
B ronSuSr.Repd1040594
7-1
92S5034A
Electronic Filing - Received, Clerk's Office, August 29, 2008
* * * * * R2009-008 * * * * *
Sangamon River; and 2.0 mg/L for the Sangamon River from this confluence to 100 yds
downstream of the
confluence
of Spring Creek with the Sangamon River, which is where the
effluent from the SMSD Spring Creek STP outfall
007
is
received. In light of the discussions
put forth in this report, it is recommended that the proposed adjusted water
quality stream
standards for boron be adopted by the IPCB for
Sugar Creek and the described reach of the
Sangamon River. Regulatory support fox this recommendation
has been stated by the IEPA.
The recommended alternative boron water quality
stream standards are justified because
the current bases for the General Use standard (agricultural irrigation, stock watering, and
drinking water) are -not relevant to Sugar Creek -or the Sangamon River-
and, as previously
discussed, are unnecessarily stringent for the protection of aquatic life. No
significant effects
are
expected
from the proposed adjusted water quality stream standards because they will only reflect
the current water quality
of 'Sugar
Creek, the-Sangamon
River, and the-concentrations of- baron
in the outfall
discharges from the CWLP power station. The adjusted water quality stream
standards would allow- the
station
to continue
to discharge outfall effluents as it has since the
1960s. Historical data indicate not only that relatively diverse aquatic communities
have existed
in the presence of, but may also be
dependent upon, discharges from the CWLP power station
outfalls during low flow conditions. Thus, the outfall
discharges
will-
help provide for the
maintenance of existing aquatic life and
diversity.
B ronSugr.Repdft140594
7-2
92S5034A
Electronic Filing - Received, Clerk's Office, August 29, 2008
* * * * * R2009-008 * * * * *
8.0 REFERENCES
Agency for Toxic Substances and Disease
Registry (ATSDR). Draft Toxicological
Profile for
Boron. U.S. Department of Health
and Human Services, 1990.
Antia, N.J., and J.Y.
Cheng. Culture Studies on the Effects form Borate
Pollution on the Growth
of Marine Phytoplankton.
Journal of the Fish Research Board
of Canada. 32:2487-2494,
1975.
Bergstrom, R.E.,
K. Piskin, and L.R. Follmer. Geology
for Planning in the Springfield
-
Decatur
Region, Illinois, Circular 497, Ill. State Geological
Survey, Urbana, Ill., 1976.
Biological Stream Characterization
Work Group. Biological Stream
Characterization (BSC): A
Biological Assessment
of Illinois Stream Quality. Special Report No.
-13 of the Illinois
State Water Plan Task Force,
1989.
B iggar,
J.W.,
and M. Fireman. "Boron absorption
and release by soils." Soil Sci.
Soc.
Amer.
Proc.
24:-115 1960.
I-..-.--....
-
Birge, W.J. and J.A. Black.
Sensitivity of vertebrate embryos to
boron comvounds. U.S.
Environmental Protection Agency
Report 560/1-76-008. 66 pp, 1977.
Butterwick, L.,
N. De Oude, and K. Raymond.
"Safety Assessment of Boron in Aquatic
and
Terrestrial
Environments." Ecotoxicology
and Environmental Safety. 17:339-371,
1989.
Chen, K.Y.,
and W. Choi. "Evaluation of Boron Removal
by Adsorption on Solids."
Environmental Science and Technology.
February 1979.
City Water, Light and Power. "Lake
Springfield Ecology and Management:
A Leaseholder and
Community Guide." Springfield,
Illinois, 1992.
CWLP. Personal Communication, 1992-93.
Dunham,
R. Boron Compliance Alternatives.
Southern Illinois Power Cooperative Marion
Power
Station, April 1992.
E
isler, R. Contaminant Hazard Reviews, Boron
Hazards to Fish, Wildlife, and Invertebrates: A
Synoptic Review. U.S. Fish
and Wildlife Service, Biol. Rep. 85 (1.20).
Washington,
D.C. 32 pp, 1990.
Eaton,
F.M. "Deficiency, toxicity, and accumulation
of boron
in plants." J. Agric. Res.
69:237-277, 1944.
B ronSugr.Repdf040594
8-1
92S5034A
Electronic Filing - Received, Clerk's Office, August 29, 2008
* * * * * R2009-008 * * * * *
Evaluation
of Alternate Water Quality Standards for the Middle Fork
Vermilion River.
Environmental
Science
and Engineering, Inc., St. Louis, MO., 1992.
Frick, H. "Boron Tolerance and Accumulation in the Duckweed, Lemna minor." Journal of
Plant Nutrition. 8:1123-1129. 1985.
Garabrant, D.H.,
L. Bernstein, J .M. Peters, and T.J. Smith. "Respiratory and Eye Irritation from
Boron
Oxide and
Boric Acid
Dusts."
Journal of Occupational Medicine. 26:584-586,
1984.
Gersich, F.M. "Evaluation of a
Static
Renewal Chronic Toxicity Test Method for Daphnia
magna (Straus) Using Boric Acid." Environmental Toxicology and Chemistry. Vol. 3,
No. 1, Pergamon Press, New York, New York, p 89, 1984.
Graham, R.D., R.M. Welch, D.L. Grimes, E.E. Cary, and W.A. Norvell. "Effect of Zinc
Deficiency on the Accumulation of Boron and Other
Mineral Nutrients
in Barley."
Journal of the
Soil
Science Society of America. 51:652-657, 1987.
Gupta, A.P., and M.D. Parrish. "Effectiveness of a new boric acid bait (roach killer cream) on
German cockroach (Blattella
germanica) populations
in urban dwellings."
Uttar Pradesh
J. Zool. 4:51-56, 1984.
Gupta, U.C., Y.W. Jame,
C .A. Campbell,
A.J.
Leyshon,
and
W. Nicholaichuk. "Boron
Toxicity
and Deficiency: A Review."
Canadian
Journal of
Soil Science.
Vol.
65. pp. 381-409,
1985.
Herkert, J.R. editor. Endangered and Threatened
Species of
Illinois: Status
and
Distribution,
Volume 2 - Animals. Illinois Endangered Species Protection Board, Springfield, Illinois.
142 pp, 1992.
Hilsenhoff,
W.L. "Using a Biotic Index to Evaluate Water Quality in Streams." Wisconsin
Department atural Resources Technical Bulletin No. 132. 1982.
Hinsman, W.J., and T.M. Skelly. Clean Lakes Program Phase I Diaoostic easibility Study for
the Lake Springfield Restoration Plan. City Water, Light and Power. Springfield
Illinois, 1987.
Hocutt, C.H. "Fish as indicators of biological integrity." Fisheries. 6(6): 28-31, 1981.
Homer, R.W. Champaign County
Surface
Water Resources. IDOC, 1969.
Homer, R.W. Macon County Surface Water Resources. IDOC, 1970.
Homer, R.W. Piatt County Surface Water Resources. Illinois Department of Conservation, 1968.
B ronSugr.Rcpdt040594
8-2
92S5034A
Electronic Filing - Received, Clerk's Office, August 29, 2008
* * * * * R2009-008 * * * * *
Illinois Environmental Protection Agency. Assessment of Nonpoint Source Impacts on Illinois
Water
Resources. Planning Section, Division of
Water
Pollution
Control, Springfield.
115
p, 1988.
I EPA.
Illinois
Water
Quality Report 1986-1987. Illinois EPA Division of Water Pollution
Control, Springfield, Illinois, 1988.
IEPA. Illinois Water Quality Report 1988-1989. Illinois EPA Division
of Water Pollution
Control, Springfield,
Illinois, 1990.
IEPA. Personal Communication, 1993 - 1994
Illinois Administrative Code, Title 35: Subtitle C, 1990.
Illinois Department of Agriculture (IDOA). Personal Communication, 1993.
Illinois Department of Transportation (IDOT). Personal Communication, 1993.
Illinois Department of Conservation (IDOC). Personal Communication, 1993.
Illinois Department of Energy and Natural Resources. Personal Communication, 1993.
Illinois State Water Survey (ISWS). Personal Communication, 1993.
ISWS.
"Map 5 Sangamon Region" (7Q10 stream flows), 1984.
Isom, B.G. "Benthic macroinvertebrates. in Methods for the assessment and prediction of
mineral
mining impacts on aquatic communities: a review and analysis. U.S. Fish &
Wildlife Service: FWS/OBS-78/30, 1978.
J ones, D.W., M.J. McElligott, and R.H. Mannz. Biological, Chemical and Morphological
Characterization of 33 Surface lvime Lakes in uiinois aiiu iv`lisaouri. Pediiuuy %Gai iv.,
1985.
Karr, J.R. "Assessment of biotic integrity using fish
communities."
Fisheries.
6(6):21-27, 1981.
K arr, J.R. K.D. Frausch, P.L. Angermeier, P.R. Yant, and I.J. Schlosser. "Assessing Biological
Integrity in
Running Waters: A Method and Its Rational." Illinois Natural History
Survey Special
Publication 5. Champaign, Illinois, 1986.
Kobayashi, N. Fertilized sea urchin eggs as an indicatory material for marine pollution bioassay,
preliminary
experiments. Publ. Seto Mar. Biol. Lab. 18:379-406, 1971.
Lee, M.T., and J.B. Stall. Sediment and Soil Loss in Illinois. Illinois State Water Survey Project
Report to the Illinois Institute for Environmental Quality. Champaign, Illinois, 1977.
B ronSugr.Repdt040594
8-3
92SS034A
Electronic Filing - Received, Clerk's Office, August 29, 2008
* * * * * R2009-008 * * * * *
Lewis, M.A., and L.C. Valentine.
"Acute and Chronic Toxicities of Boric Acid to Daphnia
magna Straus." Bulletin of Environmental
Contamination and Toxicology. 27:309-315,
1981.
Lopinot,
A.C. Illinois Surface Water Inventory. Illinois Department
of Conservation, 1972.
Mann, H. "Untersuchungen fiber
die W, irkung yon Borverbindungen auf Fische and
einige
andere
Wasserorganismen." Archiv fiir Fischereiwissenshaft Braunschweig.
24: 171-175,1973.
Merck Index.
8th ed. Merck & Co., In., Rahway, N.J. p. 160, 1974.
National Academy
of Sciences (NAS). Drinking Water and Health. The
National Research
Council, Washington, D.C.,
1977.
National Primary Drinking Water Regulations.
40 CFR 141, 1992.
O ertli, J.J.,
O.R. Lunt, and V.B. Younger. "Boron Toxicity in
Several Turfgrass Species."
Agronomy Journal.
Vol. 53. pp.
262-265,
1961.
Pagenkopf, G.K., and J.M. Connolly. "Retention
of Boron by Coal Ash." Environmental
Science
and Technology. 16:609-613, 1982.
Papachristou,
E., R. Tsitouridou, and B. Kabasakalis.
"Boron Levels in Some Ground Water of
Halkidiki."
Chemosphere. Vol. 16, No.s 1/3. Great Britain, pp 419-427,
1987.
P lafkin, J.L., M.T. Barbour,
K.D. Porter, S.K. Gross, R.M. Hughes. Rapid
Bioassessment
Protocols
for
Use
in
Streams and Rivers: Benthic Macroinvertebrates and
Fish. U.S.
Environmental
Protection Agency,
Washington, D.C. EPA/444/4-89-001. 162 p.,
1989.
Rao, D.V.S. "Effect of Boron on Primary Production
of Nanoplankton." Canadian
Journal of
Aquatic
Science. 38:52-58,1981.
Resh, V.H., and J.D.
Unzicker. "Water quality monitoring and aquatic
organisms: the
importance of species identification."
Jour. Water Pollution Control. 47:
9-19, 1975.
Rogers, R.A. Cass County
Surface Water Resources. IDOC, 1971.
Rogers, R.A. Christian County Surface Water
Resources. IDOL, 1969.
Rogers,
R.A. Menard County Surface Water Resources. IDOC, 1969.
Rogers, R.A. -Sangamon
County Surface Water Resources. IDOC, 1971.
Rohm & Haas. Technical
Bulletin IE-153a, October 1989.
Sangamon County Cooperative
Extension Service. Personal Communication, 1993.
BronSugt3e01040594
8-4
92S5034A
Electronic Filing - Received, Clerk's Office, August 29, 2008
* * * * * R2009-008 * * * * *
Sangamon
County Soil and Water Conservation District. Personal
Communication, 1993.
Sargent & Lundy.
Alternatives for Corn l yin with
Reissued NPDES Permit Limitations:
Vennilion Power
Station. Chicago, Illinois, 1992.
Smith, P.W.
The Fishes of Illinois. University
of Illinois Press. Urbana, Illinois, 1979.
Sprague, R.W. The
ecological significance of boron.
United States
Borax
and Chemical Corp.,
Los Angeles.
58 pp., 1972.
Stauffer, J.R. Jr., K.L. Dickson,
J. Cairns Jr., and D.S. Cherry.
"The
potential
and realized
influence
of temperature on the distribution of
fishes in the New River, Glen Lyn,
Virginia." Wild.
Monogr. No. 50, 1976.
Thompson,
J.A.J., J.C. Davis, and R.E.
Drew. Toxicity, Uptake and Survey
Studies of Boron in
the
Marine Environment, 1976.
T hurston, R.V., R.C.
Russo,
C.M. Fetterolf, T.A. Edsall, and Y.M. Barber.
A Review of the EPA
Red Book:
Ouality Criteria for Water. American Fisheries
Society,
Bethesda, MD.
313p, 1979.
,
U .S. Environmental
Protection Agency (USEPA).
Boron Toxicity. Office of Enforcement.
Denver, Colorado, 1983.
USEPA. Guidelines
for the Preparation of the
1990 State Water Quality Assessment
305(b)
Report.
Office of Water and Office.of Water Regulations
and Standards. Washington,
D.C., 1989.
USEPA. Preliminary Investigation
of Effects on the Environment of Boron. Indium
Nickel
Selenium,
Tin, Vanadium, and
Their
Compounds. Vol. 1. Boron. Report No.
56/2-75-
005A, 1975.
USEPA. Quality
Criterion for Water. Ambient Water Quality
Criterion (AWOC). PB-263943,
1976.
U
SGS.
Water
Resources Data Illinois Water
Year 1987. Vol. 2. USGS, Urbana, Minois,1988.
USGS. Water
Resources Data Illinois Water Year 1988. Vol.
2. USGS, Urbana, Minois, 1989.
USGS. Water
Resources Data Illinois Water Year 1989. Vol. 2. USGS,
Urbana, Minois, 1990.
USGS. Water Resources Data
Illinois Water Year 1990. Vol. 2. USGS,
Urbana, Illinois, 1991.
USGS. Water Resources Data Illinois
Water Year 1991. Vol. 2. USGS, Urbana, Minois,
1992.
BronSugr.Repdf040594
8-5
92S5034A
Electronic Filing - Received, Clerk's Office, August 29, 2008
* * * * * R2009-008 * * * * *
Waggott,
A. "An investigation of the Potential Problem of Increasing Boron Concentrations in
Rivers and Water
Courses." Water Research, 3. p 749, 1969.
Wallen, I.E., W.C.
Greer, and R. Lasater. "Toxicity to Gambusia affinis of certain pure
chemicals in turbid waters."
Sew. Ind. Wastes 29: 695-711, 1957.
Wang, W. "Toxicity
Tests of Aquatic Pollutants by
Using Common Duckweed." Environmental
Pollution
Series
B.
Peoria, Illinois, 1986.
Weber, C.H. Editor. Biological field and laboratory methods
for measuring the quality of surface
water and effluents.
National Envir. Research Center, USEPA. Cincinnati,
Ohio,
1973.
Weir, R.J., Jr., and R.S. Fisher. "Toxicologic
studies on borax and boric acid." Toxicol. Appl.
Pharmocol. 23:351-364, 1972.
Zebrun, G. Ford County Surface
Water Resources. IDOL, 1970.
B ronSugr.Repd1040594
8-6
92S5034A
Electronic Filing - Received, Clerk's Office, August 29, 2008
* * * * * R2009-008 * * * * *
APPENDIX A
IEPA AQUATIC MACROINVERTEBRATESTUDIES
OF SUGAR
CREEK
Electronic Filing - Received, Clerk's Office, August 29, 2008
* * * * * R2009-008 * * * * *
DATE:
April
5, 1985
TO:
FROM:
SUBJECT:
J im Park
-
271 -4 -
4.j
M att Short and Bill
Ettinger
S tream Assessment
Survey; Springfield Su ar Creek
Sewage
Treatment
Plant;
Sugar Creek (EOA
Introduction
M EMORANDUI
The Springfield
Sugar Creek
sewage
treatment plant
is operated by
the Springfield
Sanitary District and is one of two treatment
facilities
serving
the greater-Springfield area.
The Sugar
Creek STP is located
on the east edge of the city (pop.
100,100) near
the intersection of
Interstates 55 and
72
and
discharges into Sugar Creek,
a fifth order
stream in the Sangamon River
basin (Figure 1). The present
treatment
facility was
constructed in the mid 19701,s and
consists
of contact
stabilization activated sludge,
a polishing pond, excess flow treatment
and chlorination. Design average flow for
the facility is
10.0 mgd and
design maximum flow is 25.0 mgd. According to
IEPA records
for 1984
the actual average monthly flow was
12.85 mgd. The Sugar
Creek
plant
i s served by combined sanitary and storm
sewers and has
two
combined
sewer overflows in the system.
The first
is called the Harvard Park
CSO and is located in the southeast
corner
of Springfield
near the
Bunn
Park Golf Course. It discharges
to an
unnamed tributary
of
Sugar
Creek upstream from the Ill. Rt.
29 bridge. The
second CSO is located
at
the head end of the Sugar Creek plant
and discharges directly to
Sugar Creek when storm flows exceed
100 mgd.
T wo previous
biological
surveys on
Sugar Creek in 1977 and 1981
indicated
moderately impacted
stream
conditions downstream from the
,TP. The
present survey. however, indicated slight improvements at
Station A-1 and
significant improvements at Stations C-1 and C-2,
The improvement at the downstream stations
was
probably
due
to a
process change begun at the Sugar Creek plant
in
1983.
` ILLINOIS ENVIRONMENTAL
PROTECTION AGENCY
S urvey- Results and
Discussion
O n September 11, 1984,
biological
and
water
quality
samples were
.
collected at five stations
on
Sugar
Creek and its tributaries to deter-
mine
the
condition
of
stream environments upstream and downstream
from
the Springfield Sugar
Creek sewage
treatment
plant. The macroinverte-
brate biotic index (MBI) ranged from a high of 4,9
at
Stations
A-1
and
C -1 to a .Tow..of 4:2 at
Station
C-2 indicating
that the Springfield Sugar
Creek plant was
having little
or no
impact
on
Sugar Creek. Analysis of
water quality data, which
included
ammonia,
un-ionized ammonia, phosphorus,
COD, nitrate-nitrite, water temperature and
pH,
indicated
no violations
o f state water quality standards (Table 1).
.
Electronic Filing - Received, Clerk's Office, August 29, 2008
* * * * * R2009-008 * * * * *
April 5;
1985
Stream Assessment Survey;
Springfield
Sugar
Creek
Sewage Treatment
Plant; Sugar Creek (EOA)
Page 2
WRAF
T able 1. IEPA Stream Data for Sugar Creek
in
the
vicinity of Spr.ingfield, Illinois.
September 11, 1984
L
S ite
R iver
M ile US/DS MBI
A mm.
m q / 1
U n-ion
Amm..
m q/1
P
m /l
C
OD
m /l
N 02T
N03
m /l
TSmp.
C
H
Mean
Depth
ft.
Mean
Width
ft.
Velo-
city
ft/sec CF:
A-1
1.2
US
4.9 0.31 0.006 0.20 26ý 1.0 22.0 7.6 2.5
60
0.1
15
EFF-1 0.1
US
- 0.96 0.096 0.96 71 0.20 24.0 8.3 -
-
-
-
:EFF-2
I
0
1.6 0.011 3.1
21 5.9 23.5 7.1
-
-
-
-
'C-1
1.0
DS 4.9 0.89
0.017 1.3
28 2.9
22.5 7.6 2.
33
0.7
46
ýC-2 2.7
DS 4.2 0.76 0.015
1.2
29 2.7
22.5 7.6 2.5
40
0.2
20
D-1
-
-
7.3 0.12 0.002 0.26 33 0.26
22.0.
7.5 0.2
.12
1.0
2:
D-2
-
-
1
7 .5
I
0 .23
I
0 .004 0 .20
I
- 13
I
--1.2
I
2 1.0
I
7 .6
ý
0 .3
I
8
I
< 0.1
ý
0 .
I
B ecause of Spaulding Dam
on
Lake Springfield,
Sugar Creek, has a 7-day
10-year low flow of zero. This periodic lack of
dilution water has
caused a chronic
probler6 with ammonia for the Sugar Creek STP. In
1983,
however, changes in solids
monitoring and
wasting
at the facility appear
to have increased the ammonia removal based on
data obtained through
December 1985. This reduction in ammonia could explain
the improvement
in stream
conditions downstream from the discharge.
Electronic Filing - Received, Clerk's Office, August 29, 2008
* * * * * R2009-008 * * * * *
April 5,
1985
Stream Assessment
Survey; Springfield Sugar Creek
Sewage Treatment
Plant; Sugar Creek (EOA)
Page 3
DRAFT
E ffluent grab samples
were collected from two different discharge
points during
the present survey (Figure 1). Effluent
#1
was collected
at the concrete outfall structure of
the
excess
flow
treatment
pond.
According to the Springfield Regional Office
staff,
the discharge
from this pond is not continuous. Effluent #2 was collected from
the
effluent
ditch
just before it enters Sugar-Creek. At this point,
the
ditch is no longer
concrete
but has a sand and clay bottom as well
as
clay banks. The flow in this ditch comes from the primary discharge
of the Sugar
Creek treatment facility.
In addition tothe sampling sites on Sugar Creek, samples were also
collected
on two of
its tributaries. Station D-1 was located on
Hoover
Branch,
a
small
tributary
that
receives urban runoff from
the Grandview
area and some agricultural runoff east of I-55. Prior to 1977, a
lift station in the Grandview area had also been identified as a po-
tential discharger to Hoover Branch. During the present survey,
biological sampling indicated the presence of moderate organic enrich-
ment but the source.of this enrichment was impossible to identify.
The impact of Hoover Branch on Sugar Creek was probably negligible.
Station D-2 was located on a small unnamed tributary
that
originates
near the Bergen Park Golf Course, flows under I-55 and through the
Sugar Creek STP property. It eventually
becomes part
of the discharge
channel to Sugar Creek. This tributary
receives
urban runoff as
well
as the discharge from a storm sewer
near Bergen Park.
Biological
sampling during the present survey indicated moderate organic enrich-
ment which probably is contributed by urban runoff. The impact of this
unnamed tributary on Sugar Creek was also probably negligible.
The stream-potential of Sugar Creek
has been provisionally characterized
by IEPA
biologists as a moderate
aquatic
resource (i.e., a stream capable
of supporting
an abundant and
normally
diverse macroinvertebrate and
fish communities) while Hoover Branch and the unnamed tributary to Sugar
Creek has been provisionally characterized as limited aquatic resources
(i.e.,
a stream capable of supporting a macroinvertebrate and fish
community of limited diversity).
.
Recommendations
1. Although stream conditions in 1984 were much improved over previous
years, there is still not enough stream water quality data to indicate
conclusively whether
or
not the chronic problem of ammonia has been
eliminated. Therefore, additional in-stream water quality sampling
should be conducted, particularly during
low
flow conditions, before
a decision to add nitrification to the Springfield Sugar Creek sewage
treatment plant is made.
Electronic Filing - Received, Clerk's Office, August 29, 2008
* * * * * R2009-008 * * * * *
April 5, 1985
Stream
Assessment Survey; Springfield Sugar Creek
Sewage Treatment Plant; Sugar Creek (EOA)
Page 4
Recommendations,
continued
CRAFT
2 .
Station
C-1, located approximately
one mile
downstream
from the
Sugar
Creek sewage treatment plant,
on the
Mechanicsburg
Road, is
recommended as a provisional
location to monitor any changes in
water quality in Sugar Creek.
WHE:jg
cc: Bud Bridgewater -'Region
V - Springfield
Electronic Filing - Received, Clerk's Office, August 29, 2008
* * * * * R2009-008 * * * * *
' i'.
Sch.y
'ý
.ý, \i,
I I 1 L
I
i
.
- .n"oE
1
-.
1
...
sr I j
I
PARK
I "JIG
ý
I
1
ý-"ýý ý
"
. W+.hl'1ý
" Jr 164118."h !
I
ý.
I
,.sr
J
'RIN(iI± II,LD
Q::
ow k6
1
:J
ý
~!e se ý
LTRANQ
. _A
V[
rit
S r.
`
r.
J ý'
,
,
r Wcla.ler ýrh
CLr4R
B ERGEN
r ýl
ri
ýý
44E
' w
ý SPRINGFIELD
"ý
T
1V P
T l
A
V ..
5 99
sr
r w,
ý ý,
r r
I
I
I I
.J
IIJILý1I
P:rrkl
a':..
I
SAMPLING
LOCATION
1977
1981
1984
A - 1
5.7
5.1
.4.9
C - 1
7.2
6.7
4.9
C - 2
6.8
6.7
4.2
D - 1
7.6
5.6
7.3
D - 2
9.0
7.3
7.5
-2 $: I
I
I
Figure
l. Location
of biological and water
quality
stations in the vicinity
of
the Springfield
STP.
September 11. 1984.
Electronic Filing - Received, Clerk's Office, August 29, 2008
* * * * * R2009-008 * * * * *
FACILITY
RELATED
STREAM SURVEY
Biological
and Water Quality Survey of Sugar Creek (EOA),
U.S. EPA Reach Index 07130007-002/on
In
the Vicinity of the Springfield Sanitary District
Sugar Creek Wastewater Treatment Plant,
Sangamon County, Illinois
July, 1989
Staff Report
Prepared
by Matthew Short
State of Illinois
Illinois Environmental
Protection Agency
Division
of Water Pollution
Control
Planning
Section
Electronic Filing - Received, Clerk's Office, August 29, 2008
* * * * * R2009-008 * * * * *
INTRODUCTION
On July 26, 1989, biological and
water
quality samples were collected at three
sites on Sugar Creek, Hoover Branch
and
Clear Lake Avenue Creek to determine
the condition of stream environments upstream and downstream
from the
Springfield Sanitary District Sugar Creek sewage treatment plant
(STP).
Additional water quality samples were collected in May and September.
The
Sugar Creek STP is located at
the east
edge of the city (pop. 100,100), near
the
intersection
of
Interstates
55 and
72, and discharges into Sugar
Creek,.
a
fifth order stream in the Sangamon River basin (Figure
1). The present
treatment facility consists of activated sludge, a polishing pond,
excess flow
treatment and chlorination. However, a year-round disenfection
exemption
was
granted effective December 14, 1989. Design average flow for the
facility
is
10.0 mgd and design maximum flow is 25.0 mgd. The average flow from
January
-
July,
1989 was 8.04 mgd.
The Sugar Creek plant is
served by combined sanitary
and storm sewers and has two combined sewer overflows in the system.
The-
first is called the Harvard Park CSO and fs located in the southeast
corner
of
Springfield near the Bunn.Park Golf Course. It discharges to an unnamed
tributary
of Sugar Creek upstream
from the
Ill. Rt. 29 bridge. The second CSO
is located
at
the head
end
of the Sugar Creek plant and discharges
directly to
Sugar Creek when storm flows exceed 100 mgd.
Because of Spaulding Dam on Lake Springfield; Sugar Creek has a 7-day 10-year
low flow of zero. The stream.receives a discharge from the ash ponds
northeast of the dam and runoff from the CWLP plant.
A previous
biological
survey in 1985 indicated that the Sugar
Creek STP
discharge was having little or no impact on Sugar Creek.
Electronic Filing - Received, Clerk's Office, August 29, 2008
* * * * * R2009-008 * * * * *
IATJ
y yu.
PP
a'., Is
Wits
Jr 1
'i L
t
I _J
7 Z:
r
ýqulptedjSch
F igure
1.
Location
of biological and
water quality
stations in the vicinity of the Springfield
Sugar
Creek
STP. 1989
y 1 railer.:
t 9sýl jParký
f 1
ial-railer
P a rýC
-_ Clear
Mali
f
1ý.
I
I
f
17,
_ 4S
i
I.
1
I T
-I
Is
rýI"
313
5 76
Electronic Filing - Received, Clerk's Office, August 29, 2008
* * * * * R2009-008 * * * * *
METHODS
Macroinvertebrates
Qualitative macroinvertebrate samples were collected at each station'with a
U.S. Standard No. 30 sieve or handpicking organisms directly from all
available instream habitats. A uniform or comparable
sampling
effort,was made
at each site. Identification
of macroinvertebrate taxa were to
field
identifiable
levels. A Macroinvertebrate Biotic
Index
(MBI)
was
calculated
for each sample. The index
reflects
the
degree of tolerance (on
a scale of 0
to
11) of the macroinvertebrate community
to oxygen
demanding contaminants.
Effects of these and other in-stream contaminants
may
be indicated by a high
MBI, a
low
proportion of sensitive organisms, sparse aquatic life,
and/or
a
low macroinvertebrate diversity. The MBI is an average of tolerance values
for'each taxon weighted by abundance and is used as a 'measure of stream
degradation. Based on present assessment methods, MBI values reflect water
quality as follows:
<
5.0 Excellent
5.0 - 6.0 Very Good
6.1 - 7.5 Good/Fair
7.6 -.10.0. Poor,
.
10.0 Very Poor
W
ater Quality
Stream
anal effluent,water
quality samples were collected at each site using a
hand held bottle or a weighted
bottle
sampler
in accordance with
IEPA/DWPC
quality assurance procedures. Samples
were placed on ice and
shipped
to the
IEPA Champaign Laboratory
for analysis.
Water
temperature, dissolved oxygen,
pH and conductivity
were measured in the field with a Hydrolab Model 4041.
Water
quality data were evaluated using state general use standards. The
total
dissolved
solids
standard, 1000 mg/l is equivalent to 1667 umhos/cm
field
conductivity.
I
nstream Habitat
P hysical
habitat data is used
to
evaluate
the biotic potential (the
fisheries
resource
that would be present in the absence
of water. quality
limitations)
of
a stream
segment. Habitat data and discharge were estimated at the majority
of
sampling sites. However at the. furthest
downstream station,
habitat data
were collected using six equally spaced
transects along a
100 yard stream
segment. Measurements for depth,
water velocity and substrate
composition
were recorded at each transect. Observations
were also made
in
pool-riffle
development,
instream cove r, shading, riparian vegetation
and
adjacent
land
use practices. Discharge
measurements were
made according to
U.S. Geological
Survey
methods. Stream hydrology and morphology
as well as
substrate
values
were calculated
from
the field data and
used to predict the biotic potential
of
the study area. The predicted
Index of Biotic Integrity (PIBI) ranges from
0
to 60 indicating a poor to excellent fisheries
potential respectively
(Appendix
B).
Electronic Filing - Received, Clerk's Office, August 29, 2008
* * * * * R2009-008 * * * * *
RESULTS AND
DISCUSSION
Macroinvertebrates
Station
Al was located on Sugar Creek
1.2 miles upstream from
the effluent at
the
IL Rt. 29 bridge. This is the AWQMN
Station EOA O1.- The
MBI was 6.5 and
eight taxa were present
indicating good/fair water quality
(Table
1). The
sample was comprised primarily
of midges, Chironomidae
(54%). There
was no
measurable
flow and 1 to 3 inches
of silt covered the substrate.
Station
C1 was located on Sugar Creek
1.0 mile downstream
from the Sugar Creek
STP discharge
at the ýMechanicsburg Road
bridge. The MBI was
9.0 and ten taxa
were present
indicating poor water quality (Table
1). The sample
was
comprised
primarily of red ridges,
Chironomus s. (53.4X);
which
are tolerant
to
enrichment. This was significantly
poorer than the
sample collected
in
1988
which had a field MBI of 5.9 with
sixteen taxa present.
The substrate
was very
soft and was comprised primarily
of silt/mud 35%,
plant detritus
15%
and submerged
logs 15% (Table 3).
S tation
C2
was located on Sugar
Creek approximately
2.7 miles downstream
from
the Sugar
Creek STP
discharge.
The
MBI was 7.7 with nine taxa
indicating poor
water quality
(Table 1). Only 48 organisms
were collected
at this site and
the
majority
were midges (70.8%). As
at.Station C1, the
substrate was
very
soft and
was
comprised primarily of silt/mud,.30%
and plant
detritus
30%
(Table 3).
S tation
D1 was located on Hoover
Branch, a small tributary
that receives
urban
runoff
from the Grandview area along
with agricultural runoff.
The MBI
was
6.8 and,
four taxa were present indicating
good/fair water quality
(Table
1).
The small
stream size, 2.0 feet wide and
lack of diversity
in the sample
indicate that this
stream probably has intermittent
flow during
the summer.
Station
D2 was located on Clear Lake Avenue Creek
which originates
near Bergen
Park Golf Course,
flows under the interstates and through
the Sugar
Creek STP
property.
It
eventually
becomes part of the discharge
channel to Sugar
Creek.
The MBI was 7:0 and seven taxa
were
present indicating
good/fair-water
quality
(Table 1). Habitat is very limited since
the stream has
a concrete
channel.
Water Quality
I n. May, violations in state
general use water quality standards
occurred for
boron and iron at Stations
Al, C1 and C2 on Sugar Creek. Fecal
coliform
counts
exceeded 200/100 ml at Stations C2 on
Sugar Creek, D1 on Hoover
Branch
and
02 on Clear Lake Avenue Creek. In July, violations
occurred for boron
at
Stations
Al, C1 and C2; iron at Stations Cl and C2;
and dissolved oxygen
at
Stations
Al, C1, C2 and D1. Fec-al coliform cou.nts--exceed-e-d-200/100
ml
at
Stations
C1, C2, D1 and D2. In September, violations
occurred for boron at
Stations Al, C1 and C2; and iron
at Stations Al, C1, C2
and D1. Fecal.
coliform-counts exceeded 200/100 ml
at all stations (Table
2).
Boron violations in Sugar Creek were due to
elevated concentrations
from
the
CWLP
ash ponds effluent upstream from all sampling
locations. Concentrations
of, boron
in Sugar Creek are high enough to cause violations
at AWQMN Station
E
Electronic Filing - Received, Clerk's Office, August 29, 2008
* * * * * R2009-008 * * * * *
26 on
the
Sangamon
River near Riverton
during low flow periods. Iron
violations
were probably due
to nonpoint background concentrations. The
dissolved oxygen violations
in July were probably due to a combination
of
several factors. Elevated
water temperatures, a lack of aeration due
to low
flow anal a
high percentage of silt and
plant detritus in the sediment affected
dissolved oxygen levels on Sugar Creek.
However, concentrations were lower
downstream from.the plant-discharge:
in all three samples. Elevated fecal
coliform levels were due
to nonpoint sources.
Water
quality
parameters at Station
C1 were similar to concentrations present
during August-November, 1988.
Instream Habitat
Sugar Creek
is a fifth order tributary
to the South Fork Sangamon River.
Stream width in the sample reach
varied from 35 to 70 feet with a mean depth
of 1.8 feet. Station C1
was the only station with measurable flow. The
substrate was very soft
and comprised primarily of silt/mud 26.7%, plant
detritus 20%, and submerged
logs 13.3%. Based on
habitat,'PIBI
42, Sugar.
Creek has
the
potential
of.a highly valued aquatic
resource. A fish sample
was collected on Sugar Creek in 1988
as part of a contract study for the City
of Springfield. The Index
of Biotic Integrity was 29.5 indicating the stream
was supporting a limited
aquatic re source...
Electronic Filing - Received, Clerk's Office, August 29, 2008
* * * * * R2009-008 * * * * *
SUMMARY
l,. -Macroinvertebrate samples
indicated fair water quality
upstream and poor
water quality
downstream from the Sugar Creek STP discharge
indicating the
plant was having a moderate to slight impact on 2.7 miles of
Sugar Creek.
Hoover Branch and Clear Lake Avenue Creek appeared
to
have little or no
impact on Sugar Creek.
2.
The
Sugar
Creek
STP effluent, combined with poor instream conditions,
resulted in violations of the dissolved oxygen standard downstream from
.the discharge in July. Boron violations in Sugar Creek were a result of
the discharge from the CWLP
ash ponds.
Iron violations and.elevated fecal
coliform levels were
primarily nonpoint related.
3. Based
on
habit, fish and water quality data Sugar Creek is rated
as
partially supporting designated aquatic life uses with moderate impairment.
4. Station C1, approximately
1.0 mile downstream from the Sugar
Creek STP
discharge,
is
recommended
as a provisional site to monitor water
quality
changes on
Sugar Creek.
MBS/is/0015w
cc:
Toby Frevert,
DWPC/Planning
Bud Bridgewater, DWPC/FOS - Springfield Region
Electronic Filing - Received, Clerk's Office, August 29, 2008
* * * * * R2009-008 * * * * *
fable 1. Hacroinvertebrate
data collected on Sugar Creek from the Springfield Sugar Creek
facility related
streas survey, July 26, 1989.
S TATION
TAIOH
TOLERANCH
R ATING
A- 1
C-1
C-2
D-1
D-2
------------------------------------------------------------------------------------------------
Onionidae
Plecoptera
Other Bphe®eroptera
Oligoneuriidae
Calopterygidae
Trichoptera (Non-Hydropsychidae)
Reptageniidae
Hegaloptera
Imphipoda
Baetidae
Tipulidae
Corbicula
Anisoptera
Casbaridae
Ceratopogonidae
Blvidae or Dryopidae
Potamanthidae or
Bphemeridae
Sphaeriidae
Caenidae or Tricorythidae
Coenagrionidae
Hydropsychidae
Asellidae
Chironoaidae (Hon-Chirononus)
Sivuliidae
Turbellaria
Other
Gastropoda
Planorbidae
Helodidae
Lyanaeidae
Culicidae
Hirudinea
Physidae
Other Diptera
Oligochaeta
Chironoaus
or Red Chironoaidae
1.5
1.5
3.0
3.0
3.5
3.5
3.5
3.5
4.0
4.0
4.0 .
4.0
4.5
1
1
5.0
_
1
1
5.0
5.0
1
4
3
5.0
5.0
2
3
5.5
8
7
5.5
8
2
5.5
6.0
100
46
6.0
41
16
20
3
21
6.0
9
6.0
2
1
6.0
3
6.5
7.0
7.0
8.0
8.0
1
1
9.0
8
7
4
40
4
10.0
10.0
7
1
18
11.0
5
63
14
2
-------------------------------------------------------------------------------
TOTAL
76
118
48
144
93
TAIA
8
10
9
4
7
HBI
6.5
9.0
7.7
6.8
7.0
Electronic Filing - Received, Clerk's Office, August 29, 2008
* * * * * R2009-008 * * * * *
Table 2. Water quality data for the Springfield SD Sugar Creek FRSS, Nay 18, 1989.
P6RAMBTBR
GENERAL USE
11
E1
Cl
C2
D1
D2
STANDARD
-----------------------------------------------------------------------------------------------------------
Field Water Temp., Deg.
C.
19.1
18.6
19.0
18.7.
18.4
15.2
Field pH,
units
6.5-9.0
7.9
7.5
7.5
7.6
7.9
7.7
Field Dissolved Oxygen, mg/I
5.0 minimum
6.3
9.1
5.9
5.1
10.3
8.8
Field Conductivity, umhos/ca
918
1002
978
951
783
1117
Ammonia Nitrogen, mg/1
1.5/15b
0.19
2.8
1.4
1.5
0.2.
0.64
UOnionized Ammonia, mg/I
0.04 maximum
0_.006
0.033
0.017
0.022
0.005
0.009
Nitrate
+
Nitrite, mg/l
0.19
7.1
3.2
3.5
2.3
2.6
Total Phosphorus, ag/l
0.079
2.2
1.0
0.47
0.1
0.2
Dissolved Phosphorus, mg/l
0.02
BOD, ag/l
3
15
6
7
3
2
HOD carb (Inh.), mg/l
10
6
5
3
2
COD, mg/I
20
40
26
29
14
12
Total Susp. Solids, ag/1
46
14
82
77
14
4
Nercury, ugll
0.5 ugll
(0.05
(0.05
<0.05
T. Calcium, ag/1
114
77
102
T. Nagnesium, mg%1
27"
35
32
T. Sodium,
mg/l
30
.
68
48
T. Potassium,
mg/1
5.4
6.1
5.8
T. Aluminum, ugll
1513
345
1206
.
T. Barium,
ug/l
5000 ug/l
80
34
73
T. Boron,
ug/l
1000 ug/l
4562
851
2941
T. Beryllium, ug/1
<0.5
(0.5
(0.5
T. Cadmium, ug/l
50
ug/l
(3
(3
(3
T. Chromium, ug/l
.1050
ug/l
(5
19
(5
T. Copper, ugrl
20 ag/l
6
20
<5
T. Cobalt,
ug/l
(5
(5
(5
T. Iron,
ug/l
1000 ugll
1540
80
1238 #
T. Lead, ug/1
100 ug/1
(5
<50
(50
T. Manganese, ug/l
1000
ug/l
342
23
333
T. Nickel, ug/l
1000
ug/l
27
<5
16
T. Silver,ug/l
5 ug/l
(3
<3
(3
T. Strontium, ug/l
281.
169
248
T. Vanadium, ug/l
19
(5
(5
T: Zinc, ug/1.
1000 ugll
(50
<50
(50
(0.05
<0.05
(0.05
95
80
107
33
40
53
48
26
54
5.6
1.5
2
1494
459
573
75
75
99
2441
144
177
<0.5
(0.5
(0.5
<3
<3
<3
(5
<5
<5
(5
(5
(5
<5
<5
(5
1661
205
370
<50
(50
(50
319
150
444
15
<5
10
<3
<3
<3
233
18.3
229
9
<5
<5
(50
(50
(50
*Hardness,
ag/I
396
337
387
372
364 :-
486
Fecal Coliform
$/100m1
60
20
140
950
820
2800
Water Quality
Index
Ucalculated
value
tState Water Quality Standard Violation
"b The allowable concentration
varies in accordance with water
temperature
and ph values. In general, as both
temperature and
pH
decrease, the allowable value
of ammonia nitrogen increases.
Electronic Filing - Received, Clerk's Office, August 29, 2008
* * * * * R2009-008 * * * * *
Table 2 (coot).
Water quality
data for the Springfield SD Sugar Creek FRSS, July 26, 1989.
PiRAMSTIR
GBRRAL
USR
11
12
Cl
C2
D1
D2
STANDARD
-----------------------------------------------------=-----------------------------------------------------
Field Water Temp.,
Deg. C.
26.4
26.1
25.6
26.1
21.9
22.1
Field
pH, units
6.5-9:0
8.2
8.2
7.4
7.4
7.0
7.7
Field Dissolved
Oxygen, mg/1
5.0 minimum
4.0
7.9
3.1 t
2.6
4.4
7.3
Field Conductivity,
umhos/cm
942
846
895
877
1232
776
Ammonia Nitrogen,
mg/l
1.5/15b
<0.10
0.46
0.49
0.68
'<0.10
0.17
tt
Unionized Ammonia,
mg/l
0.04
maximum
0.010
0.043.
0.008
0.011
<0.001
0.004
Nitrate
+
Nitrite,
mg/1-
<0.1
5.8
1.6
1.8
<0.1
1.1
Total Phosphorus,
mg/l
0.07
2.0
0.8
0.93
0.19
0.62
Dissolved Phosphorus,
mg/1
0.04
BUD, mg/l
1
7
3
2
2
1
BOD
carb (Inh.), mg/ 1
3
2
<1
<1
<1
COD, mg/1
15
35
21
22
26
13
Total Susp. Solids,
mg/l
42
31
88
95
33
11
Mercury, ug/l
0.5 ug/l
<0.05
<0.05
<0.05
<0.05
(0.05
T. Calcium,
mg/1
134
54
100
91
57
83
T. Magnesium,
mg/l
27
23
27
26
23
31
T. Sodium,
mg/l
31
87
48
54
29
36
T. Potassium,
mg/l
5.6
6.0
6.2
5.5
2.6
2.2.
7, Aluminum,
ug/l
871
159
1029
1275
344
292
1. Barium,
ug/l
5000 ug/l
63
22
61
63
76
83
T. Boron,
ug/l
1000 ug/l
6468 x
'618
4403
3973 s
55
292
T.
Beryllium, ug/l
<0.5
<0.5
<0.5
<0.5
<0.5
<0.5
T. Cadmium, ug/l
50 ug/l
<3
<3
<3
<3
<3
<3
T. Chromium, ug/l
1050 ug/l
6
<5
<5
<5
<5
<5
T, Copper; ug/l
20 u,.11
<5
<5
<5
<5
<5
<5
T. Cobalt, ug/l
<5 -
<5
<5
<5
<5
<5
T. Iron, ug/l
1000 ug/l
900
236
1366 $
1682
t
520
532
T. Lead,
ug/l
100
ug/l
10.6
<50
<50
<50
<50
<50
T.
Manganese, ugll
1000 ug/l
137
42
184
205
357
262
T.
Nickel, ug/l
1000 ug/l
32
<5
c5
15
<5
6
T.
Silver,ug/l
5 ugll
<3
<3
<3
<3
.
<3
<3
T. Strontium, ug/l
314
130
253
235
131
197
T. vanadium, ug/l
34
<5
14
19
<5
<5
T. Zinc, ug/l
loco ug/l
<50
<50
<50
<50
<50
<50
st Hardness, mg/1
447
226
360
336 `
238
335
Fecal Coliforn $/100m1
130
1100
1100
960
1100
1600
Water Quality
Index
--------------------------------------------------------------------------------------------------------------------
Ucalculated value
* State Water Quality
Standard Violation
'b The allowable concentration
varies in
accordance with water
temperature
and ph values. In general,
as both temperature and pR
decrease,
the allowable
value of ammonia nitrogen increases.
Electronic Filing - Received, Clerk's Office, August 29, 2008
* * * * * R2009-008 * * * * *
Table 2 (cant). Water quality
data for the Springfield
SD
Sugar
Creek FESS, September 13, 1969.
PARAMITIR
GEBERAL OSB
11
E2
Cl
C2
D1
D2
STANDARD
Field Water
Temp., Deg.
C.
17.8
19.7 . 18.7
18.2
16.0
15.9
Field pB, units
6.5-9.0
7.9
7.1
7.4
7.3
7.3
7.5
.
Field Dissolved Oxygen,
ag/l
5.0 minimum
8.5
10.4
7.9
7.1
10.1
12.4
Field Conductivity, umhos/ca
1023
873
1098
884
532
562
Ammonia Nitrogen, ag/l
1.5/15b
0.18
2.0
1.1
1.2
<0.1
0.12
ttUnionized Ammonia, ag/l
0.04 maximum
0.005
0.010
0.010
0.009
0.001
0.001
Nitrate
+
Nitrite, mg/l
D.48
7.6
3.2
3.3
0.45
1.2
Total Phosphorus,
mg/1
0.1
1.9
1.0
0.86
0.14
0.16
Dissolved
Phosphorus, ag/l
0.05
1.8
0.81
0.7
0.08
0.12
BOD,
mg/1
3
7
6
6
4
2
BOD carb (Inh.), mg/l
4
3
3
3
1
COD, ag/l
16
27
26
25
22
16
Total Susp. Solids, mg/l
6
12
15
76
40
7
Mercury,
ug/i
0.5 ug/l
<0.05
<0.05
T. Calcium, mgll
128
59
124
T. Magnesium, mg/1
31
26
34
T. Sodium,, ag/l
31
70
52
T. Potassium, mg/l
6.5
5.5
6.6
T. Aluminum, ug/i
1450
129
2013
T. Barium, ug/l
5000
ug/l
75
24
61
T. Boron, ug/1
1000
ug/l
5038 t
481
3984 t
T. Beryllium, ug/l
<0.5
<0.5
<0.5
T. Cadmium, ug/l
50 ug/l
<3
<3
c3
T. Chromium, ug/1
1050 ug/l
5
<5
<5
T.
Copper,
ug/l
20 ug/l
<5
<5
11
T. Cobalt, ug/l
<5
<5
<5
T. Iron, ug/l
1000
ug/l
1857 3
174
2751 t
T. Lead, ug/l
100 ug/l
<5
<50
<50
T. Manganese,
ug/l
1000 ug/l
247
41
206
T. Nickel, ug/l
1000 ug/l
19
<5
13
T. Silver,ug/l
5 ug/l -
<3
<3
<3
T.
Strontium, ug/l
303
144
292
T.
Vanadium, ug/I
28
<5
21
TAinc,
ug/l
1000 ug/l
<50
<50
<100
<0.05
<0.05
(0.05
86
49
50
26
20
16
49
29
40
5.1
2.0
1.8
1187
734
229
61
69
54
2420 t
141.
240
<0.5
<0.5
<0.5
<3
<3
<3
<5
<5
<5.
<5
<5
<5
<5
<5
<5
1651 t
1041 t
396
<50
(50
<50
161'
77
161
6
<5
<5
<3
<3
<3
206
115
118
12
<5
<5
<50
(
50
<
50
s
tgardness,
mg/1
448
253
450
324
203
188
Fecal Colifora 4/100al
7200
100
6600
20000
2300
5500
Water Quality Index
Ucalcalated
value
* State
Water
Quality Standard Violation
'b The
allowable concentration varies in accordance with water
temperature and ph
values. In general, as both temperature and pH
decrease,
the allowable
value of amaonia nitrogen
increases.
Electronic Filing - Received, Clerk's Office, August 29, 2008
* * * * * R2009-008 * * * * *
?able 3. Summary
of habitat characteristics in Sugar Creek, Hoover
Branch and Clear Lake dve. Creek from
the Springfield
SD Sugar
Creek FRSS, July 26, 1989.
-----------------------------------------------------------:----------
Habitat Parameter
11
Cl
C2
D1
D2
----------------------------------------------------------------------
Stream Order
5
5
.
5
2
2
Bean Width (ft)
60.0
35.0
75.0
2.0
2.0
Bean Depth
(ft)
2.0
1.5
5.0
0.2
0.2
Bean Velocity (ft/s)
0.0
0.8
<0.1
0.0
0.05
Discharge (cfs)
0
44.1
37.5
0
0.02
Instreas Cover (%)
30
25
10
1
0
Pool (%)
100
15
100
98
0
Riffle M
0
5
0
1
1
Shading (ft)
50
50
50
0
25
S ilt/Bud (X)
15
35
30
0
0
Sand (X)
0
5
20
0
0
Fine Gravel (g)
0
5
0
10
1
Be dins Gravel
(X)
5
5
0
20
1
C narso G raga_1 (q1
5
5
0
1ý
ý
S tall
Cobble
(%)
5
5
0
30
1
Large
Cobble
(X)
15
5
5
30
0
Boulder (%)
25
5
5
0
0
Bedrock (X)
0
0
0
0
0
Claypan
(x)
0
0
0
0
0
Plant Detritus (X)
15
15
30'
0
0
Vegetation (X)
0
0
0
0
0
Submerged Logs .(X)
15
15
10
0
0
Other (%)
0
0
0
0
97
P redicted IBI
42
Electronic Filing - Received, Clerk's Office, August 29, 2008
* * * * * R2009-008 * * * * *
Appendix A. Location
of stations
for the Springfield SD Sugar Creek FRSS,
1989.
All stations
were in Sangamon County.
Station
Description
EOA 61 (A1)
'Sugar Creek
at IL Rt. 29,
upstream from the
discharge.
T15N, R4W, NW6.
EOA-SS-E2
Sugar
Creek STP effluent.
EOA-SS-C1
Sugar Creek
at Mechanicsburg Road, 1.0
mile
downstream
from the discharge.
T16N; R4W, NW32.
EOA-SS-C2
Sugar
Creek 2.7
miles downstream from the
discharge.
T16N, R4W, SW28.
EOA-SS-D1
Hoover
Branch at old Rt. 36. T16N,
R4W, NE30.
EOA-SS-D2
Clear
Lake Avenue Creek
near the I-72 exit from
I-55. T16N, R4W,
NW31.
Electronic Filing - Received, Clerk's Office, August 29, 2008
* * * * * R2009-008 * * * * *
Appendix B. Summary
of use support assessment criteria for Illinois stream
- --------------------------------------------------------------------------------------------------------
U SEPA
Full
Support
Partial Support
Non-
Minor
Moderate
Support
General Stream/Water
Excellent
Very
good
Good/Fair Poor
Very Poor
Quality Condition
IEPA/IDOC Biological
Unique
Highly
Moderate
Limited
Restricted
Stream
Characterization
Aquatic
Valued
Aquatic
Aquatic
Aquatic
R
esource
Resource
.Resource
Resource
Resource
-------------------------------------------------------------------------------------------------------:
F ish/Index of Biotic
5ý1-60
41-50
31-40
21-30
<20
Integrity
(IBI)
B enthos/Macroinvertebrate
<5.0
.5.0-6.0
6.0-7.5
7.5-10.0
>10.0
Biotic
Index
(MBI)
Water Chemistry/Storet
<10
10-30
30-50
50-70
>70
Water Quality Index (WQI)
Water Chemistry/Total Suspended
X10
10-25
25-80
80-400
>400
Solids (TSS mg/1)
S tream Habitat/Potential Index of
51-60
41-60
31-40
<31
Biotic Integrity
(PIBI)
Stream Sediment/IEPA Stream
Nonelevated
Non- to
Slightly
Elevated
Extreme
Sediment Classification
Slightly Elevated -Highly
Elevated
Elevated
--------------------------------------------------
; ------------------------------------------------------
F rom Illinois Water Quality Report, 1986-87
Electronic Filing - Received, Clerk's Office, August 29, 2008
* * * * * R2009-008 * * * * *
SEP—02—2008
14:28
HODGE DLJYER ZEMRN
217 523 4948
P.02/31
AP?ENDIXB
CWLP
FJSKER1ES
STUDY OP
SUGAR
CREEK,
SOUTH
FOK,
AND
SANGAMON
RIVER
BTmSugr.RepdftI4OS94
Electronic Filing - Received, Clerk's Office, August 29, 2008
* * * * * R2009-008 * * * * *
SEP—02—2008
14:29
HODGE DWYER ZEMRN
217 523 4948
P.03/31
EA $CINCE
AND
—
‘ECHNOLDGY
30
December
1.988
el2Antttwiytran
e Nothbock. Illro
0Q062
iefphone
(32)
6644040
Hr. Tows
Skelly
‘Springfield CIty
tiater,
Light,
&
Power
200
L
Lalce
Drive
Springfield, IL
62707
Dear Torn;
Enclosed
please
find the following;
(1)
a
surnary
of
afl
the
physicoehemical
measurements
we made
(2)
printouts Dummarizing all catch
data
(3)
information
regarding
sampling
methods that
is not in the proposal
Please
call i you have
siiy
questions.
Sincerely,
Greg
Seegert
Project Manager
BALTIMORE
CHICAGO
CINCINNATI
D
LINCOLN
Q
NEW
YORK
0
SAN
FRANCISCO
Electronic Filing - Received, Clerk's Office, August 29, 2008
* * * * * R2009-008 * * * * *
SEP—02—2006
14:29
HODGE
DWYER
ZEMAN
217
523
4948
P.04/31
METhODS
Gears
use4
were
as
foUows:
3—Phase
AC
Shock
—
The
3—p)ase
AC
system
was
powered
by
a
3000
watt
Hoinelite
generator.
In
July
aiad
August
because
of
high
(>2000)
conductivities,
we
used
only
one
or
two
droppers
in
Zones
5
and
6.
Actual
output
was
typically
13—lB
amps
and
150—170
volts.
Initially
we
atrempted.to
use
all
3
phases,
but
our
actual
output
dropped
to
about
10
amps
and
1W
volts,
a
combinatiQn
insufficient
to
shock
fish
effectively.
Thus,
we
switched
to
energizing
only
one
or
two
electrodes.
ram
Shock
—
Pram
eleccrofisbing
was
accomplished
using
a
Coeffelt
Model.
VV?—2C
electrosbockar
powered
by
a
1500
watt
generator.
The
VVP—2C
and
the
generator
were
taounte4
in
a
small
pram.
Electrofishing
was
conducted
using
a
three—person
crew;
2
peop,e
shocking,
with
the
third
person
guiding
the
pram
containing
the
electrofisher.
Pram
electrofishing
was
done
using
AC
current;
actual
output
varied
from
500.-900
watts.
Seine
—
Seine
collections
were
made
using
either
a
3116—inch
square
mesh,
6foot
x
30
foot
seine
with
a
6
x
6
x
6
foot
bag;
or
a
15
ft.
long
x
6
foot
deep
straight
seine
wish
3/lb—inch
mesh.
Stations
1,
2,
5,
and
6
were
seined
iách
month
using
the
30
ft.
seine,
whereas
the
15
ft
seine
was
used
at
Stations
-3
and
4.
The
3-phase
boom..
shocker
was
used
at
Stations
1,
2,
4,
5,
and
6
in
June
and
Novnber.
In
.Tuly
and
August,
Stations
S
and
6
were
sampled
using
the
boom
shocker,with
Stations
1—4
being
sampled
using
the
pram
unit..
Station
3
was
not
electrofisbed
in
June
or
flovember
because
a
log.
j.am
prevented
access
with
the
boom
shocker.
AU
other
methodologies
(e.g.,
sample
processing
procedures)
followed
those
described
in
our
proposal
and
were
according
to
your
specifications.
Electronic Filing - Received, Clerk's Office, August 29, 2008
* * * * * R2009-008 * * * * *
SEP—02—2008
14:29
HODGE
DWYER
ZEMRN
217
523
4948
P.05/31
sJ*ARYoF
PSIC0CUICAL
fE
t3P2tENTS
MADE
IN
THE
SACA1’ONRVJR
DURING
1988.
Station
1
_
3
4
5
6
peratuze(ç)
—
—
—
.une7—8
25.9
23.5
—
27.5
27.5
25.].
July
14—15
26.4
26.5
31,3
29..?
28.0
30.2
August
30—31
18.9
18.8
23.9
23.0
22.5
25.3
Novber
15—16
10.0
10.2
13.3
11.5
10.8
9.2
Dissoved
Oxygen
(mg/i)
Juie
7—8
9.4
7.2
—
8.2
11.4
11.0
July
14—15
4.8
3.2
7.9
5.3
7.1
11.4
August
30—31
7.0
6.9
6.0
S.C.)
9.2
15.5
Novbe
15—16
7.0
7.1
4.7
3.6
5.7
7.].
-
.
-
June
7—8
1136
1081
—
874
1146
1079
July
14—15
2425
2016
783
943
1960
1872
August
30—31
2408
2352
.
788
958
1976
1833
Novembet
15—16
1780
994
653
684
1110
1652
Sci
(cm)
June
7—8
60
51
—
34
53
33
July
14—15
40
36
50
.
40
35
27
August
50—.31
28
26
20
10
•
26
18
Novber
15—16
18
.
23
56
24
14
23
*
Adjusted
to
25C.
Electronic Filing - Received, Clerk's Office, August 29, 2008
* * * * * R2009-008 * * * * *
SEP—02—2008
14:29
HQDGE
DWYER
ZEMN
21’?
523
4948
P.06/31
Locations
of
Stations
sampled
during
EA
Science
and
Technology
fisheties
collections
on
the
Sangamon
River
South
Fork
of
the
Saigamon
River
end
Sugar
Creek.
Th4±vidual
Stations
1—6
were
split
into
two
suhstatiens
(A
and
)
after
the
December
1957
collection.
Stations:
lÀ
—
Sangamon
River
from-
the
confluence
of
the
South
Fork
(See
figures
upstream
fQr
200
meters.
1
and
2.)
-
Sangamon
River
from
the
upstream
end
of-Station
1A
upetream
for
200
meters.
2A
—
Sangamon
River
from
the
downstream
end
of
Station
lB
downstream
for
200
meters
23
—
Sangamon
River
from
the
confluence
of
the
South
Fork
downstream
for
200
meters.
3A
—
South
Fork
of
the
Sangamon
River
fcr
200
meters
upstream
of
the
confluence
with
Sugar
Creek.
33
—
South
Fork
of
the
Sangamon
River
beginning
at
the
upstream
end
of
Station
3A
upstream
for
200
meters.
4A.
—
Sugar
Creek
for
200
meters
upstream
of
the
confluence
with
the
South
Fork
of
the
Sangamon
River.
4
—
Sugar
Creek
beginning
at
the
upstream
end
of
Station
4A
upstream
for
200
meters.
5A
—
Sangainon
River
for
200
meters
downstream
of
Station
SB.
-
53
—
Sangamon
River
from
50
meters
‘upstream
to
150
meters
downstream
of
the
public
boat
ramp
at
Wheeland
park
in
Riverton,
Illinois.
-
6A—
Sangamon
kiver
at
Riverside
?ark’from
30
meters
upstream
of
the
rock
and
crib
dam
upstream
for
200
meters.
63
—
Sangamon
River
from
the
upstream
end
of
Station
6A
upstream
for
200
meters.
Electronic Filing - Received, Clerk's Office, August 29, 2008
* * * * * R2009-008 * * * * *
SEP—02—2008
14:29
H006E
DWYER
ZEMRN
217
523 4948
P.07/31
DAWSON
L.J
LAKE
SPRINGF1LD
1
2
‘—--1
----f
MIL.ES
O
$priz,f.e1d,
UUflDiS
RGEtCY
WATER,
STJ
?IY ?LAT
LOCAflON
OF
FtSE
COLLECTION
STATtONS
IN
TE
SANGAON
?.IVER
NONITORING
ARL4
Ezhibi
23A
Electronic Filing - Received, Clerk's Office, August 29, 2008
* * * * * R2009-008 * * * * *
C
C
m
m
N
m
D
Electronic Filing - Received, Clerk's
z
Office, August 29, 2008
* * * * * R2009-008 * * * * *
SEP—02—2008
14:30
HOD6E
DWYER
ZEMRN
217 523
4948
P.09/31
OIkrjj
F——..
cr
Exbjbit
23C
Electronic Filing - Received, Clerk's Office, August 29, 2008
* * * * * R2009-008 * * * * *
SVIMRY
OF
flSfl
LOtItCIED
FR1
IIIE
SMNUIII
IIlVtR,
I
MIll
2
QEWUIER
39117!
E
Science
and
Tecirnology.
1c.
U,
m
iJ
rj3
rJ
Q
U,
aian
ileet
scientific
flame
Statkrn
I
SI!t
Ion
2
Stat
Ian
3
ItaLian
45
StatIon_6
Sfl
St
SFi
lb
Se
!f
S..
11
3
lotal
toiignnse
9ar
1jfl!5
osseis
1
3
Gizzará
shad
trosoa
c!a
21
63
2
lB
210
311
39
tofinian
carp
çylIhu
çarftO
-.
-
2
1
1
4
I
15
1
tiiieraid
shiner
itotrais
alhirTnn1dei
3
21
411
Red
,hbier
Jf1tiinI
70
61
16
51
21
3
36
123
1013
31!
16
6119
36
Red
x
apoLfin
siln.r
II.
1ncI
x
spjIeflj!rIS
2
I
Sand
shiner
11.
siT
eus
29
14
5
49
:z
4
Unidentified
shiner-
H.
.
I
i
9lnpLneseuinmow
iaU5
2
-
2
3
4
2
II
I
Li11lieadInncw
.-
-
23
•25
14
14
3
I6
2Z
6]
9
39
211
14
IiOrn7IIed
CIILIb
I
i
ci
HhIle
stider
1
1
2
(I
II91Lt(1
carpsutier
I
I
(I
Ilter
carpsucker
10
9
1
1
1
U
i
QiiIInack
33
0
1
2
fl
I
Cirpsuc!tr
SPP.
.2
2
4
(1
Smitbiouth
hullalo
I
2
4
eInoutii
liuHiIo
1
2
1
1
1den
reH’arSe
-
1
3
Shorthead
redhnrse
I
I
Channel
cattish
9
36
Flathcad
taLt*sij
I
I
l4ilIe
ba
IelloH
bus
-
2
1
1
4
Brook
sflverilde
2
1
1
1
1
1
1
22
SluegLl
309
2
2
1
8
8
4Z
2
Breen
stinfisb
I
2
2
2
5
6
1
..
i
zo
.
0ranespoIted
n1Ish
1
32
1’
i
Iack
crappIe
1
1
7
l6iIte
cra9ptC
1
29
1)
Largeiouth
bass
salmoldes
2.,
2
Freshwiler
drir
—
ii
—
—
-—
t
‘total
FIsh
211
112
liii
I1
SO
S
10
57
251
190
336
153
1671
‘total
SpecIes
21
5
21
7
11
3
7
4
21
5
ii
7
29
Iffort
lUii.
oJ
hauls
or
Iirs
I
1.
2
0.5’
2
fl5
2
1
?
1
2
31
I.?
w
0
0m
0
m
NmD
z
-o
‘Si
Elecirofish
Se
=
Seine
Electronic Filing - Received, Clerk's Office, August 29, 2008
* * * * * R2009-008 * * * * *
Table
.
Numbers
of
fish
cDllected
by-eleetrufishiig
fruR
Lila
Sangwnan
River
during
June,
July
ond
August
L9fl.
1iiqnaiI
w
1
LahasIee
aisias
1(tiud
ah.d
aiaaima
Ci
tarp
1
cIplait
cnçl.
tailrtl
aIo,rn1ta,,
iptiltaa
1150113411
taftrtai4h
.iuig
bIai
1oibIl1a
Irt,
h1raa
i21frlnaidU
5h4p.d
pMra,’
1
I.
1Ui
ihltar
1
IL
ltd
abIMr,
II.
kl,auu,
hId
,Iliit,
1
11.
ttjI.iaaiI
lalfia
i)dnor
1
A.
44lIt
lmlfai
I
Iaalpaai
isiili
!LUI*OIOXII
•IaI’c%
PI01ØsIlai
.a4atas
141
IPaid
ahMaa.
llht
IbroØetd
diab
Axcal)
hl
1dLiLu,
1r,ah
cbsb
5aioIllai
•Iro.ualatal
fttv,
cuçsicbar
5
Larplalt.
nrplo
t1lbit*
4
C.
caas
Ill
jisilia
C11Øx1Ir
1
C.
.34t,e
LIalñiIltltd
Cirjltdes
kalhoalli
b.lt.lc
ItLI*II
biI,i
Ltpai4t*
bqttalc
1
I.
ei,tlnilua
Ilatb
baUa1o
1.
.1gw
1du
ratliorla
0
14iU%titi
lt)111r0r411
wihtId
rt&nsi
1
I.
cl,pIalaa.
LlmIdiiiMIlel
IaL4obIai,
tli,p.al
c.llWs,
tttaliwsi
pucliL
flilisial
ttiib)P)kdIlAU$
afiwIrta
Tidaal.
.dta.
4
Nsbrai
pyrLaap
1Jfli
hxt
3
d17IØa
aIl
es,
inipI.siJs
2
LiOa
tI3bNtI1I
L431ft1114t
31Ct1111
IIubattpt
hpelnaiw
1
F.idslai
tdalaa
leq,a
ii.ifla%
IA$Ik
tiitlin
arpapalld
1*11th,
L.IiulLLa
)IwI13
1.
aaôtthltai
tixi
arite.
LI
aIWI;
lthtlt
cru4.,
P.
agr*x.Iatit
Lir,xcills
bait
1
l(r.p4aris
n1öa1aaI
1111113%
audI..
vlIr
Id
IlicHId.
dlrtfr,
Peitiri
.xuuila
31*1*1*1
4Irk,
R
fh.iec?td111
i’jij
k*,
IlpIcliasLu
)rwuIena
-n.
Ia.
FII1I
•
53
ii
II
21
111
11
l
1%
II
Ill
353
2
5
II
6
21
3
II
34
2
21
UI
3
4
I
27
5
Ii
I
I
134
461
I
4
3
21
2
1
1
S
I
2
1
1
1
II
I
S
221
I
12
21
1:-i
m
21
1
31
N
I
I3
m
I
21
z
26
ian
.Ii
14j
3*
II
iii,
Ju3
aa
3,,’
JI
m.
1
Id
I
2
21-
Ia.
lal
JR
Jai_JhI
44
3•
J
XiS
4*
J
iii
ê.p
‘.1
lit
1.1
‘i
53
JmJIPq
Z1
17
3
1
it
15
14
3
lb
3
14
21
lb
2
I
I
LI
25
4
34
3
I
1
1237
I
I
S
I
41
m
T
..r)
1J
oJ
L’J
6*
45
Ia]
613
.h’
Jul
Sq
Ii
I
75
II
2
21
12
I
II
2
12
17
24
36
-
5
lb
30
It
I
2
2(2
2
II
12
21
2]
1
II
II
1
2
13
4
II
21
2
126
4
2
I
I
•1
II
I
I
I
I
I
0
4
21
1
II
1
3
11
2
3
*4
I
I
3
2
;
a
6
I
2
3
II
1
I
II
1
2
a
2
$
1
I
I
3
I
2
2
3
7
4
33
7
40
21
2
1
3
1
II
43
II
4
5
3
1
Il
2
I
I
I
3
4
2
1
7
II
31
2
II;
IT
Ill
322
2
14
5
13
I
I
I
2
1
4
2
4
-
I
I
3
4)
Ii
3
4?
1
1
2.
2
I
I
1
13
31
II
1
3
4
I
2
3
I
33
212
I
2
Ill
71121
.1
4
I
2
22
S
l
I
I
2
Ii
211
4
3
lb
431
13
15
1
I
1
422
214
1
I
IS
S
I)
I
1
I]
II
I
II
II
Ii
3d
II
6
II
1
3
31
21
31
31
61
Ill
53
fi
1]
U
U
I)
IT
Id
15
II
4
1)1
I
36
14
1
I
II
II
IS
II
32
II.
21
5
11
4
I]
-
34
II
*45
21
46
331
35
124
3%
52
234
1*1
2*
III
11
ITO
rJ
-J
cii
[Li
ID
-U
I-.
I
Electronic Filing - Received, Clerk's Office, August 29, 2008
r-.i
* * * * * R2009-008 * * * * *
ILL%1
CCI?
lici
501?
PIC2I
5101
4111
OUt
511?
ill?
4tLCt
CIIC
Ut!
Ifll
0?
oi
iz
ci
ci
t;
i
i
4
sic
oi
co
‘‘i”
spii,’di
‘.,
aL,*ø.’d
,pxIl_
.4
‘.iaP0r4J’PI
wpa
‘ap
‘op’i;
iiJ5*
.ipq’’nc
Uiip
052
£
iPD10
UJl1n
lI*
4
pgai
netiio4is
d4va
l1I
eIaIlwe
sp
‘i4fra
xiI
Si
I
iJioi
•
‘tulmia
flinl
r
w’
p.ndsñea
SEC
1?
sl1(wt*3
,1.d.1
IIl01
1i14
lqtcu
inppj
‘iudiip
.dT4sp114
5II!I1
iaqipçqfl
‘IPIPJI’.iI$
S4
•
asi
çj
isidssiis*
1
‘il15
lO
•
£4lILup
*AU
‘5115
i1lI
•
iliI46
iiqi
‘.w’
aiidpu
%
1
J4II
S
4
,
1p1
L
4
4’I1I
P”41’H
Iti
sppud
1,mlpPI
‘1111
I’I’
-
“i4041l
1I!’’P”(t
aiiiiip1diIou
t
Pflili*6
niii.nq*a
IlopsaI
‘SlWP
Va!I0
.Iii0V
•t
‘cIejjIq
P’Ii
q1
pup4j
aii
niodi4
irc’i
1lGiP1
1141JJ1(
qlc9p
P1lHI11IP1I
.I1J4Ia
‘3
‘sv”4i*o’io
ii&t.id0a
‘sqnv’n
c4e
ispsidwi
Jqsidas
w,y
iqpi.
‘5’ip
pa
illlfl?lI5i
lJ5
‘4fl’P
Pfl4iE!0
50
T
‘*gS’
PI14JII
I
‘9’00’
ili!l1i1Id
‘a’III
VI4
nOpl5r5i
‘0F
l4iiP1
1
Pø
14JP15
CCI
15
2
SE
SI
I
CS
I
52
1
.2
1WJlIp
N
‘1’P
P*
CkS
10(50
501
41.
02
51152
CC
512521
4lJ4’4IJliIiIpq
‘I
‘J1111(5
ilsoill
‘i4
5
J3Il41
0141.110
‘
1#11”lW
‘tO°I’W
‘JIUTI4I
PI13
ill
‘flW’I’
I%kt
IQUL1
.tip
s,iodio
‘wjoioiip
CCCL
*lJt3
IIq.1U1
‘Ji
io
£41
CCC
515
SEt
‘!P
tSPG
‘I”!’
I?II5
501110
iuisos14r
‘a
10111
coit
is
Vt?
im
1CU
?Et
ruoo
m
rcooi
Till
Iti
usc
scio
lilt
SEit
aZi
ic
ui
os
I
i
ot
S
ot
si
ii
c
e
ii
U
II
I
21
1
a
ti
i
Cot
ci
ci
SE
Cot
OlE
iso
li
soc
Osri
04
EL
St
Ill
St
CC5
St
0450
CI
2
-
0
t
t
0551
so
C.
1
SEt
040
CCI
WI
it
I
stir
Ii
SE
22
1
141
Eli
IS
I
t
02
£51
CI
2
I
QC
oot
SIC
(II
II
I
Ii
El
I
S
2?
CI
051
ft
Oct
It
Sti
It?
510
OIl
005
ft
ft
52
111
2
C
2
1
$
2
5
S
I
I
I
5$
00
000
1(1
ci
•1
CL
.
0159
il_S
‘ci;
0.1
“4
cci
at
SEC
01
05!
44?
512
Coil
0444
loll
go:
CL
C
50
4
515
Ut
41
CCI
IC
21
4521
oI
‘I
4I
ott
ci
ccij
Ott!
051
000
ci
ot
cci
VlSi
CII
ol
SI
201
I
521
aiso
ow
5141
dc
ft
coot
015
509
EtI
CL??
ot
ciii
I
Ii
0
0
?
S
ill
I
COOlS
C
StL
t
ItS
0544
05!
001114!
105
554
1?
U
00011W
541
SIlt
0SI
I
SOS
5CC
02*!
022t
0251
I2
01
025
042
01
I
SE
CitScbSE
05011
CI?
Sen
iso
ccei
It
C
51
Ii
I
11
2
1
St
I
I
Il
VI
S
I
‘0
4
0
C
11
2
I
-
055!
itS?
0Th
5241
00)?
•
0541
011
1
000
COOl
0021
.ss
0!?
cit
0420
CL!
Sib
5104
1011
Ui
0455
0011
415
SIt!
552
COIl
Still
Of
0001
CCII
till
S
Ci
5
2
Ii
2
2
I
Fl
(\1
(•J
‘SI
‘Si
-4
0
Ii-)
w
*10(2
5
I
0011
Ccii
I
02(2
950!
Sf
0412
CU
03
521
051
0101
cii
150
CL
1.1Irvog
livpirot
•lml,
it
oie
bct1.
IlipSont
b;q
0nptmi
hfCon;
Iiiir
oil
billiloil
bitMIoit
hi
Soil
01
IS
05
45
10
Ct
41
4?
—
44
ii
8R61
1)U
A[lif
‘U11f
u.n0pApi
UOW10&li?
a111
411011
UTLLBTJOIT
4
P°TT°’3
1ET1
}O
()
ssiuoçq
joioj
Electronic Filing - Received, Clerk's Office, August 29, 2008
* * * * * R2009-008 * * * * *
Table
.
Numbera
of
fish
collected
by
seiiie
from
the
Saugamon
Itiver
during
June
1
July
nd
August
1988.
11
20
Jir.
Jul
Jul
IL,
ill
Oq
34
Jwi
Jul
Iii
34
Jul
0
Jul
Ju
342,1041
J
toapost
air,
Le)IuoSIeuI
l2IS
G)izor2
ohii
1
2
2
2
5
II
Cc,mos
cit,.
Cplr.ui
orpl9
I
I
II
IC
tunlraI
OIDMCIIIOF,
upouki
tr.ouiliu
£,cO,r,uull,
1eLcIwO
.jrñIIIi
2
II
I
2
1
EosralS
ibiuir.
lloir.0i
1thwImeIu2
I
I
14rq,ed
iIoar,
II.
posqhuI
S
II
I
Oipoulh
,liIrat,
H.
êxtt1i
-
II
S
ltd
tSlUr,
I.
JuIrWiT.OL
35
25*
25*
42
555
300
133
103
150
113
*14
250
5
3
1
12
4
2
2
1
2
110
3*
50
III
50
103
12
0
500
2*1
S
3
Sind
shloar,
K.
ulti.iruos
IS
011
73
1*
*5
3?
21
51
15
12
55
3
s
Ji
21
1
3*
I
22
5.t0Ii1
ltd
l,tj
SidII.
uMu.r,
11.
mkU1li
I
UnIdoolItlud
30lr.ii
I
0aI
.hSr*r,
k4i.lpnou
u7osItuc.Ls
$luiosu
aIrs
PIurthiIos
,eti*it
7
I
I
2
2
i
s
i
is
0IIIsid
.1.
P.
100n
1
2
29
2
15
29
22
101
1,5
21
2
3
5
IS
iD
41
5
1
3
2.
2
5
2
2*’)
100
3
41
2l
13
12
100
29
13
lIe
Ibrr.tirad
clwb,
l1i
bdij11t1ui
2
2
I
Cruel
g*ub,
SuoUlil
eloa.acglilui
7
2
1
5
2
flyer
ru0,u*,r
1
[UptudtS
cmrI,
-
04101h.it%
C.
crIoa;
2
I
I
HII2ir.c1p11ur,
C.
willie
*,1,.,40t4.d
CatØidu
IS
I
33
2,
2*
5.gloaeth
bUilt.
IctIi0
14o1.i
tipotib
buI1t1o
5.
trIoaU
Iliek
b,ttilo,
1.
r.ipr
,w
reiarse,
1oDj*r.ii
,e.Thruruu
I
*n.rlbad
rttLrH
1
K.
,u&olerIdu*ui
I
-
tJiIdw410
lid
hLiiII,ai
I
21
3
Ii
9
*5
500
I
Ilivt.l
nLtleb,
ILIilur4Ji
pdu1ui
93
1
II
S
FleIhud
tilt
jg,,
F1udIv1ui
then.
Til.
etd1n
Ibttsiii
dim
I
I
Ilillebuus,
wu.erpIo
I
I
Sri
boa
lass,
II.
wO.uIuI.,IIuli
I
oa2
sthTNldI
.LelIduUiu
riccolIa
2
2
I
11
33
7
1
1*
7
5
3
3
1
*5
Ii
n
I
0
ilathirip.
*cp.lruo.,
Fdulss
at11ue
I
I
I
I.
00
2
42
II
I
11
II
rn,
surf
I,
tq.ueis
ryirailas
I
I
I
I
I
2
1
1
3
I
I?
Lhap.tti0
intlu%
L
esIlli
I
3
5
1
2
4
3
2
1
11
22
r..in,
i.
.celIres
I
2
-
I
4
20
2.!
2’
25
I
I
1*Iil5KLd
Lqrls
II
I
SlUt
asqplr,
Pueo*li
aureluelt
hilt
crflpI
2.
.l.roaIe4oa
U
Iaryuoafl
base,
*toalwrs
d.loaIurI
I
I
I
S
1
3
3
JO
I
.
I
3
1
5eli.n,
StI,.aiidt
eli,,,,
..
Ilasluld.
darIn
Purdue
.avalla
E
ri
St.04hud
dwIsr
P.
tiueguitatm
I
II
I
L
,
frishatlas
êw
1ad0rdti
,wr.5sse
-U
.3
532
4119
iSO
3*21
1105*3111
SIb
I
£7
II?
S
1
Ill
I
I
III
It.
FIIli
51
III
11?
50
204
250
23*
lii
4*0
113
541
250
3
IC
03
II
52
17
1
35
12
2
12
ii
hI
441
Iii
593
3*7
*53
513
Ml
1131
LIT
I4
25*
Electronic Filing - Received, Clerk's Office, August 29, 2008
13
* * * * * R2009-008 * * * * *
w
cii
ira
c
;;
ict
ic
iu
ir
iia
2
5
(
tJ
ILl
112
112
)01
101
L
ñ
IIC
SOIl
£
Ill
I
210
£
ê
.0
Pt
ISP
I
01511
t
p
t
2151
U
.tiiwi.a
qpeida
f
piflJJ
r4
12?
ai.,P
P!WRI5
I
-
qrp
l’pd
‘JPI’P
PI1*I1I
iIa
1001000101
U*flt3
I
I
I
I
IMI1
*I.IatI$00II
I0
011
aqq.,AIo
‘“
‘1111
sJq0
‘P’4
i1
or
Iq
PWP’PM)
i
or
si
I
JçIpI.UT
q
‘uIiii
21
Gb
S
02
Cl
L
-
01
02
54
01
54
r
qI;na
‘1
‘5qJI
oinodoa100Jo
S
1
2
1
1
V
S
i
j
2
01
iqioek
oiadwl
I
I
I
Ci
U
12
I
S
P
I
I
IW
III*3
dPIw!It
I
01
1
01
II
1?
2
2
2
CI
I
I
I
2
I
1I
“4PIP1
‘P’U
4
sp000ddlnIIiI.
0110
II1&
sd.slalp
IWJq
‘solo
1111ff
a
OIO1J*
is-InIqi
‘so)I’m
.Icdpsj
si.’no
pit4i
“s11’
P,q1,Ii
I
I
1
II
001
2
-
islIJn1
00.PPI
‘ilI4’J
l’’Q
iriJqnflq
PiiIi’ii
4
‘asIC4p13
p”i
00a.3gbL.a
0I0I1W1
‘#
“PI1
•-1
‘spg,tq
s11
“It*’IJ
1
IIJ”5
0P
0
t4
0111110,
q0IIi
‘0111210
ll10Iarq
oat
Cl
SC
00
12
1qotJrJ
p11311010101
Z
-
JOIJIM
3
a:
£
05
01
W
C
3
IJI
01pCIJ1)
J101C40)
lTI
N
S
1
92
$a,,p0010qI
001
‘*103
2
p
oI,%pI;o
,eocc
‘ou
o00#or
50)
00
501
II
020
01
WI
50
01
52
I
12
I
01
1
P
01
1
-
z’iiI;
4
‘III
psqIpe
ct
,
.
1
soiciLa.i
001*11W11,l
J1Uiø
00?19
a
‘1ê”.0lI
P1l10’1PWO
Ifl0Jn
‘J1lll
qipq
-
i
‘io1
pu
22
I
Ii
I
DI
I
02
p
op
o
i.
Gil
‘ii
-
00WIW4
1
‘4IN’
PInS
21
012
CC?
C
III
50
001.
III
01
01
021
2
22
s
*1
i
p
531
101
*0
CII
CII
012
tO
505
000
11.
II10IJII
h
JlI1I’
P
0
sii’I53
‘H
‘J”IO’
inC.1ti
I
1
0
00)TQXP
M10IS
P1II
I
1
$PiU1iW4i1
JIl5
‘‘1’1
Pi’I
I
I
I
1
i
‘1I!VI’
1140014
I0110
!0I.I9
-
.np1ui
l.Cpob’2
‘aij.uun;o
p.lrl
I?
wi;idOj
‘CtO
ino
II
I
I
SI
00
II
It
ossi.
SM;WITII1
.d
1.olloq
w
-4
i,
oic
‘10
I”t
I
P
‘(
•00
I°I
“I
104
P1
“1
‘I
r
r
los
pr
‘r
Iqi
o’t
t
‘C
r
ont
b
pc
sit
Sq
tot
r
___
—
c_li
51
01
*5
05
ft
$1
it
Si
02
II
c_li
w0
‘61
U1
£Tro[’
‘L0tIC
LLT1flP
ATZ
UOWeU
alp
iOi)
aUpB
lcq
ISJ
JO
()
ssBwoq
TUDL
a-qej
w-..
Electronic Filing - Received, Clerk's Office, August 29, 2008
* * * * * R2009-008 * * * * *
SEP—02—2008
14:32
HODGE
DWYER
ZEMRN
21?
523
4948
P.15/31
1988
SON
RZVER
FIi
S11lR1ES
SL$RY
NOKflLY
8LR
tTc15
--
-
0EAR..ECTO
ri
—
,
_,
J1
88
JLL
88
AL
88
NOV
88
VKR
TOThL
8RS
Rd4S
G
6
TE1TL
TOTIL
TUTIL
TOTIL
TaT.
PERCT
IES
L1OSEAR
0
5
0
0
5
0.001
GIZZD
SD
70%
7430
22085
11059
47670
11.599
EZNIR
STROU.ER
0
4
0
0
4
0.001
11520
12159
21260
69950.
114909
27.958
NOi1YIEADD.13
0
0
3
0
3
0.001
LDEN
SH1’ER
0
3
0
0
3
0.001
BERLD
iINER
0
7
8
106
121
0.029
STRIPED
11NER
25
0
0
0
25
0.006
1D
UPR
163
552
1076
308
2099
0.511
SD
EHUR
5
78
195
14
292
0.071
DUTHHIMGI
0
38
117
0
155
0.038
JJThIJSE
)flJ8U
0
2
7
9
Ia
0.
004
1LLIERD
$4
.
2
9
167
260
482
0.117
C(
ci*ia
0
0
-
7
0
7
0.002
RIYER
CPRPSUDER
12942
5930
14872
65738
99482
24.205
IJIIJ.BK
2850
1208
1742
34353
40153
9.770
HIfIN
CfiT(JSUCHER
295
0
425
0
720
0.175
LJ1DRP1)ES
0
29
32
85
0.021
I*IT!
SLEKER
0
0
0
1330
1330
0.324
L1iOflN
BLFFALO
5240
0
1200
1130
7570
1.842
216WTH
BLFFALD
1
0
760
1390
3995
0.972
BL
E1HL0
0
3750
0
0
3750
0.312
2470
1525
400
1710
6105
1.485
$i0flED
JORSE
0
0
0
1
19
0.005
way
ztriosi
0
0
o
0,000
OiIG.
CmFISH
2078
5553
8904
22785
39320
•
9.567
FLT)€AD
CR1flSH
825
1370
1136
470
3801
0.925
•
CHSTRIPE
TaP1lIWOW
4
5
20
0
29
0.007
9110CR
SIL1DE
13
1
ii
48
73
0.018
IU1E
BISS
295
f5
605
175
1140
0.277
YELLOII
9SS
797
130
40
72
1039
0.253
64
S()F191
.
235
1498
2339
515
4587
1.116
0
10
17
29
0.007
aIfSIU
100
649
1160
843
2760
0.672
U8DW1}1
91458
0
218
638
816
1672
0.407
TE
CPP1E
0
0
353
465
818
0,199
JCCRPIE
0
0
75
0
75
0.018
.ENLIERE?W
DARTER
•
0
0
3
--
0
3
0.001
.IXE
3230
0
1377
0
4607
1.122
URUN
5433
1305
3900
11405
22043
5.363
TUT1.
CATCH
57475
43555
84956
225004
411000
100.000
Electronic Filing - Received, Clerk's Office, August 29, 2008
* * * * * R2009-008 * * * * *
SEP—02--2008
14:32
HODGE
DWYER
ZEMAN
217
523
4948
P.16/31
1988
56O
RIYER
F1S4
iiREES
M’1RY
L
IOflILY
W
AIWL
3T1ES
——
‘I—.
—
—
PR’1E
—.
—
__$7
T
r
—
88
p1J9
88
N
88
TGWL
6RS
6$
BR
T0T.
T0T
TQTPL
TOTcL
T0TL
P€RB7
1E5
ta10sE
BR
0
0
0
0
0
0.000
BIZZRRD
D
43
28
46
0
117
0.526
0
73
0
0
73
0.330
0
1
6
3
100.045
0
1
2
201
204
0.921
STRIPED
SHtER
2
1
3
5
11
0050
0
1
3
0
4
0.018
SI1R
1024
1240
1391
9029
2684
57.285
S
SHI1R
496
231
1195
2081
9.398
DFTh
SlIDER
0
1
0
0
1
0,005
SPOTFIN
X
RED
SlIDER
0
0
1
0
1
0.005
IJIUE3
NOrROPIS
0
1
0
0
1
0.005
SXEQU11
NI110W
2
4
0
20
26
0.117
aJ)mIEE
$IlI40
0
9
54
27
90
0.406
aI1JERD
IløOl
140
233
685
2740
4004
18.083
CEKDLIB.
1
5
23
0
29
0.131
RMR
CSUCXER
15
0
1)
30
45
0.203
0
53
192
240
485
2.190
1*ID
IRP10D6S
0
450
45
0
495
2.236
ai.
W3RSE
0
0
0
113
:1.3
0.510
SlRT1ED
REDR5E
0
2
0
0
2
0.009
LIIID
1CTI1v
57
4
0
5.
76
0.
343
DWL
CITF1SH
0
121
43
5
169
0.763
T0LE
T0K
3
0
3
0
6
0.027
IUCSTRIPE
T10U
.
8
43’
21
6
78
0.352
BROCKSIL’dERSZVE
1
.78.
110
63
252,
1.138
1*IITE
BSS
23
10
0
0
143
0.646
0
0
0
0
0
0.000
$JFISH
2
34
25
157
‘‘218
0.985
0TFE1)
SLI418H
6
57
102
75
240
1.084
0
23.
85
218
326
1.472
lJUDEP()1S
0
32
0
0
38
0.172
LI3REE)WThSS
1
62
27
0
90
0.406
1&I11E
CRPIE
0
0
1
0
16
0.072
a.fiCKSThE
8RTER
5
0
2
0
7
0.032
SL9E€1W
VfiRTSR
0
4
3
0
7
0.032
T0TL
fl4
1492
3199
3319
141
22142
100.000
Electronic Filing - Received, Clerk's Office, August 29, 2008
* * * * * R2009-008 * * * * *
SEP—02-2008
14:32
HODGE
DWYER
ZEMAN
217
523
4848
P.17/31
IO1THJB8
98
SO
R1’JER
F11
SI*R1ES
E€CRaFII
TES
PEN
200
I(IERS
S0
—
I€
CflTOE
PER
2
FbCLS
GEnRCTRa
LXRT!ON
NO
FISH
61lZRD
RD
co
STRIPE
SHiNER
J
SHDER
SHIIR
BULiJED
itI
RPR
EM’SUER
HZF1N
t$SUDcER
icum
RFF.D
9IENOUTN
RIL0
O**€.
cRTFZSH
FLmE%U
tarFIsH
.RQcSTR1PE
TGFII00I’I
.B00K
SIL’)IDE
.i4ITE!SS
YE
GREBSOI1
LàILL
1U
tflTH
1
ID
28
.
ZB
4t
48
5A
5B
6R
68
TOTRL
TDT.
7OT.
T0T1
TOTtL
TQTL
TOTfiL
TO1AL
T0T,
‘T0T,
T0T
T0TL
8?IS
SR1S
BRS
GRIS
8IS
SRRS
GRS
GRS
8R$5
G
o
0
0
0
0
0
0
0
0
0
0
0
325
193
297
553
0
0
1955
.1720
579
184
455
7Th
o
0
0
235ê
0
.0
1200
690
1800
2800
2470
0
0
0
0
25
.0
0
0
0
.0
0
0
0
is
so
20
15
0
0
1
0
5
35
15
22
2
0
1
2
0
0
0
0
0
0
0
1
0
2
3
0
0
0
4
4
4
6
2
252
1.950
0
1175
0
0
935
540
33.05
32
0
650
265
55
50
125
0
0
0
0
675
1510
75
75
0
295
0
0
0
0
0
0
0
0
0
0
0
0
1360
O
-0
.0
0
0
0
0
0
660
0
Q
1070
0
0
0
755
0
0
0
0
0
0
0
0
0
0
0’
0
0
1430
1040
0
0
488
845
22
303
0
0
0
0
0
330
0
90
0
0
0
a
a
a
45
0
0
0
0
360
0
0
0
0
0
0
0
4
00
0
0
o
a
a
0
0
0
3
5
2
0
.3
0
0
65
0
0
0
0
0
0
0
65
80
05.
125
0
188
0
.0
0
339
0
100
65
0
0
0
0
14
0
0
30
140
.2
29
0
0
0
0
0
0
0
50
0
0
28
30
0
0
0
03230
0
0
0
0
0
0
0
0
255
240
515
1397
0
0
410
535
1731
205
145
0
2348
3573
3519
12508
0
0
6123
3726
9572
10C53
3322
2129
Electronic Filing - Received, Clerk's Office, August 29, 2008
* * * * * R2009-008 * * * * *
SEP—02—2008
14:33
HODGE
DW’ER
ZEMN
217
523
4948
P.18/31
ELECTR1IN$
2
6ER61ZFR0
LOCT10N
SPECIES
LLSE
EPR
£IZThRD
c9IT
sTaEROLER
c
LEEN
4UER
5HINR
W
9HR
JcKEUTH
flhIW1
RIVER
CJIP5VCER
JXLiBAD(
1141D
I0D€S
JC
&LDEN
E
ID
ICTI0BIIWE
DWE
WISH
FLR11ED
UIW!SH
kSTh1PfT0F
BRXK
SIWERSIDE
I
61ER
SERFISH
uR&SPGTTED
&!ISH
ELUE1LL
R6H
F*TER
DR14
TOTL
TH
0
340
0
1230
0
0
0
0
0
0
0
0
0
0
0
0
0
0
0
0
0
0
0
285
0
183
115
0
2153
0
5
0
105
180
285
o
0
0
0
3
0
0
3
o
0
0
o
&
20
0
0
0
o
0
0
o
o
0
0
2
10
o
o
0
0
0
0
o
0
0
o
o
0
o
0
0
o
o
0
300
0.
2385
35
0
150
0
3
o
0
0
o
0
0
0
0.
0
119
239
309
0
3
0
320
0
2
1
90
8
o
0
0
880
528
3176
0
0
0
3080
1830
170
o
o
0
0
8925
1550
o
0
0
2
5
0
0
1
0
0
0
0
o
0.0
o
0
0
2
2
0
580
4850
0
0
730
0
0
0
0
03750
0
0
1130
0
O
0
‘0
150
0-
0
o
0
0
0.
.0.
.0..
0
0
0
0
0
0
70
60
0
0
0
40
3,
.0
0
o
0
141
0
0
0
545
50
330
4432
21333
2231
IR
lB
2l
28
30
38
44
4B
5
SB
6
68
TOT..
TOT..
ToTs....
‘roiRl.
i3’ra.
TDTI4..
TOTRL.
TDT
ThTIL
TCTI&
TOT$L
‘r0T
6S
8S
61MS
6R5
BIB
61$t5
SRWS
6RS•
8RS
RRRIG
Si
o
0
0•
0
835
0
170
220
o
0.
0
4
0
0
445
6
0
0
0
0
o
0
0
0
130
70
300
a
S
15
49
10
0
5
o
23
o
0
02
4
7
0
500’
0
0
11
455
8
4
o
to
0
0
0
0
0
0
0
0
395
0
2
0
0
0
499
1771
251
197
0
0
145
1040
0
0
‘1
0
0
0
1
0
0
0
0
65
o
0
0
0
24
51
72
25
0
0
0
4
1
1
1
0
3
0
0
1
250
0
0
130
1773
2821
1884
2075
0
215
0
0
0
0
0
0
0
0
0
0
0
19
0
0
0
0
0
0
0
0
a
0
0
0
0
269
Electronic Filing - Received, Clerk's Office, August 29, 2008
* * * * * R2009-008 * * * * *
SEP-02—2006
14:33
HODGE
DW’’ER
ZEMRN
217
523
4946
P.19/31
1908
O
RflER
F191
S1mR1E
ELECRLFIU
CTaS
PER
200
TERS
CF
RE
—
CTC1E
PER
2
IILS
LOcnTION
900
75
1920
920
2140
1600
2680
0
1040
0
8990
10
0
0
.
0
3
0
0
0
1
.0
1
0
0
275
185
125
440
4
4
25
40
30
100
0
0
0
7
0
110
0
0
1
1
0
4
0
0
25
10
10
35
3
13
0
0
0
7
0
0
32
100
445
450
2270
0
240
330
12
622
85
0
0
0
425
0
0
0
o
0
20
0
0
0
o
0
0
0
0
0
.0
0
0
0
0
0
0.
400
0
0
0
3653
196O
995
116
0
300
0
0
150
656
55
0
0
O2
1
2
8
0
0
0
0
0
1
300
0
0
85
0
70
o
o
0
0
0
0
120
140
415.
265
490
315
O
0
0
1
13
14
25
75
18
185
256
261
0
31
44
193
22
0
0
0
0
3
0
o
0
0
0
0
0
.0
1
0
2
0
0
o
0
0
37
0
0
755
0
0
545
355
435
9461
2875
6085.
5541
14776
4267
lA
19
20
29
ZA
3
4A
46
5fl
59
BA
68
T0T.
T0TL
T1JTcI
TOTIL
T0TL
T0T.
t0T.
1Drn.
30T
?0T.
10ffi
10T.
61I4S
BR
6Ri1
6RAS
BI
BR
GIS
CR$S
GRS
6
ER
EtIE
BIZZRRD
S
•
co
!I’EILD
1R
1WER
D
SHIPR
$CERQUTH
MflI0
k1NR
)U)*IU
LUEU
911410W
RIVER
EPWSJ(ZER
ALtKER
LUD
OW10DES
•
RL1WtH
BIflLflN
BLFF0
•
DE
FL1)ERD
cRWISH
tRPE
TOP
OW
BROUc
SILJEJISIDE
I8U1E
BASS
BASS
B94
kfISH
OI&SP0TTED
JFISH
FUES!LL
LAROflN
BASS
bi11E
tPIE
.AD’
tP1E
SL?€14EJD
DARTER
F1ER
DR
T0T..
tATH
1035
1365
5300
4015
2245
1560
0
610
0
3660
0
2850
0
0
0
0
0.
0
1
2
1
2
0
0
4
12
8
2
4
15
0
0
0
0
0
0
0
0
0
0
0
0
0
0
0
0
0
1
4
15
17
5
10
20
0
.0
0
0
0
0
680
0
515
8470
580
1330
o
o
115
25
1
158
0
0
0
0•
0
0
0
0
0
0
0
4
0
0
0
0
0
1200
o
0
.0
0
780
0
0
0
0
0
0
0
0
240.
40.
520.
0
0
o
0
0
275
0
0
a
2
0
i•
2
0
1
5
1
3
0
0
GO
0
0
90
0
0
0
0
0
40
0
0
135
384
15
60
.
0
0
1
2
0.
0.
1
0
8
10
103
400
64
2
19
26
0
0
40
0
o
0
0
350
0
0
0
0
0
75
0
0
0..
0
0
0
0
0
o
o
o
1340
0
0
0
140
730
940
0
0
1950
2634
6843
20273
2681
7140
Electronic Filing - Received, Clerk's Office, August 29, 2008
* * * * * R2009-008 * * * * *
SEP—02—2008
14:33
HOD6E
DW?ER
ZEMAN
217
523
4948
P.20/31
198a
srocoi
RIVER
FI4
$RIES
-
aEcrRCFISHR
CTD
PER
#00
E1tRS
OF
RE
—
SEItE
CATDE
PER.2.
II.LS
NmYe8
SEflRELECT
L0RF10N
SPECIES
SIZZRRD
SD
8ER%LD
SHUER
SHflER
S
IlR
.1m4o9E
)I#W
80.UERD
IPWI
RVR
M9UQER
(JUD
t$II0DS
.I1TE
UflN
UFFRO
BIRUTN
JLFFR.D
I0R11M
RSE
DwI
ISH
rio
ww
Ecic
S1LVEIDE
UTEB14SS
ss..
S1JISH
•
marTED
SLWISH
ILL
LRUTh
BSS
14flE
CPPIE
FS*mItR
DRLM
TOTIL
RT4
1
19
2
2B,
4R
49
59
S
SB
T0TI
10TIL
T0TL
11JTI..
T0T.
TOTAL
TOTAL
TOTAL
TOTAL
tUTfL
BR4S
ERS
6R%
BS
GRA$S
GR’14S
•ES
69
6N$
6RAS
31
620
34
358
4490
670
595
359
0
212
o
3990
5680
24930
4490
10330
12280
4350
940
0
.0
4
11
3
00
59
15
0
14
.34
54
21
28
9
.5
135
19
12
2
0
0
0
0
011
1
0
0
o
2
2
2
.2
0
0
0
0
1
8
31
17
16
4
11
121
30
2
20
5919
25
19295
16310
14000
3930
522
5737
0
0
1455
1490
6948
6368
870.3
1582
1154
.3435
60
558
0
0
0
0
0
0
22
0
10
0
o
0
570
0
‘760
0
0
0
0
0
0
0
0
0
0
0,
0
0
1130
0
O
0
0
0
0
0
0
0
1390
0
0
0
540
530
0
0
640
.
0
0
0
0
0
0
0
0
0
0
19
0
0
1575
850
9540
7955
.
0
130
1690
735
0
250
0
-
0
410
0
60
O
0
0
0
0
2
0
0
0
.22
0....9
9
3
.3
o
0
0
0
0
0
‘‘0
‘‘‘0
0
175
o
0
0
‘0
0
60.
12
0
0
0
0
2
9
14
119
181
60
113
17
-
0
0
0
0
0
0
0
0
0
2
0
4
0
6
0
0
0
21
276
348
182
O
0
0
0
16
0
0
•
0
800
0
0
.
0
85
0
140
,0
0
0
280
0
1605
0
1650
1790
710
1860
3070
520
0
0
141
7068
44978
60304
33525
1695
20981
15678
7963
1423
Electronic Filing - Received, Clerk's Office, August 29, 2008
* * * * * R2009-008 * * * * *
SEP—02—2009
14:33
HODGE
DWYER
ZEMRN
217
523
4946
P.21/31
ocniiuaa
1%8
SEO4
I1V
1
ER
FI4
SLI9RZES
CTRHN6
CTD6
PER
200
€TERS
SICRE.-.
DE
CTCES
PER
.2
ILS
U3CT10$
SPEIES
61ZZIRD
SD
PTRIPED
R
D
WR
S
SHIER
LLJED
)(IW
RVER
IsrcER
LiTD
ICTZUE
TRDPCLE
WTD
BIWI
SILcERSIIE
U7E
SS
SITh
SI)FJSI4
DRESPUT
SWF1H
LPR
UXS1EE
D1RTER
T0T.
tATi
o
32
0
0
o0
2
0
0
0
35
G3
115
160
0
14
20
.19
0
o
0
2
0
0
2
0
40
30
0
0
0
0
1
0
0
0
15
0
0
1
0
10
10
0
0
0
0
0
0
0
0
0.
0
•3
o
0
0
0
0
0
0
23
0
0
0
0
0
0
0
o
0
0
0.
0
0
0
0
0
0
0
0
00
0
2
117
259..0
3
.0
0
0
11
0
0
0
0
6
5
0
120
0
0
0
0
0
0
0
0
21
4
2
2
0
0
0
0
0
0
0
0
0
0
0
4
0
3
0
0
0
0
0
3
o
0
0
1
0
0
0
0
o
0
0
2
6
0
0
.0
0
0
0
0
o
0
0
33
12.
2
143
0’
0
0
o
.0
0
210
115
295
1
2
1
0
0
2
7
30
0
0
0
o
0
0
8
0
4
0
0
0
20
0
0
0
0
‘0
0
0
0
0
0
o
0
0
0
1
0
5
0
0
176.
144.
331
IA
lB
2A
29
3A
39
4
49
5
59
6
69
TDTL
TOTAL
TOTAL
TUTAL
TOTAL
70TL
T0T
TOTAL
T0T.
TOTAL
TOTAL
TOTAL
6R
8RS
G
6S
BS
6RANS
6RiS
6RfS
GS:.
GS.
Electronic Filing - Received, Clerk's Office, August 29, 2008
* * * * * R2009-008 * * * * *
SEP—02—2006
14:34
HODGE
D5JYER
ZEMFIN
217
523
4946
P.22/31
.EfrPx1ING
T(ES
PER
2
WLS
—
..
-.
.
.4_LJ......___..__
.r
..
—r
n
THflL8S
LOCATION
IA
lB
241
2B
341
3B
441
4B
541
59
541
TOTAL
TOT.
TOTAL.
TOTAL
TOTAL
TOTAL
TOTAL
TOTAL
TOTAL
TOTAL
TOTAL
TOTAL
GRANS
B
5
.GR
6
S
SPECiES
L1JSE641R
0
0
0
0
0
0
0.
0
0
0
0
0
SI22ARDSWD
0
0
‘0
0
0
2
.5
1
0
0
0
20
O*ON
0
0
0
0
24
0
0
0
4
0
20
IANY1ADcHUB
0
0.
.0
1
0
0
0
‘0
‘0
0
0
0
BEMLDSH1R
0,00
1
0
0
‘0
‘0
‘0
0
0
0
STRIPCJSHDR
0
‘0
0
0
0
0
0
0
1
0
.0
BISt(UThSHIPR
0
1
0
0
0
0
0
0
0.
0
0
0
D
SHIIEX
200
210’
55
600
0
.
1
2
2
30
100
7
3
SAND
SHIVER
210
130
38
70
0
0
0
0
10
20
16
2
IDFINSH1ER
0
0
0
0
1
0
0
0
0
0
0
0
LIflDNOTROPIS’
0
00
1
0
0
0
0
0
0
0
0
SUIUTH1NNQW
0
0
1
1
0
0
0
0
1
1
0
0
mcsEN1?Iw
0
1
1
2
0
-o
0
0
1
3
1
0
LUEAD
I1O
1
4
24
25
2
5
9
4
80
30
15
40
CW2
.
0
3
0
2
0
0
0
0
0
0
0
0
1J1L1iK
0
13
0
0
0
0
0
0
.8
10
1!
10
L1LTD
CA10DES
29
75
0
0
0
0
0
0
40
300
0
B
•.
BOLKN
HORSE
-
.
0
.
0
0
0
0
0
,
0
0
0
0’
0
0
T1EA
IURSE
0
0
0
0’
2
0
0
Q
0’
‘0
0
.
“0
LNIO
ICTIOBI1
0
0
14
0
0
0
0
.
0
0
0
0
0
DI1.ATF1
7
106
0
2
0
0
0
0
0
‘0
6
0
!LD(STRIPETMI)Of
0
0’
1
0
1
1
5
0
25
10
0
0
BRKSILVERSIDE
1
1
7
4
1
2
2
0
25
30
4
1
h1ITE5S
0
0
0
io
0
0
0
0
0
0
0
0
YB.LDBA5S
0
0
0
0
0
0
0
0
0
0
0
0
GRNSWFISH’
0
0
0
0
30
1
0
0
1,2
0
.0
ORANSPVTTEDJF1SH.
0
0
0
0
10
0
20
7
0
0
10
10
BLIJEBILL
0
0
1
.
5
5
10
0
0
0
0
0
‘1JNIOLKIS
0
0
0
0
0.
0
0
0
30
£
0
2
)
LA.JTH
54155
0
0
3
1
10
15
15
0
10
5
0
0
I’
EREAODARER
0
0
0
0
0
0
0.
0
2
0
1
1
TOtAL
CATCH
448
544
175
8
86
‘
68
14
267
521
97
115
Electronic Filing - Received, Clerk's Office, August 29, 2008
* * * * * R2009-008 * * * * *
3
d
S3UU
313S
i6
3
SB1.I
003
d
sjl3
9HtfI0j3!13
S!fl*l7S
H$L
NS
e%T
OIU
WL
V3iü
U3I3B1s
U3.LW1
isna
1d*I3
3U1I
sat!
iuni
HSL
0LL0O
IrnIiS
N39
aiza-IIs
)OI
flINL
3dtJS
LW
FI0diJ.
HS!W
]31M13
st
ati
s
-
imiw
a,ijrnna
flQ1(IN
3SWfl
X
)4I4LO
BZ
3(!HS
RInOwgrn
ZHS
a3dZN.Ls
as
avnza
S3133dS
612
SE
LTE
22
411
901
032
2E
LL2
64L
1
0
0
0
0
0
0
0
2
0
0
0
2
0
0
0
0
0
0
0
0
0
0
0
0
0
0
0
0
0
1
T
0
0
0
0
0
0
0
0
0
0,
01
0
6
0
0
9
41
0
9
.02
1
1
-ST
51
0
1
31
21
0
•c
.02
01
o
CT
o
o
I
1
6
1
£
S
1
2
0
0’-
0’
0
0
01
05
TI
4
2
1
01
0
030
2
I
I’
I
It
1
0
9
0
0
0
0
0
0
0
0.0
0
0
0
£
0
0
0
0
I
£
0
0
0
0
CT
0
0
0
63
0
0
02
0
0
0
0
0
0
0
0
5’
02
05
0
L9
ST
0
0
0
0.
0
0
0
0
0
0
0
0
0
0
0
0
02
0T
00!
021
S2T
4
3
5
T
OG
9
5!
5!
1
1
0
0
0
0
0
0
1
1
ST
0
0
0
0
0
0
0’
0
0
0
0
1
0,
1
0
02
0
0
0
0
5
59
04
001
•
2
002
09
06
2
2
CI
5
002
021
091
005
0
0,0
‘0
.0
0
.0
0
0
0
3
1
0
0
00
0
0
0
0
1
0
3.
0
0
0
0
0
‘0
0
0
1
0
0
1
0
0
0
0
0.
0..
0
0
0
2
0
0
4
0
0
0’
0
0
0
51
02
0
11
0.
0
s,9
5’
SWII8S
.aie
S9
SfS
S9
85
SNUHO
SW49
S9
SNUNS
]UlflL
1UIOJ.
lJiOi
JUL01.
51Øj
1UJ.91.
1ULOL
Wi0.L
TdlOL
.L01
P310L
LC.L
89
U!
85
US
94
U!
e
UI
NOILUDO1
T/$’d
917617
£E9
NtM3Z
d3MG
3OUOH
1?:t’T
Electronic
Bøؗؗd3S
Filing - Received, Clerk's Office, August 29, 2008
* * * * * R2009-008 * * * * *
SEP-02—2008
14:34
HODGE
DWYER
ZEMN
217
523
4948
P.24/31
NOV
88
19R
RIVER
FISH
S(MR1ES
ELECTROFThHTNO
CATDE$
PER
200
PETERS
(F
4O
5IIE
CflTDES.
R.
LfltIDN
EPECIES.
EIE(RD
SHIIER
STRIPED
SH11ER
SHItER
JcKEIlOJTH
$1I4W
JimI.E
IM61
DLLIJERD
$i?2I
RiVER
SUDER
rU1LLEA(
R%
Lan
ICTIQRI
PE
oma
CAW1SH
OSTR1PE
TOPN1tDO(
BRO
SILVERSIDE
GRSE
1F1SH
ORI6ESPUFTED
.1F1S1
.BUILL
TOffi
CATCH
0
0
0
715
260
0
0
55
0
0
0
0
0
0
0
0
0
0
1030
0
0
0
0
0
0
B7
10
15
18
0
0
0
‘0
0
65
370
1420
64
139
0
14
97
0
7
o
0
0
0
0
0
2
7
0
0
1
131
1300
109
47
0
0
0
8
0
0
0
0
0
0
0
0.0
0
o
a
0
0
5
0
4
1
0
0
2
0
0
0
0
o
14
0
27
3
8
9
25
11
10
o
4
2
0
0
o
47
4
26
11
98
751
2870
252
248
lfl,1B
2R
2fl
20
3B
4fl
4B
SR
59
SA
f,S
TOTAL
TOTAL
TOTAL
TOTAL
TOTAL
TUIAL
TOTAL
TOTAL
TOTAL
TOTAL
TOTAL
TOTAL
S
E4S
5S
5S
61
61
6RS
GRW.S
6RiXS
6R1’IS
6PI5
6S
3
0
0
0
0
0
0
41
30
0
0
0
2
.0
3
0
0
0
605
1940
2570
220
500
21
215
245
350
5
2
0
0
0
20
0
0
0
4
2
12
0
0
0
7
265
23
8
16
0
0
13
0
0
0
0
0
0
0
0
240
0
0
3
0
0
110
o
0
0
‘0
0
0
O
0
0
0
0
0
0
0
0
1
1
2
o
4
5
2
0
8
o
8
12
25
2
43
0
0
0
0
0
9
7
107
1
5
851
2975
3710
303
512
44
I
Electronic Filing - Received, Clerk's Office, August 29, 2008
* * * * * R2009-008 * * * * *
SEP—02—2008
14:34
HODGE
DWNER
ZEMFN
217
523
4948
P.25/31
1388
SGOf
RWR
FI8H
SWARIE5
RY
I4R
TD€S
‘V
-
Vu
—-
V•
ERRSElNE
V
JU
88
JL
88
AUG
88
t(IY
88
W&_
TOTAL.
•
MIER
MSER
V
TOffi.
TOT..
TOTAL
iota..
TPTEL
PERCENT
SPECIES
V
U1N6MOS
W.R
0
•
1
0
0
1
0.004
BIZZARO
D
2
53
5
0
60
0.264
CIWI(CARP
0
27
0
0
27
0.119
H0EAD
EI4JB
0
V
V
3
1
6
0.026
DEd.D
S1Z1R
0
1
2
69
72
0.327
STRIP
94DER
I
1
2
2
6
0.026
8I6D(ITH
SHIER
0
1
2
V
V
3
0.013
SHINER
933
1160
2047
9374
13514
59.562
r—
SHIVER
112
387
211
987
1697
7.479
REDEIN
SHINER
0
1
0
0
1
0.004
SPO1FIN
X
ID
SHINER
0
0
1
0
1
0.004
INID
?CT>IS
V
0
-1
0
0
1
0.004
Jcxnum
1,eow
5
4
0
3
12
0053
EL1ITNOSE
Hflh10
0
15
37
13
.
65
0.286
BULUEAD
NII0W
116
406
1419
3275
5218
2L998
CDJB
1
4
8
0
130.057
R1VRCAStEXER
V
1
0
0
3
4
0.016
0L3ZU.BAD
0
B
14
.1
23
V
0.101
0
i4
19’
QV
33
1.027
8CL
HORSE
0
1
0
2
3
0.013
RTNEID
REER5E
0
1
0
0’
1
0.004
1I!D
ICTIDBfl#E
159
505
0
1
685
2.931
CIØE
CRWISH
0
16
10
2
0.t
TROPOII
DTO14
1
0
1
0
2
0.009
BLACSTRIPE
T[N1MW
S
64
5
100
0.441
R00K
SILcERSIDE
V
1
165
112
37
315
1.388
aU1tBASS
1
1
0
0
2
0.009
0
1
0
0
1
0.004
SREEN
*ISH
2
7
21
V
5
O0TIED
5)FISH
2
12
83
19
116
0.511
SL.UESZLL
V
0
62
120
107
289
1.274
13110
LKIS
0
102
0
0
202
0.450
LARSE)WYHB1SS
1
27
5
0
33
0.145
lI1TE
CRP1E
0
0
8
0
8
0.035
JC1$ZDE
DARTER
1
0
1
0
2
0.009
9UJE1*
DARTER
0
3
2
0
5
0.022
TOTAL
CATCH
1344
3257
4159
13923
22689
100.000
Electronic Filing - Received, Clerk's Office, August 29, 2008
* * * * * R2009-008 * * * * *
SEP—02—2008
14:34
HODGE
DWYER
ZEMAN
217
523
4948
P.26/31
1988
SION
RIVER
FiSH
JR1ES
5tJ*RY
OF
IkWflLY
NR
CRTDa
—.
II.
.4
..._..._....._....._J
—
——
$Th
J4
Ba
JL
88
E
88
MDV
88
*AR
TDT%L
TOTfiL
TQTL
T0T
TDTL
TOTAL.
PERCENT,
SPECIES
W8H0SEERR
0
2
0
0
2
04041
BZZThRD
SI*’O
119
66
235
7?
497
10.260
-
NTR$L
5TO1LLR
0
3
0
0
3
0.062
HDMWIERD
DUE
8
14
13
39
74
1.528
0
0
2
0
.2
0.041.
0
1
0
0
1
0.021
9ERALDSHINER
0
9
8
40
57
1.177
STRIPED
SHIIER
1
0
0
0
1
0,02*
RED
SHDER
109
327
1153
311
1900
35.224
SWSHINER
5
52
190
14
261
5388
SUC110UTH
NINNOI
0
16
28
0
44
0.906
EL11Itmt
0
.
7
5
14.
Q,9
IJJEPD
NI4IOW
19
19
248
197
483
5.971
CR1(OJ3
0
0
2
0
2
0.041
RiVER
CRRPSUCKER
26
12
39
127
204
4.211
J1LL8A(
11
9
52
94
170
3.509
H16F1N
CRPSUCEER.
1
0
.
1
0
2
0.041
LWID.
CRIODES
.
.
0
8
4
3
15
0.310
ilTESLJXER
3
04062
SbmLuqDLflH.BLFF-o
.
4
.
0
1
7
0,145
BISUJTH
FLFffi.0
3
0
1
1
5
0.103
EWE0
0
1
0
0
1
0.02*
4
3
1
3
11
0.227
DRR
0
0
0
1
10.021
WID
ICTI0B1E
C
3
0
0
3
0.062
CI*El.
CRW14
26
39
82
80
227
4.646
FLgTIfRD
CTF1SH
S
a
£
ai
0.434
.QSTR1PE
T(PWIOd
2
5
23
0
30
0.619
21100K
SILVERSIDE
6
1
*6
32
55
1.
1
$J4ITE
PASS
4
1
7
1
13
0.268
YaLO
PASS
16
2
1
2
21
0.434
EN
StJIF1
11
53
150
16
236
4.872
ESPOTTD
SlWISH
0
3
6
2
11
0.7
JJE61U.
3
17
24S
39
305
6.2%
.ARNWTH
BASS
0
20
32
3
I.
1
44ITEtR91E
0
0
4
3
7
0.145
LCRP(.’P1E
0
0
1
0
1
0.021
ENDER1ERD
DRTFR
0
0
3
0
3
0.062
2
0
2
0
4
0.023
FSIdATER
.DRU4
30
6
18
38
92
1.
8!!
TOTAL
UTCH
413
708
2585
*138
4844
*00.000
Electronic Filing - Received, Clerk's Office, August 29, 2008
* * * * * R2009-008 * * * * *
SEP—02—2008
14:35
HODGE
DWYER
ZEMflN
217
523
4948
P.27/31
V1THJU88
MJF8H
GIZZRRD
S1D
STR1
SHHØ
RP
SflDER
ND
SHflR
LUED
NHIW
RMR
CSUcKER
J1LLBAK
H1F1N
RPSUEY.ER
WflH
BUFFILU
BIUTh
BLFFILI3
TF14
F1.mwsiD
t1TISH
ESTREPE
TIPrn1od
RO*I
SILS’ES1DE
lIUTES,
Lau
ES
EUEGILL
FWTER
Di4
TQTIL
ATQ1
1988
SEO4
RMR
FH
SIR1[S
ELECTR0FISHU
TDES
PER
200
JE7ERS
CF
5HRE
flE
CTCES
PER
RRECTR0
LOCT10N
0
17
0
0
22
1
a
0
I
‘0
0
0
0
6
47
1
18
2
38
4R
48
SR
6%
GB
f0T%L
TOTL
D1
TOTL
TUTN..
T0TL
TDT
TOTIL
TOTaL.
TOTaL
TOTaL
ER
ER
MJER
JR
MIER
MIER
0
0
0
0
0
0
0
0
0
0
B
£
6
14
0
0
IS
16
17
5
o
14
0
0
1
.0
0
1
1
2
2
o
1
0
0
1
0
0
0
0
0
0.
0
6
16
11
ii
0
0
1
0
6
15
19
2
0
1
2
0
0
0
0
0
0
0
1
0
2
2
0
002
4
2
5
3
4
0
2
0
0
2
2
5
7
0
1.
1
1
2
0
0
0
0
1
2
o
1
1
0
.0
0
0
0
0
0
0
0
0
0
1
2
.0
0
0
0
0
0
0
0
0
2
.0
0
0
1
0
,0
0
0
0
0
0
0
0
0
0
0
3
1
0
7
7
2
7
0
0
0
0
0
a
0
0
0
0
0
0
0
1
0
0
0
1
0
0
0
0
0
0
0
2
0
0
0
0
0
0
O.
0
0
1
3
1
0•
I
0
1’
0
0
0
0
0
0
1
2
0
2
0
0
0
8
0
3
1
o0
0
3
0
0
•0
0
2
3
1
2
‘0
0
0
0
0
0
1
0
0
1
o
1
0
0
2
0
0
0
0
0
0
0
2
2
4
0
0
2
3
.
8
2
1
34
38
52
0
0
34
31
53
42
47
Electronic Filing - Received, Clerk's Office, August 29, 2008
* * * * * R2009-008 * * * * *
SEP—02—2008
14:35
H006E
DWYER
ZEP1AN
217
523
4948
P.28/31
198$
SGM)N
RMR
F1
St$R1ES
ECTR0F1W
(TD1ES
PER
200
NE1ERS
-
PE
CflT
PER
2
WaS
——
—i
s
-
ri
NONTHJIL88,
1.OCRTION
iR
1,2
22
3fl
3B
4
42
SR
SB
ER
GB
T0T
‘TOTL
TUT.
T01
TDTL
TOTRL
TDTL
TDT
T0TIL
T0T.
TOT
1UTfL
NER
MEER
MJER
M2ER
ER
MER
MER
EER..
EC1ES
LDasRR.
0
0
0
0
0.0
1
0
0
0
1
0
&ZZRRDSD
10
0
2
3
3
1
‘2
2
24
16
1
2
T.ST€RULLER
0
0
0.3
0
0
0
0
0
0
0
0
cO90N
0
01
1
2
0
1
1
0
6
2
0,
DLE€N5I4HER
:0
0
0
0
0
0
0
1
0
0
0
0
ENE..DSH1?ER
0
0
0
0
0
0
0
0
1
8
0
0
SH!)ER
55
21
55
183
0
0
4
28
0
1
0
0
41NER
.5
6
15
2
0
0
0
0
0
0
0
0
aERqaums1aw
1
0
i
o
o
o
o
o
o
o
o
BLIm1M.I1OW
0
0
2
0
0
0
0
0
0
0
0
0
L1JEK!I*O
0
1
3
3
0
0
2
6
3
1
0
0
R1RD(ER
0
1
‘0
00
0
0
0
2
9
0
0
UIL1J(
3
1
2
1
0
0
0
0
0
2
0
0
UN1DI0DE9
0
3
0
0
0
0
0
0.
0
0
0
5
a..ficKff.0
0
0
0
0
0
0
0
0
0
1
0
0
60LL1LR5E
0
0
1
.0
0
0
0
0
0
2
0.0
‘
JJNID
1CTZIME
3
0
0
0
0
0
0
.
0
0
0
0
“
0
DfIEL
CTF!I
4
10.
‘3..
12
0
1
.0
8
1
‘0
.0
0
FLTNE1F1SH
0
0
2
4
0
1
0
1
0
0
0
0
BLADCSTR1PETOPWDh1i4
‘
0
0
1•.•
0
0
0
•3
1
0
,0.,.,.0
0
B800RSILVERS!DE
0
0
1
0
0
0
0
0
0
0
0
0
HITE8SS
0
0
0
1
0
0
0
0
0
0
0
0
0
0
0
0
0
0
0
0
1
1’
0
0
aiawit
3•
2
16
2
B
5
8
12
0
0
2
1
.0ESP0TTSWFISH
0
0
0
1
0
0
1
0
1
0
0
0
2LIEIL.L
.1
1
3
0
3
4
0
2
0
0
3
0
LRØJTh
1
0
0
1
4
1
7
6
0
0
0
0
F4TERDRtI4
1
0
0
1
0
0
0
0
2
1
1
0
TDTCATCH
87
46
110
24
20
13
29
68
35
48
10
8
Electronic Filing - Received, Clerk's Office, August 29, 2008
* * * * * R2009-008 * * * * *
SEP—02—2008
14:35
HODGE
DtJT’ER
ZEMAN
217
523
4948
P.29/31
1988
5IB
RiVER
FI4
I#RlE5
ELECTROFIBHZNG
CiTC’ES
PER
200
IEIERS
aF
0fE
—
.1IE
TDES
PER
2
LOCAT1
IA
18
2A
28
3A
38
4R
48
5
SB
LA
68
TOTAL
TOTAL
TOTAL
TOTcL
TOTAL
TOTAL
TOTAL
TOTAL
TOTAL
TOTAL
TOTAL
TOTAL
MZERMJBER
NUER
MJER
R
BER
MR
.
ECIS
BUZRJDS1*ID
9
3
16
24
20
7
12
36
30
25
28
0.1
0
5
1
0
1
o
2
0
i
0
0
0
2
0
0
0
.0
0
0
0
0
BERALD9WER
0
1...
0
1
0
0
1
2
1
.2
0
0
RED
ER
311
219
156
380
6
5
7
23
11
2
8
25
SAt9iHER
19
26
34
111
0
0
0
0
0
0
0
0
S1LnNNINNOW
0
1
0
27
0
0
0
0
0
0
0
0
8UNTNOSE$UIOI4
1
1
0
4
0
0
0
0
0
0
0
1
8ULLIE
WIOW
26
16
13
44
4
18
7
29
7
20.
38
t(O*3B
0
0
0
2
0
0
0
0
0
0
0
0
RMR.Vfi9UcXER
2
8
1
1.4
0
1
0
1
18
1
2
10
.15
1
3
1
0
0
0
5
1
i
S
H16F1NRPSUER
0
0
1
0
0
0
0
0
0
0
0
0
LRUDA1IEB
0
0
3
0
0
0
0
0
0
0
0
1
$L1JLJTH
.FFPL0
0
0
0
0
0
0
0
0
0
1
0
2
B1€M1THIFFALO
0
0
0
0
0
0
0
0
0
0
1
0
OLD9d
IDiOR5E
0
0
1
0
0.
0
0
0
0
0
0
0
O*LTF1SH
.
33
28,,....,.,.13
0
1
0
1
1
.2
0
0
FLmTETF1SH
0
0
1
5
1
0
0
0
•0
1
0
0
8LOThZPE
TOPIflI0W
0
0
2
1
3
9
.2
•0
1
•a
a
0
0
0
0
0
1
2
2
2
3
0
0
3
0
0
1
0
1
1
0
0
1
0
0
0
0
0
00
0
0
0
0
1
0
0
JF18H
14
7
31
18
27
19
10
21
1
2
0
.
0
0NGEaTrSU1SH
0
0.0
0
1
1
1
1
0
p0.2
o
J1LL
7
10
22
7
54
88
16
19
4
10
8
1
LRS9CIJTNEIS
4
0
3
3
9
4
3
5
0
0
1
0
1UTEPIE
0
0
0
0
1
0
0
0
0
30
0
BL.tPIE
0
0
0
0.0
0
0
0
0
1
0
0
2RRDDRRTER
0
1
0
20
0
0
0
0
0
0
0
WLLEYL
0
0
0
1
0
0
0
0
0
1
0
0
F1M1TERDRt$
4
0
0
3
2
2
0
1
2
4
0
0
TOTAL
CRTO
445
336
298
645
142
170
59
1a2
93
93
7
107
Electronic Filing - Received, Clerk's Office, August 29, 2008
* * * * * R2009-008 * * * * *
SEP—02-2008
14:35
HODGE
DWYER
ZEMAN
217
523
4948
P30/31
1988
SION
RIVER
FI4
St?WiRIES
.ECTR1SHJNB
TD
PER
.200
WTERS
tW
—
it
CUT1ES
PER
2
II$1L5
_..-:
L.
r.
L0CTI0N
SPECIES
SIZZRRD
Sww
RED
R
SD
WER
L1TSE
M1WM
nttt
RMR
CRSDR
JILL1D(
!1I!D
I0DES
I*IITE
R
iJUT8
$FL0
BIEMOUflI
Fv.n
EULDEN
PSJIREE
R11ERD
RER
cw
cwi
RTERD
tRTFI
3fiWK
SILVEPIPE
&E
SS
vaiaw
E
BII
SJF1I
0RI1EETTD
SIfI
KIESILL
1U1E
PIE
F8EITER
DRtJI
T0T.
TDf
1
18
2B
4fl
4B
51
6
S
T01L
TUTL
TU1L
7075L
T0T
T0T
T0t.
T0T.
TPT.
T0ffi
*8ER
JR
R
ES
EER
ER
MER
MR’.
20
4
1
10
24
5
5
0
4
0
2
4
15
3
6
4
3
2
0
0
1
3
1
0
0
22
5
0
8
44
.40
16
20
9
4
10
4
1
1
2
0
0
0
0
0
11
1
0
0
0
1
2
2
1
0
0
0
0
1
6
22
13
10
3
£
65
28
3
41
12
2
38
28
23
7
5
12
0
0
5
3
20
19
15
7
13
12
1
2
0
0
0
0
0
0
2
0
1
0
0
0
1.0
2
0
0
0
0
0
0
0
0
0
0
0
0
0
1
0
0
0
0
0
0
0
0
0
2
0
C
0
1
1
0
0
1
0
0
0
0
0
0
0
0
0
0
2
0
0
a.
26
•0
I
5.
3
0
1
0
0
1
0
1
0
0
0
0.
0
0..
0
0
12
0
..,,6
6
...3
4
0
0
0
0
0
0
0
0
0
1
0
.
•0-
0
..
0
0
1
1
0
0
O
0
1
1
2
3
4
2
8
2
0
0
0
0
0
0
0
0
0
2
0
2
0
1
0
0
.
0
6
9
35
6
.0
0
0
0
1
0
0
0
2
0
.0
0.
1.
0
1
.0
.0
0
,I
.0
6
0
6
5
3
9
7
2
0
0
107
78
141
138
102
50
284
135
34
69
Electronic Filing - Received, Clerk's Office, August 29, 2008
* * * * * R2009-008 * * * * *
SEP—02—2008
14:36
HODGE
DUTh’ER
ZEMRN
217
523
4948
P.31/31
a8
ION
RZYE.R
FISH
SIRIE
EThO4fl
LTtES
FER
200
ETE
—
SEIE
CTOES
PER
2
IflLS
-—
—
I
—
-
&
T
—
NONThJ8
LOTI0N
2B
3D
44B
A
6R
68
ToTl.
TLiTL
TOTRL
7UTRL
TOTN
TUT
T0T
TQT.
TOTcL
iiir
TOt.
TOTIL
-
MMER
?WER
R
9ER
8SR
MISER
ER
MIERER
.M1ER
MMEER.
R
SPECIES
E1ZZRRDSD
0
1
0
0
0
0
0
01
0
0
0
STR1PDftER
0
1
0
0
0
0
0
0
000
0
D
SHIlER
39
42
i3-.
115
-.
0
3
4
0
130
13
82
248
ND
SHflER
15
14
37
1!
0
0
0
0
0
31
1
2
XERsDLmM1,I40I
0
0
3
0
0
0
0
0
2
0
0
1LUEDIt0W
1
0
29
13
0
1
3
2
2
3
13-29
0
0
0
1
0
0
0
0
0
0
0
0
RVIERSLJC(ER
0
0
1
0
0
0
0
0
0
0
0
0
LUD
ZCT10BIE
1
0
26
28
0
0
0
0
9
0
65
8
ThDPULEflOM
0
0
0
0
0
0.
1
0
0
0
0
0
0
0
0
0
.
2
0
0
0
2
1
0
0
BR0CKSIL’ERSIE
0
0
0
0
0
0
0
0
1
0
0
0
1ZTE8S
0
0
1
0
,0
0
0
0
0
0
0
0
GNS*Ii-
0
0
0
0
0
0
0
0
•2
0
0
0
0
0
0
0
0
2
0
0
0
0
0
0
L0uTnMSS
0
0
0
0
0
0
0
0
0
0
1
0
BUQ(SIDEDARTER
0
0
0
0
0
0
0
0
1
0
0
TaT.
CTL1.I
SG
58
234
175
2
20
8
2147
193
162
2a7
TOT1L
P.31
Electronic Filing - Received, Clerk's Office, August 29, 2008
* * * * * R2009-008 * * * * *
1988 SANGAMON RIVER FISH SU4LARIES
ELECTROFISHING CATCHES PER 200 METERS OF SHORE - SEINE. CATCHES PER 2 HAILS
GEAR-SEINE
MONTH JLL 88
LOCATION
1A
iB
2A
3
3A
3B
4A
4B
5A
SB
6A
6B
TOTAL TOTAL TOTAL TOTAL TOTAL TOTAL TOTAL TOTAL
TOTAL TOTAL
TOTAL
TOTAL'
NUMBER NLAaR HIM
R NLIMHER NUMBER-NUMBER NJKR NLIKBER.MJMBER.WQBER NUMBER
SPECIES
LONGNOSE BAR
0
0
0
0
0
0
0
0
0
0
1
0
GIZZARD SHAD
0
0
0
0
0
2
5
1
0
0
0
45
COMMON CARP
0
0
0
0
5
0
0
0
1
0
11
10
HORNYHEAD CHUB
0
0
0
2
0
0
0
0
0
0
0
0
EMERALD SHINER
0
0
0
1
0
0
0
0
0
0
0
0
STRIPED SHINER
0
0
0
0
0
0
0
0
0
1
0
0
BISMOUTH SHINER
0
1
0
0
0
0
0
0
0
0
0
0
RED SHINER
290 195 105 424
0
1
2
1
39
90
8
5
SAM SHINER
1331
65
57
59
0
0
0
0
15
28
30
2
REDFIN SHINER
0
0
0
0
1
0
0
0
0
0
0
0
LIVID NOTROPIS
0
0
0
1
0
0
0
0
0
0
0
0
am m"
MINNOW
0 .0
1
1
0
0
0
0
1
1
0
0
BLUNTNOSE
MINNOW
0.
1
2
4
0
0
0
0
1
5
2
0
BULLHEAD MINNOW
2
2
23
21
1
10
9
2 200
41
22
75
CREEK CHUG
0
2
0
2
0
0
0
0
0
0
0
0
MILLBAEK
0
1
0
0
0
0
0
0
1
2
1
3
UNID CARPIODES
15
33
0
20
0
0
0
0
15
125
0
6
GOLDEN REDHORSE
0
0
0
0
0
0
0
1
0
0
0
0
SHORTIEAD REDHORSE
0
0
0
0
i
0
0
0
0
0
0
0
UNID ICTIOBINAE
0
0
5
0
0
0
0
0
0
0 500
0
CHANNEL CATFISH
9
3
0
1
0
0
0
0
0
0
5
0
BLACKSTRIPE TOPMINANOW
0
0
1
0
1
1
2
0
43
16
0
0
BROOK SILVERSIDE
2
1
13
7
1
7
3
0
65
57
7
2
WHITE BASS
0
0
0
1
0
0
0
0
0
0
0
0
YELLOW BASS
0
0
0
0
0
0
0
1
0
0
0
0
GREEN
SUNFISH
0
0
0
0
1
1
0
0
2
3
0
0
ORAMGESPOTTED SUNFISH
0
0
0
0
A
0
3
6
0
0
1
1
BLUESILL
0
0
2
4
30
25
1
0
0
0
0
0
UNID LEPOMIS
0
0
0
0
0
0
0
0
81
15
0
6
LARGEMOUTH
BASS
0
0
3
1
4
5
10
0
1
3
0
0
SLENDERHEAD
DARTER
0
0
0
0
0
0
0
0
1
0
1
i
TOTAL CATCH
449 34 212 549 46
52
35
12 466 387 589 156
Electronic Filing - Received, Clerk's Office, August 29, 2008
* * * * * R2009-008 * * * * *
1988 SAN RIVER FISH SWRIES
ELECTROFISHIN6
CATCHES PER 200 METERS OF SHORE - SEINE
CATCHES PER 2 HAILS
BEAR-SEINE
MONTH AUG 88
LOCATION
IA
1B
2A
2B
3A
3B
4A
4B
5A
5B
6A
6B
TOTAL TOTAL
TOTAL TOTAL TOTAL' TOTAL TOTAL TOTAL TOTAL TOTAL TOTAL TOTAL
NUMBER NUMBER NUMBER NUMBER NCR NUMBER NUMBER
NUMRR NUMBER NUMBER NUMBER NUKHER
SPECIES
GIZZARD SHAD
0
0
1
0
2
2
0
0
0
0
0
0
HORNYHEAD CHUB
2
0
0
1
0
0
0
0
0
0
0
0
EMERALD SHINER
0
1
0
0
1
0
0
0
0
0
0
0
STRIPED SHINER
0
1
0
1
0
0
0
0
0
0
0
0
BIGMOUTH
SHINER
1
1
0
0
0
0
0
0
0
0
0
0
RED SHINER
550 200 190 20A
5
12
2
2 150 183
500
3
SAND
SHINER
73
32
75
3
0
0
0
0
27
0
1
0
SPOTFIN X RED
SHINER
1
0
0
0
0
0
0
0
0
0
0
0
BLUNTNOSE MINNOW
7
1
2
0
0
0
0
0
0
1
1
25
BULLHEAD MINNOW
29
11
103
2
5
41
3
5
200 210 600 210
CREEK
.CHUB
7
1
0
0
0
0
0
0
0
0
0
0
QUILLBACK
2
2
0
0
0
0
0
0
1
4
0
5
UNID CARPIODES
8
2
0
0
0
0
0
0
0
0
9
0
CHANNEL CATFISH
0
6
0
0
0
1
0
0
0
0
2
1
TADPOLE MADTOM
0
0
0
0
1
0
0
0
0
0
0
0
BLACKSTRIPE TOPMINNOW
0
0
0
0
0
8
0
1
13
1
1
2
BROOK SILVERSIDE
2
0
33
0
10
1
3
5
11
39
8
0
GREEN SUNFISH
0
0.
0
0
2
1
1
2
1
1
12
1
ORAN6ESPOTTED SUNFISH
1
0
3
0
8
4
2
2
35
6
0
22
BLLE6ILL
8
0
1
0
22
23
1
1
33
8
0
23
LAR6E0UTH BASS
1
0
0
1
0
3
0
0
0
0
0
0
WHITE CRAPPIE
0
0
0
0
7
1
0
0
0
0
0
0
SLACKSIDE DARTER
0
0
0
0
0
0
0
0
0
0
0
1
SLENDERHEAD DARTER
0
0
0
1
0
0
0
0
0
0
0
1
TOTAL CATCH
6
12 cab 408 39
63
97
12
18 471 453 1134 294
Electronic Filing - Received, Clerk's Office, August 29, 2008
* * * * * R2009-008 * * * * *
1988 SANGAMON RIVER FISH SLQWRIES
ELECTROFISHING CATCHES PER 200 METERS OF SHORE - SEINE CATCHES PER 2 HA1LS
SEAR--SEINE
MONTH NOV 88
LOCATION
IA. 1B 2A
28
3A
3B
4A
4B
5A
SB
6A
6B
T OTAL TOTAL TOTAL TOTAL TOTAL TOTAL TOTAL TOTAL TOTAL. TOTAL TOTAL TOTAL
NLRIBER NUMHI;R NJMBER NUMBER NUMBER NUMBER MJMBER NUMBER "MR hdJMBER NUMBER HJMBER
SPECIES
HORNYFEAD DUB
0
1
0
0
0
0
0
0
0
0
0
0
EMERALD SHINER
0
0
14
9
0
0
0
0
31
4
5
6
STRIPED SHINER
0
1
0
1
0
0
0
0
0
0
0
0
RED SHINER
476
600
1950 2500 2M
400
15
98 600 2100 160 250
SAND SHINER
250 200 163 265
5
2
0
0
19
75
0
8
SUCKERMOUTH MINNOW
0
0
0
3
0
0
0
0
0
0,
0
0
BLLNTNOSE MINNOW
0
2
1
5
0
0
0
0
1
4
0
0
RL.LNEAD MINNOW
47
23 1350 225
23
9
16
16 100 1300 120
46
RIVER
CARPSIJCKER
0
0
0
1
0
0
0
0
1
0
0
1
OUILLBACK
0
0
0
0
0
0
1
0
0
0
0
0
GOLDEN REDHORSE
0
0
0
1
0
0
1
0
0
0
0
0
UNID ICTIOBINAE
0
0
0
0
0
0
0
0
0
0
0
1
CHANNEL CATFISH
0
0
0
0
0
0
0
0
1
1
0
0
BLACKSTRIPE TOPMINJOW
0
0
0
0
1
2
1
1
0
0
0
0
BROOK SILVEERSIDE
0
0
3
3
1
0
5
0
10
0
14
1
GREEN SUNFISH
0
0
3
2
5
1
6
2
3
1
4
1
ORANGESPOTTED SLAJFISH
0
0
0
0
0
0
3
0
15
1
0
0
BLLEGILL
0
0
8
3
61
1
2
_0
19
1
9
3
TOTAL CATCH
773 827 349 3018 321 05
50. 117 800 3487 312 .317
Electronic Filing - Received, Clerk's Office, August 29, 2008
* * * * * R2009-008 * * * * *
APPENDIX
C
NPDES PERMIT
FOR CWLP
Electronic Filing - Received, Clerk's Office, August 29, 2008
* * * * * R2009-008 * * * * *
State
of
Illinois
E NVIRONMENTAL PROTECTION
AGENCY
M ary A. Gade, Director
2200 Churchill
Road, Springfield, IL 62794-9276
2 17/782-0610
September
29, 1993
City
of Springfield
O
ffice of Public Utilities
R
ECEIVED
C
ity
Water,
Light and Power
OCT
01
1993
Environmental
Affairs
7th and Monroe Streets
ENVIRONMENTAL
Springfield, Illinois 62757
HEALTH & SAFETY
Re: City of Springfield, Office of Public
Utilities
City Water,
Light and Power
N PDES Permit No.
IL0024767
M odification of
NPDES Permit
(After Public Notice)
G entlemen
The Illinois Environmental Protection Agency has reviewed the request for
modification of the above-referenced NPDES Permit and issued a public notice
based on that request.
The
final
decision
of the
Agency
is to modify the
Permit as follows:
T he use of sodium bromide in
Dallman
Condensor Units
1, 2
and 3: C12/Br2
will be used in
a mole
ratio
of 4:1 for
general microbiological
control and
2:1 for zebra mussel control and microbiological control; and the addition of
a polyglycol biodispersant in Dallman Condensor Unit 3 to improve the
performance of chlorine dioxide for microbiological control. The discharge
shall be
dehalogenated during application of bromine
and/or
chlorine for zebra
mussel control
pursuant to the
Federal
Clean
Water Act,
since
dehalogenation
is best available treatment. Furthermore,
a study on the
effect of the
addition of bromine
to the power plant
cooling
water on the levels
of
THM's
f ound in the d rinking
-
w ater 1ý Lv
ýb_
ue ji.ii.iiiiiLi.cu
10--LL_r t0
vv
tý.n
i.11c
T COA a
-
nA
výA_.r:
11CCDA idi+ hin
O r)
d ays of completion.
In addition, semi-annual monitoring of the lake water for
bromide ions
will be
required to determine the long term effect of bromine
addition
on THM's.
Also,
new
outfalls
for stormwater runoff
and special conditions involving a
Stormwater
Pollution Prevention
Plan (SWPPP) and treated stormwater will be
included.
Following Public Notice, the permit has
been r=evised to include Outfalls
001a,
003,
004, 006,
00,7, -008 -and 01?1, under
the special.
condition on
treated.
stormwater.
E nclosed is a copy of the modified Permit.
You have the right
to appeal this
modification to the Illinois Pollution Control
Board within a 30 day period
following the modification
date
shown
on the first page of the permit.
P rintlNl
nn Rerv cled.PaDer
Electronic Filing - Received, Clerk's Office, August 29, 2008
* * * * * R2009-008 * * * * *
Page 2
Should
you have any question.or
comments
regarding the above, please contact
Fred Rosenblum of-my
staff..
1-71
homas G.
McSwiggin, P.
Manager, Permit Section
Division of Water Pollution
Control
TGM:FLR:dks/1548v, 8-9
Attachment:
Modified Permit
cc: Records
CAS
Springfield Region
USEPA
F acility
Electronic Filing - Received, Clerk's Office, August 29, 2008
* * * * * R2009-008 * * * * *
NPDES Permit No. IL0024767
Illinois Environmental
Protection Agency
Division
of Water Pollution
Control
2 200 Churchill Road
P.O.
Box 19276
Springfield, Illinois 62794-9276
NATIONAL POLLUTANT
DISCHARGE ELIMINATION SYSTEM
M
odified (NPDES) Permit
E xpiration Date: August 1, 1996
Name and Address
of Permittee:
City of
Springfield
Office
of
Public
Utilities
City Water, Light and Power
Environmental Affairs
7th
and Monroe Street
Springfield, Illinois 62757
Discharge
Number and Name:
001 Lakeside 1 and 2 Condenser Cooling Water Outfall
001(a)
Lakeside-Turbine Room, Boiler Room and
Equipment Drains, Lakeside 2 Boiler Blowdown
002
Dallman
1 and 2 Condenser Cooling Water Outfall
005 Industrial Wastewater Treatment Plant Outfall
006 Ash Pond Discharge to Lake Springfield
007 Dallman Coal Pile Runoff
008
Lakeside Coal
Pile
Runoff
009 Dallman 3 Condenser Cooling Water Outfall
010 Dallman Plant Intake Screen Backwash
011 Scrubber Surge Pond Overflow
003
Lakeside Storm Sewer
004 Ash Pond Discharge
012 Stormwater Runoff
from
013 Stormwater Runoff from
v14 5iormwater RUn0TT Trom
015 Stormwater Runoff from
016 Stormwater Runoff from
West Drainage Ditch
East
Drainage Ditch
Tank Farm
Coal Crusher House Manholes
Landfill
Issue Date: November 14, 1991
Effective
Date: December 14, 1991
Modification Issue Date: September 29, 1993
Facility Name
and Address:
City Water, Light
and Power
3100
Stevenson Drive
Springfield, Illinois
62707
Sangamon County
Receiving
Waters
Lake Springfield
Lake Springfield via Outfall
001
Lake
Springfield
Lake Springfield
Lake
Springfield
Lake Springfield
Lake
Springfield
Lake
.Springfield
Lake
Springfield
Lake
Springfield
Sugar
Creek
Sugar
Creek
Lake Springfield
Lake Springfield
Lake Springfield
Lake Springfield
Sugar Creek
In compliance with the provisions of the Illinois
Environmental Protection Act, Subtitle
C and/or
Subtitle D Rules and Regulations of the Illinois Pollution
Control Board, and the Clean Water Act,
the above-named permittee is hereby authorized to discharge
at the above location to the
above-named receiving stream in accordance with the standard
conditions and attachments herein.
Permittee
is not authorized to discharge after the above expiration
date. In order to receive
authorization to discharge beyond the expiration date,
the permittee shall submit the proper
application as required by the Illinois Environmental Protection
Agency (IEPA) not later than
180
days prior to the expiration date.
M cSWTggin,
P.
Permit
Section
o f Water Pollution
Control
T GM:FLR:dks/sp/1994q
Electronic Filing - Received, Clerk's Office, August 29, 2008
* * * * * R2009-008 * * * * *
Page 2
Modification Date:
September 29, 1993
NPDES Permit
No. IL0024767
E ffluent Limitations
and Monitoring
L OAD LIMITS
CONCENTRATION
lbs/day
LIMITS
mg/l
30 DAY
DAILY
30 DAY
DAILY
SAMPLE
SAMPLE
PARAMETER
AVG.
MAX.
AVG.
MAX.
FREQUENCY TYPE
1 . From the effective
date of this permit until
August 1, 1996, the effluent
of the following
discharge(s) shall
be monitored and limited at all times
as follows:
Outfall:
001 -- Lakeside 1 and
2 Condenser Cooling
Water
T his discharge consists
of:
Approximate Flow
l . Lakeside 1 and 2 Condenser
Cooling Water
29
MGD
2. Lakeside 2
Turbine Rooms 4, 5 and 6
Floor Drains
Intermittent
3. Lakeside 2 Turbine
Rooms 4, 5, 6 and 7
Roof Drains
Intermittent
4.
Lakeside
2 Boiler Rooms 5, 6
and 7 Floor Drains
Intermittent
5. Lakeside
2 Boiler Rooms 5 and 6 Roof
Drains
Intermittent
6.
Lakeside 1 and 2 Equipment
Drains
Intermittent
7. Lakeside
2 Boilers 5, 6,
7
and
8 Boiler Blowdown
Intermittent
F
low
Daily
Continuous
T
emperature
See Special
Condition 3
Total Residual
Chlorine
0.2
2/Month*
Grab*
* See Special Condition
No. 4 and No. 9
Electronic Filing - Received, Clerk's Office, August 29, 2008
* * * * * R2009-008 * * * * *
Page
3
Modification Date:
September 29, 1993
NPDES
Permit No. IL0024767
E ffluent Limitations and Monitoring
L
OAD
LIMITS
CONCENTRATION
'lbs/day
LIMITS
mg/l
3 0 DAY
DAILY
30
DAY
DAILY
PARAMETER
AVG.
MAX.
AVG.
MAX.
S AMPLE
SAMPLE
FREQUENCY
TYPE
1 . From the effective date of this permit until August.l, 1996, the effluent
of the following
discharge(s) shall be monitored and limited
at
all
times as
follows:
Outfall: 001a - Lakeside Turbine Room, Boiler Room and Equipment
Drains,
Lakeside
2 Boiler Blowdown**
This discharge consists of:
Approximate Flow
1. Lakeside 2 Turbine Rooms 4, 5 and 6 Floor Drains
Intermittent
2.
Lakeside 2 Turbine Rooms
4,
5, 6 and
7
Roof
Drains
Intermittent
3. Lakeside 2 Boiler Rooms 5, 6 and 7 Floor Drains
Intermittent
4. Lakeside 2 Boiler Rooms 5 and 6 Roof Drains
Intermittent
5. Lakeside 1 and
2 Equipment Drains
Intermittent
6. Lakeside 2 Boilers 5, 6, 7 and 8 Boiler Blowdown
Intermittent
7. Yard Drains
Intermittent
8. Miscellaneous
Equipment
Drains
Intermittent
F low
1 /Week
Single
-
Reading
E
stimate
pH
See Special Condition
No.
1
2/Month
Grab
Total
Suspended
15.0
30.0
2/Month
24 Hour
Solids
Composite
Oil and Grease
15.0
20.0
2/Month
Grab
**See Special Condition
No. 19
Electronic Filing - Received, Clerk's Office, August 29, 2008
* * * * * R2009-008 * * * * *
Page 4
Modification Date: September 29, 1993
NPDES Permit No. IL0024767
Effluent Limitations and Monitoring
LOAD LIMITS
CONCENTRATION
lbs/day
LIMITS mg/1
3 0 DAY
DAILY
30 DAY
DAILY
SAMPLE
SAMPLE
PARAMETER
AVG.
MAX.
AVG.
MAX.
FREQUENCY TYPE
1 . From the effective date of this permit until August l, 1996, the effluent of the foi.lowing
discharge(s)
shall
be monitored and limited at
all
times as follows:
Outfall: 002 - Dallman 1 and 2 Condenser
Cooling
Water Outfall
Approximate
Flow
121.9 MGD
Flow
Daily
Continuous
Temperature
See Special Condition No. 3
Daily
Continuous
Total Residual
Chlorine***
0.2
2/Month*
Grab**
Total
Residual
Halogen***
0.05
2/Month*
Grab**
*See Special
Condition No. 4 and No.
9
**See Special
Condition No. 4
***A discharge limit of 0.05
mg/1-for
total residual chlorine and total residual halogen shall
apply when zebra mussel control chemicals are being added. The permittee shall indicate on the
DMR forms when chlorine and bromine are being used for zebra mussel control.
Electronic Filing - Received, Clerk's Office, August 29, 2008
* * * * * R2009-008 * * * * *
Page
5
Modification Date: September 29.,
1993
NPDES Permit
No. IL0024767
E
ffluent
Limitations and Monitoring
P ARAMETER
L OAD LIMITS
lbs/day
30
DAY
DAILY
AVG.
MAX.
C ONCENTRATION
LIMITS
mg/l
30
DAY
DAILY
AVG.
MAX.
SAMPLE
SAMPLE
FREQUENCY
TYPE
1 . From
the effective
date of this
permit
until August 1, 1996, the effluent of
discharge(s)
shall
be monitored and limited
at
all times as follows:
Outfall: 003 - Lakeside Storm Sewer***
This discharge consists of:
t
he following
Approximate
Flow
1 . Lakeside 1 Turbine Rooms 1, 2 and 3 Floor Drains
&
Equipment Drains
2. Lakeside 1 Turbine Rooms 1, 2 and 3 Roof Drains
3. Lakeside 1 Boilers 2, 3 and
4
Boiler Blowdown.
4. Lakeside 1 Boiler Rooms 2, 3 and 4 Floor Drains
&
I
ntermittent
Intermittent
Intermittent
E quipment Drains
Intermittent
5. Lakeside 1 Boiler Rooms 2, 3 and
4
Roof Drains
Intermittent
6. Lakeside 2 Turbine Rooms 6 and
7 Roof Drains
Intermittent
7. Lakeside 2 Boilers
7
and 8
Roof Drains
Intermittent
8. Lakeside 1 and 2
Intake
Screen
Backwash *
0.3 MGD
9 . Screen
Washings from Public Water Supply Intake
0.1 MGD
1 0.
Spillway
Gate Hydraulic Water *
Intermittent
11. Miscellaneou's Equipment Drains
Intermittent
12. Public Water Supply Drain*
Intermittent
F low
l/Week
p H
See Special Condition No. 1
Total Suspended
15.0
30.0
Single
Reading
Estimate
1/Week
Grab
1/Week
24 Hour
Solids
Composite
Oil and Grease
15.0
20.0
2/Month
Grab
B oron
1.0**
2/Month
Grab
* Compliance Monitoring samples are collected ahead of this
wastestream
input to Outfall 003.
**See Special Condition 13
=
'=ýee special i.orý6iZidn i7
Electronic Filing - Received, Clerk's Office, August 29, 2008
* * * * * R2009-008 * * * * *
Page 6
N
PDES
Permit
No. IL0024767
M odification Date:
September
29, 1993
Effluent Limitations and
Monitoring
LOAD LIMITS
CONCENTRATION
lbs/day
LIMITS ma/l
3 0
DAY
DAILY
30 DAY
DAILY
SAMPLE
SAMPLE
PARAMETER
AVG.
MAX.
AVG.
MAX.
FREQUENCY
TYPE
1 . From the effective date of this permit until
August 1, 1996, the effluent of
the following
discharge(s) shall be monitored and
limited at all times as follows:
Outfall: 004
- Ash Pond Discharge***
This discharge consists of:.
Approximate Flow
1. Lakeside Plant Fly Ash and Bottom
Ash
2.66 MGD
2. Dallman Plant Fly Ash and Bottom
Ash
4.32 MGD
3. Non-Chemical Metal Cleaning
Wastes *
Intermittent
4. Lime Sludge
From
the
City Water Purification
Plant
0.33 MGD
5. Flue Gas
Desulfurization System Wastes *
Intermittent
6. Industrial Wastewater Treatment Plant Sludge
0.19
MGD
7. Water Treatment Plant Yard Drains
Intermittent
8. Scrubber Sludge Disposal Site Wastewater
0.043
MGD
Flow
1 /Week
Single
Reading
Estimate
pH
See Special Condition
No. 14
2/Week
Grab
Total Suspended
15.0
30.0
2/Week
24 Hour
Solids
Composite
Oil and Grease
15.0
20.0
2/Month
Grab
Boron
1.0**
2/Month
Grab
Copper (total)
See-Special
Conditions 15 & 16
Silver (total) See Special
Conditions 15 & 16
*This
wastestream may be directed to the Industrial
Wastewater Treatment System
**See Special Condition
13
***See
Special Condition No. 19
Electronic Filing - Received, Clerk's Office, August 29, 2008
* * * * * R2009-008 * * * * *
Page 7
NPDES Permit No. IL0024767
M odification Date: September 29, 1993
Effluent Limitations and Monitoring
L OAD LIMITS
CONCENTRATION
lbs/day
LIMITS mg/l
30 DAY
DAILY
30
DAY
DAILY
SAMPLE
SAMPLE
PARAMETER
AVG.
MAX.
AVG.
MAX.
FREQUENCY TYPE
l . From the effective date of this permit until August 1, 1996, the effluent of the following
discharge(s)
shall
be monitored and limited at all times as follows:
Outfall: 005**
This discharge consists of:
Approximate Flow
l. Demineralizer Regenerant Wastes
2. Lakeside 2 Boilers 7 and 8 Slag Tank Overflow
3. Lakeside 2 Boiler Rooms 7 and 8 Floor Drains
4. Lakeside 2 Turbine Rooms 6 and
7 Floor Drains
5. Lakeside 2 Boilers 5 and 6 Slag Tank Overflow
6. Dallman 1, 2 and 3
Boiler Slowdown, Evaporator and
Deaerator Blowdown
7. Dallman l, 2 and 3 Roof and Floor Drains
8. Dallman 1, 2 and 3 Condensate Storage
Tank Wastes
9.
Dallman 1, 2 and 3 Slag Tank Overflow
10. Dallman 1, 2 and 3 Sump Pumps
11. Dallman Plant Pyrite Removal Wastes
12. Crusher House and Control
House Floor Drains
13. Flue Gas Desulfurization System Wastes*
14. Dallman
Coal
Pile Runoff (See Outfall No. 007)*
15. Dallman 1 and 2 Precipitator Area Drain
16. Non-chemical Metal Cleaning Wastes*
17. Dallman 1, 2 and 3
Equipment Drains
18. Lakeside Coal Pile Runoff (See Outfall
No.
008)*
0.6 MGD
1.02 MGD
Intermittent
Intermittent
0.001
MGD
0.44 MGD
Intermittent
Intermittent
1.8 MGD
0.3 MGD
0.85 MGD
Intermittent
Intermittent
Intermittent
Intermittent
Intermittent
Intermittent
Intermittent
Flow
Daily
Continuous
pH
See Special Condition No. 14
Daily.
Continuous
Total
Suspended
15.0
30.0
1/Week
24 Hour
Solids
Composite
Oil
and
Grease
15.0
20.0
2/Month
Grab
Iron (Total)
2.0
4.0
1/Week
24 Hour
Composite
Iron (dissolved)
1.0
1/Week
24 Hour
Composite
Copper (Total)
0.026
0.042
1/Week
24 Hour
Composite
* Discharge to the Industrial
Wastewater Treatment Plant is an alternate routing.
* *See Special Condition
No. 19
,
Electronic Filing - Received, Clerk's Office, August 29, 2008
* * * * * R2009-008 * * * * *
Page 8
Modification Date:
September
29,
1993
NPDES
Permit No.
IL0024767
Effluent Limitations
and Monitoring
LOAD LIMITS
CONCENTRATION
lbs/day
LIMITS mg/l
30
DAY
DAILY
30 DAY
DAILY
SAMPLE
SAMPLE
PARAMETER
AVG.
MAX.
AVG.
MAX.
FREQUENCY
TYPE
1 . From the effective date of this permit until August 1,
1996, the
effluent of the following
discharge(s) shall be monitored and limited at all times as follows:
Outfall: 006 - Ash Pond Discharge***
Approximate Flow
Intermittent
Flow
l/Week
24 Hour
Total
pH
See Special Condition No. 14
_
2/Week*
Grab
Total Suspended
15.0
30.0
2/Week*
24 Hour
Solids
Composite
Oil and Grease
15.0
20.0
2/Month
Grab
Boron
1.0**
2/Month
Grab
*Monitor if discharge occurs during the month excluding exercising diversion pump.
**See Special
Condition
13
***See Special Condition No. 19
Electronic Filing - Received, Clerk's Office, August 29, 2008
* * * * * R2009-008 * * * * *
Page 9
NPDES Permit No. IL0024767
M odification Date: September 29, 1993
Effluent Limitations and Monitoring
LOAD LIMITS
CONCENTRATION
lbs/day
LIMITS
mg/1
30 DAY
DAILY
30 DAY
DAILY
SAMPLE
SAMPLE
PARAMETER
AVG.
MAX.
AVG.
MAX.
FREQUENCY TYPE
1 . From the effective date of this permit until August 1, 1996, the effluent of the following
discharge(s) shall be monitored and limited at all times as follows:
Outfall: 007 - Dallman Coal Pile Runoff*
This discharge consists of:
Approximate Flow
1. Dallman Coal Pile Runoff
Intermittent
2. Dallman 1 and 2 Precipitator Area Drain
Intermittent
Flow
1/Week
Single
Reading
Estimate
pH
See Special Condition No. 14
1/Week
Grab
Total Suspended
15.0
30.0
1/Week
8 Hour
Solids
Composite
Oil and Grease
15.0
20.0
1/Week
Grab
Iron (Total)
2.0
4.0
1/Week
8 Hour
C omposite
Iron (Dissolved)
1.0
1/Week
8 Hour
C
omposite
*See Special Condition No. 19
Electronic Filing - Received, Clerk's Office, August 29, 2008
* * * * * R2009-008 * * * * *
Page 10
NPDES Permit No. IL0024767
Modification
Date: September 29, 1993
E ffluent Limitations and Monitoring
L OAD
LIMITS
CONCENTRATION
lbs/day
LIMITS ma/l
3
0 DAY
DAILY
30
DAY
DAILY
SAMPLE
SAMPLE
PARAMETER
AVG.
MAX.
AVG.
MAX.
FREQUENCY TYPE
1. From the effective date of this. permit until August 1, 1991, the effluent
of the following
discharge(s) shall be monitored and limited at all times as follows:
Outfall: 008 - Lakeside Coal Pile Runoff*
T his discharge consists of:
Approximate Flow
l .
Coal
Pile Runoff
Intermittent
2.
Lakeside
Plant
Precipitator
Area Runoff
Intermittent
3. Parking Lot Runoff
Intermittent
Flow
1/Week
Single
Reading
Estimate
pH
See Special Condition No. 14
1/Week
Grab
.
Total Suspended
15.0
30.0
1/Week
8 Hour
Solids
Composite
Oil and Grease
15.0
20.0
1/Week
Grab
Iron (Total)
2.0
4.0
1/Week
8 Hour
Composite
Iron (Dissolved)
1.0
1/Week
8 Hour
Composite
*See Special
Condition
No. 19
Electronic Filing - Received, Clerk's Office, August 29, 2008
* * * * * R2009-008 * * * * *
Page 11
NPDES Permit No. IL0024767
M odification Date: September 29, 1993
Effluent Limitations and Monitoring
L OAD LIMITS
CONCENTRATION
lbs/day
LIMITS ma/l
3 0 DAY
DAILY
30
DAY
DAILY
SAMPLE
SAMPLE
PARAMETER
AVG.
MAX.
AVG.'
MAX.
FREQUENCY TYPE
1. From the effective
date of this permit until August 1, 1.996, the- effluent of the following
discharge(s) shall be monitored and limited at
all times as follows:
Outfall: 009 -
Dallman 3
Condenser
Cooling Water****
Approximate Flow
127.3 MGD
Flow
Daily
Continuous
Temperature
See Special Condition
No. 3
Daily
Continuous
Total Residual
Chlorine***
0.2
2/Month*
Grab**
Total Residual
Halogen***
0.05
2/Month*
Grab**
*See Special Conditions No.
4
and 9
**See Special Condition
No. 4
***A discharge limit of
'0.05 mg/l for total residual chlorine
and total residual halogen shall
apply when
zebra mussel control chemicals are being added.
The permittee shall indicate on the
DMR forms when chlorine and
bromine are being used for zebra
mussel control.
****See Special
Condition No. 17.
Electronic Filing - Received, Clerk's Office, August 29, 2008
* * * * * R2009-008 * * * * *
Page 12
NPDES Permit No. IL0024767
M odification Date: September
29, 1993
Effluent Limitations and Monitoring
LOAD
LIMITS
CONCENTRATION
lbs/day
LIMITS mg/l
3 0 DAY
DAILY
30
DAY
DAILY
SAMPLE
SAMPLE
PARAMETER
AVG.
MAX.
AVG.
MAX.
FREQUENCY TYPE
1 . From the effective date of this
permit until August 1 ,. 1996, the effluent of
the following
d:ischarge(s) shall be monitored and limited
at all times as follows:
Outfall: 010 -
Dallman Plant Intake Sewer Backwash
Approximate Flow
0.16 MGD
F low
l/Week
Estimate
Electronic Filing - Received, Clerk's Office, August 29, 2008
* * * * * R2009-008 * * * * *
Page 13
Modification Date:
September 29,
1993
NPDES Permit No. IL0024767 '
E ffluent Limitations and Monitoring
L OAD LIMITS
CONCENTRATION
lbs/day
LIMITS
mg/1
3 0 DAY
DAILY
30 DAY
DAILY
SAMPLE
SAMPLE
PARAMETER
AVG.
MAX-.
AVG.
MAX.
FREQUENCY
TYPE
1 .
From
the effective.date of.
this
permit
until August -1,1996, the effluent of the following
discharge(s) shall be
monitored
and
limited
at
all times as follows:
Outfall:
011 - Scrubber
Surge
Pond Overflow*
T his
discharge consists
of:
Approximate Flow
1 .
Scrubber
sludge storage pad runoff
Intermittent
2. Groundwater pumpage from the oil spill recovery
well
Intermittent
3. Flue
gas
desulfurization wastes
Intermittent
Flow
Daily
Single
Reading
Estimate
pH
See Special Condition
14
Daily
Grab
Total
Suspended
Solids
15.0
30.0
Daily
Grab
*See Special Condition No. 19
Outfalls: 012, 013, 014, 015 and 016 -- Stormwater
Runoff*
F low
When
Estimate
Discharging
* See Special Condition No. 1.8
Electronic Filing - Received, Clerk's Office, August 29, 2008
* * * * * R2009-008 * * * * *
Page 14
Modification
Date: September 29.,
1993
NPDES Permit
No. IL0024767
Special Conditions
Special Condition
1. The pH shall be
in the range 6.0 to 10. The monthly
minimum and monthly
maximum values shall
be reported on the DMR form.
Special Condition
2. Samples taken in compliance
with the effluent monitoring requirements shall
be taken at a point
representative of the discharge;
but prior to entry into Lake Springfield
for
outfalls 001, 002,
005, 006, 007, 008, 009, 010,
011; and prior to entry into the.Sugar Creek
for
outfalls 003 and 004.
.-
Special Condition 3. The thermal
discharge to Lake Springfield
from the Lakeside plant shall
not
exceed 99oF more than 5 percent
of the hours
in the 12-month period ending
with
any
month
and
the discharge from the Dallman plant
shall not exceed 99oF
more than 8 percent of the hours in
the 12-month period ending
with any month and at
no time shall any discharge exceed 1090F.
Special Condition-4.
Chlorine compounds,
bromine compounds, or a
mixture of both may be utilized
for condenser
microbiological control or for
zebra mussel control
in
accordance
with the following
conditions:
a. Intermittent chlorine application:
A limit of 0.2 mg/l (instanteous
maximum) total
residual chlorine shall apply during
intermittent chlorination
(chlorine discharged
for no more than two hours per unit per day).
b. Intermittent bromine or
bromine/chlorine application:
The discharge shall
be dehalogenated and a
limit of 0.05 mg/l (daily maximum) shall apply.
c . Continuous
chlorine, bromine, or
bromine/chlorine application:
T he
discharge
shall be dehalogenated
and a limit of
_0.05
mg/l
(daily maximum) shall apply.
The reported mean concentration and
maximum concentration of
halogen shall be based on a
concentration
curve. The concentration
curves shall be generated
using grab samples with an
analytical frequency
of five minutes or
less during the respectove halogenation
period
of
each
unit allowing
for lag time between the
initiation of halogenation and the point of sampling
before
the first sample is taken.
Concentration curves shall
be submitted with monthly
Discharge
Monitoring Reports.
The frequency and duration
of the chlorine and bromine dosing
periods
plus.
the amount of chlorine
and bromine applied shall
be reported on the
Discharge Monitoring Reports.
The
permittee
shall conduct a study
on the effect of the addition of
bromine to the power plant
cooling
water on the levels of
THM's found in the drinking
water if bromine or bromine/chlorine is
applied.
The study shall be submitted
to the Illinois Environmental
Protection Agency and the
United States Environmental
Protection Agency within 90
days of completion. Also, the permittee
shall
indicate when bromine is
being added for zebra mussel
control and when it is being used for
microbiological control.
In addition, the permittee
shall monitoring semi-annually
for bromide ions to determine the long
term effect
of bromide addition on
THM's. This study shall
be submitted to the IEPA and USEPA at
the following addresses:
Illinois Environmental
Protection Agency
Attn:- Compliance
Assurance Section
2200 Churchill
Road
P.O. Box
19276
Springfield,
Illinois 62794-9276
.
United States Environmental
Protection Agency
Attn: 5WQP-Tim
Henry
Region
V'
77 West Jack
Boulevard
Chicago, Illinois
60604-3590
Illinois
Environmental Protection Agency
Attn: Permit Section
2200 Churchill
Road
P.O. Box 19276
Springfield,
Illinois 62794-9276
Special Condition
5.
on the effluent
pages
Special Condition
6.
rinses.
For the purpose
of this permit
for each
permitted outfall.
There shall
be no discharge of
discharges
are limited to wastewater listed
chemical metal cleaning
wastes
or associated
Electronic Filing - Received, Clerk's Office, August 29, 2008
* * * * * R2009-008 * * * * *
Page 15
Modification
Date: September 29, 1993
NPDES
Permit
No. IL0024767
S
pecial
Conditions
'Special Condition 7.. There shall be no discharge of
polychlorinated biphenyl compounds.
Special Condition 8. To calculate the average
daily flow for outfalls 001, 002 and 009 during the
reporting period, the
total number of pump hours observed is divided
by
the
number
of days in the
month and then multiplied
by the pump rate (gallons/hour). The
minimum daily flow rate
is
determined by multiplying the lowest daily pump
hour total by the pump rate. The maximum daily
pump
rate is
calculated
by multiplying the highest daily
pump hour total by the pump rate.
Special Condition 9.
During maintenance outages calcium
hypochlorite may be used to
passivate
the
condensers.
During discharge of chlorinated
wastewater from passivation of the main cooling
condensers a minimum of
three grab samples shall be taken at
five minute intervals
or less at the
condenser cooling
water outfall for each batch discharge allowing
for lag time between
chlorine
discharge and the point of
sampling before the first grab sample
is
taken.
The individual values
and
average value for each set of samples shall
be reported with monthly DMR forms including the
time samples
were
collected,
the time and duration of chlorine
release plus the amount
of chlorine
applied.
If chlorinated wastewater
is to be discharged as a result of these outage conditions
for more
than
2 hours per day the permittee
must request this permit be modified to allow
for
such a practice.
Special Condition 10.
The permittee shall record monitoring results, on
Discharge Monitoring
Report forms using
one
such form for each discharge each
month. The completed Discharge
Monitoring Report form shall
be submitted monthly to IEPA,
no
later than the
15th
of the following
month,
unless otherwise
specified by the Agency, to the following
address:
Illinois Environmental Protection Agency
Division of Water Pollution Control
Compliance Assurance Section
2200 Churchill Road
P.O. Box 19276
Springfield, Illinois 62794-9276
Special Condition 11. If an applicable effluent
standard or limitation is promulgated under
Sections 301(b)(2)(C) and (D),
304(b)(2), and 307(a)(2) of
the
Clean
Water Act and that
effluent
standard
or
limitation is more stringent than any effluent
limitation in- the permit or controls a
pollutant
not limited in the NPDES Permit, the Agency shall
revise or modify the permit in
accordance with the more stringent standard or
prohibition and shall so notify the permittee.
Special Condition 12. By such date as
required by federal regulations the permittee shall
complete
and submit Form 2F (EPA Form 3510-2F)
for those outfalls to be regulated under the new
stormwater regulations.
Special Londition t3.
ine ooron concentration limitation for
Outfaiis
vva,
UN
and iiii"v snail
become effective three years
from
the
effective date of this permit or upon compliance
with
the
regulations,
whichever
comes
first.
The permittee shall construct
treatment equipment or develop an alternative
means
of compliance
in
accordance with the following
schedule:
1.. Preliminary Report
Within 6
months
from
the
effective
date of
this
permit
2. Progress Report
Within
12 months from the effective date of this
permit
3.
Progress
Report
Within
18 months from the effective date of this
permit.
4. Provide the IEPA with a proposal for
Within 24 months from the effective.date of this
compliance.
If
treatment
is chosen
permit
then a State
construction permit shall
be submitted at this
time
Electronic Filing - Received, Clerk's Office, August 29, 2008
* * * * * R2009-008 * * * * *
Page 16
NPDES Permit No. IL0024767
Modification
Date: September 29., 1993
S tzeC al Conditions
5. Progress Report
Within
30
months from the
effective date of this
permit
6. Achieve Compliance
Within 36 months
from
the effective date of this
permit
Special Condition 14. The pH shall be in the range of, 6.0 to 9.0. The monthly minimum and
monthly maximum values shall be reported on the DMR form.
Special Condition 15. The permittee shall monitor Outfall 004
for Copper (total)
and Silver
(total), twice per month, for a period of six months from this permit effective date. Composite
samples shall be taken in accordance
with 40
CFR
136 with
results
being
submitted on the discharge
monitoring report forms and a summary being sent to the IEPA-Permit Section
within
nine months
from
the effective date of this permit.
'The
detection
limit of the analytical method
used
shall
be sufficient to determine
whether
water
quality
standards
could be violated by the discharge.
Special Condition 16. Following
public notice and opportunity for hearing, the Agency may modify
this
permit during
its
term to
include additional' requirements and/or limitations as a result of
the information received from Special
Condition
15.
Special Condition 17. In the event that
water treatment additives other than those identified in
the permit application are
discharged, the permittee shall notify the Agency in accordance with
_the
Standard Conditions (Attachment
H)
of this permit.
The additives listed in previous
applications include: Lime, Alum, Bentonite, Iron Sulfate, Cationic and Anionic Polymers, Carbon .
Dioxide, Chlorine Gas, Chlorine Dioxide, Calcium Hypochlorite, Sodium Chlorite, Sodium Bromide and
a Polyglycol Biodispersant.
Special Condition 18.
S TORM WATER POLLUTION PREVENTION
PLAN
(SWPPP)
FOR OUTFALLS 012. 013. 014. 015 and 016
A . A storm water pollution prevention
plan
shall
be developed by the permittee for the storm
water associated with industrial activity at this
facility.. The plan shall identify potential
sources of pollution which may be expected to affect the quality. of storm
water
discharges
associated with the industrial activity at the facility. In addition, the plan shall describe
and ensure the implementation of practices which
-are_-to-be-used.to reduce the pollutants
in
storm water discharges associated
with industrial
activity
at the.facility and
to assure
compliance with the terms and conditions of this
permit.
B. The plan shall be completed
within 180 days
of.the
effective date of this permit. Plans shall
provide for compliance with the terms of the
plan within 365 days of the effective date
of
this permit. The owner or operator
of the facility shall make a copy of the plan available to
the Agency at any
reasonable time upon request.
-
C. The permittee may
be
notified
by the.Agency
at
any time. that the plan does not meet the
requirements
of this condition.
After such notification, the permittee shall make changes
to
the plan and shall submit a
written certification that the requested changes have been made.
Unless otherwise provided, the permittee shall
have 30 days after such notification to make
the changes.
D. The discharger shall amend the plan whenever.. there .is a change
in
construction, operation,.,or
maintenance which may affect the discharge of significant quantities of
pollutants
to the
waters
of
the State or if a facility inspection required
by paragraph G
of
this
condition
indicates that an amendment is needed.
The
plan should
also be amended if the discharger is
in violation of any conditions of this permit, or
has not
achieved
the general
objective of
controlling pollutants in storm water discharges.
Amendments to the plan shall be made within
the
shortest
reasonable period of time, and shall
be
provided
to the Agency for review
upon
request.
E. The plan shall provide a description of potential sources
which may be
expected
to add
significant
quantities of pollutants to storm
water discharges,
or
which may result in
non-storm water discharges from storm
water
outfalls
at the facility. The plan shall include,
at a minimum, the following items:
Electronic Filing - Received, Clerk's Office, August 29, 2008
* * * * * R2009-008 * * * * *
Page 17
NPDES Permit No. IL0024767
M odification Date:
September 29, 1993
Special Conditions
1. A topographic map extending. one-quarter mile beyond the property boundaries of the
facility, showing: the
facility,
surface
water bodies, wells (including
injection
wells), seepage pits, infiltration ponds, and the discharge points
where
the facility's
storm
water
discharges
to
a
municipal
storm
drain system or other water body.
The
requirements of this paragraph
may be included
on the site map
if
appropriate.
2 . A site map showing:
i .
The storm water conveyance and discharge structures;
ii. An outline of the storm water drainage areas for each storm water discharge point;
iii. Paved areas and buildings;
iv. Areas used for outdoor manufacturing, storage, or disposal of significant
materials, including activities that generate significant
quantities
of dust or
particulates.
v .
L ocation of existing storm water structural control measures (dikes, coverings,
detention
facilities, etc.);
vi.
Surface
water locations and/or municipal storm drain locations
vii. Areas of existing and potential soil erosion;
viii. Vehicle service areas;
ix. Material loading, unloading, and access areas.
3. A narrative description of the following:
i.
The nature of the industrial activities conducted at the site, including a
description of significant materials that are .treated, stored or d.isposed-of in a
manner to allow exposure to storm
water;
ii. Materials, equipment, and
vehicle
management-prattites employed to
minimize
.
contact of significant materials
with
storm
water discharges;
iii. Existing structural and non-structural control
measures
to
reduce
pollutants in
storm water discharges;
iv. Industrial storm water discharge treatment facilities;
v.
Methods of onsite storage and disposal of significant. materials;
4. A
list
of the types of
pollutants that have a reasonable potential to be present in
storm
water discharges
in
significant
quantities.
5. An estimate of
the size
of
the facility in acres or square feet, and the percent of the
facility that has
impervious areas such as pavement or buildings.
6. A summary of existing
sampling data describing pollutants in storm water discharges.
F. The plan shall describe
the storm. water management controls which will be implemented by the
facility. The appropriate
controls shall reflect identified existing and potential sources
of
pollutants at the
facility. The description of the storm water management controls shall
include:
1.
Storm
Water Pollution Prevention Personnel - Identification
by
job titles of the
individuals who are responsible for developing,
implementing,
and
revising
the plan.
2. Preventive Maintenance - Procedures for inspection and
maintenance of
storm
water
conveyance system devices such as oil/water separators,
catch basins,
etc., and
inspection and testing of plant equipment and systems
that
could
fail
and
result in
discharges of pollutants to storm water.
Electronic Filing - Received, Clerk's Office, August 29, 2008
* * * * * R2009-008 * * * * *
Page
18
Modification Date:
September 29, 1993
NPDES Permit
No. IL0024767
S pecial C onditions
3. Good Housekeeping
-
Good housekeeping
requires the maintenance of clean,
orderly facility
areas that discharge storm
water. Material handling areas shall be inspected
and cleaned
to reduce the potential
for pollutants to enter the storm water
conveyance system.
4. Spill Prevention and
Response
-
Identification of areas where significant materials
can
spill
into
or otherwise
enter the storm water conveyance systems and their accompanying
drainage points. Specific
material handling procedures, storage requirements, spill
clean up equipment
and procedures should be identified, as appropriate. Internal
notification procedures for spills of significant materials should be established.
5. Storm Water Management Practices - Storm water management practices are practices other
than those which control the source of pollutants.
They include
measures such as
installing oil and grit separators, diverting storm water into retention basins, etc.
Based on assessment of the potential of
various
sources
to
contribute pollutants,
measures to remove pollutants from storm water discharge shall be implemented. In
developing the plan, the following management
practices
shall
be
considered:
i. Containment - Storage within
berms
or other secondary containment devices to prevent
leaks and spills from entering storm
water runoff;
ii. Oil & Grease Separation
-
Oil/water
separators, booms, skimmers or other methods to
minimize oil contaminated storm water discharges;
iii. Debris & Sediment Control - Screens, booms, sediment ponds or other methods to
reduce debris and sediment in storm water discharges;
iv.
Waste Chemý'cal Disposal - Waste chemicals such as antifreeze, degreasers and used
oils
shall'be recycled or disposed of in an approved manner and in a say Which
prevents
them
from entering storm water discharges.
v.
Storm
Water Diversion - Storm water diversion away from materials manufacturing,
storage and other areas of potential storm
water
contamination;
vi. Covered Storage or Manufacturing
Areas
-
Covered fueling
operations,
materials
manufacturing and storage areas to prevent contact with storm water.
6. Sediment and
Erosion Prevention - The plan shall identify areas which due to topography
activities, or other factors, have a high potential
for
significant soil erosion and
describe measures
to limit erosion.
7. Employee Training
- Employee training programs shall, inform personnel at all levels of
responsibility of the components and goals of the storm water
pollution
control plan.
Training should address topics such as spill-response, good housekeeping and material
management practices.
The
plan shall
identify periodic dates for such training.
8. Inspection
Procedures
- Qualified
plant personnel shall be identified to inspect
designated equipment
and plant areas. A tracking or follow-up procedure shall be used to
ensure
appropriate response has been taken in response to an inspection. Inspections and
maintenance activities shall
be documented and recorded.
G. The permittee shall conduct an annual
facility inspection to verify that all elements of
the
plan, including the site
map, potential pollutant sources, and structural and non-structural
controls to reduce pollutants in industrial
storm water discharges are accurate. Observations
that require a
response
and
the appropriate response to the observation shall be retained as
part of the plan. Records documenting
significant observations made during the site
inspection shall
be submitted to the Agency in accordance
with
the reporting requirements of
this permit.
H. This plan should
briefly describe the appropriate elements of other program requirements,
including Spill
Prevention Control and Countermeasures (SPCC) plans
required
under Section 311
of the CWA and the regulations
promulgated thereunder, and Best Management Programs under 40
CPR 125.100.
Electronic Filing - Received, Clerk's Office, August 29, 2008
* * * * * R2009-008 * * * * *
Page 19
Modification
Date:
September 29, 1993
NPDES
Permit
No.
IL0024767
S pecial Conditions
I. The plan is considered a report that shall be available to the public under Section
308(b)
of
the CWA. The permittee may claim portions of the plan as confidential business information,
including any portion describing facility security measures.
J. The plan shall include the signature and title of the person responsible for preparation of
the
plan and
include the
date of
initial preparation
and each amendment
thereto:
REPORTING
K. The facility
shall
submit
an
annual inspection report to the Illinois Environmental
Protection
Agency. The report shall include results of the annual
facility inspection which
is required
by
Part G of the Storm
Water Pollution Prevention Plan of this permit. The report
shall also
include
documentation of any event (spill, treatment unit malfunction, etc.)
which would
require
an inspection,
results of the inspection, and any subsequent corrective maintenance
activity. The report shall
be
completed and signed
by
the
authorized
facility employee(s)'who
conducted
the
inspection(s).'
L. The first report shall contain information gathered during the one year time period beginning
with the effective date of coverage under this permit and shall be submitted no later than 60
days after this one year period has expired.
Each
subsequent
report
shall contain the
previous year's information and shall be submitted no later than one year after the previous
year's report was due.
M. Annual
inspection
reports
shall
be mailed to the following address:
Illinois Environmental
Protection
Agency
Division of Water Pollution Control
Compliance Assurance Section
Annual Inspection
Report
2200 Churchill Road
P.O. Box
19276
Springfield, Illinois 62794-9276
N. If
the facility performs
inspections more frequently than required by this permit, the results
shall be included as additional
information in the annual report.
SPECIAL CONDITION 19. The Agency has determined that the effluent
limitations
in this permit
constitute BAT/BCT
for
storm
water which is
treated
in the existing treatment facilities (Outfalls
001a, 003, 004, 005, 006, 007, 008 and 011) for purposes of
this
permit
reissuance,
and no
pollution prevention
plan will be required
for such storm
water. In addition to the
chemical
specific monitoring required elsewhere
in
this permit,
the
permittee
shall conduct
an annual
inspection
of the
facility site to identify areas contributing to a storm water discharge
associated with industrial 'activity, and determine whether any facility modifications have
occurred which result in previously-treated storm
water
discharges
no
longer receiving treatment.
If any
such
discharges are identified the permittee shall request a modification of this permit
within 30 days after the inspection. Records of the annual
inspection
shall
be retained by
the
permittee for the term of this permit and be made available to the
Agency
on request.
Electronic Filing - Received, Clerk's Office, August 29, 2008
* * * * * R2009-008 * * * * *
APPENDIX D
SUNIIVIARY OF IEPA TOXICITY TEST OF
CWLP
OUTFAI.L DISCHARGE
Electronic Filing - Received, Clerk's Office, August 29, 2008
* * * * * R2009-008 * * * * *
Illinois Environmental
Protection
Agency
4500 South
6th, Springfield.
IL
62706
217/786-6892
N ovember
1, 1988
Sangamon
County
- Springfield City Water,
Light & Power
Bioassay Sample Analysis
Mr. Louis
Skibicki,
Environmental Coordinator
City
of Springfield
City Water, Light &
Power
Municipal
Building
Springfield, Illinois 62757
Dear
Mr. Skibicki:
Enclosed
are copies
of analyses results for
samples collected
from City Water,
Light & Power on
August 22, August 24, and
August 26, all in
1988. These
results
are
forwarded for your information.
Sincerely,
ENVIRONMENTAL PROTECTION
AGENCY
Tim Zook
Environmental
Protection Engineer
Field Operations
Section
D ivision of
Water Pollution
Control
T DZ/ jg
E nclosures
c c: CWL&P - Tom Skelly
Ecotoxicology - K. Christensen
DWPC/CAS - Pat Lindsey
DWPC/FOS/RU
R egional File--"
Electronic Filing - Received, Clerk's Office, August 29, 2008
* * * * * R2009-008 * * * * *
.
. .
-1EPA 1-0x i t: 1
1 .y.
U rn I ,!*
1'
. TOXICITY
TEST
SUMMARY
_
acif,i.ty: Springfield
CWLP
Permit #: - IL0024767-004
------------------------------
------------
t Receiving
water: Sugar Creek
Location:
Springfield (Region
5.i
- ------------------------
Effluent
flow..(
X Mean
/
Observed): 0.62
efs Stream
7Q10: 0.0
cfs
Samples collected:
08/1-2/88
Test(s)
initiated: 08/23/88
- --------------------
Test(s) conducted:
ACUTE
Chgot
x 96-hr
static fathead minnow
x
96,-hr a'-gal growth test'
,966-hr
f?ow-through fathead minnow
x 48-hr'static
Ceriodaphn-a dubii
Results:
ACUTE
Acute to cicity observed for:
x
No significant
acute
toxicity observed
fathead minnow.
(LC50. =
%e-12--luenz
)
Ceriodaphnia
(LC50
% effluent)
Potential acute toxicity:
results'
incondlusive
Results
: C:3RONIC
Chronic
toxicity
observed for:
. algae:
inhibition NOEC. LOEC
%
eff luent
f athead minnow:
survival NOEC.
LOEC
o effluent
.
growth
NOEC,
LOEC
b
of fluent
C
eriodaphnia:
survival.-NOEC.
,
LOEC
% effluent.
reproduction NOEL, LOEC
°o effluent
xý No significant
chronic
effect, observed
Potential
chronic effect:
results. inconclusive
Comments:--Fathead
minnow chronic test not reported
due to
poor
control survival.
.
F
---------------------------------------------------------------.----------------
--------------------------------------------------------------------------------
Completed
by:
Karen Christensen
Date:
08/31/83
- ---------------------------
-------------.-
.ezf/tstsuml
x .7-day fathead
minnow growth
test
x 7-day Ceriodaphnia
brood
test
Electronic Filing - Received, Clerk's Office, August 29, 2008
* * * * * R2009-008 * * * * *
Electronic Filing - Received, Clerk's Office, August 29, 2008
* * * * * R2009-008 * * * * *
BORON CONCENTRATIONS
AT CWLP
OUTFALLS
SINCE
OCTOBER,
1992
O IITFALL
OIITFALL
DATE
003
DATE
004
10/92
5.500
12/92
0.740
12/92
6.100
02/93
0.520
02/93
7..200
03/93
0.470
03/93
6.900
04/93
6.000
05/93
3.200
05/93
5.700
06/93
3.200
06/93
6.000
07/93
7.500
07/93
6.200
08/93
7.100
08/93
7.800
11/93
0.820
11/93
7.300
Exhibit 2
Electronic Filing - Received, Clerk's Office, August 29, 2008
* * * * * R2009-008 * * * * *
Electronic Filing - Received, Clerk's Office, August 29, 2008
* * * * * R2009-008 * * * * *
GROUP EXHIBIT 3
BEFORE
THE
I LLINOIS POLLUTION
CONTROL BOARD
I n
the Matter of:
Petition
of the City
of
Springfield,
Illinois, Office
of Public Utilities
for an Adjusted
Standard from
35 Ill.
Adm.
Code Section 302.208(e)
AS94
-
(Adjusted
Standard)
)
AFFIDAVIT OF
DAN W. JONES
I , DAN W.
JONES, being first
duly sworn, upon
oath, states as
follows:
1 .
I am employed by
the Hanson Engineers,
Incorporated,
located in
Springfield, Illinois,
specializing
in civil,
engineering.
structural
and environmental
my current position
is that of
Senior
Biologist
in the
Department,
and I
Environmental/Waste
Management
have held this position
for
approximately
three (3) years.
Prior to that,
I was
employed
as an Environmental
Biologist with Peabody
Coal
Company for
16 years.
2 .
I hereby submit
this affidavit in support
of the
Petition for an Adjusted
Standard from
the
Illinois
General Use Water Quality
Standard for boron
found at
35 Ill. Adm. Code 302.208(e).
3 .
The purpose of this
Affidavit is to
verify
the material facts
asserted in the
Petition and the
report entitled "Technical
Support Document
for Petition
for Adjusted Boron
Standards for Sugar
Creek and the
Sangamon
River", filed
herewith as Exhibit
1 to the
Petition,
as required
by 35 Ill. Adm.
Code Section
106.706.
Electronic Filing - Received, Clerk's Office, August 29, 2008
* * * * * R2009-008 * * * * *
4. I hereby
verify that all
material facts
asserted in Paragraphs
10 through 29
of.the Petition for
an Adjusted
Standard, and all
material facts asserted
in
said report
are true and
correct, to the best
of my
knowledge.
5. If called
to testify herein,
I can
competently
testify
to the above and
foregoing from
personal knowledge.
Dated
this
day of
1994.
My commission expires
7` -ý 9,6
Electronic Filing - Received, Clerk's Office, August 29, 2008
* * * * * R2009-008 * * * * *
GROUP EXHIBIT
3
B EFORE THE.
I LLINOIS POLLUTION.CONTROL
BOARD
I n the Matter of:
Petition of the City of Springfield,
Illinois, Office of Public
Utilities
for an Adjusted Standard from
.
35 111. Adm. Code Section
302.208(e)
AS94 -
(Adjusted
Standard)
0
AFFIDAVIT OF SUSAN A. CORCORAN
Susan A. Corcoran, being
first duly sworn, upon
oath states as follows:
1 . I
am employed by the City of Springfield,
Office of Public
Utilities,
i n Springfield,
Illinois.
City Water, Light and Power
My title is Engineering
Technician III
in
the Environmental Programs Section
of
the Environmental, Health and Safety Department.
I have
held this
position since February 16, 1992, and have
worked in
the Environmental Section since July 1, 1988.
My responsibilities
include participation in City Water,
Light and Power's
compliance with state and federal water
pollution control requirements,
including NPDES Permit
activities.
2 . I submit
this affidavit *pursuant to 35
Ill. Adm. Code Section
106.706,
in order to verify all
material facts asserted
in the Petition of City Water,
Light and Power
for Adjusted
Standard from
35 Ill. Adm.
Code Section 302.208(e).
3 . I hereby verify
that all material facts
asserted in the Petition and the Exhibits attached
to the
Petition
are true and correct to the best of my
knowledge,
information, and belief.
Electronic Filing - Received, Clerk's Office, August 29, 2008
* * * * * R2009-008 * * * * *
4.
If called
upon to testify, I can
competently testify to the above and foregoing from
personal knowledge.
.
.
-,
Dated
this
day of
i
" OFFICIAL SEAL"
DWIGHT J. MC FARLANO
NOTARY
PUBLIC,
.STATE
OF
ILLINOIS
MY COMMISSION EXPIRES 2.27-96
1 994.
Subscribed and sworn to before me
thisp'l day of
, 1994.
My commission
expires
2 1A
I
L,?
`
Electronic Filing - Received, Clerk's Office, August 29, 2008
* * * * * R2009-008 * * * * *