BEFORE THE ILLINOIS POLLUTION CONTROL BOARD
IN THE MATTER OF:
WATER QUALITY STANDARDS AND
EFFLUENT LIMITATIONS FOR THE
CHICAGO AREA WATERWAY SYSTEM
AND THE LOWER DES PLAINES
RIVER
: PROPOSED
AMENDMENTS TO
35 Ill. Adm. Code
Parts
301, 302
, 303 and
304
R08-9
(Rulemaking
- Water)
METROPOLITAN WATER RECLAMATION DISTRICT OF GREATER
CHICAGO'S PRE-FILED QUESTIONS TO KEVIN J. BOYLE
1.
Page 1 line 12: You indicate that the benefits you have calculated represent the amount
that Cook County households are willing to pay.
A.
How have you determined that Cook County
households are willing
to pay $47
per household to derive the
"
economic benefits
" you are
alluding to?
B.
How can a net payment be construed as an economic benefit?
2.
Page 1 lines 5 through 16: In your answer to the question "What is the purpose of your
testimony?" you first state that the purpose is to analyze the economic benefits of water
quality improvements associated with the new recreational use designations proposed for
the CAWS but then go on to state the conclusion of your analysis in terms of costs that
Cook County households are purportedly willing to pay to achieve the water quality
improvements.
What are the actual economic benefits and who would receive
actual/tangible economic benefit from the improvements?
3.
Page 1 lines 14 through 16: Please explain the statement "Willingness to pay is based on
preferences for recreational opportunities, concern about health risks, and a sense of
responsibility and stewardship toward the ecosystem" and tell us how you determined
these preferences, concerns and senses.
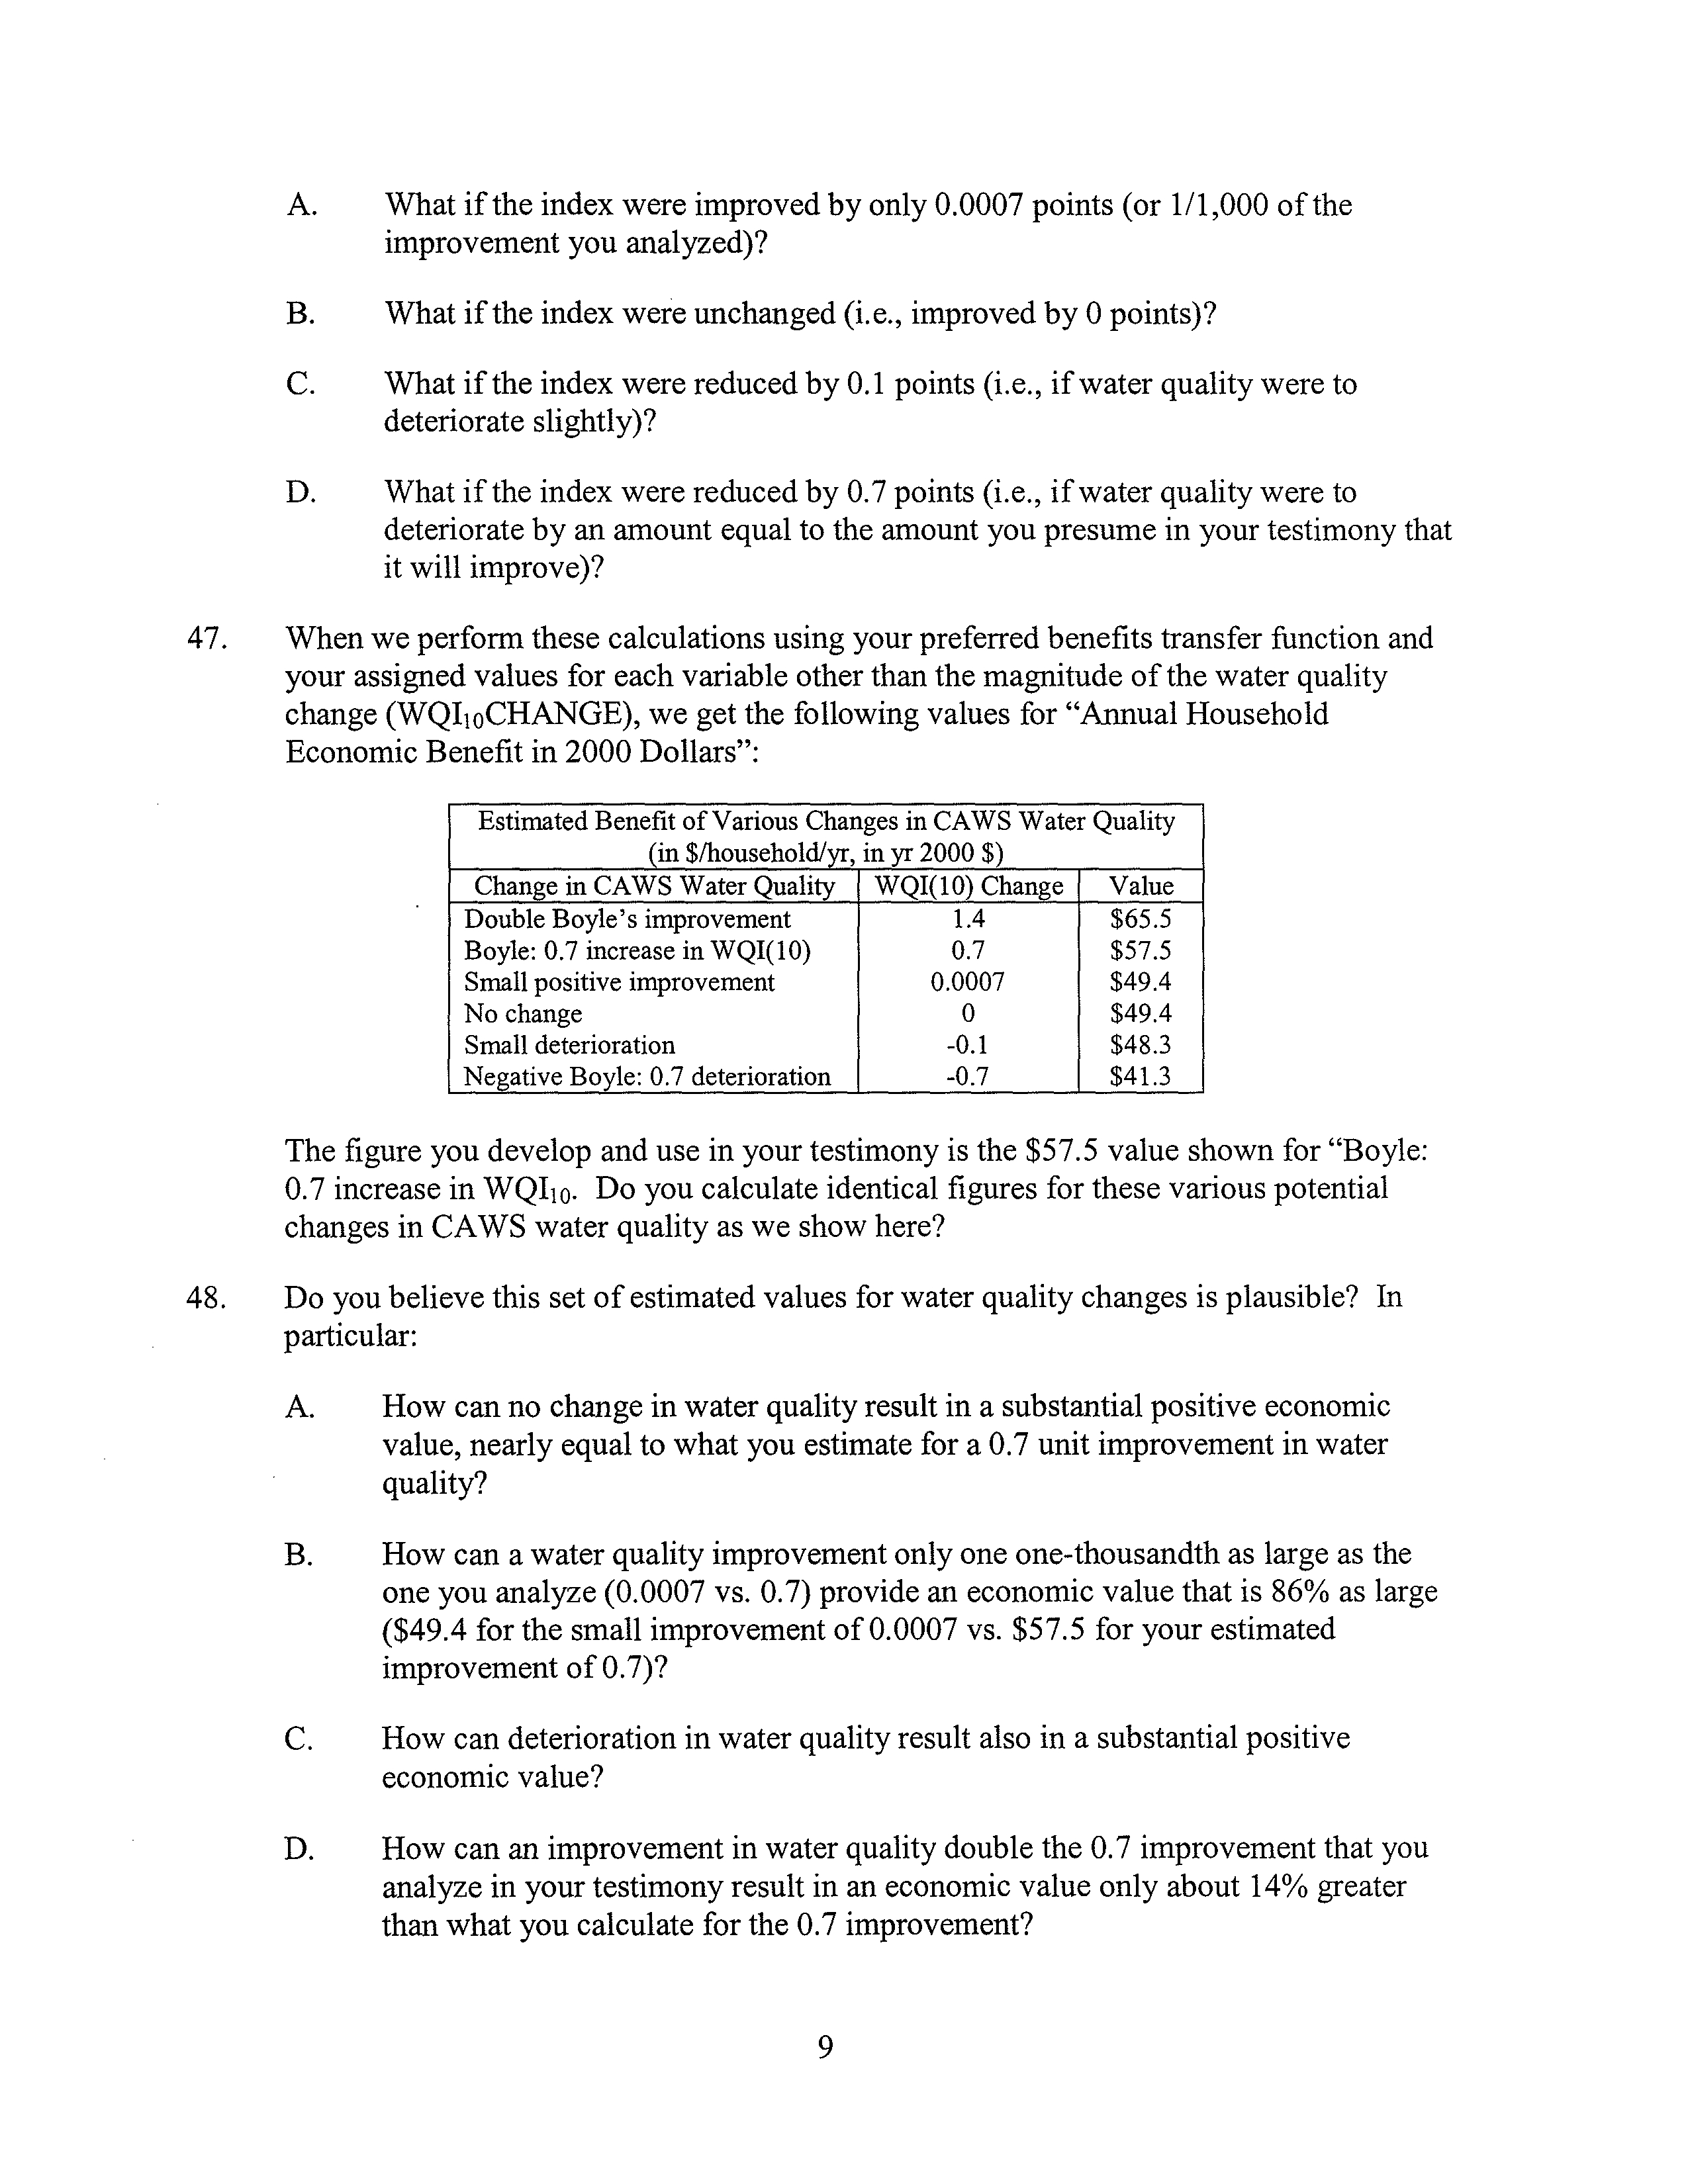
4.
On page 3, line 10, you describe the two types of benefits to households-direct "use"
benefits and indirect "intrinsic" benefits.
Are those benefits both linked to IEPA's
estimated reduction in fecal coliform levels in disinfected discharges?
5.
How is the value of the "use" and "intrinsic" benefits related to your estimate (on page 8,
line 11) that 10 percent of households actually use the CAWS?
6.
Do the "use" and/or "intrinsic" benefits, or the public's willingness to pay for those
benefits, require actual or only perceived water quality improvements?
7.
Is your estimate of the public's willingness to pay based on the perception that reduced
fecal coliform in the CAWS represents a real improvement in water quality?
Electronic Filing - Received, Clerk's Office, August 25, 2008
8.
Would your valuation, or estimate of the public's willingness to pay, change if the actual
improvement in water quality were different than that perception?
9.
For example, would the value of the proposed rulemaking be different if the reduction in
fecal coliform levels in treatment plant discharges did not result in a similar reduction in
the CAWS itself? What if the public were aware that disinfection at the plants would not
significantly reduce fecal coliform in the CAWS?
10.
Would the value of the proposed rulemaking be different if the reduction in the indicator
parameter, fecal coliform, did not correspond with actual reductions in total pathogens?
What if the public were aware that disinfection would not result in reductions in
pathogens in the CAWS?
11.
Would the value of the proposed rulemaking be different if disinfection did not result in
an actual decrease in risks to recreational users? What if the public were aware that
disinfection would not result in decreased risks?
12.
Would the value of the proposed rulemaking be different if disinfection did not reduce
the number of pathogenic illnesses suffered by recreational users? What if the public
were aware that disinfection would not reduce illnesses?
13.
Would the value of the proposed rulemaking be different if there were no significant risks
to recreational users in the CAWS from pathogens now? What if the public were aware
that there were no significant risks now?
14.
Would the value of the proposed rulemaking be different if other factors-such as
navigation safety-prevented any actual increase in the number of recreational users?
What if the public were aware that significant areas of the CAWS are unsafe for
recreational use?
15.
On Page 3, Line 19 of your testimony, you claimed that local, site-specific information
was used in your economic benefit analysis for the CAWS. Why did you not use in your
analysis the telephone survey, which was utilized by Croke, Fabian, and Brenniman in
their study for the Chicago area?
16.
Page 4 lines 11-13: You state that "The water quality improvements will occur with the
implementation of wastewater disinfection at the North Side, Stickney and Calumet
wastewater treatment plants."
A.
What
form of disinfection technology did you assume would be deployed?
B.
Did you account for introduction of carcinogenic disinfection
byproducts into the
CAWS in your
analysis?
C.
Is the water quality improvement in the economic benefit analysis solely based on
the implementation of wastewater disinfection at the North Side, Stickney and
Calumet wastewater treatment plants?
2
Electronic Filing - Received, Clerk's Office, August 25, 2008
D.
Are you aware that there are other point and non-point sources in
the CAWS,
such as combined sewer overflows
(CSOs),
storm runoff and feces
from
birds and
other riparian animals, which can introduce bacteria and pathogens into the
CAWS?
E.
Do you acknowledge that even if the bacteria level could be lower
in the CAWS
if disinfection would be implemented at the three water reclamation plants, the
reduction of pathogen level in the
CAWS would
still be unknown because of the
other bacteria sources?
F.
Do you
agree that disinfection at the three water reclamation plants will not
improve the water quality in the
CAWS with
respect to floatables and water
clarity?
17.
Page 5, Approach to Estimating Economic Benefits: Did your approach consider
degradation of air quality, increased truck traffic, and other adverse impacts that will
result from construction and operation of disinfection facilities?
18.
In a region such as metropolitan
Chicago which is already a Clean Air Act non-
attainment zone
, does your model take
into account
further degradation of air quality and
its impacts
on property
values?
19.
Page 5, Answer to question "What is the approach you followed to compute economic
benefits?"
A.
You provide an outline in this section of your methodology, but did you produce a
report that details your work?
B.
Is it available in the R08-9 record?
C.
How would one go about actually verifying that the predicted valuation ever
materializes?
D.
Has this methodology ever been verified by observing actual values before and
after affecting water quality improvements?
20.
Page 6 line 17: You make the statement that "Third, the affected populations are
similar." Please explain how you characterized and compared the affected populations.
21.
Page 7 lines 3-6:
With regard to evaluating "alternative modeling assumptions that could
lead to error in computed economic benefit," what specific assumptions did you evaluate
and how did you evaluate them?
22.
Page 7
lines 7-8:
Did any of the
18 existing studies survey households
in Cook County
Illinois?
23.
Do you have any concerns about extrapolating from a body of studies that includes
different populations (e.g., less urban), different water bodies (e.g., saltwater estuaries),
3
Electronic Filing - Received, Clerk's Office, August 25, 2008
and different kinds of water quality improvements (establishing the ability to boat or
harvest shellfish) to willingness to pay by Cook County residents for improvements in
water-based recreation on the CAWS?
24.
Are you familiar with all of the studies surveyed by Van Houtven et al.?
25.
Were they all of high quality?
26.
Do you have confidence in the Van Houtven meta-analysis of those studies?
27.
On page 7, line 20, you indicate that the expected improvement in water quality was
determined using a 10-point index scale including nine measures of water quality.
A.
Was fecal coliform density only one of those nine measures of water quality?
B.
What are the other eight measures of water quality?
28.
Page 8 lines 1-2: Can you please specify what MWRD data were used in your
computation, and what was the source of the data?
29.
On page 8, line 3, you indicate that your evaluation of economic benefits here assumes
expected improvements in CAWS water quality based on the fecal coliform reductions
estimated by IEPA in the testimony of Scott Twait. In the referenced testimony (on
pages 190-192 of the hearing transcript), Mr. Twait indicates that depending on how well
run a facility is, disinfection would reduce fecal coliform levels in the treated discharge
from 5,000 -100,000 cfu/100 ml, to 100 - 400 cfu/100 mL.
A.
Were these the values that you used in your analysis?
B.
How did you translate fecal coliform reductions in wastewater treatment plant
discharges to improvements in water quality in the
CAWS as a whole?
C.
Did
you consider the volume of discharges
from the
plants compared
to the total
flow of the CAWS?
D.
Did you consider other sources of fecal coliform loading
in the CAWS
that would
not be affected by disinfection at the treatment plants, such as stormwater runoff
and combined sewer overflows?
E.
What improvement in fecal coliform levels
in the CAWS
did you determine
would result from disinfecting treatment plant discharges?
F.
Did you consider whether disinfection would result in decreased levels of total
pathogens
in the CAWS,
rather than
only the
indicator parameter fecal coliform?
G.
Did
you consider whether disinfection would result in any decrease in risks to
recreational users?
4
Electronic Filing - Received, Clerk's Office, August 25, 2008
H.
Did you consider whether disinfection would result in any decrease in pathogenic
illnesses to recreational users?
1.
Did you consider whether disinfection would result in an increase in the number
of recreational users?
30.
On page 8, line 5, you indicate that IEPA's estimated reduction in fecal coliform density
would lead to a 0.7 improvement in the index value, from 6.1 to 6.8 out of 10. Is your
conclusion that a 0.7 increase in only one of nine measures of water quality in the CAWS
is
worth over $1 billion?
31.
On Page 8, Lines 7 to 8, you state that you used a value "reflecting average household
income for Cook County ($62,488, according to the 1999 Census)."
A.
Are you
aware that
in Van
Houtven, Powers, and Pattanayak
'
s paper, it was stated
that
"
most studies report average or median annual income
;" (
p.218)?
B.
Are you aware that the U.S. Census shows that the median household income for
Cook County, Illinois, was $45,922 in 1999 and $43,584 in 2004?
C.
Why do you select the average household income of $62,488 for Cook County in
1999 in your calculation?
32.
On Page 8, Lines 9-14, you estimate that 10% of Cook County households use the
CAWS.
A.
Did this estimate originate from a published report by Kevin Croke et al.?
B.
Could you please re-iterate how precisely you used local, site-specific information
in the economic analysis that is presented in your testimony?
C.
What were the categories of use defined in the study and which use was the
predominant use?
D.
Are you aware that Croke, Fabian, and Brenniman stated in their paper that water
quality improvement was aimed at removing odors and debris for "outings"
(1986), which will not be accomplished by the disinfection at the three water
reclamation plants?
E.
Given that outings were the predominant use by the 10% of Cook County
Households and that pollution control efforts aimed at odors and debris removal
from the river were the prescribed water quality improvements that would be
required to increase this use, what impact would reducing fecal coliform in
wastewater treatment effluents have on increasing the value of the waterways for
this predominant use?
F.
Are you aware that in the survey reported by Croke, Fabian, and Brenniman in
1986, 10 percent of households as CAWS users were an approximate calculation,
5
Electronic Filing - Received, Clerk's Office, August 25, 2008
and actually 28 respondents out of 350 households surveyed (including zero bids)
claimed to be users including outings, which constitutes only 8 percent?
G.
What is the basis of your statement that recreational use of the CAWS has
increased over time?
H.
Are you aware that Croke, Fabian, and Brenniman's study only covers 352 square
miles of the combined sewer areas including the City of Chicago and a few
surrounding communities, and the total area for Cook County is 946 square
miles?
33.
Page 8 lines
9 through 12: Did the survey you
used encompass
all of Cook County?
34.
Were Cook County communities that are not adjacent to the waterways included?
35.
On Page 9, Lines 6 to 8, you indicate that "I assign this variable a value of 27, which
reflects the date of the most recent study (from 2000) from the 18 studies used in the
Meta-analysis."
A.
Are you aware that the date of the most recent study from the 18 studies used in
the Meta-analysis by Van Houtven, Powers, and Pattanayak in 2007 was 2003
(p.213), not 2000?
B.
Why did you select 2000 in your calculations instead of 2003?
C.
What is the basis for using year 2000?
D.
What was the 2000 study about?
36.
Didn't Van Houtven
and colleagues
find that a
one-unit increase
in water quality had an
average benefit of $14?
37.
Haven't you stated that a smaller increase in quality (0.7 units) has a much higher benefit
($57), based on the same equation?
38.
How can that be?
39.
What is the meaning of the first line of your table on page 58 of your testimony?
40.
Does it show your
estimate
of the benefit of a 0.7 unit increase in the water quality index?
Is that estimate $3.11?
41.
What is
the meaning
of the
second line
of the
same table?
A.
Does it show
the increase in estimated
benefit,
assuming
that the survey also
indicates
that there
will be a recreational
benefit?
B.
Why have you assumed a value of 0.476?
6
Electronic Filing - Received, Clerk's Office, August 25, 2008
C.
Does
this mean
that
you are assuming
that 47.6% of hypothetical Cook County
respondents
would be told
about a recreational
benefit in your hypothetical
survey?
D.
Does this assumption increase your estimate of benefit of the water quality
improvement by $4.95 to a total of $8.06?
E.
Isn't this still much less than $57?
42.
Suppose you use the same equation to estimate the benefit of no water quality
improvement, so that the first two terms are zero.
A.
What result do you get?
B.
Do you get $57 - $8.06 = $48.94?
C.
Does it make sense there would be a positive benefit, even assuming no change in
water quality?
43.
Your testimony indicates (on page 9) that you used "a linear equation model where all
variables are statistically significant".
A.
Is the change in the water quality index
(WQI,o CHANGE
) one of the variables
included in that equation?
B.
How is statistical significance indicated in Table 5 of the Van Houtven paper?
With asterisks?
C.
Is there an asterisk next to the coefficient of this variable in the equation that you
used?
D.
Didn't Van Houtven et al say on page 221 that the coefficient of this variable is
"not statistically significant"?
E.
What does this indicate about the uncertainty in the estimate of this coefficient?
F.
Does it indicate that one cannot rule out the possibility that this coefficient is
really zero?
G.
Would it change your estimate if the true value of this coefficient were zero?
44.
In producing your
estimate
of benefit, do you assume that 100% of hypothetical Cook
County
residents
would be surveyed
in person?
A.
Why
did you assume that?
B.
How much effect does this have on your estimate? Does it increase it by $46.04
per household?
7
Electronic Filing - Received, Clerk's Office, August 25, 2008
C.
What did Van Houtven
et al. say about this variable
("IN PERSON")?
D.
Did they say (p.222) that their findings of a positive effect of this variable on
willingness to pay were "consistent with the hypothesis that in-person interviews
encourage yea-saying by respondents"?
E.
Given that statement by the authors, wouldn't it be more conservative to assume a
value of zero for this variable?
F.
Wouldn't that reduce your estimate of benefit by $46 per household?
G.
If you assume some other value less than 100% in-person, what would the effect
on your estimate be?
45.
In producing your estimate of benefit, do you assume a hypothetical study of willingness
to pay by Cook County residents that would be published in a peer-reviewed journal?
A.
Why?
B.
How much effect does this have on our estimate?
C.
Does it increase it by $58.94 per household?
D.
What did Van Houtven et al. say about this variable
("
PUBLISHED")?
E.
Did they say (p. 216) that "the publication process may result in estimation bias if
for example, reviewers and editors are more inclined to accept higher value
estimates or if analysts are less likely to submit lower estimates?"
F.
Did they say (p.222) that "if PUBLISHED is interpreted as a filter that favors
larger, statistically significant values, then this result suggests the presence of a
publication bias"?
G.
Given that statement by the authors, wouldn't it be more conservative to assume a
value of zero for this variable?
H.
Wouldn't this reduce your
estimate
of benefit by $59 per household?
1.
If you assume some
other
value less than 1
, what would the effect on your
estimate be?
46.
Using the
linear benefit transfer function you draw from
Van Houtven, et al. (2007) and
your assigned values for all variables other than the magnitude of the water
quality
change
(
as shown on page 58 in your testimony
),
what would you calculate to be the
annual household economic benefit if the water quality index for
CAWS
water quality
were to be improved by 1.4 points rather than 0.7 points on the 10-point scale? Assume
the current value of the index is 6. 1, as in your testimony.
8
Electronic Filing - Received, Clerk's Office, August 25, 2008
A.
What if the index were improved by only 0.0007 points (or 1/1,000 of the
improvement you analyzed)?
B.
What if the index were unchanged (i.e., improved by 0 points)?
C.
What if the index were reduced by 0.1 points (i.e., if water quality were to
deteriorate slightly)?
D.
What if the index were reduced by 0.7 points (i.e., if water quality were to
deteriorate by an amount equal to the amount you presume in your testimony that
it will improve)?
47.
When we perform these calculations using your preferred benefits transfer function and
your assigned values for each variable other than the magnitude of the water quality
change (WQIIOCHANGE), we get the following values for "Annual Household
Economic Benefit in 2000 Dollars":
Estimated Benefit of Various Changes in CAWS Water Quality
in $/household/ , in yr 2000 $)
Change in CAWS Water Quality
WQI(10) Change
Value
Double Boyle's improvement
1.4
$65.5
Boyle: 0.7 increase in WQI(10)
0.7
$57.5
Small positive improvement
0.0007
$49.4
No change
0
$49.4
Small deterioration
-0.1
$48.3
Negative Boyle: 0.7 deterioration
-0.7
$41.3
The figure you develop and use in your testimony is the $57.5 value shown for "Boyle:
0.7 increase in WQIIO. Do you calculate identical figures for these various potential
changes in CAWS water quality as we show here?
48.
Do you believe this set of estimated values for water quality changes is plausible? In
particular:
A.
How can no change in water quality result in a substantial positive economic
value, nearly equal to what you estimate for a 0.7 unit improvement in water
quality?
B.
How can a water quality improvement only one one-thousandth as large as the
one you analyze (0.0007 vs. 0.7) provide an economic value that is 86% as large
($49.4 for the small improvement of 0.0007 vs. $57.5 for your estimated
improvement of 0.7)?
C.
How can deterioration in water quality result also in a substantial positive
economic value?
D.
How can an improvement in water quality double the 0.7 improvement that you
analyze in your testimony result in an economic value only about 14% greater
than what you calculate for the 0.7 improvement?
9
Electronic Filing - Received, Clerk's Office, August 25, 2008
49.
Referring to the values shown in the table, why is it not reasonable and correct to
estimate the economic value of the 0.7 unit increase in the water quality index for CAWS
as the economic value at a "0.7 increase in WQIIO" ($57.5) less the economic value at
"no change" ($49.4)? This approach would yield an economic value of only $8.1 for the
alleged 0.7 increase in WQIIO.
50.
Why do you believe that the economic benefit that you calculate for a water quality
improvement of 0.7 points on the 10-point index will ensue from improving water quality
by this amount in the CAWS only?
A.
Don't Chicago-area residents focus some of their willingness-to-pay for water
quality improvements on water bodies other than the CAWS?
B.
Would you agree that most of Chicago-area residents' willingness to pay for
improved water quality would focus on those water bodies that are most amenable
to supporting additional recreational use, meaning those water bodies that are
already attractive for recreation in terms of all attributes other than water quality
(e.g., accessibility, proximity, existence of ancillary facilities such as beaches,
boat ramps, concessions, lack of competing commercial boat traffic, etc.)?
C.
Wouldn't you think that the bulk of Chicago-area residents' willingness to pay for
improved surface water quality would focus on improvements to Lake Michigan
water quality rather than on improvements to CAWS water quality?
51.
Are you aware that many of the surface water quality valuation studies included in the
Van Houtven, et al. meta analysis calculate their economic values for a specified
improvement in water quality that occurs across all or nearly all of the waters for which
survey respondents ascribe value? For example, the Carson and Mitchell study that has
provided the basis for the great majority of EPA's surface water quality regulatory
analyses estimates household willingness to pay for a specified water quality
improvement across all the waters of the U.S.
52.
Are you aware that Van Houtven cautions that his benefits transfer approach does not
adequately address situations where the water quality change in question does not apply
to all waters for which the study population ascribes value? Here is a quote from page
225 of his paper:
.... our results provide very limited evidence about how WTP is
related to the spatial characteristics of water quality changes. The
meta-regression does not measure how WTP varies with respect to
the proportion or amount of waters that are improved or the
distance of the water quality changes from the populations. This
lack of specificity imposes limitations on the precision of policy-
relevant benefit transfers, since policies almost always impact
waterbodies in spatially nonuniform ways.
10
Electronic Filing - Received, Clerk's Office, August 25, 2008
53.
Given that the water quality improvements associated with this rulemaking would occur,
if at all, in only some of the local waters, how did you account for Van Houtven's caution
that his benefits transfer approach does not adequately address this situation?
54.
Are you aware that the U.S. EPA typically performs benefits transfer for water quality
improvements using values such as those developed by the Van Houtven et al. equations
or the Carson and Mitchell study, when the water quality improvement being investigated
applies not to all but only to some of the waters for which the study population holds
value? EPA's typical assumptions have been that:
A.
2/3 of a household's total willingness to pay for water quality improvement
focuses on more local waters (specifically in the same State as that in which the
household resides) and 1/3 focuses on more distant waters;'
B.
If only some of the local/in-State waters will receive the specified improvement in
water quality, households' total willingness to pay for that improvement in all
local/in-State waters will be reduced proportionally in order to estimate their
willingness to pay for improvements that apply to only some of the local/in-State
waters.
C.
The proportional reduction may be calculated based on usage (e.g., usage of those
local waters whose quality will improve as a fraction of usage of all local waters),
based on volume (e.g., miles of river and acres of lakes accounted for by those
local waters whose quality will improve as a fraction of miles of river and acres of
lakes for all local waters), or based on other similar factors.
55.
Did you apply this method (considering that water quality improvement would occur only
in some of the local waters) in your analysis?
56.
Whatever economic value is calculated for Chicago
-
area residents for the hypothesized
0.7 unit improvement in the water quality index, shouldn
'
t this value be reduced to reflect
the fact that the hypothesized water quality change applies only for the
CAWS,
and does
not extend to other nearby
, likely
much more recreationally important waters
(
i.e., Lake
Michigan and its beaches), nor to other waters throughout the State of Illinois, nor to
other waters outside the State of Illinois?
57.
Applying EPA's typical approach to benefits transfer for very localized water quality
improvements such as the hypothesized water quality change for the CAWS, shouldn't
one reduce the household's willingness to pay for improvement of all waters of interest
(as calculated from the Van Houtven et al equation) by:
A.
1/3, to
account for the fraction of total willingness to pay that is allocated to out-
of-State waters; and
1
EPA's standard assumption that households allocate 2/3 of their total willingness to pay to the improvement of in-
state waters and 1/3 to the improvement of out-of-state waters is based on the findings of Carson and Mitchell
(1993).
11
Electronic Filing - Received, Clerk's Office, August 25, 2008
B.
a further 70 - 90% or more, to account for the fact that the great majority of in-
State waters on which Chicago-area households focus their willingness to pay for
water quality improvements will not undergo the hypothesized 0.7 unit
improvement?
58.
In order to represent the value of improving the CAWS only by 0.7 units, wouldn't the
EPA method reduce your figure of $57 calculated from the Van Houtven equation
(representing the value for improving the quality of all waters by 0.7 units) to perhaps
only $4 - $11 (10 - 30% of 2/3 of $57)?2
59.
Do you disagree with the approach that the U.S. EPA has used for the past 15 years or so
for valuing local improvements in water quality?
60.
On Page 10, Line 1, "...beginning in 2010 ....:" Why did you choose Year 2010 as a
beginning year?
61.
Was your,analysis of willingness to pay based on surveys of Cook County residents?
A.
Do people have the same willingness to pay for water quality improvements
everywhere?
B.
How did you control for differences between actual survey respondents and Cook
County residents (e. g. rural populations vs. an urban population?)
C.
Did you control for these differences only on the basis of income (INCOME2000)
and PERCENT USERS of the water body?
D.
Is that sufficient to control for all demographic differences?
62.
Was your analysis based on surveys asking about water-based recreation on the Chicago
Area Waterways System?
A.
Do people have the same willingness to pay for improvements in any water body?
B.
How did you control for differences in characteristics
of CAWS
and the other
water bodies people were asked about in the survey
(
e.g., salt water estuaries vs.
an urban river)?
C.
Just on the basis of differences in current water quality
(WQI10BASE)?
Is that
sufficient to control for all differences in water bodies?
63.
Was your analysis based on surveys asking about fecal coliform reductions?
A.
Do people have the same willingness to pay for every water quality improvement?
2
Note that we disagree that your figure of $57 represents a correct calculation using the Van Houtven equation for
the value of improving all waters by 0.7 units
12
Electronic Filing - Received, Clerk's Office, August 25, 2008
B.
Are your
estimates
of ability to pay specific to any particular improvement in
recreational uses
of the CAWS?
C.
How did you translate willingness to pay for one kind of improvement to
willingness to pay for another? (e.g. boatable or shellfishable, vs. swimmable)?
64.
On Page 10, Lines 18 to 20, you state that "I conservatively include only 80-percent of
Cook County households when calculating total annual economic benefits from the
CAWS water-quality improvement." Is it true that Croke, Fabian, and Brenniman's
study was used as a major reference in your economic benefit analysis?
65.
Why did you ignore in your analysis "the fact that Lake Michigan dominates the Chicago
area as a recreation resource" and the outcome of close to 30 percent of responses being
zero bids, which means that these respondents think that enough has been spent or they
simply cannot afford to pay, as reported in Croke, Fabian, and Brenniman's paper?
66.
With respect to the percentage of zero bids in the survey by Croke, Fabian, and
Brenniman's study and the differential in the area coverage between the survey study and
Cook County, do you think that using 80-percent of Cook County households in the
calculation is appropriate?
Why or why not?
67.
Page 10 lines 13-20, you indicate that most households in Cook County will experience
the benefit of the rulemaking because the affected waters are major waterways in Cook
County and are easily accessible to Cook County residents.
A.
What is the basis for your statement that most households in Cook County will
benefit from the improvement in CAWS water quality?
B.
Other than providing the map in Figure 1 of Exhibit 3, what is the basis for your
statement that the CAWS are easily accessible?
C.
Would the value of that
benefit change in areas of
the CAWS that
are not easily
accessible?
68.
The Des Plaines River and some of its tributaries, as well as Lake Michigan and other
lakes are also prominent geographic features of Cook County, Illinois, and offer
recreational opportunities to Cook County households.
What evidence have you
presented that households that live in closer proximity to these amenities will be attracted
to the CAWS by virtue of its fecal coliform concentrations being reduced during dry
weather?
69.
Are you aware that Margaret Frisbie, Executive Director of Friends of the Chicago River,
reports in her pre-filed testimony in this rulemaking that an e-mail survey to members
and friends was conducted by Friends of the River and received only a 3.3 percent
response rate?
70.
What leads you to believe that the 80
percent response
rate that you have
assumed is
accurate?
13
Electronic Filing - Received, Clerk's Office, August 25, 2008
71.
On Page 11, Lines 18 to 19, you state that "Households outside of Cook County may be
willing to pay for improved water quality in the CAWS." What is the basis of this
statement, considering that Lake Michigan is the dominant recreation resource for the
region and there are many other rivers and lakes, such as Des Plaines River, Fox River
and Lake Geneva, as recreational sources for the region?
72.
Page 11 lines 20-22: What evidence do you have to support the statement that
recreational activity has increased significantly since 1986?
73.
On Page 12 lines 10
-
20, you state that
"
Studies that I have conducted indicate that
improvements in water clarity increase sale prices of waterfront properties
."
Do you
expect that effluent disinfection will lead to improvements in water clarity
in the CAWS?
74.
What
is the complete citation for the Brashares study that you refer to in your testimony?
A.
In this study over what time period were fecal coliform concentrations and
property values tracked?
B.
How often was fecal colifrom measured?
C.
How did its concentration fluctuate with wet weather?
D.
What concentrations did it start at and increase to?
E.
How was the public made aware that fecal coliform concentrations were changing
over the time period of the study?
75.
For the Leggett and Bockstael study, over what time period was fecal coliform and
property value followed?
A.
What was
the baseline fecal coliform concentration
prior to the 110-count
reduction?
B.
What is the average property value along the Chesapeake Bay in Maryland, and
what percent of property value does $5,000 to $10,000 represent?
C.
How was the 100-count reduction in fecal coliform brought about in the
Chesapeake Bay and how was the public made aware of it?
D.
Could factors other than the fecal coliform counts themselves been responsible,
wholly or in part, for the increase in property value that was observed in this
study?
E.
How was the cause and effect relationship established between fecal coliform
count and property value increase?
76.
Given the
significant areas of the
CAWS
that are not easily accessible or otherwise
unsafe for recreational use, does your estimate of the value of this rulemaking change?
14
Electronic Filing - Received, Clerk's Office, August 25, 2008
77.
Are you
aware of another benefits transfer approach that is often used in order to estimate
the value of policy measures that increase outdoor recreational opportunities?
Dated: August 25, 2008
By:
Fredric P. Andes
David T. Ballard
BARNES & THORNBURG LLP
Suite 4400
One North Wacker Drive
Chicago, Illinois 60606
(312) 357-1313
482639v1
Respectfully submitted,
METROPOLITAN WATER RECLAMATION
DISTRI
ATE& CHICAGO
15
Electronic Filing - Received, Clerk's Office, August 25, 2008