~NATURAL
".RESOURCE
~TECHNOLOGY
Mr.
John Pozza
Ameren Services
One Ameren Plaza
190
I
Chouteau Avenue
St. Louis,
MO 63103
RE:
Groundwater Monitoring Program - Hutsonville Ash Impoundment Pond D
Dear John:
May 5, 2008
(1375-6.2)
This letter outlines a program to monitor groundwater at the above-mentioned facility. included
are
background materials, completion details for the monitoring wells, and a description of a conceptual plan
for monitoring groundwater at this facility that includes proposed adjusted standards.
Upon closure of Pond
D, a formal monitoring plan will be prepared
in accordance with conditions stipulated by the !PCB in
response to the requested variance. The anticipated plan would likely include: listing procedures
for
groundwater sampling, sample preservation and shipment, analytical methods, quality assurance and quality
control, recordkeeping and reporting
of results.
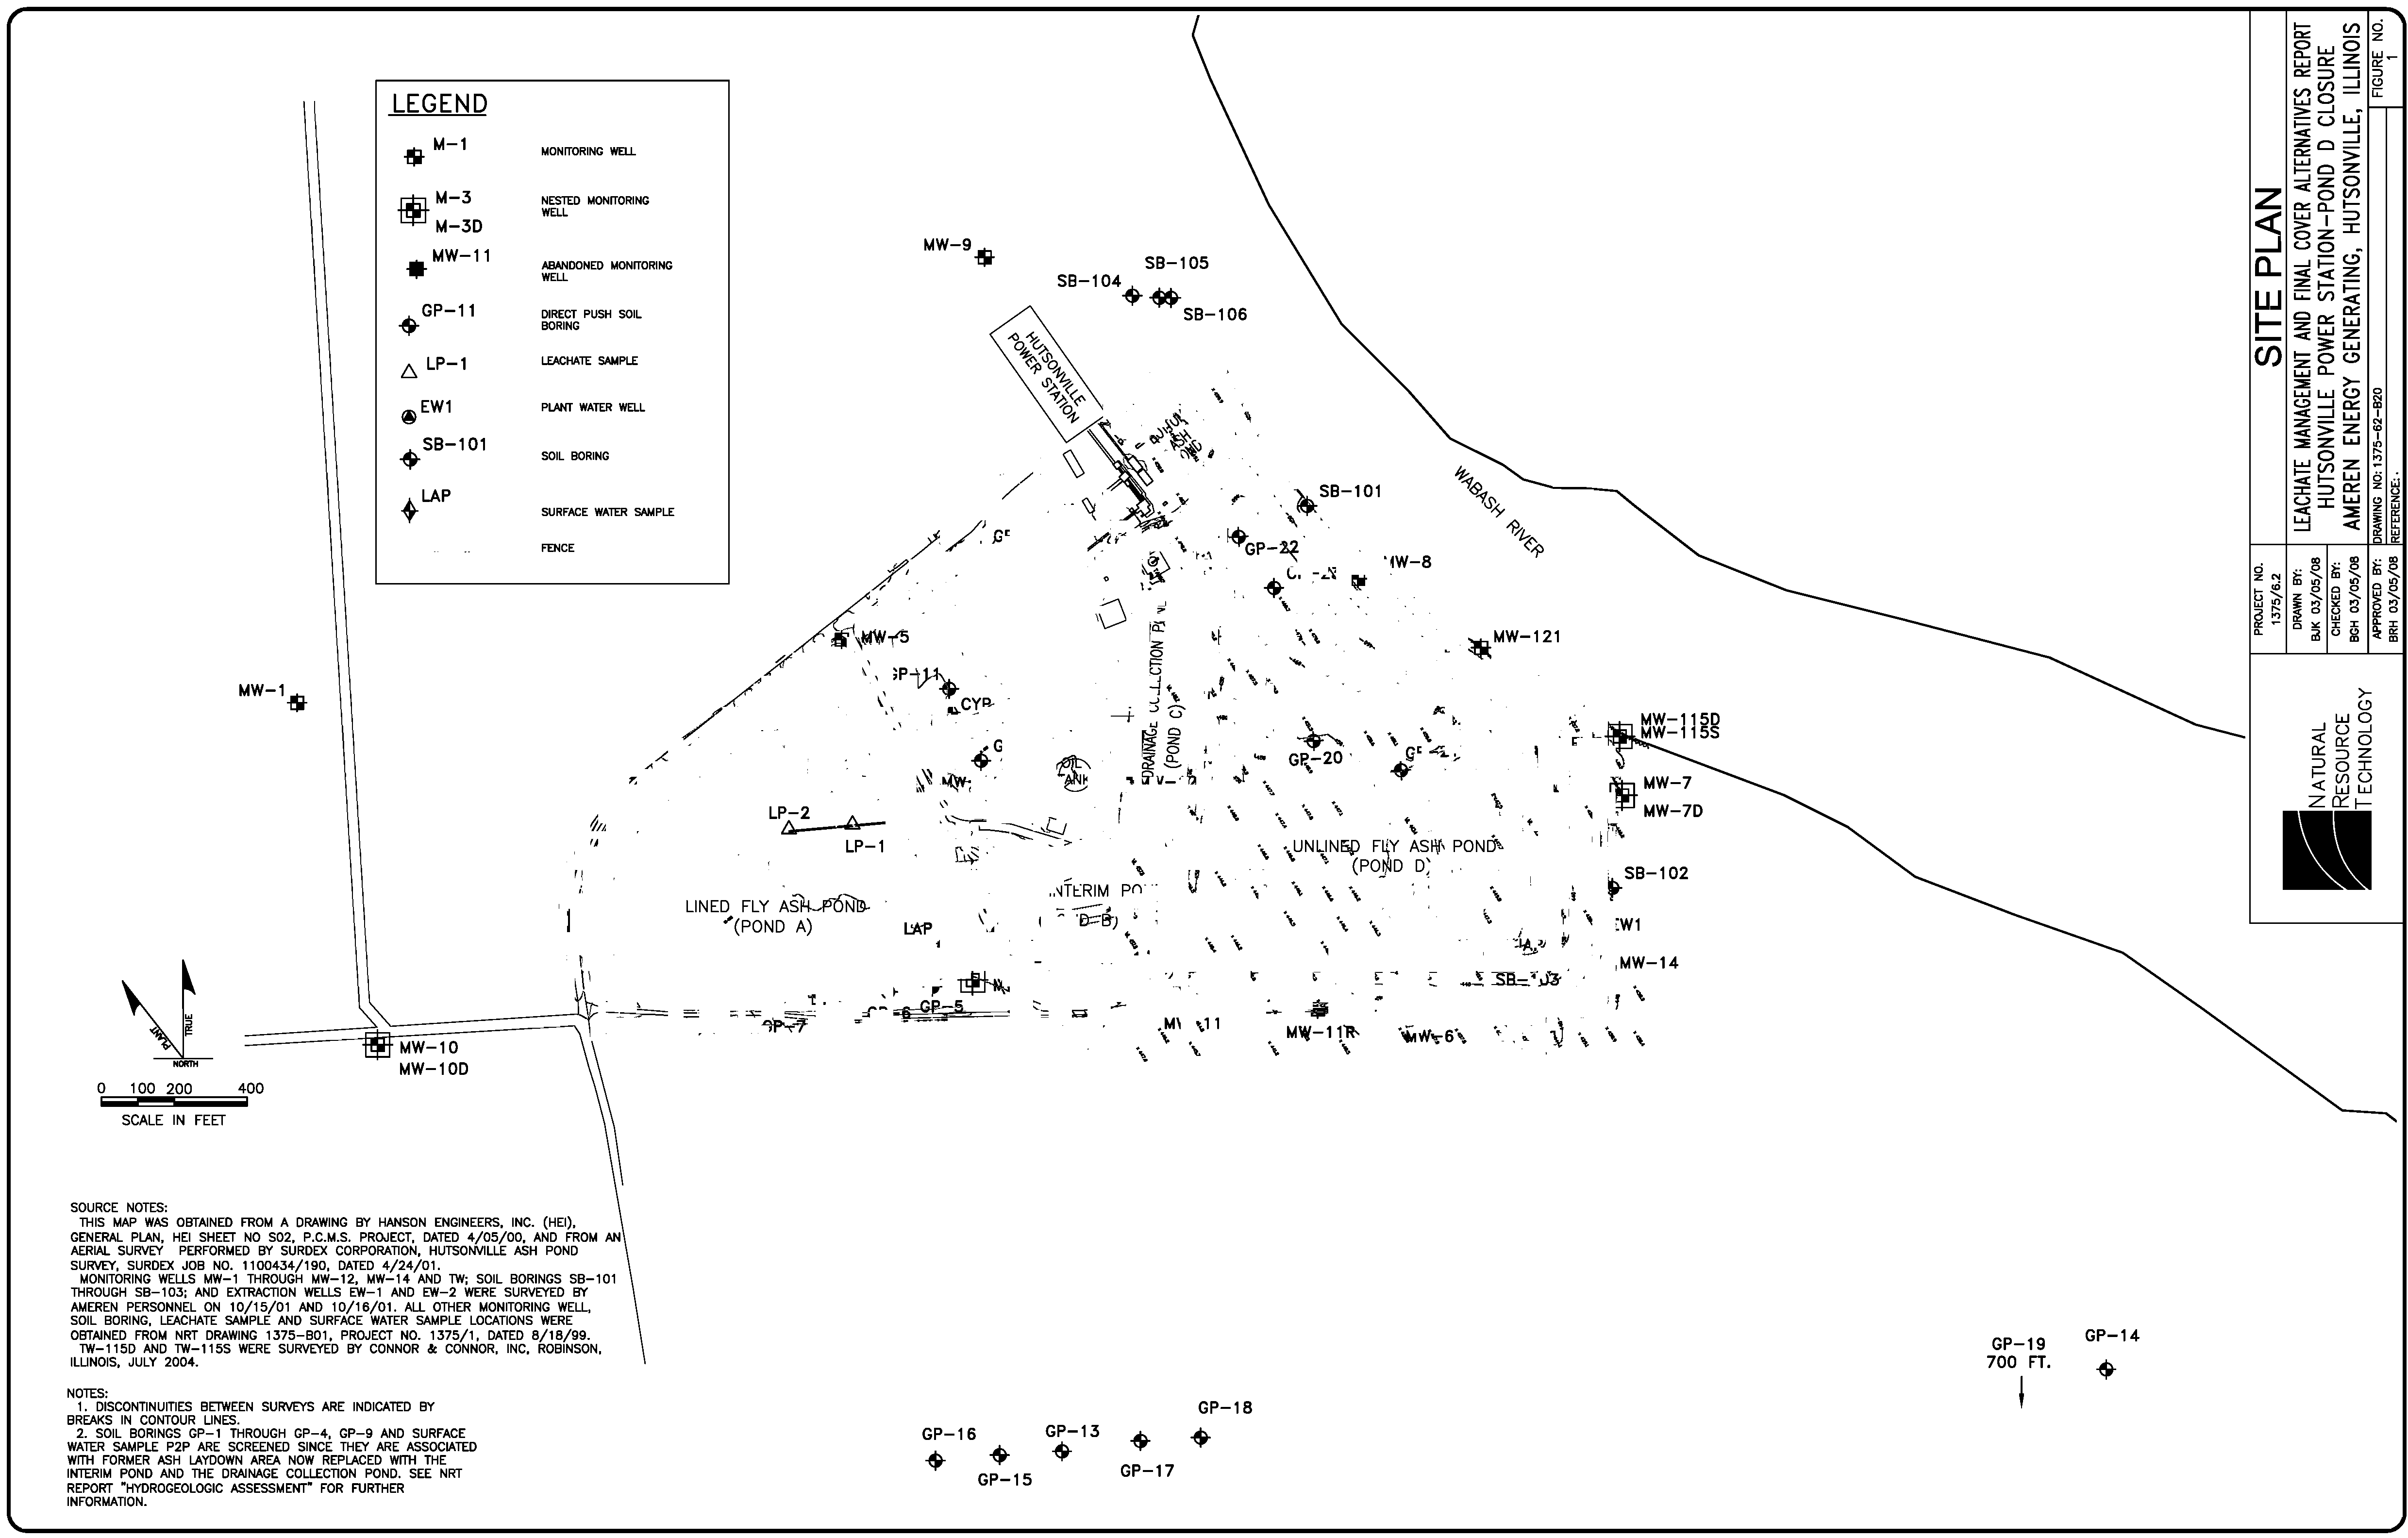
BACKGROUND
Ameren Energy Generating Company (ABG) operates an impoundment system with five ponds at the
Hutsonville generating station (Figure I-Site Plan). Ponds A and B are lined impoundments that currently
receive coal combustion by-product (CCB), Pond C
is a lined impoundment that receives stormwater runoff
and other flows from the plant, and Pond D is an unlined impoundment that formerly received CCB and is
now removed from service.
The fifth pond receives bottom ash. Ponds A, B, C, and the bottom ash pond
are permitted under the IEPA Bureau
of Water's Water Pollution Control program. Pond D, which was
formerly permitted under the Water Pollution Control program, will
be closed under the Bureau ofLand's
Solid Waste program.
Site Hydrogeology
The impoundments are underlain by two water-bearing units separated by materials that have low hydraulic
conductivity (shale bedrock
or silts and clays). The upland portion of the power plant property (the site),
and the western portion
of Pond D, are underlain by a thin (less than 20 feet thick) layer of sand-rich soil,
which is underlain
by Pennsylvanian-age sandstone and then shale (Figure 2, Cross-Section A-A'). The
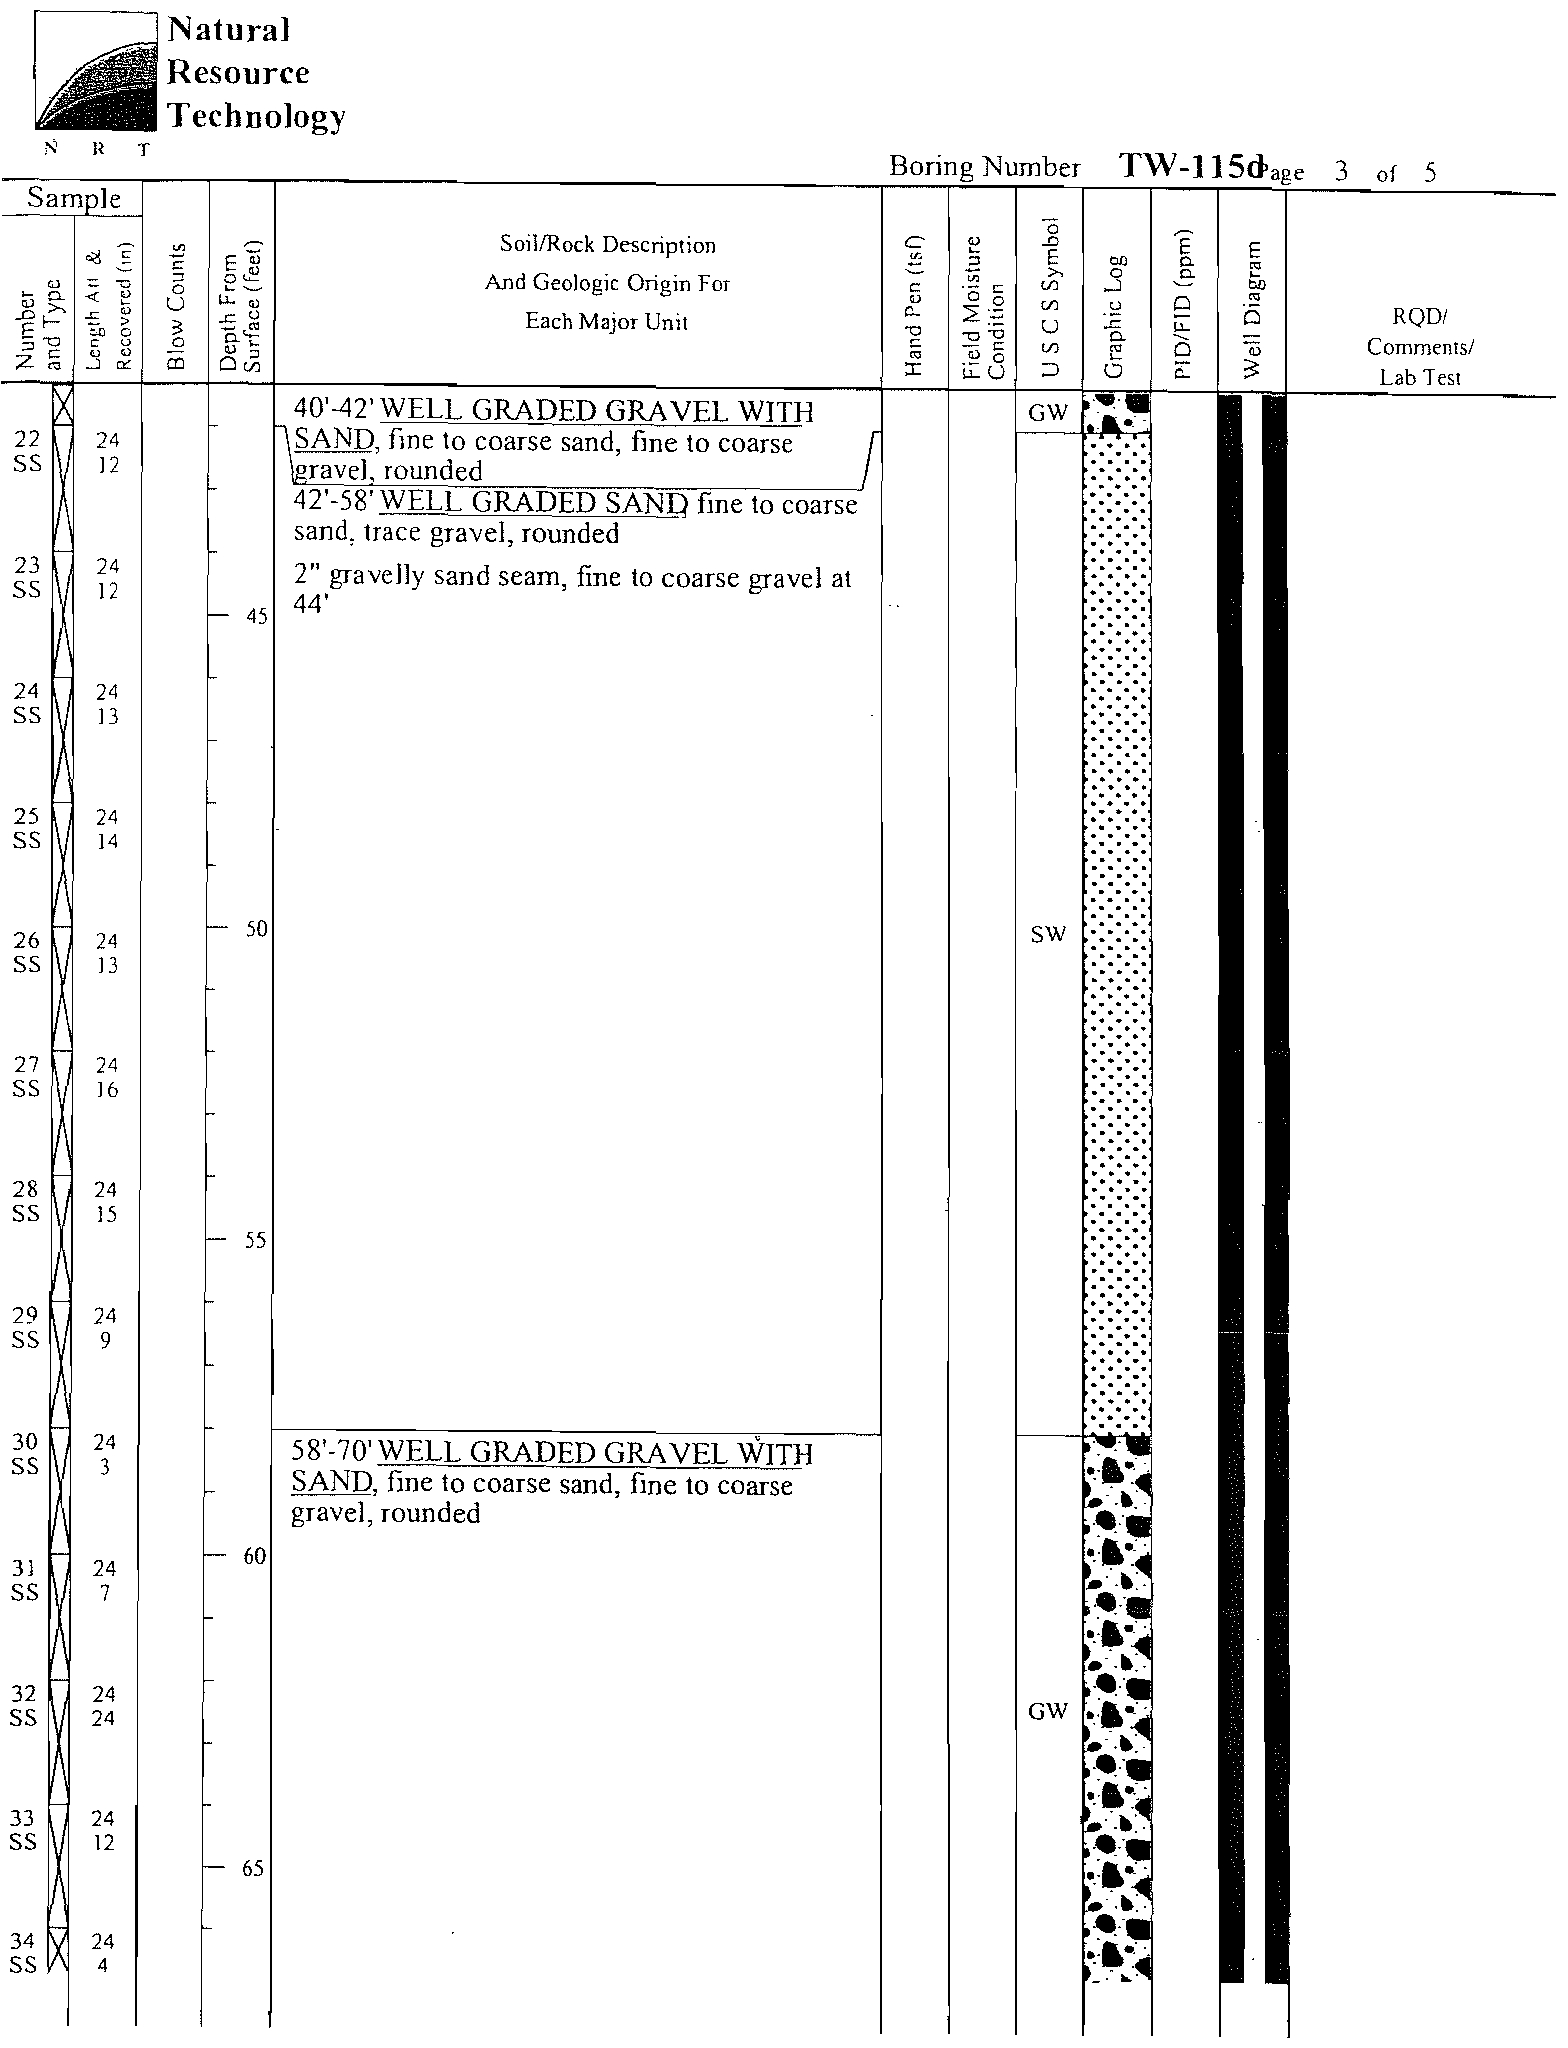
lowland portion of the site and eastern portion of Pond D are underlain by 90 feet of alluvium in the
Wabash River bedrock valley. The upper 20 feet of alluvium is fine-grained, primarily composed of silt and
clay with thin sand lenses, while the lower
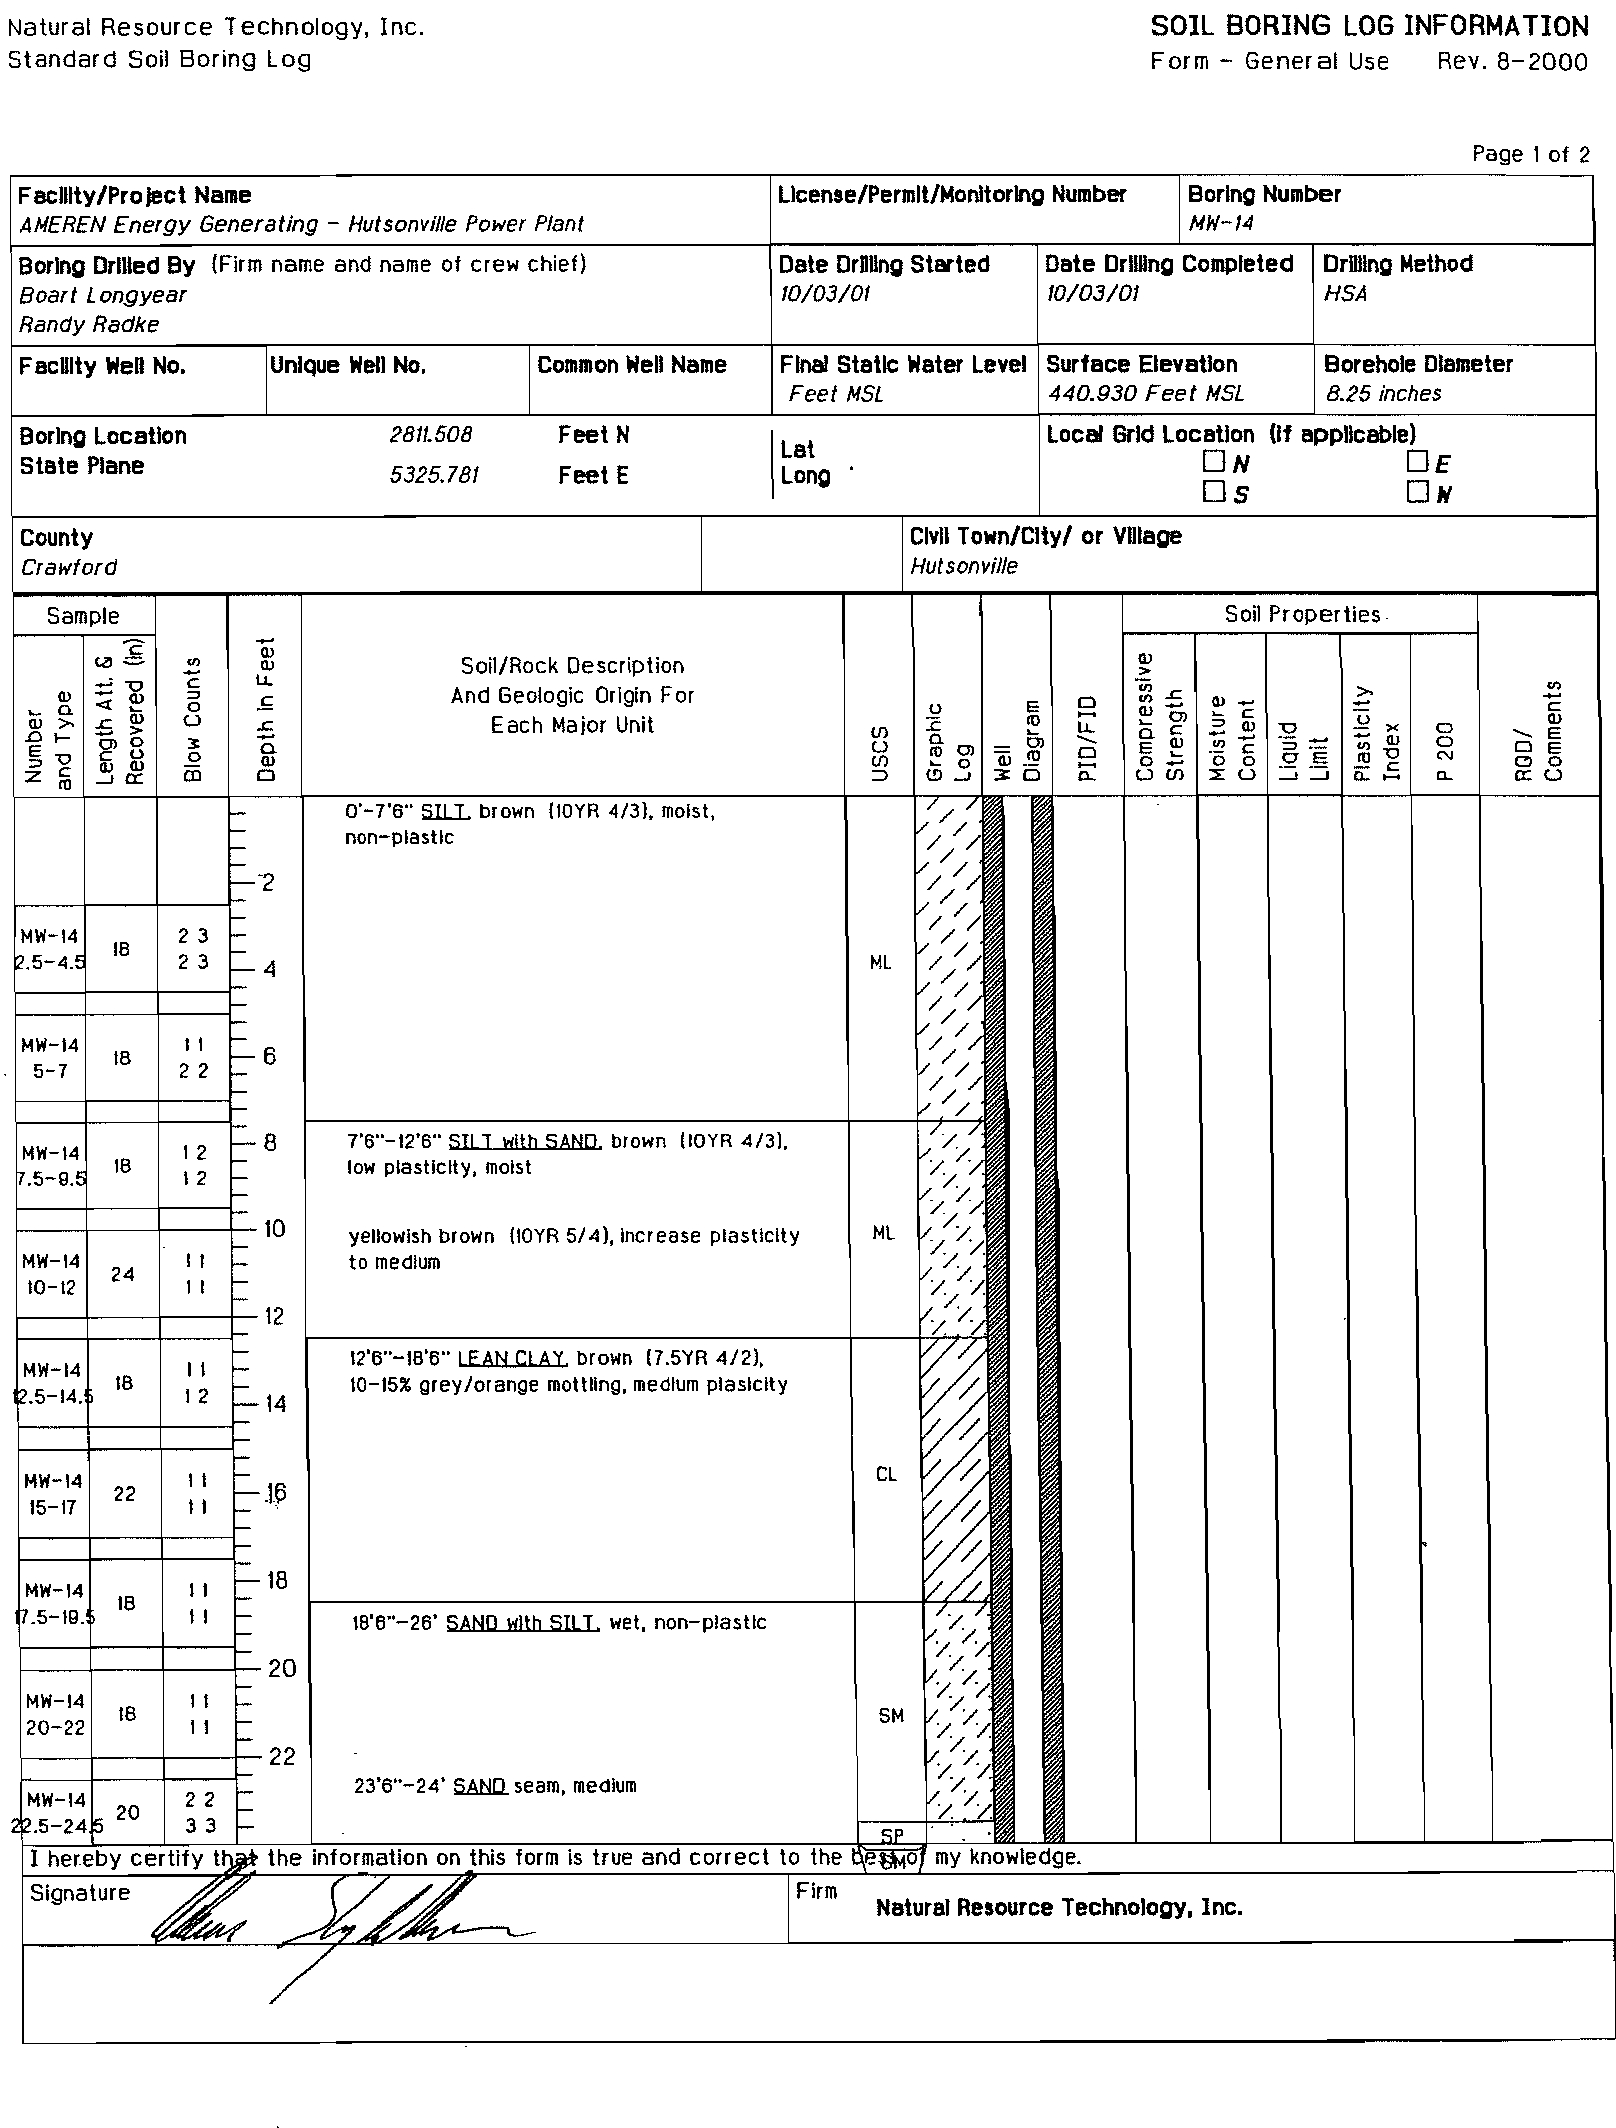
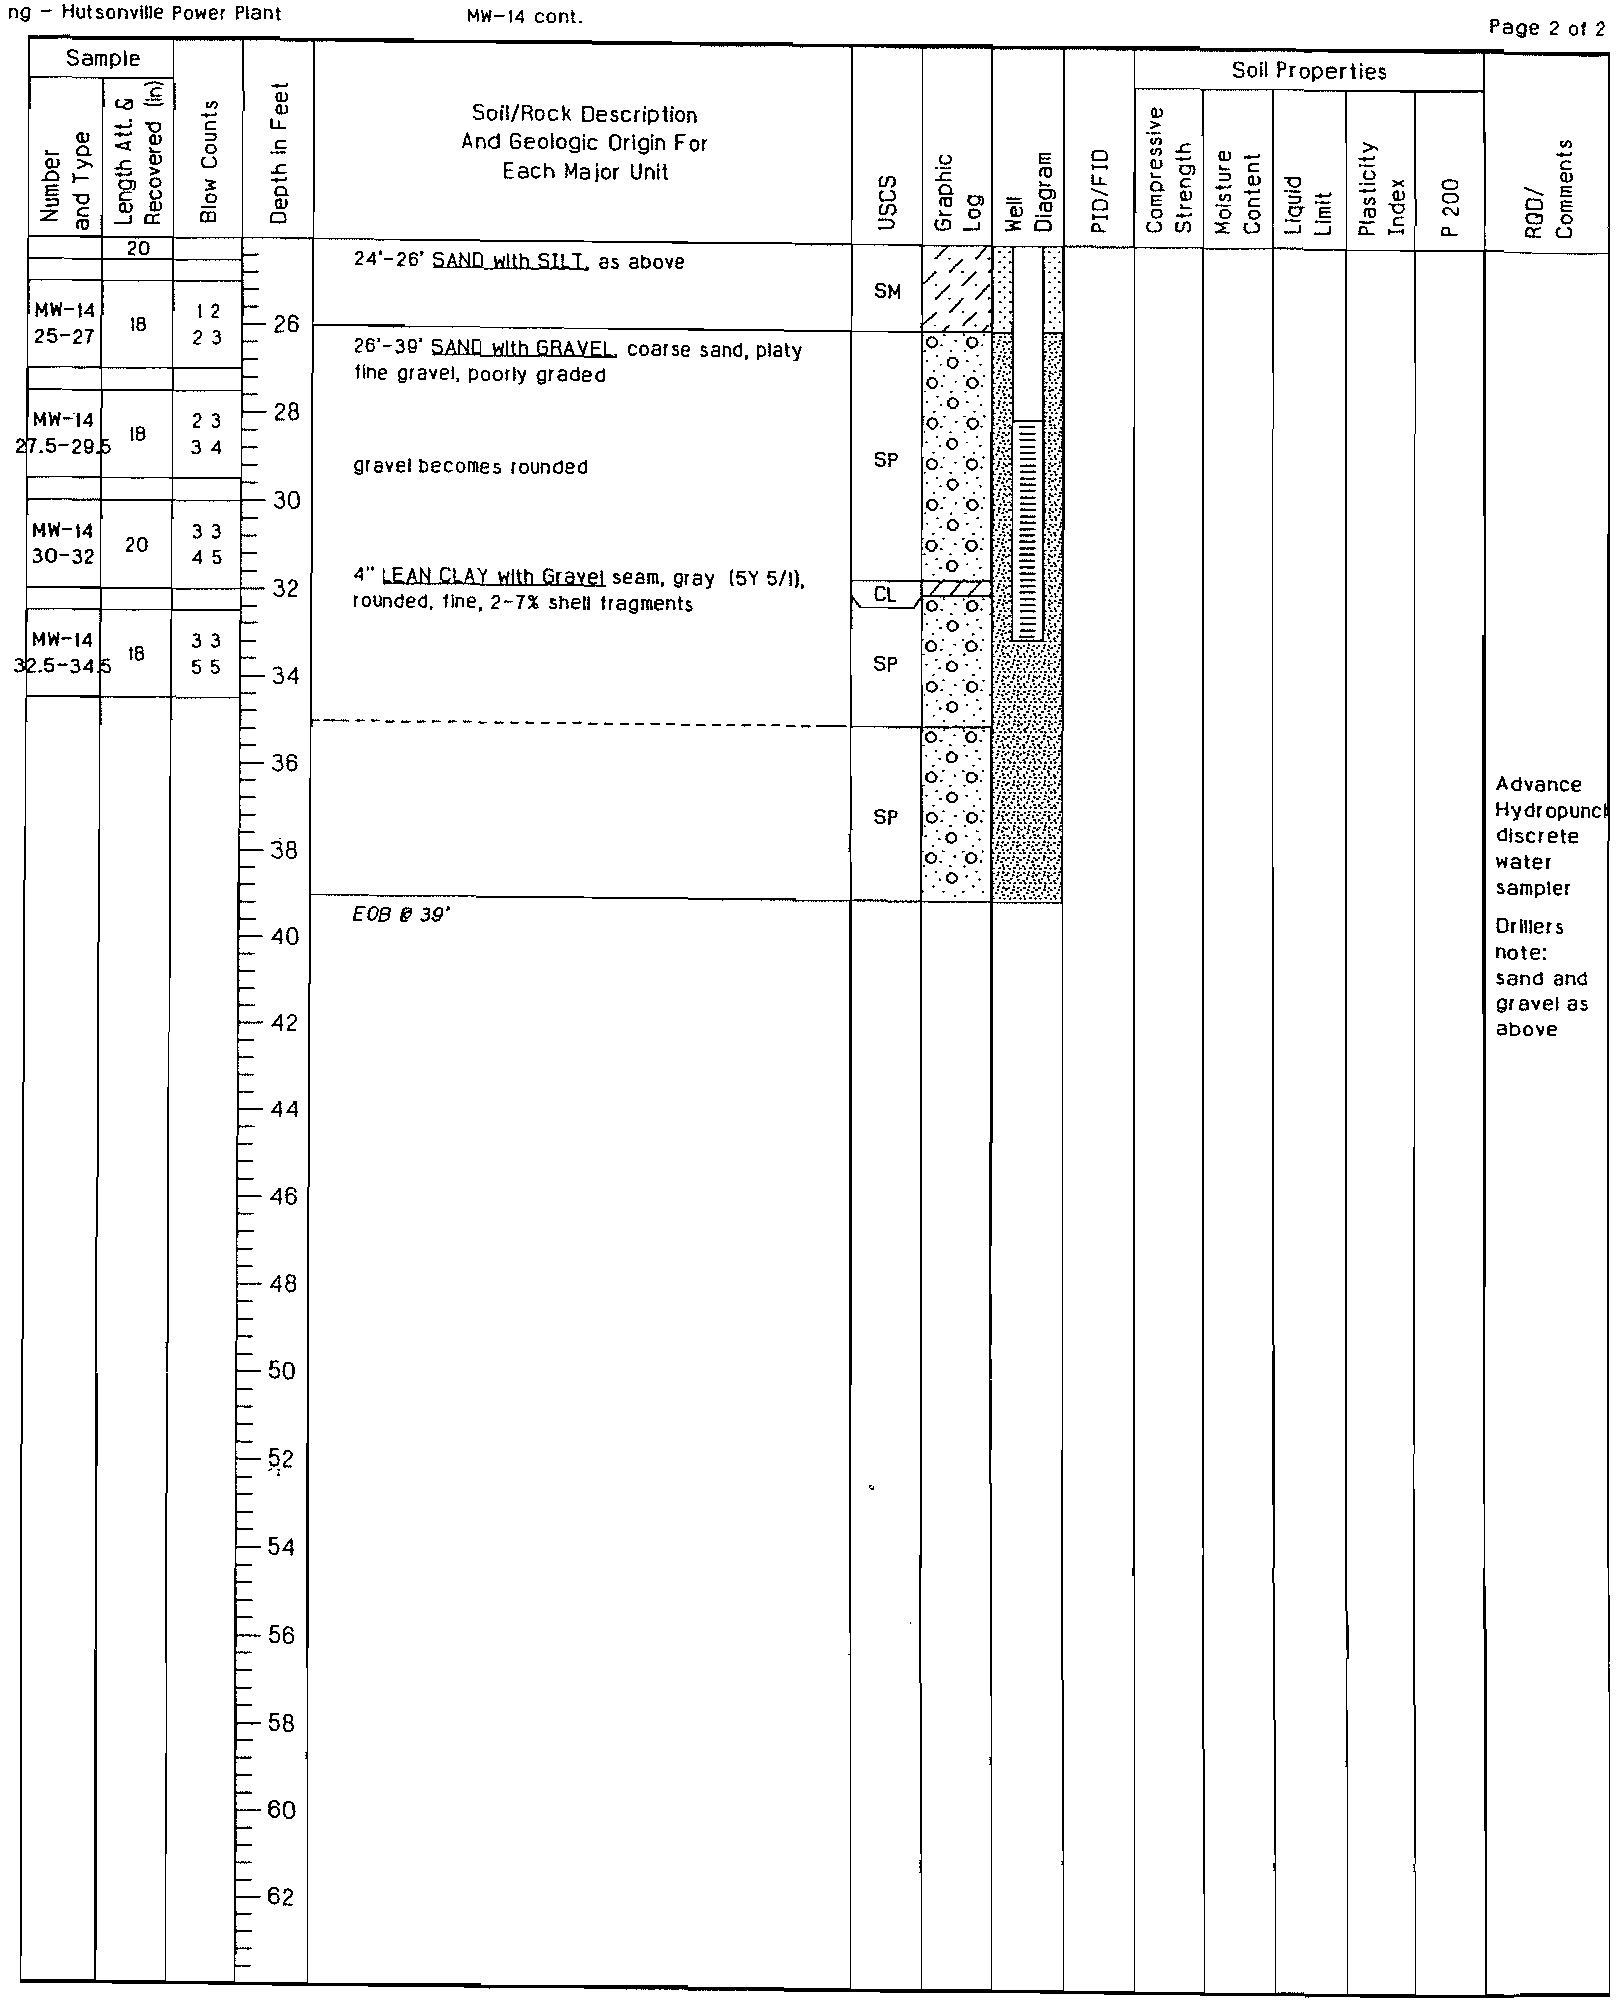
70 feet is coarse-grained, consisting of sand and gravel. Every
boring drilled over the alluvium encountered the fine-grained deposits, and on-site borings that extended to
the underlying sand and gravel (SBlOI, SBI02, MW7D, MW14, MW115, and MW12l) encountered 19 to
25 feet
of these deposits (Figure 2, Cross-Section B-B'). Pennsylvanian-age shale underlies the alluvium.
The shallow upland sand and sandstone, and sand lenses in the fine-grained alluvium are referred to at the
upper migration zone, and constitute the uppermost aquifer at this site. The coarse-grained
alluvium is
referred to as the deep alluvial aquifer. The shale underlying the upland sandstone and the silts
and clays of
the fine grained alluvium separate the upper migration zone from the deep alluvial aquifer.
23713 W, Paul Rd., Ste, 0 • Pewaukee, WI 53072 • Phone, 262.523.9000 . Fa'" 262.523.9001 • www.naturalrt.com
Mr.
John Pozzo
May 5, 2008
Page 2
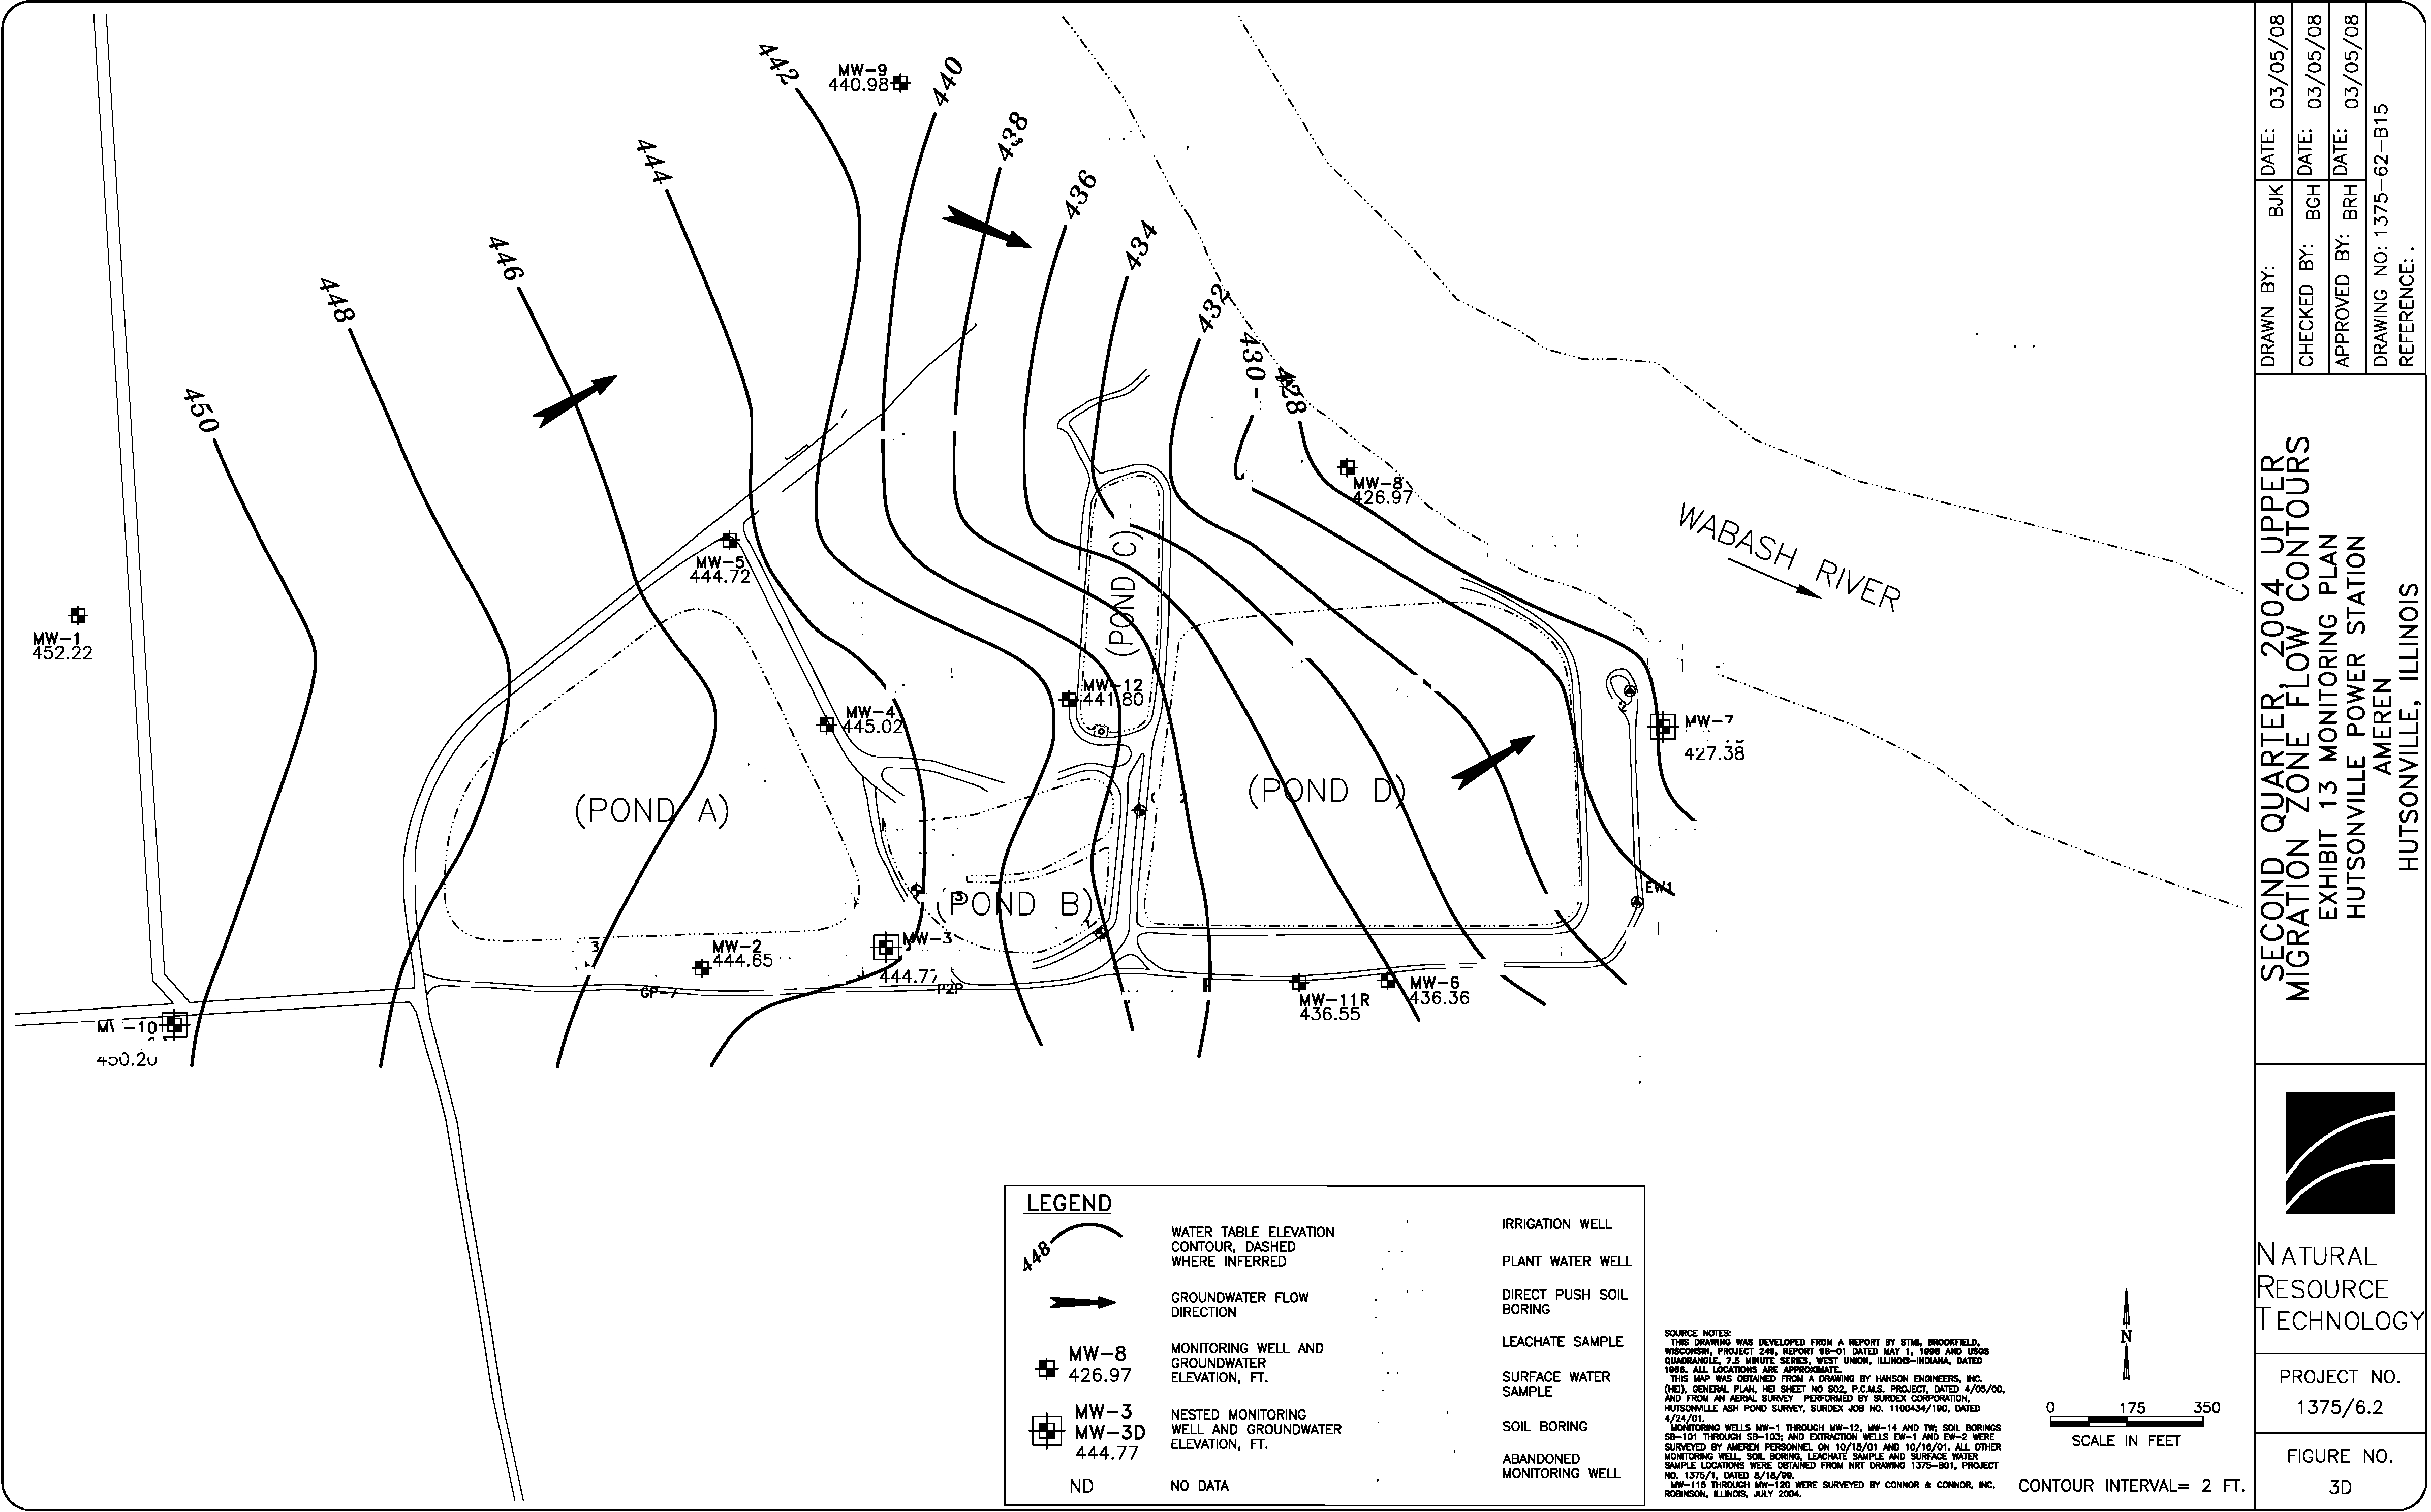
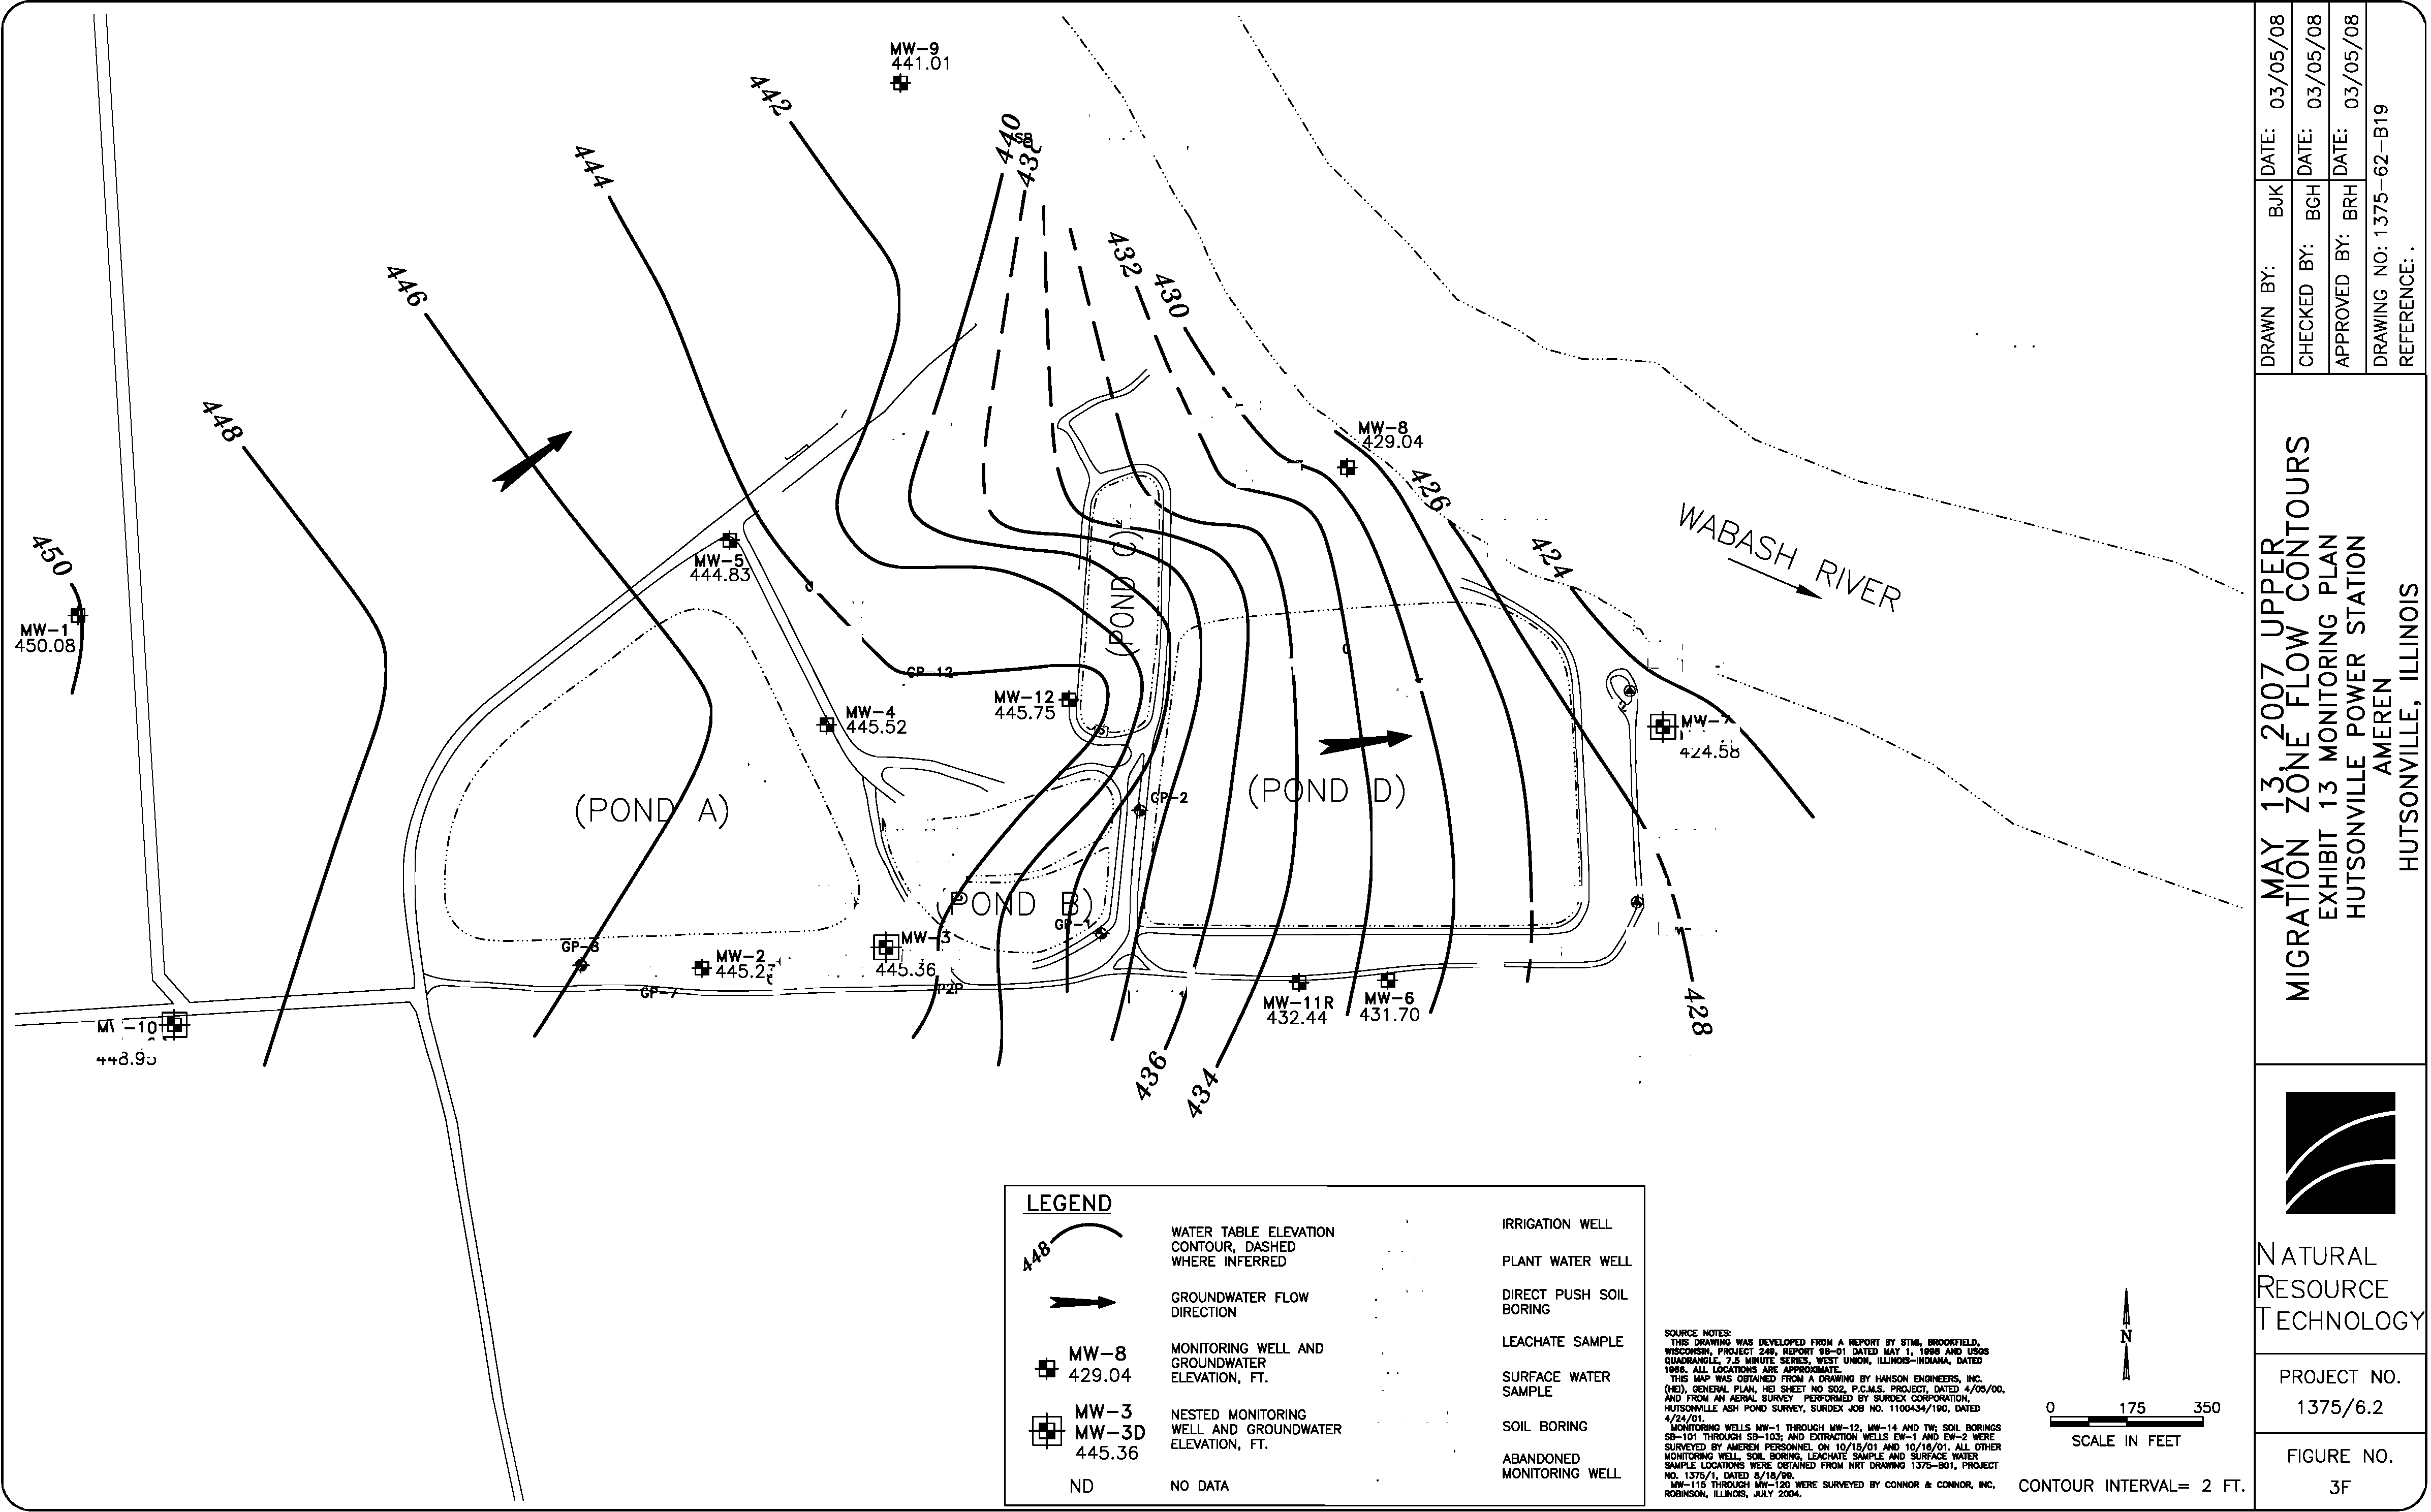
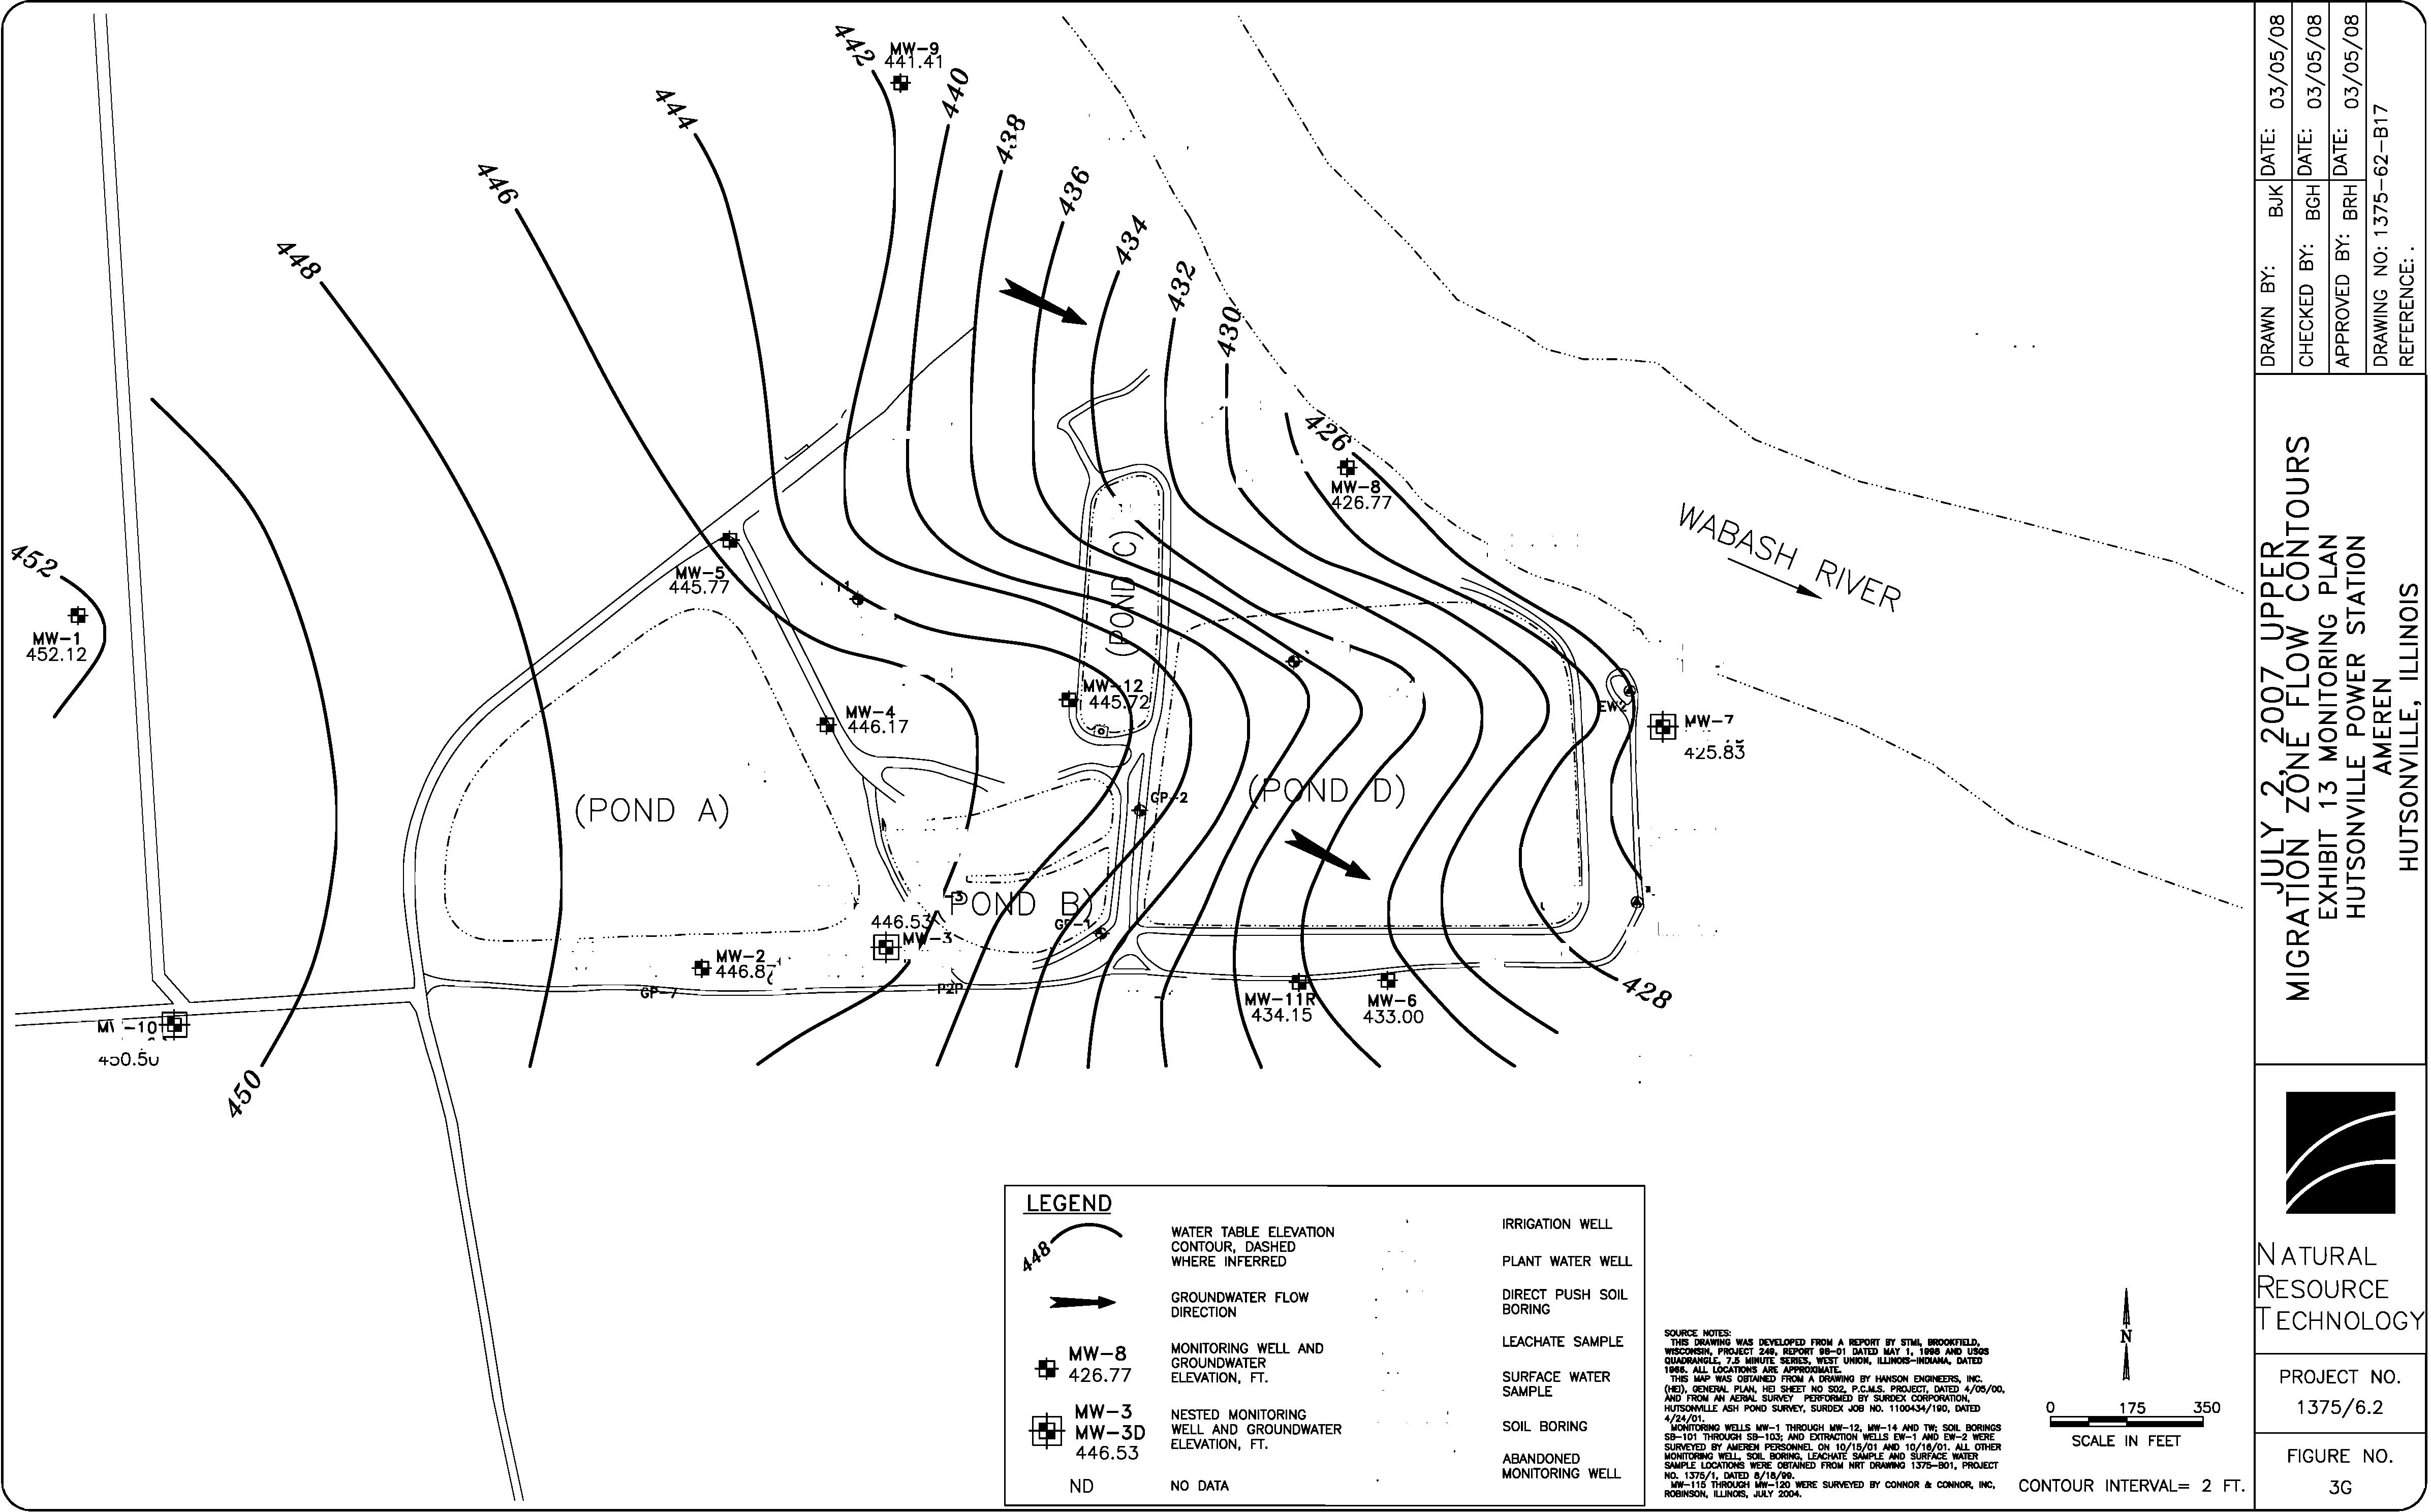
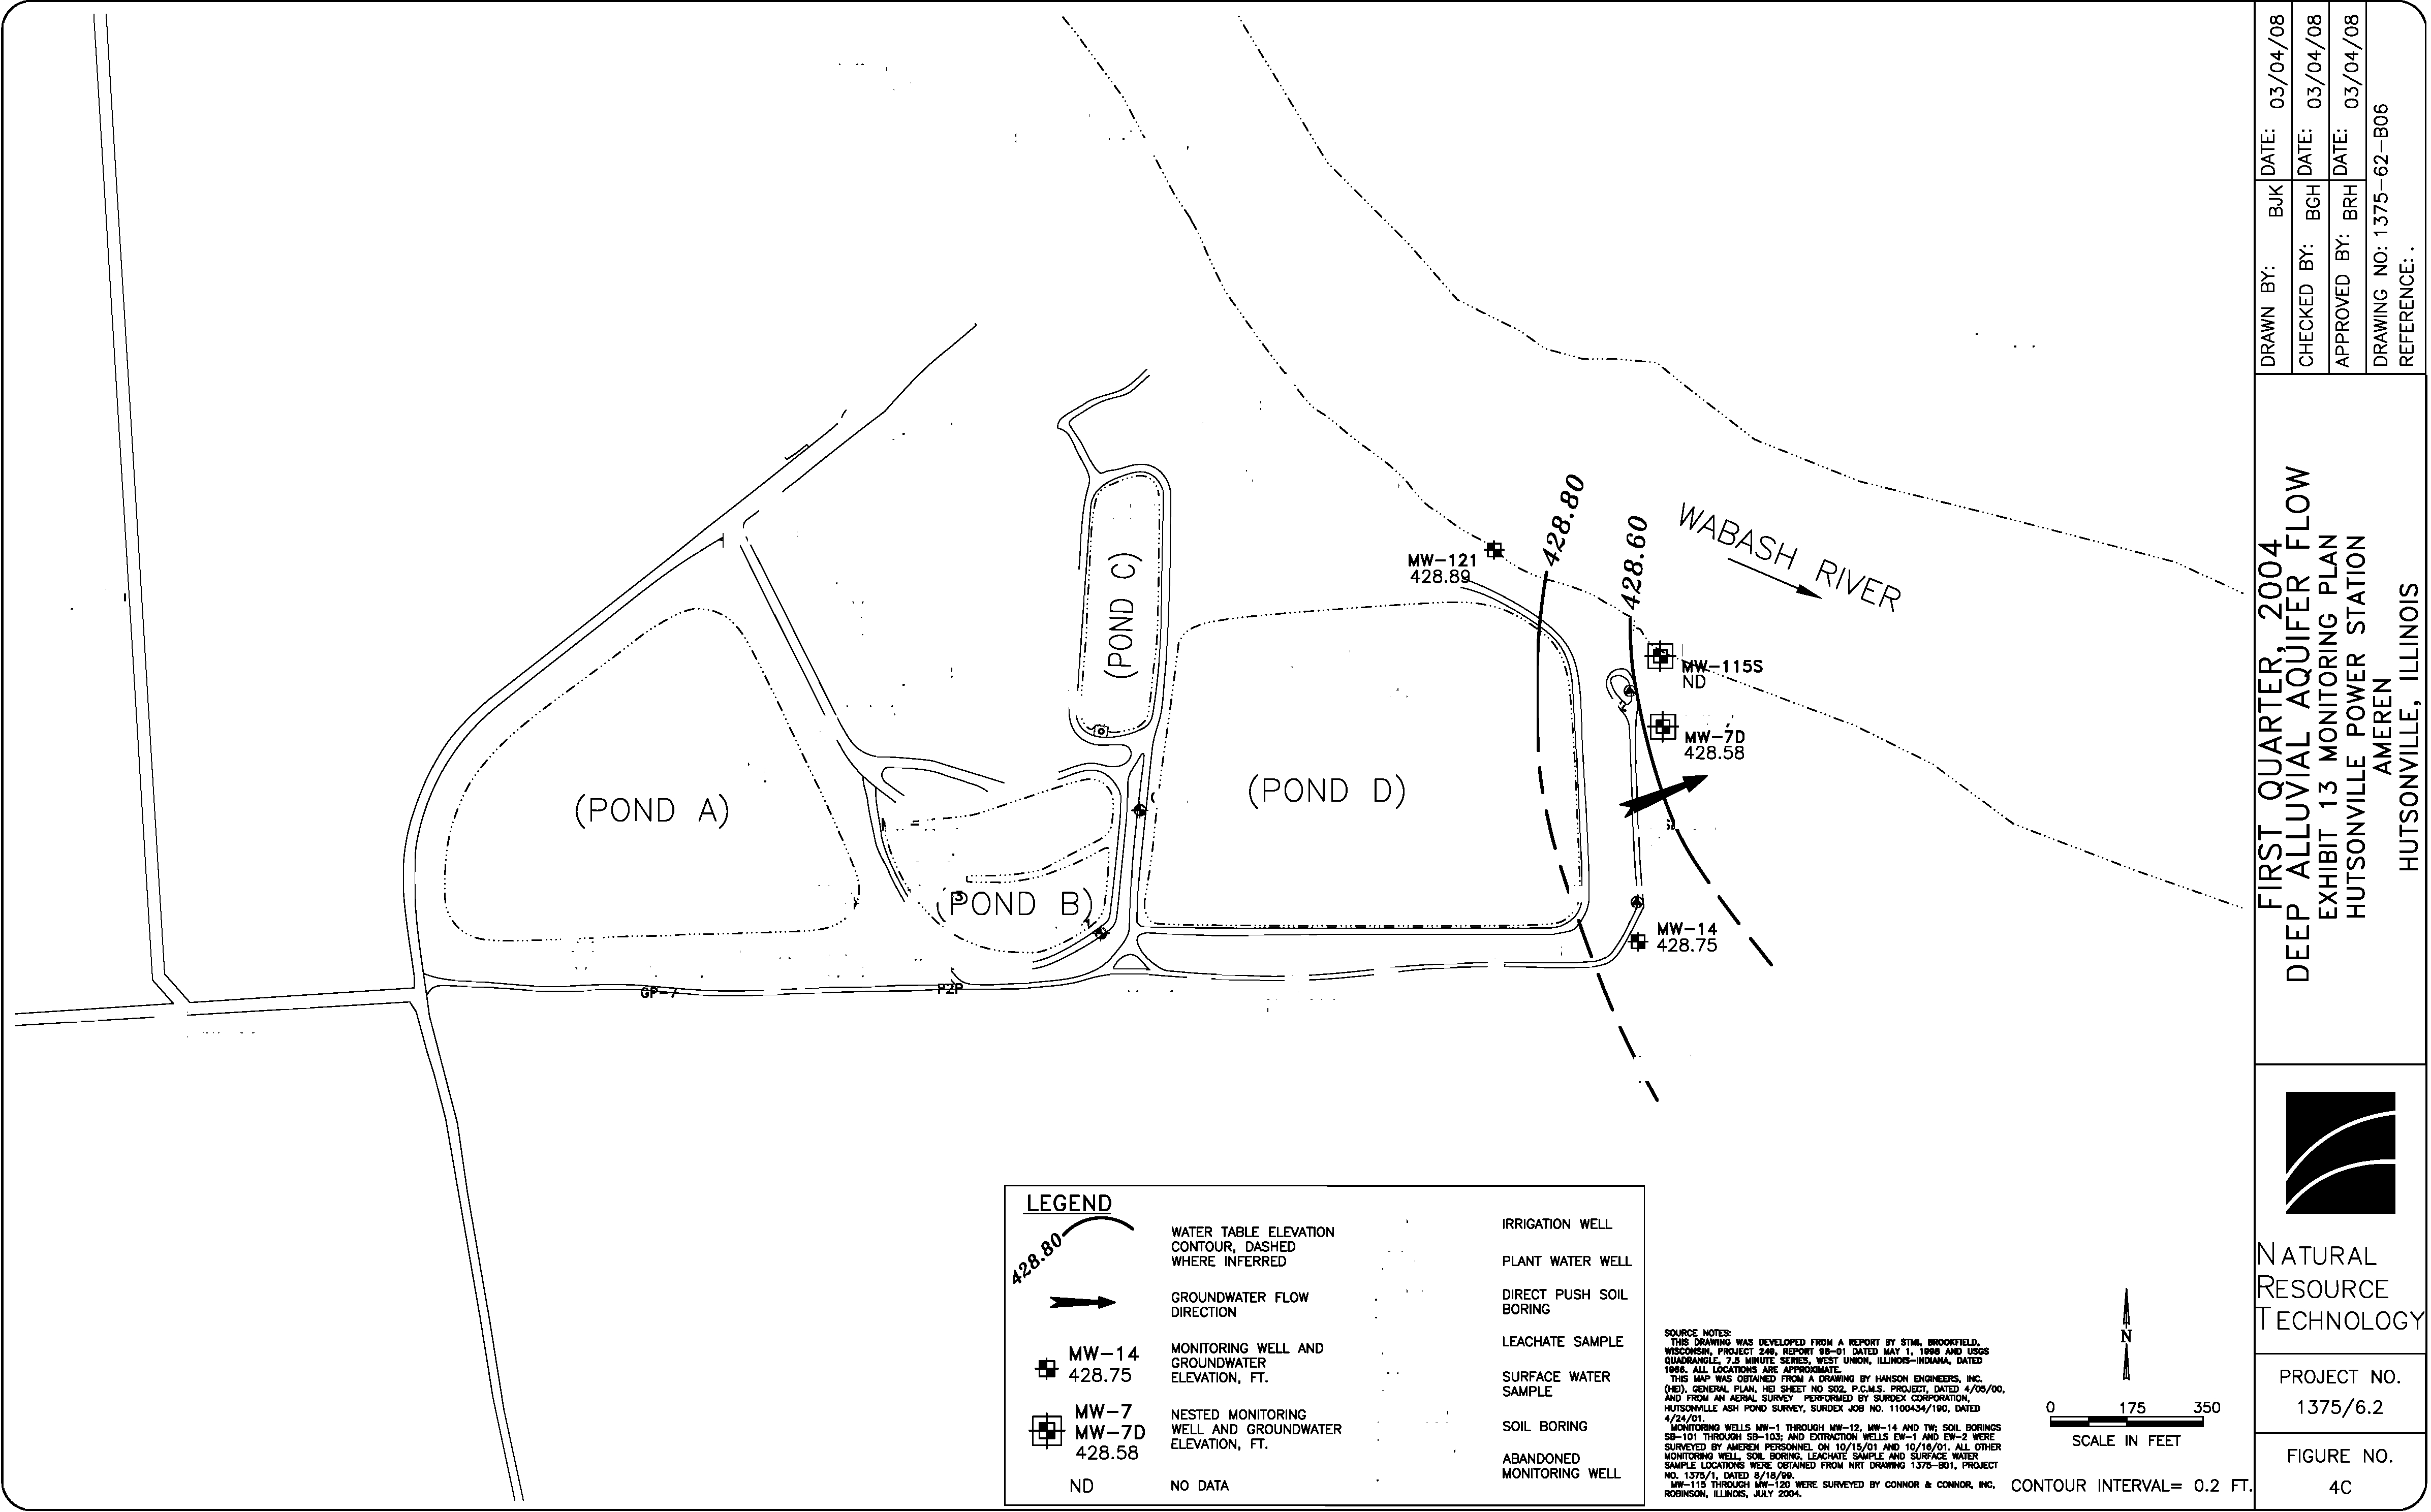
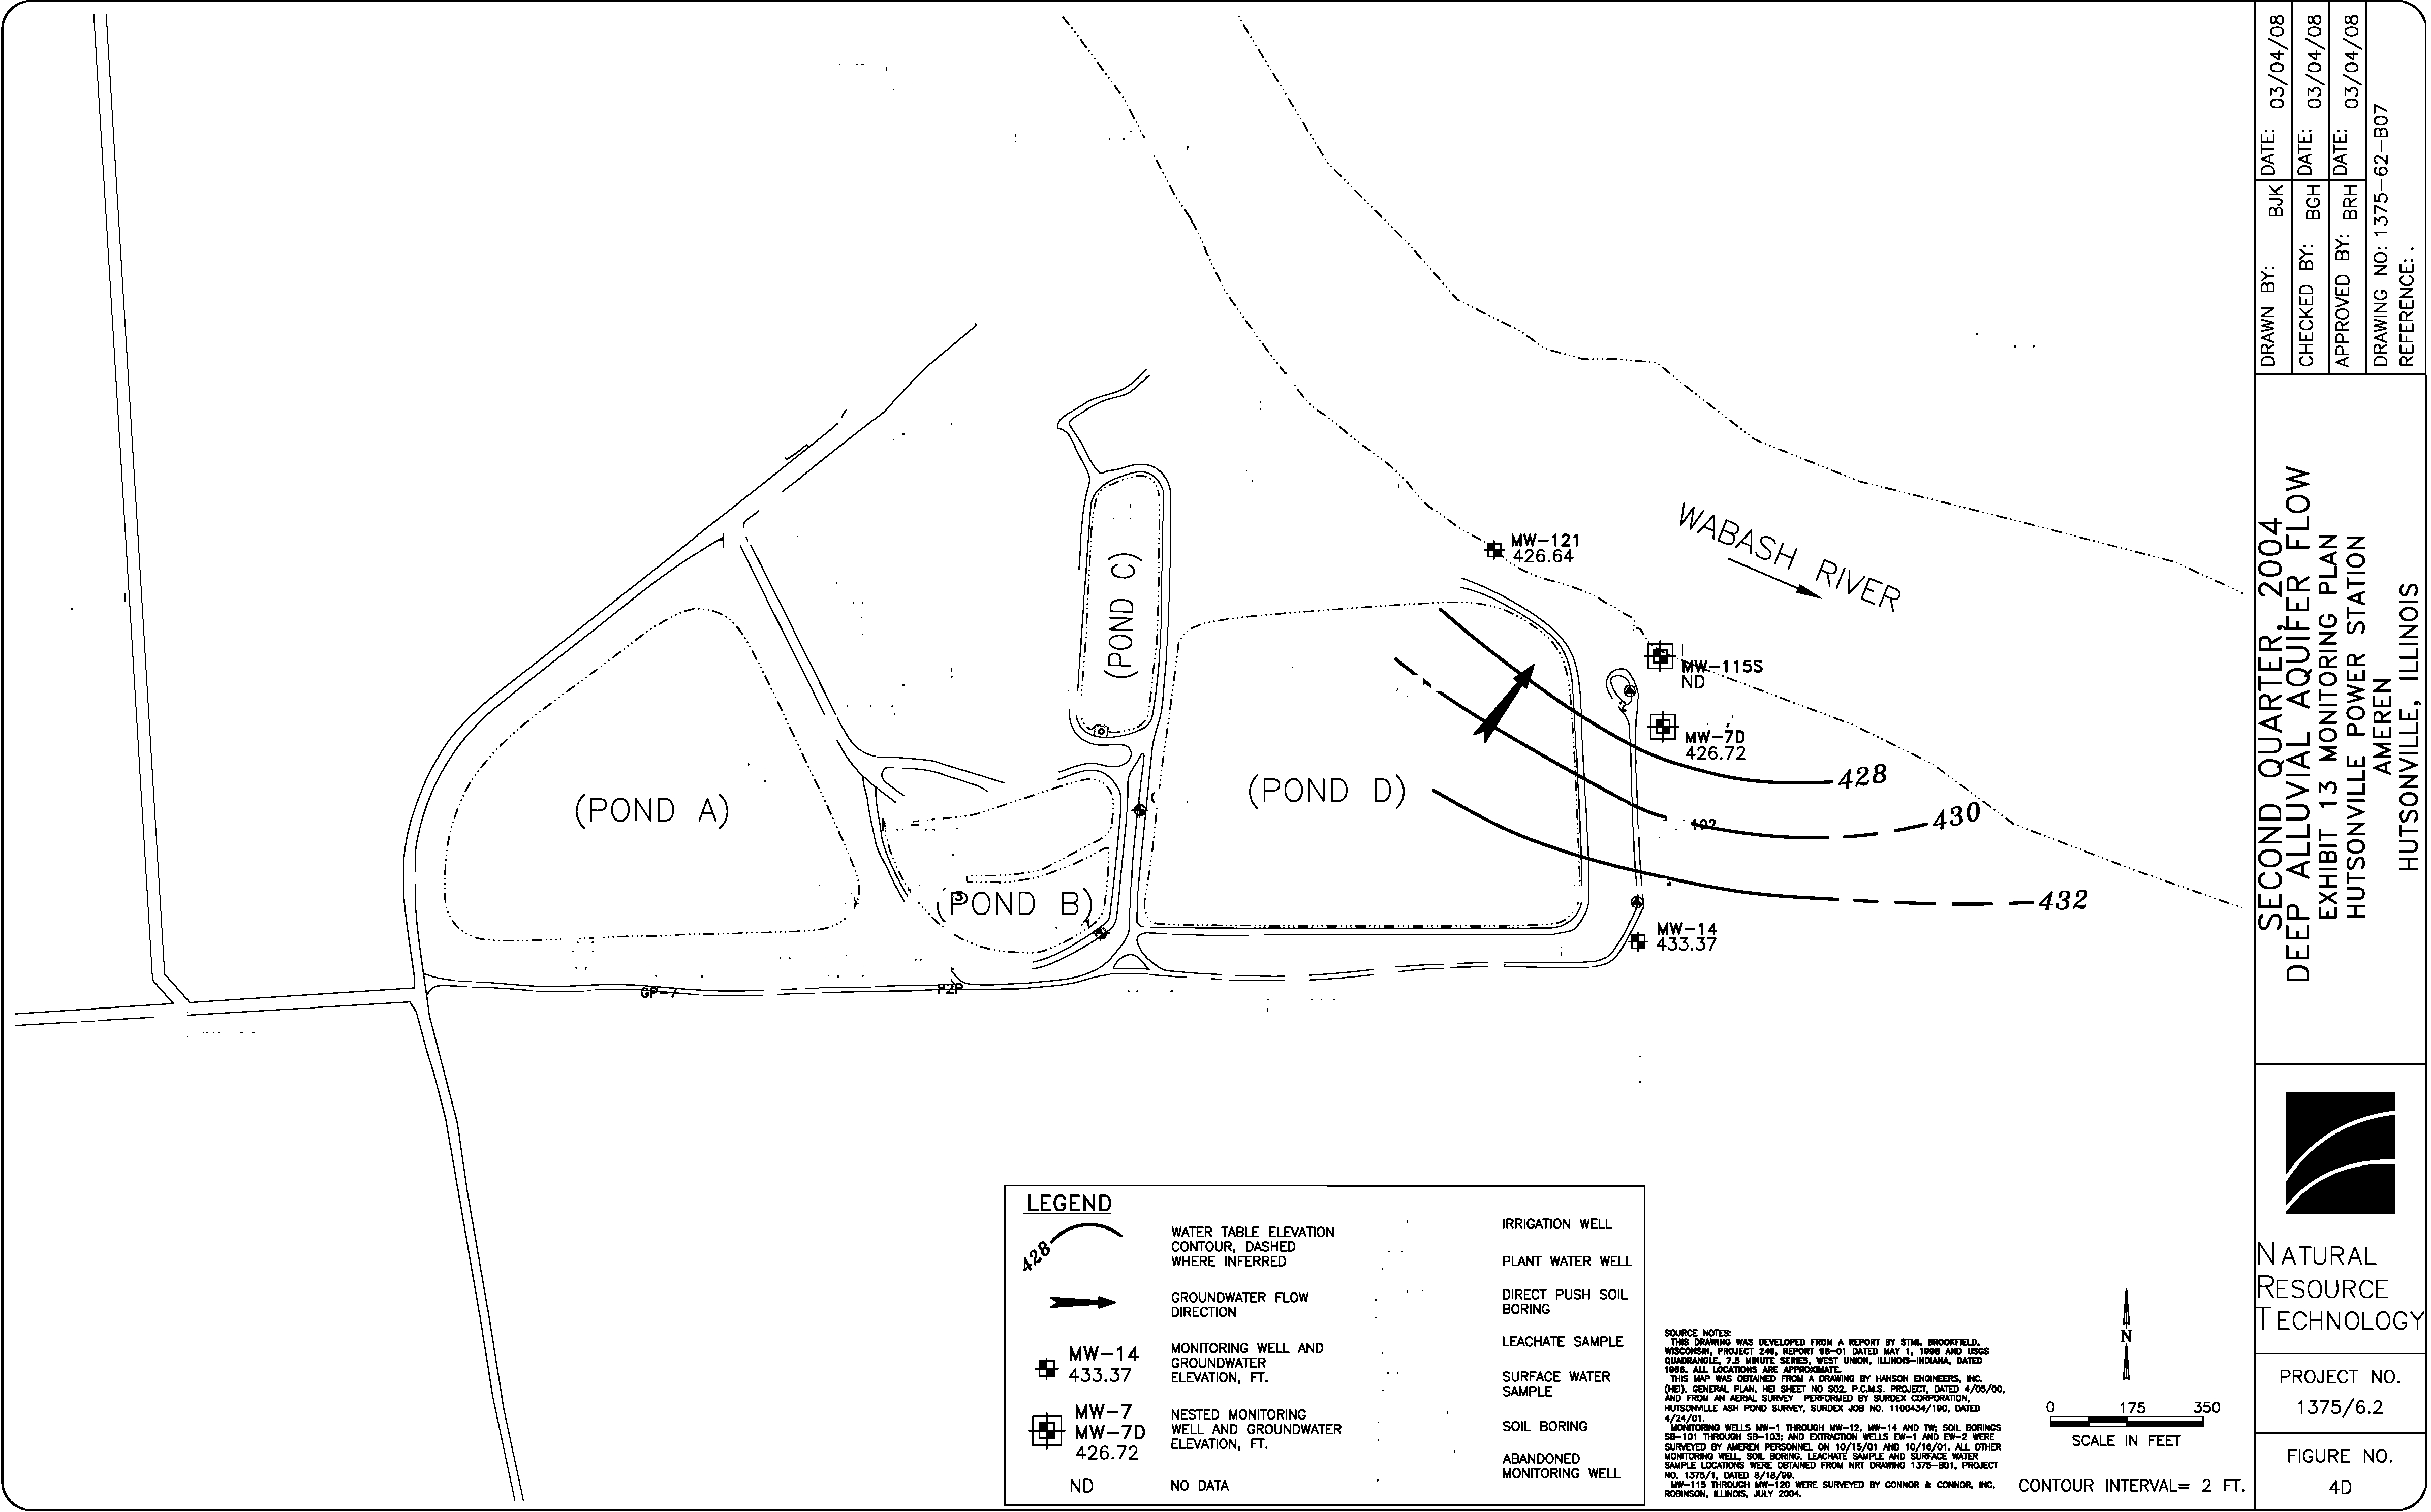
Groundwater flow was mapped for four consecutive quarters during the period used to calculate
background statistics, described later
in this document, and for which complete sample sets were available.
Unfortunately, depth to water readings for all
ofthe upper migration zone and one ofthe deep alluvial
aquifer maps were not collected on the same day. While this discrepancy did not appear to change
map
depictions of the overall direction of groundwater flow, it affected relative readings between wells.
Therefore, a second set
of drawings was produced using data collected after the plant initiated same-date
measurements beginning
in 2006. All maps show that groundwater flow in the upper migration zone and
the deep alluvial aquifer is eastward toward the Wabash River (Figures 3 and 4).
Groundwater Quality
AEG has performed groundwater monitoring at this facility and found elevated concentrations of horon and
sulfate in Pond D monitoring wells screened
in the upper migration zone (Figure Sa and 5b).
In
addition,
there are slightly elevated (higher than background, lower than Class I standards) concentrations
of boron
and sulfate in one monitoring well
in the deep alluvial aquifer (Figure 6a and 6b). Sulfate and boron are
mobile indicator parameters for coal ash leachate.
Impacted Pond D monitoring wells in
the upper migration zone are MW-6, MW-7, MW-8, and MW-IIR.
Concentrations of boron and sulfate have recently' been as high as 16 mgIL and 960
mglL,
respectively
(Figures Sa and 5b). The impacted well within the deep alluvial aquifer is MW-14, where boron and sulfate
concentrations were as high as 1.5 mgIL and 230
mglL,
respectively (Figures 6a and 6b). The fme-grained
alluvial deposits overlying the deep alluvial aquifer occur over an elevation range that overlaps
the upland
shale (Figure 2, Cross-Section
A-A'),combining to form a confining layer that restricts vertical migration of
groundwater. The efficacy of the confining layer is supported by the concentration data, because the only
ash leachate impacts observed in the deep alluvial aquifer are highly localized, and
at concentrations lower
than Class 1 standards and much lower than in
the upper migration zone, despite the fact that Pond D was
first placed in service 40 years ago.
AEG currently has a groundwater monitoring program for Pond A. The Pond A monitoring program is
designed for detection
of a release from that lined pond.
It
consists of five monitoring wells completed in
the upper migration zone', and five parameters with listed limitations, on a monthly basis (Table I).
The
Pond A monitoring program is in compliance with monitoring regulations under 35111. Adm. Code 620, as
evidenced by a permit to operate this facility issued on June 14,2005 (Permit No. 2005-EO-3689).
POND D MONITORING PROGRAM
This monitoring plan was prepared in anticipation of Pond D closure and groundwater monitoring under
35 TIl. Adm. Code 811.318 and 319. Some of the regulatory requirements for that program are designed for
detection monitoring at new sites, where groundwater quality has not been affected
by prior releases. The
situation at Pond D differs because it was constructed prior to modem regulatory requirements, and a
release has already occurred.
Relief from certain monitoring requirements will be sought in a petition to the
I
Based on data collected between September 2002 and March 2005, the period when consecutive quarterly samples were
collected. Boron concentrations as high as 50 mgIL were observed
in
the mid-to-early 1980s.
, Tbe deep alluvial aquifer does not extend beneath
the zone of attenuation at Pond A.
•
NATURAL
_RI.SOURCE.
_TECHNOLOGY
Mr.
John Pozzo
May 5, 2008
Page 3
Pollution Control Board. The following monitoring program (Table 2)
is proposed assuming a positive
decision
on the petition.
Objective
of Pond D Monitoring Program
The objectives of the monitoring program for Pond Dare:
•
To verilY that concentrations in the upper migration zone near this closed facility decrease or
are maintained at levels below adjusted standards. Groundwater flow and transport
modeling suggests that concentrations south
of Pond D (wells MW-6 and MW-llR) will
decrease over time. However, significant concentration decreases are not expected to the
east (MW-7 and MW-8), because these monitoring wells are downgradient
of saturated ash
areas within Pond D, and leachate will continue to be generated by groundwater flowing
through tbis ash, even after the impoundment is capped.
•
To verilY that concentrations
in the deep alluvial aquifer do not increase to levels higher
than background or adjusted grouudwater quality standards as appropriate.
Monitoring Wells
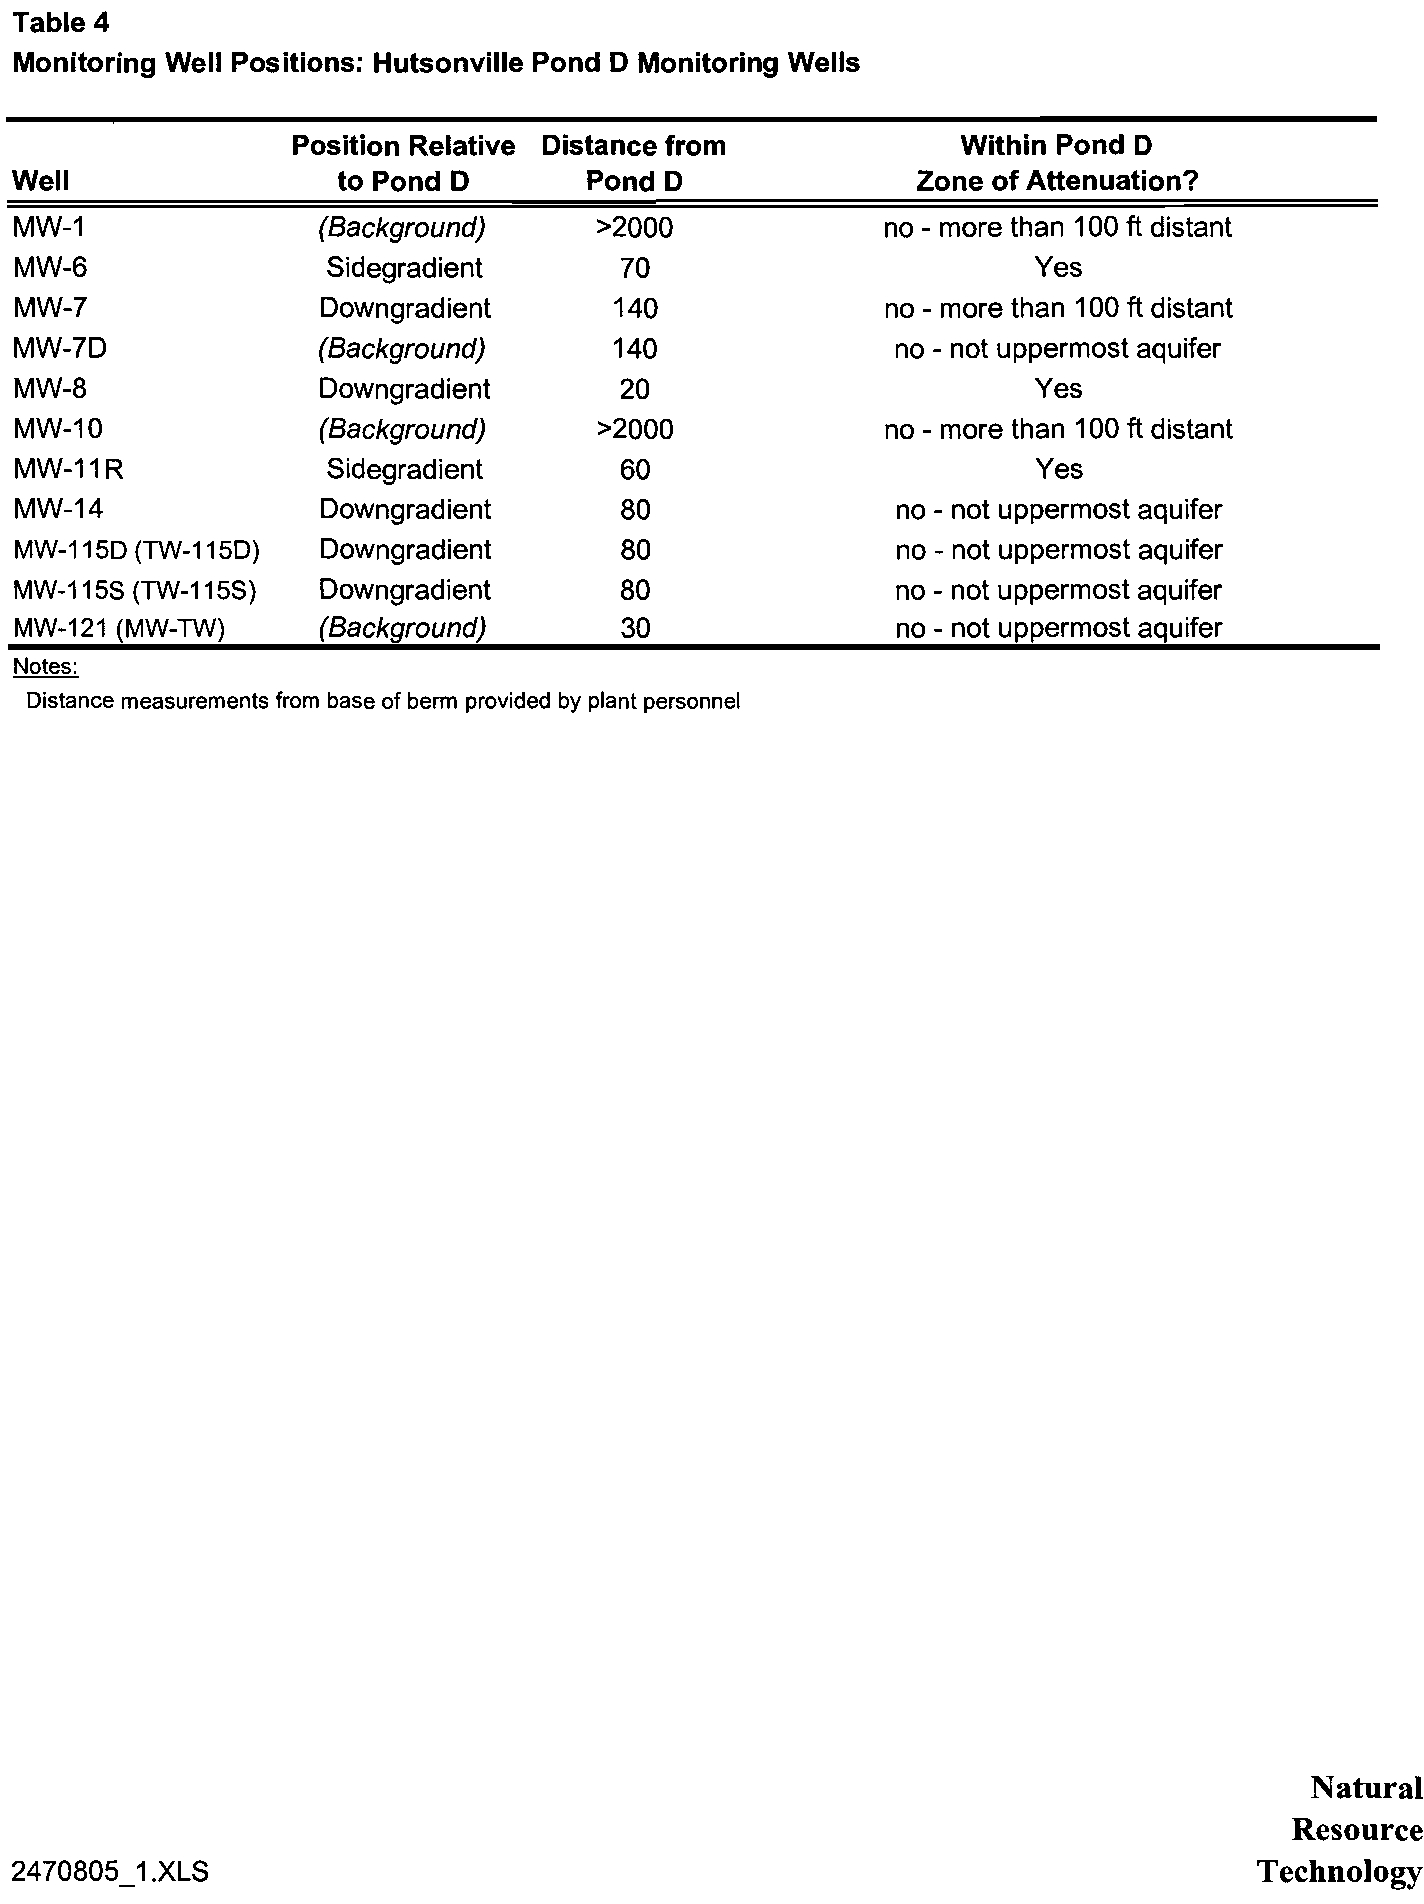
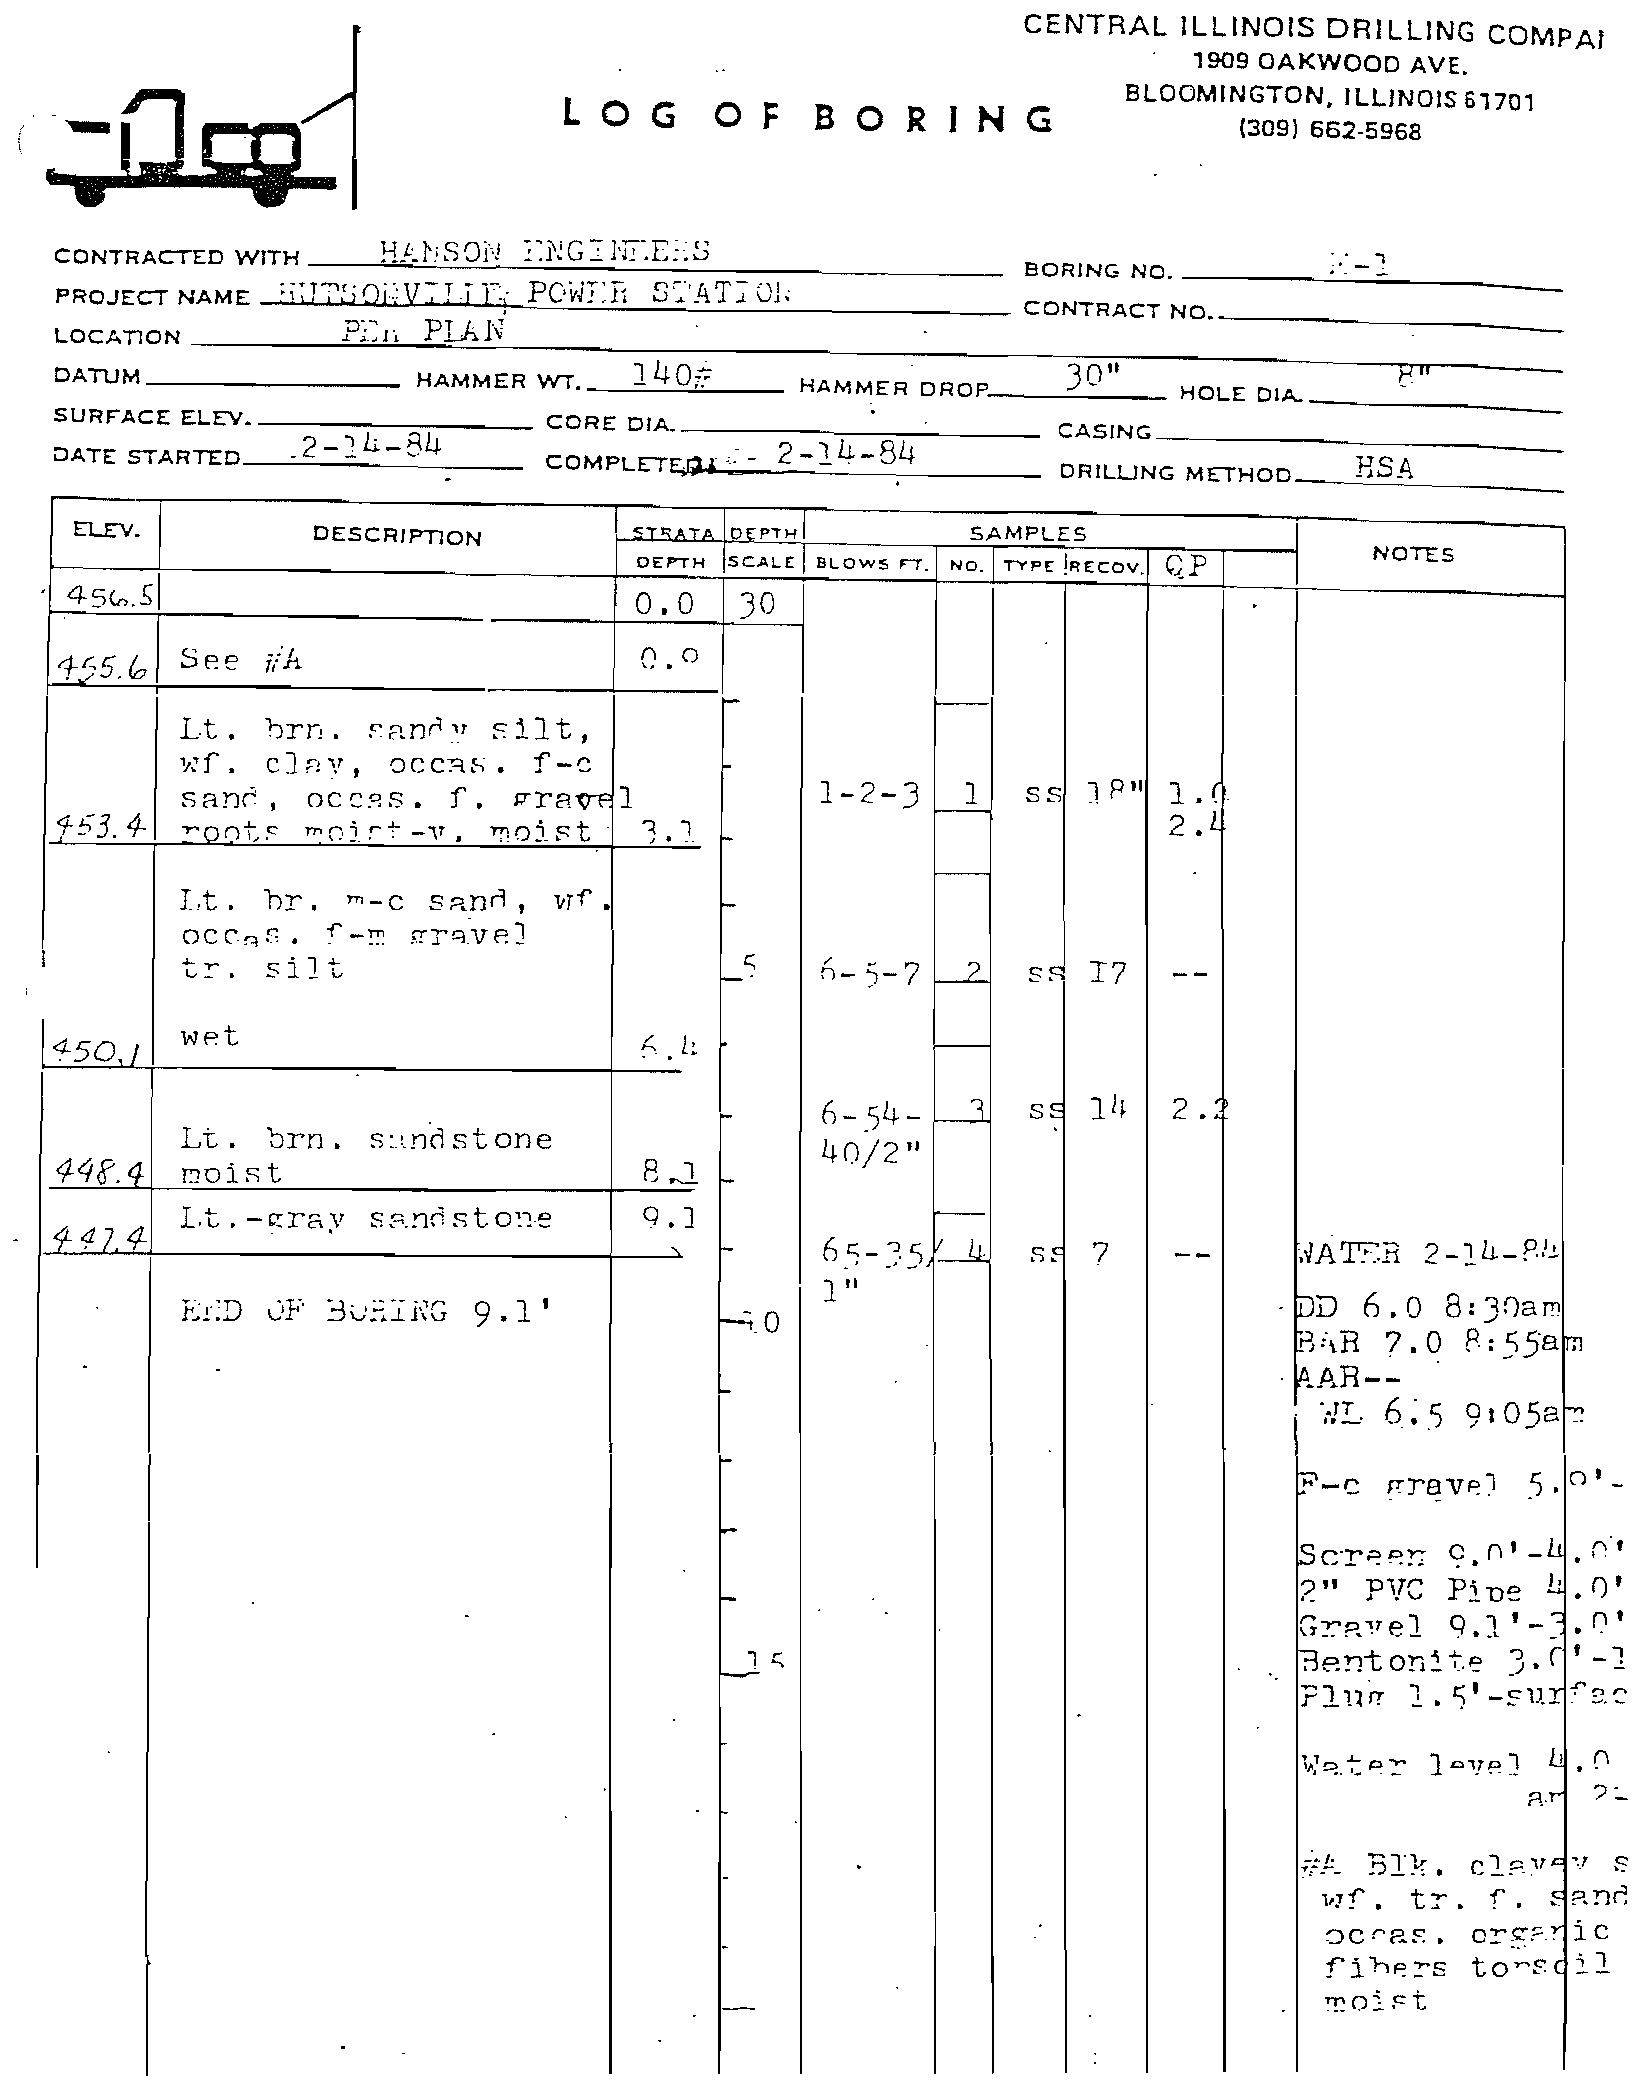
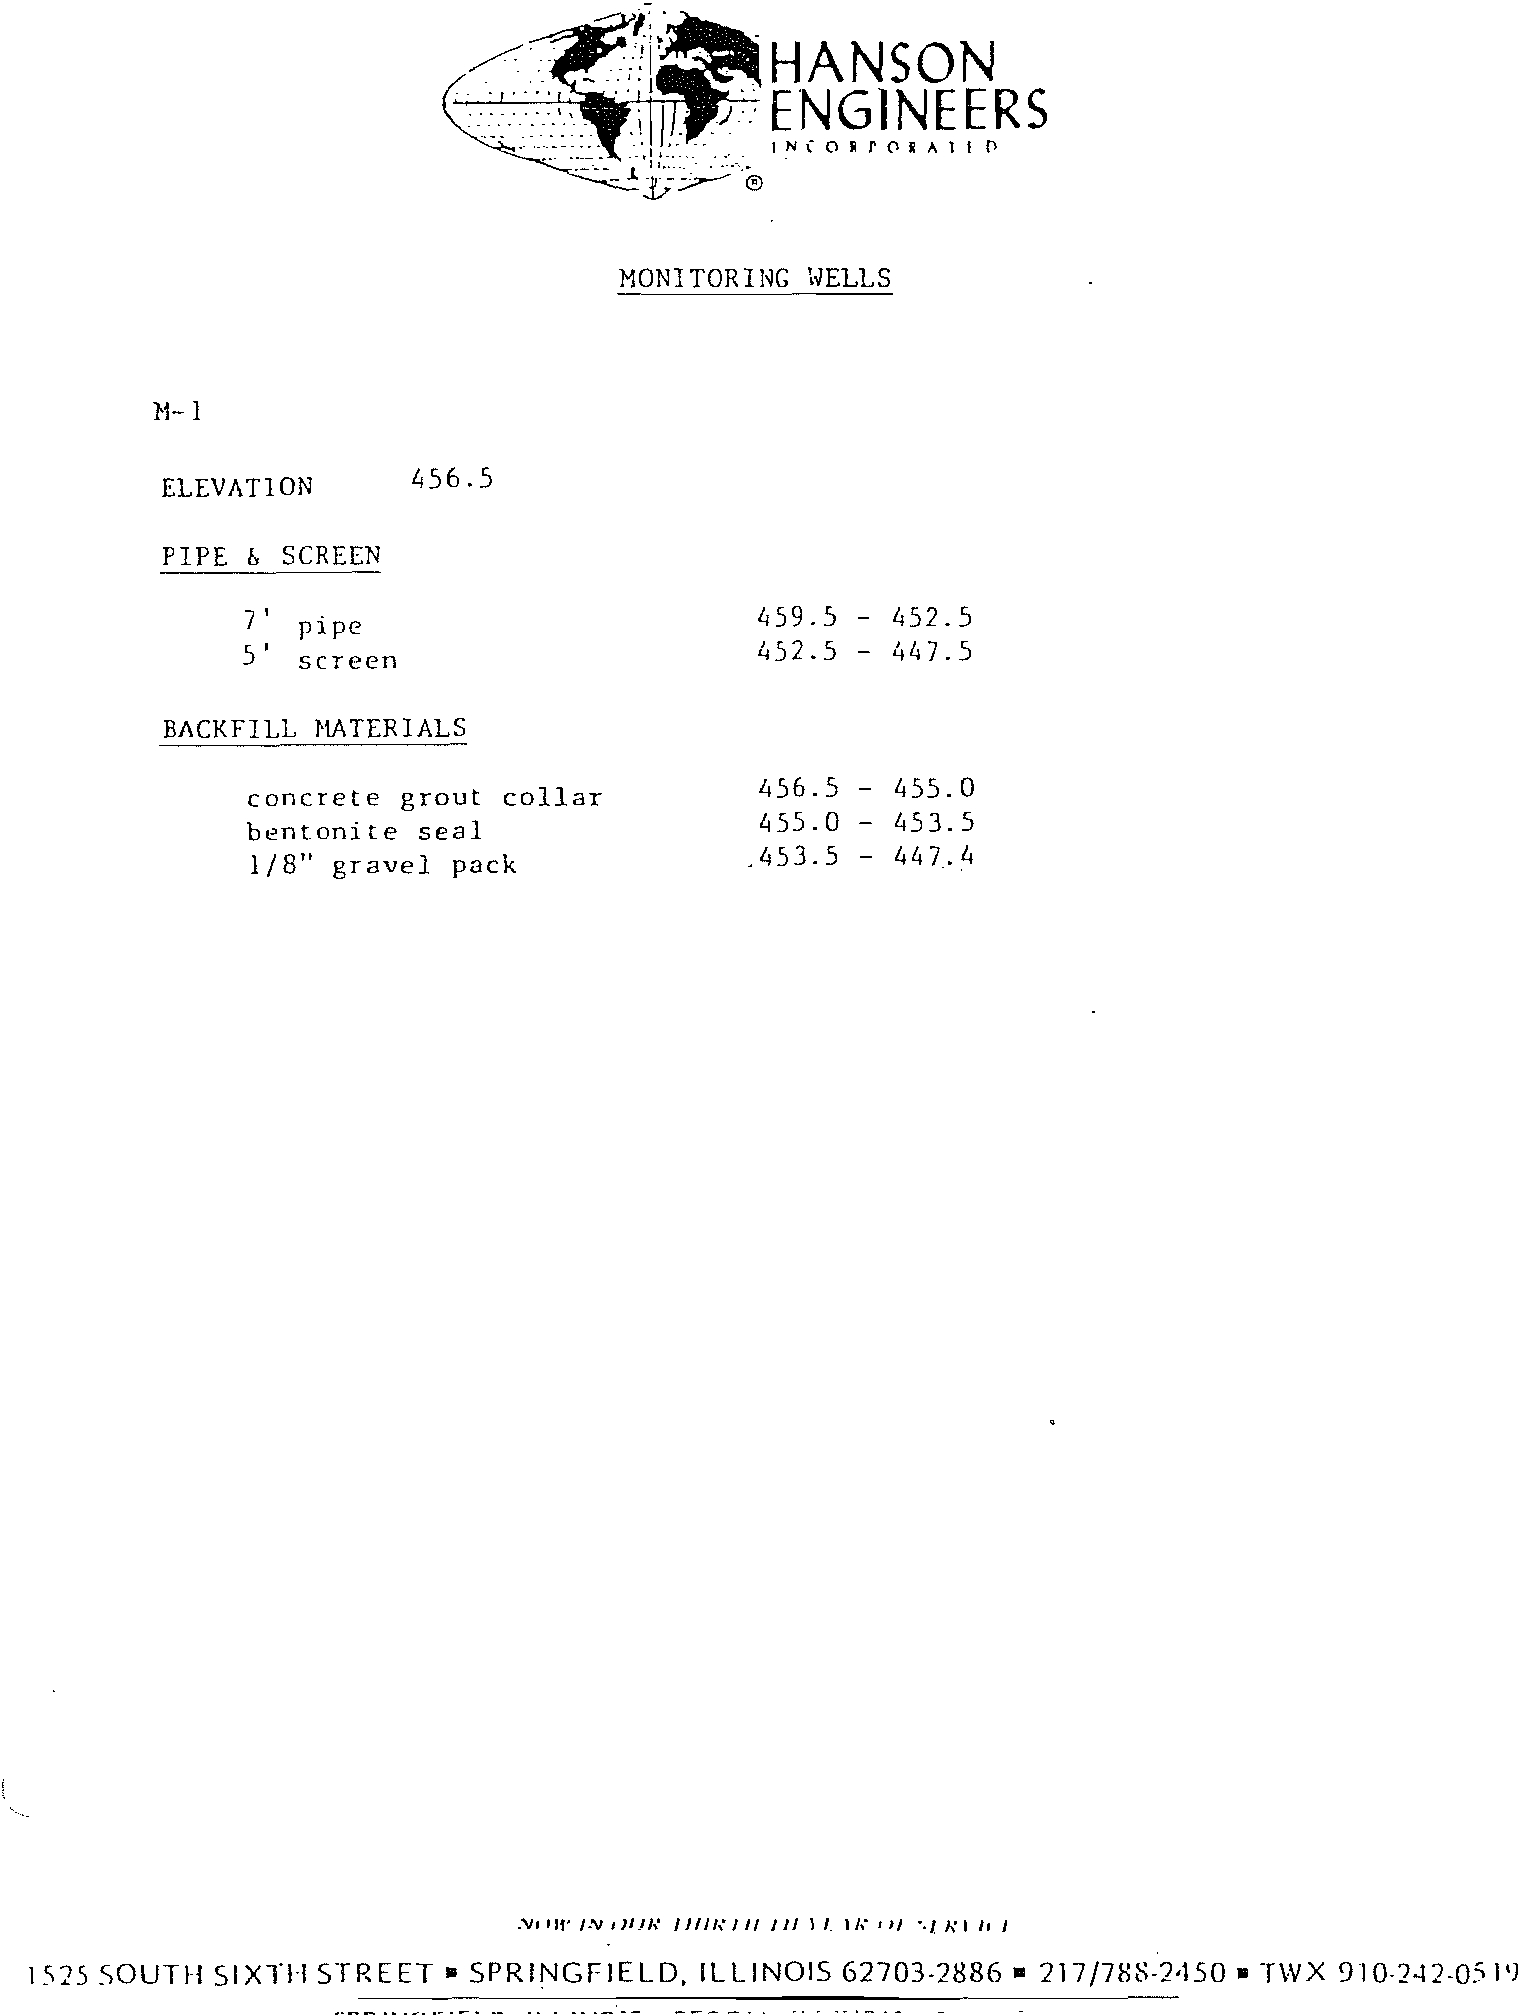
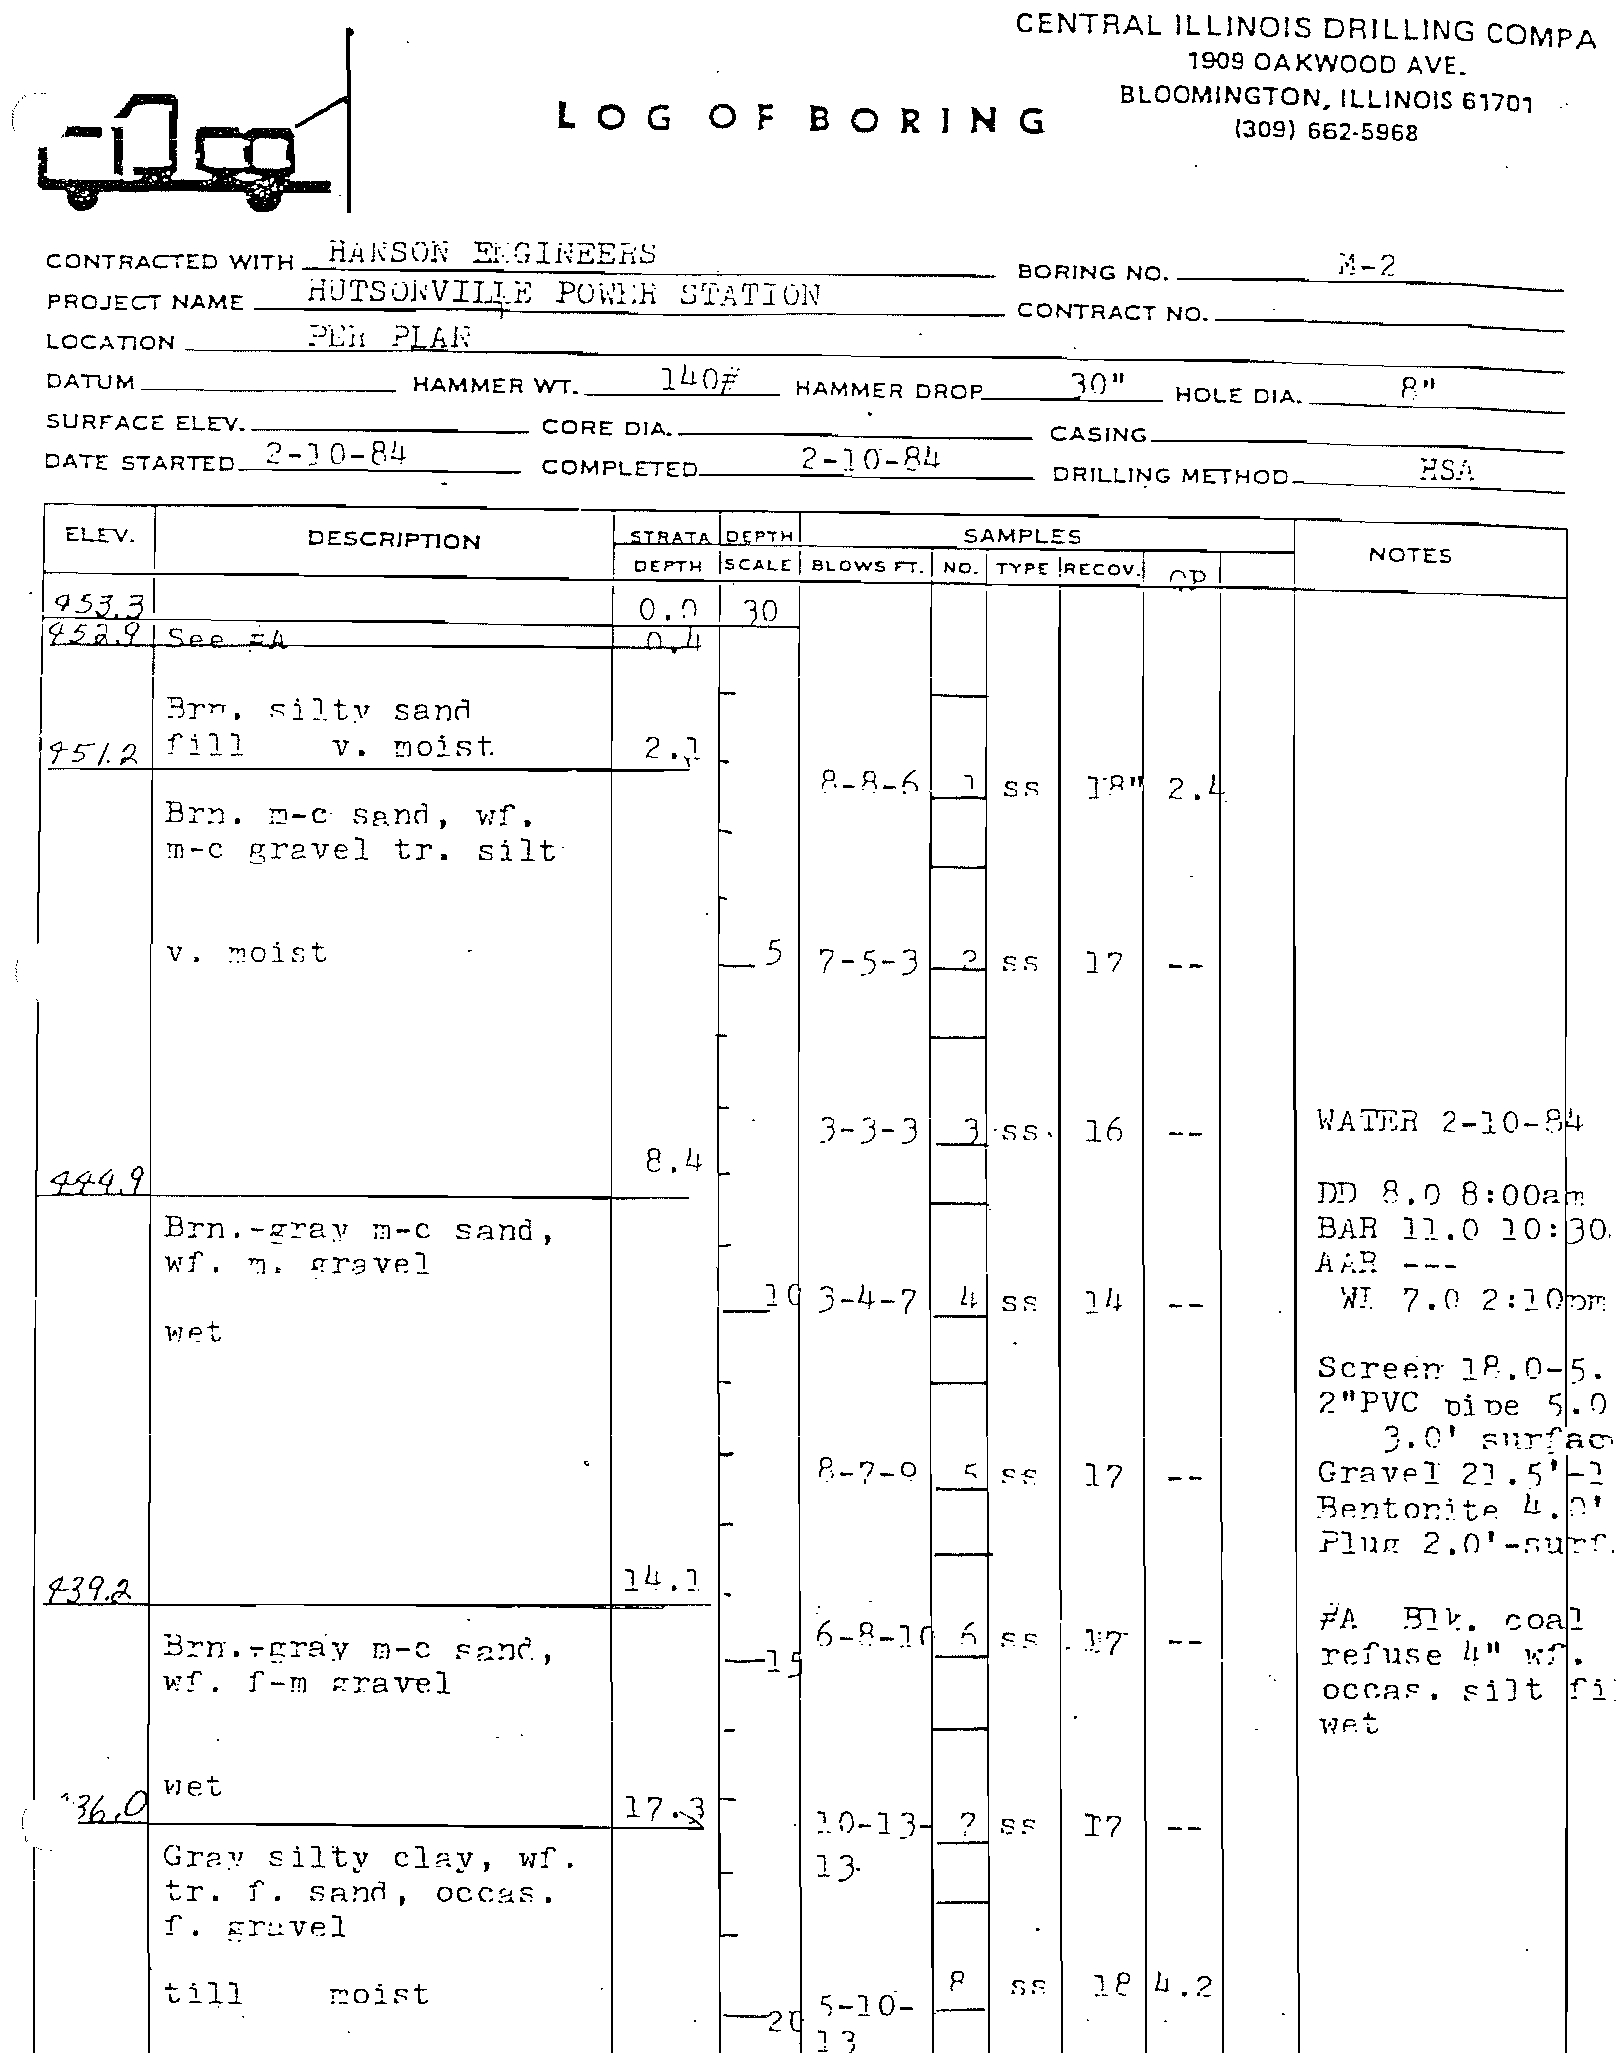
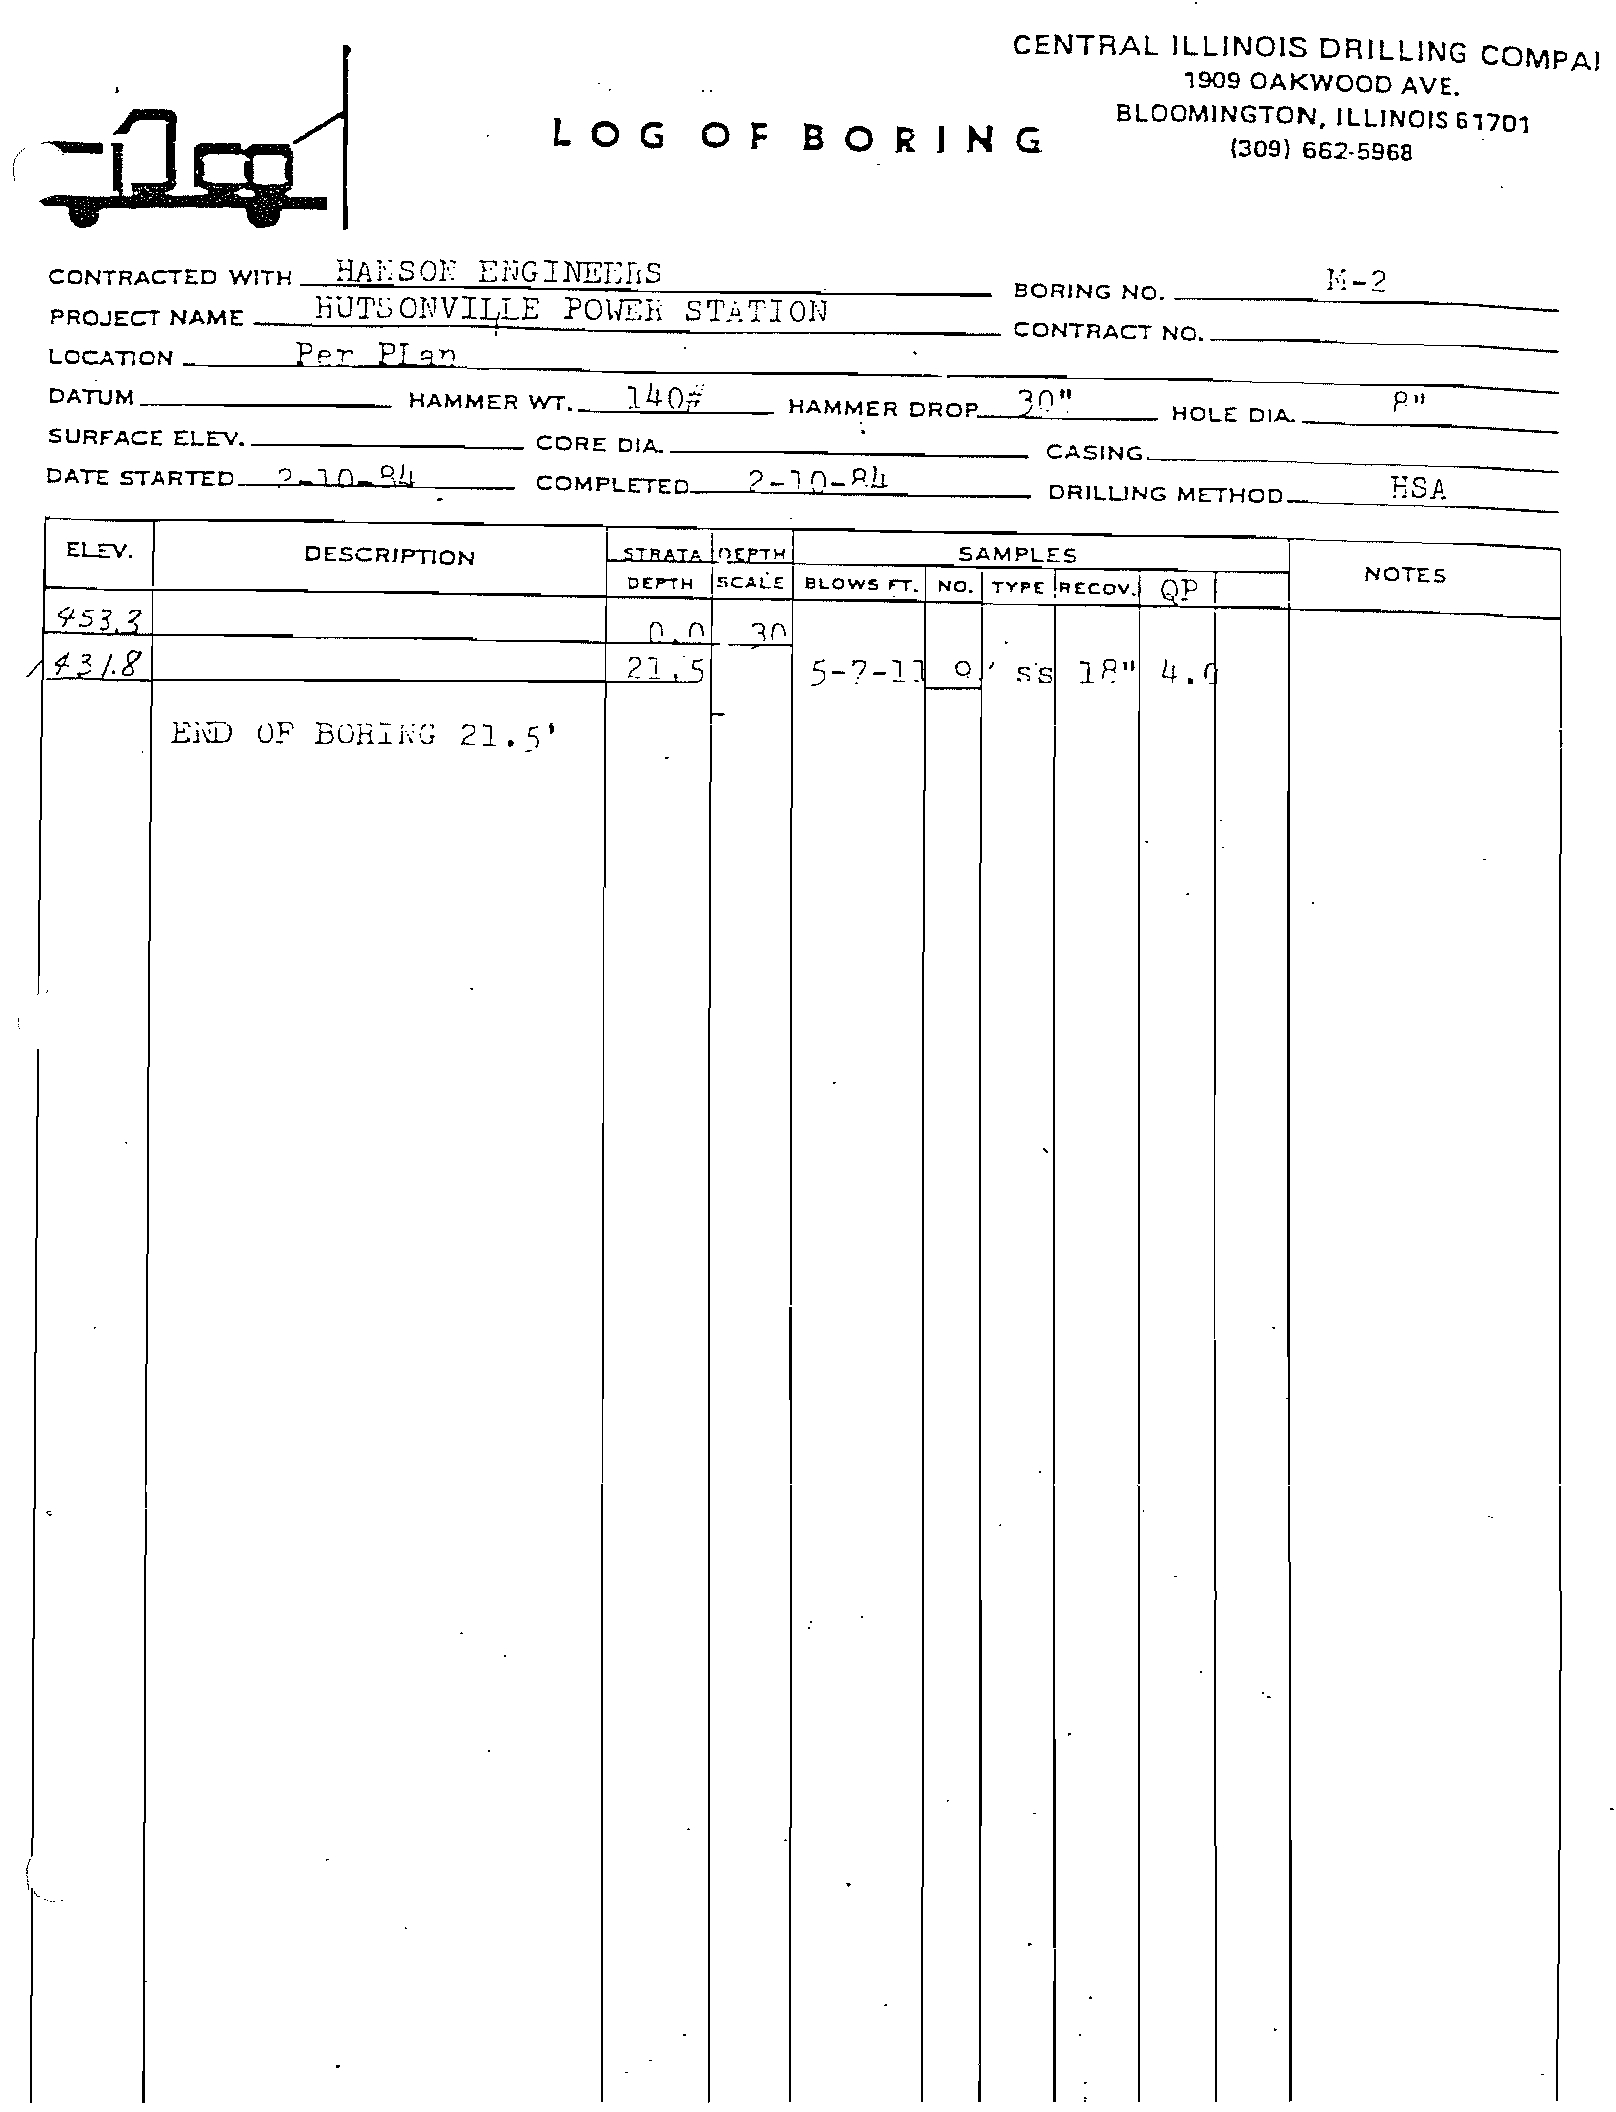
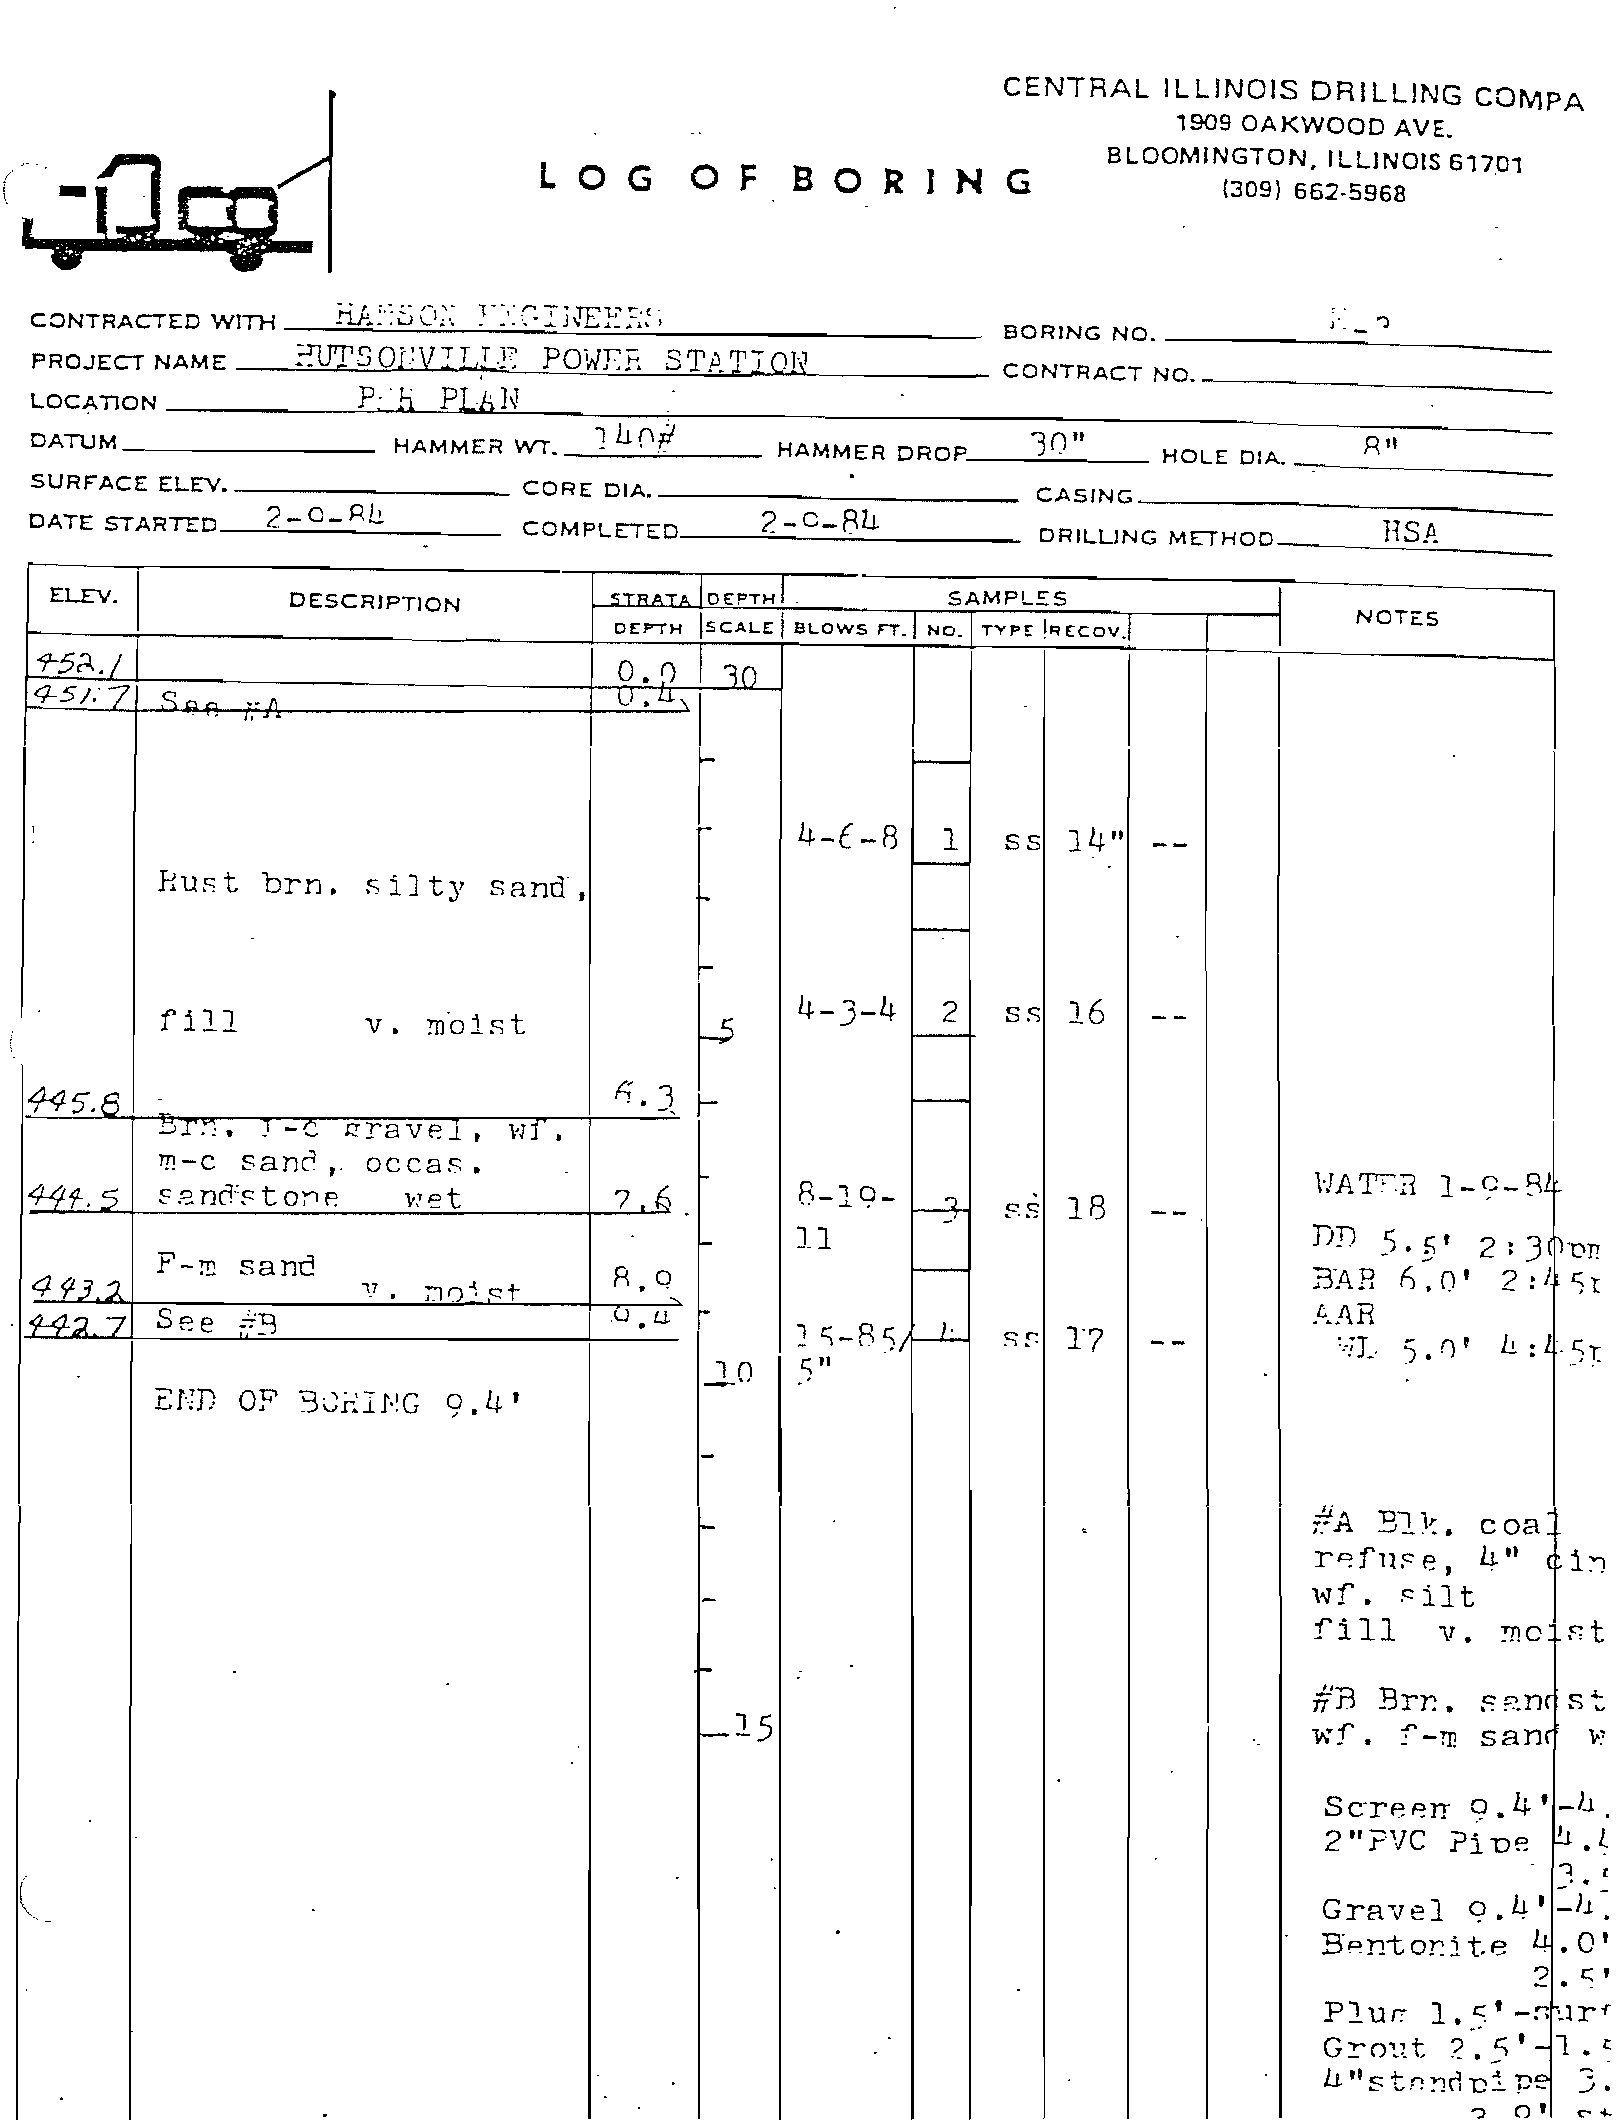
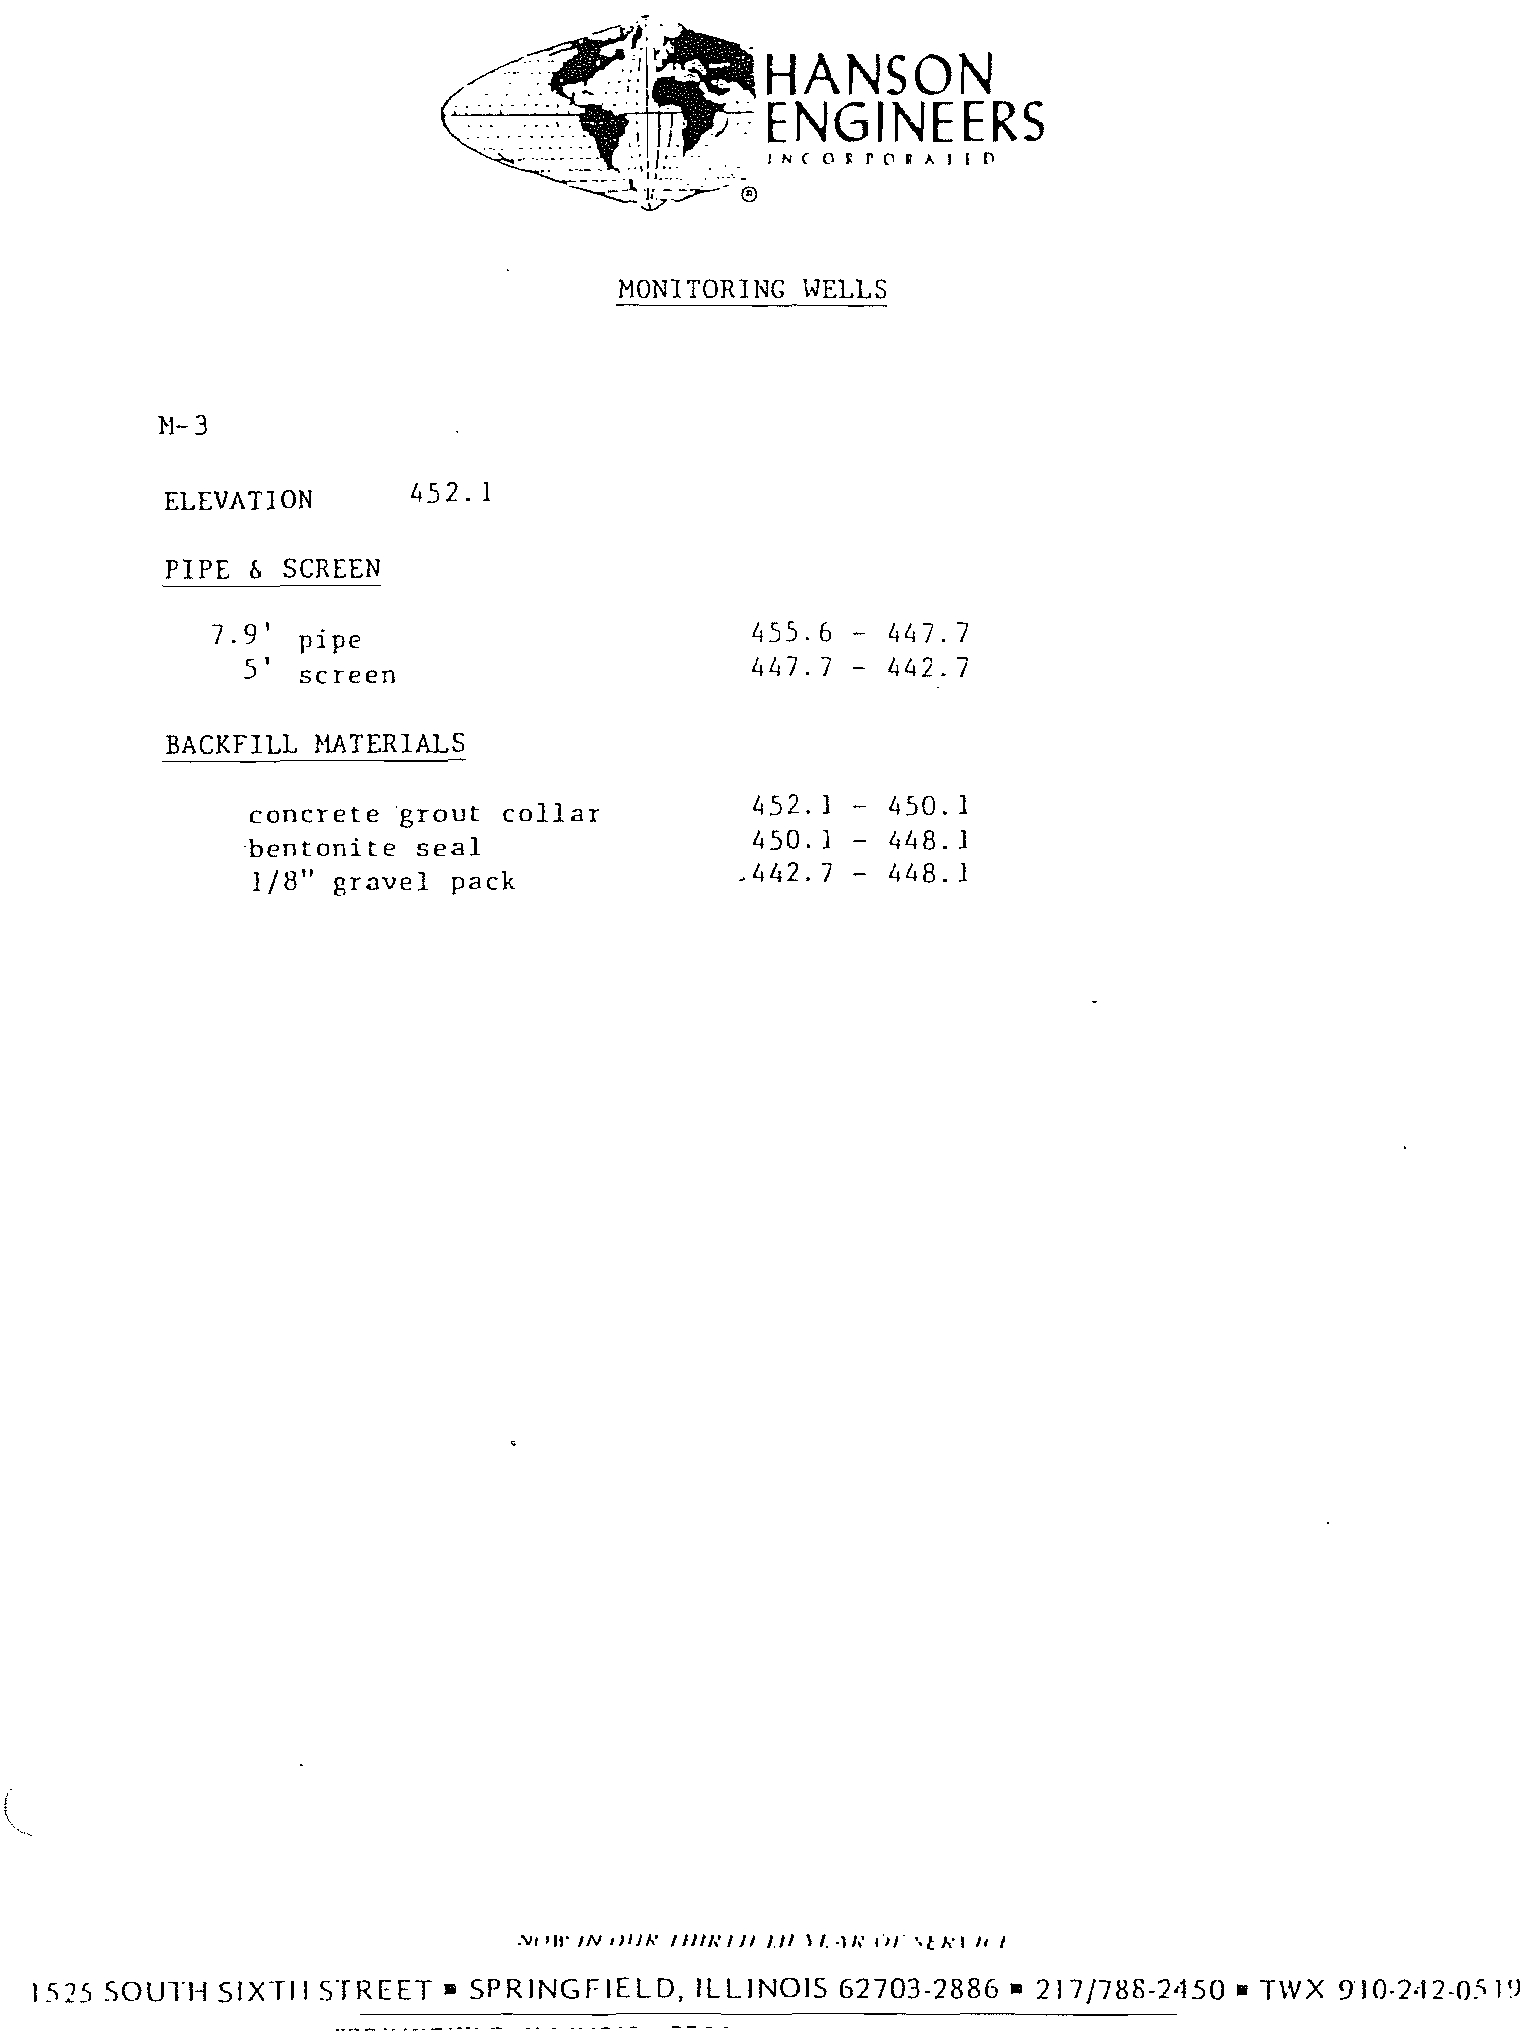
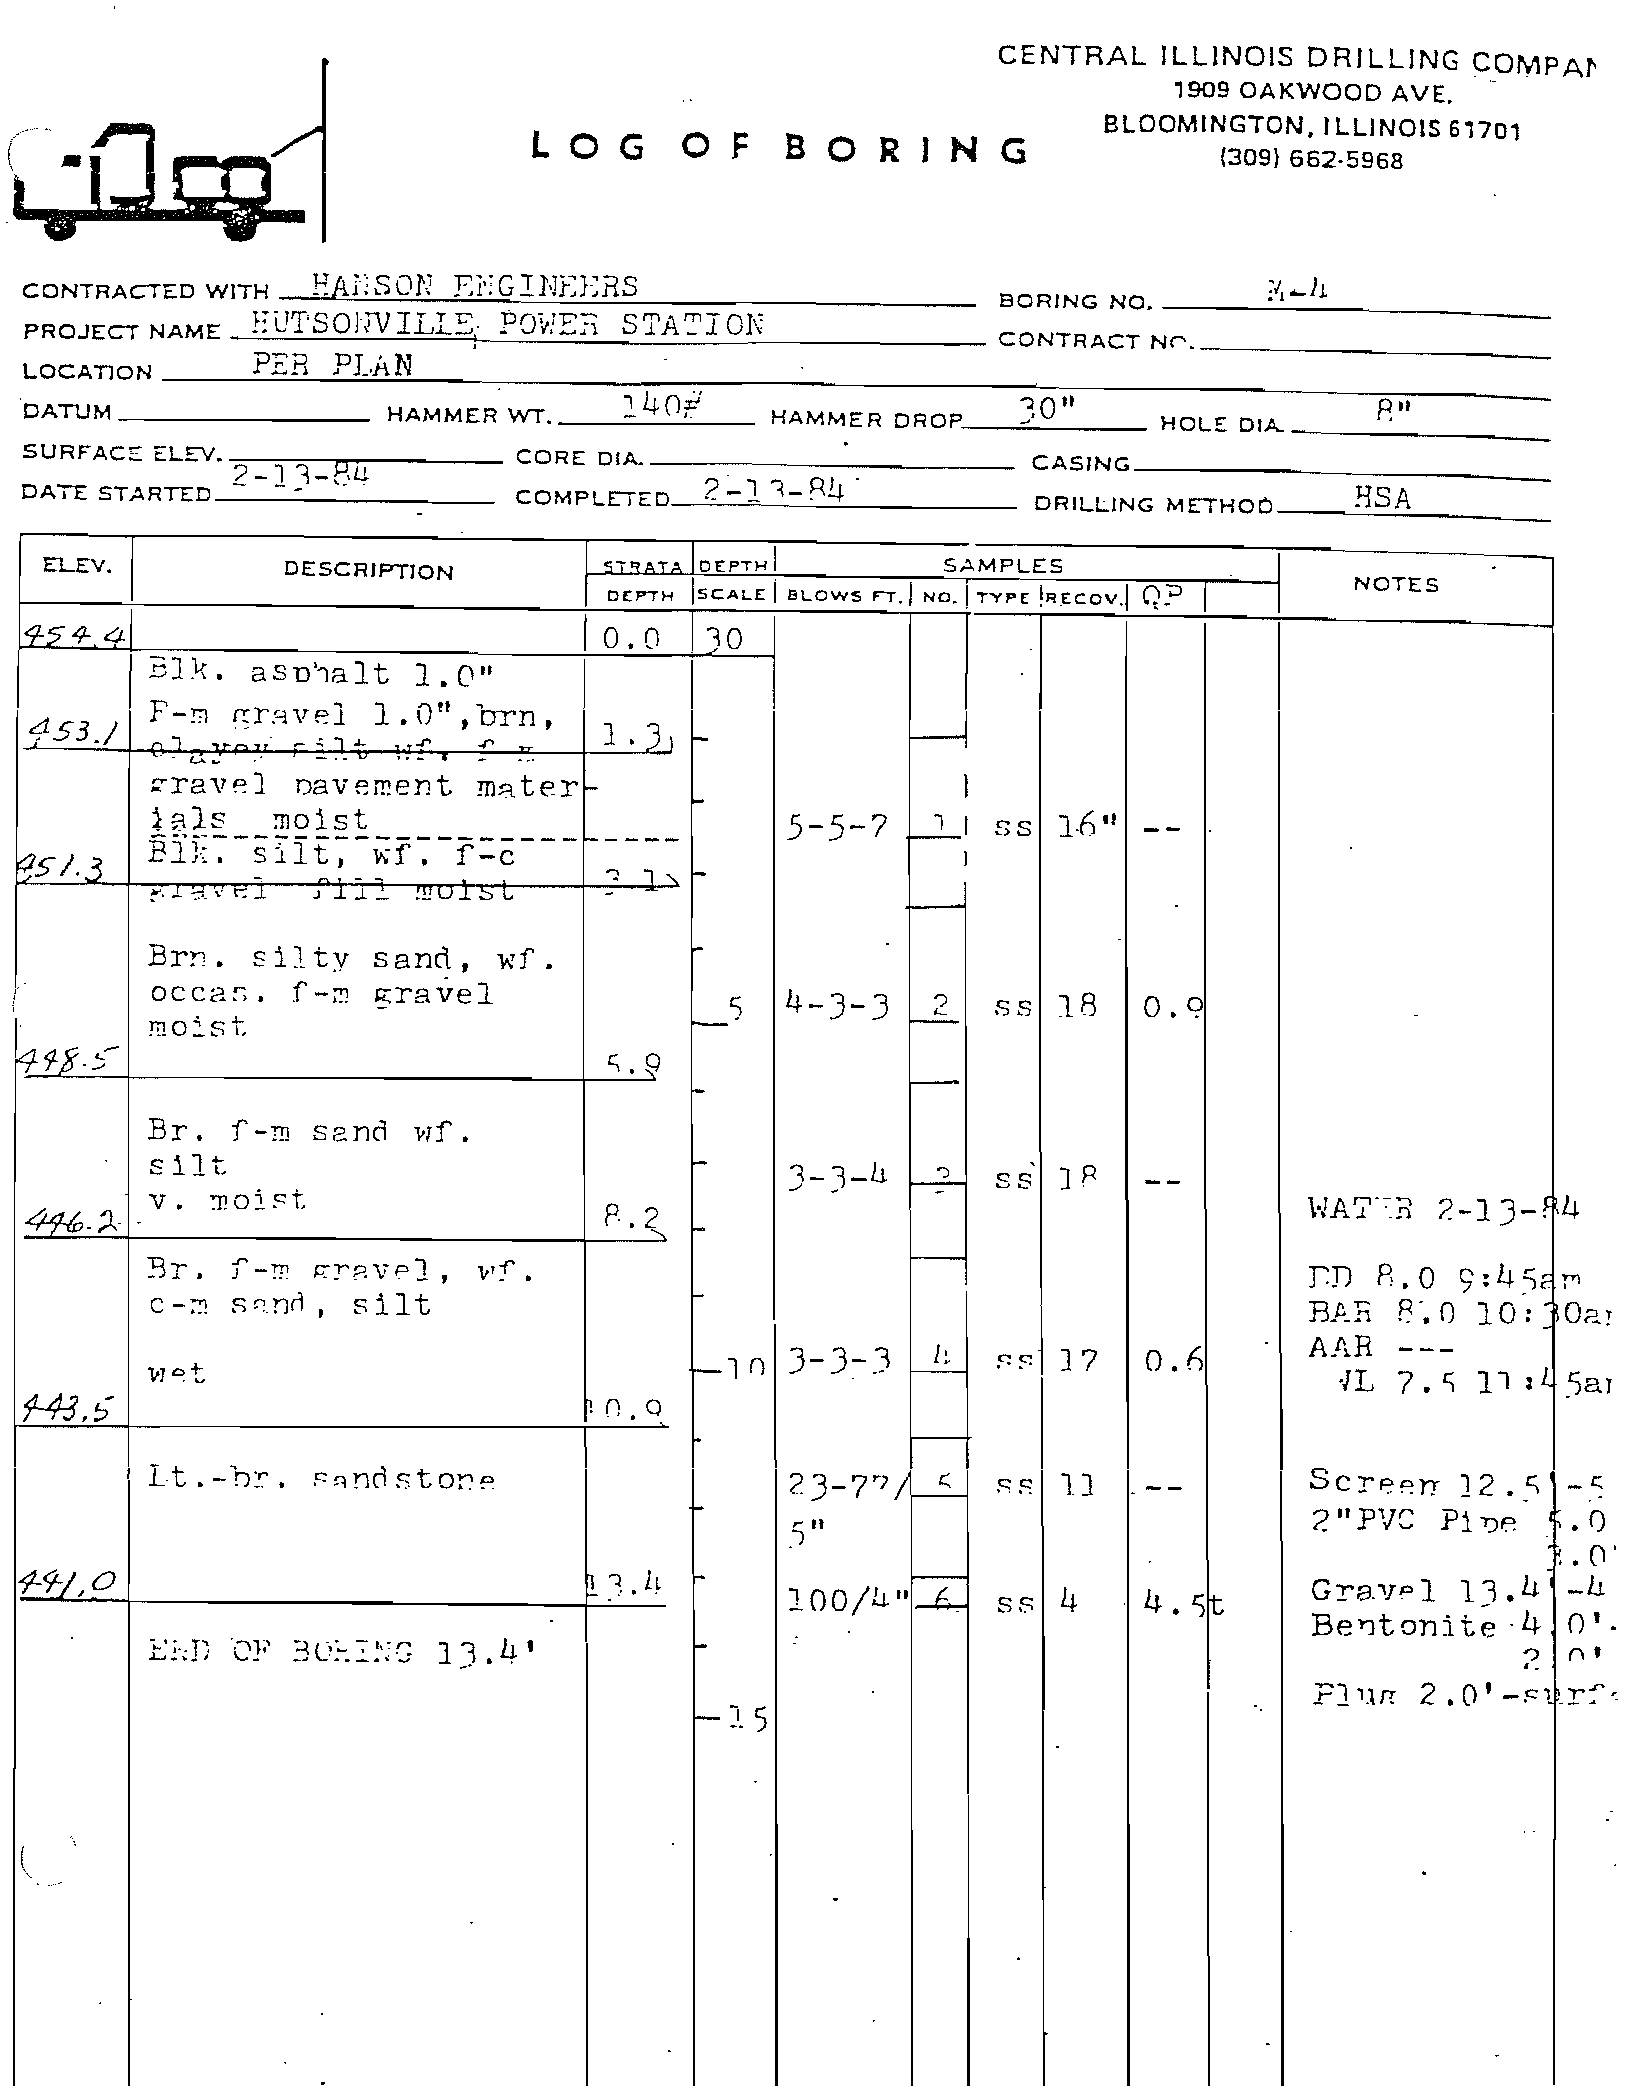
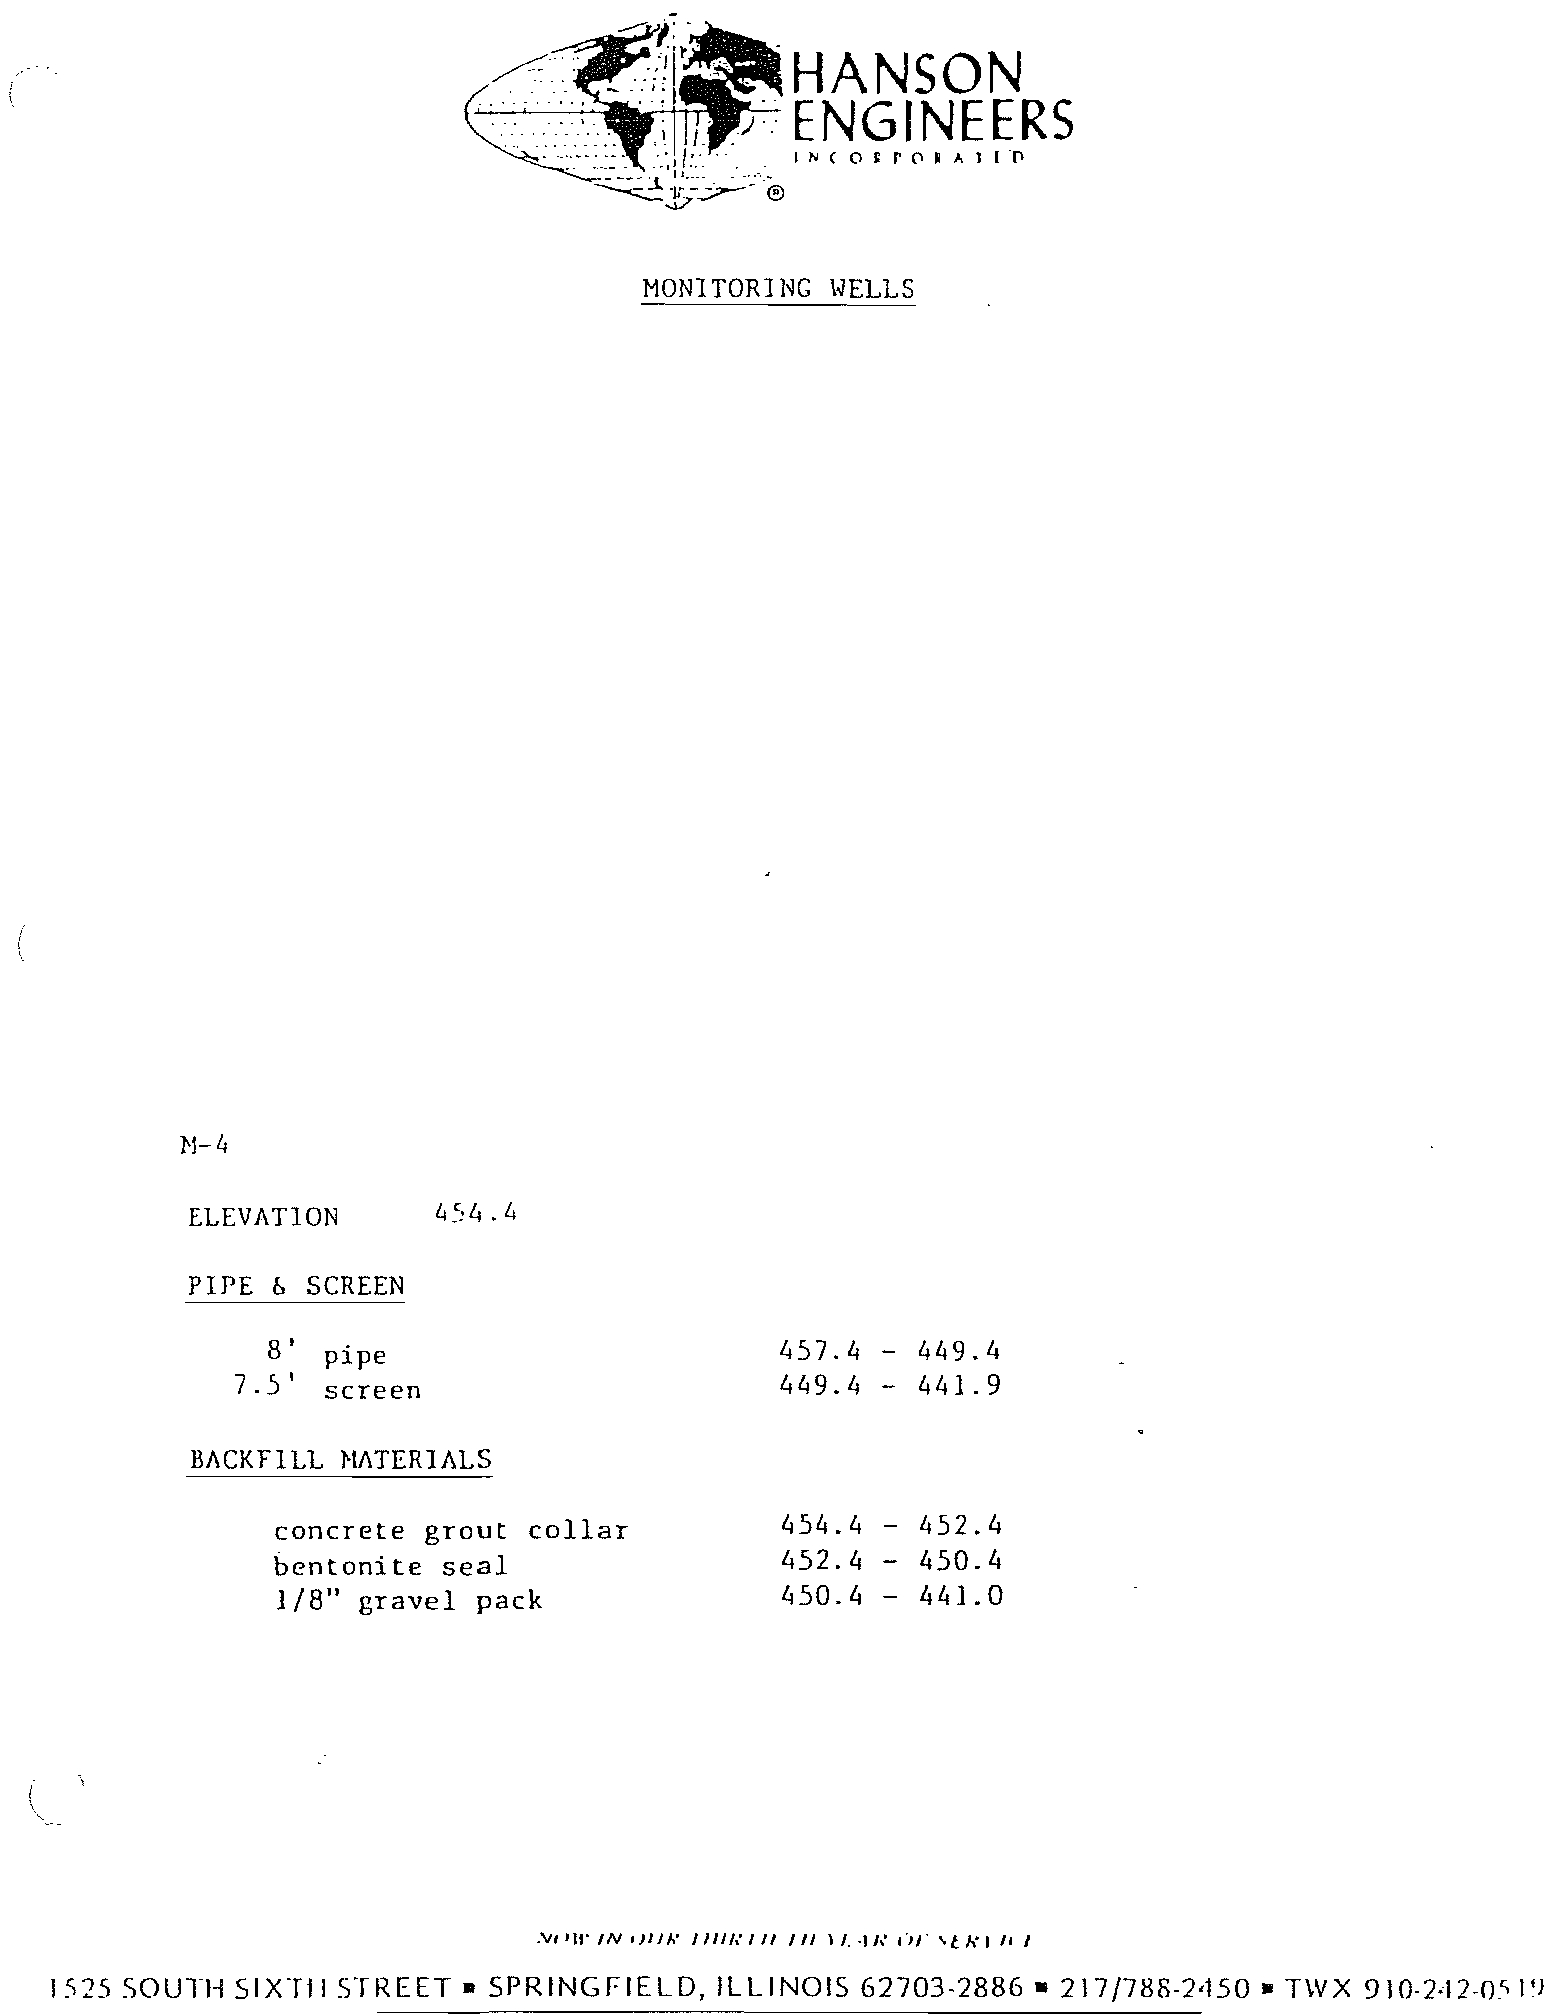
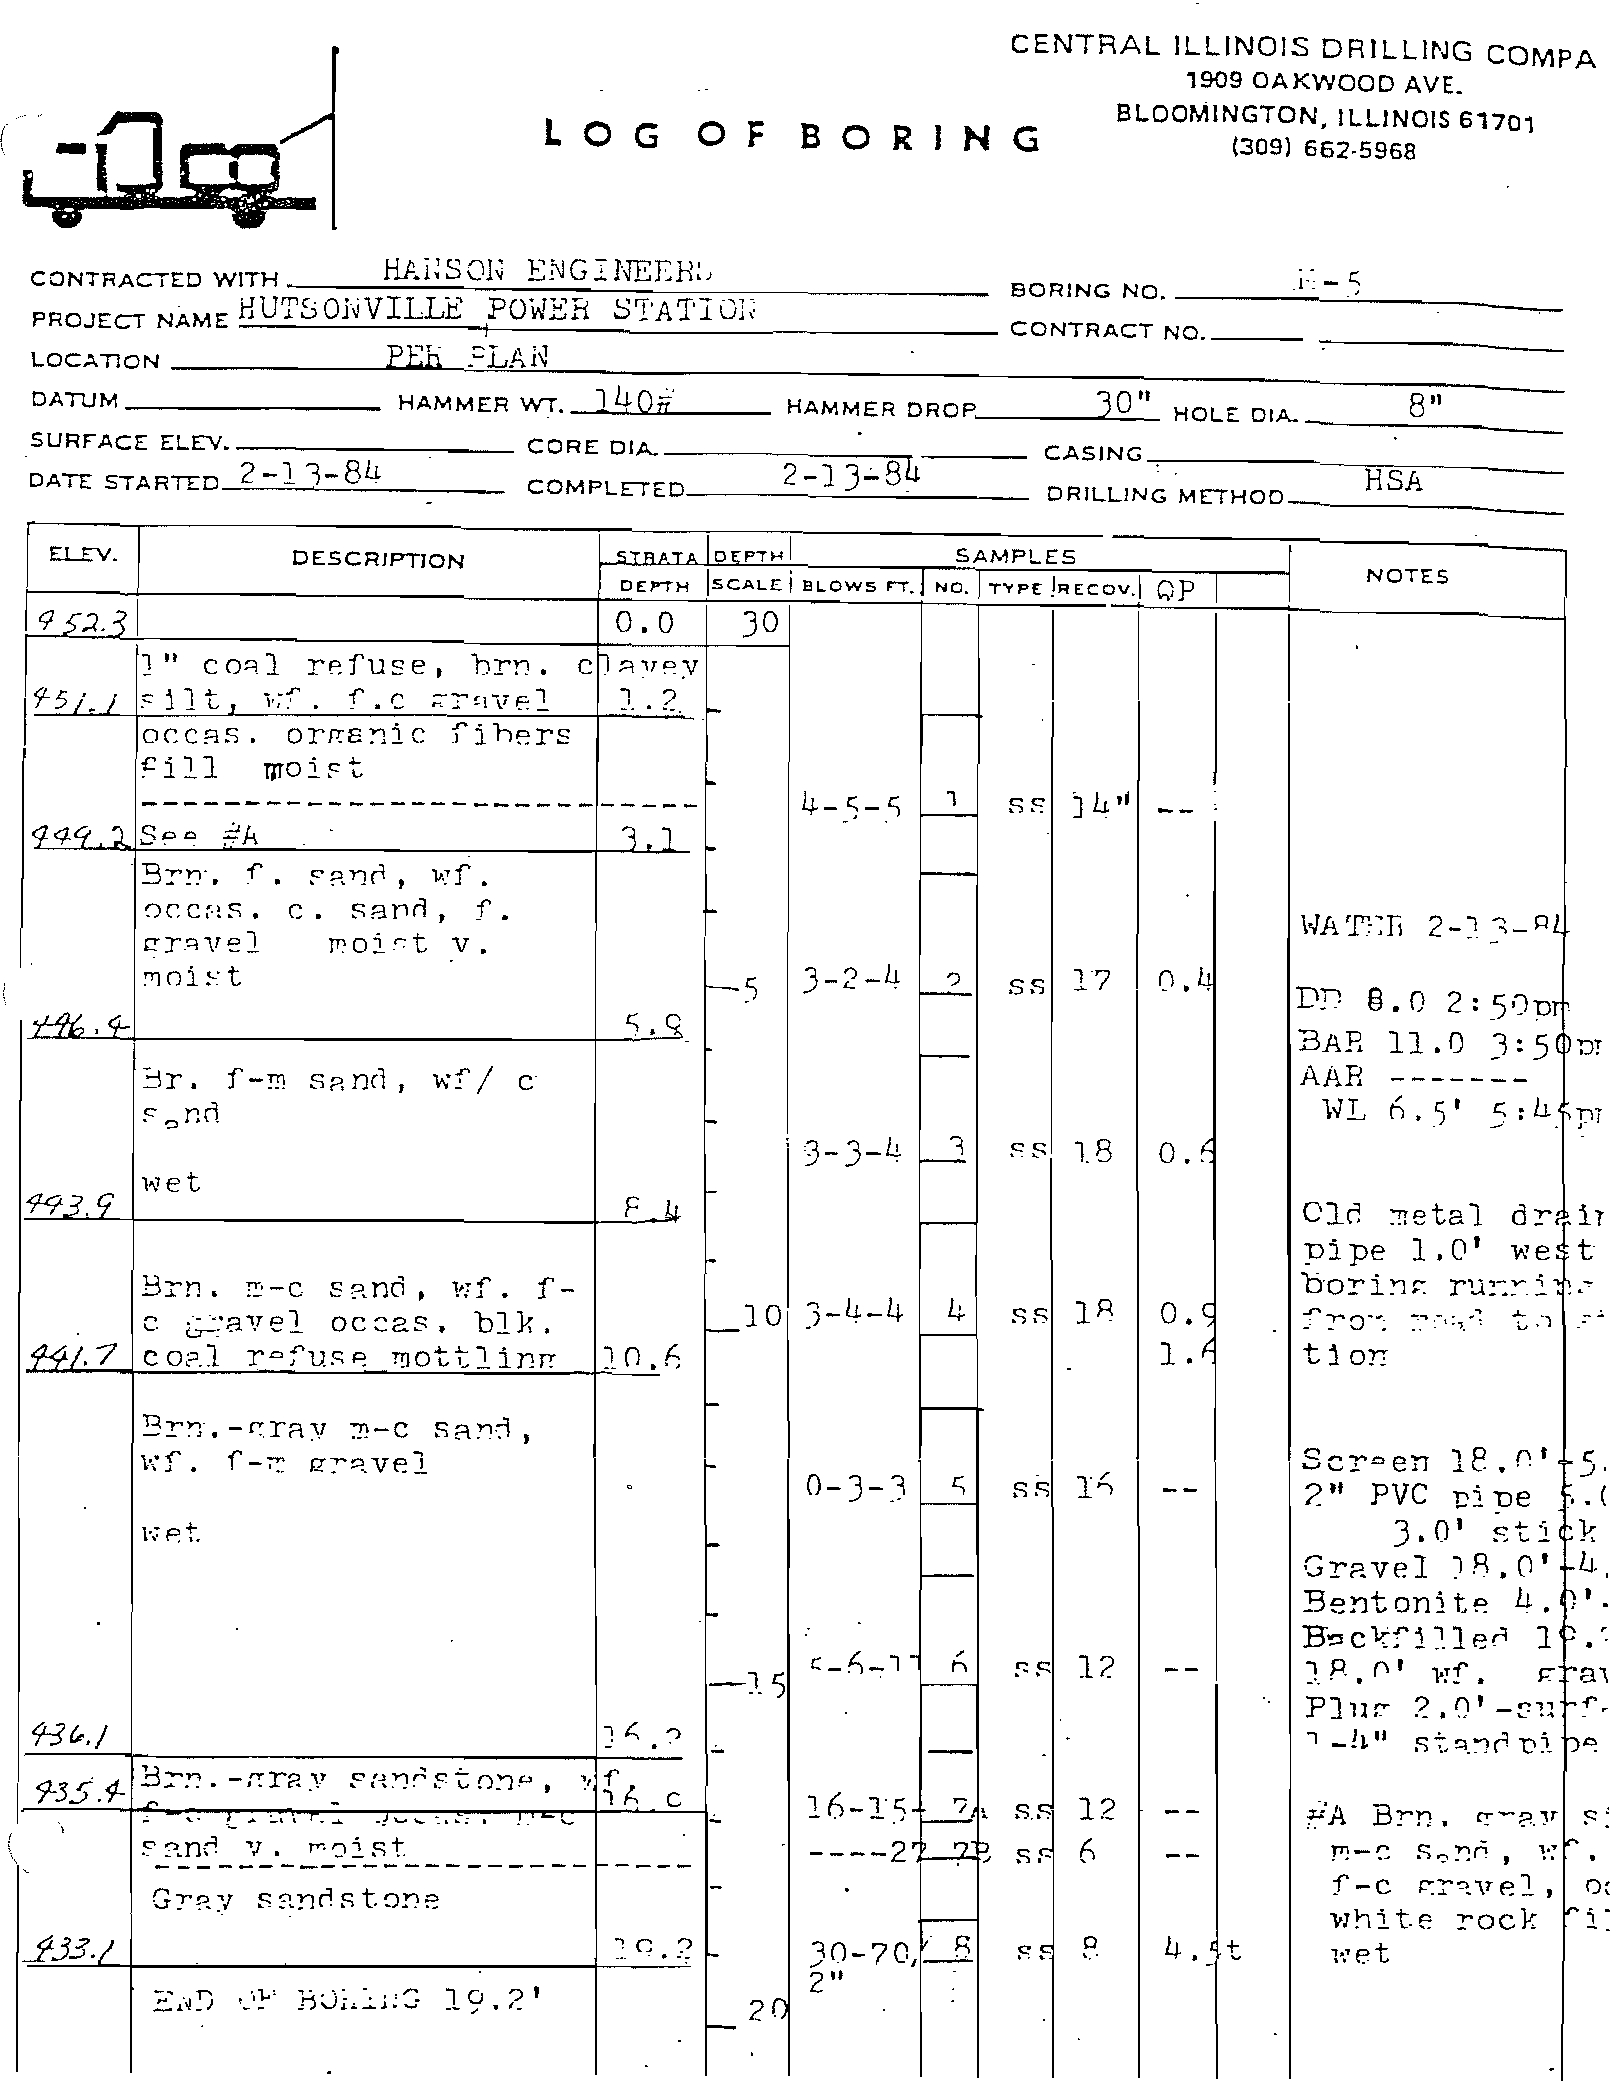
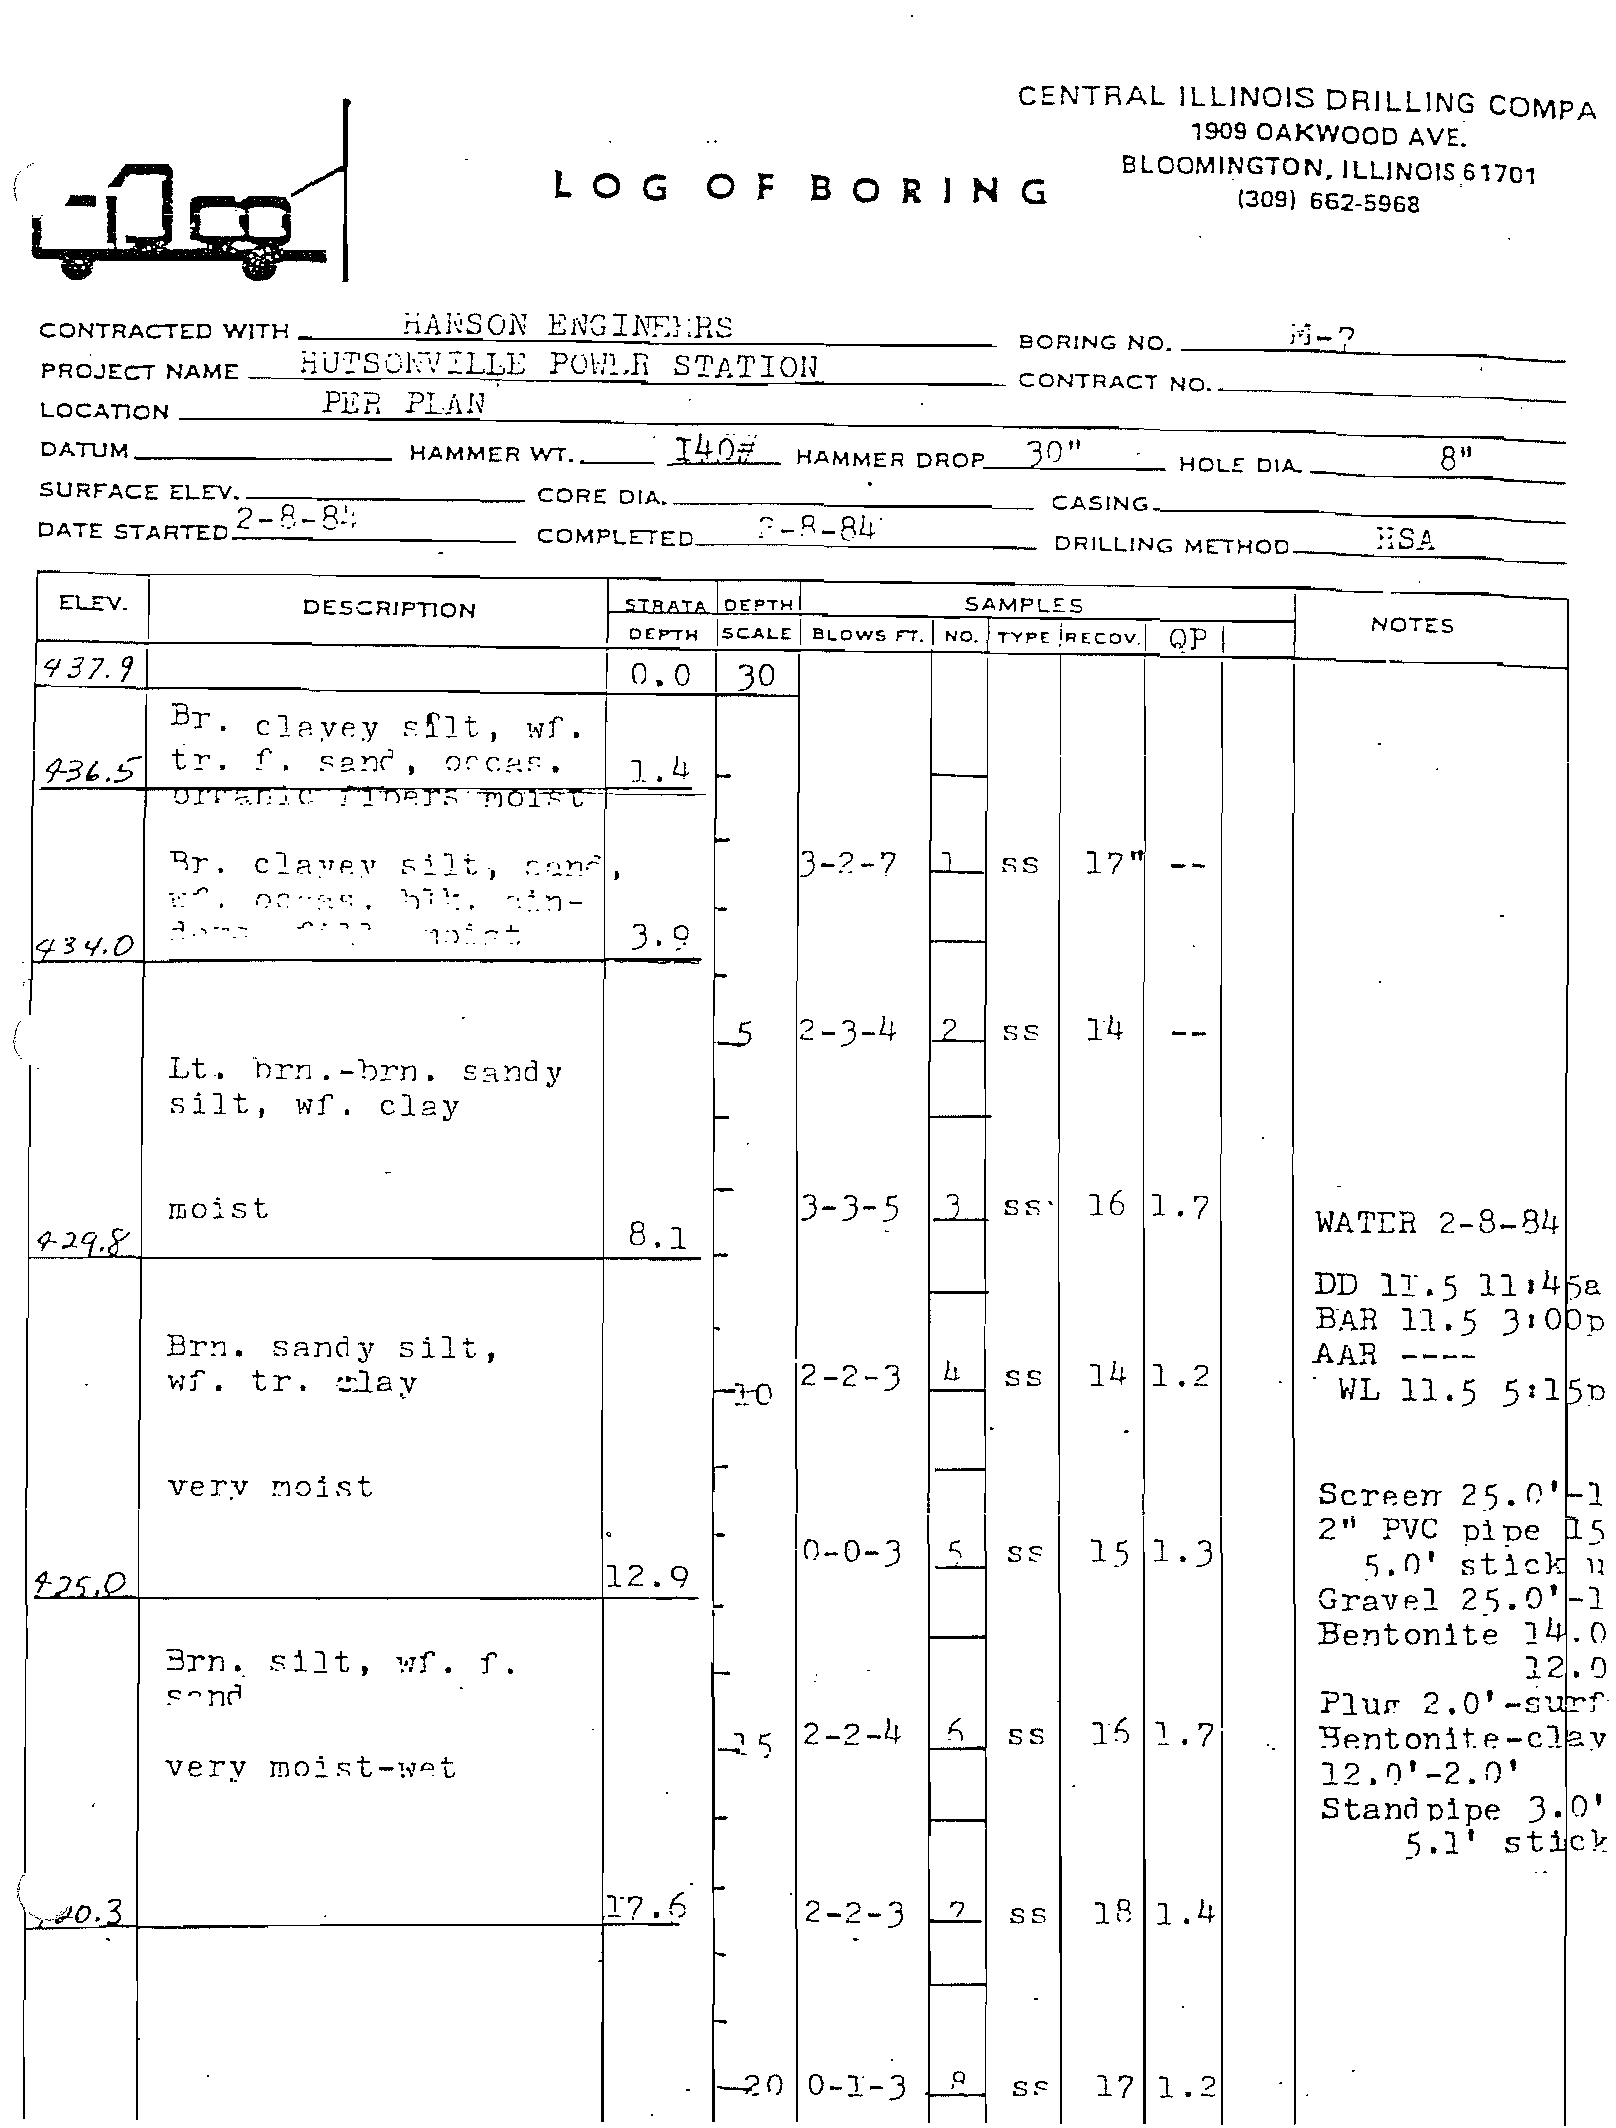
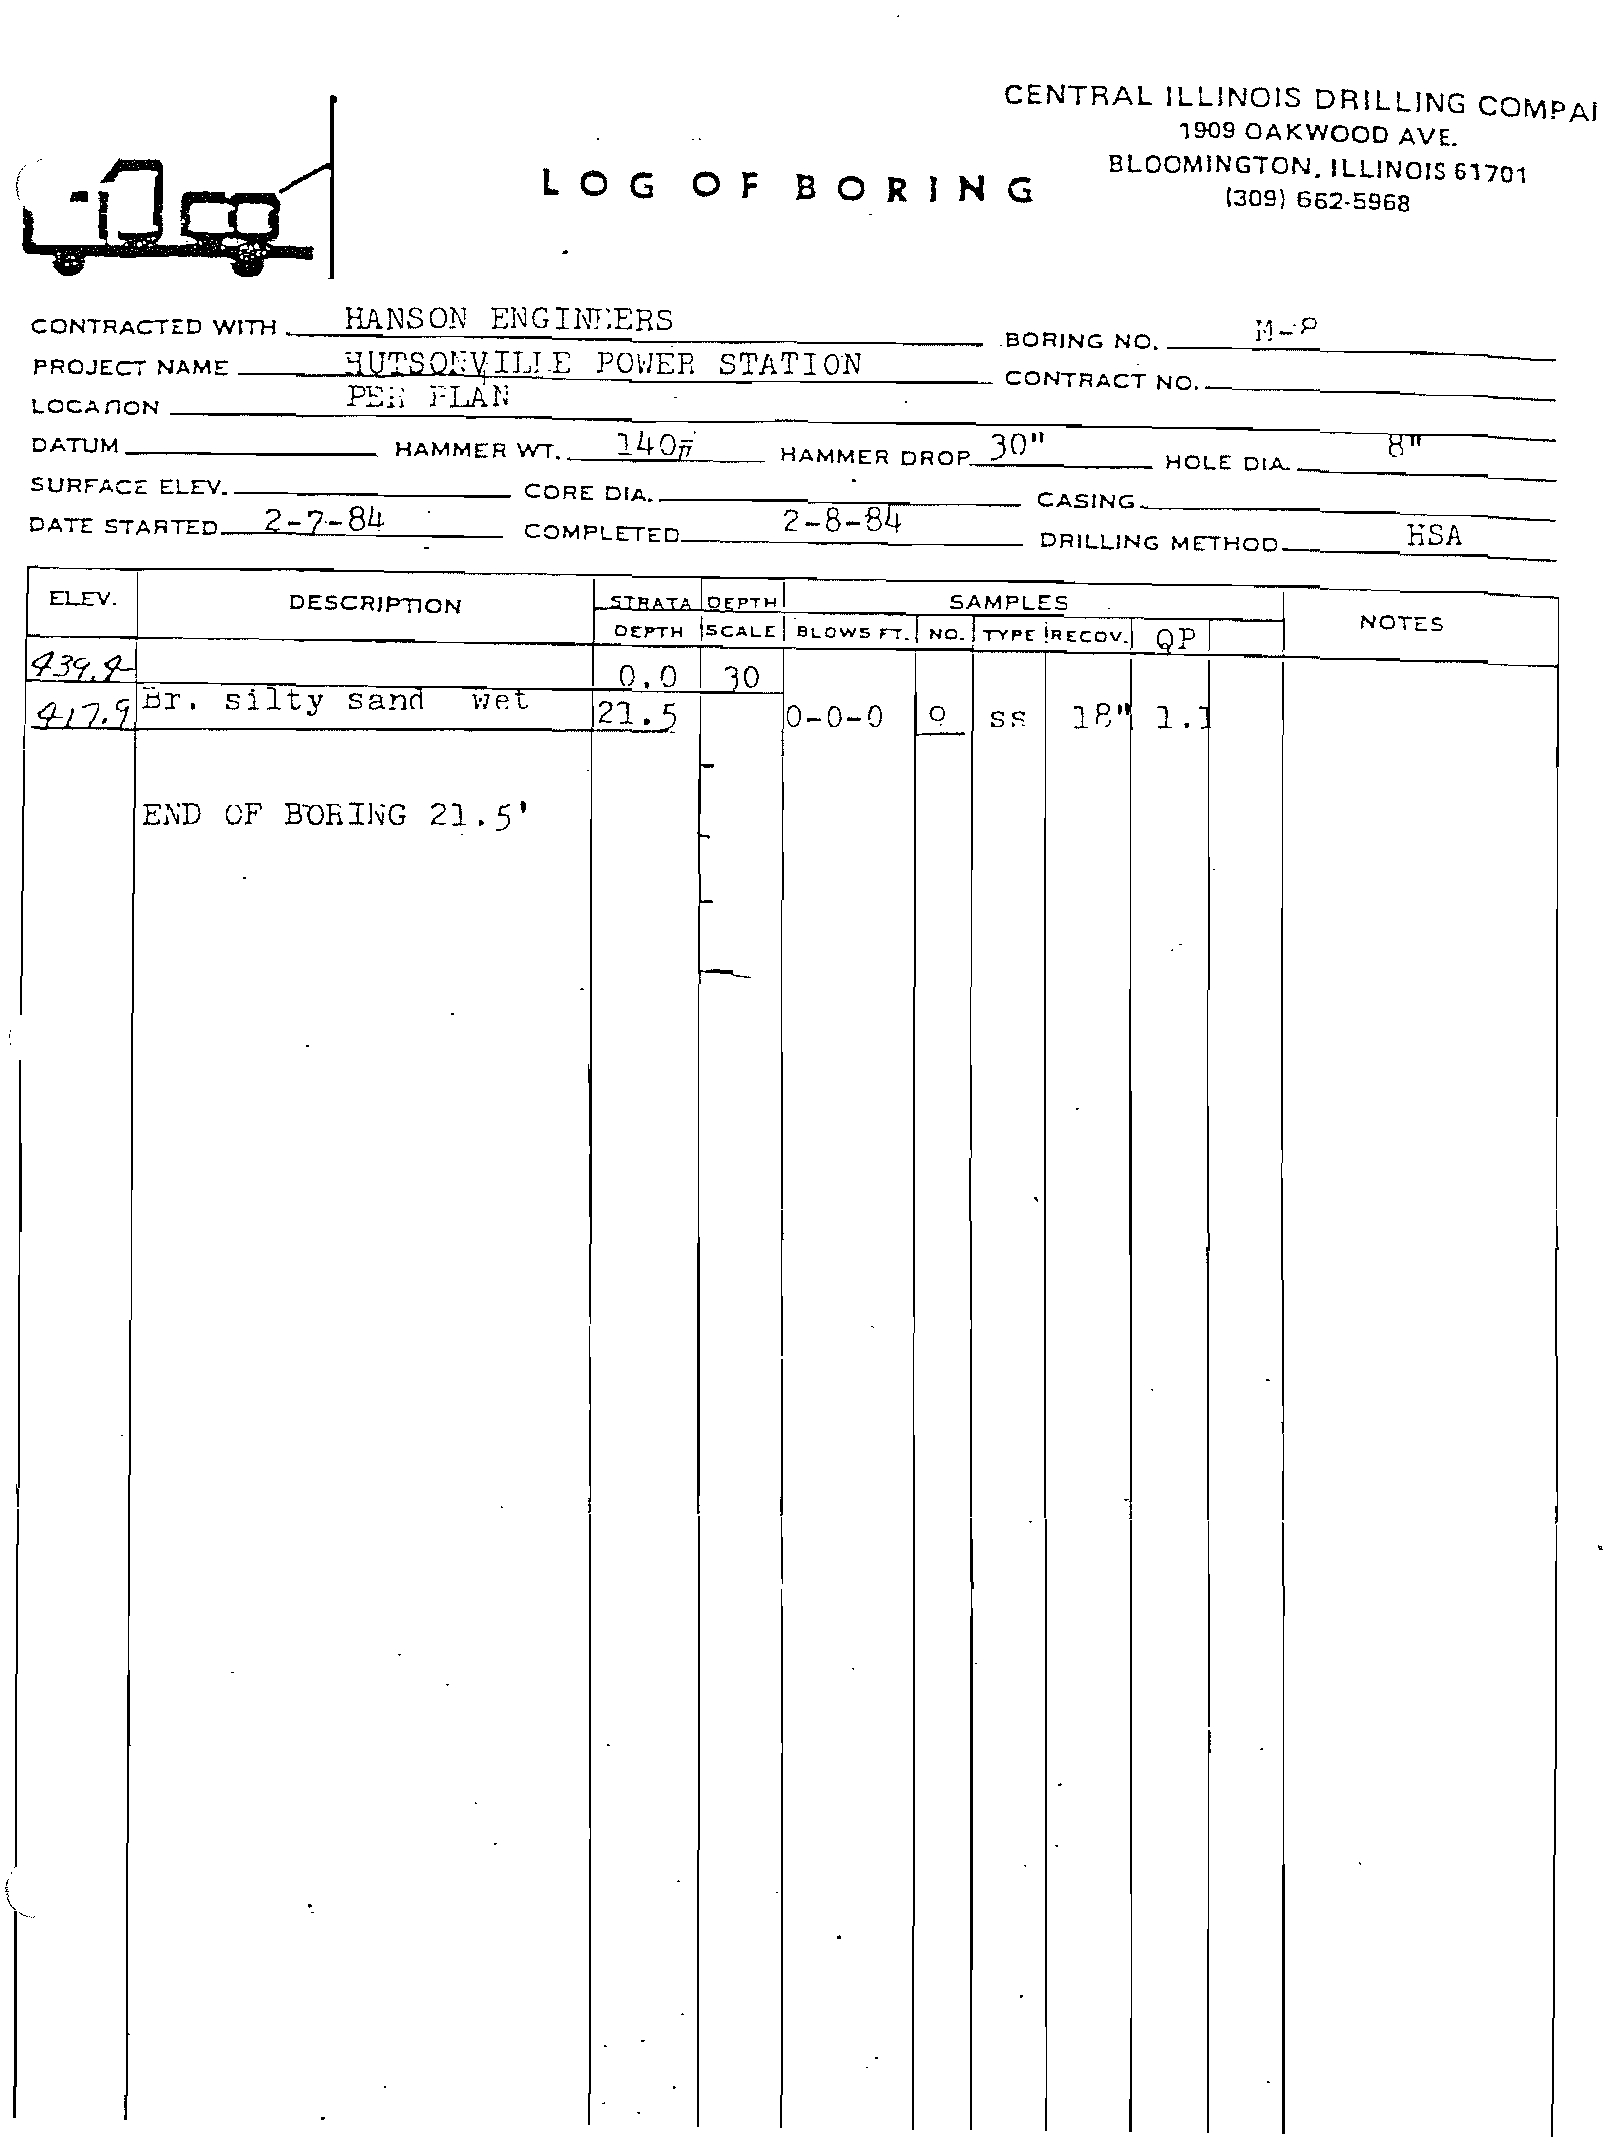
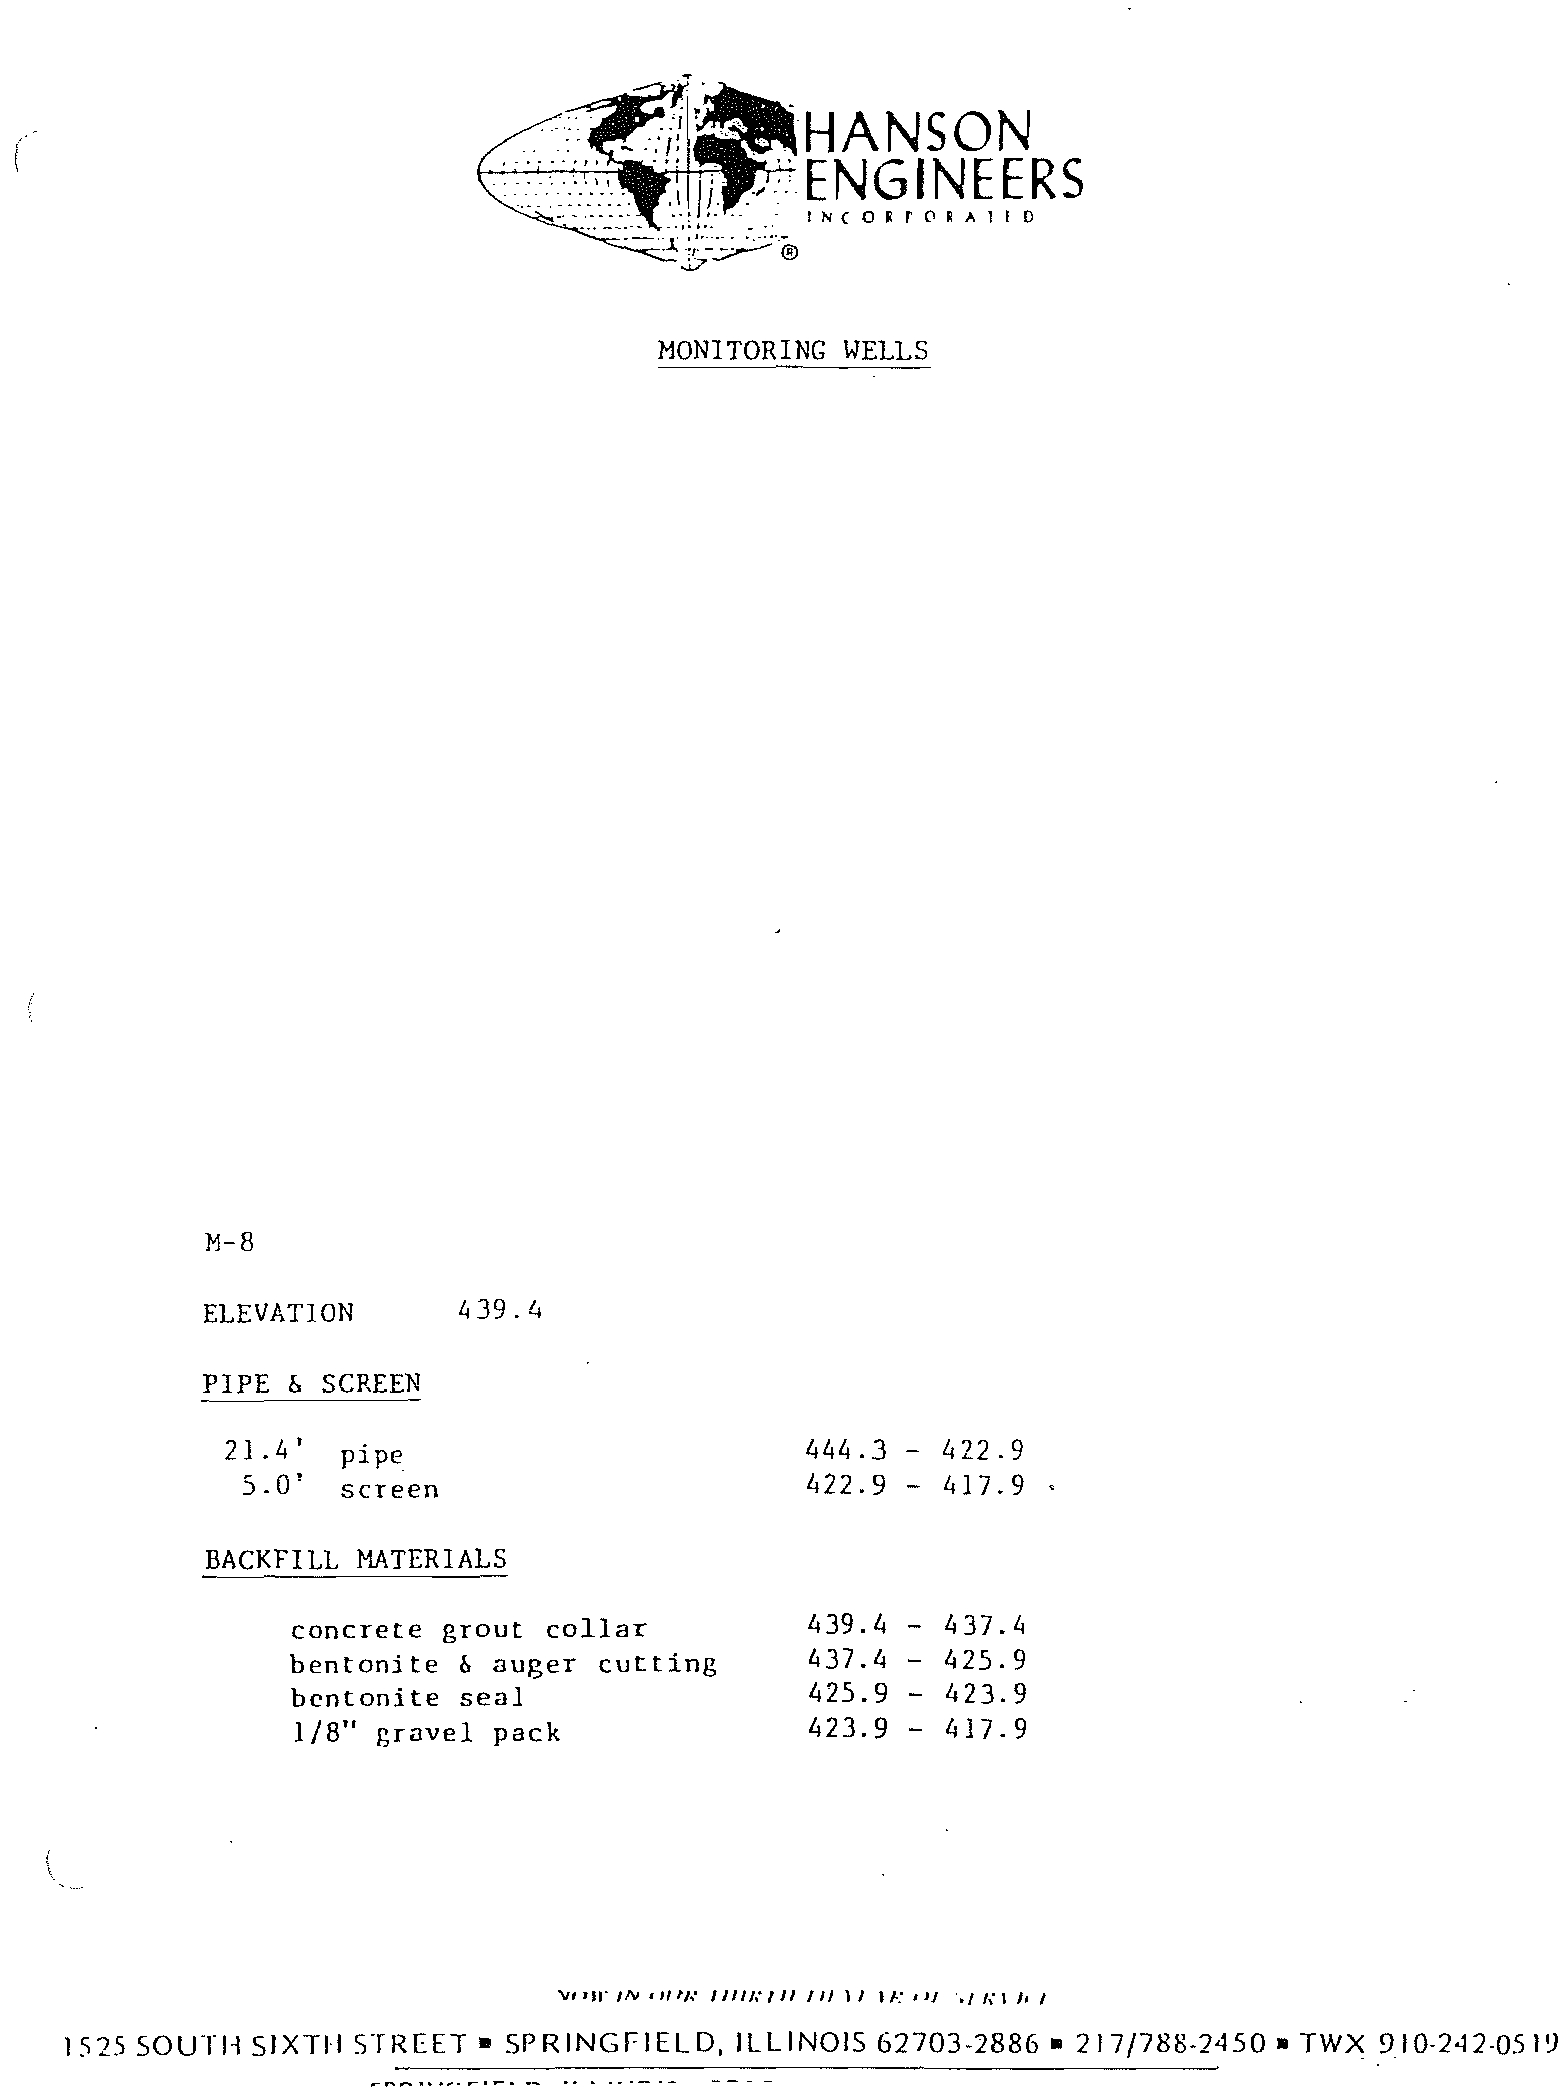
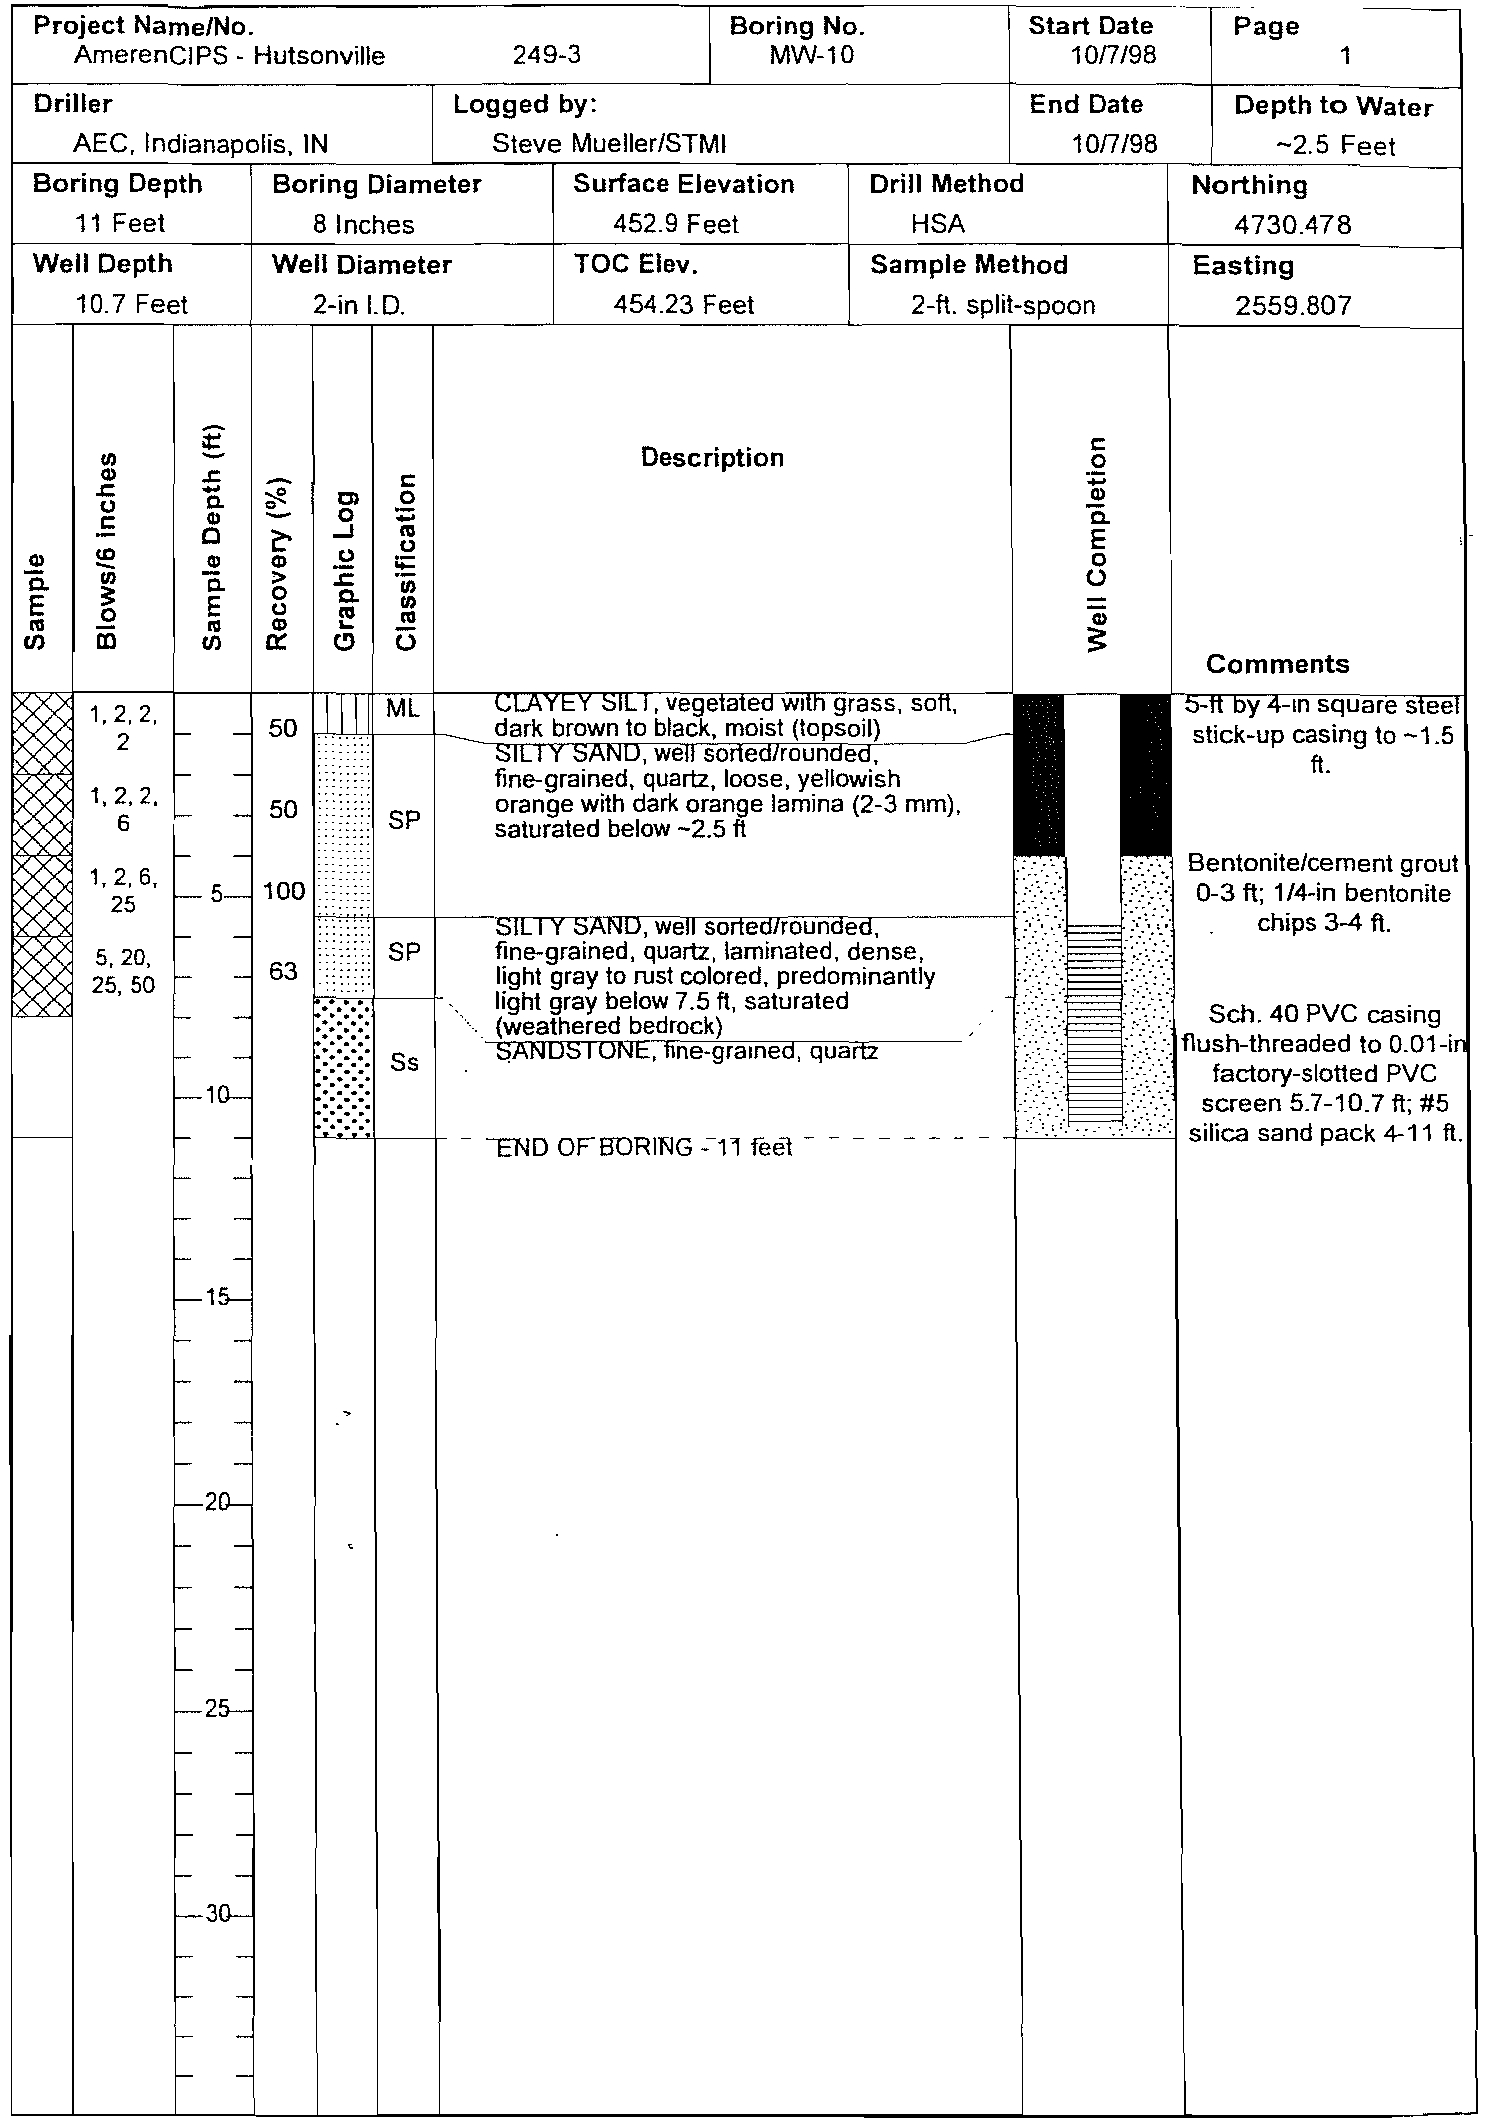
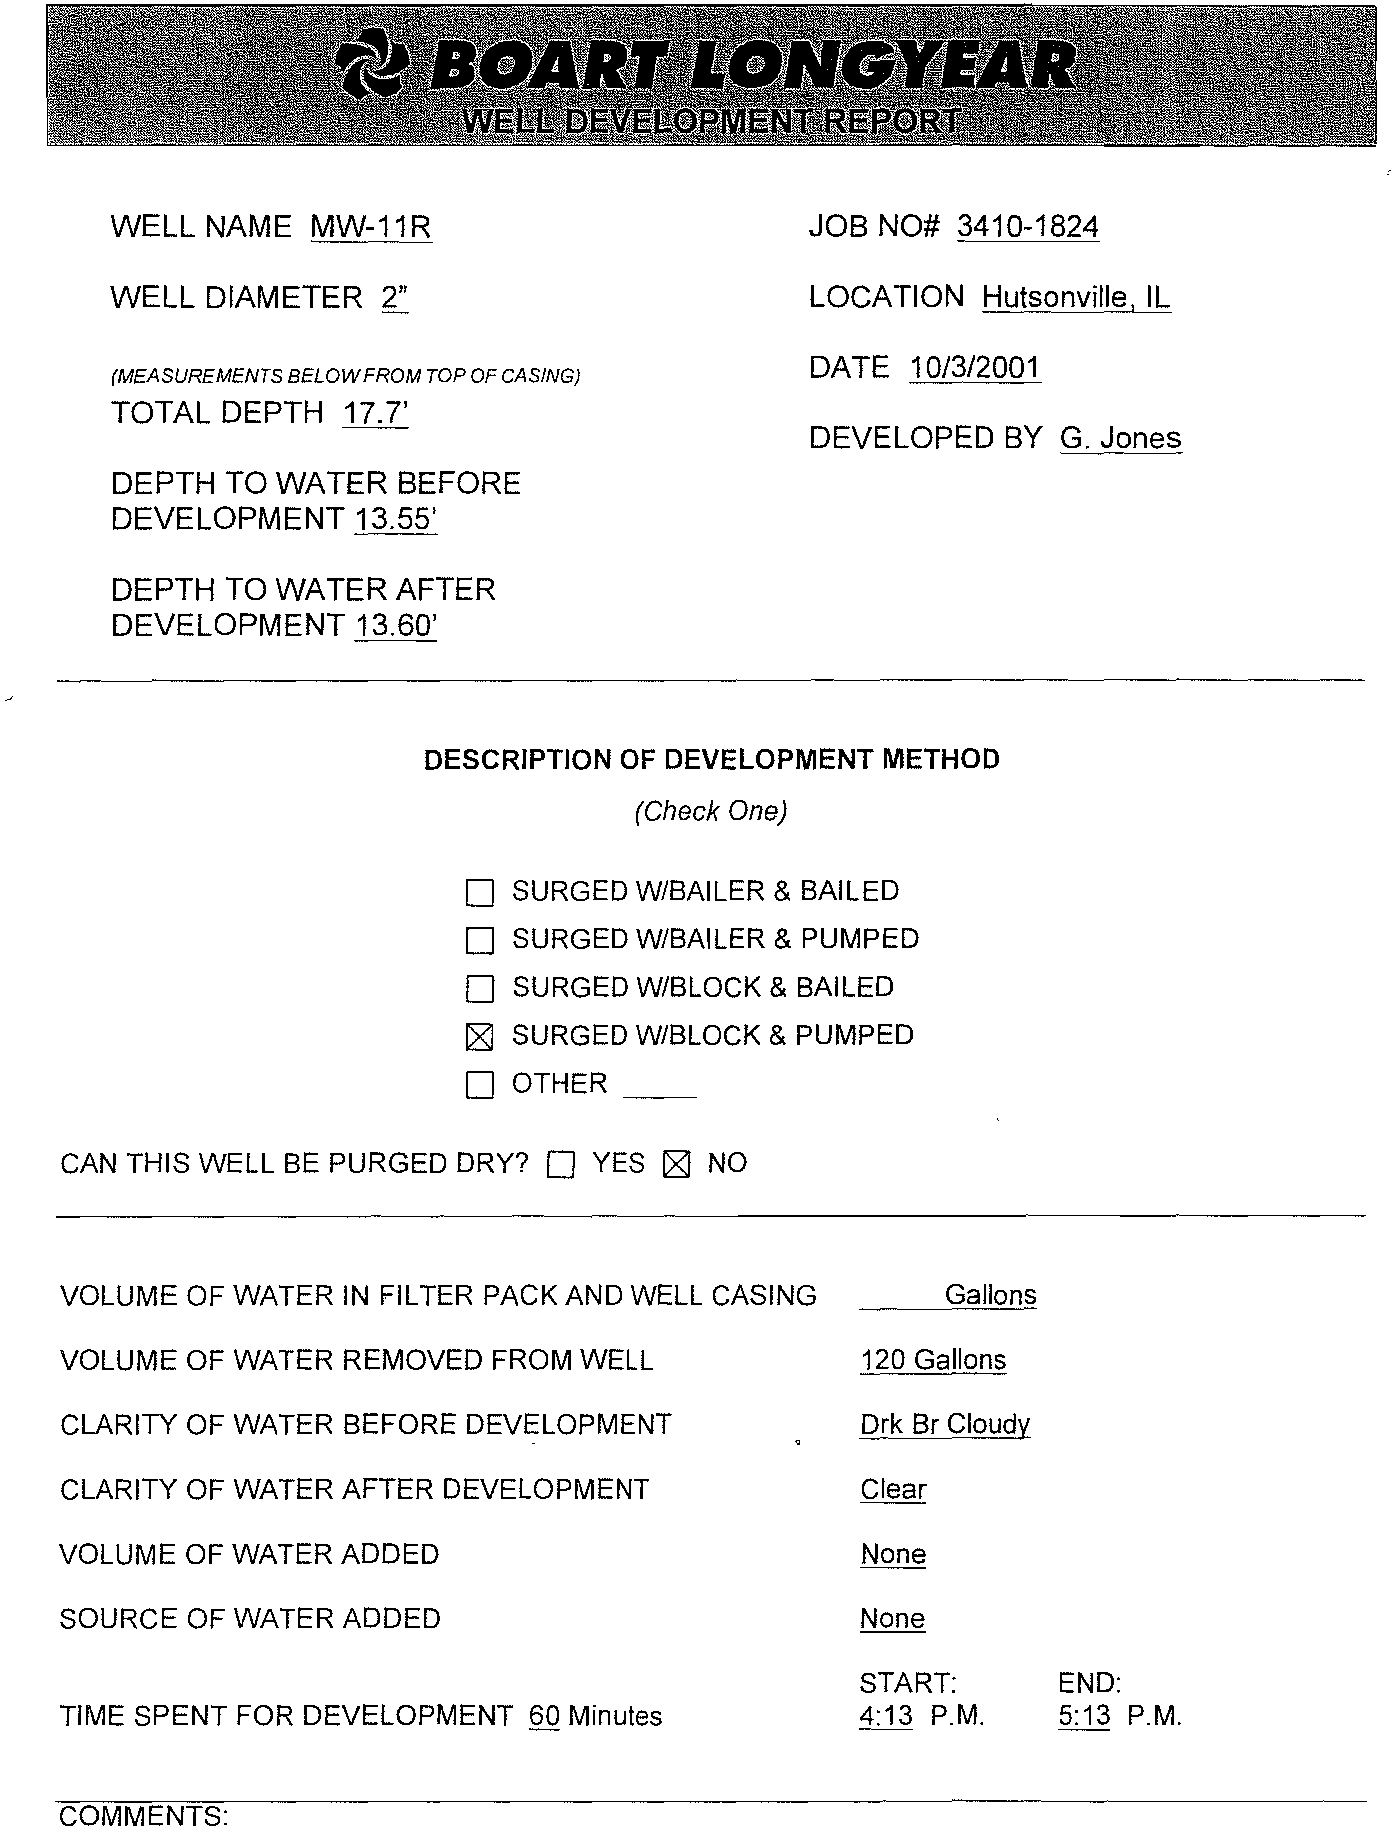
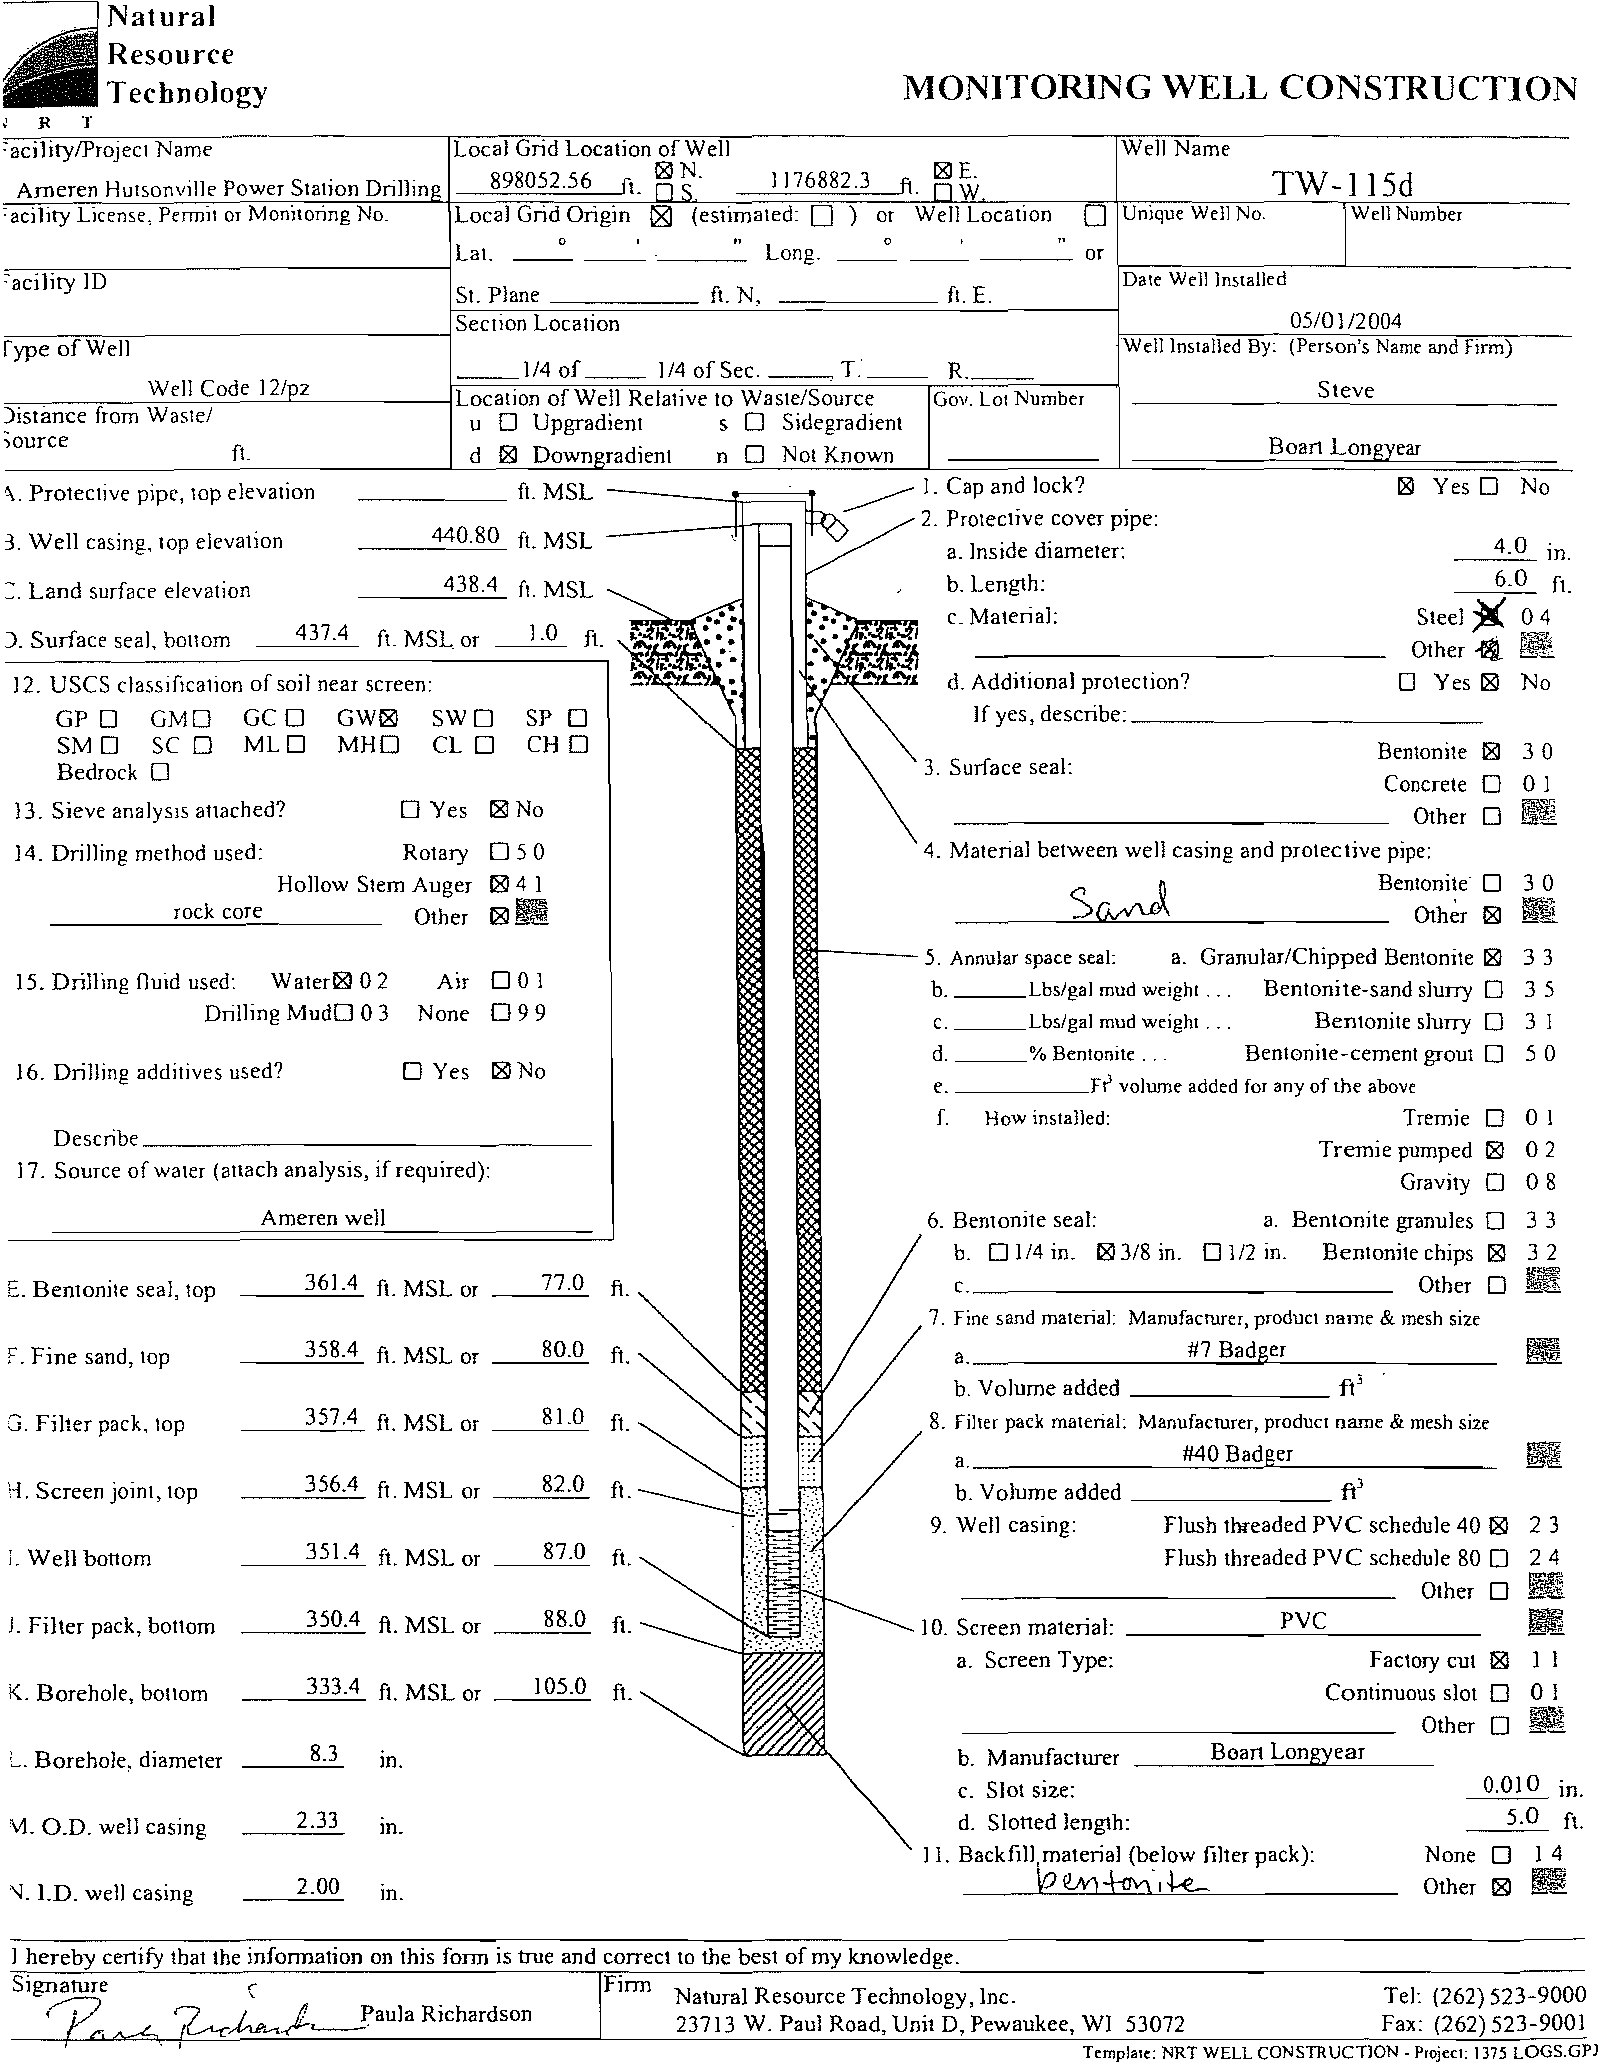
Tables 3 and 4 list monitoring well completion details; boring and well completion logs are provided
in
Attachment E. The existing wells are compliant with 35 TIl. Adm. Code 811.318 with the exception that
well nest MW-7/MW-7D is not within the I
OO-foot zone of attenuation. However these wells are as close
as possible witbout interfering with facility operations, and are capable
of detecting a release from Pond D
as demonstrated by observed concentrations
of coal ash indicator parameters (boron and sulfate) in MW-7.
Furthermore, Ameren is seeking
an adjusted standard to extend the zone of attenuation eastward to the
property boundary, which will cause MW-7 to be within the zone
of attenuation.
Monitoring wells
MW-l and MW-IO provide background data for the upper migration zone. There are no
suitable locations for deep alluvial aquifer background monitoring points, because the Wabash River
overlays the western edge
of the deep alluvial aquifer north of Pond D. Therefore, historic data from MW-
7D and MW-J21 (formerly MW-TW) were used to calculate background for this aquifer. Comparison of
analytical results from tbe proposed deep alluvial aquifer background wells (MW-7D and MW-121) to the
upper migration zone background wells (MW-I and MW-10) shows similar ranges
of groundwater quality
for all parameters except manganese (Figures 7a through 7g). Manganese is released to groundwater from
manganese oxides under reducing conditions, and the concentrations observed at MW-7D and TW-121
(which are higher than those observed
in MW-14) suggest greater manganese dissolution in the confined,
deep alluvial aquifer than
in the unconfmed, upper migration zone background wells. Concentrations for
the ash indicator constituents (boron and sulfate) will be inspected at MW-7D and
MW-12l annually, and if
concentrations increase for two consecutive years, an investigation will be performed to determine whether
these wells are still representative
of background conditions or if they should be reclassified as AGQS
wells, as defined below. All wells used for calculating background will be monitored on the same schedule
as the downgradient wells as provided
in Table 2.
Wells MW-6, MW-7, MW-8, and MW-IIR will be used to monitor downgradient groundwater quality in
the upper migration zone. Wells MW-14, MW-115S, and MW-115D will be used to monitor downgradient
rfII
•
RESOURCE.
NATURAL
_n.CHNOLOGY
Mr.
John Pozzo
May 5, 2008
Page 4
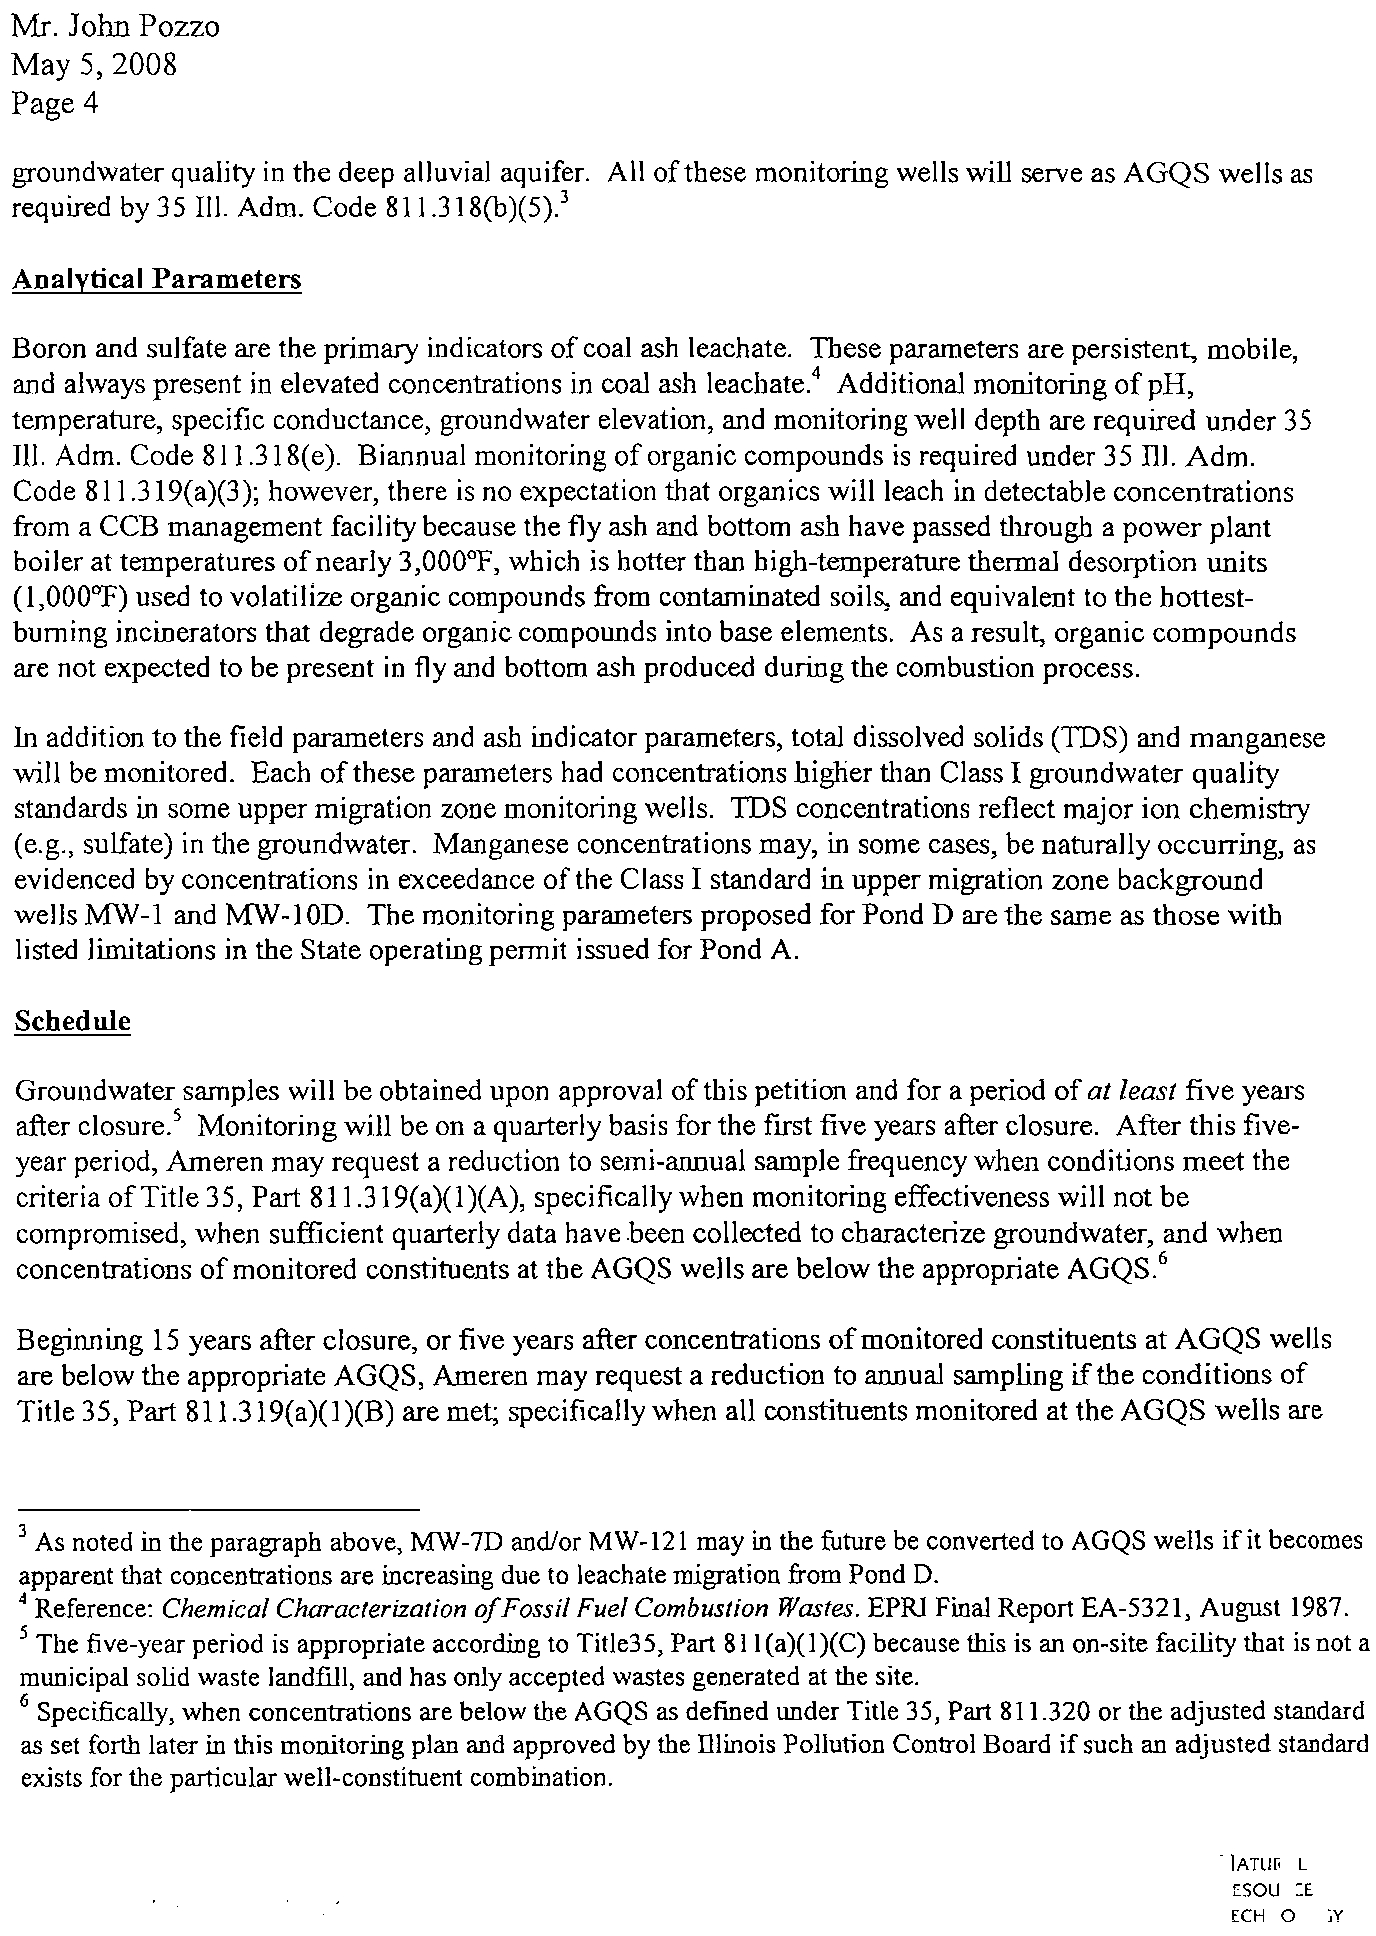
groundwater quality
in the deep alluvial aquifer. All of these monitoring wells will serve as AGQS wells as
required by 35 Ill. Adm. Code 81 1.3 I 8(b)(5)3
Analytical
Parnmeter.;
Boron and sulfate are the primary indicators of coal ash leachate. These parameters are persistent, mobile,
and always present
in elevated concentrations in coal ash leachate' Additional monitoring of pH,
temperature, specific conductance, groundwater elevation, and monitoring well depth are required under 35
Ill. Adm. Code 8 I 1.318(e). Biannual monitoring of organic compounds is required under 35 Ill. Adm.
Code 811.319(a)(3); however, there
is no expectation that organics will leach in detectable concentrations
from a CCB management facility because the fly ash and boltom ash have passed through a
power plant
boiler at temperatures
of nearly 3,000"F, which is holter than high-temperature thermal desorption units
(I
,OOO°F) used to volatilize organic compounds from contaminated soils, and equivalent to the holtest-
burning incinerators that degrade organic compounds into hase elements.
As a result, organic compounds
are not expected to be present in fly and boltom ash produced during the combustion process.
In
addition to the field parameters and ash indicator parameters, total dissolved solids
(IDS) and manganese
will be monitored. Each
ofthese parameters had concentrations higher than Class I groundwater quality
standards in some upper migration zone monitoring wells.
IDS concentrations reflect major ion chemistry
(e.g., sulfate)
in the groundwater. Manganese concentrations may, in some cases, be naturally occurring, as
evidenced by concentrations in exceedance of the Class I standard in upper migration zone background
wells
MW-1 and MW-I OD. The monitoring parameters proposed for Pond D are the same as those with
listed limitations in the State operating permit issued for Pond A.
Schedule
Groundwater samples will be obtained upon approval of this petition and for a period of
at least
five years
after
closure' Monitoring will be on a quarterly basis for the first five years after closure. After this five-
year period, Ameren
may request a reduction to semi-annual sample frequency when conditions meet the
criteria
of Title 35, Part 811.319(a)(I )(A), specifically when monitoring effectiveness will not be
compromised, when sufficient quarterly data have been collected to characterize groundwater, and when
concentrations
of monitored constituents at the AGQS wells are below the appropriate AGQS.
6
Beginning 15 years after closure, or five years after concentrations of monitored constituents at AGQS wells
are below the appropriate AGQS, Ameren may request a reduction to annual sampling
if the conditions of
Title 35, Part 811.319(a)(1)(B) are met; specifically when all constituents monitored at the AGQS wells are
3 As noted in the paragraph above, MW-7D and/or MW-121 may in the future be converted to AGQS wells if it becomes
apparent that concentrations are increasing due
to leachate migration from Pond D.
4 Reference:
Chemical Characterization ofFossil Fuel Combustion Wastes.
EPRI Final Report EA-5321, August 1987.
l
The five-year period is appropriate according to Title35, Part 81 I(a)(I)(C) because this is an on-site facility that is not a
municipal solid waste landfill, and has only accepted wastes generated
at the site.
6 Specifically, when concentrations are below the AGQS as defined under Title 35, Part 811.320 or the adjusted standard
as set forth later in this monitoring plan and approved by the Illinois Pollution Control Board if such an adjusted standard
exists for the particular well-constituent combination.
•
NATURAL
_RESOURCE
_TECHNOLOGY
Mr.
John Pozzo
May 5, 2008
Page 5
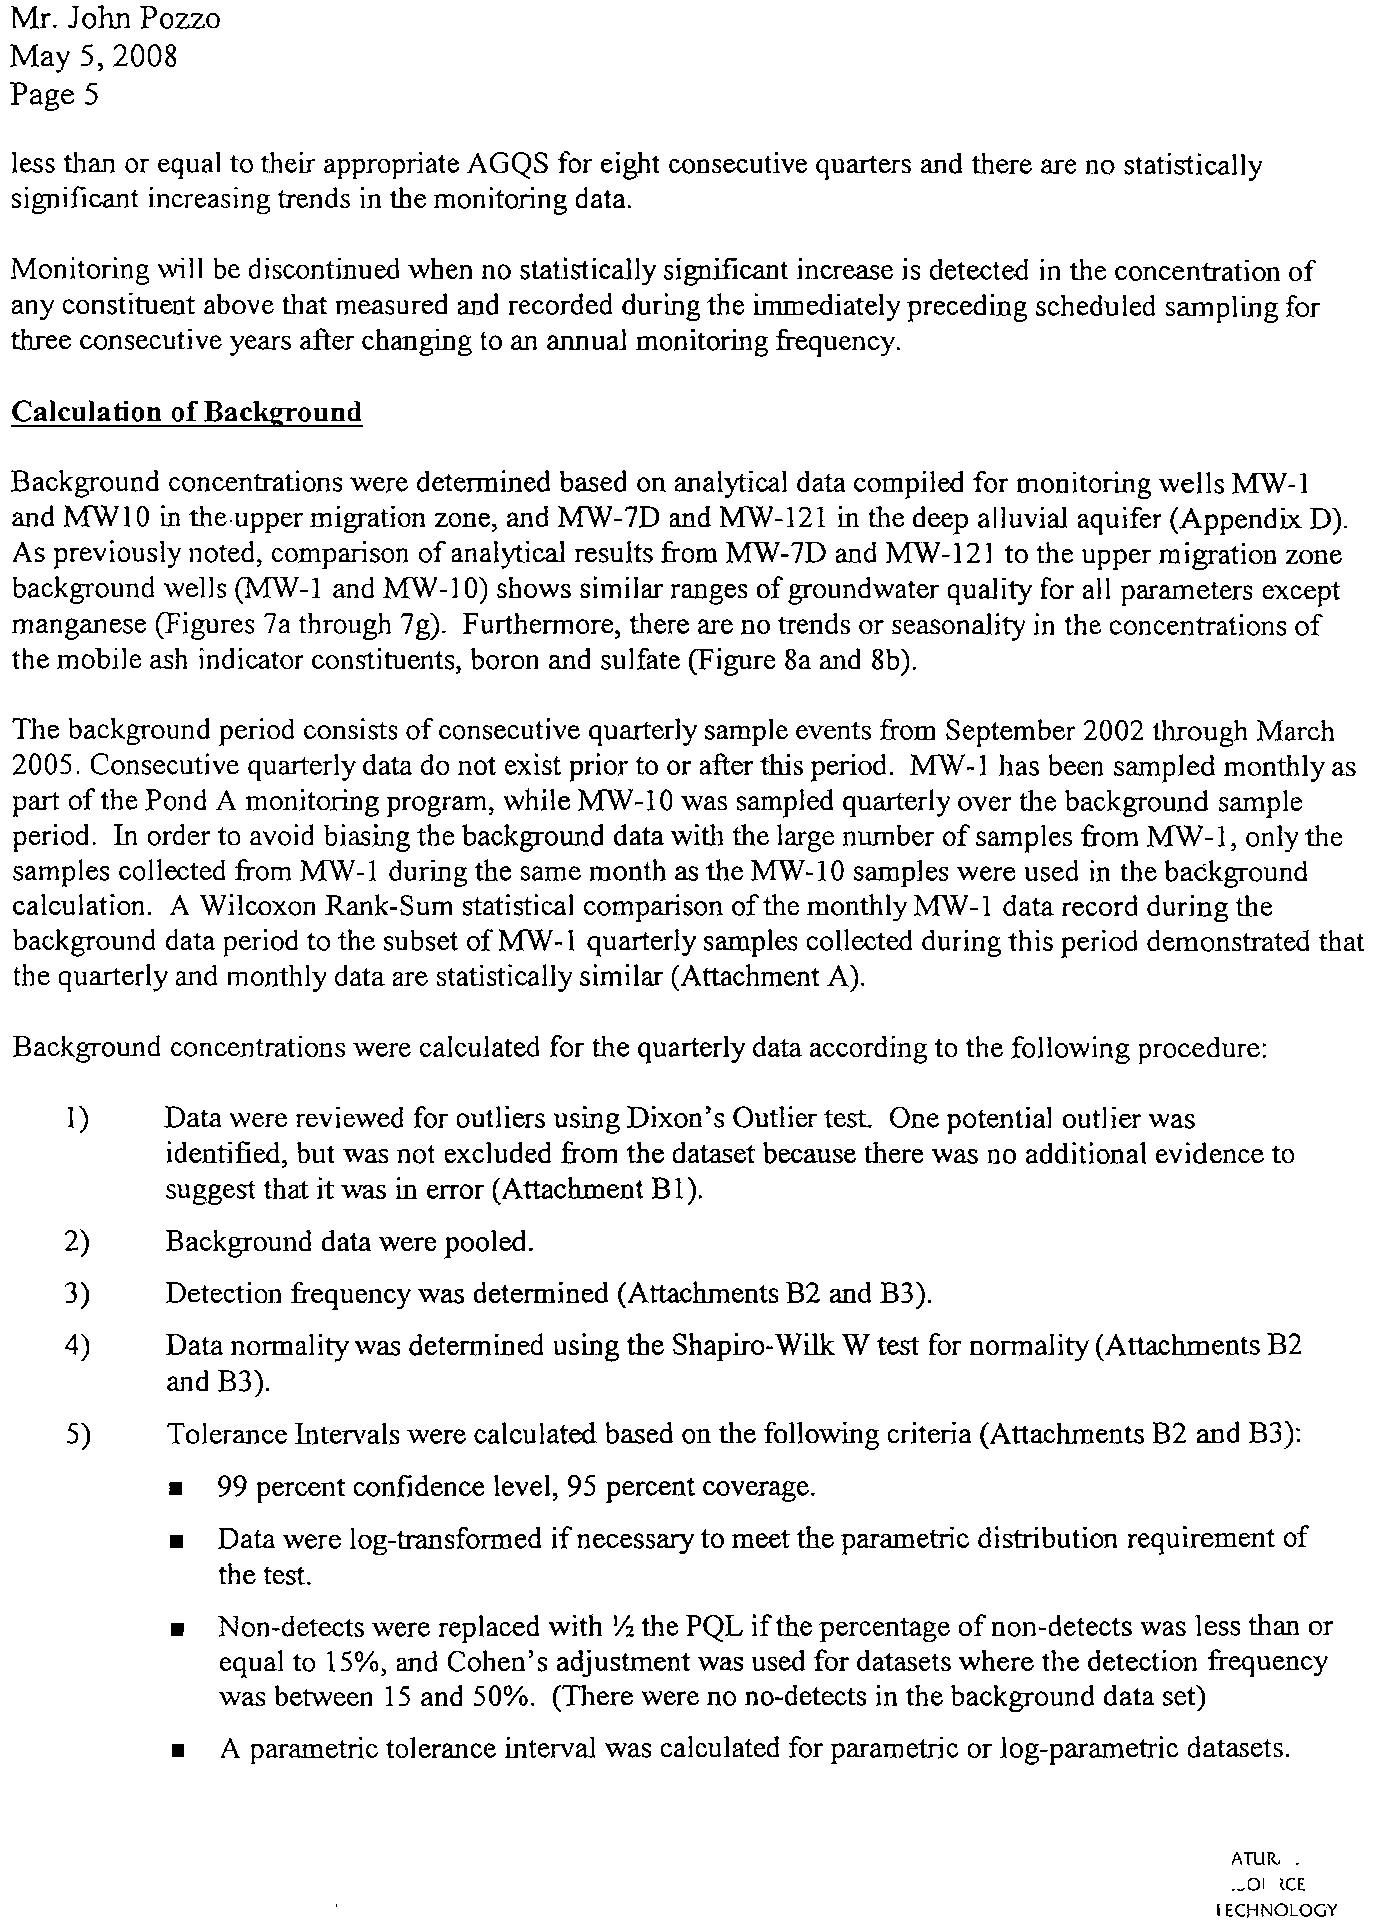
less than or equal to their appropriate AGQS for eight consecutive quarters and there are no statistically
significant increasing trends
in the monitoring data.
Monitoring will be discontinued when no statistically significant increase
is detected in the concentration of
any constituent above that measured and recorded during the immediately preceding scheduled sampling for
three consecutive years after changing to
an annual monitoring frequency.
Calculation of Bac!q:round
Background concentrations were determined based on analytical data compiled for monitoring wells MW-I
and MWlO
in the upper migration zone, and MW-7D and MW-12l in the deep alluvial aquifer (Appendix D).
As previously noted, comparison
of analytical results from MW-7D and MW-121 to the upper migration zone
background wells (MW-I and MW-l 0) shows similar ranges
of groundwater quality for all parameters except
manganese (Figures 7a through 7g). Furthermore, there are
no trends or seasonality in the concentrations of
the mobile ash indicator constituents, boron and sulfate (Figure 8a and 8b).
The background period consists
of consecutive quarterly sample events from September 2002 through March
2005. Consecutive quarterly data
do not exist prior to or after this period. MW-I has been sampled monthly as
part
of the Pond A monitoring program, while MW-10 was sampled quarterly over the background sample
period. In order to avoid biasing the background data with the large number
of samples from MW-I, only the
samples collected from MW-I during tbe same month
as the MW-10 samples were used in the background
calculation. A Wilcoxon Rank-Sum statistical comparison
of the monthly MW-I data record during the
background data period to the subset
ofMW-l quarterly samples collected during this period demonstrated that
the quarterly and monthly data are statistically similar (Attachment A).
Background concentrations were calculated for the quarterly data according to the following procedure:
I)
Data were reviewed for outliers using Dixon'sOutlier test. One potential outlier was
identified, but was not excluded from the dataset because there was no additional evidence to
suggest that it was
in error (Attachment BI).
2)
Background data were pooled.
3)
Detection frequency was determined (Attachments B2 and B3).
4)
Data normality was determined using the Shapiro-Wi!k W test for normality (Attachments B2
and B3).
5)
Tolerance Intervals were calculated based on the following criteria (Attachments B2 and B3):
•
99 percent confidence level, 95 percent coverage.
•
Data were log-transformed
if necessary to meet the parametric distribution requirement of
the test.
•
Non-detects were replaced with
Y,
the PQL if the percentage of non-detects was less than or
equal to 15%, and Cohen'sadjustment was used for datasets where the detection frequency
was between
15 and 50%. (There were no no-detects in the background data set)
•
A parametric tolerance interval was calculated for parametric or log-parametric datasets.
•
NATURAL
RESOURCE
_TE.CHNOLOGY
Mr.
John Pozzo
May 5, 2008
Page 6
•
A non-parametric tolerance interval was determined for non-parametric datasets.
6)
The background concentrations presented
in Table 5 are:
•
The upper tolerance interval for all constituents except for pH.
•
The range between the upper and lower tolerance intervals for pH.
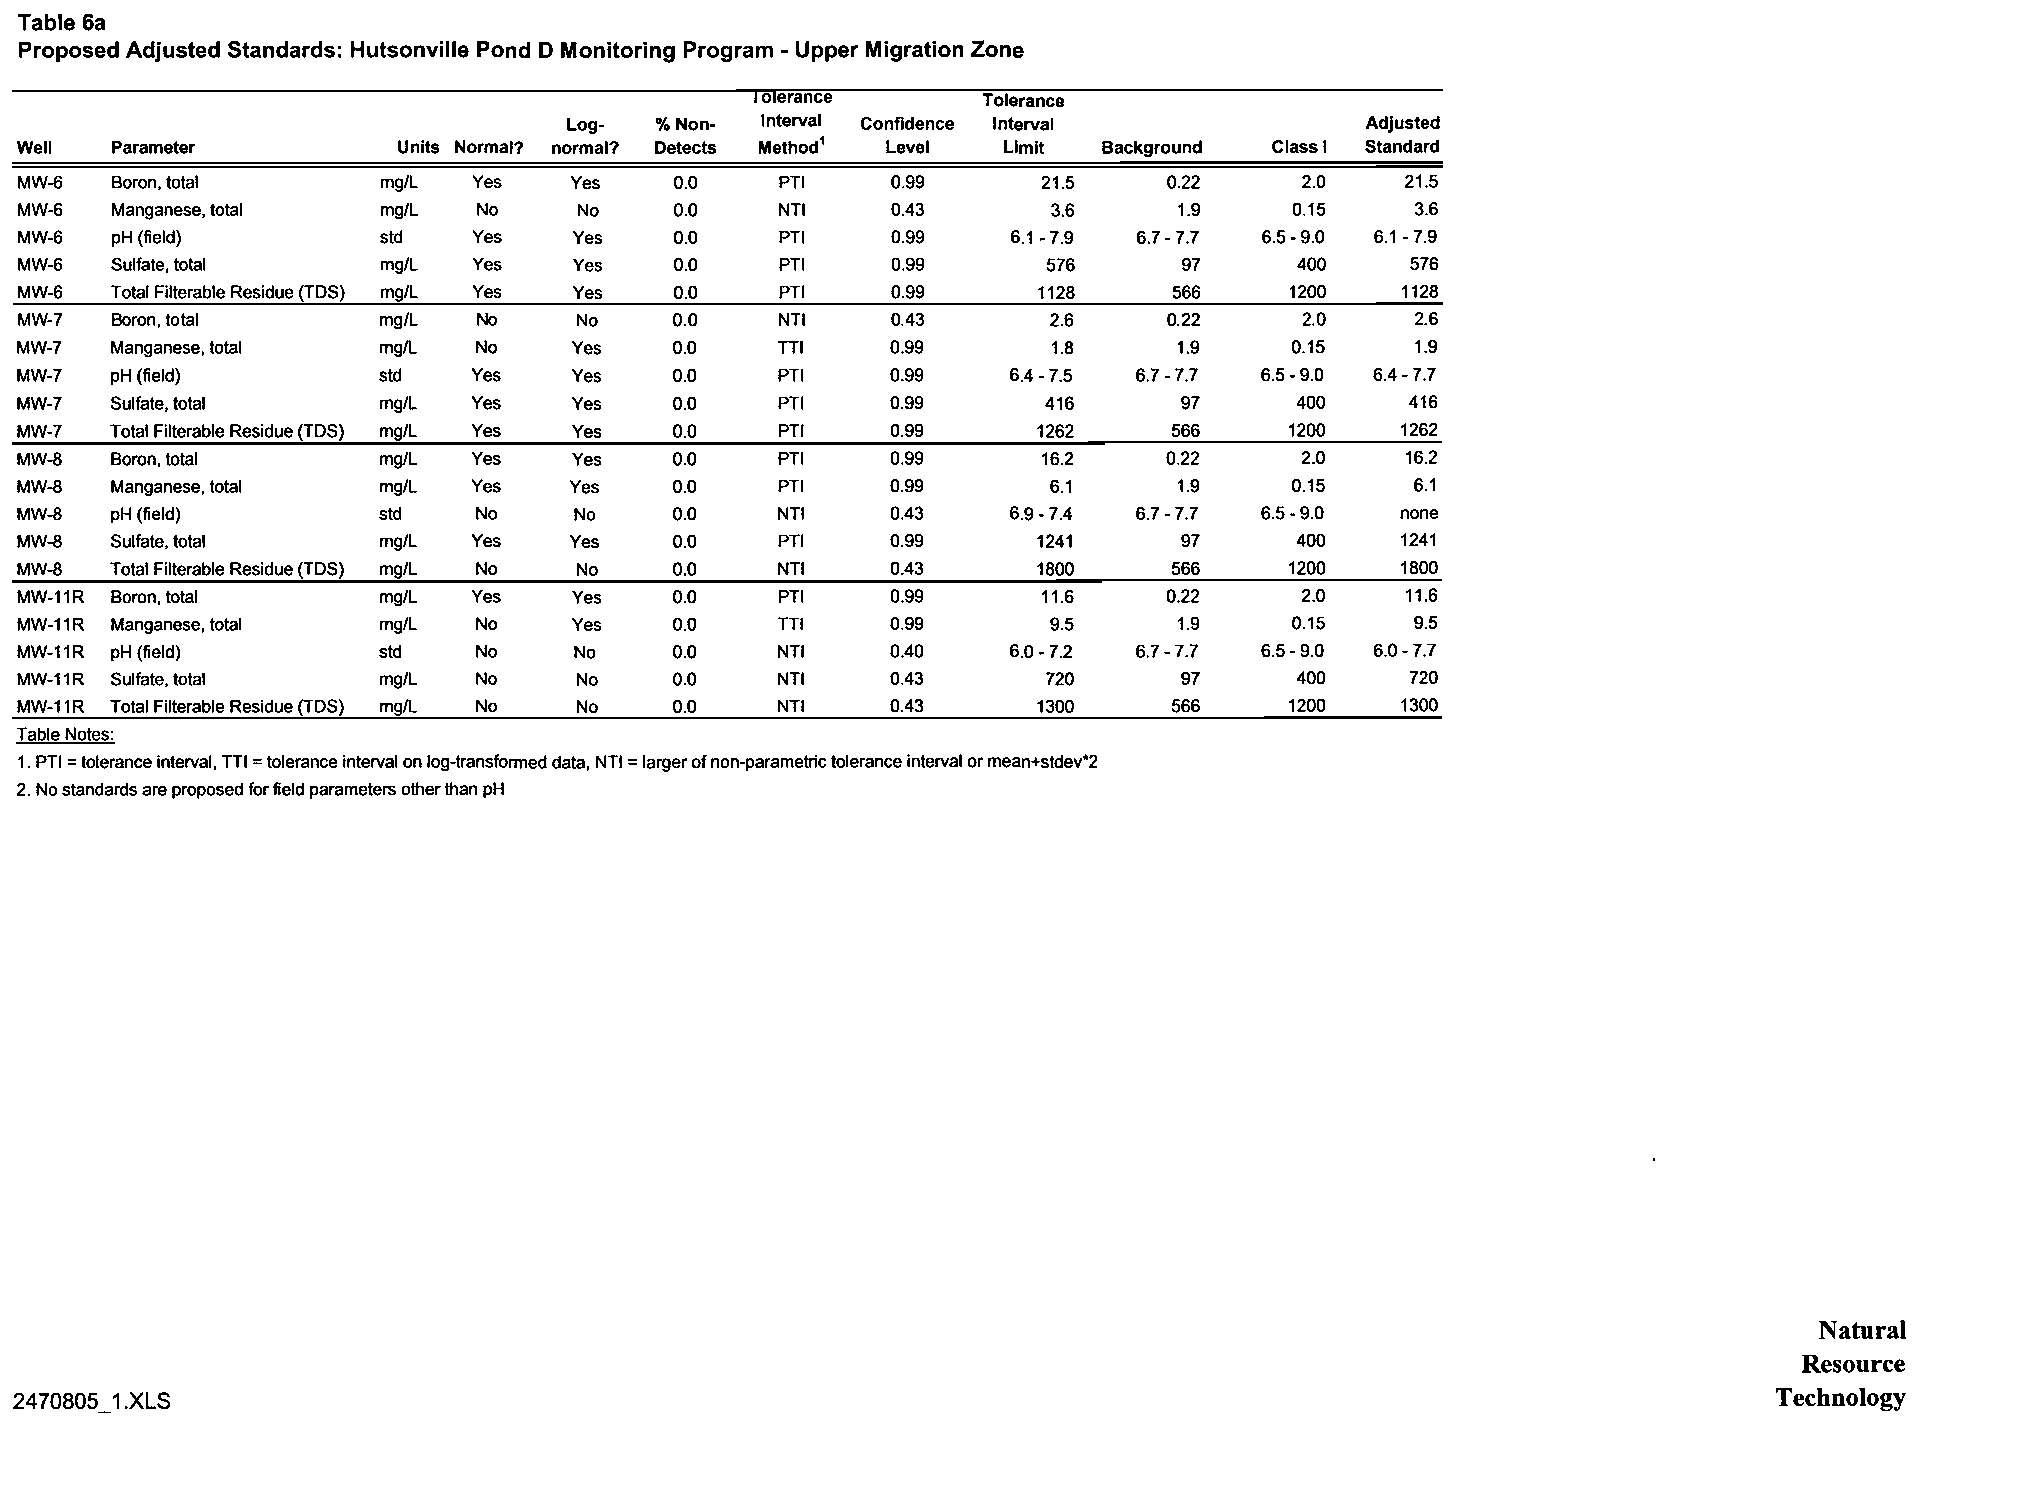
Adjusted
Standards
Adjusted stalldards were determined individually for boron, sulfate, manganese, TDS, and pH at selected
AGQS monitoring well (Table 6) using tolerance intervals.' The tolerance intervals were calculated using
data from consecutive quarterly sample events from September 2002 through March 2005. Consecutive
quarterly data do not exist prior to or after this period. Time series plots were prepared for tbese data
(Figures 9 and 10). The only constituent with
an apparent trend was boron at MW14, and that trend leveled
off over the last five quarters of sampling (Figure lOa). Otherwise, the data showed no appal.ent trends or
seasonality.
The statistical procedure outlined below was followed for each weIVparameter combination to calculate the
tolerance intervals:
1) Data were reviewed for outliers using Dixon'sOutlier test. Two potential outliers were identified,
but not excluded from the dataset because there was no additional evidence to suggest
that tbe
values were
in error (Attachment Cl).
2) Detection frequency was determined (Attachment C2).
3) Data normality was determined using the Shapiro-Wilk W test for normality (Attachment C2).
4) Tolerarlce Intervals were calculated based on the following criteria (Attachment C2):
•
99 percent confidence level,
95 percent coverage.
•
Data were log-transformed
if necessary to meet the parametric distribution requirement of
the test.
•
Non-detects were replaced with
y,
the PQL ifthe percentage of non-detects was less than or
equal to 15%, and Cohen'sadjustroent was used for datasets where the detection frequency
was between
15 and 50%. (There were no no-detects)
•
A parametric tolerance interval was calculated for parametric or log-parametric datasets.
•
A non-parametric tolerance interval was determined for non-parametric datasets.
5) Adjusted standards (Table 6) are proposed for any welVconstituent combination where
the tolerance
interval is outside the lower
of the background data range or Class 1 standard.
7 Adjusted standards were not calculated for MW-115s and MW-115d because concentrations of ash indicator
constituents
were lower than background (in limited sampling).
•
NATURAL
_RESOURCE
_TE.CHNOLOGY
Mr. John Pozzo
May 5, 2008
Page 7
CLOSING
Please do not hesitate to contact me if you have any questions concerning this or other issues associated
with this facility.
Sincerely,
LOGY, INC.
Encs: Figures I through 10
Tables 1 through 6
Attachment
A: Statistical Comparison of Upper Migration Zone and Deep Alluvial Aquifer
Background Well Data
Attachment B: Background Statistical Calculations
Attachment
C: Statistical Calculations for Adjusted Standards
Attachment D: Data used
in Statistical Calculations
Attachment E: Boring Logs and Well Completion Reports
[p:\1300\1375\6_2 Petition Support 2007IMonitoring PlanlExhibit I I Hutsonville Pond D Monitoring Program 200S.doc
CH2\2470697.J
•
NATURAL
_RESOURCE
_TECHNOLOGY
Table 1
Hutsonville Pond
A
Monitoring Program
Wells
Position
Parameters
Frequency
MW-1
Background
!
!
MW-2
Sidegradient
-------
pH, TDS, Boron,
MW-3
Downgradient
Manganese, Sulfate
Monthly
MW-4
Downgradient
MW-5
Downgradient
Notes:
Per Permit No. 2005-EO-3689
2470805JXLS
Natural
Resource
Technology
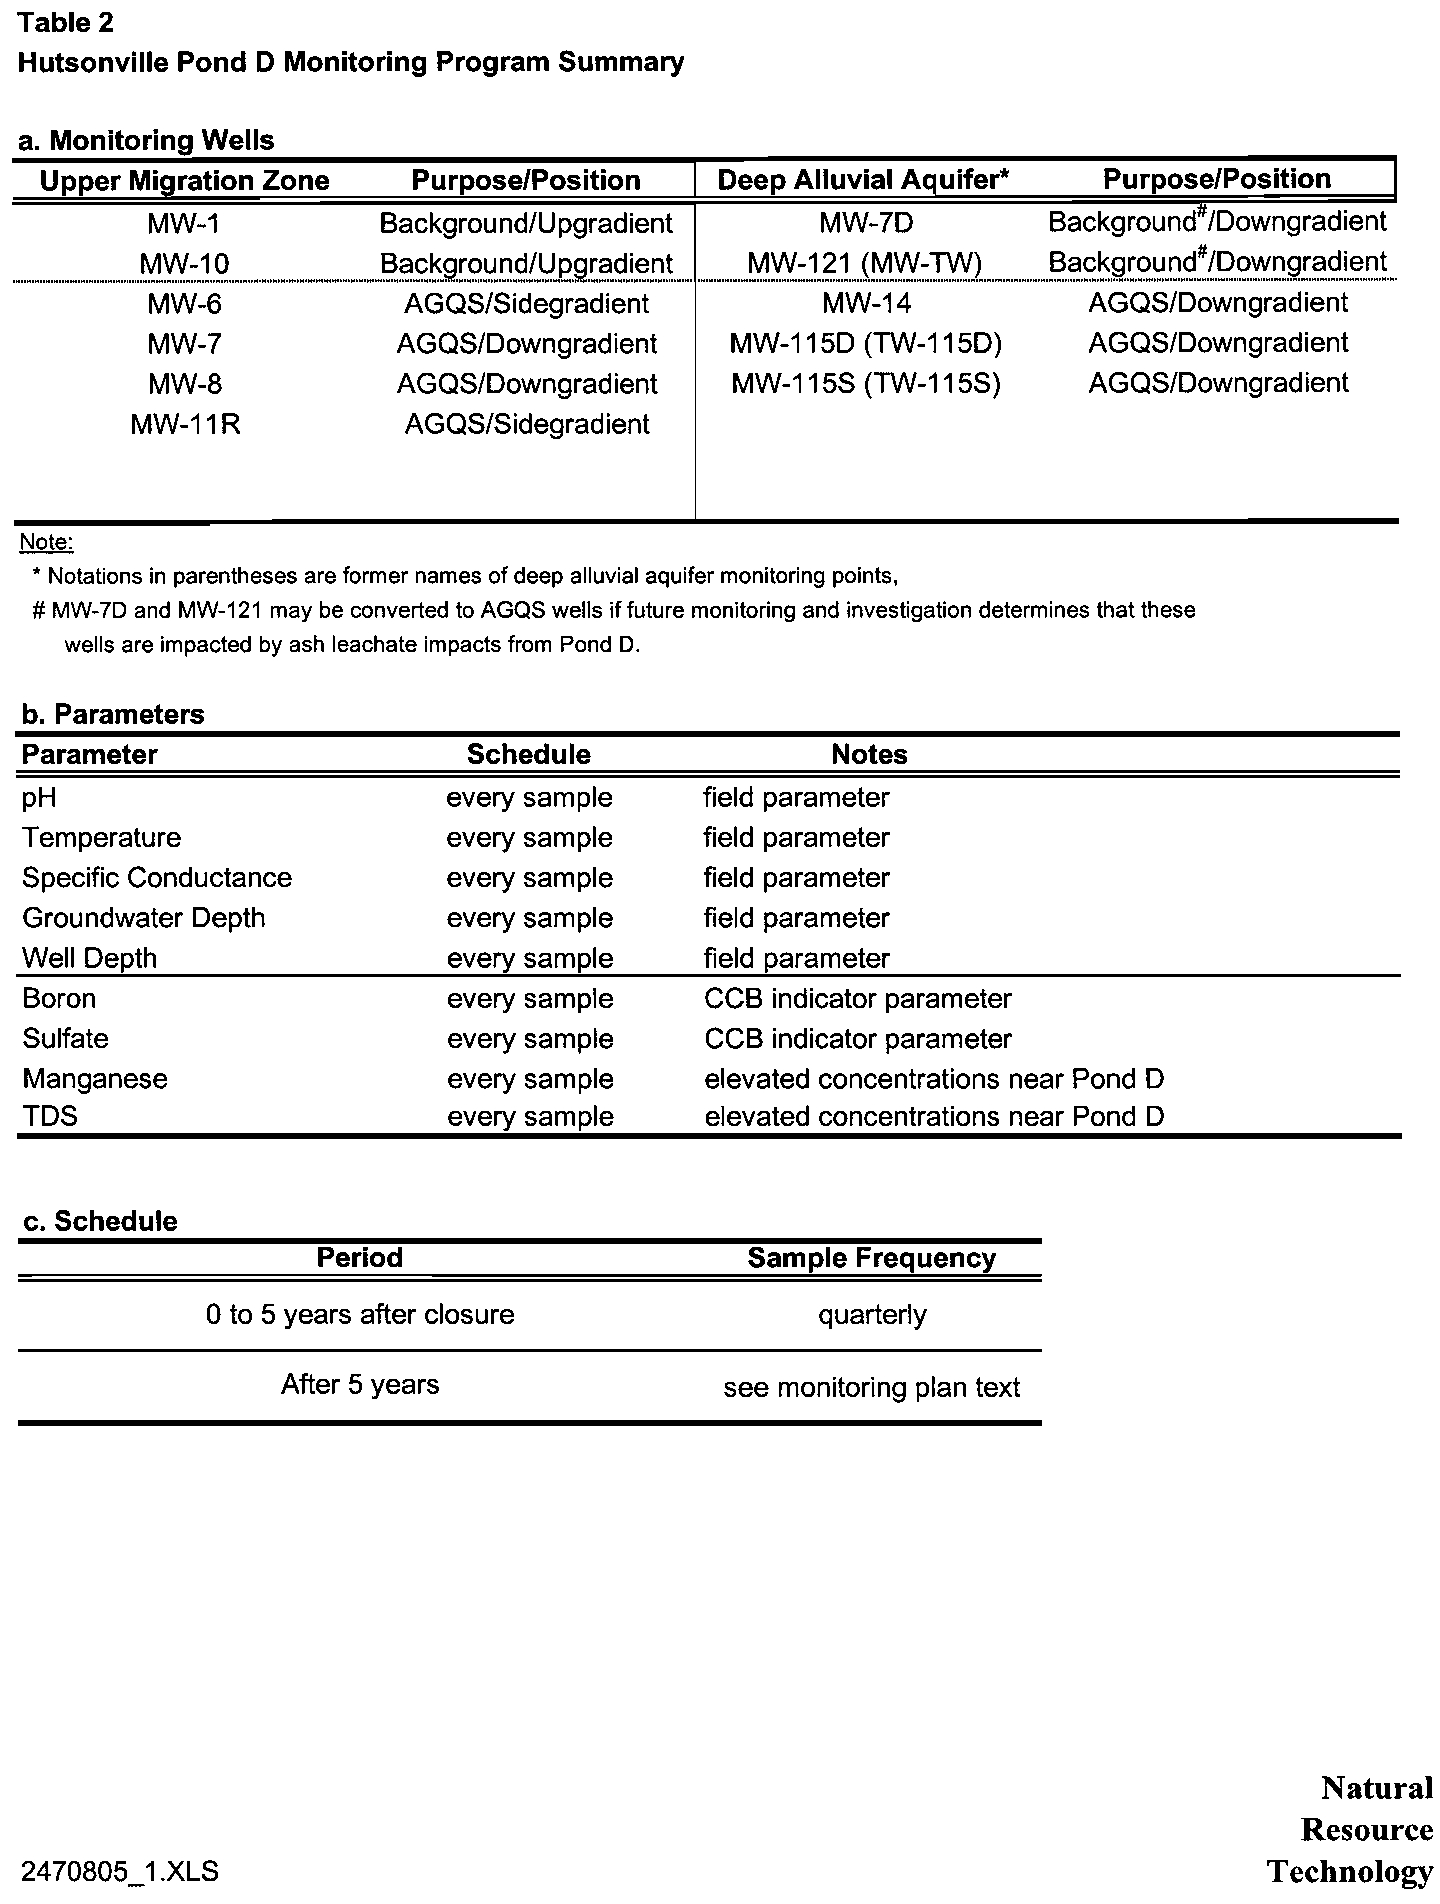
Table 2
Hutsonville Pond D Monitoring Program Summary
a. Monitoring Wells
Upper
Mi ration Zone
Purpose/Position
Deep Alluvial A uifer*
Purpose/Position
MW-1
Background/Upgradient
MW-7D
Background /Downgradient
......
_.....~YY.:.~g
_.
__
I?;;ls:~.IlE?!!.~.~!.y.eIlE~.9.i~.~~...
_~YY.:).?~.(!\'I.YY.:I'!YJ._
'?;;ls:~fJE?!!D5!
..
!.'?g'!".~fJ!~9.i.E:.~!.
MW-6
AGQS/Sidegradient
MW-14
AGQS/Downgradient
MW-7
AGQS/Downgradient
MW-115D (TW-115D)
AGQS/Downgradient
MW-8
AGQS/Downgradient
MW-115S (TW-115S)
AGQS/Downgradient
MW-11 R
AGQS/Sidegradient
Note:
* Notations in parentheses are former names of deep alluvial aquifer monitoring points,
# MW-7D and MW-121 may be converted to AGOS wells jffuture monitoring and investigation determines that these
wells are impacted
by
ash leachate impacts from Pond D.
b. Parameters
Parameter
pH
Temperature
Specific Conductance
Groundwater Depth
Well Depth
Boron
Sulfate
Manganese
TDS
c.
Schedule
Period
Schedule
every sample
every sample
every sample
every sample
every sample
every sample
every sample
every sample
every sample
Notes
field parameter
field parameter
field parameter
field parameter
field parameter
CCB indicator parameter
CCB indicator parameter
elevated concentrations near Pond D
eievated concentrations near Pond D
Sample Frequency
o
to 5 years after closure
After 5 years
quarterly
see monitoring plan text
Natural
Resource
Technology
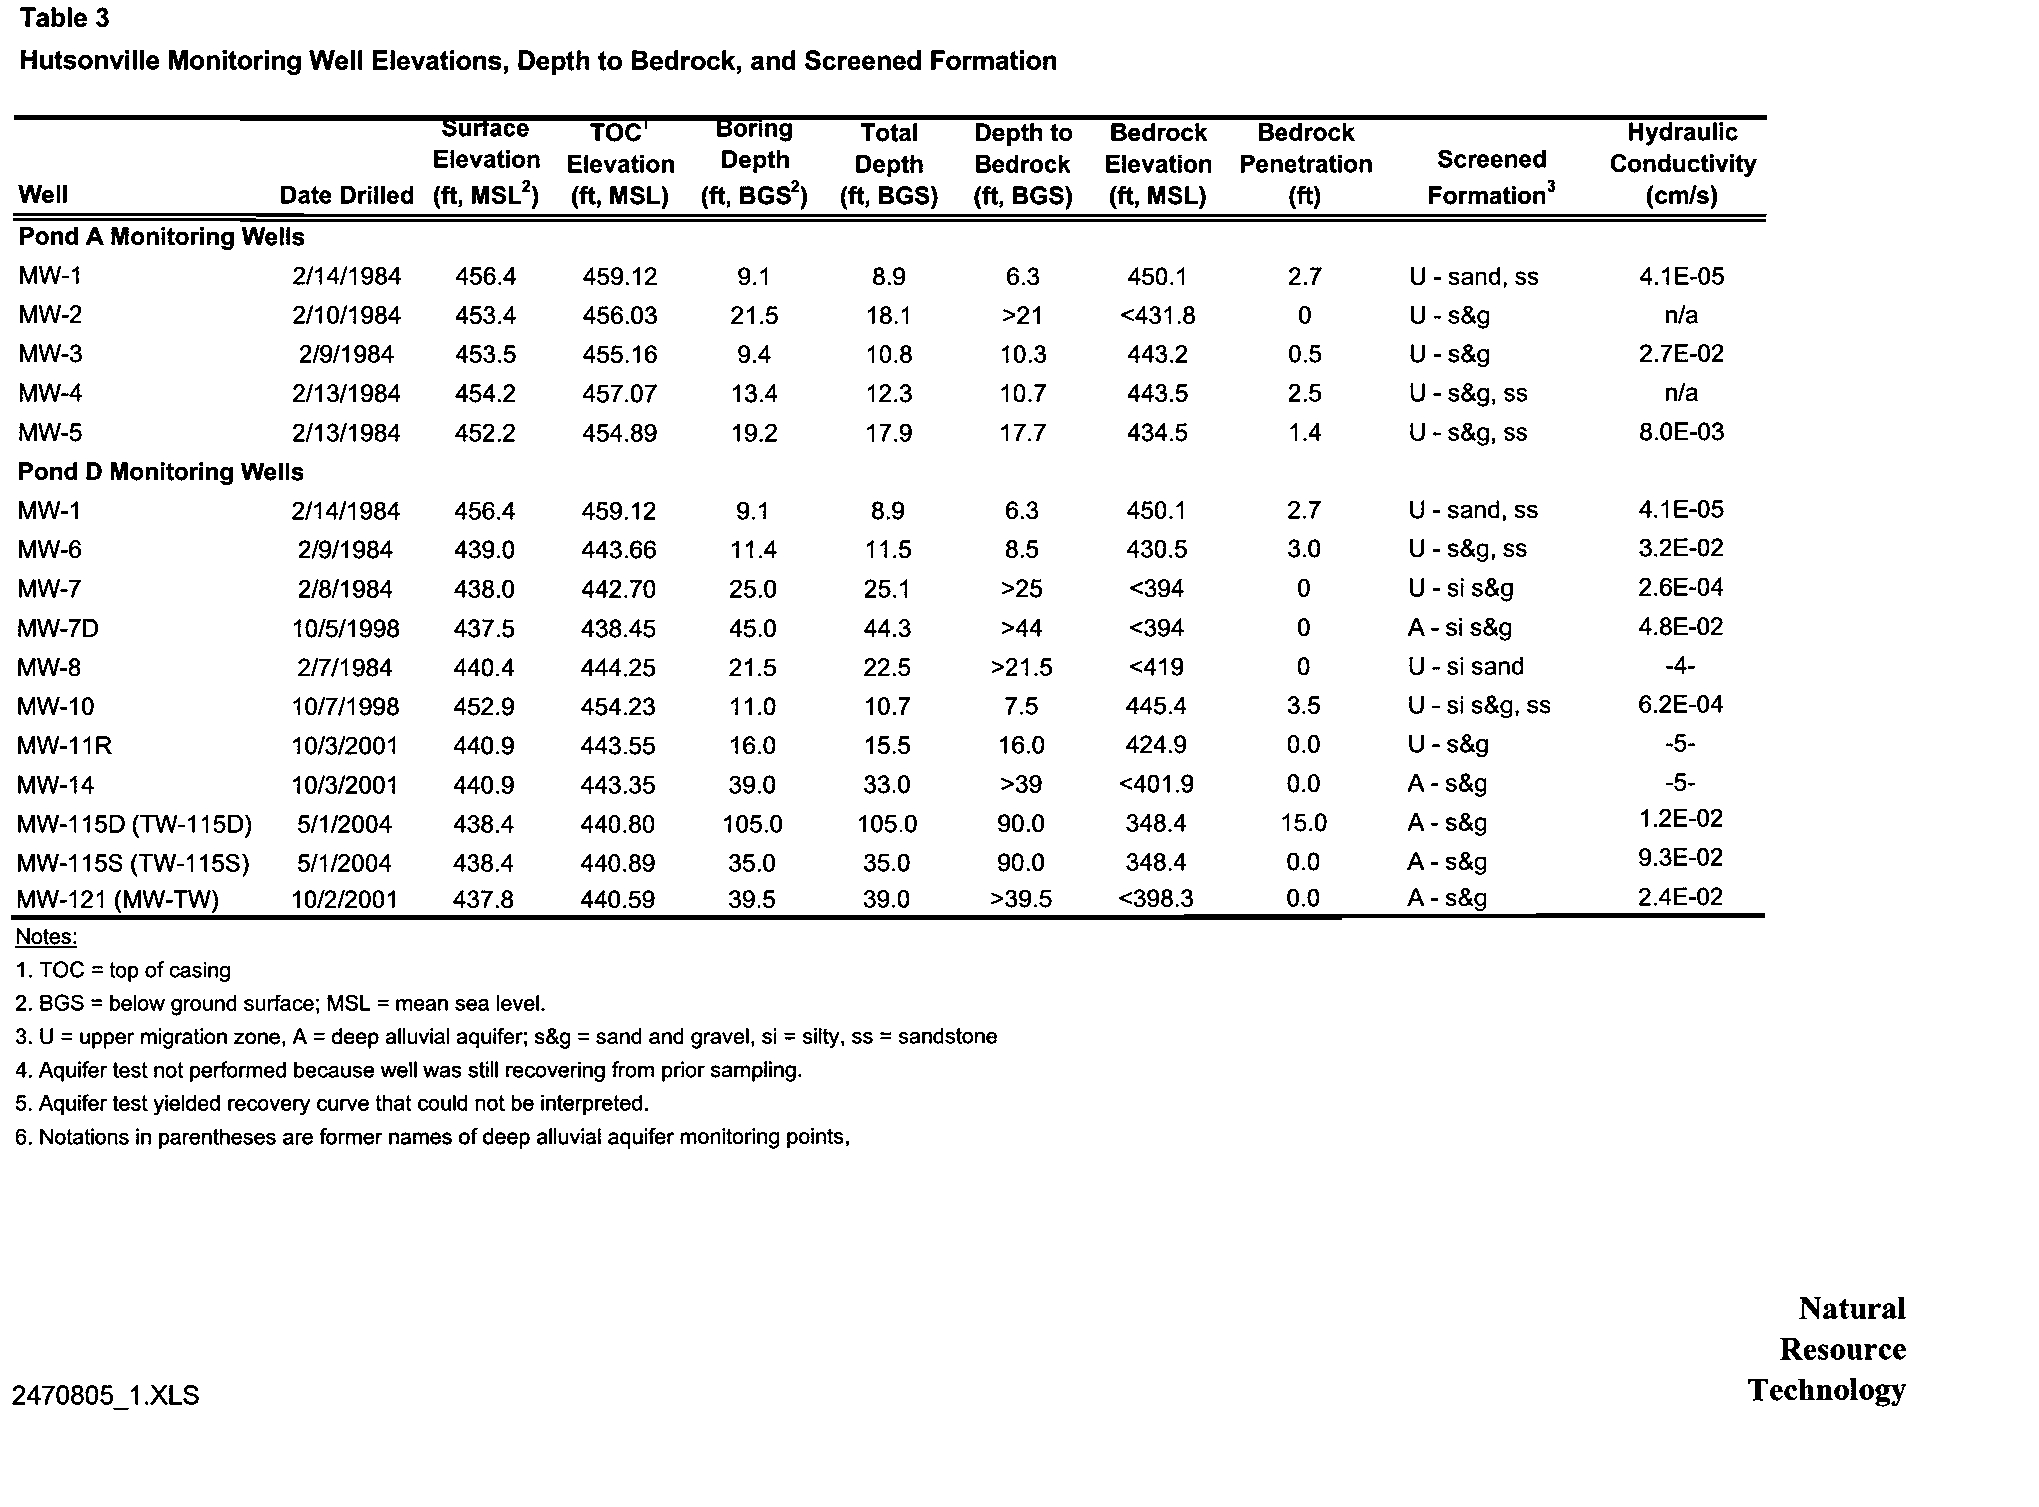
Table 3
Hutsonville Monitoring Well Elevations, Depth to Bedrock, and Screened Formation
Sunace
TOC'
BOring
Total
Depth to
Bedrock
Bedrock
Hydraulic
Elevation
Elevation
Depth
Depth
Bedrock
Elevation Penetration
Screened
Conductivity
Well
Date Drilled
(ft,
MSL')
(ft,
MSL)
(ft,
BGS')
(ft,
BGS)
(ft,
BGS)
(ft,
MSL)
(ft)
Formation
J
(cm/s)
Pond A
Monitoring Wells
MW-1
2/14/1984
456.4
459.12
9.1
8.9
6.3
450.1
2.7
U - sand,
S5
4.1 E-05
MW-2
2/10/1984
453.4
456.03
21.5
18.1
>21
<431.8
0
U
-s&g
n/a
MW-3
2/9/1984
453.5
455.16
9.4
10.8
10.3
443.2
0.5
U
-s&g
2.7E-02
MW-4
2/13/1984
454.2
457.07
13.4
12.3
10.7
443.5
2.5
U - s&g,
55
n/a
MW-5
2/13/1984
452.2
454.89
19.2
17.9
17.7
434.5
1.4
U - 5&g,
55
8.0E-03
Pond D
Monitoring Wells
MW-1
2/14/1984
456.4
459.12
9.1
8.9
6.3
450.1
2.7
U - sand,
S5
4.1E-05
MW-6
2/9/1984
439.0
443.66
11.4
11.5
8.5
430.5
3.0
U - 5&g,
55
3.2E-02
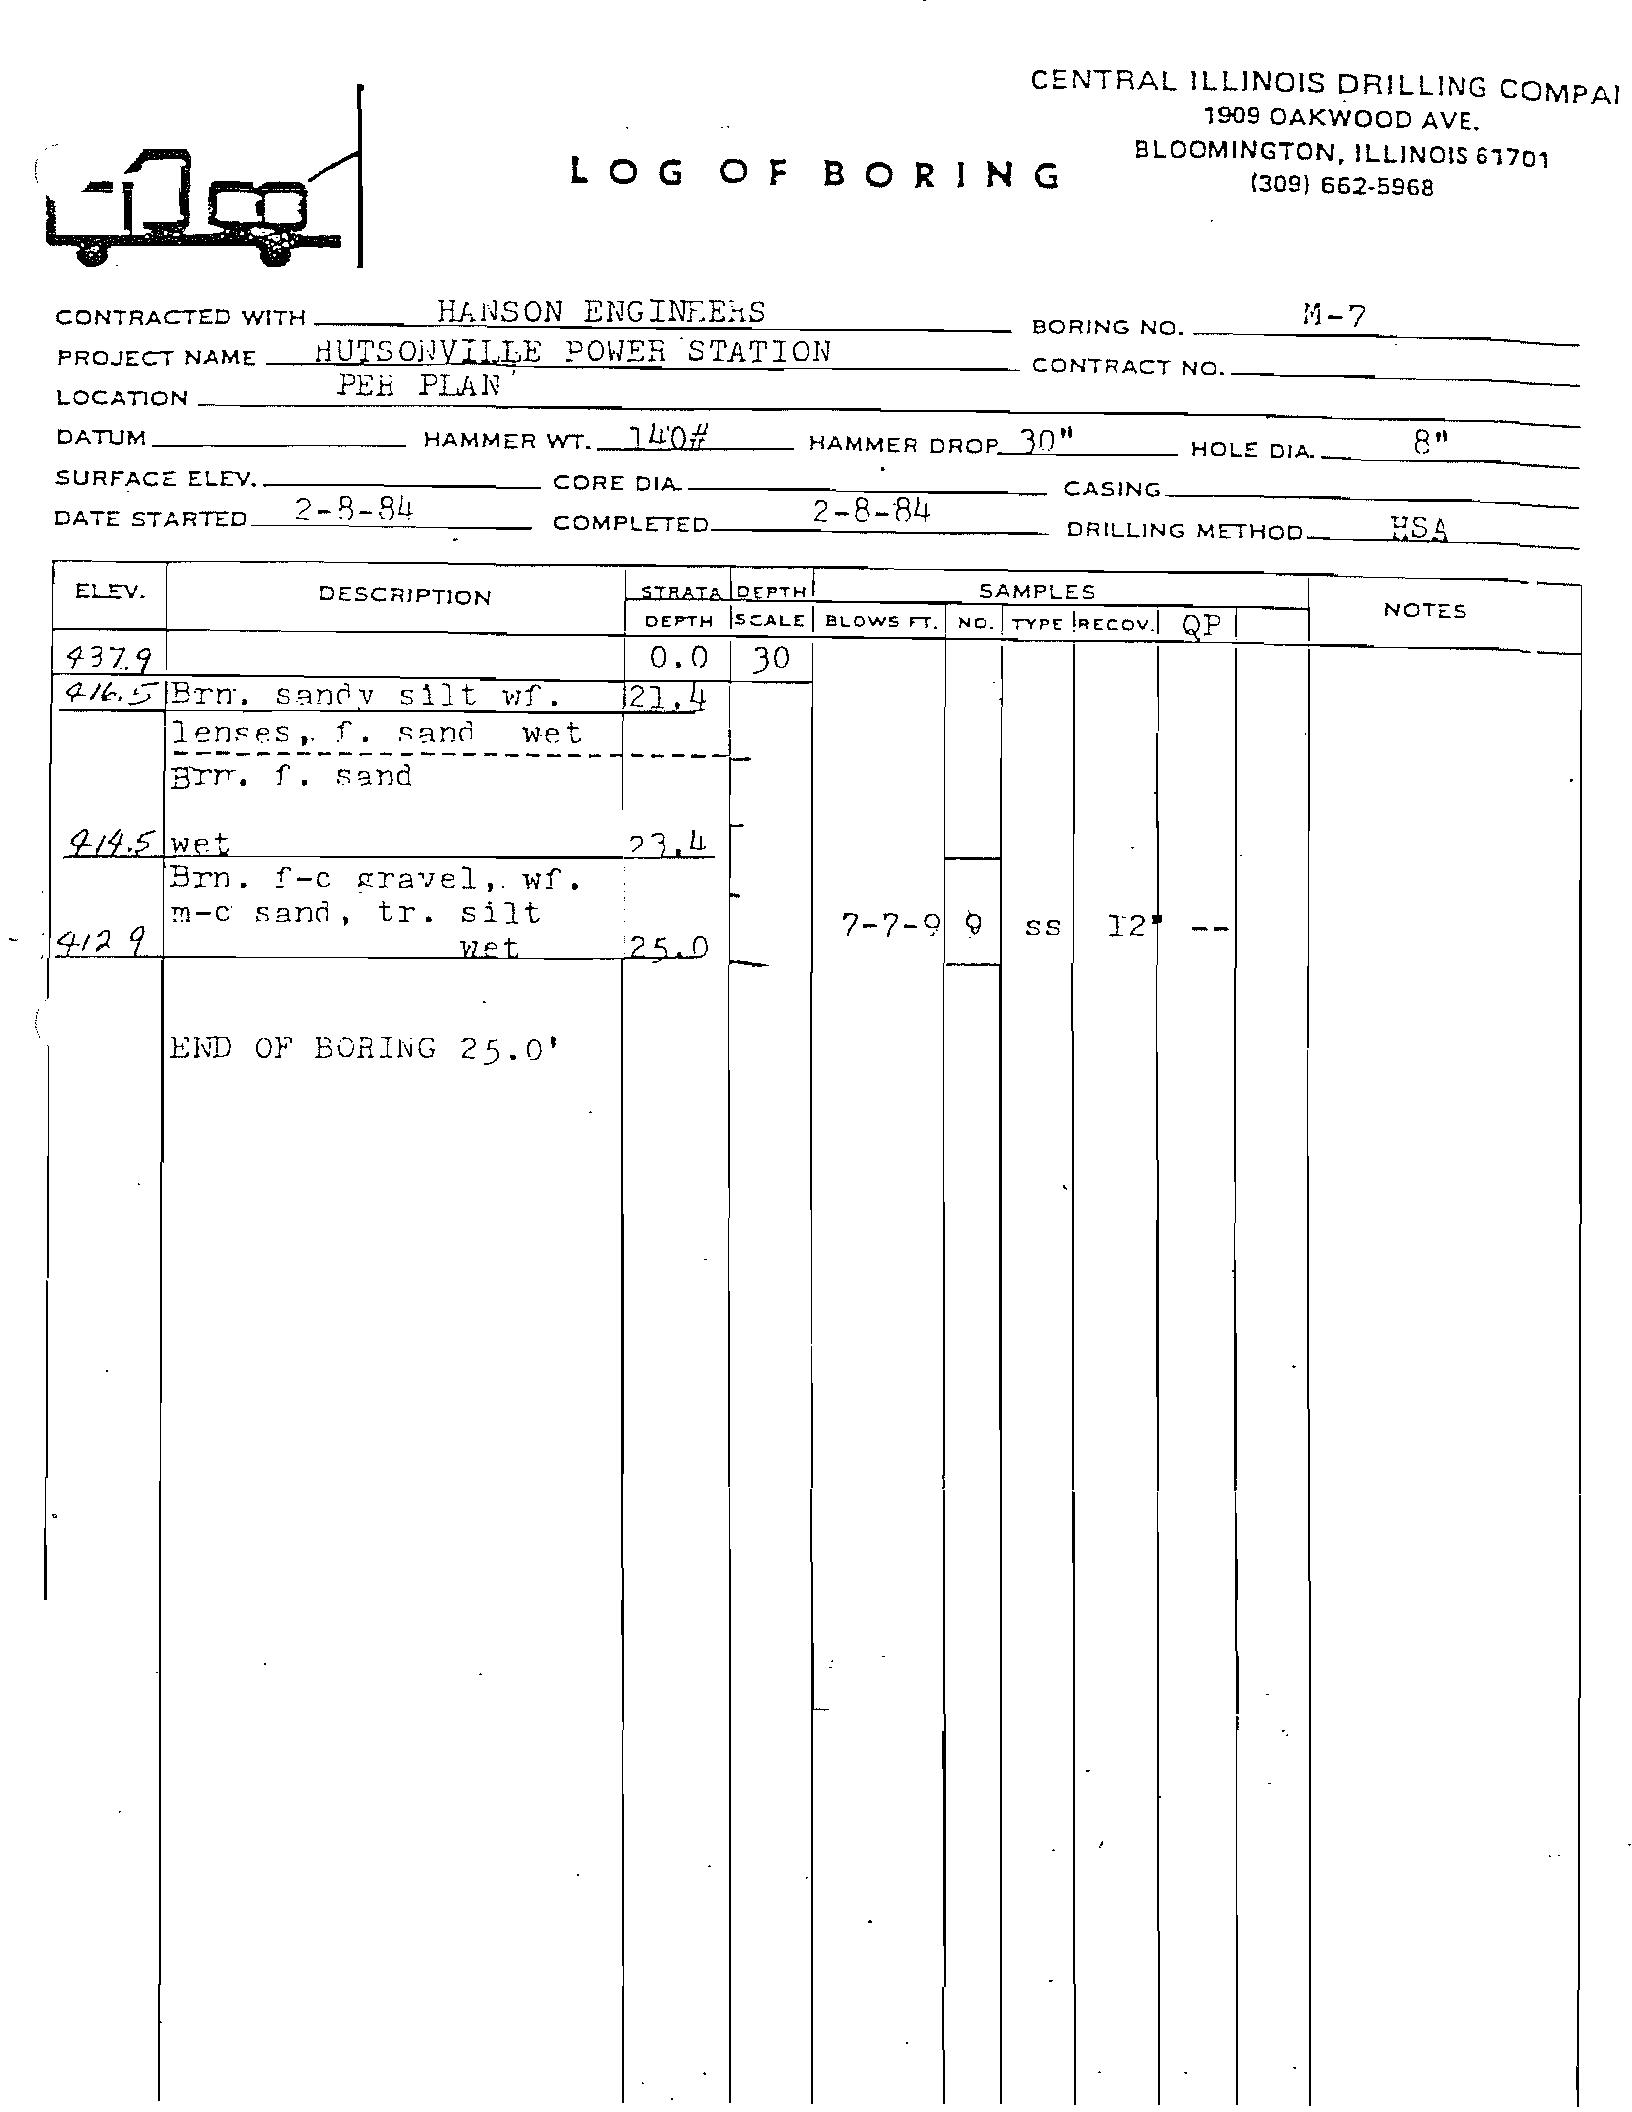
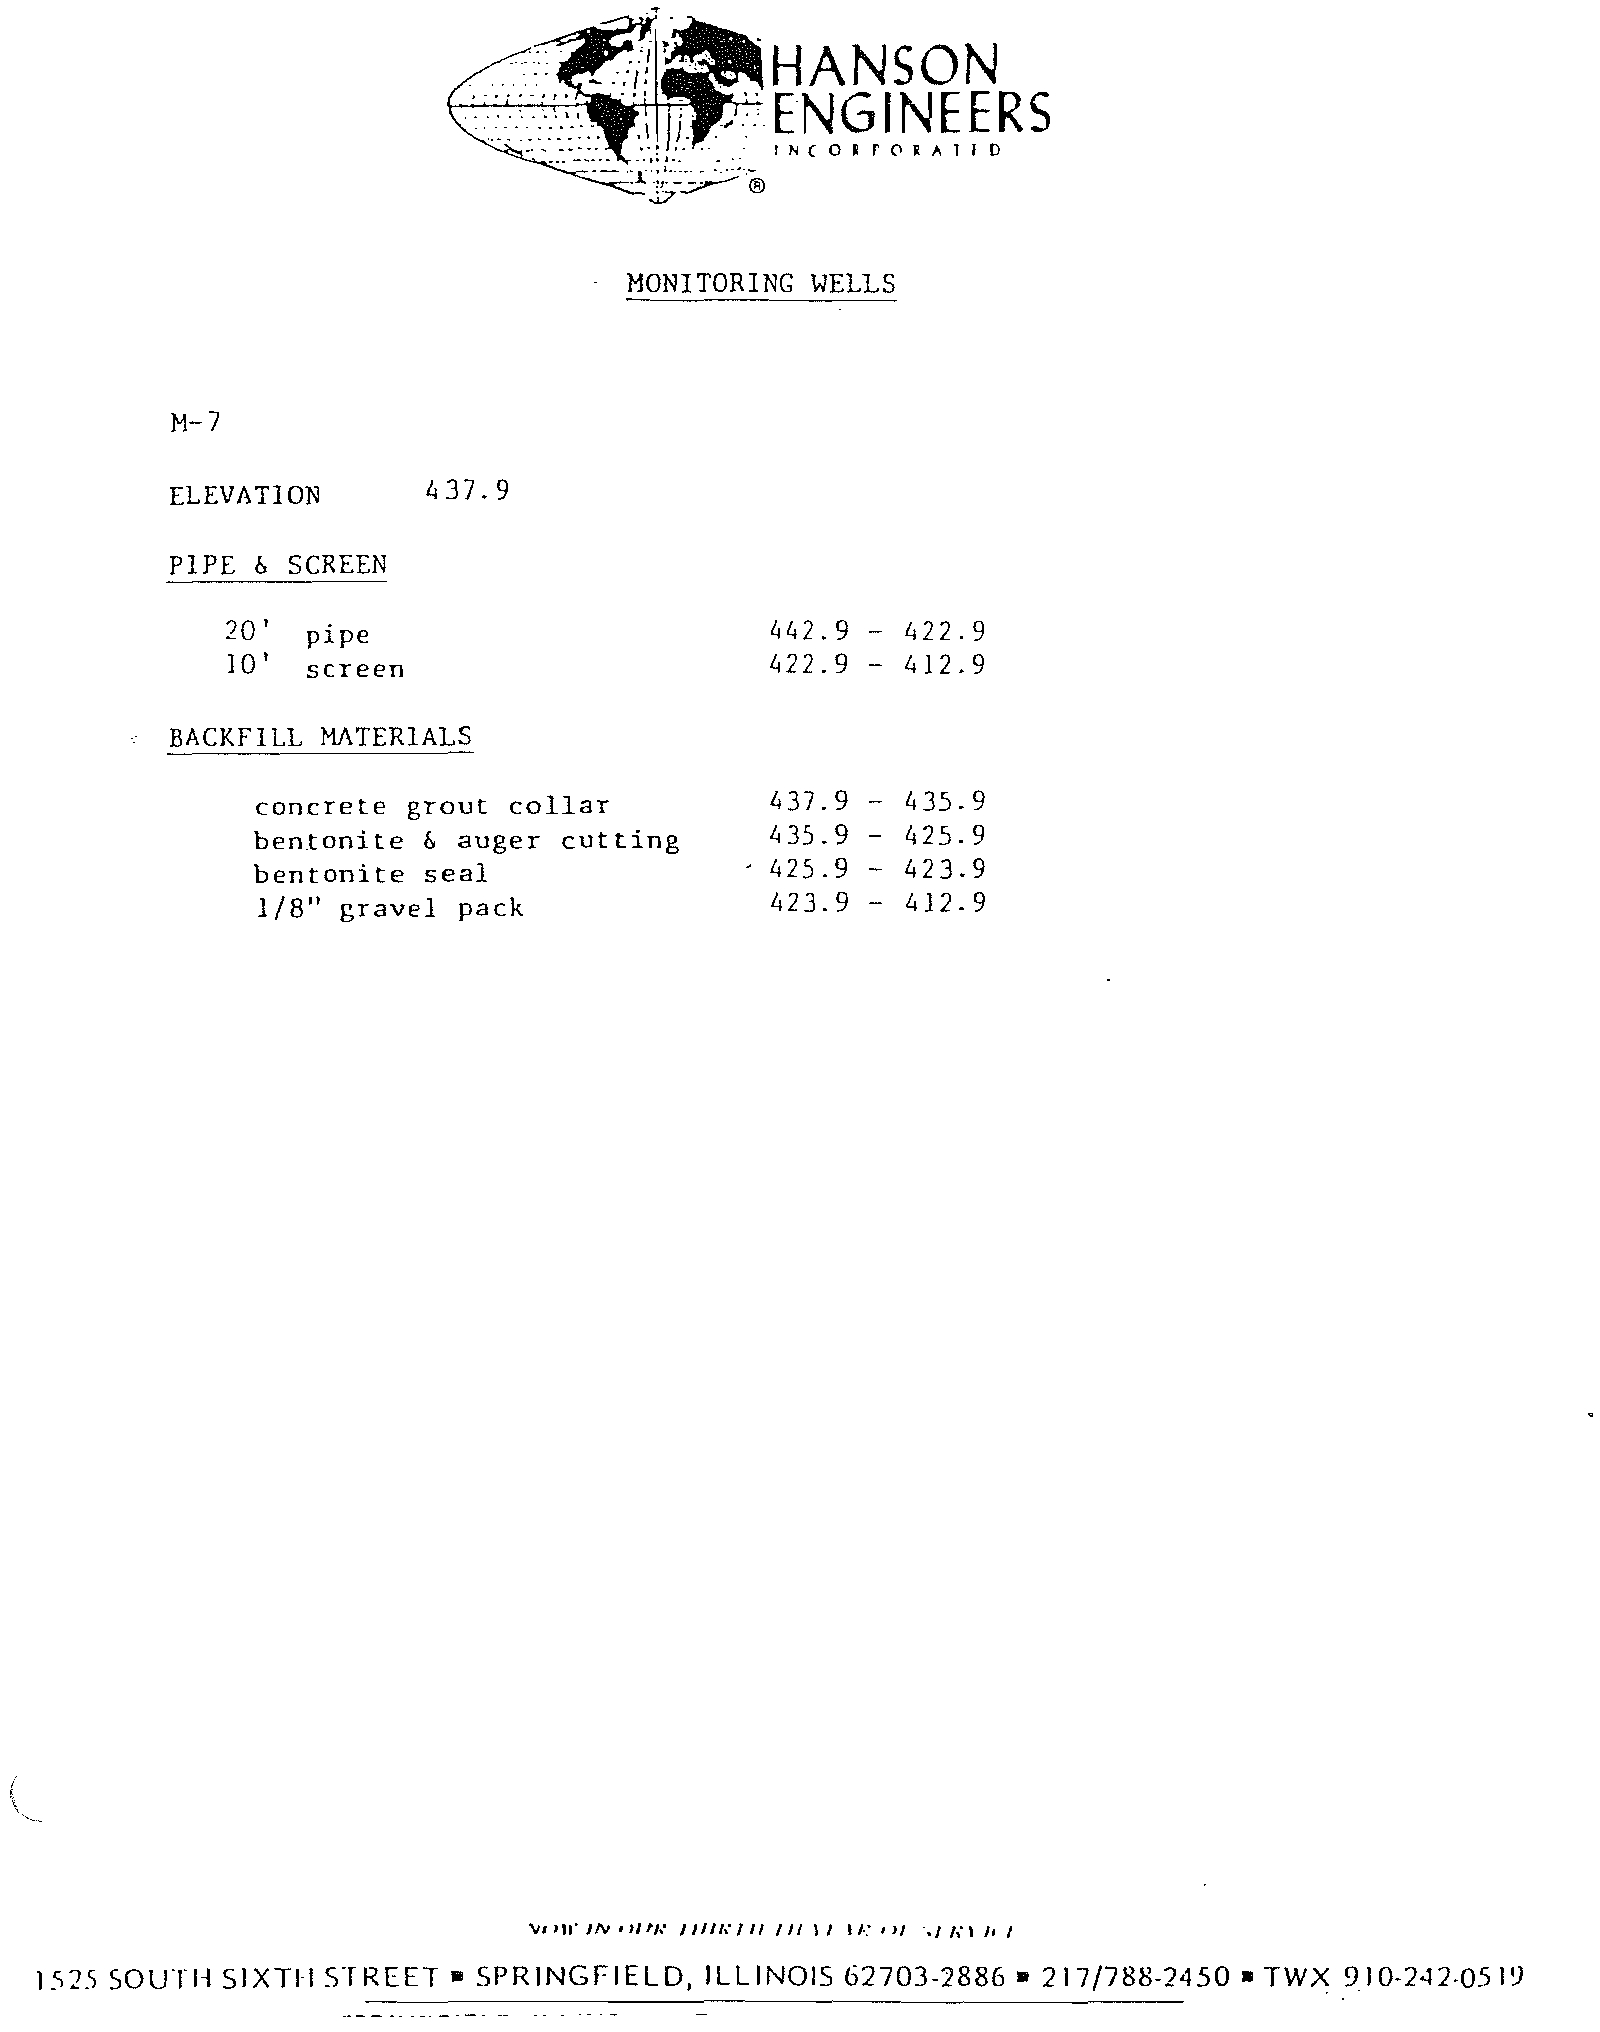
MW-7
2/8/1984
438.0
442.70
25.0
25.1
>25
<394
0
U - 5i 5&g
2.6E-04
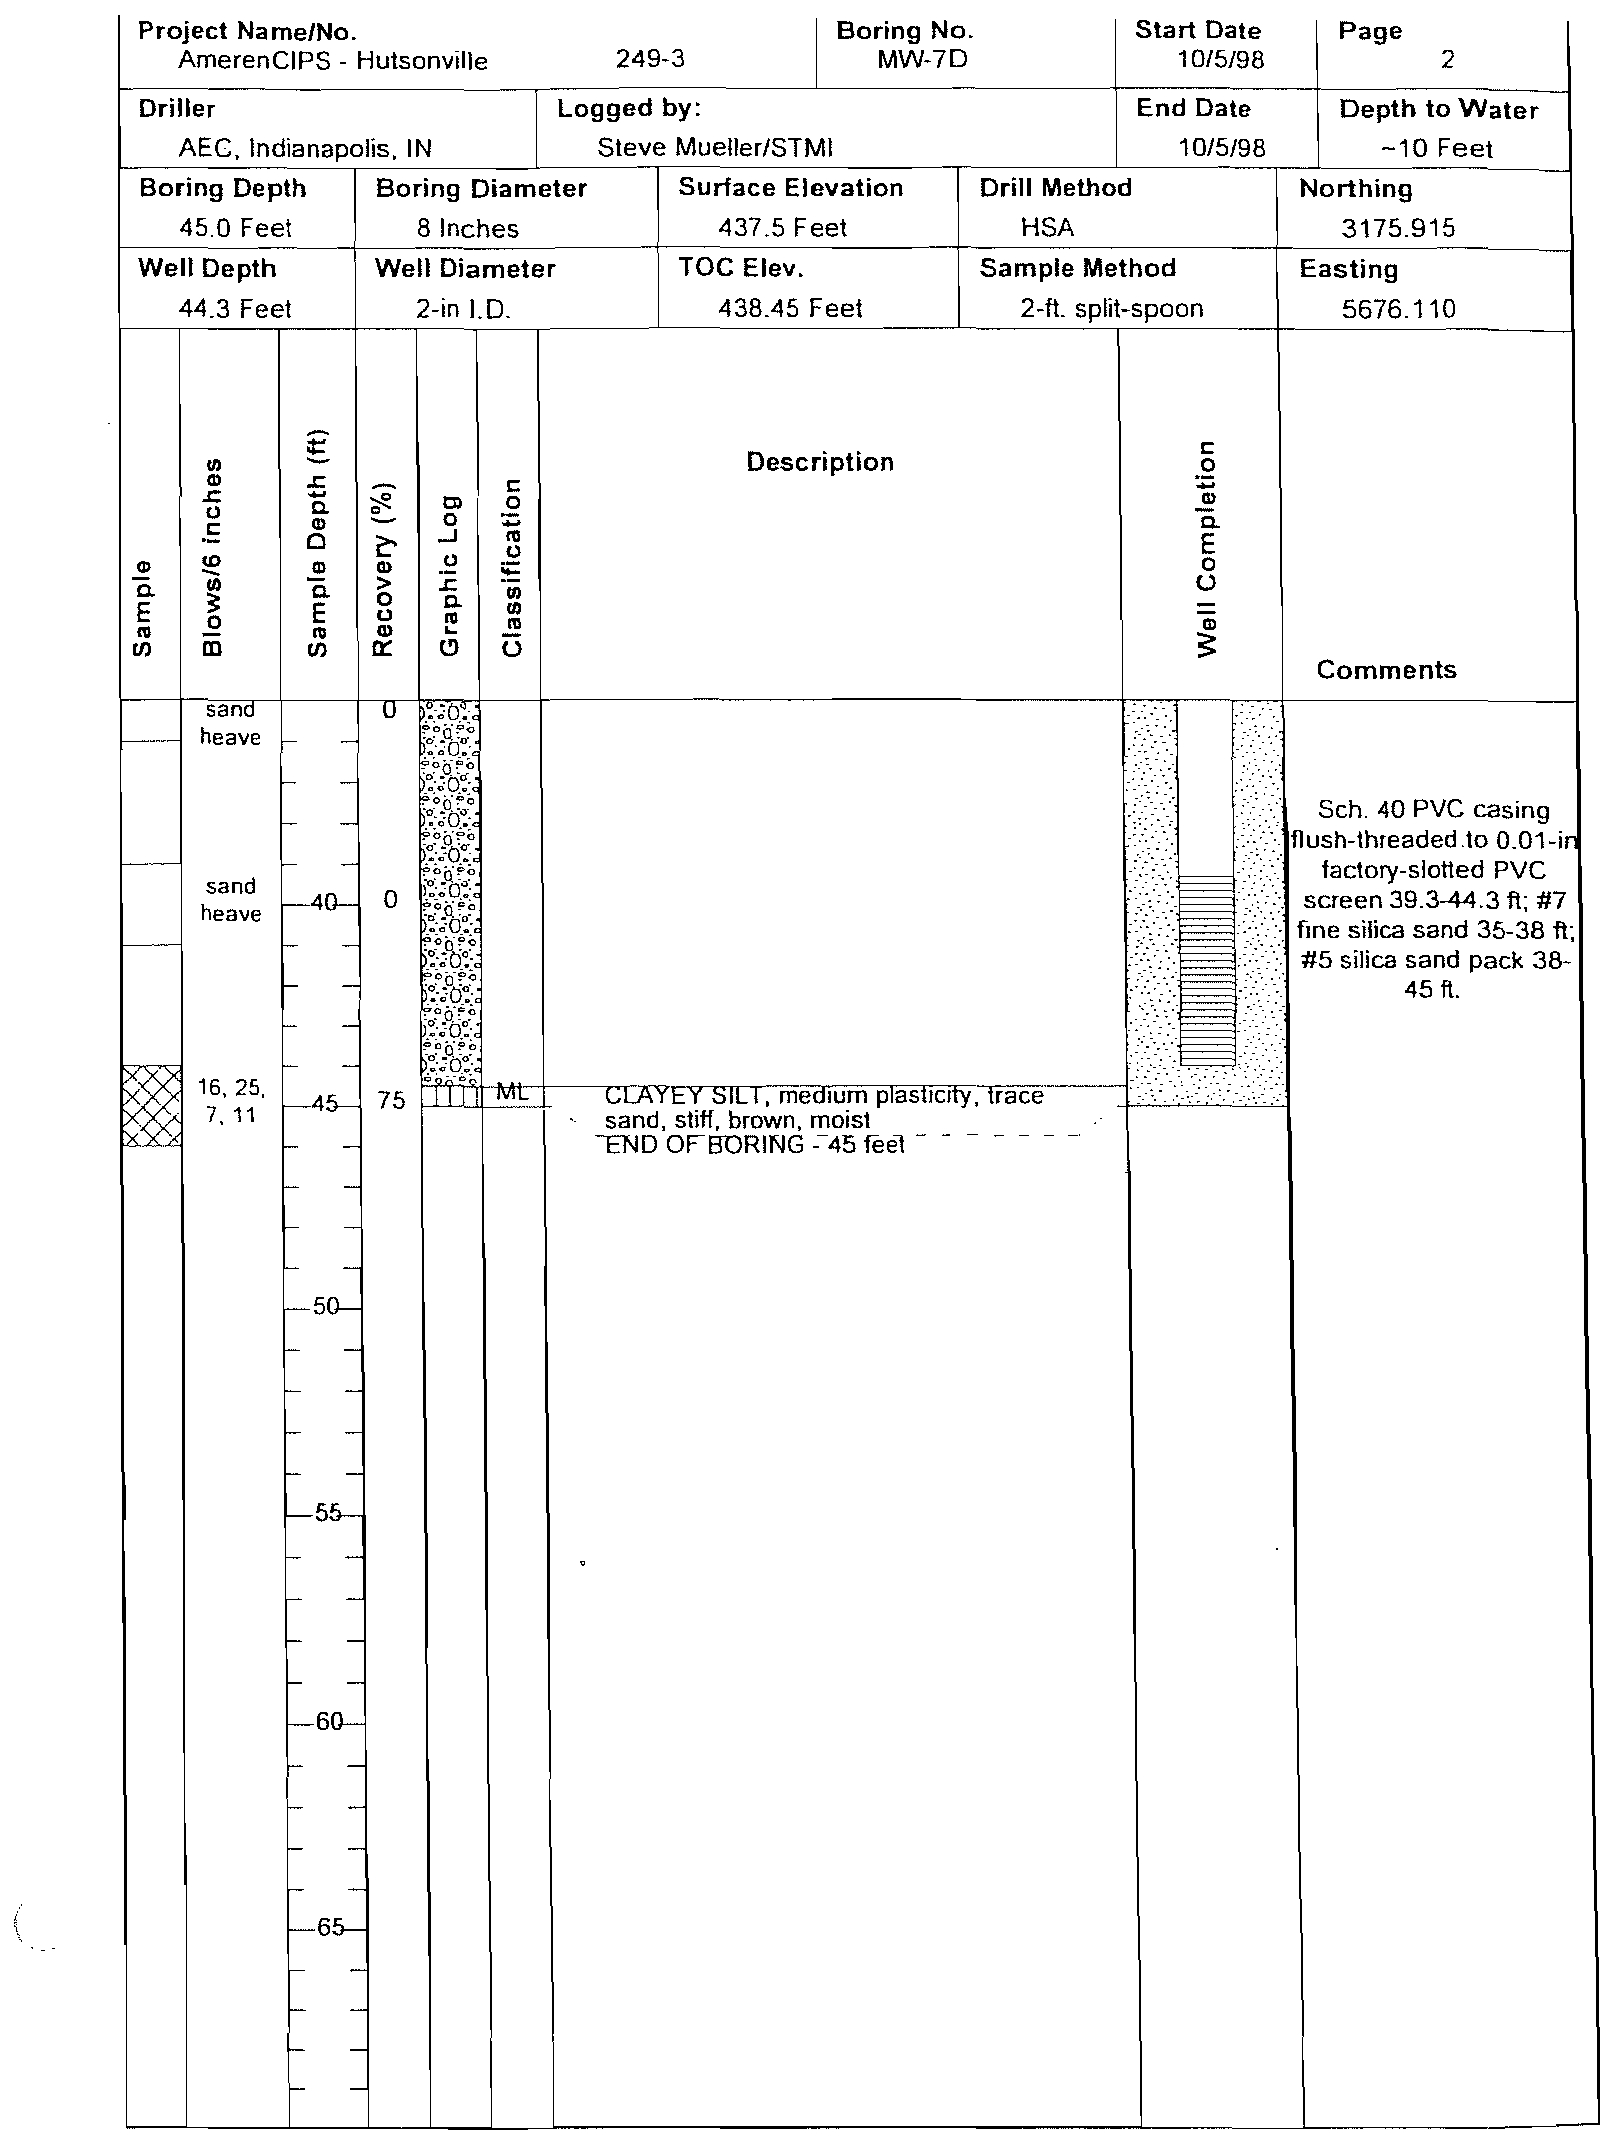
MW-7D
10/5/1998
437.5
438.45
45.0
44.3
>44
<394
0
A-5i5&g
4.8E-02
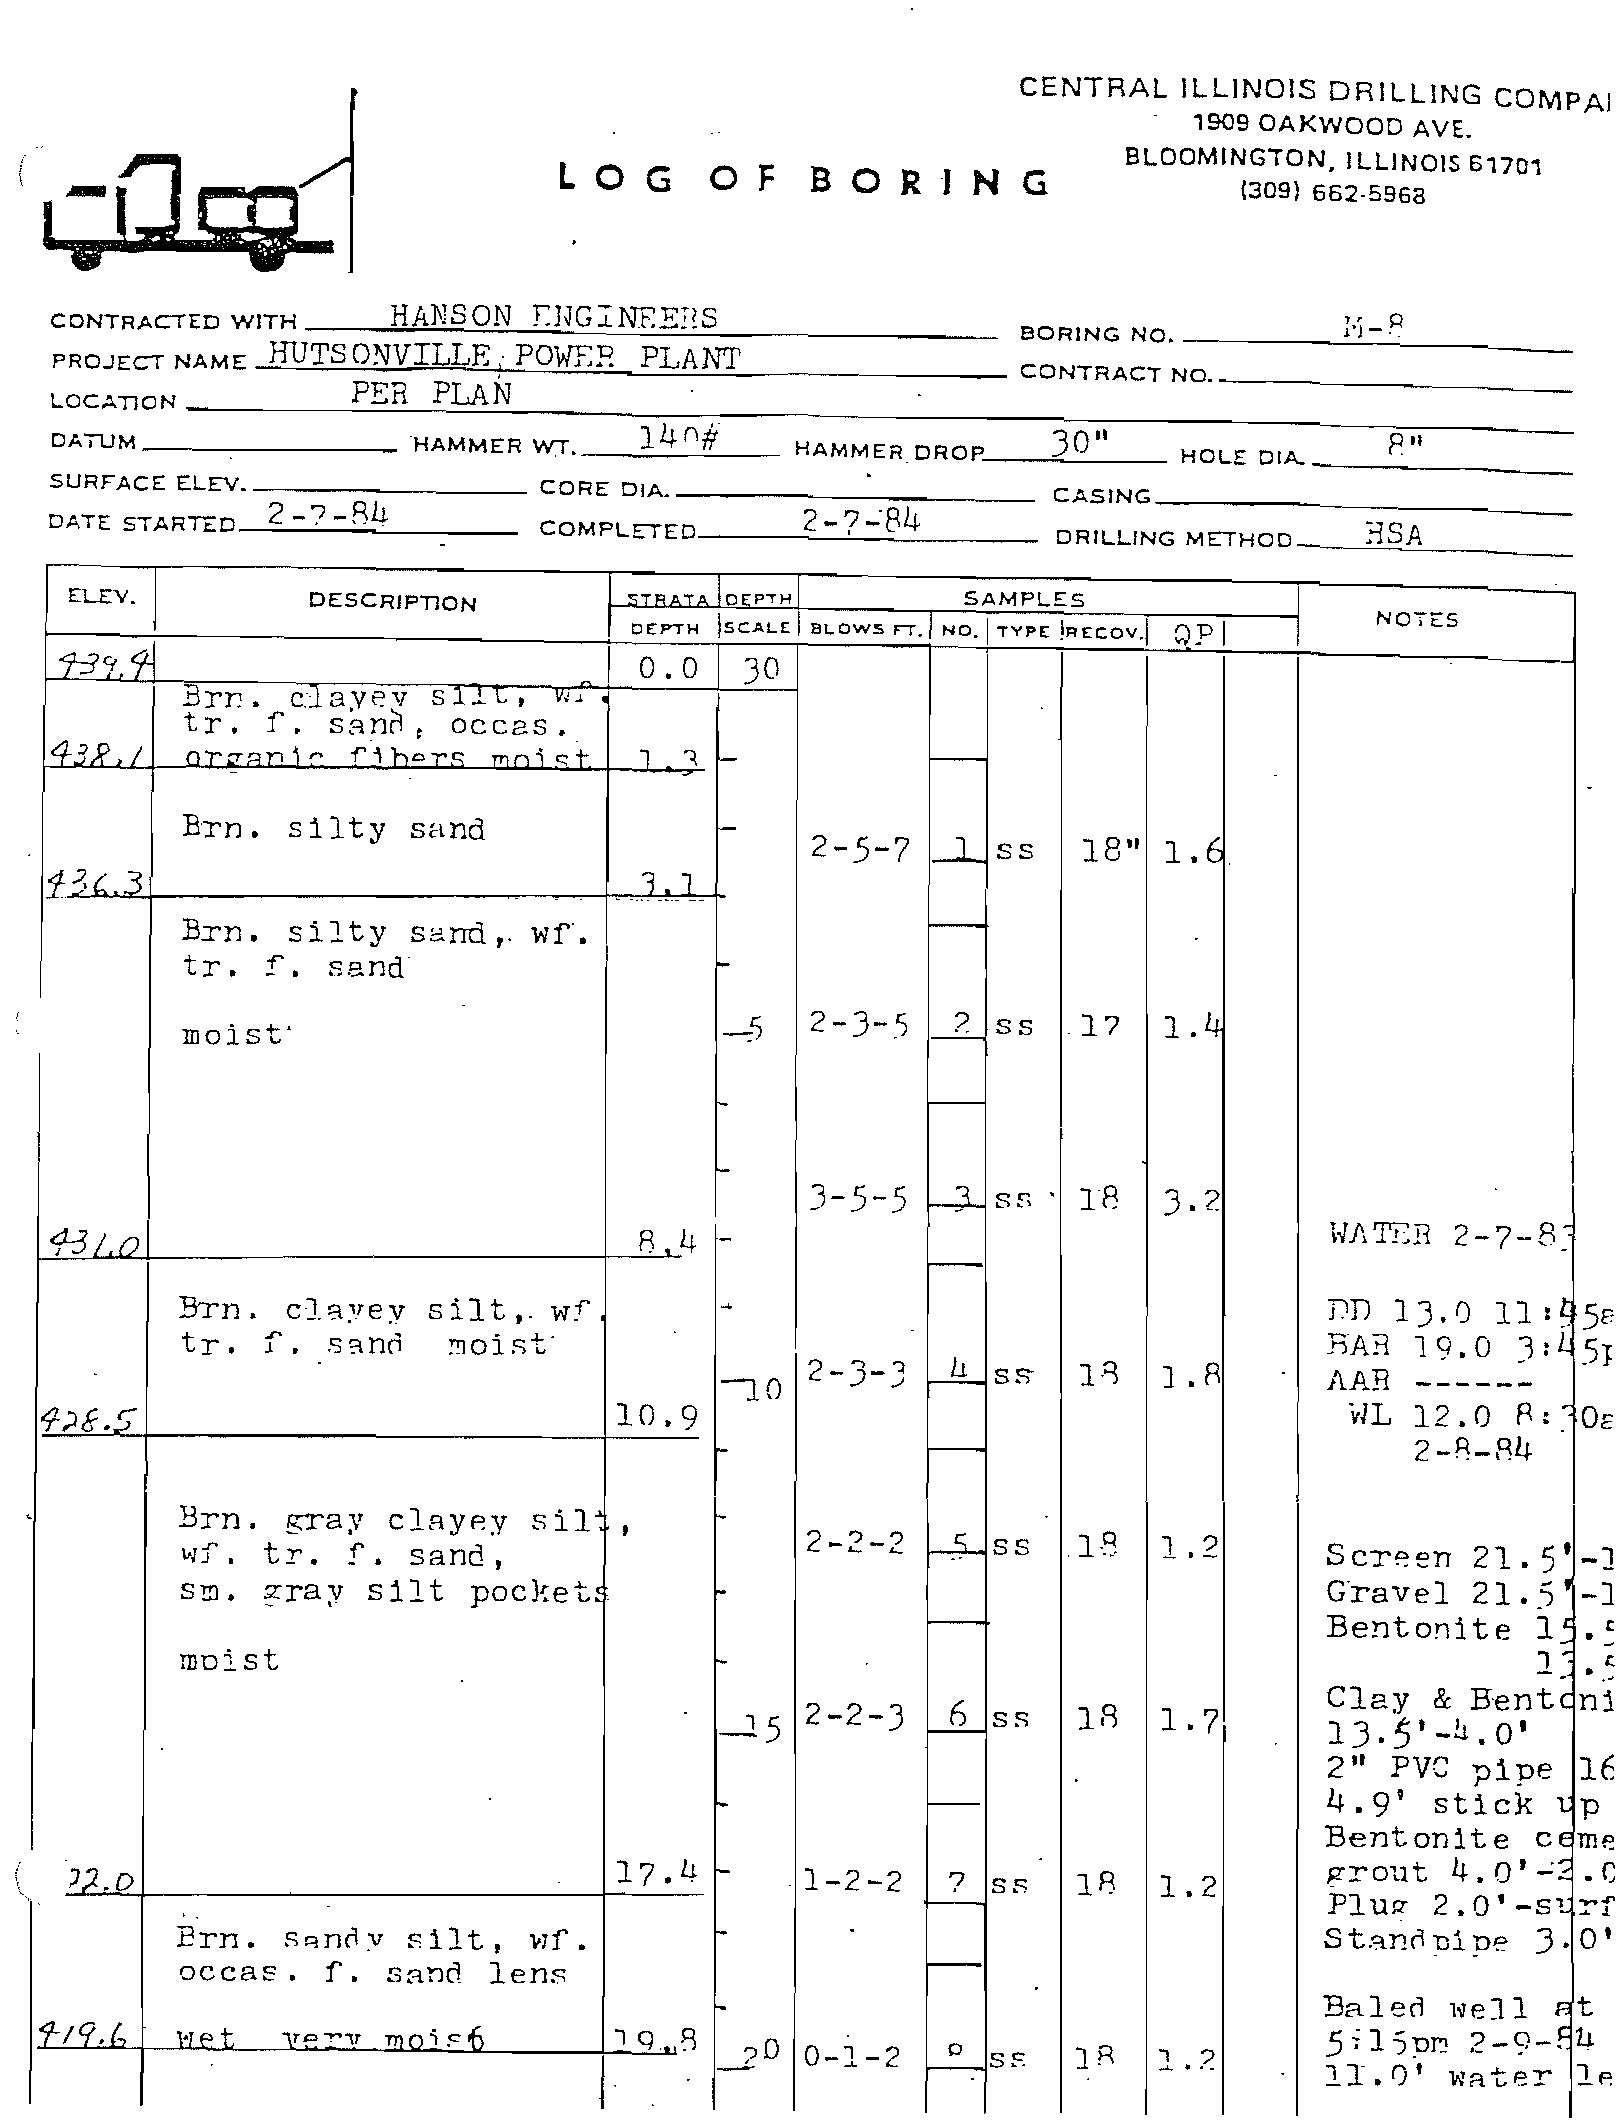
MW-8
2/7/1984
440.4
444.25
21.5
22.5
>21.5
<419
0
U -
5i 5and
-4-
MW-10
10/7/1998
452.9
454.23
11.0
10.7
7.5
445.4
3.5
U -
5i 5&g, 55
6.2E-04
MW-11R
10/3/2001
440.9
443.55
16.0
15.5
16.0
424.9
0.0
U-5&g
-5-
MW-14
10/3/2001
440.9
443.35
39.0
33.0
>39
<401.9
0.0
A- 5&g
-5-
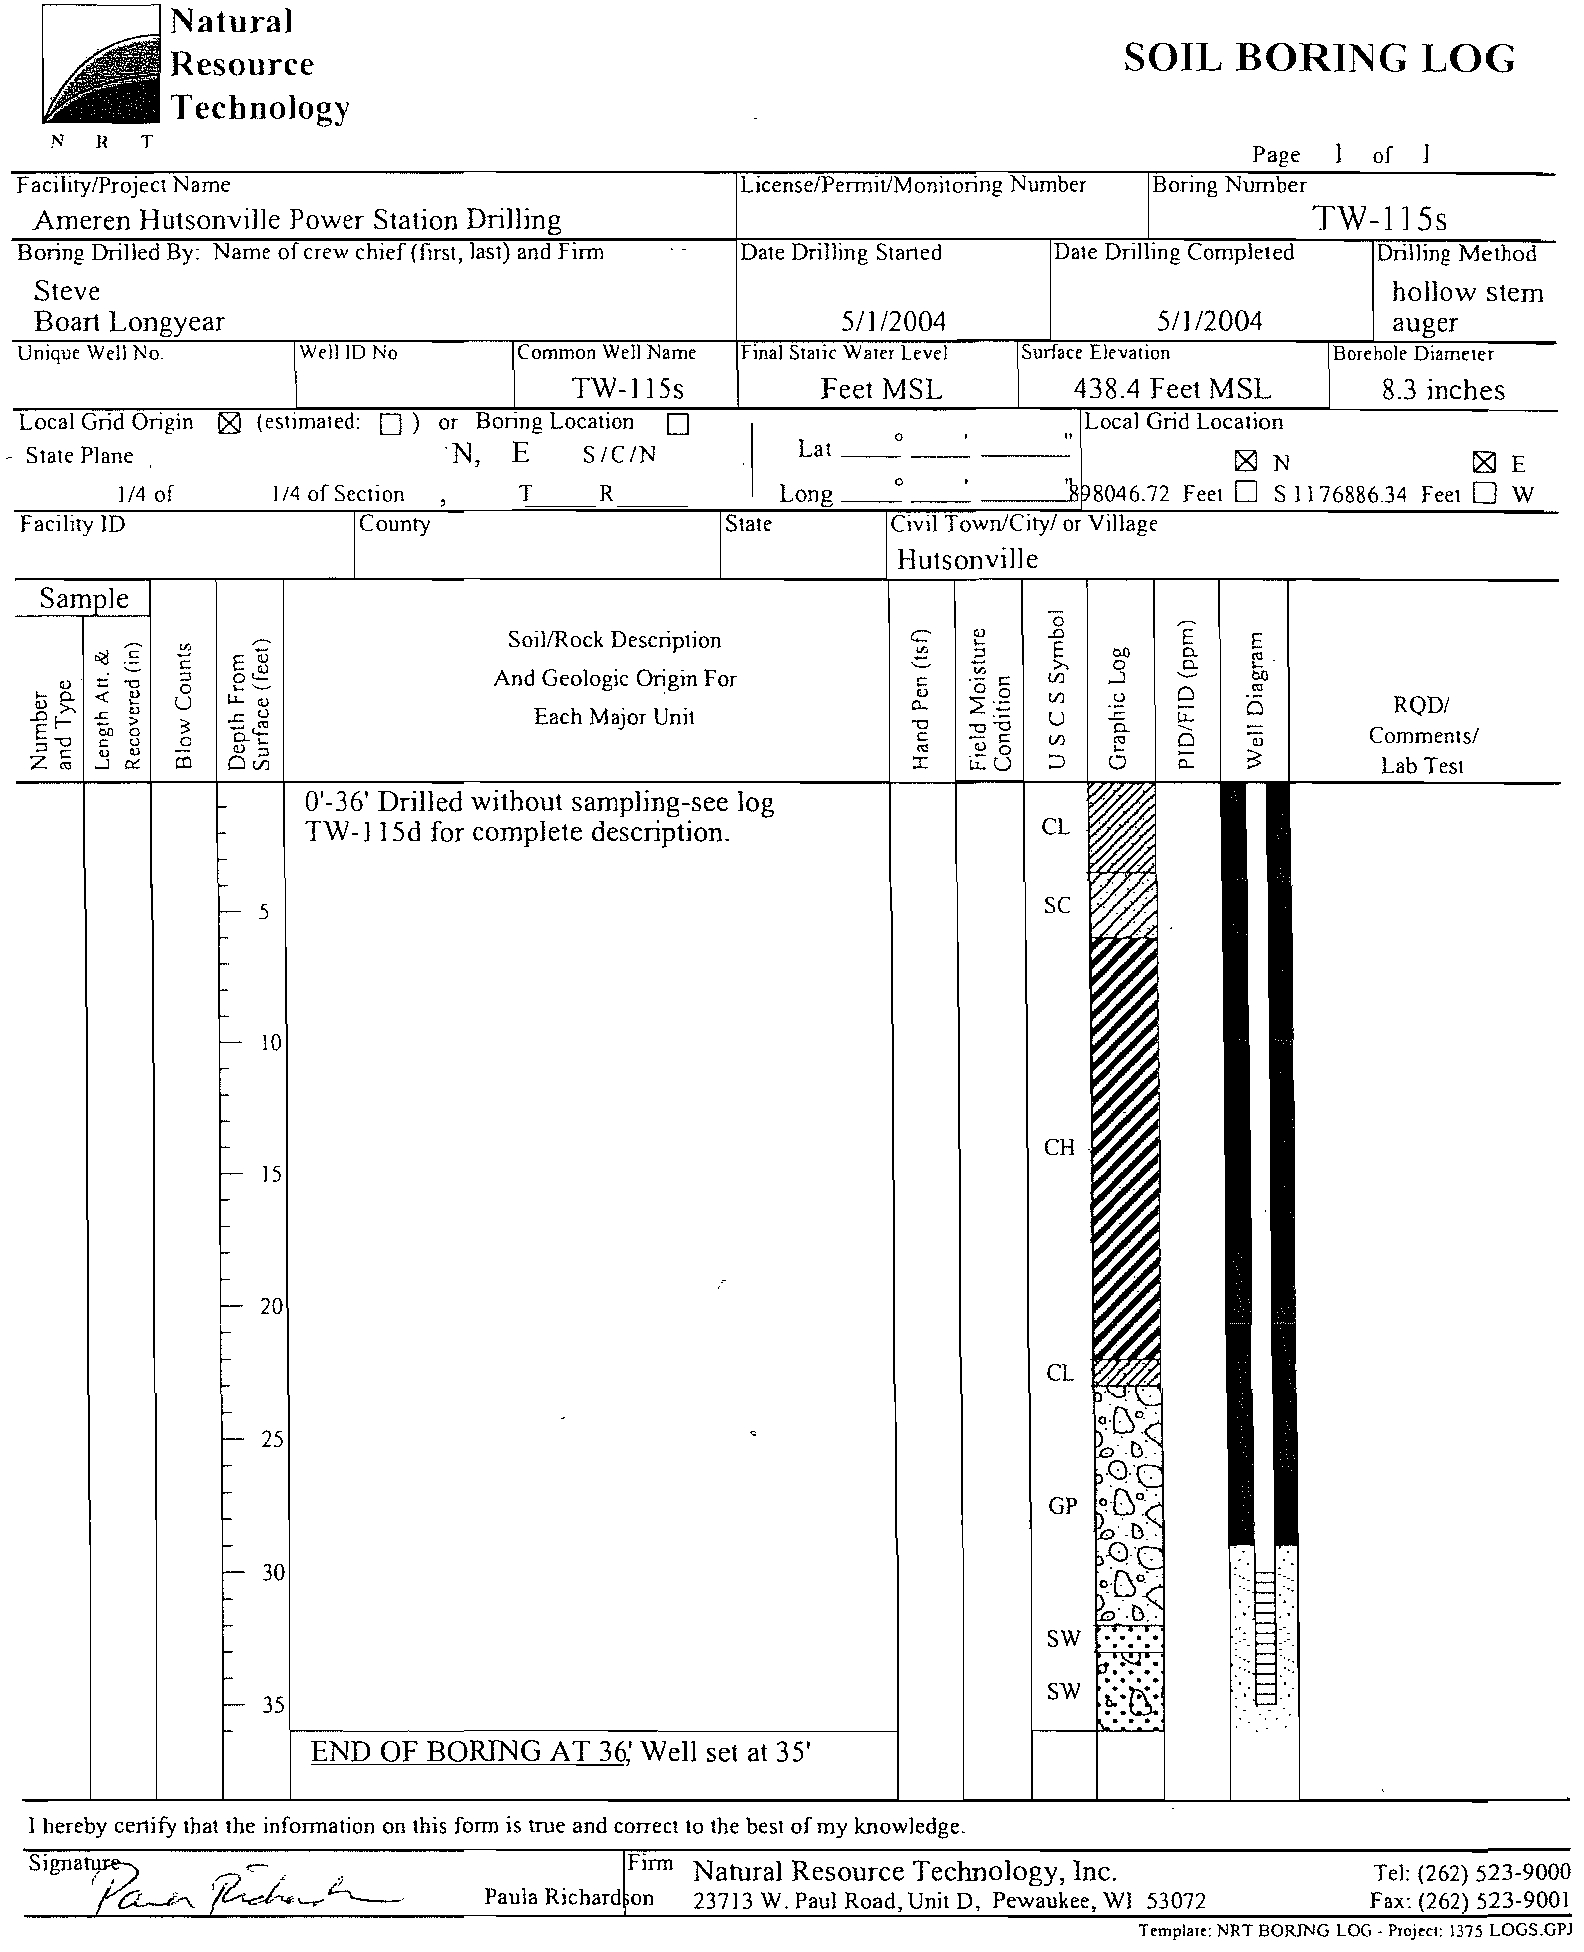
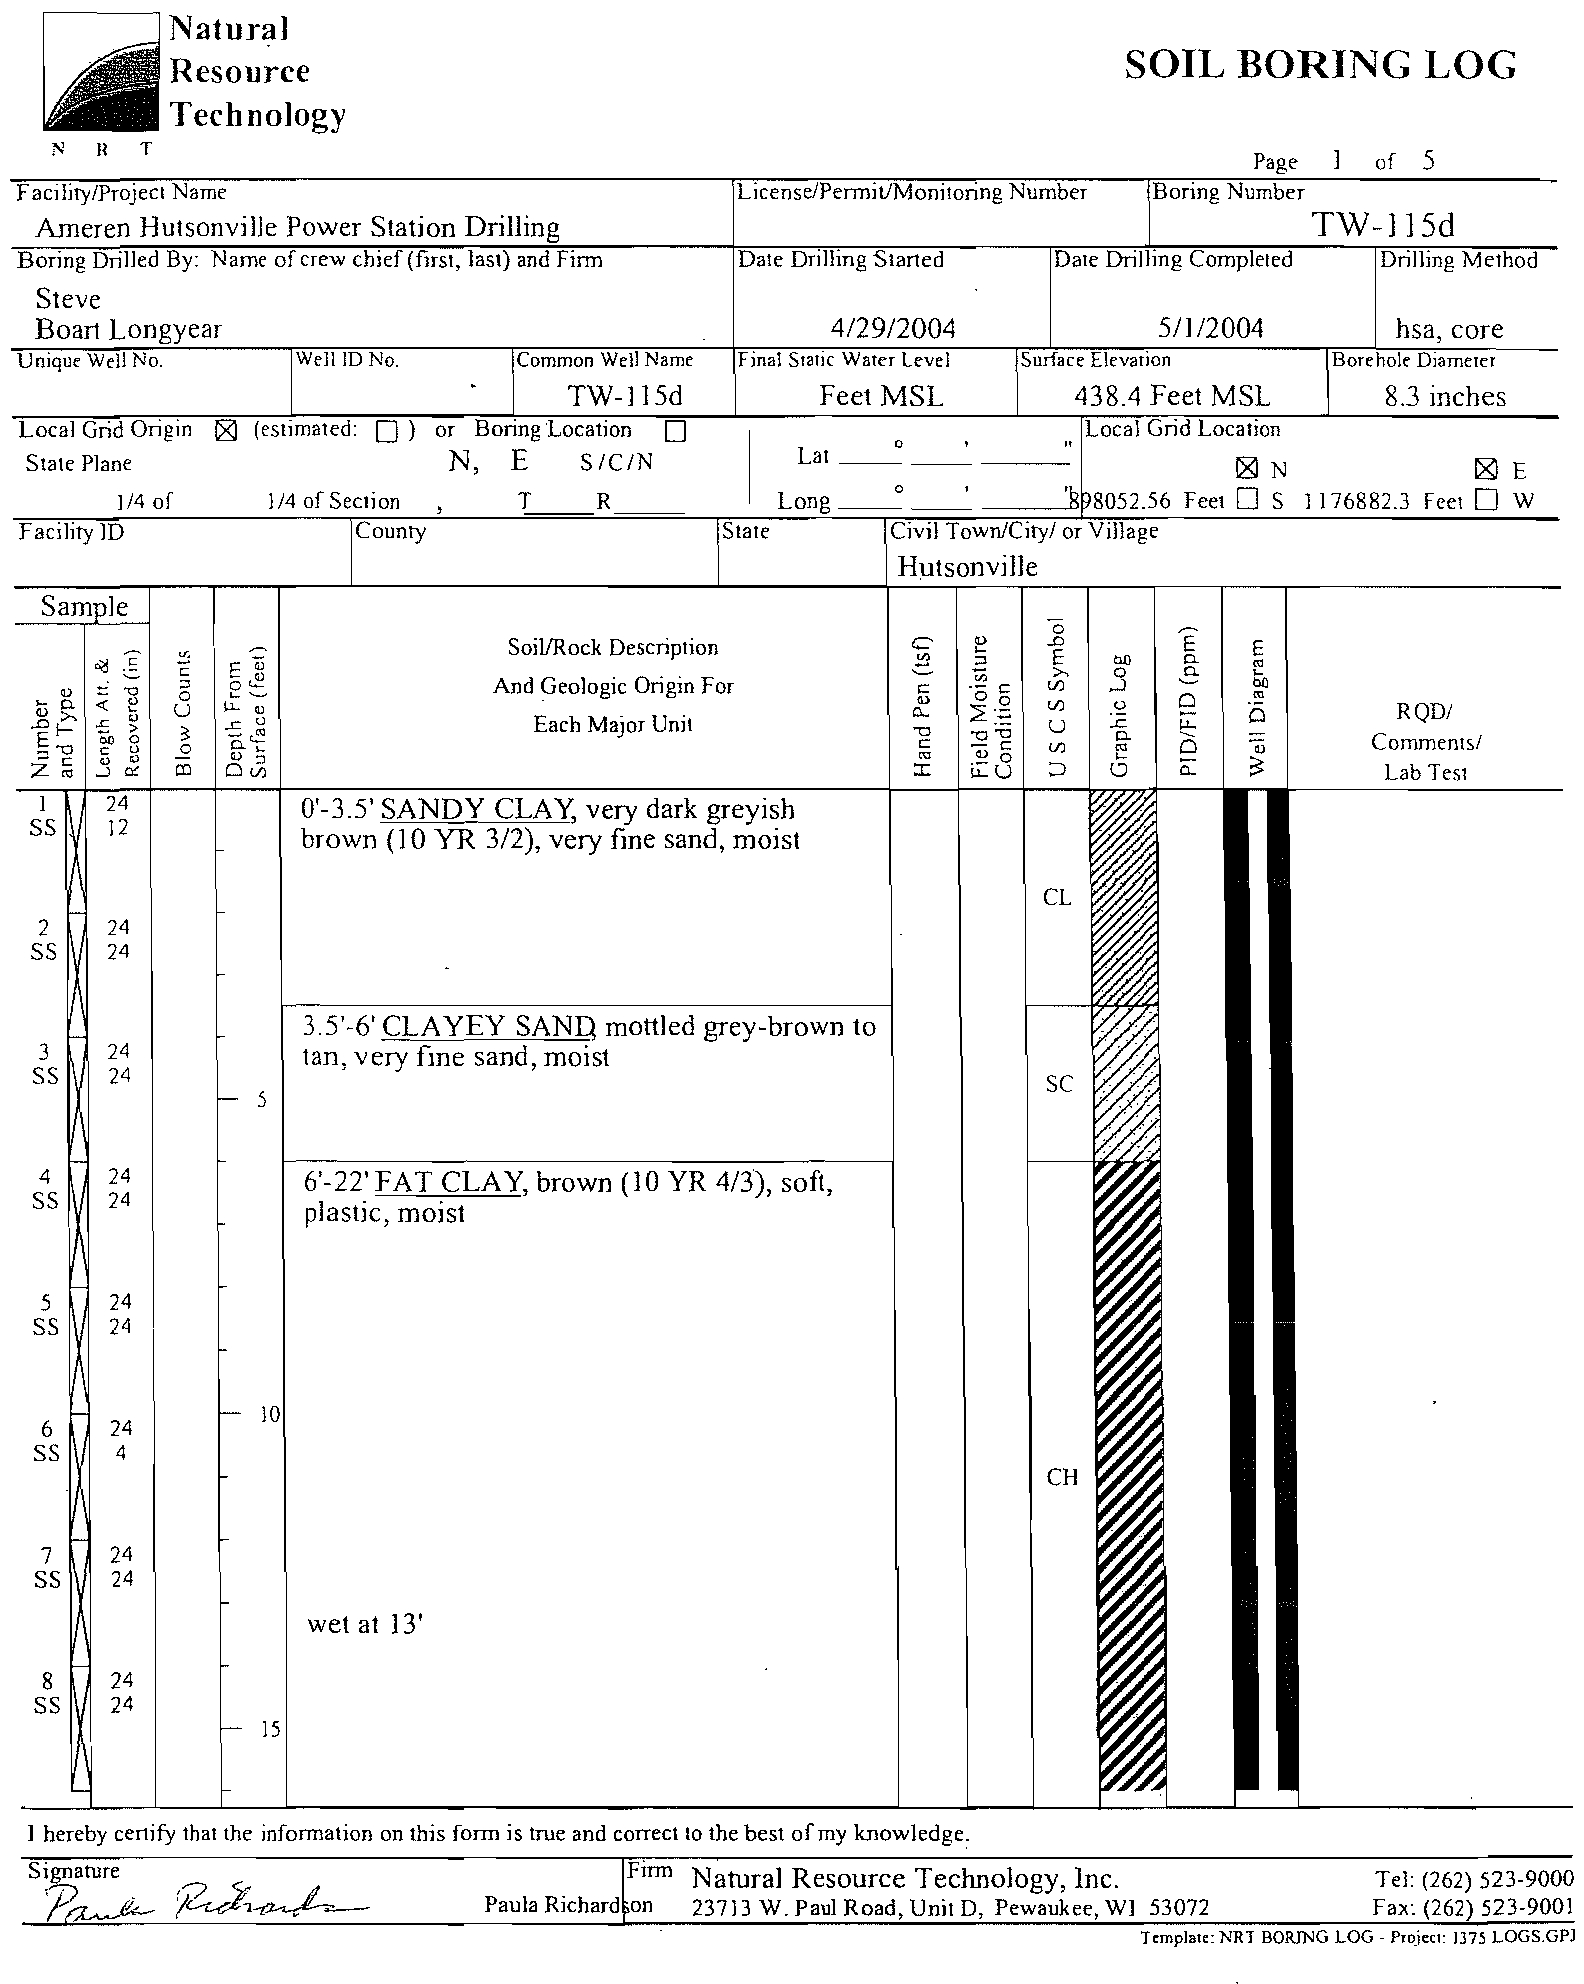
MW-115D (TW-115D)
5/1/2004
438.4
440.80
105.0
105.0
90.0
348.4
15.0
A- 5&g
1.2E-02
MW-115S (TW-115S)
51112004
438.4
440.89
35.0
35.0
90.0
348.4
0.0
A- 5&g
9.3E-02
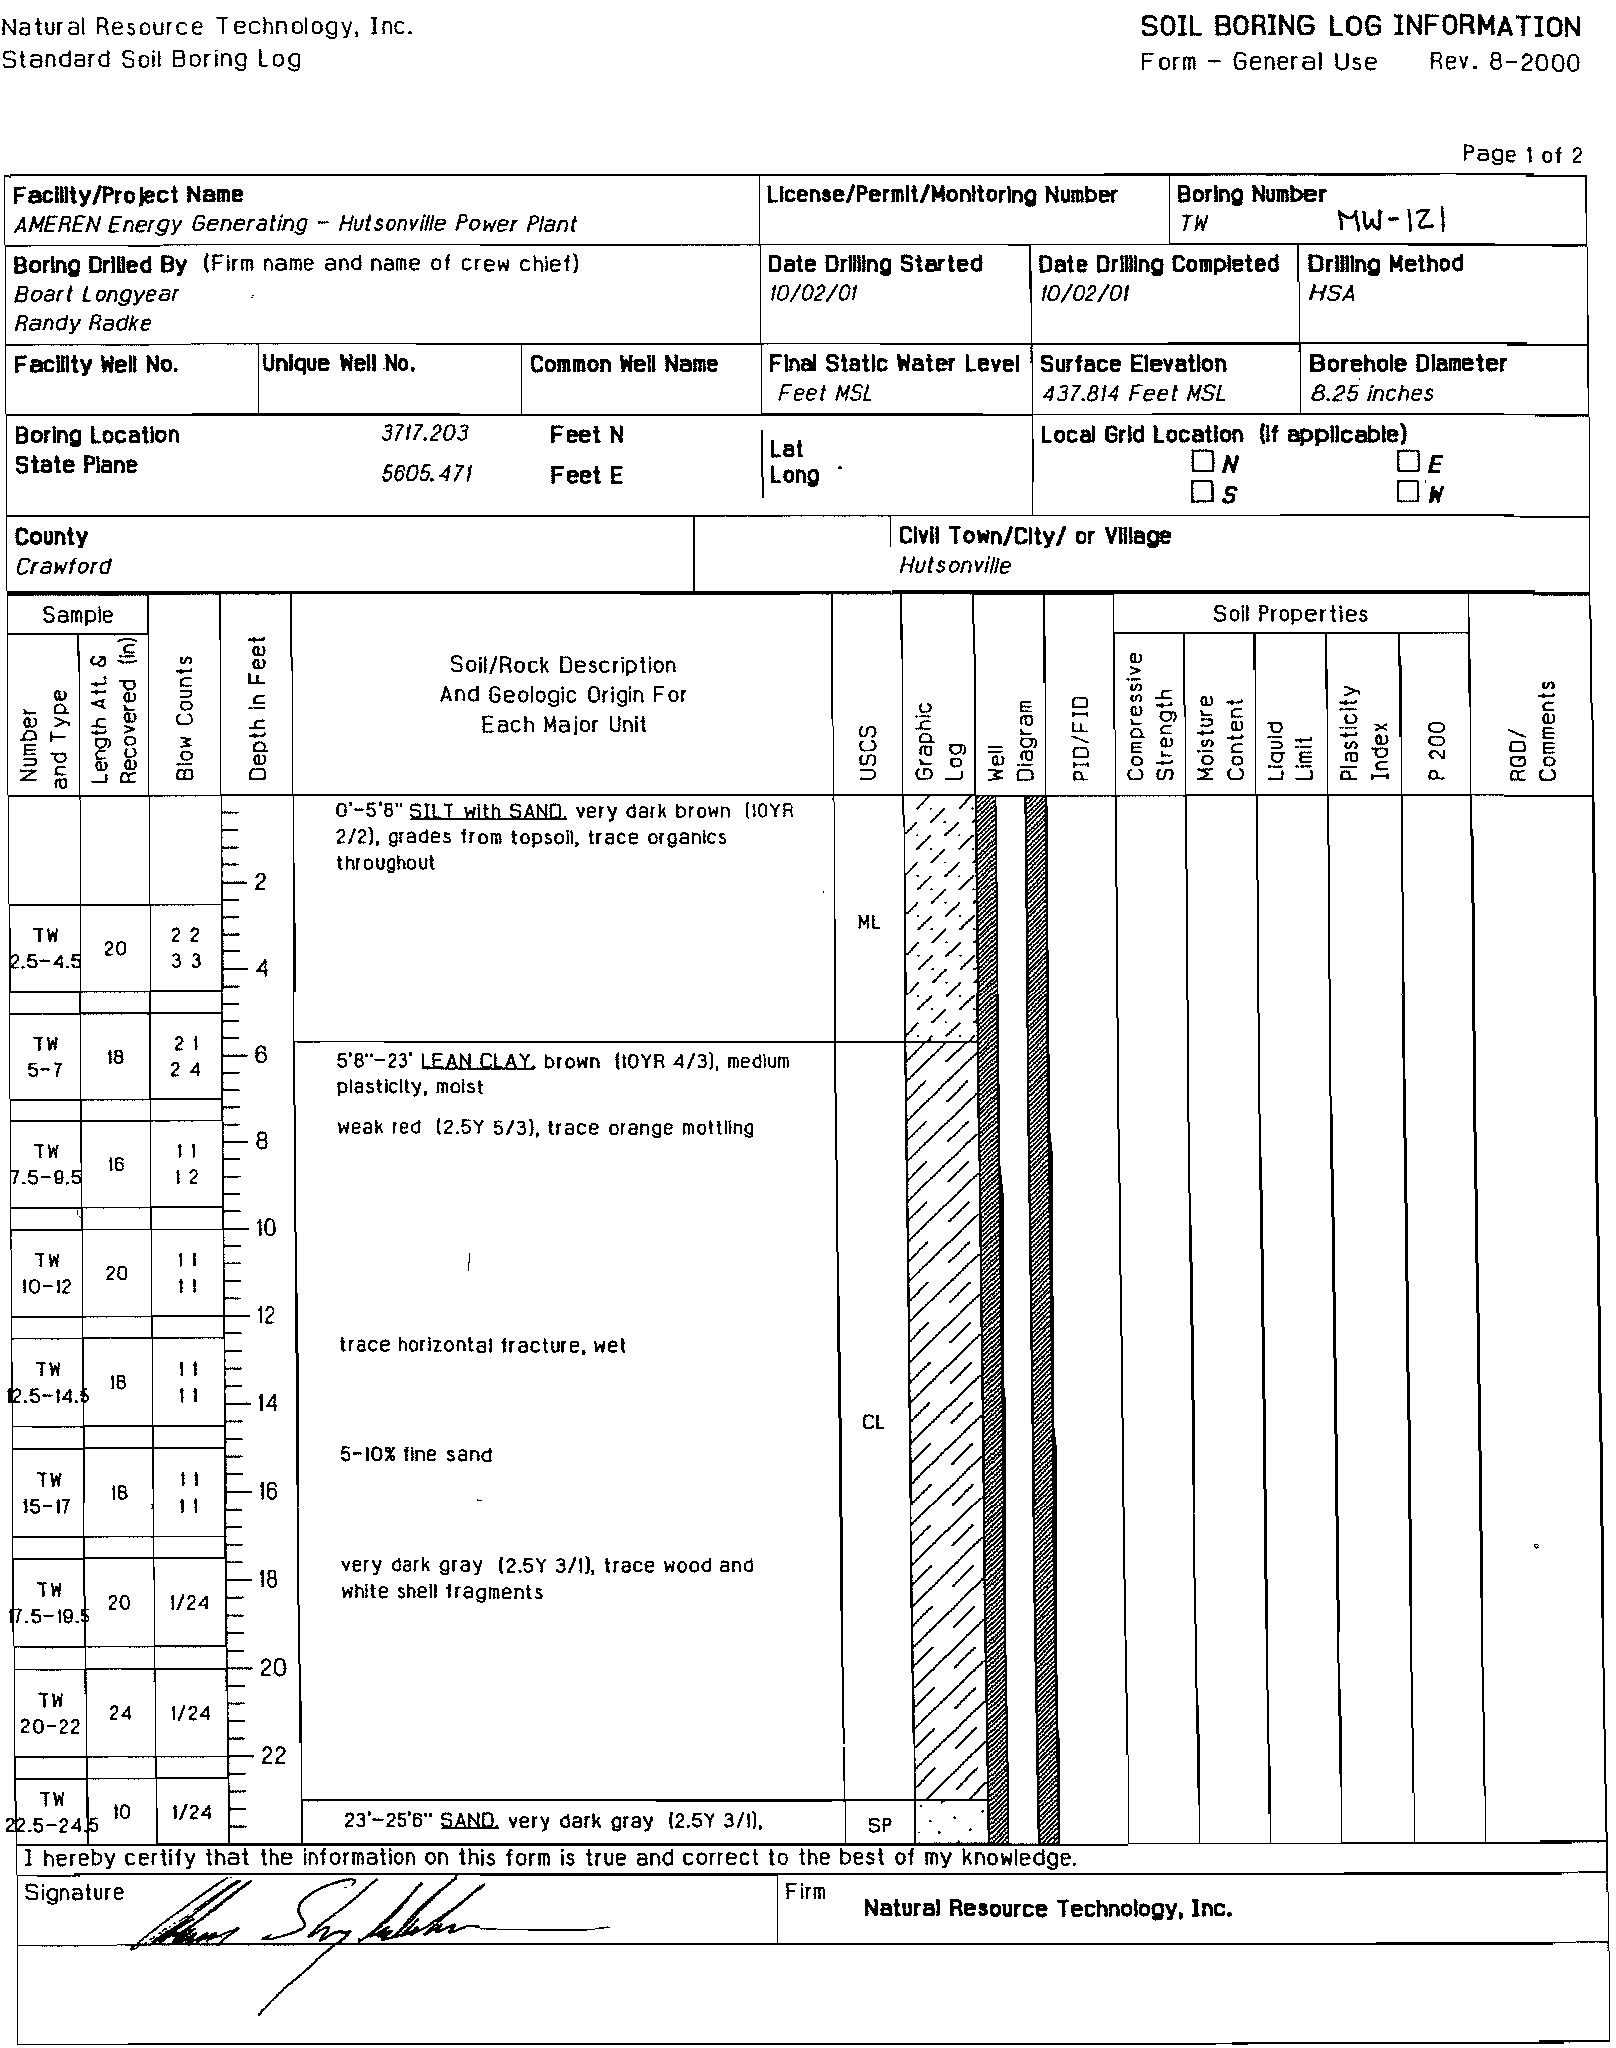
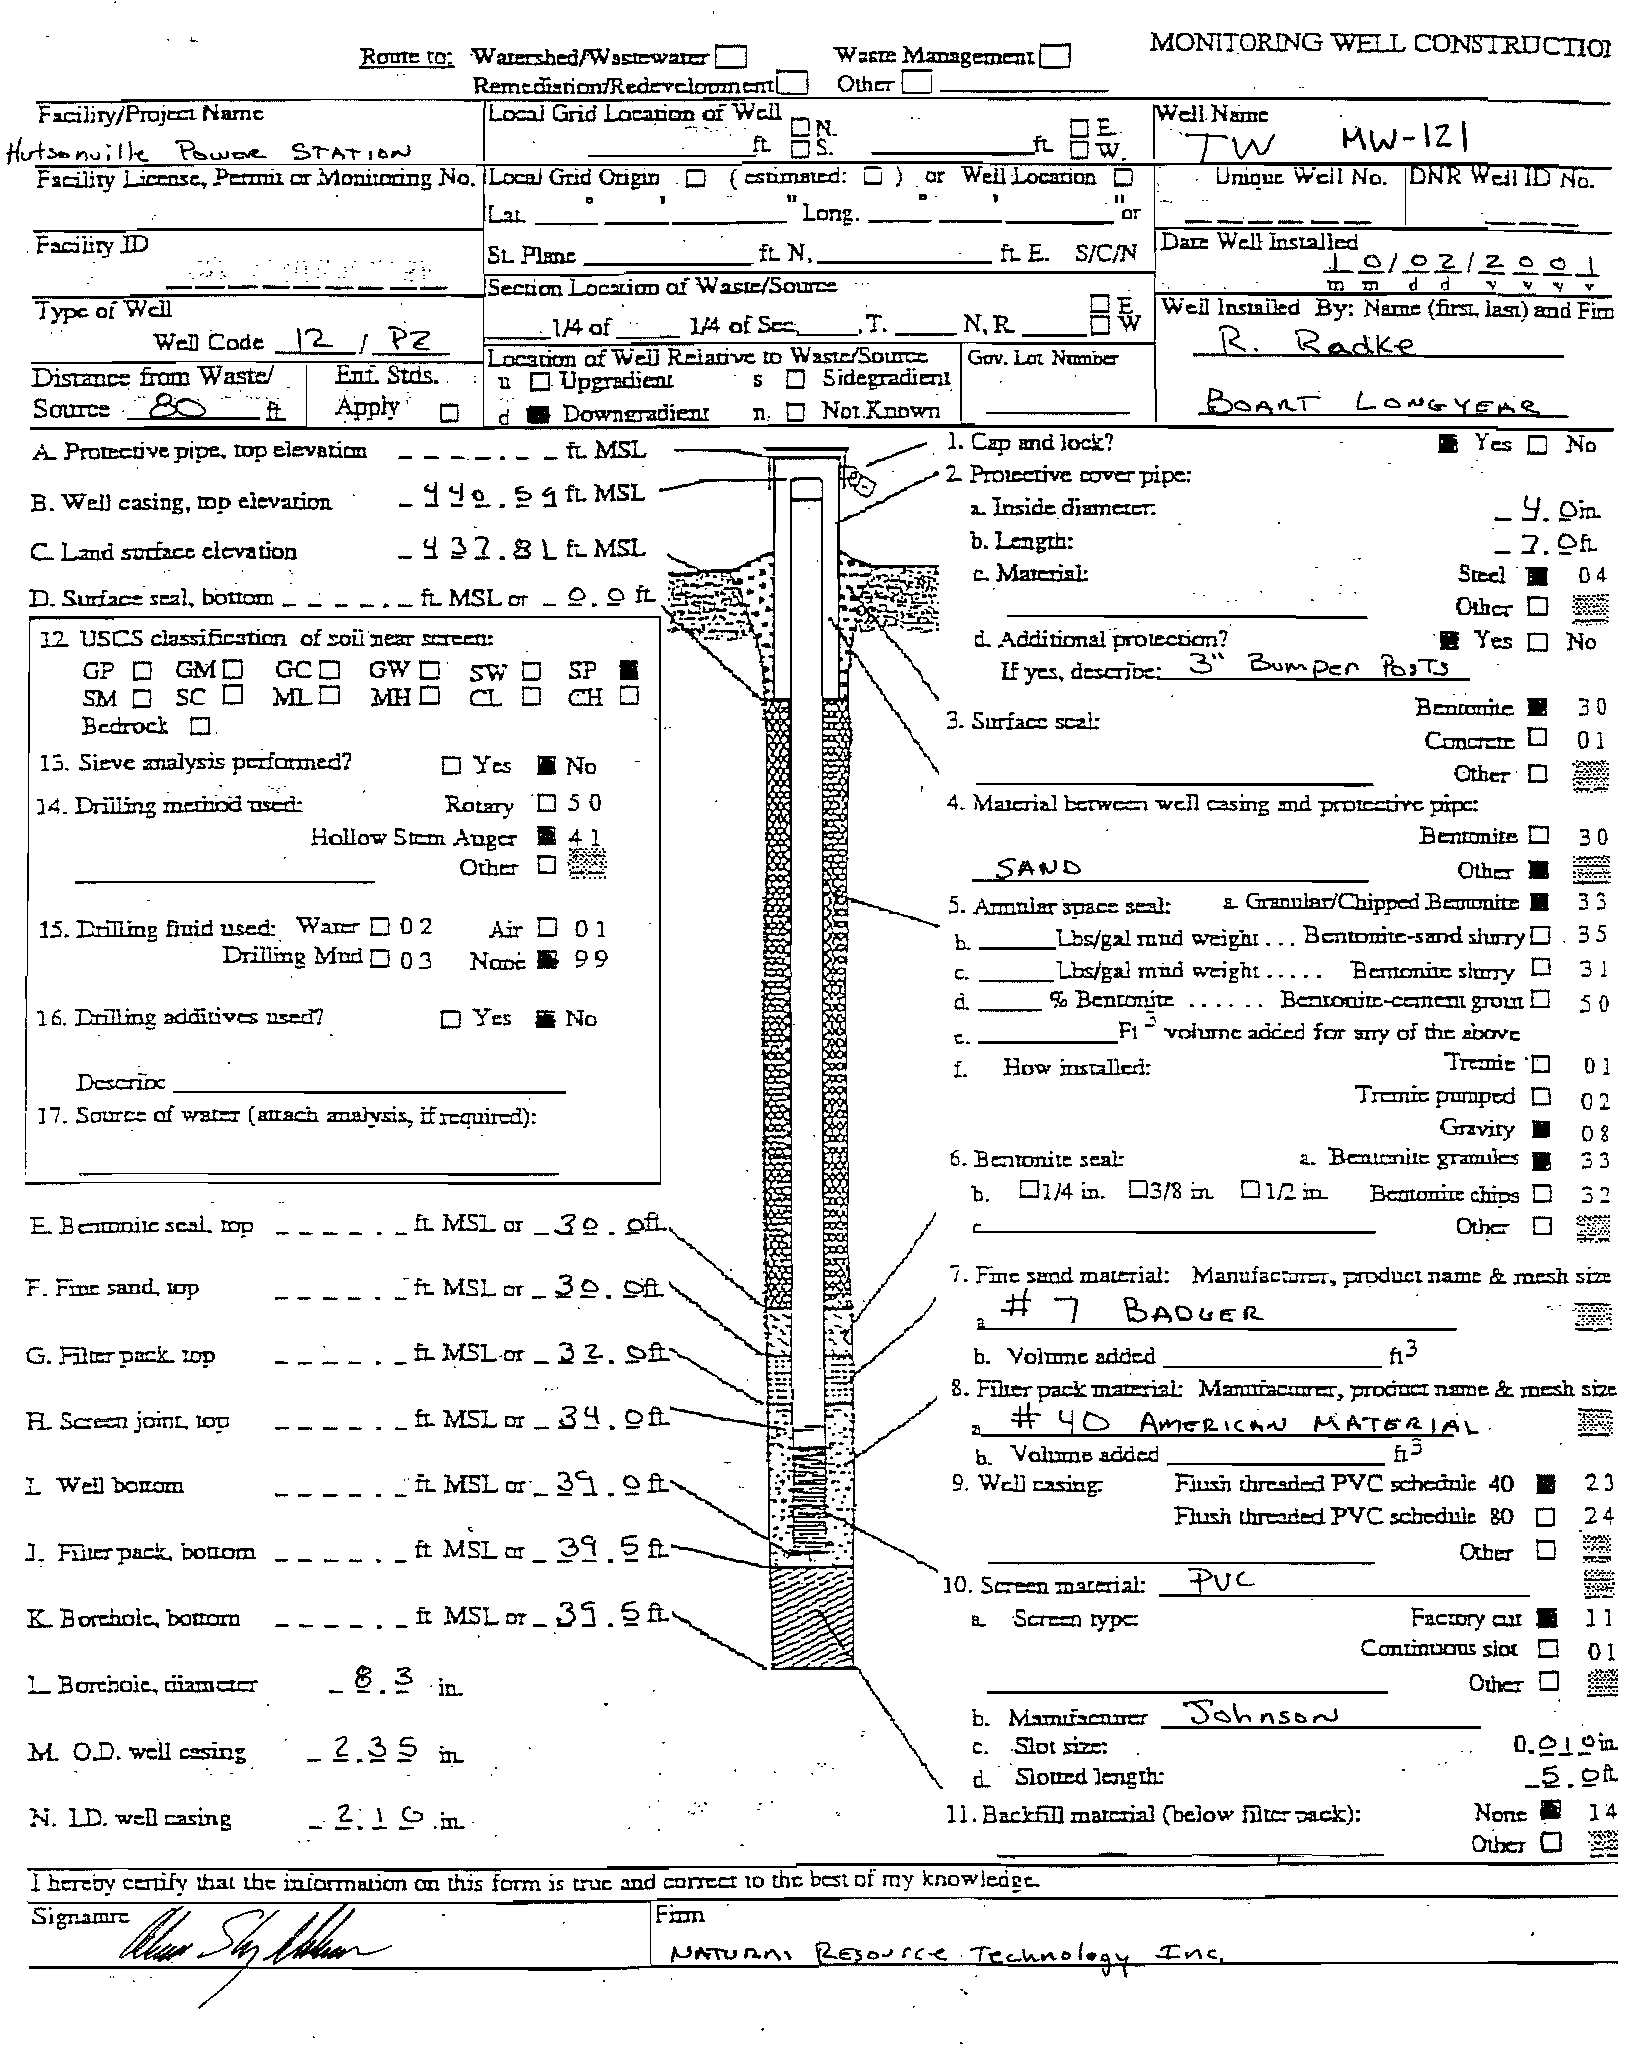
MW-121 (MW-TW)
101212001
437.8
440.59
39.5
39.0
>39.5
<398.3
0.0
A-5&g
2.4E-02
Notes:
1. TOe = top of casing
2.
BGS = below ground surface; MSL = mean sea level.
3. U
= upper migration zone, A = deep alluvial aquifer; 5&9 = sand and gravel, si = silty, 55 = sandstone
4. Aquifer test not performed because well
was still recovering from prior sampling.
5. Aquifer test yielded recovery curve that could
not be interpreted.
6. Notations in parentheses are former names
of deep alluvial aquifer monitoring points,
2470805_1XLS
Natural
Resource
Technology
Table 4
Monitoring Well Pos itions: Hutsonville Pond D Monitoring Wells
Well
MW-1
MW-6
MW-7
MW-7D
MW-8
MW-10
MW-11R
MW-14
MW-115D (TW-115D)
MW-115S (TW-115S)
MW-121 (MW-TW)
Position Relative
to Pond D
(Background)
Sidegradient
Downgradient
(Background)
Downgradient
(Background)
Sidegradient
Downgradient
Downgradient
Downgradient
(Background)
Distance from
Pond D
>2000
70
140
140
20
>2000
60
80
80
80
30
Within Pond D
Zone
of Attenuation?
no - more than 100
ft
distant
Yes
no - more than 100
ft
distant
no - not uppermost aquifer
Yes
no - more than 100
ft
distant
Yes
no - not uppermost aquifer
no - not uppermost aquifer
no - not uppermost aquifer
no - not uppermost aquifer
Notes:
Distance measurements from base of berm provided
by
plant personnel
Natural
Resource
Technology
Table Sa
Background Calculation: Hutsonville Pond 0 Monitoring Program
~
Upper Migration Zone
Wells
Parameter
% Non-
Units
Detects
Normal?
log-
normal?
tolerance
Interval
Method
1
Confidence
level
Background
MW1,MW10
MW1, MW1Q
MW1,MW10
MW1,MW10
MW1,MW10
Boron, total
Manganese, total
pH (field)
Sulfate, lotal
Total Filterable Residue (TDS)
mgIL
mgll
,'d
mgll
m,ll
o
o
o
o
o
Ye,
No
Ye'
No
Ye,
Ye,
Ye,
Ye,
Ye,
No
PTI
TTl
PTI
TTl
pn
0.99
0.99
0.99
0.99
0.99
0.22
1,9
6.7 -7.7
'7
566
Table Notes:
1. PTt = parametric tolerance interval, TIl = tolerance interval on log-transformed data, NTI = non-parametric tolerance interval
2. No standards are proposed for field parameters other than pH
Table 5b
Background Calculation: Hutsonville Pond 0 Monitoring Program. Deep Alluvial Aquifer
Wells
Parameter
%Non~
Units
Detects
Normal?
Log-
normal?
TOfefanee
Interval
Method'
Confidence
Level
Background
MW7D,MW121
MW7D,MW121
MW7D,MW121
MW7D,MW121
MW7D,MW121
Boron, lotal
Manganese, total
pH (field)
Sulfate, total
Total Filterable Residue (TDS)
mg/L
mg/L
"d
mgll
mg/L
o
o
o
o
o
No
No
Ye,
Ye,
Ye,
Ye'
Ye,
Y"
Ye,
Ye'
TTl
TTl
PTI
PTI
PTI
0.99
0.99
0.99
0.99
0.99
0.27
2.4
7.0 -7.8
84
500
Table Notes:
1. PTI = parametric tolerance interval, TTl = tolerance interval on log-transformed data, NTI = non-parametric tolerance interval
2. No standards are proposed for field parameters other than pH
2470805_1 XLS
Natural
Resource
Technology
Table 6a
Proposed Adjusted Standards: Hutsonville Pond D Monitoring Program - Upper Migration Zone
lolerance
TolerancQ
Log-
% Non-
Interval
Confidence
Interval
Adjusted
Well
Parameter
Units Normal?
normal?
Detects
Method
1
Level
Limit
Background
Class I
Standard
MW-6
Boron, tolal
mg/L
Ye,
Ye,
0.0
PTI
0.99
21.5
0.22
2.0
21.5
MW-6
Manganese, total
mg/L
No
No
0.0
NTI
0.43
3.6
1.9
0.15
3.6
MW-6
pH (field)
std
Ye,
Ye,
0.0
PTI
0.99
6.1-7.9
6.7 - 7.7
6.5 -g.O
6.1 -7.9
MW-6
Sulfate, total
mg/L
Ye,
Ye,
0.0
PTI
0.99
576
97
400
576
MW-6
Total Filterable Residue (TDS)
mg/L
Ye,
Ye,
0.0
PTI
0.99
1128
566
1200
1128
MW-7
Boron,lotal
mg/L
No
No
0.0
NTI
0.43
2.6
0.22
2.0
2.6
MW-7
Manganese, lotal
mglL
No
Ye,
0.0
TTl
0.99
1.8
1.9
0.15
1.9
MW-7
pH (field)
std
Ye,
Ye,
0.0
PTI
0.99
6.4-7.5
6,7 - 7.7
6.5 -g.O
6.4-7.7
MW-7
Sulfate, total
mg/L
Ye,
Ye,
0.0
PTI
0.99
416
97
400
416
MW-7
Tolal Filterable Residue (TDS)
mg/L
Ye,
Ye,
0.0
PTI
0.99
1262
566
1200
1262
MW-8
Boron, total
mglL
Ye,
Ye,
0.0
PTI
0.99
16.2
0.22
2.0
16.2
MW-6
Manganese, total
mg/L
Ye'
Ye'
0.0
PTI
0.99
6.1
1.9
0.15
6.1
MW-8
pH (field)
old
No
No
0.0
NTI
0,43
6.9.7.4
6.7 -7.7
6.S-9.0
none
MW-6
Sulfate. tolal
mg/L
Ye,
Ye,
0.0
PTI
0.99
1241
97
400
1241
MW-8
Tolal Filterable Residue (TDS)
mg/L
No
No
0.0
NTI
0.43
1800
566
1200
1800
MW-11R
Boron, total
mg/L
Ye,
Ye,
0.0
PTI
0.99
11.6
0.22
2.0
11.6
MW-11R
Manganese, total
mg/L
No
Ye,
0.0
TTl
0.99
9.5
1.9
0.15
9.5
MW-11R
pH (field)
,ld
No
No
0.0
NTI
DAD
6.0 -7.2
6,7 - 7.7
6.5- 9.0
6.0-7.7
MW-11R
Sulfate. total
mg/L
No
No
0.0
NTI
0.43
720
97
400
720
MW-11R
Total Filterable Residue (TDS)
mglL
No
No
0.0
NTI
0.43
1300
566
1200
1300
Table Notes:
1. PTI = tolerance interval, TTl = tolerance interval on log-transformed data, NT! = larger of non-parametric tolerance interval or mean+sldev.2
2. No standards are proposed for field parameters other than pH
2470805~
1XLS
Natural
Resource
Technology
Table 6b
Proposed Adjusted Standards: Hutsonville Pond 0 Monitoring Program. Deep Alluvial Aquifer
lolerance
Tolerance
Log-
%
Non.
Interval
Confidence
Intarva!
Adjusted
Well
Parameter
Units Normal?
normal?
Detects
Method
1
Level
Limit
Background
Class.
Standard
MW-14
Boron, total
mg/l
Ye,
Ye,
0.0
PTI
0.99
2.3
0.27
2.0
2.3
MW-14
Manganese, total
mg/L
Ye,
Ye,
0.0
PTI
0.99
0.67
2.4
0.15
2.4
MW-14
pH (field)
,td
No
No
0.0
NTI
0.43
6.8-7.3
7.0.7.8
6.5 - 9.0
6.8-7.8
MW-14
Sulfate, lotal
mg/L
Ye,
No
0.0
PTI
0.99
305
84
400
305
MW.14
Total Fillerable Residue (TDS)
mg/l
No
No
0.0
NTI
0.43
830
500
1200
830
Table Notes:
1. PTI "" tolerance interval, TTl == tolerance interval on log-transformed data, NTI
='
larger of non-parametric tolerance interval or mean+stdev"2
2. No standards are proposed for field parameters other than pH
2470805_1.XLS
Natural
Resource
Technology
Box Whisker Plot - 1 Parameter, Multi Location
Boron, total mg/L
Locations
0.0
3.2
6.4
9.6
12.8
16.0
MW1
MW10
MW11R
MW6
MW7
MW8
Figure 5a. Box-whisker plot showing boron concentrations from September 2002 through
March 2005. MW1 and MW10 are background wells.
Box Whisker Plot - 1 Parameter, Multi Location
Sulfate, total mg/L
Locations
0
200
400
600
800
1000
MW1
MW10
MW11R
MW6
MW7
MW8
Figure 5b. Box-whisker plot showing sulfate concentrations from September 2002 through
March 2005. MW1 and MW10 are background wells.
Box Whisker Plot - 1 Parameter, Multi Location
Manganese, total mg/L
Locations
0
1
2
3
4
5
MW1
MW10
MW11R
MW6
MW7
MW8
Figure 5e. Box-whisker plot showing manganese concentrations from September 2002
through March 2005. MW1 and MW10 are background wells.
Box Whisker Plot - 1 Parameter, Multi Location
pH (field) std
Locations
5.5
6.0
6.5
7.0
7.5
8.0
MW1
MW10
MW11R
MW6
MW7
MW8
Figure 5f. Box-whisker plot showing pH values from September 2002 through March 2005.
MW1 and MW10 are background wells.
Box Whisker Plot - 1 Parameter, Multi Location
Total Filterable Residue (TDS) mg/L
Locations
0
400
800
1200
1600
2000
MW1
MW10
MW11R
MW6
MW7
MW8
Figure 5g. Box-whisker plot showing TDS concentrations from September 2002 through
March 2005. MW1 and MW10 are background wells.
Box Whisker Plot - 1 Parameter, Multi Location
Boron, total mg/L
Locations
0
4
8
12
16
MW121
MW14
MW7D
Figure 6a. Box-whisker plot showing boron concentrations from September 2002 through
March 2005. MW121 and MW7D are background wells.
Box Whisker Plot - 1 Parameter, Multi Location
Sulfate, total mg/L
Locations
0
200
400
600
800
1000
MW121
MW14
MW7D
Figure 6b. Box-whisker plot showing sulfate concentrations from September 2002 through
March 2005. MW121 and MW7D are background wells.
Box Whisker Plot - 1 Parameter, Multi Location
Manganese, total mg/L
Locations
0
1
2
3
4
5
MW121
MW14
MW7D
Figure 6e. Box-whisker plot showing manganese concentrations from September 2002
through March 2005. MW121 and MW7D are background wells.
Box Whisker Plot - 1 Parameter, Multi Location
pH (field) std
Locations
5.5
6.0
6.5
7.0
7.5
8.0
MW121
MW14
MW7D
Figure 6f. Box-whisker plot showing pH values from September 2002 through March 2005.
MW121 and MW7D are background wells.
Box Whisker Plot - 1 Parameter, Multi Location
Total Filterable Residue (TDS) mg/L
Locations
0
400
800
1200
1600
2000
MW121
MW14
MW7D
Figure 6g. Box-whisker plot showing TDS concentrations from September 2002 through
March 2005. MW121 and MW7D are background wells.
Box Whisker Plot - 1 Parameter, Multi Location
Boron, total mg/L
Locations
0
4
8
12
16
MW1
MW10
MW121
MW7D
Figure 7a. Box-whisker plot showing background boron concentrations from September
2002 through March 2005. MW1 and MW10 are upper migration zone background wells,
and MW121 and MW7D are deep alluvial aquifer background wells.
Box Whisker Plot - 1 Parameter, Multi Location
Sulfate, total mg/L
Locations
0
200
400
600
800
1000
MW1
MW10
MW121
MW7D
Figure 7b. Box-whisker plot showing background sulfate concentrations from September
2002 through March 2005. MW1 and MW10 are upper migration zone background wells,
and MW121 and MW7D are deep alluvial aquifer background wells.
Box Whisker Plot - 1 Parameter, Multi Location
Manganese, total mg/L
Locations
0
1
2
3
4
5
MW1
MW10
MW121
MW7D
Figure 7e. Box-whisker plot showing background manganese concentrations from
September 2002 through March 2005. MW1 and MW10 are upper migration zone
background wells, and MW121 and MW7D are deep alluvial aquifer background wells.
Box Whisker Plot - 1 Parameter, Multi Location
pH (field) std
Locations
5.5
6.0
6.5
7.0
7.5
8.0
MW1
MW10
MW121
MW7D
Figure 7f. Box-whisker plot showing background pH values from September 2002 through
March 2005. MW1 and MW10 are upper migration zone background wells, and MW121 and
MW7D are deep alluvial aquifer background wells.
Box Whisker Plot - 1 Parameter, Multi Location
Total Filterable Residue (TDS) mg/L
Locations
0
400
800
1200
1600
2000
MW1
MW10
MW121
MW7D
Figure 7g. Box-whisker plot showing background TDS concentrations from September
2002 through March 2005. MW1 and MW10 are upper migration zone background wells,
and MW121 and MW7D are deep alluvial aquifer background wells.
B, tot (mg/L)
MW1
MW10
MW7D
Analysis Result
Sample Date
Class I
0.0
0.4
0.8
1.2
1.6
2.0
1/1/2002
1/1/2003
1/1/2004
1/1/2005
1/1/2006
SO4, tot (mg/L)
MW1
MW10
MW7D
Analysis Result
Sample Date
Class I
0
100
200
300
400
1/1/2002
1/1/2003
1/1/2004
1/1/2005
1/1/2006
Figure 8a. Time series plots comparing boron (top) and sulfate (bottom) concentrations in
deep alluvial aquifer background well MW7D to upper migration zone background wells
MW1 and MW10.
B, tot (mg/L)
MW1
MW10
MW121
Analysis Result
Sample Date
Class I
0.0
0.4
0.8
1.2
1.6
2.0
1/1/2002
1/1/2003
1/1/2004
1/1/2005
1/1/2006
SO4, tot (mg/L)
MW1
MW10
MW121
Analysis Result
Sample Date
Class I
0
50
100
150
200
250
300
350
400
1/1/2002
1/1/2003
1/1/2004
1/1/2005
1/1/2006
Figure 8b. Time series plots comparing boron (top) and sulfate (bottom) concentrations in
deep alluvial aquifer background well MW121 to upper migration zone background wells
MW1 and MW10.
B, tot (mg/L)
MW1 MW10 MW11R MW6 MW7 MW8
Analysis Result
Sample Date
Class I
0
5
10
15
20
1/1/2002
1/1/2003
1/1/2004
1/1/2005
1/1/2006
Figure 9a. Time series plots showing boron concentrations in upper migration zone
monitoring wells
SO4, tot (mg/L)
MW1 MW10 MW11R MW6 MW7 MW8
Analysis Result
Sample Date
Class I
0
200
400
600
800
1000
1200
1400
1600
1800
2000
1/1/2002
1/1/2003
1/1/2004
1/1/2005
1/1/2006
Figure 9b. Time series plots showing sulfate concentrations in upper migration zone
monitoring wells
Mn, tot (mg/L)
MW1 MW10 MW11R MW6 MW7 MW8
Analysis Result
Sample Date
Class I
0
1
2
3
4
5
1/1/2002
1/1/2003
1/1/2004
1/1/2005
1/1/2006
Figure 9c. Time series plots showing manganese concentrations in upper migration zone
monitoring wells
pH (field) (std)
MW1 MW10 MW11R MW6 MW7 MW8
Analysis Result
Sample Date
5.5
6.0
6.5
7.0
7.5
8.0
1/1/2002
1/1/2003
1/1/2004
1/1/2005
1/1/2006
Figure 9d. Time series plots showing pH values in upper migration zone monitoring wells
TDS (mg/L)
MW1 MW10 MW11R MW6 MW7 MW8
Analysis Result
Sample Date
Class I
0
500
1000
1500
2000
1/1/2002
1/1/2003
1/1/2004
1/1/2005
1/1/2006
Figure 9e. Time series plots showing TDS concentrations in upper migration zone
monitoring wells
B, tot (mg/L)
MW121
MW14
MW7D
Analysis Result
Sample Date
Class I
0.0
0.5
1.0
1.5
2.0
1/1/2002
1/1/2003
1/1/2004
1/1/2005
1/1/2006
Figure 10a. Time series plots showing boron concentrations in deep alluvial aquifer
monitoring wells (MW115s and MW115d not monitored during this period)
SO4, tot (mg/L)
MW121
MW14
MW7D
Analysis Result
Sample Date
Class I
0
400
1/1/2002
1/1/2003
1/1/2004
1/1/2005
1/1/2006
Figure 10b. Time series plots showing sulfate concentrations in deep alluvial aquifer
monitoring wells (MW115s and MW115d not monitored during this period)
Mn, tot (mg/L)
MW121
MW14
MW7D
Analysis Result
Sample Date
Class I
0
1
2
3
4
5
1/1/2002
1/1/2003
1/1/2004
1/1/2005
1/1/2006
Figure 10c. Time series plots showing manganese concentrations in deep alluvial aquifer
monitoring wells (MW115s and MW115d not monitored during this period)
pH (field) (std)
MW121
MW14
MW7D
Analysis Result
Sample Date
5.5
6.0
6.5
7.0
7.5
8.0
1/1/2002
1/1/2003
1/1/2004
1/1/2005
1/1/2006
Figure 10d. Time series plots showing pH values in deep alluvial aquifer monitoring wells
(MW115s and MW115d not monitored during this period)
TDS (mg/L)
MW121
MW14
MW7D
Analysis Result
Sample Date
Class I
0
200
400
600
800
1000
1200
1400
1600
1800
2000
1/1/2002
1/1/2003
1/1/2004
1/1/2005
1/1/2006
Figure 10e. Time series plots showing TDS concentrations in deep alluvial aquifer
monitoring wells (MW115s and MW115d not monitored during this period)
March 3, 2008
3:51:11 PM
Hutsonville Ash Impoundment
User Supplied Information
Data Deseasonalization:
Option for LT Pts:
x 0.5
Confidence level:
Period Length, mn:
3
Data Averaged?
No
Background Date Range:
09/01/2002 to 03/31/2005
Compliance Date Range:
09/01/2002 to 03/31/2005
Compliance Locations:
MW1
Attachment A
Wilcoxon Rank Sum Test for Two Group Comparison
99.00%
No
Background Locations:
MW1(Monthly)
Parameter:
Code
Name
Units
00400
pH (field)
std
Compliance Location:
Location ID
Location Type
MW1
Upper Zone
Background Location(s):
MW1(Monthly)
Upper Zone
W test (background):
Data is Normal
(At a significance level of 0.010)
W test (Compliance) :
Data is Normal
(At a significance level of 0.010)
Compliance Statistics (One-Sided Test):
Test Statistic
Avg Pts.
Less Than Pts.
Expected Value
Std Dev
Z-Value
Z-Critical
Null Hypothesis, Ho: All locations are from the same population.
Accept the Null Hypothesis, Ho.
11
0
231.000
33.800
0.370
2.326
MANAGES
1
March 3, 2008
3:51:11 PM
Hutsonville Ash Impoundment
User Supplied Information
Data Deseasonalization:
Option for LT Pts:
x 0.5
Confidence level:
Period Length, mn:
3
Data Averaged?
No
Background Date Range:
09/01/2002 to 03/31/2005
Compliance Date Range:
09/01/2002 to 03/31/2005
Compliance Locations:
MW1
Attachment A
Wilcoxon Rank Sum Test for Two Group Comparison
99.00%
No
Background Locations:
MW1(Monthly)
Parameter:
Code
Name
Units
00945
Sulfate, total
mg/L
Compliance Location:
Location ID
Location Type
MW1
Upper Zone
Background Location(s):
MW1(Monthly)
Upper Zone
W test (background):
Data is Not Normal
(At a significance level of 0.010)
W test (Compliance) :
Data is Normal
(At a significance level of 0.010)
Compliance Statistics (One-Sided Test):
Test Statistic
Avg Pts.
Less Than Pts.
Expected Value
Std Dev
Z-Value
Z-Critical
Null Hypothesis, Ho: All locations are from the same population.
Accept the Null Hypothesis, Ho.
11
0
231.000
33.941
-0.412
2.326
MANAGES
2
March 3, 2008
3:51:11 PM
Hutsonville Ash Impoundment
User Supplied Information
Data Deseasonalization:
Option for LT Pts:
x 0.5
Confidence level:
Period Length, mn:
3
Data Averaged?
No
Background Date Range:
09/01/2002 to 03/31/2005
Compliance Date Range:
09/01/2002 to 03/31/2005
Compliance Locations:
MW1
Attachment A
Wilcoxon Rank Sum Test for Two Group Comparison
99.00%
No
Background Locations:
MW1(Monthly)
Parameter:
Code
Name
Units
01022
Boron, total
mg/L
Compliance Location:
Location ID
Location Type
MW1
Upper Zone
Background Location(s):
MW1(Monthly)
Upper Zone
W test (background):
Data is Not Normal
(At a significance level of 0.010)
W test (Compliance) :
Data is Normal
(At a significance level of 0.010)
Compliance Statistics (One-Sided Test):
Test Statistic
Avg Pts.
Less Than Pts.
Expected Value
Std Dev
Z-Value
Z-Critical
Null Hypothesis, Ho: All locations are from the same population.
Accept the Null Hypothesis, Ho.
11
0
231.000
33.685
-0.045
2.326
MANAGES
3
March 3, 2008
3:51:11 PM
Hutsonville Ash Impoundment
User Supplied Information
Data Deseasonalization:
Option for LT Pts:
x 0.5
Confidence level:
Period Length, mn:
3
Data Averaged?
No
Background Date Range:
09/01/2002 to 03/31/2005
Compliance Date Range:
09/01/2002 to 03/31/2005
Compliance Locations:
MW1
Attachment A
Wilcoxon Rank Sum Test for Two Group Comparison
99.00%
No
Background Locations:
MW1(Monthly)
Parameter:
Code
Name
Units
01055
Manganese, total
mg/L
Compliance Location:
Location ID
Location Type
MW1
Upper Zone
Background Location(s):
MW1(Monthly)
Upper Zone
W test (background):
Data is Not Normal
(At a significance level of 0.010)
W test (Compliance) :
Data is Normal
(At a significance level of 0.010)
Compliance Statistics (One-Sided Test):
Test Statistic
Avg Pts.
Less Than Pts.
Expected Value
Std Dev
Z-Value
Z-Critical
Null Hypothesis, Ho: All locations are from the same population.
Accept the Null Hypothesis, Ho.
11
0
231.000
33.963
0.294
2.326
MANAGES
4
March 3, 2008
3:51:11 PM
Hutsonville Ash Impoundment
User Supplied Information
Data Deseasonalization:
Option for LT Pts:
x 0.5
Confidence level:
Period Length, mn:
3
Data Averaged?
No
Background Date Range:
09/01/2002 to 03/31/2005
Compliance Date Range:
09/01/2002 to 03/31/2005
Compliance Locations:
MW1
Attachment A
Wilcoxon Rank Sum Test for Two Group Comparison
99.00%
No
Background Locations:
MW1(Monthly)
Parameter:
Code
Name
Units
70300
Total Filterable Residue (TDS)
mg/L
Compliance Location:
Location ID
Location Type
MW1
Upper Zone
Background Location(s):
MW1(Monthly)
Upper Zone
W test (background):
Data is Normal
(At a significance level of 0.010)
W test (Compliance) :
Data is Normal
(At a significance level of 0.010)
Compliance Statistics (One-Sided Test):
Test Statistic
Avg Pts.
Less Than Pts.
Expected Value
Std Dev
Z-Value
Z-Critical
Null Hypothesis, Ho: All locations are from the same population.
Accept the Null Hypothesis, Ho.
11
0
231.000
33.890
0.044
2.326
MANAGES
5
03/03/2008
3:55:51PM
Hutsonville Ash Impoundment
Date Range: 09/01/2002 to 03/31/2005
Confidence Level: 99%
LT Multiplier: x 1.0
User Supplied Information
Attachment B1
Dixons Outlier Analysis Results - Background Wells
Number of Outliers: First 10% Outliers
Sample Date
Value
LT_Value
Outlier
Low Side
Outlier
High Side
Location: MW1
pH (field), std
Data passed the W-test for normality
T Critical of all data: Tcr = 0.679
Test Statistic, high extreme of all data: Tn = 0.182
Test Statistic, low extreme of all data: T1 = 0.268
No Outliers
Sample Date
Value
LT_Value
Outlier
Low Side
Outlier
High Side
Location: MW10
pH (field), std
Data passed the W-test for normality
T Critical of all data: Tcr = 0.679
Test Statistic, high extreme of all data: Tn = 0.048
Test Statistic, low extreme of all data: T1 = 0.300
No Outliers
Sample Date
Value
LT_Value
Outlier
Low Side
Outlier
High Side
Location: MW121
pH (field), std
Data passed the W-test for normality
T Critical of all data: Tcr = 0.679
Test Statistic, high extreme of all data: Tn = 0.387
Test Statistic, low extreme of all data: T1 = 0.000
No Outliers
1
MANAGES
Based on Dixons one-sided outlier test
03/03/2008
3:55:51PM
Hutsonville Ash Impoundment
Date Range: 09/01/2002 to 03/31/2005
Confidence Level: 99%
LT Multiplier: x 1.0
User Supplied Information
Attachment B1
Dixons Outlier Analysis Results - Background Wells
Number of Outliers: First 10% Outliers
Sample Date
Value
LT_Value
Outlier
Low Side
Outlier
High Side
Location: MW7D
pH (field), std
Data passed the W-test for normality
T Critical of all data: Tcr = 0.679
Test Statistic, high extreme of all data: Tn = 0.425
Test Statistic, low extreme of all data: T1 = 0.566
No Outliers
Sample Date
Value
LT_Value
Outlier
Low Side
Outlier
High Side
Location: MW1
Sulfate, total, mg/L
Data passed the W-test for normality
T Critical of all data: Tcr = 0.679
Test Statistic, high extreme of all data: Tn = 0.686
Test Statistic, low extreme of all data: T1 = 0.057
02/05/2003
87.000
False
1
Sample Date
Value
LT_Value
Outlier
Low Side
Outlier
High Side
Location: MW10
Sulfate, total, mg/L
Data passed the W-test for normality
T Critical of all data: Tcr = 0.679
Test Statistic, high extreme of all data: Tn = 0.400
Test Statistic, low extreme of all data: T1 = 0.222
No Outliers
2
MANAGES
Based on Dixons one-sided outlier test
03/03/2008
3:55:51PM
Hutsonville Ash Impoundment
Date Range: 09/01/2002 to 03/31/2005
Confidence Level: 99%
LT Multiplier: x 1.0
User Supplied Information
Attachment B1
Dixons Outlier Analysis Results - Background Wells
Number of Outliers: First 10% Outliers
Sample Date
Value
LT_Value
Outlier
Low Side
Outlier
High Side
Location: MW121
Sulfate, total, mg/L
Data passed the W-test for normality
T Critical of all data: Tcr = 0.679
Test Statistic, high extreme of all data: Tn = 0.310
Test Statistic, low extreme of all data: T1 = 0.116
No Outliers
Sample Date
Value
LT_Value
Outlier
Low Side
Outlier
High Side
Location: MW7D
Sulfate, total, mg/L
Data passed the W-test for normality
T Critical of all data: Tcr = 0.679
Test Statistic, high extreme of all data: Tn = 0.250
Test Statistic, low extreme of all data: T1 = 0.367
No Outliers
Sample Date
Value
LT_Value
Outlier
Low Side
Outlier
High Side
Location: MW1
Boron, total, mg/L
Data passed the W-test for normality
T Critical of all data: Tcr = 0.679
Test Statistic, high extreme of all data: Tn = 0.460
Test Statistic, low extreme of all data: T1 = 0.121
No Outliers
3
MANAGES
Based on Dixons one-sided outlier test
03/03/2008
3:55:51PM
Hutsonville Ash Impoundment
Date Range: 09/01/2002 to 03/31/2005
Confidence Level: 99%
LT Multiplier: x 1.0
User Supplied Information
Attachment B1
Dixons Outlier Analysis Results - Background Wells
Number of Outliers: First 10% Outliers
Sample Date
Value
LT_Value
Outlier
Low Side
Outlier
High Side
Location: MW10
Boron, total, mg/L
Data passed the W-test for normality
T Critical of all data: Tcr = 0.679
Test Statistic, high extreme of all data: Tn = 0.403
Test Statistic, low extreme of all data: T1 = 0.156
No Outliers
Sample Date
Value
LT_Value
Outlier
Low Side
Outlier
High Side
Location: MW121
Boron, total, mg/L
Data passed the W-test for normality
T Critical of all data: Tcr = 0.679
Test Statistic, high extreme of all data: Tn = 0.497
Test Statistic, low extreme of all data: T1 = 0.204
No Outliers
Sample Date
Value
LT_Value
Outlier
Low Side
Outlier
High Side
Location: MW7D
Boron, total, mg/L
Data passed the W-test for normality
T Critical of all data: Tcr = 0.679
Test Statistic, high extreme of all data: Tn = 0.490
Test Statistic, low extreme of all data: T1 = 0.269
No Outliers
4
MANAGES
Based on Dixons one-sided outlier test
03/03/2008
3:55:51PM
Hutsonville Ash Impoundment
Date Range: 09/01/2002 to 03/31/2005
Confidence Level: 99%
LT Multiplier: x 1.0
User Supplied Information
Attachment B1
Dixons Outlier Analysis Results - Background Wells
Number of Outliers: First 10% Outliers
Sample Date
Value
LT_Value
Outlier
Low Side
Outlier
High Side
Location: MW1
Manganese, total, mg/L
Data passed the W-test for normality
T Critical of all data: Tcr = 0.679
Test Statistic, high extreme of all data: Tn = 0.100
Test Statistic, low extreme of all data: T1 = 0.371
No Outliers
Sample Date
Value
LT_Value
Outlier
Low Side
Outlier
High Side
Location: MW10
Manganese, total, mg/L
Data passed the W-test for normality
T Critical of all data: Tcr = 0.679
Test Statistic, high extreme of all data: Tn = 0.614
Test Statistic, low extreme of all data: T1 = 0.061
No Outliers
Sample Date
Value
LT_Value
Outlier
Low Side
Outlier
High Side
Location: MW121
Manganese, total, mg/L
Data passed the W-test for normality
T Critical of all data: Tcr = 0.679
Test Statistic, high extreme of all data: Tn = 0.522
Test Statistic, low extreme of all data: T1 = 0.237
No Outliers
5
MANAGES
Based on Dixons one-sided outlier test
03/03/2008
3:55:51PM
Hutsonville Ash Impoundment
Date Range: 09/01/2002 to 03/31/2005
Confidence Level: 99%
LT Multiplier: x 1.0
User Supplied Information
Attachment B1
Dixons Outlier Analysis Results - Background Wells
Number of Outliers: First 10% Outliers
Sample Date
Value
LT_Value
Outlier
Low Side
Outlier
High Side
Location: MW7D
Manganese, total, mg/L
Data passed the W-test for normality
T Critical of all data: Tcr = 0.679
Test Statistic, high extreme of all data: Tn = 0.269
Test Statistic, low extreme of all data: T1 = 0.594
No Outliers
Sample Date
Value
LT_Value
Outlier
Low Side
Outlier
High Side
Location: MW1
Total Filterable Residue (TDS), mg/L
Data passed the W-test for normality
T Critical of all data: Tcr = 0.679
Test Statistic, high extreme of all data: Tn = 0.417
Test Statistic, low extreme of all data: T1 = 0.158
No Outliers
Sample Date
Value
LT_Value
Outlier
Low Side
Outlier
High Side
Location: MW10
Total Filterable Residue (TDS), mg/L
Data passed the W-test for normality
T Critical of all data: Tcr = 0.679
Test Statistic, high extreme of all data: Tn = 0.125
Test Statistic, low extreme of all data: T1 = 0.333
No Outliers
6
MANAGES
Based on Dixons one-sided outlier test
03/03/2008
3:55:51PM
Hutsonville Ash Impoundment
Date Range: 09/01/2002 to 03/31/2005
Confidence Level: 99%
LT Multiplier: x 1.0
User Supplied Information
Attachment B1
Dixons Outlier Analysis Results - Background Wells
Number of Outliers: First 10% Outliers
Sample Date
Value
LT_Value
Outlier
Low Side
Outlier
High Side
Location: MW121
Total Filterable Residue (TDS), mg/L
Data passed the W-test for normality
T Critical of all data: Tcr = 0.679
Test Statistic, high extreme of all data: Tn = 0.569
Test Statistic, low extreme of all data: T1 = 0.549
No Outliers
Sample Date
Value
LT_Value
Outlier
Low Side
Outlier
High Side
Location: MW7D
Total Filterable Residue (TDS), mg/L
Data passed the W-test for normality
T Critical of all data: Tcr = 0.679
Test Statistic, high extreme of all data: Tn = 0.167
Test Statistic, low extreme of all data: T1 = 0.267
No Outliers
7
MANAGES
Based on Dixons one-sided outlier test
March 3, 2008
Hutsonville Ash Impoundment
Appendix B2: Tolerance Interval Calculation Background (Upper)
Compliance Date Range: 01/01/2008 to 01/01/2008
0.01
0
95%
Interwell
Background Locations:
MW1,MW10
Background Date Range: 09/01/2002 to 03/31/2005
4:04:21 PM
Comparison Method if all Background Results are Non-Detect:
STmdl = Last MDL
Statistical Test for Parametric Background Data Distributions:
STpar = Parametric Tolerance Interval on Background
Statistical Test for Cases with High Percentage of Non-Detect Background Data:
Statistical Test for Cases with High Percentage of Non-Detect Background Data:
STnon = Non-Parametric Tolerance Interval on background
STlow1 = Non-Parametric Tolerance Interval on background (ND Frequency > 50%)
Background Comparison:
Number of Verification Samples:
Default Type 1 Individual Comparison Error Level
(False Positive Rate) for tests other than Prediction Interval
Non-Detect Processing (Parametric Tests):
Tolerance Interval Coverage:
Compliance Locations:
Null
Non-Detect Processing (All Other):
<=15% using 1/2 PQL (MDL * 10/3)
>15% using Cohen's Adj.
<=50% using MDL * 1.0
>50% using MDL * 1.0
Statistical Test for Non-Parametric Background Data Distributions:
STlow2 = Non-Parametric Tolerance Interval on background (ND Frequency > 50%)
Compliance
Normal /
Percent
of Non
detects
Count
Of Bkg
Results
Confidence
Location
Parameter
Sample Date
Lognormal
Test
Level
Upper Limit
Lower Limit
Analysis Result Exceedance Trend
01/01/2008
Null
Boron, Tot, mg/L
22
0.00
Yes/Yes
STpar
99.00
0.216
0.000
No
01/01/2008
Null
Manganese, Tot,
22
0.00
No/Yes
STpar
0.000
No
mg/L
99.00
1.869
01/01/2008
Null
pH (field), std
22
0.00
Yes/Yes
STpar
99.00
7.685
6.739
0.000
Yes
01/01/2008
Null
Sulfate, Tot, mg/L
22
0.00
No/Yes
STpar
99.00
97.460
0.000
No
01/01/2008
Null
TDS, mg/L
22
0.00
Yes/No
STpar
99.00
566.259
0.000
No
MANAGES
2
March 3, 2008
4:04:20
PM
Hutsonville Ash Impoundment
Normal Tolerance Interval on Background
Compliance Analysis
User Supplied Information
Background Date Range:
Compliauce Date Range:
Compliance Locations:
Background Locations:
COMPLIANCE
Location
Null
09/0112002 to 03/3112005
0110112008 to 0110112008
Null
MW1,MWI0
Tolerance Coverage (Gamma): 95%
Parameter Code;
00400
Parameter Name;
pH (field)
.!1.ni.U..;.
std
TL CUllller) value
7.7
Sample
Sample
Greater than
Date
Result
IL (Upper)
1/112008
0.000
N
Parameter Code;
00945
Parameter Name;
Sulfate, Tot
.lin..it1;.
mglL
II, (lJIlller) value
97.5
Sample
Sample
Greater than
Date
Result
IL (Upper)
11112008
0.000
N
Parameter Code;
01022
Parameter Name;
Boron, Tot
.!1.ni.U..;.
mglL
TL (lJllller) value
0.2
Sample
Sample
Greater than
Date
Result
IL (Upperl
1/1/2008
0.000
N
Data Transformation:
Confidence Leyel;
Option for I.T Pts,:
TL (Lower) value
6.7
Lower than
IL (Lower)
y
Data Transformation;
Confidence Level:
Option for I.T Pts.;
Data Transformation:
Confidence Level;
Option for LT Pts.;
None
0,99%
1/2 PQL (MOL
*
10/3)
Natural Log
0.99%
112
PQL (MOL
*
10/3)
None
0.99%
1/2 PQL (MOL
*
10/3)
Note: Confidence Level is sometimes referred to as Tolerance Coefficient.
When "Greater than
TL (Upper)" is Y, this indicates statistical evidence of exceedance of the upper tolerance limit.
Lower Limit only listed
for two sided test.
MANAGES
March 3, 2008
4:04:20
PM
Hutsonville Ash Impoundment
Normal Tolerance Interval on Background
Compliance Analysis
User Supplied Information
Background Date Range:
Compliance Date Range:
Compliance Locations:
Background Locations:
09/0112002 to 03/3112005
0110112008
to 0110112008
Null
MWI,MWIO
Tolerance Coverage (Gamma):
95%
--~~~--~~~~-
----
-~~~
...
_--
COMPLIANCE
Parameter Code:
01055
Parameter Name:
Manganese, Tot
.I..1ai.ti;.
mglL
TL (Upper) value
1.9
Sample
Sample
Greater than
Date
Result
TL (Upper)
1/1/2008
0.000
N
Parameter Code:
70300
Parameter Name:
TDS
!In.i.ts.;.
mglL
TL (lJpper) value
566.3
Sample
Sample
Greater than
Date
Result
TL (Upper)
111/2008
0.000
N
Data Transformation:
Confidence Leyel:
Option for itT Pts,;
Data Transformation:
Confidence Leyel:
Option for itT Pts.:
Natural Log
0.99%
112 PQL (MOL
*
10/3)
None
0.99%
112 PQL (MOL
*
10/3)
Note: Confidence Level is sometimes referred to as Tolerance Coefficient
When "Greater than TL (Upper)" is Y, this indicates statistical evidence ofexceedance of the upper tolerance limit.
Lower
Limit only listed for two sided test
MANAGES
2
March 3, 2008
4:04:20
PM
Hutsonville Ash Impoundment
Normal Tolerance Interval on Background
Background Data Pool
Background Date Range:
Compliance Date Range:
Compliance Locations:
Background Locations:
BACKGROUND
Location
Pooled
09/0112002 to 03/3112005
01101/2008 to 0110112008
Null
MWI,MWIO
~
Upper Zone
Tolerance Coverage (Gamma):
Option for LT Pts:
Total Pts
22
95%
112 PQL (MDL
*
10/3)
% LT Pts
o
Parameter Code:
00400
Parameter Name;
pH (field)
std
Pooled Results:
Data Transformation;
COnfidence Leyel;
None
0.99%
Normal
Yes
Mean
7.212
StdDev
0.154
K
Value
3.078
TL (Lower)
6.739
TU (Upper)
7.685
Parameter Code;
00945
Parameter Name;
Sulfate, Tot
lin..i.t1;,
mg/L
Pooled Results:
Normal
Mean
StdDev
K
Value
Yes
35.091
15.997
2.729
Data Transformation;
COnfidence LeYel;
TU (Upper)
97.460
Natural Log
0.99%
Parameter Code;
01022
Data Transformation:
None
Parameter Name;
Boron, Tot
Confidence Level:
0.99%
~
mg/L
Pooled Results:
Normal
Mean
StdDev
K
Value
TU (Upper)
Yes
0.120
0.035
2.729
0.216
Note: Confidence Level is sometimes referred to as Tolerance Coefficient.
MANAGES
March 3, 2008
4:04:20 PM
Hutsonville Ash Impoundment
Normal Tolerance Interval on Background
Background Data Pool
Background Date Range:
Compliance Date Range:
Compliance Locations:
Background Locations:
09/0112002
to
03/3112005
0110112008
to
0110112008
Null
MWI,MWIO
Tolerance Coverage (Gamma):
Option for LT Pts:
95%
112
PQL (MOL
* 10/3)
BACKGROUND
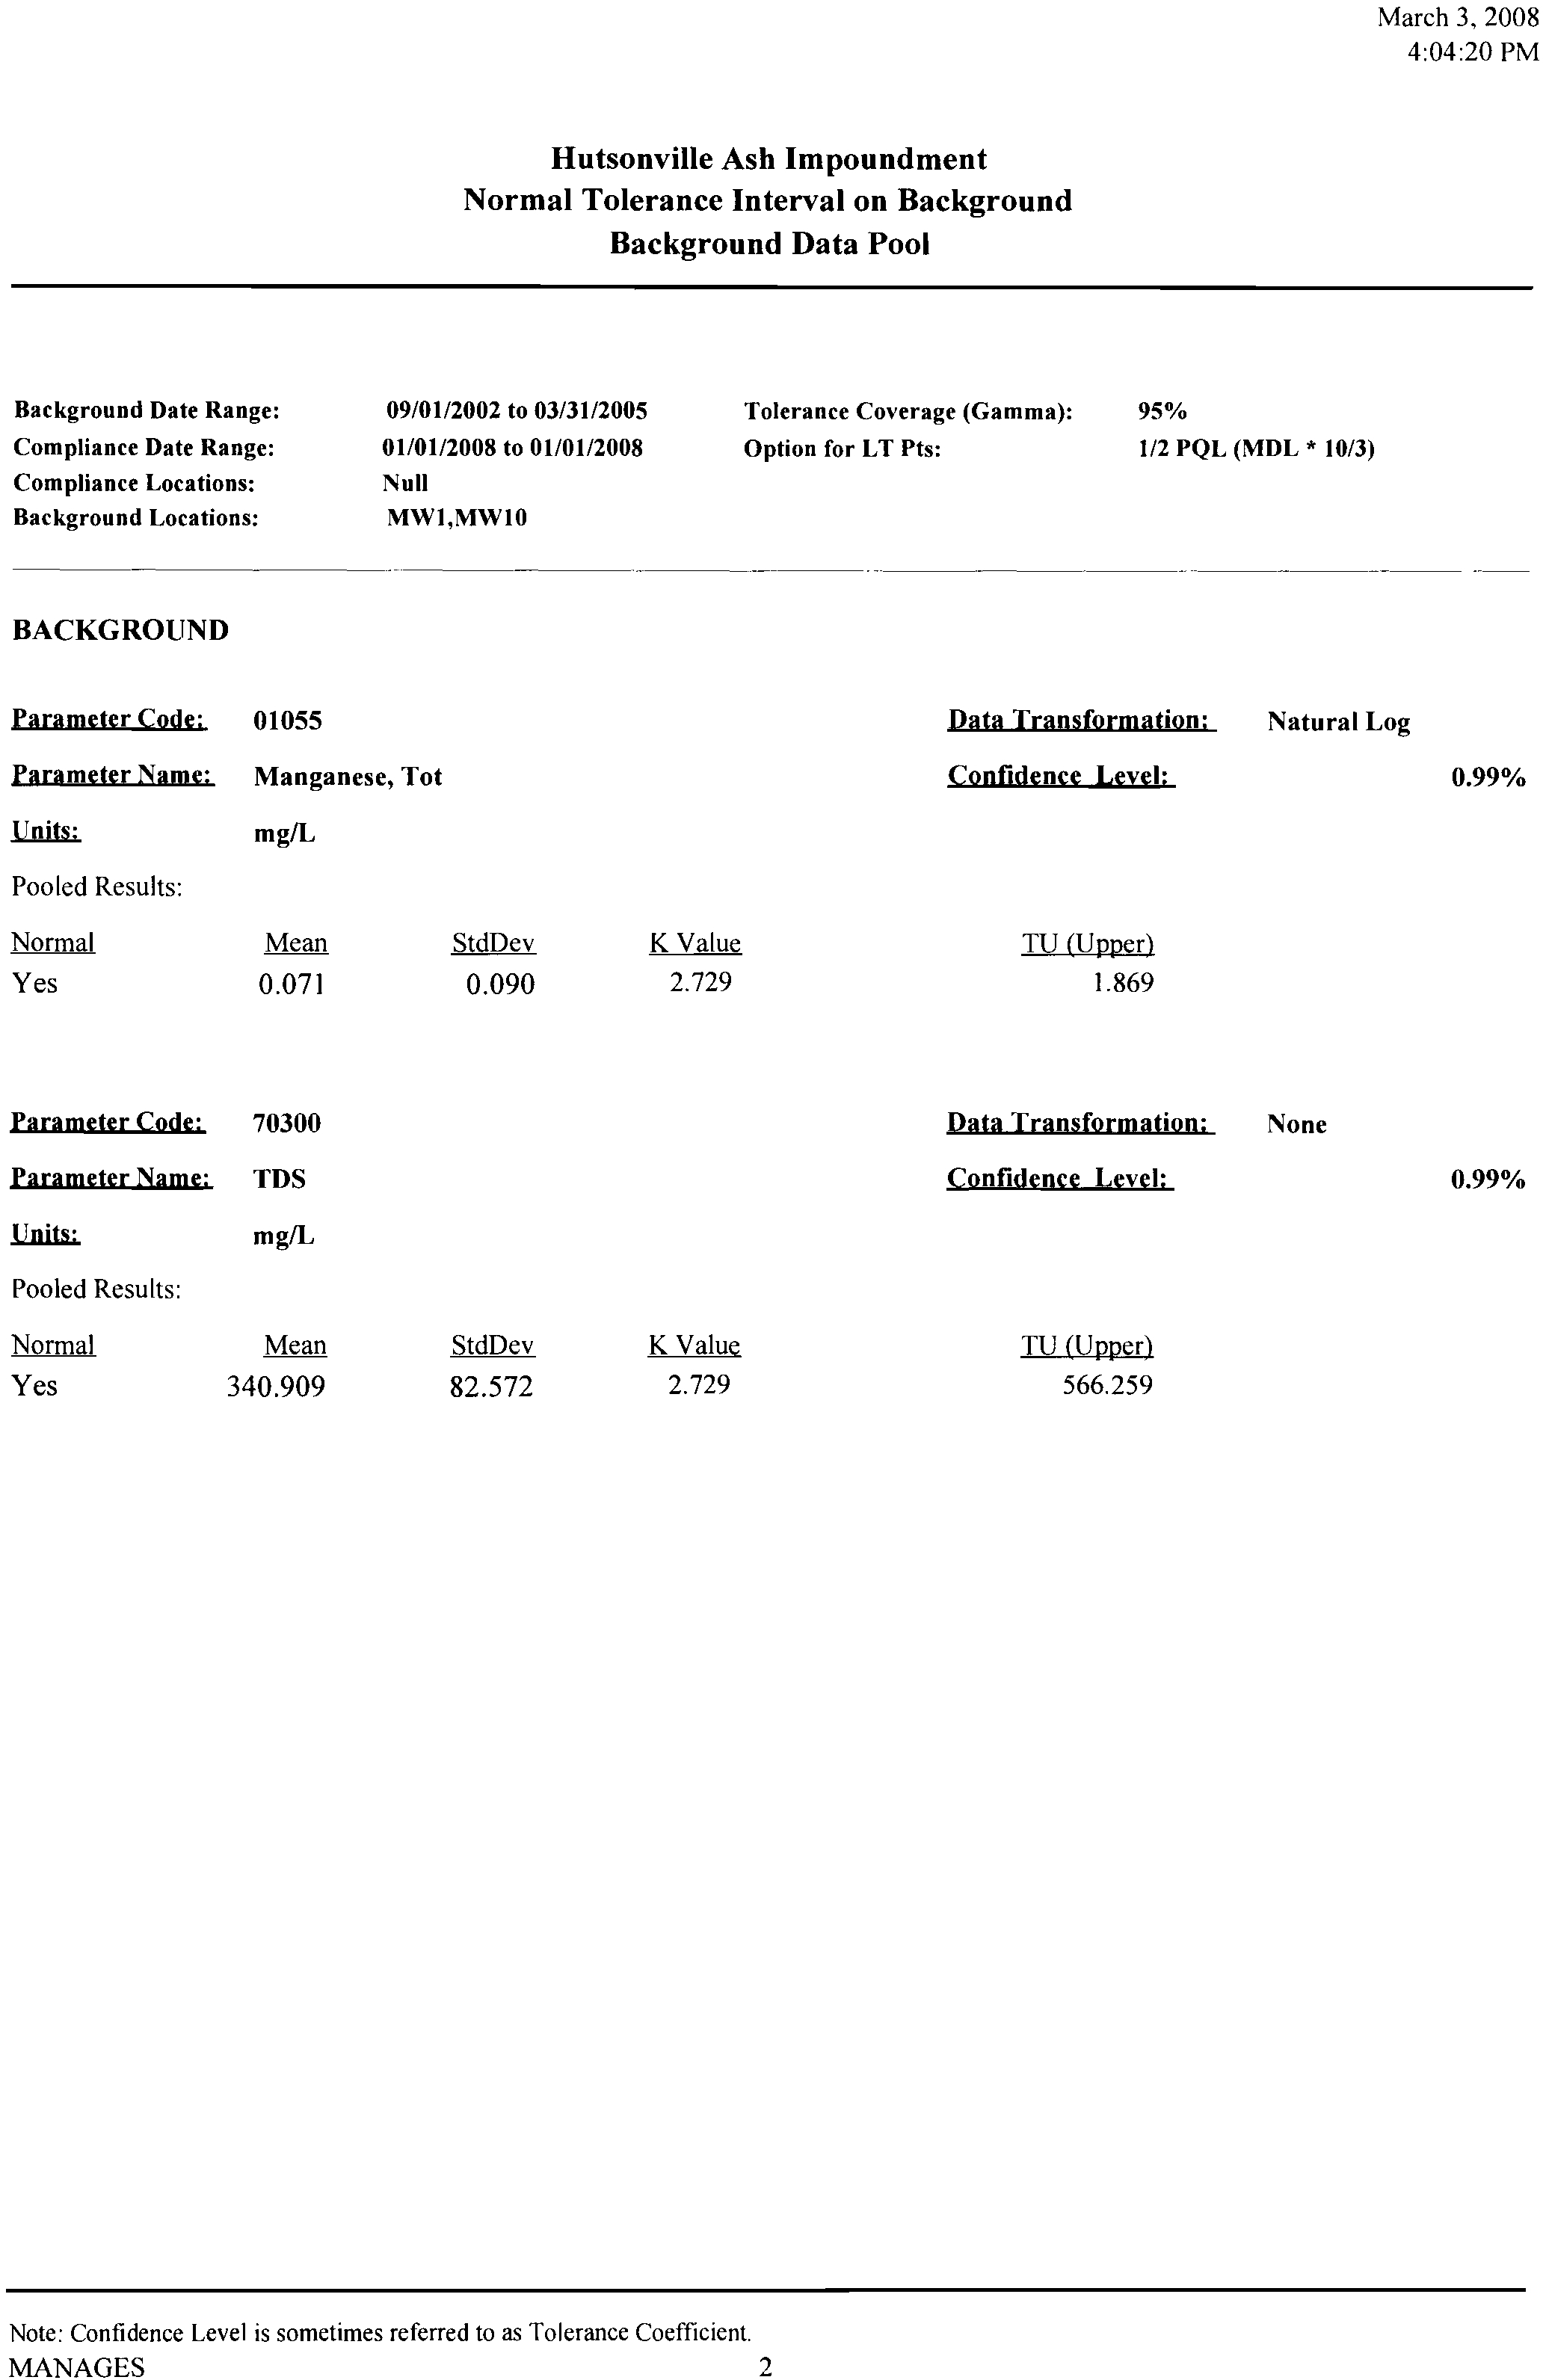
Parameter Code;
01055
Parameter Name:
Manganese, Tot
mglL
Pooled Results:
~~----~~-.-
Data Transformation;
Confidence Leyel:
Natural Log
0.99%
Normal
Yes
0.071
StdDev
0.090
K Value
2.729
TU (Upper)
1.869
Parameter Code;
70300
Data Transformation;
None
Parameter Name;
TDS
Confidence Level;
0.99%
!lJlin;.
mglL
Pooled Results:
Normal
Mean
StdDev
K Value
TU (Upper)
Yes
340.909
82.572
2.729
566.259
Note: Confidence Level is sometimes referred to as Tolerance Coefficient.
MANAGES
2
Hutsonville Ash Impoundment
Normal Tolerance Interval on Background
Background Data Pool
March 3, 2008
4:04:20 PM
Background Date Range:
Compliance Date Range:
Compliance Locations:
Background Locations:
BACKGROUND
09/0112002 to
03/3112005
0110112008 to 0110112008
Null
MW1,MWI0
Tolerance Coverage (Gamma):
Option for LT Pts:
95%
112 PQL (MOL
*
10/3)
Note: Confidence Level is sometimes referred to as Tolerance Coefficient.
MANAGES
3
March 3, 2008
Hutsonville Ash Impoundment
Appendix B3: Tolerance Interval Calculation Background (Deep)
Compliance Date Range: 01/01/2008 to 01/01/2008
0.01
0
95%
Interwell
Background Locations:
MW121,MW7D
Background Date Range: 09/01/2002 to 03/31/2005
4:07:51 PM
Comparison Method if all Background Results are Non-Detect:
STmdl = Last MDL
Statistical Test for Parametric Background Data Distributions:
STpar = Parametric Tolerance Interval on Background
Statistical Test for Cases with High Percentage of Non-Detect Background Data:
Statistical Test for Cases with High Percentage of Non-Detect Background Data:
STnon = Non-Parametric Tolerance Interval on background
STlow1 = Non-Parametric Tolerance Interval on background (ND Frequency > 50%)
Background Comparison:
Number of Verification Samples:
Default Type 1 Individual Comparison Error Level
(False Positive Rate) for tests other than Prediction Interval
Non-Detect Processing (Parametric Tests):
Tolerance Interval Coverage:
Compliance Locations:
Null
Non-Detect Processing (All Other):
<=15% using 1/2 PQL (MDL * 10/3)
>15% using Cohen's Adj.
<=50% using MDL * 1.0
>50% using MDL * 1.0
Statistical Test for Non-Parametric Background Data Distributions:
STlow2 = Non-Parametric Tolerance Interval on background (ND Frequency > 50%)
Compliance
Normal /
Percent
of Non
detects
Count
Of Bkg
Results
Confidence
Location
Parameter
Sample Date
Lognormal
Test
Level
Upper Limit
Lower Limit
Analysis Result Exceedance Trend
01/01/2008
Null
Boron, Tot, mg/L
22
0.00
No/Yes
STpar
99.00
0.274
0.000
No
01/01/2008
Null
Manganese, Tot,
22
0.00
No/Yes
STpar
0.000
No
mg/L
99.00
2.369
01/01/2008
Null
pH (field), std
22
0.00
Yes/Yes
STpar
99.00
7.845
6.974
0.000
Yes
01/01/2008
Null
Sulfate, Tot, mg/L
22
0.00
Yes/Yes
STpar
99.00
84.303
0.000
No
01/01/2008
Null
TDS, mg/L
22
0.00
Yes/Yes
STpar
99.00
499.886
0.000
No
MANAGES
2
March 3, 2008
4:07:51 PM
Hutsonville Ash Impoundment
User Supplied Information
Background Date Range:
09/01/2002 to 03/31/2005
Compliance Date Range:
01/01/2008 to 01/01/2008
Tolerance Coverage (Gamma):
Compliance Locations:
Null
Normal Tolerance Interval on Background
Compliance Analysis
95%
Background Locations:
MW121,MW7D
COMPLIANCE
Location
Type
Class
Null
Parameter Name:
Parameter Code:
Units:
00400
pH (field)
Sample
Sample
Greater than
Lower than
Date
Result
TL (Upper)
TL (Lower)
Data Transformation:
None
Confidence Level:
0.99%
std
TL (Upper) Value
TL (Lower) Value
7.8
7.0
Option for LT Pts.:
1/2 PQL (MDL *
10/3)
1/1/2008
0.000
N
Y
Parameter Name:
Parameter Code:
Units:
00945
Sulfate, Tot
Sample
Sample
Greater than
Date
Result
TL (Upper)
Data Transformation:
None
Confidence Level:
0.99%
mg/L
TL (Upper) Value
84.3
Option for LT Pts.:
1/2 PQL (MDL *
10/3)
1/1/2008
0.000
N
Parameter Name:
Parameter Code:
Units:
01022
Boron, Tot
Sample
Sample
Greater than
Date
Result
TL (Upper)
Data Transformation:
Natural Log
Confidence Level:
0.99%
mg/L
TL (Upper) Value
0.3
Option for LT Pts.:
1/2 PQL (MDL *
10/3)
1/1/2008
0.000
N
Note: Confidence Level is sometimes referred to as Tolerance Coefficient.
When "Greater than TL (Upper)" is Y, this indicates statistical evidence of exceedance of the upper tolerance limit.
MANAGES
1
Lower Limit only listed for two sided test.
March 3, 2008
4:07:51 PM
Hutsonville Ash Impoundment
User Supplied Information
Background Date Range:
09/01/2002 to 03/31/2005
Compliance Date Range:
01/01/2008 to 01/01/2008
Tolerance Coverage (Gamma):
Compliance Locations:
Null
Normal Tolerance Interval on Background
Compliance Analysis
95%
Background Locations:
MW121,MW7D
COMPLIANCE
Parameter Name:
Parameter Code:
Units:
01055
Manganese, Tot
Sample
Sample
Greater than
Date
Result
TL (Upper)
Data Transformation:
Natural Log
Confidence Level:
0.99%
mg/L
TL (Upper) Value
2.4
Option for LT Pts.:
1/2 PQL (MDL *
10/3)
1/1/2008
0.000
N
Parameter Name:
Parameter Code:
Units:
70300
TDS
Sample
Sample
Greater than
Date
Result
TL (Upper)
Data Transformation:
None
Confidence Level:
0.99%
mg/L
TL (Upper) Value
499.9
Option for LT Pts.:
1/2 PQL (MDL *
10/3)
1/1/2008
0.000
N
Note: Confidence Level is sometimes referred to as Tolerance Coefficient.
When "Greater than TL (Upper)" is Y, this indicates statistical evidence of exceedance of the upper tolerance limit.
MANAGES
2
Lower Limit only listed for two sided test.
March 3, 2008
4:07:51 PM
Hutsonville Ash Impoundment
Background Date Range:
09/01/2002 to 03/31/2005
Compliance Date Range:
01/01/2008 to 01/01/2008
Tolerance Coverage (Gamma):
Compliance Locations:
Null
Normal Tolerance Interval on Background
Background Data Pool
Option for LT Pts:
1/2 PQL (MDL * 10/3)
95%
Background Locations:
MW121,MW7D
BACKGROUND
Location
Type
Total Pts
LT Pts
% LT Pts
Pooled
Alluvial Aq.
22
0
0
Parameter Code:
Parameter Name:
Units:
Pooled Results:
Normal
Mean
StdDev
K Value
TL (Lower)
TU (Upper)
Yes
7.410
0.141
00400
pH (field)
std
3.078
6.974
7.845
Data Transformation:
None
Confidence Level:
0.99%
Parameter Code:
Parameter Name:
Units:
Pooled Results:
Normal
Mean
StdDev
K Value
TU (Upper)
Yes
43.818
14.834
00945
Sulfate, Tot
mg/L
2.729
84.303
Data Transformation:
None
Confidence Level:
0.99%
Parameter Code:
Parameter Name:
Units:
Pooled Results:
Normal
Mean
StdDev
K Value
TU (Upper)
Yes
0.104
0.044
01022
Boron, Tot
mg/L
2.729
0.274
Data Transformation:
Natural Log
Confidence Level:
0.99%
Note: Confidence Level is sometimes referred to as Tolerance Coefficient.
MANAGES
1
March 3, 2008
4:07:51 PM
Hutsonville Ash Impoundment
Background Date Range:
09/01/2002 to 03/31/2005
Compliance Date Range:
01/01/2008 to 01/01/2008
Tolerance Coverage (Gamma):
Compliance Locations:
Null
Normal Tolerance Interval on Background
Background Data Pool
Option for LT Pts:
1/2 PQL (MDL * 10/3)
95%
Background Locations:
MW121,MW7D
BACKGROUND
Parameter Code:
Parameter Name:
Units:
Pooled Results:
Normal
Mean
StdDev
K Value
TU (Upper)
Yes
0.930
0.385
01055
Manganese, Tot
mg/L
2.729
2.369
Data Transformation:
Natural Log
Confidence Level:
0.99%
Parameter Code:
Parameter Name:
Units:
Pooled Results:
Normal
Mean
StdDev
K Value
TU (Upper)
Yes
354.091
53.422
70300
TDS
mg/L
2.729
499.886
Data Transformation:
None
Confidence Level:
0.99%
Note: Confidence Level is sometimes referred to as Tolerance Coefficient.
MANAGES
2
March 3, 2008
4:07:51 PM
Hutsonville Ash Impoundment
Background Date Range:
09/01/2002 to 03/31/2005
Compliance Date Range:
01/01/2008 to 01/01/2008
Tolerance Coverage (Gamma):
Compliance Locations:
Null
Normal Tolerance Interval on Background
Background Data Pool
Option for LT Pts:
1/2 PQL (MDL * 10/3)
95%
Background Locations:
MW121,MW7D
BACKGROUND
Note: Confidence Level is sometimes referred to as Tolerance Coefficient.
MANAGES
3
03/03/2008
3:52:06PM
Hutsonville Ash Impoundment
Date Range: 09/01/2002 to 03/31/2005
Confidence Level: 99%
LT Multiplier: x 1.0
User Supplied Information
Attachment C1
Dixons Outlier Analysis Results - Downgradient Wells
Number of Outliers: First 10% Outliers
Sample Date
Value
LT_Value
Outlier
Low Side
Outlier
High Side
Location: MW11R
pH (field), std
Data passed the W-test for normality
T Critical of all data: Tcr = 0.597
Test Statistic, high extreme of all data: Tn = 0.000
Test Statistic, low extreme of all data: T1 = 0.583
No Outliers
Sample Date
Value
LT_Value
Outlier
Low Side
Outlier
High Side
Location: MW14
pH (field), std
Data failed to pass the W-test as either a normal or a lognormally distributed data set
Data is neither normally or lognormally distributed.
T Critical of all data: Tcr = 0.000
Test Statistic, high extreme of all data: Tn = 0.000
Test Statistic, low extreme of all data: T1 = 0.000
No Outliers
Sample Date
Value
LT_Value
Outlier
Low Side
Outlier
High Side
Location: MW6
pH (field), std
Data passed the W-test for normality
T Critical of all data: Tcr = 0.597
Test Statistic, high extreme of all data: Tn = 0.286
Test Statistic, low extreme of all data: T1 = 0.000
No Outliers
1
MANAGES
Based on Dixons one-sided outlier test
03/03/2008
3:52:06PM
Hutsonville Ash Impoundment
Date Range: 09/01/2002 to 03/31/2005
Confidence Level: 99%
LT Multiplier: x 1.0
User Supplied Information
Attachment C1
Dixons Outlier Analysis Results - Downgradient Wells
Number of Outliers: First 10% Outliers
Sample Date
Value
LT_Value
Outlier
Low Side
Outlier
High Side
Location: MW7
pH (field), std
Data passed the W-test for normality
T Critical of all data: Tcr = 0.679
Test Statistic, high extreme of all data: Tn = 0.560
Test Statistic, low extreme of all data: T1 = 0.360
No Outliers
Sample Date
Value
LT_Value
Outlier
Low Side
Outlier
High Side
Location: MW8
pH (field), std
Data failed to pass the W-test as either a normal or a lognormally distributed data set
Data is neither normally or lognormally distributed.
T Critical of all data: Tcr = 0.000
Test Statistic, high extreme of all data: Tn = 0.000
Test Statistic, low extreme of all data: T1 = 0.000
No Outliers
Sample Date
Value
LT_Value
Outlier
Low Side
Outlier
High Side
Location: MW11R
Sulfate, total, mg/L
Data passed the W-test for normality
T Critical of all data: Tcr = 0.679
Test Statistic, high extreme of all data: Tn = 0.308
Test Statistic, low extreme of all data: T1 = 0.667
No Outliers
2
MANAGES
Based on Dixons one-sided outlier test
03/03/2008
3:52:06PM
Hutsonville Ash Impoundment
Date Range: 09/01/2002 to 03/31/2005
Confidence Level: 99%
LT Multiplier: x 1.0
User Supplied Information
Attachment C1
Dixons Outlier Analysis Results - Downgradient Wells
Number of Outliers: First 10% Outliers
Sample Date
Value
LT_Value
Outlier
Low Side
Outlier
High Side
Location: MW14
Sulfate, total, mg/L
Data passed the W-test for normality
T Critical of all data: Tcr = 0.679
Test Statistic, high extreme of all data: Tn = 0.200
Test Statistic, low extreme of all data: T1 = 0.545
No Outliers
Sample Date
Value
LT_Value
Outlier
Low Side
Outlier
High Side
Location: MW6
Sulfate, total, mg/L
Data passed the W-test for normality
T Critical of all data: Tcr = 0.679
Test Statistic, high extreme of all data: Tn = 0.333
Test Statistic, low extreme of all data: T1 = 0.556
No Outliers
Sample Date
Value
LT_Value
Outlier
Low Side
Outlier
High Side
Location: MW7
Sulfate, total, mg/L
Data passed the W-test for normality
T Critical of all data: Tcr = 0.679
Test Statistic, high extreme of all data: Tn = 0.111
Test Statistic, low extreme of all data: T1 = 0.400
No Outliers
3
MANAGES
Based on Dixons one-sided outlier test
03/03/2008
3:52:06PM
Hutsonville Ash Impoundment
Date Range: 09/01/2002 to 03/31/2005
Confidence Level: 99%
LT Multiplier: x 1.0
User Supplied Information
Attachment C1
Dixons Outlier Analysis Results - Downgradient Wells
Number of Outliers: First 10% Outliers
Sample Date
Value
LT_Value
Outlier
Low Side
Outlier
High Side
Location: MW8
Sulfate, total, mg/L
Data passed the W-test for normality
T Critical of all data: Tcr = 0.679
Test Statistic, high extreme of all data: Tn = 0.091
Test Statistic, low extreme of all data: T1 = 0.500
No Outliers
Sample Date
Value
LT_Value
Outlier
Low Side
Outlier
High Side
Location: MW11R
Boron, total, mg/L
Data passed the W-test for normality
T Critical of all data: Tcr = 0.679
Test Statistic, high extreme of all data: Tn = 0.269
Test Statistic, low extreme of all data: T1 = 0.045
No Outliers
Sample Date
Value
LT_Value
Outlier
Low Side
Outlier
High Side
Location: MW14
Boron, total, mg/L
Data passed the W-test for normality
T Critical of all data: Tcr = 0.679
Test Statistic, high extreme of all data: Tn = 0.364
Test Statistic, low extreme of all data: T1 = 0.314
No Outliers
4
MANAGES
Based on Dixons one-sided outlier test
03/03/2008
3:52:06PM
Hutsonville Ash Impoundment
Date Range: 09/01/2002 to 03/31/2005
Confidence Level: 99%
LT Multiplier: x 1.0
User Supplied Information
Attachment C1
Dixons Outlier Analysis Results - Downgradient Wells
Number of Outliers: First 10% Outliers
Sample Date
Value
LT_Value
Outlier
Low Side
Outlier
High Side
Location: MW6
Boron, total, mg/L
Data passed the W-test for normality
T Critical of all data: Tcr = 0.679
Test Statistic, high extreme of all data: Tn = 0.200
Test Statistic, low extreme of all data: T1 = 0.412
No Outliers
Sample Date
Value
LT_Value
Outlier
Low Side
Outlier
High Side
Location: MW7
Boron, total, mg/L
Data passed the W-test for normality
T Critical of all data: Tcr = 0.679
Test Statistic, high extreme of all data: Tn = 0.333
Test Statistic, low extreme of all data: T1 = 0.650
No Outliers
Sample Date
Value
LT_Value
Outlier
Low Side
Outlier
High Side
Location: MW8
Boron, total, mg/L
Data passed the W-test for normality
T Critical of all data: Tcr = 0.679
Test Statistic, high extreme of all data: Tn = 0.333
Test Statistic, low extreme of all data: T1 = 0.333
No Outliers
5
MANAGES
Based on Dixons one-sided outlier test
03/03/2008
3:52:06PM
Hutsonville Ash Impoundment
Date Range: 09/01/2002 to 03/31/2005
Confidence Level: 99%
LT Multiplier: x 1.0
User Supplied Information
Attachment C1
Dixons Outlier Analysis Results - Downgradient Wells
Number of Outliers: First 10% Outliers
Sample Date
Value
LT_Value
Outlier
Low Side
Outlier
High Side
Location: MW11R
Manganese, total, mg/L
Data passed the W-test for normality
T Critical of all data: Tcr = 0.679
Test Statistic, high extreme of all data: Tn = 0.805
Test Statistic, low extreme of all data: T1 = 0.083
09/19/2002
3.400
False
1
Sample Date
Value
LT_Value
Outlier
Low Side
Outlier
High Side
Location: MW14
Manganese, total, mg/L
Data passed the W-test for normality
T Critical of all data: Tcr = 0.679
Test Statistic, high extreme of all data: Tn = 0.154
Test Statistic, low extreme of all data: T1 = 0.375
No Outliers
Sample Date
Value
LT_Value
Outlier
Low Side
Outlier
High Side
Location: MW6
Manganese, total, mg/L
Data passed the W-test for normality
T Critical of all data: Tcr = 0.679
Test Statistic, high extreme of all data: Tn = 0.640
Test Statistic, low extreme of all data: T1 = 0.045
No Outliers
6
MANAGES
Based on Dixons one-sided outlier test
03/03/2008
3:52:06PM
Hutsonville Ash Impoundment
Date Range: 09/01/2002 to 03/31/2005
Confidence Level: 99%
LT Multiplier: x 1.0
User Supplied Information
Attachment C1
Dixons Outlier Analysis Results - Downgradient Wells
Number of Outliers: First 10% Outliers
Sample Date
Value
LT_Value
Outlier
Low Side
Outlier
High Side
Location: MW7
Manganese, total, mg/L
Data passed the W-test for normality
T Critical of all data: Tcr = 0.679
Test Statistic, high extreme of all data: Tn = 0.495
Test Statistic, low extreme of all data: T1 = 0.054
No Outliers
Sample Date
Value
LT_Value
Outlier
Low Side
Outlier
High Side
Location: MW8
Manganese, total, mg/L
Data passed the W-test for normality
T Critical of all data: Tcr = 0.679
Test Statistic, high extreme of all data: Tn = 0.423
Test Statistic, low extreme of all data: T1 = 0.360
No Outliers
Sample Date
Value
LT_Value
Outlier
Low Side
Outlier
High Side
Location: MW11R
Total Filterable Residue (TDS), mg/L
Data failed to pass the W-test as either a normal or a lognormally distributed data set
Data is neither normally or lognormally distributed.
T Critical of all data: Tcr = 0.000
Test Statistic, high extreme of all data: Tn = 0.000
Test Statistic, low extreme of all data: T1 = 0.000
No Outliers
7
MANAGES
Based on Dixons one-sided outlier test
03/03/2008
3:52:06PM
Hutsonville Ash Impoundment
Date Range: 09/01/2002 to 03/31/2005
Confidence Level: 99%
LT Multiplier: x 1.0
User Supplied Information
Attachment C1
Dixons Outlier Analysis Results - Downgradient Wells
Number of Outliers: First 10% Outliers
Sample Date
Value
LT_Value
Outlier
Low Side
Outlier
High Side
Location: MW14
Total Filterable Residue (TDS), mg/L
Data passed the W-test for normality
T Critical of all data: Tcr = 0.679
Test Statistic, high extreme of all data: Tn = 0.222
Test Statistic, low extreme of all data: T1 = 0.708
03/18/2003
570.000
False
-1
Sample Date
Value
LT_Value
Outlier
Low Side
Outlier
High Side
Location: MW6
Total Filterable Residue (TDS), mg/L
Data passed the W-test for normality
T Critical of all data: Tcr = 0.679
Test Statistic, high extreme of all data: Tn = 0.048
Test Statistic, low extreme of all data: T1 = 0.500
No Outliers
Sample Date
Value
LT_Value
Outlier
Low Side
Outlier
High Side
Location: MW7
Total Filterable Residue (TDS), mg/L
Data passed the W-test for normality
T Critical of all data: Tcr = 0.679
Test Statistic, high extreme of all data: Tn = 0.185
Test Statistic, low extreme of all data: T1 = 0.475
No Outliers
8
MANAGES
Based on Dixons one-sided outlier test
03/03/2008
3:52:06PM
Hutsonville Ash Impoundment
Date Range: 09/01/2002 to 03/31/2005
Confidence Level: 99%
LT Multiplier: x 1.0
User Supplied Information
Attachment C1
Dixons Outlier Analysis Results - Downgradient Wells
Number of Outliers: First 10% Outliers
Sample Date
Value
LT_Value
Outlier
Low Side
Outlier
High Side
Location: MW8
Total Filterable Residue (TDS), mg/L
Data passed the W-test for normality
T Critical of all data: Tcr = 0.679
Test Statistic, high extreme of all data: Tn = 0.000
Test Statistic, low extreme of all data: T1 = 0.500
No Outliers
9
MANAGES
Based on Dixons one-sided outlier test
March 3, 2008
3:57:52 PM
Hutsonville Ash Impoundment
User Supplied Information
Background Date Range:
09/01/2002 to 03/31/2005
Compliance Date Range:
01/01/2008 to 01/01/2008
Compliance Locations:
MW11R,MW14,MW6,MW7,MW8
Background Locations:
MW11R,MW14,MW6,MW7,MW8
Non-Parametric Tolerance Interval on Background
Compliance Analysis
COMPLIANCE
Parameter Name:
Parameter Code:
Units:
00400
pH (field)
std
Two-Sided Interval
Confidence Level, %
One-Sided
TU (Upper) Value
TL (Lower) Value
Confidence Level, %
40.13
8.61
7.200
6.000
Background Sample Count:
10
Location
Sample
Sample
Greater than Lower than
Type
Class
Date
Result
TU (Upper)
TL (Lower)
Tolerance Coverage Gamma:
95%
Option for LT Pts.:
MDL * 1.0
MW11R
Upper Zone
Downgradient
01/01/2008
7.000
N
N
Parameter Name:
Parameter Code:
Units:
00945
Sulfate, Tot
mg/L
One-Sided
TU (Upper) Value
Confidence Level, %
43.12
720.000
Background Sample Count:
11
Location
Sample
Sample
Greater than
Type
Class
Date
Result
TU (Upper)
Tolerance Coverage Gamma:
95%
Option for LT Pts.:
MDL * 1.0
MW11R
Upper Zone
Downgradient
01/01/2008
0.000
N
Parameter Name:
Parameter Code:
Units:
70300
TDS
mg/L
One-Sided
TU (Upper) Value
Confidence Level, %
43.12
1,300.000
Background Sample Count:
11
Location
Sample
Sample
Greater than
Type
Class
Date
Result
TU (Upper)
Tolerance Coverage Gamma:
95%
Option for LT Pts.:
MDL * 1.0
MW11R
Upper Zone
Downgradient
01/01/2008
0.000
N
MANAGES
1
March 3, 2008
3:57:52 PM
Hutsonville Ash Impoundment
User Supplied Information
Background Date Range:
09/01/2002 to 03/31/2005
Compliance Date Range:
01/01/2008 to 01/01/2008
Compliance Locations:
MW11R,MW14,MW6,MW7,MW8
Background Locations:
MW11R,MW14,MW6,MW7,MW8
Non-Parametric Tolerance Interval on Background
Compliance Analysis
COMPLIANCE
Parameter Name:
Parameter Code:
Units:
00400
pH (field)
std
Two-Sided Interval
Confidence Level, %
One-Sided
TU (Upper) Value
TL (Lower) Value
Confidence Level, %
43.12
10.19
7.345
6.800
Background Sample Count:
11
Location
Sample
Sample
Greater than Lower than
Type
Class
Date
Result
TU (Upper)
TL (Lower)
Tolerance Coverage Gamma:
95%
Option for LT Pts.:
MDL * 1.0
MW14
Alluvial Aq.
Downgradient
01/01/2008
7.000
N
N
Parameter Name:
Parameter Code:
Units:
70300
TDS
mg/L
One-Sided
TU (Upper) Value
Confidence Level, %
43.12
830.000
Background Sample Count:
11
Location
Sample
Sample
Greater than
Type
Class
Date
Result
TU (Upper)
Tolerance Coverage Gamma:
95%
Option for LT Pts.:
MDL * 1.0
MW14
Alluvial Aq.
Downgradient
01/01/2008
0.000
N
Parameter Name:
Parameter Code:
Units:
01055
Manganese, Tot
mg/L
One-Sided
TU (Upper) Value
Confidence Level, %
43.12
3.600
Background Sample Count:
11
Location
Sample
Sample
Greater than
Type
Class
Date
Result
TU (Upper)
Tolerance Coverage Gamma:
95%
Option for LT Pts.:
MDL * 1.0
MW6
Upper Zone
Downgradient
01/01/2008
0.000
N
MANAGES
2
March 3, 2008
3:57:52 PM
Hutsonville Ash Impoundment
User Supplied Information
Background Date Range:
09/01/2002 to 03/31/2005
Compliance Date Range:
01/01/2008 to 01/01/2008
Compliance Locations:
MW11R,MW14,MW6,MW7,MW8
Background Locations:
MW11R,MW14,MW6,MW7,MW8
Non-Parametric Tolerance Interval on Background
Compliance Analysis
COMPLIANCE
Parameter Name:
Parameter Code:
Units:
01022
Boron, Tot
mg/L
One-Sided
TU (Upper) Value
Confidence Level, %
43.12
2.600
Background Sample Count:
11
Location
Sample
Sample
Greater than
Type
Class
Date
Result
TU (Upper)
Tolerance Coverage Gamma:
95%
Option for LT Pts.:
MDL * 1.0
MW7
Upper Zone
Downgradient
01/01/2008
0.000
N
Parameter Name:
Parameter Code:
Units:
00400
pH (field)
std
Two-Sided Interval
Confidence Level, %
One-Sided
TU (Upper) Value
TL (Lower) Value
Confidence Level, %
43.12
10.19
7.440
6.900
Background Sample Count:
11
Location
Sample
Sample
Greater than Lower than
Type
Class
Date
Result
TU (Upper)
TL (Lower)
Tolerance Coverage Gamma:
95%
Option for LT Pts.:
MDL * 1.0
MW8
Upper Zone
Downgradient
01/01/2008
7.000
N
N
Parameter Name:
Parameter Code:
Units:
70300
TDS
mg/L
One-Sided
TU (Upper) Value
Confidence Level, %
43.12
1,800.000
Background Sample Count:
11
Location
Sample
Sample
Greater than
Type
Class
Date
Result
TU (Upper)
Tolerance Coverage Gamma:
95%
Option for LT Pts.:
MDL * 1.0
MW8
Upper Zone
Downgradient
01/01/2008
0.000
N
MANAGES
3
March 3, 2008
Hutsonville Ash Impoundment
Appendix C2: Tolerance Interval Calculation
Compliance Date Range: 01/01/2008 to 01/01/2008
0.01
0
95%
Intrawell
Background Locations:
MW11R,MW14,MW6,MW7,MW8
Background Date Range: 09/01/2002 to 03/31/2005
3:57:52 PM
Comparison Method if all Background Results are Non-Detect:
STmdl = Last MDL
Statistical Test for Parametric Background Data Distributions:
STpar = Parametric Tolerance Interval on Background
Statistical Test for Cases with High Percentage of Non-Detect Background Data:
Statistical Test for Cases with High Percentage of Non-Detect Background Data:
STnon = Non-Parametric Tolerance Interval on background
STlow1 = Non-Parametric Tolerance Interval on background (ND Frequency > 50%)
Background Comparison:
Number of Verification Samples:
Default Type 1 Individual Comparison Error Level
(False Positive Rate) for tests other than Prediction Interval
Non-Detect Processing (Parametric Tests):
Tolerance Interval Coverage:
Compliance Locations:
MW11R,MW14,MW6,MW7,MW8
Non-Detect Processing (All Other):
<=15% using 1/2 PQL (MDL * 10/3)
>15% using Cohen's Adj.
<=50% using MDL * 1.0
>50% using MDL * 1.0
Statistical Test for Non-Parametric Background Data Distributions:
STlow2 = Non-Parametric Tolerance Interval on background (ND Frequency > 50%)
Compliance
Normal /
Percent
of Non
detects
Count
Of Bkg
Results
Confidence
Location
Parameter
Sample Date
Lognormal
Test
Level
Upper Limit
Lower Limit
Analysis Result Exceedance Trend
01/01/2008
MW11R
Boron, Tot, mg/L
11
0.00
Yes/Yes
STpar
99.00
11.582
0.000
No
01/01/2008
MW11R
Manganese, Tot,
11
0.00
No/Yes
STpar
0.000
No
mg/L
99.00
9.499
01/01/2008
MW11R
pH (field), std
10
0.00
No/No
STnon
40.13
7.200
6.000
7.000
No
01/01/2008
MW11R
Sulfate, Tot, mg/L
11
0.00
No/No
STnon
43.12
720.000
0.000
No
01/01/2008
MW11R
TDS, mg/L
11
0.00
No/No
STnon
43.12
1,300.000
0.000
No
MANAGES
2
Compliance
Normal /
Percent
of Non
detects
Count
Of Bkg
Results
Confidence
Location
Parameter
Sample Date
Lognormal
Test
Level
Upper Limit
Lower Limit
Analysis Result Exceedance Trend
01/01/2008
MW14
Boron, Tot, mg/L
11
0.00
Yes/Yes
STpar
99.00
2.285
0.000
No
01/01/2008
MW14
Manganese, Tot,
11
0.00
Yes/Yes
STpar
0.000
No
mg/L
99.00
0.668
01/01/2008
MW14
pH (field), std
11
0.00
No/No
STnon
43.12
7.345
6.800
7.000
No
01/01/2008
MW14
Sulfate, Tot, mg/L
11
0.00
Yes/No
STpar
99.00
305.104
0.000
No
01/01/2008
MW14
TDS, mg/L
11
0.00
No/No
STnon
43.12
830.000
0.000
No
MANAGES
3
Compliance
Normal /
Percent
of Non
detects
Count
Of Bkg
Results
Confidence
Location
Parameter
Sample Date
Lognormal
Test
Level
Upper Limit
Lower Limit
Analysis Result Exceedance Trend
01/01/2008
MW6
Boron, Tot, mg/L
11
0.00
Yes/Yes
STpar
99.00
21.457
0.000
No
01/01/2008
MW6
Manganese, Tot,
11
0.00
No/No
STnon
0.000
No
mg/L
43.12
3.600
01/01/2008
MW6
pH (field), std
10
0.00
Yes/Yes
STpar
99.00
7.870
6.072
7.000
No
01/01/2008
MW6
Sulfate, Tot, mg/L
11
0.00
Yes/Yes
STpar
99.00
575.634
0.000
No
01/01/2008
MW6
TDS, mg/L
11
0.00
Yes/Yes
STpar
99.00
1,127.593
0.000
No
MANAGES
4
Compliance
Normal /
Percent
of Non
detects
Count
Of Bkg
Results
Confidence
Location
Parameter
Sample Date
Lognormal
Test
Level
Upper Limit
Lower Limit
Analysis Result Exceedance Trend
01/01/2008
MW7
Boron, Tot, mg/L
11
0.00
No/No
STnon
43.12
2.600
0.000
No
01/01/2008
MW7
Manganese, Tot,
11
0.00
No/Yes
STpar
0.000
No
mg/L
99.00
1.749
01/01/2008
MW7
pH (field), std
11
0.00
Yes/Yes
STpar
99.00
7.528
6.394
7.000
No
01/01/2008
MW7
Sulfate, Tot, mg/L
11
0.00
Yes/Yes
STpar
99.00
415.575
0.000
No
01/01/2008
MW7
TDS, mg/L
11
0.00
Yes/Yes
STpar
99.00
1,262.269
0.000
No
MANAGES
5
Compliance
Normal /
Percent
of Non
detects
Count
Of Bkg
Results
Confidence
Location
Parameter
Sample Date
Lognormal
Test
Level
Upper Limit
Lower Limit
Analysis Result Exceedance Trend
01/01/2008
MW8
Boron, Tot, mg/L
11
0.00
Yes/Yes
STpar
99.00
16.215
0.000
No
01/01/2008
MW8
Manganese, Tot,
11
0.00
Yes/Yes
STpar
0.000
No
mg/L
99.00
6.136
01/01/2008
MW8
pH (field), std
11
0.00
No/No
STnon
43.12
7.440
6.900
7.000
No
01/01/2008
MW8
Sulfate, Tot, mg/L
11
0.00
Yes/Yes
STpar
99.00
1,240.719
0.000
No
01/01/2008
MW8
TDS, mg/L
11
0.00
No/No
STnon
43.12
1,800.000
0.000
No
MANAGES
6
March 3, 2008
3:57:52 PM
Hutsonville Ash Impoundment
User Supplied Information
Background Date Range:
09/01/2002 to 03/31/2005
Compliance Date Range:
01/01/2008 to 01/01/2008
Tolerance Coverage (Gamma):
Compliance Locations:
MW11R,MW14,MW6,MW7,MW8
Normal Tolerance Interval on Background
Compliance Analysis
95%
Background Locations:
MW11R,MW14,MW6,MW7,MW8
COMPLIANCE
Location
Type
Class
MW11R
Upper Zone
Downgradient
Parameter Name:
Parameter Code:
Units:
01022
Boron, Tot
Sample
Sample
Greater than
Date
Result
TL (Upper)
Data Transformation:
None
Confidence Level:
0.99%
mg/L
TL (Upper) Value
11.6
Option for LT Pts.:
1/2 PQL (MDL *
10/3)
1/1/2008
0.000
N
Parameter Name:
Parameter Code:
Units:
01055
Manganese, Tot
Sample
Sample
Greater than
Date
Result
TL (Upper)
Data Transformation:
Natural Log
Confidence Level:
0.99%
mg/L
TL (Upper) Value
9.5
Option for LT Pts.:
1/2 PQL (MDL *
10/3)
1/1/2008
0.000
N
Location
Type
Class
MW14
Alluvial Aq.
Downgradient
Parameter Name:
Parameter Code:
Units:
00945
Sulfate, Tot
Sample
Sample
Greater than
Date
Result
TL (Upper)
Data Transformation:
None
Confidence Level:
0.99%
mg/L
TL (Upper) Value
305.1
Option for LT Pts.:
1/2 PQL (MDL *
10/3)
1/1/2008
0.000
N
Note: Confidence Level is sometimes referred to as Tolerance Coefficient.
When "Greater than TL (Upper)" is Y, this indicates statistical evidence of exceedance of the upper tolerance limit.
MANAGES
1
Lower Limit only listed for two sided test.
March 3, 2008
3:57:52 PM
Hutsonville Ash Impoundment
User Supplied Information
Background Date Range:
09/01/2002 to 03/31/2005
Compliance Date Range:
01/01/2008 to 01/01/2008
Tolerance Coverage (Gamma):
Compliance Locations:
MW11R,MW14,MW6,MW7,MW8
Normal Tolerance Interval on Background
Compliance Analysis
95%
Background Locations:
MW11R,MW14,MW6,MW7,MW8
COMPLIANCE
Parameter Name:
Parameter Code:
Units:
01022
Boron, Tot
Sample
Sample
Greater than
Date
Result
TL (Upper)
Data Transformation:
None
Confidence Level:
0.99%
mg/L
TL (Upper) Value
2.3
Option for LT Pts.:
1/2 PQL (MDL *
10/3)
1/1/2008
0.000
N
Parameter Name:
Parameter Code:
Units:
01055
Manganese, Tot
Sample
Sample
Greater than
Date
Result
TL (Upper)
Data Transformation:
None
Confidence Level:
0.99%
mg/L
TL (Upper) Value
0.7
Option for LT Pts.:
1/2 PQL (MDL *
10/3)
1/1/2008
0.000
N
Location
Type
Class
MW6
Upper Zone
Downgradient
Parameter Name:
Parameter Code:
Units:
00400
pH (field)
Sample
Sample
Greater than
Lower than
Date
Result
TL (Upper)
TL (Lower)
Data Transformation:
None
Confidence Level:
0.99%
std
TL (Upper) Value
TL (Lower) Value
7.9
6.1
Option for LT Pts.:
1/2 PQL (MDL *
10/3)
1/1/2008
7.000
N
N
Note: Confidence Level is sometimes referred to as Tolerance Coefficient.
When "Greater than TL (Upper)" is Y, this indicates statistical evidence of exceedance of the upper tolerance limit.
MANAGES
2
Lower Limit only listed for two sided test.
March 3, 2008
3:57:52 PM
Hutsonville Ash Impoundment
User Supplied Information
Background Date Range:
09/01/2002 to 03/31/2005
Compliance Date Range:
01/01/2008 to 01/01/2008
Tolerance Coverage (Gamma):
Compliance Locations:
MW11R,MW14,MW6,MW7,MW8
Normal Tolerance Interval on Background
Compliance Analysis
95%
Background Locations:
MW11R,MW14,MW6,MW7,MW8
COMPLIANCE
Parameter Name:
Parameter Code:
Units:
00945
Sulfate, Tot
Sample
Sample
Greater than
Date
Result
TL (Upper)
Data Transformation:
None
Confidence Level:
0.99%
mg/L
TL (Upper) Value
575.6
Option for LT Pts.:
1/2 PQL (MDL *
10/3)
1/1/2008
0.000
N
Parameter Name:
Parameter Code:
Units:
01022
Boron, Tot
Sample
Sample
Greater than
Date
Result
TL (Upper)
Data Transformation:
None
Confidence Level:
0.99%
mg/L
TL (Upper) Value
21.5
Option for LT Pts.:
1/2 PQL (MDL *
10/3)
1/1/2008
0.000
N
Parameter Name:
Parameter Code:
Units:
70300
TDS
Sample
Sample
Greater than
Date
Result
TL (Upper)
Data Transformation:
None
Confidence Level:
0.99%
mg/L
TL (Upper) Value
1,127.6
Option for LT Pts.:
1/2 PQL (MDL *
10/3)
1/1/2008
0.000
N
Location
Type
Class
MW7
Upper Zone
Downgradient
Note: Confidence Level is sometimes referred to as Tolerance Coefficient.
When "Greater than TL (Upper)" is Y, this indicates statistical evidence of exceedance of the upper tolerance limit.
MANAGES
3
Lower Limit only listed for two sided test.
March 3, 2008
3:57:52 PM
Hutsonville Ash Impoundment
User Supplied Information
Background Date Range:
09/01/2002 to 03/31/2005
Compliance Date Range:
01/01/2008 to 01/01/2008
Tolerance Coverage (Gamma):
Compliance Locations:
MW11R,MW14,MW6,MW7,MW8
Normal Tolerance Interval on Background
Compliance Analysis
95%
Background Locations:
MW11R,MW14,MW6,MW7,MW8
COMPLIANCE
Parameter Name:
Parameter Code:
Units:
00400
pH (field)
Sample
Sample
Greater than
Lower than
Date
Result
TL (Upper)
TL (Lower)
Data Transformation:
None
Confidence Level:
0.99%
std
TL (Upper) Value
TL (Lower) Value
7.5
6.4
Option for LT Pts.:
1/2 PQL (MDL *
10/3)
1/1/2008
7.000
N
N
Parameter Name:
Parameter Code:
Units:
00945
Sulfate, Tot
Sample
Sample
Greater than
Date
Result
TL (Upper)
Data Transformation:
None
Confidence Level:
0.99%
mg/L
TL (Upper) Value
415.6
Option for LT Pts.:
1/2 PQL (MDL *
10/3)
1/1/2008
0.000
N
Parameter Name:
Parameter Code:
Units:
01055
Manganese, Tot
Sample
Sample
Greater than
Date
Result
TL (Upper)
Data Transformation:
Natural Log
Confidence Level:
0.99%
mg/L
TL (Upper) Value
1.7
Option for LT Pts.:
1/2 PQL (MDL *
10/3)
1/1/2008
0.000
N
Note: Confidence Level is sometimes referred to as Tolerance Coefficient.
When "Greater than TL (Upper)" is Y, this indicates statistical evidence of exceedance of the upper tolerance limit.
MANAGES
4
Lower Limit only listed for two sided test.
March 3, 2008
3:57:52 PM
Hutsonville Ash Impoundment
User Supplied Information
Background Date Range:
09/01/2002 to 03/31/2005
Compliance Date Range:
01/01/2008 to 01/01/2008
Tolerance Coverage (Gamma):
Compliance Locations:
MW11R,MW14,MW6,MW7,MW8
Normal Tolerance Interval on Background
Compliance Analysis
95%
Background Locations:
MW11R,MW14,MW6,MW7,MW8
COMPLIANCE
Parameter Name:
Parameter Code:
Units:
70300
TDS
Sample
Sample
Greater than
Date
Result
TL (Upper)
Data Transformation:
None
Confidence Level:
0.99%
mg/L
TL (Upper) Value
1,262.3
Option for LT Pts.:
1/2 PQL (MDL *
10/3)
1/1/2008
0.000
N
Location
Type
Class
MW8
Upper Zone
Downgradient
Parameter Name:
Parameter Code:
Units:
00945
Sulfate, Tot
Sample
Sample
Greater than
Date
Result
TL (Upper)
Data Transformation:
None
Confidence Level:
0.99%
mg/L
TL (Upper) Value
1,240.7
Option for LT Pts.:
1/2 PQL (MDL *
10/3)
1/1/2008
0.000
N
Parameter Name:
Parameter Code:
Units:
01022
Boron, Tot
Sample
Sample
Greater than
Date
Result
TL (Upper)
Data Transformation:
None
Confidence Level:
0.99%
mg/L
TL (Upper) Value
16.2
Option for LT Pts.:
1/2 PQL (MDL *
10/3)
1/1/2008
0.000
N
Note: Confidence Level is sometimes referred to as Tolerance Coefficient.
When "Greater than TL (Upper)" is Y, this indicates statistical evidence of exceedance of the upper tolerance limit.
MANAGES
5
Lower Limit only listed for two sided test.
March 3, 2008
3:57:52 PM
Hutsonville Ash Impoundment
User Supplied Information
Background Date Range:
09/01/2002 to 03/31/2005
Compliance Date Range:
01/01/2008 to 01/01/2008
Tolerance Coverage (Gamma):
Compliance Locations:
MW11R,MW14,MW6,MW7,MW8
Normal Tolerance Interval on Background
Compliance Analysis
95%
Background Locations:
MW11R,MW14,MW6,MW7,MW8
COMPLIANCE
Parameter Name:
Parameter Code:
Units:
01055
Manganese, Tot
Sample
Sample
Greater than
Date
Result
TL (Upper)
Data Transformation:
None
Confidence Level:
0.99%
mg/L
TL (Upper) Value
6.1
Option for LT Pts.:
1/2 PQL (MDL *
10/3)
1/1/2008
0.000
N
Note: Confidence Level is sometimes referred to as Tolerance Coefficient.
When "Greater than TL (Upper)" is Y, this indicates statistical evidence of exceedance of the upper tolerance limit.
MANAGES
6
Lower Limit only listed for two sided test.
March 3, 2008
3:57:51 PM
Hutsonville Ash Impoundment
Background Date Range:
09/01/2002 to 03/31/2005
Compliance Date Range:
01/01/2008 to 01/01/2008
Tolerance Coverage (Gamma):
Compliance Locations:
MW11R,MW14,MW6,MW7,MW8
Normal Tolerance Interval on Background
Background Data Pool
95%
Background Locations:
MW11R,MW14,MW6,MW7,MW8
BACKGROUND
Location
Type
MW11R
Upper Zone
Parameter Code:
Parameter Name:
Units:
Pooled Results:
Normal
Mean
StdDev
K Value
TU (Upper)
Yes
5.109
1.817
01022
Boron, Tot
mg/L
3.563
11.582
Data Transformation:
None
Confidence Level:
0.99%
Total Pts LT Pts % LT Pts
11
0
0
Option for LT Pts.:
1/2 PQL (MDL * 10/3)
Parameter Code:
Parameter Name:
Units:
Pooled Results:
Normal
Mean
StdDev
K Value
TU (Upper)
Yes
0.850
0.896
01055
Manganese, Tot
mg/L
3.563
9.499
Data Transformation:
Natural Log
Confidence Level:
0.99%
Total Pts LT Pts % LT Pts
11
0
0
Option for LT Pts.:
1/2 PQL (MDL * 10/3)
Note: Confidence Level is sometimes referred to as Tolerance Coefficient.
MANAGES
1
March 3, 2008
3:57:51 PM
Hutsonville Ash Impoundment
Background Date Range:
09/01/2002 to 03/31/2005
Compliance Date Range:
01/01/2008 to 01/01/2008
Tolerance Coverage (Gamma):
Compliance Locations:
MW11R,MW14,MW6,MW7,MW8
Normal Tolerance Interval on Background
Background Data Pool
95%
Background Locations:
MW11R,MW14,MW6,MW7,MW8
BACKGROUND
Location
Type
MW14
Alluvial Aq.
Parameter Code:
Parameter Name:
Units:
Pooled Results:
Normal
Mean
StdDev
K Value
TU (Upper)
Yes
195.455
30.778
00945
Sulfate, Tot
mg/L
3.563
305.104
Data Transformation:
None
Confidence Level:
0.99%
Total Pts LT Pts % LT Pts
11
0
0
Option for LT Pts.:
1/2 PQL (MDL * 10/3)
Parameter Code:
Parameter Name:
Units:
Pooled Results:
Normal
Mean
StdDev
K Value
TU (Upper)
Yes
0.855
0.402
01022
Boron, Tot
mg/L
3.563
2.285
Data Transformation:
None
Confidence Level:
0.99%
Total Pts LT Pts % LT Pts
11
0
0
Option for LT Pts.:
1/2 PQL (MDL * 10/3)
Parameter Code:
Parameter Name:
Units:
Pooled Results:
Normal
Mean
StdDev
K Value
TU (Upper)
Yes
0.462
0.058
01055
Manganese, Tot
mg/L
3.563
0.668
Data Transformation:
None
Confidence Level:
0.99%
Total Pts LT Pts % LT Pts
11
0
0
Option for LT Pts.:
1/2 PQL (MDL * 10/3)
Note: Confidence Level is sometimes referred to as Tolerance Coefficient.
MANAGES
2
March 3, 2008
3:57:51 PM
Hutsonville Ash Impoundment
Background Date Range:
09/01/2002 to 03/31/2005
Compliance Date Range:
01/01/2008 to 01/01/2008
Tolerance Coverage (Gamma):
Compliance Locations:
MW11R,MW14,MW6,MW7,MW8
Normal Tolerance Interval on Background
Background Data Pool
95%
Background Locations:
MW11R,MW14,MW6,MW7,MW8
BACKGROUND
Location
Type
MW6
Upper Zone
Parameter Code:
Parameter Name:
Units:
Pooled Results:
Normal
Mean
StdDev
K Value
TL (Lower)
TU (Upper)
Yes
6.971
0.211
00400
pH (field)
std
4.267
6.072
7.870
Data Transformation:
None
Confidence Level:
0.99%
Total Pts LT Pts % LT Pts
10
0
0
Option for LT Pts.:
1/2 PQL (MDL * 10/3)
Parameter Code:
Parameter Name:
Units:
Pooled Results:
Normal
Mean
StdDev
K Value
TU (Upper)
Yes
329.091
69.203
00945
Sulfate, Tot
mg/L
3.563
575.634
Data Transformation:
None
Confidence Level:
0.99%
Total Pts LT Pts % LT Pts
11
0
0
Option for LT Pts.:
1/2 PQL (MDL * 10/3)
Parameter Code:
Parameter Name:
Units:
Pooled Results:
Normal
Mean
StdDev
K Value
TU (Upper)
Yes
13.109
2.343
01022
Boron, Tot
mg/L
3.563
21.457
Data Transformation:
None
Confidence Level:
0.99%
Total Pts LT Pts % LT Pts
11
0
0
Option for LT Pts.:
1/2 PQL (MDL * 10/3)
Note: Confidence Level is sometimes referred to as Tolerance Coefficient.
MANAGES
3
March 3, 2008
3:57:51 PM
Hutsonville Ash Impoundment
Background Date Range:
09/01/2002 to 03/31/2005
Compliance Date Range:
01/01/2008 to 01/01/2008
Tolerance Coverage (Gamma):
Compliance Locations:
MW11R,MW14,MW6,MW7,MW8
Normal Tolerance Interval on Background
Background Data Pool
95%
Background Locations:
MW11R,MW14,MW6,MW7,MW8
BACKGROUND
Parameter Code:
Parameter Name:
Units:
Pooled Results:
Normal
Mean
StdDev
K Value
TU (Upper)
Yes
811.818
88.636
70300
TDS
mg/L
3.563
1,127.593
Data Transformation:
None
Confidence Level:
0.99%
Total Pts LT Pts % LT Pts
11
0
0
Option for LT Pts.:
1/2 PQL (MDL * 10/3)
Note: Confidence Level is sometimes referred to as Tolerance Coefficient.
MANAGES
4
March 3, 2008
3:57:51 PM
Hutsonville Ash Impoundment
Background Date Range:
09/01/2002 to 03/31/2005
Compliance Date Range:
01/01/2008 to 01/01/2008
Tolerance Coverage (Gamma):
Compliance Locations:
MW11R,MW14,MW6,MW7,MW8
Normal Tolerance Interval on Background
Background Data Pool
95%
Background Locations:
MW11R,MW14,MW6,MW7,MW8
BACKGROUND
Location
Type
MW7
Upper Zone
Parameter Code:
Parameter Name:
Units:
Pooled Results:
Normal
Mean
StdDev
K Value
TL (Lower)
TU (Upper)
Yes
6.961
0.140
00400
pH (field)
std
4.046
6.394
7.528
Data Transformation:
None
Confidence Level:
0.99%
Total Pts LT Pts % LT Pts
11
0
0
Option for LT Pts.:
1/2 PQL (MDL * 10/3)
Parameter Code:
Parameter Name:
Units:
Pooled Results:
Normal
Mean
StdDev
K Value
TU (Upper)
Yes
250.000
46.476
00945
Sulfate, Tot
mg/L
3.563
415.575
Data Transformation:
None
Confidence Level:
0.99%
Total Pts LT Pts % LT Pts
11
0
0
Option for LT Pts.:
1/2 PQL (MDL * 10/3)
Parameter Code:
Parameter Name:
Units:
Pooled Results:
Normal
Mean
StdDev
K Value
TU (Upper)
Yes
0.074
0.070
01055
Manganese, Tot
mg/L
3.563
1.749
Data Transformation:
Natural Log
Confidence Level:
0.99%
Total Pts LT Pts % LT Pts
11
0
0
Option for LT Pts.:
1/2 PQL (MDL * 10/3)
Note: Confidence Level is sometimes referred to as Tolerance Coefficient.
MANAGES
5
March 3, 2008
3:57:51 PM
Hutsonville Ash Impoundment
Background Date Range:
09/01/2002 to 03/31/2005
Compliance Date Range:
01/01/2008 to 01/01/2008
Tolerance Coverage (Gamma):
Compliance Locations:
MW11R,MW14,MW6,MW7,MW8
Normal Tolerance Interval on Background
Background Data Pool
95%
Background Locations:
MW11R,MW14,MW6,MW7,MW8
BACKGROUND
Parameter Code:
Parameter Name:
Units:
Pooled Results:
Normal
Mean
StdDev
K Value
TU (Upper)
Yes
822.727
123.377
70300
TDS
mg/L
3.563
1,262.269
Data Transformation:
None
Confidence Level:
0.99%
Total Pts LT Pts % LT Pts
11
0
0
Option for LT Pts.:
1/2 PQL (MDL * 10/3)
Note: Confidence Level is sometimes referred to as Tolerance Coefficient.
MANAGES
6
March 3, 2008
3:57:51 PM
Hutsonville Ash Impoundment
Background Date Range:
09/01/2002 to 03/31/2005
Compliance Date Range:
01/01/2008 to 01/01/2008
Tolerance Coverage (Gamma):
Compliance Locations:
MW11R,MW14,MW6,MW7,MW8
Normal Tolerance Interval on Background
Background Data Pool
95%
Background Locations:
MW11R,MW14,MW6,MW7,MW8
BACKGROUND
Location
Type
MW8
Upper Zone
Parameter Code:
Parameter Name:
Units:
Pooled Results:
Normal
Mean
StdDev
K Value
TU (Upper)
Yes
851.818
109.162
00945
Sulfate, Tot
mg/L
3.563
1,240.719
Data Transformation:
None
Confidence Level:
0.99%
Total Pts LT Pts % LT Pts
11
0
0
Option for LT Pts.:
1/2 PQL (MDL * 10/3)
Parameter Code:
Parameter Name:
Units:
Pooled Results:
Normal
Mean
StdDev
K Value
TU (Upper)
Yes
12.000
1.183
01022
Boron, Tot
mg/L
3.563
16.215
Data Transformation:
None
Confidence Level:
0.99%
Total Pts LT Pts % LT Pts
11
0
0
Option for LT Pts.:
1/2 PQL (MDL * 10/3)
Parameter Code:
Parameter Name:
Units:
Pooled Results:
Normal
Mean
StdDev
K Value
TU (Upper)
Yes
2.736
0.954
01055
Manganese, Tot
mg/L
3.563
6.136
Data Transformation:
None
Confidence Level:
0.99%
Total Pts LT Pts % LT Pts
11
0
0
Option for LT Pts.:
1/2 PQL (MDL * 10/3)
Note: Confidence Level is sometimes referred to as Tolerance Coefficient.
MANAGES
7
March 3, 2008
3:57:51 PM
Hutsonville Ash Impoundment
Background Date Range:
09/01/2002 to 03/31/2005
Compliance Date Range:
01/01/2008 to 01/01/2008
Tolerance Coverage (Gamma):
Compliance Locations:
MW11R,MW14,MW6,MW7,MW8
Normal Tolerance Interval on Background
Background Data Pool
95%
Background Locations:
MW11R,MW14,MW6,MW7,MW8
BACKGROUND
Note: Confidence Level is sometimes referred to as Tolerance Coefficient.
MANAGES
8
March 3, 2008
4:11:17 PM
Date Range: 09/01/2002 to 03/31/2005
Appendix D: Data Used in Statistical Calculations
Hutsonville Ash Impoundment
B, tot, mg/L
Mn, tot, mg/L
pH (field), std
SO4, tot, mg/L
TDS, mg/L
MW1
09/17/2002
02092695-1
0.150
0.042
7.530
68.000
440.000
12/11/2002
02122282-1
0.180
0.270
7.090
39.000
370.000
02/05/2003
03021653-1
0.140
0.053
7.210
87.000
340.000
05/05/2003
03051599-1
0.140
0.014
7.470
37.000
200.000
07/07/2003
03071766-1
0.092
0.240
7.318
20.000
330.000
10/06/2003
03101729-1
0.093
0.070
7.200
17.000
320.000
03/02/2004
04031476-1
0.110
0.032
7.400
32.000
240.000
04/04/2004
04041354-1
0.120
0.044
7.500
35.000
210.000
08/02/2004
04081328-1
0.099
0.170
7.200
15.000
330.000
10/04/2004
04101561-1
0.140
0.047
7.300
18.000
340.000
03/14/2005
05032818-1
0.130
0.300
7.260
26.000
180.000
MW10
09/17/2002
02092695-7
0.098
0.100
7.110
31.000
380.000
12/19/2002
02123013-5
0.200
0.004
7.060
38.000
330.000
02/05/2003
03021653-8
0.079
0.001
7.210
38.000
310.000
05/05/2003
03051599-6
0.076
0.002
7.200
38.000
270.000
07/07/2003
03071766-7
0.092
0.022
7.200
44.000
340.000
10/13/2003
03102279-5
0.120
0.019
7.000
36.000
450.000
03/02/2004
04031476-6
0.064
0.008
7.100
31.000
410.000
04/04/2004
04041382-3
0.086
0.029
7.100
29.000
390.000
08/03/2004
04081328-10
0.130
0.045
7.000
29.000
450.000
10/04/2004
04101561-10
0.160
0.040
7.100
31.000
470.000
03/14/2005
05032818-9
0.150
0.008
7.100
33.000
400.000
MW11R
09/19/2002
02092792-4
6.600
3.400
7.150
390.000
850.000
12/13/2002
02122525-3
7.000
0.880
7.090
690.000
1,300.000
03/18/2003
03032481-4
5.600
0.380
7.000
590.000
1,100.000
05/12/2003
03052186-4
5.800
0.590
7.200
590.000
1,100.000
08/04/2003
03081508-8
2.600
0.520
7.200
650.000
1,200.000
10/13/2003
03102279-6
2.800
0.700
6.700
650.000
1,200.000
02/23/2004
04022960-4
2.800
1.200
6.000
720.000
1,200.000
04/04/2004
04041354-8
4.900
0.270
6.800
650.000
1,300.000
07/12/2004
04072337-9
5.800
0.320
670.000
1,300.000
11/08/2004
04112264-8
8.000
0.240
6.800
650.000
1,300.000
01/04/2005
05011545-9
4.300
0.850
6.700
680.000
1,300.000
MW121
09/19/2002
02092792-6
0.082
1.400
7.430
40.000
340.000
12/19/2002
02123013-8
0.067
1.200
7.310
38.000
340.000
03/17/2003
03032351-3
0.200
0.930
7.300
65.000
340.000
06/17/2003
03062509-1
0.052
0.820
7.600
62.000
370.000
08/11/2003
03082176-5
0.110
1.100
7.484
52.000
310.000
Well Id
Date
Sampled
Lab Id
MANAGES
March 3, 2008
4:11:17 PM
Date Range: 09/01/2002 to 03/31/2005
Appendix D: Data Used in Statistical Calculations
Hutsonville Ash Impoundment
B, tot, mg/L
Mn, tot, mg/L
pH (field), std
SO4, tot, mg/L
TDS, mg/L
MW121
10/13/2003
03102279-9
0.075
0.760
7.500
30.000
280.000
02/23/2004
04022960-1
0.085
2.100
7.300
27.000
470.000
04/19/2004
04042676-5
0.099
1.200
7.300
19.000
340.000
08/02/2004
04081328-9
0.180
1.400
7.400
24.000
350.000
10/04/2004
04101561-12
0.084
1.400
7.400
23.000
350.000
03/16/2005
05032818-13
0.060
0.640
7.440
34.000
250.000
MW14
09/18/2002
02092792-9
0.190
0.530
7.000
230.000
790.000
12/13/2002
02122525-5
0.570
0.500
6.920
210.000
740.000
03/18/2003
03032481-5
0.730
0.510
7.000
120.000
570.000
05/12/2003
03052186-5
1.000
0.480
7.000
230.000
830.000
08/11/2003
03082176-4
0.400
0.410
7.345
180.000
740.000
10/13/2003
03102279-8
0.630
0.510
7.300
200.000
810.000
02/23/2004
04022960-3
1.400
0.430
6.800
190.000
810.000
04/04/2004
04041354-7
1.500
0.400
6.900
190.000
780.000
08/03/2004
04081328-12
1.000
0.450
6.900
200.000
810.000
11/08/2004
04112264-10
1.100
0.510
6.900
180.000
760.000
03/15/2005
05032818-12
0.880
0.350
6.920
220.000
780.000
MW6
09/19/2002
02092792-1
15.000
3.600
7.000
200.000
690.000
12/13/2002
02122525-1
16.000
1.300
6.910
240.000
640.000
03/18/2003
03032481-3
11.000
0.007
6.700
450.000
880.000
05/12/2003
03052186-3
8.200
0.004
7.000
360.000
880.000
08/04/2003
03081508-6
13.000
0.080
7.000
330.000
780.000
10/13/2003
03102279-1
15.000
0.290
6.900
300.000
770.000
02/23/2004
04022960-7
14.000
0.880
7.400
310.000
790.000
04/04/2004
04041354-6
11.000
0.890
6.900
310.000
810.000
07/12/2004
04072337-7
12.000
1.700
360.000
900.000
11/08/2004
04112264-6
14.000
0.590
6.700
380.000
900.000
01/04/2005
05011545-7
15.000
0.970
7.200
380.000
890.000
MW7
09/18/2002
02092792-7
2.200
0.052
6.890
240.000
760.000
12/19/2002
02123013-2
2.500
0.220
6.910
250.000
790.000
03/19/2003
03032570-1
0.500
0.020
7.000
160.000
570.000
06/02/2003
03061314-6
1.800
0.024
7.300
220.000
790.000
08/11/2003
03082176-1
2.100
0.018
7.020
220.000
790.000
10/13/2003
03102279-2
2.200
0.120
7.000
240.000
820.000
02/23/2004
04022960-5
2.100
0.022
6.900
280.000
880.000
04/19/2004
04042676-1
2.000
0.051
6.800
310.000
970.000
08/02/2004
04081328-6
2.000
0.160
6.800
310.000
950.000
10/04/2004
04101561-7
2.600
0.120
6.900
300.000
1,000.000
MANAGES
March 3, 2008
4:11:17 PM
Date Range: 09/01/2002 to 03/31/2005
Appendix D: Data Used in Statistical Calculations
Hutsonville Ash Impoundment
B, tot, mg/L
Mn, tot, mg/L
pH (field), std
SO4, tot, mg/L
TDS, mg/L
MW7
03/15/2005
05032818-6
1.400
0.012
7.050
220.000
730.000
MW7D
09/18/2002
02092792-8
0.083
0.750
7.410
51.000
370.000
12/19/2002
02123013-3
0.140
0.750
7.380
31.000
320.000
03/19/2003
03032570-2
0.089
0.760
7.300
51.000
350.000
06/02/2003
03061314-7
0.088
0.680
7.700
60.000
390.000
08/11/2003
03082176-2
0.140
0.660
7.530
59.000
370.000
10/13/2003
03102279-3
0.110
0.640
7.500
44.000
320.000
02/23/2004
04022960-6
0.110
0.770
7.400
68.000
430.000
04/19/2004
04042676-2
0.067
0.830
7.300
61.000
440.000
08/02/2004
04081328-7
0.091
0.570
7.000
47.000
360.000
10/04/2004
04101561-9
0.210
0.660
7.500
36.000
420.000
03/15/2005
05032818-7
0.062
0.450
7.530
42.000
280.000
MW8
09/19/2002
02092792-2
10.000
3.800
6.920
790.000
1,300.000
12/19/2002
02123013-4
11.000
3.600
6.970
740.000
1,600.000
03/17/2003
03032351-2
12.000
2.900
7.000
960.000
1,700.000
06/18/2003
03062696-1
12.000
2.500
7.400
940.000
1,800.000
08/11/2003
03082176-3
14.000
2.500
7.093
960.000
1,800.000
10/13/2003
03102279-4
13.000
2.200
7.100
930.000
1,800.000
02/23/2004
04022960-8
13.000
4.700
7.000
820.000
1,800.000
04/19/2004
04042676-3
12.000
2.300
7.000
870.000
1,800.000
08/02/2004
04081328-8
11.000
2.100
6.900
800.000
1,500.000
10/04/2004
04101561-8
11.000
1.300
6.900
620.000
1,200.000
03/16/2005
05032818-8
13.000
2.200
7.440
940.000
1,600.000
MANAGES
LOG
CENTRAL ILLINOIS DRILLING COMPAI
1909 OAKWOOO AVE,
BLOOMINGTON. ILLINOIS 61701
o
F B 0 R I N G
(309) 662.5968
CASING
_
DR ILUNG METHOO __
'-'P,"'S:..:.'l-'-
_
CO NTRACTEO WITH __
-,P-"..
:,".",t",'
S:..:'J~j,-,··!--='-,~
i'o.::.:::G:..:-=-']:.:"=-'':.:'
E;:;,
::.:'=~-=-:=-.,__-
__-_-
B 0 RING NO,
-..:..
'~.
_-='
_
·-,.T~r·n··V-T-·.,..·
pc'Vr.,'.Ji
S~'AT.l.()l~
PROJECT NAME '\,' "IV!":' -I/'j
CONTRACT NO.
.,__----
LOCAnON
~p"';,,·~.!.."~p'_=LA:..:.
·~l:.:;;-
::-;--::-.,__-----.,__----_:;-;:;-;,-------......,;nr----
4
.
JO"
p
Ii
HAMMER
WT,_~l---,-O=f
__
HAMMER OROP'__---"-
HOLE OIA.
_
OATUM
_
SUR.-ACE ELEY. __-:-..,-----,;-;-
COR E OIA.
-=---=---;--=--'-
_
DATE STARTED
.2-1
li
-84
COM PLETt,E;."'''...'-'"-_-'---''-_---,-
2-Jl.1-84
_
ELEV.
DESCRIPTION
<:T
OFPTH
SAMPLES
DEPTH SCALE: BLOWS
n.
No.IIYPE: !RECOV. QP
0.0 JO
NOTEs
1-55.0 Sp.e ;/A
0.°
f---'-o''-''-'-'''+-----------t---~i_
Lt. hrn.
sRn~"
~11t.
wf. c]nv
t
aCCR~.
f-c
sRnf,
OC~RS.
f.
S7TR"Q""f
1
1-53.4-
.,....ont.~
rnnj.:t-v.
~o5_~t
l.l
]-2-J 1
I--
S5 lP" 1 ..
2 .'
I,t. hr. m-c sRnrl, wr.
ocrqs
~_m rrrq~~J
t::
silt
-'
n-5-71---2
S~
I7
4
50./
44f,4
Lt. brn. s:'.nC1stone
"mist
f, -
54 -
r---3
40j2"
2 .
Lt. -r;rsy S9.!1r1
sto~:-e
D.]
,
r;0
r
c--
65 - :;
5
r--..!.L
]"
s. 7
;vAT?3 2-1lJ.-P,!"
uD 6.0
8:30am
ihR 7.0
P:55alm
.V.'.AR--
':i!""
6; 5 9
I
0
5a~
"-c
PT8V~1
5.°
Isc·r~p.!:
9.n'-iJ
(l"f
?" PVC Pi
De
lJ.
() f
G::.'p~~Tel
9.}'--.()'
~e!"rt
O!12."toe :3.
r f -"1
FInn-
'l.SI-~1J.r""~"'2
.
1~]~"~p:-
}.c
1
Jp]
I
(\
"r
?:..
-
~~p_
ElK.
clp-".c~.r
s
"J!'.
t:;.
f'.
~.
P.!lr.
~c {"8.~.
O~8:"F-!
i
c
f'ih,::::s to""SC" 1
~OiFt
MONITORING HELLS
H-l
screen
ELEVATION
PIPE
&
SCREEN
7
'
pipe
5'
1,56.5
1,59.5 - 1,52.5
1,52.5
- 1,47.5
BACKFILL HATERIALS
concrete grout collar
bentonite seal
1/8" gravel pack
456.5 - 455.0
455.0
- 453.5
.453.5 - 447.1,
.'Jlllf'I!VIJnJ.'
/JlJI,11I JJ/ JI.I/'"'1I
'./1\111
J
1525
SOUTH SIXTH STREET. SPRINGFIELD. ILLINOIS
62703.2886.217/788-2.150.
TWX
910-2-12-051')
LOG OF
CENTRAL ILLINOIS DRILLING COMPA
1909 OAKWOOD AVE.
BLOOMINGTON. ILLINOIS 61701
B 0 R I N G
1309) 662.5968
NOTES
0P
;> •
CASING
=
_
DR ILLJ1;J G M ETH
00
-''''''.5=-,:.:.\
_
,
P
.-
R?,
-, r--
1
SS
]',R'
I-
0.0 I 10
DEPTH ISCALE: I BLOWS n.1 NO. TYPE !REcov.1
DESCRJPTlON
<T"AH IDEPTHI
SAMPLES
siJ,tv sann
v. C'Joifit.
Br~.
~-c
sRnrl,
wf.
m-c
sravel tr. silt
CO NT RACTED WITH
-:-;,h
7'
,::4
-=J{-=Sc'(:":)!-:-·~
::::=E=::t":..;"
(':c'
1=.1.::"
>J:::E:.:E:.:l1:.:.;Oi:-:'----=-===c:-;-_____
80
R IN G NO.
--=-;,"-1----".2
_
PROJECT NAME
---=-:c:..:==-'--'='1',e.:.:---=-===.=....:==-=-
niJTS oJhVILIj,; POi':Lh :';',f'.;"Tl UN
CONTRACT
NO.
_
LOC,,-nON
~:?_'L'_"jc!.,~?
...L..
h'"J"_.:
__::__;_::_::_---------_=_=_::_-------_=_-:-
_
DATUM -
HAMMER WI.
__--=-==Lf_
IUO .,
HAMMER DROP,__--''''--_
10"
HOLE DIA. __--'-'---
P.• J
_
SURFACE
ELEV
-:::-:-
CORE
OJA.
-:-:--_--;::-;-
_
DATE STARTED
:' -
J
0- ['.4
COMPLETEDI
",,;>_-~l,--.
0:.:.'_--=8_u,-__
953 =J I
EL.OCY.
I
195~,q
"'pp
I
:3Yh.
15'/;1.
]_i1_1_
v.
~oi.st
]7
1444,9
Brn.-g~ay
rn-c sand,
wf.
':1. "T" Vp.]
8.4
J- J- J,-lfiS' lIS
3-4-7
I~ s~
]h
DTJ P,G 8:00p.m.
BAR n.o ] 0: pO
A;~?.
---
'tn
7.
(i ;>:]
Op!"
Screp.Y'" ]P.0-5
2" PVC lJi
De
~.
()
3.0'
S Hyrae;.
Gnn,p]2J.'l'1-
1
BRnto~~_
tp
1J..
~
.?l11rr
2.0'-;,u~-r
-]
-
{iA
51 ':. r;oR]
refuse
hI!
1.;f.
OC~R'"
"i]
t
:fi
1'~
F. t
vIet
Gra
u
silty clRy. wf.
tT.
f
SRnn,
occ~s.
:f. "r"ve I
J,O-J] 1-2
lJ.
1-
-
1'7
till
----;/c
~-]O-
1 .,
" ,
P
LOG
CENTRAL ILLINOIS DRILLING COMPAI
1909 OAKWOOD AVE.
BLOOMINGTON. ILLINOIS 61701
o
F B 0 R
J
N G
(309) 662,5968
CONTRACTED WITH
_-,-HA=,l",':-=S-,O:,l":"=E~]:-jG="I,,,NE-::~=,'
:-,I;::I:-.;I
S'c-=;;-:-==~_____
BORING NO,
1_,:_-_2
_
PROJECT NAME _-...:li",':::;.u.=T.::;.J:.;O::.1:.;.\1.:.V.=I:.:1'f,
'::.E::....:P...:O:.l::.E:.'.:.h:....
...:S:...T:.,:.:",.:T.:I:...O:...J_J
CONTRACT NO.
_
LOCAnON
-"P.:.p_r--'-'P_I~.-'9_n'_
-:-_::--------__--::-::-::-
-;;-:;-
_
DAruM
HAMMER
WT._-"''-'-=T'
140
';;
__
HAMMER DROP._-,-,.:..,-
~ntl
__ HOLE DIA.
pH
_
SURFACE ELEV. ----
CORE DIA.
CASING
-:::-::-
_
DATE STARTED
~
J 0 Ril
COMPLETED? - 10_ P.ll
DRILUNG METHOD
-'P.:.:S=A'--
_
ELc--V,
DESCRIPTION
_.sTRATA
Inl""p,H
SAMPL~S
OEMH
ISCALE
BLOWS
n.
NO,
TYPE !RE:COV.
QP
.
NOTE.S
953
"
('\ 0
, --J.[:
/
1-</.g
21
S
5-'7-1.
Q
.
s's
1 f'.J
4.
.
l-
f-
Eiill
OF
BOH~i-·.:G
21.5'
.
!
i
I
MONITORING WELLS
M-2
ELEVATION
PIPE
b
SCREEN
8 '
pjpe
]3' screen
456.3 - 448.3
448.3-435.3
BACKFILL
~~TERIALS
concrete grout collar
bentonite seal
J/8"
gravel pack
453.3 - 451. 3
451. 3 - 449.3
449.3 - 431.8
.VII II'
J.V
.)/.11,' J
II JN /II J 11
\
I.
I" '
'J
".J
g
I Jj
I
1525 SOUTH SIXTII STREET. SPRINGFIELD, ILLINOIS 62703.2886' 217[780-2'150' TWX 910-242-051'J
LOG OF
CENTRAL ILLINOIS DRILLING COMPA
1909 OAKWOOD AVE.
BLOOMINGTON. ILLINOIS 617.01
B 0 R I N G
(3091
662.5968
f't
_iJ
.L
l _ r
-h
.0'
.
~
,
:.lr-r
1 . '
CONTRACTED WITH
n;...
~':5(!:.:
:-~<C:IJJEE:~~,
BORING NO.
~
_
P R OJECT NAM E
_--,,:ruT~.
".e,LdS.1
0
",i,,-'
\,,-1
"T;.I,+,!~T,,-'
•
....LP.10!.!.Wr..;y"'.
~L'."--,,S,-,T,-,P::..
.
....T...
,-"O"'.
1.\..\1
CO NTR ACT NO.
_
LOCATION
-'P_._h'-'.-'-P
L""Ii:Ll'-',__
---;_~----------_::_:_::_-------___,::_:_-
_
DATUM
HAMMER WT._
1
.:...
Lt-:..0;.iJ
HAMMER DROP.__
-"l_O_"__
HOLE DIA.
R_'_'
_
SURFACE ELEY. -
CORE DIA.
-::-::-
CASING
_
DATE STARTED
2_
O
_
R
L!.
COMPLETED
'"-'?-...:O...:-:.:R"'u=-
DRILLlNG METHOD
..:.H:.::S",P.:...
_
ELEY.
I
DESCRIPTION
<:;TJHIT.o. IOEPTHI
SAMPL~S
Df:?'TH
!SCALE:! SLOWS FT_1 NO.
Typr
!~(COV.
NOTES
<+-5/.
j-5".
/
/
,c;
.. -
l
O.!)
I
,0
I
I
I
f---
.
4-(-8
14"
l
Hu~t
brn.
s
iJ
ty
sand.
-
1 ss
--
-
fill
v.
!]io
1s t
r
4-J-4
I-
2 ss
16
--
145.8
.;,.).J. • : •
-e,
Qravp.,J.,
I'll •
fi.J
r
I-
m-c
sane ,_
oc ca s •
1441-.
c;
~.S ncr~
t
Oil P.
v!,ot
7.(,
8-19-
HAT';]
l-c-S
~
~.S
18
--
I-
n
DD
5 . .5 •
2:)
493.?
F-m sane
"
::1o-\c:t
R,o
I-
Bi\.R
I) , () •
2,1
11-4;;l ..,
See
.. :'1
u
.LJ.
r-
.".l\B
2 s-R S
~
Sf:
17
--
"'iL
5. !) , e:
~[)
SJI
Elm
OP
3J.r~IJ·!G
9.4'
-
I-
#
r~fll~e,
A Bll,.
4"
C
oa t
-
l1f.
·~ilt
fill v.
TflO
#B
Err. •
~~n
1-
15
wf.
~
-m
san
SCTeerr
9.
4
'
2 "?VC
Pi De
I
I'
Gravel o.
Lt I
Bpnto?:lt.e
L.
:2
Flu".
1
...
c:'_,-;
"
G
!"'O1".~_
t
2.:;'-
lJ."stn:.-lG-ci
p~
?
o'
HANSON
ENGINEERS
MONITORING WELLS
H-3
ELEVATJON
PIPE
b
SCREEN
7.9 '
pipe
51
screen
452. I
455.6
447.7
447.7-442.7
BACKFILL
~~TERIALS
concrete 'grout collar
bentonite seal
1/8" gravel pack
452.1-450.1
450.1-448.1
.442.7 - 448.1
:VI 'II.
IN"
Ij},'
'JJt
N lilt,
J
I
1
I.
.1/,
I)
r
\/:. N I II
I
1525
SOUTH SIXTII STREET. SPRINGFIELD,ILLINOIS
62703-2886.217/788-2450.
TWX
910-2'12-051')
LOG
o
F
CENTRAL ILLINOIS DRILLING COMPM
1909 OAKWOOD AVE.
BLOOMINGTON. ILLINOIS 61701
B 0 R I N G
(309) 662.5968
CONTRACTED WITH
"ALSON
Ei':G TNEERS
BORING NO.
-=-:I:...,~_J_'
_
PROJECT NAME
EUTSOJiVILLS
pa~!E;; STA~IOI\
CONTRACT Nr.
_
LOCAnON
-'-P-'-E"'P-'-,
-'-P-'-I"'.A"-'N-'--_---,
-::c:~---------":;':;:_;;_--------__;=----
DATUM
HAMMER WT._-----'=-'-=
'_40#
__ HAMMER
DROP'_~-=
10"
HOLE DIA
A"
_
SURFACE ELEV. ",-"l:rc----- CORE DIA __-,-
~
CASING
-:::-,-
_
2-1J,(-',11
?
1'1 pI .
uSA
DArr STARTED
COMPLETE
D'_"'....:'c.;..,..:c::'c.,.
:::'1'---____
DR ILUNG 1'01 ETHO 0
__
....:"='-'-
_
• f)
• (1 ,
_1J.
O' .
n'
Sa)
4
ELEY.
DESCRIPTION
1
,""U,
IDEPTHI
SAMPLES
I
D(:PlH
ISCALE:
i
SLOWS
Fl.l No.1
T'YPE !R.ECOV.j
Q?
NOTES
14-<;" 4-
4-
I
0.0 1'10
I
!3JK.
aSD'lalt
1.0"
I
I
453./
F,,,,
~r.qvf:l
1.O!t,brn,
.1
~
.:: ,
....
~
~
1
,1
-
~.
..
...
.
-""rav~1
DaVeiP.ent
!JJ8ter-
I
~"ls
:noist
5'5-7
L..2..!
ss
1.6
.,
.-
~iE:-~rf£;'~r:-r:~"-
-----
~5/.
,
.,
"
I
.
..
~.
_ ....
_~.
r::
J..
,
~ ~
.'U~"L
.
f--
Brr> •
silty
sane'l,
wf.
OCC2:'.
f-~
ii:ravel
t-
S
4-J-J
')
CiS
18
0.<;
k9-x)"
mo:'st
I---"'-
S,rJ
f.-
Br. f-rn
s2nc1 vlf.
silt
-
/
l-l-1l
.
~
ss
] p
--
144tb.A
HA
7'~!)
2-1 J ..
v.
~oi~t
p,
'Z
k!'P-VP} ,
'v:r .
f--
By.
r
"':!!l
r:n
R.O
C;:4"f
c-::!
s cnrl
,
silt
BP.:;
fl.
0
10: .
J-J-03
~
]7
o.fi
AAR
--,
1-1 n
r:~
v1£>:t
./L
7 .
'i
11
I /
ffl.';
.n,Q
f--
I
it. - h:r.
.C:~!'1c1
sto~!"
2J-T'/
e-5-
S~
1]
--
Sc:rp~rr
12 ..s
:Sit
2" PVC;
PiTJp.
1-9-/,0
"le
lOO/Il"
=z
S8
4
4. St
GT8.V"
1
1]
.Il
Be'1tonite
4
1:.: l.J")
.OF
3U:~.:;':~':C;
n.
Il
'
?
P1
1
.1f!
2.D'.!',.
t- J. 5
1\
MONITORI NG I.ELLS
}1-4
ELEVATJON
PIPE
b
SCREEN
8'
7.5'
pipe
screen
457.4
449.4
449.4 - 441.9
BACKfILL MATERIALS
concrete grout collar
bentonite seal
J/8" gravel pack
454.4 - 452.4
452.4 - 450.4
450.4 - 441.0
.V,IW/N,)lJ},' 11IJI,'11I1/1 \/..)N
.)," \tNI'1
J
1525 SOUTH SIXlII STREET. SPRINGfiELD, IlliNOIS 62703-2886.217/788-2,150. TWX 910-2'12-0'I')
!l-OC~
U
LOG
o
F
CENTRAL ILLINOIS
DRILLI~JG
COMPA
1909 OAKWOOD AVE.
BLOOMINGTON. ILLINOIS 61701
B 0 R
J
N G
(309) 662.5968
0,
i.
..
m
-r
it
t
c
J'
, (
k
lJ
Dr
n;
BORING NO.
i·_~
-'--S--:-
_
CONTRACT NO.
.,.__-
_
CONTRACTED WITH
!.u-
U"'snj'
.. b
'-- \j
-.'!
"'JG~I·=EH'.;.
\jL,:" ,J
PROJECT NAME
HUTS ONVILLE POWER STAT}
0],
j
LOC~T10N
pEb .2LAN
DATUM
HAMMER WT,
1 U.O;r'
HAMMER DROP'
J'-'O'-'_'
HOLE DIA. __
--:--=8_
n
_
SURFACE ELEV, ------,.-- CORE DIA.
-----;:--;;-:;-c7>T ---
CASING
~.--:------='7:-----
DATE STARTED
2
-
1
l8iJ.
2-1J.:.8&.
HSA
-
.
COMPLETEOj
"-='--~
ORILLlNG METHOO
_
.
ELEV.
DESCRJPTION
<C
"To
IDEP"THI
SAMPLES
ISCALCi 8L.OWS
n-.J
NO.
T"'PE jRECOV.j
0P
DEP"TH
NOTES
9.>.:111
O.
0
JO
1
"
COR
1
rp.fuse
,
hrn
C
D;::,"~:v
,'Hi'l
1 1
t
• of'
f.c.
;:::-:;qVf:'
J.
2.
l-
I',.
r--
.
GeeRS
orrr8:"1ic
fihers
£ill
moi~t
----------------------
-----
1 .
J
4-<;-S
1
S~
] U. "
--
14<;24
J
SF',c
iff...
.' .
r--
:gy!!".
f'
~?,y]r1
,
11.;[ •
r--
(!'
0r:C[.!S
T
';:11'
e
1
C
rr:oi.<:t
S cnln
,
v
f.
t-
lolA Y.:Ji
2-
1
.
~-p
0.4
I
:rJoi~~t
-5
J-2-iJ.
r-2-
55
17
1~,1-
S.c;,
Dn
!'l. 0
2
:
5')n
.':Ir. f-rn
s Po nrl
,
"f/
C
r--
BAR
AAR
11
-------
.0
):5
~
';)r.n
HL
f,
S'
c;
:iJ.
,
,
J-J-/,
r--3-
~~
18
O. '
"h'?q
Net
F
.1J.
r-
CliJ
:n.eta1 dT
pipe
1
• (1'
we
Brn
;:o-c
E
?,no
,
1,~
•• .l
.('
•
f-
hOTi"]" ru::-::v- 2-
"
L.
;;::':'a vel
OCC2.'s
.
blk
_10
J-LL-4
-
4
Sf:;
l
R
o. c
~:Q'#;
..,..
,-',
:,.-~
't .'1
1
"14/.
"7
c 02.1
ro;'us~
!!Iott'
inrr
1 n .
f;
1
• I
t~on
\-'-'
3T~-.
'0
<'
•
f-c:
-~rRV
f.!:,",::>~
:-n-c
vel
s R '1:1
•
t-
r-
Scyoen
lE'
.
0.
f
O-J-]
r-S-
ss
l~
--
?"
PVC
pi
"De
1..: pt
J.O'
c"''1
_, L._
I-
G:rp..vel
1
R •
(1'
f--
~
Benton:itp.
il
,
B"clcfi l1e"
1
C'1_l
h
~s
12
--
J.
P
(11
rrf' •
-JS
-
'"
P11l['"
~.
0'
-~u
'Hr../
,
'"
:>
.,
_11.
11
~
-
st.~.~r
D1
p
9-35.1-
,
B;--:o;
-
..
•
L
-r::rR
•
:...,
,
.1.
.
7
.
~
E'[{:J~21,...(),;).<:.>
-...... '-
: ..
~
.
,
~
~,
fi'.
C
~
lIS-IS
I---'-
?
,
s.~
12
--
f:;'A
BTn.
~--8.1r
~?n~
-------
v
--------------
T"'J2.st
----
----2
~
t:,
S~
(',
--
~-~
f-c
s,:,~r;
t:"::-~
\T el
, 1':
.
GT~:V
S~Ylr.st~ne
-
,
f--
1'1'11t.e
Tack
JiB,;
,
c
:>
.
.
--
~
I-
)0-70
.-
.
R
"f
Q
4
t
wet
o.
.
19
? ,
r-
2(
::"J.'LJ
-. T"'
,-":-'
B;Ji~~L:'
, '.
2"
HANSON
j:'
ENGINEERS
MONITORING WELLS
H-5
ELEVATION
PIPE
&
SCREEN
452.3
8'
13 '
pipe
screen
455.3 - 447.3
447.3 - 434.3
BACKFILL MATERIALS
concrete grout collar
bentonite seal
1/8"
gravel pack
452.3 - 450.3
450.3 - 448.3
.448.3-433.1
.V,lli'
IN 1IIlN 11fJ1.:JIf III)
1 1),'
"I"
'1;.1\1
II
J
1525 SOUTH SIXTH STREET. SPRINGFIELD, ILLINOIS
62703-2886.
217/7R~-2450.
TWX
910.242-0519
rnn
..--r,r.,.,.
".-
_
~~
..
LOG
OF
CENTRAL ILLINOIS DRILLING COMPA
1909 OAKWOOD AVE.
BLOOMINGTON. ILLINOIS 61701
B 0
R
I N G
1309) 662.5968
CONTRACTED WITH
nAl'SON EJ.JGI1\'!':LRS
BORING NO.
,-,;,j'-.-_..,,-,
_
PR OJECT NAM E
_,-;,-,:-i-",iJ~'~-=S,-,C","
1,,-'''-,-/
='
-=L""L",E,-'
-,P'-.C,,-".::\l-,-~
.:=.Jl:-.:S::.T=-P;;•.::T..=I,-,O",lc..'
CONTRACT NO,
-,-_
LOCAnON
-"-"~__"__'=-'-'--
PE? PLAN
~:-;--,--:-------_=_::_::_---------_::_::---
DAruM
HAMMER WT. __
146#
HAMMER DROP
30"
HOLE 01A.
.......:8;,.."
_
SURF"ACE
ELEV.~~=
CORE OIA.
-::_-,-
CASING
_
o
ATE STA RITD
2 - e-3::
COM PL ETE 0'_---':-'-''---
,--"..:--=8..:4:...'
0 R 1LLJ N G MET H
a
0 __
'-:,-o';:cS"'.~.'__
_
NOTES
I
0.0
I
JO
I q,,,.IOEPTHI
SAMPLeS
I
J O£P"TH!SCALE:! BLOWS Fl. J NO. TYPE !REcov.1 QP !
I
ELEV,I
DESCRIPTION
c;
37,7
c:;
-i
1 ..... _
....
'-,)1:-
•
- -'-
,,'
•• --- -
J
3-:'-7
I-
3.9
17" --
(
Lt. nrn.-hrn.
s~ndy
silt, wf. clay
-.5
2-3-4
,.2- SE
14
-}:O
2-2-3
moist
Br~.
sRndy silt,
>If.
tr.
::~ay
8.1 f-
3-3-5
I-J-
ss'
-
It
ss
16 1. 7
14 1.2
WATER 2-8-84
DD E',5 1114pa
BAR 11.5 310Pp
AAR ----
I-lL 11.5
511~D
ver7'l !.'1aist
3rn. silt, wf. f.
co
~
nr'
1
0
-
0
-
3
1-.5...
sO'
15
1.J
12.9
f--
-
,
_, S 2-2-4
~
55 1'1
l..
7
I--
Scrp.err 25. 0't-l
2 ,I PVC
pi pe
~
5
5.0' stic¥'
11
Gravp.125.0'-1
Bentonite I
Ij
0
12,c)
Plu,rr
2.0'-sl.lt!'f
"'p.nton
it
P. -clp-v
12.0'-2.{)'
Standpipe J.O
5.1' sUe);:
i
h
~
p""",#~O",".",+
~
-'--
_tl-'?~, _.,~
2-2-3
r-2-
S5
1R 1.4
I--
--:<0 0-1-3 r-E- s!"
17 1.2
(L;O~
LOG
o
F
CENTRAL ILLINOIS DRILLING COMPAI
1909 OAKWOOD AVE.
BLOOMINGTON. ILLINOIS 61701
B 0 R ) N G
(309) 662-5968
CASING
_
DRILL! N G METHOD' __-,-.
D,.S'
"'.
'-'~"-
_
BORING NO.
[>1-7
-,
_
CONTRACT NO.
_
CONTRACTED WITH
HJ..JJSON ENGINf:E:tS
PROJECT NAME
rlUTSOjJVILLE ?O\I!':RSTATIOH
LOCATION
PEB
'-=-
PLAN'
-,:-:-
_
DATUM
HAMMER'vVT.
11l'O#
HAMMER
DRop,_l,,-O!...'_'
HOLE
DIA. __-'S'-,'_'
_
SURFACE ELEV.
-_ CORE
DIA.----:~n_=~---
DATE STARTED
_-=_-..c"!...---',,""-'-.
?
0 OiJ
_,,-_
COMPLETED'
.::...--'-
2-8-'84
_
137.9
0.0
I
JO
<;l-/{.,'::;-
Ern-. sane'v s 11
t
vlf.
21. 4
I
~ ~:::::~~!._~.:.
-
':~::~
-
_~::~
--
J,-
BTTY.
f.
s'J.l1d
DESCRJPTION
DEPTH IS(;ALE I BLOWS Fl.
SAMPLES
No.1 TYPE IREcov.1 QP I
NOTES
tJ-/4.<:
W\'+
?l iJ
Ern. f-c o:ra'Jel,. wf.
14-/;:1 9 !')-c sane'!.
tr.
~):~
t
I:>" .D _
7-7-9
/;J
S8
1-
12
END OF BORING 25.0'
HANSON
.
.•
ENGINEERS
!N(O~r(l~ATID
i~_;,~·~?-,®
C7
MONITORING WELLS
M-7
ELEVATION
PIPE
b
SCREEN
1.37.9
20'
10'
pipe
screen
442.9
422.9
422.9 - 412.9
BACKFILL MATERIALS
concrete grout collar
bentonite
b
auger cutting
bentonite seal
1/8"
gravel pack
437.9 - 435.9
435.9 - 425.9
425.9 - 423.9
423.9 - 412.9
""'"11" IN
•
lit,..
/1111,/11
I II
I
I
II.:
III
-./
'"
/I
I
152.\ SOUTH SIXTII STREET. SPRINGFIELD, ILLINOIS 62703-2886.217/788-2450. TWX
910-2~2·0519
Project Name/No.
AmerenCIPS - Hutsonville
249-3
Boring No.
MW.7D
Start Date
10/5198
Page
1
Driller
AEC, Indianapolis, IN
Logged by:
Sieve Mueller/STMI
End Date
10/5198
Depth to Wate r
-10
Feet
Boring Depth
Boring Diameter
45,0
Feet
8
Inches
Surface Elevation
437.5
Feet
Drill Method
HSA
Northing
3175.915
Well Depth
Well Diameter
44.3
Feel
2-in J.D.
TOC Elev.
438.45
Feet
Sample Method
2-fl. split-spoon
Easting
5676.110
Bentonite/cement grout
3-35
ft.
-:.~
SP
ML
SP-
GP
75
75
b";';"';;b0rl--+--S~I~L~I
'i'~'7w~e=<s'"'o=eor----
~y;s!'·~
medium~grained
quartz sand, trace
'",'.:'.o"·.:.~Jl.
•... bo.",
•.•...".':".,..
coarse sand, fine-grained angular to
.~o ~
subangular gravel. medium dense, pale
brown, saturated
t~~?~~?
100
I-eWLLJf-+---=~T"C<,..,.n--c=n=====-
SlL I Y SAND, wef! sorted/rounded,
-
~
fine-grained, quartz, grades from clayey
silt above, loose, medium brown,
saturated
100
100
2
2
3
1
1, 1, 1,
2
3,3,4,
9
0,0,1,
2
5,8,6,
8
1, 1, 2,
3
il:
..
Description
c
0
.c
"
.c
~
c
;0
u
c-
~
Cl
0
Cl)
c
0
Cl)
!:....
~
0
;0
c.
..J
to
u
E
"
'"
Cl)
c-
iii
C.
"
>
.c
.~
~
U
0
E
to
.!1
~
E
to
u
0
Cl)
to
~
c-
..
..
to
Cl)
(f)
[l)
(f)
It
Cl
U
3:
Comments
, me
lum pas leI
race
~
a
.........
roots fibers, soft. medium brown, 'moist,
_
,e"
.. -. .s-
- -.
~.;;;.
saturated below
10
ft.
.-.>-
...
.........
.,
.'--.~
_
.....
..
ca
:.....
1, 1, 2,
5-ft by 4.in square steel
3
5
75
stick-upcasing to -1.3
ft;
concrete seal 0-3 ft.
Project Name/No.
I Boring No.
Start Date
Page
AmerenCIPS - Hutsonville
249-3
MW-7D
10/5/98
2
Driller
Logged by:
End Date
Depth to Water
AEC, Indianapolis, IN
Steve Mueller/STMI
10/5/98
-10 Feet
Boring Depth
Boring Diameter
Surface Elevation
Drill Method
Northing
45.0 Feet
8
Inches
437.5 Feet
HSA
3175.915
Well Depth
Well Diameter
TOC Elev,
Sample Method
Easting
44.3 Feet
2-in 1.0.
438.45 Feet
2-ft. split-spoon
5676.110
g
Description
c
.c
III
Gl
.c
c:
~
Cl
0
c
,2
a;
0
!:....
,0:
Gl
0
n;
c-
O
<:-
...J
0
E
Gl
U>
~
Gl
.~
~
a
c-
Iii
>
.c
U
~
c-
o
c-
III
E
E
III
..
0
..
Gl
0
..
~
..
Gl
In
m
In
a::
Cl
U
~
Comments
~_.-
heave
sana
c-
,
u
,;C.
<
•••••••••.
,
;i~~:
D)
-
-
/ Ii
Sch. 40 PVC casing
~~~:
flush-threaded to 0.01-lr
f--.--
-
-
l)!F=[>
factory-slotted PVC
sand
rAO-
0
screen 39.3-44.3 ft; #7
heave
flOe silica sand 35-38 ft;
I------
c-
,
::~f;OJ~f
rw =fi
#5 silica sand pack 38-
c-
-
"_~:Jg~~
r\~1
45
ft.
c-
-
:tiJ&:~
~~i.l~i'
fC~li
I
c-
-
16,25,
~
.,
--"
'Mt
L.LAlEY SILl, medium plashcrry.
trace'---
'0:" .. ::"":'
1----45-
75
7, 11
sand, stiff, brown, moist
_____
e-
-
eND OFBDRING -'45teel - -
e-
-
e-
,
f-
-
~50-
-
-
-
-
-
r
-
1----55-
--
e-
-
c-
-
e-
-
1----60-
e-
-
f-
-
e-
-
-
~65-
,
-
-
-
-
-
-
-
LOG OF
CENTRAL ILLINOIS DRILLING COMPAI
1909 OAKWOOD AVE.
BLOOMINGTON. ILLINOIS 61701
B 0 R I N G
(309) 662-5963
CONTRACTED WITH
HANSON r:HG:LNF:EnS
BORING NO.
_~~~....:...r-J,---
__':;,-.
~~~~_
PROJECT NAME
HUTSO\TVILLE. POWER PLANT
CONTRACT NO. __
~
__
~
__
~_
LOCATION
-~-~-..:.P-=!':=.:R,,--,P,-LA=.:..N,--~_-=-;-:-c
__
~~~
=:-:;-
~~~-;o:-::-~~~_
DA7UM __
-,--_~
__
HAMMER
WT._--=,--,-_""-_
14
0
+.
HAMMER
DROP~~~
30"
__
HOLE
D[A.~
pOI
~_
SURFACE ELEV.-::-_---:::-:-
CORE DIA.
--=---::::-;-
CASING,
~~_
DATE STARTED
2 -
~
-Ru
COMPLETED
'=---.:..?_-..::8_4:.-
2
DRILLING
METHOO_~:"':-l"'S'-'A
_
ELEV.
14'1.R
1
DESCRIPTION
Err.. claye'! SLeL, '"
tr. r. s8nn, occas.
o.,..~on\n
f'~hoT'.~
mnj
~+
Brn. silty sHnd
Brn. silty s=.nd" wf.
tr. f. sand
moist'
OEPTH !SCALEIBLOWS FT. No.1
TYPE:!RE:COV.j
0P
I
I
0.0 30
,
"1 l-
f-
-
2-5-7
.-l..
ss
18"
1.~
1 ,
c--
~
---oS
2-3-)
1---'-'-
?
ss
17
l.L
I----
NOTES
3- 5 - 5 -,;J... s"
12
3 . 2
,"
,-J--cJ
'G2.L
7'
/
'.L~4-
•
1/
---t--,-,-R~4
-
fun.
cl"~Te)T
silt,. wf'
tr.
f
s3nct
~oist·
2-3-]
r--!L Sf>
J.O
-
1'l
].R
fin
1 3 .
I)
11
I
I 58
HArt 19.0
)IL
SJ
AAB ------
.IL 12. 0 R: c
OE
2-8-84
,
))..0
Ern. gray c18yp'y sil' ,
\l-II'. tT. f.
sand,
S!D. "ray silt pocl,et
moist
Ern.
SRn~v
silt, wf.
occaE. f.
sand
lens
2-2-2 \-.+. ss
I .
_'5 2-2-3 r-£- ss
1-2-2 7 ss
I----
1'3
18
18
1.2
1.7
1.2
Scro.en 21. 5'-]
Gravel 21.5 -J
Bento'lite
1
1.
Clay & Bent ni
1 J . :; • _11 • 0'
2" PVC pipe 16
4.9' stick Ip
Bentonite
CEme
I"TOllt
4.0'''':::.f::
Plu« 2 .0'-S' rf
St.qn~Dipo.
3.0'
~
1
1
"1-",1,,,,1
qL'
'C1'
L'T--"
1o,.,uo.J
p~ t~_-""r..:.a~--,l,-r
_m",'='
oj
~"'--IL
>f1 __--j_l_q"""'l'J
-2 0
0 _1 _ 2
~
s s
1R
,
......
• 0.
?
Balen Nell
Ft
5i1'5m~
2-9-
f
1.!
II.f)' wRter Ip.
(·o~
l"
LOG
OF
CENTRAL ILLINOIS DRILLING COMPAI
1909 OAKWOOD AVE.
BLOOMINGTON, ILLINOIS 61701
B 0 R I N G
1309) 662-5968
CONTRACTED WITH
HANSON ENGIN:r:ERS
BORING NO. __--.:.j,.:..1-_'_p
_
PROJECT NAME
-::-J~U7:':"'
...
S'-:Q~!;'_;1{~·-;'I'"'-L"'!-"E"-..:.P...:O"'\.:..·IE=Rc......:S:.:T:.:A=T..:I:..:O:.:N'-
CONTRACT NO.
_
F:::ii FLAl'
LOcAnON
--------=:...:::.:.::..:---=------:--:------------==;;------------0-....----
OATUM --
- HAMMER WT__
~l'-O~u~-
4
.
__
HAMMER OROP'--''-
30"
HOLE DIA.
8
II
_
SURFACE: ELEV.
----
CORE
DrA.----;:;--n-nr;--
CASING
=
_
DATE STARTED--
2
7
8
1.J.
.
COMPLETED
2-8-84
DRILLlNG METHOD
""":'=,-=-
ESA
__
ELEV,
DESCRJPllON
,IO<PTH
I
SAMPLES
DCPTH
!SCALE: I BLOWS n.l NO.
TYPE" !R ECOv.
QFI
NOTES
<139_
<J.
0,0
10
4-17.
r:,
:dr.
silty sanr1
\'1
p. L
21. '5
0-0-0
0
ss
18'
lo-
r-'-
E~D
OF
BURH,G
21.5'
f.
f-
r--
i
HANSON
_.,~,
.. "_
::
ENGINEERS
IN(O~r(l~AlID
--':J.;_::::':~.-®
C7
MONITORING WELLS
11-8
ELEVATION
PIPE
b
SCREEN
"39.4
2 1." '
5.0'
pipe
screen
4"".3
"22.9
422.9 - "17.9
BACKFILL MATERIALS
concrete grout collar
bentonite
b
auger cutting
bentonite seal
1/8" gravel pack
439.4 - 437."
"37.4 - 425.9
425.9 - 423.9
423.9 - 417.9
-VI'WllV.l/fN /111".,11/1111 'I-:,Jj './1,110/
152.1
SOUTI; SIXTIISTREET. SPRINGrIELD, ILLINOIS 62703.2886.217/788.2450. TWX 910-242-0519
.-r
Project Name/No.
Boring No.
Start Date
Page
AmerenCI PS - Hutsonville
249-3
MW-10
1017198
1
Driller
Logged by:
End Date
Depth to Water
AEC, Indianapolis, IN
Steve Mueller/STMI
1017198
-2.5 Feet
Boring Depth
Boring Diameter
Surface Elevation
Drill Method
Northing
11 Feet
8 Inches
452.9 Feet
HSA
4730.478
Well Depth
Well Diameter
TOe Elev.
Sample Method
Easting
10.7 Feet
2-in J.D.
454.23 Feet
2-ft. split-spoon
2559.807
!E.
Description
c:
UI
Q)
.s::
0
~
c:
:;:;
.s::
-
Cl
0
Q)
.=
0
0
"
0.
::...1:-
...J
0
:;:;
III0
c.
E
Q)
to
Q)
Q)
.!:!
l;::
0
C.
iii
C.
>
.<:
'iii
U
E
:;:
E
0
c-
UI
.2
0
III
III
Q)
III
..
Q)
~
rn
aJ
III
a::
Cl
U
~
Comments
Y'
1,2,2,
III
ML
l..LA Y to Y "'LI ,
vege1alea wlln grass, son,
,,-n oy 4-ln square stee
2
c-
-
50
I
dark
':"LI
brown
T
",,",u,
to
wellblack,sonedirounded,moist
(topsoil)
stick-up casing to
-1.5
c-
-
inn
fine-grained. quartz, loose. yellowish
ft.
1.2.2.
6
c- -
50
IE
SP
orange with dark orange lamina (2-3 mm),
¥¥-
•••••••
saturated below -2.5 ft
c-
-
Bentonite/cement grout
1,2,6,
25
r-
5-
100
IE
i>i
?:
0-3 ft; 114-in bentonite
••••••
SIL I Y SAND, well sortedlrounded,
--
. :
chips 3-4
fl.
c-
-
><
5,20,
1<
SP
fine-grained, quartz, laminated, dense,
88
25, 50
c-
-
63
light gray to rust colored, predominantly
rrf!~
--
tm~
light 9ray below 7.5 ft, saturated
Sch. 40 PVC casing
(weathered bedrock)
!-
-
Ss
SANDS lONE, tlne.gralned, quartZ
,>::....1:...
flush-threaded to 0.01-1
I>.'.
factory-slotted PVC
r-
1
0-
:::::::
I>
E=f.>
screen 5.7-10.7 fI; #5
~
c-
-
.......
- CND OFBDRING
_on
feel - - - - - - - -
t .
silica sand pack 4-11 ft.
--
c-
-
i-
-
f-15-
!-
-
c-
-
i-
-
-
c-
-
~20-
c-
-
c-
-
.
!-
-
i-
-
f-25-
!-
-
c-
-
i-
-
c-
-
f-30-
!-
-
!-
-
!-
-
t-
-
Natural Resource Technology, Inc.
Standard Soil Boring log
SOIL BORING LOG INFORMA nON
Form - General Use
Rev. 8-2000
FacUlty/Pro)ect Name
AMEREN Energy Generating
-
Hutsonvl1le Power Plant
License/Permit/Monitoring Number
I
Boring Number
I
Mh'-IfR
Pagelo11
Boring DrlDed By
(Firm name and name of crew chief)
Boart Longyear
Randy Radke
Date DrlUlng Started
/0/03/01
Oate DrUllng Completed
DrUUng Method
/0/03/0/
HSA
m
C
~
"
E
Cl E
co 0
a:u
Borehole Diameter
8.25 inches
(If applicable)
DE
ON
local Grid location
ON
Os
Soil Properties
"
>
'in
8
m
.c
£
u
E
"
C
:c
'"
u.
n"
rn
~
"
u
~
0,
C
D
'"
0
0.
'"
~
E
,g;
~
C
'3
-
~
"
0
'"
~~
8
'0
cr
'E
'"
"0
N
iii
0
0
0
J
3' Cl
"'-
U
U)
::E U
::::;
::::;
0:
'"
"'-
~
Civil Town/City/or Village
HutsonviJle
U)
u
U)
:::>
5P
FILL
Final Static Nater level Surface Elevation
Feet MSL
440.920 Feet MSL
I
lat
long
Feet N
Feet E
I Common NeU Name
Soil/Rock Description
And Geologic Origin For
Each Major Unit
32/7.083
4654.729
grades to sand with gravel, coarse
Eoe
@
16'Auger Refusal
0' 5'
E..lll..
gray with orange mottling, coarse
sand with clay, dry trIable
w
u.
"
EO
.c
Q
Cl
"
lunlQue Nell No.
50/3 ;::"'16
=
3
MW-lIR
15-17
MW-IlR
34
=-6
5'-S' 5.Alli1 orange, poorly graded, coarse
5-7
20
45
MW-IlA
14
2 3
r
S'-IO' SAND With GRAVE! brown, poorly
.5-9,
4 3
graded, rounded, fine gravel/coarse sand
10
MW-IIR
2 2
~
10'-11'6"SAtID..
pOOrly graded, medium to
10-12
18
32
t-
coarse
12
11'6"-16' SAND With GRAVEl
brown, poorly
=
graded, rounded, flne gravel/coarse sand
MW-IIA
20
23
.5-14,
3 3
=--14
FacUity Nell No.
Boring location
Slate Plane
County
Crawford
Sample
C
C(I=
m
-'"0
C
_ 0.
"
-
<l
"
_
~
0
D>--
" >-
£>
",0
"
>
u
~
E"O
5i dl
.Q
~C
lD
Z '"
Ja:
MW-IIR
18
23
0-2
46
MW-IIR
18
34
.5-4.
66
:::
-2
~4
~=+==E
I hereby certify thC!t the information on this form is true and correct to the best of my knowledge,
Signature
~
/3-/
/~
jFirm
~_
fA
/dt,;,,;_
Natural Resource Technology,lnc•
./
01
_
~.
"in.
_ J.
9ft.
SlJ:e! •
04
Oilier 0
...,.."..,.,.,
~~
• Yes 0 No
MONITORING WEU CONSTRUcnm
C-.
_
d.
Additianalpn::"eetion?
lfyes. desc:nb:" 3'" Bu .......ye
r
Po~T
3. Surf=:
=!::
B=onne. 30
==0 01
Oth"T' 0
4. Maxaiu
C:rwc::l
weD
csing
~
protective pipe::
-
Bl:llIIlnin> 0
3
0
S""'b
Other Ii!
5. AmLnJ.m- 3p:ace 3e:ll:
.a.. Granular/Chipped Bcmonite.
3 3
b. __
Lbs/pl
mud wrigill
Bentoni",-somd,]urzy 0 . 3 5
c. __.UJs,Igal
mud
mght..
Bc::mcmin:shmy 0
31
d. __
%
Beu~'"
.... .. B=1o<ri1<-=m:nt gram 0
5 0
c.
Ft ,;) volume:::a.dC..cd for 3IlY of thr;.zOOvc
1.
How iru;tillcd:
1n:::ni~
"0
T
rani<o
J"ll1ll"'d 0
0
2
Gnvity. O!
6. BClUJnite seai:
a_
Be:n..tcnilc:
~.
:3 3
b. 0114
in.
0318
m.
0 lf2 in.
lk:nmritl: em". 0
32
Ot!=
0
1.
Cllp
BIld
lock?
2. Pro=tive
cover
pipe:
:a... Inside diameter.
b.u.gm:
c.M=riul;
ArrO 01
Nane" 99
o Yes • No
15. Drilling
fluid used:
W= 0
02
Drilling
Mud 0
0
3
16.
D:rilling
IKiditiv«=s
~
.
Rcn"o;."ricnfRedevclocmcnt
thor
..
F
:iCility/Projce:t
Name
~
Grid 1
oration
ofWcll
DE.
r
dlName
u+Se.., ...
:II-e
~c:IL
'iiTA--T
,e......
-
It. ON.
OS.
ft.
OW.
M \. 1- I \ l:'
Facility Li=e, hrmit or Momtering No. LocaJ Grid OrigIn
0
( ostimmrd:
w)
or WclI.Locnticn
0
UIliqU" Weil No. IUN"
W
dl jLJ
Mo.
L:u. __•
•
..
long. __
•
•
u
.
or
Fociiity ID
SLJ'bmr.
fL N.
ft.£.
SIClN
D= WclIlIJsulled
.
.
LD!03/
200
.L
..
":
Section Loc.z:icn oi WaJm:iSourr;:e
"--
mmddv'Yv""
TypcoiWdI
DE
W"illnsIBikd By: Name (fu:lt, last) and Fin!
WclI
Code -.1..l-!
""-vJ
. l}4oi
114 of5=_.T.
N.R.
OW
.
'f,.
'¥-r.d K:e
Loc:a.tian
of
WclJ
RciaIi=
to W=eISo=
Gov.l.ot N1lI:Illx:T
Dis= from
Wastd I
E:ni. Stds.
u 0 UpgrIl<iienr
s 'JI! Sidcg=llatl.
So=.pp'fi..
Apply
0
I
d
0 Down",.dl=r
n 0 NOl.K.tmwn
?,,,,..r
-\-
.,
O~""L'
E. Bc=niIC
s."u.
IDp
• _ It. MSL
or __
~
.
QfL
D=criDc
~-
17. Scur= of
~
(=acil
=slysi"
if
n:quiral):
.
A.
Pron:etivc.pipe.
top
e1evBrion
- - _. - . - -.
fi.
MSL
-===:l='=~
B. WclJ easing, top elevl1Iion
_
'i
~ ~
.
2 ? fL MSL
c..
L=d sm:f>ee
dCV"lltiOD
_
~
"
9 •
~ ~
fL
MSL
D
.
S
uu..a=sea
·~--
1. bo
ttoID
.
._
fLMSL'"
or _
.
~._
b fL
~:
.
...;.>"'lcr$.
,.
••
..
12 uses dassi
fi
c3tion of
~:nC3I
sattIl:
:';-~-:S:a.
.:
GF 0 GMD GCO GWO sw 0 SF •
SM 0
SC 0
M1..D MHO CL 0
CH 0
Bcdrod O.
13. Sieve =-lysis perlcrmerl7
0 Yes. No
14. Driiling rm:tboO u=l:
Rotary '0 5 0
Hollow
St= Auger II 4.1.
Other 0
~
J. ruterpnd!:. bottom
. _
It
MSL or _
1
!. .
!? ft.
0.~.1.9in.
l.Q.l?ft.
None
Ii!
14
Olhcr
0
:S~
11
01
::-~%
~
b. M.:antix:tun:r AD
h.,...
SC!>
N
c..Slot
s.m;
d.
Slotted 1c:ugth:
II. Bac:1:fiIl material (bolow fil""'pack):
10.
S=
=cn:ol:
--I"P_V"-c..""-
_
.. S= 'J'P'='
Fac::ory an •
Coutinuom
slc< 0
01h:::r 0
N. LD.
wen
cuing
L We!l
baIr.om
H.. Sc;c::::n
jOint. top
G. Filtc'pm:k.
IDp
F. F"",
sand.
lOp
M.
0.0. weI!
=in:
WELL NAME MW-11R
WELL DIAMETER 2"
(MEASUREMENTS
BELOWFROM
TOP
OF CASING)
TOTAL DEPTH 17.7'
DEPTH TO WATER BEFORE
DEVELOPMENT 13.55'
DEPTH TO WATER AFTER
DEVELOPMENT 13.60'
JOB NO# 3410-1824
LOCATION Hutsonville,IL
DATE
10/3/2001
DEVELOPED BY G. Jones
DESCRIPTION
OF DEVELOPMENT METHOD
(Check One)
o SURGED WIBAILER & BAILED
o SURGED W/BAILER & PUMPED
o SURGED W/BLOCK & BAILED
[ZJ SURGED W/BLOCK & PUMPED
o OTHER __
CAN THIS WElL BE PURGED DRY? 0 YES [ZJ NO
VOLUME OF WATER IN FILTER PACK AND WELL CASING
Gallons
VOLUME
OF WATER REMOVED FROM WELL
120
Gallons
CLARITY
OF WATER BEFORE DEVElOPMENT
Drk Br Cloudy
CLARITY OF WATER AFTER DEVELOPMENT
Clear
VOLUME
OF WATER ADDED
None
SOURCE
OF WATER ADDED
None
TIME SPENT FOR DEVELOPMENT 60 Minutes
COMMENTS:
START:
4:13
P.M.
END:
5:13
P.M.
Natural Resource Technology, Inc.
Standard Soil Boring Log
SOIL BORING LOG INFORMAnON
Form - General Use
Rev. 8-2000
Page 1 of 2
Facility/Project Name
ANEREN Energy Generating
-
Hutsonville Power Plant
license/Permit/Monitoring Number
l
eorln
g
Number
/</11-/4
Boring Drilled By
(Firm name and name of crew chief)
Boart Longyear
Randy Radke
Date OrDling St...ted
10103101
Date OrllUng Completed OrlUlng Method
10103101
HSA
Facility Well No.
lunlQue Well
No.
ICommon Well Name
Final Static Water Level Surface Elevallon
Feet IISL
440.930 Feet IISL
Borehole Diameter
8.25 inches
Boring locallon
State Plane
28/1.508
5325.781
Feet N
Feet E
I
lat
long
local Grid locallon
ON
05
(If applicable)
DE
ON
Civil Town/City/ or Village
HutsonviJIe
w
"-
'"
.c
-"
Q
o
'"
Soil/Rock Description
And Geologic Origin For
Each Maior Unit
lJ)
U
Ul
:::>
o
~
u::
o
n:
'"
>
'".c
~
Ci
'" 0>
c
E
0.:0
'"
UlJ)
Soil Properties
"'-
~
c
--
.':2
~
'"
c
o 0
'" U
'"'"
N
~
~
c
~E
'"
DE
a:u
'" 0
12'6"-18'6'" FAN Cl AX brown (7.5YR 4/2),
10-15% grey/orange mottling, medium plasiclty
yellowish brown HOYR
5/4),
Increase plastlclty
to medium
7'6"-12'6" 511
J
with SANP brown (lOYR 4/31.
low plastiCity, moist
18
MW-l4
.5-19.
~
Cl
t%
::
t
8
U
~/
=
1B'6"-26' SAND with SII I
wet,
non-plastlC
~~/~
•
20
Z
/>
//
MW-14
18
I I
-
SM / //
20-22
11
// /
=
=:t==+==t-=-22
/z //
_
23'6"-24'
SAtID..
seam, medium
///.//
M;-~~
20
;;:
~~~J,g);..-c=-h===-=-;;:;::-=:::-;:""7:::::::-:::::;-::=:::-;--;,"",d~j;~·~·
1 her.eby certify tt).jt the information on this form is true and correct to the
~
my knowledge.
.,...
MW-14
23
L
~
.5-4.'
18
23
~4
MW-14
11
-
5-7
18
22
C
6
MW-14
12
f-6
.5-a.
18
12
E
10
MW-I4
24
11
-
10-12
II
12
MW-14
18
11
.5-14.
12
~14
-
MW-I4
11
-
15-17
22
11
=-1P
Signature L
X
~
IFirm
Natura' Resource Technology, Inc.
/
MW-14 cant.
Soil/Rock Description
And Geologic Origin For
Each Maior Unit
Page 2
at
2
Soil Properties
~
>
-~
:0
~
~
'-'
E
'"
~
<U
:c
ro
~
C
C
LL
0.
'"
~
;g
~
<U
~
"
'"
U)
(1
0>
-
c
~~
-3
~
E
u
ro
0>
0
E
C
'"
U)
E
~"
0
E
'"
0
0;
ro
0
Vi
-0
0
cr
~
C
N
'"
0
'"
~
"
is
;;:
u
:>: u ::0
::0
~
-
~
a:
u
24' 26' SAND with SI! T as above
26'-39' SAND with GRAVEl coarse sand, platy
fine gravel, poorly graded
gravel becomes rounded
4"
LEAN CLAY with Graye! seam, gray (5Y 5/1),
rOUnded, tine,
2-7%
shell fragments
--~-----------------------------
EOB C 39'
Advance
Hydropunc
discrete
water
sampler
Drillers
note:
sand and
gr8velas
above
MONITORING WEU. CONST.RDcnOJ
Rem~ricntRc<kYclcmncm
lh",
F3.CililY/Proja:1- Name
L=.I
Grid !.cl=i""
of
Wcll
-
ON.
DE.
rdlNamo
~
... ",;II'f.
feutt::'f'Z,.
STATION
ft.
0 S.
fL
OW.
~IJJ-
1'-\
F:acility l..iet:nsl; Pemri.t or Mcmitcring No.
Local Grid Origin
0
( c:srimJnc]:
u)
or
Well Location
0
Unique Weil No.
IIJNK
Wc:llU No.
L:u. __•
•
"
Long. __•
•
"
-
.
..
CT
. F";uty 10
SL P!lln<
fi. N.
1t.E.
S/C/N
D=
Wclllmullerl
..
."
..
J
OJ
C
"1"-
'" "'..L
Section 1.0=,,,,,of W
""""50=
m
m d d
,
v
v
v
Type oiWcll
DE
Wen InsWled
By: N=
(lim. last) and
FiI:o
"." .
WdJ Code
~f
-..1L "
l.=rian
IJ4
of
oi
Well Rclative
114 oi
S=~.
to W=dSo=
T.
N.R.
Gov. Lot Ntm:ilicr
OW
_R
R
Ai l:=e
Distana:
from Wastd I Eni. Stds.
n
0 Upgr,.;;=
s
0 Sidegradiau
Sou=:
Bey
it
Apply
0
d
.Down"",di=
n.
0 N01.Known
'G>e..,..q
Co.
I'V G- YQ<-
01
~
~
_~.
!;>in.
_ 3.
l;>fr.
Slee!. 04
Oth=
0
tt~!
Iii y=
0 No
• y=
0 No
"------------
d.
Additionll1 Prcleccion
i
Ii
ye.
d=rib::'
3'
j3"
~"
1b""
B=oni1e. 30
Coo=D OJ
Other
0
4_ lliu::rizl
berwc=:l wcll casing .mel
prox=:m:
pipe:
BCllIDniIe 0
3
0
S" ,.,<::0
Oth= •
5.
Annuim-
Space
se:U:
lL
GrmolariCbipped:Bemonite.
3 3
b.
1.bslg:aJ moo weiglll ... B""unri",..,and iliJI:ry 0 " 3 5
c.
__1.bs1g:aJ mud weight. . . . . Bcnoniu: 'lnny 0
3 J
d. __
%
1len""!iro .... ..
1lentooi..
-eem= gnom 0
5 0
c.
Ft
~
volume adC..ed for :my of thc move
f.
How imtillc:d:
1n::nie '0
T
ranie flllto!"'d
0
0
2
Gnvity. 0
j
6. BOtr:m.ilc seal:
a. lk:wr::nut::
gr.mub.
33
b.
01/4
in.
03/11
in.
011:'.
in.
Bc=min:
clli;:>s 0
32
Otl=
0
1.
Cap lind Iocl:?
2.
Proteerive c:overpip::
L 1m:ide
diameter:
b.
Lcng1ll:
"- Ma=i>l;
3. Surf=:
=l:
Air
0 01
Nane. 99
o Yes • No
15. Drilling finid
used:
W= 0 02
Drilling Mud 0 0 3
16. Ih:illing additive;.
~
D=iD<:
-
17. Sour..
of
wa= (attach
~sis,
ifrrqnin:d):
E.
Bc=i""ool.
top
. _
fr.
MSL or _
g
~
.
9ft.
,.
~.
D
.
SU:d".ac::
.
sea.
I
00
. ttam. _ _ _ _ _ _
fi.
MSL
or _ \,.i'
~
~
-
a
It.
"-'-''''It;1..o:ua,.
l~<;\"
.-
12.
uses
classi5e:ttion of
soil:nea:r
~
.
:0.;"';-5";....
GP 0 GMO GCO GWO sw 0 SF •
SM 0
sc
0 MLO MHO CL 0 Cl:! 0
Bedrocl: 0
13. Sieve 2llBlysis perl=crl7
0 Yos • No
14. Drilling m<:tbOO used:
Rntary 0 50
Hollow SIt:m Ang.,. • 4 I
Other 0
~
" A. Prot=tive pipe.
top
d"""tion
- - - - . - -
fi.
MSL
:-==f;::~
B. Well eosing, top elev:uion
_
~ ~ ~
•
~
'? fL MSL
C.Lmd
sorl>ce
clc:v2ltion
_
:l
~
f?
~ ~
r. MSL
J,
Fil""p.c..
OOlIOm
. _
it
MSL or _
;;,§.
~fl
Fac:my
CJI. J
1
Continuon!: sio< 0
0 I
.011=
0
10. S=m:ueriaJ:
---If_v.>!...Oc'--
_
a. -Scn:::n
type:
7. Fme
:>mId
mau:rial: Manufac::rm:r. ;::redUCt name
&.
.Im:Sh :sra:
, .:rt
7
e,Al)
l.-<!1>.
}it"
b. Volume
orldod
ft
3
.,;
8. Filler
pacl::
m=illl:
M3l1lIfuc=,
prrxilJt:t
=n. &; n=h,tu
~V:j
. #yc
AMr;n,~
......
t"...T ....
"-\~\
:;~,;
•
b.
\/olmne
added
ft
0
:,:
9 Well czsing:
F=il tbr=dal PVC
sohednk
40 •
2 J
,.
FJmh
thr=:!a:!
PVC sclIeduk lID
0
2 •
Other
0
~
(-VH»
~
____ . .:ft.
MSL or _
:23. Yft.
L
wen
bottem
F. FlU" sand.lDp
H.
Sc= joinL top
b.
~
'Se. hn,Sc::..r"\
M, O.D. weU ccin:
_
~.
-2;; in.
o.Slot
si=
d. Slotted long1h:
N. LD. wen """ing
_ g.l
S> .in.
II. BacJcriIl material (below filtl::'pacl::):
[or""""'f"lb,.,," C::t:>(J1sf?e
O. Pol
",in.
_S.2ft.
None 0 14
Olber.
:~~
WELL NAME MW-14
WELL DIAMETER 2"
(MEASUREMENTS BELOWFROM TOP OF CASING)
TOTAL DEPTH 35.27'
DEPTH TO
WATER BEFORE
DEVELOPMENT 18.23'
DEPTH TO
WATER AFTER
DEVELOPMENT 18.95'
JOB NO# 3410-1824
LOCATION Hutsonville,IL
DATE
10/3/2001
DEVELOPED BY G. Jones
DESCRIPTION
OF DEVELOPMENT METHOD
(Check One)
D SURGED W/BAILER & BAILED
D SURGED W/BAILER & PUMPED
D SURGED W/BLOCK & BAILED
I:8J
SURGED W/BLOCK & PUMPED
D OTHER __
CAN THIS WELL BE PURGED DRY? DYES
I:8J
NO
VOLUME OF WATER IN FILTER PACK AND WELL CASING
Gallons
VOLUME
OF WATER REMOVED FROM WELL
150 Gallons
CLARITY
OF WATER BEFORE DEVELOPMENT
Cloudy Br
CLARITY OF WATER AFTER DEVELOPMENT
Clear
VOLUME OF WATER ADDED
None
SOURCE OF WATER ADDED
None
TIME SPENT FOR DEVELOPMENT 60 Minutes
COMMENTS:
START:
3:01 P.M.
END:
4:01 P.M.
~
Natural
Resource
Technology
.N
H
T
SOIL BOR1NG LOG
Page
of
Facility/Project Name
License/Permit/Monitoring Number
Boring Number
Ameren Hutsonville Power Station Drilling
TW-IJ5s
Boring Drilled By: Name of crew chief (fmt, last) and Finn
Date Drilling Started
Dale Drilling Completed
Drilling Method
Steve
hollow stem
Boar! Longyear
5/l12004
5/]/2004
auger
Unique Well No
lweI]
ID No
\common Well Name
Final Sialic Waler Level
\SUrface Elevation
\Boreholr Diameter
TW-l15s
Feet MSL
438.4 Feet MSL
8.3 inches
Local Grid Origin
0
(es1imated:
D)
or
Boring Location
D
I
Local Grid Location
Lat __" __'
"
StatePlane
N,
E
S/C/N
0N
0
E
1/4 of
1/4 of Section
,
T
R
Long
"
'8 8046.72 feel D
S 117688634 feel 0
W
Facility JD
Icounty
IState
Civil Town/City! or Village
Hutsonville
Sample
"0
SoillRock Description
c:
~
~
E
E
'<l
c
"
EO
"
~
E
CQ
0.
0
'"
"E
»
a
-'=
•
"
=
~
.0.
a
0
e~
And Geologic Origin For
5
.-
a
"
a
'"
...J
0
~
.of--
"»
E"O
£
""
"
>
~
U
3
"-
~
"
u
Each MajorUnit
0-
~
"U:.o
2:=
U
'"
"E.
.~
G:
is
RQD/
0"
"
a
a
"
u
.S'
-..e
o
D..
0
•
"
-
"
"
a
'"
E
is
""
Commenls!
Zo
--' '"
CO
0",
:r:
i.L:U
:0
lJ
0-
"
LabTest
0'-36'Drilled without sampling-see log
TW-115d for complete description.
CL
f--- 5
SC
C
f--- 10
CH
-
15
-
20
CL
f--- 25
-
oD~<
Ib~D
C)<:
GP
b_D
oD:<
I-
30
O;§
oD:<
I.
~
.
SW
~
r--
35
SW
~'5:
END OF BORING AT 36; Well set at 35'
1 hereby ceJ1ify that the information on this form is true and correct to the best afmy knowledge.
Signa,
-::- _
Finn
r'
'O--i'""'\.
'~-'~----..-~
Paula Richard on
Natural Resource Technology, Inc.
Tel: (262) 523-9000
23713 W. Paul Road, Unit D, Pewaukee, WI 53072
Fax: (262) 523-9001
TemplaTe: NRT BORING LOG. PlOjW: 1375 LOGS.GPJ
•
NaturaJ
.
Resource
.'
T echnoJogy
R
T
MONITORlNG WELL CONSTRUCTJON
Faci}itylProject Name
Local Grid Location of Well
Well Name
Ameren Hutsonville Power Station Drilling
89804672
fl.
~~.
1l76886.34
f
I.
~E
W
TW
]]5s
Facility License, Perrnjt or Monitoring No.
Local Grid Origin
0
(estimated: 0 )
or
Well Location
0
Unique Well No.
Iwell Number
Lal.
0
"
Long.
----
----
0
"
or
Facihty ID
S1. Plane
II. N,
Date Well lmtalled
fl.E.
Section Location
05/01/2004
Type olWell
Well Installed By:
(Person's Name and Finn)
Well Code 12/pz
l/4 of
1/4 of Sec.
T.
R.
Location of Well Relative to Waste/SoUTce
Gov. LOI Number
Steve
Distance from Wasle/
u 0
Upgradient
s
0
Sidegradient
Source
fl.
d
til
Downl2.radient
n
o Not Known
Boan Longyear
J4. Drilling method used:
Rotary 050
Hollow Stem Auger
~
4
J
Other 0
!I!lE
12. uses classifIcation of soil near screen:
~in.
~f1.
Steel)l( 04
Other~~.Ji
o Yes
~
No
C?J Yes
0
No
d. Additional prolection?
If yes, describe:
_
Cap and lock?
Protective
cover pipe:
a. Inside diameter:
b.
Length:
c. Malerial:
3.
Surface seal:
Bentonite
til
30
Concrete
0
01
Other
0
I1A
4 Material between well casing and protectlve pipe:
SQ,.AD
Benlonite
0
30
~
Other
til
~
SP t'I
CH 0
SW
t'I
CL 0
o Yes
~No
GWO
MHO
----fl.
MSL
----1i==;t
440.89
fl.
MSL
_---itT,
__-,-43",8,,-,4,--
fi.
MSL
437,4
fl.
MSL or
~
fl.
GCD
MLO
GMO
SC 0
o
GP 0
SMO
Bedrock
13. Sieve analysis attached?
D. Surface seal, hallam
C. Land surface elevation
B. Well casing, top elevation
A.
Protective pipe, lap elevalJOn
Describe
_
17. Source
of water (auach analysis, if required):
E.
Bentonite seal, top
fl.
MSL or
fl.
F.
Fine sand, top
410,4
fl.
MSLor
28.0
11.
G. Filter pack, top
409,4
11. MSL or
29.0
fi"
H.
Screen joint, top
408,4
It. MSL or
30.0
fi.
L
Well ballam
403,4
II. MSL or
35.0
fl.
J.
Filter pack, bottom
402,4
f1. MSL or
36"0
II.
K.
Borehole, boltom
402,4
f1. MSL or
36.0
11.
1.
Borehole, diameter
8.3
m.
M.
O.D. well casing
2.33
m.
N.l.D.
well casing
2.00
m.
11
01
~
~in.
~fL
None:$ 14
Other4!t
~
Factory cut
~
Continuous slot 0
Other
0
PVC
b.
Volume added
ft'
a_~
"'#4-'.O=B"'ad"'g"e'_r_-,
_
b.
Volume added
ft'
9. Well casing:
Flush threaded PVC schedule 40
~
Flush threaded PVC schedule 80 0
O1her
0
8. Filter pack material: Manufacturer, product name
&
mesh size
b.
Manufacturer
",B"o"acorl"L=on",g"y"e"a"r
_
c. Slot size:
d. Slotted length:
II. Backfill material (below filter pack):
10. Screen material:
a. Screen Type:
----
S.
Annular space seal:
a. Granular/Chipped Bentonite
~
33
b.
Lbs:lgal mud weight.
Bentonite-sand slurry 0
3 5
c
Lbs/gal mud weight _
Bentonite slurry 0 3
J
d.
%
Bentonite .
Bentonite~cement
grout
0
5
0
e.
Ft' volume added for any of the above
f.
How installed:
Tremie
0
0 1
Tremie pumped 0 02
Gravity 0 08
6. Benlonite seal:
a. Bentonite granules 0
3 3
b. 0 1/4
in. 03/8 in. 0 1/2 in.
Bentonite chips 0 3 2
c.
Other
0
~
7.
Fine sand material: Manufacturer,product name
&
mesh size
a
#7 Badger
!\ll
Air 001
None
~
9 9
J
6. Drilling additives used?
o Yes
~No
15. Drilling fluid used:
WaterO 0 2
Drilling MudD 0 3
1 hereby certify that the infonnatlon on this fonn is true and correct to the best of my knowledge.
Signature
,
Finn
'~7t..e:l~~ula
Richardson
Nalural Resource Technology, lnc.
Tel: (262) 523-9000
23713 W. Paul Road, Unit D, Pewaukee, Wl 53072
Fax: (262) 523-9001
l"f"mpllllf": NRT WELL CONSTRUCTION - P,ojf"c!: 1375 LOGS.GPJ
Natural
Resource
Technology
SOIL BORING LOG
N
It
T
Page
of
S
facility/Projecl Name
LicenseJPennitJMoniloring Number
Boring Number
Ameren Hutsonville Power Station Drilling
TW-JJ5d
Boring Drilled By: Name of crew chief (firsl, last) and Finn
Date Drilling Started
Dale Drilling Completed
Drilling
Method
Steve
Boart Longyear
4/29/2004
S/I/2004
hsa, core
Unique Well No.
\WelllD No.
\common Well Name
Final SIalic Water level
lSilIf3C{' Elevation
I
Bore hole Diameter
TW-] ISd
Feet
MSL
438.4 Feet MSL
8.3 inches
Local Grid Origin
t><l
(estimated:
OJ
or
Boring 'Location
0
I
Local Grid Location
Lal
__" __'
"
State Plane
N,
E
SIC/N
t><lN
t><l
E
lJ4
of
lJ4ofSeciion
,
T
R
Long
"
'8 8052.56 Feel 0 S 1176882.3
feel 0
W
facility lD
\county
ISlate
Civjl Town/City! or Village
Hutsonville
Sample
SoillRock Description
C
e
"
.n
E
E
'"
"2
"-
~
"
E.
~
E
M
0.
ro
co
c
'"
"
0
.5;
,
"
0.
~
u
e
u
0
"
"""
e~
"
And Geologic Origin for
~
c
.-
00
c
Vl
...J
0
~
Vl
.~
6
RQD!
.nf--
""
"
"-
2::"
f;:
"
>
,
~
-C"
"
EachMajorUnil
~
~~
U
~
0.
-
S~
~
0
'"
0.,
C
-
c
U
C
Vl
ro
0
0;
Comments/
oJl
ro
"
-c
""
0
"
a:
2ro
--' "
I!l
:c
u:::u
:0
<.J
"
Lab Test
1
24
0'-3.S'
SANDY CLAY, very dark greyish
I%:
55
12
brown (l0 YR
3/2),
very fine sand, moist
CL
2
24
5S
24
~
35'-6'CLAYEY SANQ mottled grey-brown to
3
24
tan, very fme sand, moist
SS
24
SC
-
5
4
24
6'-22'FAT CLAY, brown (lO YR
4/3),
soft,
SS
24
plastic, moist
5
24
5S
24
6
24
I-
10
5S
4
CH
7
24
55
24
wet at J3'
8
24
55
24
I
-
15
] hereby cenify thai the infonnation on this fonn is true andcorrect 10 the best afmy knowledge.
Finn
Paula Richard on
Natural Resource Technology, Inc.
Tel: (262) 523-9000
237J 3 W. Paul Road, Unit D, Pewaukee, W] 53072
Fax: (262) 523-9001
Ternphl1e:NRT BORING LOG - PlOjecl: 1375 LOGS.GPJ
Boring Number
TW
-1l5dage 2 of 5
Natural
Resource
Technology
N
H
T
Samole
"0
SoillRock Description
c:
"
.D
E
~I
c
"
E"E
2
£1
•
E
'"
"-
~
E
"
~
'"Cl
"
0
o~
And Geologic Origin For
a
~-
a
Vl
"
..J
a
.5c
~
a
~-
"
~
"
c
«
"
U
w- "
"
aa
Vl
.~
0
is
•
RQDI
_u
"l'>-
-E
M
>
a
,
::::.~
Each Major Unit
-0
0-
"'0:..0
;<
.=
U
-t
G:
25
Commentsl
--0
oa
0
"
2.
"-.
a
- a
Vl
•
0;
""
"
0
•
.~
0
0
0:
'"
z •
..l '"
CO
OU)
r
w-U
:0
LabTesl
55
9
2424
6'-22' FAT
CLAY, brown (10 YR 4/3), son,
plastic, moist
at J6' color change to olive grey (5Y 5/2)
10
24
55
24
CH
11
24
I-
20
at J9.8' 2" sand seam, very fine sand
55
24
20'-22'trace very fine sand
55
12
2424
22'-22.9'SANDY CLAY
CL
22.9'-32'POORLYSAND,
olive grey (5YGRADED5/2), rounded,GRAVELveryWlTHfine
o~<
'"6~
55
J3
24
0
to fine sand
'b~IY
qs::
I-
25
oC):<
0q§
55
14
24
8
oC):<
o
.ty.
q,t':
GP
<,~.~.
oC):<
~
55
15
24
7
oC):<
o·_~_·
q,t':
qs::
16
24
I-
30
oC):<
55
4
!C;:~
OS
oC):<
j'o~~
17
24
55
5
32'-33'WELLGRADED SAND fine to coarse,
5W
trace rounded ""avel
.
-
.
33'-36'WELLGRADED SAND WlTH
'
':','
18
24
mediumGRAVEL,gravel,very
fineroundedto coarse sand, fine to
""5'
55
14
5W
'';':-:1
f-
35
::0::
.:-~,
55
19
24
8
36'-39'POORLY GRADED SAND very fine
,
........•.••..
to medium, trace gravel, rounded
~
. : .
5P
1<
55
20
24
14
~
Iii>
39'-40'WELL GRADED SAND WlTH
5W
~,,:,,'
I-
40
GRAVEl
fine to coarse gravel and sand
'::f-(
to:. ••
55
21
24
11
GW
..
..
:"',
_~.-
:~
.~-
N
n
T
Samole
Natural
Resource
Technology
Boring Number
TW-llS(}age
3 of 5
22
55
24
12
SoillRock Description
And Geologic Origin For
Each Major Unit
40'-42'WELL GRADED GRAVEL WlTH
h
SAND, fine to coarse sand, fine to coarse
/
I
liravel, rounded
-0
c
~
.D
~
~
E
>,
"-
"
c
.0
L:.~
c
'"'"
-0
"'0:.0
u
"
"
c
._ a
'"
I
,,-U
:0
GW
RQD!
Comments!
Lab Test
23
55
24
55
24
12
24
13
f-
45
42'-58'WELL GRADED SAND fine to coarse
sand, trace gravel, rounded
2" graveIJy sand seam, fine to coarse gravel at
44'
25
24
55
14
26
24
55
I]
27
24
55
16
28
24
55
15
29
24
55
9
30
24
55
]
31
24
55
7
32
24
55
24
33
24
55
12
34
24
55
4
f-
50
f-
55
-
60
f-
65
58'-70'WELL GRADED GRAVEL WlTH
SAND, fine to coarse sand, fine to coarse
gravel, rounded
..
5W
GW
N
H
T
Samnle
Natural
Resource
Technology
Boring Number TW-llSd
age
4 of 5
SoiJlRock Description
And Geologic Origin For
Each Major Unit
"0
c
~
.0
E
"
f
E
M
0-
>.
0
0
.0
0
'"
..J
"'"
"-
~
"
z:.e
~~
'"
U
j'
u
0.
0
G:
is
"
-
0
.~
0
'"
E
;r:
"-u
:;J
0
0-
"li!I
GW
..
.&~~
.
~
;~
.
.&)
r-~'
~:
~~
...._-
5W
...
RQDI
Comments!
Lab Test
43
55
44
55
45
55
46
COF
24
o
24
o
24
12
180
'- 85
r------------------------
88'-90'WELL GRADED SANg very fine to
medium
f- 901f-----------,------:------1
90'-105'SHALE, grey-blue, friable, moist
Gravel starts coming up
in cU!lings.
:."
;
:
5W
90'-J05'SHALE, grey-bJue, friable, moist
Boring Number
TW-1l5dage
S
of 5
"0
c
e
.D
E
~
E
0
E
'"
D.
ro
;;;
>-
0
'"
h
0-
5
;,;."
-
o
c
0
U)U)
.~
..J
0
"
ro
ii:
<5
RQD/
~
"'0:.0
U
0.
~
-
.~
c
0
U)
e
23
"
Comments!
:r:
o.U
::J
CJ
0-
"
Lab Tes!
SoillRock Description
And Geologic Origin For
Each Major Unit
95
10'&-----::---------_ ___._---)
END OF BORING AT
lOS;
Well set at 87'
IO
"
c
o
o
.2
U
,
CO
Natural
Resource
Technology
N
It
T
Sam Je
N31ur31
Resource
Technology
MONJTORlNG WELL CONSTRUCTION
R
T
:acilitylProjecl Name
Local Grid Location of Well
Well
Name
Arneren Hutsonville Power Stalion Drilling
898052.56
f1.
~~.
1176882.3
ft
~~
TW-]
]Sd
:acility License, Pennil or Monitoring No.
Local Grid Origin
t8l
(estimated: 0 ) or
Well Location
0
Unique Well No.
lwellNumber
Lal.
0
..
Long.
0
"
----
--
--
or
:aciliry lD
SI. Plane
f1.
N.
fl.
E.
Date Well lnstalled
Seclion
Location
05/01/2004
rype of Well
Well lnstalJed
By:
(Person's Name and Firm)
Well Code 12/pz
_ .... 114 of
1/4 of Sec.
T._~
R.
Location of Well Relative to Wasle/Source
Gov. LOI Number
Steve
)istance from Was1e/
u
o Upgradienl
,
0
Sidegradient
;ource
fl
d
@ Downgradient
n
0
Not Known
Boart Longyear
J2. USCS classiflcation of soil near screen:
\. Protective pipr,
lOp
elevation
~
Land surface elevation
~in.
~fl.
Steel
~
04
Other -&
~
DYes @ No
~
Yes
0
No
Bentonite
~
3 0
Concrete
0
0
1
Other
0 I'Il1
d. Additional protection?
If yes, describe:
_
Cap and lock?
Pro1ective cover pipe:
8. lnside diameter:
b. Length:
c Material:
3.
Surface seal:
SP 0
CH 0
SWO
CL 0
o Yes
~No
GW[8)
MHO
____ fl MSL
----tr==LT
440.80 fl MSL __
---fIT,
__--'4"'3"'8.-'-4
f!.
MSL
437.4
f1. MSL or -LCL f1.
GCO
MLO
GMO
SC 0
o
GP 0
SMD
Bedrock
13. Sieve analysis attached?
3.
Well casing, lap elevation
J.
Surface seal. hall om
J4. Drilling method used:
Rotary 050
Hollow Stem Auger
1&14
I
rock core
Other
181&
30
~
33
35
31
50
01
02
08
33
32
!!!!
~in.
---.2:2... fl.
None 0
14
Other [8)
I!\ll!1
Boar1 Longyear
a.
~#c.7
...
B~a~dg"'e"r
.,._---
b. Volume added
-
f1
3
a.
#40 Badger
!Iii
b. Volume added
ft'
9. Well casing:
Flush threaded PVC schedule 40 t8J 2 3
Flush threaded PVC schedule 80 0 24
Other 0
!ii
PVC
Ii
Factory cut
~
J
1
Continuous slot
0
0
I
Other 0
~
8. filler pack materiaL Manufacturer, product name
&
mesh size
b. Manufacturer
c. Slot size:
d. Slotted length:
II. Backfill,material (below filter pack):
\?
<!.Iv] ±<M,
k...
10. Screen material:
a. Screen
Type:
4. Material between well casing and protective pipe:
o
Bentonite
0
SQ.,-V\.O\
Oth~r
[8)
----5. Annular space seal:
a. Granular/Chipped Bentonite
~
b.
Lbs/gal mud weighl .
Bentonite-sand slurry
0
c.
Lbs/gal mud weight.
Bentonite slurry
0
d. __
._% Bentonite.
Bentonite-cement grout
D
e.
Ff
volume added for any of the above
f.
How installed:
T
rernie
0
Tremie pumped @
Gravity
0
6. Bentonite seal:
a. Bentonite granules 0
b. 0 1/4 in.
l:8j
3/8 in. 0 1/2 in.
Bentonite chips @
c.
Other
0
7.
Fine sand material: Manufacrurer, product name
&
mesh size
Air DO 1
None 099
DYes I8INo
J5. Drilling Ouid used:
Waterl81 0 2
Drilling MudD 0 3
J6.
Drilling additives used?
Describe
17.
Source of water (attach analysis, if required):
Ameren well
E.
Bentonite seal, lap
361.4
f1.
MSL or
no
ft.
t.
Fine sand, top
358.4
f1.
MSL or
80.0
f1.
J. Filter pack, lap
357.4
ft. MSL or
81.0
f1.
'1.
Screen joint, tOp
356.4
ft.MSLor
82.0
f1.
:(
Well bottom
351.4
f1. MSL or
87.0
f1.
L
Filter pack, bollom
350.4
ft. MSL or
88.0
f1.
K.
Borehole, ballom
333.4
f1. MSL or
105.0
f1.
~.
Borehole, diameter
8.3
in.
M.
G.D. well casing
2.33
m.
N. l.D. well casing
2.00
in.
1
hereby certify that the infonnation on this fonn is true and correct to the best of my knowledge.
Signature
, .
(
Firm
Natural Resource Technology, Inc.
Tel: (262)
523~9000
23713 W. Paul Road, Unit D, Pewaukee, Wl 53072
Fax: (262) 523-9001
Templale: NRT WELL CONSTRUCTJON - Plojecl: 1375 LOGS.GPJ
Natural Resource Technology, Inc.
Standard Soil 80ring log
SOIL BORING LOG INFORMATION
Form - General Use
Rev.
8-2000
Pagelof2
FaclDty!Project Name
license/Permit/Monitoring Number
IBoring Number
AMEREN Energy Generating
-
Hutsonville Power Plant
TW
MW-\l.\
Boring DrlDed By
(Firm name and name of crew chief)
Date DrlDlng Started
Date DrlDlng Completed
DrlDlng Method
Boari Longyear
10/02/01
10/02101
HSA
Randy Radke
FaclDty Well No.
lunlque Well No.
I
CommonNeU Name
Final Static Water level
Surface Elevation
Borehole Diameter
Fee/ MSL
437.8/4 Feet MSL
8.25 inches
Boring location
3717.203
Feet N
Ilat
local Grid Location
(If applicable)
Slate Plane
5605.411
Feet E
long .
ON
DE
Os
Oil'
County
Civil Town/City/or Vmage
Crawford
Hutsonville
Sample
Soli
Properties
"'=
c
~
ID
'"
Soil/Rock Description
ID
C
l.L
>
::::~
.~
..c:
~
ID
~
-"
And Geologic Origin For
"'-
>.
-
'"
"" -
0
U
E
8
ID-
C
'" >. -" '"
u
Each Major Unit
:c
'"
_ 0>
_ c
Df-
-
-"
l.L
~ID
D
Ex
0
'"
>
D.
U)
'"
0,
~
'" c
--
-
'"
'
ED
g>8
0
~
u
'" 0>
=
0
E '"
!!!.
C
3:!::
0
o EE
"E
~u
N
'"
U)
-
0
OJ .!'Q
0-"
o 0
!!' c
co
0
~
:5
ID ID
~a:
W
0
:::>
(!)~
3'0
Q'
U
U)
:>:u
::J:::i
l.L
~
l.L
a:u
0'-5'8" SI! T wIth SAND very dark brown
[\OYA
// /.
r-
=
2/2), grades 1rom topsoil. trace organiCS
/. //.
=
throughout
/.
.
i-2
.
/z /z
/ /z
,.
22
E
Ml
/. /.
20
v
/z
.5-4.'
33
i-A
z z
i/
/z
f-
Z Z
2\
1=-6
v
/z
1.
\8
~
5-7
24
5'8"-23' I fAN CI AY brown {I0YR 4/3), medlum
r-
plasticity, moist
~8
weak red t2.5Y
5/3},
trace orange mottling
,.
\I
~
.5-9.
16
\2
1=
/. /
10
~
1.
\I
'=
I
/./
10-12
20
\I
=
12
/./
~
~IA
trace horlzontal1racture, wei
~
,.
\8
\I
.5-14.
\I
Cl
V,/
~
,.
\B
5-10% flne sand
\I
15-17
\I
1=-16
~
v./
f-18
~
,.
20
1/24
very Clark gray 12.5Y 3/1), trace wood and
~
white shell Hagments
~
.5-19.
20
V,/
1.
24
1/24
'=
20-22
~
1.
=
-
22
:v;;
[/,:;-
.5-24~
10
1/24
=
23'-25'6"
SAtID.
very dark gray 12.5Y 3/Il,
SP. .
1
hereby certify that the information on this form is true and correct to the best of my
knO~dge.
Signature
~JZ//L
IFirm
Natural Resource Technology, Inc.
/
Page2of2
ng - Hutsonville
Power Plant
TW cant.
Sample
Soil Properties
~.&
~
a;
c
u.
'"
Soil/Rock Description
>
'"
'"
'"
"
~
And Geologic Origin For
~:5
,.,
~
Q;
'"
""
ii;
'"
0
-,
8
'"
C
C
u
E
~
;?
:~
,.,
£
to
£
Each Major Unit
:c
ro
u.
-=
'"
"
x
.0
>-
>
(J)
'"
'"
E
0,
"'",
,
E
~
0
~
Q
to
Q
0>
,
~
C
-3
~
'"
'"
0
E
u
0
ro
~
.!2
0
E
~
<5
0-
-"
"
N
~
"
'"
'"
en
16
0
0_
0
ro
z
c
~
a:
1D
0
:::>
~
f=.
'"
0
ro
"
0
~
to
en
:>: u
:::;
:::;
0:
~
flO
to
'0
1/24
~
medium, loose, wet
r-
SP
TW
22
t::...
26
"'
IB
25'6"-26' I
FAN
CI
AX
as abOve
CL
'-?-?-.
25-27
22
r-
0.: .0.
26'-27'6" SAND With
GRAVEL
poorly graded,
SP
-".0'"
r-
h
coar se sand, fine gravel, rounded
.0:: :0:
TW
20
35
r
8
27'6"-31' SAtiD. gray/black and White, poorly
_5-29
9
'0
graded, medIum to coarse, Increased coarsness
with
depth
SP
30
TW
46
30-32
20
~
99
31'-32'6" SAND and
GRAVEl
coarse sand,
0'- .'0'-
r-
32
poorly graded, fine gravel, rounded
SP
.... 0...
0.: :0
.
~~:
y
32'6"-39'6" SAtlQ. gray, poorly graded, medium
...;
TW
11
~;.
,5-34
12
11
=-- 34
to coarse, 5-15% gra .... el
-hI!
,
!:':::=
,:;,
TW
24
35-37
3
22
4
=-- 36
SP
···~f.1 ~
1=
)g
~
n
,
.5-39
TW
36
r-38
~r: ~
g
24
610
r
.',~.
=
~;.
ilJ)jdi
r
o
E08@39'6"
I=-- 42
r
I=-- 44
r
I=-
46
r
'=--
48
::
;::.. 50
~
I=-
52
~
-
I=-- 54
~
~56
=-- 58
;:
:-60
r-
r-
I=-- 62
r-
r-
1=
MONlTORlNG WELL CONnRDcnOJ
Renne to' W:u=bodiW.==D
W ..'"
ManogementD
Remt.rlhricntRe<kTclomncnto
Olb
.,-
0
..
F2..CiliryjProjo:::t Name
L=J
Grid Lo=:i
CJ1
• <Jf
Woll 0
M-
OE..
rdlNomo
:-nu;lk
"Pbu.JO'L
'51'"'"....,.. I
brJ
.
.
It
OS.
ft.
OW.
T\j\/
~W-\Z
I
hoili1J' U=o. P=nll or Monitoring No.
LocaJ Grit!
Origm
0
( osrixmnod:
u)
or
WclI
Location
0
U""1= Weil No.
IUNI<
Weil JlJ No.
l.>t. __
•
•
n
.
•
n
.
..
long.
0'
Fociu!)'3D
SL P!Imo
fLN.
!LE.
SIClN
D= W
clllnstallod
..
,F.'
. ..
-~
.
lO/02./z
0
0-1.
Section
Loc.z.ilJIJ
ai W
~So1:Irt=
m m
d d
,
•
,
v
Type ofWcll
DE
Woll Instoilod
By: N= (firn.las7.)
and
Fim
WclJCode
~/
'?Z
. 1/4
of
1/4
of
5=.--.
T.
N.R
OW
..
R.
\5 ...oX=\?
l.=rion ofWoll
Rciari= to
WostdSo=
Gov.l.at_
Disumc::
from
WastrJ
I
Eni Stds.
u
o
UpgndiCllL
s
0
Sidegxadiau.
Sou=: .....
8:) ..ft.
Apply
0
d
• Downo:nulie:nr
n.
0
Not.K.Dnwn
E)c)Ao'l...~
Lo,uCr'iE"e;s,
D=:rilx
~-
In.
Some: of
~
(mrach =>lysi., If=!Jliral):
I
12
uses classifu:.:Itim
of
~il
':near sc::rc:n:
GP 0 GMO GCO GWO sVlD SF •
SM 0 SC 0
MLO MIl 0
CL 0 CI:l 0
Bedrod: 0
13. Sieve :maJysis pcrlcrmodl
0 Yos • No
J4.
Drillin;; ID.OIiJoC
nsed:
Rotary .0 5 0
Hollow
So=. "'''lie: • 4 1
Otht:t 0
>t~
01
08
33
02
30
30
01
No
_ Y.
!>m.
_2.9ft.
04
~~!
•
y"" 0 No
o
b.
Length:
c.M=ml;
Stecl •
Ol!J",O
d. ...ddirionalProu:etKn;!. Yos 0
Ifyos.d='-"'.
~
"C>u""Psl' fu,T.>
B==rite •
Ccn=D
Other.
0
4.
MaJ.cri:a.l bcrwc=1
Wc.TI
casing
m.d pt'Pt=OYe pip:::
Bentonite 0
SA'"
C>
Othe: •
5.
AmmIm-
'P'==U:
.. GrmmlmiChipporl EClltCIlin: •
b.
Lbs/g>.l moo
wciglu ...
BcnlDDitt:-,=d ili=y 0 . 35
o.
LbsIgaJ
mild weight. . . .. Bcmcnin:: slnny 0
3
1
d. __
% Bentonjtt. .. .. _.
Bc=nooirr.-ccman grom D :s 0
c.
Ft
~
voiume
adC.ed
for srry of
tht:
.above
1.
How im:uTh:rl:
Trc:nie "0
Tr=rie
pnmpod
0
Gnvity •
6.
EC1tonit~
seal:
.a.
lk:ru.cnite
granub •
b. 0114 in. OJI1l
in.
01/2
in.
B=onito ohips 0
Otl= 0
1.
Cap lII1d
lock?
2. Pm=tive
=pipo:
:a.. hide diameter.
3.Suri==U:
Air
0 OJ
None
It
99
DYes
ii
No
15. Drilling fluid u=l: W= 0 02
Drilling
Mnd 0
0 J
16. Drilling
:additives
used7
A Pron:ctiveplpe. top elcvaticn
B. Well cmng, tnp e.levation
C L3nd smb= dc:vlltion
10. S=
=en>.!:
_::p-'-'V"'L=-
_
'- S= type
Faemry an. 11
ContiInJom slo<
0
0
1
Othe:r 0
~.i)
I.
rme sand mataial:
Manuia.l:~ ~
prodUCt
name & mesh :size
, .#
J
'2:>
AC " E" R.
E,,"
b. Yolmno
lidded
fi
3
8.
Filterpacl::
1l12tl:ri2l: M""""'=.
J"IOdDct nome
& mesh
sm
"
*
yD
AVVI'C""~\C.':'N
KA'6n..IA~.
;~:~~~~
b. Yolutnelldded
h"
9. Woll =tiog:
F".ILciJ
tl=odo:l
PVC >Chedclo 40 •
2 J
Flush
tl=!rled
PVC
scbcluk
go 0
2 4
Ckber 0 ";
o.
!?l
2m.
_2.
9ft.
None. 14
other
0
~~
b. M:muf=J=
-S'"\,-, "S b
N
c. .Slot
size:
d.
Slou:ed
length:
_-_~
2.,(;;,.
__ .IIL
ll. BacJd:ill
ma=ial
(below liltc:-oacl::):
_ _ _ _ . _it MSLor_.35.
§ft.~
L Bon:hoie... t:ii..amcu:r
_~.~in.
=="
N.
Ln.
well =sing
M.
0.0. well
=cin~.
K.
Boroholo. bottom
F. Fmc sand..lDp
R. Sce::::n joinr.. top
L
Well
OoItOIIl
/
WELL NAME
TW (Ml..HZI)
WELL DIAMETER 2"
(MEASUREMENTS BELOWFROM TOP OF CASING)
TOTAL DEPTH 41.8'
DEPTH TO WATER BEFORE
DEVELOPMENT 16.3'
DEPTH TO WATER AFTER
DEVELOPMENT 16.3'
JOB NO# 3410-1824
LOCATION Hutsonville,IL
DATE
10/2/2001
DEVELOPED BY G. Jones
DESCRIPTION OF DEVELOPMENT METHOD
(Check One)
o SURGED W/BAILER & BAILED
o
SURGED W/BAILER & PUMPED
o
SURGED W/BLOCK & BAILED
[g] SURGED W/BLOCK & PUMPED
o
OTHER __
CAN THIS WELL BE PURGED DRY? 0 YES [g] NO
VOLUME OF WATER IN FILTER PACK AND WELL CASING
Gallons
VOLUME OF WATER REMOVED FROM WELL
120 Gallons
CLARITY
OF WATER BEFORE DEVELOPMENT
Trubid Gry
CLARITY
OF WATER AFTER DEVELOPMENT
Clear
VOLUME
OF WATER ADDED
None
SOURCE
OF WATER ADDED
None
TIME SPENT FOR DEVELOPMENT
75
Minutes
COMMENTS:
START:
6:00 P.M.
END:
7:15
P.M.