NATURAL
RESOU
RCE
TECHNOLOGY
WAmorefi
Leachate
Management
and Final Cover
Alternatives
Analysis Report
Hutsonville
Power
Station
Unlined Ash
Impoundment Pond
Closure
Hutsonville
IL
July
19
2005
Electronic Filing - Received, Clerks' Office, August 11, 2008--AS 09-1, Exhibit 3
NATURAL
RESOURCE
TECHNOLOGY
AMEREN
SERVICES
LEACHATE MANAGEMENT
AND FINAL COVER
ALTERNATIVES ANALYSIS REPORT
HUTSONVILLE POWER STATION
UNLINED ASH IMPOUNDMENT
POND
CLOSURE
HUTSONVILLE
IL
Project
No 1375
Prepared
For
Anieren Services
One Anieren Plaza
1901 Chouteau
Avenue
St
Louis
NIissouri
Prepared By
Natural Resource
Technology
Inc
23713
Paul
Road
Suite
Pewaukee
WI 53072
Final
Report
July
19
2005
Christopher
Robb
PE
i4ice
Hensel
PG
Project
Engineer
Senior
Hydrogeologis
23713
Paul
Rd
Ste
Pewaukee
WI 53072
Phone 262.523.9000
Fax 262.523.9001
www.naturalrt.com
Pewaukee
Madison
Electronic Filing - Received, Clerks' Office, August 11, 2008--AS 09-1, Exhibit 3
EXECUTIVE SUMMARY
The Hutsonville Power Station in Crawford
County
Illinois is located on the west bank of the Wabash
River
approximately
mile north of
Hutsonville
Illinois
Fly
ash from this coal-fired
power plant
is
collected
by
an electrostatic
precipitator
and has been sluiced
to two
ash
impoundments
Groundwater
quality
has been monitored
at this
facility
since 1984 Concentrations of boron and
sulfate
indicator
parameters
of coal ash
leachate
exceed the Section 811.320
applicable
background
concentrations and Illinois Class Groundwater
Quality
Standards at several shallow
monitoring
wells
near an unlined
impoundment
Pond
which is
no
longer
in service
Impacted groundwater
is
migrating
east towards the Wabash River
through
shallow
sediments
which
are
not utilized
as
source
of
groundwater
supply
Elevated
concentrations
were
also
noted in shallow
monitoring
wells
along
the
south
property
boundary suggesting potential
for off-site
migration
however
impacts
have not been
noted in
water
samples
collected south
of the
impoundment
There are five
groundwater
supply
wells within
mile of the
site
all finished in
deep
alluvial sand
and
gravel
in the Wabash River
valley
Two
wells
directly
east of the unlined
impoundment
are
used for
potable
and
process plant
water
and
one
well southwest and
two
wells
southeast
of the
impoundment
are
used
for
irrigation
water Concentrations of boron and sulfate in
samples
collected from
one on-site
monitoring
well
were
higher
than
811.320
background
concentrations
but lower
than Class
groundwater
quality
standards Six other
monitoring
wells screened in the
deep
alluvial
aquifer
on the Illinois side of
the river show
no
evidence of
impacts
The
primary objective
of this alternatives
analysis
was
to evaluate
and make
recommendations
on
leachate
management deep
alluvial
aquifer
containment
and final cover alternatives
for closure of the
unlined
ash
impoundment Pond
based on technical and
cost
considerations
Alternatives
analysis
objectives
herein referenced
as
Closure
Objectives
were identified to
protect
human health and the
environment for both the
parameters
of concern
POCs
identified in the
Hydrogeologic Assessment
and
to limit
exposure
pathways
in
accordance with
applicable
environmental standards
Site-specific
considerations
for
establishing
appropriate
Closure
Objectives
for Pond
include
proximity
of
the
Wabash
River to Pond
hydrogeology
and
groundwater
quality
in the
vicinity
of
Pond
and the
presence
or
absence of
exposure
pathways
for identified POCs
groundwater
soil
and surface
water
Based on review of the
regulations
promulgated
in 35 Illinois
Administrative Code
IAC
Part 811 and
814 and
site-specific
considerations
identified
above
the
following
Closure
Objectives
were
developed
Manage
groundwater
quality
to meet
the
requirements
of Section 811.320 and
Construct
final
cover
system
that meets the
requirements
of Part 811
or an
adjusted
standard
approved by
the Illinois Pollution
Control Board
PCB
Specific
parameters
for
performing
the alternatives
analysis
were
developed
on the basis of
the results
of the 1999
Hydro geologic Assessment
the Groundwater Model Evaluation
of Impoundment
Closure
Options
dated
January
2000
and
two
supplemental
investigations
performed
for this
analysis
groundwater
flow and
transport modeling
for selected
alternatives
and
considerations
for
pursuing
adjusted
standards
through
the Illinois PCB Four final
cover
alternatives
and four
combinations of final
cover and leachate
management
alternatives
were carried
through
the
groundwater
transport modeling
evaluation
Subsequent
to the model
analysis
four alternatives
were
selected for
detailed
analysis
1375 Alternatives
Analysis Report-Final
NATURAL
ES-i
RESOURCE
TECHNOLOGY
Electronic Filing - Received, Clerks' Office, August 11, 2008--AS 09-1, Exhibit 3
EXECUTIVE SUMMARY
Closure Alternative
No
Geosynthetic
Final Cover with East and South
Interceptor
DrainiTrench and Groundwater
Extraction from the
Deep
Alluvial
Aquifer
This closure
alternative
adheres
to
the Section
811.314
requirements
for
final
cover
system
and
implements
leachate
collection
along
the
east
and south
boundaries of Pond
and
groundwater
extraction
in
the
deep
alluvial
aquifer
to meet the
requirements
for
meeting
applicable
groundwater
quality
standards
at
the
edge
of the
zone of attenuation
as
defined in
Section
811.320c
Closure Alternative
No
Earthen Final Cover with South
Interceptor
DrainlFrench
This
closure alternative
balances lower cost with leachate
collection
and is
designed
to
prevent
off-site
migration
of
groundwater
to the south
Adjusted
standards
would be
required
to
implement
this closure alternative
Closure Alternative
No
Earthen Final
Cover This closure alternative
represents
the
lowest
cost alternative
for closure of Pond
and would
require
adjusted
standards
to
seek relief from several sections of
Part 811 and Part 81
4.302b
Closure Alternative
No
Pozzolanic
Fly
Ash Final Cover This closure alternative
provides equivalent
effectiveness
to
Closure
Alternative
No
and has the added benefit
of
providing
renewed
capacity
for the active
Pond
fly
ash
impoundment
This
alternative
would
require adjusted
standards to seek relief from several sections of Part
811 and Part
814.302b1
utilizing technology
and
construction
techniques substantially
similar
to those
promulgated
in 35 IAC Part 816
Alternative
Standards for Coal
Combustion Power
Generating
Facilities Waste
Landfills
Surface water
management
was
considered
for each of the selected alternatives
The
optimal
alternative
routes surface water east toward the Wabash River and
west
toward
drainage
collection
pond
Costs for each of the closure alternatives
and the alternate final
cover are summarized
below
Closure Alternative
No
has the
highest
initial
capital
cost
$6.8
million
and
highest
operating
and maintenance
cost $3.1
million
over 30
years
based on 2003 dollars Ease
of
implementation
and
performance
are not
concerns as
the remedial
components
consisting
of
geosynthetic cover
leachate
collection
via an
interceptor
drain/trench
and
groundwater
extraction
in the
deep
alluvial
aquifer
are demonstrated
technologies
that are
widely
available
Closure Alternative
No
provides significant cost
savings
versus Alternative
No
in
up-front
capital
cost $4.7
million
and
lower
operating
and maintenance
cost
$1.1
million over 30
years
Predicted
performance
effectiveness
and
reliability
along
the
south
impoundment boundary
are
nearly equivalent
to Closure
Alternative
No
Closure Alternative
No
represents
the lowest cost alternative
with
significant savings
in
up-front
capital
$4.2
million
and low
operating
and maintenance cost
$0.2
million
over
30
years
Groundwater
transport
modeling suggests
that
an earthen cover
may
provide performance
and
long
term
effectiveness
along
the south
property boundary
similar to Closure Alternatives
No
and
Closure Alternative
No
provides performance
reliability
and effectiveness
equivalent
to the final covers
proposed
for each alternative
at
mid-range
capital
cost for final cover
1375 Alternatives
Analysis
Report-Final
NATURAL
ES-2
RESOURCE
TECHNOLOGY
Electronic Filing - Received, Clerks' Office, August 11, 2008--AS 09-1, Exhibit 3
EXECUTIVE SUMMARY
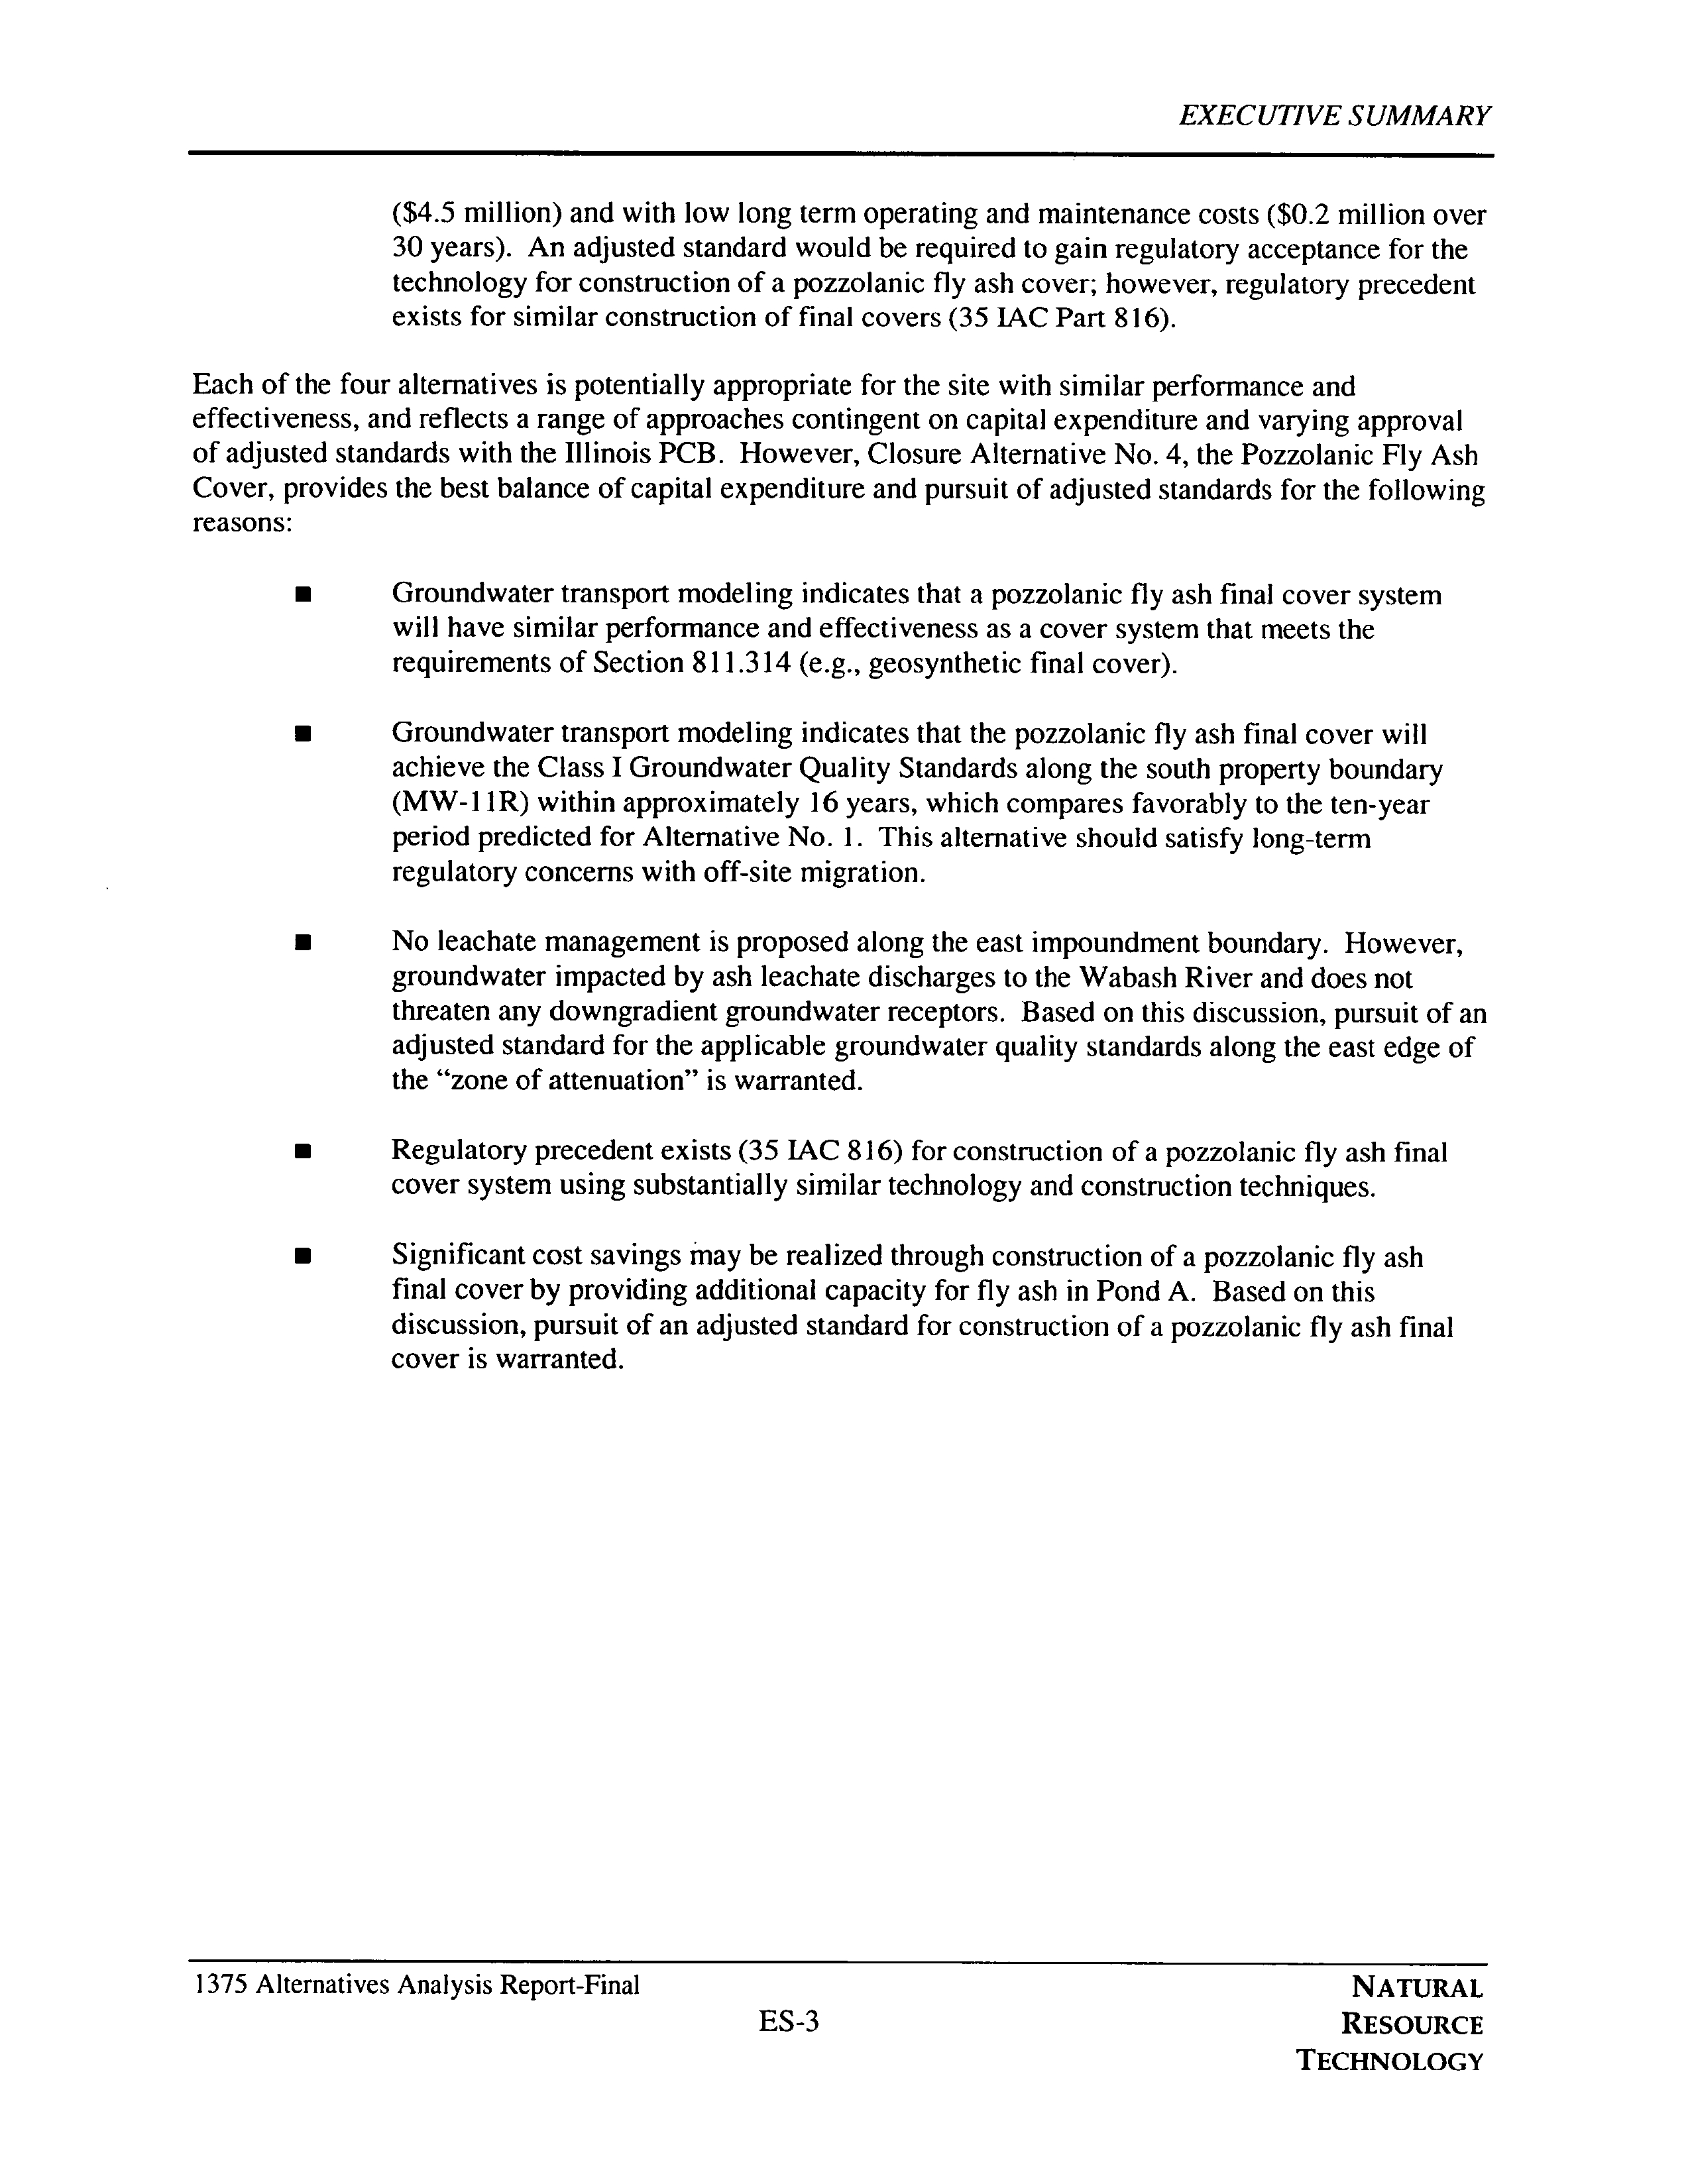
$4.5 million
and with low
long
term
operating
and maintenance
costs
$0.2
million over
30
years
An
adjusted
standard would
be
required
to
gain regulatory
acceptance
for the
technology
for construction
of
pozzolanic fly
ash
cover
however
regulatory
precedent
exists for similar
construction
of
final
covers
35
IAC Part
816
Each of the four alternatives
is
potentially appropriate
for the site with similar
performance
and
effectiveness
and reflects
range
of
approaches contingent
on
capital expenditure
and
varying approval
of
adjusted
standards
with the Illinois PCB
However
Closure Alternative
No
the Pozzolanic
Fly
Ash
Cover
provides
the best
balance of
capital expenditure
and
pursuit
of
adjusted
standards
for the
following
reasons
Groundwater
transport modeling
indicates
that
pozzolanic fly
ash final cover
system
will have similar
performance
and effectiveness
as
cover
system
that meets the
requirements
of Section 811.314
e.g geosynthetic
final
cover
Groundwater
transport modeling
indicates that the
pozzolanic fly
ash final cover will
achieve the Class Groundwater
Quality
Standards
along
the south
property boundary
MW-I IR
within
approximately
16
years
which
compares
favorably
to the
ten-year
period predicted
for Alternative
No
This alternative should
satisfy long-term
regulatory
concerns with off-site
migration
No leachate
management
is
proposed along
the east
impoundment boundary
However
groundwater
impacted by
ash
leachate
discharges
to the Wabash River and does
not
threaten
any downgradient groundwater
receptors
Based
on
this
discussion
pursuit
of an
adjusted
standard for the
applicable
groundwater
quality
standards
along
the east
edge
of
the zone of attenuation is warranted
Regulatory precedent
exists
35
JAC
816
for construction
of
pozzolanic
fly
ash final
cover
system
using
substantially
similar
technology
and
construction
techniques
Significant
cost
savings
may
be realized
through
construction
of
pozzolanic fly
ash
final cover
by providing
additional
capacity
for
fly
ash in
Pond
Based
on this
discussion
pursuit
of
an
adjusted
standard
for construction
of
pozzolanic fly
ash final
cover is warranted
1375 Alternatives
Analysis Report-Final
NATURAL
ES-3
RESOURCE
TECHNOLOGY
Electronic Filing - Received, Clerks' Office, August 11, 2008--AS 09-1, Exhibit 3
TABLE OF CONTENTS
INTRODUCTION
1-1
1.1
Background
1-1
1.2
Investigation
Time Line
1-2
1.3
Alternatives
Analysis
Objectives
and
Approach
1-3
SUMMARY OF SITE CONDITIONS
2-1
2.1
Supplemental
On-Site
Investigation
October 2001
2-1
2.1.1
Advancement of Soil
Borings
2-1
2.1.2
Installation
Abandonment of
Monitoring
Wells
2-2
2.1.3
Hydraulic Testing
2-3
2.2
Supplemental
Off-Site
Investigation
April
and
May
2004
2-3
2.2.1
Installation of
Monitoring
Wells
2-3
2.2.2
Hydraulic Testing
2-5
2.3
Groundwater
Sampling
and
Analysis
2-5
2.4
Summary
of
Hydrogeology
and Groundwater
Quality
2-6
2.4.1
Distribution
of Coal Ash Fill
2-6
2.4.2
Hydrogeology
2-6
2.4.3
Evaluation of
Daily
Groundwater and River Elevation Data
2-7
2.4.4
Groundwater
Quality
and Parameters of Concern
2-7
2.4.5
Background
Concentrations
2-7
2.4.6
Groundwater
Quality
2-9
2.5
Exposure Pathways Groundwater Soil
Surface
Water
2-10
IDENTIFICATION OF LEACHATE MANAGEMENT AND FINAL COVER ALTERNATIVES3-1
3.1
Identification
of
Alternatives Overview
3-1
3.2
Leachate
Management
and
Deep
Alluvial
Aquifer
Source Control Alternatives
3-2
3.2.1
Selection of Alternatives for Initial
Screening
3-2
3.2.2
Site
Monitoring
with No Leachate
Collection
3-2
3.2.3
Groundwater Extraction
Leachate Collection Alternatives
3-3
3.2.4
Source Control of
the
Deep
Alluvial
Aquifer
3-3
3.2.5
Ash Stabilization
3-4
3.2.6
Ash Removal and
Disposal Recycling
at an Off-Site
Facility
or
Beneficial
Reuse
3.4
3.2.7
Ash
Impoundment
Reconstruction
3-5
3.2.8
Containment
Using
Low-Permeability
Barrier Wall
3-5
3.3
Final Cover Alternatives
3-6
3.4
Surface Water
Management
Alternatives
3-7
3.5
Initial
Screening
Criteria and Results
3-8
1375 Alternatives
Analysis Report-Final
NATURAL
RESOURCE
TECHNOLOGY
Electronic Filing - Received, Clerks' Office, August 11, 2008--AS 09-1, Exhibit 3
TABLE
OF CONTENTS
3.6
Treatability Study
for
Pozzolanic
Fly
Ash Final Cover
3-10
MODELING
AND
EVALUATION OF SELECTED ALTERNATIVES
4-1
4.1
Purpose
4-1
4.2
Model
Approach
4-2
4.2.1
HELP
Modeling
4-2
4.2.2
MODFLOW/MT3DMS
4-3
4.2.3
Criteria for Evaluation of
Modeling
Results
4-3
4.2.4
Simulation of Final Cover and Leachate
Management
Alternatives
4-3
4.2.5
Simulation of
Deep
Alluvial
Aquifer
Source Control Alternative
4-4
4.3
Modeling
Results and Recommendations for Alternative
Assembly
4-4
4.3.1
Modeling
Results Final Cover Alternatives
4-5
4.3.2
Modeling
Results Final Cover Alternatives
Combined with Leachate
Management
Alternatives
4-5
4.3.3
Recommendations for
Alternatives
Assembly
4-6
ASSEMBLY AND DETAILED
ANALYSIS OF CLOSURE ALTERNATIVES
5-1
5.1
Assembly
and Selection Rationale
5-1
5.2
Detailed
Analysis
of Closure Alternatives
5-2
5.3
Recommended
Closure
Strategy
5-3
5.4
Recommended
Pre-Design
Evaluation and Field
Testing
5-4
REFERENCES
6-1
FIGURES
Figure
1-1
Site Location
Map 1375-A03
Figure
1-2
Site Plan
1375-61-B30
Figure
2-1
Geologic
Cross
Sections
1375-61-BOl
Figure
2-2
Groundwater
Elevation
Contours
September
14
2004
1375-61-A04
Figure
2-3
Groundwater Elevation
Contours
October
26
2004
1375-61-A03
Figure
2-4
Groundwater
Elevation
Contours
November
16
2004
1375-61-A02
Figure
2-5
Comparison
of Groundwater
Elevation Data to Well
Pumpage
September-
November 2004
Figure
2-6
Boron Concentration
in
Background
Wells
Figure
2-7
Sulfate Concentration
in
Background
Wells
Figure
5-1
Alternative No
PVC Final Cover With East
and South
Interceptor
Drain/Trench
and
Deep
Groundwater Extraction
System 1375-61-BO3C
Figure
5-2
Alternative No
Earthen Final Cover With
South
Interceptor
Drain/Trench
1375-61 -BO4C
Figure
5-3
Alternative No
Earthen Final Cover or Pozzolanic
Fly
Ash
Final Cover
1375-61
-BO5C
1375
Alternatives
Analysis Report-Final
NA11JRAL
ii
RESOURCE
TECHNOLOGY
Electronic Filing - Received, Clerks' Office, August 11, 2008--AS 09-1, Exhibit 3
TABLE OF CONTENTS
APPENDICES
Soil
Boring
and Discrete Groundwater
Sampling
Data
Monitoring
Well
Locations Elevations
Depth
to
Bedrock
and Screened
Formation
Monitoring
Well
Completion
Details
Monitoring
Well
Slug
Test Results
Background
Statistical
Summary
Groundwater
Concentration
Results from
Monitoring
Wells
Initial
Screening
of Leachate
Management
and Final Cover Alternatives
Areal Extent and Volumes of
Unsaturated and Saturated Ash in Pond
Final Cover Alternatives Material Balance
Analysis
Comparison
of Recommended
Mix
Designs
to Performance Goals and Cost
Sensitivity Analysis
Selected Alternatives for Groundwater Flow and
Transport
Modeling
Groundwater Flow
and
Transport
Model
Results
Closure Alternatives Cost
Summary
Detailed
Analysis
of Closure
Alternatives
Appendix
Appendix
Appendix
Appendix
Appendix
Appendix
Supplemental
Site
Investigation Appendices
A-i
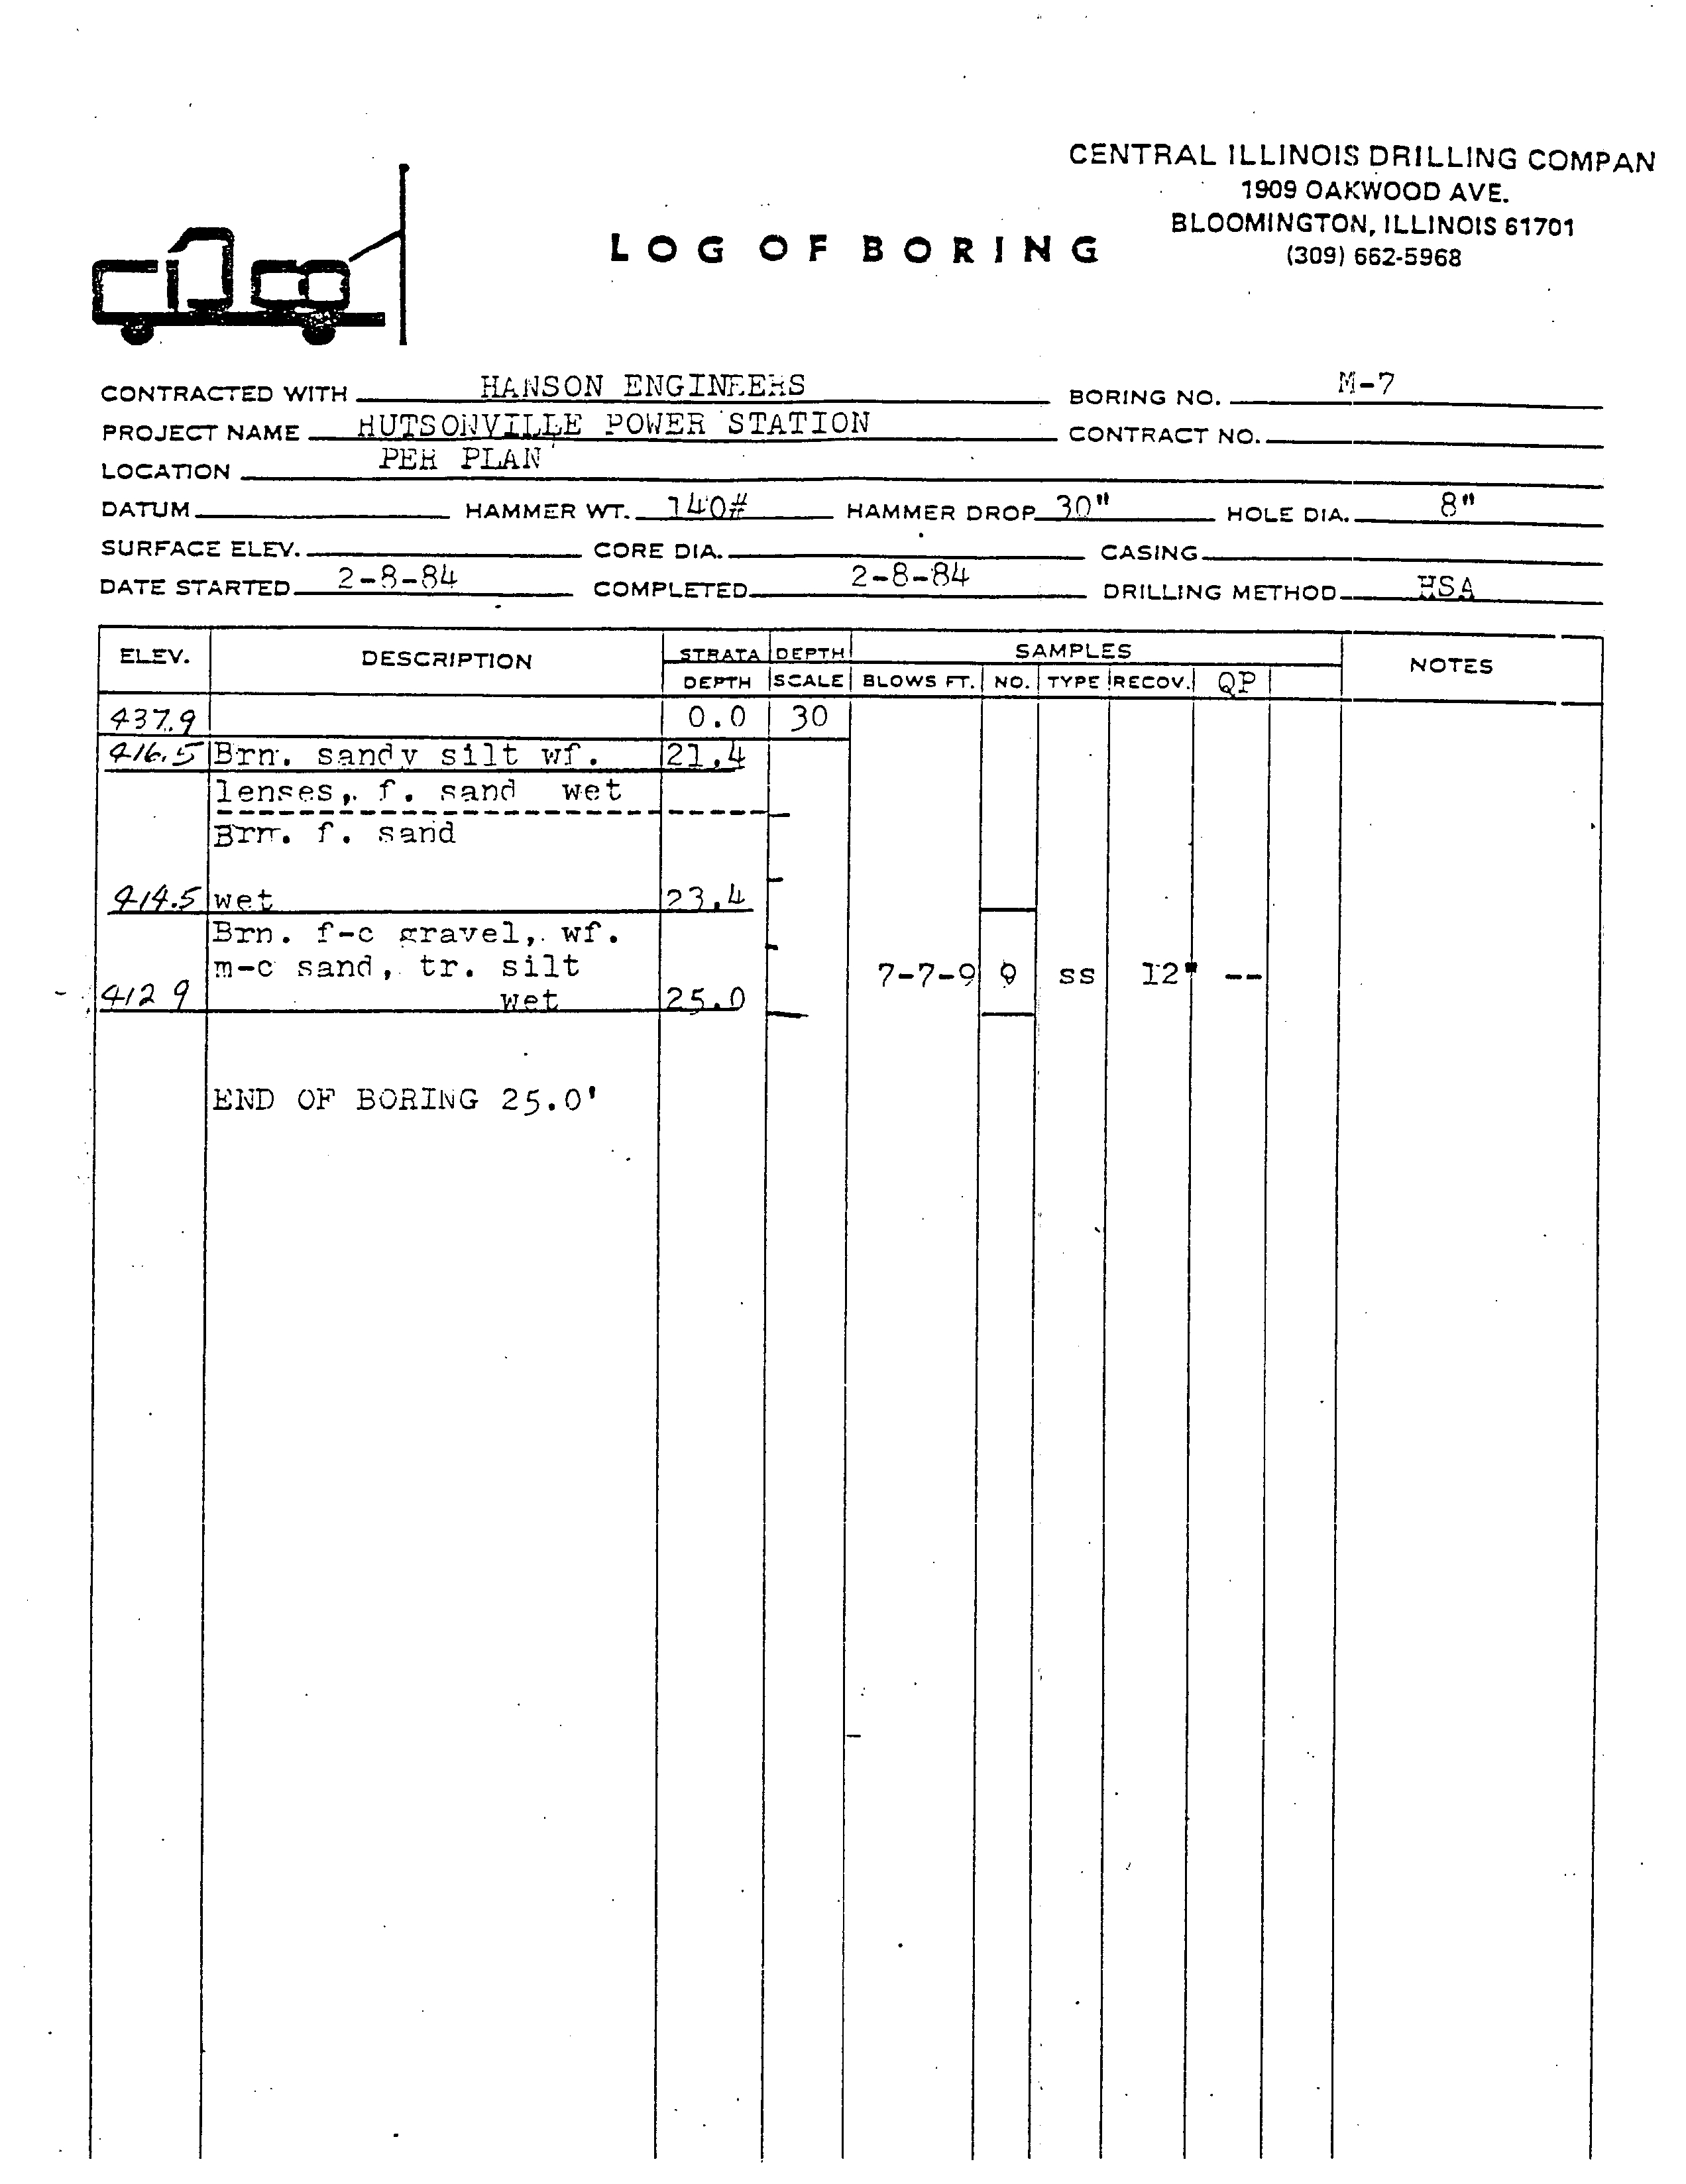
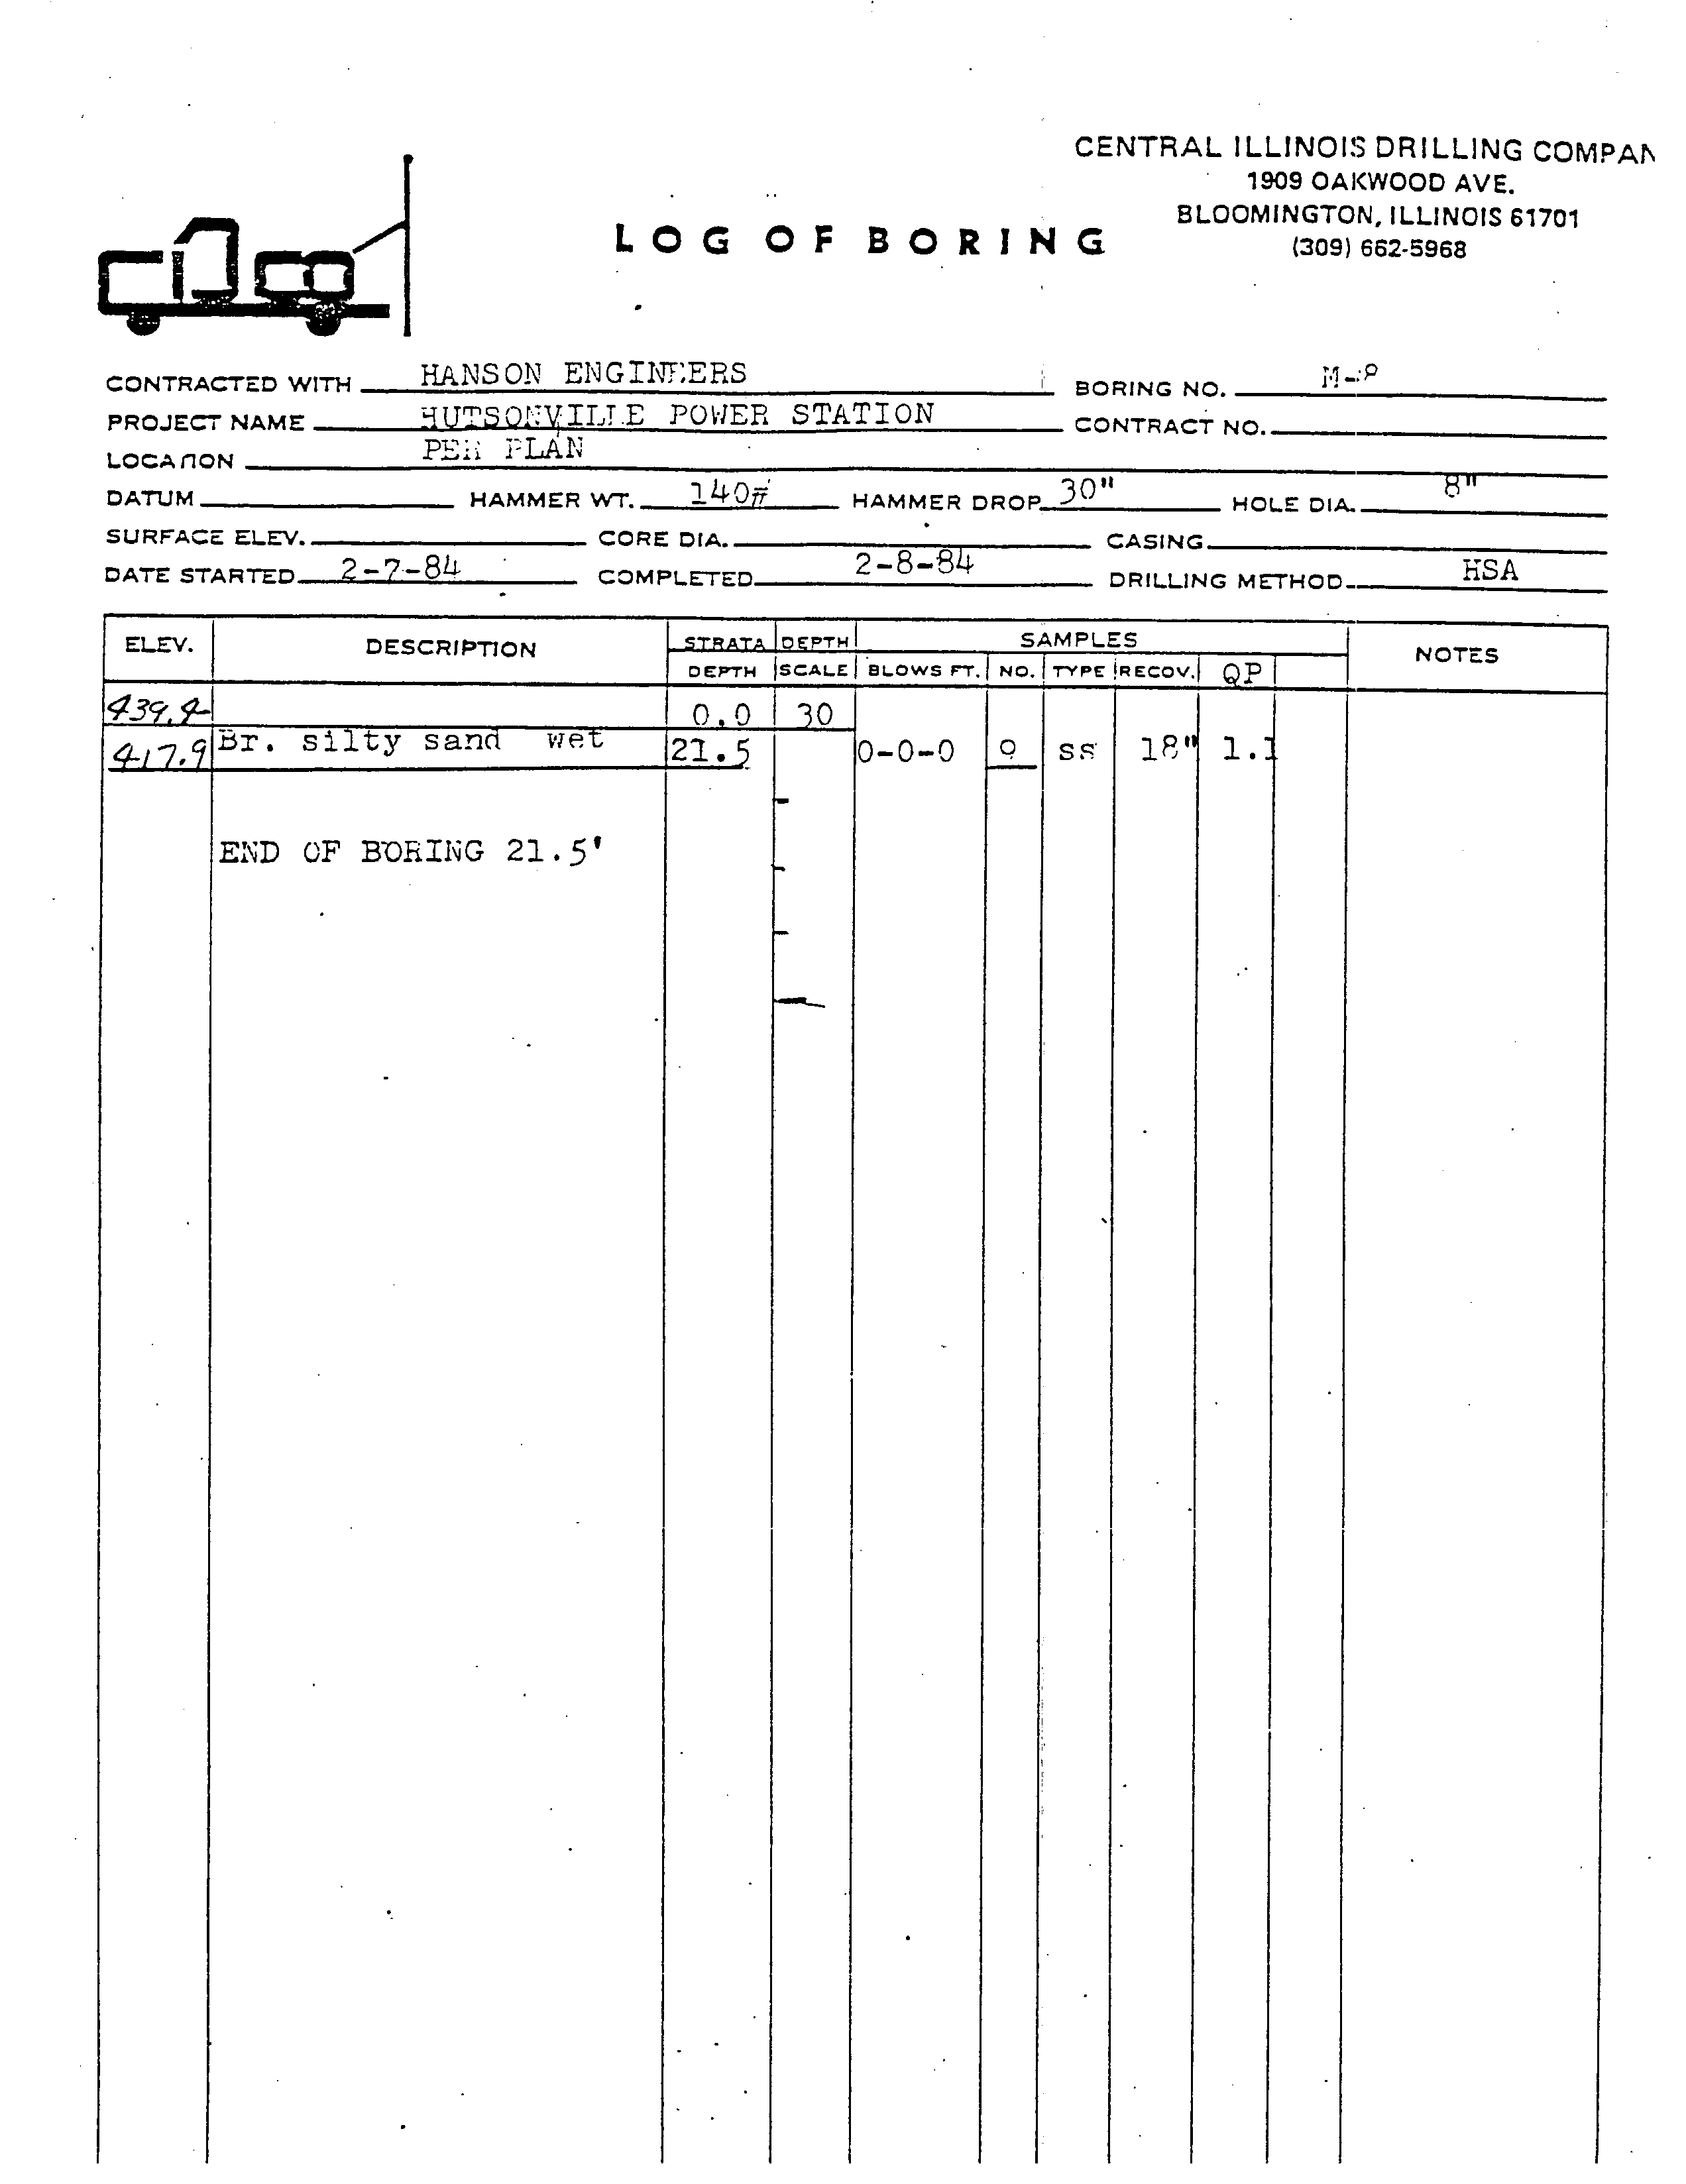
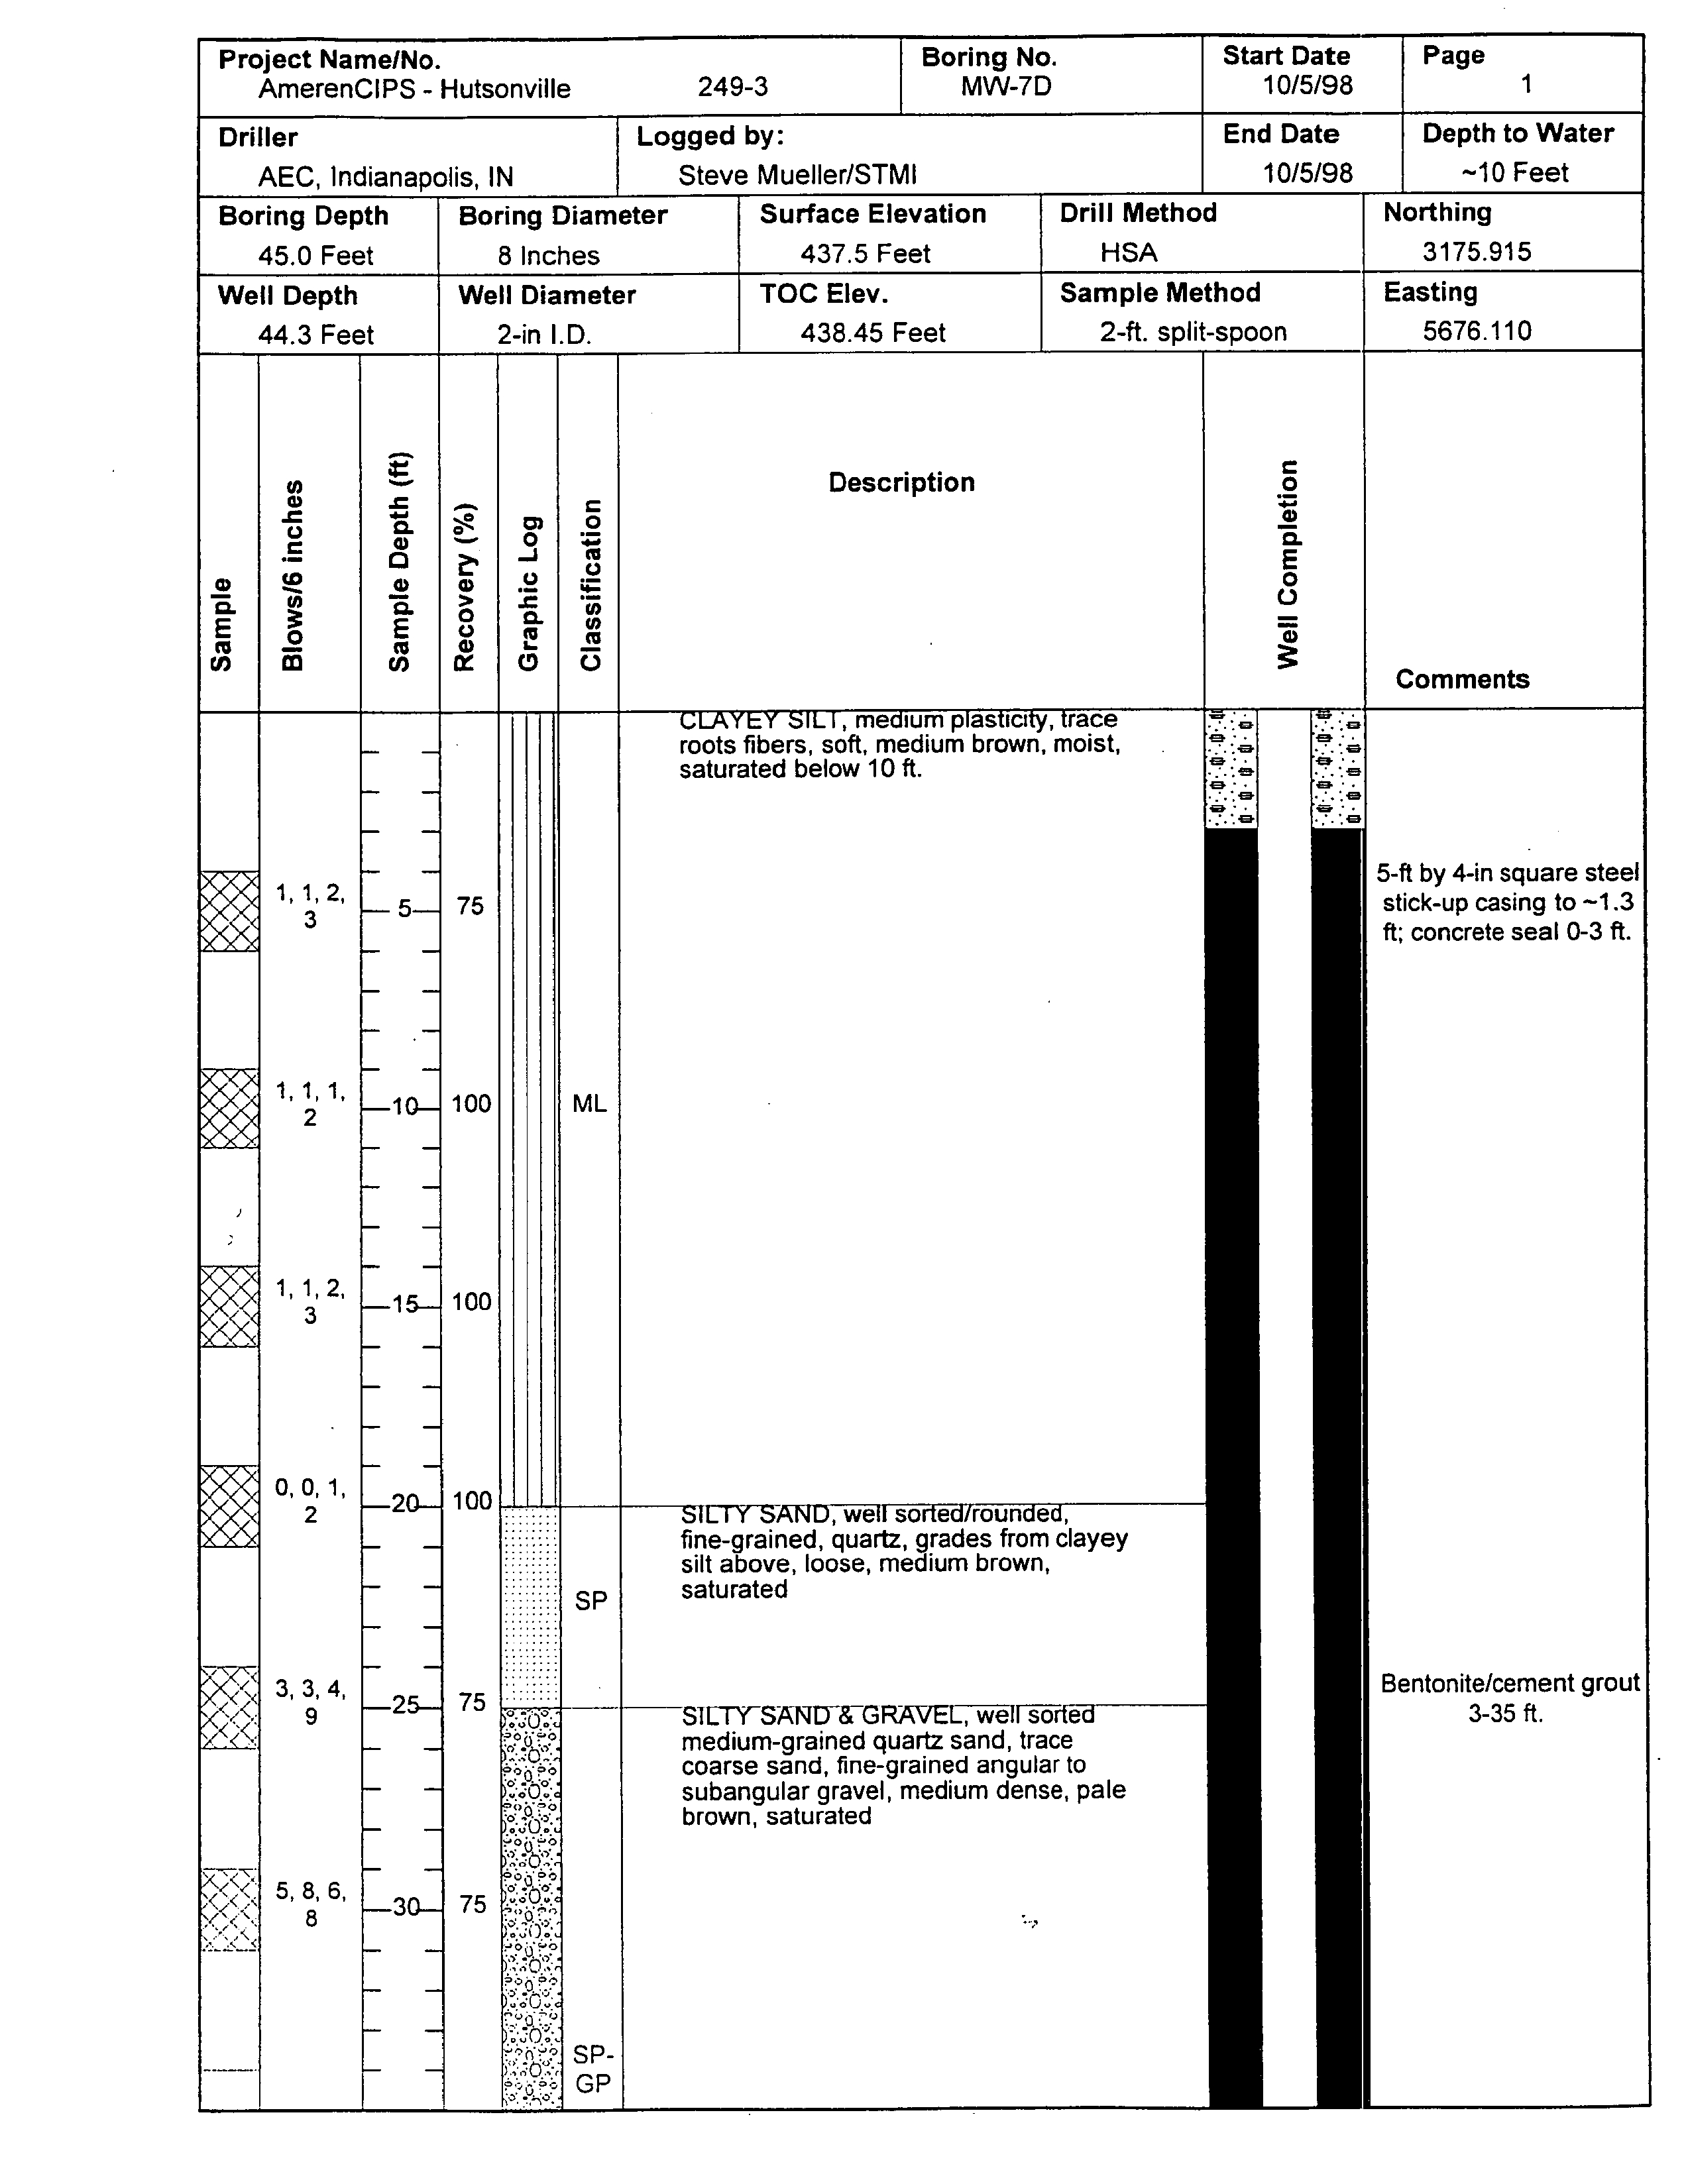
Soil
Boring Logs
A-2
Monitoring
Well
Completion Reports
and Abandonment
Log
A-3
Slug
Test
Data
A-4
Groundwater
Sampling
SOP
AEG
Alternative Cost
Summary
Sheets
Treatability
Study
for
Pozzolanic Final
Cover
System
C-i
Conceptual Development
of Pozzolanic
Cap
for Closure of Basin
at
The
Hutsonville Power Station
C-2
VFL Cost Data
Groundwater
Transport Modeling
Results and
Supporting
Documentation
Statistical Calculations
Groundwater
Velocity
Calculation
1375 Alternatives
Analysis
Report-Final
111
NATuRAL
RESOURCE
TECHNOLOGY
TABLES
Table 2-1
Table 2-2
Table 2-3
Table 2-4
Table 2-5
Table 2-6
Table 3-1
Table 3-2
Table 3-3
Table 3-4
Table 4-1
Table 4-2
Table 5-1
Table 5-2
Electronic Filing - Received, Clerks' Office, August 11, 2008--AS 09-1, Exhibit 3
INTRODUCTION
1.1
Background
Ameren
Energy Generating operates
the Hutsonville Power
Station
in
Crawford
County
Illinois
Figure 1-1
The
power
station is located
on
the
west
bank
of the Wabash River
mile north of the
city
of Hutsonville SW
Section
17
Township
8N Range 11W
The coal fired
power plant
has been in
operation
since the
1940s There are
currently
two units
operating
at the
plant completed
in 1953
unit
and 1954
unit
with combined
generating capacity
of 164 MW
Fly
ash from the
operating
units
is collected
by
an
electrostatic
precipitator
and sluiced
to
12-acre lined ash
impoundment Pond
Figure
1-2
which
was
constructed in 1984 Bottom ash is
sluiced to
separate pond
and
eventually
recycled
Sluice
water
from
Pond
is routed
through
4.2-acre lined interim
pond Pond
constructed
in
2000
before
discharge
to the Wabash River via NPDES
permitted
outfall
002
IL0000 175
Sluice
water from the bottom ash
pond
is routed
through
1.7-acre
drainage
collection
pond Pond
constructed in
2000
and Pond
before
discharge
to the Wabash River via the
same
outfall
The site also has
22-acre unlined ash
impoundment Pond
which was constructed in 1968 This
impoundment
was the
primary
ash
management
unit
prior
to
construction
of Pond
in
1984
and was
used as
secondary settling pond
from 1984
through
construction
of Pond
in 2000
It has been inactive
since 2000
although precipitation
and flood backwater have accumulated
in the
impoundment
at
times
resulting
in
ponded
conditions
Groundwater
quality
has been monitored at this
facility
since 1984 Concentrations of boron and sulfate
at several
monitoring
wells exceed the 35 Illinois
Administrative Code
IAC
811.320
groundwater
quality
standards
Section
811.320
applicable
background
concentrations
and the Illinois Class
groundwater
quality
standards Boron and sulfate
are indicator
parameters
for coal ash leachate In
response
to
these
findings
Ameren Services contracted
Science
Technology
Management
Inc
STMI
and Natural Resource
Technology
Inc
NRT
to
perform
Hydrogeologic
Assessment that
was
completed
in
August
1999
The
Hydrogeologic
Assessment identified
correlation
between shallow
groundwater
quality
elevated
boron and sulfate concentrations
in
groundwater
and
potential
leachate
sources
namely
the former ash
laydown
area which was
excavated
prior
to
construction
of
Ponds
and
and the unlined ash
1375 Alternatives
Analysis Report-Final
NATURAL
1-1
RESOURCE
TECHNOLOGY
Electronic Filing - Received, Clerks' Office, August 11, 2008--AS 09-1, Exhibit 3
INTRODUCTION
impoundment Pond
Boron and sulfate are
migrating
east
towards the
Wabash River
however
there
are no
groundwater
supply
wells in the shallow sediments between the unlined ash
impoundment
and the
Wabash River
There are four
groundwater
supply
wells within
mile of the
site
all
finished in
deep
alluvial sand and
gravel aquifer
in the Wabash River
valley
Two wells
are
directly
east
of the unlined
impoundment
and
are
used for
plant water
and two wells are southeast
of the
impoundment
and used for
irrigation
water
Groundwater
quality
data from
monitoring
well
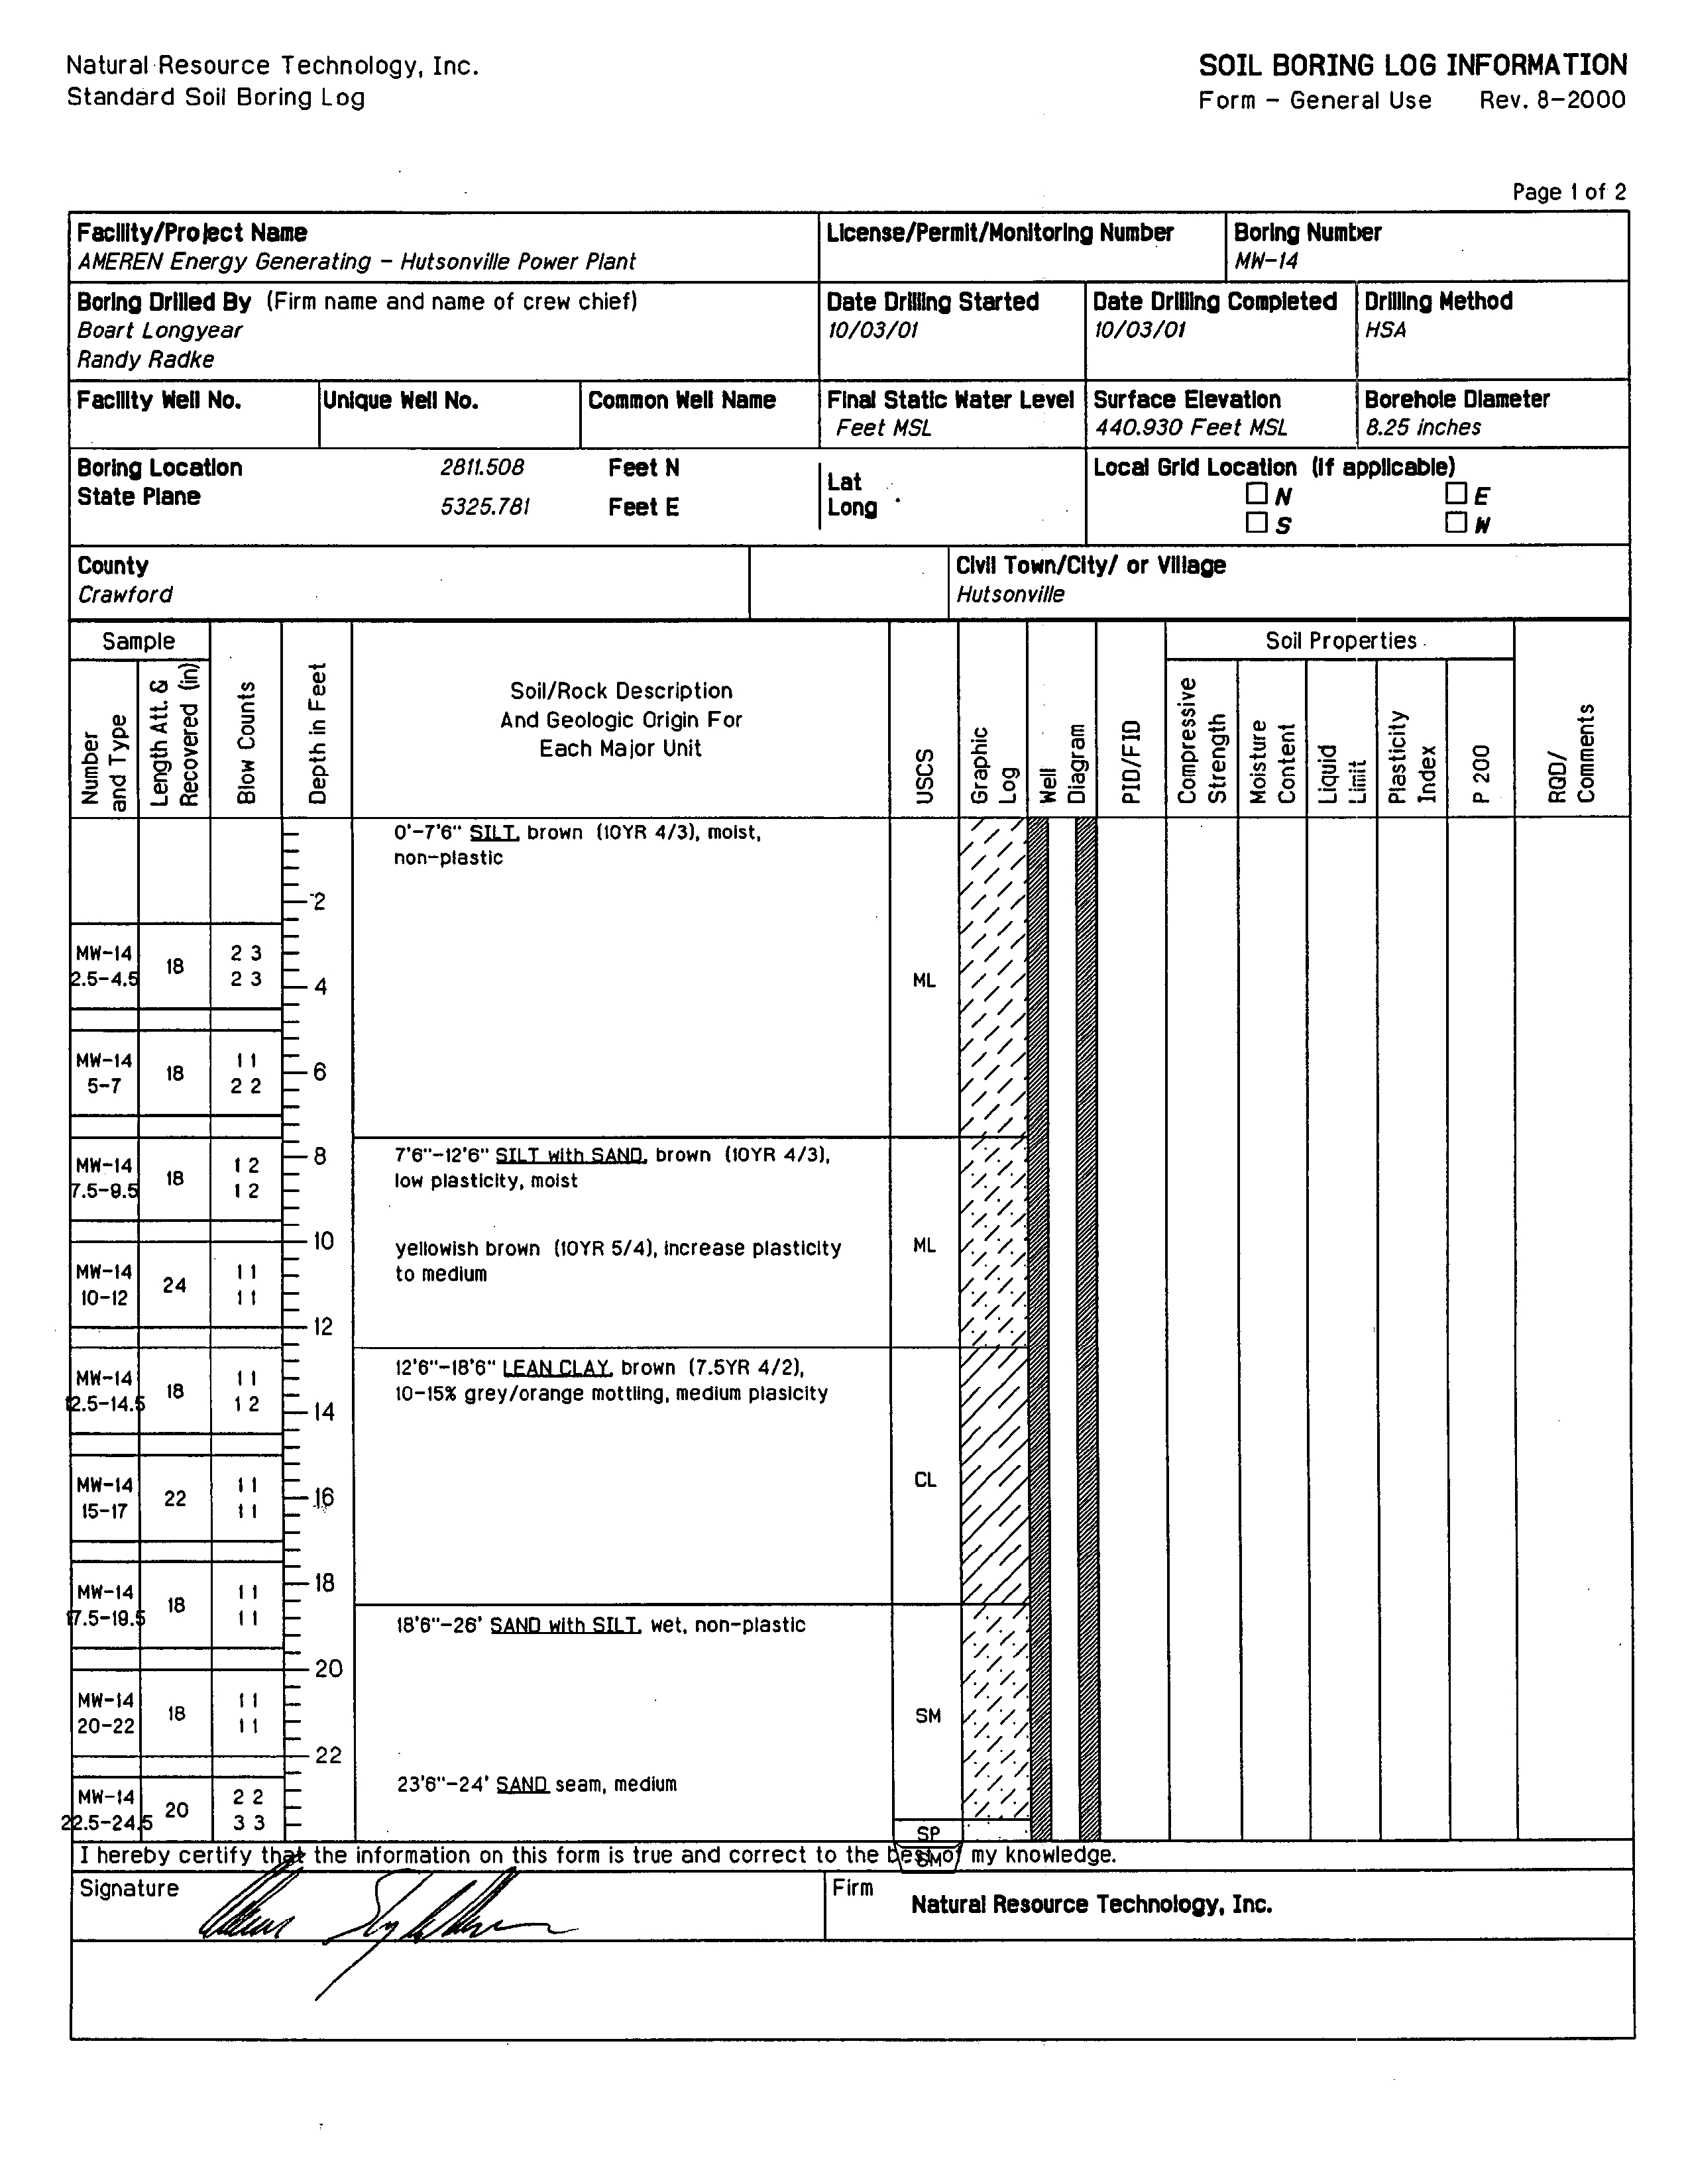
MW-14
which is
directly
southeast
of the unlined ash
impoundment
and is screened in the
deep
alluvial sand and
gravel
indicates evidence of ash
impoundment impacts
in that
aquifer
based
on
comparison
to Section 811.320
applicable background
concentrations
However
concentrations
are
lower than
the Illinois Class
groundwater
quality
standards
1.2
Investigation
Time Line
NATURAL
RESOURCE
TECHNOLOGY
1999
The
Hydrogeologic
Assessment
report
characterizes
hydrogeology
at the site and identifies
Pond
and an ash
laydown
area as the sources
of shallow
groundwater
quality impacts
at the
site No evidence of
groundwater
impacts
are found in the
deep
alluvial
aquifer
2000
Groundwater
Model Evaluation
of
Impoundment
Closure
Options
concludes that
dewatering
of Pond
will reduce leachate
loading
to the Wabash river
by
more
than
80
percent
however no
capping option
will result in
attainment of Class
groundwater
quality
standards
due to
continuing groundwater
flow
through
ash
deposited
below the water
table
2000
Ash in the former ash
laydown
area is
removed
Ponds
and
are constructed
and
Pond
is
permanently
removed from service
2001
supplemental
site
investigation
is
performed
for this
alternatives
assessment
Additional
monitoring
wells are installed in the
deep
alluvial
aquifer
There is
no evidence of ash
impacts
in the
deep
alluvial
aquifer
2002
Research is
performed
for
an
innovative
approach
to
capping
Pond
2003
The first draft of this
Alternatives
Assessment
report
and
petition
for
adjusted
standards
is
completed
After
meeting
and discussion of
preliminary
results
IEPA determines that
Groundwater
Impact
Assessment is
required
for the
deep
alluvial
aquifer
Spring
After
delays
in
obtaining
site access on off-site
private
property
an
investigation
is
performed
2004
to characterize
hydrogeology
in the
deep
alluvial
aquifer
2005
During
data
review it is determined that MW-14 has elevated boron and
sulfate
concentrations
In
response
to this
finding
it is determined that the Groundwater
Impact
Assessment is no
longer necessary
and
plan
is
developed
to
sample
the off-site wells to
determine
whether or not
groundwater
impacts
in the
deep
alluvial
aquifer
extend to the
south
however
flood conditions
on
the
Wabash river
delay
data collection Work
commences on
completion
of this Alternatives
Analysis
1375 Alternatives
Analysis Report-Final
1-2
Electronic Filing - Received, Clerks' Office, August 11, 2008--AS 09-1, Exhibit 3
INTRODUCTiON
1.3 Alternatives
Analysis Objectives
and
Approach
The
primary objective
of the alternatives
analysis
is to evaluate
and make recommendations
on
leachate
management
and
final
cover alternatives
for closure of the unlined ash
impoundment
Pond
based
on
technical and
cost
considerations
Alternatives
analysis objectives
herein referenced
as
Closure
Objectives
were
identified for
protecting
human
health and the environment for both the
parameters
of
concern POCs
identified in the
Hydrogeologic Assessment
and
exposure
pathways
in accordance with
applicable
environmental standards
Site-specific
considerations
for
establishing
appropriate
Closure
Objectives
for Pond
include
proximity
of
the Wabash River
to
Pond
hydrogeology
and
groundwater
quality
in the
vicinity
of Pond
and the
presence
or
absence
of
exposure pathways
for identified POCs
groundwater
soil
and surface
water
Standards are
promulgated
for the
design
and
operation
of solid
waste landfills under 35 Illinois
Administrative Code
IAC
Parts 810
to
816 Based
on
review of
these
regulations
and on
site-specific
considerations
the
following
Closure
Objectives
were
developed
Manage groundwater
quality
to meet the
requirements
of Section
811.320 and
Construct
final
cover
system
that
meets
the
requirements
of Part 811 or an
adjusted
standard
approved by
the Illinois Pollution Control Board
PCB
Specific
parameters
for
performing
the alternatives
analysis
were
developed
on
the basis of
the results
of the 1999
Hydrogeologic
Assessment the Groundwater Model Evaluation
of impoundment
Closure
Options
dated
January 2000
and
supplemental investigations
performed
for this
analysis Section
additional
groundwater
flow
and
transport modeling
of alternatives
Section
and
considerations
for
pursuing adjusted
standards
through
the Illinois PCB The
range
of
technological
applications
considered
included conventional and innovative
alternatives
Tables
3-1 3-2 3-3 4-1 4-2 5-1
and 5-2 summarize the
findings
of this alternatives
analysis
which are
described in Sections
and
This alternatives
analysis
process
was
developed
to meet the
substantive
regulatory
requirements
of 35 IAC Part 811 and is divided into four
major
stages
as follows
Initial
Screening
This
stage
consisted of
three
steps
First site
specific
Closure
Objectives
were established
to address
parameters
of
concern
and
exposure pathways
Section
3.1
Second closure alternatives
to meet these
objectives
were
divided into
three
categories
leachate
management
alternatives
final
cover
alternatives
and
surface
water
management
alternatives
Third
these alternatives
were
initially
screened
on
the basis of construction
implementation feasibility effectiveness
and cost
Table
1375
Alternatives
Analysis Report-Final
NATURAL
1-3
RESOURCE
TECHNOLOGY
Electronic Filing - Received, Clerks' Office, August 11, 2008--AS 09-1, Exhibit 3
INTRODUCTION
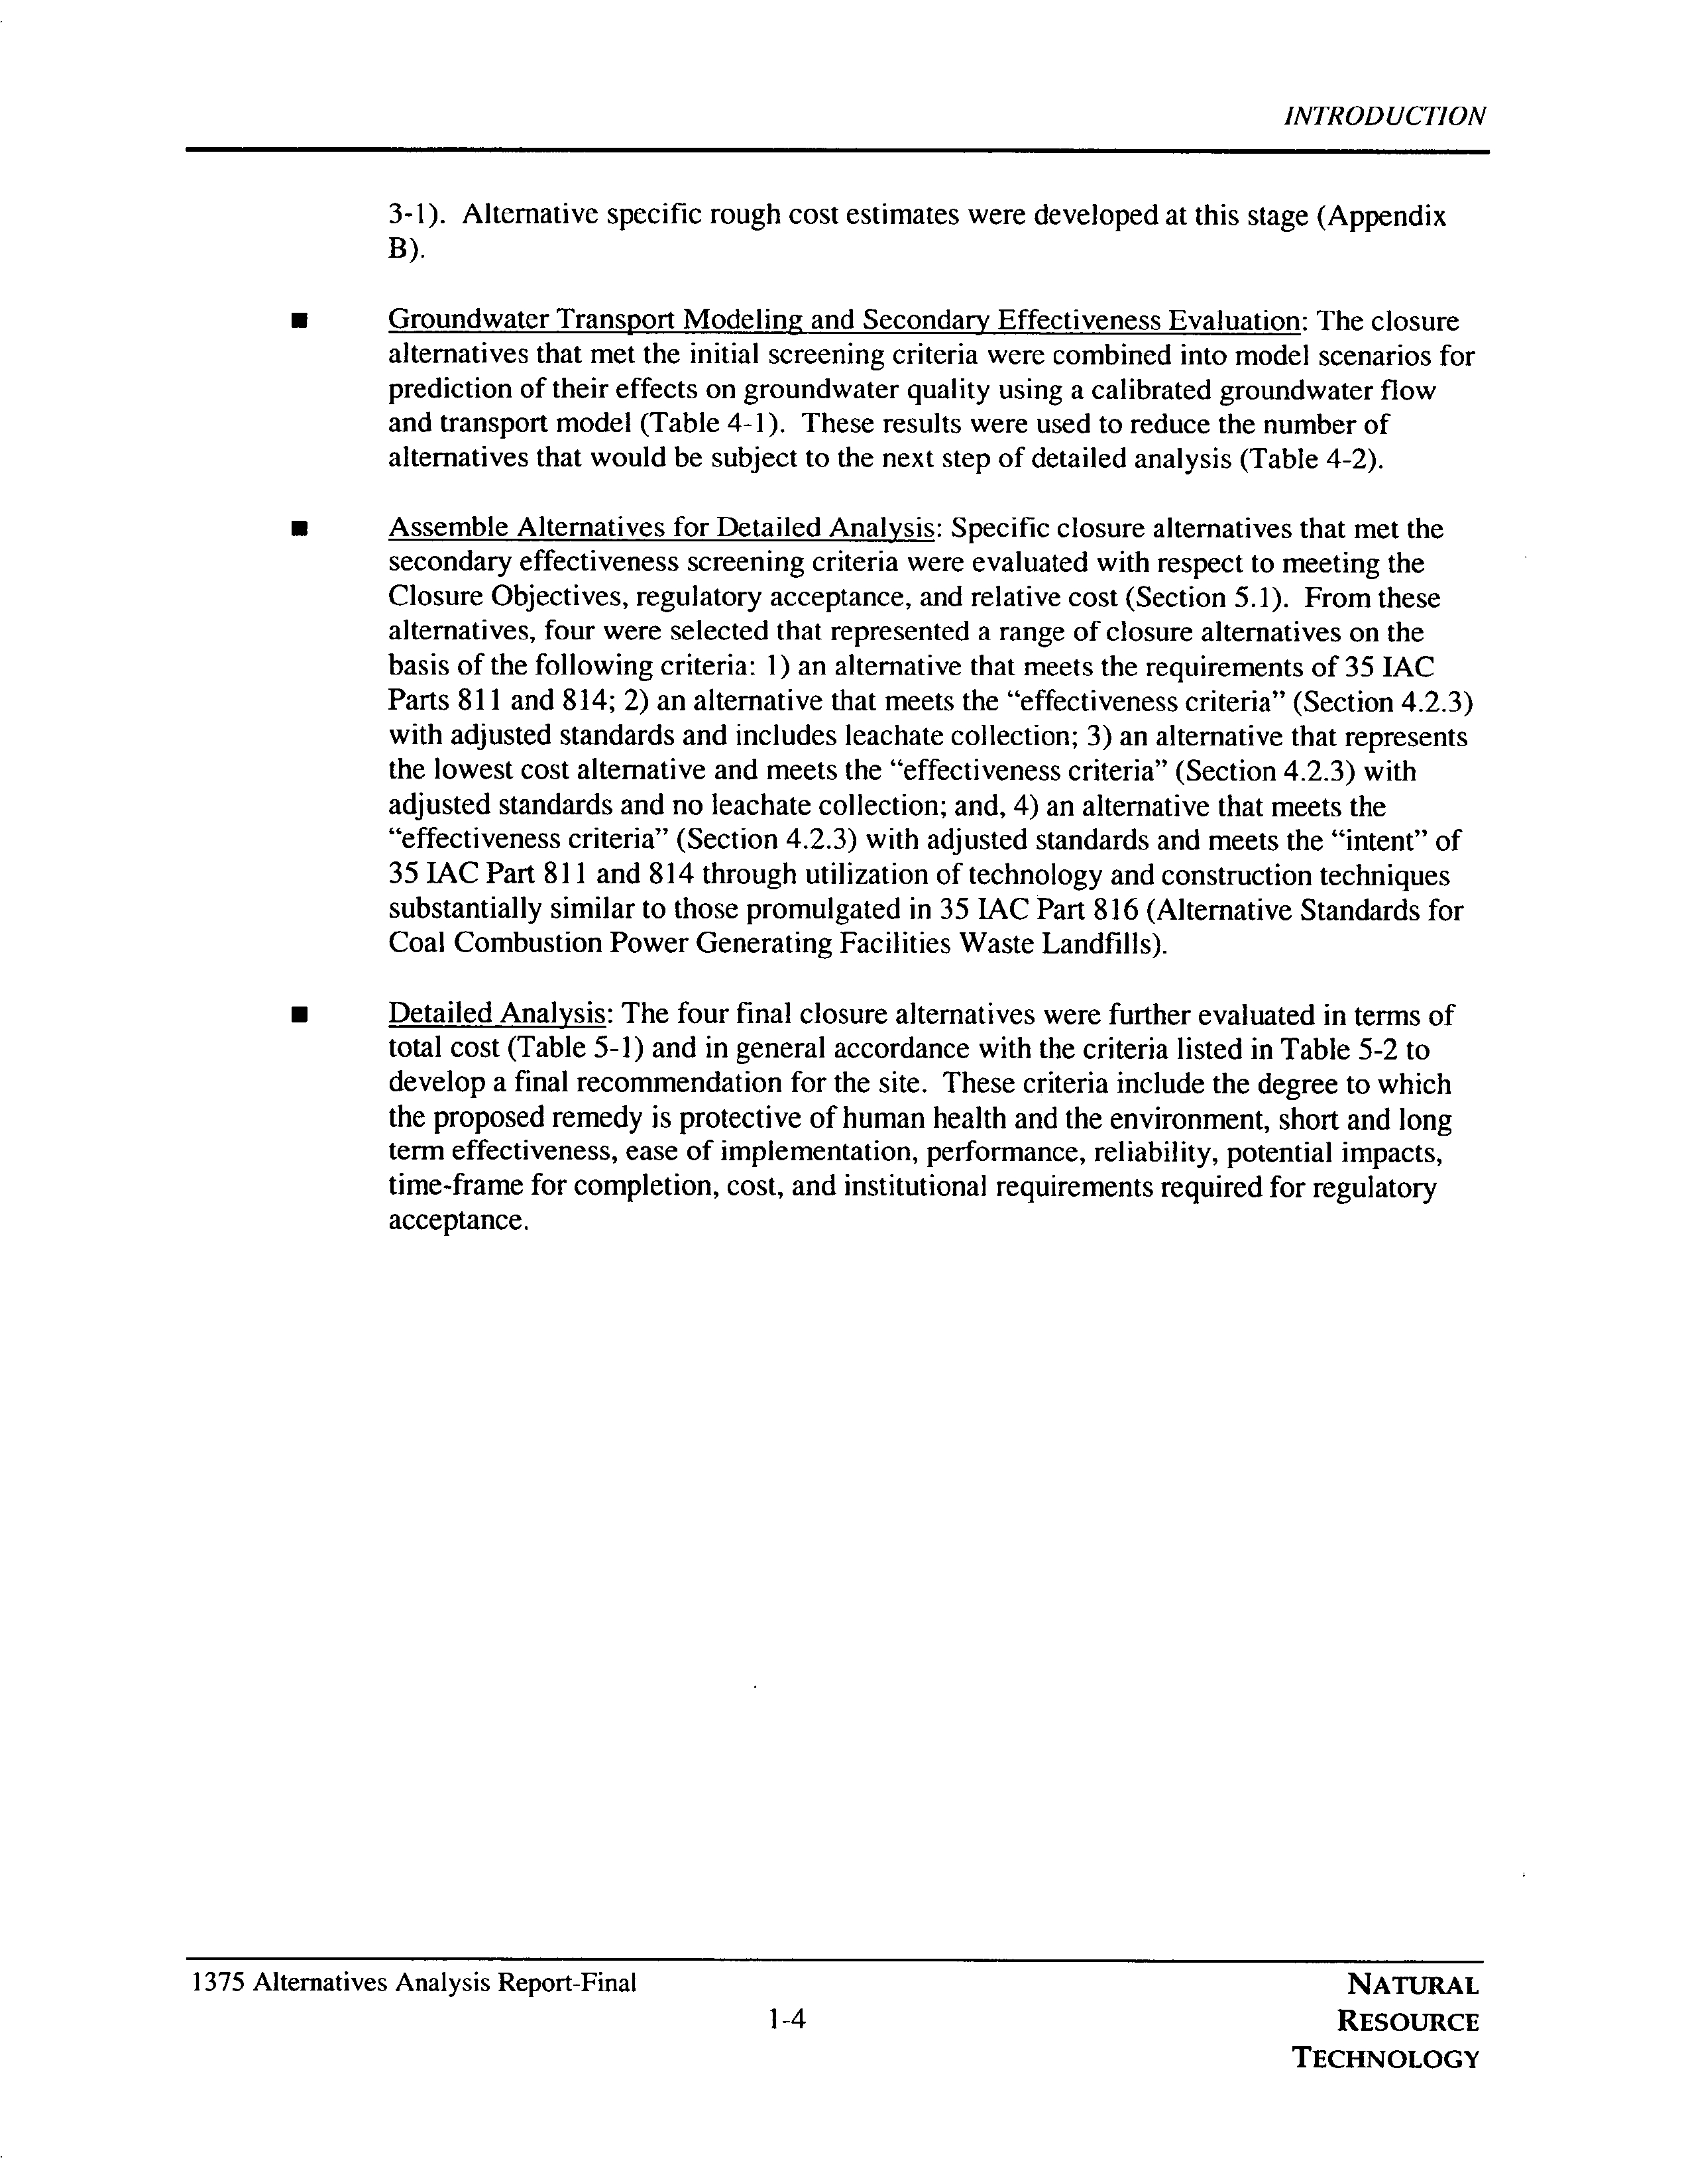
3-1
Alternative
specific rough
cost estimates were
developed
at this
stage Appendix
Groundwater
Transport Modeling
and Secondary Effectiveness
Evaluation The closure
alternatives
that met the initial
screening
criteria
were combined into model scenarios for
prediction
of their effects
on
groundwater
quality using
calibrated
groundwater
flow
and
transport
model
Table
4-1
These results
were
used
to reduce the number of
alternatives
that
would be
subject
to the next
step
of detailed
analysis
Table 4-2
Assemble
Alternatives
for Detailed
Analysis Specific
closure alternatives
that
met
the
secondary
effectiveness
screening
criteria
were
evaluated with
respect
to
meeting
the
Closure
Objectives
regulatory
acceptance
and relative cost
Section 5.1
From these
alternatives
four
were
selected that
represented
range
of
closure alternatives
on the
basis of the
following
criteria
an alternative
that
meets
the
requirements
of 35
IAC
Parts 811 and
814
an
alternative
that
meets
the
effectiveness criteria
Section 4.2.3
with
adjusted
standards
and includes leachate
collection
an alternative
that
represents
the lowest cost alternative and meets the effectiveness criteria
Section 4.2.3
with
adjusted
standards
and
no
leachate
collection and
an alternative
that meets the
effectiveness
criteria
Section 4.2.3
with
adjusted
standards
and
meets
the intent of
35 JAC Part 811 and 814
through
utilization
of
technology
and construction
techniques
substantially
similar to those
promulgated
in 35 IAC Part 816
Alternative
Standards for
Coal Combustion Power
Generating
Facilities Waste
Landfills
Detailed Analysis The four final closure alternatives
were
further evaluated in
terms of
total
cost Table
5-1
and in
general
accordance with the criteria listed in Table 5-2 to
develop
final recommendation
for the site These criteria include
the
degree
to which
the
proposed remedy
is
protective
of
human health and the
environment
short and
long
term
effectiveness
ease of
implementation
performance
reliability potential impacts
time-frame for
completion
cost
and
institutional
requirements
required
for
regulatory
acceptance
1375 Alternatives
Analysis Report-Final
NATURAL
1-4
RESOURCE
TECHNOLOGY
Electronic Filing - Received, Clerks' Office, August 11, 2008--AS 09-1, Exhibit 3
SUMMARY OF SITE CONDITIONS
Hydrogeology
and
groundwater
quality
were
thoroughly
characterized
in the
Hydrogeologic
Assessment
report
Additional
field
investigation
was
performed
for this
project
to
upgrade
the
monitoring
well
system surrounding
Pond
characterize
the
deep
alluvial
aquifer
and
to
collect detailed
information
specific
to
the alternatives
assessment
2.1
Supplemental
On-Site
Investigation
October 2001
The first
supplemental
site
investigation
was
performed
from
October
to
2001 The
scope
of work
included
advancement of
six soil
borings SB-101
through
SB-106
installation of
one additional
monitoring
well
MW-14
and one
temporary monitoring
well
TW
and
abandonment of
monitoring
well MW-Il and
replacement
with MW-I 1R In
addition hydraulic
conductivity
tests
were
performed
on
selected
new
and
existing monitoring
wells
2.1.1 Advancement of Soil
Borings
An all-terrain drill
rig equipped
with
-inch
hollow-stem
augers
was
used to
perform
all soil
borings
direct
push sampling
and
monitoring
well installations
at
the
site
total of nine soil
borings
were
advanced
at the
site
two of which
were
converted into
permanent monitoring
wells
MW-I
1R and
MW-14
and one that was converted into
temporary monitoring
well
TW
Soil
borings
SB-I01
through
SB-103 were advanced
to better characterize
the
type
and
extent
of
geologic
materials
surrounding
Pond
Soil
borings
SB-104
through
SB-106 were advanced
north of the
ash
impoundment
to find
suitable location for
background
monitoring
well within the
deep
alluvial sand and
gravel
The
latter
borings
were drilled in the
only
accessible locations that
were not
downgradient
of the ash
impoundments
However
shallow bedrock
was encountered at all three
locations
and
natural coal
seam was encountered
at
SB-106
indicating
that
the Wabash River was over the west side of the
valley
in
this area As
result an
upgradient
well could
not be installed within the
deep
sand and
gravel
of the
valley
Geologic
materials at all soil
borings were
logged every
feet
using
2-inch diameter
by
2-foot
long
split-barrel sampler
The soil
borings
were advanced
to
bedrock to
design depth
or
adjusted
in the field
as
necessary
ranging
from
feet to 39
feet below
ground
surface
Table
2-1 Upon completion
of
1375 Alternatives
Analysis
Report-Final
NATURAL
2-I
RESOURCE
TECHNOLOGY
Electronic Filing - Received, Clerks' Office, August 11, 2008--AS 09-1, Exhibit 3
SUMMARY OF SITE CONDITIONS
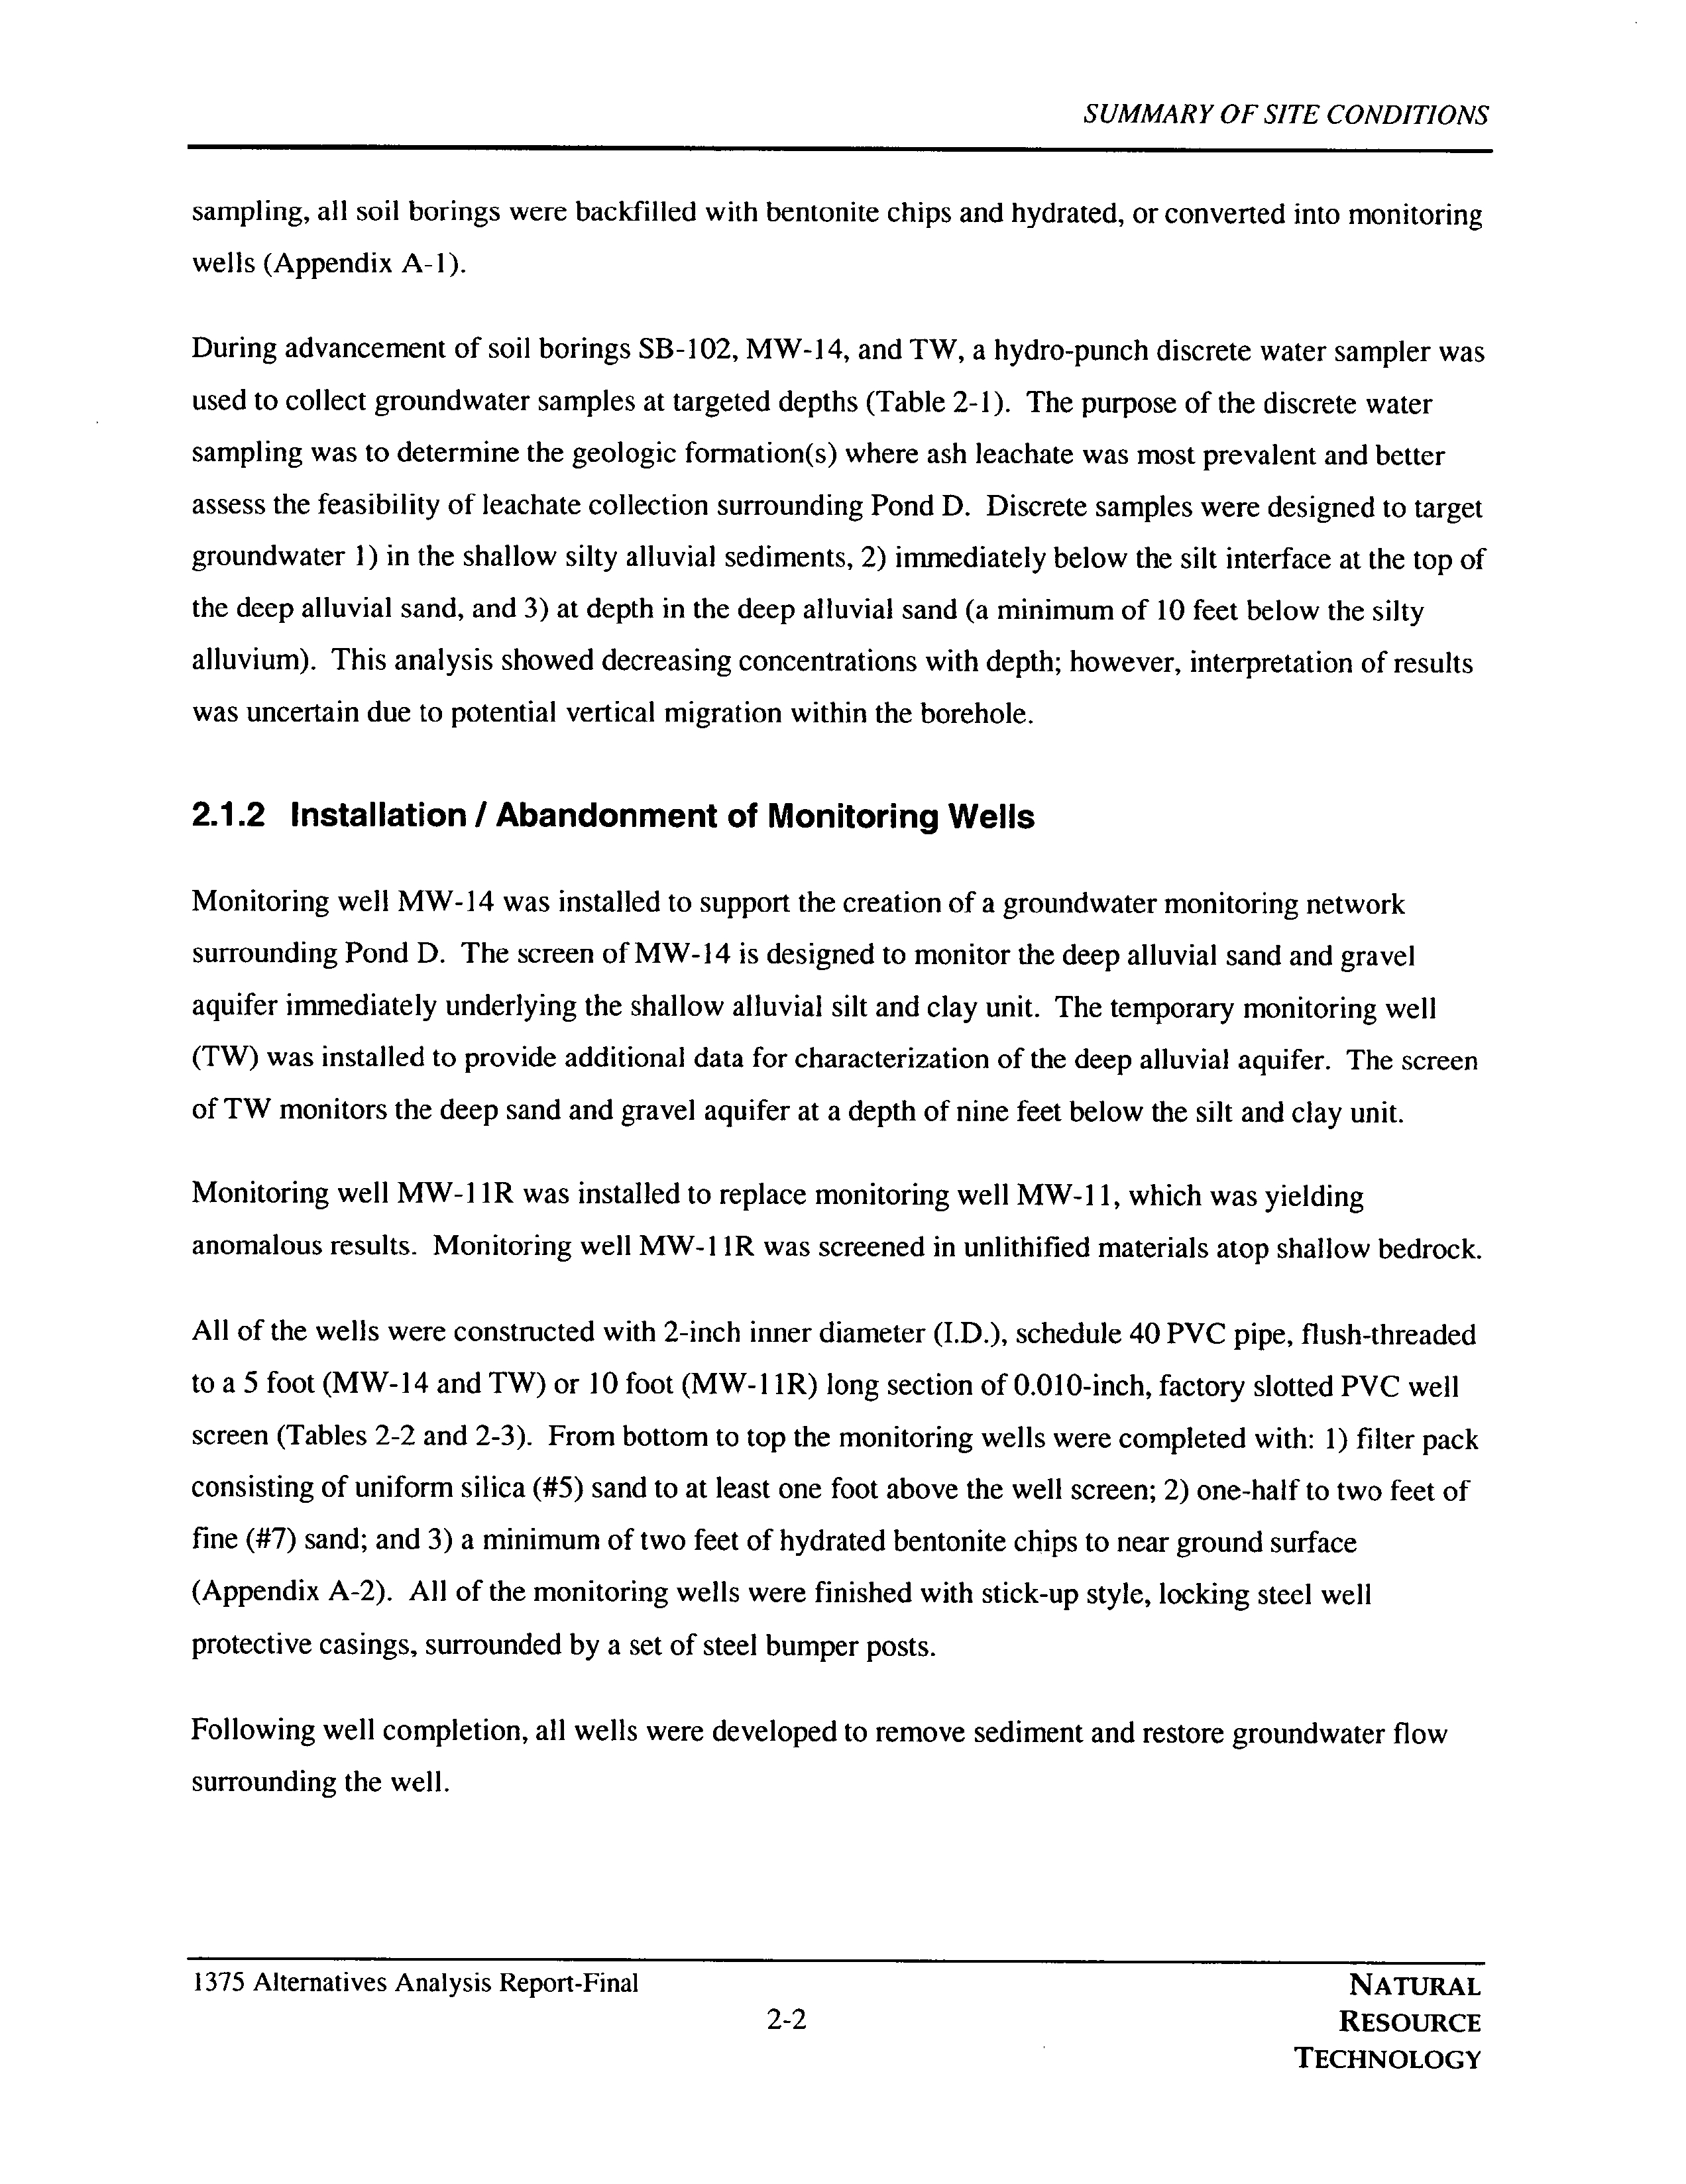
sampling
all soil
borings
were
backfilled
with
bentonite
chips
and
hydrated or
converted into
monitoring
wells
Appendix
A-I
During
advancement
of soil
borings
SB-102
MW-I
and
TW
hydro-punch
discrete water
sampler
was
used to collect
groundwater
samples
at
targeted depths Table 2-1
The
purpose
of the discrete water
sampling
was to determine the
geologic
formations
where ash leachate
was most
prevalent
and better
assess
the
feasibility
of
leachate
collection
surrounding
Pond
Discrete
samples
were
designed
to
target
groundwater
in the shallow
silty
alluvial sediments
immediately
below the silt interface
at
the
top
of
the
deep
alluvial
sand
and
at
depth
in the
deep
alluvial sand
minimum of
10 feet below the
silty
alluvium
This
analysis
showed
decreasing
concentrations
with
depth
however
interpretation
of results
was
uncertain due
to
potential
vertical
migration
within the borehole
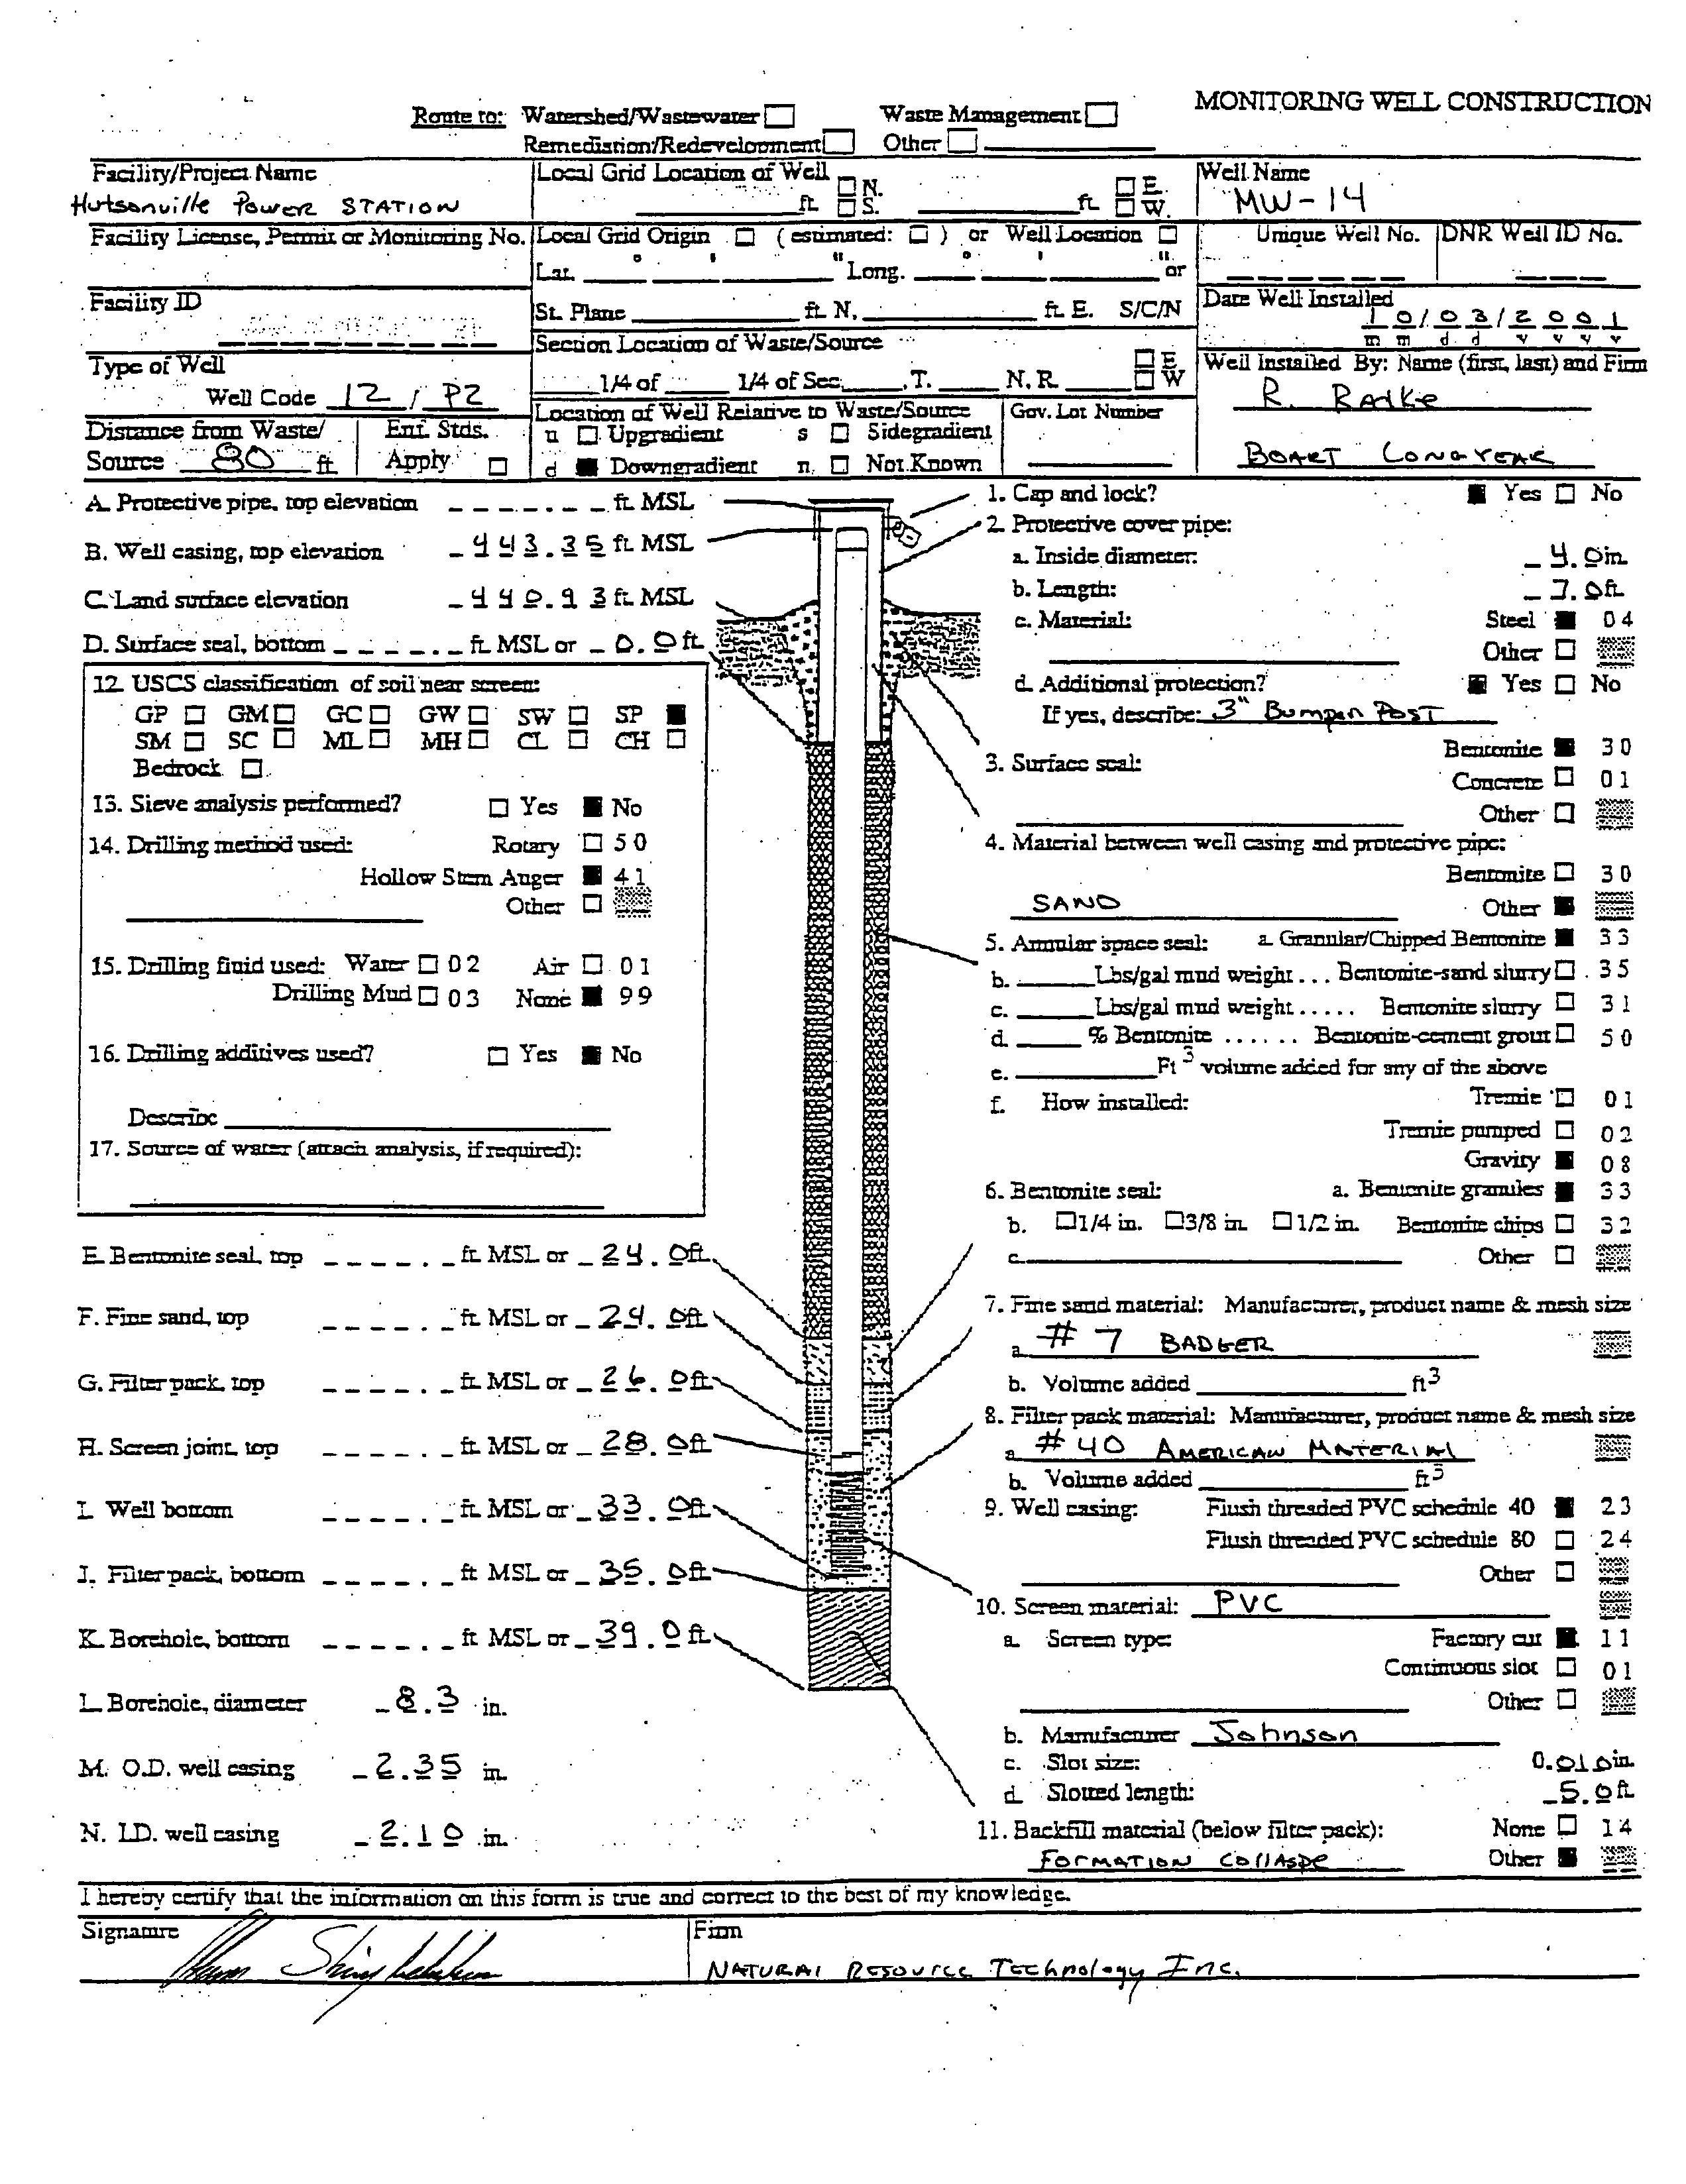
2.1.2 Installation
Abandonment of
Monitoring
Wells
Monitoring
well MW-14
was
installed
to
support
the
creation of
groundwater
monitoring
network
surrounding
Pond
The
screen
of MW-14 is
designed
to monitor the
deep
alluvial sand and
gravel
aquifer immediately underlying
the shallow alluvial silt and
clay
unit The
temporary monitoring
well
TW
was installed to
provide
additional
data for characterization
of the
deep
alluvial
aquifer
The screen
of TW monitors the
deep
sand and
gravel aquifer
at
depth
of nine feet below
the silt and
clay
unit
Monitoring
well MW-hR
was
installed
to
replace monitoring
well
MW-Il
which was
yielding
anomalous results
Monitoring
well MW-I 1R
was
screened in
unlithified materials
atop
shallow
bedrock
All
of the wells were constructed with 2-inch inner diameter
I.D
schedule 40 Pvc
pipe
flush-threaded
to
foot
MW-
14 and
TW or
10 foot
MW-Il
long
section of
0.010-inch factory
slotted PVC well
screen
Tables
2-2 and
2-3
From bottom to
top
the
monitoring
wells
were
completed
with
filter
pack
consisting
of uniform
silica
sand to at least one foot above the well
screen
one-half to two feet of
fine
sand
and
minimum of
two feet of
hydrated
bentonite
chips
to
near
ground
surface
Appendix
A-2
All of the
monitoring
wells were finished with
stick-up style locking
steel
well
protective casings
surrounded
by
set of steel
bumper posts
Following
well
completion
all
wells were
developed
to
remove
sediment and
restore
groundwater
flow
surrounding
the well
1375 Alternatives
Analysis Report-Final
NATURAL
2-2
RESOuRCE
TECHNOLOGY
Electronic Filing - Received, Clerks' Office, August 11, 2008--AS 09-1, Exhibit 3
SUMMARY
OF SITE CONDITIONS
2.1.3
Hydraulic Testing
Single
well
recovery
tests were
performed
on
newly
installed wells and wells that
were not
previously
tested Wells
MW-I MW-14
MW-hR
and TW were tested Well MW-8 could
not be tested due to
slow
recovery
after
groundwater
sampling
Data
were
collected
using
an in-Situ HermitlM
datalogger
and
pressure
transducers
Pressure transducers and
disposable
bailers were
placed
in the
wells
and time
was
allowed for
groundwater
to reach
equilibrium
After
groundwater
had returned
to static water
level
the
transducers
were linked to the
datalogger
and set to
begin
slug
of
water was removed
using
disposable
bailer with
approximately
0.037
ft3
of
displacement
for wells MW-I
and MW-IIR
Two
disposable
bailers
0.074
ft3
of
displacement
were
joined
together
and used to
remove
the
slug
at
well
MW-I
and three bailers
0.11
ft3 of
displacement
were used at TW due to the static head of the
water
table and the screened formation
Test duration was about 25
minutes or
until water had returned
to
static level
Upon
test
completion
the data
were
downloaded
and
processed using
the
Aqtesolv
software
Data were
interpreted using
the Bower-Rice
1976
method
Table 2-4
Appendix A-3 Slug
test results
from
wells
MW-14
and MW-I JR could not be
interpreted
due to
an
equipment
malfunction
2.2
Supplemental
Off-Site
Investigation April
and
May
2004
The
supplemental
off-site
investigation
was
performed
from
April
26 to
May
13
2004
The
scope
of
work included
installation of seven
temporary monitoring
wells
TW-1
15S
through TW-120
deployment
of downhole
datahoggers
for continuous
groundwater
elevation
observations in TW-1
15S
TW- 11
SD
and TW-
118
performance
of
single
well
recovery slug
tests on new wells to characterize
aquifer
characteristics
near the
monitoring points
survey
of all
new wells
and
collection
of
groundwater
elevation data
at
all
new and
existing
wells In
addition
pumpage
data for the
two
plant
water wells
was
collected and
analyzed
to determine the effect of
pumpage
on
the
nearby monitoring
wells
TW-1
15S and TW-I
15D
2.2.1
Installation of
Monitoring
Wells
An all-terrain drill
rig
equipped
with -inch hollow-stem
augers
was used to
perform
all
monitoring
well installations
during
the 2004
supplemental investigation
Geologic
materials at all well locations
were
logged
continuously
to the extent
practicable
using
2-inch
diameter
by
2-foot
long split-barrel
sampler
Rock cores were collected from
borings
TW-115D
TW-1
16 and TW-1 19
utilizing
diamond
tipped
rock core barrel Each of the wells
was
constructed
with 2-inch inner diameter
I.D
schedule 40
1375 Alternatives
Analysis Report-Final
NATURAL
2-3
REsOURCE
TECHNOLOGY
Electronic Filing - Received, Clerks' Office, August 11, 2008--AS 09-1, Exhibit 3
SUMMARY OF SITE CONDITIONS
PVC
pipe
flush-threaded
to
5-foot
long
section of 0.0
10-inch
factory
slotted PVC well screen
Tables
2-2
and
2-3
From bottom to
top
the
monitoring
wells
were
completed
with
filter
pack consisting
of
uniform silica
40
sand to at least
foot above the well
screen
foot of fine
sand and
minimumof feet of
hydrated
bentonite
chips
to near
ground
surface
Appendix A-2
All of the
monitoring
wells
were
finished with
stick-up style locking
steel
protective
casings
TW-1 15S and TW1I5D
were
drilled
directly
north of
EW2 as close to the river as
possible Figure
2-1
to be used in
conjunction
with
existing
well MW-7D and
pumpage
records from EWI and EW2 to
determine the effects of
plant
pumpage
on
groundwater
flow within the
deep
alluvial
aquifer
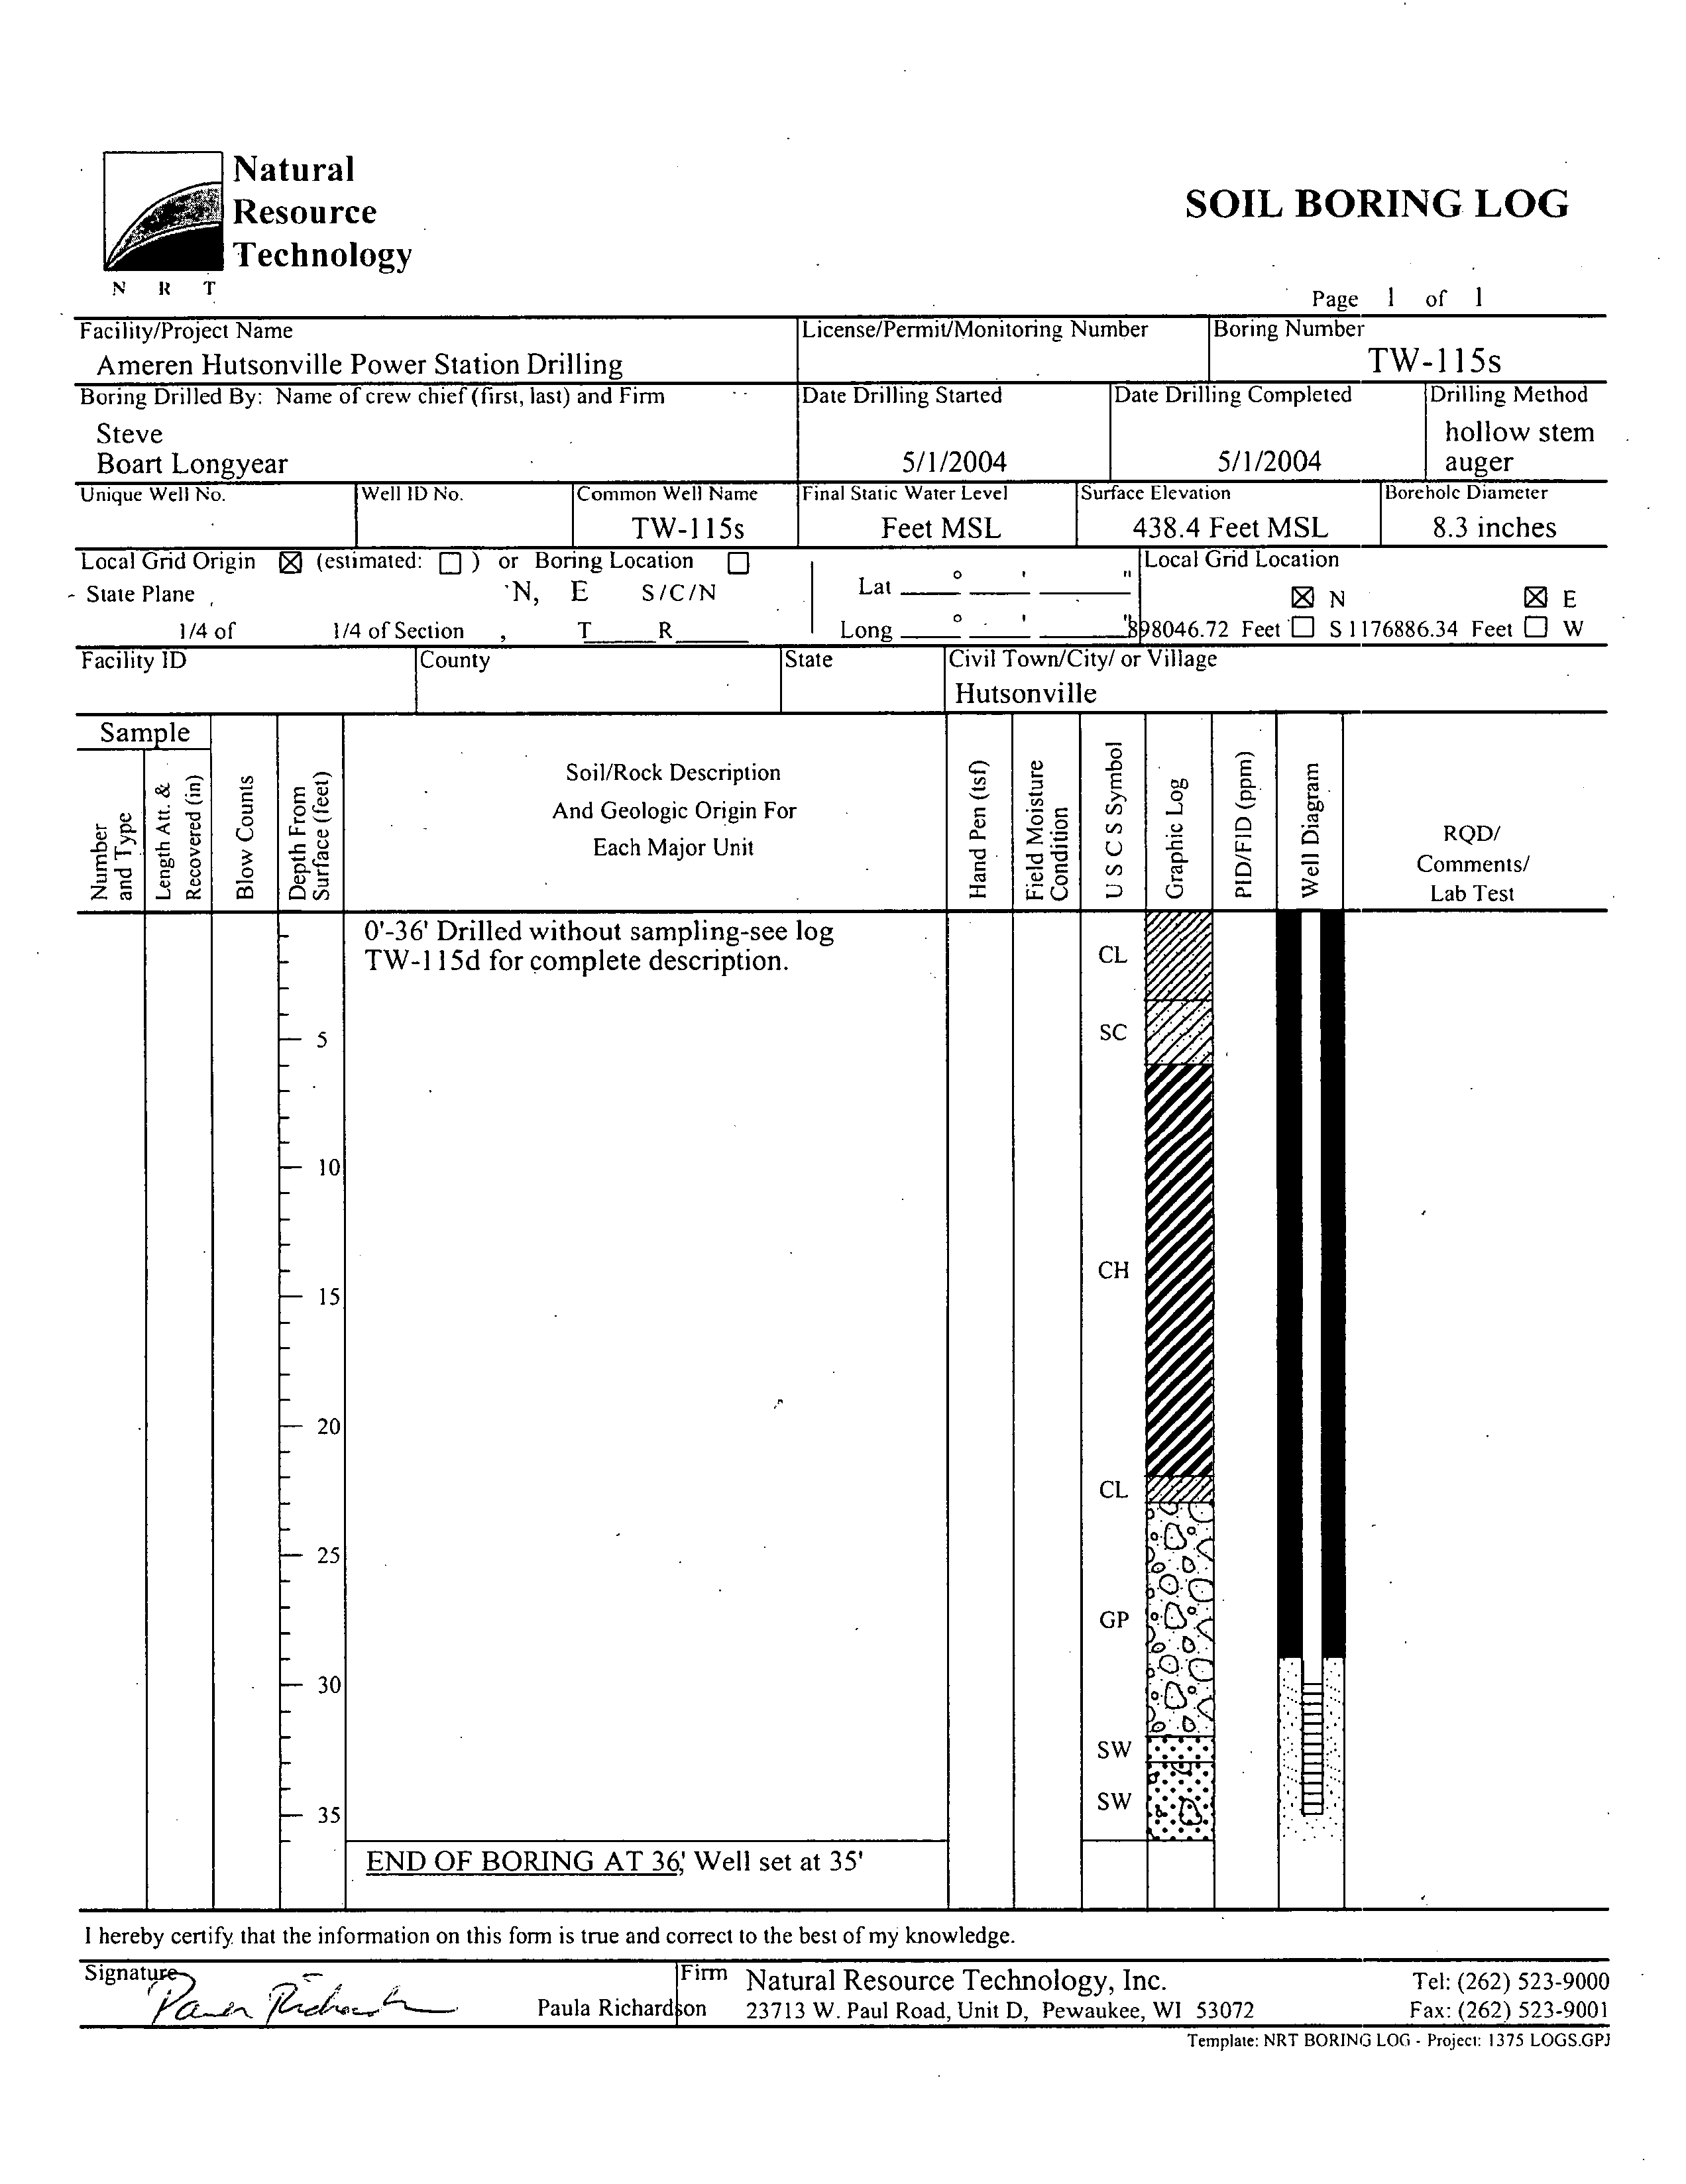
TW-l 15D
was
drilled
to
bedrock and
cored 15 feet into the
shale
to
total
depth
of 105 feet below
ground
surface
bgs
The borehole
was
then backfilled
with
bentonite to
approximately
88 feet
bgs
and the well
was
screened near the base of the
deep
alluvial
aquifer
to characterize
the vertical flow within the
aquifer
TW-l l5S was blind drilled to 36 feet and screened
near
the
top
of the
aquifer
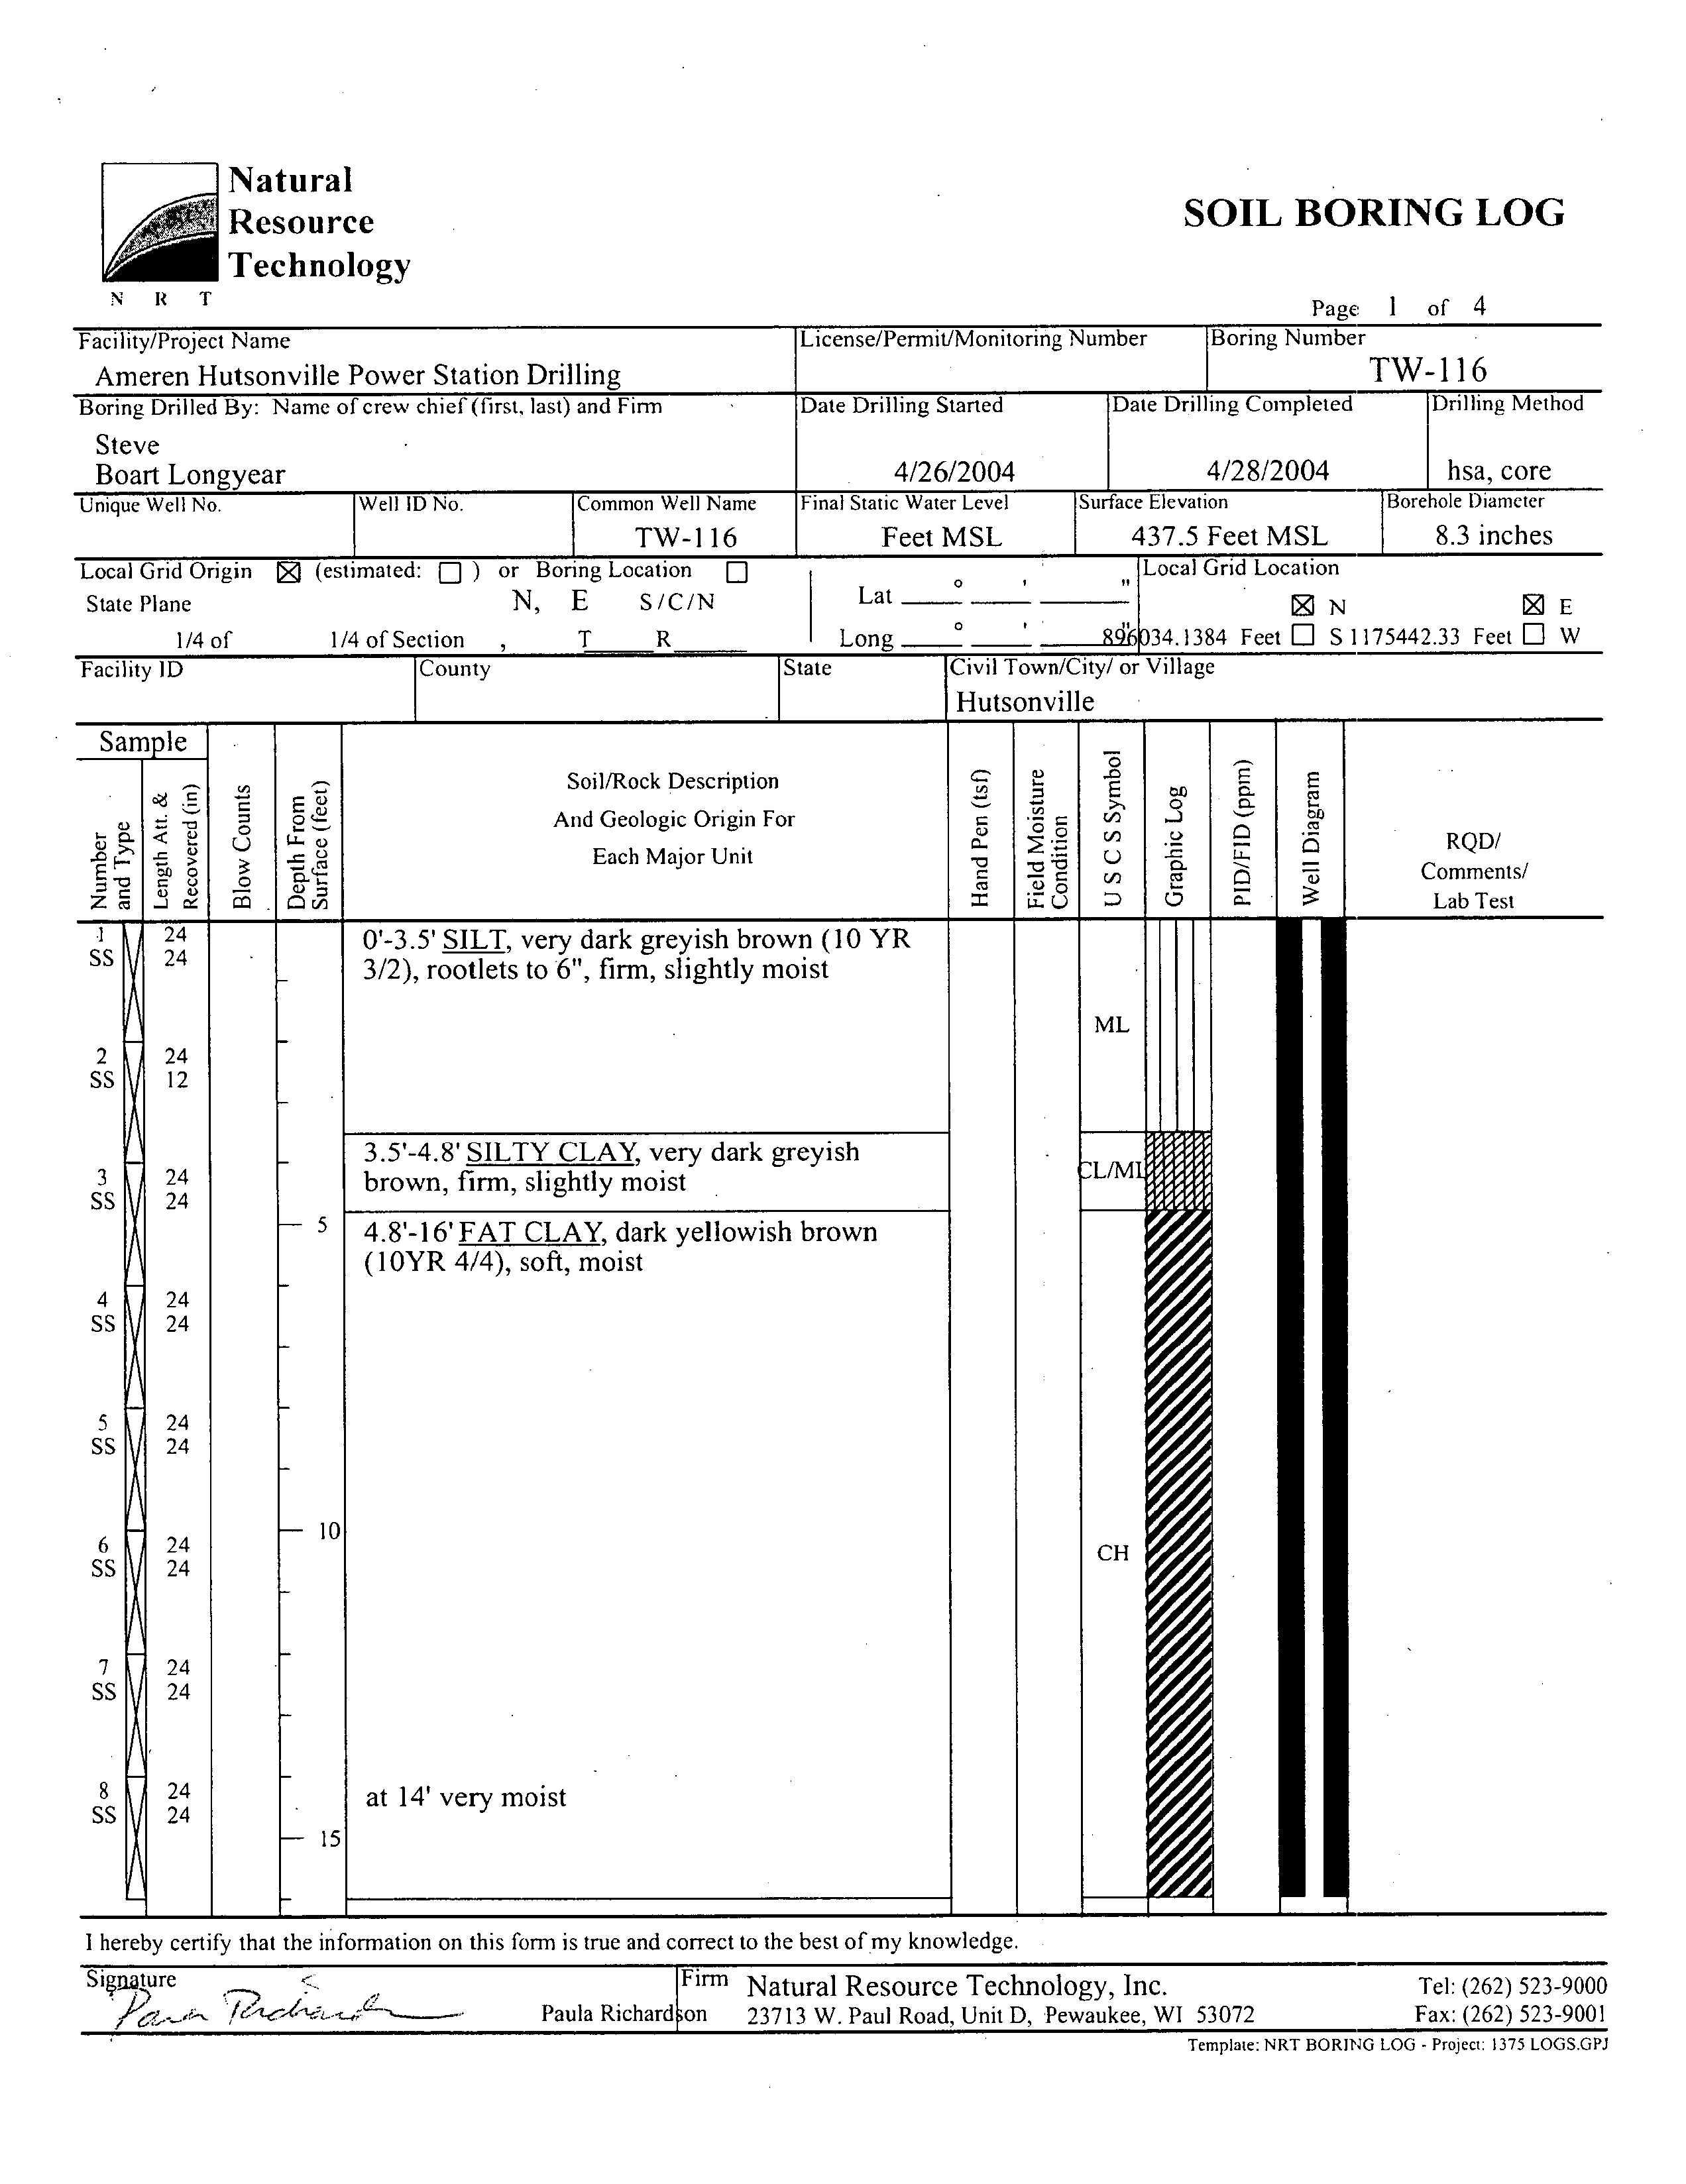
TW-1
16 and TW-1 17 were drilled
approximately
one-half mile
south/southeast
of the
impoundment
on
the west side of the river
TW-116
farther from the
river was
drilled
to
depth
of 79.2 feet
bgs
cored
19 feet into
shale
backfilled
with bentonite
to 55 feet
bgs approximately
five
feet above the
bedrock
and then the
augers
were rotated backwards
out of the hole to allow the sand and
gravel
to
collapse
The
well screen
was
set at 30 feet
bgs
in
clayey
sand
to
gravel
at what was assumed to be the
top
of the
deep
alluvial
aquifer Subsequent
review of the
lithology
determined that TW- 116 is
actually
screened in the
fine-grained
alluvium above the
deep
alluvial
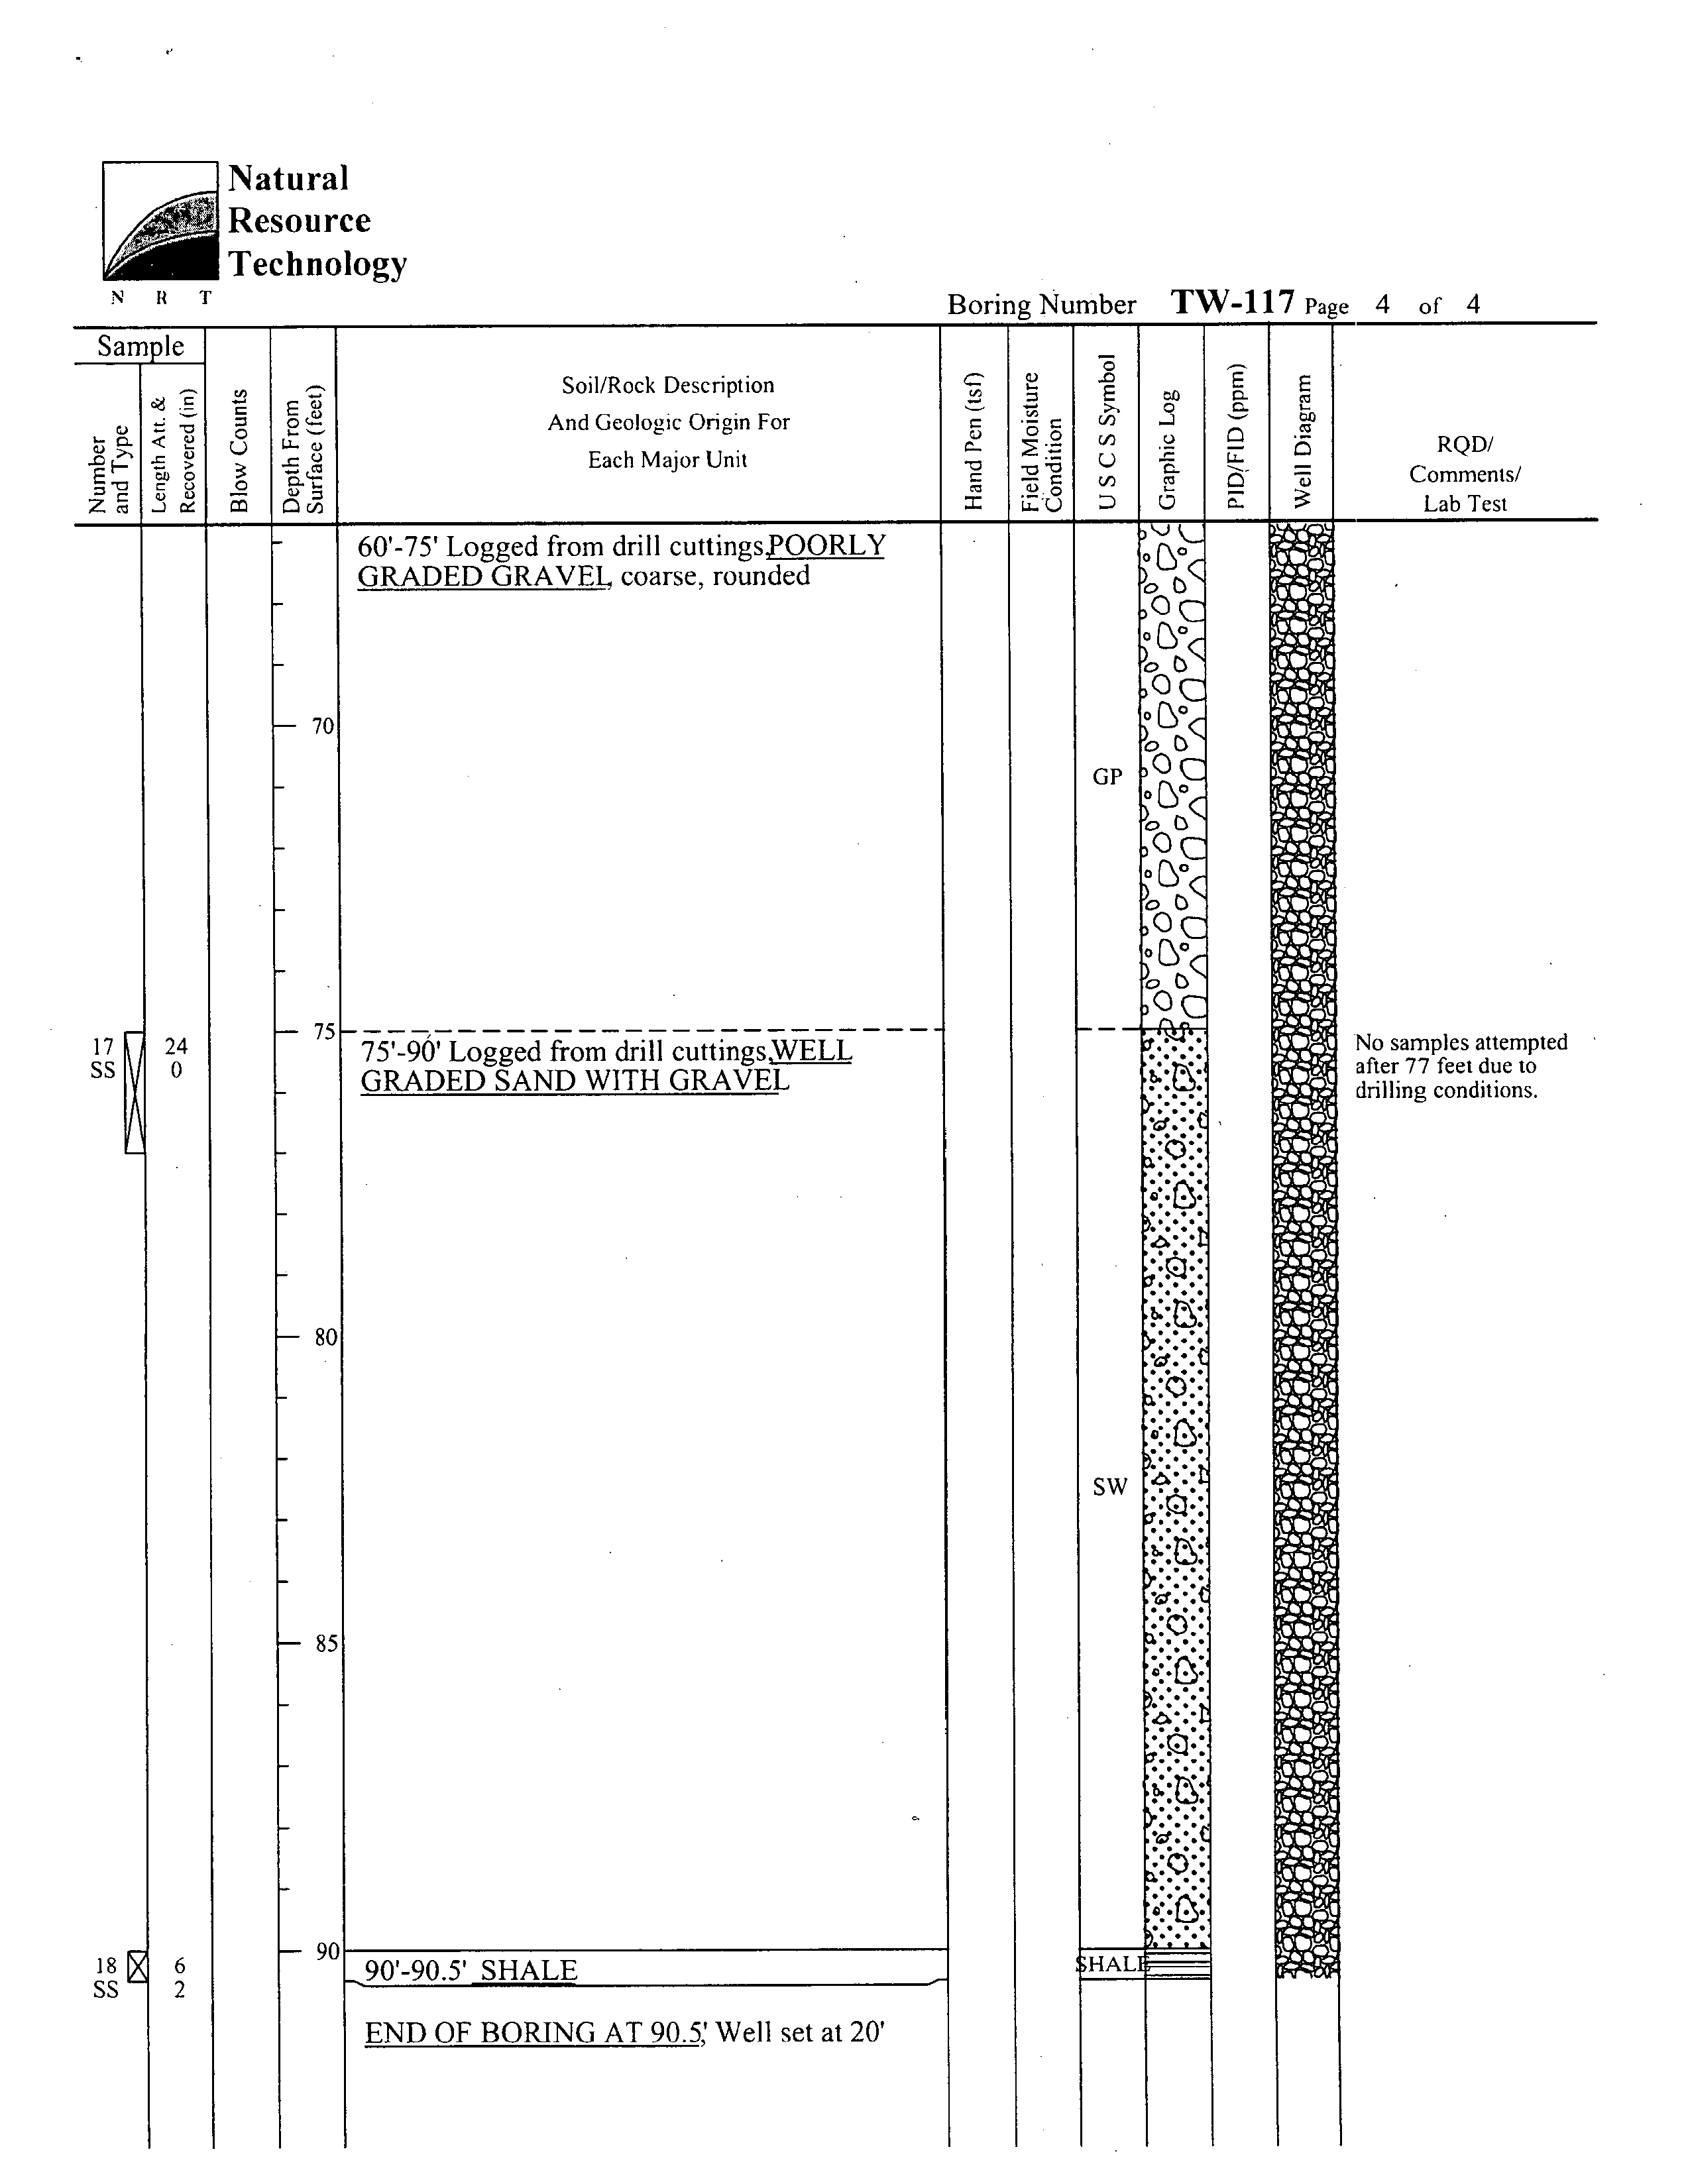
aquifer TW-117
closer
to
the
river was drilled to
total
depth
of 90.5 feet
bgs six
inches into
shale
the
augers
were
then rotated
backwards out of the borehole
and the borehole
was
allowed
to
collapse
to
depth
of 21 feet
bgs
The well
screen was set at
20
feet at
the same
approximate
elevation
as
TW-1 16
to allow the two wells to
serve as
downgradient groundwater
elevation
calibration
points
and
as
lithologic
controls
on
the
configuration
of the bedrock
valley
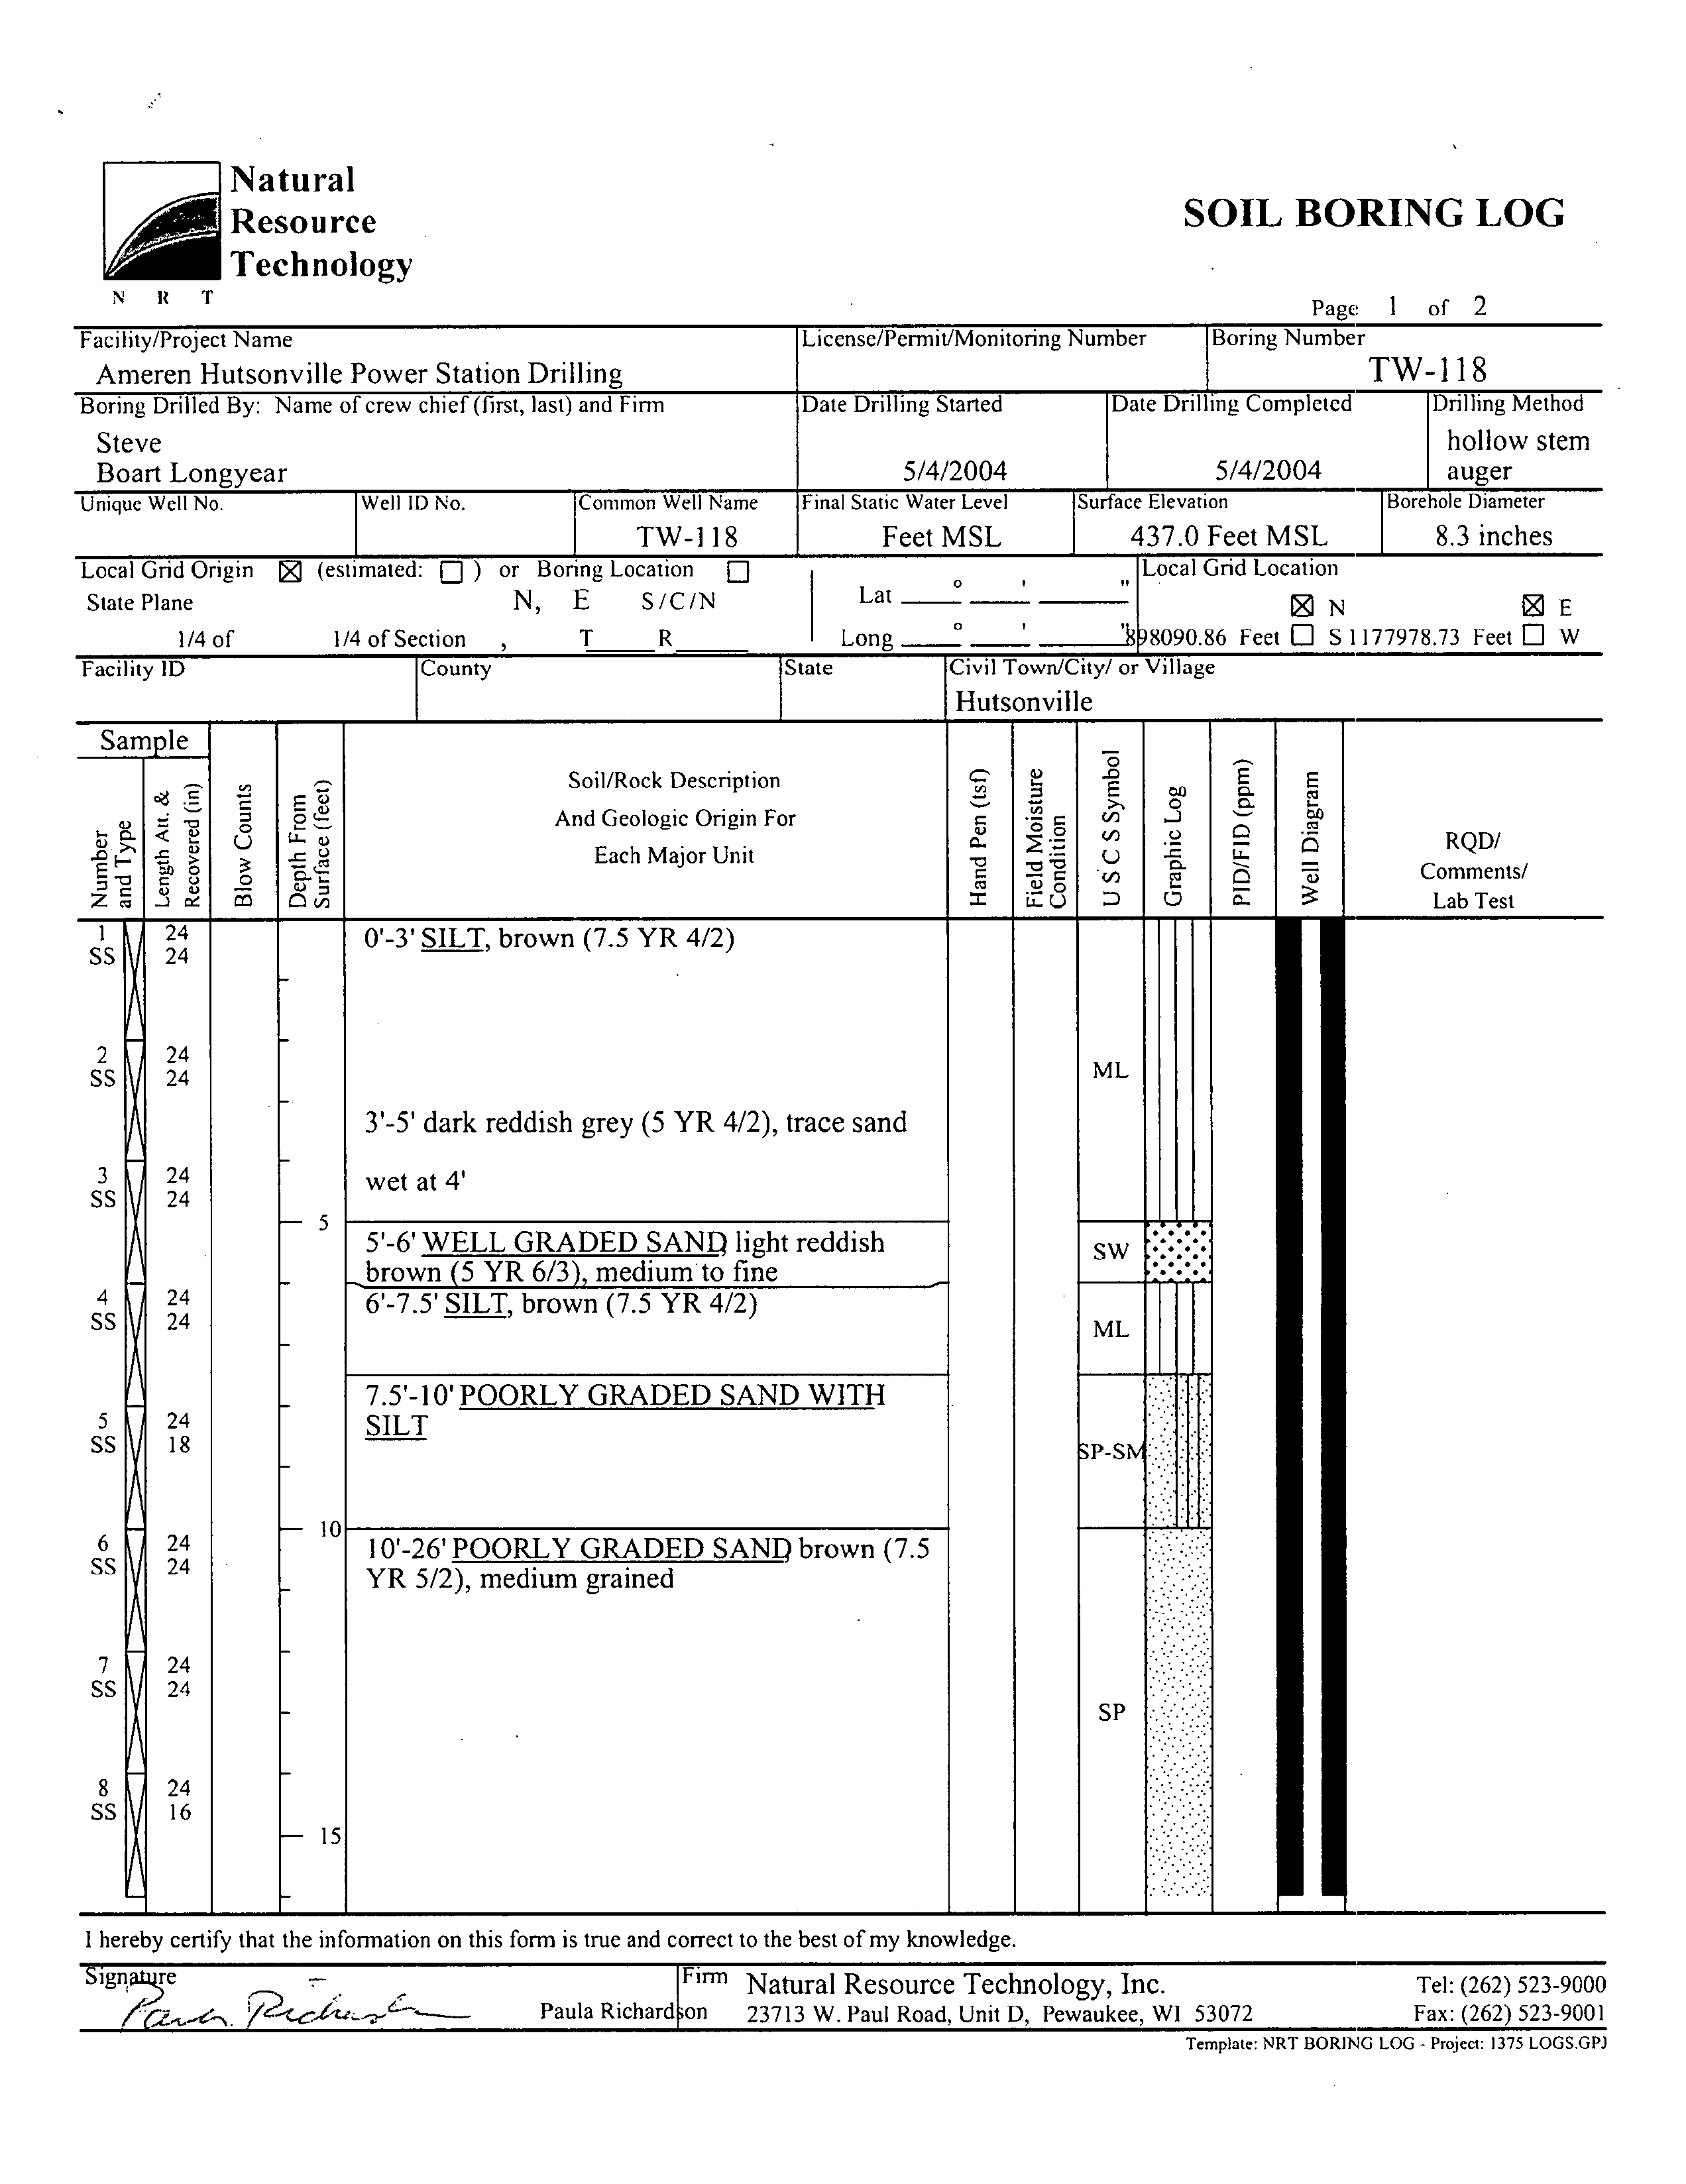
TW-118 TW-119 and TW-120 were drilled east of the river
Only
TW-119 was drilled to
bedrock as
bedrock
depth
at TW-118 was assumed to be similar
to
TW-115D
and TW-120 was assumed to be similar
to TW-119
TW-l 19 was cored 20 feet into
shale
to
total
depth
of 100 feet
bgs
The borehole
was
sealed with bentonite
to 75 feet
bgs
approximately
five feet above
bedrock The hole was then allowed to
collapse
as the
augers
were rotated out to
depth
of 21 feet
bgs
All three wells
were screened near the
top
of the
aquifer
1375 Alternatives
Analysis Report-Final
NATURAL
2-4
RESOURCE
TECHNOLOGY
Electronic Filing - Received, Clerks' Office, August 11, 2008--AS 09-1, Exhibit 3
SUMMARY OF SITE CONDITIONS
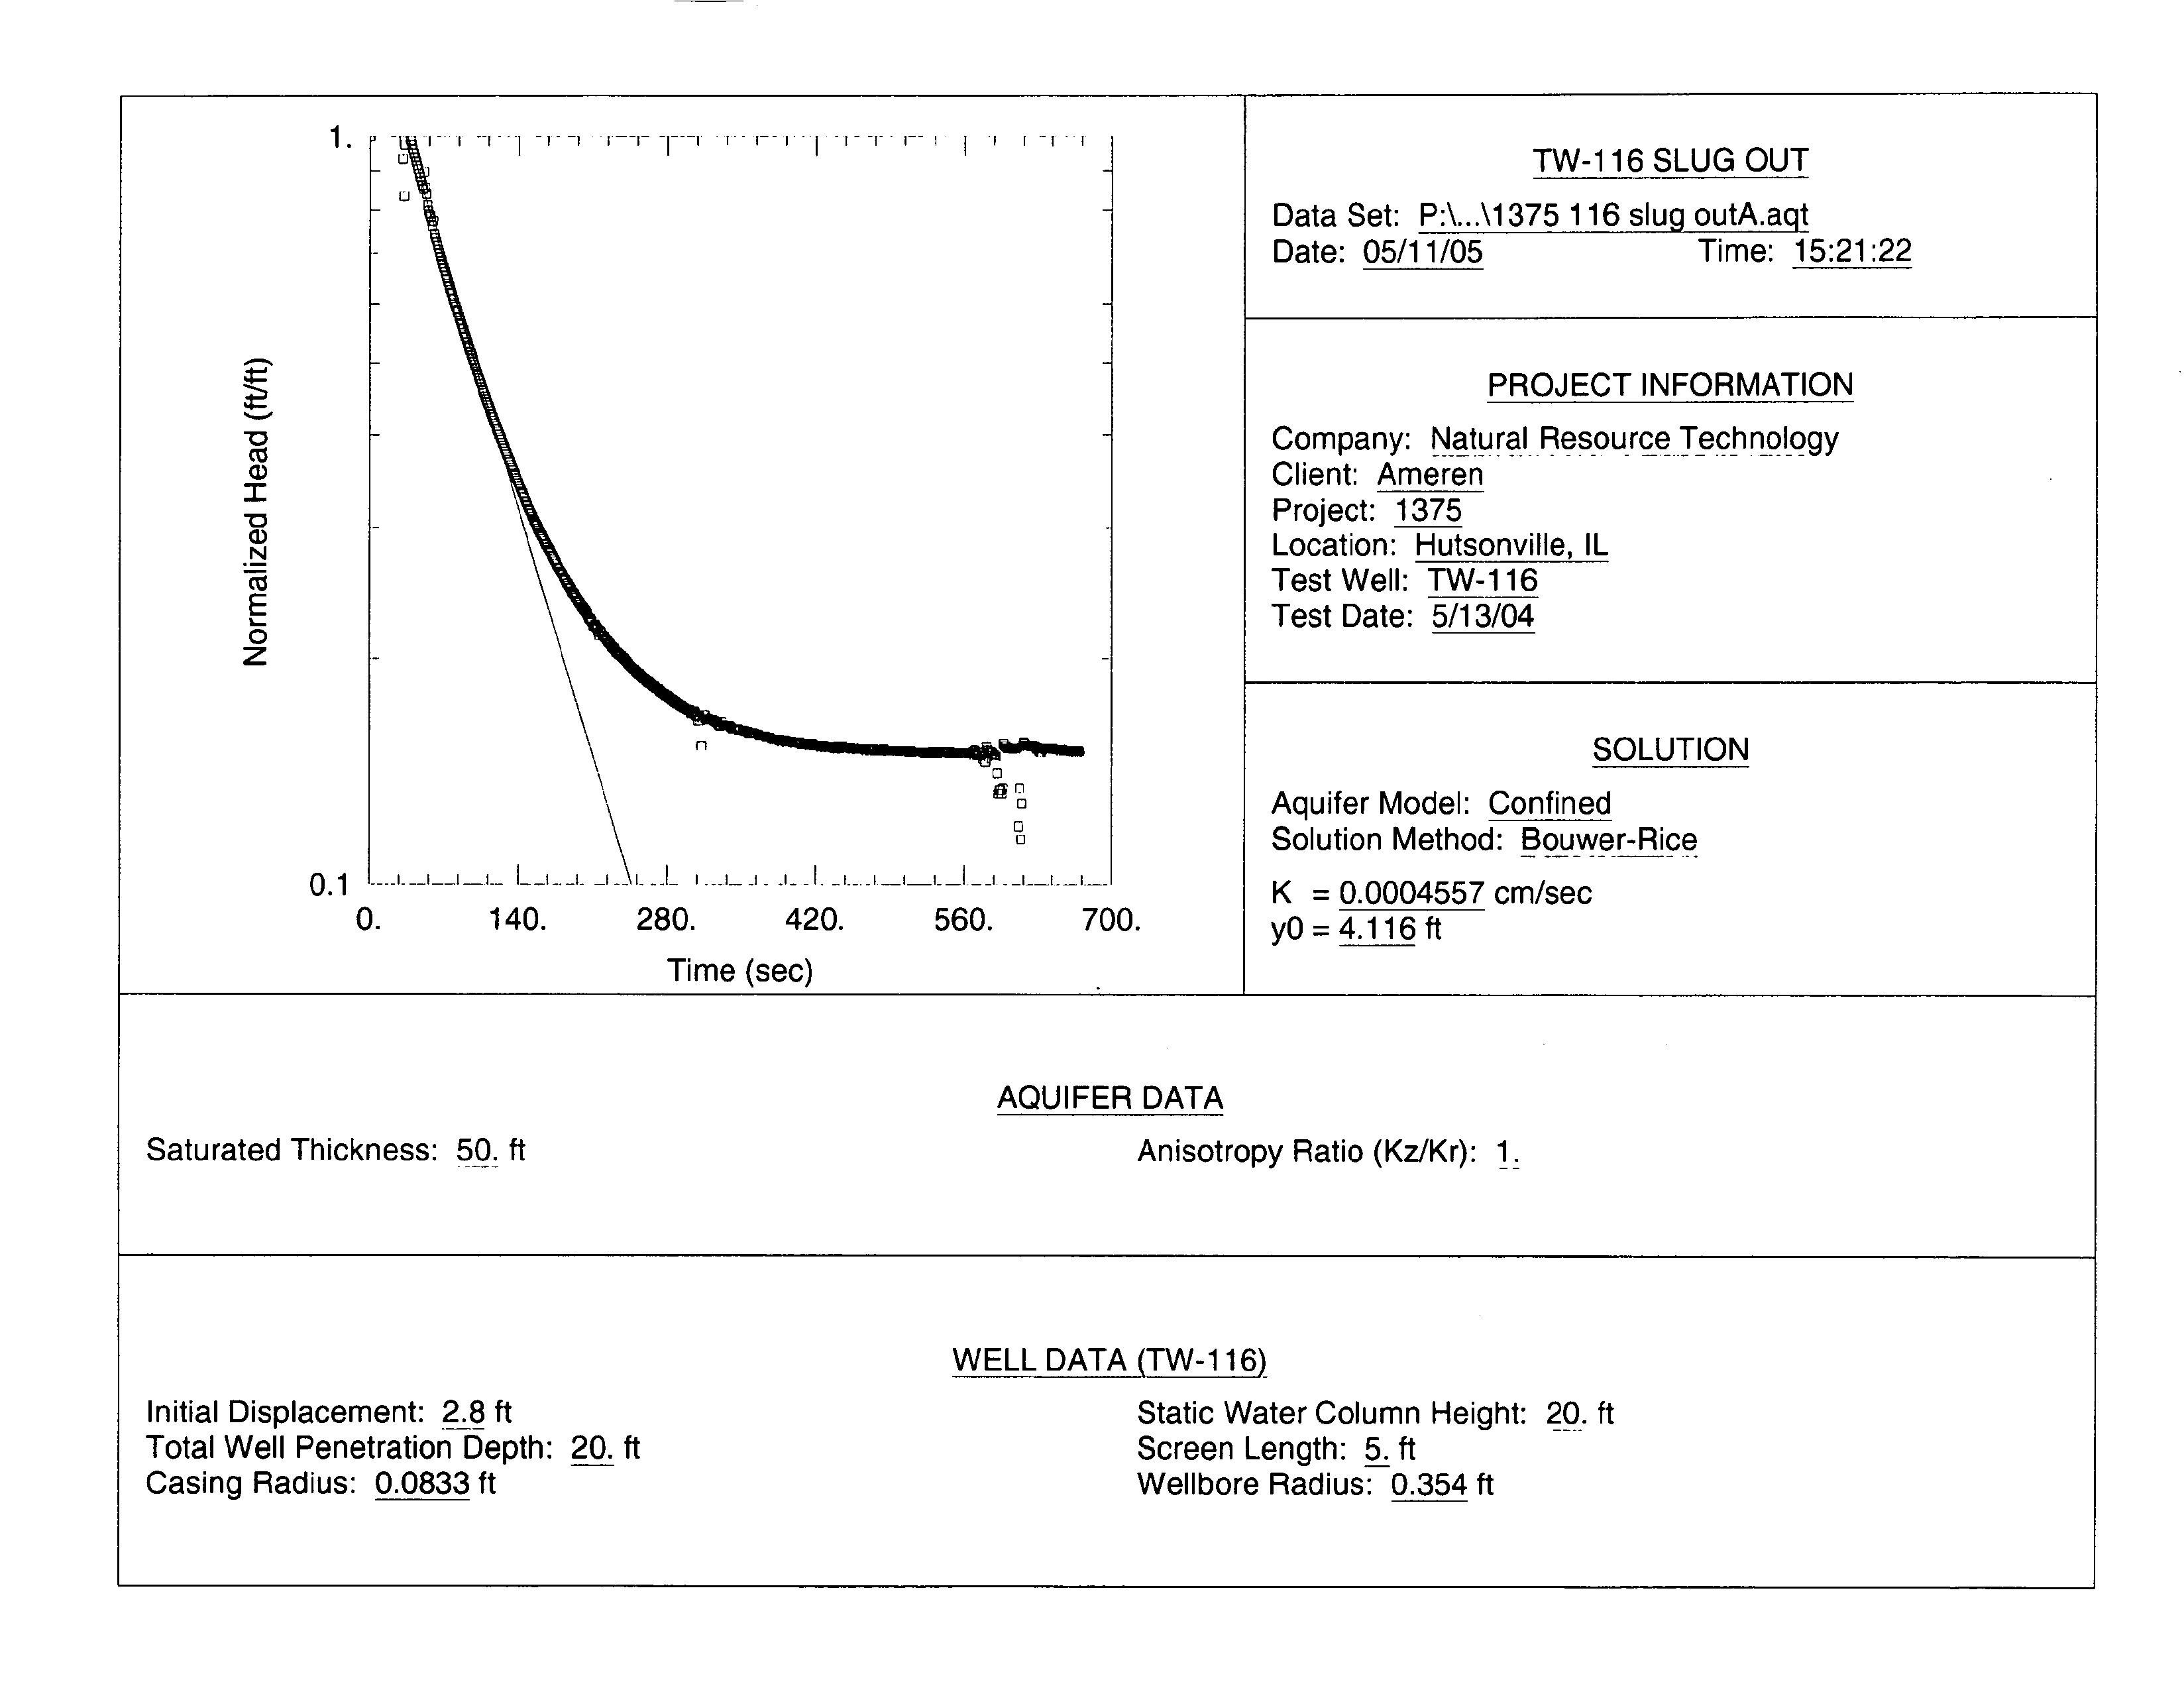
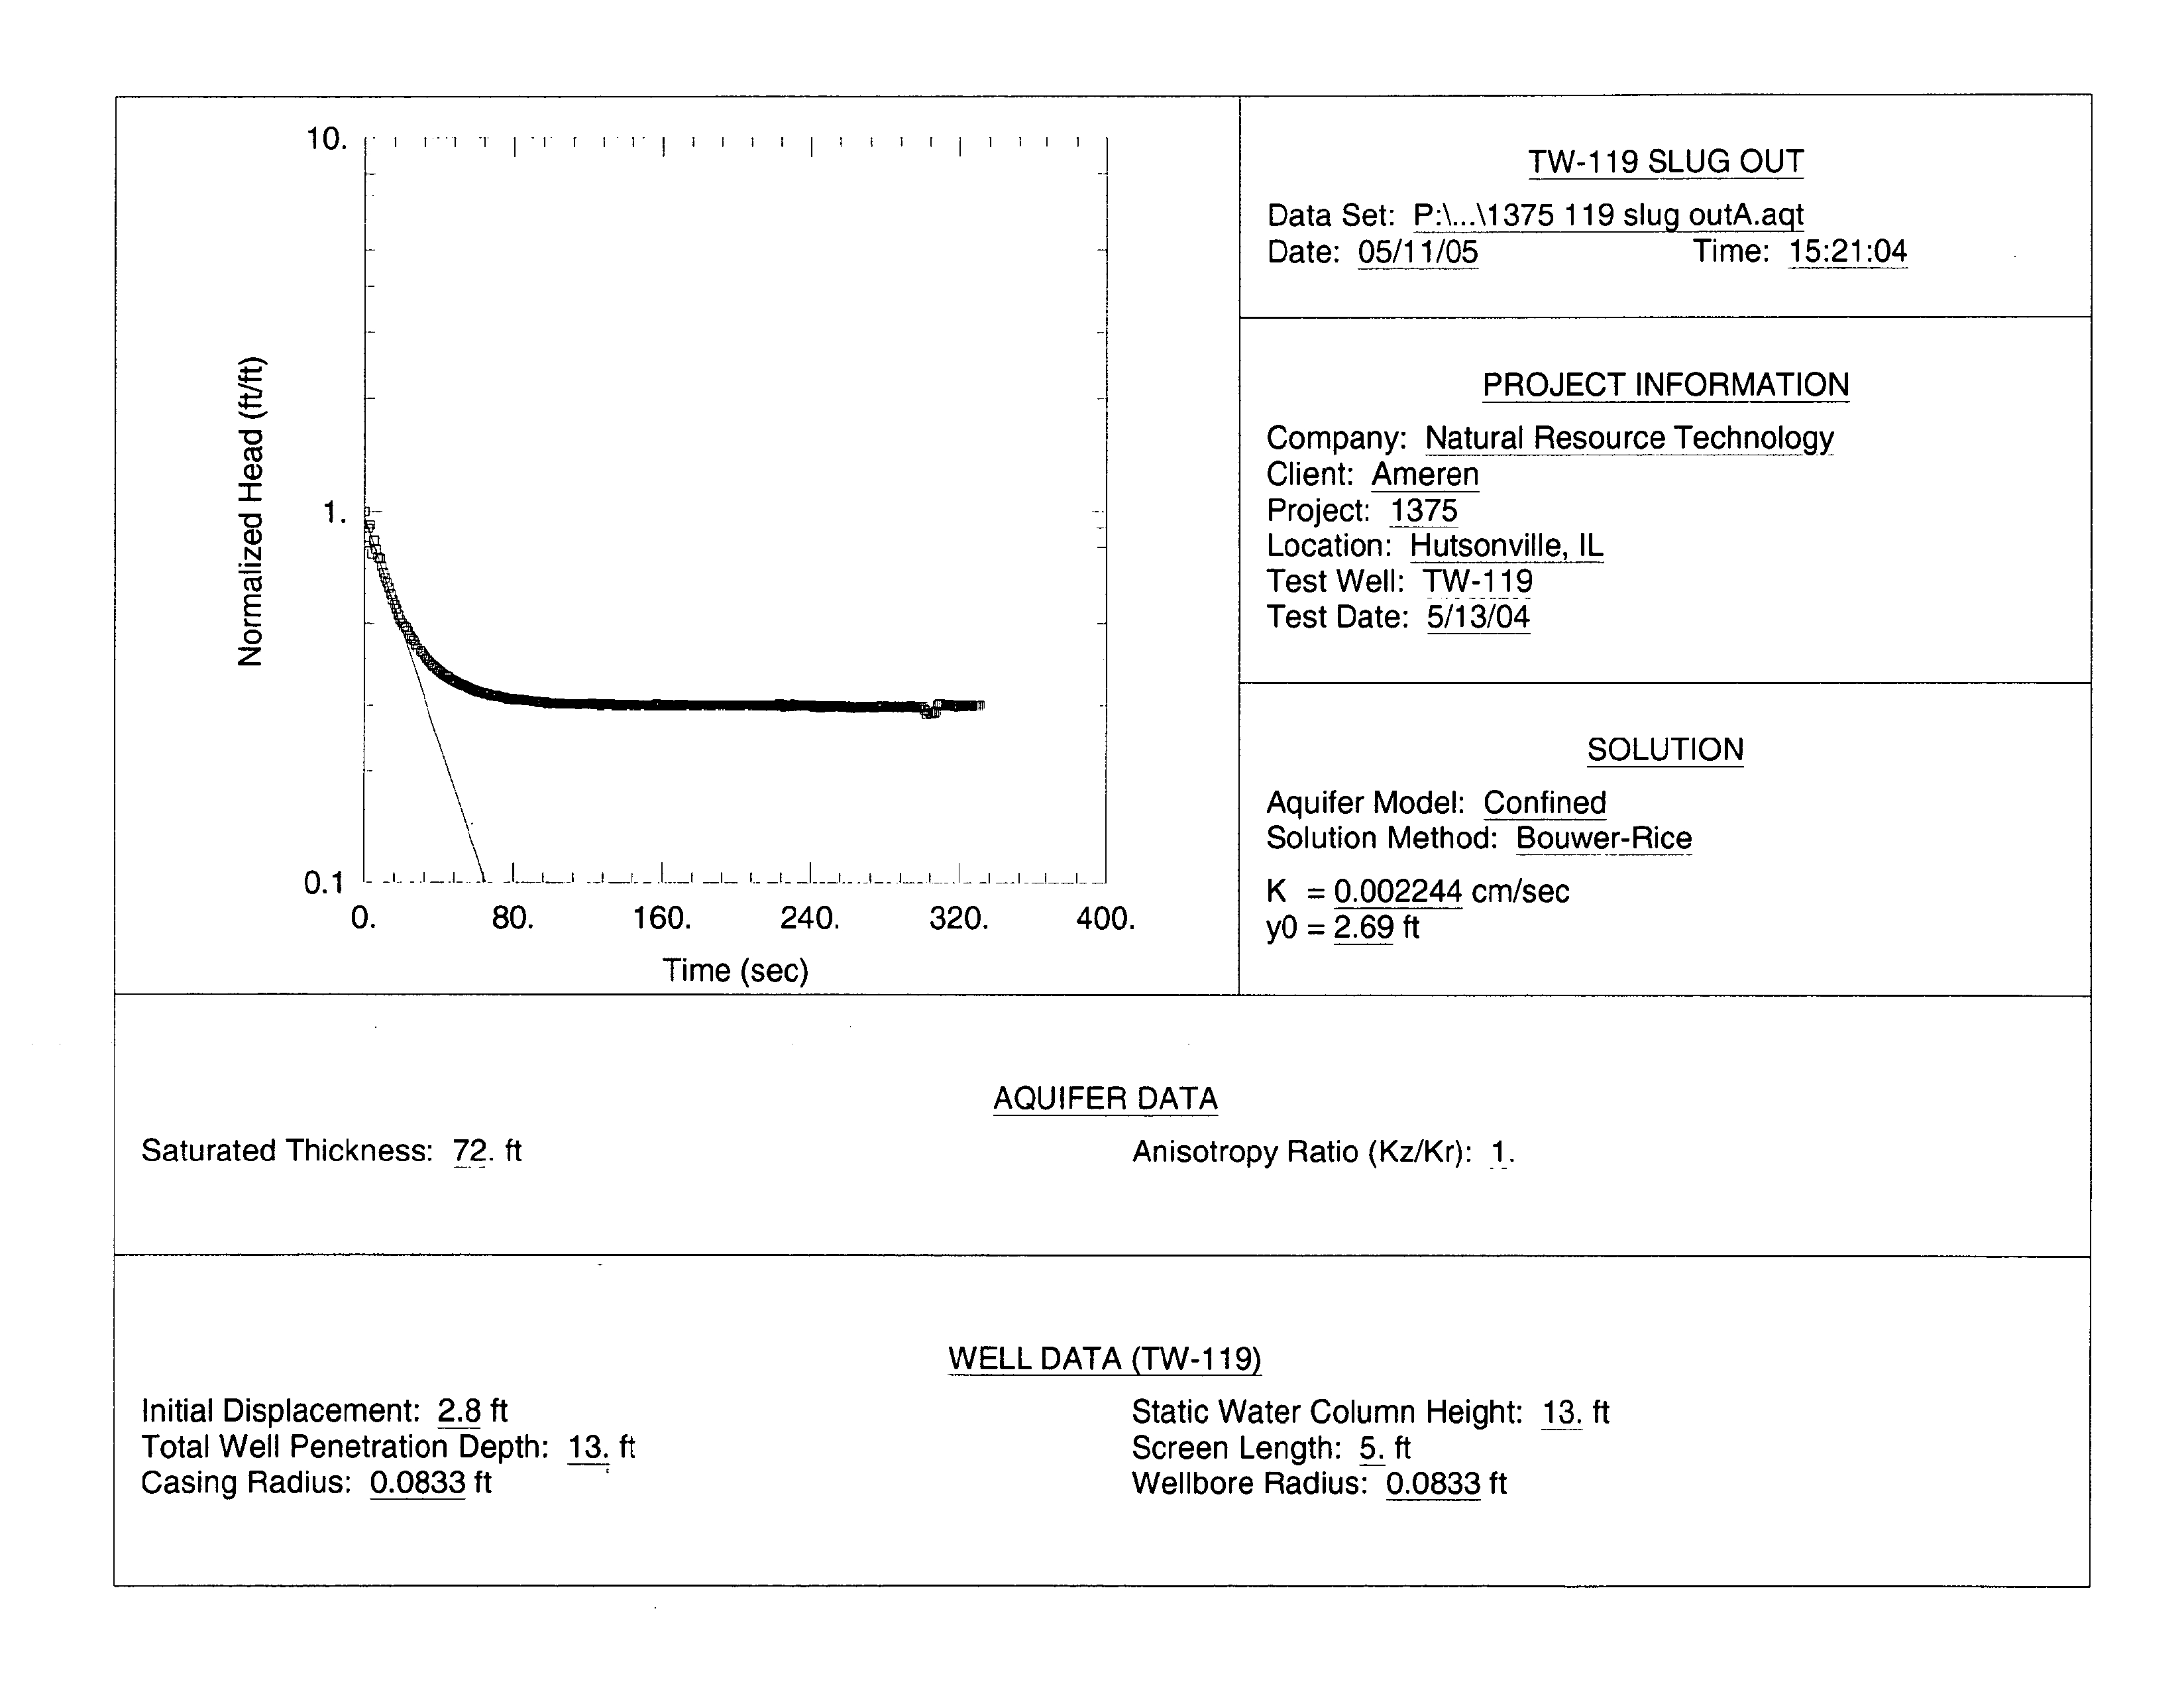
2.2.2
Hydraulic Testing
Single
well
recovery
tests were
performed
on
newly
installed wells Well
TW-120 could not be tested
because
the
depth
to
groundwater
was
greater
than the
length
of the
pressure
transducer
cord Data were
collected
using
laptop
and MiniTrollTM
pressure
transducers
Pressure transducers
were
placed
in
the
wells and the
tests started
0.061
ft3
steel
slug
was inserted
and time
was
allowed for
groundwater
to
reach
equilibrium slug-in
test
After
groundwater
had returned
to
static
water
level
the
slug
was
removed and the water column left to
equilibrate again slug-out test
Test duration was
to 10 minutes
Upon
test
completion
the data were downloaded and
interpreted
using
the Bower-Rice
1976
method as
coded
in
the
Aqtesolv software
with the
exception
of TW-1 15S and TW-1
18
which
were
interpreted
using
the Butler
1998
analysis
method
Table 2-4 Appendix
A-3
The MiniTrollTM
dataloggers
were
then
deployed
in
wells
TW-l
15S
TW-1
15D
and TW-1 18 for
continuous
groundwater
elevation observations
The
dataloggers
were set to take
pressure
head
readings
of the
height
of the water column above the transducers
every
hour
for six months
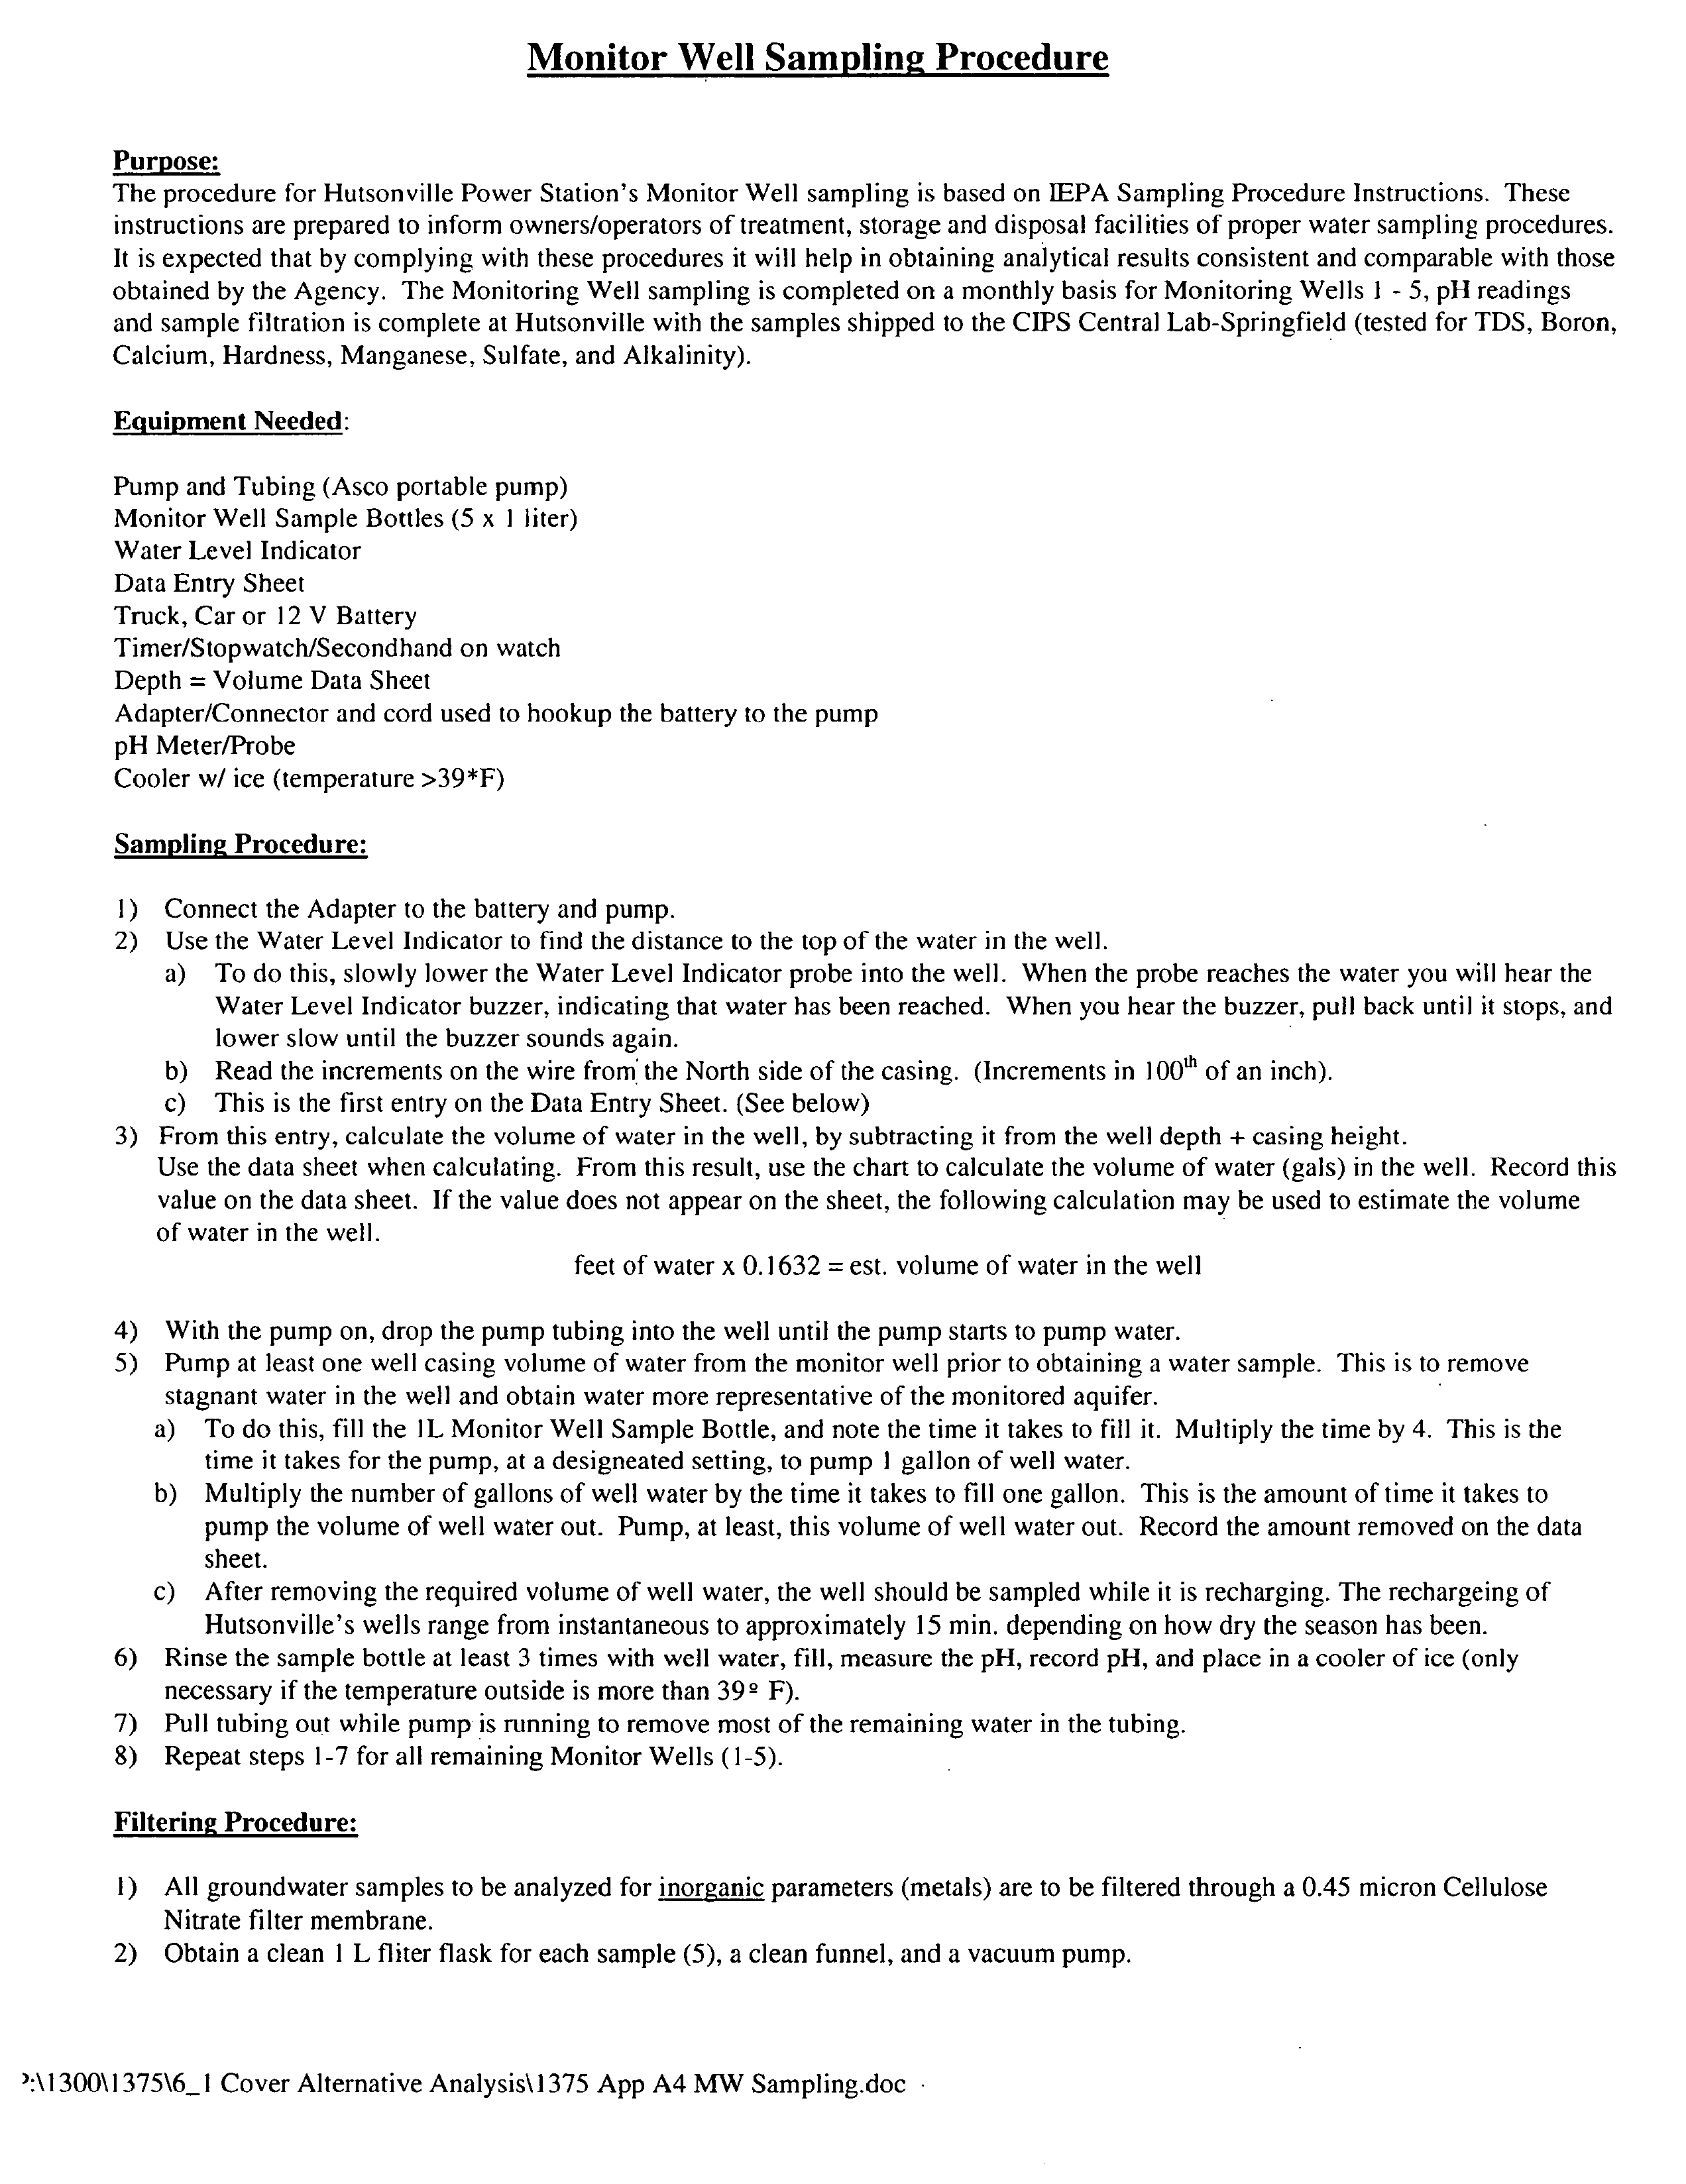
2.3 Groundwater
Sampling
and
Analysis
Groundwater
sampling
was
performed by
AEG
according
to their standard
operating
procedure
Appendix A-4 Analysis was
performed by
PDC laboratories
Analytical
methods are listed below
Analyte
Method
Alkalinity
Tot
SM
18
2320B
Boron
Tot
SW-846 6020B R0.0
Calcium
Tot
EPA 7140
prior
to
2002
SW-846 6020B
R0.0
since 2002
Hardness
total
SM
18
2340C
Manganese
Tot
243.1
prior to
2002
SW-846 6020B RO.O
since 2002
Sulfate
Tot
375.4
prior
to
2002
EPA 300.0 R2.1
since
2002
TDS
160.1
prior
to
2002
SM
18
2540C
since 2002
Only
one
of the
two in or
out
tests
is
reported
if the other test
yielded
non-linear
recovery
curve
1375 Alternatives
Analysis Report-Final
NAI1.JRAL
2-5
RESOURCE
TECHNOLOGY
Electronic Filing - Received, Clerks' Office, August 11, 2008--AS 09-1, Exhibit 3
SUMMARY OF SITE CONDITIONS
2.4
Summary
of
Hydrogeology
and
Groundwater
Quality
2.4.1 Distribution of Coal Ash Fill
Ash
at
the Hutsonville
Power Station has been
managed
in Ponds
and
In
addition
ash
was
placed
in
laydown
area between the southern
portions
of Ponds
and
The ash
laydown
area was
roughly
triangular
in
shape
and covered
an area
of about
acres
In
2000 all ash in the
laydown
area was
excavated
and the interim
pond Pond
and
drainage
collection
pond
Pond
were
constructed in that
general
location
Four
direct-push
probe
holes
GP-20 through GP-23
advanced
through
Pond
during
the 1999
Hydrogeologic
Assessment
indicated ash thickness
ranging
from
about 12 feet at the north end of the
impoundment
to 31 feet in the central
portion
of the
impoundment Section C-C
Figure
in the
Hydrogeologic
Assessment
report
Ash in the central and
southern
portions
of Pond
extended
as
much
as 16 feet below the normal water table elevation
2.4.2
Hydrogeology
The
upland portion
of the site is underlain
by
thin
less
than 20 feet
thick layer
of sand-rich
soil
which
is
underlain
by Pennsylvanian-age
sandstone
The lowland
portion
of the Site is in the
Wabash River
valley
and is underlain
by
90 feet of
alluvium
that coarsens downward The
upper
alluvium consists of
silt and
clay
with
thickness of
to
30 feet
Figure 2-1
The lower alluvium is sand and
gravel
which
extends to
Pennsylvanian-age
shale
at
60
to
90 feet
bgs
The water table
throughout
most of the
upland
area occurs within the surficial sand unit Groundwater
flow in this unit is
east
toward
the Wabash River
see Figures
and
in the 1999
Hydrogeologic
Assessment
report
Flow
velocity
in the
upper
sand
varies with
hydraulic
gradient
and
hydraulic
conductivity
and was
previously reported
at 150 to 240 feet
per year
The
water
table within the
Wabash River
valley
occurs in the surficial silt and
clay deposits
therefore
the
deep
alluvial
aquifer
is confined
Groundwater
flow in the
deep
alluvial
aquifer
on
the
Illinois side of the
river is east to
northeast
toward
the Wabash
River
Figures
2-2 2-3
and
2-4
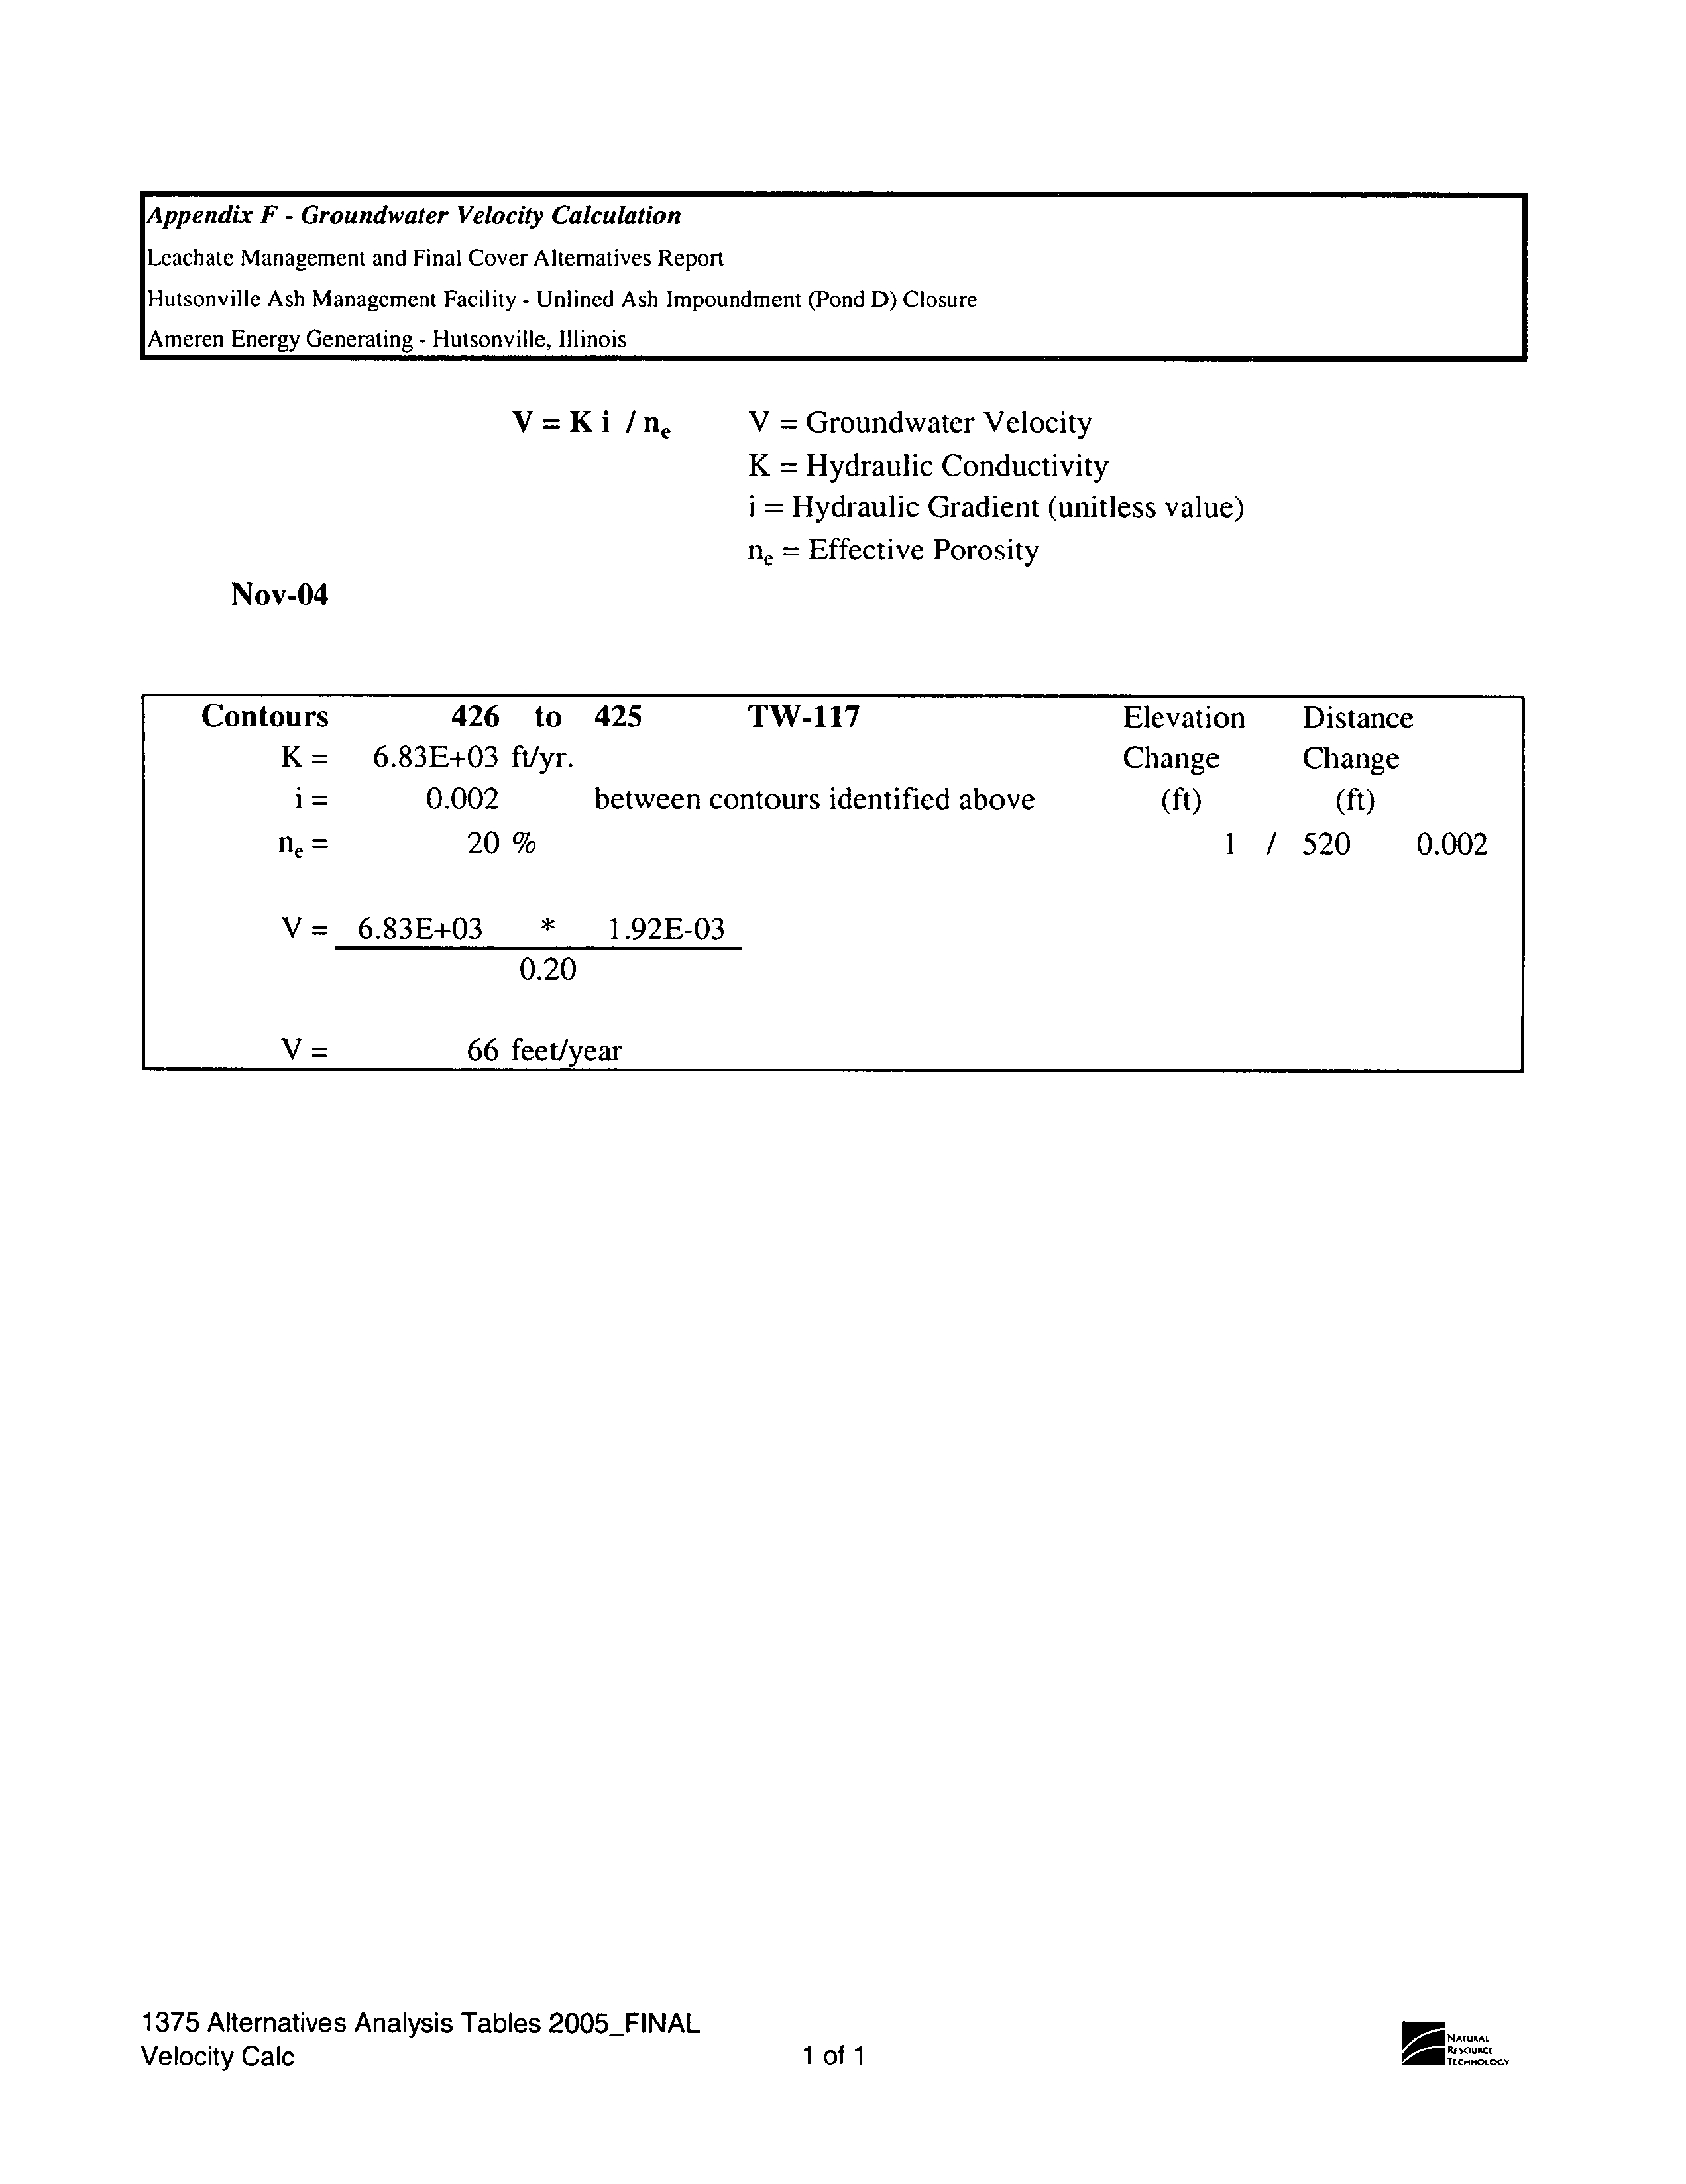
typical
horizontal
gradient
in the
deep
alluvial
aquifer
south of the site
was
0.002 ft/ft
Appendix
Horizontal
groundwater
flow
velocity
was estimated to be
approximately
66
ft/yr
in the
deep
alluvial
aquifer
Appendix
The
relatively
low
velocity
is function of the fiat
gradients
in this formation
The
high
1375 Alternatives
Analysis
Report-Final
NATURAL
2-6
RESOURCE
TECHNOLOGY
Electronic Filing - Received, Clerks' Office, August 11, 2008--AS 09-1, Exhibit 3
SUMMARY OF SITE CONDITIONS
hydraulic conductivity
of
this formation
2.2
1O
to
1.6
10
cmls
combined with its thickness
indicates
highly
transmissive
formation
2.4.3
Evaluation of
Daily
Groundwater and River Elevation Data
Groundwater
elevation
in TW-l
5D
TW-1
15S and TW-1 18 were
continuously
measured2
and the
results
compared
to determine whether
or
not
power plant
pumpage
has
noticeable
effects on
groundwater
elevation in the
deep
alluvial
aquifer
There
was no
apparent relationship
between
plant
pumpage
and
groundwater
elevation
Figure
2-6
This
indicates that the
cone
of
depression
associated
with the
plant
wells is
small
as
might
be
expected given
the
high transmissivity
of the
deep
alluvial
aquifer
2.4.4 Groundwater
Quality
and Parameters of Concern
The
1999
Hydrogeologic
Assessment identified
boron sulfate
manganese
and TDS
as
parameters
of
concern
POCs
because their concentrations
in
groundwater
near Pond
exceeded Illinois Class
groundwater
quality standards
which were the
applicable
standards
for
this site at the time Boron and
sulfate are indicator
parameters
of coal ash
leachate
and
are
the
primary
POCs
Manganese
is
ubiquitous
in
soils
may
have
higher
concentrations
in soil than in coal
ash
and is
highly
sensitive
to
redox
conditions therefore
it is
not
reliable
indicator of coal ash leachate
High
TDS
may
be observed
at
sites where coal ash leachate
migration occurs
because
high
TDS concentrations
reflect elevated
concentrations of soluble ash constituents
such
as
calcium potassium sodium
and
sulfate however
other natural and
anthropogenic
sources
can cause
high
TDS concentrations
2.4.5
Background
Concentrations
Background
groundwater
quality
values
were calculated
in
anticipation
of site closure under Section 811
These calculations
were
performed using
data from
background
wells MW-I and
MW-b.3
Data
at these
wells
were
collected
beginning
in 1984
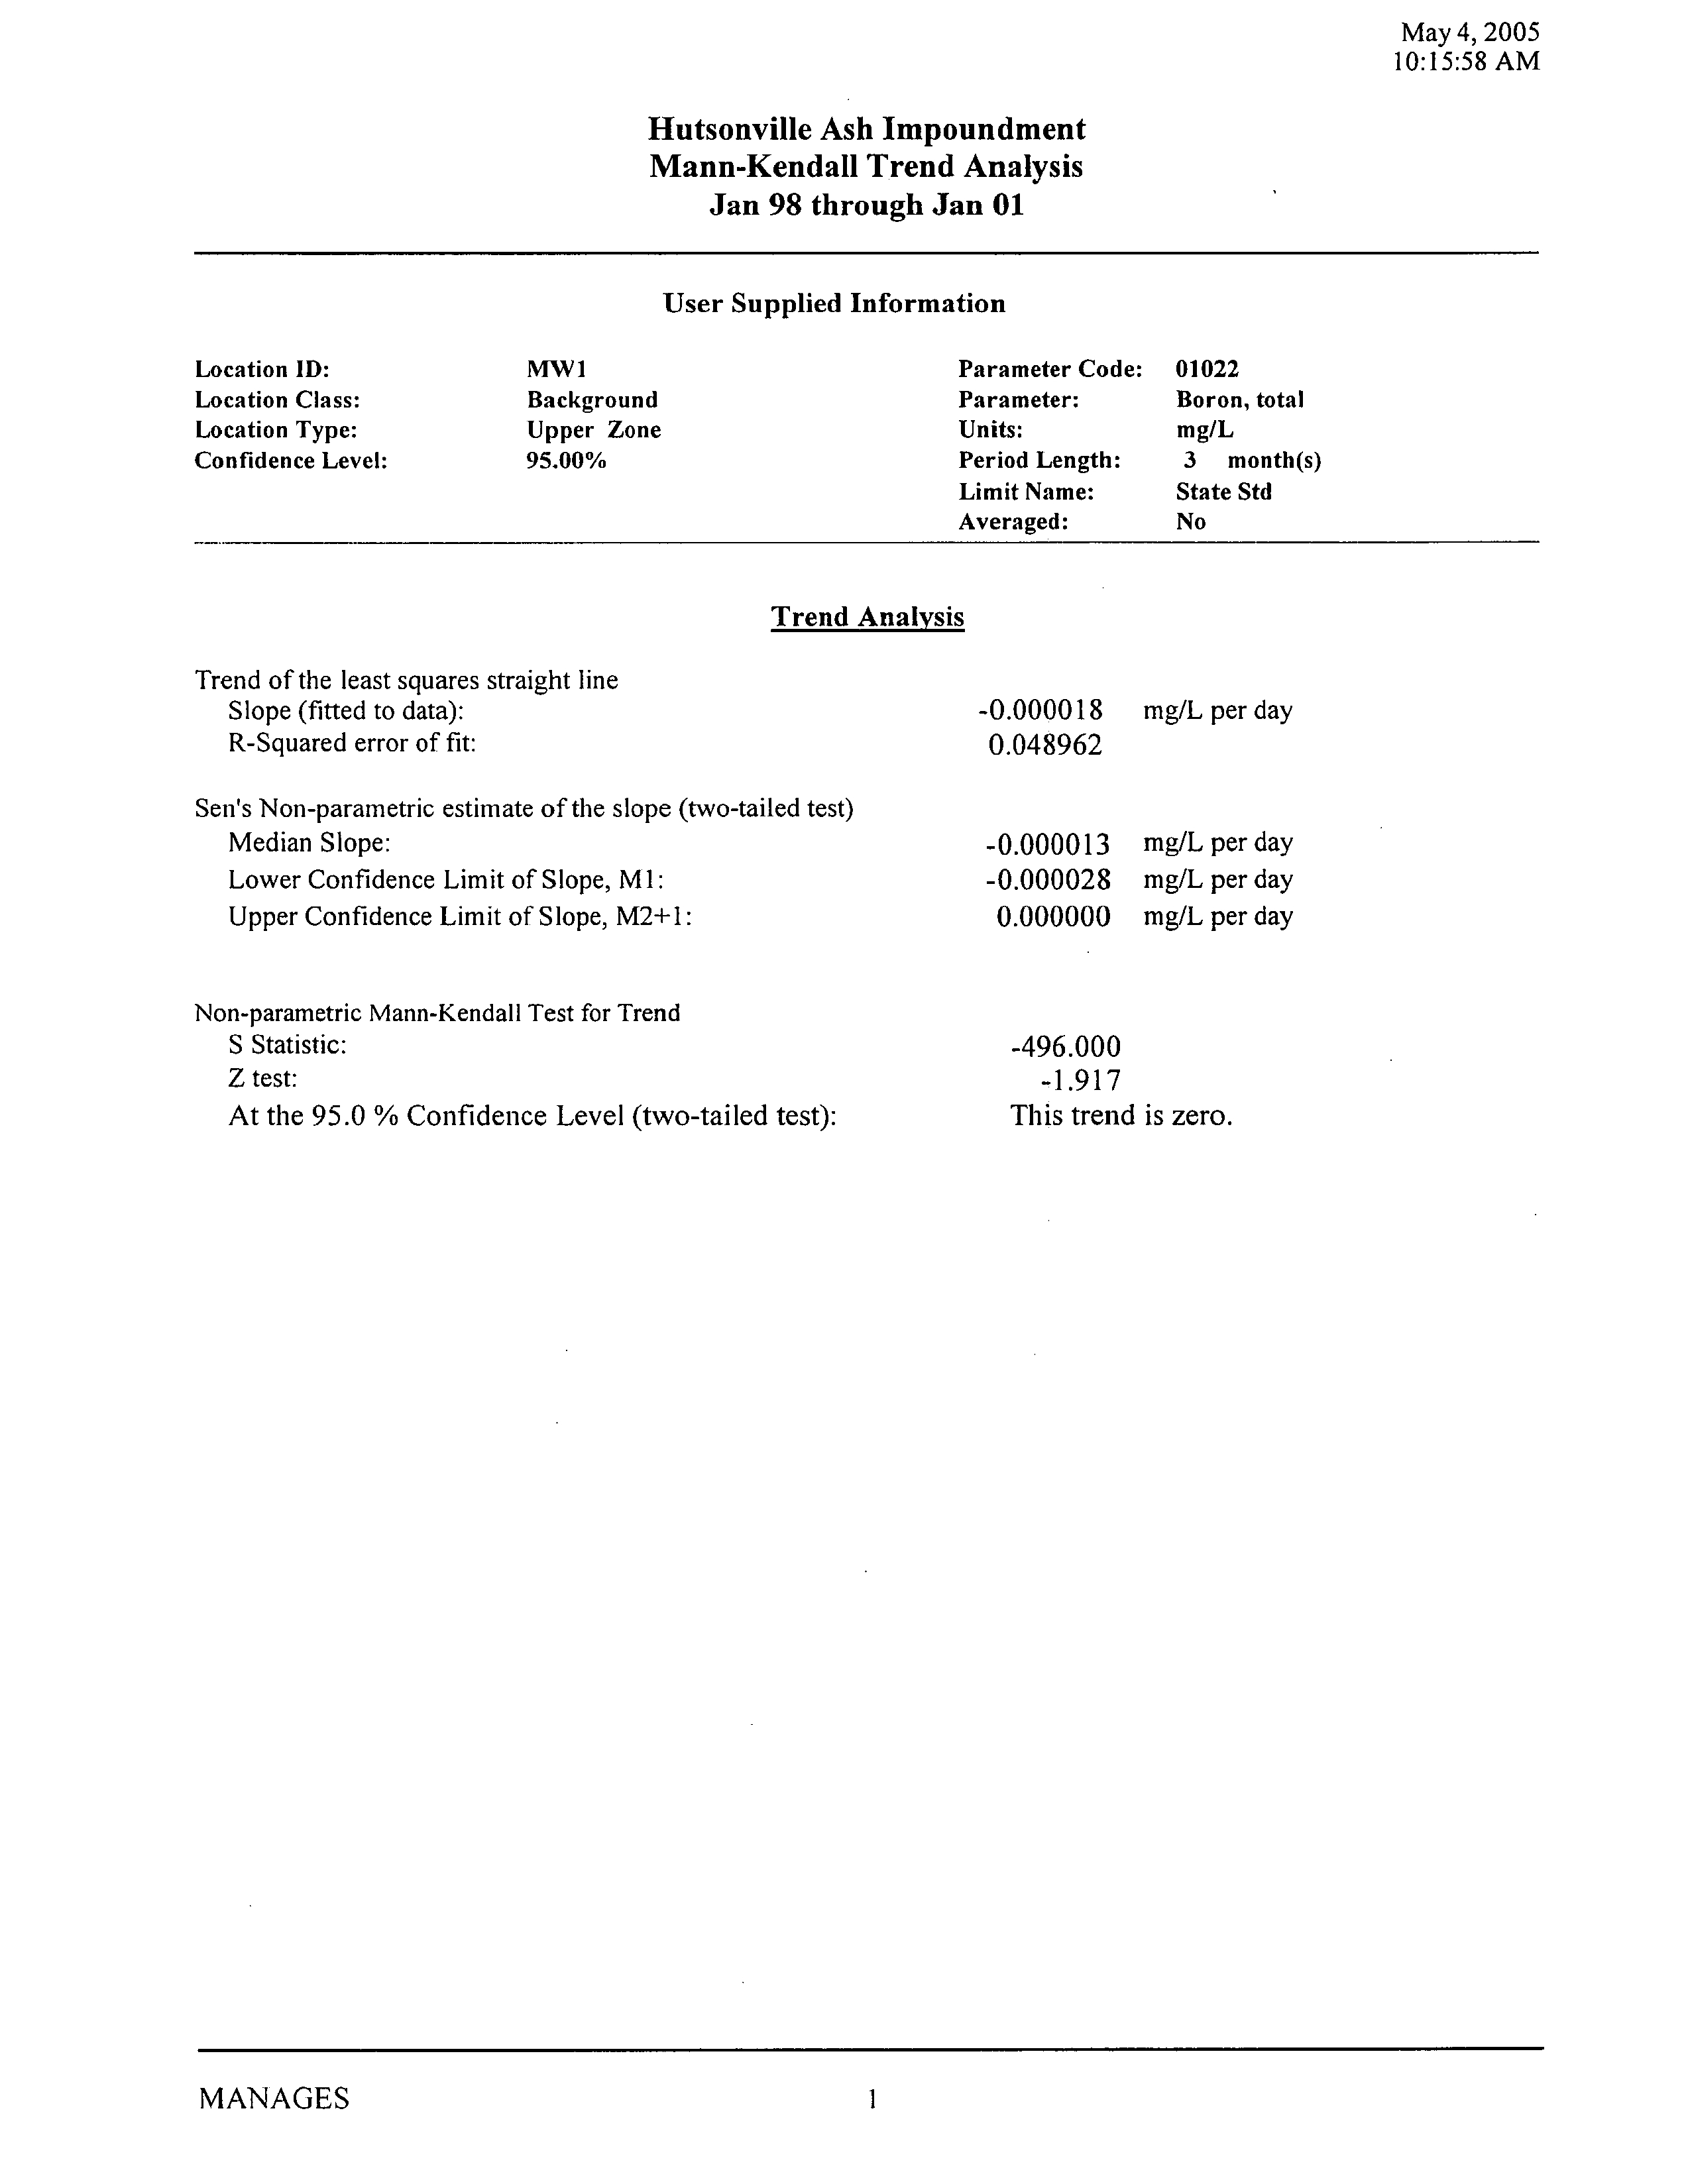
However review of these data found
anomalously high
results
for Boron in MW-
which
appear
to decrease over time
Figure 2-7
Sulfate concentrations
show
no
Due to an
equipment malfunction
continuous
data
were
only
available
for TW-1 15S after
September
2004
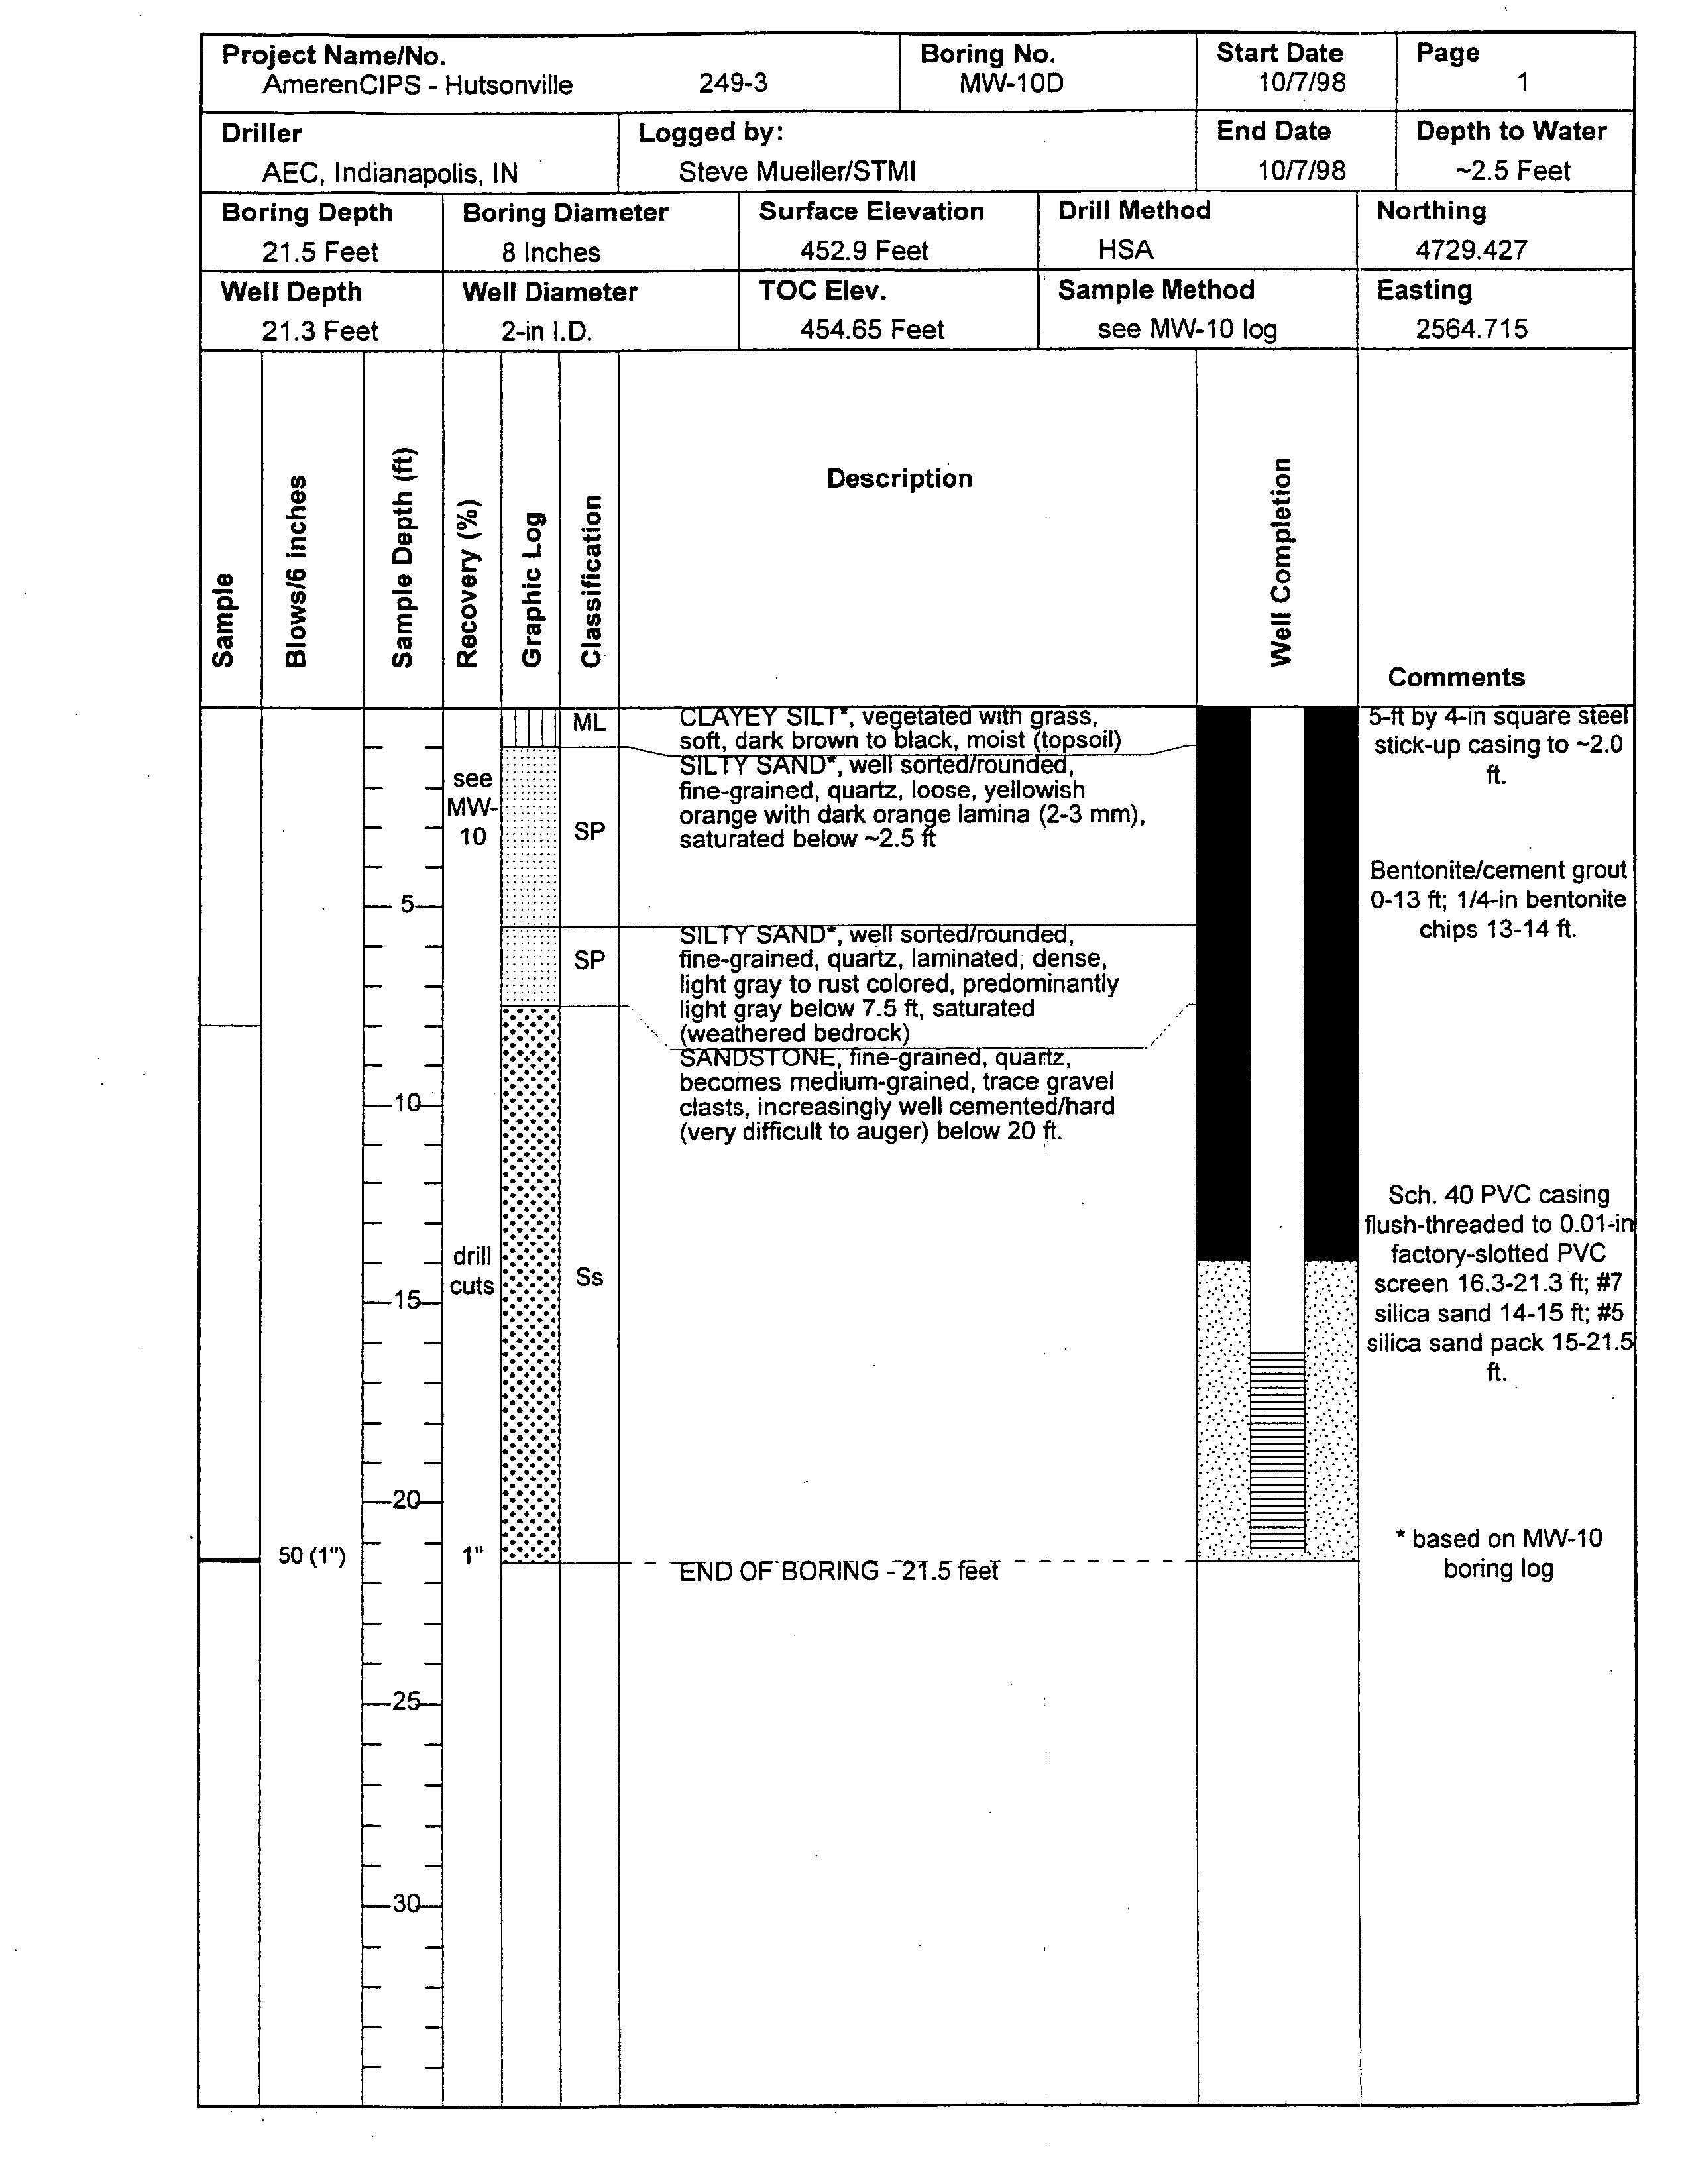
MW-10D
was not used because
it is finished in sandstone
1375 Alternatives
Analysis Report-Final
NATURAL
2-7
RESOURCE
TECHNOLOGY
Electronic Filing - Received, Clerks' Office, August 11, 2008--AS 09-1, Exhibit 3
SUMMARY OF SITE CONDITIONS
such
anomaly
and have
no
trend
Figure 2-8
As noted
previously
sulfate is also
an
indicator
parameter
for coal ash
leachate
and the absence of sulfate
suggests
that
the elevated
boron concentrations in MW-I
were not due to
migration
from the ash
ponds
Rather
these results
may
reflect
changes
in
agricultural
activity
in the
area.4
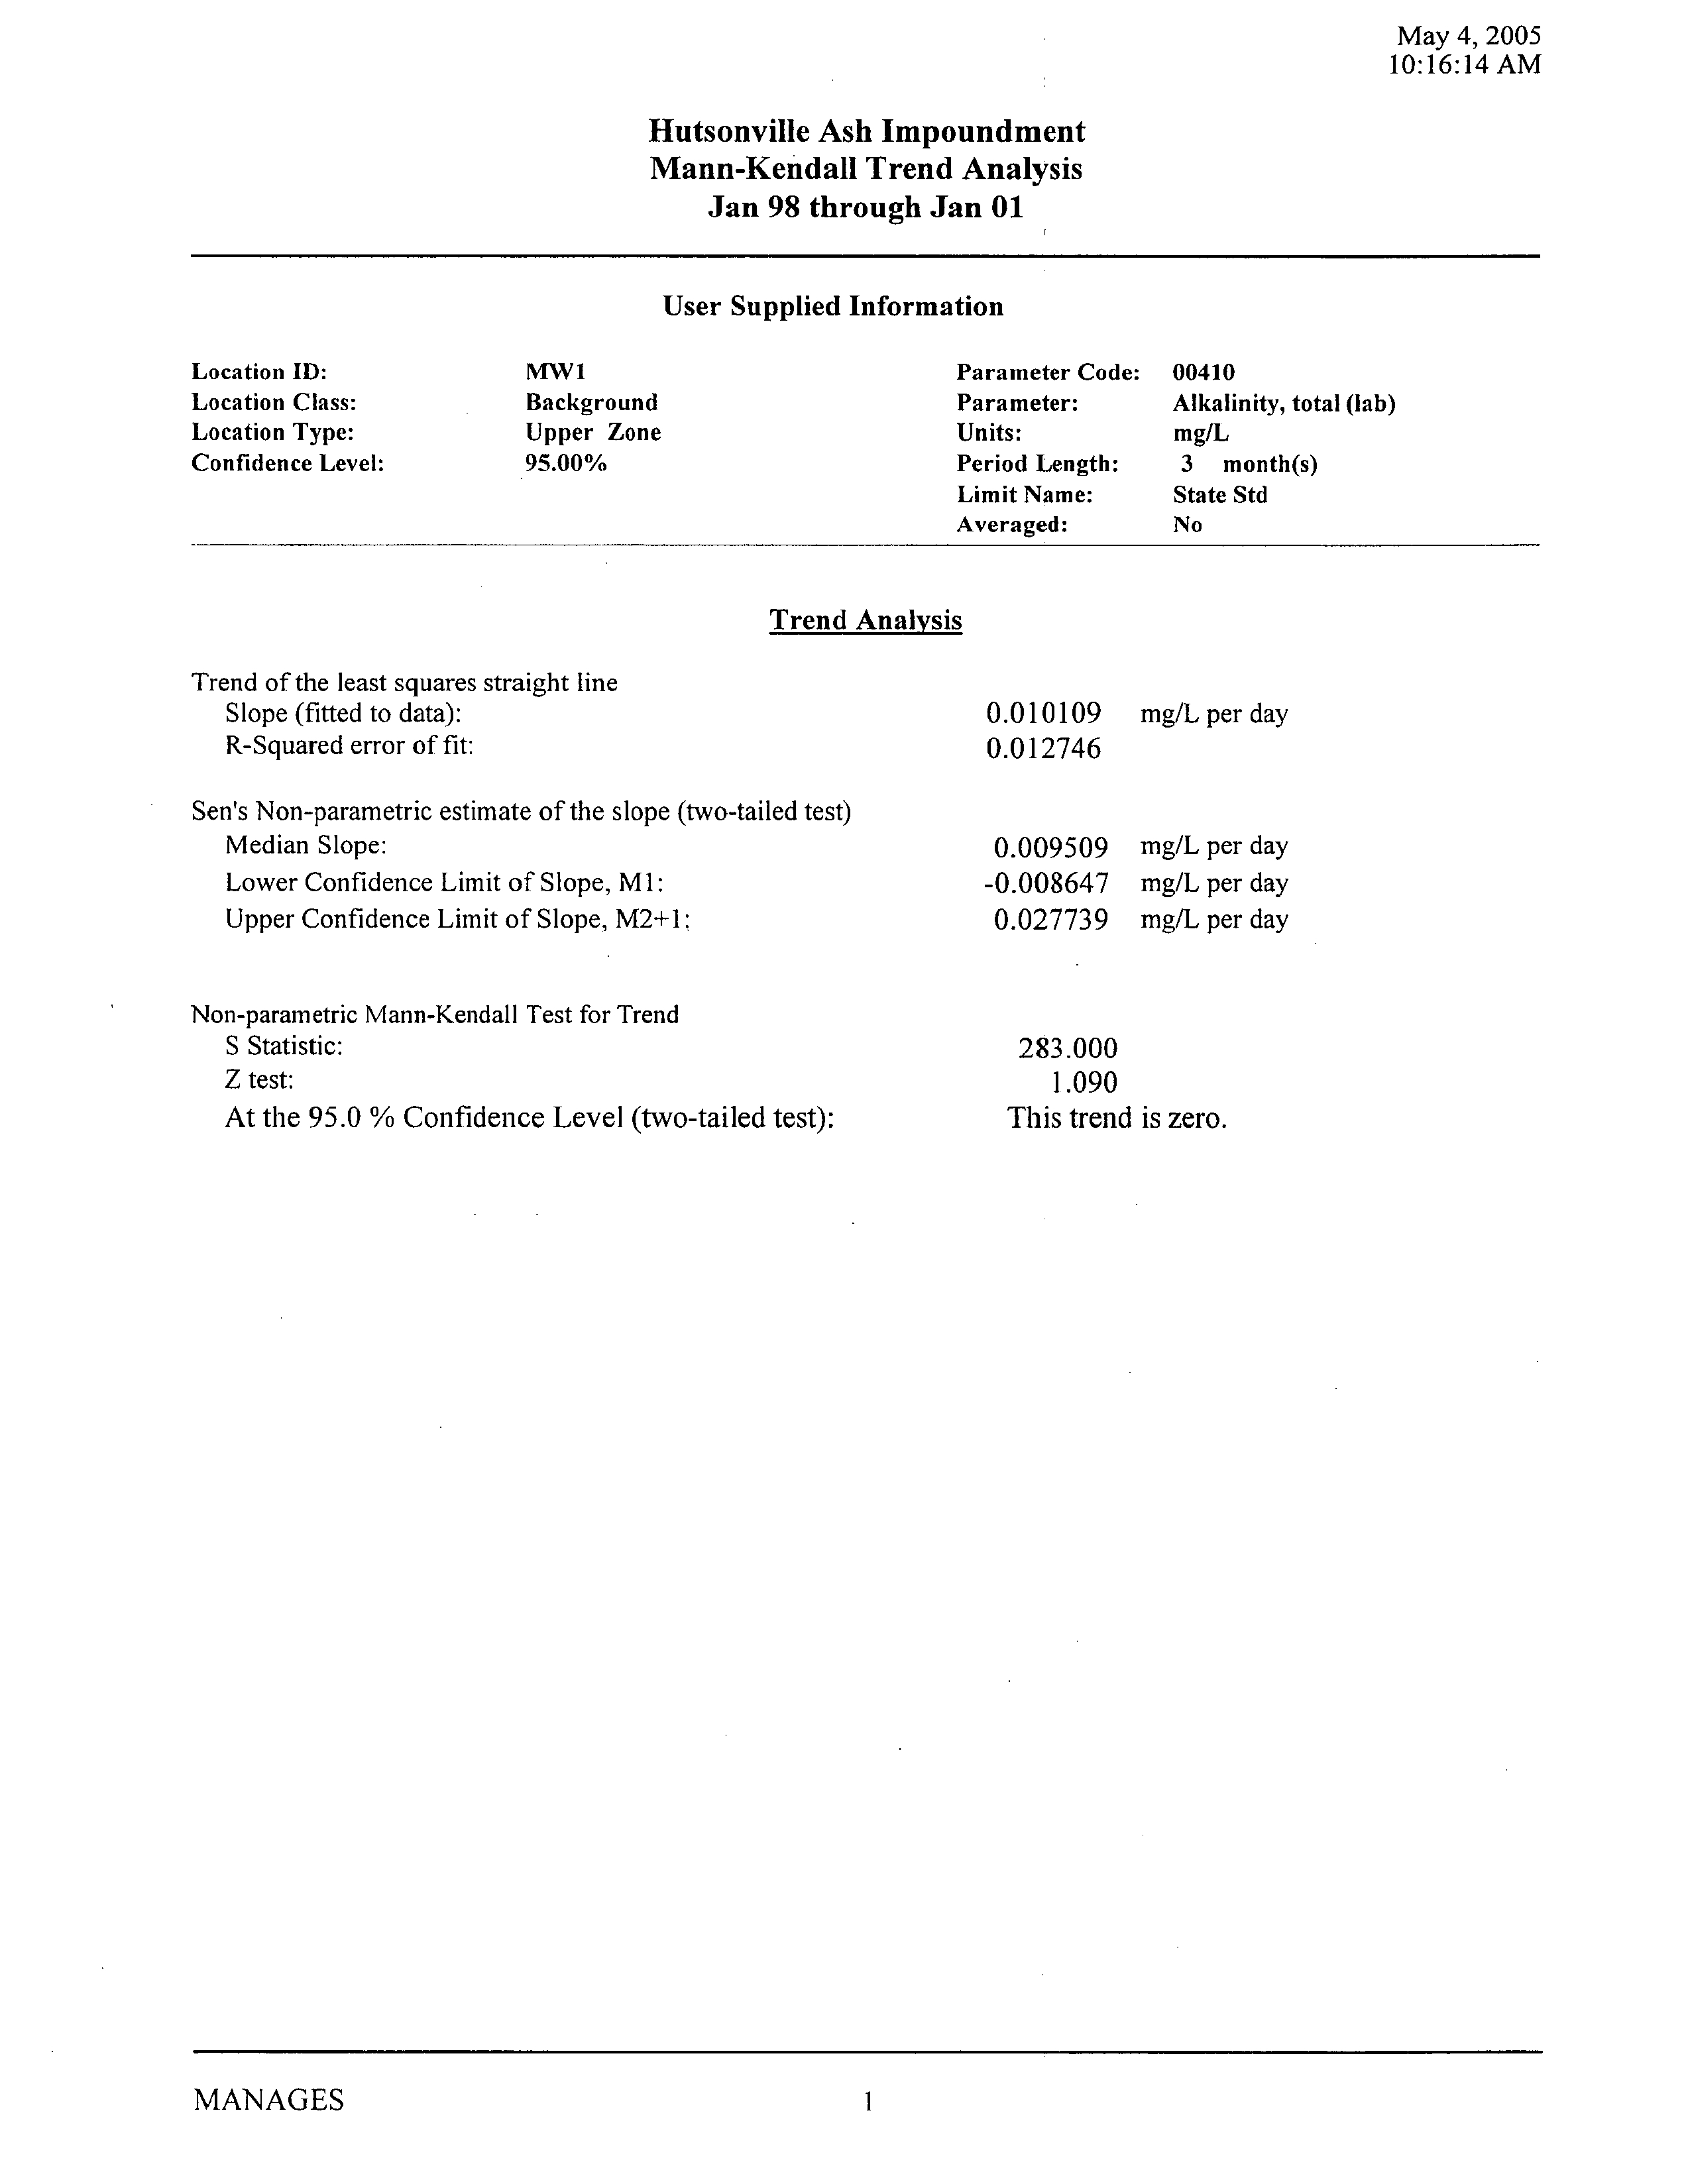
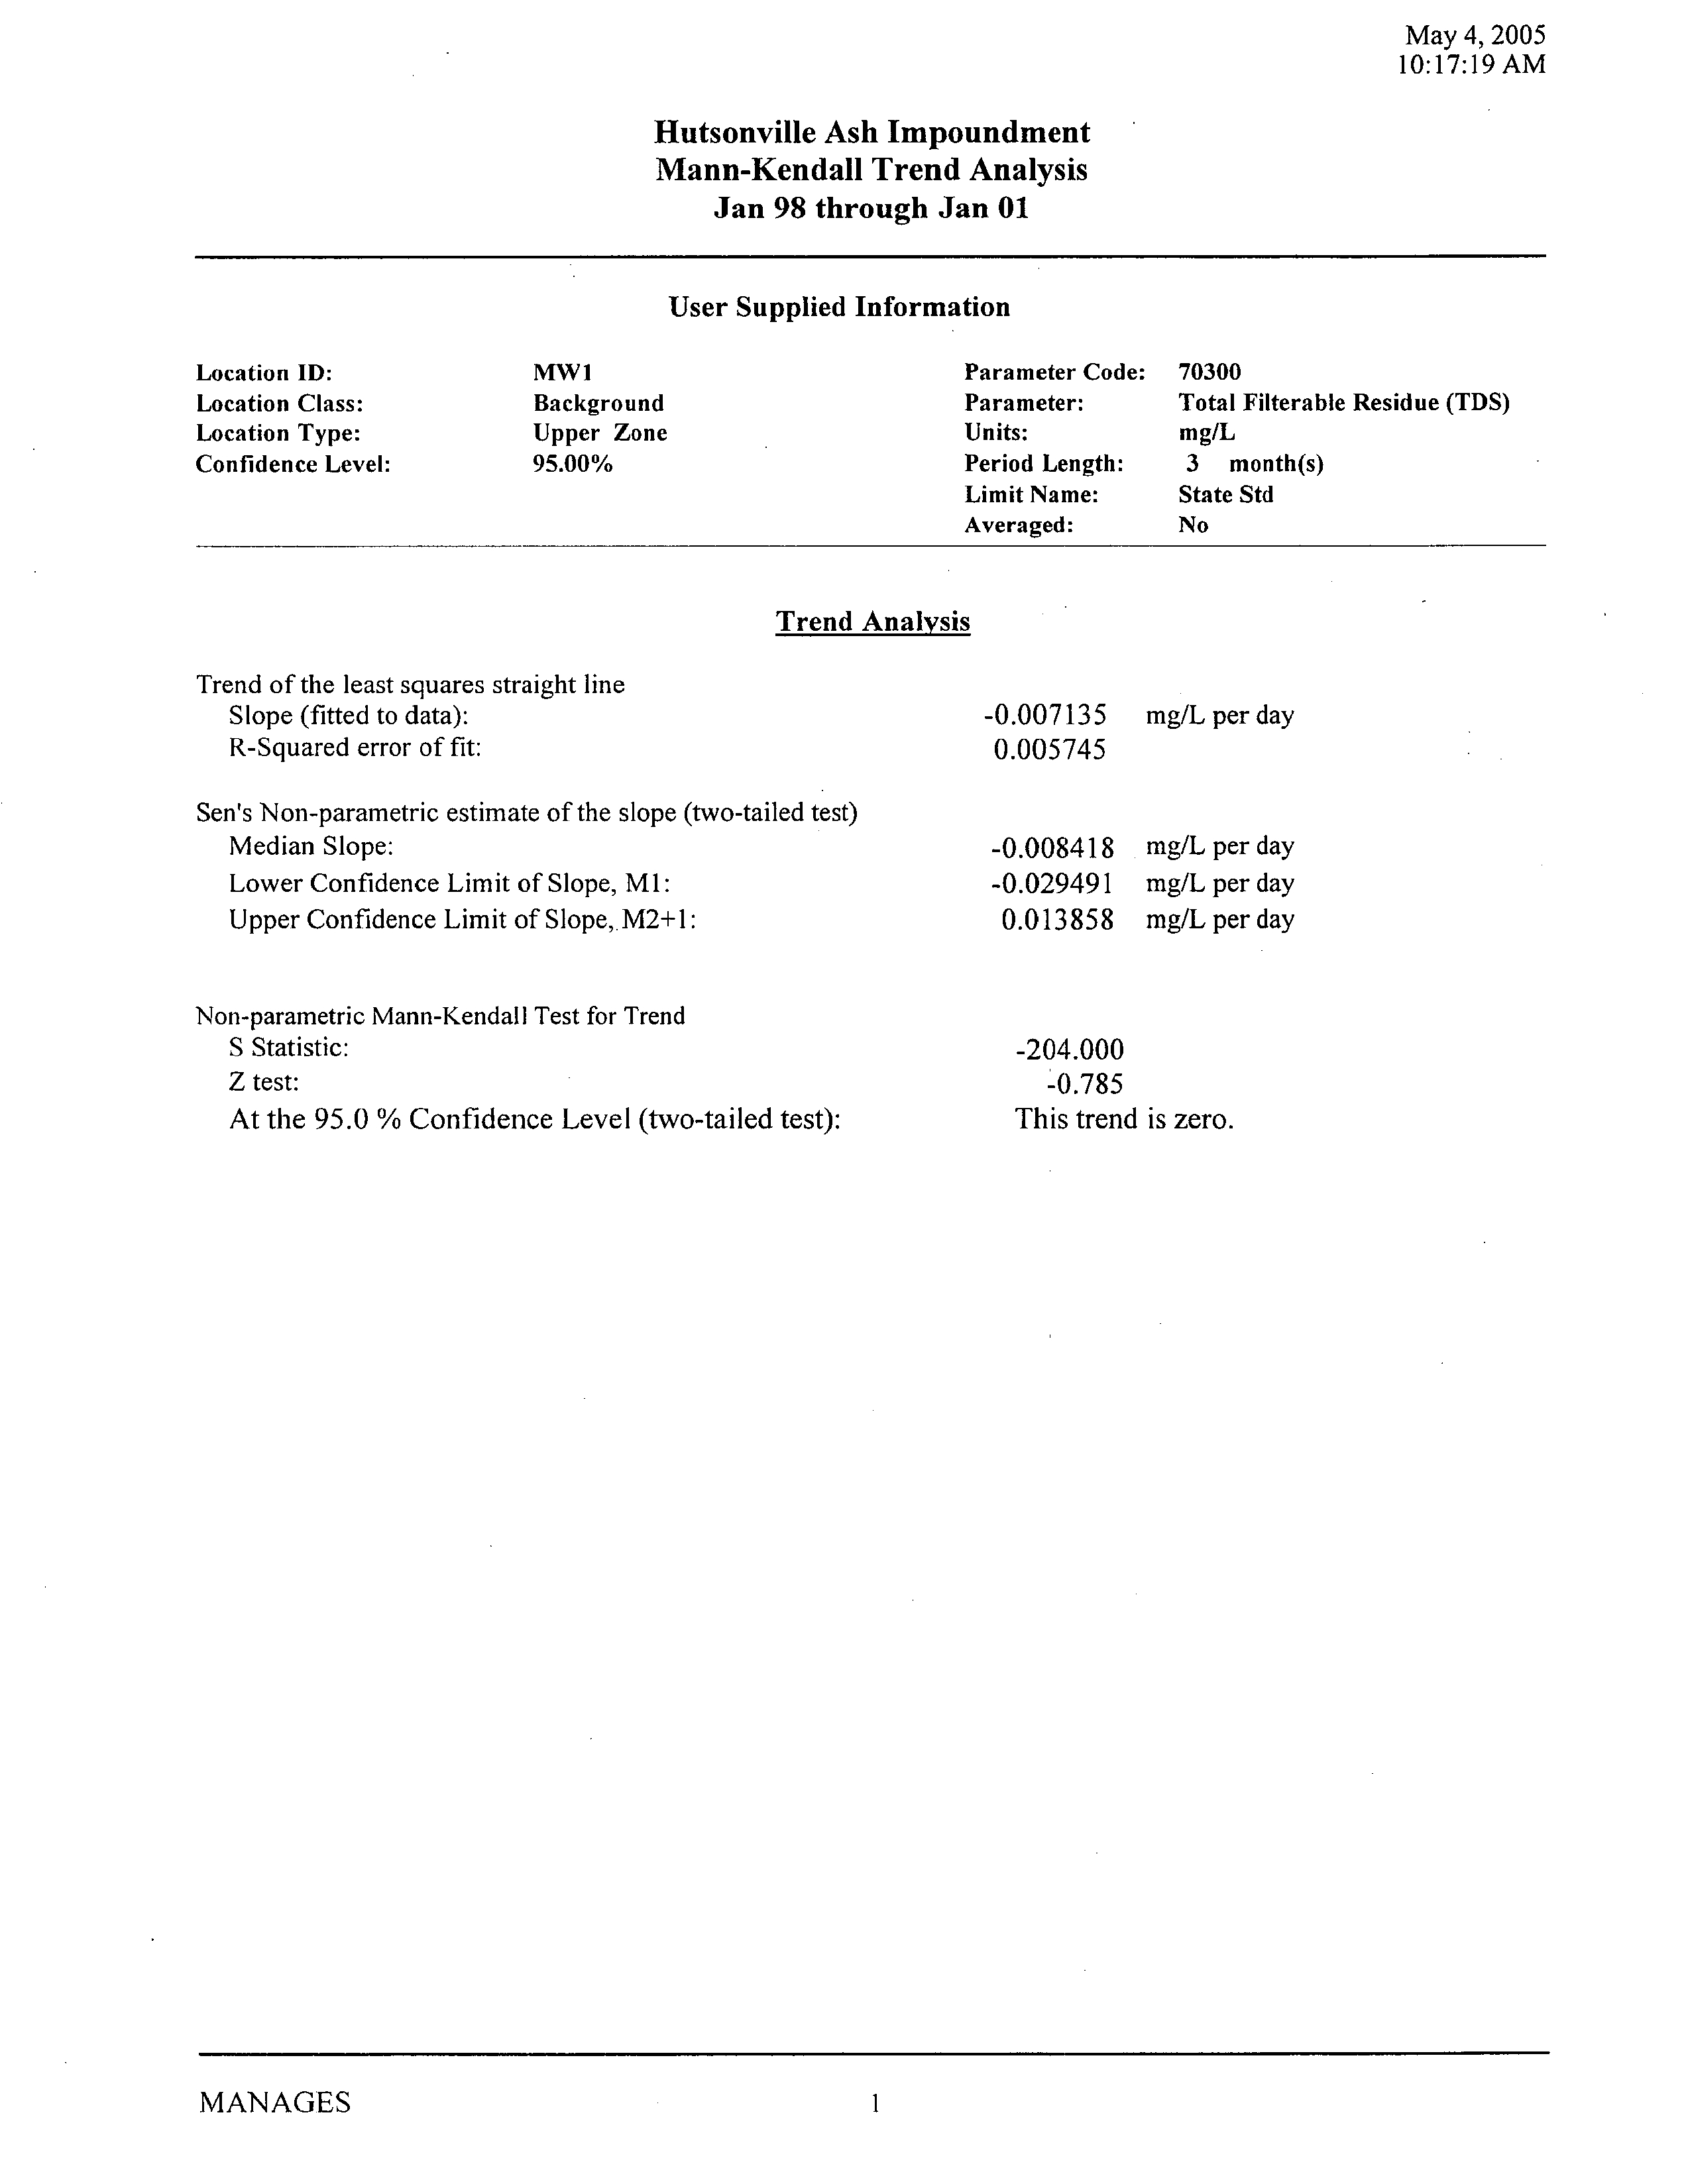
Trend
analysis
was
repeatedly performed using
the
Shapiro-Wilk test
retroactively
from 2005
i.e
based
on 2000 to 2005
data
then
based
on
data from 1999
to 2005 then based on 1998 to
2005 etc
This
analysis
indicated that there is
no
statistical
trend in boron
concentrations
in either
background
well since
1998
Appendix
Therefore
all
background
statistics for the
upper
aquifer
are calculated
using
data
collected after
January
1998
All statistical
calculations
were
performed using
the MANAGES software
EPRI 2002
Analyses
were
performed
for the
parameters currently
monitored
at Ponds
and
The data were first tested for
normality
and detection
frequency
There
were
few non-detects
in the
database
and
normality
varied
by
parameter
Based
on the
normality results
the
following background
tests were
performed
Tolerance interval at 99
percent
confidence
and 95
percent
coverage
for data with
normal distribution
TDS
Tolerance interval at 99
percent
confidence
and
95
percent
coverage
for data with
log-
normal distribution
boron
and
manganese
Non-parametric
tolerance interval
maximum concentration
for data that had
neither
normal
or log-normal
distribution
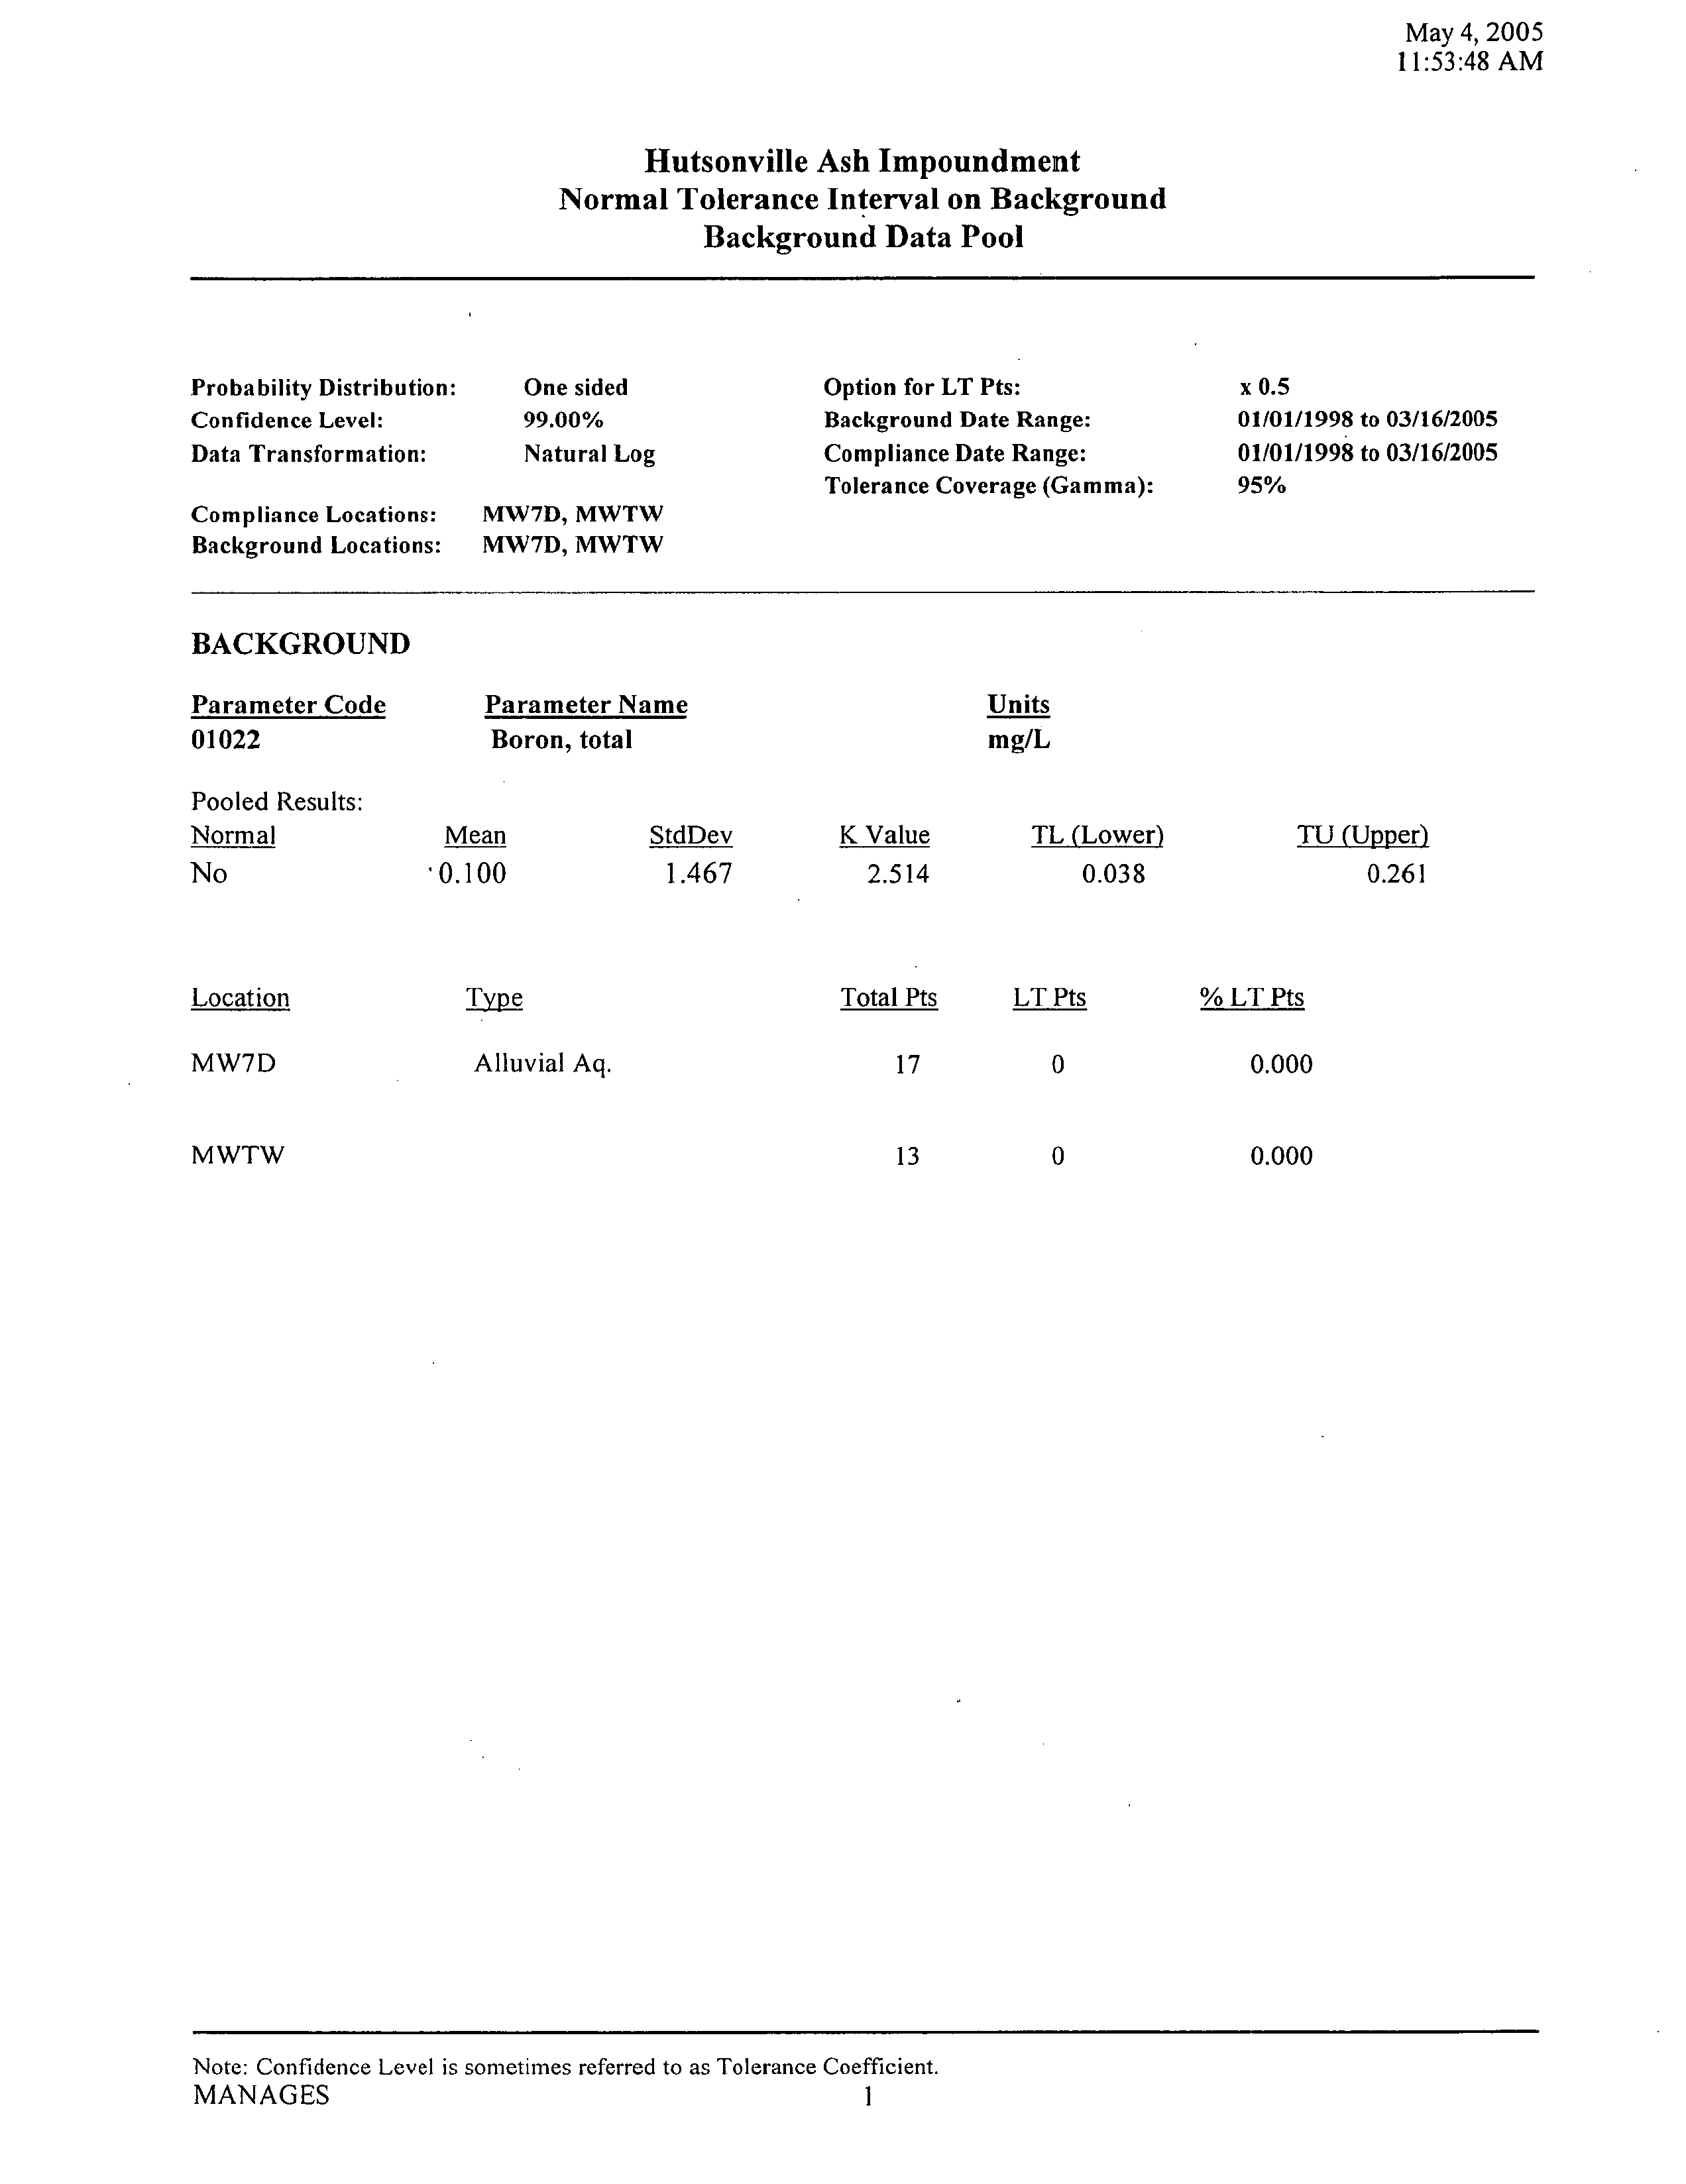
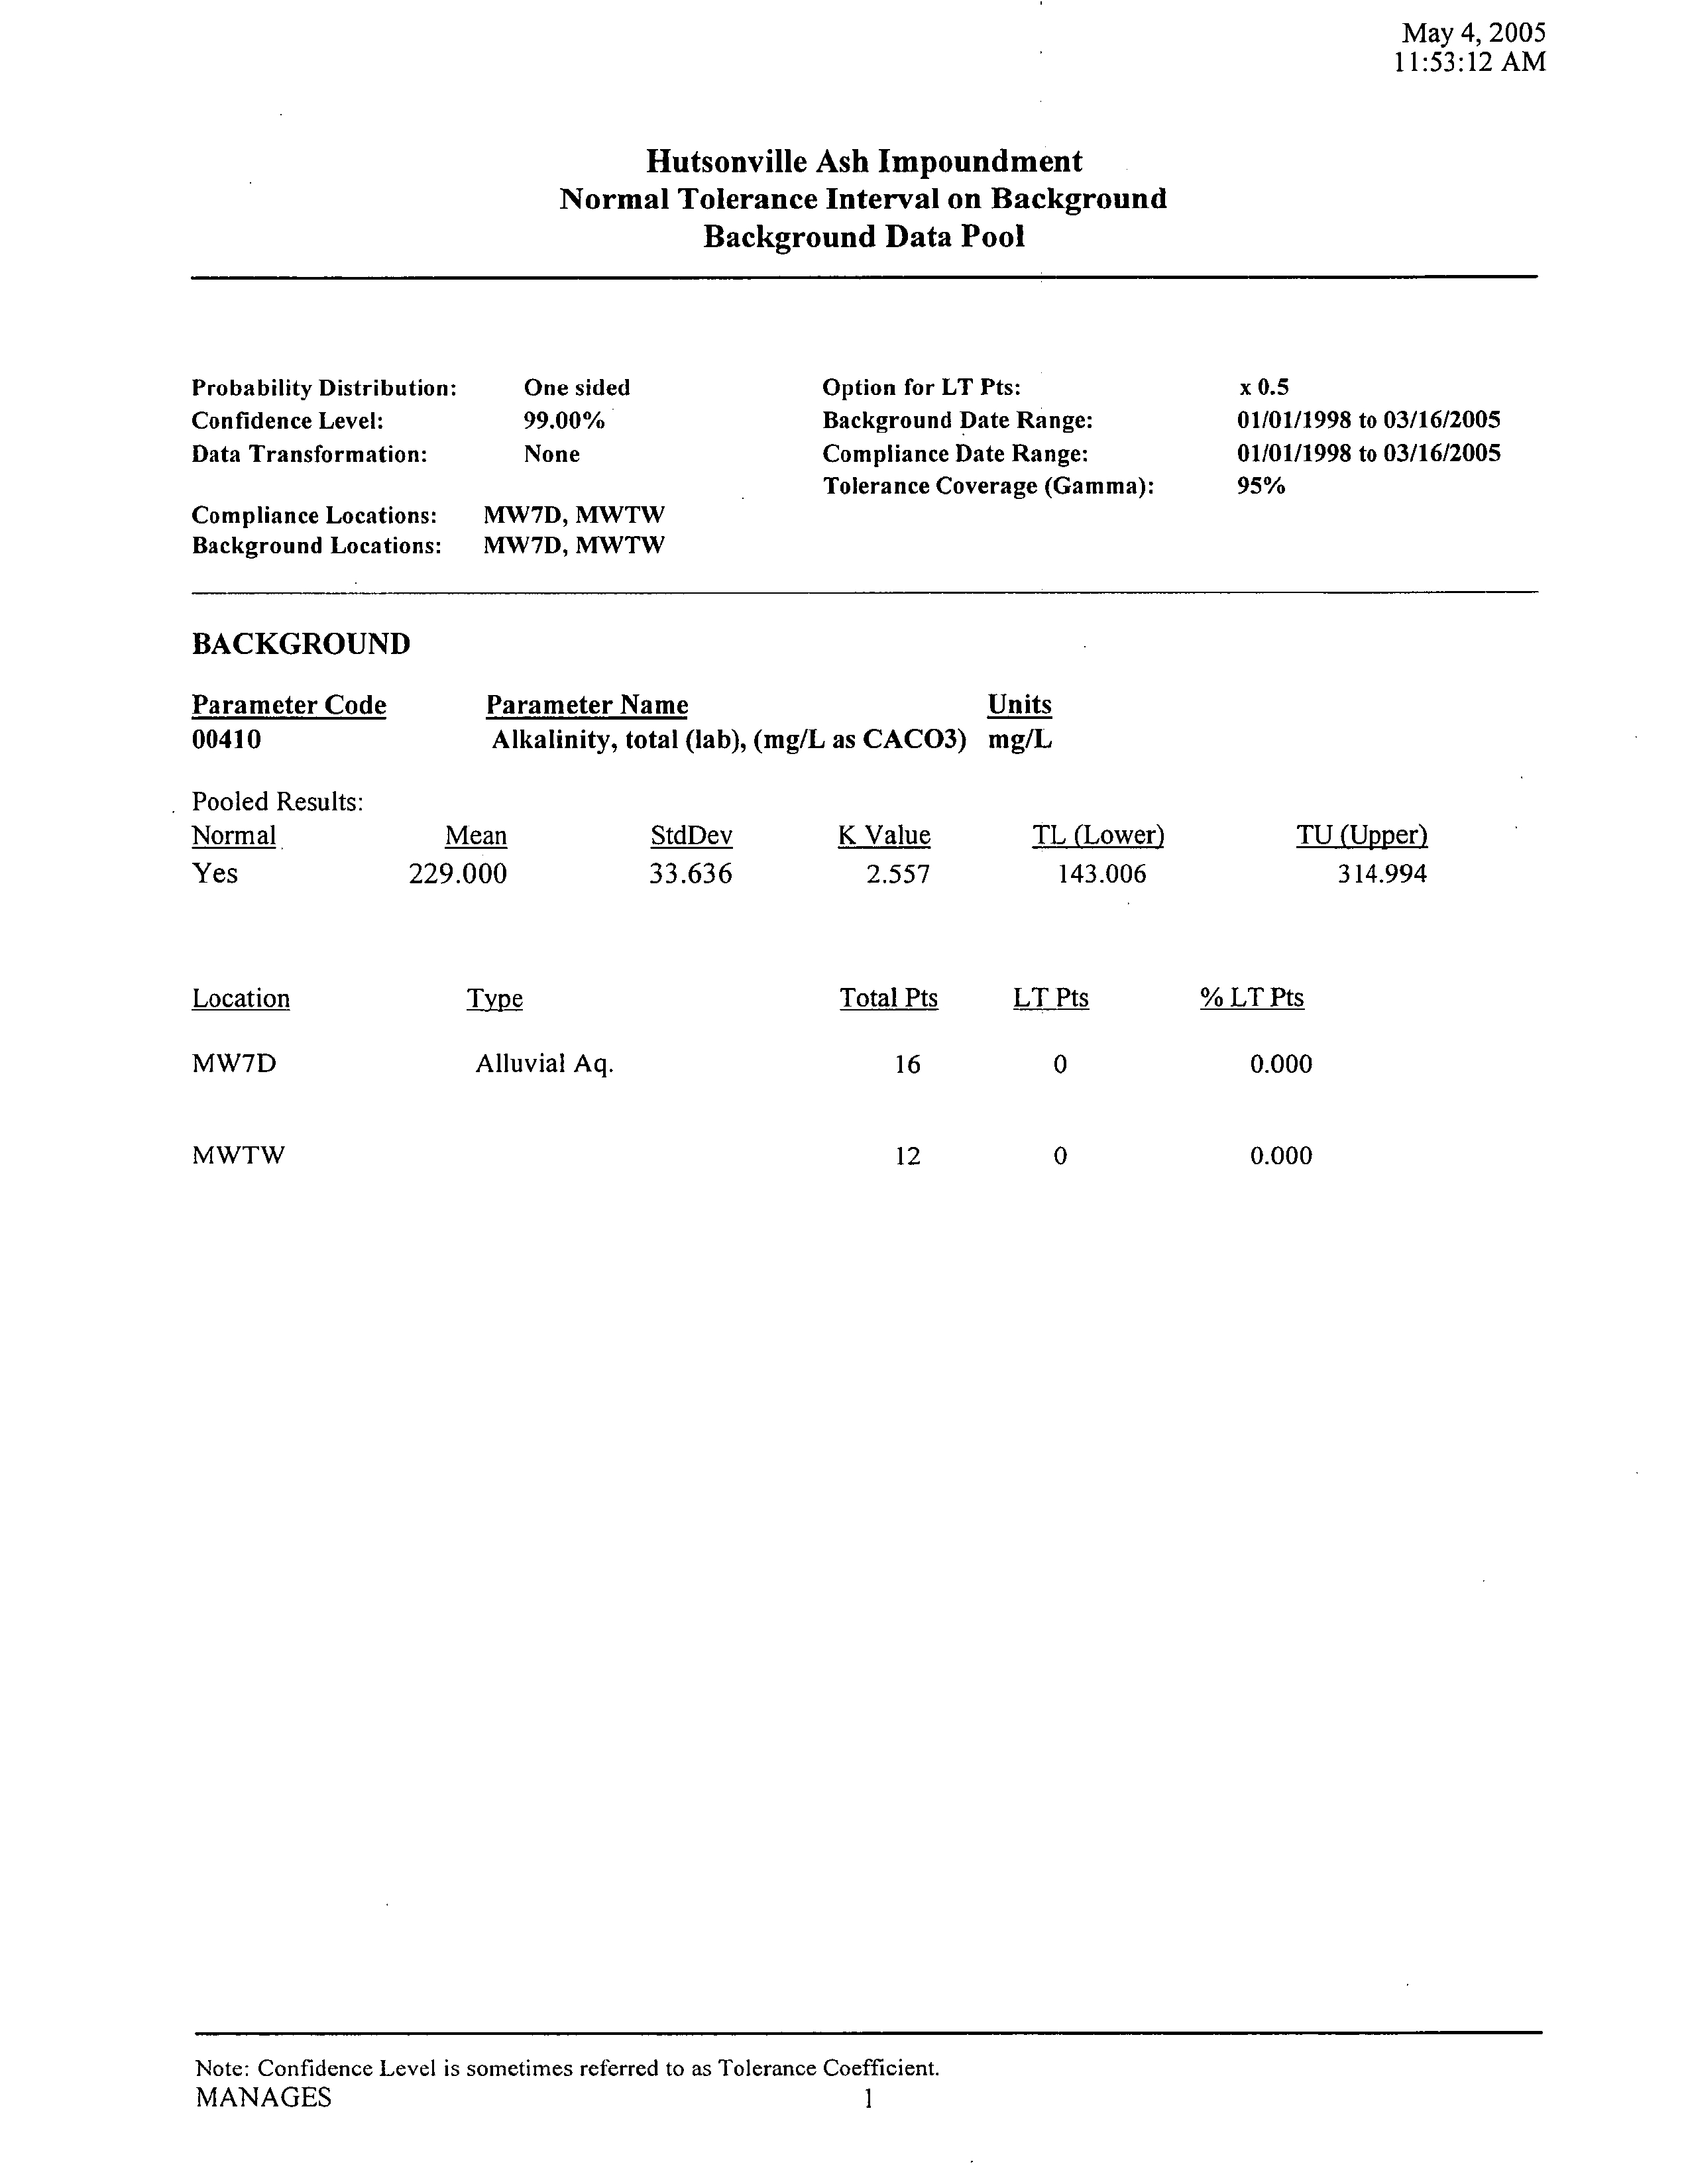
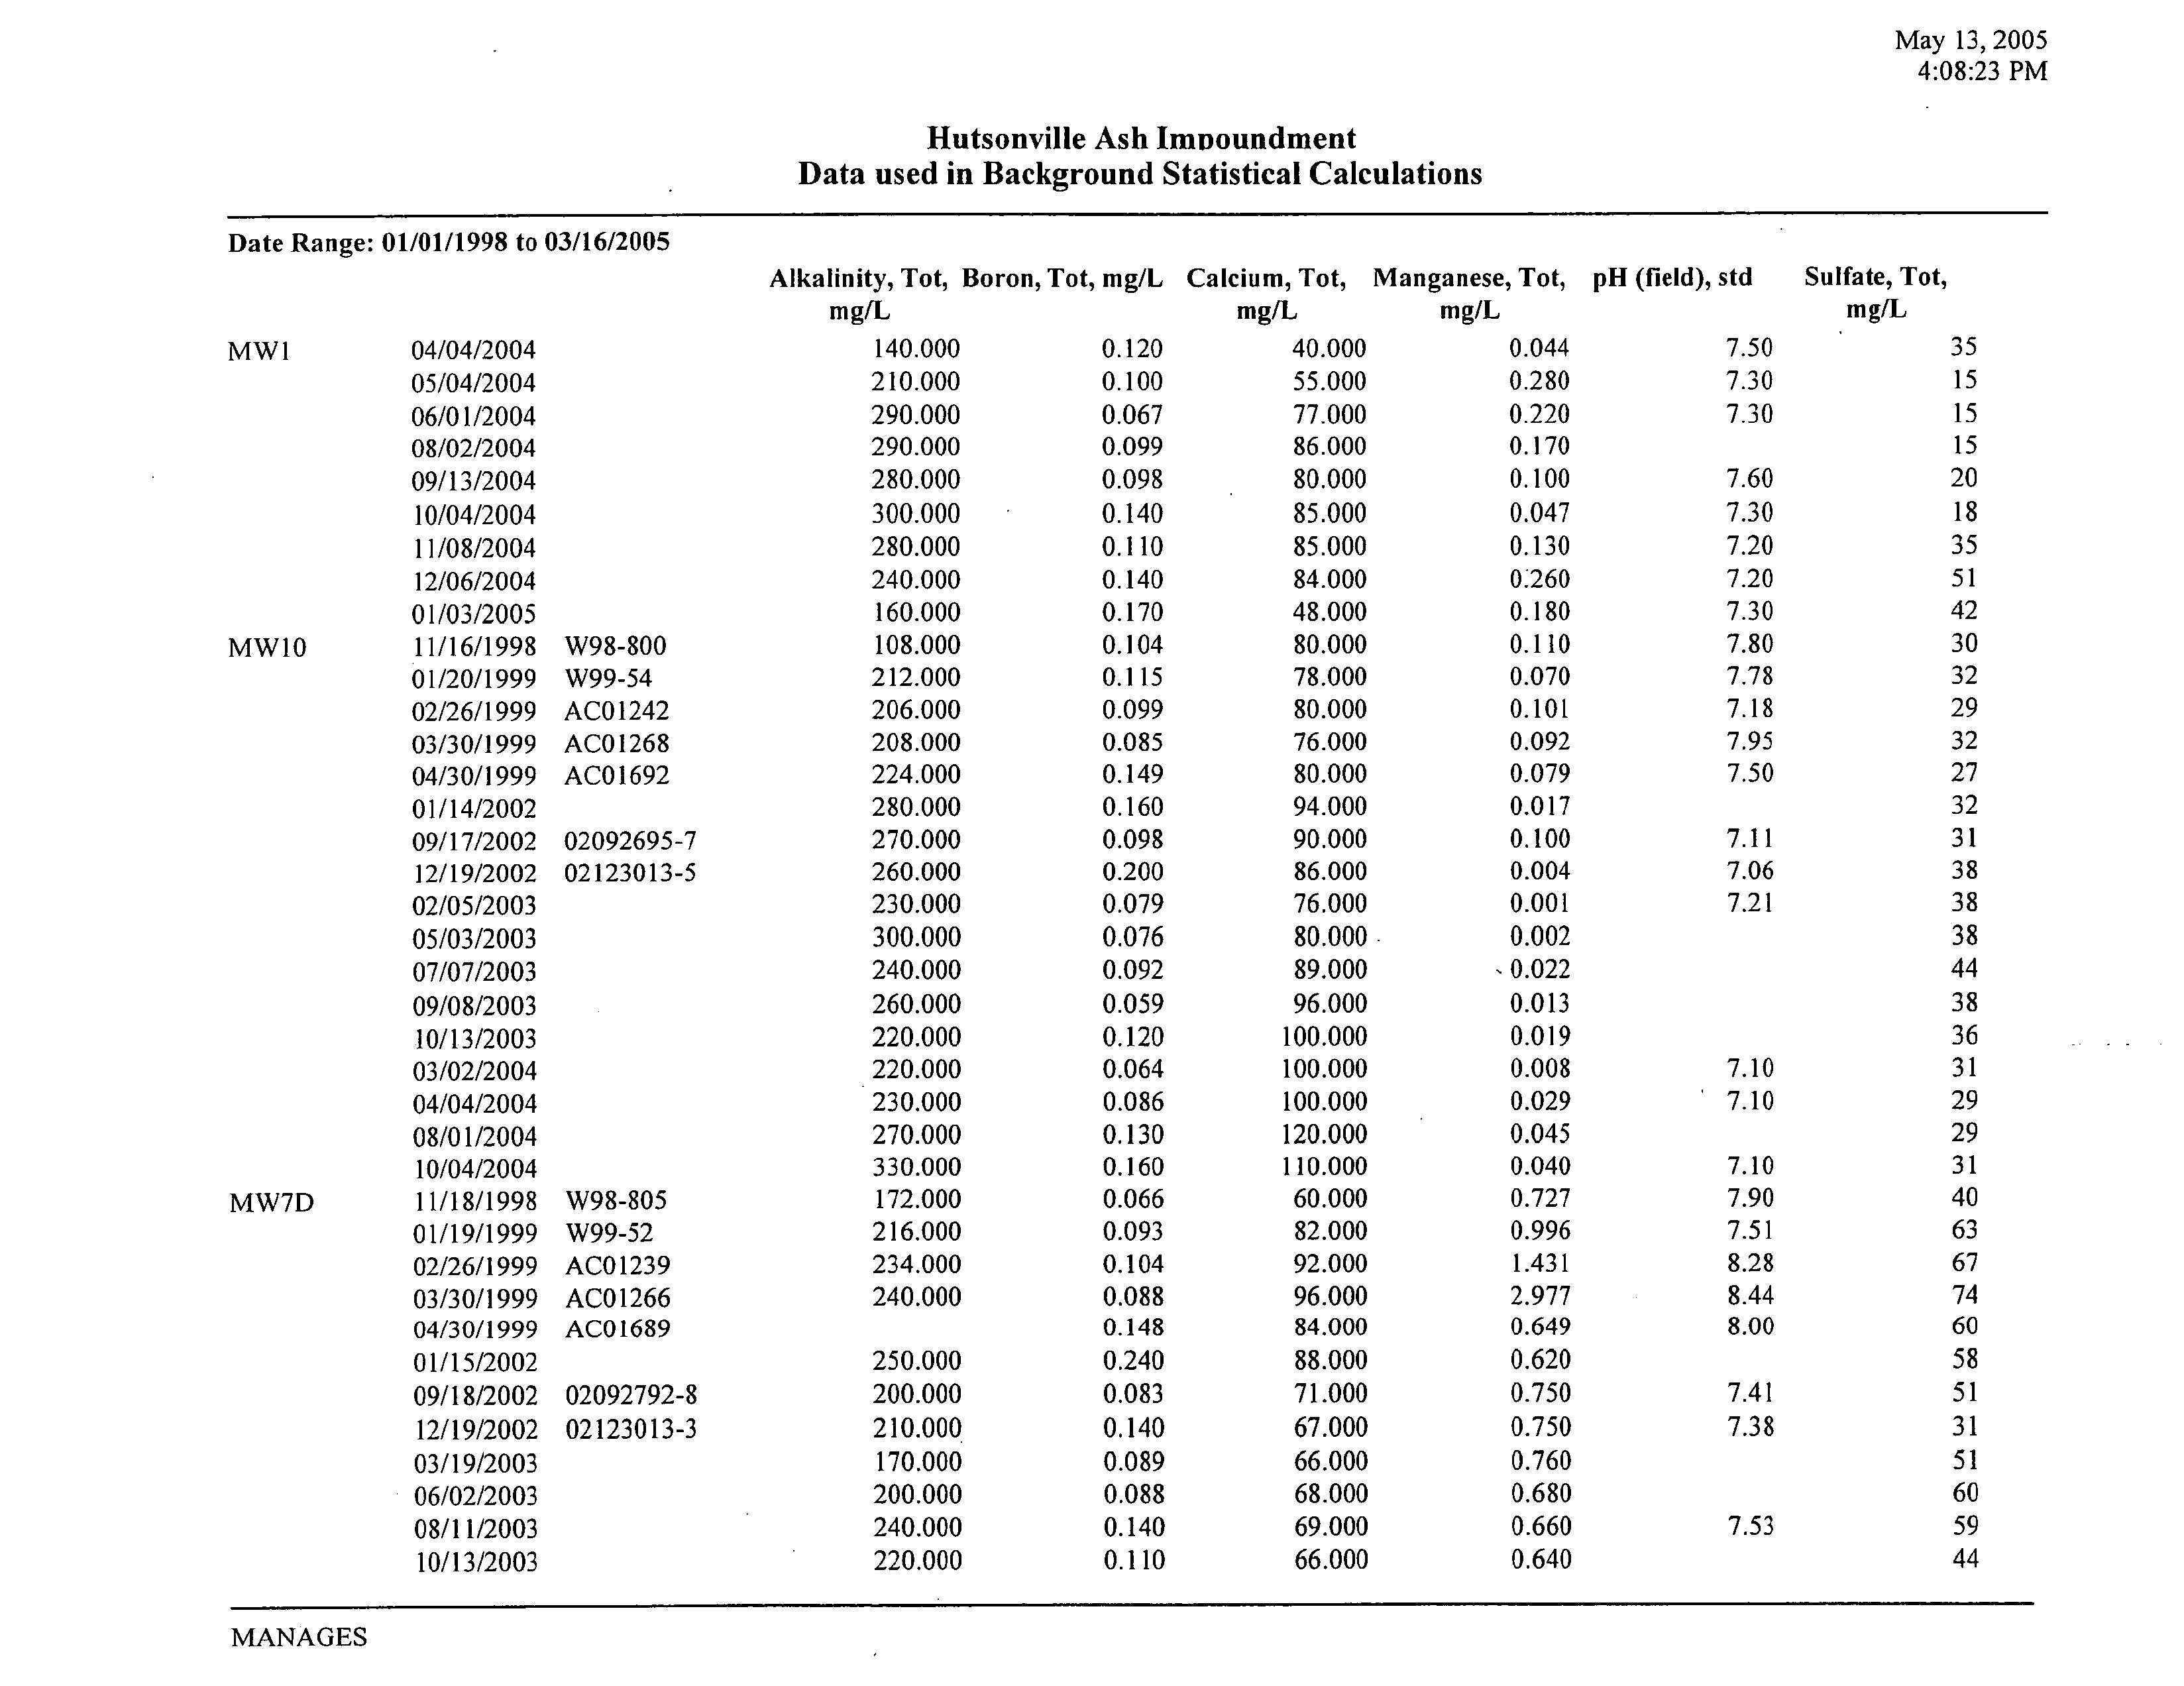
Background
statistical
analysis
results are summarized in Table
2-5
and the
adjusted
811.320
background
standards
are
compared
to
analytical
results in Table 2-6a
Background
data and statistical
print-outs
are
included in
Appendix
There are no locations
on
the
power
plant
property
where an
upgradient monitoring
well could be
screened in the
deep
alluvial
aquifer
The river
abuts the west side of the
valley
north of Pond
the
aquifer
does not extend west of Pond
and
Pond
extends to the southern
property boundary
As
discussed in Section
2.4
groundwater
flow in
this formation is
primarily
eastward toward the Wabash
River
Boron is
common constituent in
agricultural
fertilizers and
pesticides
which account for
percent
of the boron
consumed
in the United
States
Source USGS 2003
httpllminerals.usgs.gov/minerals/pubs/commodityIboronlboronmybo3
.pdf
1375 Alternatives
Analysis Report-Final
NATURAL
2-8
RESOURCE
TECHNOLOGY
Electronic Filing - Received, Clerks' Office, August 11, 2008--AS 09-1, Exhibit 3
SUMMARY OF SITE
CONDITIONS
Nine
monitoring
wells
were
installed in the
deep
alluvial
aquifer
five on the
plant property
near Pond
MW-7D
MW-
14 TW
TW- 11
5S
and TW- 11
5D
one5
south of the
plant property
TW-
117
and three
east
of the
Wabash River
TW-118
TW-1 19 and
TW-120
Six
of these wells have been in
place
since
2004
TW-100
series
and do not have sufficient data for
statistical
analysis
and one
MW-14
shows
elevated
boron and
sulfate
concentrations
indicative
of ash
pond impacts
As
result
background
concentrations were calculated
using
two of the older
wells
MW-7D and
TW which are
hydraulically
downgradient
of the
impoundment
but
are not
impacted
by
power plant
activities
The
background
calculations
were
performed
using
the
same
approach
as for the shallow sand
Tolerance interval at 99
percent
confidence and
95
percent coverage
for data with
normal distribution
alkalinity
calcium
sulfate TDS
Tolerance interval at 99
percent
confidence
and 95
percent
coverage
for data with
log-
normal distribution
boron
Non-parametric
tolerance interval
maximum concentration
for data that had neither
normal
or
log-normal
distribution
Deep
alluvial
aquifer
background
statistical
analysis
results are summarized in Table
2-5
and
the
adjusted
811.320
background
standards
are
compared
to
analytical
results in Table 2-6b The
resulting
background
concentrations
were similar to those calculated for the
upper
sand
with the
exception
of
sulfate
which
was
considerably
lower
Table 2-5 Background
data and
statistical
print-outs
are
included in
Appendix
2.4.6 Groundwater
Quality
Boron concentrations
exceeded the
Section 811.320
applicable background
concentrations
and Class
groundwater
quality
standards
at
monitoring
wells
MW-6 MW-7 MW-8
and
MW-I
lR
which are
downgradient
of Pond
Table 2-6a
The
highest
boron concentrations
were
observed
along
the south
perimeter
of
Pond
MW-6
and
MW-1IR
and in the
shallow silt unit
downgradient
of Pond
MW-8
Sulfate concentrations exceeded the
applicable background
concentrations and Class
groundwater
quality
standards
at the same four wells
TW-1 16 is screened in
fine-grained
alluvium
just
above the
deep
alluvial
aquifer note
the
relatively
low
hydraulic
conductivity
value listed in Table
2-4
The sand
pack
for this
well extends into the
deep
alluvial
aquifer
and
it
is
valid
point
for
measuring groundwater
elevation in that
formation however
it will
not
yield samples
representative
of
groundwater
in the
deep
alluvial
aquifer
1375 Alternatives
Analysis Report-Final
NATURAL
2-9
RESOURCE
TECHNOLOGY
Electronic Filing - Received, Clerks' Office, August 11, 2008--AS 09-1, Exhibit 3
SUMMARY OF SITE CONDITIONS
Since
2002
sulfate and boron
were
detected
at concentrations
higher
than the 811.320
applicable
background
concentrations
at
monitoring
well MW-14
Table 2-6b
that is screened in the
deep
alluvial
aquifer although
these concentrations
are
lower than
Class
groundwater
quality
standards Ash
impacts
were not evident until 2004 when boron
concentrations
were
consistently
higher
than
mgfL
Sulfate and
boron concentrations are lower than 811.320
applicable
background
concentrations
at
well TW-
11 SS and
TW-1 15D
Boron
was
detected
at
concentration
higher
than
background
in off-site well TW-I
16
which is screened
in
clayey
sand to
gravel
near the base of the shallow
fine-grained
alluvium
However
sulfate
concentrations
in this well
are
low The lack of
sulfate
which is
more mobile than
boron
indicates that
the boron is from
different source than the ash
pond possibly
due to fertilizer
use
in
nearby agricultural
fields
similar
to the elevated
boron concentrations
noted in
Background
well MW-I
prior
to 1998
TW-l16 will be
replaced
with well nest screened in the
deep
alluvial
aquifer
TW-1 17 has low boron
and sulfate concentrations
The water
quality
results at TW-I 17 indicate that the ash
impacts
observed at MW-14 have not
migrated
to
the south
The
deep
alluvial
aquifer
does not extend west
or
north of the ash
impoundment therefore
the boron and sulfate observed in MW-14
are
migrating east
with the
general
direction of
groundwater
flow
and
discharging
with
groundwater
to the Wabash river
2.5
Exposure Pathways Groundwater Soil
Surface
Water
There
are no
groundwater
supply wells
other than the
plant
wells
between Pond
and the Wabash
River which is the ultimate
receptor
of
groundwater
impacted by
leachate
from
Pond
The
plant
wells
and two
irrigation
wells that
are
southeast
of
Pond
are
completed
in the
deep
alluvial
aquifer
in the
Wabash River
valley
which is
overlain
by
less
permeable
silt and
clay
sediments
As documented
previously groundwater
in the shallow
upland
sand and in the silt unit
downgradient
of
Pond
have elevated
boron and sulfate
concentrations
and therefore
represent
an
exposure
pathway
however
these formations
are
not utilized for
water
supply
The
deep
alluvial
aquifer
is utilized
as
drinking
water
supply
by
the
city
of
Hutsonville
approximately
mile to the south
However
groundwater
flow in
this
aquifer
is east toward the Wabash River
Figures
2-2 2-3 and
2-4
As
result
there are no
potable
water
supply
wells
other
than the two
plant
wells
situated
between Pond
and the
discharge point
for
groundwater
the
Wabash
River
The
plant
wells
1375 Alternatives
Analysis
Report-Final
NATURAL
2-10
RESOURCE
TECHNOLOGY
Electronic Filing - Received, Clerks' Office, August 11, 2008--AS 09-1, Exhibit 3
SUMMARY OF SITE CONDITIONS
have low boron and sulfate concentrations and
do
not show evidence of
impacts
from
Pond
Table 2-6b
The
exposed
ash
in Pond
also
represents
direct
contact
exposure
pathway although access
to this
area
is
controlled
by
fence around
the
plant
so the
potential
risk is low As stated in Section
1.3
final
closure of Pond
will be in accordance with 35 TAC Part
811
and will include
final cover
system
that
meets
the
requirements
of Part 811 or an
adjusted
standard
approved by
the Illinois Pollution Control
Board
PCB
The
cover
will
eliminate the direct contact
pathway
1375 Alternatives
Analysis Report-Final
NATURAL
2-1
RESOURCE
TECHNOLOGY
Electronic Filing - Received, Clerks' Office, August 11, 2008--AS 09-1, Exhibit 3
IDENTIFICATION OF
LEACHATE
MANAGEMENT
AND
FINAL COVER ALTERNATIVES
3.1 Identification of Alternatives Overview
Consistent with the
requirements
of 35 IAC Sections 81 1.324 and
811.325
alternatives
designed
to
achieve
closure
for
Pond
were identified to
be
protective
of human health
and the
environment
address
identified
parameters
of concern and
exposure pathways
Section
2.5
and
achieve the
Closure
Objectives
stated in Section
.3 of this
report
as summarized
below
Manage groundwater
quality
to meet the
requirements
of Section
811.320
and
Construct
final cover
system
that meets the
requirements
of
Part 811 or an
adjusted
standard
approved by
the Illinois Pollution
Control Board
PCB
The Closure
Objectives
were selected to facilitate
an alternatives
analysis
that
meets
regulatory
requirements
and
adequately protects
human health and the environment
Alternatives
that
potentially
meet the Closure
Objectives
are divided into two distinct
categories
and
presented
in Table 3-1
Leachate
Management
and
Deep
Alluvial
Aquifer
Source Control
Alternatives
and
Final Cover Alternatives
Additionally
Surface Water
Management
Alternatives
have been
incorporated
with the alternatives
evaluation
as
they
will
be
critical
component
of
any
final
cover
alternative
selected for the
site General
surface water
management approaches
consist of
Routing
surface
water to the
existing
catch basin for collection
in the
drainage
collection
pond Pond
and eventual
discharge
to
the
Wabash River
Routing
surface water via overland flow to the Wabash
River or
combination of these
two
approaches
1375 Alternatives
Analysis Report-Final
NATURAL
3-1
RESOURCE
TECHNOLOGY
Electronic Filing - Received, Clerks' Office, August 11, 2008--AS 09-1, Exhibit 3
IDENTIFICATION OF LEA CHATE
MANAGEMENT AND FINAL COVER ALTERNATIVES
3.2
Leachate
Management
and
Deep
Alluvial
Aquifer
Source Control
Alternatives
3.2.1 Selection of Alternatives for Initial
Screening
Nine leachate
management
and
deep
alluvial
aquifer source
control alternatives
were selected for initial
evaluation
consisting
of the
following
Site
monitoring
with
no
leachate collection
Leachate
Management
Alternative
Three
variations
of
groundwater
extraction
leachate
collection
alternatives
Leachate
Management
Alternative
Source control for the
deep
alluvial
aquifer
via
groundwater
extraction
Source Control of
Deep
Alluvial
Aquifer
Ash stabilization
Leachate Management Alternative
Ash removal and
disposal recycling
at
an
off-site
facility
or beneficial reuse
Leachate
Management
Alternative
Ash
impoundment
reconstruction
Leachate Management Alternative
and
Containment
using
low-permeability
barrier wall
Leachate
Management
Alternative
and Source
Control of
Deep
Alluvial
Aquifer
These leachate
management
alternatives
were
initially
selected from
broad
range
of available
technologies
based on their use at similar sites and their
potential
to meet the Closure
Objectives
3.2.2 Site
Monitoring
with No Leachate Collection
This alternative consists of
groundwater
monitoring program
consistent
with the
requirements
of 35
IAC 811.319 No active leachate
collection
would be
performed as
part
of this
Leachate
Management
Alternative
Establishing
groundwater
monitoring
program
will be
required
as
component
of each
Leachate
Management
Alternative
discussed
below therefore costs for site
monitoring
have
not
been
separately
evaluated and will be included
as
part
of the
detailed
analysis
of leachate
management
and
final
cover alternatives
Section
1375 Alternatives
Analysis Report-Final
NATURAL
3-2
RESOURCE
TECHNOLOGY
Electronic Filing - Received, Clerks' Office, August 11, 2008--AS 09-1, Exhibit 3
IDENTIFICATION OF LEA CHA TE MANAGEMENT AND FINAL COVER ALTERNATIVES
3.2.3 Groundwater Extraction
Leachate Collection Alternatives
Groundwater extraction
alternatives
include wells or
drains
downgradient
of Pond
to
capture
groundwater
impacted by
ash leachate
Shallow
Groundwater
Extraction
Wells Combined with an Interceptor
Drain/Trench
This Leachate
Management
Alternative
would consist of network of vertical
groundwater
extraction
wells
designed
to
collect
impacted groundwater
from the shallow
silt and
clay
unit east of Pond
and
drain/trench
south of Pond
However this
alternative
would be difficult
to
effectively
and
efficiently
implement
because the
impacted
silt unit east of Pond
has low
hydraulic
conductivity
and the shallow sand
south of Pond
is
thin
and therefore
has low
transmissivity
Interceptor
DrainlTrench
This Leachate
Management
Alternative
would consist of
groundwater
interceptor
drain/trench
along
the entire east and south
perimeters
of
Pond
In the lowland
along
the east and south
perimeter
the
interceptor
drain/trench
would
extract
groundwater
within the silt and
clay
unit In the
upland
area
along
the south
perimeter
the
interceptor
drain/trench
would
capture
impacted
groundwater
above the
bedrock surface
Horizontal Groundwater
Extraction
Wells Combined with
Interceptor
Drain/Trench
This
Leachate
Management
Alternative
would consist of network of horizontal
groundwater
extraction
wells
designed
to
capture
impacted groundwater
along
the east
perimeter
of
Pond
The horizontal
wells could
be
designed
to
target groundwater
impacted by
leachate
in the
shallow silt and
clay Along
the south
perimeter an
interceptor
drain/trench
would be
designed
to
capture
impacted groundwater
in the lowland
silt/clay
and
upland
above the bedrock surface
For each of these Leachate
Management
Alternatives
collected
groundwater
would
be
directly
discharged
to the
drainage
collection
pond Pond
and/or the interim
pond Pond
for
management
through
the
plants
sluice water
system
and eventual
discharge
to the Wabash River via the
existing
NPDES
permit
3.2.4
Source Control of the
Deep
Alluvial
Aquifer
Containment
of
impacts
to
the
deep
alluvial
aquifer
would be achieved
by groundwater
extraction
through
vertical wells located
downgradient
of Pond
along
the southeast
corner As with the Leachate
Management
Alternatives
presented
above
groundwater
collected as
part
of this alternative
would be
directly discharged
to the
drainage
collection
pond Pond
and/or
the interim
pond
Pond
for
management through
the
plants
sluice
water
system
and eventual
discharge
to the Wabash River via the
existing
NPDES
permit
1375 Alternatives
Analysis Report-Final
NATURAL
3-3
RESOURCE
TECHNOLOGY
Electronic Filing - Received, Clerks' Office, August 11, 2008--AS 09-1, Exhibit 3
IDENTIFICATION OF LEACHATE MANAGEMENTAND
FINAL COVER ALTERNATIVES
Other in-situ alternatives
were
not considered for
source
control
of the
deep
alluvial
aquifer
because in-
situ
technologies
have not been identified for the
primary parameters
of concern
boron
and
sulfate
Containment
utilizing
low-permeability
barrier wall is
presented
below in Section
3.2.8
3.2.5 Ash Stabilization
Ash stabilization is
technology designed
to
micro-encapsulate
the ash in
cement-like matrix
monolith
to minimize the rate of
groundwater
infiltration and
leaching
of ash constituents
to
groundwater
Ash fill is
stabilized and solidified
using
one of several
reagents
delivered either via
soil
mixing
or
jet grouting technology
Once the ash is
stabilized
leachate
volume is
greatly
reduced
potentially eliminating
the need for active leachate
collection
Soil
mixing
utilizes
large
diameter
augers
to
12 feet in
diameter
that
mechanically
mix soils with
stabilizing
reagent
carried
by drilling
fluid Jet
grouting
utilizes small drill
rig
to advance
drill bit into
the
ash
through
which
grout
is
pumped
under
high pressure
As the drill steel is rotated
and
slowly
raised
cylindrical grout
column is created The
grout
injection
produces grout
columns
ranging
from
approximately
to
feet in diameter
key disadvantage
of this
technology
is
maintaining
the
continuity
and
integrity
of the
grout
column
Discontinuities
or
irregularities
in subsurface conditions
can
lead to
irregularity
in
grout
column diameter
Typically
conservative
overlapping
is
performed
to
achieve
uniform
coverage
3.2.6 Ash Removal and
Disposal Recycling
at an Off-Site
Facility
or
Beneficial
Reuse
Removal of ash from Pond
eliminates the
source
of ash leachate
impacting groundwater
at the site
Removal of ash
requires
excavation of considerable thickness
20
to 30
feet
of
ash Extensive site
dewatering
would be
required throughout
the
course
of the
project
For
purposes
of
evaluating
this
alternative
partial
removal
i.e
removal of saturated ash
only
was
compared
to removal of all ash from
the unlined
impoundment
Key design
and technical
considerations
for excavation
include
Excavated material
would be
disposed
off-site
For the
partial
removal
alternative
following
removal of
saturated
ash
capillary
break
would be created
by placing
relatively
free
draining
material such
as
self-compacting
gravel
at and above the
groundwater
interface
This
material
prevents
ash saturation due
to
capillary
rise from the
underlying
water table and also
provides
buffer to
prevent
resaturation
of the
ash
if
groundwater
elevation
increased
in the future Above the
capillary break
excavated ash would be
placed
as
backfill
to
grade
Above the ash
1375 Alternatives
Analysis Report-Final
NATURAL
3-4
RESOURCE
TECHNOLOGY
Electronic Filing - Received, Clerks' Office, August 11, 2008--AS 09-1, Exhibit 3
IDENTIFICATiON OF LEA CHA TE MANAGEMENTAND
FINAL COVER ALTERNATIVES
backfill an
engineered
cover
would be
constructed to minimize surface water infiltration
through
the unsaturated ash
Extensive
engineering
controls that
could include water
misting
would be
required
for
managing fugitive
dust emissions
3.2.7 Ash
Impoundment
Reconstruction
Reconstruction of Pond
is identified as Leachate
Management
Alternative
since
the source of ash
leachate
would be
removed Reconstruction of this
impoundment
would
require
extensive excavation and
relocation
or off-site
disposal
of all ash The
impoundment
would then be reconstructed
as new
unit
designed
to
Separate
ash
from the water table
through
addition
of clean fill to raise the base of the
impoundment
above the
water table and
Reduce or eliminate
ash leachate
generation by retrofitting
the
impoundment
with
low
permeability
liner and
prevent downgradient migration
of
ash constituents
to
groundwater
Upon completion
of
impoundment reconstruction
removed ash could either be
replaced
or
the
unit could
be
operated
as
new
ash
impoundment
Final reconstruction
would be
completed
once the reconstructed
impoundment
reached
capacity
and
final
cover was
installed
as
discussed in Section
3.3
3.2.8 Containment
Using
Low-Permeability
Barrier Wall
Installation of
low-permeability
vertical
barrier wall is identified as Leachate
Management
and
Deep
Alluvial
Aquifer
Source Control Alternative The
Leachate
Management
Alternative
would be
designed
to
prevent
lateral
migration
of
ash leachate
via
groundwater
to the Wabash River The
Deep
Alluvial
Aquifer
Source
Control Alternative
would be
designed
to
contain
or
impede
the horizontal
flow of
impacted groundwater
within the
deep
alluvial
aquifer
Construction of vertical barrier
would
require
keying
into
low-permeability geologic
formation such
as
shale bedrock
or
clay
Two basic wall
configurations
were
considered
Partially
Encapsulating
Wall
typical
layout
for this
type
of
barrier consists of wall
along
the east and south
downgradient
sides of the
impoundment
The barrier
would be
completed
with an interior
hydraulic
gradient
control
system utilizing interceptor
trenches
or extraction
wells within the
impoundment
and
upgradient
of the wall
The
hydraulic
gradient
controls would
prevent hydraulic mounding by
maintaining
an
inward
gradient
1375 Alternatives
Analysis
Report-Final
NATURAL
3-5
RESOURCE
TECHNOLOGY
Electronic Filing - Received, Clerks' Office, August 11, 2008--AS 09-1, Exhibit 3
IDENTIFICATION OF LEACHATE
MANAGEMENTAND FINAL COVER ALTERNATIVES
Fully Encapsulating Wall This
type
of barrier consists of wall
surrounding
the entire
perimeter
of
the ash
impoundment
to
fully encapsulate
the saturated ash
zone
and deflect
upgradient
groundwater
flow around the
impoundment
Internal
hydraulic
controls
may
be
required
to
manage groundwater
fluctuations
that could
potentially
compromise
containment
integrity
Several vertical barrier wall
technologies
are
available
including
sealed sheet
piling
cement-bentonite
slurry
or soil-cement
slurry
and
jet grouting
Each of these
technologies
has the
capability
to create
barrier with
hydraulic conductivity approaching
cm/sec with
proper design
and
QA/QC during
installation
However
without
competent
low
permeability
formation in which to
key
the barrier
wall
proper
containment cannot be achieved
3.3 Final Cover
Alternatives
Four different final cover alternatives
were
selected for initial evaluation
Geosynthetic
final
cover
30
mil
PVC
Compacted clay
final
cover
Layered
earthen final
cover
and
Pozzolanic
fly
ash final
cover
The first two alternatives
are consistent with the
requirements
of 35 JAC Section
811.314 These cover
systems
consist of low
permeability
layer
either
geosynthetic
membrane
e.g
30-mil
PVC
or
feet
of
compacted
clay
followed
by
3-foot thick final
protective
layer designed
to
support
vegetation
and
protect
the low
permeability layer
The third
alternative
layered
earthen final
cover
reflects
simplified
approach
to
traditionally accepted
landfill
cover
design practices
and would
require
an
adjusted
standard
from the Illinois PCB
to
implement
as
the
cover
does
not meet the
requirements
of
Section 811.314 Earthen
cover
designs
have
been used
to
achieve closure
at
similar
fly
ash
management
facilities
in Illinois Instead of
relying
on
low
permeability clay
or
geosynthetic covers
such
as PVC
the
design
of
layered
earthen cover
incorporates
the use of
high permeability
sand and/or
gravel layers
to create
capillary
break that reduces downward
infiltration of water The
capillary
break
causes
retention
of water in the
rooting zone
which increases
transpiration
to the
atmosphere
relative to
covers
without
capillary
breaks
yet
minimizes saturation in the
rooting
zone If the
rooting
zone becomes
saturated
the
high permeability
sand
and/or
gravel layers
1375 Alternatives
Analysis Report-Final
NATURAL
3-6
RESOURCE
TECHNOLOGY
Electronic Filing - Received, Clerks' Office, August 11, 2008--AS 09-1, Exhibit 3
iDENTIFICATION OF LEA CHATE
MANAGEMENTAND FINAL COVER ALTERNATIVES
promote
rapid
lateral
drainage
and continue to limit infiltration
However
migration
of
water to this
drainage layer
would
only
occur
after the retention
capacity
of the
rooting
zone is reached
Given the humid climate in this
area
the earthen
cover
will
not
be
as
effective
as
compacted clay
or
PVC cover in
limiting
infiltration into the
ash however
net reduction in annual infiltration
can
be
achieved
Additionally
the earthen cover
may prove
an
acceptable
alternative
because it
provides
direct
contact barrier meets the
requirements
of final
protective
layer
and because infiltration
represents
small fraction of ash
constituents
that
leach to
groundwater
in Pond Dthe
majority
of ash constituents
present
in the
groundwater
leach from ash situated below the
water
table via
groundwater
throughflow
Construction
of an earthen
cover
is lower cost
approach
since
no
geosynthetic
materials
are used
and it
relies on
locally
available materials
The fourth and final
cover
alternative
reflects
an innovative
approach
to cover
design Fly
ash from an
on-site source
Pond
would be collected and blended with
stabilizing reagent e.g quick
lime
Portland
cement
class
fly ash
to create
cement-like monolithic cover to minimize the rate of
groundwater
infiltration and
leaching
of ash
constituents
to
groundwater
Consistent with the
requirements
of Section 811.3
14
3-foot thick low
permeability layer
would be constructed from the
pozzolanic fly
ash mixture followed
by
3-foot thick earthen
protective
layer
With
adequate
mixture
design
and
quality control
low-permeability
cover with
properties approaching
those of
geosynthetic
or
compacted
clay
cover can
be
achieved
Construction of
pozzolanic fly
ash
cover
would
require
an
adjusted
standard from the Illinois PCB to
implement
however
regulatory
precedent
exists for similar cover
technology
Part 816
provides
alternative
standards for final
cover
systems
at coal ash
management
facilities
using
similar
process
to
stabilize flue
gas
desulfurization
FGD
sludges
with
fly
ash
Poz-O-TecTM
process
It is
likely
that
construction
of
pozzolanic fly
ash final
cover
could meet
or
exceed the alternative
standards
for
strength
and
approach
the alternative
standards
for
permeability
outlined in Section
16.530
for
testing
of
the
final
cover constructed with the Poz-O-Tec
process
Construction
of
pozzolanic fly
ash
cover
would
likely
reflect the
highest
cost final cover
approach
however
the
high
cost
may
be offset
by
the creation of
additional
capacity
for
fly
ash in the lined ash
impoundment Pond
3.4 Surface Water
Management
Alternatives
Three surface
water
management
alternatives
were selected for initial evaluation
consisting
of the
following
1375 Alternatives
Analysis Report-Final
NATURAL
3-7
RESOURCE
TECHNOLOGY
Electronic Filing - Received, Clerks' Office, August 11, 2008--AS 09-1, Exhibit 3
IDENTIFICATION OF LEA CHA TE MANAGEMENTAND
FINAL CO VER ALTERNATIVES
Route surface
water east towards the Wabash
River
Route surface water west towards the
drainage
collection
pond Pond
and
Route surface
water east
and
west
toward the Wabash River and the
drainage
collection
pond Pond
Diverting
all surface water to the Wabash River would
require
the
most fill while
combining
surface
water
drainage
to either the Wabash River or Pond
would
require
the least fill
box culvert
has
already
been constructed
to route surface water from Pond
to Pond
For
purposes
of
estimating
fill
volumes
to construct
the surface
water
management
alternatives
minimum5%
slope
has been assumed
to
provide adequate drainage
and
prevent
standing
water from
accumulating
in
depressions
on
the final
impoundment
surface
fourth surface water
management
alternative
creation of
detention
pond
and
dewatering
sump
for
diversion
to Pond
was not considered for the
following
reasons
Section 811.322
prohibits
standing
water
anywhere
on
solid waste unitan
adjusted
standard from the Illinois PCB would be
required
to construct
detention
basin
on
the
unlined ash
impoundment
and
Use of detention
basin would
likely
negate
the
opportunity
to receive
an
adjusted
standard for use of an earthen
or
pozzolanic
final
cover
system
3.5 Initial
Screening
Criteria and Results
Initial
screening
criteria for
assessing
leachate
management
final
cover
and surface water
management
alternatives
consist of the
following
Construction
Implementation
Feasibility
Construction
feasibility
refers
to
the
ability
to
build the
system given site-specific
conditions
Implementation feasibility
refers to the
ability
of this alternative
to meet technical factors such
as
appropriateness
or
suitability
and
availability
of the
technology given
site
specific
constraints and
geographic
location
and administrative
factors such
as
local
and state
permitting
requirements
and
regulatory
reviews for
approval
Effectiveness
Effectiveness
refers to three criteria
consisting
of
the
extent to
which
the alternative
protects
human health and the
environment
reduction in contaminant
levels
to meet Section 811.320
groundwater
quality
standards
and
the extent
to
which
the alternative
has been demonstrated
at
other
sites
Cost Costs for the
purpose
of initial
screening
refer to relative cost
ranges
for each of
the
alternatives
and include utilization
of available
published
cost data from similar
projects
vendor
data
and
engineering judgment
As such costs are for
general
1375 Alternatives
Analysis Report-Final
NATURAL
3-8
RESOURCE
TECHNOLOGY
Electronic Filing - Received, Clerks' Office, August 11, 2008--AS 09-1, Exhibit 3
IDENTiFICATION OF LEA CHATE
MANAGEMENTAND FINAL COVER ALTERNATIVES
comparative
purposes
and are not used
singly as
screening
tool unless substantial
cost
differentials would
immediately preclude
the
technology
from
further consideration
Of the three initial
screening
criteria identified
above the most crucial is construction
implementation
feasibility
If
technology
failed this
criterion then it was not considered for further evaluation
Therefore
the criteria of effectiveness
and cost
are
secondary
unless substantial
concerns in either of the
secondary
criteria were identified that would
clearly
eliminate the
alternative
i.e same
feasibility
and
effectiveness
with
significantly higher costs
The results and recommendations
of the initial
screening
are
listed in
the last column of Table 3-1 The
rough
cost summaries for each of the alternatives
are
provided
in
Appendix
Table 3-2
provides
summary
of the areal extent and volumes of ash in Pond
used for
quantity
estimation in
the
rough
cost
summaries Table 3-3
provides
material balance
analysis
for each of the final
cover alternatives
that
explains
how each source of fill available on site will be utilized within the final
cover alternative
The
alternatives
selected for further evaluation and
modeling
consist of the
following
Leachate
Management
Alternatives
Site
monitoring
with
no
leachate
collection
Groundwater
extraction
combined with
interceptor
drain/trench
Interceptor
drain/trench
Source Control in the
Deep
Alluvial
Muifer
via
Groundwater
Extraction
Final Cover Alternatives
Geosynthetic
final cover
Earthen final
cover
Pozzolanic
fly
ash final
cover
Surface Water
Management
Alternatives
Route surface
water east
and
west towards the Wabash River and the
drainage
collection
pond
Pond
1375 Alternatives
Analysis Report-Final
NATURAL
3-9
RESOURCE
TECHNOLOGY
Electronic Filing - Received, Clerks' Office, August 11, 2008--AS 09-1, Exhibit 3
IDENTIFICATION OF LEACHATE MANAGEMENTAND
FINAL COVER ALTERNATIVES
3.6
Treatability Study
for Pozzolanic
Fly
Ash Final Cover
The results of the initial
screening
included
the
pozzolanic fly
ash final cover alternative
for further
evaluation and
modeling
If the
pozzolanic
cover can
provide
similar
performance
to traditional final
cover
designs e.g compacted clay
and/or
geosynthetic
the Hutsonville Power Station
may
have
the
opportunity
to
beneficially incorporate
fly
ash from Pond
with the added benefit of
renewing capacity
in Pond
The
treatability study
was
performed
to evaluate
the technical
feasibility
of
constructing
pozzolanic fly
ash
cover
from Pond
Specific objectives
included
The
ability
to
approach
or meet the alternative
standards
for
strength
and
permeability
as
outlined in Part
816 for
similar
regulatory
approved
final cover
technology
the Poz-O
Tec
process
The
range
of
admixtures that can be
successfully
mixed with Pond
fly
ash to
construct
pozzolanic fly
ash final
cover
and
The best mix
design
for
pozzolanic fly
ash
cover
that
provides
the best balance of
constructability
and
performance
with
respect
to the Part 816 standards
and cost
VFL
Technology
Corporation VFL
was selected to
perform
the
treatability study
The results
of
the
treatability study
are
included
as
Appendix
C-i
Conceptual
Development
of Pozzolanic
Cap
for
Closure of Basin
and the Hutsonville Power Station
Treatability
Study
Specific
details
regarding
the
study including
geotechnical
investigation
raw
materials
characterization
mix
design preparation
mix
design performance
testing
and
extrapolation
to full-scale
operations
are
included in the
Treatability Study
Reagents
that
were
evaluated
during
the
study
included Portland
Cement
Class
fly
ash fluidized bed residue ash
FBR
quicklime
fluidized
gas
desulfurization
scrubber
sludge
FGD
or
filter
cake
and native soils VFL evaluated 16 mix
designs
as
listed in
the
Treatability Study
Table
Specific
conclusions
provided
in the
study
Section 2.0
Treatability Study
indicate that construction
of
pozzolanic fly
ash final cover
system using
ash from Pond
is feasible
from
geotechnical
treatability
and
performance
based
stance
Specifically
VFL recommended five mix
designs
that
provide
the best
performance
and
applicability
for construction
under field conditions
that included
Mix
Designs
and
Pond
fly
ash and
cement
Mix
Designs
and 10
Pond
fly
ash on-site
soil
and
cement
and
Mix
Design
14
Pond
fly
ash
FGD filter
cake
and
cement
1375 Alternatives
Analysis Report-Final
NATURAL
3-10
RESOURCE
TECHNOLOGY
Electronic Filing - Received, Clerks' Office, August 11, 2008--AS 09-1, Exhibit 3
IDENTIFICATION OF
LEACHATE MA NA GEMENTAND FINAL COVER
ALTERNATIVES
The
performance
of
each of these mix
designs
with
respect
to
performance
goals
listed above are
provided
in Table 3-4 The
following pertinent
observations were
developed
from
comparison
of each
recommended mix
design
to the
performance
goals
The
permeability
results for each mix
design
do
not meet or exceed the
performance
goal
of
cm/see
The
unconfined
compressive
strength
UCS at
84
days
for each mix
design
exceeds the
performance
goal
of 150
psi
Each mix
design
appears
to be constructable
in the
field
although
several
constructability
concerns were
noted
for Mix
Design
14
Specifically
the
rapid strength gain
and
ultimate UCS of Mix
Design
14
Figure
Treatability Study
could
present
construction
challenges
In
addition
VFL
specifically
noted
Section 4.4
Treatability Study
that
FGD
sludge
utilized in Mix
Design
14
can be
difficult to
accurately
feed into
portable
processing system
and
adequately
mix with the
fly
ash and other
reagents
as
the material
has
tendency
to adhere to the sides of the feed
hoppers
and
Three of the five recommended mix
designs Mix
Designs
and
14 were
tested for
leaching performance
Table
Treatability Study
The results of the TCLP
testing
of
RCRA metals for each mix
design
indicated that leachate
concentrations
did not exceed
the Groundwater
Quality
Standards for
Class
Potable Resource Groundwater
with the
exception
of
cadmium
detected
slightly
above the Class
standard at 0.01
mgfL
for Mix
Design
This
concentration
is well below the Groundwater
Quality
Standards for Class
II General
Resource Groundwater
for cadmium
at
0.05
rngfL
Furthermore
VFL
expressed
concern with the chemical and
physical variability
of FGD
sludge
that
could
significantly
alter the
performance
characteristics
of mix
designs
that utilize
this
reagent
Mix
Design
14
Based
on
the
results
of
the
study
and the
comparison
with the
performance
goals
the
following
considerations
have been
developed
for
possible
full-scale
implementation
of
pozzolanic fly
ash final
cover
system
for Pond
Low
permeability
conditions
can
be
achieved
that will minimize
concerns
for
continuing
impacts
to
groundwater
related
to
infiltration
of
surface water to the ash in Pond
The
range
of available
compressive
strengths
will
provide
suitable
conditions
for
construction
of
pozzolanic
final
cover
Leach
testing
indicates that the
processing
of ash from Pond
for
pozzolanic
final cover
materials for Pond
will
not result in leachate
concentrations
that exceed
Class
Groundwater
Quality Standards
range
of mix
designs
will
support
effective
construction
of
pozzolanic
final
cover
system
relative to
site-specific design requirements
and
1375 Alternatives
Analysis Report-Final
NATURAL
3-11
RESOURCE
TECHNOLOGY
Electronic Filing - Received, Clerks' Office, August 11, 2008--AS 09-1, Exhibit 3
IDENTIFICATION OF LEACHATE
MANAGEMENTAND FINAL COVER ALTERNATIVES
Mix
Design
14 is
not recommended for the
pozzolanic
final
cover
system
due
to
field
constructability
concerns
and
potential
chemical and
physical variability
concerns noted
byVFL
1375 Alternatives
Analysis
Report-Final
NATuRAL
3-12
RESOURCE
TECHNOLOGY
Electronic Filing - Received, Clerks' Office, August 11, 2008--AS 09-1, Exhibit 3
MODELING AND EVALUATION OF
SELECTED
ALTERNATIVES
4.1
Purpose
The
purpose
of the
modeling
was to
predict
the effect of closure alternatives
selected for further
evaluation
in Section
The
modeling
was
performed using
the
calibrated
groundwater
flow and
transport
model
developed
for this
site
which
was documented
in
the NRT
report
Groundwater Model
Evaluation
of
Impoundment
Closure
Options
January 2000
The calibrated
model from the
January
2000
report
was utilized
as
the
starting point
for this
modeling6
which included
variation on five final
cover
options
and four
groundwater
extraction
variations as summarized in Table 4-1
The
prediction
modeling
was
performed
with the intent
to
represent
implementation
of the final cover and
leachate
management
alternative
in 2004 Due
to
subsequent findings
of low level ash
impacts
at
monitoring
well MW-14
Section
2.4
and
subsequent
installation
of off-site
monitoring
wells
Section
2.2
the assumed timeframe for
implementation
of the closure
alternatives
has
passed
The net effect
from the model
perspective
is that the time between
dewatering
of the
impoundment 2001
and estimated
implementation
of the final
cover
and leachate
management
alternative
2006
to
2007
will increase This
increase will have
no
effect
on
the
predictive
model
comparison
and
results therefore
for
purposes
of
modeling
and evaluation
of selected
alternatives
the
model
presented
in this
report
remains valid and has
not been redone
The alternatives were modeled in the
following
order
Final cover alternatives
Final cover alternatives
combined with leachate
management
alternatives
In other
words
the initial heads and concentrations used in this
model were the final calibrated heads and
concentrations for the
steady-state portion
of the model calibrated in 2000 That
steady
state
model
was
calibrated
to
represent
conditions
through
the end of
2000
and assumed that Pond
was
in
service until the end of 2000
Therefore
prediction modeling performed
here
begins
with
dewatering
beginning
in
2001
and
assumes
that the
final cover and leachate
management
alternatives
can
first be
applied
in
2004
1375 Alternatives
Analysis Report-Final
NATURAL
4-I
RESOURCE
TECHNOLOGY
Electronic Filing - Received, Clerks' Office, August 11, 2008--AS 09-1, Exhibit 3
MODELING
AND EVALUATION OF SELECTED
ALTERNATIVES
4.2 Model
Approach
Transport
of boron
was modeled because it was the
parameter
calibrated in the 2000 model
Boron
was
modeled in 2000 because it is
an
indicator
parameter
for coal ash leachate
and it is mobile in
groundwater
Three model
codes were used to simulate
groundwater
flow and contaminant
transport
Post-closure
leachate
percolation
was modeled
using
the
Hydrologic
Evaluation
of
Landfill Performance
HELP
model
Groundwater
flow
was modeled in three dimensions
using
MODFLOW
The
HELP
model
provided
leachate
percolation
rates for
input
to
MODFLOW
and
Contaminant
transport
was
modeled in
three dimensions
using
MT3DMS
MODFLOW
calculated
the flow field that MT3DMS used in the
contaminant
transport
calculations
The
general background
and
use
of the
HELP MODFLOW
and MT3DMS codes
are described
in
detail
in the 2000 model
report
Specific
parameter changes
from the 2000
modeling
are discussed below
4.2.1 HELP
Modeling
HELP
Version 3.07 Schroeder et
al 1994
was used to estimate
percolation
from the
impoundment
for
five cover scenarios The
hydrologic
data
required by
and
entered into HELP are listed in
Appendix
Table D-1 and described in the
following paragraphs
disk
containing
model files is attached
to
the
back of the
report
CO-I
3-footEarth
CO-2 3-foot Earth
over
geosynthetic
layer
CO-3a 3-foot Earth
layer
over 3-foot
pozzolanic layer
with
lx10-7
cmlsec
CO-3b 3-foot Earth
layer
over 3-foot
pozzolanic layer
with
lx 10-6
cm/sec
and
CO-3c 3-foot Earth
layer
over 3-foot
pozzolanic layer
with
lx 10-5 cm/sec
Scenario CO-I is the native soil
cap
scenario from the 2000
modeling
The other scenarios
used in this
modeling were
developed
by
adding layers
to
represent
PVC
compacted clay
or
the
pozzolanic layer
Each cover scenario was simulated
assuming
the ash
was
uncapped
with
no runoff for three
years
2001-
2003
while the
impoundment
dewatered and the closure
alternative was enacted
Scenario-specific
1375 Alternatives
Analysis Report-Final
NATuRAL
4-2
RESOURCE
TECHNOLOGY
Electronic Filing - Received, Clerks' Office, August 11, 2008--AS 09-1, Exhibit 3
MODELING
AND
EVALUATION OF SELECTED ALTERNATIVES
changes
were
simulated
beginning
the fourth
year
2004
and
through
the end of the simulation
2025
25-year
simulation
2001 through 2025
was sufficient for the
system
to reach
equilibrium
after
enactment of the closure scenario
4.2.2
MODFLOW/MT3DMS
Percolation rates obtained from HELP
were
utilized
as
recharge
rates for the Pond
ash cells in
MODFLOW Concentration values for the ash cells
were
the
same as
in
the 2000
model
except
for the
period
after the
cap
was installed
2004-2025
when concentration
for the
ponded portion
of Pond
was
increased
from
to 20
mgIL
This
change
is based
on
NRTs
experience
at other
impoundments
and
assumes
that
leachate
concentrations
will increase after the
pond
is removed The
reasons
for this
expected
increase are associated
with removal of the
pond
water
which has
typically
has lower
concentration than
the
porewater
in the
ash
and with removal of the
hydraulic
head
imparted
on
the
impoundment by
the
pond
water when slows
percolation
rates
through
the coal ash and increases contact
time
The 2000 model included
recharge
terms to simulate the former ash
laydown
area However this feature
was removed when Ponds
and
were constructed in 2001 This model
represented
removal
of the ash
laydown
area and
replacement
with Ponds
and
by changing recharge
rates
and
concentrations
in this
area to
the values used for Pond
the
lined ash
impoundment
4.2.3 Criteria for Evaluation of
Modeling
Results
Two
general
criteria were identified for evaluation
of
modeling
results
as measure
of the
scenarios
effectiveness
Effectiveness
Criteria
No
Compliance
with the health-based
Class Groundwater
Quality
Standard for boron
mgIL
at the
monitoring
wells
surrounding
Pond
and
Effectiveness
Criteria No
The time
frame
in
years
in
which the
modeling
scenario
achieves the Class Standard
for boron at the
monitoring
wells
4.2.4
Simulation
of Final Cover and Leachate
Management
Alternatives
The final
cover
alternatives
described in Section 4.2.1 were first modeled
individually
Then
two
representative
cover
scenarios
were
modeled with the
leachate
collection
alternatives
The leachate
1375
Alternatives
Analysis Report-Final
NAI1JR.AL
4-3
RESOURCE
TECHNOLOGY
Electronic Filing - Received, Clerks' Office, August 11, 2008--AS 09-1, Exhibit 3
MODELING
AND
EVALUATION OF SELECTED
ALTERNATIVES
collection
alternatives
were
simulated in
combination with final cover
alternatives
rather than
individually
because the no cover alternative
is not
being
considered
for this
facility
For
purposes
of the
modeling
evaluation
the leachate
collection
alternatives
were
assigned
the
following
designations
referred to as leachate
extraction
options
LEO
LEO-I Shallow
groundwater
extraction
wells
east
combined with an
interceptor
drain/trench
south
LEO-2
Interceptor
drain/trench
east
and
south
LEO-3
Interceptor
drain/trench
south
only
and
LEO-4
Interceptor
drain/trench
east
and
south
700 feet shorter than in LEO-2
along
the east
alignment
In
addition two
drain/trench
depths
were modeled as
designated by
or
for shallow and
deep
respectively
The difference
between the shallow and
deep
trench
designs
is
an
approximate
foot
increase in trench
depth
The trench
depth
was
varied
to
evaluate
the
design depth
necessary
to
effectively
collect
groundwater
affected
by
ash
leachate LEO-4
was
simulated
because tiebacks
associated
with
retaining
wall on the Wabash River would interfere with trench installation
along
the
northern
portion
of Pond
Groundwater
extraction
scenarios
drains
and extraction
wells are summarized on Table 4-I Model
layout
for the drains and extraction
wells are shown on
Appendix
Figures
D-l and D-2
4.2.5 Simulation of
Deep
Alluvial
Aquifer
Source
Control Alternative
Groundwater
extraction
from the
deep
alluvial
aquifer
was not
explicitly
modeled because the
area
of
811.320 exceedances is limited to
one
monitoring
well within
the zone of
attenuation
and because boron
concentrations
are below the health-based Class Groundwater
Quality
Standard
mgfL
therefore
this
aquifer already
meets the effectiveness
criteria
4.3
Modeling
Results and
Recommendations for Alternative
Assembly
The
groundwater
transport modeling
results are summarized
in
Table 4-2 based
upon
the
performance
of
each model scenario with
respect
to the two effectiveness
criteria
identified above in Section
4.2.3 In
1375 Alternatives
Analysis Report-Final
NATURAL
4-4
RESOURCE
TECHNOLOGY
Electronic Filing - Received, Clerks' Office, August 11, 2008--AS 09-1, Exhibit 3
MODELING
AND EVALUATION OF SELECTED
ALTERNATIVES
addition
graphical
results
showing predicted
concentration
trends over time
are
included in
Appendix
Figures
D-4 and
D-5
4.3.1
Modeling
Results Final Cover Alternatives
The five
cap
scenarios modeled
using
HELP fell into two
groups
Scenarios
CO-2 and
CO-3a had
predicted
leachate
percolation
rates that
averaged approximately
inches
per year
once
dewatering
was
completed
The other scenarios
averaged slightly
less than
inches
per year
after
dewatering
Figure D-3
MODFLOW simulations
of flow and
transport
for the five
cap
scenarios did
not
identify
final cover that
significantly
reduced the concentration of boron at the east
monitoring
wells
MW-7
and
MW-8
over
time
Figure D-4
Furthermore the cover scenarios
yielded
similar results at the
downgradient
monitoring
wells
The
only
discernable
difference
was observed at
MW-8
where the
predicted
boron
concentration increase for scenarios CO-2 and CO-3a
was
slightly
lower than for the other scenarios
Similar to the 2000
model
this
modeling suggests
that the difference
between cover scenarios is
insignificant compared
to the effect of
dewatering
Pond
and to the effect that
leaching
of
ash below the
water table has on
groundwater
quality
east of Pond
4.3.2
Modeling
Results Final Cover Alternatives
Combined with Leachate
Management
Alternatives
The cover scenarios
produced
two
groups
of
results therefore
two
representative
cover scenarios were
modeled in combination with the leachate
management
alternatives
Cover
CO-2
the
synthetic
cover
alternative
was
modeled
to
represent
the low
percolation
cover
scenarios
and
cover CO-3c
the
pozzolanic
cover
with
hydraulic
conductivity
of
l0-
cm/s was
modeled to
represent
the
high
percolation
cover
scenarios
The modeled leachate
collection
alternatives
had
varying
effects on
predicted groundwater
quality
Table 4-2 Figure D-5
In
general
each of the leachate extraction
option LEO
scenarios met the
evaluation criteria at each of the south and east
downgradient monitoring
wells with the
exception
of
LEO-3
interceptor drain/trench
south
alignment
only
where
predicted
concentrations
remained
elevated
at
monitoring
wells MW-7 and MW-8 Other observations from the
model results
Placement of extraction
wells within model
layer
silty-clay layer
for
LEO-I resulted
in
dry
cells therefore
the
wells were simulated in
layer
deep
alluvial
aquifer
as
1375 Alternatives
Analysis Report-Final
NATURAL
4-5
RESOURCE
TECHNOLOGY
Electronic Filing - Received, Clerks' Office, August 11, 2008--AS 09-1, Exhibit 3
MODELING
AND EVALUATION OF SELECTED
ALTERNATIVES
discussed above in Section
4.2.4
where
they
had to be modeled at withdrawal
rates
sufficient
to
draw flow from
layer
to
layer
Each LEO scenario met Criteria No
for each
monitoring
well with the aforementioned
exception
Monitoring
well MW-6 went
dry
within four
years
for each LEO scenario
evaluated
The
interceptor
drain/trench
scenarios
LEO-2
and LEO-4
scenarios
met
Criteria
No
faster than the
groundwater
extraction
east
combined with an
interceptor
drain/trench
scenario
LEO-I scenarios
The differences
between
the
shallow and
deep interceptor
drain/trench
scenarios fall
within the realm of model
uncertaintyno
distinct
advantage
was observed for one or the
other
The differences
between the LEO-2 and LEO-4 scenarios also fell within the realm of
model
uncertaintyno
distinct
advantage
was observed for
extending
the
interceptor
drain/trench
700 ft further north
LEO-2 scenarios
This
is not
unexpected
since all of
the ash situated below the water table is located in the central and southern
portions
of
Pond
and
There were no
significant
differences
associated
with the two final
cover
scenarios
CO-2
and
CO-3c
4.3.3 Recommendations for Alternatives
Assembly
key objective
for
groundwater
transport modeling
is to reduce the number of alternatives
assembled for
final
screening
and detailed evaluation
large
number of assembled alternatives
renders detailed
analysis
in
the
final
stage
of the evaluation
cumbersome and less
meaningful
Based
on
the
groundwater
transport modeling
the
following modeling
scenarios were eliminated from further evaluation
LEO-I
all scenarios LEO-I
combinations are not as effective
as
LEO-2 and LEO-4
combinations
Effectiveness
Criteria No
time
frame
LEO-2
all scenarios LEO-2
combinations
extending
the
interceptor
drain/trench
700 ft
further
north
do not
provide significantly
better effectiveness
Effectiveness
Criteria No
time
frame
than LEO-4 scenarios at increased
capital cost
and
All
deep interceptor
drain/trench
scenarios the
deep interceptor
drain/trench
does not
provide
significantly
better effectiveness
Effectiveness Criteria No
time
frame
at
increased
capital
cost versus shallow trench scenarios
The
remaining modeling
scenarios
were
carried
through
for
alternative
assembly Although
the LEO-3
scenarios did not meet the effectiveness
criteria
along
the east
impoundment boundary
between
Pond
and the Wabash
River
two of the LEO-3 scenarios were carried
through
for alternative
assembly
based
1375
Alternatives
Analysis Report-Final
NATURAL
4-6
RESOuRCE
TECHNOLOGY
Electronic Filing - Received, Clerks' Office, August 11, 2008--AS 09-1, Exhibit 3
MODELING
AND EVALUATION OF SELECTED
ALTERNATIVES
on their
ability
to meet the effectiveness
criteria
along
the south
impoundment boundary
and
prevent
off
site
migration
of
groundwater
affected
by
ash leachate None of the final cover alternatives
were
eliminated at this time since each has
equivalent performance
and each offers
unique advantage
that will
be further evaluated in Section
1375 Alternatives
Analysis Report-Final
NATURAL
4-7
RESOURCE
TECHNOLOGY
Electronic Filing - Received, Clerks' Office, August 11, 2008--AS 09-1, Exhibit 3
ASSEMBLY AND
DETAILED ANALYSIS OF
CLOSURE
ALTERNATIVES
5.1
Assembly
and Selection
Rationale
Five final cover alternatives
and four combinations of final
cover and leachate
management
alternatives
listed in Table
4-2 were carried
through
the
groundwater
transport modeling
evaluation
for consideration
as
closure alternatives
for
detailed
analysis
In
addition
the
modeling
results discussed
in Section
indicate that substitution of final
cover
alternative
CO-3a for CO-2 and substitution of CO-I for CO-3c
would be
appropriate
for the
combinations of final cover and leachate
management
alternatives
as
CO-3a
and CO-i
provide
equivalent
effectiveness
as
CO-2 and
CO-3c
respectively
Three of the alternatives
carried
through
and one alternative
that substitutes CO-I
for CO-3c were selected for detailed
analysis
as
follows
Closure Alternative
No
Select one alternative
that
substantially
meets
the
leachate
collection
and
cap
design requirements
of 35 JAC Parts 8111 and 814 Based
on
this
selection
criterion
combination
CO-2 LEOa-4
Geosynthetic
Final Cover with East and
South
interceptor
Drain/Irench
was selected
700
feet shorter
along
east
alignment
This closure alternative
adheres to the Section 811.314
requirements
for
final
cover
system
and
implements
leachate
collection
along
the
east
and
south boundaries of Pond
and
groundwater
extraction
in the
deep
alluvial
aquifer
to meet the
requirements
for
meeting applicable
groundwater
quality
standards
at the
edge
of the zone of attenuation
as
defined in
Section
811.320c
Closure Alternative
No
Select
one alternative
that meets the effectiveness
criteria
Section 4.2.3
with
adjusted
standards
and includes
leachate
collection
Based
on
this
selection
criterion combination
CO-i
LEOa-3 Earthen Final Cover with
South
interceptor
Drain/Trench
was
selected
Although
this closure alternative
was not
explicitly
modeled the results of the final
cover
alternatives
modeling as explained
above
indicate that this alternative
combination will have
equivalent
effectiveness
as
CO-3c LEOa-3 listed in Table 4-2 This closure
alternative balances lower cost with
leachate collection
designed
to
prevent
off-site
migration
to
the
south An earthen
final
cover would
require
an
adjusted
standard
to meet the Section 811.314 final
cover
requirements
Leachate collection
along
the south
impoundment boundary
would adhere
to the
requirements
of Section
811.320 at the south
property
line however an
adjusted
standard would be needed to allow affected
groundwater
to exceed the Section 811.320
applicable
background
concentrations and Class Groundwater
Quality
Standards
beyond
the
zone
of attenuation
between
the east
edge
of Pond
and the Wabash River
Closure Alternative
No
Select one alternative
that
represents
the
lowest cost
alternative
and meets the effectiveness
criteria
Section 4.2.3
with
adjusted
standards
1375 Alternatives
Analysis Report-Final
NA11JRAL
5-1
RESOURCE
TECHNOLOGY
Electronic Filing - Received, Clerks' Office, August 11, 2008--AS 09-1, Exhibit 3
ASSEMBLY AND DETAILED ANALYSiS OF CLOSURE
ALTERNATIVES
and
no
leachate
collection Based
on
this selection
criterion final cover alternative
CO
Earthen Final Cover
was
selected This closure alternative
represents
the lowest
cost
alternative
for closure of Pond
and
would
require adjusted
standards
to seek relief from
several sections of Part 811 and Part
814.302b1
Closure Alternative
No
Select one alternative
that meets the effectiveness criteria
Section 4.2.3
with
adjusted
standards
and
meets the intent of 35 1AC Part 811 and
814
through
utilization of
technology
and construction
techniques substantially
similar to
those
promulgated
in 35 IAC Part 816
Alternative
Standards for Coal Combustion
Power
Generating
Facilities Waste
Landfills
Based
on
this selection
criterion
final
cover
alternative
CO-3c
Pozzolanic
Fly
Ash Final
Cover
iO
cm/sec
was
selected This closure alternative
provides equivalent
effectiveness
as
Closure
Alternative
No
and has the added
benefit of
providing
renewed
capacity
for the Pond
fly
ash
impoundment
This alternative
would
require adjusted
standards
to seek relief
from several sections of Part
811
and
Part
814.302b1
Each of the mix
designs
recommended
by
VFL for
pozzolanic fly
ash final
cover
had
lower
hydraulic
conductivity
than the
highest
value used for HELP and
groundwater
transport modeling
1O
cm/sec
Since each mix
design provides essentially equivalent
effectiveness
within the
modeling
performed
to evaluate
the
alternatives
feasibility
level cost data
were
provided by
VFL
to
perform
cost
sensitivity analysis
of the recommended mix
designs
The cost
sensitivity analysis
is
provided
in Table 3-
and the
feasibility-level
cost data used to create the
feasibility
cost estimates
Appendix
for each mix
design
is
provided
in
Appendix
C-2 The results of the
cost
sensitivity analysis
indicated that Mix
Design
for the
pozzolanic fly
ash final
cover
would be the
most
economical
mix
design
to achieve the
performance
modeled for Closure Alternative
No
Therefore
costs associated
with Closure Alternative
No
are
based
on
Mix
Design
for the
pozzolanic fly
ash final cover
Surface
water
management
considerations
have been included for each of the selected alternatives
Since
only
one surface water
management
alternative
passed
the initial
screening
3.5
Table 3-1 Route
surface
water east
and
west
towards
the Wabash River and the
drainage
collection
pond
Pond CIJ
costs
for
grade adjustment
within Pond
to
construct
this surface
water
management
alternative
are
incorporated
within the final
cover
cost estimates
Also
proposed grading
contours
for this surface water
management
alternative
are
shown
on
Figures
5-1
through
5-3
5.2 Detailed
Analysis
of Closure Alternatives
Costs for each of the closure alternatives
and the alternate final
cover are summarized in Table 5-1 and
were compiled using
the cost estimates
provided
in
Appendix
Detailed
analysis
of the three
alternatives
is summarized in Table 5-2 and
was
performed
in
general
accordance with the
criteria
stipulated
in Sections
811.324 and 811.325
Conceptual
layouts
of Closure Alternatives
No
through
375 Alternatives
Analysis Report-Final
NATURAL
5-2
RESOuRCE
TECHNOLOGY
Electronic Filing - Received, Clerks' Office, August 11, 2008--AS 09-1, Exhibit 3
ASSEMBLY AND DETAILED ANALYSIS OF CLOSURE
ALTERNATIVES
are shown on
Figures
5-1
through
5-3
respectively Key
conclusions from
the cost
comparison
and
detailed
analysis
Closure
Alternative
No
has the
highest
initial
capital
cost and overall
cost
for
30-year
operating
and maintenance
OM
period
based
on
2003
dollars
Performance
and
reliability
are not concerns as the remedial
components consisting
of
geosynthetic
cover
leachate
collection
via an
interceptor
drain/trench
and
groundwater
extraction
are
demonstrated
technologies
that
are
widely
available Ease of
implementation
will
present
significant
although manageable challenge
for
operation
and maintenance of the
deep
alluvial
aquifer groundwater
extraction
System reliability
and effectiveness
would be
further enhanced
by
careful
design operation
and maintenance
This alternative
reflects
the
most conventional
approach
of the three
alternatives
and
likely
would
not
require
adjusted
standards
for leachate
collection
and
cap
design
as
the alternative
is
designed
to
comply
with these
requirements
in Parts 811 and 814
Closure Alternative
No
reflects an
approach
that balances
mid-range
cost with
heightened
institutional
requirements through
the
pursuit
of
adjusted
standards This
alternative
provides significant
cost
savings
versus
Alternative
No
in
up-front capital
cost and for
30
year
OM
period
Performance effectiveness
and
reliability
along
the
south
impoundment boundary
are
nearly equivalent
to Alternative
No
Along
the
east
impoundment boundary
an
adjusted
standard would
be
required
to meet
performance
and
effectiveness
criteria An
adjusted
standard would also be
required
for
construction
of an
earthen final
cover
Closure Alternative
No
does not
rely
on
leachate
collection
for
performance
and
represents
the
lowest cost alternative
with
significant
savings
in
up-front capital
and
long
term
OM costs Groundwater
transport modeling
data
suggest
that
an
earthen
cover
may provide
similar
performance
and
long
term
effectiveness
along
the south
property
boundary
as Alternatives
No
and
However
this alternative
would
require
significant adjusted
standards
for
construction
of an earthen
cover no
leachate
collection
and
adjusted groundwater
quality
standards
Closure
Alternative
No
provides
equivalent
performance
reliability
and
effectiveness
as the final
covers
proposed
for each
alternative
at
mid-range capital
cost for final
cover
construction
Plant enhancements
resulting
from the additional
capacity
created for
fly
ash in Pond
may
offset
capital
costs Similar to Closure Alternative
No
adjusted
standards would be
required
for
no
leachate
collection
and
adjusted
groundwater
quality
standards Ji
addition an
adjusted
standard would be
required
to
gain regulatory
acceptance
of this
technology
for
construction
of
pozzolanic fly
ash
cover
however
regulatory
precedent
does exist for similar
construction
of final covers
35
IAC Part
816
5.3
Recommended Closure
Strategy
Each of the four alternatives
is
potentially appropriate
for the site with similar
performance
and
effectiveness
and reflects
range
of
approaches contingent
on
capital expenditure
and
varying approval
of
adjusted
standards with the Illinois PCB
However
Closure Alternative
No
Pozzolanic
Fly
Ash
1375 Alternatives
Analysis Report-Final
NATURAL
5-3
REsOURCE
TECHNOLOGY
Electronic Filing - Received, Clerks' Office, August 11, 2008--AS 09-1, Exhibit 3
ASSEMBLY AND DETAILED ANALYSIS OF
CLOSURE ALTERNATIVES
Cover
provides
the
optimal
balance of
capital expenditure
and
pursuit
of
adjusted
standards for the
following
reasons
Groundwater
transport modeling
indicates that
pozzolanic
fly
ash final
cover
system
will
have
substantially
similar
performance
and effectiveness
as
cover
system
that
meets
the
requirements
of Section 811.314
e.g geosynthetic
final
cover
Groundwater
transport modeling
indicates that the
pozzolanic fly
ash final
cover will
achieve the health-based Class
Groundwater
Quality
Standards
along
the south
property
boundary
MW-I IR
within
approximately
16
years
This
alternative
should
satisfy
long-term regulatory
concerns
with
off-site
migration
No leachate
management
is
proposed along
the
east
impoundment boundary
because
groundwater
impacted by
ash
leachate
discharges
to the Wabash River and does
not
threaten
any
downgradient
groundwater
receptors
Based
on this discussion
pursuit
of an
adjusted
standard
for the
applicable
groundwater
quality
standards
along
the
east
edge
of
the zone of attenuation is warranted
No
groundwater
extraction
is
proposed
for the
deep
alluvial
aquifer
The
concentration
of boron detected
in MW-14
remains below Class
groundwater
quality
standards
there
is no evidence of
migration
toward the
south
and the
only
exposure pathway
to
potable
groundwater
supply
wells is via the
plant supply
wells These wells show
no evidence of
impacts
Regulatory precedent
exists 35 IAC
816
for construction
of
pozzolanic fly
ash final
cover
system
using
substantially
similar
technology
and construction
techniques
Significant
cost
savings may
be realized
through
construction
of
pozzolanic
fly
ash
final
cover
by enhancing
plant operations
and
providing
additional
capacity
for
fly
ash in
Pond
Based
on
this
discussion
pursuit
of
an
adjusted
standard
for construction
of
pozzolanic fly
ash final
cover
is warranted
5.4 Recommended
Pre-Design
Evaluation and
Field
Testing
NRT recommends additional
pre-design
evaluation
and
field
testing prior
to
design
and full-scale
construction
of
pozzolanic fly
ash final
cover Additional
pre-design
evaluation would include
additional
geotechnical
evaluation of Pond
to determine if stable
subgrade
for
support
of
pozzolanic
fly
ash cover can be
constructed
and creation and
sampling
of
test
pad
constructed
of the
pozzolanic
materials
at the site in substantial conformance
with
Section
16.530
No additional
bench-scale
testing
is recommended at this time
1375 Alternatives
Analysis
Report-Final
NATURAL
5-4
RESOURCE
TECHNOLOGY
Electronic Filing - Received, Clerks' Office, August 11, 2008--AS 09-1, Exhibit 3
REFERENCES
Dwyer Stephen
September
1998 Alternative
Landfill
Covers Pass the Test
Civil
Engineering
American
Society
of Civil
Engineers Reston
VA
Dwyer Stephen
January
2001
Finding
Better Cover
Civil
Engineering
American
Society
of
Civil
Engineers
Reston
VA
EPRI 2002 MANAGESM Version 2.5Groundwater
Data
Management
Software for
WindowsTM
Electric Power Research Institute TR- 106900
and AD-
113595
International
Containment
Technology Workshop August
1995 Offices of
Science and
Technology
USEPA
Hanson
Engineers Inc
1984 Ground Water
Study
Hutsonville
Power Station Hutsonville IL
Hanson
Engineers
Inc
April
2000
Engineering Report
Interim Ash and
Drainage
Collection
Ponds
Hutsonville Power
Station
Hutsonville
IL
Hanson
Engineers
Inc
August
17
1984 Hut
sonville Power Station
Slurry
Wall
Study
Hutsonville
Power
Station
Hutsonville
IL
Illinois Environmental Protection
Agency
Title 35 Environmental
Protection
Subtitle
Waste
Disposal
Chapter
Pollution Control
Board
Subchapter
Solid Waste and
Special
Waste
Hauling
Part 811 Effective
July
1999 and Part
816
Effective
August
15
1996
Natural
Resource
Technology Inc
August
19
1999
Hydrogeologic
Assessment Final
Report
Project
No 1375
RAPPS
Engineering
and
Applied
Science
May
29
2001
Hutsonville
Power Station Ash Pond Closure
Hutsonville Power
Station
Hutsonville
IL
United States
Geological
Survey
2003 Minerals Yearbook
2003 Boron
httpllminerals.usgs.gov/minerals/pubs/commodity/boronlboronmybO3
.pdf
VFL
Technology
Corporation
November
2001 Hutsonville
Station
Rough
Estimate
for
Work
Associated with Hutsonville Pond Excavation
Capping
Hutsonville Power
Station
Hutsonville
IL
Wisconsin Electric Power
Company
2000 Coal Combustion Products
Utilization
Handbook
Library
of
Congress
Cataloging-in-Publication
Data
1375 Alternatives
Analysis Report-Final
NATURAL
6-I
RESOURCE
TECHNOLOGY
Electronic Filing - Received, Clerks' Office, August 11, 2008--AS 09-1, Exhibit 3
FIGURES
Electronic Filing - Received, Clerks' Office, August 11, 2008--AS 09-1, Exhibit 3
SOURCE
USGS 15 MINUTE
QUADRANGLE
WEST UNION DATED
1966
SCALE
IN
FEET
CONTOUR
INTERVAL
10
FEET
SITE LOCATION
MAP
PROJECT
NO
1375
NATURAL
HUTSONVILLE
POWER
STATION
DRAWING
NO
OURCE
AMEREN ENERGY
GENERATING
1375A04
TECHNOLOGY
HUTSONVI
LLE
ILLI NOIS
FIGURE
NO
DRAWN
BY RLH
07/18/05
APPD BY
BRH
DATE
07/18/05
11
OlS
QUADRANGLE
LOCATION
2000
4000
Electronic Filing - Received, Clerks' Office, August 11, 2008--AS 09-1, Exhibit 3
QLLJcD
cD
QV
i.i
LQ
_J
BRECI
PUSH
SOIL
BORING
MW9
SB
104
SB105
SB106
/\
-J
LEGEND
TEMPORARY
MONITORING
WE
MONITORING
WELL
ri
M3
NESTED
MONITORING
WELL
M3D
MWli
ABANDONED
MONITORING
WELL
GPi1
LPl
LEACHATE
SAMPLE
EW
Puwr
WATER
WELL
SBiOl
SOIL
BORING
LAP
SURFACE
WATER
SAMPLE
FENCE
MW-i
Jf
MW
10
MW1OD
100
200
400
SCALE
IN
FEET
SOURCE
NOTES
THIS
MAP
WAS
OBTAINED
FROM
DRAWING
BY
HANSON
ENGINEERS
INC
HE
GENERAL
PLAN
HEI
SHEET
NO
S02
P.C
MS
PROJECT
DATED
4/05/00
ANDFROM
AN
AERIAL
SURVEY
PERFORMED
BY
SURDEX
CORPORATION
HUTSONVILLE
ASH
POND
SURVEY
SURDEX
JOB
NO
1100434/190
DATED
4/24/01
MONITORING
WELLS
MWi
THROUGH
MW12
MW14
AND
1W
SOIL
BORINGS
SB101
THROUGH
SBTO
AND
EXTRACTION
WELLS
EW1
AND
EW2
WERE
SURVEYED
BY
AMEREN
PERSONNEL
ON
10/15/01
AND
10/16/01
ALL
OTHER
MONITORING
WELL
SOIL
BORING
LEACHATE
SAMPLE
AND
SURFACE
WATER
SAMPLE
LOCATIONS
WERE
OBTAINED
FROM
NRT
DRAWING
1375801
PROJECT
NO
1375/1
DATED
8/18/99
TW115D
ANDTW115S
WERE
SURVEYED
BY
CONNOR
CONNOR
INC
ROBINSON
ILLINOIS
JULY
2004
NOTES
DIsCDN11NUmES
BETWEEN
SURVEYS
ARE
INDICATED
BY
BREAKS
IN
CONTOUR
LINES
SOIL
BORINGS
GP
THROUGH
GP4
GP9
ANDSURFACE
WATER
SAMPLE
P2P
ARE
SCREENED
SINCE
THEY
ARE
ASSOCIATED
WITH
FORMER
ASHLAYDOWN
AREA
NOW
REPLACED
WITH
THE
INTERIM
POND
AND
THE
DRAINAGE
COLLECTiON
POND
SEE
NRT
REPORT
1-IYDROGEOLOGIC
ASSESSMENr
FOR
FURTHER
INFORMATION
12
-LI
GP-20
to
to
3-
TW115D
TW115S
TW
fr.
GP2l
I-
P2
\UNLIN
PLY
SF
PON
POND
c\
cOo
000
MW7D
02
--
AWl1
MW11R
W-6\
LO
z-
GPi6
GP18
GP15
GPi3
GP17
GP19
GP14
700
FT
Electronic Filing - Received, Clerks' Office, August 11, 2008--AS 09-1, Exhibit 3
-440
430-
-430
420-
-420
410-
-410
400-
390-
-390
380-
-380
370-
.370
360-
.360
350-
-350
340-
-340
330-
330
-440
430-
430
420-
420
410
410
403-
-400
390-
390
NOTES
RR
IS
THE
WAMPLER
IRRIGATION
WELL
ISGS
WELL
120333666700
EW1
IS
BASED
ON
SOS
WELL
PERMIT
47367
370-
-370
DEPTH
OF
WABASH
RIVER
IS
ASSUMED
360-
360
353-
-350
r2
340-
340
200
330
330
HORIZONTAL
SCALE
IN
FEET
V1CAL
0R310N
IS
PROJECT
NO
1375/61
GEOLOGIC
CROSS
SECTIONS
DRAWN
BY
RLH/
LEACHATE
MANAGEME
NT
AND
FINAL
COVER
LTERNATIVES
REPORT
TAS
05/03/05
HUTSONVILLE
POWER
STAll
ONPOND
CLOSURE
CHECKED
BY
AM
EREN
ENERGY
GENERATIN
44
COARSE
GRANED
ALLUVIAL
DEPOSITS
WABASH
RIVER
F1NIE
GRAINED
ALLUVIAL
DEPOSrIS
SIAALE
COARSE
GRAINED
ALLIMAL
DEPOSITS
440-
LEGEND
iI1
TOPSOIL
Eftil
SILT
SILTY
LEAN
CLAY
SANDY
SILT
SILTY
SAND
LEAN
CLAY
FAT
CLAY
POORLY
GRADED
GRAVEL
CLAYEY
GRAVEL
SHALE
E3
WELL
GRADED
SAND
WELL
GRADED
GRAVEL
WITH
SAND
WELL
GRADED
SAND
WITH
GRAVEL
POORLY
GRADED
SAND
POORLY
GRADED
SAND
WITH
GRAVEL
SANDY
LEAN
CLAY
CLAYEY
SAND
WELL
GRADED
GRAVEL
SCREENED
INTERVAL
BB
TAS
04/28/05
PAR
AA
TAS
04/28/D5
PAR
NATURAL
RESOURCE
TECHNOLOGY
APPROVED
BY
RAWING
NO
1375
61801
FIGURE
NO
BRH
05/17/05
21
IDfKD
BY
AY
EFERENCE
Electronic Filing - Received, Clerks' Office, August 11, 2008--AS 09-1, Exhibit 3
600
1200
SCALE
IN
FEET
00RCE
NOTES
THIS
DRAWING
WAS
DEVELOPED
FROM
REPORT
BY
SINAI
BROOKF1ELD
WISCONSIN
PROJECT
249 REPORT
9801
DATED
MAY
1998
AND
USGS
QUADRANGLE
7.5
MINUTE
SERIES
WEST
UNION
IWNOISINDIADAR
OUTED
1966
ALl
LOCATiONS
ARE
APPROXIMATE
THIS
MAP
WAS
OBTAJNED
FROM
DRAWING
BY
RANSON
ENGINEERS
INC
HO GENERAL
PLAN
HIT
SHEET
NO 002 P.C.U.S
PROJECT
DRiED
4/05/00
AND
FROM
AN
AERIAL
SURVEY
PERFORMED
BY
SIJROEX
CORPORAT1ON
HU1SOIWILLE
ASH
POND
SURVEY
508001
JOB
NO
1100434/190
DATED
4/24/01
MONITORING
WELLS
MWI
THROUGH
MW12
MW14 AND
1W
SOIL
BORINGS
59101
ThROUGH
SB103
AND
EXTRACTiON
WELLS
6Wi AND
EW2
WERE
SURVEYED
BY AMEREN
PERSONNEL
ON
10/15/01
AND
10/16/01
ALL
OTHER
MONITORING
WELL
ROL
BOWING
LE.HCHATE
SAMPLE
AND
SURFACE
WATER
SAMPLE
LOCATiONS
WERE
O8TAJNED
FROM
NRT
DRAWING
1375801
PROJECT
NO
1375/I
DATED
8/18/99
1W-itS
ThROUGH
IW-120
WERE
SURVEYED
BY
CONNOR
CONNOR
INC
ROBINSON
IWNOIS
JULY
2004
GROUNDWATER ELEVATION
CONTOUR
SEPTEMBER
14
2004
LEACHATE
MANAGEMENT
AND FINAL COVER ALTERNATIVES
HUTSONVILLE
POWER
STATIONPOND
CLOSURE
AMEREN
ENERGY
GENERATING
HUTSONVILLE
ILLINOIS
DRAWN
BYTAS
06/07/05
APPD
BYBRH
DATE06/07/05
LEGEND
%.26O
GROUNDWATER
ELEVA1TON
CONTOUR
FT
GROUNDWATER
FLOW
DIRECTION
MONITORING
WELL
AND
GROUNDWATER
ELEVATiON
FT
TW116
426.2
M7
M7D
TW
EW1
SB_
101
MONITORING
WELL
AND
GROUNDWATER
ELEVATION
FT
TEMPORARY
MONITORING
WELL
1Wi 18
426.9
PLANT
WATER
WELL
SOIL
BORING
TW120
427.6
1W 116
426.2
1W119
427.4
PROJECT
NO
1375/6
REPORT
DRAWING
NO
137561 A04
FIGURE NO
22
Electronic Filing - Received, Clerks' Office, August 11, 2008--AS 09-1, Exhibit 3
600
1200
SCALE
IN
FEET
SOURCE
NOTES
THIS
DRAWING
WAS
DEWLOPED
FROM
REPORT
BY
5DM
BWOOKF1ELD
WISCONSIN
PROJECT
249 REPORT
9801
DATED
MAY
1998
ANO
USGS
QUADRANGLE
7.5
MINUTE
SERIES
WEST
UNION
IWNOISINDIANA
DATED
1966
ALL
LOCATIONS
ARE
APPROXIMATE
THIS
MAP
WAS
OBTAiNED
FROM
DRAWING
BY HANSON
ENGINEERS
INC
1-IEI
GENERAL
PLAN
HO SHEET
NO S02
C.M.S
PROJECT
DATED
4/05/00
AND
FROM
AN
AERLAL
SURVEY
PERFORMED
BY
SUROX
CORPORATION
HUTSOI.MLLE
ASH
POND
SURVEY
SIJRDEX
JOB
NO
1100434/190
DATED
4/24/01
MONITORING
WELLS
MWi
THROUGH
MW12
MW14 AND
1W
SOIL
BORINGS
S8101
THROUGH
58103
AND
RXFRACTION
WELLS
FRI
AND
EW2
WERE
SURVEYED
BY AAEREN
PERSONNEL
ON
10/15/01
AND
10/16/01
ALL
OTHER
MONITORING
WELL
SOIL
BORING
LEACHATE
SAMPLE
AND
SURFACE
WATER
SAMPLE
LOCATiONS
WERE
OBTAiNED
FROM
NRT
DRAWING
1375801
PROJECT
N0
1375/I
DATED
8/16/99
IW115
THROUGH
TW120
WERE
SURVEYED
BY CONNOR
CONNOR
INC
ROBINSON
ILLINOIS
JULY
2004
INATURAL
______TECHNOLOGY
I0
GROUNDWATER
ELEVATION
CONTOUR
OCTOBER
26
2004
LEACHATE
MANAGEMENT
AND FINAL
COVER ALTERNATIVES
HUTSONVILLE
POWER
STATIONPOND
CLOSURE
AMEREN
ENERGY
GENERATING
HUTSONVILLE
ILLINOIS
DRAWN
BY TAS
06/07/05
APPD BY BRH
DATE
06/07/05
PROJECT
NO
1375/6
DRAWING
NO
137561 A03
FIGURE NO
23
LEGEND
A.6
GROUNDWATER
ELEVATION
CONTOUR
FT
GROUNDWATER
flOW
DIRECTION
MONITORING
WELL
AND
GROUNDWATER
ELEVATiON
FT
TW116
424.8
M-7
L1J
TW
EW1
101
MONITORING
WELL
AND
GROUNDWATER
ELEVATiON
PT
TEMPORARY
MONITORING
WELL
1W 118
425.3
PLANT
WATER
WELL
SOIL
BORING
TW120
426.1
1W 116
424.8
1Wi 19
425.9
REPORT
Electronic Filing - Received, Clerks' Office, August 11, 2008--AS 09-1, Exhibit 3
600
1200
SCALE
IN
FEET
SOURCE
NOTES
THIS
DRAWING
WAS
DEVELOPED
FROM
REPORT
BY
STMI
BROOKFIELD
WISCONSIN
PROJECT
249
REPORT
9801
DATED
MAY
1998
MD
USGS
QUADRANGLE
7.5
MINUTE
SERIES
WEST
UNION
IWNOIS-INDIANA
DATED
1968
ALL
LOCATIONS
ME
APPROXIMATE
THIS
MAP
WAS
OBTAINED
FROM
DRAWING
BY HANSON
ENGINEERS
INC
HO
GENERAL
PLAN
HO SHEET
NO
S02
P.C.MS
PROJECT
DATED
4/05/00
AND
FROM
AN
AERIAL
SURVEY
PERFORMED
BY SUROOC
CORPORATION
HUTSOIMLLE
ASh
POND
SURVEY
SUROEX
JOB
NO
11004.34/180
DATED
4/24/01
MONITORING
WELLS
MWi
THROUGH
MW12
MW14 AND
1W
SOIL
BORINGS
SBIO1
THROuGH
58103
MD
EXTRACTION
WW..S
LWi MD
EW2
WERE
SURVEYED
BY AMEREN
PERSONNEL
ON
10/15/01
AND
ID/I 5/01
ALL
OTHER
MONITORING
WELL
SOIL
BORING
LEACI4ATE
SAMPLE
AND
SURFACE
WATER
SAMPLE
LOCATIONS
WERE
OBTAINED
FROM
NRT
DRAWING
1375801
PROJECT
NO 1375/1
DATED
8/18/99
1W-liD
THROUGH
TW-12D
WERE
SURVEYED
BY CONNOR
CONNOR
INC
ROBINSON
IWNOBI
JULY
2004
GROUNDWATER ELEVATION
CONTOUR
NOVEMBER
16
2004
LEACHATE
MANAGEMENT
AND FINAL COVER ALTERNATIVES
REPORT
HUTSONVILLE
POWER
STATIONPOND
CLOSURE
AMEREN
ENERGY
GENERATING
HUTSONVILLE
ILLINOIS
DRAWN
BYTAS
06/07/05
APPD BYBRH
DATE06/07/05
PROJECT
NO
1375/6.1
DRAWING
NO
137561 AO2
LEGEND
GROUNDWATER
ELEVATION
CONTOUR
FT
GROUNDWATER
FLOW
DIRECTION
MONITORING
WELL
AND
GROUNDWATER
ELEVATION
FT
TW116
426.8
M7
M7D
TW
EW1
s1o1
MONITORING
WELL
AND
GROUNDWATER
ELEVATION
FT
TEMPORARY
MONITORING
WELL
PLANT
WATER
WELL
TW118
427.0
SOIL
BORING
427.5
1W
116
426.8
1WI 19
427.7
FIGURE NO
24
Electronic Filing - Received, Clerks' Office, August 11, 2008--AS 09-1, Exhibit 3
433
120
EW-1
EW-2
TW-118
TW-115D
TW-115S
431
100
TW-115s
response
is
delayed
Cause
of
these
dips
is
429
by
hours
relativeto
TW-1
lSd
80
.2
uncertain
-s
//
//
427
425
60
No
apparent
correlation
between
EW
pumpage
and
423
GW
elevation
L40
421
419
DBflllUllflC
1BflflEllhIIll
llllll
iHU
20
417
9/1/04
9/8/04
9/15/04
9/22/04
9/29/04
10/6/04
10/13/04
10/20/04
10/27/04
11/3/04
11/10/04
11/17/04
Ti
me
Figure
2-5
Comparison
of
Groundwater
Elevation
Data
to
Well
Pumpage
September-November
2004
Natural
Resource
P\1
300\1
375\Aquifer
tests\Long
term
troll
data\1375
Sept_Nov
GW
EIev.xls
Technology
Electronic Filing - Received, Clerks' Office, August 11, 2008--AS 09-1, Exhibit 3
Upper
Sand
Boron
Tot
mg/L
AMWI
Li MWJO
O\C
--
HA
LA
CCCC
4b
CCCCCC
NrIN
--
-A
LA
OCCO\C\\
-.--
0c
--
Nqr NC
.- .-
-.-
-.--
-..- .--
-.-- .-
Sample
Date
0.25-P
0.2Q
0.15-P
0.10
0.05
0.00
Deep
Alluvial
Aquifer Boron
Tot
mg/L
MW7D
MWTW
--
LA
00
Sample
Date
Figure
2-6 Boron Concentration in
Background
Wells
Electronic Filing - Received, Clerks' Office, August 11, 2008--AS 09-1, Exhibit 3
.w
Upper
Sand
Sulfate
Tot
mg/L
MW
Eli
MWJO
0C0\C
-.-
.-
Sample
Date
90
Deep
Alluvial
Aquifer Sulfate
MW7D
Lii
MWW
Tot
mg/L
AA
00
--
I-
CCC
--
--
-- .-
I-
---
-- -.-
-.-
._
I-
70
50
30
10
00
UI
NI
I-
Sample
Date
Figure
2-7 Sulfate Concentration
in
Background
Wells
Electronic Filing - Received, Clerks' Office, August 11, 2008--AS 09-1, Exhibit 3
NATURAL
RESOURCE
TECHNOLOGY
APPROVED
BY
BRH
06/07/05
ALTERNATIVE
NO
PVC
FINAL
COVER
WITH
EAST
AND
SOUTH
INTERCEPTOR
DRAIN/TRENCH
AND
DEEP
GROUNDWATER
EXTRACTION
SYSTEM
LEACHATE
MANAGEMENT
AND
FINAL
COVER
ALTERNATIVES
REPORT
HUTSONVILLE
POWER
STATIONPOND
CLOSURE
AK4EREN
ENERGY
GENERATING
HUTSONVILLE
ILLINOIS
FIGURE
NO
5i
ri
IC
ICMCM
f_Jm
P1
rri
ci
Oi
-D
-U
-r
01
-r
CM
in
-o
ciJo
-n
or_
1m1
-.1-I
-1
DRAtNACE
POND
.1
co
zz
nlCc
mO
IC
nO
PROJECT
NO
1375/61
DRAWN
BY
TAS
RLH
05/02/05
CHECKED
BY
CAR
05/16/05
RAWING
NO 137561BO3C
REFERENCE
Electronic Filing - Received, Clerks' Office, August 11, 2008--AS 09-1, Exhibit 3
PROJECT
ND
1375/6.1
DRAWN
BY
TAS
RLH
05/03/05
CHECKED
BY
CAR
05/16/05
APPROVED
BY
BRH
06/07105
ALTERNATIVE
NO
EARTHEN
FINAL
COVER
WITH
SOUTH
INTERCEPTOR
DRAIN/TRENCH
LEACHATE
MANAGEMENT
AND
FINAL
COVER
ALTERNATIVES
REPORT
HUTSONVILLE
POWER
STATIONPOND
CLOSURE
AMEREN
ENERGY
GENERATING
HUTSONVILLE
ILLINOIS
DRAWING
NO 137561--604C
FIGURE
NO
52
NATURAL
RESOURCE
OGY
REFERENCE
Electronic Filing - Received, Clerks' Office, August 11, 2008--AS 09-1, Exhibit 3
0r
z-
-a
oc
Cl
-U
Zmc
-I_b
NATURAL
RESOURCE
TECHNOLOGY
APPROVED
BY
BRH
06/07/05
ALTERNATIVE
NO
EARTHEN
FINAL
COVER
OR
ALTERNATIVE
NO
POZZOLANIC
FLY
ASH
FiNAL
COVER
LEACRATE
MANAGEMENT
AND FINAL
COVER
ALTERNATIVES
REPORT
HUTSONVILLE
POWER
STATIONPOND
CLOSURE
AMEREN
ENERGY
GENERATING
HUTSONVILLE
ILLINOIS
FIGURE
NO
53
rii
-r
ri-i
I-
-r
-v
P1
-r
-J
---
To
A-
-u
-r
Cl
-O0
rT
ON
POND
PROJECT
NO
1375/6.1
DRAWN
BY
lAS
RLH
05/03/05
CHECKED
BY
CAR
05/16/05
DRAWING
NO
137561BO5C
REFERENCE
Electronic Filing - Received, Clerks' Office, August 11, 2008--AS 09-1, Exhibit 3
TABLES
Electronic Filing - Received, Clerks' Office, August 11, 2008--AS 09-1, Exhibit 3
Table 2-1 Soil
Boring
and Discrete Groundwater
Sampling
Data
Leachate
Management
and
Final
Cover
Alternatives
Repon
NRT PROJECT NO 1375/3.1
Hutsonville Ash
Management Facility
Unlined Ash
Impoundment
Pond
Closure
BY AAS
CHKD BY
RJC/CA
Ameren
Energy
Generating
Hutsonville
Illinois
DATE 11/13/01
Ground
Depth
to
Bedrock
Surface
Depth
Location
Northing
Easting
Elevation
Target
Sample
Depth
Water
Elevation
ft
ft
ft MSL2
ft
BGS2
ft BGS
ft BGS
ft MSL
SB-101
4325
5483
440
no
water
sample
unknown
34.5
405.5
SB-102
2982
5497
440
17.5-19.526-29
unknown
29.0
410.8
SB-103
2969
5038
442
nowatersample
unknown
29.0
412.6
SB-104
.-
.-
--
no water
sample
unknown
11.0
SB-105
--
--
no water
sample
unknown
9.0
SB-106
no
water
sample
unknown
24.5
GP-1
3586
4366
460
17
14
17.3
442.5
GP-2
3753
4610
457
19
20.0
437.3
GP-3
3924
4093
459
16
11
16.0
443.3
GP-4
3951
4221
459
16
10
17.0
442.4
GP-5
3918
3859
453
11
11.3
441.9
GP-6
3981
3754
453
10
10.5
4425
GP-7
4151
3512
452
10
18.0
434.0
GP-8
4263
3380
451
no water
sample
16.0
435.3
GP-9
4307
4990
453
12
21.0
4324
GP-10
4779
4701
454
12
14.3
439.5
GP-11
4534
4399
453
10
13.0
439.5
GP-12
4325
4346
451
9.5
4413
GP-13
2693
3354
447
10.0
437.0
GP-14
1105
5752
440
32
10
40
400
GP-15
2790
3213
450
12
18.0
431.8
GP-16
2887
3065
454
12
28.0
425.7
GP-17
2583
3541
446
12.0
433.6
GP-18
2488
3677
446
12
23.8
422.2
GP-19
-.440
no water
sample
10
32
410
GP-20
3805
5099
451
21
21.0
429.7
GP-21
3594
5239
451
22
36.5
414.2
GP-22
4373
5285
459
11.5
11.5
447.2
GP-23
4203
5273
461
22
34.0
426.7
LP-1
4405
3961
466
7.3
--
--
LP-24
4502
3815
466
--
--
MW-hR
3217
4655
441
5.5-15.5
14
16.0
424.9
-14
2812
5326
441
22-2436-39
28-33
19
39
401.93
1W
3717
5605
438
25-2734-39
16
39.5
398.314
Notes
Four-foot stainless steel screen
for GPs
or
polyvinyl
chloride
PVC screen for LPs
MSL
mean sea level
BGS
below
ground
surface
Insufficient
water
sample
recovery
for
laboratory analysis
Temporary
-inch outside diameter PVC well
point
installed
in lined ash
impoundment
Chips
at
feet in GP-8 and at 0.5 feet in GP-9
Surveyors
could not locate GP-19
It was about
700 feet south of GP-14
Depth
to water in wells MW-il
MW-i
and TW were taken
from
top
of
casing
Target sample depths
in
parentheses
for B-103 MW-14 and 1W were taken
using
hydropunch
for
deep depths
and bailers
inside of
augers
for shallower
depths
Location and elevation
data not available
these soil
boring
locations
were
flooded
during
the most
recent
survey
on
October
15 and
16
2001
1375
AlternatiVes
Analysis
Tables
2005_FINAL.xls
of
Table 2-1
Electronic Filing - Received, Clerks' Office, August 11, 2008--AS 09-1, Exhibit 3
Table
2-2
Monitoring
Well
Locations
Elevations
Depth
to
Bedrock
and
Screened
Formation
Lcachatc
Managcment
and
Final
Cover
Alternatives
Report
4RTpRoJFcrNO
7sfl
Hutsonville
Ash
Management
Facility
Unlined
Ash
Impoundment
Pond
Closure
BY
AAS/
PAR
CHKDBY
RJC/CAR
Amcrcn
Energy
Generating
Hutsonville
Illinois
DATE
O-II/Ol.U.5/05
Surface
TOC1
Total
Depth
to
Bedrock
Bedrock
Date
Northing
Easting
Elevation
Elevation
Well
Depth
Bedrock
Elevation
Penetration
Screened
Well
Drilled
ft4
ft4
ft
MSL2
ft
MSL
ft
BGS
ft
BGS
ft
MSL
ft
Formation3
MW-i
2/14/1
984
5606
2964
455.8
459.22
8.9
6.3
449.5
2.7
sand
ss
MW-2
2/10/1984
4087
3594
452.9
455.85
18.1
21
--
sg
MW-3
2/9/1984
3865
3957
453.6
455.15
10.8
10.3
443.3
0.5
sg
MW-3D
10/6/1998
3860
3952
453.6
455.28
25.1
10.5
443.1
15.0
ss
MW-4
2/1
3/i
984
4351
4164
453.9
457.02
12.3
10.7
443.2
2.5
sg
ss
MW-5
2/13/1984
4822
4249
452
45502
17
17
434.5
1.4
sg
ss
MW-6
2/9/1984
3095
4818
438.9
443.70
11.5
8.5
430.4
3.0
sg
ss
MW-7
2/8/1
984
3166
5675
438.1
442.78
25.1
25
--
Si
sg
MW-7D
105/1998
3176
5676
437.5
438.68
44.3
44
--
siSg
MW-8
2/7/1984
4081
5469
440.0
443.97
22.5
21.5
--
si
sand
MW-9
2/14/1984
5408
5205
451.8
454.78
18.4
16.3
435.5
2.4
si
sg
ss
MW-b
1017/1998
4730
2560
452.8
454.40
10.7
7.5
445.3
3.5
Si
sg
ss
MW-1OD
10/7/1998
4729
2565
452.7
454.66
21.3
7.5
445.2
14.0
SS
MW-hR
10/3/2001
3217
4655
440.9
443.55
15.5
16.0
424.9
sg
MW-12
10/8/1998
4054
4638
455.3
456.70
16.9
17.0
438.3
sisg
MW-14
10/3/2001
2812
5326
440.9
443.35
33.0
39
--
Sg
TW
10/2/2001
3717
5605
437.8
440.59
39.0
39.5
--
sg
TW-115D
5/1/2004
898053
1176882
438.4
440.80
87.0
90
348.4
15
gravel
TW-115S
5/1/2004
898047
1176886
438.4
440.89
35.0
90
348.4
sg
TW-116
4/28/2004
895574
1176953
437.5
439.77
32.2
60
377.5
19
clsg
TW-117
4/29/2004
895268
1179053
435.0
438.09
21.0
90
345.0
0.5
Sand
TW-118
5/4/2004
898745
1177733
437.0
439.21
27.4
26
--
Sand
TW-119
5/3/2004
896031
1181339
435.4
438.12
23.3
80
355.4
20
Sand
TW-120
5/4/2004
898615
1180157
446.8
449.00
376
36
--
sg
Notes
TOC
top
of
casing
BGS
below
ground
surfar.e
MSI
mean
ce
level
sg
sand
and
gravel
si
silty
ss
sandstone
clclayey
Locationcoordinates
for
wells
installed
through
2001based
on
plant
coordinate
system
Coordinates
for
wellsinstalled
in
2004
are
state
plane
not
determined
1375
Alternatives
Analysis
Tables2005_FINAL.xls
of
Table
2-2
Electronic Filing - Received, Clerks' Office, August 11, 2008--AS 09-1, Exhibit 3
Table
2-3
Monitoring
Well
Completion
Details
l.eachatc
Management
and
Final
Cover
Alternatives
Report
NRTPROJECFNO
1375/3.1
l-1utonville
Ash
Management
Facility
Unlined
Ash
Impoundment
Pond
Closure
BYAAS/PAR
CHKDBY
RJc/AR
Amcrcn
Energy
Generating
Hutsonville
Illinois
DATE
0-I
I/O
U-5/O5
Screen
Screen
Screen
Top
Bottom
Screen
Casing
TopDepth
Elevation
Elevation
Length
Screen
Well
It
BGS1
ft1
ft
tt
Type
Filter
Pack
Elevation2
It
Fine
Sand
Thickness3
It
Bentonite
Chip
Thickness3
It
Annular
Seal
Thickness4
ft
Concrete
Collar
Thickness5
ft
PVC
Casing
Stickup
ft
AGS1
Gallons
Water
Purged35
Depth
to
Water
Level
Water7
Elevation7
ft
TOC1
ft
MW-i
4.0
455.3
450.32
5.0
ID
Pvc
447.4-453.5
1.5
1.5
3.4
7.43
451.79
MW-2
5.0
450.8
437.75
13.0
ID
PVC
431.8-449.3
--
--
3.0
--
8.67
447.18
MW-3
4.4
449.4
444.35
5.0
ID
PVC
442.7-448.1
--
--
1.5
--
7.64
447.51
MW-3D
18.4
435.2
430.18
5.0
ID
PVC
428.2-436.7
14
1.7
20
7.91
447.37
MW-4
5.0
452.2
444.72
7.5
ID
PVC
441.0-450.4
--
--
3.1
--
9.72
447.30
MW-5
5.0
450.1
437.12
13.0
ID
PVC
433.1-448.3
--
--
2.8
--
8.46
446.56
MW-6
5.0
438.6
432.20
6.4
ID
PVC
427.5-434.9
--
--
4.8
--
10.83
432.87
MW-7
15.0
427.7
417.68
10.0
ID
PVC
41
2.9-423.9
--
--
4.7
--
10.71
432.07
MW-7D
38.2
399.4
394.38
5.0
ID
PVC
392.5-402.5
--
32
1.1
27
10.81
427.87
MW-8
16.5
426.5
421.47
5.0
ID
PVC
417.9-423.9
--
--
4.0
--
16.05
427.92
MW-9
8.5
446.4
436.38
10.0
ID
PVC
433.2-444.0
--
--
3.0
--
7.59
447.19
MW-iO
4.1
448.7
443.70
5.0
ID
PVC
441.9-448.9
--
--
1.6
20
3.10
451.30
MW-iOD
14.3
438.4
433.36
5.0
ID
PVC
4314-438.9
14
--
2.0
12
3.68
450.98
MW-hR
2.8
438.1
428.05
10.0
ID
PVC
424.9-436.4
--
--
2.7
120
13.55
430.00
MW-i2
5.5
449.8
439.80
10.0
ID
PVC
438.5-450.5
1.5
--
1.4
23
9.63
447.07
MW-i4
25.5
415.4
410.35
5.0
ID
PVC
401.9-414.9
--
24
--
2.4
150
18.23
425.12
1W
31.2
406.6
401.59
5.0
ID
PVC
397.8-405.8
--
30
--
2.8
120
16.30
424.29
TW-ii5D
82
356.4
351.40
5.0
ID
PVC
350.4-357.4
3.0
28
--
2.4
135
15.48
425.32
1W-i
15S
30
408.4
403.40
5.0
ID
PVC
402.4-409.4
--
80
--
2.5
40
15.55
425.34
TW-i16
25
412.5
407.50
5.0
ID
PVC
406.5-413.5
--
23
--
2.3
40
13.55
426.22
TW-ii7
15
420.0
415.00
5.0
ID
PVC
414.0-421.0
--
13
--
3.1
40
12.15
425.94
IW-ii8
20
417.0
412.00
5.0
ID
PVC
411.0-418.0
--
18
--
2.2
30
12.33
426.88
1W-i
19
15
419.8
414.82
5.0
ID
PVC
414.4-421.4
--
13
--
2.7
30
1077
427.35
TW-120
30
416.4
411.40
5.0
ID
PVC
410.8-417.8
--
28
--
2.2
50
21.44
427.56
Notes
TOC
top
ofwell
casing
BGS
below
ground
surface
AGS
above
ground
surface
All
elevations
havebeen
adjusted
to
match
intormation
collected
during
October
2001
survey
of
the
monitoring
wells
Dataon
tine
sand
thickness
bentonite
chip
thickness
and
gallons
of
water
purged
were
only
available
for
wellsinstalled
since
1998
Annular
seal
thickness
includes
bentonite-cement
grout
and
bentonite
pellets/chips
Curiereie
cuiiar
was
iioi
lisle
eQ
at
shailow
998
wellsarid
au
weitsinstaiied
in
200
in
orderto
maximize
annuiar
seai
Concrete
coiiars
were
also
not
installeD
around2004
wells
due
to
their
anticipated
abandonment
within
approximately
18
months
Volume
removed
during
well
development
Depth
to
groundwater
measured
on
il/i
2198
except
as
follows
10/3/01
for
wells
MW-il
MW-14
and
TW
9/14104
for
the
1W-i
00
serieswells
Not
present
or
unknown
1375
Alternatives
Analysis
Tables2005_FINAL.xls
Table
2-3
of
Electronic Filing - Received, Clerks' Office, August 11, 2008--AS 09-1, Exhibit 3
Table 2-4
Monitoring
Well
Slug
Test Results
Leachate
Management
and Final Cover Alternatives
Report
NRT PROJECT
NO 137513.1
Hutsonville
Ash
Management
Facility
Unlined Ash
Impoundment
Pond
Closure
ByAAS/PAR
CHKDB\
RJC/CAR
Ameren
Energy Generating
Hutsonville
Illinois
DATE 0-1 I/O J-5/lJ5
Well
Hydraulic Conductivity
ft/mm
Hydraulic Conductivity
Geologic
IlJnit
MW-i
8.OE-05
4.1E-05
Sand
Sandstone
MW-3
5.2E-02
2.7E-02
Silty
Sand
Gravel
MW-3D1
1.1 E-03
5.4E-04
Sandstone
MW-51
.6E-02
8.OE-03
Silty
Sand
Gravel
MW-61
6.3E-02
3.2E-o2
Clayey
Grave
SiRy
Sand
MW-7
5.1 E-04
2.6E-04
Sandy
Silt
Sano
Gravel
MW-7D1
9.5E-02
4.8E-02
Silty
Sand
Gravel
MW-9
.6E-03
8.3E-04
Silt Silty Sand
Sandstone
MW-b1
1.2E-03
6.2E-04
Silty
Sand Sandstone
MW-10D1
7.9E-04
4.OE-04
Sandstone
MW-121
1.2E-O1
6.2E-02
Sand
MW-1312
3.5E-02
.8E-02
Clayey
Sand
Gravel
TW
4.7E-02
2.4E-02
Sand
TW-115D
2.3E-02
1.2E-02
Gravel with Sand
TW-115S3
1.8E-O1
9.3E-02
Gravel to Sand
TW-1161
9.OE-04
4.6E-04
Clayey
Sand
Gravel
TW-1171
1.3E-02
6.7E-03
Sand
TW-1183
3.2E-O1
1.6E-O1
Sand
TW-1191
4.4E-03
2.2E-03
Sand
Notes
Bouwer and
Rice
1976 analysis
method
Slug
test data for
monitoring
well MW-13
provided
for reference
MW-13
has
been abandoned
Butler
1998 analysis
method
1375 Alternatives
Analysis
Tables
2005_FINAL.xls
of
Table
2-4
Electronic Filing - Received, Clerks' Office, August 11, 2008--AS 09-1, Exhibit 3
Table
2-S
Background
Statistical
Summary
Leachate
Management
and
Final
Cover
Alternatives
Report
NR
TPROJECTNO
375/6.1
Hutsonville
Ash
Management
Facility
Unlined
Ash
Impoundment
Pond
Closure
BY
BRH
CHKDBY
PAR
Ameren
EnergyGenerating
Hutsonville
Illinois
DATE
516/ES
Shallow
Sand
and
Gravel
No
Normal/
TI
Upper
811.320
Class
Parameter
units
Results1
BDL
Lognormal
Minimum
Maximum
Limit
Background
Standard
Alkalinity
total
lab
mg/L
as
CACO3
mg/L
101
No
No
98
332
NC
332
NS
Boron
total
mg/L
101
No
Yes
0.059
0.4
0.27
0.27
2.0
Calciumtotal
mg/L
101
No/No
33
160
NC
160
NS
Manganesetotal
mg/L
101
4.76
No/Yes
0.001
3.67
2.29
2.3
0.15
pH
field
std
83
No
No
7.03
7.96
NC
7.08.0
6.5-9.0
Sulfate
total
mg/L
101
No/No
10
270
NC
270
400
Total
Filterable
Residue
TDS
mg/L
102
Yes
No
180
470
456
456
500
Deep
Alluvial
Aquifer
No
Normal
TI
Upper
811.320
Class
Parameter
units
Results1
BDL
Lognormal
Minimum
Maximum
Limit
Background
Standard
Alkalinity
total
lab
mgIL
as
CACO3
mg/L
26
Yes/Yes
170
300
315
315
NS
Boron
total
mg/L
28
No
Yes
0.052
0.24
0.26
0.26
2.0
Calcium
total
mg/L
27
Yes/Yes
56
96
102
102
NS
Manganese
total
mg/L
28
No/No
0.57
2.977
NC
3.0
0.15
pH
field
std
18
No
No
7.3
8.44
NC
7.3-8.4
6.5-9.0
Sulfate
total
mg/L
28
Yes
Yes
19
74
85
85
400
Total
Filterable
Residue
TDS
mg/L
29
Yes
Yes
280
470
511
511
500
Notes
Basedon
datafrom
1/1/1
998
through
4/30/2005
1375
Alternatives
Analysis
Tables
2005FINAL.xls
Table
2-5
of
Electronic Filing - Received, Clerks' Office, August 11, 2008--AS 09-1, Exhibit 3
MW-7
shallow
sandy
9/18/2002
silt
12/19/2002
3/19/2003
6/2/2003
8/11/2003
10/13/2003
2/23/2004
4/19/2004
8/2/2004
10/4/2004
3/15/2005
650
240
760
QQ
700
250
790
QQ
450
160
570
500
650
220
790
jQQ
540
220
Z2
Li.2Q
710
240
820
QQ
760
280
880
iQQ
840
310
970
QQQ
780
310
950
QQQ
720
300
LQQQ
QQ
580
220
730
JQQ
Table 2-6a
Groundwater Concentration
Results
from Monitoring Wells-Shallow
Sand and Gravel and Sandstone Wells
Leachate
Management
and Final Cover Alternatives
Report
Hutsonvitle
Ash
Management
Facility
Unlined Ash
Impoundment
Pond
Closure
Ameren Enerev Generalin
Hulsonville
Illinois
Sample
Date
pH
Alkalinity
Hardness
Sulfate
TDS
Boron
Calcium
Manganese
Well
Formation
s.u
mgIL
mgIL
mg/L
mg/L
iig/L
mgL
pg/L
Groundwater Quality Standards for Shallow Sand and Gravel and Sandstone
Illinois Class
GW Standard
fiQ.0
ns
ns
400
500
QQQ
ns
150
811.320
Background
From
Table
2-5
L0
ns
270
456
270
160
MW-i
shallow sand
9/17/2002
7.53
290
360
68
440
150
99
42
and
gravel
10/17/2002
--
290
370
80
450
160
19
11/21/2002
7.12
--
380
--
--
140
90
11/25/2002
7.2
290
--
49
360
--
--
--
12/11/2002
7.09
300
370
39
370
180
96
1/8/2003
--
180
274
84
300
140
67
2/5/2003
--
200
300
87
340
140
76
53
3/17/2003
--
110
180
48
180
120
41
4/7/2003
--
110
160
38
210
140
37
5/5/2003
--
140
170
37
200
140
40
14
6/2/2003
--
190
220
25
270
110
56
72
7/7/2003
--
320
310
20
330
92
85
8/4/2003
--
280
290
19
320
110
85
47
9/8/2003
--
240
270
18
300
65
87
22
10/6/2003
--
270
290
17
320
93
80
70
11/3/2003
--
290
290
16
340
93
78
120
12/1/2003
--
240
330
50
370
160
75
13
1/5/2004
--
230
260
40
260
100
60
41
219/2004
--
140
150
40
190
150
42
25
3/2/2004
--
160
190
32
240
110
46
32
4/4/2004
--
140
190
35
210
120
40
44
5/4/2004
--
210
240
15
260
100
55
6/1/2004
--
290
300
15
290
67
77
7/12/2004
--
300
380
18
350
82
85
iQ
8/2/2004
--
290
300
15
330
99
86
170
9/13/2004
--
280
310
20
370
98
80
100
10/4/2004
--
300
310
18
340
140
85
47
11/8/2004
--
280
360
35
360
110
85
130
12/6/2004
--
240
320
51
300
140
84
1/3/2005
--
160
260
42
260
170
48
1Q
2/23/2005
--
140
140
34
200
200
38
iQ
3/14/2005
--
140
150
26
180
130
40
QQ
4/19/2005
--
160
170
32
230
140
54
MW-6
shallow sand
9/19/2002
240
460
200
690
jQQQ
130
1QQ
and
gravel
1211 3/2002
6.91
250
490
240
4Q
j.QQ_0
130
iQQ
3/18/2003
--
160
590
450
880
jjQQQ
122
5/1212003
--
230
540
360
880
QQ
150
8/4/2003
--
190
500
330
780
jQQ_0
150
80
10/13/2003
--
240
550
300
770
jQQQ
140
2/23/2004
--
240
700
310
790
149QQ
150
4/4/2004
--
280
590
jQ
810
flQQQ
140
2Q
7/12/2004
--
270
700
360
900
ILQ2Q
iiQ
LZQQ
11/8/2004
--
180
610
380
900
j4QQ_0
140
1/4/2005
--
240
700
380
890
jJQQ
140
6.89
6.91
370
420
280
380
490
440
430
420
460
490
430
180
180
130
150
170
180
190
180
200
210
150
52
220
20
24
18
120
22
51
160
120
12
1375 Alternatives
Analysis
Tables 2005_FINALxls
Table 2-6a
of
Electronic Filing - Received, Clerks' Office, August 11, 2008--AS 09-1, Exhibit 3
Sample
Date
pH
Alkalinity
Hardness
Sulfate
TDS
Boron
Calcium
Manganese
Well
Formation
s.u
mgIL
mg/L
mg/I
mg/L
pg/L
mgIL
pg/L
Groundwater Quality Standards for Shallow Sand and Gravel and Sandstone
Illinois Class
GW Standard
65-9.0
ns
ns
400
500
ZQQQ
ns
iQ
811.320
Background
From
Table
2-5
LQ
332
ns
270
456
MW-8
shallow silt
9/19/2002
6.92
330
1100
790
jQQ
jQ3QQ_0
QQ
togravel
12/19/2002
220
1100
7Q
jQQ
jjQQQ
QQ
3/17/2003
--
300
1300
jQQ
j9QQ
6/18/2003
--
360
1179
940
jQQ
QQ_0
8/11/2003
--
420
1200
960
jQQ
j41QQ_0
10/13/2003
--
350
1300
j.QQ
jQQQ
2/23/2004
--
360
1500
820
800
jQQ_0
340
QQ
4/19/2004
.-
340
1200
870
jQ
iQQQ
.iQ
LQ2
8/2/2004
--
280
1200
800
jQQ
jjQ
1QQ
10/4/2004
--
220
760
jQQ
ThQQQ
iQQ
3/16/2005
--
400
1100
940
jQ
jQQ
310
QQ
MW-b
shallow sand
9/17/2002
7.11
270
320
31
380
98
90
100
and
gravel
12/19/2002
7.06
260
320
38
330
200
86
215/2003
--
230
290
38
310
79
76
5/5/2003
--
300
250
38
270
76
80
7/7/2003
--
240
310
44
340
92
89
22
9/8/2003
--
260
320
38
380
59
96
13
10/13/2003
--
220
370
36
450
120
100
19
3/2/2004
--
220
380
31
410
64
100
4/4/2004
--
230
420
29
390
86
100
29
8/3/2004
--
270
440
29
450
130
120
45
10/4/2004
--
330
380
31
470
160
110
40
3/14/2005
--
300
310
33
400
150
93
4/19/2005
--
270
350
32
430
68
130
24
MW-lCD
sandstone
9/17/2002
7.29
200
230
30
290
84
65
89
background
12/19/2002
7.33
200
250
31
270
96
65
71
2/5/2003
--
210
230
30
220
240
130
270
5/5/2003
--
250
230
28
240
77
63
74
7/7/2003
--
210
230
35
270
88
66
82
9/8/2003
--
210
230
32
270
59
67
82
10/6/2003
--
230
230
30
280
96
66
82
3/2/2004
--
210
260
30
270
95
64
65
4/4/2004
--
210
240
28
260
74
61
88
8/3/2004
--
220
230
29
280
100
66
81
10/4/2004
--
220
280
27
280
140
67
93
3/14/2005
--
240
230
32
260
130
61
55
4/19/2005
--
200
290
31
270
160
77
180
MW-11Fl
shallow sand
9/19/2002
7.15
200
480
390
850
QQ
150
and
gravel
12/13/2002
7.09
260
950
LQQ
L2Q
3/18/2003
--
210
740
L1QQ
QQ
2Q
5/1 212003
--
280
480
590
L1QQ
2Q
22Q
QQ
8/4/2003
120
620
650
jQQ
220
10/13/2003
--
120
780
650
PQ
ZQQ
2/23/2004
--
61
890
720
jQQ
QQ
.L.QQ
4/4/2004
--
260
970
1Q
QQ
24
2ZQ
7/1212004
--
230
940
670
1JQ
QQ
260
320
11/8/2004
--
220
810
650
jQQ
QQQ
1/4/2005
--
140
880
1QQ
4QQ
TW-116
shallow
clay
3/28/2005
--
260
300
80
410
QQ
75
.LQ2Q
togravel
4/11/2005
7.56
250
380
410
4Q
78
ZQ
Concentrations
equaling
exceeding
an Illinois Class
1Gw Standard
are underlined
italicized
Concentrations
equaling
eaceedrng
811.320
Background
level
are botW
undetlined
1375 Alternatives
Analysis
Tables
2005_FINAL.xls
Table 2-6a
ol
Table 2-6a
Groundwater Concentration
Results
from Monitoring
Wells-Shallow
Sand and Gravel and Sandstone Wells
L.eachale
Management
and Final Cover Alternatives
Report
tutsonville
Ash
Management
Facility
Unlined
Ash
Impoundment
Pond
Closure
Armeren
Energy Generating
Hulsonville
Illinois
Electronic Filing - Received, Clerks' Office, August 11, 2008--AS 09-1, Exhibit 3
Sample
Date
pH
Alkalinity
Hardness
Sulfate
TDS
Boron
Calcium
Manganese
Well
Formation
s.u
mg/L
mg/I
mg/L
mg/I
pg/L
mg/I
pg/I
Groundwater
Quality Standardsfor
Deep Alluvium
Illinois Class 1GW Standard
65-9
ns
ns
400
QQ
ns
150
811.320
Background From
Table 2-5
Lr4
ns
85
fl
jQ
QQQ
MW-7D
deep alluvium
9/18/2002
7.41
200
270
51
370
83
71
background
12/19/2002
7.38
210
320
31
320
140
67
750
3/19/2003
--
170
310
51
350
89
66
760
6/2/2003
--
200
410
60
390
88
68
680
8/11/2003
--
240
270
59
370
140
69
660
10/13/2003
--
220
320
44
320
110
66
2/23/2004
--
260
510
68
430
110
89
ZZQ
4/19/2004
--
260
420
61
440
67
85
8/2/2004
--
260
330
47
360
91
81
570
10/4/2004
--
300
330
36
420
210
85
3/15/2005
--
220
240
42
280
62
61
450
MW-14
deep
alluvium
9/18/2002
430
640
230
790
190
180
5Q
12/13/2002
692
400
700
210
740
570
180
500
3/18/2003
--
390
630
120
570
510
5/12/2003
--
480
700
jQQQ
1Q
8/11/2003
--
430
640
180
740
400
160
410
10/13/2003
--
430
680
200
810
630
170
510
2/23/2004
--
690
j.Q
j.Q
L4FQ
iQ
4/4/2004
--
740
190
780
LQ
i7
.QQ
8/3/2004
--
500
660
200
810
LQQQ
11/8/2004
--
440
700
180
760
jjQQ
510
3/15/2005
--
450
620
220
780
1W
deep
alluvium
9/19/2002
7.43
200
270
40
340
82
77
LQQ
background
12/19/2002
7.31
230
360
38
340
67
78
1QQ
3/17/2003
--
200
300
65
340
200
83
930
6/17/2003
--
210
290
62
370
52
74
8/11/2003
--
220
300
52
310
110
71
jQQ
10/13/2003
--
200
230
30
280
75
56
Z.Q
2/23/2004
--
290
410
27
470
85
86
4/19/2004
--
260
420
19
340
99
72
JQQ
8/2/2004
--
260
420
24
350
180
72
I4QQ
10/4/2004
--
280
350
23
350
84
77
1.QQ
3/16/2005
--
187.5
250
34
250
60
57
1W-i 15D
deep
alluvium
4/11/2005
--
220
300
55
320
22
59
4/27/2005
7.41
--
--
--
36
--
--
TW-1
15S
deep
alluvium
4/11/2005
--
260
340
46
340
20
75
QQ
4/27/2005
7.5
--
--
--
32
--
--
EW-i
deep
alluvium
8/1/200
--
289
380
60
472
80
108
445
EW-2
deep
alluvium
7/31/2001
--
250
340
60
434
130
92
590
3/23/2005
8.2
260
300
50
--
100
82
TW-117
deepalluvium
3/28/2005
--
540
51
61
4/11/2005
--
460
550
49
580
65
1.Q
4127/2005
88
--
--
--
--
86
--
--
1W-i 19
deep
alluvium
4/27/2005
--
270
320
39
370
40
97
Z.Q
Concentrations
equaling
exceeding
an Illinois Class
lOW Standard
are tinderlirted
italicized
Concentrations
equalingl
exceeding
811.320
Background
level
are
boldl underlined
Sample taken
trom combined
treader EW-2
pumped
Ire 24 hours and
EW-1
pumped
for
hoar on
3123/OS
1375 Alterrtalives
Analysis
Tables
2005 FINAL.xls
Table
2-6b
of
Table 2-6b
Groundwater Concentration
Results
from Monitoring Wells-Deep
Alluvium Wells
Leachate
Management
and Final Cover Alternatives
Report
F-lutsonville
Ash
Management
Facility
Unlined
Ash
Impoundment
Pond
Closure
Amenen
Enerav
Generatine
Hutsonville
Illinois
Electronic Filing - Received, Clerks' Office, August 11, 2008--AS 09-1, Exhibit 3
Table
3-1
Initial
Screening
of
Leachate
Management
and
Final
Cover
Alternatives
Leachate
Management
and
Final
Cover
Alternatives
Report
Hutsonville
Ash
Management
Facility
Unlined
Ash
Impoundment
Pond
Closure
Ameren
Energy
Generating
1-tutsonville
Illinois
NR
pRoilicT
NO
375/6.1
BY
CAR
FiT
CHKD
BY
CAR/ItRH
1ff
Sf19/OS
DAlE
7118/05
Site
monitoring
will
have
no
effect
on
downgradient
groundwater
quality
or
leachate
loading
ratestothe
Wabash
River
QUARTERLY
MONITORING
CURRENTLY
PERFORMED
NO
A1DITIONAL
COST
Quarterly
site
monitoring
continues
at
the
site
and
site
monitoring
would
be
required
br
any
leachate
management
or
final
cover
alternative
for
an
indefinite
period
ottime
YES
At
minimum
site
monitoring
will
be
performed
at
the
site
Additional
leachate
management
alternatives
nay
be
incorporated
with
site
monitoring
Shallow
Groundwater
Extraction
Combined
with
Interceptor
DrainlFrench
network
of
10
groundwater
extraction
well
along
the
east
boundary
of
Pond
and
an
interceptor
drainltrench
along
thesouth
boundary
of
Pond
to
capture
leachate
mixed
with
groundwater
fromtheshallow
silt/clay
unit
Extracted
leachate
would
be
conveyed
to
the
Drainage
Collection
PondPond
and/or
the
Interim
Pond
Pond
Installation
of
groundwater
extraction
wells
between
Pond
and
the
Wabash
River
could
prove
difficult
due
to
spatial
constraints
buried
utilities
and
sheet
pile
walltiebacks
which
could
effect
access
for
conventional
drilling
equipment
and
limit
conventional
well
size
The
area
downgradient
of
Pond
is
below
the
lOG-year
flood
elevation
and
prone
to
flooding
hydraulic
analysis
needs
to
be
performed
to
model
additional
loading
to
thesluice
water
system
and
toevaluate
compliance
with
the
NPDES
permit
foroutfall
002
Effectiveness
is
questionable
because
impacted
silty
clay
unit
has
low
hydraulic
conductivity
and
would
be
difficult
to
pump
efficiently
System
would
have
to
be
designed
towithstand
seasonal
flooding
ofthe
Wabash
River
Collection
ofleachate
and
management
through
Pond
and/or
Pond
for
eventual
discharge
tothe
Wabash
River
via
outfall
002
would
reduce
concentrations
in
downgradient
groundwater
but
would
notresult
in
net
reduction
ofleachate
loading
tothe
river
May
prevent
migration
of
ash
constituents
offsite
and
meet
Part
811
320
zone
ofattenuation
requirements
if
properly
designed
$930000
Questionable
effectiveness
for
capital
cost
Costcould
increase
substantially
to
times
iftreatment
ofextracted
leachate
is
required
$56000
YES
would
Groundwater
extraction
and
an
continue
for
an
interceptor
drain/trench
could
indefinite
period
effectively
contain
downgradient
00
years
migration
of
ash
constituents
Capital
costsare
similar
tothose
for
installation
of
an
interceptor
drain/trench
along
the
entire
east
and
south
boundary
of
Pond
Interceptor
DrainFrench
An
interceptor
trench
and
drain
would
be
installed
downgradient
east
and
south
of
Pond
to
capture
leachate
mixed
with
groundwater
The
drain
would
flow
tocollection
sumps
designed
to
convey
leachate
to
the
Drainage
Collection
PondPond
and/or
theInterim
Pond
Pond
Spatial
constraints
buried
utilities
and
sheet
pile
wall
tiebacks
between
the
river
and
Pond
could
affect
constructability
of
an
interceptor
trench
hydraulic
analysis
would
need
to
be
performed
to
model
additional
loading
tothesluice
water
system
and
evaluate
compliance
with
the
NPDES
permit
foroutfall
002
Depending
on
site
access
system
could
be
designed
to
collect
leachate
downgradtent
of
Pond
and
will
be
lesssusceptible
to
horizontal
variations
in
liydrngeology
than
groundwater
extraction
An
interceptor
trench
would
likely
better
target
thegeologic
strata
sandy
silt
impacted
by
ash
leachate
than
groundwater
extraction
wells
Collection
ofleachate
and
management
through
Pond
and/or
Pond
for
eventual
discharge
tothe
Wabash
River
via
outfall
002
may
reduce
concentrations
in
downgradient
groundwater
but
would
notresult
in
netreduction
ofleachate
loading
tothe
river
May
prevent
migration
of
ash
constituents
offsite
and
meet
Pan
811.320
zone
of
attenuation
requirements
if
properly
designed
$950000
Questionable
effectiveness
for
capital
cost
Costcould
increase
suhsiantially
to
times
if
treatment
of
extracted
leachate
is
required
$460000
If
an
interceptor
drain/trench
is
installed
only
along
thesouth
boundary
of
Pond
$47000
would
conuiniie
for
an
indefinite
period
100
years
$30000
Annual
costs
for
south
interceptor
drain/trench
only
YES
Installation
of
groundwater
extraction
wells
and
an
interceptor
drain/trench
could
effectively
contain
downgradient
migration
of
ash
constituents
Capital
costsare
similar
tothose
for
installation
of
groundwater
extraction
wells
along
theeast
boundary
and
an
interceptor
drain/trench
along
thesouth
boundary
of
Pond
Horizontal
Wells
Combined
with
Interceptor
Drain/Trench
system
ofhorizontal
extraction
wells
to
intercept
the
groundwater
plume
and
leachate
from
Pond
Extracted
leachate
would
be
conveyed
to
Drainage
Collection
Pond
Pond
and/or
theInterim
PondPond
horizontal
wells
may
be
easier
toconstruct
than
conventional
groundwater
extraction
or
an
interceptor
drain/trench
system
hydraulic
analysis
would
be
needed
toino1el
additional
loading
tothesluice
water
system
and
evaluate
compliance
with
the
NPDES
permit
foroutfall
002
It
could
be
difficult
todemonstrate
theeffectiveness
of
horizontal
well
system
especially
if
preferential
flow
pathways
exist
in
the
sandy
silt
unit
horizontal
well
system
may
have
more
difficult
time
targeting
the
geologic
strata
impacted
by
ash
leachate
Collection
ofleachate
and
management
through
Pond
and/or
Pond
for
eventual
discharge
to
the
Wabash
Rivervia
outfall
002
would
reduce
concentrations
in
downgradient
groundwater
but
would
notresult
in
netreduction
ofleachate
loading
tothe
river
Installation
ofthe
interceptor
drain/trench
along
thesouth
boundary
of
Pond
may
prevent
migration
of
ash
constituents
offsite
and
meet
Part
811.320
zone
ofattenuation
requirements
if
properly
designed
$1040000
High
costleachate
management
alternative
compared
to
an
interceptor
trench
Questionable
effectiveness
for
capital
cost
further
hydrogeologic
evaluation
may
reveal
the
system
is
not
effective
Cost
could
increase
substantially
to
times
if
treatment
ofextracted
leachate
is
required
$56000
would
continue
for
an
indefinite
period
100
years
NO
Highest
costleachate
management
alternative
for
direct
leachate
collection
compared
to
groundwater
extraction
and
interceptor
drain/trench
Effectiveness
is
more
questionable
thanotherdirect
leachate
collection
technologies
Ash
fill
is
stabilized
and
solidified
using
one
ofseveral
reagents
toform
cementlike
matrix
monolith
that
immobilizes
ash
constituents
increases
strength
and
decreases
permeability
Stabilization
process
would
result
in
substantial
increase
in
volume
on
site
typically
20
40
Bench
scale
test
would
be
needed
to
determine
specific
applicabtlity
and
performance
for
minimal
leaching
ofcontaminants
and
may
demonstrate
that
stabilization
is
not
feasible
technology
Stabilized/solidified
ash
monolith
would
minimize
production
ofexisting
ash
contaminants
such
as
boron
and
sulfate
butconcentrations
ofcertain
trace
constituents
such
as
selenium
may
increase
with
pH
Would
reduce
mass
loading
rateto
Wabash
River
however
amount
ofreduction
and
effect
on
downgradient
groundwater
concentration
would
be
difficult
to
predict
nng
termmonitoring
would
be
required
toevaluate
effectiveness
Leachate
Management
Alternatives
Site
Monitoring
w/
No
Leachate
Collection
Establish
groundwater
monitoring
program
for
Pond
toevaluate
trends
in
groundwater
quality
Cloture
Carry
Forward
to
Modeling
and
Alternatives
Option
Description
Construction
Implementation
Feasibility
Effectiveness
Relative
Cost
Further
Evaluation
Yes/No
Capital
Annual
The
groundwater
nionitoring
network
is
already
in
place
additional
wells
cart
beadded
as
necessary
to
enhance
the
monitoring
network
Implementation
of
this
option
may
require
establishment
ot
background
concentrations
and
possibly
petition
br
adjusted
groundwater
quality
standards
Ash
Stabilization
$20000000
$5000
NO
Veryhigh
cost
leachate
management
costs
would
be
Capital
cost
is
much
too
high
alternative
Capital
costtoo
high
to
be
similar
tothose
compared
toother
leachate
seriously
considered
associated
with
final
management
alternatives
cover
1375
Alternatives
Analysis
Tables
2005
FINAL.xIs
Table
3-1
Initial
Screening
Electronic Filing - Received, Clerks' Office, August 11, 2008--AS 09-1, Exhibit 3
Table
3-1
Initial
Screening
of
Leachate
Management
and
Final
Cover
Alternatives
Leachate
Management
and
Final
Cover
Alternatives
Report
NR
PROJECT
NO.
7/6
Hutsonville
Ash
ManagementFacility
Unlined
Ash
ImpoundmentPond
DClosure
BY
CAR/UI
CHKDBY
CARJBRHEJT5/19/05
Ameren
Energy
Generating
Hutsonville
Illinois
DATE
7118/OS
C1oure
Carry
Forward
to
Modeling
and
Afternatives
Option
Description
Construction
Implementation
Feasibility
Effectiveness
Relative
Cost
Further
Evaluation
Yes/No
Capital
Annual
Leachate
Ash
Removal
and
A.h
is
excavated
and
tranponed
to
an
Excavation
involves
standard
construction
equipment
Excavation
of
saturated
ah
may
Removal
of
ash
is
an
etfeclive
means
of
source
control
provided
thatsaturated
$23000000
to
$34000000
None
to
$5000
NO
Management
Disposal
Recycling
appropriate
landlill
moved
to
require
shoring
dewatering
and
ue
ofdragline
bucket
or
mudcat
Saturated
ash
removal
ah
removed
and
removal
ofsaturated
ash
may
be
very
difficult
due
to
its
Very
high
capital
co%i
for
managing
costs
would
be
Capital
cost
much
toohigh
Alternatives
at
an
Off-Site
appropriate
sues
for
recycling
or
is
likely
not
technically
oreconomically
feasible
This
alternative
would
likely
require
depth
below
thewater
table
Removal
of
ash
would
result
in
groundwater
ah
leachate
Range
ofco.ts
associated
with
those
compared
toother
leachate
continued
Facility
or
Beneficial
Re-Use
excavated
and
re
used
on
site
Recycling
may
include
tncorporation
into
cement
for
use
in
agricultural
setting
as
source
ofminerals
or
as
flowable
fill
in
slurry
form
profiling
ofthe
ah
waste
for
disposal
in
an
appropriate
landfill
oridentification
of
large
volume
users
ofmixedash
Recycling
may
require
grading
or
soning
ofash
Based
on
prior
testing
excavated
ash
from
Pond
may
not
meet
criteriafor
beneficial
re
use
quality
improvement
and
reduction
of
loading
ratetothe
Wabash
River
represents
partial
removal
saturated
for
linal
cover
if
management
alternatives
ah
only
and
overburden
replacement
partial
excavation
was
to
total
removal
of
ash
If
general
fill
performed
or
ash
disposal/recycling
Costs
increase
capital
costs
forthis
alternative
could
double
Limited
ash
disposal
orrecycling
may
be
considered
br
otherclosure
alternatives
NOTEVALUATED
NOTEVALUATED
Due
toconstruction
feasibility
and
very
high
estimated
capital
costs
Capital
risk
is
too
high
versus
potential
gain
in
effective
leachate
management
Potential
for
significant
regulatory
issues
Landfill
Reconstruction
Ash
Excavation
Install
Liner
and
Leachate
Collection
System
Ash
Replacement
Ash
excavated
and
moved
to
facilitate
reconstruction
as
new
unit
to
limitinfiltration
leachate
generation
and
offstte
migration
separate
ash
from
water
table
and
control
erosion
Landfill
recunstruLtiun
would
require
excavation
and
off
site
disposal
orrelocation
of
all
ash
in
Pond
As
discussed
above
excavation
ofsaturated
ah
is
likely
nottechnically
oreconomically
feasible
Clean
OIl
would
have
to
be
replaced
tocreate
base
for
the
landfill
at
least
feet
above
thehistorical
high
water
table
This
option
is
not
implementable
simply
based
on
very
high
estimated
capital
costs
Potential
for
significant
regulatory
issues
for
permitting
new
landfill
iii
an
areawith
impacted
groundwater
Landfill
reconstruction
could
be
an
effective
solution
however
viable
method
for
removing
ash
up
to
feet
below
thewater
table
would
be
needed
forthis
option
to
be
seriously
considered
effectiveness
would
be
greatly
reduced
particularly
in
terms
of
downgradient
groundwater
concentrations
if
saturated
ah
could
not
be
removed
Capital
risk
is
too
high
versuspotential
gain
in
effective
leachate
management
Leachate
Containment
Using
An
impermeable
vertical
barrier
wall
slurry
wall
may
not
be
constnictable
between
Pond
and
the
Wabash
River
due
to
An
impermeable
barner
wall
would
not
be
effective
at
the
site
since
an
NOTEVALUATED
NOTEVALUATED
Management
and
an
Impermeable
constructed
ofmaterials
tominimize
spatial
constraints
and
buried
utilities
Installation
of
sheet
pile
wall
may
be
impermeable
key-in
layer
is
not
present
in
all
areas
Due
toineffective
application
at
the
site
venical
barrier
Source
Control
of
Barrier
Wall
groundwater
flow
through
thebarner
constructable
depending
on
depth
An
impermeable
banter
wall
requires
an
impermeable
wall
is
notimplementable
or
effective
for
leachate
the
Deep
Alluvial
would
be
installed
downgradient
or
key-in
formation
for
effective
barrier
Based
on
theSlurry
WallSzuuiv
prepared
by
management
withiit
competent
key-in
layer
Aquifer
surrounding
Pond
Hanson
Engineers
Inc
and
slug
tests
performed
at
the
site
the
sandstone
bedrock
present
attheupland
portion
ofthe
site
would
notprovide
good
key-in
layer
for
an
impermeable
barner
wall
Source
Control
of
Groundwater
Vertical
groundwater
extraction
wells
The
areadowngradient
of
Pond
is
below
the
100
year
flood
elevation
and
prone
to
System
would
have
to
bedesigned
towithstand
seasonal
flooding
of
the
$690000
$52000
YES
the
Deep
Alluvial
Extraction
from
the
along
thesoutheast
corner
ofthe
flooding
hydraulic
analysis
needs
to
be
performed
to
model
additional
loading
tothe
Wabash
River
Collection
ofleachate
and
management
through
Pond
Questionable
effectiveness
for
capital
would
Groundwater
extraction
fromthe
deep
Aquifer
Deep
Alluvium
impoundment
to
capture
groundwater
impacted
by
ash
leachate
fromthe
deep
alluvial
aquifer
Extracted
leachate
would
beconveyed
tothe
Drainage
Collection
Pond
Pond
and/or
the
Interim
Pond
Pond
sluice
water
system
and
toevaluate
compliance
with
the
NPDES
permit
foroutfall
002
Extraction
oflarge
volumes
of
groundwater
would
likely
be
necessary
to
affect
groundwater
now
in
the
deep
alluvium
and/or
Pond
for
eventual
discharge
to
the
Wabash
River
via
outfall
002
would
reduce
concentrations
in
downgradient
groundwater
but
would
not
result
in
netreduction
ofleachate
loading
tothe
river
May
prevent
migration
of
ash
constituents
offsite
and
meet
Part
.320
zone
of
attenuation
requirements
if
properly
designed
cost
Costcould
increase
substantially
to
times
if
treatment
ofextracted
groundwater
is
required
continue
for
an
indefinite
period
100
years
alluvial
aquifer
could
effectively
contain
downgradient
migration
of
ash
constituents
in
the
deep
alluvial
aquifer
Final
Cover
Geosynthetic
Final
Pond
is
covered
with
geosynthetic
Geosynthetic
final
covers
arereadily
constructable
and
have
been
installed
atother
fly
Ageosynthetic
final
cover
would
effectively
reduce
surface
water
infiltration
$5200000
$5000
YES
Mternatives
Cover
final
cover
toprevent
direct
contact
control
infiltration
ofsurface
water
reduce
leachate
generation
and
provide
erosion
control
ash
management
facilities
to
reduce
surface
water
infiltration
and
leachate
generation
geosynthetic
final
cover
would
be
constructed
in
accordance
with
35
IAC
Part
.3
14
geomembrane
followed
by
feetof
final
protective
cover
Geosynthetic
materials
are
readily
available
throughout
the
U.S
Limitations
to
overcome
include
raising
the
final
grade
to
prevent
surface
water
from
ponding
on
the
completed
fill
surface
and
to
promote
iuiioff
to
slic
Wabash
River
oi
She
Diaiitagc
Coliection
Poiid
Potid
resulting
in
reduced
leachate
generation
from
Pond
Additionally
the
cover
would
provide
protection
fromerosion
and
prevent
direct
contact
with
ash
This
option
does
notaddress
leaching
from
saturated
ash
which
hydrogeologic
investigations
have
identified
as
significant
component
of
leachate
generation
from
Pond
and
if
used
alone
would
not
result
in
reduction
ui
downgradient
groundwater
concentrations
however
tile
COVer
would
result
in
net
reduction
in
leachate
loading
tothe
Wabash
River
Lowest
cost
final
cover
option
for
35
IAC
.3
14cover
system
Capital
costs
may
decrease
as
surface
water
management
options
are
more
thoroughly
explored
and
fill
estimates
are
reviseo
It
local
source
for
flu
cannot
be
located
capital
costs
may
increase
costs
associated
with
maintaining
foot
protective
layer
maintaining
vegetation
and
repairing
erosion
damage
The
geosynthetic
final
cover
will
be
evaluated
as
the
base
case
for
Part
cover
system
Capital
costs
arelower
thaneither
clay
or
pozzolanic
final
cover
that
may
meet
the
i.3i4requireilietirs
Compacted
Clay
Final
Cover
Pond
is
covered
with
compacted
clay
final
cover
to
prevent
direct
contact
control
tnfiltration
ofsurface
water
reduce
leachate
generation
and
provide
erosion
control
Compacted
clay
final
covers
arereadily
constructable
and
have
been
installed
atother
fly
ash
management
facilities
to
reduce
surface
water
infiltration
and
leachate
generation
compacted
clay
final
cover
would
be
constructed
in
accordance
with
35
IAC
Part
81
.314
feetof
compacted
clay
followed
by
feetof
final
protective
cover
localsource
for
cover
grade
clay
would
have
to
be
identified
and
may
not
be
available
Similar
limitations
to
overcome
as
geosynthetic
final
cover
compacted
clay
final
cover
would
effectively
reduce
surface
water
infiltration
resulting
in
reduced
leachate
generation
from
Pond
Additionally
similar
to
geosynthetic
cover
theclay
cover
would
provide
protection
from
erosion
and
prevent
direct
contact
with
ash
This
option
does
notaddress
leaching
fromsaturated
ashwhich
hydrogeologic
investigations
have
identified
as
significant
component
of
leachate
generation
from
Pond
and
if
used
alone
would
notresult
in
reduction
of
groundwater
concentrations
however
the
cover
wotild
result
in
netreduction
in
leachate
loading
tothe
Wabash
River
$5500000
Highest
cost
final
cover
option
for
35
IAC
81
.314
cover
system
When
compared
to
geosynthetic
cover
compacted
clay
is
not
cost
competitive
cover
option
$5000
costs
associated
with
maintaining
foot
protective
layer
maintaining
vegetation
and
repairing
erosion
damage
NO
Highest
cost
final
cover
alternative
for
Part
811.314
cover
system
Additional
capital
notwarranted
versus
geosynthetic
final
cover
system
1375
Alternatives
Ariatysis
Tables
2005
EINAL.xts
Tabte
3-1
Initial
Screening
ol
Electronic Filing - Received, Clerks' Office, August 11, 2008--AS 09-1, Exhibit 3
Table
3-1
Initial
Screening
of
Leachate
Management
and
Final
Cover
Alternatives
Leachate
Management
and
Final
Cover
Alternatives
Report
NRI
IkJLCE
NO
7/6
Ash
Management
Facility
Unlined
Ash
Impoundment
Pond
Closure
nY
CAR
UT
CI-IKD
BY
CARIBRI-I
EJT
5119/0S
Ameren
Energy
Generating
Hutsonville
Illinois
DATL
7II8/O
Closure
Carry
Forward
to
Modeling
and
Alternatives
Option
Description
Construction
Implementation
Feasibility
Effectiveness
Relti.tive
Cost
Further
Evaluation
Yes/No
Capital
Annual
Final
Cover
Earthen
Final
Pond
is
covered
with
final
cover
An
earthen
final
cover
could
be
readily
constnicted
from
on
site
materiak
and
earthen
An
earthen
final
cover
will
reduce
surface
water
infiltration
and
leahate
$4200000
$5OOO
YES
Alternatives
Cover
constructed
from
on
site
earthen
covers
have
been
installed
at
other
fly
ah
management
facilities
in
Illinois
to
achieve
site
generailon
troni
Pond
and
modeling
studies
indicated
thatoverall
Lowest
cost
tinal
cover
option
if
the
cot
This
alternative
represents
thelowest
continued
materials
toprevent
direct
contact
reduce
intiltratton
ofsurface
water
reduce
leachate
generation
and
provide
erosion
control
closure
An
earthen
final
cover
would
he
constructed
from
minimum
of
feet
ot
earthen
materials
i.e
general
fill
and
designed
to
reduce
surface
water
intiltratton
and
leachate
generation
Local
sources
for
general
fill
areavailable
Implementation
of
an
earthen
final
cover
would
require
approval
ofan
adjusted
standard
from
the
PCB
to
seek
relief
from
the
requirements
of
35
IAC
.3
14
Similar
limitations
to
overcome
as
geosynthetic
final
cover
with
respect
tosurface
water
pertomtance
would
approach
that
ofcompacted
clay
cover
The
earthen
cover
proide
erosion
control
and
prevents
direct
contact
wtth
ash
This
option
does
notaddress
leaching
from
saturated
ash
which
hydrogeologic
tnvestigation
have
identified
as
significant
component
ofleachate
generation
trout
Pond
and
if
used
alone
would
notresult
in
reduction
of
groundwater
concentrations
however
the
cover
would
result
in
net
reduction
in
leachate
loading
tothe
Wabash
River
PCB
approves
an
adjusted
standard
for
relief
from
35
IAC
81
1.314
associated
with
maintaining
the
earthen
cover
maintaining
vegetation
and
repairing
erosion
damage
Costalternative
for
final
cover
constmctton
Pozzolanic
Fly
Ash
Final
Cover
Pond
is
covered
with
pozzolanic
fly
ash
final
cover
to
prevent
direct
contact
control
intiltration
ofsurface
water
reduce
leachate
generation
and
provide
erosion
control
Pozzolanic
fly
ash
final
covers
have
been
constwcted
at
some
fly
ash
management
facilities
around
the
to
reduce
surface
water
infiltration
and
reduce
leachate
generation
Fly
ash
would
be
mixed
with
stabilizing
reagents
e.g
lime
Portland
cement
Class
fly
ash
toform
cement
like
low
permeability
cover
pozzolanic
final
cover
would
be
constructed
with
feetof
pozzolanic
fly
ash
mixture
Low
Permeability
Layer
followed
by
feetof
final
protective
cover
Final
Protective
Layer
similar
to
LAC
Part
1.3
14
Implementation
of
pozzolanic
final
cover
would
require
approval
of
an
adjusted
standard
fromthe
PCB
to
seek
relief
from
the
requirements
of
35
81
.3
14
Construction
of
pozzolanic
final
cover
could
potentially
use
fly
ash
already
on
site
in
thelined
ash
pond
Pond
and
result
in
significant
costsavings
for
materials
Apozzolanic
fly
ash
final
cover
would
effectively
reduce
surface
water
infiltration
and
leachate
generation
from
Pond
provide
erosion
control
and
present
direct
contact
with
ash
This
option
does
notaddress
leaching
from
saturated
ash
which
hydrogeologic
investigations
have
identified
as
significant
component
ofleachate
generation
from
Pond
and
if
used
alone
would
notresult
in
reduction
ofgroundwater
concentrations
however
the
cover
would
result
in
netreduction
in
leachate
loading
tothe
Wabash
River
$4700000
Mid
range
cost
final
cover
option
for
35
LAC
14
final
cover
However
capital
cost
for
the
cover
should
be
evaluated
versus
thebenefit
of
creating
an
additional
10.000
yd3
capacity
in
thelined
ash
impoundment
$5000
costs
associated
with
maintaining
two
foot
protective
layer
above
the
pozzolanic
cover
maintaining
vegetation
and
repairing
erosion
damage
YES
While
this
alternative
represents
the
highest
costalternative
for
final
cover
system
it
provides
thebenefit
of
creating
additional
capacity
in
the
Itned
ash
impoundment
Surface
Water
Route
Surface
The
grade
of
Pond
would
be
Technically
and
administratively
feasible
the
grade
of
Pond
could
be
readily
adjusted
This
would
be
an
effective
surface
water
management
option
thatcould
be
SEE
FINAL
COVER
OPTIONS
NO
Management
Water
East
Toward
adjusted
to
promote
gravity
drainage
oftoroutesurface
water
toward
the
Wabash
River
Can
be
constructed
if
adequate
readily
integrated
with
fiiial
covei
Fill
required
for
grade
adjustment
toroutesurface
water
Routing
all
surface
watertothe
Alternatives
Vabash
River
surface
water
toward
the
Wabash
River
sources
of
general
fill
areidentified
in
close
proximity
tothe
site
drainage
is
already
included
as
part
ofthe
final
cover
estimates
Wabash
River
would
require
excess
fill
Route
Surface
Water
West
Toward
Drainage
Collection
Pond
Pond
The
grade
of
Pond
would
be
adjusted
to
promote
gravity
drainage
of
surface
watertoward
Pond
Technically
and
administratively
feasible
the
grade
of
Pond
could
be
readily
adjusted
toroute
surface
water
towards
the
Drainage
Collection
Pond
Pond
similar
tolayout
as
shown
on
Hanson
Engineers
Inc
Interim
Ashand
Drainage
Collection
Poids
Drawing
No
S37
Can
be
constructed
if
adequate
sources
ofgeneral
fill
areidentified
in
close
proximity
tothe
site
This
surface
water
management
option
would
require
less
fill
than
routing
surface
water
towards
the
Wabash
River
box
culvert
has
already
been
constructed
toallow
surface
water
drainage
from
Pond
to
Pond
This
would
bean
effective
surface
water
management
option
thatcould
be
readily
integrated
with
final
cover
If
combined
with
an
eanhen
cover
swales
designed
toroute
surface
water
may
have
to
be
lined
with
geornembrane
SEEFINAL
COVER
OPTIONS
Fill
required
for
grade
adjustment
toroutesurface
water
drainage
is
already
included
as
part
ofthe
final
cover
estimates
NO
Routing
all
surface
water
tothe
Drainage
Collection
Pond
would
require
excess
fill
Route
Surface
Water
East
and
West
Towards
the
Wabash
River
and
Use
rainage
Collection
Pond
Pond
The
grade
of
Pond
would
be
adjusted
to
promote
gravity
drainage
of
surface
water
toward
Pond
and
tothe
Wabash
River
toeliminate
the
need
for
excess
tiii
Technically
and
administratively
feasible
the
grade
of
Pond
could
be
readily
adjusted
toroute
surface
water
towards
the
Drainage
Collection
Pond
Pond
and
the
Wabash
River
Can
be
constructed
if
adequate
sources
of
general
fill
areidentified
in
close
proximity
tothe
site
This
surface
water
management
option
would
require
theleast
aiiiouiit
of
fill
to
toiistiutl
box
cuiveil
has
aiieady
been
cOnsuus.icti
toaiiow
SotIdLe
water
drainage
from
Pond
to
Pond
This
would
be
an
effective
surface
water
management
option
thatcould
be
readily
integrated
with
final
cover
If
combined
with
an
earthen
cover
swales
designed
toroutesurface
water
may
have
to
be
lined
with
geomembrane
SEE
FINAL
COVER
OPTIONS
Fill
required
for
grade
adjustment
to
route
surface
water
drainage
towards
the
Drainage
Collection
Pond
and/or
the
Wabash
River
is
already
included
as
part
ofthe
final
cover
tissic
ActuaI
costa
wosld
hisdy
be
Lssthan
routing
surface
water
exclusively
towards
the
Wabash
River
or
the
Drainage
Collection
Pond
YES
As
this
surface
water
management
alternative
represents
theleast
amount
of
fill
needed
toroutesurface
water
oft
of
Pond
it
has
been
ncorporated
within
the
final
cover
alternative
estimates
1375
Alternatives
Analysis
Tables
2005_FINAL.sls
of
Table
3-1
Initial
Screening
Electronic Filing - Received, Clerks' Office, August 11, 2008--AS 09-1, Exhibit 3
Table
3-2
real
Extent
and
Volumes
of
nsaturated
and
Saturated
Ash
In
Pond
Leachate
Management
and
Final
Cover
Alternatives
Report
NRT
PROJECT
NO
1375/6.1
Hutsonville
Ash
Management
Facility
BY
GRUEJT
CHKDBY
CAR
EJT
5/19/05
Ameren
Energy
Generating
Hutsonville
Illinois
DATE
7/18/05
Site
Specific
Parameters
Unit
Unlined
Ash
Impoundment
Pond
Total
Volume
of
Ash
CY
830000
Volume
of
Unsaturated
Ash
CY
550000
Volume
of
Saturated
Ash
CY
280000
Area
Extent
of
Ash
SF
ACRES
966000
22
Area
Extent
of
Saturated
Ash
SF
ACRES
790000
18
Thickness
of
Unsaturated
Ash
FT
11-31
Thickness
of
Saturated
Ash
FT
5-14
Depth
to
Bottom
of
Saturated
Ash
FT
11-31
Source
Notes
Totalestimated
area
for
saturated
ash
area
extent
790000
ft2
average
thickness
9.5
ft
averagedepth
to
bottom
ofsaturated
ash
25
ft
Based
on
above
estimates
280.000
yd3
saturated
ash
7900UO
ft2
9.5
ft
Totalestimated
area
for
ash
areal
extent
22
acres
966000
ft2
average
thicknessestimatedfrom
Geoprobe
boring
logs
20.9
feet
Basedonabove
estimates
750000
yd
ash
966000
ft2
average
thickness
80000
yd3
transferred
in
2004
830000
yd3
Total
ash
volume
includes
unsaturated
ash
550000
yd3
and
saturated
ash
280000yd3
CY
Cubic
yards
SF
Square
Feet
1375
Alternatives
Analysis
Tables
2005
FINAL.xls
of
Table
3-2
ASH
ESTIMATES
Electronic Filing - Received, Clerks' Office, August 11, 2008--AS 09-1, Exhibit 3
Table
3-3
Final
Cover
Alternatives
Material
Balance
Analysis
Leachale
Management
and
Final
Cover
Alternatives
Report
NRTPROJECTNO
375/6
Fltilsonville
Ash
Management
Facility
Unlined
Ash
Impoundment
Pond
Closure
BY
CAR
Ct-lED
BY
FJT5/i9/O5
Amcrcn
EnergyGenerating
Hutsonvillc
Illinois
DATE
7/IS/OS
Final
Cover
Alternative
Fill
Utilization
Fill
Origin
Calculation
Unit
Clay
Pozzolanic
Geosynthetic
Earthen
Establish
Grade
Fly
Ash
Stockpile
Vaj
Assumption
CY
50500
50500
50500
50500
Additional
Imported
Fill4
CY
120700
120700
206100
206100
Beneflcial
ReuseAsh
Assumption
CY
--
--
20000
20000
Low
Permeability
Layer5
V1
Clay
ID
Assumption
CY
105400
--
--
--
Cement
5%
of
Poziolanic
Cover
dry
weight
basis
CY
--
2500
--
--
Fly
Ash-Pozzolanic
Mix
EJ
CY
--
102900
--
--
Final
Protective
Layer6
Beneficial
ReuseAsh
IG
Assumption
CY
20000
20000
--
--
ImportedRooting
Zone
Soil
Assumption
CY
85400
85400
105400
87800
Sand
Drainage
Layer7
Assumption
CY
--
--
--
17.600
Total
ImportedRooting
Zone
CY
85400
85400
105400
105400
Total
Fill
Volume
for
Pond
Assumption
CY
382000
382000
382000
382000
Assurnttions
andReferences
The
Total
Fill
Volume
for
Pond
was
calculated
from
design
grades
with
minimum
5%
final
cover
slope
for
drainage
and
the
existing
grades
established
by
aerial
survey
performed
by
Connor
Connor
on
April
142005
and
included
an
estimate
of
capacity
below
standing
water
of
5.000
yd
thecalculated
Total
Fill
Volmoc
for
Pond
was
approximately
382.000
ydt
Alt
volume
calculations
were
performed
using
AutoCad
LandDesk
Development
soft
ware
tinal
cover
material
estimates
areincluded
as
pan
of
estimated
volume
of
fill
to
make
Pond
grades
Alt
material
balance
estimates
assiinte
theash
stockpile
wilt
he
used
as
fill
beneath
the
final
cover
Additional
imported
fill
is
required
if
V1
357.000
yd1
tow
permeability
layer
volume
105400
CY
estimated
assuming
an
approximate
22
acre
cover
area
with
thick
cover
clay
and
poz7olanic
final
coversonty
tmal
protective
layer
volume
105.400
CY
estimated
using
an
approximate
22
acre
cover
area
with
thick
cover
required
for
ALL
final
cover
alternatives
tot
theearthen
cover
the
final
protective
layer
consists
of
sand
drainage
layer
and
2.5
rooting
zone
layer
1ly
ash
stockpile
volume
50.500
CY
estimate
calculated
front
elevation
453
feet
andabove
Beneficial
ash
volume
estimated
by
Ftutsonvillc
Power
Station
personnel
at
approximately
20.000
ydt
t375
Alternatives
Analysis
Tables
2005
FINAL.xls
ott
Table
33
Maienal
Balance
Electronic Filing - Received, Clerks' Office, August 11, 2008--AS 09-1, Exhibit 3
Table
3-4
Comparison
of
Recommended
Mix
Designs
to
Performance
Goals
and
Cost
Sensitivity
Analysis
NRTPROJECT
NO
1375/3.1
Leachate
Management
and
Final
Cover
Alternatives
Report
BY
CAR
CHKDBY
BRHEJT
5/19/05
Hutsonville
Ash
Management
Facility
Unlined
Ash
Impoundment
Pond
Closure
DATE
7/18/05
Ameren
Energy
Generating
Hutsonville
Illinois
Performance
Goals
Substantially
consistent
withthePart
816
standards
Cost
Sensitivity
Analysis
Recommended
Pozzolanic
Final
over
Mix
Design
Net
Capacity
Created
in
Pond
Average
Final
Cover
Permeability3
Goal
IO
cm/sec
Uncontined
Compressive
Strength
UCS
psi
Goal
150
psi
84
days
Field
Constructahility
Goal
YES
Leaching
Performance
Goal
Leachate
Concentrations
Class
Groundwater
Quality
Standards
Capital
Costs
lozolanic
Final
CoverMix
Design
Pond
fly
ash
andcement
100.480
CY
6.5
l0
cm/sec
305
YES
All
Parameters
Class
Groundwater
Quality
Standards
$5333000
Pnj.olanic
Final
CoverMix
Design
Pond
fly
ash
andcement
100480
CY
4.9
l0
cm/sec
165
YES
NA
$4533000
Pozzolanic
Final
CoverMix
lesign
lond
fly
ash
on
site
native
soil
and
cement
85408
CY
1.6
106cm/sec
191
YES
All
Parameters
Class
Groundwater
Quality
Standardswith
the
exception
of
cadmium
detected
slightly
above
theClass
standard
at
0.01
mgIL
$4864000
lozolanic
Final
CoverMix
1esign
10
Pond
fly
ash
on
site
native
soil
and
cement
85.408
CY
NA
380
YES
NA
$5914000
Po.zolanic
Final
CoverMix
Design
14
Pond
fly
ash
FGD
filter
cakeand
cement
70.336
CY
1.3
10
cm/sec
1110
High
initial
strength
and
tendency
to
adhere
to
the
All
Parameters
Class
Groundwater
Quality
sides
of
the
feed
hoppers
Standards
present
field
construction
challenges
$5316000
General
Notes
See
Section
3.6
for
description
of
the
poi.i.nlanic
final
cover
mix
designs
NA
Not
Analyicd
Sec
VFL
Technology
Corporation
Table
for
Mix
Designs
Strength
and
Permeability
Data
Appendix
C-I
FGD
Fluidiied
gas
dcsulfurtation
scrubber
sludge
1375
Alternatives
Analysis
Tables
2005
FINAL
xIs
Oil
Table
COst
Sensitivity
Electronic Filing - Received, Clerks' Office, August 11, 2008--AS 09-1, Exhibit 3
Table 4-i
Selected Alternatives
for
Groundwater
Flow
and
Transport Modeling
Leachate
Management
and Final Cover Alternatives
Report
NRT PROJECT NO 1375/6.1
Hutsonville
Ash
Management
Facility
Unlined Ash
Impoundment
Pond
Closure
BY CAR
CHKDBY BRH
Ameren
Energy Generating
1-lutsonville
Illinois
DATE 7118105
Model Scenario
Final Cover Alternative
CO
Leachate Extraction
Option LEO
Permeability
Layering
Bottom to
Top Thickness
ft
cmlsec
LEO
Description
co-i
ft earth
NA
NONE
CO-2
GeosyntheticLayer3ftearth
2.OOE-li
NONE
CO-3a
ft Pozzolanic
Layer
ft earth
Layer
.OOE-07
NONE
CO-3b
ft Pozzolanic
Layer
ft earth
Layer
.OOE-06
NONE
it
CO-3c
ft Pozzolanic
Layer
ft earth
Layer
.OOE-05
NONE
CO-2
LEOa-i
Geosyrithetic
Layer
ft earth
2.OOE-1
11
Extraction
Wells
EAST
1000 ft TRENCH
SOUTH
CO-3c LEOa-1
ft Pozzolanic
Layer
ft earth
Layer
.OOE-05
11 Extraction
Wells
EAST
1000 ft TRENCH
SOUTH
CO-2
LEOb-i
Geosynthetic
Layer
ft earth
2.OOE-i
11 Extraction
Wells
EAST
1000 ft TRENCH
SOUTH
CO-3c
LEOb-1
ft Pozzolanic
Layer
ft earth
Layer
.OOE-05
Extraction
Wells
EAST
1000 ft TRENCH
SOUTH
00-2
LEOa-2
Geosynthetic
Layer
ft earth
2.OOE-1
3200 ft TRENCH
EAST
and
SOuTH
CO-3c
LEOa-2
ft Pozzolanic
Layer
ft earth
Layer
.OOE-05
3200 ft TRENCH
EAST
and
SOuTH
CO-2 LEOb-2
Geosynthetic
Layer
ft earth
2.OOE-i
3200 ft TRENCH
EAST
and
SOUTH
CO-3c
LEOb-2
ft Pozzolanic
Layer
ft earth
Layer
.OOE-05
3200 ft TRENCH
EAST
and
SOUTH
00-2 LEOa-3
Geosynthetic
Layer
ft earth
2.OOE-1
1000 ft TRENCH
SOUTH
CO-3c
LEOa-3
ft Pozzolanic
Layer
ft earth
Layer
1.OOE-05
1000 ft TRENCH
SOUTH
00-2
LEOb-3
Geosynthetic
Layer
ft earth
2.OOE-1
1000 ft TRENCH
SOUTH
CO-3c
LEOb-3
ft Pozzolanic
Layer
ft earth
Layer
.OOE-05
1000 ft TRENCH
SOUTH
CO-2 LEOa-4
Geosynthetic
Layer
ft earth
2.OOE-1
2500 ft TRENCH
EAST
and
SOuTH
CO-3c
LEOa-4
ft Pozzolanic
Layer
ft earth
Layer
.OOE-05
2500 ft TRENCH
EAST
and
SOUTH
it
00-2
LEOb-4
Geosynthetic
Layer
ft earth
2.OOE-1
2500 ft TRENCH
EAST
and
SOtJTH
CO-3c
LEOb-4
ft Pozzolanic
Layer
ft earth
Layer
.OOE-05
2500 ft TRENCH
EAST
and
SOUTH
Final Cover Alternatives
CO-i
Final Cover Alternative
Earthen Final Cover Scenario
00-2
Final Cover Alternative
Geosynthetic
Final Cover Scenario
CO-3a
Final Cover Alternative 3a
Pozzolanic
Fly
Ash Cover
Scenario
1.0 xi
crn/sec
CO-3b
Final Cover Alternative 3b
Pozzolanic
Fly
Ash Cover Scenario
1.0
10.6
crn/sec
C0-3c
Final Cover Alternative 3b
Pozzolanic
Fly
Ash Cover Scenario
1.0
i0
crn/sec
Leachate
Management
Alternatives
LEO-i Leachate Extraction
Option
Groundwater extraction
east combined
with an interceptor drain/trench
south
LEO-2 Leachate Extraction
Option
Interceptor
drain/trench
east
and
south
LEO-3 Leachate Extraction
Option
Interceptor
drain/trench
South only
LEO-4 Leachate Extraction
Option
Interceptor
drain/trench
east
and
south
700 feet shorter
along
east
alignment
Indicates shallow trench
design
Indicates
deep
trench
design
1375 Alternatives
Analysis
Tables 2005.FINAL.xls
of
Table
4-1
Modeling
Scenarios
Electronic Filing - Received, Clerks' Office, August 11, 2008--AS 09-1, Exhibit 3
Table
4-2
Groundwater
Flow
and
Transport
Model
Results
Leachate
Management
and
Final
Cover
Alternatives
Report
NRT
PROJECT
NO
1375/6.1
Hutsonville
Ash
Management
Facility
Unlined
Ash
Impoundment
Pond
Closure
BY
CAR
CHKD
BY
BRH
Ameren
Energy
Generating
Hutsonville
Illinois
DATE
7/18/05
Evaluationof
Modeling
ScenariosVersus
Effectiveness
Criteria
Effectiveness
Criteria
No
Compliance
withClass
Groundwater
Quality
Standard
for
Boron
mg/L
Model
Scenario
Effectiveness
Criteria
No
TimeFrame
yrs
Carry
Forward
to
Assembly
of
Closure
Alternatives2
Downgradient
Downgradient
Downgradient
Downgradient
MW-6
MW-7
MW-8
MW-hR
YES/NO
Og.Q
coo
CO-i
DRY/4
NO
NO
YES/16.0
YES
CO-2
DRY/4
NO
NO
YES/15.3
YES
CO-3a
DRY/4
NO
NO
YES/15.4
YES
CO-3b
DRY/4
NO
NO
YES/16.i
YES
CO-3c
DRY/4
NO
NO
YES/16.i
YES
-J
CO-2LEOa-i
DRY/3
YES/h1.8
YES/8.7
YES/10.3
NO
CO-3c
LEOa-i
DRY
YES
12.0
YES
/8.7
YES
10.3
NO
CO-2LEOb-1
DRY/3
YES/10.2
YES/8.5
YES/8.8
NO
CO-3cLEOb-1
DRY/3
YES/1O.3
YES/8.5
YES/8.9
NO
CO-2
LEOa-2
DRY
YES
/5.3
YES
3.7
YES
9.9
NO
CO-3c
LEOa-2
DRY
YES
/5.3
YES
3.7
YES
9.9
NO
CO-2
LEOb-2
DRY
YES
6.8
YES
3.3
YES
8.6
NO
CO-3c
LEOb-2
DRY
YES
6.9
YES
3.3
YES
8.6
NO
CO-2
LEOa-3
DRY
NO
NO
YES
9.6
YES
CO-3c
LEOa-3
DRY
NO
NO
YES
10.2
YES
CO-2
LEOb-3
DRY
NO
NO
YES
NO
CO-3c
LEOb-3
DRY
NO
NO
YES
8.9
NO
CO-2
LEOa-4
DRY
YES
5.3
YES
4.0
YES
9.9
YES
CO-3cLEOa-4
DRY/3
YES/5.3
YES/4.0
YES/10.0
YES
CO-2LEOb-4
DRY/3
YES/6.9
YES/3.5
YES/8.6
NO
CO-3c
LEOb-4
DRY
YES
6.9
YES
3.5
YES
8.6
NO
Final
Cover
Alternatives
Notes
CO-i
Final
Cover
Alternative
Earthen
Final
Cover
Scenario
See
Appendix
for
groundwater
transport
modeling
results
CO-2
Final
Cover
Alternative
Geosynthefic
Final
Cover
Scenario
Section4.3.3
provides
an
explanation
of
which
modeling
scenarios
CO-3a
Final
Cover
Alternative
3a
Pozzolanic
Fly
Ash
Cover
Scenario
1.0
iO7
cm/sec
carried
forward
to
assembly
of
theclosure
alternatives
CO-3b
Final
Cover
Alternative
3b
Pozzolanic
Fly
Ash
Cover
Scenario
1.0
10.6
cm/sec
CO-3c
Final
Cover
Alternative
3c
Pozzolanic
Fly
Ash
Cover
Scenario
1.0
i0
cm/sec
Leachate
Management
Alternatives
LEO-t
Leachate
Extraction
Option
Groundwater
extraction
east
combined
with
an
interceptor
drain/trench
south
LEO-2
Leachate
Extraction
Option
Interceptor
drain/trench
east
and
south
LEO-3
Leachate
Extraction
Option
Interceptor
drain/trench
south
only
LEO-4
Leachate
Extraction
Option
Interceptor
drain/trench
east
and
south
700
feet
shorter
along
east
alignment
Indicates
shallow
trench
design
Indicates
deep
trench
design
1375
Alternatives
Analysis
Tables
2005
FINAL.xls
of
Table
4-2
Modeling
Results
Electronic Filing - Received, Clerks' Office, August 11, 2008--AS 09-1, Exhibit 3
Table
5-1
Closure
Alternatives
Cost
Summary
NRTPROJECT
NO
1375/6.1
Leachate
Management
and
Final
Cover
Alternatives
Report
BY
CARCHKD
BY
EJT
Hutsonville
Ash
Management
Facility
Unlined
Ash
Impoundment
Pond
Closure
DATE
7118105
Ameren
EnergyGenerating
Hutsonville
Illinois
ClosureAlternative
Capital
Costs
Annual
Costs
Cumulative
Capita
and
Costs
Year
Compared
to
Todays
30
Year
Compared
to
Todays
Dollars
Dollars
ClosureAlternative
No
Geosynthetic
Final
Cover
with
East
and
South
Interceptor
Drain/Trench
and
Deep
Alluvial
Aquifer
Groundwater
Extraction
$6.840.000
$104.000
$7.360.000
$9.960.000
ClosureAlternative
No
Earthen
Final
CoverWith
South
Interceptor
Drain/Trench
$4.660.000
$35000
$4835.000
$5.7
10000
ClosureAlternative
No
Earthen
Final
Cover
$4.200.000
$5000
$4225000
$4350000
ClosureAlternative
No
Pozzolanic
Fly
Ash
Final
Cover
$4.530.000
$5.000
$4555000
$4680000
GeneralNotes
See
Section
5.0
for
description
of
theclosure
alternatives
cost
summary
Capital
costs
for
Closure
Alternative
No.4
Pozzolanic
Fly
Ash
Final
Cover
based
on
costdata
for
Mix
Design
providedby
VFL
technology
Corporation
Appendix
C-2
1375
Alternatives
Analysis
Tables
2005_FINAL.xls
Table
5-1
Final
Cost
Summary
of
Electronic Filing - Received, Clerks' Office, August 11, 2008--AS 09-1, Exhibit 3
Table
5-2
Detailed
Analysis
of
Closure
Alternatives
NRTPROJECT
N0
375/3.1
Leachate
Management
and
Final
Cover
Alternatives
Report
BYCAR
CHKDBYBRH
Hutsonville
Ash
Management
Facility
Unlined
Ash
Impoundment
Pond
Closure
DATE
7/18/05
Ameren
Energy
Generating
Hutsonville
Illinois
Criteria
Closure
Alternative
No
Geosynthetic
Final
Cover
with
East
and
South
Interceptor
DrainlTrench
and
Deep
Alluvial
Aquifer
Groundwater
Extraction
Closure
Alternative
No
Earthen
Final
Cover
With
South
Interceptor
Drain/Trench
Closure
Alternative
No
Earthen
Final
Cover
Closure
Alternative
No
Pozzolanic
Fly
Ash
Final
Cover
Evaluation
Criteria
Summary
Overall
Irotection
of
Human
Health
the
Environment
Alternative
No
protects
Human
Uealth
and
the
Environment
by
limiting
direct
contact
exposure
to
ash
and
reducing
leaching
of
ash
constituents
to
groundwater
via
infiltration
of
surface
water
The
leachate
management
and
groundwater
extraction
components
of
this
alternative
prevent
groundwater
affected
by
ash
leachatc
and
ash
POCs
from
discharging
to
the
Wabash
River
or
migrating
off-site
thus
protecting
the
river
and
potential
downgradient
groundwater
receptors
pursuant
to
Class
groundwater
quality
standards
Alternative
No
protects
Human
Health
and
the
Environment
by
limiting
direct
contact
exposure
to
ash
and
reducing
leachmg
of
ash
constituents
to
groundwater
via
infiltration
of
surface
water
The
leachate
management
component
of
this
alternative
prevents
groundwater
affected
by
ash
leachate
from
migratmg
off
site
to
the
south
thus
protecting
potential
downgradient
groundwater
receptors
Alternative
No
protects
Human
Health
and
the
Environment
by
limiting
direct
contact
exposure
to
ash
and
reducing
leaching
of
ash
constituents
to
groundwater
via
infiltration
of
surface
water
The
groundwater
monitoring
program
would
be
utilized
to
ensure
potential
downgradient
groundwater
receptors
arenot
impacted
poiiolanic
fly
ash
Final
cover
would
provtde
similar
to
equivalent
protection
io
human
health
and
theenvironment
as
each
of
theother
final
covers
proposed
in
Alternatives
to
Each
alternative
is
protective
of
human
health
and
th
environment
Speciflcally
each
altemative
effectively
limits
direct
contact
exposure
via
finallandfill
cover
and
protects
potential
downgradient
groundwater
receptors
by
capturing
monitoring
the
groundwater
contaminant
plume
AltemativL
No
would
likely
provide
the
greatest
protection
for
potentia
downgradient
groundwater
receptors
viacombination
of
fina
cover
and
significant
leachate
and
groundwater
extraction
Short
Long
Term
Effectiveness
Analysis
ofRisk
After
tmplementation
Short
Term
This
alternative
would
immediately
limit
direct
contact
exposure
to
ash
and
reduce
leaching
of
ash
constituents
via
surface
water
infiltration
improvements
in
downgradient
groundwater
quality
boron
mg/L
should
be
observed
at
eastern
downgradient
monitoring
wells
within
to
years
Long
Term
Improvement
of
groundwater
quality
may
be
observed
at
MW-
within
10
years
Leachate
pumping
and
groundwater
extraction
could
be
required
indefinitely
until
the
mass
of
ash
constituents
completely
leaches
from
saturated
ash
to
groundwater
Extended
groundwater
monitoring
would
be
required
Impoundment
cover
would
have
to
be
maintained
indefmitely
to
limit
direct
contact
exposure
Short
Term
This
alternative
would
immediately
limit
direct
contact
exposure
to
ash
and
reduce
leaching
of
ash
constituents
via
surface
water
infiltration
improvements
in
downgradient
groundwater
quality
along
thesouth
impoundment
boundary
will
not
be
observed
within
years
Long
Term
Improvement
of
groundwater
quality
is
not
expected
along
the
east
impoundment
boundary
between
the
impoundment
and
the
Wabash
River
however
improvement
of
groundwater
quality
may
be
observed
at
MW
within
approximately
years
southboundary
Groundwater
extraction
could
be
required
indefinitely
until
the
mass
of
ash
constituents
completely
leaches
from
saturated
ash
to
groundwater
Extended
groundwater
monitoring
would
be
required
Impoundment
cover
would
have
to
be
maintained
indefinitely
to
limit
direct
contact
exposure
Short
Term
This
alternative
would
immediately
limit
direct
contact
exposure
to
ash
and
reduce
leaching
of
ash
constituents
viasurface
water
infiltration
Long
Term
Improvement
of
groundwater
quality
is
not
expected
along
theeast
impoundment
boundary
between
the
impoundment
and
the
Wabash
River
howeverimprovement
in
groundwater
quality
may
be
observed
at
MW
within
years
south
boundary
Extended
groundwater
moniioring
would
be
required
Impoundment
cover
would
have
to
be
maintained
mdcfinitely
to
limit
direct
contact
exposure
Short
Term
pozzolanic
fly
ash
Imal
cover
would
immediately
limit
direct
contact
exposure
to
ash
and
reduce
leaching
of
ash
constituents
viasurface
water
infiltration
Long
Term
Improvement
of
groundwater
quality
is
nnt
expected
along
the
east
impoundment
boundary
between
the
impoundment
and
the
Wabash
River
howeverimpiovement
of
groundwaier
quality
may
be
observed
at
MW-
withm
approximately
16
years
south
boundary
Extended
groundwater
monitoring
would
be
required
Impoundment
cover
would
have
to
be
maintained
indefinitely
to
limit
direct
contact
exposure
Each
alternative
could
provide
both
short
and
long
tern
effectiveness
Alternatives
Nos
and
effectiveness
hinges
oi
groundwater
and/or
leachate
collection
via
downgradien
interceptor
drain/trenches
and/or
wells
tocapture
the
affectei
groundwater
and
bnng
the
site
Into
compliance
in
shorter
time-
frame
Alternative
Nos
and
may
provide
sinillar
long-
term
effectiveness
at
the
south
impoundment
boundary
Alternatives
Nos
and
without
up-front
capital
expens
and
extensive
annual
operation
and
maintenance
of
leachate
collection
system
Alternative
No
would
provid
the
greatest
short-term
effectiveness
Ease
of
Implementation
geosynthetic
landfill
cover
could
be
readily
implemented
at
the
site
contractors
and
materials
are
widely
available
Contractors
and
materials
for
construction
of
the
interceptor
drainltrench
system
arereadily
available
Implementation
ofthe
groundwater
extraction
system
for
the
deep
alluvial
aquifer
would
present
significant
challenge
however
groundwater
extraction
systems
of
this
magnitude
have
been
successfully
constructed
For
an
earthen
final
cover
an
adjusted
standard
from
the
Illinois
PCB
would
be
required
However
earthen
covers
have
been
used
for
closure
of
several
fly
ash
impoundment
facilities
throughout
Illinois
Contractors
and
materials
are
locally
available
for
construction
of
an
earthen
cover
Similar
to
Alternative
No
contractors
and
materials
for
construction
of
the
interceptor
drain/trench
system
are
readily
available
Similar
to
Alternative
No
an
adjusted
standard
from
the
Illinois
PCB
would
be
required
toconstruct
an
earthen
cover
However
earthen
covers
have
been
used
for
closure
ofseveral
fly
ash
impoundment
facilities
throughout
Illinois
Contractors
and
materials
are
locally
available
for
construction
of
an
earthen
cover
Similar
to
Alternative
No
an
adjusted
standard
from
the
Illinois
PCB
would
be
required
toconstruct
pozzolanic
fly
ash
final
cover
level
ofeffectiveness
would
likely
have
to
be
demonstrated
tothe
Illinois
PCB
before
full-scale
construction
this
could
require
additional
field
scale
testing
Contractors
and
materials
are
available
for
construction
of
pozzolanic
fly
ash
cover
Each
alternative
may
require
additional
evaluation
prior
implementation
pozzolanic
fly
ash
Imal
cover
Altcrnativ
No
would
likely
require
additional
field
study
prior
to
ful
scale
construction
Alternative
No
would
require
pump
tes
prior
to
final
design
Alternative
No
requires
the
least
amount
of
study
prior
to
implementation
Performance/
Reliability
Potential
Impacts
geosynthetic
final
cover
would
reduce
leaching
of
ash
constituents
to
groundwater
via
surface
water
infiltration
The
interceptor
drain/trench
system
would
rely
on
careful
design
equipment
performance
and
proper
maintenance
Interceptor
rcnch
sytcn
have
kttiGuuaLed
ieiiabiiiiy
ui
variety
of
environmental
applications
Groundwater
extraction
systems
have
demonstrated
reliability
with
the
proper
design
operation
and
maintenance
Alternative
No
would
bring
Pond
into
compliance
with
the
Part
811
regulations
in
the
shortest
tinieframe
due
to
the
most
significant
leachate
collection
proposed
for
all
of
the
alternatives
Potential
for
adverse
environmental
affects
is
minimal
tonon-existent
Similar
to
geosynthetic
final
cover
an
earthen
final
cover
would
reduce
leaching
of
ash
constituents
to
groundwater
via
surface
water
infiltration
Alternative
No
is
not
expected
to
meet
theClass
Groundwater
Quality
Standards
along
the
east
iviW-7
and
MW-8
impounament
bounoary
atong
the
Wabash
River
without
an
adjusted
standard
The
interceptor
drain/trench
system
would
rely
on
careful
designequipmentperformance
and
proper
maintenance
Interceptor
trench
systems
have
demonstrated
reliability
in
variety
of
environmental
applications
Potential
for
adverse
environmental
affects
is
minimal
Similar
to
geosynthetic
fmal
cover
an
earthen
final
cover
would
reduce
leaching
of
ash
constituents
to
groundwater
via
surface
water
infiltration
Alternative
No
is
not
expected
to
meet
theClass
Groundwater
Quality
Standards
along
the
east
MW-7
and
MW-8
impoundment
boundary
without
an
adjusted
standard
However
theClass
Groundwater
Quality
Standards
may
be
met
atthe
south
impoundment
boundary
MW
IR
within
approximately
16
years
without
leachate
collection
The
potential
for
adverse
environmental
affects
is
minimal
Similar
loan
earthen
final
cover
pozzolanic
fly
ash
final
cover
would
reduce
leaching
of
ash
constituents
to
groundwater
via
surface
water
infiltration
This
alternative
will
likely
have
similar
performance
as
Closure
Alternative
No
Class
Groundwater
Quality
Standards
may
be
met
at
the
south
impoundment
boundary
MW-li
within
approximately
16
years
Greater
and
up-front
field
testing
may
be
required
toassure
performance
and
reliability
of
pozzolanic
fly
ash
cover
The
potential
for
adverse
environmental
affects
is
minimal
with
proper
design
ofthe
pozzolanic
fly
ash
mixture
Performance
ofAlternatives
and
would
be
enhanced
installation
of
the
interceptor
chain/trench
Ieachate
collectio
system
Each
alternative
could
be
reliable
if
properly
designed
constructed
and
maintained
Alternative
No
could
provid
the
greatest
performance
if
the
groundwater
extraction
system
is
properly
operated
and
maintained
Historically
groundwater
extraction
systems
are
difficult
to
operate
aix
maintain
over
long
periods
oftime
reliability
could
be
an
issul
for
Alternative
No
1375
Alternatives
Analysis
Tables
2005_FINAL.xls
Table
5-2
Detailed
Anafysis2005
of
Electronic Filing - Received, Clerks' Office, August 11, 2008--AS 09-1, Exhibit 3
Table
5-2
Detailed
Analysis
of
Closure
Alternatives
Leachate
Management
and
Final
Cover
Alternatives
Report
BYCAR
CHKDBY
BRH
Hutsonville
AshManagement
Facility
Unlined
Ash
Impoundment
Pond
Closure
DATE
7/18/05
AmerenEnergy
Generating
1-lutsonville
Illinois
Criteria
Closure
Alternative
No
Geosynthetic
Final
Cover
vith
East
and
South
Interceptor
Drain/Trench
and
Deep
Alluvial
Aquifer
Groundwater
Extraction
Closure
Alternative
No
Earthen
Final
Cover
With
South
Interceptor
Drain/Trench
Closure
Alternative
No
Earthen
Final
Cover
Construction
ofAlternative
No
could
be
completed
in
single
Closure
Alternative
No
Pozzolanic
Fly
Ash
Final
Cover
Construction
of
pozzolanic
fly
ash
final
cover
could
be
Evaluation
Criteria
Summary
Each
alternative
would
have
similar
time-frames
fo
Time-frame
for
Alternative
Completion
Construction
ofAlternative
No
could
possibly
be
completed
in
single
construction
season
Startup
of
the
interceptor
trench/drain
leachate
collection
system
and
the
deep
alluvial
groundwater
extraction
system
could
begin
within
one
year
Maintenance
ofthe
final
cover
would
be
performed
mdefmitely
100
years
Maintenance
of
extraction
system
would
be
performed
until
concentrations
of
ash
constituents
decrease
to
Class
groundwater
quality
standards
Construction
ofAlternative
No
could
be
completed
single
construction
season
Startup
of
the
interceptor
trench/drain
leachate
collection
system
could
begin
within
one
year
Maintenance
of
the
final
cover
and
extraction
of
affected
groundwater
would
be
peormed
indefinitely
100
years
construction
season
The
earthen
final
cover
would
have
to
be
maintained
indefinitely
Lowest
closure
alternative
Low
to
medium
riskfor
completed
in
single
construction
season
The
pozzolanic
fly
ash
final
cover
would
have
to
be
maintained
indefinitely
Highest
capital
cost
for
final
cover
alternative
Additional
cost
construction
Alternatives
and
would
require
significan
long
term
operation
and
maintenance
indefinitely
fo
leachate
and
groundwater
extraction
Long
term
OM
rcqurcments
for
the
final
cover
would
be
similarfor
each
ofthe
alternatives
Alternative
No
is
the
lowest
cost
closure
alternative
ani
Cost
Highest
cost
closure
alternative
Low
riskfor
additional
cost
as
the
geosynthetic
final
cover
combined
with
the
interceptor
drain/trench
and
groundwater
extraction
system
will
effectively
prevent
downgradient
migration
of
groundwater
affected
by
ash
leachate
Lower
cost
closure
alternative
that
incorporates
an
earthen
cover
with
south
interceptor
drain/trench
Low
to
medium
risk
for
additional
cost
depending
on
adjusted
standards
approved
by
the
Illinois
PCB
PCB
would
likely
be
additional
cost
depending
on
adjusted
standards
approved
by
the
Illinois
PCB
and
behavior
of
downgradient
migration
of
groundwater
affected
by
ash
leachate
over
time
Adjusted
standards
from
the
Illinois
PCB
would
likely
be
for
construction
of
pozzolanic
fly
ash
cover
versus
lower
capital
yet
equally
protective
final
cover
earthen
final
cover
needs
to
be
evaluated
with
respect
toadditional
capacity
that
could
be
created
for
fly
ash
in
Pond
for
enhancernent
of
future
plant
operations
Similar
to
Alternative
No
adjusted
standards
from
the
Illinois
Alternative
No
is
the
highest
cost
closure
alternative
Alternatives
and
could
provide
significant
cost
savings
versus
Alternative
No
if
regulatory
approval
can
be
obtained
Although
Alternative
No
has
higher
capital
costs
than
Alternatives
and
enhancement
of
future
plan
operations
may
off-set
theincreased
cost
Each
alternative
can
potentially
gain
regulatory
approval
Institutional
Requirements
Alternative
No
would
not
require
adjusted
standards
for
leachate
collection
and
cap
design
with
the
Illinois
PCB
to
implement
Construction
of
this
alternative
would
be
subject
to
Illinois
EPA
review
and
approval
Modifications
ofthe
plants
NPDES
permit
may
be
required
to
accommodate
discharge
of
collected
groundwater
through
the
existing
ash
sluice
water
system
and
outfall
002
This
alternattve
would
likely
have
relatively
low
difficulty
to
gain
regulatory
acceptance
Adjusted
standards
from
the
required
for
Alternative
No
for
alternative
cover
construction
to
seek
relief
from
the
Section
811.314
requirements
and
adjusted
groundwater
quality
standards
pursuant
toSection
811.320
Construction
of
this
alternative
would
be
subject
to
Illinois
EPA
review
and
approval
Modifications
ofthe
plants
NPDES
permit
may
be
required
to
accommodate
discharge
of
collected
groundwater
through
the
existing
ash
sluice
water
system
and
outfall
002
required
for
Alternative
No
for
alternative
cover
construction
to
seek
relief
from
the
Part
811
requirements
relief
from
Section
811.309
and
8l4.302b
for
no
leachate
collection
and
adjusted
groundwater
quality
standards
pursuant
to
Section
811.320
Construction
of
this
alternative
would
be
subject
to
Illinois
EPA
review
and
approval
PCB
would
likely
be
required
for
thealternate
final
cover
to
seek
relief
from
Part
811
and
814
requirements
for
alternate
cover
construction
no
leachate
collection
and
adjusted
groundwater
quality
standards
Construction
of
this
alternative
would
be
subject
to
Illinois
EPA
review
and
approval
Regulatory
precedent
does
exist
for
construction
of
final
cover
systems
using
similar
technology
35
IAC
Part
816
Alternatives
and
would
require
adjusted
standards
fron
the
Illinois
PCB
prior
toapproval
Alternative
No
wouk
likely
have
very
low
difficulty
to
gain
regulatory
acceptance
Pursuit
of
adjusted
standards
for
Alternatives
and
may
be
warranted
based
on
the
significant
cost
savings
plant
enhancements
these
alternatives
may
provide
General
Notes
See
Section
for
description
ofthedetailed
analysis
ofalternatives
1375
Alternatives
Analysis
Tables
2005_FINAL.xls
Table
5-2Detailed
AnaIysis2005
NRTPROJECT
NO
1375/3.1
of
Electronic Filing - Received, Clerks' Office, August 11, 2008--AS 09-1, Exhibit 3
APPENDIX
SUPPLEMENTAL SITE INVESTIGATION APPENDICES
Electronic Filing - Received, Clerks' Office, August 11, 2008--AS 09-1, Exhibit 3
APPENDIX A-2
MONITORING WELL COMPLETION REPORTS AND
ABANDONMENT LOG
Electronic Filing - Received, Clerks' Office, August 11, 2008--AS 09-1, Exhibit 3
HANSON
PDRAD
MONITORING
WELLS
Ni
ELEVATION
456.5
PIPE
SCREEN
pipe
452.5
screen
BACKFILL MATERIALS
concrete
grout
collar
456.5
455.0
bentonite
seal
455.0
453.5
1/8
gravel pack
453.5
M-2
ELEVATION
453.3
PIPE
SCREEN
pipe
456.3
448.3
13
screen
448.3
435.3
BACKFILL MATERIALS
concrete
grout
collar
453.3
451.3
bentonite seal
451.3
449.3
1/8
gravel pack
449.3
431.8
.VrI I.V IJF HI/I/Il I/I
II
./ /t lii
1525 SOUTH
SIXTH STREET
SPRINGFIELD
ILLINOIS 62703-2886
217/788-2450
TWX
910-242-0510
SPRINGFIELD
ILLINOIS
PEORIA
ILLINOIS
ROCKFORD ILLINOIS
Electronic Filing - Received, Clerks' Office, August 11, 2008--AS 09-1, Exhibit 3
HANSON
ENGINEERS
MONITORING
WELLS
ELEVATION
452.1
PIPE
SCREEN
7.9
pipe
455.6
447.7
screen
447.7
442.7
BACKFILL
MATERIALS
concrete
grout
collar
452.1
450.1
bentonite seal
450.1
448.1
1/8
gravel pack
442.7
448.1
ELEVATION
454.4
PIPE
SCREEN
pipe
457.4
449.4
screen
441.9
BACKFILL MATERIALS
concrete
grout
collar
454.4
452.4
bcntonite
seal
452.4
450.4
1/8
gravel pack
450.4
441.0
.VIi IN il/IA IFII/.11/
III
1k .I LkI Iii
1525 SOUTH
SIXTH SIREET
SPRINGFIELD
ILLINOIS 62703-2886
217/788-2450
TWX 910-242-051
SPRINGFIELD
ILLINOIS
PEORIA
ILLINOIS
ROCKFORI
ILLINOIS
Electronic Filing - Received, Clerks' Office, August 11, 2008--AS 09-1, Exhibit 3
__1lIJ- .--
..IHANSON
41i7ENGINEERS
MONITORING
WELLS
ELEVATION
452.3
PIPE
SCREEN
pipe
455.3
screen
BACKFILL MATERIALS
concrete
grout
collar
452.3
450.3
bentonite
seal
450.3
448.3
1/8
gravel pack
448.3
433.1
M6
ELEVATION
438.9
PIPE
SCREEN
lot
pipe
443.9
433.9
6.4
screen
433.9
427.5
BACKFILL
MATERIALS
concrete
grout
collar
438.9
436.9
bentonite
seal
436.9
434.9
1/8
gravel pack
434.9
427.5
VIf IN IJ/ IIII/
1//Il
IA
Al
1525 SOUTH SIXTH STREET
SPRINGFIELD ILLINOIS 62703-2886
217/78S-245O
TWX
910-242-0519
SPRINGFIELD
ILLINOIS
PEORIA
ILLINOIS
ROCKFORD ILLINOIS
Electronic Filing - Received, Clerks' Office, August 11, 2008--AS 09-1, Exhibit 3
ELEVATION
PIPE
SCREEN
HANSON
JJ.....ENGINEERS
437.9
MONITORING
WELLS
20
pipe
10
screen
BACKFILL MATERIALS
442.9
422.9
422.9
412.9
concrete
grout
collar
bentonite
auger
cutting
bentonite seal
1/8
gravel pack
21.4
pipe
5.0
screen
BACKFILL
MATERIALS
444.3
422.9
422.9
417.9
concrete
grout
collar
bentonite
auger cutting
bentonite seal
1/8
gravel pack
437.9
435.9
425.9
423.9
435.9
425.9
423.9
412.9
ELEVATION
439.4
PIPE
SCREEN
439.4
437.4
425.9
423.9
437.4
425.9
423.9
417.9
II /iv
I/
////
/1/ In
/.
./
II
S25 SOUTIl SIXTIl STREET
SPRINGFIELD
ILLINOIS 62703-2886
217/788-2450
TWX
910-242.0519
SPRINGFIELD
ILLINOIS
PEORIA
ILLINOIS
ROCKFORD
ILLINOIS
Electronic Filing - Received, Clerks' Office, August 11, 2008--AS 09-1, Exhibit 3
1.HANSON
ENGINE ERS
MONITORING
WELLS
ELEVATION
452.0
PIPE
SCREEN
11.5
pipe
455.0
443.5
10
screen
443.5
433.5
BACKFILL MATERIALS
concrete
grout
collar
452
450
bentonite
cement
sand
450
446
beritonite
seal
446
444
1/8
gravel pack
444
433.2
ye
ty Ill
1//It I/I
F/I
.1/sj
\f
Fe
52 SOUflI SIXTI STREET
SPRINGFIELD
ILLINOIS 62703-2886
21
7/788-2450
TWX 910-212-05
SPRINGFIELD
ILLINOIS
PEORIA
ILLINOIS
ROCKFORD
ILLINOIS
Electronic Filing - Received, Clerks' Office, August 11, 2008--AS 09-1, Exhibit 3
Additional
protection
If
yes
describe
______
Surface
seal
Manufacturer
Boart
Longyear
Slot size
Slotted
length
II
Backfill material
below
filter
pack
Yes
No
4.0
in
6.0
ft
Steely
04
Other
Yes
No
Bentonite
Concrete
Other
30
33
35
31
50
Tremie
Tremie
pumped
Gravity
23
24
Factory
Cut
Continuous
slot
_____
Other
0.010
in
5.0
ft
None
Other1
EU
Natural
Resource
Technology
ft
MONITORING WELL CONSTRUCTION
Facility/Project
Name
Local Grid Location
of Well
Well Name
Ameren
Hutsonville
Power Station
Drilling
898046.72
ft
176886.34
ft
TW-l 15s
Facility License
Permit or
Monitoring
No
Local Grid
Origin
estimated
or Well
Location
Unique
Welt No
Welt Number
Lat
.__L
Long
_L
or
Facility
ID
St Plane
ft
ft
Date Welt
Installed
Section
Location
05/01/2004
Type
of
Well
Well Installed
By
Persons Name
and
Firm
._1/4of_._ 1/4 of Sec
.1
R.__
Well Code
12/pz
Location
of Well Relative
to Waste/Source
lGov
Lot Number
Steve
Distance
from Waste
Upgradient
Sidegradient
Source
ft
Downgradient
Not Known
Boari
Longyear
Protective
pipe top
elevation
_____________
ft MSL
Well
casing top
elevation
Land surface elevation
440.89
ft MSL
438.4
ft MSL
Surface seal bottom
4374
ft MSL
or
1.0
ft
12 USCS classification
of soil near screen
GPO
GMD
GCD
GWO
SW
SMD
SC
MLD
MHD
CL
Bedrock
Cap
and lock
Protective
cover
pipe
Inside diameter
Length
Material
13 Sieve
analysis
attached
14
Drilling
method
used
SP
CH
UYes No
Rotary
050
Hollow Stem
Auger
41
______
Other
15
Drilling
fluid used
WaterD 02
Air DO
Drilling
MudD
None
99
16
Drilling
additives used
DYes
No
Material
between well
casing
and
protective
pipe
Bentonite
______________________
Other
Annular
space
seat
Granular/Chipped
Bentonite
Lbs/gal
mud
weight.
Bentonite-sand
slurry
Lbs/gal
mud
weight..
Bentonite
slurry
______% Bentortite..
Bentonite-cement
grout
_____________Ft3
volume
added for
any
of the above
How instatted
17 Source of water
attach
analysis
if
required
Bentonite
seal
top
ft MSL
or ________
Fine
sand
top
410.4
ft MSL
or
28.0
Filter
pack
top
409.4
ft MSL
or
29.0
Screen
joint top
408.4
ft MSL or
30.0
Well bottom
___________
_________
Filter
pack
bottom
____________
_________
Borehole
bottom
__________
________
Borehole
diameter
8.3
in
O.D well
casing
2.33
in
1.D well
casing
2.00
in
403.4
ft MSL or
35.0
402.4
ft MSL
or
36.0
Bentonite
seal
Bentonite
granules
D1/4in
03/8in
D1/2in
Bentonitechips
32
c._________________________
Other
Fine sand material
Manufacturer
product
name
mesh size
Badger
Volume added
_________________
ft3
Filter
pack
material
Manufacturer
product
name
mesh size
40
Badger
Volume added
_________________
ft3
Well
casing
Flush threaded PVC schedule
40
Flush threaded
PVC schedule
80
______________________________________
Other
10 Screen
material
PVC
Screen
Type
402.4
ft MSL
or
36.0
hereby certify
that the information
on this
form is
true
and
correct to
the best of
my
knowledge
Signature
Firm
Natural
Resource
Technology
Inc
Tel
262
523-9000
Richardson
23713
Paul
Road
Unit
Pewaukee
WI 53072
Fax
262
523-9001
Template
NRT WELL CONSTRUCTION
Project
1375 LOGS.GPJ
Electronic Filing - Received, Clerks' Office, August 11, 2008--AS 09-1, Exhibit 3
10 Screen
material
Screen
Type
Yes El No
4.0
in
6.0
ft
Steel
Other
Yes
No
Bentonite
Concrete
Other El
Tremie El
Tremie
pumped
Gravity
Factory
cut
Continuous
slot
_____
Other
0.010
in
5.0
ft
hereby certify
that the information
on
this form is true and correct to the best of
my
knowledge
Signature
Firm
...____
Natural Resource
Technology
Inc
Tel
262
523-9000
Paula Richardson
Kr
-cii.t---
23713
Paul
Road
Unit
Pewaukee
WI 53072
Fax
262
523-9001
Template
NRT WELL CONSTRUCTION
Project
1375
LOGS.GPJ
Natural
Resource
Technology
MONITORING WELL CONSTRUCTION
Facility/Project
Name
Local Grid
Location of Well
Well Name
1176882.3
Arneren
Hutsonville
Power Station
Drilling
898052.5
ft
El
ft
ow
TVV1 5d
Facility
License
Permit
or
Monitonng
No
Local
Grid
Origin
estimated fl
or
Well Location
Iintque
Well No
IWell
Number
Lat
Long
or
Facility
ID
Date Well Installed
St Plane
ft
ft
Section
Location
05/01/2004
Type
of Well
Well Installed
By Persons
Name and
Firm
of._
1/4 of Sec
Well Code
12/pz
Location
of Well Relative
to
Waste/Source
lGov Lot Number
Steve
Distance
from Waste/
Upgradient
Sidegradient
Source
ft
Downgradient
Not Known
fo
Longyear
Protective
pipe top
elevation
_____________
ft MSL
Well
casing top
elevation
Land
surface elevatton
440.80
ft MSL
438.4
ft MSL
Surface
seal
bottom
437.4
ft MSL or
1.0
ft
Cap
and lock
Protective
cover
pipe
Inside diameter
Length
12 USCS classification of soil near screen
GP
GMO
GC
GW
SWO
SMO
SC
MLD
MHD
CLD
Bedrock
SP
CH
13
Sieve
analysis
attached
14
Drilling
method
used
rock core
Material
Additional
protection
If
yes
describe
DYes No
Rotary
050
Hollow Stem
Auger
Other
Surface seal
15
Drilling
fluid used
Water
Air 00
Drilling
MudD 03
None
99
16
Drilling
additives used
Describe____________
DYes No
17 Source of water
attach
analysis
if
required
Ameren
well
Material
between well
casing
and
protective
pipe
Bentonite
______________________
Othr
Annular
space
seal
Granular/Chipped
Bentonite
Lbs/gal
mud
weight..
Bentonite-sand
slurry
Lbs/gal
mud
weight..
Bentonite
slurry
_______%
Bentonite..
Bentonite-cement
grout
______________Ft3
volume
added for
any
of the above
How installed
Bentonite
seal
top
361.4
ft MSL
or
77.0
Fine
sand
top
358.4
ft MSL or
80.0
Filter
pack
top
3574
ft MSL or
81.0
Screen
joint top
356.4
ft
MSL or
82.0
Well bottom
351.4
ft MSL
or
87.0
Filter
pack
bottom
350.4
ft MSL or
88.0
Borehole
bottom
333.4
ft MSL or
105.0
Borehole
diameter
8.3
in
O.D well
casing
2.33
in
ID well
casing
2.00
in
Bentonite
seal
Bentonite
granules
0l/4in
3/8in
Dl/2in
Bentonitechips
32
c._________________________________
Other
Fine sand material
Manufacturer
product
name
mesh size
Badger
Volume added
_________________
ft3
Filter
pack
material Manufacturer
product
name
mesh size
40
Badger
Volume added
_________________
ft3
Well
casing
Flush threaded PVC schedule
40
Flush threaded
PVC schedule
80
_______________________
Other
PVC
Manufacturer
Boart
Longyear
Slot size
Slotted
length
II Backftllmaterial
below
filter
pack
V7
None
14
Other
Electronic Filing - Received, Clerks' Office, August 11, 2008--AS 09-1, Exhibit 3
Length
Material
Additional
protection
If
yes
describe
Surface seal
Bentonite
seal
Manufacturer
Boart
Longyear
Slot size
Slotted
length
11
Bsckfill
material
below
filter
ack
Yes
No
4.0
in
6.0
ft
Steel
Other
Yes
No
Bentonite
Concrete
Other
30
33
35
31
50
Tremie
Tremie
pumped
Gravity
23
24
01
0.010
in
5.0
ft
None
14
Other
hereby certify
that the information
on this form is true and correct
to
the best of
my knowledge
Signature
Firm
Natural Resource
Technology
Inc
Tel
262
523-9000
-7
7_
Paula Richardson
23713
Paul
Road
Unit
Pewaukee
WI 53072
Fax
262
523-9001
Template
NRT WELL CONSTRUCTION
Project
1375
LOGS.GPJ
Natural
Resource
Technology
MONITORING WELL CONSTRUCTION
Facility/Project
Name
Local Grid Location
of Well
Well Name
Ameren
Hutsonville
Power Station
Drilling
896034.1384
OS
175442.33
ft
TW-116
Facility
License
Permit
or Monitoring
No
Local Grid
Origin
estimated
or Well Location
Unique
Well No
Welt Number
Lat
._L ......._L
Long
.......L
or
Facility
ID
Date
Well Installed
St Plane
ft
ft
Section
Location
04/28/2004
Type
of Well
Well Installed
By Persons
Name and
Firm
.._._....l/4
of_......._..
1/4 of Sec
R...._.........
Well Code
l2/pz
Location
of Well Relative
to
Waste/Source
lGov Lot Number
Steve
Distatice from Wasie/
Upgradient
Sidegradient
Source
ft
Downgradient
ii
Not Known
Boart
Longyear
Protective
pipe top
elevation
_____________
ft MSL
Well
casing lop
elevation
Land surface elevation
439.77
ft
MSL
437.5
ft
MSL
Surface
seal
bottom
436.5
ft MSL or
1.0
ft
Cap
and lock
Protective
cover
pipe
Inside diameter
12 USCS classification
of soil
near screen
GP
GM
GC
GWO
SW
SP
SM
SC
MLD
MHO
CL
CH
Bedrock
13 Sieve
atialysis
attached
Yes
No
14
Drilling
method used
Rotary
05
Hollow Stem
Auger
rock core
Other
15
Drilling
fluid used
WaterO 02
Air 00
Drilling
MudO
None
16
Drilling
additives used
Yes
No
Describe
17 Source
of water
attach
analysis
if
required
Ameren
well
Material
between well
casing
and
protective
pipe
Bentonite
Sctcx
Other
Annular
space
seal
Granular/Chipped
Bentonite
Lbs/gal
mud weight..
Bentonite-sand
slurry
Lbs/gal
mud
weight..
Bentonite
slurry
_______% Bentonite..
Bentonite-cement
grout
_____________Ft3
volume
added
for
any
of the above
How installed
Bentonite
granules
33
Bentonite
seal
top
ft MSL or
_________
Fine
sand top
414.5
ft MSL or
23.0
Filter
pack top
413.5
ft MSL
or
24.0
Screen
joint top
412.5
ft MSL
or
25.0
Well bottom
407.5
ft MSL or
30.0
Filter
pack
bottom
406.5
ft MSL
or
31.0
Borehole
bottom
__________
________
Borehole
diameter
8.3
in
O.D well
casing
2.33
in
l.D well
casing
2.00
in
358.5
ft MSL
or
79.0
D1/4in
03/8in
0l/2in
Bentonitechips
32
_________________________________
Other
Fine sand material
Manufacturer
product
name
mesh stze
Badger
Volume
added
_________________
ft3
Filter
pack
material
Manufacturer
product
name
mesh size
40
Badger
Volume
added
__________________
ft3
Well
casing
Flush threaded PVC schedule
40
Flush threaded PVC schedule
80
______________________________________
Other
10 Screen
material
PVC
Screen
Type
Factory
cut
Continuous slot
_______
Other
Electronic Filing - Received, Clerks' Office, August 11, 2008--AS 09-1, Exhibit 3
Cap
and lock
Protective
cover
pipe
Inside diameter
Length
Material
Screen
material
Screen
Type
Manufacturer
Slot size
Slotted
length
11 Backfill
malerialbelow
filter
pack
Yes
No
4.0
in
6.0
ft
Steel
04
Other
Yes
No
Bentonite
Concrete
Other
30
33
35
31
50
Tremie
Tremie
pumped
Gravity
Factory
cut
Continuous slot
_______
Other
0.010
in
5.0
ft
None
14
Other
hereby certify
that the information
on
this form is
true
and
correct to
the
best
of
my knowledge
Signature
Firm
Natural Resource
Technology
Inc
Tel
262
523-9000
.__ula
Richardson
23713
Paul Road Unit
Pewaukee
WI 53072
Fax
262
523-9001
Template
NRT WELL CONSTRUCTION-
Project
1375
LOGS.GPJ
Natural
Resource
Technology
MONITORING WELL CONSTRUCTION
Facility/Project
Name
Local Grid Location
of Well
Well Name
ZN
17905333
ZE
Ameren Hutsonville
Power Station
Drilling
895267.78
ft
ft
T\V-
Facility License
Permit or
Monitoring
No
Local Grid
Origin
estimated
or
Well Location
Unique
Well No
IWell Number
Lat .....
Long
or
Facility
ID
Date
Well
Installed
St.Plane
ft.N
ft.E
Section Location
04/29/2004
Type
of Well
Well Installed
By Persons
Name and
Firm
1/4 of Sec
T.._......_
R........_.
Well
Code
I2/1
Location
of Well Relative
to
Waste/Source
Gov Lot Number
Steve
Distance
from Waste/
Upgradient
Sidegradient
Source
ft
Downgradient
Not Known
Boart Longyear
Protective
pipe
top
elevation
_____________
ft MSL
Well
casing top
elevation
Land surface elevation
438.09
ft.MSL
435.0
ft MSL
Surface
seal
bottom
434.0
ft MSL or
1.0
ft
Additional
protection
If
yes
describe
Surface seal
12
USCS
classification of soil
near screen
GP
GMU
GC
GWD
SWD
SP
SMO
SCD
MLD
MHD
CLO
CHO
Bedrock
13 Sieve
analysis
attached
Yes
ZNo
14
Drilling
method
used
Rotary
Hollow Stem
Auger
__________________
Other
15
Drilling
fluid used
WaterD 02
Air DO
Drilling
MudD
None
16
Drilling
additives
used
LI Yes
No
17
Source of
water attach
analysis
if
required
Material
between well
casing
and
protective
pipe
Bentonite
t.VtC\
Other
Annular
space
seal
Granular/Chipped
Bentonite
Lbs/gal
mud
weight
Bentonite-sand
slurry
_______Lbs/gal
mud
weight
l3entonite
slurry
______% Bentonite..
Bentonite-cement
grout
____________Fr3
volume
added for
any
of the above
How installed
_________
ft MSL or
_______
422.0
ft MSL or
13.0
421.0
ft.MSLor
14.0
420.0
ft MSL
or
15.0
415.0
ft MSL or
20.0
Bentonite
seal
top
Fine sand
top
Filter
pack top
Screen
joint
top
Well bottom
__________
Filter
pack
bottom
___________
Borehole
bottom
__________
Borehole
diameter
8.3
in
O.D well
casing
2.33
in
ID well
casing
2.00
in
414.0
ft MSL
or
21.0
Bentonite
seal
Bentonite
granules
33
Dl/4in
03/8in
Dl/2in
Bentonitechips
32
c.___________________________________
Other
lJ
Fine sand material
Manufacturer
product
name
mesh size
Badger
Volume
added
_________________
ft3
Filter
pack
material
Manufacturer
product name
mesh size
40
Badger
Volume
added
_________________
ft3
Well
casing
Flush
threaded
PVC schedule
40
Flush threaded
PVC schedule
80
______________________________________
Other
PVC
345.0
ft MSL
or
90.0
23
24
II
01
Boart
Longyear
Electronic Filing - Received, Clerks' Office, August 11, 2008--AS 09-1, Exhibit 3
Protective
cover
pipe
Inside diameter
Length
Material
Additional
protection
If
yes
describe
______
Surface seal
Manufacturer
Slot size
Slotted
length
11 Backfill material
below
filter
pack
Yes
No
4.0
in
6.0
ft
Steely
q1
Other
Yes
No
Bentonite
Concrete
Other
01
02
Gravity
Factory
cut
Continuous
slot
Other
0.010
in
5.0
ft
None
Other
hereby certify
that the information
on
this form is
true
and
correct to
the best of
my
knowledge
Signaix5
IFirm
aula
Richardson
Natural Resource
Technology
Inc
Tel
262
523-9000
23713
Paul
Road
Unit
Pewaukee
WI 53072
Fax
262
523-9001
Template
NRT WELL CONSTRUCTION
Project
1375
LOGS.GPJ
Natural
Resource
Technology
ft
MONITORING WELL CONSTRUCTION
Facility/Project
Name
Local Grid Location
of Well
Well Name
Ameren
Hutsonville
Power Station
Drilling
898090.86
ft
77978.73
fl
ow
T\V-
Facility License
Permit or
Monitoring
No
Local Grid
Origin
estimated
or
Well Location
Unique
Welt
No
IWell
Number
Lat
Long
or
Facility
ID
Date Well Installed
St Plane
ft
ft
Section
Location
05/04/2004
Type
of Well
Well
Installed
By Persons
Name and
Fimi
...._.....1/4
of...........
1/4
ofSec
Well Code
12/pz
tocalion
of Well Relative
to
Waste/Source
Gov Lot Number
Steve
Distance
from Waste
Upgradient
Sidegradient
Source
ft
Downgradient
Not Known
Boart
Longyear
Protective
pipe top
elevation
____________
ft MSL
Well
casing
top
elevation
Land surface elevation
439.21
ft
MSL
437.0
ft MSL
Surface
seal
bottom
436.0
ft MSL or
1.0
ft
Cap
and lock
12 USCS classification of soil near screen
GP
GMD
GC
GWD
SWD
SP
SM
SC
MLE
MHO
CL
CH
Bedrock
13 Sieve
analysis
attached
Yes
No
14
Drilling
method
used
Rotary
Hollow Stem
Auger
__________________
Other
15
Drilling
fluid used
WaterD 02
Air 00
Drilling
MudO
None
16
Drilling
additives
used
Yes
No
Describe
17 Source of water
attach
analysis
if
required
Material
between well
casing
and
protective
pipe
Bentonite
___________________________
Other
Annular
space
seal
Granular/Chipped
Bentonite
_______Lbs/gal
mud
weight.
Bentonite-sand
slurry
Lbs/gal
mud
weight..
Bentonite
slurry
31
______% Bentonite..
Bentonite-cement
grout
_____________Ft3
volume
added for
any
of the above
How installed
Tremie
Tremie
pumped
Bentonite
seal top
Fine
sand top
Filter
pack top
_________
ft MSL or
_______
419.0
ft
MSL or
18.0
418.0
ft MSL
or
19.0
ft
Bentonite
seal
Bentonite
granules
33
01/4
in
03/8
in 01/2 in
Bentonite
chips
32
c.________________________
Other
Fine sand material
Manufacrurer
product
name
mesh size
Badger
Volume
added
_________________
ft3
Filter
pack
material
Manufacturer
product
name
mesh
size
40
Badger
Volume
added
_________________
ft3
Well
casing
Flush threaded
PVC schedule
40
Flush threaded
PVC schedule
80
__________________________
Other
10
Screen
material
PVC
Screen
Type
Screen
joint top
417.0
ft MSLor
20.0
Well bottom
412.0
ft
MSL or
25.0
Filter
pack
bottom
411.0
ft MSL
or
26.0
Borehole
bottom
411.0
ft MSL or
26.0
Borehole
diameter
8.3
in
O.D
well
casing
2.33
in
ID well
casing
2.00
in
Boart
Longyear
Electronic Filing - Received, Clerks' Office, August 11, 2008--AS 09-1, Exhibit 3
hereby certify
that
the
information
on this
form
is true and correct to the best of
my
knowledge
ature
IFii-m
Natural Resource
Technology
Inc
Tel
262
523-9000
Paula
Richardson
23713
Paul
Road
Unit
Pewaukee
WI 53072
Fax
262
523-9001
Template
NRT WELL CONSTRUCTION
Project
375
LOOS.GPJ
Natural
Resource
Technology
ft
MONITORING WELL
CONSTRUCTION
Facility/Project
Name
Local Grid Location
of Well
Well
Name
Anieren Hutsonville
Power Station
Drilling
896030.54
181 339.05
ft
t_OS
ci
TW- 19
Facility License
Permit
or Monitoring
No
Local Grid
Origin
estimated
or
Well Location
Unique
Well No
Well Number
Lat
Long
or
Facility
ID
Date Well Installed
St Plane
ft
ft
Section
Location
05/03/2004
Type
of Well
Well Installed
By Persons
Name and
Firm
1/4 of Sec
T...._.._...
R..._._
Well
Code
12/pz
Location
of Well Relative
to
Waste/Source
Gov Lot Number
Steve
Distance
from Waste/
Upgradient
Sidegradient
Source
ft
Downgradient
Not Known
Boart
Longyear
Protective
pipe top
elevation
Well
casing
top
elevation
Land surface elevation
_____________
Surface seal bottom
43
ft MSL or
1.0
ft
12 USCS classification of soil
near screen
GP
GMD
GC
GWO
SWU
SP
SM ci
SC
MLD
MHD
CL
CH
Bedrock
13 Sicve
analysis
attached
Yes
No
14
Dnlling
method
used
Rotary
50
Hollow Stem
Auger
rock core
Other
15
Drilling
fluid used
Water 02
Air 00
Drilling
MudLJ 03
None
99
16
Drilling
additives
used
Yes
No
Describe
17 Source of
water attach
analysis
if
required
Town of Hutsonville
well
__________
ft MSL -__
Protective
cover
pipe
43812
ft MSL
Cap
and lock
Inside diameter
435.4
ft MSL
Length
Material
Additional
protection
If
yes
describe
_______________________________
Surface
seal
Material
between
well
casing
and
protective
pipe
Bentonite
______________________________________
Other
Yes
No
4.0
in
6.0
ft
Steel
Other
Yes
No
Bentonite
Concrete
Other
30
----
Annular
space
seat
Granular/Chipped
Bentonite
Lbs/gal
mud
weight.
Bentonite-sand
slurry
Lbs/gal
mud
weight..
Bentonite
slurry
_______% Bentonjte..
Bentonite-cement
grout
_____________
Fr
volume
added for
any
of the above
How installed
ft
ftNN
Bentonite
seal
top
ft MSL or
________
Fine
sand
top
422.4
ft MSL
or
13.0
Filter
pack
top
421.4
ft MSL or
14.0
Screen
joint top
420.4
ft MSL or
15.0
Well bottom
415.4
ft MSL
or
20.0
Filter
pack
bottom
414.4
ft MSLor
21.0
Borehole
bottom
335.4
ft MSL or
100.0
Borehole
diameter
8.3
in
O.D well
casing
2.33
in
l.D well
casing
2.00
in
Tremie
Tremie
pumped
Gravity
Bentonite
seal
Bentonite
granules
Dl/4in
03/8in
Dl/2in
Bentonitechips
032
OtherDI
Fine sand material
Manufacturer
product
name
mesh size
Badger
Volume added
_________________
ft3
Filter
pack
material Manufacturer
product
name
mesh size
40
Badger
Volume added
_________________
ft3
Well
casing
Flush threaded PVC schedule
40
Flush
threaded
PVC schedule
80
Other
10 Screen
material
Screen
Type
PVC
23
24
Factory
cut
Continuous
slot
Other
Manufacturer
Boart Lonavear
Slot size
Slotted
length
II
Bacl?fill
material
below
filter
pack
h.a.v14tA
I4
s/t-.-
0.010
in
5.0
None
14
Other
Electronic Filing - Received, Clerks' Office, August 11, 2008--AS 09-1, Exhibit 3
Protective
cover
pipe
Inside diameter
Length
Material
Additional
protection
If
yes
describe
______
Screen
material
Screen
Type
Manufacturer
Slot size
Slotted
length
11
Backfill material
below
filter
pack
Yes
No
4.0
in
6.0
ft
Steel
Other
El Yes
No
Bentonite
Concrete
Other El
Tremie
Tremie
pumped
Gravity
Factory
cut
Continuous slot
____
Other
0.010
in
5.0
ft
None
Other
hereby
certify
that the information
on
this form is
true
and
correct to
the best of
my knowledge
Signature
lFirm
Natural Resource
Technology
Inc
Tel
262
523-9000
Paula
Richardson
23713
Paul
Road
Unit
Pewaukee WI 53072
Fax
262
523-9001
Template
NRT WELL CONSTRUCTION
Project
1375
LOGS.GP
Natural
Resource
Technology
MONITORING WELL CONSTRUCTION
Facility/Project
Name
Local Grid Location
of Well
Well Name
Ameren Hutsonville
Power Station Drilling
1180157.14
ft
ow
TW-120
898614.9
ft
Facility License
Permit or
Monitoring
No
Local Grid
Origin
estimated
or Well Location
Unique
Well No
Well Number
Lat
.........L
Long
..........L
or
Facility
ID
Date Well Installed
St Plane
ft
ft
Section
Location
05/04/2004
Type
of Well
Well Installed
By
Persons
Name and
Firm
1/4oL............
1/4 of Sec
R....._
Well Code
12/pz
Location of Well Relative
to Vaste/Source
Gov Lot Number
Steve
Distance
from Waste/
Upgradient
Sidegradient
Source
ft
Downgradient
Not Known
Boart
Longyear
Protective
pipe
top
elevation
_____________
ft MSL
Well
casing top
elevation
Land
surface elevation
449.00
ft MSL
446.8
ft MSL
Surface seal bottom
445.8
ft MSL or
1.0
ft
Cap
and lock
12 USCS classification of soil
near screen
GP El
GMD
GC El
GWD
SWD
SP
SM
SC El
MLD
MHD
CL El
CH
Bedrock
El
13 Sieve
analysis
attached
14
Drilling
method
used
DYes No
Rotary
Hollow Stem
Auger
______
Other
DL
Surface seal
15
Drilling
fluid used
WaterD
Air 00
Drilling
MudO
None
16
Drilling
additives used
DYes
No
17 Source of
water attach
analysis
if
required
Material
between well
casing
and
protective
pipe
19
Bentonite
_________________________
Other
Annular
space
seal
Granular/Chipped
Bentonite
Lbs/gal
mod
weight..
Bentonite-sand
slurry
Lbs/gal
mud
weight
Bentonite
slurry
El
_______% Bentonite..
Bentonite-cement
grout
_____________Fr
volume
added for
any
of the above
How installed
421.8
ft MSL or
25.0
418.8
ft MSL
or
28.0
417.8
ft MSL
or
29.0
416.8
ft MSL or
30.0
Bentonite
seal
top
Fine
sand
top
Filter
pack top
Screen
jOinl
top
Well bottom
__________
Filter
pack
bottom
__________
Borehole
bottom
__________
Borehole diameter
8.3
in
O.D well
casing
2.33
in
l.D well
casing
2.00
in
411.8
ft MSL or
35.0
410.8
ft MSL
or
36.0
Bentonite
seal
Bentonite
granules
El
1/4 in 03/8 in
1/2
in
Bentonite
chips
El
c._______________________
Other
Fine sand material
Manufacturer
product
name
mesh size
Badger
Volume
added
_________________
ft3
Filter
pack
material Manufacturer
product
name
mesh size
40
Badger
Volume
added
_________________
ft3
Well
casing
Flush threaded PVC schedule
40
Flush threaded PVC schedule
80 El
_____________________
Other El
PVC
410.8
ft MSL
or
36.0
Boart
Longyear
Electronic Filing - Received, Clerks' Office, August 11, 2008--AS 09-1, Exhibit 3
MONITORING WELL
CONSIUCTIoi
Adcnaiproteciari7
er
Pr
BtmtcxthcR
__________________
Other
Maicrial bctw well
casmg
proaithe
ppc
Besite0
Other
Amiular
larlcbipped
Besthto
Lga1
mud
weiei..
Bcntcitc-sand
shixxy
____L/gai
mud
wsight
erttcnim
ziury
Bcurcrte
-cemt
grout
__________Ft
vcurne
addcd for
any
of the above
How jutafled
rrte
Tr
ptrnptd
Btiite stol
Bitxsite grarniler
01/4th D3fSth D1Jz BocD
OthD
Ftc sdmateriaL
Ilanufaettrsr rodiot
xaae
xnsh
size
t-
Voitetie added
______________
it3
Filter
peek
mazerialt
Martuczmer
prodee
name
mesh
size
-c teZp.ilU
1CTttrL
Flush threaded PVC bednlc
40
23
FlxzhthresdedPVCscediæe0
24
Facryoax
11
Cotmuouctiot
oi
______________
othP
Route to
Wad/Wastowares
Waste
Mgcmout
RdiatiRedevelcmnesttE
Other
Fsity/ProjeciNarnc
Local Grid Locaæirn of
Well
Wc11.Nthn
srIIe
ft
________ft
ow
ti-
FaityLicePernmorManitcnngNo
iridOngth
.0
es?mntad
or WeilLocaon
Ur?queWciINo
DNRWeiIIDKo
.11
Lat.___________
Lang._
or
FacilIty
.ID
Daze Well installed
SLPIe
S1C
________.______
SecdottLccatioofWazzc/5oce
..
Typc
of Well
\Wdil Inzzaid
By
Name
frs last
Dfrstf
Ex.d
LW
Souroe
ft
APP
Dowriradient
Not.Kmown
Proreenve.pipe
top
elevatum
ft MSL
ft MSL
and lock
..mtectivecoverpipe
Tnsidedamcmr
Length
e.Maxetial
Surfaca
scal
Well
casing top
elevaou
Ld sirthce
c1evtion
ft
MSL
ttfacs seal
bottom
ft MSL or
ft
12 USCS ifeai of zoiln scream
GP
GM
GC
GW
SW
SM
SC
1L
MH
Bcock
13 Sieve
212aIyS pf17
Yes
No
14
Dl1methednsed
Rotary
50
Hollow Ston
Anger
___________
Other
1S.D1gfiniduzedWaXerD02
AirO
Dl
Di1iigMtd3 NomcL99
16
Th11iT1g
additives
nsed
Yes
No
17 Sotce of wa
auach
anEiysis
if
required
Yes
No
SteelI
_i
04
OtherD
Yes
No
30
01
30
33
35
31
50
E.Btmtixc seaL
Fuc sand
top
Filneck
top
ft.MSLor_.fLN
ftMSLor__.ft
--i--
SLor__
Screerijoitz ion
ft MEL or
51t
LWellbocni
ft MEL or..j ft
cacit
bottom
ft
MEL
or_I
ft
Boreh1c bonorti
ft MEL
Borehole
diamcrer
Well
eazing
in-
MO.D.wc1casizg
_L
LD.weflasiug
10
Seresumatestal
JC
Screcrt
typc
Mamx
.Slotsiz
siotdength
11 Becitfill material
below filtcrnack
herenv
cerrif that the
jfcrrnatjoa
fo
nd
con to
the bcrt of
my
lcnowledre
ric
None1
14
OtherD
Electronic Filing - Received, Clerks' Office, August 11, 2008--AS 09-1, Exhibit 3
MONITORING WE.L CONSDCI1o
Stec1
04
________
___________
Oilier
Yes
No
Barnthc
30
Cnem0 01
___________
OthcrO
Maicrial
bczwi
wfl
sug
ptucnthc pipc
BenniteD
30
____________________
ot
Aul
GrmnnChipped
Besroalte
33
Lbs/gal
mud
weight.
Bcrnothtc-sand
shniy
35
LIgaJ
mud
weight
Bcntcnitc
siutry
31
___ Bcrnnni
pout
50
__________Pt
volurnc adccd for
my
of thu above
Bow irisrallcd
Tth
Træc
pumped
GraviLy
Buttanite sb
B?ie
granuler
D1I4iz 03 01J
BcmonrecliosD
C-
.OtD
Pme seu material
Manufaunrcr
duct name
muth si
Vomnc added ______________ft3
Filmr
pack
uxzia1
Mmuxacunor
pruduet
nume
mesh size
Vobnuethalcd
L4O
AA
ft
WeB
uzsiug
Plush threaded PVC schedule
40
Plush chrded PVC schedule
SO
vc
Faciliiy/Prcjccs
Name
vuI/C
UCVt
$.741ioQ
Ronte
ra Wairskzed/Waetowar
Waste
Mmgerxzesit
other
Local
dLocWcii
ON
S..
DW
Wcll.N8m
Faflty
L.es
or
Mothrmg
No Local Grid
Origin
umuted
or Well Locarion
Unique
Well No DNR Well ID
Lat._......
.Long._.......
hr
Fau
.ID
PLT
Date Well Installed
..._L
Tc
of Well
Well Inszailed
By
Natee
flutE last
Fi
..
WeB Code j2_
of
of
SceT
of Well Relanve
toW
Gay Lot
L-e
Thztaxiac
Sotc
from
14PPY
Waste
E.nx ds
uiesi
Dnerndir
Not.Known
sni
Well
casing top
elevaricit
Protective
pipe
top
eevaricm
ft MSL
ft MSL
C.Lastd suthc elevation
.3 ft MSL
flSacesea1.b?tti_
..
_ft.MSLor
Length
Yez0No
12 USCS
_____
tei of zai1ue
CF
CM
CC
GW
SW
SP
SM
SC
4LEI
MHCI
CL
CH
Bcoc.t 0.
13 Sieve
TIaIyS
pedued
Yes
No
14
nezbrid used
Rotary
Hollow Sutn
Augur
41
l.Cdloc1c
Protective
ver
pine
InsIde dboneter
Surfacu scab
Adneslrotecxion7
If
yes
dnsafne
15
zidg
fluid used
Waiur
02
DriIiinMudD?3
16
flrlli
additives
used
Alt-
None
99
OYes INc
17 Scnu
of
wat
ac analysis
if
required
Bnire seal
too
ft MSL or
P.Fmcsand..top
ftM3Lnr_l
G.Piltonack.top
MSLor.
H.Scrojoitt.tcp
ftMSLor._. fi
Wail boisain
ft ML
or
pack.bootn
Borehole
bonorn
ft
MSL or
Borthoi
dianictur
O.D.weilessing
LD.wefl
easing
Sin
Other
2.3
24
111
001
OtherO
Factory
uix
Ccntuous
slot
10
Sorecn material
Scruututypc
M.sxnxfacnur
hn.se
.Sloisian
11 Backfifl
material
below filtcrack
fr
ce
.5-S_I-
4c
.1 hurav ecttilv that the iuicrrriathon
cm
this farm is true anti ccrmcz to
the bust of
my
know leditu
Fn
r?
.Zplc
in
NoneO
_S
14
Otherl
/7
Electronic Filing - Received, Clerks' Office, August 11, 2008--AS 09-1, Exhibit 3
FathiTy/PIjcct
Name
Local Grid ocaæon of
-_ft
Well
casing top
elevaT ton
L.d snaee cievcion
ID Siface
eal
bbttom
ft MSL or
12 USCS clas ficn of soil
GP
GM
GC
GW
Sw
SP
SM
SC
IL9
MHO
Beock
13 Sieve
aiia1yths pformed7
14
Drfllmerbcd.isc
DYes No
Rotary
050
Hollow Stt
Angor
Oth
IS
PilThig
finid used
Wax
002
DiiflingMud903
1Tflhigadvesured7
Yes
ÆNo
17
DctDC___
Sc
of
Caacli
anzlvth lijred
coixc zeal too
ft MSL
or ...3
RFisand..tcp
ft.MSLor_
G.Pilpock.top
MSLor1-
Sn
joint
tao
M5L or .3
ft
LWellbo
_ft.MSLor_ft
Fitcrpck
bottom
ft MEL or
ft
Bureboie
bottom
ft M5L or
ft
Barthoie
dimeror
O.D well
casing
LD well
asirig
SD
WeIl.Namc
ftw
TAI
LCapid1ock
Protective
cover pipe
Inside diamcre
Length
cL
Addiflanalprotecthon7
If
yes
desorf
PcI
__________________
Other
Material bczwcei well
sng
md
prozethvc pipc
Bextmnite0
Other
__
GranTllarlcthpped
Bennite
____Lbga1
mu
weighs
Bctuthte-sartd
slurry
____U/ga1
mud
weight
Dcmanite
slmuy
___ Bernox
__________Ft
volume
added for
arry
of the above
How installed
Tree
Tr
purcd
Grayl
Bentonite seal
Bonitmixe
graxuiles
D1/4in
D3S 0112in
BothosD
Volume
added____________
We
casing
Flush threaded PVC schedule
40
Flush threaded PVC schedule
_____________
Other
10 Screenaterial
PUC
Screm
typ
Mamxfsenner
ns
Srnsiz
S1oidiength
11 Backi material below iltcrack
Route so WajeshedJWagtewar
Waste
M.mngetncnt
Renr.atjonfRedevejcounentfl
Other
MONITORING
CONSI1IJCTIQi
Fasiuisy
L.ienrxse
P?r
Moitrthxg
No Lomi Grid
OrAgin .0
esmntd Ci or Well Location
Unthue
Weil to DNR Welt ID
II
.11
.-
Lax
Long
or
lit
ID
Date Well Installed
c?an1iafWazrc/5otuce
Type
of Well
Weil Instajled
By
Name fret last and FIro
.s
L114
of
114 of Sec...._.T
We Code
acn?on
We Raladve to W5oL
Gov Lot Nno
ts
Distce from Wastef
EflL Stds
IJpadient
5idendii
Sotoe
ft
Apkv
Downrzdieni
Not.Knowrt
CSI0T Lc.yp
Protective
pine top
elevation
ft MSL
ft MSL
_..2.8Lft.MSL
Yes
No
...2.ft
SteclB
04
OthcrD
Yes
No
Stuface scaui
AfrO
01
Nc
99
30
01
30
33
35
31
50
Pine sdmaterial Maiuiacorer
oducs
name
mesh si
Vohrne added_____________
Flherpackmnxurial
Mamiacer product
utzne
mesh size
44-
Lej AP.C..Q
in
23
24
11
01
Factory
Cantuons slot
0th
hrev certify thai the jnforrxuaijon
this farm is
true
and correct
to
the best of
my
Icriowledee
Finn
t..J
ru
fl.
o-
1C
T.i
.Z
QOiojn
_fL
NoneB
14
OtlzrO
Electronic Filing - Received, Clerks' Office, August 11, 2008--AS 09-1, Exhibit 3
Client
Location
Job Name
Job Number
Well/Boring
Number
Date of Abandonment
Reason for Abandonment
Abandonment Done
By
Hutsonville
IL
Hutsonville
Project
hJ
..9
10/03/01
Study Complete
Radke
NOV
2OO
Hole
Type
Construction
Type
Formation
Type
Sealing
Method
Sealing
Materials
Monitoring
Well
Drilled
Unconsolidated
Gravity
Bentonite
Chips
Drillhole
Driven
Bedrock
Pumped
El
Cement-Bent
Grout
Pumping
Well
El
Other
______
Other
Other
Sealing
Material
Topsoil
Bentonite
Chips
Gallons
From
ft
To
ft
Quantity
Bags
Surface
0.5
______________
Gallons
0.5
16.2
Bags
Total Well
Depth
Casing
Diameter
Casing Depth
Depth
to Water
16.2 Ft
In
16.2
Ft
8.95 Ft
Screen Removed
Overdrilled
Casing
Left in Place
Casing
Cut
Below Surface
RI
Well Information ONLY
All measurements
are
from
ground
surface
Yes
No
Comments
Electronic Filing - Received, Clerks' Office, August 11, 2008--AS 09-1, Exhibit 3
APPENDIX
A-3
SLUG TEST DATA
Electronic Filing - Received, Clerks' Office, August 11, 2008--AS 09-1, Exhibit 3
Ii
TW-1
15S
SLUG
OUT
Data
Set
P\.
.\1
375
11
5s
slug
outA.aqt
Date
05/11/05
Time
152128
0.6
PROJECTINFORMATION
0.2
Company
Natural
Resource
Technology
Client
Ameren
Project
1375
Location
Hutsonville
IL
-0.2
TestWell
TW-115s
Test
Date
5/13/04
-0.6
SOLUTION
Aquifer
Model
Confined
Solution
Method
Butler
-1
0.09332cm/sec
40
80
120
160
200
CD0.3464
Time_sec
___________________________________________________
AQUIFER
DATA
SaturatedThickness
80
ft
Anisotropy
Ratio
Kz/Kr
WELL
DATA
TW-1
15s
Initial
Displacement
2.8
ft
Static
Water
Column
Height
23.37
ft
Total
Well
Penetration
Depth
23.37
ft
Screen
Length
ft
Casing
Radius
0.0833
ft
Wellbore
Radius
0.0833
ft
Electronic Filing - Received, Clerks' Office, August 11, 2008--AS 09-1, Exhibit 3
10
TW-15D
SLUG
OUT
Data
Set
P\...\1375
15d
slug
outA.aqt
Date
05/11/05
Time
152132
PROJECTINFORMATION
Company
Natural
Resource
Technology
Client
Ameren
Project
1375
Location
Hutsonville
IL
TestWell
TW-115d
Test
Date
5/13/04
SOLUTION
Aquifer
Model
Confined
Solution
Method
Bouwer-Rice
0.1
0.0117
cm/sec
160
200
yO
6.028
ft
Time_sec
_____________________________________________________
AQUIFER
DATA
SaturatedThickness
77
ft
Anisotropy
Ratio
Kz/Kr
WELL
DATA
TW-1
15d
Initial
Displacement
2.8
ft
Static
Water
Column
Height
77
ft
Total
Well
Penetration
Depth
77
ft
Screen
Length
ft
Casing
Radius
0.0833
ft
Wellbore
Radius
0.0833
ft
40
80
120
Electronic Filing - Received, Clerks' Office, August 11, 2008--AS 09-1, Exhibit 3
TW-1
16
SLUG
OUT
Data
Set
P\...\1375
116
slug
outA.aqt
Date
05/11/05
Time
152122
PROJECTINFORMATION
Company
Natural
Resource
Technology
Client
Ameren
Project
1375
Location
Hutsonville
IL
TestWell
1W-i
16
Test
Date
5/13/04
SOLUTION
Aquifer
Model
Confined
Solution
Method
Bouwer-Rice
0.1
0.0004557cm/sec
140
560
700
yO4.116ft
Time_sec
_____________________________________________________
AQUIFER
DATA
SaturatedThickness
50
ft
Anisotropy
Ratio
Kz/Kr
WELL
DATA
TW-1
16
Initial
Displacement
2.8
ft
Static
Water
Column
Height
20
ft
Total
WellPenetration
Depth
20
ft
Screen
Length
ft
Casing
Radius
0.0833
ft
Wellbore
Radius
0.354
ft
280
420
Electronic Filing - Received, Clerks' Office, August 11, 2008--AS 09-1, Exhibit 3
10
11
TW-1
17
SLUG
OUT
Data
Set
P\...\1375
117
slug
outA.aqt
Date
05/11/05
Time
152118
PROJECTINFORMATION
Company
Natural_Resource_Technology
Client
Ameren
Project
1375
Location
Hutsonville
IL
Test
Well
TW-117
Test
Date
5/13/04
Aquifer
Model
Unconfined
Solution
Method
Bouwer-Rice
0.006694
cm/sec
yO6.341
ft
0.1
40
80
120
Time
sec
160
SOLUTION
200
AQUIFER
DATA
SaturatedThickness
82
ft
Anisotropy
Ratio
Kz/Kr
WELL
DATA
TW-1
17
Initial
Displacement
2.8
ft
Static
Water
Column
Height
12
ft
Total
WellPenetration
Depth
12
ft
Screen
Length
ft
Casing
Radius
0.0833
ft
Wellbore
Radius
0.0833
ft
Electronic Filing - Received, Clerks' Office, August 11, 2008--AS 09-1, Exhibit 3
0.4
T1JV118SLUGII\J
Data
Set
P\...\1375
118
sluginA.aqt
Date
05/11/05
Time
152114
0.28
PROJECT
INFORMATION
0.16
Company
Natural
Resource
Technology
Client
Ameren
Project
1375
Location
Hutsonville
IL
0.04
Test
Well
TW-118
Test
Date
5/13/04
_________
-0.08
SOLUTION
Aquifer
Model
Confined
Solution
Method
Butler
0.2
0.1638cm/sec
16
24
32
40
CD
0.3179
Time_sec
___________________________________________________
AQUIFER
DATA
SaturatedThickness
71
ft
Anisotropy
Ratio
Kz/Kr
WELL
DATA
TW-1
18
Initial
Displacement
2.8
ft
Static
Water
Column
Height
16
ft
Total
Well
Penetration
Depth
16
ft
Screen
Length
ft
Casing
Radius
0.0833
ft
Weilbore
Radius
0.0833
ft
Electronic Filing - Received, Clerks' Office, August 11, 2008--AS 09-1, Exhibit 3
10
TW-119
SLUG
OUT
Data
Set
P\...\1
375119
slug
outA.aqt
Date
05/11/05
Time
152104
PROJECTINFORMATION
Company
Natural
Resource
Technology
Client
Ameren
Project
1375
Location
Hutsonville
IL
TestWell
TW-119
Test
Date
5/13/04
SOLUTION
Aquifer
Model
Confined
Solution
Method
Bouwer-Rice
0.1
0.002244cm/sec
240
320
400
yO
2.69
ft
Time_sec
_____________________________________________________
AQUIFER
DATA
SaturatedThickness
72
ft
An
isotropy
Ratio
Kz/Kr
WELLDATA
TW-1
19
Initial
Displacement
2.8
ft
Static
Water
Column
Height
13
ft
Total
WellPenetration
Depth
13
ft
Screen
Length
ft
Casing
Radius
0.0833
ft
Wellbore
Radius
0.0833
ft
80
160
Electronic Filing - Received, Clerks' Office, August 11, 2008--AS 09-1, Exhibit 3
APPENDIX A-4
GROUNDWATER SAMPLING SOP
AE
Electronic Filing - Received, Clerks' Office, August 11, 2008--AS 09-1, Exhibit 3
Monitor Well
Sampling
Procedure
Purpose
The
procedure
for Hutsonville Power Stations Monitor Well
sampling
is based
on
IEPA
Sampling
Procedure
Instructions
These
instructions
are
prepared
to
inform
owners/operators
of
treatment
storage
and
disposal
facilities of
proper
water sampling
procedures
It is
expected
that
by complying
with these
procedures
it will
help
in
obtaining analytical
results consistent and
comparable
with those
obtained
by
the
Agency
The
Monitoring
Well
sampling
is
completed
on
monthly
basis for
Monitoring
Wells
pH readings
and
sample
filtration
is
complete
at Hutsonville
with the
samples shipped
to the CIPS Central
Lab-Springfield
tested
for
TDS Boron
Calcium Hardness
Manganese
Sulfate and
Alkalinity
Equipment
Needed
Pump
and
Tubing Asco portable pump
Monitor Well
Sample
Bottles
liter
Water Level Indicator
Data
Entry
Sheet
Truck Car or 12
Battery
Timer/StopwatchlSecondhand
on
watch
Depth
Volume Data Sheet
Adapter/Connector
and cord used to
hookup
the
battery
to the
pump
pH
Meter/Probe
Cooler w/ ice
temperature 39F
Sampling
Procedure
Connect
the
Adapter
to the
battery
and
pump
Use the Water Level Indicator
to
find the distance
to
the
top
of the
water
in the well
To do
this
slowly
lower the Water Level Indicator
probe
into the well When the
probe
reaches the water
you
will hear the
Water Level Indicator
buzzer indicating
that water has been reached When
you
hear the
buzzer pull
back until it
stops
and
lower slow until the buzzer sounds
again
Read the increments
on the wire from the North side of the
casing
Increments in
100th
of an inch
This is the first
entry
on
the Data
Entry
Sheet
See below
From this
entry
calculate the volume of
water
in the
well
by
subtracting
it from the well
depth
casing height
Use the data sheet when
calculating
From this
result
use the chart to calculate the volume of water
gals
in the well Record this
value
on
the data sheet
If the
value does not
appear
on the sheet the
following
calculation
may
be used to
estimate
the volume
of water in the well
feet of
water
0.1632
est
volume of
water
in the well
With
the
pump
on drop
the
pump
tubing
into
the well until the
pump
starts to
pump
water
Pump
at
least
one
well
casing
volume of
water
from the monitor well
prior
to
obtaining
water
sample
This is
to remove
stagnant
water
in the well and obtain
water more
representative
of the monitored
aquifer
To do
this
fill the IL Monitor Well
Sample
Bottle
and
note
the time it takes to fill it
Multiply
the time
by
This is the
time it takes for the
pump
at
designeated
setting
to
pump
gallon
of well water
Multiply
the number of
gallons
of well water
by
the time it takes to
fill
one
gallon
This is the amount of time it takes to
pump
the volume of well
water out
Pump
at least
this volume of well
water out
Record the
amount
removed
on
the data
sheet
After
removing
the
required
volume of well
water
the well should be
sampled
while it is
recharging
The
rechargeing
of
Hutsonvilles
wells
range
from instantaneous
to
approximately
15 mm
depending
on
how
dry
the
season
has been
Rinse the
sample
bottle at least
times with well
water fill measure
the
pH
record
pH
and
place
in cooler of ice
only
necessary
if the
temperature
outside is
more
than 399
Pull
tubing
out while
pump
is
running
to remove most of the
remaining
water in the
tubing
Repeat
steps
1-7 for all
remaining
Monitor Wells
1-5
Filtering
Procedure
All
groundwater samples
to
be
analyzed
for
inorganic parameters
metals are to
be filtered
through
0.45 micron Cellulose
Nitrate filter membrane
Obtain
clean
filter flask for each
sample
clean
funnel
and
vacuum
pump
\1300\1375\6_l
Cover
Alternative
Analysis\1375
App
A4
MW
Sampling.doc
Electronic Filing - Received, Clerks' Office, August 11, 2008--AS 09-1, Exhibit 3
Filtering Procedure
continued
In order
to
equilibrate
the filter with
sample water
allow
approximately
100 mIs of
sample well mixed
to
pass through
the filter
and into
separate
filter
flask Once
equilibrated
place
the filter in the
proper
clean
filter flask
Connected the filter to the
flask connect the
pump
to
the
flask
and turn
on
the
pump
Empty
each monitor well
sample
well
mixed
into its
respective
filter
Preservation
Procedure
Empty
the
filtrate into its
sample
bottle
using
the
following preservative techniques
CIPS
Chemistry Program Manual
Metals 10
drops
of concentrated
HNO3
in 80-100
mIs of
sample
will
drop
the
pH
to less than
as
required
for
preservation
use
small
metals
bottle
All
other monitor well
preservative requirements are
time
related
during
storage
at 4C
use IL
bottles
TDS
needs to be
analyzed
within
days
Label all
the bottles
appropriately
and
fill
out the PDC Chain of
Custody
Form
Store the
sample
in
4C
refrigerator
until
shipped
to PDC Labs for
analyses
which at that time will
be trasferred
into
an
ice
cooler/chest
\I 300\I
375\6_1
Cover
Alternative
Analysis\I
375
App
A4
MW
Sampling.doc
Electronic Filing - Received, Clerks' Office, August 11, 2008--AS 09-1, Exhibit 3
Date
Collected
by
Hutsonville
Monitoring
Well
Samples
Depth
Volume of
Quantity
MW
to
top
of
Calculations
Water in
Discharged
pH
Water
Well
before
sampling
.50
21.25
12.42
18.17
20.67
Remarks
\1300\1375\6_1
Cover
Alternative
Analysis\1375
App
A4
MW
Sampling.doc
Electronic Filing - Received, Clerks' Office, August 11, 2008--AS 09-1, Exhibit 3
\13OO\I375\6_I
Cover
Alternative
Analysis\1375
App
A4
MW
Sampling.doc
Electronic Filing - Received, Clerks' Office, August 11, 2008--AS 09-1, Exhibit 3
APPENDIX A-i
SOIL BORING LOGS
Electronic Filing - Received, Clerks' Office, August 11, 2008--AS 09-1, Exhibit 3
CONTRACTED
WITH
LOCATION
-1 PLAN
DATUM
SURFACE
E1..Ev ____________
DATE
STARTED________
See jyk
CENTRAL ILLINOIS
DRILLING
COMPAtI
1909
OAKWOOD AVE
BLOOMINGTON
ILLINOIS
61701
309J 662-5968
CONTRACT
NO._________________
2_11J._PL
6.0
830am
7.0
55a
AR
dL
905a
ive
LC
F1..T
7..
iBlk c1v
wf tr
ocas
fihrs to5
LOG OF
BORING
J1A1S0iJ
NGNTES
PROJECT
NAME
Ji0i.VLjt
PCWFH SATIO1
BORtNG NO
COMPLET
1Li_ 8L
HAMMER WT
HAMMER
DROP__________
311
HOLE
DA.______________
CORE DIA
__________-
DESCRION
AA
SAMPLES
DE SCALE
NOTES
0.0
DRILUNG
METHOD.
ESA
.t
Lt hrn PanI1r
slit
wf
cTh
occ fc
sane
occs
p-rc-i
-34
roots ic.rtv ost 3.i
It br
safl1
VT
occr
rrive
tr silt
45Q
wet
Lt hrn s.ndstone
ro1st
8.J
Lt.ray
s.ricstoe
9.1
30
-.0
123
__i
6--7
.2
615L
4o/2
it
ED
BuSING
9.1
SL
1.1
--
-v
crav
co_
Scr ?n_1
pvc Ploe
Grre1
Rentonlt.e
Plun-
.0
an
i.e
Electronic Filing - Received, Clerks' Office, August 11, 2008--AS 09-1, Exhibit 3
CENTRAL
ILLiNOIS
DRILLING
COMPAt
1909 OAKW000
AVE
BLOOMINGTON
ILLINOIS
61701
309 662-5968
CONTRACTED WITH
HNSQN E.GIiEEis
PROJECT NAME
riJTS
POW
3TATION
SORJNC NO
LAL
Gr.r
silty c1y
wf
ti
sand occ.s
rvel
till
r2oist
WATER
2l08
DT s0 8OOa
BAR 11.0 10
iI
7.0
210
Screer IP.0
2PVC
tioe
rl
Gravel 2LY
enton.t
lj5
P1ur 2.Oru
131k
coa
refuse
IL
Occas
sJt
wet
LOCATION
DATUM
DATE
STARTED
21 08LL
CONTRACT NO
HAMMER WT
10
HAMMER
DROP
30
HOLEDA
______________
SURFACE ELEV
CORE DIA
ELEV
DESCRIPTION
COMPLETED
21.0L
53.3
0.fl
TPATA
SAMPLES
OEF-r4 SCALE BLOWS r-r NO
DRILLING
METHOD
IL
HSJ
rPE
RECOV.I
NOTES
55
--
Jt
r7-r
i1ty sand
fill
Tnoist
2.L
Brn ic
sanc1 wf
re_c eravel
tr silt
noi5t
4q49
8.L
Brn.-rav
rn-c
sand
wf
rrsvel
wet
5$
17
.ss
16
S$
Brn.-izrav
rn_c snc
wf frn rave1
wet
l7
SF
17
5.1
.0
17
21
ip
Ii
Electronic Filing - Received, Clerks' Office, August 11, 2008--AS 09-1, Exhibit 3
LOG OF
BORING
CONTRACTED wi-ru
HAISO1 ENGINEEriS
PROJECT NAME_
HUTSONVILLE
POWEIi
3T..TIO1J
LOCATION
P- PT.n
rT
CENTRAL ILLINOIS
DRILLING
COMPAIN
1909
OAKWOOD
AVE
BLOOMINGTON
ILL1NOS
61701
309 662-5968
BORING NO
______________________
CONTRACT
NO.____________________
SURFACE ELZV
HAMMER ._
CORE
____________
014.
HAMMER DROP
CASING_______________________
HOLE OI
Pu
DATE
STARTED
2_i nLL
COMPLED
2.1
fl1L
DRILLING
METHOD
T-ISA
Electronic Filing - Received, Clerks' Office, August 11, 2008--AS 09-1, Exhibit 3
CENTRAL
ILLINOIS
DRILLING
COMPAt
1909
OAKW000
AVE
BLOOMINGTON
ILLINOIS
61701
309662-5968
CONTRACTED WITH
PROJECT
NAME
i-UTSOi.\TILLE
POWEF
STpTION
LOCATION
____
DATUM
_______
SURFACE ELEY
DATE
STARTED_
Ph PTiN
2_C_PL
COMPLETED
BORING
NO
CONTRACT
NO
____________________
HAMMER WT
HAMMER
DROP
-r
HOLE DIA
CORE DIA
2_C_81j
DRILLING
METHOD
______________
HSP
ELEV
DESCRIPTION
J7
Rut
brn
siJty sand
fill
moist
Br
3C
sLrravei WI
ric
sanc occas
44.5
sandtore
wet
F-rfl
sand
Z3
17
mir
52427 See_
END OF
3iLIrG
9.4
18
WATER
l9
23
BAR f.O
AAR
17
iL
.Dfli
5.fl
.?p
_15
fA BIk
coa
refuse
wf sj1t
fill
mnc
Brr.
WI f-rn
fl
san
ifl
st
4-
_1J
.0
Li r1
St
ScreenT .4
2PVC
Gravel 914
Bntonite
Plurr
Grout 2.-
Electronic Filing - Received, Clerks' Office, August 11, 2008--AS 09-1, Exhibit 3
CENTRAL ILUNOS
DRILLING
COMPAN
1909
OAKW000 AVE
BLOOMtNGTON
ILLINOIS
61701
309 662-5968
.rAT
213
TT 9.0
9L
BAR 8.0 10
AAR --
JL
11
LOG
OF
BORING
CONTRACTED WITH
HA1SON
ENGINEERS
ROJET
NAME
1UTSOUVILL POWER STATION
LOCATION
PER PLAN
DATUM
______________
HAMMER WT
___________
HAMMER
DROP__________
HOLE
DATE
SURFACZ
STARTED
ELEV
_________
21
_____________
BORING
NO
CONTRACT Ne
CORE DIA
_____________
COMPLETED
2_v_RLI
ELEV
DESCRIPTION
STRATAIDPT-d
SAMPLES
NOTES
DEPTH SCALE BLOWS
FT.IHoJTrrEREcovj
Bak
asD-?alt
1.0
F-i rrrqvi 1.0
bn
DRILLING
METHOb
HSA
0.0
t-
rav1 Davernerit
rnter
i1s moist
5/.3
31k
si.1t wf fc
i.L_ .UUISL
Brn
s.1ty sand
wf
occa frn gravel
mo.st
ttc
rr.o
Br f-m sand iif
silt
pot
9.2
Br f-rn
rRve1
crn
i1t
5-57
43...3
3_3_Li
3-33
237
100/Li
_l_I
1.6
ss
18
o.c
ss
17
FS
ss
-4_
no
Lt.hr ndston
/co
tiP OF 3L-iG
13.LL
0ar
ar
Scr
12
2PVC Pj.oe
Grav1 13.Li
Bentonite
P2.rr 2.0
Electronic Filing - Received, Clerks' Office, August 11, 2008--AS 09-1, Exhibit 3
CENTRAL ILLINOIS
DRILLING
COMPAI
1909
OAKWOOD
AVE
BLOOMINGTON
ILLINOIS
61701
309 662-5968
Scien 18J
Pvc
ioe
3.0
sti
Gravel
P.0
entonte
Li
Bckfi...1e
iRr wf
Pluc-2.0
-q
?A 3m
rc
fc
rtve1
white
rock
LOG OF
BORING
CONTRACTED WITH
HAi Oi ENG INEERb
PROJECT NAME
tIUTL ONVILLE P0WEP
STATI3i
LOCATiON
PEh ELAN
DATIJ
_______
SURFACE
ELEV
DATE STARTED
2138L
COMPLETED
BORING
NO
____________
CONTRACT
NO
_____-
______________
HAMMER WT
1--0
HAMMER
DROP
HOLE DIA._
_____-
CORE DIA
--
____
_____________________
0.0
30
co1
refuse
hrn
crey
9-51 1t ir .c TIV2
1.2
ELEV
DESCRIPTION
STRATA
IDPrI-II
SAMPLES
DEDTH SCALET
BLOWS
o.Iov
NOTES
2-138L
HSA
DRILLING
METHOD.________________
WATfl
213l
DP
.0
2SOoi
BAR 11.0
35
AAR
WL
fS
5Lpir
occas
orcanic fibers
i11
troist
q-QS_A
Brr
wf
ccas
sanr
zr.re1
rI7oirt
rnoit
f-rn
sand wf/
nd
wet
Brn
rn-c
sano
wf
-ire1
occas blk
9L7 coal
rfue_rnottlinrr
Brn.crray rnc
sad
if fr
rravel
et
142
Em
....
-rrav
sctnrton
1C
cfld
rnoist
Gray
sancstone
33./
IC
-I
3-2-4
-j
3_hL
033
1615
3070
Old rrretal dr
ripe
1.0 we
boring rui
10
fro--
ss
17
0.1
F5
1R
0.c
12
12
SE-
i-fl
Li
av
.1
DC
..i
wet
E4
19.2
Electronic Filing - Received, Clerks' Office, August 11, 2008--AS 09-1, Exhibit 3
Ir iG
J.14
CONTRACTED
WITH
iA SQL NGIEis
CENTRAL ILLINOIS
DRILLING
COMPAJ
1909 OAKWOOD
AVE
BLOOMINGTON
ILLINOIS
61701
309662-5968
r-6
PROJECT
NAME
POWhR
TION
LOCATiON
PER__PLA1
_________
DATUM
_______________
SURFACE ELEV
CORE
DIA
DATE
STARTED
2_C_RLj
COMPLETED
2O_RLI-
BORING
NO
CONTRACT NO
HAMMER
WT._
HAMMER DROP
HOLE DIA
-______
Brrr
c72y
slit wf
77
f-Y
ELEV
DESCRTION
STATAIOETJ-J
SAMPLES
OCU
ISALEf
BLOWS
RECOV
________
0.0
NOTES
DRILLING
METHOD...______
30
or--mc
moist
Brn
c1.-vey silt
if
frrsa1c occaF
Tp rrol.t
-3-.5
Grirhrn
sltv
c1iv
t. 1.
OCC
crnl flOi5
.1_7_q3
Em fc
rrpvel wf
Cv
Far1d
43o.$
Er f-c sand
ret
Lt
hr
snciston
wf
SEiflG
75
SF
13
1.2
Fs
$S 12
55
ss 144
12_LL
3_L._5
.2.
8-R--
----15
80-20
WATER 2-Q-.L
Q.7\-
BAR
9.0 JQ3
AAR
WL
ioo
Screen 11.L
PVC
noe
Gra-vel
Li
Eent.onte 4.
Plur
su
Standpipe
3.
c.f
ci
f.c
_23
Electronic Filing - Received, Clerks' Office, August 11, 2008--AS 09-1, Exhibit 3
CENTRAL ILLINOIS
DRILLING
COMPA
1909
OAKWOOD
AVE
BLOOMINGTON
ILUNOLS 61701
309 662-5968
SA
WATER 2-8-84
DD
11.5
11i4
BAR
11.5
3t0
AAR---
WL
11.5
51
Screen 2S.fl
PVC pipe
?.0
stick
Gravel
25.0
3entoriite
114
Plup-
2.Os
entonit
ec1
12.O2
.0
Standipe
5.1
st
LOG
OF
BORING
CONTRACTED WITH
HANSON
ENGINERS
PROJECT NAME
HUTSCIT.7ILLE
POWLR
STATION
LOCATION
___________
DATUM
______________
_____
_______
SURFACE ELEV
_______
DATE
STARTED
288
PER
PLAN
ECRING NO
CONTRACT
NO
HAMMER wr
____
I4o
HAMMER OP
30
HOLE DIA
CORE DIA._
COMPLETED
ELEV
DESCRIPTION
STATAIDEP4I
SAMPLES
DRILLING
METHOD
0.0
By
clsvey
sfilt wi
tr
oc-ca
30
cri- SCALE BLOWS r.l NO TYPE IRECOV.J
OP
Li
NOTES
Uf.121C
c1arev
silt
.-.----
-j..
...__J_
LV.O
Lt hrri.-hrn
ssndy
silt
wf
clay
moist
8.1
Brn
sandy
silt
wf tr
1ay
very rioist
12.9
Brn
silt
wf
flR
very
moist_wet
o.3
3-27
-.5
23LI
3-3-5
-1-0
223
0-03
2-24
223
0-1-3
ss
17
ss
14
ss
16
1.7
ss
hi 1.2
ss 15
1.3
ss
16 1.7
ss
18 1.4
ss
17 1.2
5ar
pr
.1
tc
Ji
.0
.0
Electronic Filing - Received, Clerks' Office, August 11, 2008--AS 09-1, Exhibit 3
CENTRAL ILLINOIS
DRILLING
COMPAN
1909
OAKWOOD
AVE
BLOOMINGTON
ILLINOIS
61701
309 662-5968
HAMMER WT
1U-Urr
HAMMER DROP
HOLE DIA._
CORE DIA
CASiNG_______________________
COMPLETED
2_8..8L1
DRILLING
METHOD_
S-4
CONTRACTED WITH
PROJECT
NAME
LOCATION
____
LA
HANSON ENGINEhS
HUTS
ONVILLE POEH STATION
PEh
SURFACE
ELEV
DATESTARTED
29-.8L1
ELEV
8ORING NO
Al
CONTRACT
NO
DESCRIPTION
437.9
i5Brry
s.qndv s11t wf
0.0
SAMPLES
______
$SCALZ
BLows
FT
NO.1
QP
30
21
lenses
sand
wet
3rrr
sand
c2i4.wet
73L
3m f-c
rave1
wf
rnc sand
tr silt
4/
wt
2?U
NOTES
779
55
12
END OF BORIING
25.0
Electronic Filing - Received, Clerks' Office, August 11, 2008--AS 09-1, Exhibit 3
CENTRAL ILLINOiS
DRILLING
COMPAN
1909
OAKWOOD
AVE
BLOOMINGTON
ILLINOiS 61701
309662.5963
CONTRACTED WITH
HANSON
ENG1NEEflS
PROJECT NAME
HUTS ONVILLE
POWER
PLANT
LOCATION
PER PLAN
DATUM
SURFACE
ELEV
CORE DA
DATE STARTED
2R4
COMPLTn
2784
BORING
NO
CONTRACT
NO
HAMMER WT
114
HAMMER DROP
30
HOLE DIA..______
eIKI
ELEV
STRATA
OEPThJ
SAMPLES
DESCRIPTION
NOTES
DEPTH
SCALE 8LOWS
Fr NO TYPE
RECOV.I
3m
clayev
sl.LL
tr
san occas
4P.i
i-rc --
DRILLING
METHOD
0.0
30
HSA
Brn
silty
sand
Brn
silty sand
wi
tr
sand
-S
moist
LL2
8.14
3m
clarey silt
wf
tr
stnd rnoit
10.9
Brn
gray
clayey
sil
wf tr
sand
sm
zray
silt
pocket
moist
l7
Brrr sncv
silt
wf
occas
sane lens
257
235
355
233
222
223
1-2-2
012
ss
ss
55
ss
ss
ss
--ss
i8
1.6
17
1.1
18
3.2
l- 1.8
18
1.2
iS
1.7
18
1.2
IR
1.2
WATER
278-
PT
13.0
1l
AR
19.0
31
AAR
WL 12.0
2_R_84
Screen
2l
Gravel
Bentonite
Clay
3ent
13
Lo
PVC
pipe
L.9
stick
Bentonite
gTout 4-.o
Plu 2..0s
Standoipe
Baled
well
5l5pn
29f
11.0 water
5a
Oa
-1
.5
.5
ni
16
me-
.0
T/9
wet
1rrv
1Q.8
ii
Electronic Filing - Received, Clerks' Office, August 11, 2008--AS 09-1, Exhibit 3
CONTRACTED wrr
PROJECT
NAME
LOCAflON
DATUM
_______
SURFACE ELEV
DATE STARTED.
HANSON
ENGINTERS
HUTSOfILT.E
PO1ER STATION
pwj
jp
DESCRIPTTO
LOG
OF
BORJNG
CENTRAL ILLINOIS
DRILLING
COMPAI\
1909 OAKWOOD
AVE
BLOOMINGTON
ILLINOIS
61701
C309
662-5968
I.
BORING
NO
CONTRACT NO
_______
-AMMER
WT
1OT
HAMMER
DROP
-Ou
HOLE DIA
CORE DIA
CASING_________
278
COMPLETED
288k
DRILLING METHOD
HSA
OF
BDRING
21.5
Electronic Filing - Received, Clerks' Office, August 11, 2008--AS 09-1, Exhibit 3
CONTRACTED wrn
HANSON ENGINFERS
PROJECT NAME
HUTS ONVILLE
POWER
STATION
LOCATION_
330
OF STAI
DATUM
______________
/5O
Brrr
si.lty sand
wf
coal refuse occas
44g4
f1Th
Brn
sandy
silt wf
frn ra1Te1 concrete
flU moist
Brn
sandy silt
wf
ash coal
refuse
tr
cy
fill moist
439
8.1
Gray
sandy silt
wf
occas
gravel
gj
wet
0.6
8rn
sand
at ura ed
_3
3.4
Gray claey silt
wf
sand
occa
-3...5
rve1
Br rnc.sandwf
CENTRAL LUNOS
DRLLNG
COMPANY
1909
OAKW000 AVE
BLOOMINGTON
ILLINOIS
61701
LOG OF
BORING
3O962.5968
SURFACE ELEV
DATE
STARTED__214814
COMPLETED
BORING
NO
CONTRACT NO
CORE DIA.
r4i
HAMMER
WT
7t
HAMMER DROP
HOLE DIA
2-14-84
45_i
0.0
KI
ELEV
DESCRIPTION
STRATA
PT4
SAMPLES
______________
NOTES
J_DEPTH
SCALC
BLOWS FT NO TYPE
ECOV
QP
_________________
See
0.8
DRILLING
METHOD
30
HSA
2.3
2.2
2.3
10
5101
.__
Lk_19_
18
212
221 -_
011
0-33
172
__
22/1
100/3
ss
ss
ss
ss
ss
SE
18
16
10
14
13
iA
Brrr.-bi
f_
sand
irf
coal
rfuse 5.0
wf
sand
OC
oranic
firs
fill
wet
Brn- f-i
Sa
wf slit f11
rn 1st
Water 21414
DD 8.0
11151
rn
BAR
17.0
2Opm
AAR
WL
9.0
41
Concrte fr
gme
Cob1es cci
cret
2.c3.o
Screen lF.58
Pvc pIpe 8.5
3.0
stick
Gravel
iR.09.
entonlte
P.O
Cement
Groul
Plur .0
fa
Stand pipe
3m-
san3stone
933..
p-p
END
OF BoFING l8
20
Electronic Filing - Received, Clerks' Office, August 11, 2008--AS 09-1, Exhibit 3
12.3
5-
Project
Name/No
Boring
No
Start Date
Page
AmerenCIPS
Hutsonville
249-3
MW-3D
10/6/98
Driller
Logged by
End Date
Depth
to Water
AEC Indianapolis
IN
Steve Mueller/STMI
10/6/98
Feet
Boring
Depth
Boring
Diameter
Surface Elevation
Drill Method
Northing
25.5 Feet
Inches
453.7 Feet
HSA/air-rotary
3860.230
Well
Depth
Well Diameter
TOC
Elev
Sample
Method
Easting
25.1
Feet
2-inl.D
455.28 Feet
2-ft
split-spoon
3952.034
Description
.c
.2
.-
Cl
Cl
CD
Comments
123
446
ML
SANDY
SILL
little
tine-grained gravel
trace coal
fragments
medium
stiff
dark
brown
moist
topsoil
75
88
75
63
50
222
10
223
SAND
well
sorted/rounded
tine-grained
quartz
loose
light
brown to medium
brown
saturated below
ft
SP
SILTY SAND
GRAVEL poorly
sorted
SW-
medium-grained
sand
fine-grained
GW
subangularto
subround
gravel
loose
light
gray
saturated
10-
o_
-15-
20
25
Ss
5-It
by
4-in
square
steel
stick-up
casing
to
1.8
ft concrete
seal 0-3 ft
Bentonite/cement
grout
3-16
ft
1/4-in bentonite
chips
16-17 ft
Sch 40 PVC
casing
flush-threaded to 0.01-li
factory-slotted
PVC
screen 20.1-25.1 ft
fine silica sand
17-18
ft
silica sand
pack
18-
25.5 ft
4-in diam borehole
drilled 16-25.5 ft
using
air-hammer
LflN
quriz
END OFBORING -25.5fºe
30
Electronic Filing - Received, Clerks' Office, August 11, 2008--AS 09-1, Exhibit 3
oO
o0
Project
Name/No
Boring
No
Start Date
Page
AmerenCiPS
Hutsonville
249-3
MW-7D
10/5/98
Driller
Logged by
End Date
Depth
to Water
AEC indianapolis
IN
Steve Mueller/STMI
10/5/98
10 Feet
Boring
Depth
Boring
Diameter
Surface Elevation
Drill Method
Northing
45.0
Feet
8lnches
437.5 Feet
HSA
3175.915
Well
Depth
Well Diameter
TOC Elev
Sample
Method
Easting
44.3 Feet
2-inl.D
438.45 Feet
2-ft
split-spoon
5676.110
Description
.C
CO
.-
.2
Cl
00
Comments
Ia
a.
ML
75
100
100
fV
12
111
Ho
112
_i
001
20-
25-
586
30-
L..L/rr ILT
medium
plasticity
trace
roots fibers soft
medium
brown moist
saturated below 10 ft
STLTYSAND
well sorted/rounded
fine-grained
quartz grades
from
clayey
silt
above loose
medium
brown
saturated
S1LTYSANDGRAVEE11ted
medium-grained
quartz
sand trace
coarse sand fine-grained angular
to
subangular gravel
medium
dense pale
brown saturated
5-ft
by
4-in
square
steel
stick-up
casing
to 1.3
ft
concrete seal 0-3 ft
Bentonite/cement
grout
3-35 ft
SP
75
75
sP
GP
Electronic Filing - Received, Clerks' Office, August 11, 2008--AS 09-1, Exhibit 3
Project
Name/No
Boring
No
Start
Date
Page
AmerenCIPS
Hutsonville
249-3
MW-7D
10/5/98
Driller
Logged by
End Date
Depth
to Water
AEC
Indianapolis
IN
Steve Mueller/STMI
10/5/98
10 Feet
Boring
Depth
Boring
Diameter
Surface Elevation
Drill Method
Northing
45.0 Feet
8lnches
437.5 Feet
HSA
3175.915
Well
Depth
Well Diameter
TOC
Elev
Sample
Method
Easting
44.3 Feet
2-inl.a
438.45 Feet
2-ft
split-spoon
5676.110
in
Description
.c
.2
...
.2
CD
Comments
Sch 40 Pvc
casing
cj
flush-threaded to
01
ii
sand
factory
slotted
vc
heave
40
screen
39 3-44 ft
fine silica sand 35-38 ft
silica sand
pack
38-
16 25
ff
Mt
.LAYEY SILT
medium
pIasticit
trace
__________
sand stiff brown
moist
END OFBORING 45 fee
50
55
60
65
Electronic Filing - Received, Clerks' Office, August 11, 2008--AS 09-1, Exhibit 3
Project
Name/No
Boring
No
Start
Date
Page
AmerenClPS
Hutsonville
249-3
MW-b
10/7/98
Driller
Logged by
End Date
Depth
to Water
AEC
Indianapolis
IN
Steve Mueller/STMI
10/7/98
2.5 Feet
Boring
Depth
Boring
Diameter
Surface Elevation
Drill Method
Northing
11 Feet
Inches
452.9
Feet
HSA
4730.478
Well
Depth
Well Diameter
TOC Elev
Sample
Method
Easting
10.7 Feet
2-in ID
454.23 Feet
2-ft
split-spoon
2559.807
Co
Cu
Cu
Cl
Description
-J
Cu
I-
CD
Cu
CD
Cu
ML
sP
122
122
126
25
20
25
50
50
Ui
50
100
63
tLAY1 ILI
vegeatea
witn
grass
soii
dark brown to
black
moist
topsoil
SILTY SAND
well
sorted/rounded
fine-grained
quartz
loose
yellowish
orange
with dark
orange
lamina
2-3 mm
saturated below 2.5 ft
SILTY SAND
well
sorted/rounded
SP
fine-grained
quartz laminated dense
light gray
to rust
colored predominantly
light
gray
below 7.5 ft saturated
weathered bedrock
Ss
SANDSTONE tine-grained quartz
ENDQFBORlNG-1TfŁe
Comments
o-lt
by
4-in
square
steel
stick-up casing
to 1.5
ft
Bentonite/cement
grout
0-3
ft
1/4-in bentonite
chips
3-4 ft
Sch 40 PVC
casing
flush-threaded
to 0.01 -ii
factory-slotted
PVC
screen 5.7-1
0.7
ft
silica sand
pack
4-11 ft
-10-
-15-
20
25--
30
Electronic Filing - Received, Clerks' Office, August 11, 2008--AS 09-1, Exhibit 3
Project
Name/No
Boring
No
Start Date
Page
AmerenCiPS
Hutsonville
249-3
MW-lCD
10/7/98
Driller
Logged by
End Date
Depth
to Water
AEC
Indianapolis
IN
Steve Mueller/STMI
10/7/98
2.5
Feet
Boring
Depth
Boring
Diameter
Surface Elevation
Drill Method
Northing
21.5 Feet
Inches
452.9 Feet
HSA
4729.427
Well
Depth
Well Diameter
TOC EIev
Sample
Method
Easting
21.3 Feet
2-inl.D
454.65 Feet
see MW-iC
log
2564.715
..
Description
.2
Cl
co
Comments
ML
sP
sP
Ss
see
MW-
10
-i0
drill
cuts
20
25--
LL.PYY lLI
grass
soft
dark brown to black moist
topsoil
SILTY
SAND
well
sorted/rounded
fine-grained
quartz
loose
yellowish
orange
with dark
orange
lamina
2-3 mm
saturated below
2.5 ft
SILTY SAND
well
sorted/rounded
fine-grained
quartz laminated dense
light gray
to rust
colored predominantly
light
gray
below 7.5 ft saturated
weathered bedrock
SANDSTONE
fine-grained quartz
becomes
medium-grained
trace
gravel
clasts
increasingly
well cemented/hard
very
difficult
to
auger
below 20 ft
END OFBDRING 2t5fºei
-n
oy
i-in
square
sieei
stick-up
casing
to 2.0
ft
Bentonite/cement
grout
0-13
ft
1/4-in bentonite
chips
13-14 ft
Sch 40
PVC
casing
sh-threaded to 0.01-li
factory-slotted
PVC
screen 16.3-21.3 ft
silica sand 14-15
ft
silica sand
pack
15-21.1
ft
based on MW-lU
boring log
501
30
Electronic Filing - Received, Clerks' Office, August 11, 2008--AS 09-1, Exhibit 3
Description
trace coal
fragments
mdium
medium brown
moist
topsoil
Comments
chips
3-4
ft
Sch
40 Pvc
casing
flush-threaded to 0.01-
factory-slotted
PVC
screen 4.5-14.5 if
silica sand
pack
4-15
END OFORING -l5 fee
Electronic Filing - Received, Clerks' Office, August 11, 2008--AS 09-1, Exhibit 3
coarse-grained
subangular
to
subround
quartz
trace fine
gravel
loose
light
brown
saturated below 12 ft
Bentonite/cement
grout
0-3.5
ft
1/4-in
bent
chips
3.5-5 ft
Sch 40 Pvc
casing
flush-threaded to
0.01-jr
factory-slotted
vc
screen 6.9-1 6.9
ft
fine silica sand 5-6 ft
silica sand
pack
6-17
Description
Comments
stick-up
casing
to 1.5
ft
Electronic Filing - Received, Clerks' Office, August 11, 2008--AS 09-1, Exhibit 3
123
SW
GW
IL
SAND
with
gravel
loose
dark
brown
moist
topsoil
SAND
well
sorted/rounded
tine- to
medium-grained quartz light
brown
saturated below
ft
5-it
by
4-in
square
steel
stick-up casing
to 2.0
it concrete
0-3 ft
Bentonite/cement
grout
3-6.3
ft
1/4-in bentonite
chips
6.3-7 ft
Sch 40
Pvc
casing
flush-threaded
to 0.01-u
factory-slotted
PVC
screen 9-14 it
fine
silica sand 7-8
ft
silica sand
pack
8-16.5
ft
Unslotted
casing/sediment
sump
14-16 ft
Project
Name/No
Boring
No
Start Date
Page
AmerenCiPS
Hutsonville
249-3
MW-13
10/6/98
Driller
Logged
by
End Date
Depth
to Water
AEC
Indianapolis
IN
Steve Mueller/STMI
10/6/98
Feet
Boring
Depth
Boring
Diameter
Surface Elevation
Drill Method
Northing
16.5
Feet
Inches
456.4 Feet
HSA
3961 .759
Well
Depth
Well Diameter
TOC Elev
Sample
Method
Easting
16.0 Feet
2-inl.D
458.03 Feet
2-ft
split-spoon
4241 .200
Description
.2
ft
.2
Comments
25
SM
50
SP
122
based
on
drill
cuttings
and
geologic log
for
geoprobe
GP-4
TLAYEYSANDGRAVEL
5orl
sorted
fine- to
coarse-grained
sand
fine-grained subangular
gravel loose
light
brown
saturated
e.
-10-
-15-
20
25-
SAND3
ON
Ss
END OFBORING
-16.5fºº
30
Electronic Filing - Received, Clerks' Office, August 11, 2008--AS 09-1, Exhibit 3
Natural Resource
Technology
Inc
SOIL BORING LOG INFORMATION
Standard Soil
Boring Log
Form
General Use
Rev 82000
Page
of
Facility/Project
Name
License/Permit/Monitoring
Number
Boring
Number
AMEREN
Energy
Generating
Hutsonville
Power P/ant
MW-/IA
Boring
Drilled
By
Firm name and
name
of crew chief
Date
Drilung
Started
Date Drilling Completed
Drilling
Method
Boart
Longyear
10/03/01
10/03/01
HSA
Randy
Radke
Facility
Well No
Unique
Well No
Common Well Name
Final Static Water Level
Surface Elevation
Borehole Diameter
Feet MSL
440.920 Feet MSL
8.25 inches
Boring
Location
3217.083
Feet
Local Grid Location
if applicable
State Plane
454 729
Feet
Os
Ow
County
Civil
Town/City
or
Village
Crawford
Hutsonville
Sample
Soil
Properties
.2
Soil/Rock
Description
And
Geologic Origin
For
Each
Major
Unit
cn
30
Co
.j
.j
0.
MW
O5
QL.L
gray
with
orange
mottling coarse
is
sand with
clay dry
friable
grades
to sand with
gravel
coarse
FILL
MWHR
.54
66
MWhR
5B
orange poorly graded
coarse
MWIIR
14
10
SAND with GRAVEL
brown
poorly
.5
graded rounded fine gravel/coarse
sand
sP
MWllR
lOlI.6 AIJD
poorly graded
medium to
1012
coarse
12
ll616 SAND with GRAVEL
brown poorly
graded rounded
fine
gravel/coarse
sand
MWhR
23
MWhR
i517
50/3 16
EO8@16Auger
Refusal
18
20
22
hereby certify
tha
the information
on this
form
is true and correct
to the
best of
my knowledge
Signature
Firm
Natural
Resource
Technology
Inc
Electronic Filing - Received, Clerks' Office, August 11, 2008--AS 09-1, Exhibit 3
NaturalResource
Technology
Inc
SOIL BORING
LOG INFORMATION
Standard Soil
Boring Log
Form
General
Use
Rev 82000
Page
lof2
Facility/Project
Name
License/Permit/MonItorIng
Number
Boring
Number
AMEREN
Energy Generating
Hutsonvi/le
Power Plant
MW14
Boring
Drilled
By
Firm name
and
name of crew chief
Date
Drilling
Started
Date
Drilling
Completed
Drilling
Method
Boart
Longyear
10/03/01
10/03/01
HSA
Randy
Radke
Facility
Well No
Unique
Well No
Common Weii Name
Final Static Water Level
Surface Eievatlon
Borehole Diameter
Feet HSL
440.930
Feet MSL
8.25 inches
Boring
LocatIon
2811.508
Feet
Local
Grid Location If
applicable
State Plane
5325.78/
Feet
Long
Os
Ow
County
Civil
Town/City or Village
Craw ford
Hutsonville
Sample
Soil Properties
.2
Soil/Rock Description
LL
And
Geologic Origin
For
.c
Each Maior Unit
...j
..j
a.
Q.
O76LLbrownlOYR4/3Inoist
77
nonplastic
///
MWl4
18
23
.5-4
23
ML
M4
18
///
MW14
76l26 SILT with SAND Drown
IOYR 4/3
18
low
plasticity
moist
10
yellowish
brown
IOYR 5/4 increase
plasticity
ML
MWl4
24
to medium
MWl4
12
1012
126l86 LEAN CLAY brown
7.5YR 4/2
.514
18
14
1015%
grey/orange mottling
medium
plaslcity
MW14
22
Il
CL
ISIT
/7/
//
MW14
18
II
MW14
20
.5 19
II
186 26 SAND with SILT wet nonplastic
2022
SM
MW14
22
23824 1seam medium
5_4.20
hereby
L_
certify
33
the information
on
this form is true and correct to the
s_
my knowledge
--
-__
Signature
Firm
Natural
Resource
Technology
Inc
Electronic Filing - Received, Clerks' Office, August 11, 2008--AS 09-1, Exhibit 3
ng
Hutsonvllie
Power Plant
MWl4
cont
Page
of
7n
Sample
Soil
Properties
Soil/Rock
Description
And
Geologic Origin
For
Each
Major
Unit
Cl
-j
2426 SAND with SILT as above
HW14
12
2527
18
MW14
23
28
.529
18
30
MW14
3032
20
SM
2639 SAND with GRAVEL coarse
sand platy
fine
gravel
poorly graded
gravel
becomes rounded
LEAN
CLAY with Gravel
seam gray
SY
5/I
rounded fIne
27% shell
fragments
MW14
.534
18
33
55
SP
CL
sP
SP
EQS
39
Advance
Hydropunc
discrete
water
sampler
Orillers
note
sand and
gravel
as
above
34
36
38
40
42
44
46
48
50
52
54
56
58
60
62
Electronic Filing - Received, Clerks' Office, August 11, 2008--AS 09-1, Exhibit 3
Natural Resource
Technology
Inc
SOIL BORING
LOG INFORMATION
Standard Soil
Boring Log
Form
General
Use
Rev 52000
Page
of
Facility/Project
Name
License/Permit/Monitoring
Number
Boring
Number
AMEREN
Energy Generating
Hutsonville
Power
Plant
TW
Boring
Drifled
By
Firm name and name of crew
chief
Date
Drilling
Started
Date
Drilling Completed
Drilling
Method
Boart
Longyear
10/02/0/
10/02/01
HSA
Randy
Radke
Facility
Well No
Unique
Well No
Common Well Name
Final Static Water Level
Surface Elevation
Borehole
Diameter
Feet
MSL
437.8/4 Feet MSL
8.25 inches
Boring
Location
3717.203
Feet
Local Grid Location
If
applicable
Let
State Plane
5605.47/
Feet
Long
i...i
Os
ON
County
Civil Town/City or
Village
Crawford
Hutson villa
Sample
Soil Properties
Soil/Rock
Description
._j
Li.
And
Geologic Origin
For
Each Major Unit
ci
..
..j
D_j XC
OW ZO ...j_l 0...-
058 SILT with SAND
very
dark Drown
lOY
2/2 grades
from
topsoil
trace
organics
throughout
ML
.54
33
iii
18
5823 LEAN CLAY brown
IOYR 4/3 medium
plasticity
moist
weak
red
2.SY 5/3 trace orange
mottling
7W
18
TW
2H
20
trace horizontal fracture wet
TW
II
5i4.W4
CL//
510% lIne sand
22
1517
18
16
7/
very
dark
gray
2.5Y 3/I trace wood and
TM
whIte shell
fragments
.519
20
1/24
-20
//
7W
24
1/24
2022
-22
--
.524
tO
1/24
23256
5.ÆJI very
dark
gray
2.5Y
3/I
hereby certify
that the information
on
this form is true and correct
to the Dest of
my knowledge
Signature
Firm
Natural
Resource
Technology
Inc
Electronic Filing - Received, Clerks' Office, August 11, 2008--AS 09-1, Exhibit 3
rig
Hutsonville
Power Plant
1W
cont
Sample
Soil Properties
.G
Soil/Rock
Description
And
Geologic Origin
For
Each
Major Unit
fli
._j
0..
C.
..j
0.
l0
1W
2527
1W
.520
20
medium loose wet
Page
of
1/24
22
22
28
910
SP
1W
46
3032
20
-__25626
LEAN CLAY
as
above
26276 SAND with GRAVEL
poorly graded
SP
coarse
sand
fine
gravel
rounded
27631
SAND gray/black
and
white
poorly
graded
medium
to coarse Increased
coarsness
with
depth
31326 SAND and GRAVEL coarse
sand
poorly graded
fIne
gravel
rounded
1W
12
1W
24
1W
24
326396
gray poorly graded
medium
to
coarse
515%
gravel
II
II
22
34
36
10
SP
EOB
396
34
36
38
40
42
44
46
48
50
52
54
56
58
60
62
Electronic Filing - Received, Clerks' Office, August 11, 2008--AS 09-1, Exhibit 3
Natural
Resource
Technology
Steve
Boart
Longyear
SOIL
BORING
LOG
Page
of
Facility/Project
Name
License/PermiliMonitoring
Number
Boring
Number
Ameren Hutsonville Power Station
Drilling
TW-
5s
Boring
Drilled
By
Name of crew chief first
last
and
Firm
Date
Drilling
Started
5/1/2004
Date
Drilling
Completed
Drilling
Method
hollow
stem
5/1/2004
auger
Unique
Well No
Well ID No
Common Well Name
Final
Static Water Level
Surface Elevation
Borehole Diameter
TW-1 15s
Feet MSL
438.4 Feet MSL
8.3 inches
Local Grid
Origin
estimated
or
Boring
Location
Local Grid Location
State
Plane
S/C/N
Lat
1/4 of
1/4 of Section
Long
8046.72
Feet
1176886.34 Feet
Facility
ID
County
State
Civil
Town/City/
or
Village
Hutsonville
Samp
Soil/Rock
Description
And
Geologic Origin
For
.3
.2 Cl
-c
Each
Major
Unit
Comments/
cz
Lab Test
0-36 Drilled without
sampling-see
log
TW-
Sd for
complete description
CL
SC
10
CH
15
20
CL
-25
GP
30
.b
SW
35
SW
END OF BORING AT
36
Well set at 35
hereby certify
that the information
on
this form is
true
and
correct to
the best of
my knowledge
Signatue-
Firm
Natural Resource
Technology
Inc
Tel
262
523-9000
tIr_-__
Paula
Richar4on
23713
Paul
Road
Unit
Pewaukee
WI 53072
Fax
262
523-9001
Template
NRT BORING LOG
Project
375
LOGS.GPJ
Electronic Filing - Received, Clerks' Office, August 11, 2008--AS 09-1, Exhibit 3
Natural
Resource
Technology
SOIL BORING LOG
Page
of
Facility/Project
Name
License/Permit/Monitoring
Number
Boring
Number
Ameren Hutsonville Power Station
Drilling
1W-i 5d
Boring
Drilled
By
Name
of
crew
chief
first last
and Firm
Date
Drilling
Started
Date
Drilling
Completed
Drilling
Method
Steve
Boart
Longyear
4/29/2004
5/1/2004
hsa core
Unique
Well No
WeH ID No
Common Well Name
Final
Static Water
Level
Surface
Elevation
Borehole Diameter
TW-l 15d
Feet MSL
438.4 Feet MSL
8.3 inches
Local Grid
Origin
estimated
or
Boring
Location
Local Grid Location
State Plane
S/C/N
Lat
1/4 of
1/4 of Section
Long
8052.56 Feet
1176882.3 Feet
Facility
ID
County
State
Civil
Town/City
or Village
Hutsonville
Samp
Soil/Rock
Description
And
Geologic Ongtn
For
.3
U-
.9
ID
RIM
Each
Major
Unit
Comments
Lab Test
0-3.5 SANDY
CLAY
very
dark
greyish
brown
10
YR
3/2
very
fine
sand
moist
CL
3.5-6 CLAYEY
SANI
mottled
grey-brown
to
24
tan
very
fine
sand
moist
SS
24
SC
6-22 FAT
CLAY
brown
10
YR
4/3 soft
plastic
moist
24
SS
24
24
10
SS
CH
24
SS
24
wet at 13
24
SS
24
15
hereby certify
that the information
on this form is true and correct to the best of
my
knowledge
Siture
Firm
Natural Resource
Technology
inc
Tel
262
523-9000
/ccii_a..z.l.m____
Paula Richard
on
23713
Paul
Road
Unit
Pewaukee
WI 53072
Fax
262
523-9001
Template
NRT
BORING LOG
Project
375 LOOS.GPJ
Electronic Filing - Received, Clerks' Office, August 11, 2008--AS 09-1, Exhibit 3
6-22 FAT
CLAY
brown
10
YR
4/3 soft
plastic
moist
at
16 color
change
to
olive
grey
5Y
5/2
at 19.8
sand
seam very
fine sand
20-22 trace
very
fine sand
22-22.9 SANDY CLAY
22.9-32
POORLY GRADEDGRAVEL WITH
SAND
olive
grey
5Y 5/2 rounded
very
fine
to
fine sand
32-33 WELL GRADED
SANU
fine
to
coarse
jrace
rounded
gravel
33-36 WELL GRADED SAND WITH
GRAVEL
very
fine to coarse
sand
fine to
medium
gravel
rounded
36-39 POORLY GRADED
SANI
very
fine
to
medium
trace
gravel
rounded
SW
GW
Natural
Resource
Technology
It
Boring
Number
TW-1
lShge
Sam
Soil/Rock
Description
And
Geologic Origin
For
RQD/
Each
Major
Unit
Comments/
ZU
Lab Test
of
SS
10
SS
II
SS
12
SS
13
ss
14
SS
15
SS
16
ss
17
SS
18
SS
19
SS
20
sS
24
24
24
24
24
24
24
24
24
24
24
24
24
24
14
24
24
14
20
25
30
35
CH
CL
GP
SW
SW
Sp
39-40 WELL GRADED SAND WITH
GRAVEL fine
to coarse
gravel and sand
21
24
SS
II
Electronic Filing - Received, Clerks' Office, August 11, 2008--AS 09-1, Exhibit 3
40-42 WELL GRADED GRAVEL WITH
GW
22
24
SAND fine to coarse sand fine to coarse
SS
12
\gravel
rounded
42-58 WELL GRADED SANU
fine to
coarse
sand
trace
gravel
rounded
gravelly
sand
seam
fine to coarse
gravel
at
24
24
SS
13
25
24
SS
14
26
24
50
SW
SS
13
27
24
SS
16
28
24
ss
15
55
29
24
SS
30
24
SS
S.
60
31
24
SS
..
32
24
SS
24
S.
33
24
SS
12
65
14
SI
11
Natural
Resource
iTechnoloY
BoingNumber
TW-Il5thge
of
Sampj
._
Soil/Rock
Descnption
And
Geologic
Ongrn
For
-o_
RQDI
LL
-E
Each
Major
Unit
Comments/
Lab Test
58-70 WELL GRADED GRAVEL WITH
SAND
fine to
coarse sand
fine to coarse
gravel
rounded
34
24
SS
Electronic Filing - Received, Clerks' Office, August 11, 2008--AS 09-1, Exhibit 3
58-70 WELL GRADED GRAVEL WITH
SAND
fine to coarse
sand
fine to coarse
gravel
rounded
70-74 WELL GRADED
SAN
fine to coarse
88-90 WELL GRADED
SANU
very
fine to
medium
181
.b.
SI
.b.
.b
0i
.b
11
Natural
Resource
Technology
Boring
Number
Sam
Soil/Rock
Description
And
Geologic Ongin
For
RQD/
Each
Major
Unit
Comments/
Lab Test
TWI
5da2e
of
74-88
Logged
from
cuttingsWELL
GRADED
GRAVEL WITH
SANU
fine to
coarse sand
fine to
coarse
gravel
70
75
80
85
35
SS
36
ss
37
SS
38
SS
39
SS
40
SS
41
SS
42
SS
43
SS
44
SS
45
SS
46
COF
24
24
24
24
24
24
24
24
24
24
24
12
180
Gravel starts
coming up
in
cuttings
GW
SW
GW
SW
HAL
90-105
SHALE grey-blue friable
moist
Electronic Filing - Received, Clerks' Office, August 11, 2008--AS 09-1, Exhibit 3
-11
CD
tl
CD
00
-ZLZ
CD
CD
CD
cD
Electronic Filing - Received, Clerks' Office, August 11, 2008--AS 09-1, Exhibit 3
_J
Natural
Resource
Technology
SOIL BORING
LOG
Page
of
Facility/Project
Name
License/PermillMonitoring
Number
IBoring
Number
Ameren Hutsonville Power Station
Drilling
TW-
Boring
Drilled
By
Name of crew
chief
first
last
and Firm
Date
Drilling
Started
Date
Drilling Completed
Drilling
Method
Steve
Boart
Longyear
4/26/2004
4/28/2004
hsa core
Unique
Well No
Well ID No
Common
Well Name
Final
Static
Water
Level
Surface Elevation
Borehole
Diameter
1W-I 16
Feet MSL
437.5 Feet MSL
8.3 inches
Local
Grid
Origin
estimated
or Boring
Location
Local Grid Location
State Plane
S/C/N
Lat
1/4
of
1/4 of Section
Long
8d
34.1384 Feet
Li SI 175442.33
Feet Li
Facility
ID
County
State
Civil
Town/City/ or Village
Hutsonville
Sam
-o
Soil/Rock
Description
as
And
Geologic
Origin
For
C/
..J
RQD/
.0
Each
Major
Unit
Comments/
iC
Lab Test
0-3.5SILT
very
dark
greyish
brown
10
YR
SS
24
3/2
rootlets to
firm slightly
moist
ML
24
SS
12
3.5-4.8 SILTY
CLAY
very
dark
greyish
24
brown firm
slightly
moist
L/M
SS
24
4.8-16 FAT
CLAY
dark
yellowish
brown
1OYR 4/4 soft
moist
24
SS
24
24
SS
24
624
10
CH
SS
24
24
SS
24
24
at 14
very
moist
SS
24
15
hereby certify
that the information
on this form is true and correct to
the best of
my knowledge
Siuture
I11t
Natural Resource
Technology
Inc
Tel
262
523-9000
Paula
Richardon
23713
Paul
Road
Unit
Pewaukee
WI 53072
Fax
262
523-9001
Template
NRT BORING
LOG
.Project
375
LOGS.GPJ
Electronic Filing - Received, Clerks' Office, August 11, 2008--AS 09-1, Exhibit 3
Natural
Resource
Technology
II
Samp
.E
00
LL
SS
Boring
Number
TW-1 16
Soil/Rock
Description
And
Geologic Origin
For
Each
Major
Unit
-c
-L
C-
16-20.5 SANDY LEAN
CLAY
olive brown
2.5
4/3
very
fine
sand soft
wet
-c
C-
.color
change
to dark
grey
2.5
4/1
20.5-26.5CLAYEY
SANL
dark
grey very
fine
sand
wet
20
25
24
24
24
24
24
24
24
18
24
12
24
26.5-30CLAYEY
GRAVEI
fine
gravel
few
shell
fragments
wet
30-60 WELL GRADED
SAND
olive brown
2.5
4/4
fine to
coarse subangular
to
rounded wet
35
40
Electronic Filing - Received, Clerks' Office, August 11, 2008--AS 09-1, Exhibit 3
.J
Natural
Resource
Technology
Bong
Number
TW-116
Page
of
Samp
Soil/Rock
Description
c._
And
Geologic
Origin
For
ci
.J
U-
R1D/
-E
Each
Major
Unit
cj
Comments/
iZL
Lab Test
30-60 WELL GRADED
SANU
olive
brown
2.5
4/4
fine
to
coarse subangular
to
rounded
wet
24
10
24
50
12
Sw
24
24
6C
19
180
65
coRj
60-79
SHALE
grey-blue slightly
moist
friable
Electronic Filing - Received, Clerks' Office, August 11, 2008--AS 09-1, Exhibit 3
Number
and
Type
Length
Alt
Recoveredin
Blow
Counts
.1
DepthFrom
Surface
feet
ru
\O
CD
or
.o
rE
cD
-I
Th
rI
1j
1r
Ir1
cO
-oc
Hand
Pen
tsf
Field
Moisture
Condition
USCSSyniboI
Graphic
Log
PID/FID
ppm
-t
CD
-t
Well
Diagram
Electronic Filing - Received, Clerks' Office, August 11, 2008--AS 09-1, Exhibit 3
Natural
Resource
_______
Technology
SOIL BORING
LOG
Page
of
Faci
lily/Project
Name
License/Permit/Monitoring
Number
Boring
Number
Ameren Hutsonville Power Station
Drilling
TW-1 17
Boring
Drilled
By
Name of crew chief
first last
and Firm
Date
Drilling
Started
Date
Drilling Completed
Drilling
Method
Steve
hollow
stem
Boart
Longyear
4/28/2004
4/29/2004
auger
Unique
Welt No
Well ID No
Common
Welt Name
Final
Static
Water Level
Surface Elevation
Borehole Diameter
1W-I 17
Feet MSL
435.0 Feet MSL
8.3 inches
Local Grid
Origin
estimated
or
Boring
Location
Local
Grid Location
State Plane
S/C/N
Lat
1/4 of
1/4 of Section
Long
...............
......._.L
5267.78
Feet
179053.33
Feet LI
Facility
ID
County
State
Civil
Town/City
or
Village
Hutsonville
Samp
Soil/Rock
Description
E8
And
Geologic Ongin
For
c/D
RD/
t-
Each
Major
Unit
c._
u.
Comments
-J
uL
Lab Test
0-6 SANDY
LEAN
CLAY
dark olive
brown
2.5
3/3 very
fine
sand
slightly
moist
24
SS
24
CL
24
SS
6-7.8 FAT
CLAY
dark olive
brown high
toughness
and
plasticity
moist
CH
24
7.8-25 POORLY GRADED
SANP
dark
SS
10
yellowish
brown
10
YR
4/4
very
fine
wet
24
10
SS
12
SP
24
15
55L
10
hereby certify
that the information
on
this form is
true
and
correct to
the best of
my
knowledge
Siture
FilTh
Natural Resource
Technology
Inc
Tel
262
523-9000
/c..__S
Paula Richard
on
23713W
Paul
Road
Unit
Pewaukee
WI 53072
Fax
262
523-9001
Template
NRT BORING
LOG
Project
375 LOGS.GPJ
Electronic Filing - Received, Clerks' Office, August 11, 2008--AS 09-1, Exhibit 3
Natural
Resource
Technology
II
Samp
oo
Soil/Rock
Description
And
Geologic Origin
For
Each
Major
Unit
CO
-J
Boring
Number
TW-1
-C
C/
Cl
C.
C/
ZL
Sp
SW
GW
7.8-25 POORLY GRADED
SANL
dark
yellowish
brown
10
YR
4/4
very
fine
wet
trace
shell
fragments
at 16
25-26 WELL GRADED
SANU
fine to
.medium coarsens
downward
26-35 WELL GRADED
GRAVE1q
trace sand
and shell
fragments
rounded
grey clay
in shoe of
split
spoon
24
24
24
24
24
20
25
30
35
40
1l
Sq
SI
SI
Sq
SI
11
is
35-60 WELL GRADED
SANU
fine to coarse
SW
Electronic Filing - Received, Clerks' Office, August 11, 2008--AS 09-1, Exhibit 3
_4
Natural
Resource
Technology
it
Sam
oo
Zc
L1
Soil/Rock
Description
And
Geologic Origin
For
Each
Major
Unit
Boring
Number
b1
CD
cJ
t1D
LU
24
14
24
17
24
24
35-60 WELL GRADED
SAND
fine to coarse
60-75
Logged
from drill
cuttingsjOORLY
GRADED
GRAVEL
coarse
rounded
SW
45
50
55
60
65
.t
ob
ob
oc
O?
Went to
larger sample
interval
due
to drilling
conditions
GP
Electronic Filing - Received, Clerks' Office, August 11, 2008--AS 09-1, Exhibit 3
ob
0c
Natural
Resource
Technology
Ft
Samp
EG
L1
Boring
Number
Soil/Rock
Description
And
Geologic Origin
For
Each
Major
Unit
of
Ct
LLU
-C
/D
ID
Ct
RQD
Comments
Lab Test
60-75
Logged
from drill
cuttings.POORLY
GRADED
GRAVEl coarse
rounded
75-9O
Logged
from drill
cuttings
WELL
GRADED
SAND WITH GRAVEL
70
75
80
85
No
samples attempted
after 77 feet due to
drilling
conditions
24
18
SS
90-90.5 SHALE
END OF BORING AT
90.5
Well
set at 20
Electronic Filing - Received, Clerks' Office, August 11, 2008--AS 09-1, Exhibit 3
Natural
Resou rce
Technology
SOIL BORING LOG
Page
of
Facility/Project
Name
License/PermitJMonitoring
Number
Boring
Number
Ameren
Hutsonville
Power Station
Drilling
TW-
Boring
Drilled
By
Name of crew chief
first last
and Finit
Date
Drilling
Started
Date
Drilling Completed
Drilling
Method
Steve
hollow stem
Boart
Longyear
5/4/2004
5/4/2004
auger
Unique
Welt No
Well ID No
Common
Well Name
Final
Static Water
Level
Surface Elevation
Borehole Diameter
TW-1
18
Feet MSL
437.0 Feet MSL
8.3 inches
Local Grid
Origin
estimated
LI
or
Boring
Location
Local Grid Location
State Plane
S/C/N
Lat
1/4 of
1/4 of Section
Long
._
8090.86 Feet
LI
177978.73
Feet LI
Facility
ID
County
State
Civil
Towra/City/
or Village
Hutsonville
Soil/Rock
Description
And
Geologic Origin
For
.3
.2
n1
RD/
Each
Major
Unit
Comments/
Lab Test
0-3
SILT
brown
75
YR
4/2
24
SS
24
ML
3..5 dark reddish
grey
YR
4/2
trace sand
wet
at
5-6 WELL GRADED
SANL light
reddish
sw
.brown
YR
6/3
medium
to
fine
24
6-7.5
SILT
brown
7.5
YR
4/2
SS
24
ML
7.5-10 POORLY GRADED SAND WITH
24
SILT
SS
18
IC
l0-26POORLYGRADEDSANbrown7.5
YR
5/2
medium
grained
24
SS
24
24
SS
16
15
hereby certify
that the information
on this form is true and correct to the best of
my
knowledge
Signa5re
Firm
Natural
Resource
Technology
Inc
Tel
262
523-9000
/_-
-cc---
Paula Richard on
23713
Paul
Road
Unit
Pewaukee
WI 53072
Fax
262
523-9001
Template
NRT BORING
LOG
Project
1375
LOGS.GP
Electronic Filing - Received, Clerks' Office, August 11, 2008--AS 09-1, Exhibit 3
JNatural
Resource
Technology
Boring
Number
TW-1 18
Page
of
Soil/Rock
Description
AndGeologic
Origin
For
Cl
RQDI
Each
Major
Unit
Comments
Lab Test
-__________
IO-26 POORLY GRADED SAN1
brown
7.5
YR
5/2
medium
grained
24
SS
12
20
22 coarse
sand with few
gravel
25
END OF BORING AT 26 Well
set at
25
Electronic Filing - Received, Clerks' Office, August 11, 2008--AS 09-1, Exhibit 3
Natural
Resource
Technology
hereby certify
that the
information
on
this form is
true
and
correct to
the
best of
my
knowledge
Sig1re
Firm
Natural Resource
Technology
Inc
Tel
262
523-9000
Paula Richard on
23713
Paul
Road
Unit
Pewaukee
WI 53072
Fax
262
523-9001
Template
NRT BORING
LOG
Project
1375
LOGS.GPJ
SOIL BORING LOG
Page
of
Facility/Project
Name
License/Permit/Monitoring
Number
Boring
Number
Ameren Hutsonville Power Station
Drilling
TW-1 19
Boring
Drilled
By
Name of
crew
chief
first last
and Firm
Date
Drilling
Started
Date
Drilling
Completed
Drilling
Method
Steve
Boart
Longyear
5/1/2004
5/3/2004
hsa
core
Unique
Well No
Welt
ID No
Common Well Name
Final
Static Water
Level
Surface Etevation
Borehole Diameter
TW-1 19
Feet MSL
435.4 Feet MSL
8.3
inches
Local Grid
Origin
estimated
or Boring
Location
Local Grid Location
State Plane
S/C/N
Lat
1/4
of
1/4
of Section
Long
.._
6030.54 Feet
1181339.05
Feet
Facility
ID
County
State
Civil
TownlCity/
or
Village
Hutsonville
Samp
Soil/Rock
Description
en
And
Geologic Origin
For
Cl
.J
Each
Major
Unit
RD/
Comments/
u.
Lab Test
0-4 SILTY
CLAY
very
dark
greyish
brown
10
YR
3/2
firm
moist
1/MI
color
change
to
dark
greyish
brown
2.5
4/2
4-11.7 FAT
CLAY
dark
greyish
brown soft
moist
at
very
moist
CH
24
SS
24
at
wet
24
10
SS
24
24
11.7-41 POORLY GRADED
SANI
mottled
SS
16
orange
brown and
grey
brown
very
fine
wet
at 12 color
change
to dark
yellowish
brown
10
YR
4/4
SP
15
Electronic Filing - Received, Clerks' Office, August 11, 2008--AS 09-1, Exhibit 3
Number
and
Type
NJ
Length
Att
Recovered
in
CD
Blow
Counts
Depth
From
Surface
feet
CD
CD
eD
eo
CD4
CD
CD
-t
CD
CD
c/D
CD
CDCD
0C
00
iu
Hand
Pen
tsf
Field
Moisture
Condition
SC
SSymbol
Graphic
Log
PID/FID
ppm
go
CD
f1l11I
1111111111111111111
Well
Diagram
cM
r-o
Electronic Filing - Received, Clerks' Office, August 11, 2008--AS 09-1, Exhibit 3
Natural
Resource
Technology
it
Boring
Number
TW-1 19
Soil/Rock
Description
And
Geologic Origin
For
Each
Major
Unit
of
L1L
L/
41-45
WELL GRADED
SANU
very
fine to
coarse
trace
rounded
gravel
-J
RQD/
Comments/
Lab Test
SW
45-60 POORLY GRADED SAN
very
fine
to medium
60-80
Logged by
drill
cuttingsWELL
GRADED SAND
WITH
GRAVEL
to
WELL
GRADED GRAVEL WITH SAND
24
17
24
12
24
24
24
SP
50
55
60
65
f.
Gravel starts
coming up
in
cuttings
SW
Electronic Filing - Received, Clerks' Office, August 11, 2008--AS 09-1, Exhibit 3
Natural
Resource
Technology
Boring
Number
TW119
Page
o2
ac
Soil/Rock
Description
And
Geologic Origin
For
Each
Major
Unit
of
Ct
Ct
.2
/D
VJ
60-80
Logged by
drill
cuttingsWELL
GRADED SAND WITH GRAVEL to WELL
GRADED
GRAVEL WITH SAND
RQD/
Comments
Lab Test
70
75
SW
24
24
84
24
72
30
80-lOO
SHALE greyto
black laminated
poorly
lithified no
circulation of
drilling
water
20
COR
21
COP
.A
.f..
85
90
Electronic Filing - Received, Clerks' Office, August 11, 2008--AS 09-1, Exhibit 3
Natural
Resource
Technology
Boring
Number
TW-119
Page
of
Sampj
vu
cM
Eu
Soil/Rock
Description
And
Geologic Origin
For
Each
Major
Unit
22
COR
84
54
cu
LJL
-C
/D
80-100
SHALE
grey
to
black laminated
poorly lithified
no
circulation of
drilling
water
95
RQD/
Comments/
Lab Test
END OF BORING
AT
100
Well
set at
20
Electronic Filing - Received, Clerks' Office, August 11, 2008--AS 09-1, Exhibit 3
Natural
Resource
Technology
it
SOIL BORING LOG
.Page
of
Faci
lily/Project
Name
License/PermitlMonitoring
Number
Boring
Number
Ameren Hutsonville Power Station
Drilling
TW-120
Boring
Drilled
By
Name of crew chief first
last
and Firm
Date
Drilling
Started
Date
Drilling Completed
Drilling
Method
Steve
hollow stem
Boart
Longyear
5/3/2004
5/4/2004
auger
Unique
Well No
Well ID No
Common Well Name
Final Static Water Level
Surface Elevation
Borehole Diameter
TW-120
Feet MSL
446.8 Feet MSL
8.3 inches
Local Grid
Origin
estimated
or
Boring
Location
Local Grid Location
StatePlane
S/C/N
Lat___.___
1/4of
l/4ofSection
Long___i
8614.91
Feet
S1180157.14
Feet
Facility
1D
County
State
Civil
Town/City
or Village
Hutsonville
Samp
Soil/Rock
Description
And
Geologic
Origin
For
Each
Major
Unit
RD/
Comments
1Z
Lab Test
SS
17
0-0.5
TOPSOIL
.3
0.5-14 POORLY GRADED
SANli
brownish
yellow 10
YR
6/6
medium
24
SS
15
24
SS
15
24
SS
12
10
color
change
to reddtsh
yellow 7.5
YR
6/6
moist
24
14-36 POORLY GRADED SAND WITH
SS
10
15
GRAVEL
reddish
yellow
medium
sand
rounded
gravel
moist
hereby certify
that the information
on this form is true and correct to the best of
my
knowledge
Signat
Firm
/-
Paula Richardon
Natural23713W Resource
Paul
Road
Unit
Technology
Pewaukee
Inc
WI 53072
FaxTel
262262
523-9000523-9001
Template
NRT
BORING
LOG
Project
375
LOGS.GPJ
Electronic Filing - Received, Clerks' Office, August 11, 2008--AS 09-1, Exhibit 3
.j
.0.
03
.0
.0.
.0.
0.
Natural
Resource
Technology
Boring
Number
TW-120
Page
of
.3
Soil/Rock
Description
And
Geologic
Origin
For
.2
Each
Major
Unit
RQD/
cf
Commentsf
Lab Test
14-36 POORLY GRADED
SAND WITH
GRAVEI
reddish
yellow
medium
sand
rounded
gravel
moist
24
24
24
24
24
24
wet at 19
34-36
coarse
sand
SP
END OF BORING AT 36 Well set at 35
Electronic Filing - Received, Clerks' Office, August 11, 2008--AS 09-1, Exhibit 3
APPENDIX
ALTERNATIVE COST SUMMARY SHEETS
Electronic Filing - Received, Clerks' Office, August 11, 2008--AS 09-1, Exhibit 3
FINAL COVER ALTERNATiVE
Pozzolanic
Fly
Ash Final Cover Mix No
Leachate
Management
and
Final
Cover Alternatives
Report
NRT PROJECT NO 137516.1
Hutsonville Ash
Management
Facility
Unlined Ash
Impoundment
Pond
Closure
BY CAR
CHKD BY BRH
Anieren
Energy Generating
Hutsonville
Illinois
DATE 627/05
UT 5/19/05
SUB
cPNSULTINGCAPUALCOSTS
TOTAL
Consulting
Hydrogeologic
Evaluation
Engineering
Design System
Installation
Oversight
Final
System
Documentation
$500000
Jeotechnical Evaluation
SUBTOTAL
CONSTRUCTION CAPITAL COSTS
$500000
30%
Estimating
Contingency
$150000
TOTAL
CONSULTING CAPITAL COSTS
$650000
QUANTITY
UNIT
UNIT
HEM
SUB-
CONSTRUCTION
CAPITAL COSTS
COST
COST
TOTAL
Construction
$3602622
MobiDemoh
iS
$324108
$3241ffl4
Site Facilities
Maintenance
Erosion Controls
$8000
58.001
Regrade
Stockpiled
Ash to Fill
Depressions
50500
CV
$1.97
$99485
Excavate Ash From
Pond
for Pozzolanic
Mix
100480
Ci
$1.81
$181869
Blend Ash wI
Reagents
to Form Pozzolanic
Mix
100480
Ci
$1.86
$186893
Place 3.0 Pozzolanic
Ash Final Cover
100.480
C\
$1.61
$161773
Place
Fly
Ash
From Pond
to Construct Grade
120.700
CY
$3.42
$412794
Place
Rooting
Zone to
Compete
Protective
Layer
100.480
CV
$93
5935.469
Additional Construction Items Identified
by VFL
Dewalering
IS
$23951
$23951
Reagent
Cost
Cement8
12.824
TN
$95.00
$I2l8280
Relocate Sluice
Pipes
and
Supports
LS
550001
$50000
SUBTOTAL
CONSTRUCTION
CAPITAL COSTS
$3nt 12.622
30%
Estimating Contingency
$1 .lSt.SlRl
TOTAL CONSTRUCTION
CAPITAL COSTS
$4..6H3.422
TOTAL APITAL COSTS
Without
Additional
Excavation
in Pond Ai
$5333TOii11
ANSI IMPTIONS
Total area
of
Pond
for final cover estimated at
966000 SF approxirnatcly
22
aercs
Pozzolanic
Ily
ash cover consists
oF
foot PctnIariic
Fly
ash
t.ayer-3
foot Proteciive
Soil
Layer
Mix
Design
No
100%
liAsh c/ 10% cement
reagent dry weight basis
See VFL
Technology
Corporation
Tables
A.Ilestimaied final cover alternative
material
quantities
axe provided
in Table 3-3
Earthwork
quantities
based on VFL
Technology
Cotp
Estimates
Earthwork estimates
provided by
NRT in the
original
estimate
are within 5% of VFLs Earthwork Estimates
Estimate 100480
of ash excavated
from Pond
for
pozzolanic
final
cover
Costs for the
pozzolanic
fly
ash
cover
construction
based on estimates
provided by
VFL
Technology
Corporation
in their letter dated
Ma
2042
Several tine items from
Pozzolanic
Fly
Ash Final
Cover
Initial Ear/mate
are
incorporated
in this estimate as described below
Line Items Site
Vegetation Clearing t22 acres
Documentation
Surveying
and
Revegerat
ion
mulch seed fertilizer
are included in Mok/ljemob
Line
Item
Load and Haul to
Processing
Plant is included in Ereavate
Ash From Pond
Afar Pozo/anw
Mix
Line Items
Install Beneficial Reuse Ash for
Protective
Layer
Grain Size
Analysis/Geotechnical
Testing
and Site
Drainage
arc included in Install 10
Pozzolanic
c/i
Final over and install General Fill to
ontpete
Protector
lavcr
Construction
Capita
Cost not included in VFL Estimate
Revised
reagent
cost
provided by
VFL
Technology
Corporation
in Table
datcd
July
2.2002-3
cover 12824 tons of cment
Appendix C-2
Above is
preliminary
estimate and
may
be revised if selected
for final
design
the
consulting
costs
and
estimating contingency
provided
in this
spreadsheet
are conservative
actual
costs
may
be lower
10 For
ease
of
comparison
to initial
pozzolanic fly
ash final cover estimate
the same
consulting costs engineering
design costs
and
estimating contingency
have been used
--
--
1375 Pozzolanic
Estimates
200SJINAL
Pozzolanie
Cover
Mix No
Page
of
Natural
Resource
Technolog
Inc
Electronic Filing - Received, Clerks' Office, August 11, 2008--AS 09-1, Exhibit 3
IFINAL
COVER ALTERNATIVE
Pozzolanic
Fly
Ash Final Cover Mix No.2
Leachate
Management
and Final Cover Alternatives
Report
NRT PROJECT NO
1375/6.1
Hutsonville Ash
Management
Facility
Unlined Ash
hnpoundment Pond
Closure
BY CAR
CHICO BY BRH
Energy Generating
Hutsonville
Illinois
DAVE
6/27/05
EIT 5/i9/05
SUB-
CONSULTING
CAPITAL COSTS
TOTAL
Consulting
1-lydrogeologic
Evaluation
Engineering
Design System
Installation
Oversight
Final
System
Documentation
$500000
Geotechnical
Evaluation
SUBTOTAL
CONSTRUCTION CAPITAL
COSTS
$500000
3lYJ
Estimating
Contingency
$150000
TOTAL
CONSULTING CAPITAL COSTS
$650000
QUANTITY
UNIT
UNIT
ITEM
SUB-
CONSTRUCTION
CAPITAL COSTS
COST
COST
TOTAL
Construction
52.987117
Mob./Demob
LS
$324108
$324108
Site Facilities
Maintenance
Erosion Controls
LS
$8000
$8000
Regrade
Stockpiled
Ash
to
Fill
Depressions
50500
CY
$1.97
$99485
Excavate Ash From Pond
for Pozzolanic
Mix
100480
CY
$1.81
$181869
Blend Ash wI
Reagents
to
Form Pozzolanic
Mix
100480
Cr
$1.86
186893
Place 3.0 Pozzolanic
Ash Final Cover
100.480
CY
$1.61
$161773
Place
Fly
Ash
From
Pond
to Construct Grade
120700
CV
53.42
$412794
Place
Rooting
Zone to
Compete
Protective
Layer
100480
CV
$9.31
5935.469
Additional Construction Items Identified
by
VFL
Dewatering
LS
$23951
$23951
Reagent
Cost
Cement8
6345
TON
$95.00
$602775
Relocate Sluice
Pipes
and
Supports
LS
$50000
$50000
SUBTOTAL
CONSTRUCTION
CAPITAL COSTS
$2987117
30%
Estimating Contingency
$896.1
00
TOTAL CONSTRUCTION
CAPITAl COSTS
$3883217
AL
CAPLIAL COSTS Without Additional
Excavation
in Pond
$4533000
ASSUMPTIONS
Total area of Pond
for Final cover estimated at
966000 SF approximately
22
acres
Pozzotanic
fly
ash
cover
consists
of
foot Pozzolanic
Fly
ash
Layer
foot Protective
Soil
Layer
Mix
Design
No
100%
Fly
Ash wi 5%
cement
reagent
dry
weight
basis See VFt
Technology
Corporation
Tables
All estimated final cover
alternative
material
quantities
are
provided
in Table 3-3
Earthwork
quantities
based
on
VFL
Technology
Corp
Estimates
Earthwork estimates
provided by
NRT in the
original
estimate are within 54 of VFLs Earthwork
Estimates
Estimate
100480 yd3
of ash excavated
from Pond
for
pozzohsnic
final cover
Costs for the
pozzolanic
fly
ash cover construction
based
on
estimates
provided
VU
Technology
Corporation
in their letter dated
May 92002
Sescral tine iteiis froni Pazzolanie Fit Ash Final Cover
Initial Estimate
are
incorporated
in this estimate as described below
Line Items Site
Vegetation
Clearing
22
acres Documentation
Surveying
and
Revegetation mulch seed fertilizer
are included in Moh./Demab
Line Item Load asid Haul to
Processing
Plant iv included in Excavate
Ash Front
Pond
Afar
Pozzolanic
Ito
Line Items
Install Beneficial Reuse Ash for Protective
Layer
Grain Size
Analysis/Gcotechnical
Testing
and Site
Drainage
arc
included in Install 3.0
/ozrolanir Ash Final foier and Jns tall General Fill to
Compete
Prteective LAter
Construction
Capital
Cost not included in VU Estimate
11 Revised
reagent
cost
provided by
VFL
Technology
Corporation
rable
dated
July
2002
ft
cover
6345 tons
of
cement
Appendix C-2
Above is
preliminary
estimate and
may
he revised if
selected
for final
design
the
consulting
costs and
estimating
contingency
provided
in
this
spreadsheet
are conservative
actual
costs
may
be lower
10 For
ease
of
comparivon
Er initial
pozzolanic fly
ash final cover
estimate
the same
consuhing
costs
engineenng
design costs
and
estimating contingency
have been used
375 Pozzolsnic
Istinsates
2005._FINAI
Pozzolanic
over
Mis No
Psge
of
Nausrat
Itusosruc
techsology
Inc
Electronic Filing - Received, Clerks' Office, August 11, 2008--AS 09-1, Exhibit 3
FINAL COVER ALTERNATIVE
Pozzolanic
Fly
Ash Final
Cover Mix No
Leachate
Management
and Final Cover
Alternatives
Report
NItT PROJECr NO 375/6
1-lu
tstinville
Ash
Management
Facility
Unlined Ash
Impoundment
Pond
Closure
BY CAR
CHKD BY I3RH
Ameren
Energy Generating
Hutsonvillc illinois
DATE 6/27/05
FiT
5/19/05
SUB-
CONSULTING
CAPITAL
COSTS
Consultinc
Hydrogeologic
Evaluation
Engineering
Design System
tnstallation
Oversight
Final
System
Documentatiot
$500000
Cieiitechnical
Evaluation
SUBTOTAL CONSTRUCTION
CAPITAL COSTS
$500000
30%
Estimating Contingency
$150000
TOTAL
CONSULTING
CAPITAL COSTS
56500
QUANTiTY
UNIT
UNiT
hIM
SUB
CQNSTRUCTION
CAPITAL
COSTS
COST
COST
TOTAL
Construction
$3.24 1.575
MohiDemob
LS
$324108
$324108
Site
Facilities
Maintenance
Erosion Controls
LS
$8000
58.000
Regrade
Stockpiled
Ash to FIB
Depressions
50.500
CY
$1.97
$99485
Excavate Ash From Pond
for Pozzolanic
Mix
85.408
CV
$1.8
5154.588
Blend
Ash w/
Reagents
to Form Pozzolanic
Mix
85.408
CY
$1.86
5158859
Place
3.0 Pozzolanic
Ash Final Cover
85.408
CY
$1.61
$137507
Place
Fly
Ash From Pond
to Construct Grade
120700
CY
$3.42
$412394
Place
Rooting
Zone
to
Compete
Protective
Layer
100.48t
CY
$9.31
$935469
Additional
Construction Items Identified by VFL
Dewatering
LS
$23951
$23951
Soil Additive Cost-
Black
Sand8
23237
TON
$7.00
$162659
Reagent
Cost
Cement8
8.149
TON
$95.00
$774155
Relocate Sluice
Pipes
and
Supports
LS
$50000
$50000
SUBTOTAL CONSTRtJCIION
CAPITAL COSTS
$3241 .575
30%
Estimating
Contingency
$972500
TOTAL CONSTRUCTION
CAPI1AL COSTS
$4214075
CAPITAL
COSTS Without Additional Excavation
in Pond
$4864000
ASSUMPT IONS
Total
area
of Pond
for final
cover estimated at 966000
SE
approximately
22
acres
Piitlariic
fly
a-ai
cover consists
oft
foot Pozzolanic
Fly ash
taser
foot Protective
Soil Laser
Mix
Design
No
85%
Fly
Ash w/ 15% black sand
wet
weight
basis
6.iKi censent
reagent
dry weight basis
See
VFL
Technology
Corp
Tables
All estimated final
cover
alternative
material
quantities
are
provided
in Table
3-1
Earthwork
quantities
based on
VEtTechnology Corp
Estimates
Earthwork estimates
provided
my NRT in the
original
estimate arc within 5% of VEils
Earthwork Estimates
Estimate 85.4tH yd of ash excavated
from
Pond
for
pozzolanic
final
cover
Costa for the
pozzolamc
fly ash ower construction based
on estimates
provided by
VEt
Technology
Corporation
in their letter dated
May
2002
Several line items front
Piizzotamio
F/v As/s
toter Initial Estimate
are
incorporated
in this estimate as desenhed
below
Line
Items
Site
Vegetation Clearing
22 acresl tocuntentation
Surveying
and
Revegetation mulch seed fenilizerl are
included in ttmm/m
Line Item
Load and Haul to
Processing
Plant is
included in Excavate
As/i From Pond
for Pozzo/anit
Mix
Line Items
Iristalt
Beneficial
Reuse Ash for Protective
Layer
Grain Size
AnalysislGeotechnical
Testing
end Site
trainage
are included in Ivtssall
3.0 /rzo/anii
Ash PimmiI Cover
and install
General Fill am
Compete
Proteelo-t
Layer
Construction
Capital
Cost not included in VA Estimate
Revised
reagent
coat
provided by
VEt
Technology
Corporation tn
Table
dated
July
2002
Appendix
fi
cover
149 tons
of
cement
and
23237 Ions
of black
sand
Addition of black sand
tIl reduce the
reqwreomt
it for
fly
ash
excavation
by
IS 072
ey
wet
weight
busts
black
sand
Above
is
preliminary
estimate
and
may
be revised
if selected
for flmmsl
design
the
consultinmm
costs
and e.imnmning
contingency provided
in this
spreadsheet
are conservative
actual
costs
may
be lower
10 Fir
ease
of
conmparison
to initial
pozzolanic fly
ash final cover estimate the
same
consulting costs engineering design costs
and
estimating
contingency
have been used
1375
Pozzolanic
Estimates
2005_ANAL
Pozzolanic
Cover Mix Nw
Page
oil
Natural
Resource
Tectmnology
tnt
Electronic Filing - Received, Clerks' Office, August 11, 2008--AS 09-1, Exhibit 3
FINAL COVER ALTltNATIVE Pozzolanic
Fly
Ash Final Cover
Mix No 10
Leachate
Management
and Final
Cover Alternatives
Report
NRT PROJECT
NO. 1375/6.1
Hutsonville
Ash
Management
Facility
Unlined Ash
impoundment
Pond
Closure
BY CAR
CBKD BY BRH
Ameren
Energy
Generating
Hutsonville Illinois
tATE
6/27/05
EdT
5/19/05
SUB-
CONS
ULTING
CAPITAL
COSTS
TOTAL
Consulting
Hydrogeologic
Evaluation
Engineenng
Design System
Installation
Oversight
Final
System
Documentatiot
5500.000
Geotechnical
Evaluation
SUBTOTAL
CONSTRt.rCTION
CAPITAL COSTS
$500000
30%
Estimating Contingency
$150000
TOTAL
CONSULTING
CAPITAL COSTS
$650000
QUANTITY
NIT
UNIT
ITEM
SUB
CONSTRUCTION
CAPITAL OSTS
COST
COST
TOTAL
Construction
$4114 167
Moh.fflemob
LS
$324108
$324108
Site Facilities
Maintenance
Erosion Controls
ES
18.000
$8000
Regrade
Slockpiled
Ash to Fill
Depressions
50500
CT
$1 97
$99.4N5
Excavate Ash From Pond
for
Pozzolanic Mix
85408
CT
$1.81
$154588
Blend
Ash w/
Reagents
to Form Pozzolanic Mix
85408
CV
$1.86
$U8.859
Place
3.0 Pozzolanic
Ash
Final Cover
85.408
CT
$1.61
$137507
Place
Fly
Ash From Pond
to Construct Grade
120700
CV
$342
$4
12.794
Place
Rooting
Zone
to Compete Protective
Layer
100.480
CV
$9.31
$935469
Additional
Construction Items Identified
by
VFL
Dewatering
l.S
$23951
523951
Soil
Additive Cost
Black
Sand8
23.888
TON
$7.00
$167216
Reagent
Cost-
CementS
16602
TON
$95.00
$1577190
Relocate
Sluice
Pipes
and
Supports
LS
$50000
$50000
SUBTOTAL
CONSTRUCTION
CAPITAL COSTS
$4049167
30%
EsI imati
ng
Contingency
$1.21
4800
TO1AI CONSTRUCTION
CAPITAL COSTS
$5263967
ITOTAI
CAPITAL
COSTS Witliuut Additional Excavation
in
Pond
$5914000
ASStMv
FIONS
Total
area
of
Pond
for final cover estimated at 9h6.t00 SF
approximately
22
acres
Poaolattic
fir ash
cover consists
or
foot
Pozzolanie
Fly
ash
Layer
fool Protective
Soil
Layer
Mix
Design
No
0- 85%
Fly
Ash w/ 15% black
sand wet
weight
basis
I2.54
cement
reagent
dry
weight
basis
Sec VFL
Technology
Corp
Tables
AU
estimated fuel cover
alternative
material
quantities
are
provided
in Tahlr 3-3
Earthwork
quantities
based on VFL
Technology
Corp
Estimates
Earthwork
estimates
provided by
NRT in the
original
estimate
are
within
5%
of VFIs
Earthwork Estimates
Estirrtate
85.408
yd5 of ash excavstcd
frsstn
Pond
for
pozzolanic
final
cover
Costs for the
ponolantc
fly
ash
cover construction
based
on estimates
provided by
VA
Technology
Corporatiott
in their letter dated
May
2002
Several
ltne items from Poczolonjc
F/s
Ash Final
Cover Initial E.otmrtot
are
incorporated
in this estimate
as
described below
Line
Items Site
Vegetation Clearing
22
acres
Documentation
Surveying
and
Revegetation mulch
see
fertilizer
are
included in Mob Vent Is
Lttte Item
Lrnad and Haul
to
Processing
Plant
is
included in reovate Ash Front Pond
for Pozzolanr
MIX
Line Items
Install Beneficial
Reuse Ash for Protective
Layer
Grain Size
Analysis/Geotechnica
Testing
and Site
Drainage
ate included in nato
3.0 Pezzo/antt A.s/t Final over
and /n.rtaU
General Fill to
Compete
lrouetitr Lanvr
Construction
Capital
Cost not included in VFL Estimate
Revised
reagent
cost
provided by
VFL
Technology
Corporation
in Table
dated
July
2002
Appendix
C-TI -3 ft
cover
16602 tons of cement
and
23888 tons
of
black sand
Addition of black
sand will reduce the
requirement
for
fly
ash
excavation
by
15072
cy wet weight
basis black
sand
Above ts
preitmtnary
estimate
and
may
be revised
if selected
for final
design
the
consulting
costs and
estimating contingency provided
tn this
spreadsheet are
conservative
actual
coats
may
be
lower
10
For
ease
of
contpzst-ison
to initial
pstzzolanic
fly
ash final corer estimate the sattte
consulting
costs
engineering design
coats
and
estimating contingency
have bcett used
1375
Poerolanic
Estimates
2005
INAL
Pozzolanic
Cover Mix No 10
Page
of
Natural
Resource
Teehitology
Inc
Electronic Filing - Received, Clerks' Office, August 11, 2008--AS 09-1, Exhibit 3
FINAL COVER ALTERNATIVE
Pozzolanie
Fly
Ash Final Cover Mix
No.14
Leachate
Management
and Final Cover Alternatives
Report
NRT PROJECT
NO 1375/6
Hutsonville
Ash
Management
Facility
Unlined Ash
Impoundment Pond
Closure
BY CAR
CHXD
KY BRI-I
Ameren
Energy
Generating
Hutsonville Illinois
DATE 6/27/05
FiT
5/19/05
SUB-
CONSULTING
CAPITAL COSTS
TOTAL
out
oiting
Hydrogeologic
Evaluation
Engineering Design System Installation
Oversight
Final
System
Doeumentatiot
5500.000
Geotechnical
Evaluation
SUBTOTAL
CONSTRUCTION
CAPITAL COSTS
$500000
30%
Estimating Contingency
$150.XO
TOTAL CONSULTING CAPITAL
COSTS
$650000
QUANT1TY
UNIT
UNIT
ITEM
StiR-
CONSTRUCTION
CAPITAL COSTS
COST
COST
TOTAL
Construction
$3589501
\lohfDemoh
IS
$324108
$324108
Site Facilities
Maintenance
Erosion Controls
IS
$8000
58.000
Regrade
Stockpiled
Ash to Fill
Depressions
50500
CY
$1.97
$99485
Excavate Ash From Pond
for Pozzolanic Mix
70.336
CV
$L81
$127308
Blend Ash w/
Reagents
to
Form
Poazolanic Mix
70336
CV
$1.86
$130825
Place 3.0 Pozzolartic
Ash Final Cover
70336
CV
$1.61
$113241
Place
Fly
Ash From Pond
to Make Grade
120700
CV
$3.42
$4
12.794
PIat
L.uung
Zone to
Compete
Protective
Layer
100.480
CV
$9.31
$935.469
Additional
Construction Items
Identified by VFL
Dewatering
IS
$23951
$23951
Soil Additive Cost
FOD
Sludge8
45985
TON
$5.00
$229925
Reagent
Cost
Cement8
11941
TON
$95.00
$1134395
Relocate Sluice
Pipes
and
Supports
Ut
$50000
$30000
SUBTOTAL CONSTRUC11ON
CAPITAL COSTS
$3589501
30%
Estimating
Contingency
$1
.076.9X
TOTAL CONSTRUCtION CAPITAL
COSTS
$46e64o1
TOTAL CAPITAL
COStS
Without
Additional
Excavation
in Pond
$5316000
ASStJMPTJtNS
Total
area
of Pond
for final
cover estimated at 966000SF
apprortiniately
22
acres
Pozsolsntc
fly
ash
cover consists
of
foot Poezolanic
Fly
ash
Layer
foot
Prrrcetivc
Soil
Layer
Mts
Design
No
14 -70%
fly
Ash w/ 30t FGD
Sludge
wet
weight basis
10% cement
reagent
dry
wetght
basis
See VFL
Technology
Corp
Tables
All estimated tinal cover alternative
material
quantities
are
provided
in Table 33
Earthwork
quantities
based
on
VA.
Technology
Corp
Estimates
Earthwork estimates
provided by
NRT in the
original
estimate are within 5% of VFLs
Earthwork Estimates
Estimate
70336 yd5
of ash
excavated
limo
Pond
for
pozzolanie
final
cover
Costs
for
the
ponnlansc
fly
ash cover construction based on estimates
pruxided by
VFL
Technology
Corporatton ut
their
letter
dated
May
2002
Several
line items from
/uzo/anic
F/s
.4th Final Cover
Initial Estimate
are
irteorporated
tn
this estimate
as described
below
Line Items Sue
Vegetation
Cleanng
22 acres Documentation
Surveying
and
Reveeetation mulch seed
fertilizer
are
included in
MoblDentob
Lane Item Load and Haul to
Processrng
Plant is included in Esaernir Asr
Front Pond
Afor Pozzulwric
Mix
Ltne Items Install Beneflctsl
Reuse sb for
Protective
Layer
Grain Size
Analysis/Certeehnicsl
Testing
and Sits
Drainage
are
included in Install 3.0
Pozzolanig-
Ash Final Co ret and Install General Fill
to Compete
Pro
rective Layer
Construction
Capita
Cost not included in VA.
EstImate
Revised
reagent
cost
provided by
VFL
Technology
Corporation tn
Table 413
dated
July
2002
Appendix 0.2
ft
cover- 11941
tons
of
cement
and
45985 tons of FGD
Sludge
Addition of FCJD
sludge
will reduce the
requirement
for
fly
ash
excavation
by 30111.9
cy
wet
weight basis
R3D
sludge
Above
is
preltmsnarv estinrare
and
may
be revised
if selected
for final
design
the
consulting
costs and
estimating
contingency provided
in
this
spreadsheet
are conservative
actual
costs
may
be lower
10 For
ease
of
comparison
to tnitial
pozzolantc fly
ash final cover
estimate
the
same
consulting
costs
engineering
design
costs
and
cat.tniating
contingency
have been used
1375
Pozsolsntc
Eatinsates
2005JINAL
Pozzolaaic
user Mix No 14
Page
of
Natural
Resource
iechnology
Inc
Electronic Filing - Received, Clerks' Office, August 11, 2008--AS 09-1, Exhibit 3
LEACHAIE MANAGEMENT AL1ERNA
Groundwater
Extraction Combined with
Interceptor/Drain
Trench
Leachate
Management
and Final Cover Alternatives
Report
NRT PROJECT NO 1375/6.1
Hutsonville Ash
Management
Facility
Unlined Ash
Impoundment
Pond
Closure
BY CAR
CHKD BY BRH
Ameren
Energy Generating
Hutsonville
Illinois
DATE 6/27/05
SUB-
CONSULTING CAPITAL COSTS
TOTAL
Consulting
Hydrogeologic
Evaluation
Engineering
Design System
Installation
Oversight
Final
System
Documentatiot
$150000
SUBTOTAL
CONSTRUCTION
CAPITAL COSTS
$150000
30%
Estimating Contingency
$45000
TOTAL
CONSULTING
CAPITAL COSTS
$200000
SUBTOTAL
CONSTRUCTION
CAPITAL COSTS
30%
Estimating Contingency
TOTAL CONSTRUCTION
CAPITAL COSTS
QUANTITY
UNIT
UNIT
COST
$563200
$169000
$730000
ITOTAL
CAPITAL COSTS
93DUOU
LMAI
GW Extraction
Page
of
Natural
Resource
Technology
Inc
ITEM
COST
SUB
CONSTRUCTION
CAPITAL COSTS
TOTAL
General Construction
Design
Pump
Test
LS
$50000
$50000
Mob./Demob
IS
$15000
$15000
Erosion Controls
LS
$4000
$4000
Site
Vegetation
Clearing
iS
$5000
$5000
Startup/Testing
LS
$20000
$20000
Construction and Documentation
Surveying
LS
$10000
$10000
Restoration of Disturbed Areas
LS
$4000
$4000
Extraction
Well
Construction
Extraction Well Installation
WELL
$5000
$55000
Trenching
2600
LF
$4.00
$10400
Underground
Piping
to
Drainage
Collection Pond
2600
LF
$8.00
$20800
Electrical
and Control
Wiring
for Each Well
13050
LF
$5.00
$65300
Pre-Engineering System
Enclosure
and Foundation
LS
$40000
$40000
PLC Control
System
and Electrical
LS
$40000
$40000
Groundwater Extraction
Pumps
EA
$5000
$55000
Additional Trench Backfill
1300
TONS
$4.00
$5200
Stockpile
and
Replace
Trench Material
4000
CY
$5.00
$20000
South
Interceptor/Drain
Trench Construction
Interceptor
Trench
Excavation
1800
CY
$6.00
$10800
Install 8.5
Avg
Washed River Rock
2000
TONS
$12.00
$24000
Install
Bentonite Seal
90
TONS
$90.00
$8100
Install General Fill to Grade
6.5
Avg
750
CY
$4.00
$3000
Blend Overburden
Trench
Spoil
Into
Existing
Grade
1000
CY
$2.00
$2000
Install Leachate Collection
Sumps
EA
$10000
$30000
Pumps
for
Drainage
Collection
Sumps
Each
EA
$3000
$18000
HDPE Drain Tile For
Interceptor
Trench
1000
LF
$6.00
$6000
Underground Piping
to
Interim Pond
1450
LF
$8.00
$11600
Electrical
and Control
Wiring
for Each Well
6000
LF
$5.00
$30000
$108000
$311700
$143500
1375 Alternatives
Estimates
2005_FINAL
Electronic Filing - Received, Clerks' Office, August 11, 2008--AS 09-1, Exhibit 3
LEACHATE MANAGEMENT ALTERNATIVE
Groundwater
Extraction Combined with
Interceptor/Drain
Trench
Leachate
Management
and Final Cover Alternatives
Report
NRT PROJECT NO 1375/6.1
Hutsonville Ash
Management
Facility
Unlined Ash
Impoundment Pond
Closure
BY CAR
CHKD BY BRH
Ameren
Energy Generating
1-lutsonville
Illinois
DATE 6/27/05
SUB-
ANNUAL
COSTS
Annual
Costs
$43000
Sampling
Labor
Equipment
LS
$5000
$5000
Discharge
Sampling Analytical
LS
$3000
$3000
Annual
Equipment
Maintenance
LS
$5000
$5000
Electric
Costs
LS
$30000
$30000
ANNUAL SUBTOTAL
$43000
30%
Estimating Contingency
$12900
TOTAL ANNUAL
COSTS
$56.000
ASSUMPTIONS
Leachate
collection
along
east via 11 wells for
groundwater
extraction
200 ft
spacings
total flow of
approximately
10 to 25
gpm
Leachate
collection
along
south via
1000
foot
long interceptor/drain
trench
total flow of
approximately
10 to 25
gpm
Trench
design
Consists
of
toll washed river rock w/
HDPE drain
tile
followed
by
bentonite
seal
backftlled
to
grade
with
general
fill
This
options
assumes
no treatment of extracted leachate and
discharge directly
to
the Interim Pond and/or the
Drainage
Collection
Pond
Results of further
hydrogeological
assessment
and
design
pump
test could
impact
size and
scope
of the leachate collection
system
Additional
sources of estimated costs RS Means Site Work
Landscape
Cost Data
Above is
preliminary
estimate and
may
be revised if selected
for final
design
1375 Alternatives
Estimates
2005_FINAL
UvIAI
GW Extraction
Page
of
Natural
Resource
Technology
Inc
Electronic Filing - Received, Clerks' Office, August 11, 2008--AS 09-1, Exhibit 3
LEACHATE MANAGEMENT
ALTERNATIVE Groundwater Extraction from
Deep
Alluvial
Aquifer
Leachate
Management
and Final Cover Alternatives
Report
NRT PROJECT
NO 1375/6.1
Hutsonville
Ash
Management
Facility
Unlined
Ash
Impoundment
Pond
Closure
BY EJT
CHKD BY CAR
Ameren
Energy Generating
Hutsonville
Illinois
DATE 6/27/05
SUB-
CONSULTING
CAPITAL COSTS
TOTAl
Consulting
Hydrogeologic
Evaluation Engineering
Design System
Installation
Oversight
Final
System
Documentatio
$150000
SUBTOTAL
CONSTRUCTION
CAPITAL COSTS
$150000
30%
Estimating
Contingency
$45000
TOTAL
CONSULTING
CAPITAL COSTS
$200000
QUANTITY
UNIT
UNIT
ITEM
SUB-
CONSTRUCTION
CAPITAL COSTS
COST
COST
TOTAL
General
Construction
$108000
Design Pump
Test
LS
$50000
$50000
Mob./Demob
LS
$15.000
$15000
Erosion
Controls
LS
$4000
$4000
Site
Vegetation
Clearing
LS
$5.000
$5000
Startup/Testing
LS
$20000
$20.000
Construction
and Documentation
Surveying
$t0.000
$10000
Restoration
of Disturbed
Areas
LS
$4.000
$4.000
Extraction
Well Construction
$271200
Extraction
Well Installation
WELL
$15.000
$75000
Trenching
1.950
LF
$4.00
$7800
Underground
Piping
to
Drainage
Collection
Pond
1950
LF
$8.00
$15.600
Electrical and Control
Wiring
for Each Well
9.750
LF
$5.00
$48800
Pre-Engineered
System
Enclosure and Foundation
LS
$40000
$40000
PLC Control
System
and Electrical
LS
$40000
$40.000
Groundwater
Extraction
Pumps
EA
$5000
$25000
Additional
Trench Backfill
1.000
TONS
$4.00
$4000
Stockpile
and
Replace
Trench Material
3.000
CY
$5.00
$15000
SUBTOTAL
CONSTRUCTION
CAPITAL
COSTS
$379200
30%
Estimating
Contingency
$113800
TOTAL
CONSTRUCTION
CAPITAL COSTS
$490000
ITOTAL
CAPITAL
COSTS
$690000
ANNUAL COSTS
Annual
Costs
$40000
Sampling
Labor
Equipment
LS
$20000
$20000
Discharge Sampling Analytical
LS
$5000
$5000
Annual
Equipment
Maintenance
LS
$5000
$5000
Electric Costs
LS
$10000
$10000
ANNUAL SUBTOTAL
$40000
30%
Estimating
Contingency
$12000
TOTAL ANNUAL
COSTS
$52000
ASSUMPTIONS
Groundwater
extraction
at southeast
corner
of Pond
via
welts
200 ft
spacings
total 110w of
approximately
250
gpm
Groundwater
extraction
not
necessary
east of MW.6 since
existing
site
geology
information
suggests
that
aquifer
pinches
out east of this location
Groundwater
extraction
not
necessary
north of MW-7 based
upon
observed
extent
of
impact
to
deep
alluvium
Annual
OM cost
represents
average
lifecycle
cost
actual
OM costs will
likely
be
higher
than
average
initially
This
options
assumes
no treatment
of extracted
leachate
and
discharge
directly
to
the Interim
Pond
and/or
the
Drainage
Collection
Pond
Results
of further
hydrogeological
assessment
and
design
pump
test could
impact
size and
scope
of the teachate
collection
system
Additional
sources
of estimated
costs RS Means
Site Work
Landscape
Cost
Data
Above
is
preliminary
estimate
and
may
be revised
if selected
for final
design
1375
Alternatives
Estimates
2005_FINAL
LMAI
Deep GW Extraction
Page
of
Natural
Resource
Technology
Inc
Electronic Filing - Received, Clerks' Office, August 11, 2008--AS 09-1, Exhibit 3
LEACHATE MANAGEMENT ALTERNATIVE
Interceptor
DrainiTrench
Leachate
Management
and Final Cover Alternatives
Report
NRT PROJECT NO 1375/6.1
Hutsonville Ash
Management
Facility
Unlined Ash
Impoundment Pond
Closure
BY CAR
CHKD BY BRFI
Ameren
Energy Generating
Hutsonville
Illinois
DATE 6/27/05
SUB-
CONSULTING CAPITAL COSTS
TOTAL
Consulting
Hydrogeologic
Evaluation Engineering
Design System
Installation
Oversight
Final
System
Documentatiot
$150000
SUBTOTAL
CONSTRUCTION
CAPITAL COSTS
$150000
30%
Estimating Contingency
$45000
TOTAL
CONSULTING CAPITAL COSTS
$200000
QUANTITY
UNIT
UNIT
ITEM
SUB-
CONSTRUCTION
CAPITAL COSTS
COST
COST
TOTAL
General Construction
$184600
Design Pump
Test
LS
$25000
$25000
Mob./Demob
LS
$25000
$25000
Erosion
Controls
LS
$8000
$8000
Site
Vegetation
Clearing
LS
$10000
$10000
Pre-Engineering System
Enclosure
and Foundation
LS
$40000
$40000
PLC Control
System
and Electrical
LS
$30000
$30000
Blend Overburden
Trench
Spoil
Into
Existing
Grade
3300
CY
$2.00
$6600
Startup/Testing
LS
$20000
$20000
Documentation
Surveying
LS
$10000
$10000
Restoration of Disturbed Areas
LS
$10000
$10000
East
Interceptor/Drain Trench Construction
$247500
Interceptor
Trench Excavation
4800
CY
$6.00
$28800
Remove and
Replace
Sheet Pile Tiebacks
34
34
EA
$1000
$34000
Install 10
Washed River Rock
Drainage Layer
4200
TONS
$12.00
$50400
Install
Bentonite Seal
210
TONS
$90.00
$18900
Install General Fill
to
Grade
9.5
Avg
750
CY
$4.00
$3000
Install Leachate Collection
Sumps
EA
$10000
$40000
Pumps
for
Drainage
Collection
Sumps
Each
EA
$3000
$24000
HDPE Drain Tile For
Interceptor
Trench
2300
LF
$6.00
$13800
Underground piping
to
Drainage
Collection Pond
2200
LF
$8.00
$17600
Electrical
and
Control
Wiring
for Each Well
3400
LF
$5.00
$17000
South
Interceptor/Drain
Trench Construction
$141500
Interceptor
Trench Excavation
1800
CY
$6.00
$10800
Install
8.5
Avg
Washed River Rock
2000
TONS
$12.00
$24000
Install
Bentonite Seal
90
TONS
$90.00
$8100
Install General Fill to Grade
6.5 Avg
750
CY
$4.00
$3000
Install Leachate Collection
Sumps
EA
$10000
$30000
Pumps
for
Drainage
Collection
Sumps
Each
EA
$3000
$18000
HDPE Drain Tile For
Interceptor
Trench
1000
LF
$6.00
$6000
Underground Piping
to Interim Pond
1450
LF
$8.00
$11600
Electrical
and
Control
Wiring
for Each Well
6000
LF
$5.00
$30000
SUBTOTAL
CONSTRUCTION
CAPITAL COSTS
$573600
30%
Estimating Contingency
$172100
TOTAL
CONSTRUCTION
CAPITAL COSTS
$750000
ITOTAL
CAPITAL COSTS
$950000
1375 Alternatives
Estimates
2005_FINAL
LMA2
Interceptor
Trench
Page
of
Natural
Resource
Technology
Inc
Electronic Filing - Received, Clerks' Office, August 11, 2008--AS 09-1, Exhibit 3
LEACHATE MANAGEMENT ALTERNATIVE
Interceptor
Drain/Trench
Leachate
Management
and Final Cover Alternatives
Report
NRT
PROJECT
NO 1375/6.1
Hutsonville
Ash
Management
Facility
Unlined Ash
Impoundment Pond
Closure
BY CAR
CHKD BY BRH
Ameren
Energy Generating
Hutsonville
Illinois
DATE 6/27/05
SUB-
ANNUAL
COSTS
Annual
Costs
$36000
Sampling
Labor
Equipment
LS
$5000
$5000
Discharge
Sampling Analytical
LS
$3000
$3000
Annual
Equipment
Maintenance
LS
$8000
$8000
Electric
Costs
LS
$20000
$20000
ANNUAL SUBTOTAL
$36000
30%
Estimating Contingency
$10800
TOTAL ANNUAL COSTS
$47.000
ASSUMPTIONS
Leachate
collection
via
3300
foot
long interceptor
Drain/Trench
sloped
1.0% to seven
collection
sumps
total
groundwater
extraction
10-25 GPM
Trench
design
consists
of
to 10 washed river rock w/
HDPE drain
tile
followed
by
bentonite
seal
backfilled to
grade
with
general
fill
The east
trench is
designed
to extract
leachate
just
above
the
sandy
silt and
clay
alluvial
sand and
gravel
interface
along
the Wabash
River
This
options
assumes
no treatment of extracted leachate and
discharge directly
to
the Interim Pond and/or the
Drainage
Collection
Pond
Results of further
hydrogeological
assessment
and
design
pump
test could
impact
size and
scope
of the leachate collection
system
Additional
sources
of
estimated costs RS Means Site Work
Landscape
Cost Data
Above is
preliminary
estimate and
may
be revised if selected for final
design
1375 Altematives
Estimates
2005_FINAL
LN1A2
Interceptor
Trench
Page
of
Natural
Resource
Technology
Inc
Electronic Filing - Received, Clerks' Office, August 11, 2008--AS 09-1, Exhibit 3
LEACHATE MANAGEMENT ALTERNATIVE
Horizontal Wells
Leachate
Management
and Final Cover Alternatives
Report
NRT PROJECT NO 1375/6.1
Hutsonville Ash
Management
Facility
Unlined Ash
Impoundment
Pond
Closure
BY
CAR
CHKD BY BRH
Ameren
Energy Generating
Hutsonville
Illinois
DATE 6/27/05
SUB
CONSULTING CAPITAL COSTS
TOTAL
Consulting
Hydrogeologic
Evaluation
Engineering
Design System
Installation
Oversight
Final
System
Documentatioi
$150000
SUBTOTAL
CONSTRUCTION
CAPITAL COSTS
$150000
30%
Estimating Contingency
$45000
TOTAL
CONSULTING CAPITAL COSTS
$200000
QUANTITY
UNIT
UNIT
ITEM
SUB-
CONSTRUCTION
CAPITAL COSTS
COST
COST
TOTAL
General Construction
$118000
Design Pump
Test
LS
$50000
$50000
MobiDemob
LS
$25000
$25000
Erosion Controls
LS
$4000
$4000
Site
Vegetation
Clearing
LS
$5000
$5000
Startup/Testing
LS
$20000
$20000
Documentation
Surveying
LS
$10000
$10000
Restoration of Disturbed Areas
LS
$4000
$4000
Horizontal Well Construction
$382800
Horizontal Well
Drilling
and
Installation
2100
LF
$100.00
$210000
Horizontal Well Materials
2100
LF
$15.00
$31500
Pumps
for Horizontal Well
EA
$5000
$25000
Underground piping
to
Drainage
Collection Pond
600
LF
$8.00
$4800
Electrical
and Control
Wiring
for Each Well
6250
LF
$5.00
$31300
Pre-Engineering System
Enclosure
and Foundation
LS
$40000
$40000
PLC Control
System
and Electrical
LS
$40000
$40000
Blend Overburden
Trench
Spoil
Into
Existing
Grade
100
CY
$2.00
$200
South
Interceptor/Drain
Trench Construction
$143500
Interceptor
Trench
Excavation
1800
CY
$6.00
$10800
Install 8.5
Avg
Washed River Rock
2000
TONS
$12.00
$24000
Install
Bentonite Seal
90
TONS
$90.00
$8100
Install
General
Fill
to Grade 6.5
Avg
750
CY
$4.00
$3000
Blend Overburden
Trench
Spoil
Into
Existing
Grade
1000
CY
$2.00
$2000
Install Leachate Collection
Sumps
EA
$10000
$30000
Pumps
for
Drainage
Collection
Sumps
Each
EA
$3000
$18000
HDPE Drain Tile For
Interceptor
Trench
1.000
LF
$6.00
$6000
Underground Piping
to Interim Pond
1450
LF
$8.00
$11600
Electrical
and Control
Wiring
for Each Well
6000
LF
$5.00
$30000
SUBTOTAL
CONSTRUCTION
CAPITAL COSTS
$644300
30%
Estimating Contingency
$193300
TOTAL
CONSTRUCTION
CAPITAL COSTS
$840000
TOTAL CAPITAL COSTS
$1040000
1375 Alternatives
Estimates
2005_FINAL
Ltv.A3
Horizontal
Wells
Page
of
Natural
Resource
Technology
Inc
Electronic Filing - Received, Clerks' Office, August 11, 2008--AS 09-1, Exhibit 3
MANAGEMENT ALTERNATIVE
Horizontal Wells
Leachate
Management
and Final
Cover Alternatives
Report
NRT PROJECT NO 1375/6.1
Hutsonville Ash
Management
Facility
Unlined Ash
Impoundment
Pond
Closure
BY CAR
CHKD BY BRH
Ameren
Energy Generating
Hutsonville
Illinois
DATE 6/27/05
SUB-
ANNUAL COSTS
Annual
Costs
$43000
Sampling
Labor
Equipment
LS
$5000
$5000
Discharge
Sampling
Analytical
LS
$3000
$3000
Annual
Equipment
Maintenance
LS
$10000
$10000
Electric
Costs
LS
$25000
$25000
ANNUAL SUBTOTAL
$43000
30%
Estimating
Contingency
$12900
TOTAL ANNUAL COSTS
$56000
ASSUMPTIONS
Leachate
collection
via
4400 horizontal wells
and
500 horizontal
well with
submersible
pumps
total
groundwater
extraction
10-25 GPM
Leachate
collection
along
south via
1000
foot
long interceptor/drain
trench
total flow of
approximately
10
to
25
gpm
Horizontal
well
design
consists of
Dia HDPE Screen
Horizontal
well
system
installed
near
the
sandy
silt and
clay
alluvial sand and
gravel
interface
This
options
assumes
no treatment of extracted leachate and
discharge directly
to
the Interim Pond and/or the
Drainage
Collection
Pond
Results of further
hydrogeological
assessment
and
design
pump
test could
impact
size and
scope
of the leachate collection
system
Additional
sources of estimated costs RS Means Site Work
Landscape
Cost Data
Above is
preliminary
estimate and
may
be revised if selected
for final
design
1375 Alternatives
Estimates
2005_FINAL
LMA3
Horizontal
Welts
Page
of
Natural
Resource
Technology
tnc
Electronic Filing - Received, Clerks' Office, August 11, 2008--AS 09-1, Exhibit 3
LEACHATE MANAGEMENT ALTERNATIVE
Ash
Stabilization
Leachate
Management
and Final Cover Alternatives
Report
NRT PROJECT NO 1375/6.1
Hutsonville Ash
Management
Facility
Unlined Ash
Impoundment Pond
Closure
BY CAR
CHKD BY BRH
Ameren
Energy Generating
Hutsonville Illinois
DATE 6/27/05
EJT 5/I9/05
SUB-
CONSULTING CAPITAL COSTS
TOTAL
Consulting
Hydrogeologic
Evaluation Engineering
Design System
Installation
Oversight
Final
System
Documentatiot
$500000
SUBTOTAL
CONSTRUCTION
CAPITAL COSTS
$500000
30%
Estimating Contingency
$150000
TOTAL
CONSULTING CAPITAL COSTS
$650000
QUANTITY
UNIT
UNIT
ITEM
SUB-
CONSTRUCTION
CAPITAL COSTS
COST
COST
TOTAL
Construction
$l4529000
Bench Scale
Pilot
Testing
IS
$50000
$50000
Stabilization
Drill
Rig
MobilizationlDemob
IS
$250000
$250000
Fencing
and Erosion Control
LS
$20000
$20000
Stabilizing
Reagent
Materials
280000
CY
$19.00
$5320000
Treatment
Via Shallow Soil
Mixing Rig
SSM
280000
CY
$30.00
$8400000
Additional
Testing/Quality
Control
LS
$250000
$250000
Regrade
Overburden
From SSM Treatment
112000
CY
$2.00
$224000
Documentation
Surveying
1.5
$15000
$15000
SUBTOTAL
CONSTRUCTION
CAPITAL COSTS
$14529000
30%
Estimating Contingency
$4358700
TOTAL CONSTRUCTION
CAPITAL COSTS
$18900000
ITOTAL
CAPITAL COSTS
$20000000
ASSUMPTIONS
Total estimated area for saturated ash areal extent
790000
ft2
average
thickness
9.5
fi average
depth
to bottom of saturated
ash
25 ft
Based
on above estimates 280000
yd3 790000
ft2
9.5
ft targeted
for SSM treatment
This estimate is for stabilization
of saturated ash
only
See final
cover
estimates for
costs
associated with final landfill
cover
construction
less backfill
costs
overburden
from SSM
treatment
used for
fill
Earthwork
quantities
based on
1.6 ton
cubic
yard
CY ratio all earthwork
quantities
are
approximate
and need to be field verified
during design
Additional
sources of estimated costs
previous
ash landfill
cover construction
RS Means Site Work
Landscape
Cost Data
Above is
preliminary
estimate and
may
be revised if selected
for final
design
1375 Alternatives
Estimates
2005..FINAL
LMA4
Ash Stabilization
Page
of
Natural
Resource
Technology
Inc
Electronic Filing - Received, Clerks' Office, August 11, 2008--AS 09-1, Exhibit 3
LEACHATE MANAGEMENT ALTERNATIVE
Ash Removal
and
Disposal Recycling
or Beneficial Reuse
Leachate
Management
and Final Cover Alternatives
Report
NRT PROJECT NO 1375/6.1
Hutsonville Ash
Management
Facility
Unlined Ash
Impoundment
Pond
Closure
BY CAR
CHKD BY BRH
Ameren
Energy Generating
Hutsonville
Illinois
DATE 6/27/05
EJT
5/19/05
SUB-
CONSULTING CAPITAL COSTS
TOTAL
Consulting
Hydrogeologic
Evaluation Engineering
Design System
Installation
Oversight
Final
System
Documentatiot
$500000
SUBTOTAL
CONSTRUCTION
CAPITAL COSTS
$500000
30%
Estimating Contingency
$150000
TOTAL
CONSULTING CAPITAL COSTS
$650000
QUANTITY
UNIT
UNIT
ITEM
SUB-
CONSTRUCTION
CAPITAL COSTS
COST
COST
TOTAL
Construction
$17345000
Mob.IDemob
$50000.00
$50000
Site Facilities
Maintenance
$8000.00
$8000
Site
Vegetation
Clearing
22 acres
22
ACRES
$1000.00
$22000
Excavate Ash Overburden
Stockpile
550000
CY
$4.00
$2200000
Excavate
Saturated
Ash via Mudcat
Stockpile
280000
CY
$7.00
$1960000
Surface Water
Drainage
Control
Erosion Controls
L.S
$100000.00
$100000
Import
General Fill
Place
Compact
430000
CY
$8.40
$3612000
Off-Site
DisposallRecycling
of Saturated Ash
280000
CY
$25.50
$7140000
Overburden
Ash
ReplacementlCompactionlRegrade
550000
CY
$4.00
$2200000
Grain
Size
Analysis/Geotechnical
Testing
$16000.00
$16000
Documentation
Surveying
$15000.00
$15000
Revegetation
mulch seed fertilizer
22
ACRES
$1000.00
$22000
SUBTOTAL
CONSTRUCTION
CAPITAL COSTS
$17345000
30%
Estimating Contingency
$5203500
TOTAL
CONSTRUCTION
CAPITAL COSTS
$22500000
ITOTAL
CAPITAL COSTS
$23000000
ASSUMPTIONS
Total
estimated area for saturated ash areal extent
790000
ft2
average
thickness
9.5
ft
average
depth
to bottom of saturated ash
25 ft
Table 3-2
Based
on above estimates
280000
yd3 saturated ash 790000
ft2
9.5
ft
550000
yd3 overburden
ash 790000
ft2
15.5 ft 80000 yd3
2004
transfer
targeted
for excavation Table
3-2
Estimate includes removal of saturated ash and
replacement
with clean fill
to
approximately
feet above the static
water table
430000 yd3
Excavated
saturated ash to be
stockpiled
dried and
disposed/recycled
off-site
overburden
ash to be
replaced
atop
clean fill
See landfill
cap
estimates for costs
associated with final landfill cover construction
less backfill
costs
placement
of additional fill will raise
grade
Earthwork
quantities
based
on
1.6
ton
cubic
yard
CY ratio all earthwork
quantities
are
approximate
and need to be field verified
during design
Based
on
numbers discussed
during
6-15-01
meeting
including
$4.00/ton
to
haul clean fill On-Site
Off-site
disposal/recycling
of ash cost
based on
previous
cost estimates
prepared by
Hutsonville
Power Station
personnel
for similar off-site
disposal
$7.00/ton
transportation
$7.40/ton
disposal
$1
.50/ton
loading
1.6 tons/yd3
$25.50/yd3
This cost could
significantly
increase with variable landfill
pricing
Additional
sources of
estimated
Costs
previous
ash landfill cover
construction
RS Means Site Work
Landscape
Cost Data
10 Above is
preliminary
estimate and
may
be revised if selected
for final
design
1375 Alternatives
Estimates
2005_FINAL
LMA5
Ash
Removal Recycling
Page
of
Natural
Resource
Technology
Inc
Electronic Filing - Received, Clerks' Office, August 11, 2008--AS 09-1, Exhibit 3
LEACHATE MANAGEMENT ALTERNATIVE
Ash Removal
and Off-Site
Disposal
Leachate
Management
and Final Cover Alternatives
Report
NRT PROJECT NO 1375/6.1
Hutsonville Ash
Management
Facility
Unlined Ash
Impoundment
Pond
Closure
BY CAR
CHKD BY BRH
Ameren
Energy Generating
Hutsonville
Illinois
DATE 6/27/05
EJT
5/19/05
SUB-
CONSULTING CAPITAL COSTS
TOTAL
Consulting
Hydrogeologic
Evaluation
Engineering
Design System
Installation
Oversight
Final
System
Documentatiot
$500000
SUBTOTAL
CONSTRUCTION
CAPITAL COSTS
$500000
30%
Estimating Contingency
$150000
TOTAL
CONSULTING CAPITAL COSTS
$650000
QUANTITY
UNIT
UNIT
ITEM
SUB-
CONSTRUCTION
CAPITAL COSTS
COST
COST
TOTAL
Construction
$25558000
Mob./Demob
LS
$50000.00
$50000
Site Facilities
Maintenance
LS
$8000.00
$8000
Site
Vegetation
Clearing
22
acres
22
ACRES
$1000.00
$22000
Excavate
Ash
Stockpile
550000
CY
$4.00
$2200000
Excavate Saturated Ash via Mudcat
Stockpile
280000
CY
$7.00
$1960000
Surface Water
Drainage
Control
Erosion Controls
LS
$100000.00
$100000
Off-Site
Disposal/Recycling
of Ash
830000
CY
$25.50
$21165000
Grain Size
Analysis/Geotechnical
Testing
LS
$16000.00
$16000
Documentation
Surveying
LS
$15000.00
$15000
Revegetation
mulch seed fertilizer
22
ACRES
$1000.00
$22000
SUBTOTAL
CONSTRUCTION
CAPITAL COSTS
$25558000
30%
Estimating Contingency
$7667400
TOTAL
CONSTRUCTION
CAPITAL COSTS
$33200000
ITOTAL
CAPITAL
COSTS
$34000000
ASSUMPTIONS
Total estimated
area
for saturated ash areal
extent
790000
ft2
average
thickness
9.5 ft
average
depth
to bottom of saturated
ash
25 ft
Based
on
above estimates
280000
yd3
saturated ash
790000
ft2
9.5 ft
Total estimated
area
for ash areal
extent
22
acres 966000
ft2
average
thickness estimated from
Geoprobe
boring logs 20.9 feet
Based
on
above estimates
830000
yd3
ash
966000
ft2
average
thickness
120.9
feet
80000 yd3 ash transfer
in
2004
Estimate includes removal of
dry
ash
550000 yd3
and saturated
ash
280000
yd3
All estimated
areas
and
volumes
are
provided
in Table 3-2
Excavated
ash and saturated ash to be
stockpiled
dried and
disposed/recycled
off-site
This estimate does not include
replacement
of clean fill to an elevation
above the static water table
Earthwork
quantities
based on
1.6 ton
cubic
yard CY ratio
all earthwork
quantities
are approximate
and need to be field verified
during design
10 Off-site
disposal/recycling
of ash cost based
on previous
cost estimates
prepared by
Hutsonville
Power Station
personnel
for similar off-site
disposal
$7.00/ton
transportation
$7.40/ton
disposal
$1 .50/ton
loading
1.6
tons/yd3
$25.50/yd3
This cost
could
significantly
increase with variable
landfill
pricing
II Additional
sources
of estimated
costs
previous
final cover
construction
RS Means Site Work
Landscape
Cost Data
12 Above is
preliminary
estimate and
may
be revised if
selected for final
design
1375 Alternatives
Estimates
2005_FINAL
LMA6-Ash
Removal Disp.-Recyc
Page
of
Natural
Resource
Technology
Inc
Electronic Filing - Received, Clerks' Office, August 11, 2008--AS 09-1, Exhibit 3
LEACHATE MANAGEMENT ALTERNATIVE
Interceptor
Drain/Trench
South
Alignment
Only
Leachate
Management
and
Final
Cover Alternatives
Report
NRT PROJECT
NO 1375/6.1
Hutsonville
Ash
Management Facility
Unlined Ash
Impoundment
Pond
Closure
BY CAR
CHKD BY BRH
Ameren
Energy Generating
Hutsonville
Illinois
DATE
6/27/05
SUB-
CONSULTING
CAPITAL COSTS
TOTAL
Consulting
Hydrogeologic
Evaluation
Engineering Design System
Installation
Oversight
Final
System
Documentation
$70000
SUBTOTAL CONSTRUCTION
CAPITAL COSTS
$70000
30%
Estimating Contingency
$21000
TOTAL
CONSULTING
CAPITAL COSTS
$90000
QUANTITY
UNIT
UNIT
ITEM
SUB-
CONSTRUCTION
CAPITAL COSTS
COST
COST
TOTAL
South
Interceptor/Drain
Trench Construction
$281500
Design Pump
Test
LS
$15000
$15000
Mob.IDemob
LS
$20000
$20000
Erosion Controls
LS
$4000
$4000
Site
Vegetation Clearing
LS
$5000
$5.000
Pre-Engineering System
Enclosure and Foundation
LS
$40000
$40.000
PLC Control
System
and Electrical
LS
$30000
$30.000
Blend Overburden Trench
Spoil
Into
Existing
Grade5
1.000
CY
$2.00
$2000
Startup/Testing
LS
$15000
$15.000
Documentation
Surveying
LS
$5000
$5.000
Restoration
of Disturbed Areas
LS
$4000
$4.000
Interceptor
Trench Excavation
1.800
$6.00
$10800
Install
8.5
Avg
Washed
River Rock
2.000
TONS
$12.00
$24000
Install
Bentonite
Seal
90
TONS
$90.00
$8100
Install General Fill to Grade
6.5 Avg
750
CY
$4.00
$3.000
Install Leachate Collection
Sumps
EA
$10000
$30.000
Pumps
for
Drainage
Collection
Sumps
Each
EA
$3000
$1 8.000
HDPE Drain Tile For
Interceptor
Trench
1.000
LF
$6.00
$6.000
Underground
Piping
to
Interim Pond
1.450
LF
$8.00
$11600
Electrical and Control
Wiring
for Each Well
6000
LF
$5.00
$30000
SUBTOTAL
CONSTRUCTION
CAPITAL COSTS
$281500
30%
Estimating
Contingency
$84500
TOTAL
CONSTRUCTION CAPITAL COSTS
$370000
ITOTAL
CAPITAL
COSTS
$460000
ANNUAL COSTS
Annual
Costs
$23000
Sampling
Labor
Equipment
LS
$5000
$5000
Discharge Sampling Analytical
LS
$3000
$3000
Annual
Equipment
Maintenance
LS
$5000
$5000
Electric Costs
LS
$10000
$10000
ANNUAL SUBTOTAL
$23000
30%
Estimating
Contingency
$6900
TOTAL ANNUAL COSTS
$30000
ASSUMPTIONS
Leachate
collection
along
south via 1.000 foot
long interceptor/drain
trench
total flow of
approximately
I0to25
gpm
Trench
design
Consists
of 610 lI washed
river rock W/
HDPE drain tile followed
by
bentonite
seal backfilled
to
grade
with
general
fill
This
options
assumes
no treatment
of extracted
leachate
and
discharge directly
to
the Interim
Pond
Results
of further
hydrogeological
assessment
and
design pump
lest could
impact
size and
scope
of the
leachate
collection
system
Additional
sources of estimated costs RS Means Site Work
Landscape
Cost Data
Above
is
preliminary
estimate
and
maybe
revised
if
selected
for final
design
1375
Alternatives
Estimates
2005_FINAL
LMA7
South
interceptor
Trench
Page
of
Natural
Resource
Technology
Inc
Electronic Filing - Received, Clerks' Office, August 11, 2008--AS 09-1, Exhibit 3
FINAL COVER ALTERNATIVE
Geosynthetic
Final Cover
Leachate
Management
and
Final
Cover Alternatives
Report
NRT PROJECT NO 1375/6.1
Hutsonville Ash
Management
Facility
Unlined Ash
Impoundment
Pond
Closure
BY CAR
CHKD BY BRH
Ameren
Energy Generating
Hutsonville
Illinois
DATE 6/27/05
EJT
5/19/05
SUB-
CONSULTING CAPITAL COSTS
TOTAL
Consulting
Hydrogeologic
Evaluation Engineering
Design System
Installation
Oversight
Final
System
Documentatiot
$400000
SUBTOTAL
CONSTRUCTION
CAPITAL COSTS
$400000
30%
Estimating Contingency
$120000
TOTAL
CONSULTING CAPITAL COSTS
$520000
QUANTITY
UNIT
UNIT
ITEM
SUB-
CONSTRUCTION
CAPITAL COSTS
COST
COST
TOTAL
Construction
$3602300
Mob./Demob
LS
$25000
$25000
Site Facilities
Maintenance
Erosion
Controls
LS
$8000
$8000
Site
Vegetation
Clearing 22 acres
22
ACRES
$1000
$22000
Regrade
Stockpiled
Ash to Fill
Depressions
50500
CY
$2.00
$101000
Bedding Layer
for PVC
Silty
Sand
12000
CY
$12.00
$144000
Install 30 mil PVC Geomembrane
Cover
966000
SF
$0.23
$222200
Install 200 mil
Geocomposite
Drainage Layer
966000
SF
$0.28
$270500
Place
Rooting
Zone
to
Complete
Protective
Layer
105.400
CY
$8.40
$885400
Place Beneficial Reuse Ash to Construct Grade
20000
CY
$4.00
$80000
Place General Fill
to
Construct Grade
206100
CY
$8.40
$1731200
Grain Size
Analysis/Geotechnical
Testing
LS
$10000
$10000
Site
Drainage/piping
22
ACRES
$3000
$66000
Documentation
Surveying
LS
$15000
$15000
Revegetation
mulch seed fertilizer
22
ACRES
$1000
$22000
SUBTOTAL
CONSTRUCTION
CAPITAL COSTS
$3602300
30%
Estimating Contingency
$1080700
TOTAL
CONSTRUCTION
CAPITAL COSTS
$4700000
ITOTAL
CAPITAL COSTS
$5200000
ASSUMPTIONS
Total
area of Pond
for final
cover estimated at 966000 SF
approximately
22 acres
Geosynthetic
Cover consists
of
Bedding
layer
30 mil PVC Geomembrane
200 mil
Geocomposite
Drainage
Layer-
foot Protective Soil
Layer
All
estimated final cover alternative
material
quantities
are
provided
in Table
3-3
Earthwork
quantities
based
on
1.6 ton
cubic
yard
CY ratio
all earthwork
quantities
are
approximate
and need
to be field verified
during design
Above
costs
based
on
numbers
discussed
during
6-1 5-01
meeting including
$4.00/ton to haul clean fill on-site
Additional
sources
of estimated Costs
previous
final
cover construction
RS Means Site Work
Landscape
Cost Data
Above is
preliminary
estimate and
may
be
revised
if
selected
for final
design
1375 Alternatives
Estimates
2005_FINAL
Coven
Geosynthetic
Cover
Page
of
Natural
Resource
Technology
Inc
Electronic Filing - Received, Clerks' Office, August 11, 2008--AS 09-1, Exhibit 3
FINAL COVER ALTERNATIVE
Compacted
Clay
Final Cover
Leachate
Management
and Final Cover Alternatives
Report
NRT
PROJECT
NO 1375/6.1
Hutsonville Ash
Management
Facility
Unlined Ash
Impoundment Pond
Closure
BY CAR
CHKD BY BRH
Ameren
Energy Generating
Hutsonville
Illinois
DATE 6/27/05
EJT
5/19/05
SUB-
CONSULTING CAPITAL
COSTS
TOTAL
Consulting
Hydrogeologic
Evaluation Engineering
Design System
Installation
Oversight
Final
System
Documentatioi
$450000
SUBTOTAL
CONSTRUCTION
CAPITAL COSTS
$450000
30%
Estimating
Contingency
$135000
TOTAL CONSULTING CAPITAL COSTS
$590000
QUANTITY
UNIT
UNIT
ITEM
SUB-
CONSTRUCTION
CAPITAL COSTS
COST
COST
TOTAL
Construction
$3802400
MobiDemob
LS
$25000
$25000
Site Facilities
Maintenance
Erosion Controls
LS
$8000
$8000
Site
Vegetation
Clearing
22 acres
22
ACRES
$1000
$22000
Regrade
Stockpiled
Ash
to
Fill
Depressions
50500
CY
$2.00
$101000
Place Beneficial Reuse Ash for Protective
Layer
20000
CY
$4.00
$80000
Place
Rooting
Zone to
Complete
Protective
Layer
85.400
CY
$8.40
$717400
Clay
Purchased
Delivered and Installed
3.0
105400
CY
$16.50
$1739100
Place General Fill to Construct Grade
120700
CY
$8.40
$1013900
Grain Size
Analysis/Geotechnical
Testing
LS
$15000
$15000
Site
Drainage
22
ACRES
$2000
$44000
Documentation
Surveying
LS
$15000
$15000
Revegetation
mulch seed fertilizer
22
ACRES
$1000
$22000
SUBTOTAL
CONSTRUCTION
CAPITAL COSTS
$3802400
30%
Estimating Contingency
$1140700
TOTAL
CONSTRUCTION
CAPITAL COSTS
$4900000
ITOTAL
CAPITAL
COSTS
$5500000
ASSUMPTIONS
Total area of Pond
for final
cover
estimated at
966000
SF
approximately
22
acres
Compacted
Clay cover
consists of
foot
Compacted
Clay Layer
foot Protective
Soil
Layer
All
estimated final cover alternative
material
quantities
are
provided
in Table
3-3
Earthwork
quantities
based
on
1.6
ton
cubic
yard
CY ratio all earthwork
quantities
are
approximate
and need to be field verified
during design
Above costs
based
on numbers discussed
during
6-15-01
meeting including
$4.00/ton to haul clean fill on-site
Additional
sources of estimated costs
previous
final
cover construction
RS Means Site Work
Landscape
Cost Data
1375 Alternatives
Estimates
2005_FINAL
Cover2
Clay
Cover
Page
of
Natural
Resource
Technology
tnc
Electronic Filing - Received, Clerks' Office, August 11, 2008--AS 09-1, Exhibit 3
FINAL COVER ALTERNATIVE
Earthen Final Cover
Leachate
Management
and Final Cover Alternatives
Report
NRT PROJECT NO 1375/6.1
Hutsonville Ash
Management
Facility
Unlined Ash
Impoundment Pond
Closure
BY CAR
CHKD BY BRH
Ameren
Energy Generating
Hutsonville
Illinois
DATE 6/27/05
EJT
5/19/05
SUB-
CONSULTING CAPITAL COSTS
TOTAL
Consulting
Hydrogeologic
Evaluation
Engineering
Design System
Installation
Oversight
Final
System
Documentatioi
$250000
SUBTOTAL
CONSTRUCTION
CAPITAL COSTS
$250000
30%
Estimating Contingency
$75000
TOTAL
CONSULTING CAPITAL COSTS
$330000
QUANTITY
UNIT
UNIT
ITEM
SUB-
CONSTRUCTION
CAPITAL COSTS
COST
COST
TOTAL
Construction
$3001900
Mob.IDemob
LS
$25000
$25000
Site Facilities
Maintenance
Erosion Controls
LS
$8000
$8000
Site
Vegetation
Clearing 22 acres
22
ACRES
$1000
$22000
Regrade
Stockpiled
Ash to Fill
Depressions
50500
CY
$2.00
$101000
Place
Drainage Layer
Clean
Sand
17600
CY
$12.00
$211200
Place
Rooting
Zone for Protective
Layer
87800
CY
$8.40
$737500
Place Beneficial Reuse Ash to Make Grade
20000
CY
$4.00
$80000
Place General Fill
to
Construct Grade
206100
CY
$8.40
$1731200
Grain Size
Analysis/Geotechnical
Testing
LS
$5000
$5000
Site
Drainage
22
ACRES
$2000
$44000
Documentation
Surveying
LS
$15000
$15000
Revegetation
mulch seed fertilizer
22
ACRES
$1000
$22000
SUBTOTAL
CONSTRUCTION
CAPITAL COSTS
$3001900
30%
Estimating Contingency
$900600
TOTAL
CONSTRUCTION
CAPITAL COSTS
$3900000
TOTAL CAPITAL COSTS
$4200000
ASSUMPTIONS
Total area of Pond
for final cover estimated at 966000 SF
approximately
22 acres
Earthen Cover Consists of
Sand
Drainage
Layer Capillary Barrier
2.5 foot Protective
Soil
Layer
All estimated final
cover
alternative
material
quantities
are
provided
in
Table
3-3
Earthwork
quantities
based on
1.6 ton
cubic
yard CY ratio
all earthwork
quantities
are
approximate
and need
to
be field verified
during design
Above
costs
based
on numbers discussed
during
6-15-01
meeting including
$4.00/ton to haul clean fill on-site
Additional
sources of estimated costs
previous
final cover
construction
RS Means Site Work
Landscape
Cost Data
1375 Alternatives
Estimates
2005_FINAL
Cover3
Earthen Cover
Page
of
Natural
Resource
Technology
Inc
Electronic Filing - Received, Clerks' Office, August 11, 2008--AS 09-1, Exhibit 3
FINAL COVER ALTERNATIVE
Pozzolanic
Fly
Ash Final Cover
Initial Estimate
Leachate
Management
and Final Cover Alternatives
Report
NRT PROJECT NO 1375/6.1
Hutsonville Ash
Management
Facility
Unlined Ash
Impoundment
Pond
Closure
BY CAR
CHKD BY BRFI
Ameren
Energy
Generating
Hutsonville
Illinois
DATE 6/27/05
EJT
5/19/05
SUB-
CONSULTING CAPITAL COSTS
TOTAL
Consulting
Hydrogeologic
Evaluation
Engineering
Design System
Installation
Oversight
Final
System
Documentatioi
$500000
SUBTOTAL
CONSTRUCTION
CAPITAL COSTS
$500000
30%
Estimating Contingency
$150000
TOTAL
CONSULTING CAPITAL COSTS
$650000
QUANTITY
UNIT
UNIT
ITEM
SUB-
CONSTRUCTION
CAPITAL
COSTS
COST
COST
TOTAL
Construction
$3038800
Mob.IDemob.7
LS
$150000
$150000
Site Facilities
Maintenance
Erosion Controls
LS
$8000
$8000
Site
Vegetation
Clearing
22 acres
22
ACRES
$1000
$22000
Regrade
Stockpiled
Ash to Fill
Depressions
50500
CY
$2.00
$101000
Excavate Ash From Pond
for Pozzolanic
Mix
102900
CY
$3.10
$319000
Load and Ash Haul to
Processing
Plant7
102.900
CY
$1.85
$190400
Blend Ash wI
Reagents
to Form Pozzolanic
Mix
105400
CY
$5.50
$579700
Place 3.0 Pozzolanic
Ash Final Cover
105400
CY
$2.85
$300400
Place Beneficial
Reuse Ash for Protective
Layer
20000
CY
$4.00
$80000
Place
Rooting
Zone to
Compete
Protective
Layer
85400
CY
$8.40
$717400
Place
Fly
Ash From Pond
to Make Grade
120700
CY
$3.81
$459900
Grain Size
Analysis/Geotechnical
Testing
LS
$30000
$30000
Site
Drainage
22
ACRES
$2000
$44000
Documentation
Surveying
LS
$15000
$15000
Revegetation
mulch seed fertilizer
22
ACRES
$1000
$22000
SUBTOTAL
CONSTRUCTION
CAPITAL
COSTS
$3038800
30%
Estimating Contingency
$911600
TOTAL
CONSTRUCTION
CAPITAL COSTS
$4000000
ITOTAL
CAPITAL COSTS
$4700000
ASSUMPTIONS
Total area of Pond
for final
cover
estimated at
966000
SF
approximately
22
acres
Pozzolanic
flyash
cover consists of
foot Pozzolanic
Flyash Layer
foot Protective Soil
Layer
All estimated final
cover
alternative
material
quantities
are
provided
in
Table 3-3
Earthwork
quantities
based on
1.6 ton
cubic
yard CY ratio
all earthwork
quantities
are
approximate
and need
to
be field verified
during design
Above costs based on numbers discussed
during
6-15-01
meeting including
$4.00/ton to haul clean fill On-Site
102900
yd3
of ash excavated
from Pond
Costs for the
pozzolanic
flyash
cover construction
partially
based
on
rough
estimates
provided by
VFL
Technology
Corporation
Pre-Bench
Study
Additional
sources
of
estimated costs
previous
final cover
construction
RS Means Site Work
Landscape
Cost Data
Above is
preliminary
estimate and
may
be revised if selected for final
design
1375 Alternatives
Estimates
2005_FINAL
Cover4
Pozzolanic
Cover
Page
of
Natural
Resource
Technology
Inc
Electronic Filing - Received, Clerks' Office, August 11, 2008--AS 09-1, Exhibit 3
APPENDIX
TREATABILITY STUDY FOR POZZOLANIC
FINAL COVER SYSTEM
Electronic Filing - Received, Clerks' Office, August 11, 2008--AS 09-1, Exhibit 3
APPENDIX
C-2
VFL COST DATA
Electronic Filing - Received, Clerks' Office, August 11, 2008--AS 09-1, Exhibit 3
Note
All
mixesperformed
on
composite
of
decanted
ash
No
Al
-A6
Stockpile
time
for
all
mixes
was
30
minutes
tICS
strength
data
is
average
of
cylinders
FGD
Sludge
added
on
wetweight
basis
to
ash
Soil
added
on
wet
weight
basis
to
ash
Reagents
added
on
dry
weight
basis
to
soil
fly
ash
and
sludge
fly
ashblends
Reagent
costs
areestimated
Mixes
12.5
and
arethebestmix
possibilities
at
this
point
Two
mines
will
be
selected
for
30-day
permeability
frommixes
it
-16
5%
Grade
4.5
Cap
34855
35831
33787
34519
Scrubber
Sludge
-est
FBR
24
Class
Ash
5%
Grade
Cap
23237
23888
22524
23013
TABLE
HUTSONWLLE
POWER
AMERNENENERGY
CONCEPTUAL
REAGENTCOST
PER
YARD
OF
MIX
100
100
10.0
100
150720
yards
required
100
5.0
81.5
100
116.0
15.0
80.3
100
116.5
30.0
94.5
1.57
100480
yards
required
93.5
82.3
100
113.4
1.57
83.5
100
19236
10.0
107.5
9517
93.3
1.53
20.0
89.8
82.2
85
10
$12.12
1.45
106.4
84.3
15
85
28485
977
$6.00
54792
87.5
15
10.0
11
82.4
$904148
1.44
51.827.443
12824
81.1
85
6.3
$1.32
12
5.0
1.32
107.1
17796
6345
80.5
85
15
12.5
$2.54
86.9
113.4
33516
15
13
$12.12
$383547
91.2
1.45
$199392
18990
83.5
70
Mix
Mix
DeSlaj
Solids
Density
Mix
DensIty
T/yd3
Reagent
Tons
Soil
Tons
Scrubber
Tons
Additive
Cost
per
YD3
Total
Reagent
Cost
Reagent
Tons
Soil
Tons
Scrubber
Tons
Additive
Cost
per
YD3
Total
Reagent
Cost
Number
Fly
Ash
SoIl3
FCD
Sludge2
Cement
CAsh
FBR
0-lIme
Initial
Wet
Dry
tCI4t
lckSaa1t
HOoitEnogy
garsW
Norton
IADMI
Mu
lbs/it3
lbs1tt
15
70
30
6.6
79.9
10.0
81.1
114.2
91.2
1.54
12254
69710
$10.04
$1512634
8169
46473
$10.04
$1008422
16
70
30
112.4
91.2
1.52
18548
68611
$13.97
$2105092
12365
45741
$13.97
$1403395
14
$1218295
$2.83
1.53
114.2
17673
$6.00
36528
83.4
70
$427
1CC
95.4
$5.34
9283
117.4
$602768
30
6.3
$1.32
1.54
$804393
97.9
11864
83.5
5.0
10.0
30
$132928
1.58
$11.14
110.7
12224
22344
$2.54
81.9
10.0
$5.85
$1678953
92.4
113.1
24903
$255698
5881.893
1.49
92.6
$2.83
11782
77.3
$9.31
1.53
1849
112.4
8189
$5.34
$284733
77.9
$1402872
$15.70
18847
113.0
$536262
86.9
1.52
S.3ot
Oh
$11.14
8149
88.0
$7.47
$5.85
1.53
16602
$1119302
8839
S1.125.64g
$11.88
$587928
17911
$1790502
$9.31
7899
68605
$7.85
$15.70
68977
12565
$935248
$13.58
$1.577.18C
$7.47
52.046.433
$1182687
5892
$11.88
$750433
1941
Reagent
Cement
Lime
Soil
$1193668
45736
$7.85
45985
95
95
$1358
5788.458
$1
.36428g
Electronic Filing - Received, Clerks' Office, August 11, 2008--AS 09-1, Exhibit 3
APPENDIX C-i
CONCEPTUAL DEVEOPMENT
OF POZZOLANIC CAP
FOR CLOSURE OF BASIN
AT THE
HUTSONVILLE POWER STATION
Electronic Filing - Received, Clerks' Office, August 11, 2008--AS 09-1, Exhibit 3
Conceptual Development
Of
Pozzolanic
Cap
For the
Closure
of
Basin
at the
Hutsonville Power Station
VFL
Technology Corp
16
Hagerty
Boulevard
West
Chester
Pennsylvania
19382
610
918-1100
PHONE
610
918-7222
FAX
Electronic Filing - Received, Clerks' Office, August 11, 2008--AS 09-1, Exhibit 3
CLOSURE OF
if
TIIE
SONF
OW.R
STATiLKJLI
VILLE
IL
-repared
fori
_l Resource
Teºhnology
23713
Paul
$oad
Pes4ukee
WI
53Q72
Corjwration
ulevard
PA 19382
61uJ
918-1100
March
25
2003
Electronic Filing - Received, Clerks' Office, August 11, 2008--AS 09-1, Exhibit 3
TABLE OF CONTENTS
BACKGROUND
OVERALL
PROGRAM CONCLUSIONS
GEOTECILNICAL
INVESTIGATION
TREATABILITY
STUDY
4.1
RAW MATERIALS CIIARACTERIZAION
4.2
REAGENTS
4.3
MIX DESIGN
PREPARATION
4.4
MIX DESIGN
PERFORMANCE TESTING
EXRAPOLATEON
TO FULL-SCALE OPERATIONS
APPENDIX
VFL
Technology
Corporation
March 26 2003
Hutsonville Power Station
C-i 703-02
Electronic Filing - Received, Clerks' Office, August 11, 2008--AS 09-1, Exhibit 3
Final Report
Conceptual
Development
of
Pozzolanic
Cap
for the
Closure of
Basin at the Hutsonville
Power Station
1.0
Background
Basin
at the Hutsonville Power Station
Photo
is an inactive ash
disposal
area
that will be closed under Illinois
Title 35 Part 811 Natural Resource
Technology
NRT
Pewaukee
Wisconsin
contracted the services of VFL
Technology
Corp
VFL
to
determine the
feasibility
of
developing
concept
for the
creation
manufacture
and
placement
of
pozzolanic
cap
for Basin
The
purpose
of this
report
is to
present
final
summary
of the
information findings
and test results
that have been
generated
for the
conceptual
development
of the
pozzolanic
cap
for the closure of Basin
at
the Hutsonville Power Station in
Hutsonville Illinois
The
Program
Goals of this
study
were to
Attempt
to
develop
pozzolanic
cap
material that would achieve
permeability
of
107cm/sec
have
an
unconfined
compressive
strength
of
approximately
150
psi
and have
minimal
cracking
after
placement
Develop
pozzolanic
material that is
environmentally
acceptable
and
minimizes
leaching
If the
107cm/sec
permeability
goal
is
unrealistic
or
unachievable with
these
materials
estimate the
most
realistic
performance
of these materials
under field
conditions
Produce
cost-effective
pozzolanic
cap
material
that
can
be
easily
handled
and
placed
with common
earth
moving equipment
To
accomplish
these
goals
VFL
and NRT
developed
scope
of work
for the
project
VFL
employed
the
help
of
GeoSystems
Consultants Inc
GeoSystems
to
assist with
the
geotechnical engineering
portion
of the
program
The
scope
of work
basically
included
field assessment
of the site
VFL
and
GeoSystems
review of
existing geotechnical
data
of the site to determine if additional
information
is needed to finalize the
cap design
and construction
GeoSystems
VJL
Technology
Corporation
March
26
2003
Hutsonville Power Station
C-i 703-02
Electronic Filing - Received, Clerks' Office, August 11, 2008--AS 09-1, Exhibit 3
PHOTO
HuiitsowªEie Power Station
TIashiis
ind
Electronic Filing - Received, Clerks' Office, August 11, 2008--AS 09-1, Exhibit 3
Collect
samples
of the Basin
materials
VFL
Conduct
treatabiity study
to determine
if
pozzolanic cap
can
be
developed
to
meet the current
design guidelines
for closure
cap
construction
and
develop
an
operational
approach
to
construct
the
cap
\TFL
and
Conceptual development
of the basic
cap
design
appearance
and
estimated
volumes of material to
be used in
the
cap
construction
GeoSystems
On March
and
2002 representatives
of VFL and
GeoSystems
visited the
Hutsonville site
Samples
from basins
and
were collected
and
existing
geotechnical
data
was
reviewed
The Hutsonville
ash
samples
were
tested at \FLs
Corporate laboratory
in West
Chester Pa
using
variety
of
locally
available
stabilization
reagents
2.0
Overall
Program
Conclusions
The
preliminary
geotechnical
evaluation
indicates
that
the construction
of
pozzolanic cap
is
feasible however
some additional
more
refined
analyses
are
needed to finalize the
engineering
and
design
of
the
cap
system
The results of the
Treatability
Study program
show
that it is feasible to
construct
structurally
stable
environmentally
acceptable
Pozzolanic
Cap
and
use
this
cap
in the final closure of
Basin
at the
Huntsville Power Station
Althouh
the
permeability
results do not meet the
original goal
of
10
cm/sec
the results of several
mixes
are
in the mid to low
07cm/sec
range
By
using
Basin
ash
as
construction
material for the
pozzolanic
cap
approximately
160000 yds3
of ash
can
be
utilized
100000yd3 as
pozzolanic
final
cover
and
60000yd3
to
adjust
the Basin
final
slopes
All- of the
mixes that
were
considered
potential
candidates for
cap
construction
easily
met the
unconfined
compressive
strength goal
of 150
psi
3.0 Geotechnical
Investigation
As
indicated
above
the
geotechnical
data
-review conceptual design
material
volume
estimates preliminary
settlement
and
slope stability
analyses
were
conducted
by GeoSystems
The
report
of their
findings
and
analyses
has
been included in
Appendix
of this
report
In
summary GeoSystems
believes
the construction
of
pozzolarnc
cap
is feasible
and will be an
effective
system
VFL
Technology Corporation
March
26
2003
Hutsonville
Power Station
C-i 703-02
Electronic Filing - Received, Clerks' Office, August 11, 2008--AS 09-1, Exhibit 3
An overview of the conclusions of the
GeoSystems
report
indicate
...
parametric analysis varying cap
permeability
fromi
lO5cmIsec to
07cm/sec
yielded
effectiveness
ranging
from 78% to 97%
As the
slope
of the final
cover
increases from 1% to
5%
the volume of
regrading
reduces from
10000yds3
to
75000 yds3
With
5%
slope
the
volume of
ash fill material needed from Basin
is
estimated
to
be
160000 yds3
The volume of the
pozzolanic
cap
feet
thick
is estimated to
be
100000
yds3
and varies little as
the
slope
varies from 1% to 5%
graphical presentation
of
conceptual representative
cross section
of Basin
showing
the
cap
design regrading requirements
needed
fly
ash fill material from
Basin
etc
was
developed by GeoSystems part
of
GeoSystems report
see
Appendix
and has been included here
as
Figure
for reference
purposes
4.0
Treatability Study
few Performance Goals were established for
the final
pozzolanic
cap
material
The
intent
was to see
if the stabilized materials could meet the
existing cap design
specifications
and if
not
determine how well
they performed against
these
existing
specifications
The Performance Goals for this
project
were to
Develop
permeability
of
107cm/sec
or determine how close the
stabilized materials
can
realistically
come to
these
specifications
Develop approximately
150
psi
unconfined
compressive
strength
Attempt
to
develop
cost-effective
mix
design
that can be
easily implemented
and constructed in the
field
Minimize
cracking
and
Develop
cap system
that was
environmentally
acceptable
minimizes
leaching
VFLs
treatabiity study
can
be broken down into four basic
areas
Raw Materials
Characterization
Reagents
Mix
Design Development
and
Mix
Design
Performance
Testing
Each of these
areas
is discussed further in the
following
sections of this
report
VPL
Technology Corporation
March
26
2003
Hutsonville Power Station
C-i
703-02
Electronic Filing - Received, Clerks' Office, August 11, 2008--AS 09-1, Exhibit 3
REPRESENTATIVE
CROSS
SECTION
PONDD
HUTSONVILLE
POWER
STATION
HUTSONVILLE
ILLINOIS
GeoSystems
Consultants
Inc
PROJECT
NO
02G106
APRIL
2002
FLY
ASHTO
BE
RELOCATED
FLY
ASHNEEDEDFOR
GRADING
TOPSOIL
COVER
GRANULAR
DRAINAGE
LAYER
POZZOLANIC
CAP
REVISED
12-26-02
Electronic Filing - Received, Clerks' Office, August 11, 2008--AS 09-1, Exhibit 3
4.1 Raw Materials Characterization
During
the site
visit
VFL
collected six
samples
of sluiced ash from
different locations in
Basin
and two
samples
of ash from
different
locations in Basin
The six
samples
from Basin
and two
samples
from
Basin
were individually
tested for moisture
content pH
density
and Loss
on
Ignition
LOT
The solids content of the ash excavated
from Basin
ranged
from 1.4% to
74.2% solids
40.0%
to 34.8%
moisture
on
dry weight
basis or
dwb
The
dry weight
basis
refers
to
the
test
that
uses
the
dry weight
of the
sample
in the
calculation Please
see
the further
explanation
in this section
The
pH
values
for Basin
ranged
from 8.4 to
11.0
while the LOIs
for Basin
ranged
from 2.1% to 8.9%
All ash
samples
showed
varying degrees
of
bleeding
draining
of free
liquids
from
the
material
As indicated
previously
the intent is to use
material from Basin
to
produce
the
pozzolanic
cap
for the closure
of Basin
In order to simulate full-scale
operations
the
as received
samples
of ash from Basin
were allowed to
decant/drain
This
was
done to estimate the
handling
and
solids
content
characteristics
of the ash that will be used in the
full-scale
operations
The
data showed that some
of the ash
samples
decanted/drained
nicely
while
others did not
decant/drain
as
well The decanted/drained
solids content
of
the Basin
materials
ranged
from 73.9% to
81% solids
35.3%
to 23.5%
moisture
dwb
or
11.8% to 2.5% decrease
in moisture
content
At this
point
more
thorough explanation
of solids content
and moisture
content is
required
The calculations
are
Solids Content
Dry
Weight
of
Sample
100
Wet
Weight
of
Sample
Moisture Content
dwb
Weight
of Water in the
Sample
100
Dry Weight
of
Sample
As
shown
both calculations
are
sometimes
needed
to
explain
what is
happening
with certain materials We have
provided
both sets of numbers at
various
points
in this text
Generally
moisture
content
is referred to when
describing
soils Solids
content
is
required
for
our
purposes
when
describing
mixtures
of
materials that
may
not all be soils The two
systems
developed
independently
based
on
the
type
of work
taking place
In
summary
moisture
content
is
generally
soil based and solids content is mixed material
based
The
two
samples
of ash collected from Basin
showed
solids
content
range
Va
Technology Corporation
March
26
2003
Hutsonville Power Station
C-i 703-02
Electronic Filing - Received, Clerks' Office, August 11, 2008--AS 09-1, Exhibit 3
of 72.9% to 82.6% solids
37.2%
to 21.1% moisture
dwb
The
sample
that showed the
high
solids content was taken
from
stockpile
of material
that
was
sitting
on the
Basin
age unknown
The
pHs
for the
two
samples
collected
from Basin
were
8.8 and 8.2
respectively
The results of the
physical analysis
of the ash
samples
can
be
found on
Table
TABLE
Physical
Characterization
of the ilutsonville Ash
A-I
A-2
A-3
A-4
A-5
A-6
Inflow
Inflow
Inflow
Inflow
Inflow
10.4
9.6
11.0
11.0
8.6
8.4
72.7
74.2
72.2
71.4
72.3
72.5
80.8
80.8
81.0
79.3
78.2
73.9
3.1
2.1
4.5
2.6
2.5
8.9
95.9
90.4
83.8
78.0
64.1
63.1
Basin
Sample
Sample
As Received Decanted Loss on
Particle
Size
Density
WetlDry
Number
ID
pH
Solids
Solids
Ignition
100
200
325
Rodded
Compacted
Passing
ibslft3
1bs/ft
D-I
BasinD
8.8
72.9
5.2
D-2
56KStkpl
82.6
NA
4.0
A-7
Outfall
Composite
A1-A6
10.0
NA
79.6
93.0
95.9
79.5
85.6
66.0
71.4 7.6
69.7 115.2/91.7
In addition to the
physical
characterization
of the ash
samples
listed
above an
elemental
analysis
and TCLP leachate
analysis
for the
RCRA metals
was
run on
composite sample
of the
Hutsonville ash The
composite sample
was
generated by combining equal portions
of ash
samples
A-i
through
A-6
The results of the chemical
analyses
are
listed
in
Table
The actual data
reports
from Dalare Labs in
Philadelphia
Pa
have been included in
Appendix
A-2
VFL
Technology Corporation
Hutsonville
Power Station
C-i 703-02
March
26
2003
WL
Electronic Filing - Received, Clerks' Office, August 11, 2008--AS 09-1, Exhibit 3
TABLE
Elemental and TCLP
Analysis
of
the Rutsonville Ash
Basin
Fly
Ash
Conposite
PARAMETER
METALS ANALYSIS
TOTAL
LEACHABLE
Arsenic
34.4
0.020
Barium
95.0
0.56
Cadmium
1.0
0.01
Chromium
24.3
0.01
Lead
55.6
0.12
Mercury
0.076
0.001
Selenium
18.3
0.013
Silver
1.0
0.01
Notes Total
Total Elemental
Concentration
in
mg/kg
Leachable
TCLP Leachable Metals in
mg/L
Lessthan
4.2
Reagents
\TFL
has
used
numerous
reagents
in the
development
of
pozzolanic
construction
materials VFL
reviewed these various
reagents
and based on
previous
full-scale
experience
with similar
projects
selected what
it believes
to
be the best
performing
commercially
available
in large quantities
and
most
cost-effective
reagents
for this
project
from
sources
in the
vicinity
of
the
job
site These
reagents
include
Portland
Cement
Class
Fly
Ash
self.setting
type
Fluidized Bed Residue
Ash
Quicklime
FGD Scrubber
Sludge used
to make the
particle
size of the mix
design
finer
which
improves
permeability
and
Native Soils
used
to make
the
particle
size of the mix
design
finer
which
improves
permeability
VFL
experienced
few minor
delays
in the
treatability study portion
of the
project
These
delays
are
directly
attributed to
the
delays
in
receiving
some
of the
samples
of
reagents
from the various vendors One of the most
problematic
was
the FGD Scrubber
Sludge
which
was
finally
received on
date
06/06/02
VFL
Technology Corporation
March 26 2003
Hutsonville Power
Station
C-i 703-02
Electronic Filing - Received, Clerks' Office, August 11, 2008--AS 09-1, Exhibit 3
4.3 Mix Design Preparation
In order
to
simulate
full-scale
conditions
VFL
combined the
six
decanted/drained
samples
of ash
from Basin
into one
composite
ash
sample
that
was
used to
prepare
all of the
mixes
The solids content of
this
composite
sample
was
approximately
79% solids
26.6%
moisture
dwb
All mix
designs
were prepared
in
laboratoty
mixer
and mixed to the
consistency expected
to
be achieved
using
full-scale
processing
equipment
All mix
designs
were
damp granular
soil-like materials that
could be
easily
handled
and
placed
with common
earth
moving
equipment
All of the mixes
were
prepared
on
the
wet side of
optimum
moisture
to assure
that there was
enough
moisture in the
mix for
reagent hydration
and
proper
compaction
This wet side of
optimum
moisture
consistency
also minimizes
the
potential
for
dusting during
full-scale
operations
After
blending
the mixes
were
allowed to rest
and
cure
for
one
hour
prior
to
compaction
in the test
cylinder
molds This was done to
simulate
the
approximate
amount of time
the
mixed material would need to be
moved from the
mixing
plant spread
and
compacted
See Table
for the
mix
designs developed
in this
project
Solids
contents
as
well
as
wet and
dry compacted
densities were
recorded for
all
mixes These values will be
used
as
operating specifications
during
full-
scale
production
and
placement
operations
All mixes
were
compacted
into standard
size
compaction
molds labeled
and
stored in sealed
plastic
bags
to insure
proper
curing
and
prevent
moisture loss
during
their
curing
cycle
4.4
Mix Design
Performance
Testin2
Immediately
after mix
preparation
all of the
mixes
were
evaluated for
consistency
handlability
and
constructability
As
previously
mentioned
all
of the mixes had
damp granular
soil-like
consistency
All mixes could be
easily
handled
transported
and
placed
with
common
earth
moving
equipment
All of the
mixes could
support
heavy equipment
traffic
immediately
after
placement
and
compaction
This means
that
multiple
lifts
of stabilized
material could be
sequentially
placed
on
top
of each other
throughout
the
day during
full-scale
operations
As
proposed
all of the mixes were
tested for unconfined
compressive
strength
UCS
in accordance with ASTM
39
All
compressive
strength
VPL
Technology Corporation
March
26
2003
Hutsonville Power Station
C-i 703-02
Electronic Filing - Received, Clerks' Office, August 11, 2008--AS 09-1, Exhibit 3
cylinders
were
tested in
duplicate
and
capped
prior
to UCS
testing
The mix
designs
and UCS test results can
be
found in Table
Overall
the mixes
generally performed
as
expected
with
the
exception
of the
quicklime
mixes
All mixes showed
good
solids contents as
well
as
wet and
dry
compacted
densities
Based
on
the mix
densities costs
UCS
results etc
the best
performing
mixes
were
selected
for the next
phase
of
permeability
testing
These mixes were
Mix
10% cement
Mix
5% cement
Mix 5%fluidized bed
residue
Mix
6.3% cement
15% native soils
Mix 14
30% FGD Filtercake
10%
cement
Mix 16 30% FGD Filtercake
10%
quicklime
Triaxial
permeability
tests were run on
the above
listed mixes after 28 and
84
days
of
curing
The results of these tests are
listed in Table
During
the 84
day
permeability testing
problem
was
discovered in the test
results All of
the test
specimens
showed
higher more permeable
values than
the
28
day
results In some
cases
it
was over an
order of
magrntude
This data trend is
extremely unusual for
pozzolanic
reaction
mechanisms
which
are
known to
improve
with time It
was
concluded
that the entire set of
cylinders
must
have been
damaged
during
transport
and
handling
Companion cylinders
were
tested
again
after
curing
84
days
and
these
permeability
values fell in
the
expected
range
The
only
mix that did not show the normal
permeability improvement
characteristics
was
Mix 16 All of the
indicator
parameters
for this
Mix
looked
promising consistency
compaction
characteristics densities strength
development
etc yet
the
permeability
data did not follow
the usual trends
At this
point
the mixes
prepared
in this
program
are
considered to be
excellent
indicator
mixes to examine the
feasibility
of the
program
and
provide
data
to determine
the
basis for final mix
design
Further refinement
of the mix
design
can
be
assessed
to
improve performance
permeability
and
cost-effectiveness
of the
pozzolanic
cap
material
as
necessary
After
reviewing
all of the
permeability
data listed in Table
it
appears
that
the realistic
performance range
for these
types
of
pozzolanic
materials
is the
low 10cmIsec to the midlow
107cm/sec
range
for materials to be
produced
under fill-scale
field conditions The
typical
lO7cmIsec liner
spec
means
that the material must be
in the lO8cmIsec
range
so
as
not to
exceed thel
lO7cmIsec
spec
under field conditions These
types
of values
are
extremely
difficult to meet
with
most
materials under field
conditions
VIL
Technology Coiporation
March 26 2003
Hutsonville Power Station
C-I
703-02
Electronic Filing - Received, Clerks' Office, August 11, 2008--AS 09-1, Exhibit 3
TABLE
TREATABILITY
STUDY
SUMMARY
SHEET
10.0
20.0
81.5
80.3
82.3
83.5
82.2
84.3
11.9
11.7
10.9
11.4
12.3
12.5
116.0
116.5
113.4
107.5
106.4
97.7
94.5
93.5
93.3
89.8
87.5
82.4
184
79
31
81
277
291
231
125
41
124
276
583
305
165
37
114
372
609
5.37E-07
5.03E-06
.75E-06
7.64E-07
4.74E-06
5.84E-06
UCS
strength
data
is
average
of
cylinders
2FGD
sludge
added
on
wet
weight
basis
to
ash
Soil
added
on
wet
weight
basis
Reagents
added
on
dy
weight
basis
Second
set
of
permeability
results
for
mixes
14
and
16
are
at
56-day
cures
100
100
10.0
100
5.0
100
100
15.0
100
30.0
Mix
Numbe
Mix
Design
%-
Fly
Ash
FIlter
Cake2
Soil3
Comp
14
BlackSand
Reagents4
Cement
Ash
FBR
Q-lime
Lafarge
Newton
AOM
Mian
Sc
lids
pH
SU
Density
Wet
Dry
Ibslft3
Ibslft
UCS
28dy
56
day
84
day
PSI
PSI
PSI
Permeabilit
28
d?y
K20
cni/sec
84
day
100
10.0
81.1
12.5
107.1
86.9
38
70
138
100
5.0
80.5
12.3
113.4
91.2
22
27
82
85
15
6.3
83.5
11.7
114.2
95.4
110
142
191
1.99E-06
1.30E-06
10
85
15
12.5
83.4
11.9
117.4
97.9
320
416
380
11
85
15
6.3
83.5
12.4
110.7
92.4
26
42
48
12
85
15
10.0
81.9
12.6
113.1
92.6
35
84
82
13
70
30
5.0
77.3
11.6
112.4
86.9
123
168
164
14b
70
30
10.0
77.9
12.0
113.0
88.0
364
856
1110
1.22E-07
1.38E-07
15
70
30
6.6
79.9
12.8
114.2
91.2
130
194
304
16b
70
30
10.0
81.1
12.9
112.4
91.2
157
314
603
4.32E-05
2.91E-05
Note
Reagent
addedon
dryweight
basis
toto
soil-fly
ash
blend
Stockpile
Time
for
all
mixes
was30
minutes
ft\Hutsonville
PowehSpread
Sheet
6/27/2003
Electronic Filing - Received, Clerks' Office, August 11, 2008--AS 09-1, Exhibit 3
1200
1000
800
600
400
200
FIGURE
Unconfined
Compressive
Strength
Development
for
Selected
Mixes
--4--Mix
M1x2
Mix
Mix
Mix
14
-Mix
16
28
56
84
Days
Cured
Electronic Filing - Received, Clerks' Office, August 11, 2008--AS 09-1, Exhibit 3
Based on all of the
above
data
the four
best
performing
mixes in the
study
were
then tested for
leachate characteristics
using
the
TCLP
leaching
procedure
The results of
the TCLP
leaching
tests are
presented
in
Table
TABLE
TCLP Leachate
Analysis
of the Treated
Ash
Untreated
TREATED
ASH
PARAMETER
Fly
Ash
Mix
Mix
Mix
Mix
14
Arsenic
0.020
0.010
0.010
0.010
0.010
Barium
0.56
0.28
0.25
0.14
0.11
Cadmium
0.01
0.01
0.01
0.01
0.01
Chromium
0.01
0.06
0.01
0.05
0.01
Lead
0.12
0.02
0.02
0.02
0.02
Mercury
0.001
0.001
0.001
0.001
0.001
Selenium
0.013
0.019
0.010
0.010
0.010
Silver
0.01
0.01
0.01
0.01
0.01
Notes
Treated material cured
for
84
days
All results
expressed
in
ppm.unless
otherwise noted
ppm
Parts
per
Million
Less
than
As shown in Table
all of the
mixes showed
low
leaching potential
One
interesting
trend
to
observe is the fact that all of the stabilized
mixes reduced the
leachable
level of
arsenic
barium and lead when
compared
to
the
original
untreated
ash
This is
common
trend
seen
in the
leachate
characteristics
of
pozzolanic
stabilization
matrices
Upon
reviewing
all of the data
generated
in the
study
the most
promising reagents
and material blends to
produce
pozzolarnc cap
under field
conditions
appear
to be
Basin
fly
ash and cement
Mix
and
Basin
fly
ash
onsite soil and cement
Mix
and
10
Basin
fly ash
FGD Filtercake and cement
Mix 14
FBR was not
included
in the final selection for several reasons
FBR has been used
in the
past
for various
construction
needs
including permeability
which is
why
we
JFL
Technology Corporation
March 26 2003
Hutsonville Power
Station
C-i 703-02
Electronic Filing - Received, Clerks' Office, August 11, 2008--AS 09-1, Exhibit 3
have
included it in this
treatability
study
FBR is
quite
useful
when handled
properly
and used in the correct
application
Recently
there have been
reports
on several
construction
projects
that
some
FBR
are
susceptible
to
expansion
problems
Situations
where it should be avoided
are
employing
it where
slight expansion
is not
acceptable
FOD
sludge
is
good
additive
for
most
mix
applications
However
FGD
sludge
from
each
power
plant
can
be
very
different
chemically
and
physically
based on the
coal
source
and
type
of boiler used Another issue
that VFL has with FGD
sludge
in
this
specific application
is
making
sure
that it is mixed
thoroughly
with the other
ingredients
FGD
sludge
is
very
sticky
material It is difficult to
accurately
feed
it
into
portable processing system
because the FGD
sludge
has
tendency
to adhere
to
the sides of feed
hoppers
that
are
used on
portable pugmill plants
known
as
bridging
In most construction
applications
where
precise
mix
designs
are
not
required
this is not
problem
The mixes
containing
cement tend to be
the easiest
to
quality
control in field
construction
applications
Cement
is manufactured
product
and varies
very
little
Further
optimization
testing
is
recommended for the final mix
design prior
to full-
scale
operations
VFL would recommend that
test
pad
be
constructed with full-
scale
equipment
and
sampled
in substantial
conformance
with 35 Illinois
Administrative Code
IAC
Part
816
to evaluate
the
proposed process equipment
train and
optimized
the
final
mix
design
5.0
Extrapolation
to Full-Scale
Operations
The basic full-scale
operational approach
that VFL would use to construct
the
pozzolanic
cap
for Basin Ds closure would conform to
the
following
schedule of
events
Regrade
Basin
to the lines and
grades specified by
the
Engineer
Excavate the
fly
ash from Basin
and allow it to drain to the
proper
moisture
content before
using
it in the
mix
design
Run On/Run Off to and from the
area
will be controlled
and
water
drained from the ash will be routed
back
through
the
plants pond system
Construct
processing
area
in the
vicinity
of
the
two
Basins Erect the
processing
plant
silos and
any
other
ancillary processing
equipment
needed
Construct haul roads to and from the
placement
area
Process the
designated
mix
design
Place and
compact
the
stabilized
cap
mix in reasonable time frame
allowing
the material
curing period prior
to
compaction
to the lines and
grades
established
by
the
Engineer
for the final
cap
design
Cover
the
placed
material with the
cover
soils to
protect
the
pozzolanic
cap
from
severe
weather events
VIL
Technology Corporation
March
26
2003
Hutsonville Power Station
C-i 703-02
Electronic Filing - Received, Clerks' Office, August 11, 2008--AS 09-1, Exhibit 3
Place the
topsoil
and
vegetate
as soon as
possible
To
develop
the
necessary
documentation for submittal to
the State
Regulatory
Agencies
the basic
Quality
Control
program
for
the
pozzolanic
cap
construction
would involve
Quality
Control
conformation
testing
on
the materials to
be used in the
cover
system
and
their
placement
Process control
testing
of the mix
design during production
in substantial
conformance with
35
IAC
Part 816
Quality
Control
of the
cap
mix
design during placement
and
compaction
in
substantial
conformance
with
QA/QC procedures
outlined in 35 IAC Part
816
Moisture
monitoring
on
the excavated and drained Basin
fly
ash
Control
and
QC
confirmation checks on the
reagents
and
any
other materials of
construction
that will be used
in the mix
design
Plant calibration
Insure
that Basin
has been
regraded
to the lines
and
grades specified
Insure that the
cover
system
has been installed to
the lines and
grades
specified
The
cap
construction
activities listed in this section have been used
by
VFL on
several other
pozzolanic
cap
projects
To demonstrate
this
the
following photos
of
pozzolamc
cap system
that VFL constructed
on an
industrial landfill in New
Jersey
have been included for review
VPL
Technology Corporation
March
26
2003
Hutsonville Power Station
C-i 703-02
Electronic Filing - Received, Clerks' Office, August 11, 2008--AS 09-1, Exhibit 3
REGRADING
LANDFILL
Electronic Filing - Received, Clerks' Office, August 11, 2008--AS 09-1, Exhibit 3
JH
PROC ESSIING
QU1PMENT
IS
Electronic Filing - Received, Clerks' Office, August 11, 2008--AS 09-1, Exhibit 3
PLACEMENT
AND COMPACTION
OF THE
POZZOLAMC CAP
MATERIAL
-_._
31
-L
4-
tz
tv
Otsit
t_a__
_s\
--
_-a
Y4.Hft
..
at
Electronic Filing - Received, Clerks' Office, August 11, 2008--AS 09-1, Exhibit 3
1$
?Th
.1
COMPACTED
AND GRADED
POZZOLANIC CAP MATERIAL
Electronic Filing - Received, Clerks' Office, August 11, 2008--AS 09-1, Exhibit 3
if
PLACEMENT OF THE DRAINAGE
LAYER
AND TOP SOIL FOR COVER
SYSTEM
----
-.
cli
4-
ti
ti_p
Electronic Filing - Received, Clerks' Office, August 11, 2008--AS 09-1, Exhibit 3
46
.1
13
II
II
344
IIi
1I
113
--
FINISHED
LANDFILL
13-
I-
i_I
i__I
1-
ci
--
Electronic Filing - Received, Clerks' Office, August 11, 2008--AS 09-1, Exhibit 3
Appendix
A-i
Draft
Geotechnical
Report
by
GeoSystems
Consultants Inc
Fort
Washington
Pa
V1L
Technology Corporation
March 26
2003
Hutsonville Power Station
C-i 703-02
Electronic Filing - Received, Clerks' Office, August 11, 2008--AS 09-1, Exhibit 3
GeoSystems Consultants
Inc
514
Pennsylvania
Avenue
_____
Fort
Washington
PA 19034
Telephone
215
654-9600
Fax
215
643-9440
June
2002
2002G106
Revised 24 December 2002
VFL
Technology Corporation
16
Hagerty
Boulevard
West
Chester
PA
19382-7594
Attention Mr
Douglas
Martin
Re
Geotechnical
Evaluation
Closure
of the
Fly
ash Basins and
Stockpile
Hutsonville Power Station
Hutsonville
IL
Dear Mr
Martin
In accordance with \TFL
Technology Corporations request GeoSystems
Consultants
Inc is
pleased
to
submit this Final
Report regarding
the Geotechnical
aspects relating
to
the closure of
Flyash
Basin
Basin
at the
subject
site The
closure will utilize
conditioned
and
processed
coal ash from
Flyash
Basin
Basin
and other
Stockpiled
materials in Basin
at the Hutsonville Power Station in
Hutsonville
Illinois
GeoSystems
Consultants
provided geotechnical
engineering
consultation
services to the VFL team for this
project
The
professional
services
provided
are
presented
below
PROFESSIONAL SERVICES
Professional Services
provided
for this
project
consist
of the
following
tasks
Task
Site Walk
Site walk
was
conducted
on
March
and
2002
as was
site
meeting
with
representatives
of Natural Resource
Technology NRT
Inc
Christopher
Robb
and
Steve
Miller
James
Alberta
Jaquie
Bush of
AMEREN SERVICES
Hutsonville
Power Station
Field
Assessment of
geotechnical
conditions
at
Basin
and
sampling
of Basins
and
were
also
performed
Samples
obtained
were
shipped
to
VFLs
West Chester
Facility
One bucket
of
flyash
from Basin
was
then
transported
to
GeoSystems
Fort
Washington
facility
M\Projects\2002\.2002G106\Report\Report
Revised
12-2002.doc
Electronic Filing - Received, Clerks' Office, August 11, 2008--AS 09-1, Exhibit 3
GeoSystems Consultants
Inc
Task
Review
Readily
Available
Geotechnical Data
Mr
C.A Robb of
NRT
submitted
selected
geotechnical
data
regarding
the subsurface
conditions
site
drawings
and tables
containing
volumetric data for Basin
list of
these documents
is included
as
Attachment
These documents
were
reviewed
to
ascertain subsurface conditions in the
vicinity
of Basin
Several inferred subsurface
cross section
and the associated test
boring logs
were evaluated
These data were then
used
to
develop
an
Idealized
Cross
Section
of the
completed
Basin
closure at the
location
GeoSystems
believes is the critical section with
respect
to
slope stability
Soil
strength
characteristics
were
estimated based
on
information
presented
in relevant test
boring logs
Where soil
strength
data was not
available
GeoSystems
used
engineering
judgment
to
select reasonable
strength
values for subsurface and embankment soils
and
impounded
flyash
GeoSystems
also obtained and reviewed selected sections of the State of Illinois Title 35
Environmental
Protection
Subtitle
Waste Disposal
Part
816
Alternative Standards for
Coal Combustion
Power
Generating
Facilities
Waste
Landfills
and Subtitle
Waste
Disposal
Part
811
Standards for New Solid Waste
Landfills
Task
Engineering
Consultation Services
GeoSystems provided Engineering
Consulting
Services
regarding
the
geotechnical
issues
for the
project
Specifically
the
following
issues were addressed
Field
Investigation
Program
GeoSystems
identified data
gaps
in the
geotechnical
information
provided
with
respect
to
performing
the
design
evaluation
These deficiencies include insufficient
laboratory
data
that
characterizes
physical
and
engineering
properties
of the
impounded flyash
containment
dikes
the various soil
strata
underlying
the
site
and the
stratigraphy
in the
areas
judged
to be critical with
respect
to
slope stability.
It is
our
opinion
that at least
additional
test
borings
are
required
to
develop
adequate
cross sections
in
critical areas
and to obtain
samples
for
physical
and
engineering
property laboratory testing
These
data would be used
to
perform analyses regarding slope stability
and settlement
Alternate
Cap
Effectiveness
Based
on
review of the
pertinent
sections of the State of Illinois Title 35
Code
pozzolanic
barrier
layer
is
an
acceptable
alternate
cover
system
in lieu of
using
goemembrane
cover
system
To evaluate the
effectiv?ness
of the
pozzolanic
cover
system
the HELP
computer
model
was
used
USEPAs
computer
model
HELP
Hydrologic
Evaluation
of Landfill
Performance
has
been used
to
perform
water
balance
to
estimate the
quantity
of fluid
percolating
through
M\Projects\2002\2002G106\Report\Report
Revised
12-2002.doc
Electronic Filing - Received, Clerks' Office, August 11, 2008--AS 09-1, Exhibit 3
GeoSystenis Consultants
Inc
the final
cover
system
to the basin
materials
estimate the amount of
runoff
and head
on
the
cover
system
barrier
layer
HELP
uses
water
balance
method to estimate the
quantity
of
precipitation
which will
theoretically penetrate
the basin
fmal
cover
system
and
percolate
through
the waste Site-
specific
climatological
and
design
data
can
be
input
into the model in order to assess fmal
cover
performance
To determine the
quantity
of rainfall
penetrating
the
final
cover
the model estimates
runoff
cover
system drainage
and
evapotranspiration
These calculations are
generally
based
on
assumptions
made
regarding
the
runoff
coefficient
root zone
depth quality
of
plant cover
soil
porosity
field
capacity
and initial
water content
All rainwater
remaining
after
runoff
cover
system
drainage
and
evapotranspiration
can
either become
leachÆte
or
can be
incorporated
into the waste
The HELP model is
generally accepted
as
useful tool in the evaluation of
cap
and liner
designs
To
simplify
the
analysis
of these
designs
it makes several
assumptions
These
include
steady
state flow and
homogeneous isotropic layers Steady
state
flow
may
be
achieved in
an
unknown number of
years
after the site has been closed and fmal
cover
installed The
non-homogeneous
nature of the basin materials could result in rainwater
channeling
through
-voids
resulting
in non-uniform flow The effect of rainwater
absorption
by
the waste or
trapped
rainwater
remaining
from
active
operations
can be
accounted for
by setting
the initial water content
of
the waste
These
assumptions
make
the HELP model useful as
tool
to
compare
various
design
options
The information needed to
run
the HELP model includes
climatologic
design
soil
and
runoff data To assist the
user
in
operating
the
HELP
model
the
program
can
generate
synthetic
climatologic
data for 20
years
using
internal databases with weather conditions
for
139
cities
throughout
the United States
Evansville
IN
was
used for
present study
which is about
90 miles from the
site
vegetation
cover
types
and 18 soil
types
The
user
may
select default values from these databases that best
represent
the
expected
site-
specific
conditions
Details
of data
input
and
modeling
results
using
the
20-year
synthetic
weather
generator
are
presented
in Attachment
HELP
analyses
were
performed
using
6-foot
thick
cap
section
feet
pozzolanic
cap
feet
cover
soil 0.5 to 1.5 feet
drainage
2.5 to 1.5 feet cover
soil
Permeability
of the
pozzolanic cap
was varied from
1x10⁵
to
lx i0
cmlsec
and final
cover
slopes
varied
from 1% to 5%
Based
on
the results of the
modeling
the
proposed
cover
design
for Hutsonville
Flyash
Basin
for the flat
cap
area
would result in
range
of 78 to 97
percent
effectiveness
in
eliminating drainage through
the
cover
system
to the basin materials
These
percentages
are
based
on
the
average
total
precipitation
for
one
year
and the
percolation
from
base of
cover values calculated
using
the HELP model
see
Table
The
percolation
from
base of cover is assumed to be the amount of
leachate
which is
conservative
M\Projects\2002\2002G106\Report\Report
Revised
12-2002.doc
Electronic Filing - Received, Clerks' Office, August 11, 2008--AS 09-1, Exhibit 3
GeoSystems Consultants
Inc
assumption
that
ignores
the
potential
for
storage
in the waste material
However
it
does
not account
for
fluid
generated by
the waste materials The
percolation
from
base of
cover has been
computed
on
gallons-per-acre-per-day
basis For the Hutsonville
Flyash
Basin
percolation
ranges
from
90
gallons-per-acre-per-day
Case 2B
to 680
gallons-per-acre-per-day
Case 1A
The calculated
results from
HELP
model
runs
indicate
that
the maximum head associated with the
24-hour
25-year
storm
event
on
the
barrier
layer
within
the
drainage
layer
is less than
inches
This head
can
be
accommodated in
the
drainage
layer
and the
overlying granular cover
soil
Potential Post-Closure
Settlement
Calculations to estimate differential
settlements
affecting
the
performance
of the
cap
elements
were
made
using
the
GeoSystems
Consultants
computer program
SETTLE
This
program
calculates total
settlements
consisting
of the sum of
consolidation
elastic
compression
and/or
secondary compression
of each
layer
The settlement would be
mainly
due to the consolidation of the
flyash layer
This
layer
is
normally
consolidated
and is soft
No
site-specific
consolidated
characteristics
of this
layer
are
available To
compute settlements
data
for similar materials from other sites
was
used Available
correlations
for consolidation
properties
were
utilized
The
following properties
were
used
in the
analysis
Unit
total
weight 7t
90.0
pcf flyash
100.0
pcf silty clay
Compression
Index
Ce
0.17
flyash
1.25
silty clay
Pore Pressure Factor
1.0
Poissons Ratio
pt
0.35
Coefficient of
Secondary Compression Ca
0.005
flyash
0.0 10
silty clay
The 5%
final
cover
slope
was evaluated for settlement
potential
Based
on
reasonable
expected
value for
Compression Index
settlement
at
the
center
of the closed Basin
was
calculated
to
be about
foot This estimate of settlement was based on
an
assumed
value for the
flyash
Compression
Index
Actual
Compression
Index
data from
laboratory
testing
of the Basin
flyash together
with consolidation characteristics of
the various
strata
underlying
Basin
are
required
to
perform
an
analysis
for final submission
Slope
Stability Analyses
Preliminary slope Stability Analyses
for the closed Hutsonville
Flyash
Basin
were
performed using
the
strength parameters
obtained
from
site data
provided
and assumed
soil
properties
where
no
data
was
available
Analyses
were made
using
computer
program
XSTABL Version 4.1
Using
this
computer
program
search
for
critical
surface
having
minimum factor of
safety
was
made Both circular and
block modes of
failure
were
investigated
Based on review of results from the
Preliminary Slope Stability Analyses
insufficient
data
are
available to
perform
comprehensive
evaluation at this time
supplemental
field
investigation designed
to obtain relevant soil
property
data is needed to
perform
the
M\Projects\2002\2002G106\Report\Report
Revised
12-2002.doc
Electronic Filing - Received, Clerks' Office, August 11, 2008--AS 09-1, Exhibit 3
GeoSystems Consultants
Inc
required Slope Stability analyses
for submission to the state
Volume Calculations
Volume
calculations
for
fly
ash utilization associated with the various
slopes
1%
to
5%
for the finale closure
configurations
were
performed
The results are
presented
in
Attachment
Based
on
the
analyses
performed
the
following
conclusions
have been
developed
As the
slope
of the fmal cover increases from 1% to 5% the volume of soil to be
regraded
reduces from
110000 yd3
for
1% to
75000 yd3
for 5%
As the
slope
of the fmal
cover
increases from 1%
to
5%
the volume of structural
fill increases from
yd3
for 1% to
160000 yd3
for 5%
The
volume of
protective
soil cover
feet
including vegetative support layer
and
drainage layer
varies little
with
the
change
in
fmal cover
grade
from 1% to 5%
100000
yd3
The volume of
pozzolanic cap
feet
thick
varies little with the
change
in final
cover
grade
from 1% to 5%
-400000
yd3
Utilization of
flyash
from Basin
increases with
increasing slope
from
1% to
5%
Erosion
Potential
Erosion control of the
cover
system
is
important
because
loss of the soil cover
overlying
the barrier
layer
increases the
potentiaL
for
damage by gnawing/burrowing
animals
thus
decreasing
the effectiveness
of the barrier Erosion
may
be
wind- and/or
water-induced
The
potential
for erosion
by
these two environmental factors should be evaluated
using
the Universal
Soil
Loss
Equation
USLE
and the Wind Erosion
Equation WEE
Erosion calculations
are
highly dependent
upon
the
type
and condition
of vegetation
anticipated
after closure Erosion loss due
to
wind and
water can be
calculated
based on
the
anticipated
short
and
long
term condition of the
cover
system
No calculations
were
performed
for this
phase
of the
design
process
Freeze-Thaw Effects
The maximum
estimated frost
penetration
depth
in Central Illinois is 30 inches and the
average
depth
of frost
penetration
is
about 10
inches
conceptual
cover
system
design
for the flat
area
could
provide
for soil
depth
above the barrier
fmal cover will not be
sensitive
to
freeze-thaw
effects
when
properly designed
M\Projects\.2002\2002G106\Report\Report
Revised
12-2002.doc
Electronic Filing - Received, Clerks' Office, August 11, 2008--AS 09-1, Exhibit 3
GeoSystems Consultants
Inc
Air Emission Control
Airborne
migration
of
landfill materials will be
predominantly
migration
of dust
particles
during
closure
subgrade
preparation
and initial
placement
of the
general
fill
layer
As the
general
fill
layer variable thickness
installation
proceeds
the
potential
for
fugitive
dust
containing
landfihled materials
would lessen and then be
virtually
eliminated
once
the
general
fill has been
partially completed
over the entire site
CONCLUSIONS
Additional
field
investigation
is
necessary
to better define the
geotechnical
properties
of
the
impounded flyash
containment
dikes
and various soil strata
underlying
the
site
as
well
as
better
defining
the
stratigraphy
for the
critical sections identified
pozzolanic
cap
having
minimum thickness of feet
0.91 meters
can
be
constructed
parametric
analysis varying
cap
permeability
from lxi
cmls
to
lxi
cniis
yielded
effectiveness
ranging
from
78
percent
to 97
percent
The
permeability
of the
cap
greatly
influences
its effectiveness
Post-closure
settlement has been estimated
to
be
about
foot for the
cases
evaluated
This is
rough
estimate based on
interpretation
of
engineering
properties
from
soil
descriptions presented
in
the
boring logs provided
and assumed
properties
of the
impounded flyash Laboratory
test data were available for
use
in these evaluations
Based
on
review of
results from the
Preliminary Analyses
insufficient data
are
available
to
perform
comprehensive
evaluation
at this time
supplemental
field
investigation
designed
to
obtain relevant
soil
property
data is needed
to
perform
the
required Slope
Stability analyses
for submission
to
the
state
LIMITATIONS
The
conclusions
and recommendations
presented
in this
report
are
based
on
the
assumptions
that the subsurface conditions
at
the
site and the assumed soil
properties
do
not deviate
appreciably
from those disclosed
by
the test
boring
data
provided
and that the
proposed
design
is
substantially
in conformance
with the
project
description
GeoSystems
Consultants
should
be notified
immediately
should
differing
conditions be
encountered
or
if
significant changes
in
design
are
contemplated
so
that
appropriate
revisions
can
be
made
to
the
recommendations
M\rojects\2002\20020106\Report\Report
Revised
12-2002.doc
Electronic Filing - Received, Clerks' Office, August 11, 2008--AS 09-1, Exhibit 3
GeoSystems Consultants
Inc
We
sincerely appreciate
the
opportunity
to submit this
Progress Report
for this
challenging
project
If
you
have
any
questions please
do not hesitate
to contact
us.Very
truiy
yours
GEOSYSTEMS
CONSULTANTS
INC
M\Projec2002\20020106\Report\Report
Revised
12-2002.doc
Principal
Electronic Filing - Received, Clerks' Office, August 11, 2008--AS 09-1, Exhibit 3
Table
Pozzolanic
Cap
Effectiveness
Effectiveness
Cases
Pozzolanic
Cap
.PermeabiIityj?mfs
1x10⁵
1x10⁶
1x10⁷
Case 1A
78%
78%
95%
Case lB
78%
79%
95%
Case2A
78%
81%
96%
Case
2B
79%
86%
97%
Case 1A
Case
IB
Case
2A
Case 2B
30
topsoil
sand at lxi
cm/s
36
pozzolanic
cap
on
1%
slope
30
topsoil
sand at lxi
cmls
36
pozzolanic
cap
on
5%
slope
18
topsoil
18 sand at 1x10²
cm/s
36
pozzoianic
cap
on
1%
slope
18
topsoil
18 sand at lxi 0.2
cm/s
36
pozzolanic
cap
on
5%
slope
Electronic Filing - Received, Clerks' Office, August 11, 2008--AS 09-1, Exhibit 3
Attachment
Electronic Filing - Received, Clerks' Office, August 11, 2008--AS 09-1, Exhibit 3
Natural
TRANSMIT
AL
Resource
Technology
lnc
To
VFL
Technology
Corporation
Date
March
11
2002
16
Hagerty
Boulevard
Project
No
1375
West
Chester
PA 19382
From
Christopher
Robb
Re DataTransfei-Sojl
Borings
Topography
etc
Attn Mr
Doug
Martin
Ameren Services
Hutsonville
Power
__________________________________
Station
For
Your Files
As
Requested
For Review
Approve
and Return
Copies
Description
Boring
Logs
EW-1 MW-6
MW-7
MW-7D
MW-8
GP-20
to
GP-23 MW-li
________
MW-hR
SB-lW to
SB-103
MW-14
TW
_________
Sheet
Pile Wall Site
Plan S-350l
arid Details S-351 PARTIAL
COPYI
_________
Figure No
Geologic
Cross Sections
1375-B12
Figure
No
Bedrock Elevation
Contours
375-B
_________
Figure
No
Alternative No
Earthen Final
Cover 1375-B33C
Figure No
Site Plan
1375-B3rn
via electronic
malt
Table
3-2
Areal
Extent and
Volumes of UnsÆthrated
and
Saturated Ash In Pond
Table 3-3
Final
Cover
Alternatives
Material Balance
Analysis
_Title
TAC Part
811 and 816
via electrnnjc
mail
Comments
Doug
Please
find enclosed
copies
of the
above listed
materials The
following
is
quick
list of
some
additional
potentially
useful
information
GP-20
2122
and 23
are inside of the
unlined ash
impoundment
Pond
No soil
borings
were
performed
in Pond
Ds berm
For Pond
fill
estimated
approximately
15500
cy
fill below
water surface
23713
Paul
Road
Pewaukee
WI 53072
Phone
262/523-9000
Fax 262/523-9001
375 VFL
Data
Requect
O2O3
trans.doc
Electronic Filing - Received, Clerks' Office, August 11, 2008--AS 09-1, Exhibit 3
Aftachment
Electronic Filing - Received, Clerks' Office, August 11, 2008--AS 09-1, Exhibit 3
10
POZZOLANIC
GAP
PERFORMANCE
Permeability
of
Pozzolanic
Cap
IE-X
Electronic Filing - Received, Clerks' Office, August 11, 2008--AS 09-1, Exhibit 3
Cap
Design
100%
95%
90%
85%
80%
75%
70%
65%
60%
55%
50%
H-cAsE
1A
30
TOPSOIL
SAND
AT
1E-3
36
POZZOLANIC
CAP
1%
SLOPE
CASE
30
TOPSOIL
SAND
AT
E-3
36
POZZOLANIC
CAP
5%SLOPE
4---CASE
2A
18
TOPSOIL
18
SAND
AT
1E-2
36
POZZOLANIC
CAP
1%
SLOPE
---CASE
2B
18
TOPSOIL
18
SAND
AT
1E-2
36
POZZOLANIC
CAP
5%
SLOPE
Electronic Filing - Received, Clerks' Office, August 11, 2008--AS 09-1, Exhibit 3
VFL-15 .OUT
HYDROLOGIC
EVALUATION
OF
LAIWFILL
PERFORMANCE
HELP
MODEL
VERSION 3.07
NOVEMBER
1997
DEVELOPED
BY
ENVIRONMENTAL
LABORATORY
USAE
WATERWAYS
EXPERIMENT
STATION
FOR USEPA
RISK
REDUCTION
ENGINEERING
LABORATORY
PRECIPITATION
DATA
FILE
TEMPERATURE
DATA
FILE
SOLAR RADIATION
DATA
FILE
EVAPOTRANSpIaATION
DATA
SOIL AND DESIGN DATA
FILE
OUTPUT
DATA
FILE
\ENGINE1\HELP--M1\DATA4
D4
M\ENGINE1\HELP-M...1\DATA7
D7
\ENGINEl\HELP-M....1\DATA13
013
\ENGINE.-1\HELP-M-4\DATAI1
.Dll
\ENGINE-.1\HELP-M.-1\DATA1O
D1O
M\ENGINE.4\HELP-M..4\vFL-15
.OUT
TITLE
VFL/Amereii Services-Hutsonvjlle
Power Station
NOTE
INITIAL
MOISTURE
CONTENT
OF THE
LAYERS
AND
SNOW
WATER
WERE
COMPUTED
AS NEARLY
STEADY-STATE
VALUES
BY THE
PROGRAM
LAYER
TYPE
VERTICAL
PERCOLATION
LAYER
MATERIAL
TETURE
NUMBER
18.00
INCHES
0.4630
VOL/VOL
0.23.20
VOL/VOL
0.1160 VOL/VOL
0.2404
VOL/VOL
O.369999994000E-03
CM/SEC
TYPE
LATERAL
DRAINAGE
LAYER
Page
TIME
1655
DATE
3/27/2002
THICKNESS
POROSITY
FIELD CAPACITY
WILTING
POINT
INITIAL
SOIL WATER
CONTENT
EFFECTIVE
SAT HYD COND
LAYER
Electronic Filing - Received, Clerks' Office, August 11, 2008--AS 09-1, Exhibit 3
VFL-15
OUT
MATERIAL
TEXTURE
NUMBER
18.00
INCHES
0.4570
VOL/VOL
0.1310
VOL/VOL
0.0580
VOL/VOL
0.1477
VOL/voL
O.100000005000E-02
CM/SEC
1.00
PERCENT
375.0
FEET
THICKNESS
POROSITY
FIELD
CAPACITY
WILTING
POINT
INITIAL
SOIL
WATER
CONTENT
EFFECTIVE
SAT
HYD
COND
SOIL
LINER
NUMBER
36.00
INCHES
0.5410
VOL/VOL
0.1870
VOL/VoL
0.0470
VOL/VOL
0.5410
VOL/VOL
O.999999975000E-05
CM/SEC
EVAPOTRANSPIRATION
AND
WEATHER
DATA
NOTE
EVAPOTRANSPIR.ATION
DATA
WAS OBTAINED
FROM
EVANSVILLE
INDIANA
STATION
LATITUDE
MAXIMUM
LEAF
AREA
INDEX
START
OF
GROWING
SEASON
JULIAN
DATE
END OF
GROWING
SEASON
JULIAN
DATE
EVAPORATIVE
ZONE
DEPTH
38.03
DEGREES
0.00
96
300
21.0
INCHES
THICKNESS
POROSITY
FIELD
CAPACITY
WILTING
POINT
INITIAL
SOIL WATER
CONTENT
EFFECTIVE
SAT HYD
COND
SLOPE
DRAINAGE
LENGTH
LAYER
TYPE
BARRIER
MATERIAL
TEXTURE
GENERAL
DESIGN AND
EVAPORATIVE
ZONE DATA
NOTE
SCS
RUNOFF
CURVE
NUMBER
WAS
COMPUTED
FROM DEFAULT
SOIL DATA
BASE
USING SOIL TEXTURE
WITH
FAIR
STAND
OF
GRASS
SURFACE
SLOPE
OF
1.%
AND
SLOPE
LENGTH
OF
375
FEET
SCS RUNOFF
CURVE
NUMBER
78.50
FRACTION
OF
AREA
ALLOWING
RUNOFF
100.0
PERCENT
AREA
PROJECTED
ON
HORIZONTAL
PLANE
1.000
ACRES
EVAPORATIVE
ZONE
DEPTH
21.0
INCHES
INITIAL
WATER
IN
EVAPORATIVE
ZONE
5.014
INCHES
UPPER
LIMIT OF
EVAPORATIVE
STORAGE
9.705
INCHES
LOWER
LIMIT OF
EVAPORATIVE
STORAGE
2.262
INCHES
INITIAL
SNOW WATER
0.000
INCHES
INITIAL
WATER IN
LAYER
MATERIALS
26.462
INCHES
TOTAL
INITIAL
WATER
26.462
INCHES
TOTAL
SUBSURFACE
INFLOW
0.00
INCHES/YEAR
Page
Electronic Filing - Received, Clerks' Office, August 11, 2008--AS 09-1, Exhibit 3
Attachment
Electronic Filing - Received, Clerks' Office, August 11, 2008--AS 09-1, Exhibit 3
REPRESENTATIVE
CROSS
SECTION
POND
HUTSONVILLE
POWER
STATION
HIJTSONVILLE
ILLINOIS
GeoSystems
Consultants
Inc
PROJECT
NO
02G106
IGU
RE
FLY
ASHTO
BE
RELOCATED
FLY
ASHNEEDEDFORGRADING
TOPSOIL
COVER
GRANULAR
DRAINAGE
LAYER
POZZOLANIC
CAP
REVISED
12-26-02
APRIL
2002
Electronic Filing - Received, Clerks' Office, August 11, 2008--AS 09-1, Exhibit 3
Ameren Services
Hutsonville
Power Station
Basin
Closure
EARTHWORK QUANTITIES
VOLUMES
1%
SLOPE
GRADING
Basin
Flyash
to be relocated
107561
85751
71811
Calculatedfill from
Basin
57828
42338
142531
Material needed to fill basins
15500
15500
15500
Total borrow material from BasinA
42328
57838
158031
CAP
Total
Cap
201047
200745
200960
36 Pozzolanic
Cap
100524
100373
100480
18
Drainage
Layer
50262
50186
50240
18
Topsoil
50262
50186
50240
TOTAL
FLYASH BORROW REQUIRED
58195
158211
258511
Electronic Filing - Received, Clerks' Office, August 11, 2008--AS 09-1, Exhibit 3
Earthwork
Quantities
for
Closure
Regraded
Basin
Flyash
4Borrow
needed
from
Basin
for
Grading
APozzolanic
Cap
U----Total
Borrow
from
Basin
_____
LL
300000
250000
200000
150000
100000
50000
-50000
-100000
1%
3%
5%
Final
Cap
Grade
Electronic Filing - Received, Clerks' Office, August 11, 2008--AS 09-1, Exhibit 3
Appendix
Analytical
Laboratory Reports
from
Dalare
Laboratories
Philadelphia
Pa
V1L
Technology
Corporation
March
26
2003
Hutsonville
Power Station
C-i703-02
Electronic Filing - Received, Clerks' Office, August 11, 2008--AS 09-1, Exhibit 3
Dalare
Associates
Inc
VEL
Technology
Attn
Rocus Peters
16
Hagerty
Blvd
West
Chester PA
19382
Dear Mr
Peters
217
24th Street
Philadelphia
PA
19103
Telephone
215 -567-1953
Facsimile
215-567- 1168
ANALYTICAL AND
ENVIRONMENTAL
TESTING
April 25 2002
mg/Kg
milligrams
per Kilogram
rng/L
milligras
per
Liter
Less
than
Analytical
Report
328
HutsonvJ.e
Power
Fly
Ash
3/28102
1.0
mg/Kg
24.3
mg/Kg
55.6
mg/Kg
0.076
mg/Kg
18.3
mg/Kg
1.0
mg/Kg
Very
truly
DALARE
ASS0IATES INC
We have
examined
the
sample
submitted
and would
report
our
follows
findings
as
Date
Received 4/2/02
Total
Metals
Arsenic
Barium
Cadmium
Chromium
Lead
Mercury
Selenium
Silver
TCLP
Leachate
Arsenic
Barium
Cadmium
Chromium
Lead
Mercury
Selenium
Silver
0.020
0.56
0.01
0.01
0.12
0.001
0.013
0.01
mg/L
mg/L
mg/L
mg/L
mg/L
mg/L
mg/L
mg/L
Paul
Weber
PAW
Electronic Filing - Received, Clerks' Office, August 11, 2008--AS 09-1, Exhibit 3
Dalare
Associates Inc
21
24th Street
.PhiladeTphia
PA 19103
Telephone 215-567-1953
FacsimUe2l5-567-1168
ANALY1CAL
AND
ENVIRONMENTAL
TESTING
October
2002
VFL
Technology
Attn
Rocus
Peters
16
Hagerty
Blvd
West
Chester PA 19382
Dear
Mr
Peters
We have
examined
the
samples submitted
and would
report
our
findings as
follows
Date
Received
9/27/02
Analytical
Report
910
Hutsonville
Mix
Mix
TCLP
Leachate
Arsenic
0.010
PPM
0.010
PPM
Barium
0.28
PPM
0.25
PPM
Cadmium
0.01
PPM
0.01
PPM
Chromium
0.06
PPM
0.01
PPM
Lead
0.02
PPM
0.02
PPM
Mercury
0.001
PPM
0.001
PPM
Selenium
0.019
PPM
0.010
PPM
Silver
0.01
PPM
0.01
PPM
PPM
Parts
per
Million
Less
than
The
TCLP
Leachate
was
analyzed
in
accordance
with the
method
described in
the
Federal
Register
Volume
55
No.61 3/29/90
pages
11863-75
Very truly
yours
DALARE
ASSOCIATES
INC
Paul
Weber
PAWjc
Electronic Filing - Received, Clerks' Office, August 11, 2008--AS 09-1, Exhibit 3
Dalare Associates
VFL
Technology
Attn
Rou
Peters
16
Hagerty
Blvd
West
Chester PA
19382
Dear
Mr
Peters
21
24th
Street
Philadelphia
PA
19103
Telephone 215
-567-1953
FacsirniIe215-567
1168
ANALYTICAL
AND
ENVIRONMENTAL
TESTING
October
2002
We
follows
have
ecamined
the
samples submitted
and
would
report our
findings as
Date
Received
9/18/02
Analytical
Report
908
Huts
onvill
Mix 14
The
the
TCLP
Federal
Leachate
Register
was
Volume
analyzed
55in
No.61
accordance
3/29/90
with
pages
the
method
11863-75described
in
Very
truly
yours
DALARE
ASSOCIATES
INC
Paul
Weber
TCLP
Leachate
Arsenic
Barium
Cadmium
Chromium
Lead
Mercury
Selenium
Silver
PPM
Parts
per
Million
Less
than
0.010
PPM
0.010
PPM
0.14
PPM
0.11
PPM
0.01
PPM
0.0
PPM
0.05
PPM
0.01
PPM
0.02
PPM
0.02
PPM
0.001
PPM
0.001
PPM
0.010
PPM
0.010
PPM
0.01
PPM
0.01
PPM
PAWjc
Electronic Filing - Received, Clerks' Office, August 11, 2008--AS 09-1, Exhibit 3
APPENDIX
GROUNDWATER TRANSPORT MODELING RESULTS
AND
SUPPORTING DOCUMENTATION
Electronic Filing - Received, Clerks' Office, August 11, 2008--AS 09-1, Exhibit 3
Table
D-1
HELP
Input
Parameters
Climate-General
ET/aeneral
.D11t
Soil File D10
hulco
hutco
hutco
hutco
hutco
CO-i
CO-2
CO-3a
CO-3b
CO-3c
Note
Pozzelanc
cap scenaros
CO-3ab.c
were modeled as both vertical
percolaton
layers
and barrier
layers
Results
when
modeled
as vertical
percolation
layers
were kienhcal
to each
other and
kientical
to results
lot CO-SC
when
modeled
as
vertical
percotanon
layer
Barrier
layer
results
are
presented
here
to show
maximum
modeled
ditterence
berween
scenaros
Natural
Resource
Technology
bc
Cap Report Desicination
City
Dewaterina
CO-i
Latitude
EvaD Zone
Time Period
2001-2003
2004-2025
Notes
CO-2
Evansville
Evansville
Evansville
Ev
39.13
CO-3a
CO-3b
CO-3c
snsville
Evansville
Evansvith
39.13
39.13
39.13
Plant
Leaf Index
bare
lair
21
21
21
21
bare9fair21
All Others
Defaults
for
Evansville
IN
Climate-precip/temp/ET
All
see note
see note
see note
see note
see note
see note
Synthetically
generated
using
Evansville
defaults
plant
30
year
averages
precip
and
average
temperature
in
Palestine
Soils-General
Area
unit
area
where runoff
possible
100
100
100
100
100
Specify
Initial MC
Surface
Water/Snow
60
represents
ponded
condilion
Soils-Layers
ash
native
native
native
native
native
ash
ash
synthetic
pozzolonic
pozzolonic
pozzolonic
ash
ash
ash
ash
ash
ash
ash
ash
ash
ash
ash
ash
ash
ash
ash
Soil
Parametersnative
Type
verlical
percolation
layer
Thickness
in
36
36
36
36
36
Texture
loam
defaut
parameters
used
Moisture
Content
0.232
0.232
232
0.232
0.232
set
equal
to field
Capacity
Soil Parameterssyntheti
Type
rieomembrane
Thickness
in
0.03
Texture
37
default for PVC
Kcm/s
2.OOE-11
Pinhole
density
Inslallation
Defects
Placement
Quality
qood
placement
quality
Soil
Parameterspozzolartic
Type
harder
layer see note
below
Thickness
in
36
36
36
Texture
16
16
16
default barriersoil
IMoislure
Content
0.187
0.187
0.187
set equal
10 field
capacity
Kcm/s
1.OOE-07
1.OOE-06
1.OOE-05
Soil Parametersash
laye
Type
Thickness
in
60
60
60
60
60
60
Texture
30
30
30
30
30
30
Porosity
0.541
0.541
0.541
0.541
0.541
0.541
Field
Capacity
0.187
0.187
0.187
0.187
0.187
0.187
Wining
point
0.047
0.047
0047
0.047
0.047
0.047
Moisture
Content
Li
0.541
0.2504
0.2504
0.2504
0.2504
0.2504
base
case
moisture
conlenl
for
saturated
Moisture
Content
12
0.541
0.2883
0.2883
0.2883
0.2883
0.2883
lponded
conditions
CO- case MC values
equal
Moisture
Content
L3
0.541
0.3212
0.3212
0.3212
03212
0.3212
to MC at end of base case simulation
cm/s
5.OOE-05
5.OOE-05
5.OOE-05
b.OOE-05
5.OOE-05
5.OOE-05
SoilsRunoff
Equation
n/a
HELP
CN
HELP CN
HELP
CN
HELP
CN
HELP CN
Slope
n/a
2%
2%
2%
2%
2%
Length fi
ti/a
500
500
500
500
500
Texture
ri/a
Vegetation
n/a
fair
fair
fair
fair
fair
Execution Parameters
Years
1-3
4-25
4-25
4-25
4-25
4-25
Report
Daily_________
Report
Monthly
Report_Annual
Output
Filename
.out
Base
CO-i
CO-2
CO-3a
CO-3b
CO-3c
Precip
File
.D4
huts
hulx4_23
hutx4_23
hutx4_23
hutx4_23
hutx4_23
Temp File D7
huts
htjtx4_23
huto4.23
hutx4_23
hutx4.23
hutx4_23
SR
P.Di3
hulbase
hutco
hutco
hutco
hutCo
flutco
r375 Model
fln
Tubles.xls
Help
lryur Paranetcs
Electronic Filing - Received, Clerks' Office, August 11, 2008--AS 09-1, Exhibit 3
Table
D-2
Pond
Recharge
Ratesused
in
MODFLOW
Basedon
HELP-Predicted
Perrcolation
Rates
Model
Year
Stress
Period
Period
Length
days
Recharge
Rates
Used
in
MODFLOW
feet/day
Notes
CO-i
CO-2
CO-3a
CO-3b
CO-3c
2001
120
0.0670
0.0670
0.0670
0.0670
0.0670
Dewatering
no
cap
or
leachate
collection
system
modeled
2001
123
0.0103
0.0103
0.0103
0.0103
0.0103
2001
122
0.0032
0.0032
0.0032
0.0032
0.0032
2002
120
0.0036
0.0036
0.0036
0.0036
0.0036
2002
123
0.0085
0.0085
0.0085
0.0085
0.0085
2002
122
0.0045
0.0045
0.0045
0.0045
0.0045
2003
365
0.0042
0.0042
0.0042
0.0042
0.0042
2004
365
0.0018
0.0018
0.0018
0.0019
o.ooi9
Cap
and
leachate
collection
3ystem
modeled
during
these
two
stress
periods
2005-2025
7665
0.0018
0.0004
0.0005
0.0018
0.0018
1375Model
Report
Tables.xls
Help
Percolation
Rates
of
Natural
Resource
Technology
Inc
Electronic Filing - Received, Clerks' Office, August 11, 2008--AS 09-1, Exhibit 3
Table
D-3
MODFLOW
Drain
Construction
for
LEO-i
LEO-2LEO-3
and
LEO-4
Drain
Drain
Length
feet
Drain
Pipe
Diameter
feet
Drain
Bed
Thickness
feet
Drain
Bed
Hydraulic
Conductivity
cm/s
Drain
Bed
Hydraulic
Conductivity
ft/day
South/East
Drain
Base
Elevation
North/West
Drain
Base
Elevation
MODFLOW
Layer
Number
MODFLOW
Drain
Reach
la
1000
0.1
283
440
423
2a
70
0.1
283
423
423
3a
105
0.1
283
423
422
4a
615
0.1
283
422
420
5a
710
0.1
283
420
425
6a
700
0.1
283
425
425
lb
1000
0.1
283
437
420
2b
70
0.1
283
420
420
3b
105
0.1
283
420
419
4b
615
0.1
283
419
417
5b
710
0.1
283
417
422
6b
700
0.1
283
422
422
Extraction
Type
Leachate
Extraction
Option
LEOa-l
LEOb-l
LEOa-2
LEOb-2
LEOa-3
LEOb-3
LEOa-4
LEOb-4
la
On
On
On
On
2a
On
On
3a
On
On
4a
On
On
5a
On
On
6a
On
lb
On
On
On
On
2b
On
On
3b
On
On
4b
On
On
5b
On
On
6b
On
Extraction
Wells
On
On
1375Model
Report
Tables.xls
MODFLOW
DrainConstruction
of
Natural
Resource
Technology
Inc
Electronic Filing - Received, Clerks' Office, August 11, 2008--AS 09-1, Exhibit 3
Table D-4
Hutsonville Pond
Leachate Collection Scenarios
Estimated
Discharge
Volumes
MODFLOW Data
CO-2 and LEOa-1
StrDss
Wells
Volume
Drain
Period
Step
ft1day
gpm
ft/day
gpm
1_
42350
220
11890
62
42350
220
10265
53
42350
220
9929
52
42350
220
9752
51
42350
220
9615
50
42350
220
9530
50
42350
220
9397
49
42350
220
9.314
48
220
9239
48
42350
220
9.169
48
42350
220
9102
47
42350
220
9055
47
42350
220
9032
47
42350
220
9004
47
9_
42350
220
8993
47
10
42350
220
8.978
47
11
42350
220
8954
47
12
42350
220
8941
46
13
42350
220
8941
46
14
42350
220
8941
46
15
42.350
220
8.941
46
16
42350
220
8941
46
17
42350
220
8.941
46
18
42350
220
8941
46
Average
42350
220
9325
48
CO-2 and LEOa-2
Stress
Wells
Volume
Drain
Period
Step
ft3lday
gprn
f/day
gpm
184200
957
177860
924
176870
919
176460
917
176230
915
176040
914
175680
913
175400
911
175240
910
175120
910
174930
909
174870
908
174850
908
174770
908
174720
908
.10
0_
174680
907
11
174650
907
12
174650
907
13
174650
907
14
174650
907
15
174650
907
16
174650
907
17
174650
907
18
174650
907
Average
175630
912
CO-2 and LEOb-1
Stress
Wells
Volume
Drain
Period
Step
ft3lday
gpm
ftIday
gpm
42350
220
26197
136
42350
220
23715
123
42350
220
23254
121
42350
220
23049
120
42350
220
22945
119
42350
220
22862
119
42350
220
22728
118
42.350
220
22645
118
42350
220
22554
117
42350
220
22518
117
42350
220
22461
117
42350
220
22427
117
42350
220
22394
116
42350
220
22365
116
42350
220
22344
116
10
42350
220
22329
116
11
42350
220
22324
116
12
42350
220
22316
116
13
42350
220
22316
116
14
42350
220
22316
116
15
42350
220
22316
116
16
42350
220
22316
116
17
42350
220
22311
116
18
42350
220
22308
116
Average
42350
220
22721
118
CO-2 and LEOb-2
Stress
Wells- Volume
Drain
Period
Step
ft3day
gpm
ftalday
gpm
265280
1378
257920
1340
256850
1334
256430
1332
256210
1331
256030
1330
0_
255.620
1328
255390
1327
255190
1326
255130
1325
255010
1325
254940
1324
254890
1324
0_
254810
1324
254730
1323
10
254680
1323
11
254680
1323
12
0_
254660
1323
13
254660
1323
14
254660
1323
15
254660
1323
16
254660
1323
17
254660
1323
18
254660
1323
Average
255684
1328
1375
Model
Report Tables.xls
Extraction
Discharge
Volumes
of4
Natural
Resource
Technology
Inc
Electronic Filing - Received, Clerks' Office, August 11, 2008--AS 09-1, Exhibit 3
Table D-4
continued
Hutsonville Pond
Leachate Collection Scenarios
Estimated
Discharge
Volumes
MODFLOW
Data
CO-2 and LEOa-3
Stress
Wells
Volume
Drain
Period
Step
ftday
gpm
ft3/day
gpm
j4191
74
12791
66
12517
65
12361
64
12234
64
12152
63
12017
62
11934
62
11859
62
11797
61
11729
61
11685
61
11662
61
11628
60
11605
60
10
11594
60
11
11579
60
12
11576
60
13
11576
60
14
11576
60
15
11574
60
16
11574
60
17
11574
60
18
11574
60
Average
11932
62
CO-2 and LEOa-4
Stress
Wells
Volume
Drain
Period
Step
ft3day
gpm
ftday
gpm
149490
777
143740
747
142840
742
142470
740
142260
739
142130
738
141810
737
141620
736
141510
735
141.410
735
141290
734
141250
734
141240
734
141.200
734
141130
733
10
141.110
733
11
141090
733
12
141090
733
13
141080
733
14
141080
733
15
141080
733
16
141080
733
17
141080
733
18
141080
733
Average
141882
737
CO-2 and LEOb.-3
Strss
Wells Volume
Drain
Period
Step
ftday
gpm
ftday
gpm
28412
148
26176
136
25772
134
25573
133
25474
132
25389
132
25267
131
181
131
25096
130
25057
130
25000
130
24966
130
24927
129
24907
129
24891
129
10
24865
129
11
24863
129
12
24850
129
13
24850
129
14
24850
129
15
24.850
129
16
24850
129
17
24850
129
18
24850
129
Average
25240
131
CO-2 and LEOb-4
Stress
Wells- Volume
Drain
Period
Step
i/day
gpm
ft3lday
gpm
183.420
953
176720
918
175.740
913
175380
911
175180
910
175.040
909
174720
908
174550
907
174420
906
174370
906
174280
905
174230
905
174200
905
174.150
905
174080
904
10
174050
904
11
174050
904
12
174040
904
13
174040
904
14
174040
904
15
174030
904
16
174030
904
17
174030
904
18
174030
904
Average
174868
908
1375
Model
Report
Tables.xls
Extraction
Discharge
Volumes
of
Natural
Resource
Technology
Inc
Electronic Filing - Received, Clerks' Office, August 11, 2008--AS 09-1, Exhibit 3
Table D-4
continued
Hutsonville Pond
Leachate Collection Scenarios
Estimated
Discharge
Volumes
MOOFLOW Data
CO-3c and LEOa-1
Stress
Wells
Volume
DrAin
Period
Step
ftiday
gpm
ftIday
gpm
42350
220
11892
62
42350
220
10273
53
42350
220
9939
52
42350
220
9770
51
42350
220
9633
50
42350
220
9540
50
42350
220
9501
49
42350
220
9460
49
42350
220
9418
49
42350
220
9369
49
42350
220
9314
48
6_
42350
220
9281
48
7_
42350
220
9268
48
42350
220
9232
48
42350
220
9216
48
10
42350
220
9203
48
11
42.350
220
9188
48
12
42350
220
188
48
13
42350
220
9188
48
14
42350
220
9180
48
15
42350
220
9180
48
16
42350
220
9182
48
17
42350
220
9180
48
18
42350
220
9177
48
Average
42350
220
9.490
49
CO-3c and LEOa-2
Stress
Wells
Volume
Drain
Period
Step
ttIday
gpm
ttIday
gpm
184.220
957
2_
177890
924
176910
919
176490
917
176250
916
176090
915
176010
914
175860
914
175770
913
175690
913
175550
912
175510
912
175510
912
175420
911
175380
911
10
175340
911
11
175300
911
12
175300
911
13
175300
911
14
175.300
911
15
175300
911
16
175300
911
17
175300
911
18
175300
911
Average
176095
915
CO-3c and
LEOb-1
Strss
Wells
Volume
Drain
Period
Step
ft3day
gpm
ftday
gpm
42350
220
26200
136
42350
220
23723
123
42350
220
23264
121
42.350
220
23062
120
42350
220
22961
119
42350
220
22.873
19
42350
220
22829
19
42350
220
22785
18
42350
220
22717
118
42350
220
22702
118
42.350
220
22655
118
42350
220
22.632
118
42350
220
22593
117
42350
220
22577
117
42350
220
22552
117
10
42350
220
22544
117
11
42350
220
22539
117
12
42350
220
22.536
117
13
42350
220
22536
117
14
42.350
220
22539
117
15
42350
220
22536
117
16
42350
220
22539
117
17
42350
220
22536
117
18
42350
220
22536
117
Average
42350
220
22874
119
CO-3c and LEOb-2
Stress
Wells
Volume
Drain
Period
Step
ftIday
gpm
fday
gpm
265290
1378
257940
1340
256890
1334
256.470
1332
256240
1331
256060
1330
255940
1330
255800
1329
255680
1328
255650
1328
255530
1327
255490
1327
255470
1327
255380
1327
255310
1326
10
255280
1326
11
255280
1326
12
255280
1326
13
255280
1326
14
255280
1326
15
255240
1326
16
255240
1326
17
255240
1326
18
255240
1326
Average
256104
1330
1375
Model
Report
Tables.xls
Extraction
Discharge
Volumes
of
Natural
Resource
Technology
Inc
Electronic Filing - Received, Clerks' Office, August 11, 2008--AS 09-1, Exhibit 3
Table D-4
continued
Hutsonville Pond
Leachate Collection Scenarios
Estimated
Discharge
Volumes
MODFLOW
Data
CO-3c and LEOa-3
Stress
Wells
Volume
Drain
Period
Step
ftIday
gpm
ftday
gpm
14196
74
12799
66
12530
65
12374
64
12250
64
12162
63
12115
63
12079
63
12035
63
11.999
62
11942
62
11911
62
11895
62
11861
62
62
10
61
11
jj
61
12
jj
61
13
1j
61
14
61
15
LL
61
16
17
61
17
11.807
61
18
11807
61
Average
12.096
63
CO-3c and LEOa-4
Stress
Wells- Volume
Drain
Period
Step
ii/day
gpm
ft/day
gpm
149520
777
143760
747
142870
742
142510
740
0_
142290
739
142150
738
142090
738
141.980
738
141910
737
141850
737
141750
736
141710
736
141720
736
141660
736
141610
736
10
141580
735
11
141560
735
12
141560
735
13
141560
735
14
141560
735
15
141560
735
16
141.560
735
17
141560
735
18
141560
735
Average
142227
739
CO-3c and LEOb-3
Stress
Wells-Volume
Drain
Period
Step
ft3lday
gpm
ftiday
gpm
28.417
148
26187
136
25782
134
25586
133
25487
132
25409
132
25365
132
25319
132
25259
131
25241
131
25197
131
25176
131
25137
131
25124
131
25101
130
10
25078
130
11
0_
25080
130
12
25065
130
13
25067
130
14
25065
130
15
25065
130
16
25067
130
17
25.067
130
18
25067
130
Average
25392
132
CO-3c and LEOb-4
Stress
Wells
Volume
Drain
Period
Step
ft3lday
-gpm
ft3lday
gpm
183440
953
176740
918
175770
913
175390
911
175210
910
175070
909
174970
909
174880
908
174790
908
174780
908
174690
907
174660
907
174630
907
174580
907
174520
907
10
174490
906
11
174490
906
12
174480
906
13
174470
906
14
174470
906
15
174470
906
16
174470
906
17
174470
906
18
174470
906
Average
175183
910
1375
Model
Report
Tables.xls
4of4
Natural
Resource
irechnology
lnc
Extraction
Discharge
Volumes
Electronic Filing - Received, Clerks' Office, August 11, 2008--AS 09-1, Exhibit 3
Top Layer
Bottom
Layer
Pumping
Rate
Pumping
Rate
Extraction
Wells
of Screen
of Screen
feet3/day
gallons/minute
EW-1
through
EW-lI
3850
20
Figure
Di
MODFLOW extraction well
layout
Electronic Filing - Received, Clerks' Office, August 11, 2008--AS 09-1, Exhibit 3
Extraction
Leachate_Extraction_Option
Type
LEOa-l LEOh-l LEOa-2 LEOb-2 LEOa-3
LEOh-3 LEOa4 l.Nfl
Drainla
On
On
On
On
Drain2a
On
On
Drain3a
On
On
Drain4a
On
On
Drain5a
On
-_
On
Drain ha
On
Drainib
On
On
On
On
Drainzb
On
On
Drain 3h
--
On
On
Drain4b
On
On
Drain5b
On
On
Drain6b
On
Wells
On
On
--
Drain
Drain
Pipe
irain Bed
Drain
Drain
South/East
North/West
Layer
Drain
Length
Diameter
Thickness
Bed
Bed
Drain Base Drain Base
Reach
Drain
feet
feet
feet
cmfs It/day
Elevation
Elevation
in
1000
0.1
283
440
423
2a
70
0.1
283
423
423
3a
105
283
423
422
4a
615
0.1
283
422
421
Sn
710
0.1
283
420
425
6a
700
.1
283
425
425
lb
1000
0.1
283
437
420
2b
70
283
420
420
3b
105
111
283
420
4b
615
0.1
283
419
47
Sb
710
0.3
283
417
422
6b
700
0.1
283
422
422
Figure
D-2 MODFLOW drain
layout
Electronic Filing - Received, Clerks' Office, August 11, 2008--AS 09-1, Exhibit 3
Annual Percolation
120
100
s0
60
20
2000
2025
Annual Percolation
25
20
.E
15
cj
10
2000
2025
---Dewate
ring
co-i
-CO-2
0-CO-Sa
M--- CO-3b
--4- CO-3c
2005
2010
2015
2020
Years
Dewatering
aCo_i
0-- CO-2
6--- CO-3a
---CO-3b
CO-3c
Years
2005
2010
2015
2020
Figure
D-3 HELP
predicted percolation rates
Electronic Filing - Received, Clerks' Office, August 11, 2008--AS 09-1, Exhibit 3
MW-6
CO-i
CO-2
CO-3a
well
goes dry
CO-3b
.2
Jan-2001
Jan-2006
Jan-201
Jan-201
Jan-2021
Jan-2026
Time
10
MW-7
___________
co-i
CO-2
CO-3a
CO-3b
06
Class Standard
--
01
Jan-2001
Jan-2006
Jan-201
Jan-2016
Jan-2021
Jan-2026
Time
Figure
D-4a Predicted Boron concentrations
for
cover
only
scenarios
Cover
Options
MODFLOW RESULTS.xls
Fig
D-4
of
Natural
Resource
Technology
inc
Electronic Filing - Received, Clerks' Office, August 11, 2008--AS 09-1, Exhibit 3
Cover Options MODFLOW RESULTSxls
Co-i
CO-2
CO-3a
CO-3b
CO-3c
Class Standard
12
MW-8
Jan-2001
Jan-2006
Jan-201
Jan-201
Jan-2021
Jan-2026
Time
_______________________
Jan-2001
Jan-2026
MW-hR
Co-i
CO-2
CO-3a
C0-3b
C0-3c
Class
Standard
Jan-2006
Jan-201
Jan-2016
Jan-2021
Time
Figure
D-4b Predicted Boron concentrations
for
cover
only
scenarios
Fig
D-4
of
Natural
Resource
Technology
inc
Electronic Filing - Received, Clerks' Office, August 11, 2008--AS 09-1, Exhibit 3
MW-6
C0-2
LEOa-1
well goes dry
CO-2
LEOa-2
CO-2
LEOa-3
CO-2
LEOa-4
Class Standard
g2
Jan-2001
Jan-2006
Jan-201
Jan-2016
Jan-2021
Time
10-
MW-7
_______________________
CO-2
LEOa-1
CO-2
LEOa-2
CO-2
LEOa-3
06
___
C0-2 LEOa-4
Class
Standard
Jan-2001
Jan-2006
Jan-201
Jan-201
Jan-2021
Time
Figure
D-5a Predicted concentrations
for the leachate collection scenarios
CO-2
Shallow
EIev
MOOFLOW
Fig
D-5
of
Natural
Resource
Technology
Inc
Electronic Filing - Received, Clerks' Office, August 11, 2008--AS 09-1, Exhibit 3
Figure
D-5b Predicted concentrations
for the leachate collection
scenarios
of
Natural
Resource
Technology
Inc
CO-2
LEOa-1
CO-2
LEOa-2
CO-2
LEOa-3
CO-2
LEOa-4
Class Standard
10
MW-8
28
Ce
Jan-2001
Jan-2006
Jan-2011
Jan-2016
Jan-2021
Time
MW-hR
Jan-2001
Jan-2006
Jan-201
Jan-201
Jan-2021
Time
CO-2
LEOa-1
CO-2
LEOa-2
CO-2
LEOa-3
CO-2
LEOa-4
Class Standard
CO-2
Shallow Elev
MODFLOW
Fig
D-5
Electronic Filing - Received, Clerks' Office, August 11, 2008--AS 09-1, Exhibit 3
MW-6
CO-2
LEOb-1
______CO-2
LEOb-2
C0-2
LEOb-3
well
goes
dry
CO-2
LEOb-4
Class Standard
Jan-2001
Jan-2006
Jan-201
Jan-201
Jan-2021
Time
10
MW-7
CO-2
LEOb-1
_____CO-2
LEOb-2
CO-2
LEOb-3
CO-2
LEOb-4
Class
Standard
Jan-2001
Jan-2006
Jan-201
Jan-201
Jan-2021
Time
Figure
D-5c Predicted concentrations
for the leachate collection scenarios
CO-2
Deep EIev
MODFLOW
Figure
D-5
of
Natural
Resource
Technology
Inc
Electronic Filing - Received, Clerks' Office, August 11, 2008--AS 09-1, Exhibit 3
Figure
D-5d Predicted
concentrations
for the leachate collection
scenarios
of
Natural
Resource
Technology
Inc
CO-2
LEOb-1
CO-2
LEOb-2
C02
LEOb-3
CO-2
LEOb-4
Class
Standard
10
MW-8
26
Co
___
----------
Jan-2001
Jan-2006
Jan-201
Jan-201
Jan-2021
Time
MW-hR
_____________
Jan-2001
Jan-2006
Jan-201
Jan-2016
Jan-2021
Time
CO-2
Deep Elev
MODFLOW
Figure
D-5
Electronic Filing - Received, Clerks' Office, August 11, 2008--AS 09-1, Exhibit 3
MW-6
C0-3c
LEOa-1
C0-3c
LEOa-2
well
goes dry
CO-3c
LEOa-3
CO-3c
LEOa-4
ass IStandard
Jan-2001
Jan-2006
Jan-2011
Jan-2016
Jan-2021
Time
10
MW-7
________________________
CO-3c
LEOa-1
-J
___
CO-3c
LEOa-2
CO-3c
LEOa-3
CO-3c
LEOa-4
Co
Class
Standard
ci
Jan-2001
Jan-2006
Jan-201
Jan-201
Jan-2021
Time
Figure
D-5e Predicted concentrations
for the leachate collection scenarios
CO-3c
Shallow Elev
MODFLOW
FIG D-5
of
Natural
Resource
Technology
inc
Electronic Filing - Received, Clerks' Office, August 11, 2008--AS 09-1, Exhibit 3
12
Figure
D-5f
Predicted concentrations
for the leachate collection
scenarios
of
Natural
Resource
Technology
inc
10
MW-8
-J
Co
C-
CO-3c
LEOa-1
CO-3c
LEOa-2
CO-3c
LEOa-3
CO-3c
LEOa-4
Class IStandard
Jan-2001
Jan-2006
Jan-20
11
Time
Jan-201
MW-hR
Jan-2021
-J
CO
CO-3c
LEOa-1
CO-3c
LEOa-2
CO-3c
LEOa-3
CO-3c
LEOa-4
Class
Standard
Jan-2001
Jan-2006
Jan-201
Time
Jan-2016
Jan-2021
CO-3c
Shallow Elev
MODFLOW
FIG D-5
Electronic Filing - Received, Clerks' Office, August 11, 2008--AS 09-1, Exhibit 3
MW-6
C0-3c
LEOb-1
_____CO-3c
LEOb-2
CO-3c
LEOb-3
well
goes
dry
CO-3c
LEOb-4
Class Standard
Jan-2001
Jan-2006
Jan-2011
Jan-2016
Jan-2021
Time
10
MW-7
_______________________
CO-3c
LEOb-1
C0-3c
LEOb-2
CO-3c
LEOb-3
CO-3c
LEOb-4
Ce
Class Standard
C-
Jan-2001
Jan-2006
Jart-201
Jan-2016
Jan-2021
Time
Figure D-5g
Predicted concentrations
for the leachate collection
scenarios
CO-3c
Deep Elev
MODFLOW
Fig
D-5
of
Natural
Resource
Technology
inc
Electronic Filing - Received, Clerks' Office, August 11, 2008--AS 09-1, Exhibit 3
Figure
D-5h Predicted concentrations
for the leachate collection
scenarios
of
Natural
Resource
Technology
Inc
CO-3c
LEOb-1
CO-3c
LEOb-2
CO-3c
LEOb-3
CO-3c
LEOb-4
Class
Standard
12
MW-8
10
-J
_______
Ca
04
Jan-2001
Jan-2006
Jan-201
JÆn-201
Jan-2021
Time
MW-hR
_____________
Jan-2001
Jan-2006
Jan-201
Jan-2016
Jan-2021
Time
CO-3c
Deep Elev
MODFLOW
Fig
D-5
Electronic Filing - Received, Clerks' Office, August 11, 2008--AS 09-1, Exhibit 3
1375
Ameren
Modeling
Scenarios
The disk in the binder attached to this
report
contains the ASCII
input
files and
output
files used and
generated
by HELP MODFLOW
and MT3D for each
scenario
The files are named as follows
HELP
Model Scenarios
Layering
Bottom to
Top
Thickness
foot
co-I
foot Earth
CO-2
Geosynthetic
Layer
foot Earth
C0-3a
foot Pozzolonic
Layer
K1x107
foot Earth
Layer
CO-3b
foot Pozzolonic
Layer K1x10
foot Earth
Layer
C0-3c
foot Pozzolonic
Layer K1x105
foot Earth
Layer
MODFLOW/MT3DMS
Model Scenarios
Layering
Bottom to
Top Thickness
foot
Leachate Extraction
Option LEO
co-i
foot Earth
None
co-2
Geosynthetic
Layer
foot Earth
None
co-3a
foot Pozzolonic
Layer
K1xi07
foot Earth
Layer
None
co-3b
foot Pozzolonic
Layer Kixi0
foot Earth
Layer
None
co-3c
foot Pozzolonic
Layer
K1xi05
foot Earth
Layer
None
CO-2
LEOa-i
Geosynthetic
Layer
foot Earth
ii
Extraction
Wells
East
1000 foot Trench
South
co-3c
LEOa-1
foot
Pozzolonic
Layer
KixiO5
foot Earth
Layer
ii Extraction
Wells
East 1000 foot Trench
South
cO-2
LEOb-i
Geosynthetic
Layer
foot Earth
ii Extraction
Wells
East
1000 foot Trench
South
co-3c
LEOb-1
foot Pozzolonic
Layer
Kix105
foot Earth
Layer
ii Extraction
Wells
East
1000 foot Trench
South
CO-2
LEOa-2
Geosyrtthetic
Layer
foot Earth
3200
foot Trench
CO-3c
LEOa-2
foot Pozzolonic
Layer
Kix105
foot Earth
Layer
3200 foot Trench
CO-2
LEOb-2
Geosynthetic
Layer
foot Earth
3200 foot
Trench
co-3c
LEOb-2
foot
Pozzolonic
Layer
Kix105
foot Earth
Layer
3200 foot Trench
cO-2
LEOa-3
Geosynthetic
Layer
foot Earth
1000 foot
Trench
co-3c
LEOa-3
foot Pozzolonic
Layer
KixiO5
foot Earth
Layer
1000 foot Trench
co-2
LEOb-3
Geosynthetic
Layer
foot Earth
1000 foot Trench
CO-3c
LEOb-3
foot Pozzolonic
Layer KixiO5
foot Earth
Layer
1000 foot
Trench
O-2
LEOa-4
Geosynthetic
Layer
foot Earth
2500 foot Trench
co-3c
LEOa-4
foot Pozzolonic
Layer
K1x105
foot Earth
Layer
2500 foot Trench
cO-2
LEOb-4
Geosynthetic
Layer
foot Earth
2500 foot Trench
co-3c
LEOb-4
foot
Pozzolonic
Layer KrIxi05
foot Earth
Layer
2500 foot Trench
1375 Model
Report
Tables.xls
MODFLOW File
Names
of
Natural
Resource
Technology
Inc
Electronic Filing - Received, Clerks' Office, August 11, 2008--AS 09-1, Exhibit 3
APPENDIX
STATISTICAL
CALCULATIONS
Electronic Filing - Received, Clerks' Office, August 11, 2008--AS 09-1, Exhibit 3
Hutsonville
Ash
Impoundment
Statistical
Summary
for
PooledLocations
May
2005
114626
AM
User
upplied
Information
Date
Range
01/01/1998
to
01/03/2005
Option
for
LT
Pts
0.5
Pooled
Locations
MW7D
MWTW
Parameter
Units
Count
Mean
Median
Maximum
Minimum
Std
Dev
Sen
Slope
Units/yr
Normal
Log
Normal
of
Non-Detects
Alkalinity
total
lab
mg/L
as
llh/L
26
230.846
225.000
300.000
170.000
33.975
15.543
Yes
Yes
0.00
Boron
total
mgfL
28
0.111
0.092
0.240
0.052
0.047
0.000
No/Yes
0.00
Calcium
total
mgfL
27
76.48
77.000
96.000
56.000
9.95
-0.408
Yes
Yes
0.00
Manganese
total
mg/L
28
1.066
0.825
2.977
0.570
0.548
-0.011
No/No
0.00
pHfield
std
18
7.595
7.457
8.440
7.300
0.348
-0.102
No/No
0.00
Sulfatetotal
mg/L
28
47.571
49.500
74.000
19.000
15.557
-4.016
Yes/Yes
0.00
Total
Filterable
Residue
TDS
mgfL
29
374.414
370.000
470.000
280.000
52.392
-4.276
Yes
Yes
0.00
Shapiro-Wilk
Normality
test
performed
at
0.05
significance
level
MANAGES
Electronic Filing - Received, Clerks' Office, August 11, 2008--AS 09-1, Exhibit 3
May
2005
115348 AM
Hutsonville Ash
Impoundment
Normal Tolerance Interval
on
Background
Background
Data Pool
Probability
Distribution
One sided
Option
for LT Pts
0.5
Confidence
Level
99.00%
Background
Date
Range
01/01/1998
to 03/16/2005
Data Transformation
Natural
Log
Compliance
Date
Range
01/01/1998
to 03/16/2005
Tolerance
Coverage
Gamma
95%
Compliance
Locations
MW7D
MWTW
Background
Locations
MW7D
MWTW
BACKGROUND
Parameter Code
Parameter Name
Units
01022
Boron
total
mg/L
Pooled Results
Normal
Mean
StdDev
Value
TL
Lower
TU
Upper
No
0.100
1.467
2.514
0.038
0.261
Location
Total Pts
LT Pts
LT Pts
MW7D
Alluvial
Aq
17
0.000
MWTW
13
0.000
Note Confidence Level is sometimes referred to as Tolerance Coefficient
MANAGES
Electronic Filing - Received, Clerks' Office, August 11, 2008--AS 09-1, Exhibit 3
May
2005
115312 AM
Hutsonville Ash
Impoundment
Normal Tolerance Interval on
Background
Background
Data Pool
Probability
Distribution
One sided
Option
for LT Pts
0.5
Confidence
Level
99.00%
Background
pate
Range
01/01/1998
to 03/16/2005
Data Transformation
None
Compliance
Date
Range
01/01/1998
to 03/16/2005
Tolerance
Coverage
Gamma
95%
Compliance
Locations
MW7D
MWTW
Background
Locations
MW7D
MWTW
BACKGROUND
Parameter Code
Parameter Name
Units
00410
Alkalinity
total
lab mg/L
as
CACO3 mgIL
Pooled Results
Normal
Mean
StdDev
Value
IL
Lower
TU
Upper
Yes
229.000
33.636
2.557
143.006
314.994
Location
Total Pts
LT Pts
LI Pts
MW7D
Alluvial
Aq
16
0.000
MWTW
12
0.000
Note
Confidence Level is sometimes referred
to as
Tolerance Coefficient
MANAGES
Electronic Filing - Received, Clerks' Office, August 11, 2008--AS 09-1, Exhibit 3
May
2005
115312 AM
Hutsonville Ash
Impoundment
Normal Tolerance Interval on
Background
Background
Data Pool
Probability
Distribution
One
sided
Option
for LT Pts
0.5
Confidence
Level
99.00%
Background
Date
Range
01/01/1998
to 03/16/2005
Data Transformation
None
Compliance
Date
Range
01/01/1998
to
03/16/2005
Tolerance
Coverage
Gamma
95%
Compliance
Locations
MW7D
MWTW
Background
Locations
MW7D
MWTW
BACKGROUND
Parameter Code
Parameter Name
Units
00916
Calcium
total
mg/L
Pooled Results
Normal
StdDev
Value
TL
Lower
TU
Upper
Yes
75.276
10.613
2.535
48.377
102.175
Location
Total Pts
LI Pts
LT Pts
MW7D
Alluvial
Aq
17
0.000
MWTW
12
0.000
Note Confidence Level is sometimes referred to
as
Tolerance Coefficient
MANAGES
Electronic Filing - Received, Clerks' Office, August 11, 2008--AS 09-1, Exhibit 3
May
2005
115312AM
Hutsonville Ash
Impoundment
Normal Tolerance Interval on
Background
Background
Data Pool
Probability
Distribution
One sided
Option
for LT Pts
0.5
Confidence
Level
9900%
Background
Date
Range
01/01/1998
to
03/16/2005
Data Transformation
None
Compliance
Date
Range
01/01/1998
to 03/16/2005
Tolerance
Coverage
Gamma
95%
Compliance
Locations
MW7D
MWTW
Background
Locations
MW7D
MWTW
BACKGROUND
Parameter Code
Parameter Name
Units
00945
Sulfate
total
mg/L
Pooled Results
Normal
Mean
StdDev
Value
TL Lower
TU Upper
Yes
46.933
15.243
2.514
8.614
85.253
Location
Total Pts
LT Pts
LT Pts
MW7D
AlluvialAq
17
0.00
.3
MWTW
13
0.00
Note Confidence Level is sometimes referred to as Tolerance Coefficient
MANAGES
Electronic Filing - Received, Clerks' Office, August 11, 2008--AS 09-1, Exhibit 3
May
2005
115312 AM
Hutsonville Ash
Impoundment
Normal Tolerance Interval
on
Background
Background
Data Pool
Probability
Distribution
One sided
Option
for LT Pts
0.5
Confidence
Level
99.00%
Background
Date
Range
01/01/1998
to
03/16/2005
Data Transformation
None
Compliance
Date
Range
01/01/1998
to 03/16/2005
Tolerance
Coverage
Gamma
95%
Compliance
Locations
MW7D
MWTW
Background
Locations
MW7D
MWTW
BACKGROUND
Parameter Code
Parameter Name
Units
70300
Total Filterable Residue
TDS
mgIL
Pooled Results
Normal
Mean
StdDev
Value
TL
Lower
TU
Upper
Yes
367.355
57.650
2.495
223.541
511.168
Location
Total Pts
LT Pts
LI Pts
MW7D
Alluvial
Aq
18
0.00
MWTW
13
0.00
Note Confidence Level is sometimes referred to as Tolerance Coefficient
MANAGES
Electronic Filing - Received, Clerks' Office, August 11, 2008--AS 09-1, Exhibit 3
Electronic Filing - Received, Clerks' Office, August 11, 2008--AS 09-1, Exhibit 3
May
2005
101744
AM
Hutsonville
Ash
Impoundment
Statistical
Summary
for
Pooled
Background
Locations
MW-i
and
MW-iO
User
Supplied
Information
Date
Range
01/01/1998
to
01/03/2005
Option
for
LT
Pts
0.5
Pooled
Locations
MW1
MW1O
Sen
Slope
Normal
of
Parameter
Units
Count
Mean
Median
Maximum
Minimum
Std
Dev
Units/yr
Log
Normal
Non-Detects
Alkalinity
lab
mg/L
101
226.208
240.000
332.000
98.000
63
.628
4.838
No
No
0.00
Btot
rng/L
101
0.139
0.130
0.400
0.059
0.059
-0.006
No/Yes
0.00
Catot
mg/L
101
75.111
80.000
160.000
33.000
21.875
1.248
No/No
0.00
Mn
tot
mg/L
101
0.270
0.097
3.670
0.00
0.523
-0.0
10
No
Yes
3.96
pHfield
std
83
7.387
7.350
7.960
7.030
0.228
-0.033
No/No
0.00
S04tot
rng/L
101
40.267
34.000
270.000
10.000
30.116
-1.610
No/No
0.00
TDS
mg/L
102
321.765
329.000
470.000
180.000
69.797
3.734
Yes/No
0.00
Shapiro-Wilk
Normality
test
performed
at
0.05
significance
level
MANAGES
Electronic Filing - Received, Clerks' Office, August 11, 2008--AS 09-1, Exhibit 3
May
2005
101943 AM
Hutsonville Ash
Impoundment
Normal Tolerance Interval on
Background
Background
Data Pool
Probability
Distribution
One sided
Option
for LT Pts
0.5
Confidence
Level
1.00%
Background
Date
Range
01/01/1998
to 01/03/2005
Data Transformation
Natural
Log
Compliance
Date
Range
01/01/1998
to
01/03/2005
Tolerance
Coverage
Gamma
95%
Compliance
Locations
MWl
MW1O
Background
Locations
MW
MW1O
BACKGROUND
Parameter Code
Parameter Name
Units
01022
Boron total
mgIL
Pooled Results
Normal
StdDev
Value
TL
Lower
TU
Upper
Yes
0.139
0.059
1.925
0.061
0.270
Location
Total Pts
LT Pts
LT Pts
MWI
Upper
Zone
84
0.000
MWIO
Upper
Zone
17
0.000
Note Confidence Level is sometimes referred
to as
Tolerance Coefficient
MANAGES
Electronic Filing - Received, Clerks' Office, August 11, 2008--AS 09-1, Exhibit 3
May
2005
102015 AM
Hutsonville Ash
Impoundment
Normal Tolerance Interval
on
Background
Background
Data Pool
Probability
Distribution
One
sided
Option
for LT Pts
0.5
Confidence
Level
1.00%
Background
Date
Range
01/01/1
998 to 01/03/2005
Data Transformation
Natural
Log
Compliance
Date
Range
01/01/1998
to 01/03/2005
Tolerance
Coverage
Gamma
95%
Compliance
Locations
MWI MWIO
Background
Locations
MWI
MWIO
BACKGROUND
Parameter Code
Parameter Name
Units
01055
Manganese
total
mgfL
Pooled Results
Normal
Mean
StdDev
Value
TL
Lower
TU
Upper
Yes
0.270
0.523
1.925
0.003
2.287
Location
Total Pts
LI Pts
LI Pts
MWI
Upper
Zone
84
4.762
MW1O
Upper
Zone
17
0.000
Note Confidence Level is sometimes referred to as Tolerance Coefficient
MANAGES
Electronic Filing - Received, Clerks' Office, August 11, 2008--AS 09-1, Exhibit 3
May
2005
102037 AM
Hutsonville Ash
Impoundment
Normal Tolerance Interval on
Background
Background
Data Pool
Probability
Distribution
One sided
Option
for LT Pts
0.5
Confidence
Level
1.00%
Background
Date
Range
01/01/1998
to 01/03/2005
Data Transformation
None
Compliance
Date
Range
01/01/1998
to 01/03/2005
Tolerance
Coverage
Gamma
95%
Compliance
Locations
MW1
MW10
Background
Locations
MWI
MWIO
BACKGROUND
Parameter Code
Parameter Name
70300
Total Filterable Residue
TDS
mgfL
Pooled Results
Normal
Mean
StdDev
Value
TL Lower
hi
Upper
Yes
321.765
69.797
1.923
187.522
456.008
Location
Iyp
Total Pts
LT Pts
LT Pts
MWI
Upper
Zone
84
0.000
MWIO
Upper
Zone
18
0.000
Note Confidence Level is sometimes referred to as Tolerance Coefficient
MANAGES
Electronic Filing - Received, Clerks' Office, August 11, 2008--AS 09-1, Exhibit 3
Electronic Filing - Received, Clerks' Office, August 11, 2008--AS 09-1, Exhibit 3
May
13
2005
40823
PM
Hutsonville
Ash
Impoundment
Dataused
in
Background
Statistical
Calculations
Date
Range
01/01/1998
to
03/16/2005
Well
Id
Date
Lab
Id
Alkalinity
TotBoronTot
mg/L
CalciumTot
Manganese
Tot
pH
field
std
Sulfate
Tot
Sampled
mgIL
mg/L
mg/L
mgfL
MWI
01/06/1998
228.000
0.167
82.000
0.005
7.52
91
02/09/1998
240.000
0.134
108.000
0.125
7.17
88
03/24/1998
128.000
0.122
44.000
0.005
7.55
55
04/14/1998
116.000
0.295
44.000
0.005
7.61
50
05/27/1998
160.000
0.090
56.000
0.020
7.35
38
06/24/1998
188.000
0.203
68.000
0.040
7.48
32
07/21/1998
268.000
0.160
80.000
0.181
7.11
22
08/31/1998
284.000
0.110
92.000
0.438
7.48
16
09/28/1998
264.000
0.150
88.000
0.043
7.14
22
10/26/1998
240.000
0.251
80.000
0.185
7.22
270
11/16/1998
W98-794
222.000
0.098
80.000
0.060
7.60
26
12/16/1998
270.000
0.079
108.000
0.582
7.06
29
01/19/1999
W99-44
128.000
0.122
56.000
0.017
7.96
53
02/24/1999
AC01231
100.000
0.139
44.000
0.005
7.44
47
03/30/1999
AC01258
98.000
0.185
40.000
0.034
7.67
42
04/30/1999
AC01681
126.000
0.256
88.000
0.155
7.90
34
05/24/1999
AC01895
210.000
0.241
64.000
0.598
7.39
27
06/29/1999
224.000
0.129
76.000
0.440
7.20
30
07/26/1999
308.000
0.160
92.000
0.623
7.20
33
08/30/1999
284.000
0.150
88.000
0.261
7.10
19
09/28/1999
272.000
0.080
96.000
0.147
7.50
39
10/29/1999
250.000
0.130
93.000
0.071
7.50
54
11/30/1999
254.000
0.150
63.000
0.016
7.90
64
12/27/1999
247.000
0.250
48.000
0.040
7.70
56
1/28/2000
259.000
0.240
72.000
0.030
7.66
49
02/28/2000
244.000
0.110
84.000
0.162
7.68
45
03/31/2000
138.000
0.060
52.000
0.011
7.39
75
04/29/2000
126.000
0.130
56.000
0.005
7.57
48
05/22/2000
265.000
0.100
87.000
0.397
7.25
59
07/03/2000
290.000
0.090
80.000
0.247
7.20
40
08/02/2000
292.000
0.110
87.000
0.228
7.40
22
08/31/2000
260.000
0.140
73.000
0.243
7.38
21
09/29/2000
289.000
0.120
85.000
0.113
7.35
24
10/31/2000
251.000
0.220
77.000
1.620
7.03
30
11/30/2000
220.000
0.100
42.000
1.239
7.29
28
12/30/2000
169.000
0.400
58.000
1.264
7.14
25
01/30/2001
177.000
0.240
53.300
1.047
7.42
20
02/28/2001
164.000
0.150
52.000
0.824
7.83
27
MANAGES
Electronic Filing - Received, Clerks' Office, August 11, 2008--AS 09-1, Exhibit 3
May
13
2005
40823
PM
Hutsonville
Ash
Imnoundment
Dataused
in
Background
Statistical
Calculations
Date
Range
01/01/1
998
to
03/16/2005
Alkalinity
TotBoronTot
mg/L
CalciumTot
Manganese
Tot
pH
field
std
Sulfate
Tot
mg/L
mg/L
mg/L
mg/L
MWI
03/31/2001
166.000
0.130
49.900
1.088
7.57
24
04/30/2001
202.000
0.140
56.000
1.242
7.27
17
05/31/2001
314.000
0.060
81.000
3.670
7.40
12
06/29/2001
302.000
0.080
88.000
2.524
7.33
10
07/31/2001
332.000
0.090
100.000
1.014
7.39
10
08/28/2001
296.000
0.070
89.000
0.384
7.28
28
09/28/2001
288.000
0.100
100.000
0.196
7.34
45
10/31/2001
224.000
0.250
88.000
0.057
7.31
117
11/28/2001
196.000
0.170
76.000
0.135
7.29
64
12/18/2001
176.000
0.230
69.000
0.097
7.33
53
01/14/2002
180.000
0.170
58.000
0.180
7.30
57
02/25/2002
140.000
0.150
44.000
0.069
7.77
43
03/25/2002
120.000
0.150
35.000
0.098
40
04/23/2002
110.000
0.150
33.000
0.130
7.43
37
05/23/2002
140.000
0.170
42.000
0.420
7.38
25
06/27/2002
250.000
0.098
74.000
0.690
7.45
24
07/30/2002
330.000
0.110
96.000
0.091
7.41
30
08/31/2002
300.000
0.160
96.000
0.014
7.51
63
09/17/2002
02092695-1
290.000
0.150
99.000
0.042
7.53
68
10/17/2002
290.000
0.3
10
160.000
0.019
80
11/21/2002
0.140
90.000
0.150
7.12
11/25/2002
290.000
7.20
49
12/11/2002
02122282-1
300.000
0.180
96.000
0.270
7.09
39
01/08/2003
180.000
0.140
67.000
0.270
84
02/05/2003
200.000
0.140
76.000
0.053
7.21
87
03/17/2003
110.000
0.120
41.000
0.003
48
04/07/2003
110.000
0.140
37.000
0.001
38
05/03/2003
140.000
0.140
40.000
0.014
37
06/02/2003
190.000
0.110
56.000
0.072
25
07/07/2003
320.000
0.092
85.000
0.240
7.32
20
08/04/2003
280.000
0.110
85.000
0.047
19
09/08/2003
240.000
0.065
87.000
0.022
18
10/06/2003
270.000
0.093
80.000
0.070
17
11/03/2003
290.000
0.093
78.000
0.120
16
12/01/2003
240.000
0.160
75.000
0.013
50
01/05/2004
230.000
0.100
60.000
0.041
7.09
40
02/09/2004
140.000
0.150
42.000
0.025
7.50
40
03/02/2004
160.000
0.110
46.000
0.032
7.40
32
MANAGES
Electronic Filing - Received, Clerks' Office, August 11, 2008--AS 09-1, Exhibit 3
May
13
2005
40823
PM
Hutsonville
Ash
ImDoundment
Dataused
in
Background
Statistical
Calculations
Date
Range
01/01/1998
to
03/16/2005
Alkalinity
Tot
Boron
Tot
mg/L
Calcium
Tot
Manganese
Tot
pH
field
std
Sulfate
Tot
mgIL
mgIL
mg/L
mgIL
MW
04/04/2004
140.000
0.120
40.000
0.044
7.50
35
05/04/2004
210.000
0.100
55.000
0.280
7.30
15
06/01/2004
290.000
0.067
77.000
0.220
7.30
15
08/02/2004
290.000
0.099
86.000
0.170
15
09/13/2004
280.000
0.098
80.000
0.100
7.60
20
10/04/2004
300.000
0.140
85.000
0.047
7.30
18
11/08/2004
280.000
0.110
85.000
0.130
7.20
35
12/06/2004
240.000
0.140
84.000
0.260
7.20
51
01/03/2005
160.000
0.170
48.000
0.180
7.30
42
MW1O
11/16/1998
W98-800
108.000
0.104
80.000
0.110
7.80
30
01/20/1999
W99-54
212.000
0.115
78.000
0.070
7.78
32
02/26/1999
AC01242
206.000
0.099
80.000
0.101
7.18
29
03/30/1999
AC01268
208.000
0.085
76.000
0.092
7.95
32
04/30/1999
ACO692
224.000
0.149
80.000
0.079
7.50
27
01/14/2002
280.000
0.160
94.000
0.017
32
09/17/2002
02092695-7
270.000
0.098
90.000
0.100
7.11
31
12/19/2002
02123013-5
260.000
0.200
86.000
0.004
7.06
38
02/05/2003
230.000
0.079
76.000
0.001
7.2
38
05/03/2003
300.000
0.076
80.000
0.002
38
07/07/2003
240.000
0.092
89.000
0.022
44
09/08/2003
260.000
0.059
96.000
0.013
38
10/13/2003
220.000
0.120
100.000
0.019
36
03/02/2004
220.000
0.064
100.000
0.008
7.10
31
04/04/2004
230.000
0.086
100.000
0.029
7.10
29
08/01/2004
270.000
0.130
120.000
0.045
29
10/04/2004
330.000
0.160
110.000
0.040
7.10
31
MW7D
11/18/1998
W98-805
172.000
0.066
60.000
0.727
7.90
40
01/19/1999
W99-52
216.000
0.093
82.000
0.996
7.51
63
02/26/1999
AC01239
234.000
0.104
92.000
1.431
8.28
67
03/30/1999
AC01266
240.000
0.088
96.000
2.977
8.44
74
04/30/1999
AC01689
0.148
84.000
0.649
8.00
60
01/15/2002
250.000
0.240
88.000
0.620
58
09/18/2002
02092792-8
200.000
0.083
71.000
0.750
7.41
51
12/19/2002
02123013-3
210.000
0.140
67.000
0.750
7.38
31
03/19/2003
170.000
0.089
66.000
0.760
51
06/02/2003
200.000
0.088
68.000
0.680
60
08/11/2003
240.000
0.140
69.000
0.660
7.53
59
10/13/2003
220.000
0.110
66.000
0.640
44
MANAGES
Electronic Filing - Received, Clerks' Office, August 11, 2008--AS 09-1, Exhibit 3
May
13
2005
40823
PM
Hutsonville
Ash
Lmnoundment
Dataused
in
Background
Statistical
Calculations
Date
Range
01/01/1998
to
03/16/2005
Alkalinity
TotBoron
Tot
mg/L
CalciumTot
Manganese
Tot
pH
field
std
Sulfate
Tot
mg/L
mg/L
mg/L
mg/L
MW7D
02/23/2004
260.000
0110
89.000
0.770
7.40
68
04/19/2004
.260.000
0067
85.000
0.830
7.30
61
08/02/2004
260.000
0.091
81.000
0.570
47
10/04/2004
300.000
0.210
85.000
0.660
7.50
36
03/15/2005
220.000
0.062
61.000
0.450
7.53
42
MWTW
10/03/2001
0090
1.055
7.83
48
01/15/2002
220.000
0.110
70.000
2.000
34
09/19/2002
02092792-6
200.000
0.082
77.000
1.400
7.43
40
12/19/2002
02123013-8
230.000
0.067
78.000
1.200
7.31
38
03/17/2003
200.000
0.200
83.000
0.930
65
06/17/2003
210.000
0.052
74.000
0.820
62
08/11/2003
220.000
0.110
71.000
1.100
7.48
52
10/13/2003
200.000
0.075
56.000
0.760
30
02/23/2004
290.000
0.085
86.000
2.100
7.30
27
04/19/2004
260.000
0.099
72.000
1.200
7.30
19
08/01/2004
260.000
0.180
72.000
1.400
24
10/04/2004
280.000
0.084
77.000
1.400
7.40
23
03/16/2005
190.000
0.060
57.000
0.640
7.44
34
MANAGES
Electronic Filing - Received, Clerks' Office, August 11, 2008--AS 09-1, Exhibit 3
01/06/1998
02/09/1998
03/24/1998
04/14/1998
05/27/1998
06/24/1998
07/21/1998
08/31/1998
09/28/1998
10/26/1998
11/16/1998
12/16/
1998
1/19/1999
02/24/1999
03/30/1999
04/30/1999
05/24/1999
06/29/1999
07/26/1999
08/30/1999
09/28/1999
10/29/1999
11/30/1999
12/27/
1999
01/28/2000
02/28/2000
03/31/2000
04/29/2000
05/22/200
07/03/2000
08/02/2000
08/31/2000
9/29/2000
10/31/2000
11/30/2000
12/30/2000
1/30/200
02/28/2001
W98-794
W99-44
AC01231
ACO
1258
AC01681
ACO
1895
366
408
226
224
272
290
300
350
358
316
306
334
254
230
186
234
280
340
396
276
376
394
394
376
398
384
286
258
384
458
372
334
342
340
314
220
246
220
May
13
2005
40823
PM
MW1
Hutsonville
Ash
Impoundment
Dataused
in
Background
Statistical
Calculations
Date
Range
01/01/1998
to
03/16/2005
Well
Id
Date
Lab
Id
TDS
mg/L
Sampled
MANAGES
Electronic Filing - Received, Clerks' Office, August 11, 2008--AS 09-1, Exhibit 3
Hutsonville
Ash
Imnoundment
Dataused
in
Background
Statistical
Calculations
Date
Range
01/01/1998
to
03/16/2005
TDS
mg/L
M\V1
03/31/2001
208
04/30/200
300
05/31/2001
360
06/29/200
354
07/31/2001
382
08/28/200
400
09/28/200
404
10/31/2001
398
11/28/2001
324
12/18/2001
302
01/14/2002
290
02/25/2002
270
03/25/2002
190
04/23/2002
220
05/23/2002
240
06/27/2002
290
07/30/2002
390
08/31/2002
450
09/17/2002
02092695-1
440
10/17/2002
450
11/25/2002
360
12/11/2002
02122282-1
370
01/08/2003
300
02/05/2003
340
03/17/2003
180
04/07/2003
210
05/03/2003
200
06/02/2003
270
07/07/2003
330
08/04/2003
320
09/08/2003
300
10/06/2003
320
11/03/2003
340
12/01/2003
370
1/05/2004
260
02/09/2004
190
03/02/2004
240
04/04/2004
210
MANAGES
May
13
2005
40823
PM
Electronic Filing - Received, Clerks' Office, August 11, 2008--AS 09-1, Exhibit 3
Hutsonville
Ash
Imnoundment
Dataused
in
Background
Statistical
Calculations
Date
Range
01/01/1998
to
03/16/2005
TDS
mgIL
MWI
05/04/2004
260
06/01/2004
290
08/02/2004
330
09/13/2004
370
10/04/2004
340
11/08/2004
360
12/06/2004
300
01/03/2005
260
MWIO
11/16/1998
W98-800
326
01/20/1999
W99-54
278
02/26/1999
AC01242
330
03/30/1999
AC01268
314
04/30/1999
AC01692
328
01/14/2002
370
06/30/2002
370
09/17/2002
02092695-7
380
12/19/2002
02123013-5
330
02/05/2003
310
05/03/2003
270
07/07/2003
340
09/08/2003
380
10/13/2003
450
03/02/2004
410
04/04/2004
390
08/01/2004
450
10/04/2004
470
MW7D
11/18/1998
W98-805
286
01/19/1999
W99-52
402
02/26/1999
AC01239
462
03/30/1999
AC01266
432
04/30/1999
ACO
1689
460
01/15/2002
420
07/01/2002
420
09/18/2002
02092792-8
370
12/19/2002
02123013-3
320
03/19/2003
350
06/02/2003
390
08/11/2003
370
MANAGES
May
13
2005
40823
PM
Electronic Filing - Received, Clerks' Office, August 11, 2008--AS 09-1, Exhibit 3
Hutsonville
Ash
Imnoundmcnt
Dataused
in
Background
Statistical
Calculations
Date
Range
01/01/1998
to
03/16/2005
TDS
mg/L
MW7D
10/13/2003
320
02/23/2004
430
04/19/20
04
440
08/02/2004
360
10/04/2004
420
03/15/2005
280
MWTW
10/03/200
376
1/15/2002
340
09/19/2002
02092792-6
340
12/19/2002
02123013-8
340
03/17/2003
340
06/17/2003
370
08/11/2003
310
10/13/2003
280
02/23/2004
470
04/19/2004
340
08/01/2004
350
10/04/2004
350
03/16/2005
250
MANAGES
May
13
2005
40823
PM
Electronic Filing - Received, Clerks' Office, August 11, 2008--AS 09-1, Exhibit 3
Hutsonville Ash
Impoundment
Mann-Kendall Trend
Analysis
Jan 97
through
Jan 01
May
2005
101530 AM
User
Supplied
Information
Location
ID
IVWl
Parameter
Code
01022
Location
Class
Background
Parameter
Boron
total
Location
Type
Upper
Zone
Units
mgIL
Confidence
Level
95.00%
Period
Length
months
Limit Name
State Std
Averaged
No
Trend
Analysis
Trend of the least
squares
straight
line
Slope fitted
to
data
-0.000028
mg/L
per
day
R-Squared
error
of fit
0.111613
Sens
Non-parametric
estimate of the
slope two-tailed
test
Median
Slope
-0.00002
mg/L
per
day
Lower Confidence Limit of
Slope
Ml
-0.000034
mg/L per day
Upper
Confidence
Limit of
Slope
M21
0.000000
mgfL per day
Non-parametric
Mann-Kendall Test
for Trend
Statistic
.1075.000
test
-3.405
At the 95.0
Confidence
Level
two-tailed test
This trend is
non-zero
MANAGES
Electronic Filing - Received, Clerks' Office, August 11, 2008--AS 09-1, Exhibit 3
Hutsonville Ash
Impoundment
Mann-Kendall Trend
Analysis
Jan 98
through
Jan 01
May
2005
101558 AM
User
Supplied
Information
Location ID
MWI
Parameter
Code
01022
Location Class
Background
Parameter
Boron
total
Location
Type
Upper
Zone
Units
mg/L
Confidence Level
95.00%
Period
Length
months
Limit Name
State Std
Averaged
No
Trend
Analysis
Trend of the least
squares straight
line
Slope fitted
to
data
-0.0000 18
mg/L
per
day
R-Squared
error of fit
0.048962
Sens
Non-parametric
estimate of the
slope two-tailed
test
Median
Slope
-0.0000 13
mg/L
per
day
Lower Confidence
Limit of
Slope
Ml
-0.000028
mg/L per day
Upper
Confidence
Limit of
Slope
M21
0.000000
mg/L per day
Non-parametric
Mann-Kendall
Test for Trend
Statistic
-496.000
Ztest
-1.917
At the 95.0
Confidence
Level
two-tailed test
This trend is zero
MANAGES
Electronic Filing - Received, Clerks' Office, August 11, 2008--AS 09-1, Exhibit 3
Hutsonville
Ash
Impoundment
Mann-Kendall Trend
Analysis
Jan 98
through
Jan 01
May
2005
101614 AM
User
Supplied
Information
Location ID
MW
Parameter
Code
00410
Location Class
Background
Parameter
Alkalinity
total
lab
Location
Type
Upper
Zone
Units
mg/L
Confidence
Level
95.00%
Period
Length
months
Limit Name
State Std
Averaged
No
Trend
Analysis
Trend of the least
squares straight
line
Slope fitted
to
data
0.010109
mg/L
per
day
R-Squared
error of fit
0.0 12746
Sens
Non-parametric
estimate of the
slope two-tailed test
Median
Slope
0.009509
mg/L
per
day
Lower Confidence Limit of
Slope
Ml
-0.008647
mg/L
per
day
Upper
Confidence
Limit of
Slope
M21
0.027739
mg/L per day
Non-parametric
Mann-Kendall
Test for Trend
Statistic
283.000
test
.090
At the
95.0
Confidence
Level
two-tailed test
This trend is zero
MANAGES
Electronic Filing - Received, Clerks' Office, August 11, 2008--AS 09-1, Exhibit 3
Hutsonville Ash
Impoundment
Mann-Kendall
Trend
Analysis
Jan
98
through
Jan
01
May
2005
101629 AM
User
Supplied
Information
Location
ID
MW1
Parameter
Code
00916
Location Class
Background
Parameter
Calcium total
Location
Type
Upper
Zone
Units
mg/L
Confidence
Level
95.00%
Period
Length
months
Limit Name
State Std
Averaged
No
Trend
Analysis
Trend of the least
squares straight
line
Slope fitted
to
data
-0.001554
mgIL
per
day
R-Squared
error
of fit
0.002704
Sens
Non-parametric
estimate of the
slope two-tailed
test
Median
Slope
-0.001773
mg/L per day
Lower Confidence Limit of
Slope
Ml
-0.007660
mgfL
per
day
Upper
Confidence Limit of
Slope
M21
0.003308
mg/L
per
day
Non-parametric
Mann-Kendall Test for Trend
Statistic
-203.000
test
-0.78
At the 95.0
Confidence
Level
two-tailed test
This trend is
zero
MANAGES
Electronic Filing - Received, Clerks' Office, August 11, 2008--AS 09-1, Exhibit 3
Hutsonville Ash
Impoundment
Mann-Kendall Trend
Analysis
Jan 98
through
Jan 01
May
2005
101641
AM
User
Supplied
Information
Location
ID
MW1
Parameter
Code
01055
Location
Class
Background
Parameter
Manganese
total
Location
Type
Upper
Zone
Units
mg/L
Confidence
Level
95.00%
Period
Length
months
Limit Name
State Std
Averaged
No
Trend
Analysis
Trend
of
the
least
squares straight
line
Slope fitted
to
data
-0.00005
mgIL
per
day
R-Squared
error
of fit
0.004394
Sens
Non-parametric
estimate of the
slope two-tailed
test
Median
Slope
0.000000
mg/L
per
day
Lower Confidence
Limit of
Slope
Ml
-0.000055
mg/L per day
Upper
Confidence Limit of
Slope
M21
0.000029
mgfL
per
day
Non-parametric
Mann-Kendall Test for Trend
Statistic
-42.000
test
-0.158
At the 95.0
Confidence
Level
two-tailed test
This trend is zero
MANAGES
Electronic Filing - Received, Clerks' Office, August 11, 2008--AS 09-1, Exhibit 3
Hutsonville
Ash
Impoundment
Mann-Kendall Trend
Analysis
Jan
98
through
Jan 01
May
2005
101654 AM
User
Supplied
Information
Location
ID
MW
Parameter
Code
00400
Location Class
Background
Parameter
pH field
Location
Type
Upper
Zone
Units
std
Confidence
Level
95.00%
Period
Length
months
Limit Name
State Std
Averaged
No
Trend Analysis
Trend of the least
squares straight
line
Slope fitted
to
data
-0.00005
std
per day
R-Squared
error
of fit
0.039521
Sens
Non-parametric
estimate of the
slope
two-tailed
test
Median
Slope
-0.000059
std
per
day
Lower Confidence
Limit of
Slope
Ml
-0.000124
std
per day
Upper
Confidence Limit of
Slope
M21
0.000000
std
per
day
Non-parametric
Mann-Kendall
Test for Trend
Statistic
-331 .000
test
-1.605
At the 95.0
Confidence
Level
two-tailed test
This trend is zero
MANAGES
Electronic Filing - Received, Clerks' Office, August 11, 2008--AS 09-1, Exhibit 3
Hutsonville Ash
Impoundment
Mann-Kendall Trend
Analysis
Jan 98
through
Jan 01
May
2005
101708 AM
User
Supplied
Information
Location ID
MWI
Parameter
Code
00945
Location Class
Background
Parameter
Sulfate
total
Location
Type
Upper
Zone
Units
mg/L
Confidence
Level
95.00%
Period
Length
months
Limit Name
State Std
Averaged
No
Trend Analysis
Trend of the least
squares
straight
line
Slope fitted
to
data
-0.009 142
mgIL per day
R-Squared
error
of fit
0.042442
Sens
Non-parametric
estimate of the
slope two-tailed test
Median
Slope
-0.005285
mg/L
per
day
Lower Confidence
Limit of
Slope
Ml
-0.010330
mgfL
per
day
Upper
Confidence Limit of
Slope
M21
0.000000
mg/L
per
day
Non-parametric
Mann-Kendall
Test for
Trend
Statistic
-495.000
test
-1.909
At the 95.0
Confidence
Level
two-tailed test
This trend is zero
MANAGES
Electronic Filing - Received, Clerks' Office, August 11, 2008--AS 09-1, Exhibit 3
Hutsonville Ash
Impoundment
Mann-Kendall Trend
Analysis
Jan 98
through
Jan 01
May
2005
101719 AM
User
Supplied
Information
Location
ID
MW1
Parameter
Code
70300
Location Class
Background
Parameter
Total Filterable
Residue
TDS
Location
Type
Upper
Zone
Units
mg/L
Confidence
Level
95.00%
Period
Length
months
Limit Name
State Std
Averaged
No
Trend
Analysis
Trend of the least
squares
straight
line
Slope fitted
to
data
-0.007 135
mg/L
per
day
R-Squared
error
of fit
0.005745
Sens
Non-parametric
estimate of the
slope two-tailed
test
Median
Slope
-0.008418
mg/L
per
day
Lower Confidence Limit of
Slope
Ml
-0.02949
mg/L
per
day
Upper
Confidence
Limit of
Slope
M21
0.013858
mg/L per day
Non-parametric
Mann-Kendall Test for Trend
Statistic
-204.000
test
-0.785
At the 95.0
Confidence
Level
two-tailed test
This trend is
zero
MANAGES
Electronic Filing - Received, Clerks' Office, August 11, 2008--AS 09-1, Exhibit 3
APPENDIX
GROUNDWATER VELOCITY
CALCULATION
Electronic Filing - Received, Clerks' Office, August 11, 2008--AS 09-1, Exhibit 3
Appendix
Groundwater
Velocity
Calculation
Leachate
Management
and Final Cover Alternatives
Report
Hutsonville
Ash
Management
Facility
Unlined Ash
Impoundment
Pond
Closure
Ameren
Energy Generating
Hutsonville
Illinois
Groundwater
Velocity
Hydraulic Conductivity
Hydraulic
Gradient
unitless value
Effective
Porosity
Nov-04
Contours
426
to
425
TW-117
Elevation
Distance
6.83E03
ftlyr
Change
Change
0.002
between
contours
identified above
ft
ft
11e
20%
520
0.002
6.83E03
.92E-03
0.20
66
feetlyear
1375 Alternatives
Analysis
Tables
2005_FINAL
Velocity
CaIc
of
Electronic Filing - Received, Clerks' Office, August 11, 2008--AS 09-1, Exhibit 3