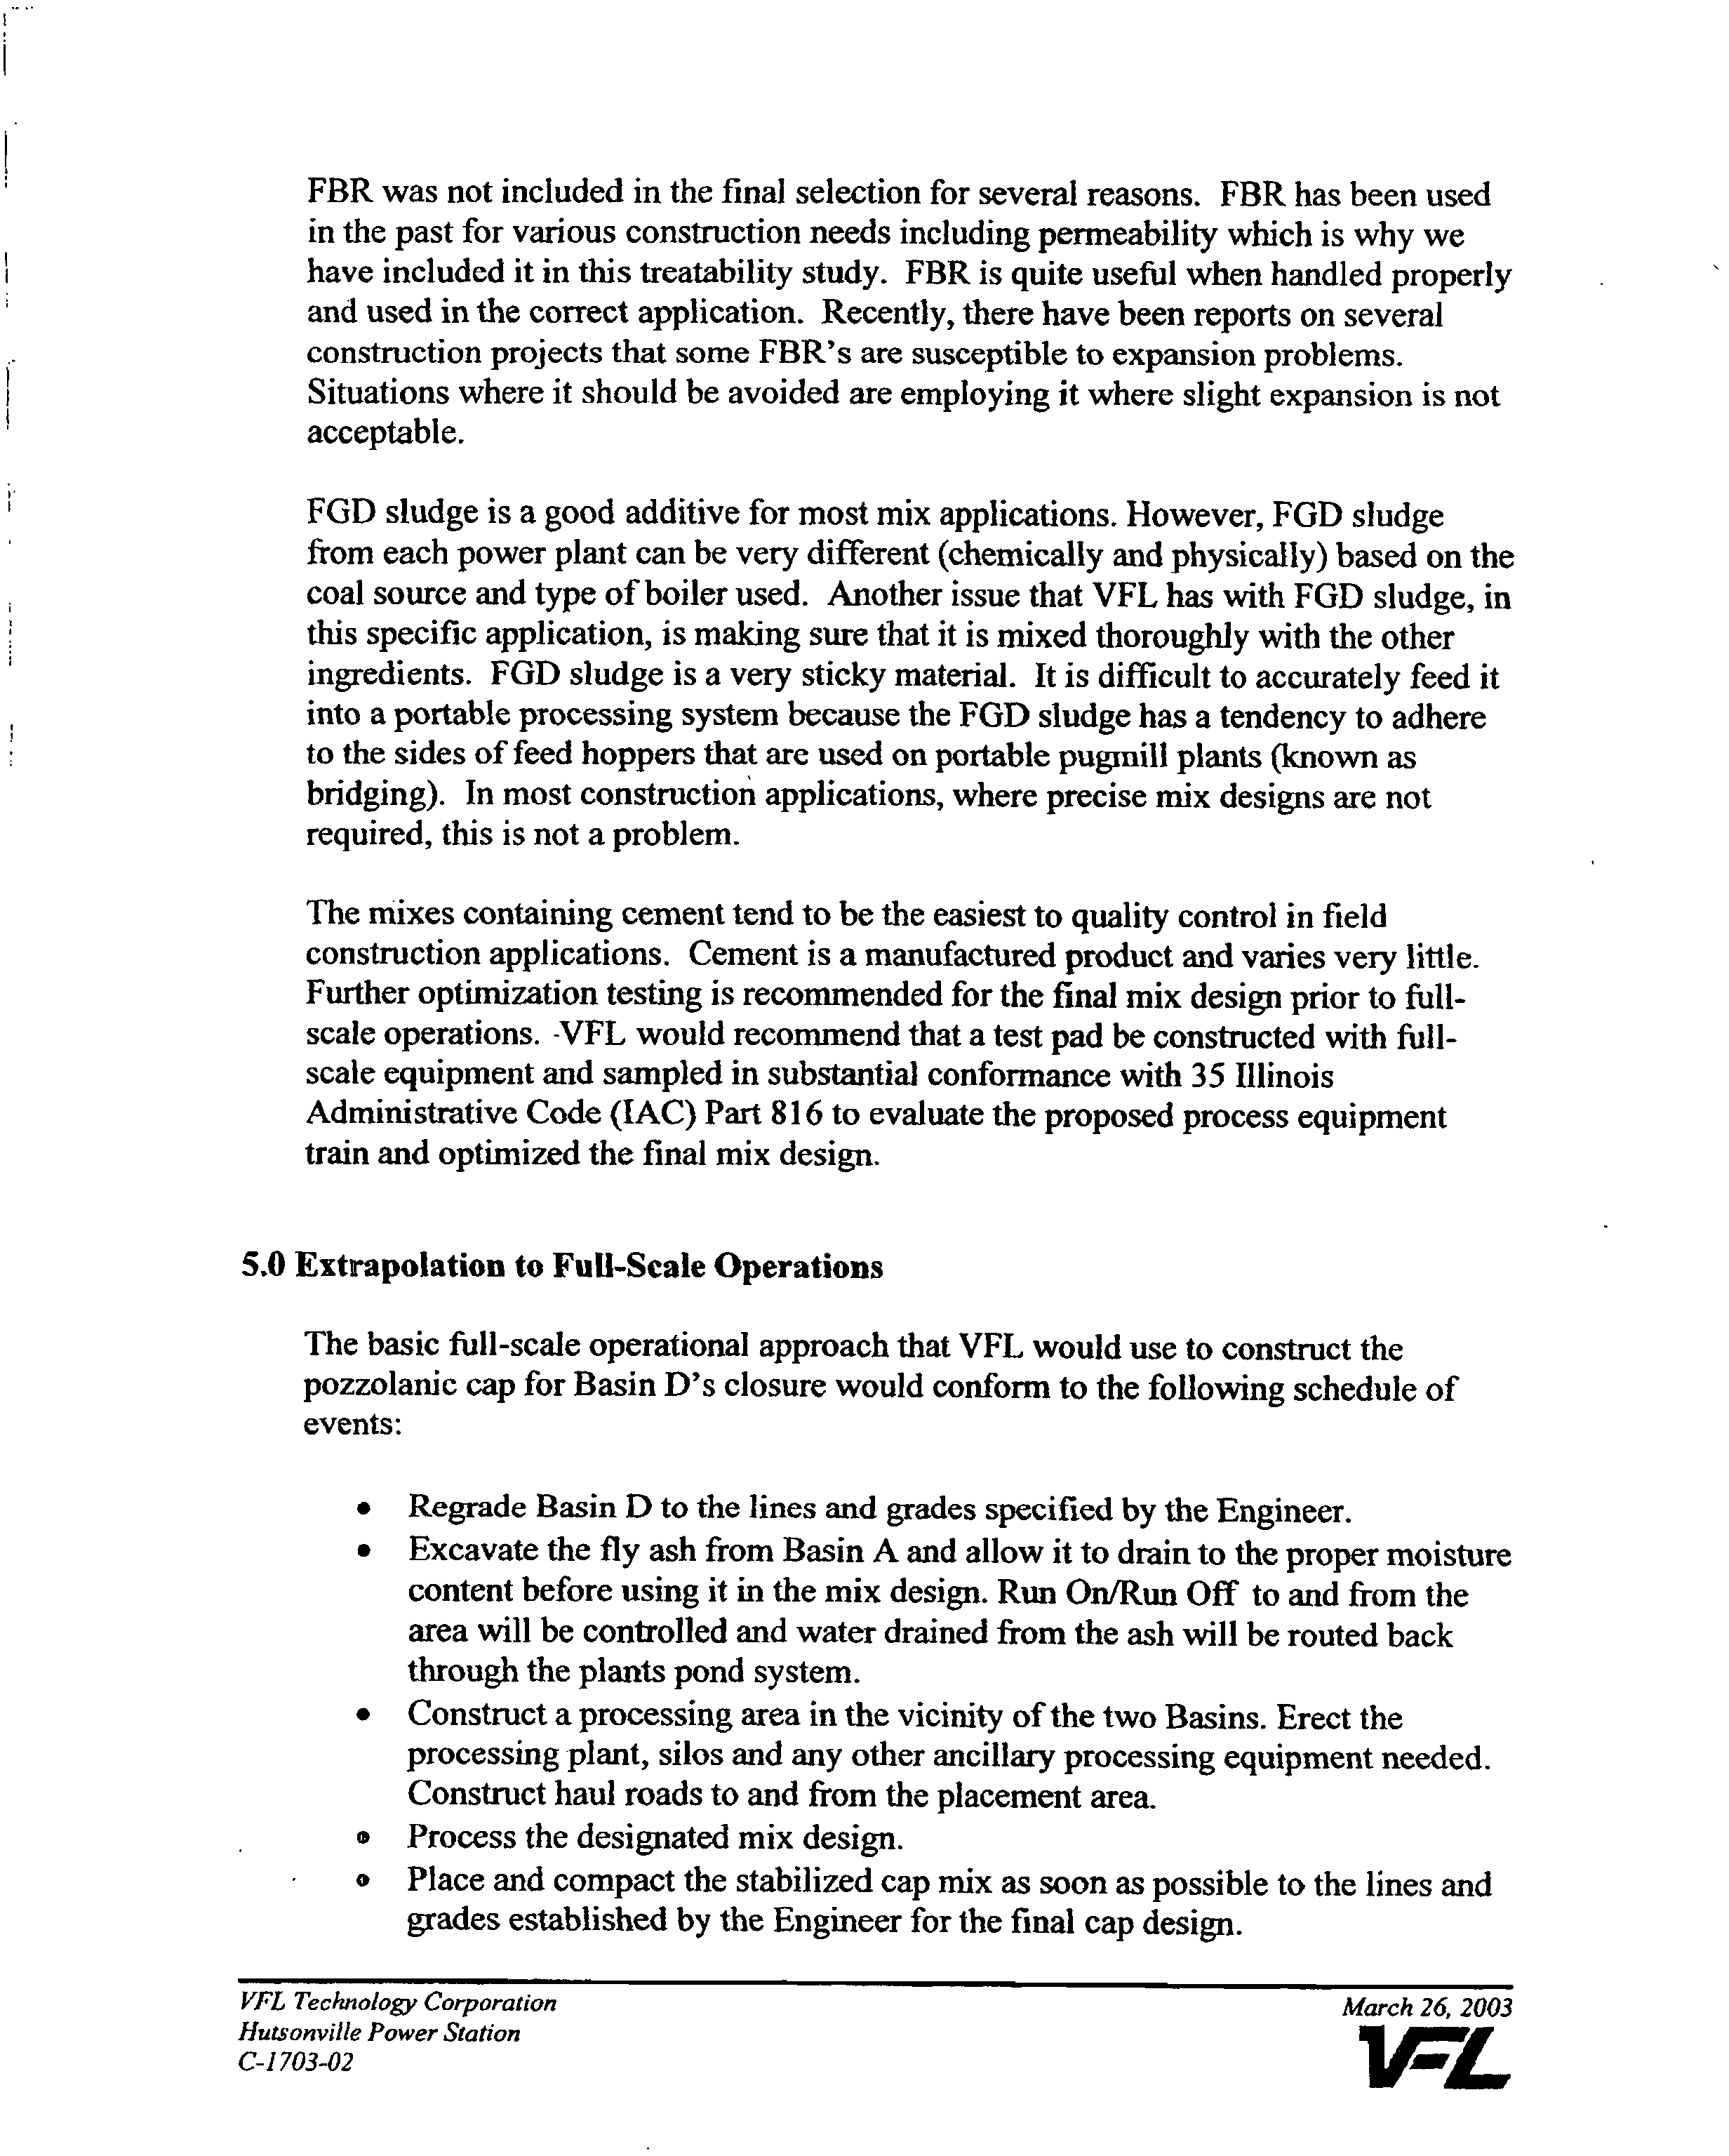
SOURCE
USGS
15 K1NUTE
QUADRANGLE
WEST
UNION
DATED
1966
L\
Li
QUARANGU
LOMtON
2000
4000
SCALE IN FEET
CONTOUR
INTERVAL
10
FEET
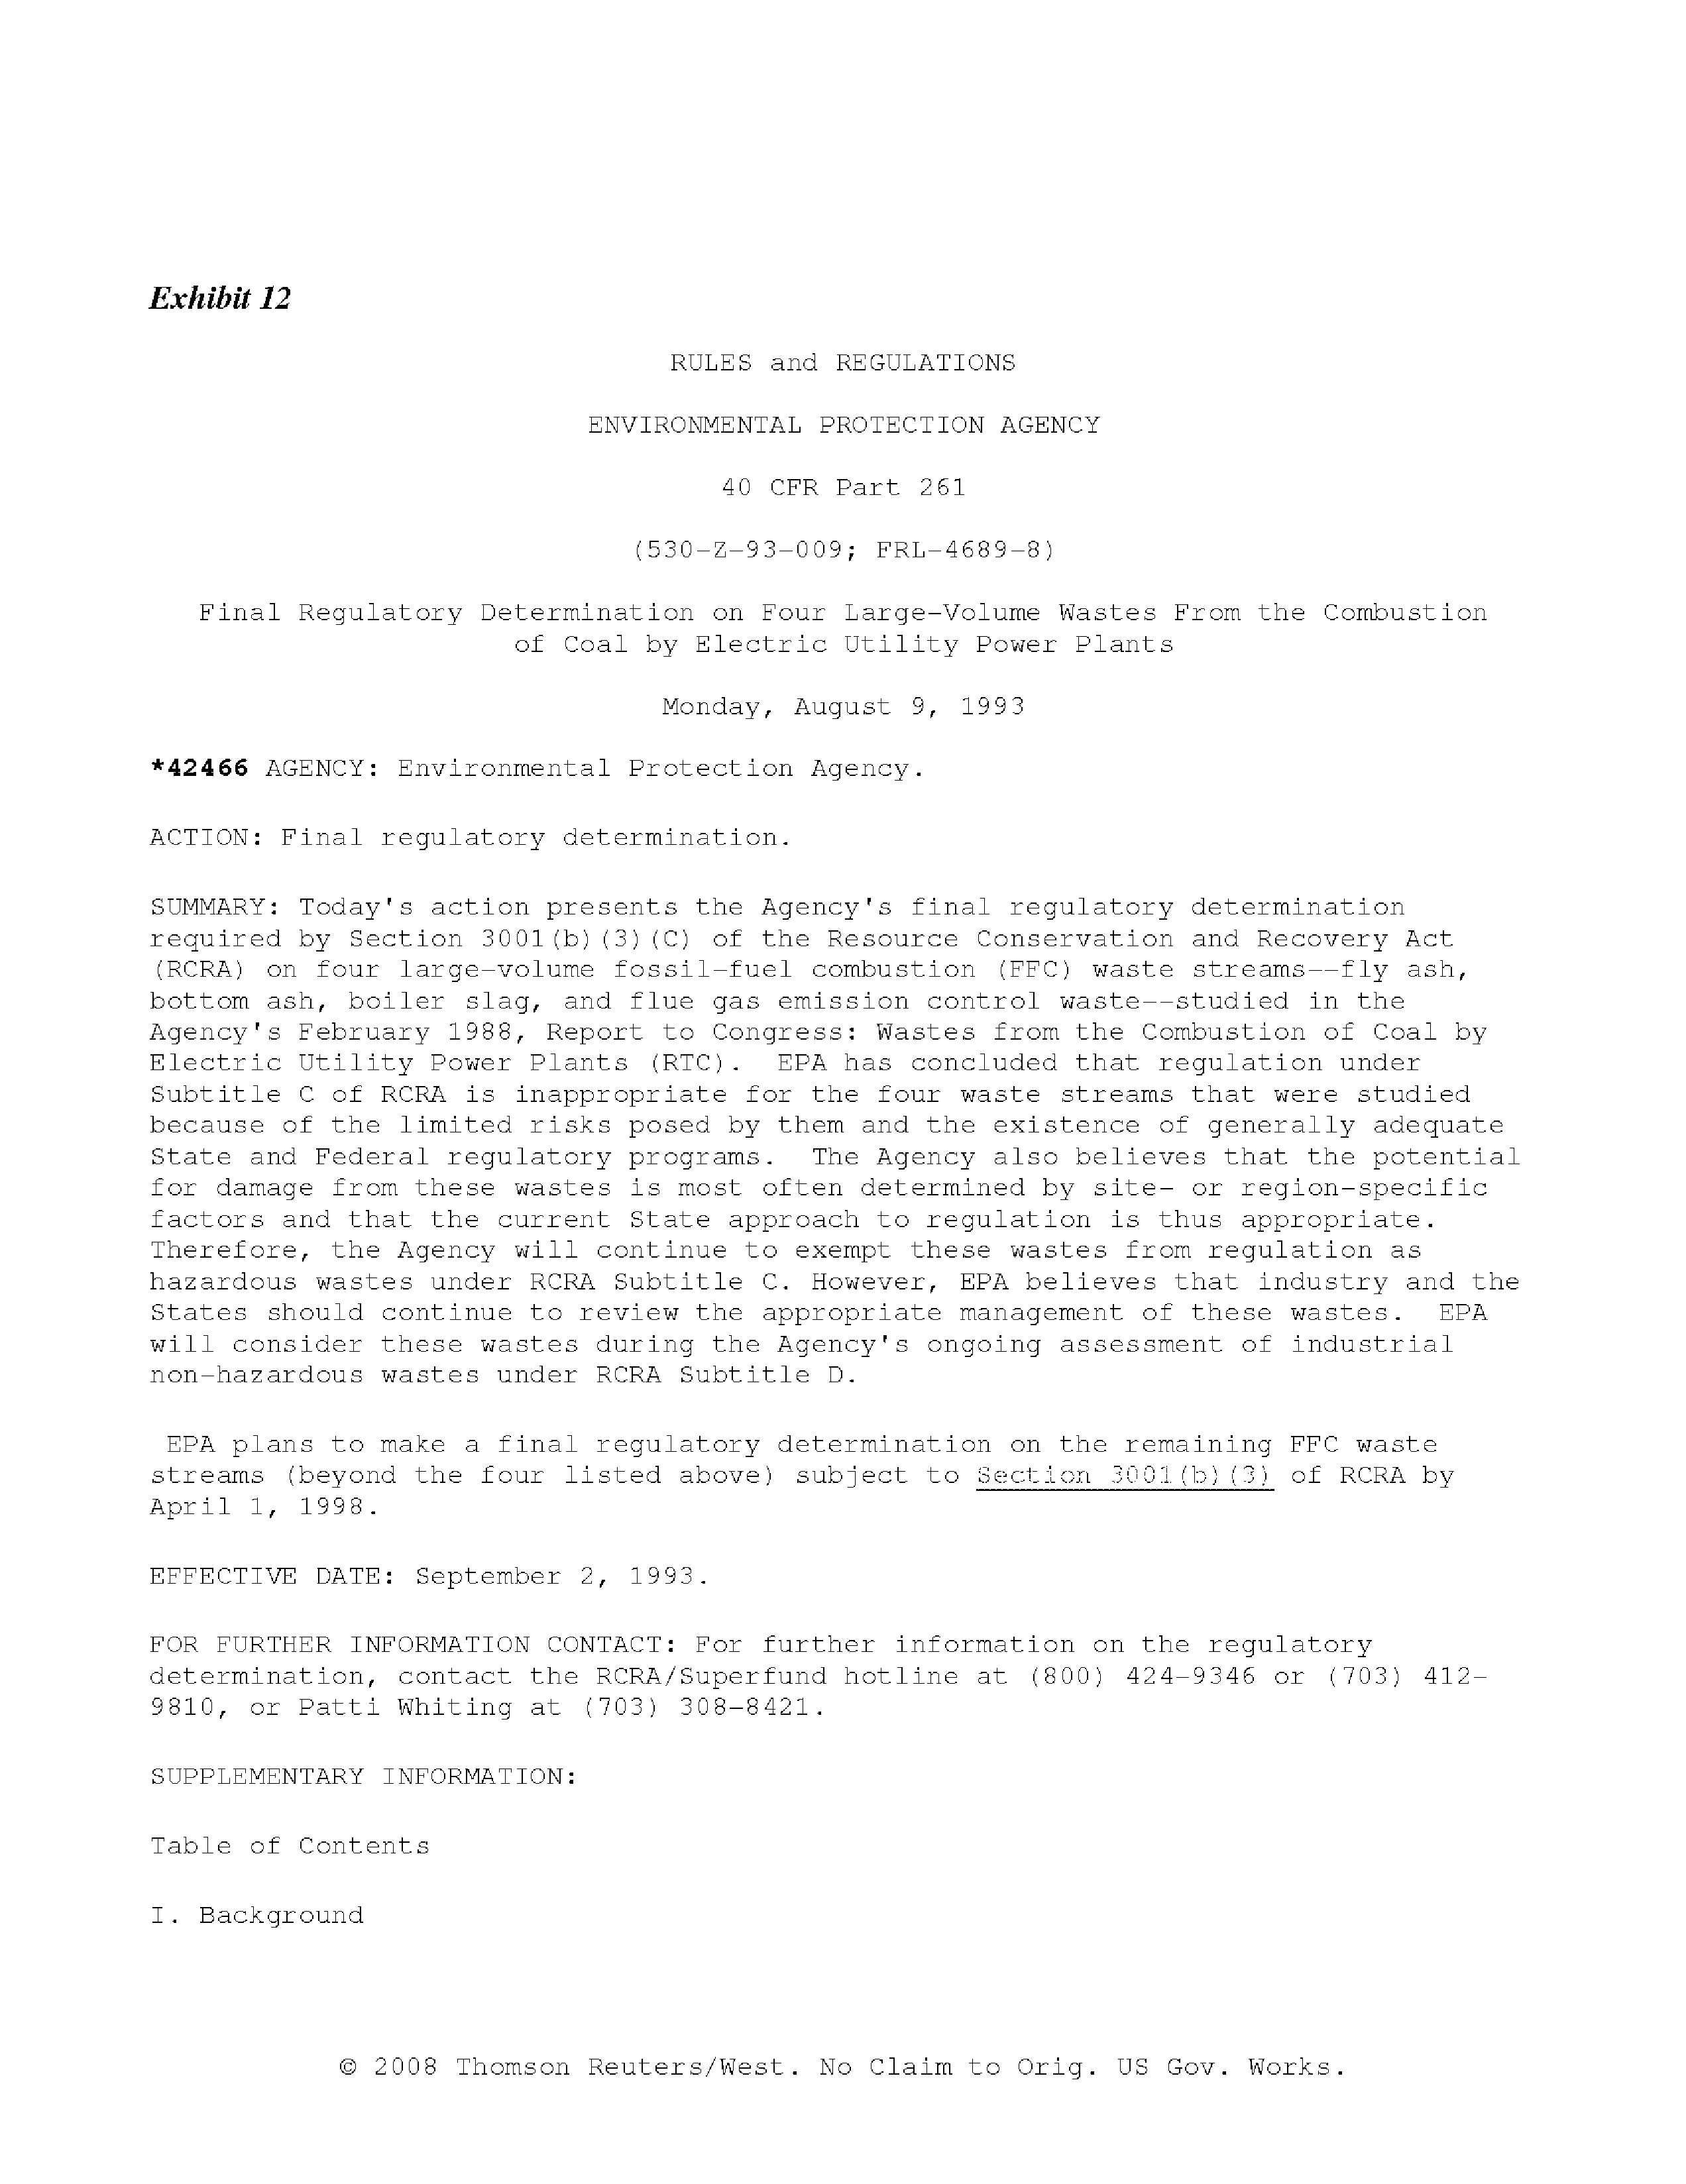
SITE
LOCATION
kIAP
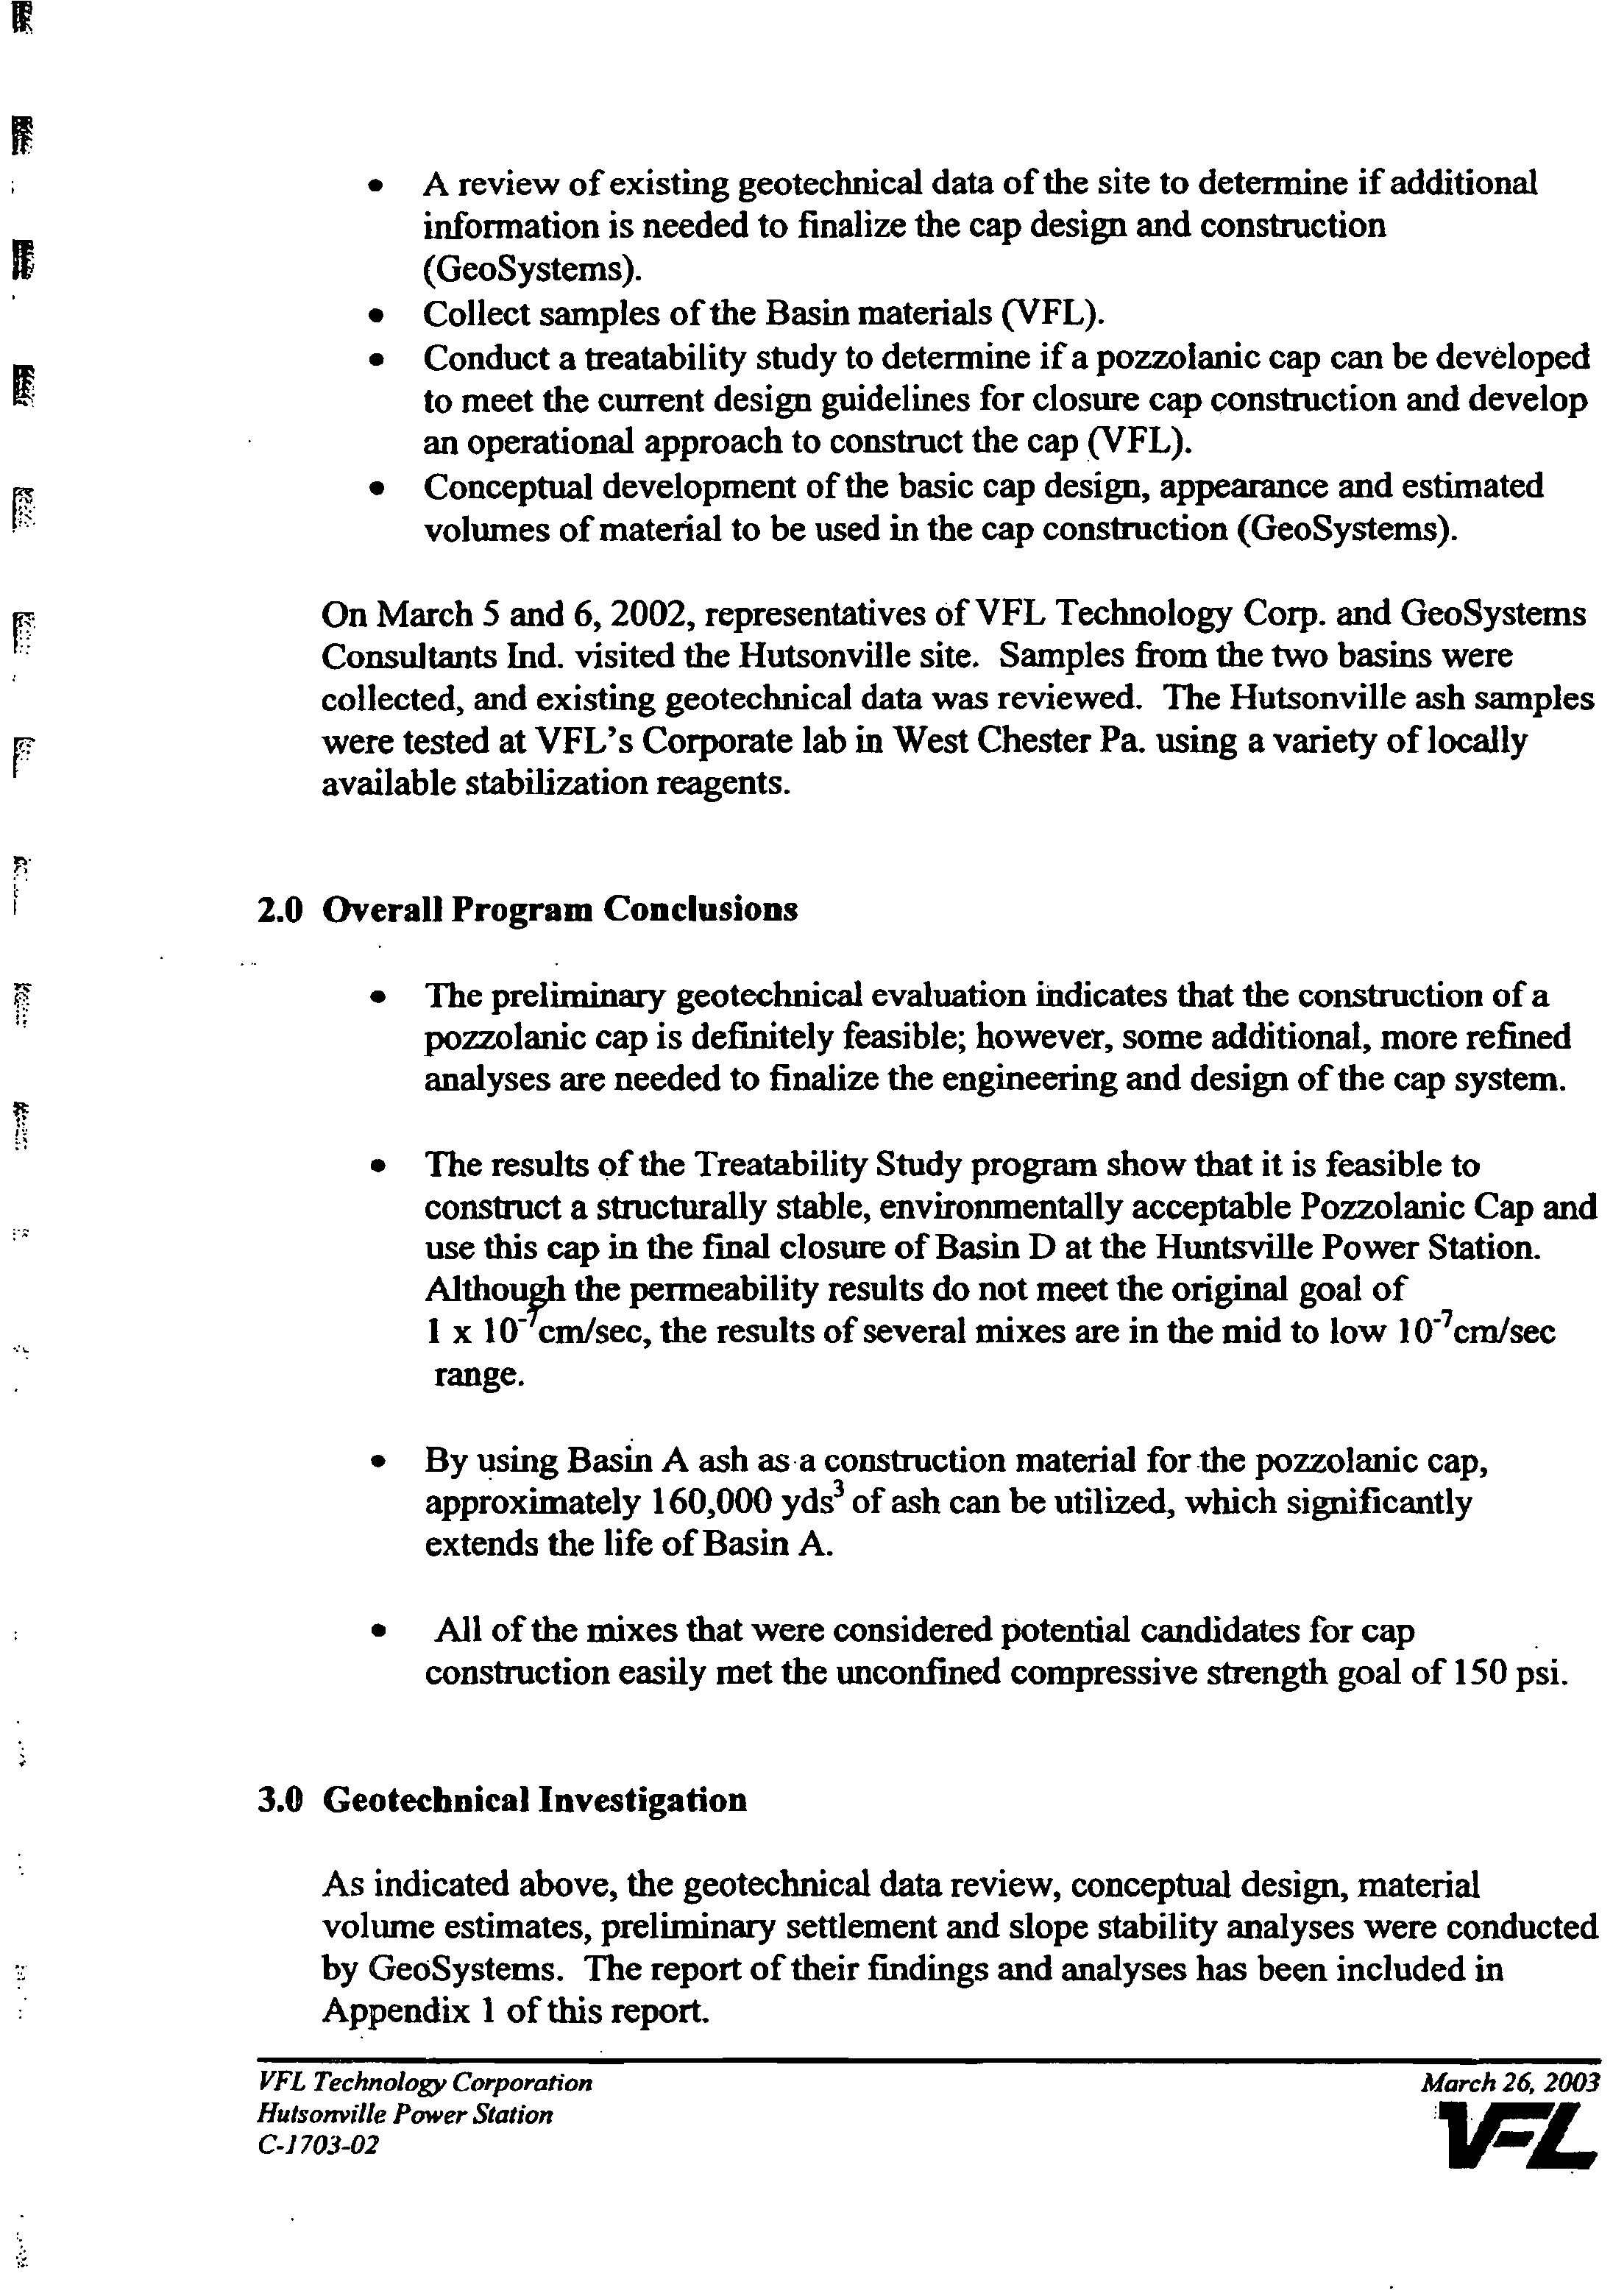
PROJECT
NO
NATURAL
HUTSONVftLE
POWER
STATION
DRAWING
NO
RESOURCE
AMEREN
ENERGY
GENERATING
375A04
TECHNOLOGY
HUTSONVILLE
ILLINOIS
FIGURE
NO
DRAWN
BYRLH
o7/le/os
APPD
8Y DRH
TEO7/16/O5
11
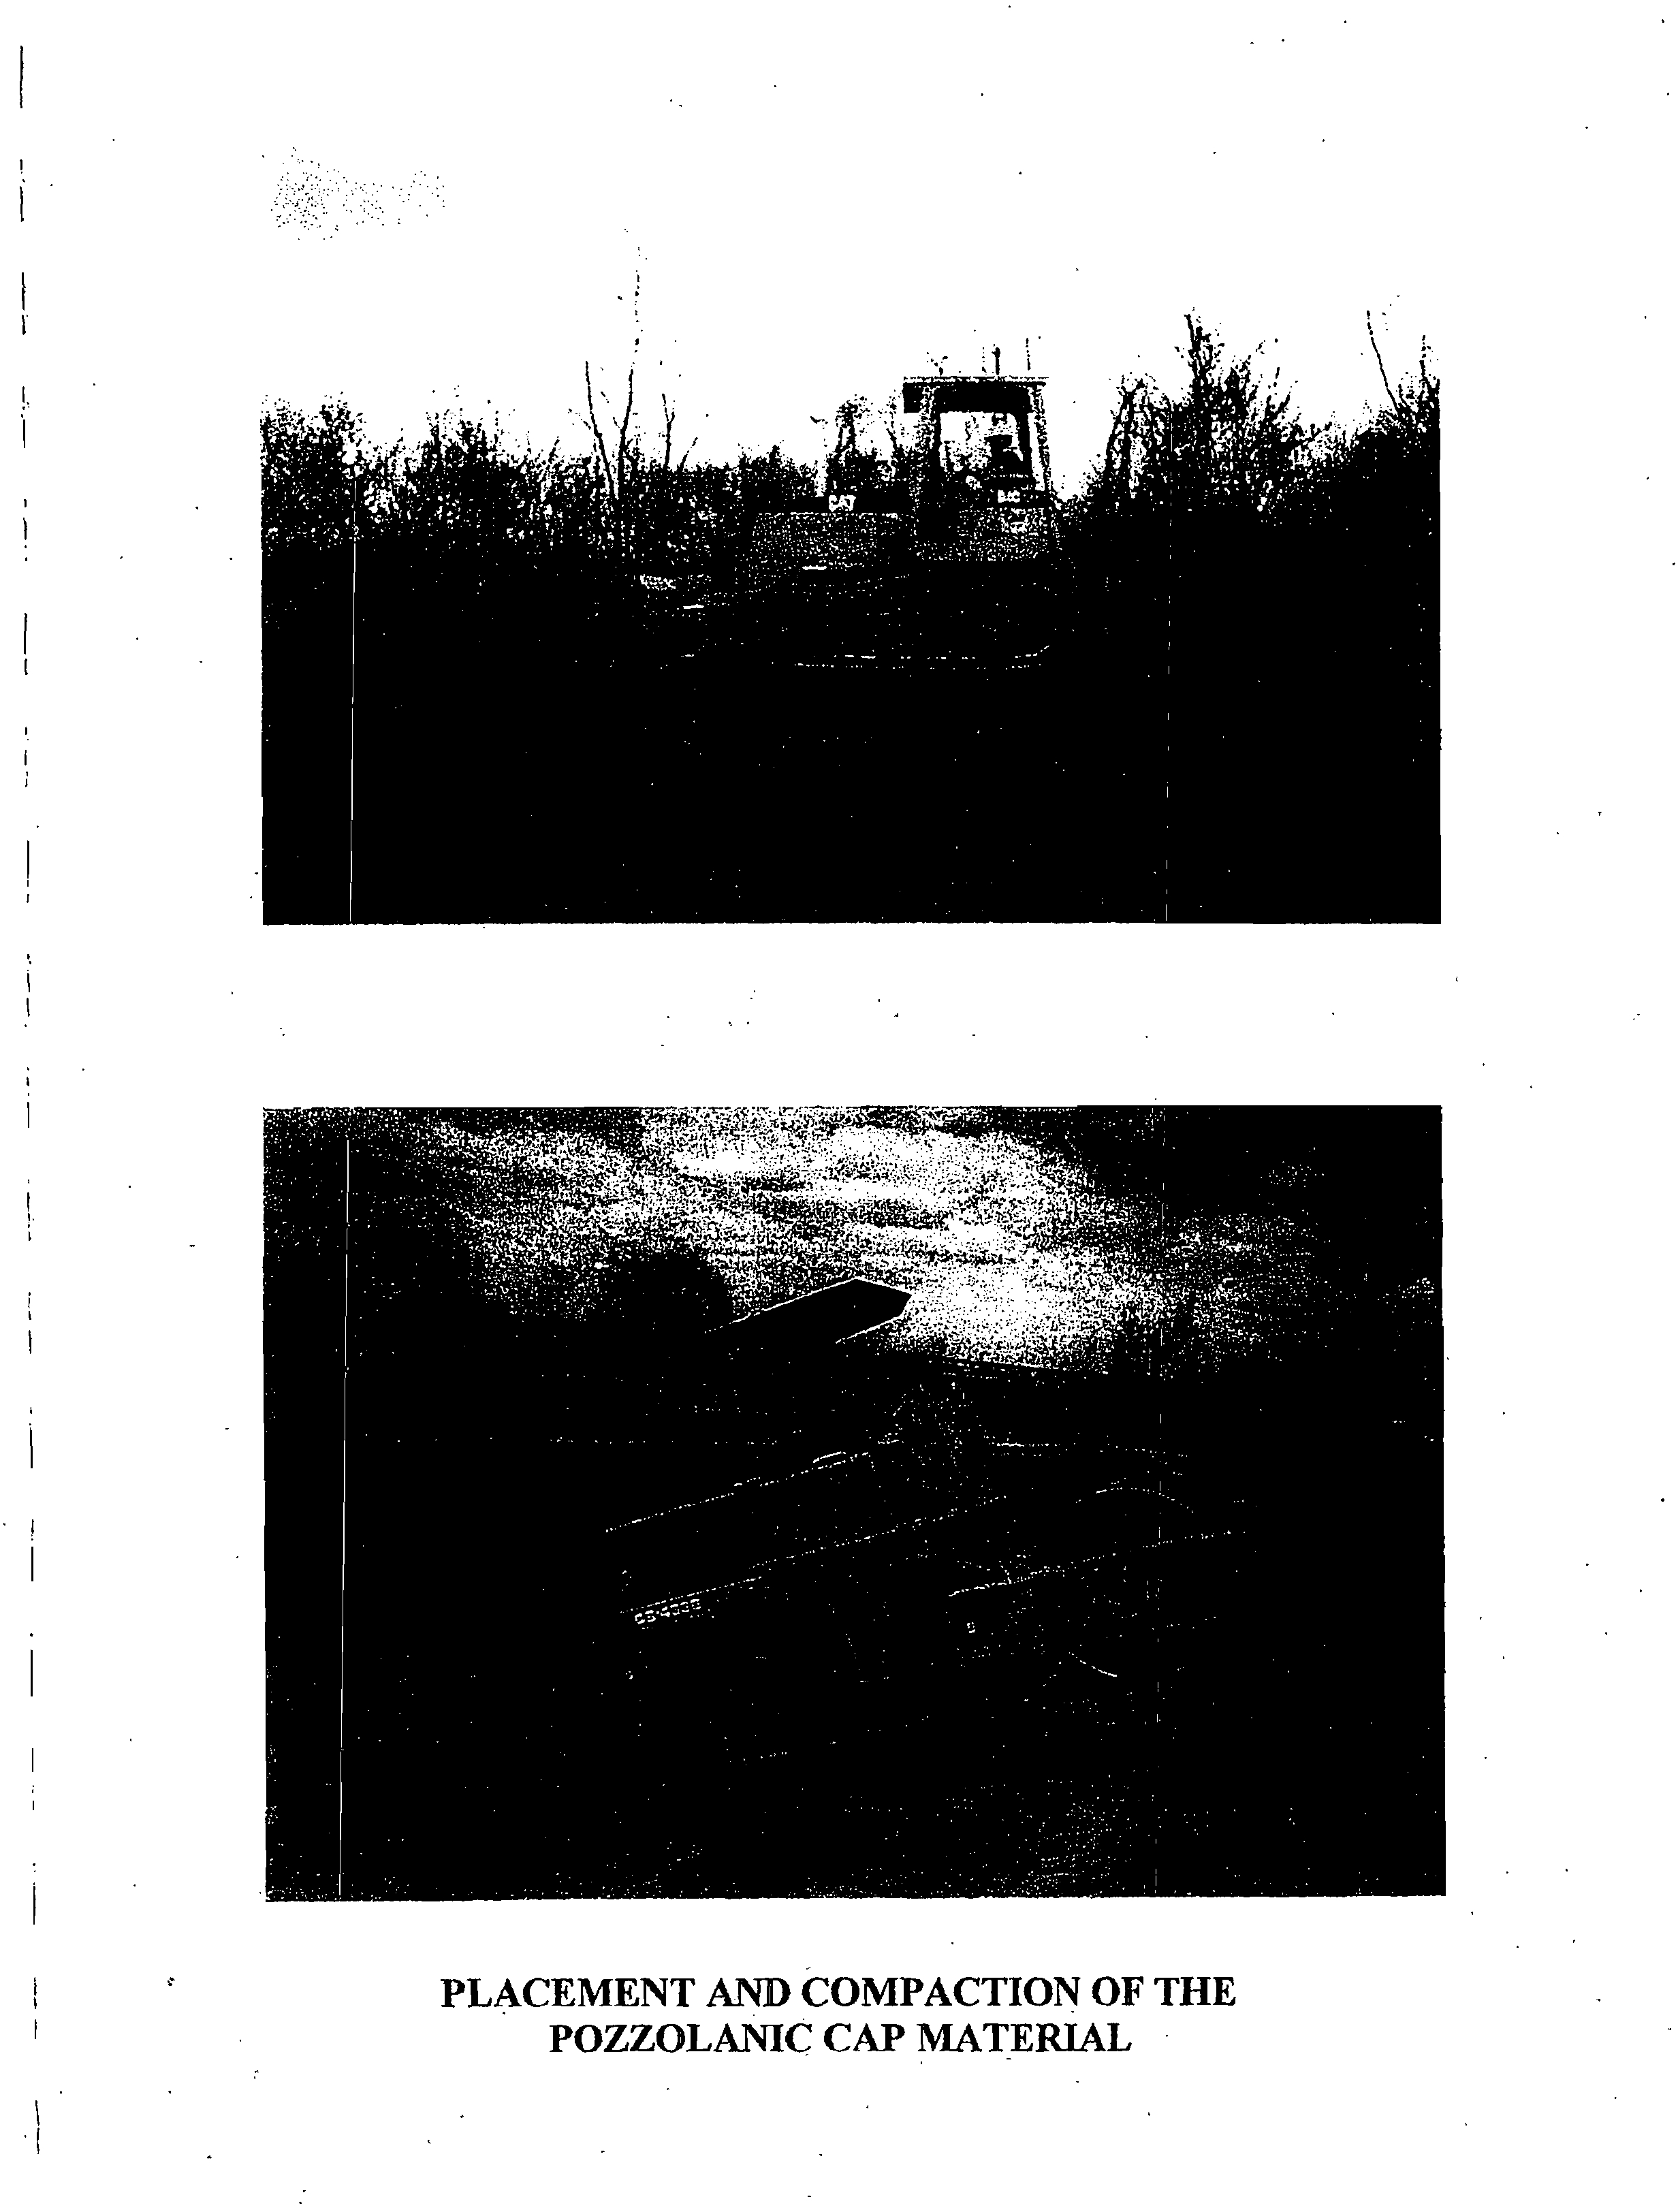
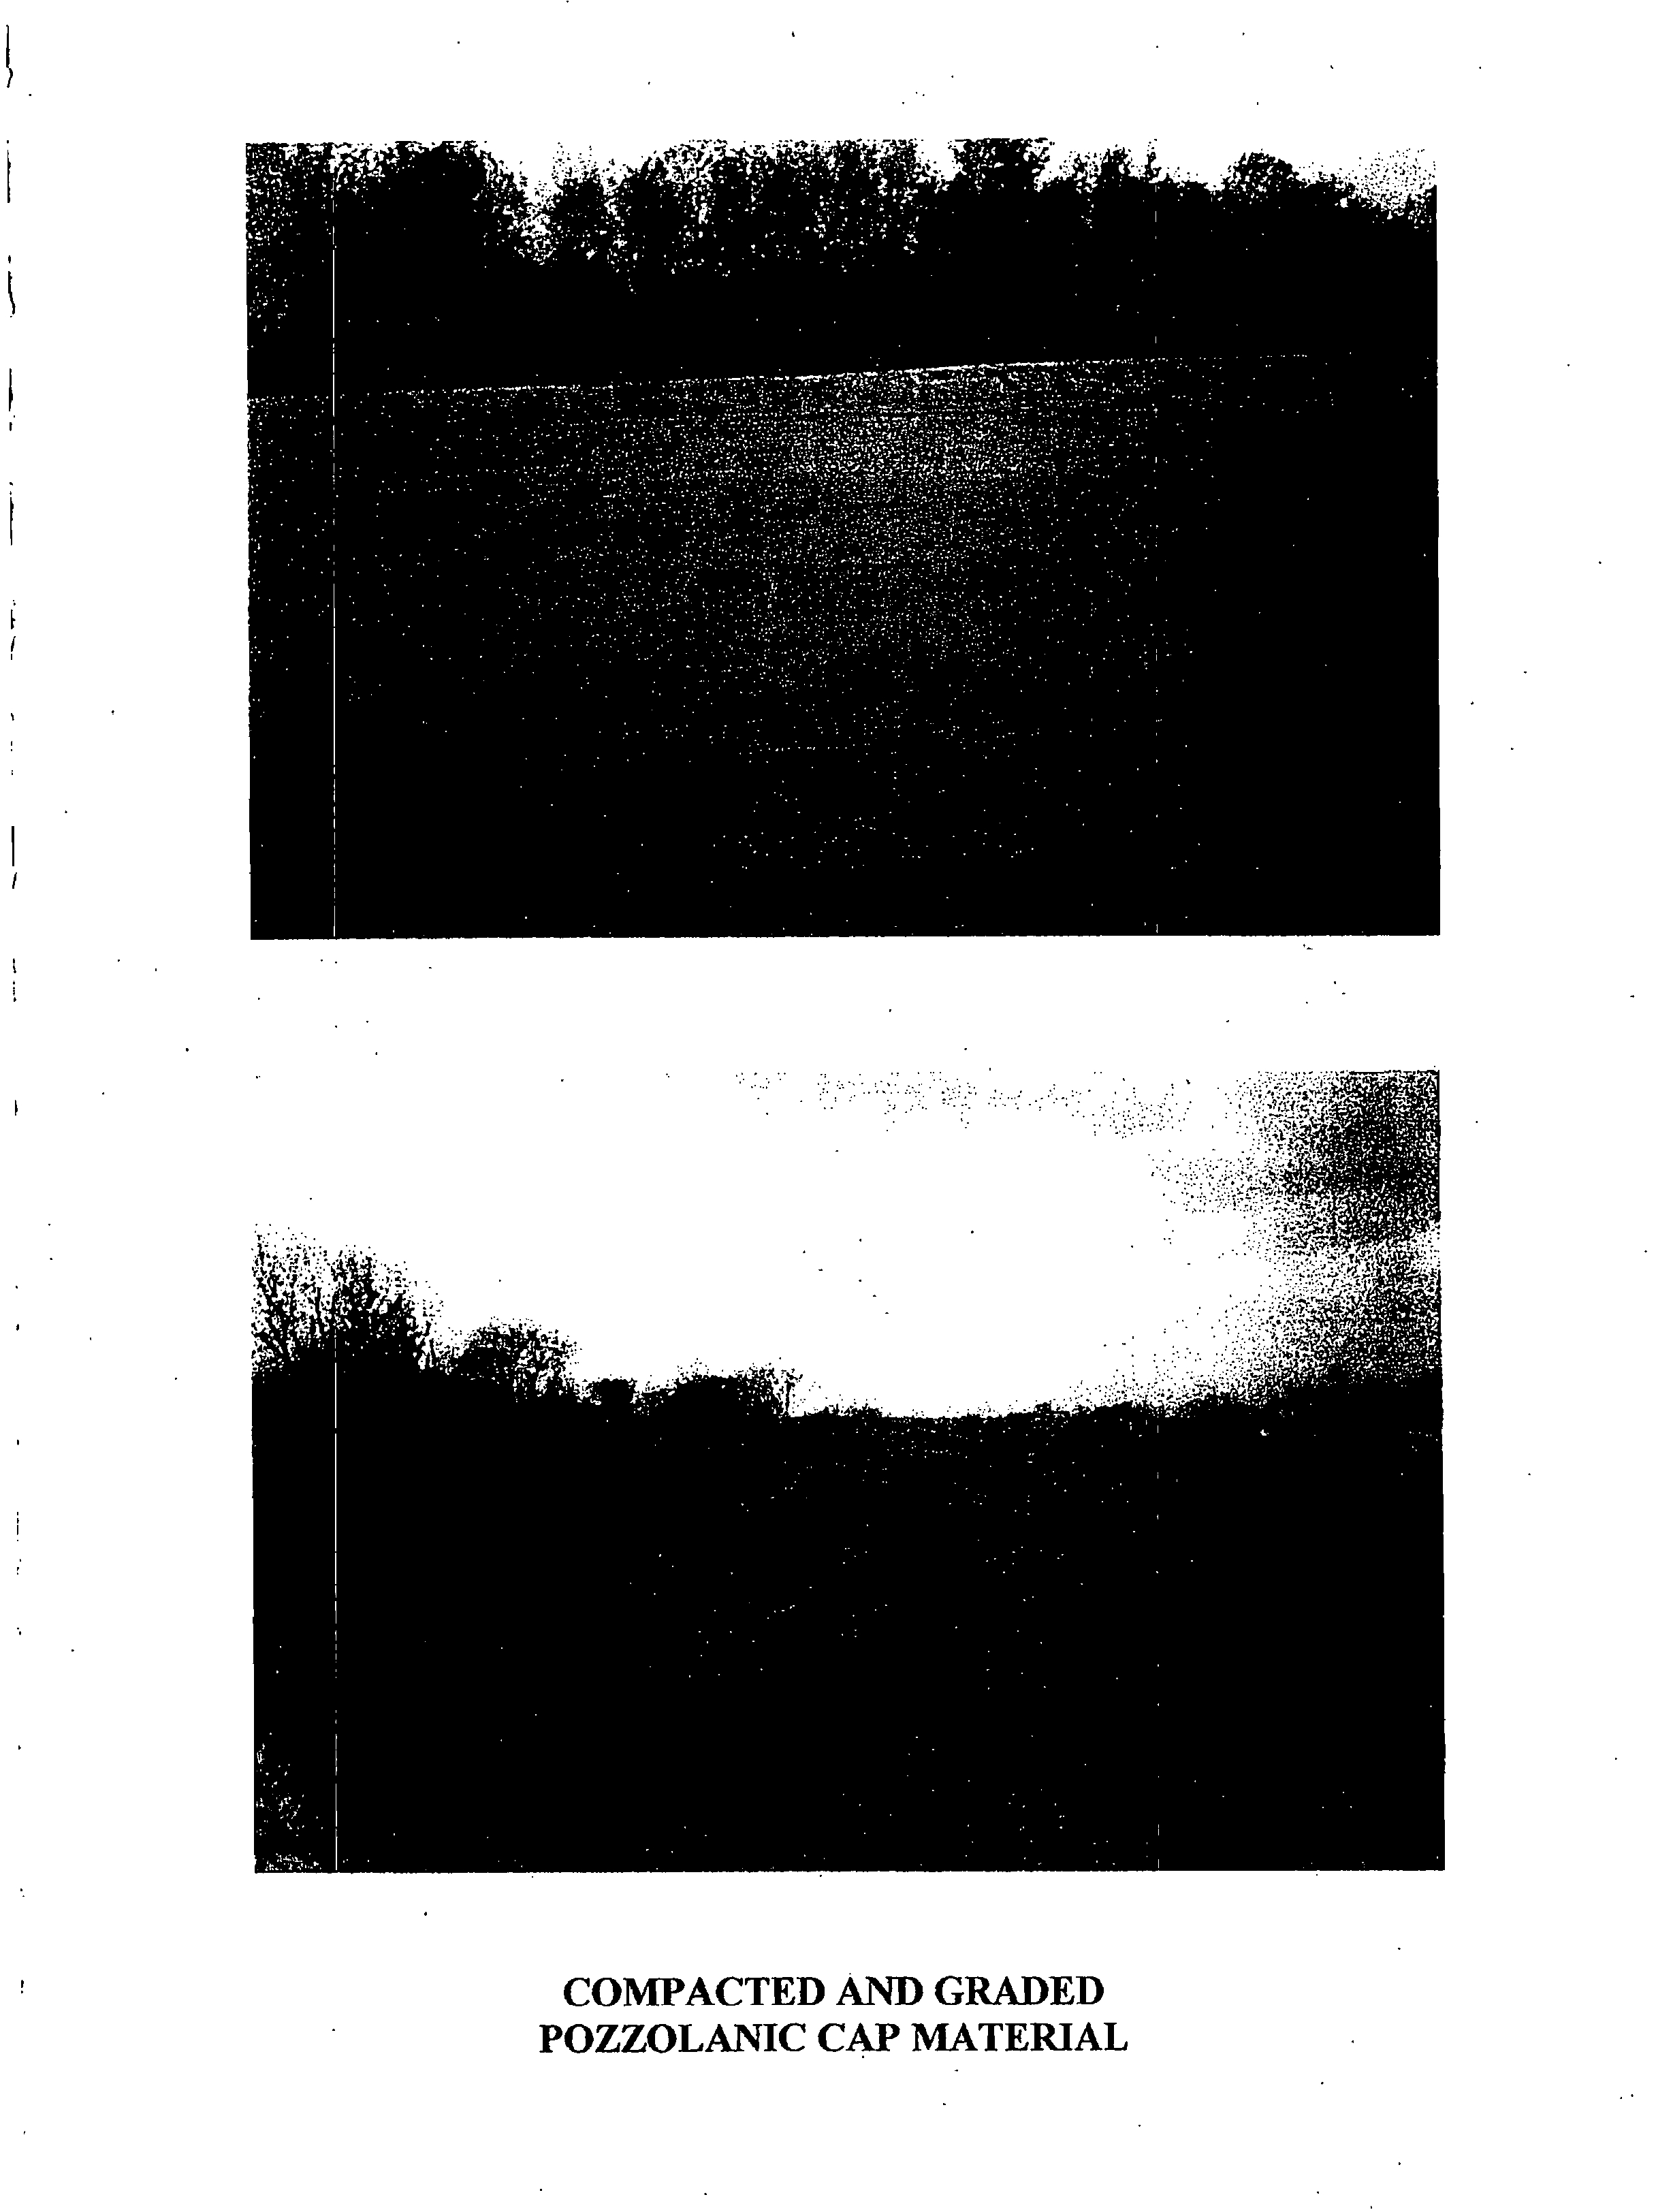
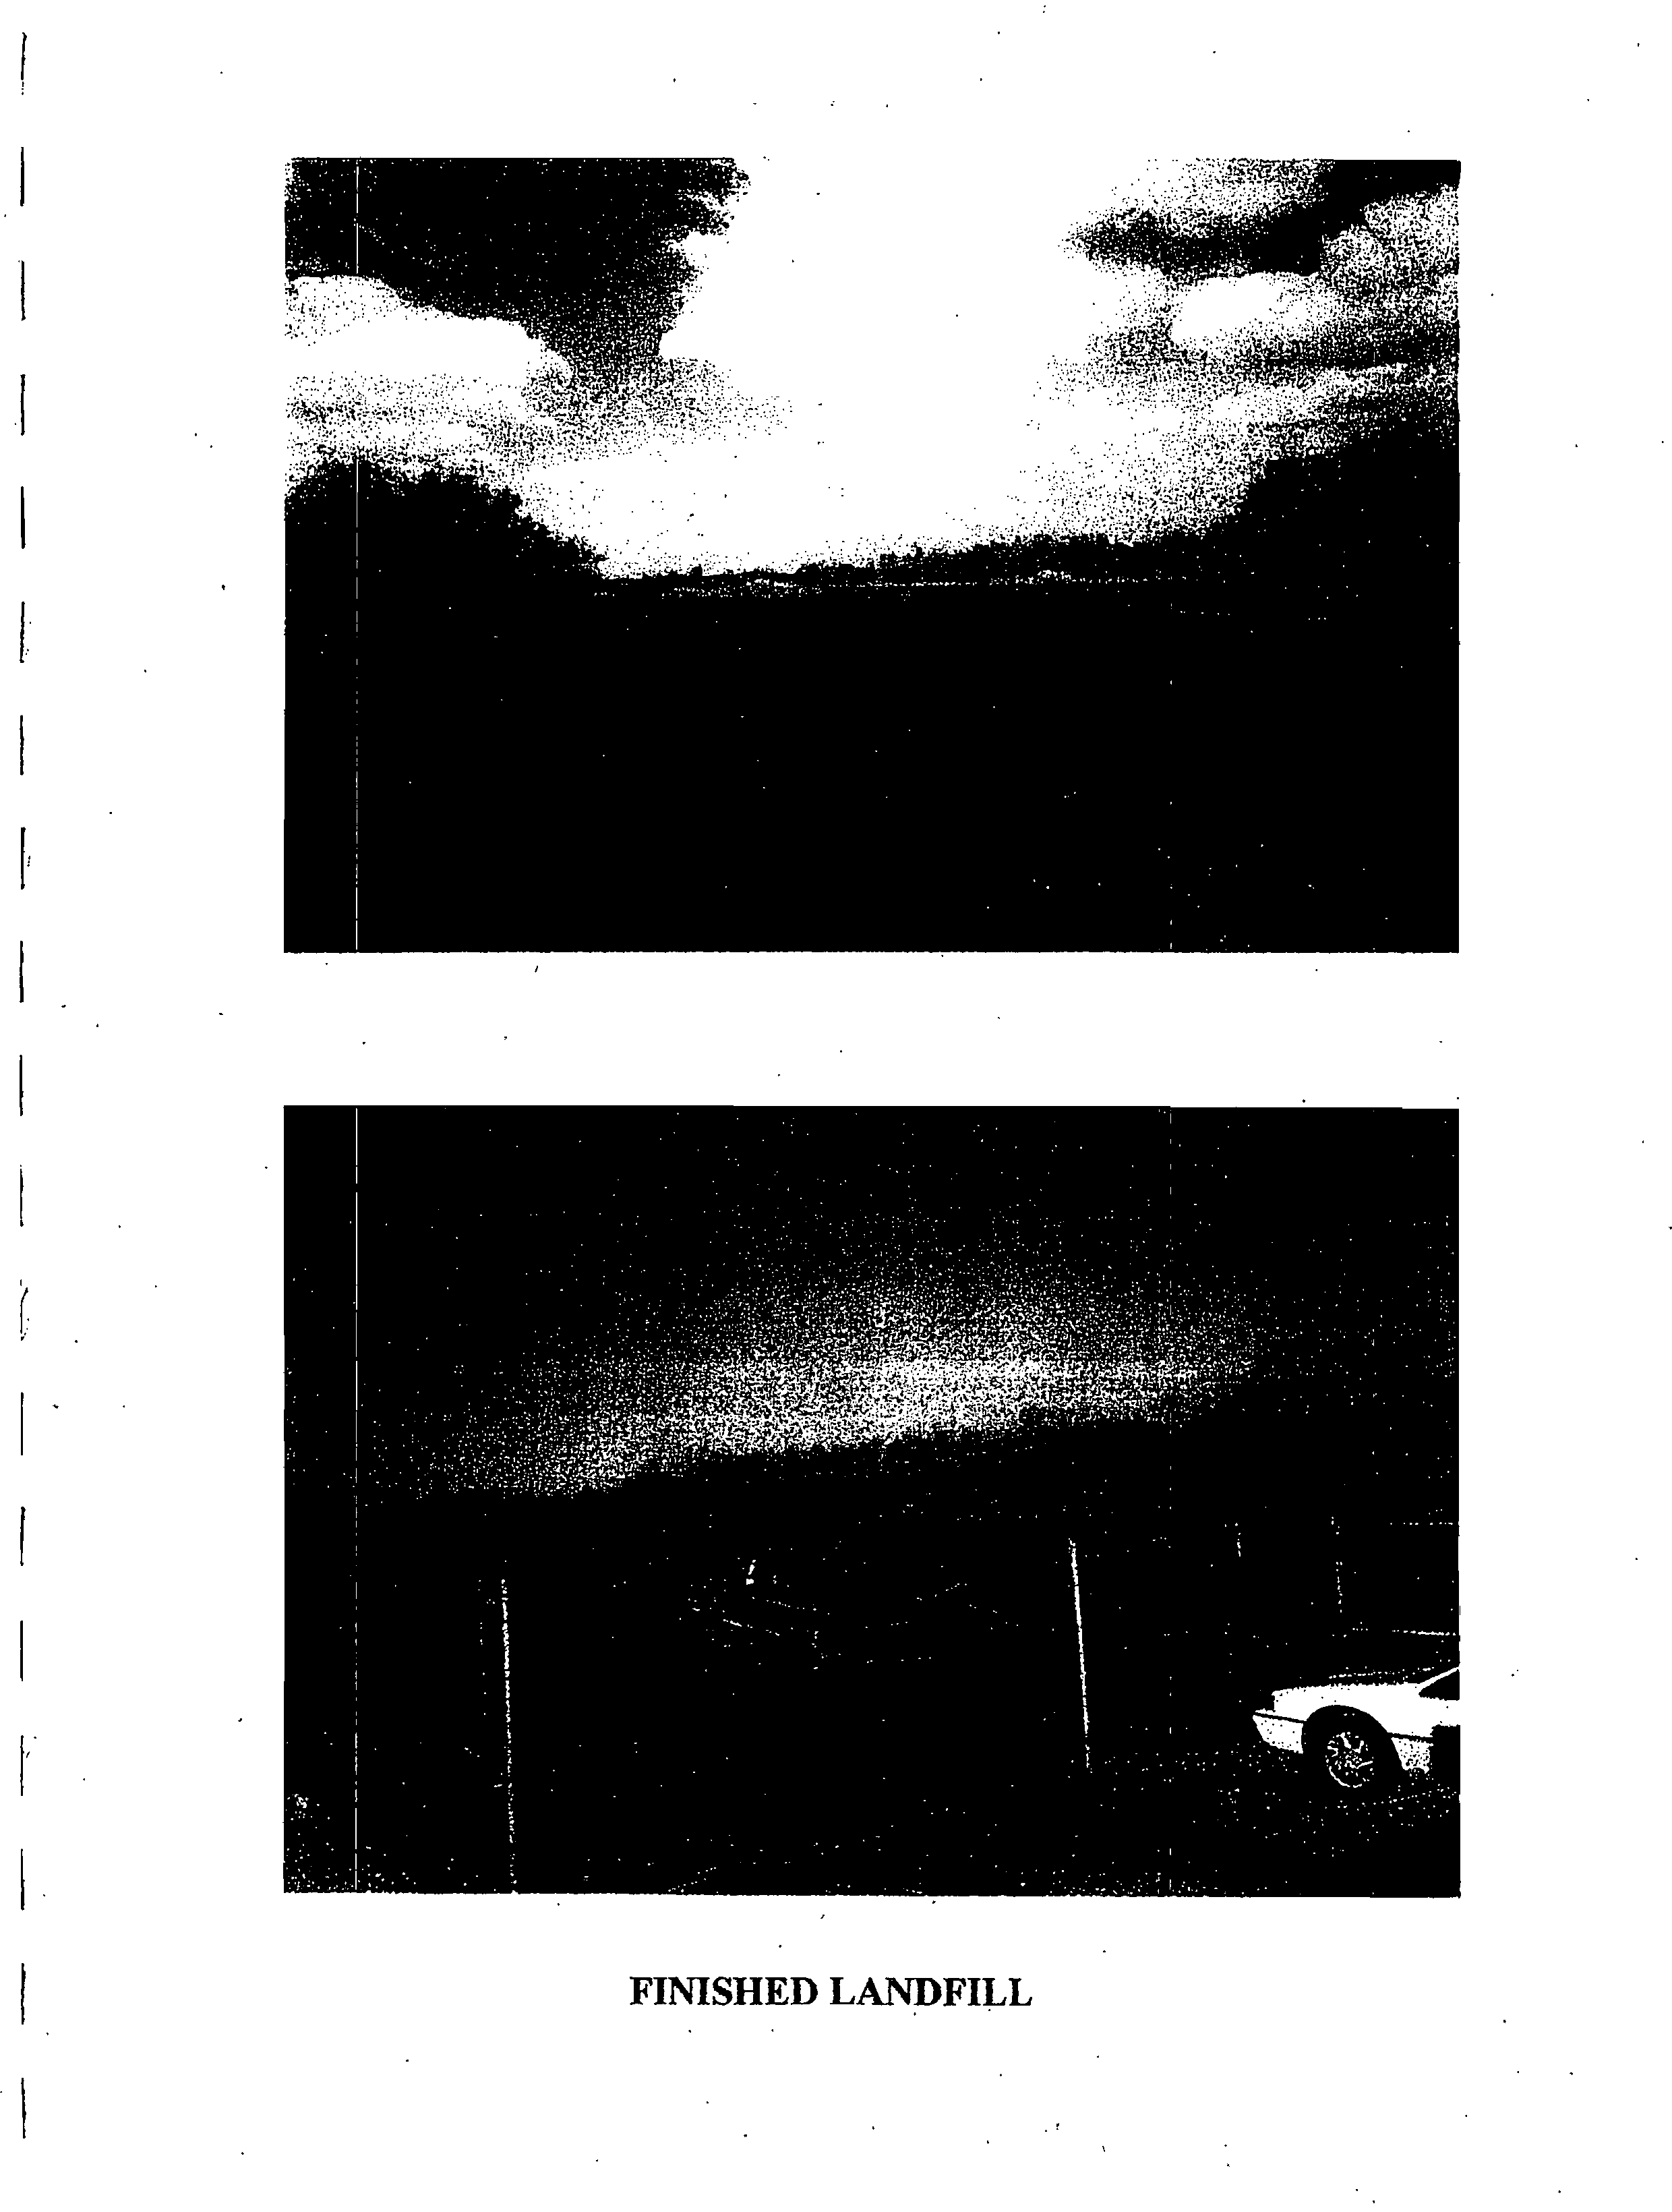
Electronic Filing - Received, Clerks' Office, August 11, 2008--Exhibits 1,2,5-10, & 12
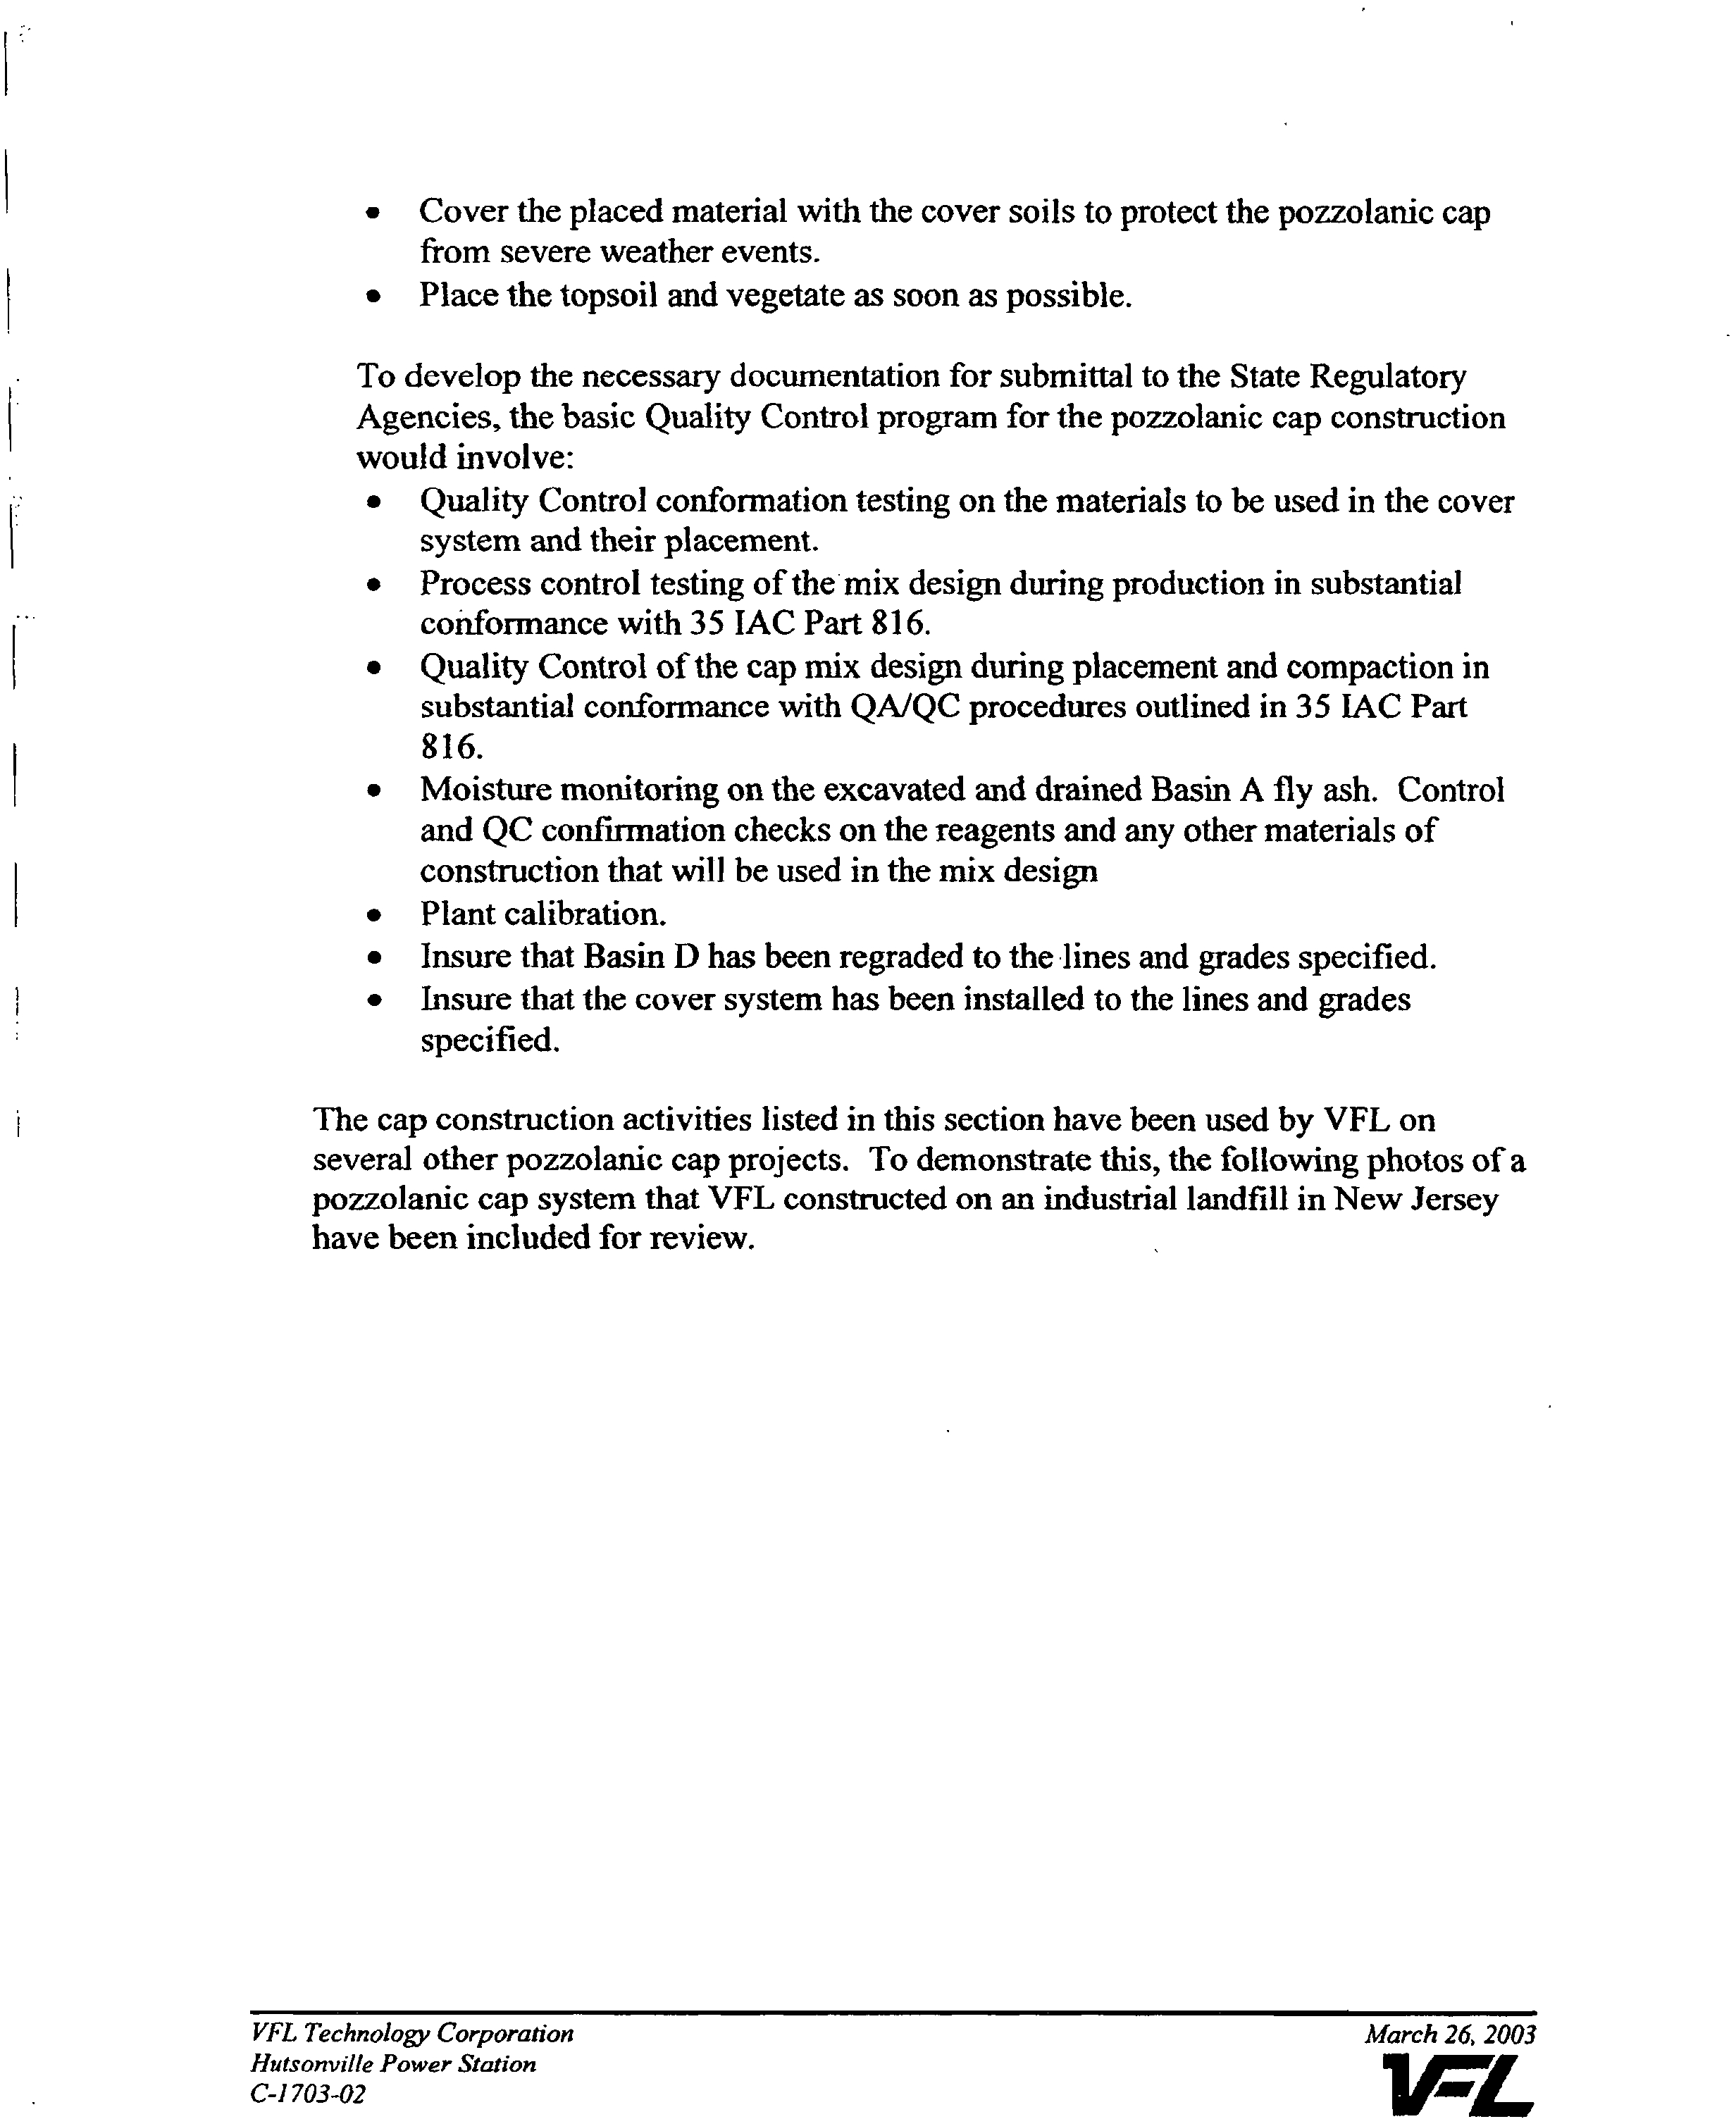
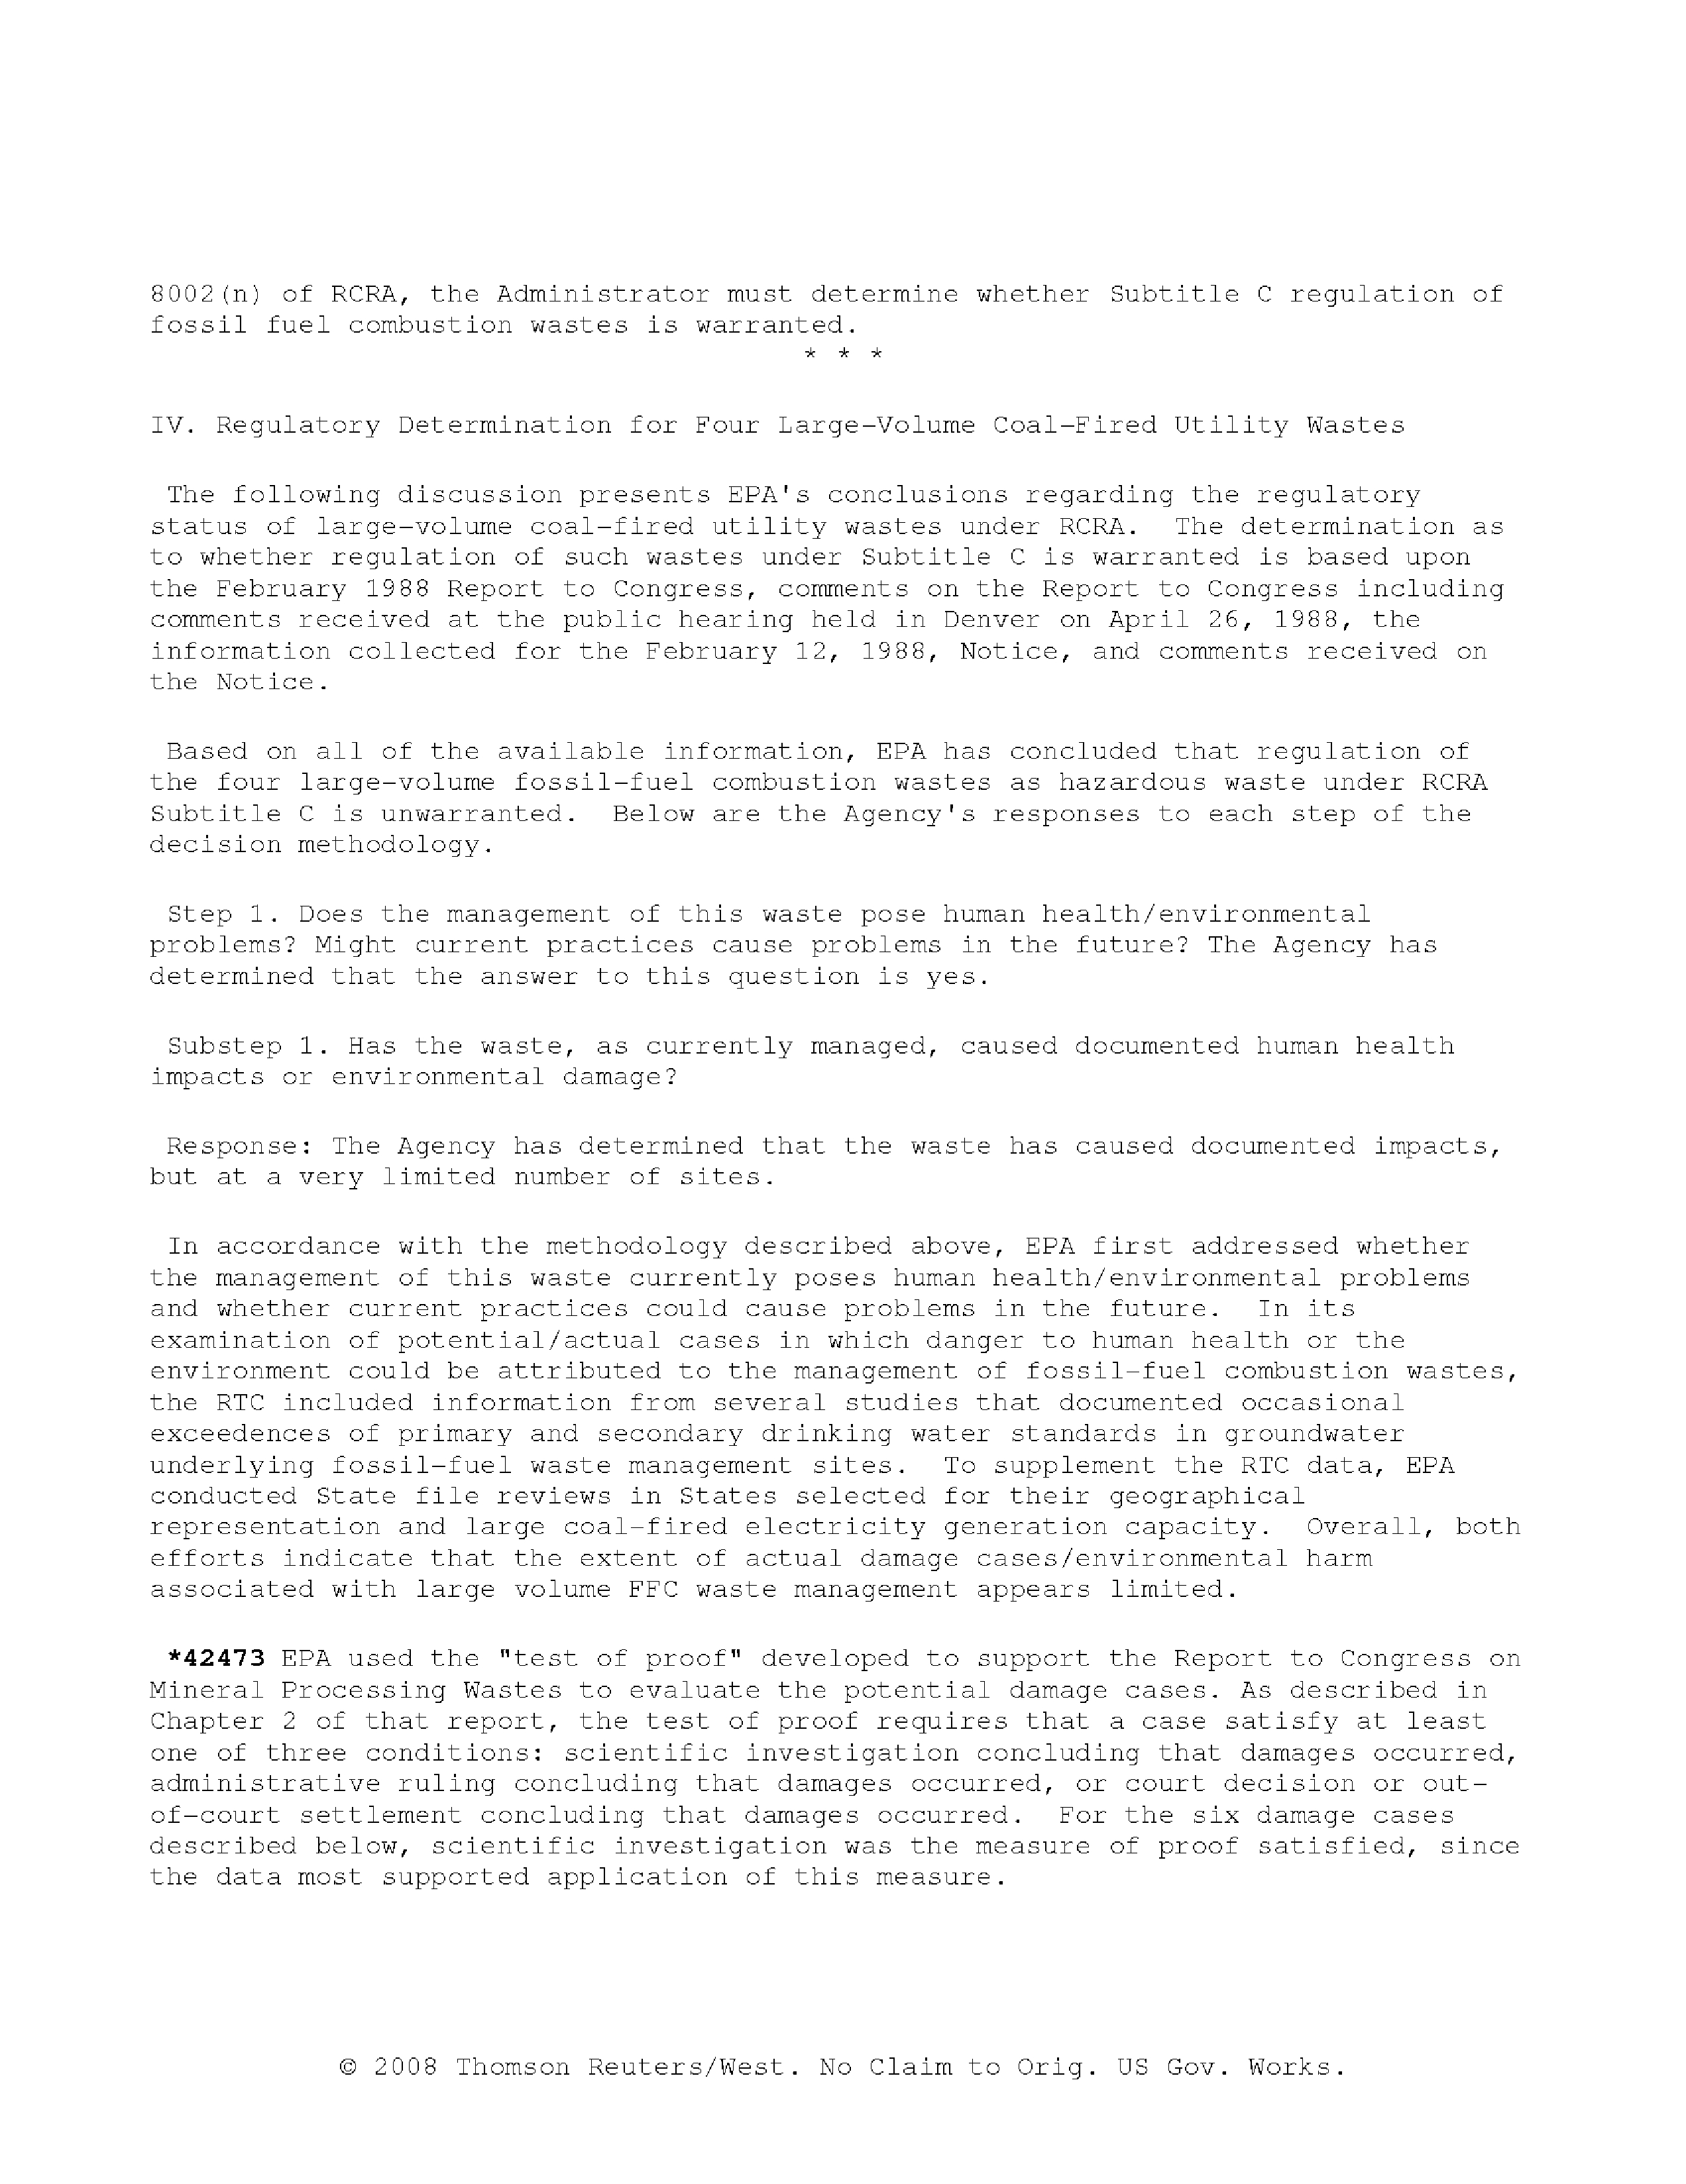
SN
INS
SB
004
01
p2
MWN
CDA_2
SMW_12
OP?Z
MW-7D
UNUN
PLY
POND
POND
.k
002
p0MW
04
MWDD
MW
MHOrB
LEGEND
M-I
LtJ
3D
MW-Il
GPI
LPI
EWl
SO
01
OOJNDDNEDM0000PNO
NEW
SB
INN
MW
SD
200
450
SCALE
IN
FEET
THIS
MAP
WAS
ORDAINED
PPOMADPAMINS
ES
HANSON
ENOINEEPS
INC
HE
DOAEPAL
PLOD
HE
SHEET
ND
502
P.5MW
PPOJELD
D0010
4/05/DO
AND
POOR
AEPAL
SUBSET
PEPPD
PMED
ND
DOPDED
LDPP000DDDN
HODSOPDOLLE
ASH
POND
SUEDES
ANDES
JON
NO
000434/DNA
DODSD4.I24/Ol
EDNTOPNO
WELLS
MWDH
P0000
MW
DO
MW
AND
ONI
DCNL
POPN050ND
0000000
SN
03
AND
E000DAOD
ON
WELLS
ENOND
EN
2WEEE
SUNDErED
NO
SMEPENPE000NNELON
iO/D
5/00
AND
D/DN/OL
PA
OmEN
MONDONEG
WELL
ONDANED
POOR
NET
DENNIND
370
NO
PPOJECD
NO
375/I
DATED
0/
N/ON
TM
DOD
AND
TM
DO
WEPE
0000EED
NTCDNNOP
000NNOP
INC
000NSDN
ISJNOS
JOLS
2004
NODES
DI500PDDINOOES
BETWEEN
SOPOEDS
APE
INLICADED
PD
EPENKS
IN
LON0000
ONES
DOLNDENOS
OP
00000000
OP
OP
HAND
SUPPOSE
000EP
SAMPLE
P2P
APE
500EENED
ONCE
OH
ES
APE
0500L0005D
PD
REP
ASH
LADDO
MN
APEA
NOW
PEP
LOGED
WDH
OH
IN000I
POND
AND
ONE
005INADE
LDS.E500N
POND
SEE
OPT
PEPOPT
5000000EDLDOL
000ESONENO
POP
P000HEP
POEM
ODD
OPIN
OP
IS
0P13
OPIN
0PD7
OPDY
GP14
700
FT
Electronic Filing - Received, Clerks' Office, August 11, 2008--Exhibits 1,2,5-10, & 12
AMEREN SERVICES
GROIIIND WATER MODEL EVALUATION OF
IMPOUINDMIENT CLOSURE OPTIONS
AMERENCIPS HIUTSONVIILLE POWER
STATION
CRAWFORD
COUNTY
ILLINOIS
PROJECT NO 1375
Electronic Filing - Received, Clerks' Office, August 11, 2008--Exhibits 1,2,5-10, & 12
GROUNDWATER
MODEL EVALUATION OF IMPOUNDMENT
CLOSURE
OPTIONS
AMERENCIPS
HUTSONVILLE POWER STATION
JANUARY
2000
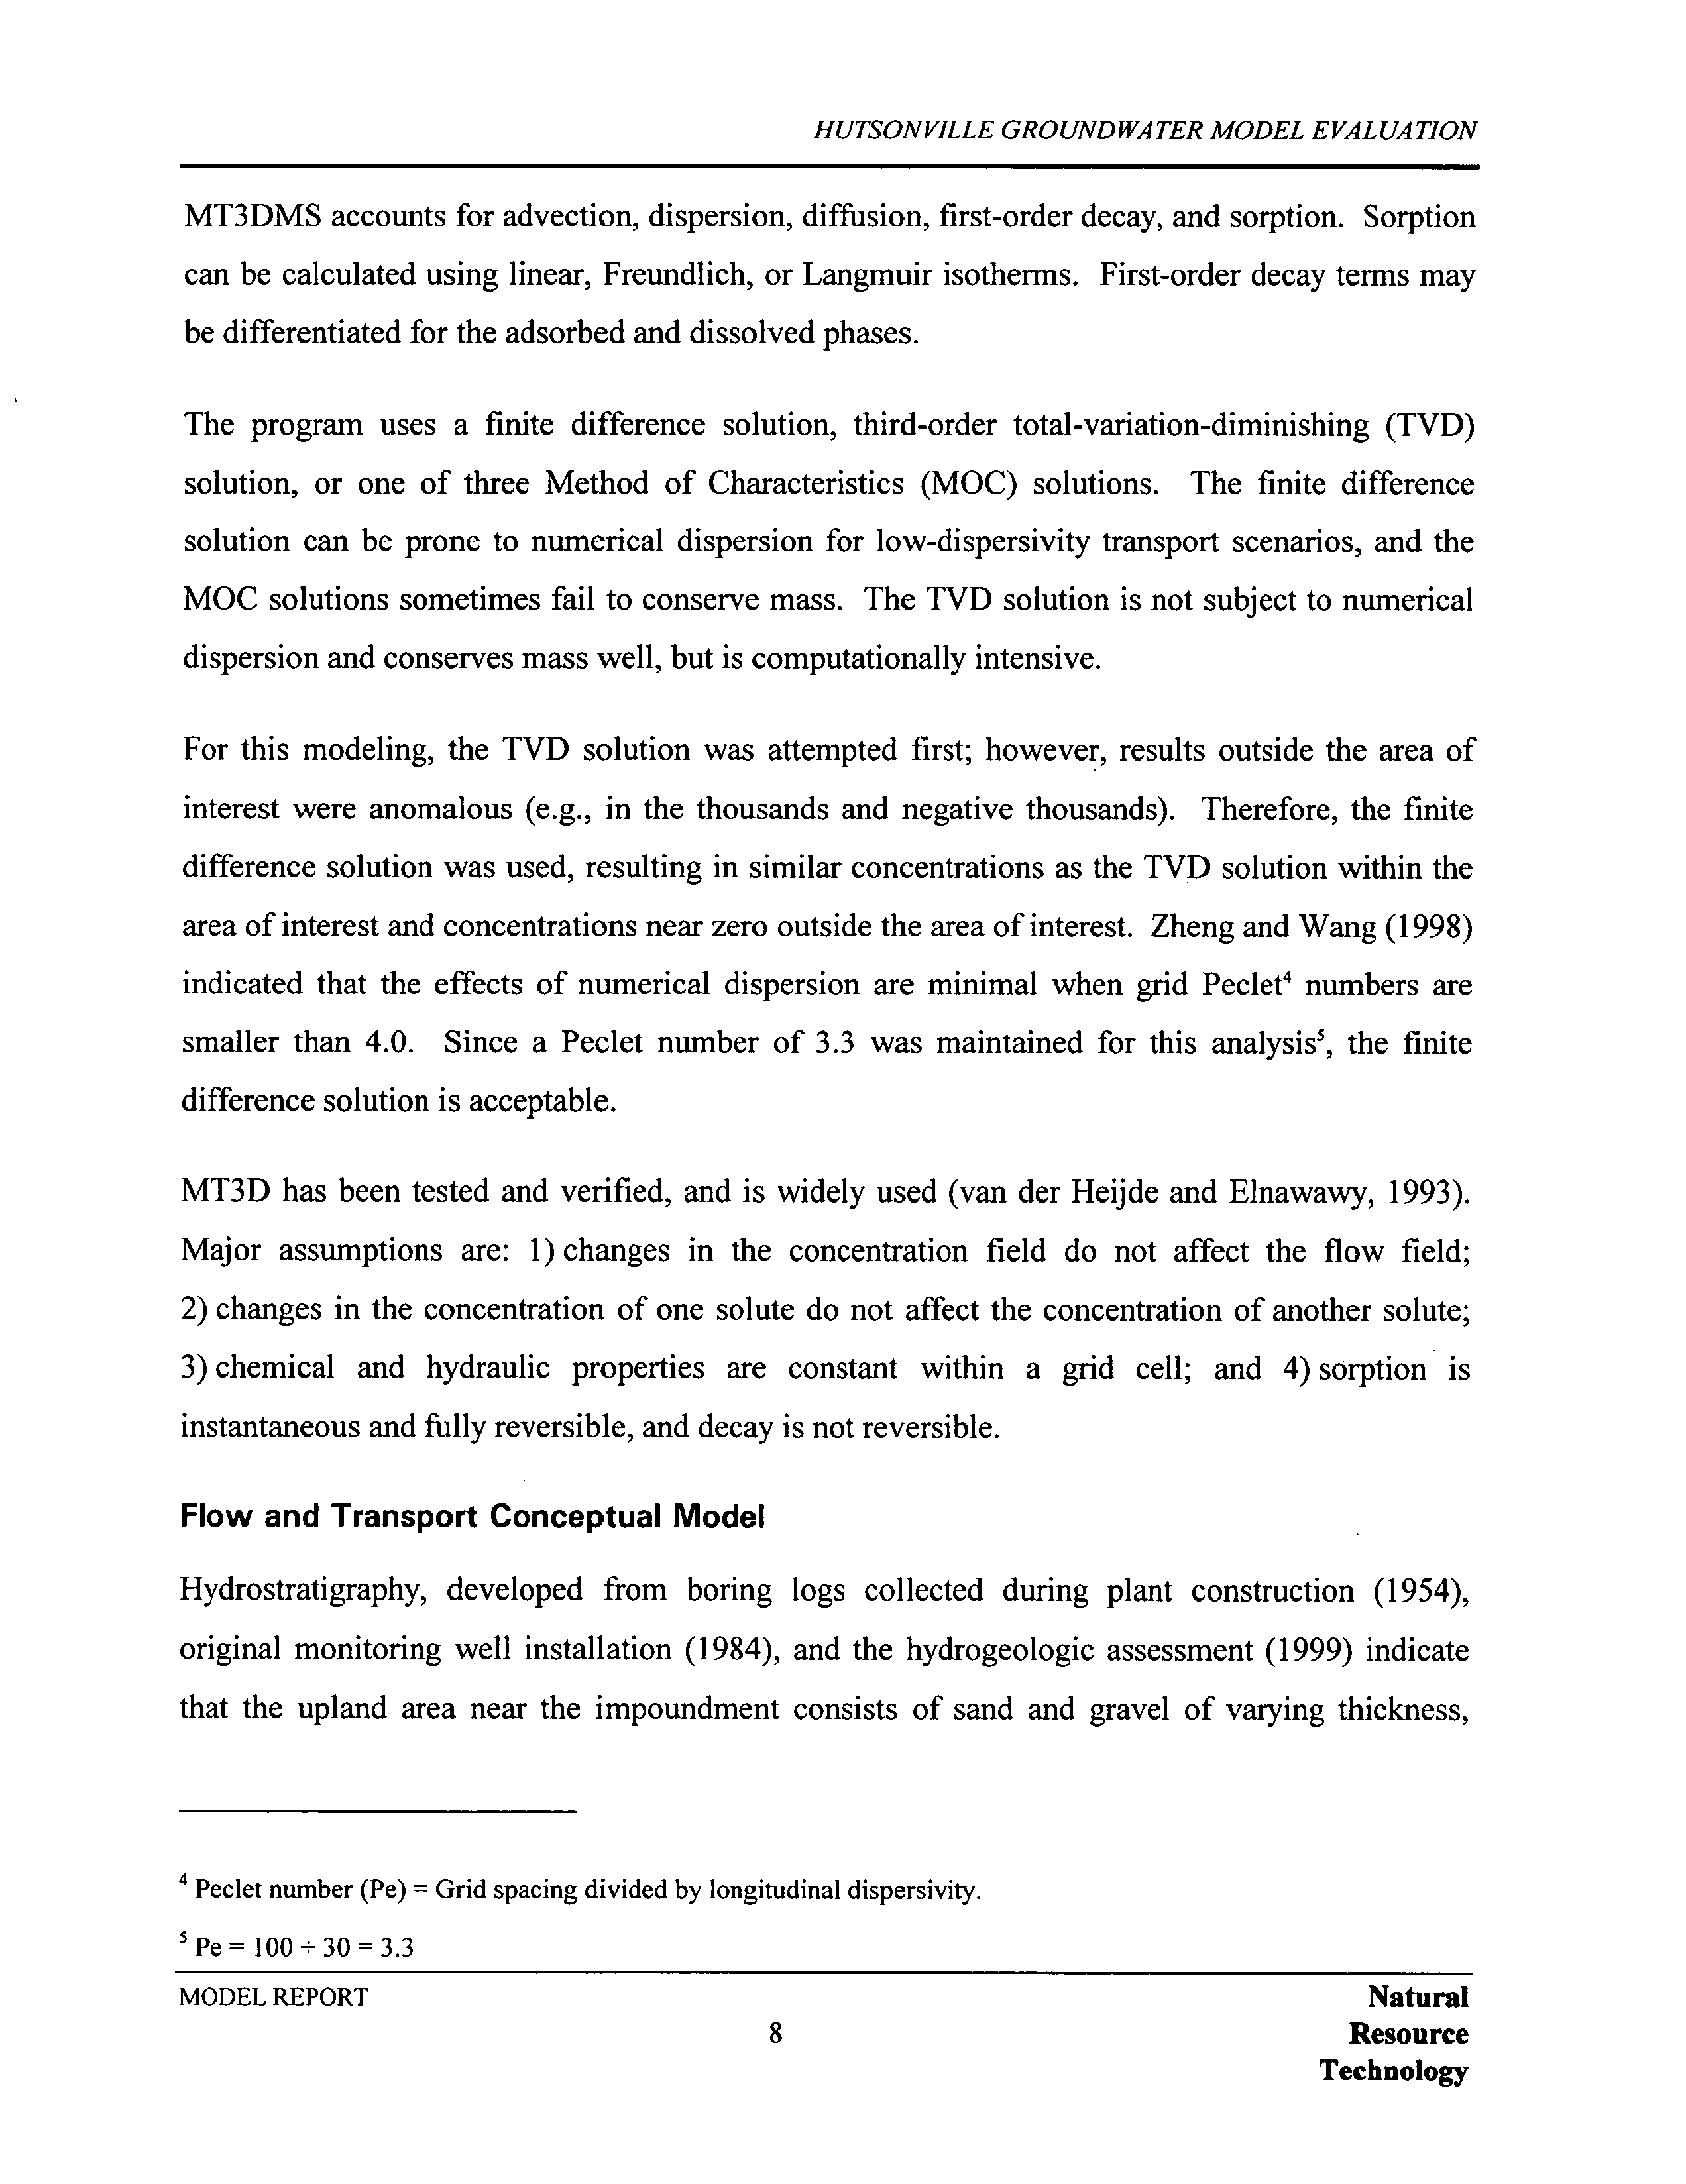
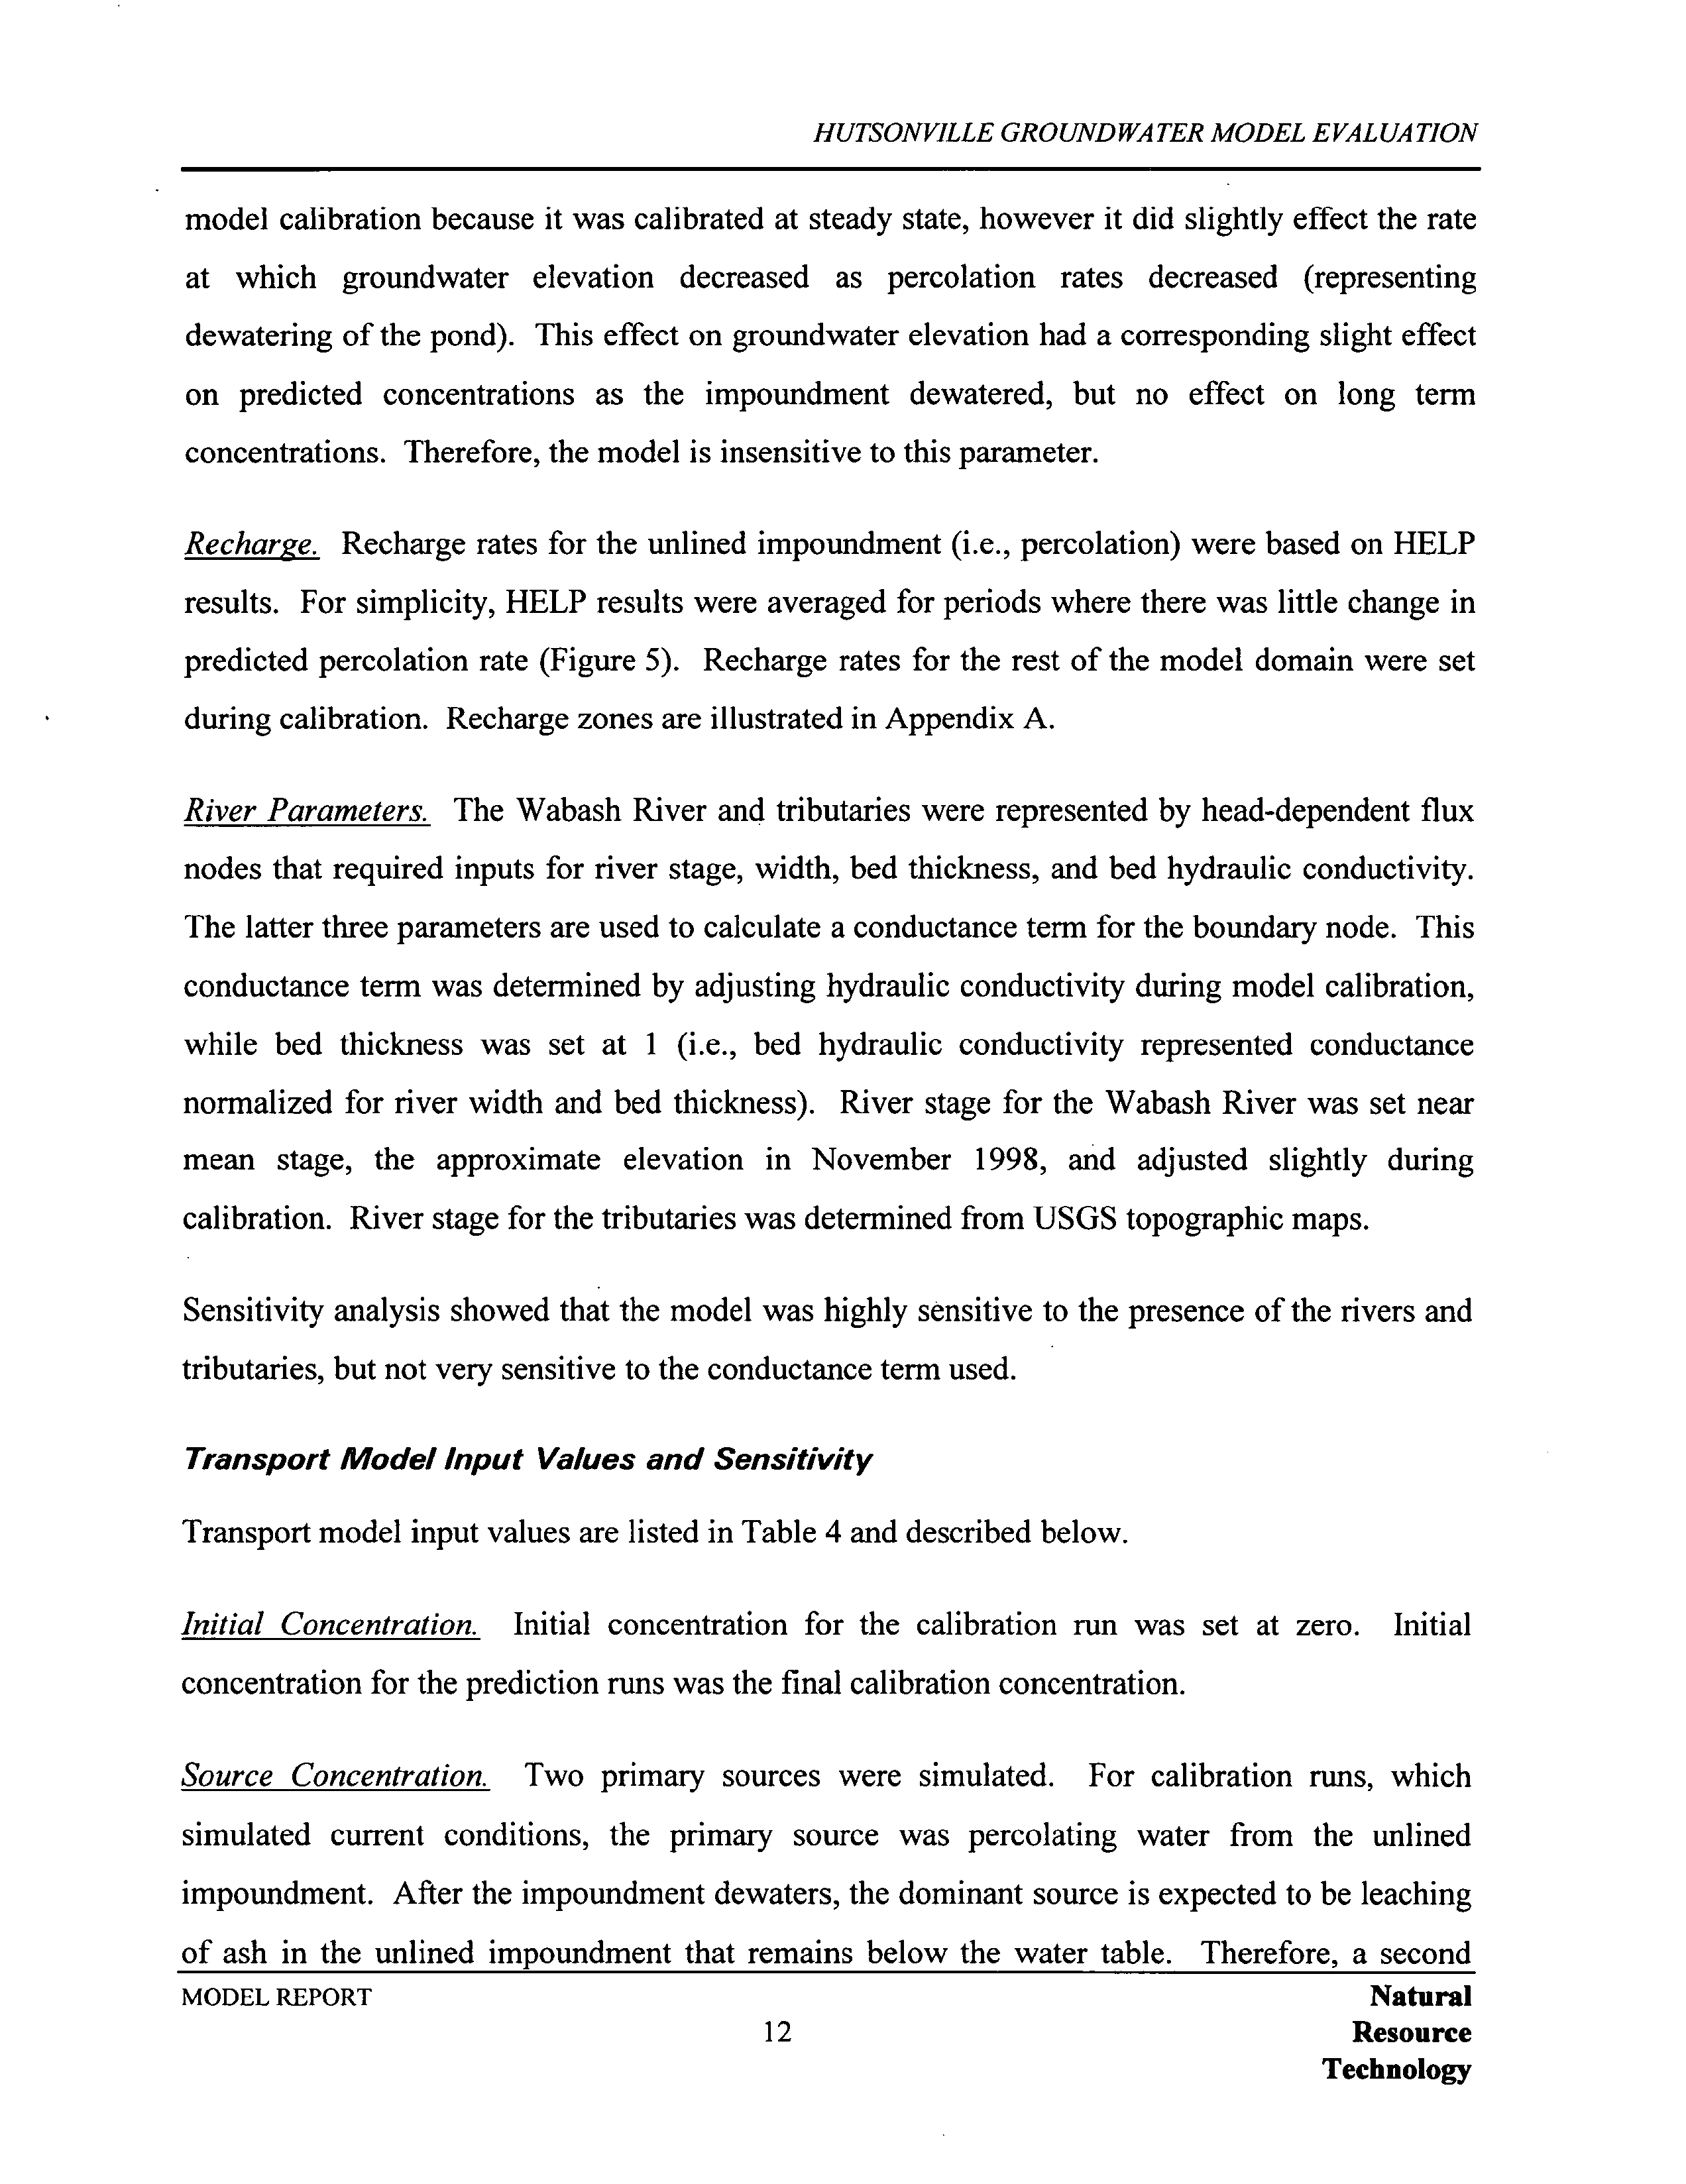
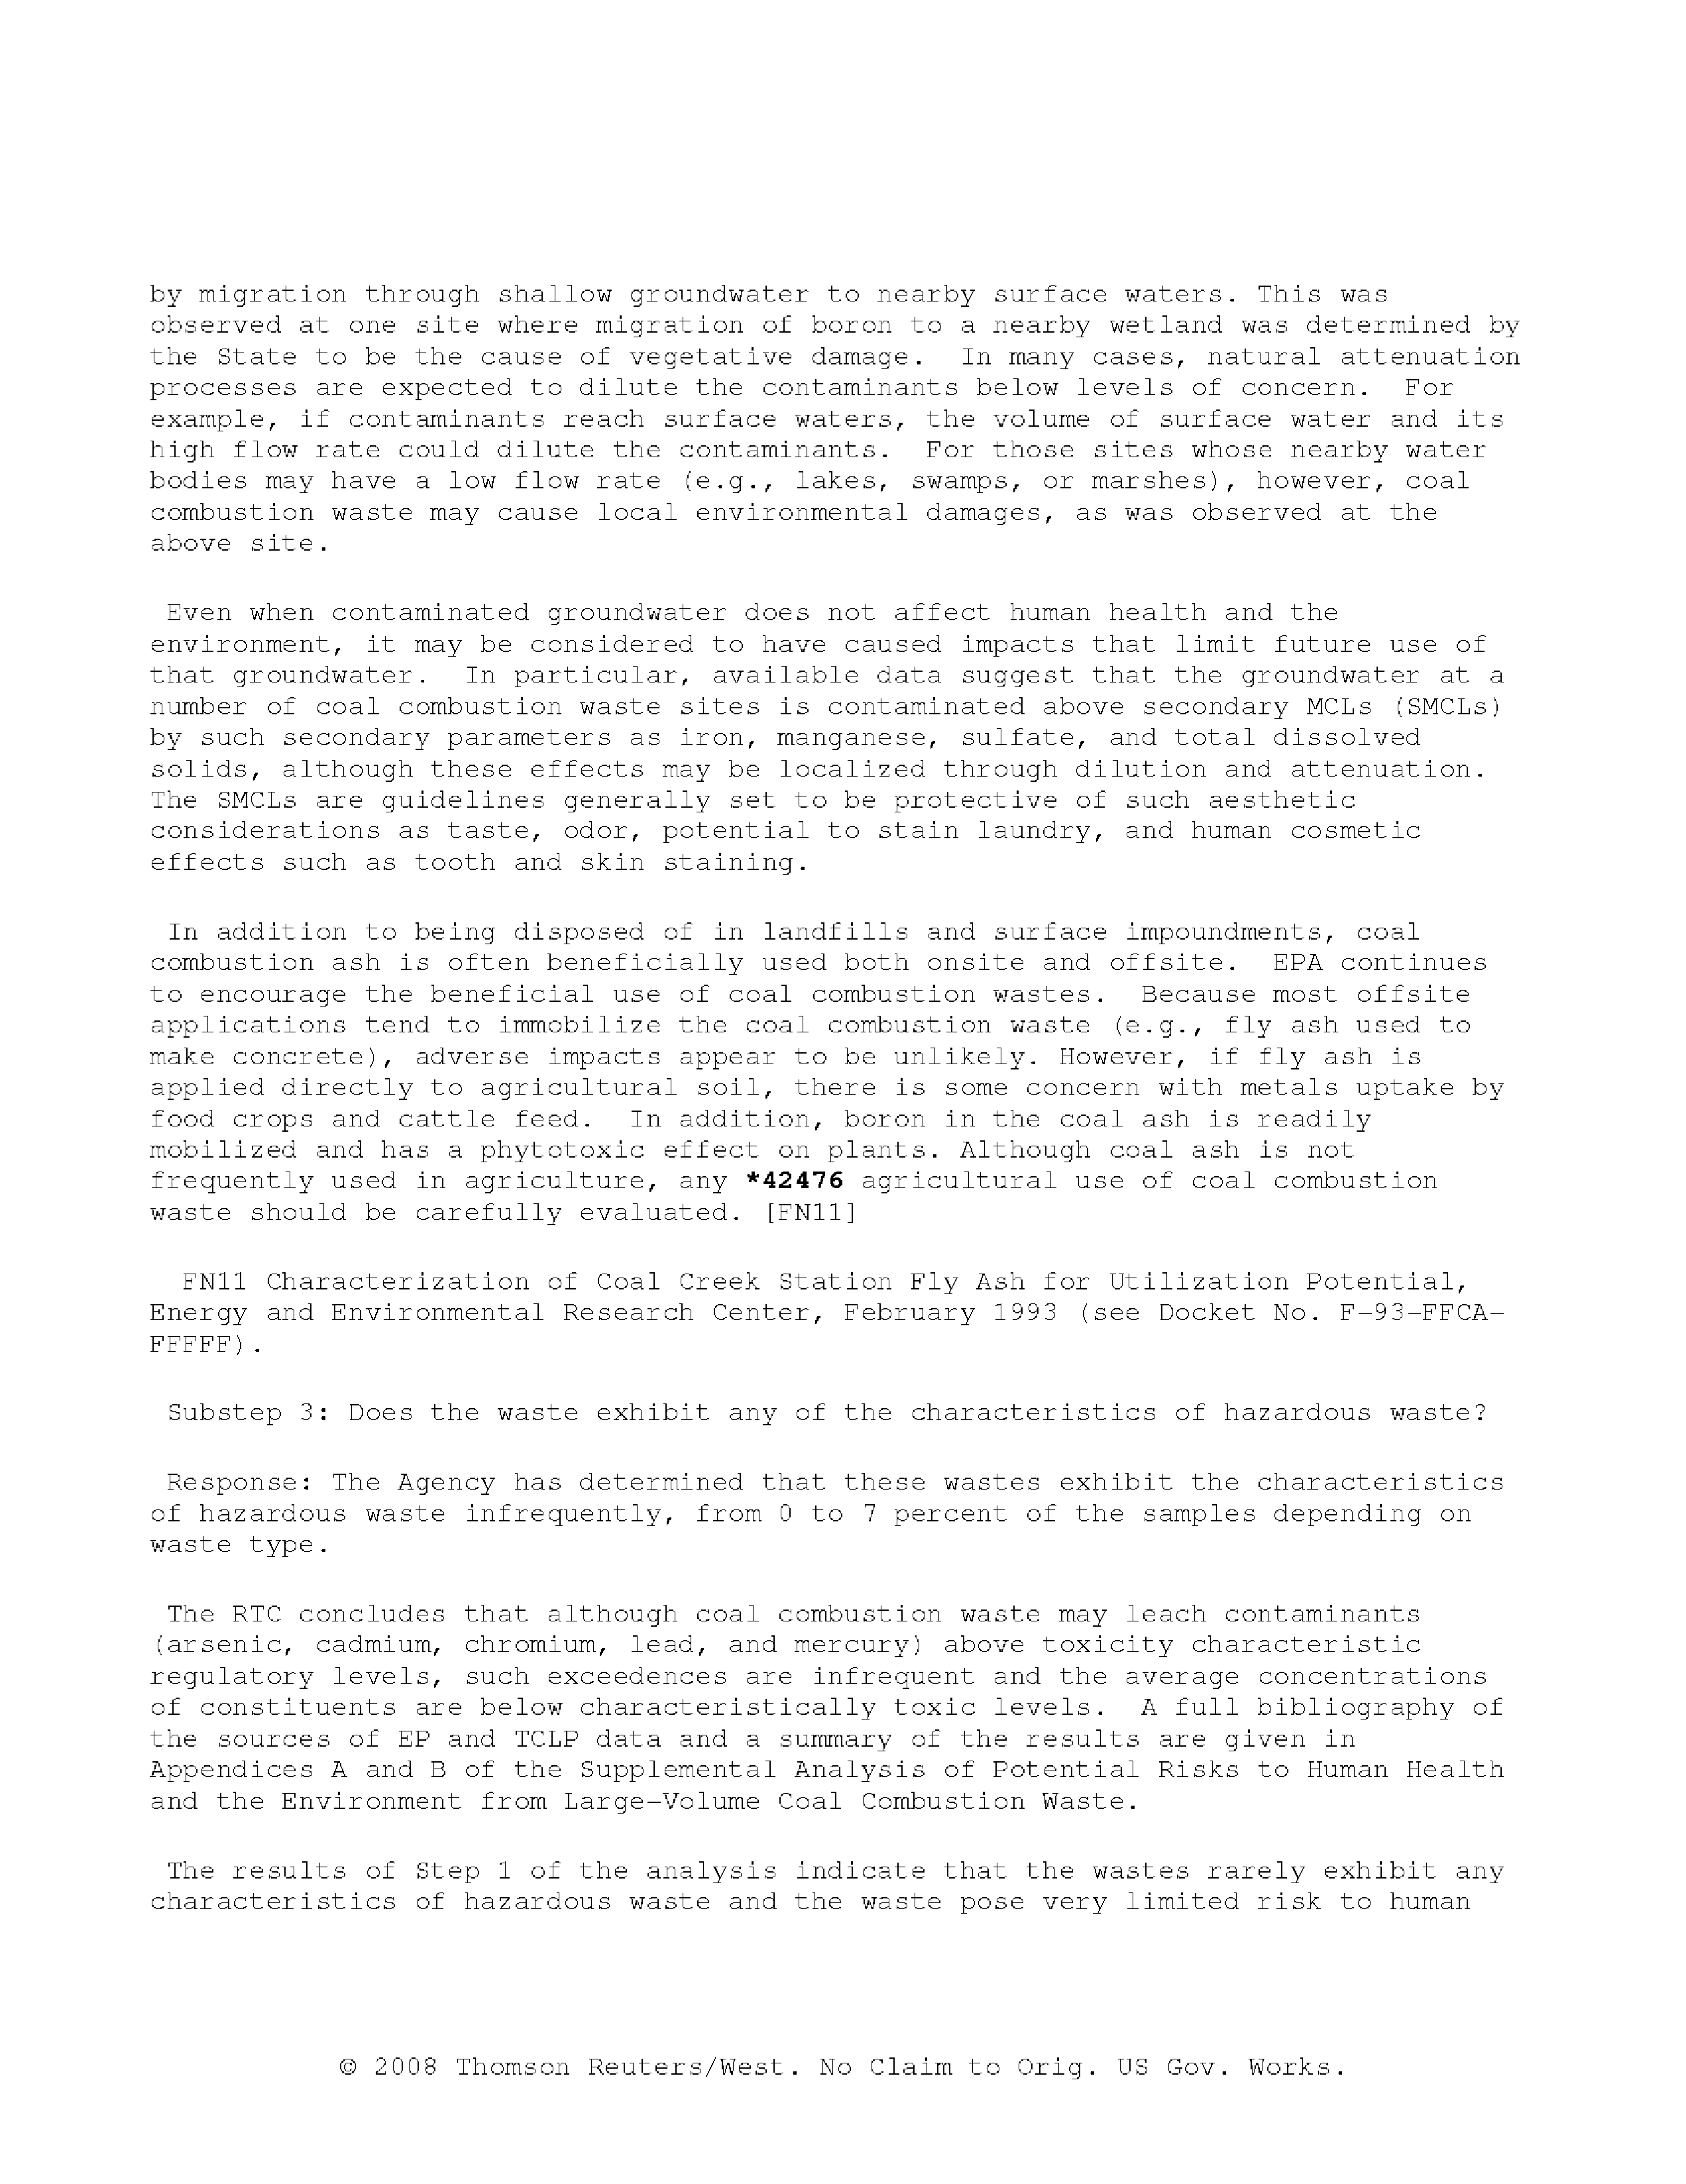
INTRODUCTION
Background
AmerenCIPS
operates
the
Hutsonville Power Station in Crawford
County
Illinois
The Power
Station is located on the west bank of the Wabash River between the Towns of Hutsonville and
York
SW
Section
17
Township
8N
Range 11W
The coal-fired
power
plant
has been in
operation
since the
1940s
There
are
currently
two units
operating
at the
plant completed
in
1953
unit
and 1954
unit
with
combined
generating capacity
of 164 MW
Fly
ash from
the
operating
units is collected
by
an
electrostatic
precipitator
and sluiced
to
lined ash
impoundment
Bottom ash is sluiced to
separate pond
and
eventually recycled
Sluice water
from both the bottom ash
pond
and lined
fly
ash
impoundment
is routed
through
an
unlined ash
impoundment
before
discharge
to the Wabash River via an NPDES
permitted
outfall The lined
ash
impoundment
was
constructed in
1986
and has
an area
of about 12
acres
Most of this
area
is
ponded
The unlined
impoundment
was
constructed
in
1968
and has
an area
of about
17 acres
Only
the southern
portion
of the unlined
impoundment
is
ponded
the northern
portion
is
dry
In addition to the
impoundments
there is
an
ash
laydown
area
between the
impoundments
that
covers an area of about
acres The ash
laydown
area is
dry
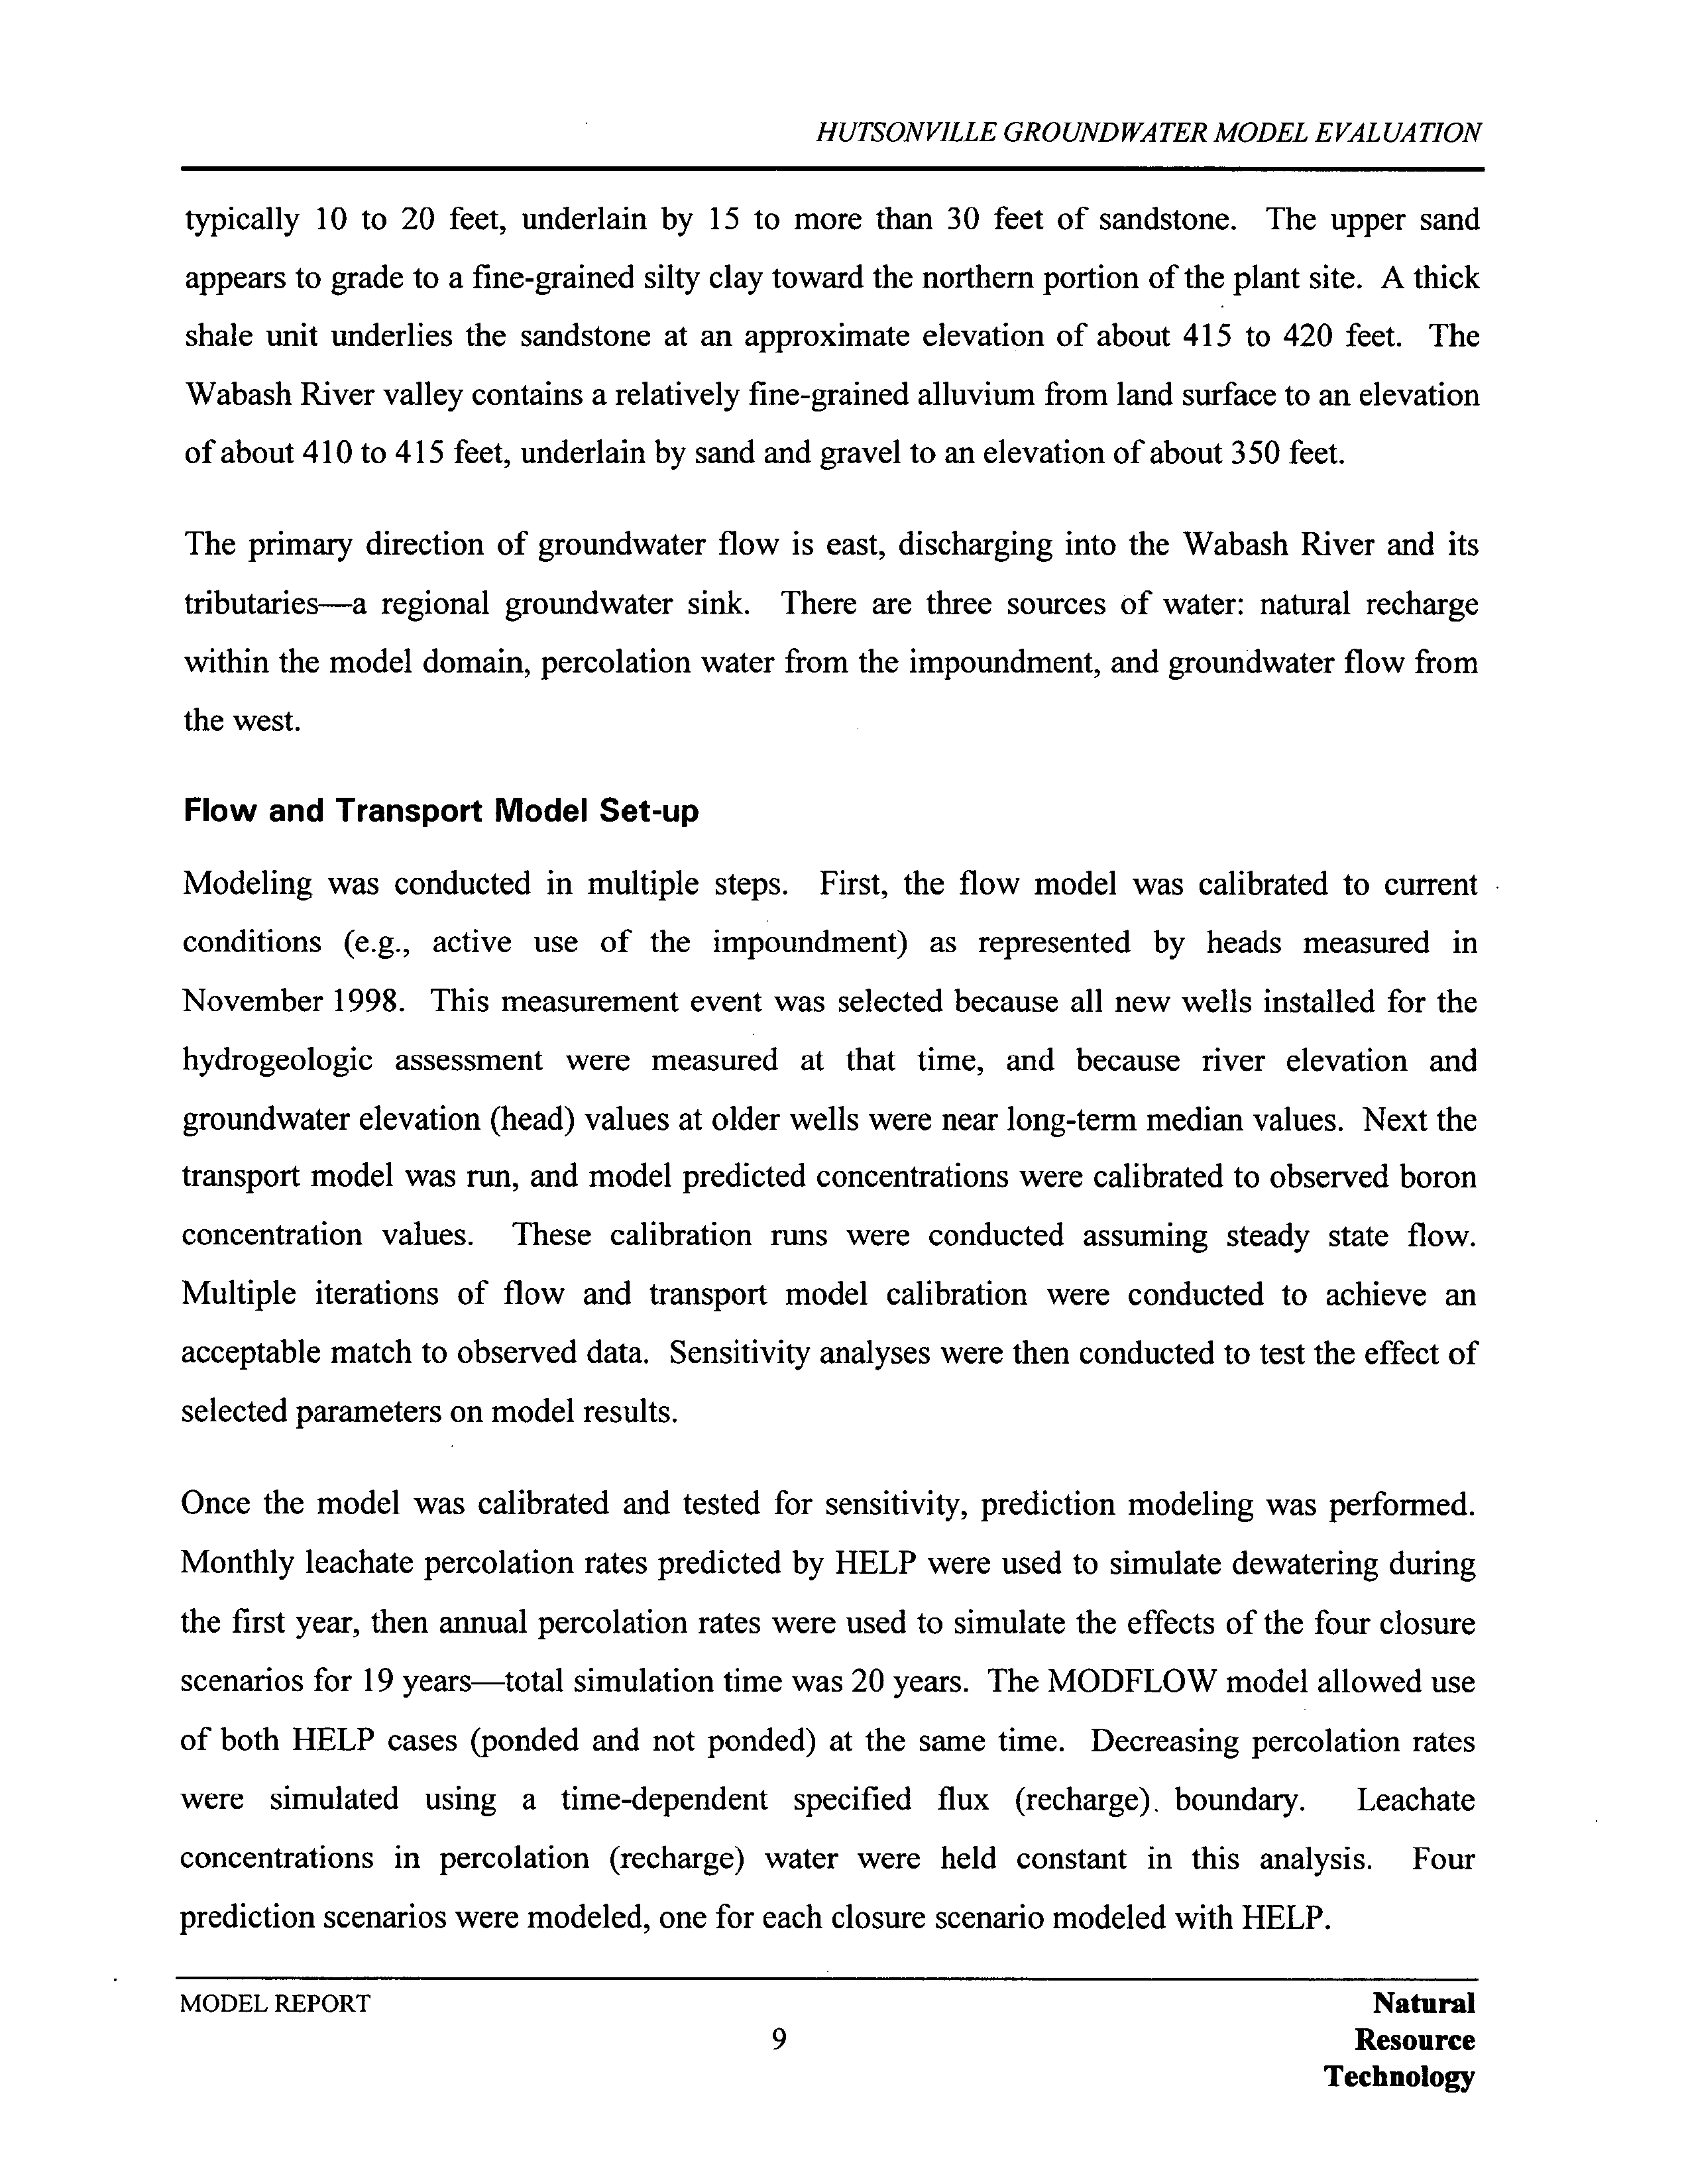
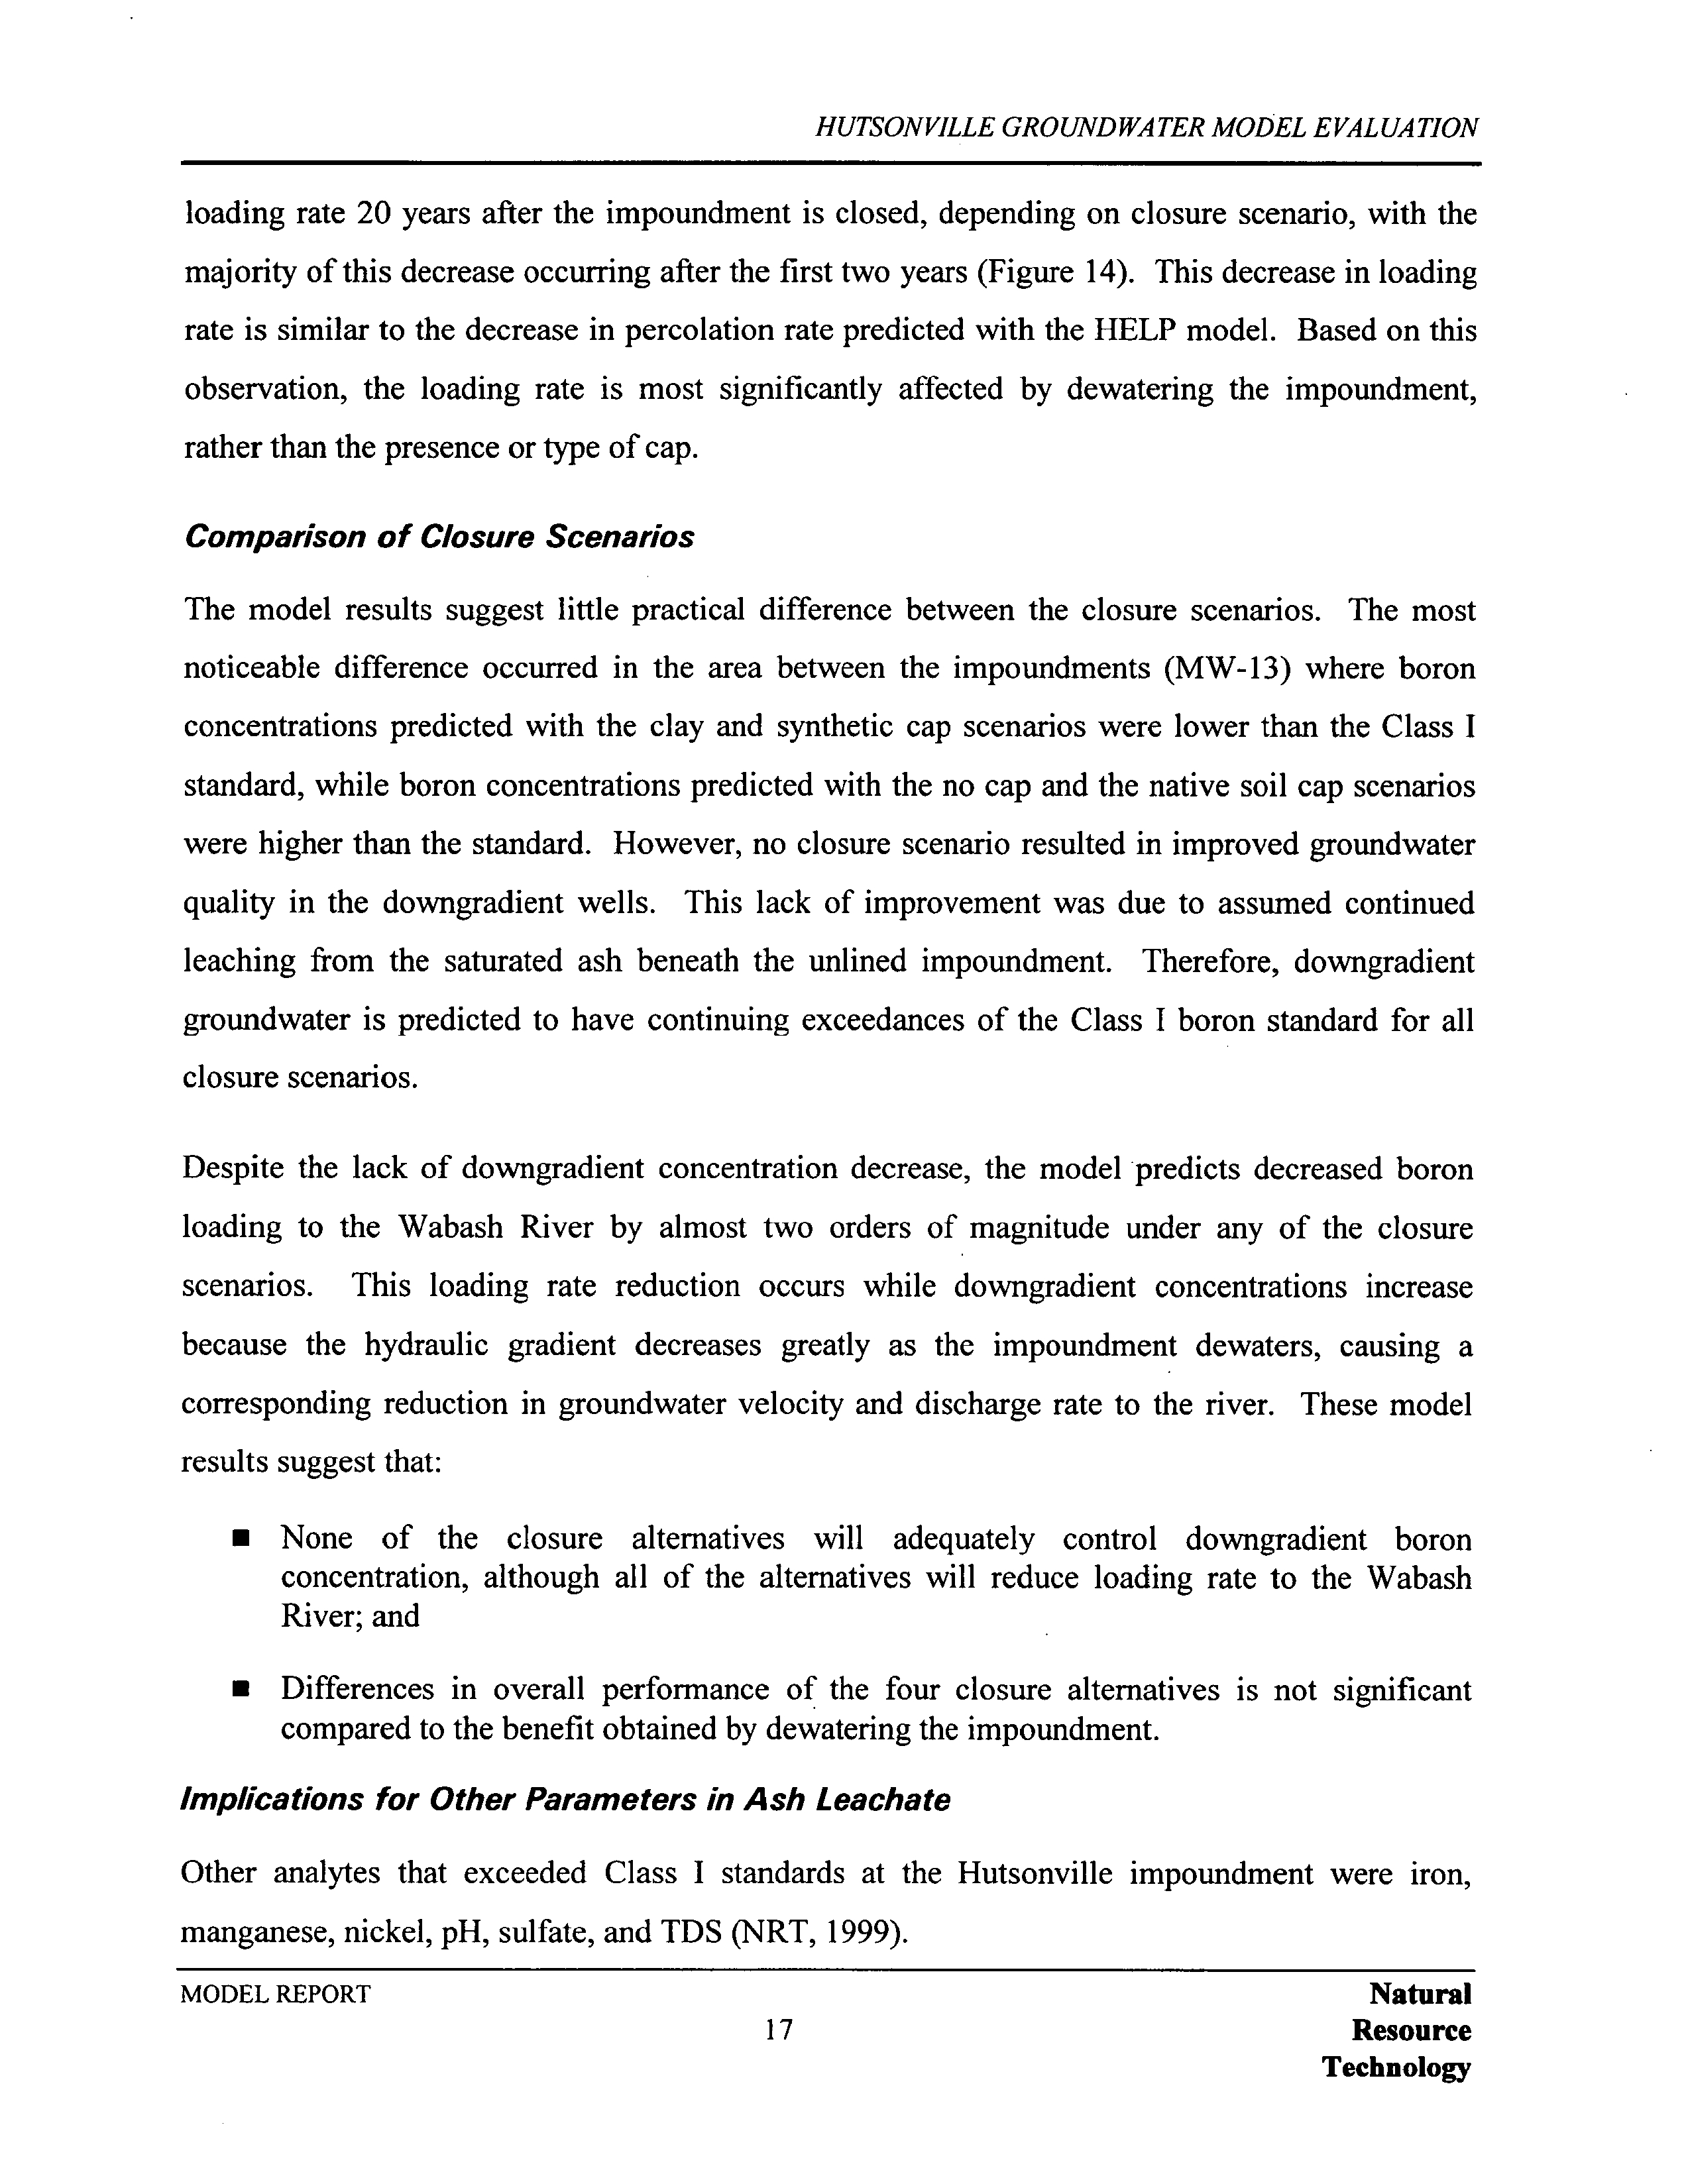
Groundwater
quality
has been monitored at this
facility
since 1984 Concentrations
of
boron
sulfate
and several other
parameters
exceed Illinois Class
groundwater
standards at some
monitoring
wells
Boron
and sulfate are indicator
parameters
for
coal
ash
leachate in
groundwater
hydrogeologic
assessment
report
for this
facility
was
prepared
in
August
1999
by
Science
Technology Management
and Natural Resource
Technology NRT 1999
That
MODEL REPORT
Natural
Resource
Technology
Electronic Filing - Received, Clerks' Office, August 11, 2008--Exhibits 1,2,5-10, & 12
HUTSONVILLE
GROUNDWATER
MODEL EVALUATION
report
describes
hydrogeologic
conditions and
sources
for elevated concentrations
of
boron
sulfate
and other constituents in
groundwater
Monitoring
wells and
boring
locations used in the
hydrogeologic
assessment
as
well
as
site
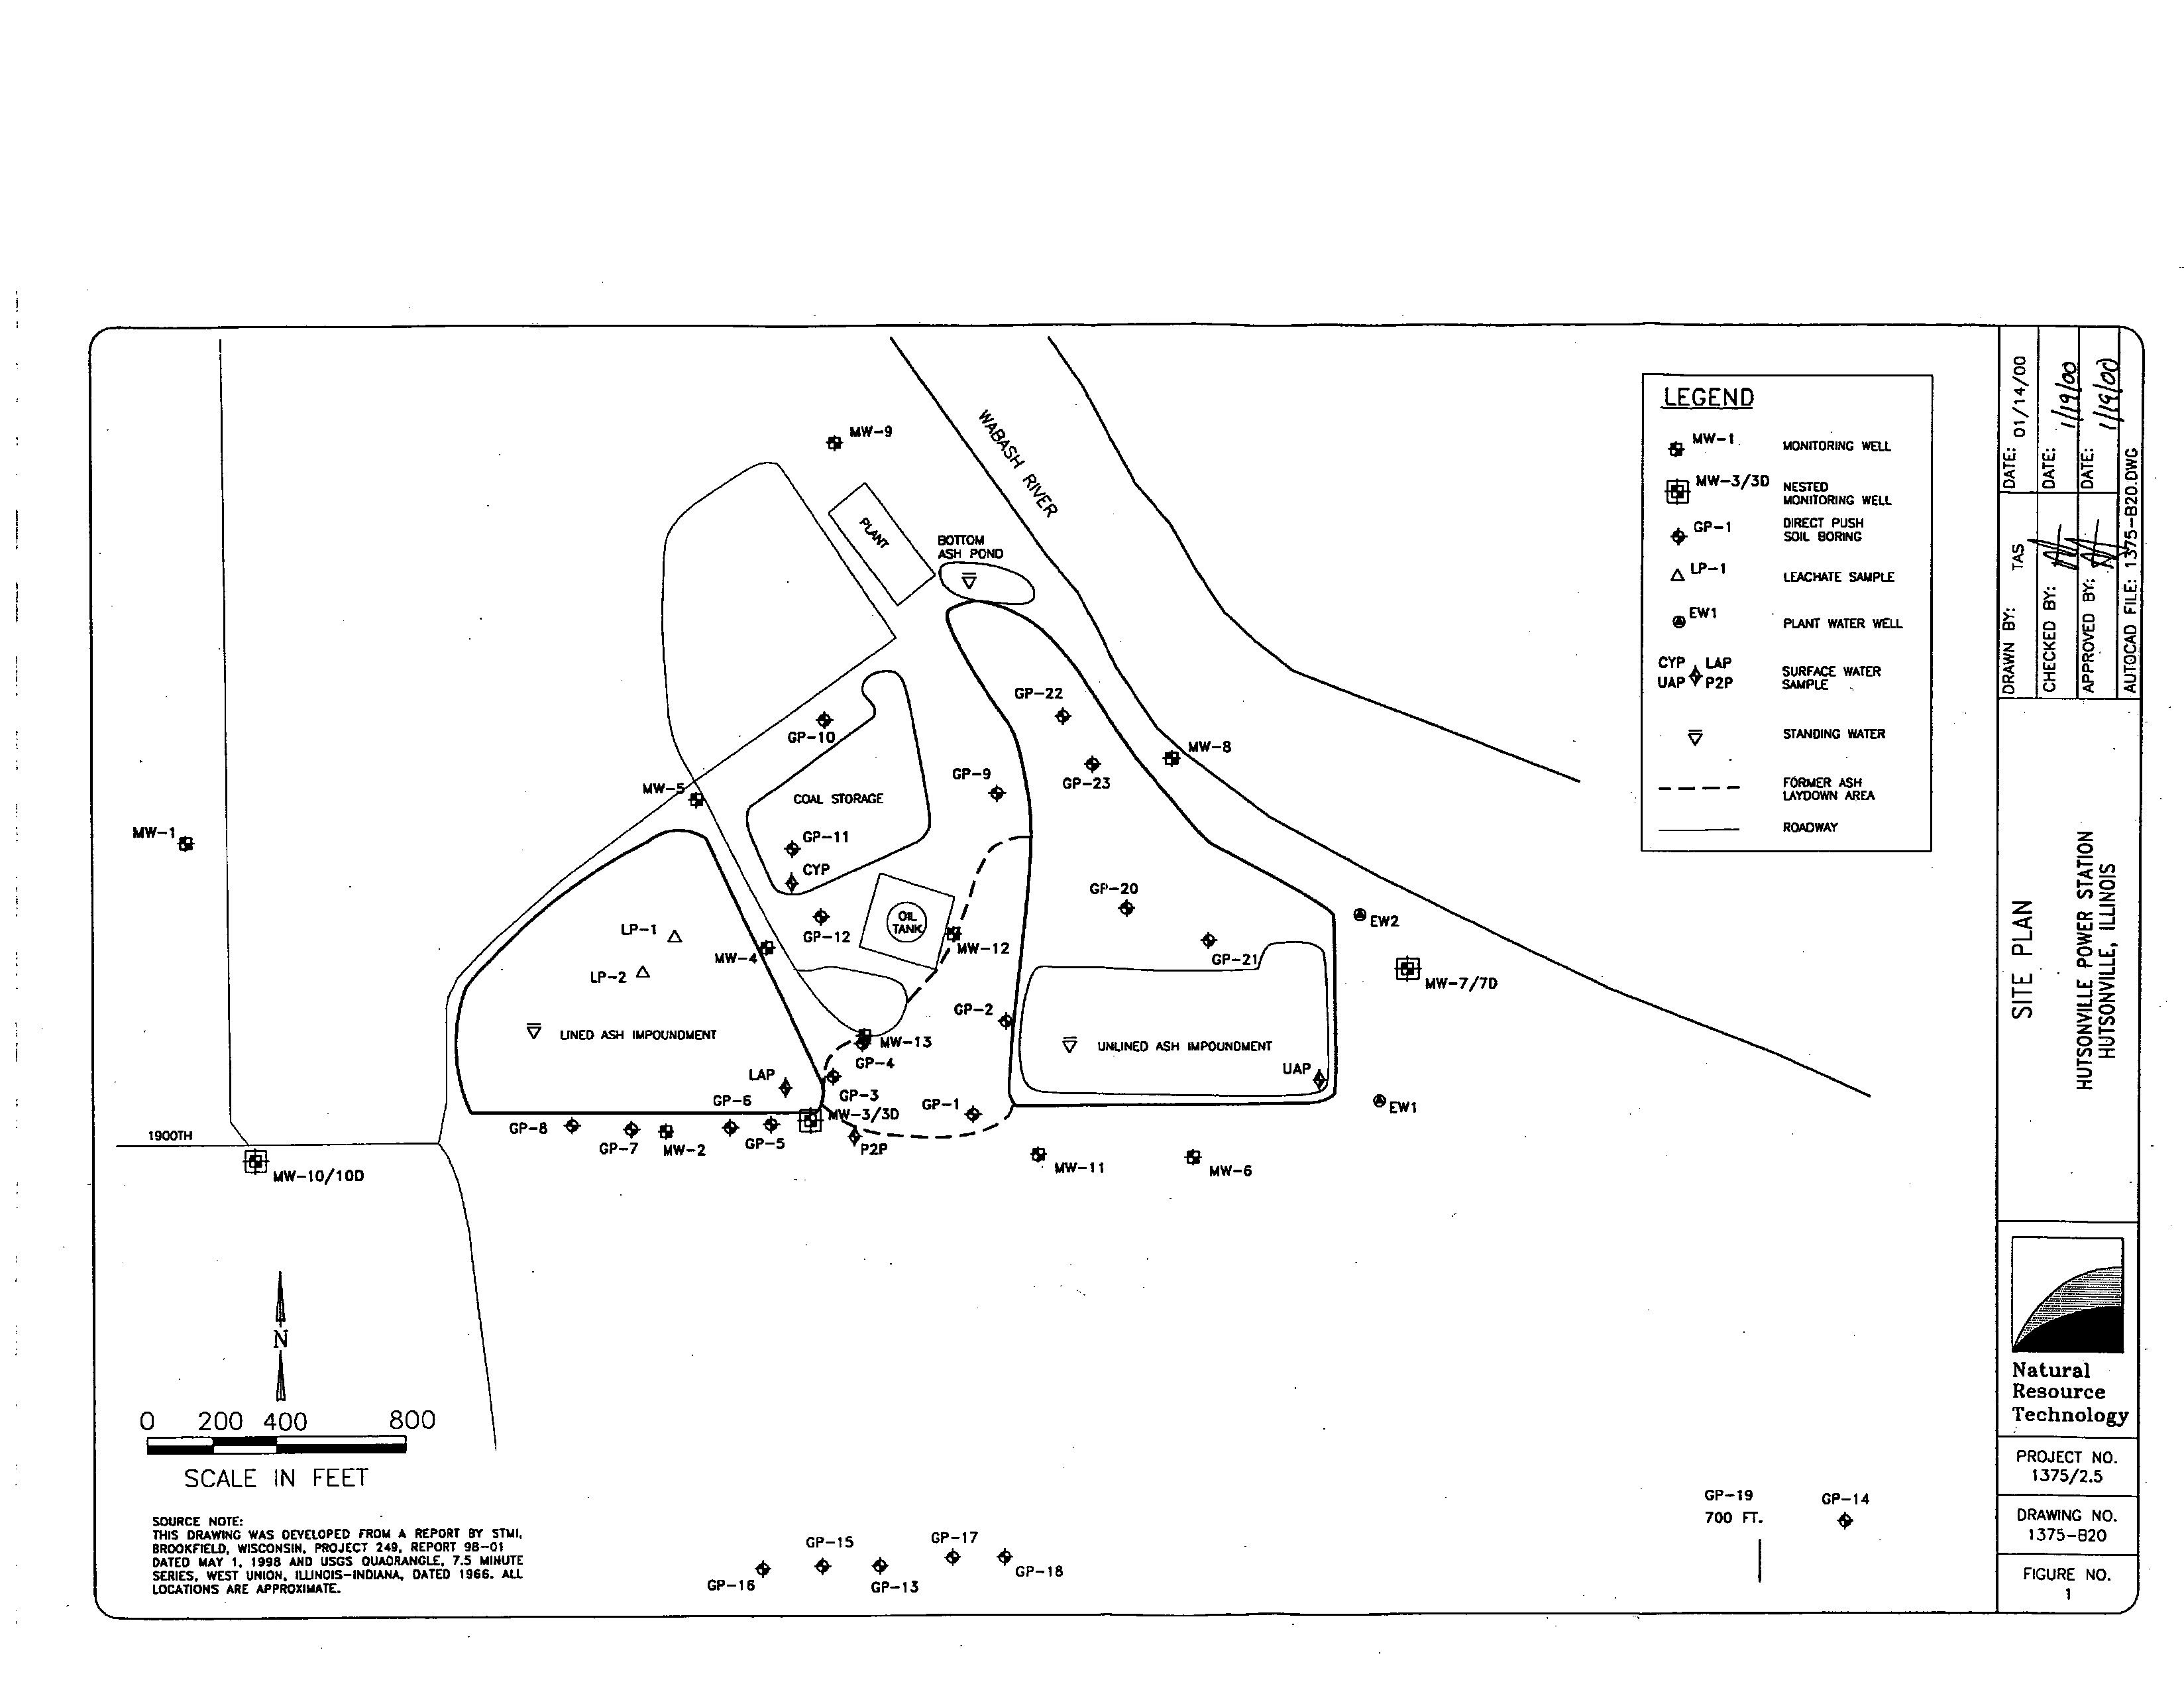
layout
are
shown in
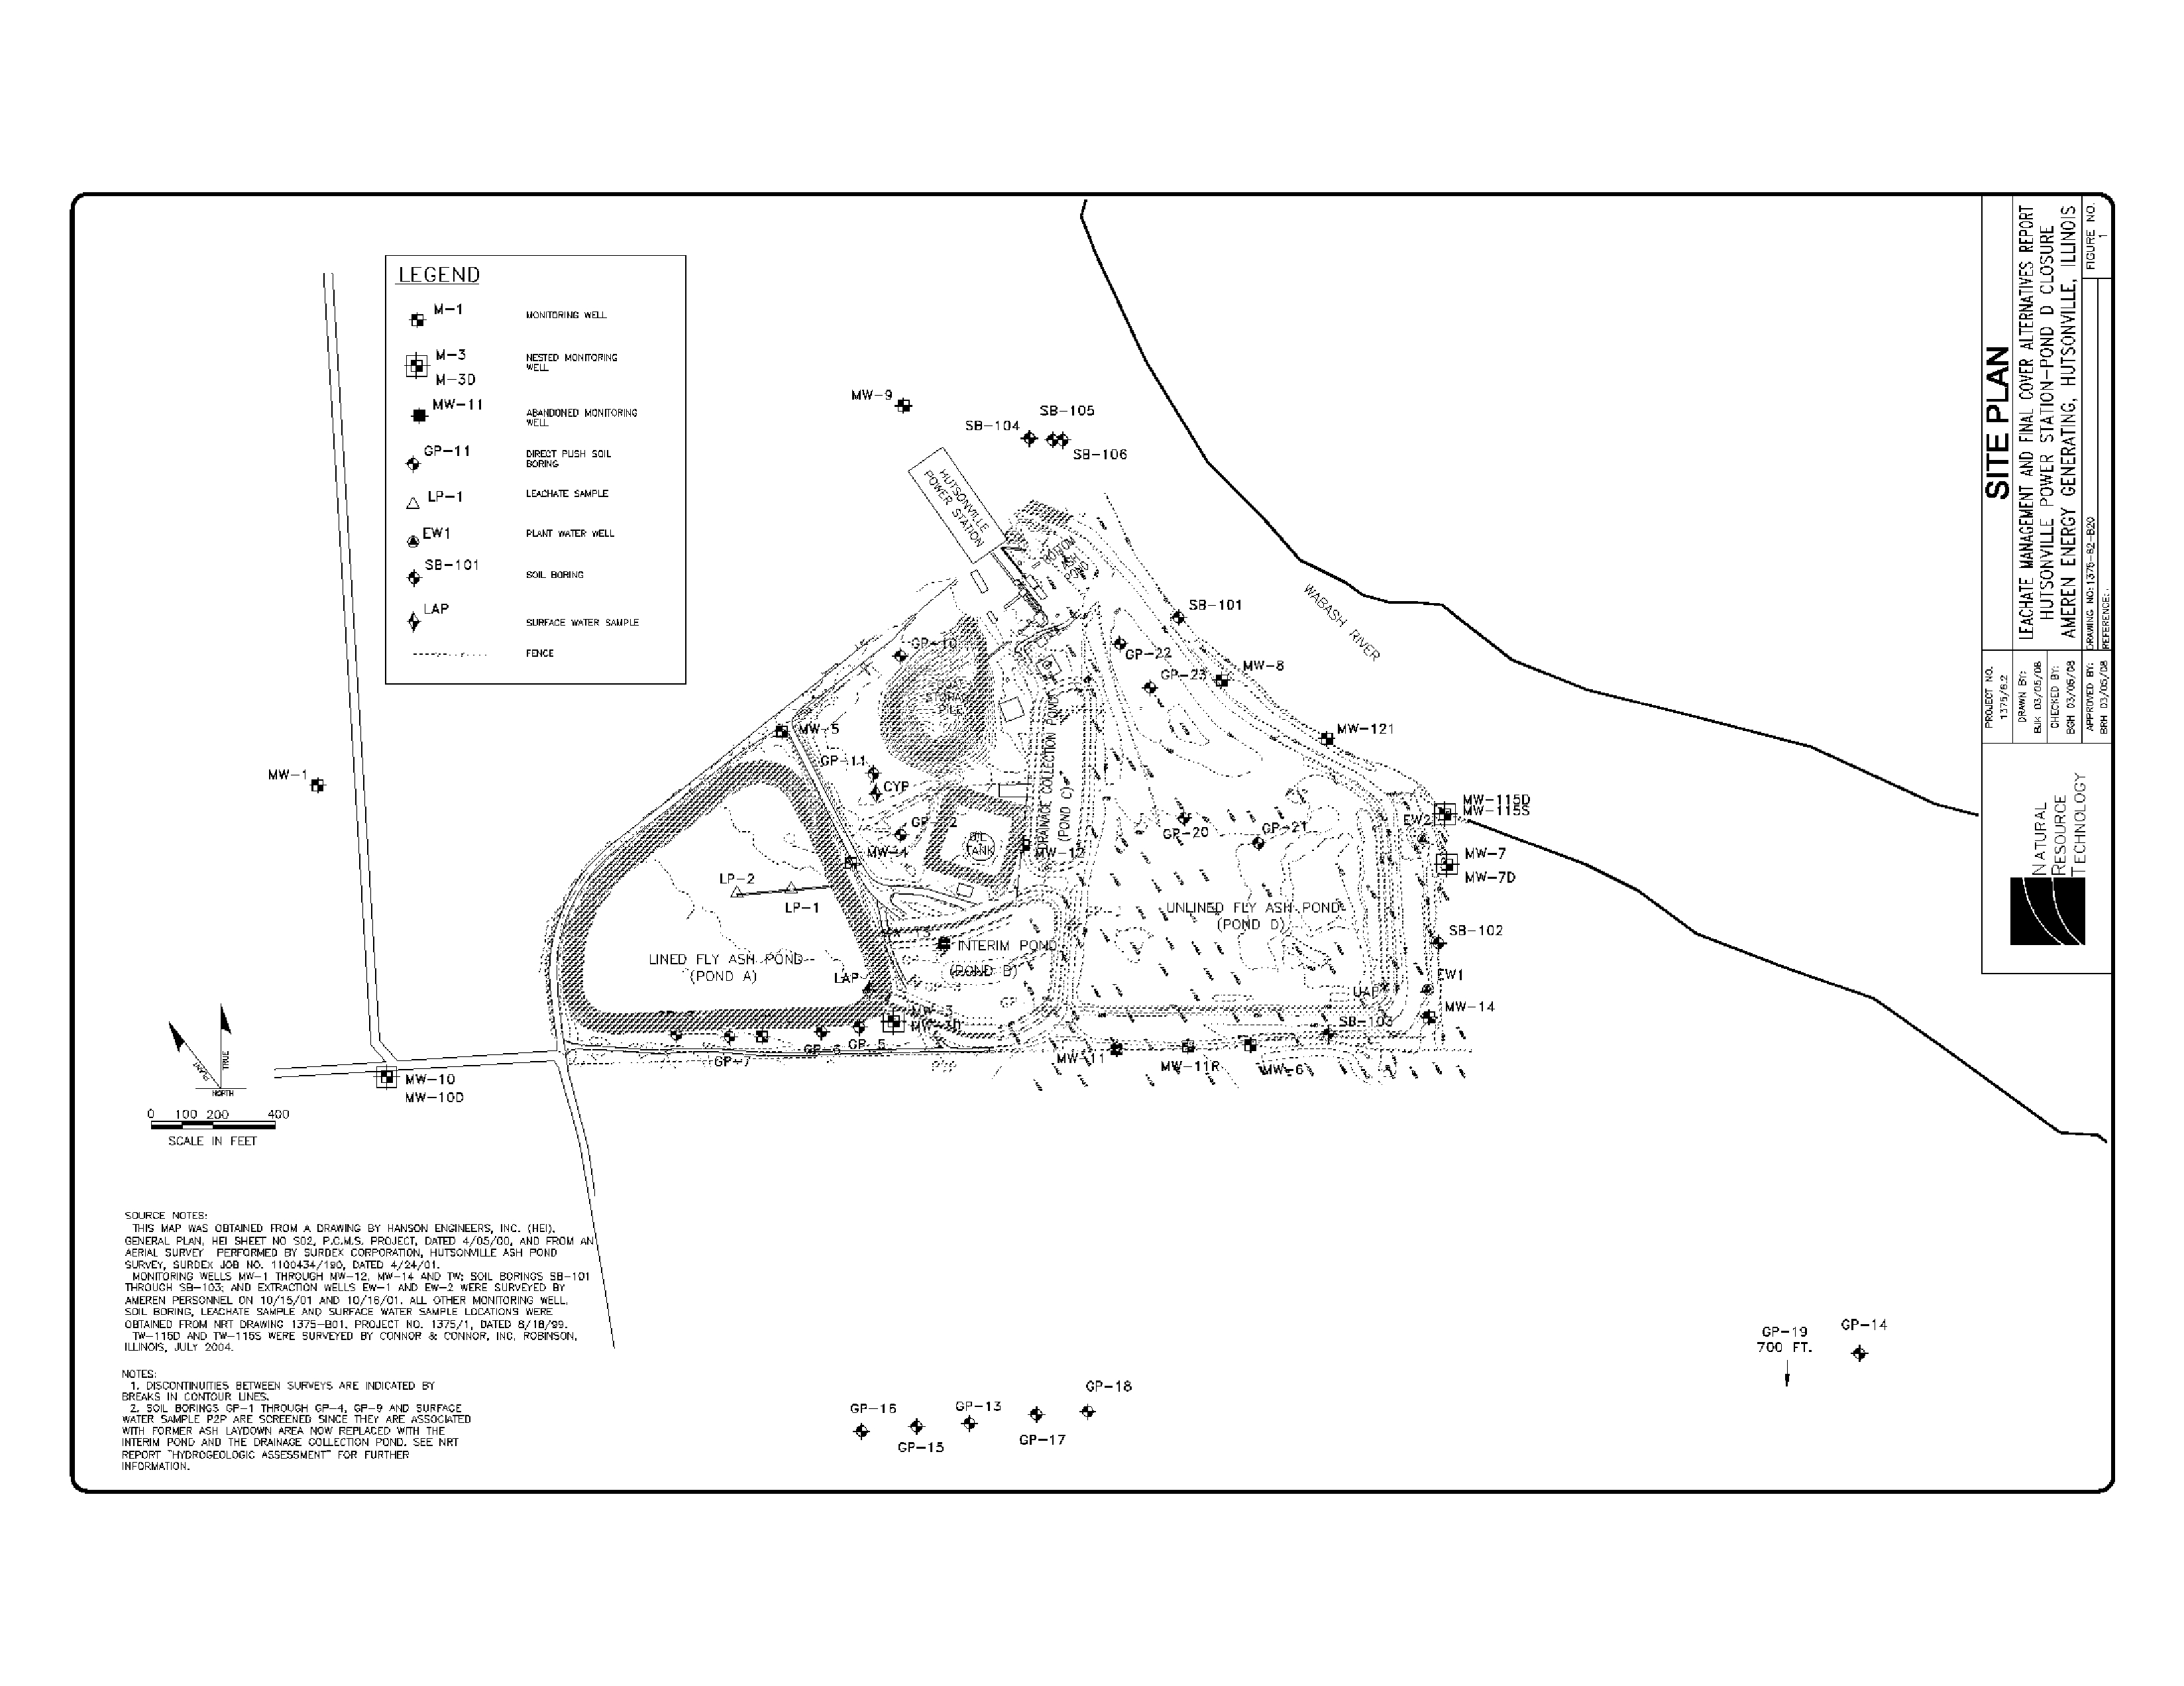
Figure
The
purpose
of this work
was
to model
groundwater
flow and
transport
at the site to
predict
the
effect of different closure scenarios for the unlined
impoundment
on
groundwater quality
Four
closure scenarios
were
modeled
Dewatering
with
no
cap
Dewatering
with
native soil
cap
Dewatering
with
compacted
clay
cap
constructed
as
specified
in
Illinois
Title
35
Part 811.3 14
Dewatering
with
synthetic
barrier
cap
Summaries from the
hydrogeologic
assessment
are
presented
below
and
modeling procedures
assumptions
and results
are
described
in the
following
sections
Summary
of
Hydrogeologic
Assessment
The
upland portion
of the site is underlain
by
thin
layer
of
sandy
sediments
which
are
underlain
by
sandstone
bedrock
The lowland
portion
of the
site
in
the Wabash River
valley
is
underlain
by
alluvium that coarsens
downward
Regional
groundwater
flow
through
these
materials is
predominantly
northeast toward the Wabash
River
although
localized
irregularities
occur
due
to
the unlined
impoundment
and
past pipe
leaks
between the
impoundments
Groundwater
samples
from
some
sample
locations had
concentrations
of
boron
manganese
sulfate TDS iron
and nickel
higher
than Class
groundwater
standards
High
iron and nickel
concentrations
were
found in locations where coal
was
present
however
there
was no
evidence
that
iron and nickel from the coal
pile
and coal
spill
areas is
migrating beyond
those areas
Manganese
is
ubiquitous
in
local
groundwater exceeding
the Class
standard in
background
and
downgradient groundwater
Boron
and sulfate2
are
migrating
east toward the Wabash River The
Passive
dewatering
via
gravity drainage
is assumed for all scenarios
Because TDS
is
an
indicator
parameter
rather
than
specific
constituent in
groundwater
it does not
migrate
but it
MODEL REPORT
Natural
Resource
Technology
Electronic Filing - Received, Clerks' Office, August 11, 2008--Exhibits 1,2,5-10, & 12
HUTSONVILLE
GROUND WA TER MODEL EVALUATION
primary
sources
of boron
were
identified
as
the unlined
impoundment
and the ash
laydown
area
between the
impoundments
while the unlined
impoundment
ash
laydown area
and coal
pile
were
all identified
as sources
of sulfate
MODEL INVESTIGATION GENERAL APPROACH
Boron
transport
was
modeled because it has
high
concentration
in all
source areas
and is mobile
in
groundwater
The model
was
first calibrated
to
produce
head and
concentration
distribution
representative
of conditions while the unlined
impoundment
was
in service
The
calibrated
model was then used as
starting point
to
predict changes
in boron concentrations
caused
by
removing
the
impoundment
from service
Three model codes
were
used to simulate
groundwater
flow and contaminant
transport
post-
closure
leachate
percolation
was
modeled
using
the
Hydrologic
Evaluation
of Landfill
Performance
HELP model
groundwater
flow was modeled in three dimensions
using
MODFLOW
and
contaminant
transport
was
modeled in three dimensions
using
MT3DMS
The HELP model
provided
leachate
percolation
rates for
input
to
MODFLOW
and MODFLOW
calculated the flow field that MT3DMS used in the contaminant
transport
calculations
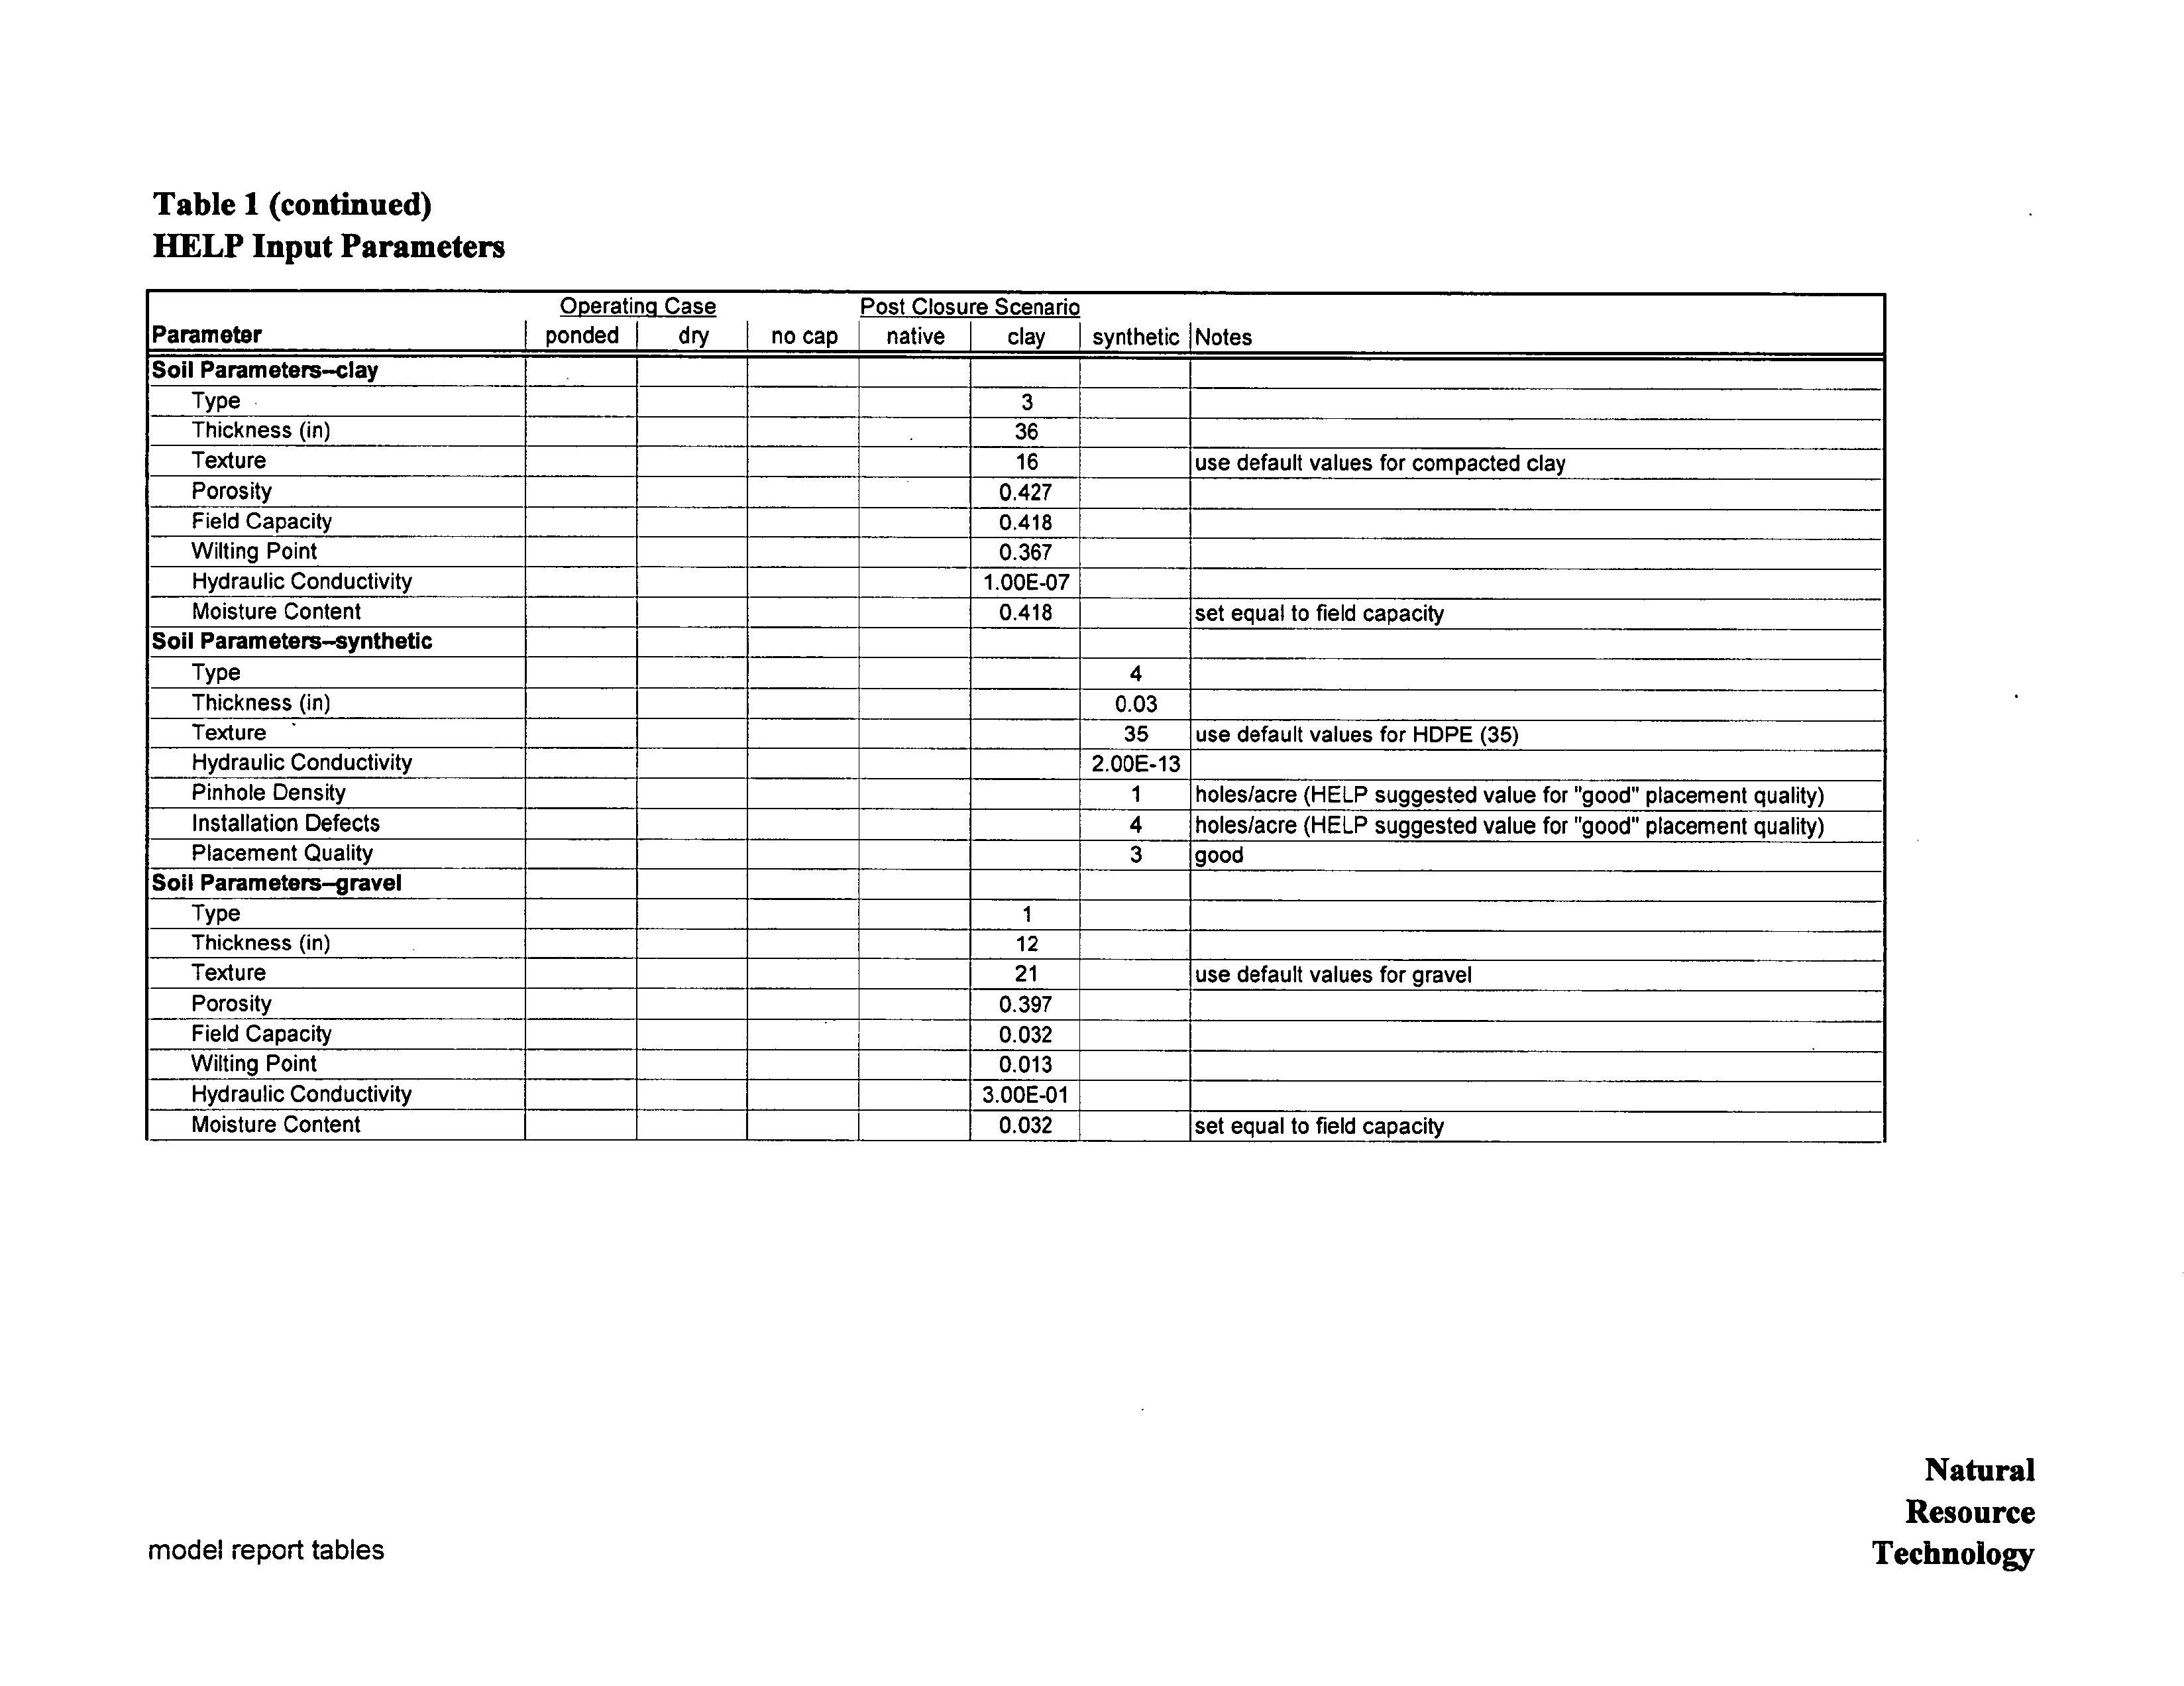
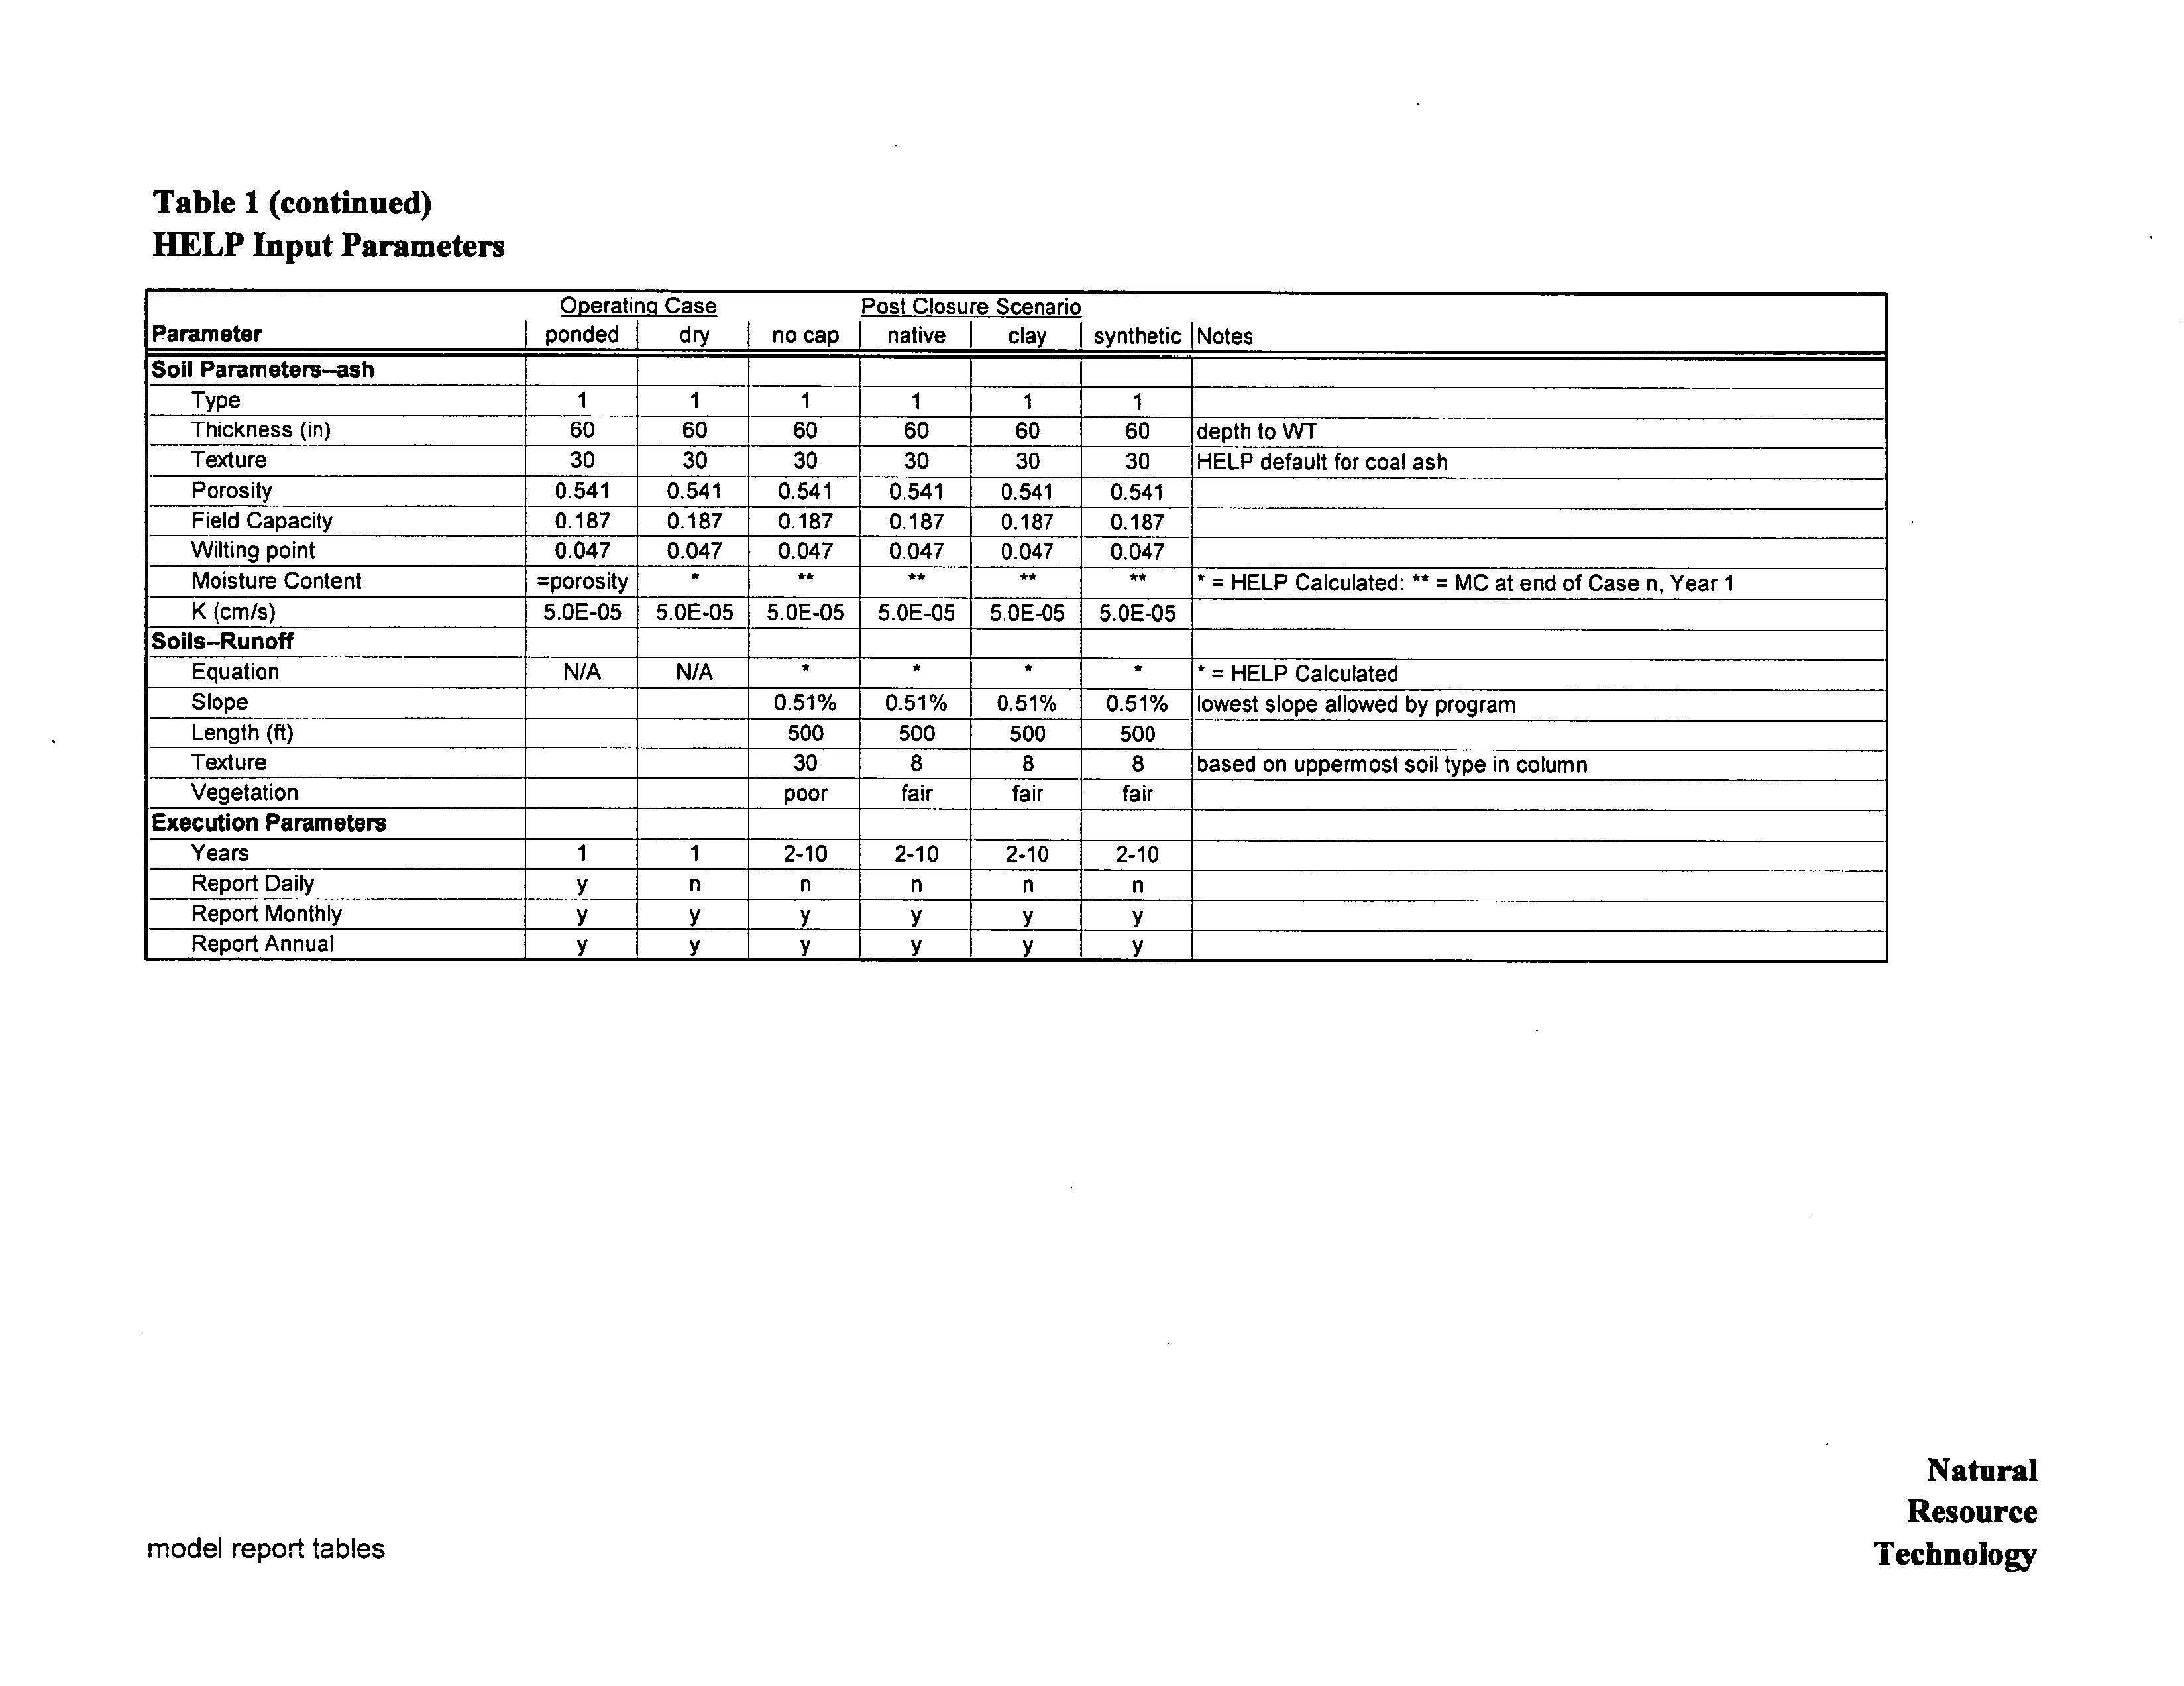
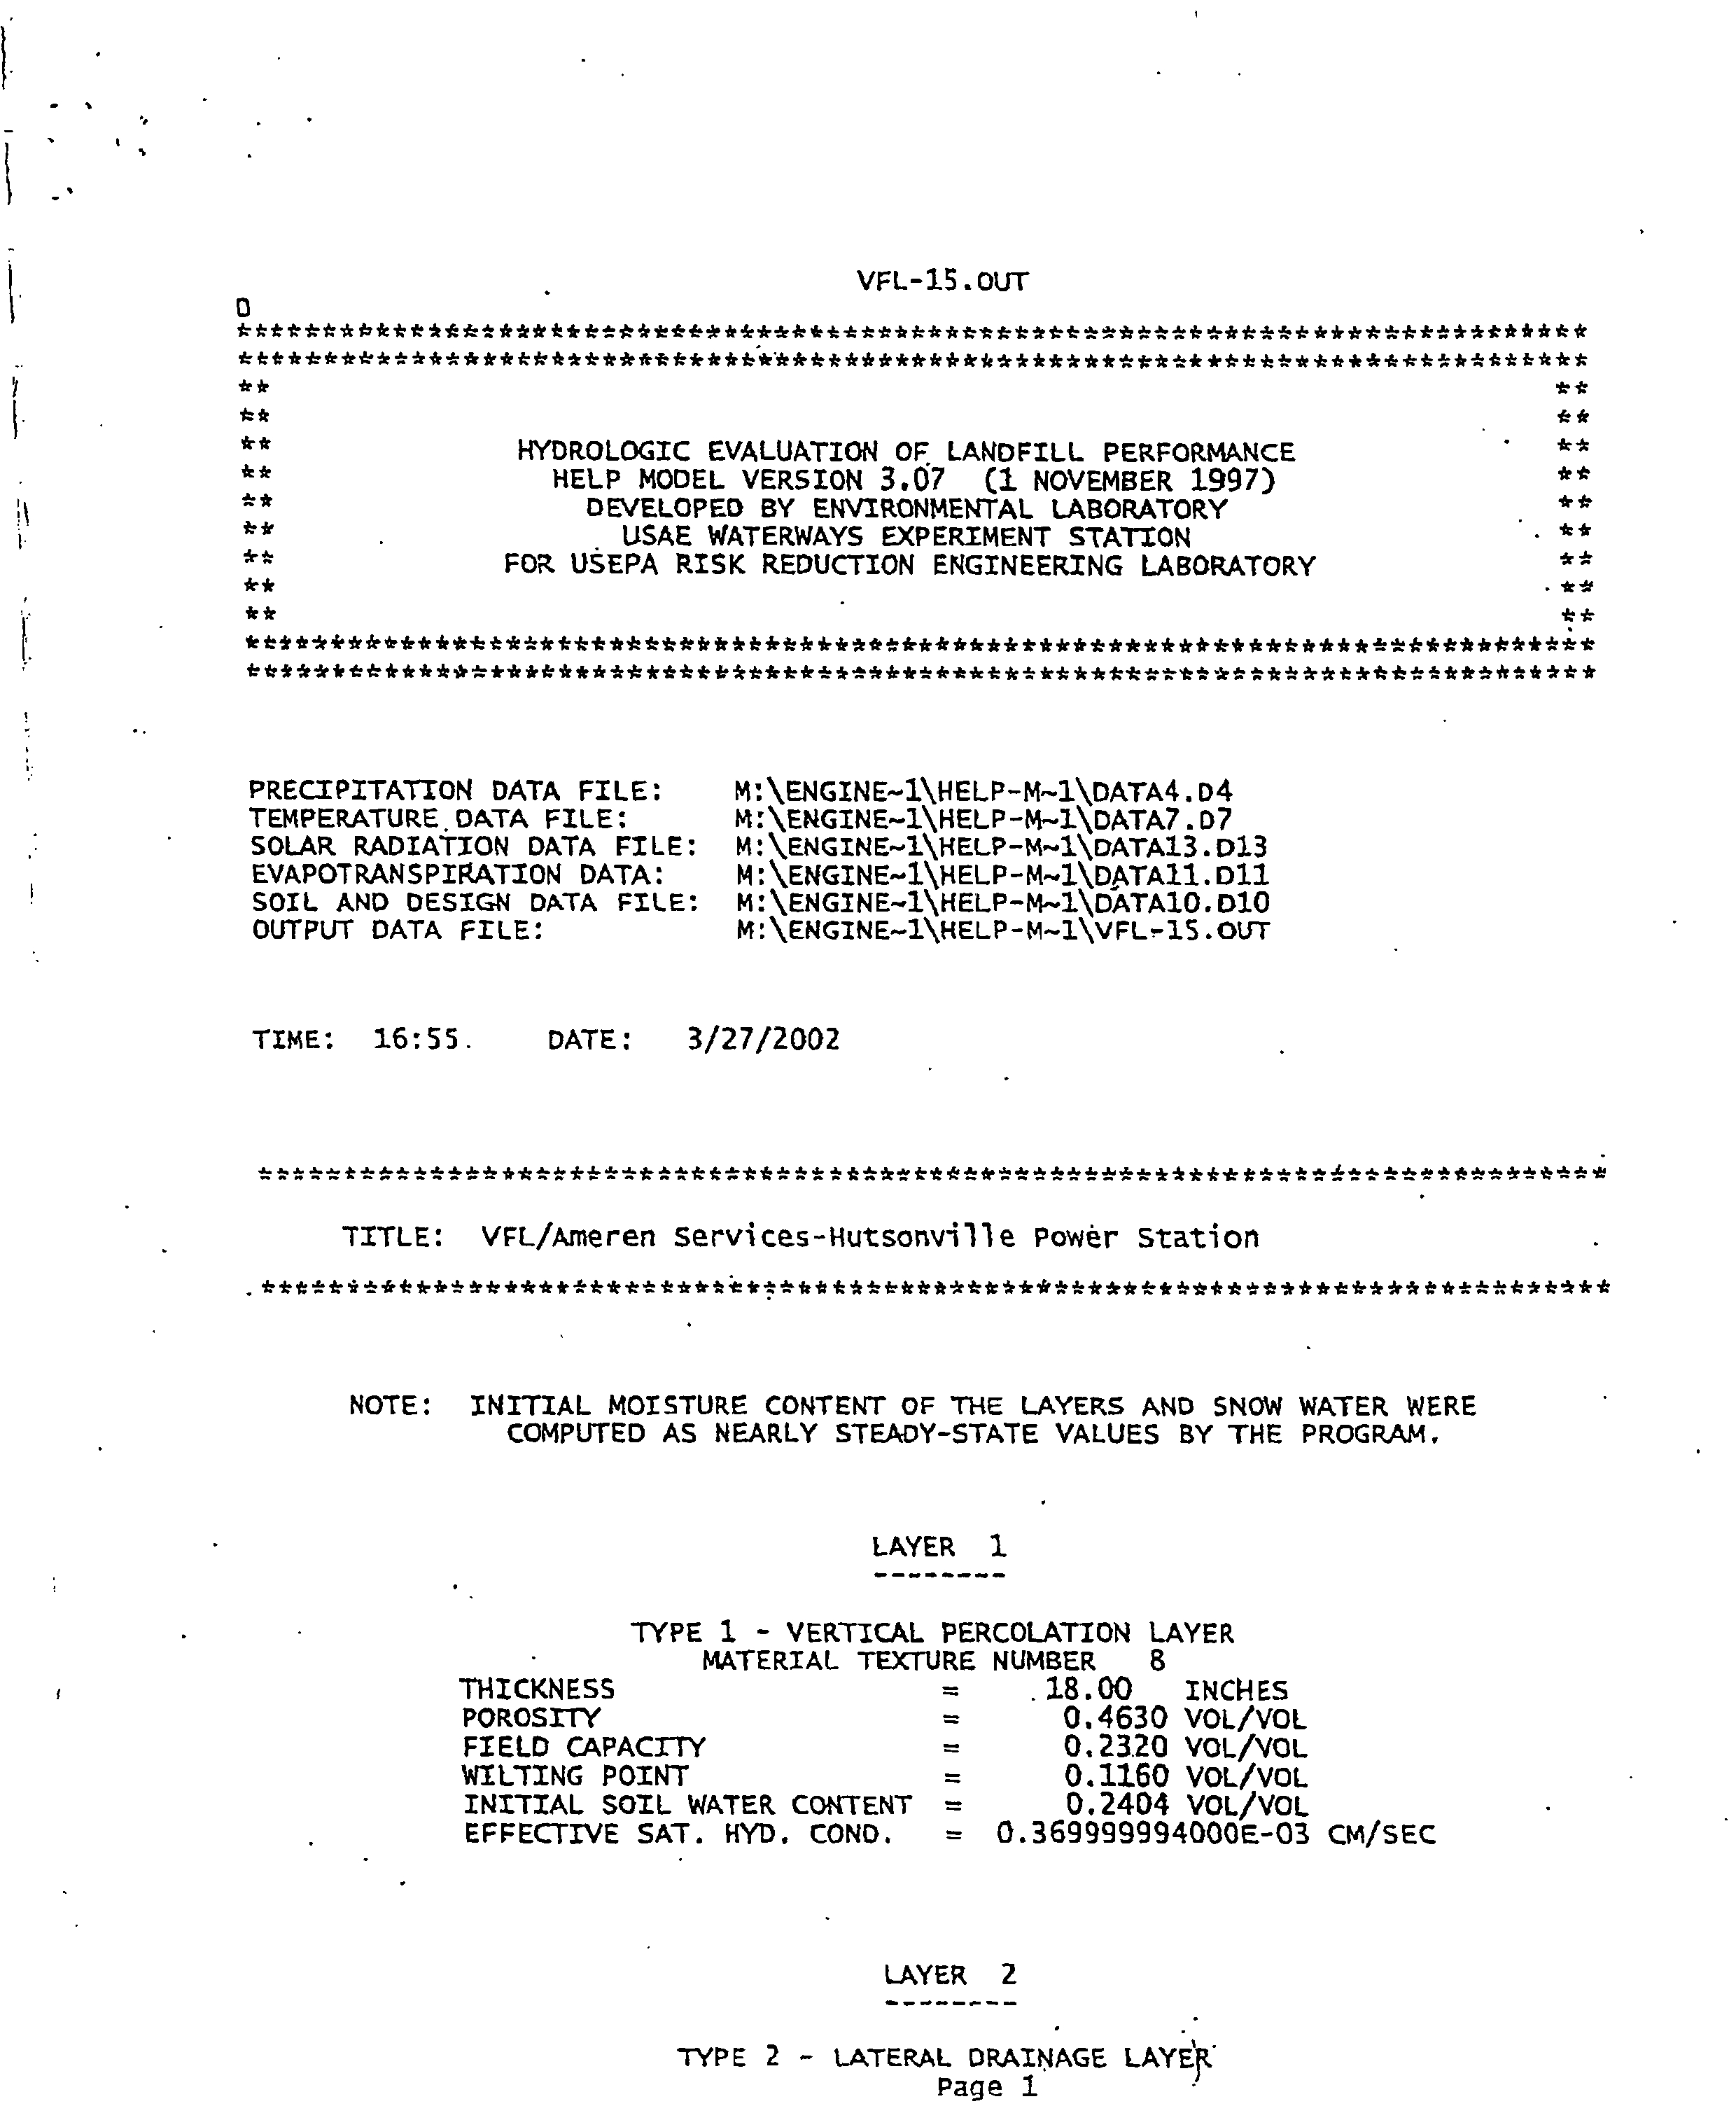
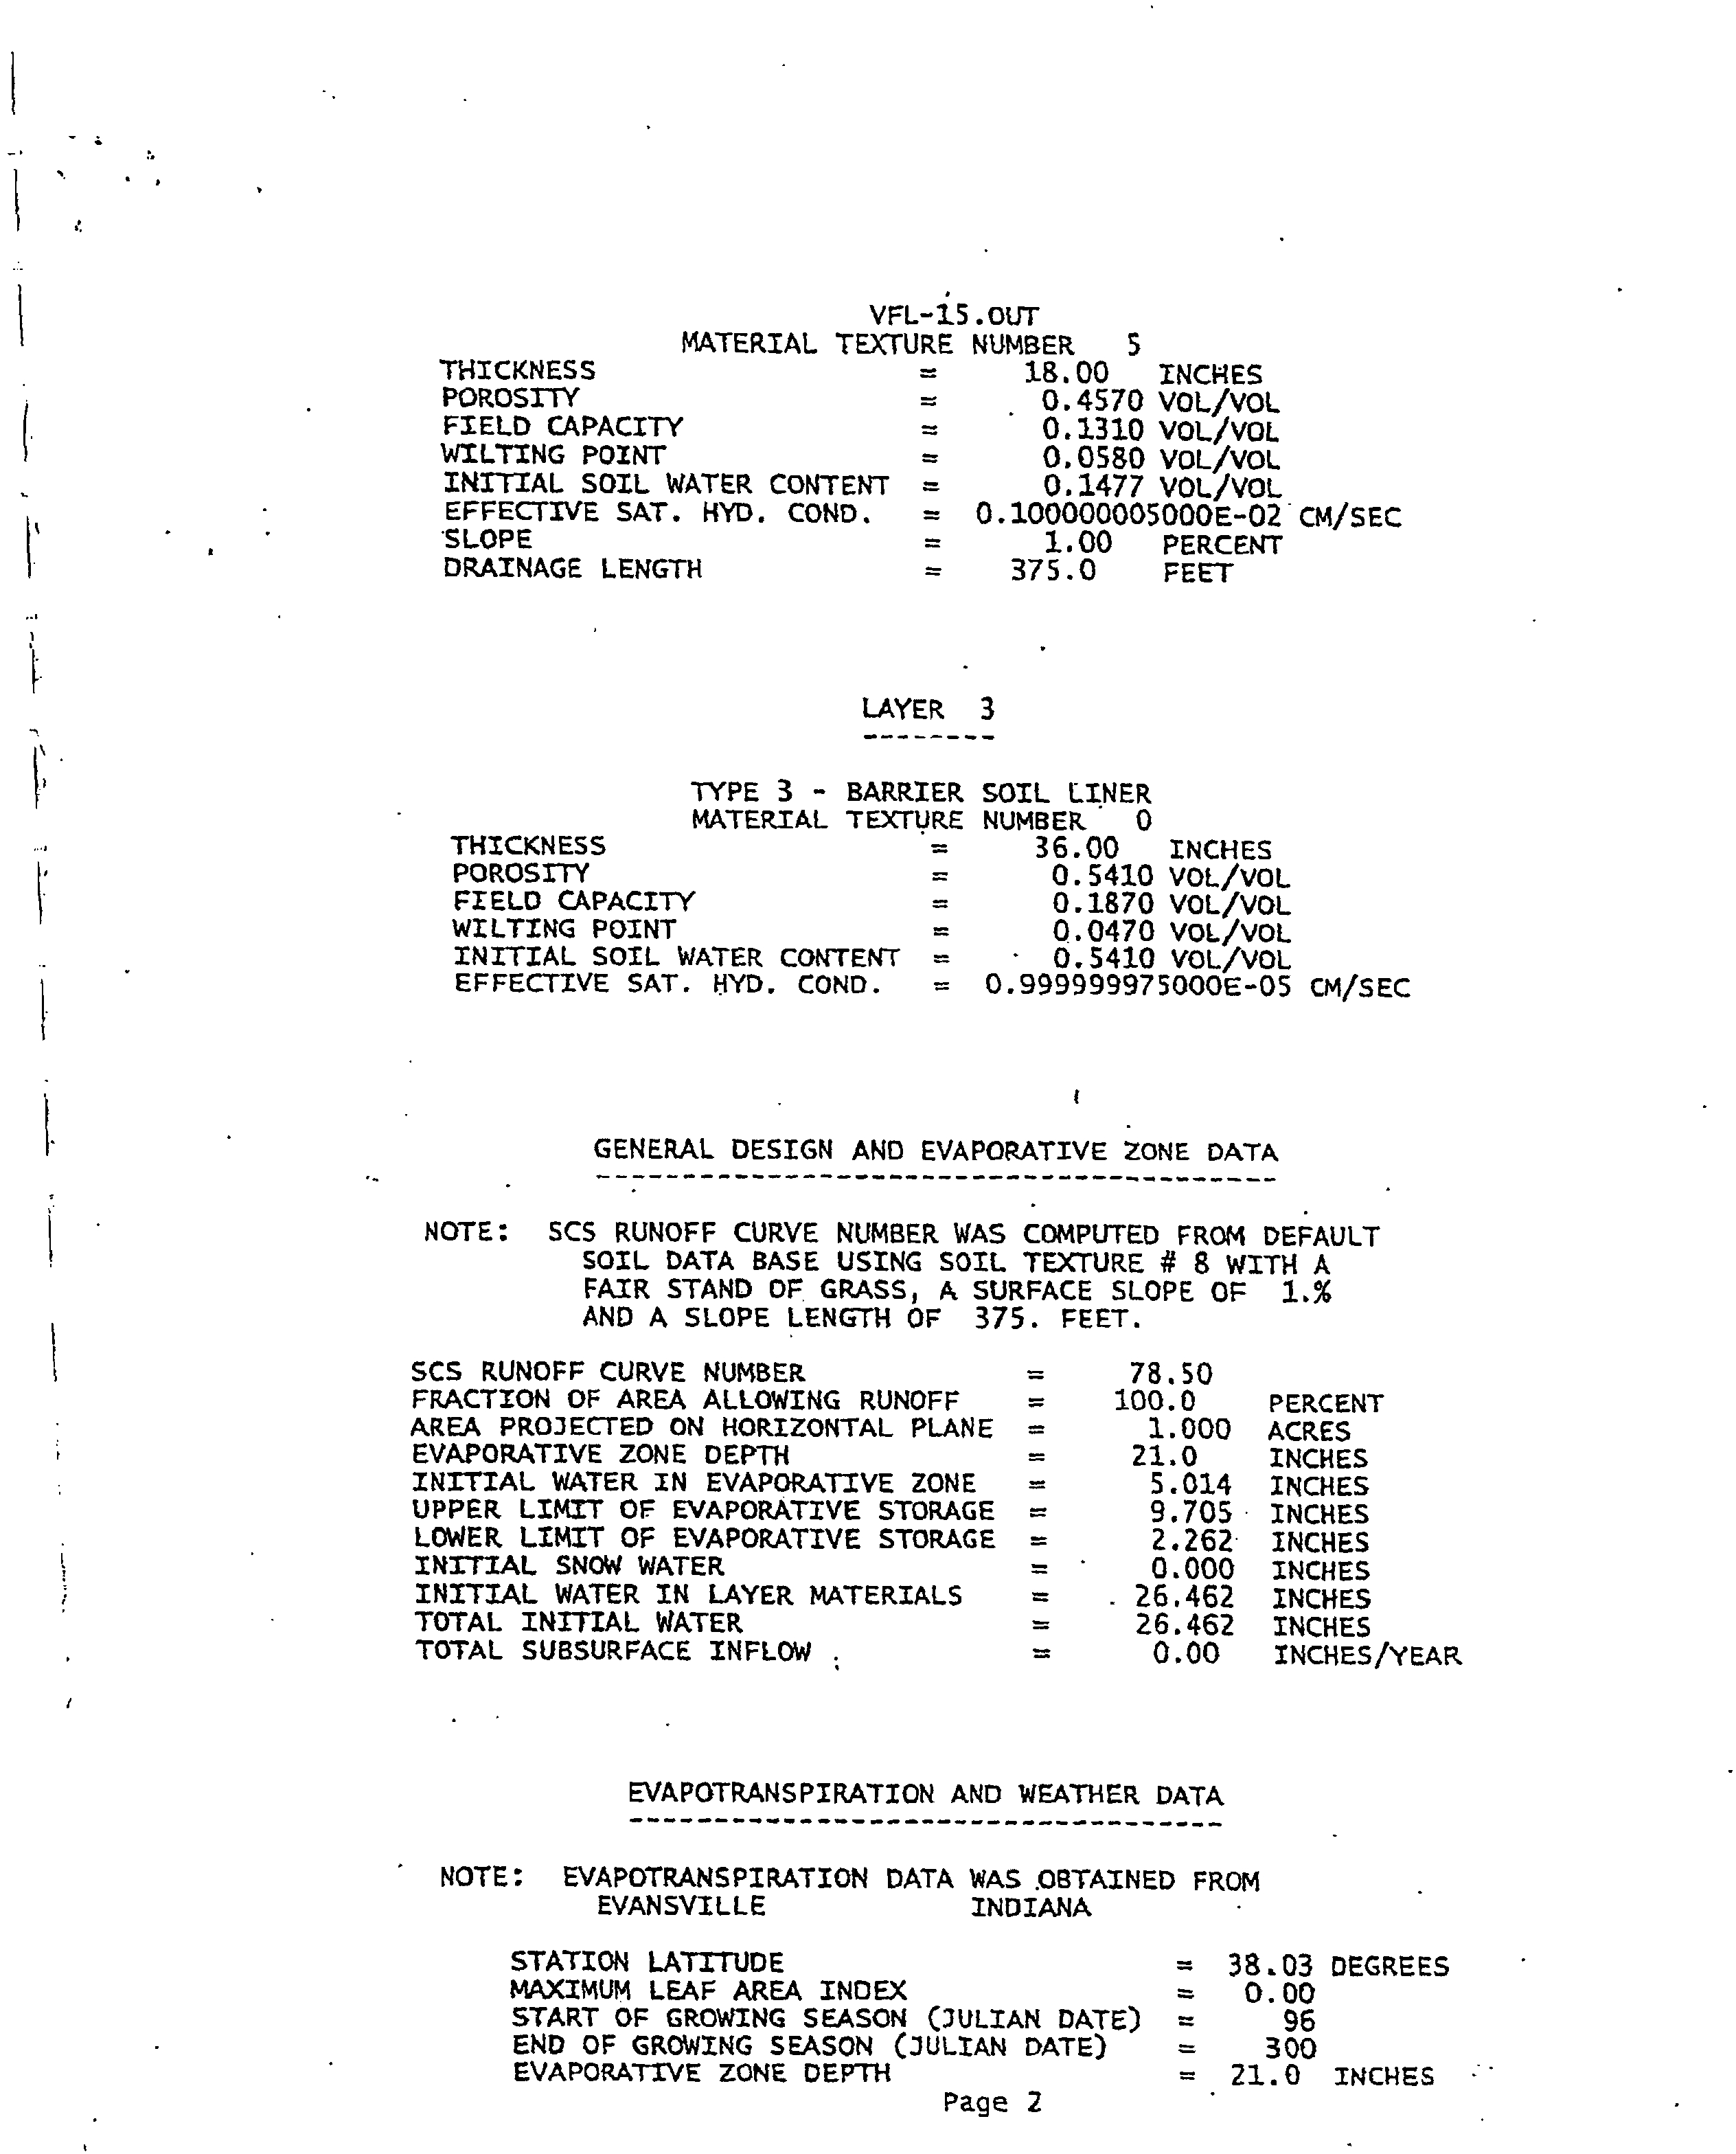
Help
Simulation of Closure Alternatives
Help
Model
Description
The
Hydrologic
Evaluation
of Landfill Performance
HELP
code
was
developed by
the U.S
Environmental Protection
Agency
and is used
extensively
in
waste
facility
assessments HELP
predicts
one-dimensional vertical
percolation
from
landfill or soil column
based
on
precipitation
evapotranspiration
runoff
and the
geometry
and
hydrogeologic
properties
of
layered
soil and waste
profile
For this
investigation
the
most-recent
version of HELP
Version 3.07
Schroeder
et
al
1994
was selected to estimate
percolation i.e
water
flux
from the
impoundment
for four closure
tends to be elevated where sulfate is elevated
MODEL REPORT
Natural
Resource
Technology
Electronic Filing - Received, Clerks' Office, August 11, 2008--Exhibits 1,2,5-10, & 12
HUTSONVILLE
GROUNDWATER MODEL EVALUATION
scenarios
The
hydrologic
data
required by
and entered into HELP
are
listed in Table
and
described in the
following paragraphs
Help
Model
Set-up
Four
closure scenarios
were
modeled
No
Cap
assumes
the
impoundments
were
allowed to dewater and the ash
uncapped
with
poor
vegetative
cover
This scenario
assumes
that
measures are
taken
to
facilitate surface
water
runoff
Native Soil
Cap
one-layer
cap
comprised
of three feet of
native soils with
fair
grass
cover
Compacted Clay
Cap
three-layer
cap
comprised from
top
to
bottom
of three feet of
native soil with fair
grass cover
three feet of
low-permeability compacted clay
and
one
foot
gravel
subbase
Synthetic
Cap two-layer cap comprised
from
top
to
bottom
of
one
foot of native soil
with fair
grass cover
and
30-mil HDPE
synthetic
barrier material
Each closure scenario
was
simulated
for
two
impoundment
cases
One
impoundment
case
represented
the southern
portion
of the unlined
impoundment
that
is
currently ponded
and the
other
represented
the northern
portion
of the unlined
impoundment
that is
dry
For
all
scenarios
the
ash
was
assumed
uncapped
with
no
runoff
during
the
first
year
2001
while the
impoundment
dewatered and the closure alternative
was enacted
Scenario-specific changes
were
simulated
beginning
the second
year 2002
and
through
the
end of the simulation
2010
10-year
simulation
2001 through 2010
was
sufficient
for the
system
to
reach
equilibrium
after
enactment
of the closure scenario
Input
Data
Climatic
input
variables were
synthetically generated by
the model
using
modified default values
for
Evansville Indiana
and
latitude of 39.13
for the Hutsonville Power Station Rainfall
frequency
and
temperature
patterns
for
more
than 100 cities
are
programmed
into HELP
Evansville was selected as the closest
city
to Hutsonville
The model used Evansvilles
precipitation
and
temperature
patterns
with
average
monthly precipitation
data recorded
at
the
MODEL REPORT
Natural
Resource
Technology
Electronic Filing - Received, Clerks' Office, August 11, 2008--Exhibits 1,2,5-10, & 12
HUTSONVILLE
GROUND WA TER MODEL EVALUATiON
two
closest
monitoring
stations
with
long-term
records3
to
generate
daily precipitation
and
temperature
data
Physical input
data were based on the
configuration
of the
impoundment
and
combination of
measured
and assumed soil
properties
The ash
was
subdivided
into three 60-inch
thick
sublayers
This
subdivision resulted in
more
rapid percolation responses
to surface
changes
such
as
dewatering
than
two
90-inch
layers
yet
provided
the
same
results
as
six
30-inch
thick
layers
The 15-foot combined
thickness of the ash
layers represented
the estimated thickness
of ash
above the water table after
dewatering
Hydrogeologic
properties
for the ash and
cap
soils
were
selected from the HELP database For
simulation of the
ponded portion
of the
impoundment
initial moisture
content
of the
uncapped
ash was set
equal
to its
porosity
as
expected
under saturated conditions
Dewatering
of the
saturated ash
was
then modeled for
one
year
Then the four closure scenarios
were
simulated
with initial moisture
content
of the ash
layers equal
to
the moisture
content
calculated
by
HELP
at
the end of the first
dewatering
year
Initial moisture
content
of
the
cap
materials used in the
closure scenarios
was set
equal
to
their field
capacity
Initial moisture
conditions for the
dry
part
of the
impoundment
were
simulated
similarly
to
the
ponded impoundment
except
that values for
the first
year
were set
by
the model based
on
average
climatic
conditions
The HELP
modeling
assumed that sluicewater
discharge
to the
impoundment for
the wet
impoundment scenario
ceased
immediately
before
the simulation
began
the
cap
was
instantaneously
placed
at the end of the first
year
the
cap
materials and ash had uniform texture
and
hydraulic properties
there
was no
lateral
groundwater
flow into
or
out of the
impoundment
and all
leakage
to
groundwater
was
vertical Other
assumptions
inherent
in
the model are listed
in Schroeder et al
1994
Precipitation
recorded at the Hutsonville
power
station and
average temperature
data recorded
at
Palestine
Illinois
MODEL REPORT
Natural
Resource
Technology
Electronic Filing - Received, Clerks' Office, August 11, 2008--Exhibits 1,2,5-10, & 12
HUTSONVILLE
GROUND WA TER MODEL EVALUATION
Help
Model
Execution
Two
types
of HELP simulations
were
performed
sensitivity
analysis
and
prediction
analysis
The
sensitivity
analysis
was
performed
to
identify
critical factors
affecting performance
of the
proposed
closure scenarios
The
prediŁtion analysis
was
conducted
to
estimate
percolation
rates
for each closure
scenario
which
were later
input
to
the
groundwater
flow
model
Help
Model Results
Sensitivity analysis
Sensitivity analysis
results
are
presented
in Table
The model
was
sensitive to
vegetation
assumptions
which
affect
calculation
of
evapotranspiration
and
runoff
and the
hydraulic
properties
of the
cap
materials
The most sensitive
parameters
were ash
permeability
the
vegetation
assumption
used in the runoff
calculation
and
placement quality
of the
synthetic
cap
material
which
changed
total
predicted
flux
by
to -42
percent
30
to
-36
percent
and 104
to
percent
respectively
The
large change
for
placement quality
occurred when
defect
density
for
poor
placement
was assumed
All
other
parameters
changed
flux
by
less than 20
percent
The
model was not
sensitive
within
tested
ranges
to the thickness and
presence
of
gravel
subbase
and to soil runoff
parameters
other than
vegetation
This
analysis
indicates
that the model is sensitive to selected
input parameters
The
parameters
used for the
prediction
runs
represent conservatively
reasonable estimates
and
assumptions
of
current and future conditions at the unlined ash
impoundment
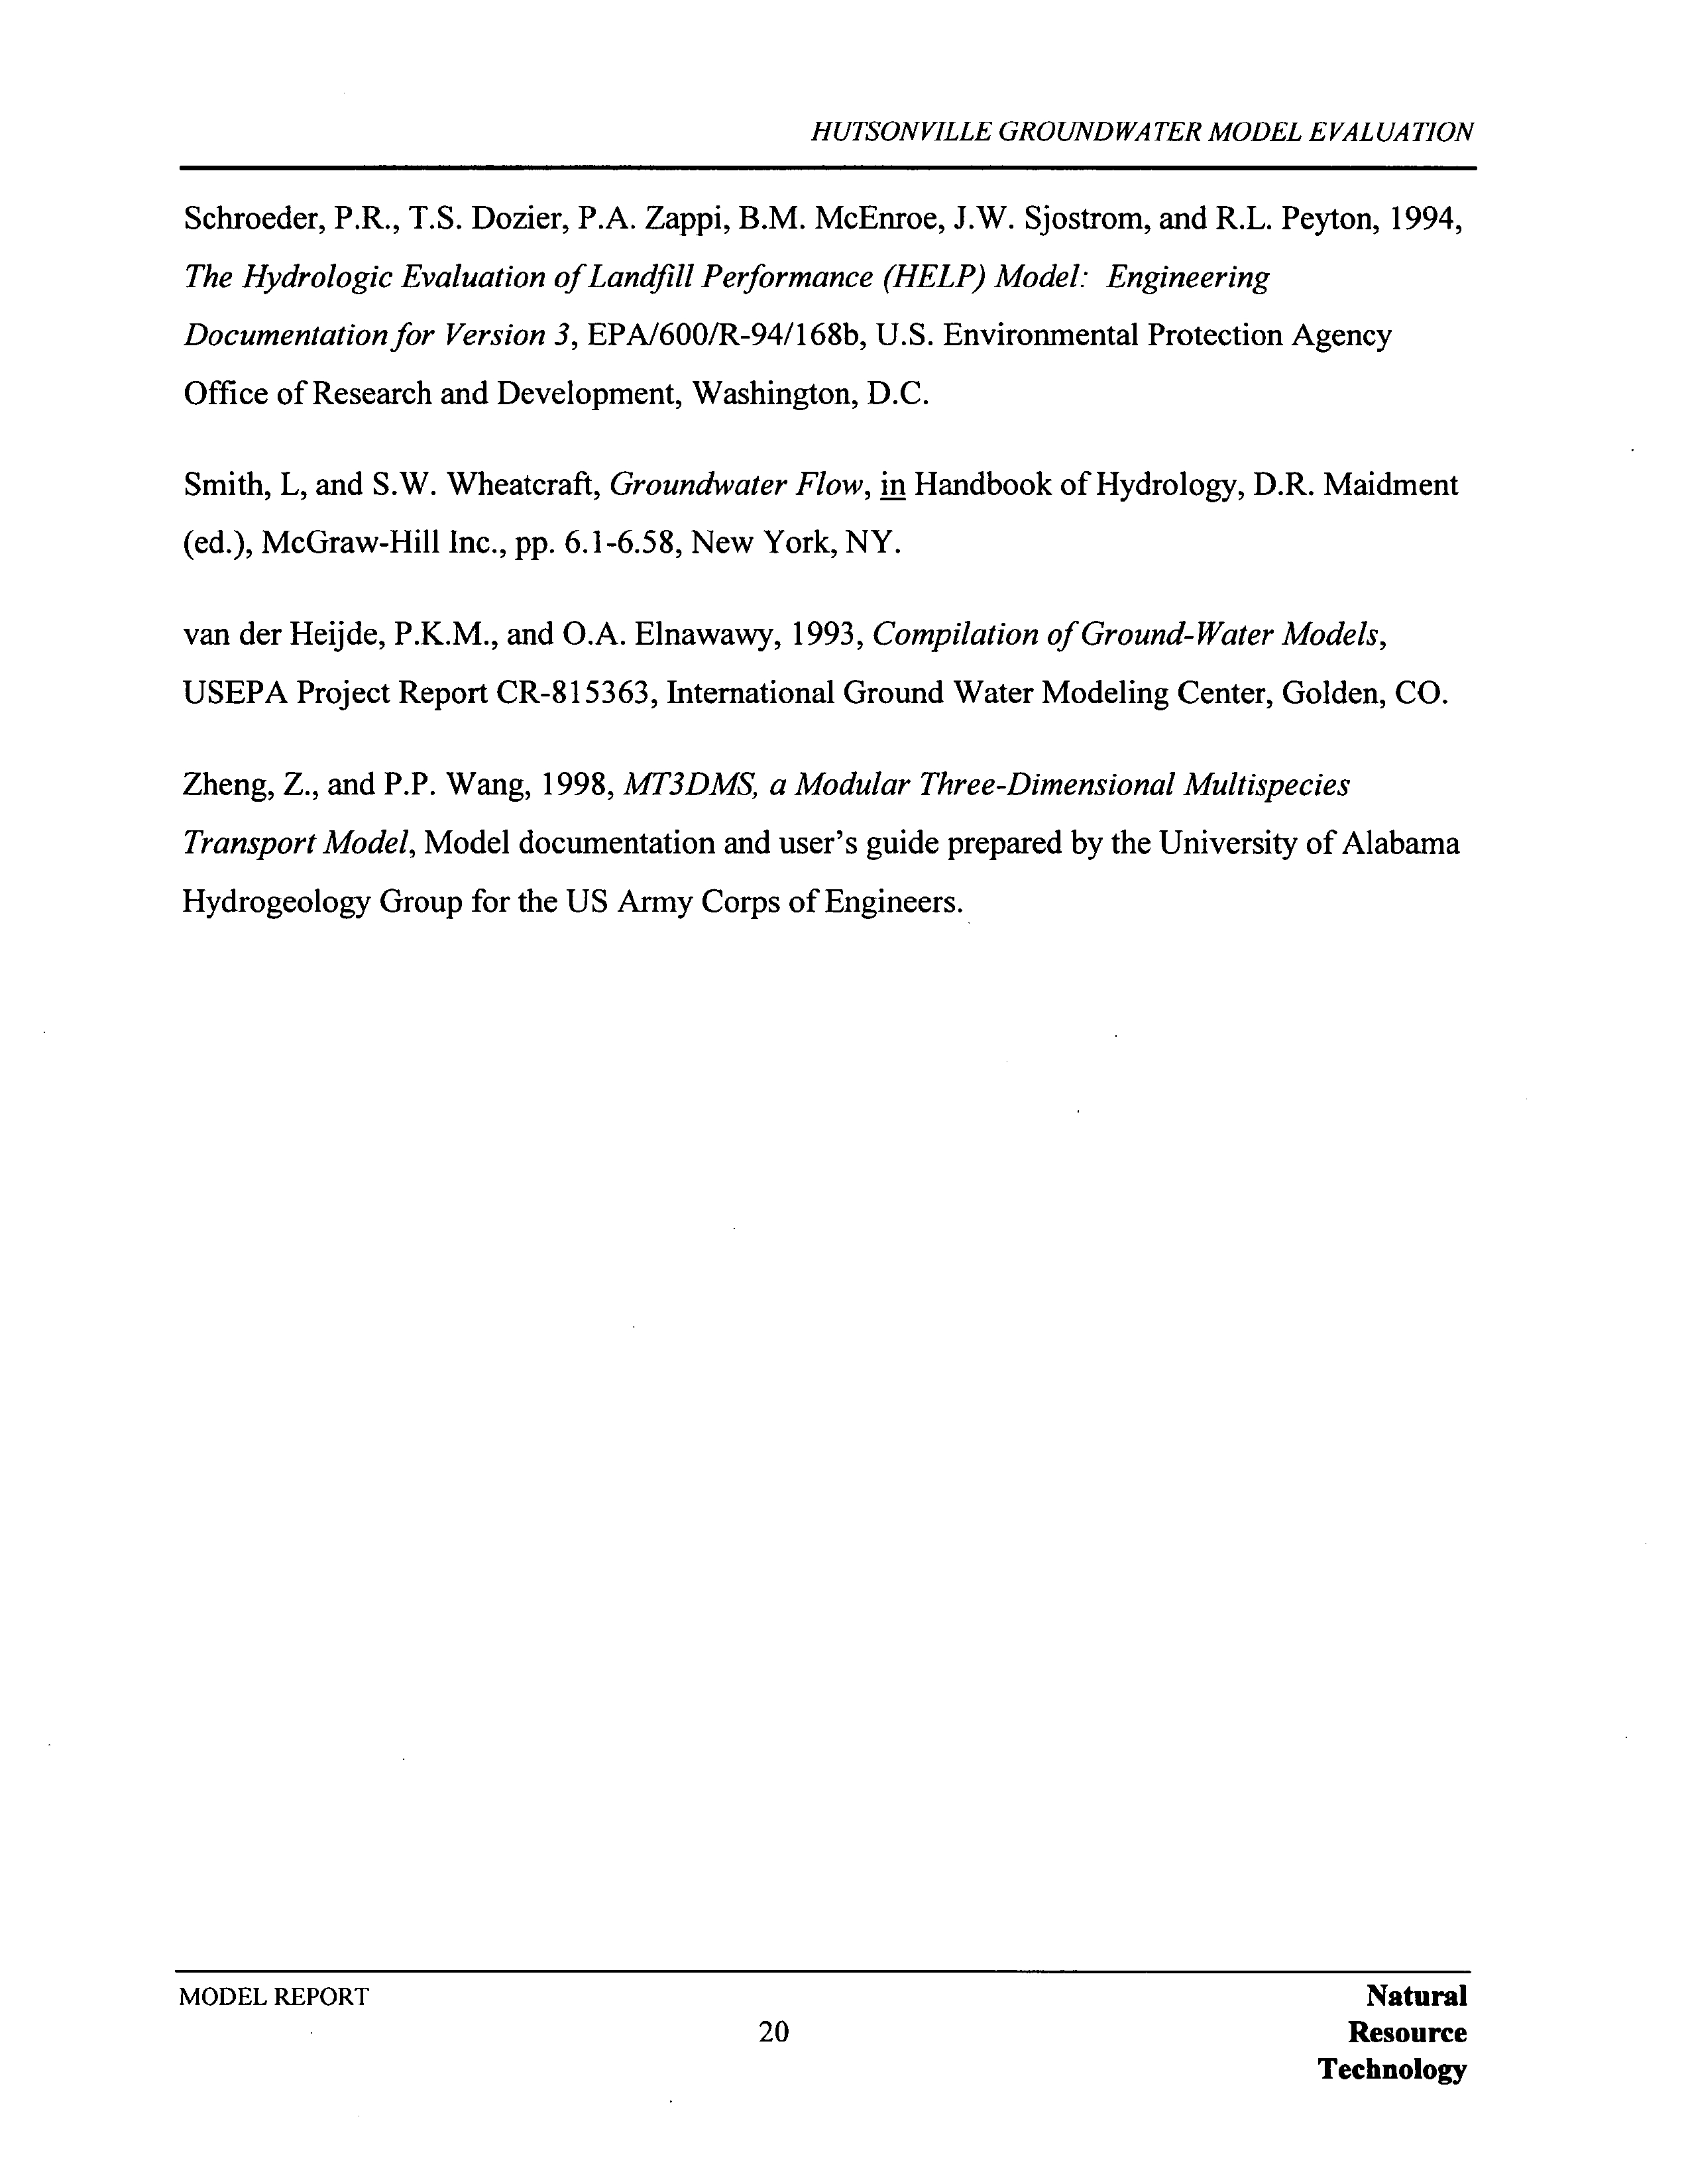
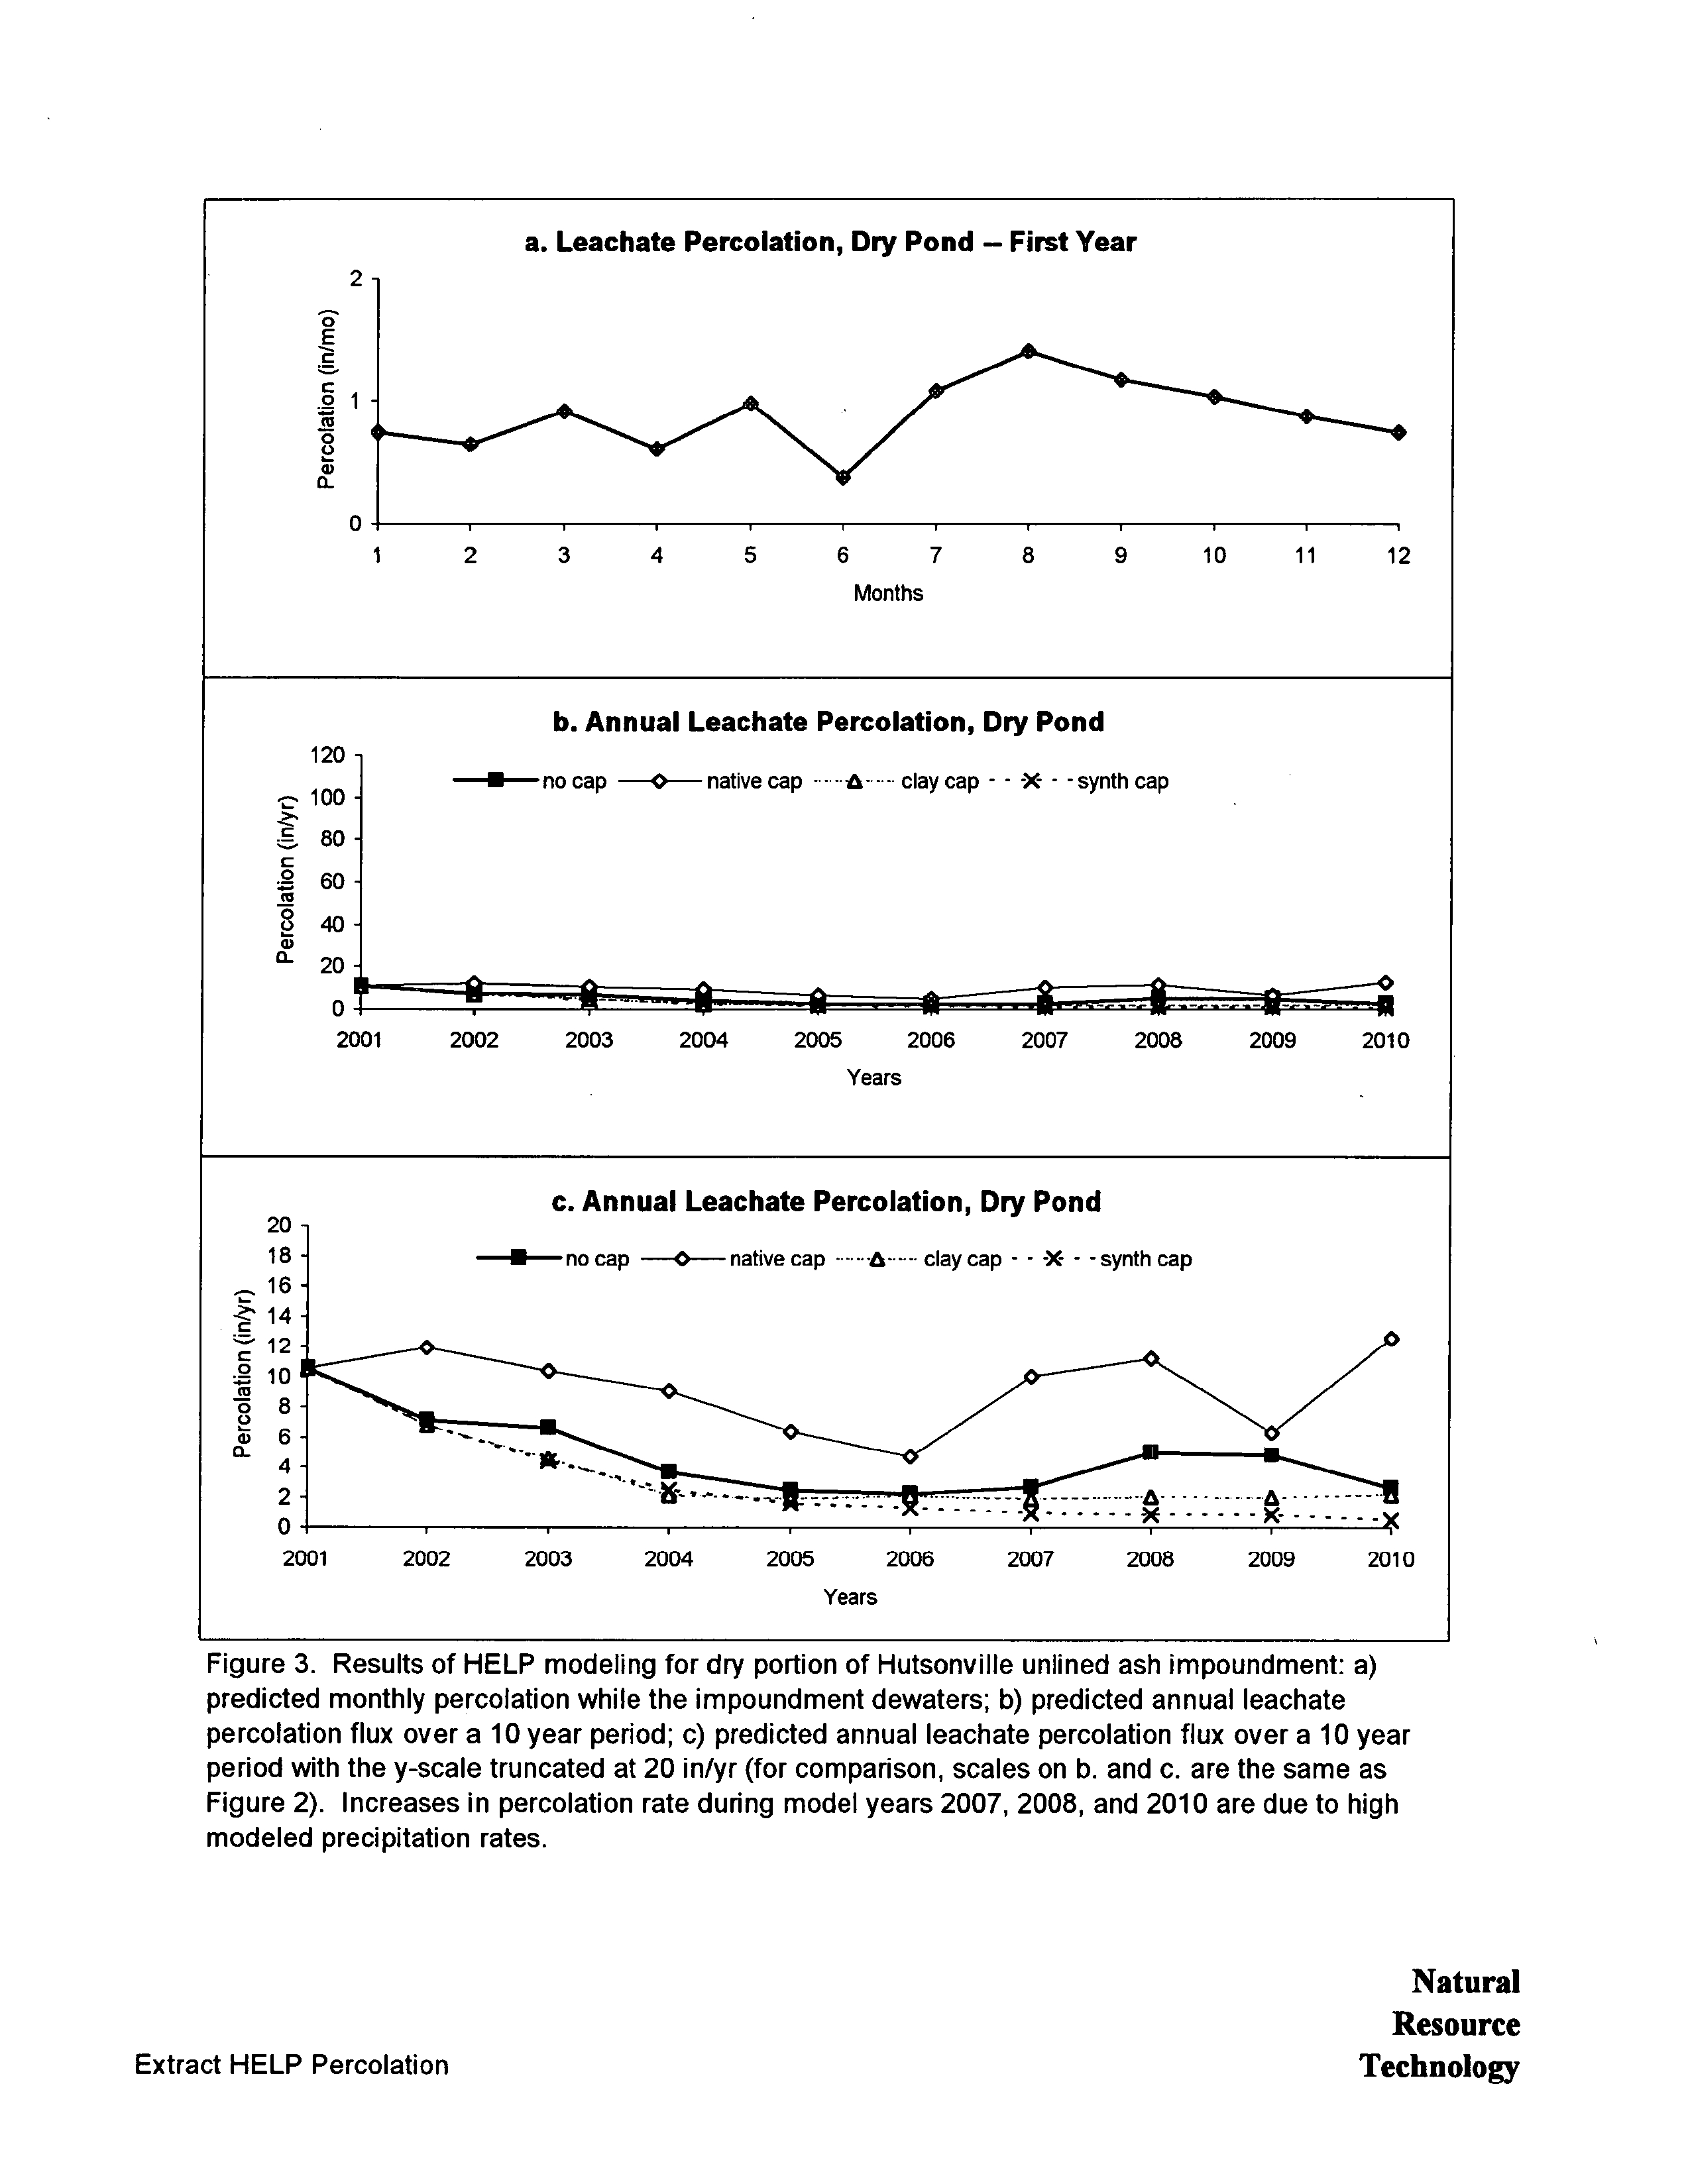
Prediction
analysis
Model results for the
wet
portion
of the
impoundment
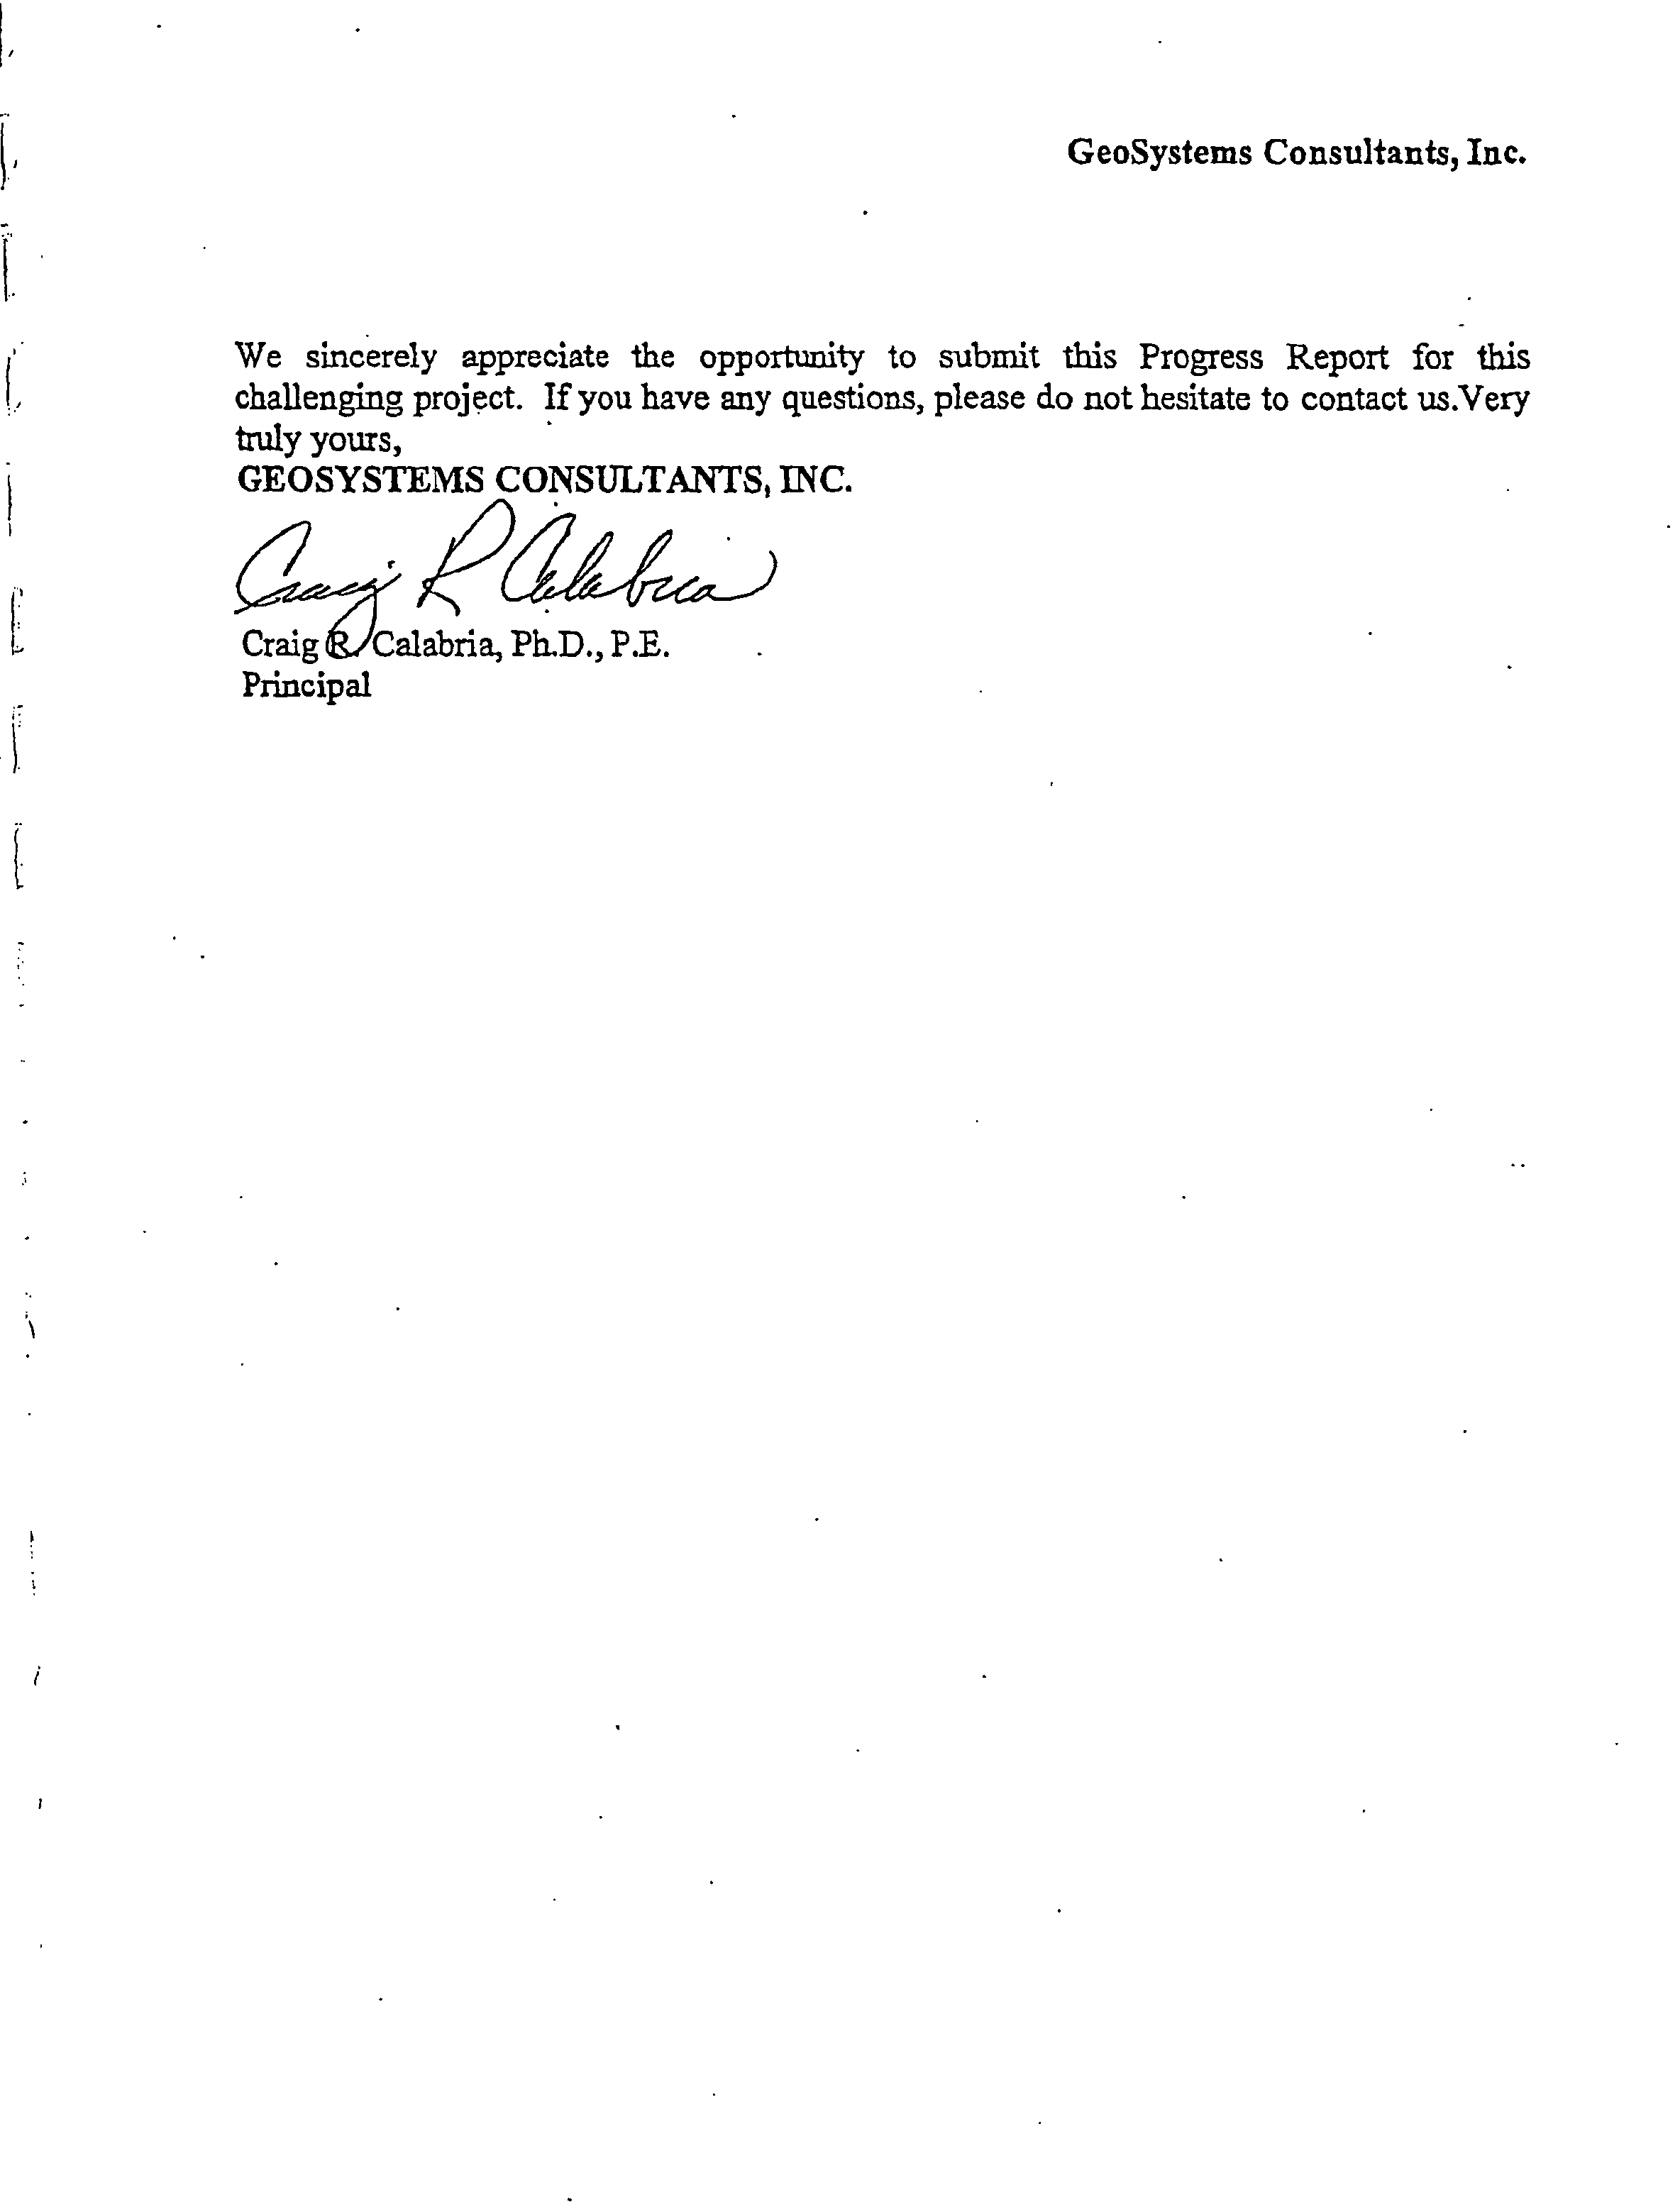
show
97
percent
decrease in
monthly
percolation
flux
by
the end of the first
year
due to
impoundment
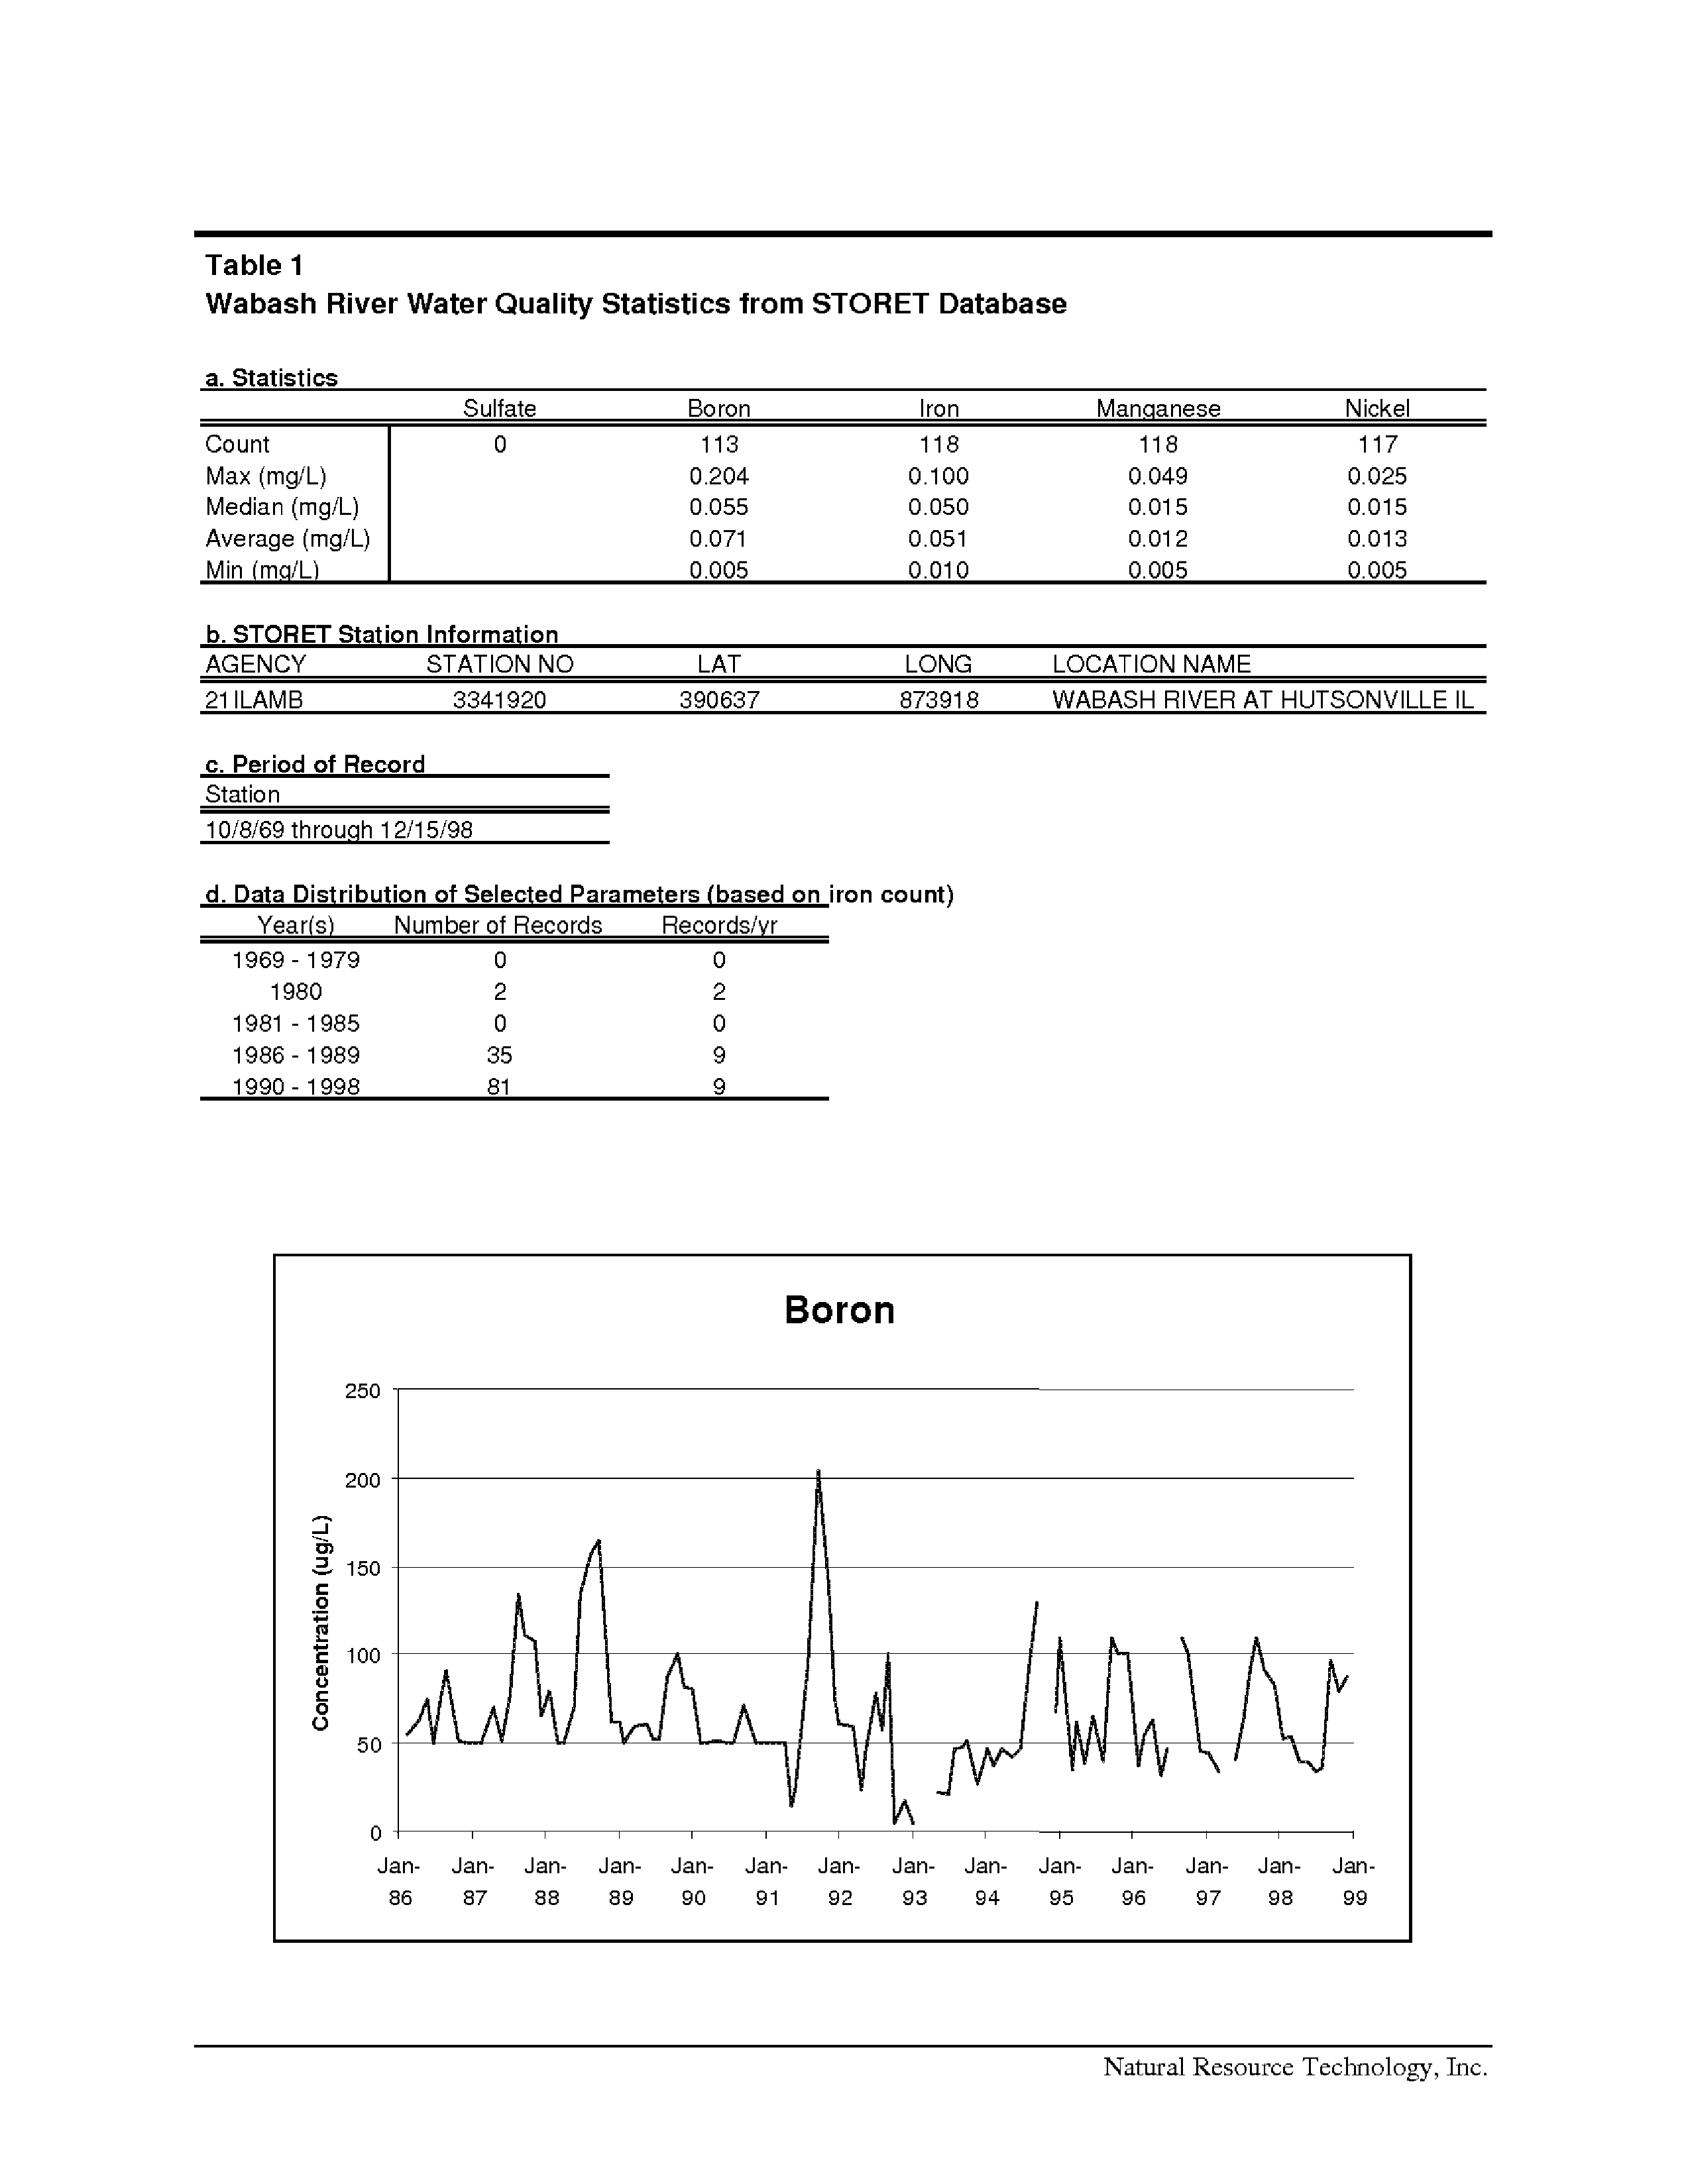
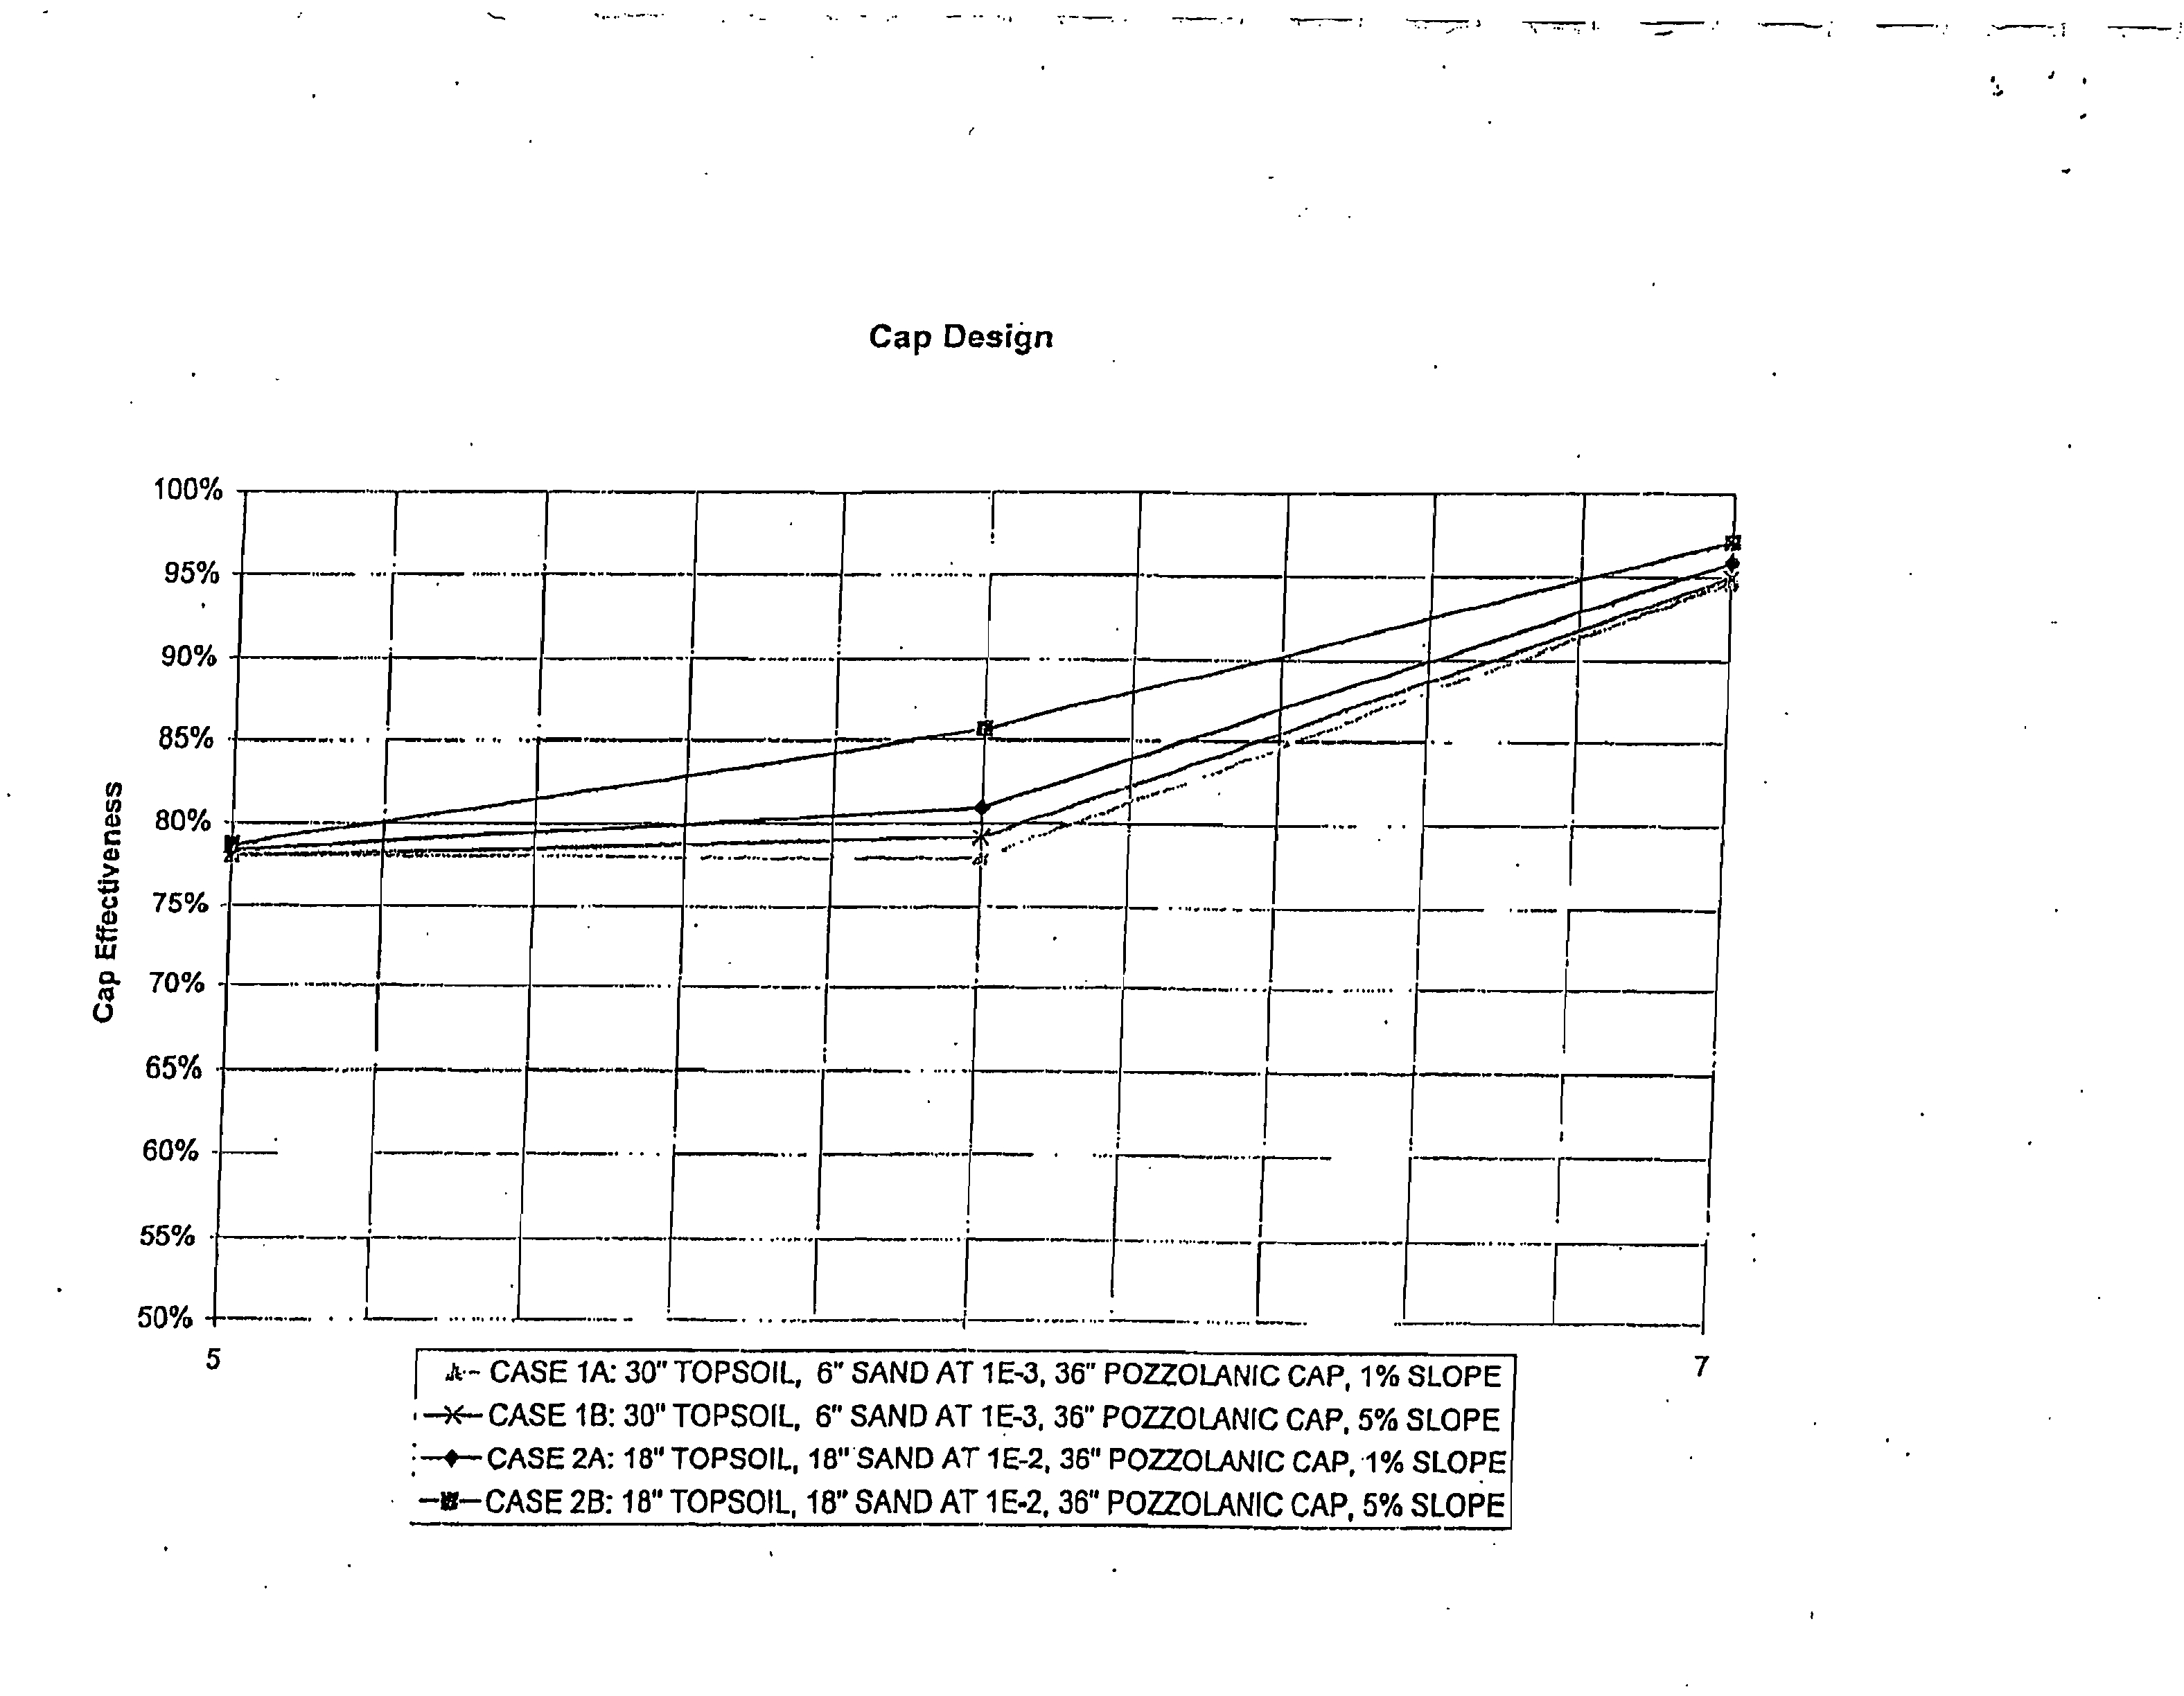
dewatering Figure 2a
Differences
between
the closure
scenarios
were
negligible compared
to the decrease in flux due
to
dewatering Figure 2b however
the scenarios with
clay
or
synthetic
cap
performed slightly
better than the scenarios with no
cap
or
native soil
cap Figure 2c
MODEL REPORT
Natural
Resource
Technology
Electronic Filing - Received, Clerks' Office, August 11, 2008--Exhibits 1,2,5-10, & 12
HUTSONVILLE
GROUNDWATER MODEL EVALUATiON
Model results for the
dry portion
of the
impoundment
show
no
initial decrease
Figure 3a
which
is
expected
since these scenarios did not
assume
saturated ash
or
surface
ponding
Annual
leachate
percolation
flux after the first
year
is similar to that
predicted
for the wet
portion
of the
impoundment
Figures
3b
3c
The
significance
of the
predicted
differences in leachate
percolation
flux
on
groundwater quality
near the Hutsonville unlined ash
impoundment
was tested
by inputting
these values into
groundwater
flow and
transport
model
which is described below
Groundwater Flow/Contaminant
Transport
Modeling
Flow and
Transport
Model
Descriptions
MODFLOW
uses
finite difference
approximation
to solve
three-dimensional
head
distribution in
transient
multi-layer heterogeneous anisotropic variable-gradient
variable-
thickness
confined
or unconfined flow
systemgiven
user-supplied inputs
of
hydraulic
conductivity
aquifer/layer
thickness
recharge
wells
and
boundary
conditions
The
program
also calculates water balance at
wells
rivers
and drains
MODFLOW was
developed by
the United States
Geological
Survey
McDonald
and
Harbaugh
1988
has been
extensively
tested for
accuracy
van
der
Heijde
and
Elnawawy 1993
and is the
most
widely
used code for
groundwater
model
applications Rumbaugh
and
Ruskauff 1993
Major assumptions
of the
code are
groundwater
flow is
governed by
Darcys
law
the
formation behaves as
continuous
porous
medium
flow is not affected
by
chemical
temperature
or
density gradients
and
hydraulic properties
are
constant
within
grid
cell
Other
assumptions
concerning
the
finite difference
equation
can be
found in McDonald and
Harbaugh
1988
MT3DMS
Zheng
and
Wang 1998
is the latest version of MT3D
It calculates concentration
distribution for
single
dissolved
solute as
function of time and
space
Concentration
is
distributed
over
three-dimensional
non-uniform
transient flow field Solute
mass
may
be
input
at discrete
points
wells
drains
river
nodes
constant head
cells
or
areally
distributed
evenly
or
unevenly
over the land surface
recharge
MODEL REPORT
Natural
Resource
Technology
Electronic Filing - Received, Clerks' Office, August 11, 2008--Exhibits 1,2,5-10, & 12
HUTSONVILLE
GROUND WA TER MODEL EVALUATION
MT3DMS accounts
for
advection
dispersion
diffusion
first-order
decay
and
sorption Sorption
can
be
calculated
using
linear Freundlich or
Langmuir
isotherms First-order
decay
terms
may
be differentiated for the
adsorbed
and
dissolved
phases
The
program
uses
finite difference
solution
third-order
total-variation-diminishing
TVD
solution or one
of three Method of Characteristics
MOC
solutions
The finite difference
solution can be
prone
to numerical
dispersion
for
low-dispersivity
transport
scenarios
and the
MOC solutions sometimes fail to
conserve
mass
The TVD solution is not
subject
to numerical
dispersion
and
conserves
mass well
but is
computationally
intensive
For this
modeling
the TVD
solution was
attempted first however
results outside the
area
of
interest
were
anomalous
e.g
in the
thousands and
negative
thousands
Therefore
the finite
difference solution
was used
resulting
in similar concentrations
as
the TVD solution within the
area
of interest and concentrations
near zero
outside the
area
of interest
Zheng
and
Wang 1998
indicated that the effects
of numerical
dispersion
are
minimal when
grid
Peclet4
numbers are
smaller than 4.0
Since
Peclet number of 3.3
was maintained for this
analysis5
the finite
difference solution is
acceptable
MT3D has been tested and
verified
and is
widely
used
van
der
Heijde
and
Elnawawy
1993
Major assumptions are
changes
in the concentration
field do
not
affect
the flow
field
changes
in the concentration
of
one
solute do not affect the concentration
of another
solute
chemical and
hydraulic properties
are constant within
grid cell
and
sorption
is
instantaneous and
fully reversible
and
decay
is not reversible
Flow and
Transport Conceptual
Model
Hydrostratigraphy
developed
from
boring logs
collected
during plant
construction
1954
original monitoring
well installation
1984
and the
hydrogeologic
assessment
1999
indicate
that the
upland
area near the
impoundment
consists of sand and
gravel
of
varying thickness
Peclet number
Pc
Grid
spacing
divided
by longitudinal dispersivity
5Pe
100303.3
MODEL REPORT
Natural
Resource
Technology
Electronic Filing - Received, Clerks' Office, August 11, 2008--Exhibits 1,2,5-10, & 12
HUTSONVILLE
GROUND WA TER MODEL EVALUATION
typically
10
to
20
feet
underlain
by
15
to more
than 30 feet of sandstone
The
upper
sand
appears
to
grade
to
fine-grained
silty clay
toward the northern
portion
of the
plant
site
thick
shale unit
underlies the sandstone
at an
approximate
elevation
of about 415 to 420 feet
The
Wabash River
valley
contains
relatively fine-grained
alluvium
from land surface to an elevation
of about 410 to 415
feet
underlain
by
sand and
gravel
to
an
elevation of about 350 feet
The
primary
direction of
groundwater
flow is
east discharging
into the Wabash River and its
tributariesa
regional groundwater
sink
There
are
three
sources
of
water natural
recharge
within the model
domain
percolation
water from the
impoundment
and
groundwater
flow from
the west
Flow and
Transport
Model
Set-up
Modeling
was
conducted in
multiple steps
First
the flow model
was
calibrated
to current
conditions
e.g
active
use
of the
impoundment
as
represented
by
heads measured
in
November 1998 This
measurement
event was
selected because all
new wells installed for the
hydrogeologic
assessment
were
measured
at that
time
and because river elevation and
groundwater
elevation
head
values
at
older wells
were near
long-term
median
values Next the
transport
model
was
run
and model
predicted
concentrations
were
calibrated
to
observed boron
concentration
values
These calibration
runs were
conducted
assuming steady
state flow
Multiple
iterations
of flow and
transport
model calibration
were
conducted
to achieve
an
acceptable
match to observed data
Sensitivity analyses
were
then conducted to test the effect of
selected
parameters
on
model results
Once the model
was
calibrated
and tested for
sensitivity prediction
modeling
was
performed
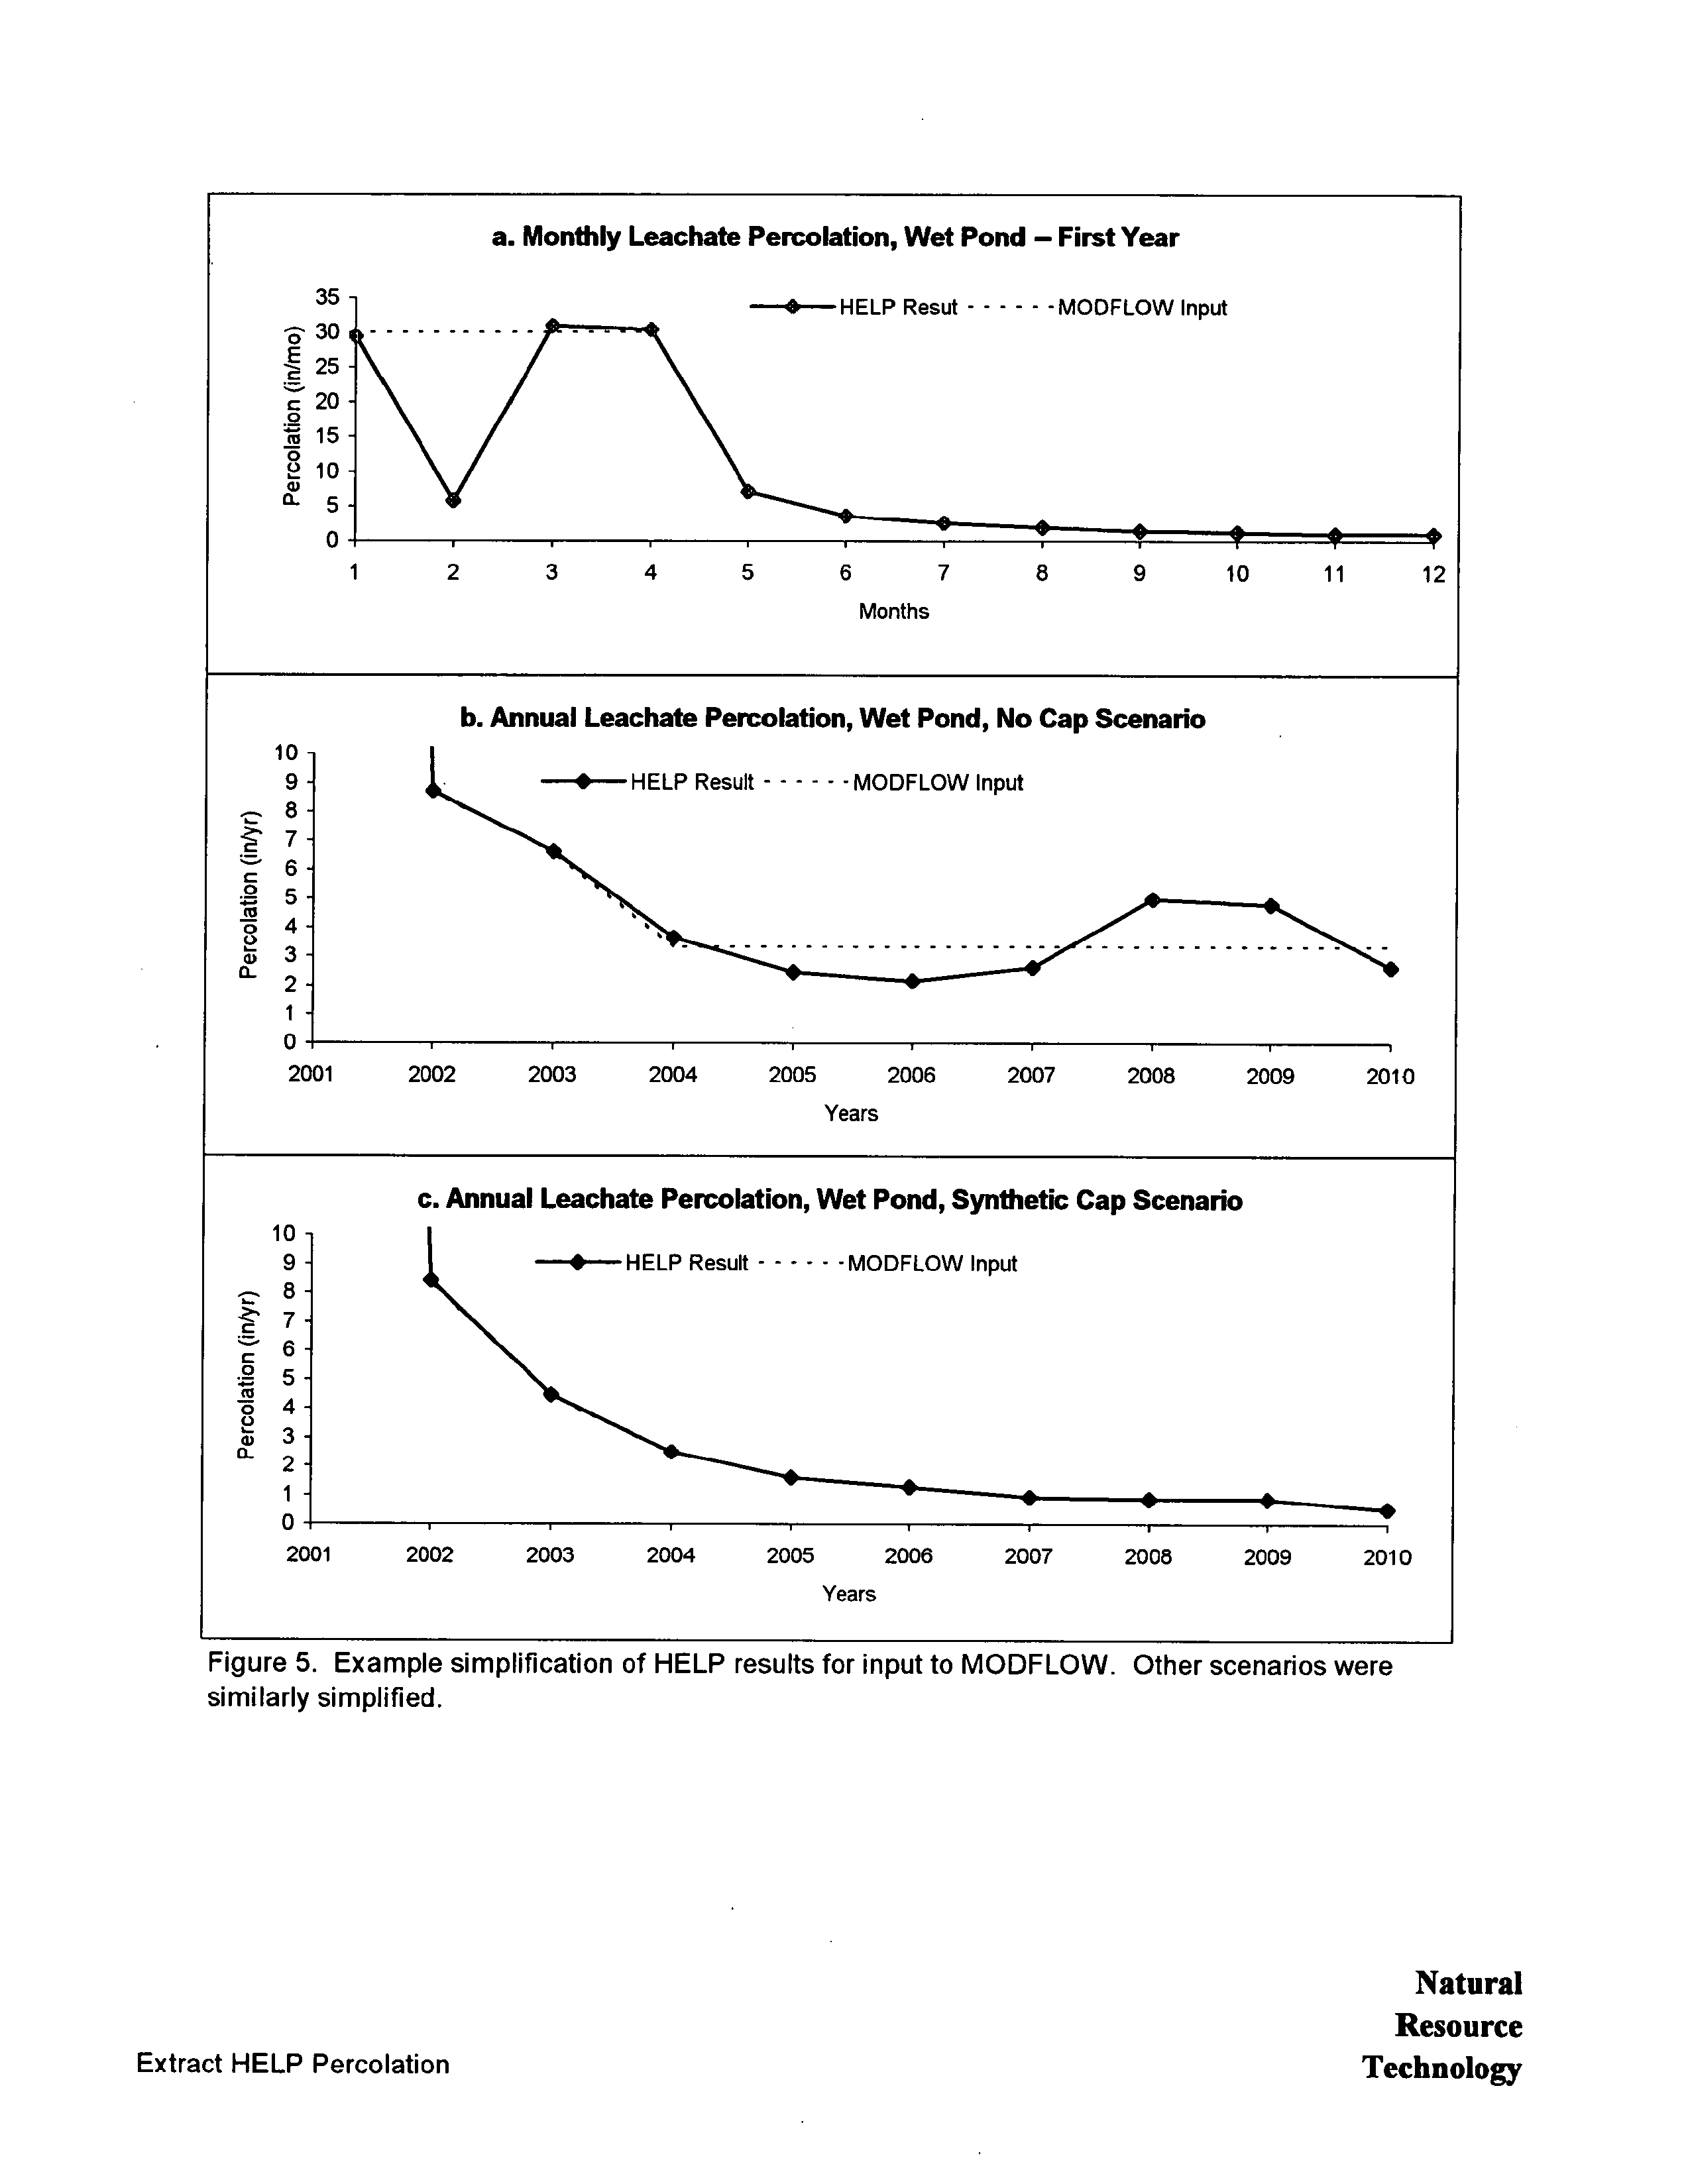
Monthly
leachate
percolation
rates
predicted by
HELP
were
used
to
simulate
dewatering
during
the
first
year
then annual
percolation
rates were
used
to
simulate
the effects of the four closure
scenarios for 19
yearstotal
simulation time
was
20
years
The MODFLOW model allowed
use
of both HELP
cases
ponded
and not
ponded
at the
same
time
Decreasing percolation
rates
were simulated
using
time-dependent
specified
flux
recharge
boundary
Leachate
concentrations
in
percolation recharge
water
were
held constant
in this
analysis
Four
prediction
scenarios
were
modeled
one
for each closure scenario
modeled with HELP
MODEL REPORT
Natural
Resource
Technology
Electronic Filing - Received, Clerks' Office, August 11, 2008--Exhibits 1,2,5-10, & 12
HUTSONVILLE
GROUND
WA TER MODEL EVALUATION
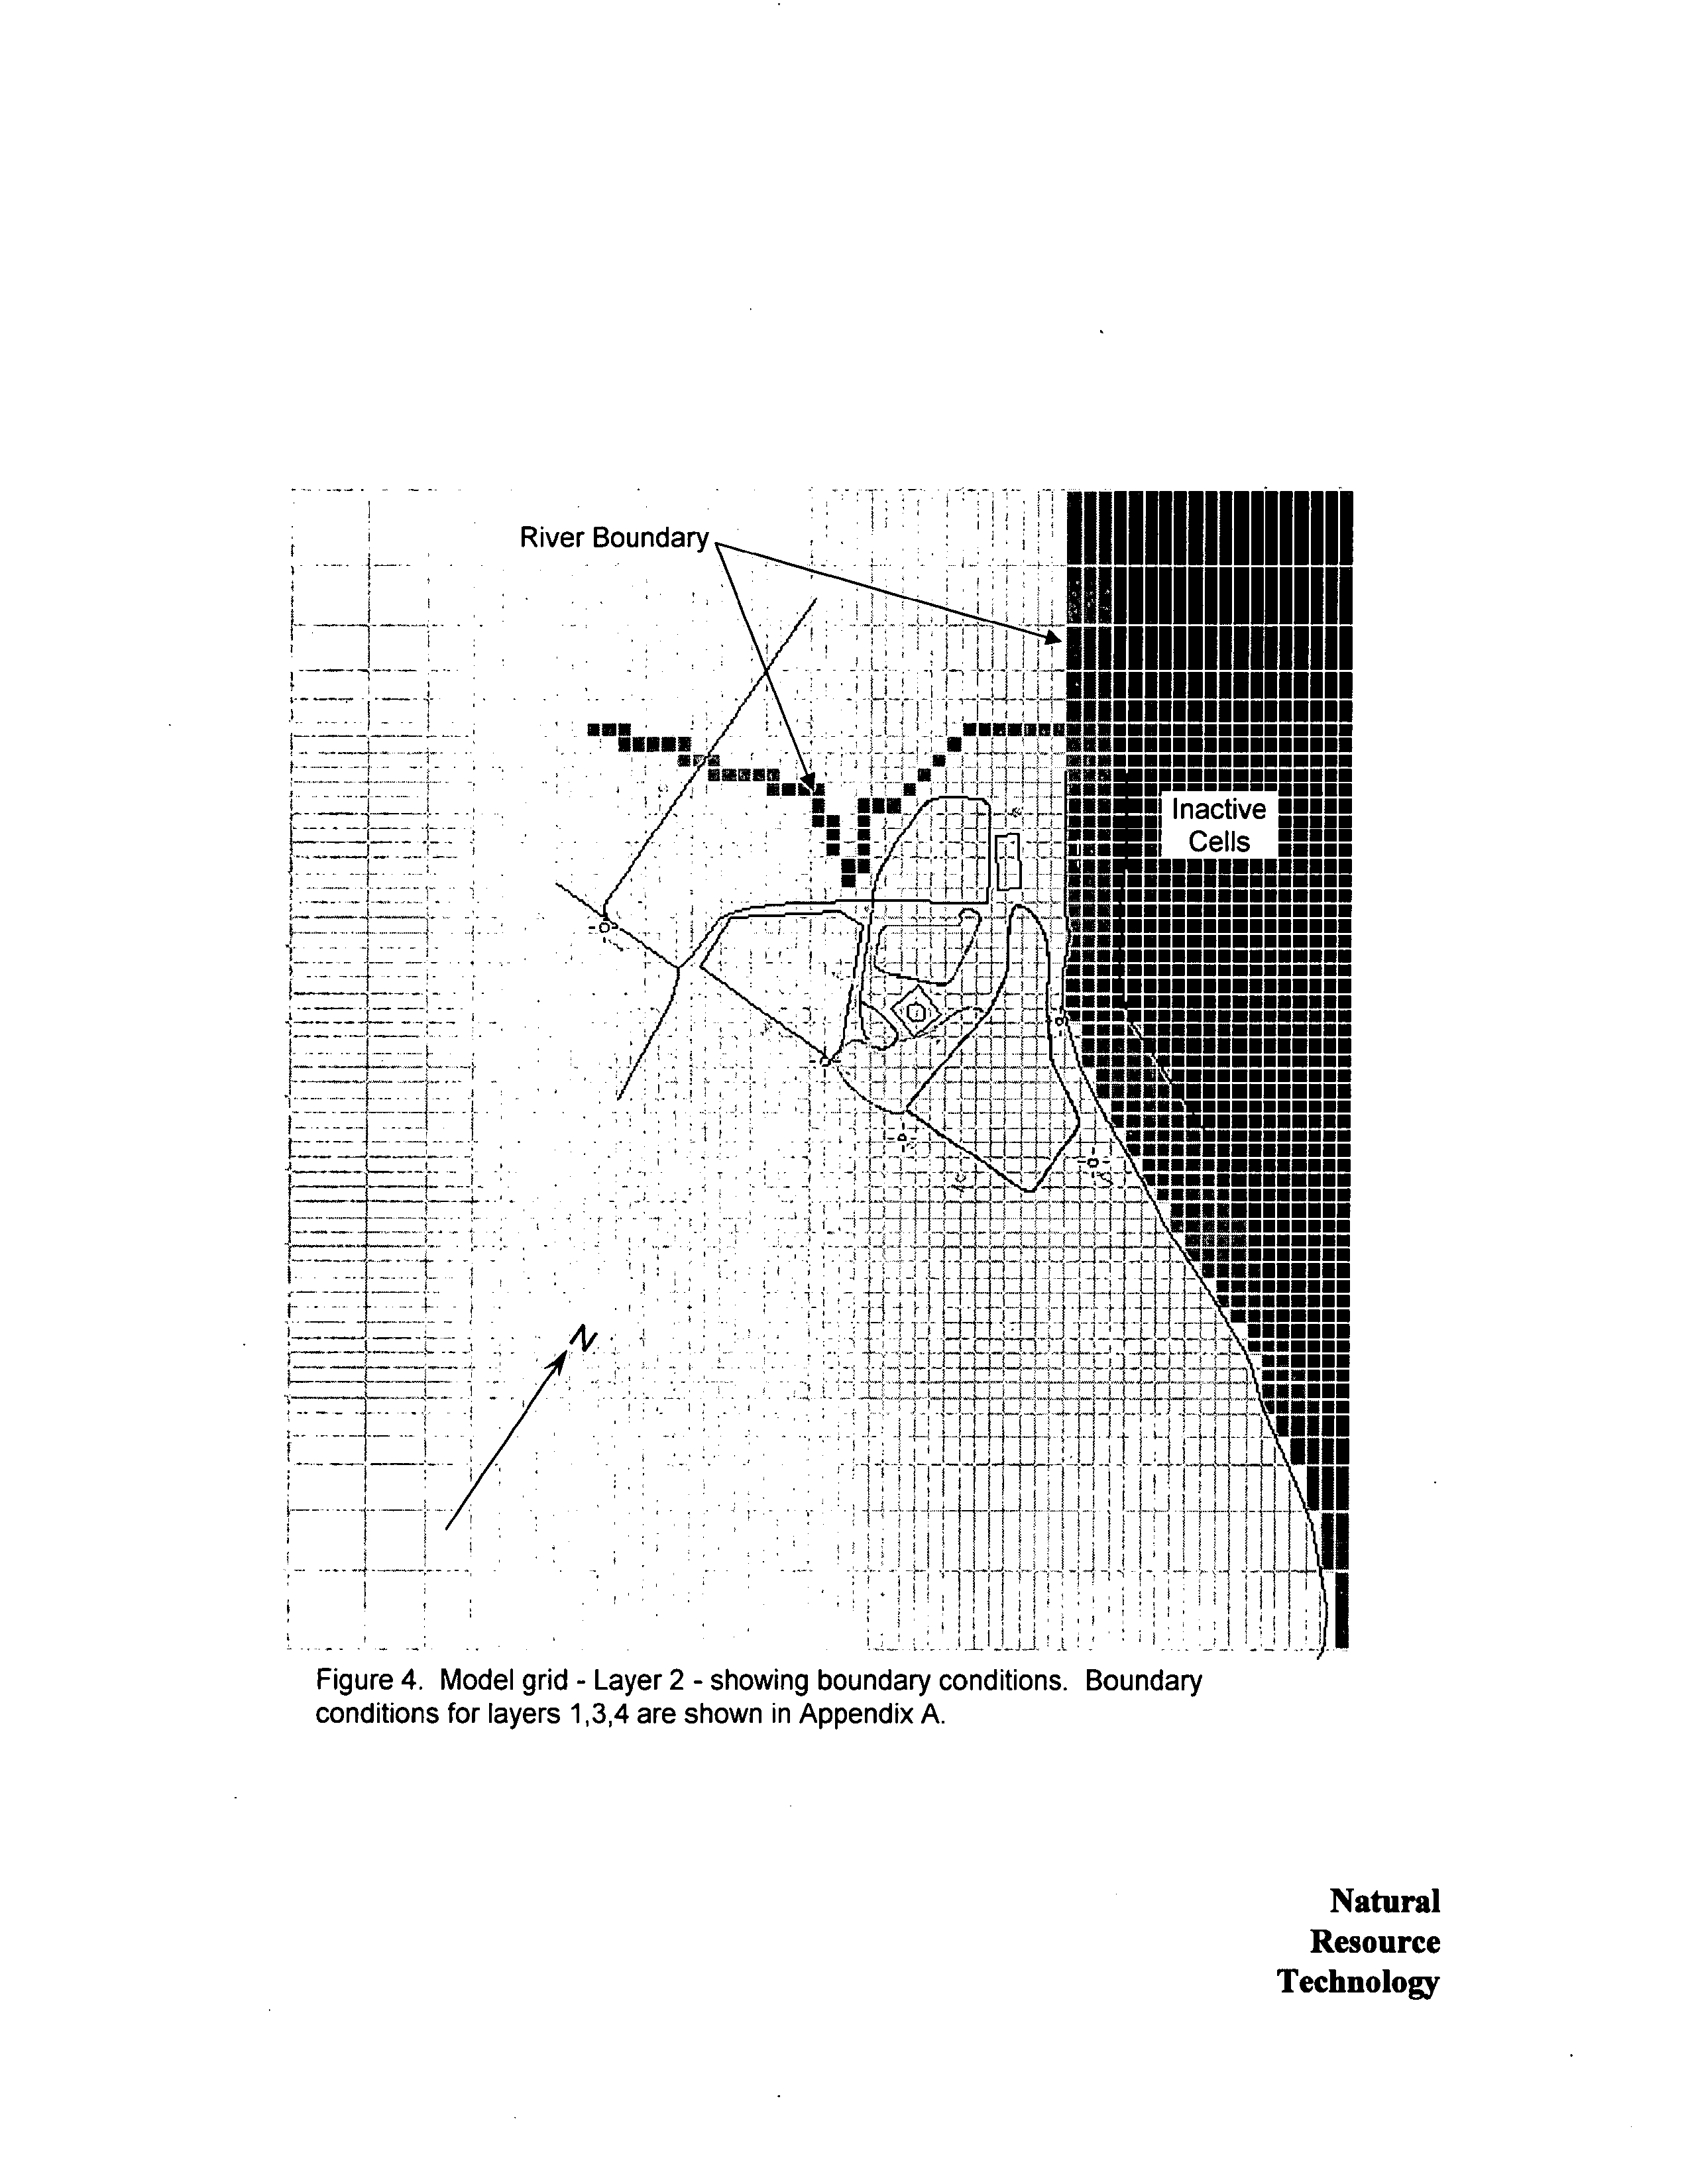
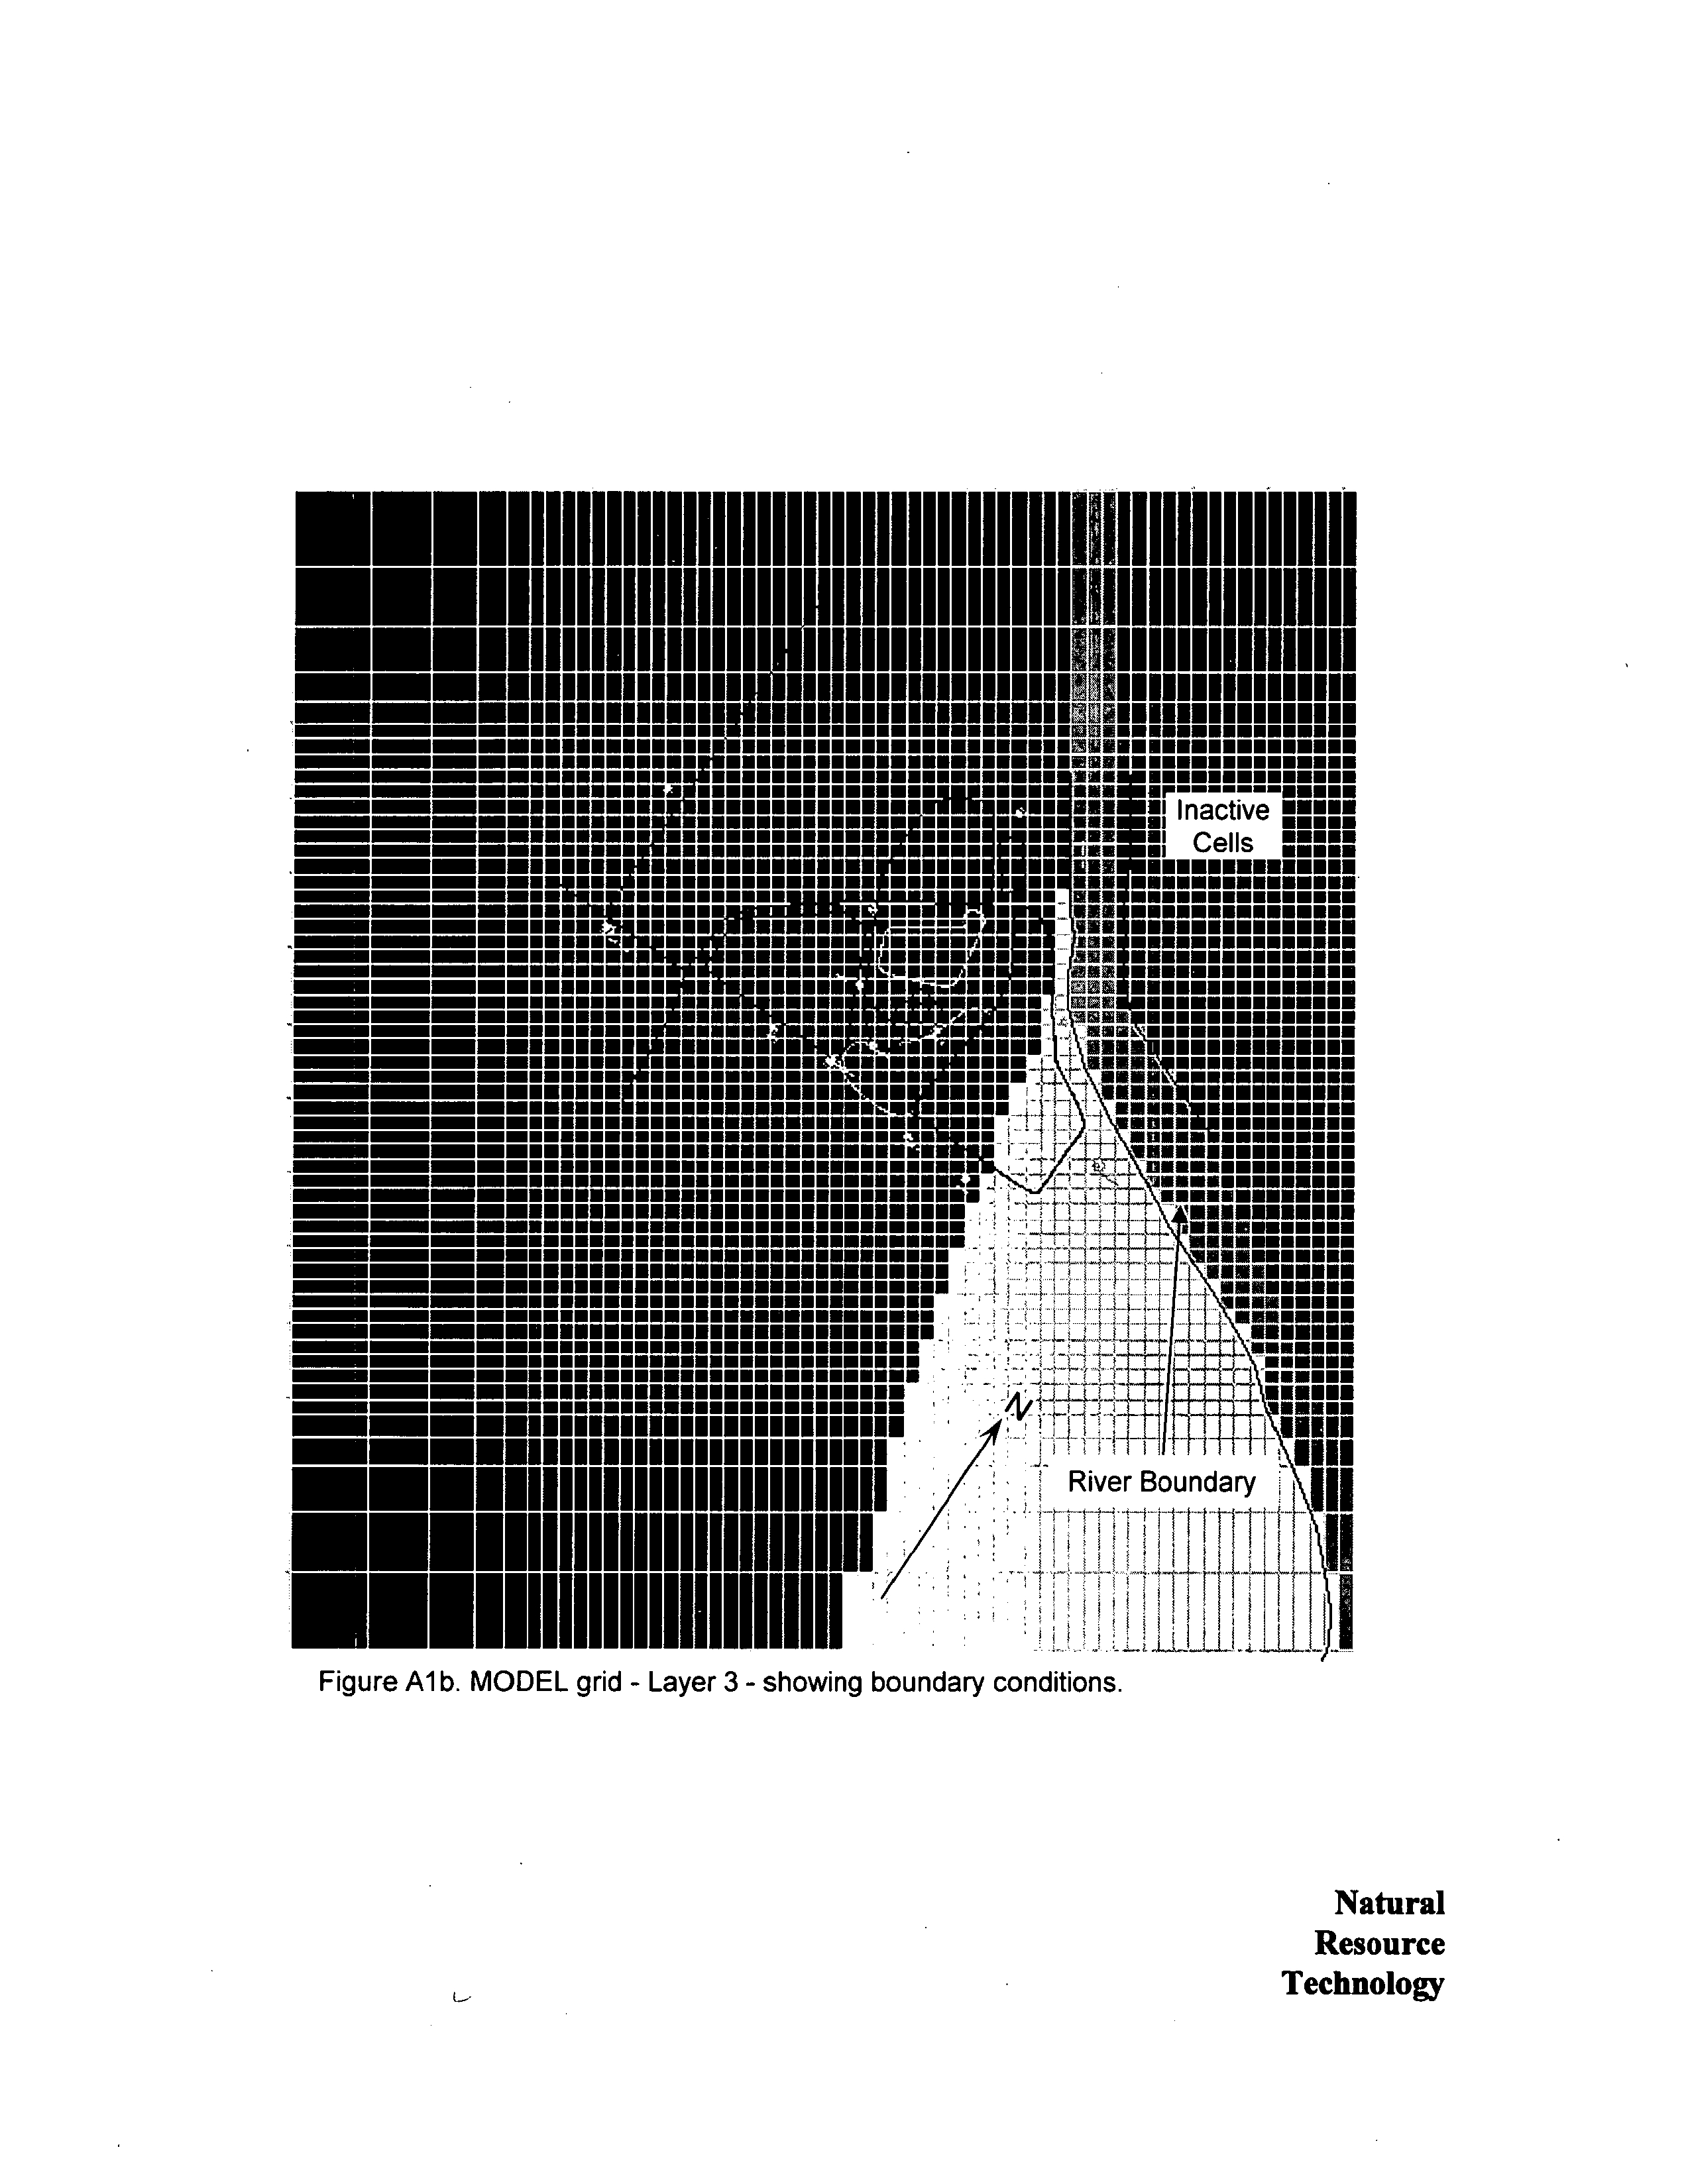
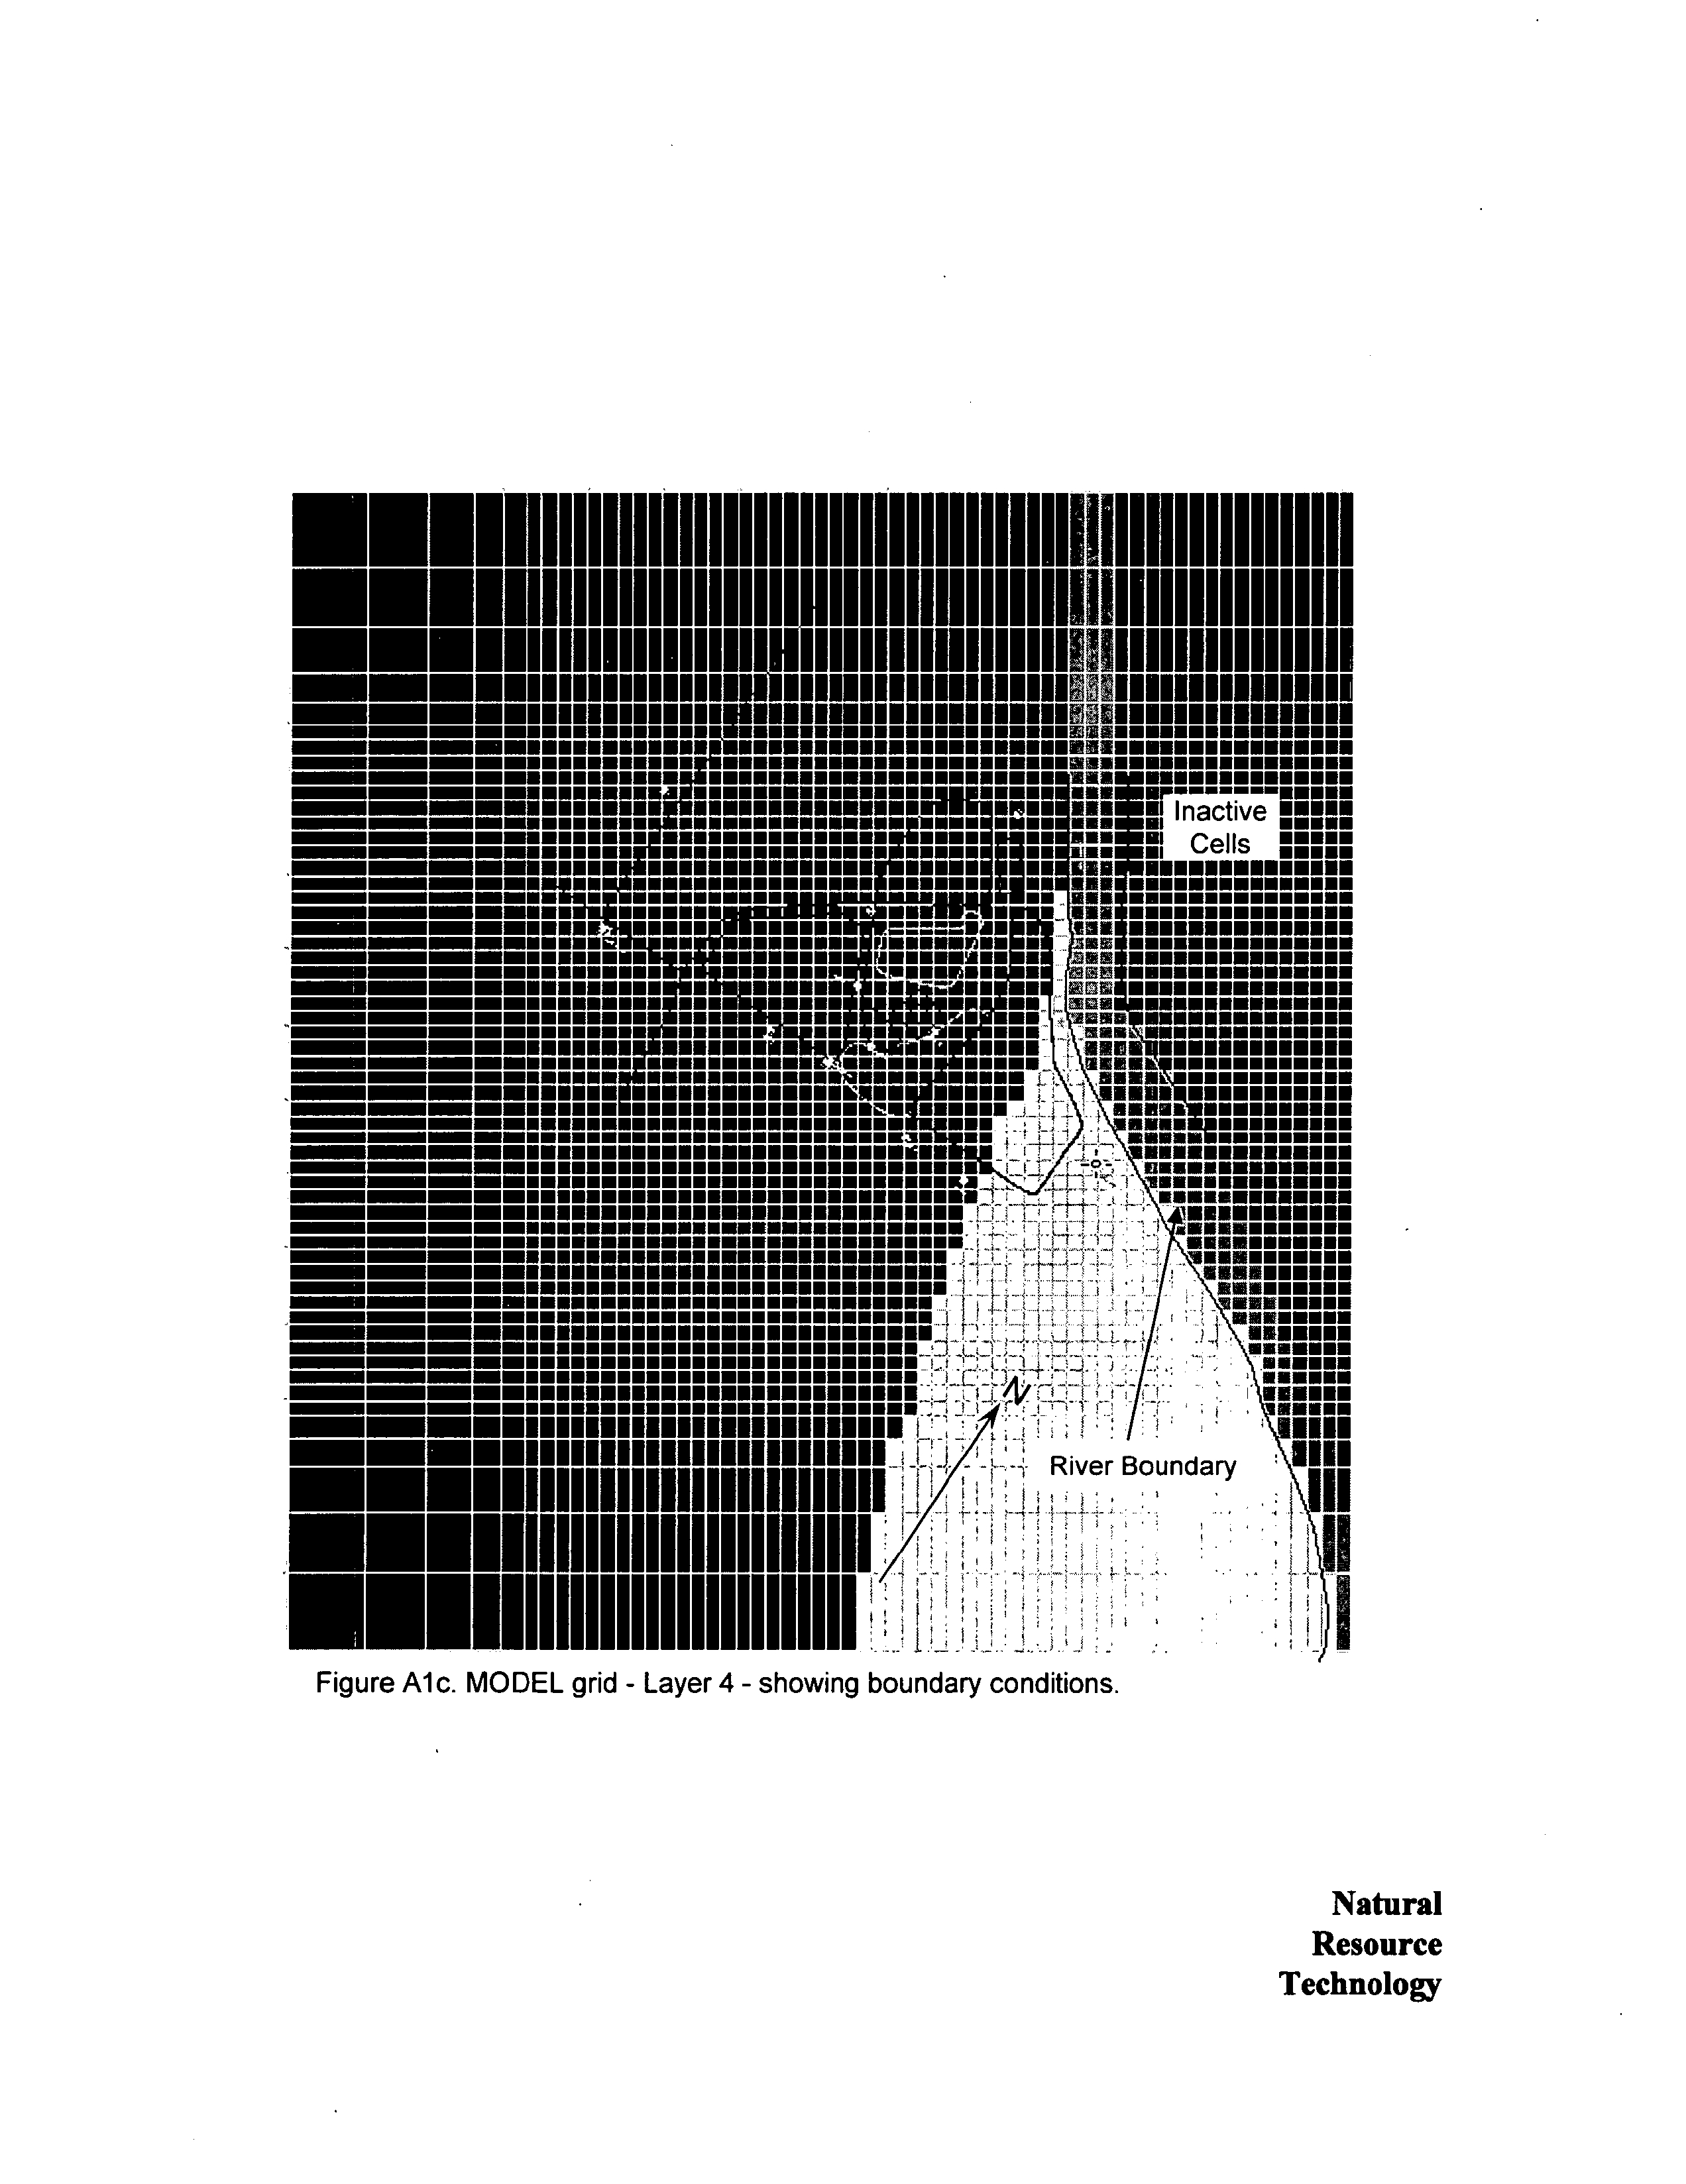
Grid and
Boundaries
four
layer
56
by
60 node
grid
was established
with variable
grid spacing ranging
from 100 feet
to 500 feet in
length parallel
to the
primary
flow
direction and 100 feet to 500 feet
perpendicular
to
the
primary
flow
direction
Figure
The
largest
node
spacings
were near
the
upgradient
and
lateral model
boundaries
and the finest node
spacings
were
along
the
river and
near
the
impoundment
Flow and
transport
boundaries
Figure
Appendix
were
the
same
for all scenarios
The
upgradient
edge
of the model was
constant head
Dirichiet boundary
The lower and lateral
boundaries
were
no-flow
Neumann
boundaries
The
downgradient
boundaries
were
either
MODFLOW river
Mixed
boundaries
layers 2-4
or no
flow
layer
The
upper
boundary
was
time-dependent specified
flux
Neumann boundary
with
specified
flux rates
equal
to the
recharge
rate or
the
rate
of
percolation
from the
impoundment
Two
types
of
transport
boundaries
were
used
Specified
mass
flux
Cauchy condition
boundaries
were
used
to simulate downward
percolation
of solute
mass
in
areas
where the
source
was
above the
water table
and
constant
concentration
Dirichlet condition
boundaries were used
in
areas
where the
source
i.e
coal
ash
was
below the water table
The former
boundary
condition
assigns
specified
concentration
to
recharge
water
entering
the
cell
and in
this
application
the
resulting
concentration
in the cell is
function of the relative
rate and
concentration
of water
percolating
from the ash
compared
to the rate and concentration
of
groundwater
flow The latter
boundary type assigns
the
specified
concentration
to all water
passing
through
the cell
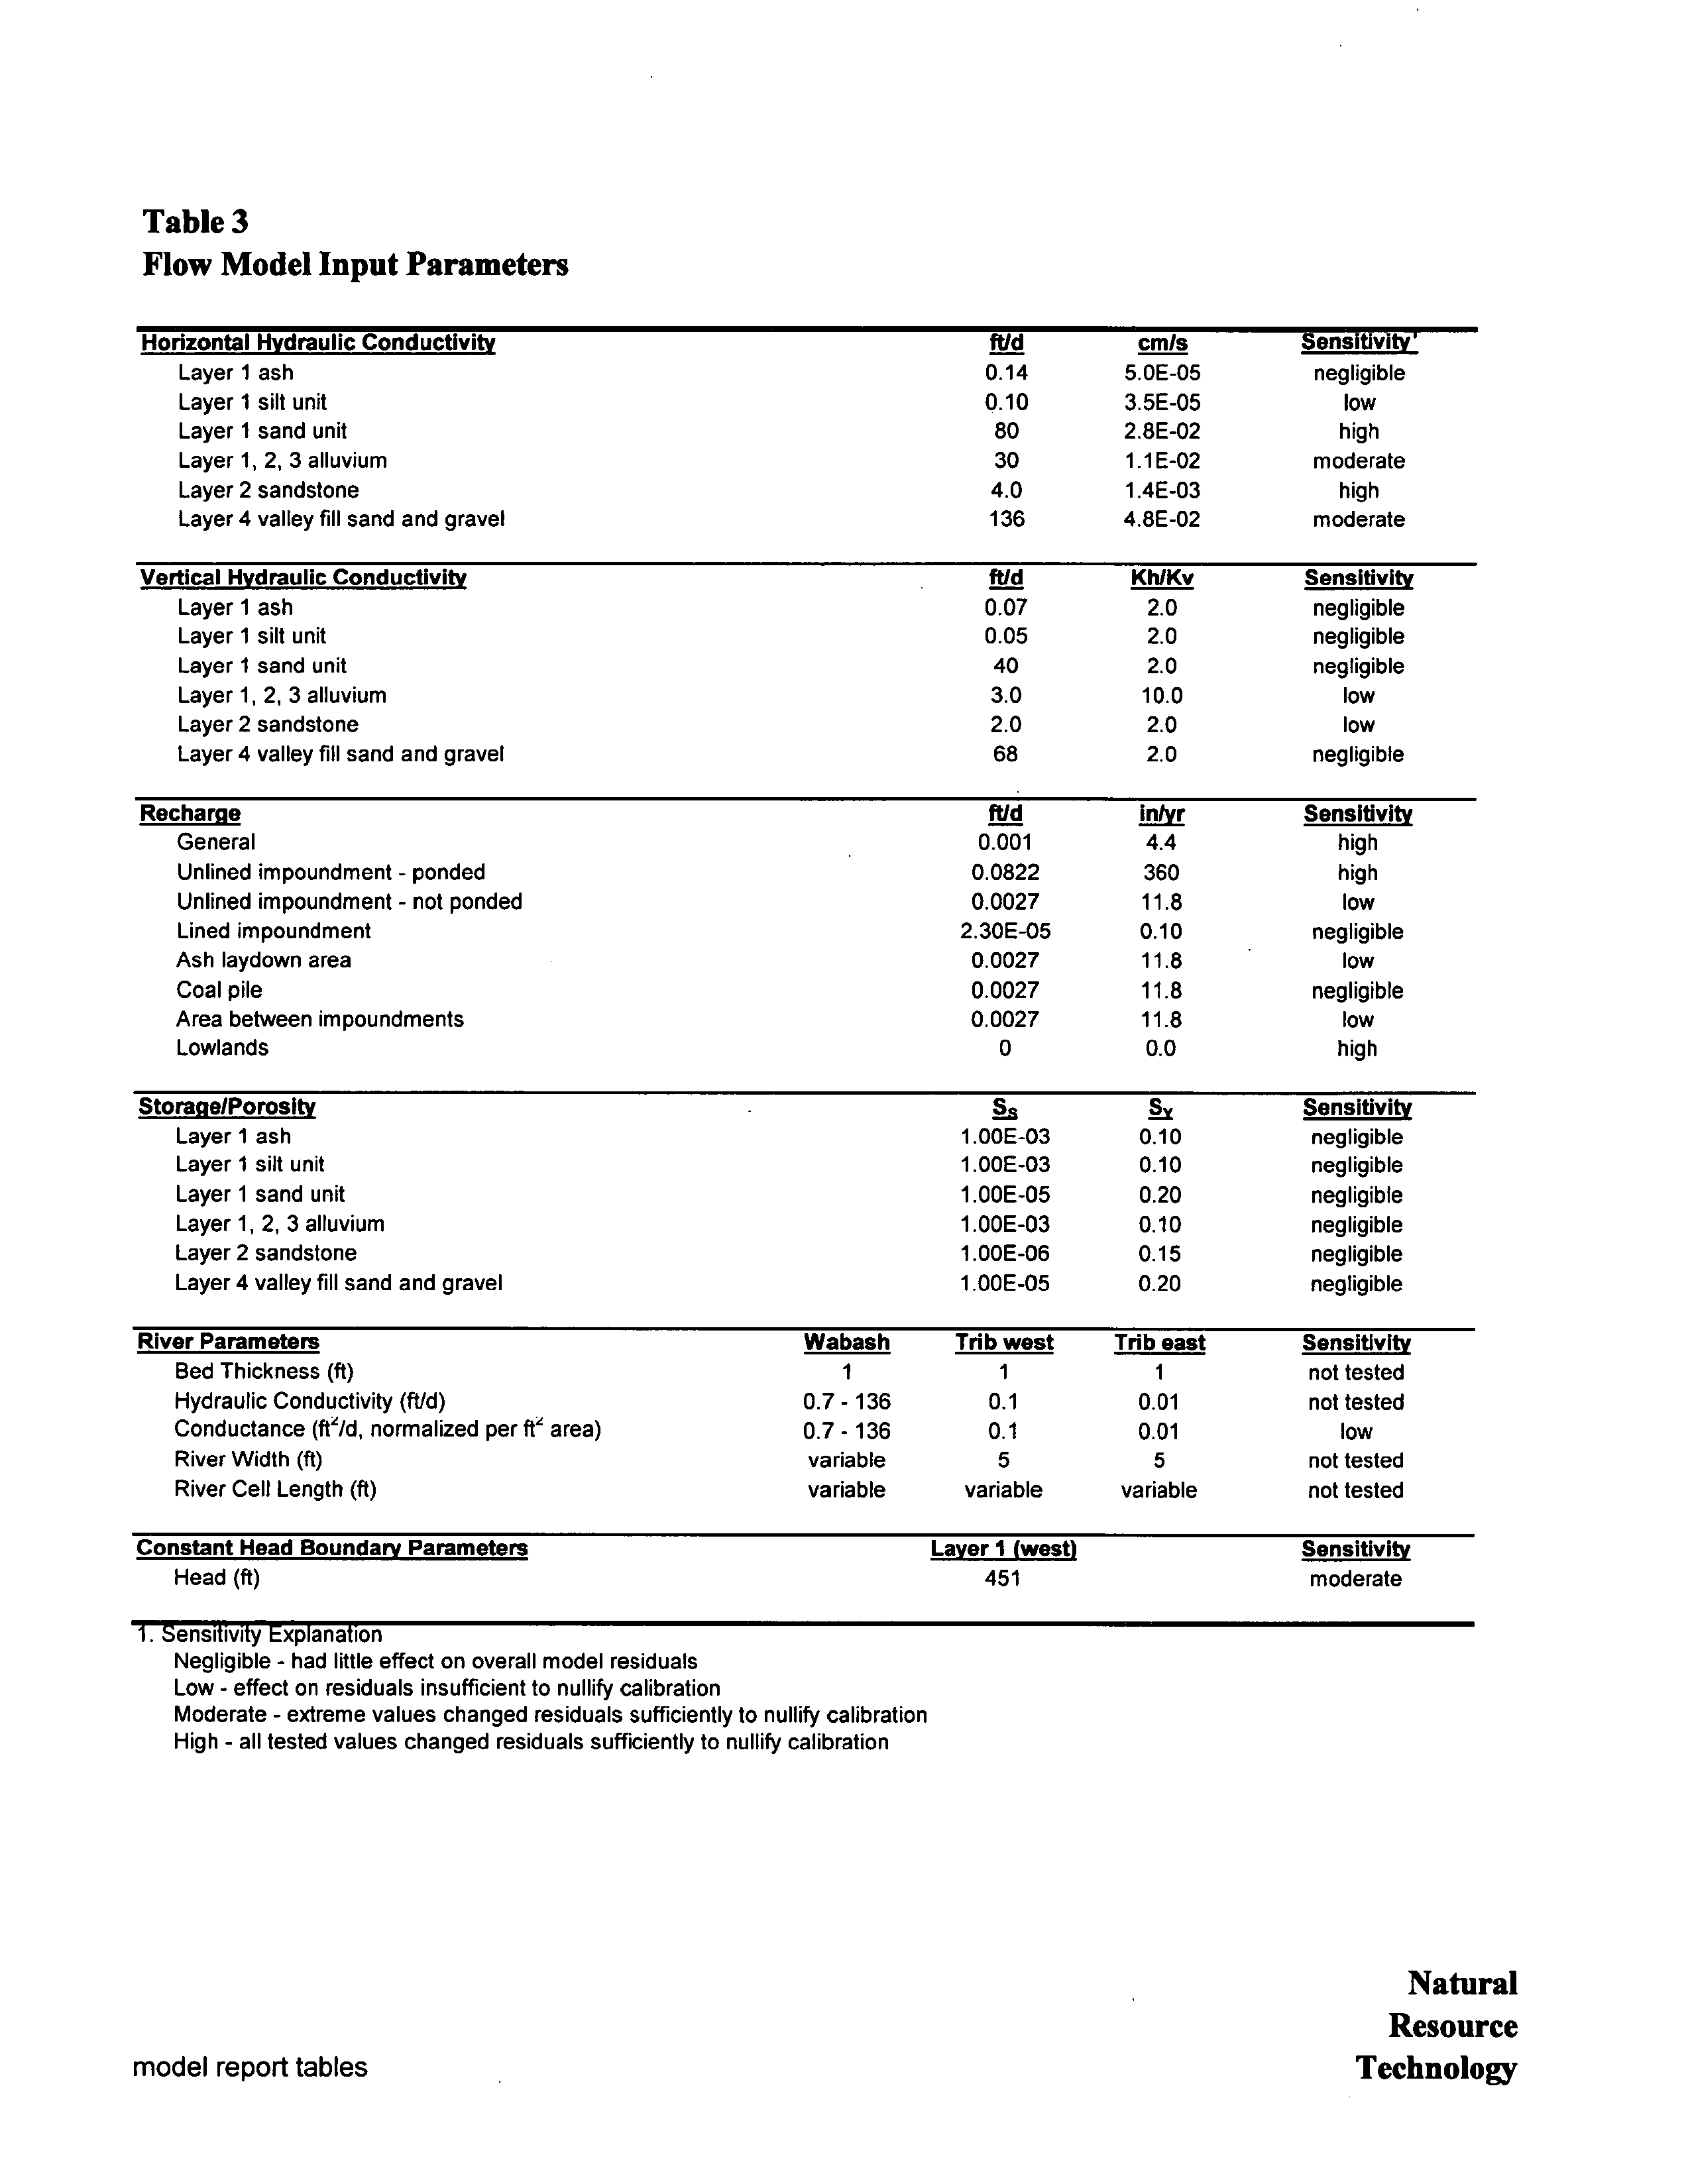
Flow Model
Input
Values and
Sensitivity
Flow model
input
values
are
listed in Table
and described below
Aquifer Top/Bottom
Groundwater in the
upper
sand
aquifer
is
unconfined
therefore the
top
of
the
aquifer
was the water table and the elevation of the
top
model
layer was
set at 460
feet
value
higher
than the water table
elevation
of 427 to 450 feet The
top
of
layers
2-4
was
the base
of the
overlying layer
MODEL REPORT
Natural
10
Resource
Technology
Electronic Filing - Received, Clerks' Office, August 11, 2008--Exhibits 1,2,5-10, & 12
HUTSONVILLE
GROUNDWATER MODEL EVALUATION
The base of the
upper
sand unit was determined
by
contouring
bedrock elevation and
importing
the contour data into MODFLOW The
corresponding
base elevations for
layer
were
between
424 and 450
feet
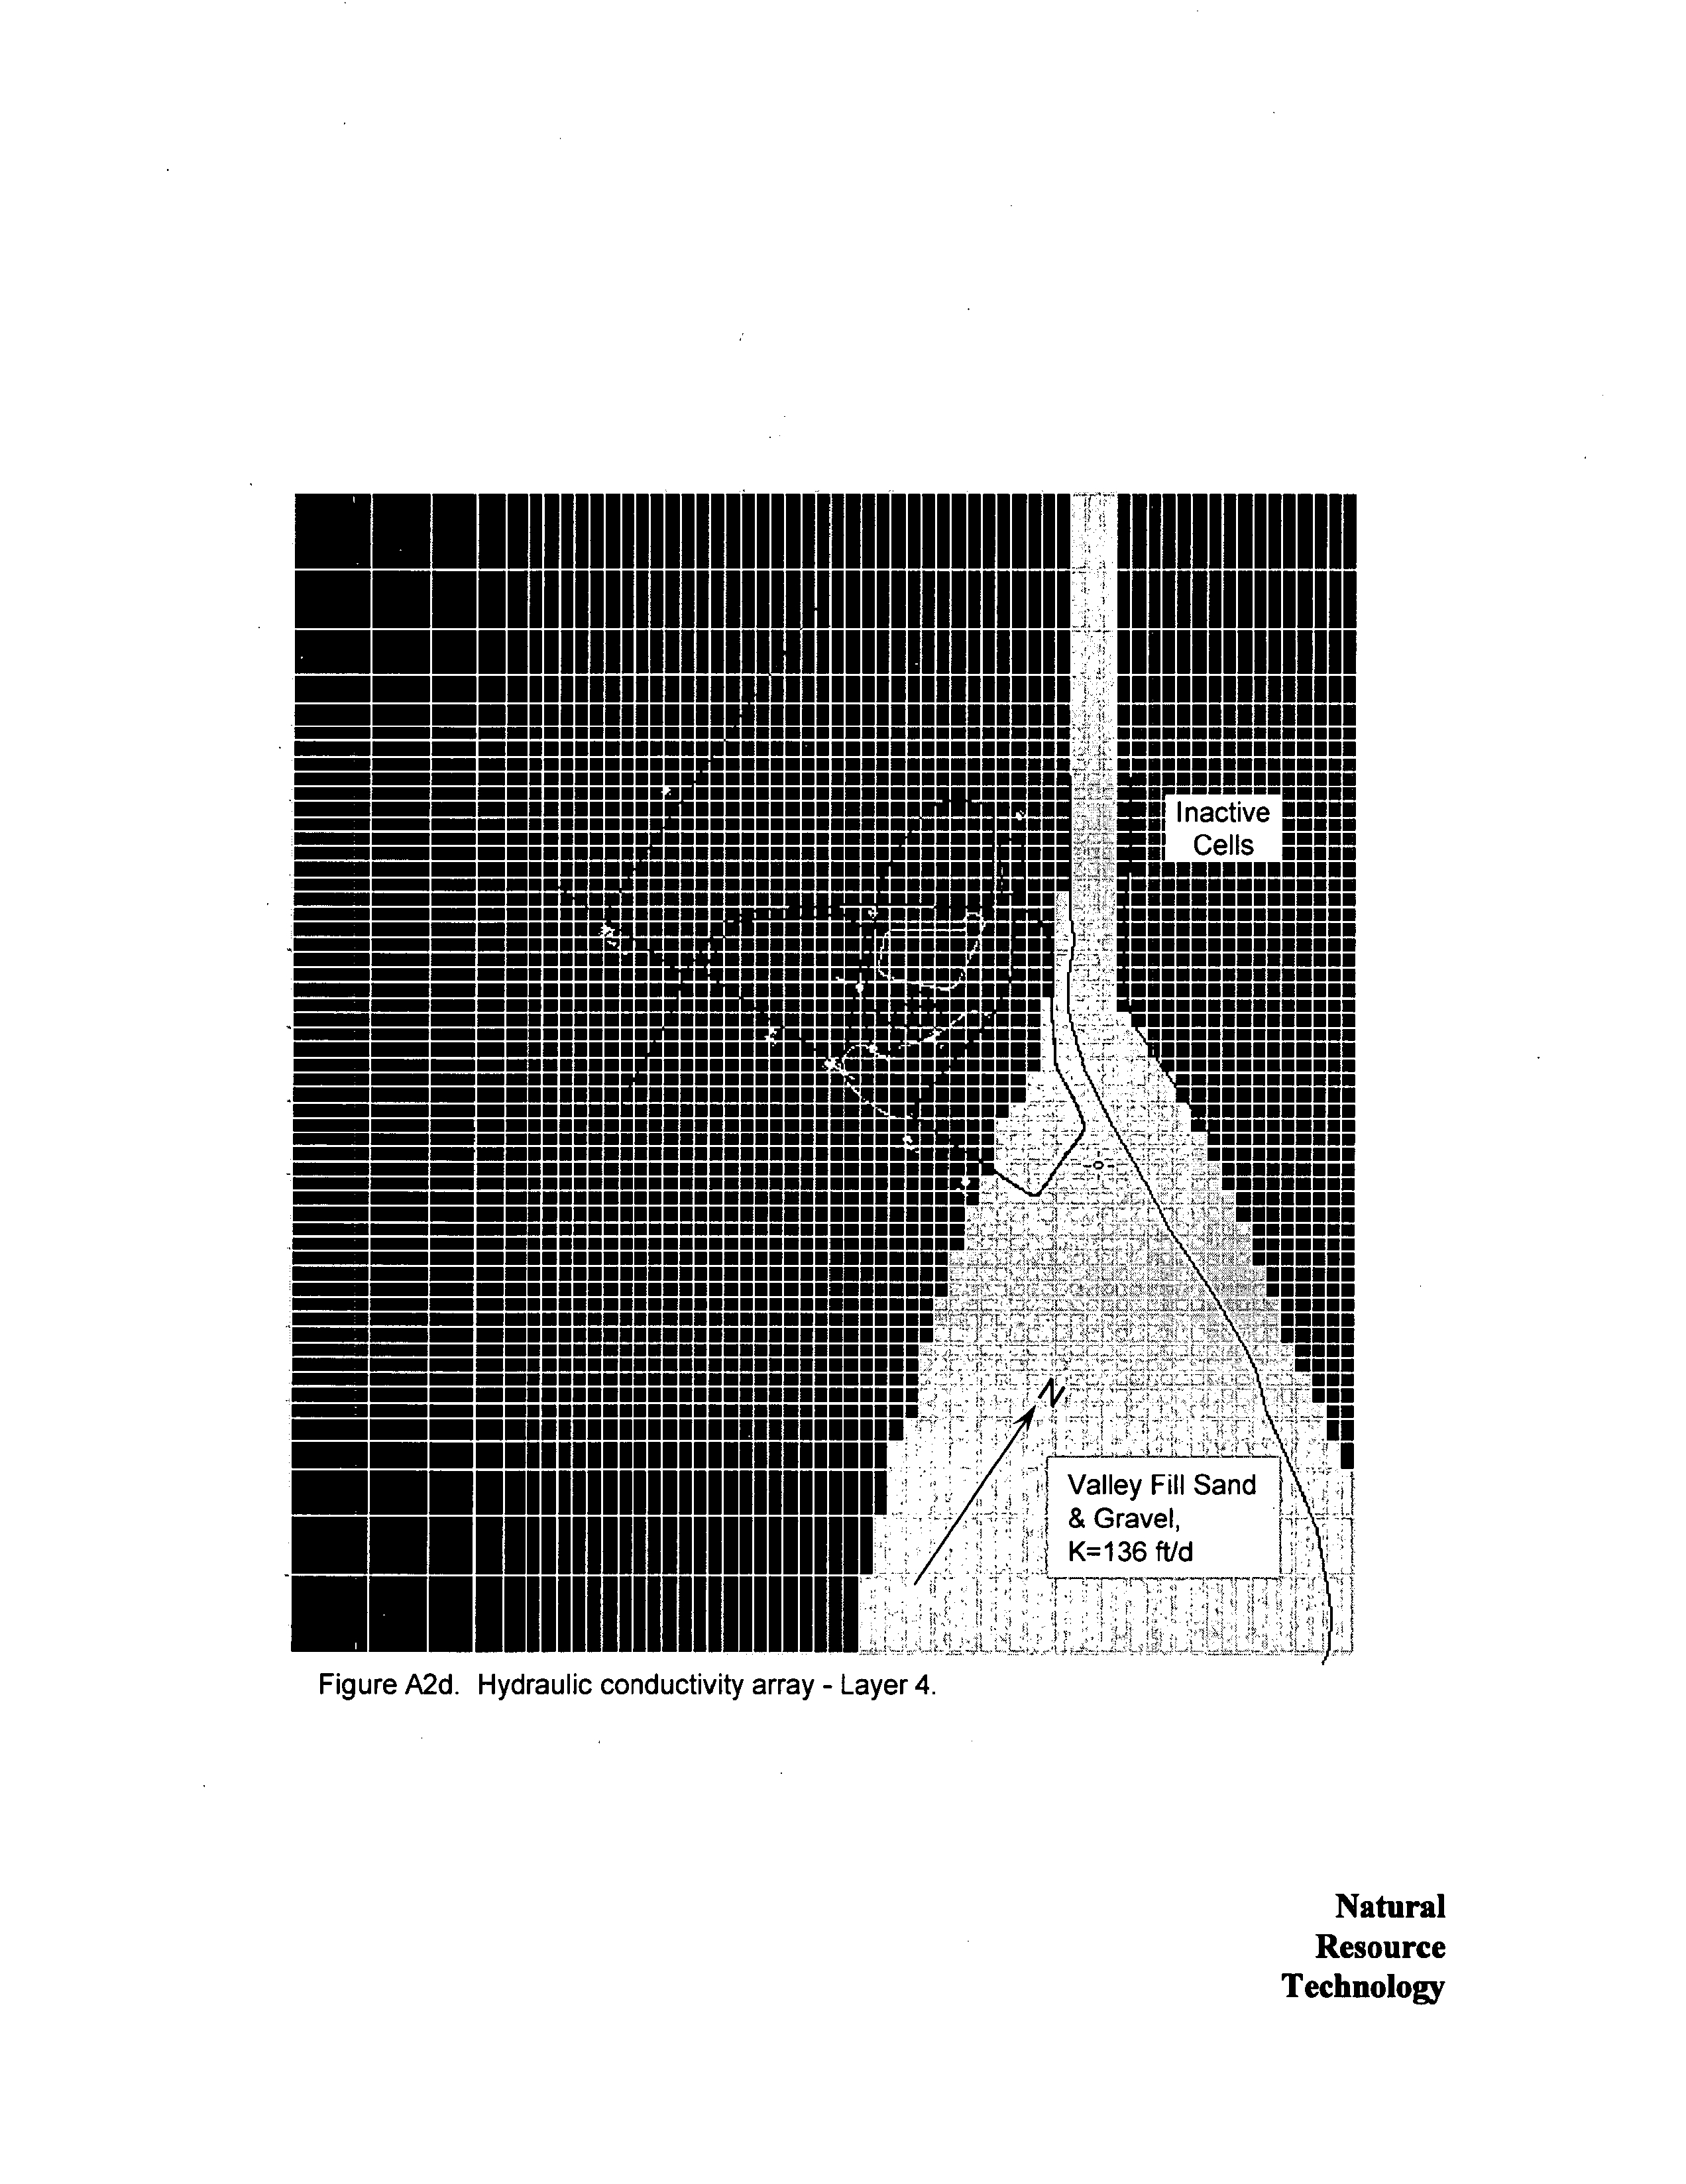
The base of the second
layer corresponded
to the base of the
sandstone
418 feet The base of the third
layer corresponded
to the
top
of the
valley
fill sand
unit
412 feet
The base of the bottom
layer 350 feet corresponded
to the base of the unlithified fill in the
Wabash
River
valley
Layer
one
of the model included
zone
with
hydraulic conductivity
representing
coal
ash
This
zone was
also used
as
source
area representing
saturated
ash
during prediction modeling
The
base elevation of this
zone was
based
on
contouring
as was
the rest of model
layer
Base
elevations
were contoured
from 424
to
444 feet
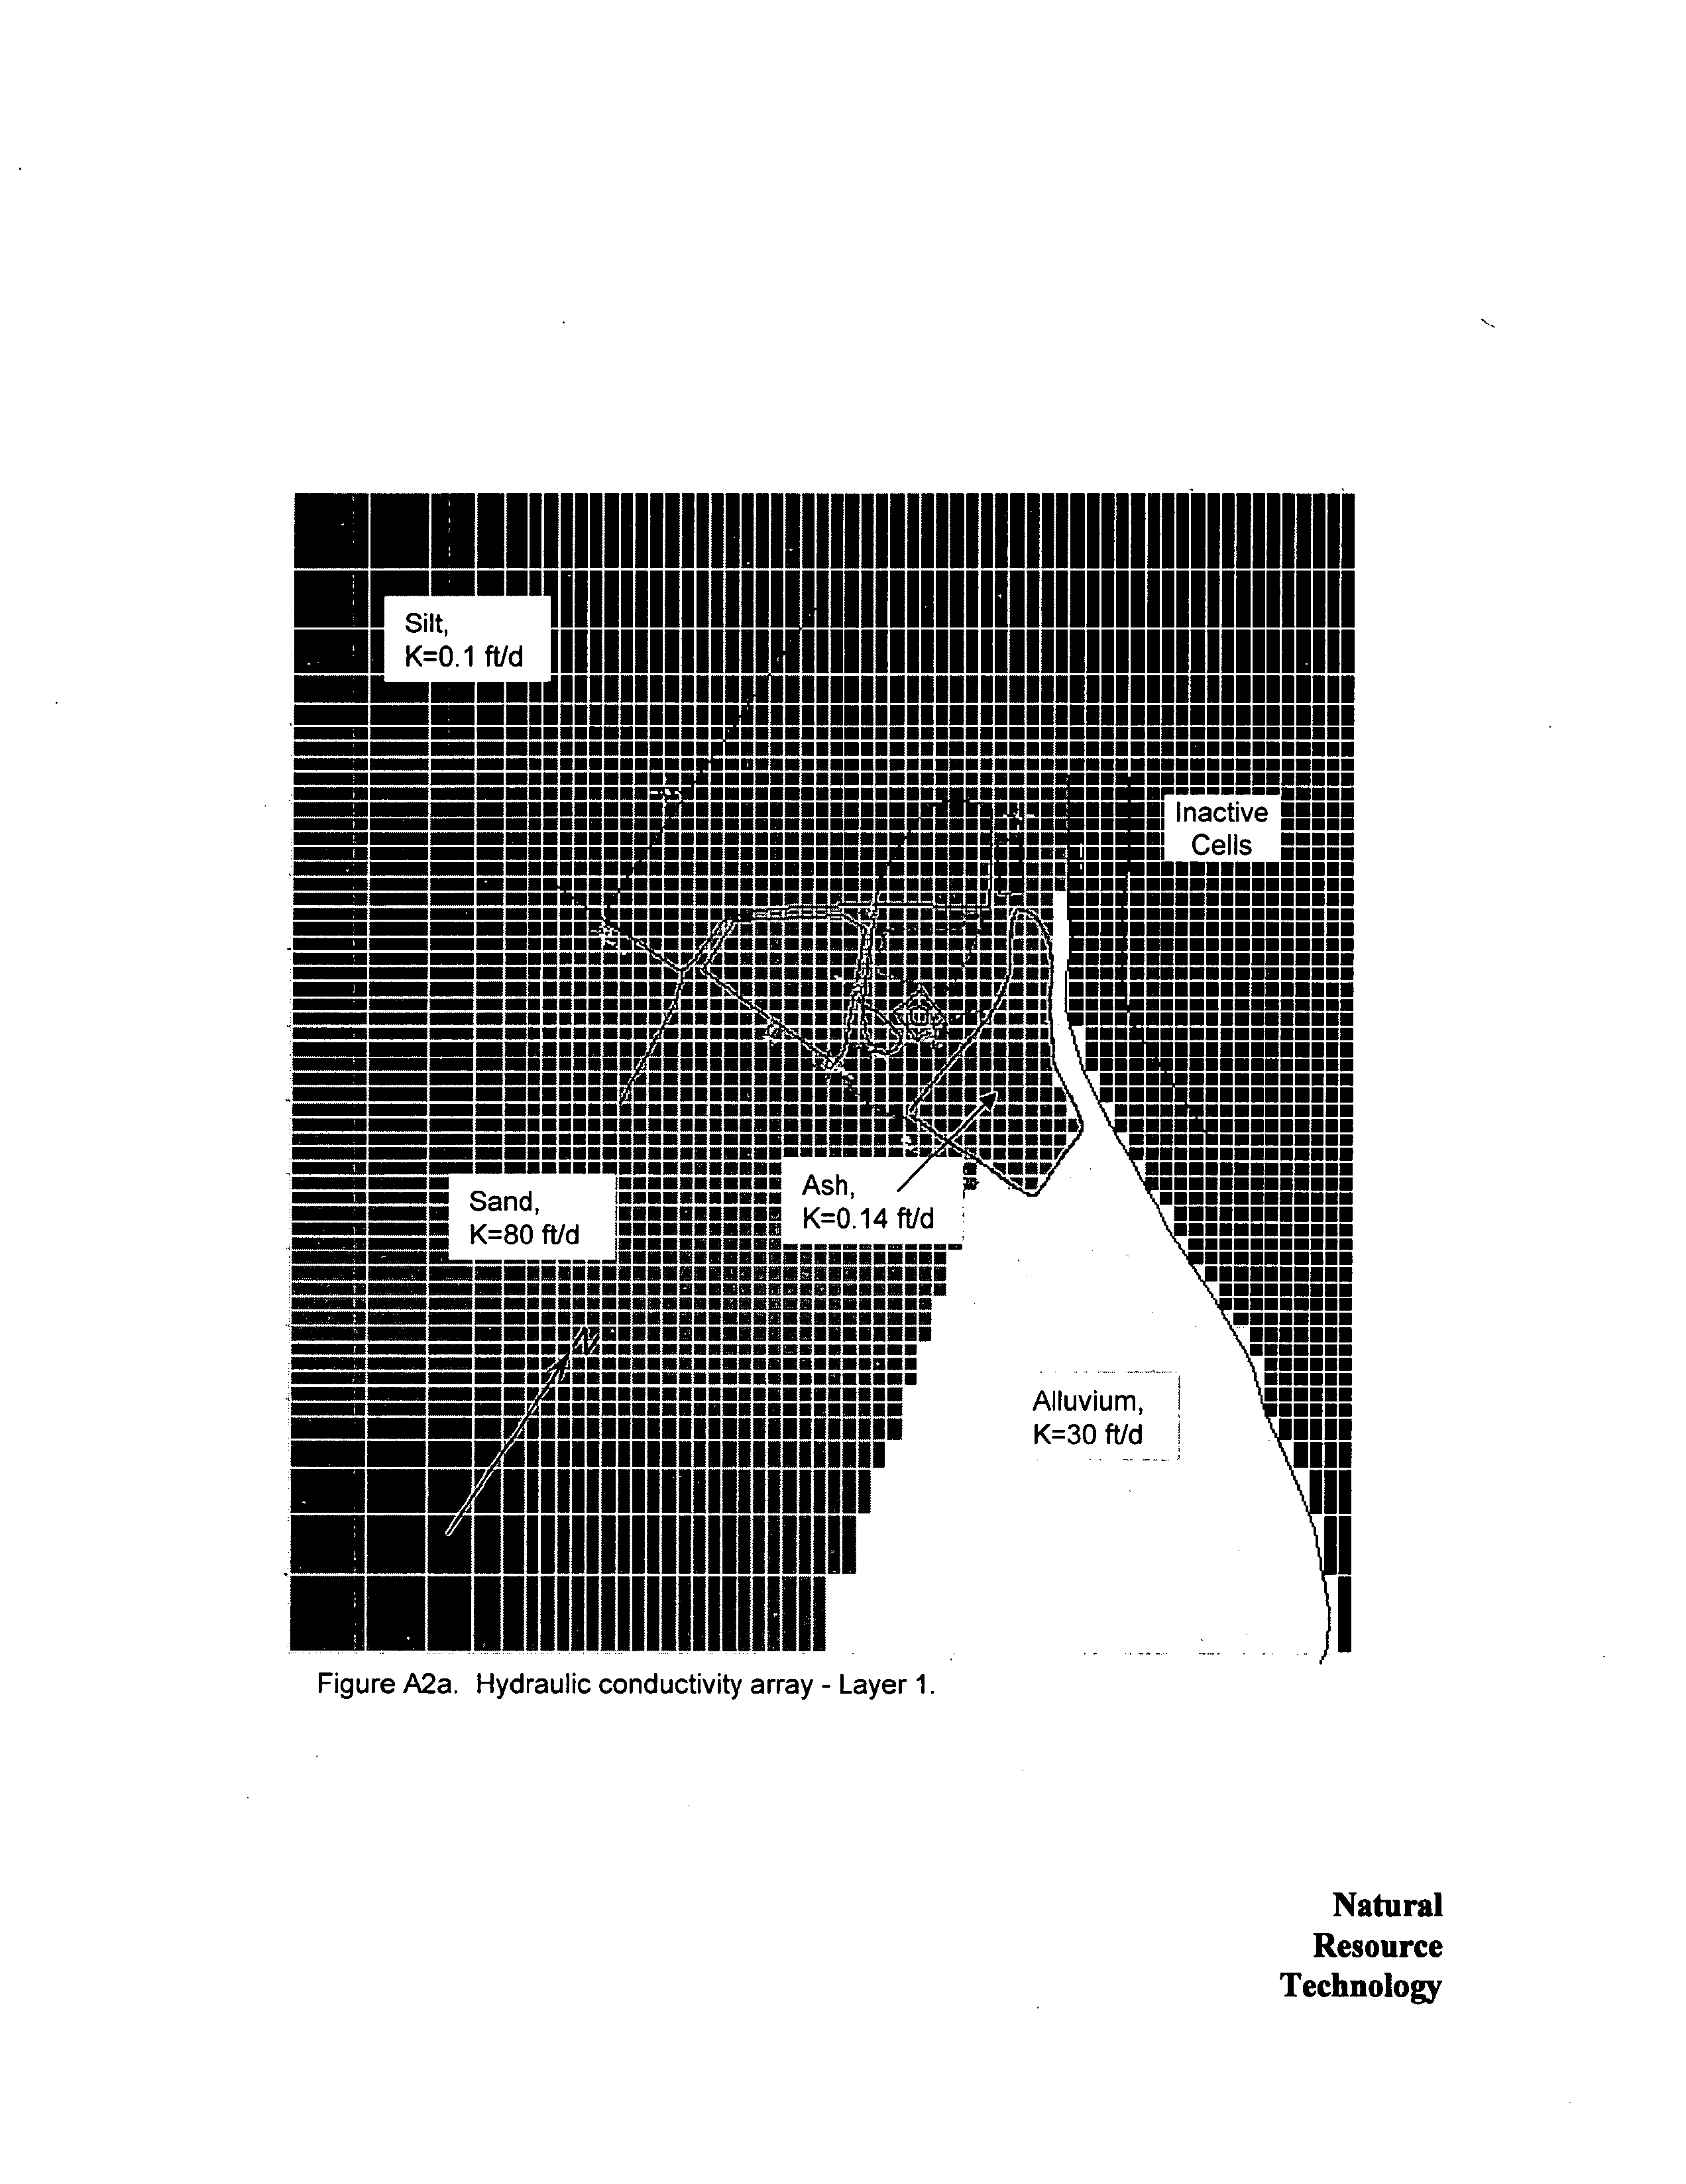
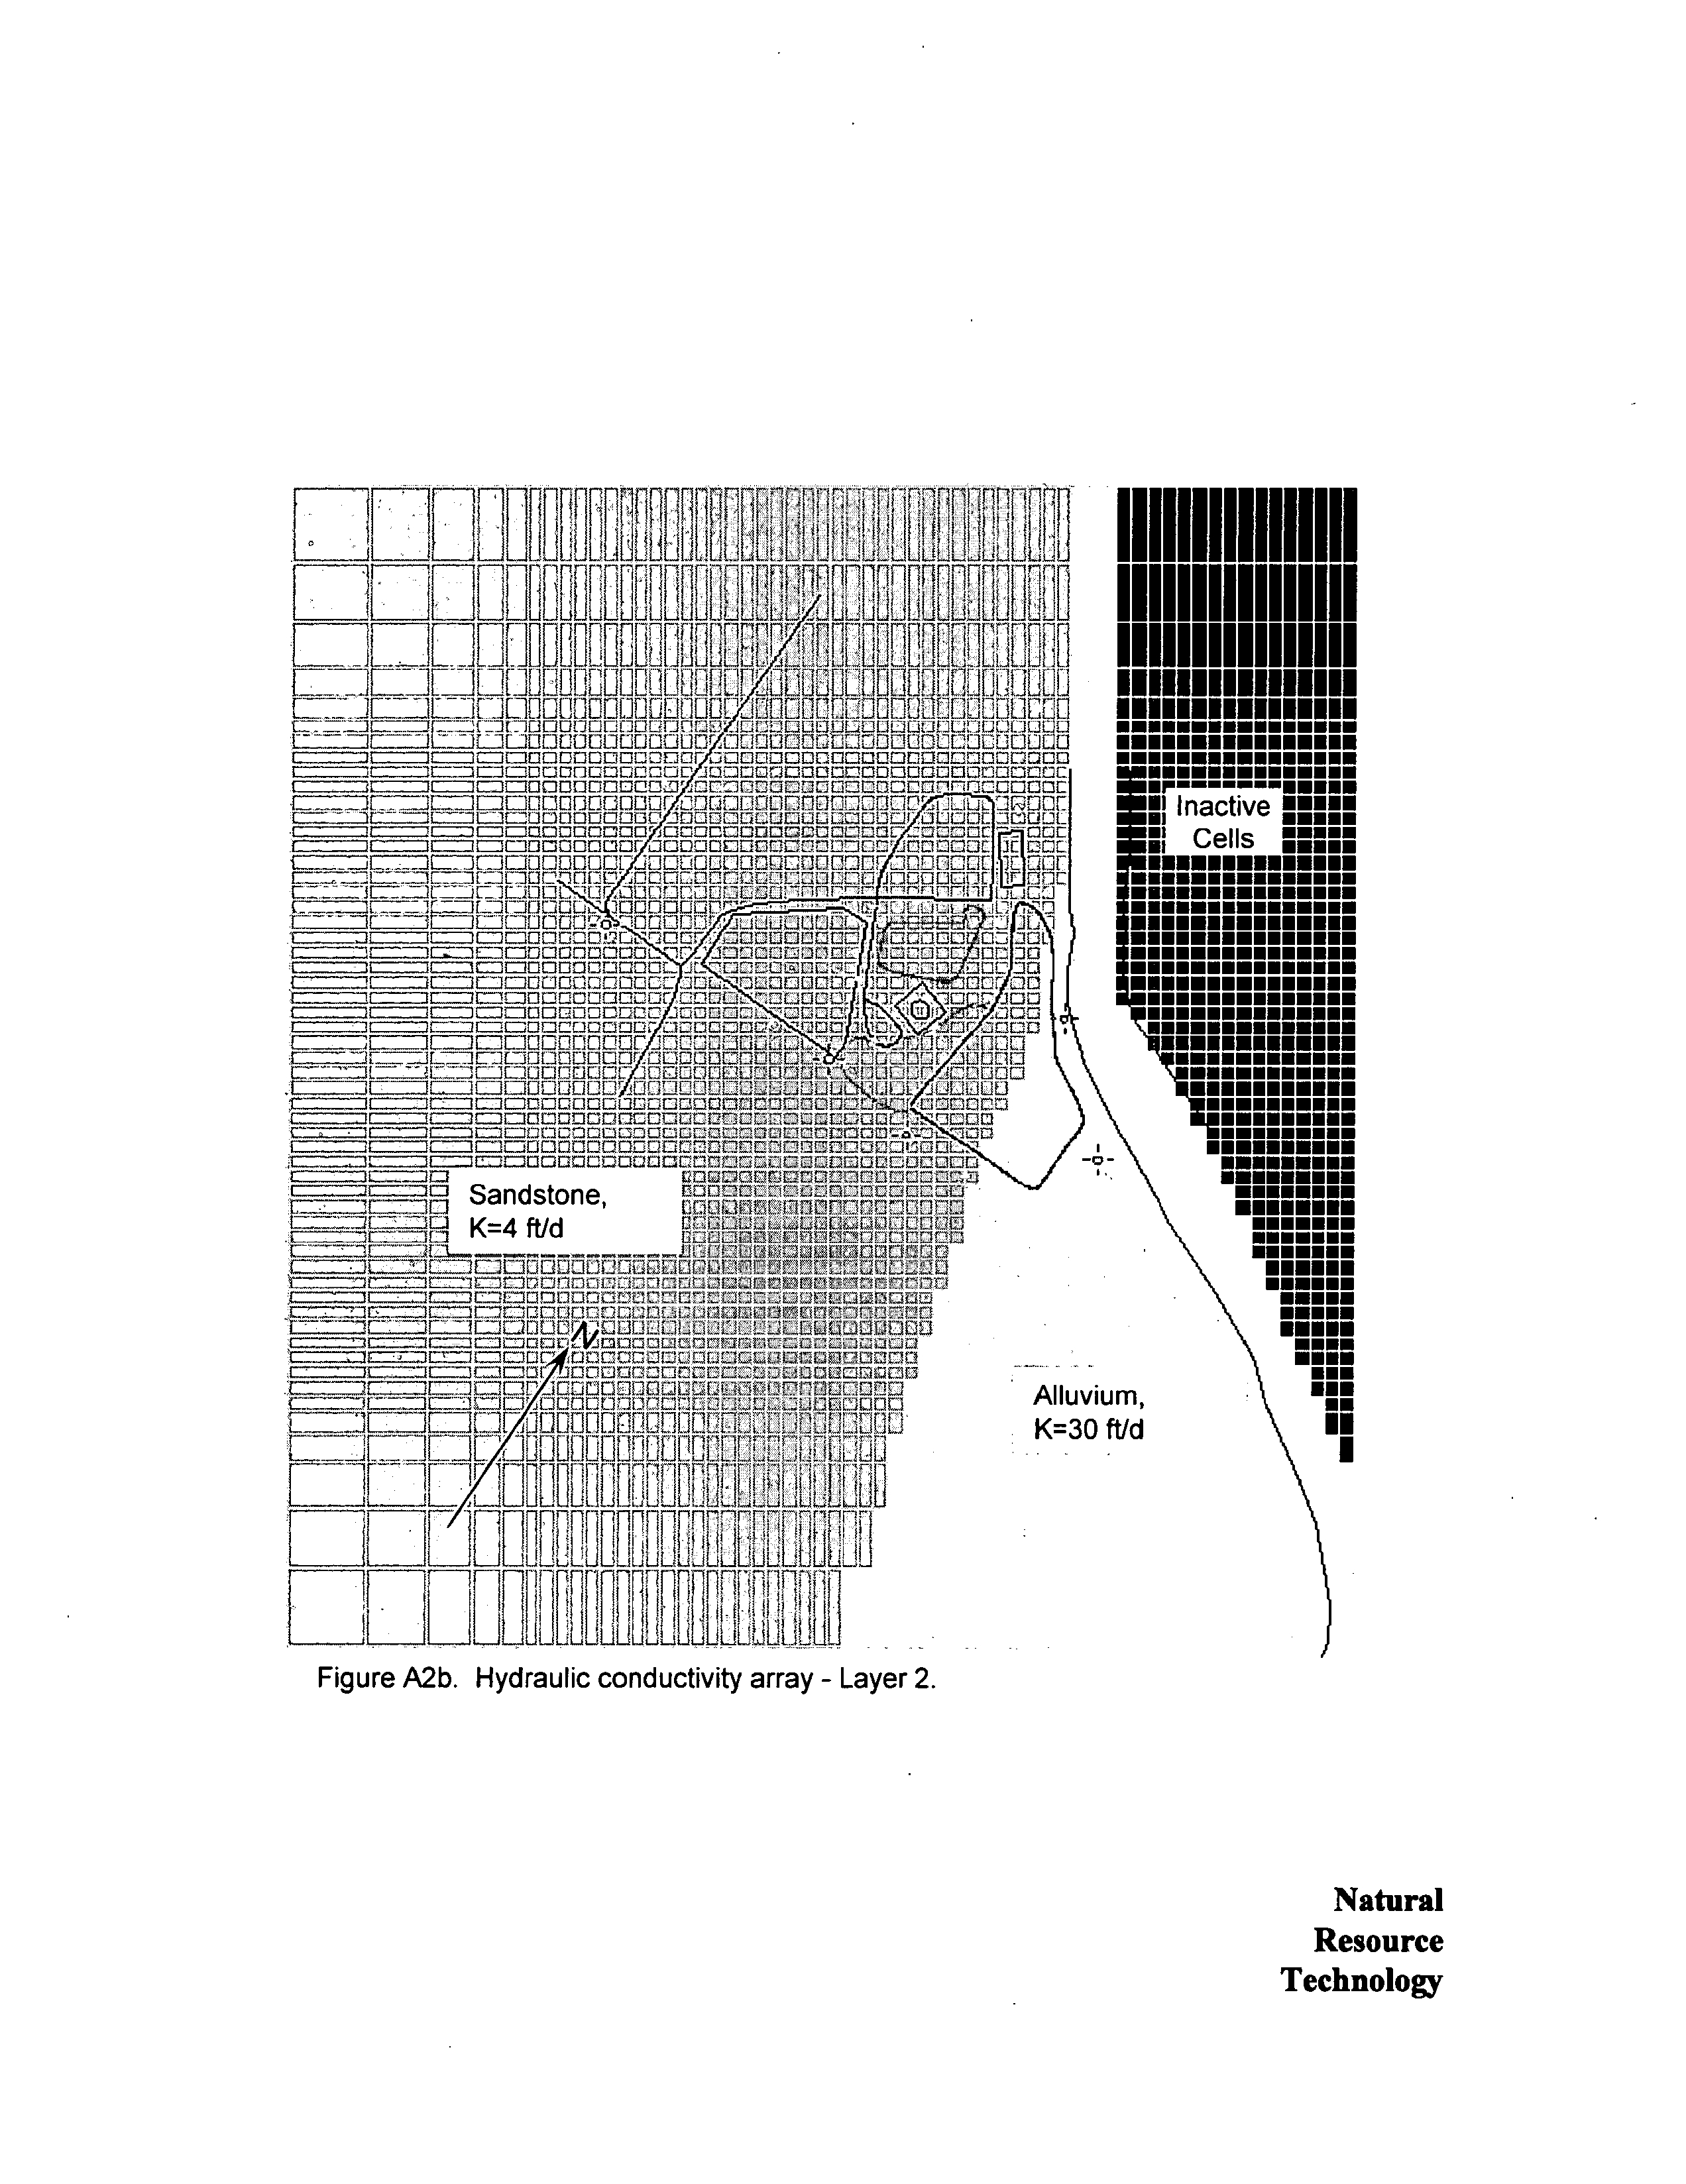
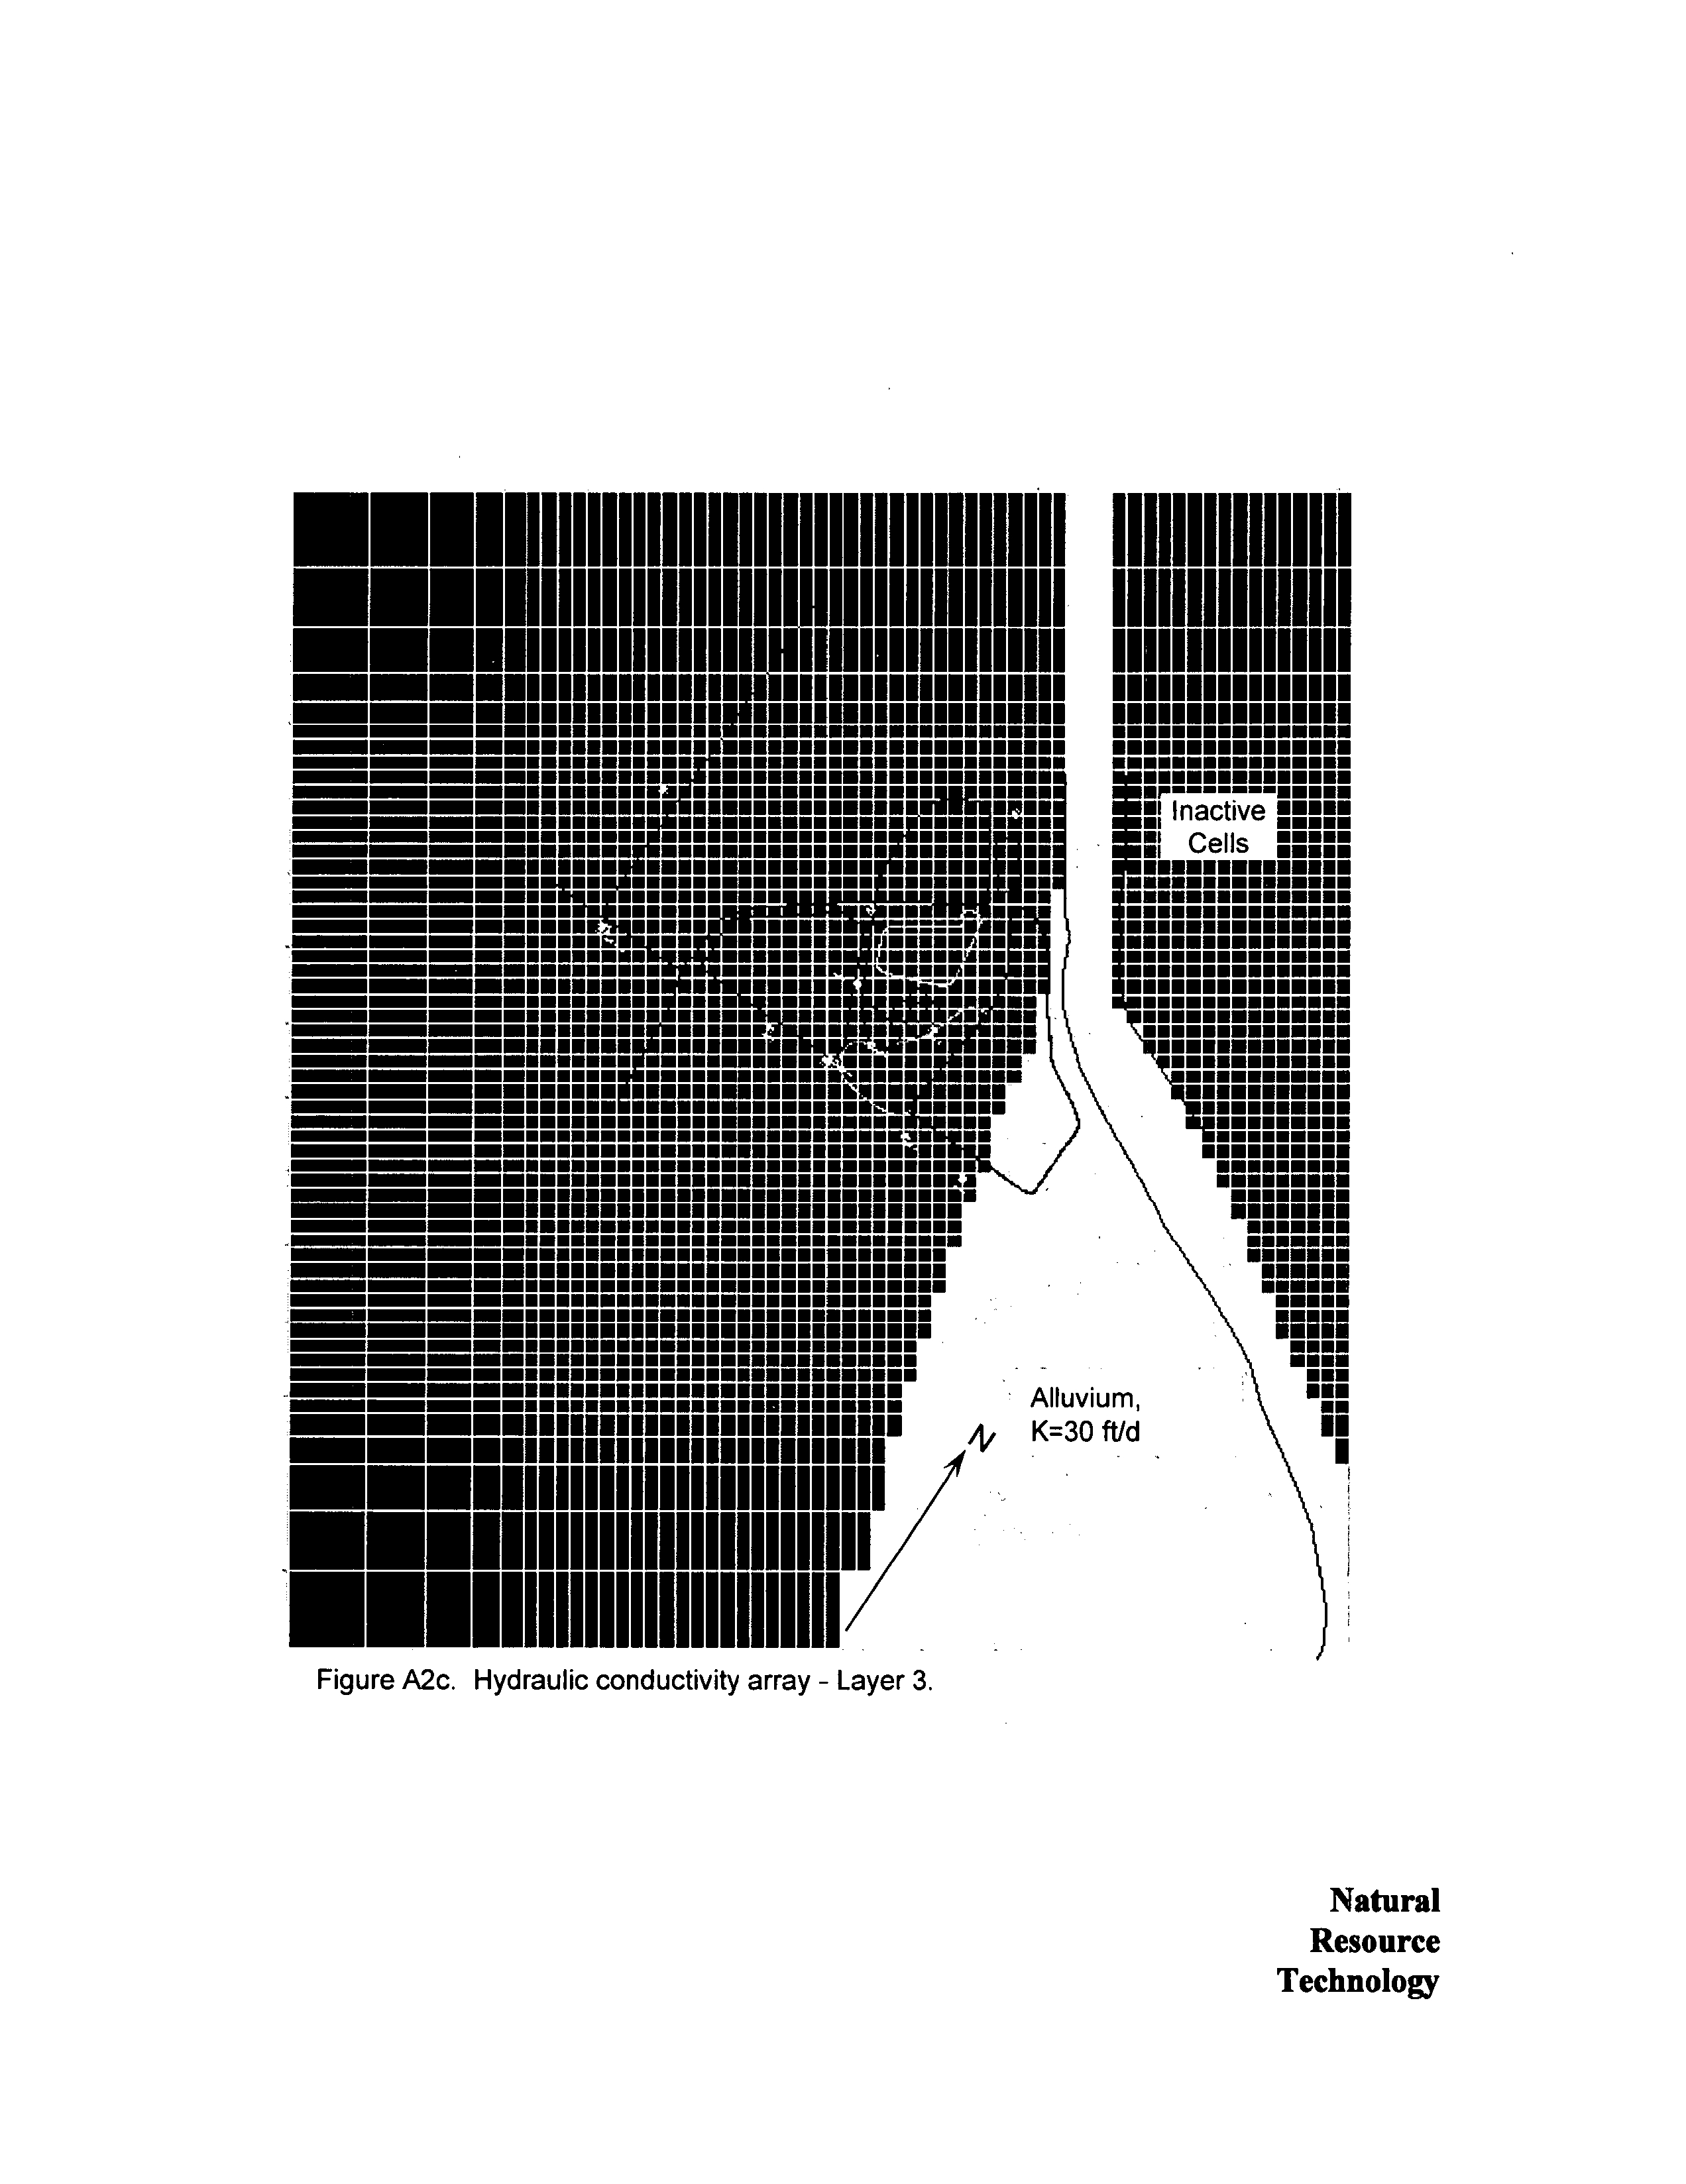
Hydraulic Conductivity
Hydraulic
conductivity
values
Appendix
were initially
derived
from field measured
values
then
adjusted during
calibration
The
largest
variation from initial
field values
was
for the
alluvium
where the modeled value of 30 ftld
compared
to
single
field
measured value of 0.7 ftld at
MW-7
was
necessary
for flow
calibration
and
across
the northern
portion
of
layer
where
value
of
0.1 ft/d
compared
to values of
to
ftld at MW-9 and
MW-
10
resulted in best head match
Vertical
anisotropy
ratios were set at
2.0
everywhere
except
the
alluvium
where
ratio of 10
was
the lowest
possible
without
affecting
calibration
The
larger
Kx/Kz ratio
represented expected
stratification within the alluvium
The shale bedrock
underlying
the sandstone
was not
discretely
modeled
Rather
cells
representing
shale
all in
layers
and
were
set
with
no-flow
boundary
conditions
This
setting
inherently
assumed that
groundwater
flow in the shale
was
negligible
Model
sensitivity
to
hydraulic conductivity ranged
from
negligible
to
high
The model
was
most
sensitive to the
layer
sand unit and the
layer
sandstone
and
was
generally
not
sensitive
to
vertical
hydraulic conductivity
Storage
No field data
were
available
defining
these
terms so
representative
values for similar
materials
were
obtained from Smith and Wheatcraft
1993
The
storage
term had no
effect
on
MODEL REPORT
Natural
11
Resource
Technology
Electronic Filing - Received, Clerks' Office, August 11, 2008--Exhibits 1,2,5-10, & 12
HUTSONVJLLE
GROUNDWATER
MODEL EVALUATION
model calibration because it
was
calibrated at
steady state
however it did
slightly
effect the rate
at which
groundwater
elevation
decreased
as
percolation
rates
decreased
representing
dewatering
of the
pond
This effect
on
groundwater
elevation had
corresponding
slight
effect
on
predicted
concentrations
as
the
impoundment dewatered
but
no
effect
on
long
term
concentrations
Therefore
the model is insensitive to this
parameter
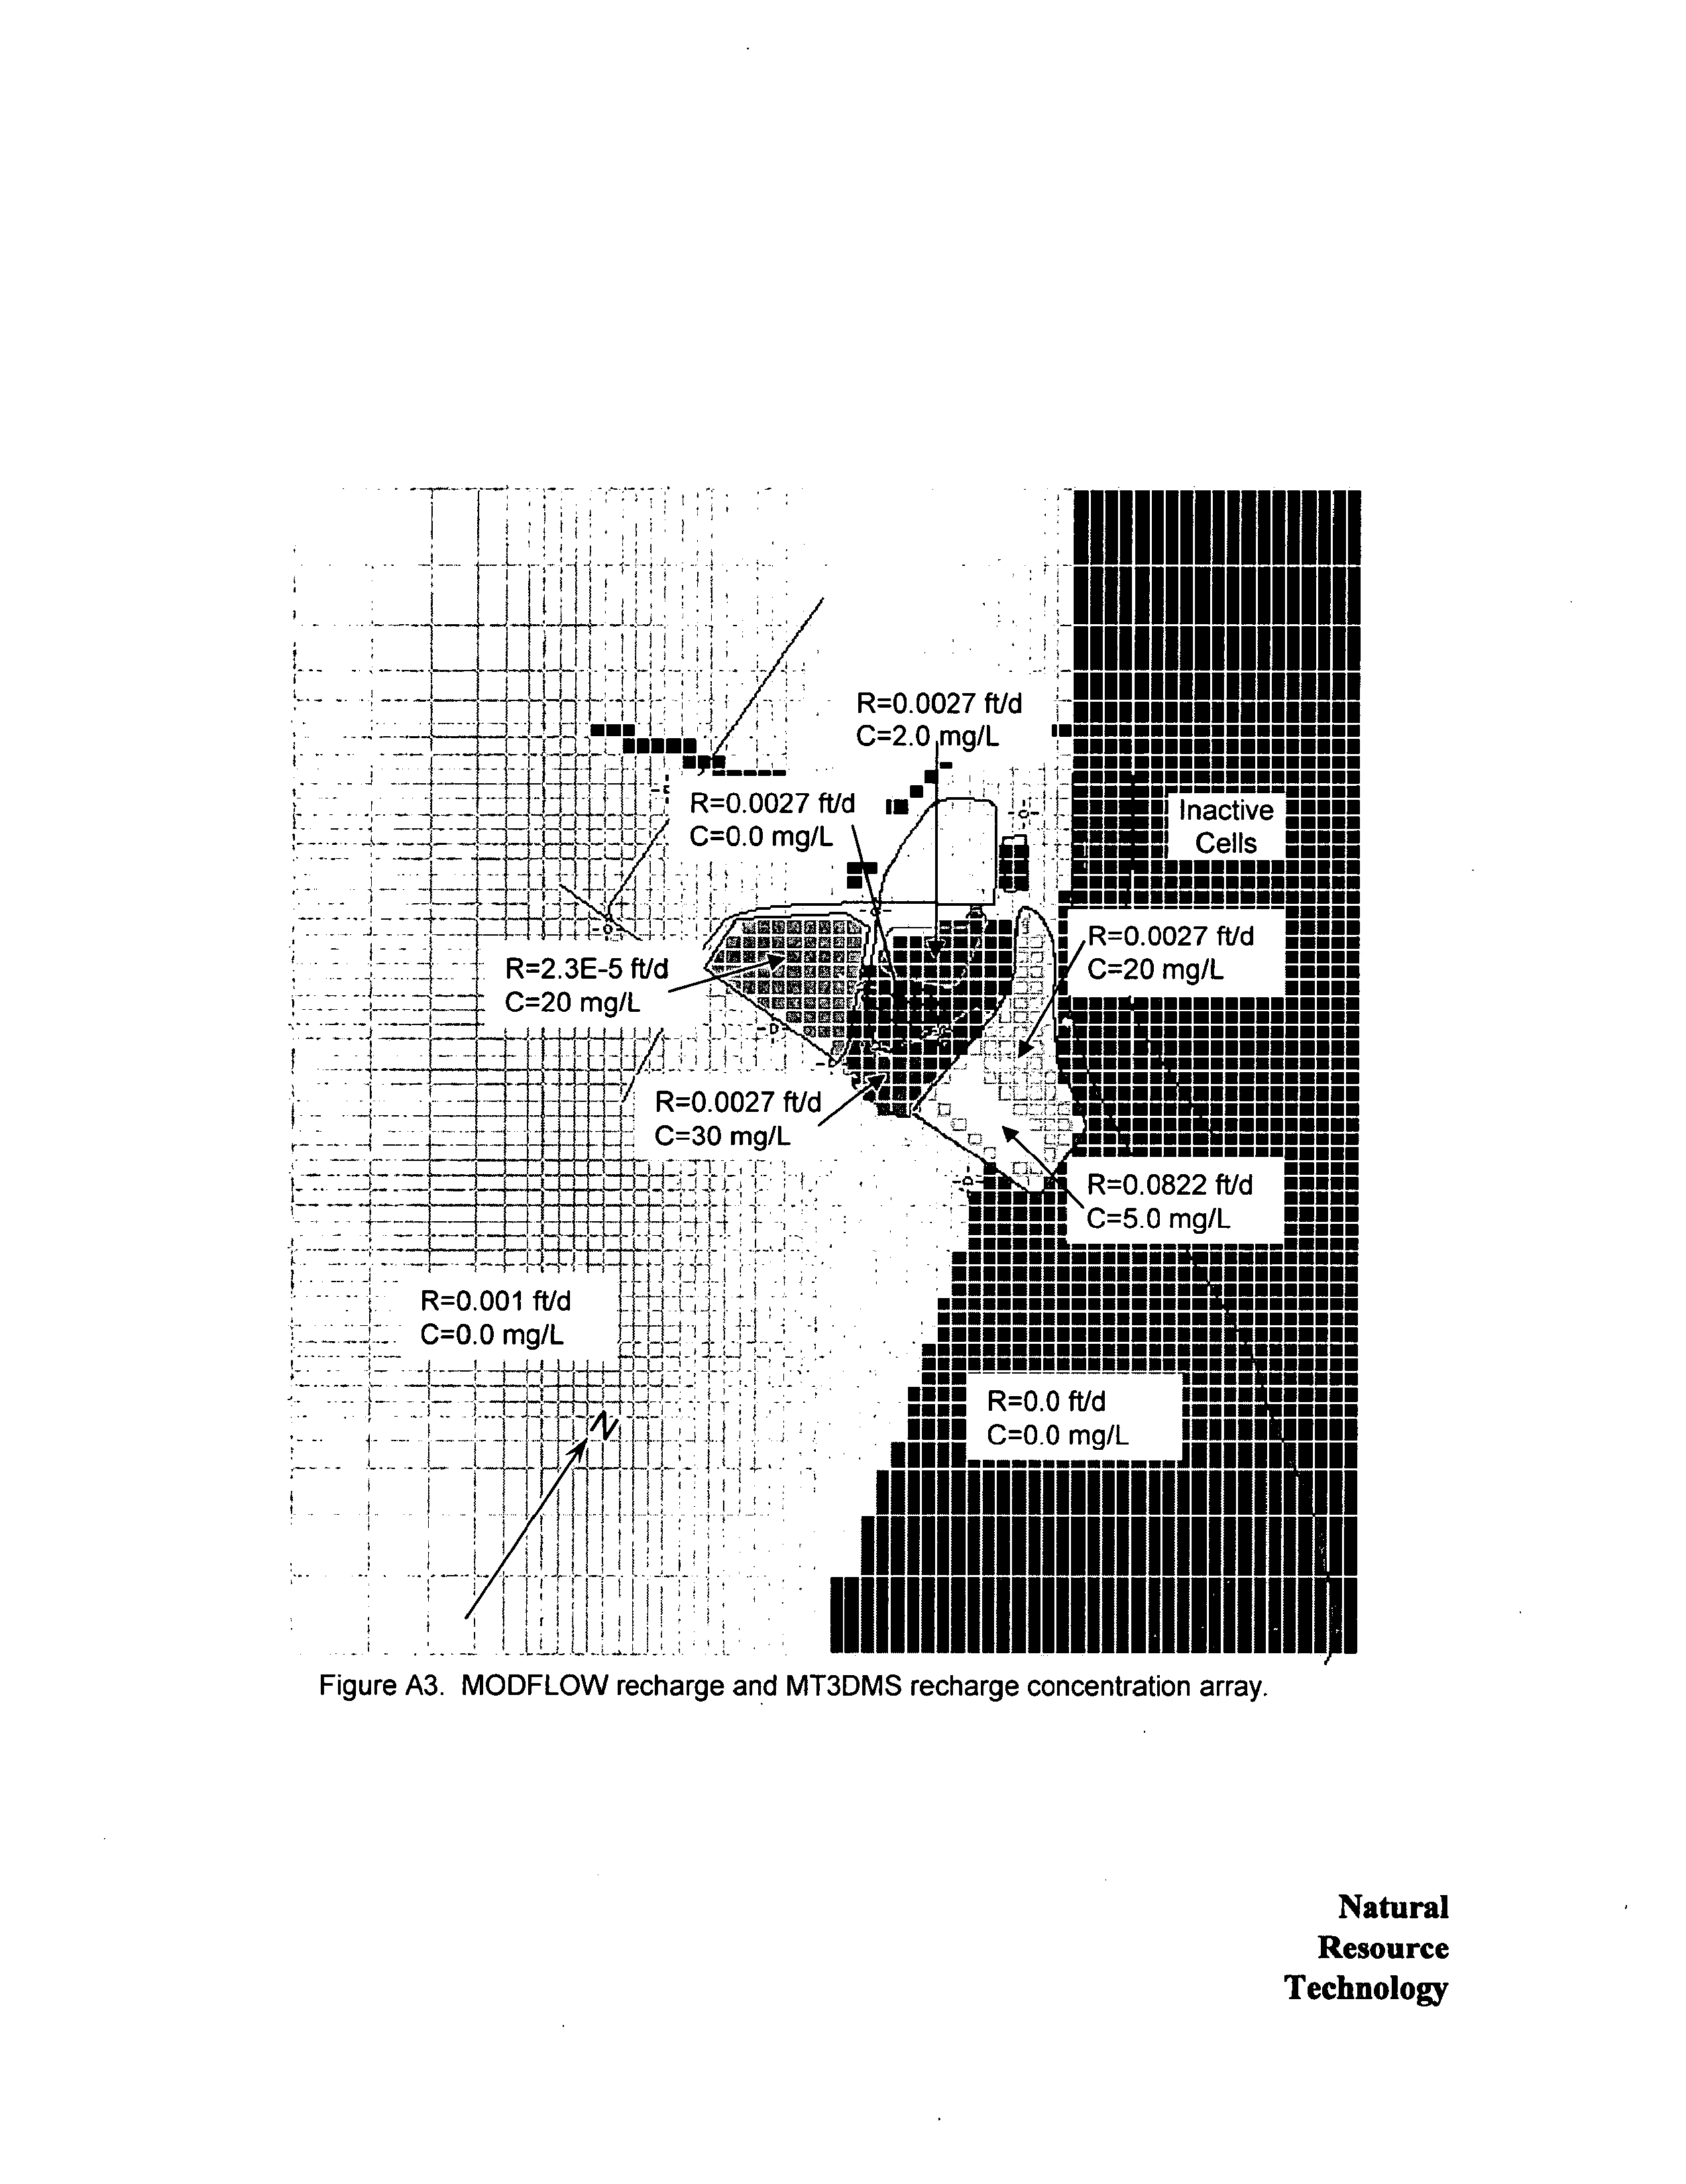
Rechare
Recharge
rates for the unlined
impoundment
i.e
percolation
were
based
on
HELP
results For
simplicity
HELP results
were
averaged
for
periods
where there
was
little
change
in
predicted percolation
rate
Figure
Recharge
rates for the rest of the model domain
were
set
during
calibration
Recharge
zones are
illustrated in
Appendix
River Parameters
The Wabash River and tributaries
were
represented by head-dependent
flux
nodes that
required inputs
for
river
stage
width
bed
thickness
and
bed
hydraulic conductivity
The latter three
parameters
are
used to calculate
conductance term for the
boundary
node This
conductance term
was
determined
by
adjusting hydraulic conductivity during
model
calibration
while
bed thickness
was
set at
i.e
bed
hydraulic conductivity represented
conductance
normalized for river width and bed
thickness
River
stage
for the Wabash River
was set near
mean
stage
the
approximate
elevation in November
1998
and
adjusted
slightly during
calibration
River
stage
for the tributaries
was
determined from USGS
topographic
maps
Sensitivity analysis
showed that the model
was
highly
sensitive
to
the
presence
of the rivers and
tributaries
but not
very
sensitive
to the conductance term used
Transport
Model
lnput
Values and
Sensitivity
Transport
model
input
values are listed in Table
and described below
Initial Concentration
Initial concentration
for the calibration
run was
set at
zero
Initial
concentration
for the
prediction
runs was the final calibration concentration
Source Concentration
Two
primary
sources were
simulated
For calibration
runs
which
simulated
current
conditions
the
primary
source was
percolating
water
from the
unlined
impoundment
After the
impoundment
dewaters
the dominant
source
is
expected
to be
leaching
of ash in the unlined
impoundment
that remains below the water table
Therefore
second
MODEL REPORT
Natural
12
Resource
Technology
Electronic Filing - Received, Clerks' Office, August 11, 2008--Exhibits 1,2,5-10, & 12
HUTSONVILLE
GROUND WA TER MODEL EVALUATION
primary
source
term representing
the saturated
ash was
added for
prediction scenarios
beginning
two
years
after the
impoundment
is removed from service
This
assumes
that
mass
loading
at
that time will be
primarily
from
leaching
of ash below the
water
table
rather than
percolation
from the
impoundments
Mass
loading
for the saturated ash
source term was
function of
groundwater
velocity
in
the cells
representing
saturated
ash and the saturated
thickness of those cells
Concentrations
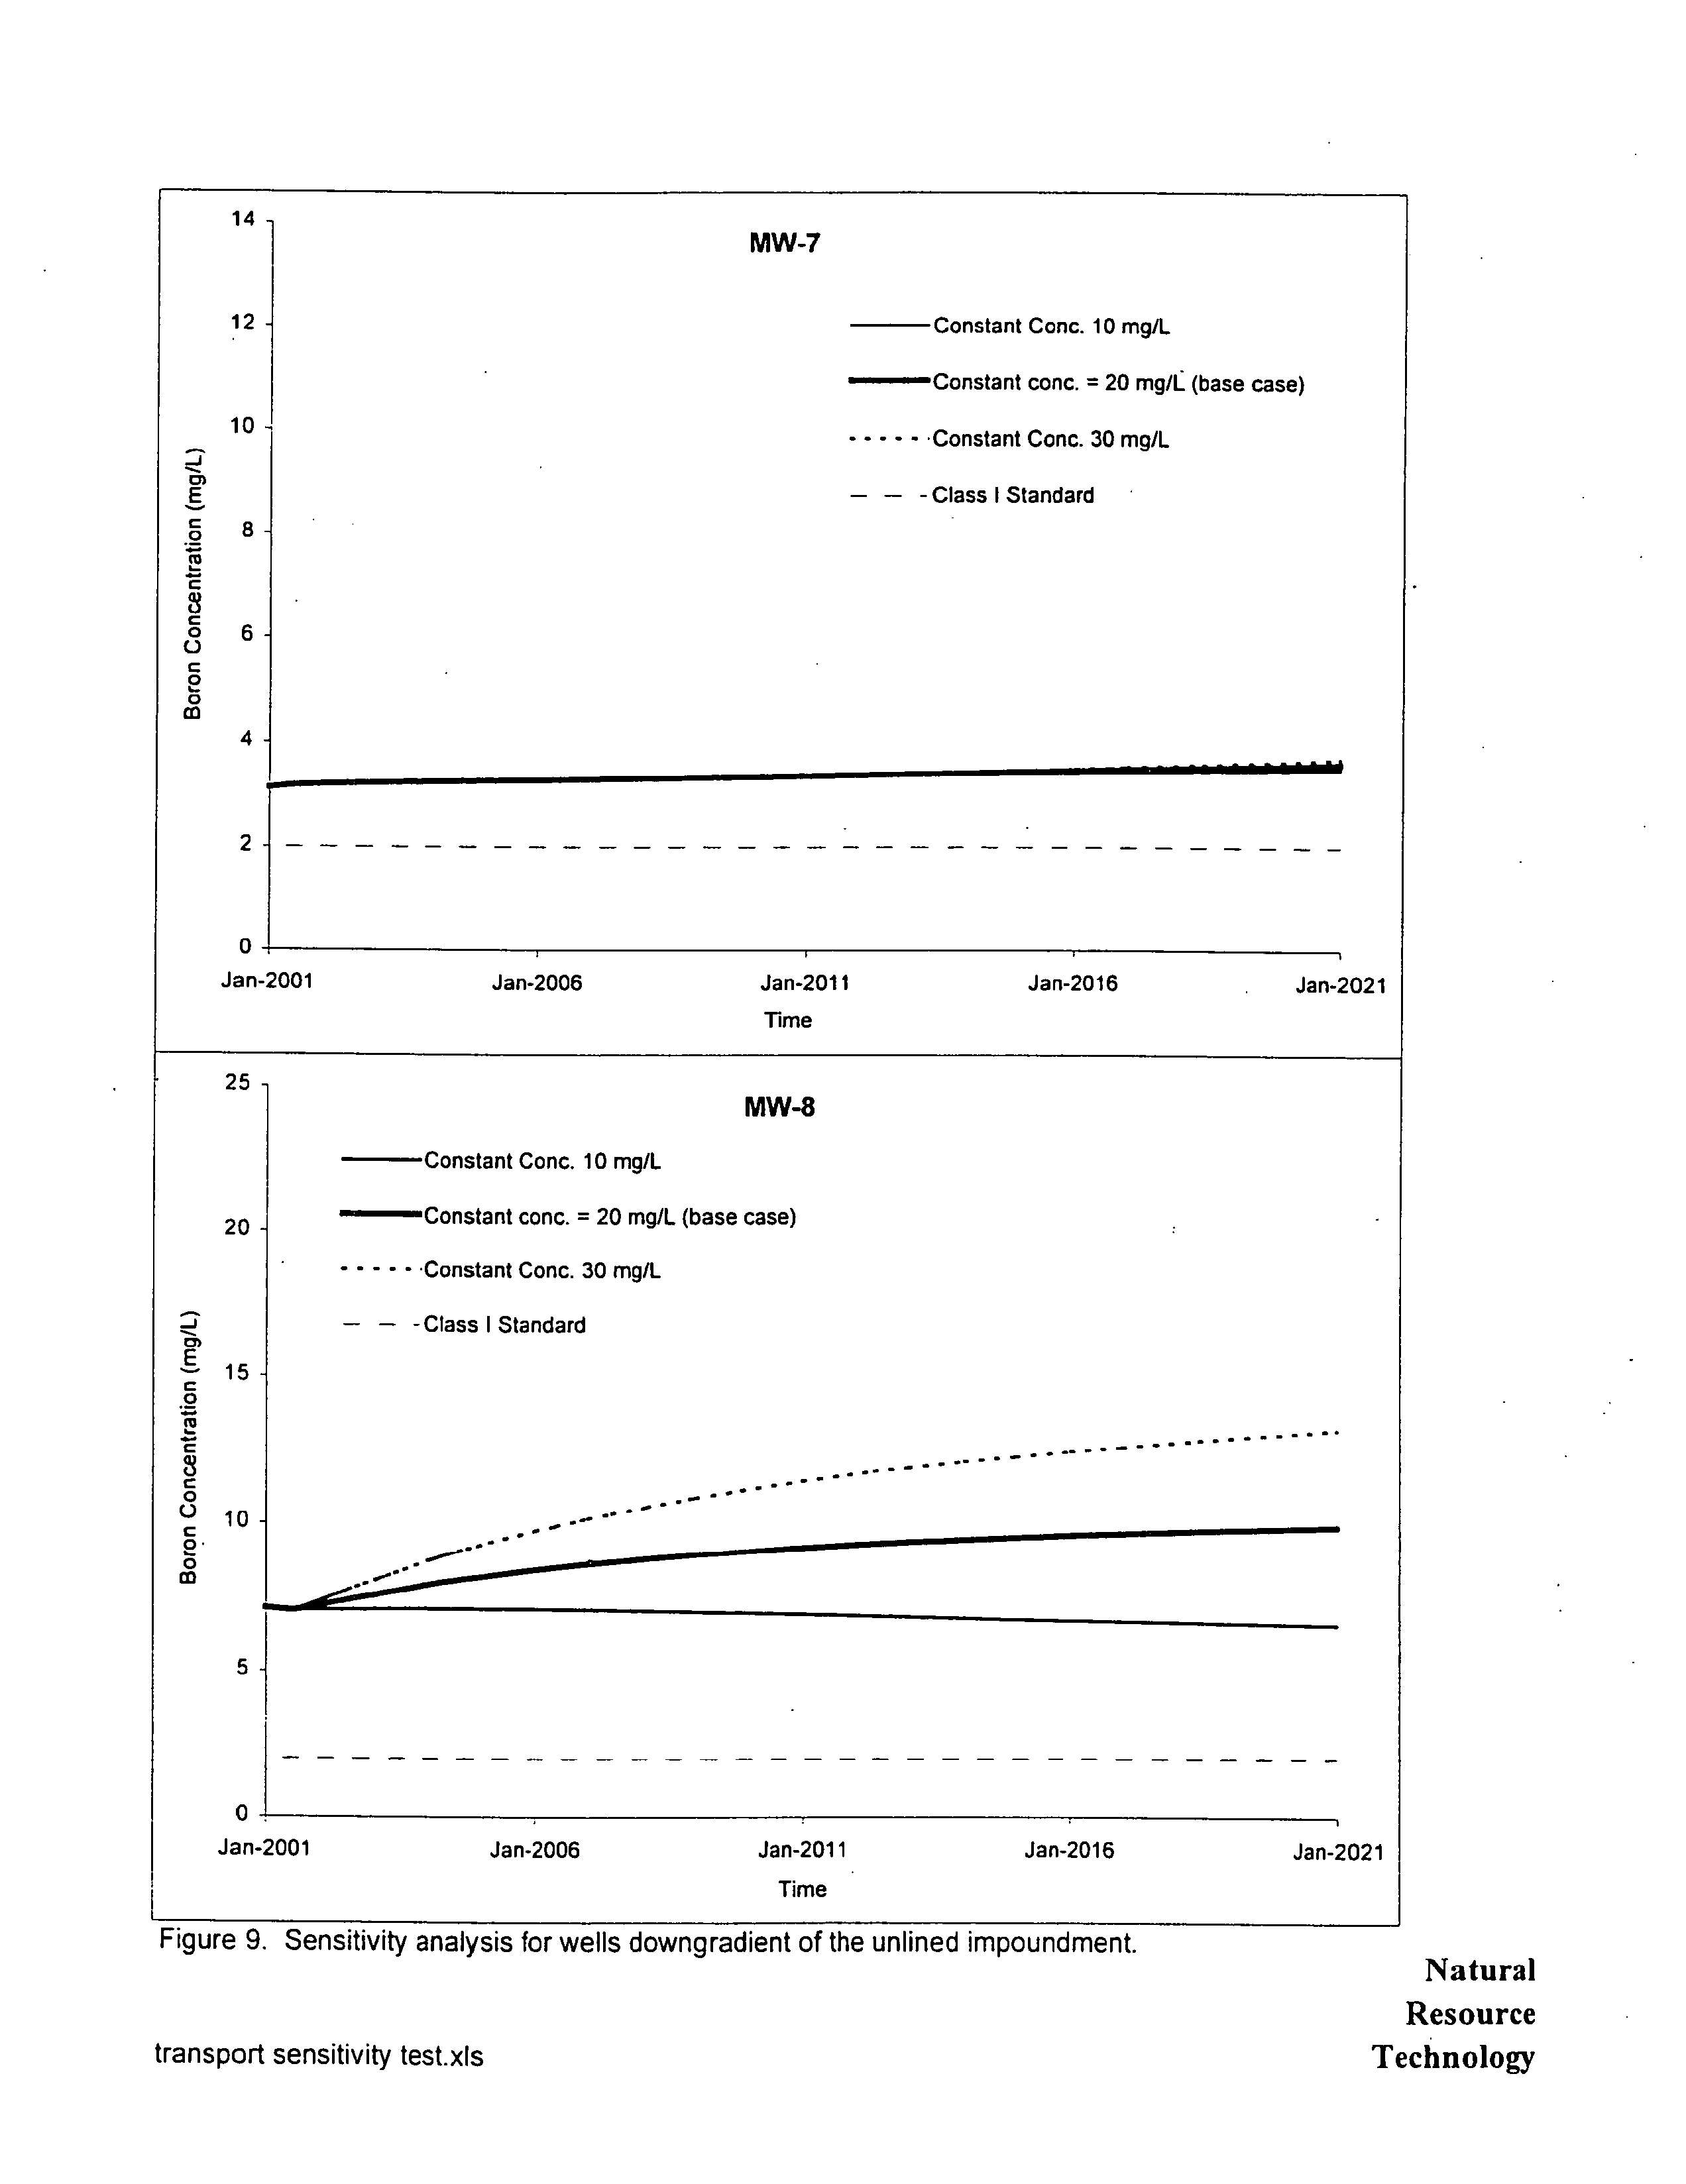
at several wells were sensitive
to the concentration
of the
percolation
source
term
Only
well MW-8 was sensitive to the concentration
of the saturated ash
source term
and
resulting
concentrations
at this well varied
greatly
with
changes
in saturated
source
concentration
Concentrations
at
MW-7
were not
significantly
influenced
by
the saturated ash
source term
during
the
period
simulated
Secondary
sources were the lined
impoundment
and
the coal
pile
Concentrations
for these two
sources were
set at 20 and
mg/L respectively
based
on
concentrations
in leachate
samples
obtained
during
the
hydrogeologic
investigation
Effective Porosity
Effective
porosity
values
were
based
on
ranges provided by
Mercer
and
Waddel
1993
Predicted concentrations
were
not sensitive
to this
term
so
it
was not
adjusted
during
calibration
Dispersivizy
One well
MW-3
was
highly
sensitive
to
dispersivity values
and the value of 30 ft
was selected
during
calibration based on
predicted
concentration
at that well
Transverse and
vertical
dispersion
were
estimated
according
to ratios
developed by
Geihar
et al
1985
Retardation Retardation is calculated
by
the model based
on
the distribution coefficient
Kd
The Kd value used for the
sandy
materials in this model
0.17 mLIg
was based on
testing
performed by
NRT for similar materials in another state The Kd value for the silt materials
0.85 mL/g
was assumed
factor
of
five
higher
than
for sand
While concentrations
at several
wells varied with
Kd
no concentrations
varied
by
more than 10
percent
so
this number
was
not
adjusted during
calibration
MODEL REPORT
Natural
13
Resource
Technology
Electronic Filing - Received, Clerks' Office, August 11, 2008--Exhibits 1,2,5-10, & 12
HUTSONVILLE
GROUNDWATER MODEL EVALUATION
Flow and
Transport
Model
Assumptions
and Limitations
Several
simplifying assumptions
were made while
developing
this model
The
impoundment
dewaters for
one
year
For closure scenarios with
caps
the
cap
is
placed
on
the
impoundment
at the end of the
first
year
Leachate
is assumed to
instantaneously
reach
groundwater e.g migrate through
the
unsaturated
zone
River
stage
and natural
recharge
are
assumed constant over
time
Leachate
concentrations
are assumed to remain constant over time
The model is limited
by
the data used for
calibration
which
adequately
define the
local
groundwater
flow
system
and the
sources
and extent of the
plume
These data
are
from
points
near the Hutsonville ash
impoundments
Groundwater
flow data
were
representative
of data
collected
during
the
980s and
1990s
while concentration
data
are
mostly representative
of data
collected
during
the
late
990s
Therefore
model
predictions
of
transport
distant from the
impoundment
will
not
be
as
reliable
as
predictions
of
transport
near
the
impoundment
and the
reliability
of model
predictions
decreases with
increasing
time
Flow and
Transport
Model Results
Calibration
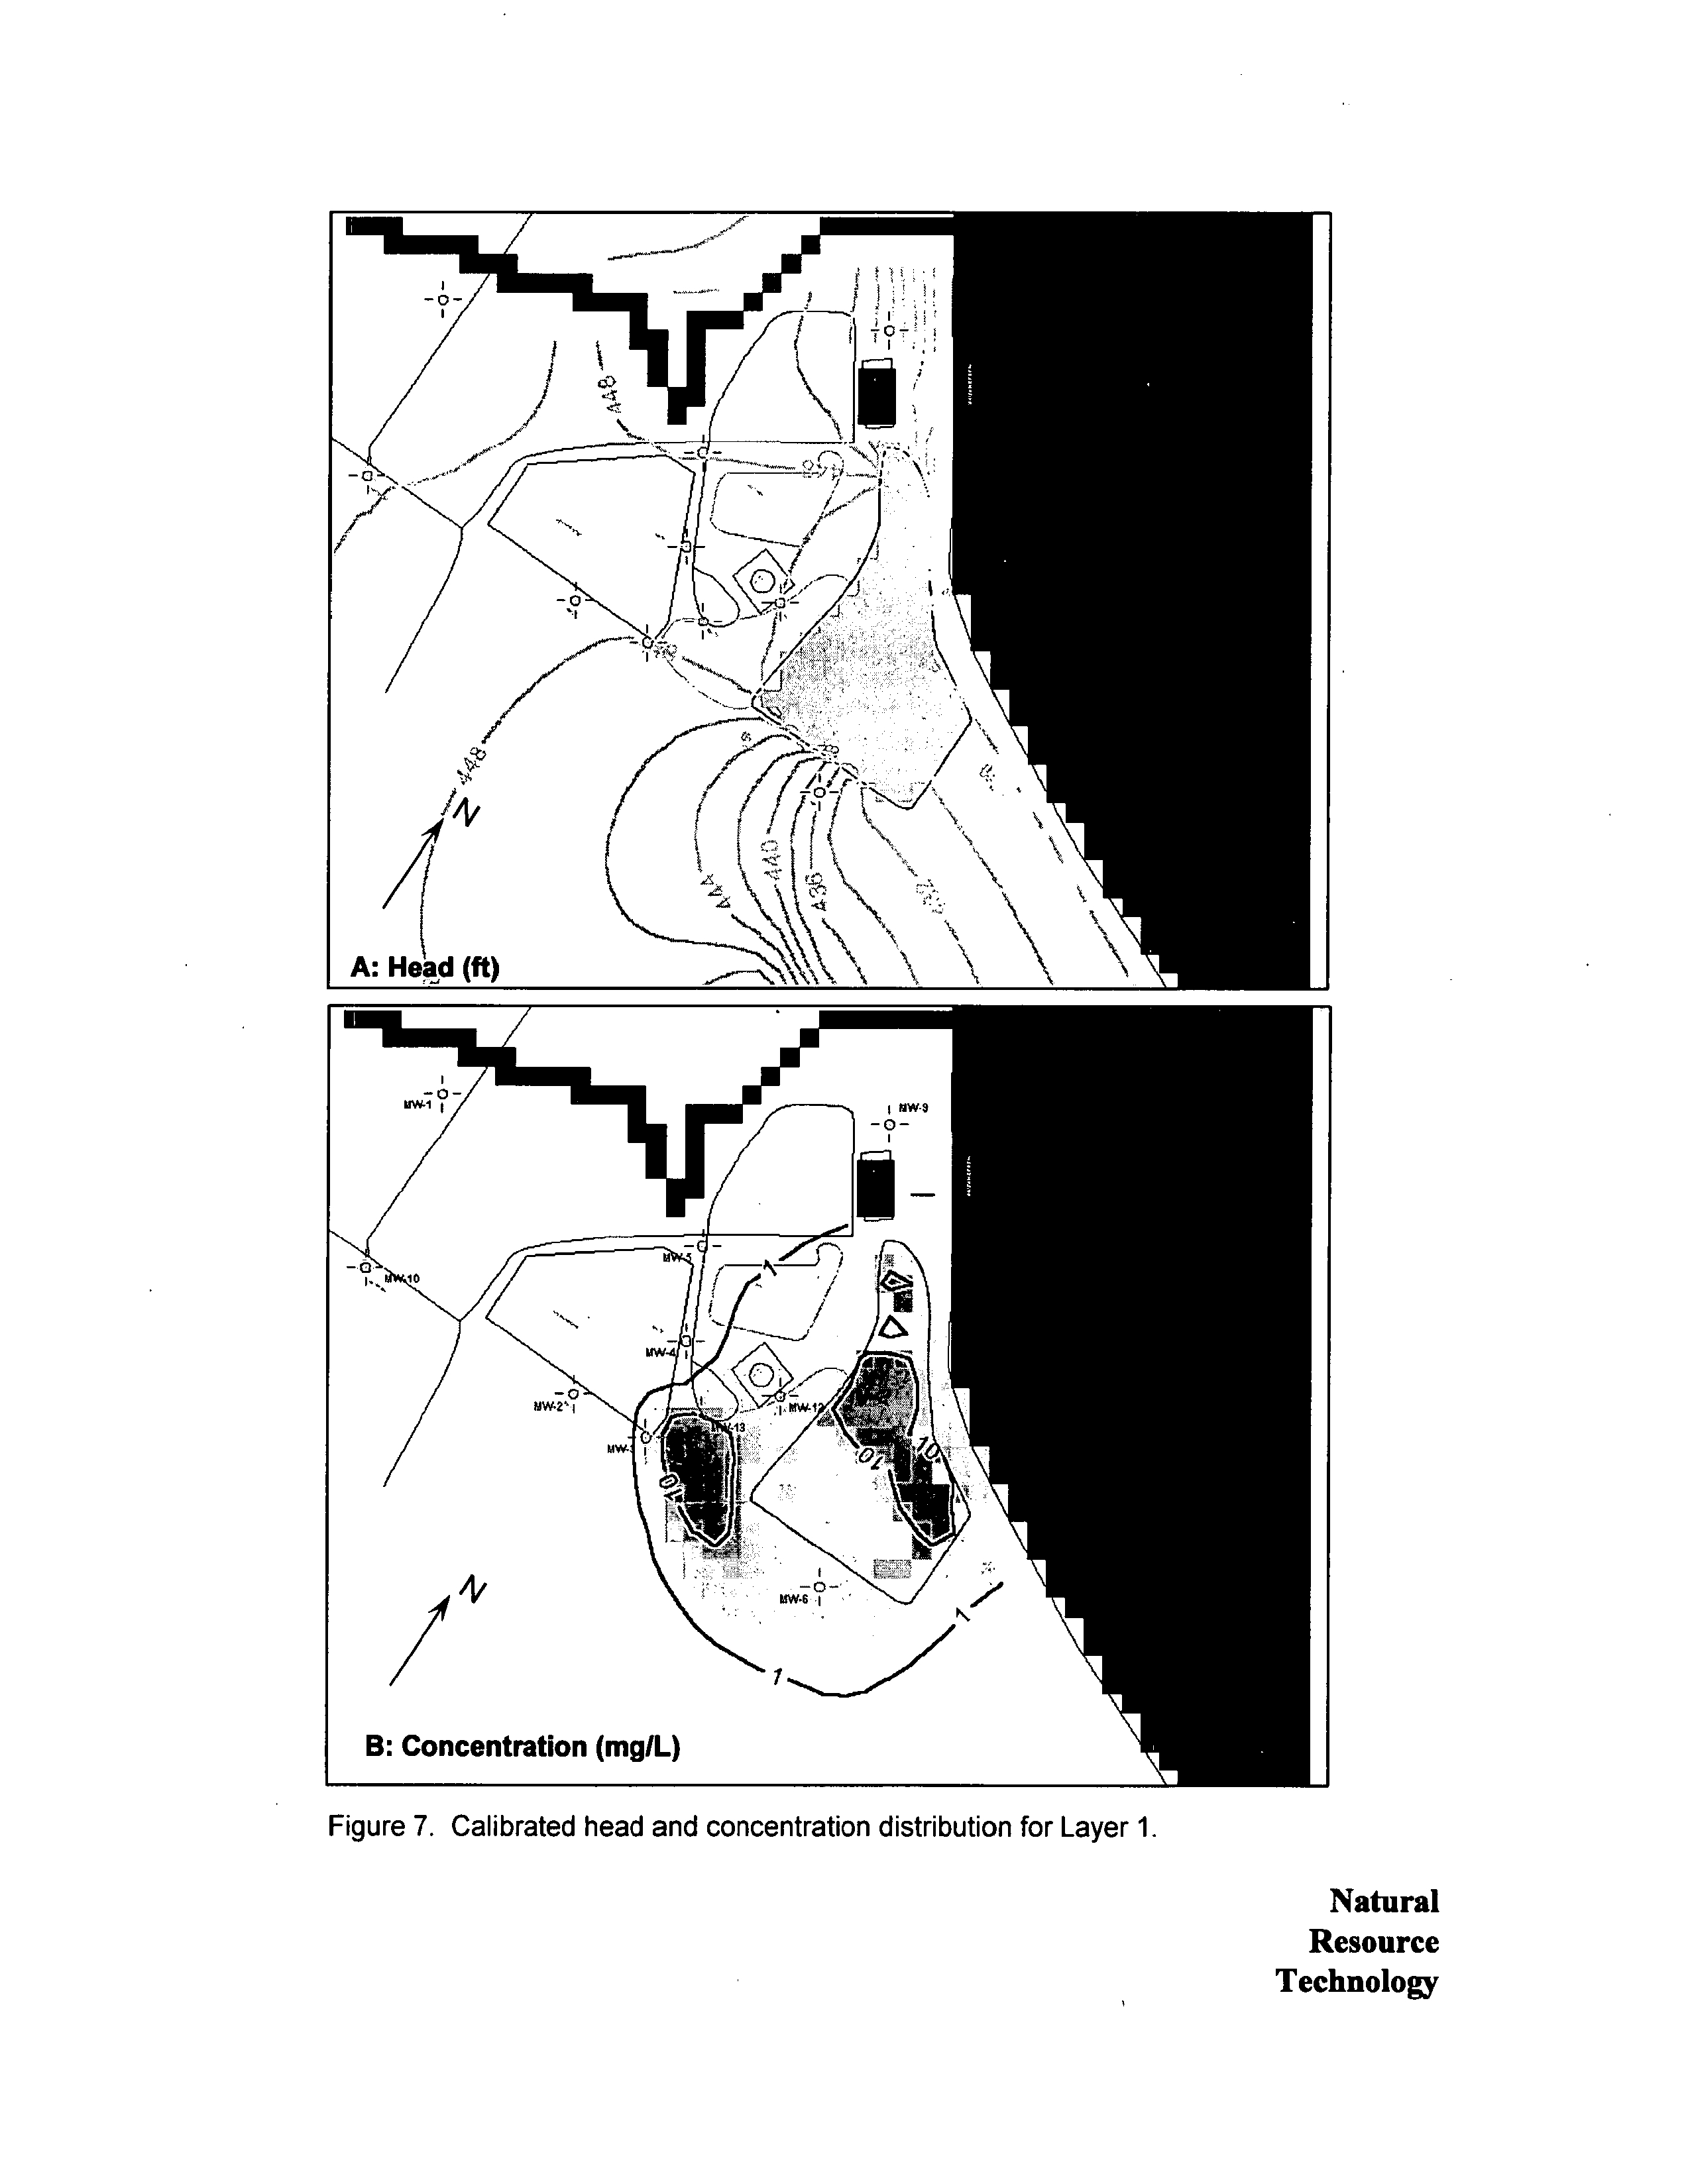
The model was first calibrated to observed
groundwater
head data collected in November
1998
and then
to
observed concentration
data
mostly
collected from
November 1998
through May
1998
An
exception
to
the concentration
date
range
was
made for
wells
MW-2 and
MW-3
Boron concentrations
at these wells were affected
by leaking pipe
that
was
not simulated in the
model because the volume of the
pipe
leak
was unknown
the leak
was
temporary
i.e transient
and the calibration was
performed
for
steady
state conditions
Therefore
these wells were
calibrated to the concentration
range
recorded
prior
to the
pipe
leak
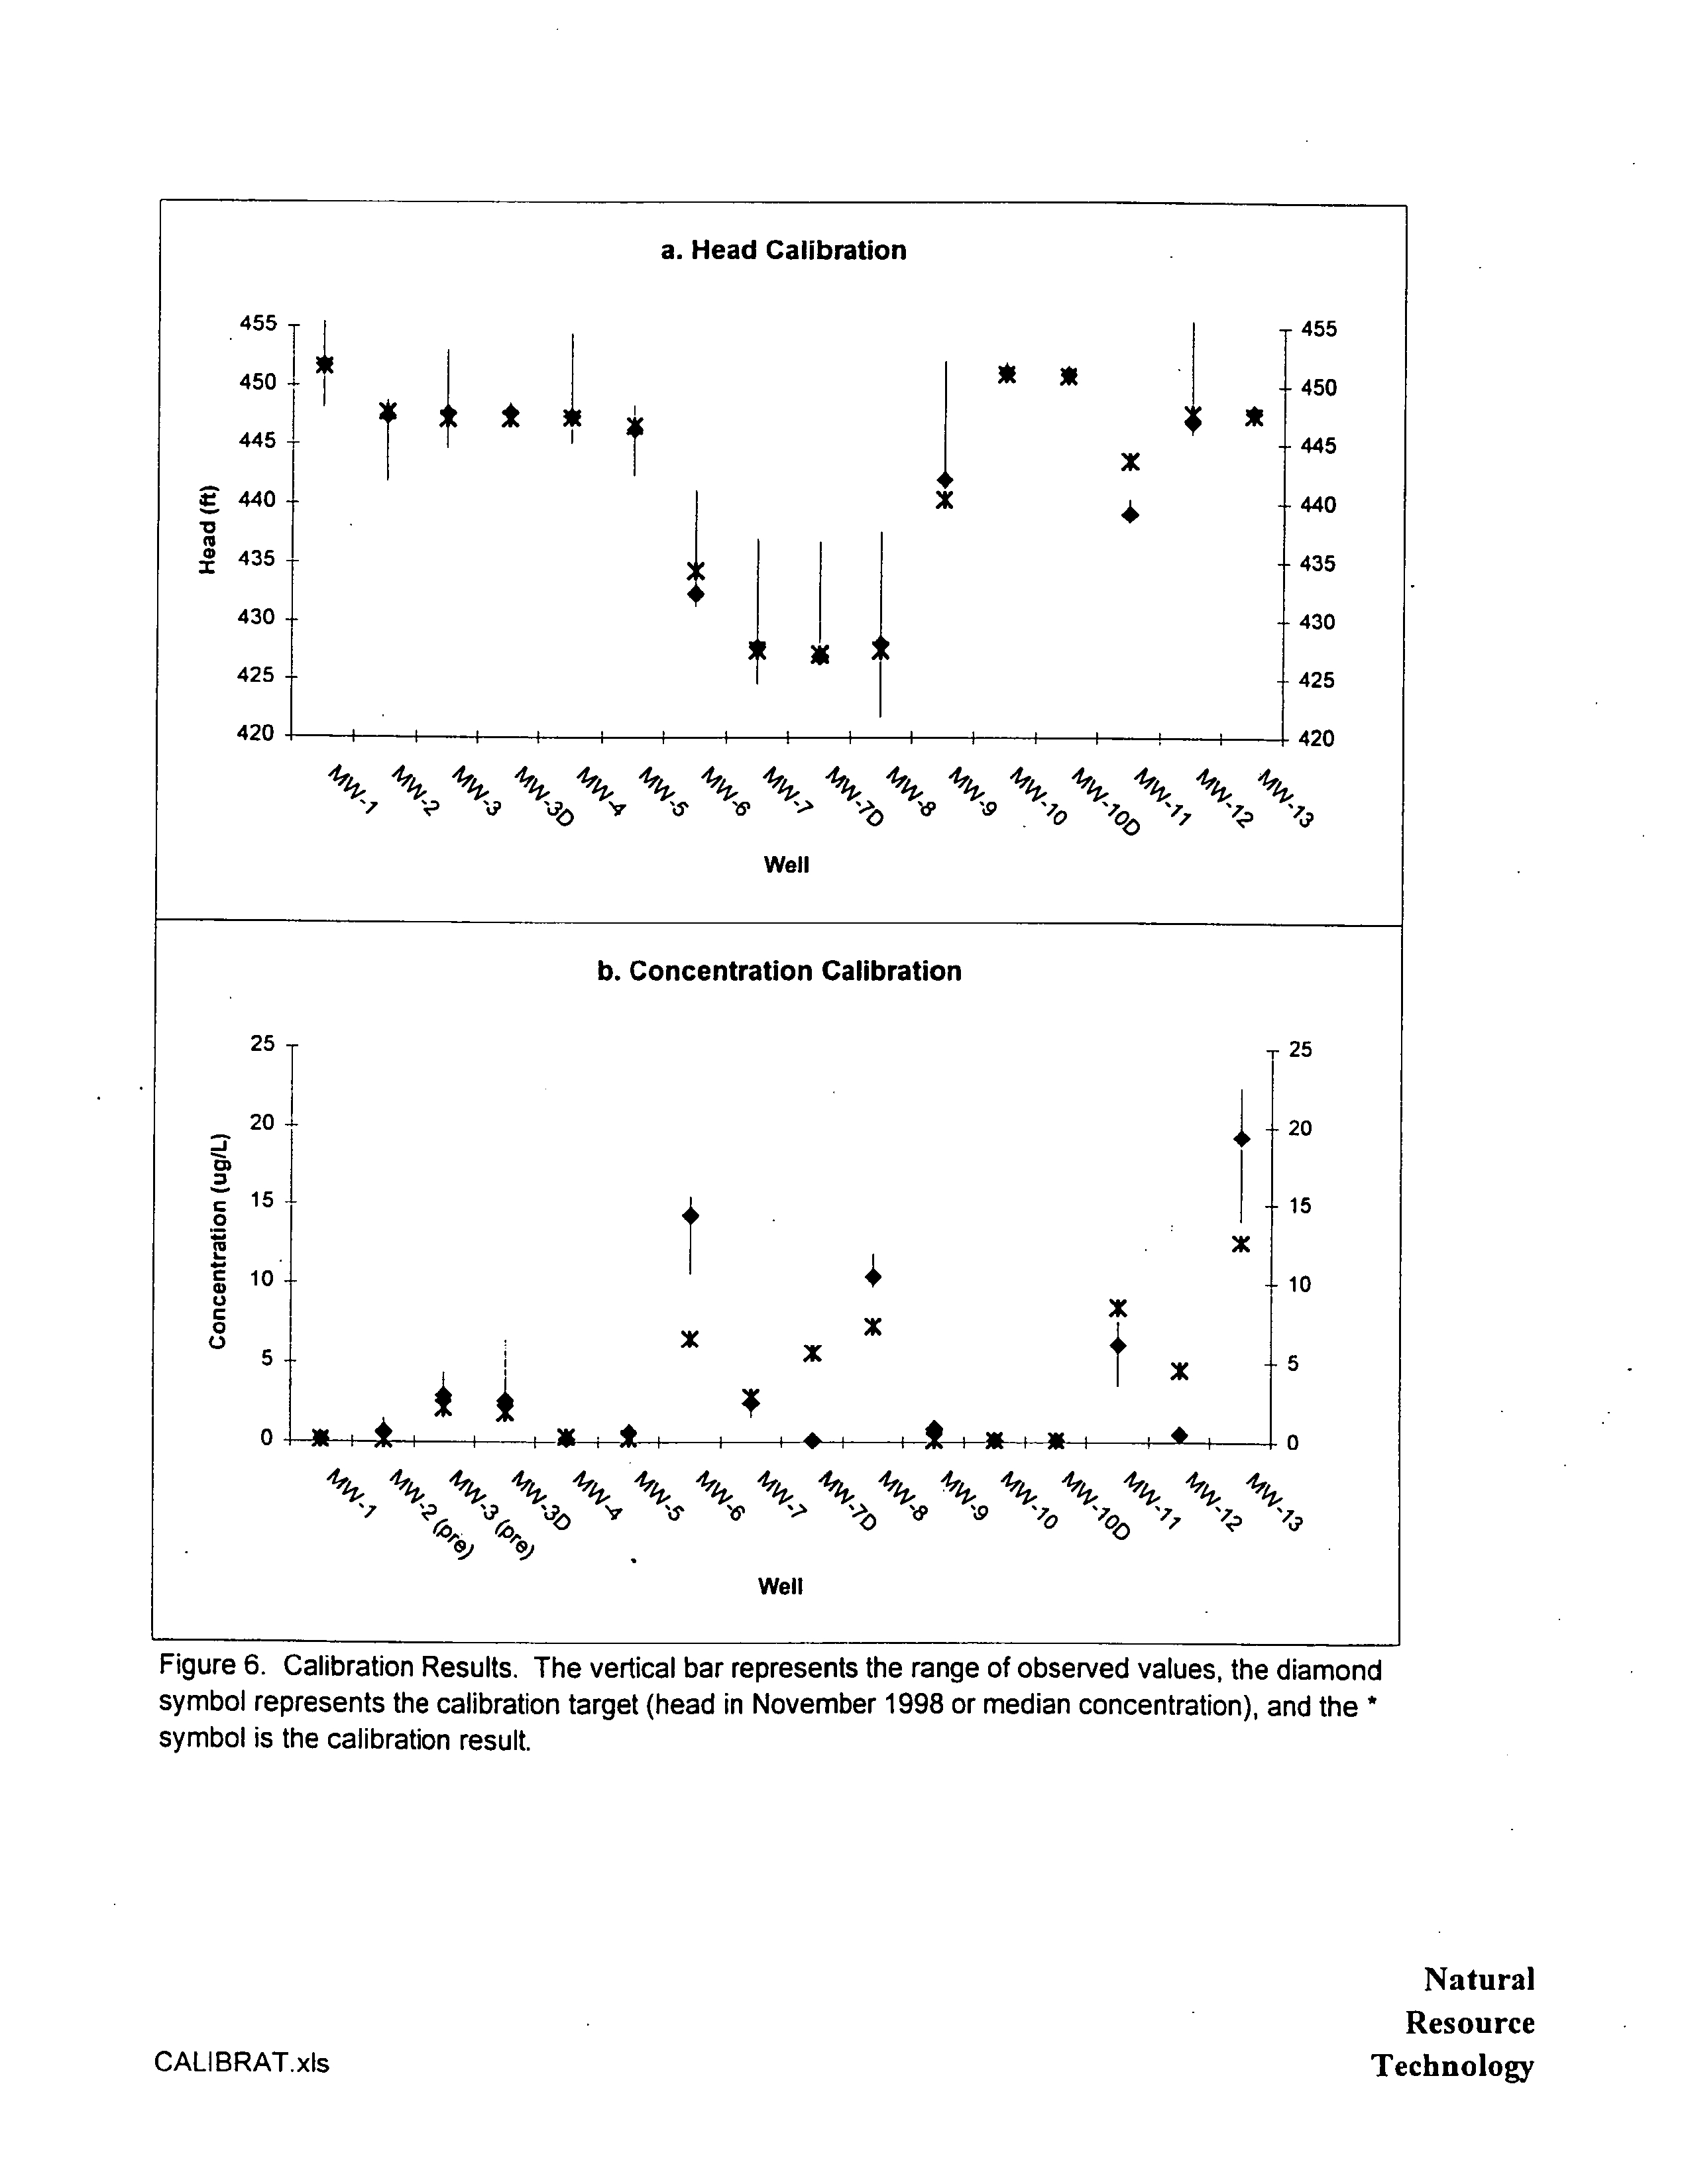
Head calibration results
were
generally good
with modeled heads
generally
within 1-foot
of
target
heads
Figure
6a and
Figure 7a particularly
between
and
downgradient
of the
impoundments
The
areas
of
largest discrepancy
were near
MW-6
MW-9
and MW-I
The
MODEL REPORT
Natural
14
Resource
Technology
Electronic Filing - Received, Clerks' Office, August 11, 2008--Exhibits 1,2,5-10, & 12
HUTSONVILLE
GROUNDWATER MODEL EVALUATiON
discrepancy
at MW-9 is
acceptable given
its distance from the
impoundments
and
the
sparse
geologic
data in that
area
The
discrepancies
at MW-6 and MW-i
are
likely
due to the close
proximity
of these wells
to
the unlined
impoundment
where heads
change
rapidly
over
short
distance
Given this
observation
and
considering
that concentration
match
for
these
two wells
was
acceptable
the head
discrepancy
is also considered
acceptable
Concentration
calibration was within the
range
of observed concentrations
at most
monitoring
wells
Figure
6b and
Figure 7b
The model calculated
elevated boron concentrations
at wells
with observed boron concentrations
greater
than Class
standards
and
generally
did
not show
elevated boron concentrations
for wells with low boron concentrations
The
two notable
exceptions
for wells MW-7D and MW-
12 were
both
cases
where the model calculated
higher
concentrations
than observed
The low observed concentration
at MW-7D could not be
replicated
without
using
unrealistically
low
hydraulic conductivities
and would have
probably
required
several additional model
layers
to simulate The
high
concentration
at MW- 12 is
likely
due to model discretization Concentration
match
may
have
improved
with
finer
grid spacing
however
this result
was conservatively
high
and such
grid spacing
was
considered
unwarranted
Slightly
low concentrations
were
predicted
for MW-6 and MW- 13
The
concentration
discrepancy
at MW-6
was
likely
due to model
discretization
similar
to
MW-i2
The
discrepancy
at
MW-13
where observed boron concentration
is
higher
than
any
other
monitoring
well on
site
is
likely
related to the
pipe
leak that was not simulated
Prediction
Modeling
was
performed
to
predict
effects
of
impoundment
dewatering
and closure
on
groundwater quality
Closure effects
were
simulated
by decreasing
the
MODFLOW
recharge
rate in the area beneath the unlined
impoundment
and ash
laydown
area The
recharge
rate for
the wet and
dry portions
of the unlined
impoundment
was
decreased
as
illustrated in
Figures
and
In
addition
it
was assumed
that the
ash
laydown
area would be treated
similarly
to the
dry
portion
of the unlined
impoundment.6
similar result would be
expected
if the ash was removed from this area
MODEL REPORT
Natural
15
Resource
Technology
Electronic Filing - Received, Clerks' Office, August 11, 2008--Exhibits 1,2,5-10, & 12
HUTSONVILLE
GROUND
WA TER MODEL EVALUATION
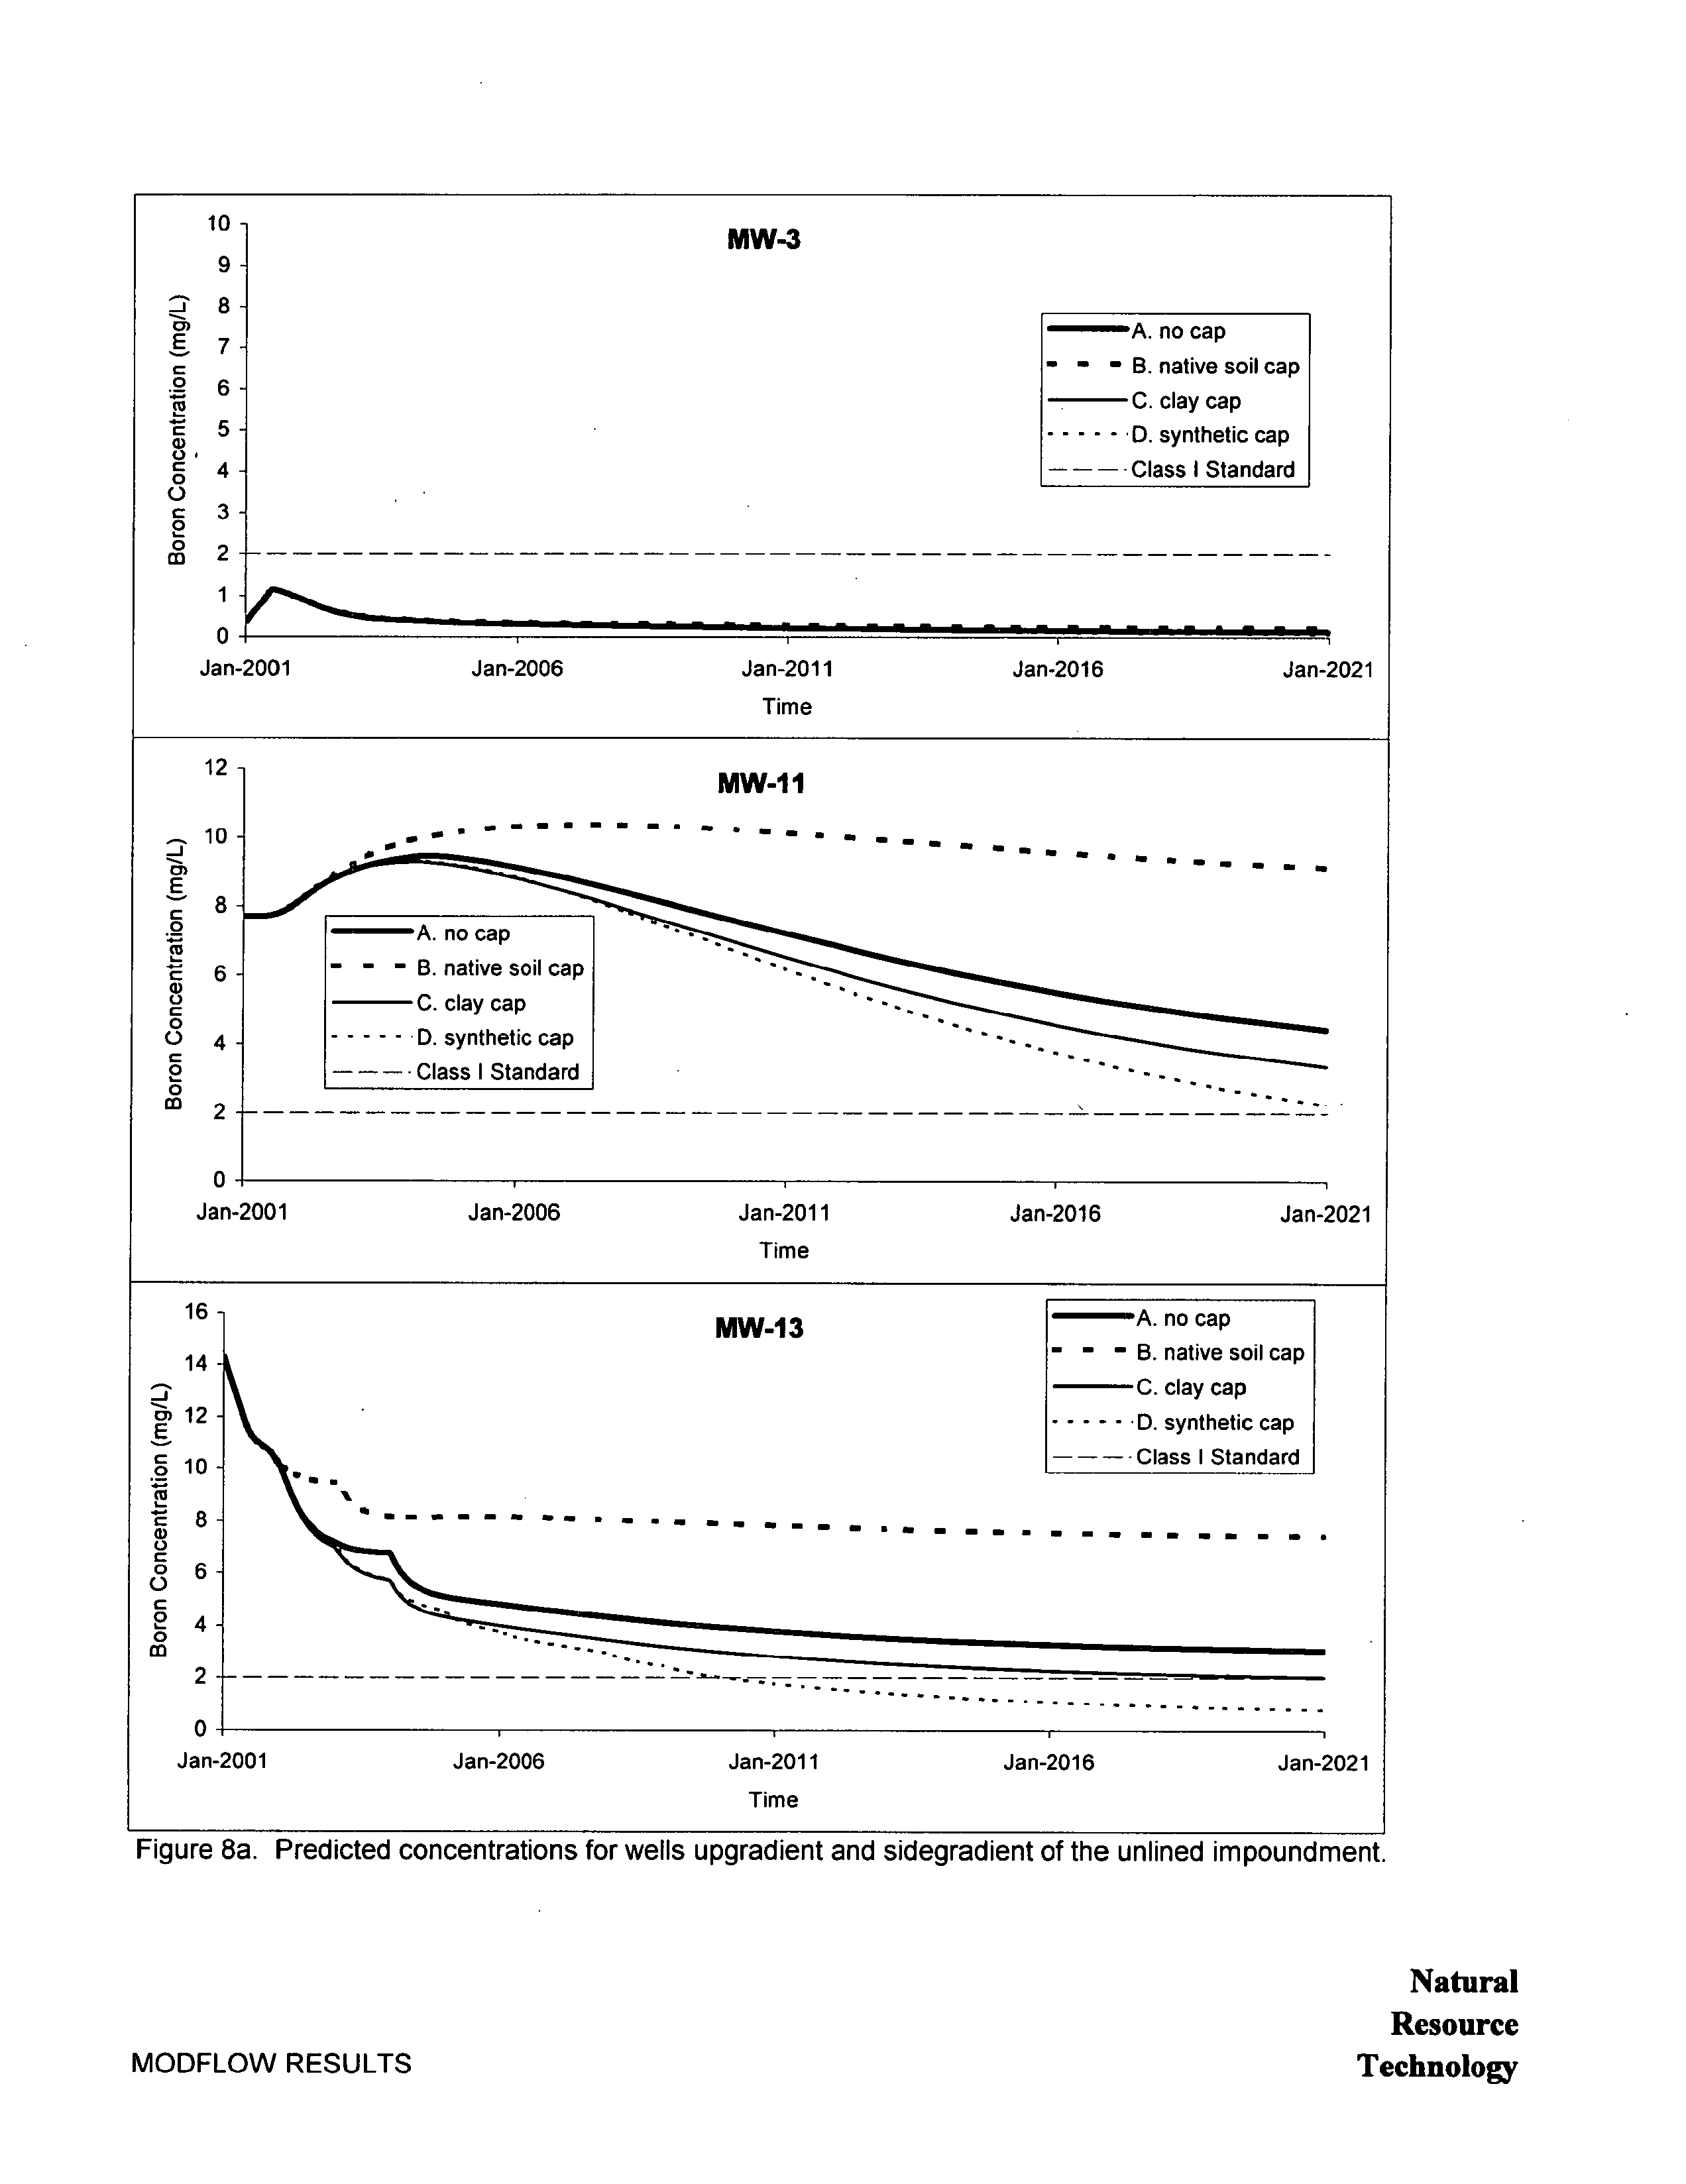
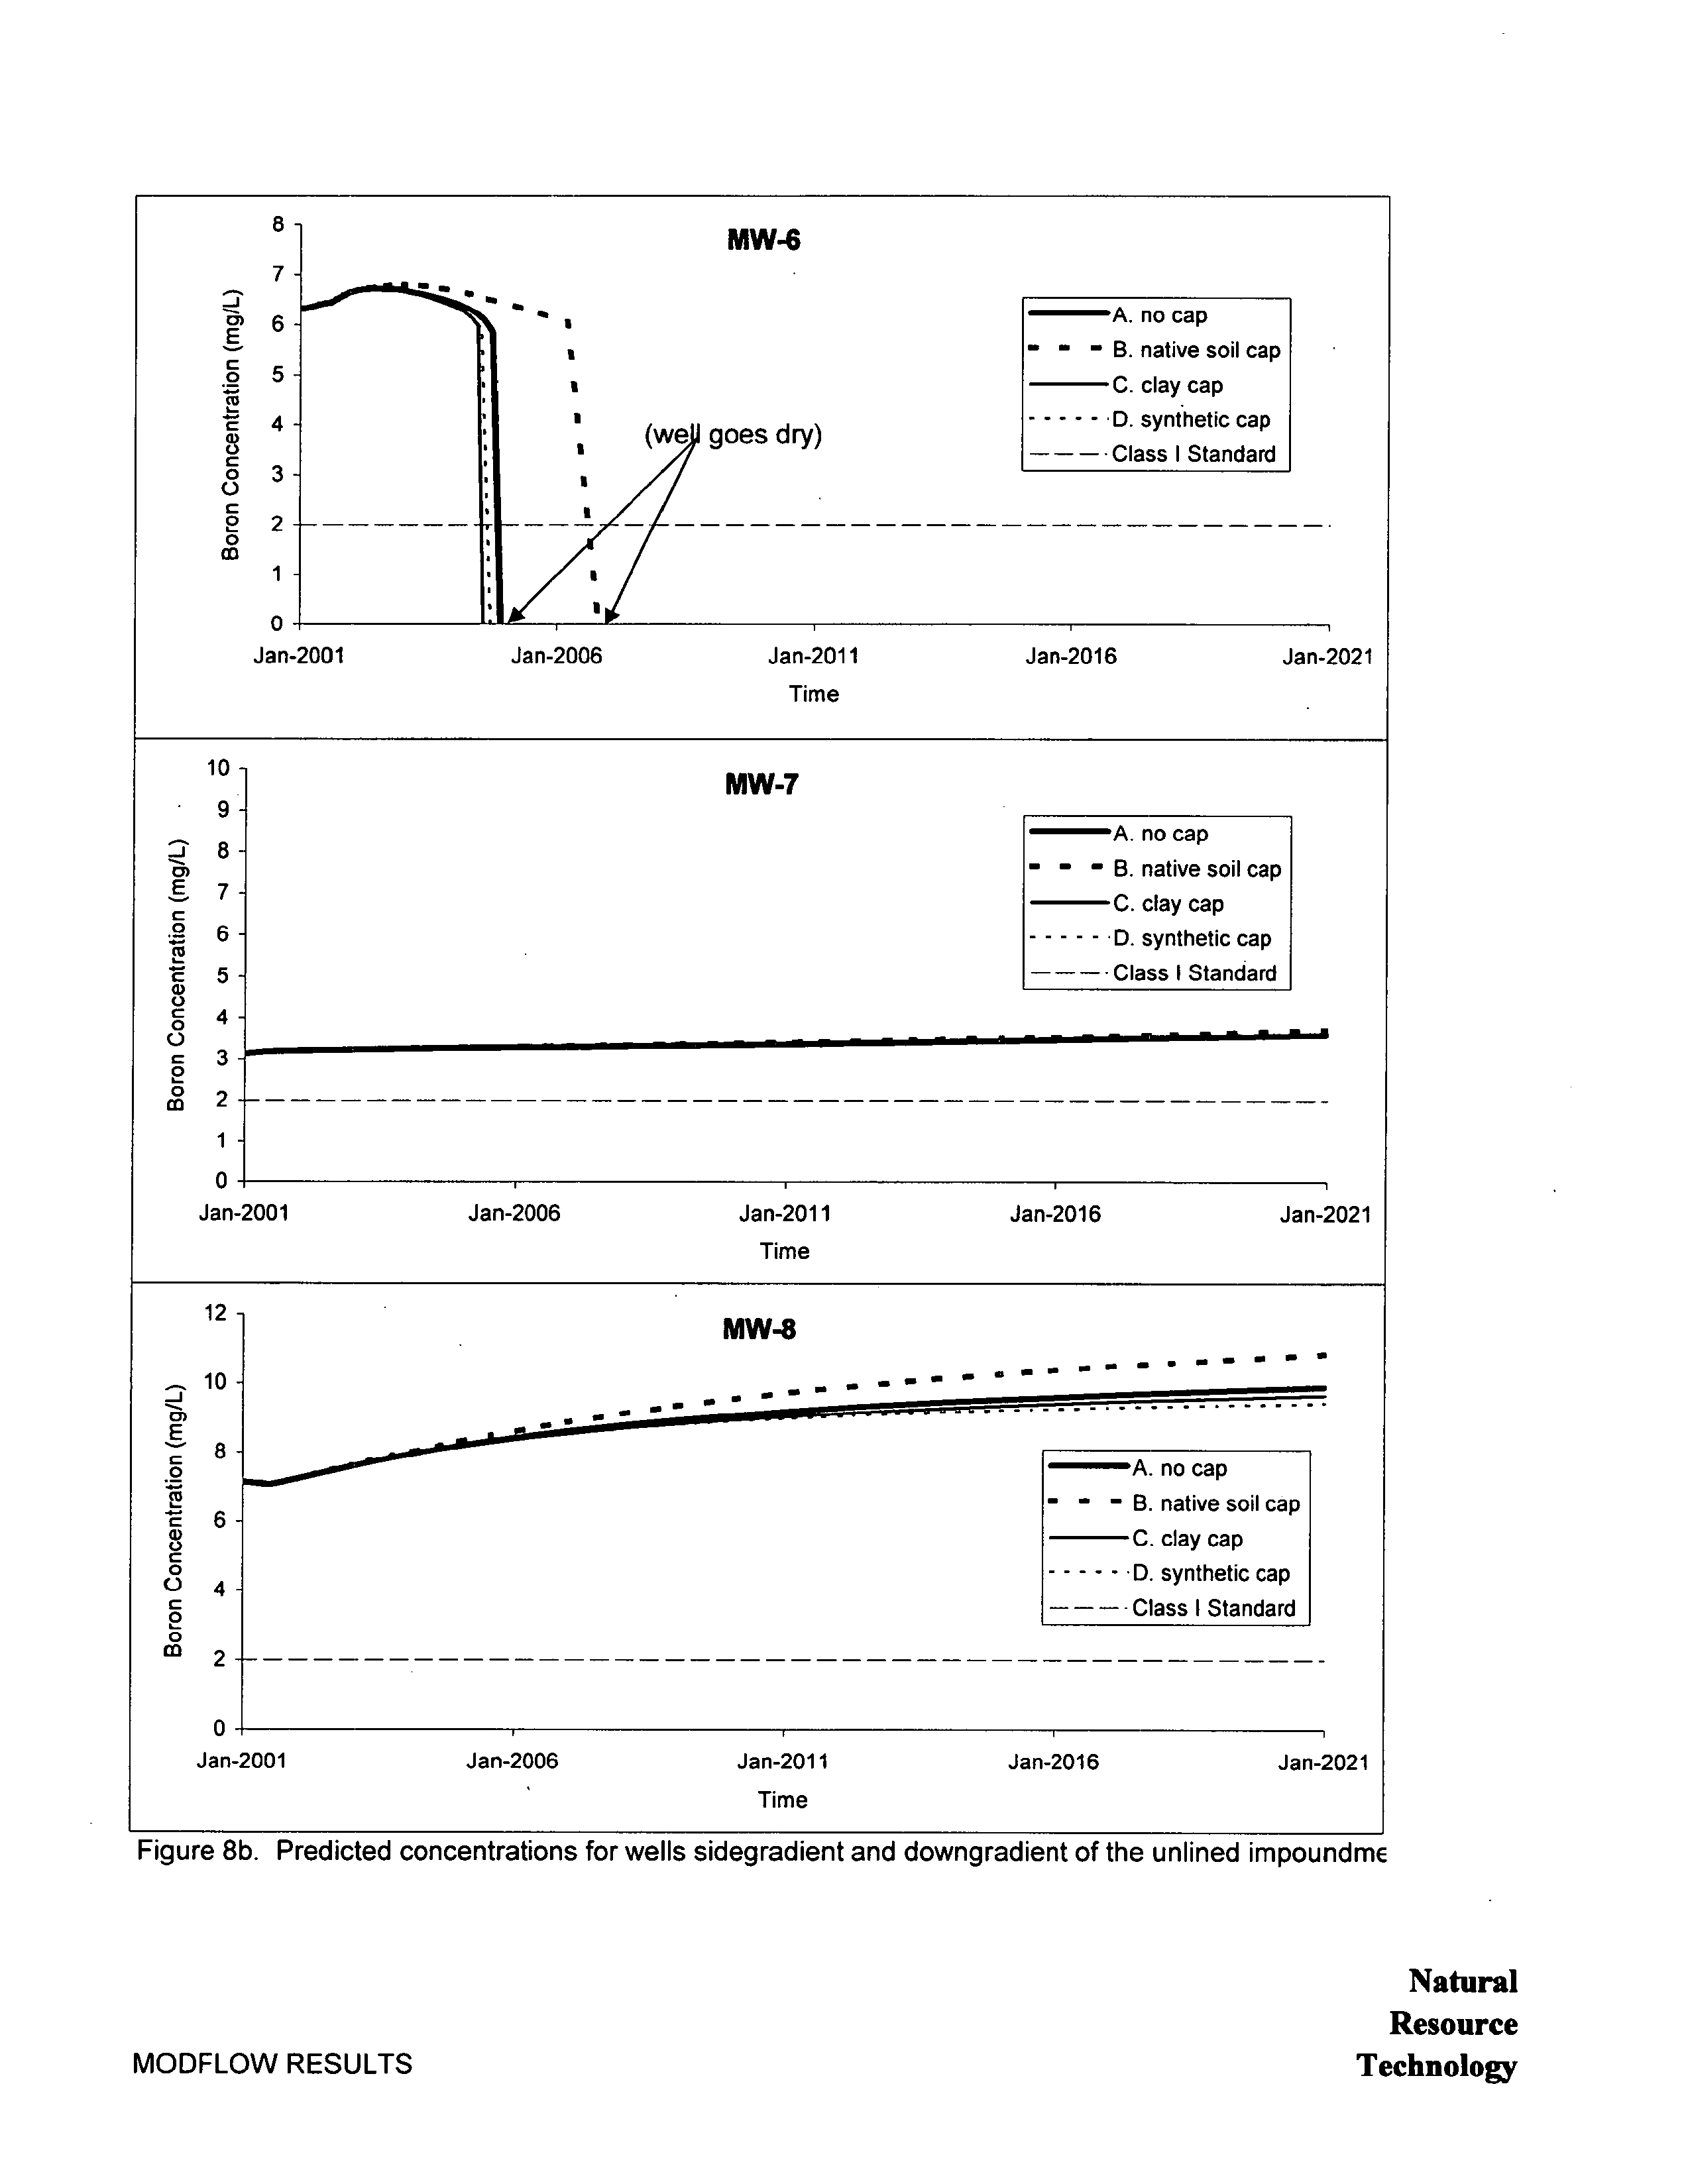
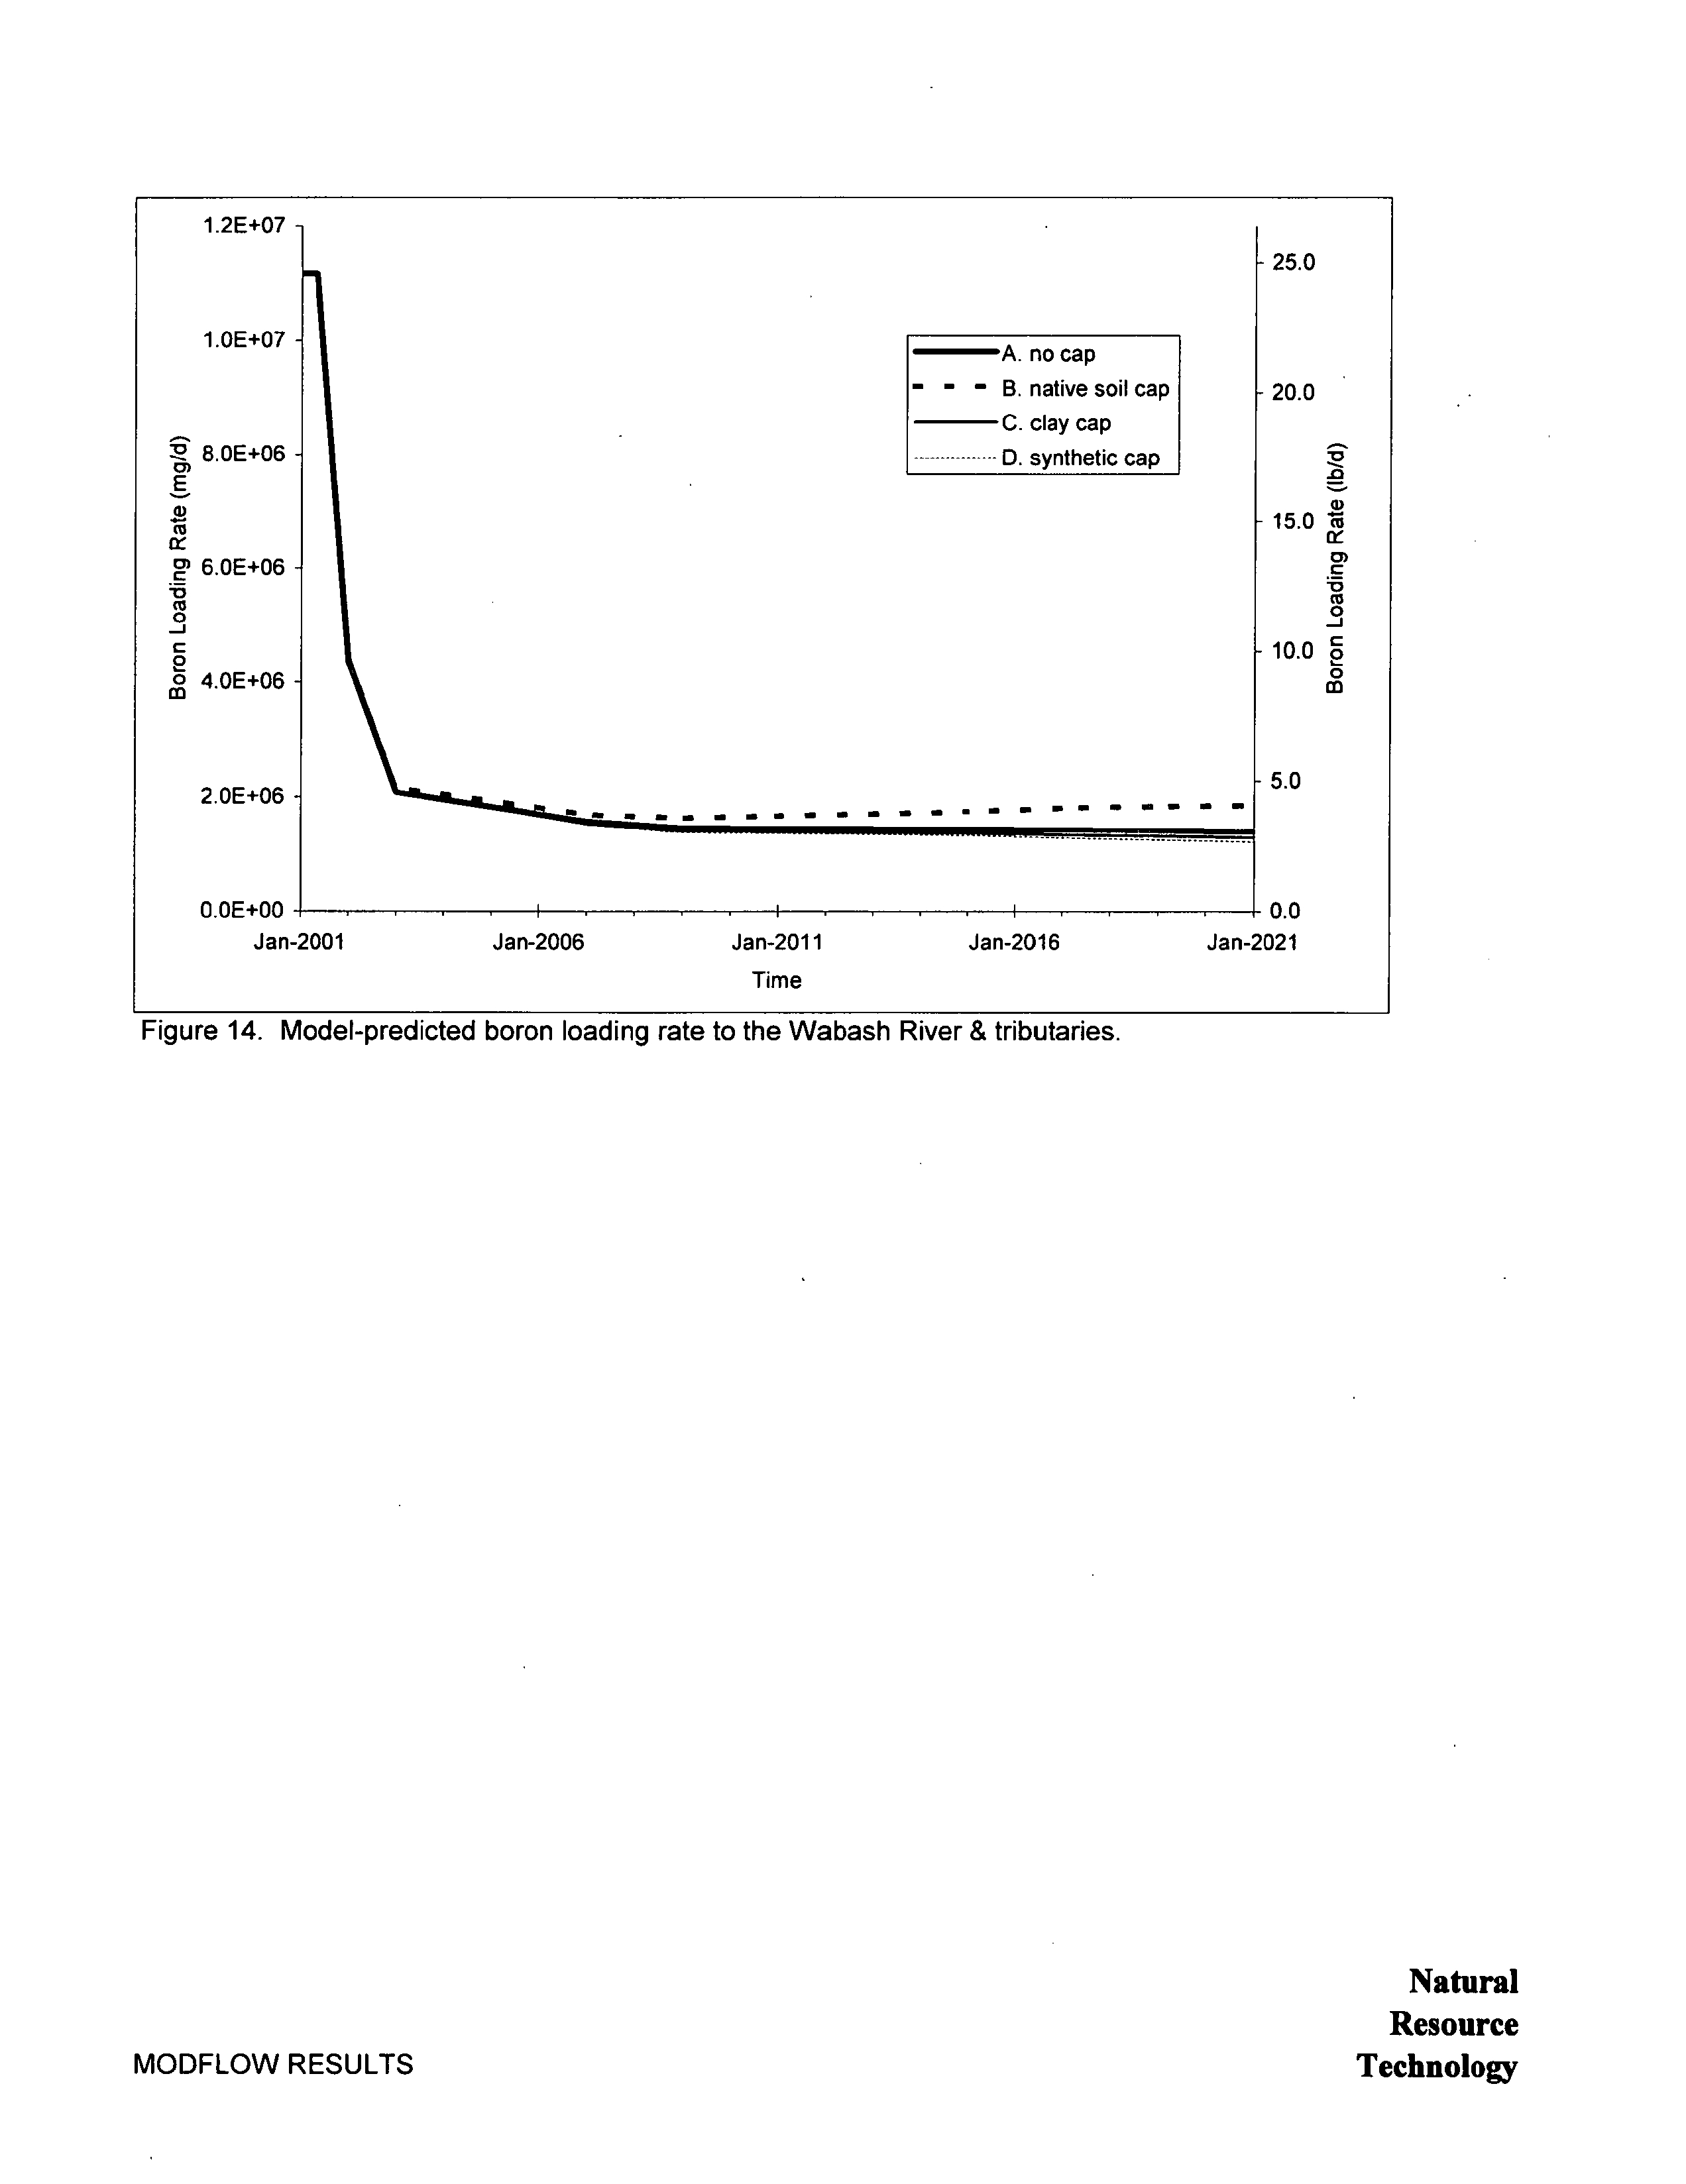
The results
suggest
boron concentration
decreases of 40
percent
to
more
than 90
percent
between
the
impoundments
Table
Figure
8a
but little
decrease
and
even
some
increase at
downgradient monitoring
wells
MW-7 and
MW-8
Figure 8b Long-term change
at MW-6 was
not
predicted
by
the model because
predicted groundwater
elevation fell below the bottom of the
well
Concentration
at
downgradient
well MW-8
was
dependent
on
the assumed leachate
concentration
from the saturated ash
zone
Figure
Comparison
of
predicted
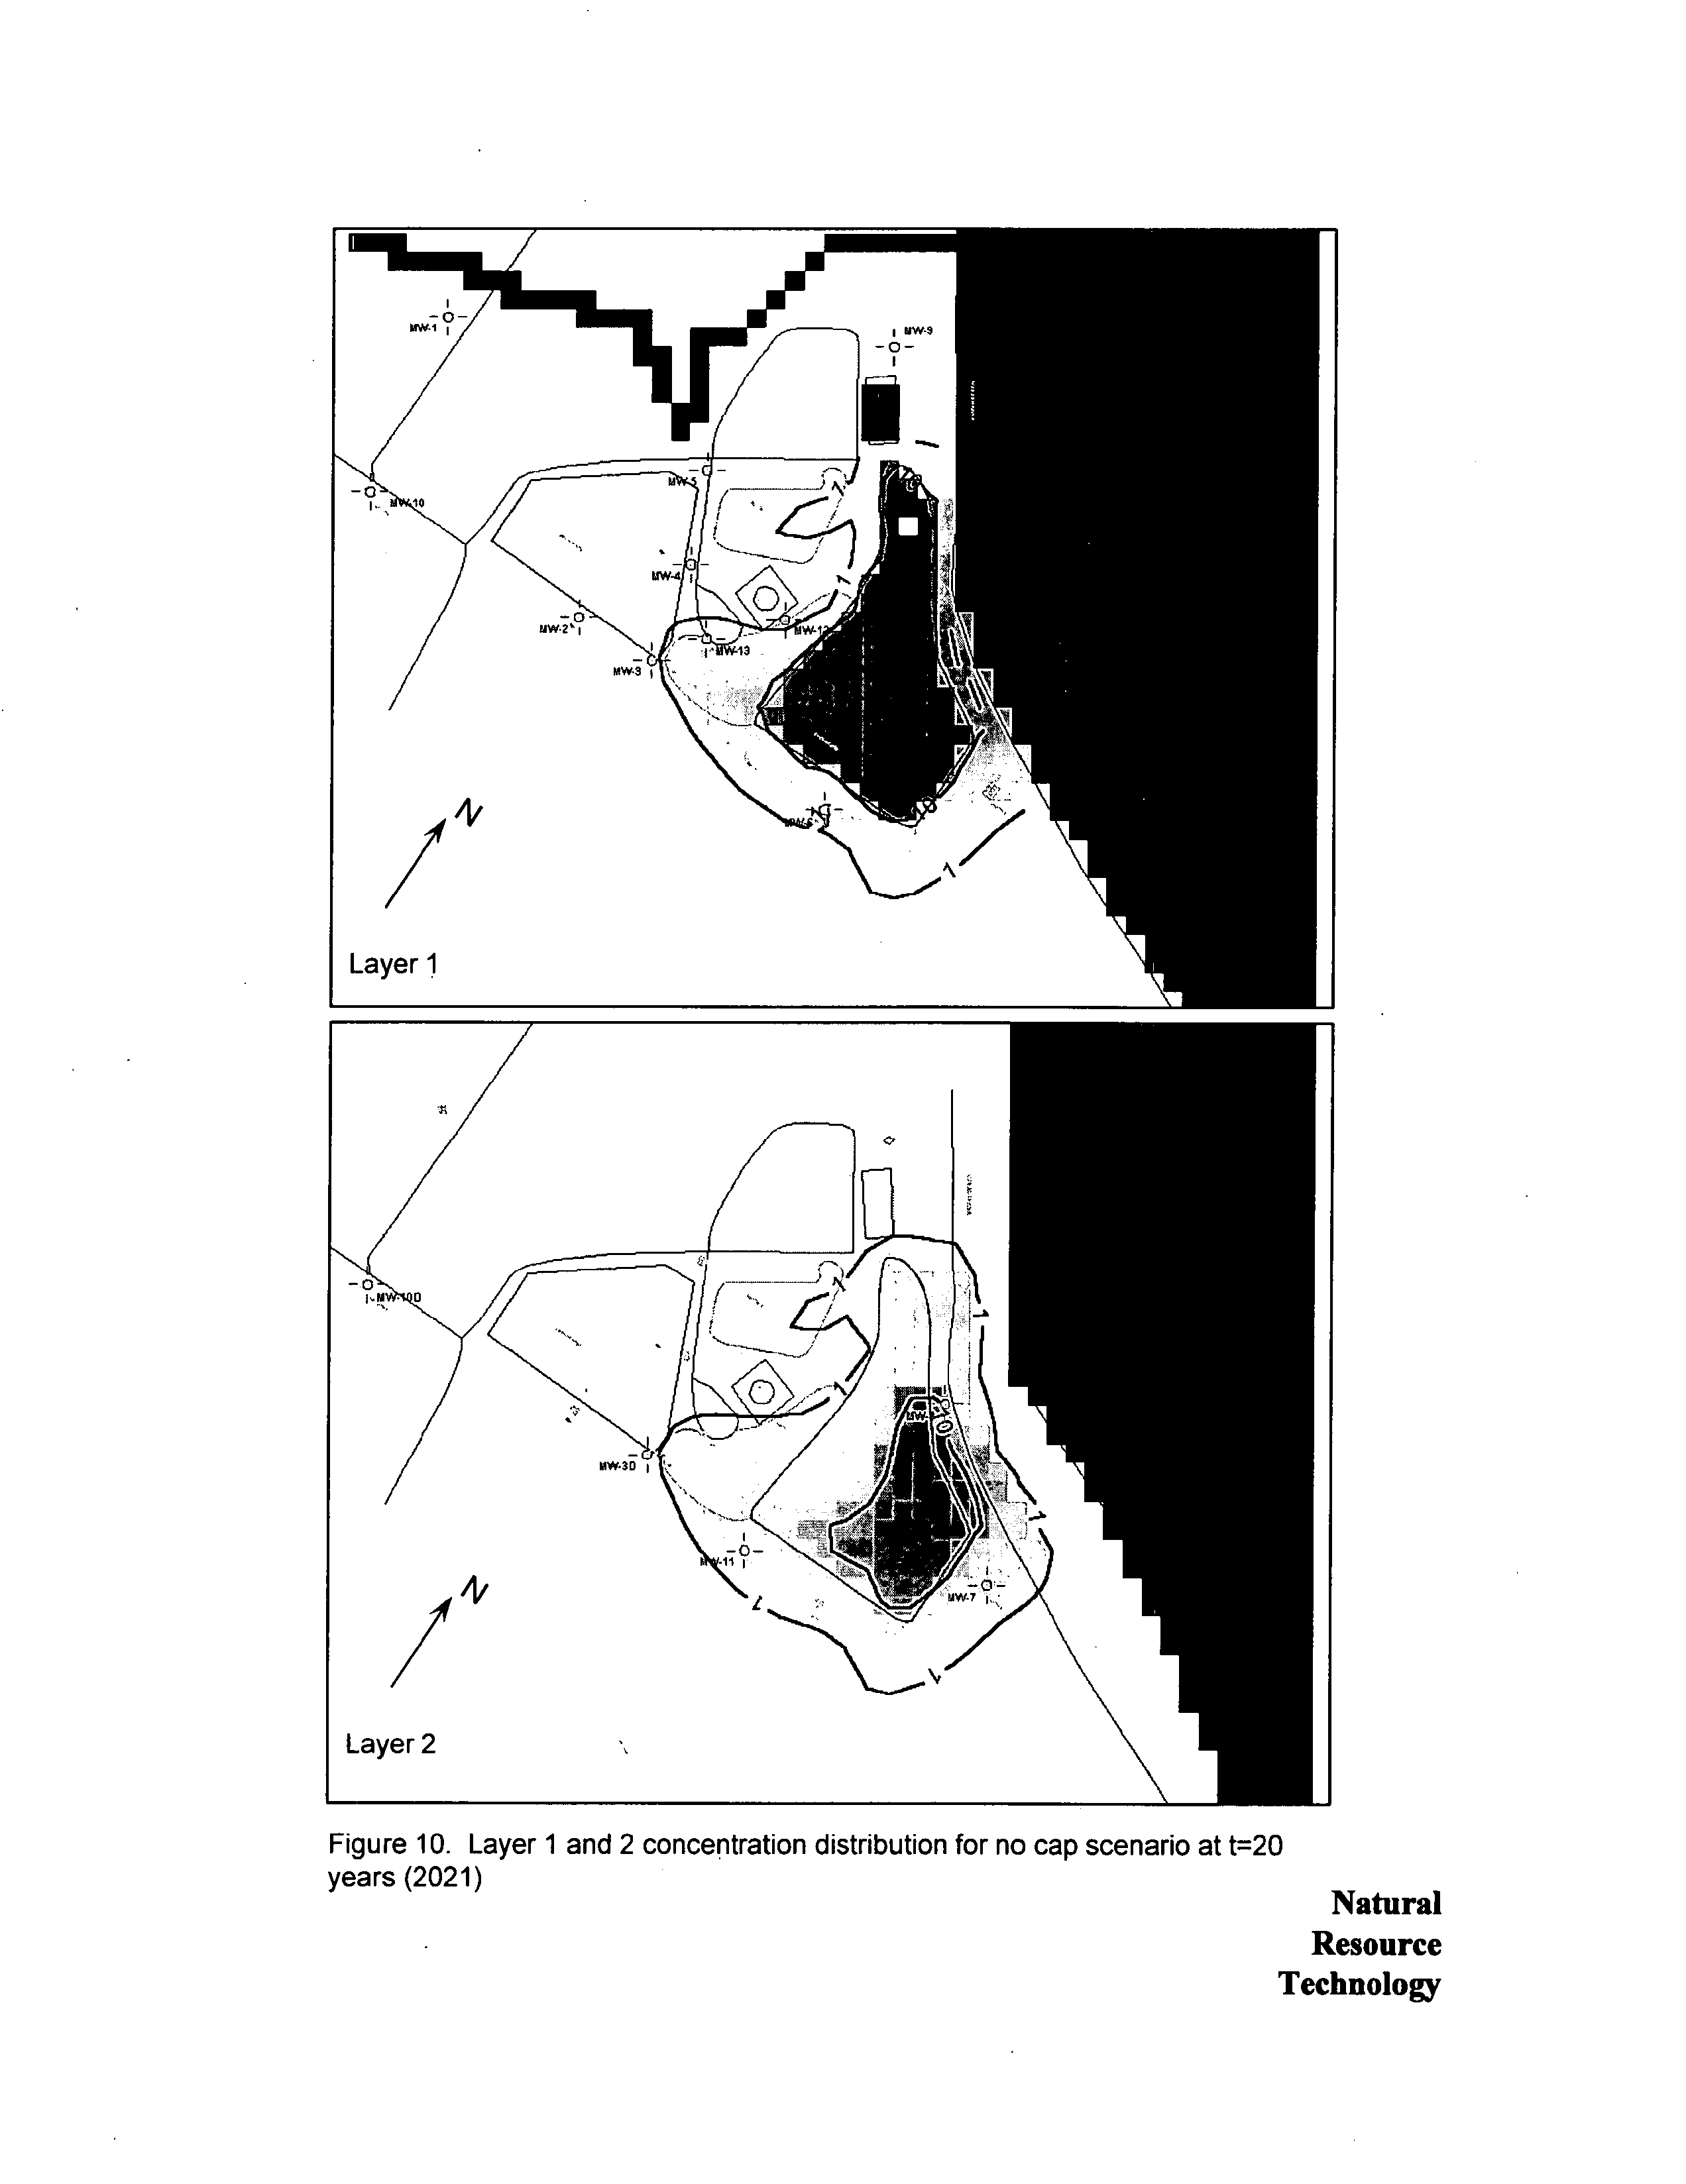
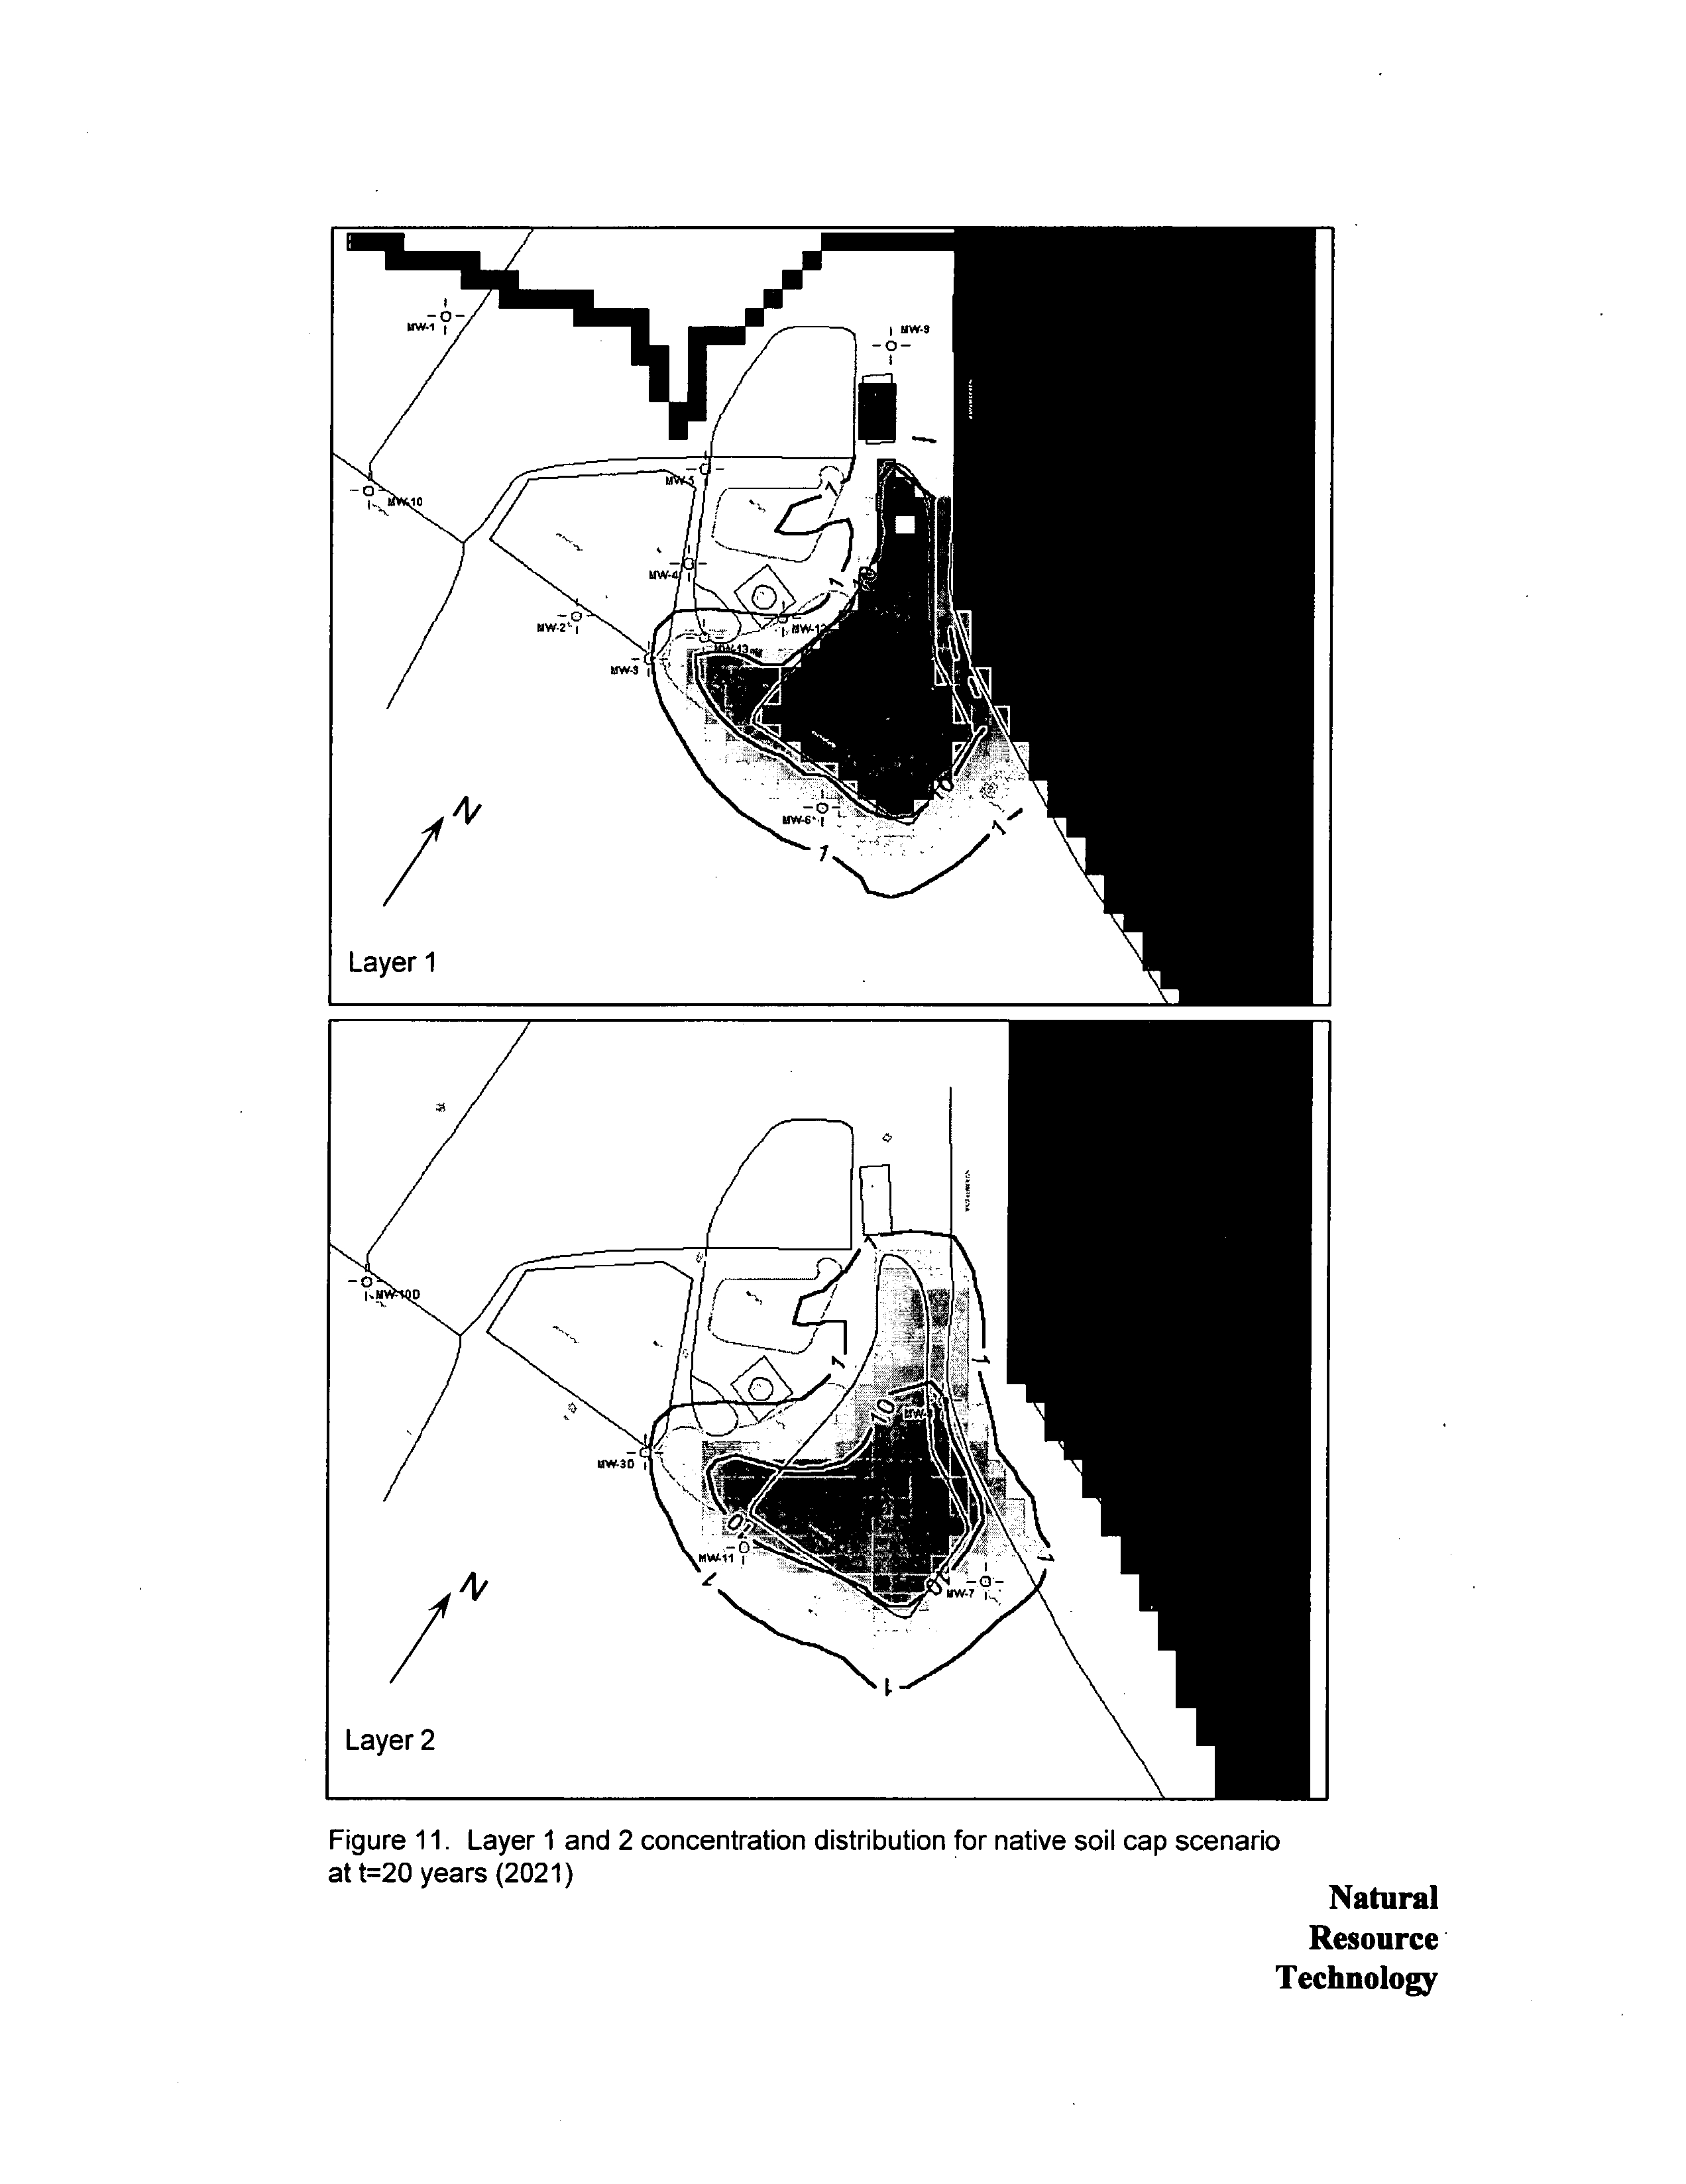
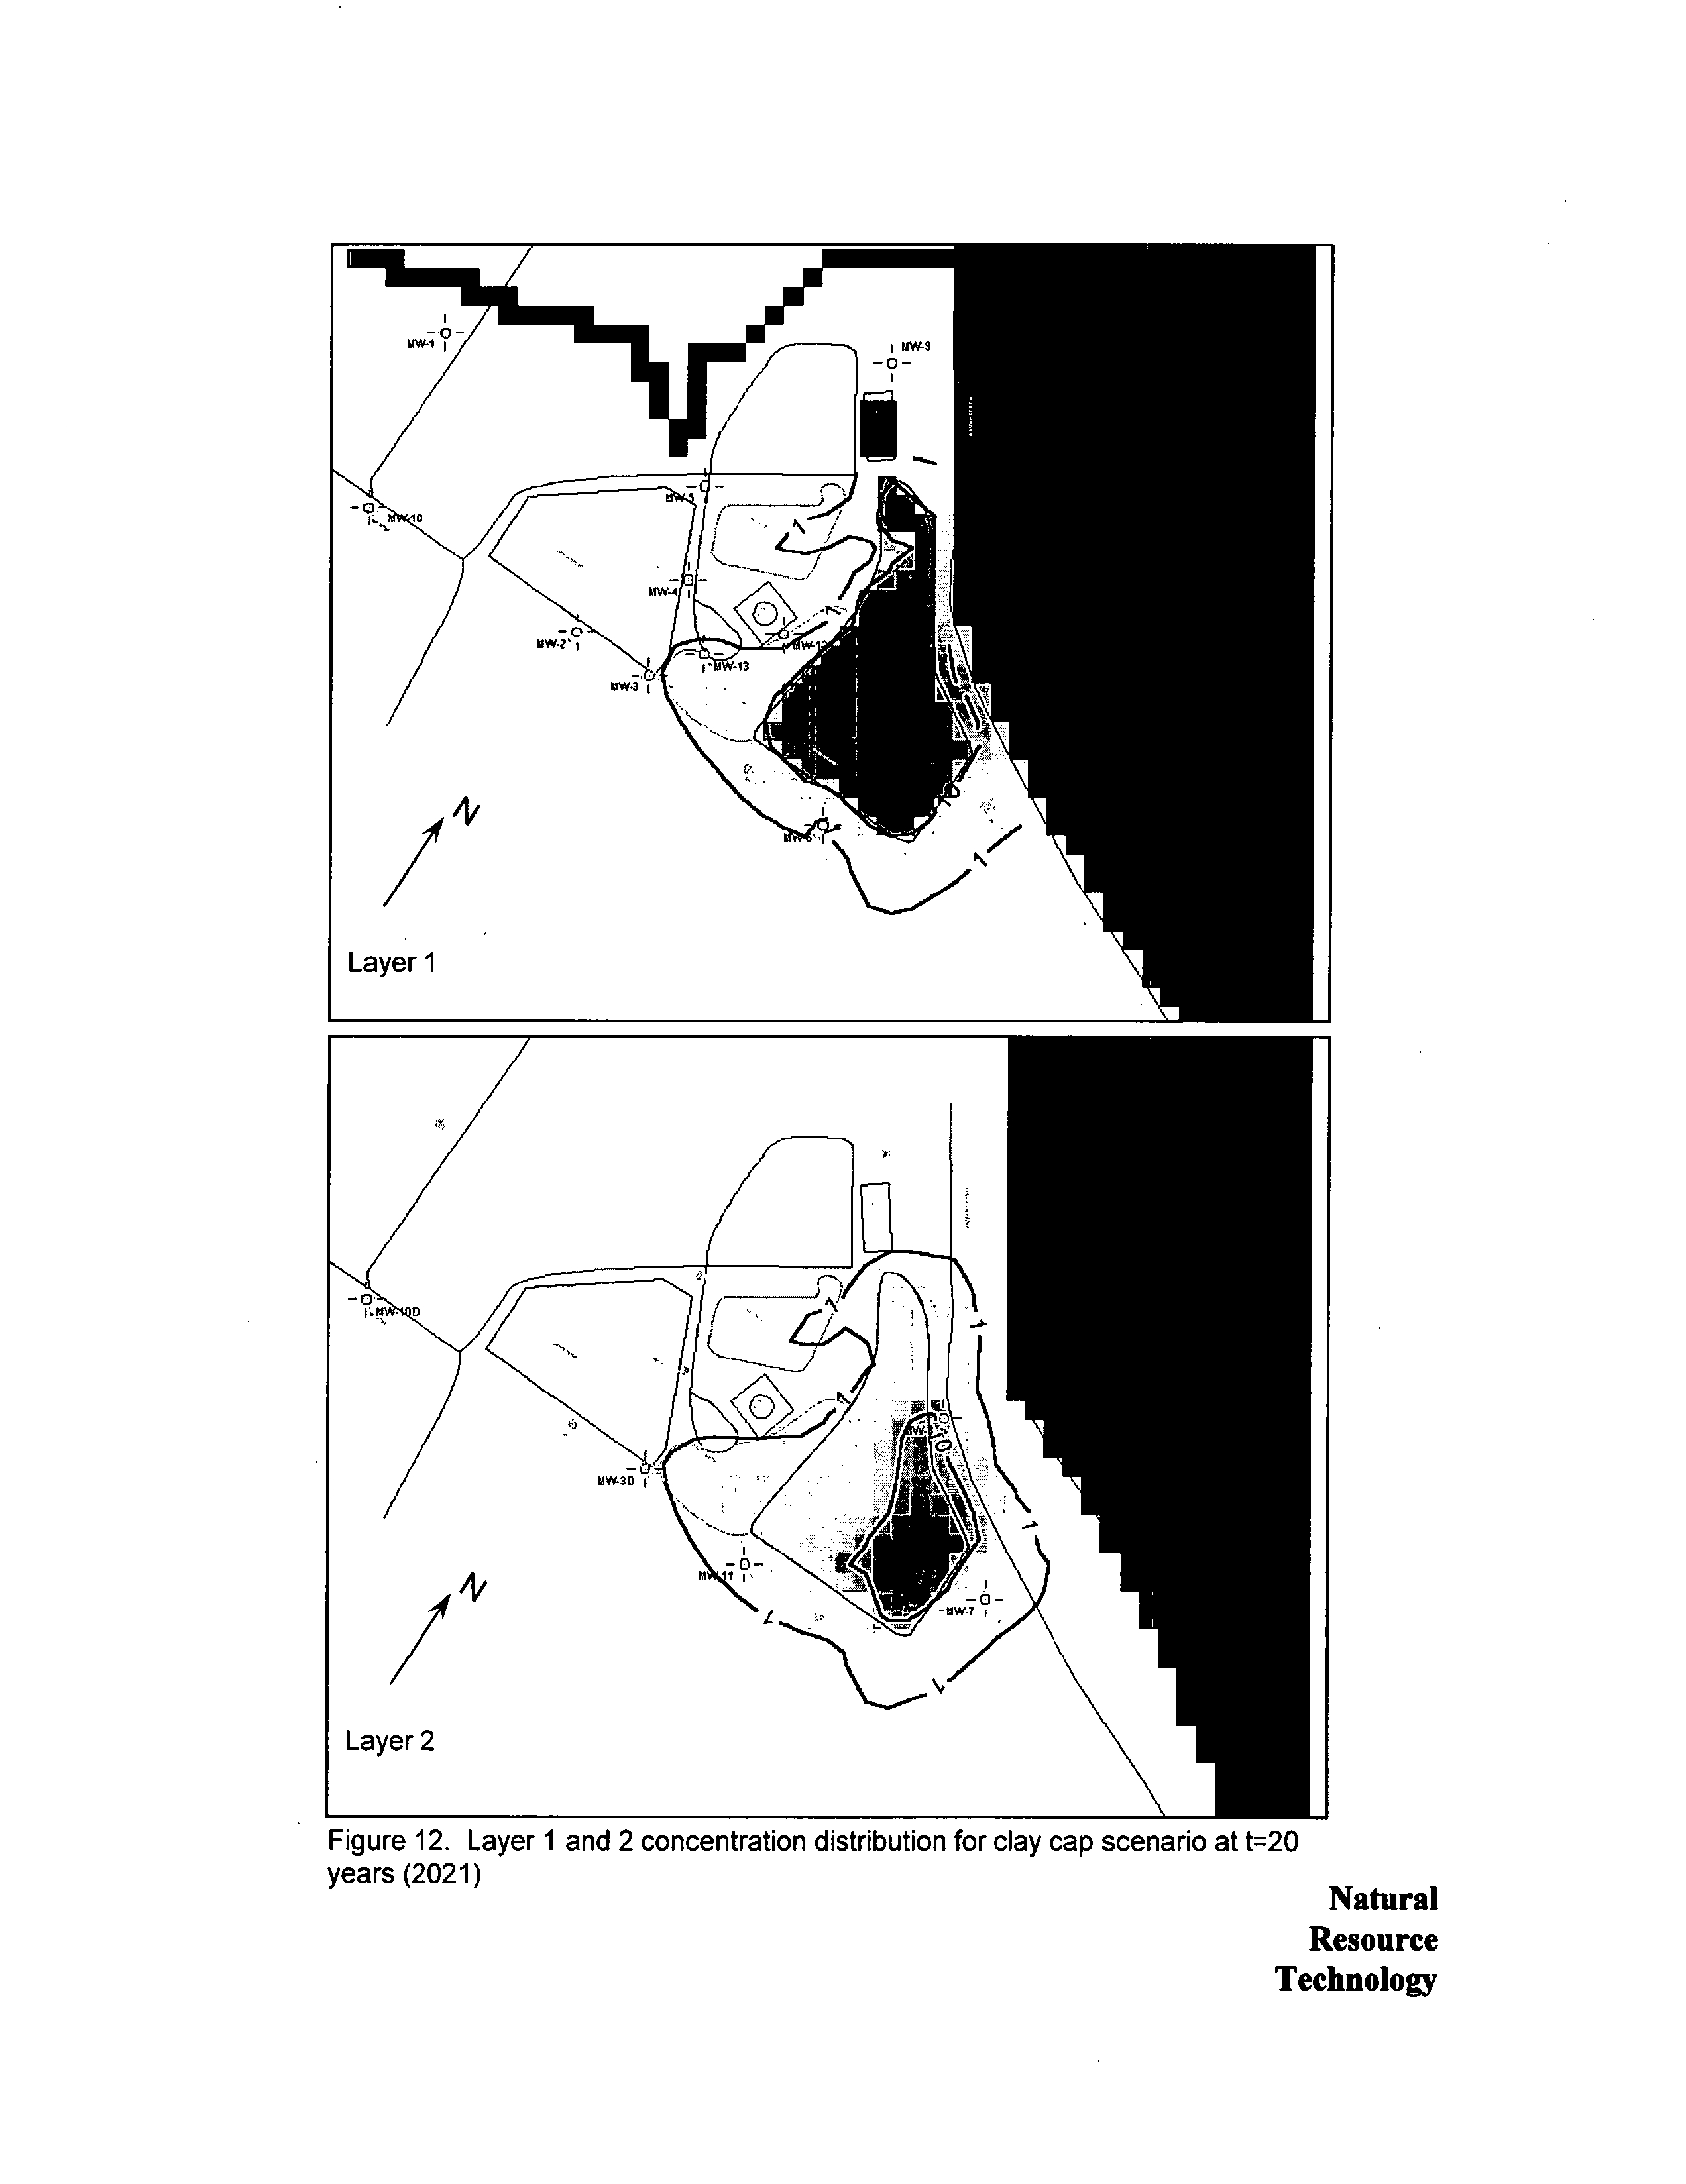
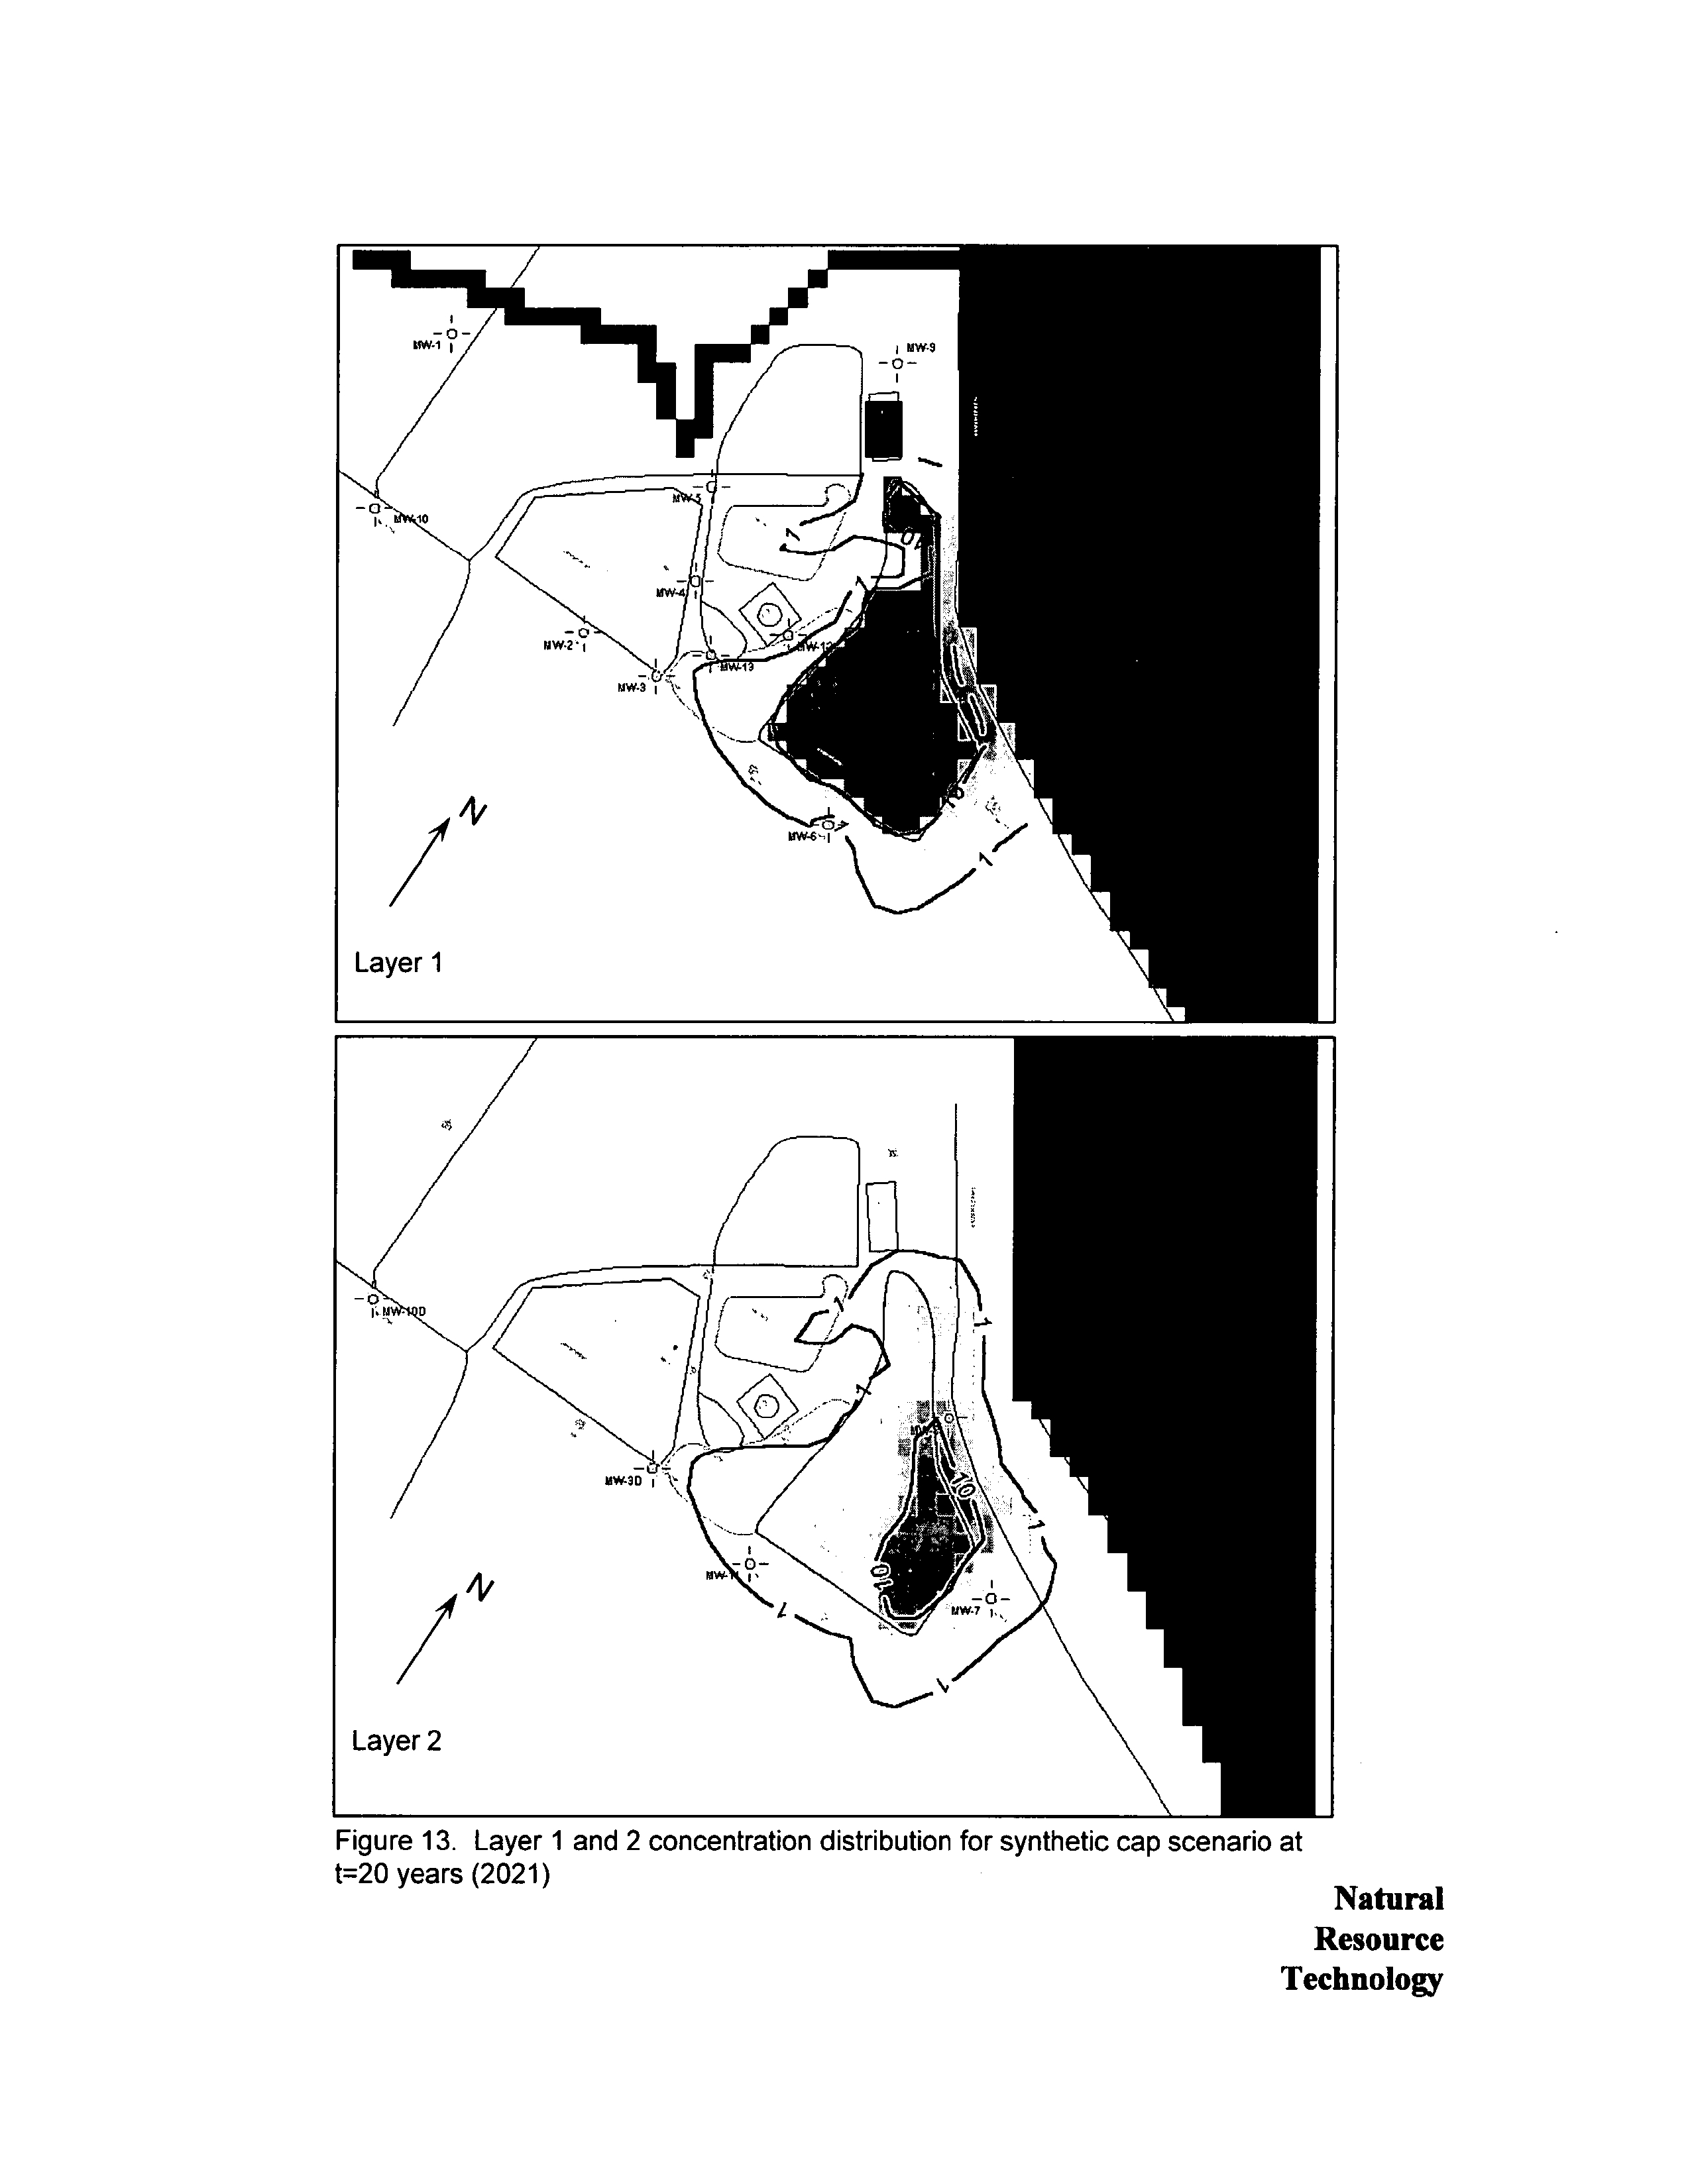
areal distribution in 2021
Figures 10-13
to current
areal distribution
Figure 7b
shows lower concentration
in the
area
between the
impoundments
and less
plume
extent to the south Areal differences between the four closure scenarios
are
primarily
reflected
in the lower concentrations
in the ash
laydown
area
and south of the
impoundment
and
to
lesser
extent
beneath the southern half of the unlined
impoundment
An
interesting
result of the
modeling
is the
predicted
increase
in
concentration
at
MW-3
MW-il
MW-7 and MW-8
The
slight
temporary
increase at MW-3 is due to
shifting
groundwater
flow
patterns
between the two
impoundments
The increase
at
the other wells is
caused
by
the saturated ash
source zone
simulated in the
model
which has
higher
concentration
than
percolation
from the unlined
impoundment
The effect is
temporary
at
MW-i
which is
sidegradient
because the mound
eventually
dissipates
and the effects
of the unlined
impoundment
on this well
dissipate
with the mound
However
the increase is
permanent
at
MW-7 and
MW-8
which
are
directly downgradient
of the saturated ash
zone
NRT has observed
similar increases
at
other
impoundments
during
or
shortly
after
dewatering
This concentration
increase results
from
increased water contact time with the
ash
which is
result of
decreasing
percolation
rate
For
cases
where the ash is above the water
table
this increase is
temporary
and
concentrations
eventually
decrease
as
percolation
rates
continue
to
decrease
However
these
model results
suggest
that the effect
may
be
long-term
for
case where ash is below the water
table
Groundwater
Loading
Rate to the Wabash River
The model was used to calculate boron
loading
rate in
groundwater discharge
to the Wabash
River and tributaries
The results of this
analysis
indicated
an
83
to
89
percent
decrease in
MODEL REPORT
Natural
16
Resource
Technology
Electronic Filing - Received, Clerks' Office, August 11, 2008--Exhibits 1,2,5-10, & 12
HUTSONVILLE
GROUND WA TER MODEL EVALUATION
loading
rate 20
years
after the
impoundment
is
closed
depending
on
closure
scenario
with the
majority
of
this decrease
occurring
after the first two
years Figure 14
This decrease in
loading
rate
is similar
to
the decrease in
percolation
rate
predicted
with the HELP model Based
on
this
observation
the
loading
rate is most
significantly
affected
by dewatering
the
impoundment
rather than the
presence
or
type
of
cap
Comparison
of Closure Scenarios
The model results
suggest
little
practical
difference between the closure
scenarios
The most
noticeable
difference occurred in the area between the
impoundments
MW- 13
where boron
concentrations
predicted
with the
clay
and
synthetic
cap
scenarios
were
lower than the Class
standard
while boron concentrations
predicted
with
the no
cap
and the native soil
cap
scenarios
were
higher
than the
standard
However
no
closure
scenario
resulted in
improved
groundwater
quality
in the
downgradient
wells This lack of
improvement was
due to assumed continued
leaching
from the saturated ash beneath the unlined
impoundment
Therefore downgradient
groundwater
is
predicted
to have
continuing
exceedances of the Class
boron
standard for all
closure scenarios
Despite
the lack of
downgradient
concentration
decrease
the model
predicts
decreased
boron
loading
to the Wabash River
by
almost two orders of
magnitude
under
any
of the closure
scenarios
This
loading
rate reduction
occurs while
downgradient
concentrations
increase
because the
hydraulic gradient
decreases
greatly
as
the
impoundment dewaters causing
corresponding
reduction
in
groundwater velocity
and
discharge
rate to
the
river These model
results
suggest
that
None
of the closure
alternatives
will
adequately
control
downgradient
boron
concentration
although
all of the alternatives
will reduce
loading
rate to the Wabash
River
and
Differences
in
overall
performance
of the four closure alternatives
is not
significant
compared
to the benefit obtained
by dewatering
the
impoundment
Implications
for Other Parameters in Ash Leachate
Other
analytes
that exceeded Class
standards at the Hutsonville
impoundment
were
iron
manganese
nickel pH sulfate
and TDS
NRT 1999
MODEL REPORT
Natural
17
Resource
Technology
Electronic Filing - Received, Clerks' Office, August 11, 2008--Exhibits 1,2,5-10, & 12
HUTSONVILLE
GROUND WA TER MODEL EVALUATiON
Iron exceedances were
only
found in
direct-push samples
near
the
coal
pile
while nickel and
pH
exceedances
were
found in
direct-push samples
near
the coal
pile
and in
groundwater monitoring
wells
MW-Il
and
MW-13
near localized
areas
where coal had been
spilled
or
stormwater
runoff from the coal
pile
accumulates
The limited
occurrence
of these
parameters
indicates
much less
mobility
in
groundwater
than boron
Additionally
iron and nickel
typically
had low
concentrations
in the ash leachate while
pH
was
neutral
to
alkaline
Action
to
control
water
percolation
near MW-Il and MW-13 will
likely
result in
decreasing
concentrations
of iron and
nickel as
pH
in
groundwater
increases
Because iron and nickel are less mobile than
boron
their
rate of decrease
may
be slower than the rate of boron concentration
decrease No
changes
in
PH
iron or
nickel
concentrations
would be
expected
downgradient
of the
impoundment
where
concentrations
are
within Class
standards
Manganese
exceeds Class
standards
throughout
the
site including
the
upgradient
wells
and
exhibits
highest
concentration
near
the
impoundments
Since it is
present
in ash
leachate
it is
expected
that
manganese
will continue to leach from saturated ash and exceed Class
standards
after
closure alternative is enacted Neither
manganese
nor
iron nickel
and
pH
can be
reliably
modeled because these
parameters
are
highly
sensitive
to chemical
or
REDOX conditions that
current
groundwater
transport
models do not simulate
Sulfate is
similarly
mobile or more mobile
than
boron
and TDS is
an
indicator based
mostly
on
mobile
parameters
such
as
sulfate
Therefore
these
parameters
can
be
expected
to behave
similarly
to the modeled
boron
and should not be
expected
to meet standards in
downgradient
wells
Loading
rates to the Wabash River would decrease
similarly
to boron under the modeled
closure scenarios
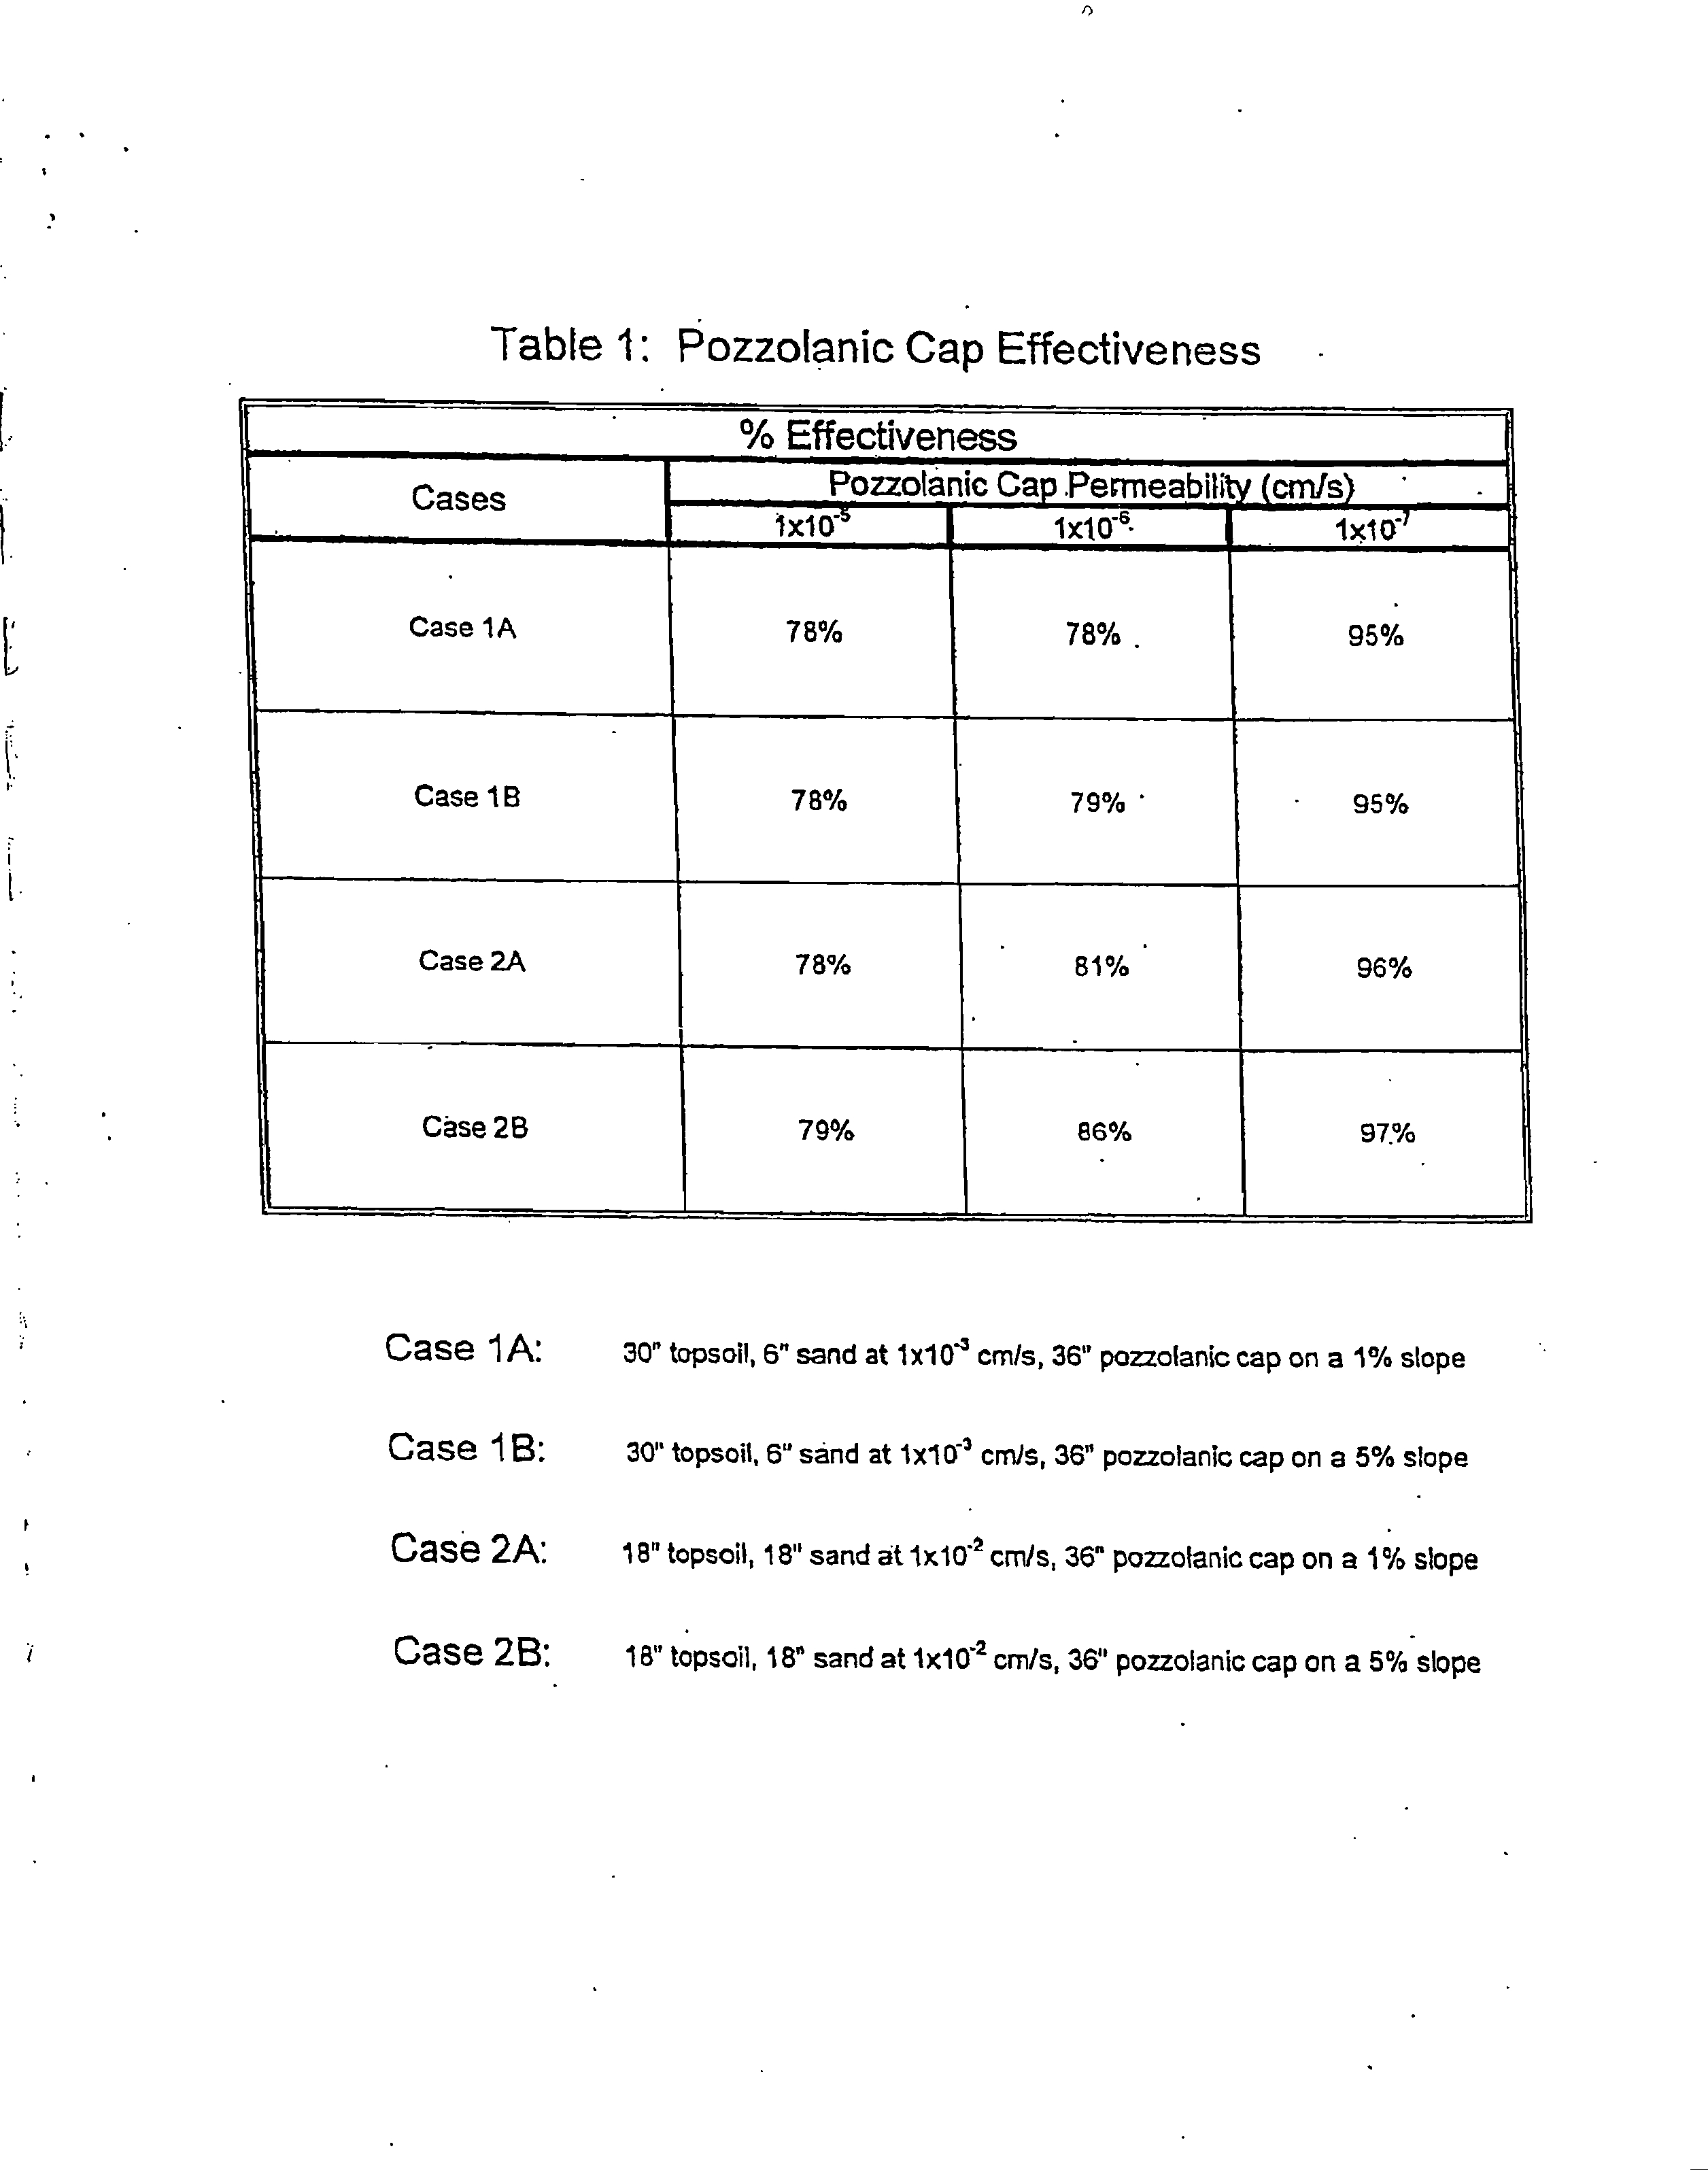
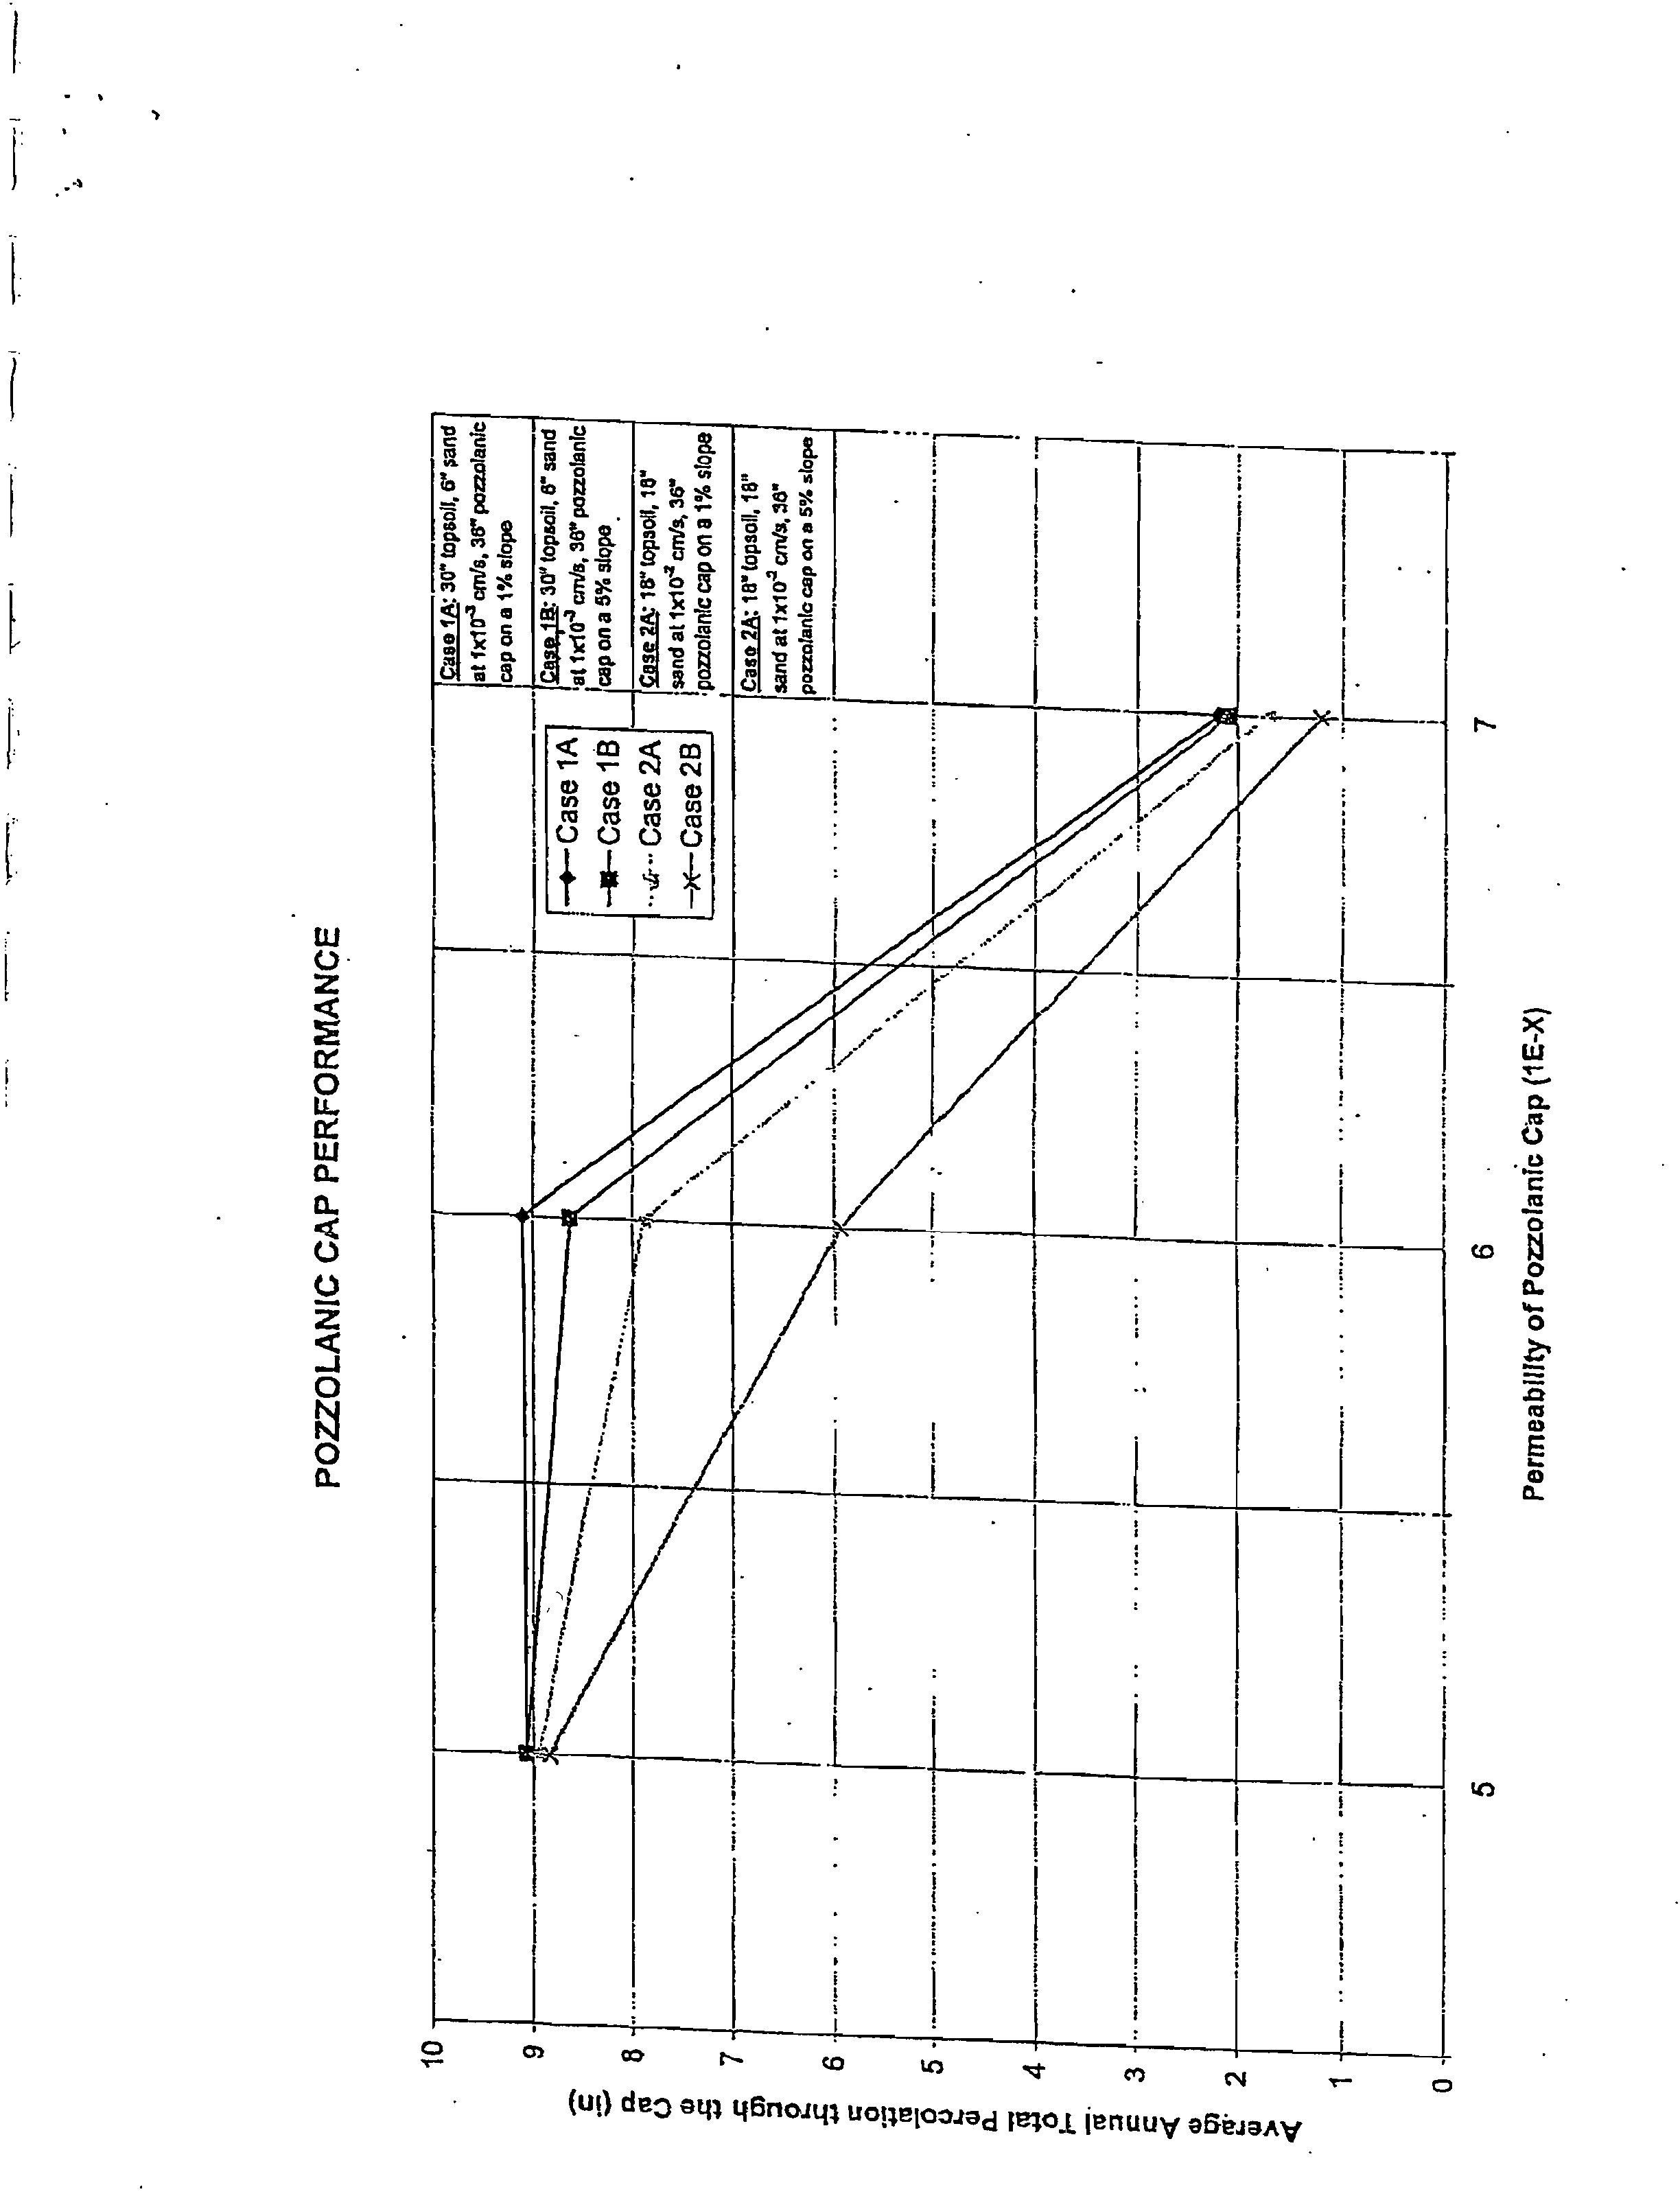
CONCLUSIONS
HELP
modeling suggests
that
dewatering
the
Hutsonville
impoundment
will result in 97
percent
decrease in leachate
percolation
to
groundwater
from the
ponded portion
of the
impoundment
after
year
This decrease due
to
dewatering
is
considerably
larger
than
the
additional decrease attained after simulation of four closure alternatives
Modeling
of closure alternative
performance
with
coupled groundwater flow/transport
model
suggests
that
no
alternative
will result in
downgradient
concentrations
meeting
MODEL REPORT
Natural
18
Resource
Technology
Electronic Filing - Received, Clerks' Office, August 11, 2008--Exhibits 1,2,5-10, & 12
HUTSONVILLE
GROUND WA TER MODEL EVALUATION
Class
standards because saturated ash in the unlined
impoundment
will continue to
leach
Even
though
model
results indicated that Class
standards will not be
met predicted
boron
mass
loading
rate
to
the Wabash River decreased
by
83
to
89
percent
under the
modeled closure scenarios
This decrease
occurs
because the
hydraulic gradient
and
groundwater velocity
are
reduced
as
the
impoundment
dewaters The
presence
or
type
of
cap
had
minimal effect on modeled mass
loading
rate
For other
analytes
that exceed Class
groundwater standards
iron nickel
and
pH
concentrations
should
improve perhaps
at
slow
rate
if
action is taken to limit
infiltration in areas where coal was
spilled
and coal
pile
runoff accumulates
Manganese
sulfate
and TDS
may
continue to leach from saturated
ash therefore downgradient
concentrations
may
not
improve
after the
impoundment
is
closed
although
mass
loading
rates for these constituents should decrease
similarly
to that modeled for boron
The
area
of
impacted groundwater predicted
with the
synthetic
liner scenario
was
less
extensive
than the other scenarios
However
those differences
were
upgradient
and
sidegradient
of the unlined
impoundment
Based
on
downgradient performance
no
closure
scenario
was
inherently
better
than
the others
because
downgradient
concentrations
are not
predicted
to meet
Class
groundwater standards
and the boron
loading
rate to the river decreases
similarly
under all four scenarios
REFERENCES
Gelhar L.W
Mantoglou
Welty
and K.R
Rehfeldt 1985
Review
of
Field-Scale
Physical
Solute
Transport
Processes in Saturated and Unsaturated Porous
Media
Electric
Power Research
Institute
EA-4
190
Palo
Alto
CA
McDonald M.G
and A.W
Harbaugh 1988
Modular Three-Dimensional
Finite-Difference
Ground-Water Flow Model
Techniques of
Water-Resources
Investigations Techniques
of
Water-Resources of the United States
Geological
Survey
Book
Chapter
Al
Mercer J.W
and R.K
Waddell 1993
Contaminant
Transport
in
Groundwater
in Handbook of
Hydrology
D.R Maidment
ed
McGraw-Hill
Inc
pp
16.1-16.41
New
York
NY
Natural Resource
Technology 1999 Hydro geologic
Assessment
Report
Hutsonville Power
Station unpublished
report
to
Ameren
Services August
1999
Rumbaugh
III J.O
and L.L
Ruskauff 1993
Geraghty
Miller
Modeling Survey Analysis of
May
1992
Survey Results Geraghty
Miller
Modeling Group
MODEL REPORT
Natural
19
Resource
Technology
Electronic Filing - Received, Clerks' Office, August 11, 2008--Exhibits 1,2,5-10, & 12
HUTSONVILLE
GROUND
WA TER MODEL EVALUATION
Schroeder P.R
T.S
Dozier
P.A
Zappi
B.M
McEnroe
J.W
Sjostrom
and R.L
Peyton 1994
The
Hydrologic
Evaluation
of Landfill Performance HELP
Model
Engineering
Documentation
for
Version
EPAI600IR-94/168b
U.S Environmental Protection
Agency
Office of Research and
Development Washington
D.C
Smith
and S.W
Wheatcraft
Groundwater
Flow
in Handbook of
Hydrology
D.R Maidment
ed
McGraw-Hill
Inc
pp
6.1-6.58
New
York
NY
van der
Heijde
P.K.M
and O.A
Elnawawy 1993
Compilation of
Ground-Water
Models
USEPA
Project
Report
CR-8
15363
International Ground
Water
Modeling Center Golden
CO
Zheng
and P.P
Wang
1998 MT3DMS
Modular Three-Dimensional
Multispecies
Transport
Model
Model documentation and users
guide prepared by
the
University
of Alabama
Hydrogeology Group
for the US
Army Corps
of
Engineers
MODEL REPORT
Natural
20
Resource
Technology
Electronic Filing - Received, Clerks' Office, August 11, 2008--Exhibits 1,2,5-10, & 12
HUTSONVILLE
GROUNDWATER MODEL
EVALUATION
Natural Resource
Technology appreciates
the
opportunity
to
prepare
this
modeling report
If
there
are
any
questions please
contact
the
individual listed below
Bruce
Hensel
P.G
Senior
Hydrogeologist
MODEL REPORT
Natural
21
Resource
Technology
Electronic Filing - Received, Clerks' Office, August 11, 2008--Exhibits 1,2,5-10, & 12
HUTSONVILLE
GROUNDWATER MODEL EVALUATION
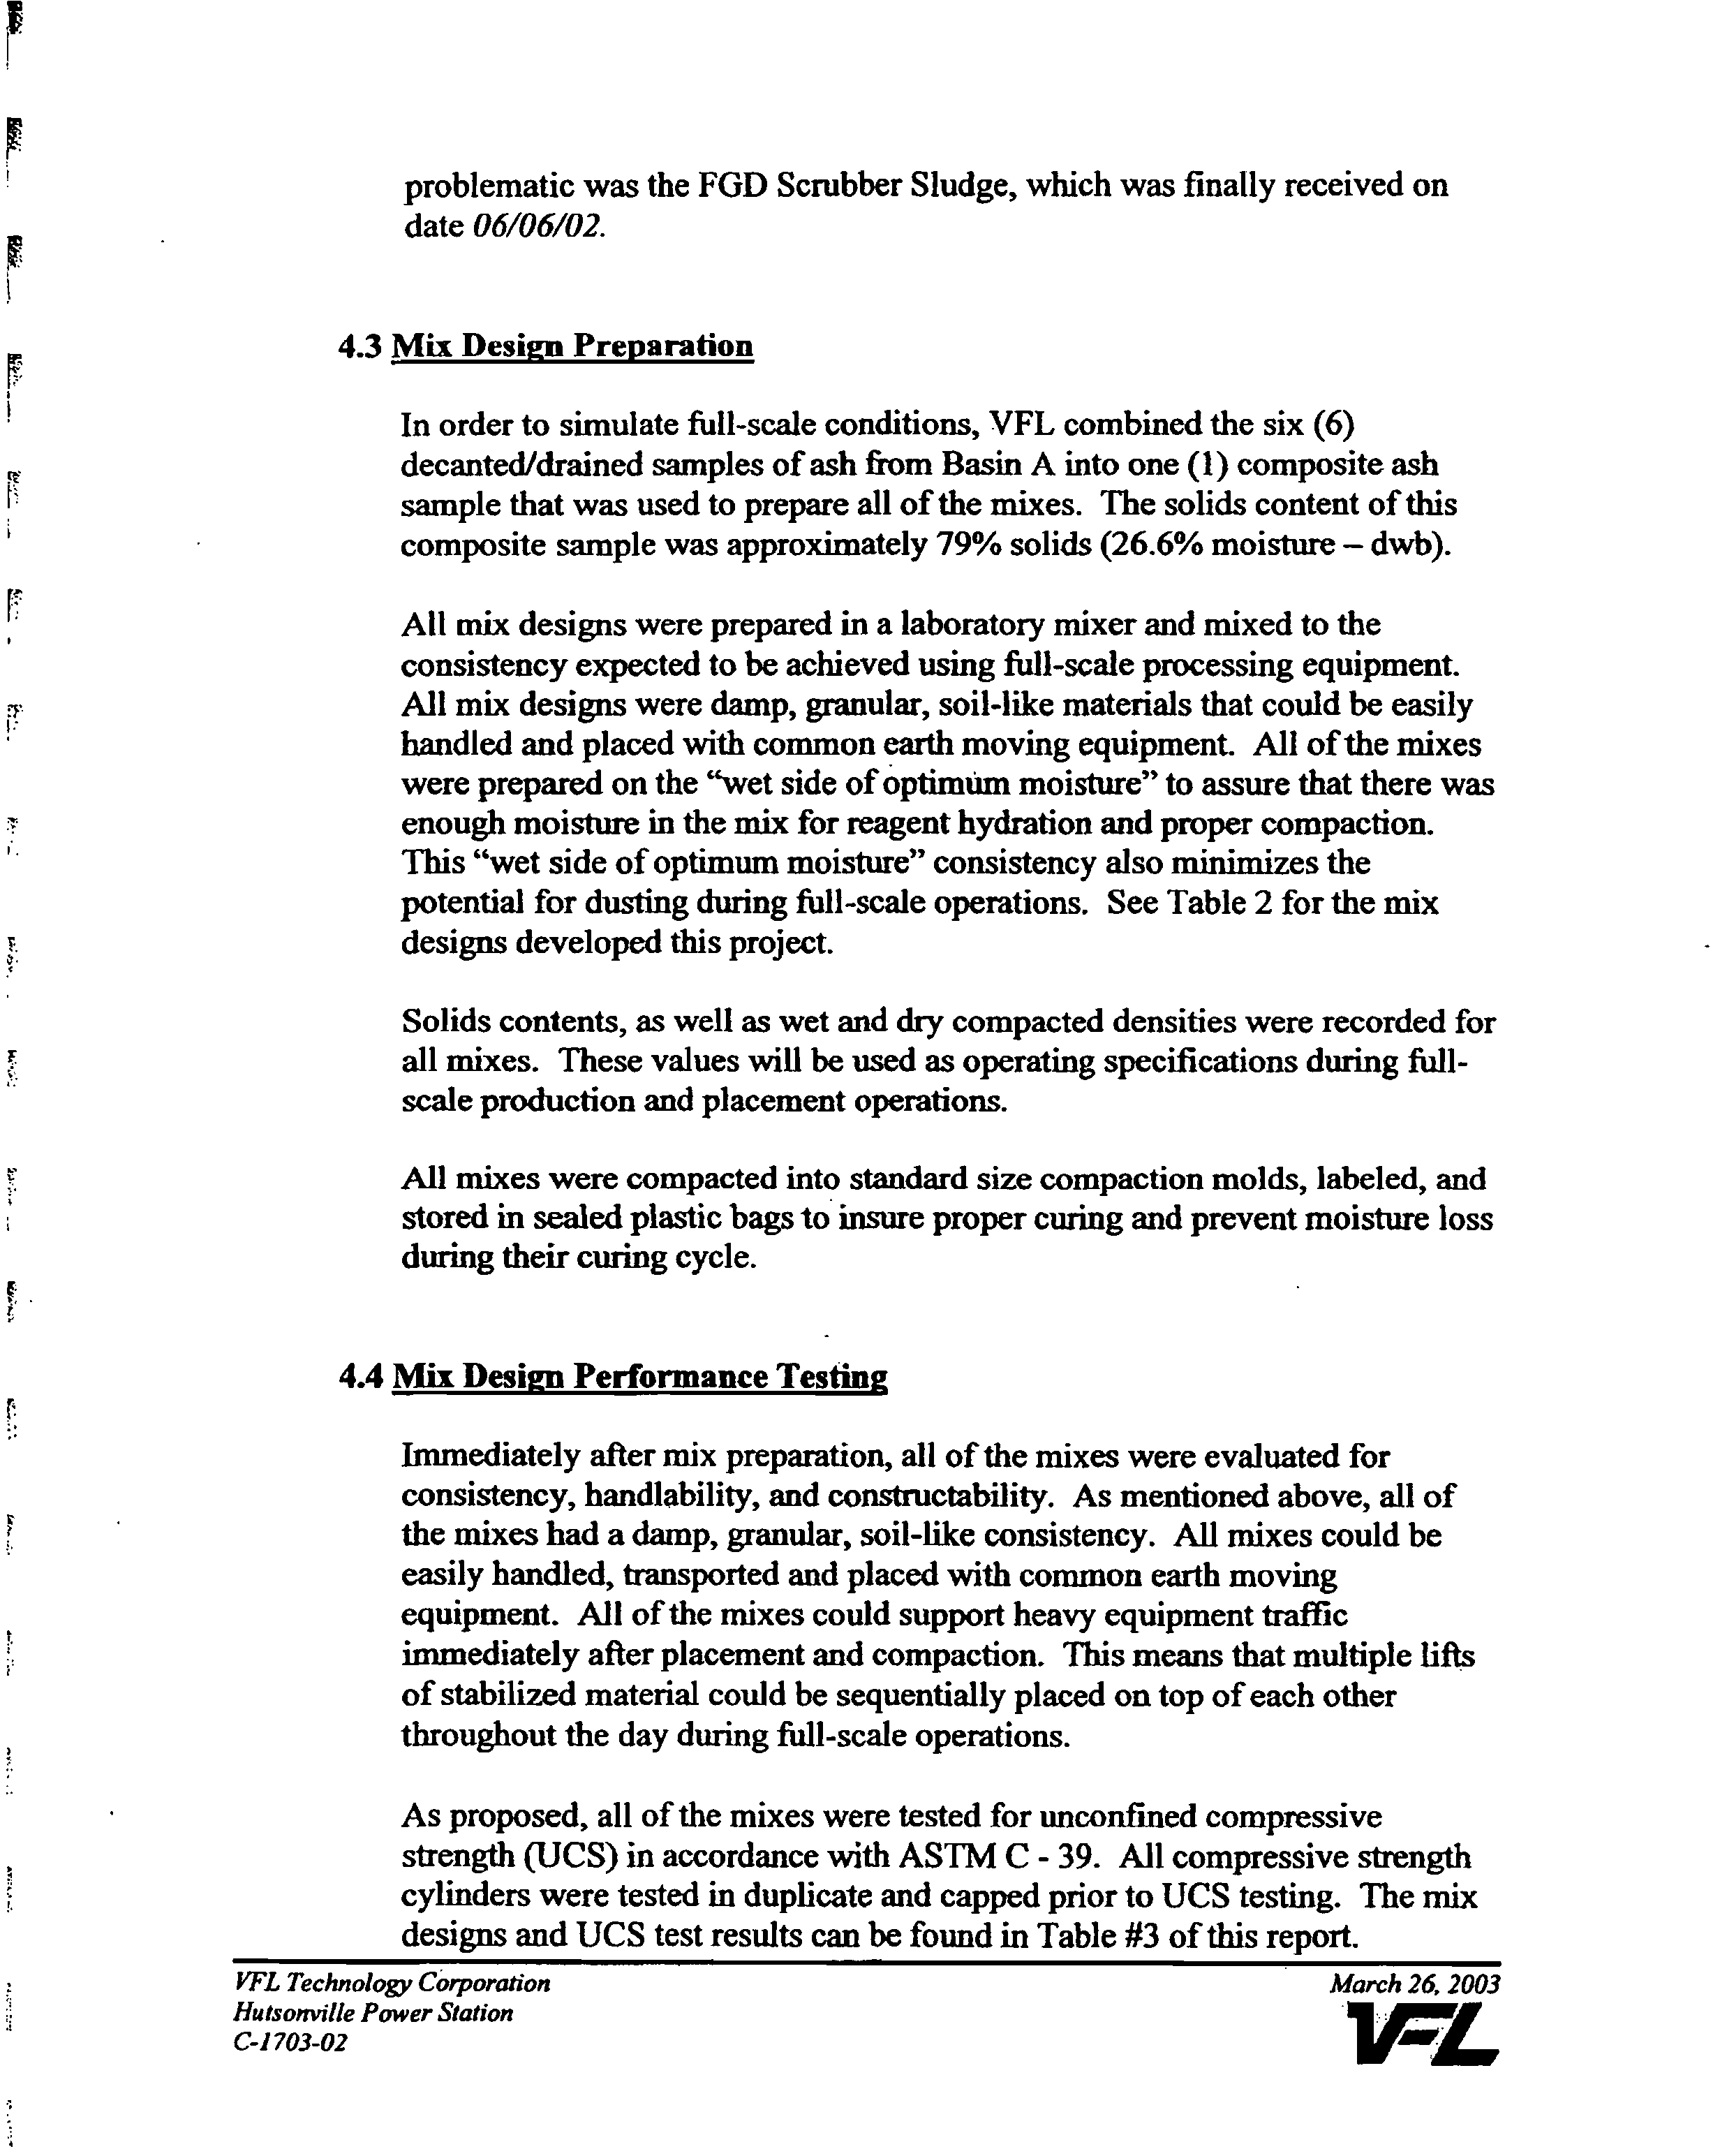
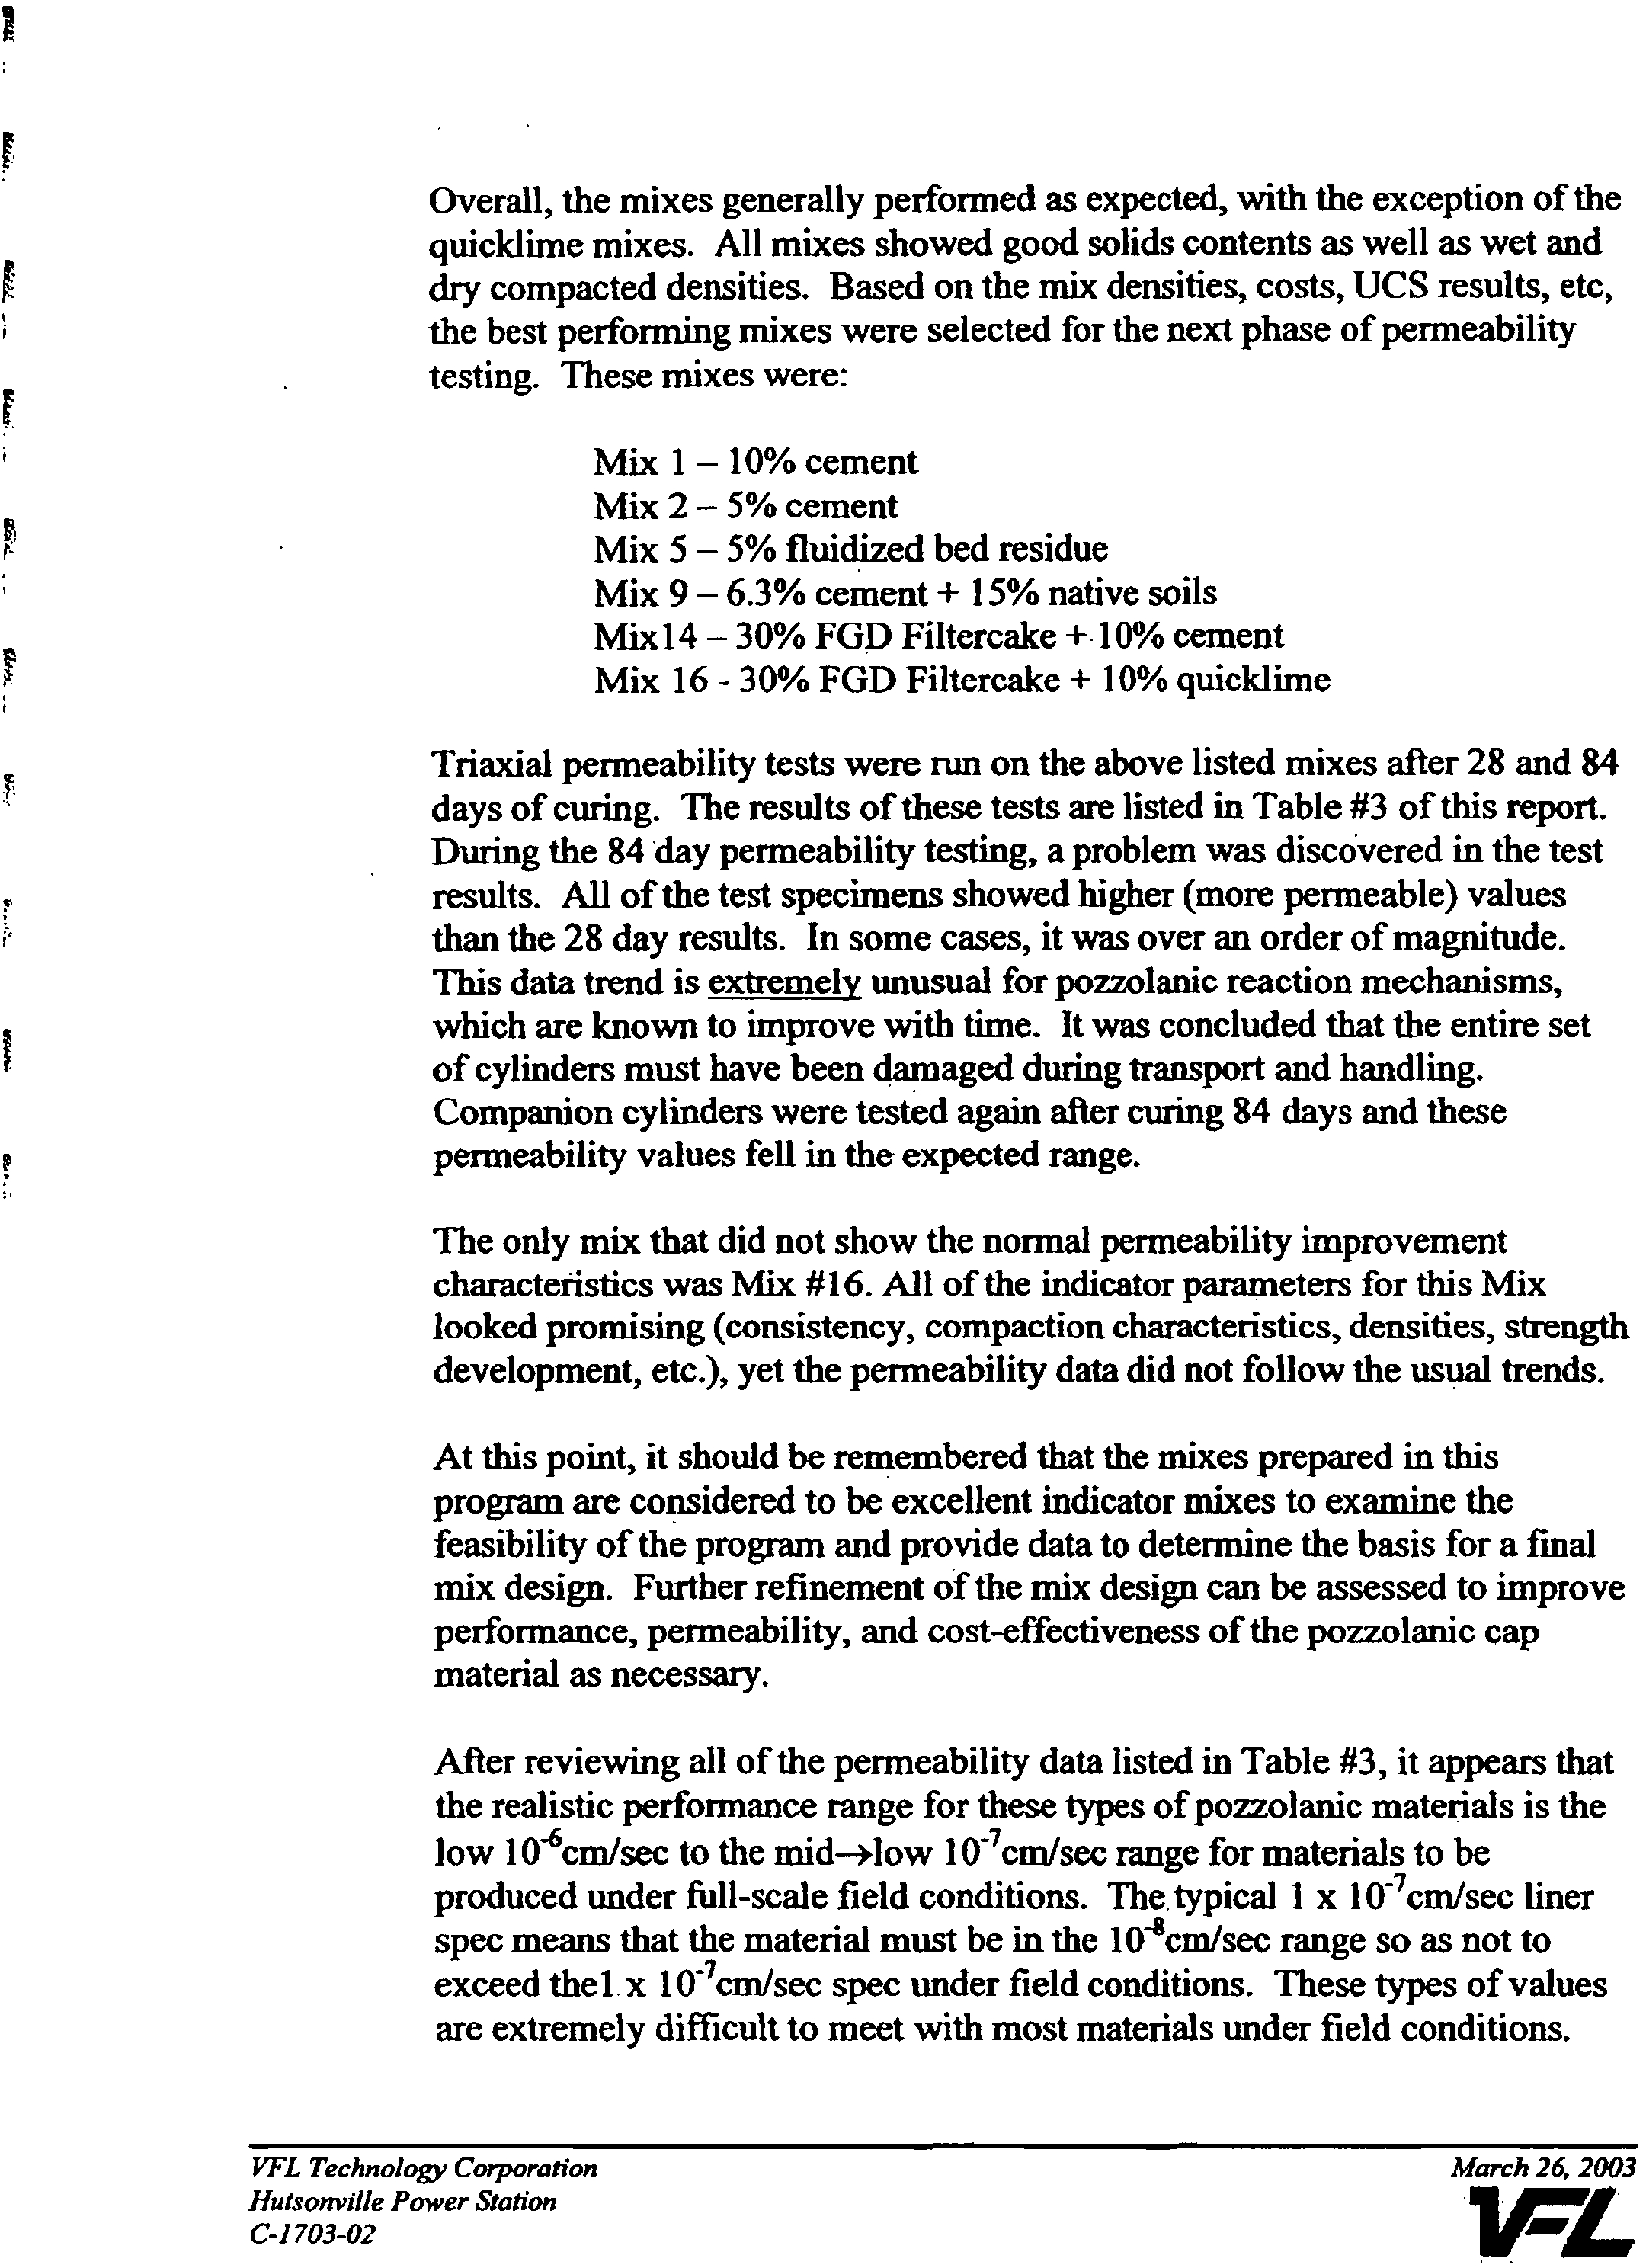
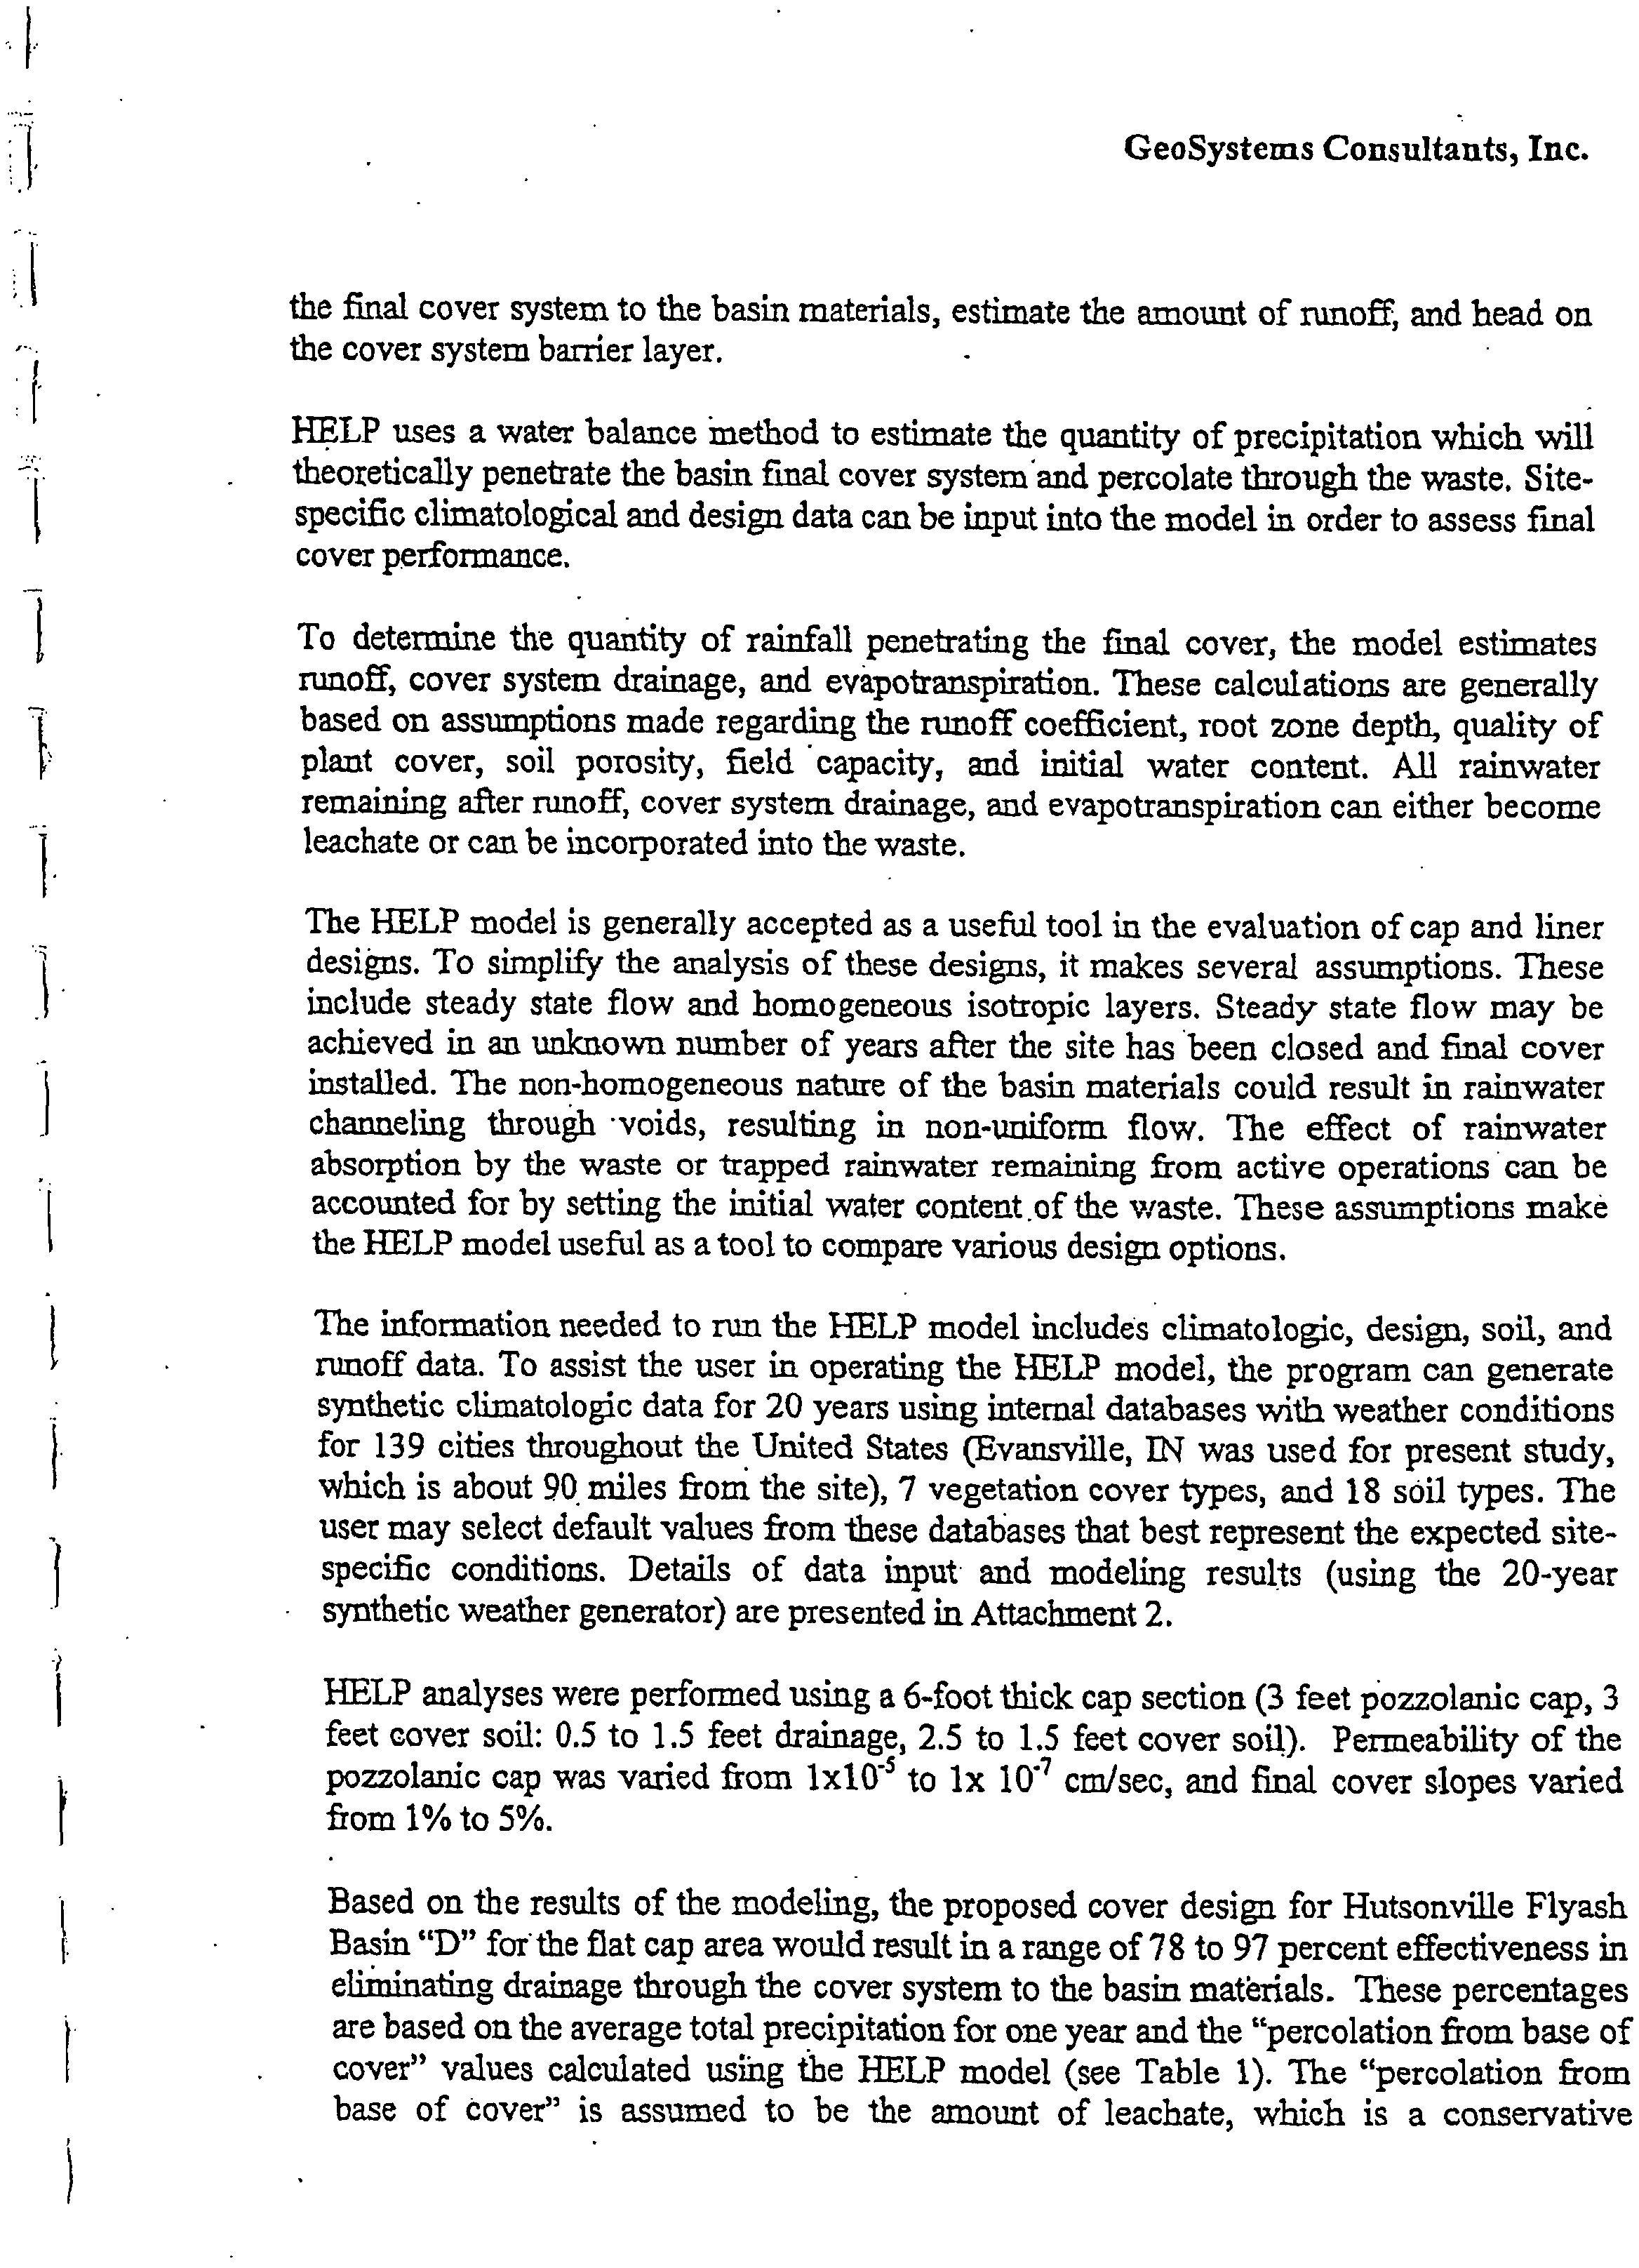
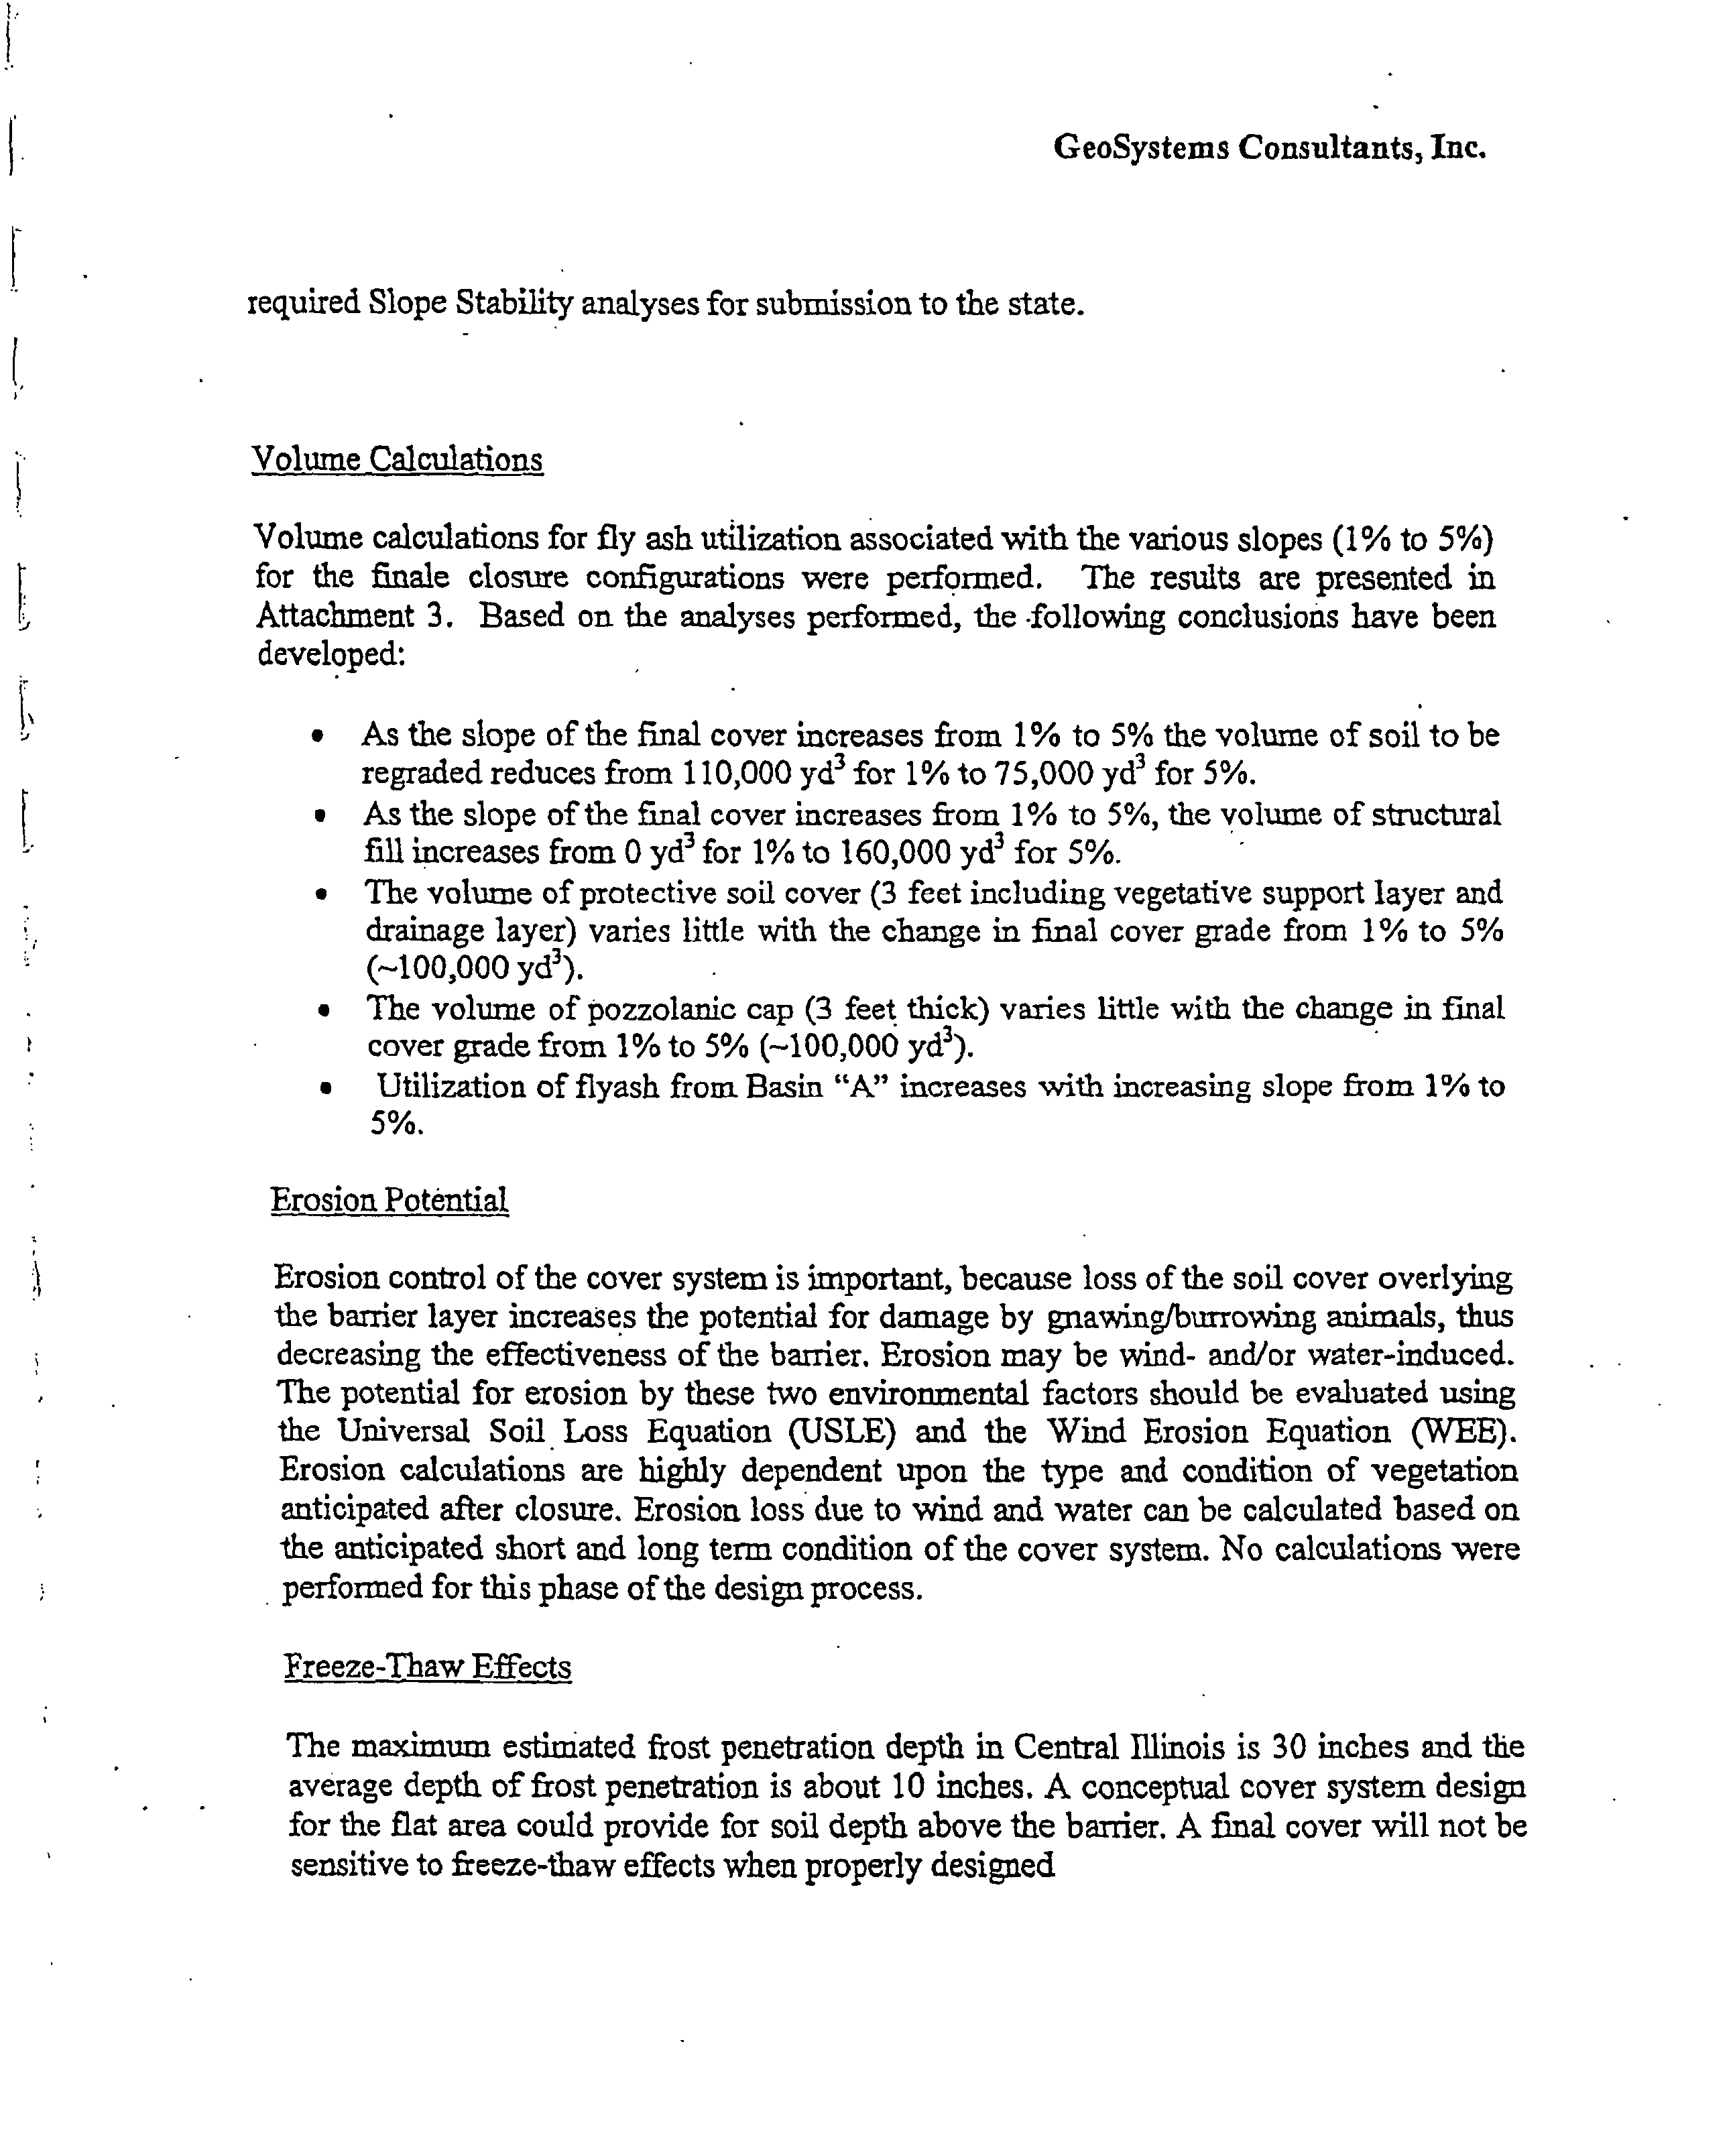
FIGURES
Figure
Site
map
Figure
Results
of HELP
modeling
for
wet
portion
of Hutsonville unlined ash
impoundment
Figure
Results
of HELP
modeling
for
dry portion
of ilutsonville unlined ash
impoundment
Figure
Model
grid Layer
showing boundary
conditions
Figure
Example simplification
of HELP results for
input
to
MODFLOW
Figure
Calibration results
Figure
Calibrated head and concentration
distribution
for
Layer
Figure
Predicted concentrations
for wells near the unlined
impoundment
Figure
Sensitivity analysis
for wells
downgradient
of the unlined
impoundment
Figure
10
Layer
and
concentration
distribution
for
no
cap
scenario
at
t20
years
Figure
11
Layer
and
concentration
distribution for native soil
cap
scenario at t20
years
Figure
12
Layer
and
concentration
distribution for
clay
cap
scenario at t20
years
Figure
13
Layer
and
concentration
distribution
for
synthetic
cap
scenario
at
t20
years
Figure
14 Model
predicted
boron
loading
rate to
the Wabash River
tributaries
TABLES
Table
HELP
input parameters
Table
HELP
sensitivity analysis
results
Table
Flow model
input parameters
Table
Transport
model
input parameters
Table
Model
predicted change
in
boron concentration
2001
2021
APPENDICES
Appendix
Model
Figures
Appendix
Model Data Files
Data disk
on
back
cover
MODEL REPORT
Natural
22
Resource
Technology
Electronic Filing - Received, Clerks' Office, August 11, 2008--Exhibits 1,2,5-10, & 12
FIGURES
Electronic Filing - Received, Clerks' Office, August 11, 2008--Exhibits 1,2,5-10, & 12
Natural
Resource
Technology
PROJECT
NO
1375/2.5
DRAWING
NO
375B20
MWI
Li
LEGEND
MWi
MONITORING
WELL
MW3/3D
NESTED
1J
MONITORING
WELL
GP1
DIRECT
PUSH
SOIL
BORING
LP1
LEACHATE
SAMPLE
PLANT
WATER
WELL
CYPAI..AP
SURFACE
WATER
UAPTP2P
SAMPLE
STANDING
WATER
FORMER
ASH
LAYDOWN
AREA
ROADWAY
LP-1
It
Li
-j
Li
LP2
I900TH
UNED
ASH
IMPOUNDMENT
UWlO/100
GP7
MW2
GP
MW-7/7D
200
400
MWil
EW1
MW-6
I-0
Ld
QLJ
LiJ
Lii
fl
800
SCALE
IN
FEET
SOURCE
NOTE
THIS
DRAWING
WAS
DEVELOPED
FROM
REPORT
BY
51141
BROOKFIELD
WISCONSIN
PROJECT
249
REPORT
9801
DATED
MAY
1998
AND
USGS
QUADRANGLE
7.5
MINUTE
SERIES
WEST
UNION
IWNOISINDIANA
DATED
1966
ALL
LOCATIONS
AREAPPROXIMATE
GP15
GP17
44
44
GP18
GP16
GP13
GP
19
700
FT
GP14
FIGURE
NO
Electronic Filing - Received, Clerks' Office, August 11, 2008--Exhibits 1,2,5-10, & 12
Leachate
Percolation
Wet Pond
First Year
20
18
16
14
12
10
o8
Figure
Results
of HELP
modeling
for wet
portion
of Hutsonville
unlined ash
impoundment
predicted
monthly
percolation
while the
impoundment dewaters
predicted
annual leachate
percolation
flux over
10
year period
predicted
annual leachate
percolation
flux over
10
year
period
with the
y-scale
truncated at 20
in/yr
The
relatively
low
percolation
rate observed for month
is due to model simulation
of frozen soil conditions Increases in
percolation
rate
during
model
years
2007 2008
and 2010
are
due to
high
modeled
precipitation
rates
Natural
Resource
35
30
25
20
15
10
Q5
10
11
12
Months
Annual Leachate
Percolation
Wet Pond
120
100
cap
clay
cap
synth
cap
2001
2002
2003
2004
2005
2006
2007
Years
2008
2009
2010
Annual Leachate
Percolation
Wet Pond
no
cap
0---native
cap
clay cap
synth cap
2001
2002
2003
2004
2005
2006
2007
2008
2009
2010
Years
Extract HELP Percolation
Technology
Electronic Filing - Received, Clerks' Office, August 11, 2008--Exhibits 1,2,5-10, & 12
Leachate Percolation
Dry
Pond
First Year
Annual
Leachate
Percolation
Dry
Pond
no
cap
0-
native
cap
clay cap
synth cap
Annual Leachate
Percolation
Dry
Pond
Years
Figure
Results
of HELP
modeling
for
dry portion
of Hutsonville
unlined ash
impoundment
predicted
monthly percolation
while the
impoundment
dewaters
predicted
annual leachate
percolation
flux over
10
year
period
predicted
annual leachate
percolation
flux over
10
year
period
with the
y-scale
truncated at 20
in/yr for comparison
scales
on
and
are
the
same as
Figure
Increases
in
percolation
rate
during
model
years
2007 2008
and 2010
are
due to
high
modeled
precipitation
rates
Natural
Resource
.2
10
11
12
Months
120
c-
100
80
60
240
20
----
2001
2002
2003
2004
2005
2006
2007
2008
2009
2010
Years
no
cap
0---native
cap
clay cap
synth cap
20
18
16
14
12
10
o8
a6
2001
2002
2003
2004
2005
2006
2007
2008
2009
2010
Extract HELP Percolation
Technology
Electronic Filing - Received, Clerks' Office, August 11, 2008--Exhibits 1,2,5-10, & 12
River
Boundary
flfl
HhIIIIIIIIIIIIHI
JIIIIIIIIIIIIIIIII
jlIHhIIuIIuIIIIII
lIflIflhUHhlIlUIlI
luvI
Inactive
IF-i Ii ii
lu1Ui
fl
tINIiUIUUUiUU
JLJ
__j.1
.tWEkU
//
li.i.......u......
/1
i.iuuuuuiuN
..I..ui.u.u..u.i.u.uuu
IL
/.\
ii................
z..
l--
.im.uuiiuuuu.uui
\MUUUUUUUUi
LU
i.s..ajuuuu.uu
.\.w.siuuu
i.ui.iui.ui
uiuuuuu
--
.-
U.....
.-
..uu
I....
Figure
Model
grid
Layer
showing boundary
conditions
Boundary
conditions for
layers 1.34
are shown
in
Appendix
Natural
Resource
Technology
Electronic Filing - Received, Clerks' Office, August 11, 2008--Exhibits 1,2,5-10, & 12
25
20
15
10
10
Monthly
Leachate
Percolation
Wet Pond
First Year
HELP Resut
MOOFLOW
Input
Months
2001
2002
2003
2004
2005
2006
2007
2008
2009
2010
10
Years
2001
2002
2003
2004
2005
2006
2007
2008
2009
2010
Figure
Example simplification
of HELP
results for
input
to MODFLOW Other scenarios
were
similarly simplified
Natural
Resource
Technology
35
10
11
12
Annual Leachate
Percolation
Wet
Pond
No
Cap
Scenario
HELP Result
MODFLOW
Input
Annual Leachate
Percolation
Wet
Pond Synthetic Cap
Scenario
HELP Result
MODFLOW
Input
Years
Extract HELP Percolation
Electronic Filing - Received, Clerks' Office, August 11, 2008--Exhibits 1,2,5-10, & 12
Head Calibration
455
455
45011
450
445
440
440
435
435
430
430
425
425
420
420
S55
Sj
S9Sf
757
Well
Concentration
Calibration
25
25
20
20
-J
15
15
10
10
44
44
44 44 4444
44 44
44
.S1
Well
Figure
Calibration
Results The vertical
bar
represents
the
range
of observed
values the diamond
symbol
represents
the calibration
target head
in November 1998 or median
concentration
and the
symbol
is the
calibration result
Natural
Resource
CALIBRAT.xls
Technology
Electronic Filing - Received, Clerks' Office, August 11, 2008--Exhibits 1,2,5-10, & 12
Figure
Calibrated head and concentration
distribution for
Layer
Natural
Resource
Technology
Concentration
mgIL
Electronic Filing - Received, Clerks' Office, August 11, 2008--Exhibits 1,2,5-10, & 12
10
Jan-2001
Jan-2006
Jan-2011
Jan-2016
Jan-2021
Jan-2001
Jan-2006
Jan-201
Jan-2016
Jan-2021
Time
Figure
8a Predicted concentrations for wells
upgradient
and
sidegradient
of the unhned
impoundment
Natural
Resource
Technology
MW-3
-J
Cu
no
cap
native soil
cap
clay cap
synthetic
cap
Class Standard
Time
-J
cu
12
10
MW-Il
no
cap
native soil
cap
clay cap
synthetic
cap
Class Standard
Time
MW-13
16
14
Jan-2001
no
cap
native
soil
cap
clay cap
synthetic
cap
-Class Standard
Jan-2006
Jan-2011
Jan-2016
Jan-2021
MODFLOW RESULTS
Electronic Filing - Received, Clerks' Office, August 11, 2008--Exhibits 1,2,5-10, & 12
-J
C-
Co
Jan-2001
Jan-2006
Jan-201
Jan-2016
Jan-2021
Jan-2011
Jan-2016
Jan-2021
Natural
Resource
Technology
MW-6
goes dry
no
cap
native soil
cap
clay cap
synthetic
cap
Class Standard
Jan-2001
Jan-2006
Jan-2011
Jan-2016
Time
MW-7
Jan.2021
10
no
cap
native soil
cap
clay cap
synthetic
cap
Class Standard
Time
-J
co
12
MW-8
native soil
cap
clay cap
synthetic
cap
Class Standard
Jan.2001
Jan-2006
Time
Figure
8b Predicted concentrations for wells
sidegradient
and
downgradient
of the unlined
impoundmc
MODFLOW RESULTS
Electronic Filing - Received, Clerks' Office, August 11, 2008--Exhibits 1,2,5-10, & 12
14
MW-7
12
Constant Conc 10
mg/L
Constant conc
20
mg/L base
case
10
Constant
Conc 30
mg/L
Class Standard
Jan-2001
Jan.2006
Jan.2011
Jan-2016
Jan.2021
Time
25
MW-8
Constant Conc 10
mg/L
20
Constant
conc
20
mgIL base case
Constant Conc 30
mg/L
-Class Standard
15
Jan2001
Jan-2006
Jan-201
Jan-2016
Jan-2021
Time
Figure
Sensitivity
analysis
for wells
downgradient
of the unlined
impoundment
Natural
Resource
transport
sensitivity
test.xls
Technology
Electronic Filing - Received, Clerks' Office, August 11, 2008--Exhibits 1,2,5-10, & 12
Layer
Figure
10
Layer
and
concentration
distribution for no
cap
scenario att20
years
2021
Natural
Resource
Technology
/4
Layer
/4
Electronic Filing - Received, Clerks' Office, August 11, 2008--Exhibits 1,2,5-10, & 12
Layer
Figure
11
Layer
and
concentration
distribution for native soil
cap
scenario
at t20
years 2021
Natural
Resource
Technology
/11/
Layer
/4/
Electronic Filing - Received, Clerks' Office, August 11, 2008--Exhibits 1,2,5-10, & 12
Natural
Resource
Technology
Layer
Layer
Figure
12
Layer
and
concentration
distribution for
clay
cap
scenario att20
years
2021
Electronic Filing - Received, Clerks' Office, August 11, 2008--Exhibits 1,2,5-10, & 12
Natural
Resource
Technology
Layer
Layer
Figure
13
Layer
and
concentration
distribution for
synthetic
cap
scenario at
t20
years 2021
Electronic Filing - Received, Clerks' Office, August 11, 2008--Exhibits 1,2,5-10, & 12
.2E07
Natural
Resource
Technology
no
cap
native soil
cap
clay cap
synthetic
cap
25.0
.OE07
_______
20.0
8.OE06
Ii
15.0
6.OE06
.5
-J
0.02
4.OE06
5.0
2.OE06
0.OE0O
0.0
Jan-2001
Jan-2006
Jan-2011
Jan-2016
Jan-2021
Time
Figure
14
Model-predicted
boron
loading
rate to the Wabash River
tributaries
MODFLOW RESULTS
Electronic Filing - Received, Clerks' Office, August 11, 2008--Exhibits 1,2,5-10, & 12
TABLES
Electronic Filing - Received, Clerks' Office, August 11, 2008--Exhibits 1,2,5-10, & 12
Table
hELP
Input
Parameters
Operating
Case
Post
Closure
Scenario
Parameter
ponded
dry
no
cap
native
clay
synthetic
Notes
Climate-General
City
Evansville
IN
Latitude
39
13
Plant
Evap
Zone
Depth
in
15
15
21
21
21
9-bare
ground
15-
poor
grass
21
fair
grass
Leaf
Index
bare
ground
poor
grass
fair
grass
All
Others
Defaults
for
Evansville
Climate-precipltemp/ET
All
see
note
Synthetically
generated
using
Evansville
defaults
plant
30
yr
avg
precip
and
avgtemp
in
Palestine
IL
Soils-General
Area
acres
unit
area
%where
runoff
possible
100
100
100
100
Specify
Initial
MC
Surface
Water/Snow
in
n/a
use
value
at
end
of
year
Soils-Layers
ash
ash
ash
native
native
native
ash
ash
ash
ash
clay
synthetic
ash
ash
ash
ash
gravel
ash
ash
ash
ash
ash
ash
ash
Soil
Parametersnative
Type
Thickness
in
36
36
12
Texture
use
default
values
for
loam
Porosity
0.463
0.463
0.463
Field
Capacity
0.232
0.232
0.232
Wilting
Point
0.116
0.116
0.116
Hydraulic
Conductivity
3.70E-04
3.70E-04
3.70E-04
Moisture
Content
0.232
0.232
0.232
set
equal
to
field
capacity
Natural
Resource
model
report
tables
Technology
Electronic Filing - Received, Clerks' Office, August 11, 2008--Exhibits 1,2,5-10, & 12
Table
continued
HELP
Input
Parameters
ODerating
Case
Post
Closure
Scenario
Parameter
ponded
dry
no
cap
native
clay
synthetic
Notes
Soil
Parametersclay
Type
Thickness
in
36
Texture
16
use
default
values
for
compacted
clay
Porosity
0.427
Field
Capacity
0.418
Wilting
Point
0.367
Hydraulic
Conductivity
1.OOE-07
Moisture
Content
0.418
set
equal
to
field
capacity
Soil
Parameterssynthetic
Type
Thickness
in
0.03
Texture
35
use
default
values
for
HDPE
35
Hydraulic
Conductivity
2.OOE-13
Pinhole
Density
holes/acre
HELP
suggested
value
for
good
placement
quality
Installation
Defects
holes/acre
HELP
suggested
value
for
good
placement
quality
Placement
Quality
good
Soil
Parametersgravel
Type
Thickness
in
12
Texture
21
use
default
values
for
gravel
Porosity
0.397
Field
Capacity
0.032
Wilting
Point
0.013
Hydraulic
Conductivity
3.OOE-01
Moisture
Content
0.032
set
equal
to
field
capacity
Natural
Resource
mod
report
tables
Technology
Electronic Filing - Received, Clerks' Office, August 11, 2008--Exhibits 1,2,5-10, & 12
Table
continued
HELP
Input
Parameters
Operating
Case
Post
Closure
Scenario
Parameter
ponded
dry
no_cap
native
clay
synthetic
Notes
Soil
Parametersash
Type
Thickness
in
60
60
60
60
60
60
depth
to
WT
Texture
30
30
30
30
30
30
HELP
default
for
coal
ash
Porosity
0.541
0.541
0.541
0541
0.541
0.541
Field
Capacity
0.187
0.187
0.187
0.187
0.187
0.187
Wilting
point
0.047
0.047
0.047
0.047
0.047
0.047
Moisture
Content
porosity
Calculated
MC
at
end
of
Case
Year
cm/s
5.OE-05
5.OE-05
5.OE-05
5.OE-05
5.OE-05
5.OE-05
SoilsRunoff
Equation
N/A
N/A
HELP
Calculated
Slope
0.51%
0.51%
0.51%
0.51%
lowest
slope
allowed
byprogram
Length
ft
500
500
500
500
Texture
30
basedon
uppermost
soil
type
in
column
Vegetation
poor
fair
fair
fair
Execution
Parameters
Years
2-10
2-10
2-10
2-10
Report
Daily
Report
Monthly
Report
Annual
Natural
Resource
model
report
tables
Technolo
Electronic Filing - Received, Clerks' Office, August 11, 2008--Exhibits 1,2,5-10, & 12
Table
HELP
Sensitivity
Analysis
Results
Base
Default
Parameter
Scenario
Value
Tested
Range
Sensitivity
Notes
Climate-General
Evap
Zone
Depth
in
no
cap
15
21
mod
to
high
bare
ground
15-
poor
grass
21
fair
grass
Leaf
Index
no
cap
mod
to
high
bare
ground
poor
grass
fair
grass
Soil
Parametersnative
Thickness
in
no
cap
36
24
48
negligible
Texture
no
cap
10
mod
to
high
sandy
loam
loam
10
sandy
clay
loam
Thickness
in
synthetic
12
24
36
moderate
percolation
increases
with
increasing
soil
thickness
Texture
synthetic
10
negligible
sandy
loam
loam
10
sandy
clay
loam
Soil
Parameterssynthetic
Placement
Quality
synthetic
low
to
high
excellent
good
poor
Sensitivity
is
low
for
excellent
installation
and
high
for
poor
installation
Installation
Defects
synthetic
10
low
to
high
Soil
Parametersgravel
Thickness
in
clay
12
18
low
to
negl
Soil
Parametersash
Thickness
in
no
cap
60
30
90
negl
to
mod
negligible
difference
for
30
in
by
layers
total
180
in
compared
to
default
cm/s
no
cap
5.OE-05
1.OE-04
1.OE-05
mod
to
high
SoilsRunoff
Slope
no
cap
0.51%
0.75%
1.00%
negligible
Length
ft
no
cap
500
250
750
low
Vegetation
no
cap
poor
bare
fair
high
Negligible
less
than
percent
change
intotal
percolation
volume
relative
to
base
scenario
Low
to
percent
change
intotal
percolation
volume
Moderate
to
10
percent
change
intotal
percolation
volume
High
greater
than
10
percent
change
intotal
percolation
volume
Natural
Resource
model
report
tables
Technolor
Electronic Filing - Received, Clerks' Office, August 11, 2008--Exhibits 1,2,5-10, & 12
Table
Flow Model
Input
Parameters
Horizontal Hydraulic Conductivity
ftd
cm/s
Sensitivity
Layer
ash
0.14
5.OE-05
negligible
Layer
silt unit
0.10
3.5E-05
low
Layer
sand unit
80
2.8E-02
high
Layer
alluvium
30
1.1E-02
moderate
Layer
sandstone
4.0
.4E-03
high
Layer
valley
fill sand and
gravel
136
4.8E-02
moderate
Vertical Hydraulic Conductivity
ftld
KhIKv
Sensitivity
Layer
ash
0.07
2.0
negligible
Layer
silt unit
0.05
2.0
negligible
Layer
sand unit
40
2.0
negligible
Layer
alluvium
3.0
10.0
low
Layer
sandstone
2.0
2.0
low
Layer
valley
fill sand and
gravel
68
2.0
negligible
Recharge
ftd
Sensitivity
General
0.001
4.4
high
Unlined
impoundment
ponded
0.0822
360
high
Unlined
impoundment
not
ponded
0.0027
11.8
low
Lined
impoundment
2.30E-05
0.10
negligible
Ash
laydown area
0.0027
11.8
low
Coal
pile
0.0027
11.8
negligible
Area between
impoundments
0.0027
11.8
low
Lowlands
0.0
high
Storage/Porosity
Sensitivity
Layer
ash
1.OOE-03
0.10
negligible
Layer
silt unit
1.OOE-03
0.10
negligible
Layer
sand unit
.OOE-05
0.20
negligible
Layer
alluvium
1.OOE-03
0.10
negligible
Layer
sandstone
1.OOE-06
0.15
negligible
Layer
valley
fill sand and
gravel
.OOE-05
0.20
negligible
River Parameters
Wabash
Trib
west
Tnb east
Sensitivity
Bed Thickness
ft
not tested
Hydraulic
Conductivity
ft/d
0.7- 136
0.1
0.01
not tested
Conductance
ft2/d
normalized
per
ft4
area
0.7- 136
0.1
0.01
low
River Width
ft
variable
not tested
River Cell
Length ft
variable
variable
variable
not tested
Constant Head
Boundary
Parameters
Layer
west
Sensitivity
Head
ft
451
moderate
Sensitivity xpIanation
Negligible
had little effect on overall model residuals
Low
effect on residuals insufficient
to
nullify
calibration
Moderate
extreme values
changed
residuals
sufficiently
to
nullify
calibration
High
all tested values
changed
residuals
sufficiently
to
nullify
calibration
Natural
Resource
model
report
tables
Technology
Electronic Filing - Received, Clerks' Office, August 11, 2008--Exhibits 1,2,5-10, & 12
Table
Transport
Model
Input
Parameters
Initial Concentration
mgIL
Base Case
Alternatives
Sensitivity1
Entire Domain
0.0
not tested
Source Concentration
Recharge mg/L
Base Case
Alternatives
Sensitivity
Unlined
Impoundment ponded
not tested
high2
Unlined
Impoundment not ponded
20
not tested
high2
Ash
Laydown
Area
30
not tested
high2
Lined
Impoundment
20
not tested
high2
Coal Pile
not tested
high2
Source Concentration
Constant mgIL
Base Case
Alternatives
Sensitivity
Saturated Ash
Nodes3
20
10
30
high
Effective
Porosity
Base Case
Alternatives
Layer
ash
0.10
0.05
0.15
low
Layer
silt unit
0.10
0.05
0.15
low
Layer
sand unit
0.20
0.15
0.25
low
Layer
1-3 alluvium
0.10
0.05
0.15
low
Layer
sandstone
0.15
0.10
0.20
low
Layer
valley
fill sand and
gravel
0.20
0.15
0.25
low
Dispersivity ft
Base Case
Alternatives
Sensitivity
Longitudinal
30
10
50
high
Transverse
3.75
high
Vertical
0.188
0.10
0.30
high
Retardation
Base Case
Alternatives
Sensitivity
Bulk
Density
g/cm3
1.6
not tested
Distribution Coefficient
sand
mUg
0.17
0.25
moderate
Distribution
Coefficient
silt
mUg
0.85
0.5
1.2
moderate
Sensitivity Explanation
Negligible
little effect on concentrations
Low concentrations
at
one or
two wells
changed
by
to 10
percent
Moderate
concentrations
at one or two wells
changed
by
10 to 20
percent
Fligh
concentration
at one or two wells
changed
by
more than 20
percent
or concentration
at more than two wells
changed
by
to 10
percent
Determined
to be
highly
sensitive
during transport
model calibration
Used
only
in
prediction
simulations
beginning
the third
year
Natural
Resource
model
report
tables
Technology
Electronic Filing - Received, Clerks' Office, August 11, 2008--Exhibits 1,2,5-10, & 12
Table
Model Predicted
Change
in Boron Concentration 2001
2021
Cap
Scenario
Well
no
cap
native soil
cap
clay cap
synthetic
cap
MW-3
-68%
-42%
-74%
-83%
MW-3D
-80%
-64%
-84%
-89%
MW-6
n/a
n/a
n/a
n/a
MW-7
15%
19%
14%
13%
MW-7D
-65%
-54%
-67%
-69%
MW-8
39%
52%
35%
32%
MW-li
-43%
18%
-57%
-71%
MW-12
-89%
-85%
-90%
-91%
MW-13
-78%
-48%
-86%
-94%
Only
listed for wells with calibrated
concentrations
1.0
mg/L
Natural
Resource
model
report
tables
Technology
Electronic Filing - Received, Clerks' Office, August 11, 2008--Exhibits 1,2,5-10, & 12
APPENDIX
MODEL FIGURES
Electronic Filing - Received, Clerks' Office, August 11, 2008--Exhibits 1,2,5-10, & 12
..
..I
Constant Head
Boundary
Natural
Resource
Technology
Figure
Ala MODEL
grid Layer
showing boundary
conditions
Electronic Filing - Received, Clerks' Office, August 11, 2008--Exhibits 1,2,5-10, & 12
Natural
Resource
Technology
Inactive
Cells
Figure
Al
MODEL
grid Layer
showing boundary
conditions
Electronic Filing - Received, Clerks' Office, August 11, 2008--Exhibits 1,2,5-10, & 12
Figure
Aic MODEL
grid Layer
showing boundary
conditions
Natural
Resource
Technology
Inactive
dl
Electronic Filing - Received, Clerks' Office, August 11, 2008--Exhibits 1,2,5-10, & 12
Natural
Resource
Technology
Figure
A2a
Hydraulic conductivity
array
Layer
Electronic Filing - Received, Clerks' Office, August 11, 2008--Exhibits 1,2,5-10, & 12
IllIllIlIllIlIll
____1L1L1UUEllI
IllIllIllIllhlIl
IlIlIllIllIllOl
JLL1
ULQtLI1j1J IlIlIulullIlluul
LII JLI.JLj L1UDL
IlluuuluIlIuuull
JcJr1oooooDDoJrJnr
1jJLjLJLJU
7iD
IDUDEkflDDDDDIJD
DULflJUDD1JUUL3U
JD
.umm..u.
uuiuuuuuu
i_____
ErE1JnUL1DUIJDU flUi
LJLJL
oor
ruu
Inactive
iuiu
L3UUDL JUiUDL
....
ODE
ii
JU0000
JE DCL
UI
_EJLL_jD1LDDL
ELL
JrJEJoDnr1u1DrUULflrDU
oonCo2rJCnLoLou
nnr
JDDDDDJC
rr11nnflr
L1DUflUD
IJLJCJ
ir
DUr
DDE
UUUUU
uiuuiuuuu
t_L_JLJLJUDUDo
looooUorr
DDUL jr
ci iL/NJ
tCDJDDDDD2ECr3DD
riEcCDr3ooooDUL--ir
.rDDCLJUDDDCDDIJO
iCUDUDCDIDQDDDDCFJUL
r3DoCCCtMoIDDoij3
ECJiUUUDDEJDDCL
DLIUDDDDE
oDrr3oor/oD
_____EiEcLlECnDoooaoDor
JcooDocooIn
DDElDDDDDD
cJElDDDDD
JDDDDD
DUDLi DLJDDUFDDC1ElDD
31
ilL
Dr
LLJ
DDDDD
IJOC
UUUUUUUU
.............
ncoouuo DL tic
iuuuuuuuuu
rJLDrJLJoDoUooor DDDDDDDUDDD
tf YiDrrZ3UDflU
.EJILJ
LCJDJLjDDUDDE
jUr
JDDUE3U
inol uoo
CDOLXIUDUiUDflUU
DO JiUDUDD
........
LJOElJDDoooEl1JEloooDDDr3EloD
D1CLDLDODCElC
J3r3DDDDntJDr3EDDD_DDD
CL3JDDU3..EJDDD
JJIDDJDIODJIEDIDJ
DDODUDDDLJLDL
DtEl3DDiJ--
1JCD
EJECDDDDDDDCDDDDDDoDDElDDoUElUEloUL
uDDiJDDL12
DDDDD
_____
IDElDC
DC
ii
I_____
1D
Sndtrn
lC
IOCU
DC
LrHfl
El DOD
XnnD
LLJLLJD VA furl
Uk
UI 1thL Li ILJL LiD
EJ
L1_
.__IILiU
li Ek
LillEl
El rri
DElElElUtiUDUDElDO
ri
U.....
cX2JL3EJDOUDDDUUD
EDJOD1CCDiCDttJDD
DLI CUD
UDMI IFILi
IElEl
JU
ODD
.....
--
LJELIOZJDJEC000
EZJ0CLI
JCJDDLUf
DJODUUDC
UUDLLI
CLI
D1T
Lii
DElD
Dlii
iiUU1I
Ci
no
DODD
00
______
EJO.JEJ1CoUrVJD
ODLIIIJD
10JDJCJU
DUD 1UUILIUC1I110
El Ci 13000
JL
C3ElJDiCl7r
DODD DD
DUD 01300
UJCJEJEUEJrJCCDUE1UU-
Li
OCr
I.
L1LL1L1
CT
LJCLJLJD/DL000
PflD
LI II
Li UCJDOD
friuuvIum
K30
ft/d
II
_ILIT/J
Eiu
3iiLiJLi
i___
iinz rurj
QI
111
Figure
A2b
Hydraulic conductivity
array
Layer
Natural
Resource
Technology
Electronic Filing - Received, Clerks' Office, August 11, 2008--Exhibits 1,2,5-10, & 12
Natural
Resource
Technology
Inactive
Alluvium
K30 ft/d
Figure
A2c
Hydraulic conductivity
array
Layer
Electronic Filing - Received, Clerks' Office, August 11, 2008--Exhibits 1,2,5-10, & 12
Natural
Resource
Technology
Figure
A2d
Hydraulic conductivity
array
Layer
Electronic Filing - Received, Clerks' Office, August 11, 2008--Exhibits 1,2,5-10, & 12
lOOlIlIlIlIHIlO
L4IL1
LIHIIIOIIIIIIIIIH
.LLJJLJL
IIIuIIIIIIIIIIIIIII
ILL_
_IIIIIIIIIIIIIlIIIII
RO.0027ft1d
uuuuuuuuuiiuuiiiui
1______j
J3 _i
mn/I
IUUUUUU
..................
__L_t1J_1H-D_F11
LL
4J
LLLH
-c
RO.0027 ftld
it
Ji
La .....m
UI
Inactive
UI
CO.O
mg/L
Ii
Cells
ii Li
ii
.uuuauu
iiiiu
---4-
RO.0027 Wd IIHI
R2.3E-5 ft/d
i.r
C20
mg/L
....
C20
mg/L
..
_Lf
LD
UUUR
III1OOh1OffluI
JI
00822ft/d
C5.O
mg/L
UUU
rsu.uu IL/U
_L
ii
..................u.......
uuuiuuuuiuiiiamiuuuui
UUUU4UUUUUUUUU
iii
CO.O
mg/L
LU
LLU 1J
UUUUUUUUUUUUUUUUUUUI
JJ_LL1
_L.LJ
LLLLLJ
iUL --
UIUU
afl /d
I. LJJL
Lii
liii
CO
IL
IUIHIIII
--
_LI
II
IF
IIIIIIIIIIIIIAIIIIIIIIIIIIPII
IIIHIIHNIIIIHIIIIIIHIIIII1II
__1 L1
IIIIIIIIIHIIIIIIIIIIIIIIIIIIIIIIJI
Figure
A3 MODFLOW
recharge
and MT3DMS
recharge
concentration
array
IL
tl-1-1- I-
Natural
Resource
Technology
Electronic Filing - Received, Clerks' Office, August 11, 2008--Exhibits 1,2,5-10, & 12
APPENDIX
MODEL
DATA
FILES
Electronic Filing - Received, Clerks' Office, August 11, 2008--Exhibits 1,2,5-10, & 12
The disk in the binder attached to this
report
contains the ASCII
input
files and
output
files used
and
generated by HELP MODFLOW
and MT3D for each scenario
The
output
files
are
named
as
follows
HELP
input/output
files
are
in the HELP
directory
MODFLOW/MT3DMS files are
organized
as listed below
Cap
Scenario
Directory
Active site
calibration
Hut5
No-cap
scenario
Hut5a
Native soil scenario
I-Iut5b
Clay
cap
scenario
Hut5f
Synthetic
cap
scenario
Hut5e
Steady
state
sensitivity
analyses
Hut5tnn
where nnOl 02
..
11
Transient
sensitivity
analyses
Hut5aSn
where
n1
or
Electronic Filing - Received, Clerks' Office, August 11, 2008--Exhibits 1,2,5-10, & 12
Exhibit 6. Statewide aquifer maps showing no major bedrock aquifers within 300 feet of ground surface at Hutsonville and total
dissolved solids concentration greater than 10,000 mg/L in aquifers deeper than 500 feet below ground surface.
CH2\2470678.1
Hutsonville
Power
Station
Hutsonville
Power
Station
Electronic Filing - Received, Clerks' Office, August 11, 2008--Exhibits 1,2,5-10, & 12
Exhibit 7 – Potable Well Search Results
Map and related well records from: http://meltwater.isgs.uiuc.edu/website/ilwater/viewer.htm
On June 16, 2005, NRT conducted a search for potable well records within a ½ -mile radius of
Pond D using the Illinois State Geological Survey’s (ISGS) online interactive map of well
records at the website above. Hutsonville Power Station Plant wells #1 and #2 are numbered 90
and 88 on the map above. Wells 60, 61, and 64 are owned by Margaret Dement and are used for
irrigation (64 does not appear to be correctly located on the map). Well number 66 is also used
for irrigation and is owned by Duane Wampler. Well 73, a City of Hutsonville water supply
well, is approximately one mile south of Pond D.
The following landowners were identified within approximately ½ mile of Pond D: J.P, Allison
(three residences), J.Grimes, Slaughter, M. Kelly, M. Dement. Records for potable wells
servicing these landowners could not be located through the ISGS. Representatives from the
Hutsonville Power Station field inspected these residences; no well heads were observed at the
three residences to the south (Slaughter, Kelly, Dement). There are wells servicing the
residences to the west (Allison, Grimes). These wells are upgradient of both the plant and
upgradient monitoring wells MW-10 and 10D.
Electronic Filing - Received, Clerks' Office, August 11, 2008--Exhibits 1,2,5-10, & 12
Exhibit
Mixing
Calculation
Showing
Effectof
Boron
Loading
on
Wabash
River
Quality
at
Low
Flow
7-day
10-year
low
flow
at
Hutsonville
Station
1234
of
3.OE09
L/day
Boron
loading
ratewhile
Pond
was
in
service
25
lb/day
Li
1.1E07
mg/day
10
ii
Boron
loading
rate
after
Pond
is
dewatered
and
capped
lb/day
12
L2
2.3E06
mg/day
13
14
Boron
concentration
increase
in
Wabash
River
at
low
flow
due
to
loading
from
Pond
is
When
Pond
Dwas
in
servioe
0.0038
mg/L
16
After
Pond
is
dewatered
and
oapped
0.0008
mg/L
17
18
Median
boron
oonoentration
in
Wabash
River
at
City
of
Hutsonville
0.0550
mg/L
19
Typioal
boron
laboratory
deteotion
limit
0.0038
mg/L
20
21
Conclusion
The
oaloulated
boron
oonoentrationinorease
in
the
Wabash
River
at
low
flow
due
to
groundwater
loading
while
Pond
was
in
servioe
was
an
order
of
ma
inoreasefrom
loadingpredioted
to
ooour
after
dewatering
and
oapping
Pond
is
well
below
thedeteotion
limits
of
boron
analytioal
methods
These
oaloul
Wabash
River
at
Pond
Dare
negligible
22
23
24
25
26
27
Electronic Filing - Received, Clerks' Office, August 11, 2008--Exhibits 1,2,5-10, & 12
Source
ISWSCR
441
1988
Source
Exhibit
Fig
14
10
11
12
Source
Exhibit
Fig
14
13
14
15
L1/Q710
16
L2/Q710
17
18
Source
Exhibit
12
19
Source
USEPA
SW-846
Method6010c
20
21
---
25
26
27
nitudelower
than
median
observed
concentrations
The
calculatedconcentration
tions
indicate
that
the
effectsof
boron
loading
in
groundwater
discharge
to
the
Electronic Filing - Received, Clerks' Office, August 11, 2008--Exhibits 1,2,5-10, & 12
Natural
MEMORANDUM
Resource
Technology
Inc
TO
Michael
Bollinger
Ameren Services
FROM
Bruce Hensel
DATE
August 19
1999
RE
STORET
Data
Wabash River
near
Hutsonville
IL
Wabash
River water
quality
data from the
STORET
database
were not
included
in
the
hydrogeologic
assessment
for the Hutsonville ash
impoundments
because the closest downstream
station with relevant
parameters
is in
Hutsonville
about two river miles
downstream
and
because there
are no
upstream
data with relevant data for
comparison
However
thought you
might
be interested in these data as an overview of
general
water
quality
in the Wabash
River
therefore
they
are
summarized in this
separate
memorandum
The STORET data contained records from Station
3341920
Wabash River
at Hutsonville
for
boron
manganese
iron
and nickel
Only
one other
nearby
station contained boron
data
and
records for that
station
which was
just
downriver of the station
used
had no
records after 1980
There
was
also
one station
that
based
on
latitude
may
have been
at
the
plant however boron
iron
manganese
and nickel
were
not monitored at that station
although
sulfate
was
Two
agencies reported duplicate samples
to the database for the station that
used so
queried
it to
only report
records for the
agency
with the most records The results
are
provided
in Table
The results in Table
show
that maximum Wabash River
concentrations
at
the
City
of
Hutsonville
are
similar
to
the 95th
percentile
concentrations
of
background groundwater quality
presented
in Table
of the
hydrogeologic
assessment
and median concentrations
are lower than
or similar to the medians
displayed
on
Figures
10 13 14
and 15 of the
hydrogeologic
assessment
also included
plot
of boron concentration
in the Wabash River at Hutsonville
versus time
and
the
resulting graph
appears
to
indicate annual
peaks occurring
at
the end of almost
every year
Whether these
peaks
are due to river
stage
or some other cause are unknown
Overall
Wabash
River water
quality
appears
to
be
good
at
this
station
relative
to
background
groundwater
concentrations
observed
at the
plant
however
it is difficult to determine
possible
plant
impacts
on
Wabash River water
quality
because there
are no
upstream
data for
comparison
Electronic Filing - Received, Clerks' Office, August 11, 2008--Exhibits 1,2,5-10, & 12
Table
Wabash River Water
Quality
Statistics from STORET Database
Statistics
Sulfate
Boron
Iron
Manganese
Nickel
Count
113
118
118
117
Max
mg/L
0.204
0.100
0.049
0.025
Median
mg/L
0.055
0.050
0.015
0.015
Average
mg/L
0.071
0.051
0.012
0.013
Mm
mg/L
0.005
0.010
0.005
0.005
STORET Station Information
AGENCY
STATION
NO
LAT
LONG
LOCATION NAME
21 ILAMB
3341920
390637
873918
WABASH RIVER AT HUTSONVILLE IL
Period of Record
Station
10/8/69
throuqh
12/15/98
Data Distribution of Selected
Parameters based
on
iron
count
Years
Number of Records
Records/yr
1969-1979
1980
1981 -1985
1986-1989
35
1990-1998
81
Boron
250
200
-J
ISO
100
50
Jan-
Jan-
Jan-
Jan-
Jan-
Jan-
Jan-
Jan-
Jan-
Jan-
Jan-
Jan-
Jan-
Jan
86
87
88
89
90
91
92
93
94
95
96
97
98
99
Natural Resource
Technology
Inc
Electronic Filing - Received, Clerks' Office, August 11, 2008--Exhibits 1,2,5-10, & 12
Conceptual Developmettt
Of a Pozzoianic Cap
For the
Closure of
Basin D
at
the
HutsonviUe Power Stadion
VFL
Technology Corp.
16
Hagerty Boulevard
West Chester, Pennsylvania
19382
(610) 918-1100
-
PHONE
(610)
918-7222
-
FAX
Electronic Filing - Received, Clerks' Office, August 11, 2008--Exhibits 1,2,5-10, & 12
.
.
.
.
~~6ral
Resource ~eibqology
. . . ..
23713 W. Paul
pad
!..
(.,
.
.
pewgukee,
WI
50072
).
.
I
,.
....
-
. .
.. :
.....
...
:
....
-:.!;:r.:.q7:
.....
.
.,,.?:>.,,.
,,.
)..,,..
.
:
...
.
..---
, .;:;:.
..,-.
..::
.i.. ..:.,:
......
......
.
.-
..-..
....
..,
L:..:-;
....
......
..-'.:.':-.<;'
.....
..::.
:.:.::.::..;..
.-
:
:
March
25,2003
,
.;.v<+
...
-.
G:;+T:i
,:
'c>,-.:
2~;;;::;;~F.::~;:g;$::.:<.:;,:
.......
: ..,..
t,
,,:
.,
.:
.
.:&::..I;
. ,
...
. :..
.
.........
....
-.
.
.:'.""'
i...;...a.....:l-
'*.<.,:--;&
.i.>+:
...,:,
,,.;
.,:,y-.!
. ..,,..,.
.....
.....-
,;.,,':;.
?.;
...
..>;.,..:
::..
.....
.
.
..:.
, ,;:,.::;;
.........
i:.,:t2.:.c;,,;..
:<,:.:;,,
: .<
.......,
y;:2>3;
+?
..b
....
!...
;;
%::.:,:.
.,:::: .:.
..
:.,:><$;$!<<:.
c:, ..",.c:,.>-;:.-....
, : .:,:,
.
.. ,
. ......
..
......
,,
,pa-=
i:..:..,.-
..
..-
+>.;;,,;.,
.>.
...
i.-...
-
........
......
;::::?:,.::
........
1
..,.<::,c.;.;:%.c\.:.::,;;.
.,.;...;
...
..,:-
:.:.
!.. ...
...
Electronic Filing - Received, Clerks' Office, August 11, 2008--Exhibits 1,2,5-10, & 12
TABLE OF CONTENTS
1
BACKGROUND
2
OVERALL PROGRAM CONCLUSIONS
4
TREATABILITY STUDY
4.1
RAW MATERIALS CHARACTERIZAION
4.2
REAGENTS
43
MIX DESIGN PREPARATION
4.4
MIX DESIGN PERFORMANCE TESTING
5
EXRAPOLATION TO FULL-SCALE OPERATIONS
APPENDIX
VFL
Technology Corporahohon
March 26,2003
Hutsonville Power Station
C-170342
Electronic Filing - Received, Clerks' Office, August 11, 2008--Exhibits 1,2,5-10, & 12
Final Re~ort
Conceptual Development of
a Pozzolanic Cap
for the
Closure
of Basin D at the Hutsonville Power Station
1.0 Background
Basin D at the Hutsonville Power Station is an inactive ash disposal area that needs a
cap for final closure (Photo
#
1). Natural Resources Technology
(NRT),
Pewaukee,
Wisconsin, contracted the services of
VFL
Technology Corp.
(VFL)
to determine the
feasibility of developing a concept for the creation, manufacture, and placement of a
pozzolanic cap for Basin
D at the Hutsonville Station.
The purpose of this report is to present a
final
summary
of the information, findings
and test results that have
been generated for the conceptual development of the
pozzolanic cap for the closure of Basin
D at the Hutsonville Power Station in
Hutsonville Lllinois.
The Program Goals of this study were to:
a
Attempt to develop a pozzolanic cap material that would achieve a
permeability of 1 x 1 ~'~crn/sec,
and have an unconfined compressive strength
of approximately
1 50 psi.
If the 1
x
1 ~-~cm/sec
goal is unrealistic or unachievable with
these materials, estimate the most realistic performance
of these materials
under field conditions.
Produce a cost-effective pozzolanic cap material that
can be easily handled
and placed
with common earth moving equipment.
Attempt to
minimize the amount of regarding needed to prepare Basin D for
the cap, while maximize the
use of Basin A
fly
ash as a stable fill material
and
as a construction material for the development of the pozzolanic cap.
To accomplish these goals,
VFL and
NRT
developed a scope of work for the project.
VFL
employed the help of GeoSystems Consultants Ind. to assist with the
geotechnical
engineering portion of the program. The scope of work basically
included:
A field assessment of the site
(VFL
and GeoSystems);
VFL
Technology Corporation
Hutsodle Power Station
C-1703-02
Electronic Filing - Received, Clerks' Office, August 11, 2008--Exhibits 1,2,5-10, & 12
-.
PHOTO
Hutsonville Power Station Basins A and D
Electronic Filing - Received, Clerks' Office, August 11, 2008--Exhibits 1,2,5-10, & 12
A review of existing geotechnical data of the site to detennine if additional
information is needed to finalize the cap design and construction
(GeoSystems).
Collect samples of the Basin materials
(VFL).
Conduct a treatability study to determine if a powlanic cap can be developed
to meet the current design guidelines for closure cap construction and develop
an operational approach to construct the cap (VFL).
Conceptual development of the basic cap design, appearance and estimated
volumes of material to be used
in the cap construction (GeoSystems).
On
March 5 and 6,2002, representatives of VFL Technology Corp. and GeoSystems
Consultants Ind. visited the HutsonviIle site. Samples
fiom the two basins were
collected, and existing geotechnical
data
was reviewed. The Hutsonville ash samples
were tested at VFLYs Corporate lab
in West Chester Pa. using a variety of locally
available stabilization reagents.
2.0 Overall Program Conclusions
The preliminary geotechnical evaluation indicates that the construction of a
pozzolanic cap is definitely feasible; however, some additional, more refined
analyses
are needed to finalize the engineering and design of the cap system.
The results of the Treatability Study program show that it is feasible to
construct a structurally stable, environmentally acceptable Pozzolanic Cap
and
use this cap in the final closure of Basin D at the Huntsville Power Station.
Althou
1 x 10-
P
cm/sec,
the permeability
the results of
results
several
do
mixes
not meet
are
the
in the
original
mid to
goal
low
of
10-'cm/sec
range.
By using Basin
A ash
asa
construction material for the pozzolanic cap,
ap~oxirnately 160,000 yds3 of ash can be utilized, which significantly
extends the life
of Basin A.
All of the mixes that were considered potential candidates for cap
construction easily met the unconfined compressive
strength goal of 150 psi.
3.0 Geotecbnical Investigation
As indicated above, the geotechnical data review, conceptual design, material
volume estimates, preliminary settlement and slope stability analyses were conducted
by GeoSystems. The report of their findings and analyses
has been included in
Appendix 1 of this report.
VFL Technology Corporation
March 26,2003
Hutsonville power station
C-1703-02
Electronic Filing - Received, Clerks' Office, August 11, 2008--Exhibits 1,2,5-10, & 12
In summary, GeoSystems believes the construction of a pozzolanic cap is feasible
and will be
an effective system; however, some additional information is needed to
complete the
final
engineering and design of the cap system.
An
overview of the conclusions of the GeoSystems report indicate:
*
. . . .
A parametric analysis varying cap permeability from1 x 1 ~-~cm/sec
to
1
x
10-~cm/sec
yielded "effectiveness" ranging
hm
78% to 97%.
. . . . . ..
.....
As the slope of the
final
cover increases fiom 1% to 5%, the volume of
regarding reduces fiom
1 10,000~ds~
to 75,000 yds3
. . . . . .
; . ...
With a 5% slope, the volume of ash fill material needed from
Basin
A is
estimated to be 160,000 yds3
. . . . . . . . . . . .
. . ...
The volume of the pozzolanic cap (3 feet thick) is estimated to be 100,000
yds3 and varies little as the slope varies hm 1% to 5%.
. . . . . . . . ..
A graphical presentation of a conceptual, representative cross section of
Basin
D
showing the cap design, regarding requirements, needed fly ash fill material fiom
Basin
A, etc.
was
developed by GeoSystems (part of GeoSystems report
-
see
Appendix 1) and has
been included here as Figure 1 for reference purposes.
4.0
Treatability Study
A few 'Terformance Goals" were established for the
final
pozzolanic cap material.
The intent was to see if the stabilized materials could meet the existing cap design
specifications,
and if
not,
determine how well they performed against these existing
specifications. The "Performance Goals" for this project
were
to:
Develop a permeability of 1
x
l~-~cm/sec,
or determine how close the
stabilized materials can realistically come to these specifications.
Develop approximately
1 50 psi unconfined compressive strength.
Attempt to develop a cost-effective
mix
design that can be easily implemented
an constructed in the field.
Develop a cap system that
was
environmentally acceptable (minimizes
leaching).
VFL's treatability study can be broken down into four basic areas: Raw Materials
Characterization; Reagents;
Mix
Design Development
and Mix
Design Performance
Testing. Each of these areas is discussed fUrther in the following sections of this
report.
WL Technology Coporation
March 26,2003
Hutsonville Power Station
C-1703-02
Electronic Filing - Received, Clerks' Office, August 11, 2008--Exhibits 1,2,5-10, & 12
r
FLY ASH TO BE RELOCATED
TOPSOIL COVER
,
GRANULAR DRAINAGE LAYER
FLY ASH NEEDED FOR GRADING
//I-''/
POZZOUNIC CAP
REVISED
12-2642
REPRESENTATIVE CROSS SECTION
.
POND D
HUTSONVILLE POWER STATION
HUTSONVILL~,
ILLINOIS
I
GeoSystems
Consultants,
Inc.
I
FIGURE
I
APRIL 2002
Electronic Filing - Received, Clerks' Office, August 11, 2008--Exhibits 1,2,5-10, & 12
4.1
Raw Materials Characterization
During the site visit, VFL collected six (6) samples of ponded ash from
different locations
in
Basin
A, and two (2) samples of ash from different
locations in Basin
D. The six samples fiom Basin A and two samples from
Basin
D were individually tested for moisture content, pH, density and Loss
on Ignition
(LOI).
The
natural
solids content of the ash excavated fkom Basin A ranged from
71 -4%
to
74.2%
solids
(40.0%
to
34.8%
moisture
-
dwb). The pH values for
Basin A ranged fkom 8.4 to 1
1 .O,
while the LOI's for Basin A ranged from
2.1% to 8.9%. All
ash
samples showed varying degrees of bleeding (draining
of fiee liquids from
the material).
As indicated previously, the intent is to use material fiom Basin
A to produce
the pozzolanic
cap for the closure of Basin D. In order to simulate fbll-scale
operations, the
"as
received" samples of ash fiom Basin A were allowed to
decantldrain. This was done to estimate the handling and solids content
characteristics of the
ash that will be used in the full-scale operations. The
data showed that
some of the ash samples decanteddrained nicely, while
others did not decantidrain
as
well. The decanted/ldrained solids content of
the Basin
A materials ranged fiom
73.9%
to
81
%
solids
(35.3%
to
23.5%
moisture
-
dwb), or a 1.4% to
8.8%
increase in solids content.
The
two samples of ash collected fiom Basin D showed a solids content range
of 72.9% to 82.6% solids (37.2% to 2 1.1
%
moisture
-
dwb). The sample
that showed the
high solids content was
taken
fiom a stockpile of material
that
was sitting on the Basin
(age
unknown). The pH's for the two samples
collected from
Basin D were 8.8 and 8.2 respectively. The results of the
physical analysis of
the ash samples can be found on Table 1 of this report.
WL Technolorn Cornoration
March 26. 2003
Electronic Filing - Received, Clerks' Office, August 11, 2008--Exhibits 1,2,5-10, & 12
TABLE
1
Physical Characterization of the Hutsonville Ash
In addition to the physical characterization of the
ash
samples listed above, an
elemental analysis and TCLP Ieachate analysis for the 8 RCRA metals was
run
on a composite sample of the Hutsonville ash. The composite sample
was
generated by combining equal portions of ash samples
A- 1
through A-6.
The results of the chemical analyses are listed below in Table 2. The actual
data reports from Dalare Labs in Philadelphia, Pa. have been included in
Appendix
A-2.
VFL
Technology Corpwotion
March 26,2003
Hutsonville Power Station.
C-1703-02
Electronic Filing - Received, Clerks' Office, August 11, 2008--Exhibits 1,2,5-10, & 12
TABLE 2
Elemental and TCLP Analysis of the HutsonviPle Ash
Arsenic
Barium
Cadmium
Chromium
Lead
Mercury
Selenium
Silver
Notes: Total
=
Total Elemeirtal Concentration in mghg
Leachable
=
TCLP Leachable Metah in mg/l
< =
Lm than
VFL
has used numerous
reagents
in the development of pozzolanic
construction materials. VFL reviewed these various reagents and
based on
previous full-scale experience
with similar projects, selected what it believes
to be the best performing, commercially available
(in large quantities), and
most cost-effective reagents for this project, fiom sources in the vicinity of
the job site. These
reagents
include:
Portland Cement,
Class
C Fly Ash (self-setting
type)
Fluidized Bed Residue Ash
Quicklime
FGD Scrubber Sludge (used to make the particle size of the
mix
design
finer, which improves permeability)
Native Soils
(used to make the particle size of the mix design finer, which
improves permeability).
VFL experienced a few minor delays in the treatability study portion of the
.
project. These delays are directly attributed to the delays in receiving some
of the samples
of reagents from the various vendors. One of the most
Hutsonville
VFL Technolom
Power
-
Corporation
Station
March 26,2003
C-1703-02
Electronic Filing - Received, Clerks' Office, August 11, 2008--Exhibits 1,2,5-10, & 12
problematic was the FGD Scrubber Sludge, which was finally received on
date
06/06/02.
4.3
Mix Design Preparation
In order to simulate full-scale conditions, VFL combined the six (6)
decanted/drained samples of ash hm Basin A into one (1) composite ash
sample that was used to prepare all of the mixes. The solids content of this
composite sample was approximately
79% solids (26.6% moisture
-
dwb).
All
mix designs were prepared in a laboratory mixer and mixed to the
consistency expected to
be achieved using full-scale processing equipment.
All
mix designs were damp, granular, soil-like materials that could be easily
handled and placed
with common earth moving equipment. A11 of the mixes
were prepared on the "wet side of
optirniun
moisture" to assure that there was
enough moisture
in the mix for reagent hydration and proper compaction.
This "wet side of optimum moisture" consistency also minimizes the
potential for dusting
during full-scale operations. See Table
2 for the mix
designs developed this project.
Solids contents,
as well as wet and dry compacted densities were recorded for
all mixes. These values
will
be used as operating specifications during full-
scale production and placement operations.
All mixes were compacted into standard size compaction molds, labeled,
and
stored in sealed plastic bags to' insure proper curing and prevent moisture loss
during their curing cycle.
4.4
Mix
Design Performance Testing
Immediately after mix preparation, all of the mixes were evaluated for
consistency, handlability, and constructability. As mentioned above, all of
the
mixes
had a damp, granular, soil-like consistency.
All
mixes could be
easily handled, transported and placed
with common earth moving
equipment.
All of the mixes could support heavy equipment t~dlic
immediately after placement and compaction. This
means that multiple lifts
of stabilized material could be sequentially placed on top of each other
throughout
the day during full-scale operations.
As proposed, all of the mixes were tested for unconfined compressive
strength (UCS) in accordance
with ASTM C
-
39.
All compressive strength
cylinders were tested in duplicate and capped prior to UCS testing. The mix
designs and UCS test results can be found in Table
#3
of this re~ort.
WL
Technology Corporation
Hutsonville Power Station
C-1703-02
March
wL
26.2003
Electronic Filing - Received, Clerks' Office, August 11, 2008--Exhibits 1,2,5-10, & 12
Overall, the mixes generally performed as expected, with the exception of the
quicklime mixes. All mixes showed good solids contents as well
as
wet and
dry compacted densities. Based on the
mix
densities, costs, UCS results, etc,
the best performing mixes were selected for the next phase of permeability
testing. These mixes were:
Mix 1
-
10% cement
Mix
2
-
5% cement
Mix
5
-
5% fluidized bed residue
Mix
9
-
6.3% cement
+
15% native soils
Mix1
4
-
30% FGD Filtercake
+-
10% cement
Mix 16
-
30% FGD Filtercake
+
10% quicklime
Triaxial permeability tests were
run
on the above listed mixes after 28 and 84
days of curing. The results of these tests are listed in Table #3 of this report.
During the 84
day
permeability testing, a problem was discovered in the test
results.
All
of the test specimens showed higher (more permeable) values
than
the 28 day results. In some cases, it
was
over an order of magnitude.
This
data trend is extremely unusual for pozzolanic reaction mechanisms,
which are known to improve
with time. It was concluded that the entire set
of cylinders must have been damaged during
transport
and handling.
Companion cylinders were tested again after
curing 84 days and these
permeability values fell
in the expected range.
The only
mix
that did not show the normal permeability improvement
characteristics was
Mix
#16.
All of the indicator parameters for this Mix
looked promising (consistency, compaction characteristics, densities, strength
development, etc.), yet the permeability data
did not follow the usual trends.
At this
point, it should be remembered that the mixes prepared in this
program
are
considered to beexcellent indicator mixes to examine the
feasibility of the program and provide data to determine the basis for a frnal
mix design. Further refinement of the
mix design can be assessed to improve
performance, permeability, and cost-effectiveness of the pozzolanic cap
material
as
necessary.
After reviewing all of the permeability data listed in Table #3, it appears that
the realistic performance range for
these
types of pozzolanic materials is the
low 1 oacm/sec to the mid+low 10=]cm/sec range for materials to
be
produced under full-scale field conditions. The.typical 1
x
10-~crn/sec liner
spec means that the material must be in the 10-~cm/sec range so as not to
exceed the1 x 10-~cmlsec spec under field conditions. These types of values
are extremely difficult to meet with most materials under field conditions.
VFL
Technology
Corporation
Mamh 26,2003
Hutsonville
Power Station
C-
1703-02
Electronic Filing - Received, Clerks' Office, August 11, 2008--Exhibits 1,2,5-10, & 12
TABLE
3
-
TREATABILITY STUDY SUMMARY SHEET
Mik
,
Mix Design,%
. .
.
..
. ,: .
~uinbef!. <FI~$~s&
:fllt&&~t$~
&.3&1'.~&
5
a$&&&+
(B .
and).;
.~eagents~
.
-.
1
2
3
4
5
-
10.0
81.1
12.5
86.9
38
80.5 12.3 113.4 91.2 22
70
27
138
82
-
-
-
Solids
-
100
100
100
100
100
9
10
11
12
13
14
15
16
pH
~--
-
Note:
Reagent added on
a dry weight basis
lo
soil-fly ash blend.
'UCS strength data is average of
2
cylinders.
'FGD sludge added on a wet weight basis to ash.
Stockpile time for all mixes was
30 minutes.
Soil added on a wet weight basis.
Reagents added on
a dry weight basis
Second set of mrmeability nsulfs for mixes 14 and 16 am at 56day cures.
85
85
85
85
70
-
70
70
70
:::. :
.
.
$, ?.\-: .;
$[sUk9
11.9
11.7
10.9
11.4
12.3
12.5
:c&nfjnti
,
,Density.
15
1
15
15
15
&;,5*&~:~
..,:.(&h&f
10.0
5.0
li~~&&
UCS'
.Wet
Dry
,5uR:
.,;.
$S
;<:
,.j;:.
.,.
,::.:;L.r
'. ..
;I :
-_---
6.3
12.5
Permeability
(cmlsec)
K20
-
f;hnI;;
$?.&*<%,
-
-
15.0 .
30.0
1
-
---
-
1
FBRj
116.0
116.5
113.4
107.5
106.4
97.7
{Qdimw.
28,d.y
..j,>:Y*
... :.
(p
184
79
31
81
277
291
94.5
93.5
93.3
89.8
87.5
82.4
-
30
-
30
-
+X$;i?.*.$
:
w&
-
-
-
I
10.0
20.0
.
-28 day
.: ..... ;:."'.... .1' '..
. ';:
. . . . . . ,
5.37~~'
5.03~"
-
1.75~~'
--
-
6.6
10.0
30
30
84 day
..
..).j.
. . ..I.
.:.
. . *. ..
7.64~~'
4.74~~~
-
-
5.84~~'
.
-.
-
56 day
1
84 day
-
-
-
.. -
.
.: '..
..
231
125
41
124
276
583
;;;;,+: ;*..
..P.
: 7
~2.
x:..(%]:gt:
77.3
77.91
79.9
-
81.1
, .. .
,;.'..'
p
305
165
37
114
372
609
-
-
-
-
6.3
10.0
-
-
. 81.5
80.3
82.3
83.5
82,2
84.3
11.6
12.0
12.8
12.9
83.5
83.4
83.5
81.9
112.4
113.0
114.2
112.4
11.7
11.9
12.4
12.6
86.9
91.2
91.2
114.2
117.4
110.7
113.1
123
168.
164
364
95.4
97.9
92.4
92.6
130
157
110
320
26
35
194
314
142
416
42
84
304
603
------.
191
380
48
82
4.32~~~
-
2.91 E"
1.99~~'
1.30~~~
-
-
-
Electronic Filing - Received, Clerks' Office, August 11, 2008--Exhibits 1,2,5-10, & 12
FIGURE 2
Unconfined Compressive Strength Development
for Selected
Mixes
Days
Cured
Electronic Filing - Received, Clerks' Office, August 11, 2008--Exhibits 1,2,5-10, & 12
Based on all of the above data, the four (4) mixes best performing mixes in
the study were then tested for leachate characteristics using the
TCLP
leaching procedure. The results of the TCLP leaching tests are presented in
Table
#4
of this report.
TABLE
4
TCLP Leachate analysis of the Treated Ash
Arsenic
Barium
Cadmium
Chromium
Lead
Mercury
Selenium
Silver
Notes:
Treated material curedfor 84 days
AII results expressed in
PPM. unless otherwise noted.
PPM
=
Parts per MiIIion
<
=Less than
As can be seen in Table #4, all of the mixes showed
ve_rv
low leaching potential.
One interesting trend to observe is the fact that all of the stabilized mixes reduced the
leachable level
of arsenic,
barium
and lead when compared to the original, untreated
ash.
This is a common trend seen in the leachate characteristics of pozzolanic
stabilization matrices.
Upon reviewing
all of the data generated in the study, the most promising reagents
and material blends to produce a pozzolanic cap under field conditions appear to
be:
Basin A fly ash and cement (Mix 1 and 2)
Basin
A fly ash, onsite soil and cement (Mix 9 and 10)
Basin
A fly ash, FGD Filtercake and cement (Mix 14)
VFL
techno log^
Corporation
March 26. 2003
Electronic Filing - Received, Clerks' Office, August 11, 2008--Exhibits 1,2,5-10, & 12
FBR was not included in the final selection for several reasons. FBR has been used
in the past for various construction needs including permeability which is why we
have included it in
this treatability study. FBR is quite useful when handled properly
and used in the correct application. Recently, there have been reports on several
construction projects that some
FBR7s
are susceptible to expansion problems.
Situations where it should be avoided are employing it where slight expansion is not
acceptable.
FGD sludge is a good additive for most mix applications. However, FGD sludge
fiom each power plant can be very different (chemically
and physicdIy) based on the
coal source and type of boiler used. Another issue that VFL
has with
FGD
sludge, in
this specific application, is making sure that it is mixed thoroughly
with the other
ingredients.
FGD sludge is a very sticky material. It is difficult to accurately feed it
into a portable processing system because the
FGD sludge has a tendency to adhere
to the sides of feed hoppers that are
used on portable pugmill plants (known as
bridging). In most construction applications, where precise
mix
designs are not
required, this is not a problem.
The mixes containing cement tend to be the easiest to quality control in field
construction applications. Cement is
a manufactured product and varies very little.
Further optimization testing is recommended for the
final mix design prior to full-
scale operations. -VFL would recommend that a test pad be constructed with full-
scale equipment and sampled in substantial conformance
with 35 Illinois
Administrative Code
(IAC)
Part 8 16 to evaluate the proposed process equipment
train and optimized the final mix design.
5.0 Extrapolation to Full-scale Operations
The basic full-scale operational approach that VFL would use to construct the
pozzolanic cap for Basin D's closure would conform to the following schedule of
events:
Regrade Basin D to the lines
and
grades specified by the Engineer.
Excavate the
fly
ash fiom Basin A and allow it to drain to the proper moisture
content before using it
in the mix design. Run OnRun Off to and from the
area
will be controlled and water drained from the ash will be routed back
through the plants pond system.
Construct a processing
area in the vicinity of the two Basins. Erect the
processing plant, silos and any other ancillary processing equipment needed.
Construct haul roads to and from
the placement area.
Q
Process the designated mix design.
0
Place and compact the stabilized cap mix as
soon
as possible to the lines and
grades established by the Engineer for the final cap design.
VFL Technology Corporation
March 26.2003
Hutrionville Power ~Ltion
C-1703-02
Electronic Filing - Received, Clerks' Office, August 11, 2008--Exhibits 1,2,5-10, & 12
Cover the placed material with the cover soils to protect the pozzolanic cap
fiom severe weather events.
Place
the topsoil and vegetate
as
soon as possible.
To develop the necessary documentation for submittal to the State Regulatory
Agencies, the basic Quality Control program for the pozzolanic cap construction
would involve:
Quality Control conformation testing on the materials to
be used in the cover
system
and
their placement.
Process control testing of the mix design during production in substantial
conformance
with 35 IAC Part 81 6.
Quality
Control of the cap mix design during placement and compaction in
substantial conformance
with
QAIQC
procedures outlined in 35
IAC
Part
816.
Moisture monitoring on the excavated and drained Basin A
fly
ash. Control
and QC confirmation checks on the reagents and any other materials of
construction that
will
be used in the mix design
Plant calibration.
Insure that
Basin D has been regraded to the lines and grades specified.
Insure that the cover system
has been installed to the lines and grades
specified.
The cap construction activities listed in this section have been used by
VFL on
several other pozzolanic cap projects. To demonstrate
this, the foIlowing photos of a
pozzolanic cap system that VFL constructed on an industrial landfill in New Jersey
have been included for review.
VFL Technology Corporation
Hutsonville Power
Station
C-1703-02
March 26,2003
Electronic Filing - Received, Clerks' Office, August 11, 2008--Exhibits 1,2,5-10, & 12
PLACEMENT OF THE DRAINAGE LAYER
AND TOP SOIL FOR COVER SYSTEM
Electronic Filing - Received, Clerks' Office, August 11, 2008--Exhibits 1,2,5-10, & 12
REGRADING LANDFILL
Electronic Filing - Received, Clerks' Office, August 11, 2008--Exhibits 1,2,5-10, & 12
PROCESSING EQUIPMENT
Electronic Filing - Received, Clerks' Office, August 11, 2008--Exhibits 1,2,5-10, & 12
PLACEMENT
ANID
COMPACTION
OP
THE
POZZOLANIC CAP MATERLAL
Electronic Filing - Received, Clerks' Office, August 11, 2008--Exhibits 1,2,5-10, & 12
COMPACTED
AM)
GRADED
POZZOLANIC CAP MATERlAL
Electronic Filing - Received, Clerks' Office, August 11, 2008--Exhibits 1,2,5-10, & 12
FINISHED LANDFILL
Electronic Filing - Received, Clerks' Office, August 11, 2008--Exhibits 1,2,5-10, & 12
GeoSystems
Consultants,
Inc.
Task 2:
Review
Readily
Available Geotechnical
Data
Mr. C.A. Robb of NRT submitted selected geotechnical data regarding the subsurface
conditions, site drawings,
and tables containing vo1umetric data for Basin
'73."
A
list of
these documents is included as Attachment
1.
These documents were reviewed to
ascertain subsurface conditions
in the vicinity
of Basin "D."
Several inferred subsurface
cross section and the associated test boring logs were evaluated. These data were then
used to develop an "Idealized Cross Section" of the completed
Basin
closure at the
location GeoS
ystems
believes, is the critical section with respect to slope stability.
Soil
strength characteristics were estimated
based
on
information
presented in relevant test
boring logs. Where soil (strength) data
was
not available, GeoSystems
used engineering
judgment to select reasonable strength values for subsurface
-and
embankment soils and
impounded flyash.
GeoSystems also obtained and reviewed selected sections
of
the State
of
nfinois Title
35:
Environmental Protection, Subtitle B (Waste Disposal Part 816, Alternative Standards for
Coal Combustion Power Generating Facilities Waste Landfills), and Subtitle G (Waste
Disposal Part 8 11, Standards for New Solid Waste Landfills).
Task
3: Engineering
Consultation Services
!
GeoSystems provided Engheeriig Comdting Services
regarding
the geotechnical issues
for the project. Specifically the following issues were addressed:
Field Investigation Prom
GeoSystems identified data
gaps
in the geotechnical information provided with respect to
I
performing the design evaIuatioa. These deficiencies include insufficient laboratory data
that characterizes physical and engineering properties of the impounded
flyash,
containment-dikes, the various soil strata underlyidg the site, and the stratigraphy in the
areas judged to be critical with respect to slope stability. It is
our opinion
that at least 6
additional test borings are required to develop adequate cross sections
in
critical areas
and to obtain samples for physical and engineering property laboratory testing. These
data would be used to perform analyses regarding slope stability
and
settlement.
Alternate C~D
Effectiveness
Based on a review of the pertinent sections of the State of Illinois Title 35 Code, a
pozzolanic
barrier layer is
an
acceptable alternate cover
system
in
lieu of using
a
.
goemembrane cover system. To evaluate the effectiveness
of
the pozzolanic cover
system,
the
HELP computer model was used.
USEPA's computer model HELP (Hydrologic Evaluation of Landfill Performance) has
been used to perform a water balance to estimate the
quantity
of fluid percolating through
Electronic Filing - Received, Clerks' Office, August 11, 2008--Exhibits 1,2,5-10, & 12
GeoSystems Consultants, Inc.
the
final
cover system to the basin materials, estimate the amount of runoff, and head on
the cover system barrier layer.
HELP
uses a
water balance method to estimate the quantity of precipitation which will
theoretically penetrate the
basin
kal cover system'and percolate through the waste. Site-
specific climatological and design data can be input into the model
In
order to assess final
cover performance.
To determine the
quantity
of
rainfall penetrating the final cover, the model estimates
runoff, cover system drainage, and evapotranspiration. These calculations
are generally
based on assumptions made regarding the runoff coefficient, root
zone
depth, quality of
plant cover, soil porosity, field 'capacity, and
initial water content.
All
rainwater
remaining after
runoff,
cover system drainage,
and
evapotranspiration can either become
leachate or can be incorporated into the
waste.
The
HELP model is generally accepted as a useful tool in the evaluation of cap and liner
designs. To
simplify the
analysis
of these designs, it makes several assumptions. These
include steady state flow and homogeneous isotropic layers. Steady state flow
may
be
achieved
in an unknown number of
years
after the site has been closed and
final
cover
installed. The non-homogeneous nature of the
basin materials could result in rainwater
channeling through -voids, resulting
in
non-uniform flow. The effect
of
rainwater
absorption
by
the waste or
trapped
rainwater remaining from active operations can be
accounted for by setting the initial water content .of the waste.
These
amptions make
the HELP model useful as a tool to
compare
various design options.
The information needed to
run the
HELP
model includes climatologic, design, soil, and
runoff data. To assist the user in operating the HELP model, the program can generate
synthetic climatologic data
for 20 years using internal databases with weather conditions
for
139
cities throughout
the
United States @vansville, IN was used for present
study,
which is about 90
miles
fiom the site),
7
vegetation cover
types,
and
18 soil types. The
user
may select default values fiom these databases that best represent the expected site-
specific conditions. Details of data input
a. modeling results (using the 20-year
synthetic weather generator) are presented
in Attachment 2.
HELP analyses were performed
using
a 6-foot thick cap section
(3
feet pozzolanic
cap, 3
feet cover soil: 0.5 to 1.5 feet drainage, 2.5 to 1.5 feet cover
soil).
Permeability of the
pozolanic
cap was varied fiom
1xl0-'
to
lx
10"
cmfsec, and final cover slopes
varied
fiom
1% to
5%.
Based on the results of the modeling, the proposed cover design for Hutsonville Flyash
Basin
"D" fofthe flat cap area would result in a range of
7
8 to 97 percent effectiveness in
elhhating drainage
through
the cover system to the basin materials. These percentages
are based on the average total precipitation for one year and
the
"percolation fiom
base
of
cover"
values calculated using the
HELP
model (see Table 1). The "percolation from
base
of cover" is assumed to be the amount of leachate, which is a conservative
Electronic Filing - Received, Clerks' Office, August 11, 2008--Exhibits 1,2,5-10, & 12
GeoSystems Consultants, Inc.
required Slope Stability analyses for submission to the state.
Volume
Calculations
Volume calculations for
fly
ash utilization associated with the various slopes (1% to 5%)
for the hale closure configurations were performed. The results are presented in
Attachment
3.
Based on the analyses performed, the -following conclusions
have
been
developed:
As the slope of
the final cover increases fiom 1% to 5% the volume of soil to be
regraded reduces fiom 1
10,000
yd3
for 1
%
to 75,000 yd3 for 5%.
8
As
the slope of the final cover increases from 1% to 5%, the volume of structural
fill
increases fiom
0
yd3
for
1%
to
160,000
yd3 for
5%.
The volume of protective soil cover (3 feet including vegetative support Iayer and
drainage layer) varies little with
the change in final
cover grade from
1%
to 5%
(-100,000
yd3).
r
The volurne of pozzolanic cap
(3
feet thick) varies little with the change in final
cover grade from 1% to 5%
(-100,000
yd3).
a
Utilization of flyash from
Basin
"A"
increases with increasing slope from 1% to
5%.
Erosion Potential
Erosion control of
the cover system is important, because loss of the soil cover overlying
the barrier layer increases the
potential for damage by gnawinghurrowing animals, thus
decreasing the effectiveness of the banier. Erosion
may
be
wind-
andlor water-induced.
.
The potential for erosion by these two environmental factors should be
evaluated
using
the Universal
Soil.
Loss Equation (USLE) and the Wind Erosion Equation (WEE).
Erosion calculations are highly dependent upon the type and condition of vegetation
anticipated
after closure. Erosion loss' due to wind
and
water can be calculated based on
the anticipated short and long term condition of the cover system. No calculations were
performed for this
phase of the design process.
Freeze-Thaw Effects
The maximum estimated frost penetration depth in Central Illinois is 30 inches
and
the
. -
average depth of
frost
penetration is about 10 inches.
A
conceptual cover system
design
.
for the flat area could provide for
soil
depth above the barrier.
A
final cover will not be
sensitive to freeze-thaw effects
when
properly designed
Electronic Filing - Received, Clerks' Office, August 11, 2008--Exhibits 1,2,5-10, & 12
GeoSystems
Consultants,
Inc.
. .
Air Emission Control
.
Airborne migration of landfill materials \Kill be predominantly migration of dust particles
during
closure subgrade preparation and initial placement of the general fill layer. As the
general
fill layer (variable thickness) installation proceeds, the potential for fugitive dust
containing landfilled materials would lessen and
then be virtually eliminated once. the
general
fill
has been partially completed over the entire site.
CONCLUSIONS
Additional field investigation is necessary to better define the geotechnical properties of
the impounded flyash, containment dikes, and various soil skata underlying the site, as
well as better defining the stratigraphy for the critical sections identified.
A pozzolanic cap having a
minimum
thickness of
3
feet (0.91 meters) can be constructed.
A parametric
analysis
varying cap permeability from
1x1
0.'
cds to
1x1
0"
cds yielded
"effectiveness":
ranging
from 78 percent to 97 percent. The permeability of the cap
greatly influences its "effectiveness."
Post-closure settlement
has been estimated to be about 1 foot for the cases evaluated.
This is
a rough estimate based on interpretation of engineering properties fiom soil
descriptions presented
in the boring logs provided, and assumed properties' of .the
impounded flyash. Laboratory test data were available for use in-these .evaluations.
Based on review of results fiom the Preliminary Analyses, insufficient data
are
available
to perform .a comprehensive evaluation at this he.
A
supplemental field investigation
designed to obtain relevant soil property
data is needed to perfom the required. Slope
Stability analyses for submission to the state.
.
LIMITATIONS
'
The
ooncl'usions and recommendations presented in this report are based on the
assumptions that the subsurface conditions at the site
and
the assumed soil properties do
not deviate appreciably
from
those disclosed by the test boring data p*ovided
and
that the
proposed design
is substantially in conformance with the project description.
GeoSystems
Consultants
should be notified immediately should differing conditions be
encountered or
if significant
changes
in design are contemplated, so that appropriate
revisions
can be made to the recommendations.
Electronic Filing - Received, Clerks' Office, August 11, 2008--Exhibits 1,2,5-10, & 12
GeoSystems Consultants,
Inc.
We
sincerely appreciate the opportunity to submit this Progress Report for this
challenging project. If you have any questions, please do not hesitate to contact us.Very
truly
yours;
GEOSYSTEMS CONSULTANTS,
MC.
U~alabria, PhD., P.E.
Princip
a1
Electronic Filing - Received, Clerks' Office, August 11, 2008--Exhibits 1,2,5-10, & 12
Table 1: ,
~ozzolanic
Cap
Effectiveness
-
Case
1
A:
30"
topsoil. 6" sand at 1x10~ cmls, 36 ponolanic cap on a 1% slope
Case
1
8:
30"
topsoil.
6" sand at 1x10-' cmls,
36
pozzclanic
cap
on a 5% slope
Case 2A:
18" topsoil, 18 sand
zit
1x1~~
crn/s,
36" ponofanic cap on a 1
%
slope
Case
28:
18" topsail, 18" sand at 1x10.' cmls, 36" ponolanic cap on a 5% skpe
% Effectiveness
Cases
Case 1A
Case 1 B
Case
2A
Case
28
Ponolanic Cap Permeability
(cmls)
.
I
1x1 0-7
95%
95%'
96%
9
7.Yo
'I
XI
o-~
I
1 x1
0-=.
78%
78%
78%
79%
78%
.
79%
'
81%
86%
Electronic Filing - Received, Clerks' Office, August 11, 2008--Exhibits 1,2,5-10, & 12
Attachment 1
Electronic Filing - Received, Clerks' Office, August 11, 2008--Exhibits 1,2,5-10, & 12
Natural
Resource
T.echnotogy, I
nc.
TRANSMITTAL
To:
Vl?L
Technotogy Corporation
Date: March
11,2002
16
Ragerty Boulevard
Project
No: 1375
West
Chester, PA
19382
From:
Christopher
A.
Robb
Re: Data Transfer Soil
brings, Topography,
e
tc.
Attn: Mr. Doug Martin
Ameren Services
-
Hutsonville Power
Station
'
-
x
For
Your
Files
x
As Requested x
For
Review
13
Approve and
Return
Copies:
Description
Boring
Logs
-
EW-1, MW-6, MW-7, MW-7D, MW-8,
GP-20
10
GP-23, MW-11,
MW-IIR,
SB-I01
tdSB-103,
W-14.
W
'
W
W
~
.l
i
t
e
-.
)
p(PARTIA1,
.
copy)
Fig=
No.
3
-
Oe&&c
Clr-s
(1
3w)
-
Bedras=l;
(1
375-13tf)
-
Fi
m
-
w
ve No.
3:
co
V-C)
-,
Fiu
Nn
7!
_,
5-
(1
375-R10),-
-
Tahle-2 -
A
r
e
a
l
of uu
L
&d
Cover
Titl~m
81 1
-ail
. .
I
Comments:
Doug,
Pleasefind enclosed copies
of
the above listed materials. The follotving,is
a
quick list of some
additional potentiaIIy
useful
information:
r
GP-20,21,Z and
23
are
inside
of
the unlined ash impoundment (Pond D).
R
No soil borings were performed in
Pond
D's berm.
For
Pond D
fill: estimated approximately
15,500
cy fill below water
surface.
*.. ... -_.-- .-.-.----
-.-. . -
. -- -
-- -
23713
W.
Paul Road,
Pewaukee, WI
55072
Phone
262/523-9000
r Fax
2621523-9001
Electronic Filing - Received, Clerks' Office, August 11, 2008--Exhibits 1,2,5-10, & 12
Attachment
2
Electronic Filing - Received, Clerks' Office, August 11, 2008--Exhibits 1,2,5-10, & 12
POZZOLANIC
CAP PERFORMANCE
Electronic Filing - Received, Clerks' Office, August 11, 2008--Exhibits 1,2,5-10, & 12
Cap
Design
5
A-
CASE
1/41
30" TOPSOIL, 6" SAND
7
l+CASE
1B:
30" TOPSOIL, 6 SAND AT 1E-3,36 POUOLANlC CAP, 5% SLOPE
:+CASE
2A: 76" TOPSOIL; 18"'SAND AT 7E-2,36"
POZZOLANIC
CAP;I% SLOPE
-&-CASE 28:
18"
TOPSOIL,
18"
--.-
.
8
Electronic Filing - Received, Clerks' Office, August 11, 2008--Exhibits 1,2,5-10, & 12
VFL-15. OUT
0
tffffh**tf~)f*t*t*t*fdt**tC..****tCa~fff*f:***~~*+f*%%*+*******5*****************
~~f*t***~f**+*******c***cf*****************k********~*************************
*
*
*
*
+*
* *
* *
HYDROLOGIC EVALUATION OF LANDFILL PERFORMANCE
-
drt
a
*
* *
HELP MODEL VERSION 3.07
(1
NOVEMBER 1997)
+
f
**
DEVELOPED BY EMRONMENTAL LABORATORY
*+
USAE WATERWAYS EXPERIMENT STATION
. *+
f
*
dr*
FOR USEPA RISK REDUCTION ENGINEERING LABORATORY
+ ?:
.
fY
PRECIPITATION DATA FILE:
M:\ENGINE- HELP-M-~\DATA~.D~
TEMPERATURE. DATA FILE
:
M:\ENGINE-I\HELP-M-~\DATA~.D~
SOLAR RADIATION DATA FILE:
M:\ENGINE- HELP-M-~\DATA~~.D~~
EVAPOTRANSPIRATION DATA: bl
:
\ENGINE-I\HELP-M-~\D,ATA~~.
Dl1
SOIL AND DESIGN DATA FILE:
M:\ENGINE-~\HELP-MU~\DATA~O.D~O
OUTPUT DATA FILE:
M:\ENGINE- HELP-M-~\vF~~s.oL~~.
TIME:
16:55.
DATE
:
3/27/2002
TITLE:
V~~/meren
servi
ces-~utsonvi
11
e
Power
station
NOTE:
INITIAL
MOISTURE CONTENT OF THE LAYERS AND SNOW WATER WERE
COMPUTED AS NEARLY STEADY-STATE VALUES BY THE PROGRAM,
LAYER
--------
1
TYPE 1
-
VERTICAL PERCOLATION LAYER
MATERIAL TEXTURE NUMBER
8
THICKNESS
- -
.18.00
INCHES
POROSIlY
=
I
0.4630 VOLIVot
FIELD CAPACrrY
-
0.23.20
VOL/VOL
WILTING
POINT
-
0.1160 VOL/VOL
INITIAL SOIL WATER CONTENT
=
0.2404 VOL/VOL
EFFECTIVE SAT. HYD.
COND.
=
0.369999994000~-03 CM/SEC
LAYER
--------
2
TYPE
2
-
LATERAL DRAINAGE LAY+
Page I
Electronic Filing - Received, Clerks' Office, August 11, 2008--Exhibits 1,2,5-10, & 12
VFL-is .OUT
MATERIAL
TWURE NUMBER
5
THICKNESS
=
-
18.00 INCHES
POROSrrY
-
-
.
0.4570 VOL/vOC
FIELD
CAPACITY
-
0.13 10 VOL/VOL
WILTXNG POINT
t
O.OS8O
VOL/VOL
INITIAL SOIL WATER CONTENT
=
0.1477 VOL/VOL
EFFECrIVE SAT.
HYD.
COND.
=
O.10OOOOOO5000E-02
CM/SEC
'SLOPE
- -
1.00
PERCENT
DRAINAGE LENGTH
=
375.0
FEET
LAYER
3
--------
NPE 3
-
BARRIER SOIL
LINER
MATERIAL TEXTURE NUMBER
0
THICKNESS
- -
-
36.00
INCHES
POROSS7-Y
-
-
0.5410 VOL/VOL
FIELO CAPACITY
-
-
0.1870 VOL/VOL
WILTING POINT
-
0.0470 VOL/VOL
INITIAL SOIL
WATER CONTENT
=
-
0.5410 VOL/VOL
EFFECTIVE
SAT.
HYD.
COND.
=
0.999999975000E-05 CM/SEC
GENERAL
DESIGN
AND EVAPORATIVE ZONE DATA
,..
----------------------------------------
NOTE: SCS
RUNOFF CURVE NUMBER WAS COMPUTED FROM DEFAULT
SOIL DATA BASE USING SOIL TEXTURE
#
8 WITH A
FAIR STAND OF GRASS, A SURFACE SLOPE OF
I.%
AND A
SLOPE
LENGTH OF 375.
FEET.
SCS RUNOFF CURVE NUMBER
FRACTION
OF AREA ALLOWING RUNOFF
AREA PROJEtTED ON HORIZONTAL PLANE
EVAPORATIVE ZONE DEPTH
INITIAL WATER IN EVAPORATIVE ZONE
UPPER
Lfm OF
EVAPORATIVE
STORAGE
LOWER LIMIT
OF EVAPORATIVE
STORAGE
XN3XtAL
SNOW WATER
INITIAL
WATER IN LAYER MATERIALS
TOTAL
INITIAL
WATER
TOTAL SUBSURFACE INFLOW
.
78.50
1Oo.O
PERCENT
1.000
ACRES
21.0
INCHES
5.014
INCHES
9.705
.
INCHES
2.262. INCHES
0.000 INCHES
-
26,462
INCHES
26.462
INCHES
0
.OO
f
NCHES/YEAR
EVAPOTRANSPIRATXON
-----------------------------------
AND
WEATHER DATA
NOTE:
EVAPOTRQNSPIRATION DATA WAS .OBTAINED
FROM
EVAN
SVL
L L E
INDIANA
STATION
LATINDE
=
38.03 DEGREES
MAXIMUM LEAF AREA
INDEX
=
0.00
START OF GROWING SEASON (3ULIAN DATE)
=
96
END OF
GROWING SEASON
(JULIAN
DATE)
=
300
EVAPORATIVE
ZONE
DEPTH
=
21.0
INCHES
-'
Page
2
Electronic Filing - Received, Clerks' Office, August 11, 2008--Exhibits 1,2,5-10, & 12
Attachment 3
Electronic Filing - Received, Clerks' Office, August 11, 2008--Exhibits 1,2,5-10, & 12
/-
FLY ASH TO BE RELOCATED
FLY ASH
NEEDED
FOR GRADING
7
/--
TOPSOIL COVER
/
I--
GRANULAR
DRAINAGE LAYER
REPRESENTATIVE CROSS SECTION
POND D
UUTSONVILLE
POWER
STATION
GeoSystems
HUTSONVILLE,
Consultants,
ILLINOIS
1
Inc.
.
FIGURE 1
Electronic Filing - Received, Clerks' Office, August 11, 2008--Exhibits 1,2,5-10, & 12
Attachment
4
Electronic Filing - Received, Clerks' Office, August 11, 2008--Exhibits 1,2,5-10, & 12
Ameren Services
-
Hutsonville Power Station
Basin
"D" Closure
EARTHWORK QUANTITIES
-
VOLUMES
GRADING
Basin "D Flyash to be relocated
Calculated
fill from Basin
"A"
Material needed to fill basins
Total
borrow
material from BasinWA"
CAP
Total Cap,
36" Pouolanic Cap
'
18" Drainage Layer
18" Topsoil
TOTAL FLYASH BORROW REQUIRED
1%
107,561
.
(57,828)
15,500
(42,328)
201',047
100,524
50,262
50,262
58,195
SLOPE
3%
85,751
42,338
15,500
57,838
200,745
100,373
50,186
50,186
158,211
5%
71,811
142,531
15,500
158,031
200,960
100,480
50,240
50,240
258,511
Electronic Filing - Received, Clerks' Office, August 11, 2008--Exhibits 1,2,5-10, & 12
Earthwork
Quantities
for
Closure
Flnal Cap Grade
Electronic Filing - Received, Clerks' Office, August 11, 2008--Exhibits 1,2,5-10, & 12
Appendix A -2
Analytical Laboratory Reports
from
Dalare Laboratories
Philadelphia
Pa.
VFL Technology Corporation
Morch
26.2003
Hutsonville Power Station
C-1703-02
Electronic Filing - Received, Clerks' Office, August 11, 2008--Exhibits 1,2,5-10, & 12
.
Dalare Associates lnc.
.a
.
21
7 S. 24th Street
/
Philadelphia,
PA,
I
91
03
Te~ephone'215-567-1953/Facsirnil~2~~-~~67-~~~8
- - .
ANALYTICAL AND
ENVl
RONM ENTAL
TESTING
I
April 25,
2002
,El
WL Technology
Attn
. :
Rocus' Peters
41
West
16 Kagerty
Chestgr,
Blvd.
PA 19382
I
. -
I
Dear Mr. Peters:
i
I
r
,
We have examined the sample submitted
and
would
report
our
findings
as
.
follows
:
i
Date Received:
4/2/02
Analytical
Report
#
3 28
4
.
Total Metals:
Arsenic
4
Barium
Cadmiurn
- -
Chromium
Lead
, +.
Selenium
Silver
.
TCLP Leachate
:
Hutsonville Power
Flv Ash (3/28/02)
-.
Arsenic
Barium
Chromium
Mercury
Selenium
Silver
mg/~g
-
milligrams
per
Kilogram
E
-
mg/~.
p
milligrams per Liter
<-.: ,
Less
than
C..
.
.
.>
I.:.'....
...
-p&k,~&
Paul
A tt,~,,
Electronic Filing - Received, Clerks' Office, August 11, 2008--Exhibits 1,2,5-10, & 12
Date
Received: 9/27/02
Dalare Associates
Inc.
21 7 S. 24th Street
/
.Philadelphia, PA. 191 03
Telephone 215
-
567
-
1953
1
Facsimile 215
-
567
-
1168
ANALMICAL AND
ENVIRONMENTAL TESTING
October 2, 2002
VEL
Technology
Attn.: Rocus
Peters
16 Bagerty
Blvd.
West Chester, PA 19382
Dear Mr. Peters:
We have examined the samples submitted. and would report our findings as
follows
:
Analytical.
Report
#
910
Rut sonvill
e
TCLP
Leachate
:
Arsenic
Barium
Cadmium
Chromium
Lead
Mercury
Selenium
Silver
<
0!010
.PPM
0.28
PPM
(0.01
PFM.
0.06
PPM
(0.02
PPM
<
0.001 PPM
0.019 PPM
<
0.01
PPM
PPM
.
PPM
PPM
PPM
PPM
PPM
PPM
PPM
PPM
-'
parts per Million
<
-
Less than
The
TCLP Leachate
was
analyzed in accordance with the method described in
the
Federal ~e~iqter,
Volume 55, No.
61,
3/29/90,
pages 11863-75.
Very
truly
yours,
DALARE
ASSOCIATES, INC.
PAW: j c.
Paul
A. Weber
.
.. .
Electronic Filing - Received, Clerks' Office, August 11, 2008--Exhibits 1,2,5-10, & 12
Dalare
Associates Inc.
21 7
S.
24th Street
I
Philadelphia, PA.
1910;
Telephone
21
5
-
567
-
1953
/
Facsimile 2 15
-
567
-
1 168
ANALMICAL AND ENVIRONMENTAL
TESTING
VFL
Technology
Attn.:
Rocus
Peters
16 Eagerty Blvd.
.
West
Chester. PA 19382
October
2,
2002
Dear Mr. Peters:
I
We have examined
the samples submitted
and
would
report
our
findings
as
follows
:
Date Received: 9/18/02
Analytical
Report
/,,
908
TCLP ~eachate:
Ar s'e'ni c
Barium
.
Cadmium
Chromium
Lead
Mercury
.
Selenium
Silver
<
0.010 PPM
.
0.14
PPM.
0.01
PPM
0.05
PPM
<.
0.02
PPM
<
0.001
PPM
(0.010 PPM
.
<
0.01
PPM
(0.010
PPM
.
0.11
PPM
(0.01
PPM
<
0 .Ol
PPM
<0.02
PPM
<
0.001 PPM
<
0 .OlO PPM
<
0.01
PPM
PPM
-
Parts per
Million
<
a
Less than
The
TCLP Leachate
was
analyzed
in.accordance
with
the
method described in
the
FederalRegister,
Volvlie
55. 80.61,
3/29/90.
pages 11863-75.
PAW:
jc-
.
a.
. .
Very
truly
yours.
0ALAR.E
.
A
ASSOCIATES
.
INC
.
.
3s
Paul
A. Weber
a8Q&
.
Electronic Filing - Received, Clerks' Office, August 11, 2008--Exhibits 1,2,5-10, & 12
Exhibit 12
RULES
and
REGULATIONS
ENVIRONMENTAL
PROTECTION
AGENCY
40 CFR Part 261
530Z93009
FRL46898
Final
Regulatory
Determination
on Four
LargeVolume
Wastes From the Combustion
of Coal
by
Electric
Utility
Power
Plants
Monday August
1993
42466
AGENCY
Environmental
Protection
Agency
ACTION Final
regulatory
determination
SUMMARY
Todays
action
presents
the
Agencys
final
regulatory
determination
required
by
Section
3001b
of the Resource
Conservation
and
Recovery
Act
RCRA on
four
largevolume
fossilfuel combustion
FFC
waste
streamsfly
ash
bottom
ash
boiler
slag
and flue
gas
emission control wastestudied in the
Agencys
February
1988 Report
to
Congress
Wastes from the Combustion of Coal
by
Electric
Utility
Power Plants
RTC
EPA has concluded that
regulation
under
Subtitle
of RCRA is
inappropriate
for the four waste streams that were studied
because of the limited risks
posed by
them and the existence of
generally
adequate
State and Federal
regulatory
programs
The
Agency
also believes that the
potential
for
damage
from these
wastes
is
most
often determined
by
site or
regionspecific
factors and that the current State
approach
to
regulation
is thus
appropriate
Therefore
the
Agency
will continue
to
exempt
these wastes from
regulation
as
hazardous
wastes
under
RCRA
Subtitle
However
EPA
believes that
industry
and the
States
should continue
to review the
appropriate
management
of these wastes
EPA
will consider these wastes
during
the
Agencys
ongoing
assessment
of industrial
nonhazardous wastes under RCRA Subtitle
EPA
plans
to make
final
regulatory
determination
on
the
remaining
FFC waste
streams
beyond
the four listed above
subject
to
Section 3001b
of
RCRA
by
April
1998
EFFECTIVE
DATE
September
1993
FOR FURTHER
INFORMATION
CONTACT
For further information on the
regulatory
determination
contact the
RCRA/Superfund
hotline at
800
4249346
or 703
412
9810
or Patti
Whiting
at
703 3088421
SUPPLEMENTARY
INFORMATION
Table of Contents
Background
2008
Thomson Reuters/West
No Claim to
Orig
US Gov Works
Electronic Filing - Received, Clerks' Office, August 11, 2008--Exhibits 1,2,5-10, & 12
Statutory Authority
History
of the Combustion Waste Exclusion
Overview
of the
Report
to
Congress
Scope
of the
Report
Study
Factors
Preliminary Findings
LargeVolume
Wastes
LowVolume Wastes
Waste
Utilization
Public Comment Process
Supplemental
Analysis
and Notice of Data
Availability
II
Scope
of the
Regulatory
Determination
AsGenerated
LargeVolume
Wastes
AsManaged LargeVolume
Wastes
III
Factors Considered in
Making
the
Regulatory
Determination
IV
Regulatory
Determination for Four
LargeVolume
CoalFired
Utility
Wastes
Regulatory Flexibility
Act
VI
Regulatory
Determination Docket
Appendix AAnalysis
of and
Responses
to
Public
Comments
on the
Report
to
Congress
Appendix
BAnalysis
of and
Responses
to Public Comments on the Notice of Data
Availability
Background
Statutory Authority
Todays
notice is issued under the
authority
of Section
2001b
of
RCRA
which
requires
that
after
completion
of the
Report
to
Congress
mandated
by
Section
2008 Thomson Reuters/West
No Claim to
Orig
US Gov Works
Electronic Filing - Received, Clerks' Office, August 11, 2008--Exhibits 1,2,5-10, & 12
8002
of
RCRA
the Administrator must determine
whether Subtitle
regulation
of
fossil fuel combustion wastes is warranted
IV
Regulatory
Determination for Four
LargeVolume
CoalFired
Utility
Wastes
The
following
discussion
presents
EPAs conclusions
regarding
the
regulatory
status of
largevolume
coalfired
utility
wastes under RCRA
The determination
as
to whether
regulation
of such wastes under Subtitle
is warranted
is based
upon
the
February
1988
Report
to
Congress
comments
on the
Report
to
Congress including
comments received
at the
public hearing
held in Denver on
April 26 1988
the
information collected
for the
February
12 1988 Notice
and comments received
on
the Notice
Based
on
all of the available
information
EPA has concluded that
regulation
of
the four
largevolume
fossilfuel combustion
wastes
as hazardous
waste
under
RCRA
Subtitle
is unwarranted
Below are the
Agencys
responses
to each
step
of the
decision
methodology
Step
Does the
management
of this waste
pose
human
health/environmental
problems Might
current
practices
cause
problems
in the future The
Agency
has
determined that the answer to this
question
is
yes
Substep
Has the
waste
as
currently managed
caused
documented
human health
impacts or
environmental
damage
Response
The
Agency
has
determined
that the waste has caused
documented
impacts
but at
very
limited number of sites
In
accordance
with the
methodology
described
above
EPA
first addressed whether
the
management
of this waste
currently
poses
human health/environmental
problems
and whether current
practices
could
cause problems
in the future
In its
examination
of
potential/actual
cases in which
danger
to human health or the
environment
could be attributed to the
management
of fossilfuel combustion
wastes
the RTC included information from several studies that documented
occasional
exceedences
of
primary
and
secondary drinking
water
standards
in
groundwater
underlying
fossilfuel waste
management
sites
To
supplement
the RTC
data
EPA
conducted
State file reviews in States selected for their
geographical
representation
and
large
coalfired
electricity generation capacity
Overall
both
efforts indicate that the extent of actual
damage
cases/environmental
harm
associated
with
large
volume FFC waste
management
appears
limited
42473 EPA used the test of
proof developed
to
support
the
Report
to
Congress
on
Mineral
Processing
Wastes to evaluate
the
potential
damage
cases
As described
in
Chapter
of that
report
the
test
of
proof requires
that
case
satisfy
at
least
one of three conditions scientific
investigation
concluding
that
damages occurred
administrative
ruling concluding
that
damages occurred or
court decision
or
out
ofcourt settlement
concluding
that
damages
occurred
For the six
damage
cases
described
below
scientific
investigation
was the measure of
proof satisfied
since
the
data most
supported
application
of this measure
2008 Thomson Reuters/West
No Claim to
Orig
US Gov Works
Electronic Filing - Received, Clerks' Office, August 11, 2008--Exhibits 1,2,5-10, & 12
In
applying
the
test
EPA first considered
whether actual documentation
exists
that
shows that human health or environmental
harm occurred
e.g
contaminated
groundwater
in
water
supply well
observed
impacts
on wildlife
Only
limited
number of
largevolume
FFC waste
management
sites
actually
meet this criterion and
can
be considered
proven
damage
cases
These cases include the two sites
identified
in the
RTC as
well
as
four additional sites identified
during
recent
data collection
efforts
EPA notes that of these six
cases only
one case can
clearly
be attributed to
fly
ash
management
alone
The
remaining
five cases are
associated
with the
comanagement
of the
largevolume
wastes with other wastes
Because
comanagement
of
large
and lowvolume
wastes
is the
predominant
waste
management practice
limited information exists on
independently managed large
volume wastes
The RTC described
site that involved
dike failure that caused
an
accidental
release from
fly
ash
disposal lagoon
to
river This
case
resulted in
substantial
damage
to river
organisms
The other case described
in the RTC
involved
comanagement
In this
case
release occurred from
fly
ash and
petroleum
coke waste
disposal
site that resulted in the contamination
of
drinking
water
wells with selenium and vanadium
This site is ranked on the
CERCLA
Superfund
National
Priority
List
Site
EPAs more recent data collection efforts resulted in the identification
of four
additional
sites that
are
considered
proven
cases
of
damage
see
the
Supplemental
Analysis
of Potential Risks to Human Health and the Environment
from
LargeVolume
Coal Corcbustion
Waste
found in Docket no
F93FFCAFFFFF
Each case involves co
management
of wastes at
older
unlined waste
management
units These incidents
involved
groundwater
contamination and/or
vegetative
damages
due
to releases from
waste
management
units
In
summary
there is minimal documentation
of
impacts
on
drinking
water sources in
the
vicinity
of coalfired utilities In
addition
it is
important
to note that
the
damage
case sites were chosen for
study
because
of known releases and
cannot
necessarily
be
extrapolated
to the
general
universe
Also
most releases have been
from unlined units at older sites that in
many
States
are
now subject
to
more
stringent design
and
operating
criteria
Furthermore
actual
cases
of harm to
human health or the environment
may
be limited to
few
sites
often with other
contributing factors including
additional
pollutant
sources attributed to the co
management
with other
FFC
and
nonFFC wastes
The review of such cases of co
management
will be reserved
for the
remaining
waste
study
FN7 The
percentage
of units
required
to meet more
stringent design
and
operating
criteria will increase as older units reach
capacity assuming
typical
lifetime
fo 15
years
and
new
units
come
online
and are
subject
to these
more
stringent
requirements
The FFC waste
damage
case/environmental
data collected
to date
indicate
therefore
that
although
the extent
appears
limited damage
to the environment
has
occurred
Although
the releases
are
often confined
to the
vicinity
of the units
and have not reached
environmental/human
receptors
the
potential
for
exposure
necessitates
further
analysis
in
Substep
which examines
the
potential
risks
posed by
these
wastes
2008 Thomson Reuters/West
No Claim to
Orig
US Gov Works
Electronic Filing - Received, Clerks' Office, August 11, 2008--Exhibits 1,2,5-10, & 12
Substep
Does EPAs
analysis
indicate that
the waste could
pose significant
risk
to
human health or the environment
at
any
sites that
generate
coal combustion
wastes
under either current
management practices
or
plausible mismanagement
scenarios
Responses
Groundwater contamination
and surface water contamination
through
groundwater
recharge
are
possible
under some
plausible
conditions
unlined units
Available
information on the environmental conditions
of the sites indicates
ecological
and natural resource
damages
are of
most
concern
because
potential
for
human
exposure
is limited
The RTC contains considerable
information on the four
largevolume
coal combustion
wastes
fly ash
bottom
ash slag
and flue
gas
desulfurization
FGD sludge
Information
includes waste characteristics
and
management
practices
environmental
factors
affecting
human
exposure potential
at
disposal sites
and evidence of
ecological
damage
at coal corcbustion sites
In
addition
EPA collected
supplemental
information from various EPA offices and other Federal
agencies
State
agencies
and the electric
utility industry
on
waste
characterization management
and
potential impacts
This
supplemental
information included
groundwater
monitoring
data for 43 coal combustion waste sites collected
from State
regulatory
agencies
and from EPA site visit
reports
All data used in this
supplemental
analysis
are available
for
public inspection
in the docket No F93FFCAFFFFF
bibliography
of the sources used in the risk
analysis
is found in
Appendix
of the
Supplemental
Analysis
of Potential Risks to Human Health and the Environment
from
LargeVolume
Coal Combustion
Waste
also found in Docket no F93FFCAFFFFF
The first
step
of the
methodology
was to evaluate
constituents
of concern
identified by
waste
characterization
data using
risk screen
risk screen
analysis
is
process
which
applies
conservative
and
simplified methodology
to
the constituents
and
pathways
to determine
if
they
are
of
concern
The risk
screen
compared
waste characterization
data with
screeninglevel
criteria The
screening
criteria
were developed
to
identify wastes constituents
and
pathways
requiring
further
analysis
that
is
wastes
captured
by
the screen
may
or
may
not be of
concern Criteria for 23 constituents
primarily metals
were
developed
for
groundwater
surface
water ingestion
and inhalation
exposure
pathways
using
methodology
similar to that used in the mineral
processing
regulatory
determination
In the cases where the
Agency regulatory
levels
had
changed
since
the mineral
processing
RTC
the
screening
criteria were also
updated
Groundwater
exposure
criteria
were developed using
the
MCLs set
by
the
Agency
to
protect drinking
water
If
no
primary
MCL had been established
for
particular
parameter
then
healthbased level
HBL
was calculated
using
Agency
cancer
slope
factors or noncancer reference doses
RfDs
from IRIS
In instances where
the calculated
HBL
was less than
corresponding
MCL both values were considered
in
the
screening
FN8 U.S Environmental
Protection
Agency
Integrated
Risk Information
System
IRIS
IRIS
November 1992
update
Screening
criteria based on
primary
MCLs were derived
by multiplying
the MCL
by
2008 Thomson Reuters/West
No Claim to
Orig
US Gov Works
Electronic Filing - Received, Clerks' Office, August 11, 2008--Exhibits 1,2,5-10, & 12
factor of 10 to simulate scenarios where
only
limited dilution of waste leachate
occurs
prior
to
exposure
HBLs were derived from
IRIS9
drinking
42474 water or oral
cancer
slope
factors CSFs
representing
iio5
lifetime
cancer
risk
or RfDs
Calculation
of the HBLs relied on the
following
conservative
assumptions
the
maximally
exposed
70
kg
individual
drinking
liters of water
per
day
365
days
per
year
for
lifetime duration of 70
years
The 70year
exposure
duration
was
chosen to maintain
comparability
with the
MCLs
this
approach
is consistent
with
that taken in the mineral
processing
regulatory determination
These
assumptions
yield
the
following general equations
HBLCSF
mg/l
110
70
70 kg/ CSF mg/kg/d
l/d 70
HBRfD
mg/l
RfD mg/kg/day
70 kg/2 1/day
As with the MCLbased
criteria
the HBLs
were
multiplied by
factor of 10 to
simulate
scenario where
only
limited dilution of
waste
leachate
occurs
prior
to
exposure
Groundwater
exposure
criteria were
compared
with waste EP
Toxicity
and
TCLP
analysis
results for each of the four waste steams
FN9 Ibid
The surface water
exposure
criteria
were
selected to
represent potential
harm to
aquatic organisms exposed
to
surface
water
releases of
wastes
or
waste
leachate
The criteria were derived
by multiplying
the freshwater chronic Ambient Water
Quality
Criteria
AWQC
for nonhuman effects
by
factor of 100 to simulate
scenario
where
only
limited dilution occurs
Surface
water
exposure
criteria were
compared
with waste EP
Toxicity
and TCLP
analysis
results for the four waste
streams
The
ingestion
screening
criteria were derived from IRIS oral RfDs and oral
CSFs
assuming
incidental
ingestion
of solid waste materials
Exposure assumptions
are
an
ingestion
rate of 200
mg/day
from
ages
to
and 100
mg/day
from
ages
to 31
resulting
in
an
average
of 0.114
soil/day an
adult
receptor weight
of 70
kg
and
an
exposure
of 350
days/year
for 30
years
For CSFderived
values
lifetime
averaging
70
years
was assumed
These
assumptions
were then used to calculate
the
concentration
of
constituent
in
waste that would result in an
exposure
equivalent
to the RfD
or
the concentration
corresponding
to
lifetime
cancer
risk
of
1x10⁵
The
equations
for RfD and CSFbased criteria are shown below
CriterionRfD
mg/g
RfD
mg/kg/d
70
kg
365
d/y
30
350
d/y
30
0.114
soil/d
CriterionCSF
mg/g
105/CSF
mg/kg/d 70 kg 365 d/y 70
350 d/y 30
0.114
soil/d
No dilution factor
was
employed
in
deriving
the criteria for solid
samples
The
exposure
pathway
assumes
exposure
to
particulate
whole waste material
Ingestion
exposure
criteria were
compared
with waste total constituent
analysis
results for
the four waste steams
2008 Thomson Reuters/West
No Claim to
Orig
US Gov Works
Electronic Filing - Received, Clerks' Office, August 11, 2008--Exhibits 1,2,5-10, & 12
The
exposure
assumptions
used in
deriving
inhalation
exposure
criteria include 50
MUg/m3
airborne dust
concentration
adult inhalation volume of 20 m3/d 70
kg
body
weight
exposure frequency
of 350
days per year exposure
duration of 30
years
and
for CSFderived
values
70
year
lifespan
or
averaging
time and
1x10⁵
risk of cancer
Note that 50
MUg/m3x20
m3/d results in
soil
exposure
rate of
mg/d
The
equations
used to derive the criteria from both inhalation RfDs and
inhalation CSFs
are
shown below
CriteriaRfD
mg/g
RfD
mg/kg/d
70
kg
365
d/y
30
350
d/y
30
0.001
soil/d
CriteriaCSF
mg/g
lxlY5/CSF mg/kg/d 70 kg 365 d/y 70
350
d/y 30
0.001
soil/d
Again
no
dilution factor
was
employed
in
deriving
the criteria for solid
samples
The
exposure pathway
assumes
exposure
to
particulate
whole
waste
material
Inhalation
exposure
criteria were
compared
with waste total constituent
analysis
results for the four waste steams
FN1O 50
MUg/m3
is the National Arcbient
Air
Quality
Standard for annual
exposure
to
particulates
The
screening
criteria described
above were then
compared
to
EP TCLP
and total
constituent
data from the RTC and
subsequent
data
collection
efforts
For all
waste constituents
that exceeded
screeninglevel
criterion at
more
than 10
percent
of the sites
sampled
or exceeded the criteria
by
more than
factor of
10
further
analysis
was conducted
summary
of
screening
criteria
exceedences
reported by
waste
type
and
by
exposure
pathway can
be found in
Appendix
of the
Supplemental
Analysis
of Potential Risks
to Human
Health and the Environment
from
LargeVolume
Coal Combustion Waste
The results of the risk
screening
suggest
that of the
largevolume wastes fly
ash
and
FGD
sludge
are
of most
concern
The risk
screen
also identified
groundwater
surface
water
and inhalation
as
exposure pathways
needing
further
analysis
The
constituents
needing
further
analysis
included
arsenic cadmium chromium lead
mercury
nickel Ph selenium
and silver
The
Agency
then evaluated
the
release
transport
and
exposure
potential
of those
constituents wastes
and
pathways
for which the risk
screen
indicated that further
analysis
was
necessary
When
available monitoring
data were used to determine
the
potential
for human and environmental
exposure
In other
cases
information on the
physical
setting
of coal combustion waste sites and
on
the waste
management
practices
was used
to
evaluate
exposure
potential
In
the case of the inhalation
pathway
the
potential
for human health risk was evaluated
using
an
atmospheric
fate and
transport
model For the inhalation
pathway
the
potential
for human
health
risk
when evaluated
using
an
atmospheric
fate and
transport model
was
found to be
negligible
For more information on the air
pathway analysis please
consult the
Supplemental
Analysis
of Potential Risks to Human Health and the
Environment
from
LargeVolume
Coal Combustion Waste
Further
analyses
of the
groundwater
and surface water
pathway
are summarized below
2008 Thomson Reuters/West
No Claim to
Orig
US Gov Works
Electronic Filing - Received, Clerks' Office, August 11, 2008--Exhibits 1,2,5-10, & 12
Groundwater
monitoring
data were used in both the
groundwater
and surface water
exposure
pathway
analyses
summary
table of the
groundwater
monitoring
sites is
in
Appendix
of the
Supplemental
Analysis
of Potential Risks
to Human
Health and
the Environment
from
LargeVolume
Coal Combustion Waste found in the docket
When
interpreting
the
groundwater
monitoring data
the
Agency
took several factors into
account
First
many
of the sites
may
have
comanaged
their coal combustion
wastes with
other
wastes
such as boiler
cleaning
solution or
pyrites
The
extent to
which
these
other wastes
may
have contributed
to
groundwater
contamination
could not be
conclusively
determined
because it was difficult to assess in
many
cases whether
comanagement
had occurred and without this
information
it was
not
possible
to
separate
the effects of the
largevolume
wastes from the other wastes
However
at
least two site
operators
asserted
that
they
believed
that
comanaged wastes
and
not the
largevolume wastes
were
the
cause
of
groundwater
contamination
The
Agency
took the
presence
of
comanaged
wastes into account when
evaluating
the
risk
from the
largevolume
coal combustion wastes
Second some
of the sites have other
possible
sources
of contamination
nearby
To
the extent that
they
can
be
determined
these
sources
are
noted in the
summary
table referenced
above
Finally
in the case of some contaminants
e.g iron
naturally occurring
levels
may
be
quite high
Again
to the extent that
naturally
occurring
constituents
can be 42475 determined
to be
adding
to
downgradient
concentrations
this is noted in the
summary
table
With these considerations
in
mind
the
Agency
determined
that available
data from
coal
combustion
waste landfills and surface
impoundments
demonstrated
the existence
of
potential
for human
exposure
to
groundwater
contamination
because coal
combustion
waste
constituents
identified in the risk screen as
needing
further
study
were found to be
leaching
onsite
in excess of the
primary
MCLs
Subsequent
analyses
of coal combustion waste sites
suggest however
that
potential
for actual
human
exposure
is
very
limited
For
example
nine sites of the
fortynine
sites with
groundwater
monitoring
data
had contaminants
above the MCL that
appeared
to stem from coal combustion
units
Another
ten sites had
upgradient
concentrations
equal
to
downgradient
concentrations
other
possible
sources
of
groundwater
contamination or in
two
cases
lack of
upgradient information preventing any
conclusions
about the
effects of the coal combustion units on
groundwater
contamination
Constituents
with
exceedences
include
arsenic barium cadmium chromium fluoride lead
mercury nickel
and selenium
Of the nine
sites
none were
completely lined
although
one site had
claylined disposal
unit with an underdrain
emptying
into
series of unlined
ponds
All nine sites have older
pre1975
units
four
consisting
of surface
impoundments
four
consisting
of
landfills
and
one
with both
types
of units
Fly
ash was the
principal
waste
disposed
of in all units
Four
sites of the nine also are known to have
accepted
comanaged
wastes
pyrites
boiler
cleaning wastes
demineralizer
regenerant
oil
ash
etc
and the others
may
have as well
Potential for human
exposure
to
groundwater
contaminants
from coal combustion
wastes
is limited because of the location of most coal combustion sites
Based on
2008 Thomson Reuters/West
No Claim to
Orig
US Gov Works
Electronic Filing - Received, Clerks' Office, August 11, 2008--Exhibits 1,2,5-10, & 12
random
study
found in the RTC of one hundred
sites only
29
percent
of the
sites have
any
population
within
kilometer
and
only
34
percent
of the sites have
public drinking
water
systems
within
kilometers
Although
infiltration and
transportation
of contaminants
in
groundwater
varies with site or
regional
specific
factors
such
as
depth
to
groundwater
hydraulic conductivity
soil
type
and net
recharge
exposure
to coal combustion
waste
groundwater
contaminants
kilometers
from the
source
of contamination
is not
expected
to
occur
Of the
public
drinking
water
systems
within
kilometers
of coal combustion
waste
sites
just
under half
47 percent
are
expected
to treat the
groundwater
for hardness
i.e these
systems
have
groundwater
with over 240
ppm
CaCO3 which would tend
to
remove cocontaminant
metals as well
Coal combustion units also tend to be near surface water bodies The same RTC
study
revealed that 58
percent
of the sites
are
within 500 meters of
surface
water
body
The volume
and flow rate of surface water would tend to dilute and
divert the contaminant
plume
In
addition groundwater
contamination
appears
to be attributable
to
past
management
practices
As the
Agencys
groundwater
monitoring
data outlines
above
all of the nine sites with
clear indication of
groundwater
contamination
are
older
pre1975
unlined units
In contrast
of the 13 lined
sites only
one had
exceedences
of an
MCL
and that site had
equal
concentrations
upgradient
and
downgradient
Finally some
of the
groundwater
contamination
may
be attributable
to
co
management
with other
wastes
such as
pyrites
boiler
cleaning waste
and
demineralizer
regenerant
Because of the
prevalence
of
comanagement
several
public
comments
on
the RTC
reported
that the
predominant
industry practice
is to
codispose
of lowvolume
wastes
in ash or flue
gas
emission control
waste
ponds
the
largevolume
waste
may
not be the sole contributor
to the
groundwater
contamination
Two of the nine sites
report
that
comanagement
is the cause of the
contamination
In
conclusion
hazardous constituents
in coal combustion
waste
particularly
in
fly
ash and flue
gas
emission control
waste
have the
potential
to
leach into
groundwater
under
certain conditions Contaminants
of concern include
arsenic
cadmium chromium lead
mercury
and selenium
Available
data
suggest
however
that contamination
stems
from
older
unlined units
representing
past practices
and
that the units are not
typically
located near
populations
and
drinking
water
systems
In
addition
the sites within
kilometers of
public drinking
water
systems
about half have
groundwater
with over 240
ppm
CaCo3
and are therefore
expected
to treat the water for
hardness
thus
removing
cocontaminant
metals as
well
Furthermore
at least
some
of the
groundwater
contamination is attributable
to
other wastes
managed
with the
largevolume
coal combustion
wastes
Thus
potential
for human
exposure
solely
from the
largevolume
coal combustion
waste
from current
management practices
is limited
An examination
of the surface water
pathway
reveals
that although
direct
discharge
of untreated coal combustion waste to surface water is not
likely
because
of Clean Water Act
controls
few of the coal combustion
waste constituents
have
the
potential
in some
instances
to affect
nearby vegetation
and
aquatic organisms
2008 Thomson Reuters/West
No Claim to
Orig
US Gov Works
Electronic Filing - Received, Clerks' Office, August 11, 2008--Exhibits 1,2,5-10, & 12
by migration
through
shallow
groundwater
to
nearby
surface waters This was
observed at one site where
migration
of boron to
nearby
wetland
was determined
by
the
State
to
be the cause of
vegetative
damage
In
many cases
natural attenuation
processes
are
expected
to dilute the contaminants
below levels of concern
For
example
if contaminants
reach surface
waters
the volume of surface water and its
high
flow
rate could dilute the contaminants
For those sites whose
nearby
water
bodies
may
have
low flow rate
e.g
lakes
swamps
or marshes however
coal
combustion waste
may
cause local environmental
damages
as was observed at the
above site
Even
when contaminated
groundwater
does not affect human health and the
environment
it
may
be considered
to
have caused
impacts
that limit future use of
that
groundwater
In
particular
available
data
suggest
that the
groundwater
at
number of coal combustion waste sites is contaminated
above
secondary
MCLs
SMCLs
by
such
secondary parameters
as iron
manganese
sulfate
and total dissolved
solids although
these
effects
may
be localized
through
dilution and attenuation
The SMCLs are
guidelines
generally
set to be
protective
of such aesthetic
considerations
as
taste odor potential
to stain
laundry
and human cosmetic
effects such as tooth and skin
staining
In addition to
being disposed
of in landfills and surface
impoundments
coal
combustion ash is often
beneficially
used both onsite and offsite
EPA continues
to
encourage
the beneficial
use
of coal combustion wastes
Because most offsite
applications
tend to immobilize the coal combustion
waste
e.g fly
ash used to
make
concrete
adverse
impacts
appear
to be
unlikely However
if
fly
ash is
applied directly
to
agricultural soil
there is
some concern
with metals
uptake by
food
crops
and cattle feed
In
addition
boron in the coal ash is
readily
mobilized and has
phytotoxic
effect on
plants Although
coal ash is not
frequently
used in
agriculture
any
42476
agricultural
use of coal combustion
waste should
be
carefully
evaluated
FN11 Characterization
of Coal Creek Station
Fly
Ash for Utilization
Potential
Energy
and Environmental
Research
Center February
1993 see Docket No F93FFCA
FF
Substep
Does the waste exhibit
any
of the characteristics
of hazardous waste
Response
The
Agency
has
determined
that these wastes exhibit the characteristics
of hazardous
waste
infrequently
from
to
percent
of the
samples depending
on
waste
type
The RTC concludes
that
although
coal combustion
waste
may
leach contaminants
arsenic cadmium chromium lead
and
mercury
above
toxicity
characteristic
regulatory
levels
such exceedences
are
infrequent
and the
average
concentrations
of constituents
are below
characteristically
toxic
levels
full
bibliography
of
the sources of EP and TCLP data and
summary
of the results are
given
in
Appendices
and
of the
Supplemental
Analysis
of Potential Risks to Human Health
and the Environment
from
LargeVolume
Coal Combustion Waste
The results of
Step
of the
analysis
indicate that
the wastes
rarely
exhibit
any
characteristics
of hazardous waste and the waste
pose very
limited risk to human
2008 Thomson Reuters/West
No Claim to
Orig
US Gov Works
Electronic Filing - Received, Clerks' Office, August 11, 2008--Exhibits 1,2,5-10, & 12
health or the environment
under certain
scenarios
such as unlined units sited over
shallow
groundwater
with
nearby drinking
water wells
Furthermore
since most
releases have occurred
at
unlined older
sites
EPA
recognized
that
review of
current waste
management practices
and
regulatory
control
governing
these
practices
was
appropriate
as outlined in
Step
of the
methodology
which assesses the need
for
more stringent regulation
Step
Is
more
stringent regulation necessary
or
desirable The
Agency
has
determined that the answer is no
EPA
regulation
is
not
necessary
or desirable
In
evaluating
the
need for more
stringent
controls
to address the
potential
risks
associated
with the
management
of these
wastes
EPA first evaluated
the
adequacy
of
current
industry
waste
management practices
in
limiting
contaminant
release and
associated
risk
The
Agency
then viewed the
adequacy
of current State and Federal
regulatory
controls
addressing
these
wastes
For the
purposes
of this
analysis
EPA
supplemented
the data
supplied
in the RTC with site
visits
1992 EPA
study
under which the
Agency
obtained
and reviewed
State
regulations applicable
to FFC
waste
management
the
Department
of
Energys
1991
report
entitled Coal Combustion
Waste
Disposal Update
of State
Regulations
and Cost
Data dialogue
with
industry
and State
representatives
the Electric Power Research Institutes
Facility Design
and Installation Manual
1991
State file
searches
and literature reviews
Substep
Are
current
practices
adequate
to limit contaminant
release and
associated
risk
Response
The
Agency
has
determined
that
industry
practices
are moving
toward
increased
use
of control
measures
liners
covers
etc
and
groundwater
monitoring
The
Agencys
data on current
practices
indicate that
industry
is
moving
toward an
increased
use of control measures
e.g liners covers
and
groundwater
monitoring
For
example
the RTC noted that before
1975
less than 20
percent
of
units surface
impoundments
and
landfills in the United States for which data were
available
had installed some form of liner
More recent data
EEls
Power
Statistics
Database 1989
suggest
that 13 to 29
percent
of surface
impoundments
for which data are available have some form of liner and that 41
to
43
percent
of
landfills have some form of liner
As the
damage
case and
groundwater
monitoring
information
suggests
most of the releases have occurred at
older
unlined units
EPA
has observed
during
site visits that newer units are
generally
lined
Furthermore
most newer
utility
waste
management
facilities have
groundwater
monitoring
systems
and
many
also have leachate
collection
systems
Despite
the
positive
trends in
management
of FFC
wastes
some
of these units
may
be sited with
inadequate
controls
Therefore
in addition to
viewing industry management
practices
EPA collected
and evaluated
information on the extent of current State
and Federal
regulation
of coalfired
utility
waste
management
Substep
Are
current Federal and State
regulatory
controls
adequate
to address
the
management
of the waste
Response
Effluent limitations in the Clean Water Act
regulations
for steam
electric
power
plants
under 40 CFR
part
423
require
no
discharge
from new
fly
ash
2008
Thomson Reuters/West
No Claim to
Orig
US Gov Works
Electronic Filing - Received, Clerks' Office, August 11, 2008--Exhibits 1,2,5-10, & 12
ponds
State
programs
are
generally
adequate
and
are
improving
with most States
now
requiring permits
and minimum
design
and
operating
criteria that would address
likely
risks
Additionally
Federal authorities exist
to
address
sitespecific
problems posing
threats to human health and the environment
under RCRA Section
7003
and CERCLA
Sections
104 and 106
The RTC included information on coalfired electric
utility
waste
regulation
in
all 50 States
In
updating
this
information
EPA conducted
review of States that
were selected
according
to
the
high
levels of ash
generated
in those
States
This
approach
resulted in
study
universe
of 17 States that
generate approximately
70
percent
of all coal ash in the United States
The data show that States have
generally
implemented
more
stringent regulations
for FFC waste since 1983
when
the State
regulation
review
was
conducted
for the
RTC
Under
developing
State industrial solid waste
management
programs
coal
fired utilities are more
frequently being required
to meet waste
testing standards
and waste
management
units often must
comply
with
design
and
operating requirements
e.g
liners and
groundwater monitoring
standards
Of the 17 States for which EPA
updated
the RTC
data
14
regulate
coalfired
utility
wastes
as
solid
wastes explicitly exempting
them from hazardous waste
regulation
16 States
require
offsite FFC waste
management
units to have
some
type
of
operating permit
with
design
and
operating
criteria
varying by State
12 have
mandatory
liner
requirements
while three States
provide
for
discretionary
authority
to
impose
liner
requirements on
sitespecific basis
12
impose
mandatory groundwater
monitoring
requirements
on FFC waste
disposal sites
and 16
impose
final cover
requirements
In
addition
some States have been
working
to
reduce the threat of
groundwater
and surface water
contamination
by discouraging
the
use of
wet
management
in
ponds
as
disposal practice
through permitting
requirements
and location
restrictions
On the Federal
level
National Pollutant
Discharge
Elimination
System permits
under the Clean Water Act
regulate
all direct
discharges
to
surface
water
Effluent limitations under 40
CFR
part
423
govern
steam
electric
power
generating point
sources and
require
no zero
discharge
to
surface waters from
new source fly
ash
transport
waters
40
CFR
422.15g
FN12 Of the
remaining
three
States
two States establish
requirements
based on
waste characteristics
and
one
exempts
these wastes
from their solid and hazardous
waste
management program
Considering industrys
trend toward more
protective
waste
management practices
the fact that State
regulatory
programs
are generally
adequate
and because Federal
authorities
exist that
can
address these
wastes
EPA has concluded that current
management practices
and
regulatory
controls
are
adequate
for
managing
the four
largevolume
FFC wastes
42477
Substep
Would Subtitle
effectively
address the
problems
associated
with the waste without
imposing significant
unnecessary
controls
Response
The
Agency
has
determined
that it is
unlikely
that Subtitle
would
effectively
address the
problems
associated
with the four
largevolume
fossilfuel
combustion wastes without
imposing
unnecessary
controls
2008 Thomson Reuters/West
No Claim to
Orig
US Gov Works
Electronic Filing - Received, Clerks' Office, August 11, 2008--Exhibits 1,2,5-10, & 12
After
reviewing industry practices
and current State and Federal
regulation
EPA
reviewed the alternative
scenario of
regulating
the four
largevolume
FFC wastes
under
Subtitle
First
it was
recognized
that coal combustion
wastes
rarely
exceed the RCRA characteristics
for hazardous
waste
and
therefore
that most coal
combustion wastes would not be
subject
to Subtitle
controls unless
they
were
listed as hazardous wastes
Furthermore
it was noted that even if these wastes
were
listed
as hazardous
and
therefore
regulated
under Subtitle
such
an
approach
would be
inappropriate
for these
wastes
Subtitle
system
would
require
coal combustion units to obtain
Subtitle
permit which
would
unnecessarily
duplicate
existing
State
requirements
and would establish
series
of
waste
unit
design
and
operating requirements
for these
wastes
which would
generally
be in excess of
requirements
to
protect
human health and the environment
For
example
if such wastes
were placed
in the Subtitle
universe
all ash
disposal
units would be
required
to meet
specific
liner and
monitoring
requirements
Since FFC sites
vary
widely
in terms of
topographical geological
climatological
and
hydrological
characteristics
e.g depth
to
groundwater
annual
rainfall
distance to
drinking
water
sources
soil
type
and the wastes
potential
to
leach into the
groundwater
and travel
to
exposure points
is linked
to
such
factors
it is more
appropriate
for individual States to have the
flexibility
necessary
to tailor
specific
controls to
the site
or region specific
risks
posed by
these
wastes
EPA also reviewed the comments received
in
response
to the 1988 RIC and the
Notice
Comments received
on the RIC showed unanimous
support
for EPAs initial
recommendation that
largevolume
combustion wastes do not warrant
regulation
under
RCRA Subtitle
Specifically
the commenters
felt that current Subtitle
criteria together
with
existing
State
regulations
have
proved adequate
to
protect
human health and the environment
Furthermore
of the
respondents
to the Notice
who addressed the recommendation
that
largevolume
combustion
wastes do not warrant
regulation
under Subtitle
all
agreed
that the
supplemental
data
support
this
recommendation
For these
reasons
EPA concludes that Subtitle
is
inappropriate
to address the
problems
associated
with these wastes and that the site
or region specific
State
approach
is
appropriate
for
addressing
the limited human health and environmental
risks involved with the
disposal
of FFC wastes
The
Agency
encourages
States to
continue
to
develop
and
implement sitespecific approaches
to
these
wastes
EPA
believes that
industry
and the States should continue
to review the
appropriate
management
of these wastes
EPA will also consider these wastes
during
the
Agencys
ongoing
assessment
of industrial nonhazardous wastes under RCRA Subtitle
Should the characteristics
of the waste streams
change
as
result of
implementation
of
any
provisions
of the Clean Air Act as amended
in
1990
the
Agency
may
choose to reexamine the
exemption
Step
What would be the
operational
and economic
consequences
of
decision to
regulate
special
waste
under
Subtitle
Although
the
analysis
never
reached
this
point
EPAs
preliminary
examination
of
potential
costs under Subtitle
indicates that annual costs of full Subtitle
controls
would
range
between
$100 and $500 million
per year
This assumes that
2008 Thomson Reuters/West
No Claim to
Orig
US Gov Works
Electronic Filing - Received, Clerks' Office, August 11, 2008--Exhibits 1,2,5-10, & 12
these wastes would be listed as hazardous in RCRA
part 261 subpart
However
if
these wastes were not
listed
the wastes would often not be
subject
to Subtitle
since
they
rarely
test
characteristically
hazardous
pursuant
to
part 261 subpart
Subtitle
controls include
groundwater monitoring liners
leachate
collection
closure/covers
dust
control
financial
assurance
location
restrictions
and
corrective
action
2008 Thomson Reuters/West
No Claim to
Orig
US Gov Works
Electronic Filing - Received, Clerks' Office, August 11, 2008--Exhibits 1,2,5-10, & 12