AMEREN SERVICES
HYDROGEOLOGICASSESSMENT FINAL
REPORT
HUTSONVILLE POWER STATION
CRAWFORD
COUNTY
ILLINOIS
PROJECT
NO 1375
Electronic Filing - Received, Clerk's Office, August 11, 2008 - AS 09-1, Exhibit 4
HUTSONVILLE POWER STATION
HUTSONVILLE
ILLINOIS
HYDROGEOLOGICASSESSMENT
FINAL REPORT
Project
No 1375
Prepared
For
Ameren Services
One Ameren
Plaza
1901 Chouteau Avenue
St Louis
Missouri
Prepared By
Natural Resource
Technology
Inc
23713
Paul
Road
Suite
Pewaukee
WI 53072
August 19
1999
Sp
ros
Fafalios
P.E
ruc
Hensel
1S.G
Environmental
Engineer
Senior
Hydrogeologist
Electronic Filing - Received, Clerk's Office, August 11, 2008 - AS 09-1, Exhibit 4
TABLE OF CONTENTS
EXECUTIVE SUMMARY
ES-i
INTRODUCTION
1-1
FIELD PROCEDURES
2-1
2.1
Direct-Push
Sampling
2-1
2.1.1
Laboratory Samples
2-2
2.1.2 Probe Hole Abandonment
2-3
2.2 Installation of New
Monitoring
Wells
2-3
2.2.1 Rationale
2-3
2.2.2
Drilling
2-4
2.2.3 Construction
2-4
2.2.4
Development
2-5
2.2.5
Hydraulic Testing
2-6
2.3
Decontamination
2-6
2.4
Waste
Handling
2-7
RESULTS OF FIELD INVESTIGATION
3-1
3.1
Site
Geology
3-1
3.1
.1
Stratigraphic
Units
3-1
3.1.2
Subsurface
Ash/Coal Distribution
3-2
3.1.3 Bedrock
Topography
3-4
3.2
Site
Hydrogeology
3-5
3.2.1
Hydraulic Conductivity
3-5
3.2.2 Groundwater Flow
3-5
3.2.3
Elevation of Groundwater
Relative to Ash
3-7
3.3
Nearby
Groundwater Users
3-8
hutsonville
hydrogeologic
assessment.doc
Natural
Resource
Technology
Electronic Filing - Received, Clerk's Office, August 11, 2008 - AS 09-1, Exhibit 4
TABLE
OF CONTENTS
GROUNDWATER QUALITY IN DIRECT-PUSH
SAMPLES
4-1
4.1
Parameters of Concern
4-1
4.2 Direct-Push Leachate
Samples
4-1
4.3 Direct-Push Groundwater
Samples
4-2
GROUNDWATER QUALITY IN MONITORING WELLS
5-1
5.1
Parameters of Concern
5-1
5.2 Groundwater Results
5-1
5.3 Surface Water Results
5-3
5.4
Source Area and
Receptor Analysis
5-4
CONCLUSIONS
6-1
FIGURES
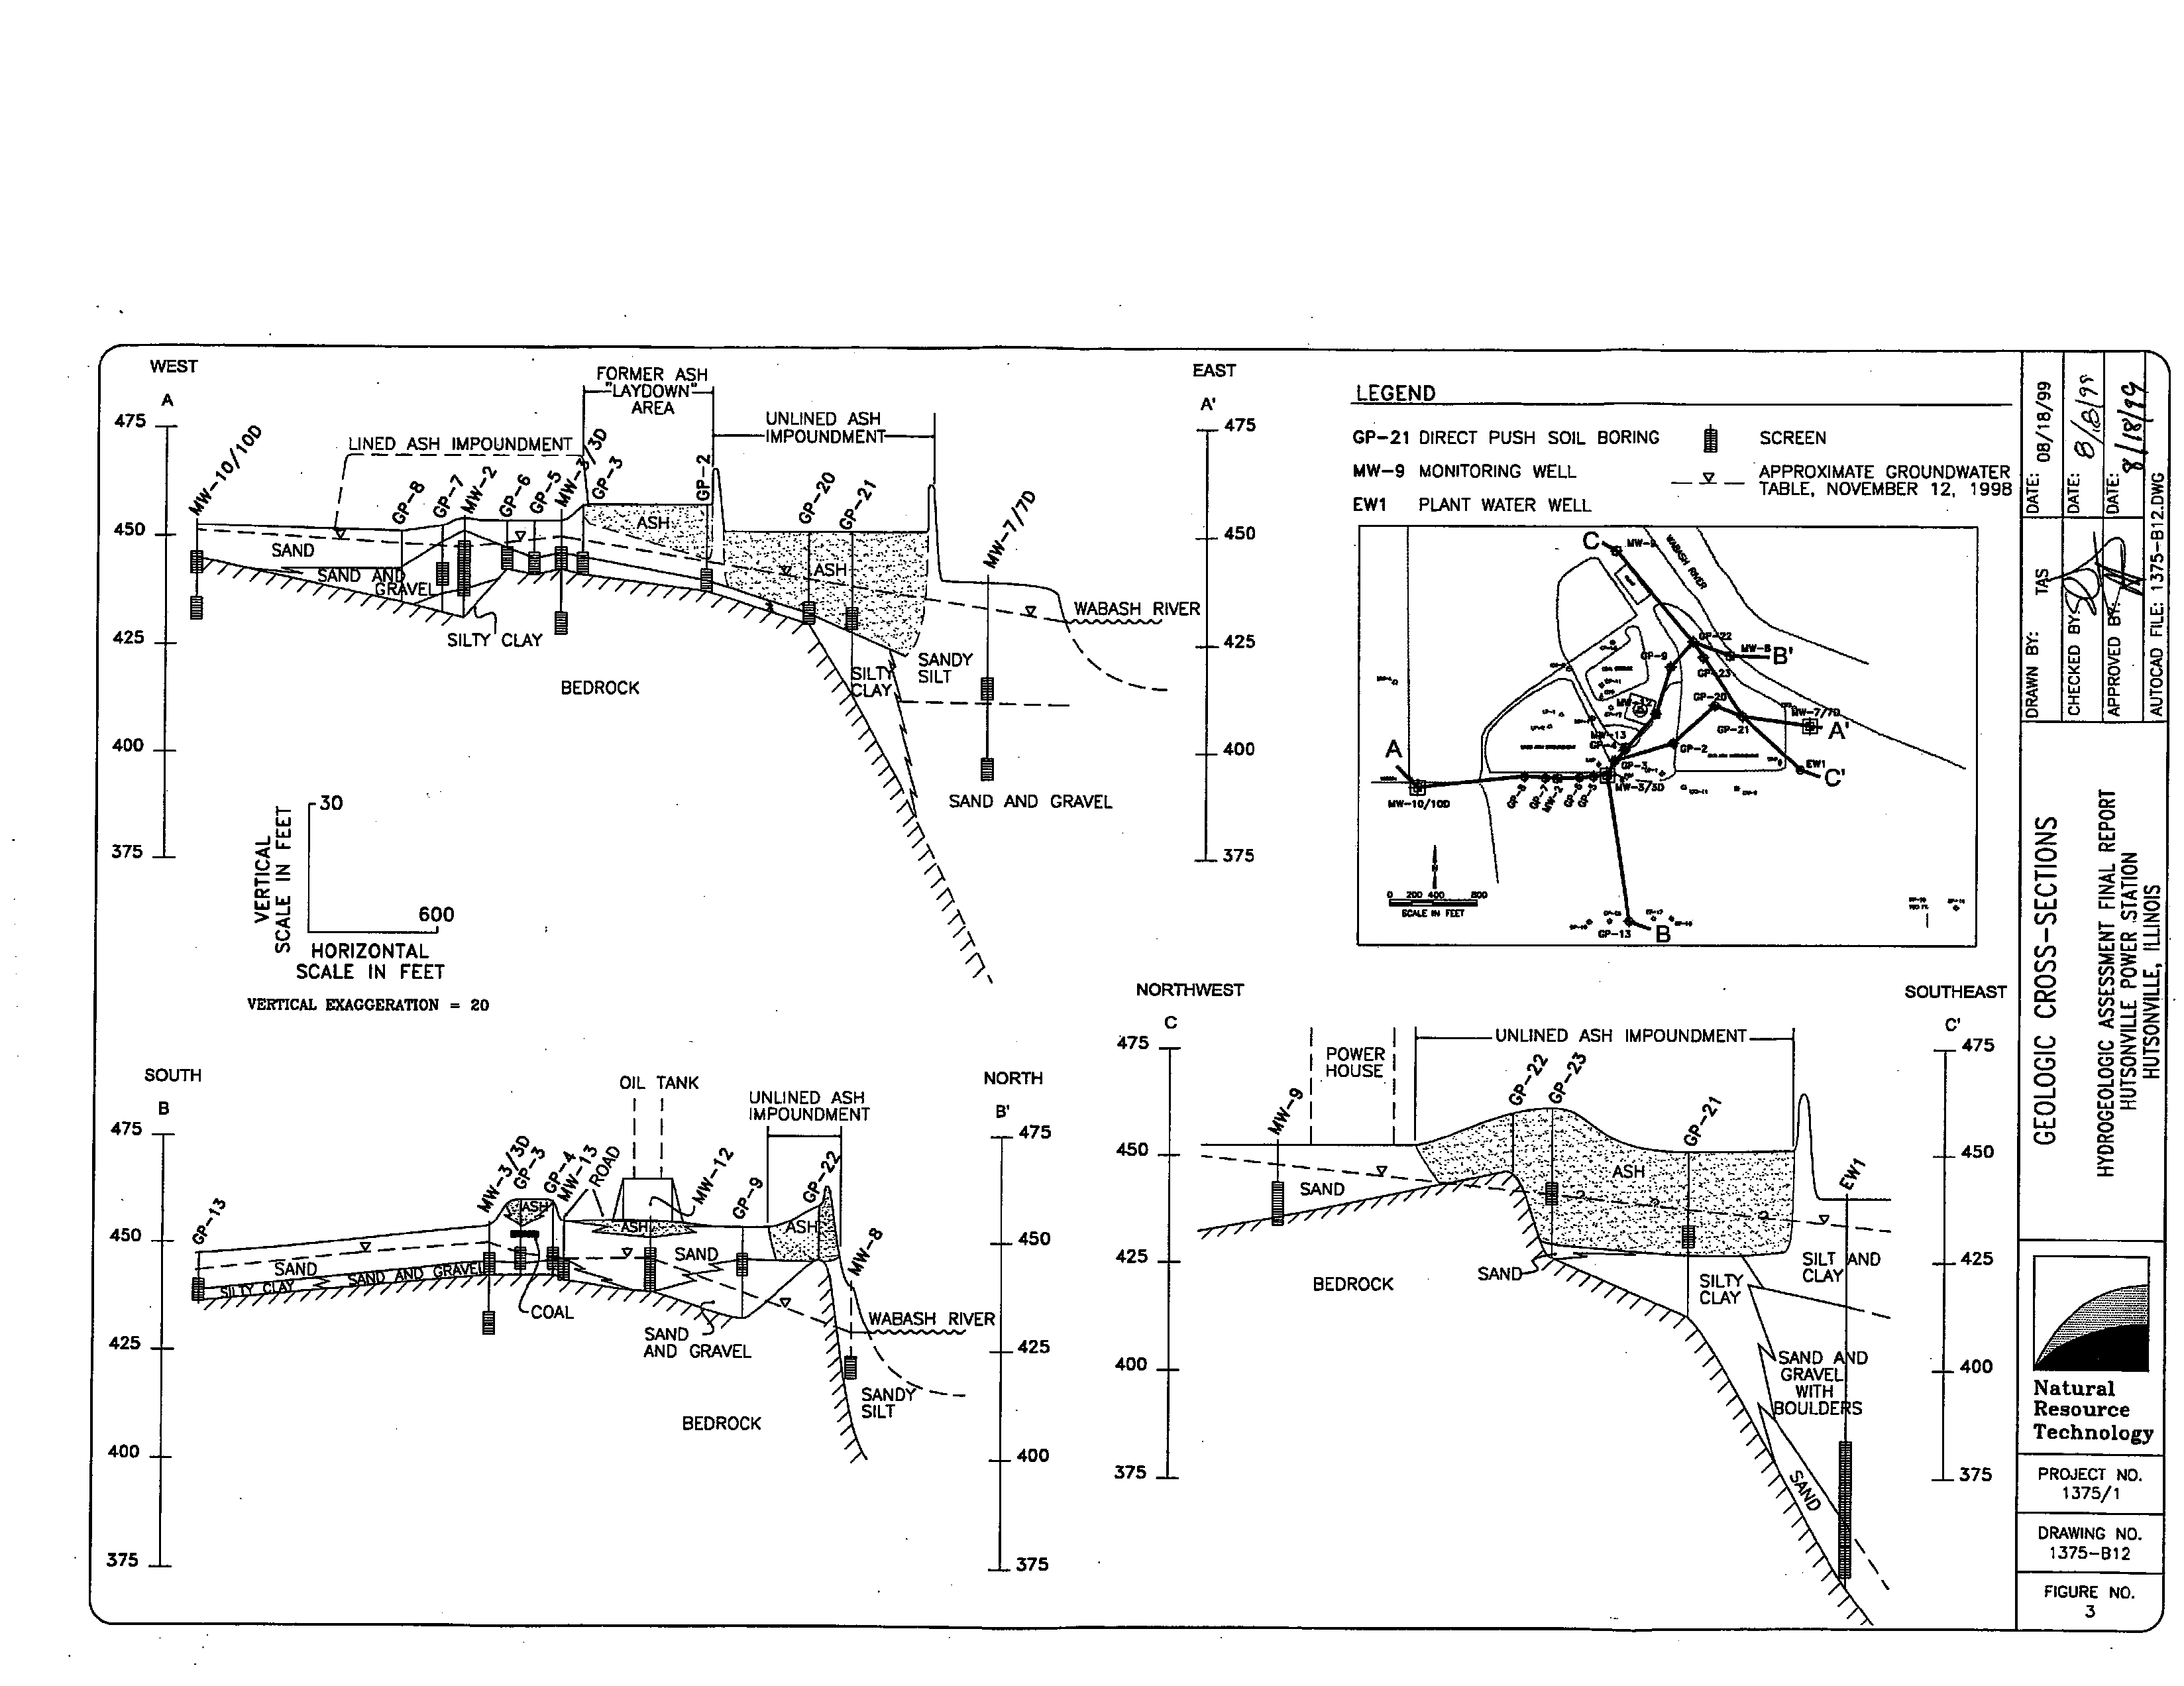
Figure
Site Plan
1375-1-BOl
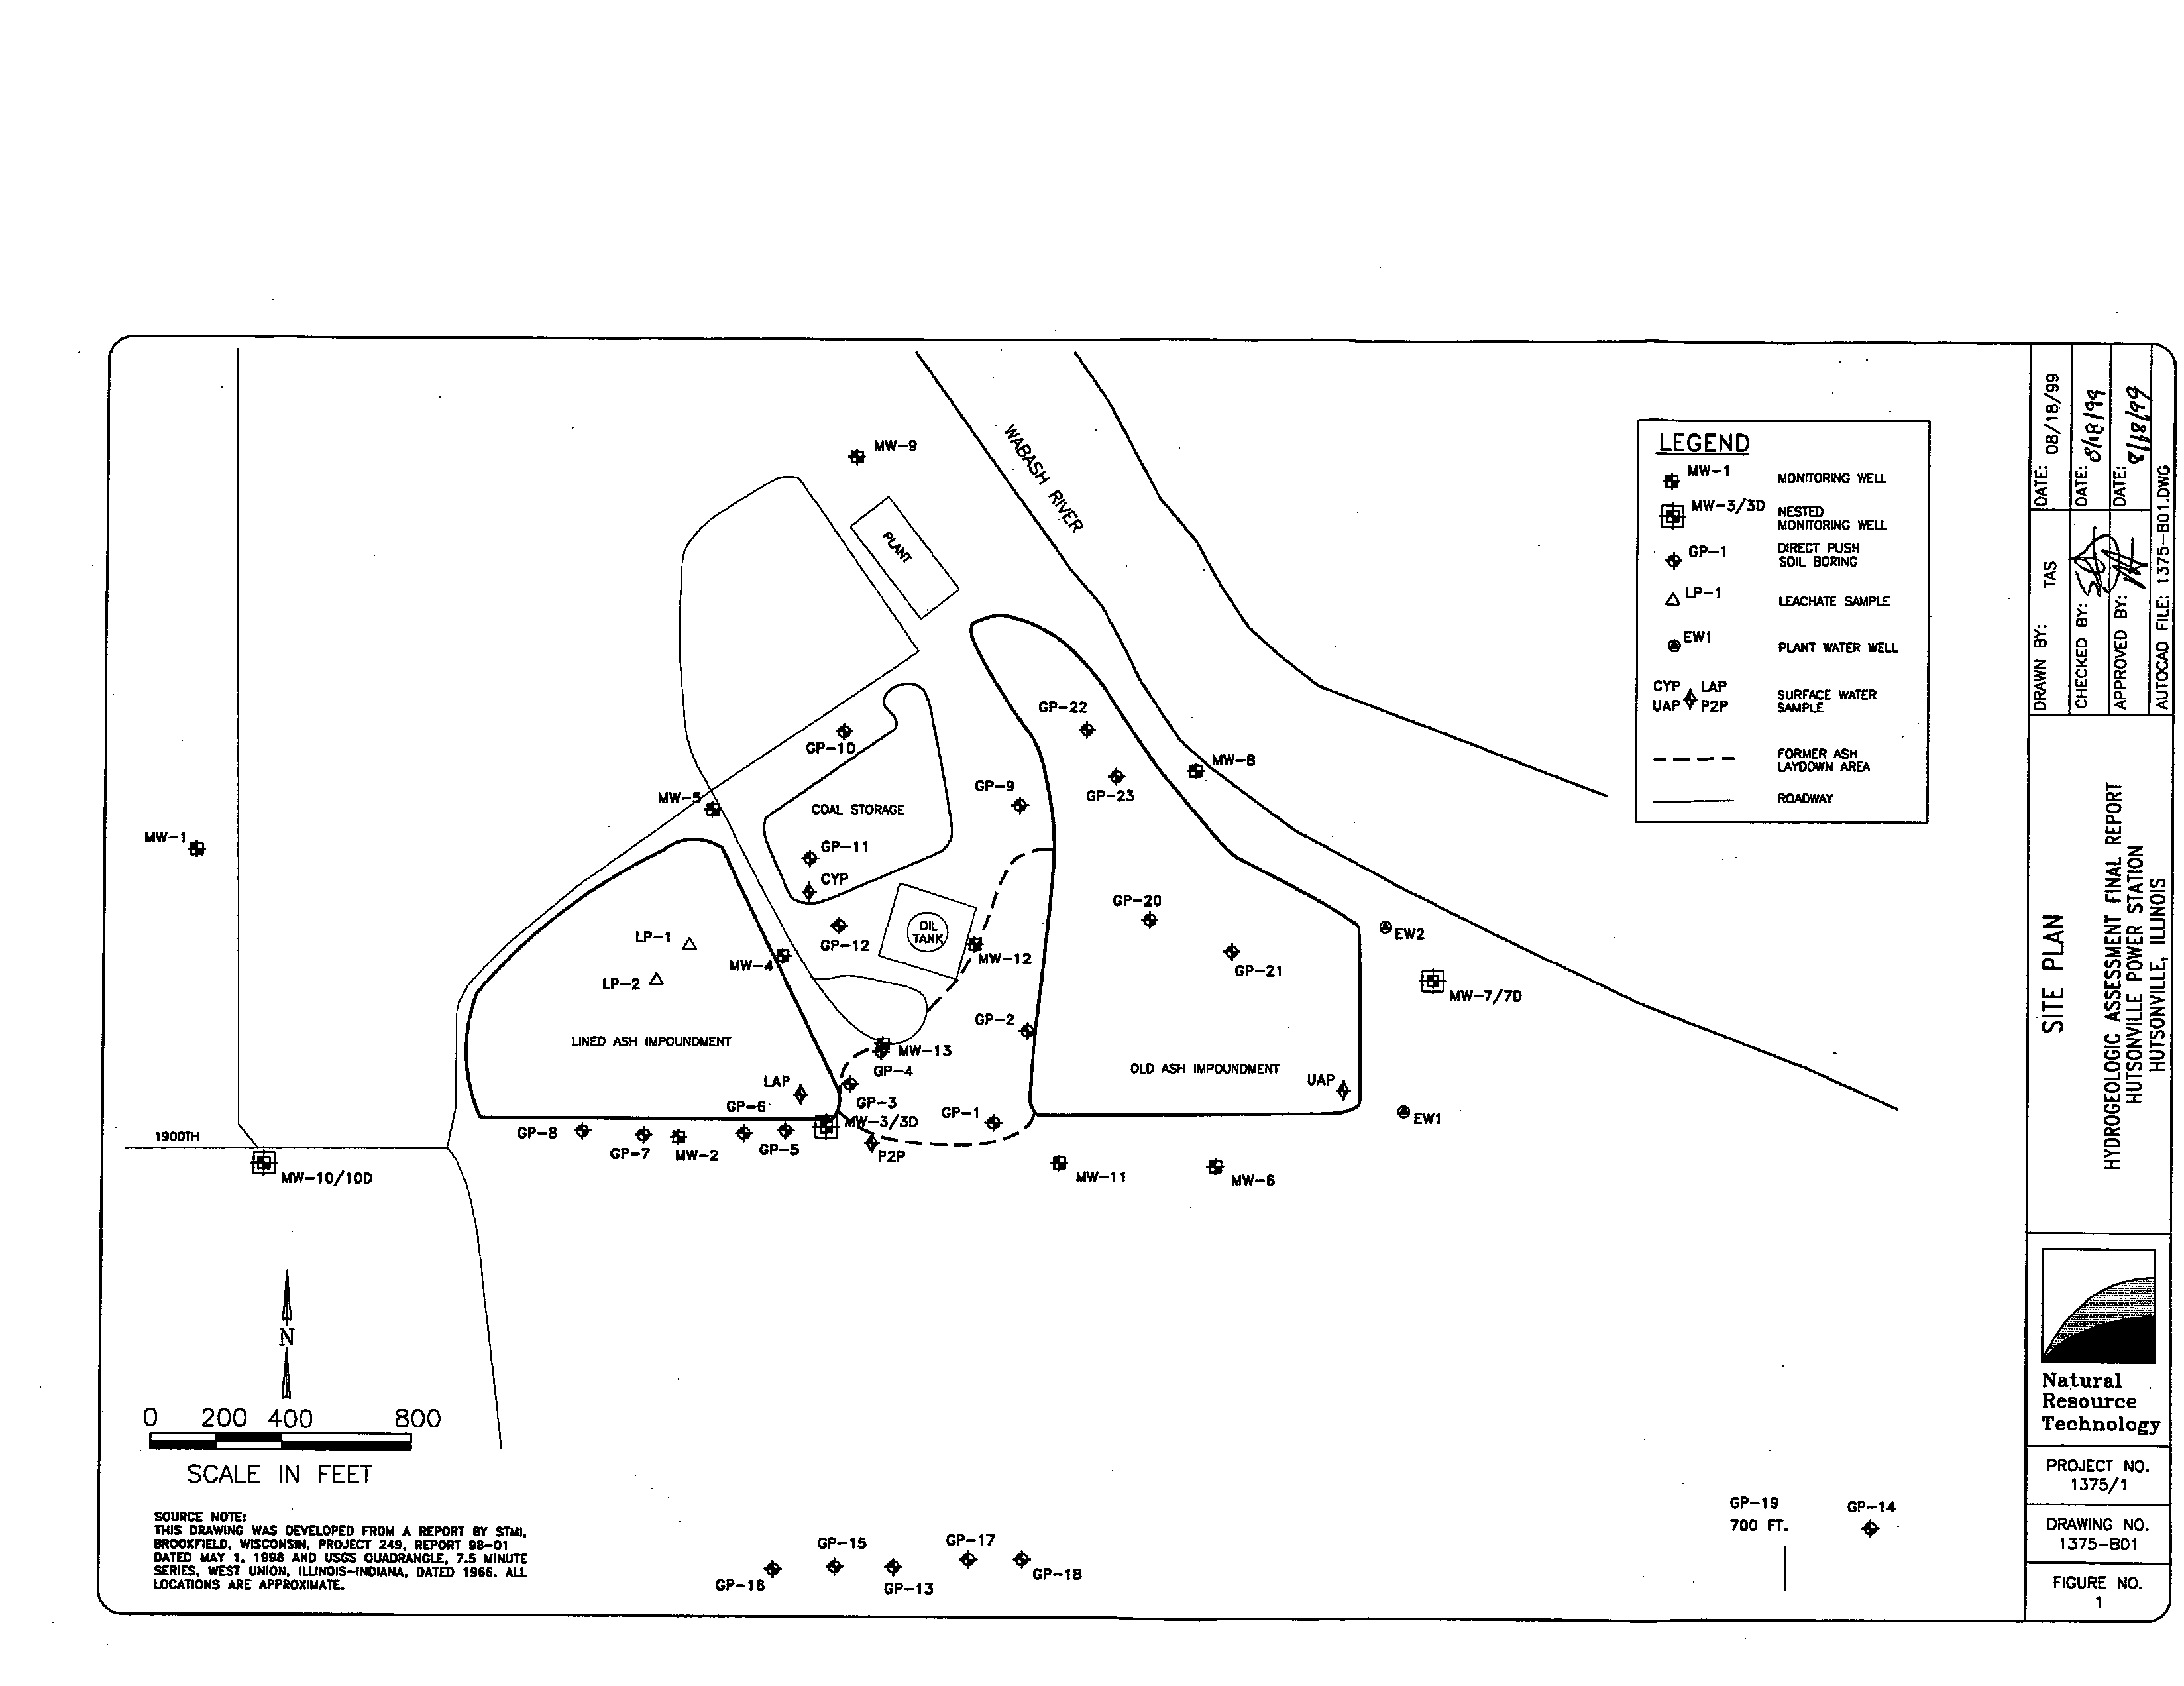
Figure
Elevation
of well
screens ground
surface
bedrock
surface
and
groundwater
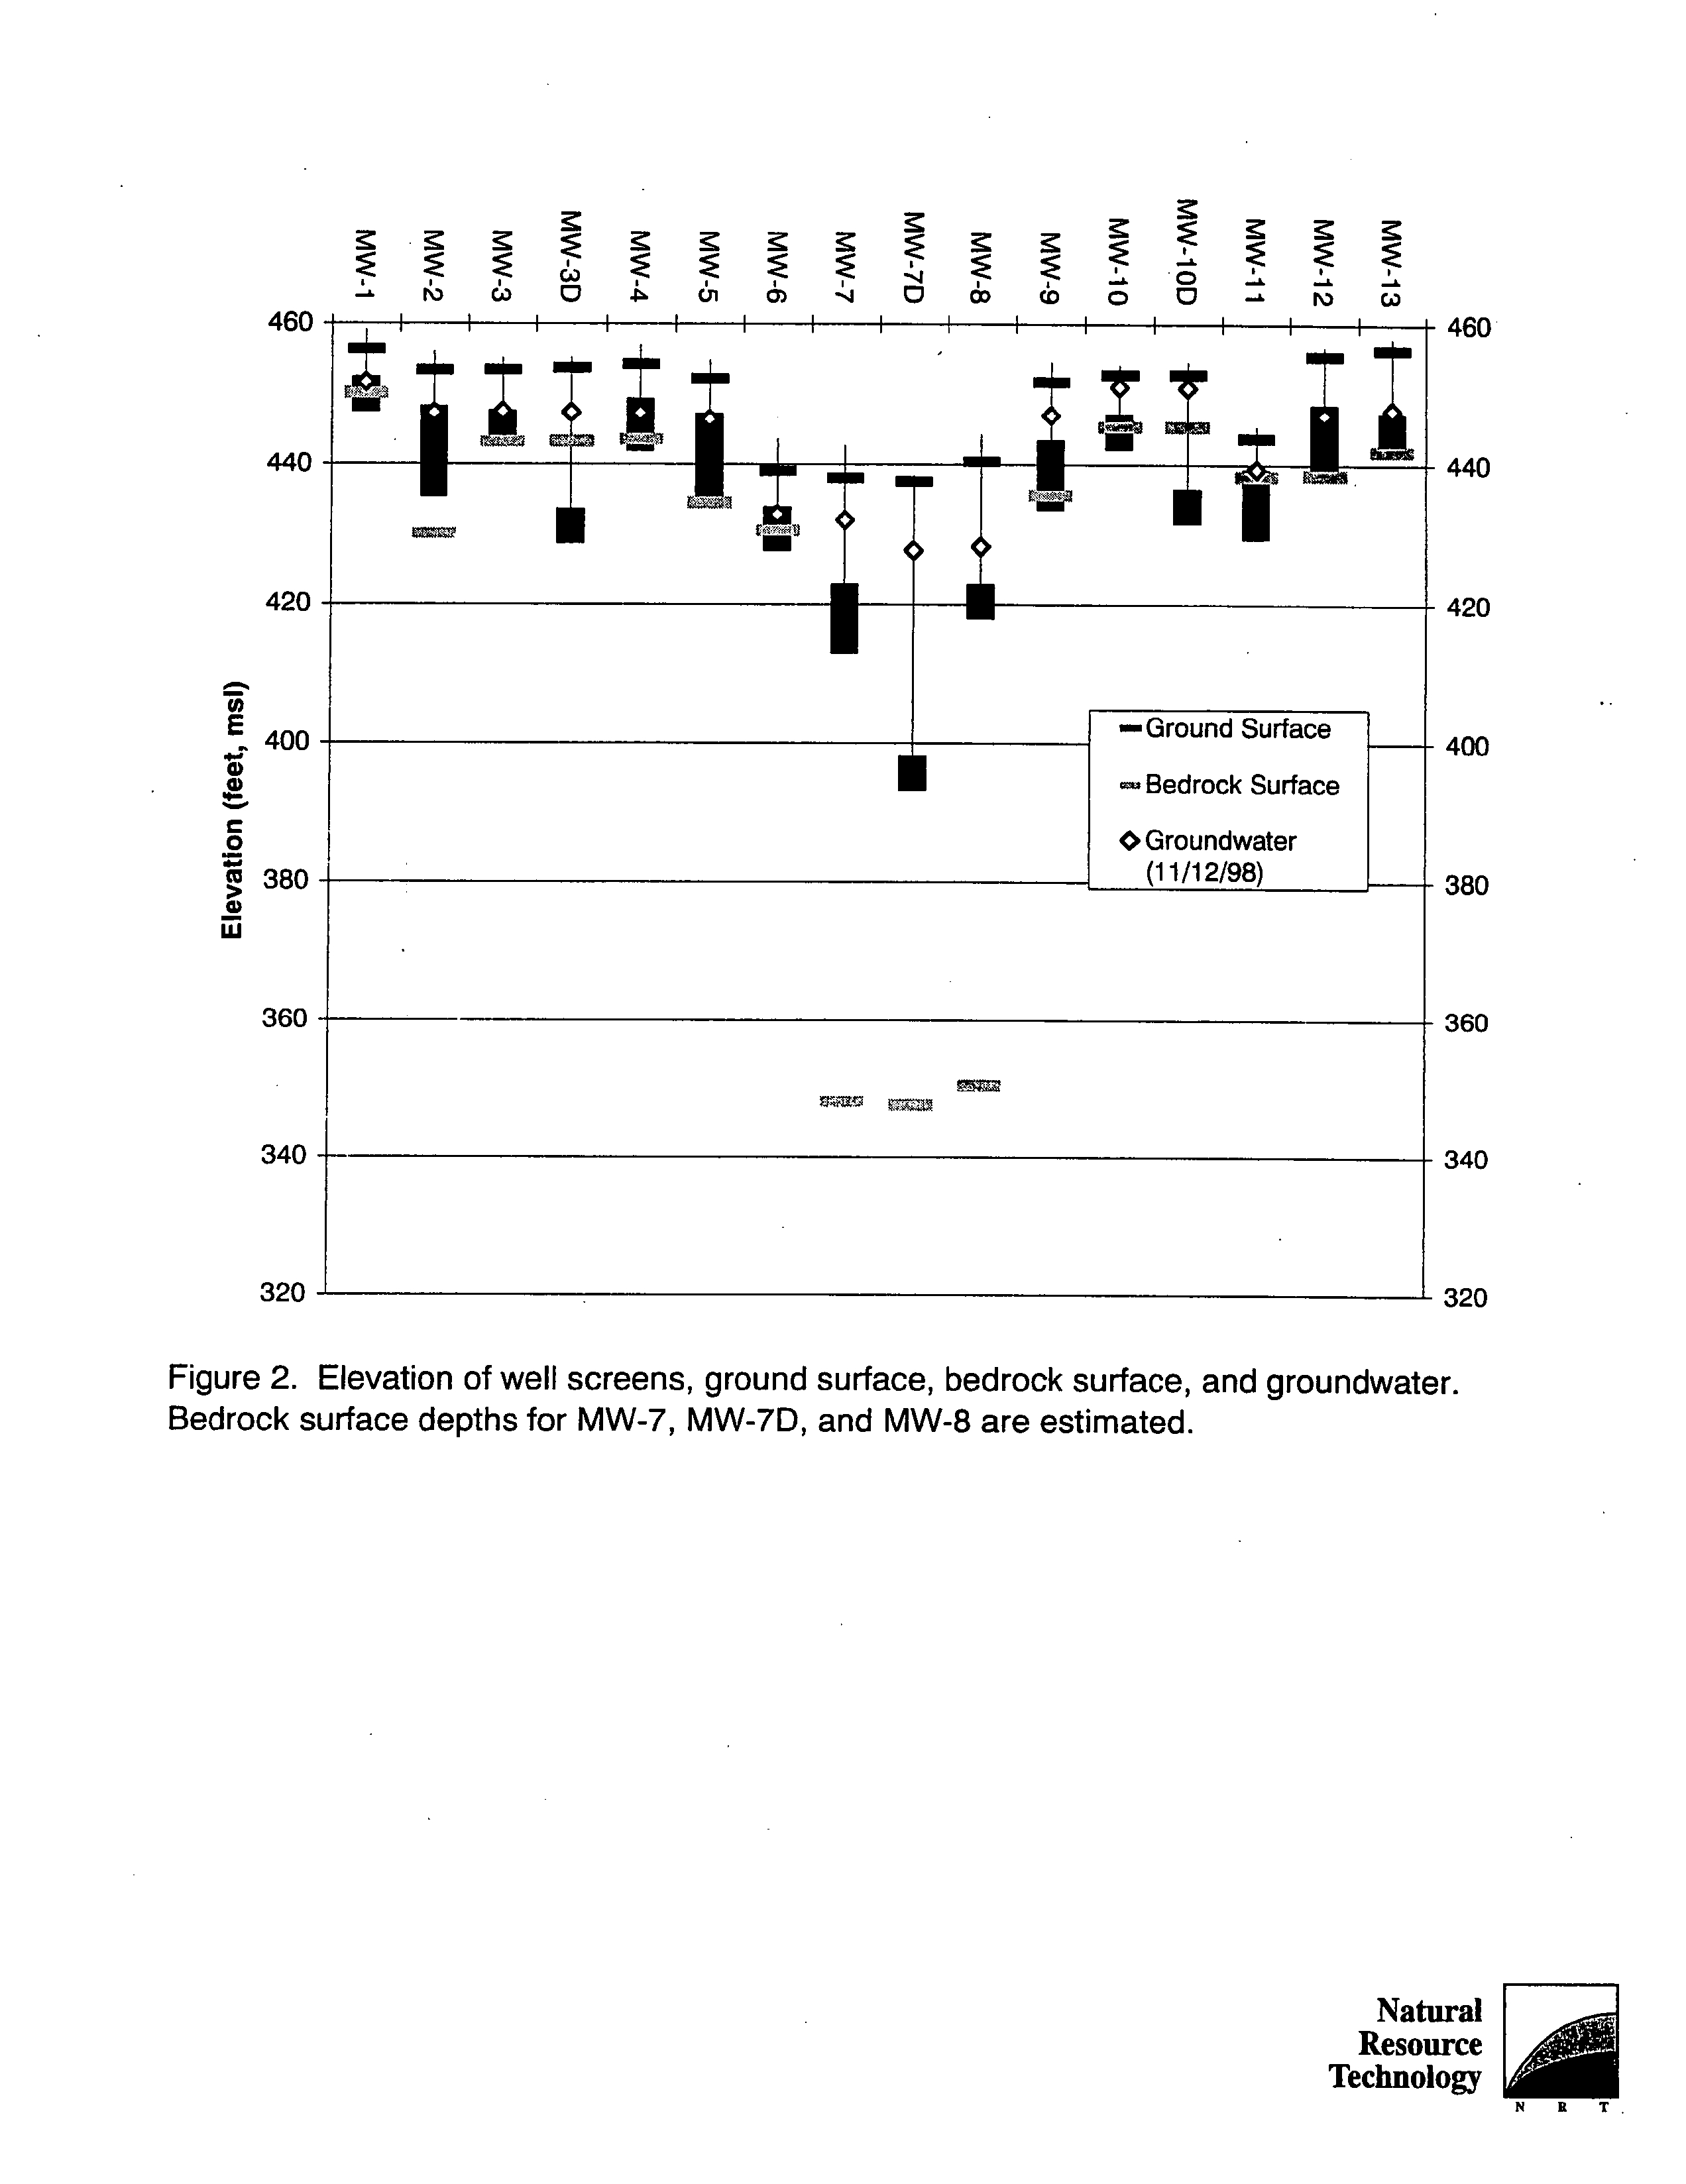
Figure
Geologic
cross-sections
1375-l-B12
Figure
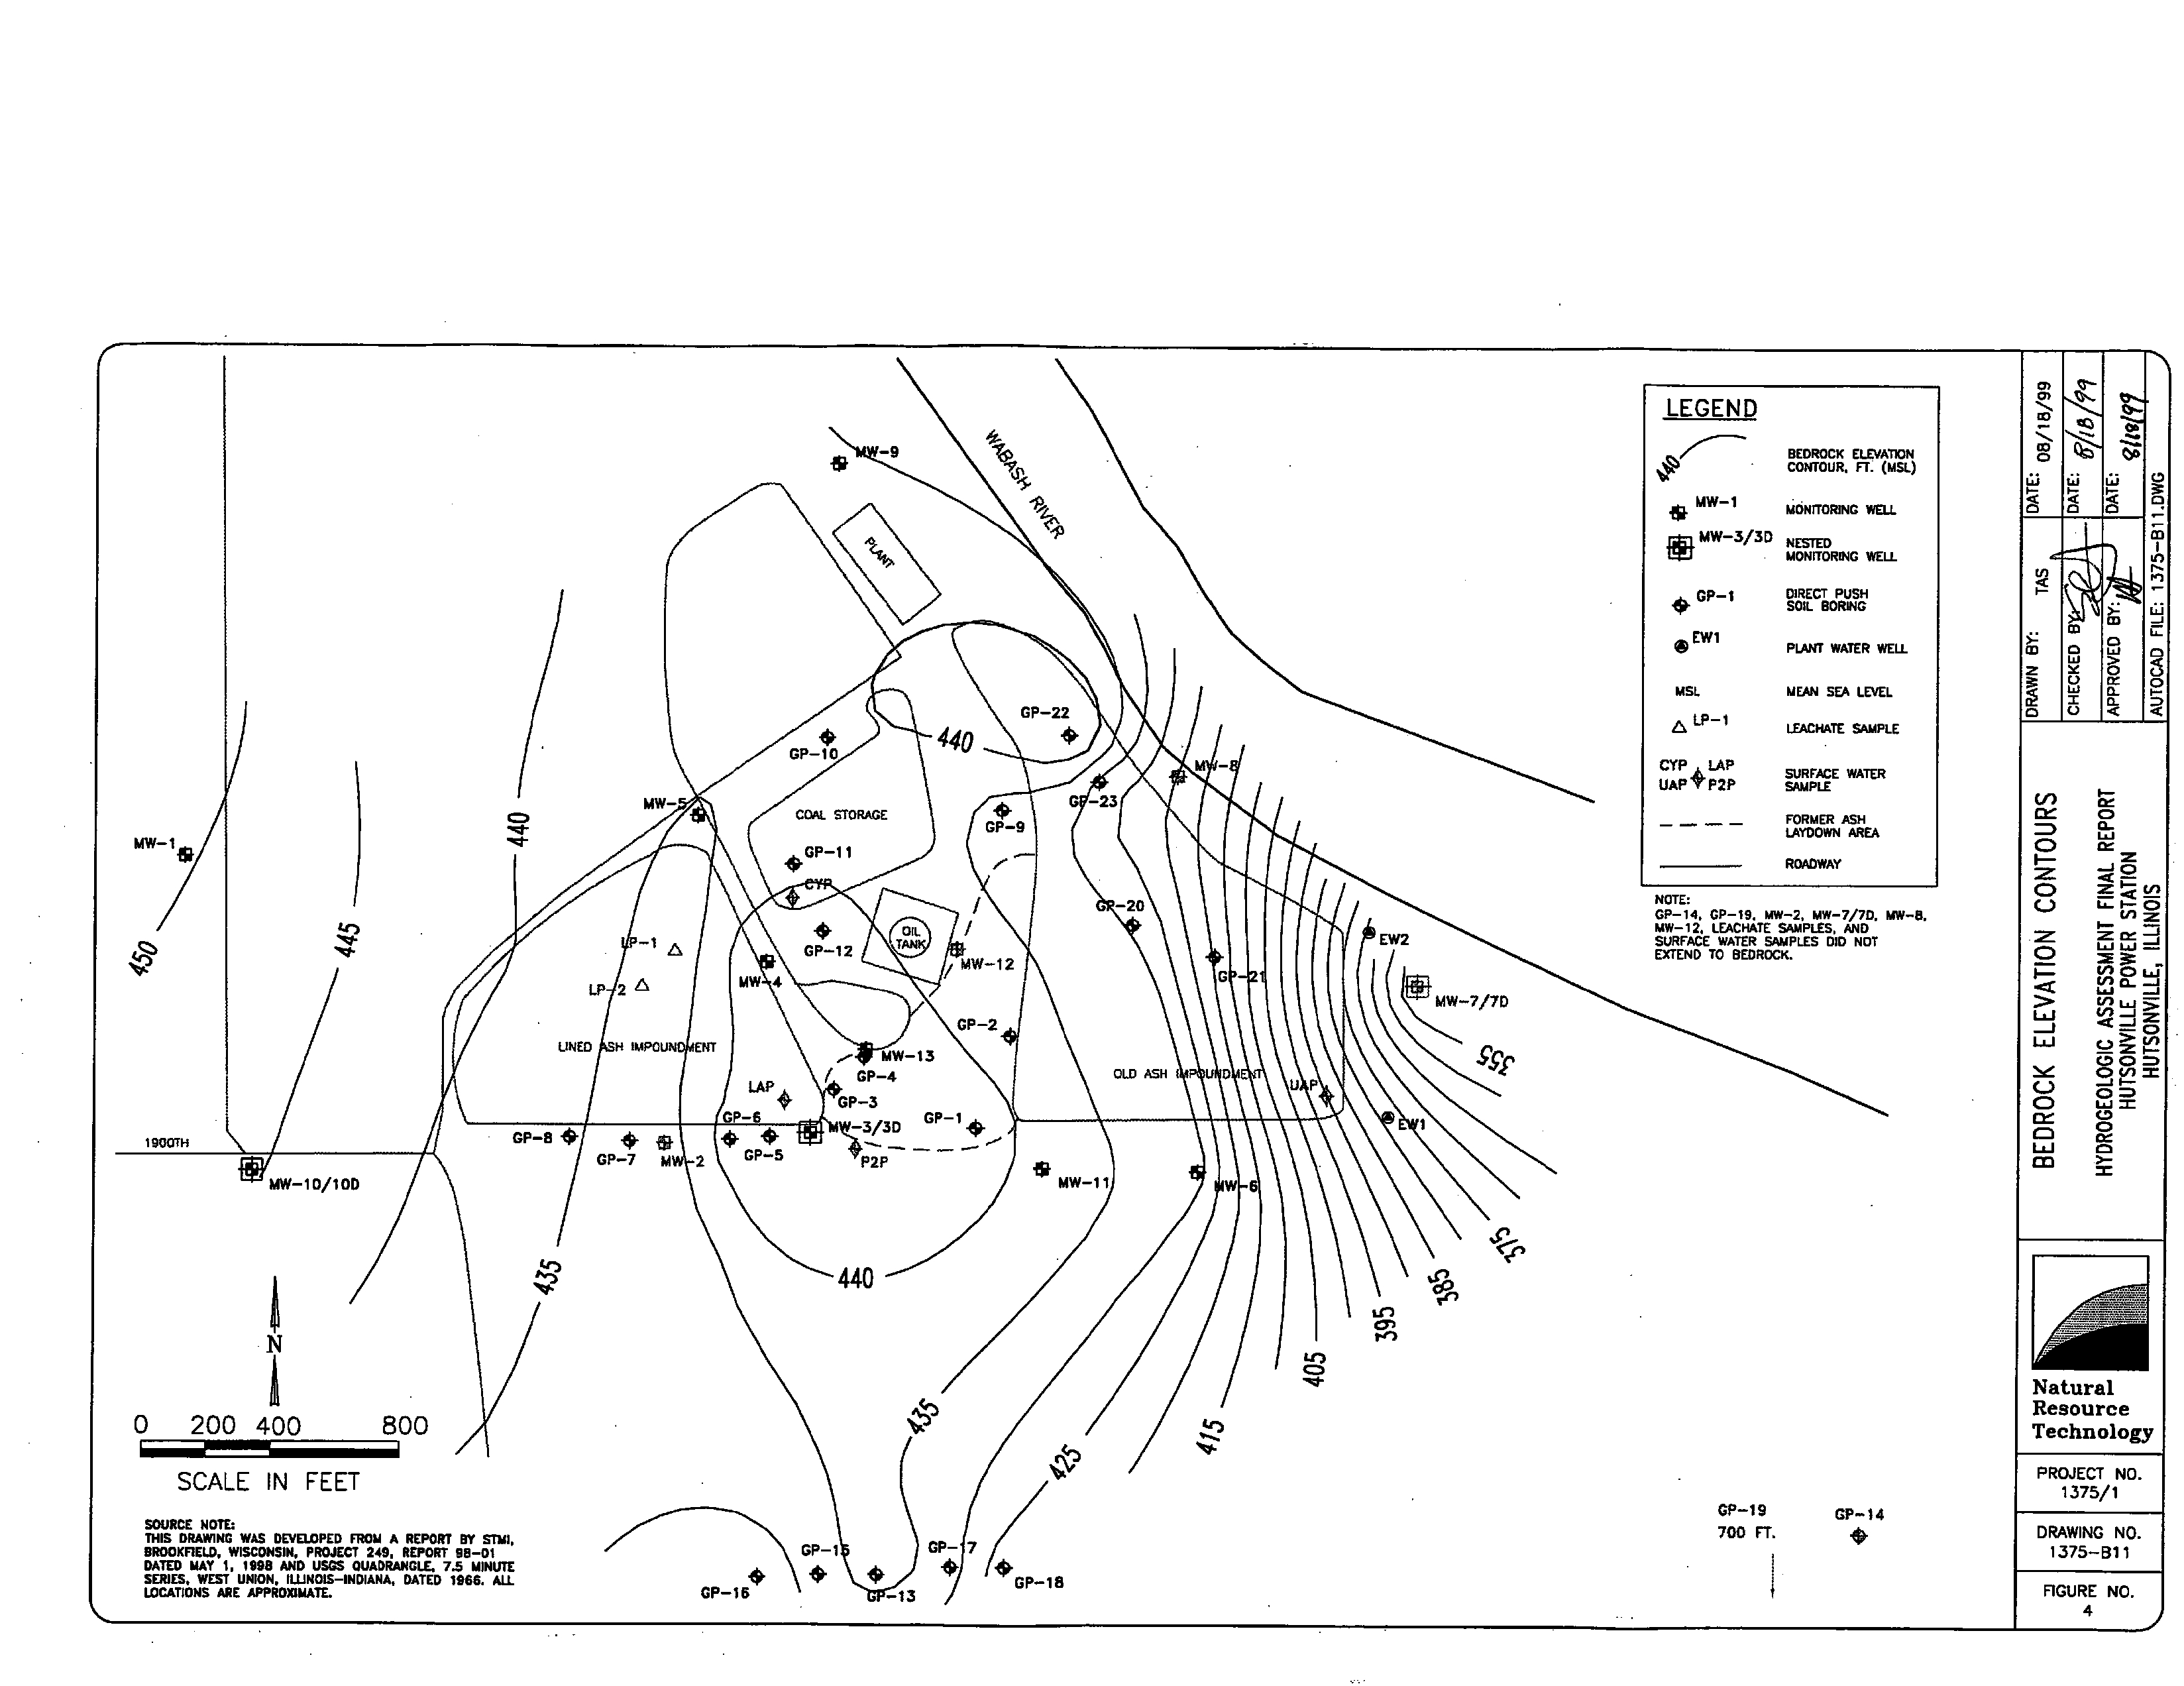
Bedrock elevation contours
1375-1-Bli
Figure
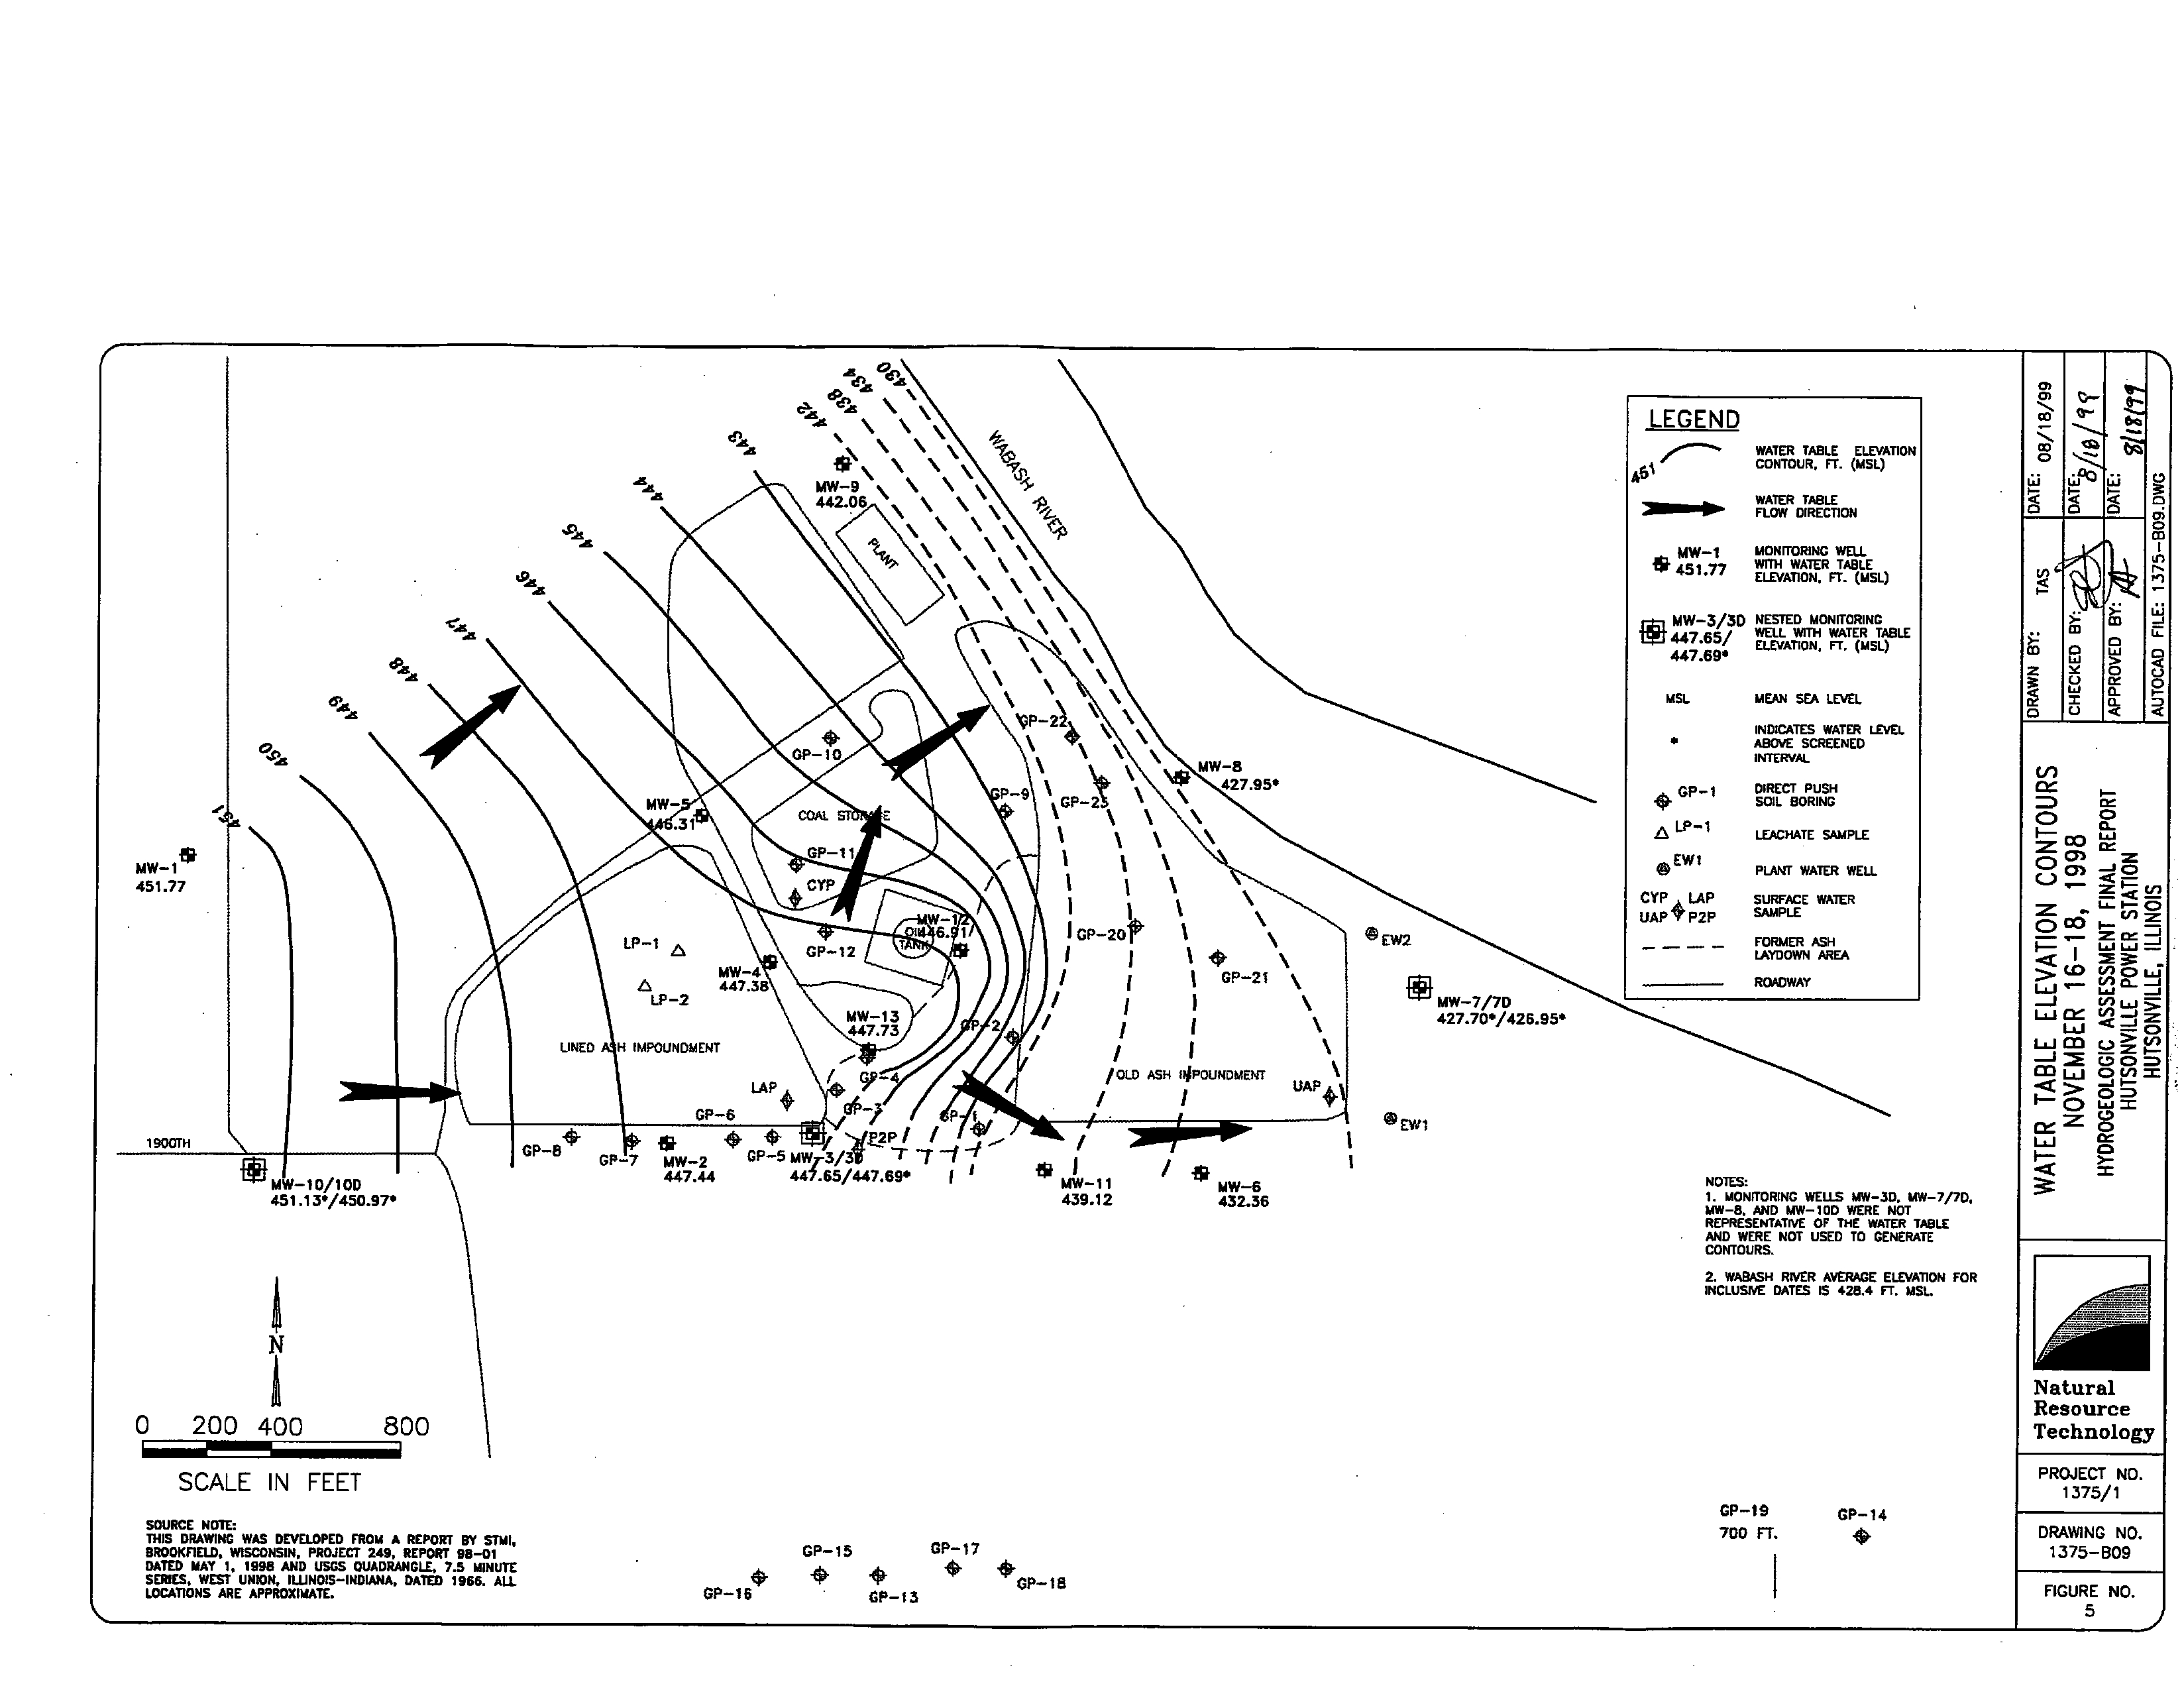
Water table elevation
contours
November
16-18
1998
1375-1-B09
Figure
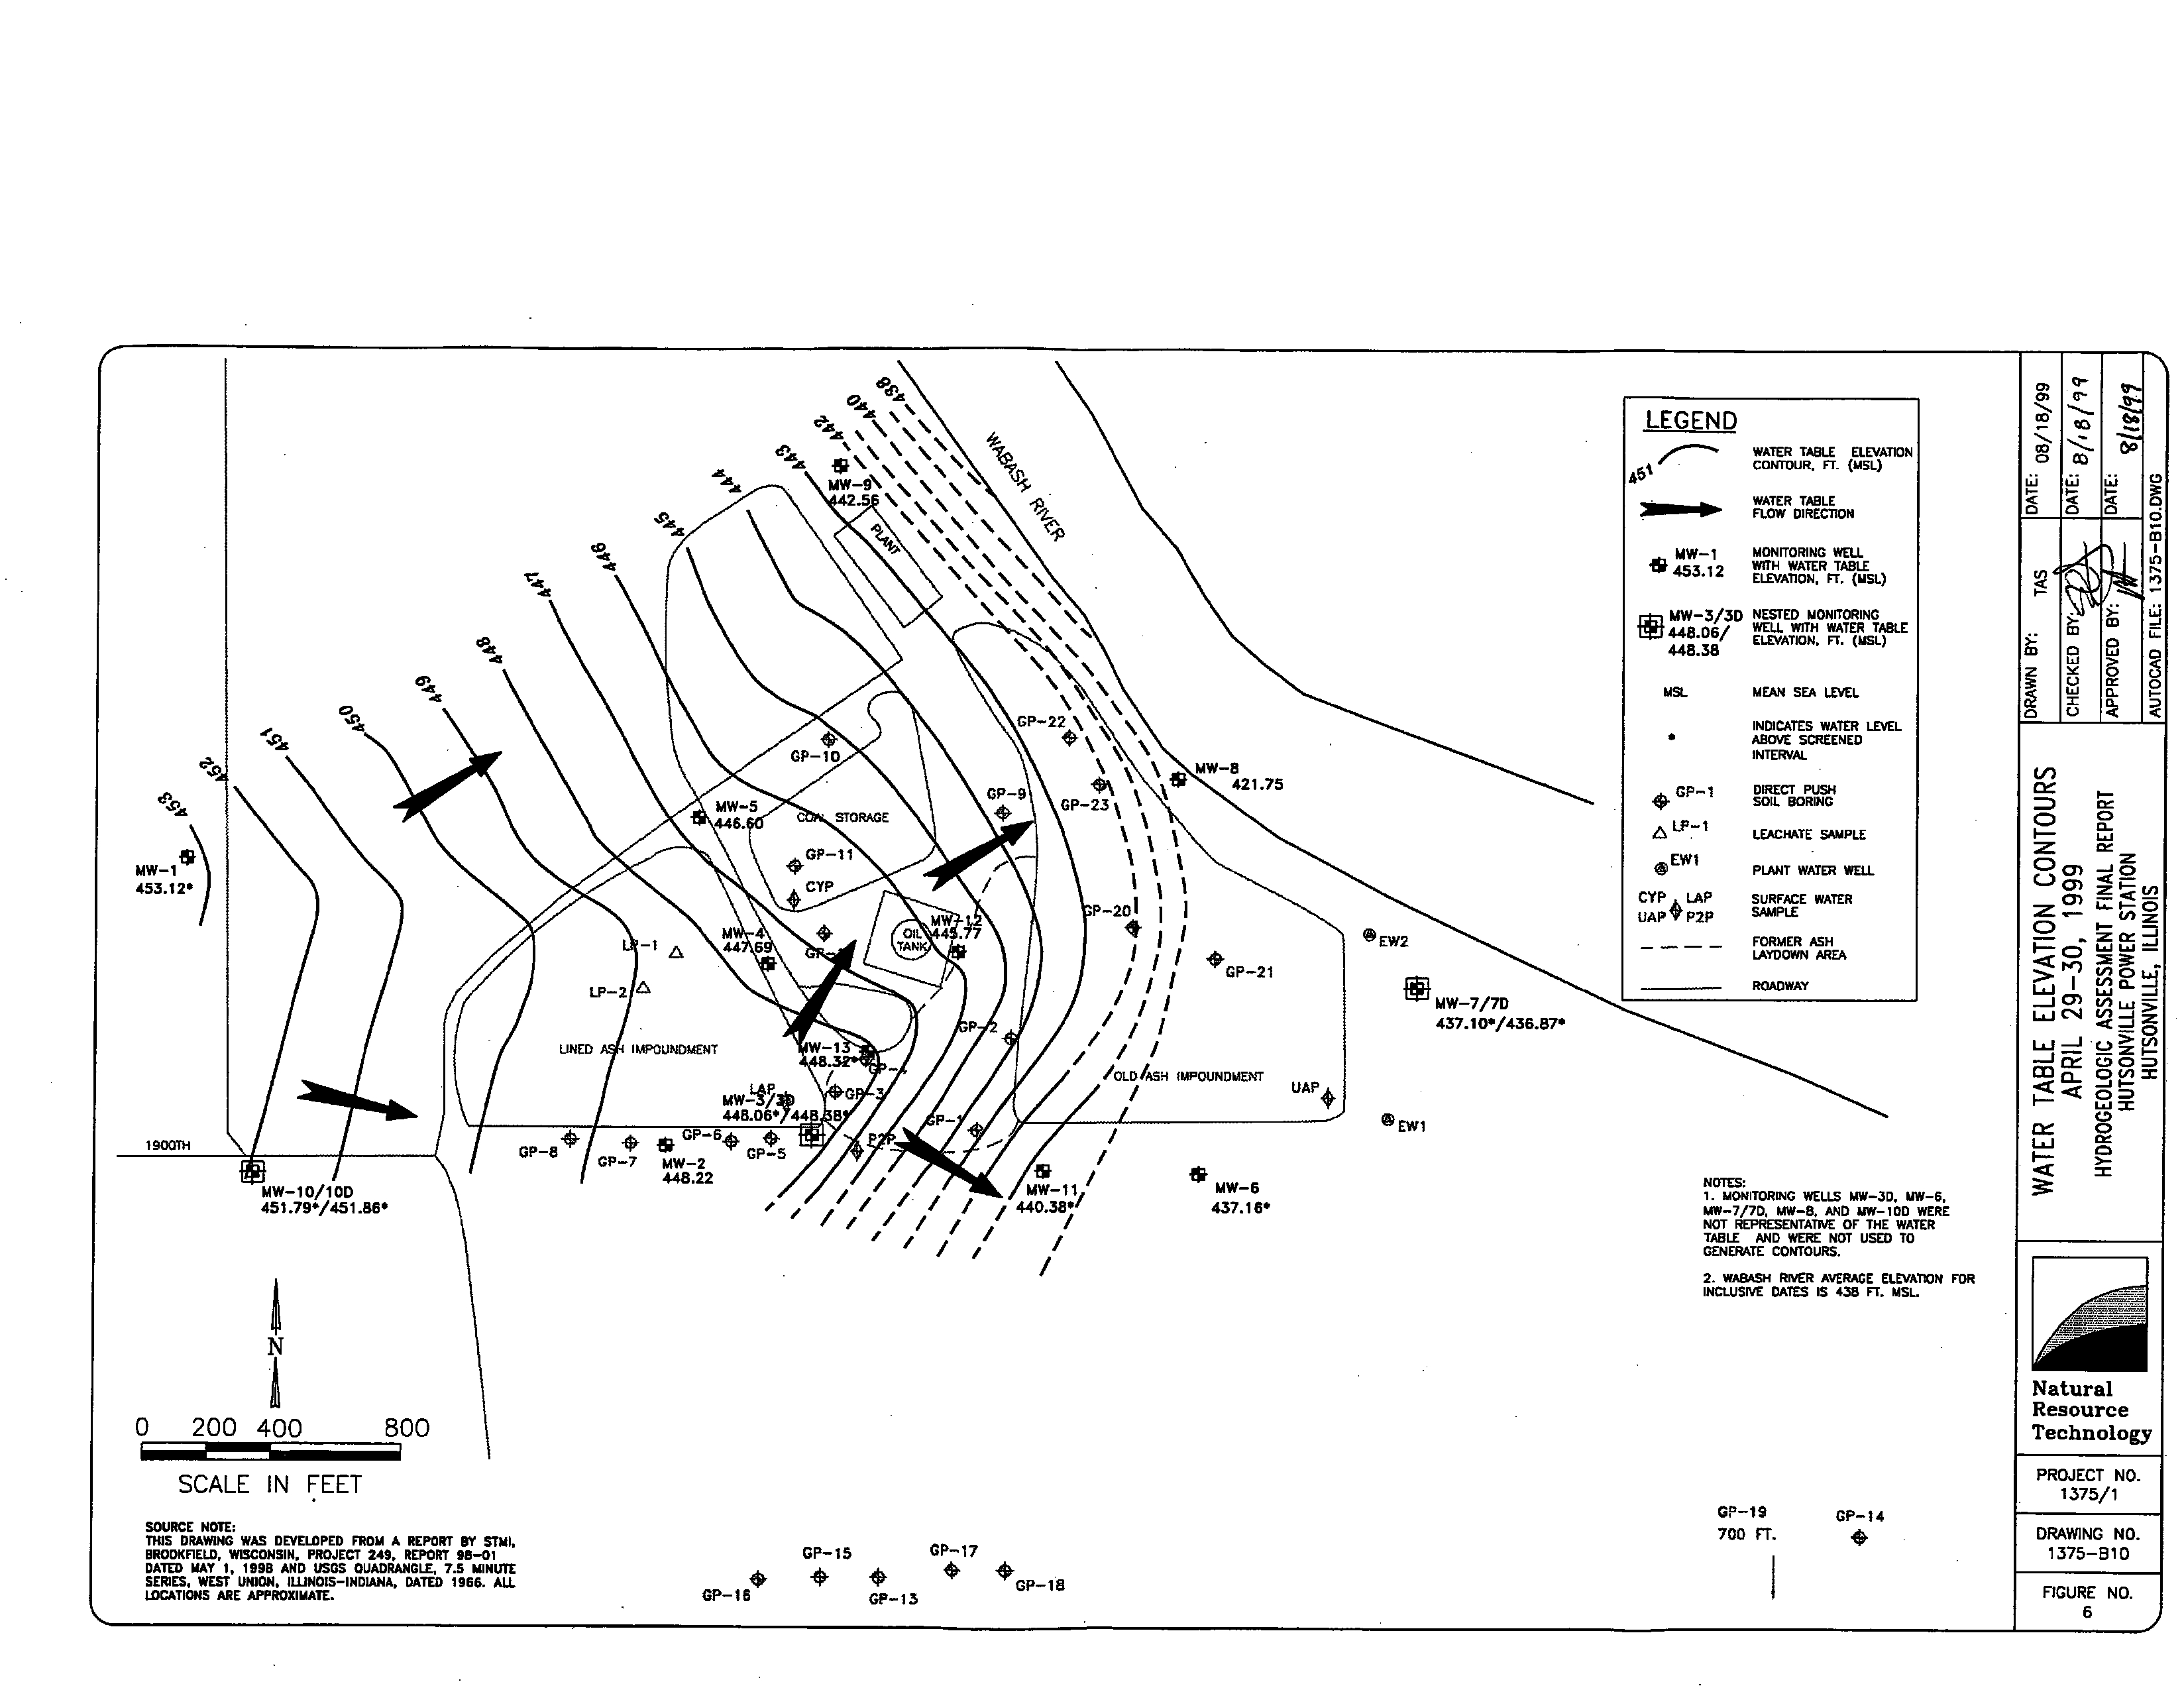
Water table elevation
contours April 29-30
1999
1375-1-BlO
Figure
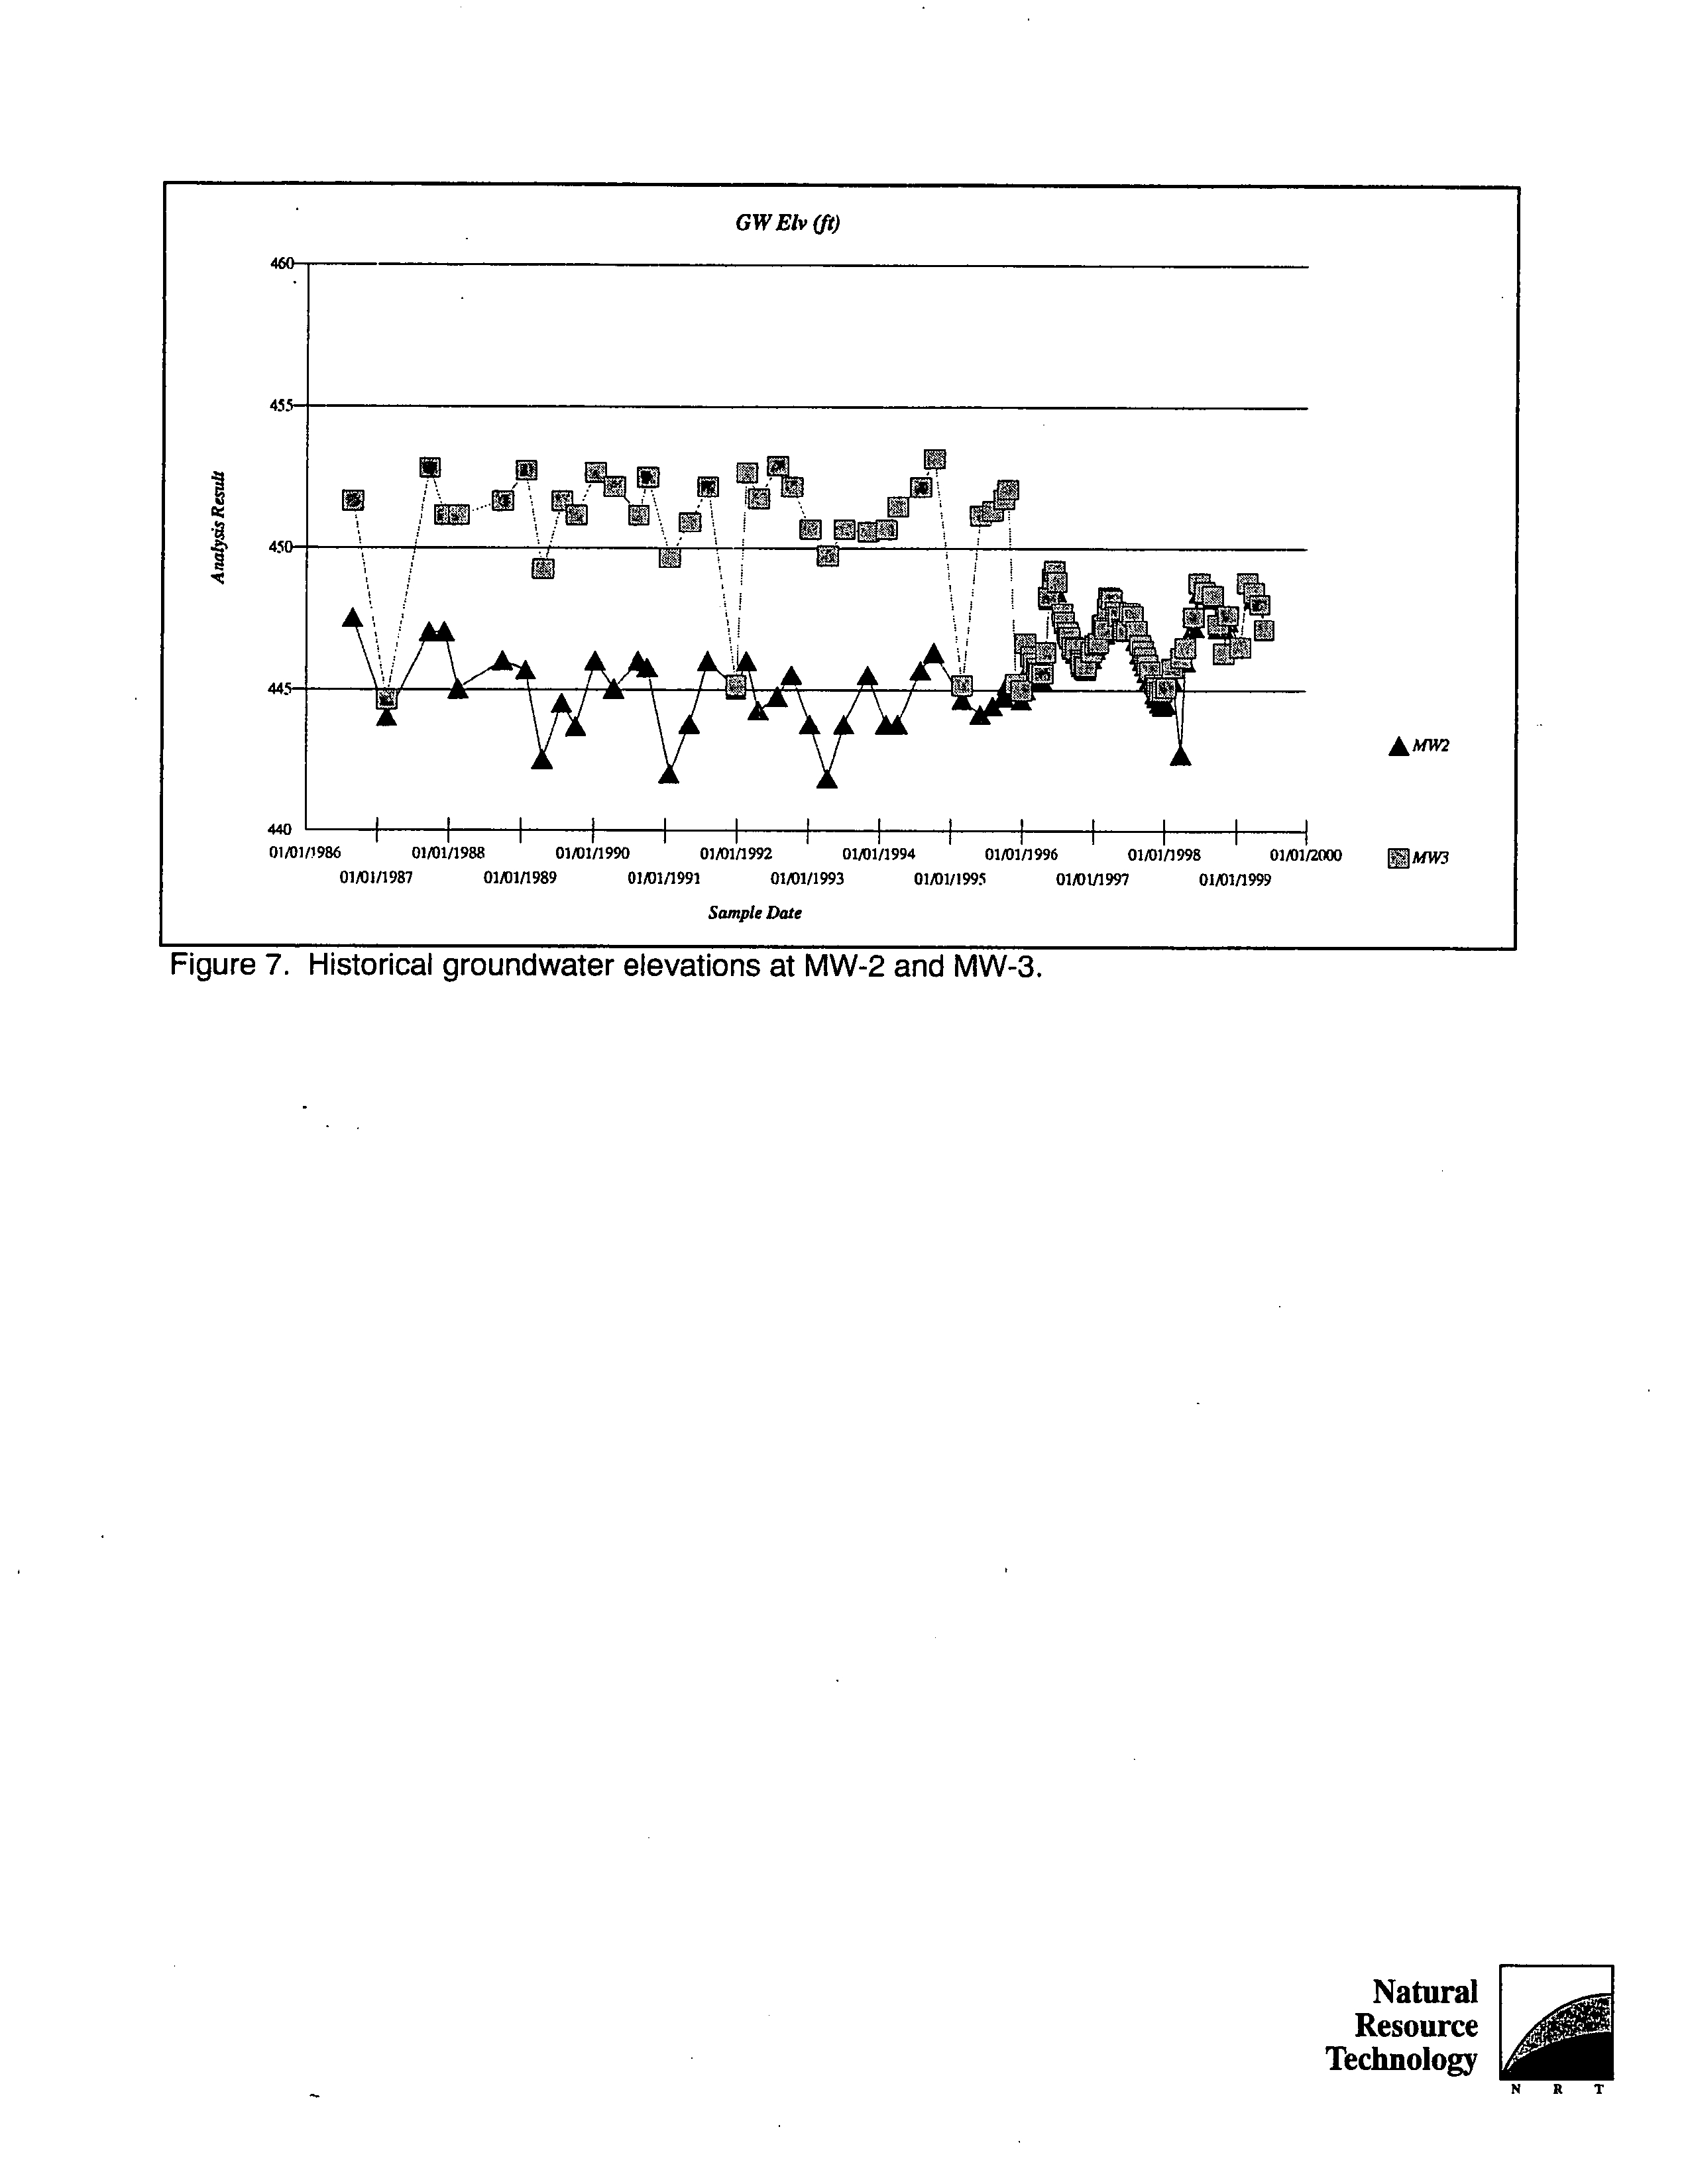
Historical
groundwater
elevations at MW-2 and MW-3
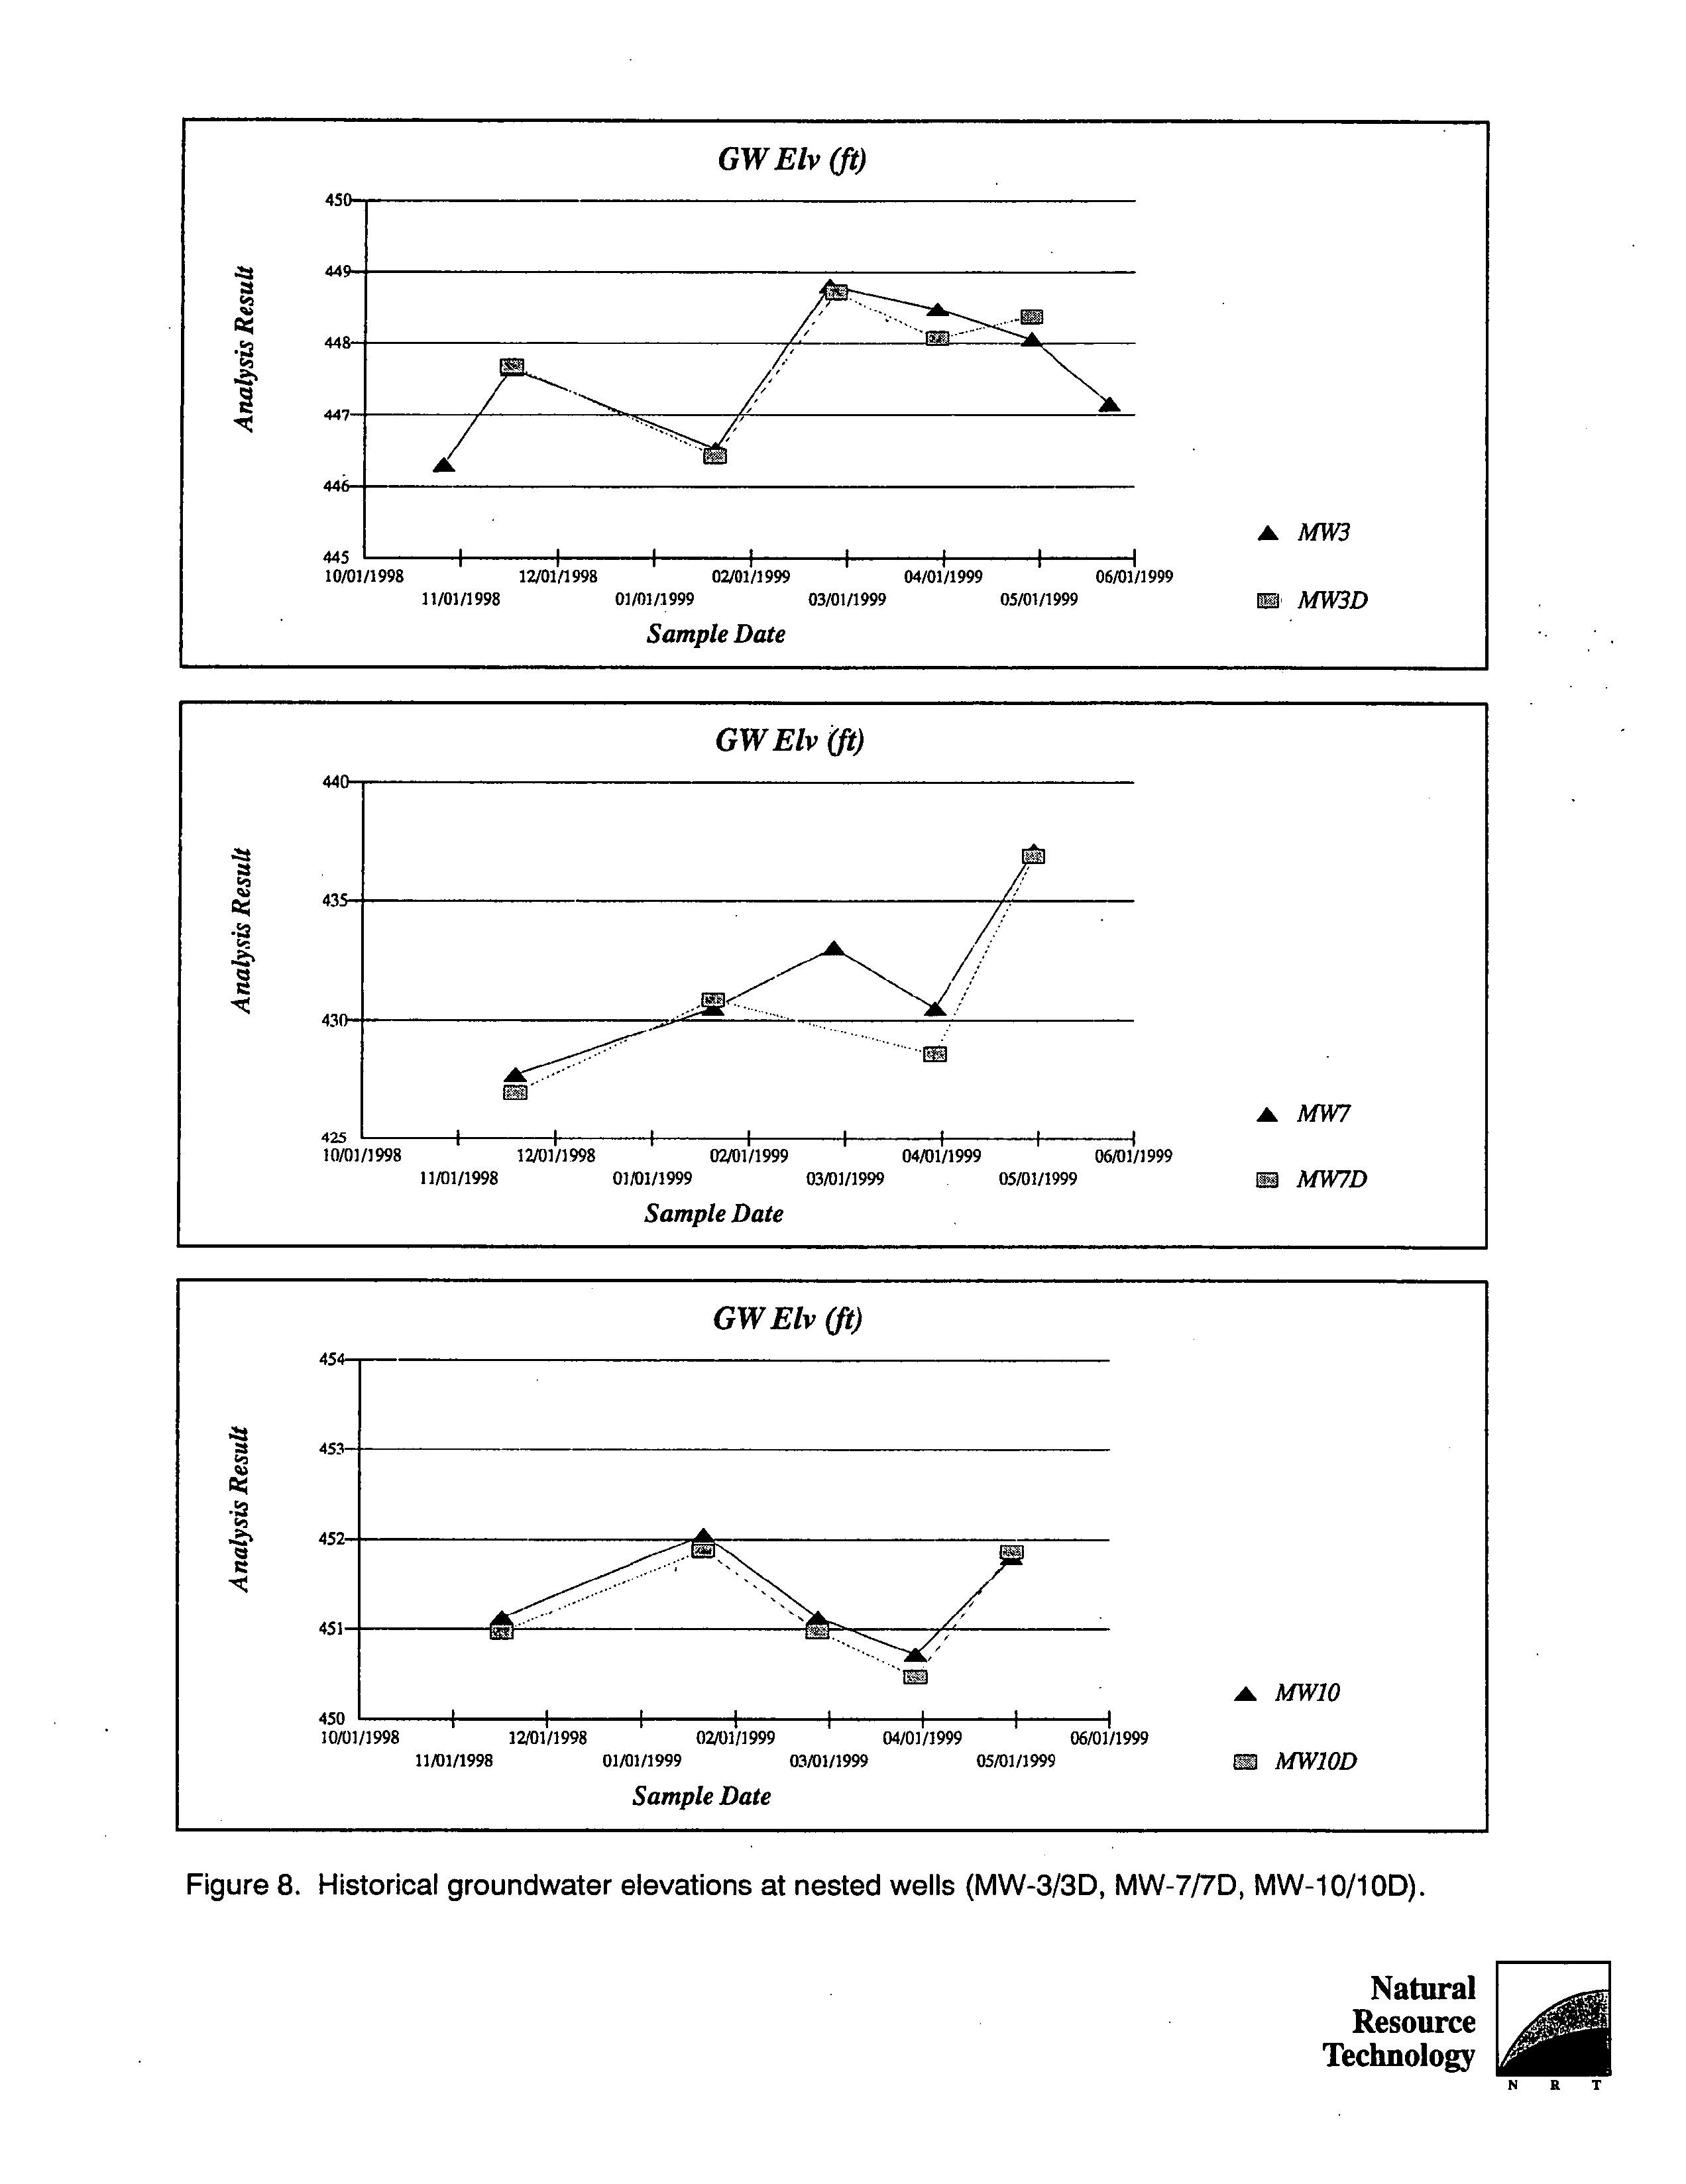
Figure
Historical
groundwater
elevations at nested wells
MW-3/3D
MW-7/7D
MW-10/1OD
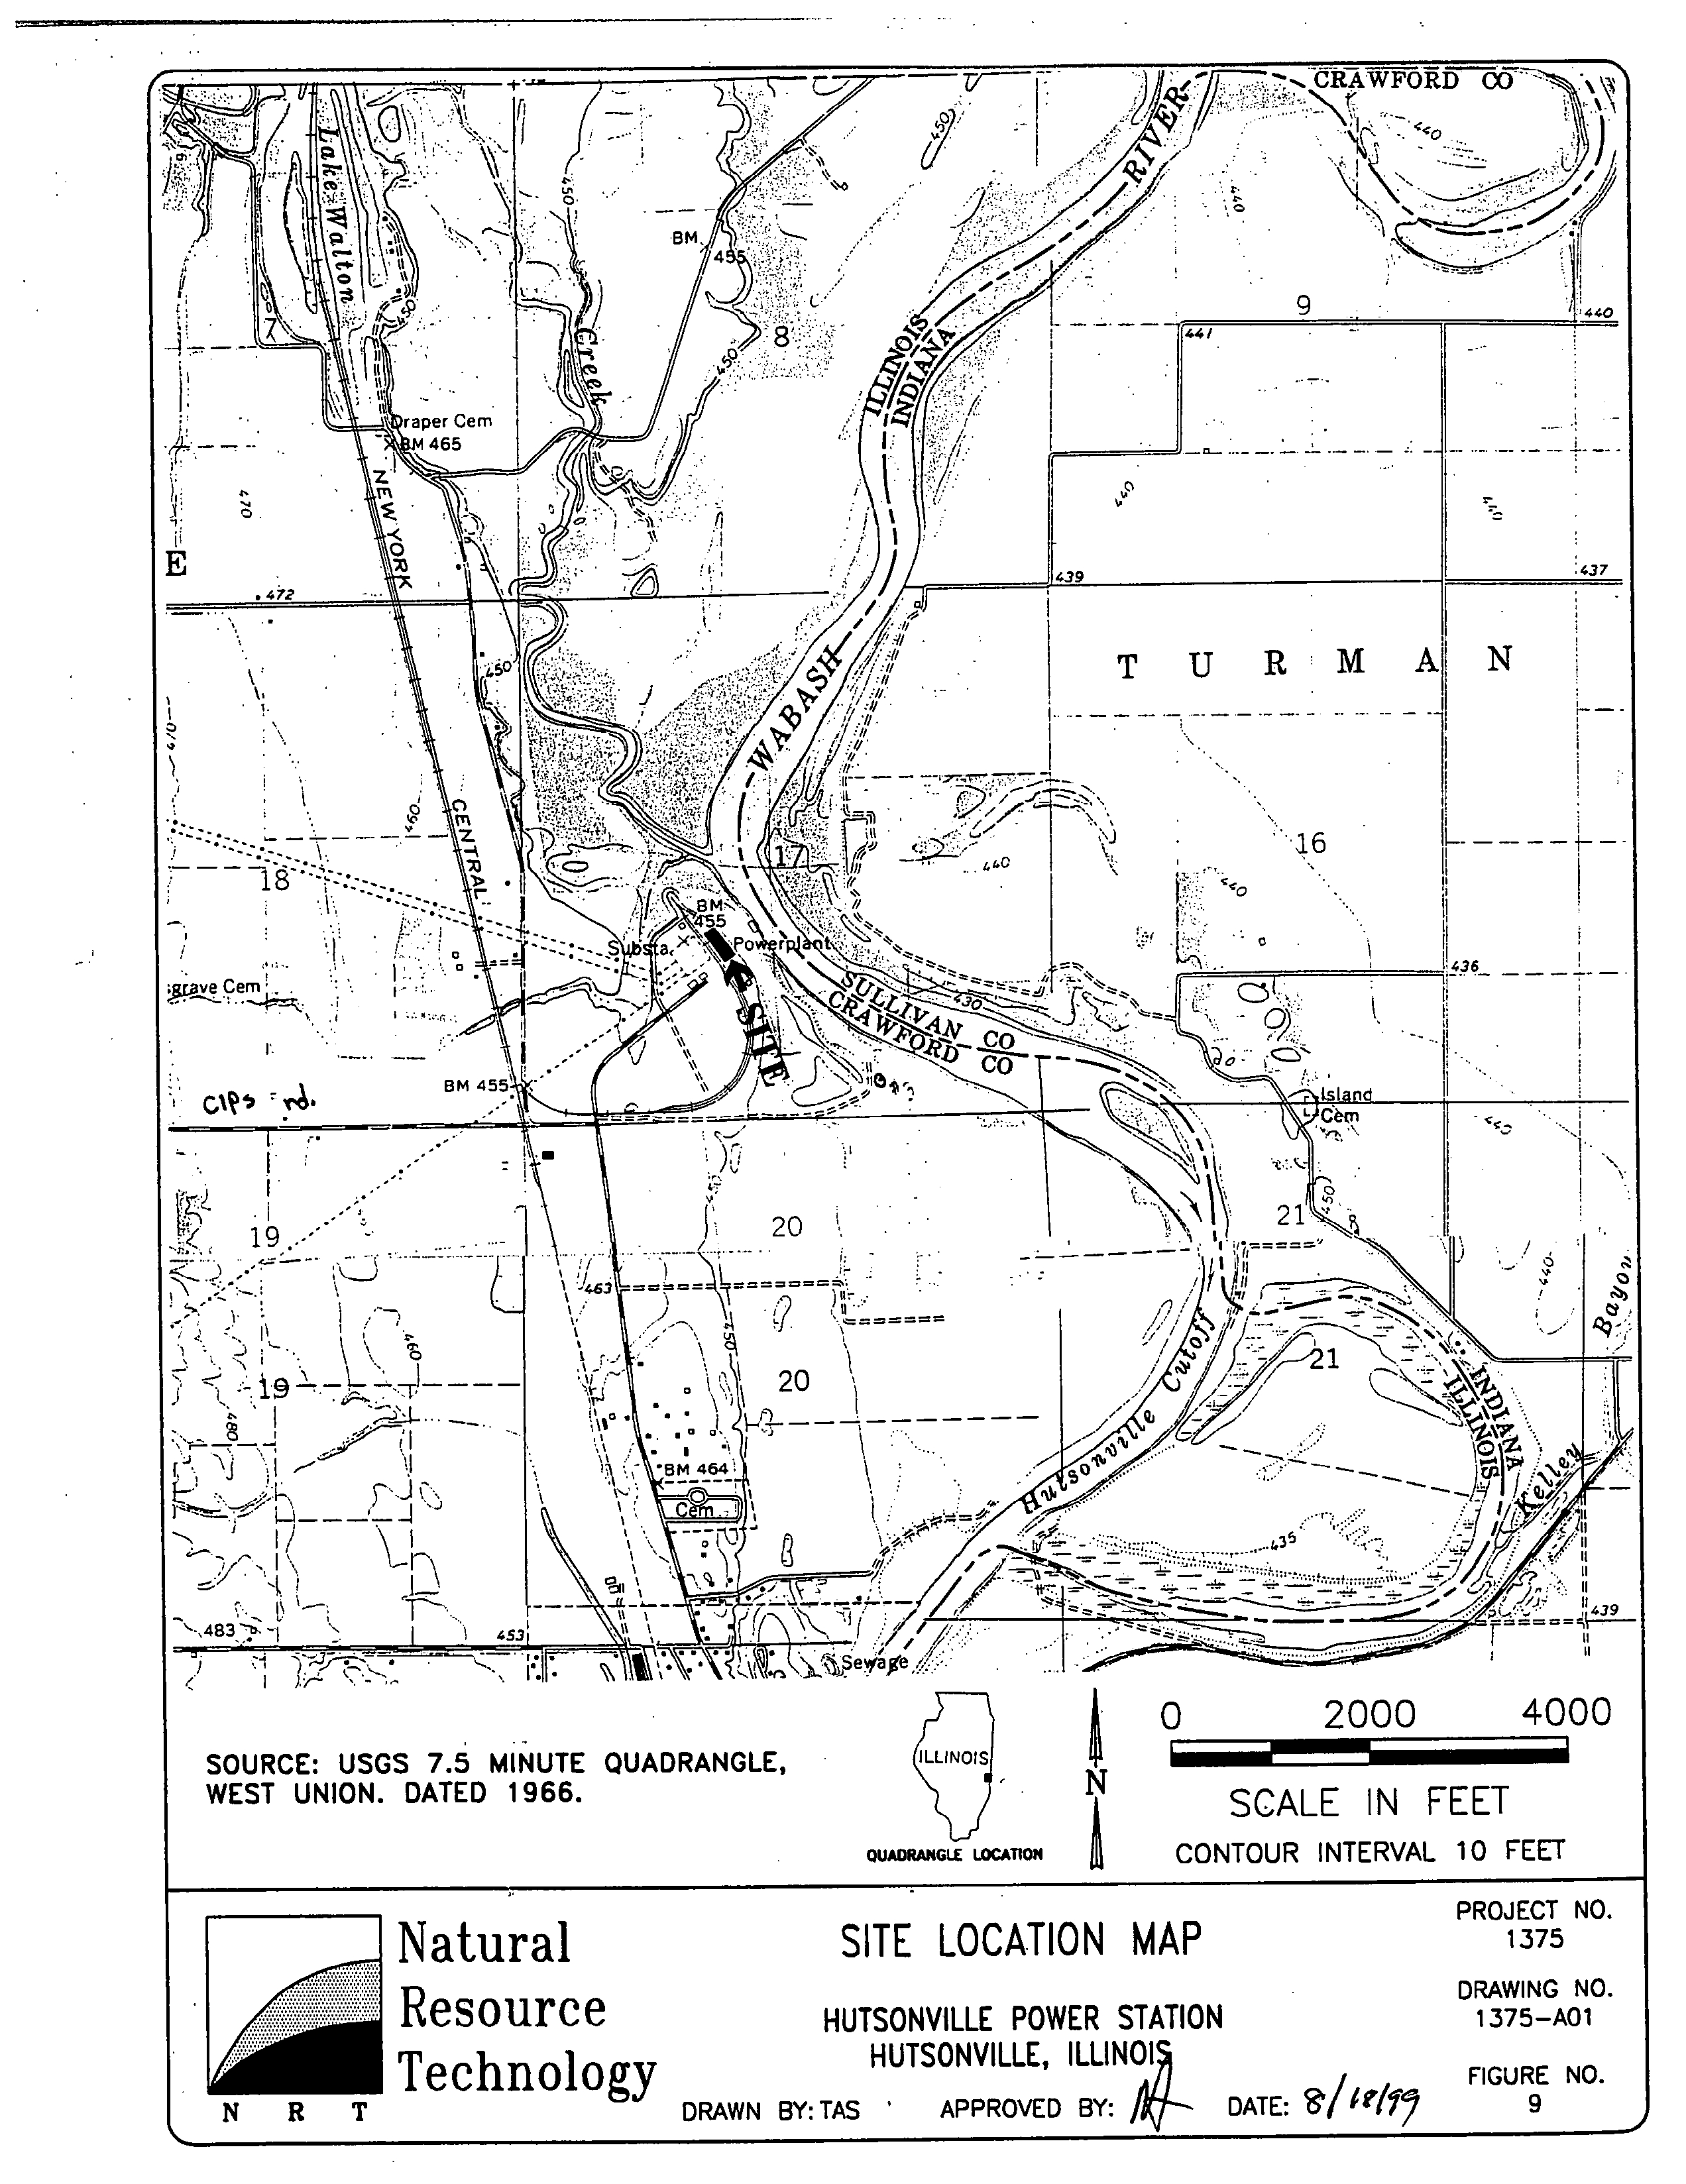
Figure
Site location
map
1375-Aol
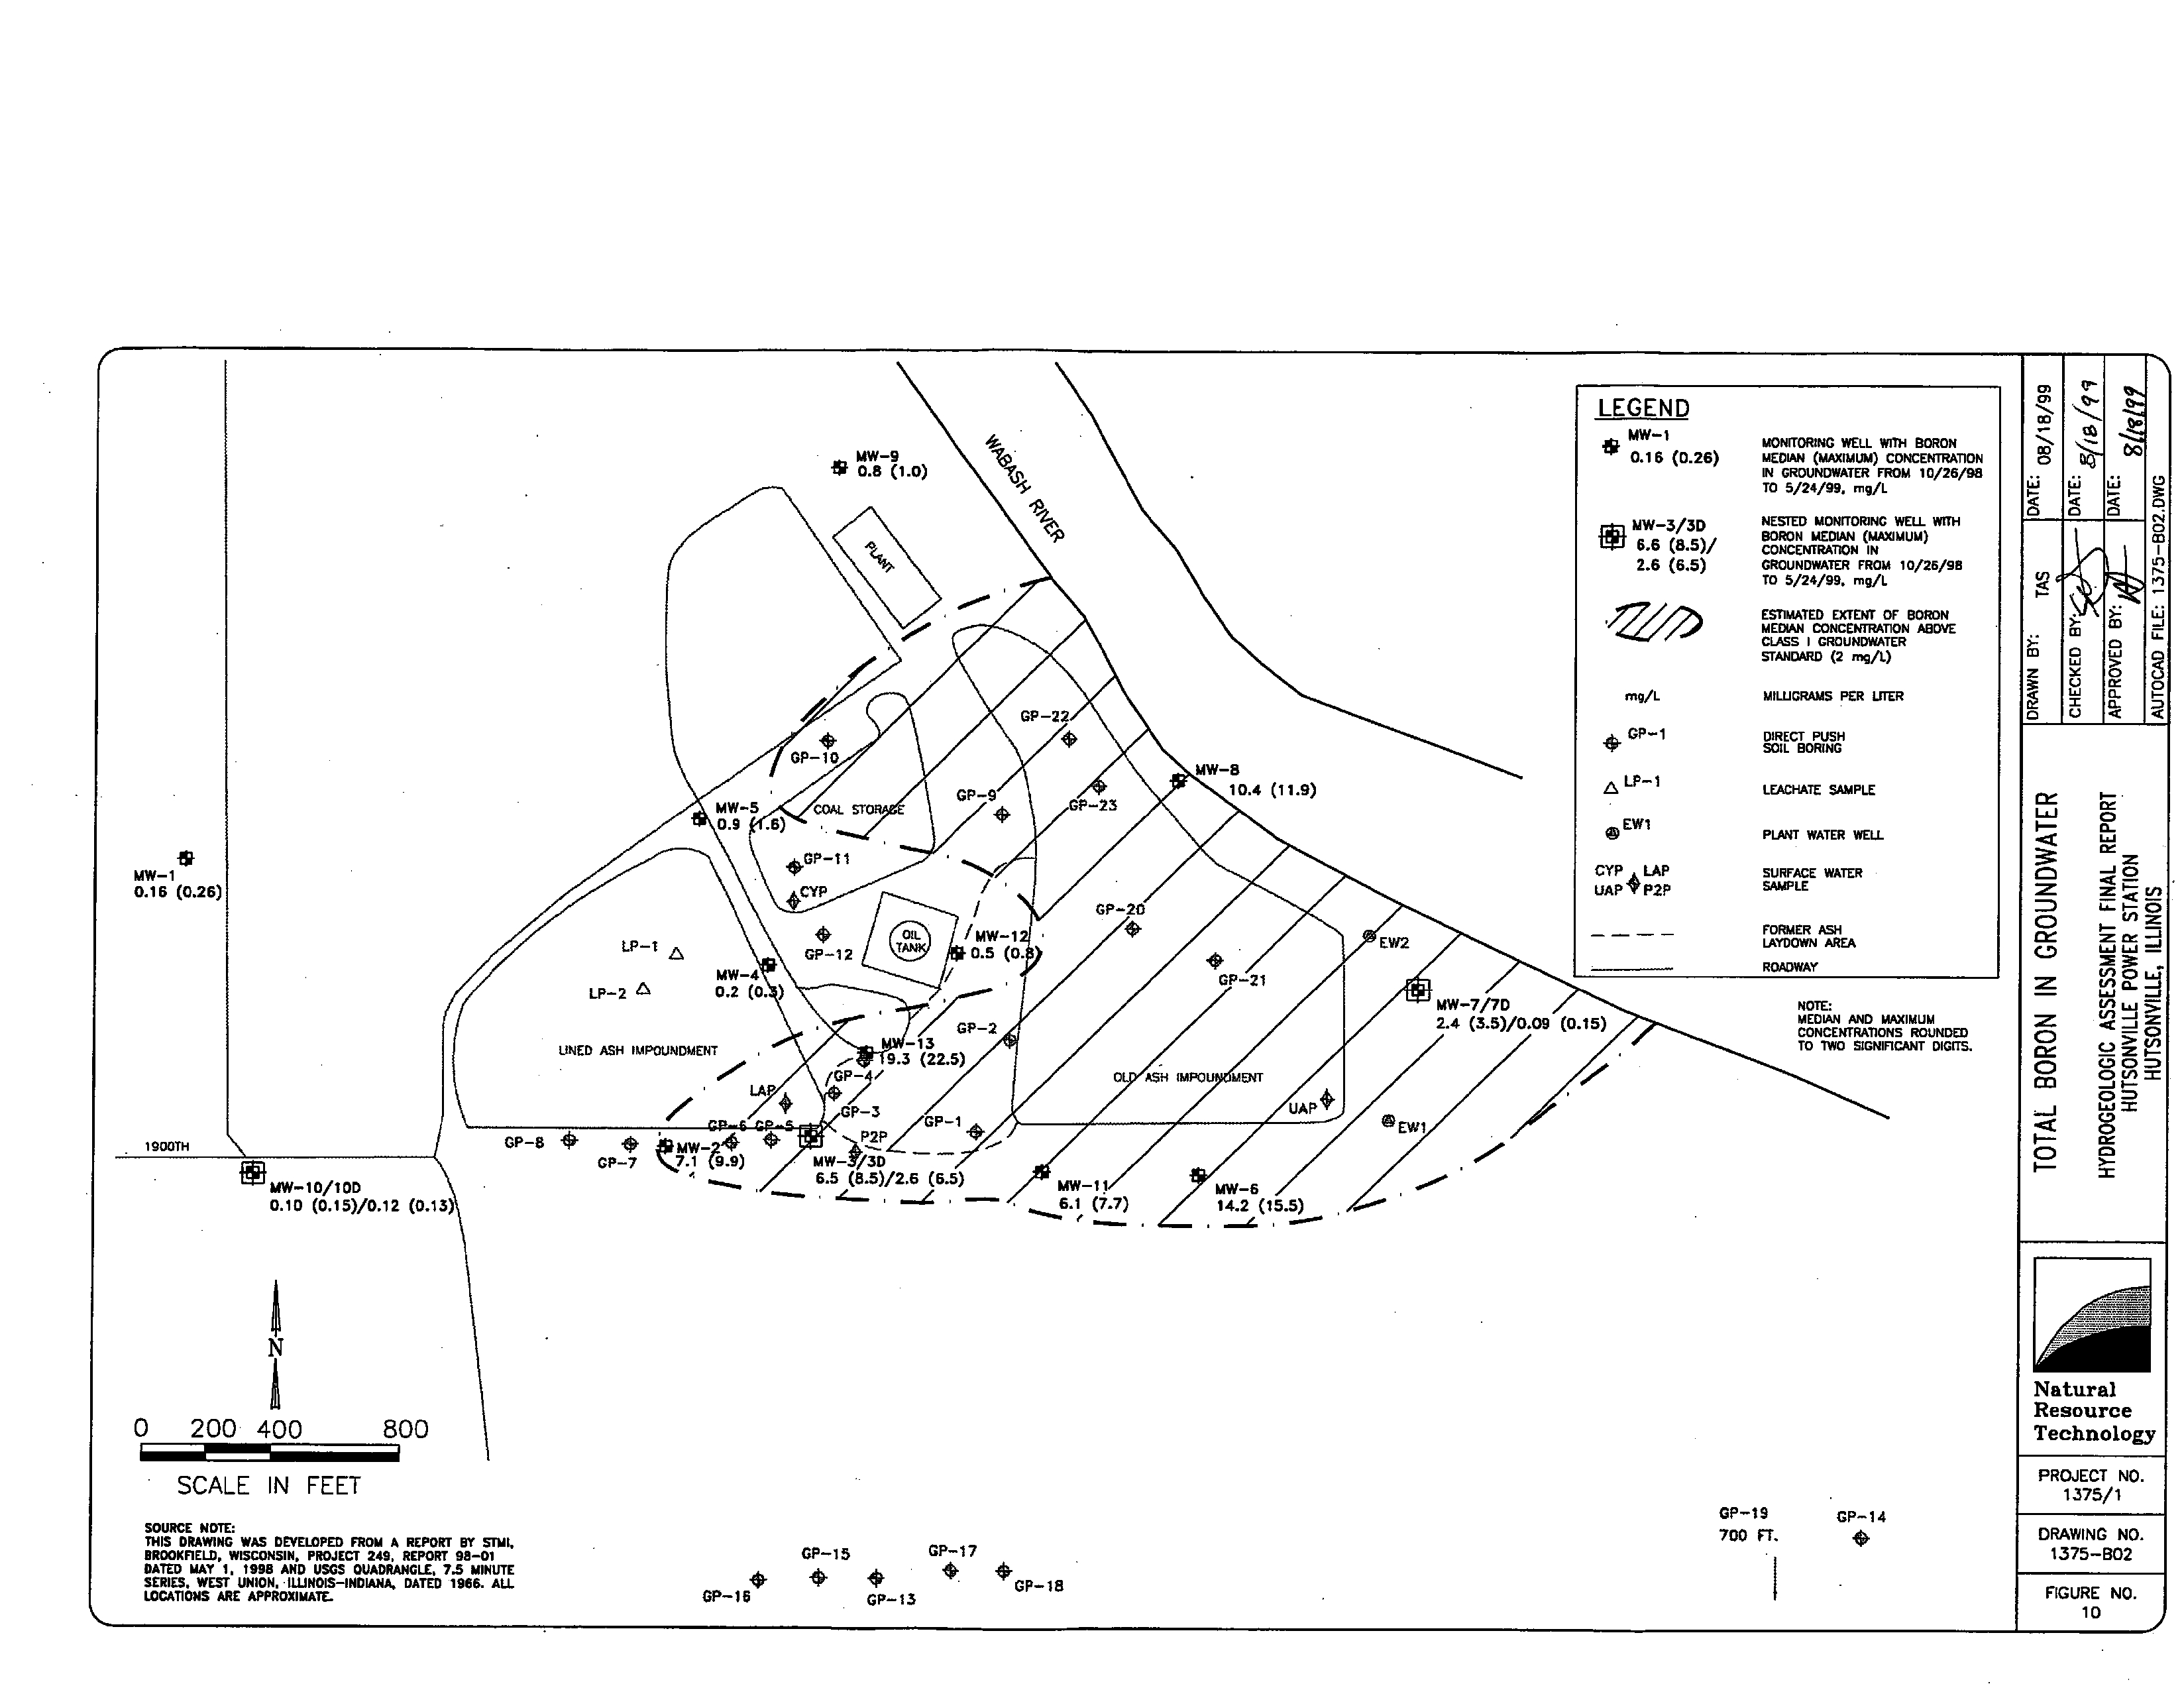
Figure
10
Total
boron
in
groundwater
1375-l-B02
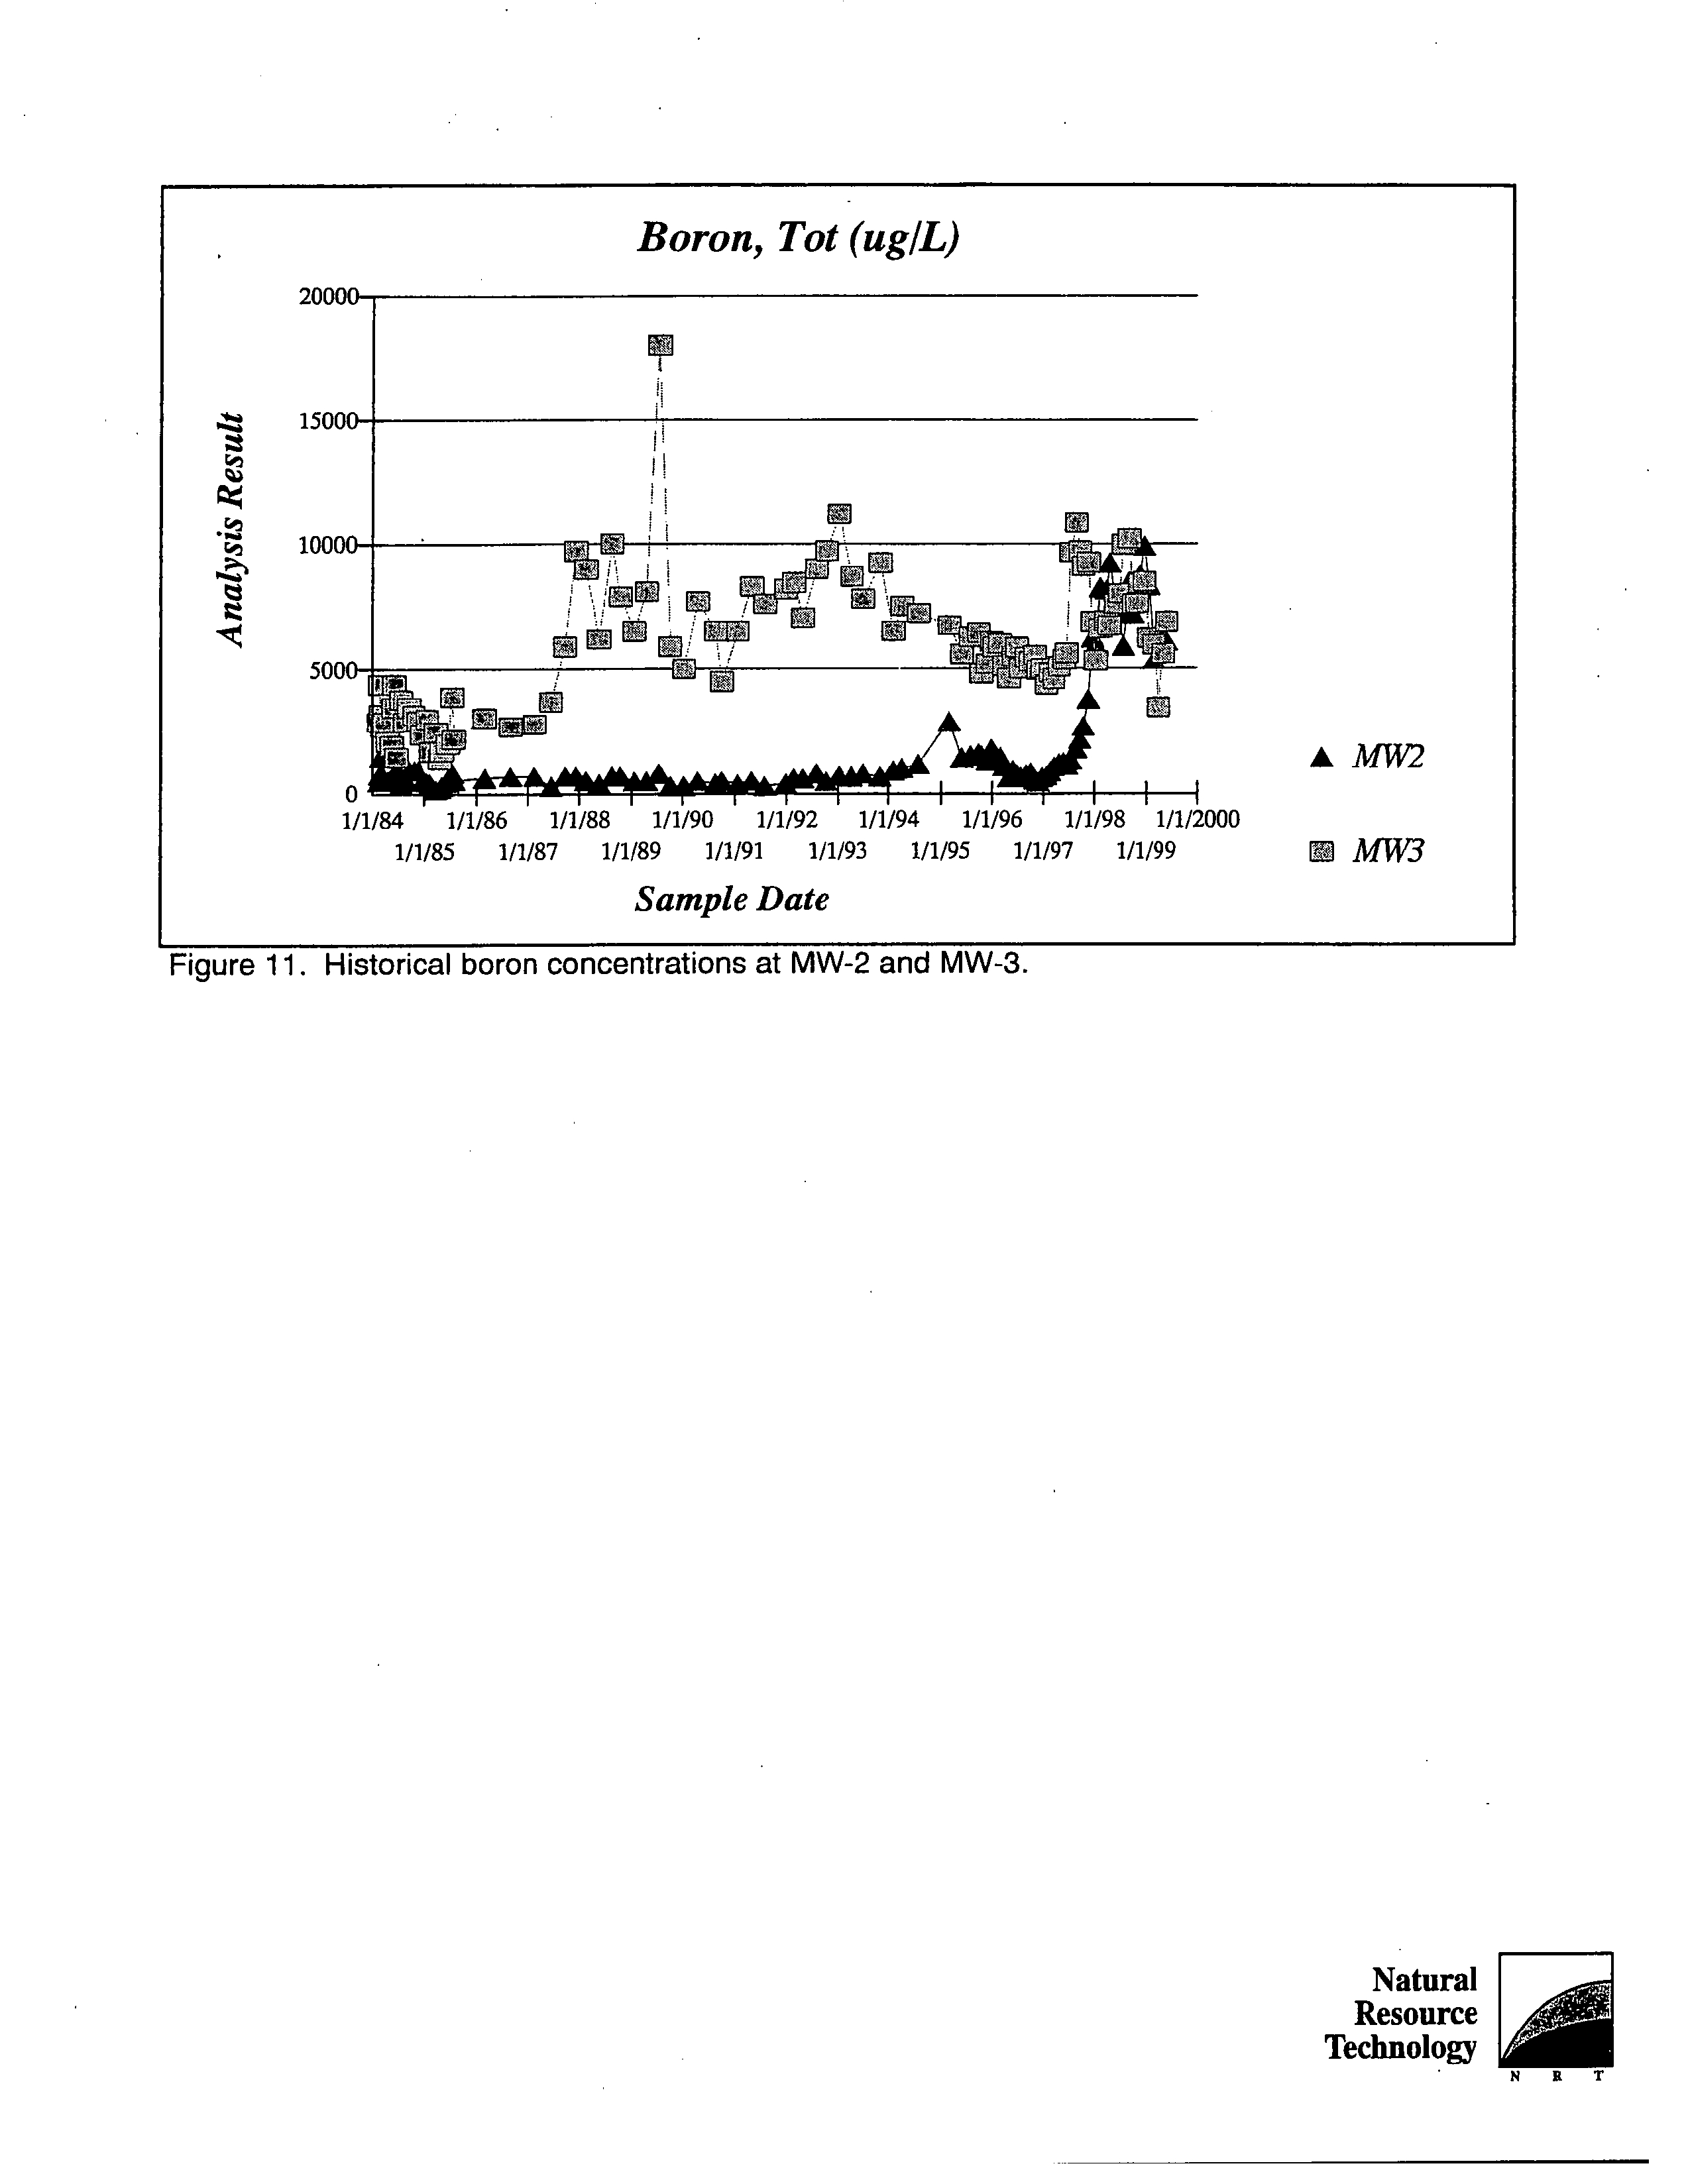
Figure
11
Historical total boron concentrations
in MW-2
and MW-3
Figure
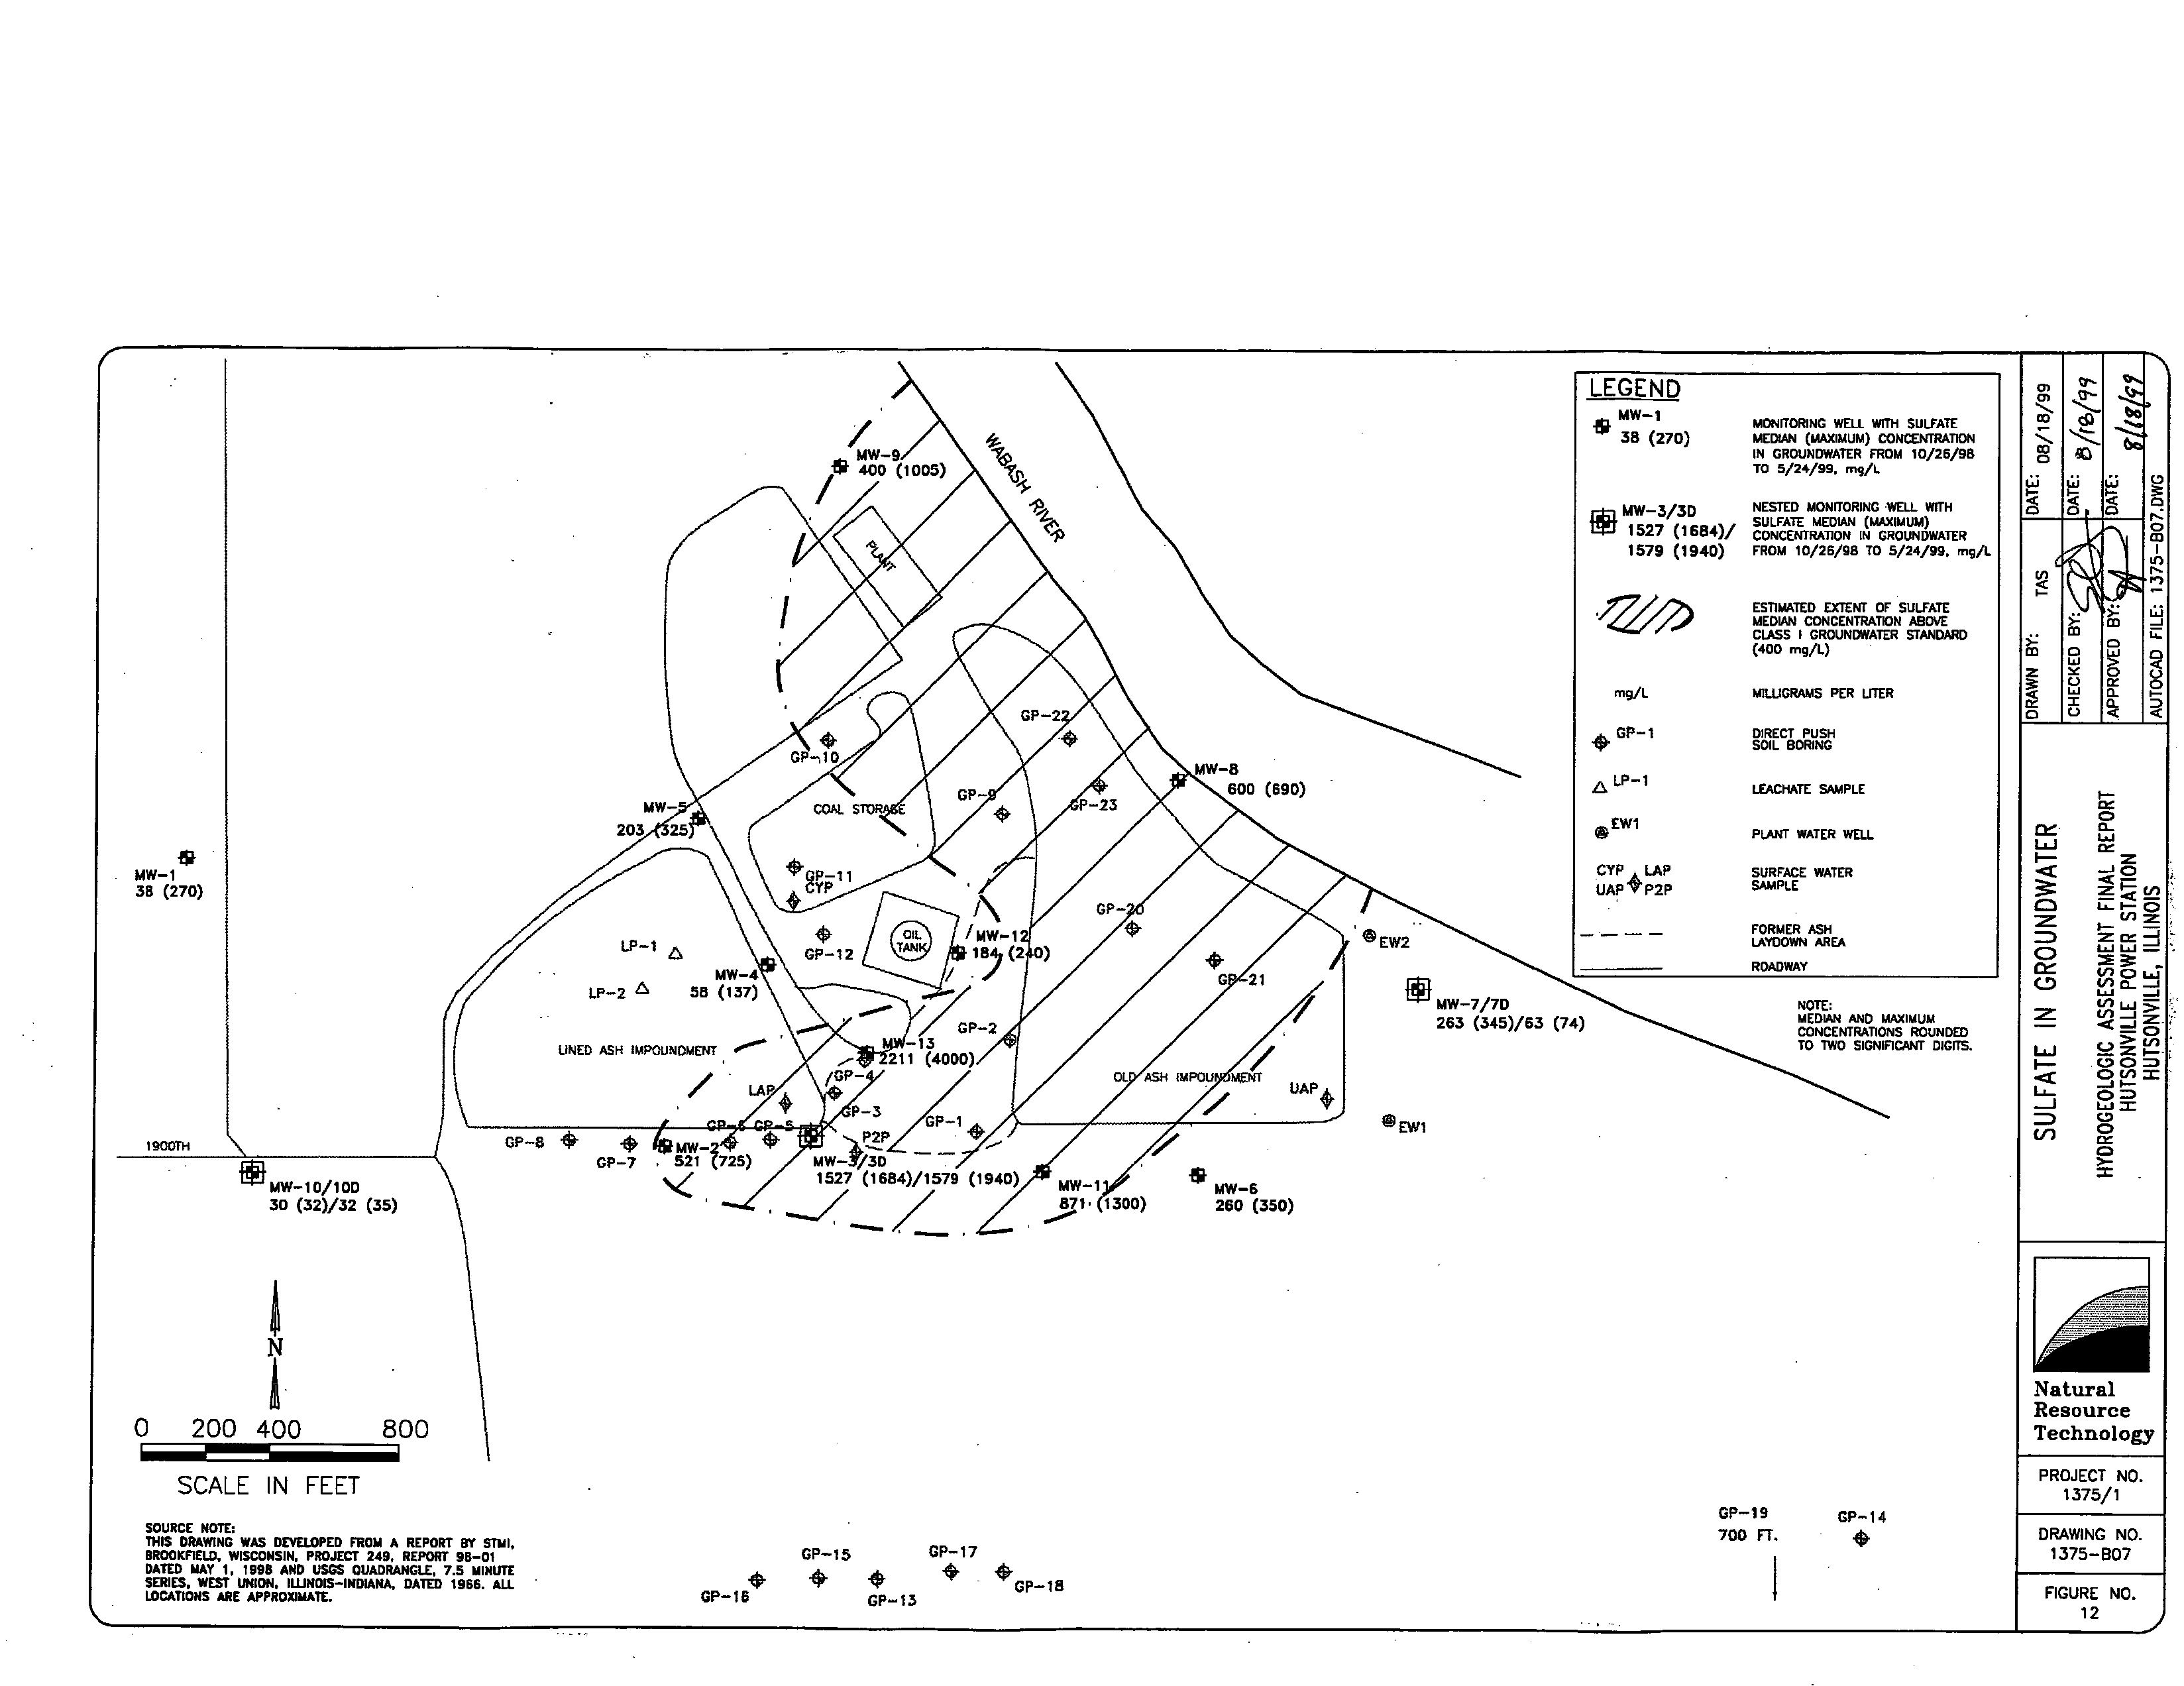
12
Sulfate in
groundwater 1375-1-B07
Figure
13
Total
maganese
in
groundwater 1375-1-B03
Figure
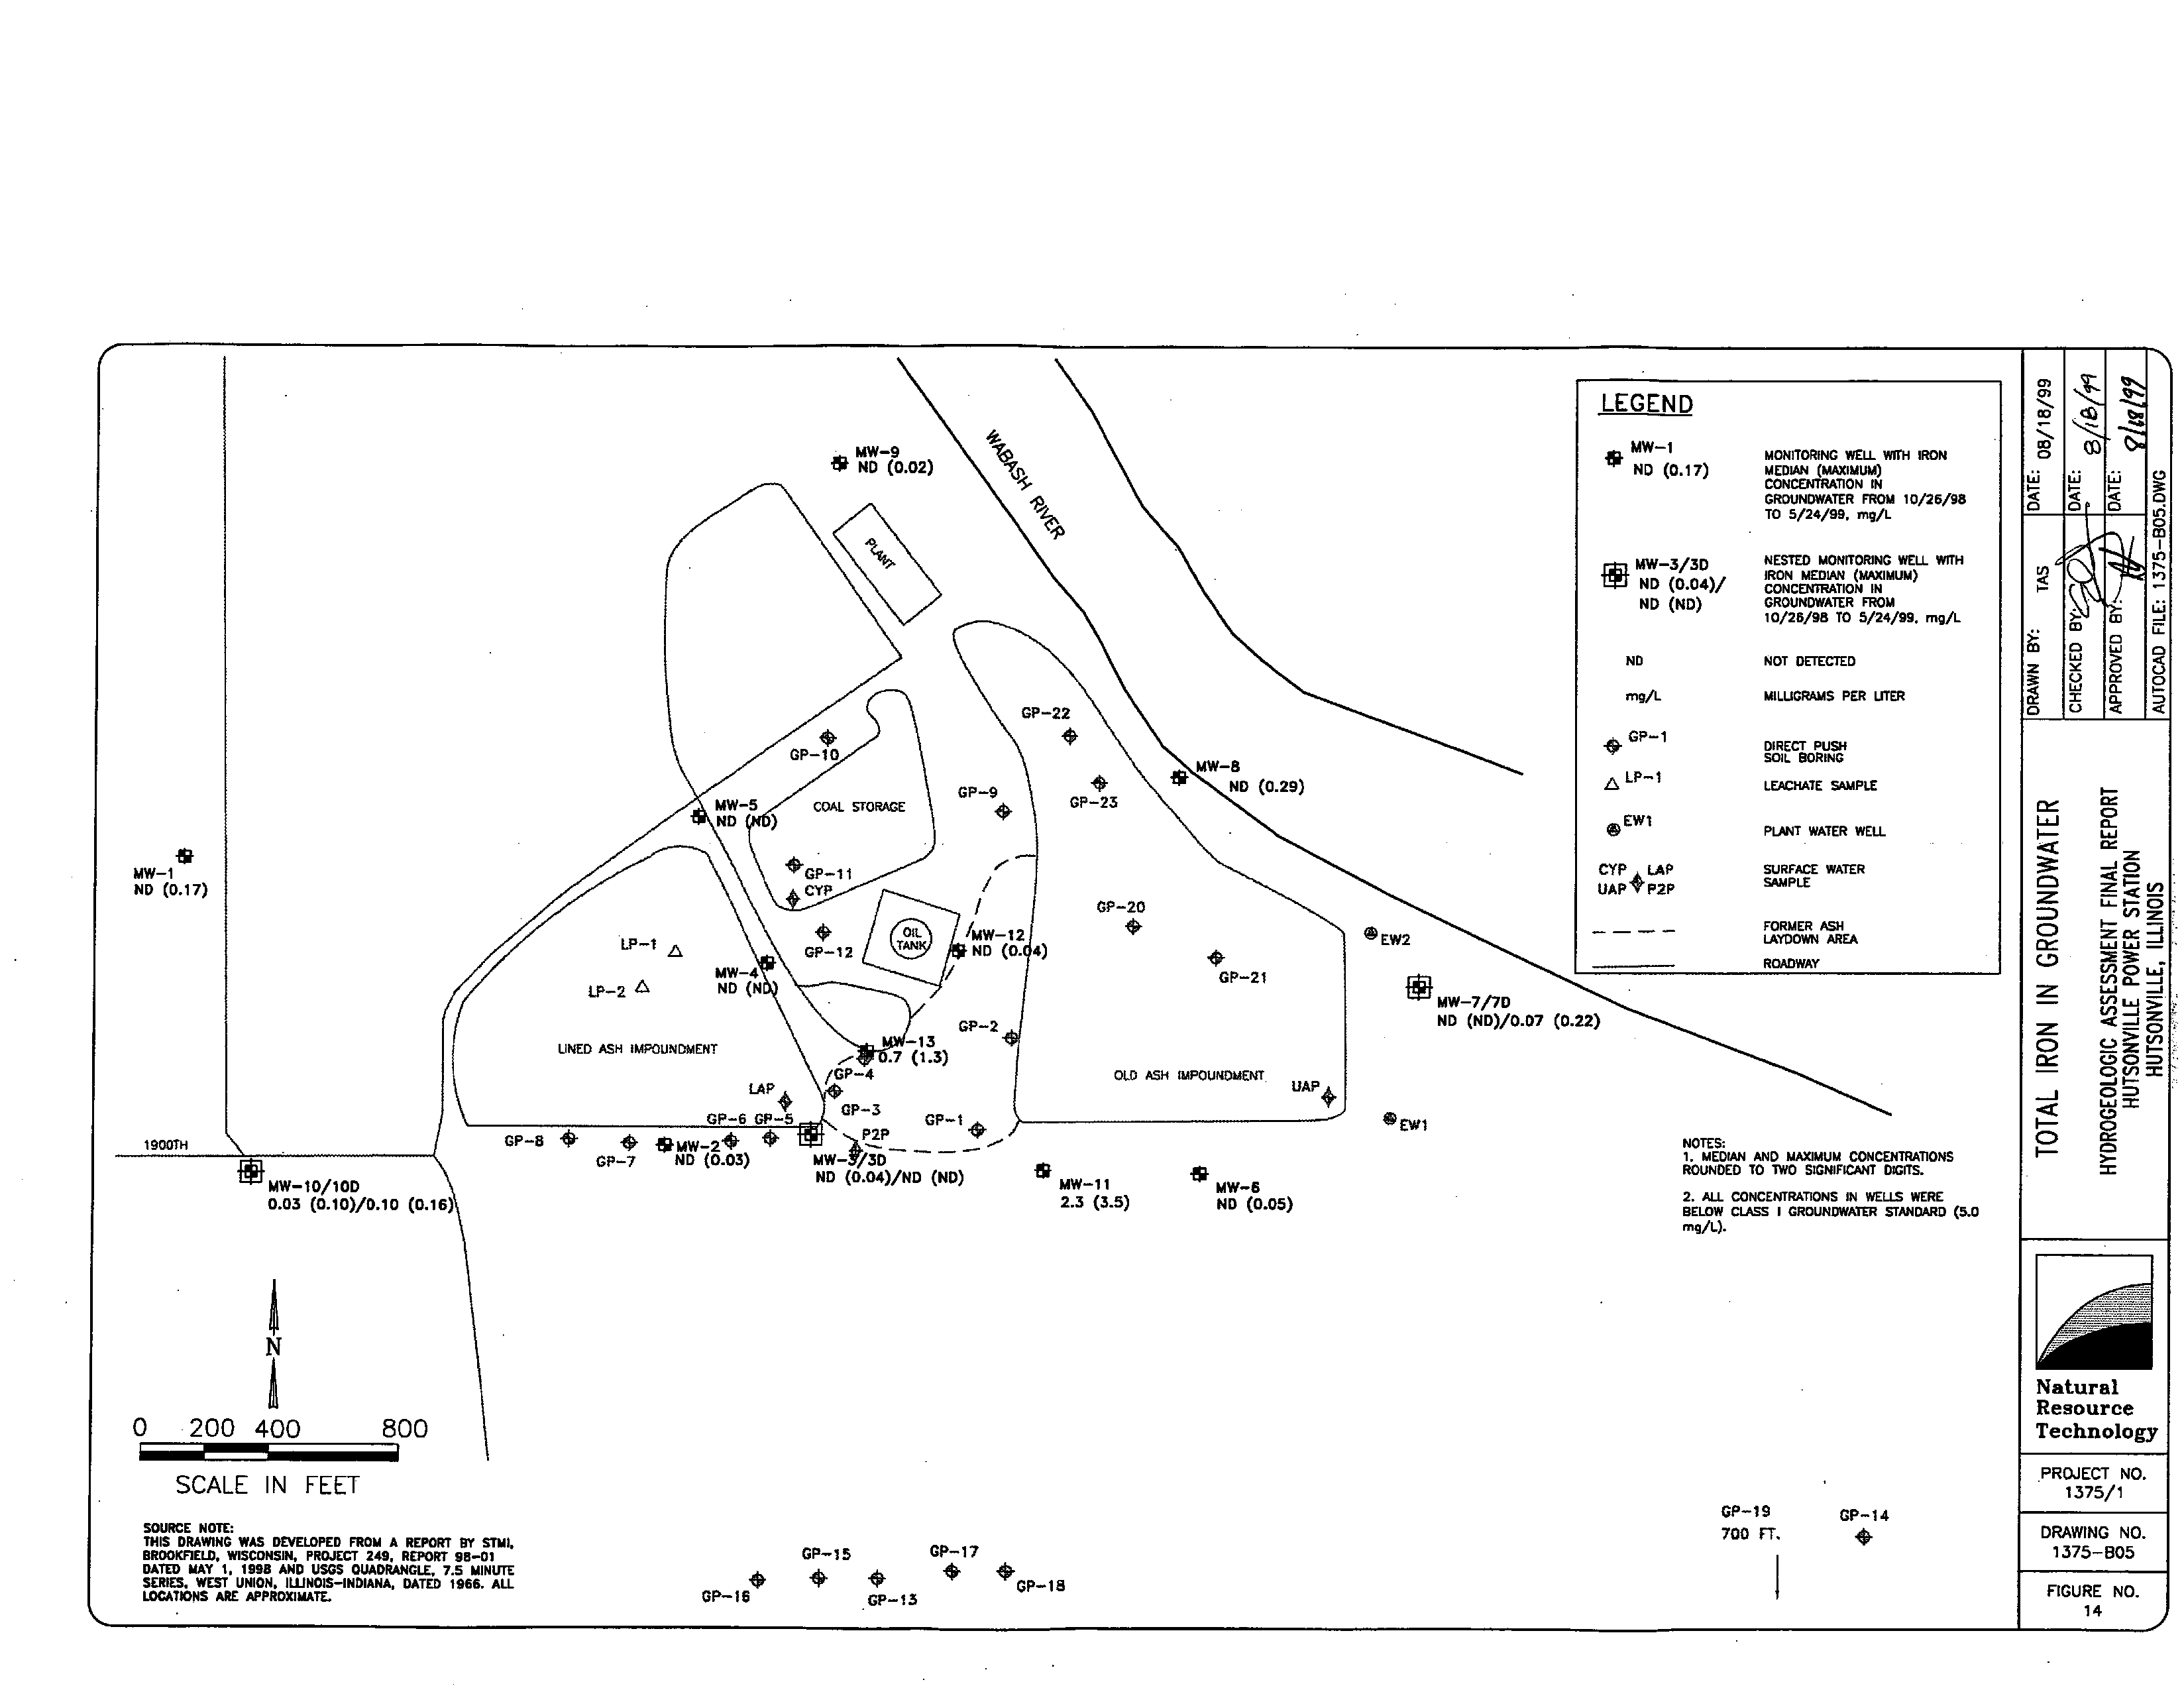
14
Total iron in
groundwater 1375-1-B05
Figure
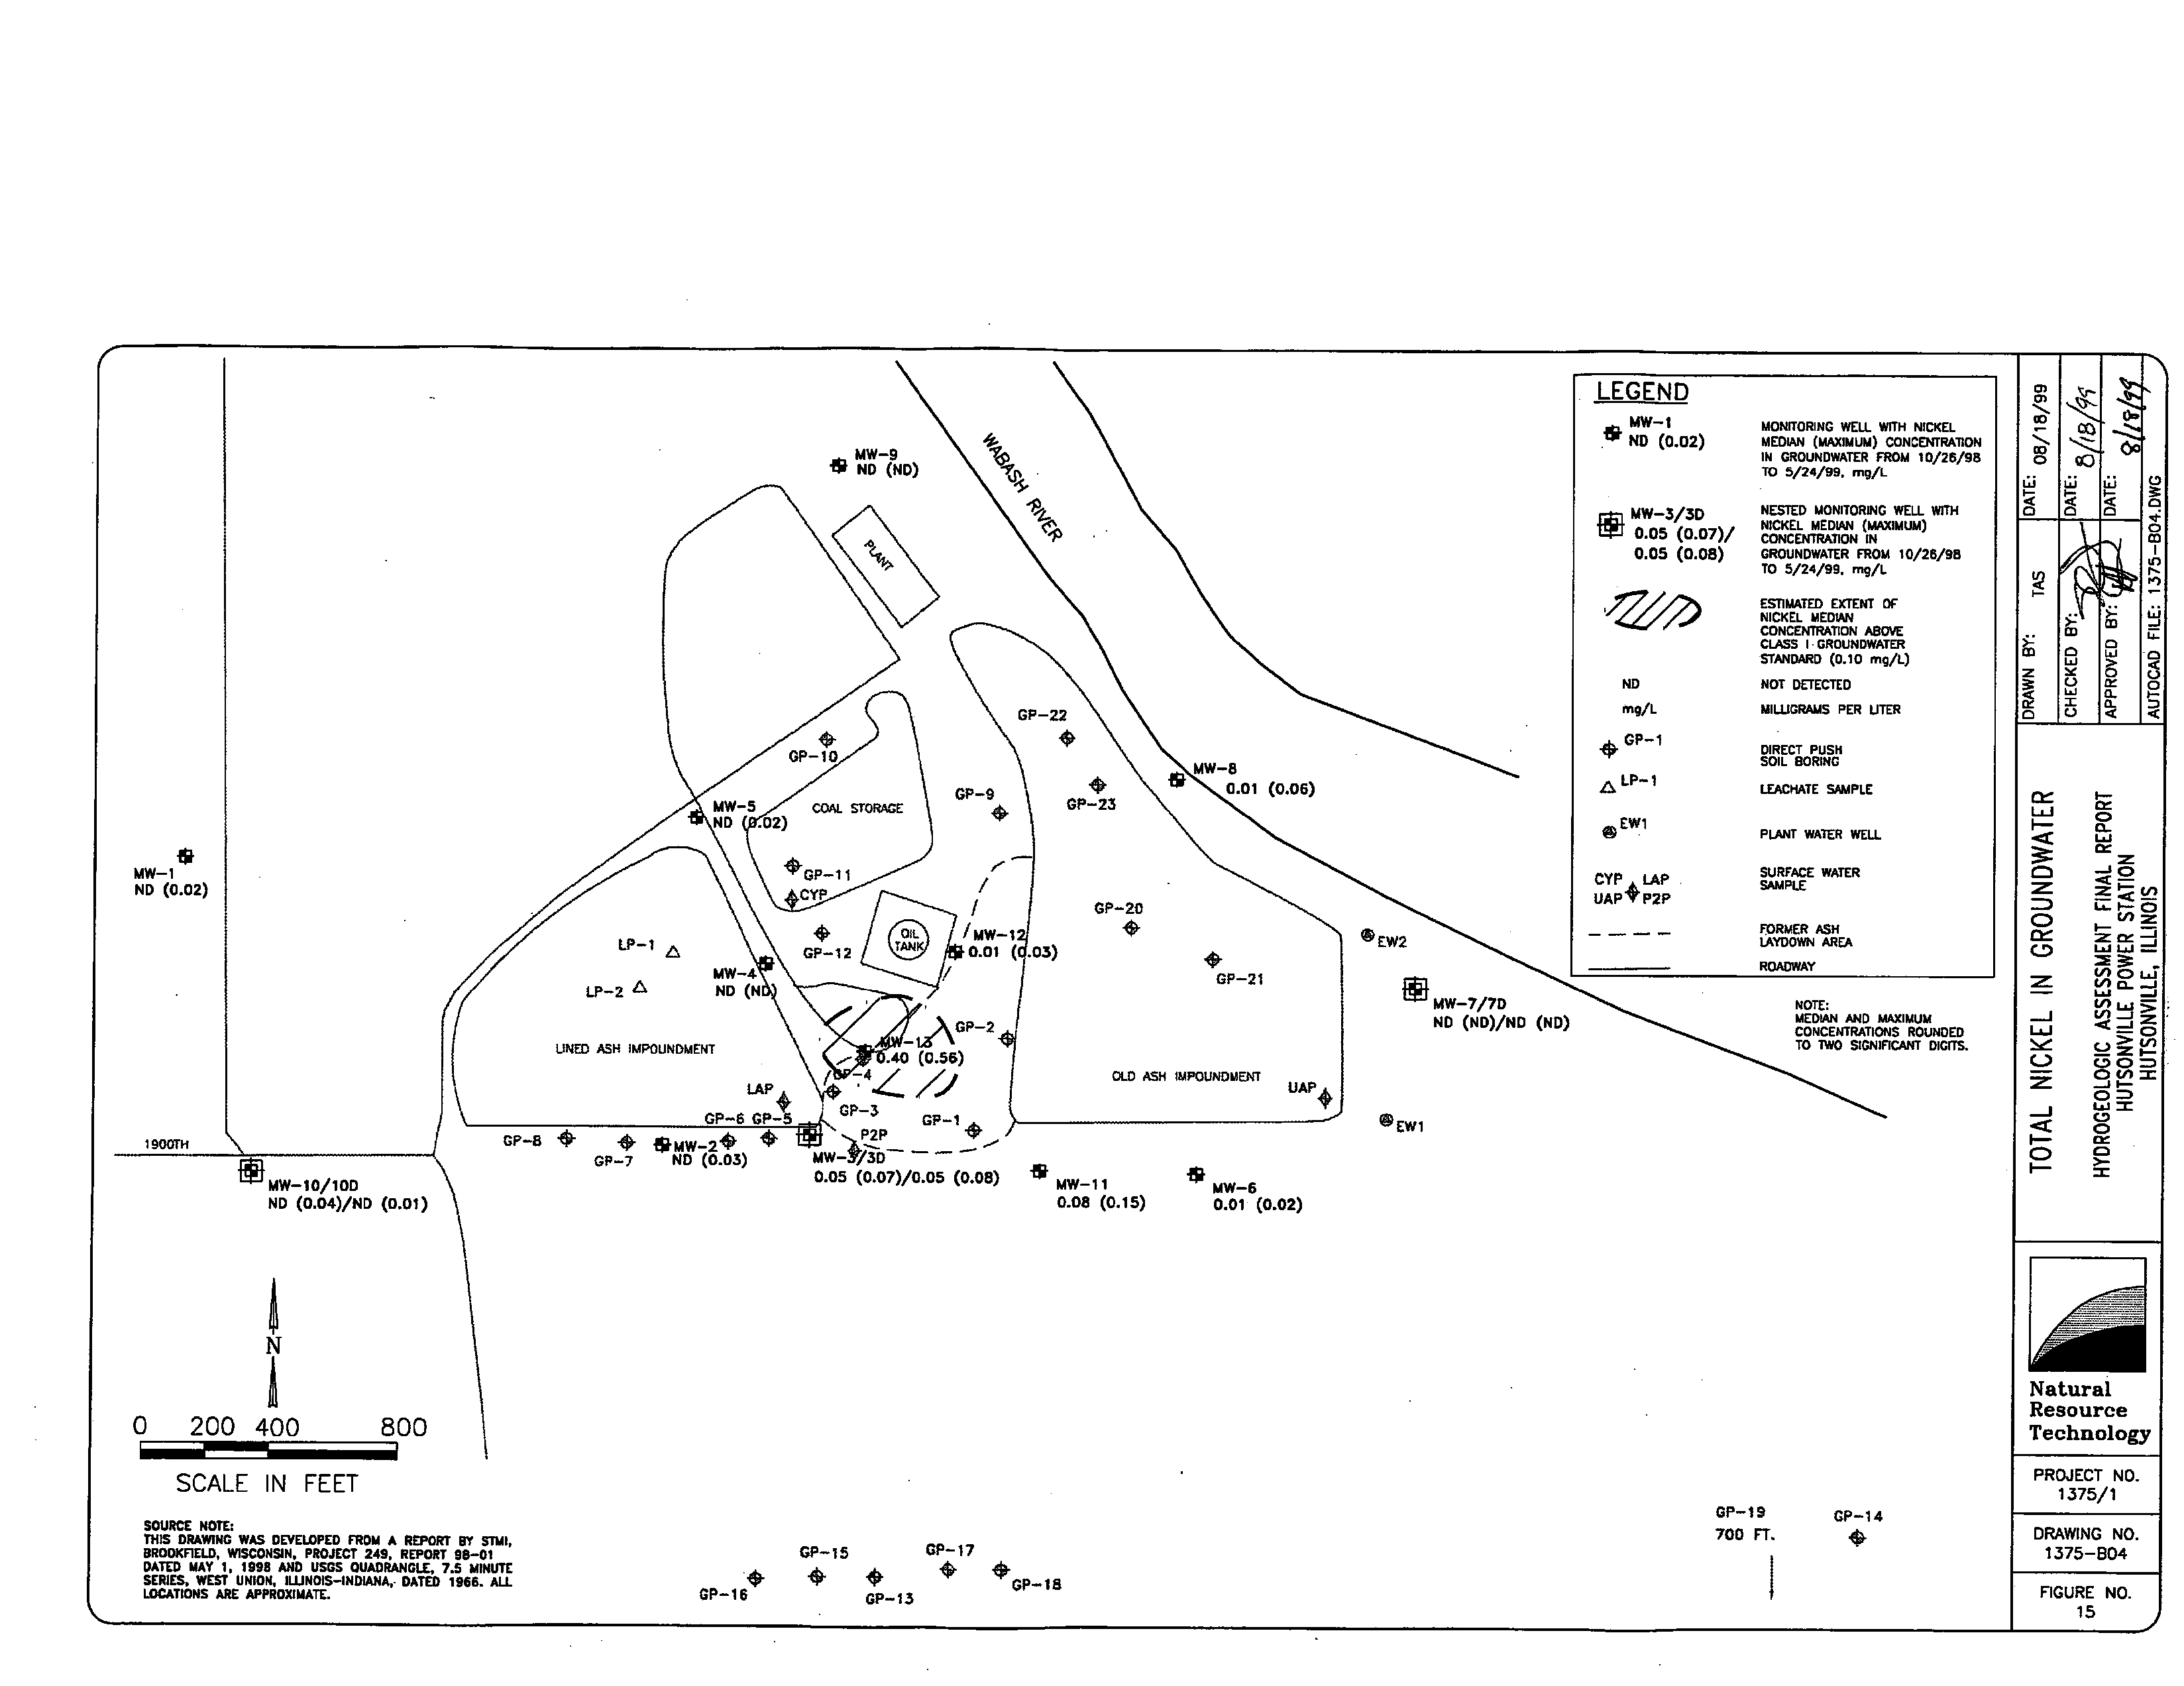
15
Total nickel in
groundwater l375-l-B04
Figure
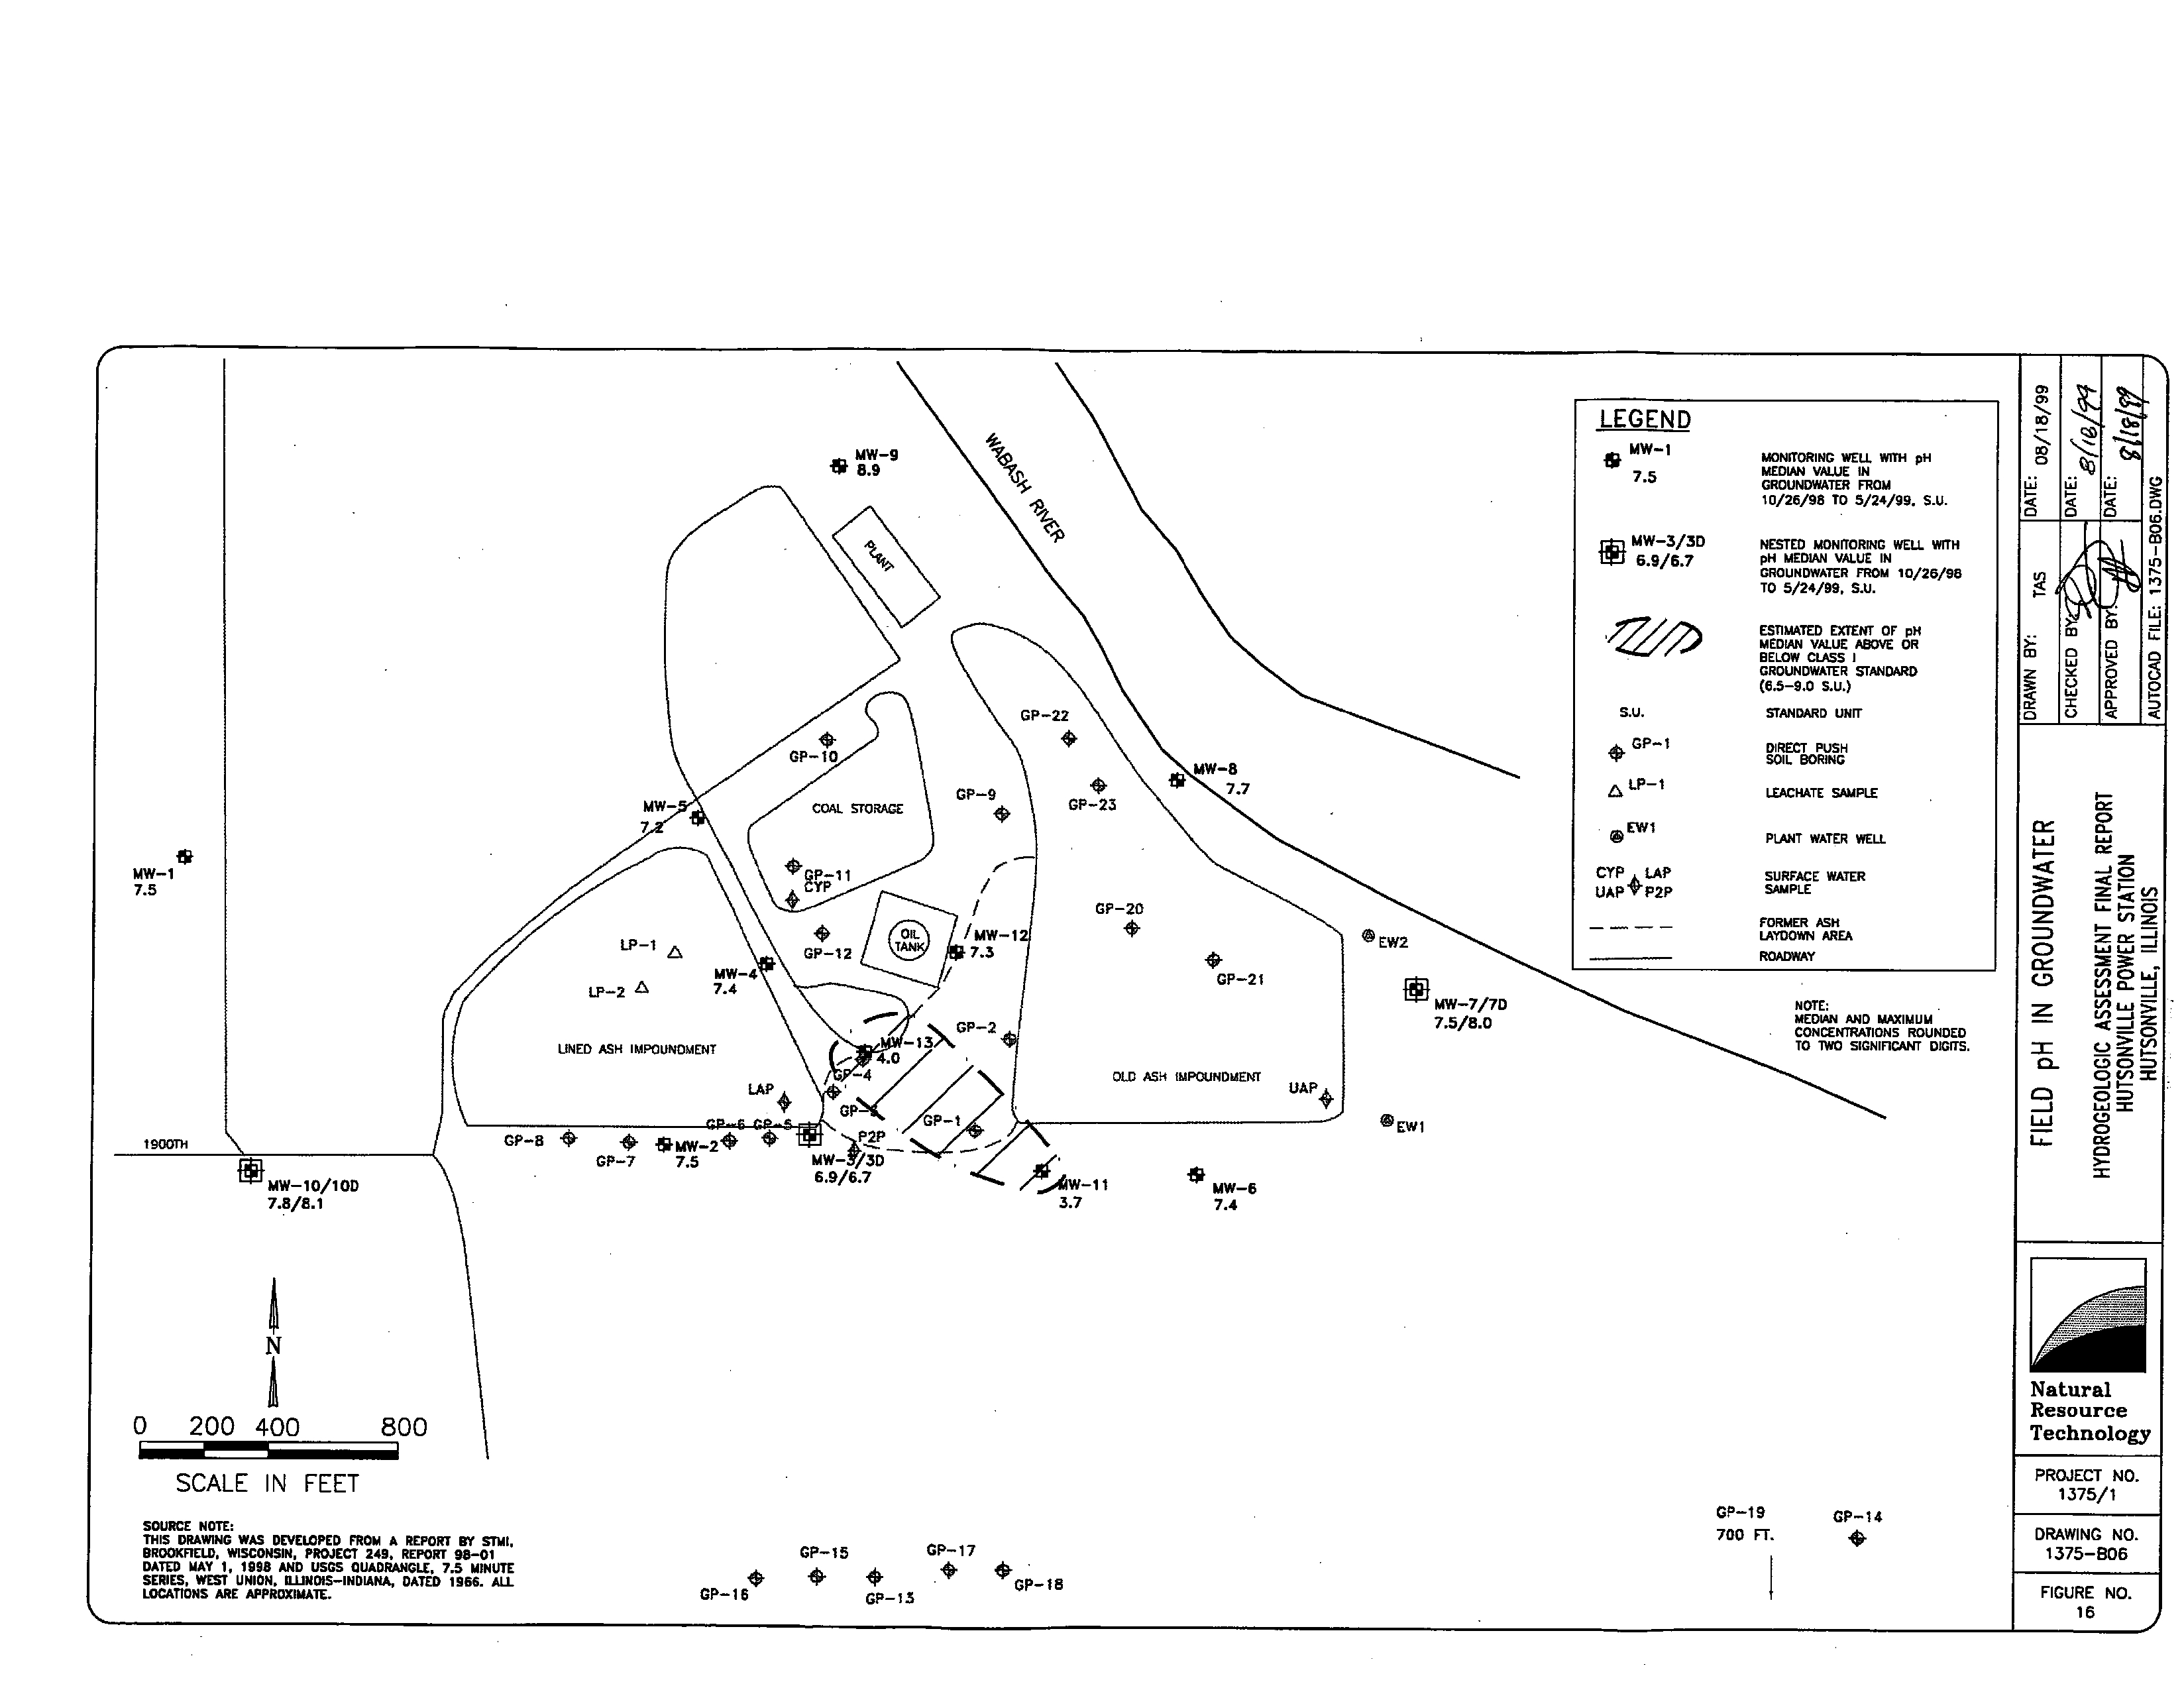
16
Field
pH
in
groundwater 1375-1-B06
Figure
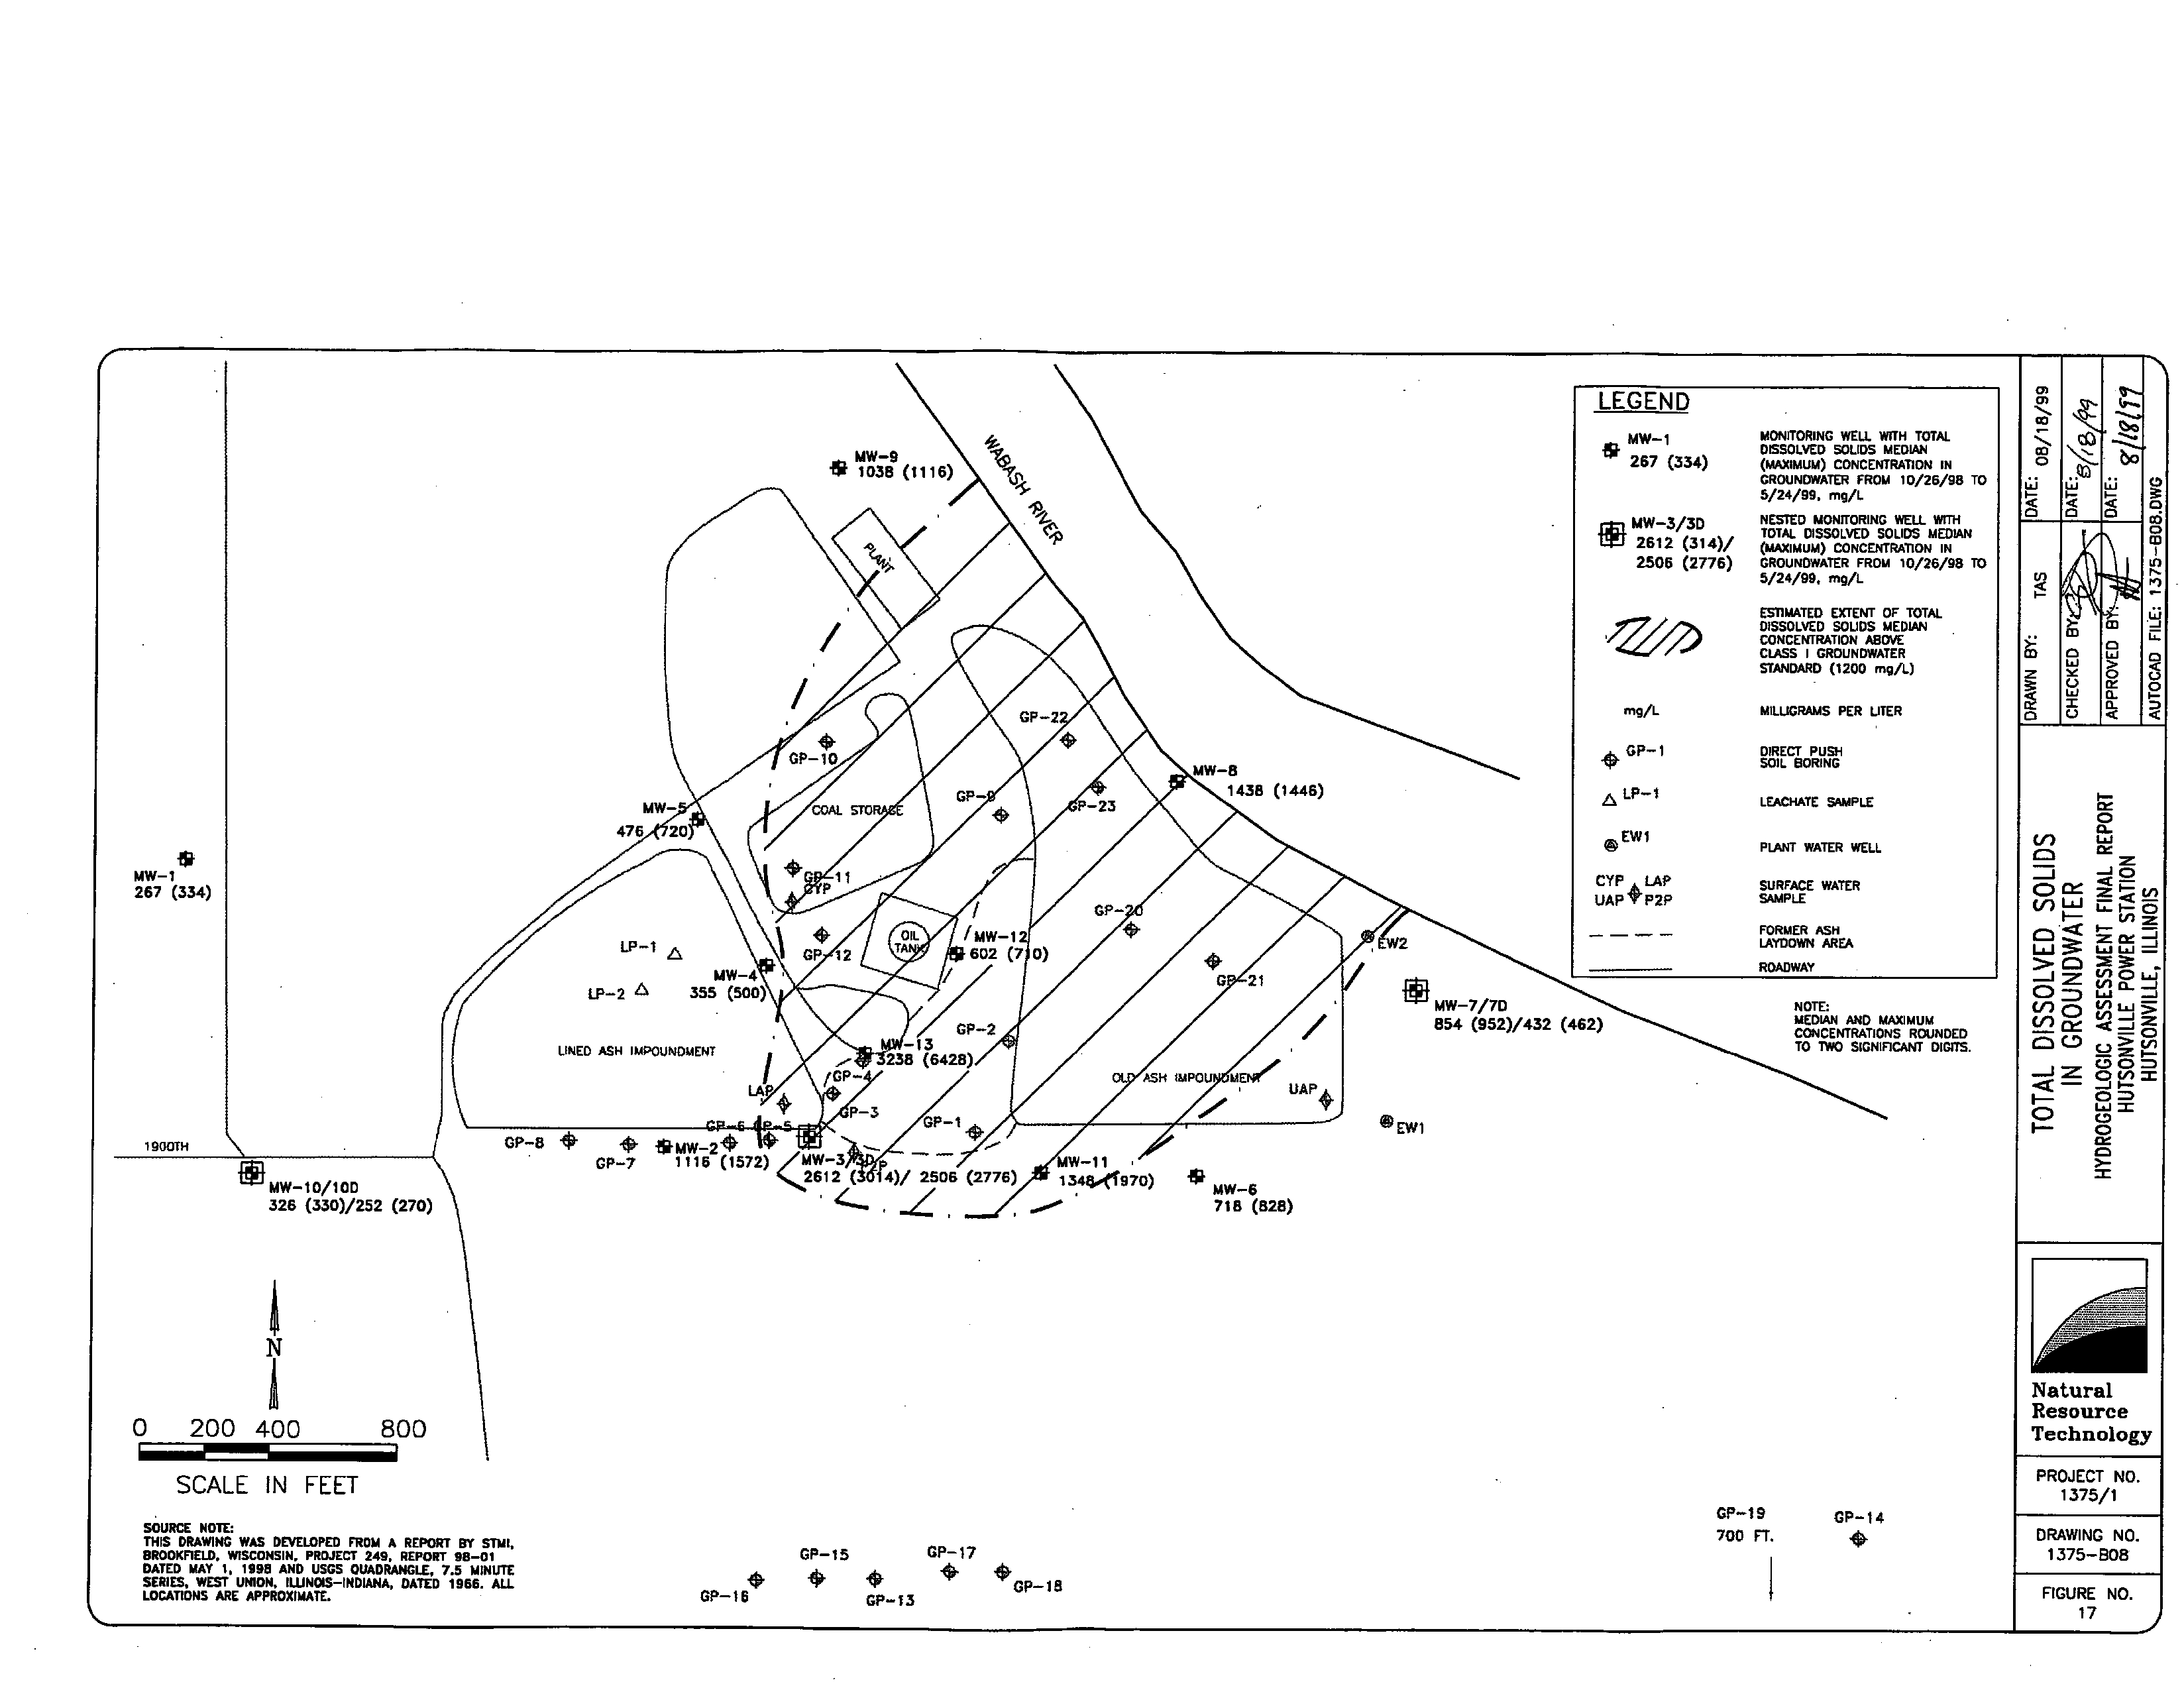
17
Total dissolved solids in
groundwater 1375-l-B08
hutsonvil le
hydrogeologic
assessment.doc
Natural
ii
Resource
Technology
Electronic Filing - Received, Clerk's Office, August 11, 2008 - AS 09-1, Exhibit 4
TABLE OF CONTENTS
TABLES
Table
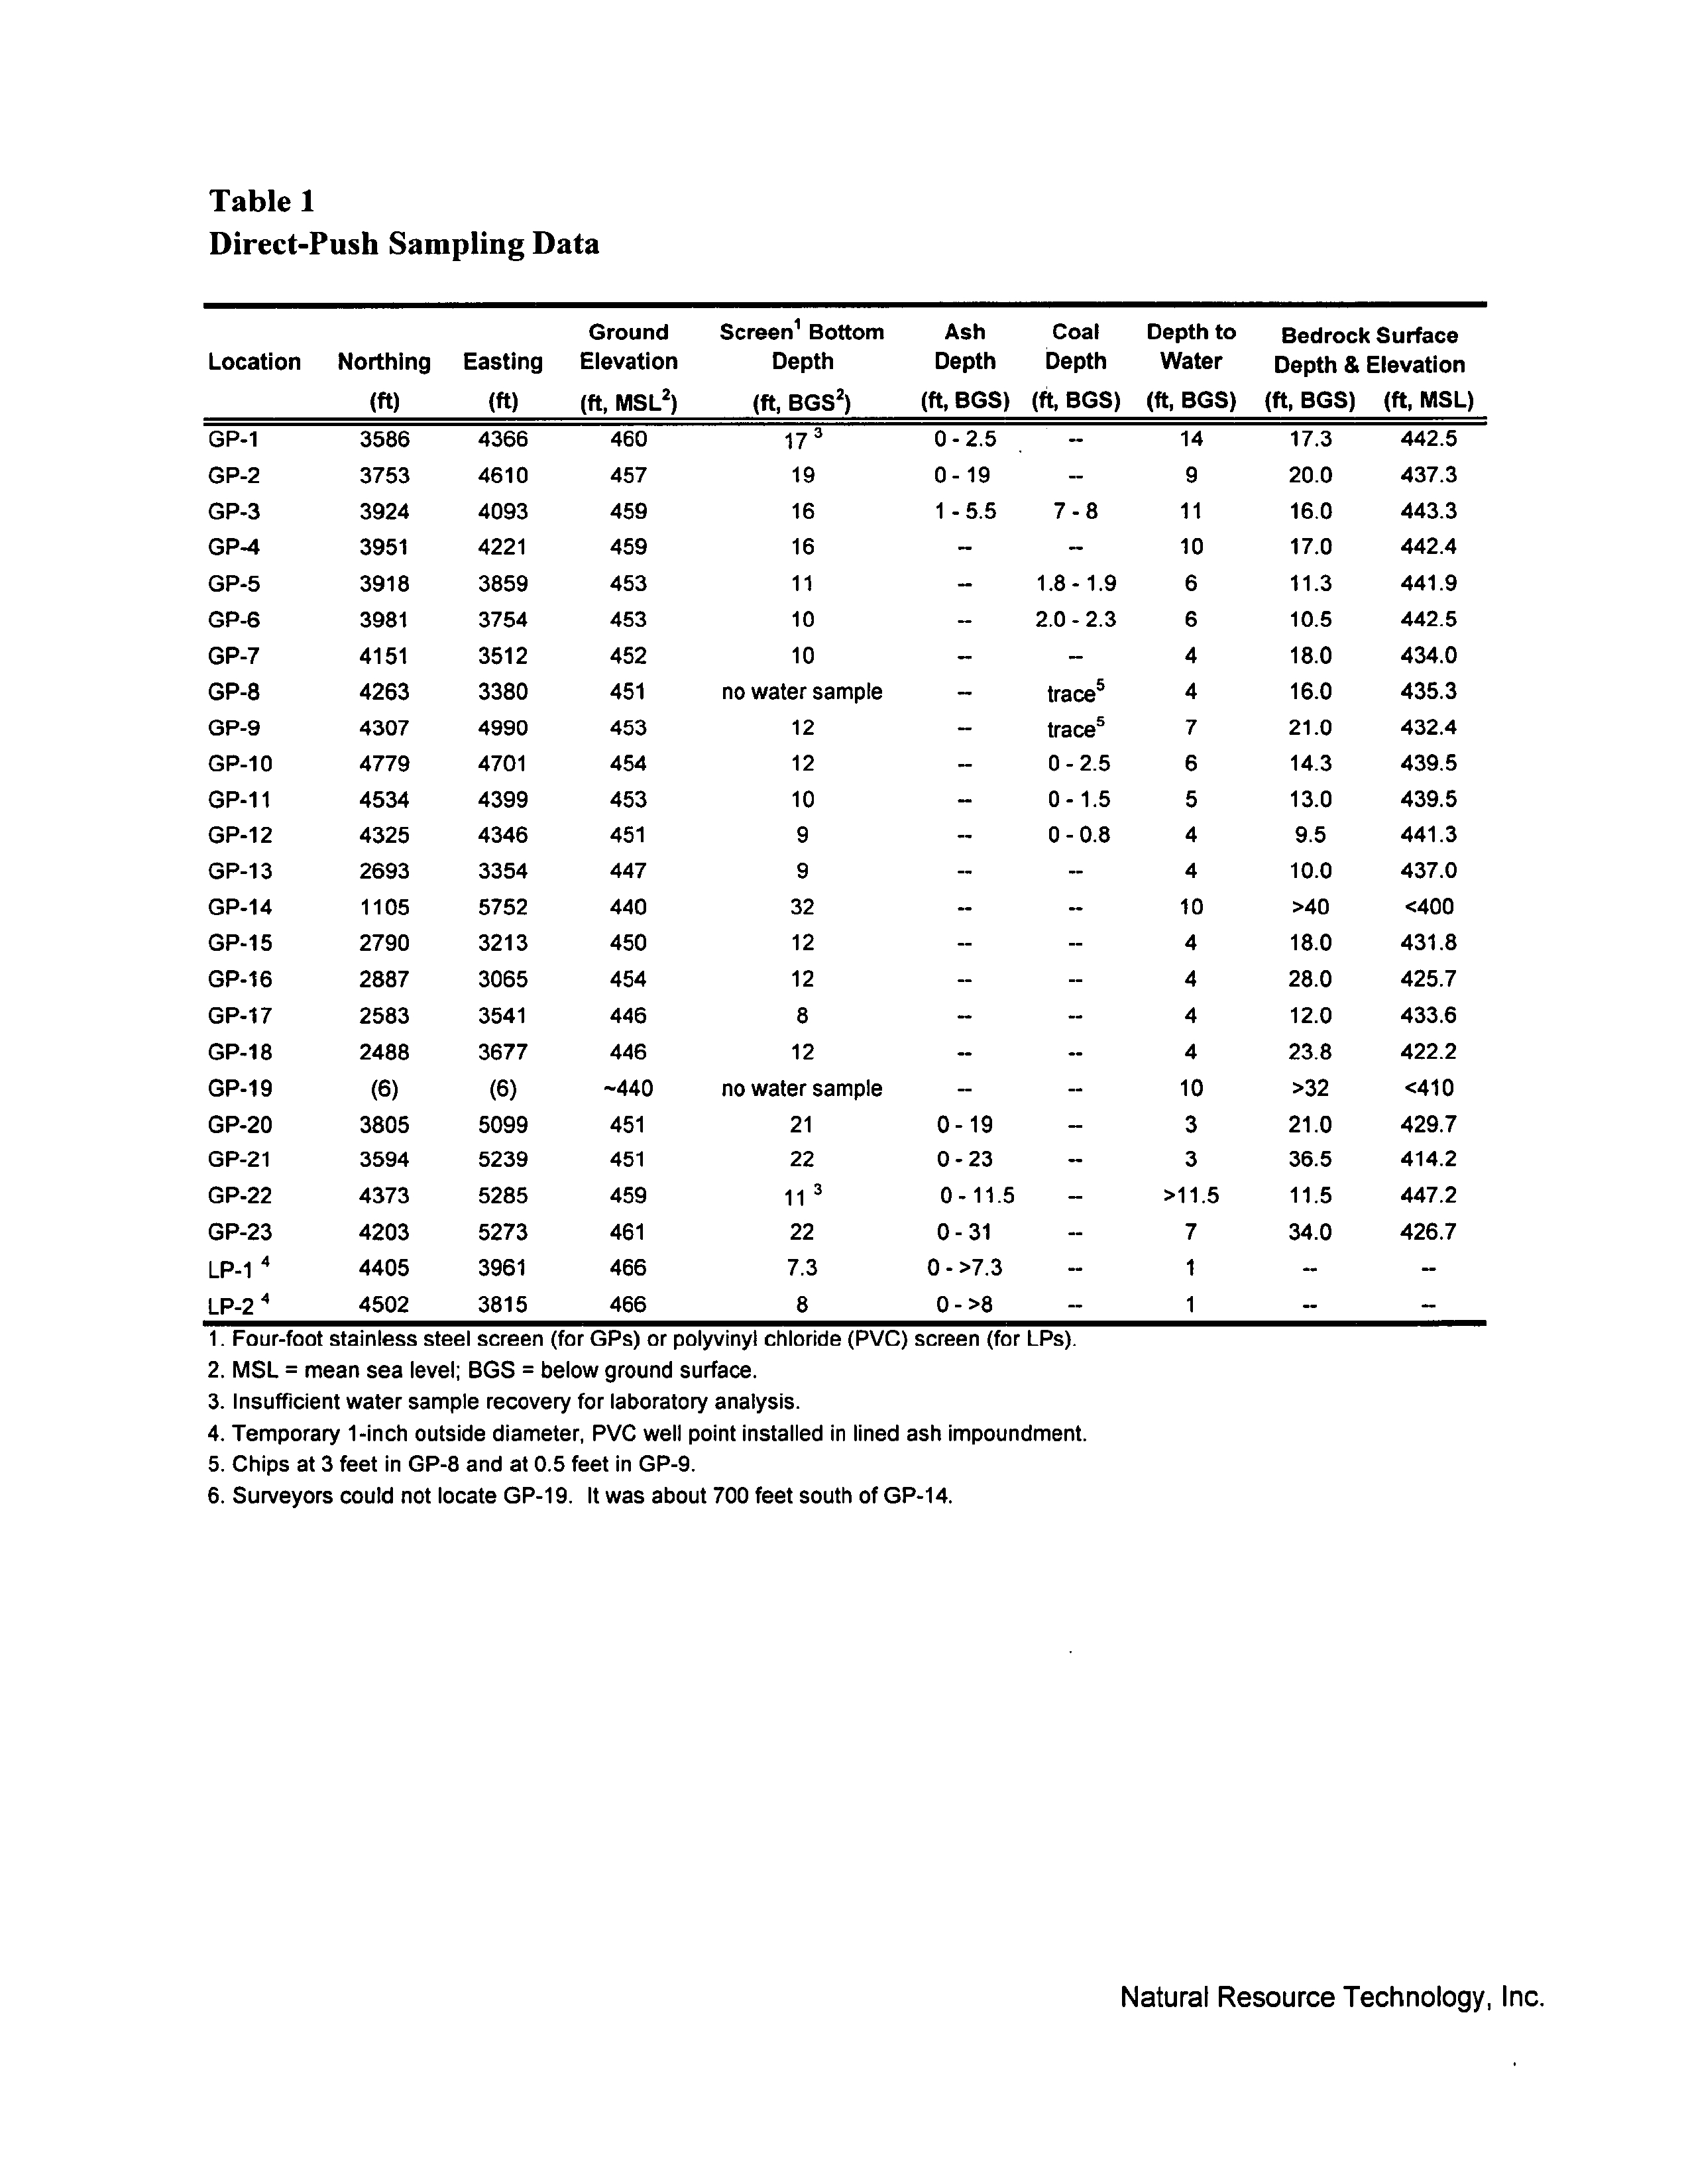
Direct-Push
Sampling
Data
Table
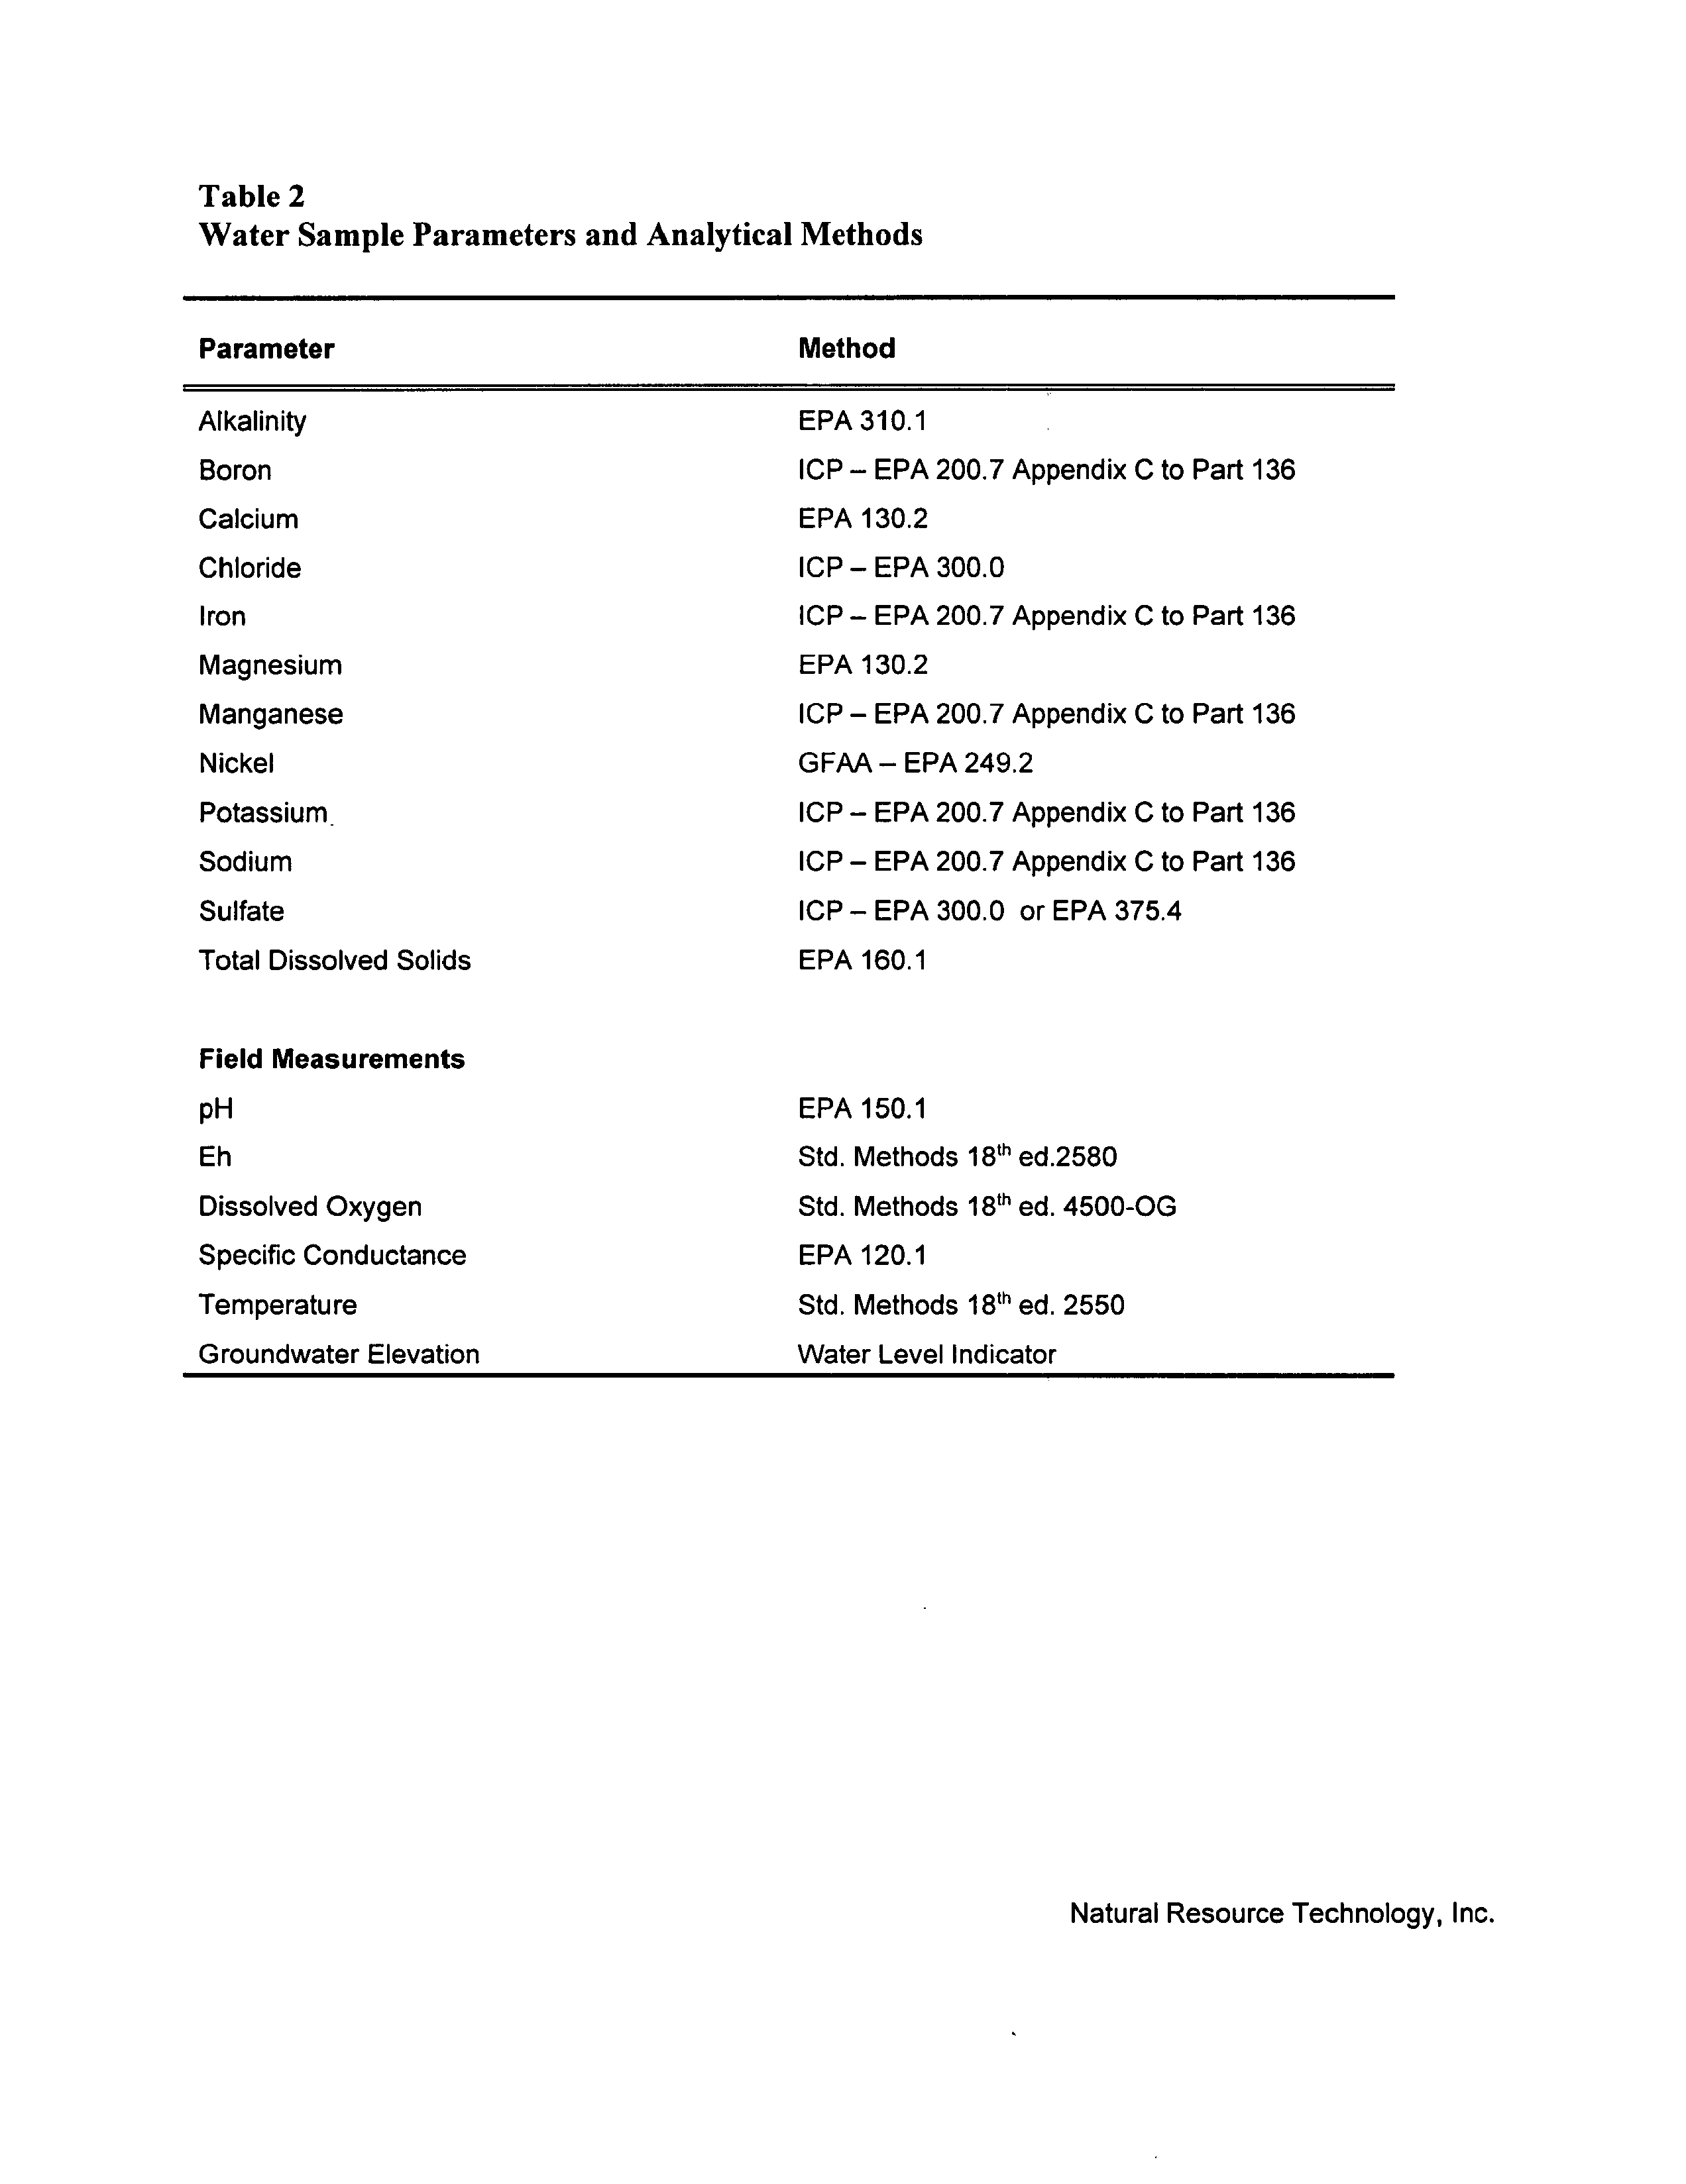
Water
Sample
Parameters and
Analytical
Methods
Table
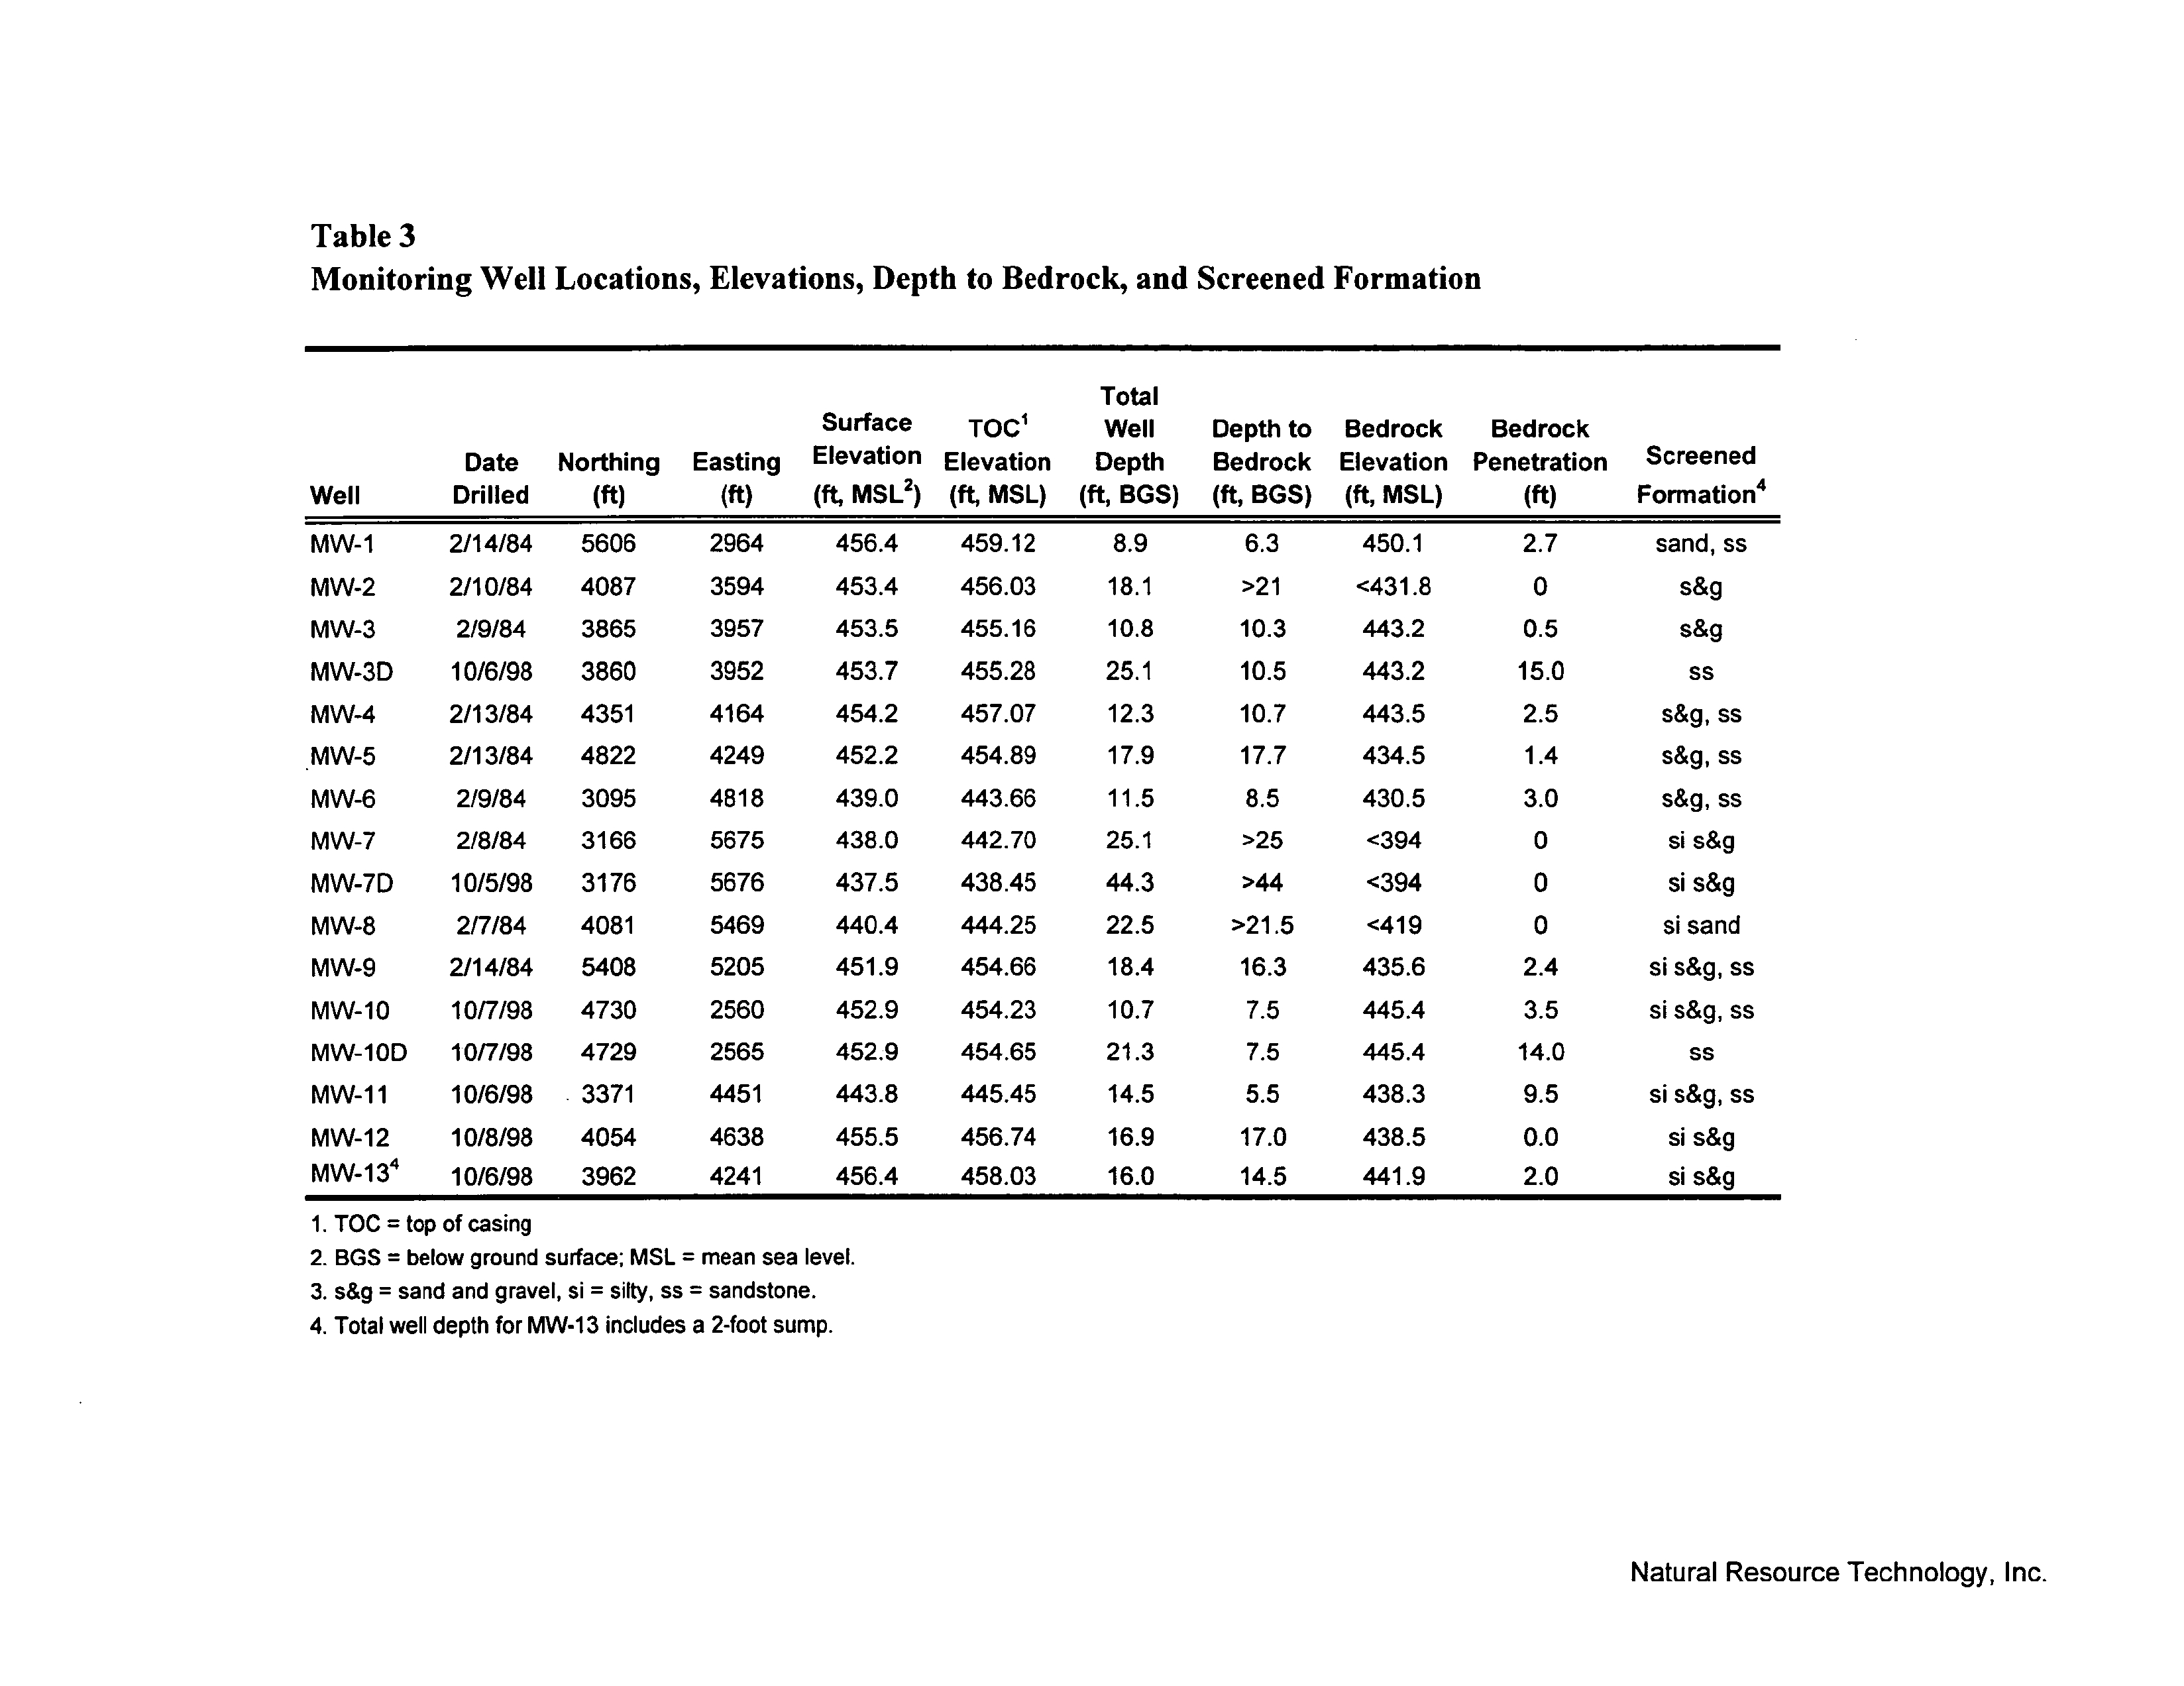
Monitoring
Well
Locations
Elevations
Depth
to
Bedrock
and Screened
Formation
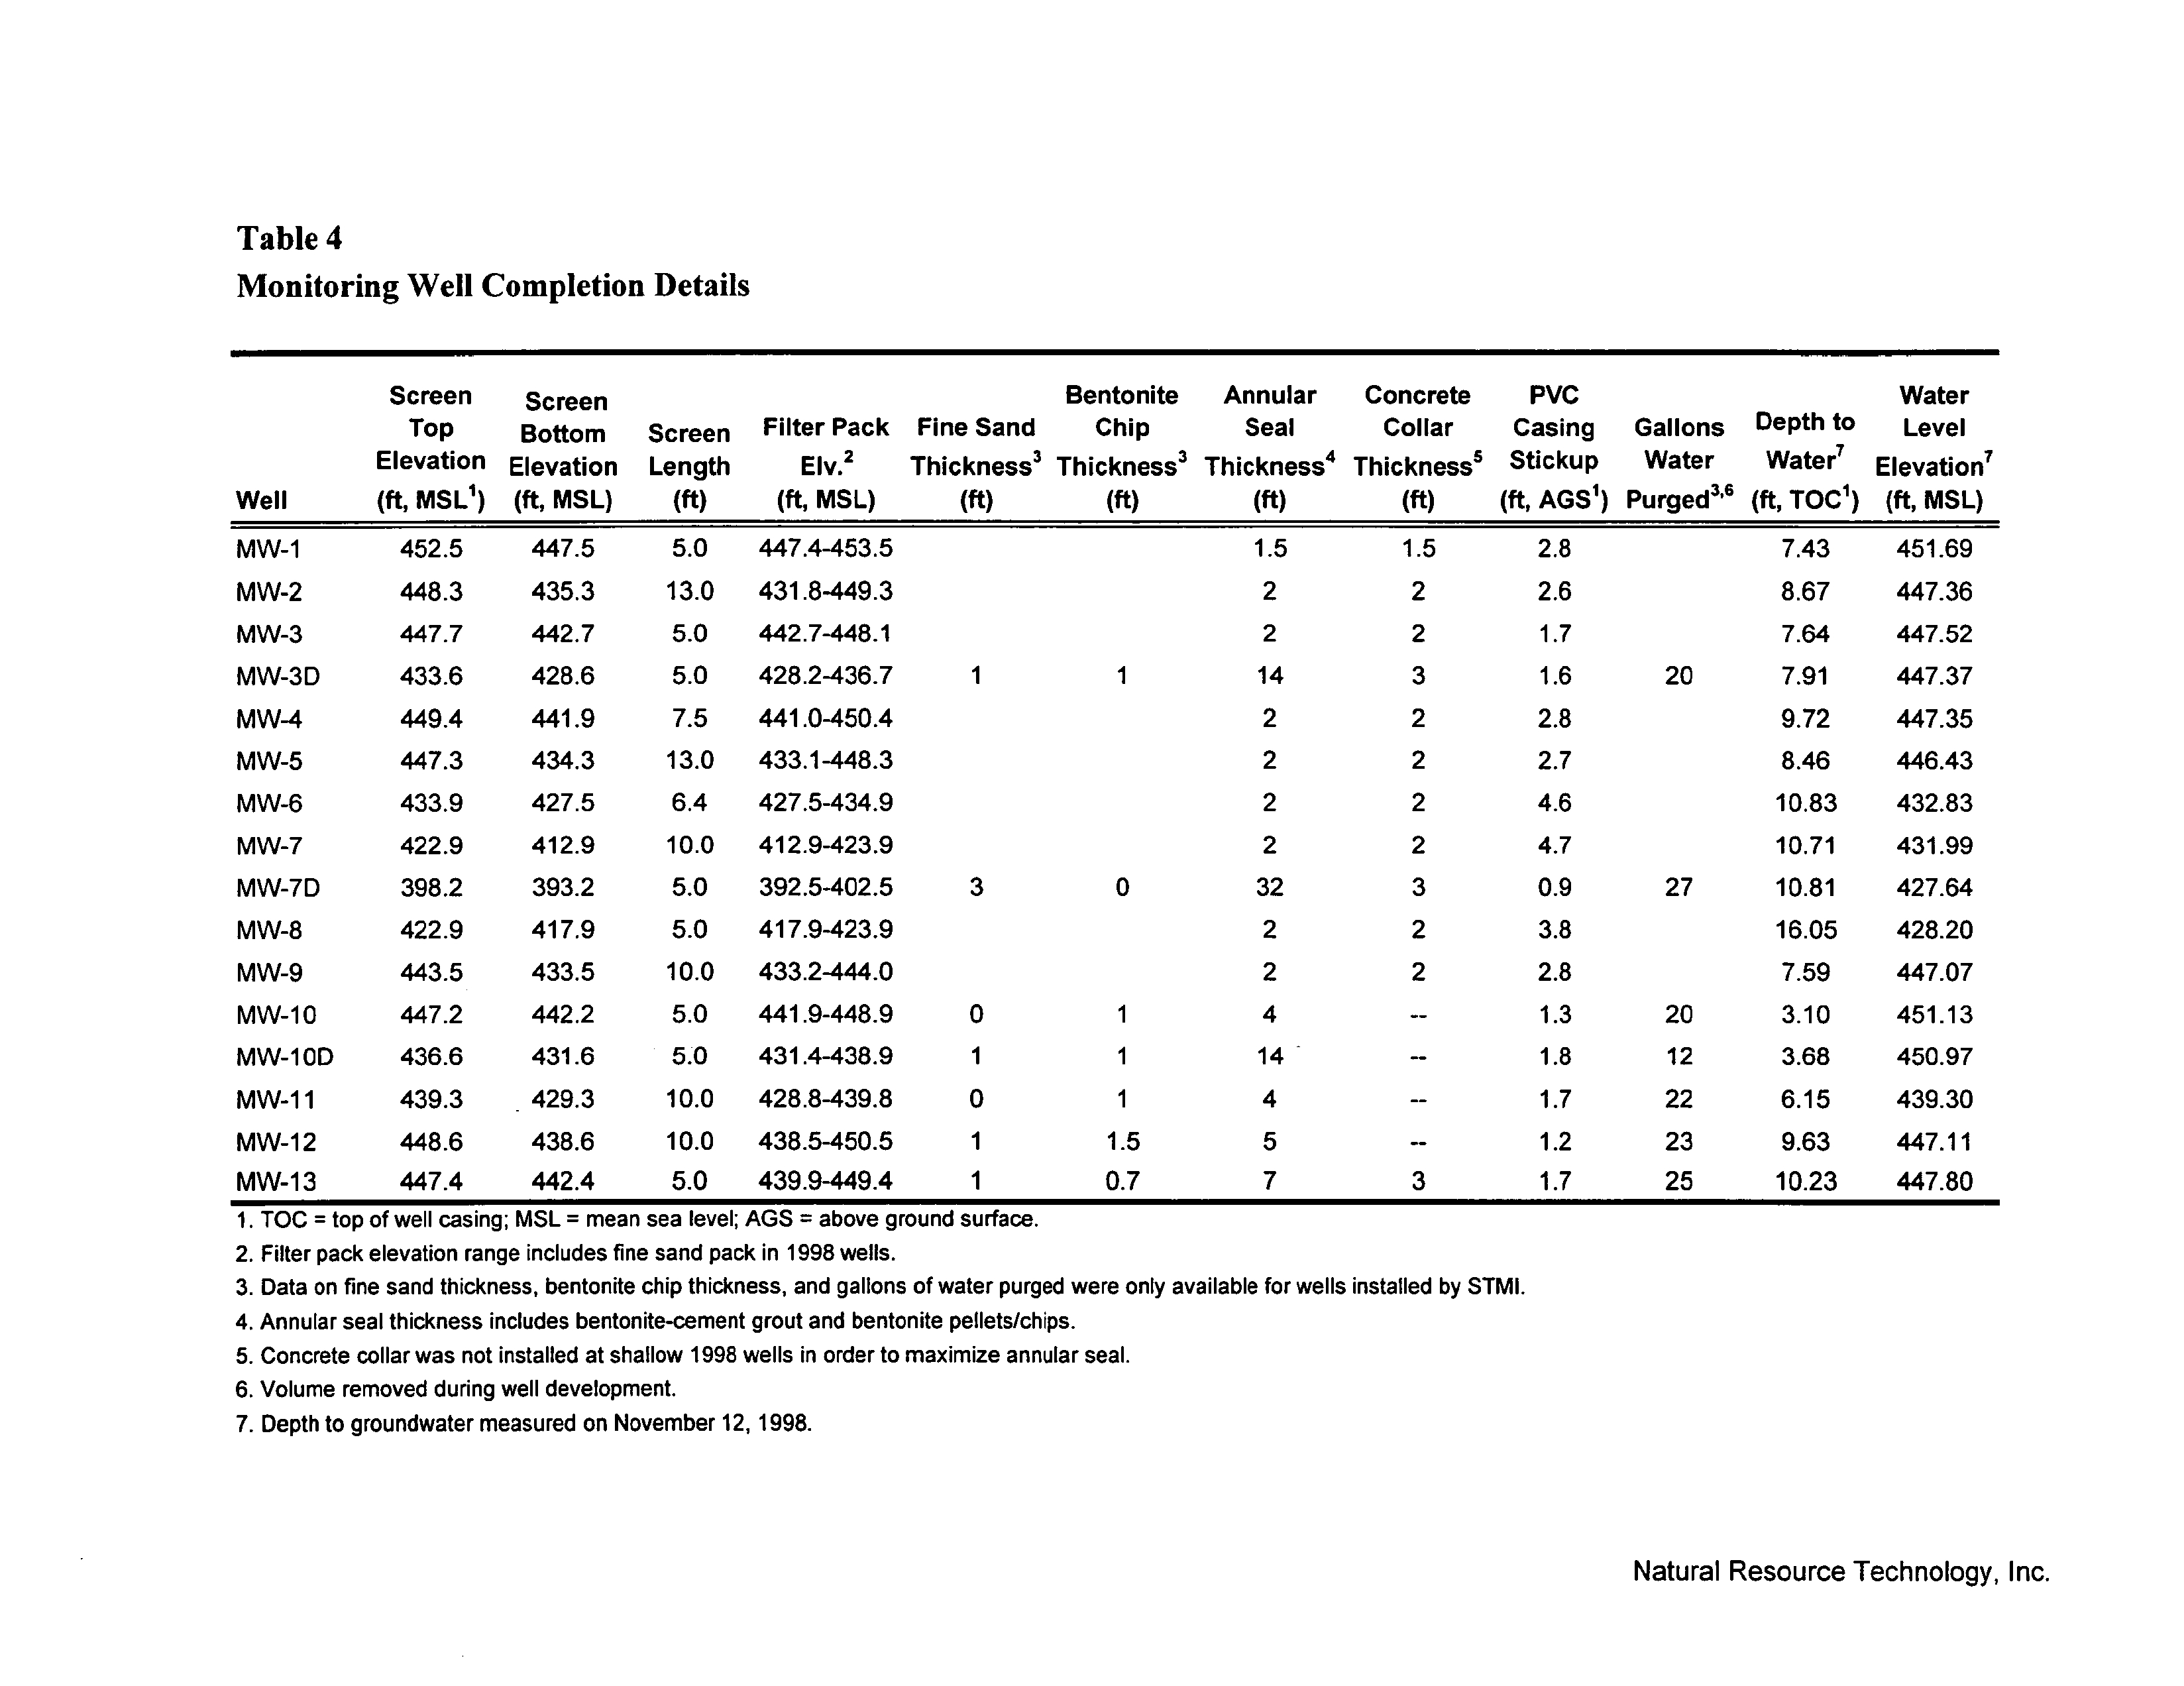
Table
Monitoring
Well
Completion
Details
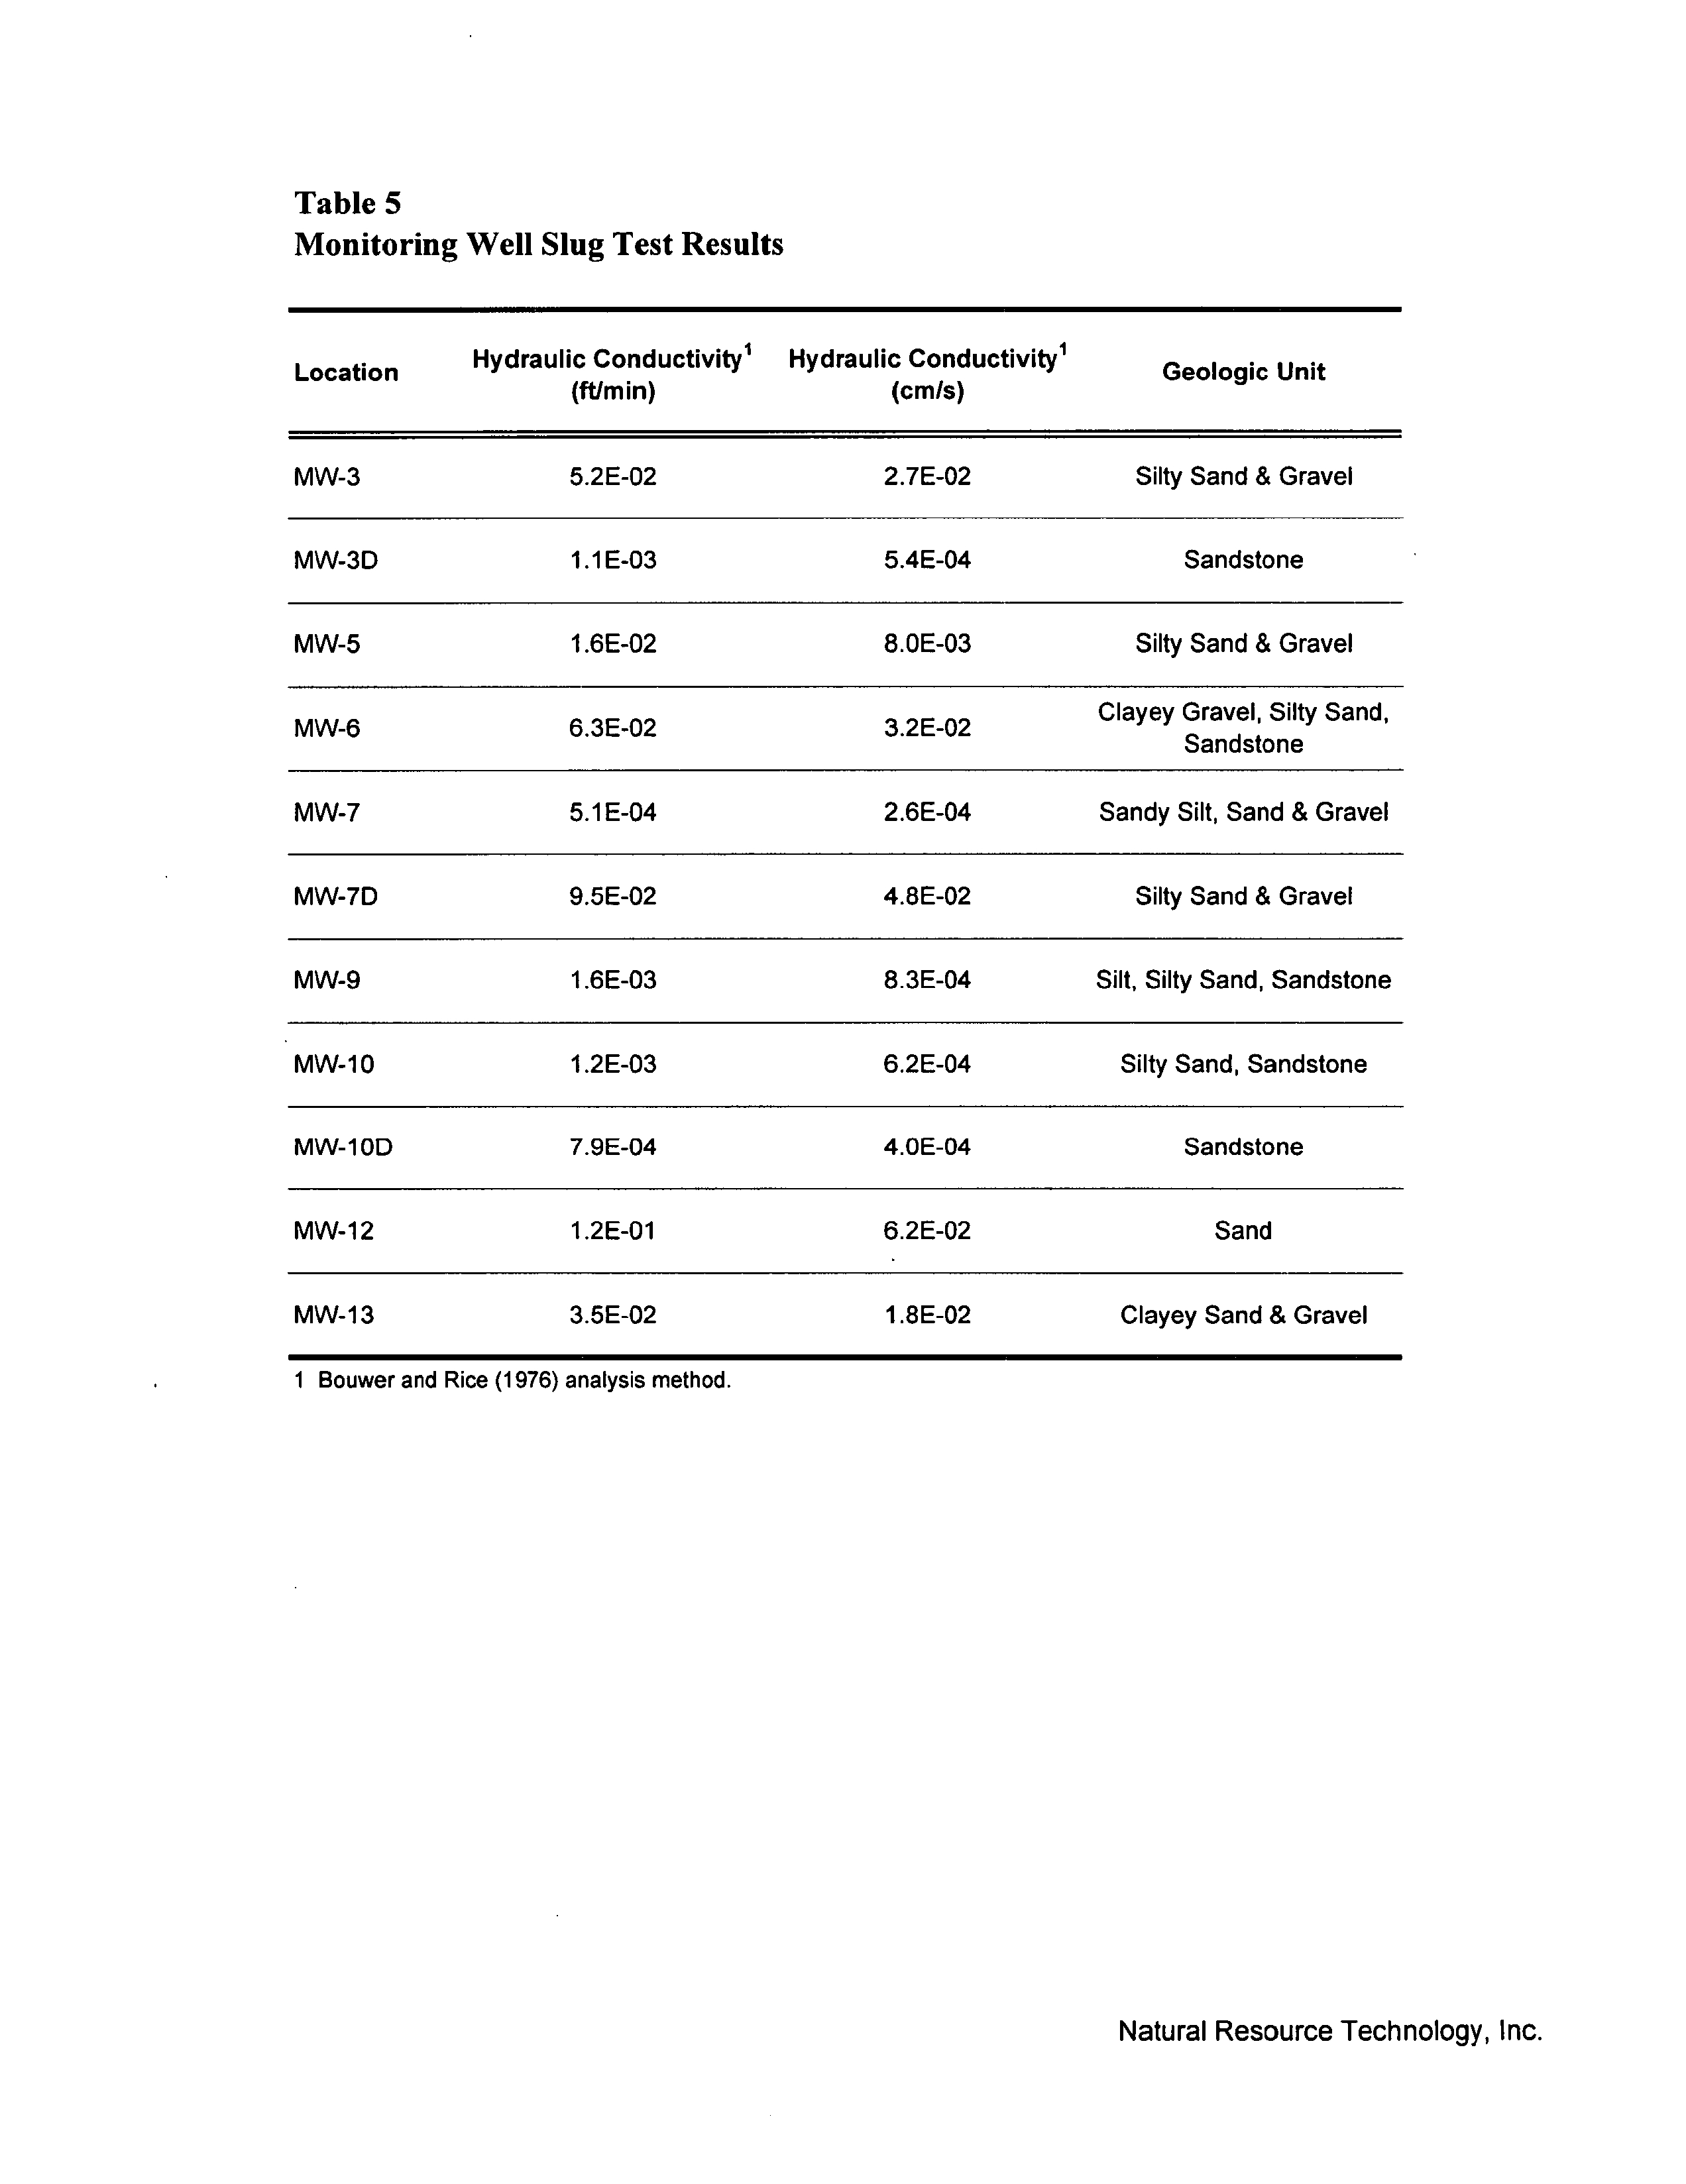
Table
Monitoring
Well
Slug
Test Results
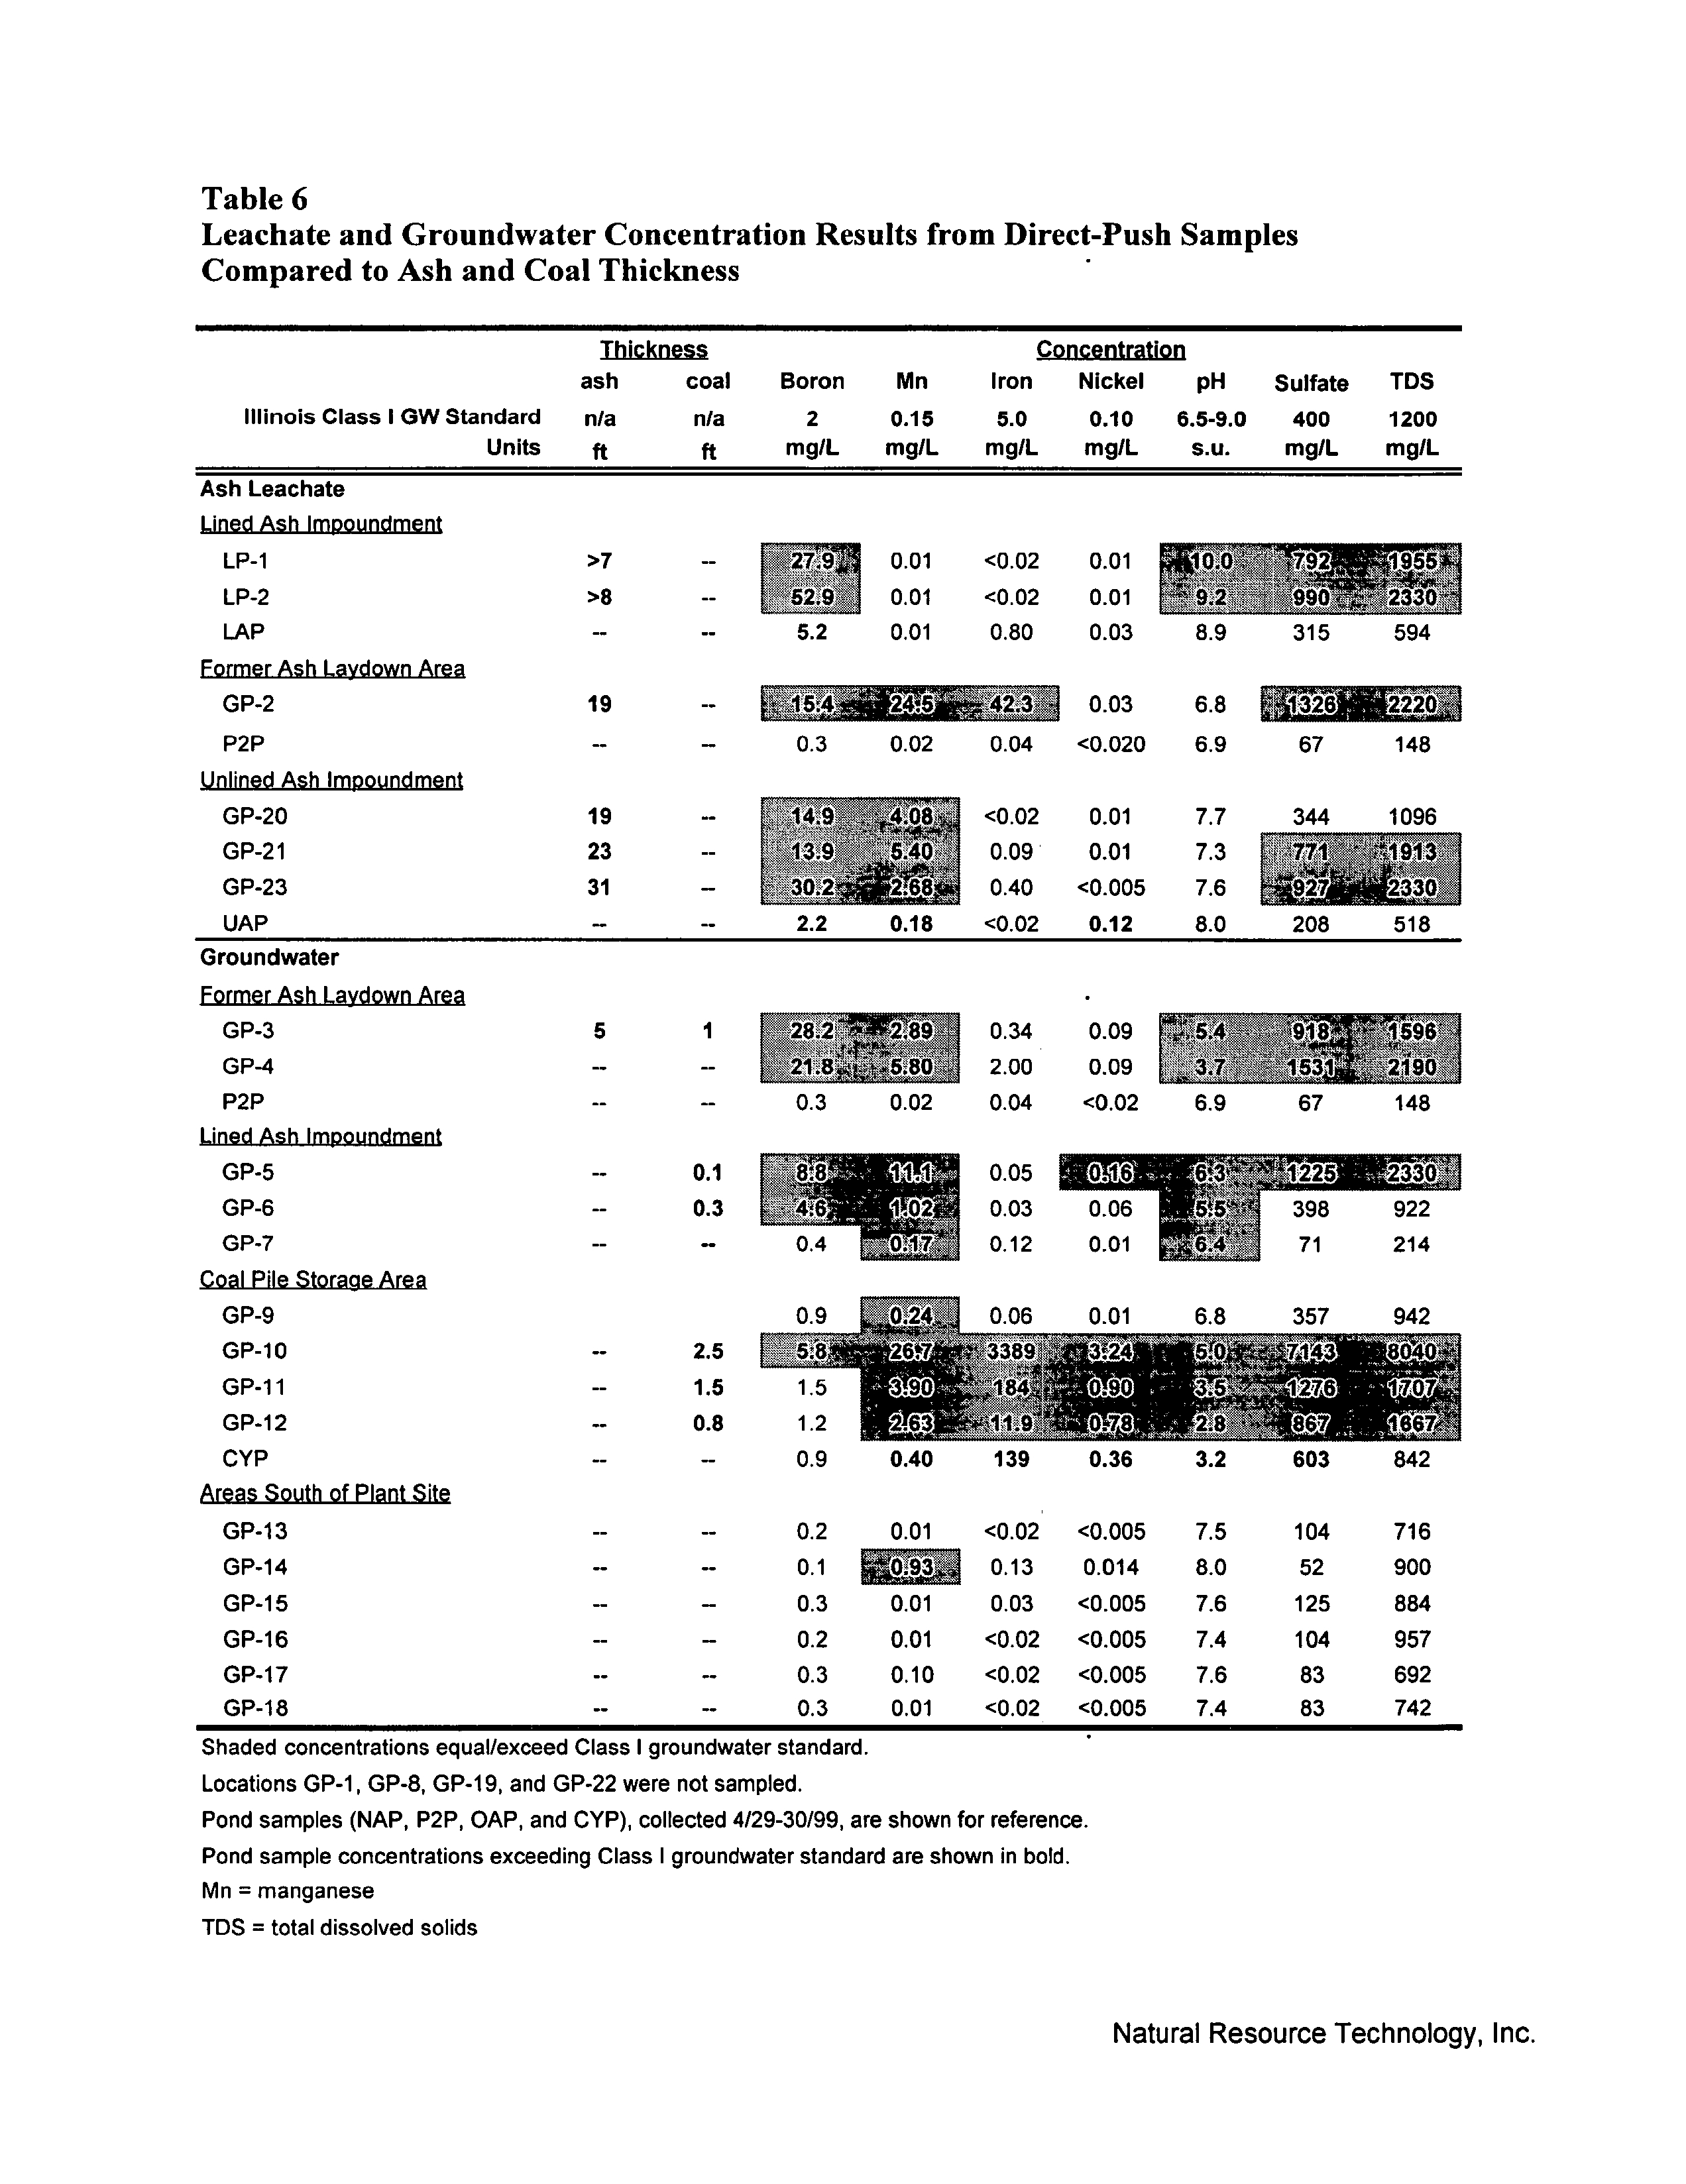
Table
Leachate
and Groundwater Concentration
Results from Direct-Push
Samples
Compared
to Ash and Coal
Thickness
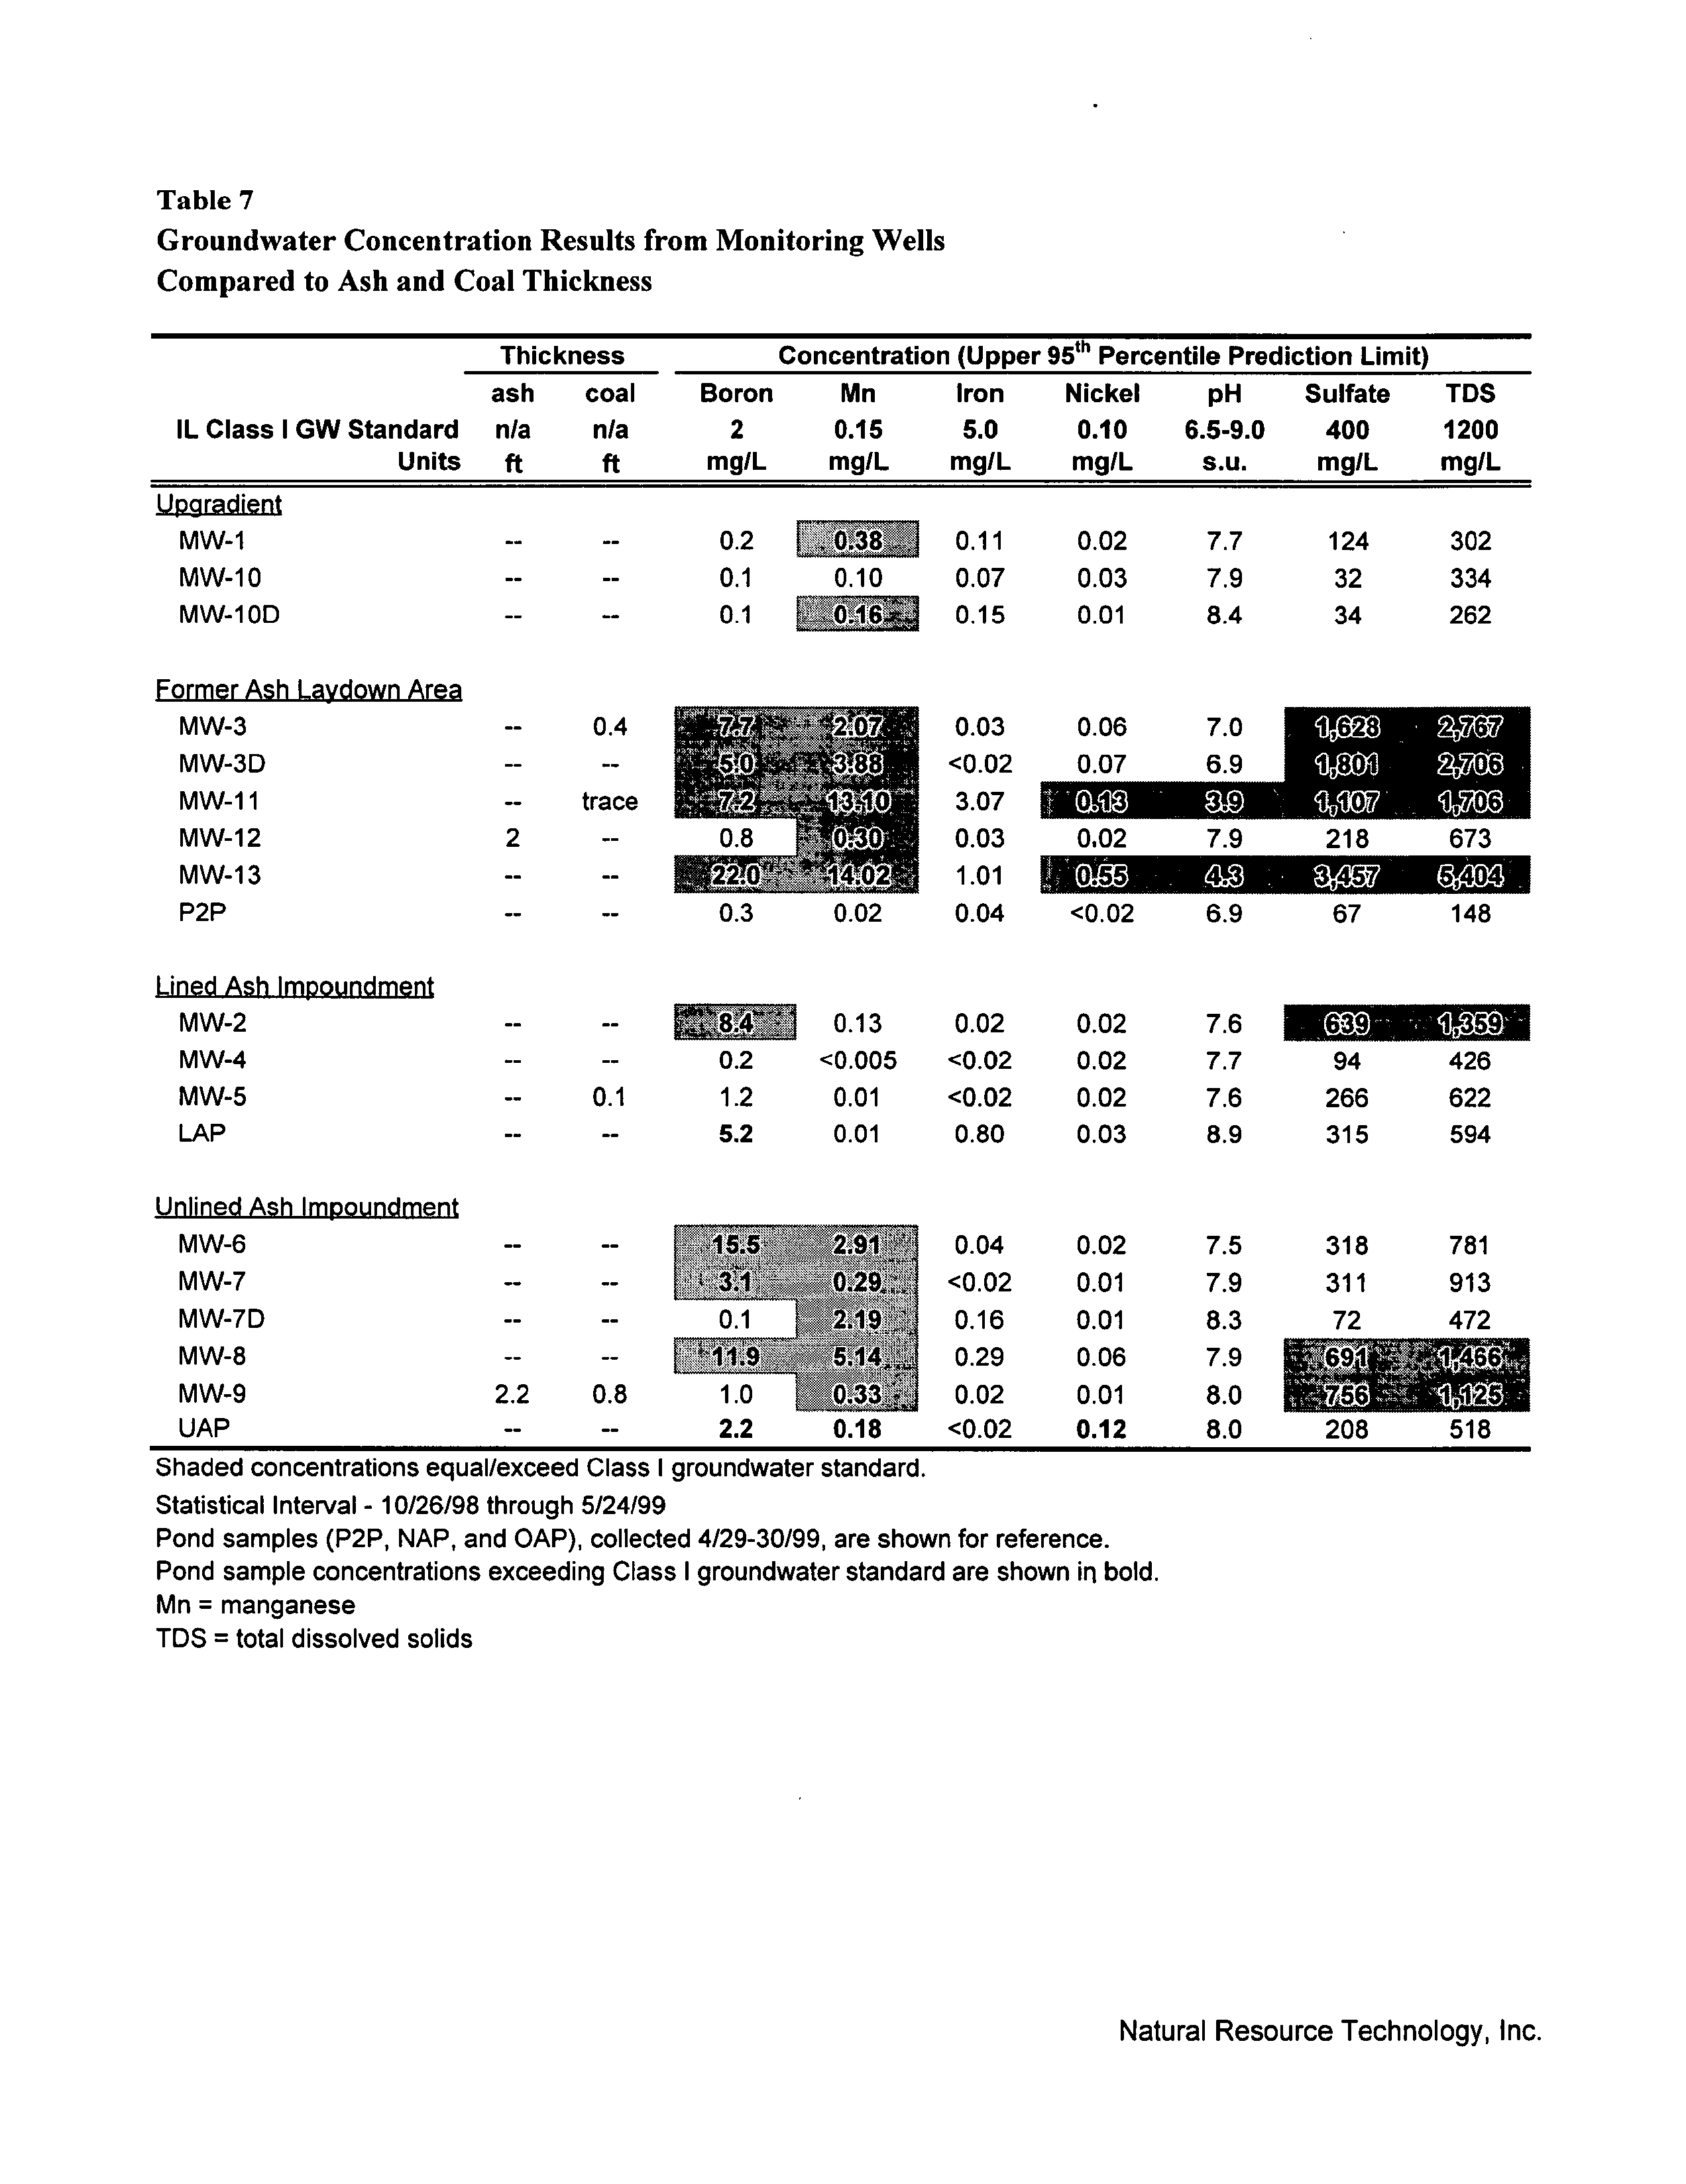
Table
Groundwater
Concentration
Results from
Monitoring
Wells
Compared
to Ash and
Coal
Thickness
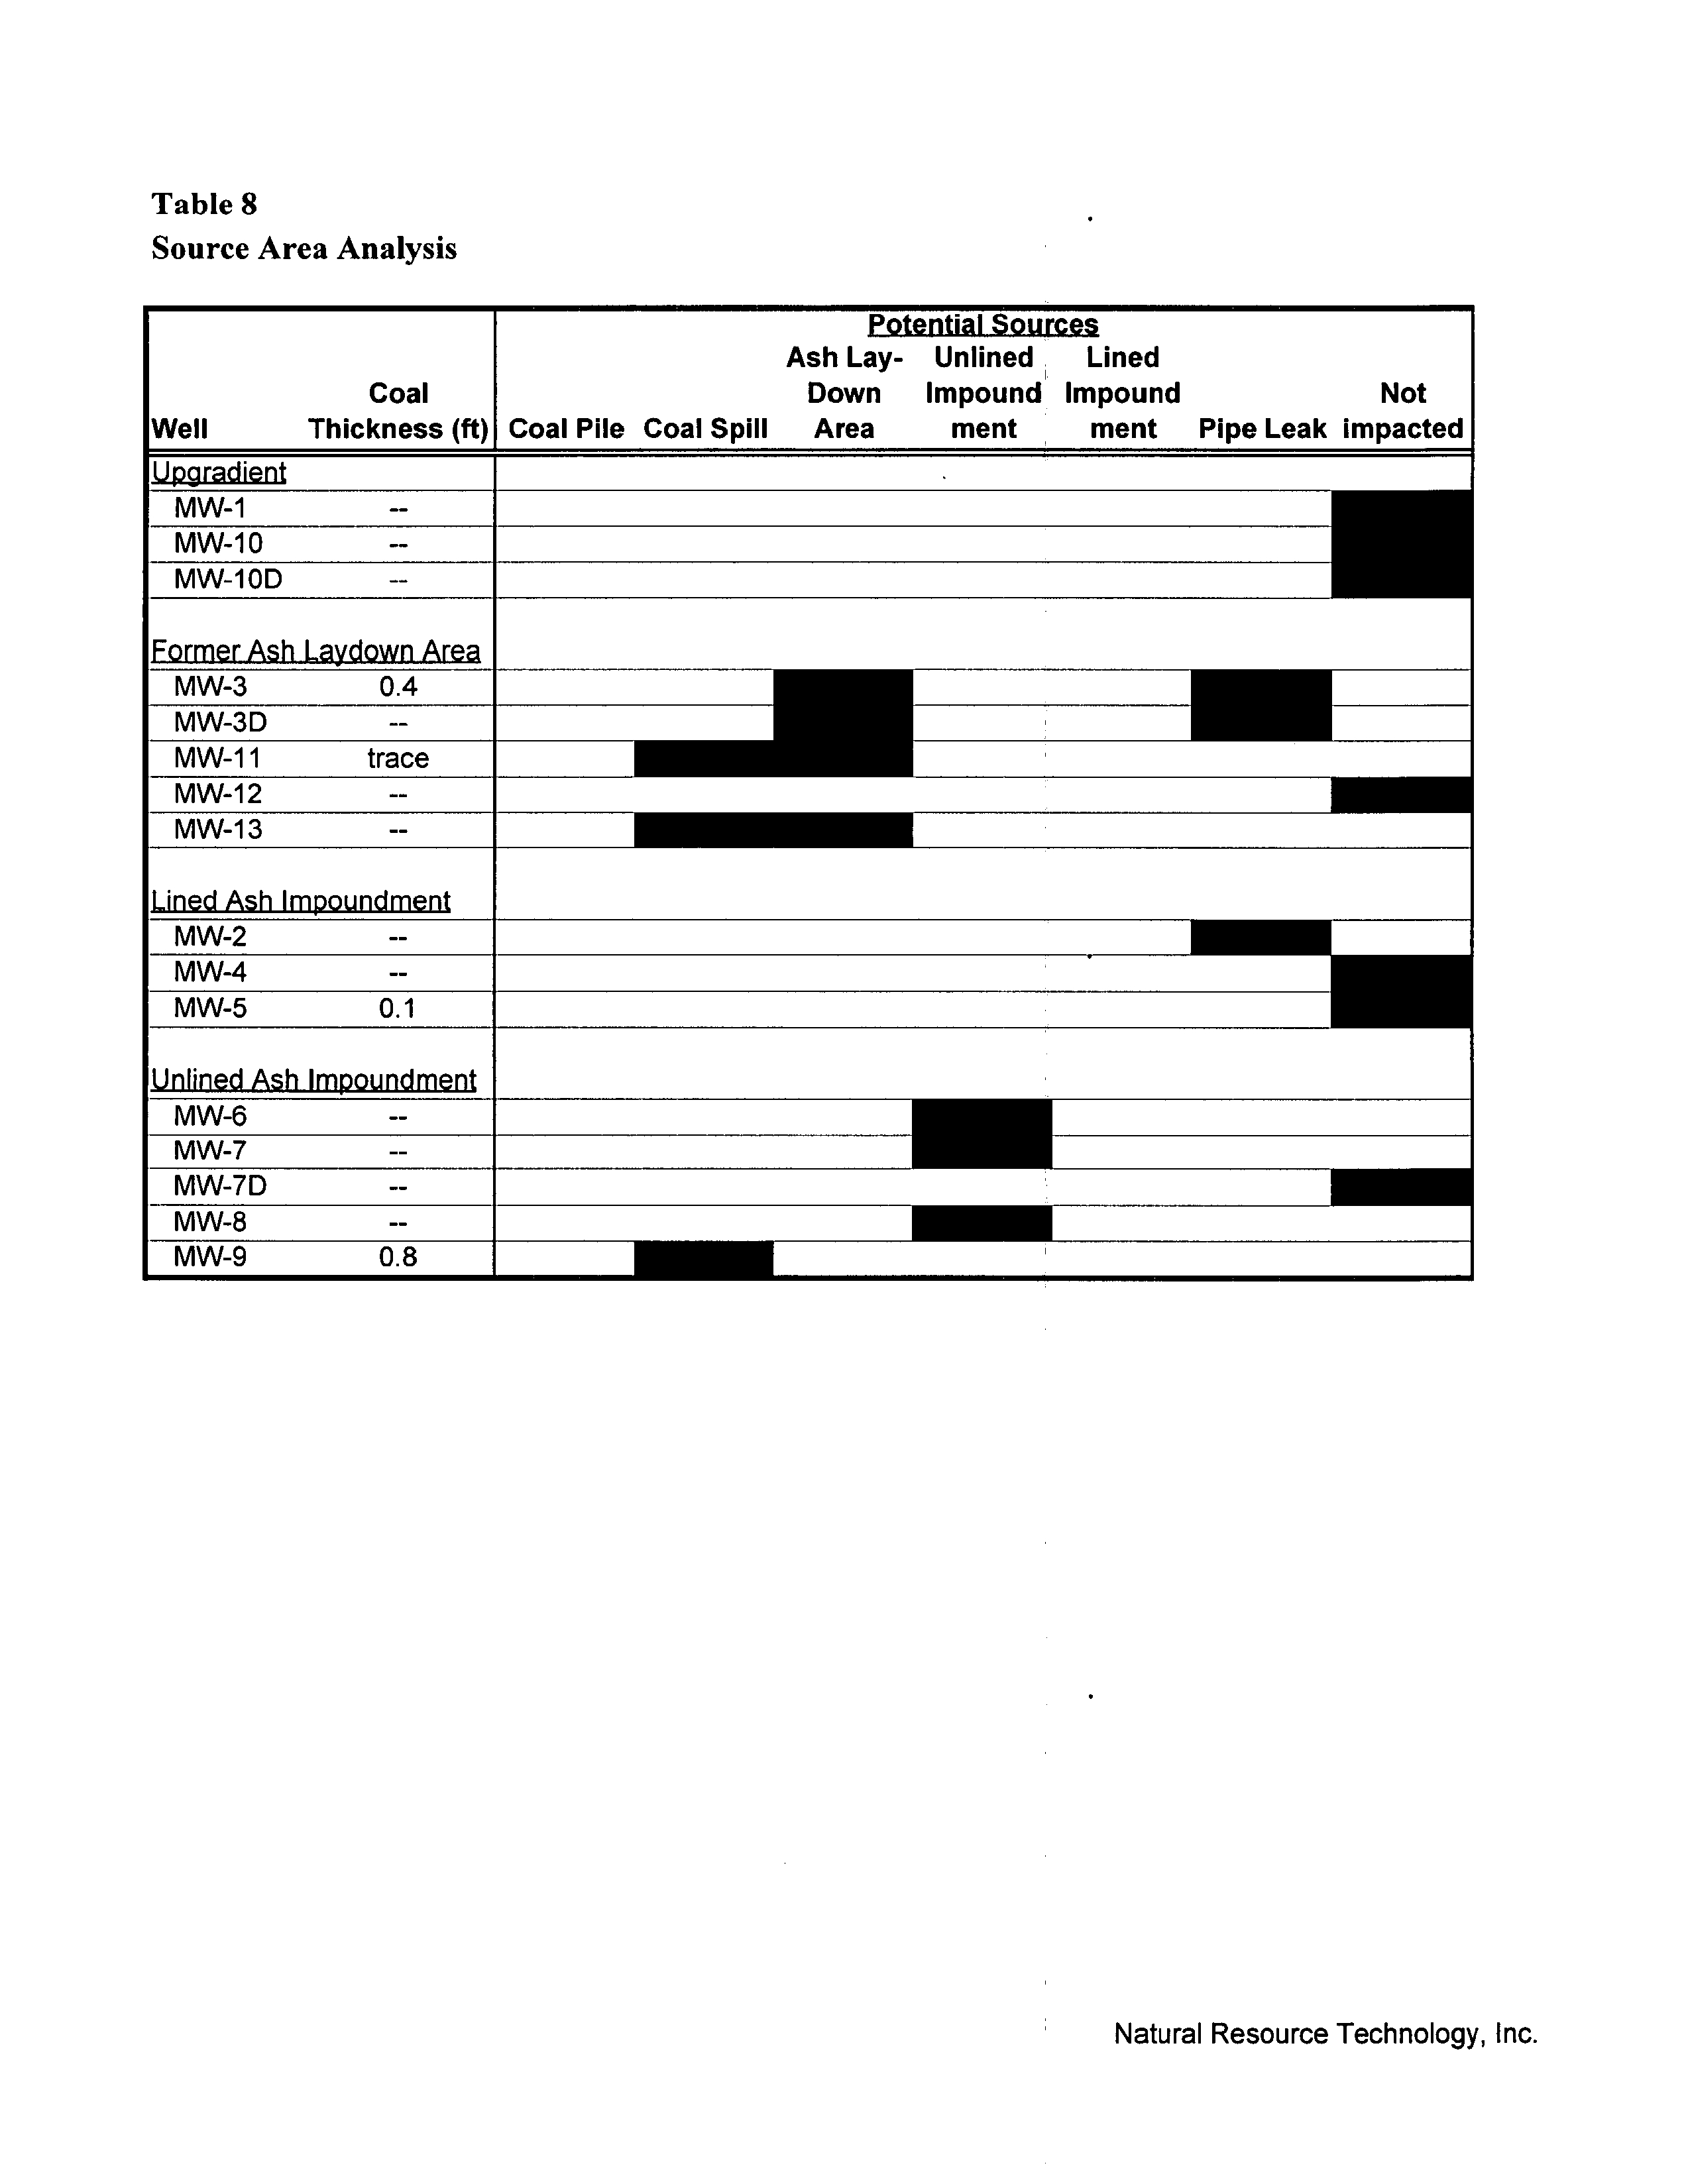
Table
Source Area
Analysis
APPENDICES
Appendix
Boring/Monitoring
Well Construction
Logs
Appendix
Slug-Test
Data
Appendix
Direct-Push Water
Quality
Results
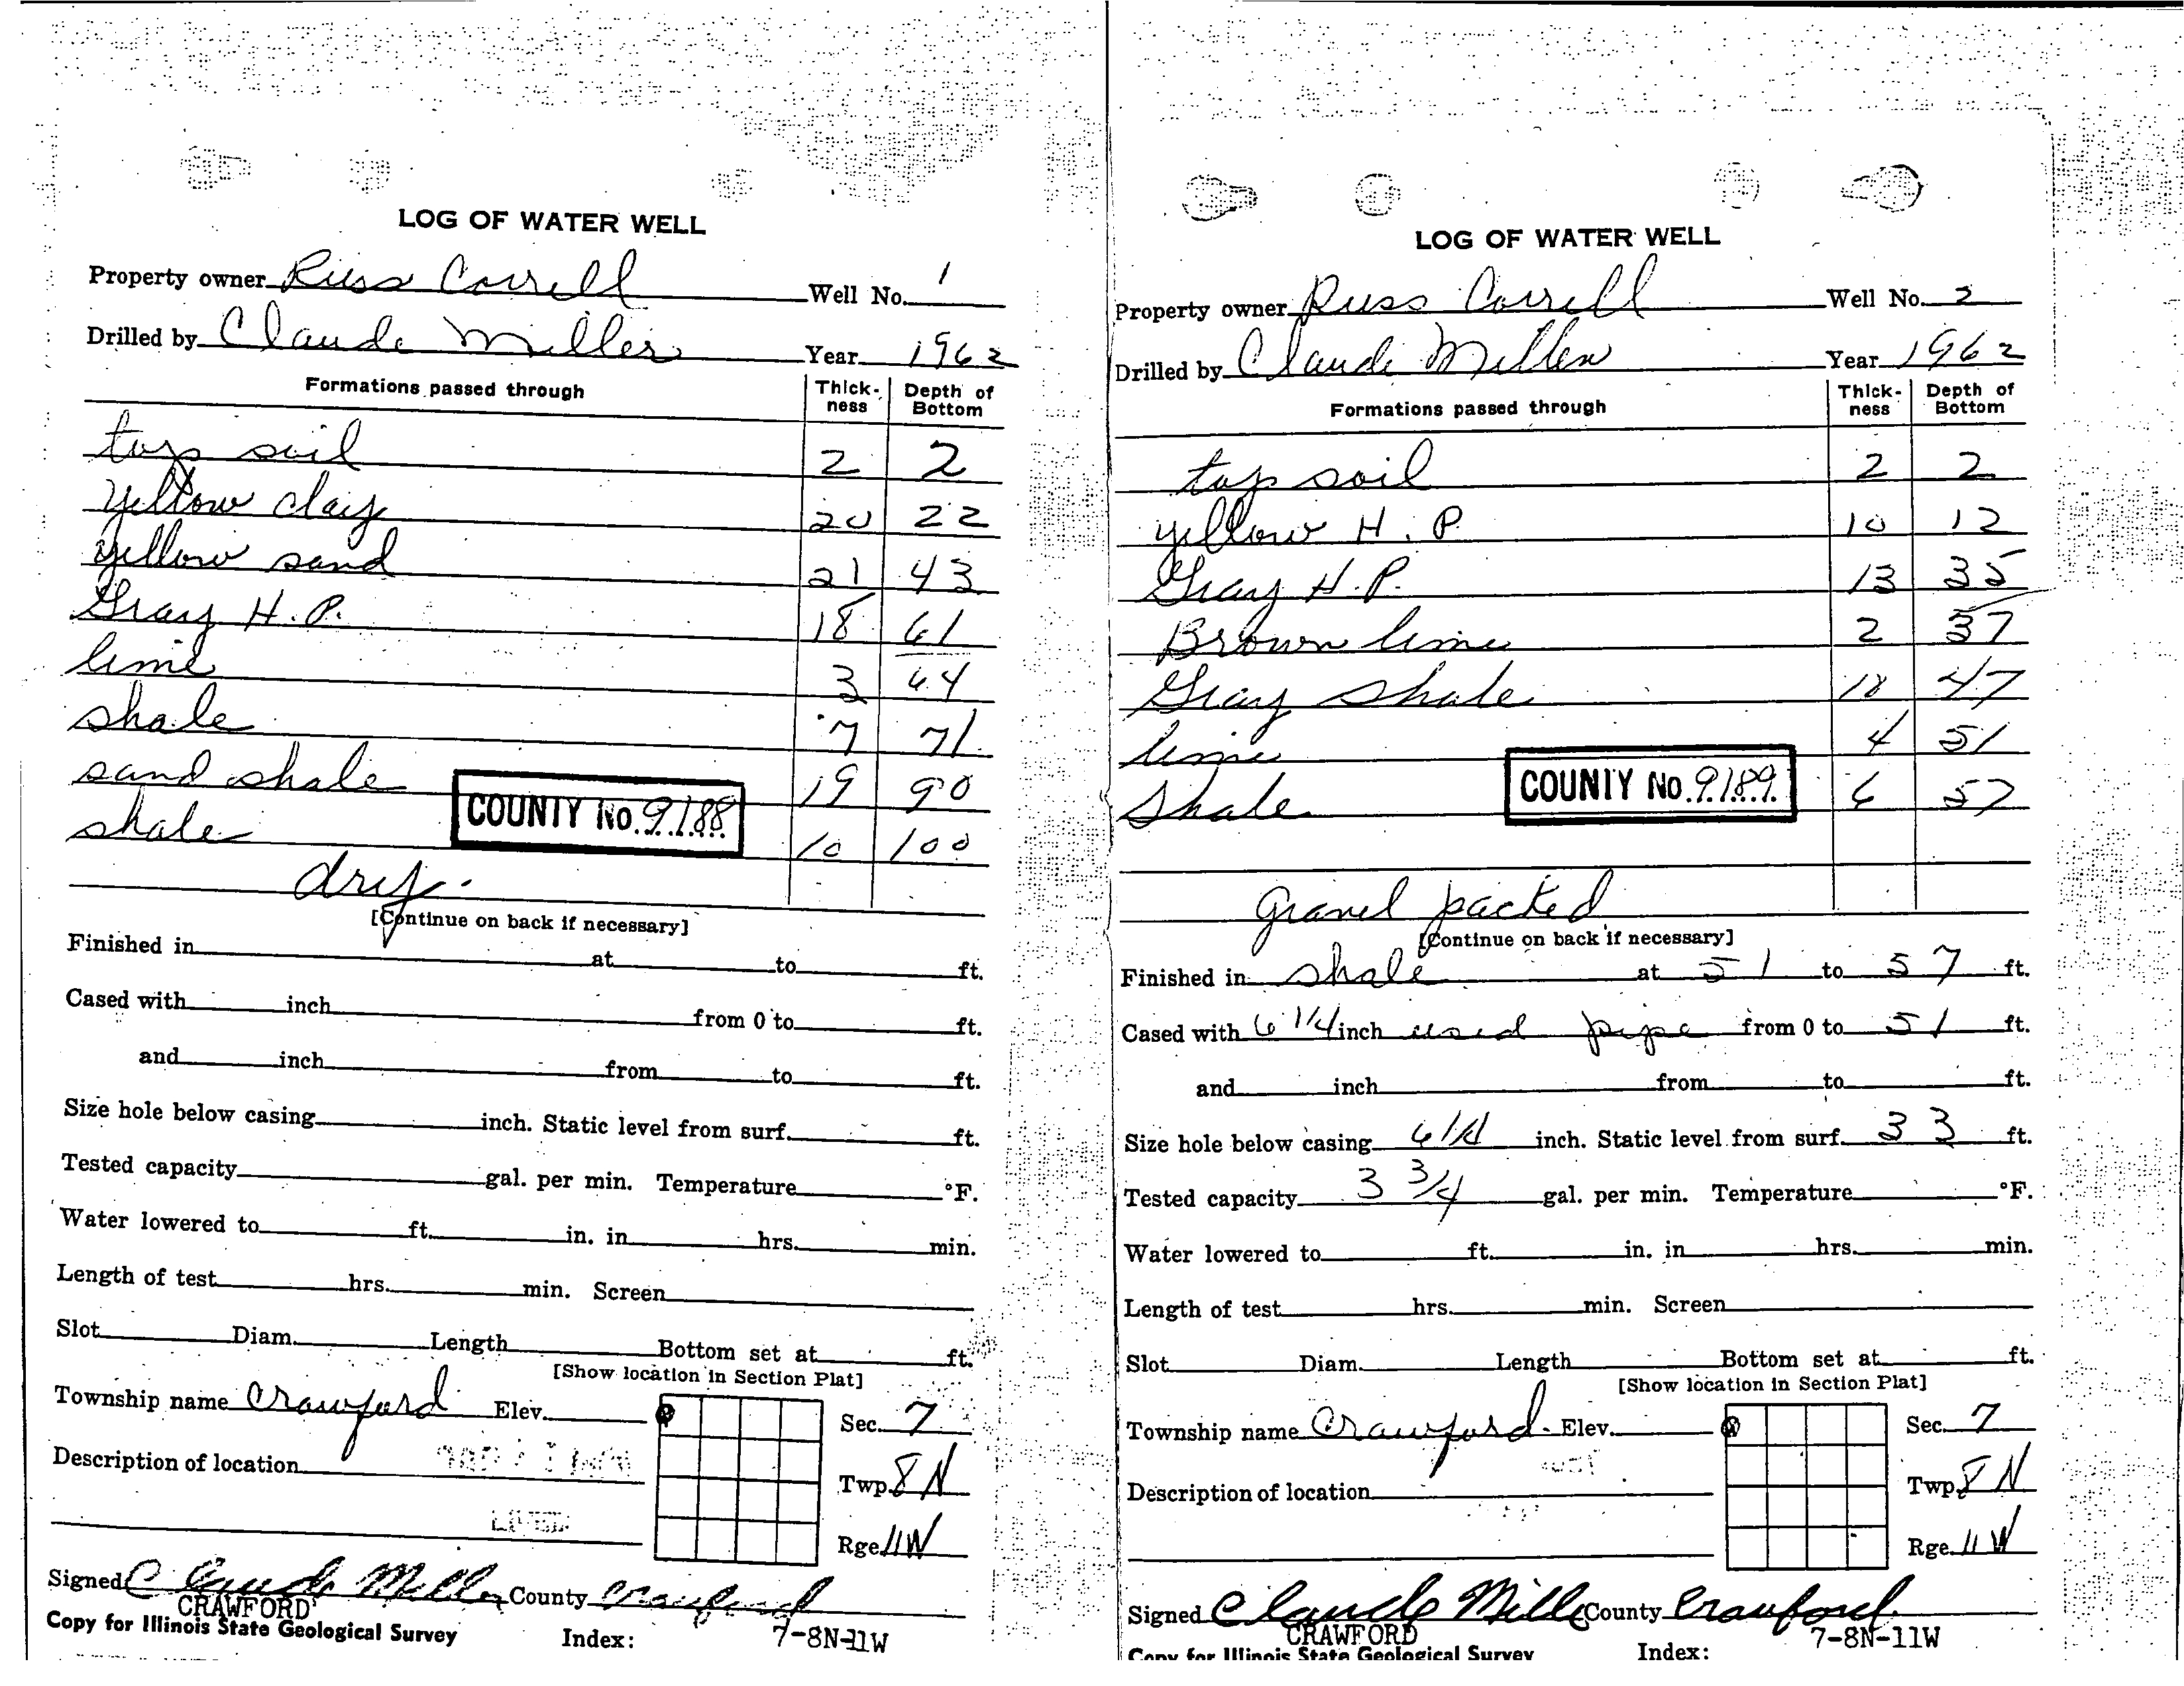
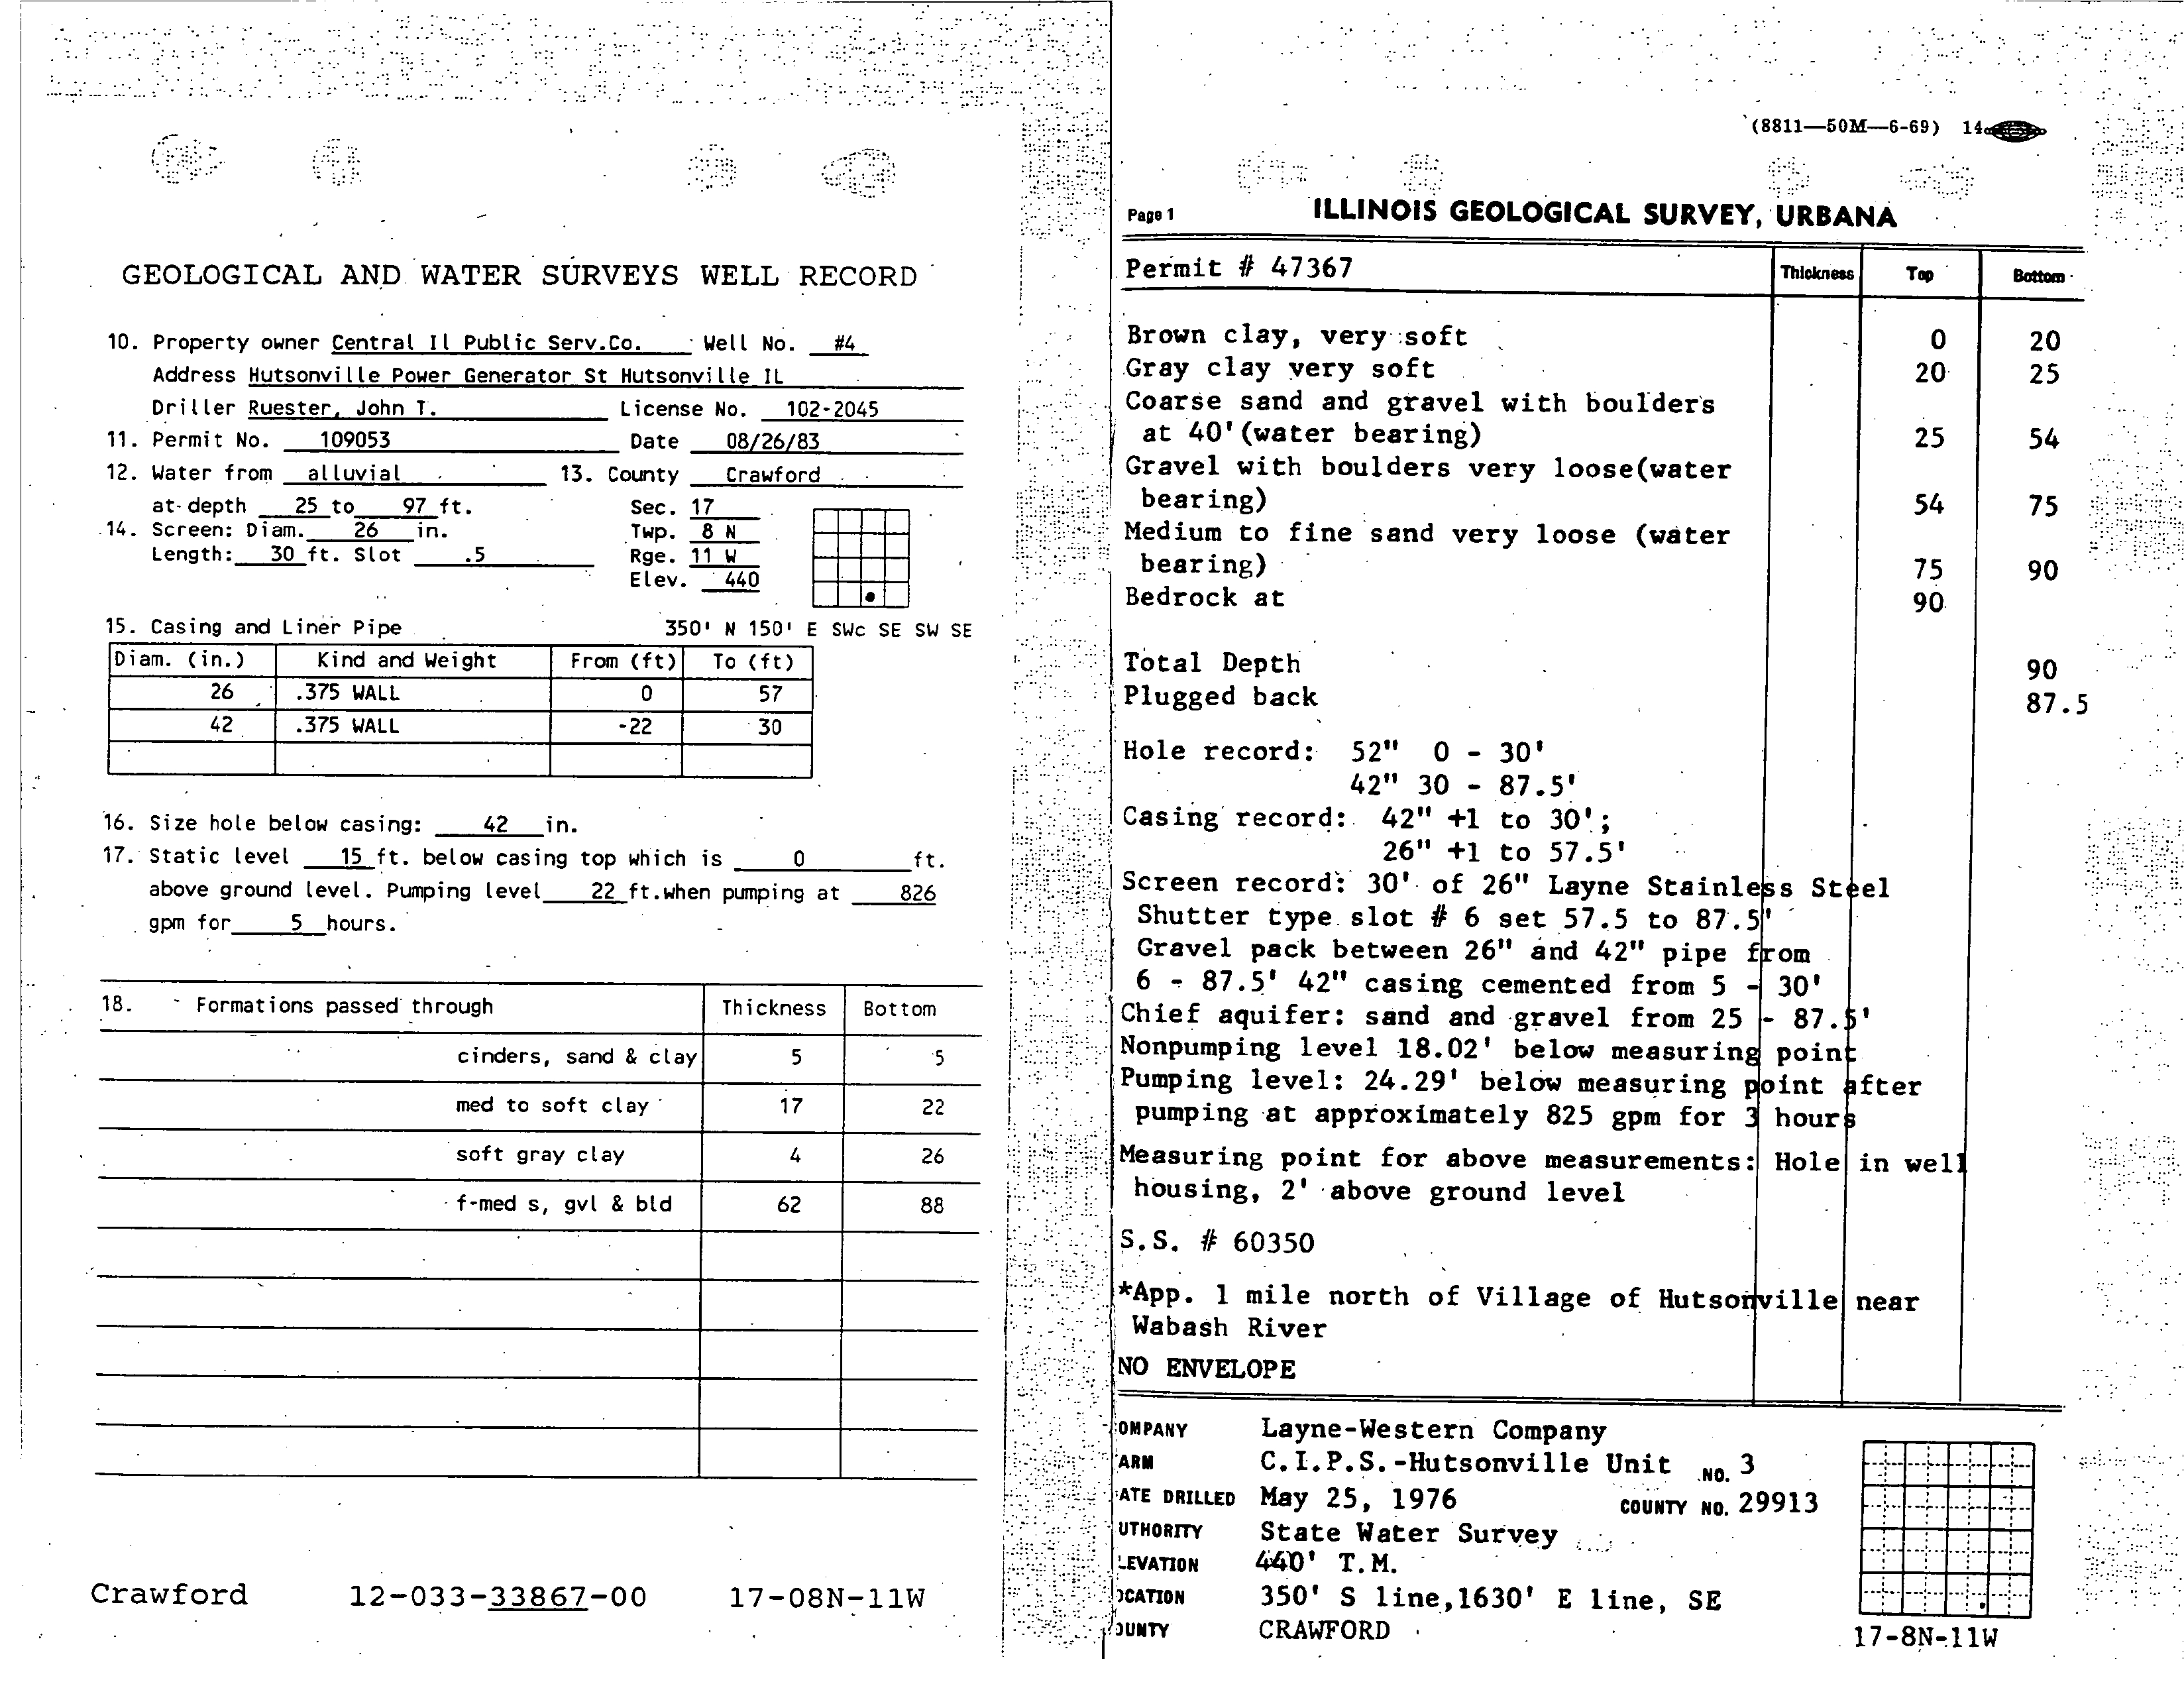
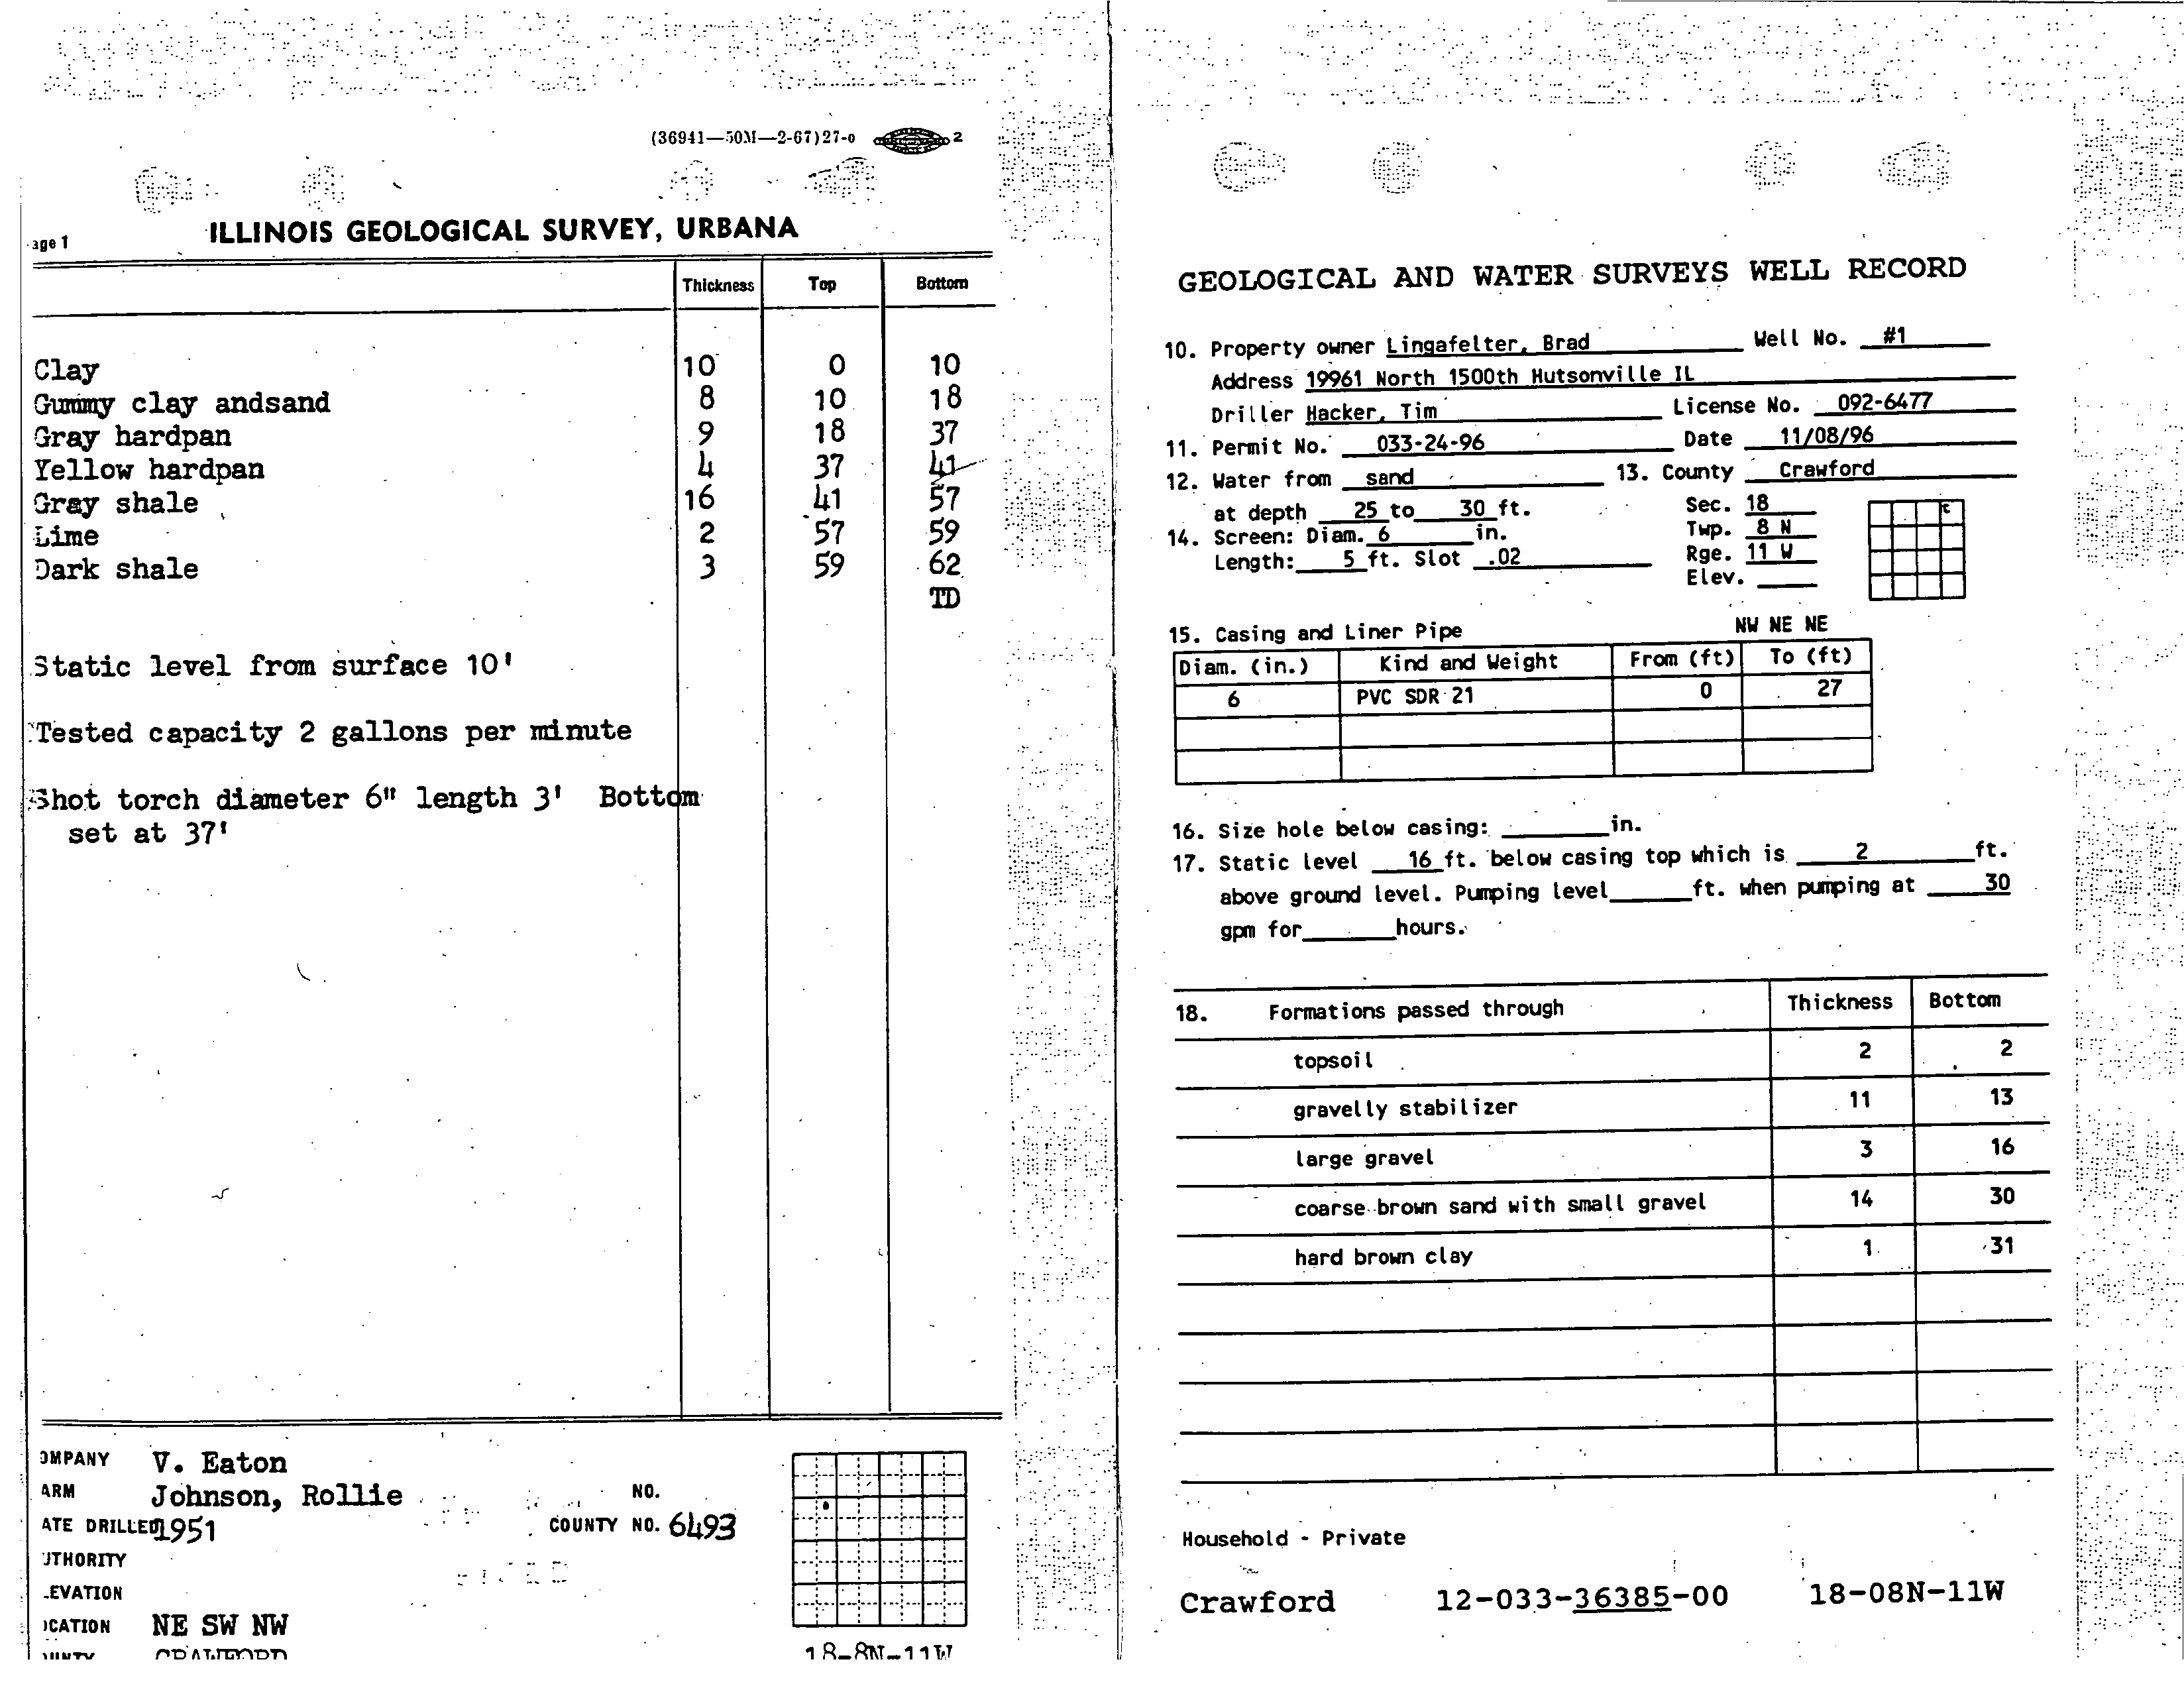
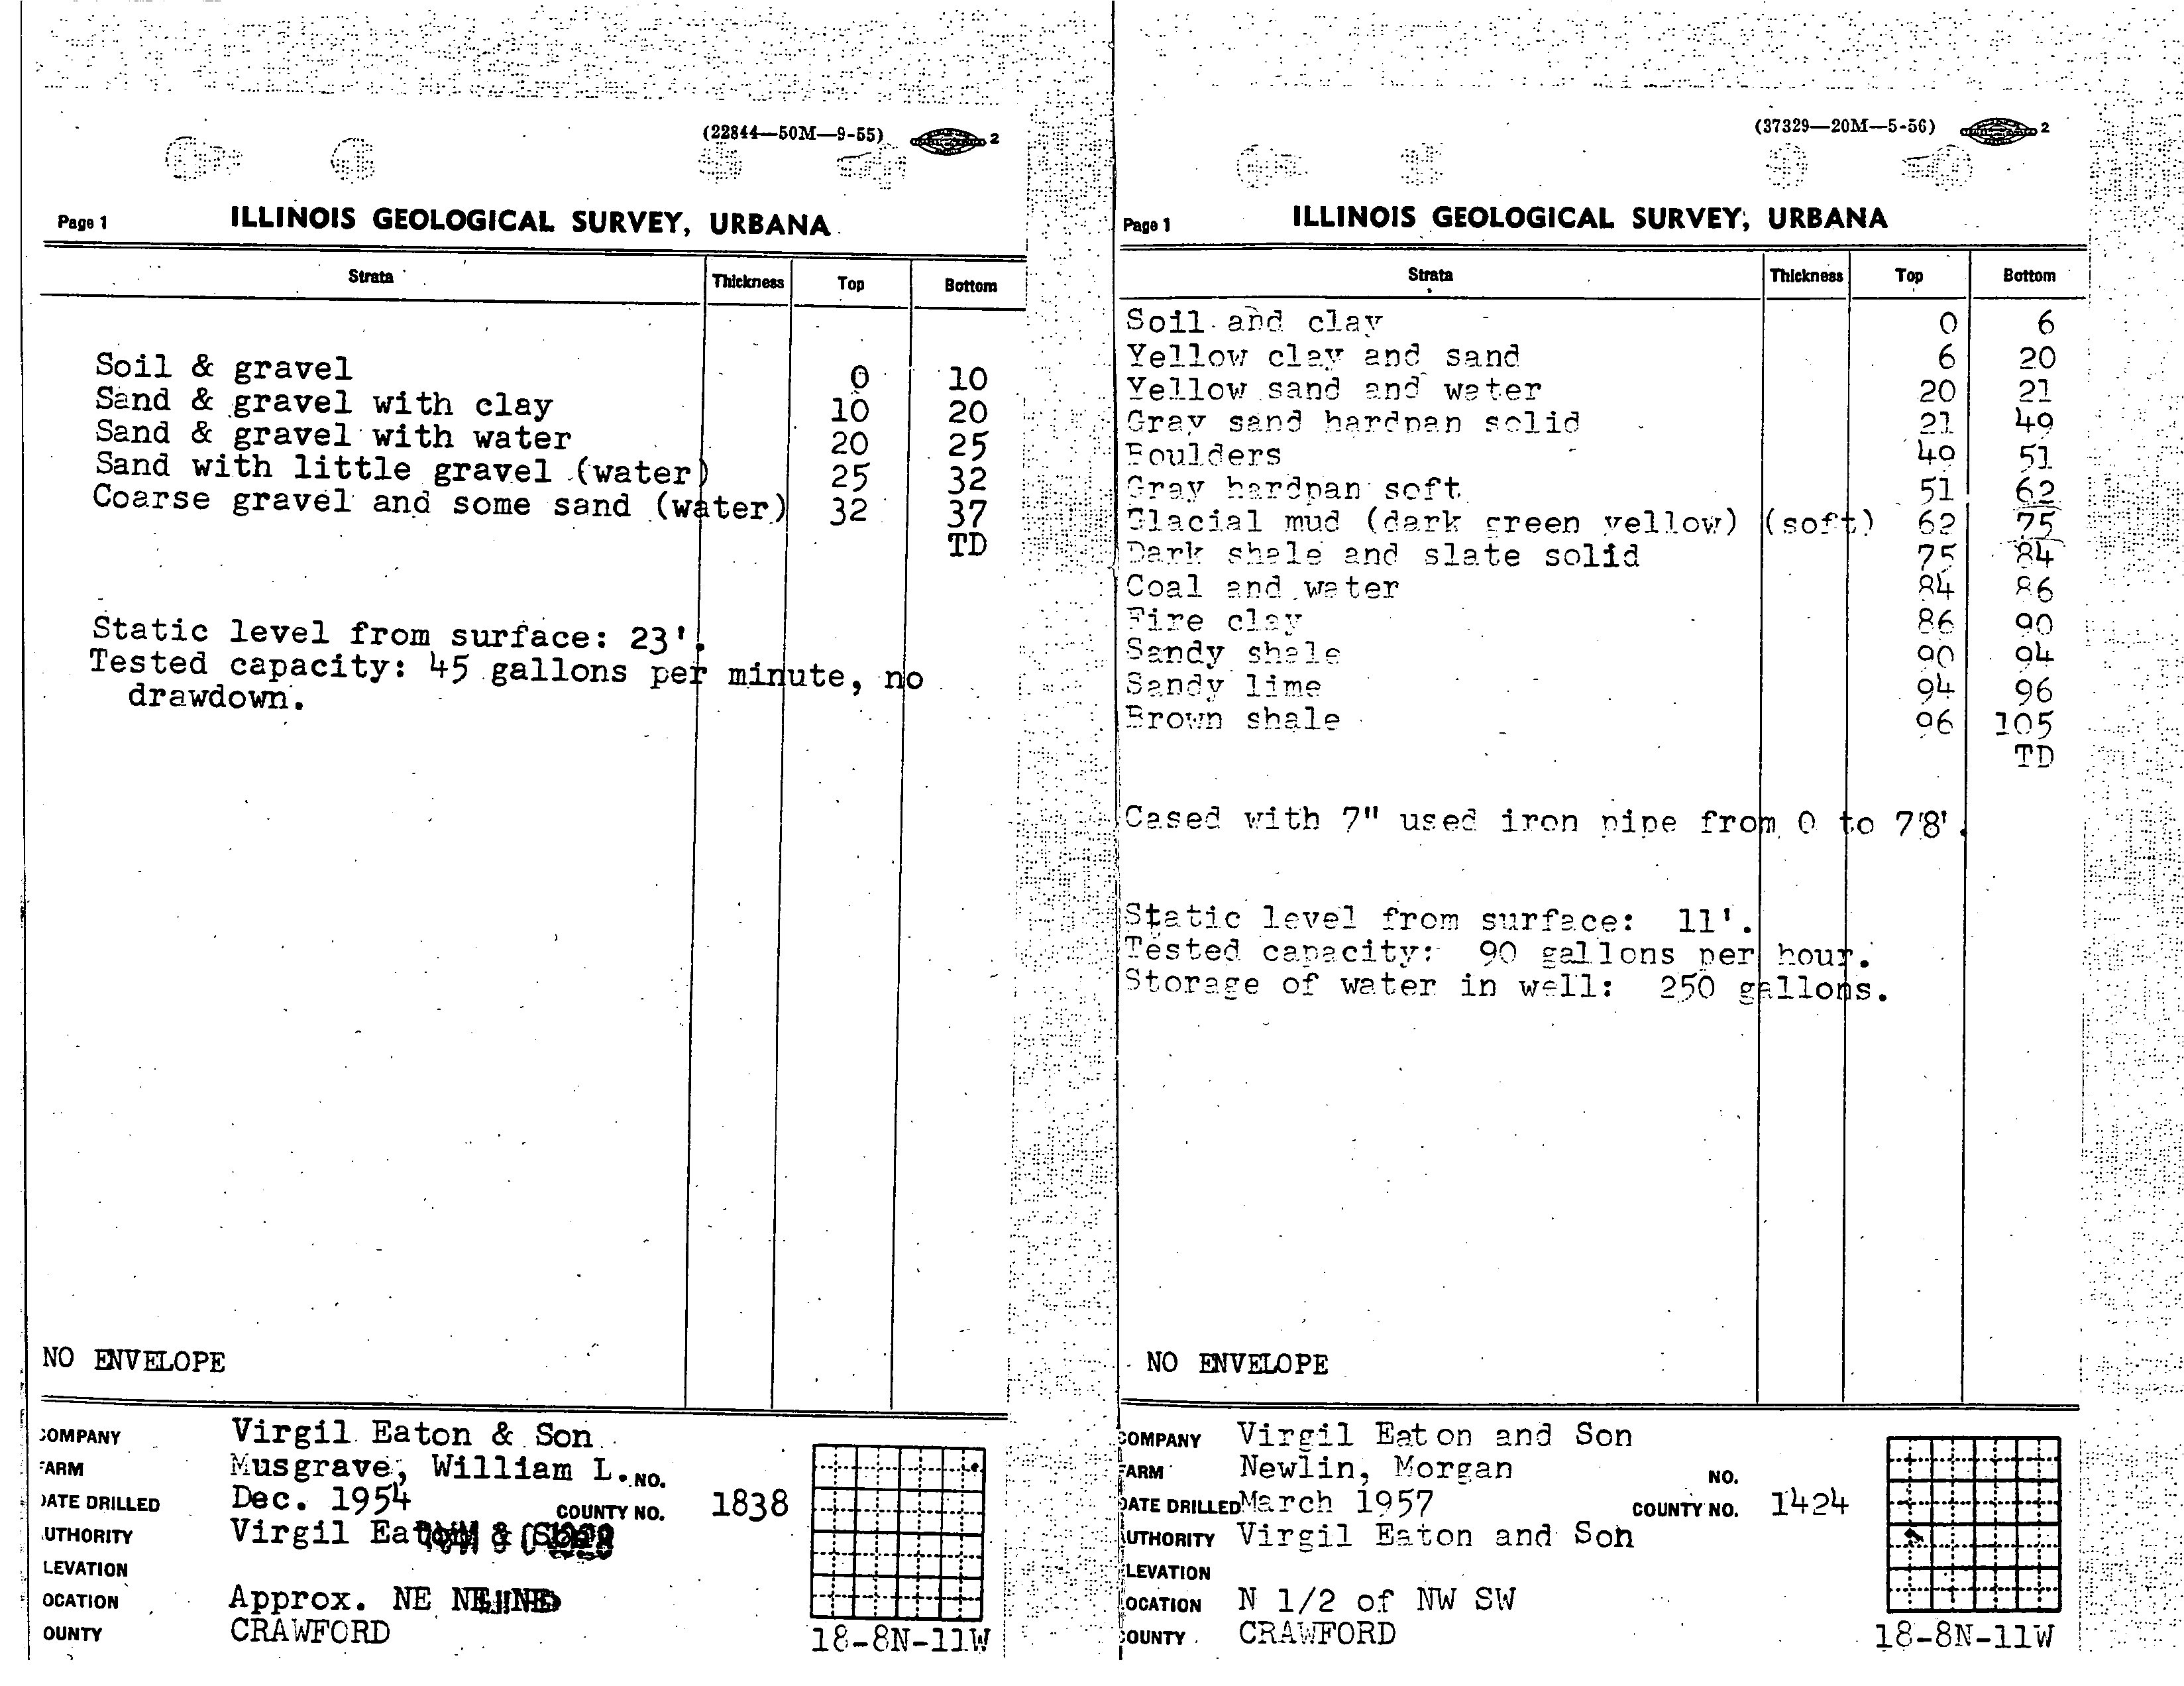
Appendix
Water Well
Logs
hutsonvilte
hydrogeotogic
assessment.doc
Natural
iii
Resource
Technology
Electronic Filing - Received, Clerk's Office, August 11, 2008 - AS 09-1, Exhibit 4
EXECUTIVE SUMMARY
This
hydrogeologic
assessment
describes
hydrogeology
groundwater
flow
and
groundwater
quality
near
the
AmerenCIPS Hutsonville Power Station ash
impoundments
There
are
two
impoundments
at this
site an
unlined
impoundment
that has been in
operation
since
1968 and
lined
impoundment
that has been in
operation
since
1986 This assessment
was
prompted by
concentrations
of boron and sulfate at several
monitoring
wells
near
these
impoundments
that
exceeded Illinois Class
groundwater
standards
Boron and sulfate are indicator
parameters
for
coal ash leachate in
groundwater
Two
rounds
of field work
were
performed
From
August 25-28 1998 soil leachate
and
groundwater samples
were
collected
at
23 locations
across
the site
using direct-push sampling
methods In
addition
two
temporary
well
points
were installed and
sampled
in the lined ash
impoundment
From October
5-10 1998
seven
monitoring
wells were installed to
augment
the
existing
network of nine
monitoring
wells
Results of Field
Investigation
Coal ash is found
predominantly
in three
areas
of the
plant
site the two
impoundments
and
an
ash
laydown
area
that is between the
two
impoundments
Ash
thickness
in the unlined
impoundment ranged
from about 12 feet at the north end of the
impoundment
to 31 feet in the
central
portion
of the
impoundment
Ash thickness in the
laydown
area
is
as
much
as
12 feet
There is also
coal
pile
near
the
impoundments
and
some
boreholes outside the coal
pile
area
encountered
thin
seams of
spilled
coal near
the surface
The
stratigraphy
encountered
at the Hutsonville Power Plant consisted of
relatively
thin
veneer
of unlithified
deposits overlying
bedrock
Over most of the
site
the unlithified units
are
sandy
and less than 20 feet
thick however
thickness
abruptly
increases
to at least
90 feet
near
the
Wabash
River
where there is
bedrock
valley
Silt was found in the
upper portion
of
the
hutsonville
hydrogeologic
assessment.doc
Natural
ES-i
Resource
Technology
Electronic Filing - Received, Clerk's Office, August 11, 2008 - AS 09-1, Exhibit 4
EXECUTIVE SUMMARY
bedrock
valley
and sand and
gravel
occurs
in
the lower
portions
of
the
valley
The
underlying
bedrock is
comprised mainly
of
Pennsylvanian-age
sandstone and shale
The
groundwater
surface
throughout
most of the
plant
site
occurs
within sand and
gravel
However
near
the
river
it
occurs
within alluvial silt and
clay deposits
and
near
the southern
portion
of
the unlined
impoundment
the
groundwater
surface occurs
within ash Groundwater
flow
through
the
sand is east toward the Wabash River Horizontal
groundwater
flow
velocity
varies with
hydraulic gradient
and
hydraulic conductivity
and
was
estimated to
range
from
150
ft/yr
to 240
ft/yr
in
the sand.and
gravel deposits
Groundwater and Leachate
Quality
The Hutsonville work
plan
identified
boron sulfate
manganese
pH
and TDS
as
parameters
of
concern
POCs
because
they
had concentrations
in
groundwater
near
the
impoundments
that
exceeded Illinois Class
groundwater
standards
Boron and sulfate
are
indicator
parameters
of
coal ash
leachate
while the other POCs are not
necessarily
indicators
Iron
and nickel
were
also
included
in
this assessment because these
parameters
sometimes
have
high
concentrations
in
groundwater
near
coal
piles
Most ash leachate
samples
had
boron sulfate
and TDS concentrations
that exceeded the Class
groundwater
standard
Manganese
exceeded
the standard in leachate from the unlined
ash
impoundment
and from the former ash
laydown area
but not in the lined ash
impoundment
lowest
concentrations
on
site thereby
exhibiting
its
unreliability
as an ash
indicator
parameter
iron
was
below the standard in all leachate
samples
from the
impoundments
but exceeded the
standard
in the
leachate
sample
from
the
former
ash
laydown
area
Nickel
was
below the
standard
in all leachate
samples
The
pH
of the leachate
samples
was neutral
except
in the lined
impoundment
where it
was
alkaline
Direct-push
groundwater samples
showed concentrations
of
boron
manganese
sulfate
and TDS
higher
than
Class
standards
in
most
samples
near
the
impoundments
and
the
ash
laydown
area
hutsonville
hydrogeotogic
assessment.doc
Natural
ES-2
Resource
Technology
Electronic Filing - Received, Clerk's Office, August 11, 2008 - AS 09-1, Exhibit 4
EXECUTIVE SUMMARY
Groundwater
samples
extracted near the coal
pile typically
had
high
concentrations
relative to
standards
of
iron nickel sulfate TDS
and
manganese
Acidic
pH
values
were
recorded in
groundwater samples throughout
the coal
pile area
and values
were
typically
lower than the
lower Class
standard There
was
only
one
standard exceedance
manganese
in
groundwater
sampled
south of the site
Groundwater
samples
from several
monitoring
wells near the ash
laydown
area and unlined ash
impoundment
had
high
concentrations
relative
to Class
standards
of
boron
manganese
sulfate
and TDS There
were
also two wells with
high
nickel and low
pH
and both of these
wells
were
in
areas
where coal had been
spilled
Overall
there is
correlation between
groundwater quality
and
potential
leachate
sources
Groundwater
near
the unlined coal
ash
impoundment
and
ash
laydown
area
had
high
boron
and
sulfate concentrations
Groundwater near the coal
pile
and coal
spill
areas
typically
had
high
nickel iron
and sulfate concentrations
Groundwater
near
the coal
pile
also had
very
low
pH
Conclusions
Groundwater
samples
from some on-site
monitoring
wells and
direct-push
locations
had
concentrations
of
boron
manganese
sulfate TDS iron
and nickel
higher
than Class
standards
High
iron and nickel concentrations
were
found in locations where coal
was
present
These
observations indicated
two
general
sources
for
groundwater quality impacts
the coal
pile
and
coal
spill areas
and
the ash
laydown
area
and unlined
ash
impoundment
There is
no
evidence
that iron and nickel from the coal
pile
and coal
spill
areas
is
migrating
beyond
those
areas
However
boron and sulfate
are
migrating
east
toward the Wabash River
There
are no
groundwater
extraction wells in the shallow sediments between the unlined ash
impoundment
and the
Wabash River There are four extraction wells within 1/2 mile of the
site
all finished in
deep
sand and
gravel
in the Wabash River
valley
Two wells
are
directly
east
of
hutsonville
hydrogeologic
assessment.doc
Natural
ES-3
Resource
Technology
Electronic Filing - Received, Clerk's Office, August 11, 2008 - AS 09-1, Exhibit 4
EXECUTIVE SUMMARY
the unlined
impoundment
and
are used for
plant
water
and two wells are southeast
of the
impoundment
and
used for
irrigation
water
Groundwater
quality
data from
monitoring
well
MW-7D
which is
directly downgradient
of the unlined ash
impoundment
and
is the
deepest
on
site
monitoring
well in the Wabash River
valley
indicates
no evidence
of ash
impoundment
or
coal
pile
impacts
at that
depth
hutsonville
hydrogeologic
assessment.doc
Natural
ES-4
Resource
Technology
Electronic Filing - Received, Clerk's Office, August 11, 2008 - AS 09-1, Exhibit 4
INTRODUCTION
AmerenCIPS
operates
the
Hutsonville Power Station in Crawford
County
Illinois
The Power
Station is located on the west bank of the Wabash River between the towns
of Hutsonville and
York
SW
/4
Section
17
Township
8N
Range 11W
The coal-fired
power
plant
has been
in
operation
since
the 1940s There
are
currently
two
units
operating
at the
plant completed
in
1953
unit
and 1954
unit
with
combined
generating capacity
of 156 MW
Fly
ash from
the
operating
units is collected
by
an
electrostatic
precipitator
and sluiced
to
lined ash
impoundment
Bottom ash is sluiced
to
separate
pond
and
eventually recycled
Sluice
water
from both the bottom ash
pond
and
lined
fly
ash
impoundment
is routed
through
an unlined ash
impoundment
before
discharge
to the Wabash River via an NPDES
permitted
outfall
The lined
ash
impoundment
was constructed
in
1986
and has an area of about 12 acres
The unlined
impoundment
was
constructed in
1968
and has
an area
of about 17
acres
Groundwater
quality
has been monitored
at
this
facility
since 1984 Concentrations
of boron and
sulfate at several
monitoring
wells exceed Illinois Class
groundwater
standards
Boron and
sulfate
are
indicator
parameters
for coal ash leachate in
groundwater
In
response
to these
findings
Ameren Services contracted
Science
Technology Management
Inc
STMI
and
Natural Resource
Technology
Inc
NRT
to
perform
hydrogeologic
assessment
that will
characterize
hydrogeology groundwater
flow
and
groundwater quality
at this
facility
Science
Technology
Management
Inc
STMI
ceased
operations
on
January 31
1999
At that
time
the STMI
project manager overseeing
this
investigation
took
position
at
Natural Resource
Technology
Inc
NRT
NRT
developed
this
report
based
on
information in STMIs files
and on the
project managers past
involvement
with this
project
hutsonville
hydrogeologic
assessment.doc
Natural
1i
Resource
Technology
Electronic Filing - Received, Clerk's Office, August 11, 2008 - AS 09-1, Exhibit 4
FIELD PROCEDURES
Two rounds of field work were scheduled
and
completed
From
August
25-28
1998
soil and
groundwater samples
were
collected at 23 locations
across
the
site
Figure
using direct-push
sampling
methods In
addition
two
temporary
well
points
were
installed and
sampled
in the
lined ash
impoundment
From October
5-10
1998
seven
monitoring
wells
were
installed
to
augment
the
existing
network of nine
monitoring
wells The
monitoring
wells
were
installed in
manner consistent with
specifications
in Section
811.318d
of the Illinois Waste
Management
Rules
In
addition hydraulic conductivity
tests were
performed
on selected new and
existing
monitoring
wells
Drilling
was
performed by
American Environmental
Corporation
of
Indianapolis
IN
under subcontract
to STMI
Field
geology
and
hydraulic testing
were
performed by
STMI Water
quality analyses
were
performed by
AmerenCIPS central
laboratory
2.1 Direct-Push
Sampling
truck-mounted
GeoProbeTM
direct-push sampling system
was used to collect coal
ash soil
and
groundwater samples
from 23 locations
across
the
Hutsonville
plant
site
Figure
The direct-
push sampling
was
conducted
to
survey
groundwater quality
around the
site
to estimate
the
depth
of ash
and
obtain leachate
samples
in the old
impoundment
to
log
the
type
and extent of
geologic
and fill
materials
and to estimate
depth
to bedrock
Table
lists
direct-push sampling
data
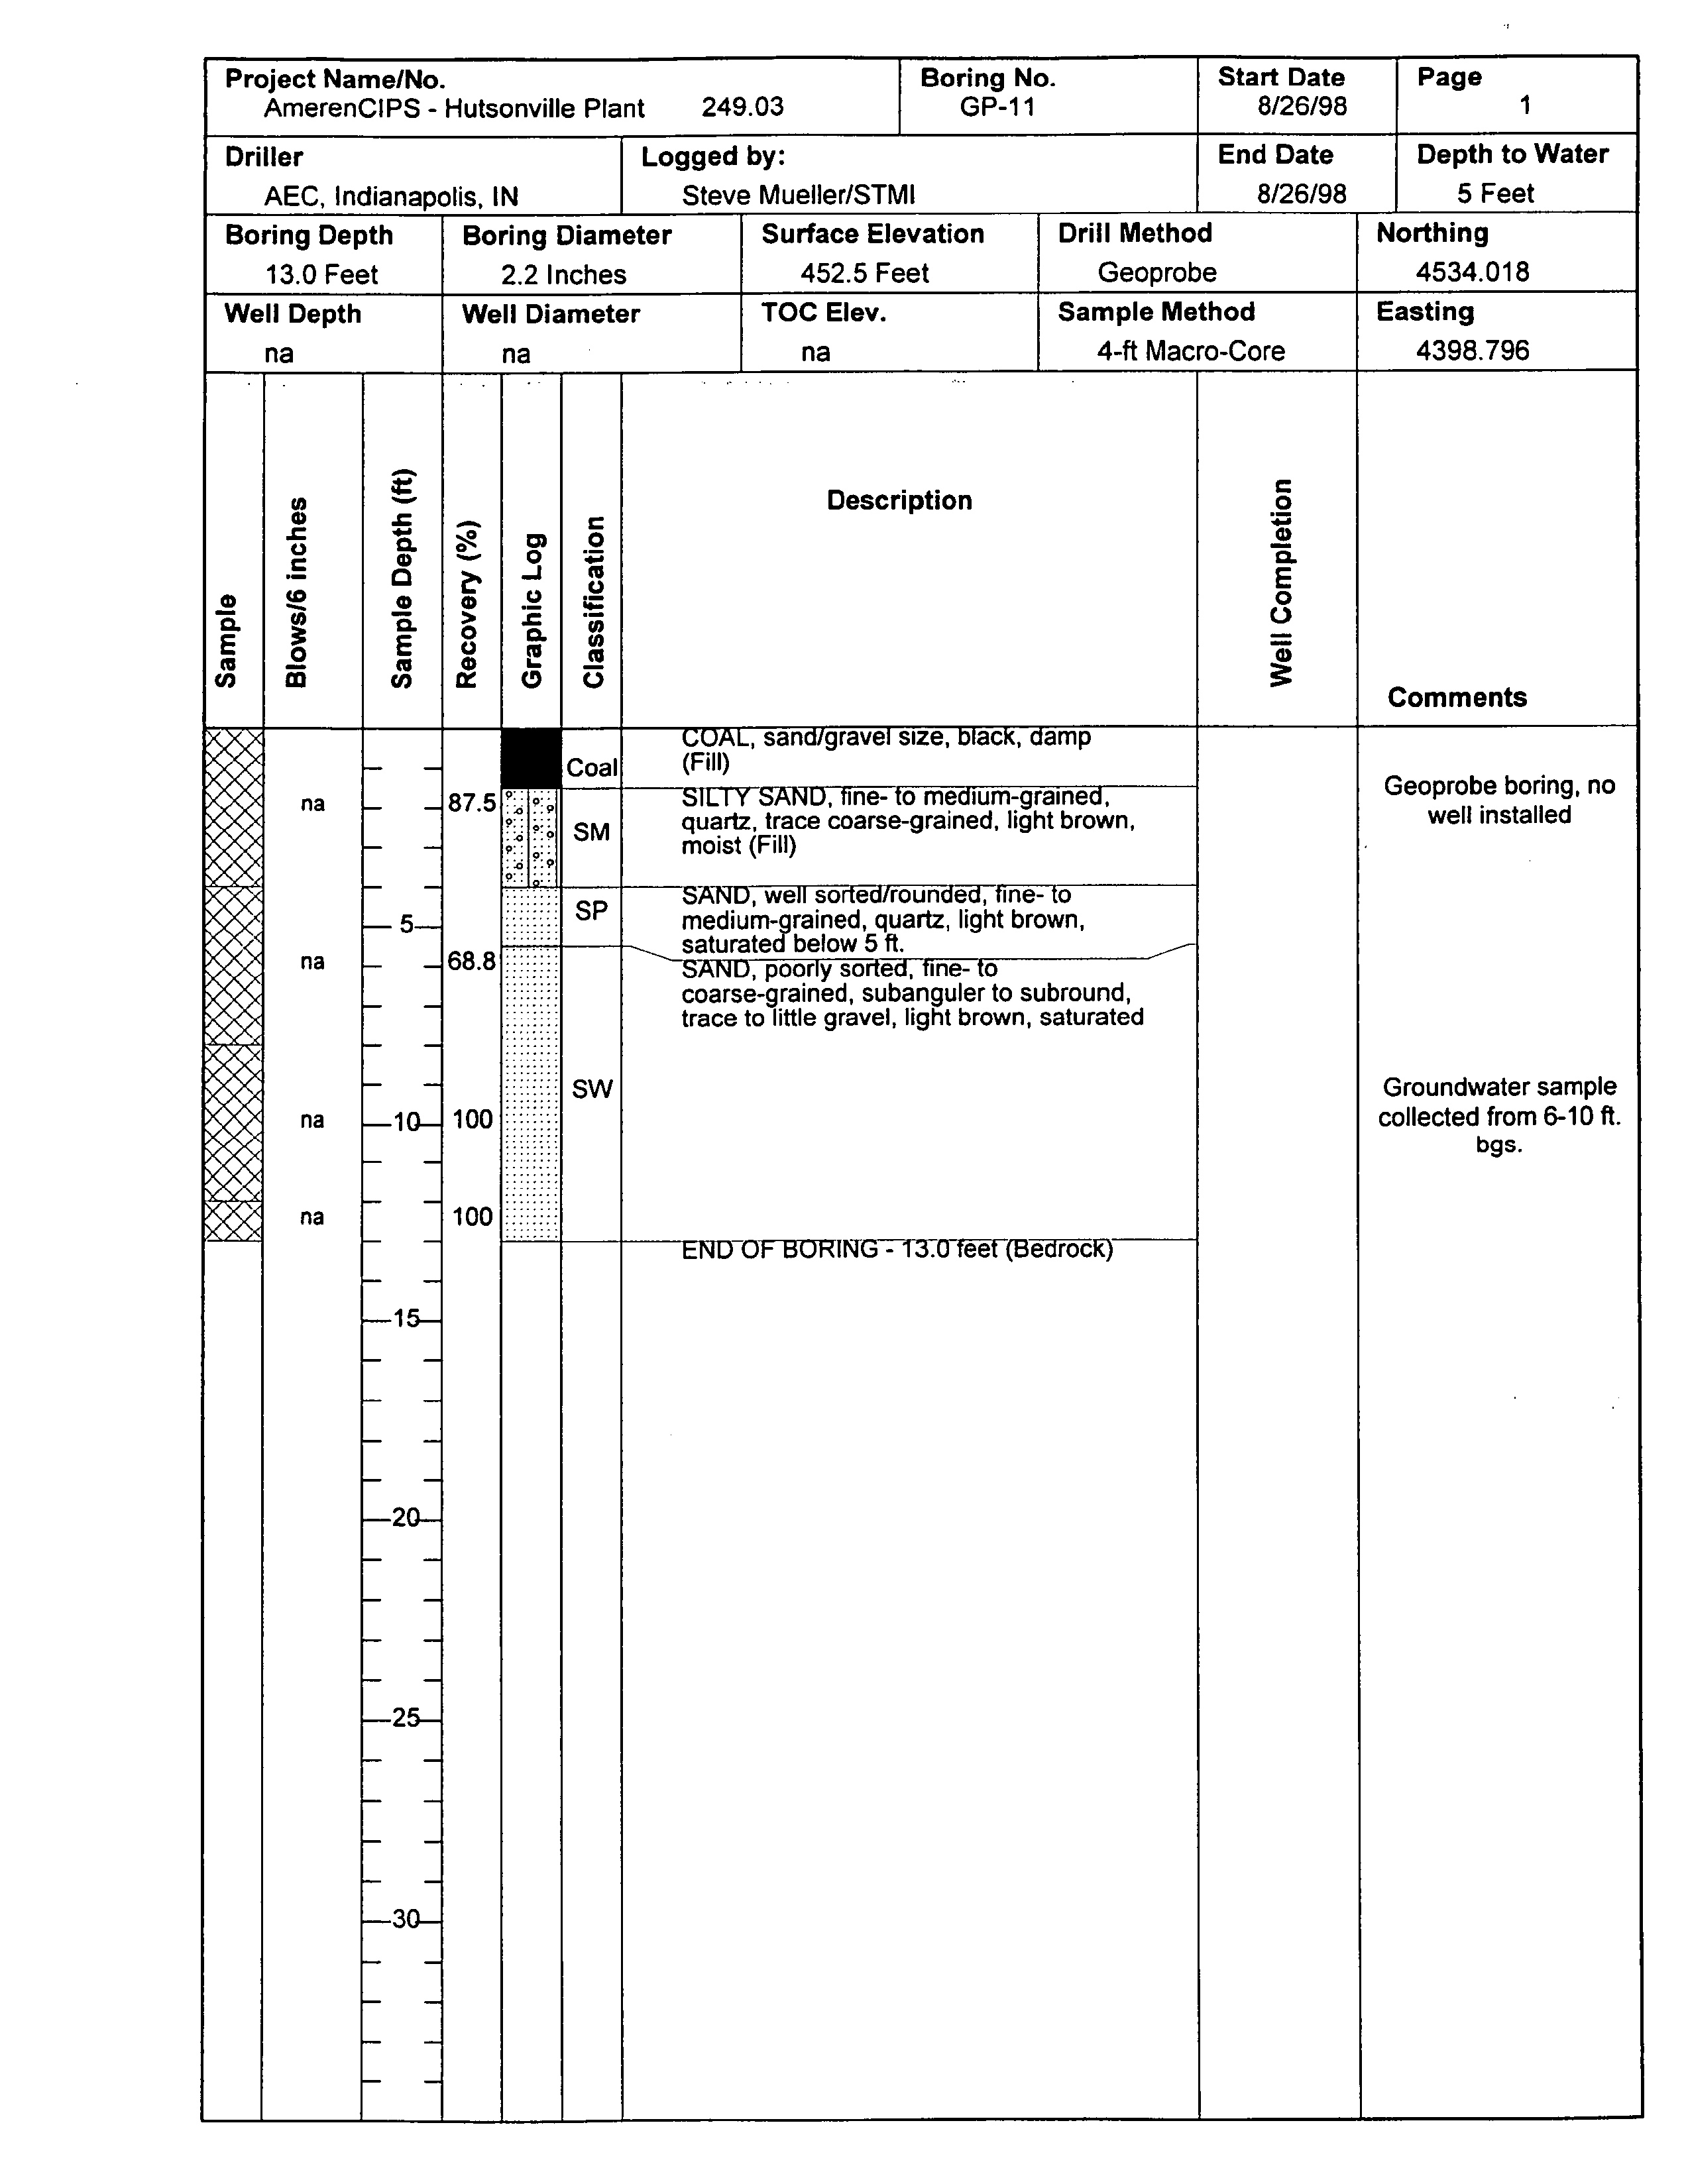
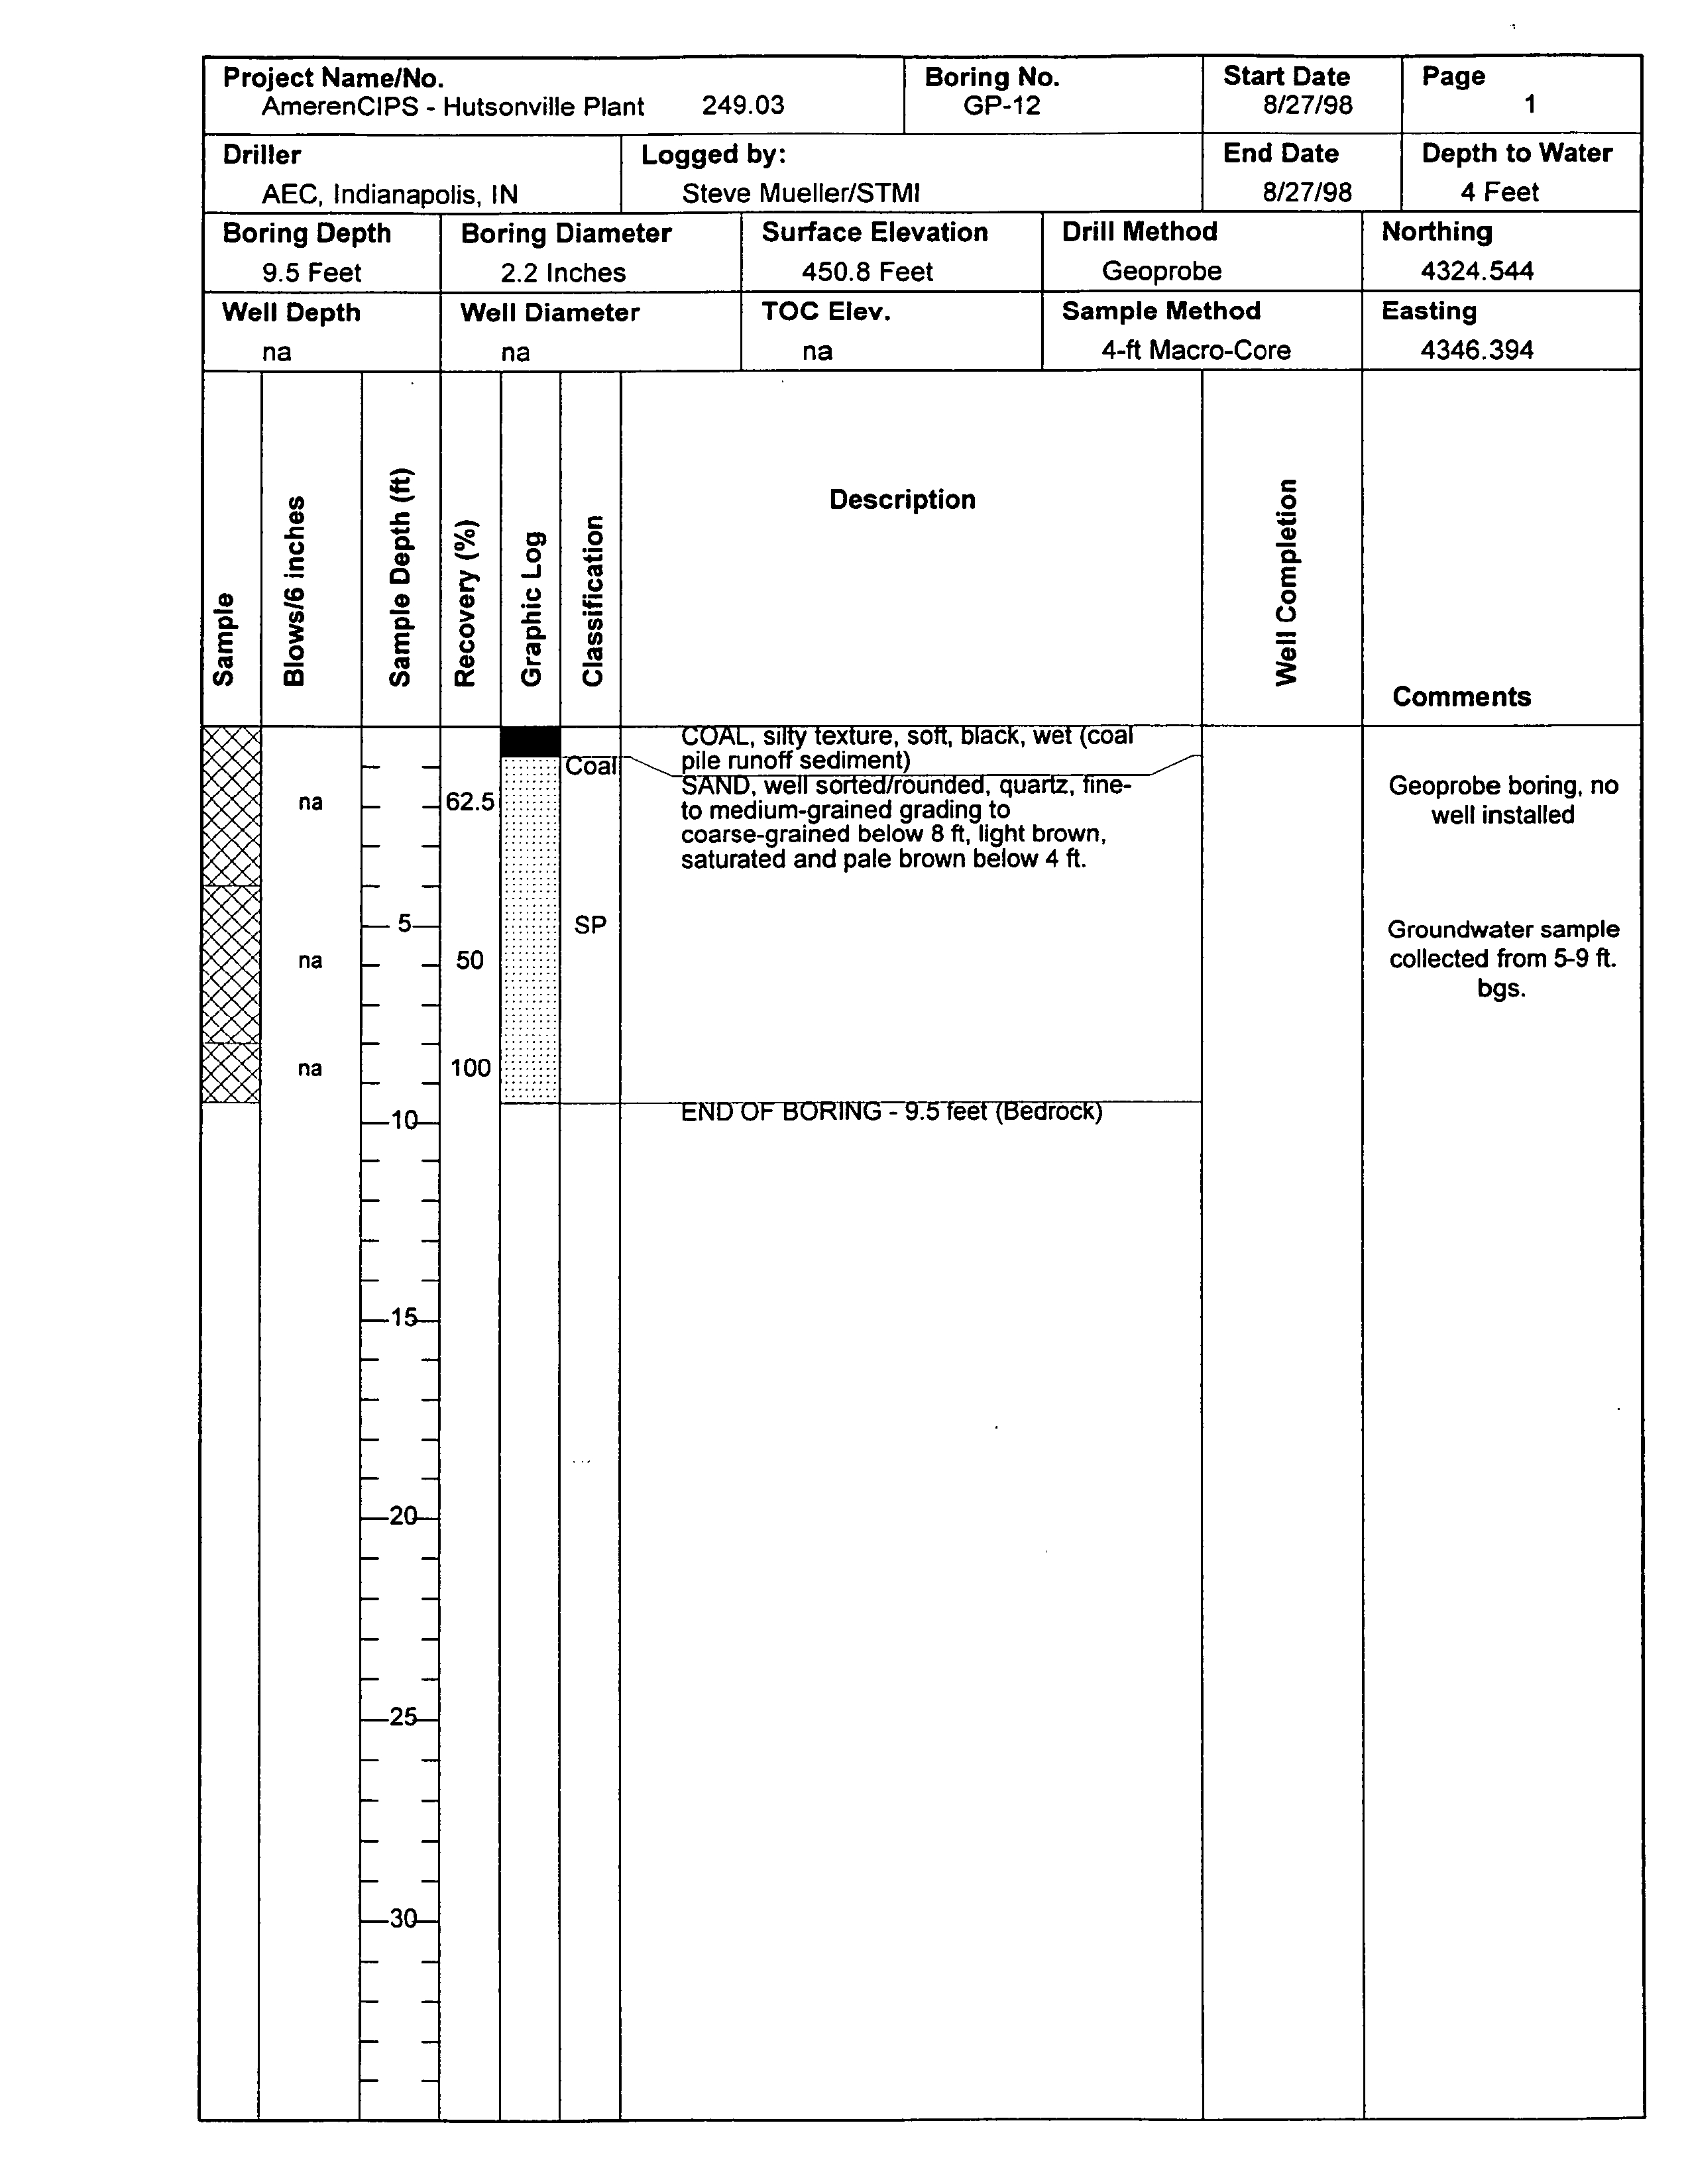
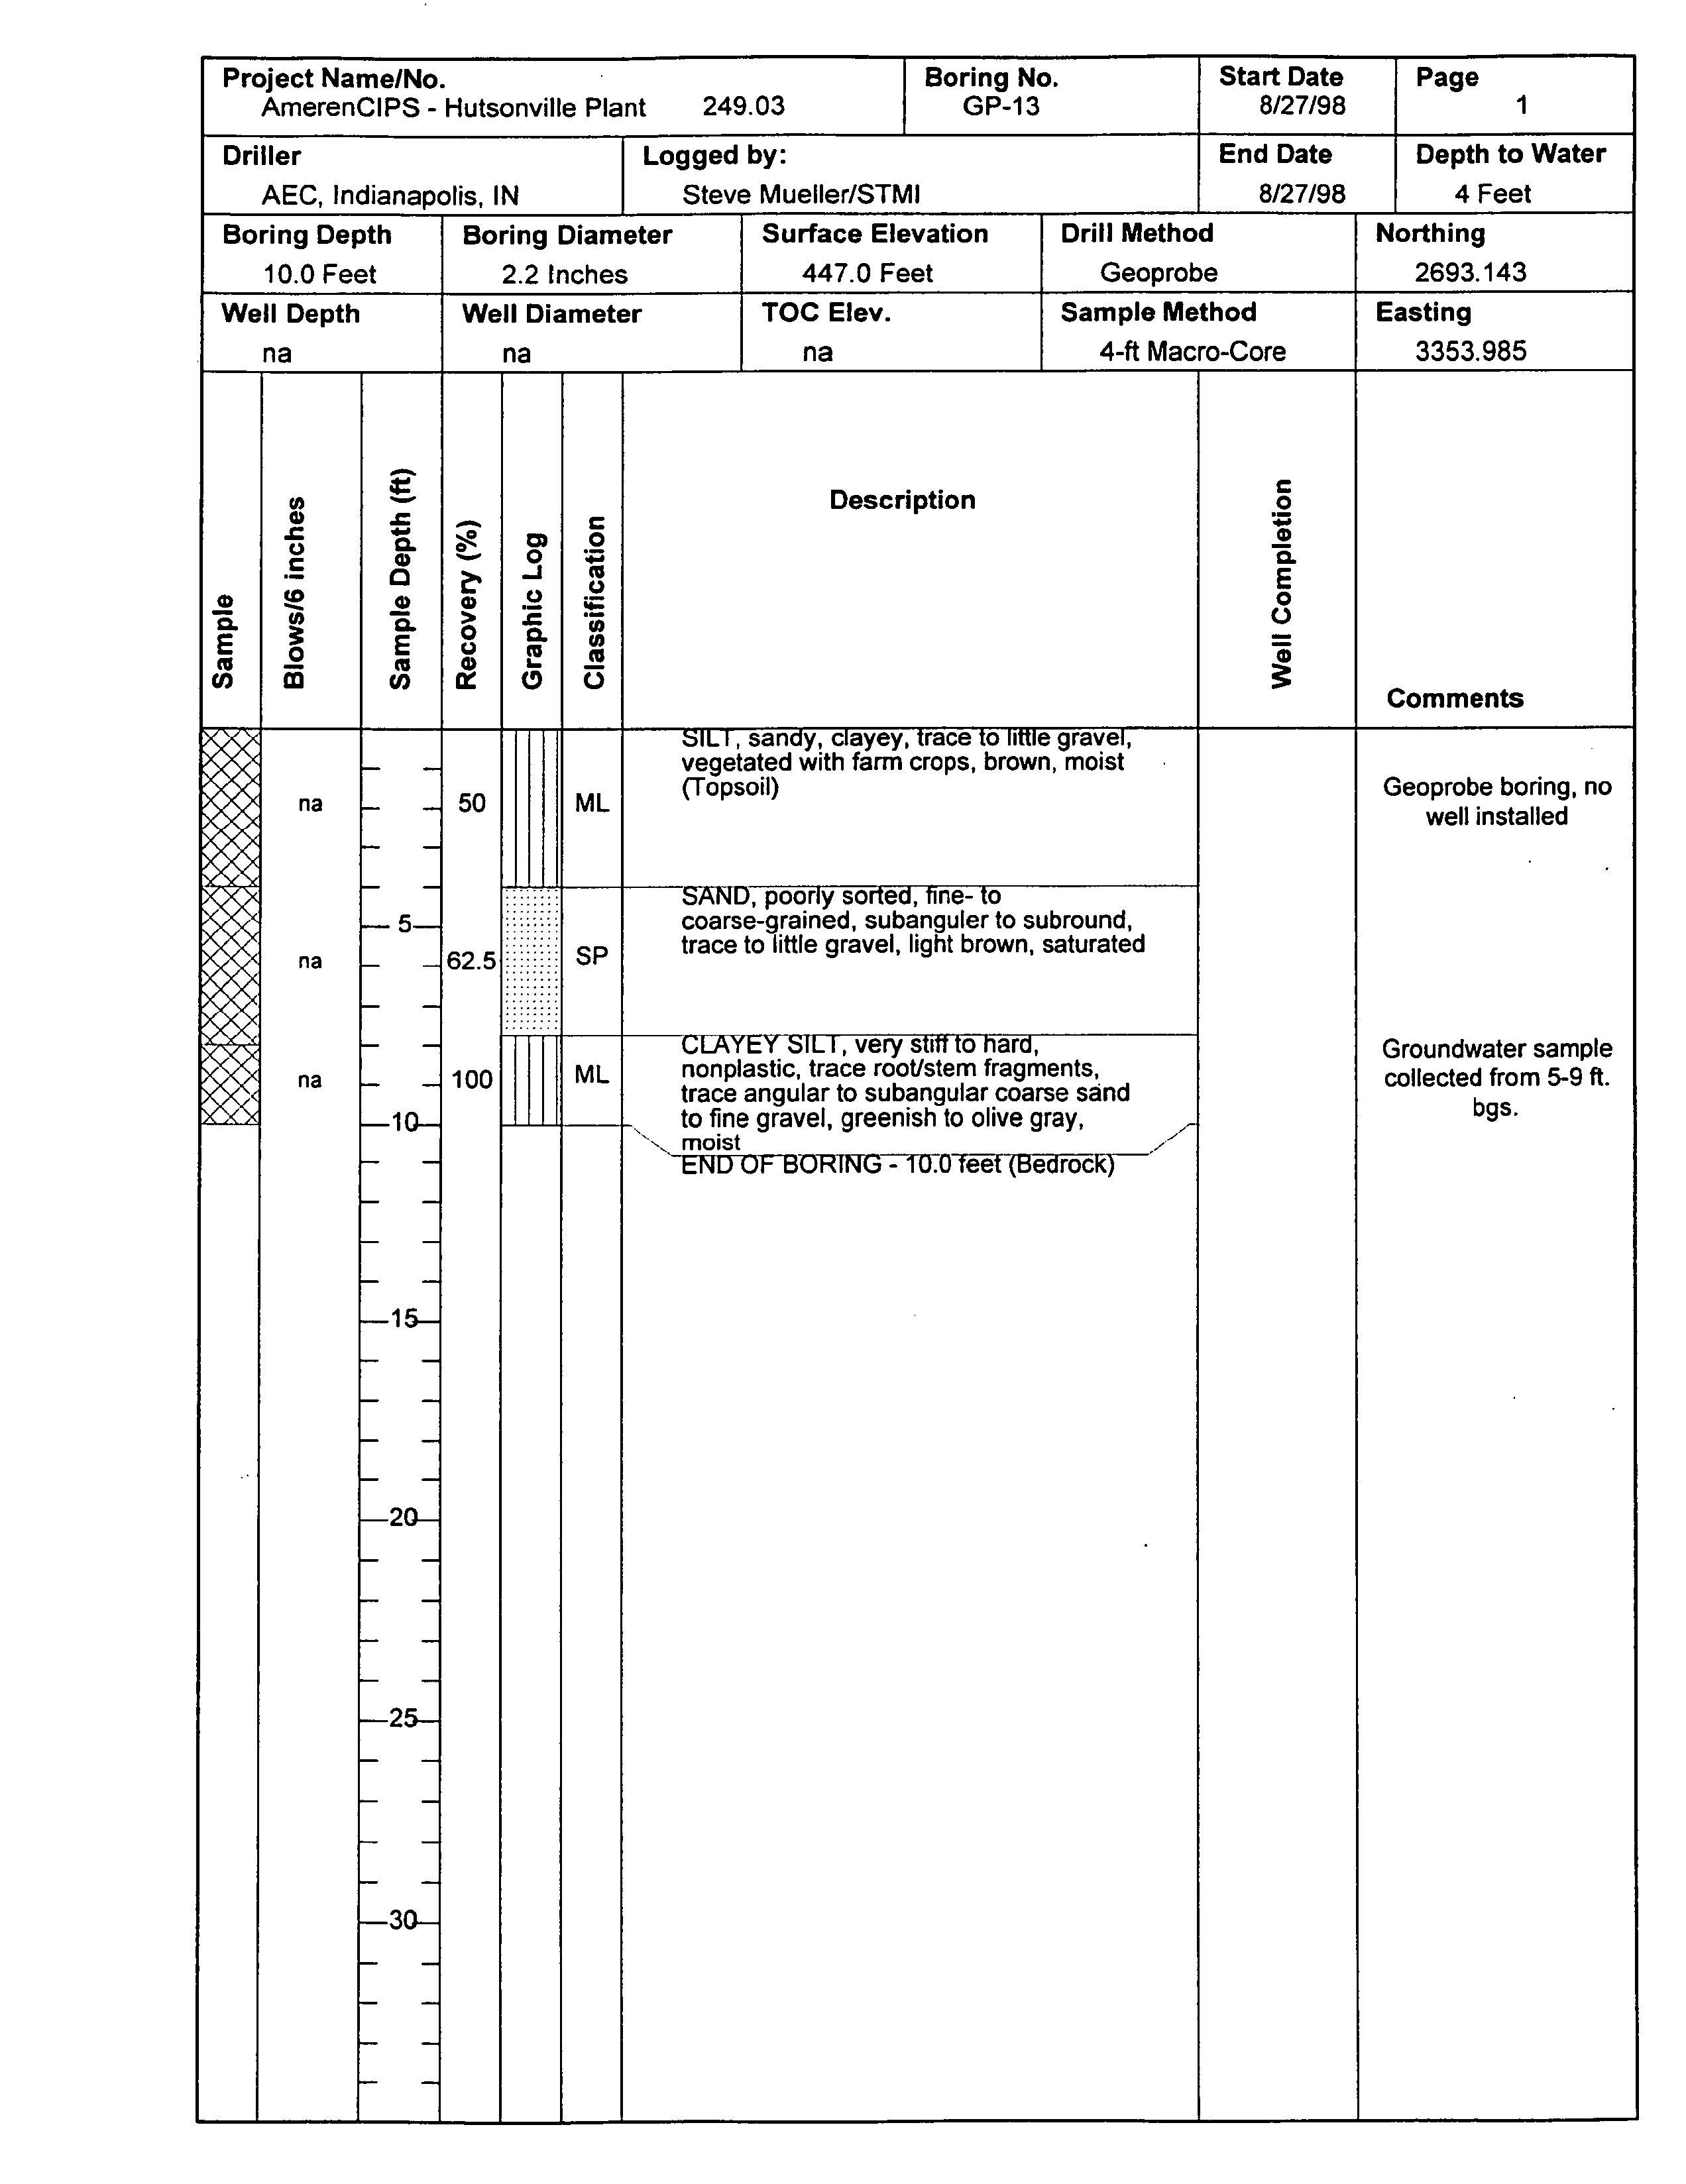
boring logs
are
provided
in
Appendix
Macro-Core Soil
Sampler
consisting
of
52-inch
long
by
2.2-inch O.D
split-barrel sampler
fitted with
replaceable plastic liner
was
used
to
collect
continuous
sequence
of soil and ash
core at
each
probe
hole location
The
probe
holes were advanced
to
bedrock
typically
encountered
at
depths
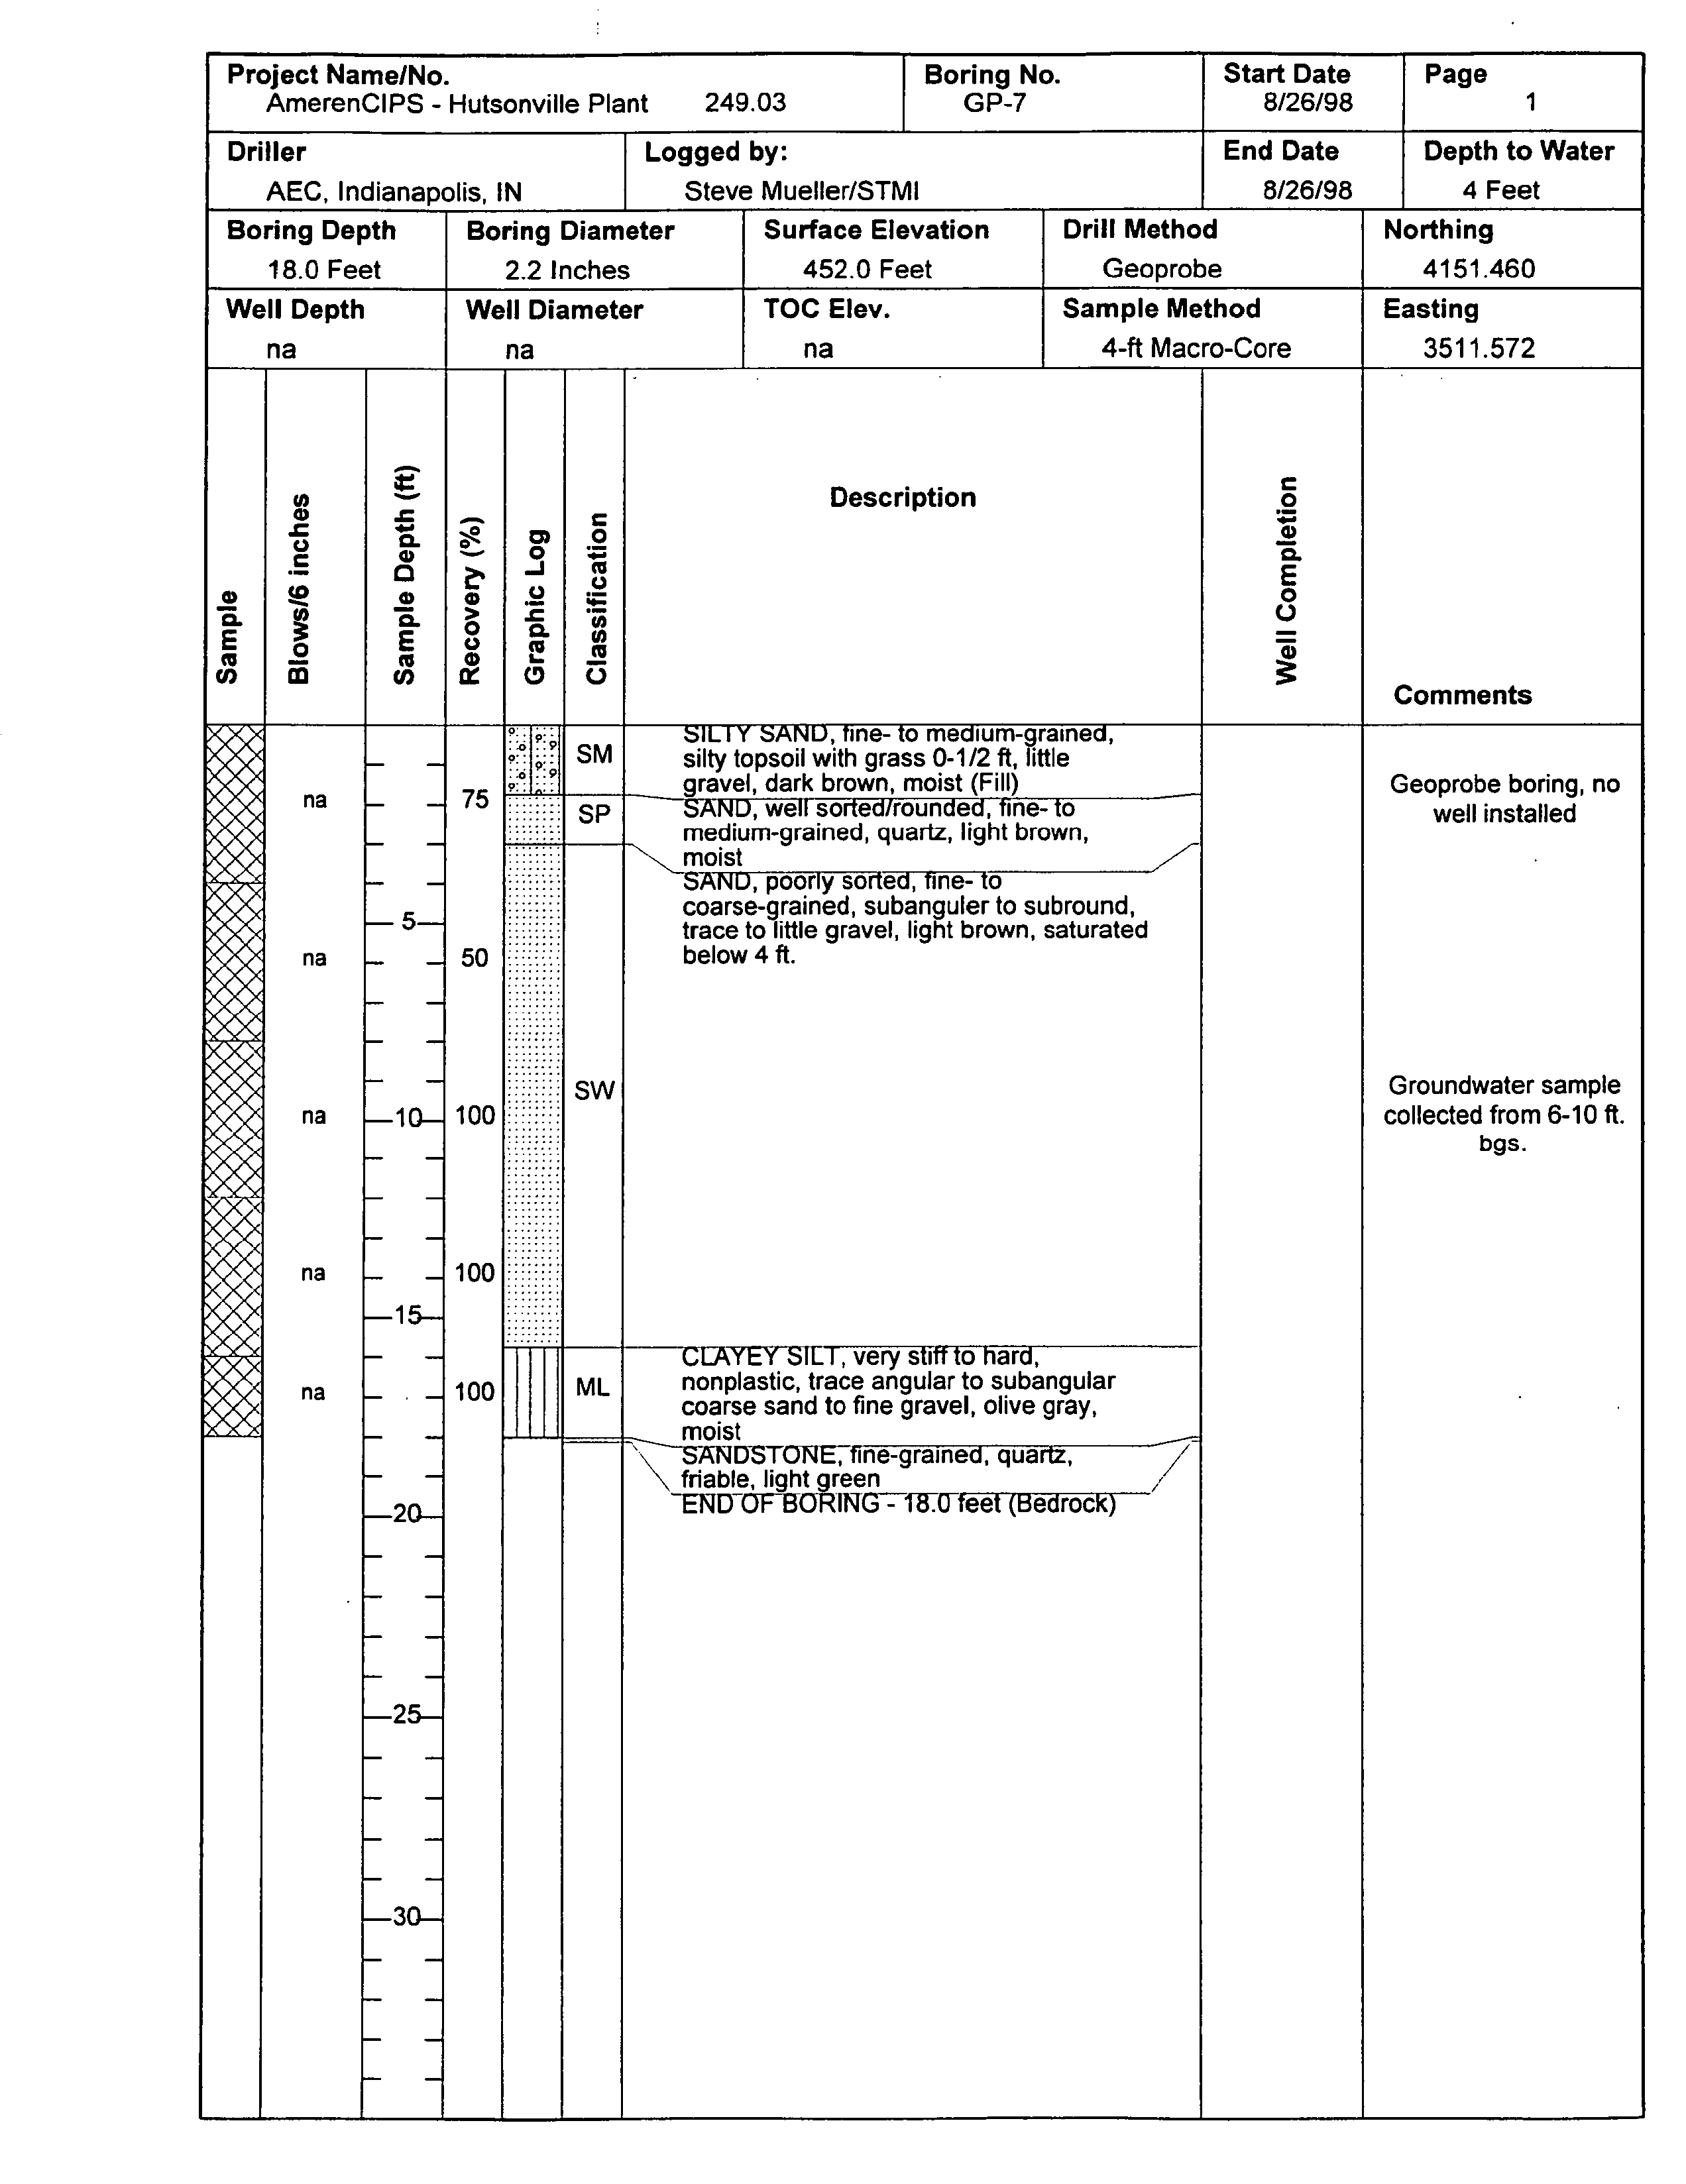
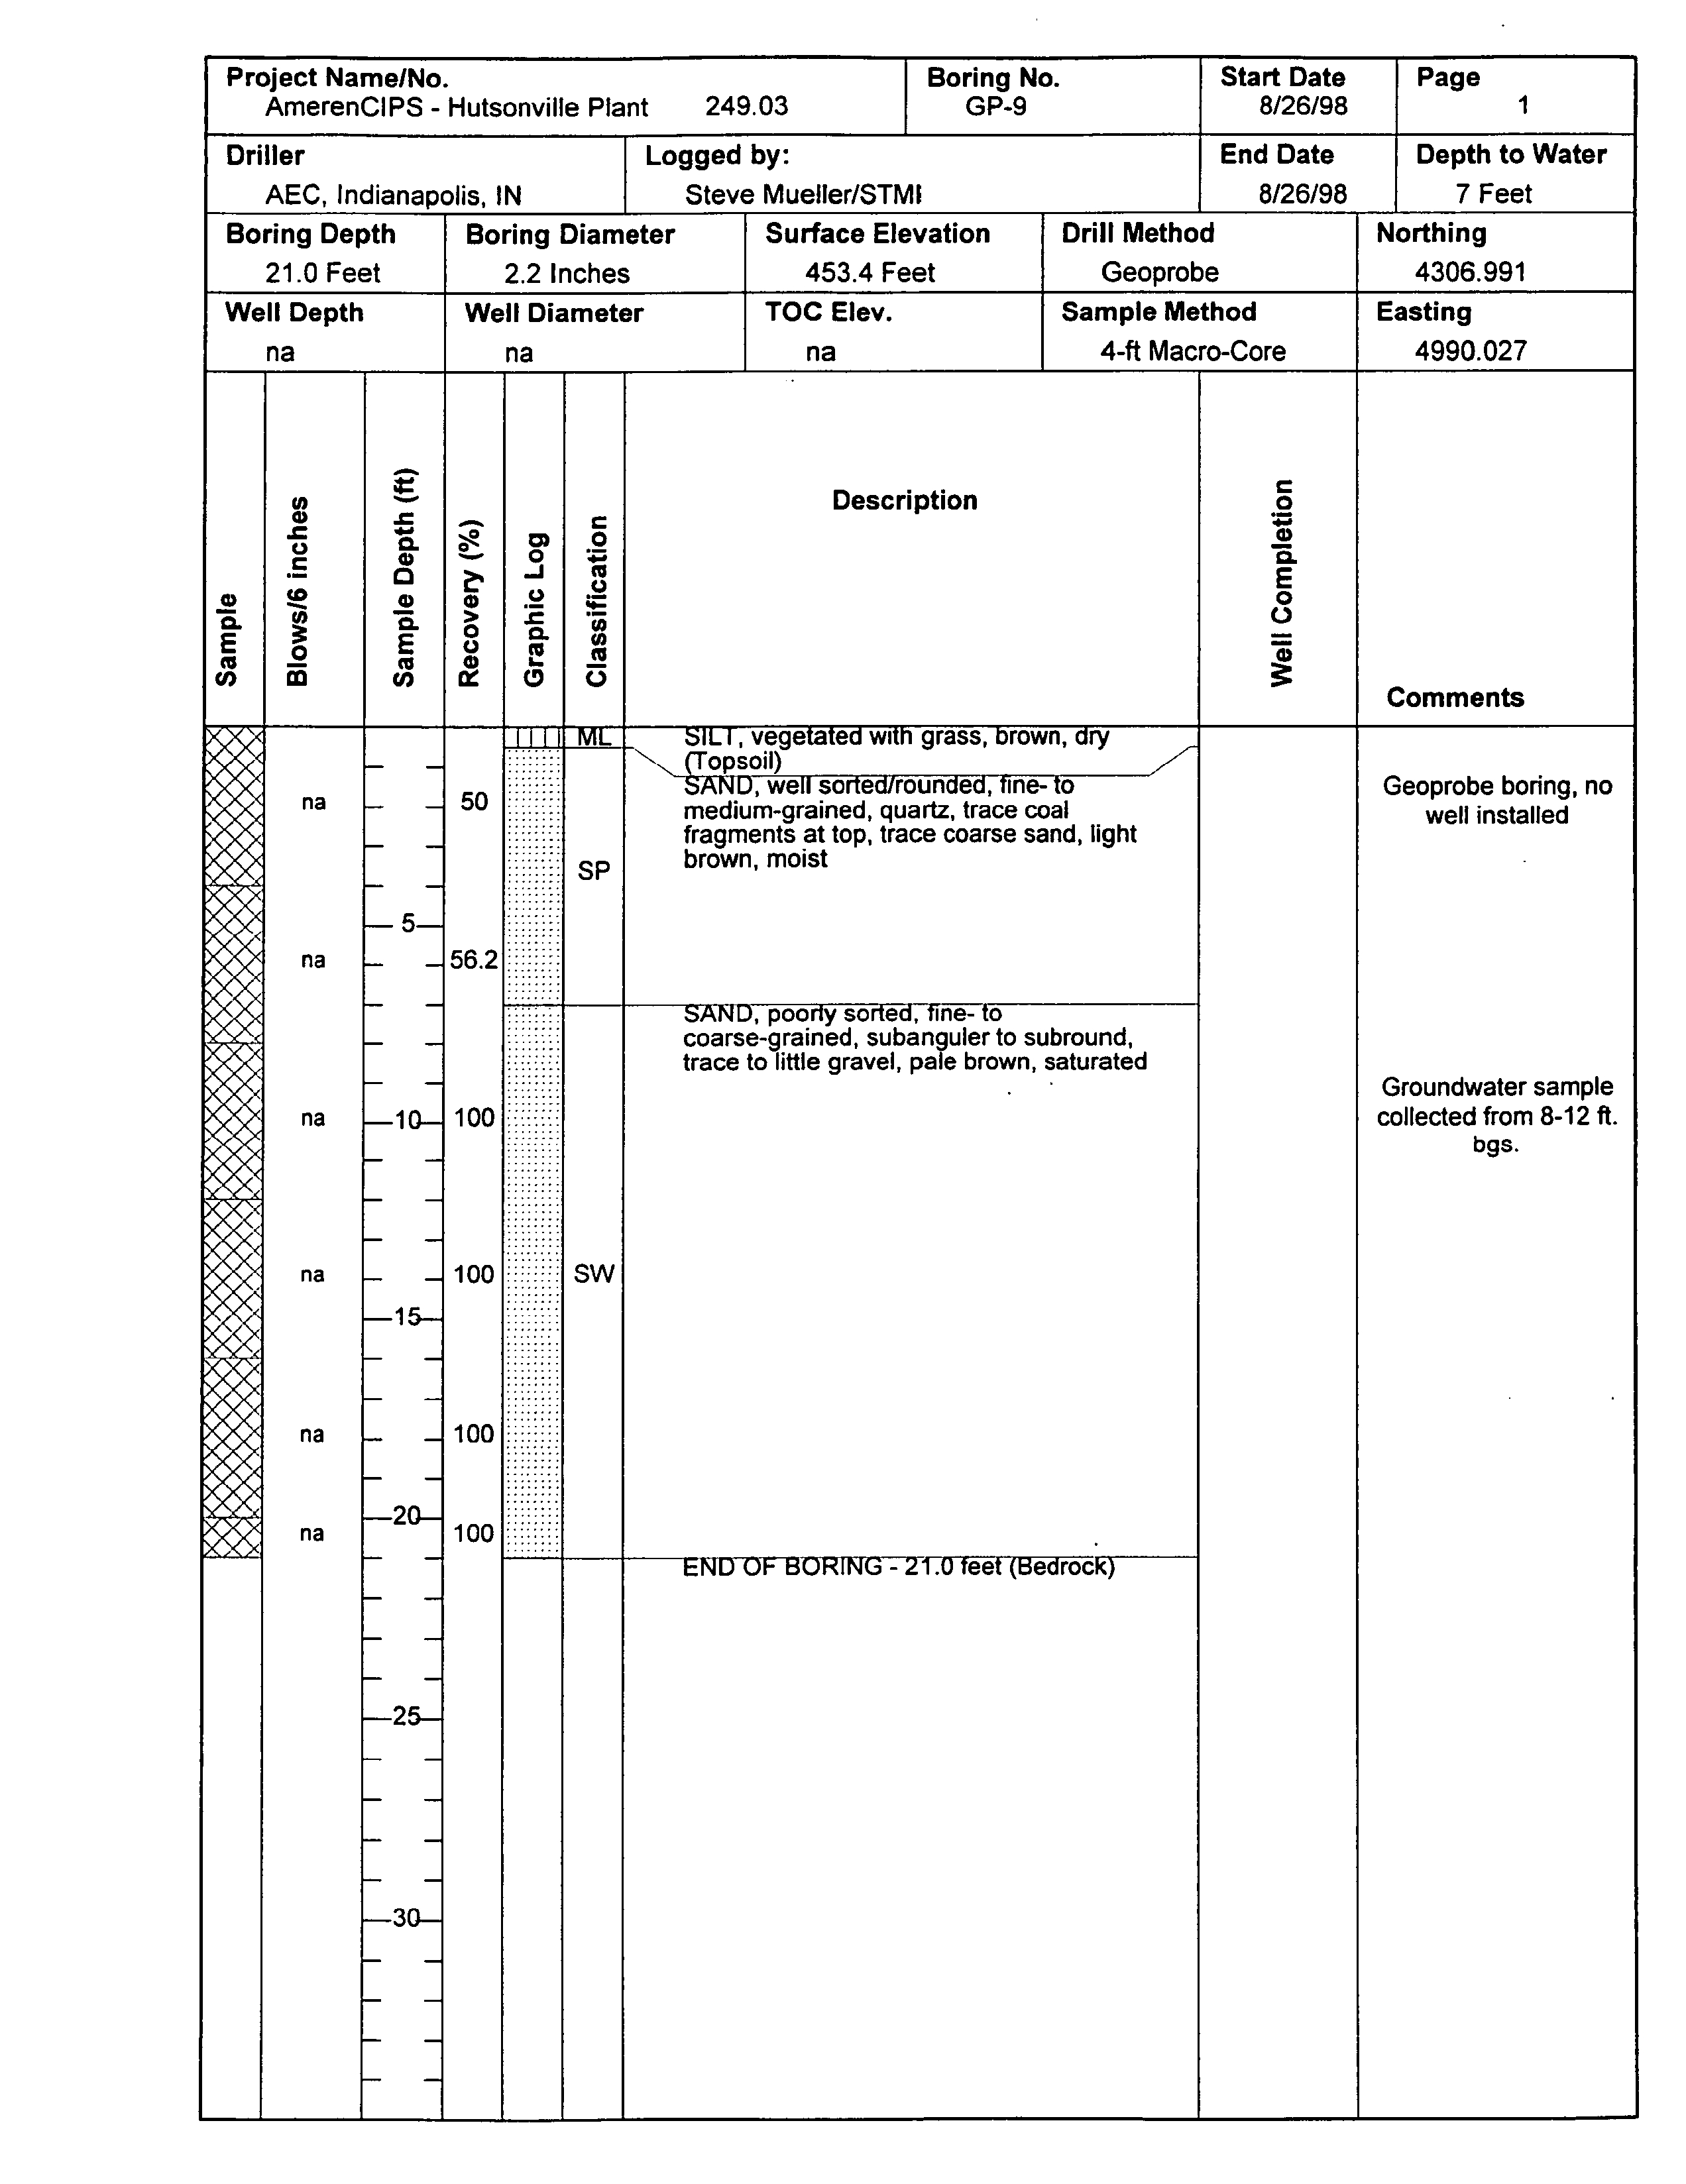
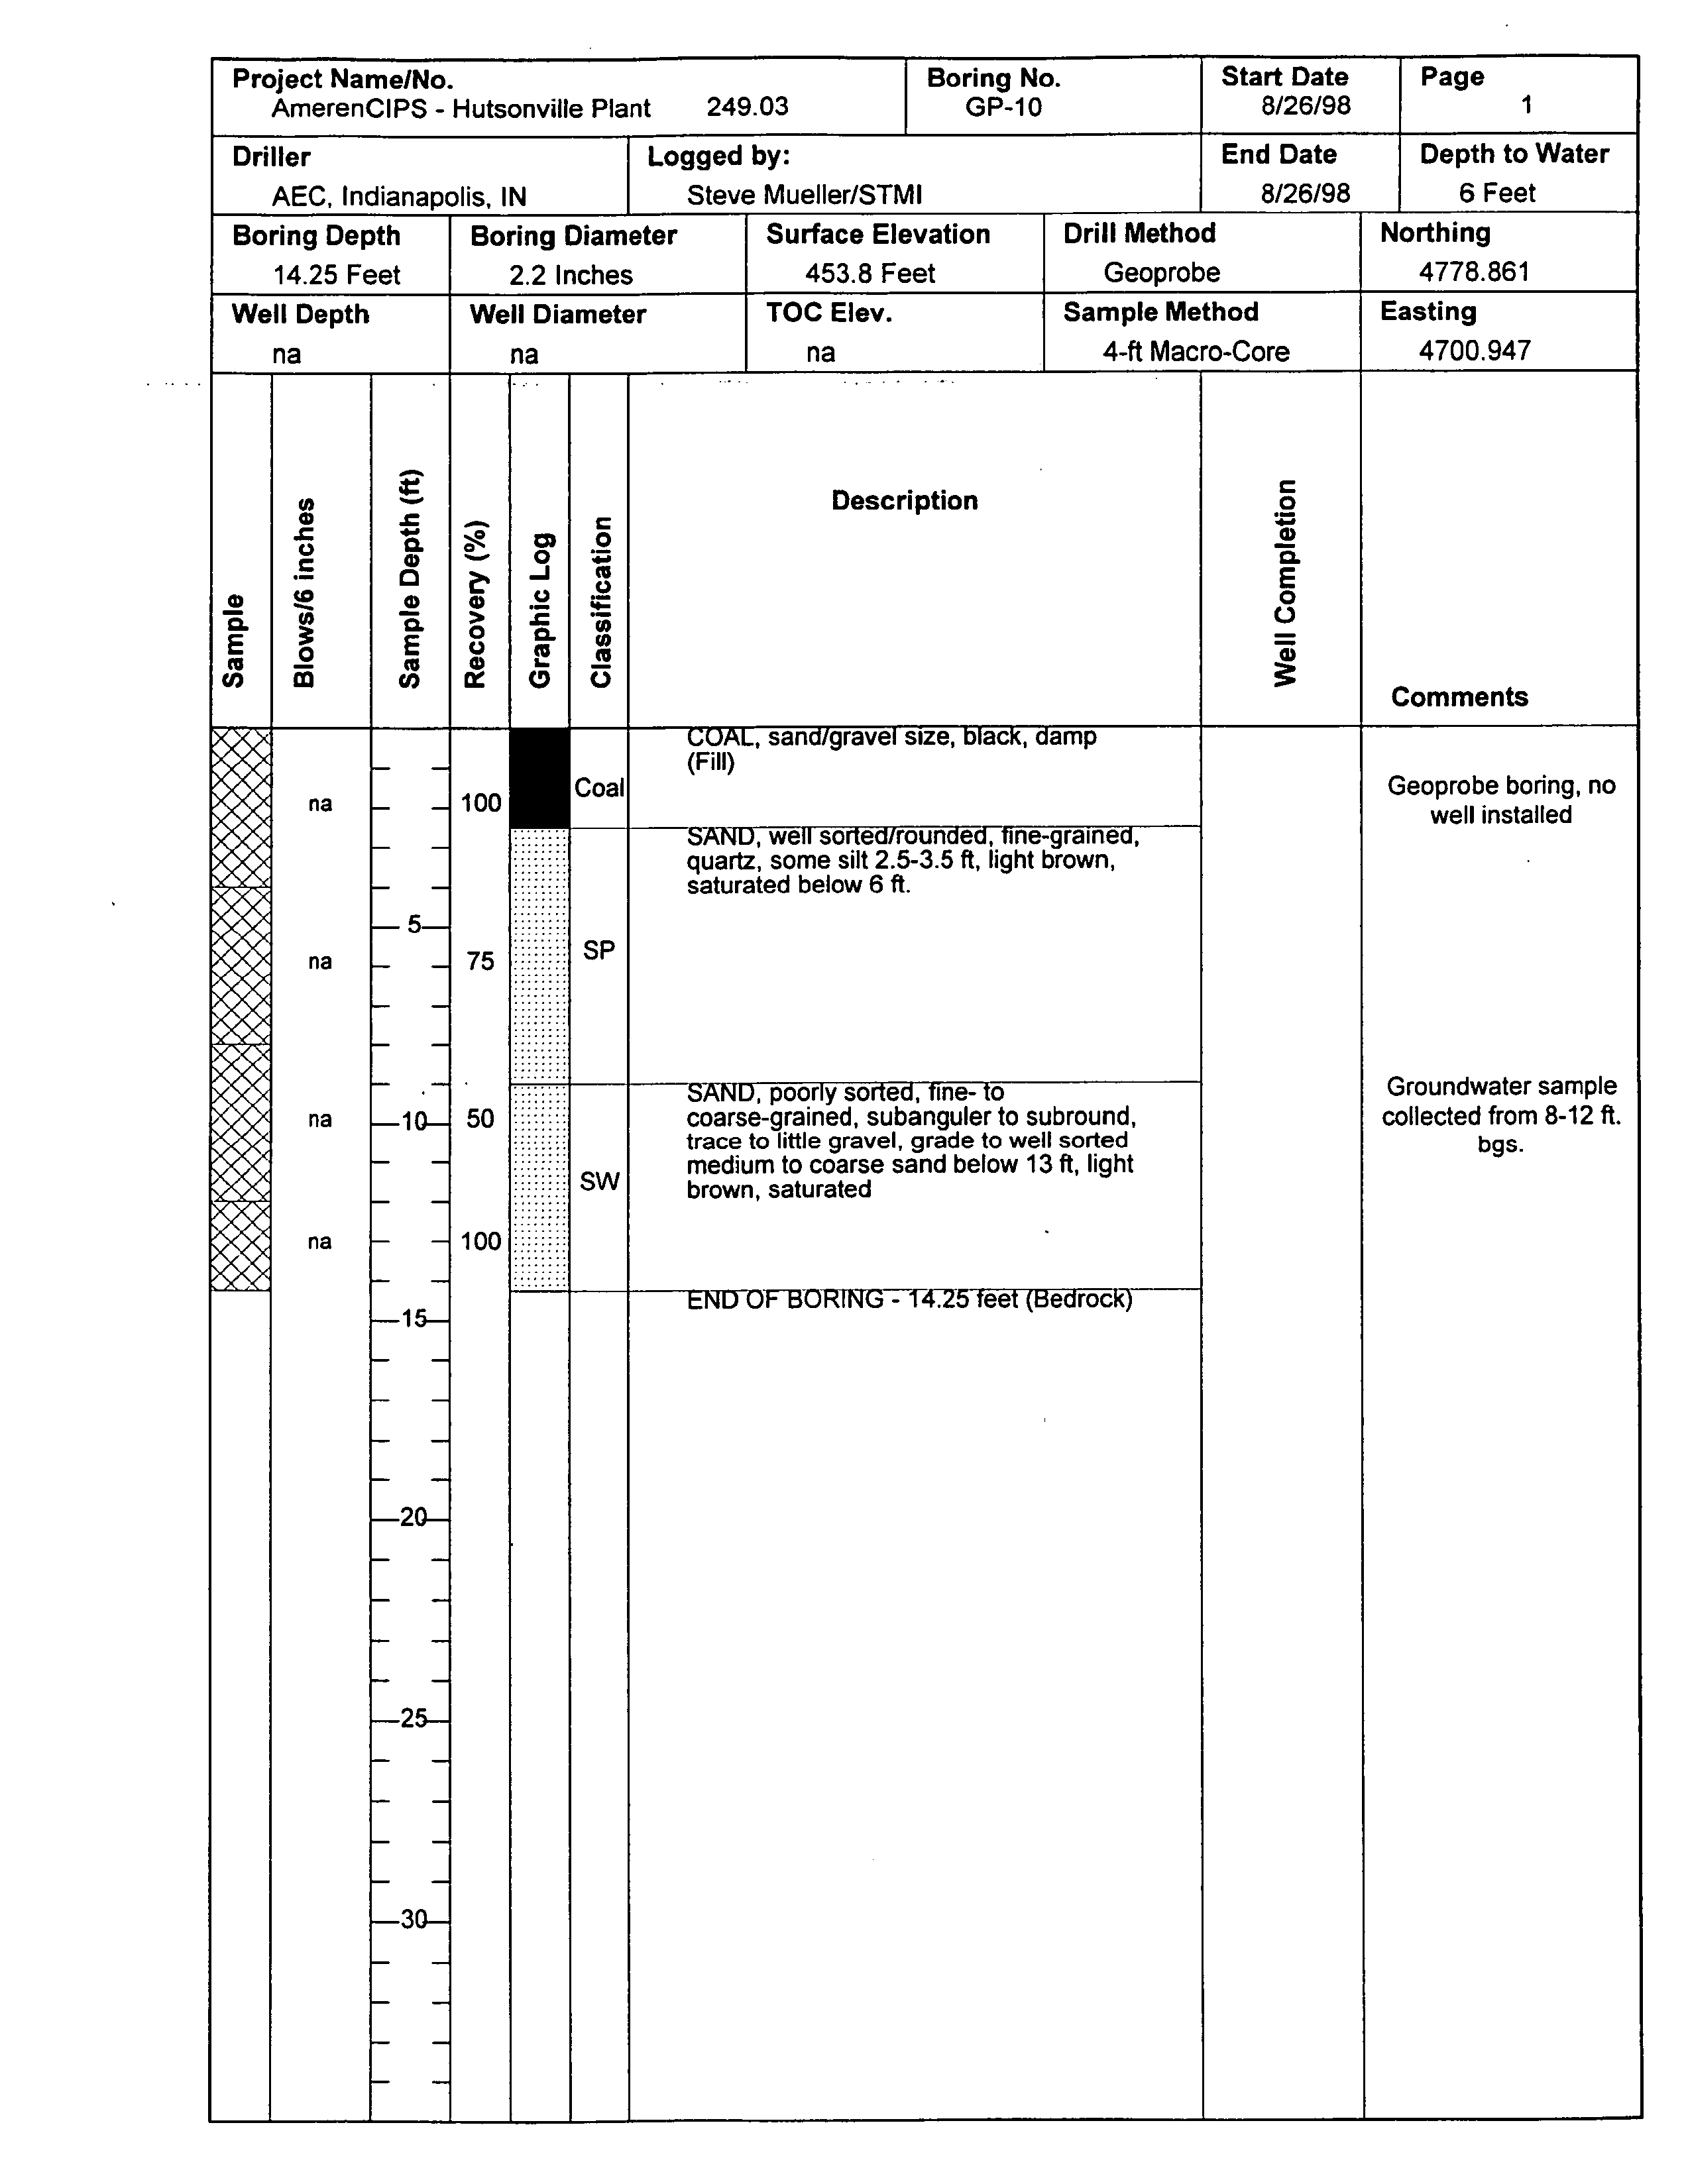
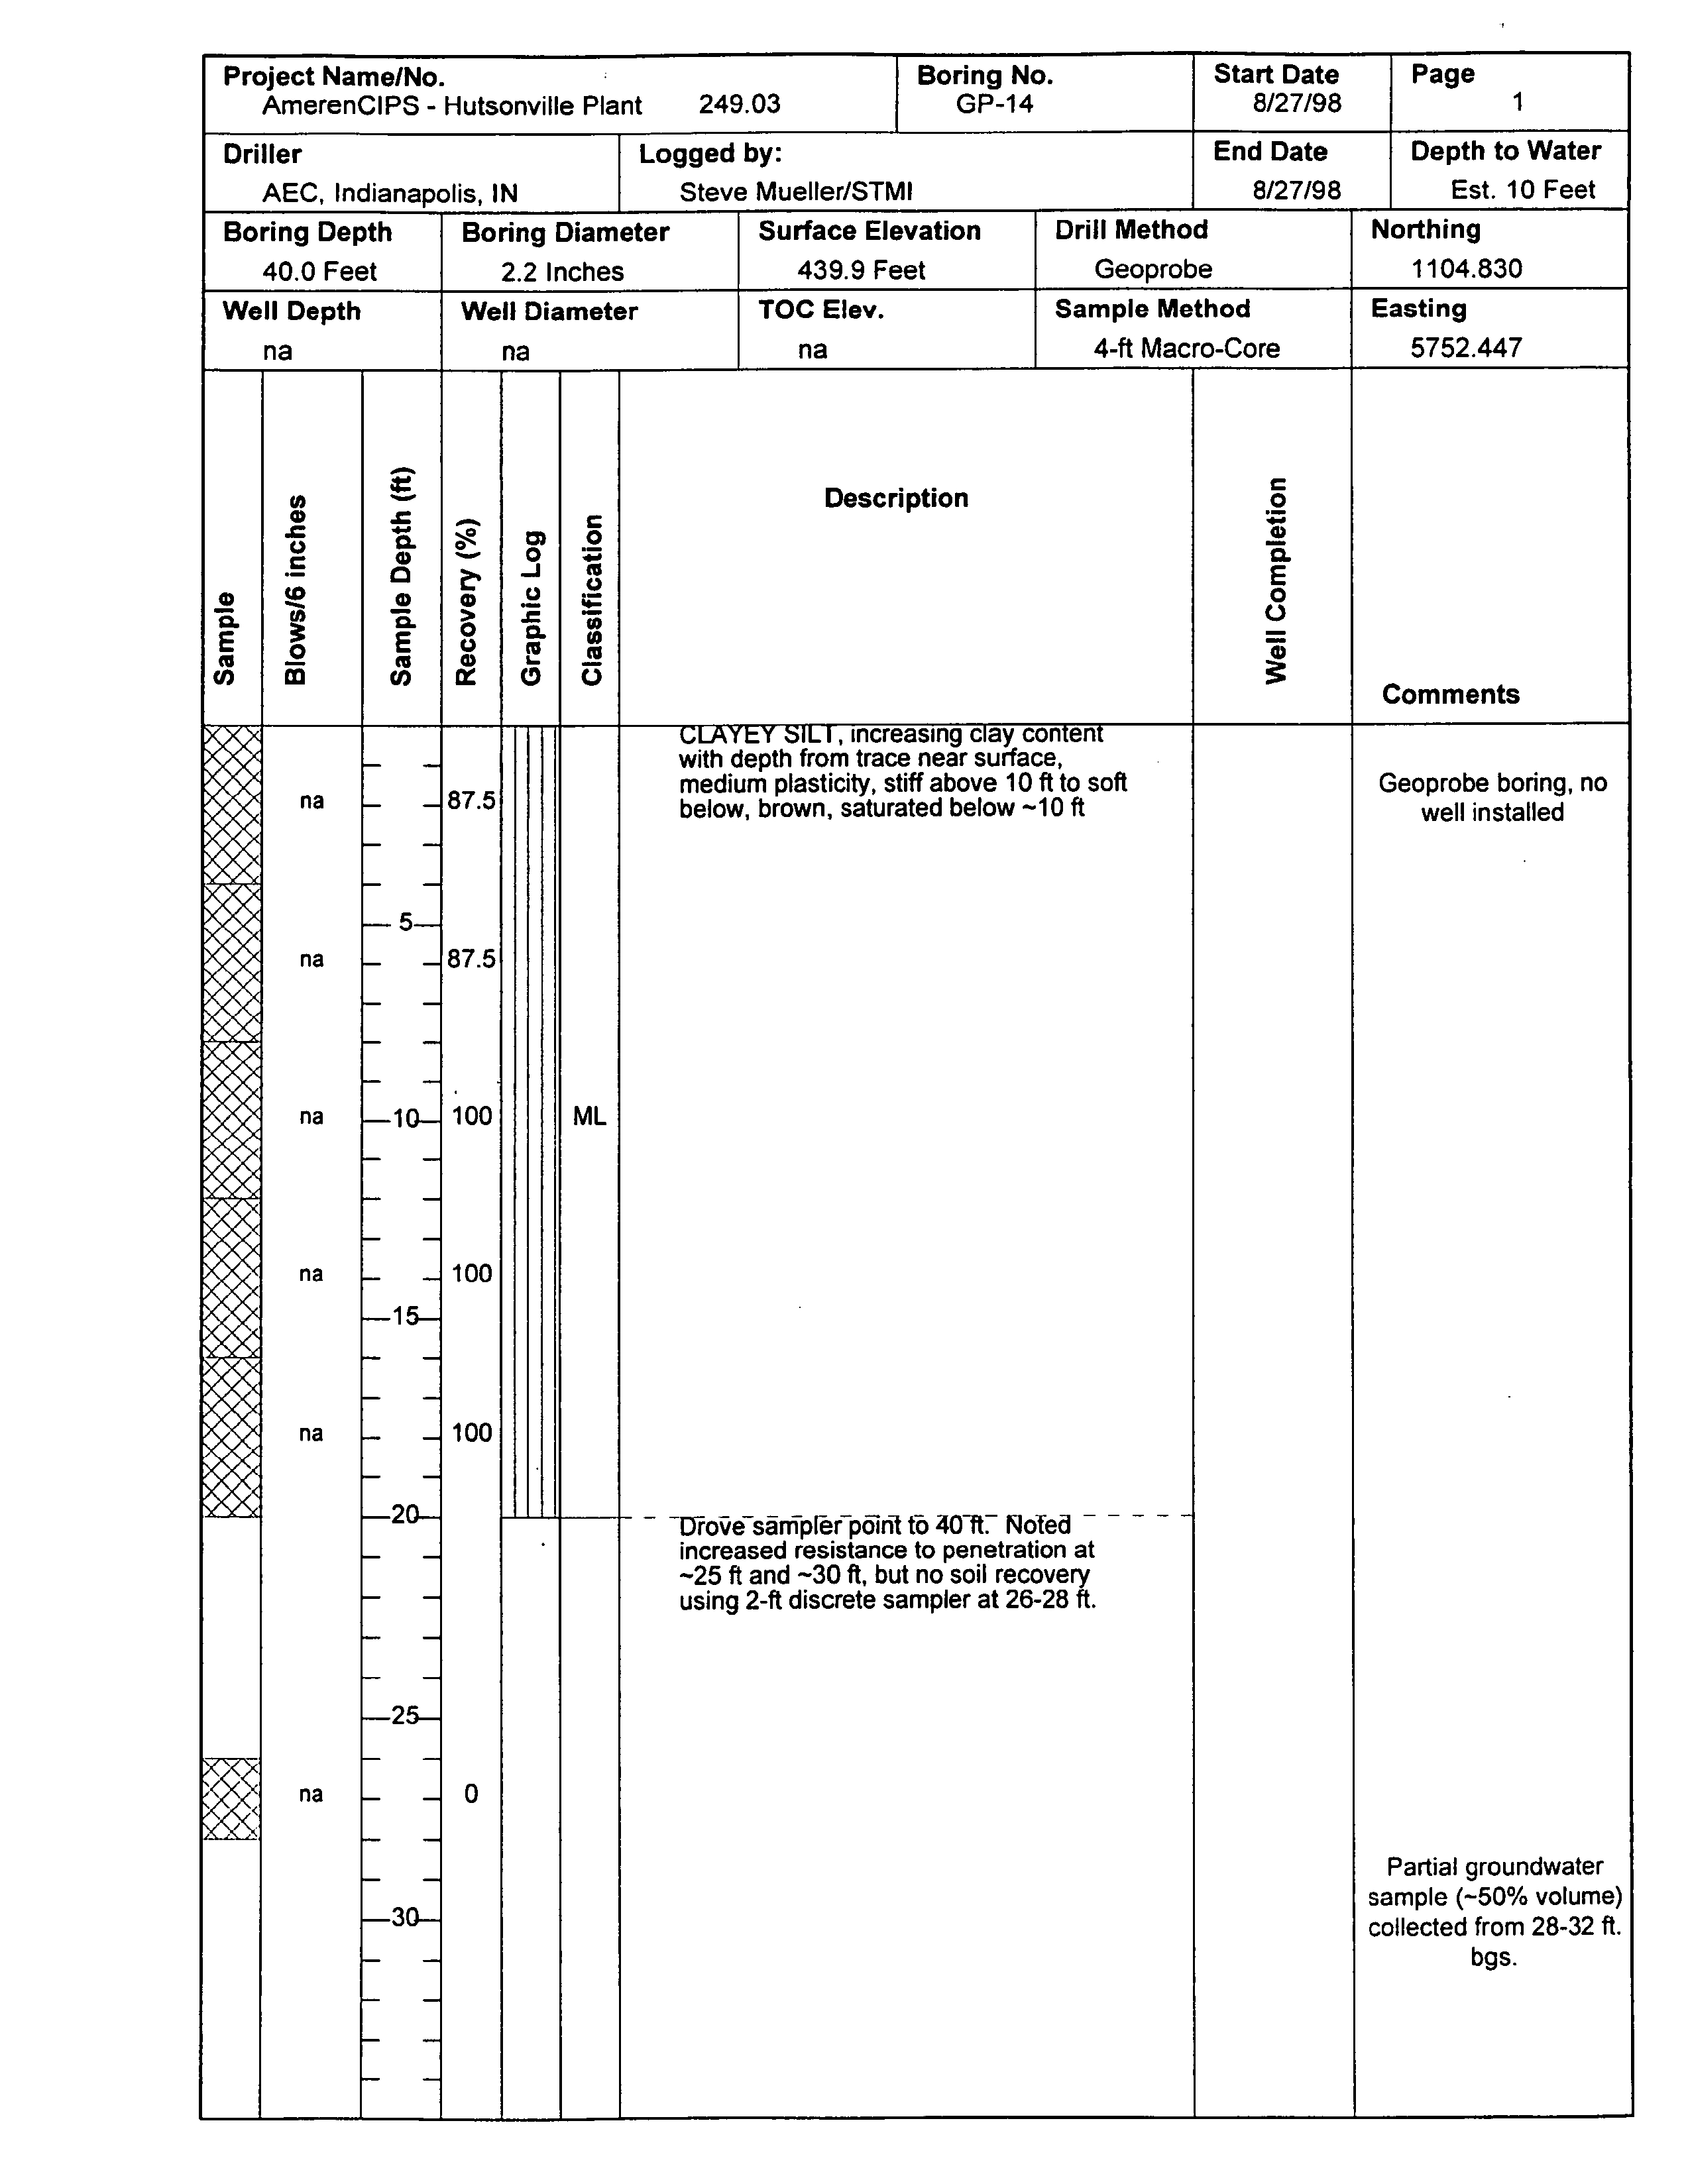
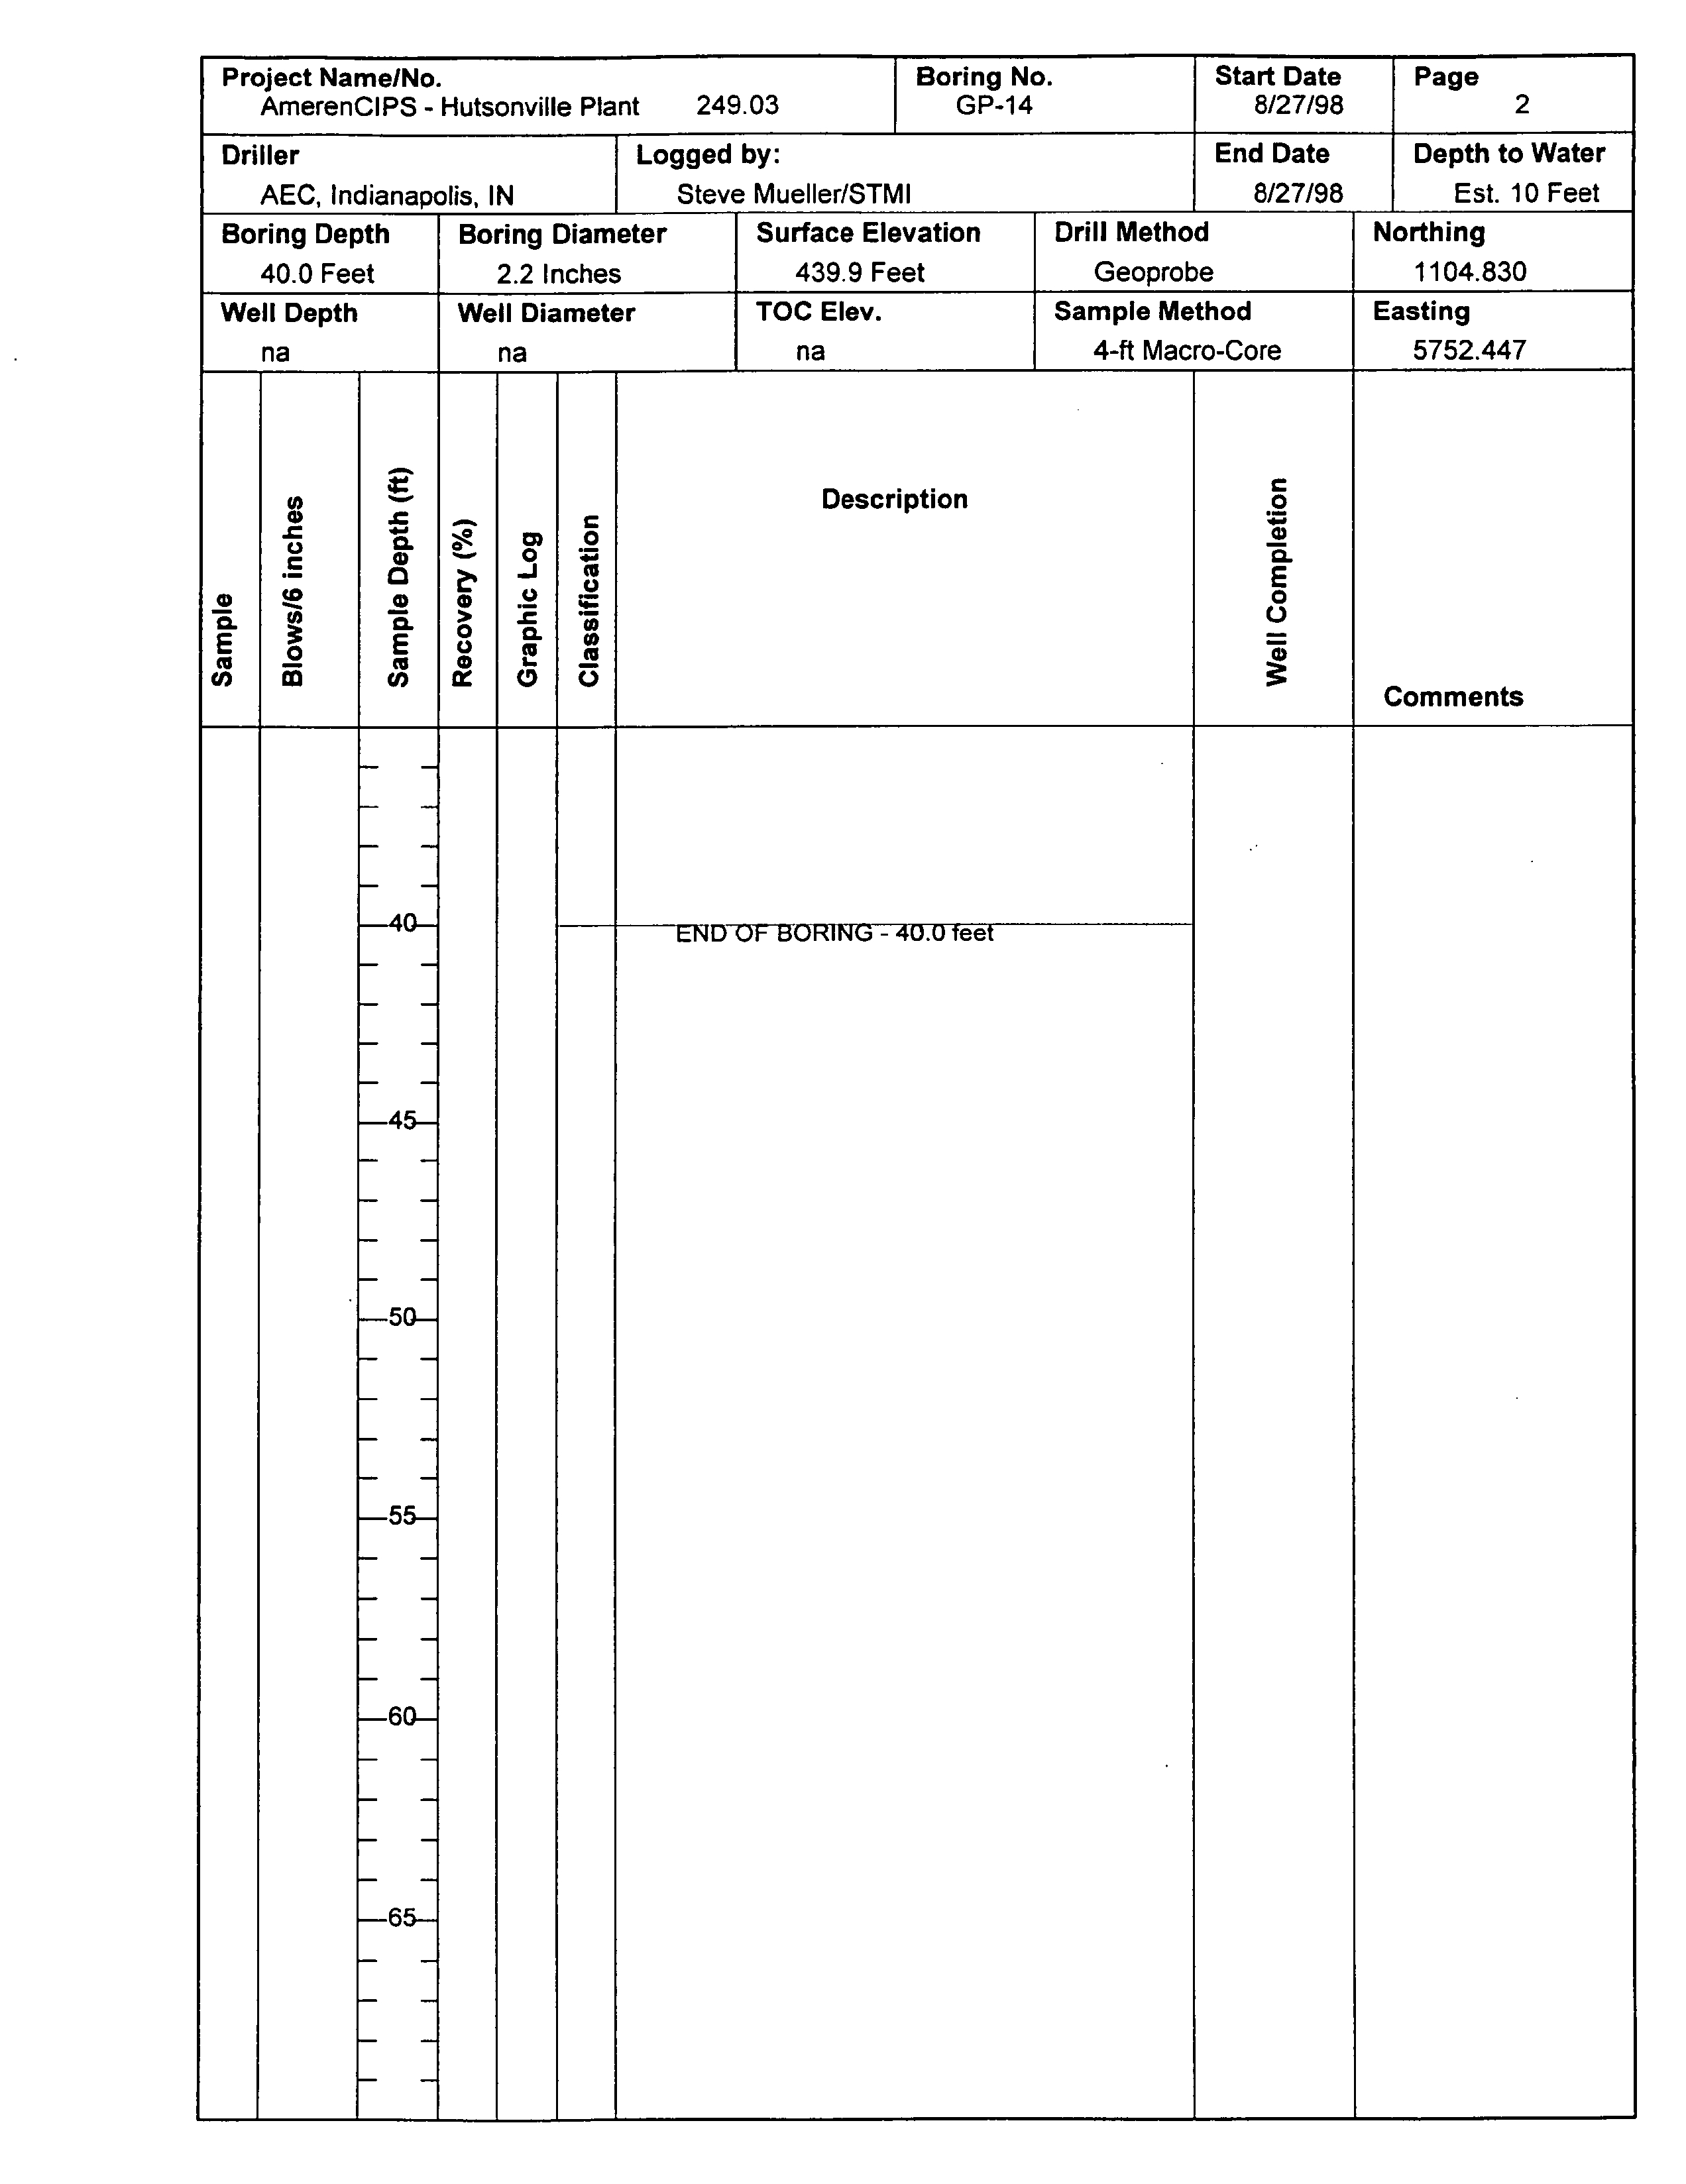
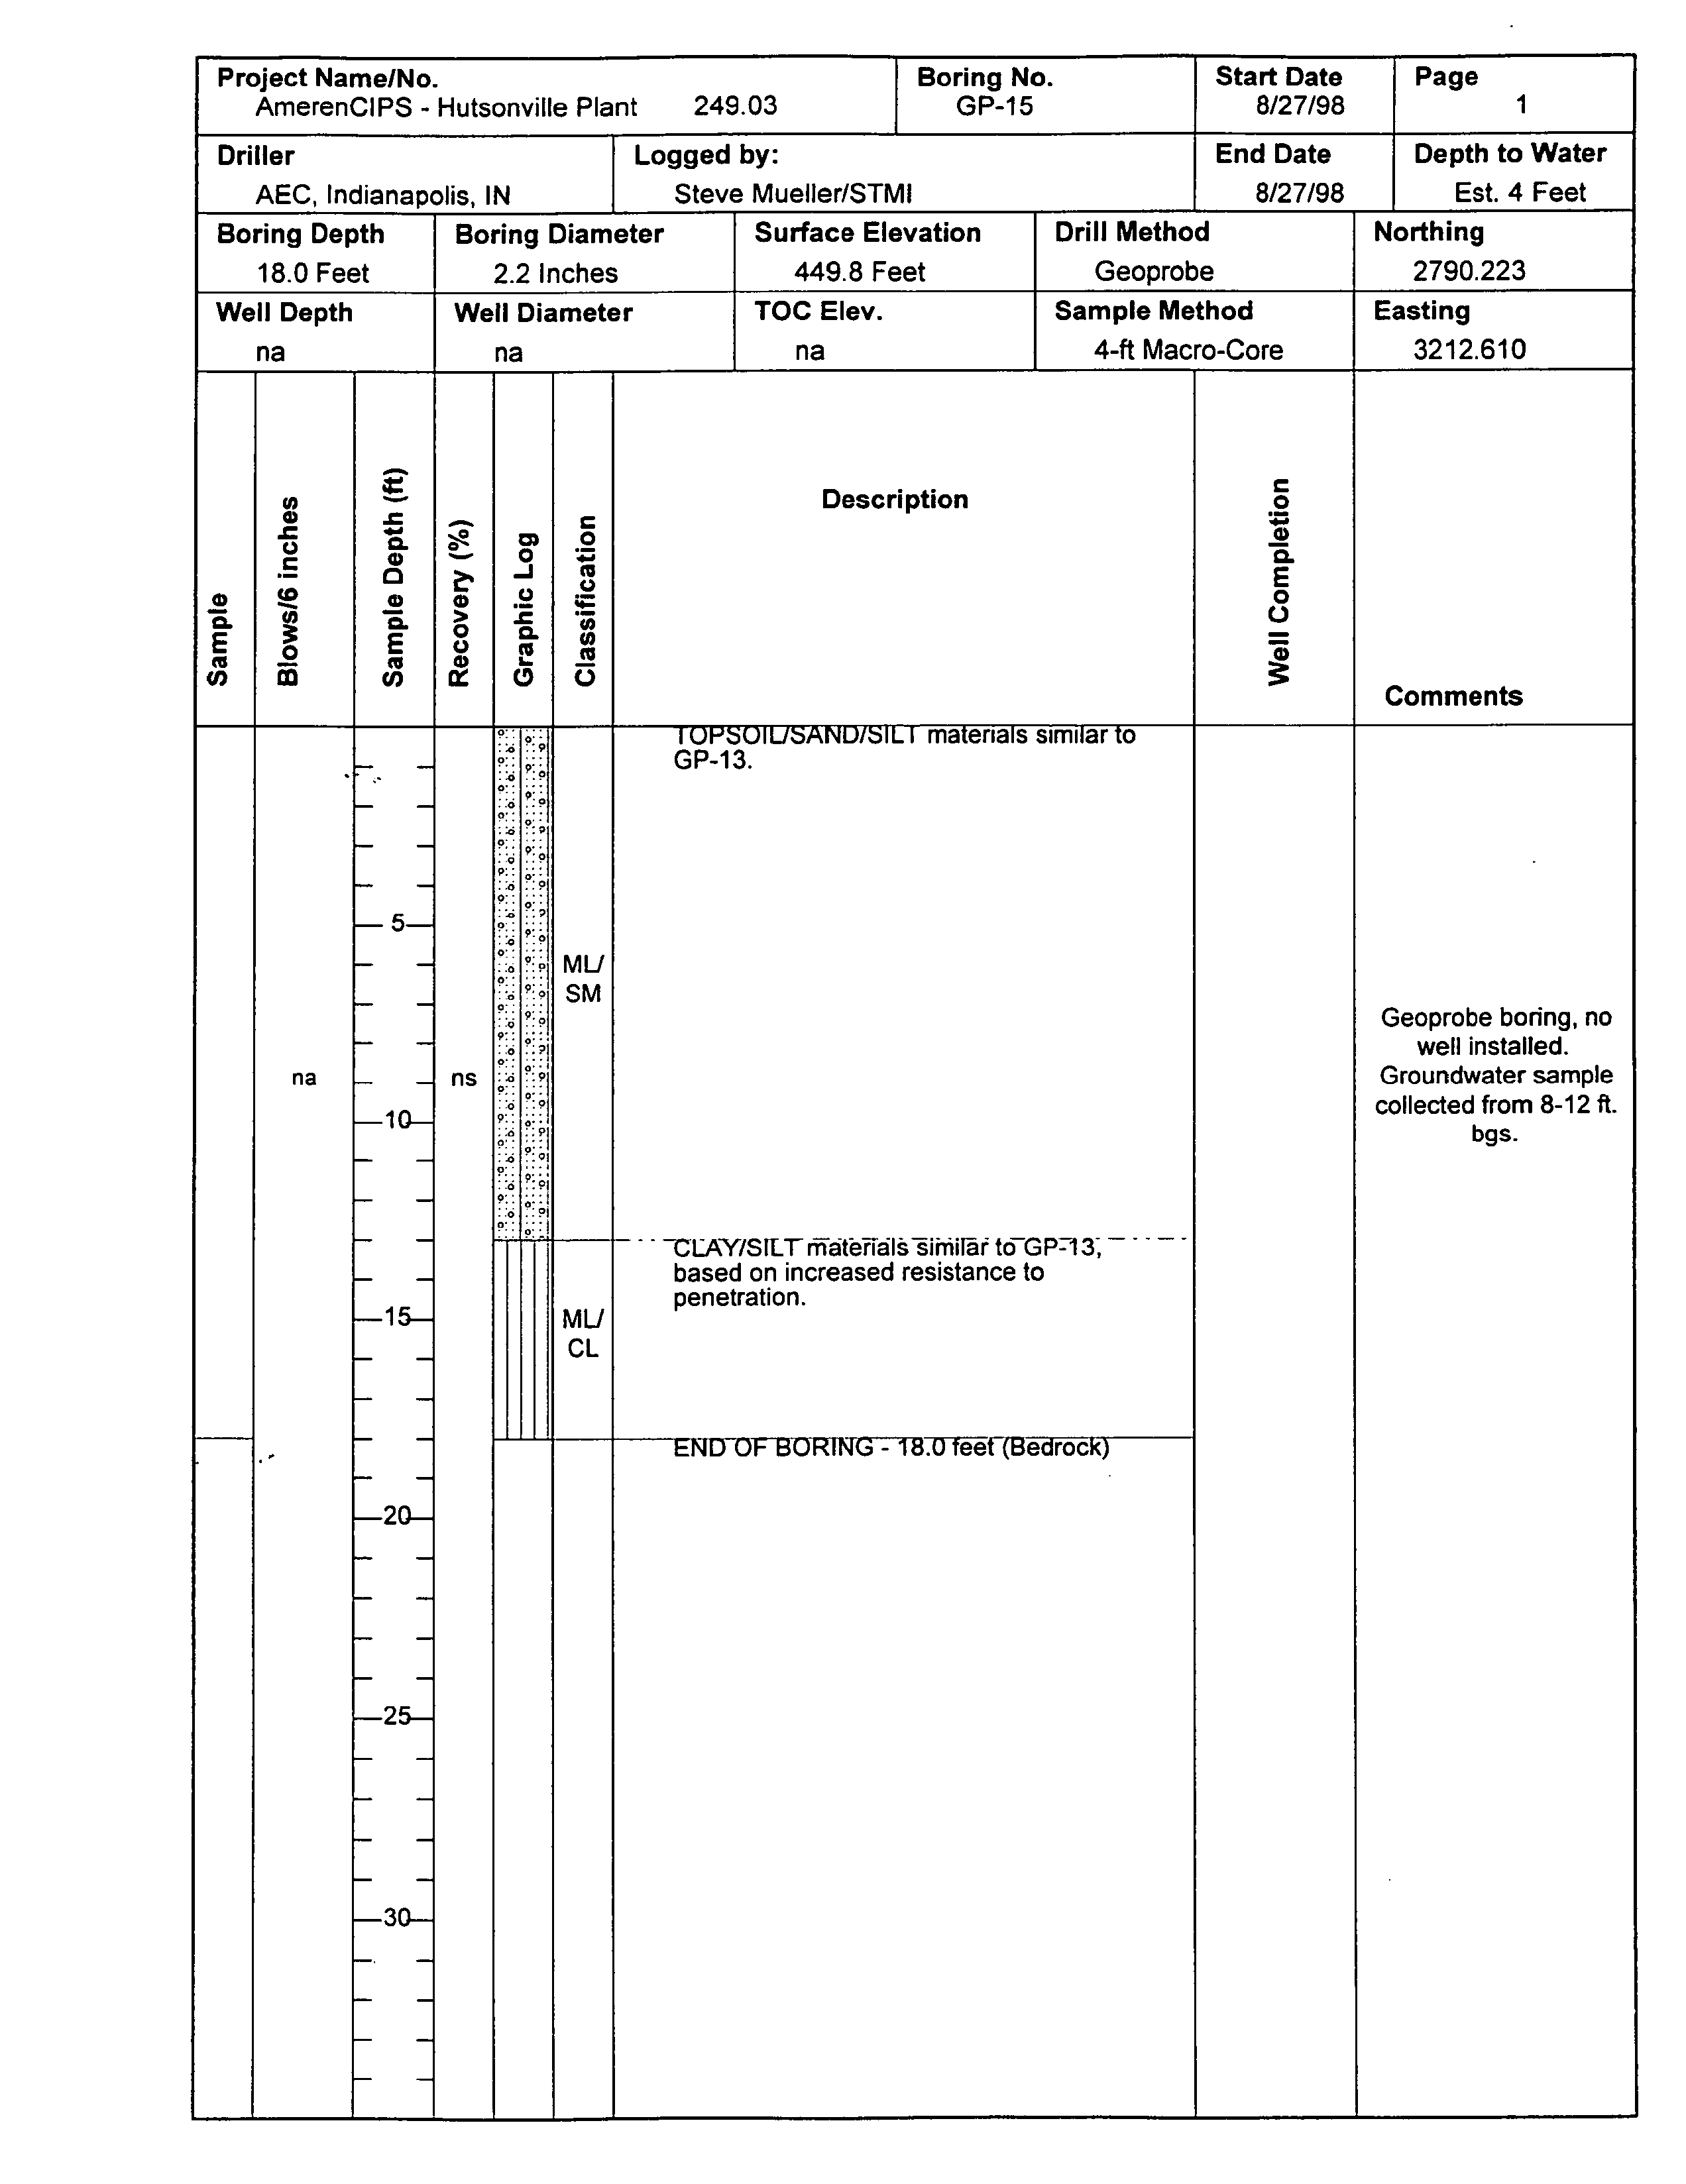
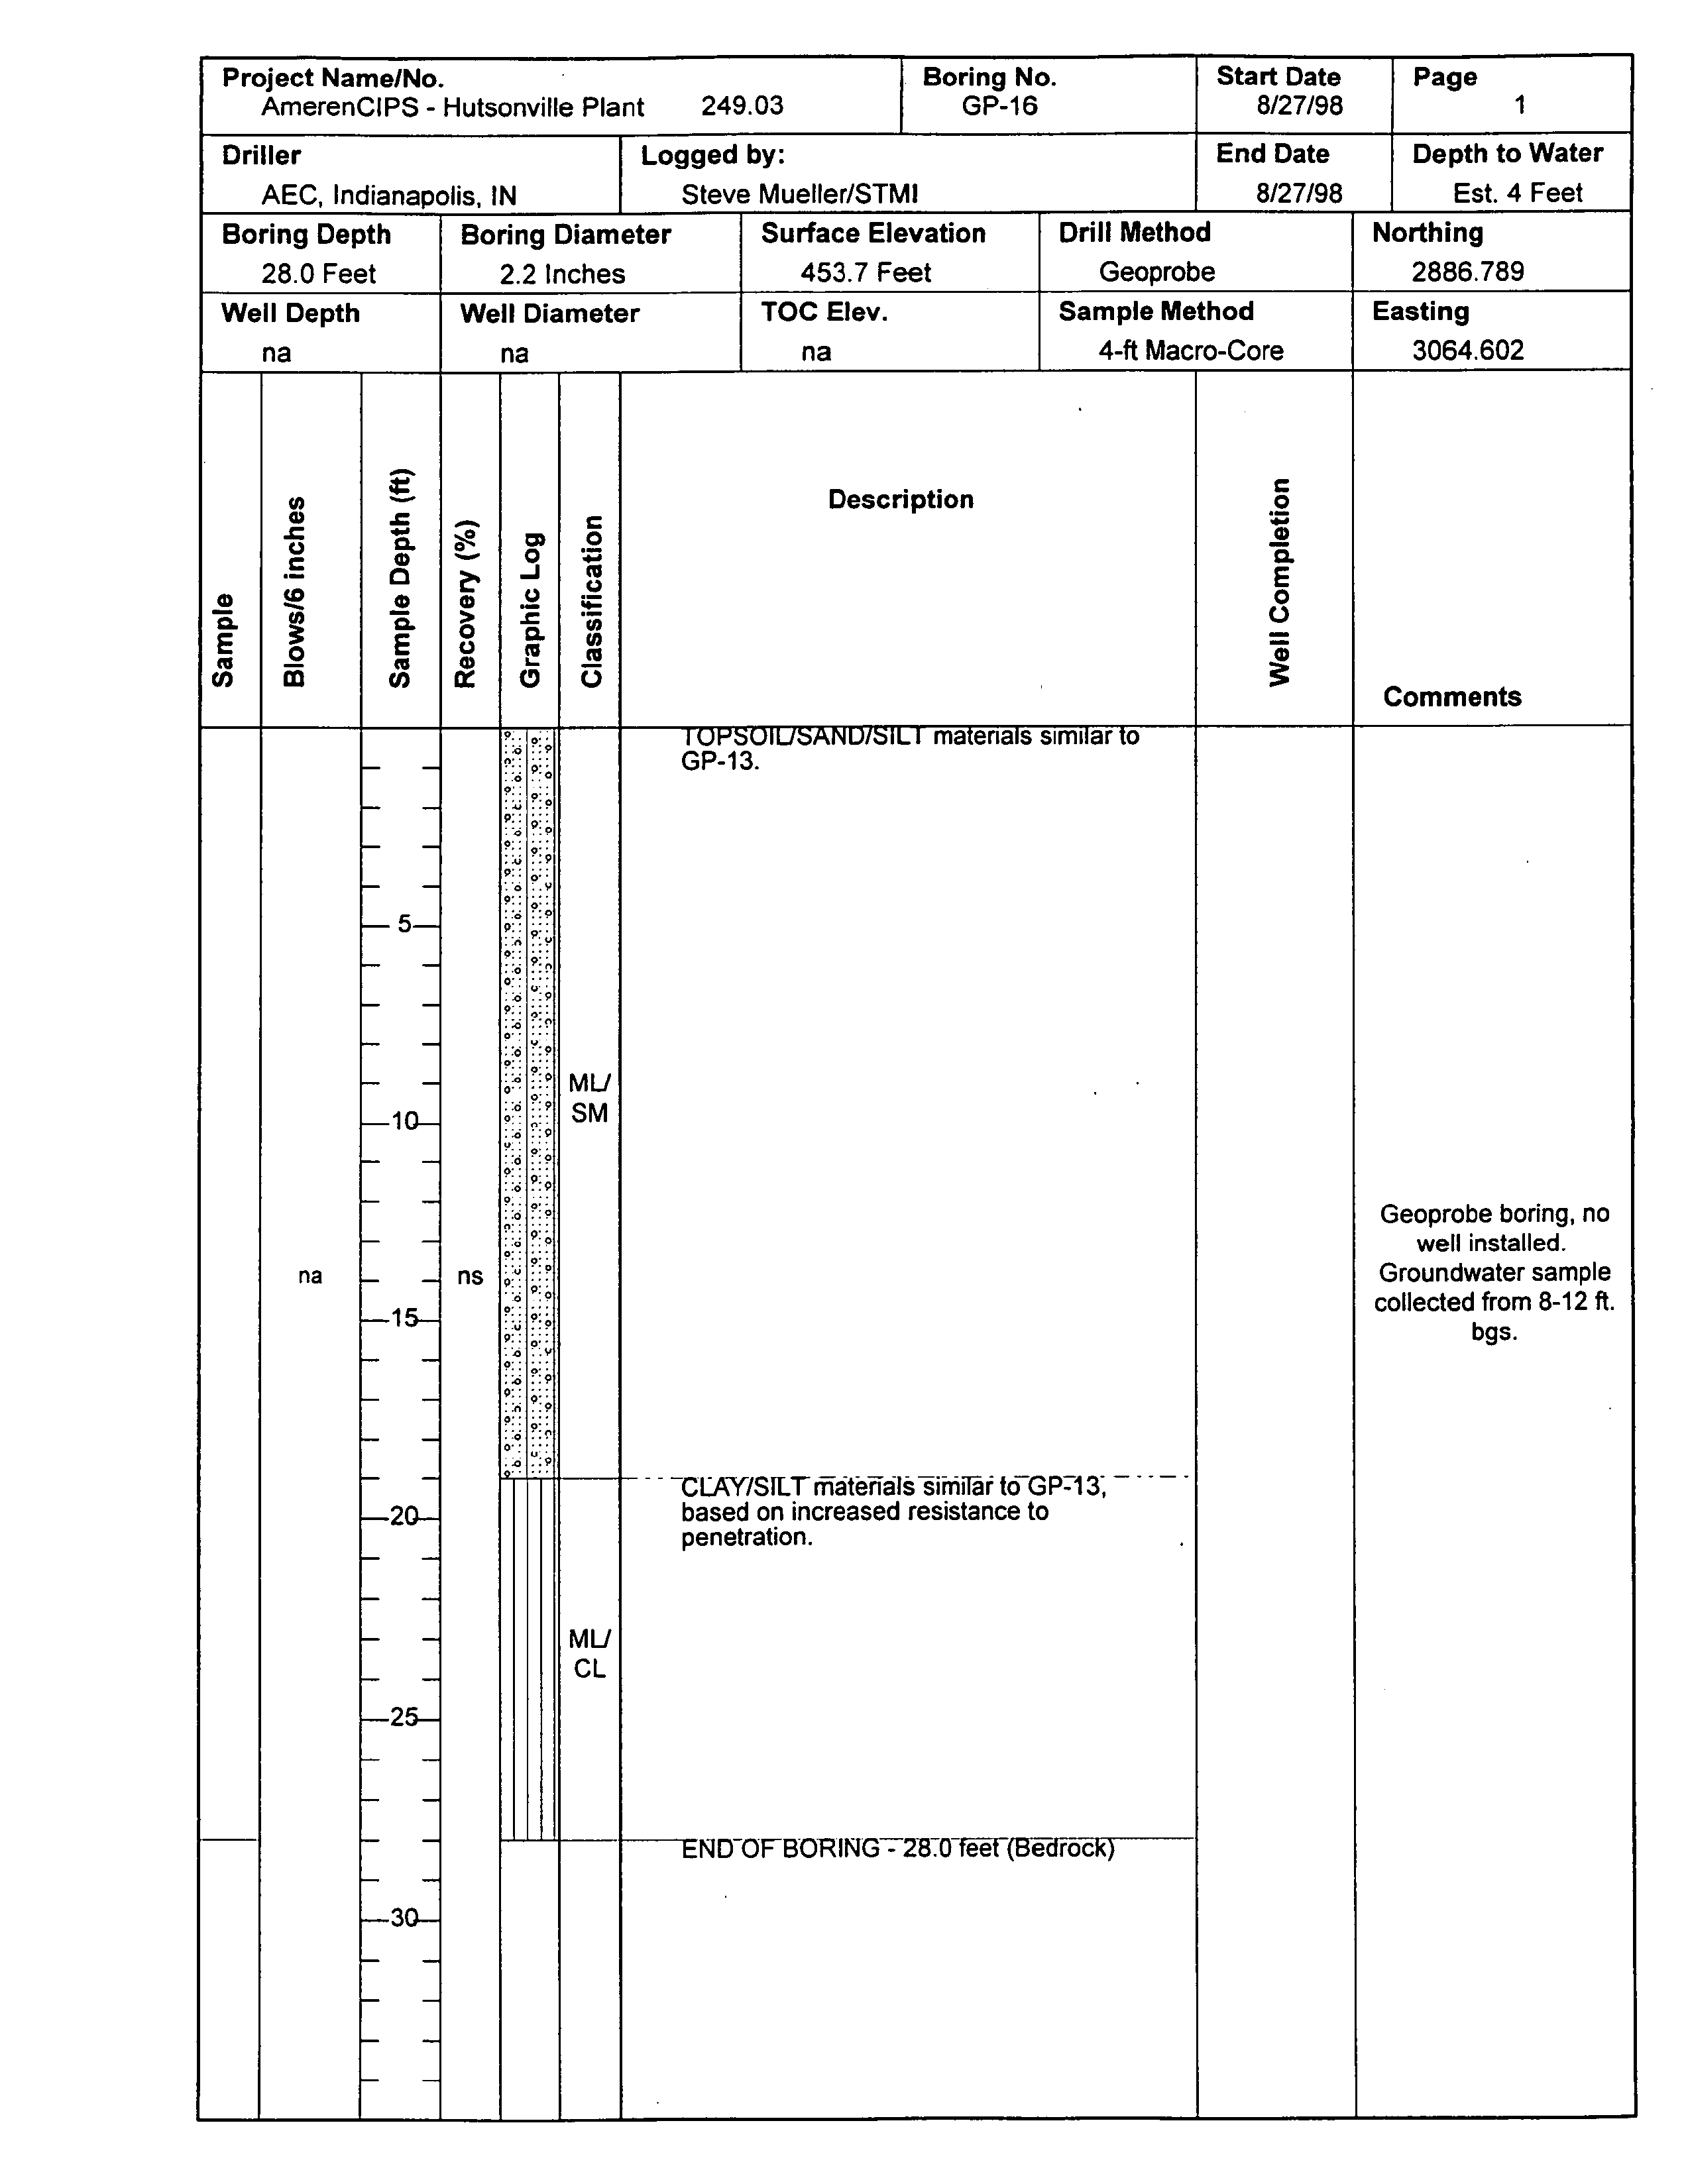
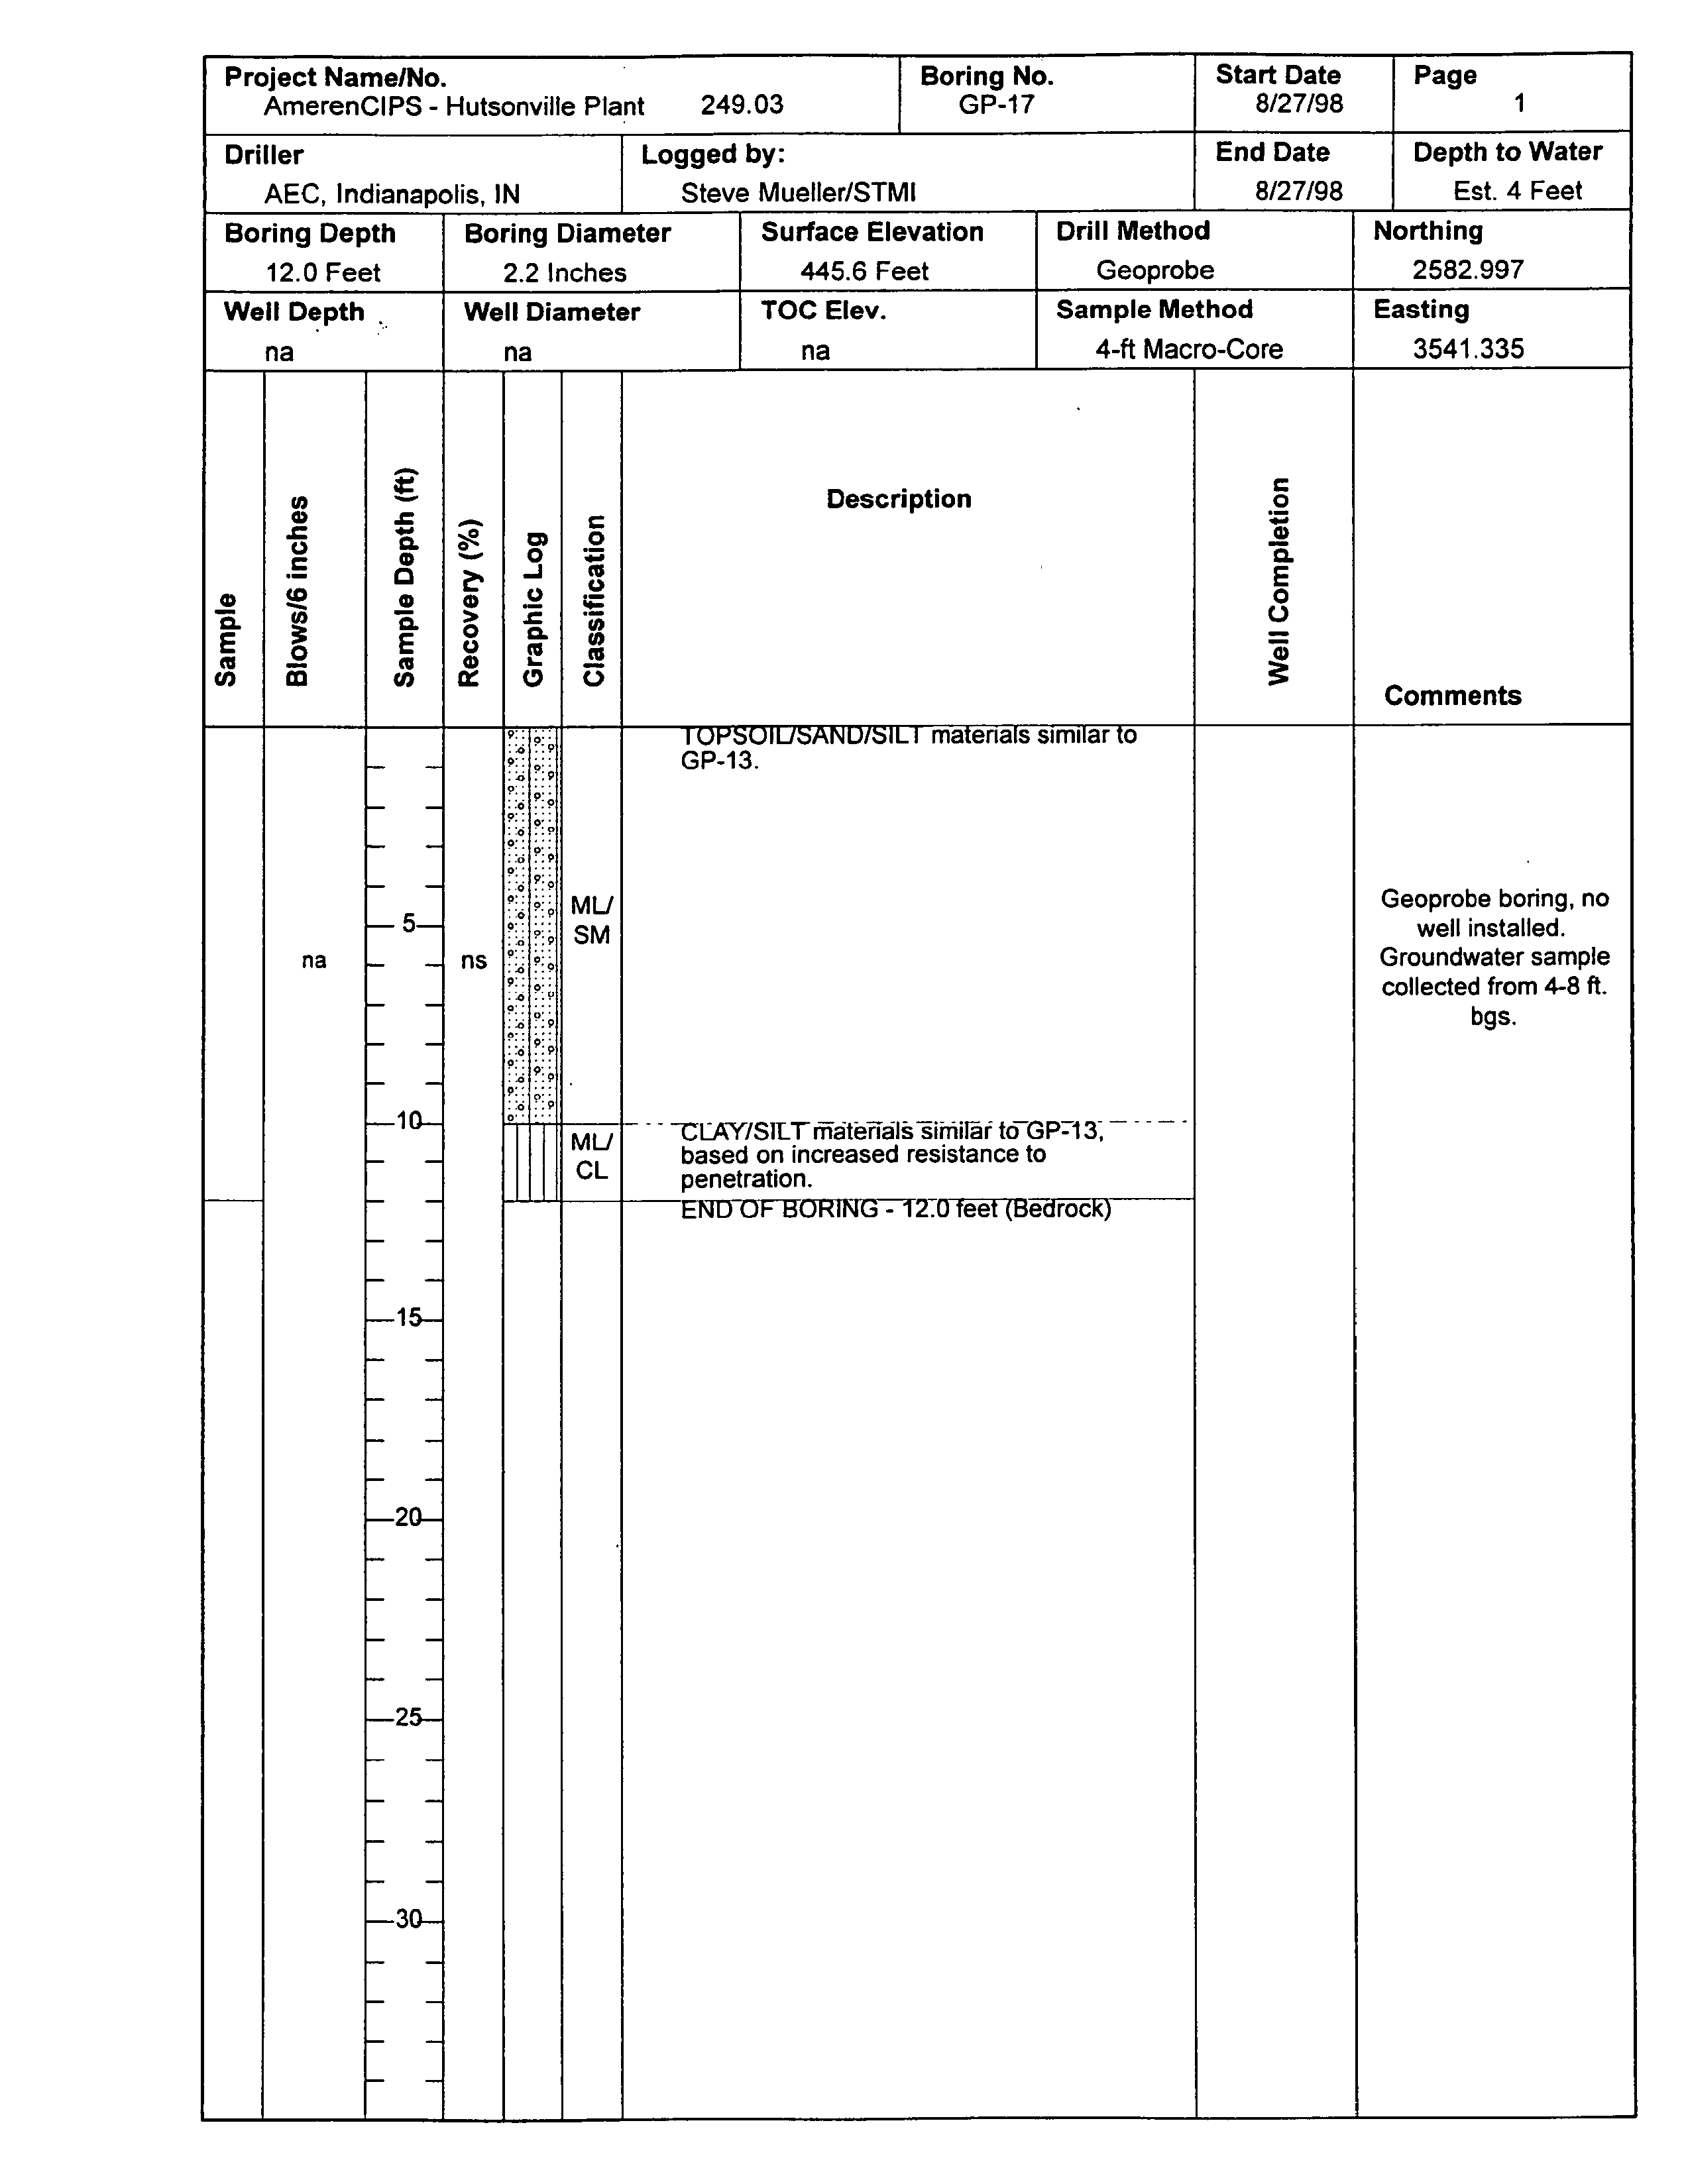
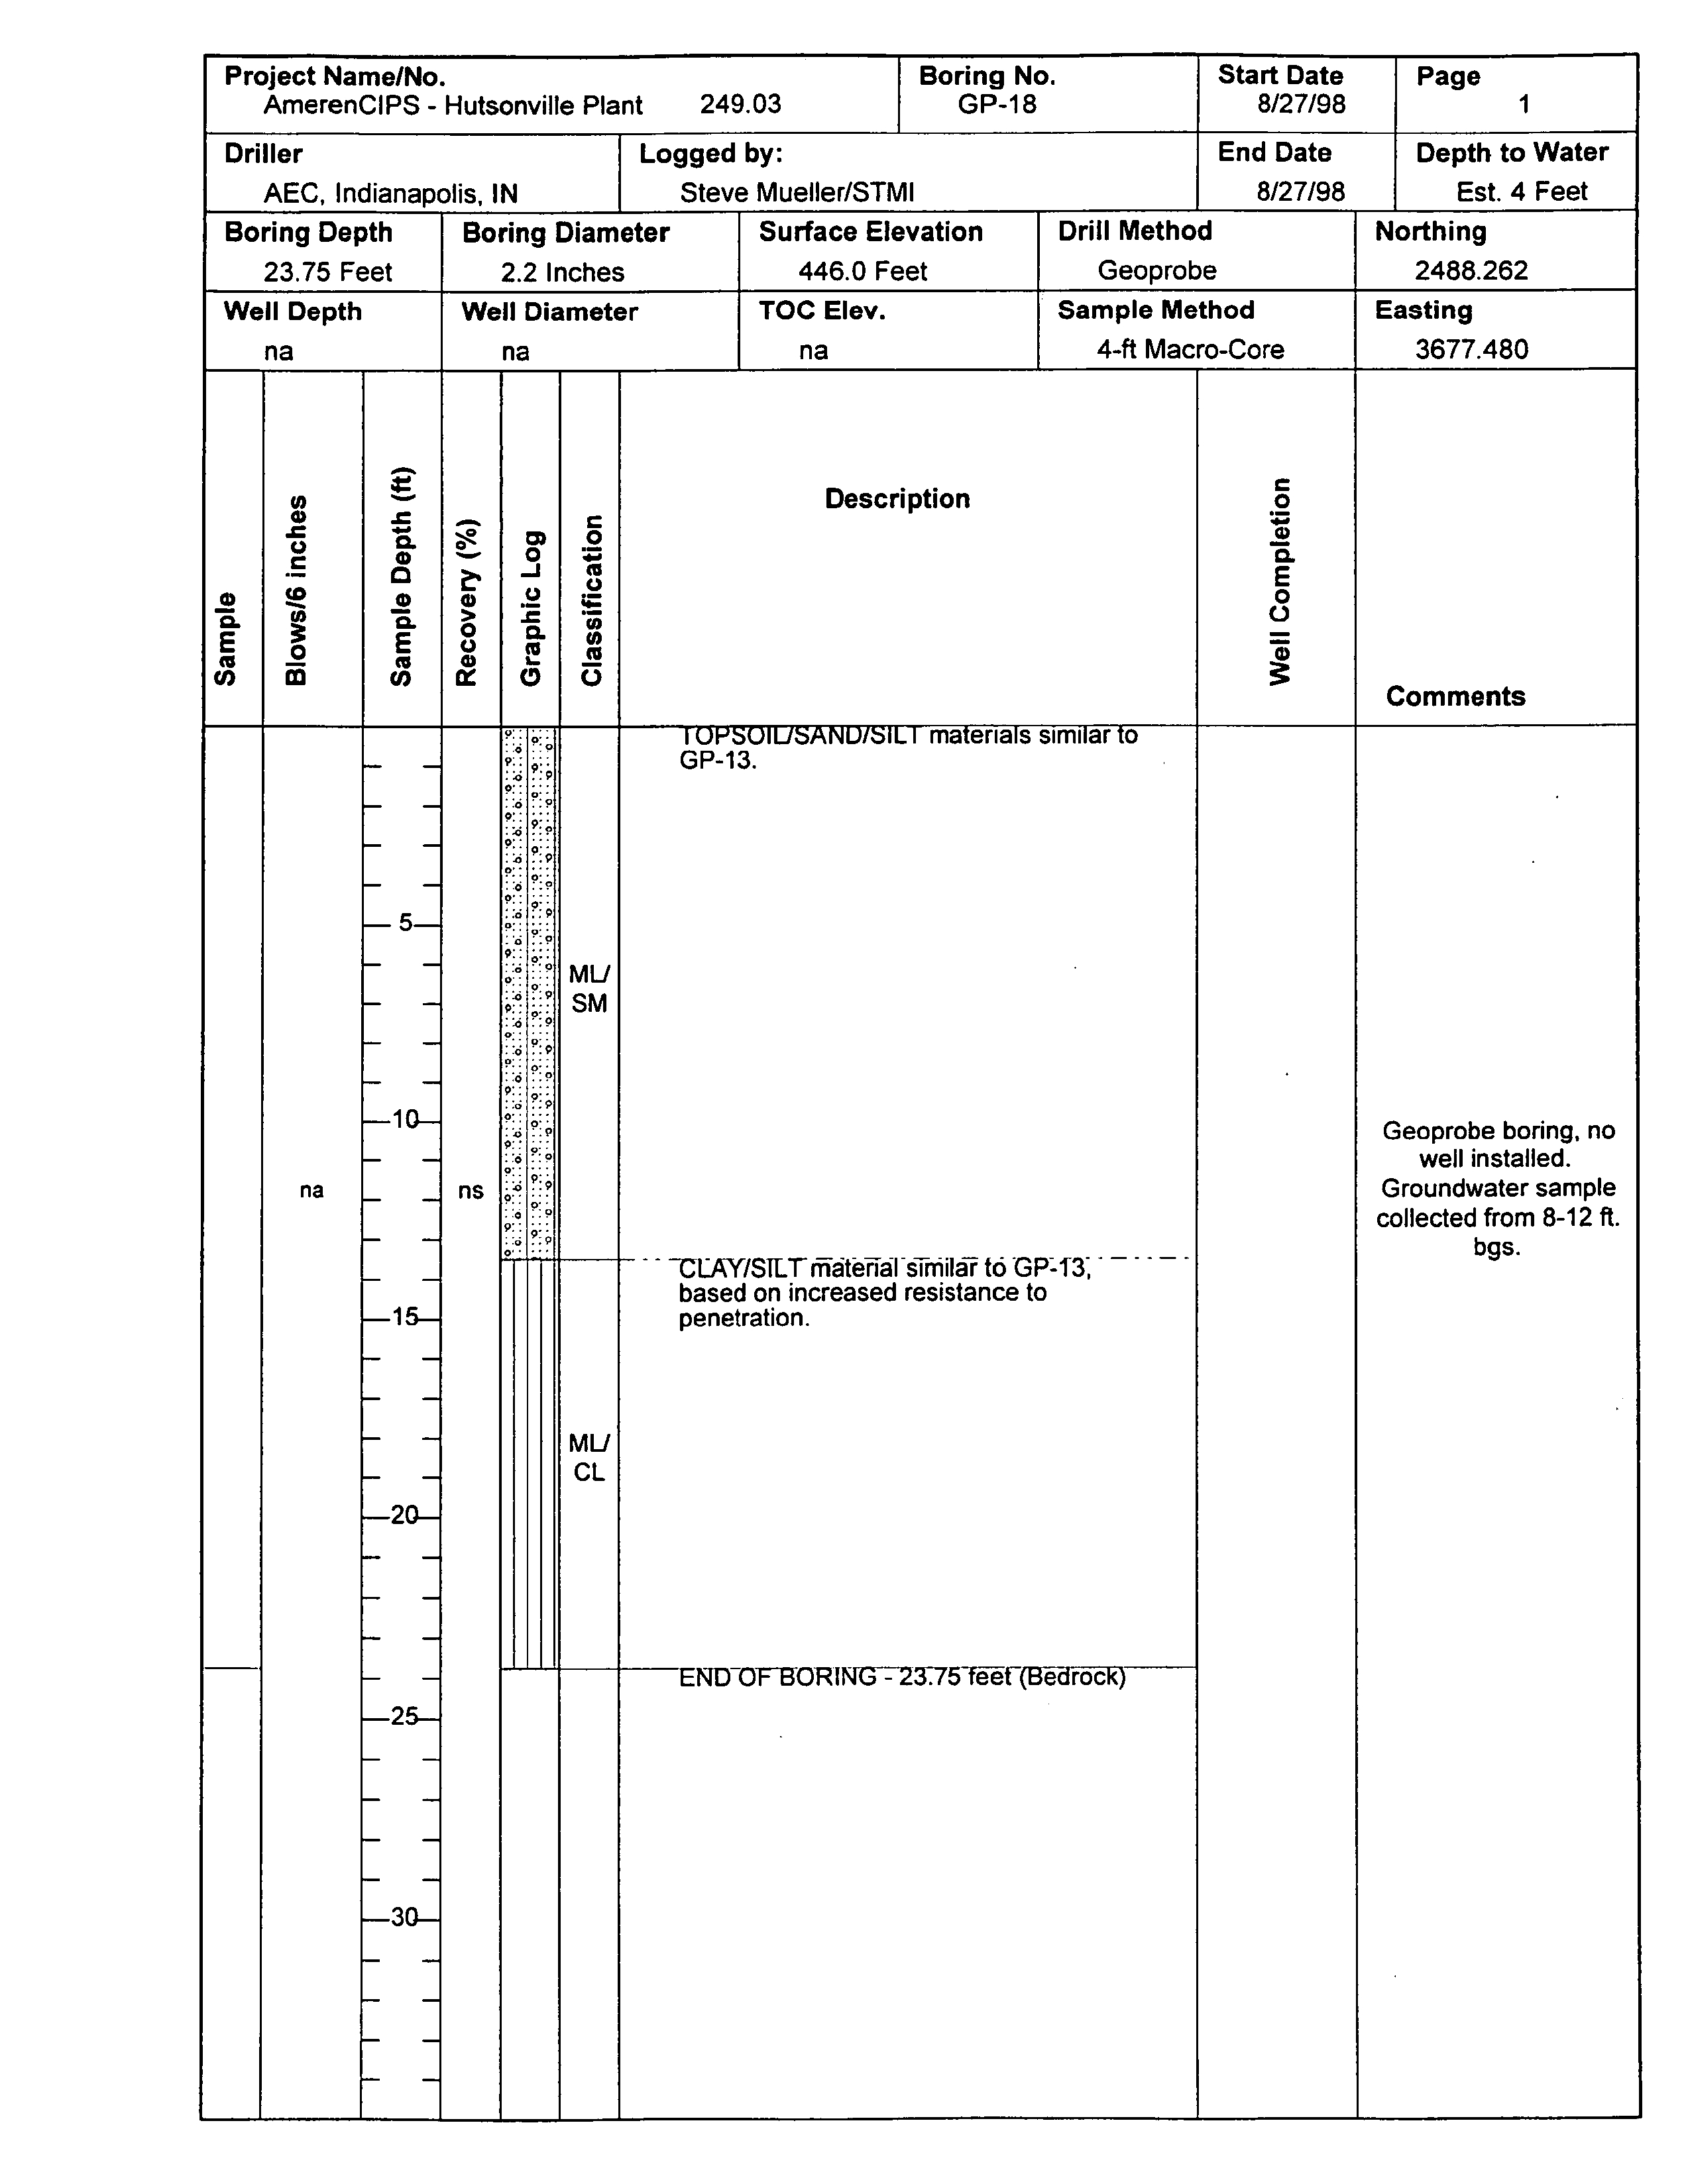
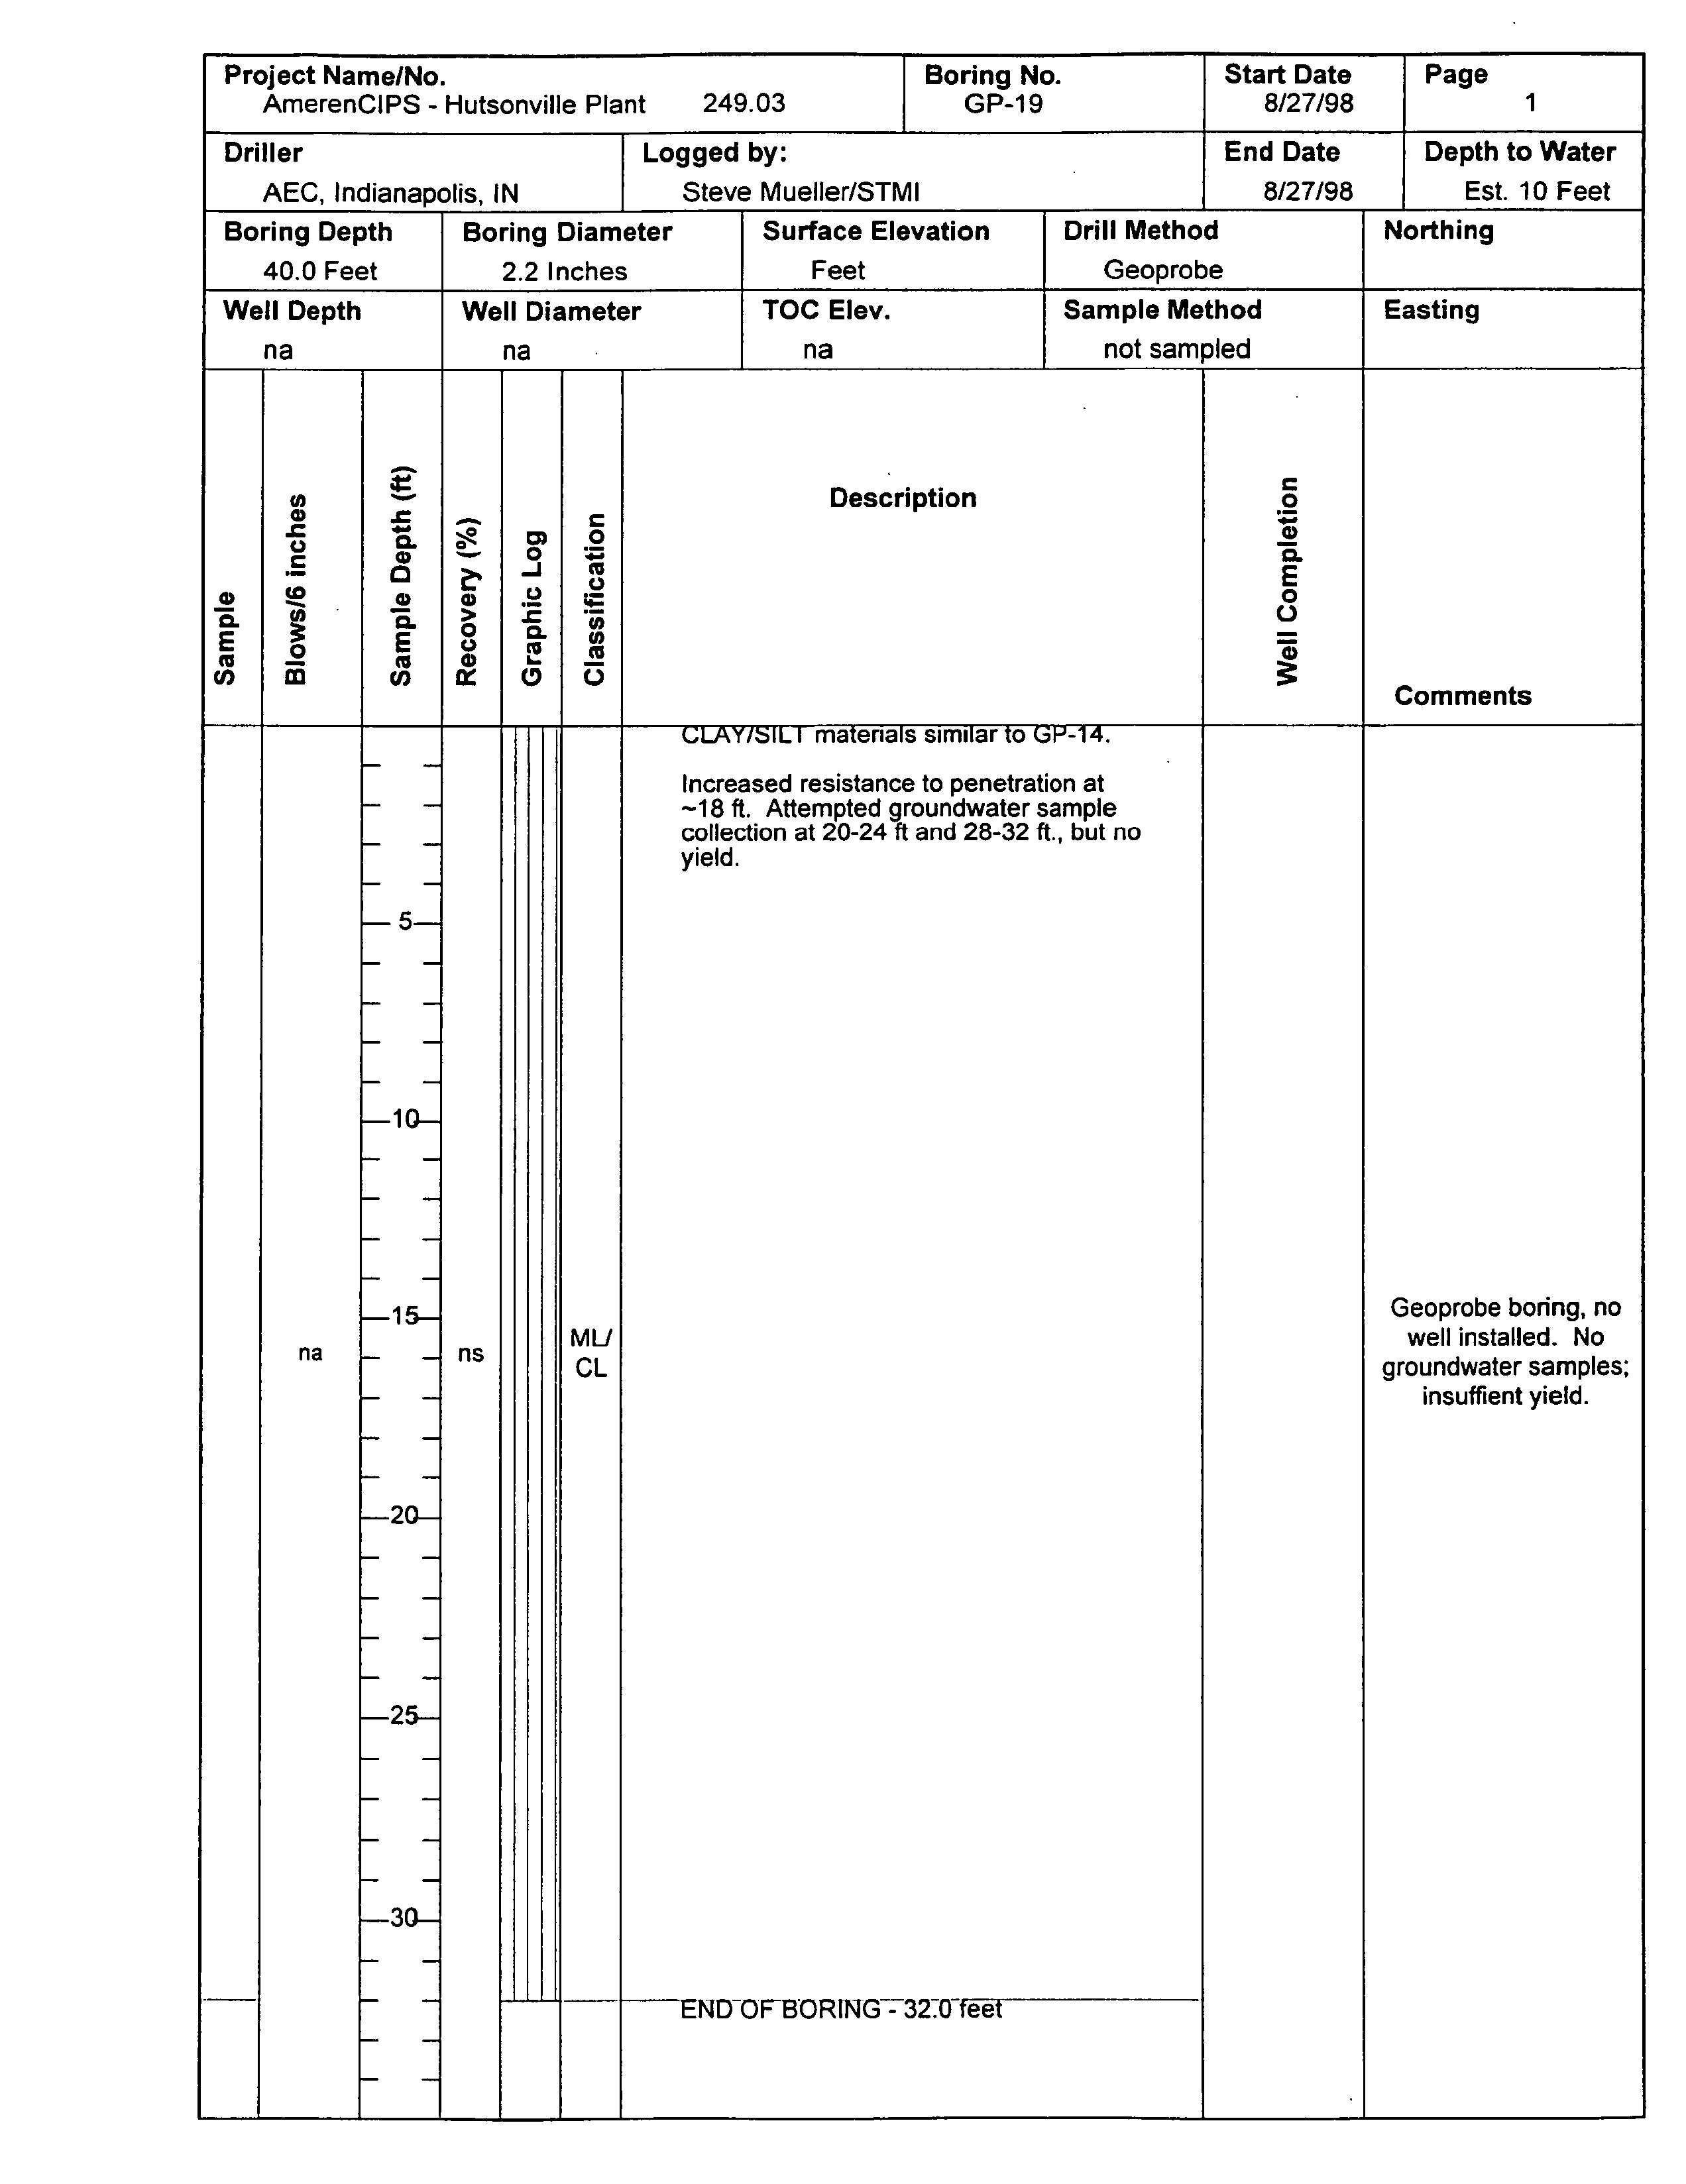
of 9.5 feet to 36.5 feet Bedrock
was not
encountered
at
locations GP-14
total depth
40
feet
and GP-19
total depth
32
feet
southeast of the
plant
site After
probe
hole
was
geologically logged
Screen Point 15 Groundwater
Sampler
was
connected
to
the
direct-push
rod and driven into the
ground
to the
target sampling depth
The water
sample
was
hutsonvil le
hydrogeologic
assessment.doc
Natural
2-1
Resource
Technology
Electronic Filing - Received, Clerk's Office, August 11, 2008 - AS 09-1, Exhibit 4
FIELD PROCEDURES
collected
by retracting
the rod several feet
to
expose
the
samplers
stainless steel
screen
then
inserting
section of
disposable polyethylene
tubing
and
slowly extracting
the
sample
using
peristaltic pump
connected to
the
tubing
Water
samples
were
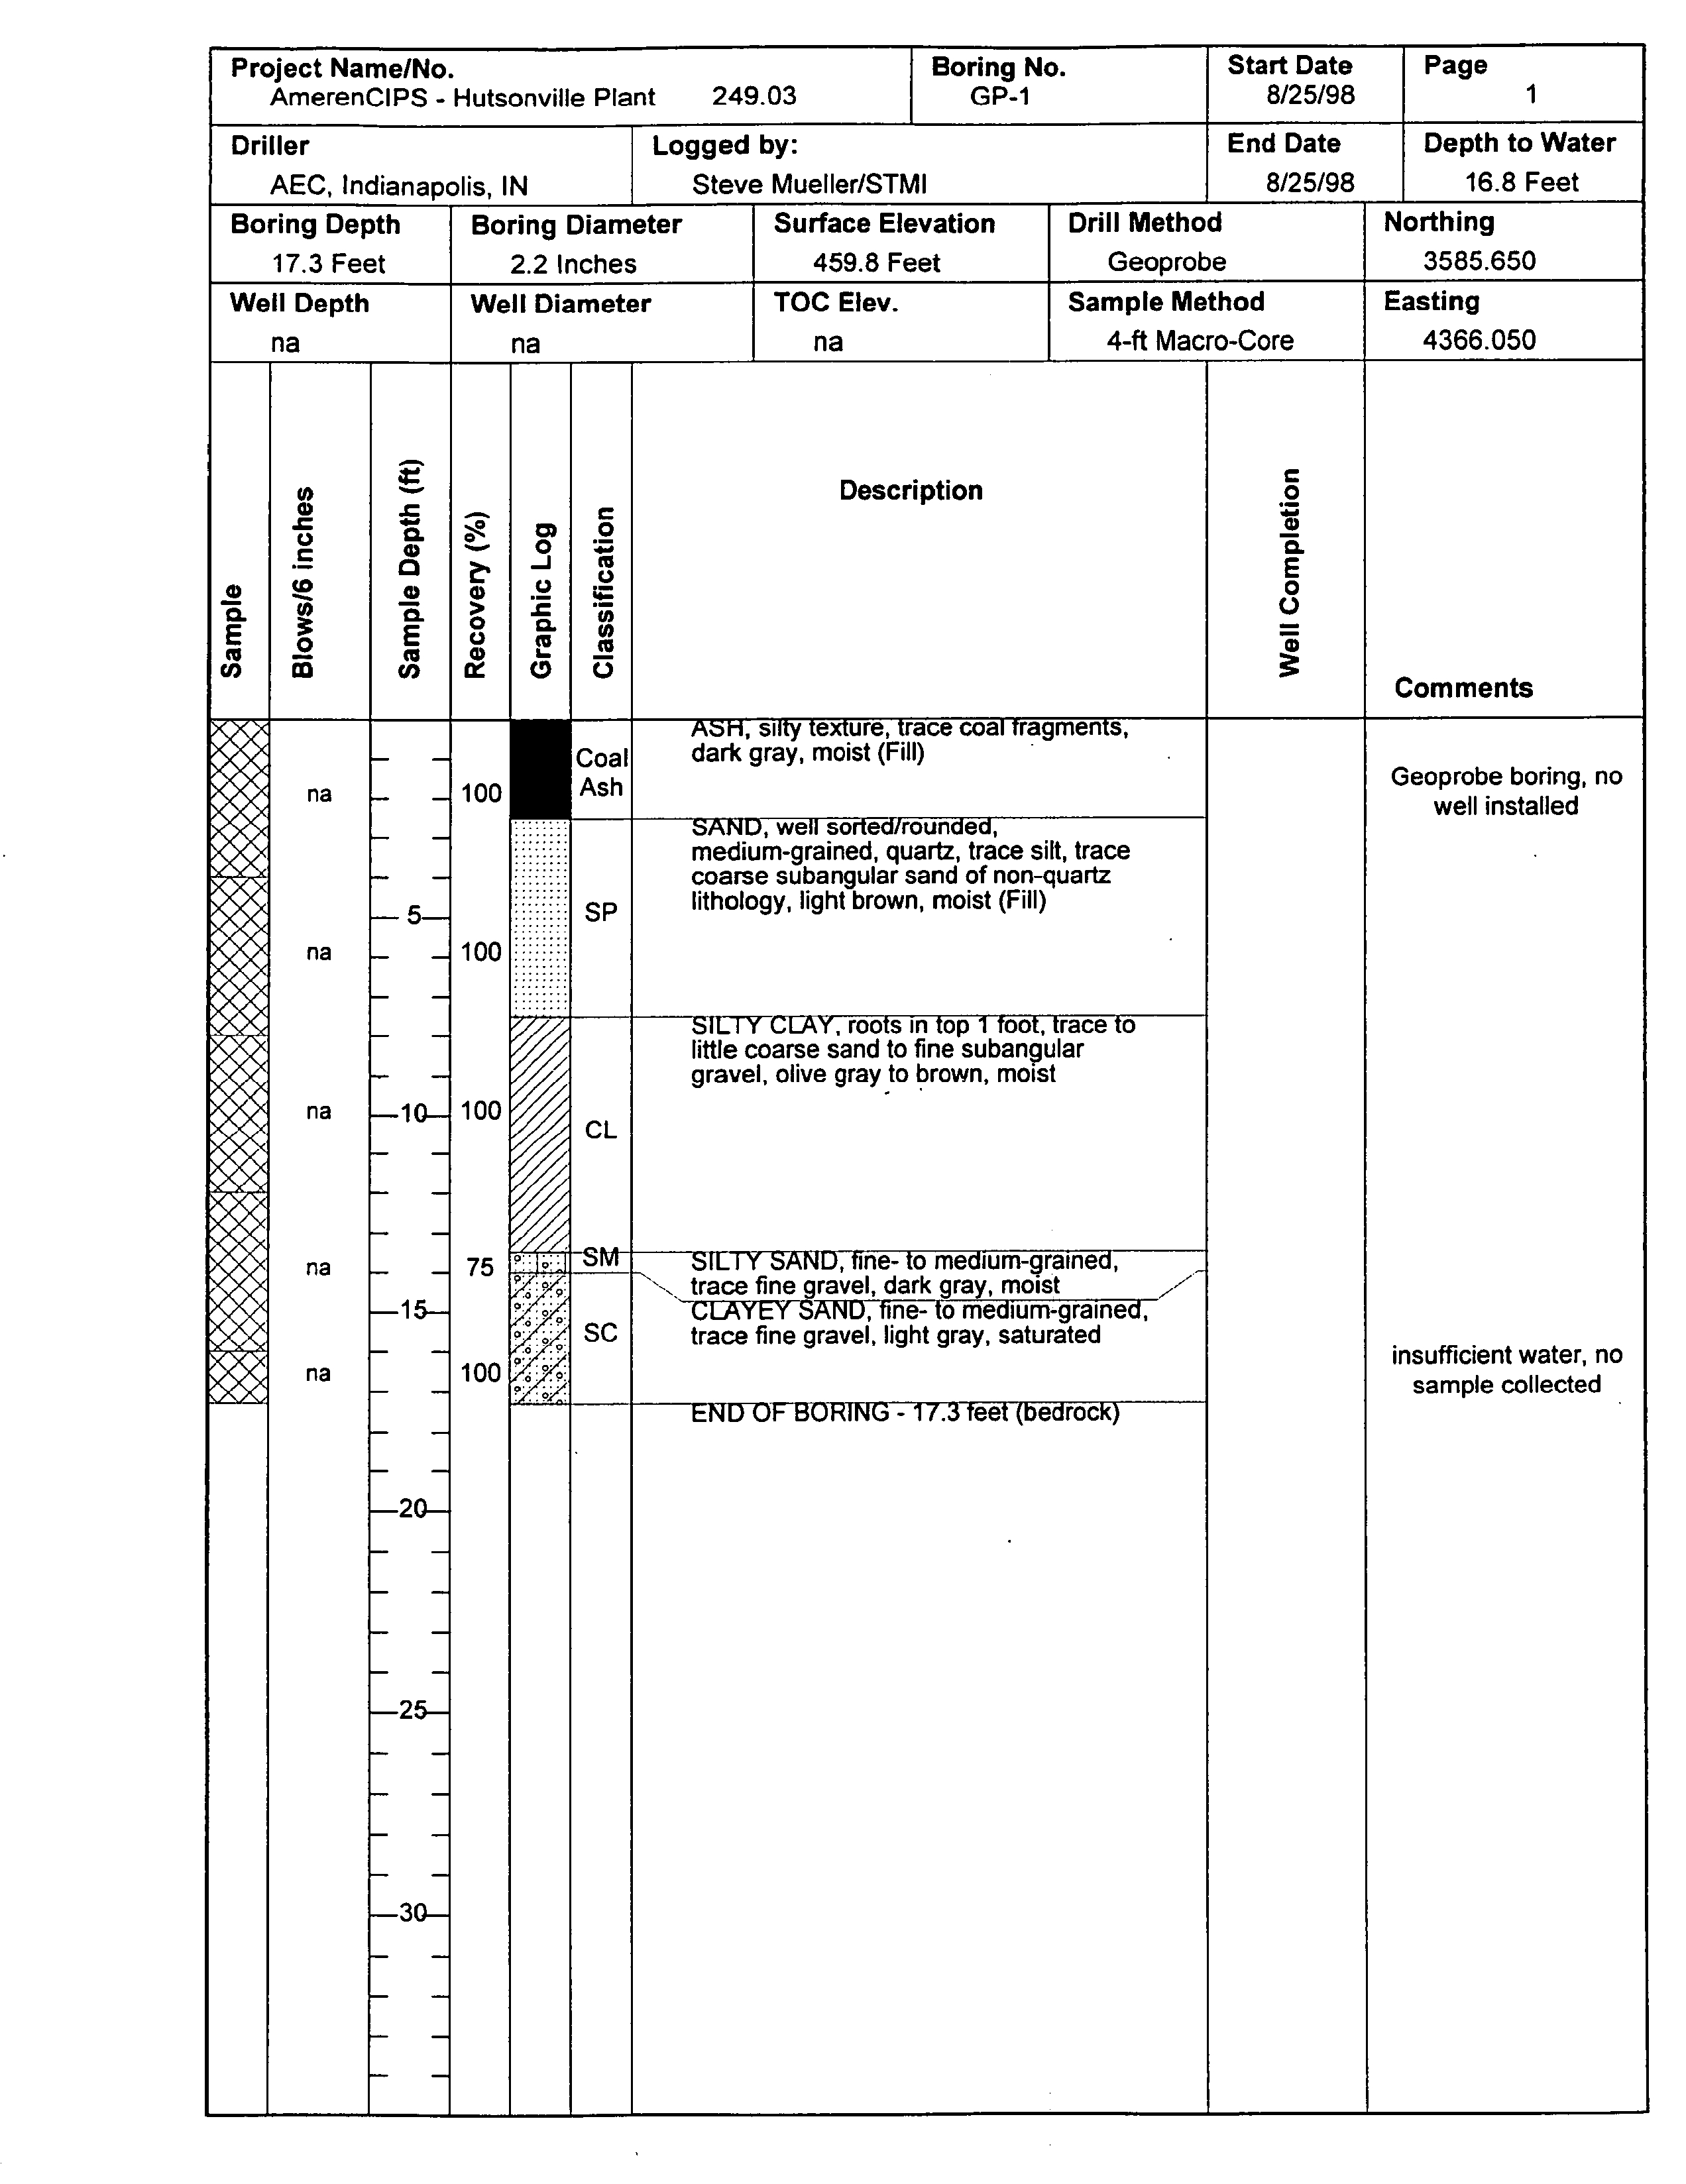
not collected at locations
GP-1 GP-19
and GP-22 because of low water
yield
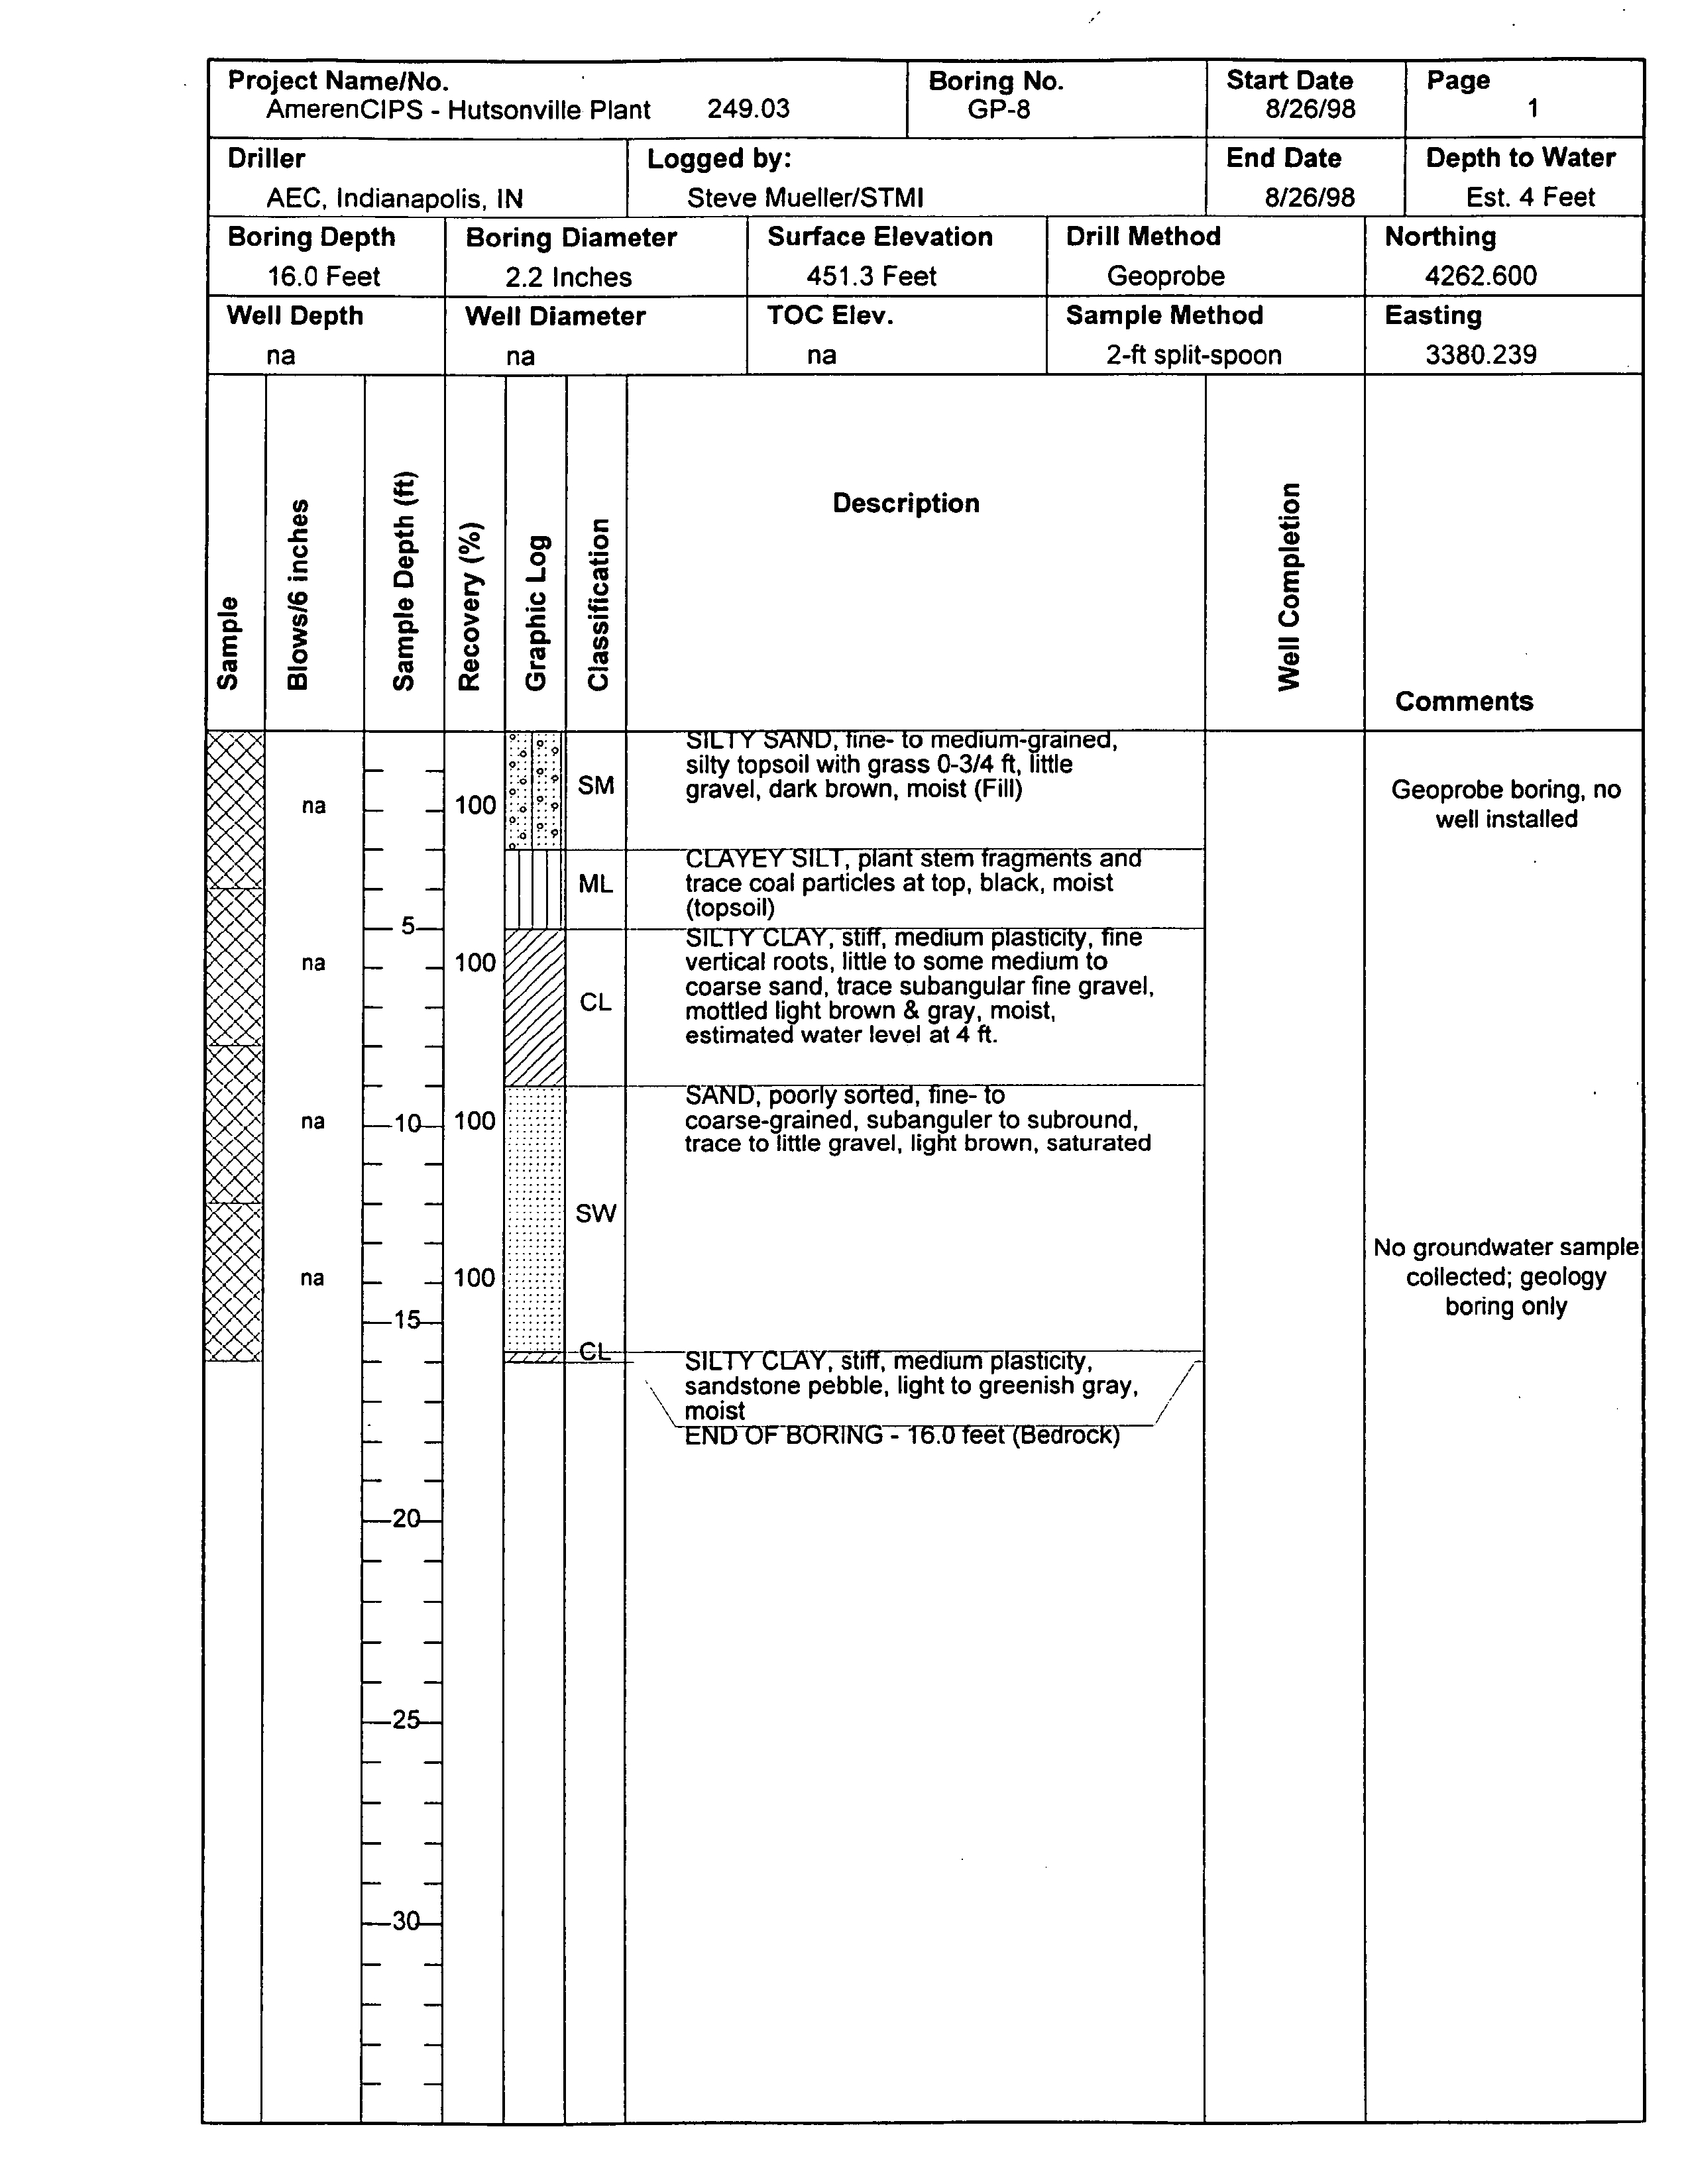
from the screened materials No water
sample
was
collected at
probe
hole
GP-8
which
was
used
only
to
log
geology
near
the southwest
corner
of the lined
ash
impoundment
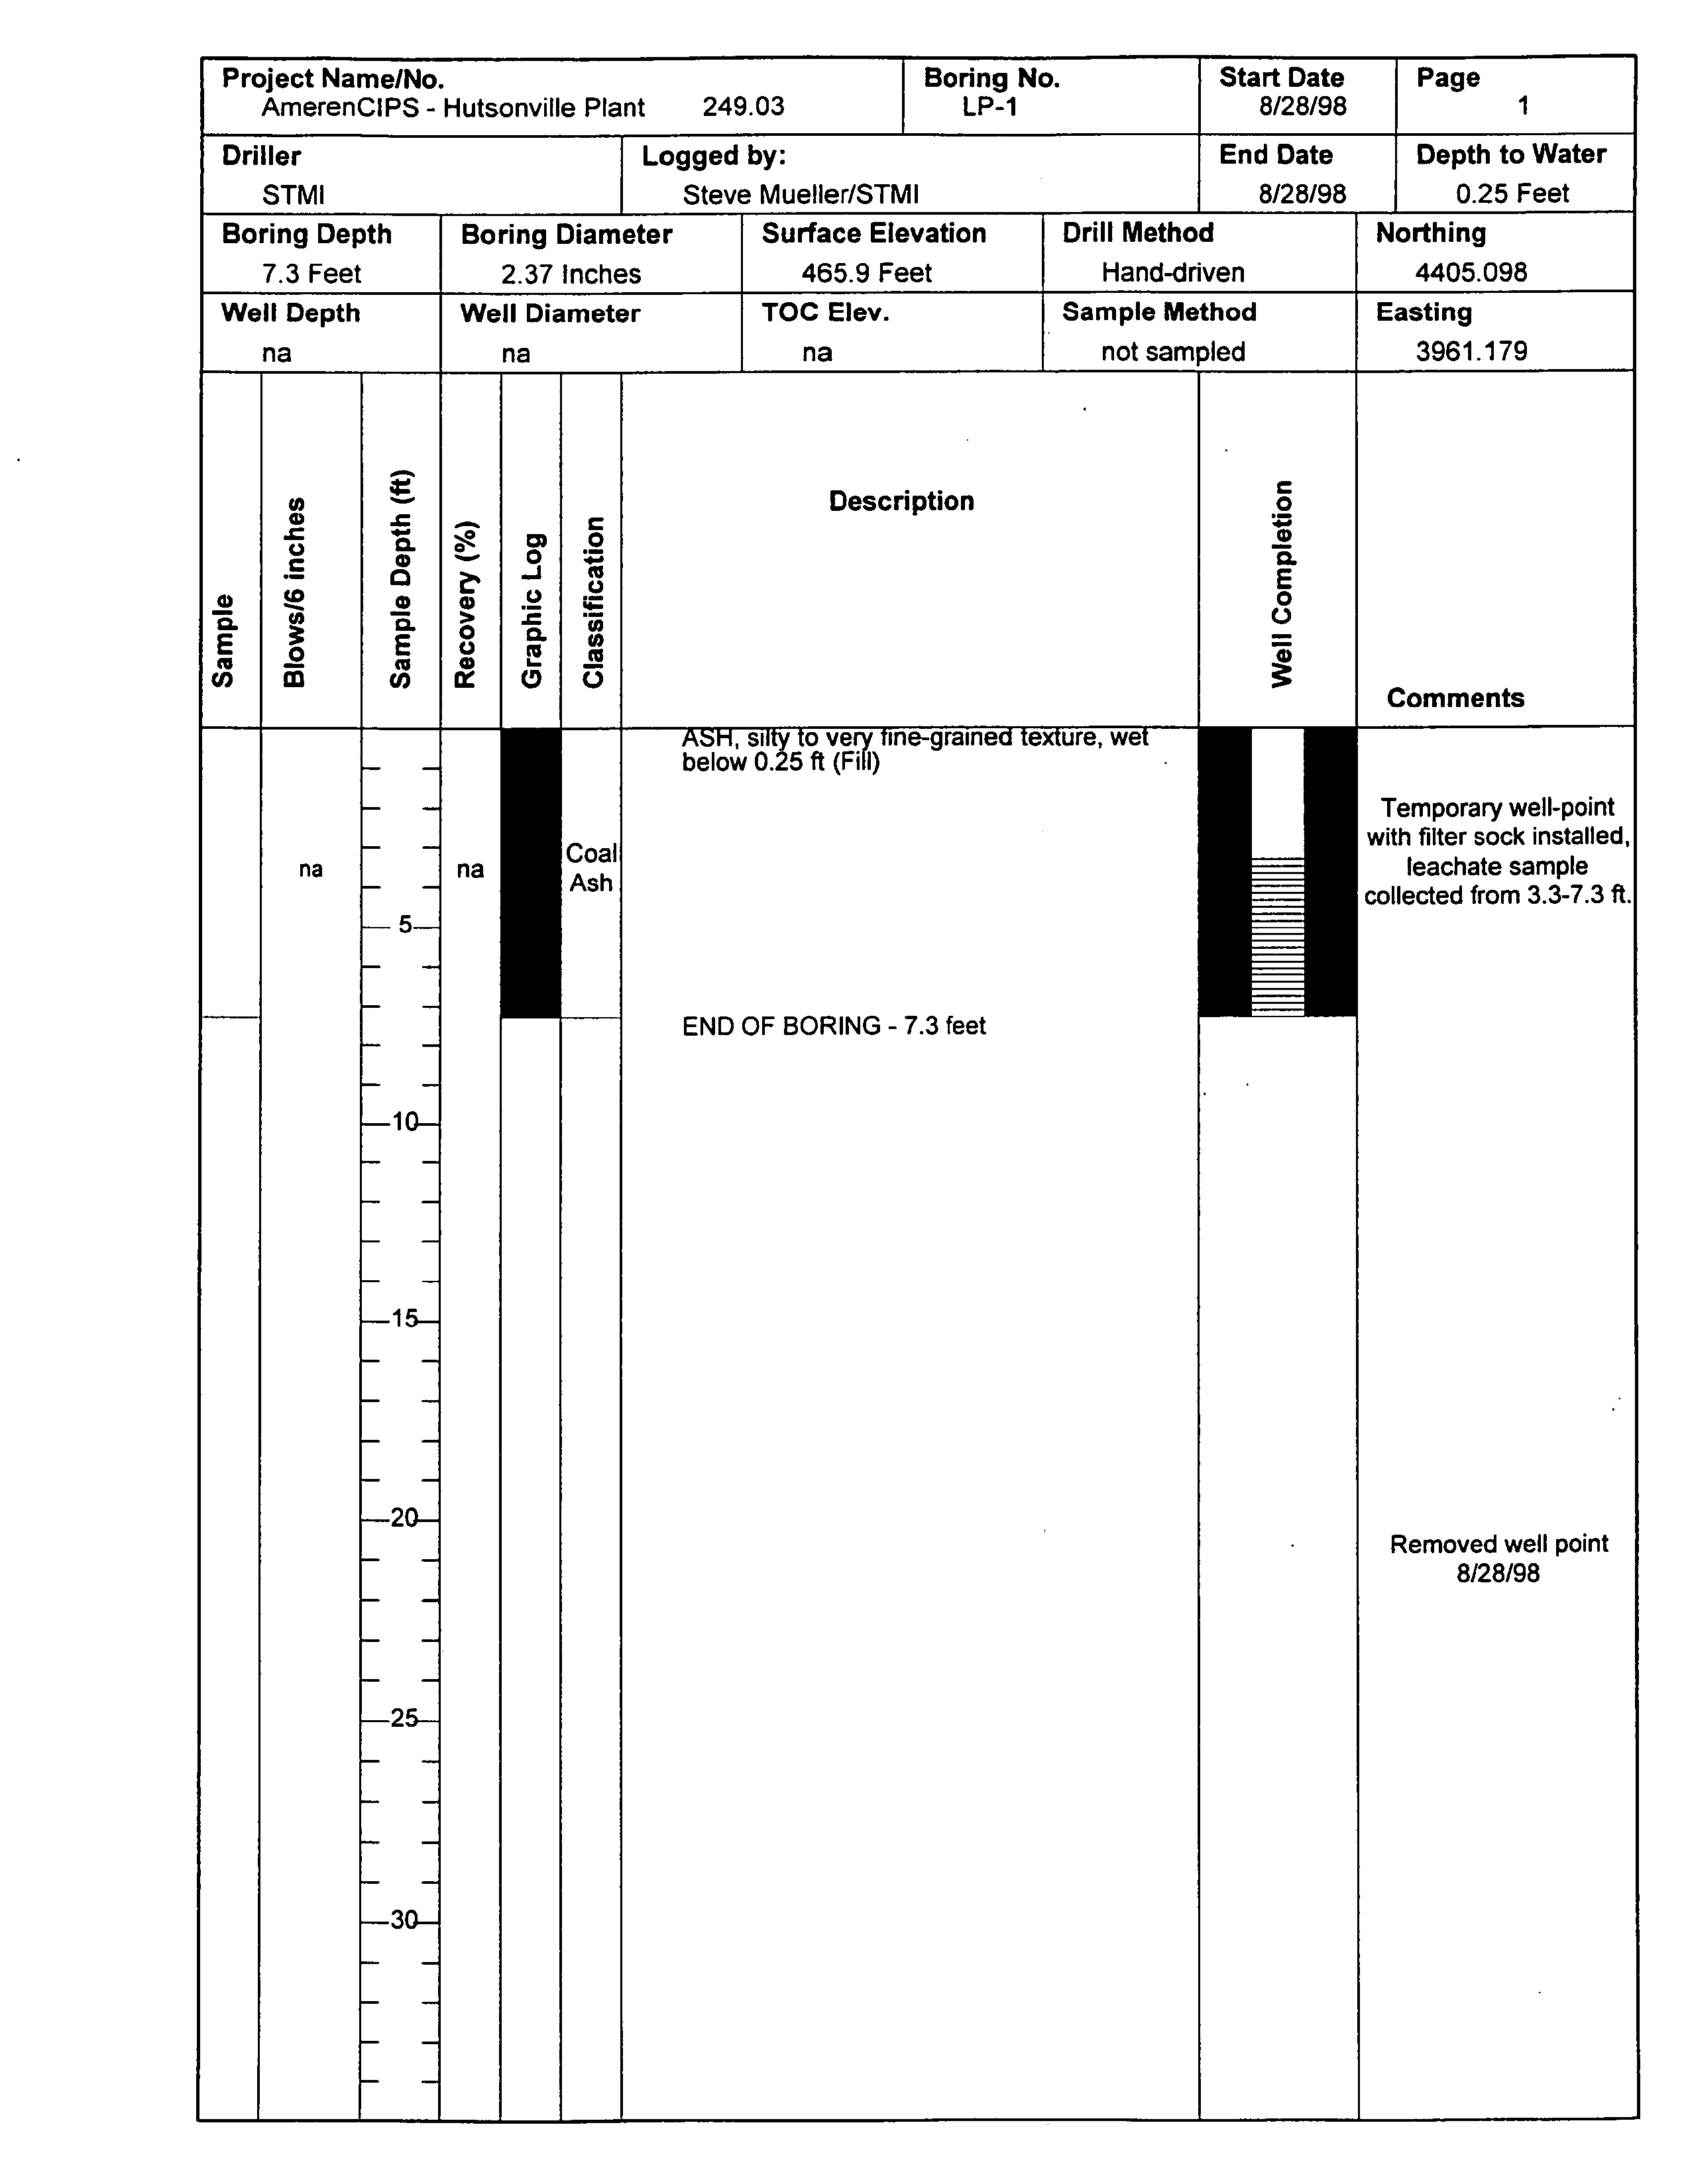
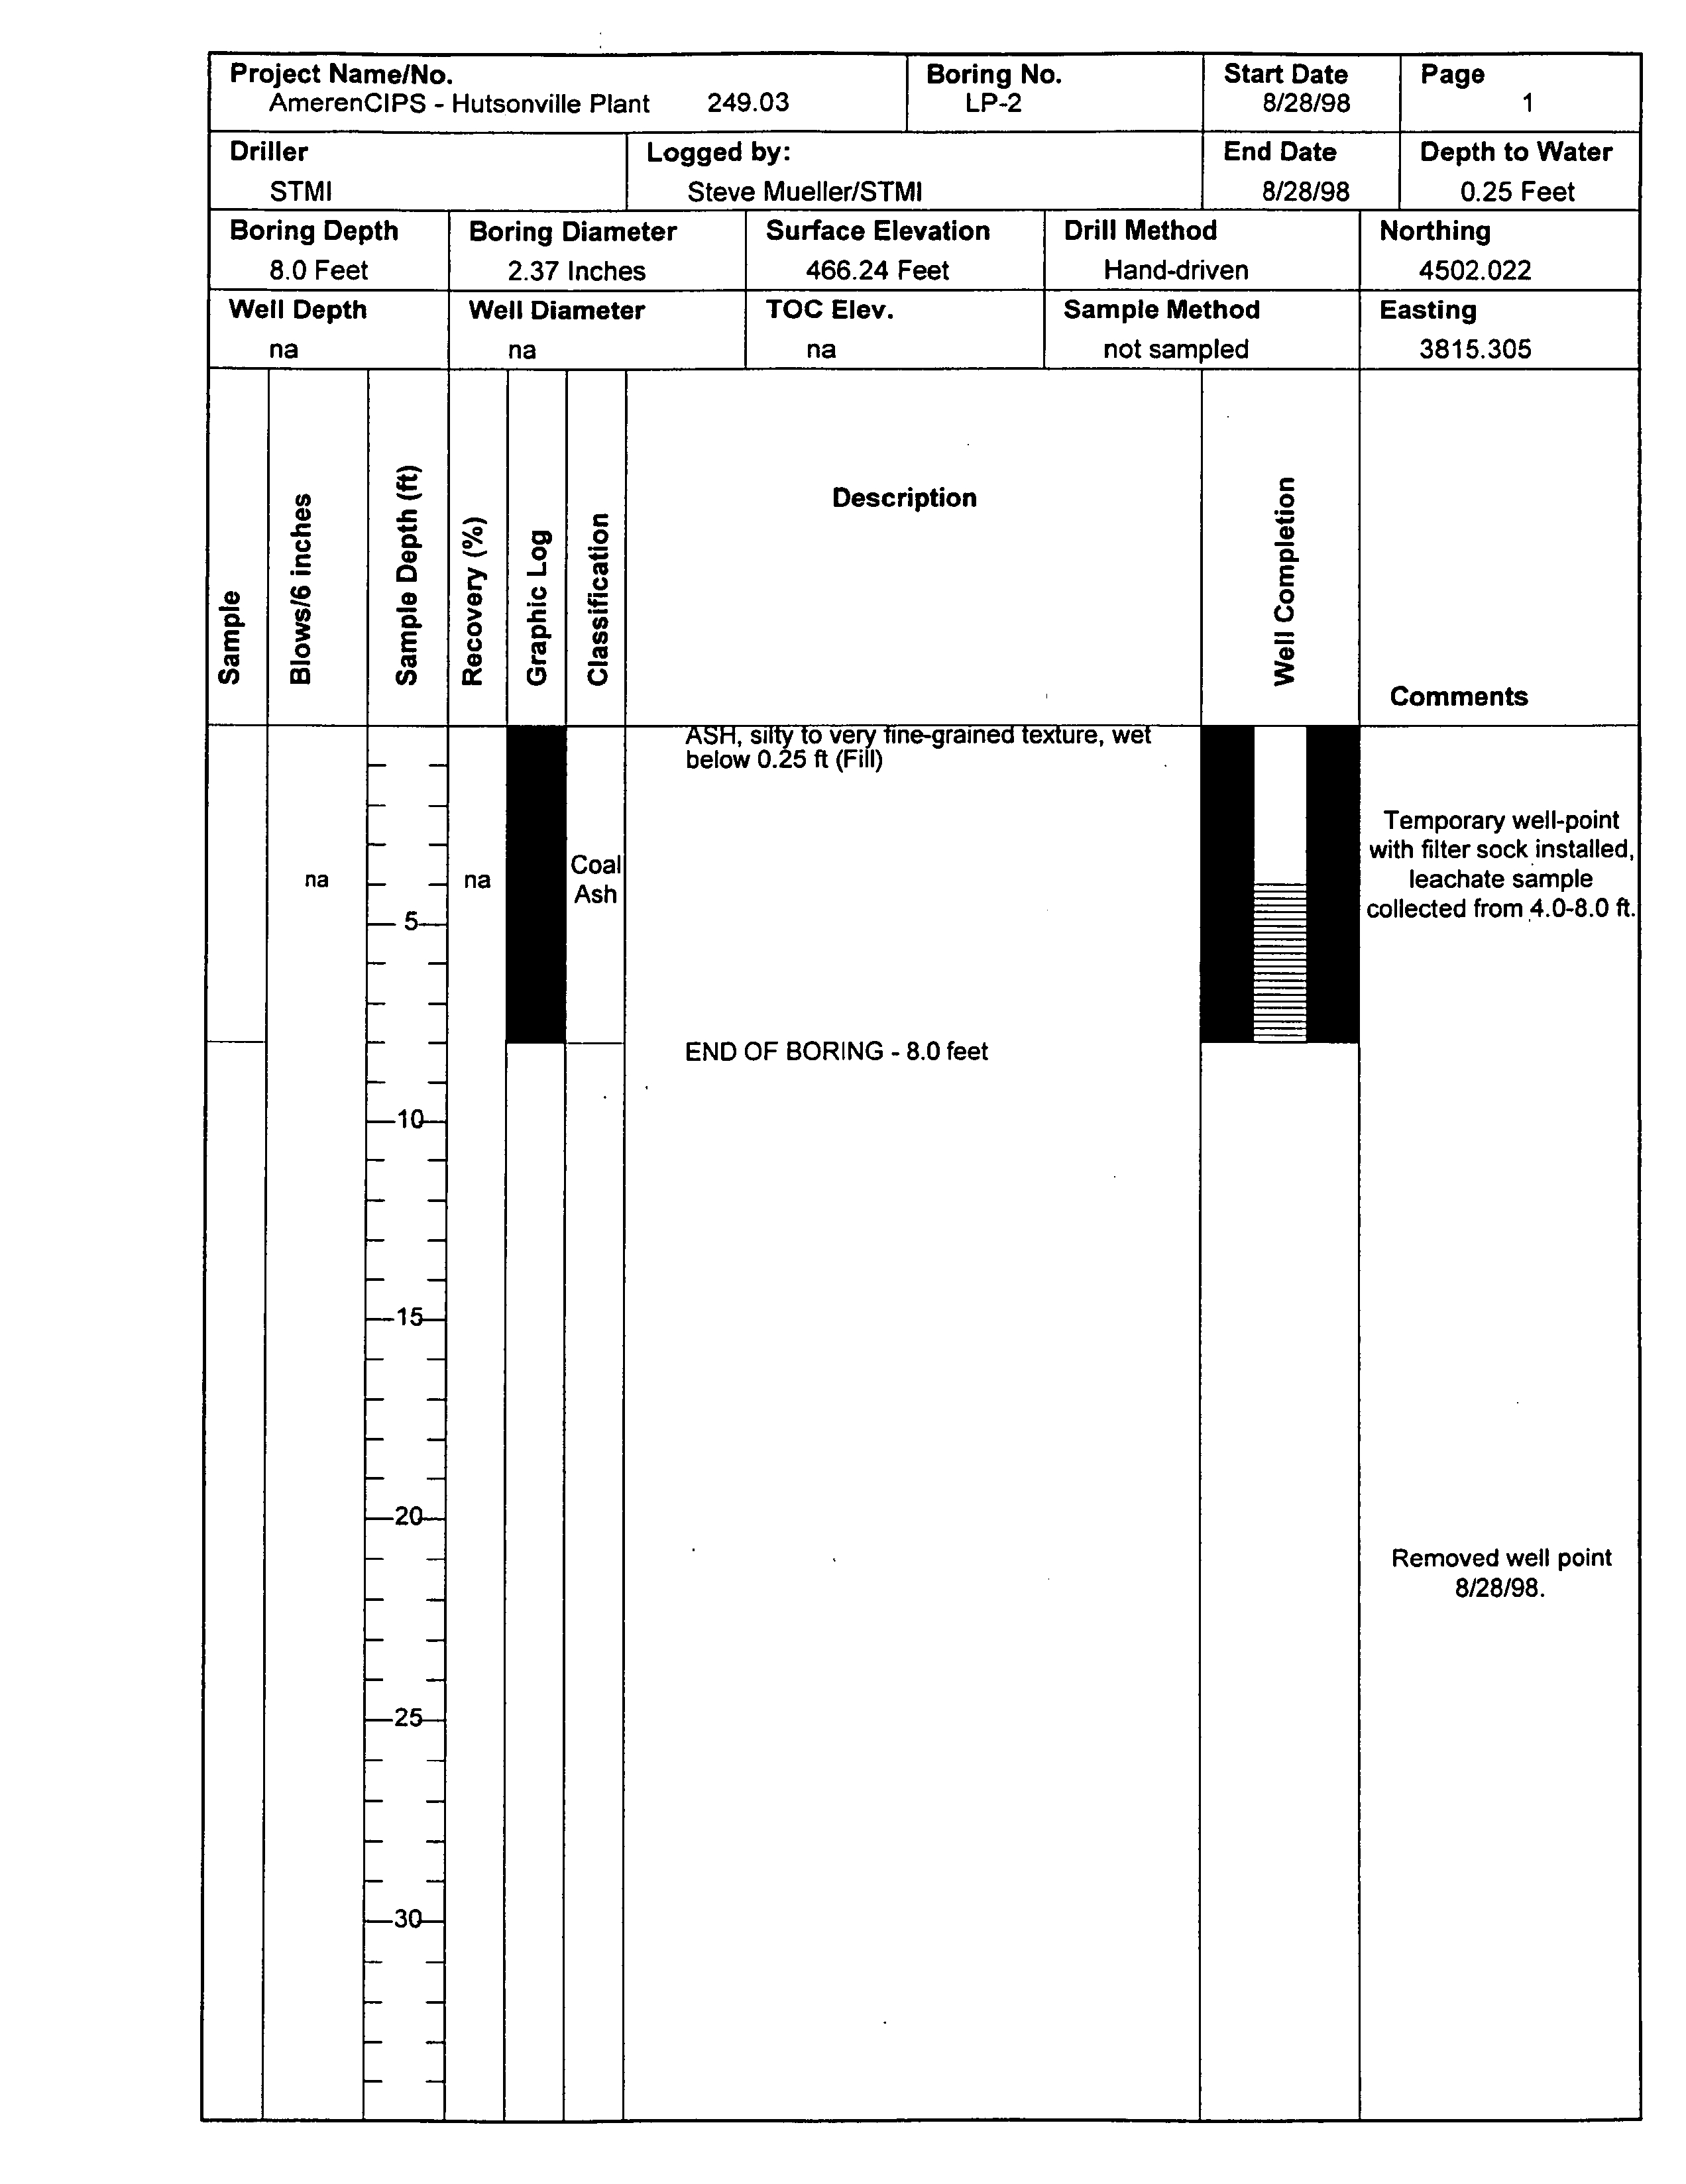
Concurrent with
direct-push
sampling
two
temporary
well
points
were
installed at
depths
of
seven to
eight
feet
in
the lined ash
impoundment
to collect leachate
samples Figure
LP
locations
Each well
point
was constructed of 1.25-inch
I.D polyvinyl
chloride
PVC pipe
flush-threaded to
four-foot
long
section
of 0.01-inch
factory-slotted
PVC
screen
covered
by
filter sock
Because the lined
impoundment
was
too soft for truck
access
the well
points
were
hand-driven
into the ash
The leachate
samples
were
collected
by
hand
pumping
section of
disposable high-density polyethylene
HDPE tubing
connected
to
stainless steel foot-valve
After
sampling
the
temporary
well
points
were
completely
removed and
the
holes
were
allowed
to
collapse
2.1.1
Laboratory Samples
All
direct-push
water
samples
were collected in
laboratory
transfer containers and
transported
to
the Hutsonville
plants
on-site
laboratory
for
measurement
of
temperature
electrical
conductivity
pH
dissolved
oxygen
and oxidation-reduction
potential
Samples
for metals
analysis
were
then
passed through
0.45
micron cellulose nitrate filter membrane
one per
sample
into 250-mi
polyethylene
containers
and
preserved
with concentrated nitric acid The
remaining sample
volume
was
transferred into 1000-ml
polyethylene
containers
without
preservatives
All
sample aliquots
were
stored at
temperature
below 39F
4C prior
to
analysis
at
AmerenCIPS
laboratory
Parameters
analyzed
and
analytical
methods used
are
listed
in Table
hutsonville
hydrogeologic
assessment.doc
Natural
2-2
Resource
Technology
Electronic Filing - Received, Clerk's Office, August 11, 2008 - AS 09-1, Exhibit 4
FIELD PROCEDURES
2.1.2 Probe Hole Abandonment
Upon completion
of
sampling probe
holes
that encountered
coal
or coal ash were backlilled
with
bentonite
grout
that
was
injected
as
the
probe
or
sampler
was withdrawn
while
probe
holes that
did not encounter ash
were
backlilled with
granular
bentonite
Pump tubing
was
discarded after
collection
of
each
water
sample
and all reusable
direct-push sampling equipment
was
decontaminated to
prevent
cross-contamination
between
sampling
locations
2.2 Installation of New
Monitoring
Wells
2.2.1 Rationale
Seven
new
groundwater monitoring
wells were installed at locations determined after
analysis
of
previous groundwater sampling
and the
direct-push sampling
Well
location elevation
and
completion
details
are
listed in Tables
and
Boring logs
and well
completion
reports
are
provided
in
Appendix
Four
shallow
wells
were
installed
One shallow well
MW-b
was
installed
to
provide
additional
background
groundwater quality
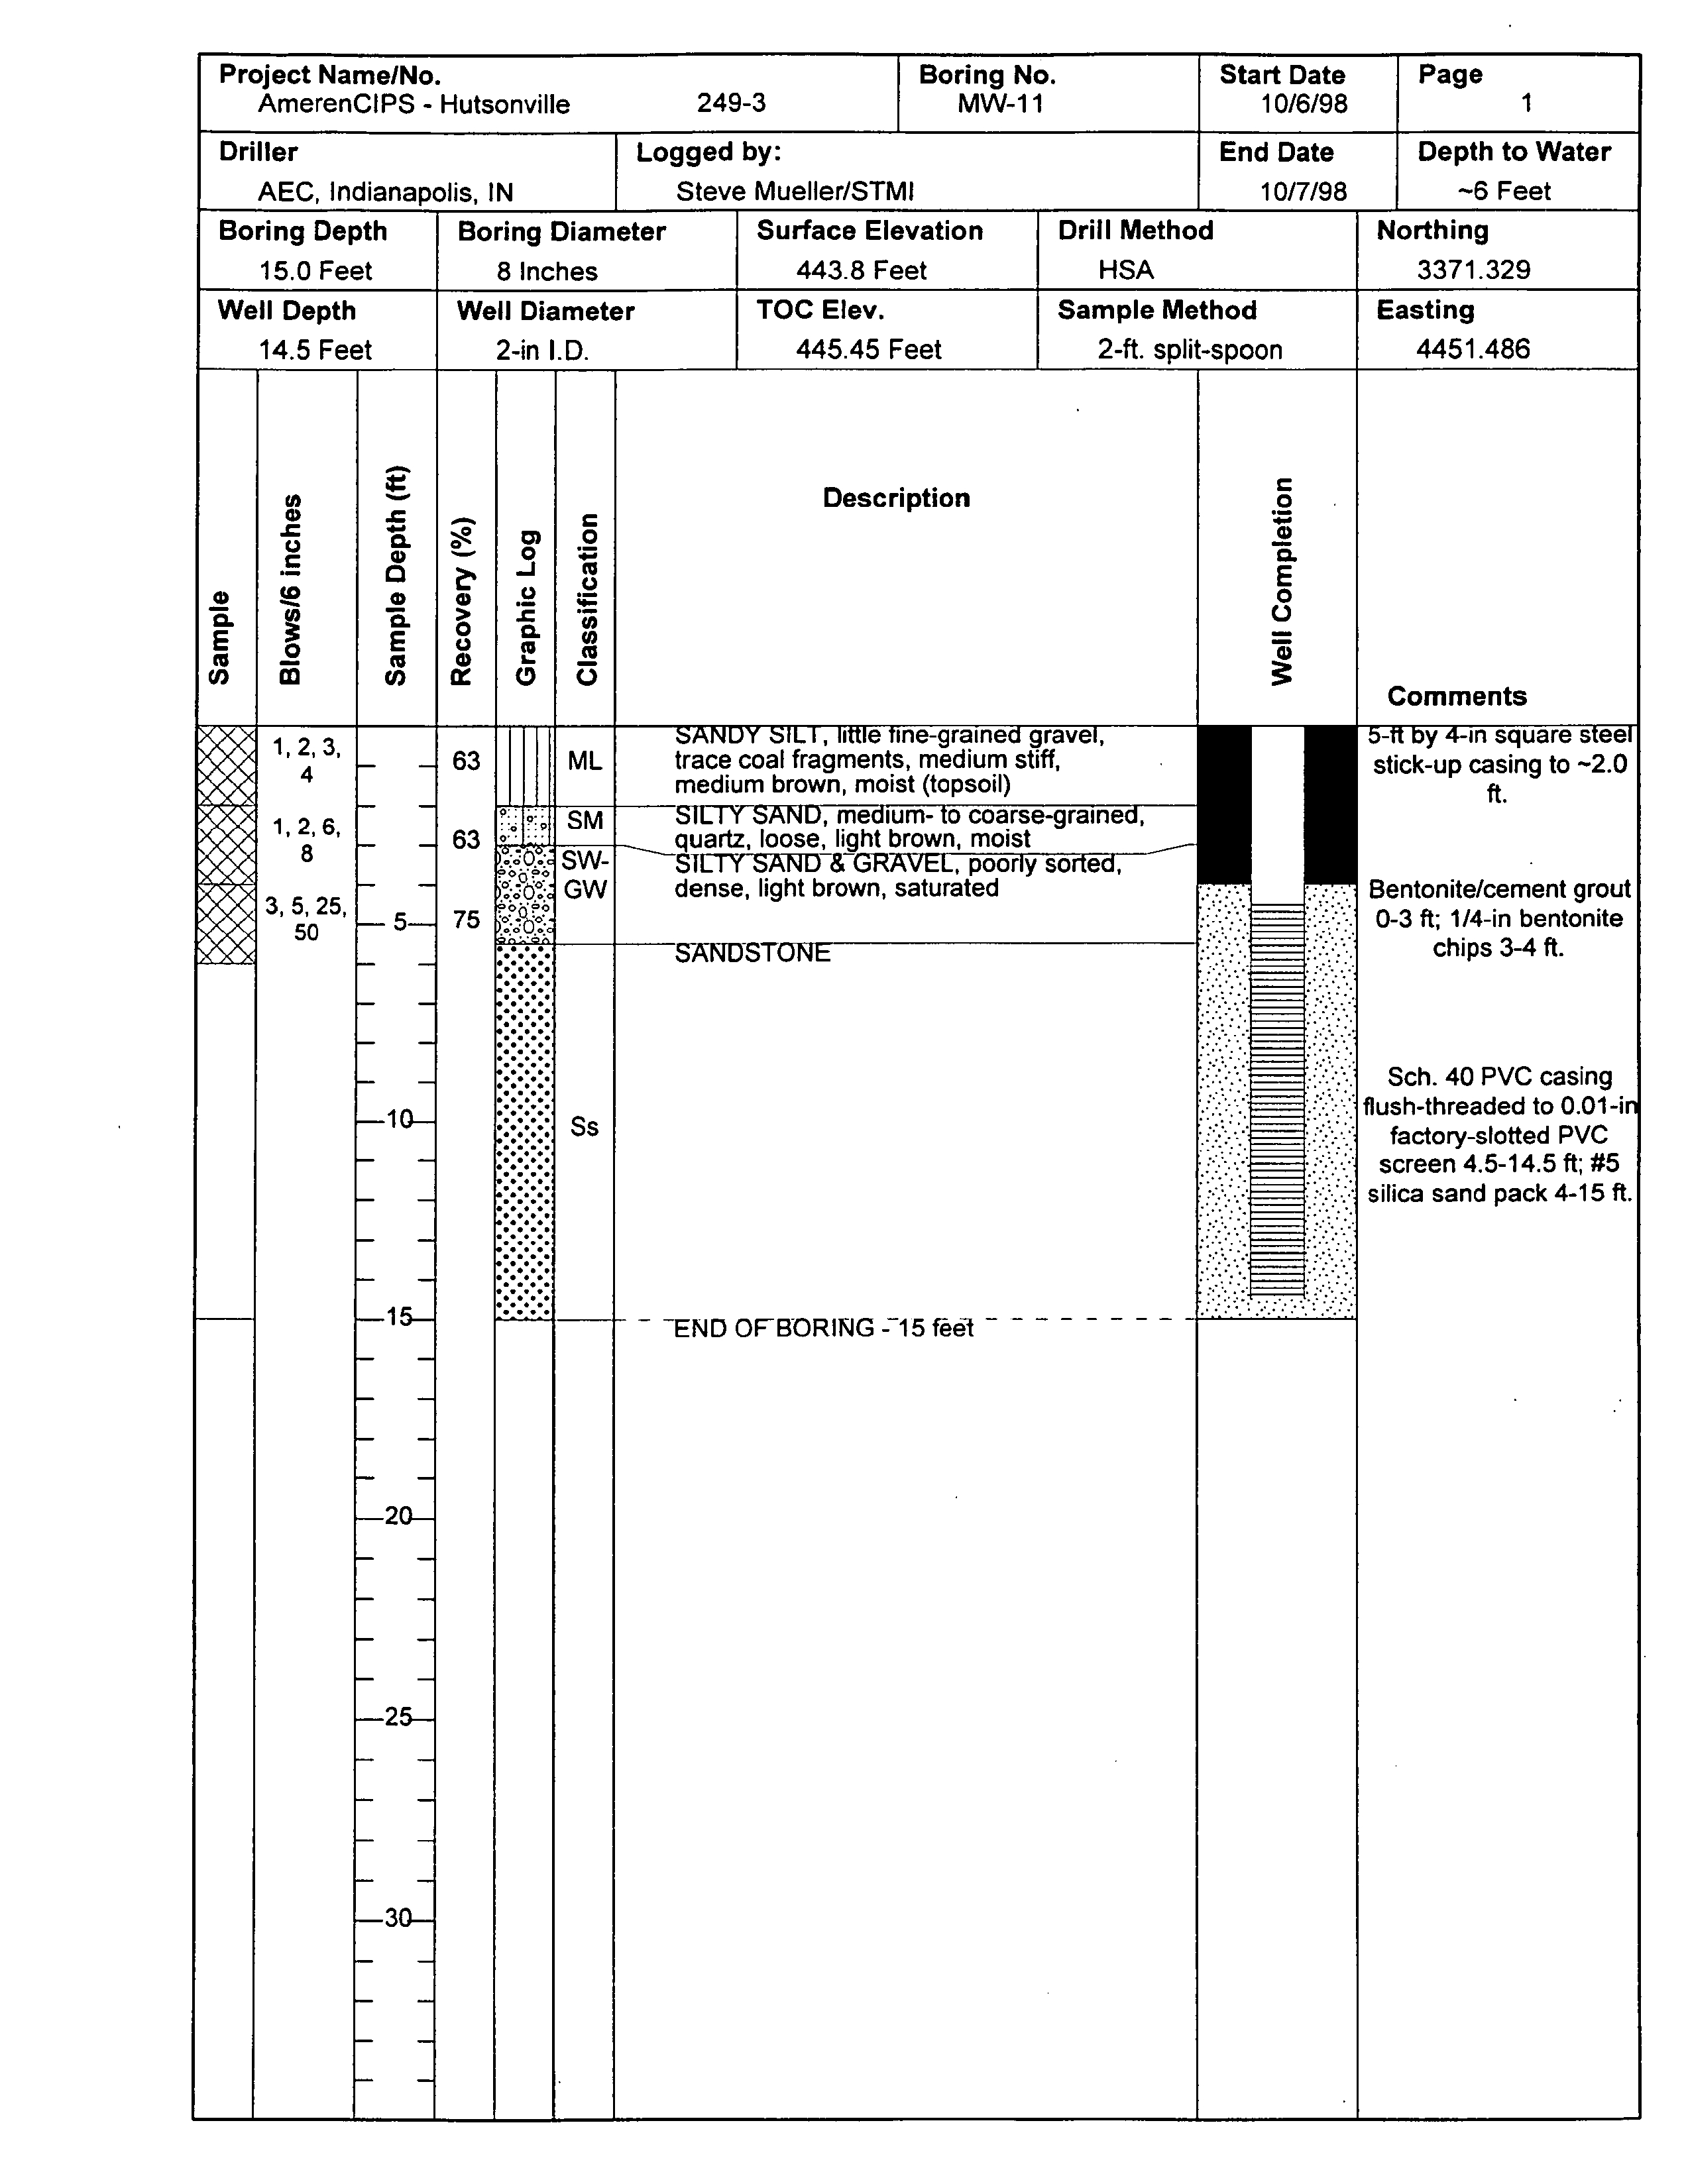
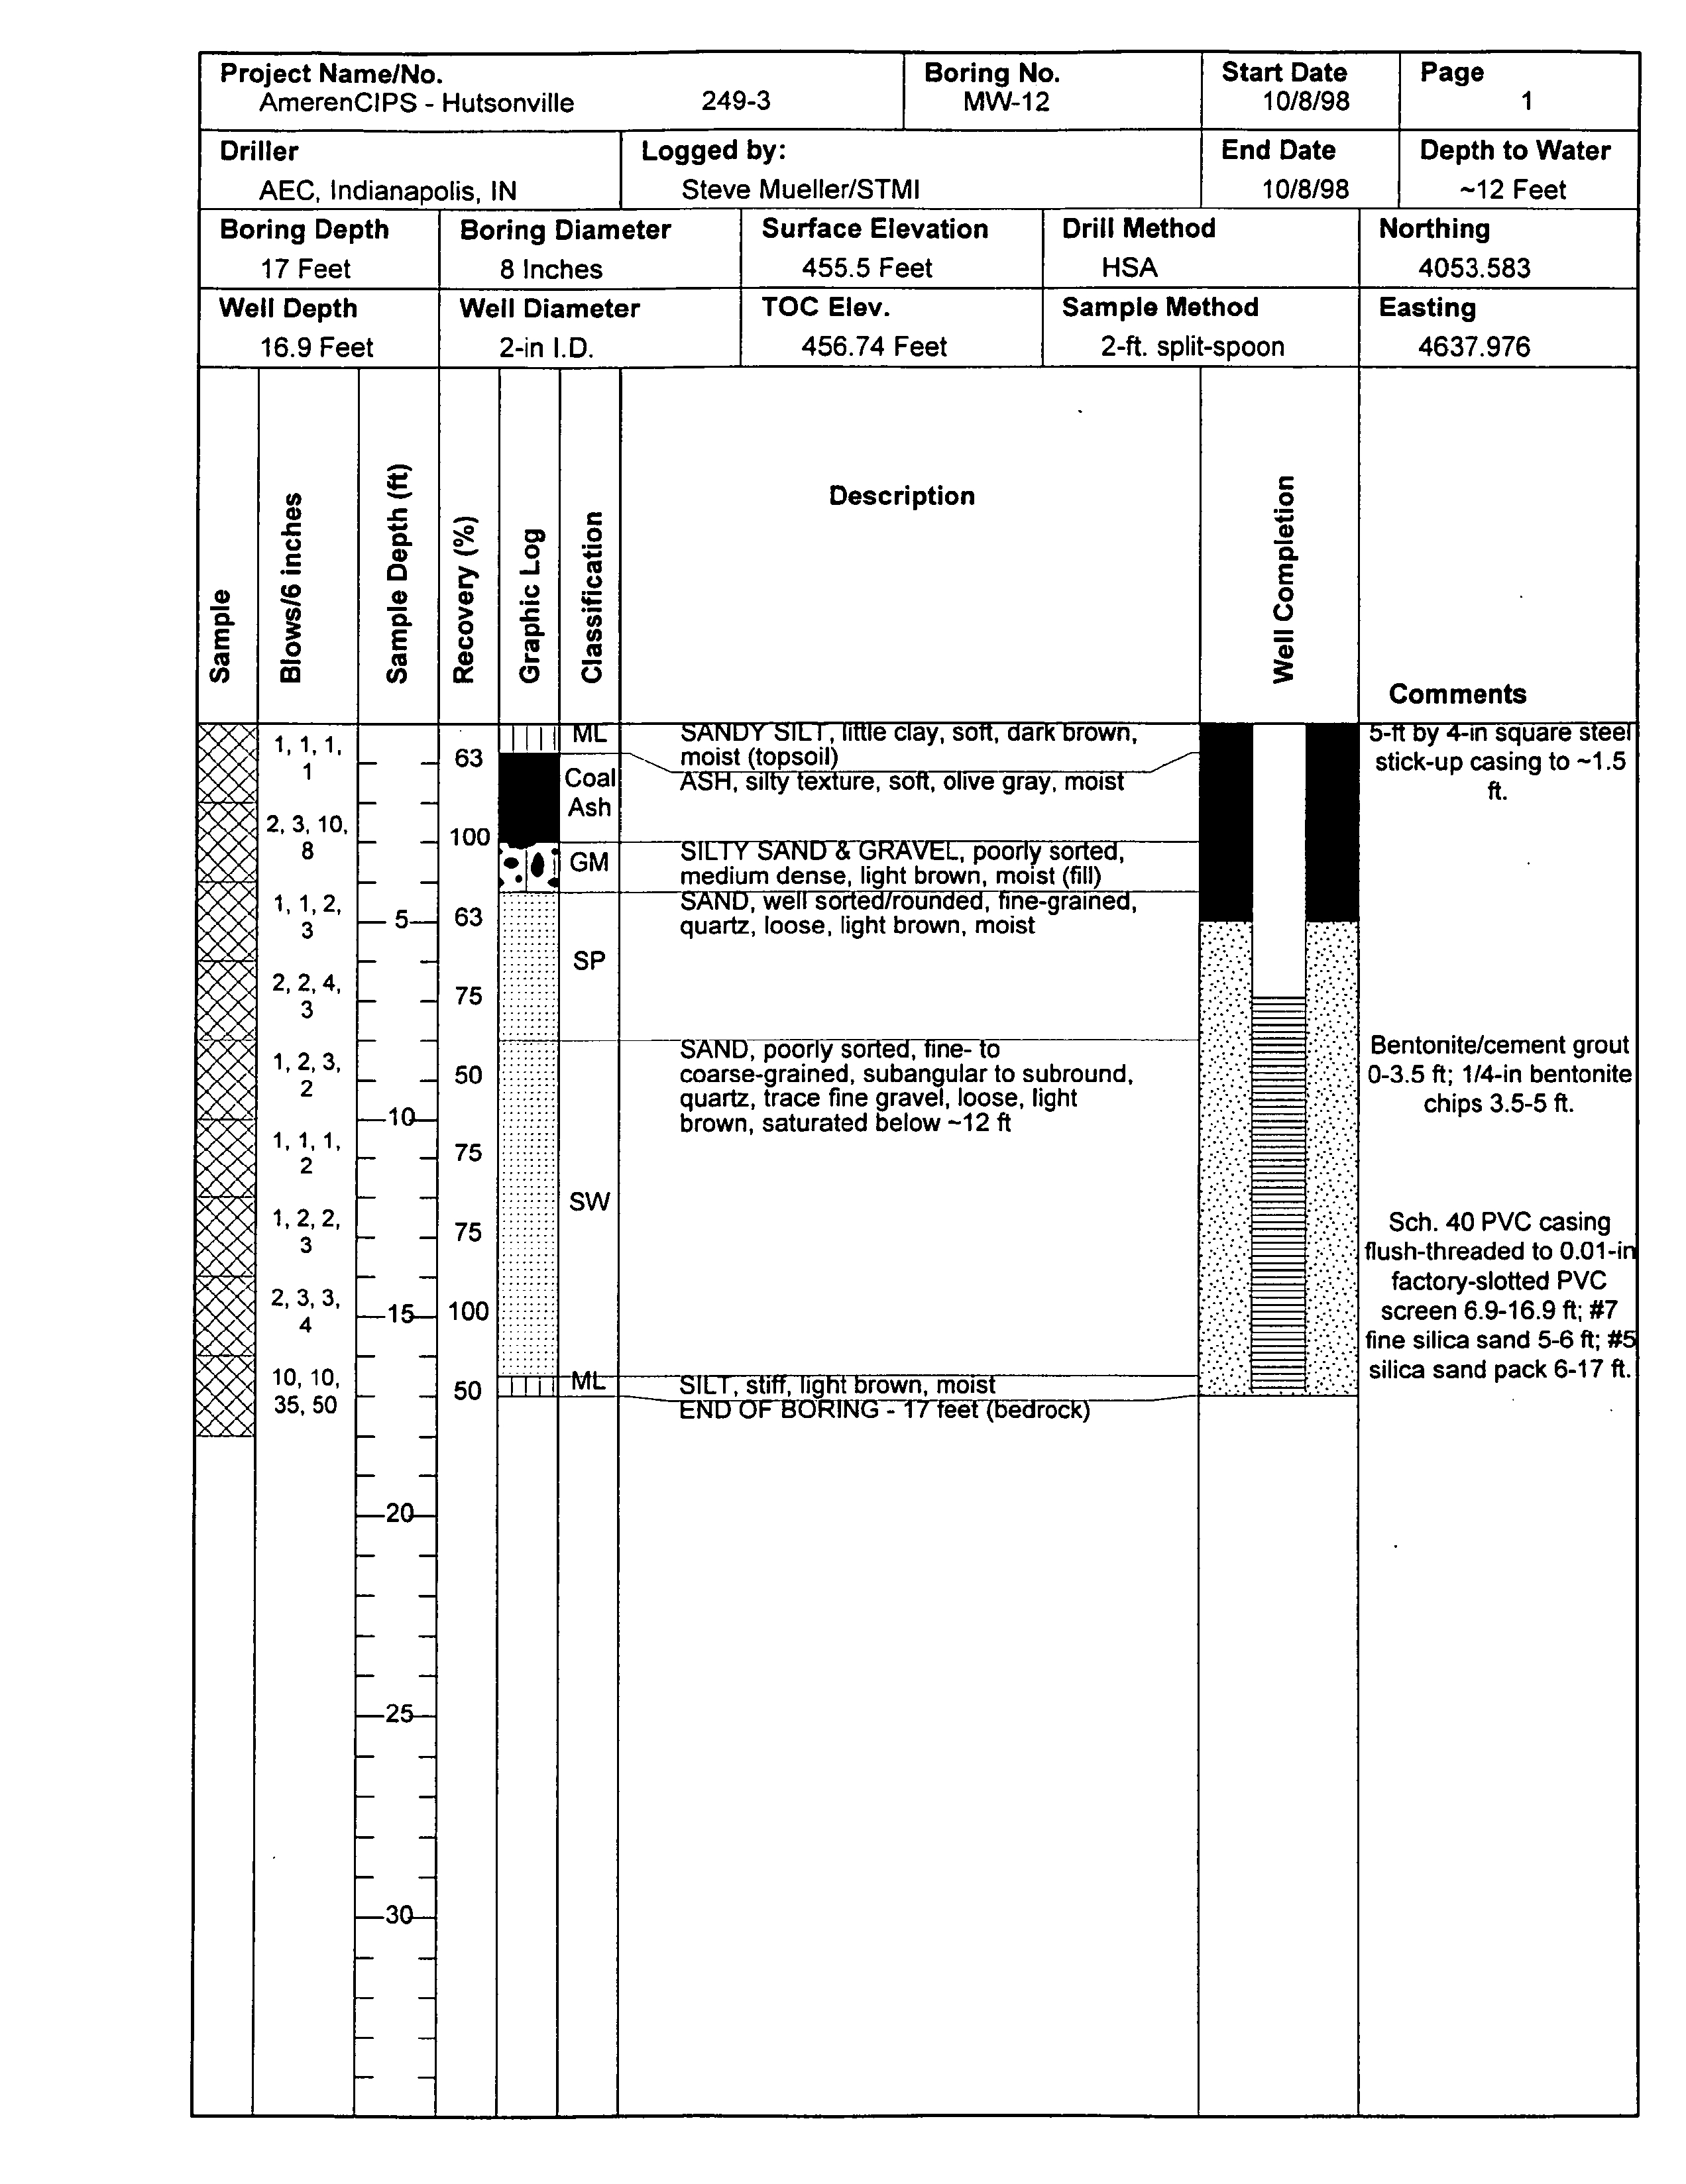
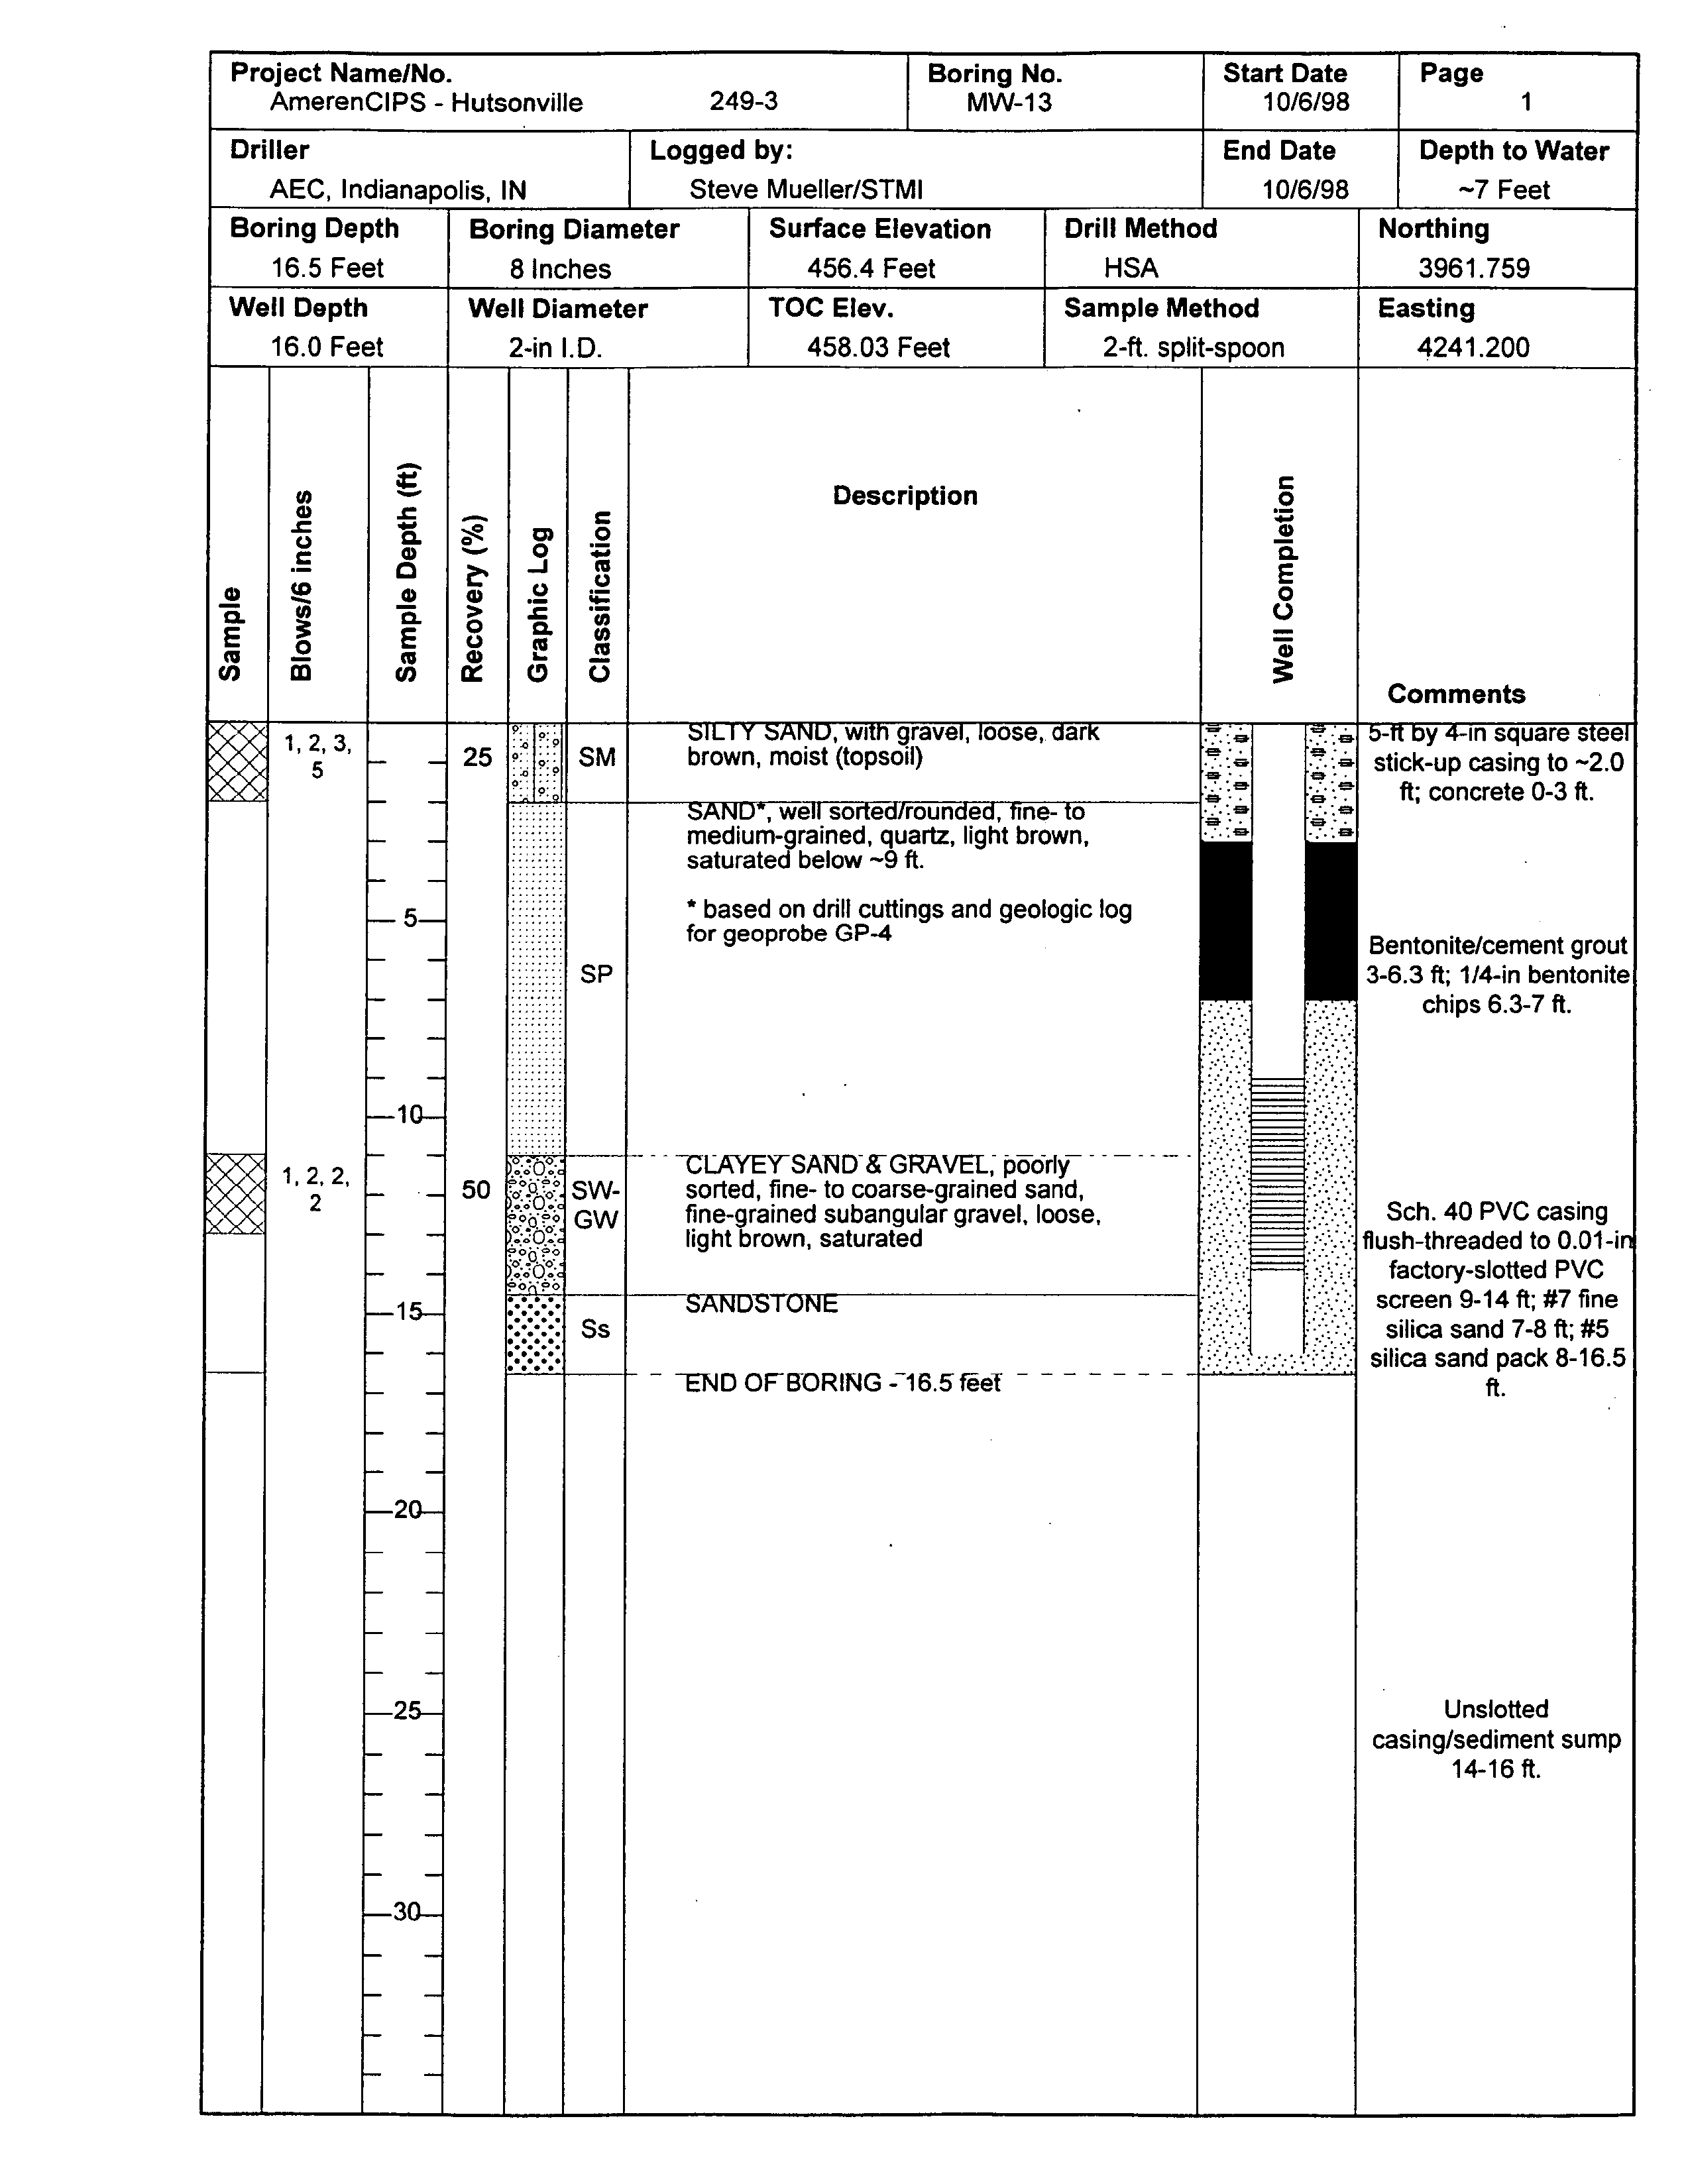
data Three shallow wells
MW-il
MW-i2
and
MW-13
were
installed
to
characterize
aquifer properties
and
groundwater
flow
at
the
site
and
to
delineate the
extent
of
groundwater
impacts
associated
with
the ash
impoundments
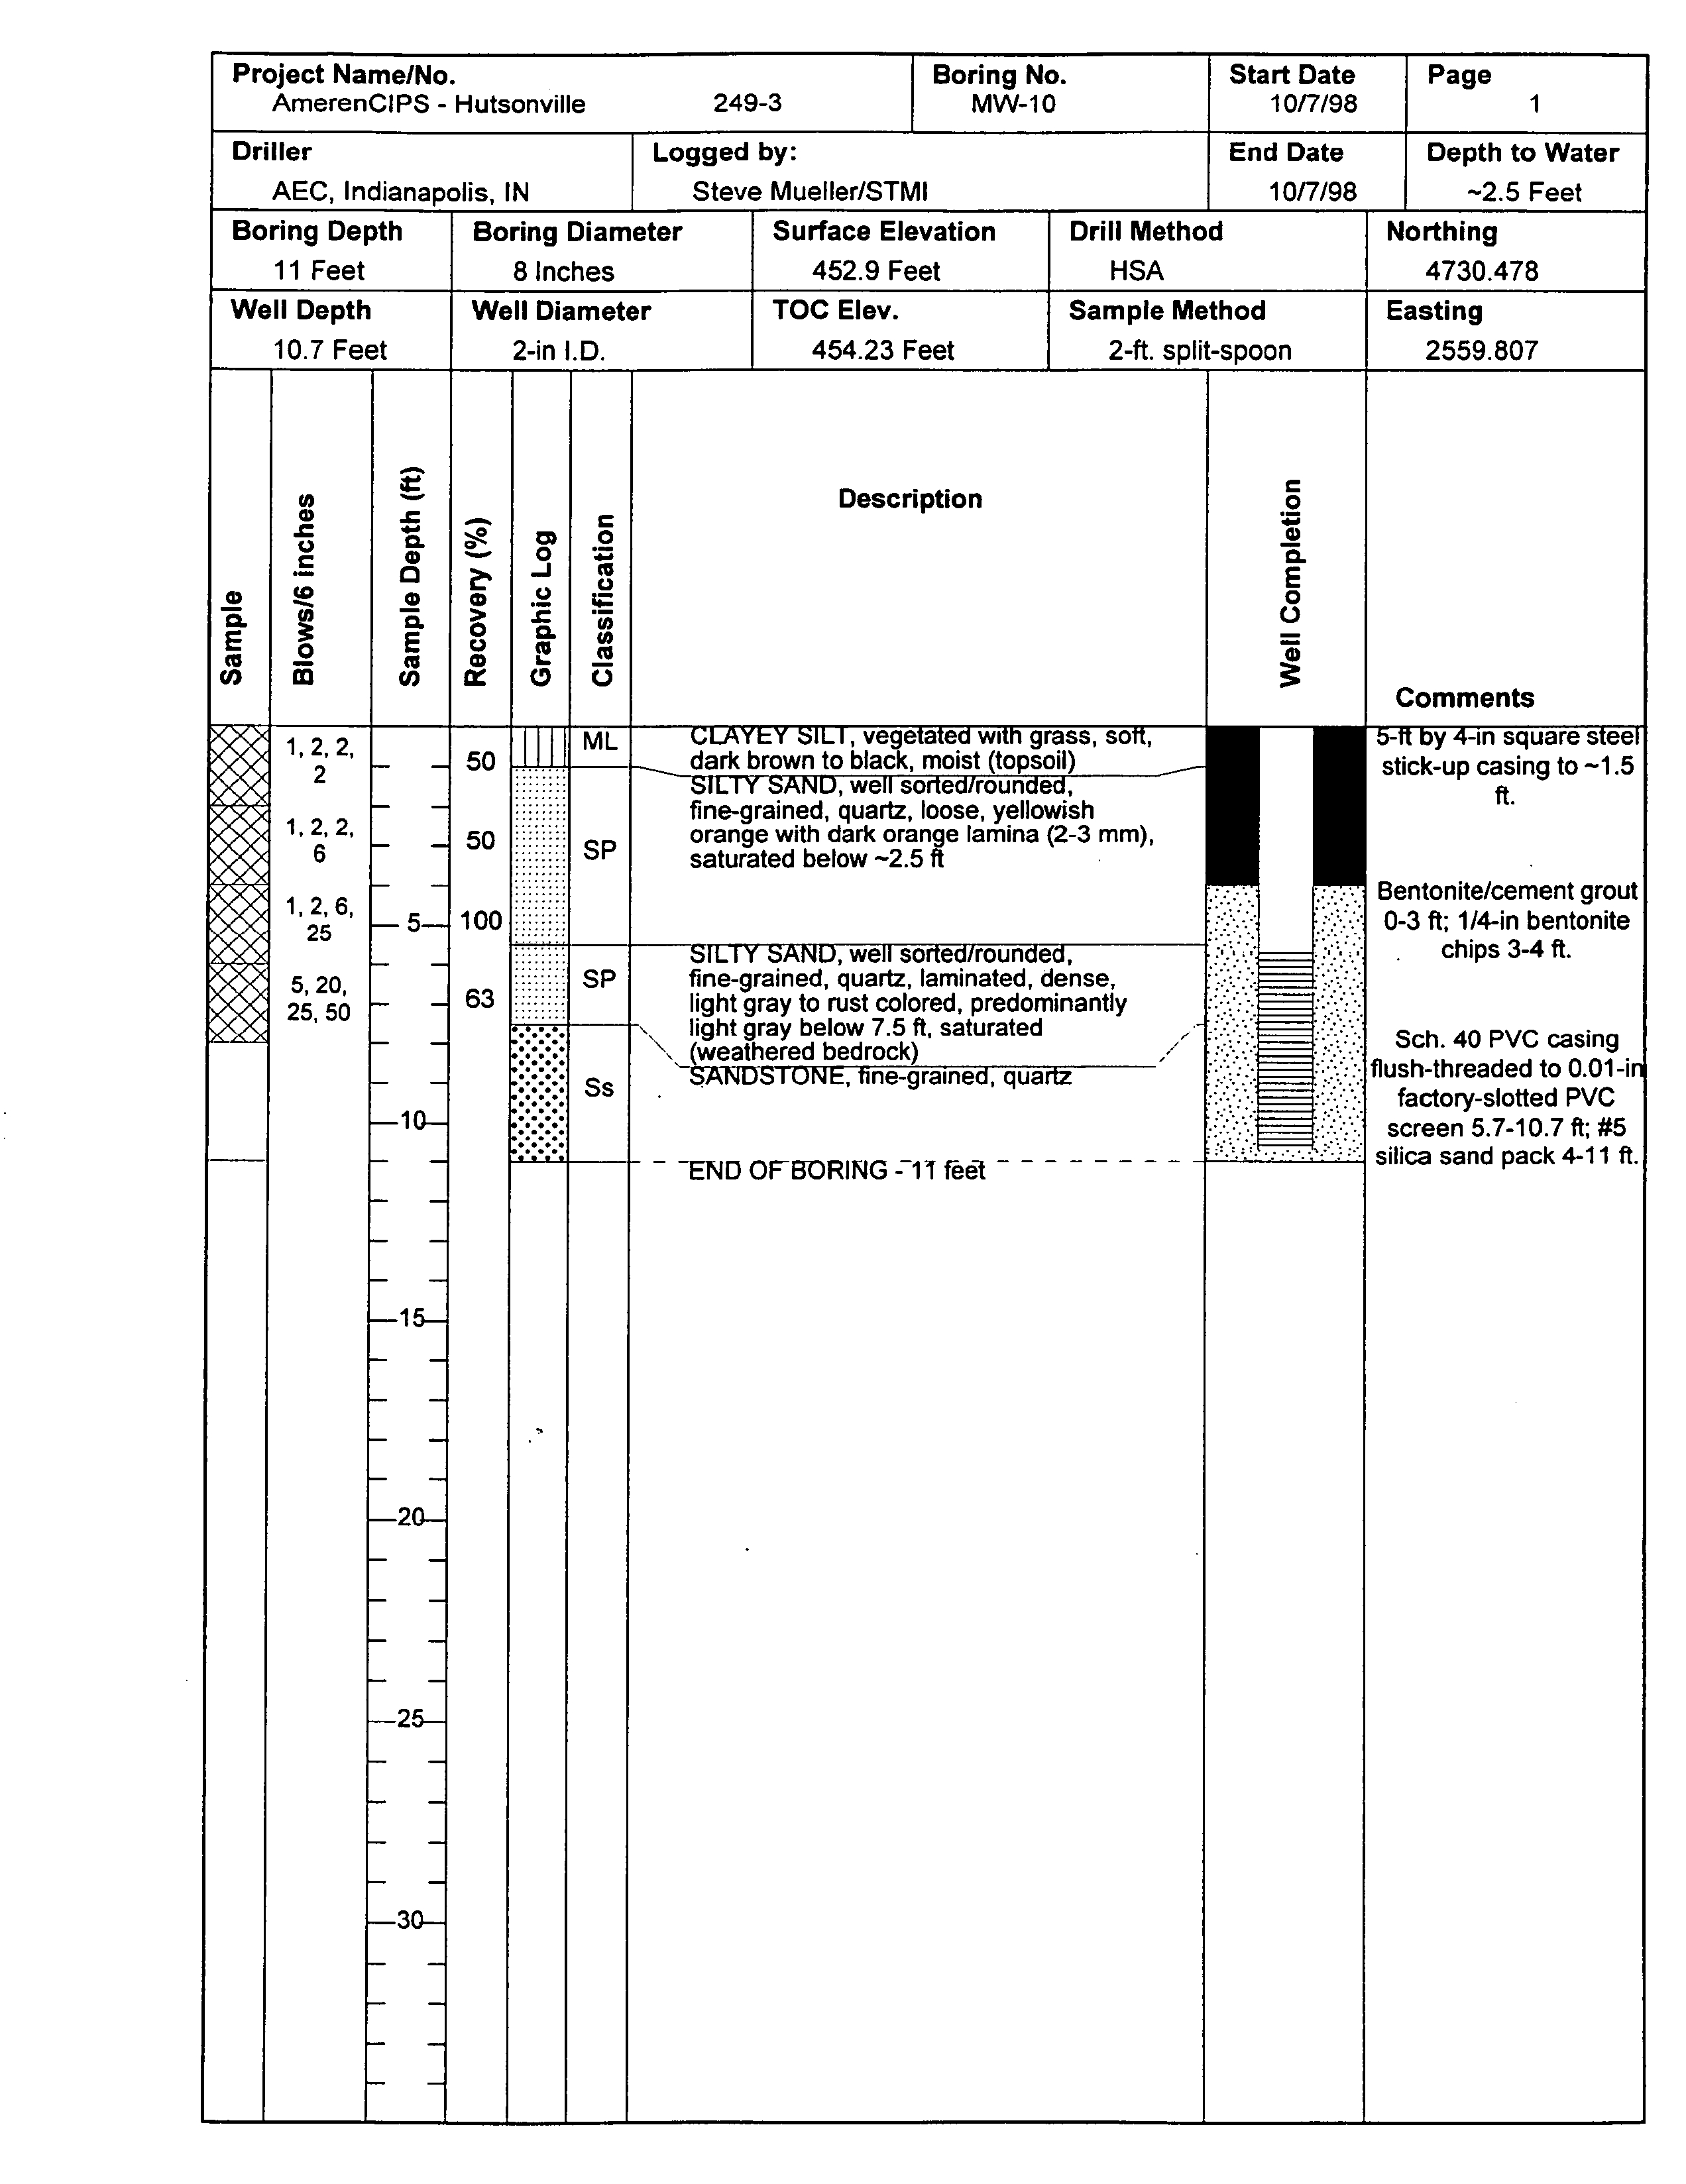
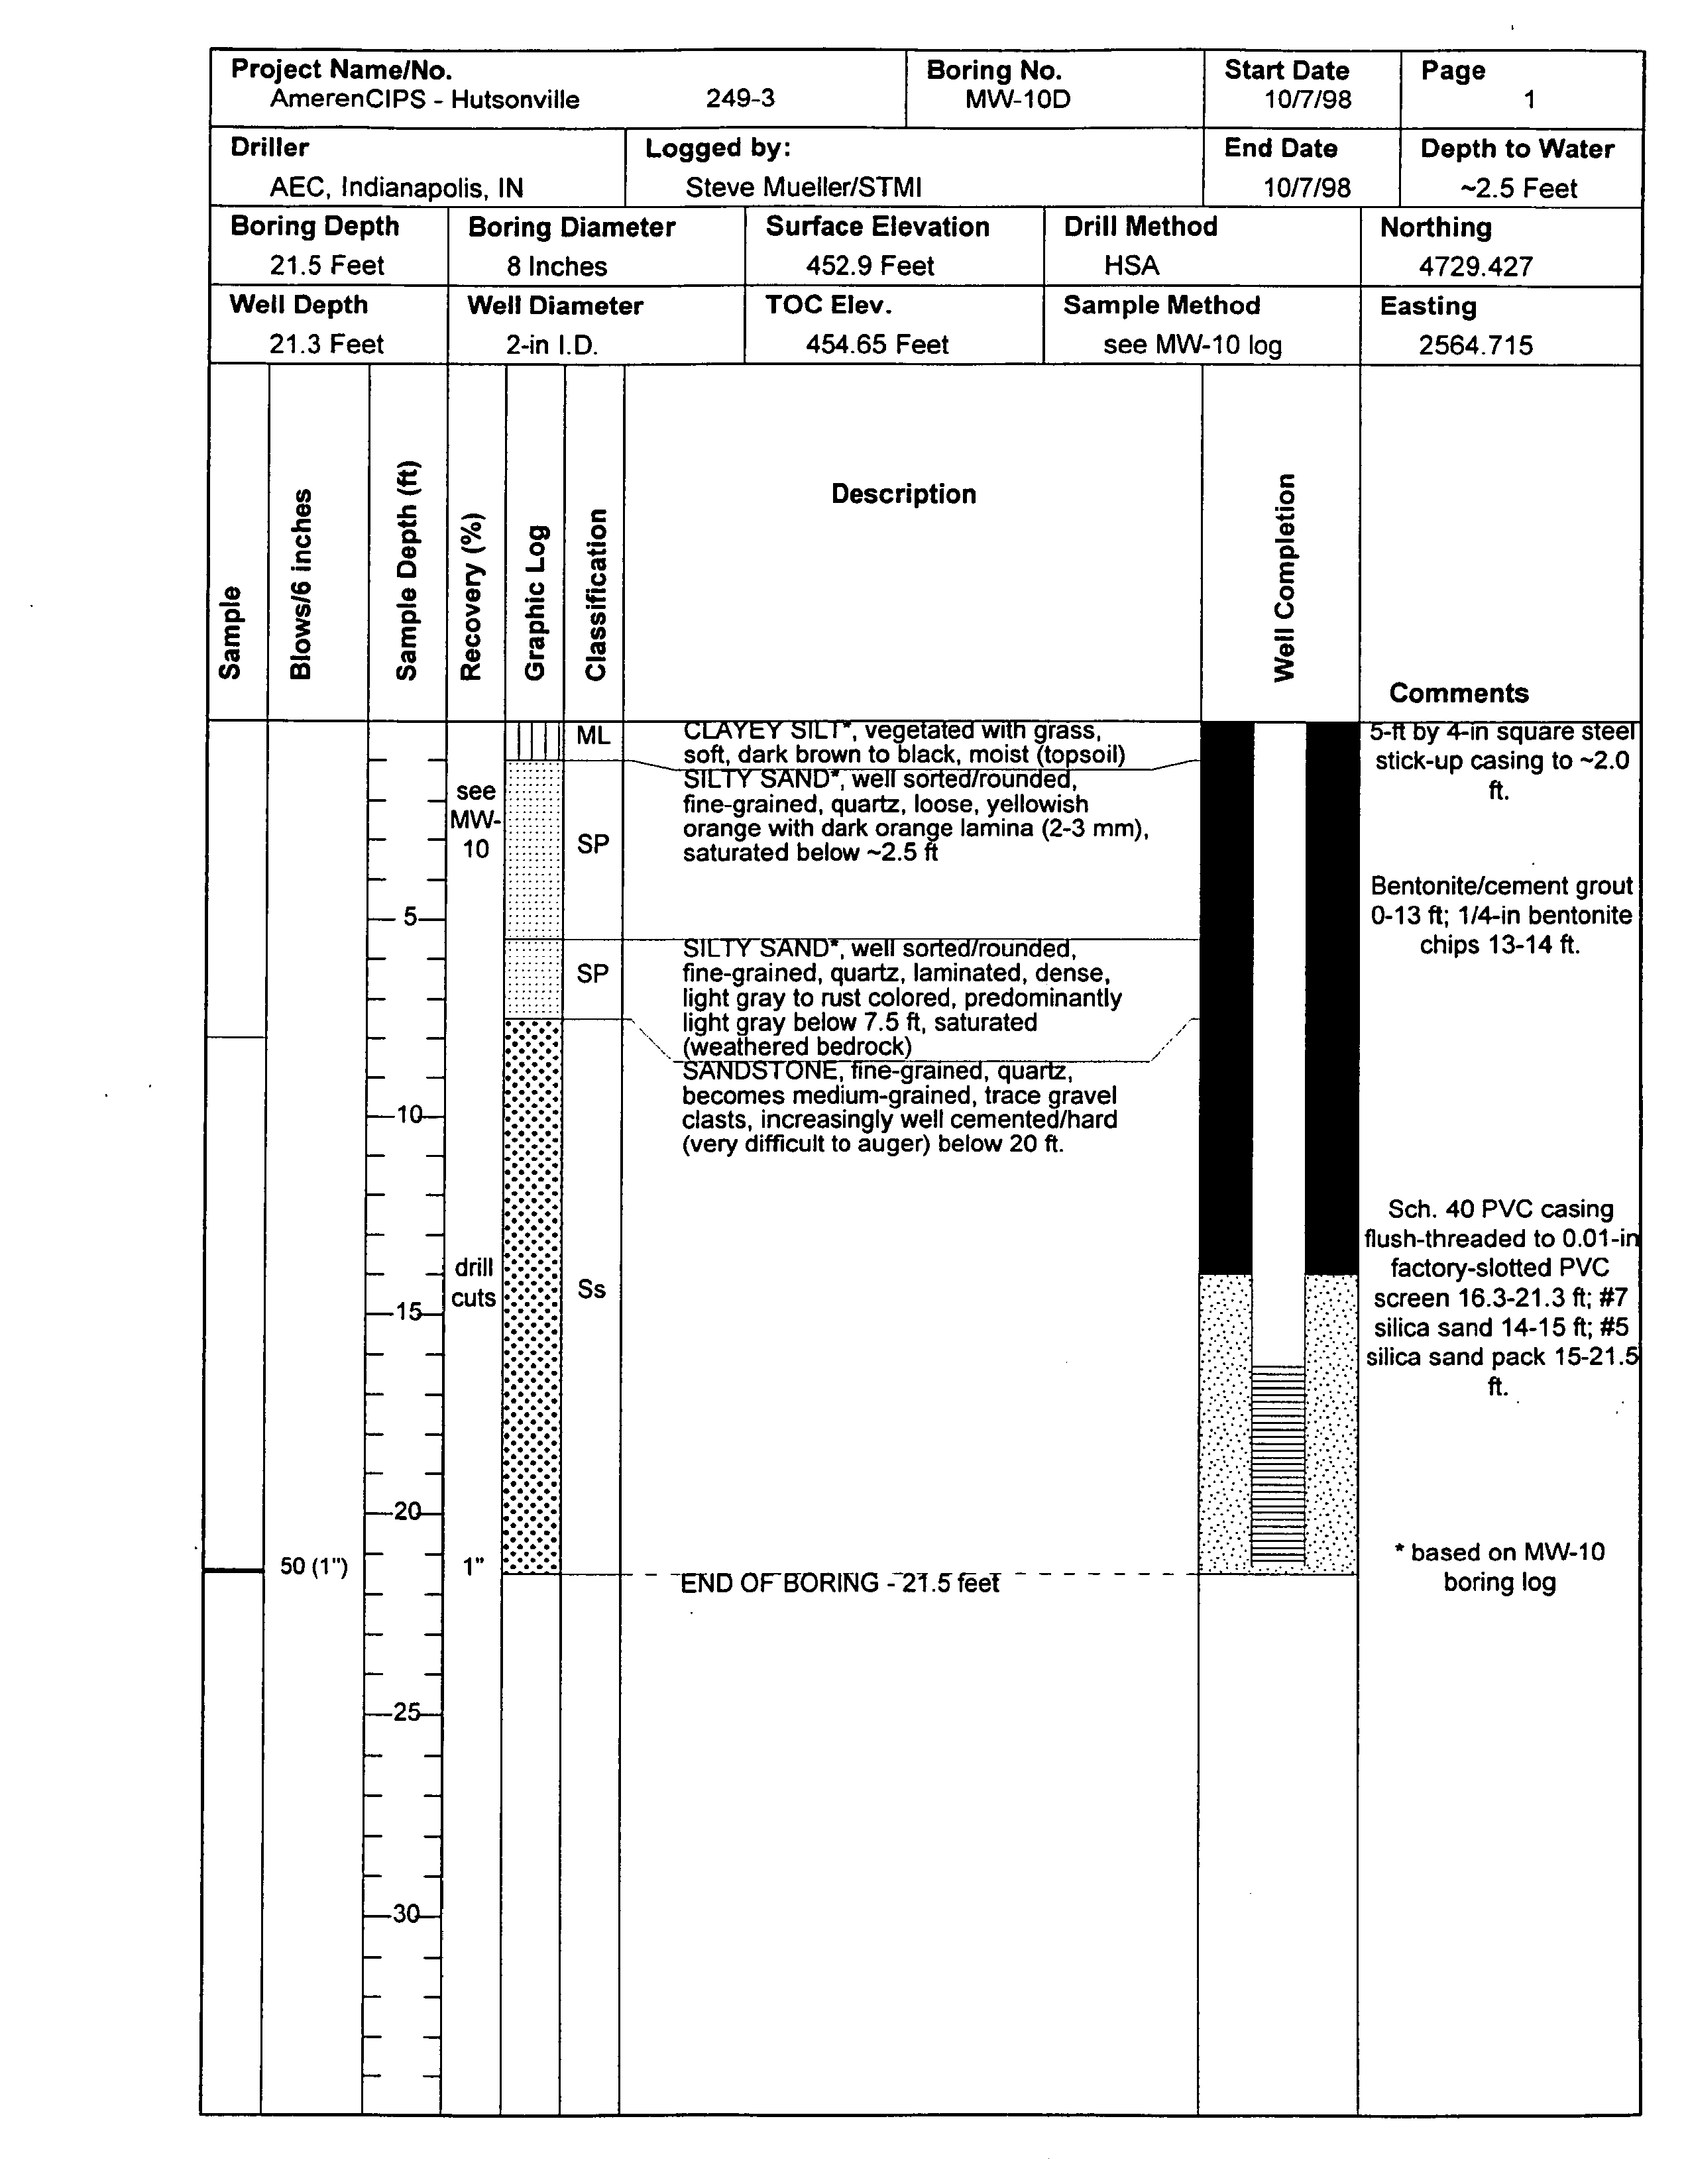
Wells
MW-iO MW-12
and MW-13
were
screened
predominantly
in unlithified
materials
although
MW-iO extended into the
very
shallow bedrock
Figure
Shallow
monitoring
well
MW-li
was
screened
mostly
within shallow
bedrock
where the
water
table
was
encountered
Three
deep
wells were installed
Deep
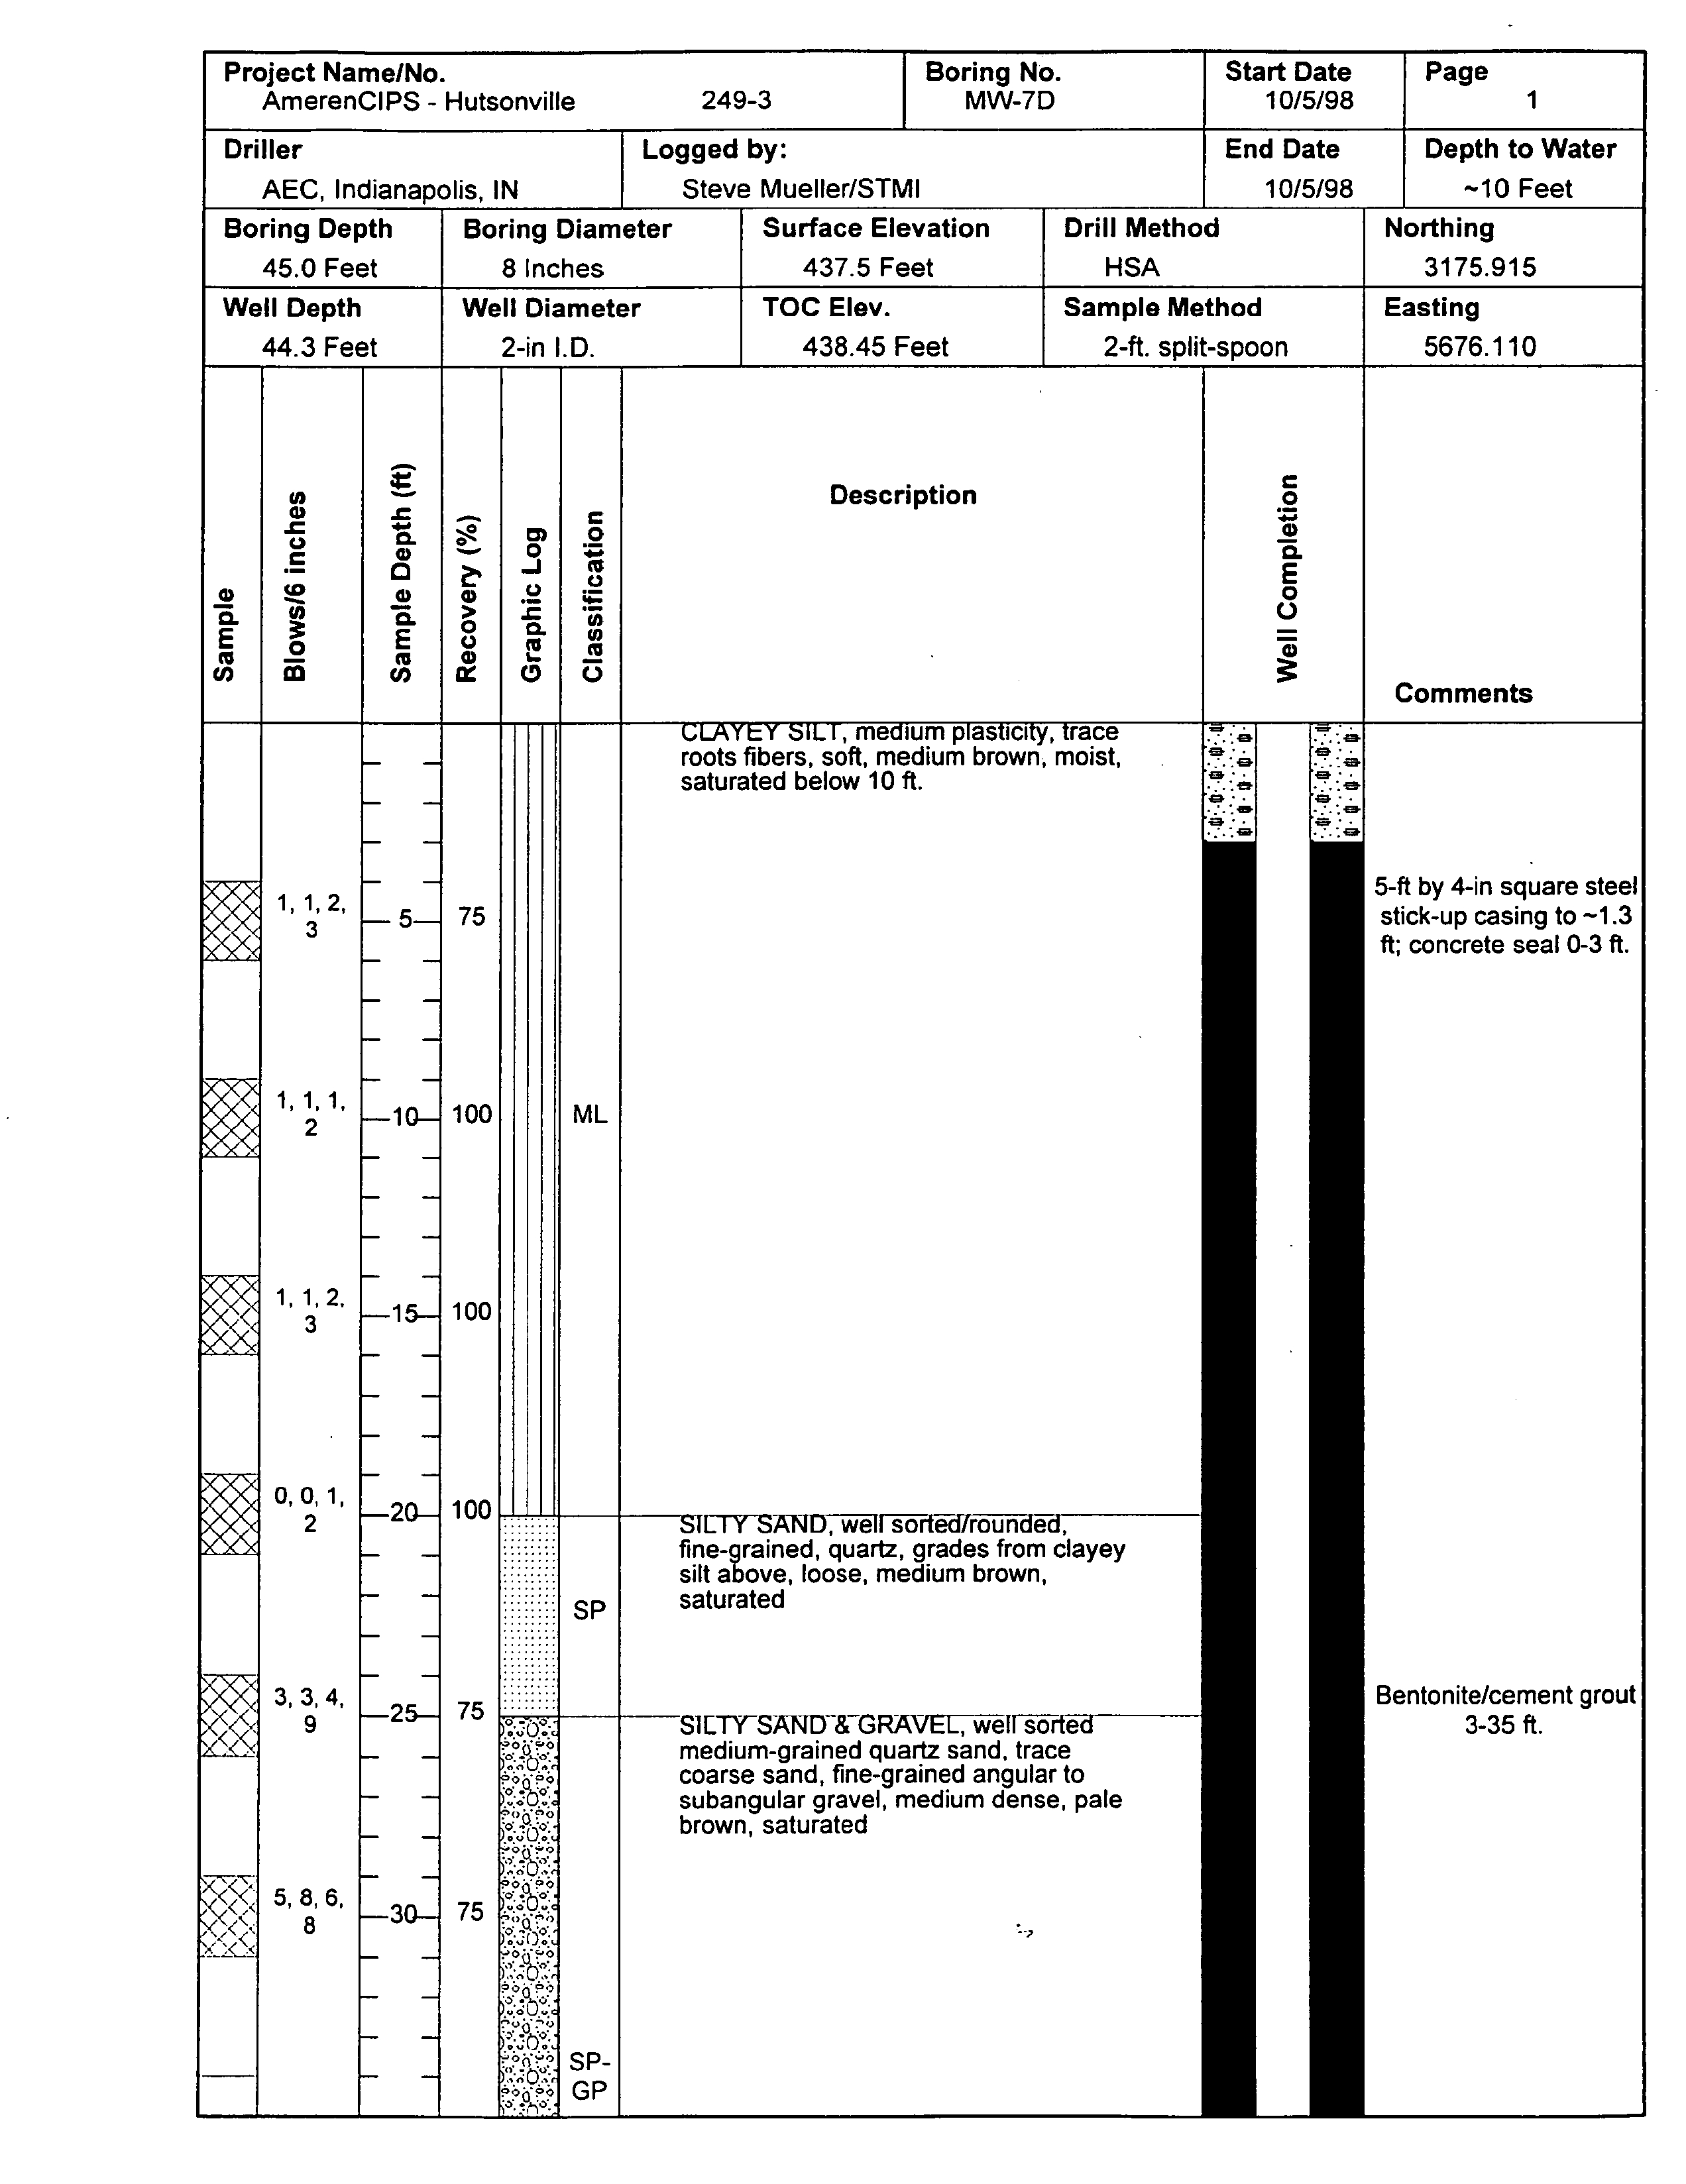
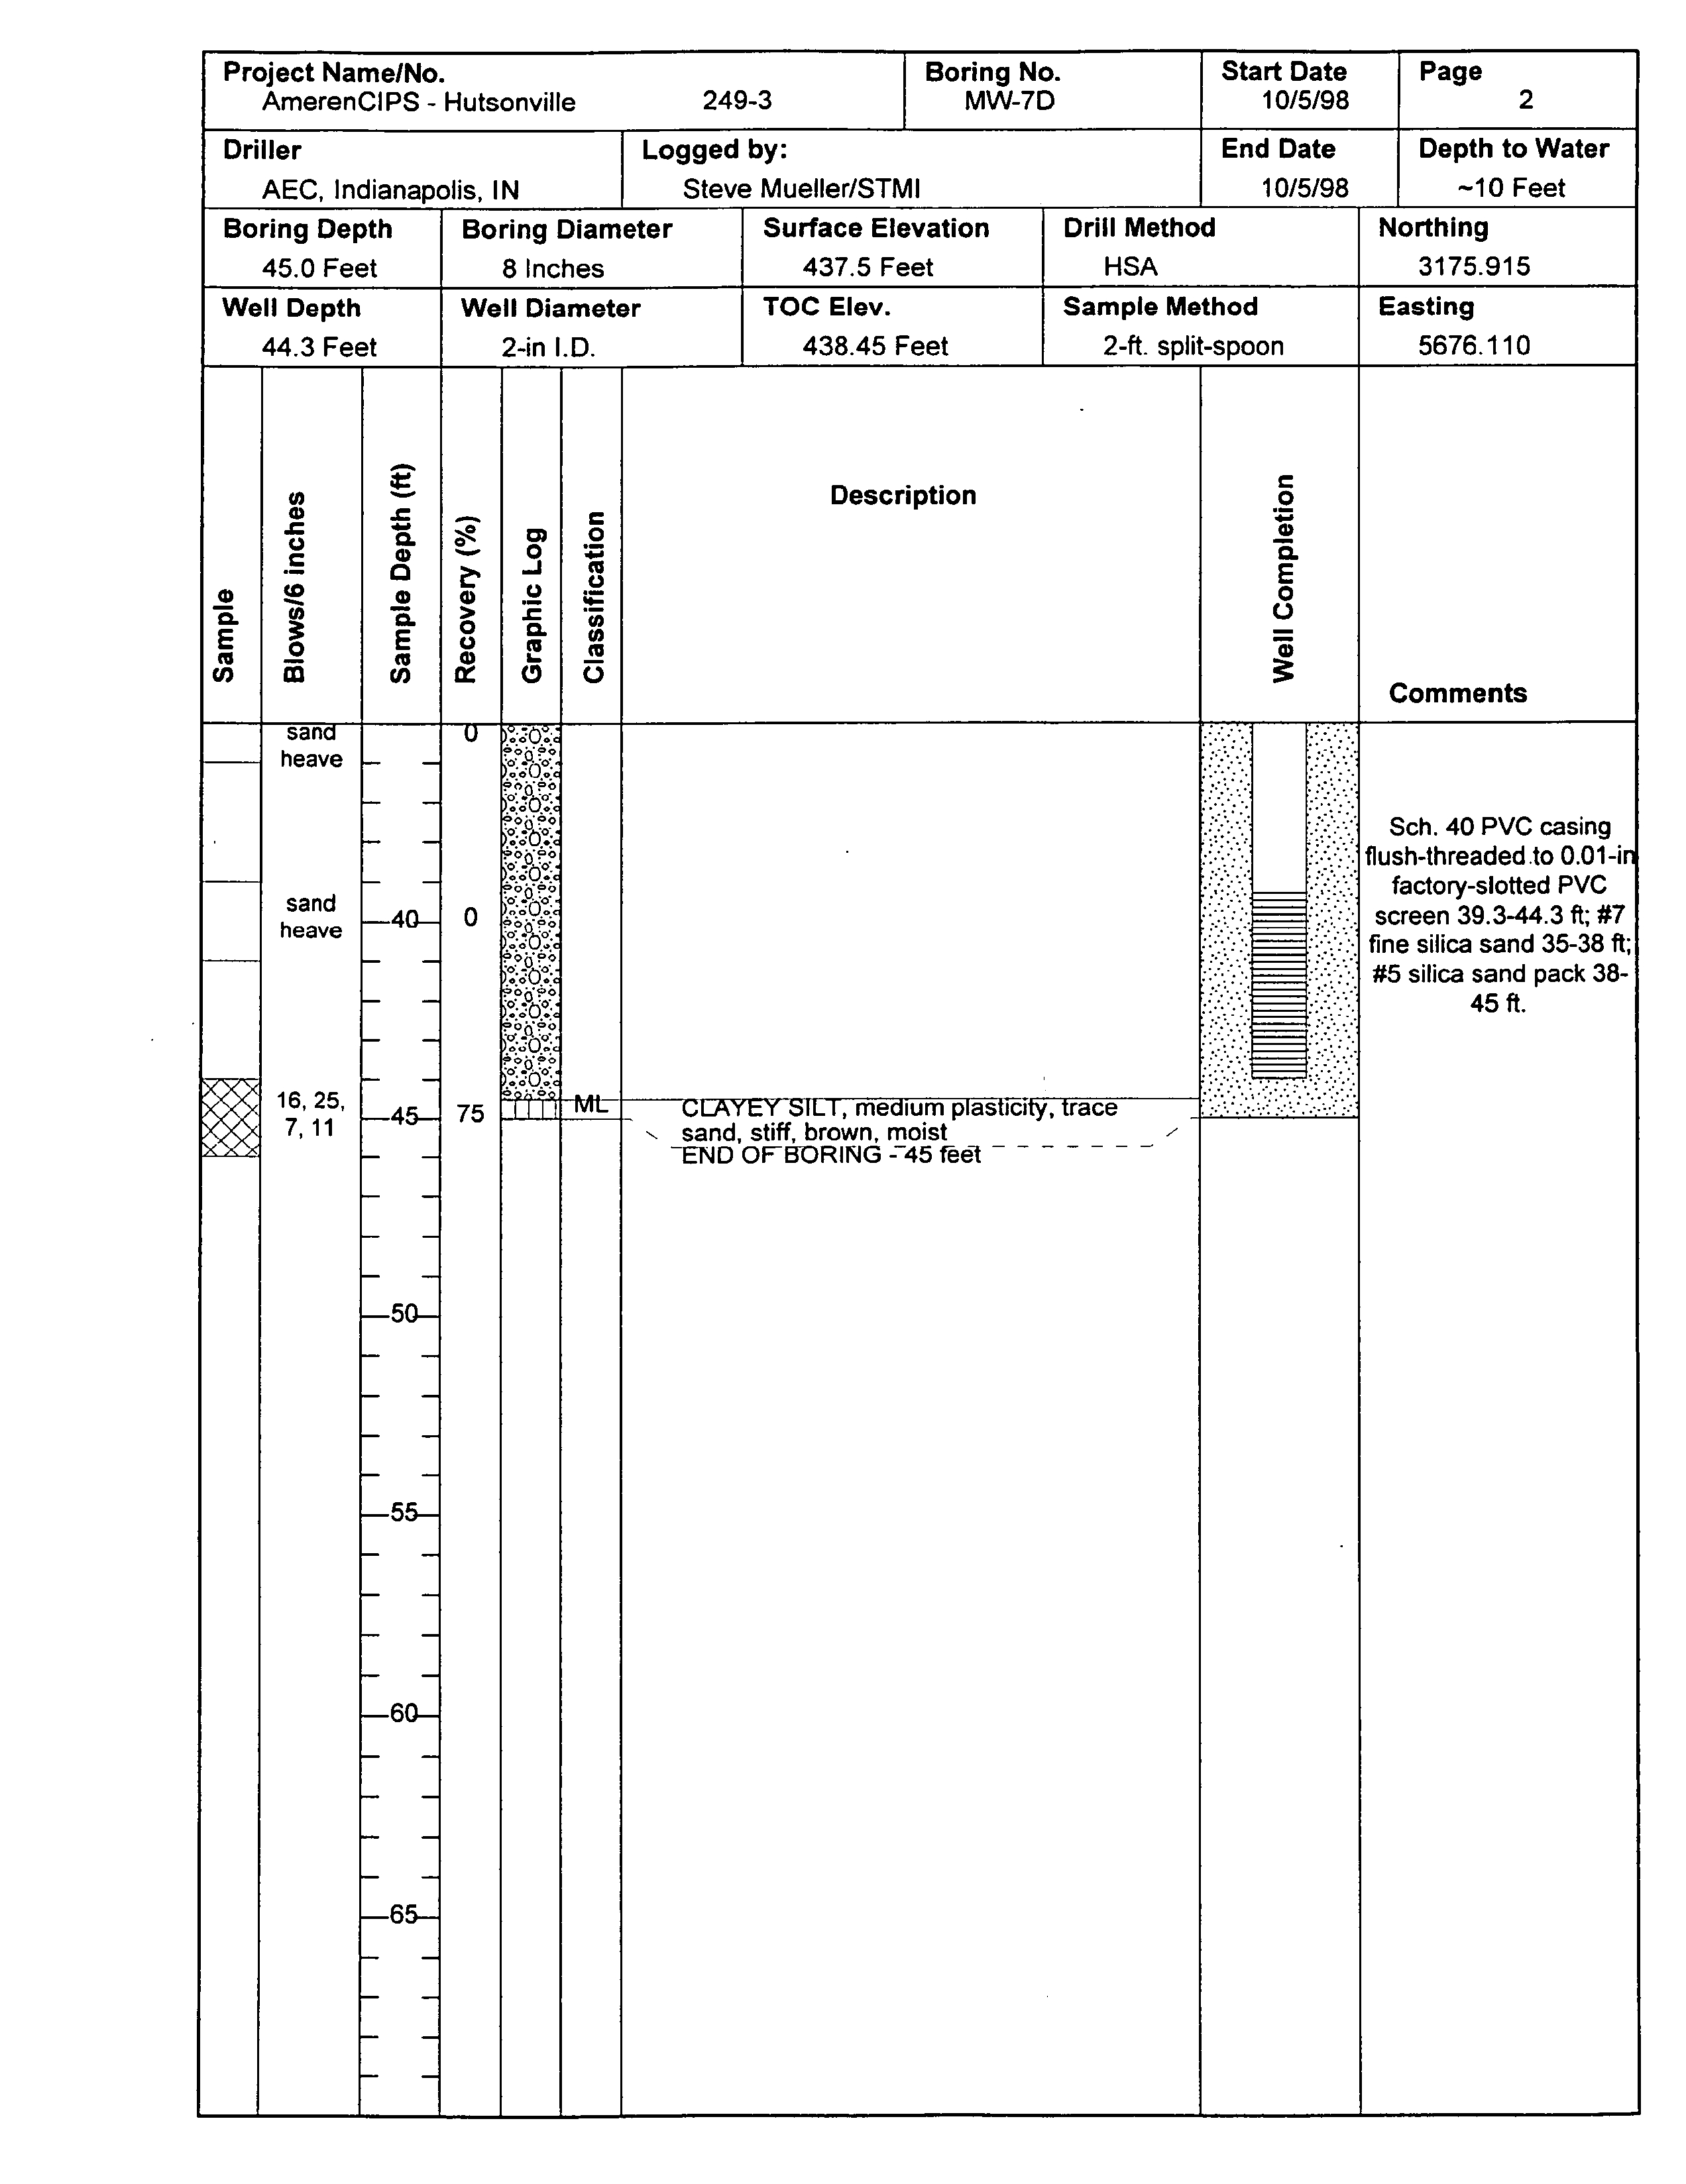
well MW-7D
was
nested with
existing
well MW-7 to
evaluate the vertical
groundwater quality
distribution
and vertical flow conditions between the
unlined
ash
impoundment
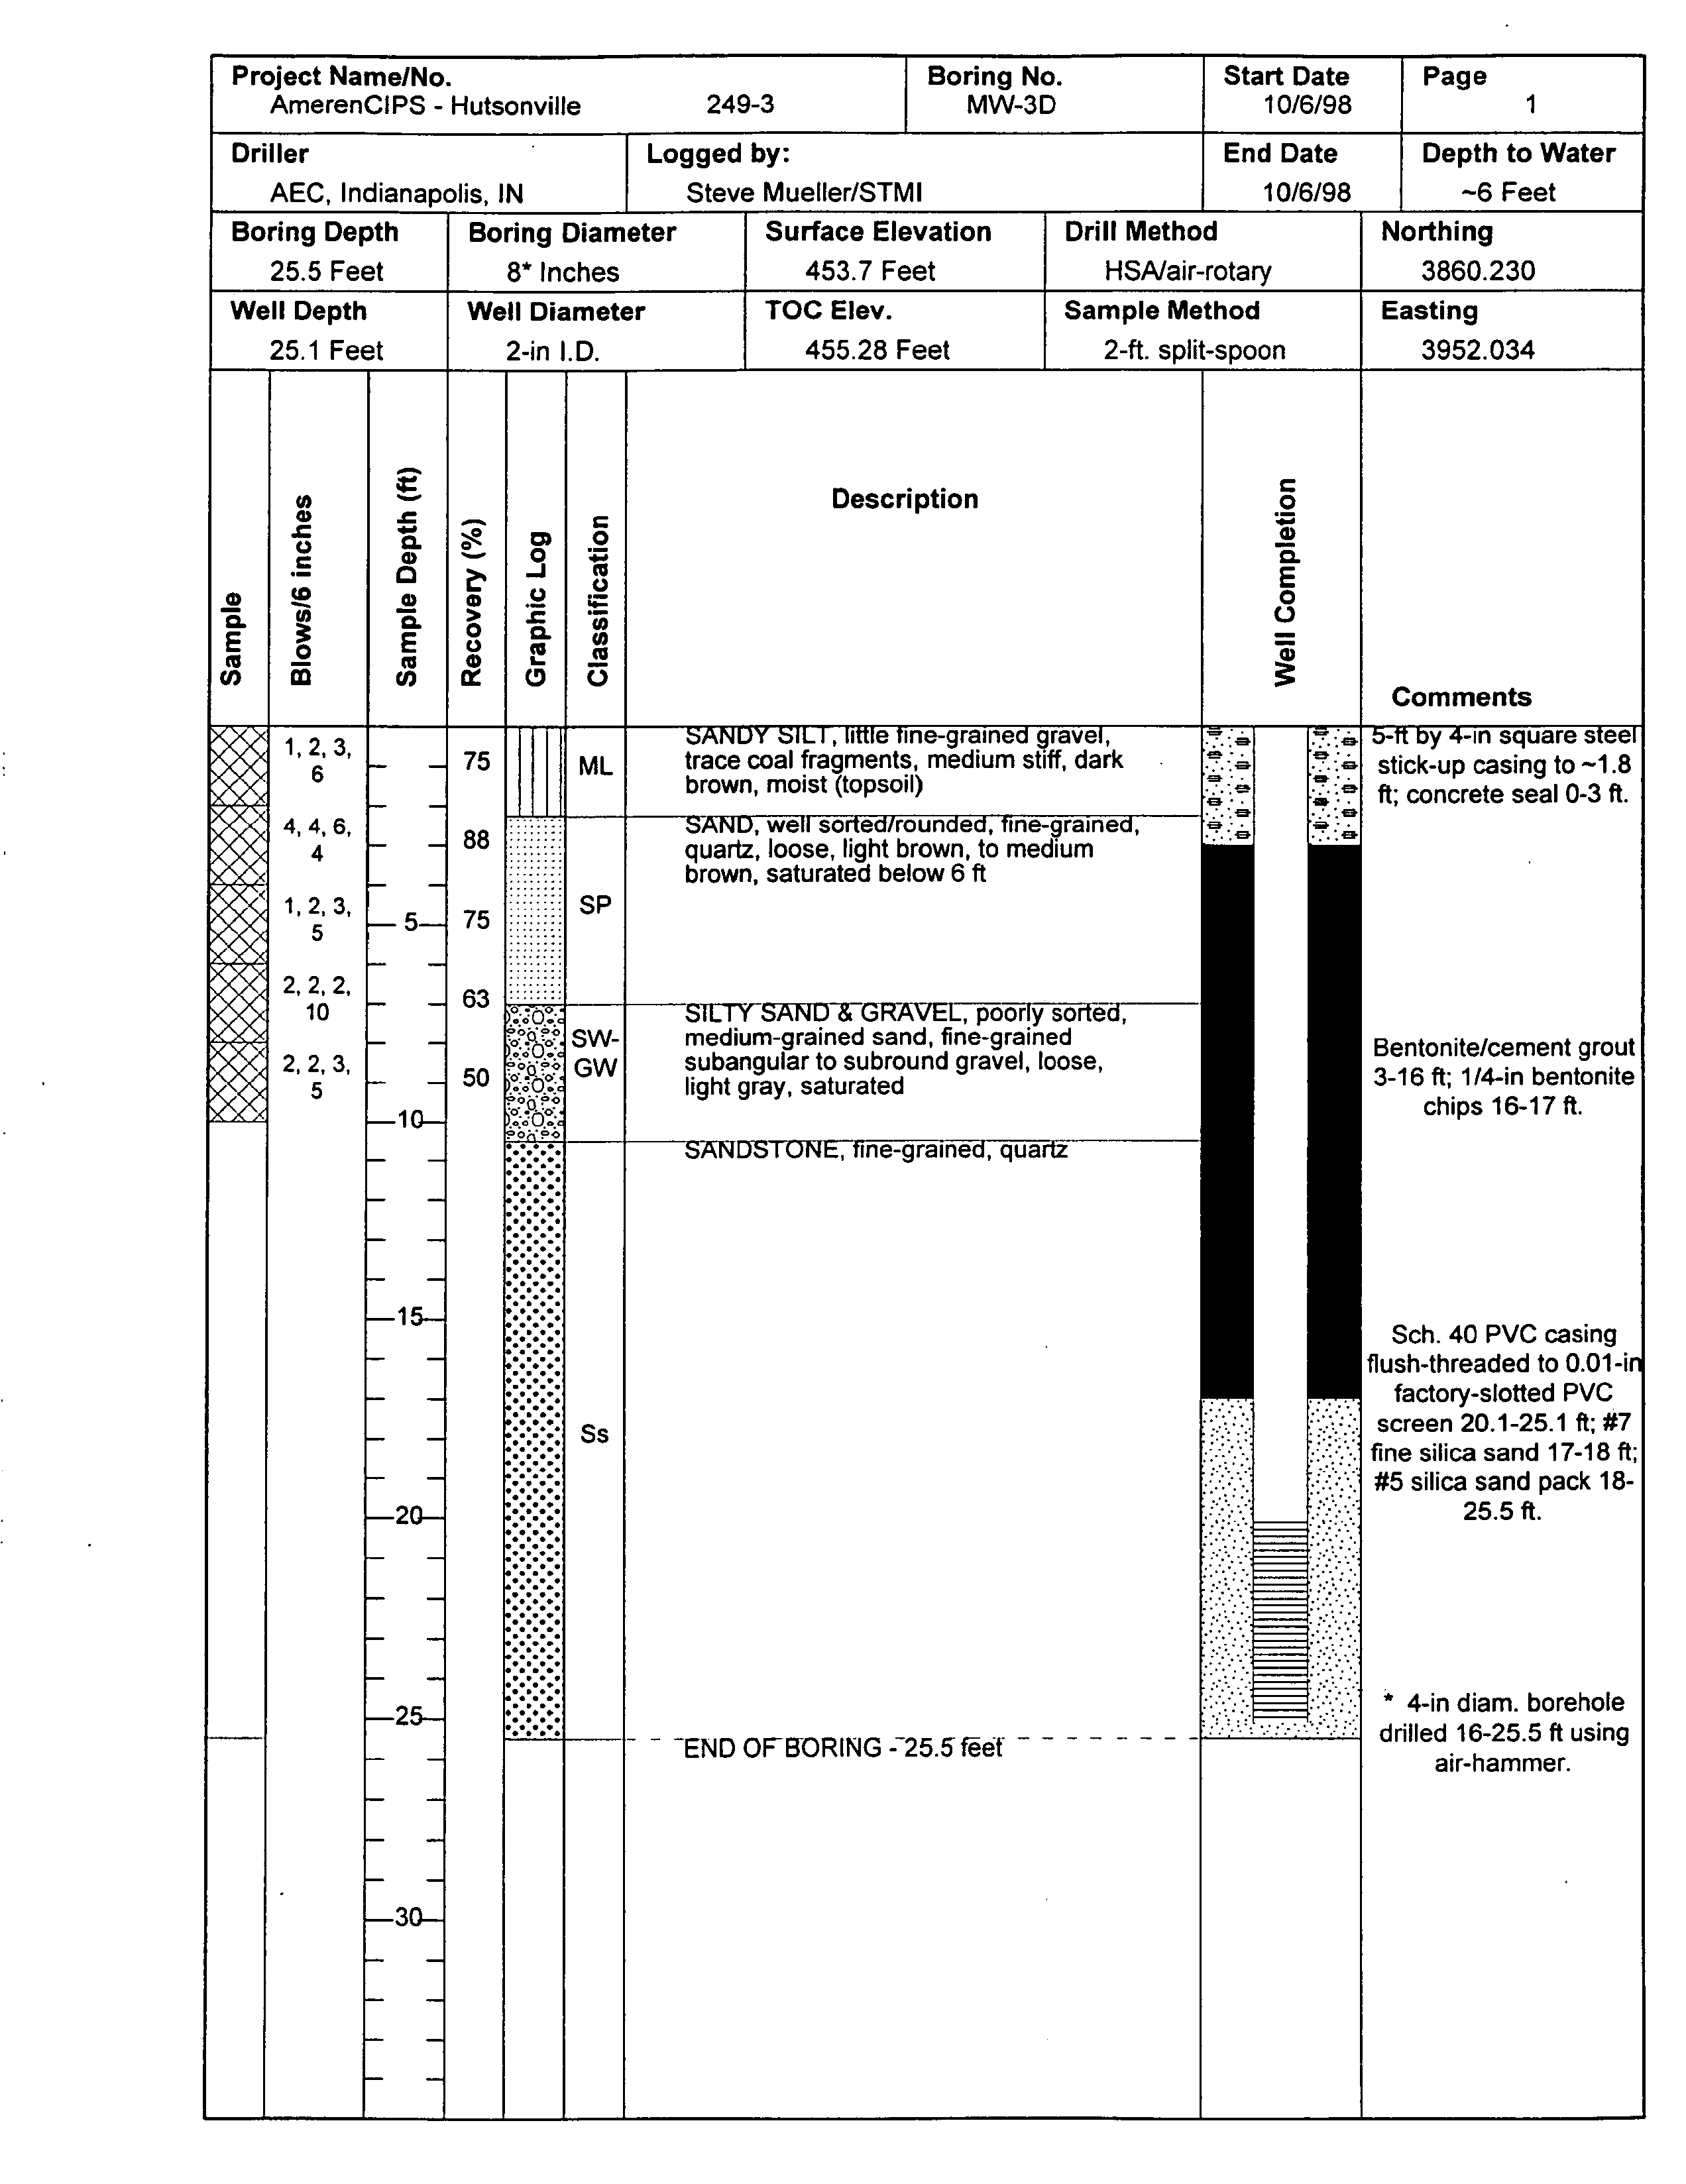
and the Wabash River Wells MW-3D and MW-1OD were installed
completely
within bedrock to
measure
hydraulic properties
and
groundwater quality
in the
sandstone The two wells
were
nested with
existing
shallow wells to determine vertical
gradient
hutsonville
hydrogeologic
assessment.doc
Natural
2-3
Resource
Technology
Electronic Filing - Received, Clerk's Office, August 11, 2008 - AS 09-1, Exhibit 4
FIELD PROCEDURES
between the sandstone
and the
overlying
unlithified
sediments
and to evaluate whether the
sandstone
is
potential pathway
for solute
transport
2.2.2
Drilling
truck-mounted drill
rig
with 41/4-inch
inside diameter
I.D
hollow-stem
augers
was used to
advance
eight-inch
diameter
borings
into the unlithified materials Hollow-stem
augers
were also
used to advance the boreholes for
MW-3D MW-10/1OD
and MW-il into bedrock At
MW-3D
the
augers
were
used
to
drill the
upper
five feet of bedrock
rotary
air-hammer
was
then used
to
extend
the
bedrock
borehole
at
four-inch
diameter
to
the
depth
of
completion
At
MW-1OD fine-grained
materials
in the bedrock caused the
rotary
air-hammer to bind
internally
therefore
the
augers
were
used
to advance the borehole until bedrock
composition
halted
further
augering
During drilling
the unlithified materials
were
sampled
with
split-spoon
and described in the
field
by
STMIs
geologist
The
split-spoon samples
were
collected
at
five-foot
intervals in
previously investigated
areas
near existing
wells or
direct-push borings
and
were
collected at
two-foot intervals in
newly
drilled areas Bedrock was characterized
by examining
drill
cuttings
2.2.3
Construction
All
new
well boreholes
were
drilled
to
their intended
screen
depths
except
MW-7D
which
was
drilled five feet
deeper
than
originally proposed
to
provide
15 feet of vertical offset from nested
well MW-7 The
new
monitoring
wells were constructed with two-inch
I.D
schedule 40 Pvc
pipe
flush-threaded to
section of
0.01-inch
factory-slotted
PVC screen
The four shallow
wells
which were screened across the water
table
were constructed with either five-foot or ten-
foot
screens depending
on water
table and bedrock
depths
The
deep monitoring
wells
were
constructed with five-foot
screens
From bottom to
top
the annulus for wells
MW-3D MW-1OD MW-12
and MW-13
was
filled
with
filter
pack
consisting
of
uniform silica
sand to at least one-half foot above the
hutsonville
hydrogeologic
assessment.doc
Natural
2-4
Resource
Technotogy
Electronic Filing - Received, Clerk's Office, August 11, 2008 - AS 09-1, Exhibit 4
FIELD PROCEDURES
screen
about
one to
three feet of fine
sand
about
one
foot of bentonite
chips
and
Portland cement-bentonite
51 weight ratio
grout
mixture
to near
ground
surface
Wells
MW-lO and
MW-il
were
completed
in
similar
manner except
that fine sand
was not
used in
order to maximize the annular
bentonite
seal thickness
Conversely
because of the
depth
of
water in the MW-7D
borehole
three feet of fine sand
was
installed
in
lieu of bentonite
chips
to
separate
the filter
pack
and
grout
seal
The bentonite
chips
had
tendency
to swell and
bridge
inside
the
auger
instead of
settling
to the
top
of
the
filter
pack
The
grout
was
pumped
into the
boreholes
using
tremie hose inserted to the base of the hollow-
stem
augers
The tremie hose
was
then removed from the
augers
and the
augers
were
gradually
withdrawn from the
borehole
allowing
the
grout
to settle
The
grout
was
brought up
to
depth
of three feet to allow for construction
of
concrete
well
pads
or
up
to the
ground
surface at
shallow
well
locations
to maximize the annular seal
After
grouting
all of the
new
monitoring
wells
were
finished with
stick-up
style
locking
steel
well
protector
surrounded
by
set of two to three steel
bumper posts
for additional
protection
The steel
protectors
for
MW-3D MW-7D
and MW-13
were
set in three feet of
concrete
and the
protectors
for the other four wells were set into the bentonite-cement
grout
that was
brought up
to
the
ground
surface and
topped
with native soil
2.2.4
Development
New wells were
developed
to
remove
sediment from within the wells and to restore
the natural
flow of
groundwater
around
the wells
Except
for
MW-il
development
was
accomplished
using
surge
and
pump technique using
GeosquirtTM
pump
until extracted water achieved
visual
clarity
and at least 1.5 borehole volumes
defined
as
the volume of
water
in the well and
filter
pack
were removed
Table
Monitoring
well MW-li
readily
bailed
dry
and continued
to
produce
turbid
silty
water after removal of 22
gallons
of
water
2.7
borehole
volumes
over
two-day period
The well borehole
was
augered
into sandstone
bedrock that has
high
silt/fine
hutsonville
hydrogeologic
assessment.doc
Natural
2-5
Resource
Technology
Electronic Filing - Received, Clerk's Office, August 11, 2008 - AS 09-1, Exhibit 4
FIELD PROCEDURES
sand
content
and substantial
amounts of these materials
may
continue
to
pass
through
the
filter
pack
2.2.5
Hydraulic Testing
Single
well
recovery
tests
were
performed
per
STMI standard
operating
procedure
see
Hutsonville Work
Plan STM11249198-01
using
five-foot
long by
one-inch diameter solid PVC
slug
which has
displacement
volume of 0.027 ft3
0.20 gallons
An In-Situ Troll1M SP4000
pressure
transducer
with on-board
datalogger
was used to monitor
groundwater
levels
during
the
testing
The tests were
programmed
utilizing
portable
PC loaded with software
designed
for
the Troll1M unit
After
measuring
static water
level
the TrollTM
was
inserted into the well to
approximately
one foot above the
bottom
and the water level
was
allowed to return to static
level
For wells with screen and filter
pack
completely
below the water
table
the TrollTM
was
activated
from
portable
PC and the PVC
slug
was
quickly
lowered below the water level in the well For
wells screened
across
the
water table
the
slug
was
lowered below the
water
level
at
the
same
time the TrollTM was
positioned
After
the water level
stabilized
the test
was
initiated and the
slug
was
quickly
removed from the water
The tests
were
manually
terminated
when
check of
water
levels
via
the Tr011TM
software
indicated that
recovery
was at
least 90
percent
complete
Data
were
then downloaded
to
the
portable
PC for
analysis using
commercial
aquifer
test
analysis
software
2.3 Decontamination
The GeoProbeTM truck and the drill
rig
arrived at the site in
visibly
clean condition
The
drilling
tools rods
augers
and
sampling equipment were
steam-cleaned
before
use
at the
site
between
drilling/sampling
locations
and before
leaving
the
site The Screen Point 15
groundwater
hutsonvil le
hydrogeologic
assessment.doc
Natural
2-6
Resource
Technology
Electronic Filing - Received, Clerk's Office, August 11, 2008 - AS 09-1, Exhibit 4
FIELD PROCEDURES
sampler
and the Macro-Core
and
split-spoon
soil
samplers
were
cleaned between individual
samples
The
groundwater sampler
was
decontaminated
by
spraying
with
solution of nitric acid and
deionized water
Approximately
one-half
liter
of solution was used after each
sample collection
followed
by
spray
rinse
using approximately
one
liter
of deionized water
The
nitric acid
solution and deionized water
were
provided by
the
plants
on-site
laboratory
Soil
samplers
were
decontaminated
by washing
with
an
AlconoxTM-water solution and then
rinsing
with clean water Water used
during
both the
direct-push sampling
and
monitoring
well
installation
activities
was
collected from
potable
water faucet
east of the coal crusher house
2.4 Waste
Handling
Auger cuttings
from on-site boreholes
were
spread
on
the
ground surface including
ash
cuttings
brought
up
in ash
disposal
areas
Auger-cuttings
from the
two
upgradient
off-site
boreholes
which
did
not
contain
ash were
spread
on
the
ground
surface in
way
that minimized visual
impact
and would allow reestablishment
of native
vegetation
Disposable
soil and
groundwater
sampling
materials
e.g
water
sample tubing
soil
core
liners
were discarded
in the
plants
waste
dumpsters
hutsonville
hydrogeologic
assessment.doc
Natural
2-7
Resource
Technology
Electronic Filing - Received, Clerk's Office, August 11, 2008 - AS 09-1, Exhibit 4
RESULTS OF FIELD INVESTIGATION
3.1 Site
Geology
In order
to
illustrate the
spatial variability
of the unlithified
deposits
and
bedrock
three
geologic
cross-sections
were
constructed
Figure
Section A-A and the northern
one-half of
Section B-B are oriented
roughly parallel
to
groundwater flow
while the southern
off-site
section of Section B-B is oriented
perpendicular
to flow to the south of the
plant
site Section
C-C is oriented
along
the
river and
perpendicular
to
groundwater
flow
3.1.1
Stratigraphic
Units
The
stratigraphy
of natural materials
encountered
at the Hutsonville Power Plant consists of
relatively
thin veneer
of unlithified
deposits overlying
bedrock
Three textural
units were
identified within the unlithified
deposits
river-laid
silt
clay
and
fine-grained
sand
classified
as
Cahokia
Alluvium
poorly
sorted sand and
gravel
deposited by glacial
meitwaters
and
classified
as
Henry
Formation
and
stiff to hard silt and
clay
diamicton unit Across most of
the
plant site
the unlithified units
are
less than 20 feet
thick however they abruptly
increase
to
at least 90 feet thick
near
the
Wabash
River
where there is
bedrock
valley Sections
A-A and
C-C
Figure
The location of this bedrock
valley
was
defined
by monitoring
well and direct-
push
boreholes in the southern
portion
of
the
site however
it
was
not defined in the northern
portion
of
the site where it
probably
occurs
beneath the
river
east
of the
plant buildings
The
underlying
bedrock is
comprised mainly
of
Pennsylvanian-age
sandstone and shale
The Cahokia Alluvium
is derived from eroded bess
and
till
and
occurs
in the
flood
plains
and
channels
of modern rivers and streams
Berg
and
Kempton 1987
Locally
the alluvium is
found in the Wabash River bedrock
valley
and is
composed
of
silt clay
and
clayey sand
with
wood and shell
fragments
Lenses of
poorly
sorted
silty
sand and
gravel
occur
locally
within the
hutsonvi lie
hydrogeologic
assessment.doc
Natural
3-1
Resource
Technology
Electronic Filing - Received, Clerk's Office, August 11, 2008 - AS 09-1, Exhibit 4
RESULTS
OF
FIELD
INVESTIGATION
alluvium
In the
study
area
the unit is
to 15 feet thick beneath
portions
of
the
plant
site and
abruptly
thickens to at least 25 feet
near
the Wabash River
The
Henry
Formation
is
composed
of
glacial
outwash sand and
gravel
and is
locally
the
predominant
unit in the
upland
areas
upon
which the
plant
and
impoundments
were
constructed
Berg
and
Kempton
1987
The
Henry
Formation
sands
are
also found in the Wabash River
bedrock
valley
where thickness
ranges
to at least 65 feet
The diamicton
was
encountered
in several isolated
areas
MW-2 GP-13
and
GP-20/21
in the
southern
portion
of
the
study
area
Sections
A-A and
B-B Figure
The unit is stiff to
hard
nonplastic
to
moderately plastic
and is at least
five feet
thick beneath
the
southern
portion
of
the
unlined ash
impoundment
The unit
was not
encountered
beneath
the northern
portion
of
the
impoundment
where ash fill is underlain
by
bedrock
or alluvial sands
Section c-c Figure
Bedrock
was
drilled at three locations
MW-3D
MW-1OD
and MW-i
Shallow bedrock at
these locations is
composed
of siltstone and
fine-grained
sandstone The boreholes
were
augered
between
feet and 13.5 feet into
bedrock
with
generally
little
difficulty indicating
that the
bedrock is weathered
and/or
moderately
friable At
MW-1OD
the borehole
was
advanced
13.5 feet into bedrock before bedrock
composition
prevented
further
auger
drilling
sample
of
bedrock retrieved in the
tip
of
split-spoon
was
composed
of well
cemented
fine-
to
medium
grained
quartz
sandstone
with
occasional coarse sand to fine
gravel
sized shale clasts
3.1.2 Subsurface
Ash/Coal
Distribution
Fill is
present
across
much of
the
site
based on
the
boring
log
data for the
direct-push borings
and all
monitoring
well
boreholes
In
general
the fill
consists of
sandy
silt and
silty
sand that
was
likely generated
from on-site excavations and site
grading
The fill is underlain
by
native
materials that often contain evidence
of the former
ground
surface
e.g
root
fibers
topsoil
and
in
some
areas
such
as
near the coal
storage
area
and
along
the former railroad
spur
contains
hutsonville
hydrogeologic
assessment.doc
Natural
3-2
Resource
Technology
Electronic Filing - Received, Clerk's Office, August 11, 2008 - AS 09-1, Exhibit 4
RESULTS
OF FIELD INVESTIGATION
trace amounts
to thin
layers
of
coal Where
encountered
the fill
ranges
from about two feet to
eight
feet thick
Coal ash is found
predominantly
in three
areas
of the
plant
site Most of the ash that has been
generated by
the Hutsonville Plant is located in the
two
ashimpoundments
In
addition
ash
was
placed
in the
area
between the southern
portions
of
the
impoundments
in what
was one
of two
cells that
originally
made
up
the unlined ash
impoundment
Some ash from this
area
called the
former ash
laydown
area
was
reportedly
used
in
the construction
of
the berm for the lined ash
impoundment
The former ash
laydown
area
is
roughly triangular
in
shape
and
covers
an area of
about six
acres
Figure
Ash in this
area was
encountered
to
depth
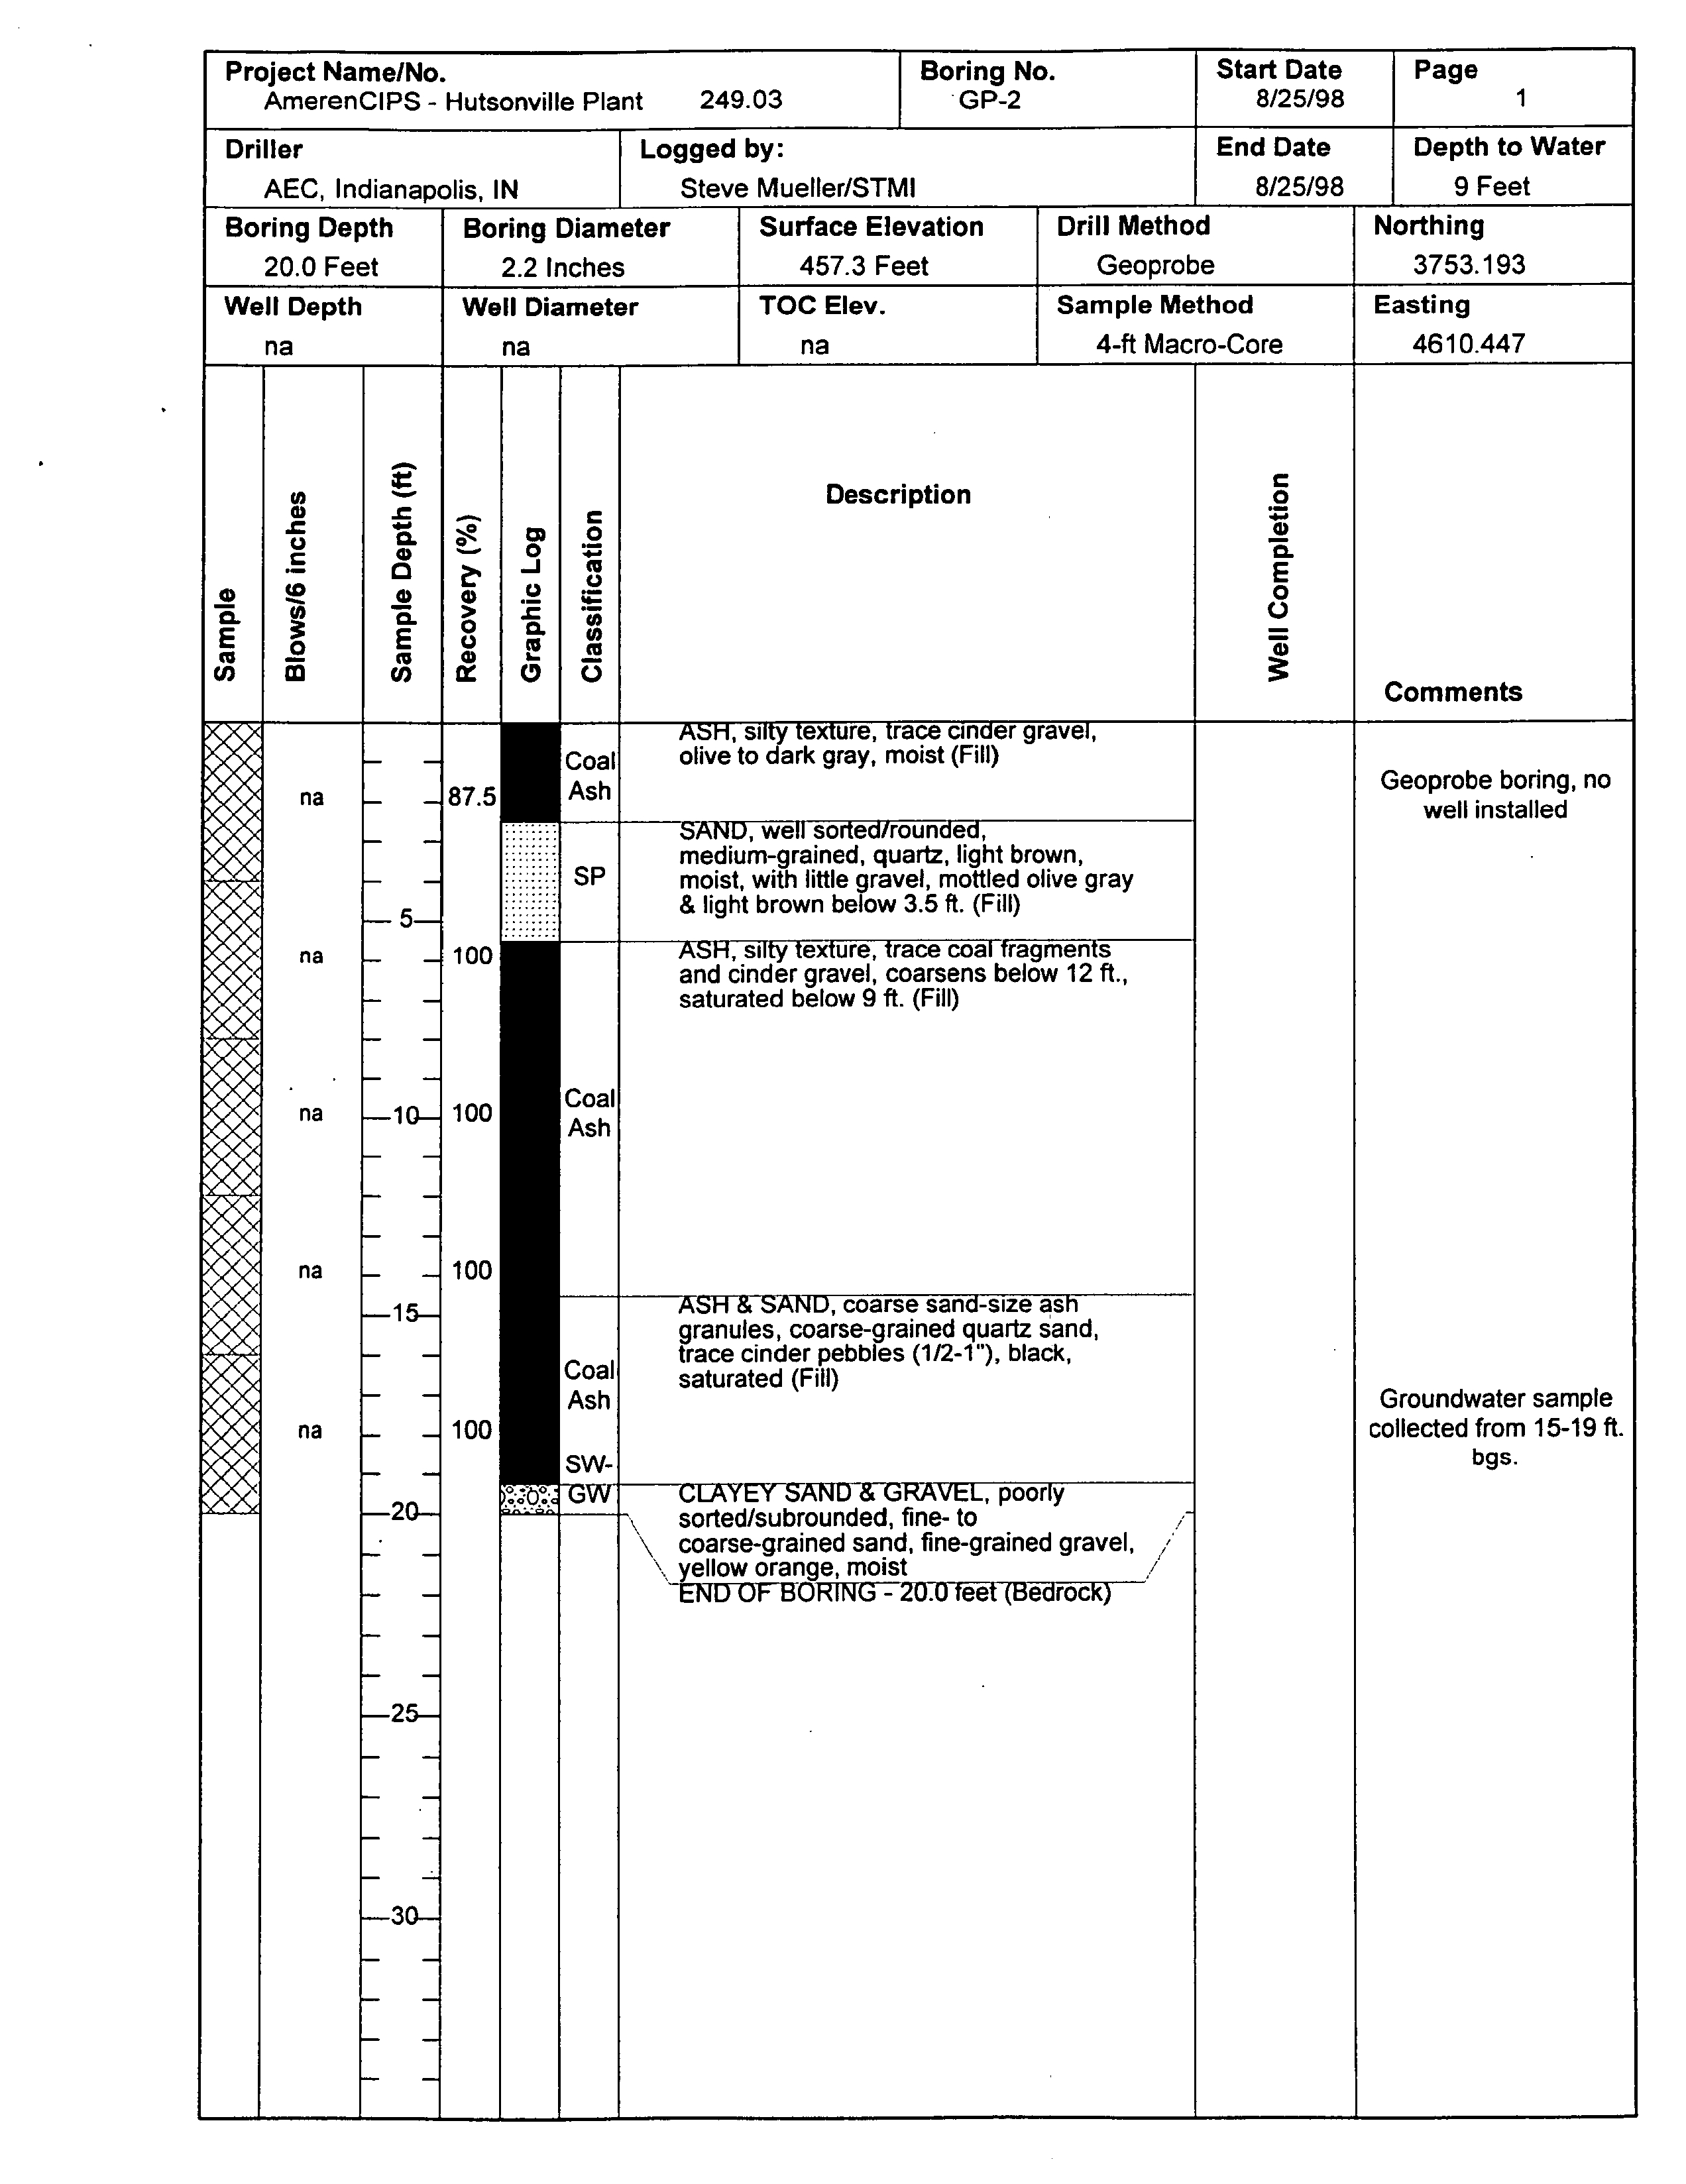
of 19 feet
GP-2 location
near the southwest corner of the unlined ash
impoundment however
this
probe
location
was
subsequently
identified
as
being
in an
area
where the ash and
underlying
soil had been excavated
for
pipeline
repair
The excavation
was
back-filled with
soil-ash
mixture
as identified on the
GP-2
boring log Appendix
Plant
personnel
report
that maximum ash thickness in the
laydown
area
is about 12 feet
Section
A-A
Figure
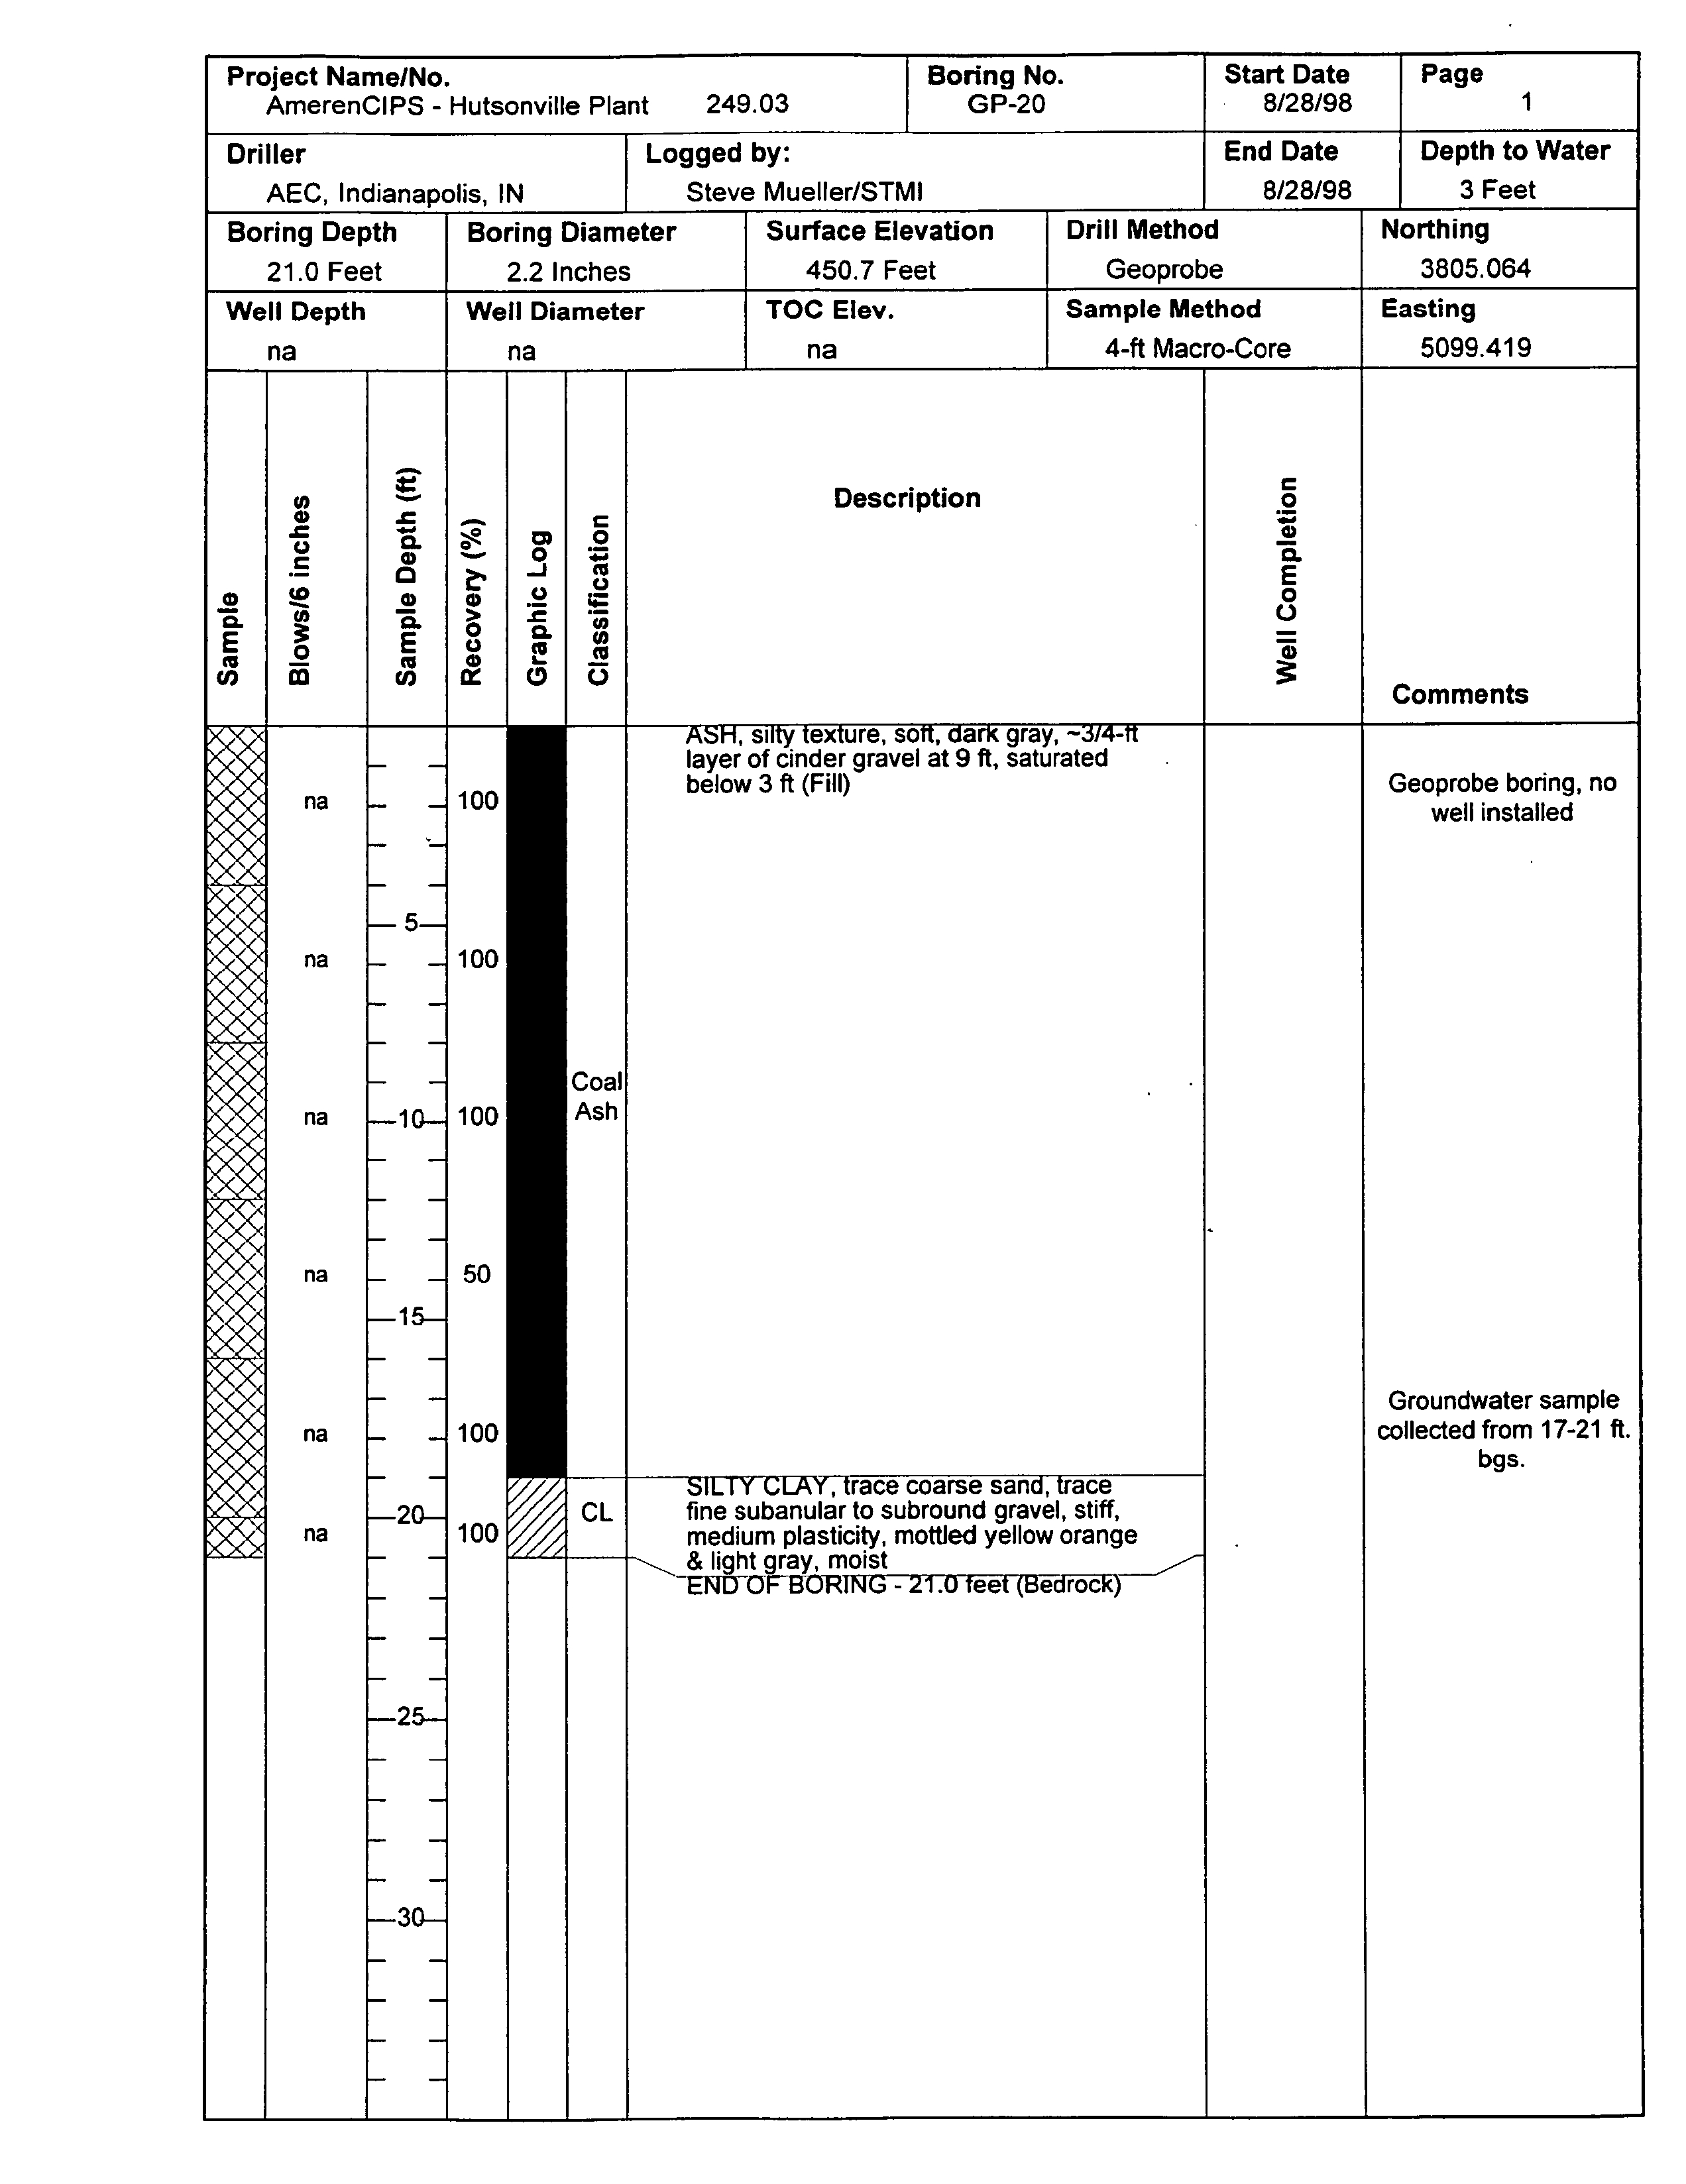
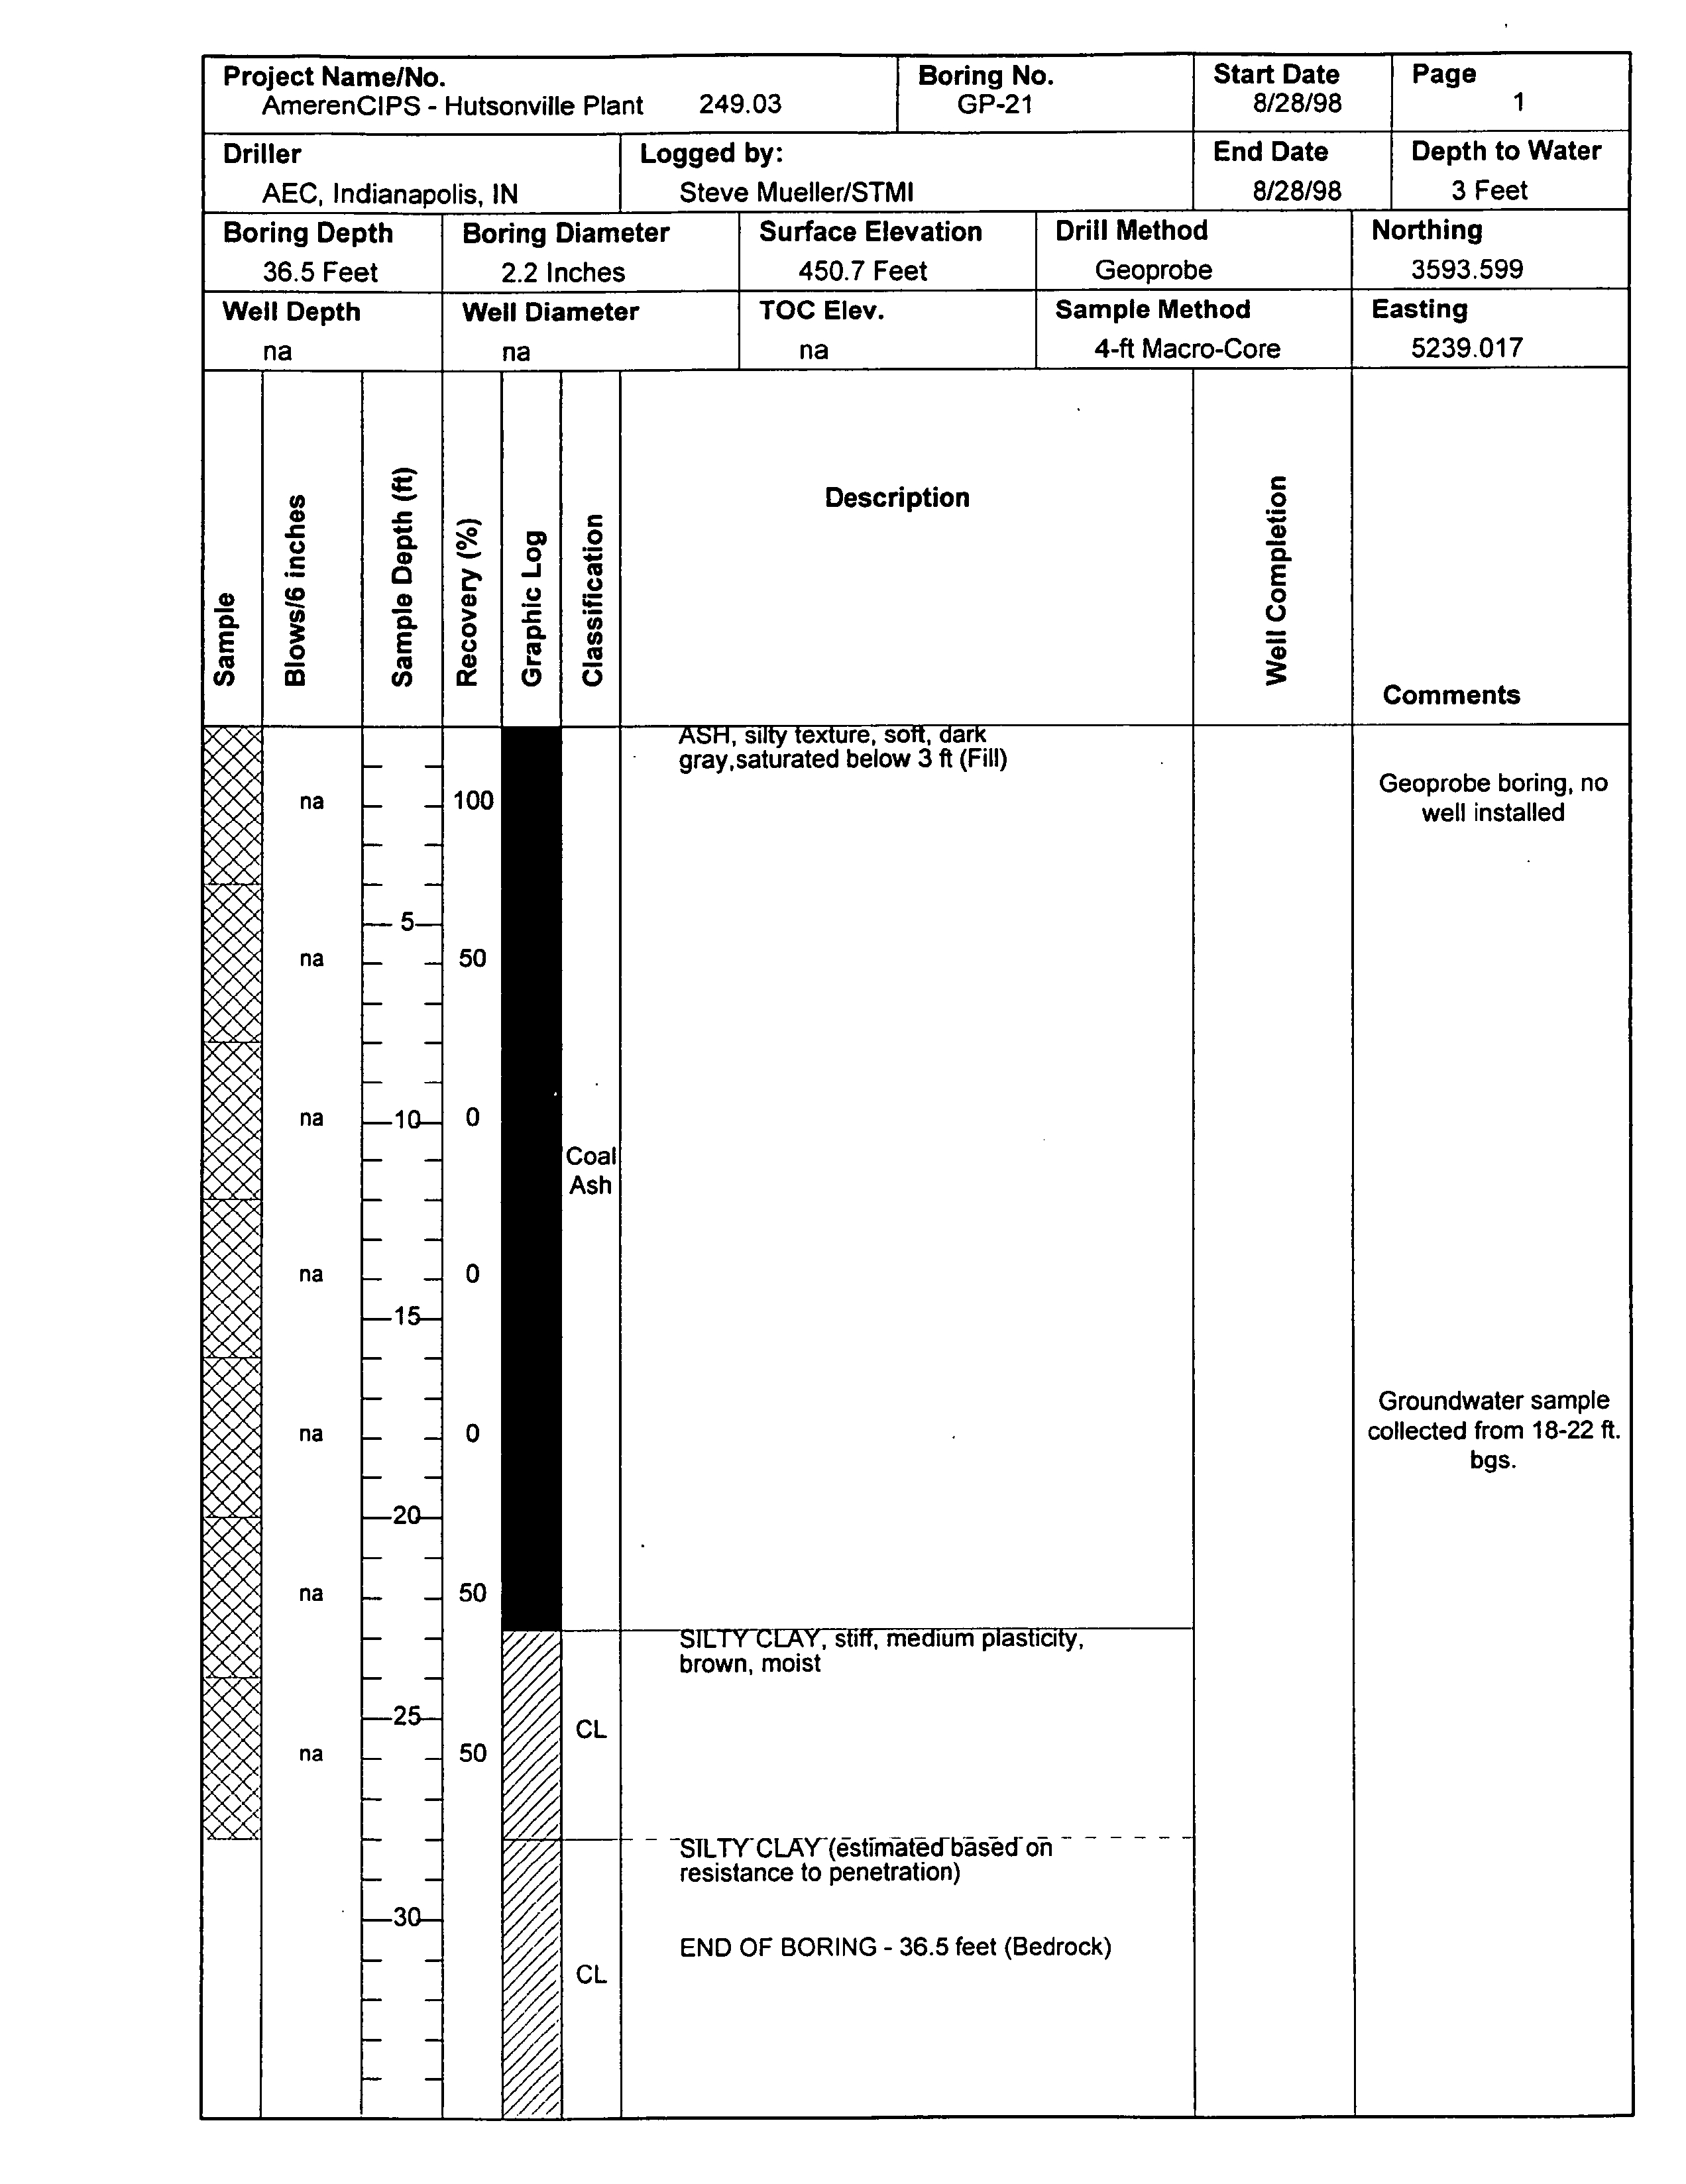
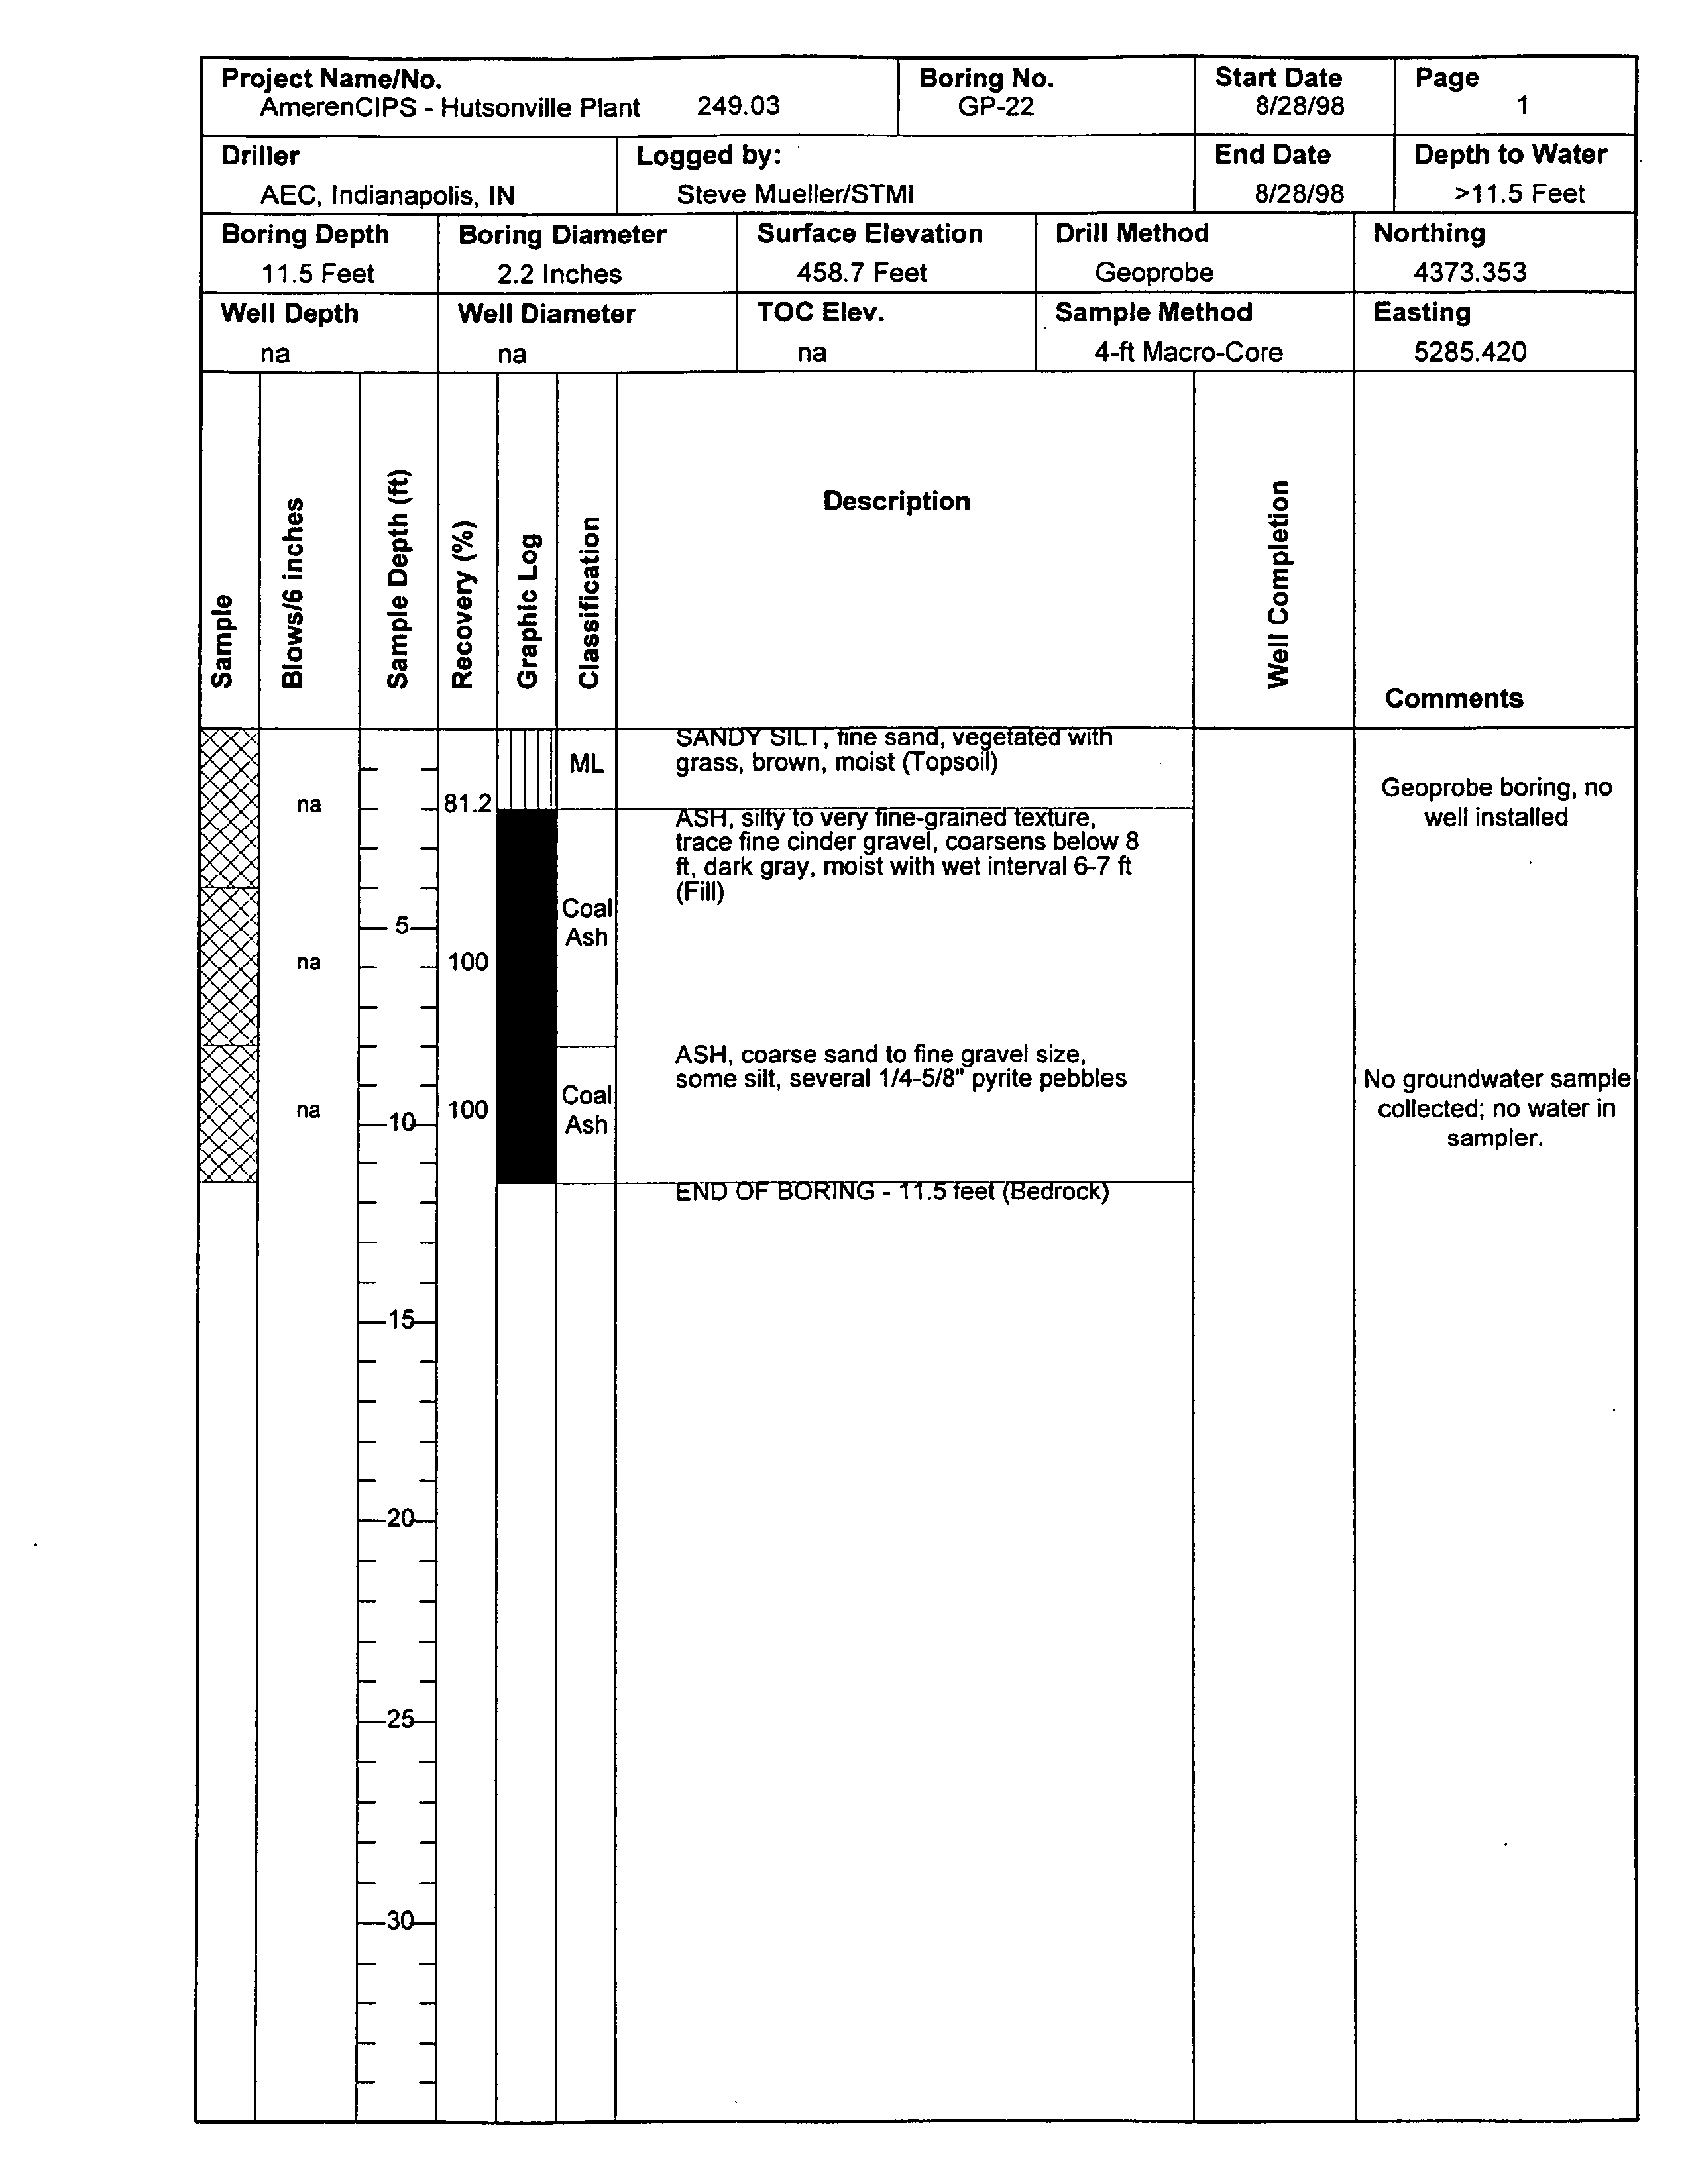
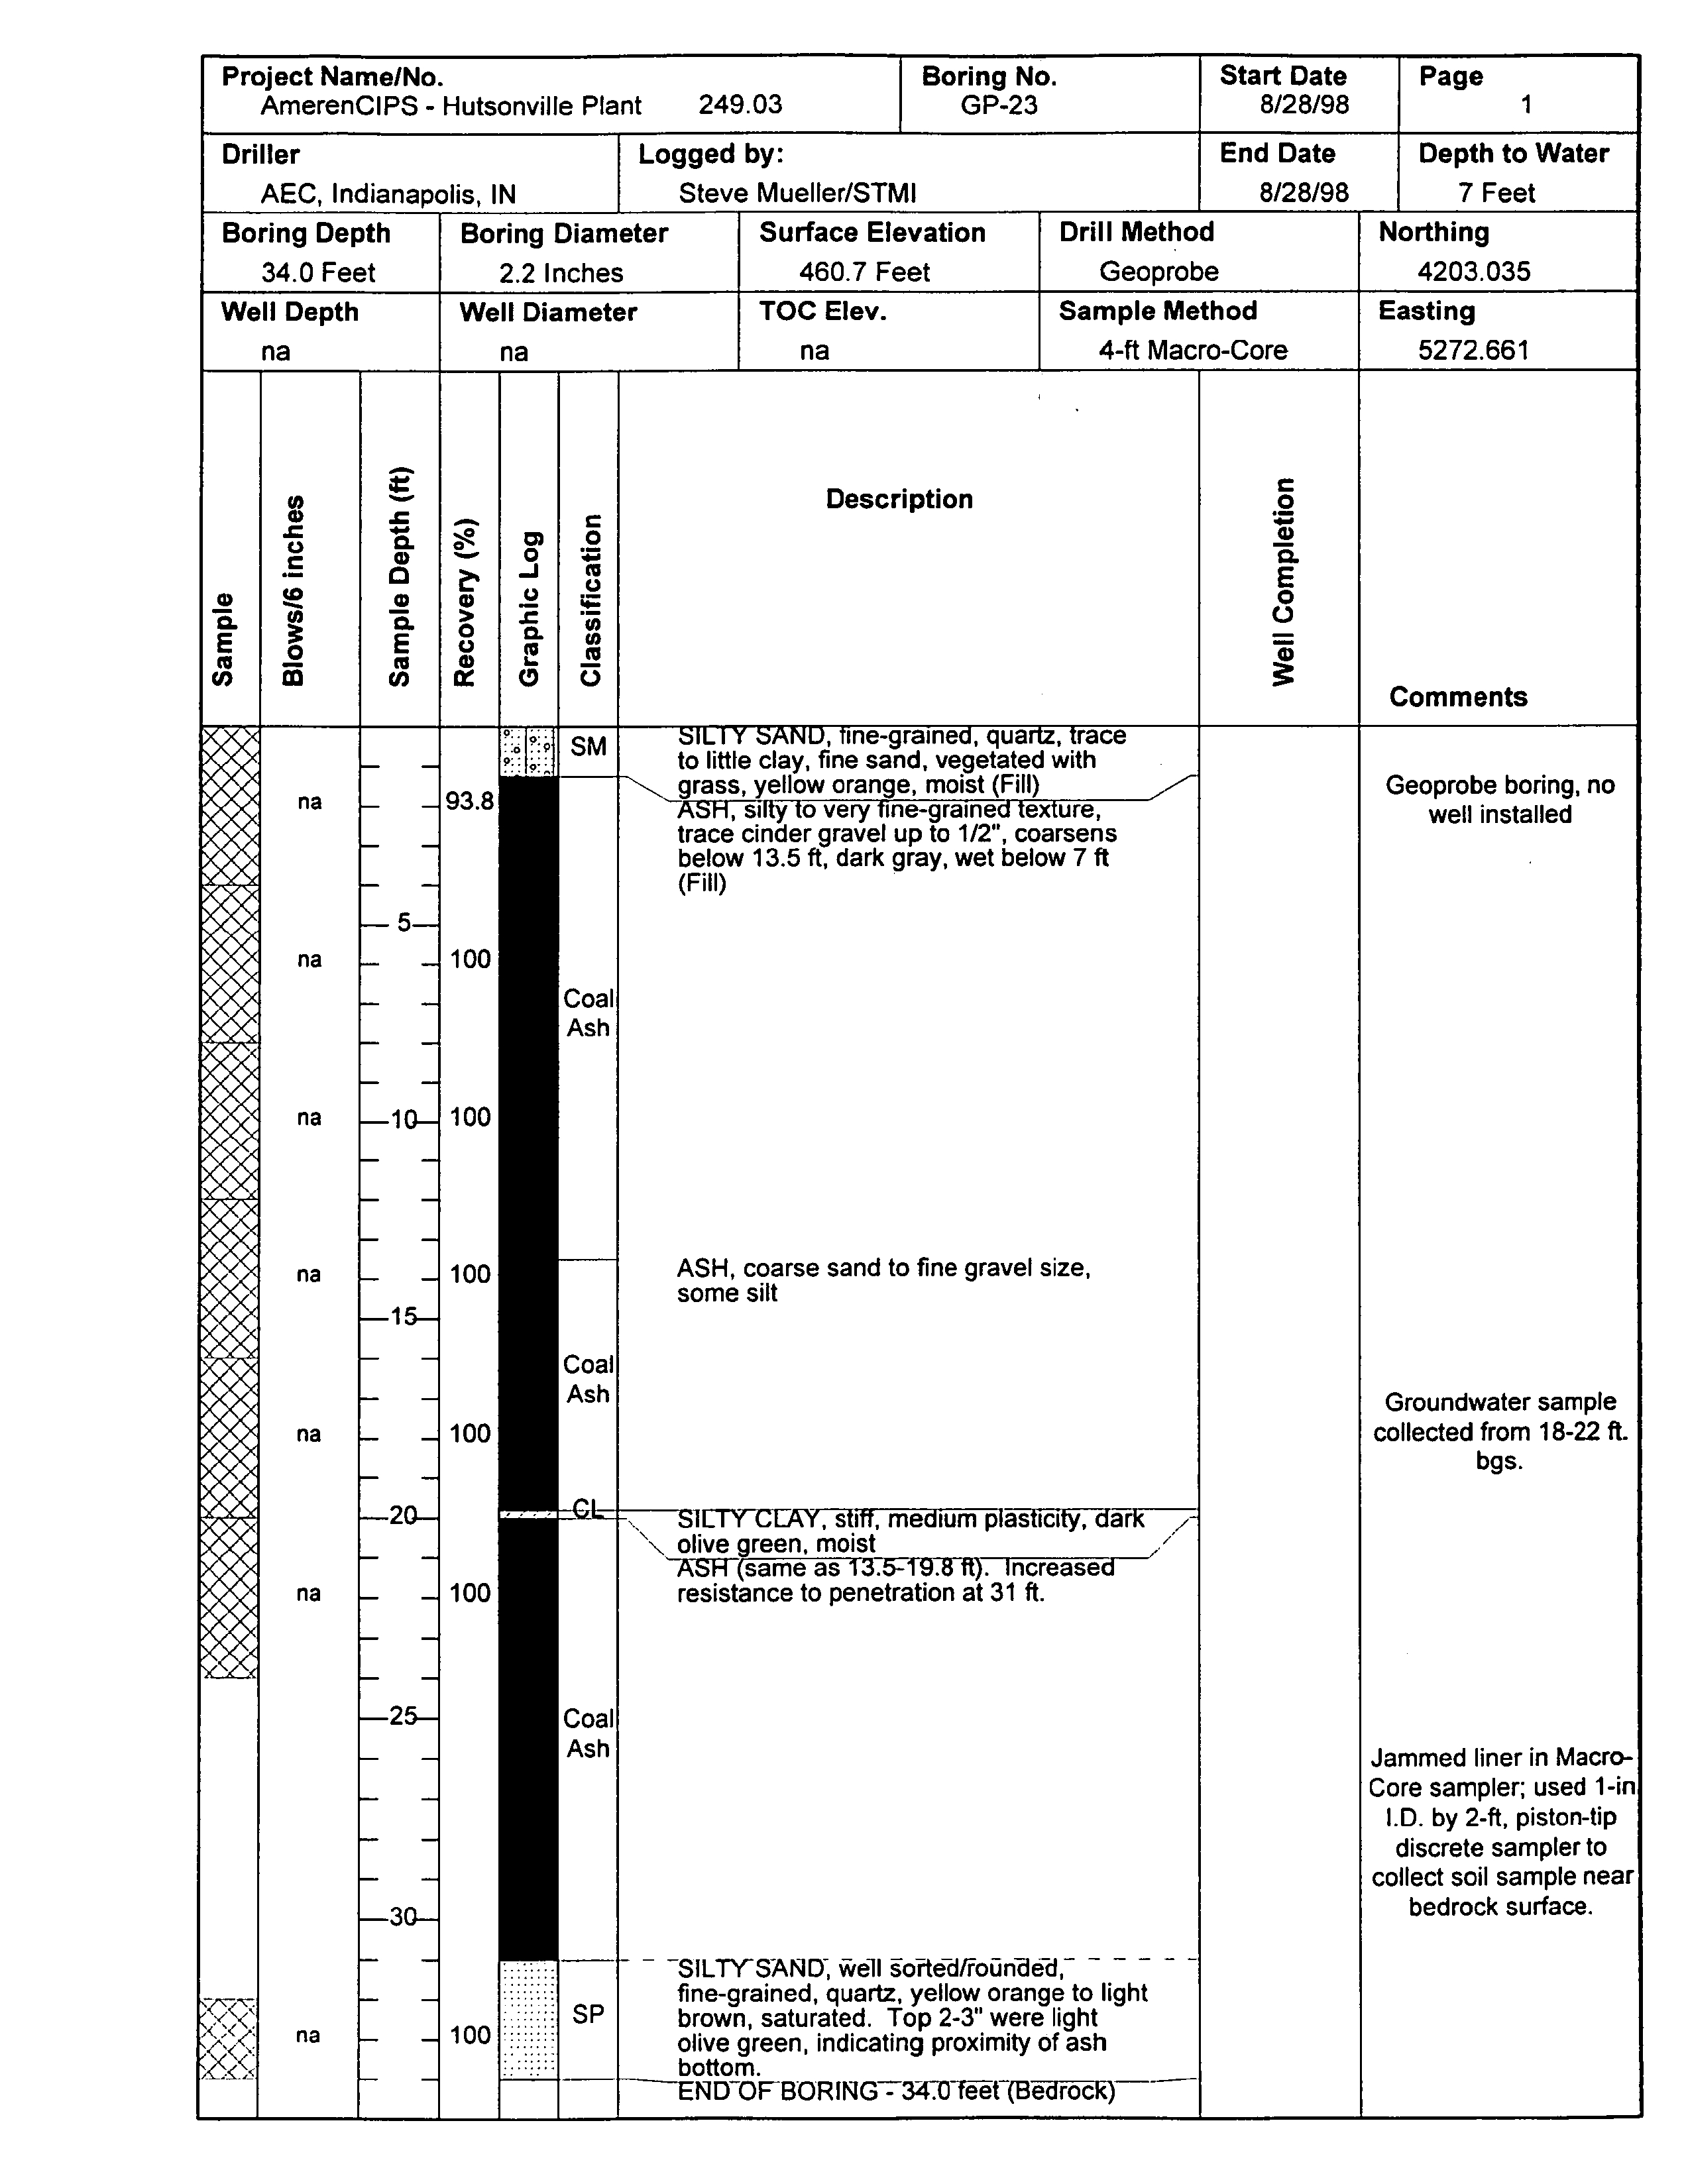
Four
direct-push probe
holes
GP-20
GP-23
were advanced
through
the
ash in the unlined
impoundment
Ash thickness
ranged
from about
12
feet at the north
end
of
the
impoundment
GP-22 location
to 31 feet in the central
portion
of
the
impoundment
GP-23
location
Section
C-C
Figure
Prior
to
the
1980s
coal
was
shipped
to
the
plant by
railroad
following
spur
that
ran
south
of the
lined ash
impoundment
and
then between the
impoundments
to the coal
unloading
area
The
spur
was
removed in the 1980s
Currently
coal is delivered to the
plant by
trucks
Most of the
coal is stored in the coal
storage
area
north of the
aboveground
fuel oil
storage
tank At
one
time
there was
reportedly
small
coal
pile
approximately
150
yd2
located south of the lined ash
impoundment
area
This
pile
was
moved to the current coal
pile
in December 1952 In
addition
coal
spillage occasionally
occurred
along
the
railroad
spur
when the bottom
discharge
doors
on
coal train car
accidentally opened
The
spilled
coal
was
reportedly
cleaned
up periodically
with
shovel and wheelbarrow and added to
reclamation
pit
hutsonville
hydrogeologic
assessmenLdoc
Natural
33
Resource
Technology
Electronic Filing - Received, Clerk's Office, August 11, 2008 - AS 09-1, Exhibit 4
RESULTS
OF
FIELD INVESTIGATION
During
this field
study
minor
amounts of coal
were
observed in
borings
near
the southeast
corner
of the lined ash
impoundment
Coal amounts
ranged
from
trace in near-surface soils
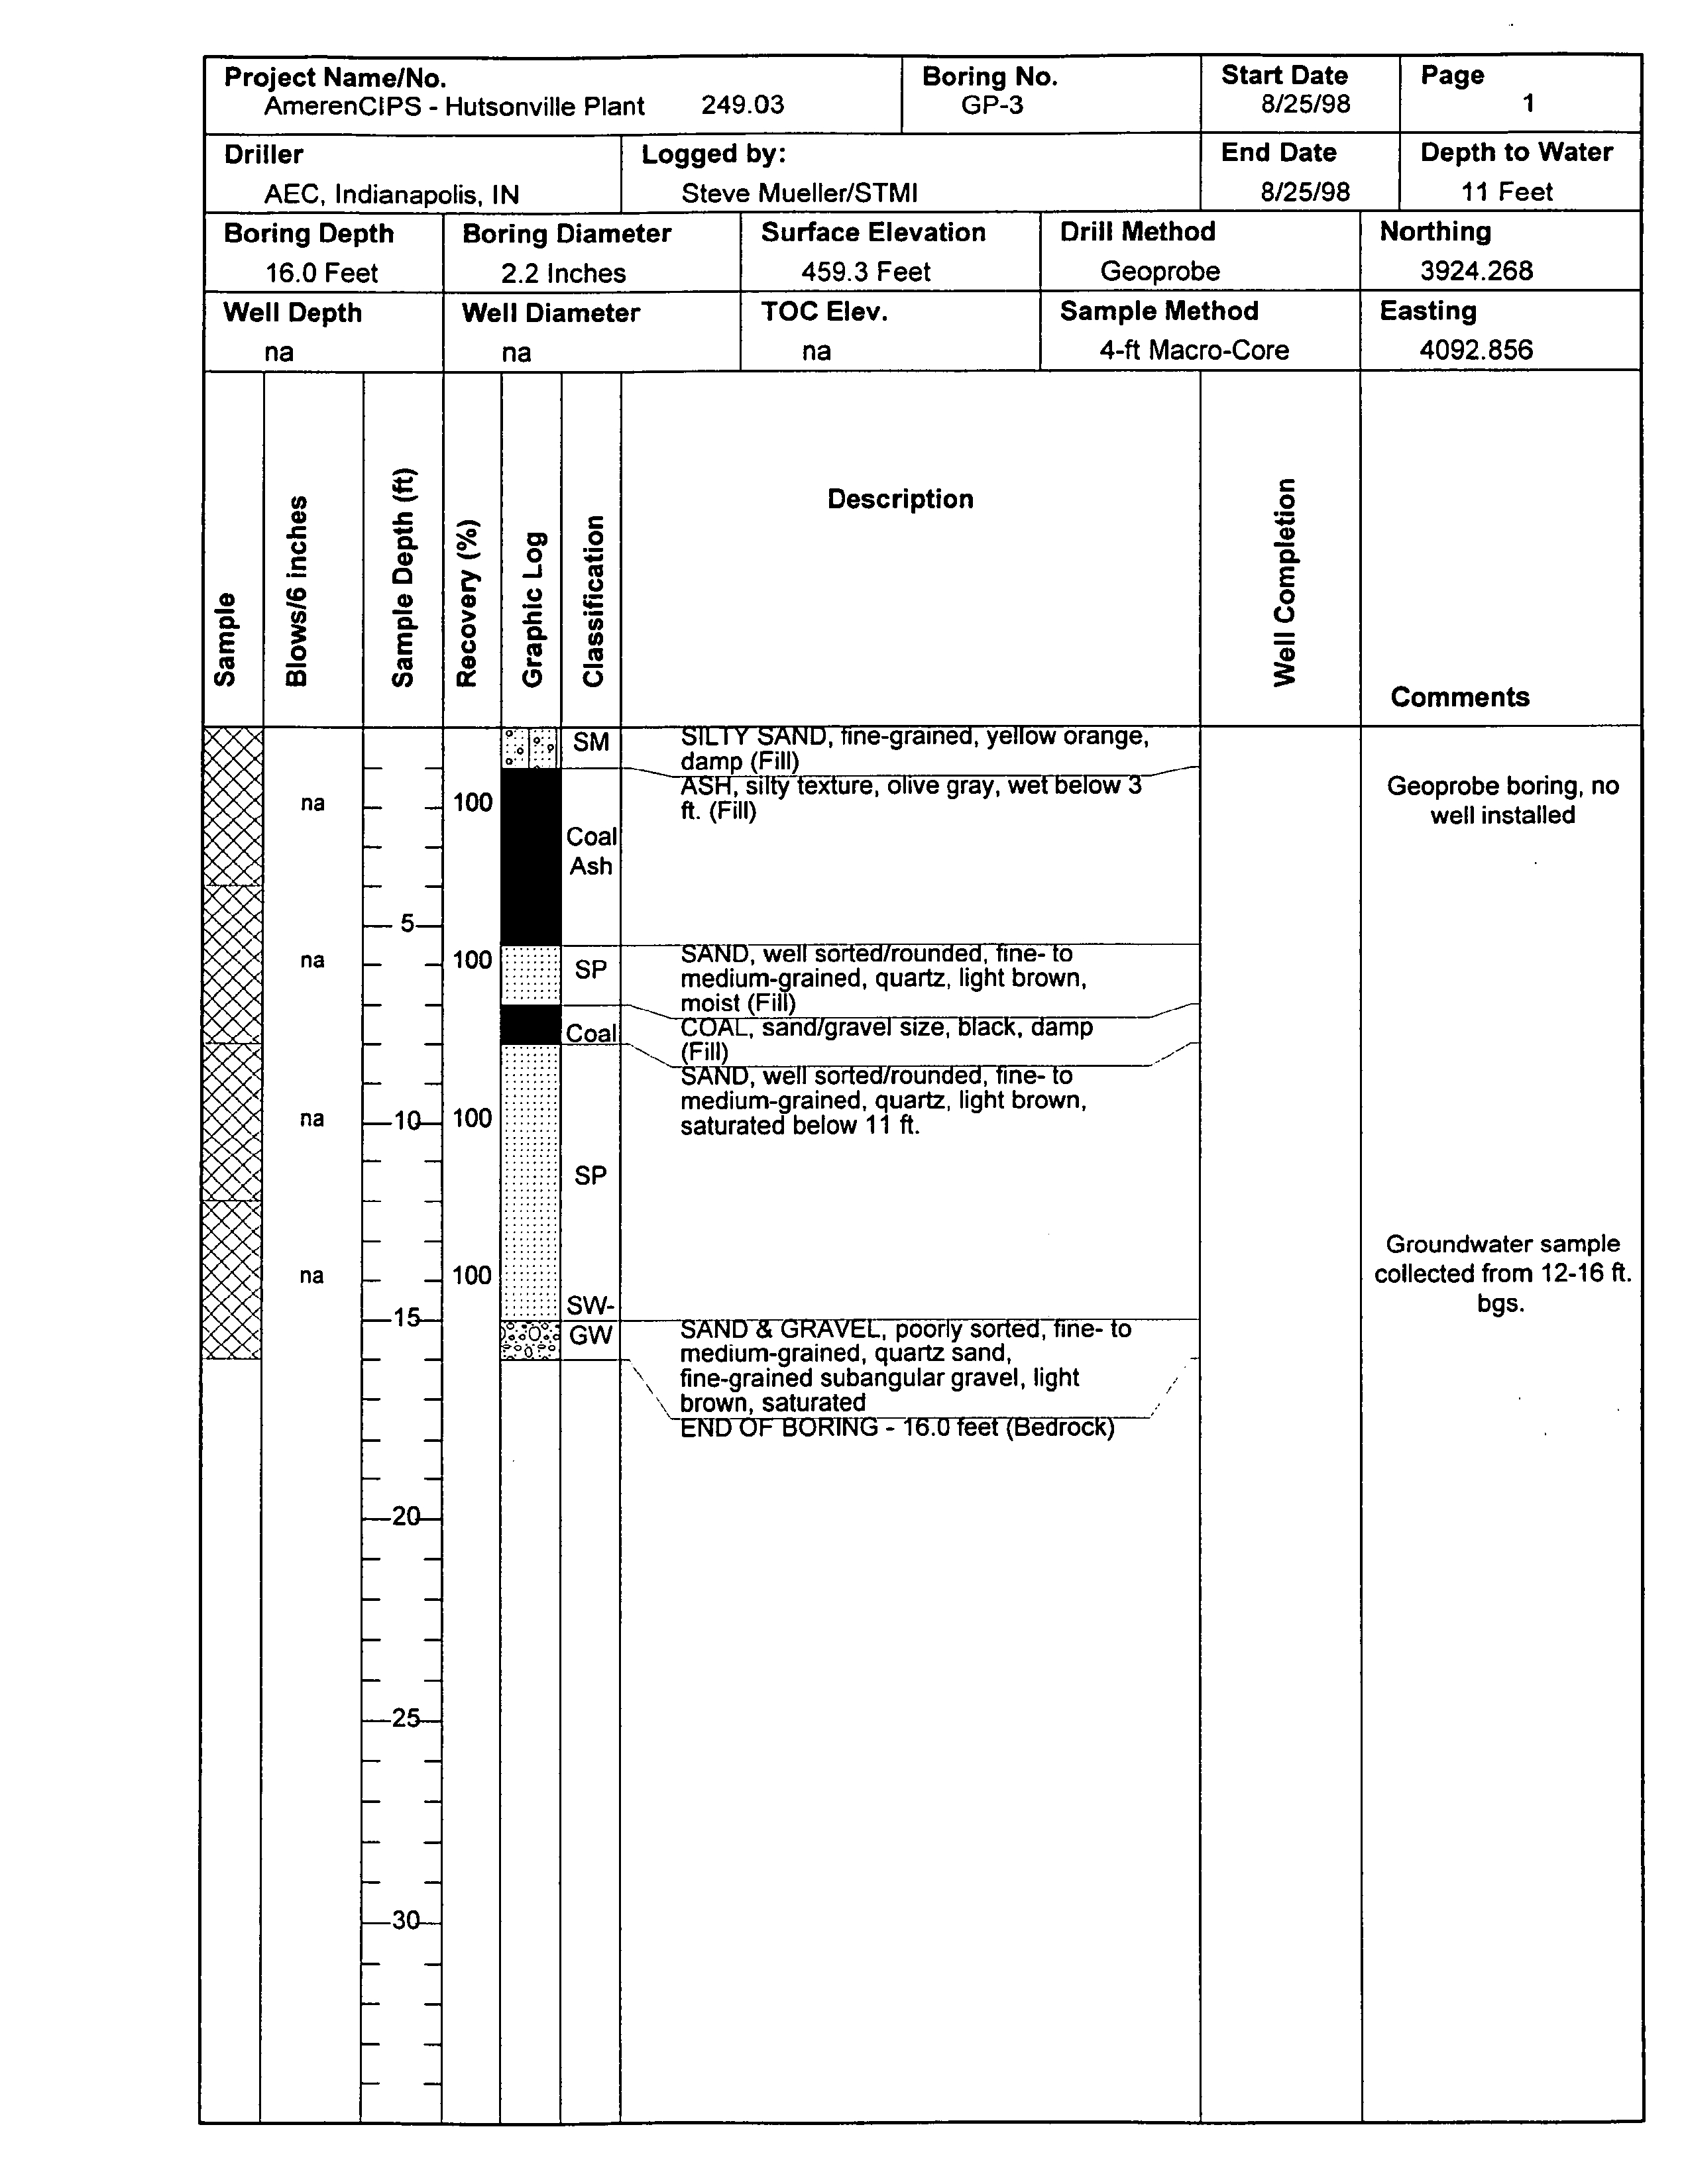
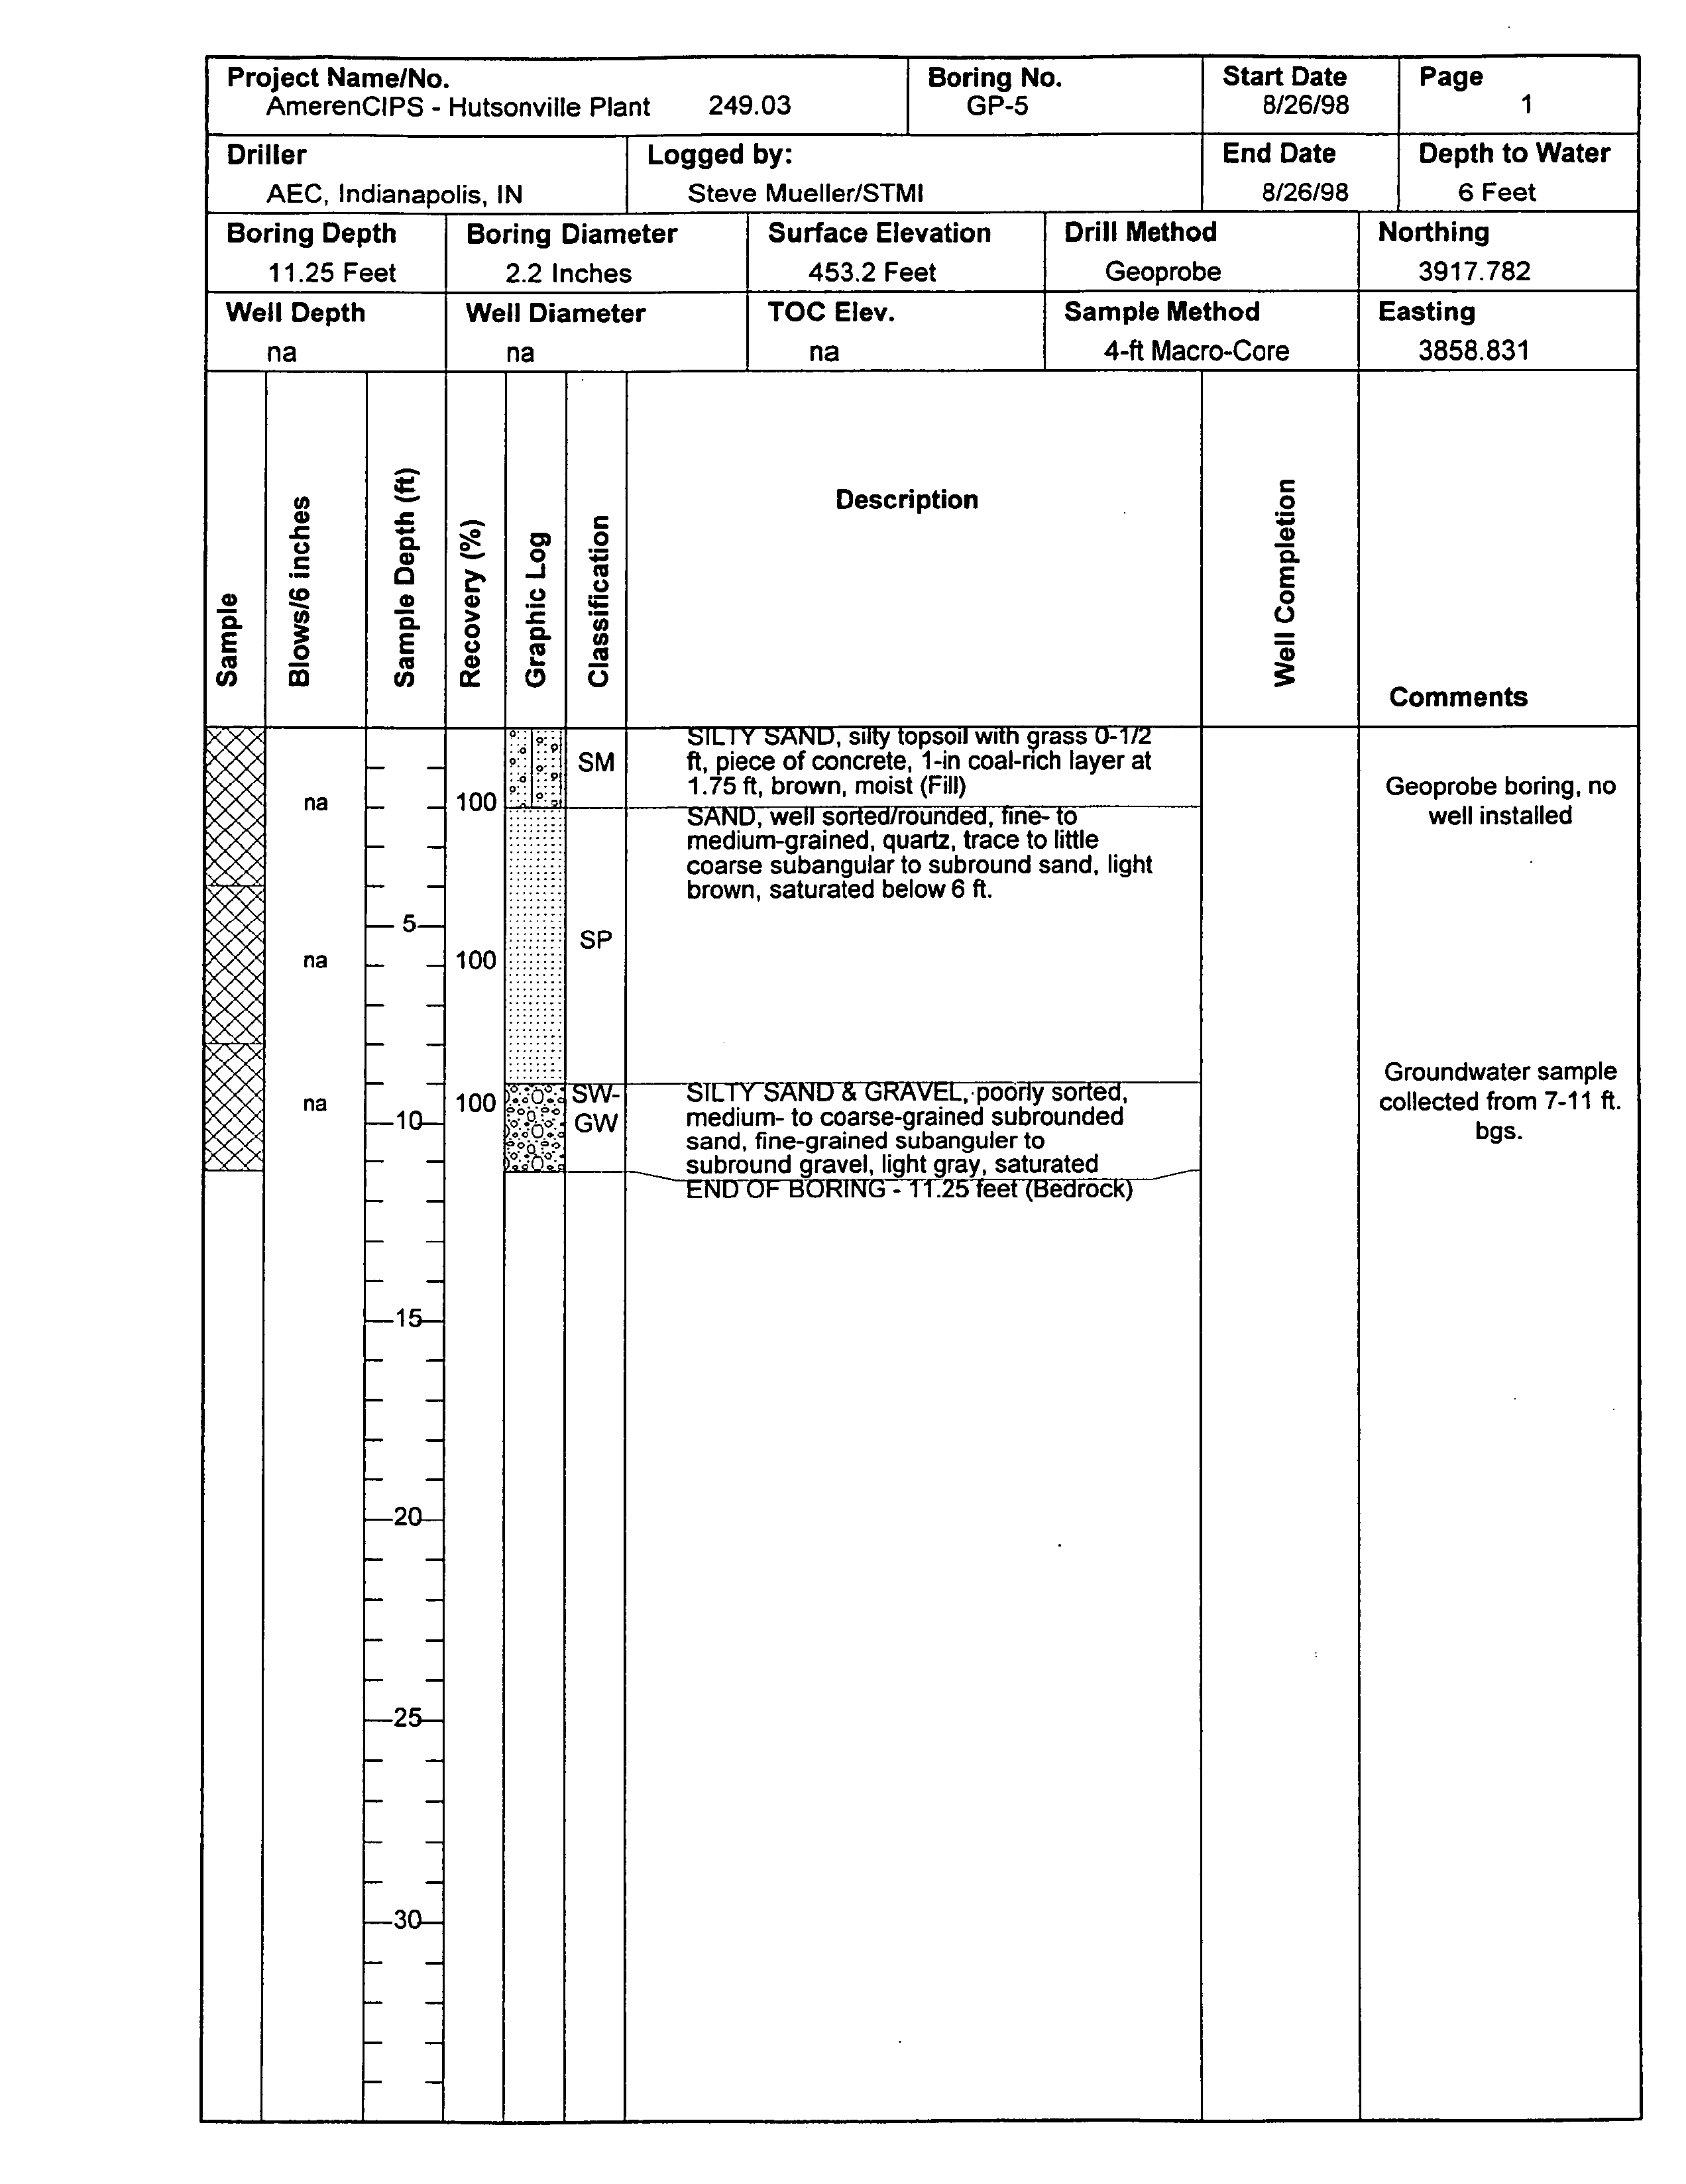
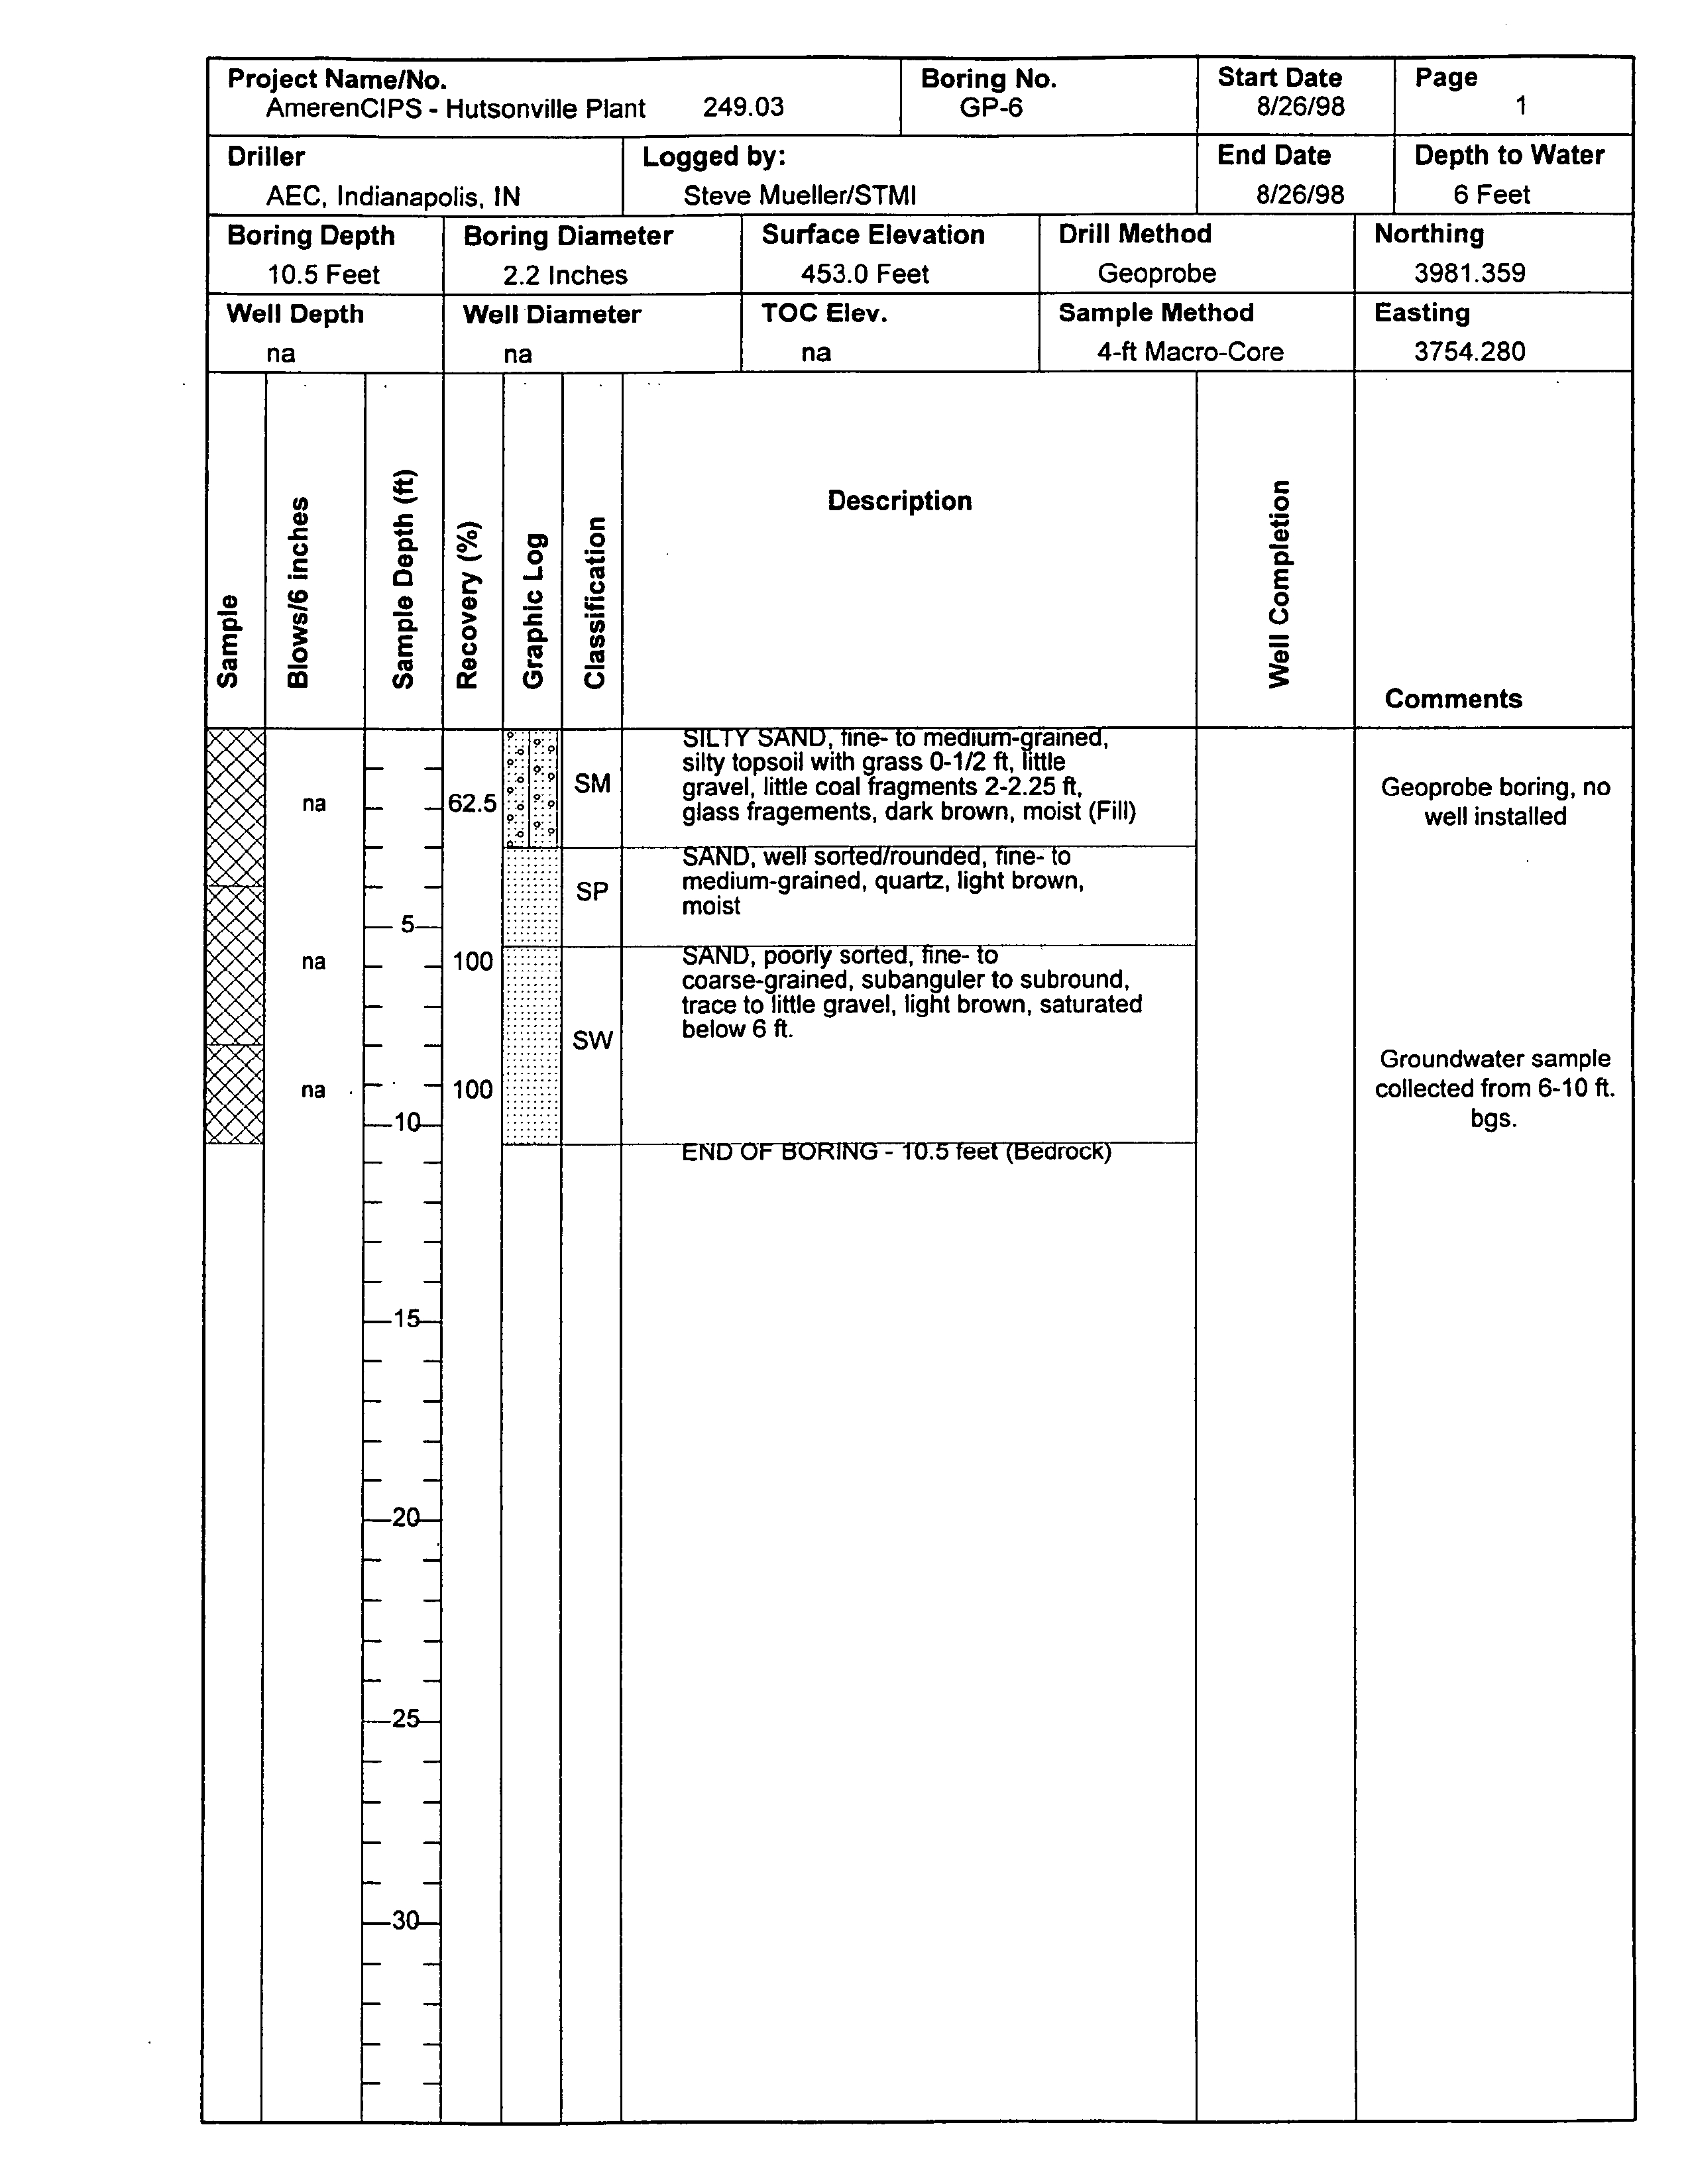
GP-5
GP-6
locations
to an
approximate
one-foot thick
layer
beneath
the southwest corner
of the ash
laydown
area
GP-3 location Section
B-B
Figure
four-inch
thick
surficial
layer
of
coal
refuse
was
logged during
installation
of MW-2 and MW-3
HEI 1984
however
this
layer was
reportedly
removed when
scrap
metals and other refuse
were
removed
from this
area
in the
1980s
No coal or other refuse were observed at the
surface
outside of the coal
pile during
the
1998 field activities
3.1.3
Bedrock
Topography
The bedrock surface beneath the
upland
areas
slopes
gently
toward the Wabash
River however
that
slope
steepens
abruptly
at
the
Wabash River bedrock
valley Figure
Bedrock elevation is
about 445 feet above mean sea level
MSL along
the
west side of the
plant property
and about
435 feet MSL beneath the
power
house
the lined ash
impoundment
and the western
portion
of
the unlined ash
impoundment
Bedrock elevation is less than 350 feet MSL in the Wabash River
bedrock
valley
which lies beneath the eastern half of the unlined ash
impoundment
broad
bedrock rise
occurs
in the
area
between the two ash
impoundments extending
from south of the
plant
site
to
about
the coal
storage
pile
Bedrock
elevation of
nearly
445 feet MSL
was
encountered
at
the southeast
corner
of the
lined ash
impoundment MW-3
To the
northeast
an
elevation of about
447 feet MSL was observed
beneath
the north end of the unlined
ash
impoundment
GP-22
Bedrock
along
this
high
appears
to
protrude
above the
water
table
at
least
during periods
of low
groundwater
elevation
Section
C-C Figure
hutsonvi lie
hydrogeologic
assessment.doc
Natural
3-4
Resource
Technology
Electronic Filing - Received, Clerk's Office, August 11, 2008 - AS 09-1, Exhibit 4
RESULTS OF FIELD INVESTIGATION
3.2 Site
Hydrogeology
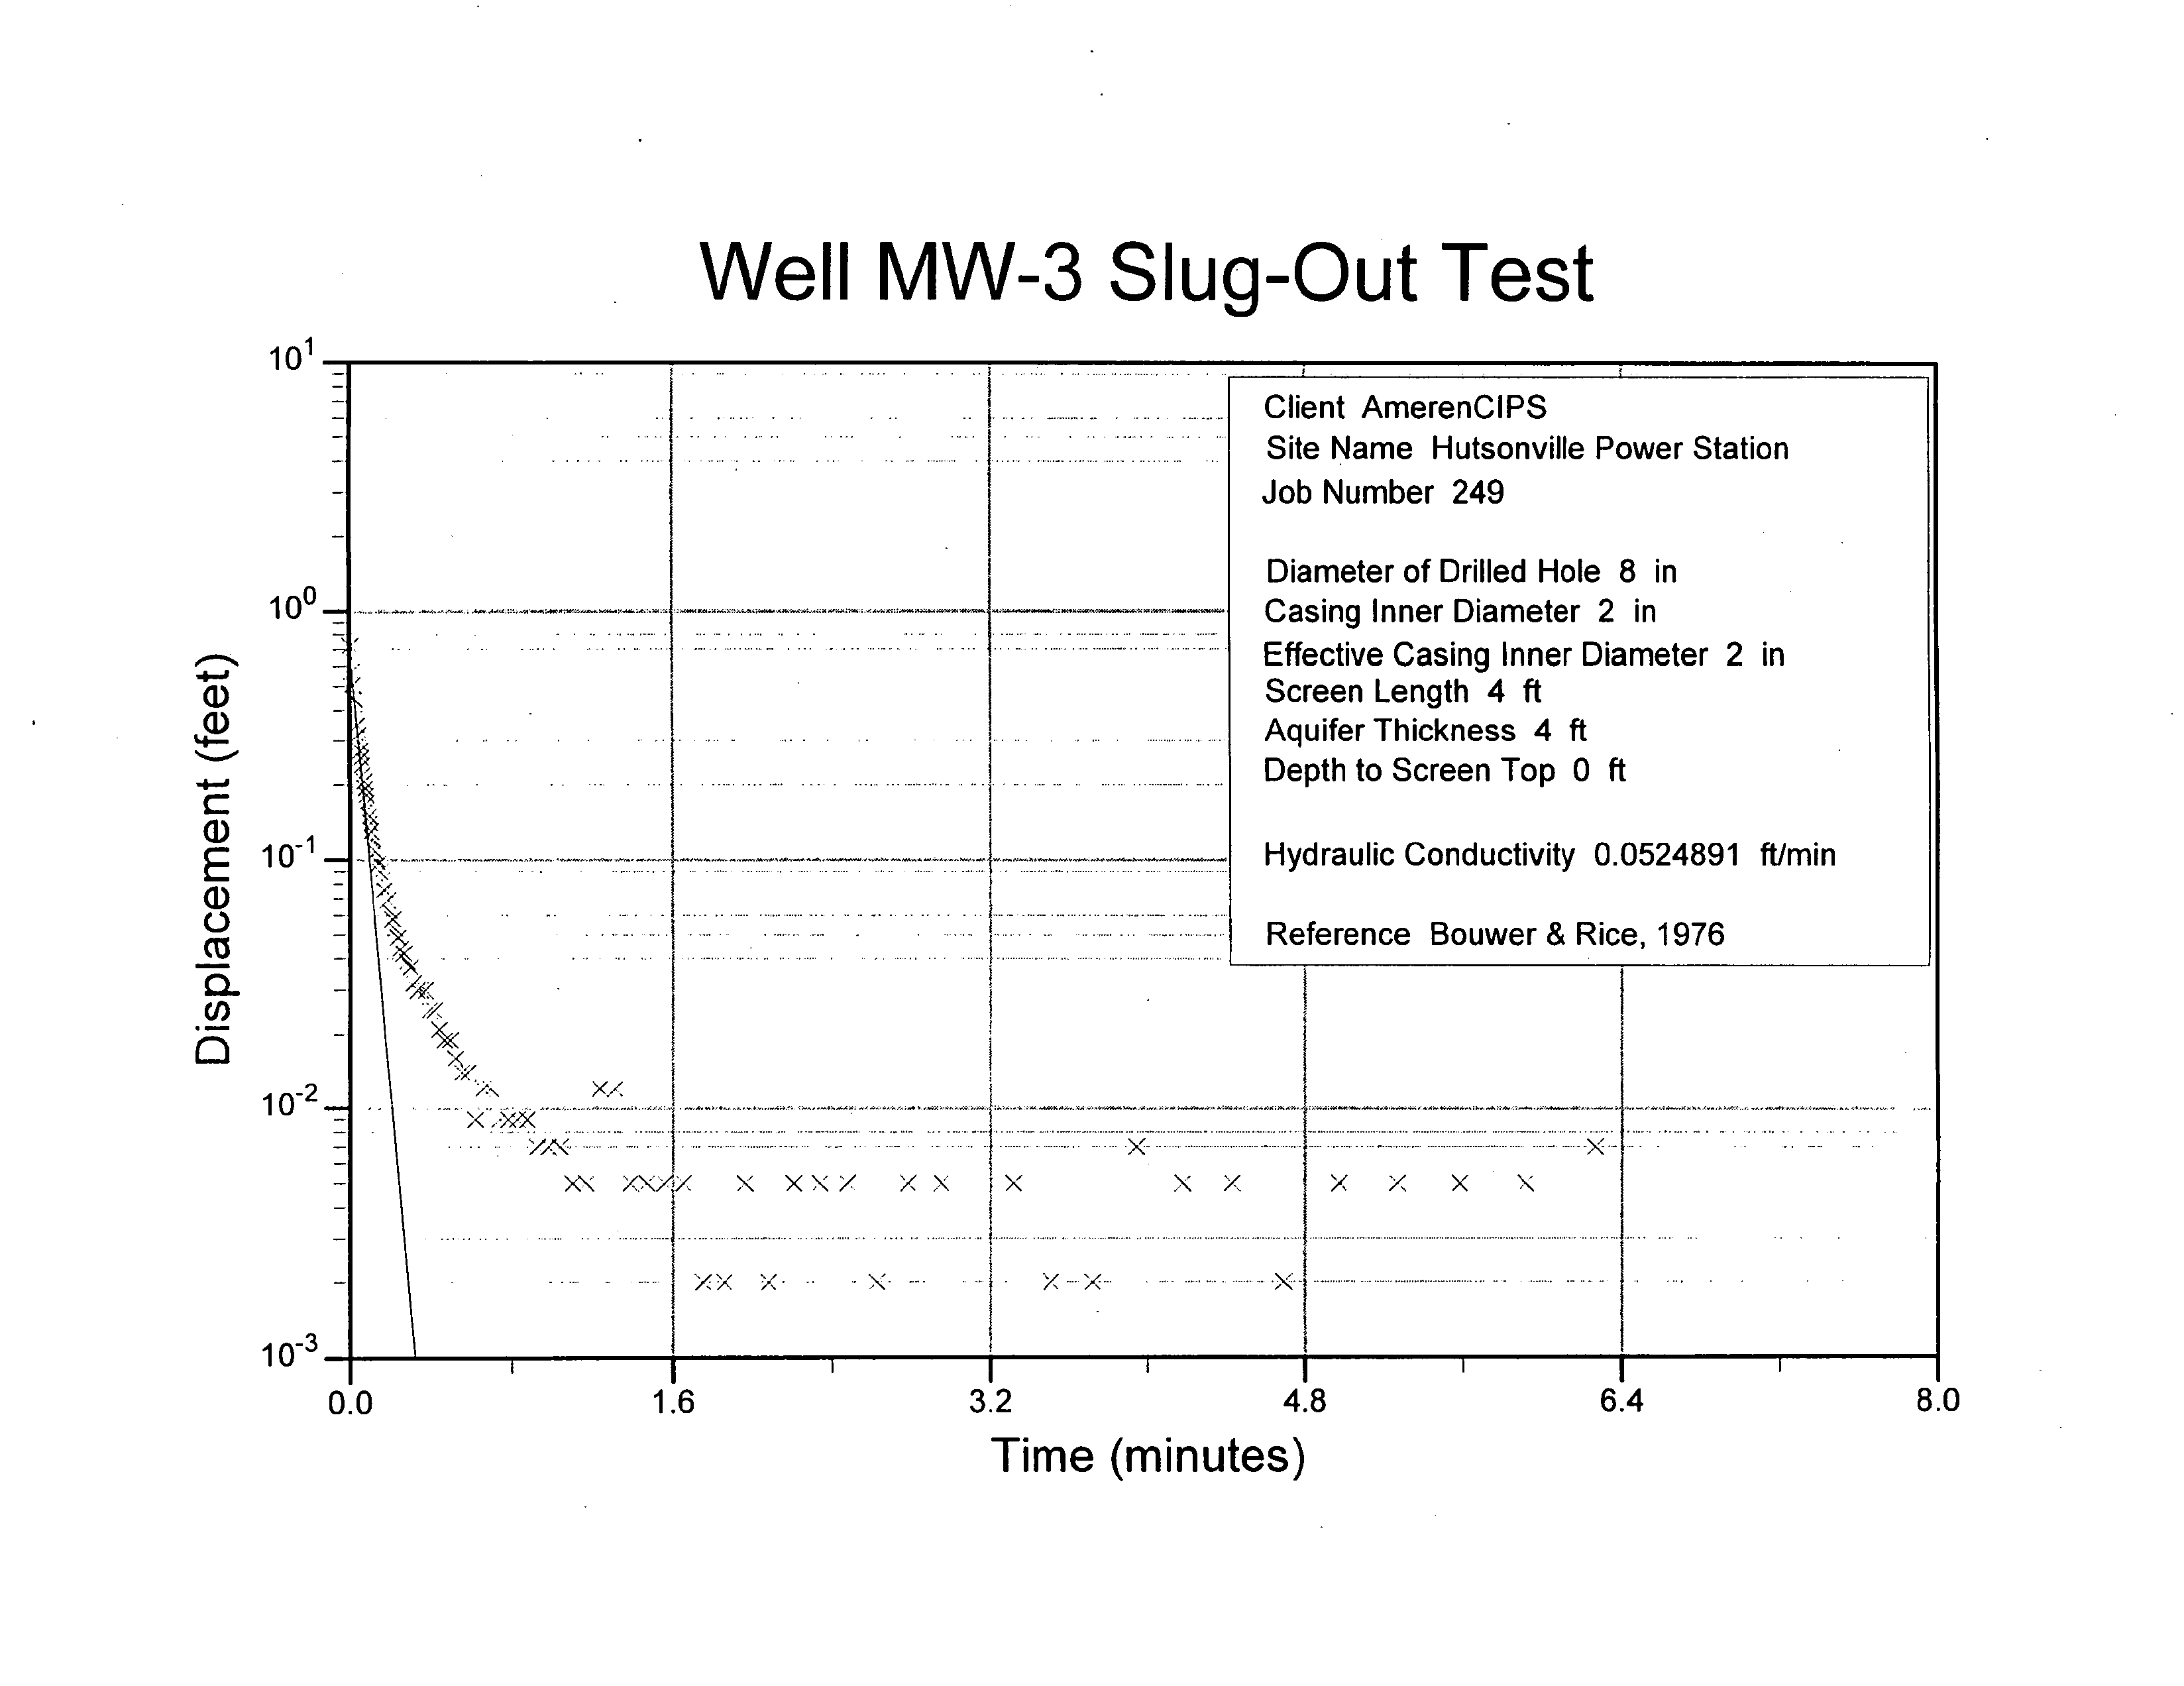
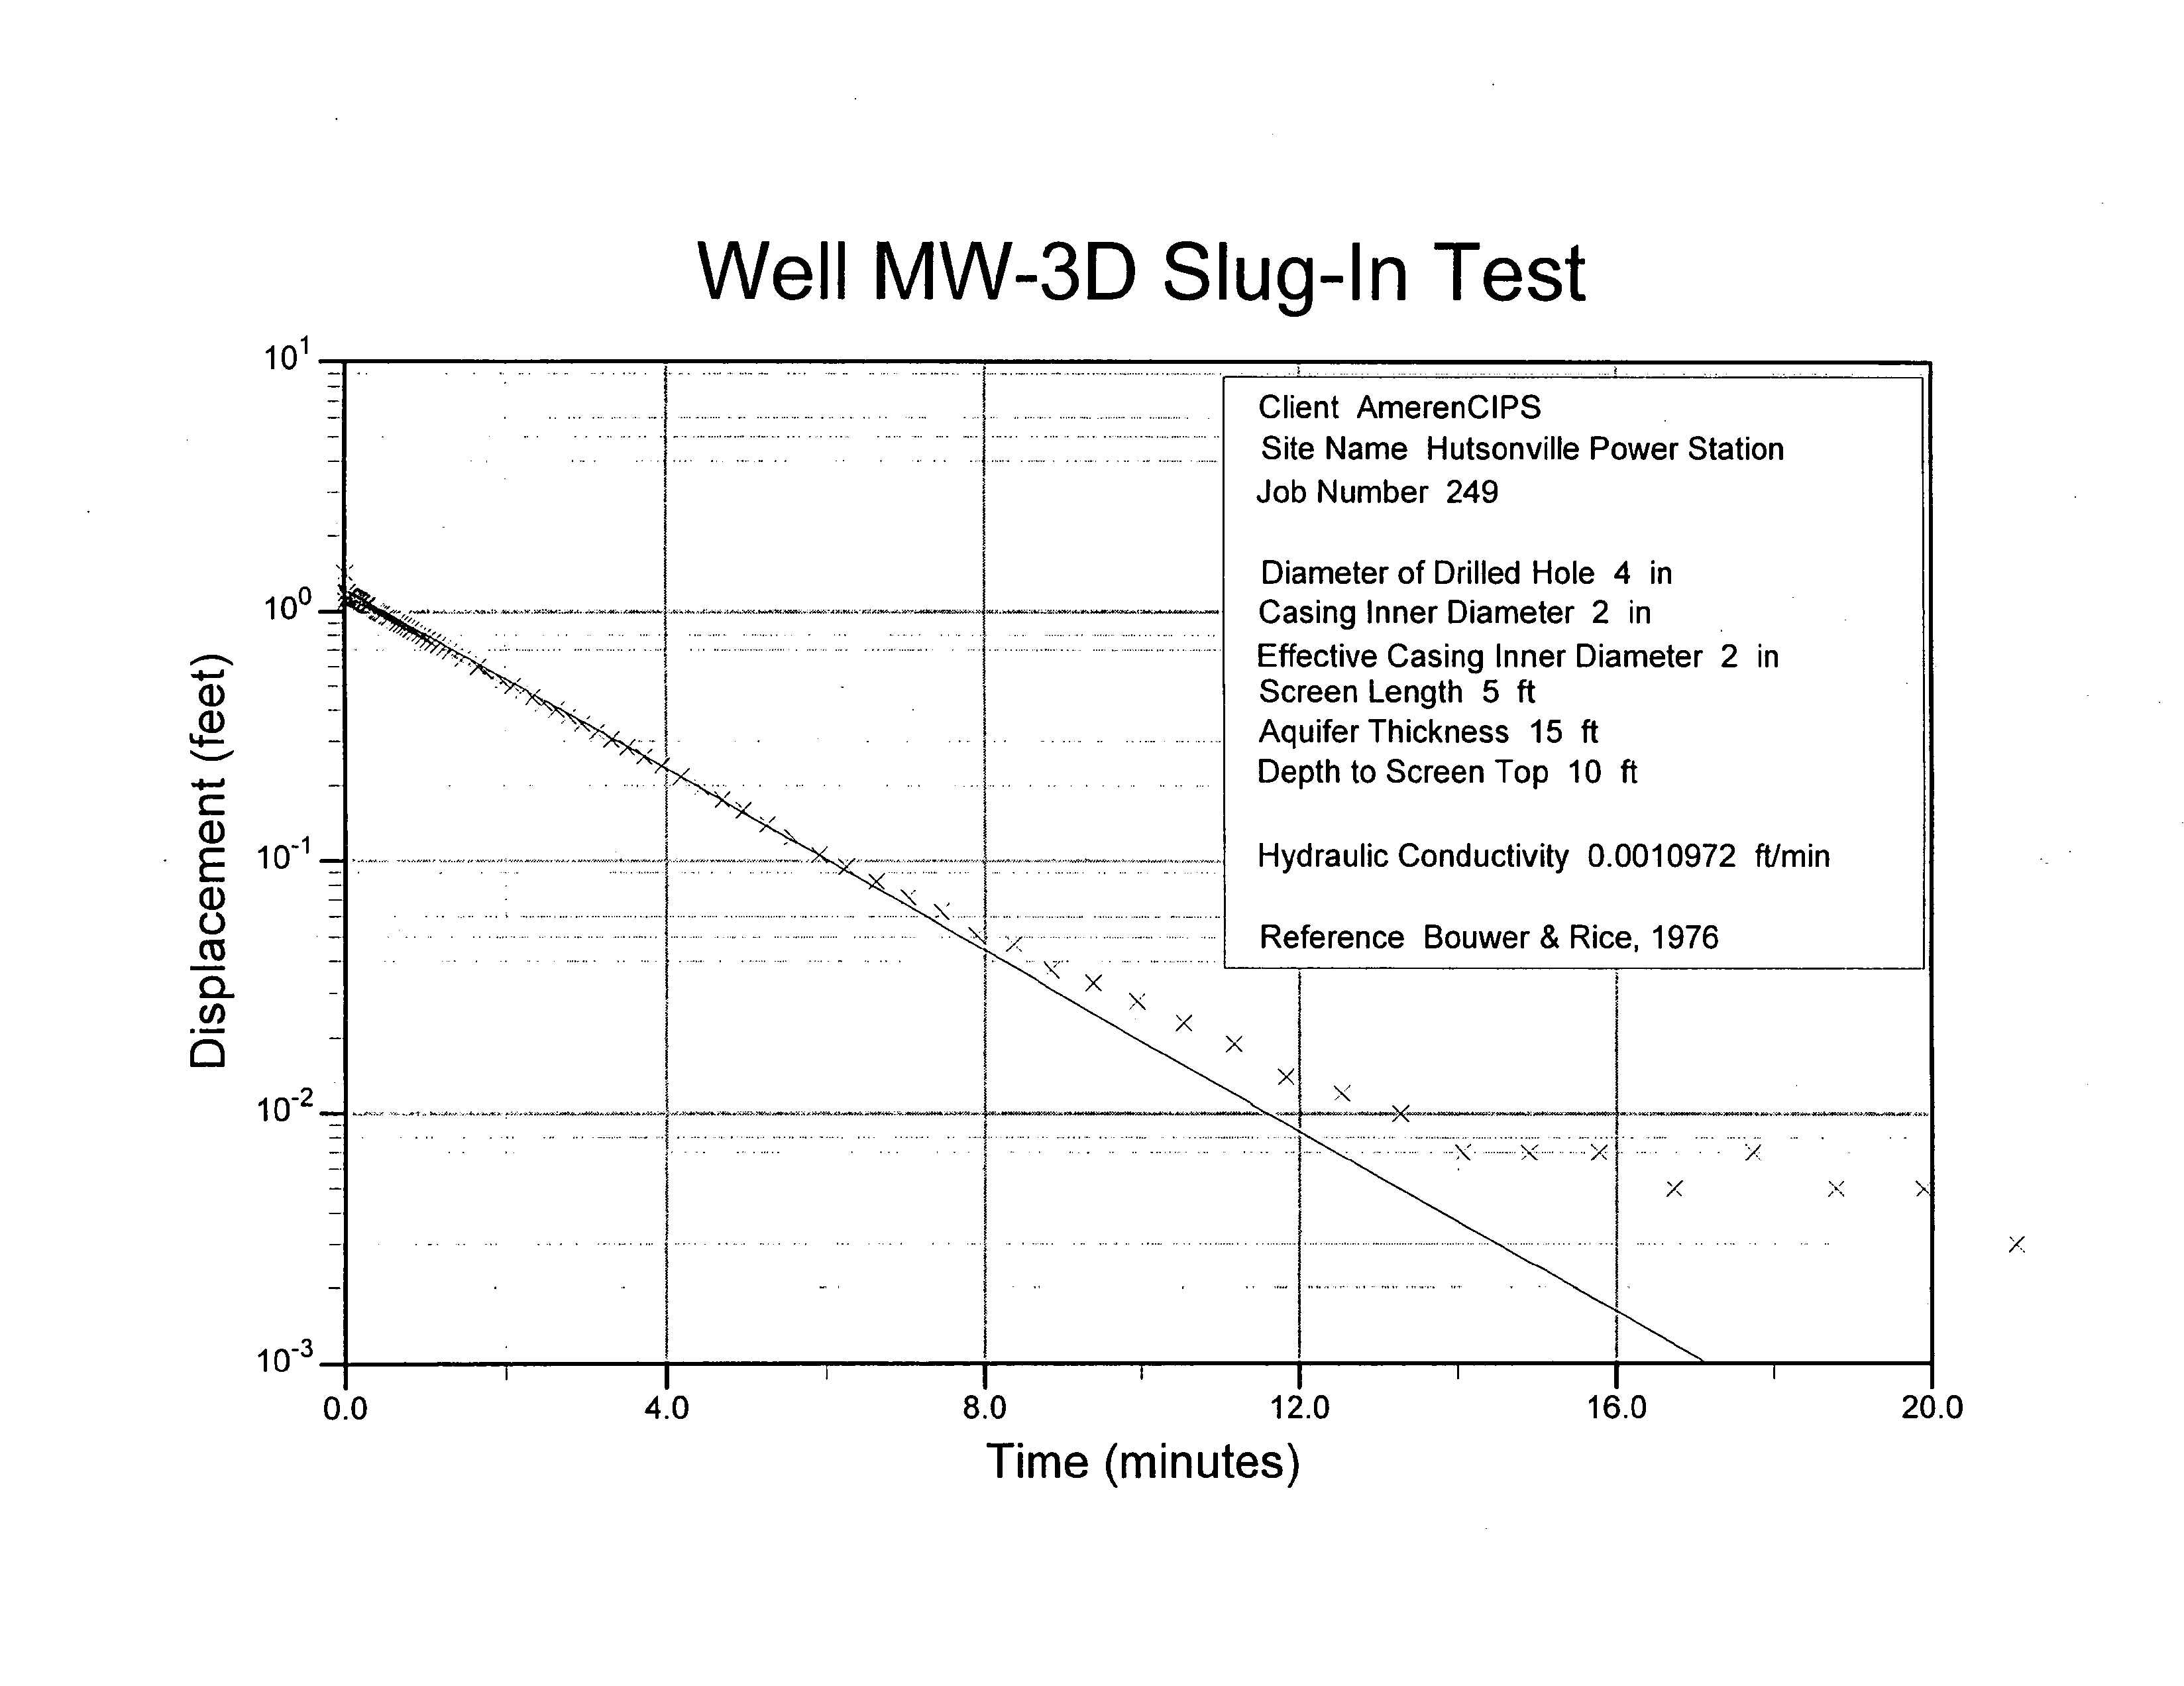
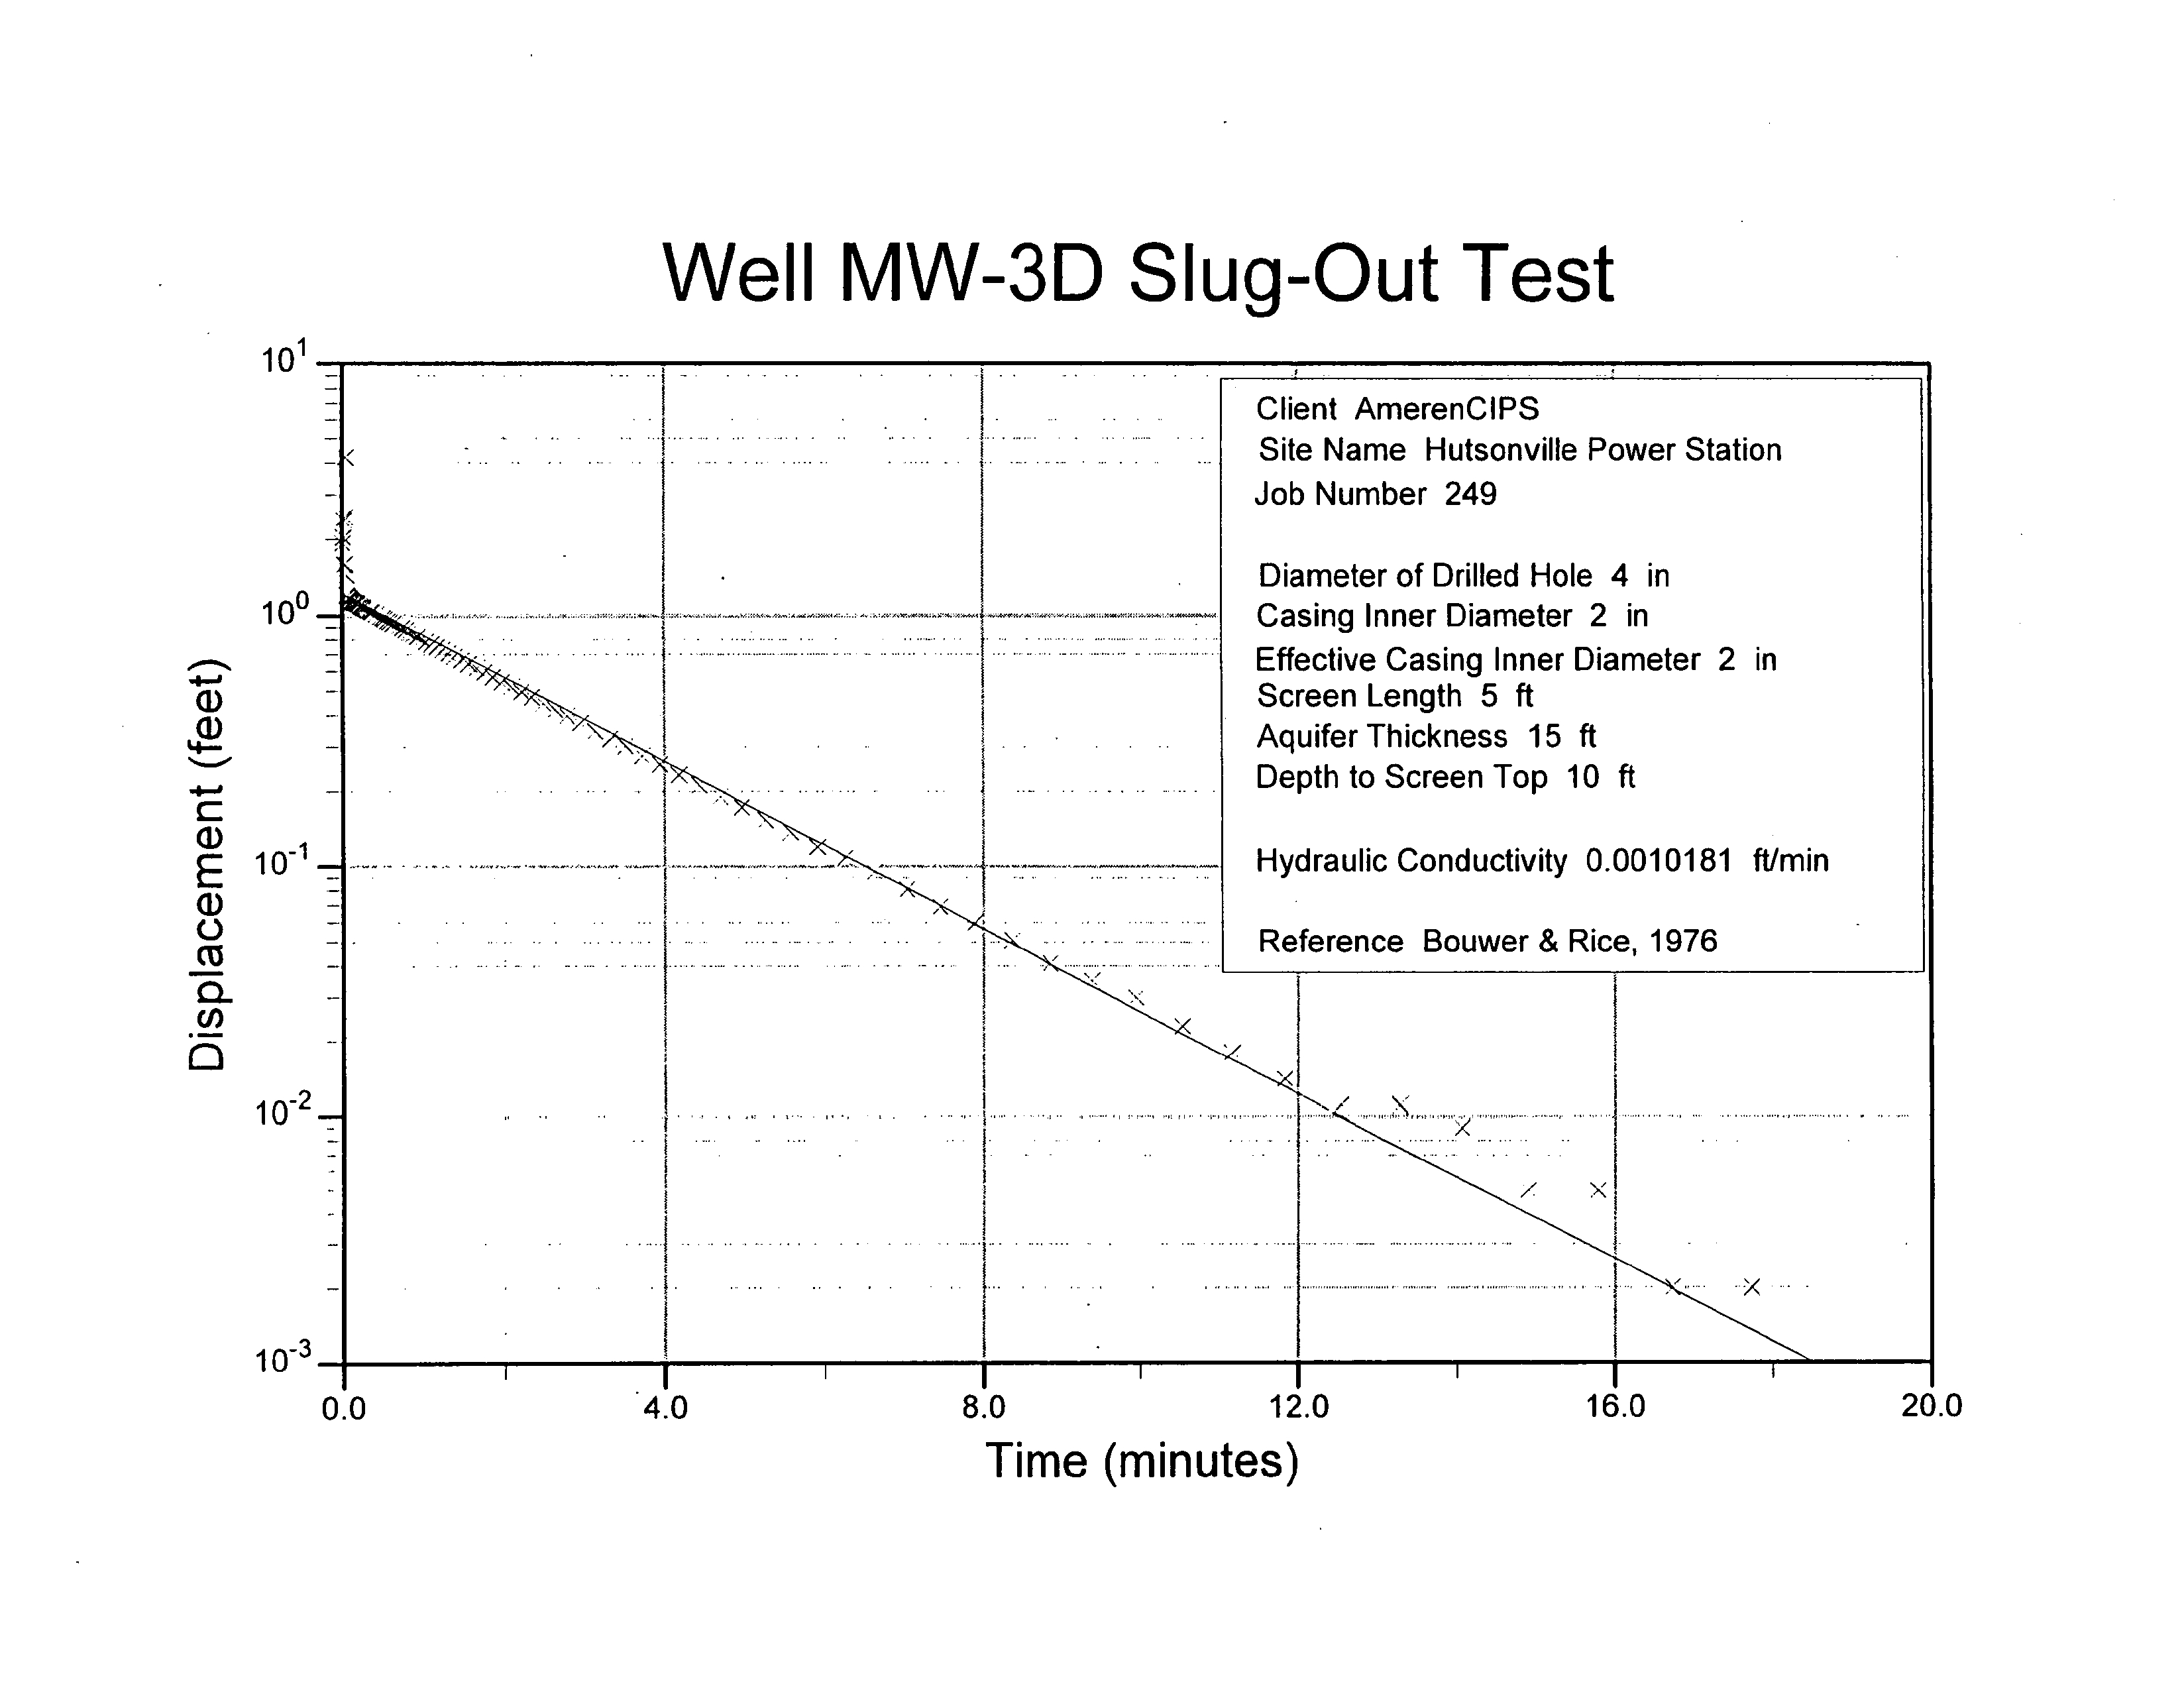
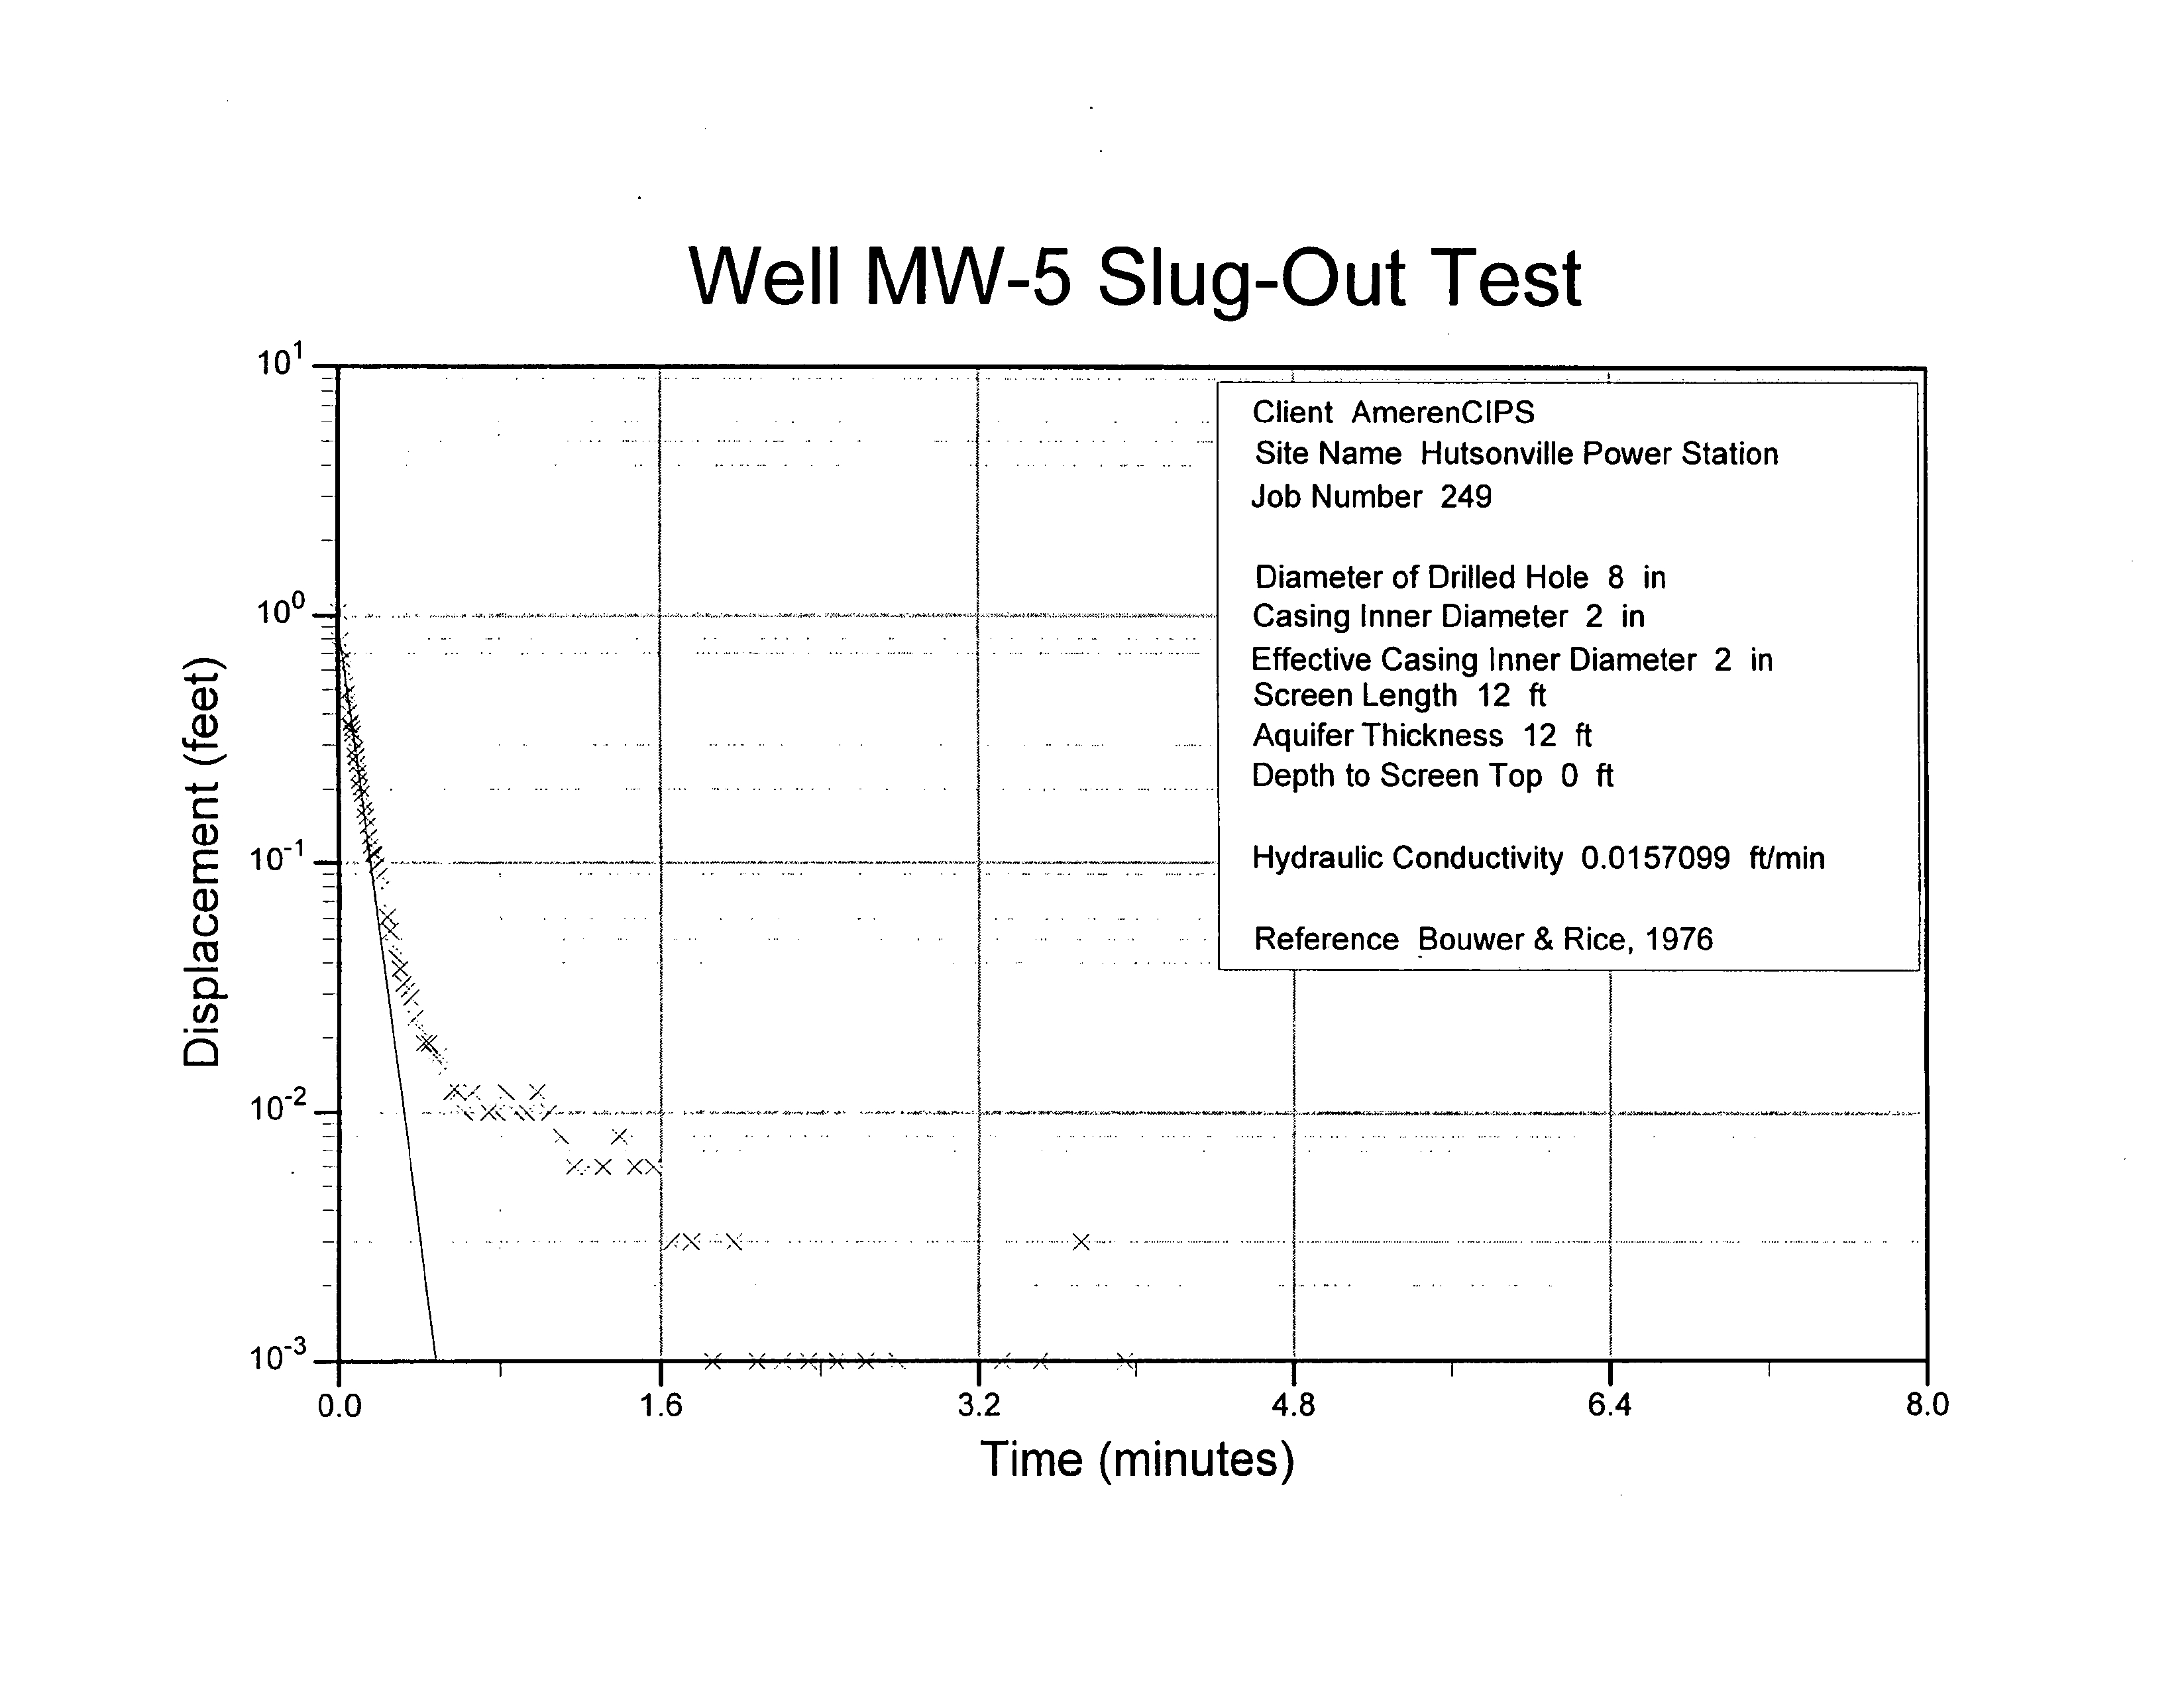
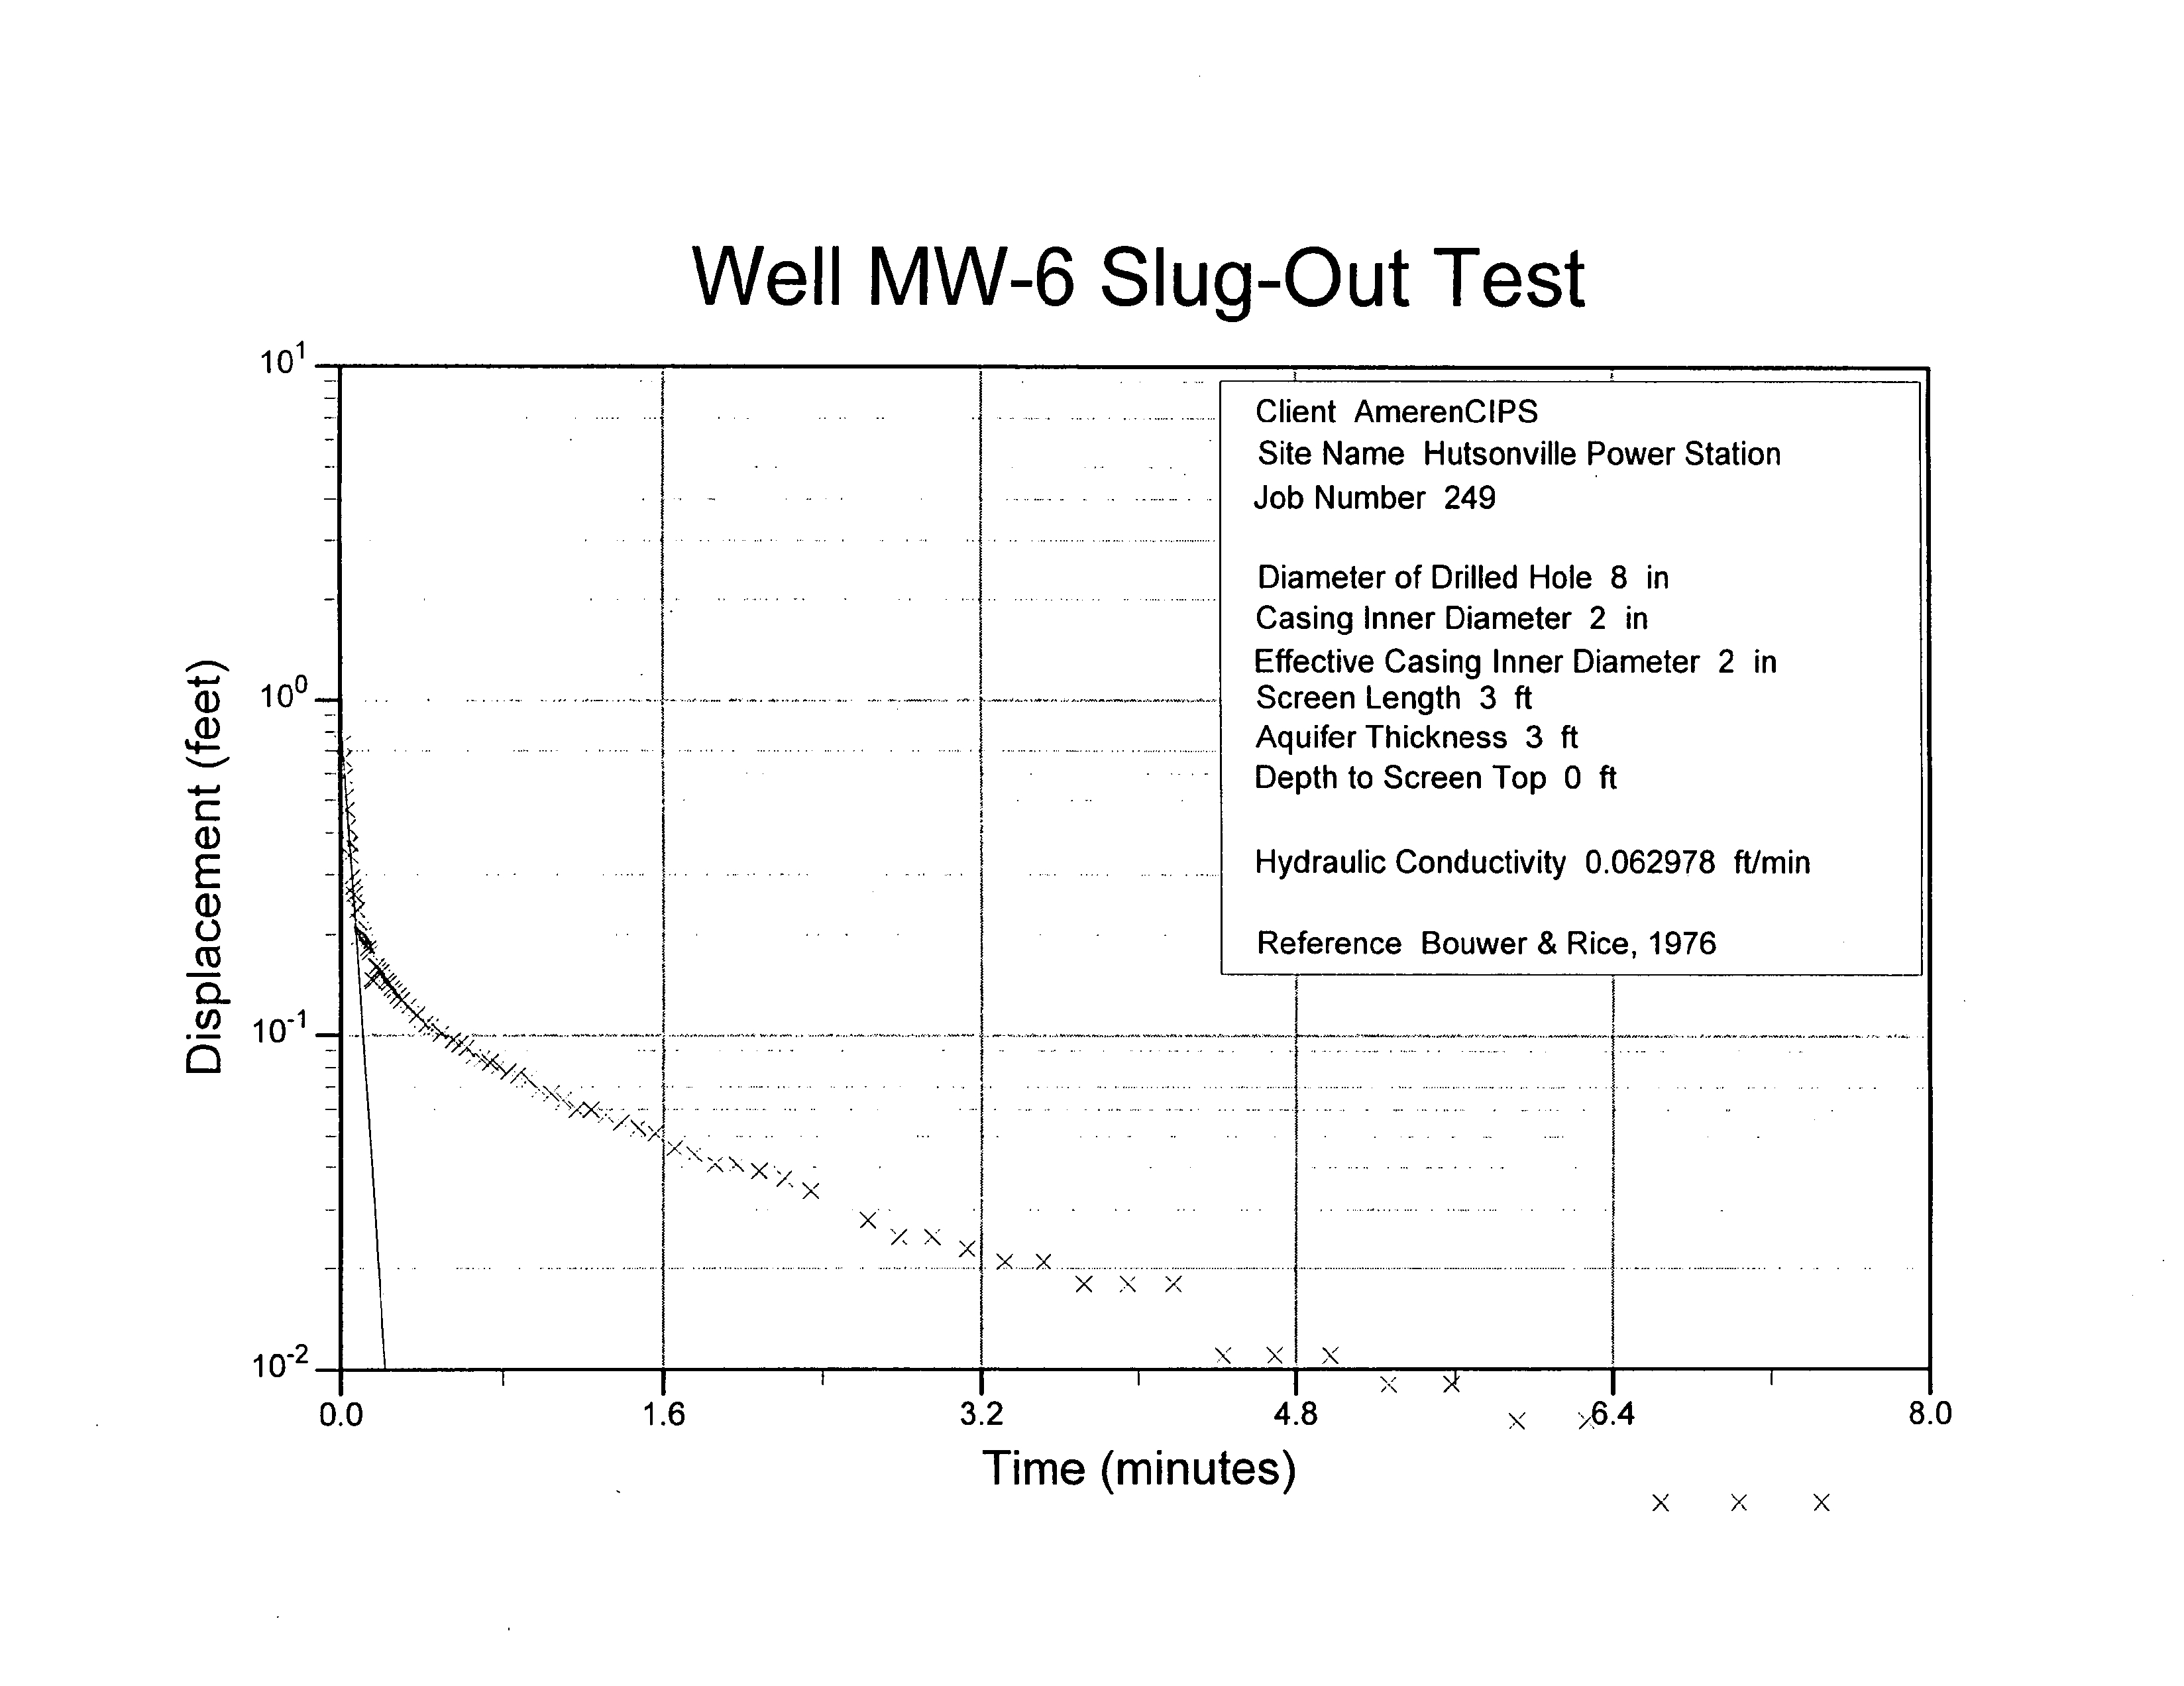
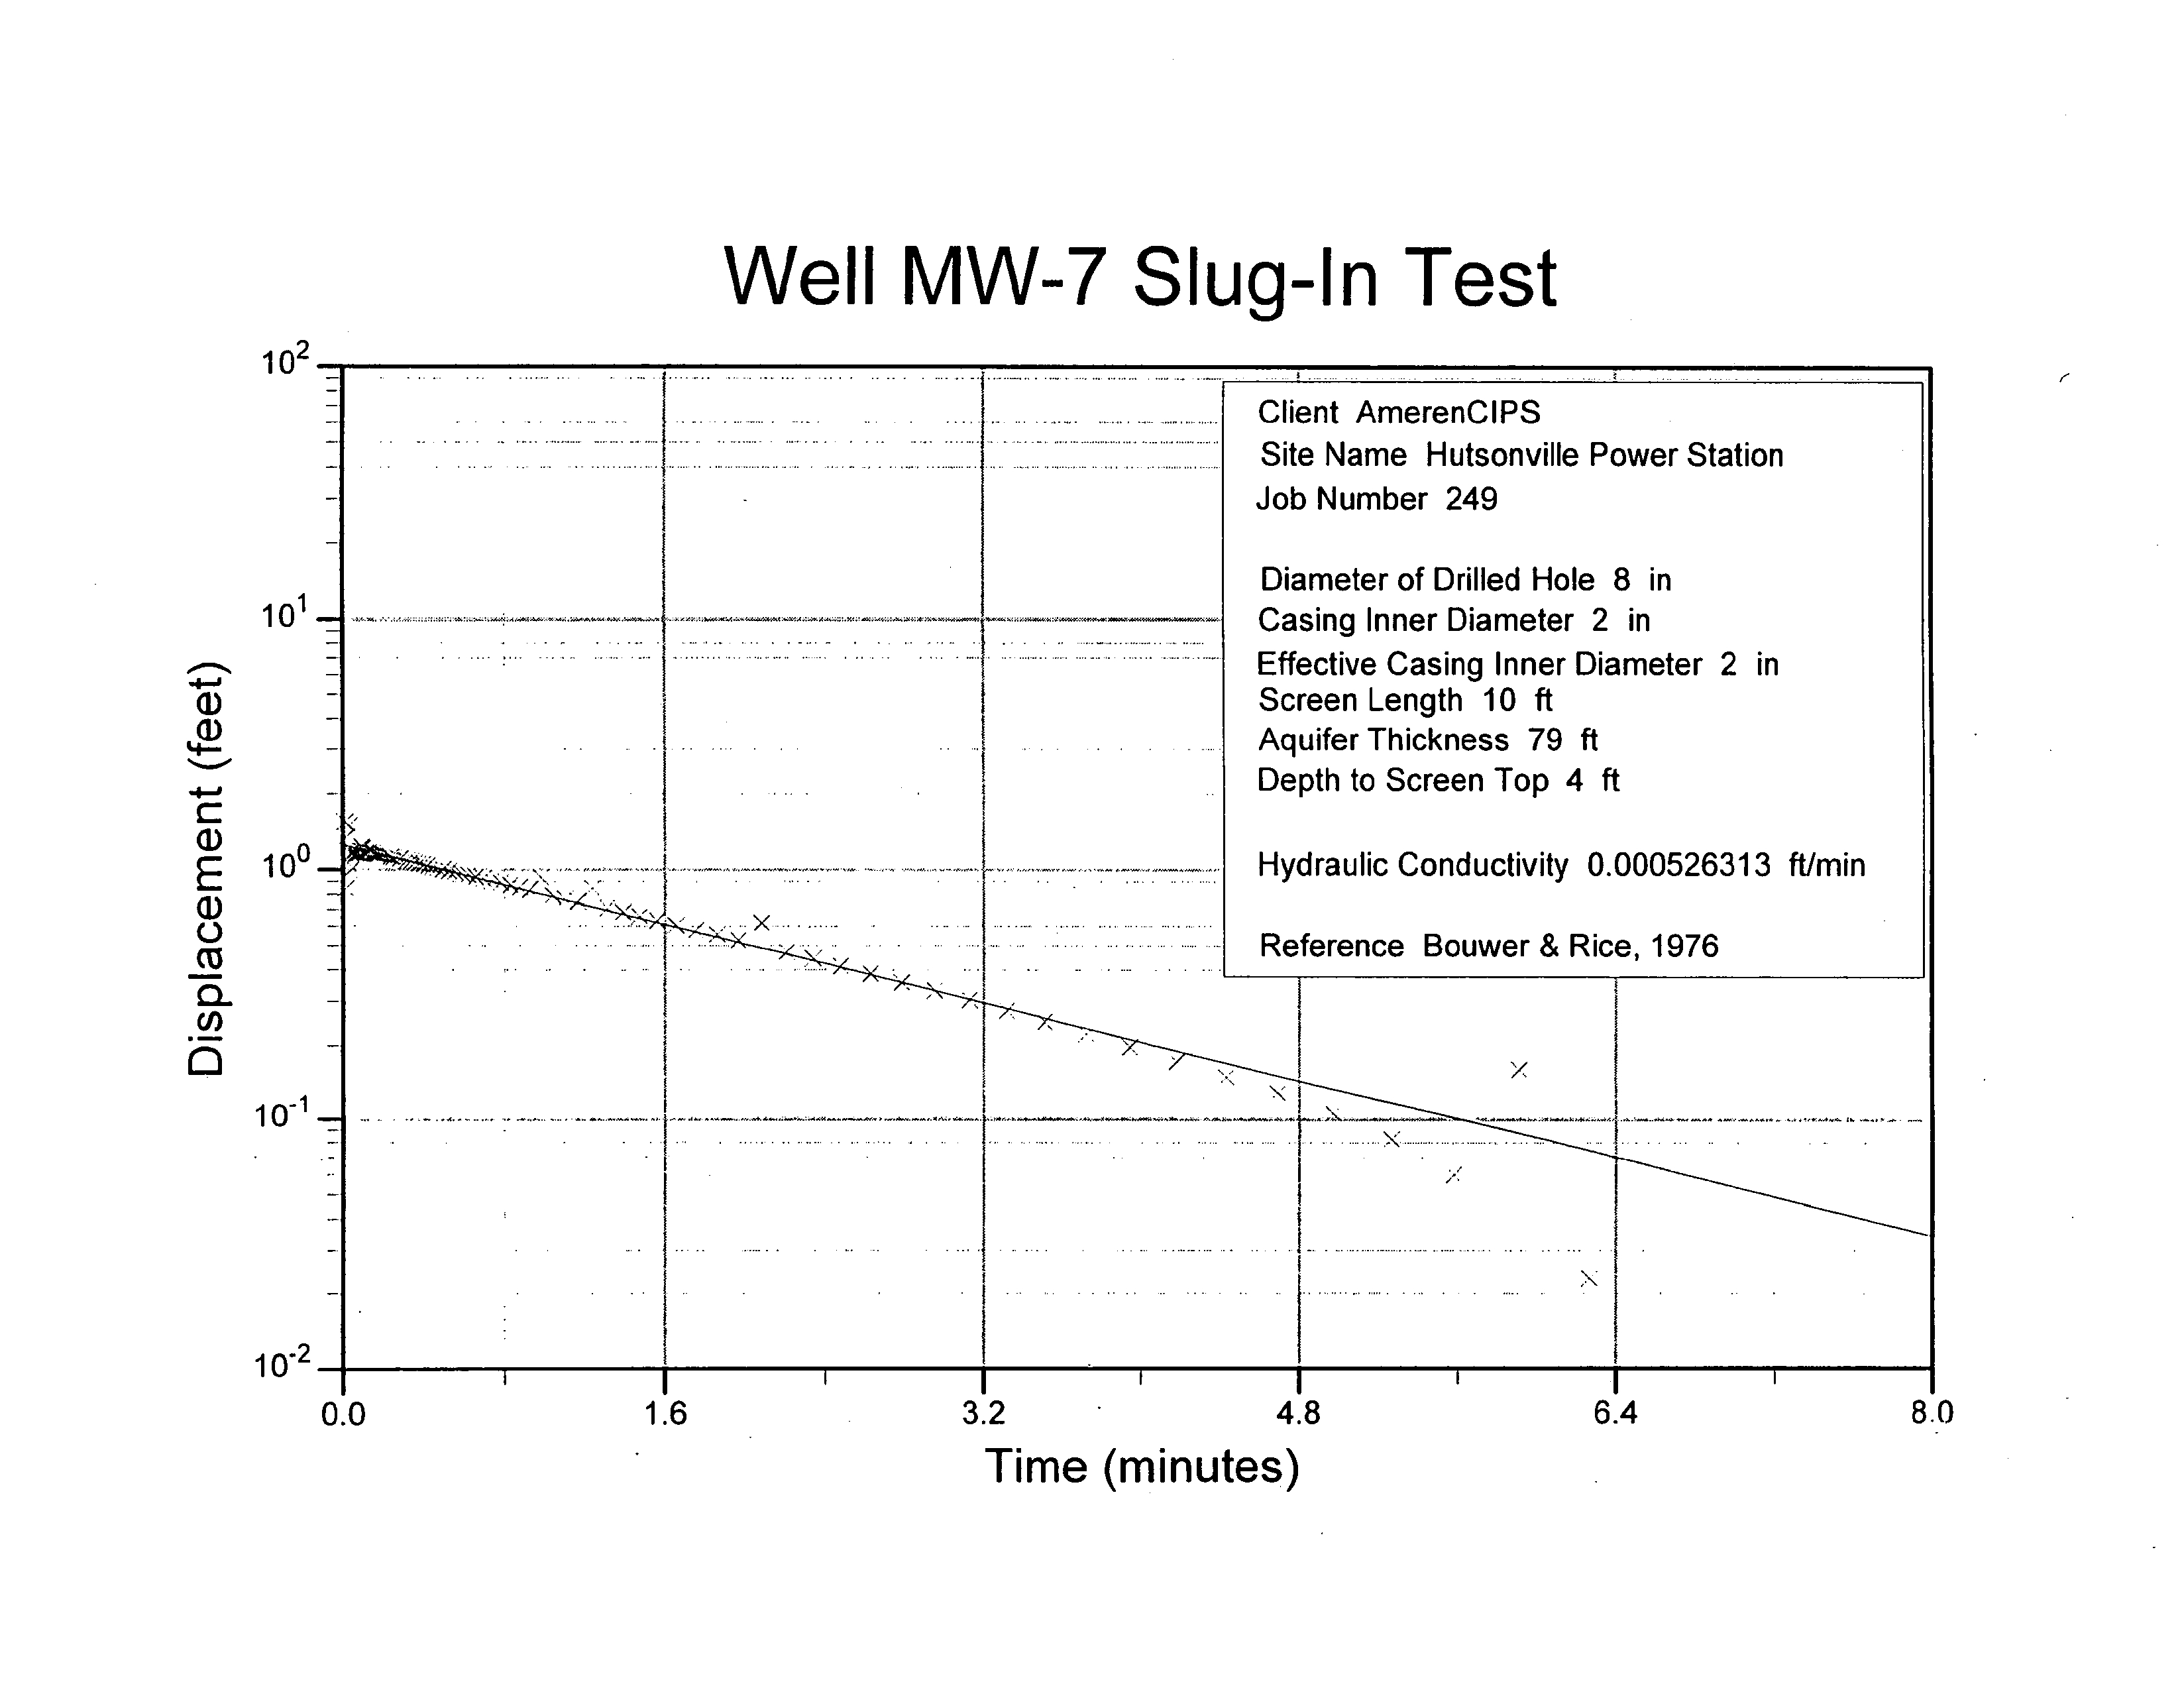
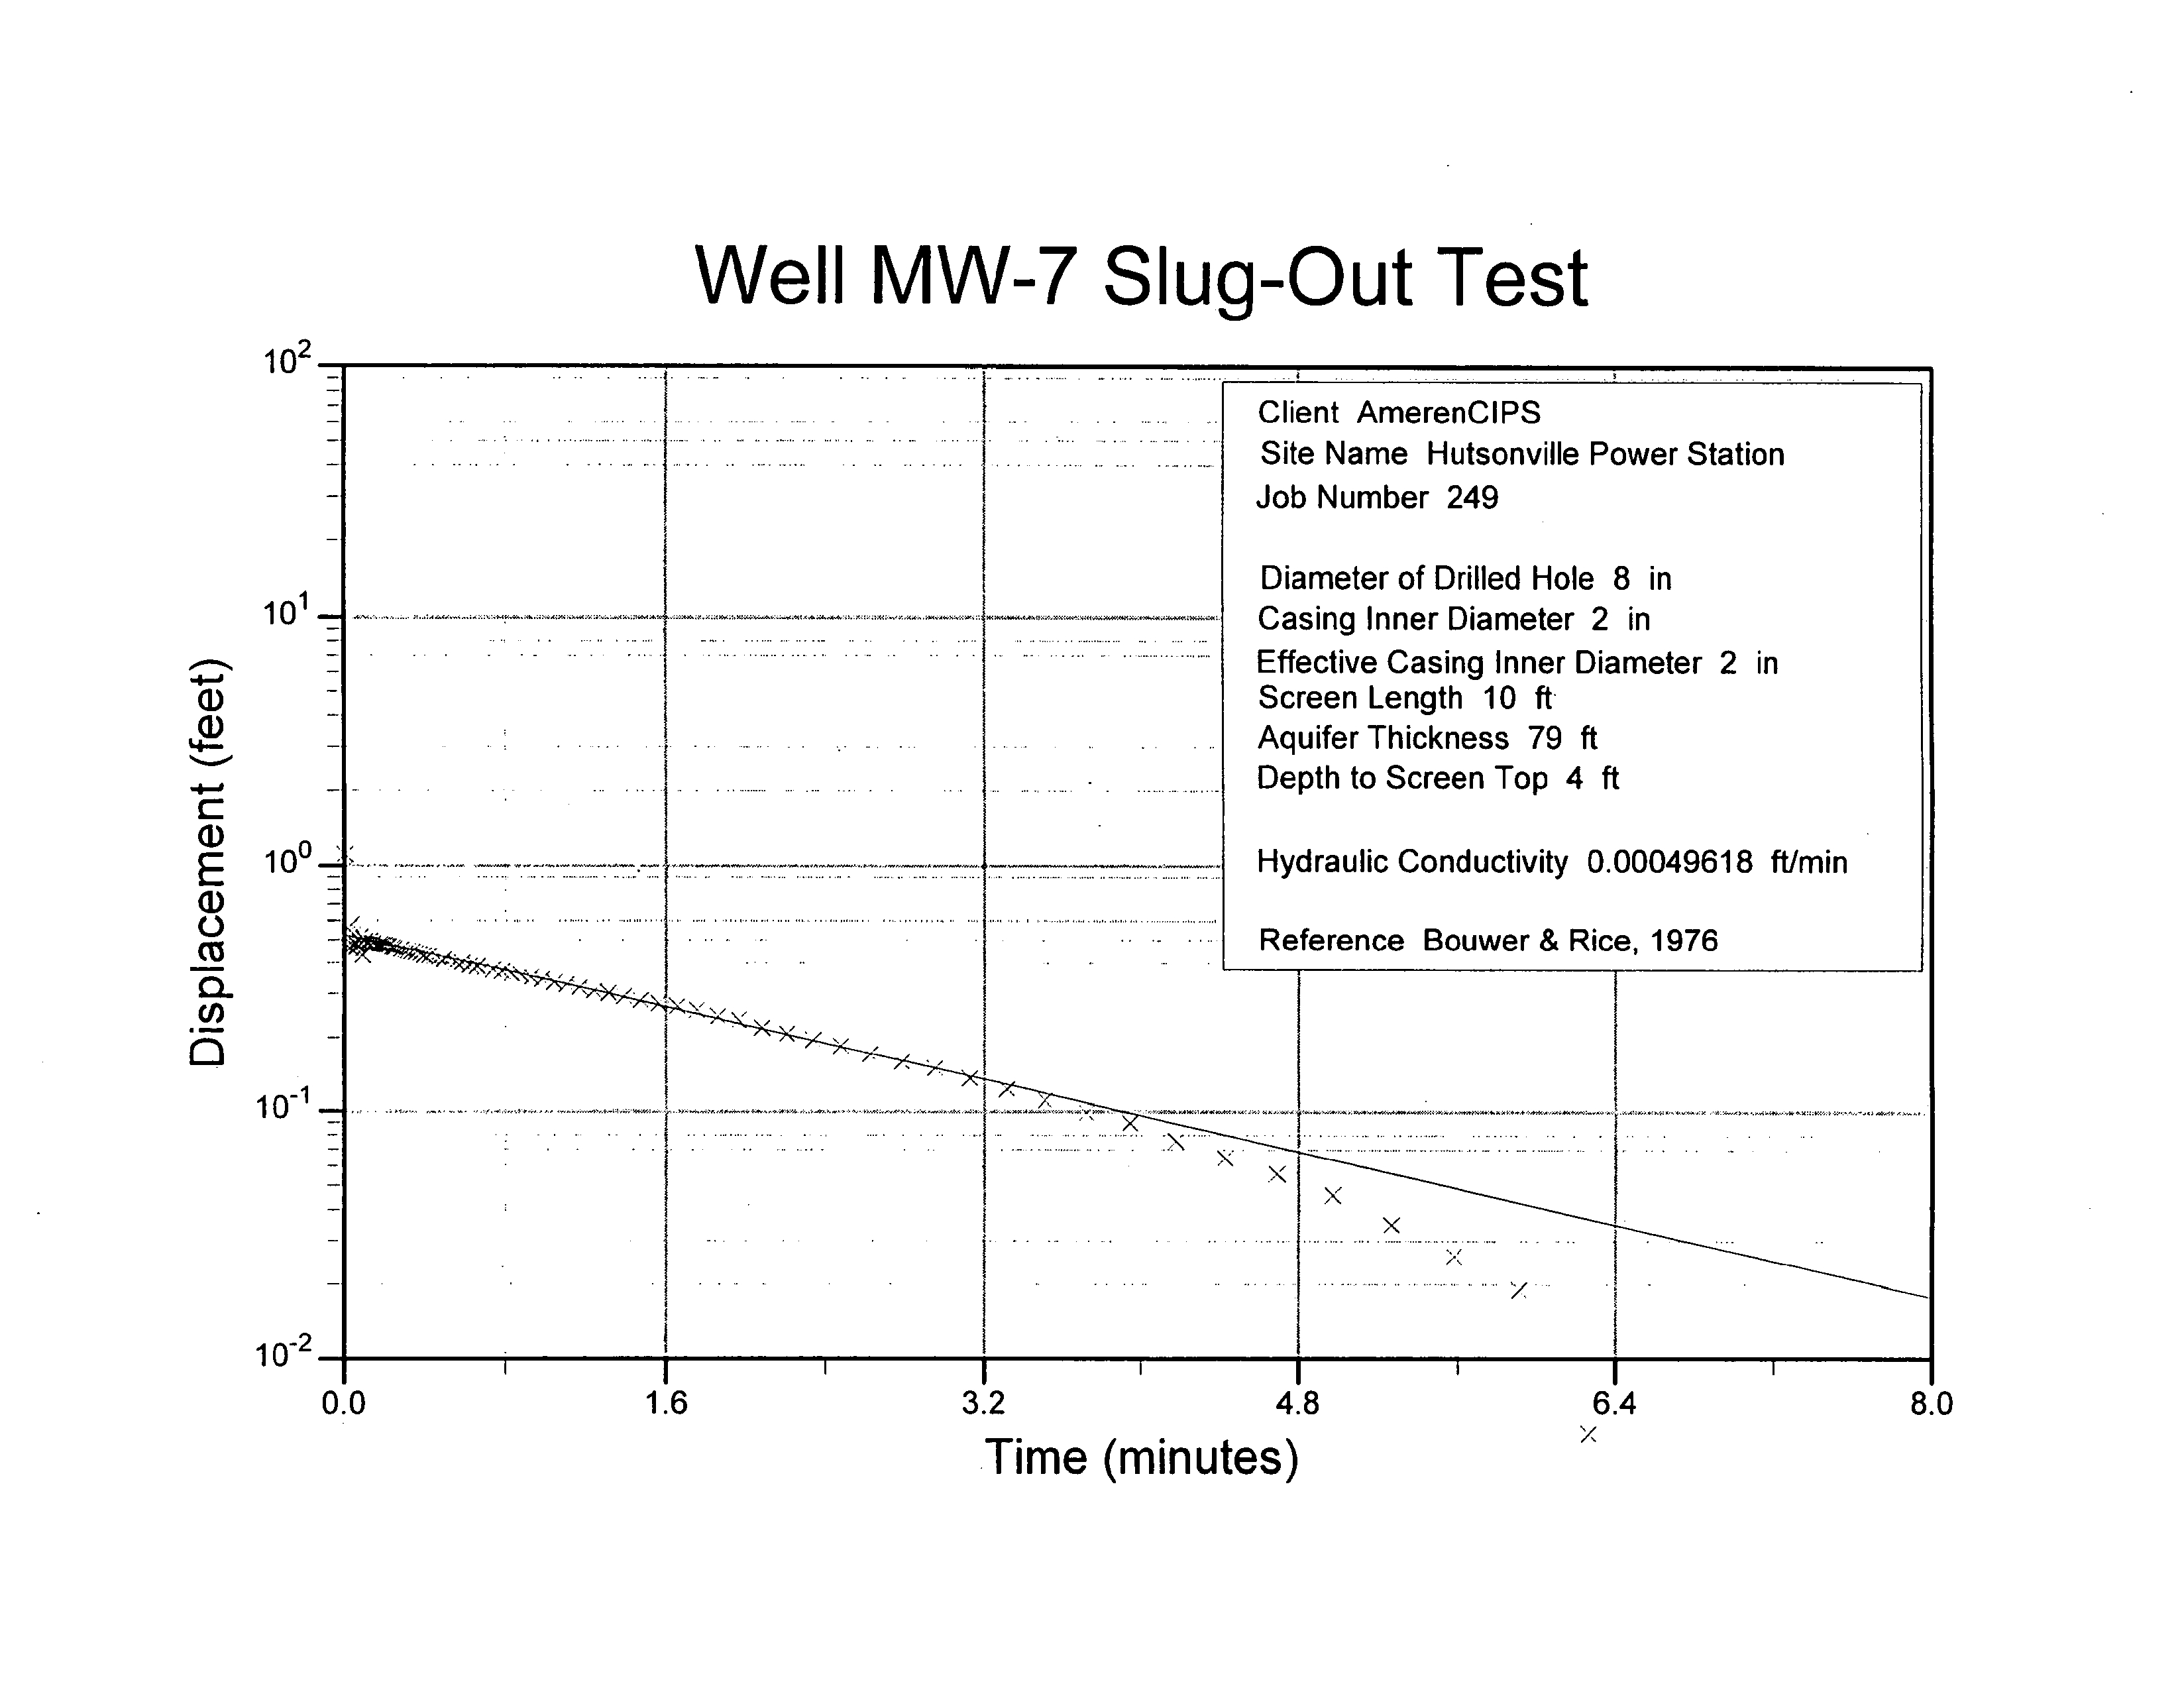
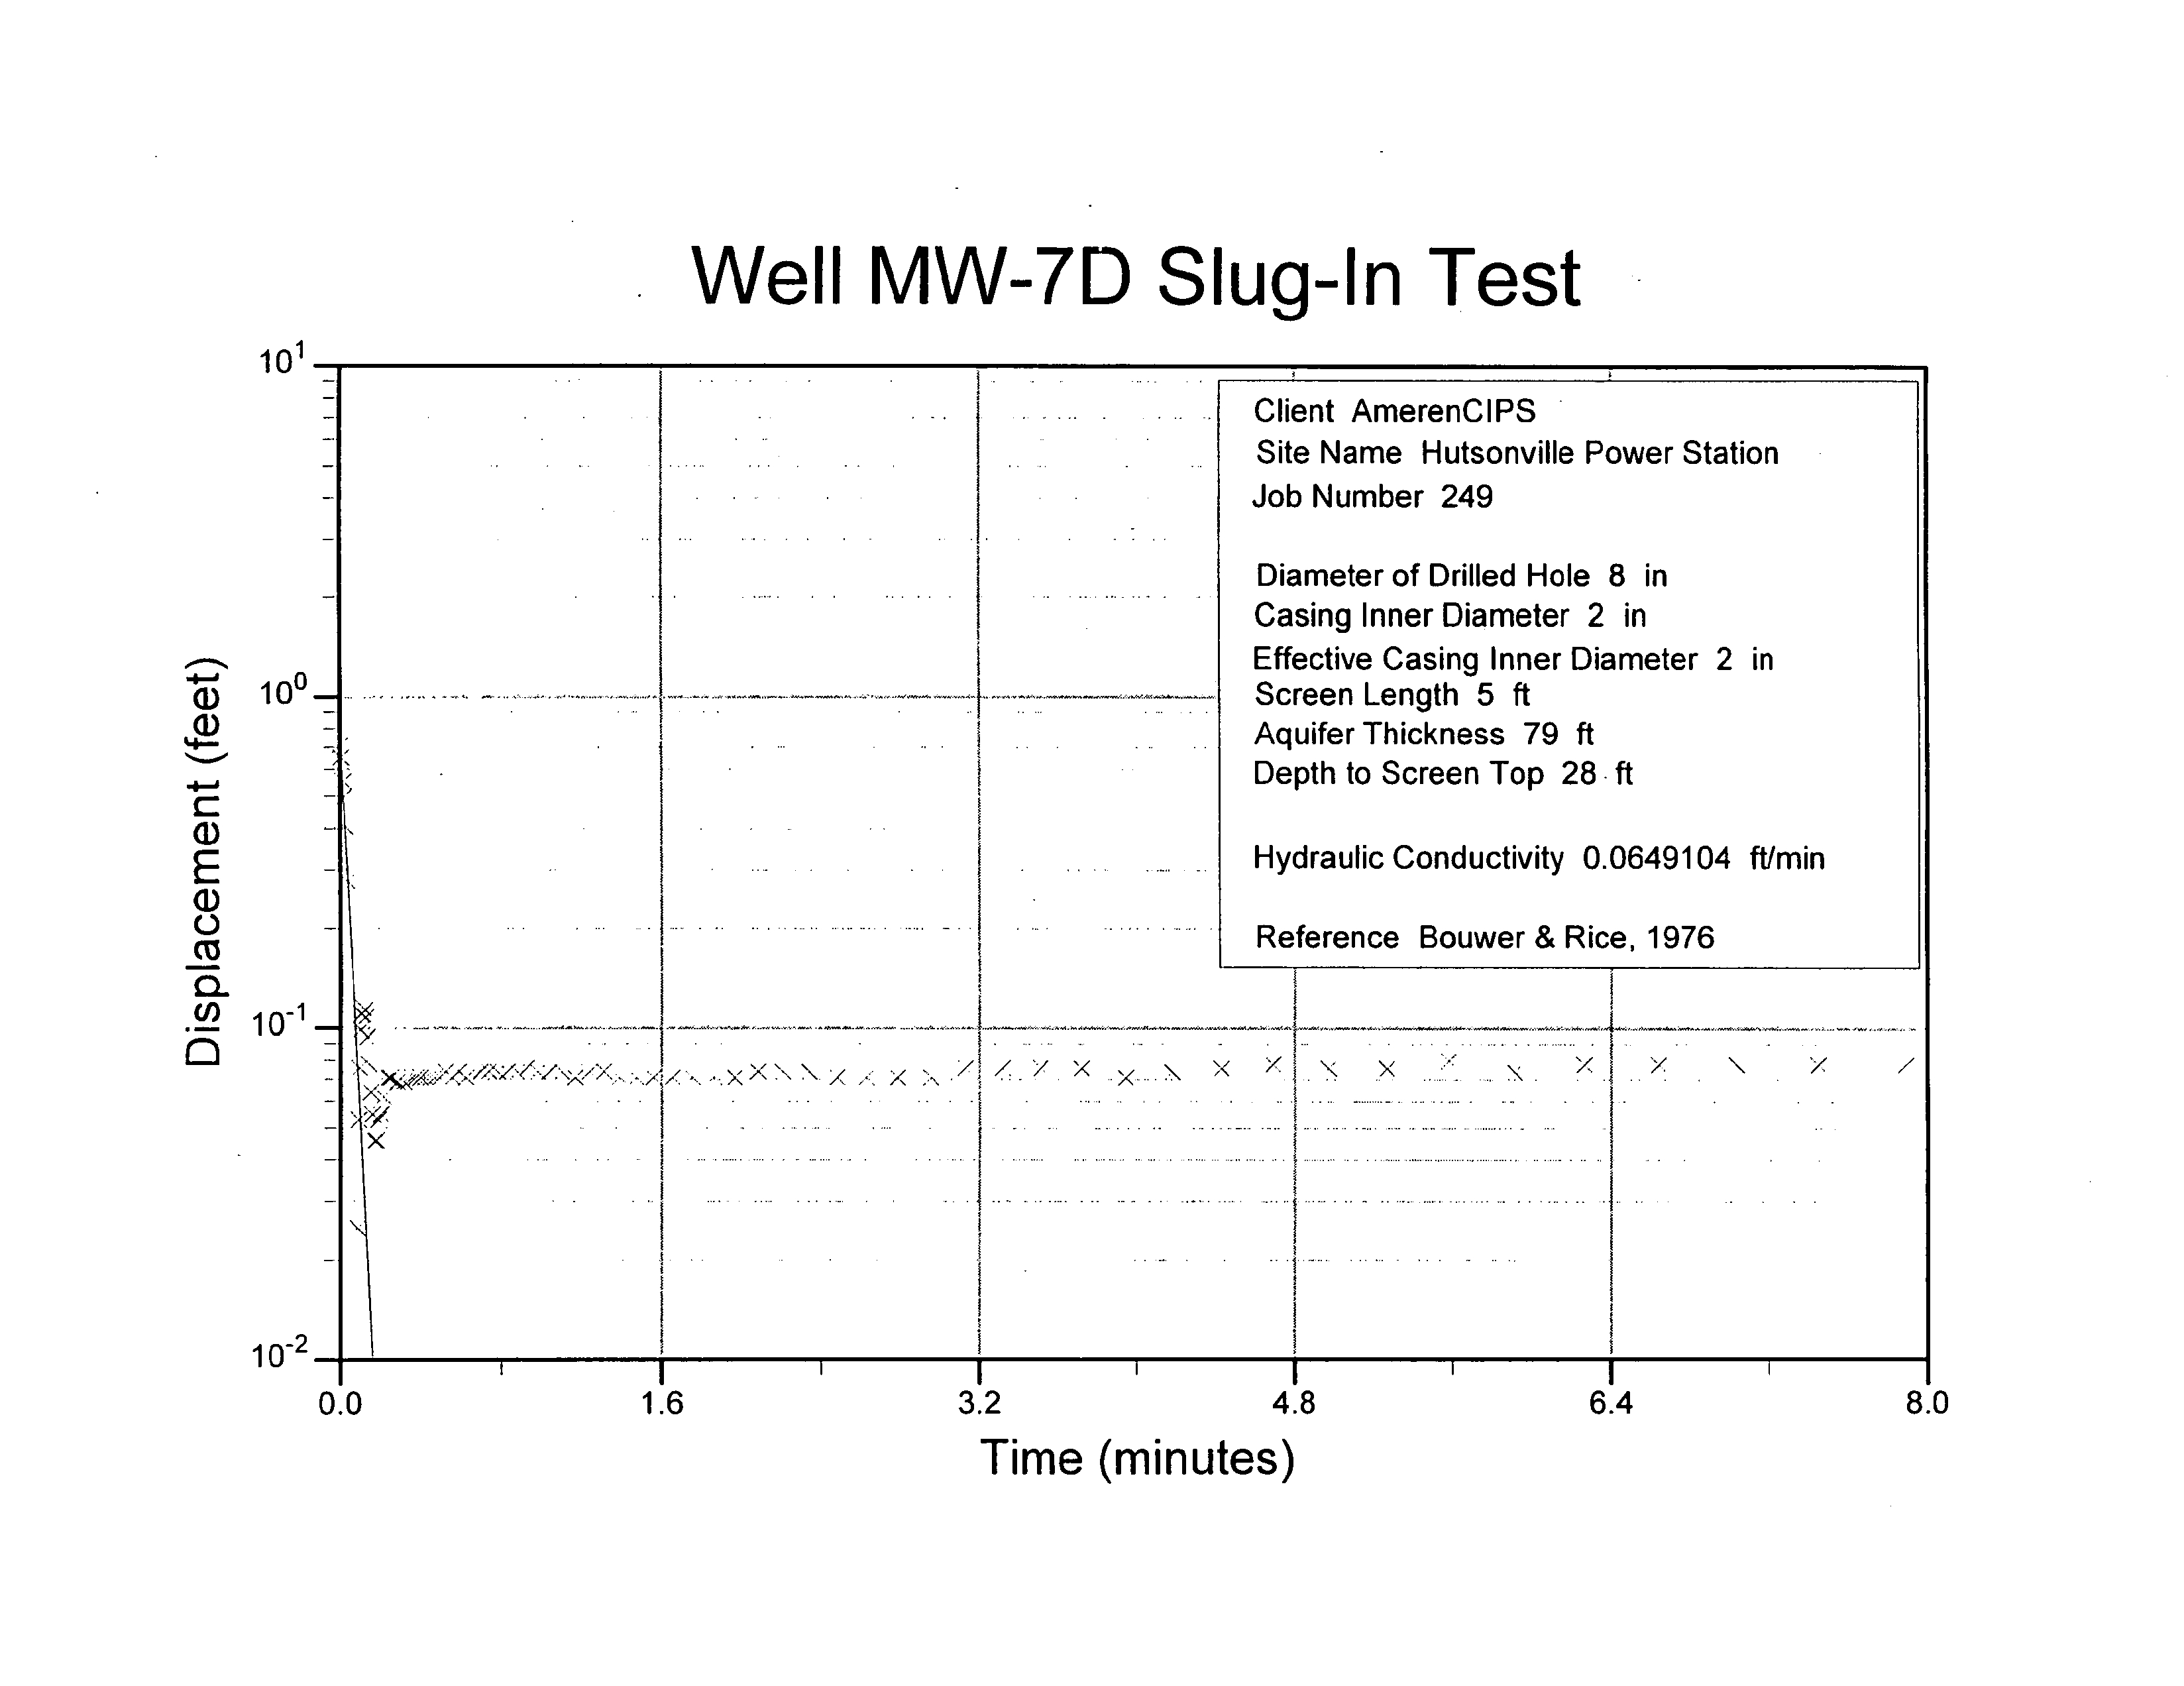
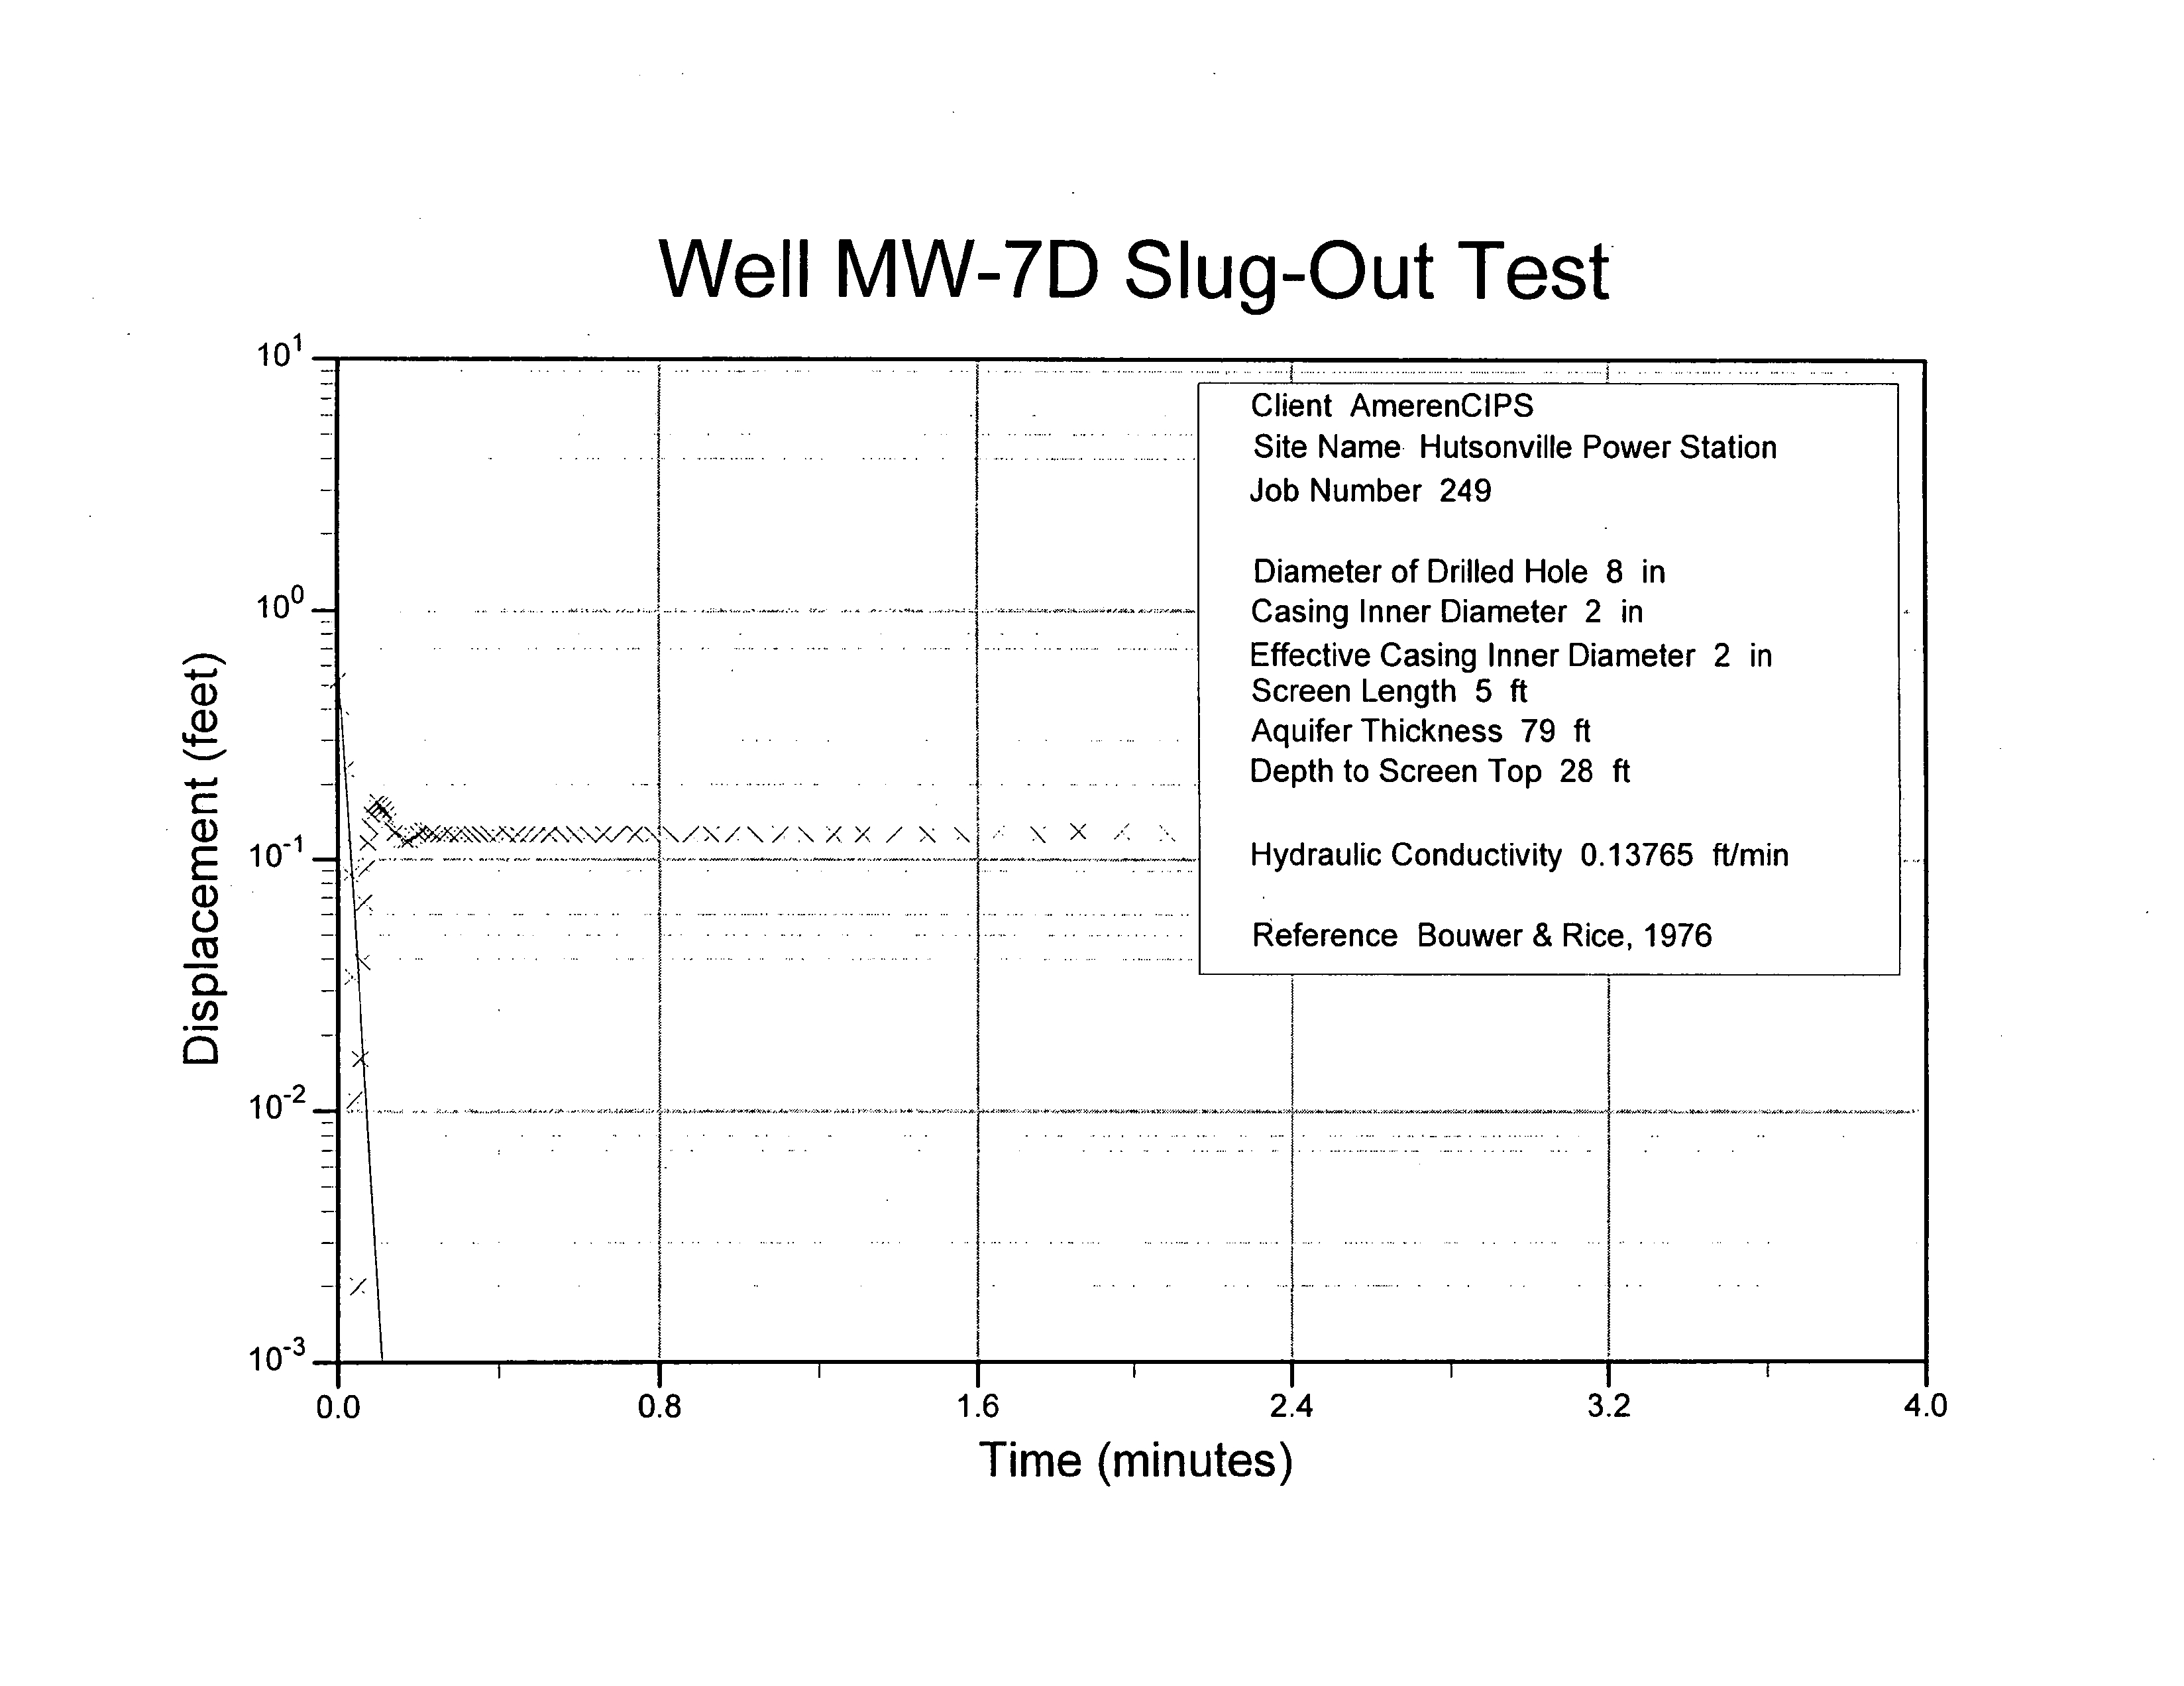
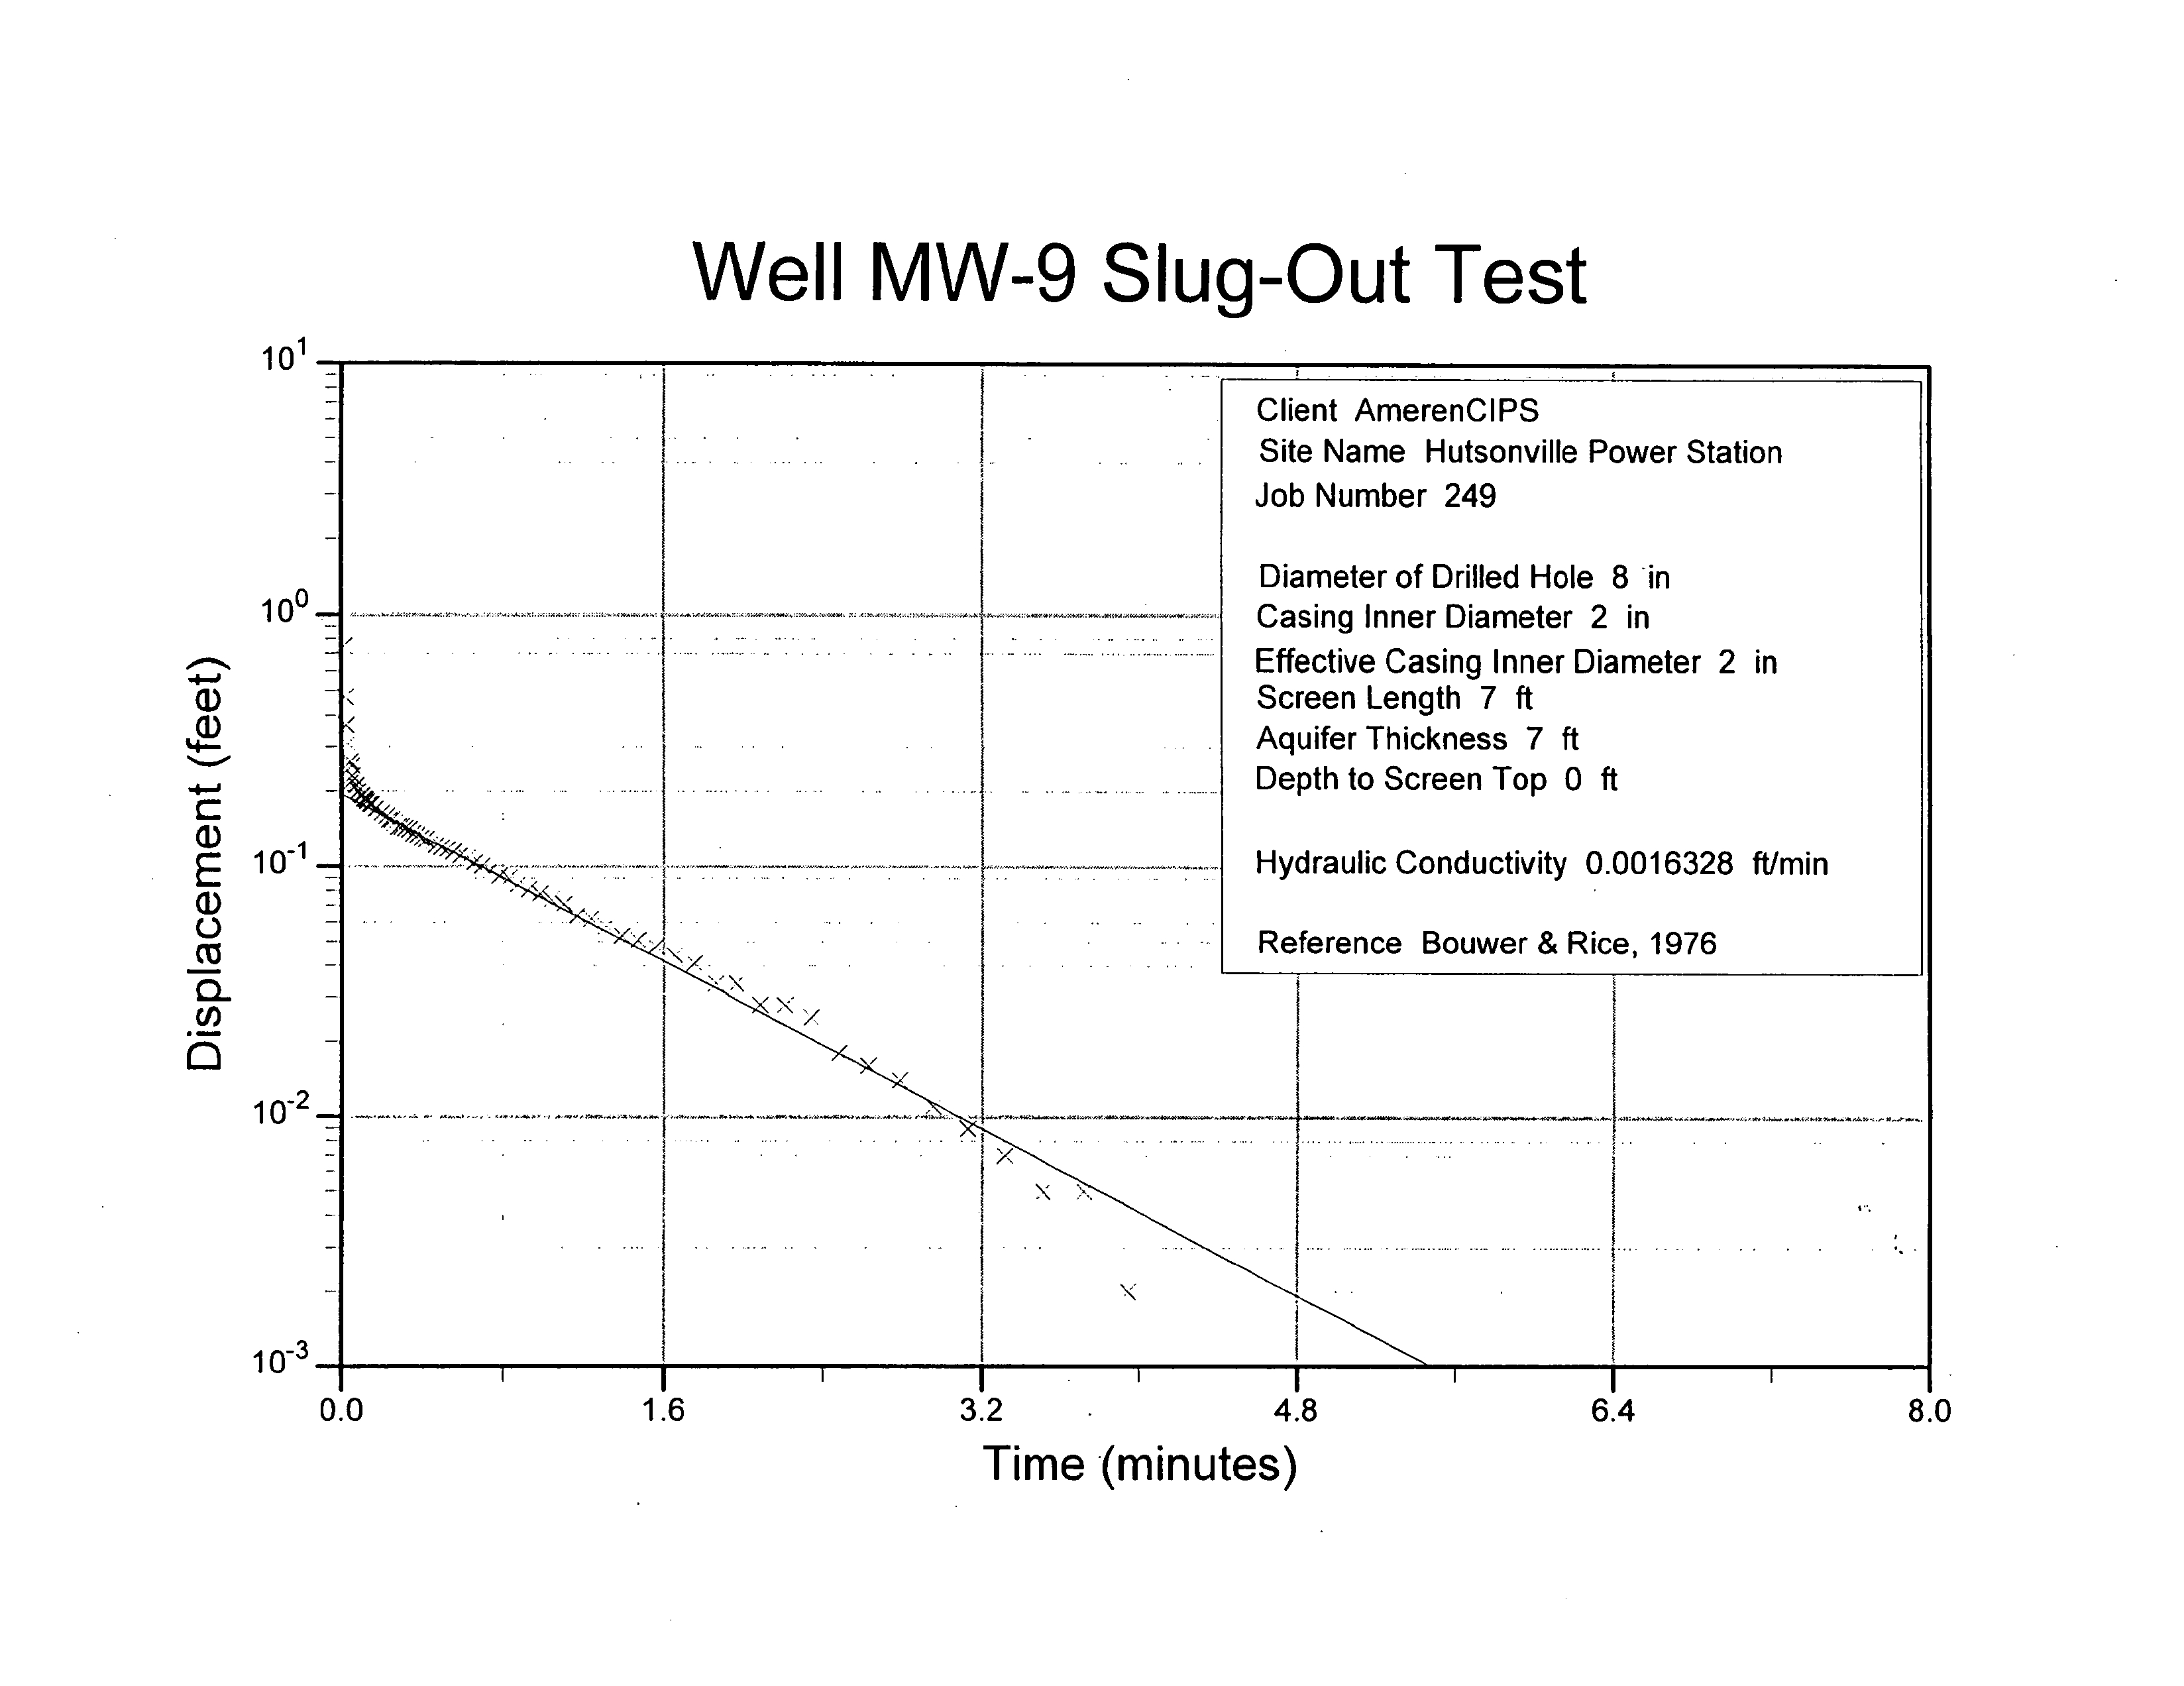
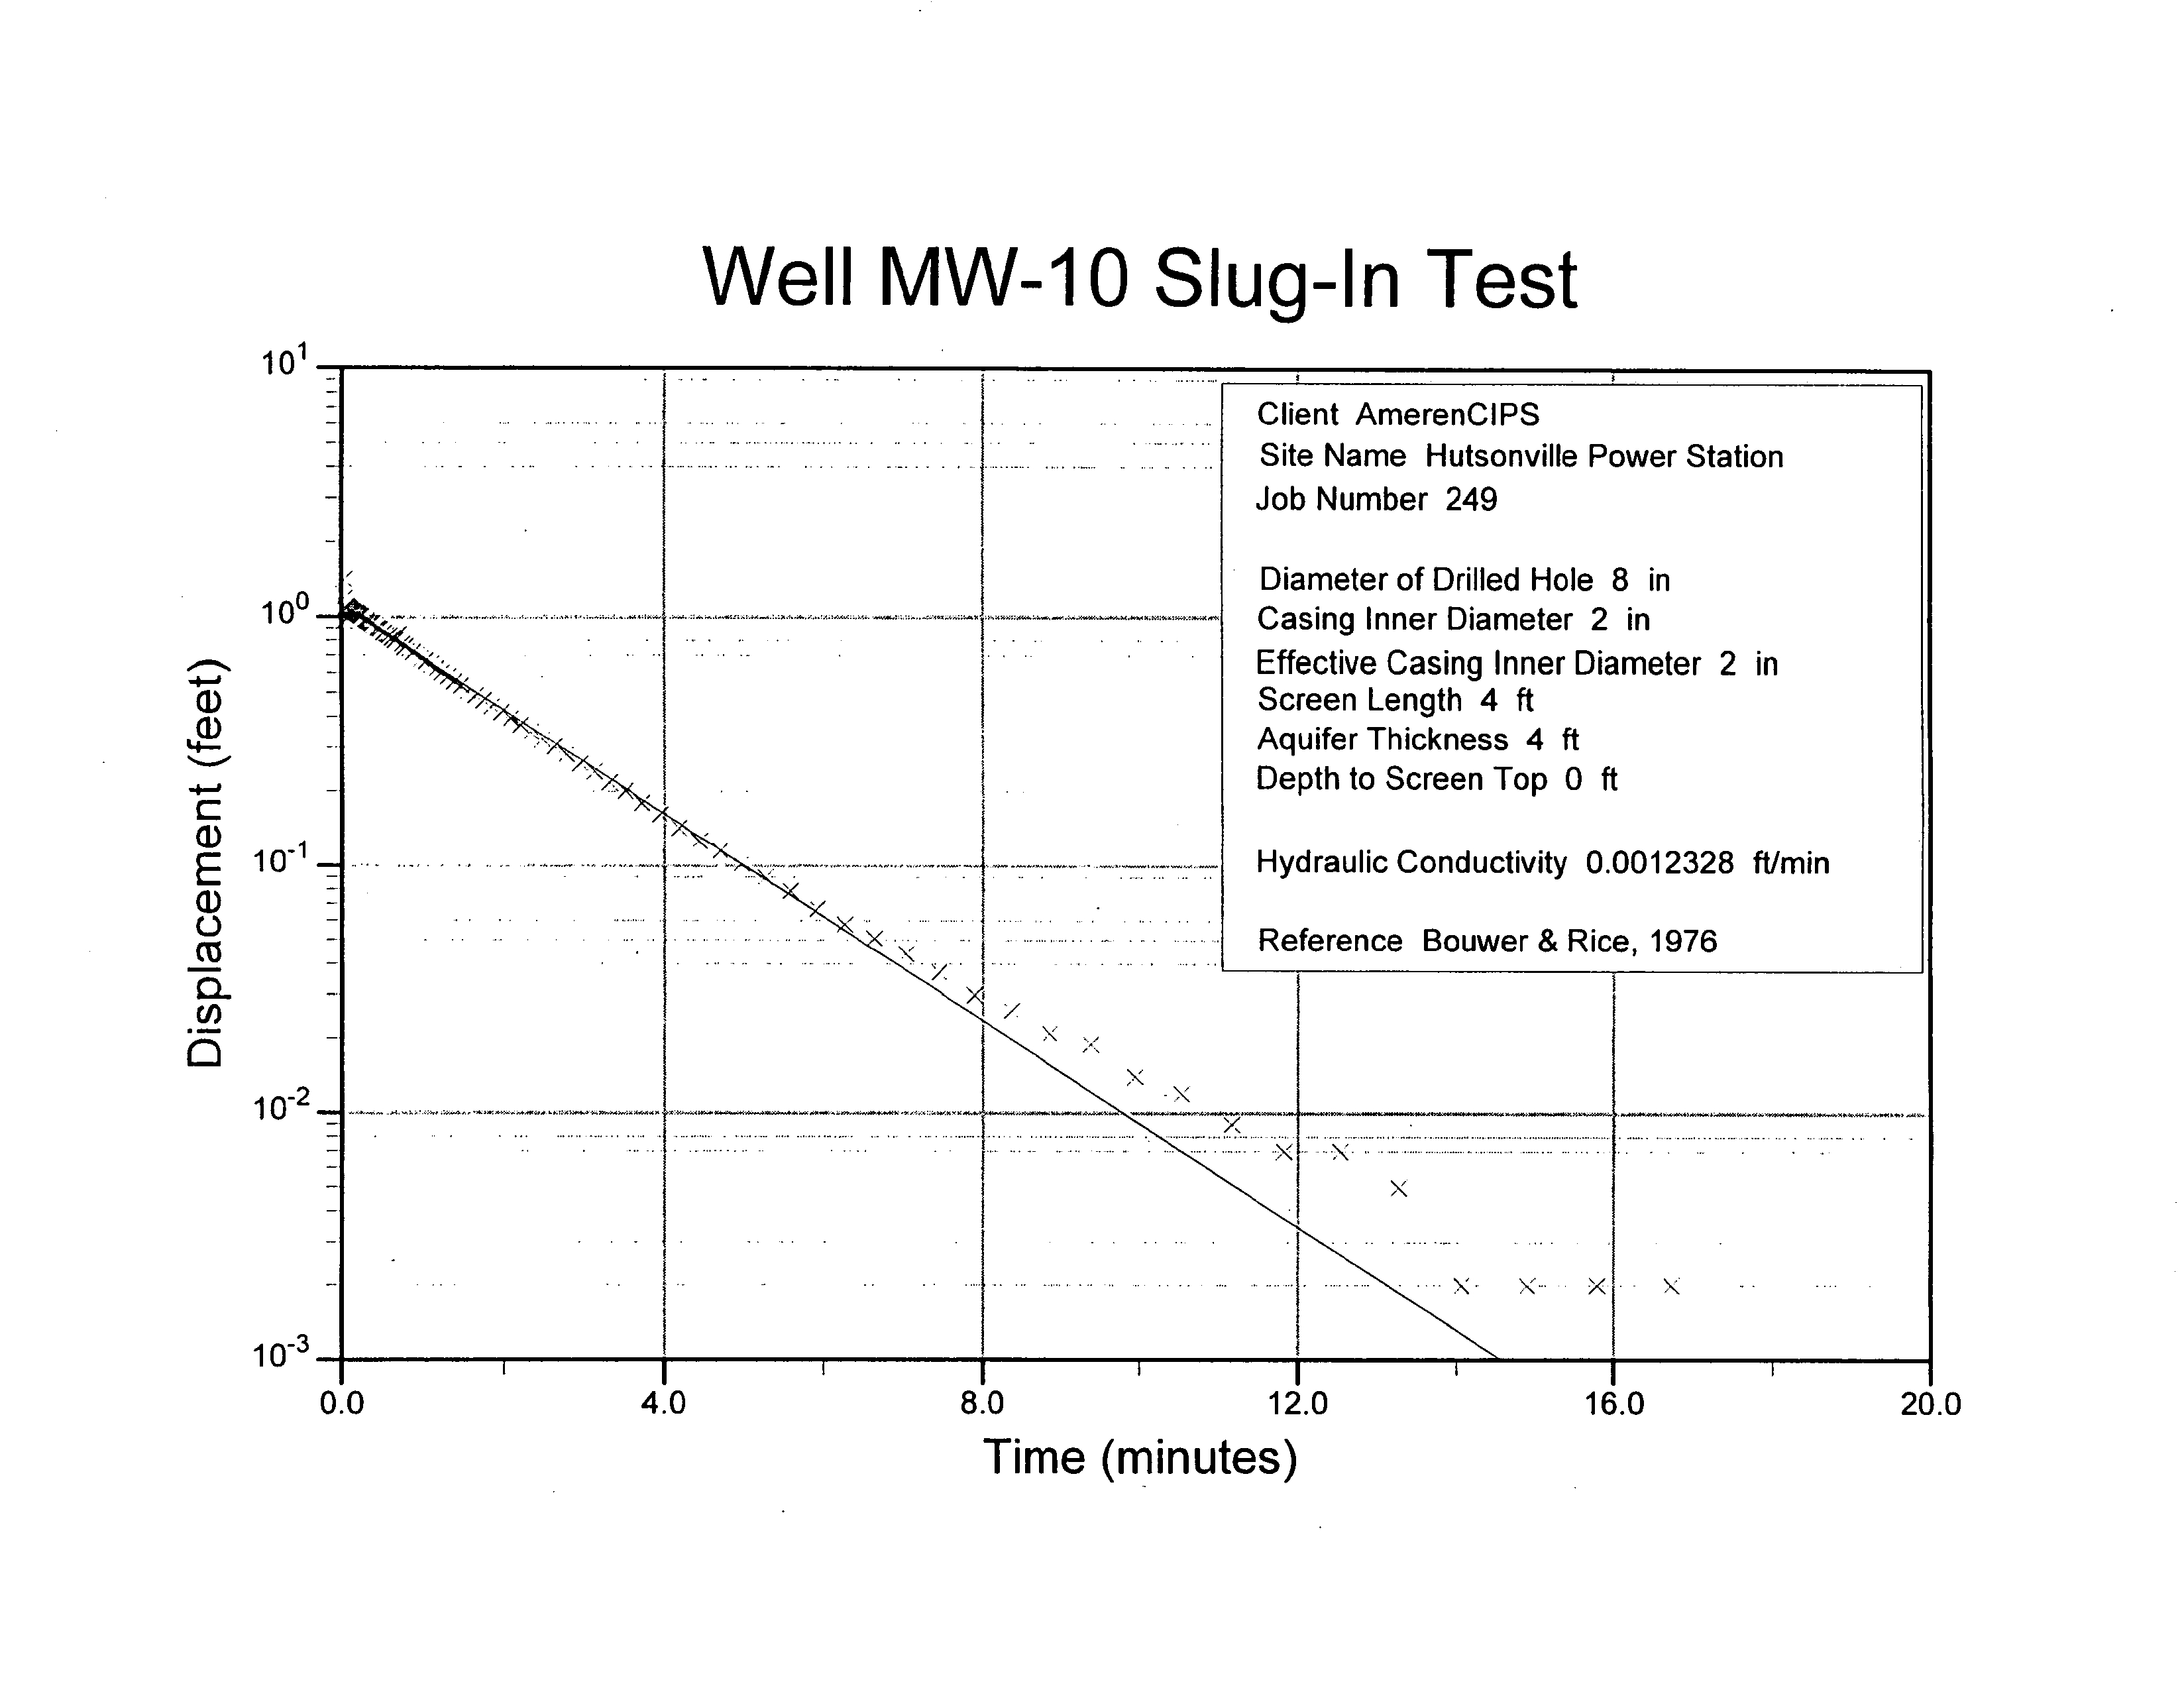
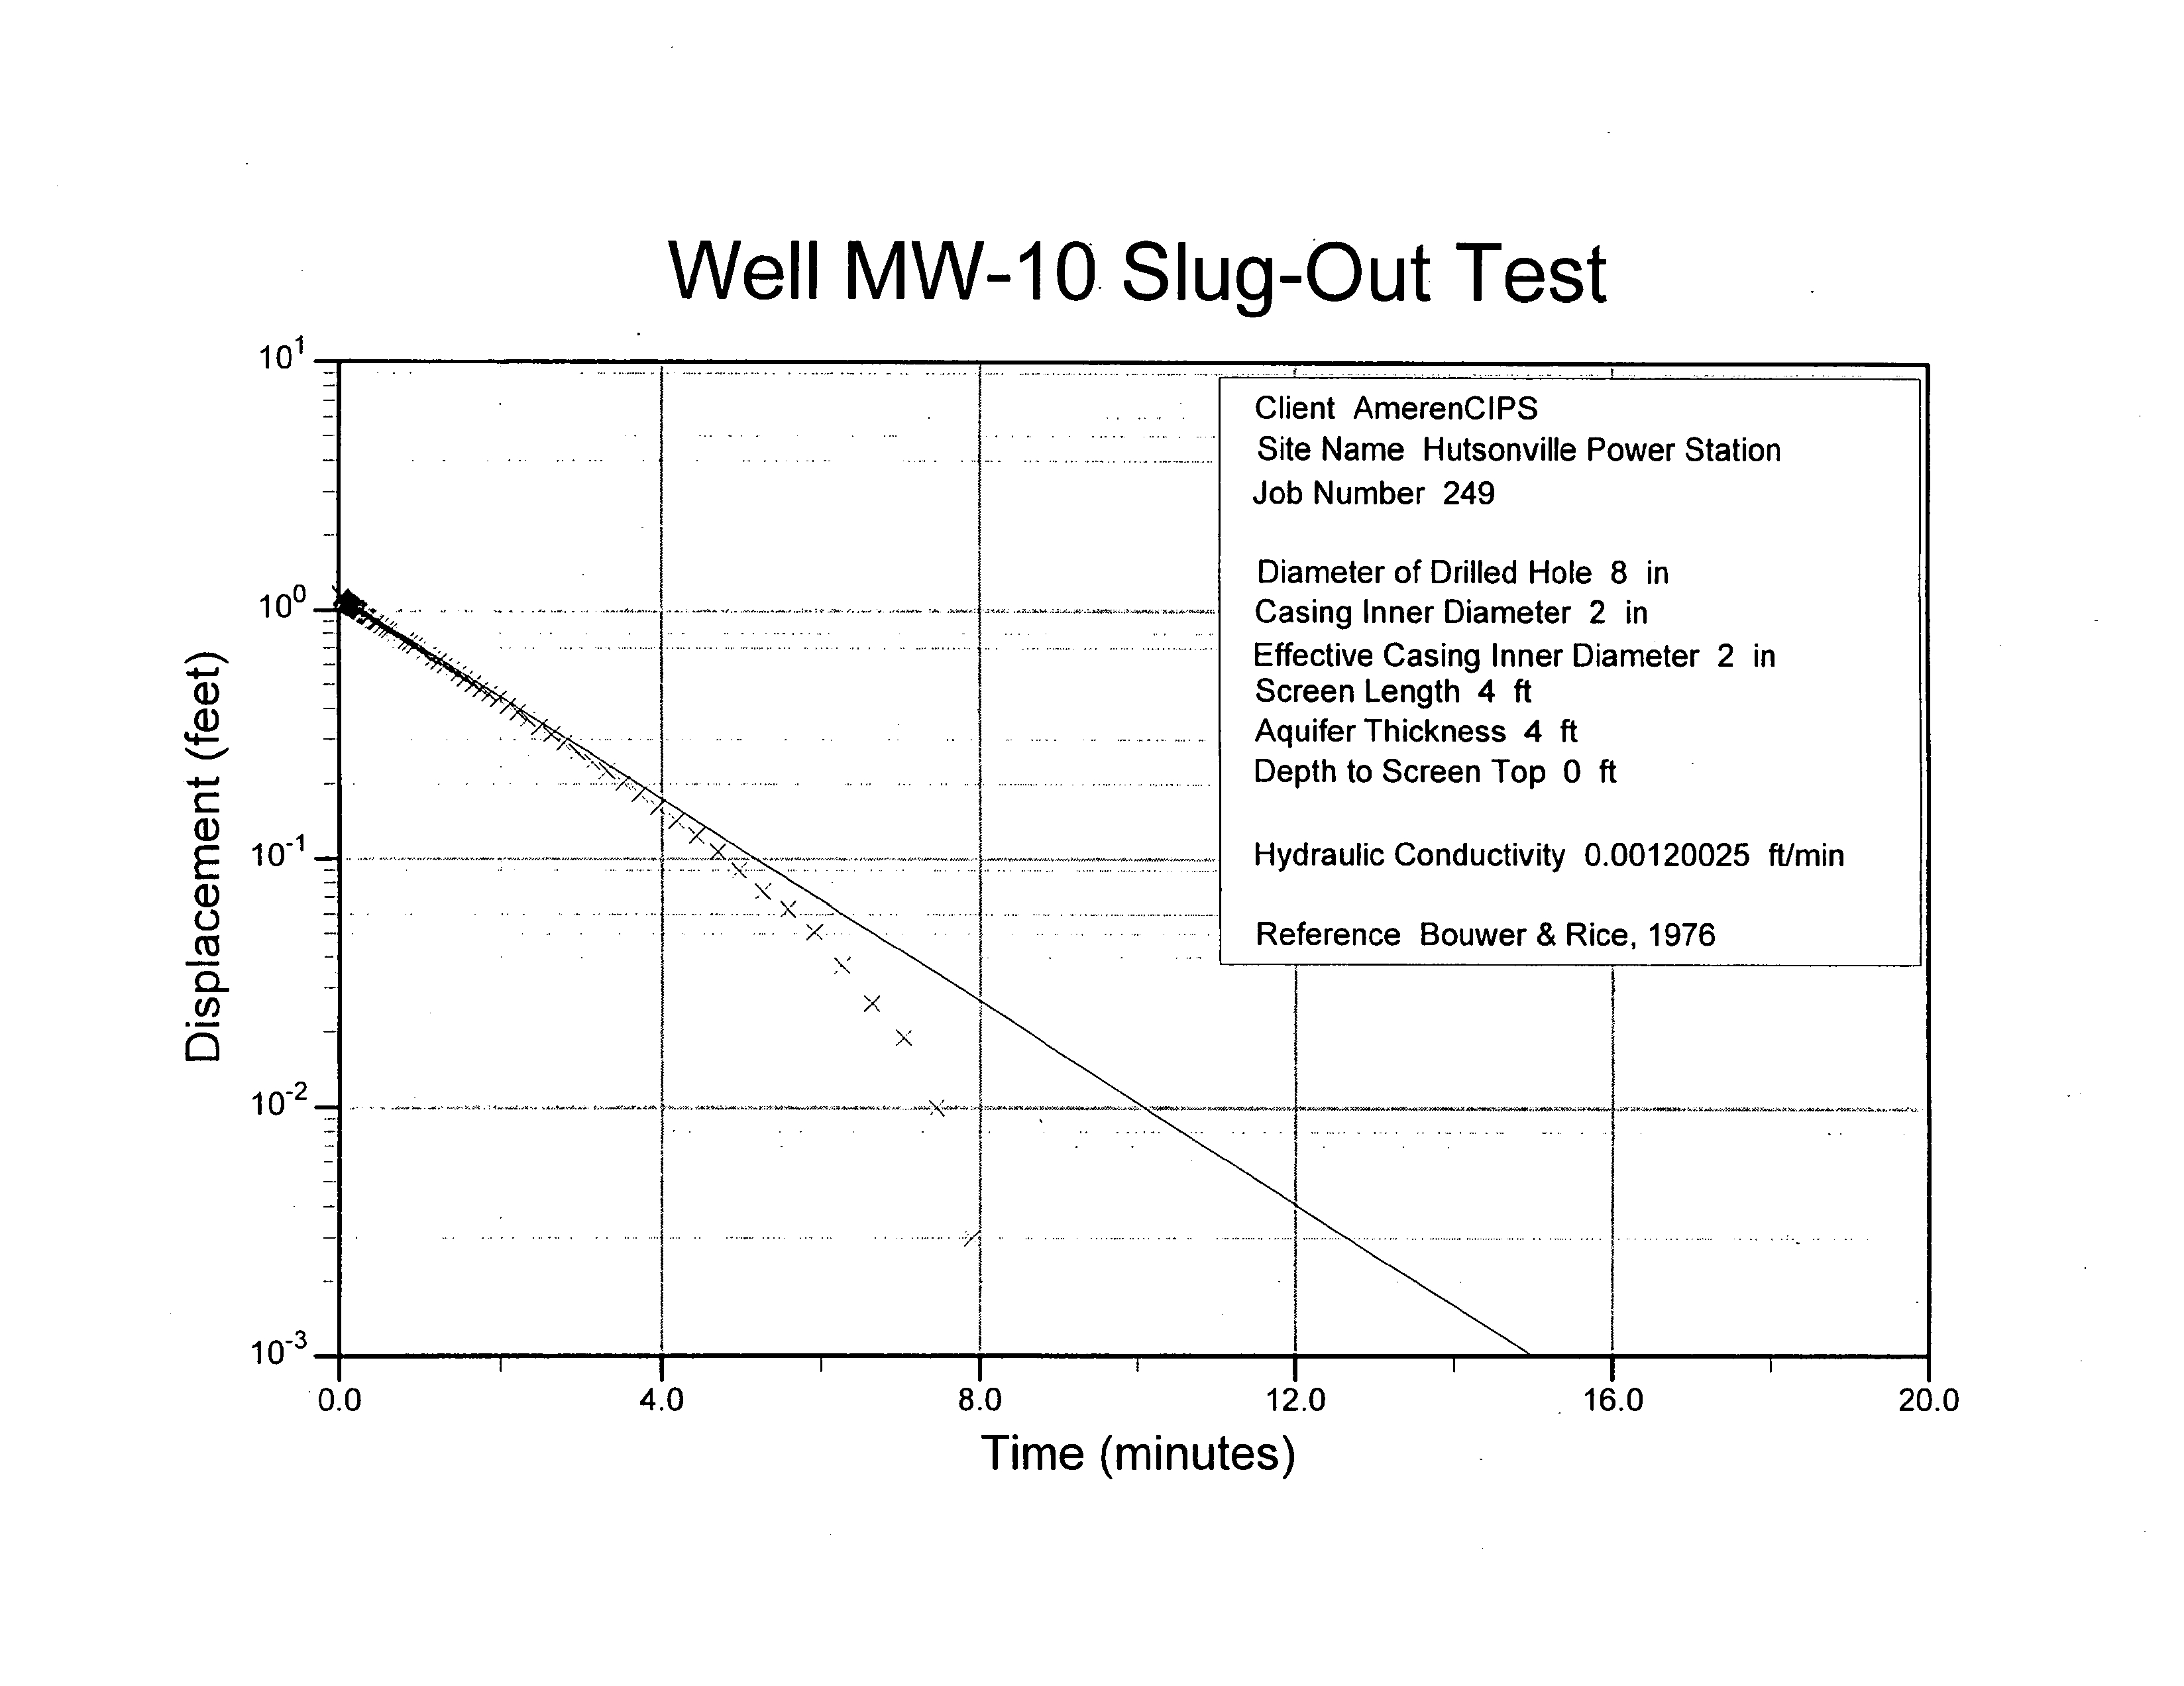
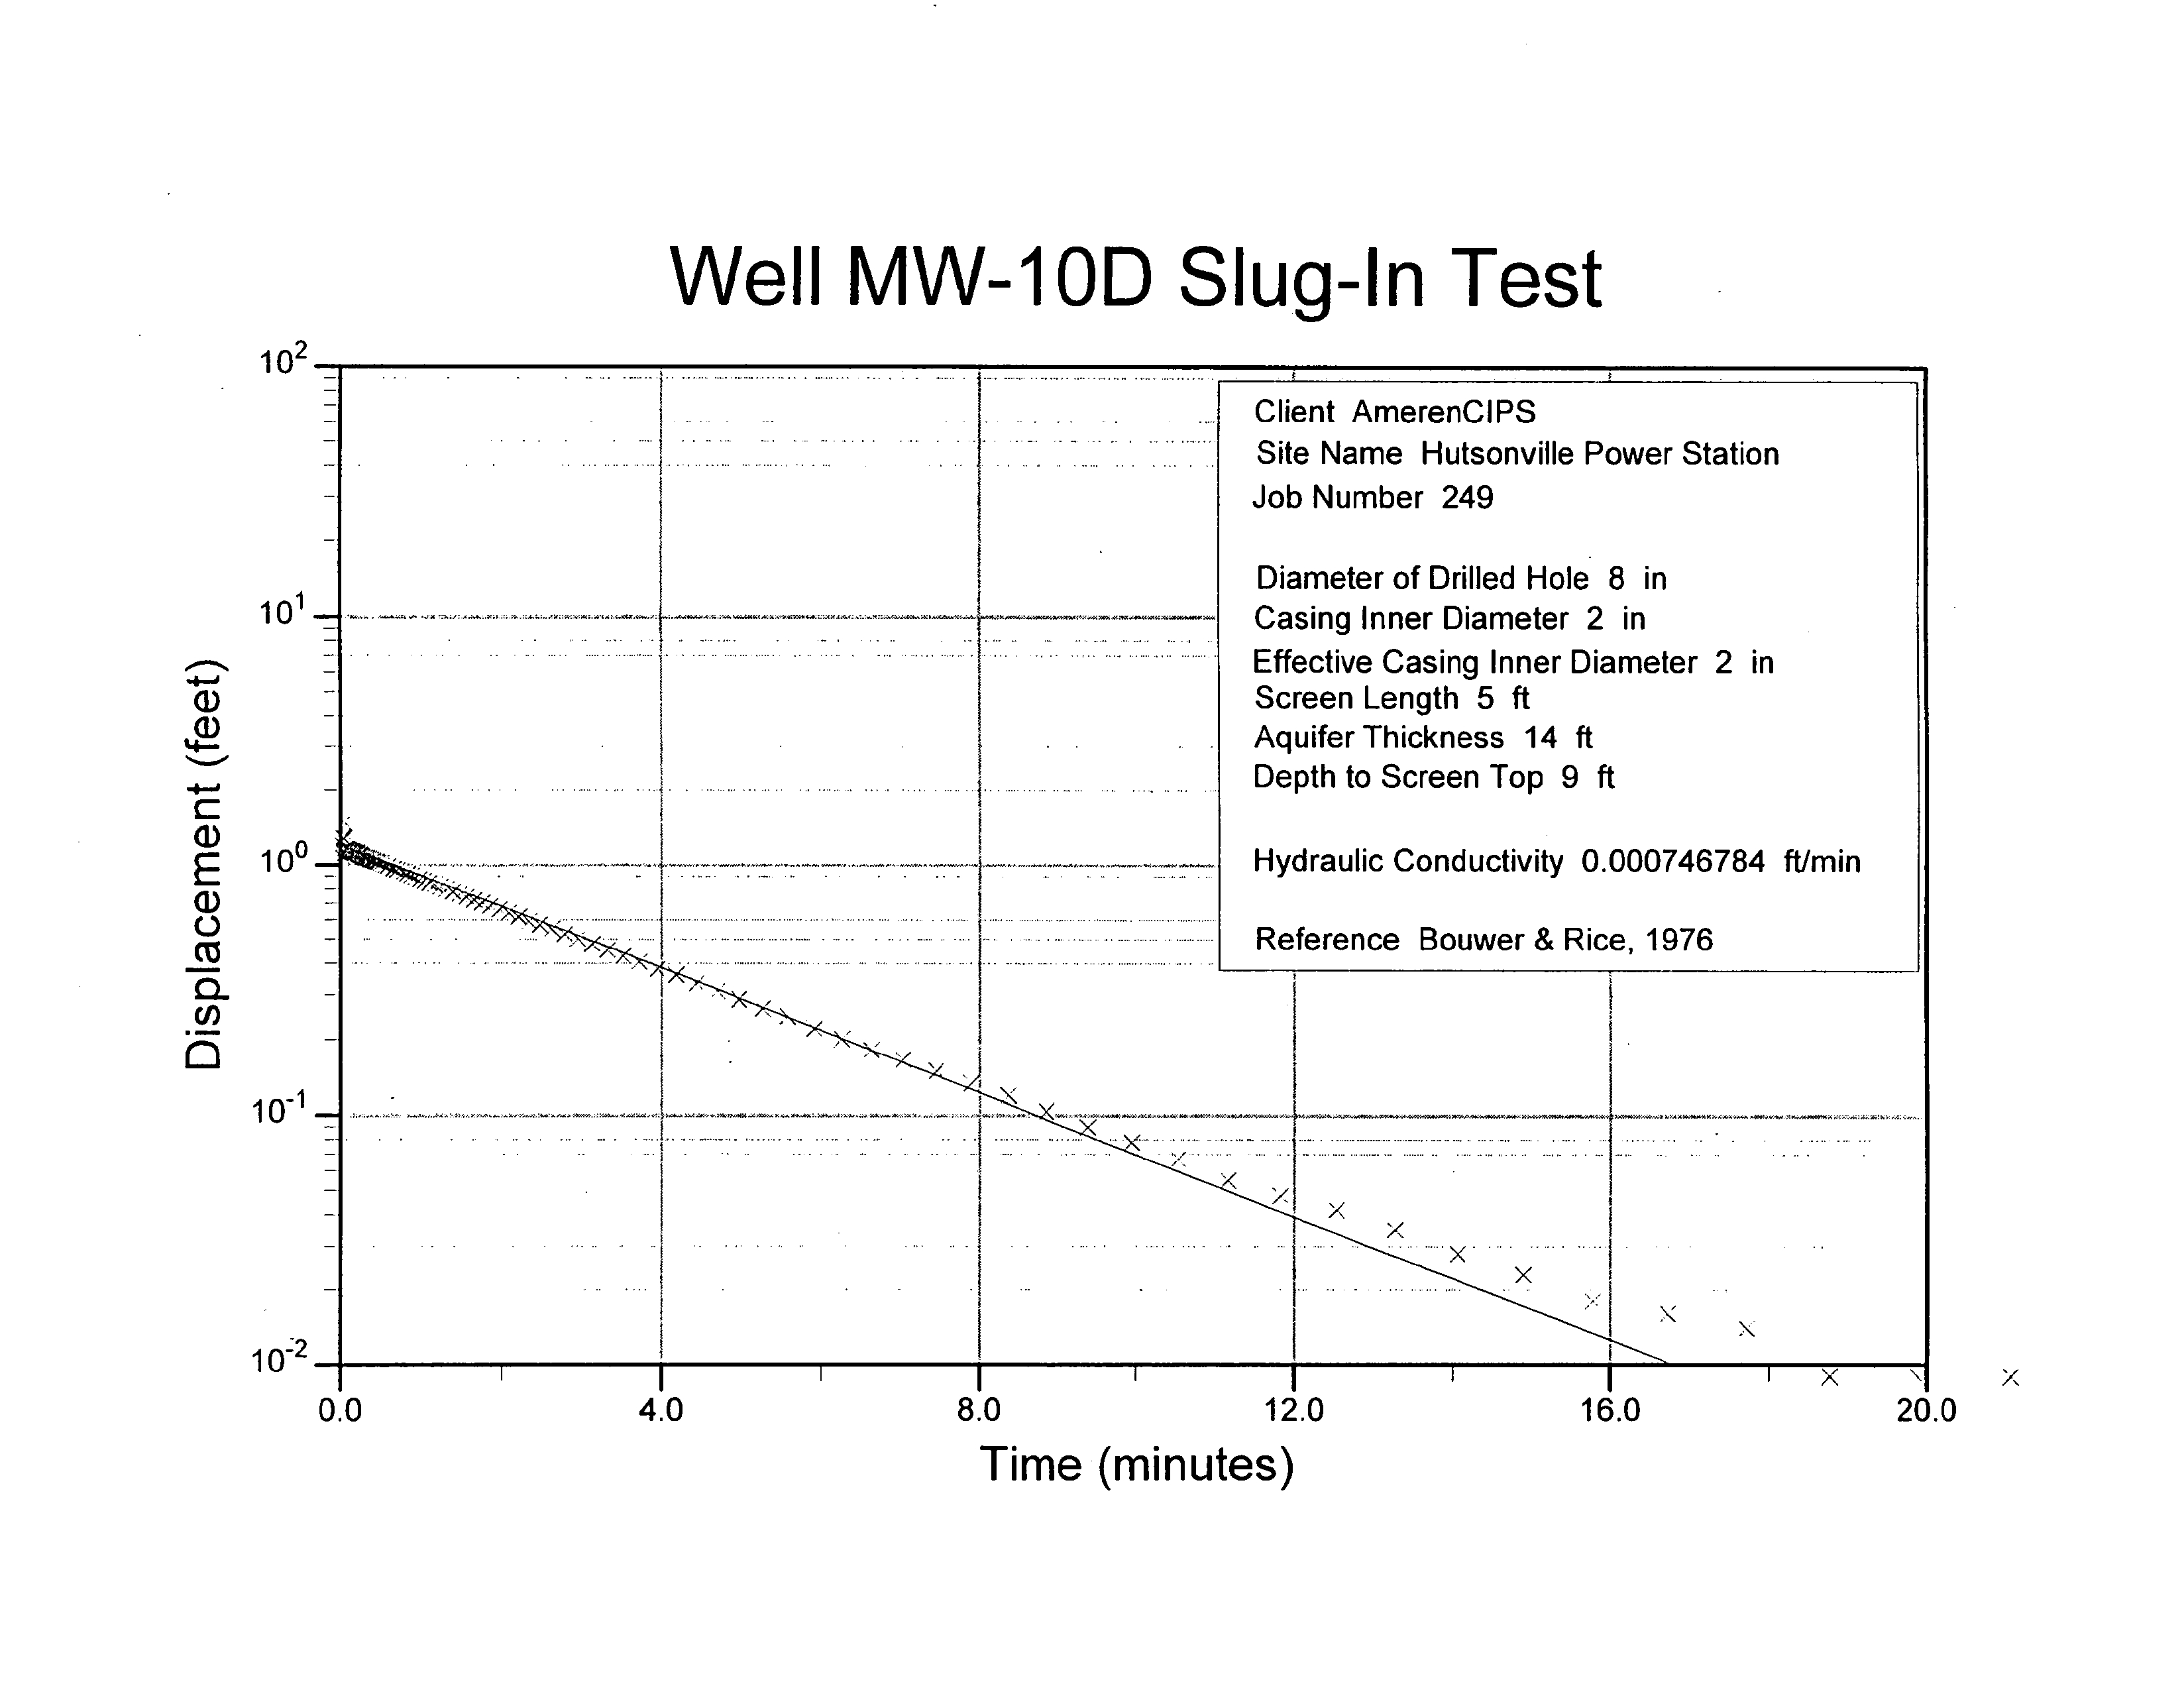
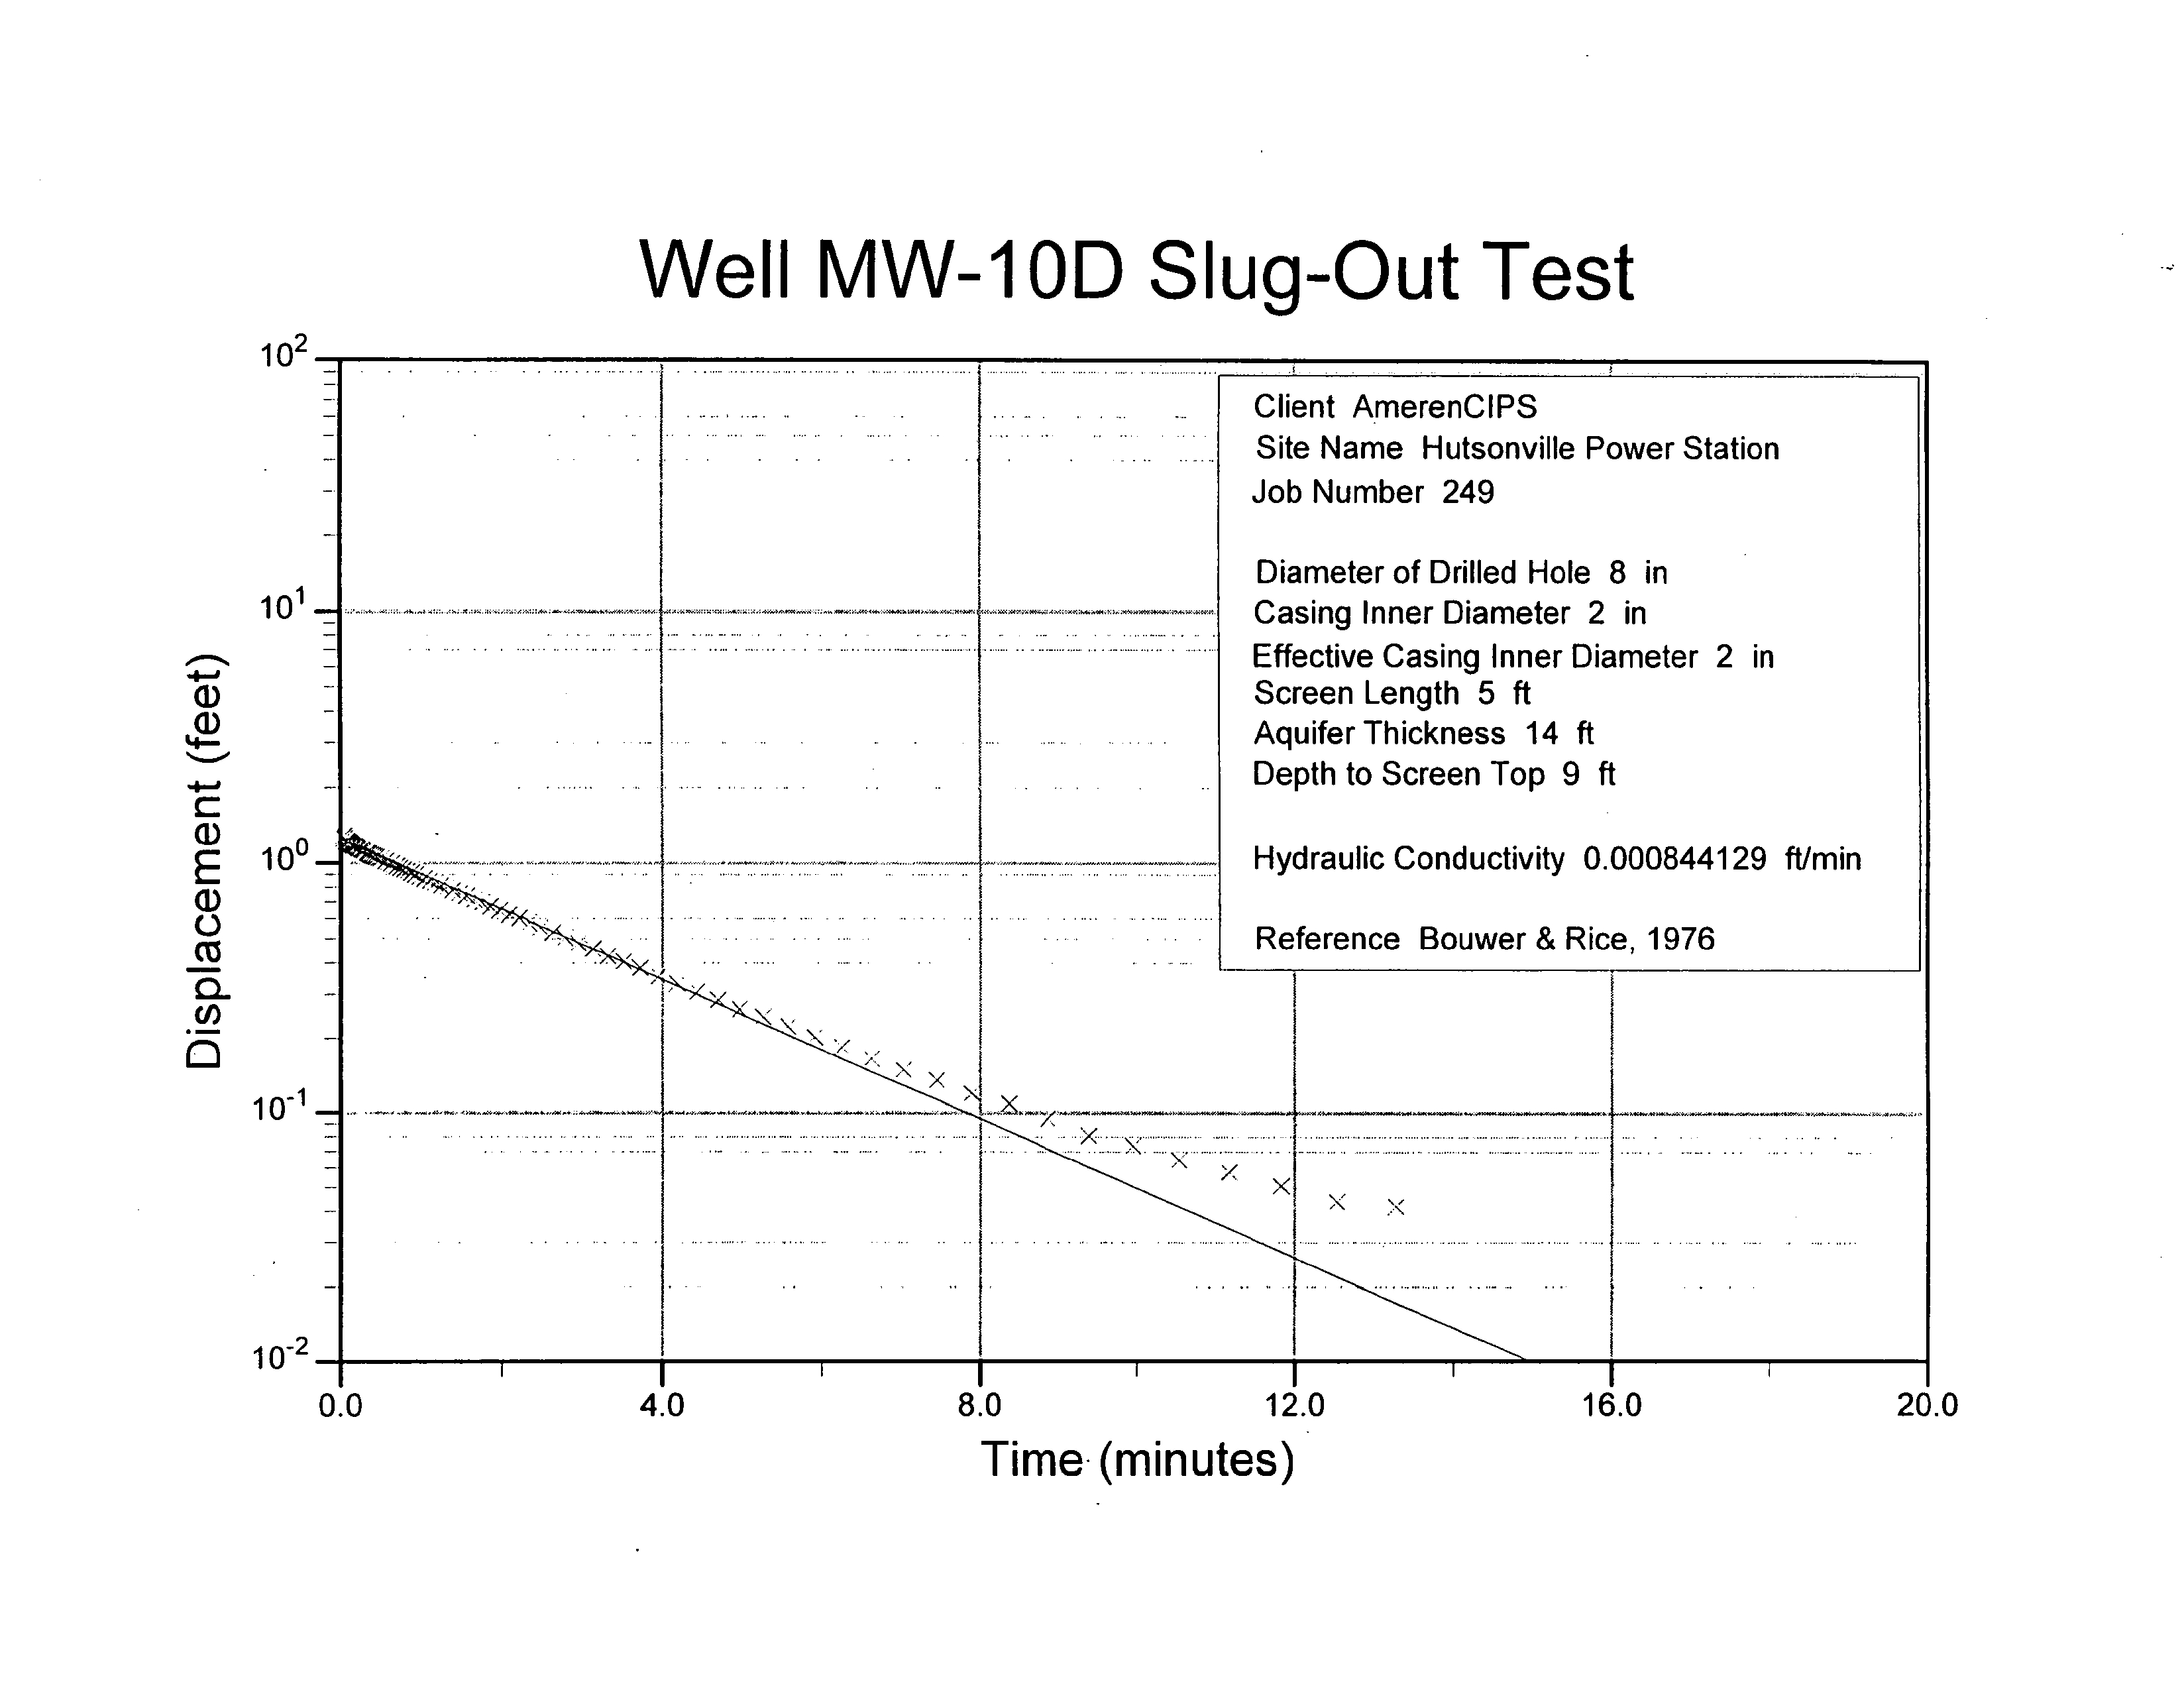
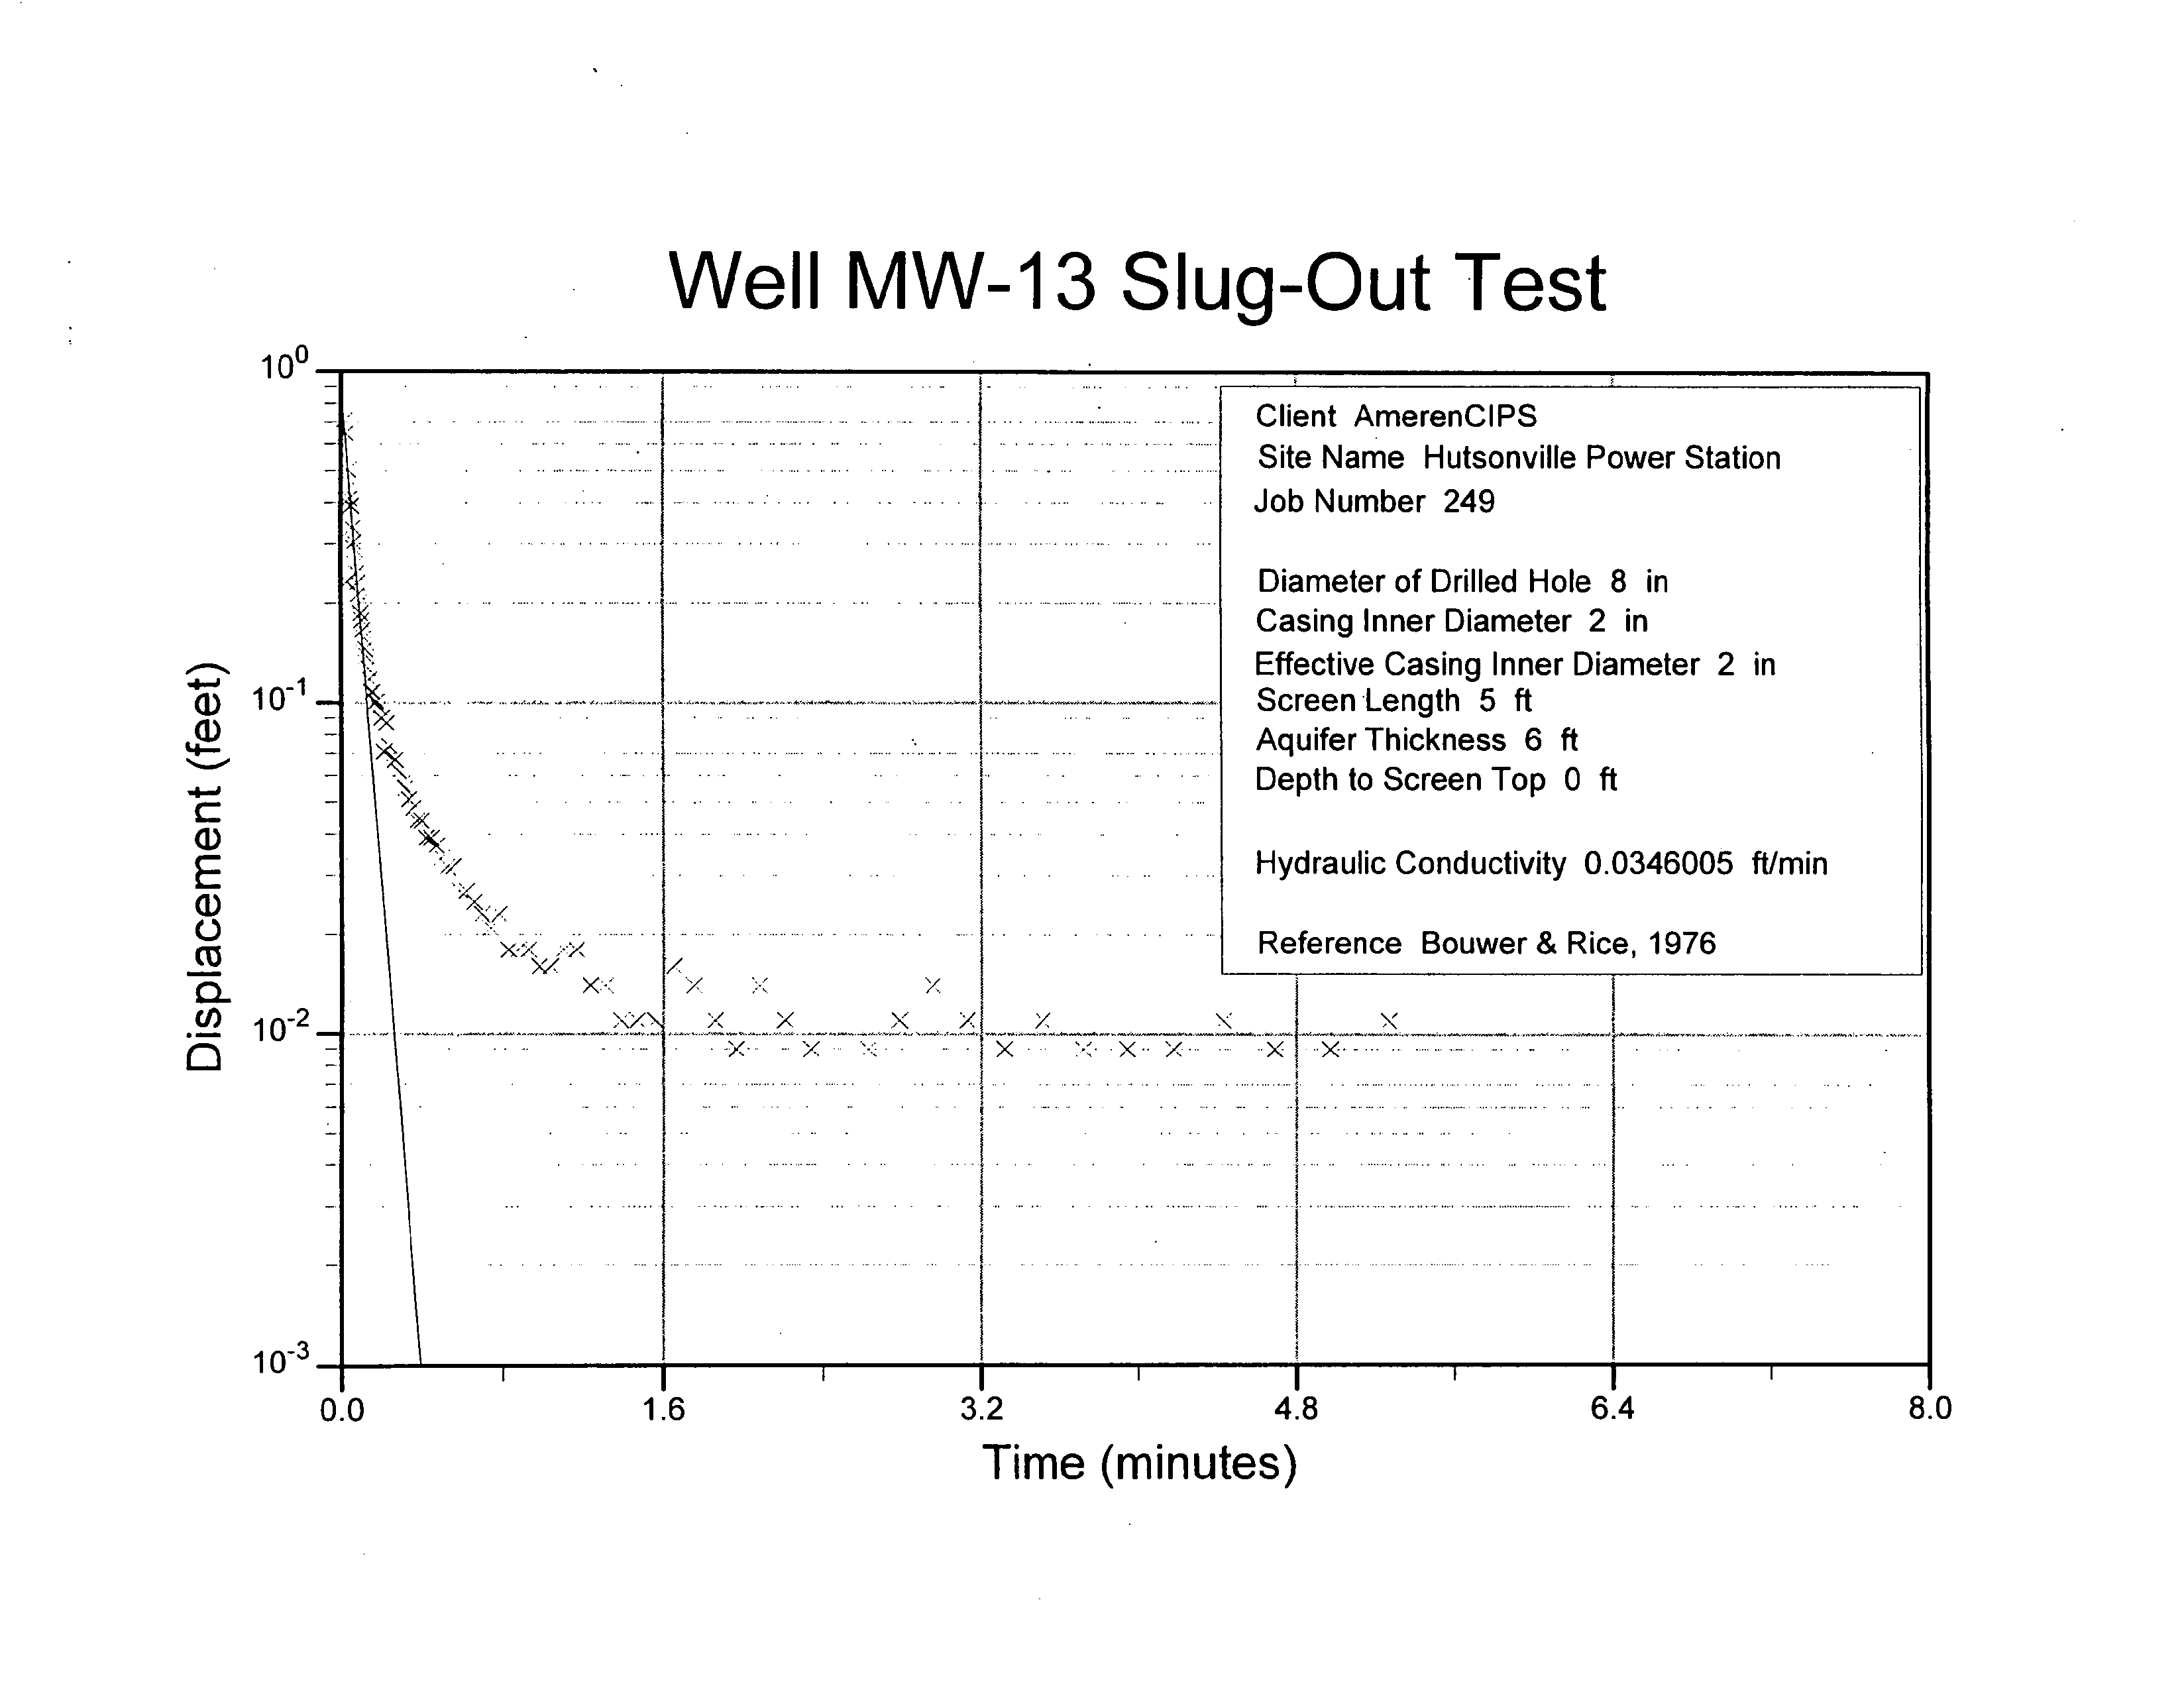
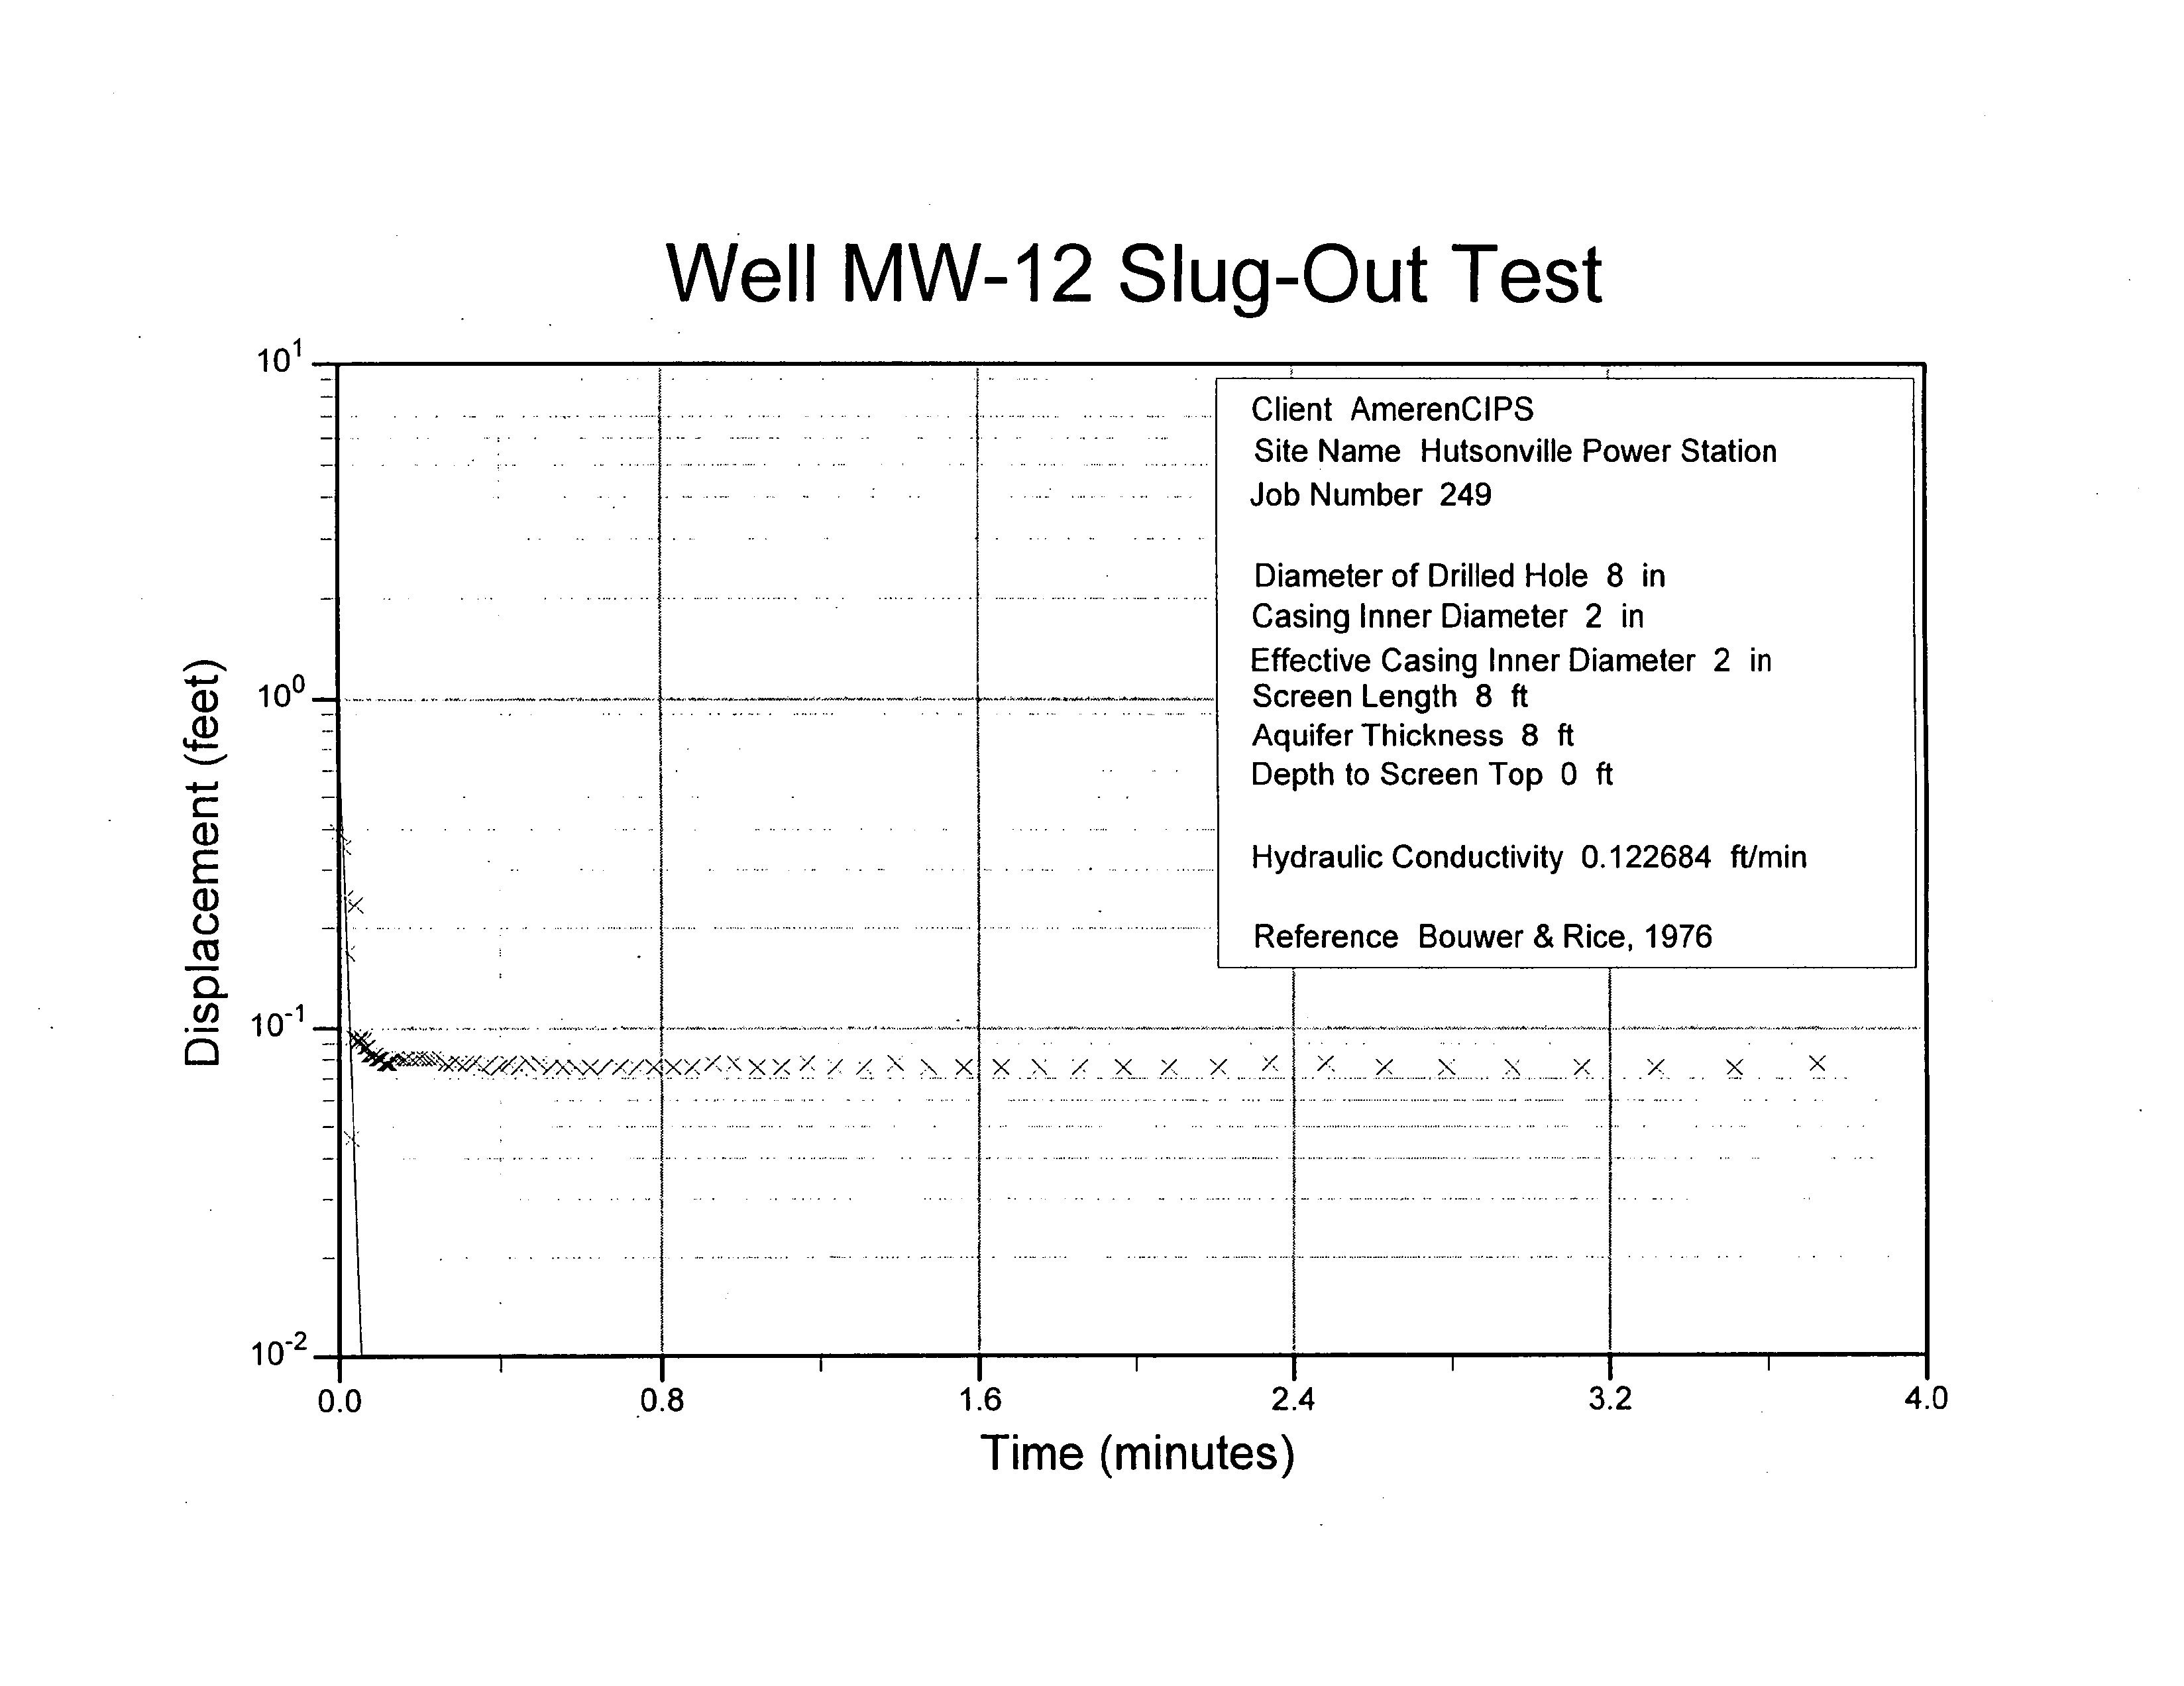
3.2.1
Hydraulic Conductivity
Values for horizontal
hydraulic conductivity
Kh
were
calculated for six
new
and five
pre
existing monitoring
wells
using
the
Bouwer and Rice
1976
data
analysis
method for unconfined
aquifers
Data
and
analysis plots
are
listed in
Appendix
Horizontal
hydraulic conductivity
values for the alluvial and outwash units
ranged
from 2.2
101
ft/mm
1.1
10
cm/s
to
5.1
i01
ft/mm
2.6
i0
cm/s Table
The
screen
for MW-7
lowest
Kh
value
was
installed
mostly
in alluvial
sandy
silt
while the
screen
for MW-12
highest
Kh
value
was
positioned
in
sand
zone
relatively
free of silt and
clay
The
geometric
mean
Kh
of the
unlithified materials is 1.5
102
ft/mm
7.6
i0
cm/sec
Bedrock
Kh
was
relatively
uniform
at about 9.4
i04
ft/mm
4.8
i0
cm/s
3.2.2
Groundwater Flow
Groundwater flow conditions
at
the Hutsonville Plant site
were assessed
using
water
level data
collected
on
November 16-18 and
April
29-30 1999
generalized groundwater
flow directions
for the unlithified units
are
illustrated in
Figures
and
The
groundwater
surface contour
map
for Nov
16-18
1998
was
constructed
using
the water
level data from 10 shallow
monitoring
wells screened in the
unlithified
deposits
and the
pool
elevation for the
Wabash
River
428.4
feet
MSL
Water
level data from
shallow
monitoring
wells screened in unlithified
deposits
and the
pool
elevation for the Wabash River
438.0
were
used to construct
the
April
29-30
groundwater
surface contour
map
Horizontal
hydraulic
gradients
in the unlithified
deposits
and vertical
gradients
between the
deposits
and
underlying
bedrock
were
determined from the water level data Elevations
generally
decreased
toward the
east in the direction of the Wabash
River
regional groundwater
sink
The
groundwater
surface
throughout
most of the
plant
site
occurs
within sand and
gravel
However near
the
river
it
occurs
within alluvial silt and
clay deposits
and
near
the
southern
utsonville
hydrogeologic
assessment.doc
Natural
3-5
Resource
Technology
Electronic Filing - Received, Clerk's Office, August 11, 2008 - AS 09-1, Exhibit 4
RESULTS
OF FIELD INVESTIGATION
portion
of
the unlined
impoundment
the
groundwater
surface
occurs
within
ash
Section
A-A
Figure
Unconfined conditions
occur
in the areas where the water table
occurs
within the sand
and
gravel deposits
whereas
semi-confined
conditions
likely
occur in the areas where the
groundwater
surface is in the alluvial silts and
clays
The
coarse-grained
deposits
are the most-
likely pathways
for
migration
of
coal ash leachate from the
impoundments
Horizontal
gradients
varied across the site Based on
the
November
16-18
1998
groundwater
elevation
data
the horizontal
hydraulic gradient
ranged
from about 0.0041 ft/ft to 0.0065 ft/ft
across
the
site Gradients
were as
steep
as
0.020
ft/ft
in the former ash
laydown
area
and
0.053
ft/ft
between the
plant generating
building
and the Wabash River
slight
but
historically persistent groundwater high
was
apparent
near
the southeast
corner
of
the lined
ash
impoundment
based on water
level data from
new
well MW-13 and
nearby pre-existing
wells
MW-2
and
all of which were
surveyed
in October 1998
Horizontal
groundwater
flow
velocity
varies with
hydraulic gradient
and
hydraulic conductivity
Assuming geometric
mean
hydraulic conductivity
of
1.5
102
ft/mm
7.6
i0
cm/s
and
an
assumed effective
porosity
of
0.20
groundwater
velocity
ranges
from 150
ft/yr
to
240
ft/yr
in the
sand and
gravel deposits
across
the site
While
groundwater
flow
over most of
the
site
is
east toward
the
Wabash
River groundwater
elevations at MW-2 have
historically
been lower than at MW-3
Figure
suggesting potential
for westward
reverse
flow
between these wells Head differential between these wells
was
several feet from 1986
through
1996
Figure
approximately
corresponding
to
the time
during
which the sluicewater
pipe connecting
the two
impoundments
was leaking
The
abrupt
decrease
in elevation at MW-3 in 1996 is
likely
due to
repair
of the
pipe
leak
However
since
1996
groundwater
elevation in MW-3 has
usually
been
slightly higher
than
MW-2 possibly suggesting
residual effects
from the
pipe
leak The November
16-18
1999
groundwater
elevation data
suggest
westward
hydraulic gradient
of
0.00047 ft/ft between MW-3 and MW-2 Given the
much
larger
eastward
gradient
observed
across
this
site
it is
likely
that
any
reverse
westward
flow
in
this area
will
wrap
around this
anomaly
and
discharge
to the Wabash
River
hutsoriville
hydrogeologic
assessrnent.doc
Natural
3-6
Resource
Technology
Electronic Filing - Received, Clerk's Office, August 11, 2008 - AS 09-1, Exhibit 4
RESULTS OF FIELD INVESTIGATION
Groundwater
velocity
was calculated for
the
area
of
reverse
flow
using
the
hydraulic conductivity
value of 5.2
102
ft/mm
calculated for
MW-3
gradient
of
0.00047
ft/ft
and an estimated
effective
porosity
value of
0.2
with
resulting
value of about 64
ft/year
Vertical
gradients
at
piezometers
are
depicted visually
in
graphs
on
Figure
Vertical
gradients
between the unlithified
deposits
and shallow bedrock
were
estimated from
monitoring
well
nests
MW-10/1OD and MW-3/3D
The MW-10 well nest had
fairly
consistent downward
vertical
gradient
while there
was no consistent
upward
or downward vertical
gradient
at the MW-3 well
nest The lack of consistent vertical
gradient
at
MW-3/3D
does not
suggest high
potential
for
flow into
bedrock however
vertical
gradients may
have been
stronger
downward
prior
to
repair
of the
sluicepipe
in 1996 Vertical
gradients
at
MW-7/7D were
typically
downward
however
gradients
at this well
nest are
expected
to
be influenced
by
fluctuations in Wabash River
stage
and the short
period
of observation
November
1998
April 1999
does not
provide
sufficient
data
to evaluate these effects
3.2.3 Elevation of Groundwater Relative to Ash
Ash was encountered
in seven
direct-push probe
holes
GP-1
20 21 22
23
and in one
monitoring
well
boring MW-12
located within the unlined ash
impoundment
and
former ash
laydown
area
Figure
Ash in the central
and southern
portions
of
the unlined
ash
impoundment
extended as much as 16 feet below the
groundwater
surface
The thickness of
saturated ash is
dependent
on
the elevation of the water
table
which varies
seasonally
and with
changes
in Wabash River
stage
The values for ash thickness listed here are based
on
water table
elevation in November
1998
when it
was near
average
based
on
observations at
MW-6 MW-7
and MW-8
hutsonville
hydrogeologic
assessment.doc
Natural
37
Resource
Technology
Electronic Filing - Received, Clerk's Office, August 11, 2008 - AS 09-1, Exhibit 4
RESULTS
OF FIELD INVESTIGATION
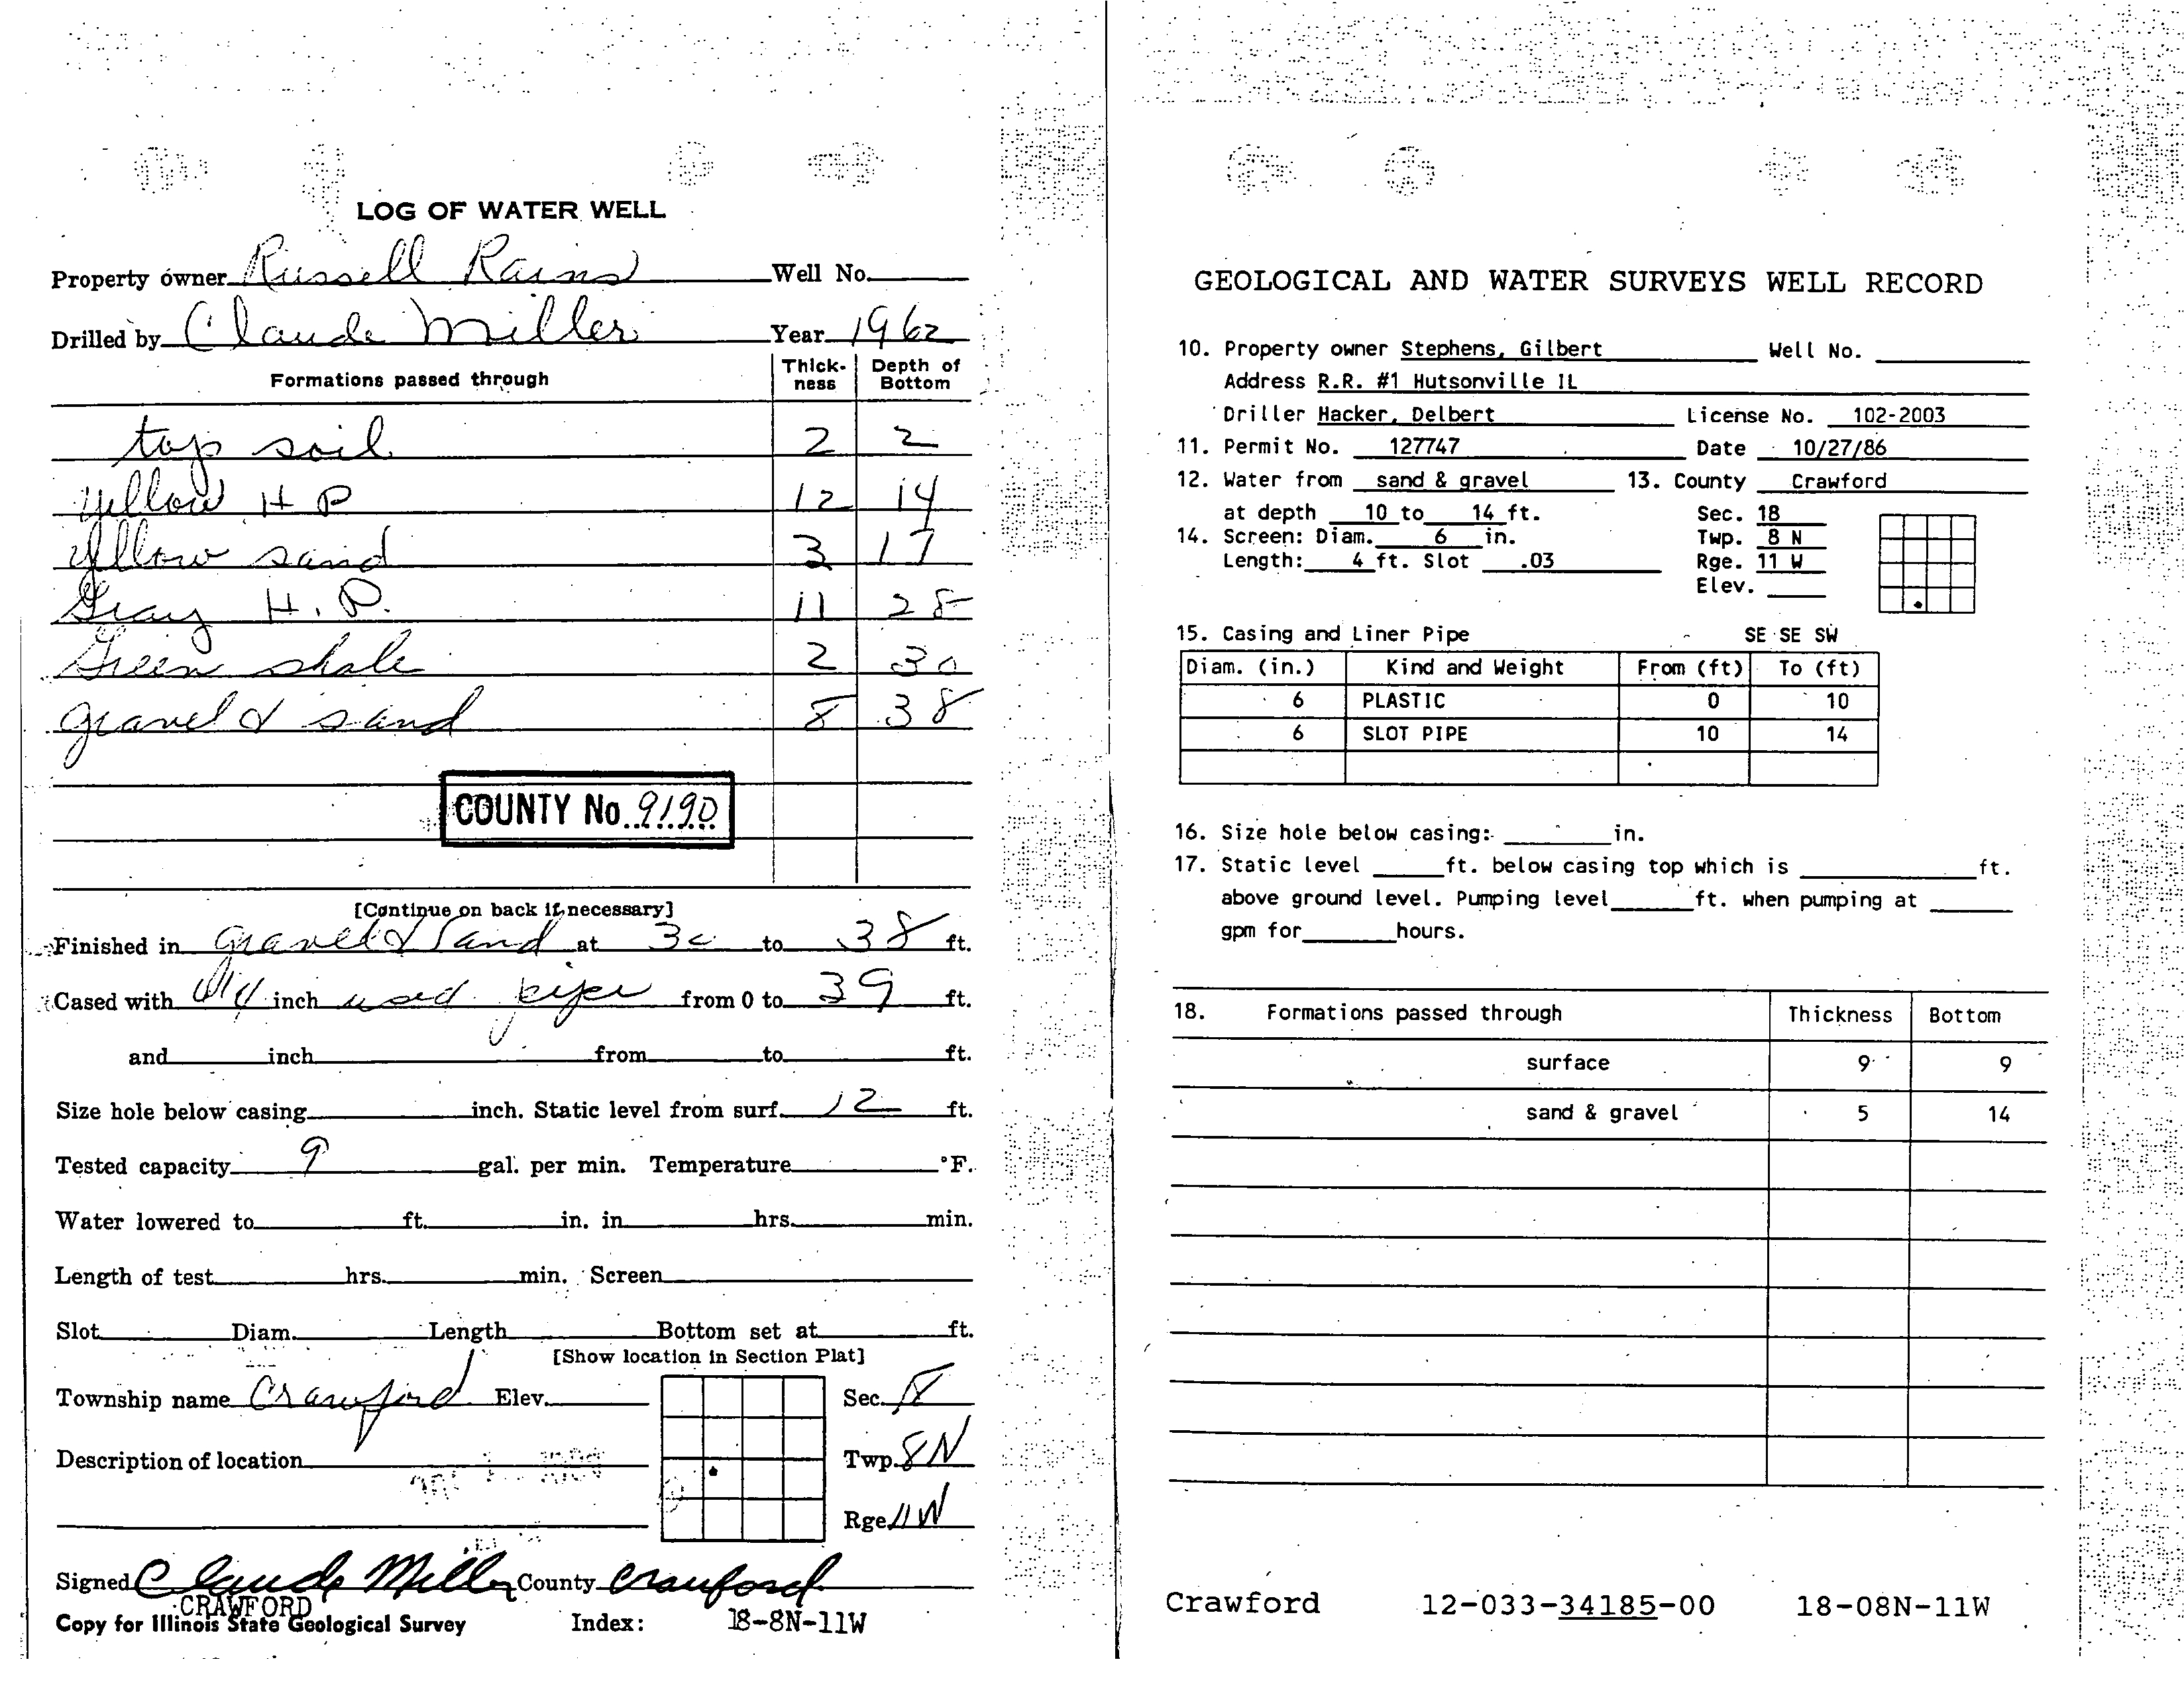
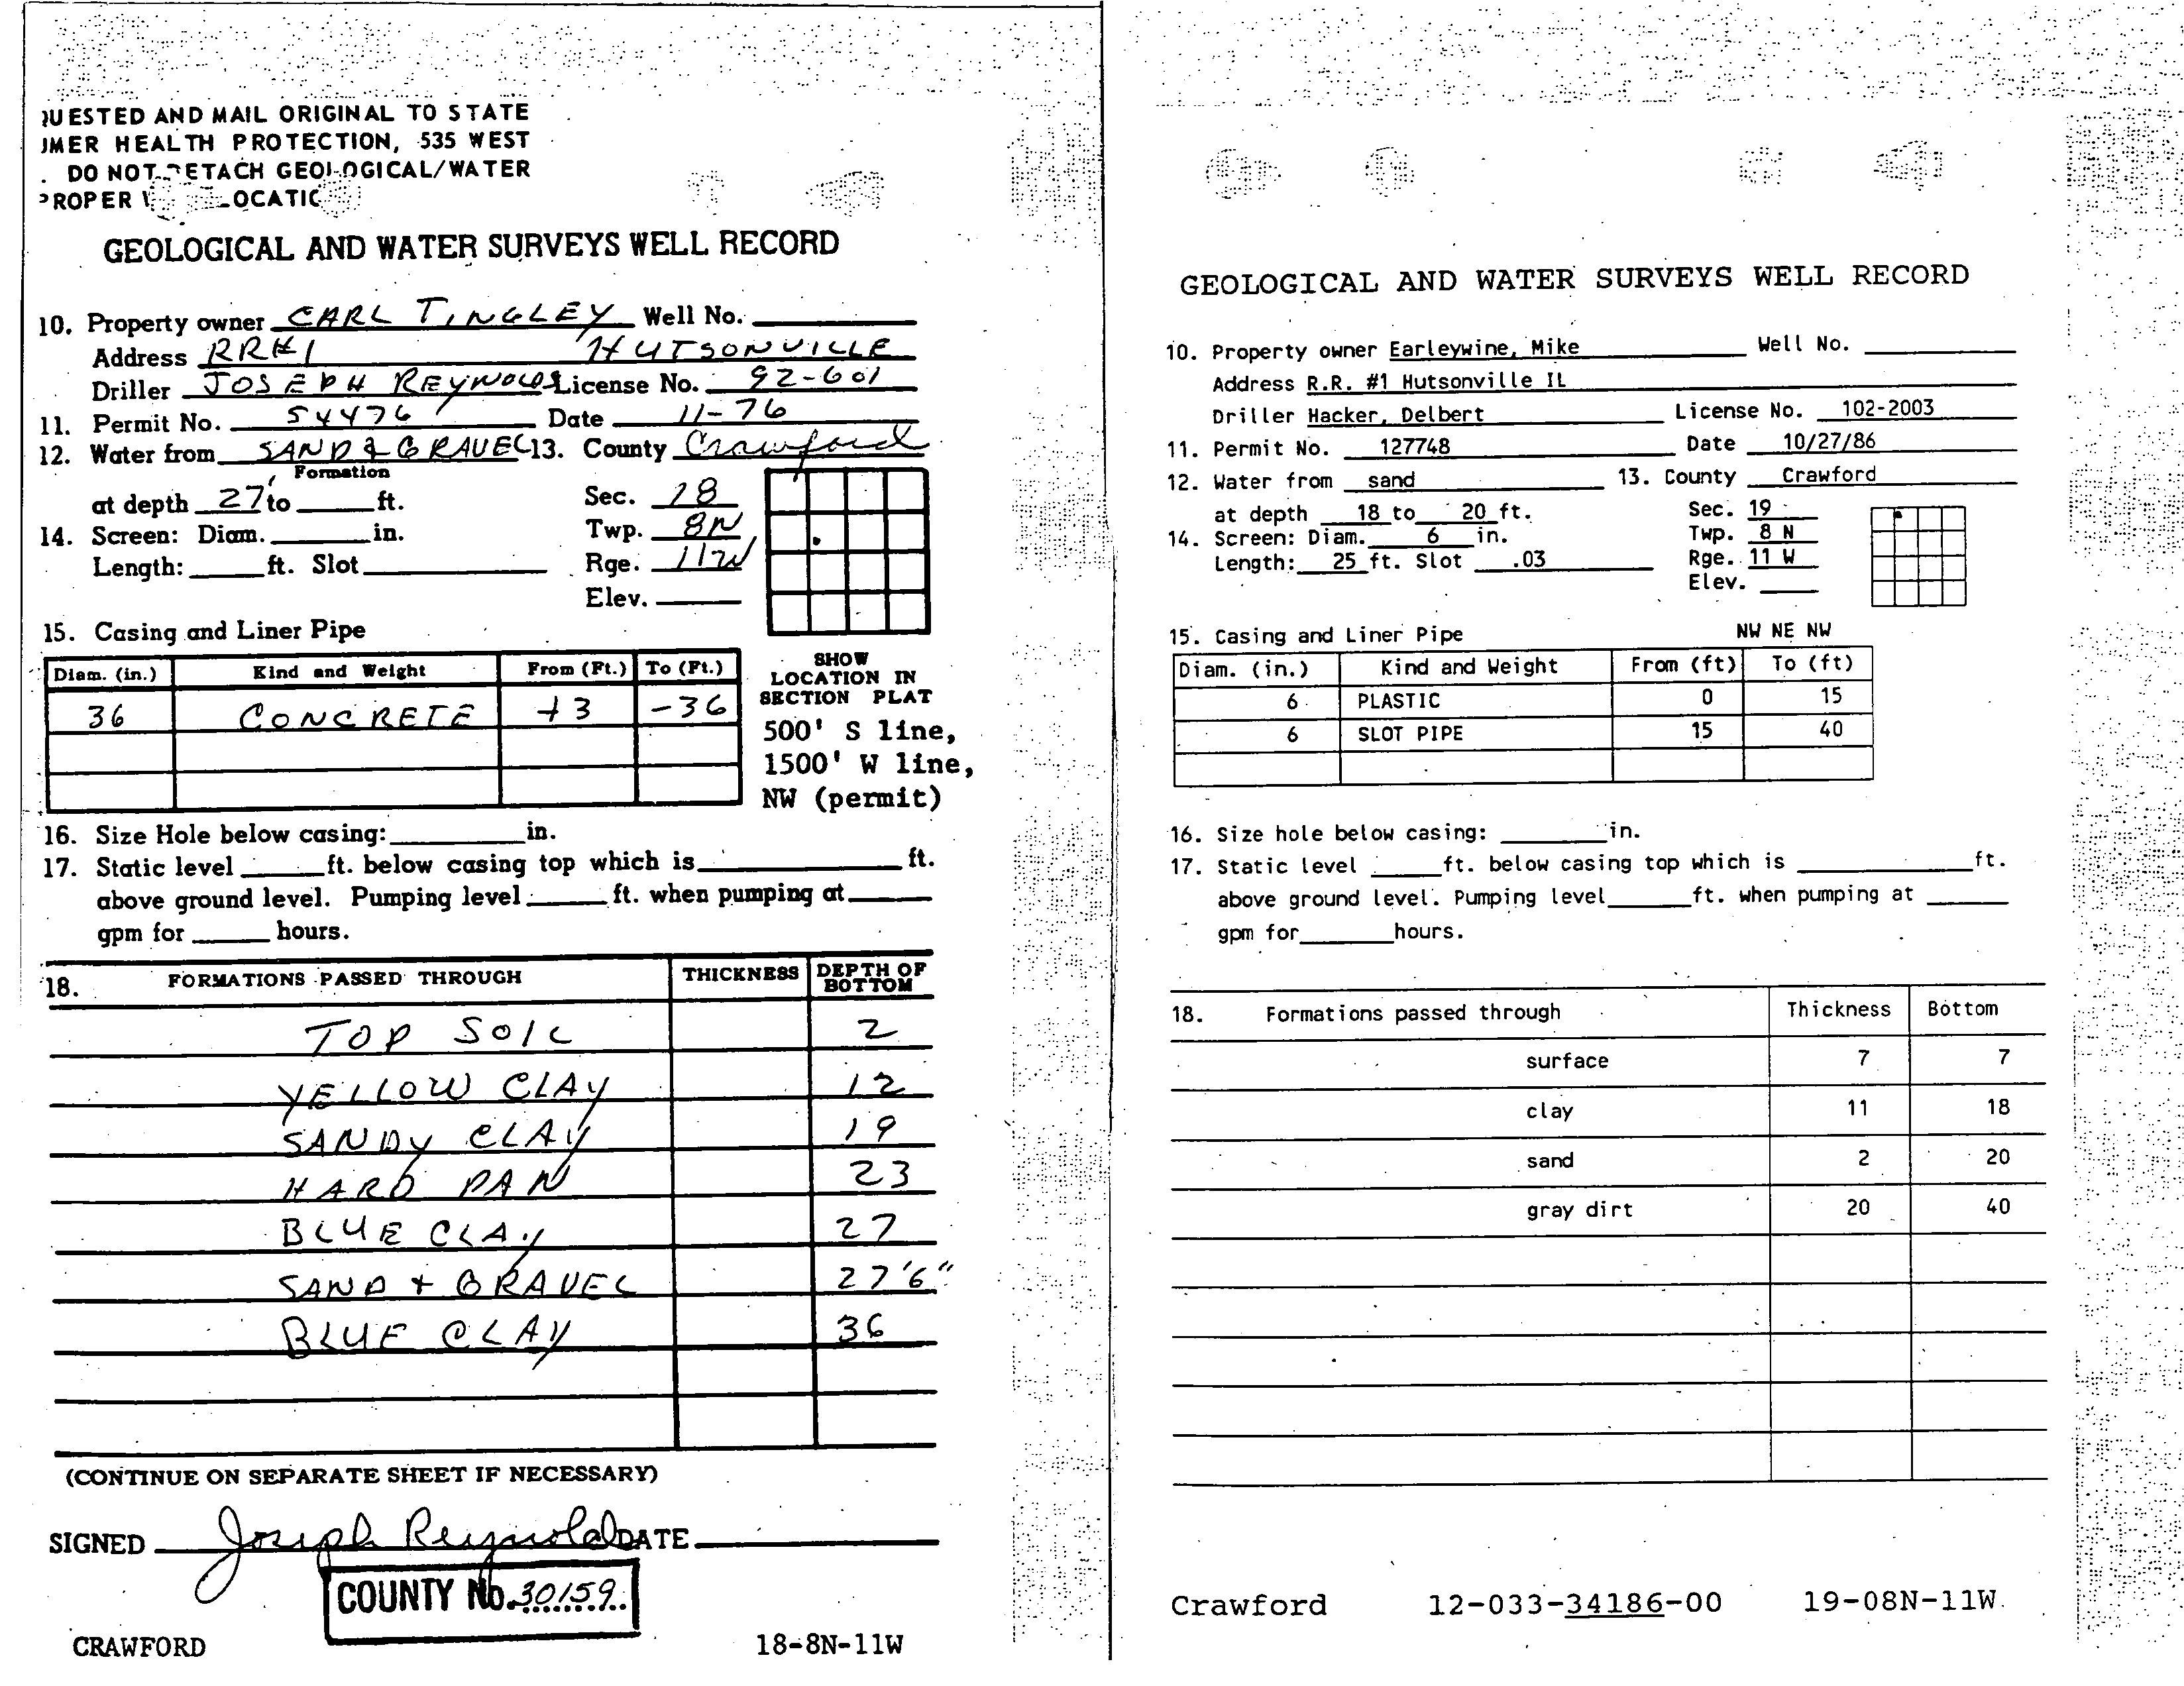
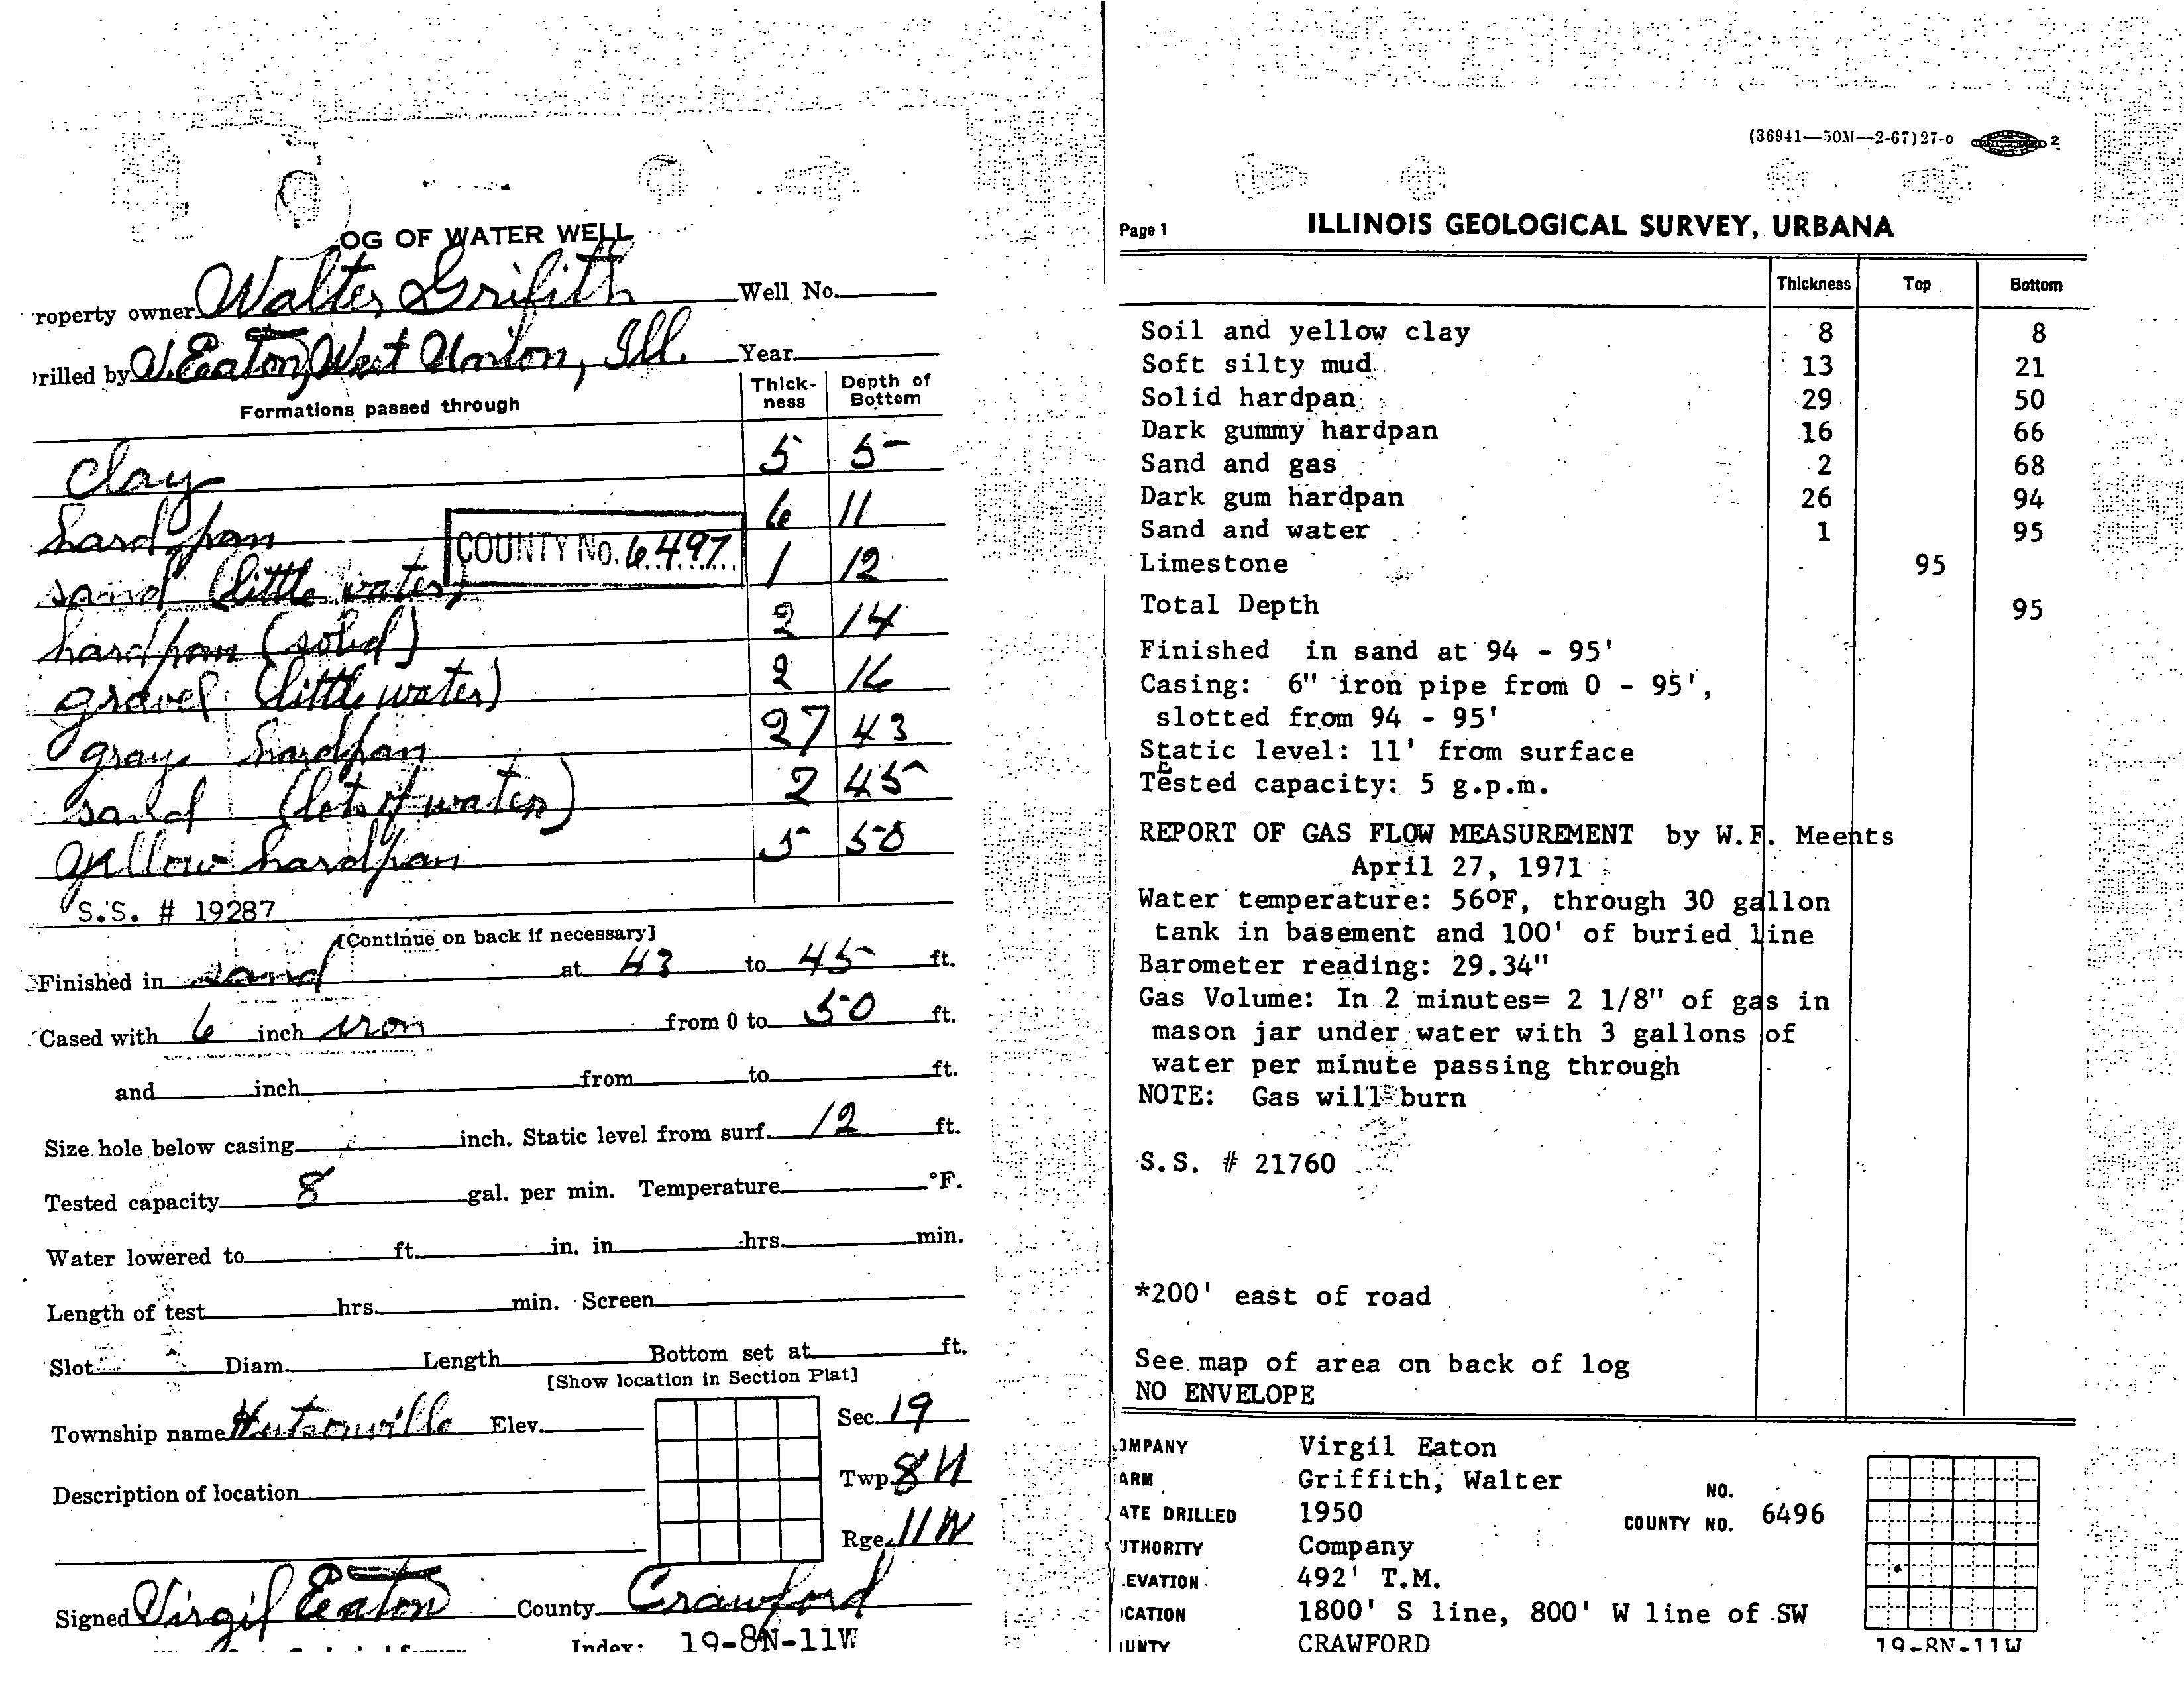
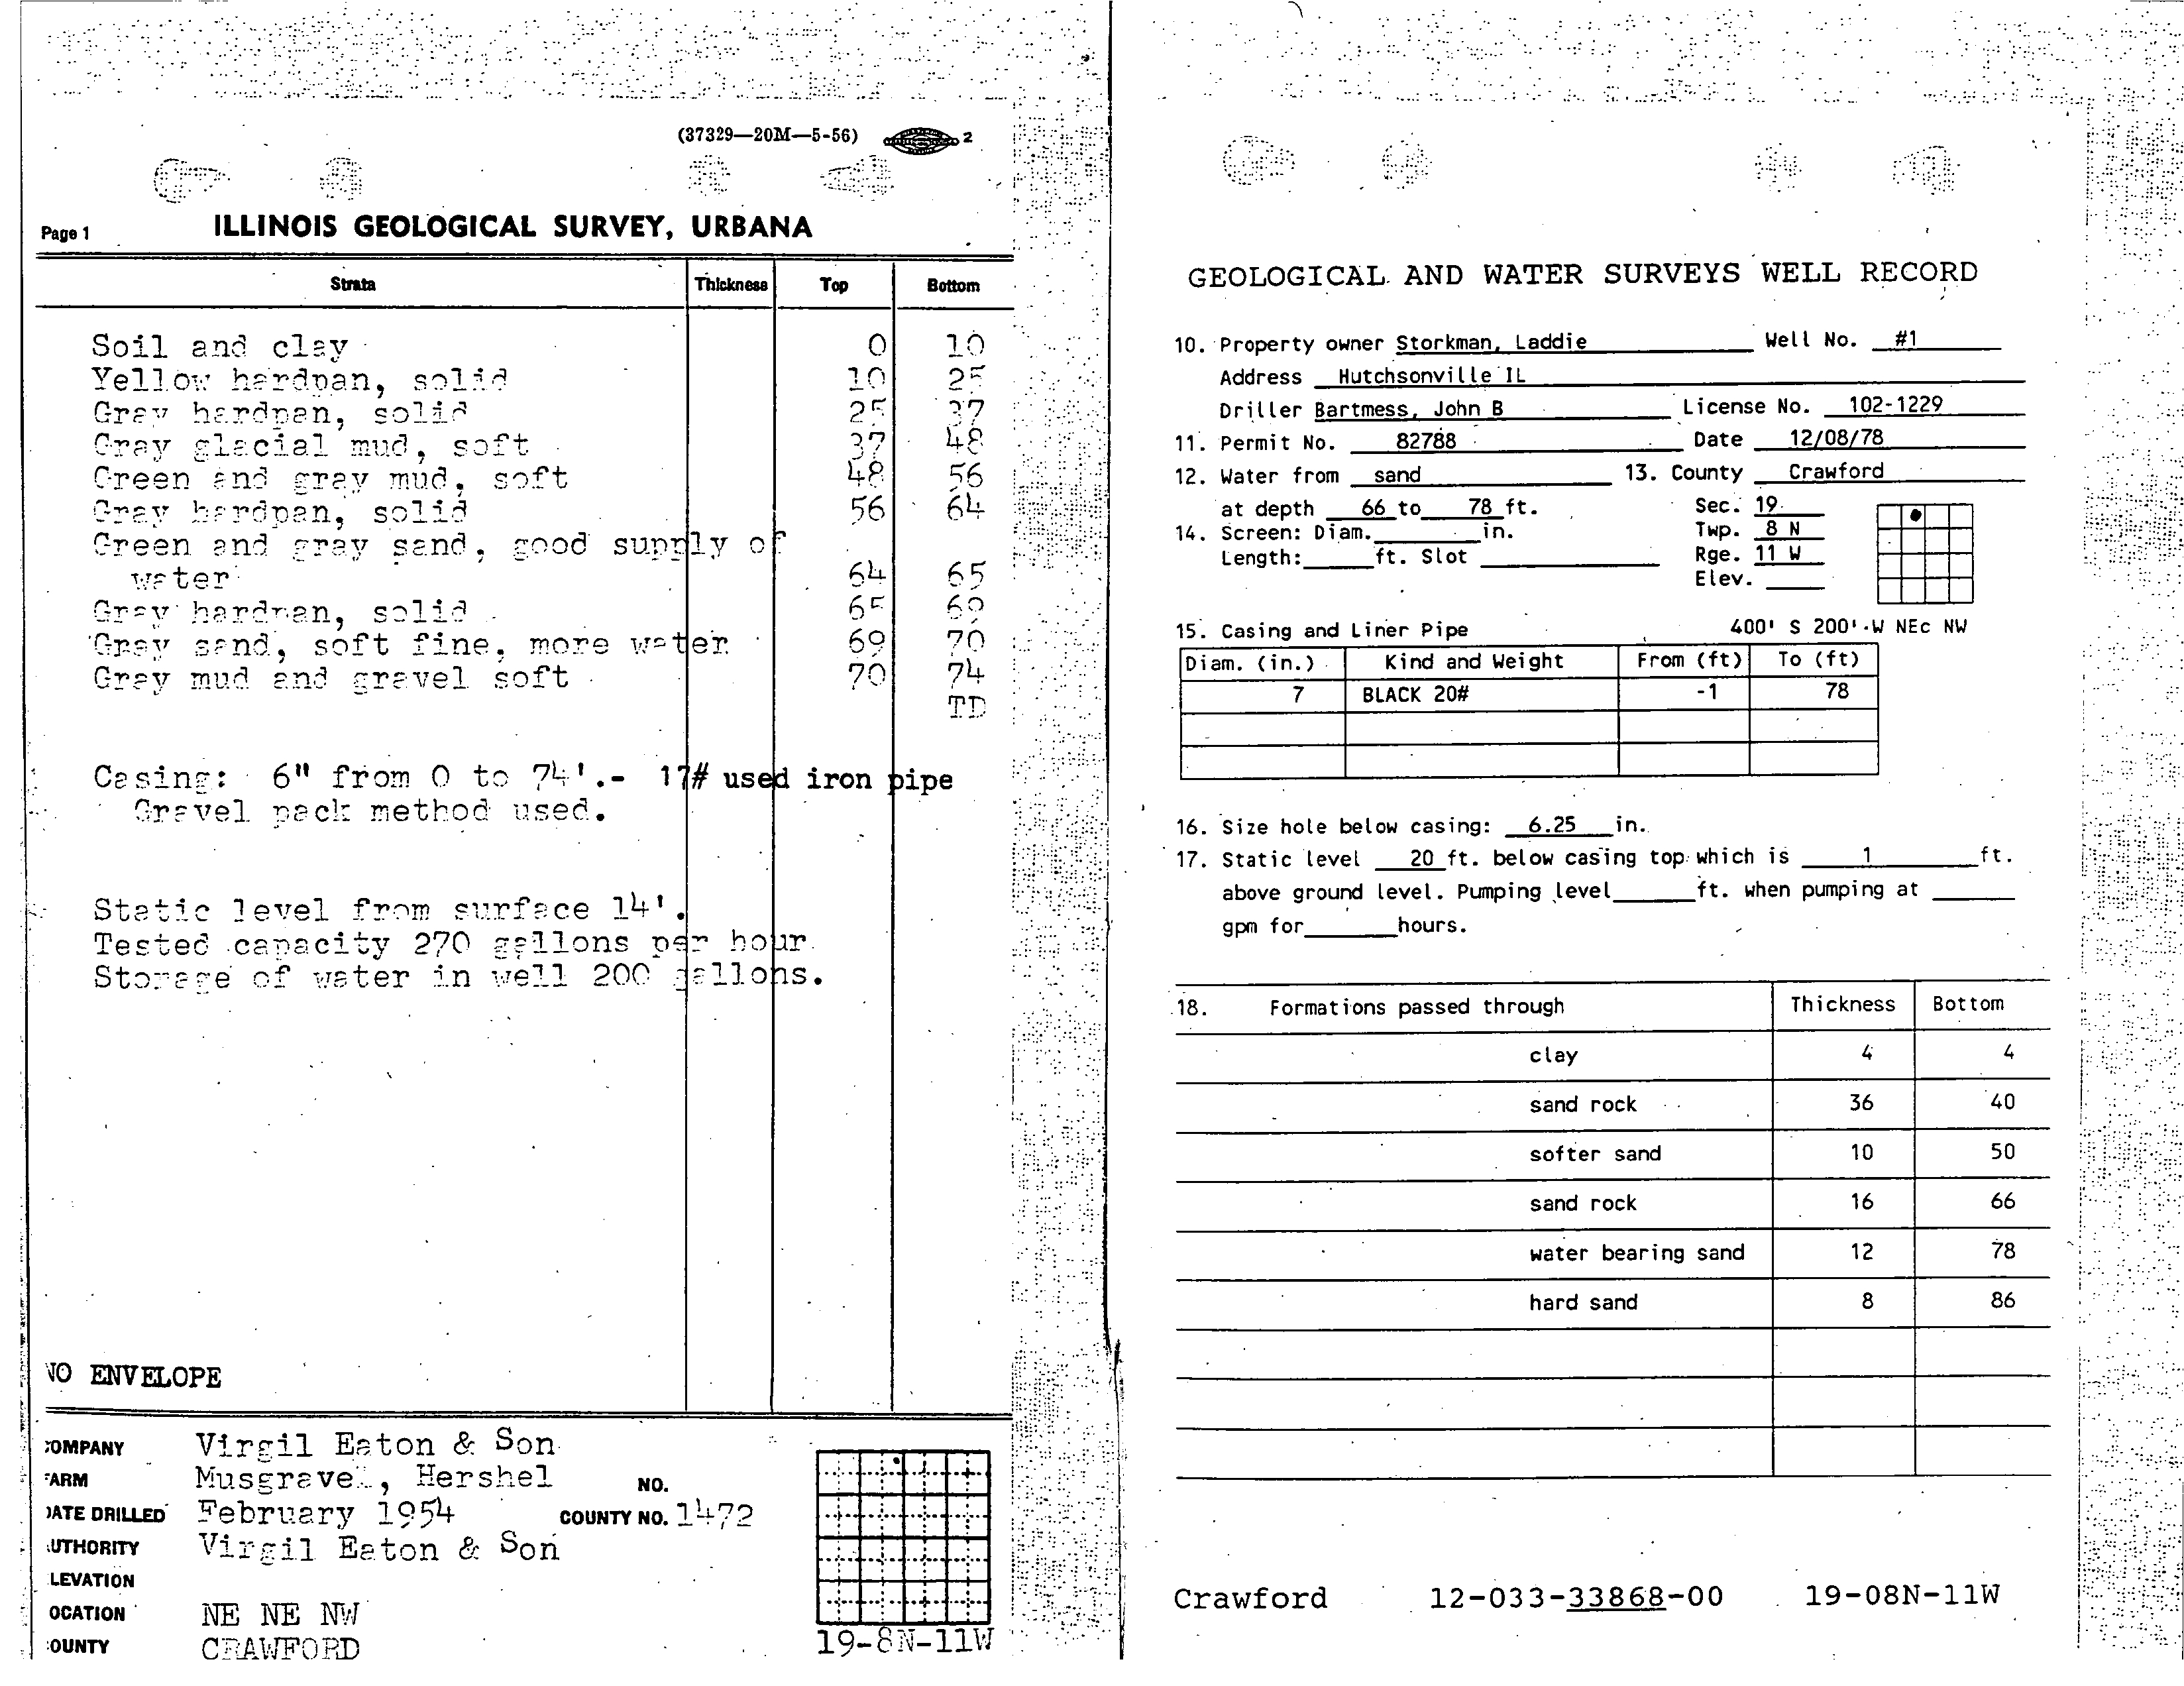
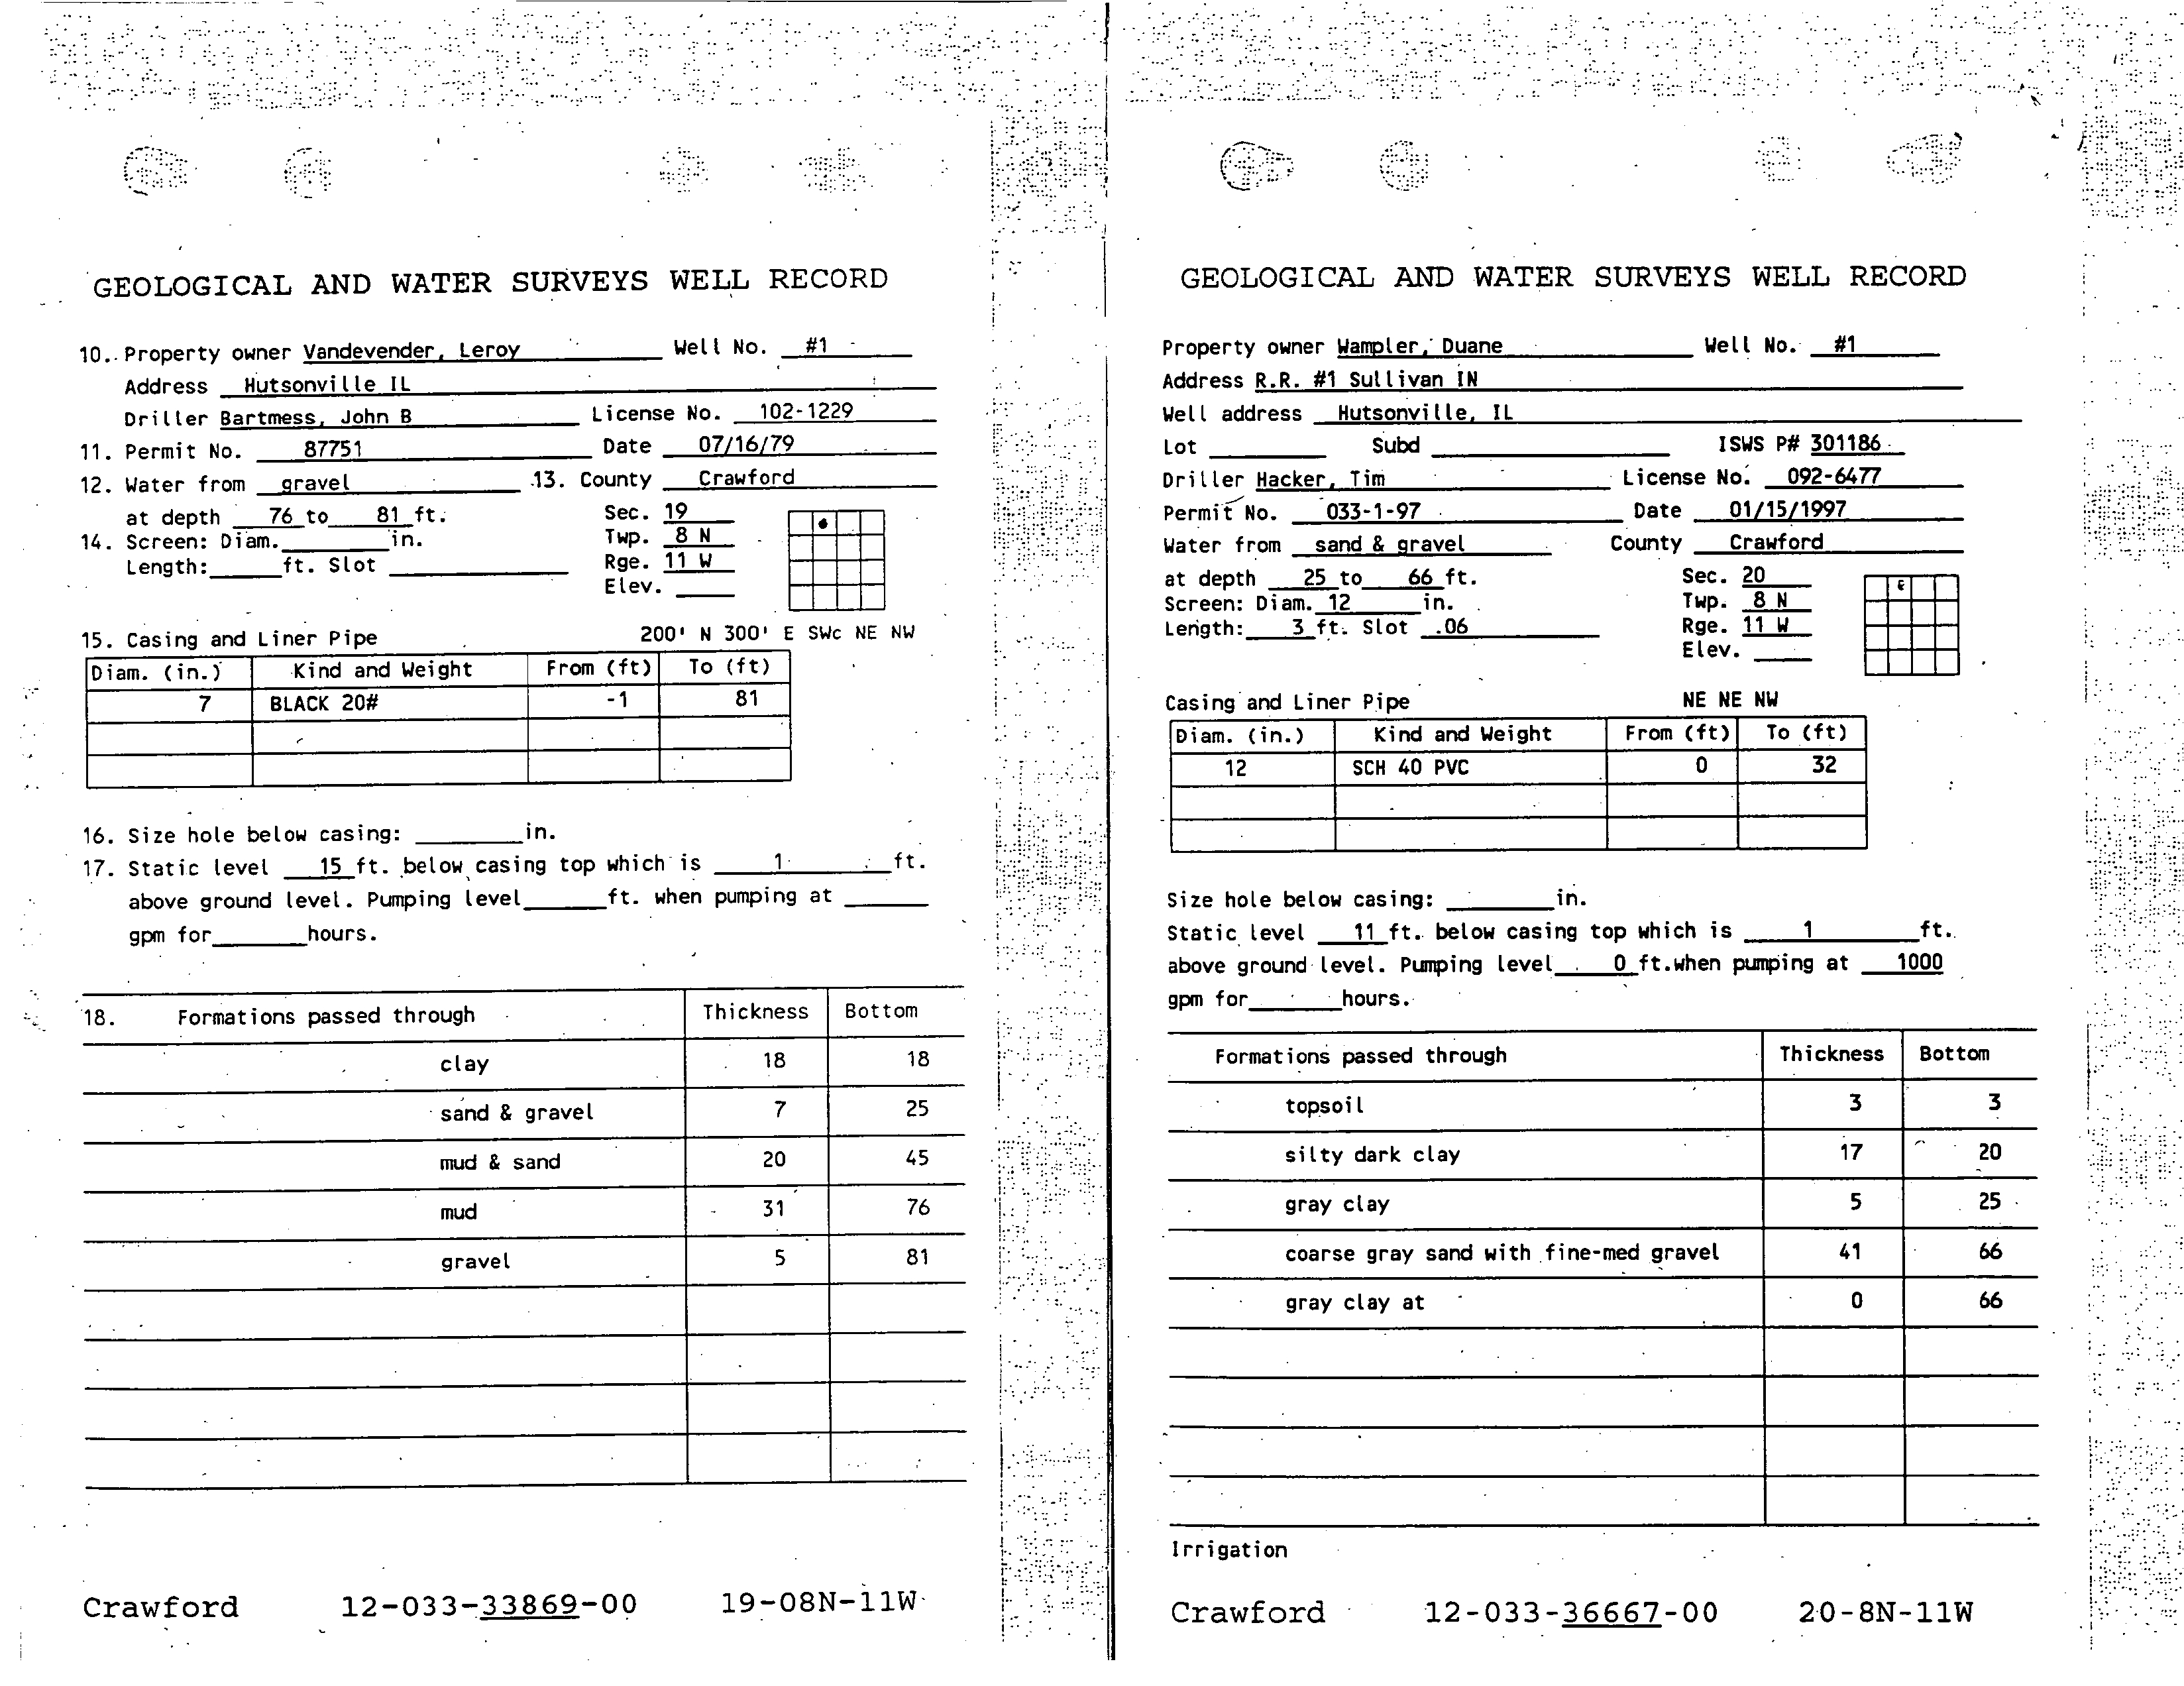
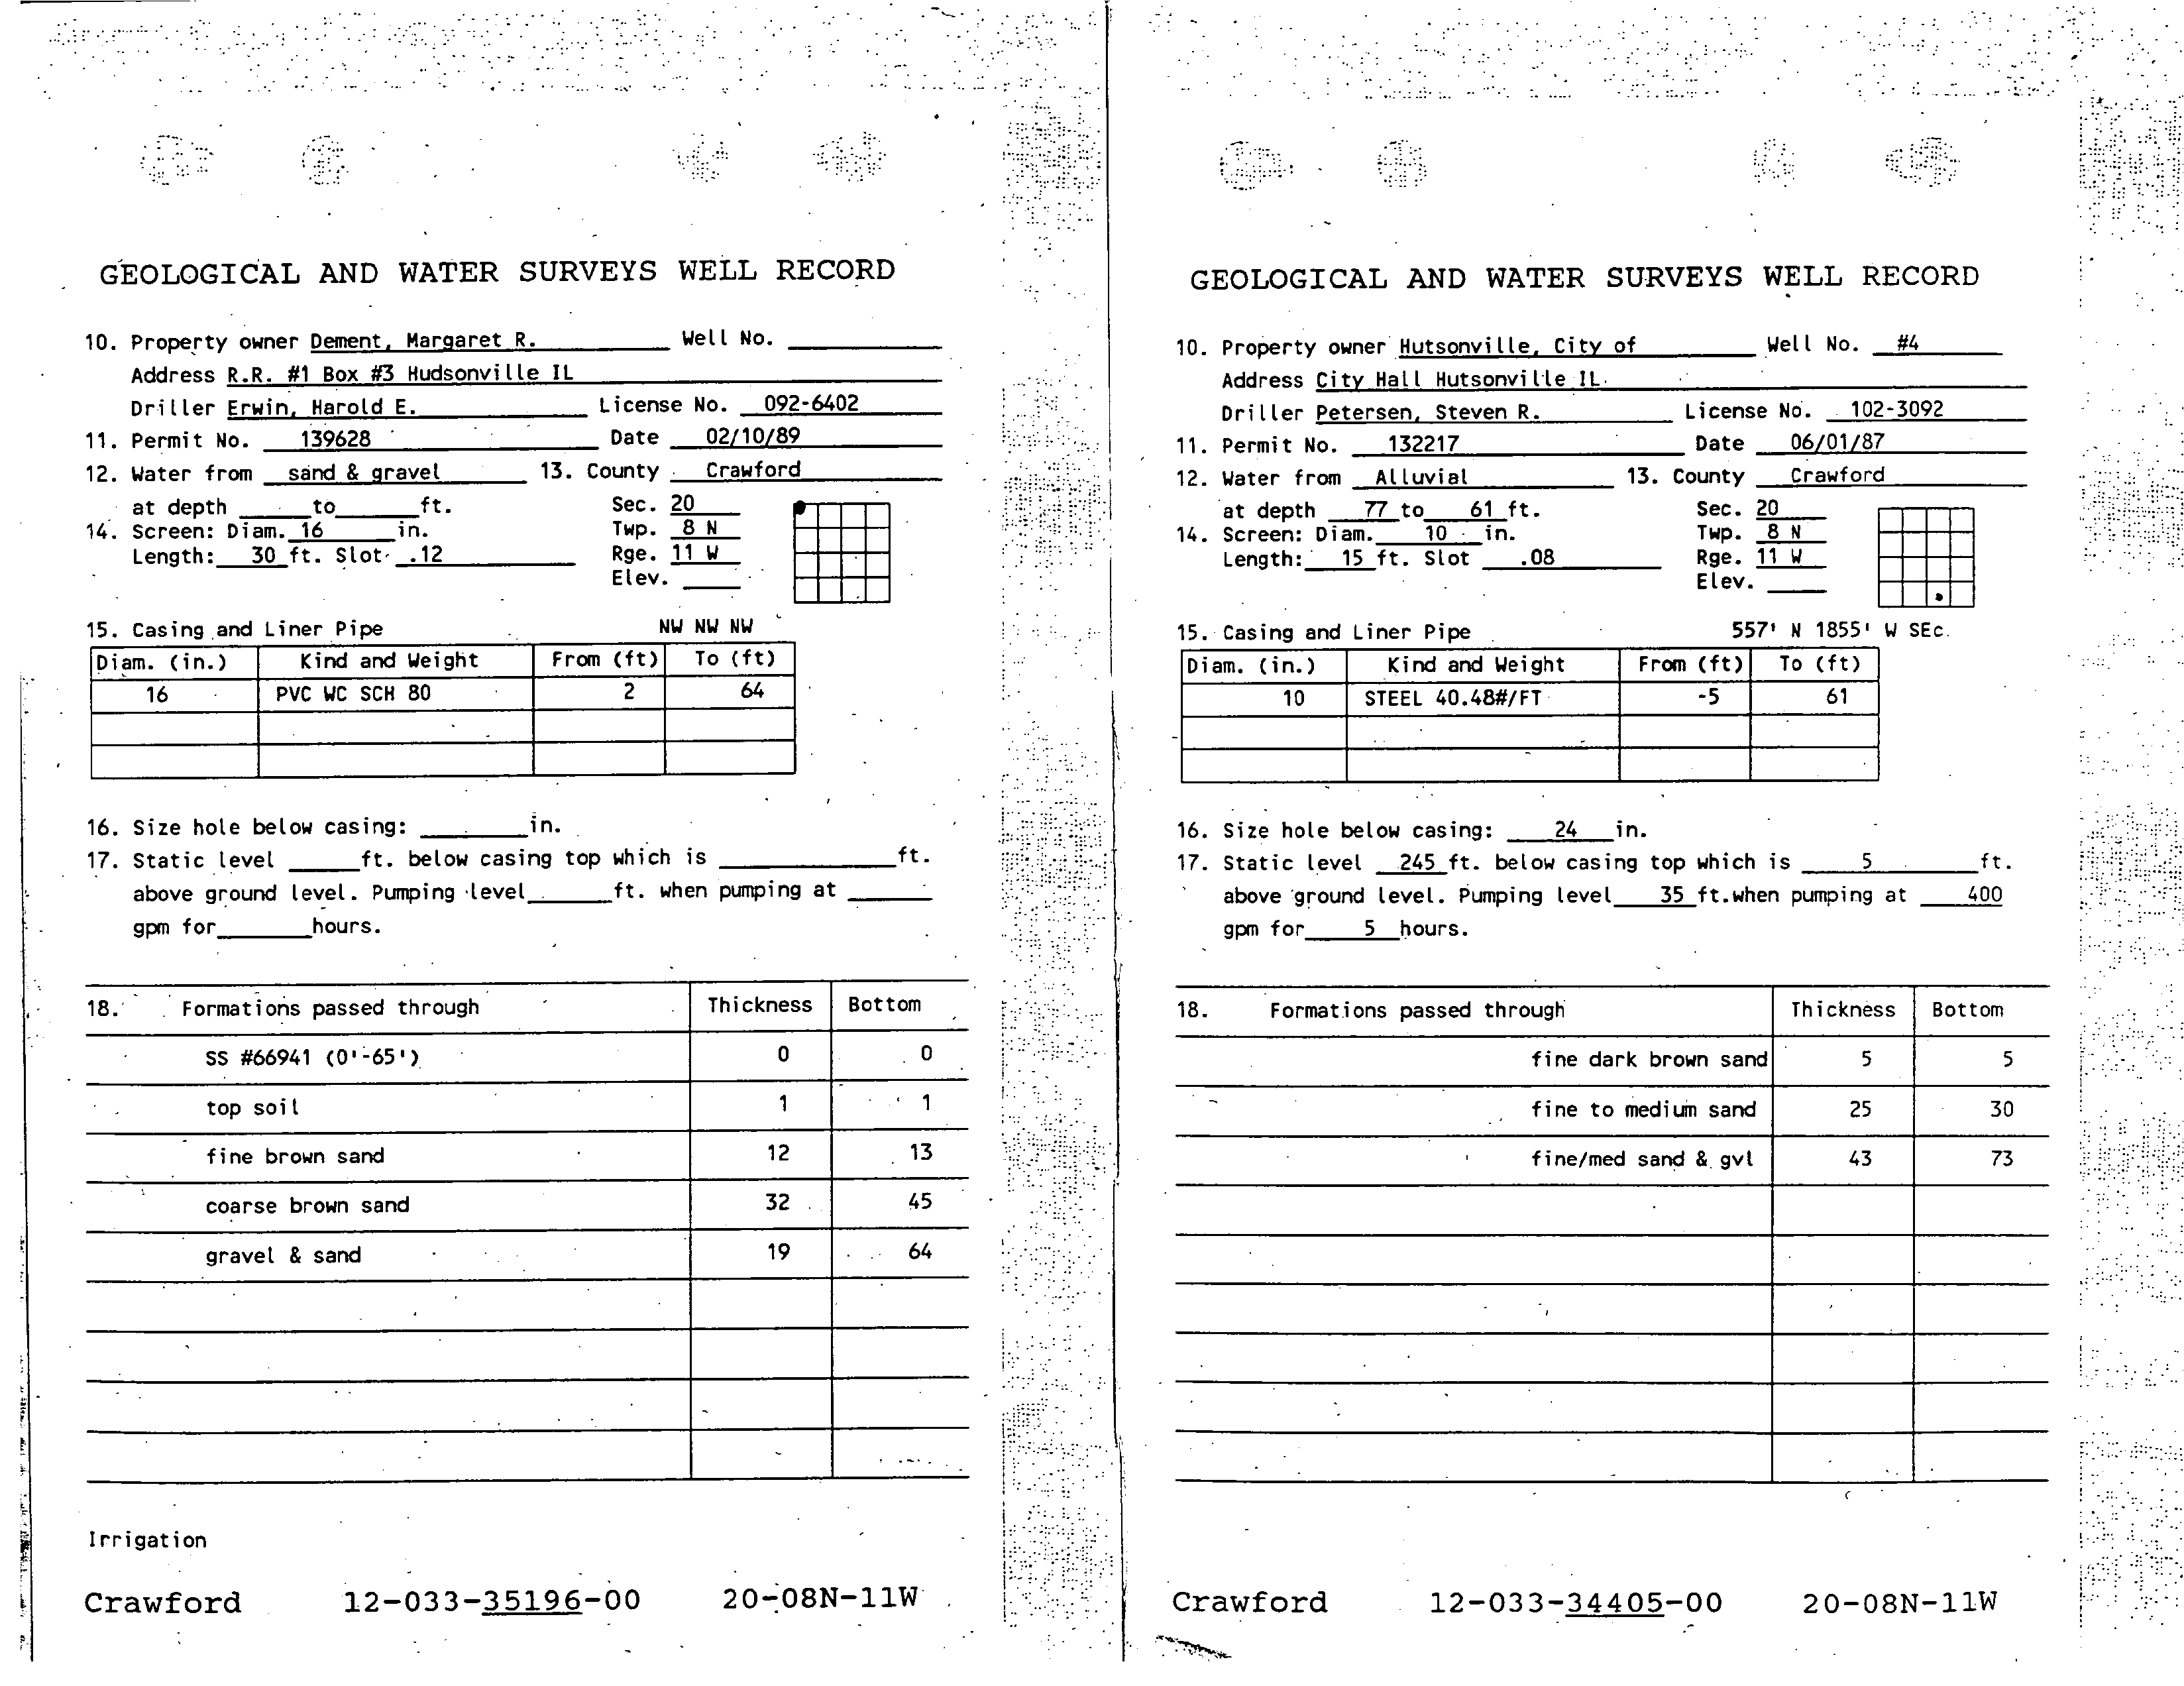
3.3
Nearby
Groundwater Users
Water well
logs
for all wells in the sections
surrounding
Township
8N Range 11W
Section 17
of the West
Union
Illinois-Indiana
USGS
quadrangle
were
queried
from the Illinois State
Groundwater
Survey
Figure
Water well
logs
are
included
in
Appendix
for reference
The
two water
supply
wells located in Section 17
are
plant
extraction wells
EW-1 and EW-2 The
closest off-site wells
are
south of the site
Section 20
where
two
irrigation
wells for the Dement
and
Wampler
farms draw
groundwater
from
depths
of 64 and 32
feet
respectively
near
the
Wabash
River
in the northeast /4 of the section.2 Further to the south in the southwest 1/4 of the
southeast 1/4 of Section
20 City
of Hutsonville
public
water
supply
Well
draws
groundwater
from maximum
depth
of 61 feet below
ground
surface
No
recent
groundwater quality
data is
available
for
any
of the
aforementioned
supply
wells
All
of these wells are screened
in the
deep
sand
and
gravel
in the
Wabash
River
valley
Well locations described
on the well records
appear
incorrect
because
the
lithologic
description
on the
logs
is of
alluvial sediments while the indicated locations are outside the Wabash River
valley
Based on
knowledge
of the
site
these wells
are
assumed
to
be in the northeast
corner
of
the
section
hutsonville
hydrogeologic
assessment.doc
Natural
3-8
Resource
Technology
Electronic Filing - Received, Clerk's Office, August 11, 2008 - AS 09-1, Exhibit 4
GROUNDWATER QUALITY IN DIRECT-PUSH
SAMPLES
4.1 Parameters of Concern
The Hutsonville work
plan
identified
boron sulfate
manganese pH
and TDS
as
parameters
of
concern
POCs
because
they
had concentrations
in
groundwater
near the
impoundments
that
exceeded Illinois Class
groundwater
standards
These POCs
historically
exhibited the
highest
frequency
of exceedances in
monitoring
well
MW-3
at the southeast
corner
of the lined ash
impoundment
and in MW-6 and
MW-8
located south and east of the unlined
impoundment
respectively
Boron and sulfate are indicator
parameters
of coal ash leachate
Manganese
is
ubiquitous
in
soils
and
may
have
higher
concentrations
in soil than
in
coal
ash therefore
it is
not
reliable indicator of coal ash leachate
The
pH
of coal ash
can
be
high
neutral or low
depending
on
the
geochemistry
of the
ash
therefore pH
is not
always
good
indicator of coal
ash leachate
migration High
TDS
may
be
observed at sites where coal ash
leachate
migration
occurs
because
high
TDS
concentrations
reflect
elevated
concentrations
of soluble ash
constituents such
as
calcium
potassium
sodium
and
sulfate however
other natural and
anthropogenic
sources
can cause
high
TDS
concentrations
The
following
discussion
focuses
on
results from the
direct-push
water
samples
and includes
iron and nickel because these
parameters
sometimes have
high
concentrations
in
groundwater
near
coal
piles Complete
results
of the
direct-push
water
quality sample analyses
are
provided
in
Appendix
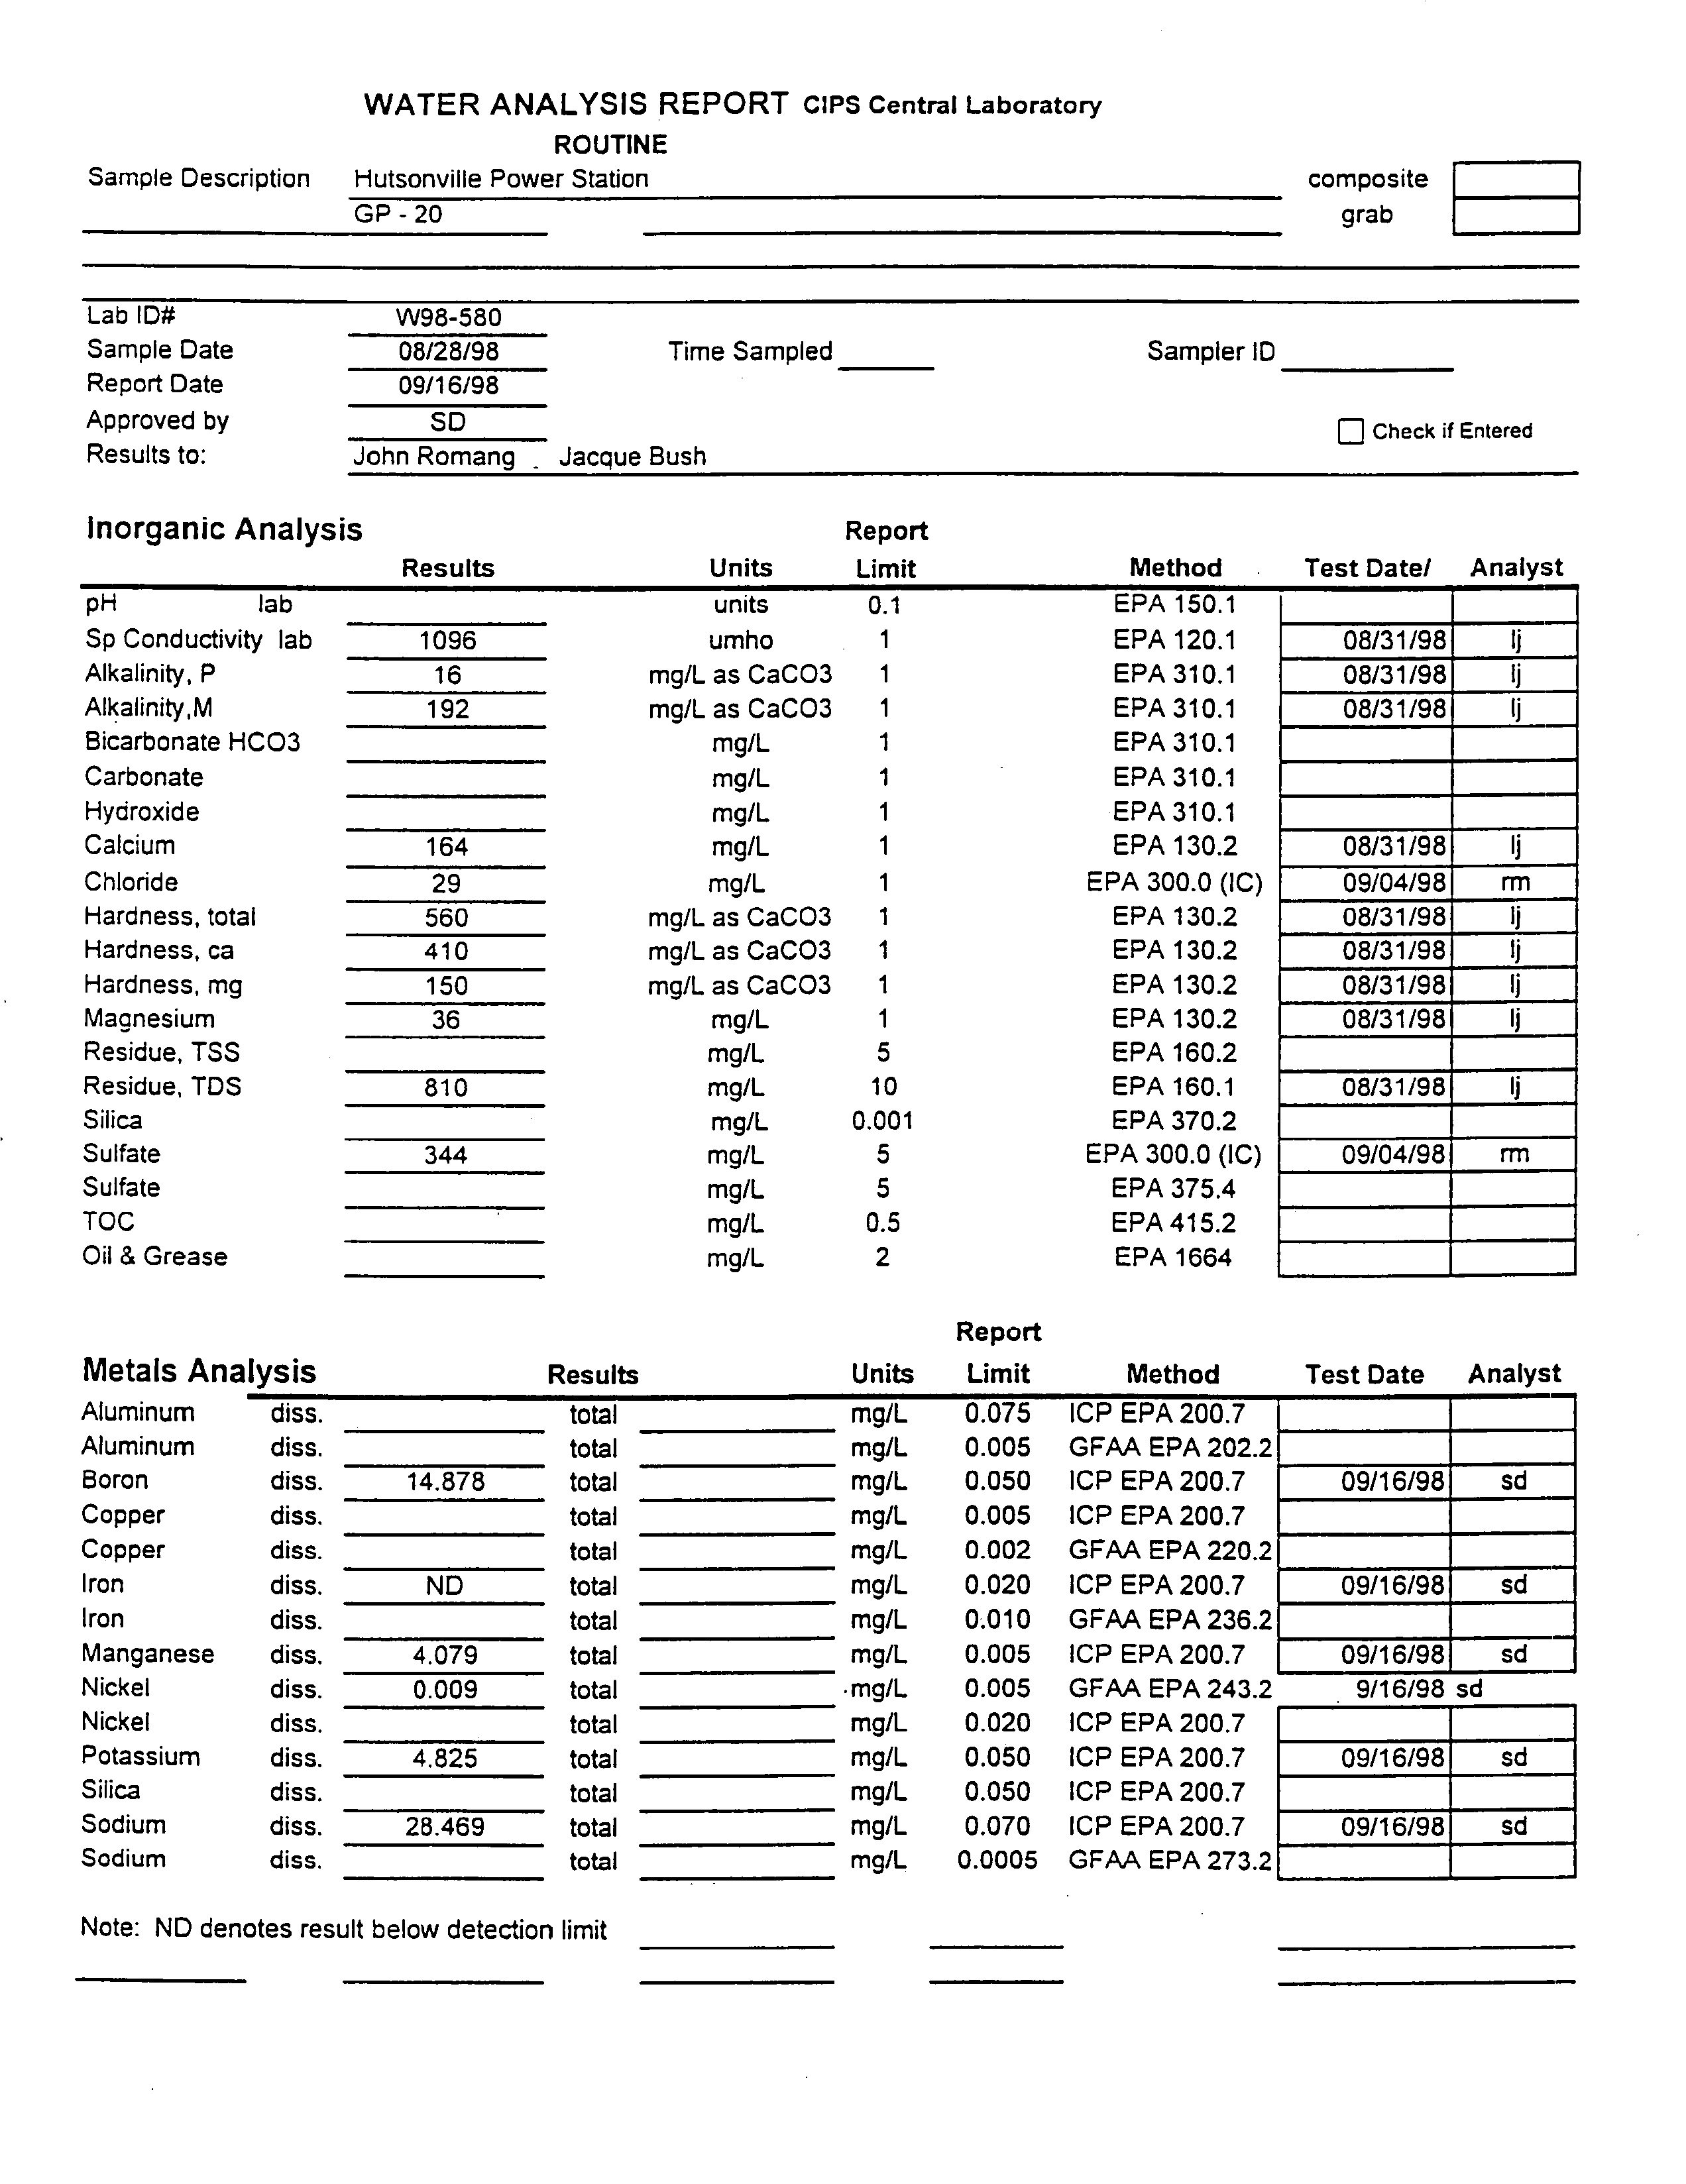
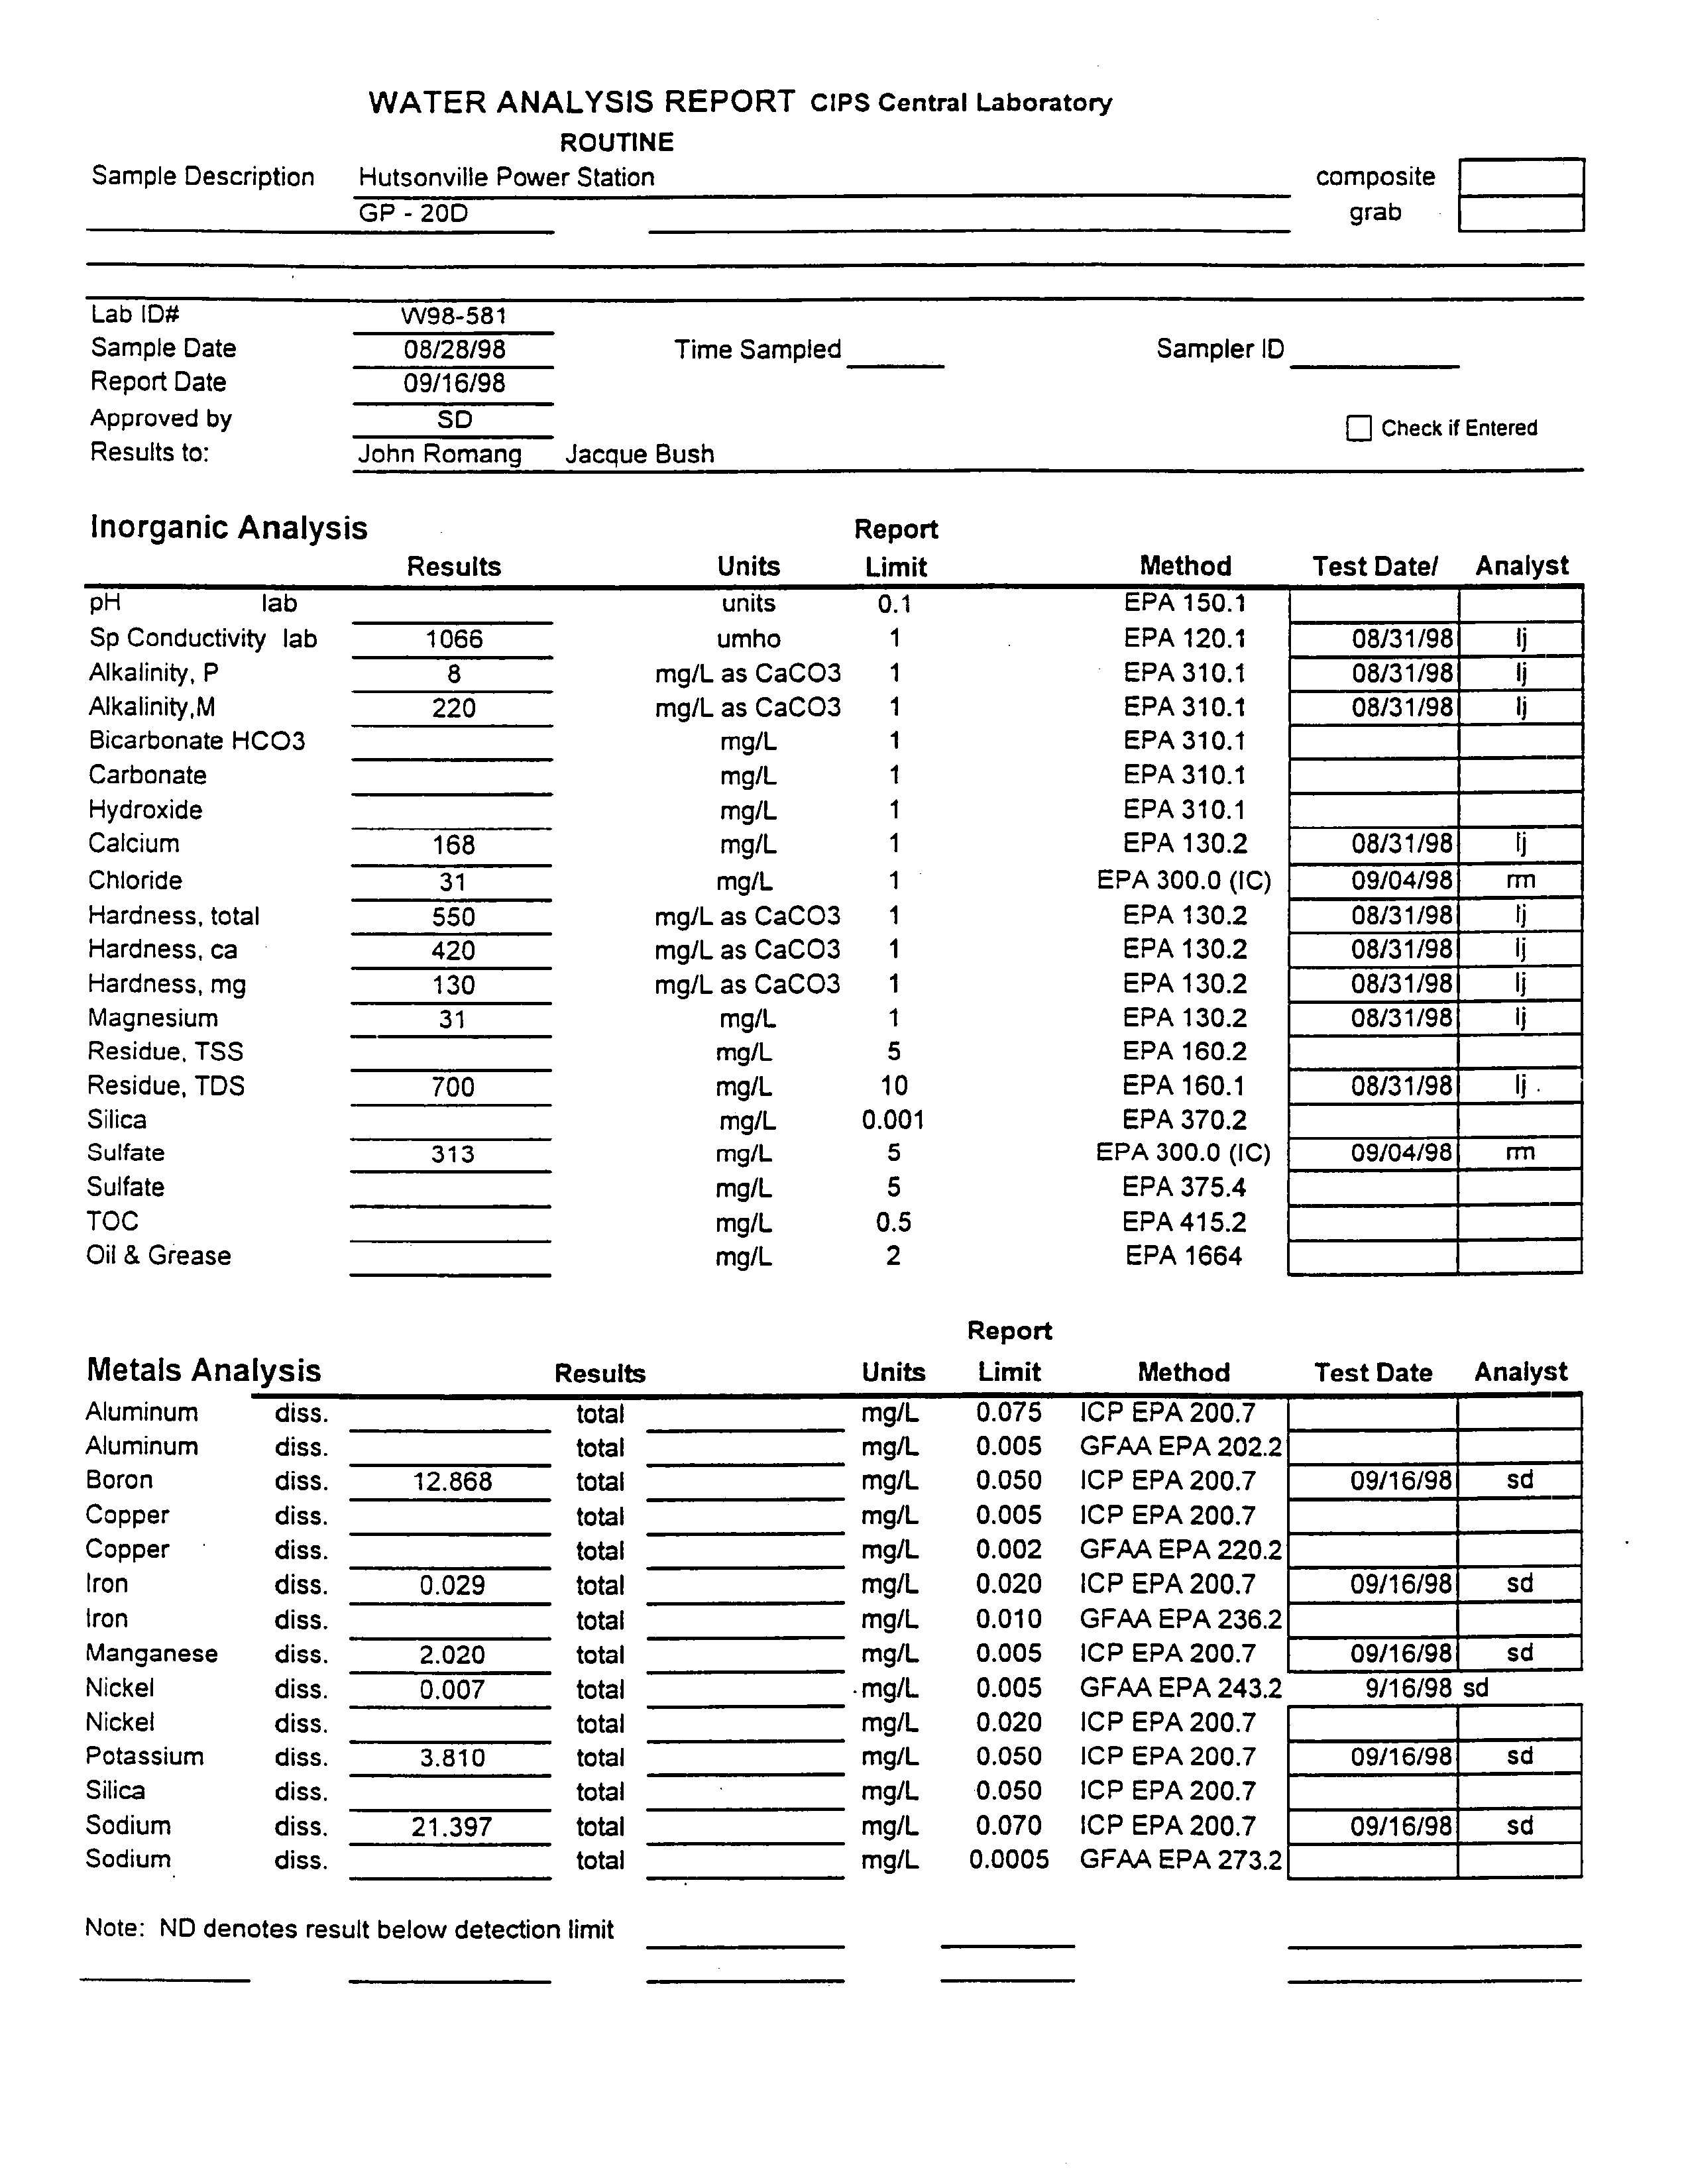
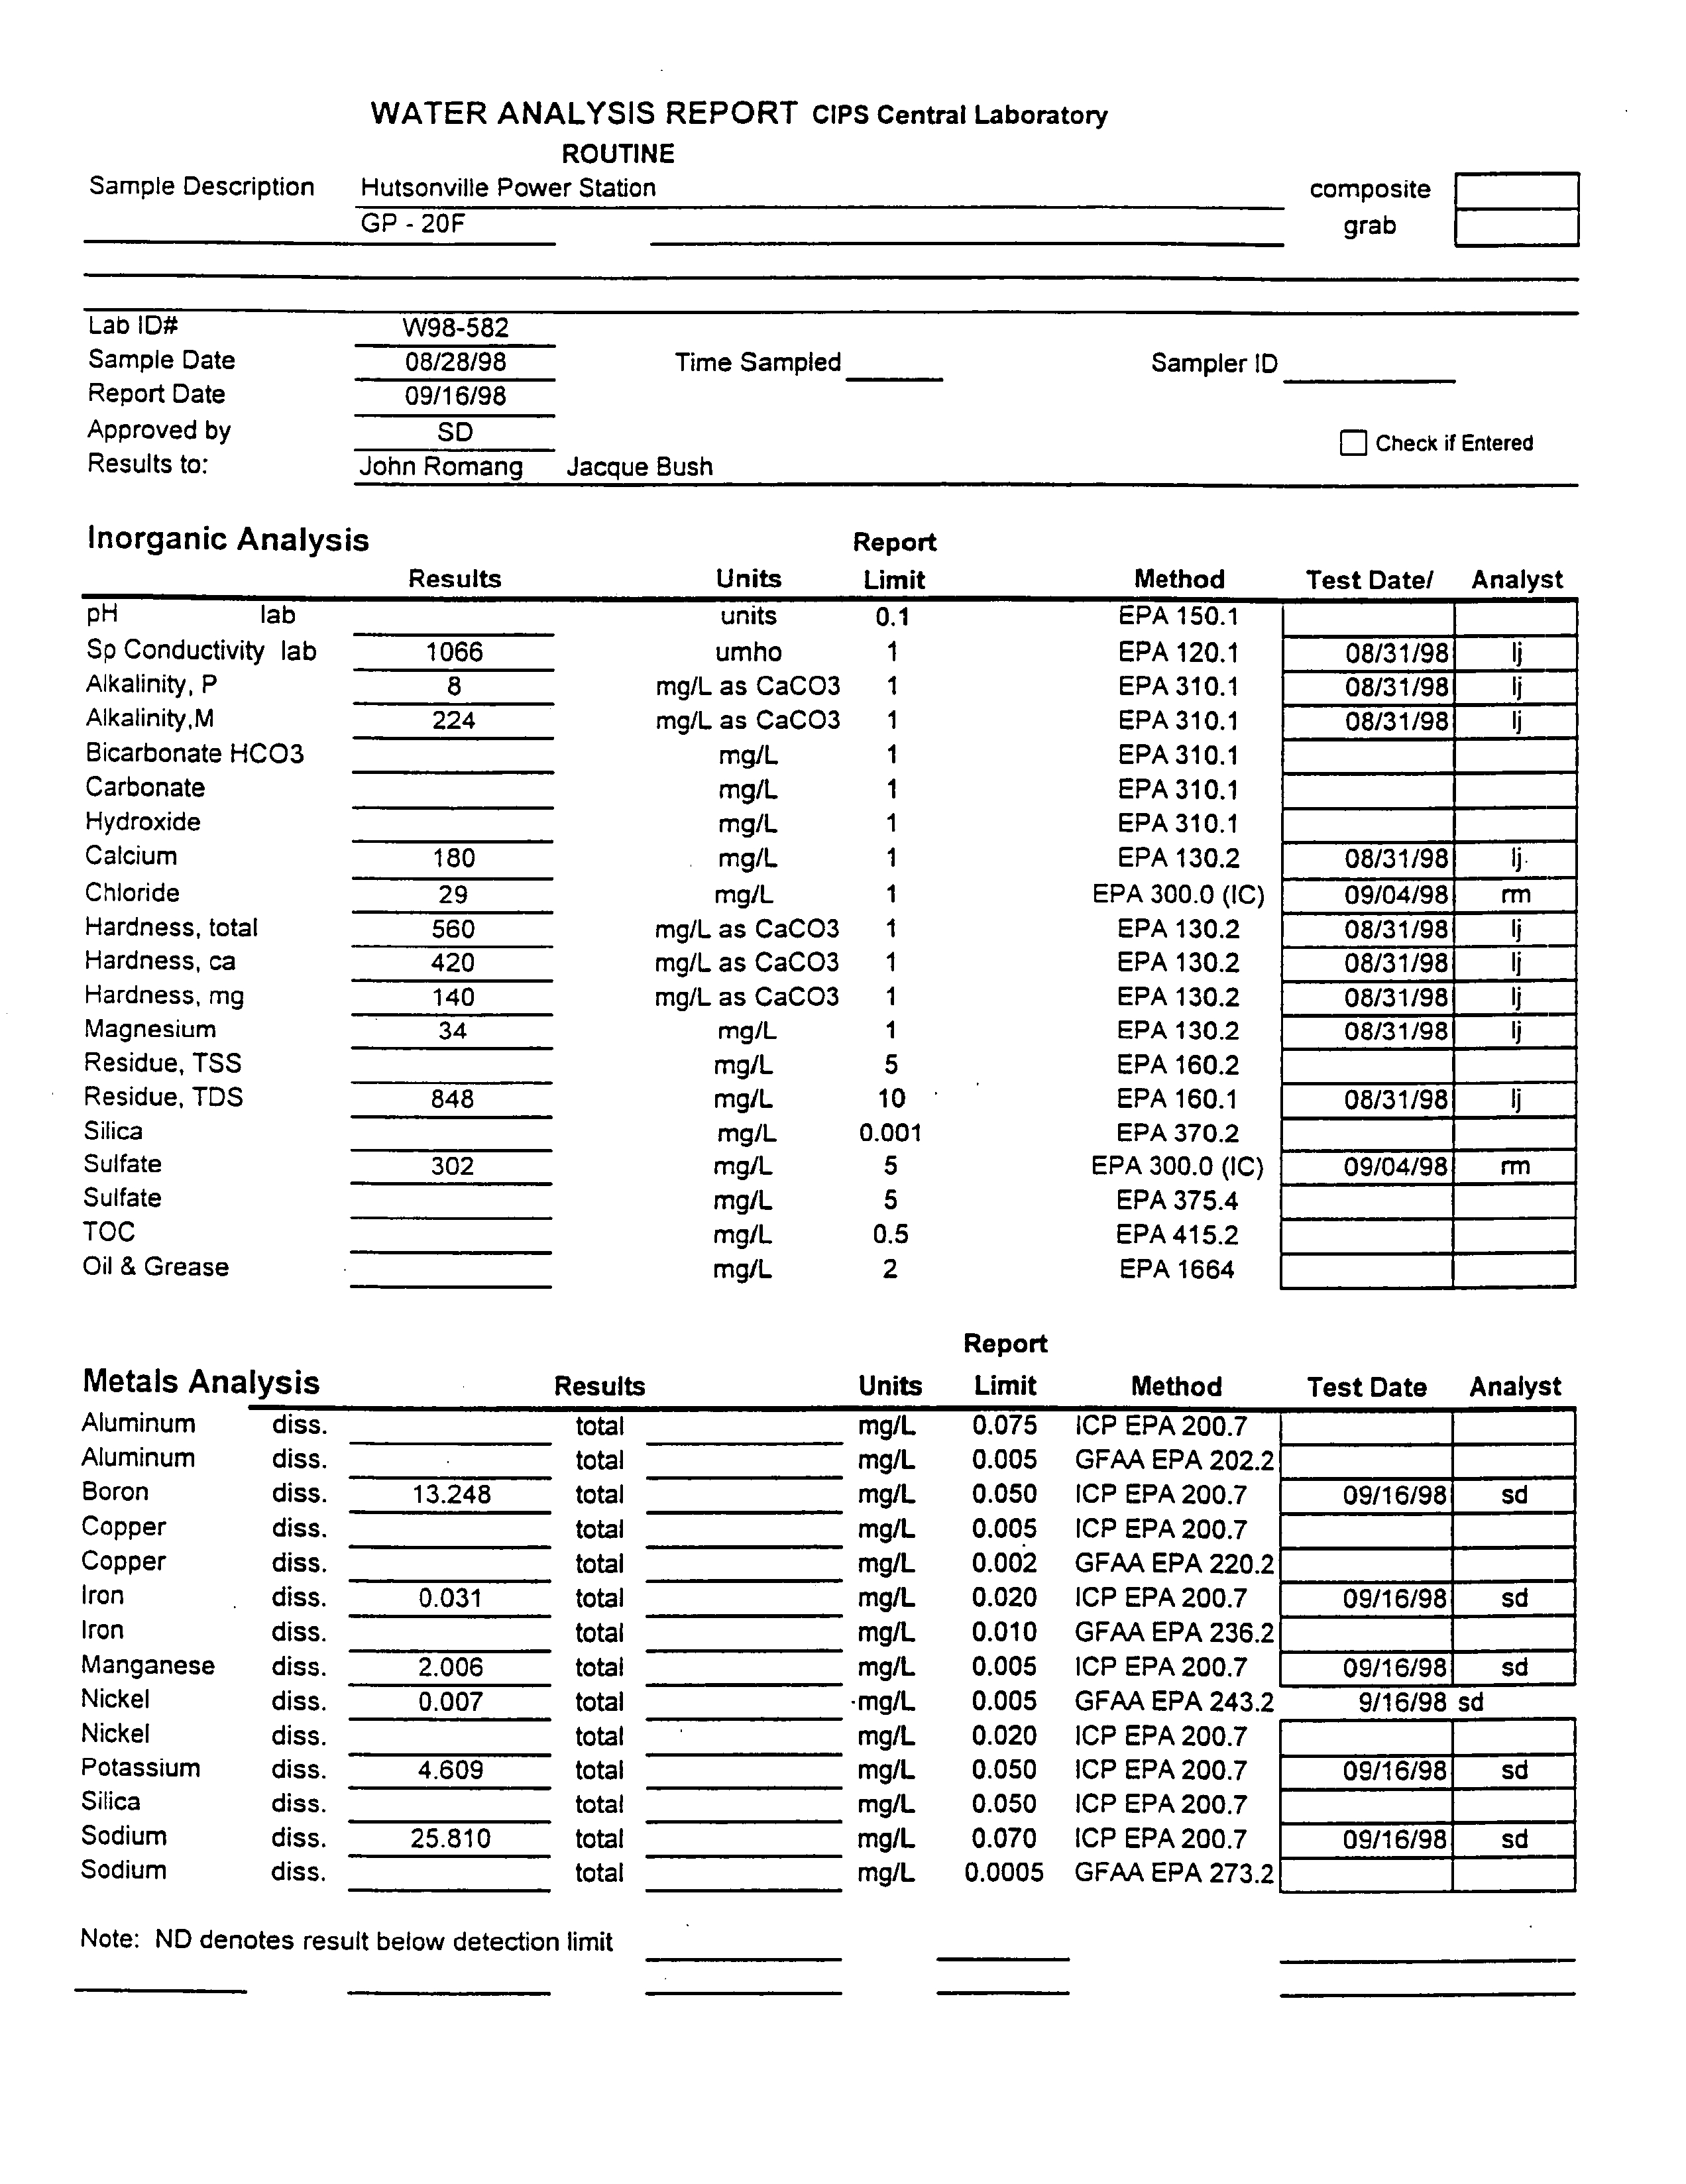
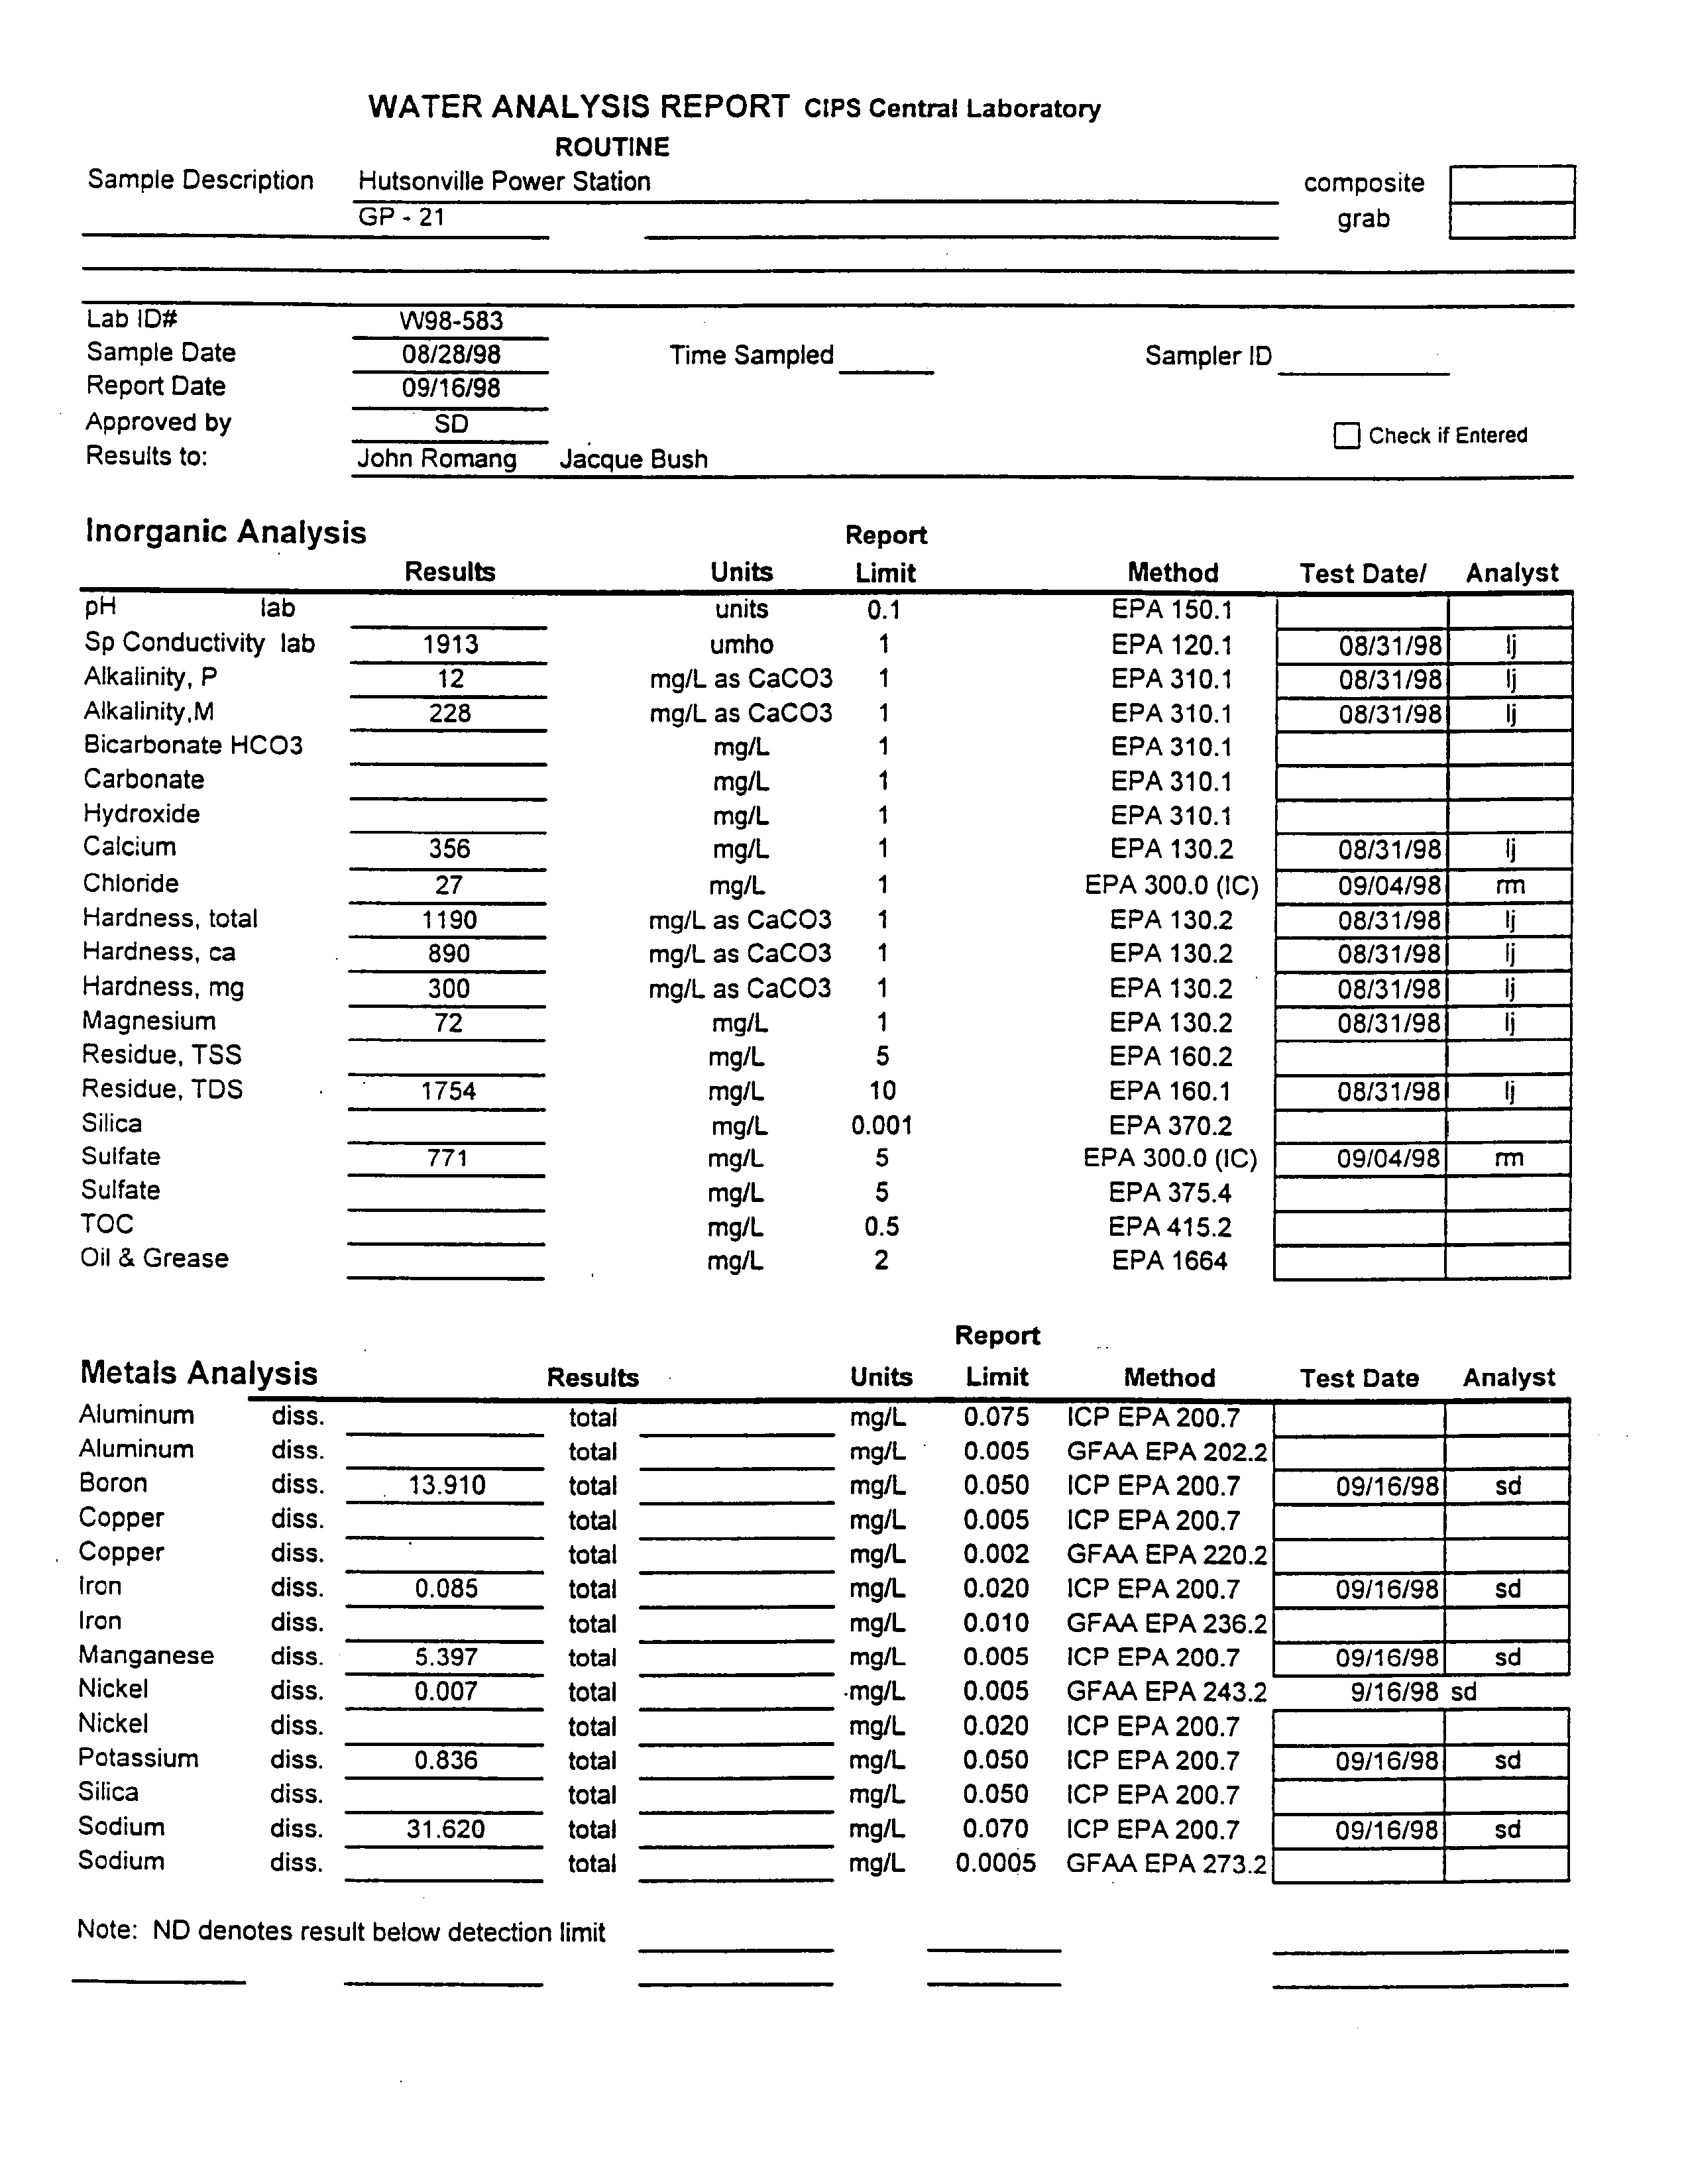
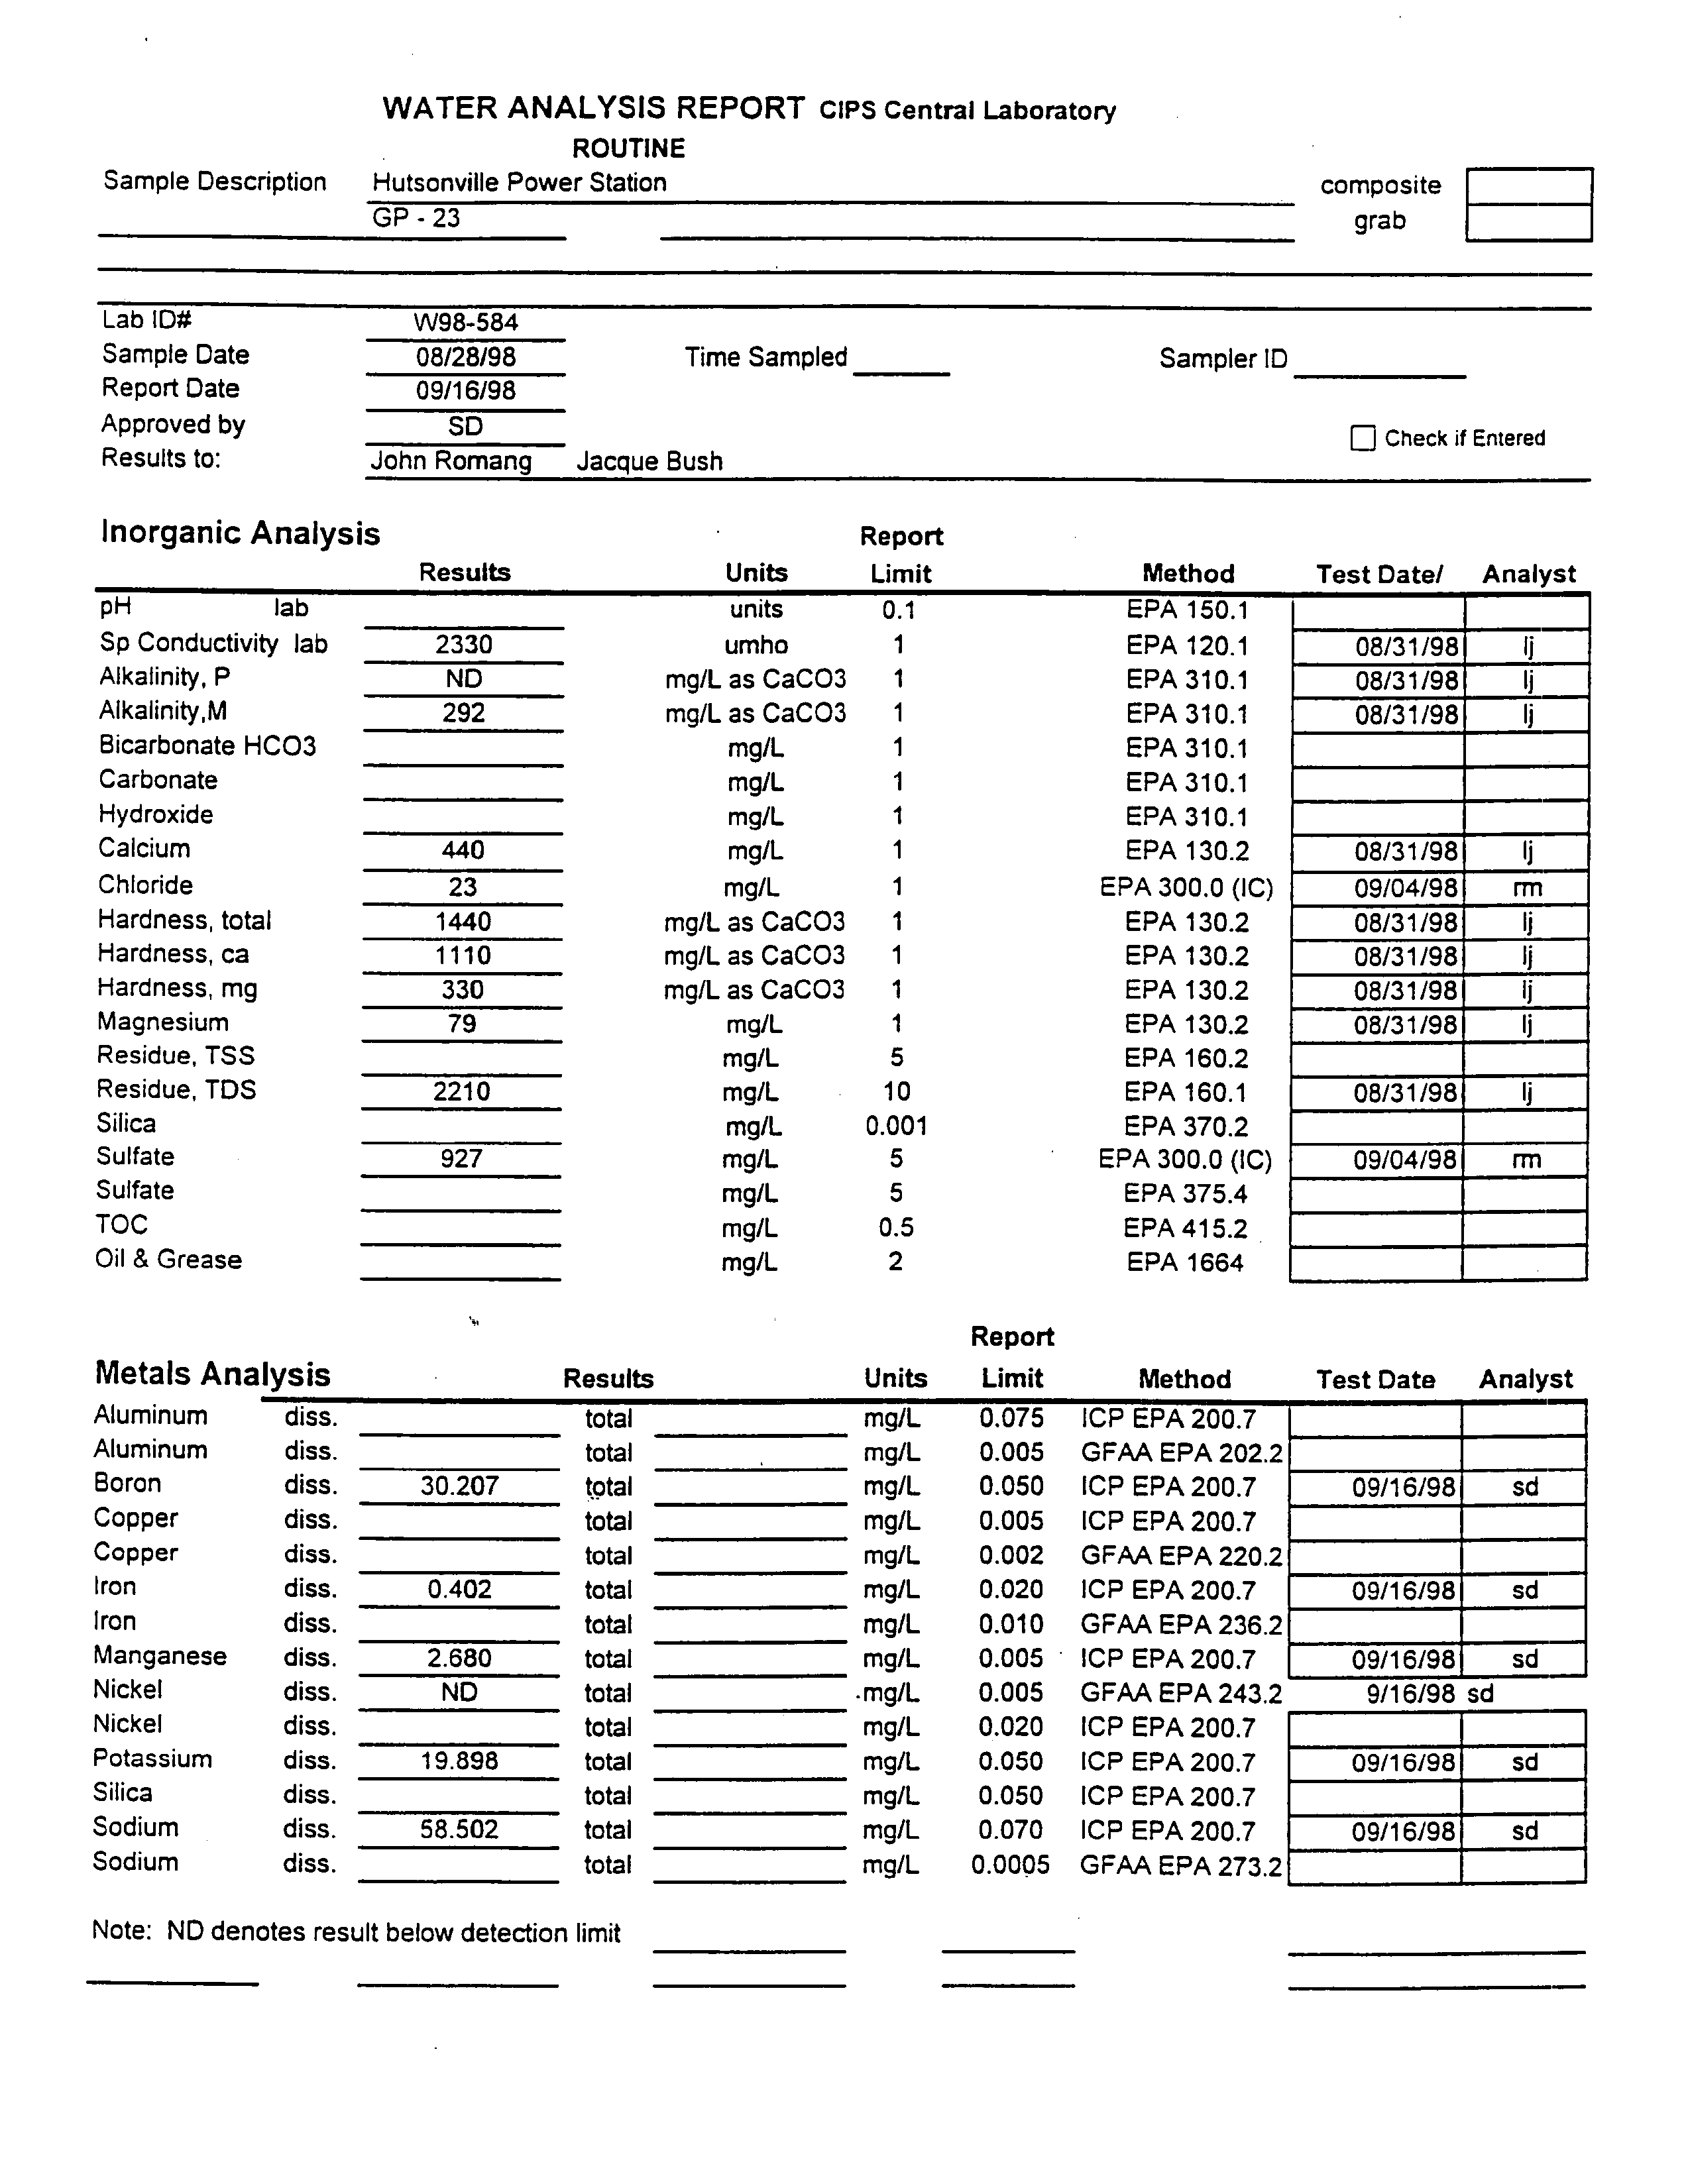
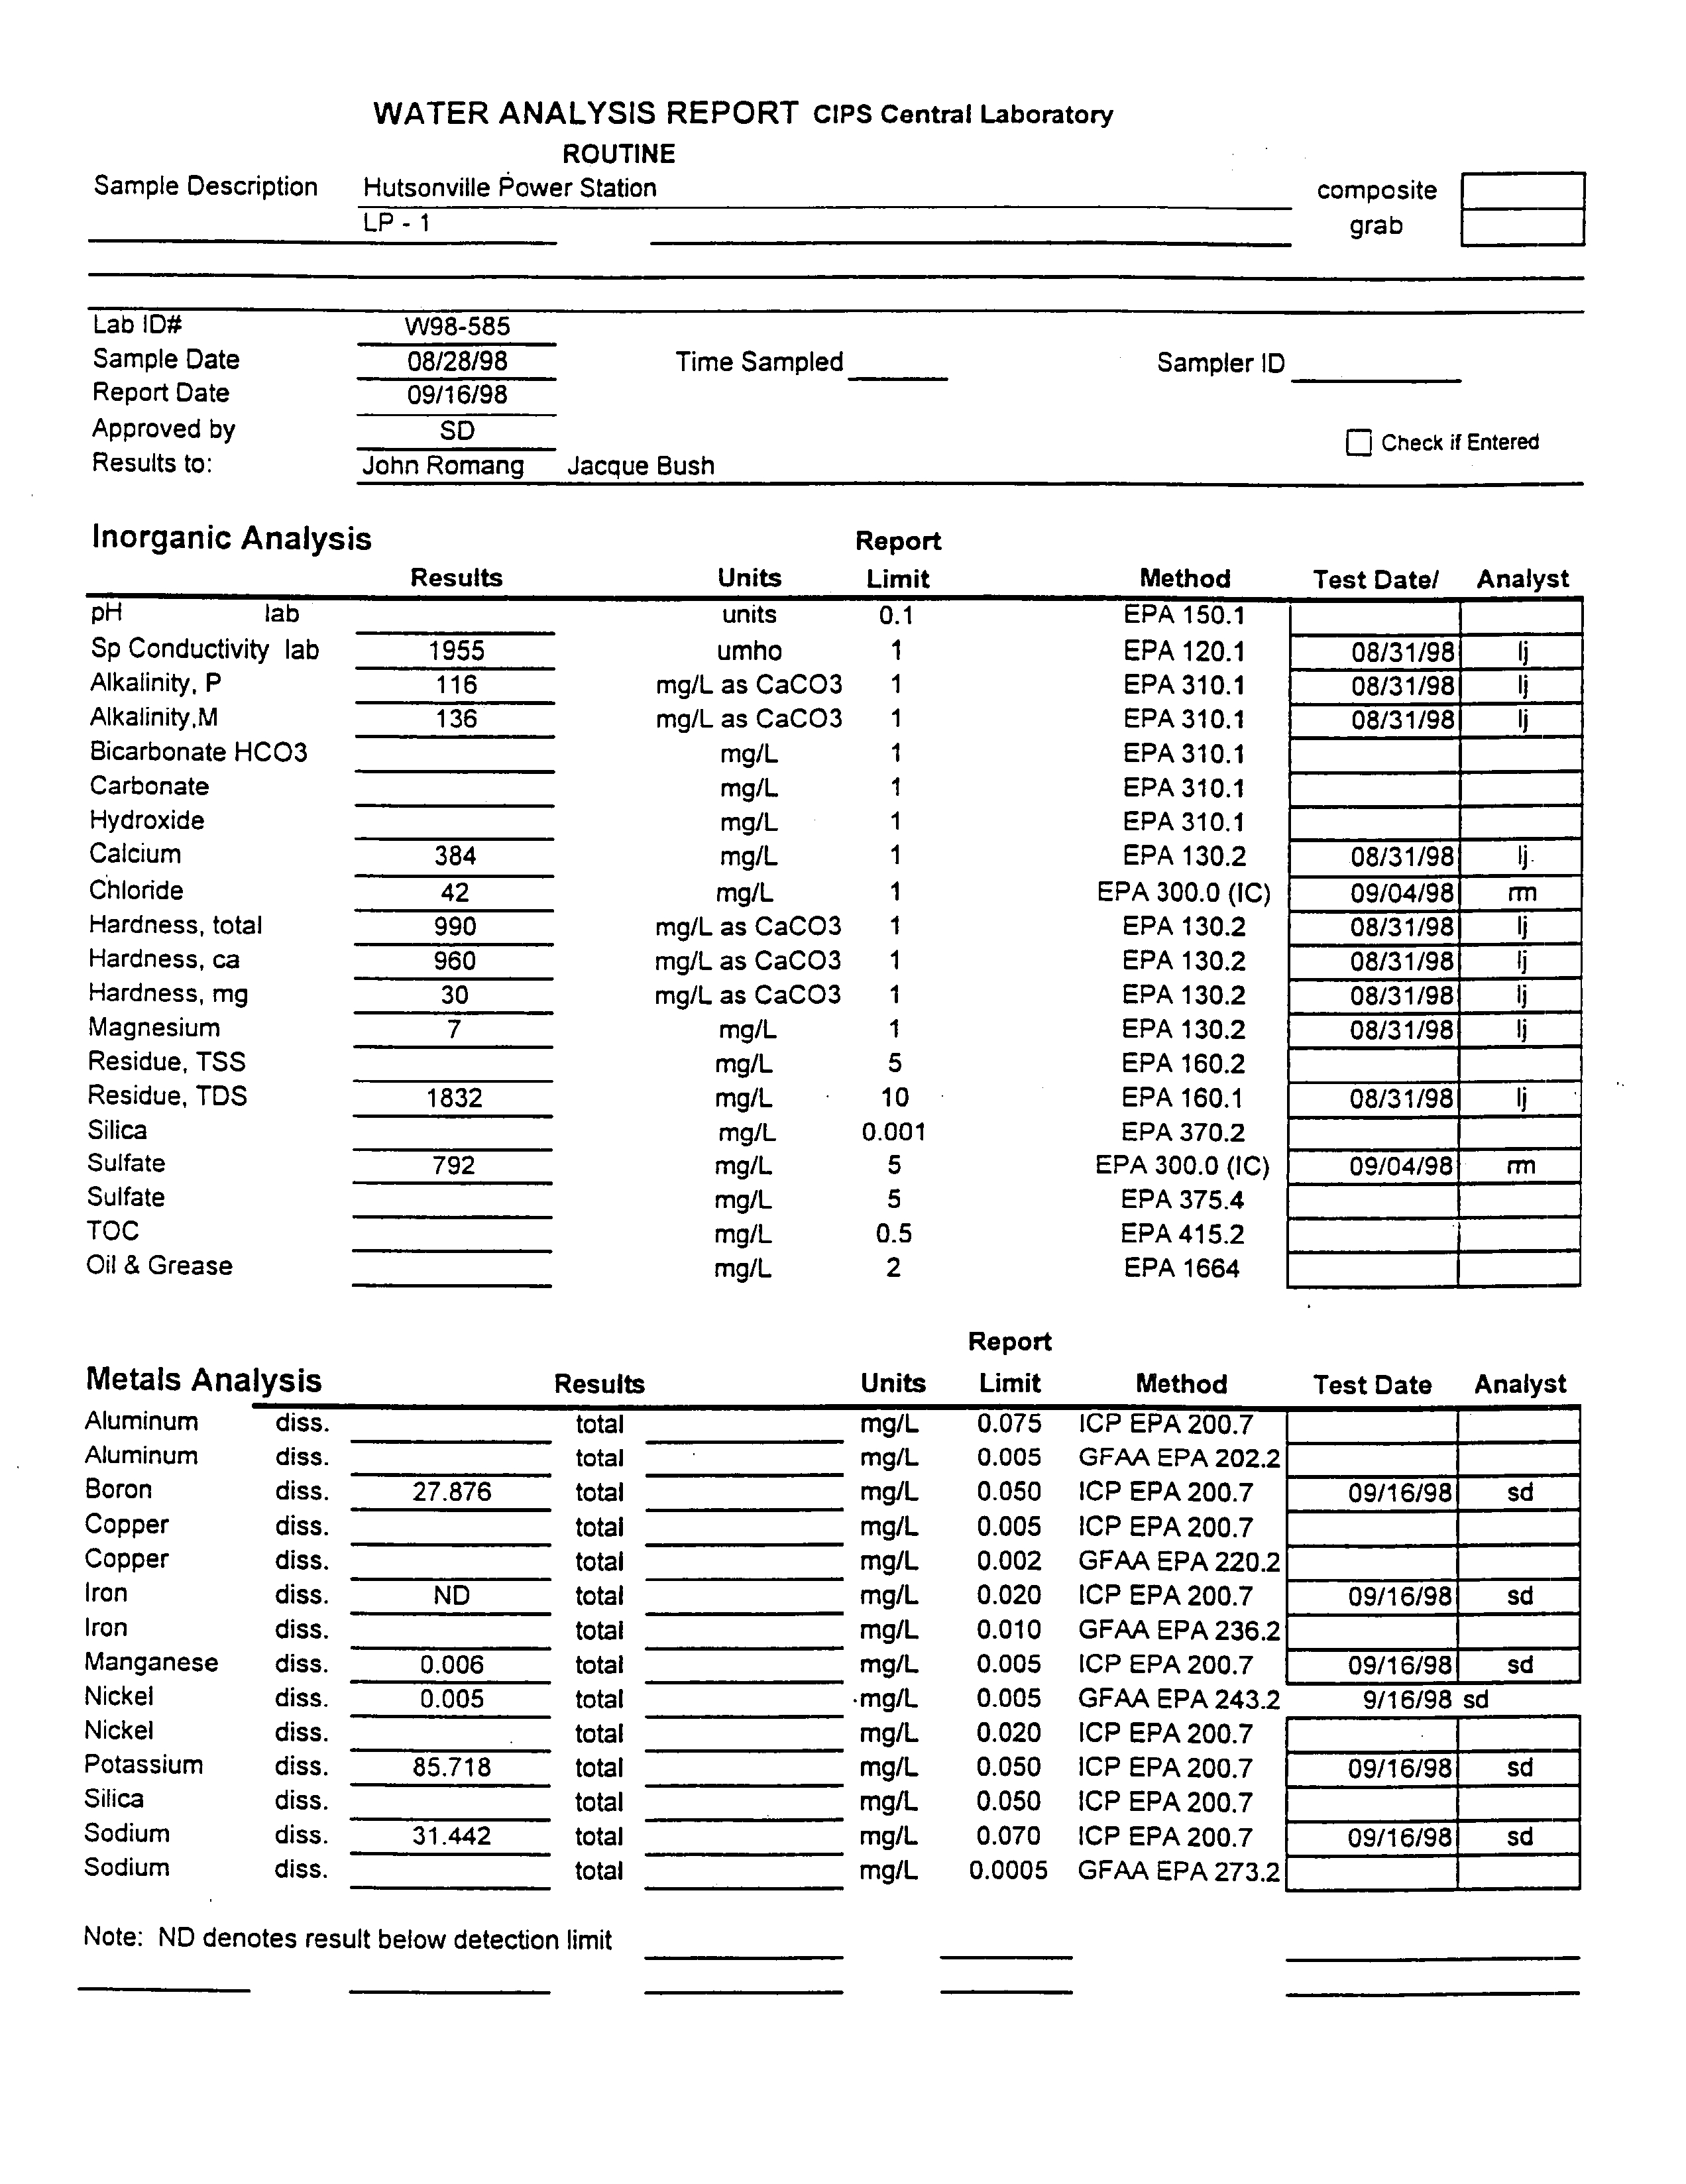
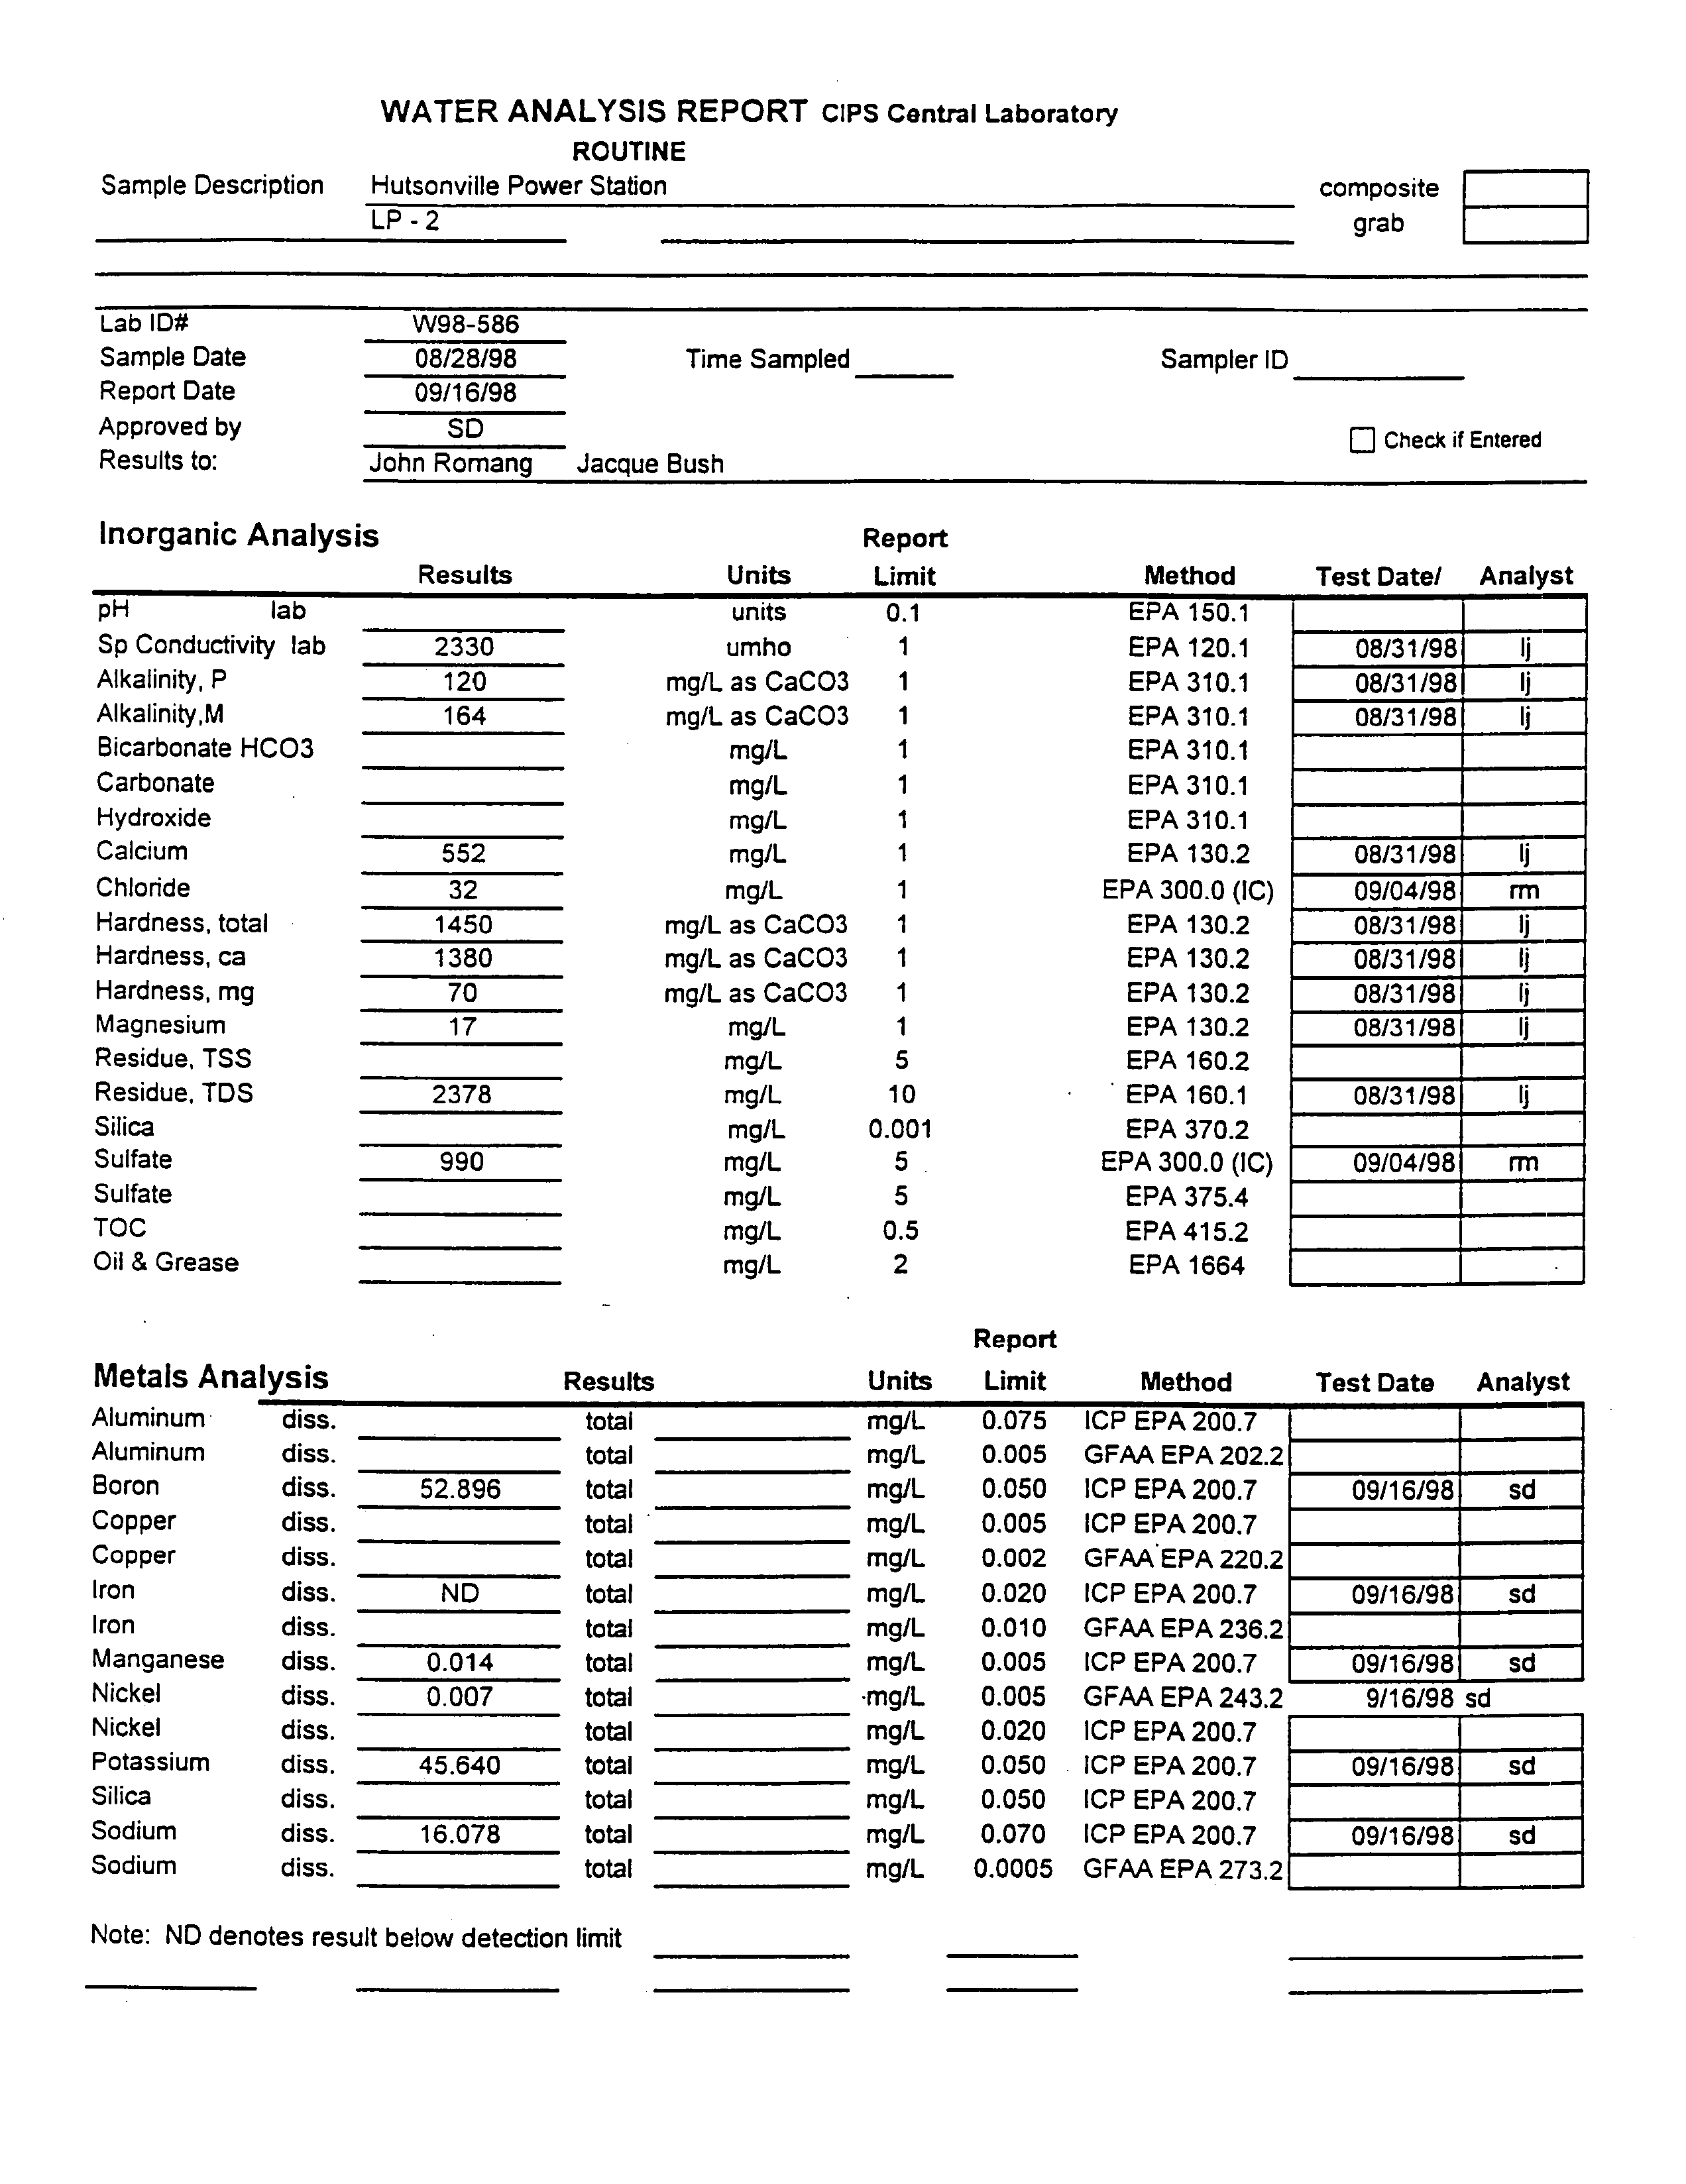
4.2 Direct-Push Leachate
Samples
Ash leachate
samples
were
collected from the lined
impoundment
LP-1
and
LP-2
from the
unlined
impoundment GP-20 GP-21
and
GP-23
and
from
the former
ash
laydown
area
GP-2
Boron sulfate
and TDS concentrations
ranged
from about 1.5 to 27 times the
groundwater
standards
mg/L
400
mg/L
and 1200
mg/L
respectively
in
most
of the leachate
hutsonville
hydrogeologic
assessment.doc
Natural
4-1
Resource
Technology
Electronic Filing - Received, Clerk's Office, August 11, 2008 - AS 09-1, Exhibit 4
GROUND WA TER
QUALITY
IN DIRECT-PUSH SAMPLES
samples however
sulfate and TDS
were
slightly
below the standards
at
location GP-20 in the
unlined
ash
impoundment
Table
Manganese
was between
18 and 165 times the standard
0.15 mgIL
in leachate from the unlined
ash
impoundment
and from the former ash
laydown area
but
was
less than one-tenth
the
standard in the lined ash
impoundment
lowest
concentrations
on
site thereby exhibiting
its
unreliability
as an ash indicator
parameter
Iron
was
below the standard in all leachate
samples
from the
impoundments
but exceeded the standard in the
sample
from the former ash
laydown
area
Nickel
was
less than one-third the standard
0.10 mg/L
in all of the leachate
samples
The
pH
of the coal ash leachate was
neutral
to
alkaline
The
pH
of the fresh
leachate in the
lined ash
impoundment
was above
9.0
while the
pH
in
the unlined ash
impoundment
was
slightly
elevated at 7.3 to 7.6 The
pH
at location
GP-2
in the former ash
laydown area
was near
neutral at 6.8
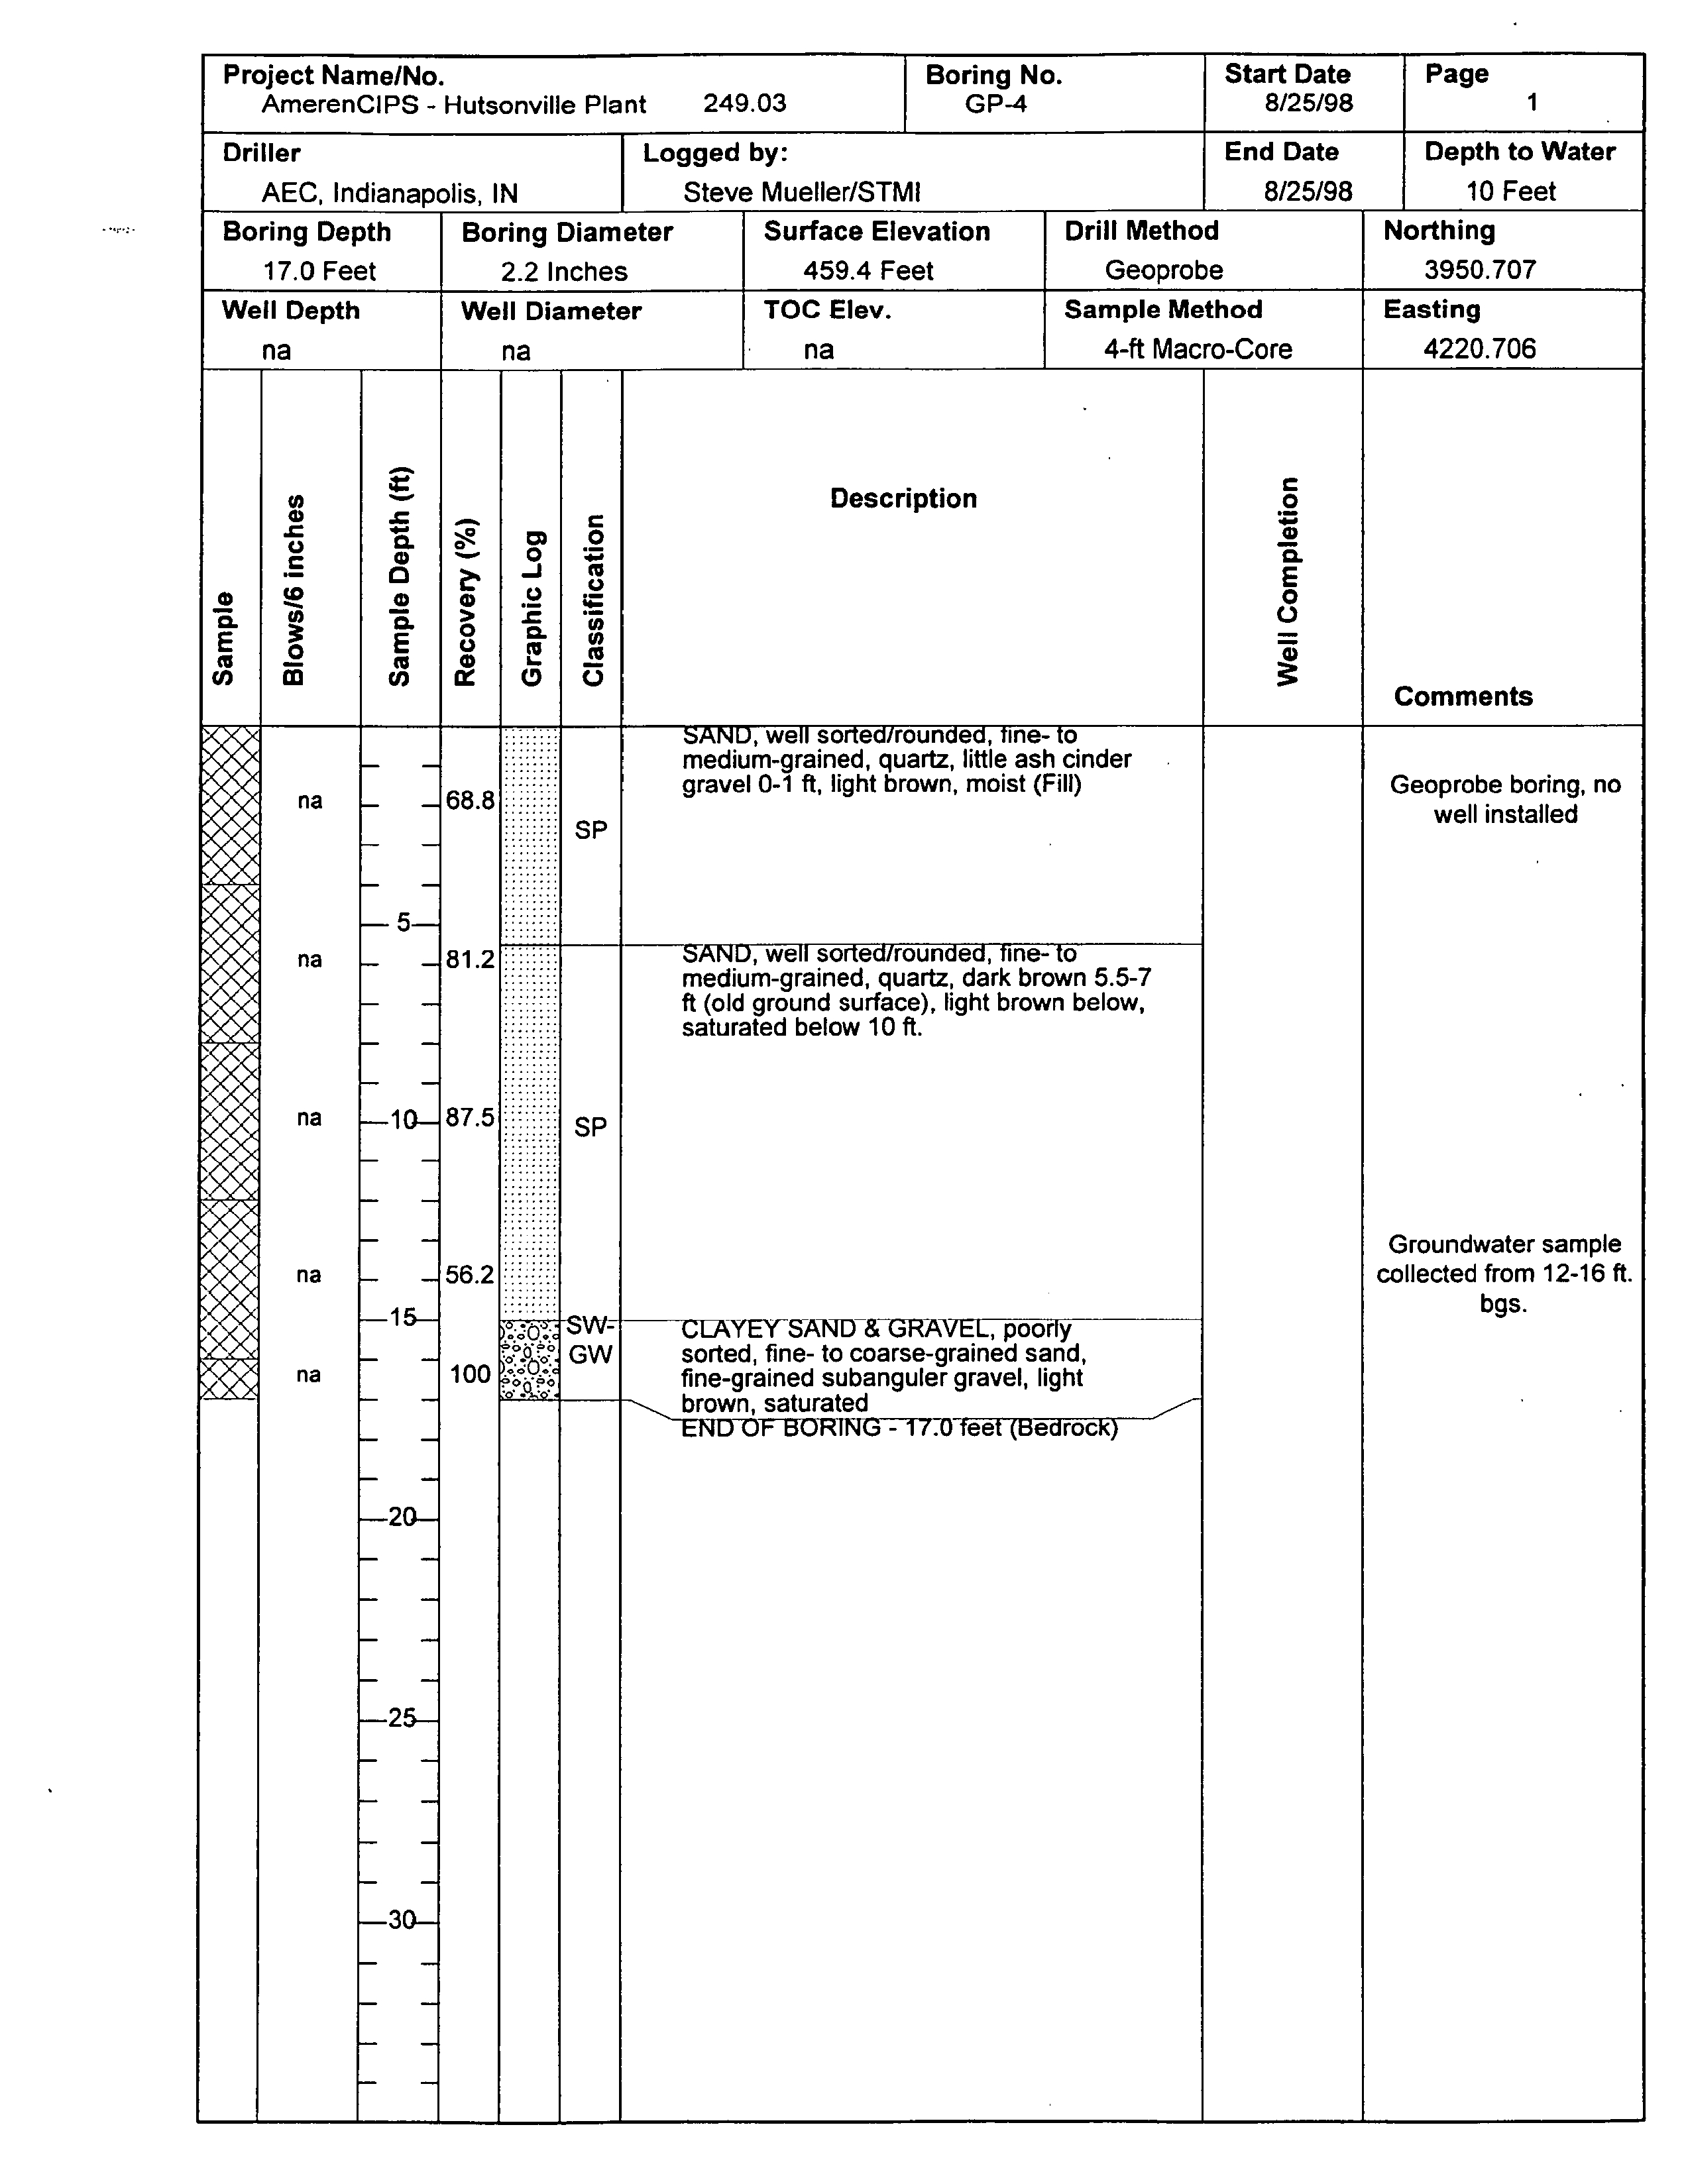
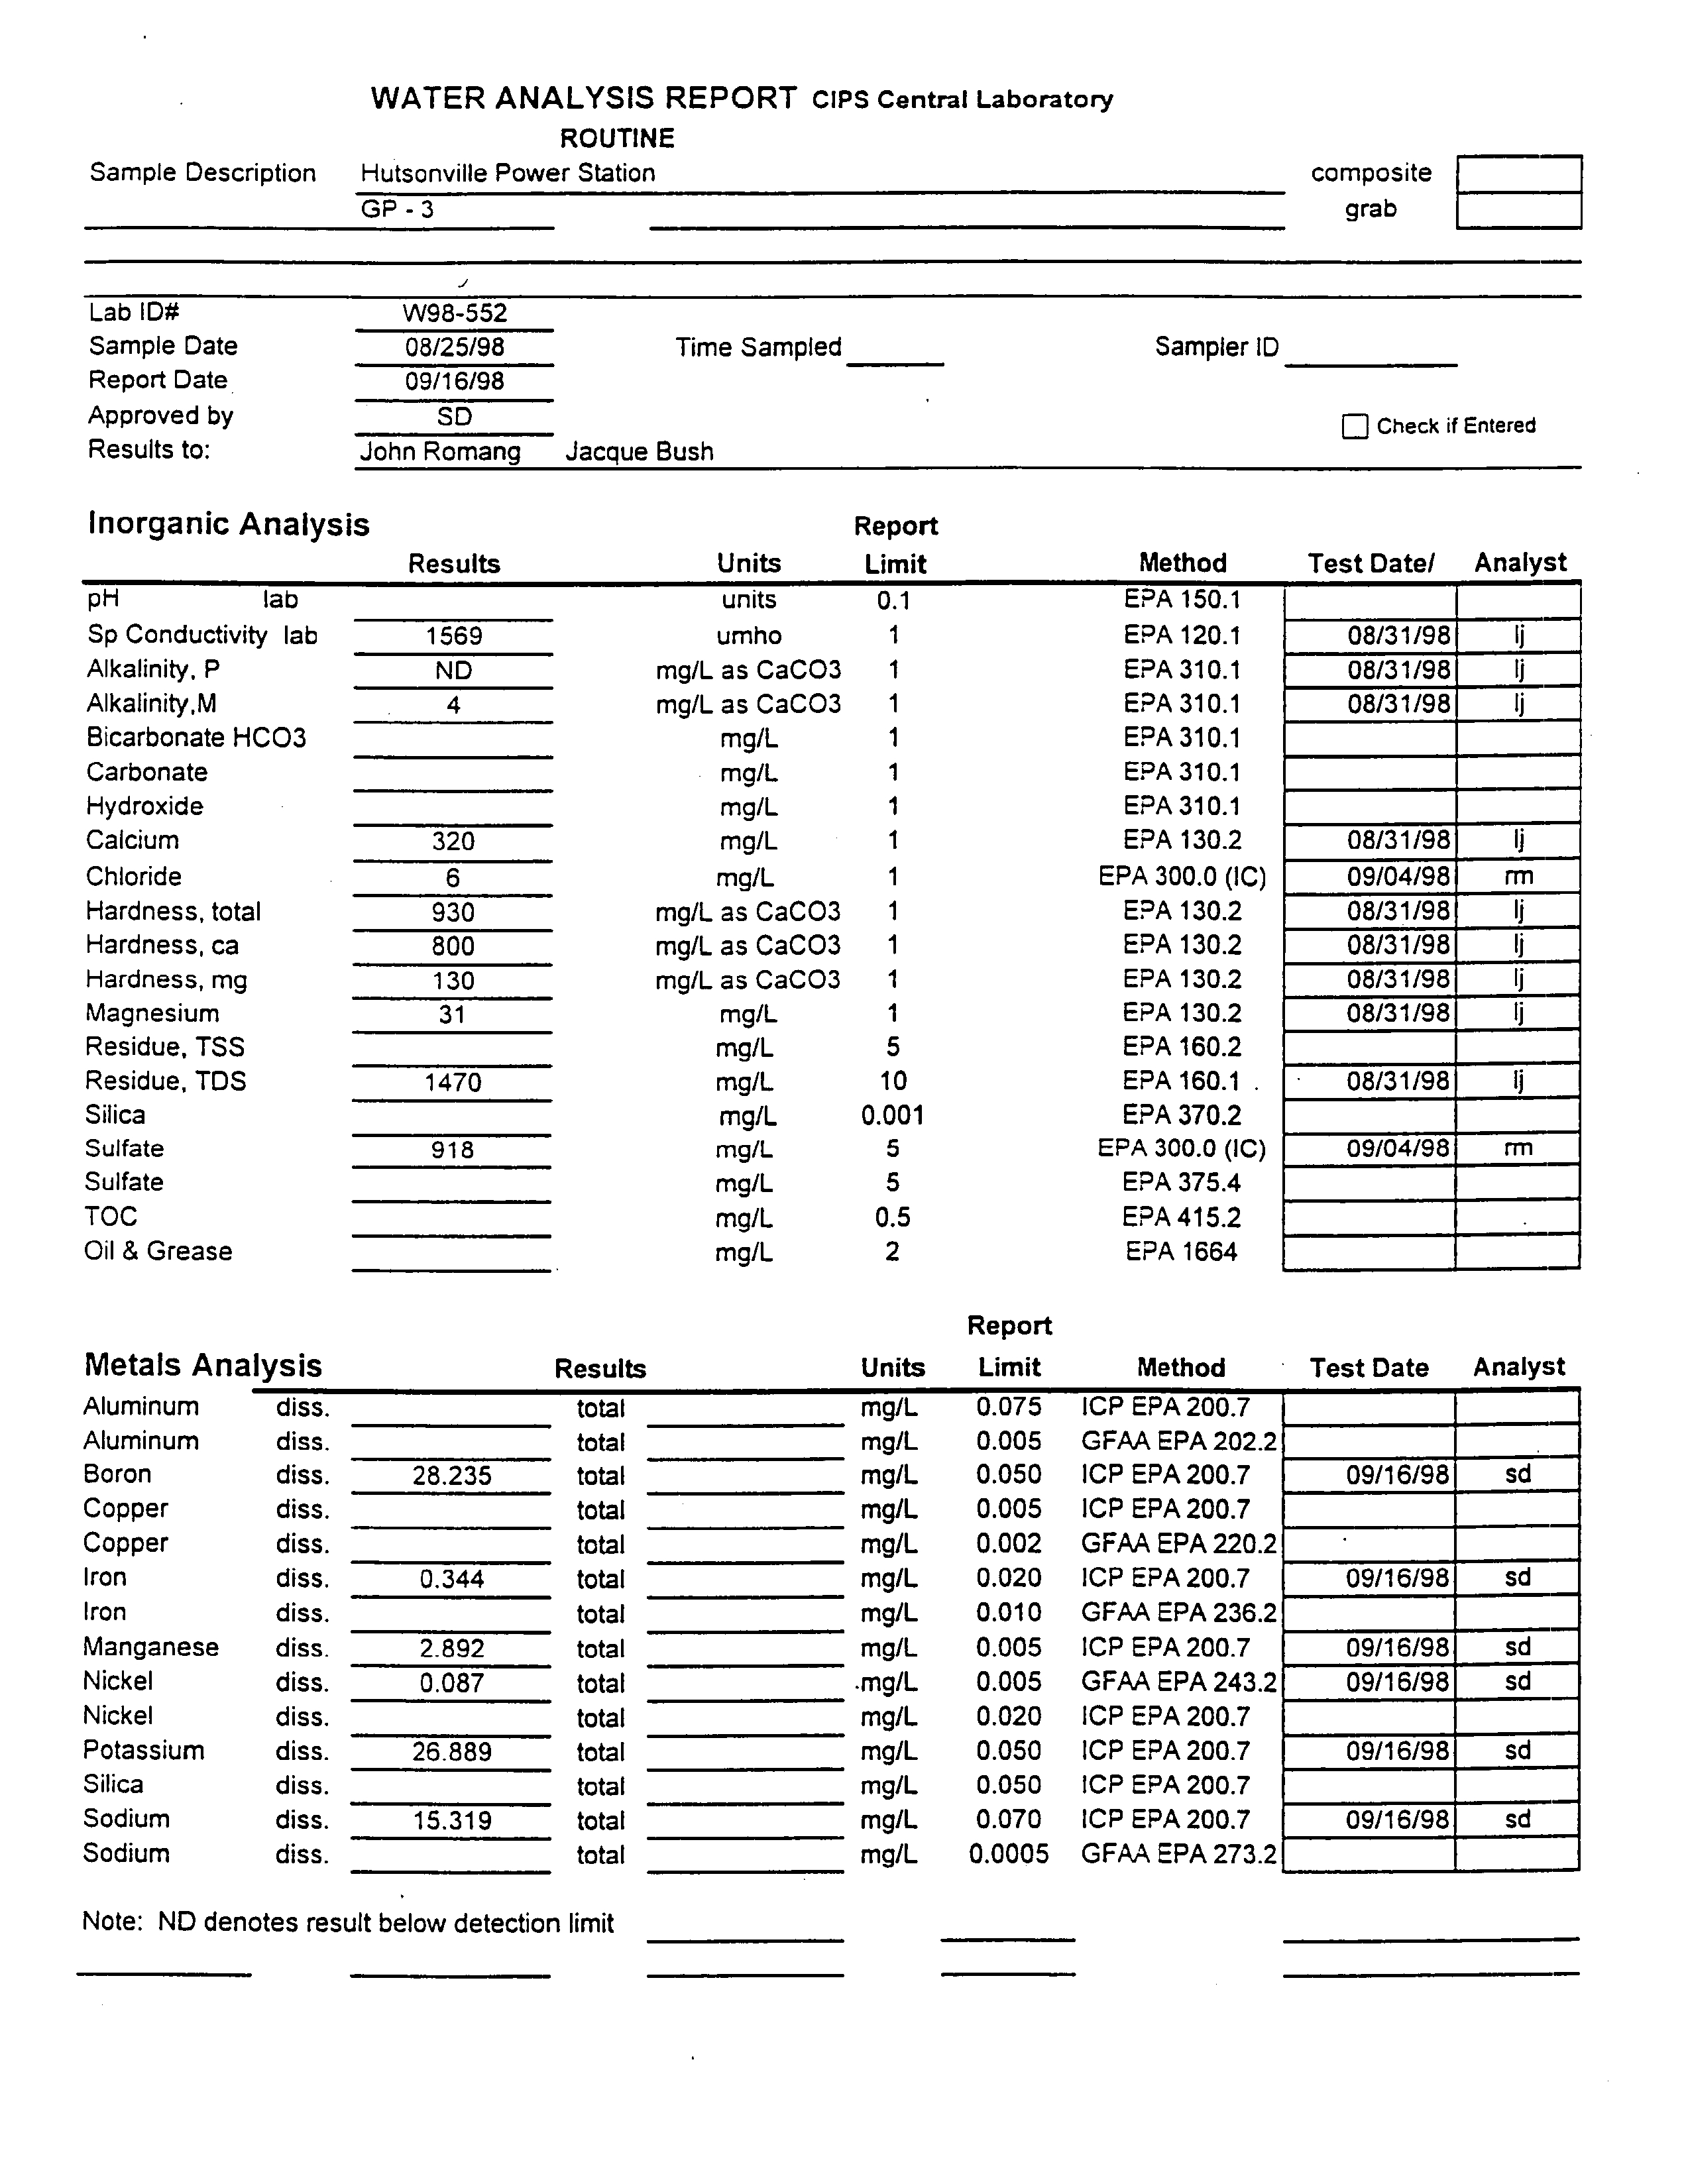
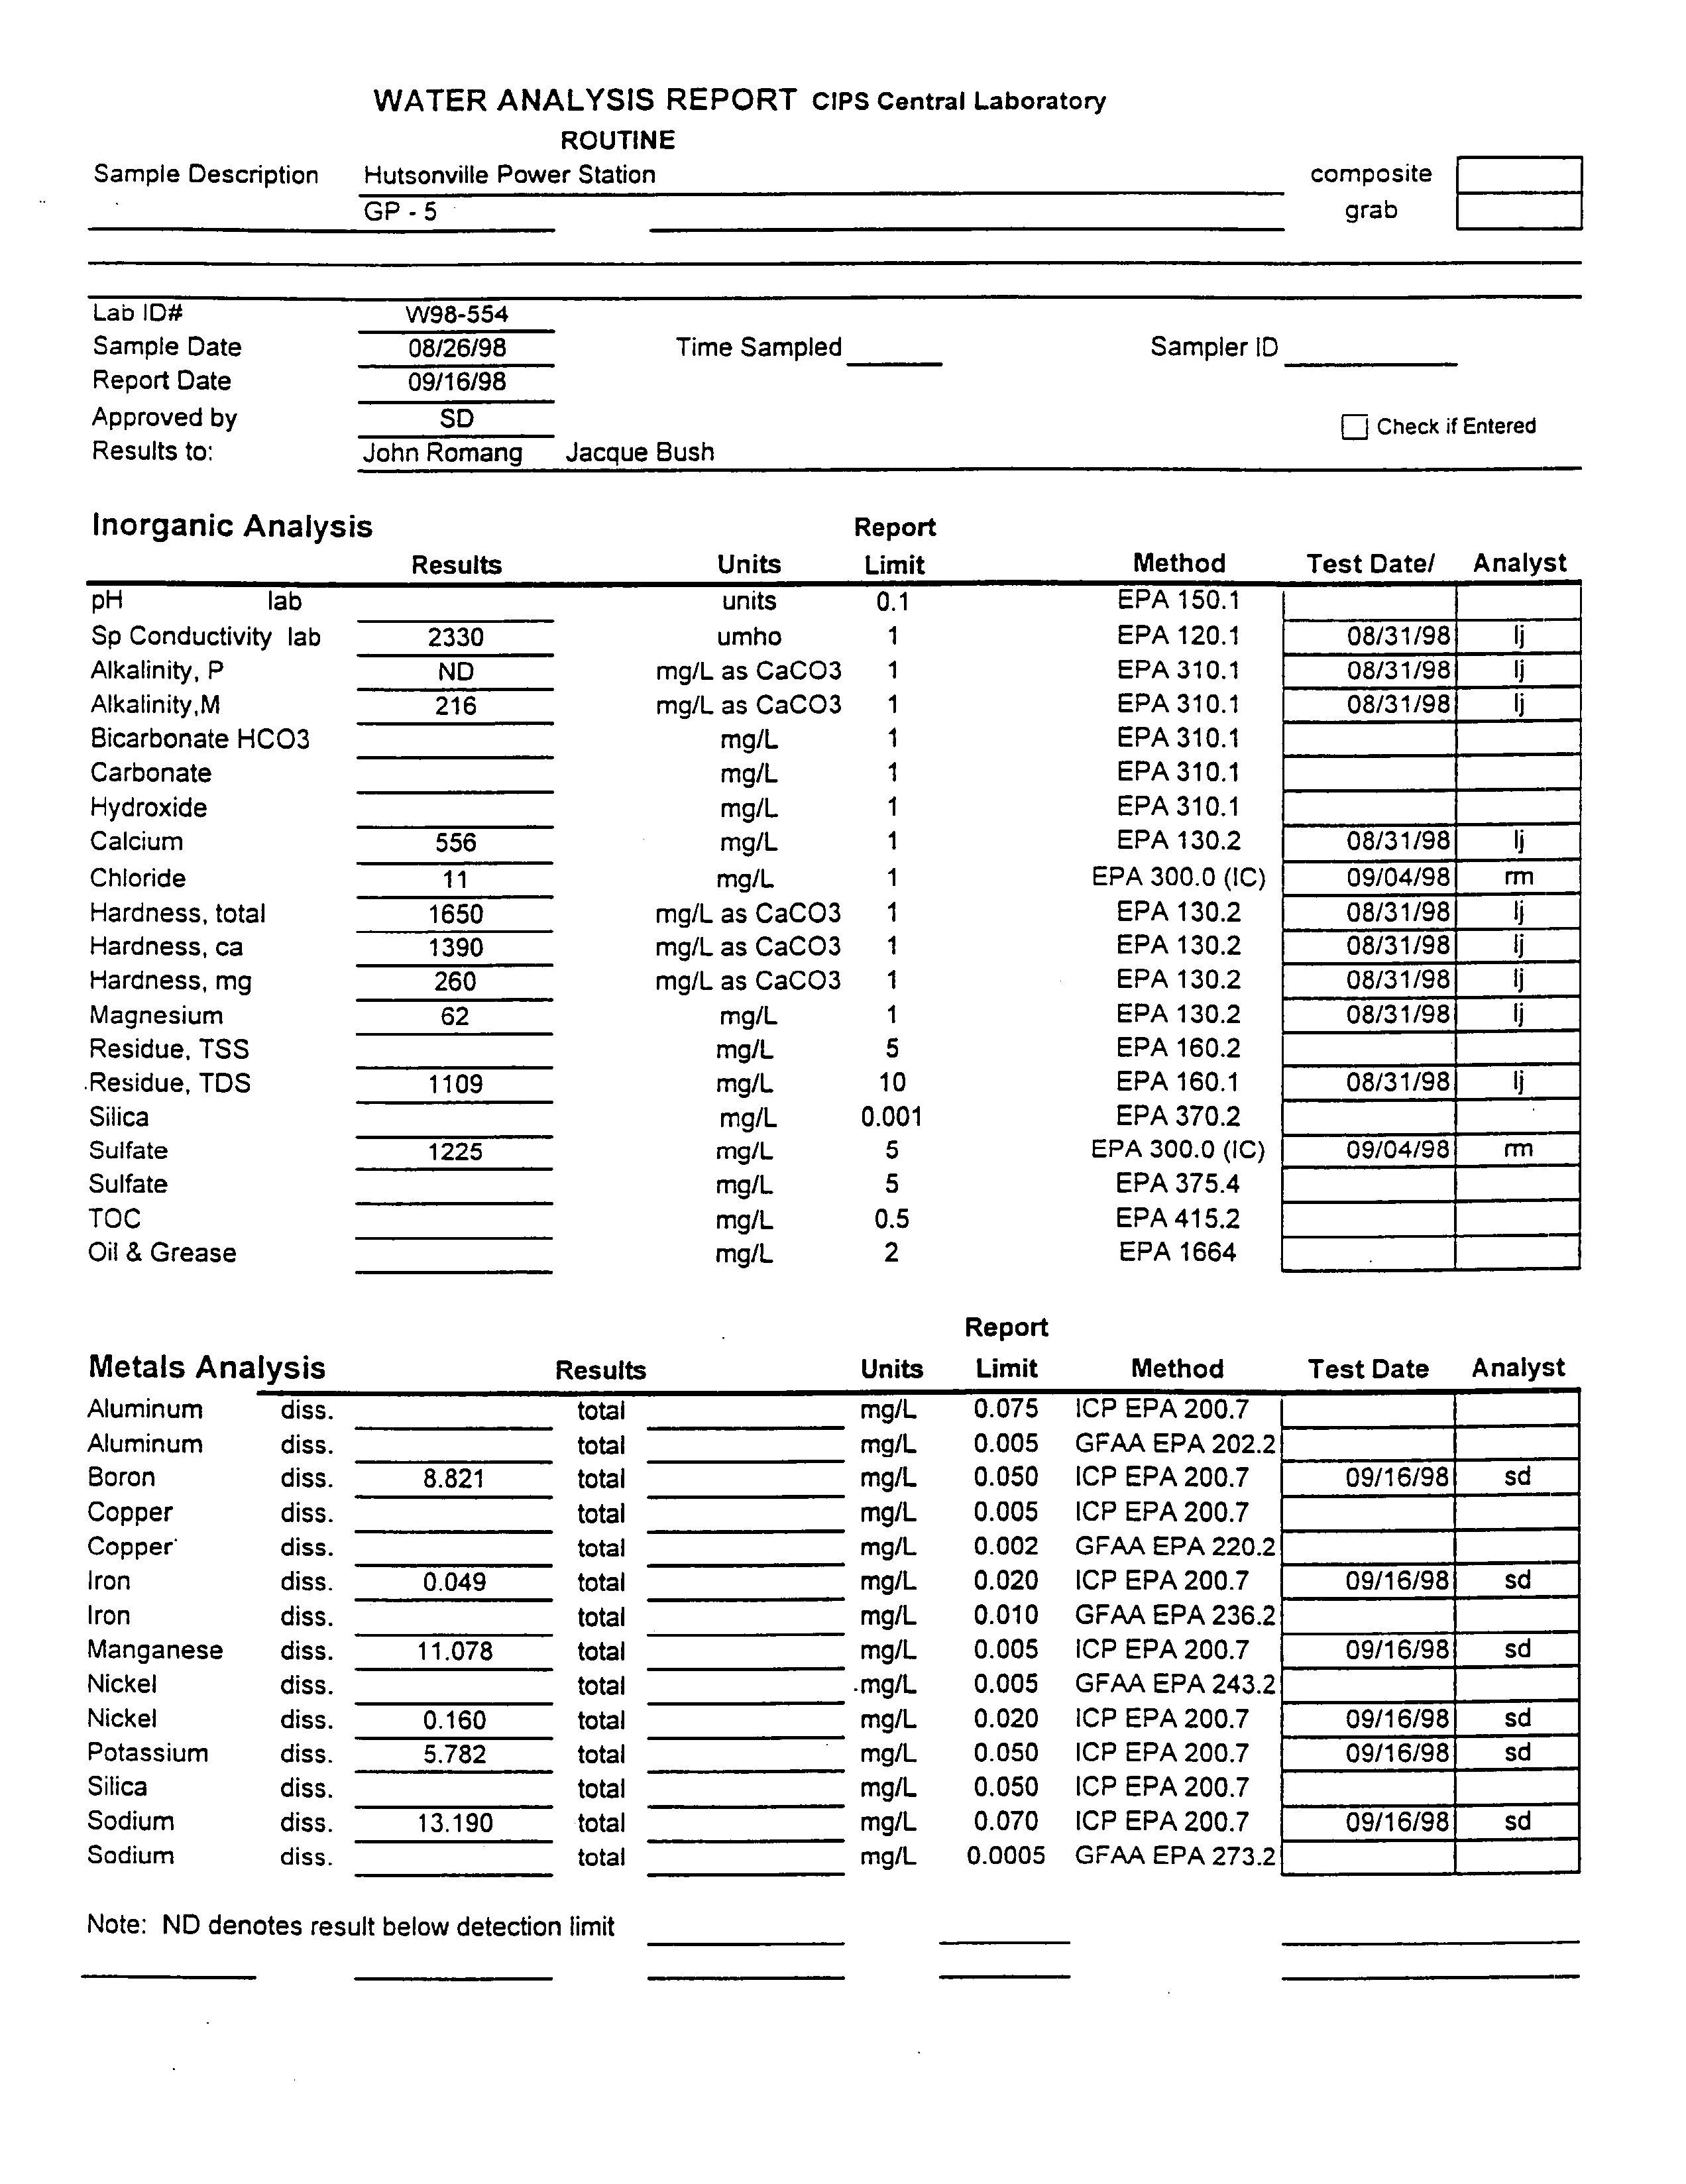
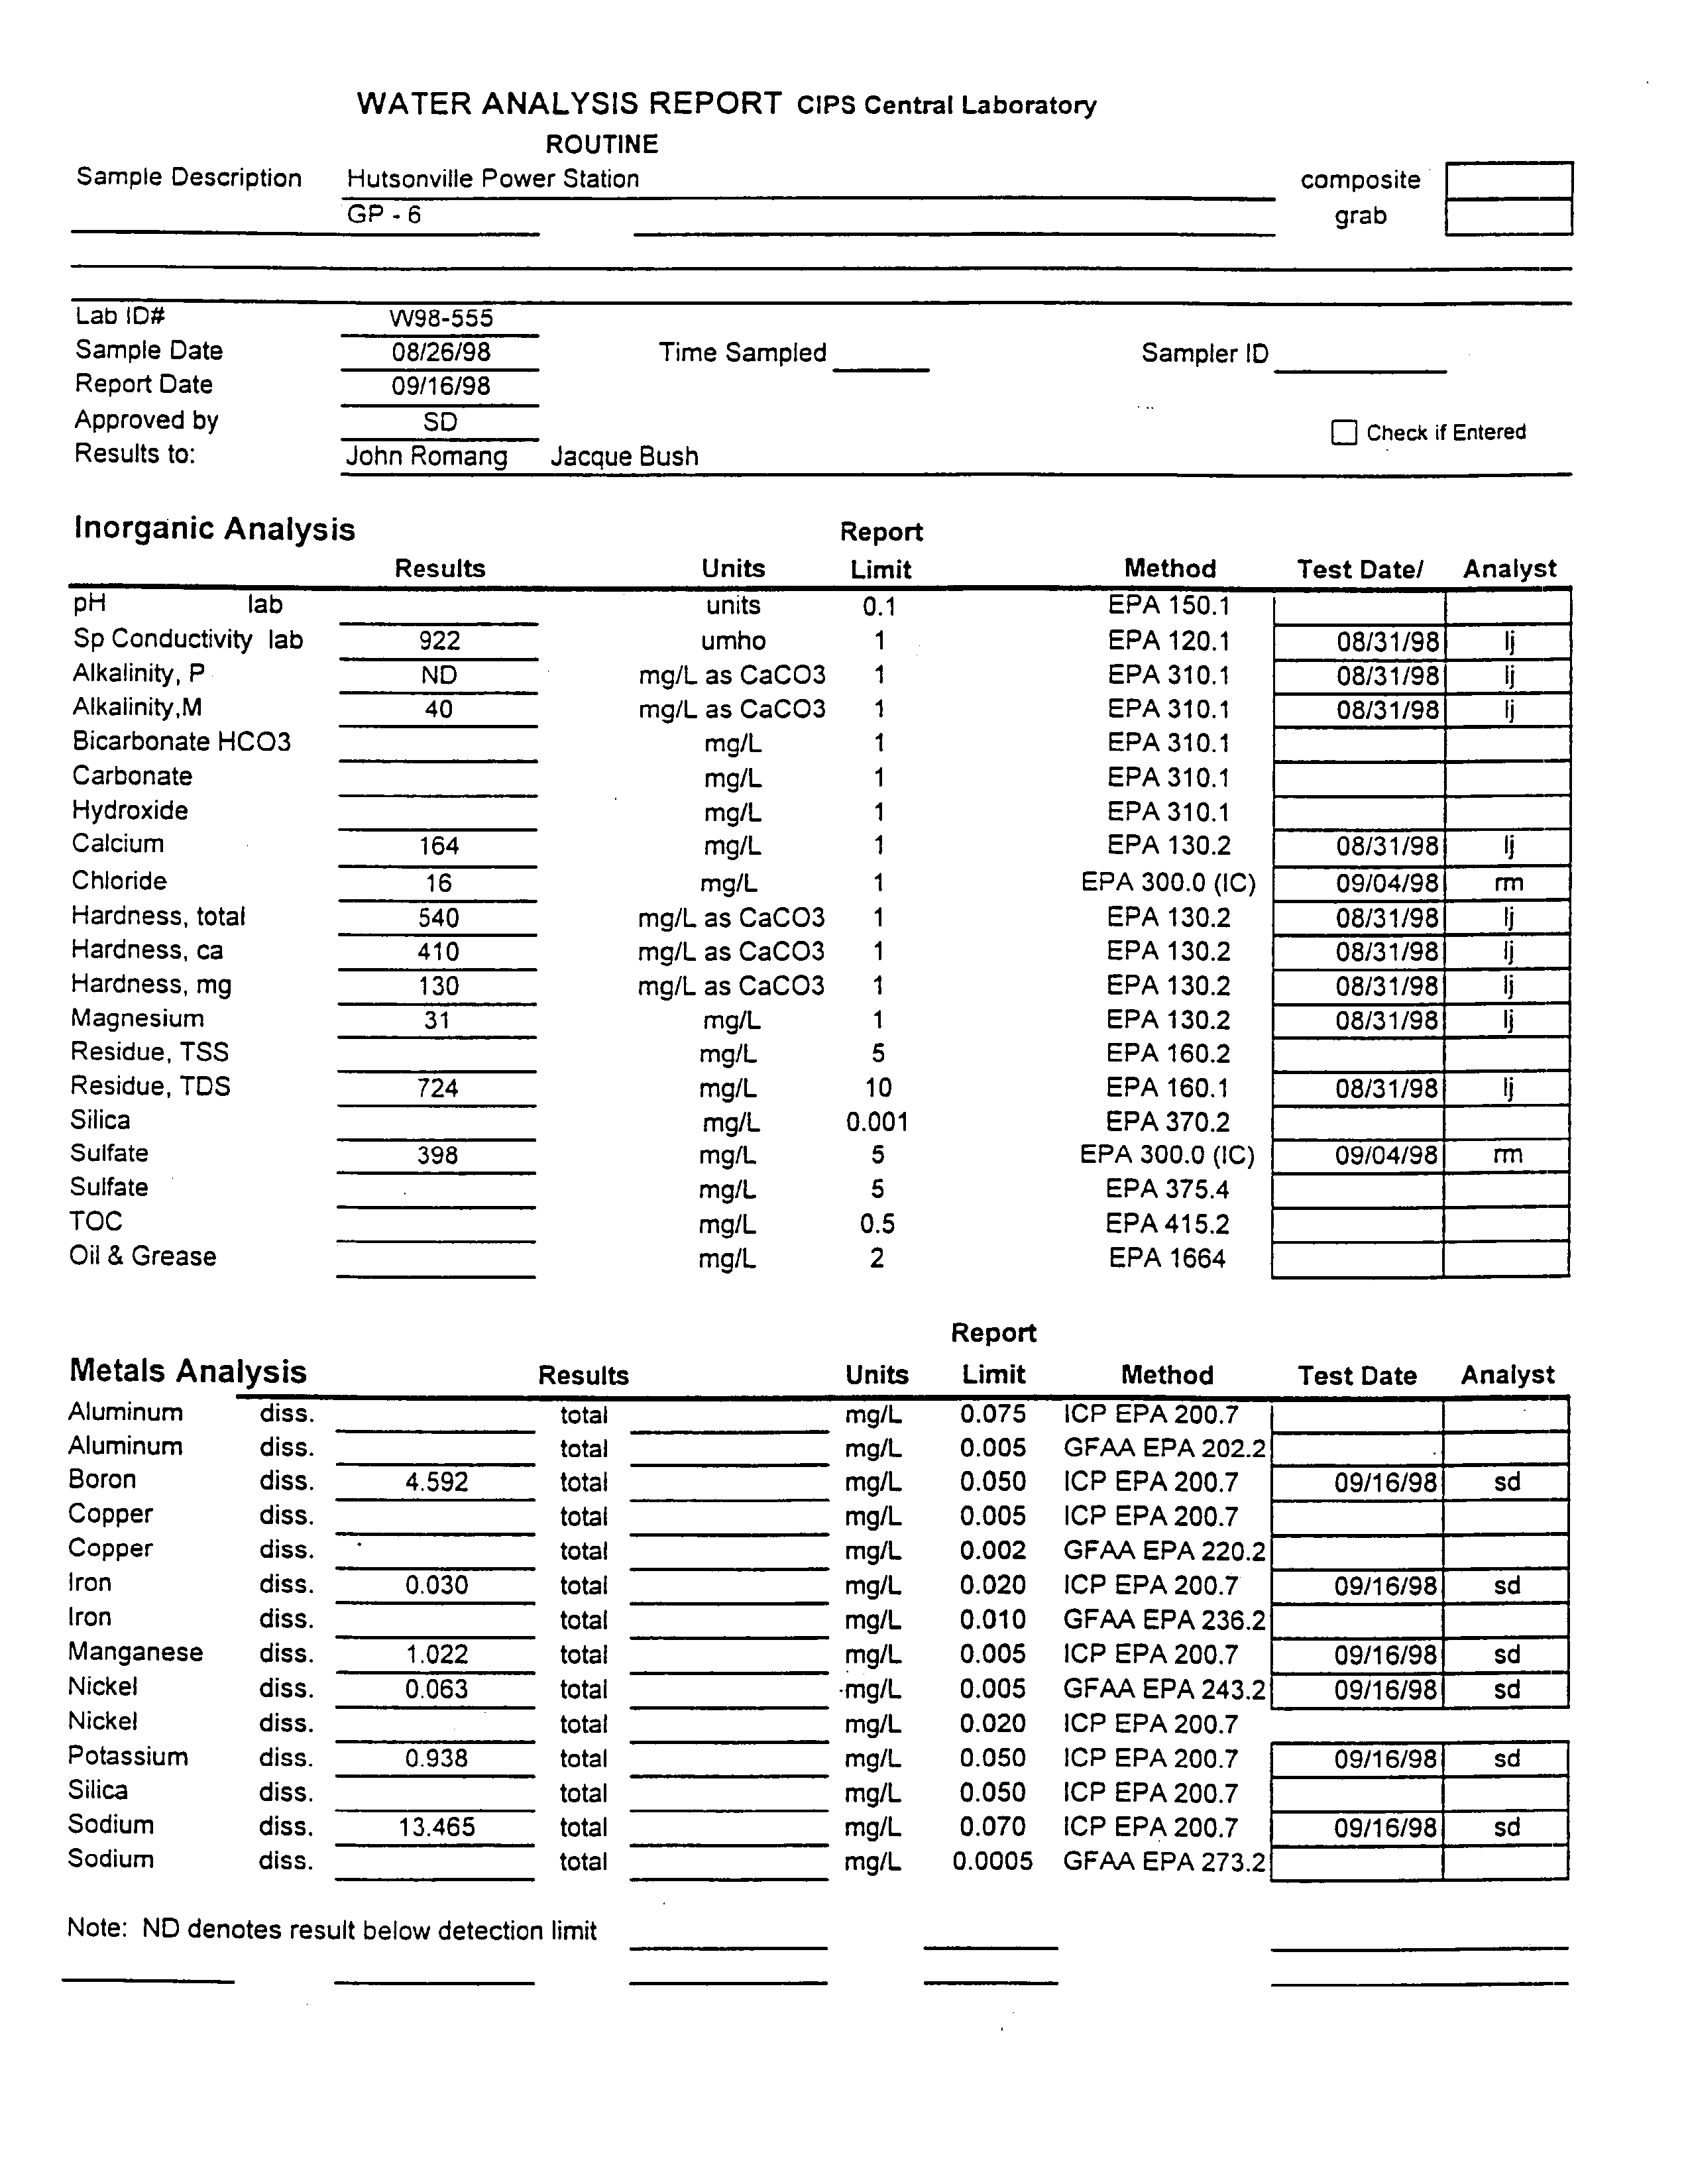
4.3 Direct-Push Groundwater
Samples
Boron and sulfate concentrations
in
groundwater
between the ash
impoundments
were
higher
than the Class
groundwater
standards
Boron concentrations
ranged
from 4.6
mg/L
to
28.2
mg/L
and sulfate concentrations
from 398
mg/L
to 1531
mg/L
near the southeast corner of
the lined ash
impoundment see
GP-3
through
GP-6
Table
Boron also exceeded the standard
in one
sample
near the coal
pile
while three
samples including
GP-11
directly
beneath the coal
pile
had boron concentrations
below the
standard
and
generally
lower than
near
the ash
impoundments
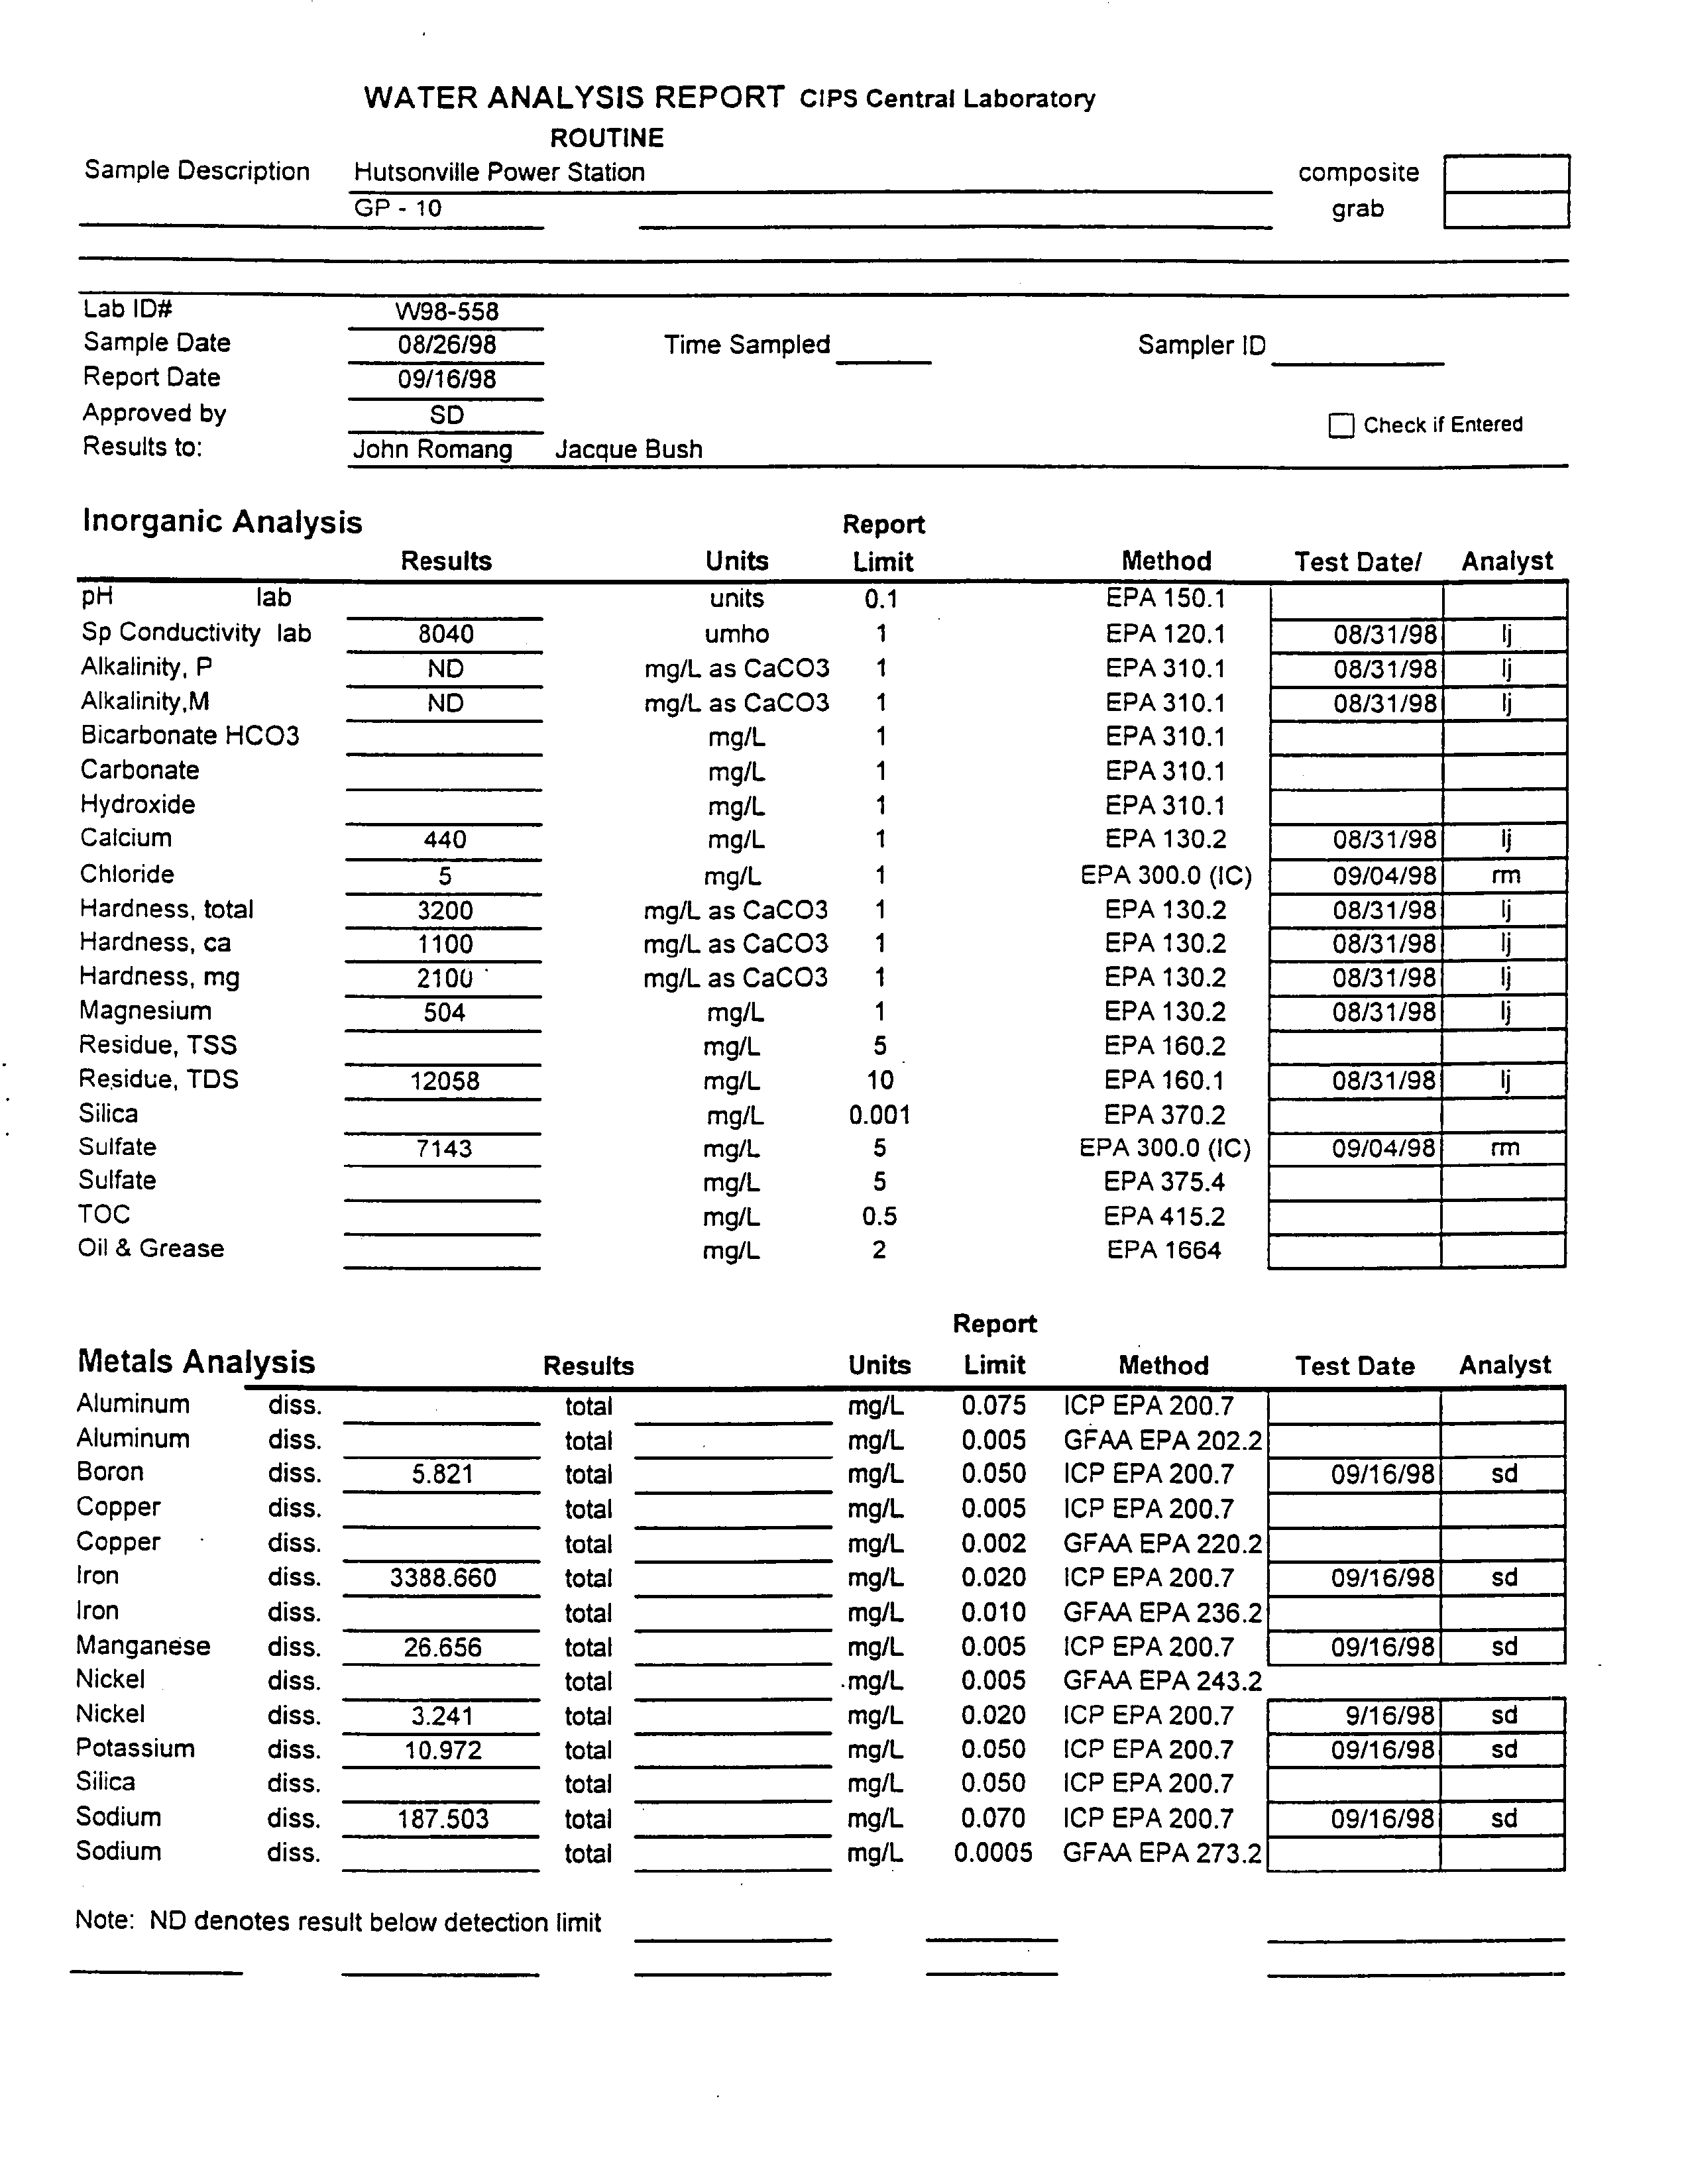
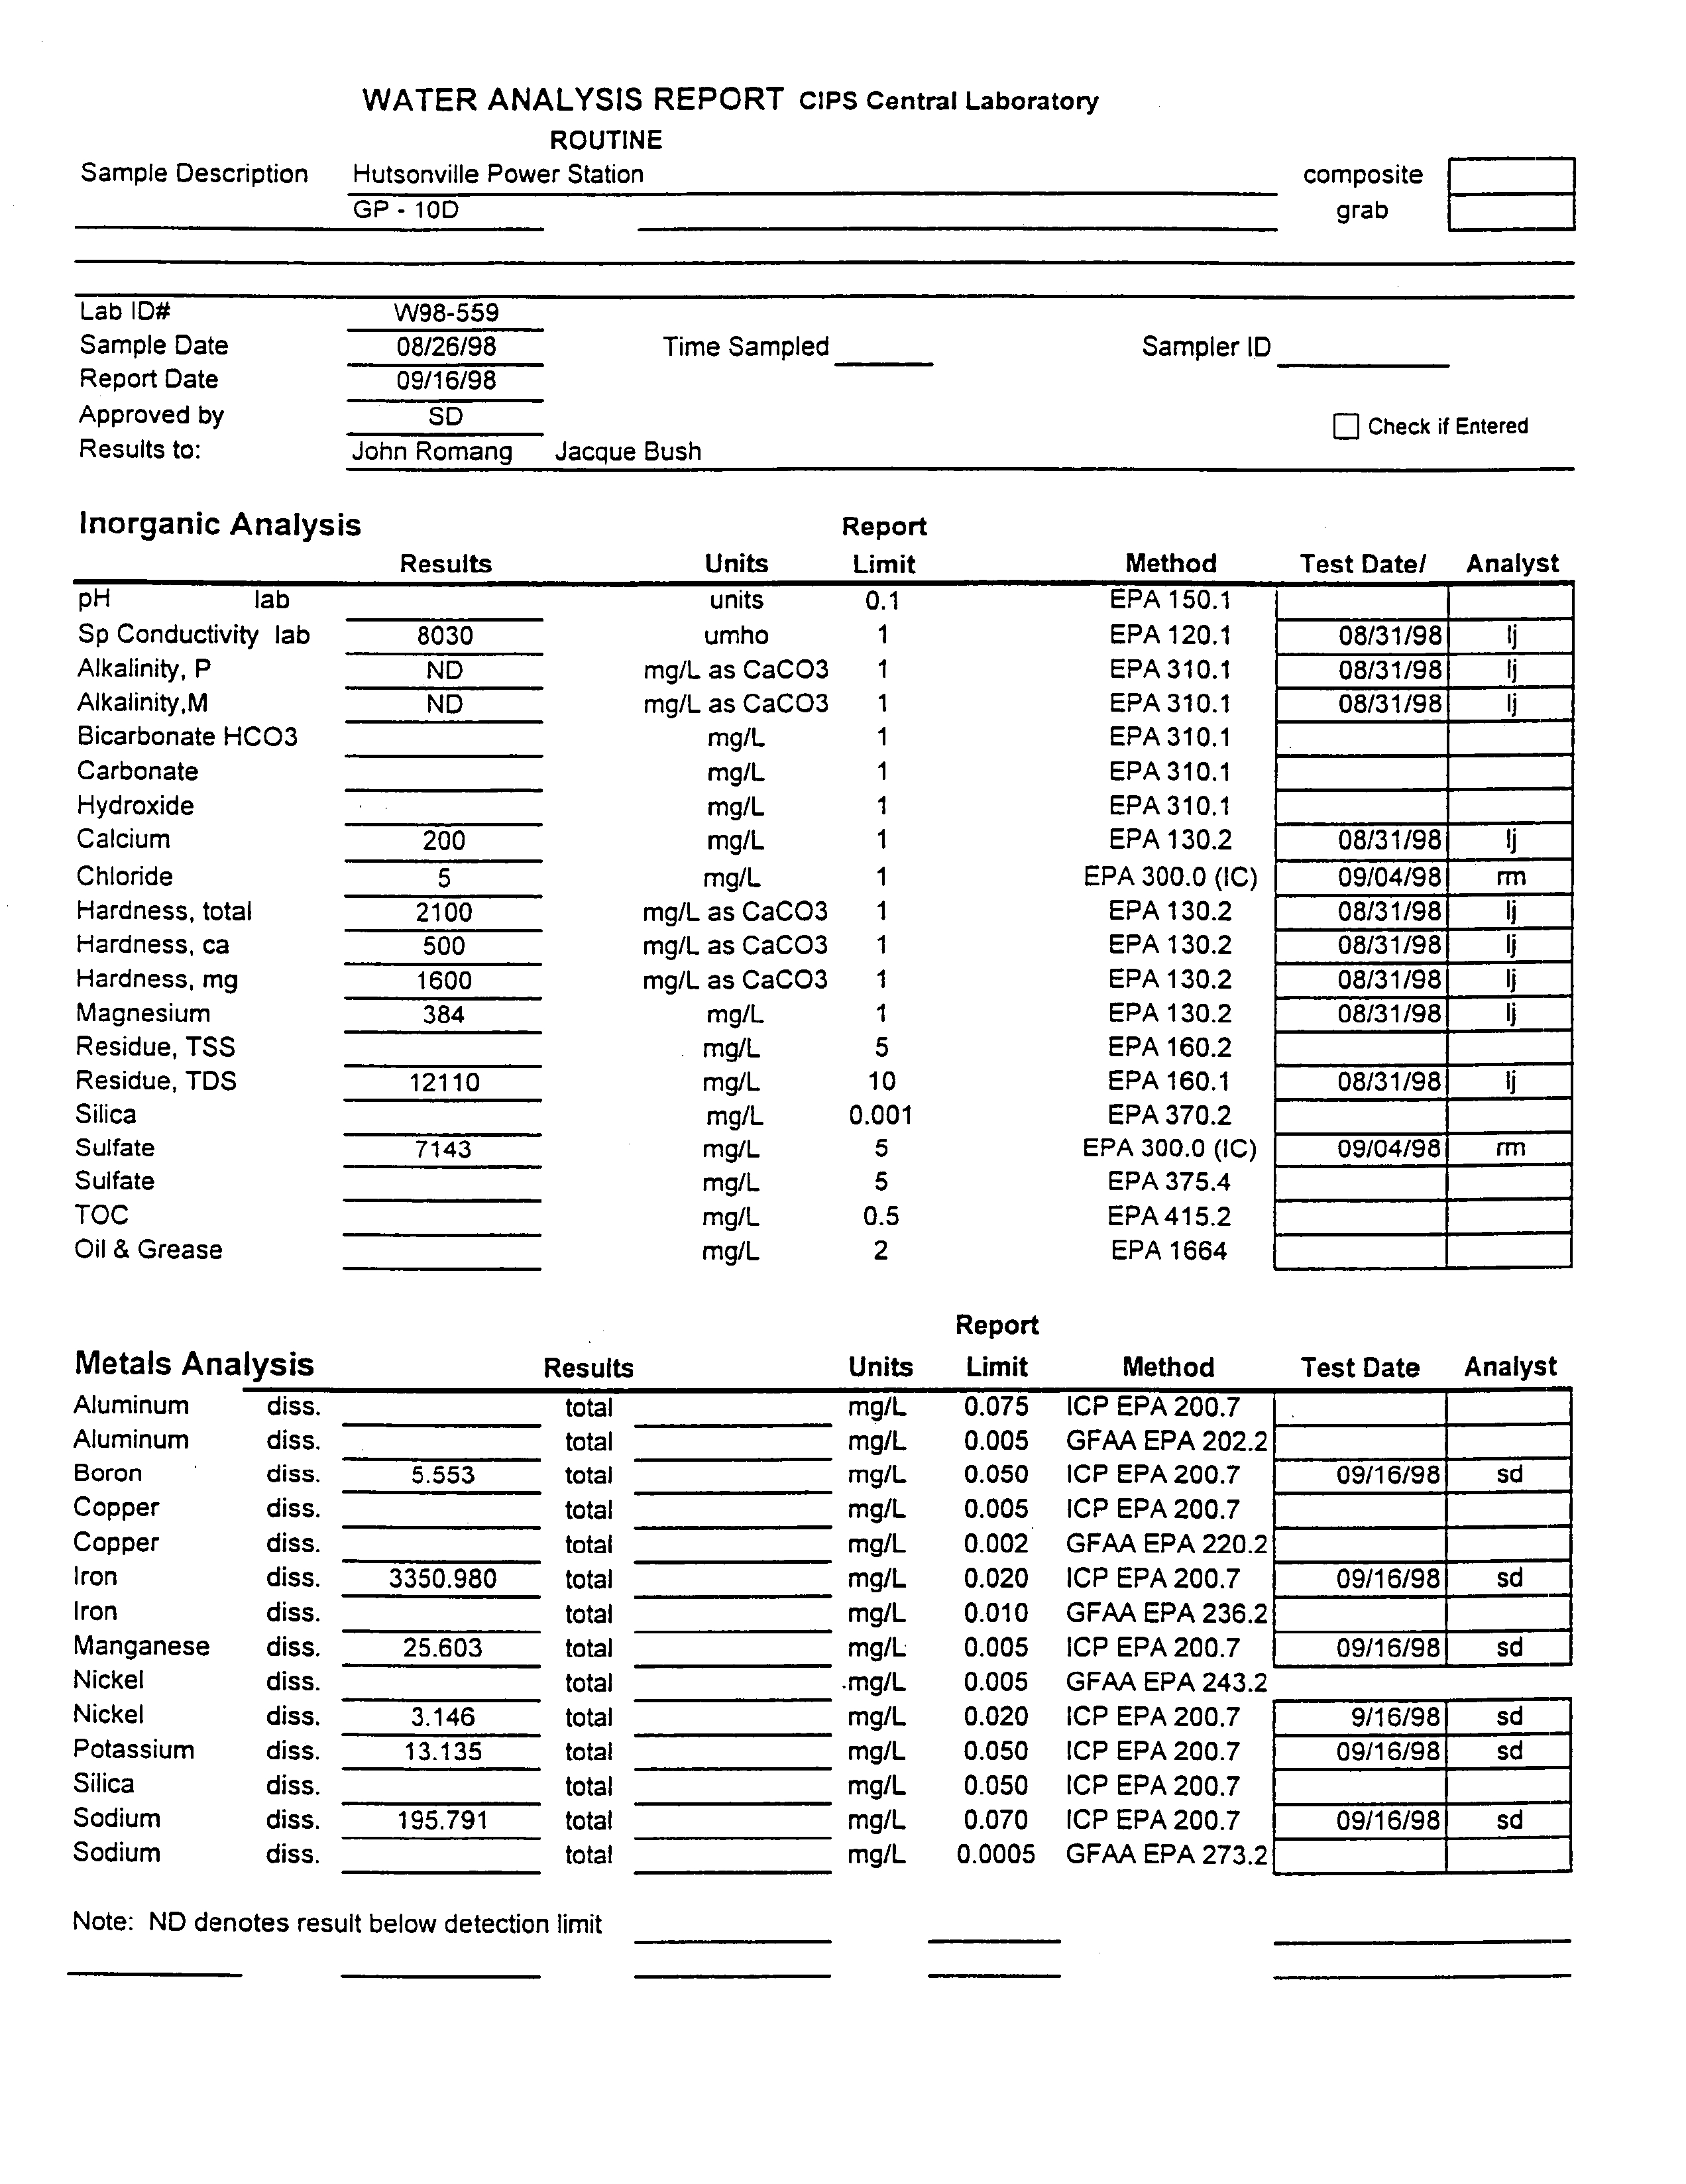
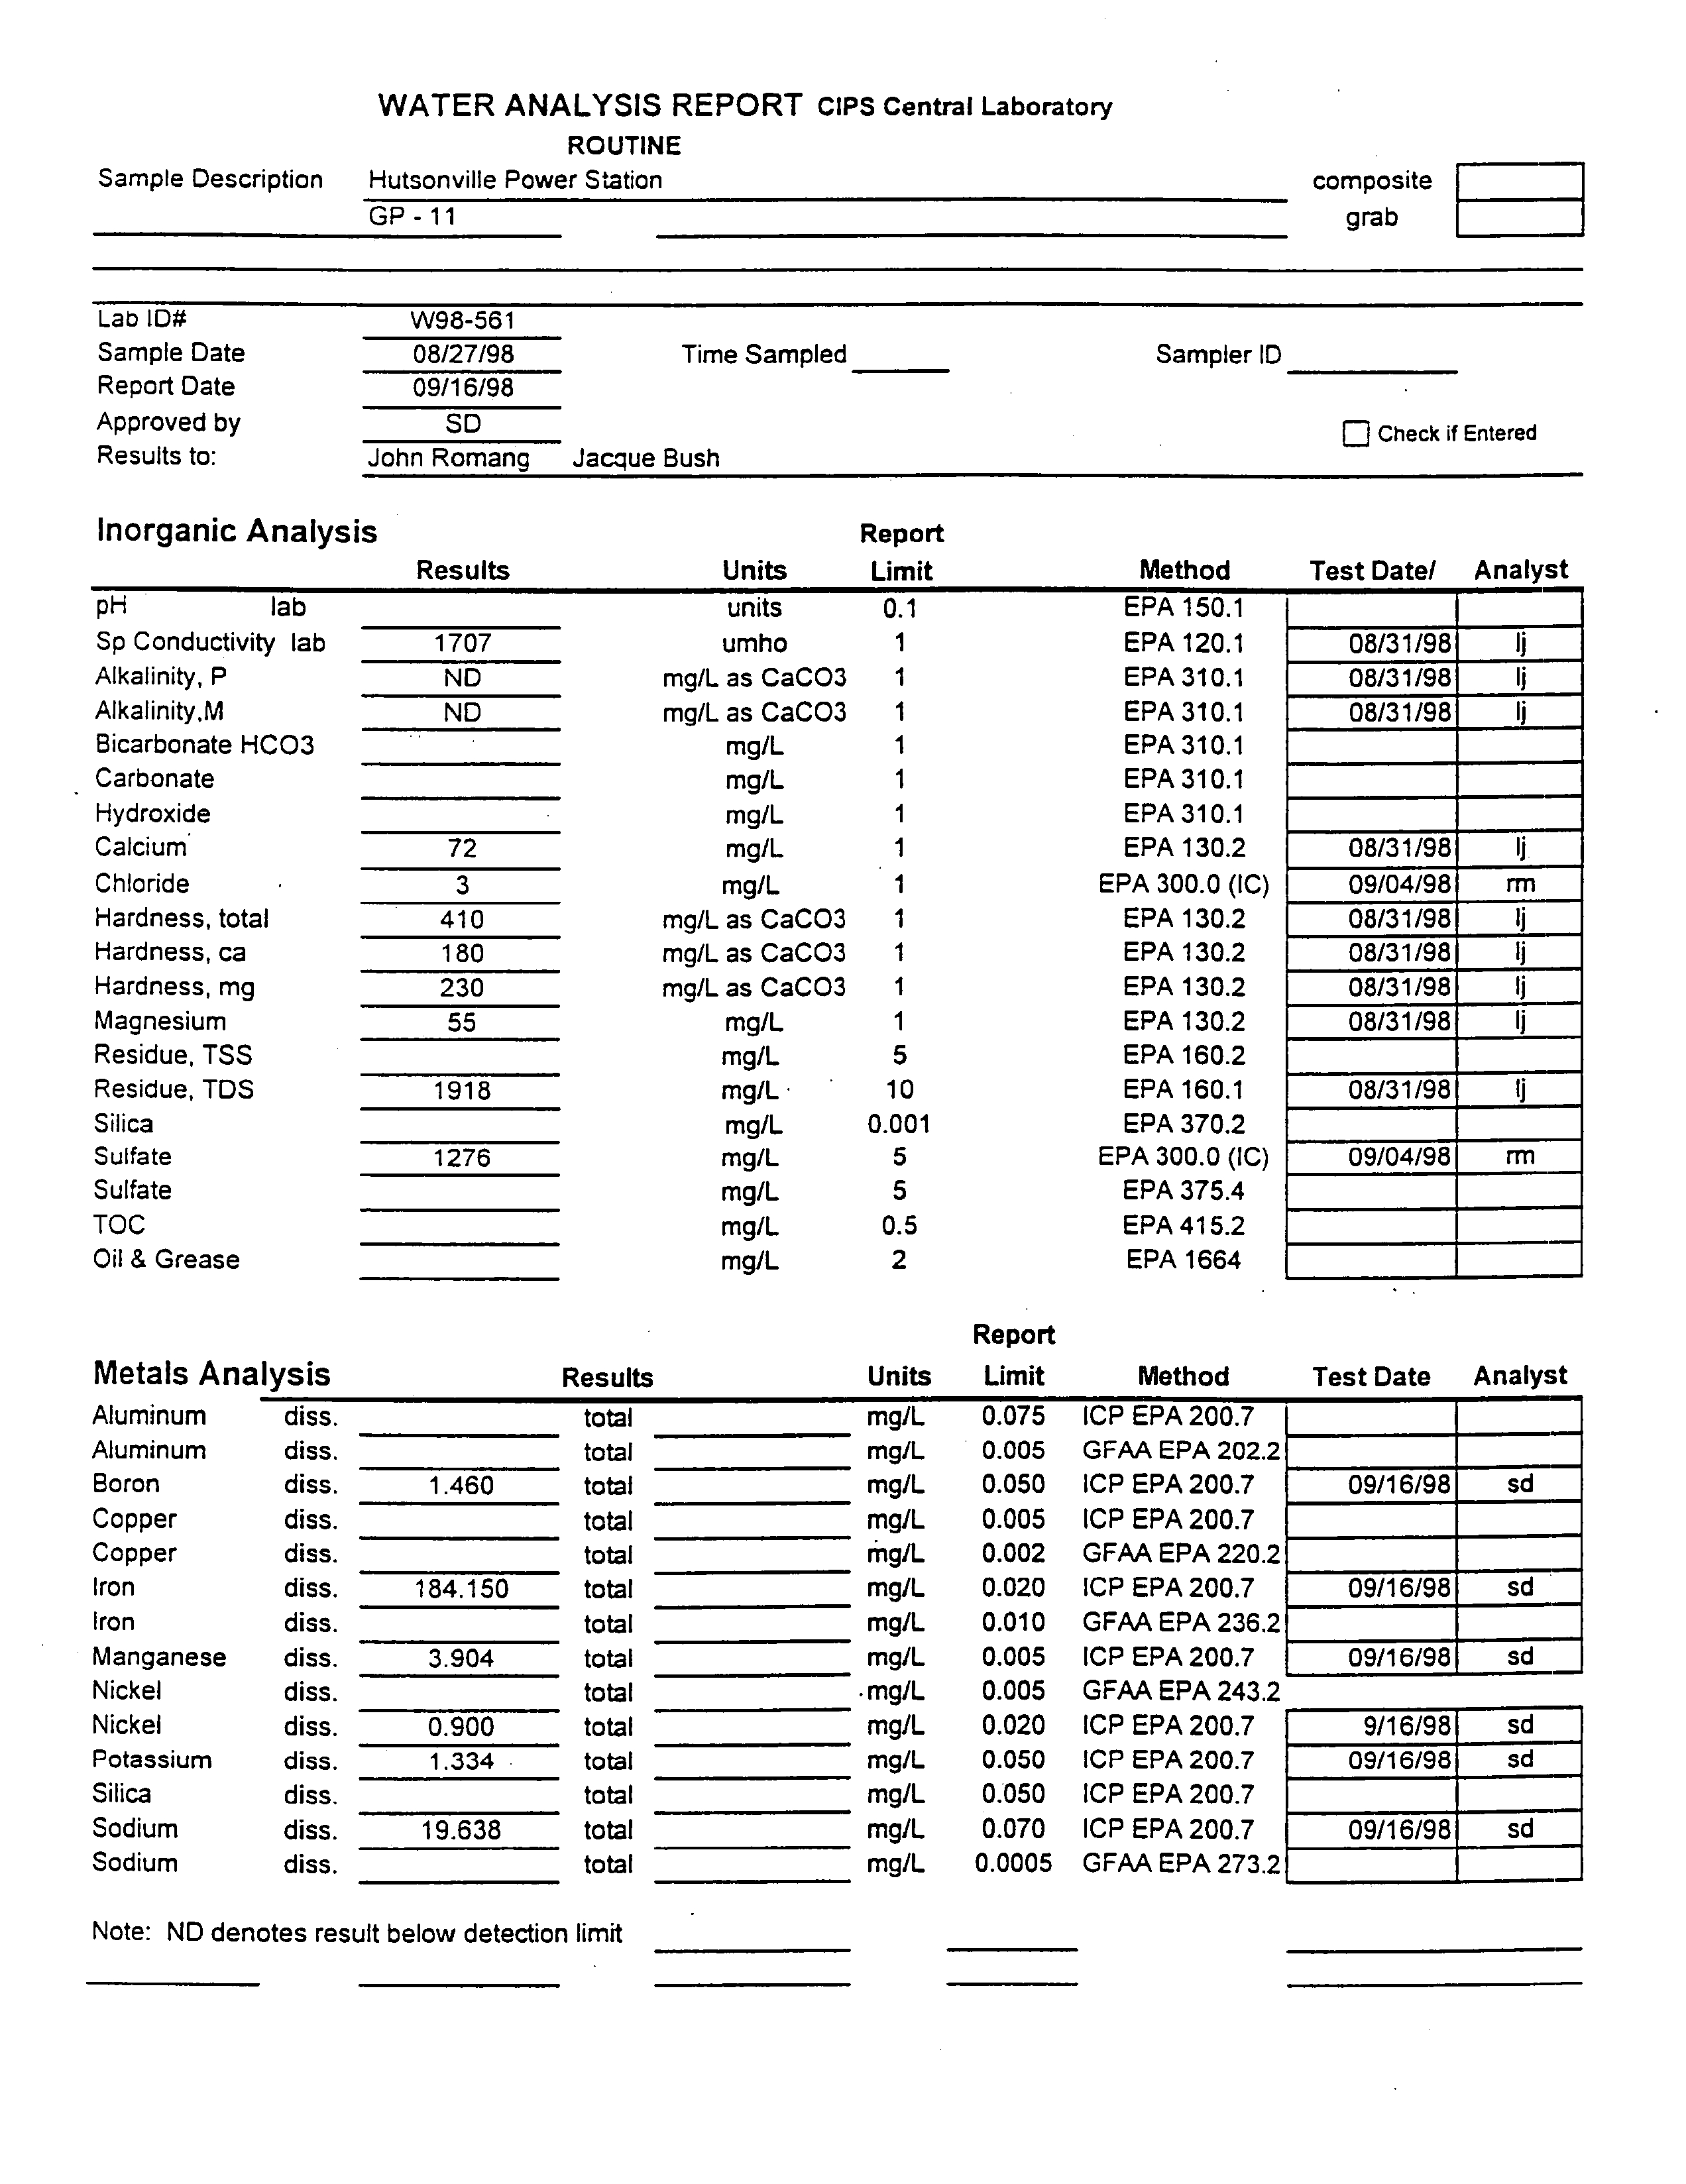
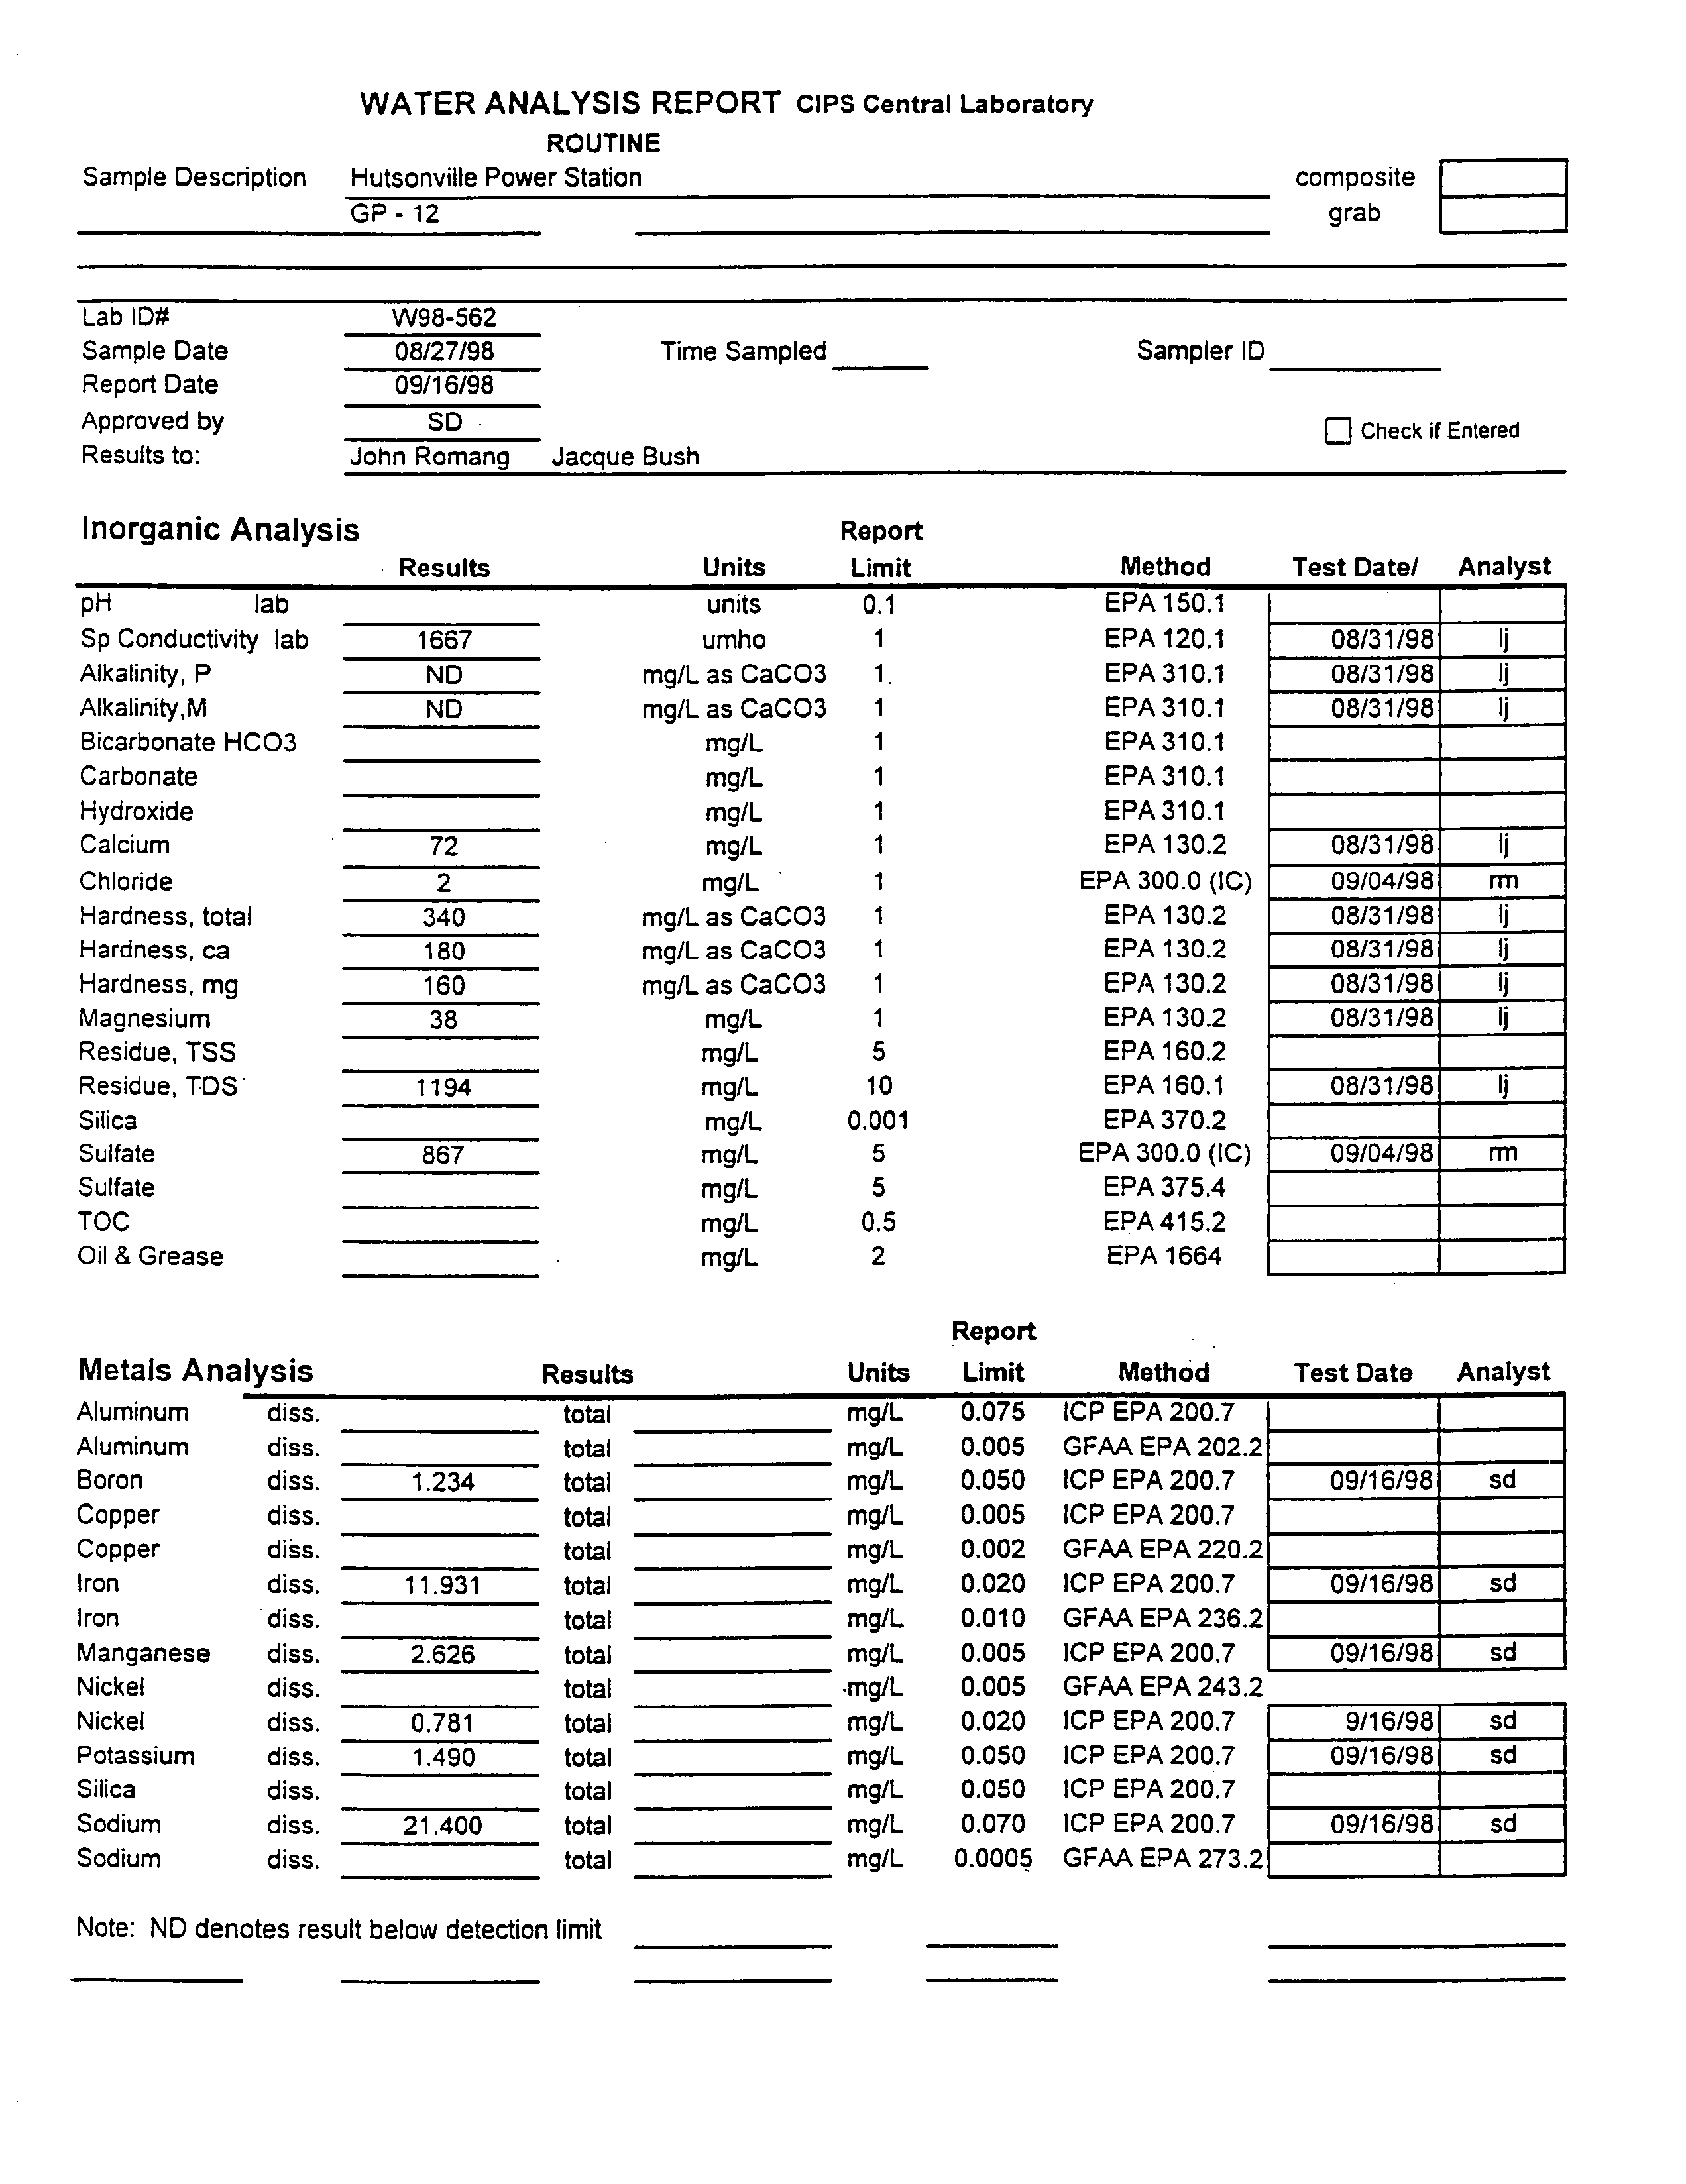
Sulfate concentrations
were
highest
near
the coal
storage
pile ranging
from
867
mg/L
to 7143
mg/L
Off-site
south
of the
impoundments
boron concentrations
were
less
than one-fifth the
groundwater standard
and sulfate concentrations
were
less than one-third the
standard
Manganese
concentrations
were
above
the Class
groundwater
standard in all of the
direct-push
groundwater samples
from the
plant
site The
highest
concentration
occurred
in coal
pile
area
hutsonvil le
hydrogeologic
assessment.doc
Natural
4-2
Resource
Technology
Electronic Filing - Received, Clerk's Office, August 11, 2008 - AS 09-1, Exhibit 4
GROUND WA TER
QUALITY
IN DIRECT-PUSH
SAMPLES
boring
OP-b
26.7 mg/L Manganese
was
less than one-tenth the standard
at
the five off-site
probe
hole locations south of the
impoundments
but was above the standard in off-site
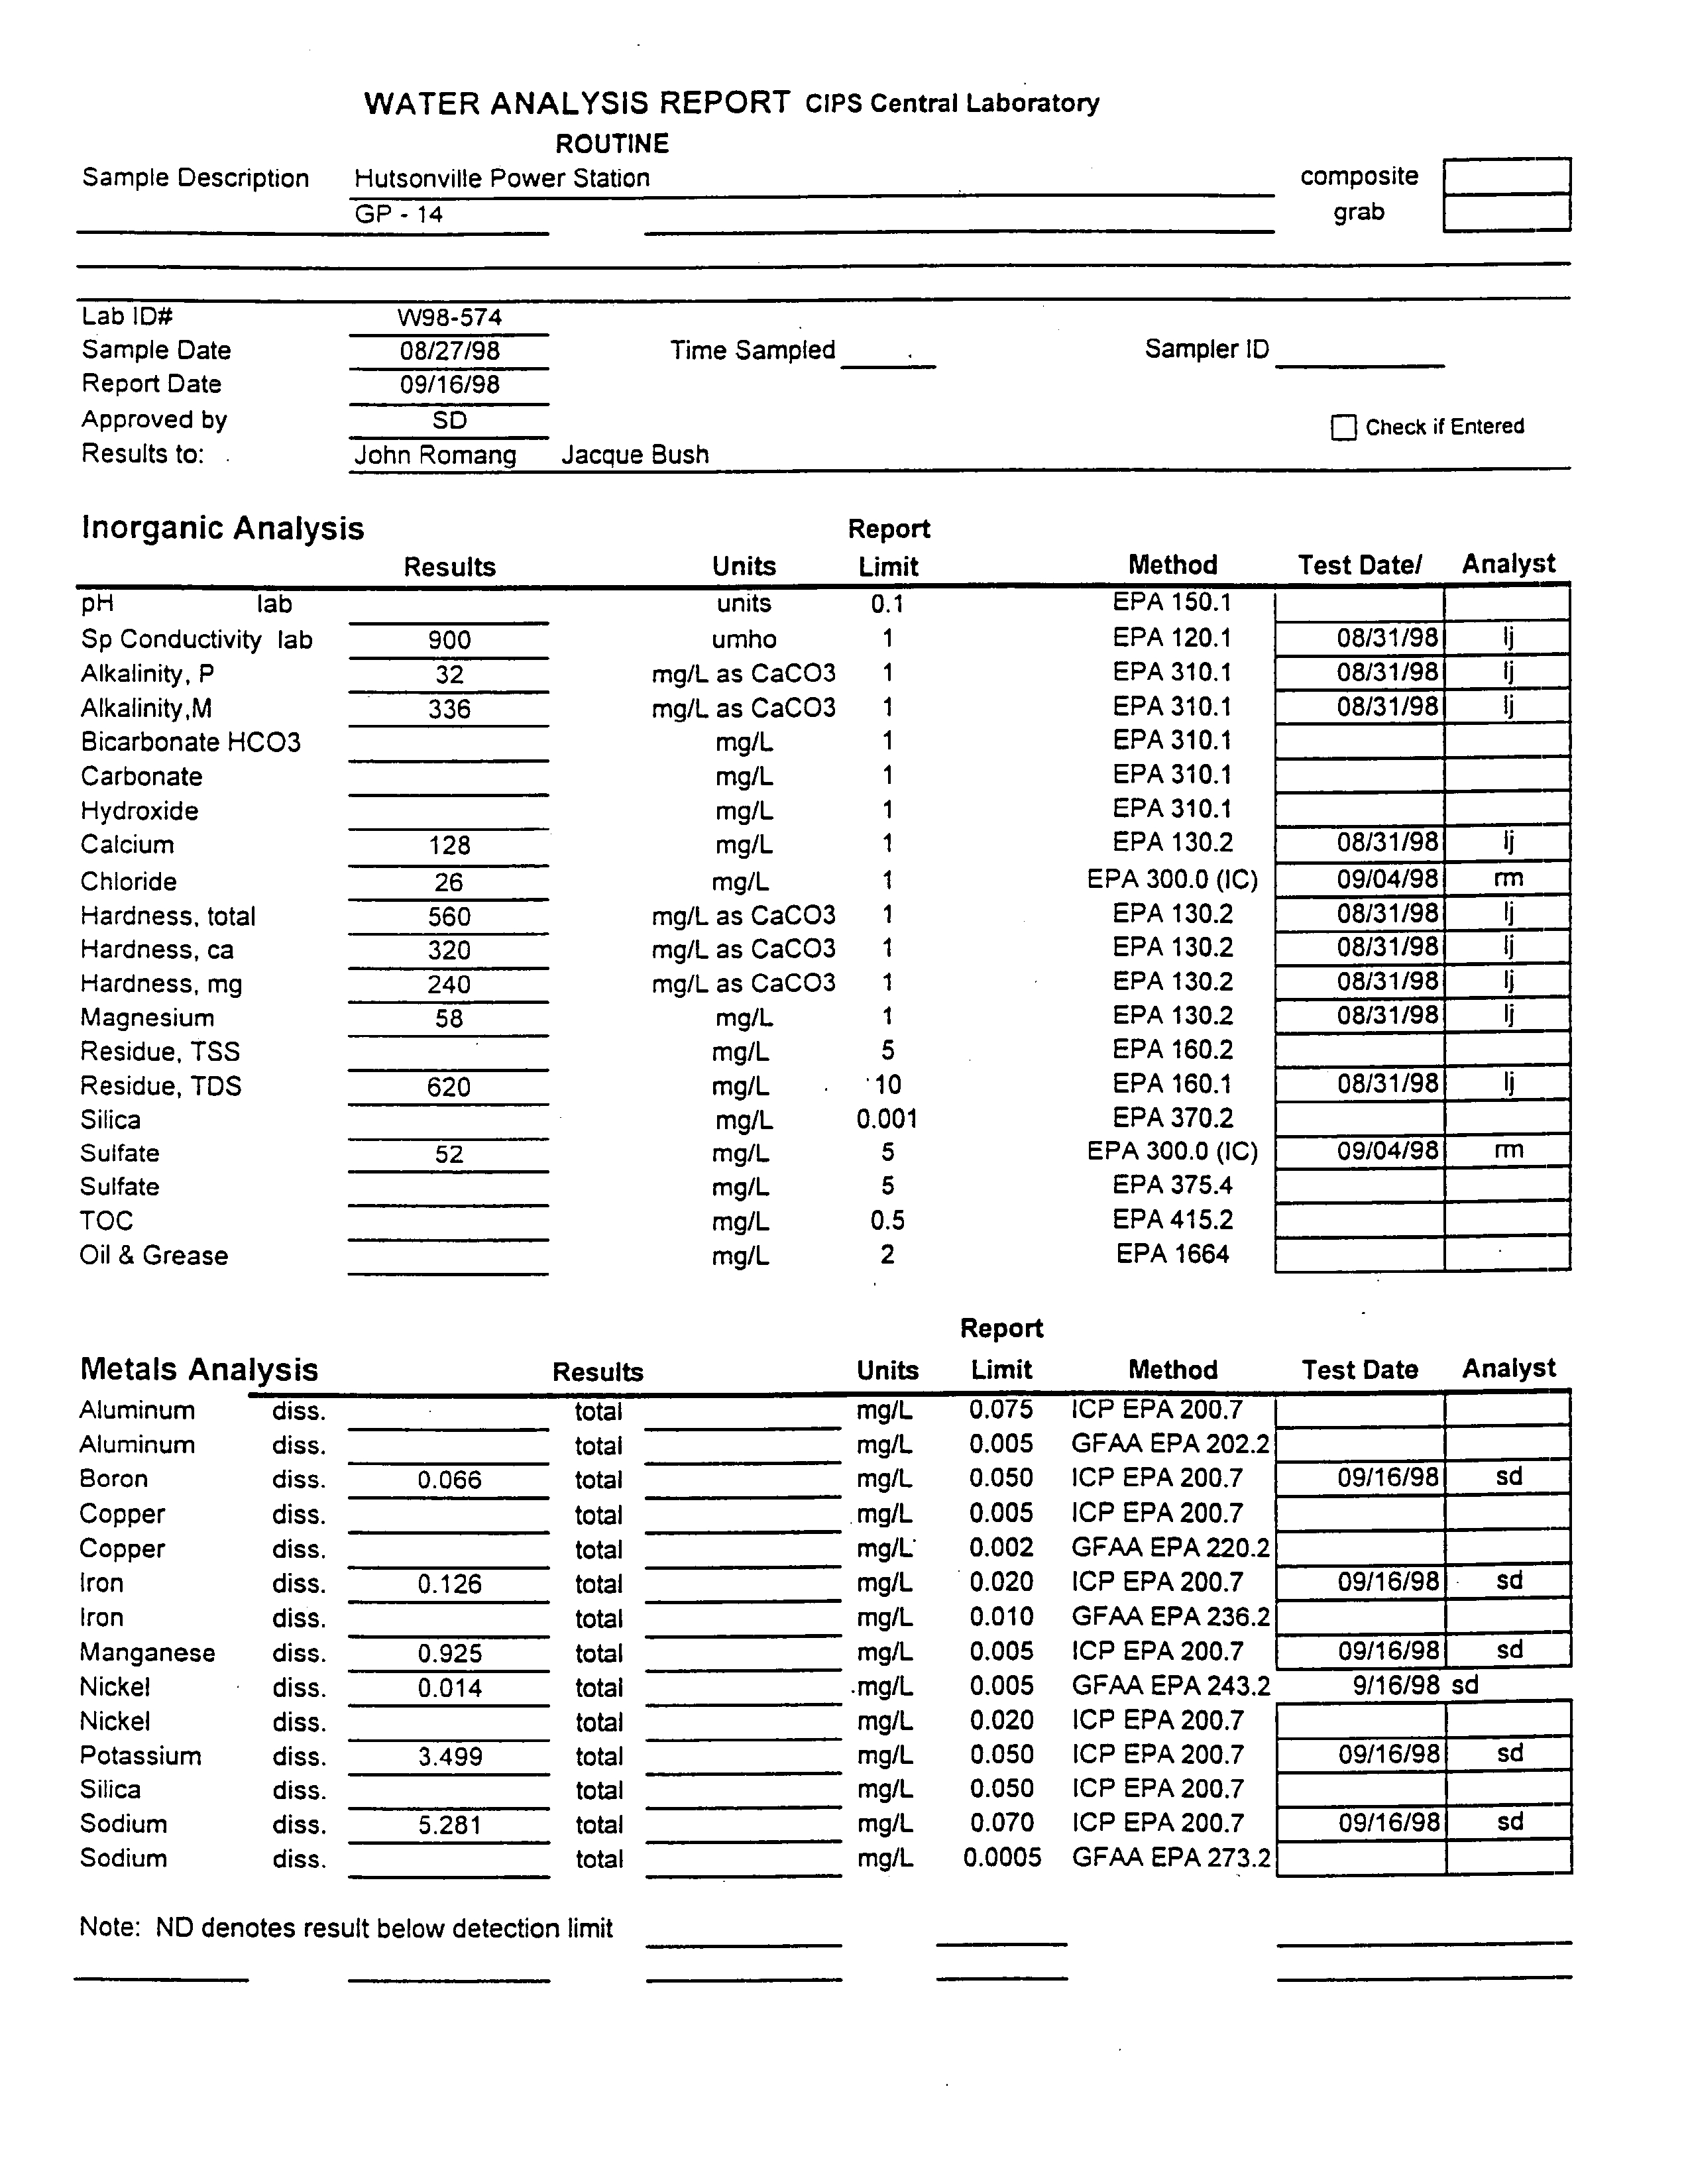
boring
GP-14
0.93 mg/L
located southeast of the
impoundments
Iron concentrations
only
exceeded the standard in
groundwater samples
from the
coal
pile
area
concentration
of about
3300 mg/L
was
repeated
in all three
replicate samples
from OP-b
However
iron concentrations
were
very
low at
GP-9
which
was
downgradient
of the coal
pile
suggesting
limited
migration
The limited observed
iron
migration may
be due to
geochemical
changes
which
are
evidenced
by
pH change
from less than 5.0 beneath
the coal
pile
to
6.8
at
GP-9
Nickel concentrations
ranged
from below detection
0.005 mgfL
to 3.2
mg/L
and exceeded the
Class
groundwater
standard in the coal
pile storage
area
OP-b
OP-li
and
GP-12
and
near
the southeast
corner
of the lined ash
impoundment
GP-5
Elevated nickel concentrations
occurred in
areas
currently
used for coal
storage
or
in which coal
spillage
occurred in the
past
such
as
along
the former railroad
spur
near
locations
GP-3 GP-5
and
GP-6
However
nickel
concentration
in
GP-9
which was
downgradient
of the coal
pile
was below the
standard
suggesting
that nickel
migration
is limited Nickel was below detection in the five off-site
probe
hole locations south of the
impoundments
and was detected at
concentration
lower than the
standard in off-site
boring
GP-14
0.014 mg/L
located southeast of the
impoundments
Exceedances
of
pH
in
groundwater
were
for values lower than the Class
standard of 6.5
Values of
pH ranging
from 2.8 to
6.3
occurred in all
probed
areas on
the
plant
site These
values
were
lower than off-site
pH
values
7.4
to
8.0
and ash
pond/leachate
pH
values
6.8-
10.0
TDS exceedances
generally
exhibited
distribution
similar
to
that of the sulfate
exceedances
and
probably
reflect that distribution Off-site TDS concentrations
were less than 1000
mg/L
hutsonville
hydrogeologic
assessment.doc
Natural
4-3
Resource
Technology
Electronic Filing - Received, Clerk's Office, August 11, 2008 - AS 09-1, Exhibit 4
GROUND WA TER
QUALITY
IN DIRECT-PUSH SAMPLES
Overall
the
direct-push
results
suggest
correlation
between
groundwater quality
and
potential
leachate sources Groundwater near the coal ash
impoundments
generally
had
high
boron and
sulfate concentrations
Groundwater
near
the coal
pile typically
had
high
nickel iron
and sulfate
concentrations
Groundwater near the coal
pile
also had
very
low
pH
hutsonville
hydrogeologic
assessment.doc
Natural
4-4
Resource
Technology
Electronic Filing - Received, Clerk's Office, August 11, 2008 - AS 09-1, Exhibit 4
GROUNDWATER QUALITY IN MONITORING
WELLS
5.1 Parameters of Concern
As
stated
in the
previous section
the
POCs
in
groundwater
include
boron sulfate
maganese
pH
and TDS Iron and nickel
were
also included
as
POCs
because
they
were
detected in
direct-push
samples
Boron
and sulfate are the
primary
indicator
parameters
for coal ash due to their
consistent
occurrence
at
coal ash
sites Groundwater results are included as
Microsoft
Excel
spreadsheet
on
diskette attached to the back of this
report
The
following
discussion focuses on
groundwater
results collected since
new
monitoring
wells
were
installed
October
26
1998
through May
24
1999
5.2 Groundwater Results
review of
groundwater
trends
by
POC and
area
of the
site
is included in this section
Figures
10
and
12
through
17
present
graphical interpretation
of the extent of
groundwater
exceeding
Illinois Class
groundwater
standards for each
compound
based
on
median
groundwater
concentrations
from October
26
1998
through May
24
1999 Median and maximum results
are
shown in the
drawings
Concentration
references
are
to
the data shown in the
Figures
and
Table
which
summarizes
the
upper
95%
prediction
limit for each POC
shown
calculated
using
the
inclusive
sampling
data from October
26
1998 to
May
24
1999
The distribution
of recent boron concentrations
is illustrated in
Figure
10 Boron concentrations
exceed the Class
groundwater
standard
at
eight monitoring wells
but concentrations
are
highest
in
the former ash
laydown
area
MW-13
and unlined ash
impoundment
area
MW-6 MW-8
Boron is
present
in bedrock
piezometer
MW-3D however
that concentration
is
likely
due to
leakage
from the
sluicepipe Similarly
boron concentration
in MW-2
appears
to
be related
to
the
pipe
leak The concentration
of boron
over
time in MW-2 and MW-3 is
presented
in
Figure
11
hutsonvifle
hydrogeologic
assessment.doc
Natural
5-1
Resource
Technology
Electronic Filing - Received, Clerk's Office, August 11, 2008 - AS 09-1, Exhibit 4
GROUND WA TER
QUALITY
IN MONITORING WELLS
Boron concentrations
in
MW-3
prior
to the construction
of the lined ash
impoundment
are
likely
due to the
proximity
of
the well to the former ash
laydown
area
Assuming groundwater velocity
calculated
in Section 3.2 for MW-3 toward
MW-2
the
appearance
of boron in elevated
concentrations
in
MW-2
coincides with the travel time for boron
transport
from MW-3 to
MW-2
or
approximately
10
years assuming
boron
retardation factor of
1.5
Boron
concentrations
in both wells have been
decreasing
since
their
peak suggesting
that the effects of
the
pipe
leak
are
diminishing
since it
was
repaired
in 1996 The extent of Class
groundwater
standard exceedences shown
on
Figure
10 correlates
with
direct-push
sample
data
Sulfate
concentrations
exceeded the Class
groundwater
standard in and
downgradient
of the
coal
storage
area
the old ash
impoundment
and the old ash
laydown
area
MW-2
MW-3
MW-3D MW-8 MW-9 MW-il
and
MW-13 Direct-push samples
indicate results consistent
with
monitoring
well
observations
presented on Figure
12
Maganese
concentrations
exceed the site Class
groundwater
standard in
upgradient
wells
MW-i MW-1OD
the former ash
laydown
area
MW-3 MW-3D MW-il
MW-12 and
MW-i3
and in the unlined ash
impoundment
MW-6
MW-7 MW-7D
MW-8 and
MW-9
and
are
highest
in
monitoring
wells MW-il and
MW-13
in the former ash
laydown
area
Figure 13
Direct-push
groundwater samples
correlate
with the estimated
extent
of the Class
groundwater
standard for
maganese
Iron is not
present
in
groundwater monitoring
wells above the Class
groundwater
standard
Figure 14
This observation does not correlate with
direct-push
samples directly adjacent
to the
coal
storage
pile GP-9 GP-iO
and
OP-li
where iron concentrations
were
above
the Class
groundwater
standard
however
no
monitoring
wells were finished in the coal
storage
pile
area
Iron is not
present
in
monitoring
wells
downgradient
of the coal
storage
pile
area
above the
Class
groundwater
standard
MW-7 MW-8 indicating
no
offsite
migration
Nickel
concentration
exceeds the Class
groundwater
standard in MW-il and MW-i3
Figure 15
Elevated concentrations
of nickel in MW-il and MW-i3 coincide with low
pH
hutsonvi lie
hydrogeologic
asscssment.doc
Natural
5-2
Resource
Technology
Electronic Filing - Received, Clerk's Office, August 11, 2008 - AS 09-1, Exhibit 4
GROUND WA TER
QUALITY
IN MONITORING WELLS
readings
and
locations of
near-surface
coal
deposits Table
Nickel
exceeds the Class
groundwater
standard in
direct-push samples
located
near
the coal
storage
area
and the former
ash
laydown
area
GP-5
GP-1O GP-11
and
GP-12
coincident with low
pH Figure 16 and
in
the case of the coal
storage
area
elevated iron concentrations
Total dissolved solids
TDS
is
present
in on-site
groundwater monitoring
wells above
th?
Class
groundwater
standard in the
same
locations
as
sulfate exceedences
Figure 17
As described
previously
elevated
sulfate
concentrations
in coal ash leachate
can cause
high
TDS
concentrations
TDS distribution
in
ash leachate and
groundwater direct-push samples
shown
on
Table
also reflects this association
5.3
Surface Water Results
Surface water
samples
were
collected from
pooled
surface
water
or
ponds
at
the
approximate
locations shown in
Figure
in
April
1999 Surface water
samples
were
collected from
ponds
located
in
the lined ash
impoundment
LAP
unlined ash
impoundment
UAP
coal
storage
area
CYP
and south of the former ash
laydown
area
P2P
Sample
results are summarized in
Tables
and
for
comparison
with
groundwater
and
leachate
samples
in the same
general
locations Leachate
samples
in the lined ash
impoundment
correlate
with elevated concentrations
of boron in surface water
sample
LAP Groundwater and leachate results in the unlined ash
impoundment
area
correlate
with elevated concentrations
of boron and
maganese
in
surface water
sample
UAP
although
concentrations
are
much lower in the surface
water
sample
Elevated
maganese
iron nickel
sulfate and TDS
in
sample
CYP
along
with low
pH
correlate
to direct
push groundwater
samples
from the coal
pile storage
area
The P2P
sample
is dissimilar to
any
groundwater samples
and
likely
does
not
represent
any
source areas
hutsonville
hydrogeologic
assessment.doc
Natural
5-3
Resource
Technology
Electronic Filing - Received, Clerk's Office, August 11, 2008 - AS 09-1, Exhibit 4
GROUND WA TER
QUALITY
IN MONITORING WELLS
5.4 Source Area and
Receptor Analysis
The
direct-push
monitoring well
and surface water
sample
data
suggest
two
general
sources
for
groundwater impacts
at this
facility
the unlined ash
impoundment
and
ash
laydown
areas
and
the coal
pile
and coal
spill
areas
Groundwater affected
by
the ash
impoundment
and
ash
laydown
areas
is characterized
by
boron
concentrations
greater
than
mg/L
sulfate concentrations
greater
than 200
mg/L
and neutral to
alkaline
pH
Manganese
concentrations
tend
to
be
greater
than
mgfL
in these
areas however
the
ubiquitous
nature
of
manganese
in the environment makes it
difficult to
determine whether
manganese
in
groundwater
is released from the coal ash or whether
reducing
conditions
potentially
caused
by
the coal ash
impoundment
are
causing
release
of
manganese
from the soil
Relatively
low boron and sulfate concentrations
in wells MW-4 and
MW-5
immediately
downgradient
of
the lined ash
impoundment suggest
that it is
not
significant
source
of
groundwater impacts
Groundwater
affected
by
the coal
pile
and coal
storage
areas
is characterized
by
boron
concentrations
greater
than
mg/L
sulfate
concentrations
greater
than 500
mg/L
iron
concentrations
greater
than 10
mg
nickel concentrations
greater
than 0.10
mg/L
and acidic
pH
Again manganese
concentrations
tend to be
greater
than
mgIL
in this area
The
constituents that differentiate
coal
impacts
from ash leachate
impacts
are iron nickel
and
pH
These characteristics
suggest
that
sources
affecting groundwater monitoring
wells
can
be
identified
by groundwater quality
and
by position
relative
to
the
sources
Table
The results
of this
hydrogeologic
assessment
indicate that coal
impacts
are
restricted
to
the
source areas
Neither
direct-push
nor
monitoring
well data outside of the coal
pile
and coal
spill
areas
showed
characteristics
of coal
impacts
Alternatively
characteristics
of ash
impacts
were observed
downgradient
of the ash
disposal areas
and boron and sulfate
are
known to be mobile in
groundwater
therefore
migration
of
these constituents toward the Wabash River
the regional
groundwater sink
is
likely
hutsonvi lie
hydrogeologic
assessment.doc
Natural
5-4
Resource
Technology
Electronic Filing - Received, Clerk's Office, August 11, 2008 - AS 09-1, Exhibit 4
GROUND WA TER
QUALITY
IN MONITORING WELLS
There
are no
groundwater
extraction
wells
other than the
plant
wells
between the
source areas
identified
in this
hydrogeologic
assessment
and the Wabash River The
plant
wells as
well
as
two
irrigation
wells that
are
southeast
of the
facility
are
completed
in
deep
sand and
gravel
in the
Wabash River
valley
which is overlain
by
less
permeable silty
sediments
Furthermore
groundwater
quality
at
MW-7D
relatively
deep
monitoring
well finished in the Wabash River
valley
is within
standards
with the
exception
of
manganese
which
is
likely
due
to anoxic
conditions beneath the river sediments
The low boron and sulfate concentrations
in MW-7D
well
suggest
little vertical
migration
of
ash
constituents therefore
migration
from the ash
impoundments
is
directly
to the
river
rather than downward toward
any
extraction wells
hutsonvitle
hydrogeologic
assessment.doc
Natural
5-5
Resource
Technology
Electronic Filing - Received, Clerk's Office, August 11, 2008 - AS 09-1, Exhibit 4
CONCLUSIONS
The
hydrostratigraphy
of
the
upland
area
where the ash
impoundments
are
located
consists of
thin
layer
of
unlithified sand-rich material
overlying
sandstone
and siltstone
bedrock
The unlithified sands
are more
permeable
than the sandstone
and therefore
constitute
more-probable pathway
for leachate
migration
from the
impoundments
There are
three
areas with coal ash fill
the unlined
ash
impoundment
the lined ash
impoundment
and
former ash
laydown
area
immediately
west of
the unlined ash
impoundment
Saturated ash
was
encountered
within the unlined
ash
impoundment
with saturated
thickness
up
to 16 feet
Direct-push
water
samples
indicated
high
concentrations
relative to Class
standards
of
boron
manganese
sulfate
and TDS
in ash
leachate although
manganese
concentrations
were
only high
in
samples
from the unlined
impoundment
The
direct-push groundwater samples
showed
no
evidence
of
groundwater impacts
south
of
the
impoundments
Groundwater
samples
from
some
on-site
monitoring
wells and
probe
holes had
concentrations
of
boron
manganese
sulfate TDS iron
and nickel
higher
than Class
standards
High
iron and nickel concentrations
were
found in locations where coal
was
present
near
the land surface
These observations
indicate two
sources
for
groundwater quality impacts
the coal
pile
and coal
spill areas
and
the ash
laydown
area
and unlined ash
impoundment
There is
no evidence
that iron and nickel from the coal
pile
and coal
spill
areas is
migrating
hutsonville
hydrogeologic
assessment.doc
Natural
6-i
Resource
Technology
Electronic Filing - Received, Clerk's Office, August 11, 2008 - AS 09-1, Exhibit 4
CONCLUSIONS
beyond
those
areas
However
boron and sulfate from all
sources are
migrating
east
toward the Wabash River
There
are no
groundwater
extraction wells in the shallow sediments between the unlined
ash
impoundment
and the Wabash River There
are
four extraction wells within
mile
of the
site
all finished in
deep
sand and
gravel
in the Wabash River
valley
Two wells
are directly
east of the unlined
impoundment
and are used for
plant water
and two
wells
are
southeast of the
impoundment
and used for
irrigation
water
Groundwater
quality
data from
monitoring
well
MW-7D
which is
directly downgradient
of the unlined ash
impoundment
and
is the
deepest
on-site
monitoring
well in the Wabash River
valley
indicates
no evidence
of ash
impoundment
or coal
pile impacts
at that
depth
hutsonvi lie
hydrogeologic
assessment.doc
Natural
6-2
Resource
Technology
Electronic Filing - Received, Clerk's Office, August 11, 2008 - AS 09-1, Exhibit 4
FIGURES
Electronic Filing - Received, Clerk's Office, August 11, 2008 - AS 09-1, Exhibit 4
SOURCE
NOTE
THIS
DRAWING
WAS
DEVELOPED
FROM
REPORT
BY
STMI
BROOKFIELD
WISCONSIN
PROJECT
249
REPORT
9801
DATED
MAY
1998
AND
USGS
QUADRANGLE
7.5
MINUTE
SERIES
WEST
UNION
IWNOISINDIANA
DATED
1966
ALL
LOCATIONS
ARE
APPROXIMATE
Natural
Resource
Technology
MW9
MWI
LEGEND
MWi
MW-3/3D
LiJ
I.-
MONflORING
WELL
NESTED
MONITORING
WELL
DIRECT
PUSH
SOIL
BORING
LEACHATE
SAMPLE
I-
PLANT
WATER
WELL
LP1
CYP
LAP
UAPtP2P
to
I.
IJJ
-J
U-
LP2
SURFACE
WATER
SAMPLE
1900TH
UNED
ASH
IMPOUNDMENT
FORMER
ASH
LAYDOWN
AREA
ROADWAY
MW10/1OD
GP8
GP7
MW2
GP5
MW-7/7D
OLD
ASH
IMPOUNDMENT
UAP4
it
200
400
MWil
EW1
-J
MW6
LL-0
WLU
V0J
Lii
.0
0V
-ii
LLJ
800
SCALE
IN
FEET
GP16
CR
15
GP13
GP17
GP.i8
GP19
700
FT
GP14
PROJECT
NO
1375/
DRAWING
NO
1375BOl
FIGURE
NO
Electronic Filing - Received, Clerk's Office, August 11, 2008 - AS 09-1, Exhibit 4
460
460
440i9I
ti9j1
440
villi
420
420
400
Ground
Surface
400
Bedrock Surface
Groundwater
380
1/12/98
380
360
360
340
340
320
320
Figure
Elevation
of well
screens
ground
surface
bedrock
surface
and
groundwater
Bedrock surface
depths
for
MW-7
MW-7D
and
MW-8 are estimated
Natural
Resource
Technology
Electronic Filing - Received, Clerk's Office, August 11, 2008 - AS 09-1, Exhibit 4
WEST
475
450
425
EAST
475
LEGEND
SIL
400
GP21
MW9
DIRECT
PUSH
SOIL
BORING
BEDROCK
450
MONITORING
WELL
EW1
PLANT
WATERWELL
SCREEN
375
WABASH
RIVER
LJ
LU
c2z
I-
.425
APPROXIMATE
GROUNDWATER
TABLE
NOVEMBER
12
1998
600
SANDAND
HO
RI
ZONTAL
SCALE
IN
FEET
400
GRAVEL
VERTICAL
EXAGGERATION
20
SOUTH
475
-375
450
OIL
TANK
NORTHWEST
UNLINED
ASH
IMPOUNDMENT
475
NORTH
475
425
POWER
HOUSE
450
UNLINED
ASH
IMPOUNDMENT
SOUTHEAST
400
C-
LU
CD
-J
LU
450
LiJ
L-Q
LUW
VJ
01
SAND
AND
GRAVEL
475
425
RIVER
375
BEDROCK
425
BEDROCK
450
400
SI
LTY
CLAY
400
SILT
425
375
375
.400
-375
Electronic Filing - Received, Clerk's Office, August 11, 2008 - AS 09-1, Exhibit 4
SCALE
IN
FEET
SOURCE
NOTE
THIS
DRAWiNG
WAS
DEVELOPED
FROM
REPORT
BY
STMI
BROOKF1ELD
WISCONSIN
PROJECT
249
REPORT
9801
DATED
MAY
1998
AND
USGS
QUADRANGLE
7.5
MINUTE
SERIES
WEST
UNION
IWNOISINDIANA
DATED
1966
ALL
LOCATIONS
ARE
APPROXIMATE
Lr
if
LEGEND
MWi
MW3/3D
NESTED
MONITORING
WELL
OPi
BEDROCK
ELEVA11ON
CONTOUR
FT
MSL
MONITORING
WELL
DIRECT
PUSH
SOIL
BORING
PLANT
WATER
WELL
Cl
Ew1
LJ
-J
MSL
LP1
GYP
UAPYP2P
MEAN
SEA
LEVEL
LEACHATE
SAMPLE
1900TH
SURFACE
WATER
SAMPLE
FORMER
ASH
LAYDOWN
AREA
ROADWAY
NOTE
GP14
GP19
MW2
MW7/7D
MWB
MW12
LEACHATE
SAMPLES
AND
SURFACE
WATER
SAMPLES
DID
NOT
EXTEND
TO
BEDROCK
api
200
400
-J
C-
LU
-JO
L1-Q
Cn
I-
LLJW
VOLJ
LJ
OV
ii
800
Natural
Resource
Technology
GP19
700
FT
GP
14
PROJECT
NO
1375/1
DRAWING
NO
1375Bi
FIGURE
NO
Electronic Filing - Received, Clerk's Office, August 11, 2008 - AS 09-1, Exhibit 4
LEGEND
WATER
TABLE
ELEVATION
CONTOUR
FT
MSL
WATER
TABLE
FLOW
DIRECTION
SOURCE
NOTE
THIS
DRAWING
WAS
DEVELOPED
FROM
REPORT
BYSTMI
BROOKFIELD
WISCONSIN
PROJECT
249
REPORT
9801
DATED
MAY
1998
AND
USGS
QUADRANGLE
7.5
MINUTE
SERIES
WEST
UNION
IWNOIS-INDIANA
DATED
1966
ALL
LOCATIONS
ARE
APPROXIMATE
MWi
G451.77
MONITORING
WELL
WITH
WATER
TABLE
ELEVATION
Fr
MSL
NESTED
MONITORING
WELL
WITH
WATER
TABLE
ELEVATION
Fr
MSL
MEAN
SEA
LEVEL
INDICATES
WATER
LEVEL
ABOVE
SCREENED
INTERVAL
NOTES
MONITORING
WELLS
MW3D
MW7/7D
MW8
AND
MW1OD
WERE
NOT
REPRESENTATIVE
OF
THE
WATER
TABLE
AND
WERE
NOT
USED
TOGENERATE
CONTOURS
WABASH
RIVER
AVERAGE
ELEVATION
FOR
INCLUSIVE
DATES
IS
428.4
FT
MSL
MW1
451.77
Ui
I-
NW-3/3D
447.65/
447.69
LJo
Ui
1900TH
IMPOUNDMENT
GPi
LP-1
DIRECT
PUSH
SOIL
BORING
451
GP21
LEACHATE
SAMPLE
EWI
CYP
LAP
UAPP2P
PLANT
WATER
WELL
NW2
447.44
/OLD
ASH
SURFACE
WATER
SAMPLE
MW-7/7D
427.701426.95
FORMER
ASH
LAYDOWN
AREA
200
400
ROADWAY
MWil
439.12
EW1
00
LJ
-J
LJc
LU
LU
MW6
432.36
Li
LLI-c
I-
Li
.cn
OV
-II
LLJ
800
SCALE
IN
FEET
opis
GP
15
GP.-
17
GP
13
Gp18
Natural
Resource
Technology
GP14
GP19
700
FT
PROJECT
No
1375/1
DRAWING
NO
1375809
FIGURE
NO
Electronic Filing - Received, Clerk's Office, August 11, 2008 - AS 09-1, Exhibit 4
SOURCE
NOTE
THIS
DRAWING
WAS
DEVELOPED
FROM
REPORT
BY
STMI
BROOKF1ELD
WISCONSIN
PROJECT
249
REPORT
9801
DATED
MAY
1998
AND
USGS
QUADRANGLE
7.5
MINUTE
SERIES
WEST
UNION
IWNOISINDIANA
DATED
1966
ALL
LOCATIONS
ARE
APPROXIMATE
cn
I-
WLaJ
VQLjJ
0u
JI-
LiJ1
LEGEND
WATER
TABLE
ELEVATION
CONTOUR
Fr
MsL
__________
WATER
TABLE
FLOW
DIRECTION
MWI
MONITORING
WELL
453.12
WITH
WATER
TABLE
ELEVATION
Fl
MSL
MW-3/3D
1448.06/
448.38
LJ
NESTED
MONITORING
WELL
WITH
WATER
TABLE
ELEVATION
FT
MSL
MSL
MEAN
SEA
LEVEL
It
r-
Li
-j
1900TH
OPi
LP1
EW1
CYP
UAPP2P
GP2
INDICATES
WATER
LEVEL
ABOVE
SCREENED
INTERVAL
DIRECT
PUSH
SOIL
BORING
LEACHATE
SAMPLE
PLANT
WATER
WELL
SURFACE
WATER
SAMPLE
MW2
448.22
MW7/7D
437.1
0/436.87
FORMER
ASH
LAYDOWN
AREA
ROADWAY
200
400
EW1
//
MW6
437.1
800
SCALE
IN
FEET
NOTES
MONITORING
WELLS
MW3D
HW6
MW7/7D
UW8
AND
MW-100
WERE
NOT
REPRESENTATIVE
OFTHE
WATER
TABLE
AND
WERE
NOT
USED
TO
GENERATE
CONTOURS
WABASH
RIVER
AVERAGE
ELEVATION
FOR
INCLUSIVE
DATES
IS
438
FT
MSL
GP-15
GP17
GP16
GP13
Natural
Resource
Technology
GP19
700
FT
GP14
PROJECT
NO
1375/1
DRAWING
NO
1375BlO
FIGURE
NO
Electronic Filing - Received, Clerk's Office, August 11, 2008 - AS 09-1, Exhibit 4
GWEIv
IV
Natural
Resource
Technology
_______
OliVi/1987
OKP1t1989
OIiVlfl99l
ObO1/1993
Sample Date
AMI42
Figure
Historical
groundwater
elevations at MW-2 and MW-3
0101/1995
010111997
0101/1999
Electronic Filing - Received, Clerk's Office, August 11, 2008 - AS 09-1, Exhibit 4
Figure
Historical
groundwater
elevations at nested wells
MW-3/3D MW-7/7D
MW-i 0/i
OD
Natural
Resource
Technology
GWE1v
ft
11/01/1998
01/01/1999
Sample
Date
AMW
03/01/1999
05/01/1999
MTV3D
GWEIv
It
425
11/01/1998
01/01/1999
03/01/1999
05/01/1999
Sample
Date
.MW7
MW7D
GWEIv
ft
450
10/01/1998
12/01/1998
1101/1998
01/01/1999
0301/1999
Sample
Date
05/01/1
999
MW1O
MWIOD
Electronic Filing - Received, Clerk's Office, August 11, 2008 - AS 09-1, Exhibit 4
98
\j
fl
/4
______
_________
___________________________
__________________
--
________
_____________
5O
_____________________
veCe
BM455
____________
_____
..
._/----
\2
QW
4___
//
--
SOURCE
USGS 7.5 MINUTE
QUADRANGLE
WEST UNION
DATED
1966
PROJECT
NO
Natural
SITE LOCATION
MAP
1375
Resource
HUTSONVILLE
POWER STATION
375AOl
DRAWING
NO
Technology
HUTSONVILLE
ILLINOIS
DRAWN
BYTAS
APPROVED
BY
DATE
FIGURE
NO
ILLINOS
QUADRANGLE
LOCA11ON
2000
4000
SCALE
IN FEET
CONTOUR
INTERVAL
10
FEET
Electronic Filing - Received, Clerk's Office, August 11, 2008 - AS 09-1, Exhibit 4
SCALE
IN
FEET
SOURCE
NOTE
THIS
DRAWING
WAS
DEVELOPED
FROM
REPORT
BY
SINI
BROOKFIELD
WISCONSIN
PROJECT
249
REPORT
9801
DATED
MAY
1998
AND
USGS
QUADRANGLE
7.5
MINUTE
SERIES
WEST
UNION
IWNOISINDIANA
DATED
1966
ALL
LOCATIONS
ARE
APPROXIMATE
In
In
Lii
C-
LI
Lii
-J
Li
C-
LU
LLI-Q
I-
WLii
VQLJ
--
0cn
-JI
1jJ
MW9
0.8
1.0
LEGEND
MWi
0.16
0.26
Lii
00
Lii
ri
MW-3/3D
tJ
6.6
8.5/
2.6
6.5
MONITORING
WELL
WITH
BORON
MEDIAN
MAXIMUM
CONCENTRATiON
IN
GROUNDWATER
FROM
10/26/98
TO
5/24/99
rng/L
NESTED
MONITORING
WELL
WITH
BORON
MEDIAN
MAXIMUM
CONCENTRATION
IN
GROUNDWATER
FROM
10/26/98
TO
5/24/99
mg/L
ESTIMATED
EXTENT
OFBORON
MEDIAN
CONCENTRATION
ABOVE
CLASS
GROUNDWATER
STANDARD
rng/L
MILUGRAMS
PER
UTER
DIRECT
PUSH
SOIL
BORING
LP1
LP2
In
mg/L
GP1
LP1
EW1
LAP
UAPP2P
ASH
IMPOUNDMENT
LEACHATE
SAMPLE
MW
10/1
OD
0.10
0.15/0.12
0.1
GP7
PLANT
WATER
WELL
SURFACE
WATER
SAMPLE
FORMER
ASH
LAYDOWN
AREA
ROADWAY
200400
NOTE
MEDIAN
AND
MAXIMUM
CONCENTRATIONS
ROUNDED
TO
TWO
SIGNIFICANT
DIGITS
800
GP16
GP15
GP17
GP13
9GP18
-j
Natural
Resource
Technology
GP19
700
FT
GP14
PROJECT
NO
1375/1
DRAWING
NO
1375B02
FIGURE
NO
10
Electronic Filing - Received, Clerk's Office, August 11, 2008 - AS 09-1, Exhibit 4
Figure
11
Historical
boron concentrations
at MW-2 and MW-3
Natural
Resource
Technology
Boron
Tot
ugiL
c-i
1/1/84
1/1/86
1/1/88
1/1/90
1/1/92
1/1/94
1/1/96
1/1/98
1/1/2000
1/1/85
1/1/87
1/1/89
1/1/91
1/1/93
1/1/95
1/1/97
1/1/99
Sample
Date
AMT42
FEIiMW
Electronic Filing - Received, Clerk's Office, August 11, 2008 - AS 09-1, Exhibit 4
200
400
SOURCE
NOTE
THIS
DRAWING
WAS
DEVELOPED
FROM
REPORT
BY
STMI
BROOKFIELD
WISCONSIN
PROJECT
249
REPORT
9801
DATED
MAY
1998
AND
USGS
QUADRANGLE
7.5
MINUTE
SERIES
WEST
UNION
IWNOISINDIANA
DATED
1966
ALL
LOCATIONS
ARE
APPROXIMATE
L.J
.10
LL-Q
LLJW
VOLaJ
1/
C0
ocn
LUC
LEGEND
MWi
38
270
MWI
38
270
MW-3/3D
iJ
1527
1684/
1579
1940
MONITORING
WELL
WITH
SULFATE
MEDIAN
MAXIMUM
CONCENTRATION
IN
GROUNDWATER
FROM
10/26/98
TO
5/24/99
mg/I
NESTED
MONITORING
WELL
WITH
SULFATE
MEDIAN
MAXIMUM
CONCENTRATION
IN
GROUNDWATER
FROM
10/26/98
TO
5/24/99
rng/L
LPIL
1-
Ijj
-J
ESTIMATED
EXTENT
OFSULFATE
MEDIAN
CONCENTRATION
ABOVE
CLASS
GROUNDWATER
STANDARD
400mg/L
MILUGRAMS
PER
LITER
DIRECT
PUSH
SOIL
BORING
LP2
mg/L
GP1
LP1
EW1
CYP
UAPP2P
LEACHATE
SAMPLE
MWi
0/1
OD
30
32/32
35
PLANT
WATER
WELt
SURFACE
WATER
SAMPLE
MW-7/7D
263
345/63
74
FORMER
ASH
LAYDOWN
AREA
ROADWAY
EW1
-J
NOTE
MEDIAN
AND
MAXIMUM
CONCENTRATIONS
ROUNDED
TOiWO
SIGNIFICANT
DIGITS
MW6
260
350
800
SCALE
IN
FEET
GP15
CP17
GP-18
GP13
Natural
Resource
Technology
GP19
GP14
700
FT
PROJECT
NO
1375/1
DRAWING
NO
375B07
GP16
FIGURE
NO
12
Electronic Filing - Received, Clerk's Office, August 11, 2008 - AS 09-1, Exhibit 4
SCALE
IN
FEET
SOURCE
NOTE
THIS
DRAWING
WAS
DEVELOPED
FROM
REPORT
BY
SIMI
BROOKF1ELD
WISCONSIN
PROJECT
249
REPORT
9801
DATED
MAY
1998
AND
USGS
QUADRANGLE
7.5
MINUTE
SERIES
WEST
UNION
IWNOISINDIANA
DATED
1966
ALL
LOCATIONS
ARE
APPROXIMATE
Natural
Resource
Technology
LEGEND
MW-i
0.11
0.60
MWi
0.11
0.60
MONITORING
WELL
WiTH
MAGANESE
MEDIAN
MAXIMUM
CONCENTRATION
IN
GROUNDWATER
FROM
10/26/98
TO
5/24/99
rng/L
MW-3/3D
tr
1.1
3.9/
2.9
4.7
LP-lL
NESTED
MONITORING
WELL
WITH
MAGANESE
MEDIAN
MAXIMUM
CONCENTRATION
IN
GROUNDWATER
FROM
10/26/98
TO
5/24/99
mg/L
ESTIMATED
EXTENT
OF
MAGANESE
MEDIAN
CONCENTRATION
ABOVE
CLASS
GROUNDWATER
STANDARD
0.15
mg/L
NOT
DETECTED
MILLIGRAMS
PER
UTER
DIRECT
PUSH
SDIL
BORING
LEACHATE
SAMPLE
LC
LU
-J
LP2
900TH
ND
mg/L
LP1
EW1
CYP
LAP
UAPP2P
LINED
ASH
IMPOUNDMENT
MW10/1OD
0.09
0.11/0.10
0.21
CP7
PLANT
WATER
WELL
SURFACE
WATER
SAMPLE
FORMER
ASH
LAYDOWN
AREA
ROADWAY
200
400
LU
CD
LU
LU
-J
CD
NOTE
MEDIAN
AND
MAXIMUM
CONCENTRATIONS
ROUNDED
TO
TWO
SIGNIFICANT
DIGITS
Li
-Jo
I-cn
LUJLJJ
t1OLJ
Cl
--
OV
ii
800
GPi5
GP
15
GP
17
GP
13
GP18
GP19
700
FT
GP14
PROJECT
NO
1375/
DRAWING
NO
1375803
FIGURE
NO
13
Electronic Filing - Received, Clerk's Office, August 11, 2008 - AS 09-1, Exhibit 4
Natural
Resource
Technology
PROJECT
NO
1375/
DRAWING
NO
1375605
FIGURE
NO
14
MW9
ND
0.02
LEGEND
MWi
ND
0.17
MWi
ND
0.17
MONITORING
WELL
WITH
IRON
MEDIAN
MAXIMUM
CONCENTRATION
IN
GROUNDWATER
FROM
10/26/98
TO
5/24/99
mg/L
MW3/3D
ir
ND
0.04/
ND
ND
to
NESTED
MONITORING
WELL
WITH
IRON
MEDIAN
MAXIMUM
CONCENTRATION
IN
GROUNDWATER
FROM
10/26/98
TO
5/24/99
mg/L
NOT
DETECTED
MILUGRAMS
PER
UTER
LP1
Lfl
IJ
-J
LP2
ND
ND
mg/L
OPi
LPi
EW1
CYP
LAP
UAPPP2P
1DOOTH
GP20
UNED
ASH
IMPOUNDMENT
DIRECT
PUSH
SOIL
BORING
LEACI-LATE
SAMPLE
GP21
MW1O/1OD
0.03
0.10/0.10
0.1
GP7
PLANT
WATER
WELL
SURFACE
WATER
SAMPLE
MW-2
ND
0.03
OLD
ASH
IMPOUNDMENT
MW7/7D
ND
ND/0.07
0.22
ND
FORMER
ASH
LAYDOWN
AREA
ROADWAY
200400
ND
UAP
MWil
2.3
3.5
EW1
MW6
ND
0.05
u-i
Jc
Cfl
I-
CD
tflQj
/0--I
tfl
_.JI
Li
CD
800
SCALE
IN
FEET
SOURCE
NOTE
THIS
DRAWING
WAS
DEVELOPED
FROM
REPORT
BYSTMI
BROOKFIELD
WISCONSIN
PROJECT
249
REPORT
9801
DATED
MAY
1998
AND
USGS
QUADRANGLE
7.5
MINUTE
SERIES
WEST
UNION
IWNOISINDIANA
DATED
1966
ALL
LOCATIONS
ARE
APPROXIMATE
NOTES
MEDIAN
AND
MAXIMUM
CONCENTRATIONS
ROUNDED
TO
TWO
SIGNIFICANT
DIGITS
ALL
CONCENTRATIONS
IN
WELLS
WERE
BELOW
C1.ASS
GROUNDWATER
STANDARD
5.0
mg/L
GP16
OPIS
GP13
GP17
GP19
700
FT
GP14
4-
Electronic Filing - Received, Clerk's Office, August 11, 2008 - AS 09-1, Exhibit 4
I-
SOURCE
NOTE
THIS
DRAWING
WAS
DEVELOPED
FROM
REPORT
8Y
51111
BROOKFIELD
WISCONSIN
PROJECT
249
REPORT
9801
DATED
MAY
1998
AND
USGS
QUADRANGLE
7.5
MINUTE
SERIES
WEST
UNION
IWNOISINDIANA
DATED
1966
ALL
LOCATIONS
ARE
APPROXIMATE
MW-9
ND
ND
LEGEND
MWi
ND
0.02
MWi
ND
0.02
MW-3/3D
1J
0.05
0.07
0.05
0.08
LU
LI
MONifORING
WELL
WITH
NICKEL
MEDIAN
MAXIMUM
CONCENTRATION
IN
GROUNDWATER
FROM
10/26/98
TO
5/24/99
mg/L
NESTED
MONITORING
WELL
WITH
NICKEL
MEDIAN
MAXIMUM
CONCENTRATION
IN
GROUNDWATER
FROM
10/26/98
TO
5/24/99
mg/I
ESTiMATED
ECIENT
OF
NICKEL
MEDIAN
CONCENTRATION
ABOVE
CLASS
GROUNDWATER
STANDARD
0.10
mg/L
NOT
DETECTED
MILLILRAMS
PER
UTER
DIRECT
PUSH
SOIL
BORING
LEACHATE
SAMPLE
LP-1
LU
LP2
ND
mg/L
GP1
LP1
@EW1
ND
900TH
GP20
LINED
ASH
IMPOUNDMENT
GP8
MW10/1OD
ND
0.04/ND
0.01
CP21
CYP
LAP
UAPP2P
GP7
PLANT
WATER
WELL
SURFACE
WATER
SAMPLE
eMW-2
ND
0.03
OLD
ASH
IMPOUNDMENT
HW7/7D
ND
ND/ND
ND
0.05
FORMER
ASH
1.AYDOWN
AREA
ROADWAY
200
400
UAP4
0.08
MWil
0.08
0.15
EW1
-J
C-
F-
NOTE
MEDIAN
AND
MAXIMUM
CONCENTRATIONS
ROUNDED
TO
TWO
SIGNIFICANT
DIGITS
MW6
0.01
0.02
L-Q
I-
LajLjJ
cnc
--
OV
JI
800
SCALE
IN
FEET
GP
15
GP17
GP-18
GP13
Natural
Resource
Technology
GP19
700
FT
GP14
PROJECT
NO
1375/1
DRAWING
NO
375B04
GP16
FIGURE
NO
15
Electronic Filing - Received, Clerk's Office, August 11, 2008 - AS 09-1, Exhibit 4
200
400
SOURCE
NOTE
THIS
DRAWiNG
WAS
DEVELOPED
FROM
REPORT
BYSTMI
BROOKFIELD
WISCONSIN
PROJECT
249
REPORT
9801
DATED
HAY
1998
AND
USGS
QUADRANGLE
7.5
MINUTE
SERIES
WEST
UNION
IWNOISINDIANA
DATED
1966
AU
LOCATIONS
ARE
APPROXIMATE
MW-9
8.9
LEGEND
MWi
7.5
MWi
7.5
MW3/3D
IJ
6.9/6.7
co
MONITORING
WELL
WITH
pH
MEDIAN
VALUE
IN
GROUNDWATER
FROM
10/26/98
TO
5/24/99
S.U
NESTED
MONITORING
WELL
WITH
pH
MEDIAN
VALUE
IN
GROUNDWATER
FROM
10/26/98
TO
5/24/99
S.U
ESTIMATED
EXTENT
OF
pH
MEDIAN
VALUE
ABOVE
OR
BELOW
CLASS
GROUNDWATER
STANDARD
6.59.0
S.U
STANDARD
UNIT
DIRECT
PUSH
SOIL
BORING
LEACHATE
SAMPLE
LP1
LU
IJJ
LI
-J
LP2
S.U
OPi
LP1
900TH
LINED
ASH
IMPOUNDMENT
MWi0/1OD
7.8/8.1
CYP
UAPP2P
GP7
MW-2
7.5
PLANT
WATER
WELL
SURFACE
WATER
SAMPLE
FORMER
sASH
LAYDOWN
AREA
ROADWAY
OLD
ASH
MW7/7D
7.5/8.0
/-ii
LW
LU
-J
LU
Li
NOTE
MEDLAN
AND
MAXIMUM
CONCENTRATIONS
ROUNDED
TOiWO
SIGNIFICANT
DIGITS
MW6
7.4
Lu
L-Q
I-
WLaJ
LU
cIQ
LjJ
800
SCALE
IN
FEET
OPiS
CRli
0P-18
CR
13
Natural
Resource
Technology
GP19
700
FT
GP14
PROJECT
NO
1375/
DRAWING
NO
375B06
GP16
FIGURE
NO
16
Electronic Filing - Received, Clerk's Office, August 11, 2008 - AS 09-1, Exhibit 4
I-
MW7/7D
854
9527432
462
NOTE
MEDIAN
AND
MAXIMUM
CONCENTRATIONS
ROUNDED
TO
TWO
SIGNIFICANT
DIGITS
Natural
Resource
Technology
PROJECT
NO
1375/1
DRAWING
NO
1375808
FIGURE
NO
17
LEGEND
MWi
MONITORING
WELL
WITH
TOTAL
DISSOLVED
SOLIDS
MEDIAN
267
334
MAXIMUM
CONCENTRATION
IN
GROUNDWATER
FROM
10/26/98
TO
5/24/99
mg/L
MWi
267
334
MW3/3D
ir
2612
3141
2506
2776
LP1
NESTED
MONITORING
WELL
WITH
TOTAL
DISSOLVED
SOLIDS
MEDIAN
MAXIMUM
CONCENTRATION
IN
GROUNDWATER
FROM
10/26/98
TO
5/24/99
mg/I
ESTIMATED
EXTENT
OF
TOTAL
DISSOLVED
SOLIDS
MEDIAN
CONCENTRATION
ABOVE
CLASS
GROUNDWATER
STANDARD
1200mg/I
MILLIGRAMS
PER
UTER
DIRECT
PUSH
SOIL
BORING
LEACHATE
SAMPLE
LP2
mg/L
GP1
LINED
ASH
IMPOUNDMENT
MWb/laD
326
330/252
270
CYP
l..AP
OAPP2P
GP7
PLANT
WATER
WELL
SURFACE
WATER
SAMPLE
FORMER
ASH
LAYDOWN
AREA
ROADWAY
1i
200
400
@EW1
-J
-J
-J
F-
F-
MW6
718
828
LiJ
I-
LaJW
Lii
co
800
SCALE
IN
FEET
SOURCE
NOTE
THIS
DRAWING
WAS
DEVELOPED
FROM
REPORT
BYSTMI
BRooIcFIaD
WISCONSIN
PROJECT
249
REPORT
9801
DATED
MAY
1998
AND
USGS
QUADRANGLE
7.5
MINUTE
SERIES
WEST
UNION
IWNOISINDIANA
DATED
1966
All
LOCATIONS
ARE
APPROXIMATE
GP
16
GP15
GP
13
GP17
GP18
GP19
700
FT
GP14
Electronic Filing - Received, Clerk's Office, August 11, 2008 - AS 09-1, Exhibit 4
TABLES
Electronic Filing - Received, Clerk's Office, August 11, 2008 - AS 09-1, Exhibit 4
Table
Direct-Push
Sampling
Data
Ground
Screen1
Bottom
Ash
Coal
Depth
to
Bedrock
Surface
Location
Northing
Easting
Elevation
Depth
Depth
Depth
Water
Depth
Elevation
ft
ft
ft
MSL2
ft BGS2
ft BGS ft BGS ft BGS ft BGS ft MSL
GP-1
3586
4366
460
17
0-2.5
--
14
17.3
442.5
GP-2
3753
4610
457
19
0-19
--
20.0
437.3
GP-3
3924
4093
459
16
-5.5
7-8
11
16.0
443.3
GP-4
3951
4221
459
16
10
17.0
442.4
GP-5
3918
3859
453
11
1.8
1.9
11.3
441.9
GP-6
3981
3754
453
10
2.0- 2.3
10.5
442.5
GP-7
4151
3512
452
10
18.0
434.0
GP-8
4263
3380
451
no water
sample
trace5
16.0
435.3
GP-9
4307
4990
453
12
trace5
21.0
432.4
GP-10
4779
4701
454
12
0-2.5
14.3
439.5
OP-il
4534
4399
453
10
0- 1.5
13.0
439.5
GP-12
4325
4346
451
--
0-0.8
9.5
441.3
GP-13
2693
3354
447
--
--
10.0
437.0
GP-14
1105
5752
440
32
--
10
40
400
GP-15
2790
3213
450
12
--
--
18.0
431.8
GP-16
2887
3065
454
12
--
--
28.0
425.7
GP-17
2583
3541
446
--
12.0
433.6
GP-18
2488
3677
446
12
--
--
23.8
422.2
GP-19
440
no water
sample
--
10
32
410
GP-20
3805
5099
451
21
0-19
21.0
429.7
GP-21
3594
5239
451
22
0-23
36.5
414.2
GP-22
4373
5285
459
ii
0-11.5
11.5
11.5
447.2
GP-23
4203
5273
461
22
31
--
34.0
426.7
LP-1
4405
3961
466
7.3
0- 7.3
--
--
LP-24
4502
3815
466
0-8
--
--
Four-foot
stainless steel screen
for GP5
or
polyvinyl
chloride
PVC
screen
for LP5
MSL
mean sea level BGS
below
ground
surface
Insufficient water
sample
recovery
for
laboratory
analysis
Temporary
1-inch outside
diameter
PVC
well point installed in lined ash impoundment
Chips
at
feet in GP-8 and at 0.5 feet in GP-9
Surveyors
could
not
locate GP-19
It
was
about 700 feet south of GP-14
Natural Resource
Technology
Inc
Electronic Filing - Received, Clerk's Office, August 11, 2008 - AS 09-1, Exhibit 4
Table
Water
Sample
Parameters and
Analytical
Methods
Parameter
Method
Alkalinity
EPA 310.1
Boron
ICP
EPA 200.7
Appendix
to Part 136
Calcium
EPA 130.2
Chloride
ICP
EPA 300.0
Iron
ICP
EPA 200.7
Appendix
to Part 136
Magnesium
EPA 130.2
Manganese
ICP
EPA 200.7
Appendix
to Part 136
Nickel
GFAA
EPA 249.2
Potassium
ICP
EPA 200.7
Appendix
to Part 136
Sodium
ICP
EPA 200.7
Appendix
to Part 136
Sulfate
ICP
EPA
300.0 or
EPA 375.4
Total Dissolved Solids
EPA
160.1
Field Measurements
pH
EPA 150.1
Eh
Std Methods
18th
ed.2580
Dissolved
Oxygen
Std Methods 18th ed
4500-OG
Specific
Conductance
EPA 120.1
Temperature
Std Methods 18th ed 2550
Groundwater
Elevation
Water Level Indicator
Natural Resource
Technology
Inc
Electronic Filing - Received, Clerk's Office, August 11, 2008 - AS 09-1, Exhibit 4
Table
Monitoring
Well
Locations
Elevations
Depth
to
Bedrock
and
Screened
Formation
Total
Surface
TOC1
Well
Depth
to
Bedrock
Bedrock
Date
Northing
Easting
Elevation
Elevation
Depth
Bedrock
Elevation
Penetration
Screened
Well
Drilled
ft
ft
ft
MSL2
ft
MSL
ft
BGS
ft
BGS
ft
MSL
ft
Formation4
MW-i
2/14/84
5606
2964
456.4
459.12
8.9
6.3
450.1
2.7
sand
ss
MW-2
2/10/84
4087
3594
453.4
456.03
i8.i
21
431.8
sg
MW-3
2/9/84
3865
3957
453.5
455.16
10.8
10.3
443.2
0.5
sg
MW-3D
10/6/98
3860
3952
453.7
455.28
25.1
10.5
443.2
15.0
SS
MW-4
2/13/84
4351
4164
454.2
457.07
12.3
10.7
443.5
2.5
sg
ss
MW-5
2/13/84
4822
4249
452.2
454.89
17.9
17.7
434.5
1.4
sg
ss
MW-6
2/9/84
3095
4818
439.0
443.66
11.5
8.5
430.5
3.0
sg
ss
MW-7
2/8/84
3166
5675
438.0
442.70
25.1
25
394
Si
sg
MW-7D
10/5/98
3176
5676
437.5
438.45
44.3
44
394
si
sg
MW-8
2/7/84
4081
5469
440.4
444.25
22.5
21.5
419
si
sand
MW-9
2/14/84
5408
5205
451.9
454.66
18.4
16.3
435.6
2.4
si
sg
ss
MW
10
10/7/98
4730
2560
452.9
454.23
10.7
7.5
445.4
3.5
Si
sg
ss
MW-1OD
10/7/98
4729
2565
452.9
454.65
21.3
7.5
445.4
14.0
ss
MW-il
10/6/98
3371
4451
443.8
445.45
14.5
5.5
438.3
9.5
Si
sg
ss
MW-12
10/8/98
4054
4638
455.5
456.74
16.9
17.0
438.5
0.0
Si
sg
MW-134
10/6/98
3962
4241
456.4
458.03
16.0
14.5
441.9
2.0
Si
sg
TOC
top
of
casing
BGS
below
ground
surface
MSL
mean
sea
level
sg
sandand
gravel
si
silty
ss
sandstone
Total
well
depth
for
MW-13
includes
2-foot
sump
Natural
Resource
Technology
Inc
Electronic Filing - Received, Clerk's Office, August 11, 2008 - AS 09-1, Exhibit 4
Table
Monitoring
Well
Completion
Details
Screen
Screen
Bentonite
Annular
Concrete
PVC
Water
Top
Bottom
Screen
Filter
Pack
Fine
Sand
Chip
Seal
Collar
Casing
Gallons
Depth
to
Level
Elevation
Elevation
Length
Ely.2
Thickness3
Thickness3
Thickness4
Thickness5
Stickup
Water
Water7
Elevation1
Well
ft
MSL1
ft
MSL
ft
ft
MSL
ft
ft
ft
ft
ft
AGS
Purged36
ft
TOC1
ft
MSL
MW-i
452.5
447.5
5.0
447.4-453.5
1.5
1.5
2.8
7.43
451.69
MW-2
448.3
435.3
13.0
431.8-449.3
2.6
8.67
447.36
MW-3
447.7
442.7
5.0
442.7-448.1
1.7
7.64
447.52
MW-3D
433.6
428.6
5.0
428.2-436.7
14
1.6
20
7.91
447.37
MW-4
449.4
441.9
7.5
441.0-450.4
2.8
9.72
447.35
MW-5
447.3
434.3
13.0
433.1-448.3
2.7
8.46
446.43
MW-6
433.9
427.5
6.4
427.5-434.9
4.6
10.83
432.83
MW-7
422.9
412.9
10.0
412.9-423.9
4.7
10.71
431.99
MW-7D
398.2
393.2
5.0
392.5-402.5
32
0.9
27
10.81
427.64
MW-8
422.9
417.9
5.0
417.9-423.9
3.8
16.05
428.20
MW-9
443.5
433.5
10.0
433.2-444.0
2.8
7.59
447.07
MW-b
447.2
442.2
5.0
441.9-448.9
--
1.3
20
3.10
451.13
MW-bOD
436.6
431.6
5.0
431.4-438.9
14
--
1.8
12
3.68
450.97
MW-il
439.3
429.3
10.0
428.8-439.8
--
1.7
22
6.15
439.30
MW-12
448.6
438.6
10.0
438.5-450.5
1.5
--
1.2
23
9.63
447.11
MW-i3
447.4
442.4
5.0
439.9-449.4
0.7
1.7
25
10.23
447.80
TOC
top
of
well
casing
MSL
mean
sea
level
AGS
above
ground
surface
Filter
pack
elevation
range
includes
fine
sand
pack
in
1998
wells
Dataon
fine
sand
thickness
bentonite
chip
thickness
and
gallons
of
water
purged
were
only
available
for
wells
installed
by
STMI
Annular
sealthickness
includes
bentonite-cement
grout
and
bentonite
pellets/chips
Concrete
collar
was
not
installedat
shallow
1998
wells
in
order
to
maximize
annular
seal
Volume
removed
during
well
development
Depth
to
groundwater
measured
on
November
12
1998
Natural
Resource
Technology
Inc
Electronic Filing - Received, Clerk's Office, August 11, 2008 - AS 09-1, Exhibit 4
Table
Monitoring
Well
Slug
Test Results
Location
Hydraulic
Conductivity1
ft/mm
MW-3
5.2E-02
MW-3D
1.1E-03
MW-5
.6E-02
MW-6
6.3E-02
MW-7
5.1 E-04
MW-7D
9.5E-02
MW-9
.6E-03
MW-b
1.2E-03
MW-1OD
7.9E-04
MW-12
1.2E-O1
MW-13
3.5E-02
Bouwer
and Rice
1976 analysis
method
Hydraulic
Conductivity1
cmls
2.7E-02
5.4E-04
8.OE-03
3.2E-02
2.6E-04
4.8E-02
8.3E-04
6.2E-04
4.OE-04
6.2E-02
.8E-02
Geologic
Unit
Silty
Sand
Gravel
Sandstone
Silty
Sand
Gravel
Clayey
Gravel
Silty
Sand
Sandstone
Sandy
Silt Sand
Gravel
Silty
Sand
Gravel
Silt
Silty
Sand Sandstone
Silty
Sand
Sandstone
Sandstone
Sand
Clayey
Sand
Gravel
Natural Resource
Technology
Inc
Electronic Filing - Received, Clerk's Office, August 11, 2008 - AS 09-1, Exhibit 4
Table
Leachate and Groundwater Concentration Results from Direct-Push
Samples
Compared
to Ash and Coal Thickness
i4
TTT1
13.9
5.40
3O2$2L
Pond
sample
concentrations
exceeding
Class
groundwater
standard
are shown in bold
Mn
manganese
TDS
total dissolved
solids
Thickness
Concentration
ash
coal
Boron
Mn
Iron
Nickel
pH
Sulfate
TDS
Illinois Class GW Standard
n/a
n/a
0.15
5.0
0.10
6.5-9.0
400
1200
Units
ft
ft
mg/I
mg/L
mg/L
mg/L
s.u
mg/L
mg/L
Ash
Leachate
Lined Ash Impoundment
LP-1
--
0.01
0.02
0.01
LP-2
--
I521JJ
0.01
0.02
0.01
LAP
--
--
5.2
0.01
0.80
0.03
Former Ash
Laydown
Area
GP-2
19
--
24.5
0.03
6.8
P2P
--
0.3
0.02
0.04
0.020
6.9
67
148
Unlined
Ash Impoundment
8.9
315
GP-20
19
GP-21
23
--
GP-23
31
594
0.02
0.01
7.7
0.09
0.01
7.3
0.40
0.005
7.6
UAP
--
2.2
0.18
0.02
0.12
8.0
208
518
Groundwater
Former Ash Lavdown
Area
GP-3
GP-4
--
--
P2P
--
--
344
1096
Ih1l91
28.22.89
218
550
0.3
0.02
0.34
0.09
200
009
37
153j
2190
0.04
0.02
6.9
67
148
Lined Ash
Impoundment
GP-5
--
0.1
GP-6
--
0.3
GP-7
--
Coal Pile
Storage
Area
GP-9
GP-10
--
2.5
GP-11
--
1.5
GP-12
--
0.8
CYP
--
Areas South of
Plant
Site
GP-13
--
--
0.2
0.01
0.02
0.005
7.5
104
716
GP-14
--
--
0.1
0.13
0.014
8.0
52
900
GP-15
--
0.3
0.01
0.03
0.005
7.6
125
884
GP-16
--
0.2
0.01
0.02
0.005
7.4
104
957
GP-17
--
--
0.3
0.10
0.02
0.005
7.6
83
692
GP-18
--
--
0.3
0.01
0.02
0.005
7.4
83
742
Shaded concentrations
equal/exceed
Class
groundwater
standard
Locations
GP-1
GP-8 GP-1
and GP-22 were not sampled
Pond
samples NAP
P2P OAP and
CYP
collected 4/29-30/99 are shown for reference
Natural Resource
Technology
Inc
Electronic Filing - Received, Clerk's Office, August 11, 2008 - AS 09-1, Exhibit 4
Table
Groundwater
Concentration
Results from
Monitoring
Wells
Compared
to Ash and
Coal
Thickness
Lined Ash
Impoundment
MW-2
--
--
1II
0.13
0.02
MW-4
--
0.02
7.6
359
--
0.2
0.005
0.02
0.02
7.7
94
426
MW-5
--
0.1
1.2
0.01
0.02
0.02
7.6
266
622
LAP
--
--
5.2
0.01
0.80
0.03
8.9
315
594
Unlined Ash
Impoundment
MW-6
--
--
15.5
2.91
0.04
0.02
7.5
318
781
MW-7
--
--
31
O.29.
0.02
0.01
7.9
311
913
MW-7D
--
--
0.1
2.19
0.16
0.01
8.3
72
MW-8
--
--
11.9
5.14
0.29
0.06
7.9
MW-9
2.2
0.8
1.0
O.33J
0.02
0.01
8.0
UAP
--
--
2.2
0.18
0.02
0.12
8.0
Shaded
concentrations
equal/exceed
Class
groundwater
standard
Statistical
Interval
10/26/98
through
5/24/99
Pond
samples P2P NAP
and
OAP
collected
4/29-30/99
are shown for reference
Pond
sample
concentrations
exceeding
Class
groundwater
standard are shown
bold
Mn
manganese
TDS
total dissolved solids
Thickness
Concentration
Upper
95th
Percentile
Prediction
Limit
ash
coal
Boron
Mn
Iron
Nickel
pH
Sulfate
TDS
IL Class GW Standard
n/a
n/a
0.15
5.0
0.10
6.5-9.0
400
1200
Units
ft
ft
mg/L
mg/L
mg/L
mg/L
s.u
mg/L
mg/L
Lipgradient
MW-I
--
--
0.2
0.11
0.02
7.7
124
302
MW-b
--
--
0.1
0.10
0.07
0.03
7.9
32
334
MW-IOD
--
--
0.1
ii6
0.15
0.01
8.4
34
262
Former Ash
Laydown
Area
MW-3
--
0.4
MW-3D
--
--
MW-Il
--
trace
MW-12
--
MW-13
--
--
P2P
--
--
____
JO
0.03
0.06
7.0
0.02
0.07
6.9
3.07
0.03
002
7.9
218
673
1.01
0.04
0.02
6.9
67
148
Natural Resource
Technology
Inc
Electronic Filing - Received, Clerk's Office, August 11, 2008 - AS 09-1, Exhibit 4
Table
Source Area
Analysis
Potential
Sources
Ash
Lay-
Unlined
Lined
Coal
Down
Impound
Impound
Not
Well
Thickness
ft
Coal Pile Coal
Spill
Area
ment
ment
Pipe
Leak
impacted
Upgradient
MW-I
--
MW-b
--
MW-lCD
--
Former Ash
Laydown
Area
MW-3
0.4
MW-3D
--
MW-Il
trace
MW-12
--
MW-13
--
Lined Ash
Impoundment
MW-2
--
MW-4
--
MW-5
0.1
Unlined Ash
Impoundment
MW-6
--
MW-7
--
MW-7D
--
MW-8
--
MW-9
0.8
Natural Resource
Technology
Inc
Electronic Filing - Received, Clerk's Office, August 11, 2008 - AS 09-1, Exhibit 4
APPENDIX
BORING/MONITORING
WELL
CONSTRUCTION LOGS
Electronic Filing - Received, Clerk's Office, August 11, 2008 - AS 09-1, Exhibit 4
Project
Name/No
Boring
No
Start Date
Page
AmerenCiPS
Hutsonville
Plant
249.03
GP-1
8/25/98
Driller
Logged by
End Date
Depth
to Water
AEC
Indianapolis
IN
Steve
Mueller/STMI
8/25/98
16.8 Feet
Boring
Depth
Boring
Diameter
Surface Elevation
Drill
Method
Northing
17.3 Feet
2.2 Inches
459.8 Feet
Geoprobe
3585.650
Well
Depth
Well Diameter
TOC EIev
Sample
Method
Easting
na
na
na
4-ft Macro-Core
4366.050
Description
-J
4-
CS
4-
100
Coal
Ash
/h
siity
texture
trace coai
Tragmenis
dark
gray
moist
Fill
Corn ments
sP
100
piu
weu
soneo/rounaea
medium-grained
quartz
trace
silt
trace
coarse
subangular
sand of
non-quartz
lithology light brown
moist
Fill
na
na
na
na
na
-10-
100
75
100
77
SILTY CLAY roots in
top
foot trace
to
little coarse sand to fine
suban9ular
gravel
olive
gray
to
brown
moist
CL
SM-
SILTY
SAND
fine- to
medium-grained
trace fine gravel
dark
gray
moist
j0
CLAYEY
SAND
fine- to
medium-grained
./o
SC
trace fine
gravel light
gray
saturated
Geoprobe boring
no
well
installed
insufficient
water
no
sample
collected
-15--
20
25--
tND ut- tiUKiN
i.i feet
DOCK
30
Electronic Filing - Received, Clerk's Office, August 11, 2008 - AS 09-1, Exhibit 4
Project
Name/No
Boring
No
Start Date
Page
AmerenCIPS
Hutsonville Plant
249.03
GP-2
8/25/98
Driller
Logged by
End Date
Depth
to Water
AEC Indianapolis
IN
Steve Mueller/STMI
8/25/98
Feet
Boring
Depth
Boring
Diameter
Surface Elevation
Drill Method
Northing
20.0
Feet
2.2 Inches
457.3 Feet
Geoprobe
3753.193
Well
Depth
Well Diameter
TOC Elev
Sample
Method
Easting
na
na
na
4-ft Macro-Core
4610.447
Description
.r
.2
.-
.2
Comments
.r
87.51
Ash
1001
na
na
na
na
na
100
ri
trace cinuer
gravel
olive to
dark
gray
moist
Fill
SAND
well
sorted/rounded
medium-grained
quartz light brown
moist
with little
gravel
mottled olive
gray
light
brown below 3.5 ft
Fill
ASH silty
texture trace coal
fragments
and
cinder
gravel
coarsens
below 12
ft
saturated below
ft
Fill
ASW
SAND
coarse sand-size ash
granules
coarse-grained quartz sand
trace cinder
pebbles 1/2-1
black
saturated
Fill
100
100
Geoprobe boring
no
well installed
Groundwater
sample
collected from 15-19
ft
bgs
-10-
-15-
20--
25
30--
CLAYEY SAND
AVIL
poorly
sorted/subrounded
fine- to
coarse-grained
sand
fine-grained gravel
yellow orange
moist
END 01- bUIIN.i U.U reet
iiearoc
Electronic Filing - Received, Clerk's Office, August 11, 2008 - AS 09-1, Exhibit 4
Project
Name/No
Boring
No
Start Date
Page
AmerenCIPS
Hutsonville Plant
249.03
GP-3
8/25/98
Driller
Logged by
End Date
Depth
to Water
AEC
Indianapolis
IN
Steve Mueller/STMI
8/25/98
11 Feet
Boring
Depth
Boring
Diameter
Surface Elevation
Drill
Method
Northing
16.0
Feet
2.2 Inches
459.3 Feet
Geoprobe
3924.268
Well
Depth
Well Diameter
TOC Elev
Sample
Method
Easting
na
na
na
4-ft Macro-Core
4092.856
Description
.c
.2
I.
Cl
fl
Cl
Comments
__
... ...
t.na_nr..narI
IL
/iINLJ
damp
Fill
ASH
silty
texture
olive
gray
wet below
ft
Fill
SAND
well
sorted/rounded
tine- to
medium-grained quartz light brown
moist
Fill
COAL sand/gravel
size
black
damp
Fill
SAND
well
sorted/E?ded
tine- to
medium-grained quartz light brown
saturated below 11 ft
100
na
na
na
na
sP
Coal
-10-
100
-15-
sP
SW-
100
Geoprobe boring
no
well installed
Groundwater
sample
collected from 12-16
ft
bgs
GW
SAND
UI-AVL pooriy sortec
line- tO
medium-grained quartz
sand
\\
fine-grained subangular
gravel light
\brown
saturated
__________________
END OF bORlNGib.O
teef
20
25--
30--
Electronic Filing - Received, Clerk's Office, August 11, 2008 - AS 09-1, Exhibit 4
Project
Name/No
Boring
No
Start Date
Page
AmerenCIPS
Hutsonville Plant
249.03
GP-4
8/25/98
Driller
Logged by
End Date
Depth
to Water
AEC
Indianapolis
IN
Steve Mueller/STMI
8/25/98
10 Feet
Boring
Depth
Boring
Diameter
Surface
Elevation
Drill Method
Northing
17.0 Feet
2.2 Inches
459.4 Feet
Geoprobe
3950.707
Well
Depth
Well Diameter
TOC Elev
Sample
Method
Easting
na
na
na
4-ft Macro-Core
4220.706
Description
.2
Cl
Comments
SP
/klNU well sorted/rounded
tine- to
medium-grained quartz
little ash cinder
gravel
0-1 if
light
brown
moist
Fill
na
na
na
na
na
68.8
81.2
87.5
56.2
100
TT
SAND
well
sorted/rounded
tine- to
medium-grained quartz
dark brown 5.5-7
ft
old ground surface light
brown below
saturated below
10 ft
SP
Geoprobe boring
no
well installed
Groundwater
sample
collected from 12-16 ft
bgs
10-
-15-
20
25
30
vv
GW
.LAYbY bPNU
jKAVL poorty
sorted
fine- to
coarse-grained
sand
fine-grained subanguler
gravel light
---
brown
saturated
1r1U ut- LflCINi
.U ieet
earocj
Electronic Filing - Received, Clerk's Office, August 11, 2008 - AS 09-1, Exhibit 4
-15-
20-
25
ILI
PINL SII
U-JI
ft
piece
of
concrete
1-in coal-rich
layer
at
1.75
ft brown
moist
Fill
SILlY SANU
.KAVLpOOriy
sortea
medium- to
coarse-grained
subrounded
sand
fine-grained subanguler
to
subround
gravel light gray
saturated
ENDUFBORING
feet
Bedrock
Project
Name/No
Boring
No
Start Date
Page
AmerenClPS
Hutsonville
Plant
249.03
GP-5
8/26/98
Driller
Logged by
End Date
Depth
to Water
AEC
Indianapolis
IN
Steve Mueller/STMI
8/26/98
Feet
Boring
Depth
Boring
Diameter
Surface Elevation
Drill Method
Northing
11.25 Feet
2.2 Inches
453.2 Feet
Geoprobe
3917.782
Well
Depth
Well Diameter
TOC Elev
Sample
Method
Easting
na
na
na
4-ft Macro-Core
3858.831
en
Description
.-
en
Comments
..-
SM
na
na
na
100
100
100
10-
SAND
well
sorted/rounded
fine- to
medium-grained quartz
trace to little
coarse subangular
to subround sand
light
brown
saturated below
ft
SP
vv
GW
Geoprobe boring
no
well installed
Groundwater
sample
collected
from 7-11 ft
bgs
30
Electronic Filing - Received, Clerk's Office, August 11, 2008 - AS 09-1, Exhibit 4
na
10-
-15-
20--
25
Project
Name/No
Boring
No
Start Date
Page
AmerenCIPS
Hutsonville
Plant
249.03
GP-6
8/26/98
Driller
Logged by
End Date
Depth
to Water
AEC
Indianapolis
IN
Steve Mueller/STMI
8/26/98
Feet
Boring
Depth
Boring
Diameter
Surface Elevation
Drill Method
Northing
10.5 Feet
2.2 Inches
453.0 Feet
Geoprobe
3981.359
Well
Depth
Well Diameter
TOC EIev
Sample
Method
Easting
na
na
na
4-ft Macro-Core
3754.280
Description
.c
.2
.2
.2
Cl
00
Comments
na
SM
biLl
Tine- rn
meaium-grainea
silty topsoil
with
grass
0-1/2 ft little
gravel
little coal
fragments
2-2.25
ft
glass fragements
dark
brown
moist
Fill
62.5
100
na
100
SAND
well
sorted/rounded
fine- to
medium-grained quartz light
brown
moist
SAND poorly
sorted tine- to
coarse-grained
subanguler
to subround
trace to little gravel light brown
saturated
sw
below
ft
.-
.-..-.--.--.
Geoprobe boring
no
well installed
Groundwater
sample
collected from 6-10 ft
bgs
INL
Lr DurcJIN
RJ IL
30
Electronic Filing - Received, Clerk's Office, August 11, 2008 - AS 09-1, Exhibit 4
25
30
SiLl
SAND tine- to
meclium-grainea
silty topsoil
with
grass
0-1/2
ft
little
gravel
dark
brown
moist
Fill
SAND
well
sorted/rounded
tine- to
medium-grained
quartz light brown
N.moist
SAND poorly sorted
tine- to
coarse-grained
subanguler
to subround
trace to little
gravel light
brown
saturated
below
ft
CEAYEY
SILT
very
stiff to
hard
nonplastic
trace
angular
to
subangular
coarse sand to fine
gravel
olive
gray
moist
__________________________
SANDSTONE
fine-grained
quartz
friable
light green
____________
ENDUFBORINGT80feet
Bedrock
Project
Name/No
Boring
No
Start Date
Page
AmerenCIPS
Hutsonville Plant
249.03
GP-7
8/26/98
Driller
Logged by
End Date
Depth
to Water
AEC Indianapolis
IN
Steve Mueller/STMI
8/26/98
Feet
Boring
Depth
Boring
Diameter
Surface Elevation
Drill Method
Northing
18.0 Feet
2.2 Inches
452.0 Feet
Geoprobe
4151.460
Well
Depth
Well Diameter
TOC Elev
Sample
Method
Easting
na
na
4-ft Macro-Core
3511.572
Description
._
..J
Cl
Comments
SM
SP
SW
75
50
100
100
100
na
na
na
10
na
-15-
na
20-
Geoprobe boring
no
well installed
Groundwater
sample
collected
from 6-10 ft
bgs
ML
Electronic Filing - Received, Clerk's Office, August 11, 2008 - AS 09-1, Exhibit 4
Project
Name/No
Boring
No
Start
Date
Page
AmerenCIPS
Hutsonville
Plant
249.03
GP-8
8/26/98
Driller
Logged by
End Date
Depth
to Water
AEC
Indianapolis
IN
Steve Mueller/STMI
8/26/98
Est
Feet
Boring
Depth
Boring
Diameter
Surface Elevation
Drill Method
Northing
16.0 Feet
2.2 Inches
451.3 Feet
Geoprobe
4262.600
Well
Depth
Well Diameter
TOC EIev
Sample
Method
Easting
na
na
na
2-ft
split-spoon
3380.239
Description
.o
.i
.a
Cl
Corn ments
0.9
0.9
SM
ILTY SAND tine- to
medium-grained
silty topsoil
with
grass
0-3/4 ft little
gravel
dark
brown
moist
Fill
na
na
na
na
100
100
100
100
CLAYEY SILT
plant
stem
fragments
and
ML
trace coal
particles
at
top
black
moist
topsoil
7/7/
SJETTCEAYUtT
medium
plasticity
tine
///
vertical
roots
little to some medium to
coarse sand
trace
subangular
fine
gravel
//
CL
mottled
light
brown
gray
moist
estimated
water level at
ft
SAND
poorly
sorted
tine- to
coarse-grained
subanguler
to
subround
trace to little
gravel light
brown
saturated
-10-
-15-
20
25
Geoprobe boring
no
well installed
No
groundwater
sample
collected
geology
boring only
SIL
eLAY Stiff
medium
pIdLJI..lLy
sandstone
pebble light
to
greenish gray
moist
________/
ENDOF BOR1NGT6iTffBed
rock
30
Electronic Filing - Received, Clerk's Office, August 11, 2008 - AS 09-1, Exhibit 4
ILI
grass Drown ury
Topsoil
SAND
well
sorted/rounded
tine- to
medium-grained quartz
trace coal
fragments
at
top
trace coarse
sand light
brown
moist
SAND
poorly
sorted
fine- to
coarse-grained
subanguler
to
subround
trace to little
gravel pale brown
saturated
Geoprobe boring
no
well installed
Project
Name/No
Boring
No
Start
Date
Page
AmerenCiPS
Hutsonville Plant
249.03
GP-9
8/26/98
Driller
Logged by
End Date
Depth
to Water
AEC
Indianapolis
IN
Steve Mueller/STMI
8/26/98
Feet
Boring
Depth
Boring
Diameter
Surface Elevation
Drill Method
Northing
21.0 Feet
2.2 Inches
453.4 Feet
Geoprobe
4306.991
Well
Depth
Well Diameter
TOC Elev
Sample
Method
Easting
na
na
na
4-ft Macro-Core
4990.027
Description
.-
.5
1-
Cl
00
Comments
ML
..nh
SP
50
56.2
100
100
100
100
SW
na
na
na
10--
na
-15-
na
na
20
25
30
Groundwater
sample
collected from 8-12 ft
bgs
END OF BORINi
i.U teet
bedrocK
Electronic Filing - Received, Clerk's Office, August 11, 2008 - AS 09-1, Exhibit 4
Project
Name/No
Boring
No
Start Date
Page
AmerenCIPS
Hutsonville
Plant
249.03
GP-10
8/26/98
Driller
Logged by
End Date
Depth
to
Water
AEC
Indianapolis
IN
Steve Mueller/STMI
8/26/98
Feet
Boring
Depth
Boring
Diameter
Surface Elevation
Drill Method
Northing
14.25 Feet
2.2 Inches
453.8 Feet
Geoprobe
4778.861
Well
Depth
Well Diameter
TOC Elev
Sample
Method
Easting
na
na
na
4-ft Macro-Core
4700.947
S.
.c
4-
Ca
Description
-J
4-
4-
IAJFkL sanaigraveu
size ouacic aamp
Fill
SAND
well sorted/rounded
tine-grained
quartz
some
silt 2.5-3.5
ft
light
brown
saturated below
ft
Comments
SP
na
na
na
na
100
75
50
100
Geoprobe boring
no
well installed
Groundwater
sample
collected from 8-12
ft
bgs
SAND
poorly
sorted
tine- to
coarse-grained
subanguler
to subround
trace to little
gravel grade
to
well sorted
medium to coarse
sand below 13
ft
light
SW
brown
saturated
-10-
-15-
20
25
30
I1U tjr urcipi
14.25 feet
8edroclc
Electronic Filing - Received, Clerk's Office, August 11, 2008 - AS 09-1, Exhibit 4
Project
Name/No
Boring
No
Start
Date
Page
AmerenCiPS
Hutsonville
Plant
249.03
GP-1
8/26/98
Driller
Logged by
End Date
Depth
to
Water
AEC Indianapolis
IN
Steve Mueller/STMI
8/26/98
Feet
Boring
Depth
Boring
Diameter
Surface
Elevation
Drill Method
Northing
13.0 Feet
2.2 Inches
452.5 Feet
Geoprobe
4534.018
Well
Depth
Well Diameter
TOC Elev
Sample
Method
Easting
na
na
na
4-ft Macro-Core
4398.796
Description
-J
S.
Co
4-
U/L sanaigravei size oiacic aamp
Fill
SM
SIL
SANU
Tine- to
mecium-grainea
quartz
trace
coarse-grained
light
brown
moist
Fill
Comments
na
na
na
na
871
68.8
100
100
SAND
well sorted/rounded
tine-
to
SP
medium-grained quartz light
brown
-saturated
below
ft
HH
SAND poorly
sorted
fine- to
coarse-grained
subanguler
to
subround
trace to little
gravel light brown
saturated
sw
Geoprobe boring
no
well installed
Groundwater sample
collected from 6-10 ft
bgs
NL ut- UiN
i.U teet
iearocK
-10-
15-
20.--
25
30
Electronic Filing - Received, Clerk's Office, August 11, 2008 - AS 09-1, Exhibit 4
Project
Name/No
Boring
No
Start Date
Page
AmerenCiPS
Hutsonville
Plant
249.03
GP-12
8/27/98
Driller
Logged by
End Date
Depth
to Water
AEC Indianapolis
IN
Steve Mueller/STMI
8/27/98
Feet
Boring
Depth
Boring
Diameter
Surface Elevation
Drill Method
Northing
9.5
Feet
2.2 Inches
450.8 Feet
Geoprobe
4324.544
Well
Depth
Well Diameter
TOC EIev
Sample
Method
Easting
na
na
na
4-ft Macro-Core
4346.394
Co
Description
.2
.-
-a
CD
CD
Comments
._-7-
asit Ira
20
25
30
LLfrkL siuy
soft black
wet
coal
pile
runoff
sediment
SAND
well
sorted/rounded
quartz
tine-
to
medium-grained grading
to
coarse-grained
below
ft
light
brown
saturated and
pale
brown below
ft
na
na
na
62.5
50
100
sP
-10-
-15--
Geoprobe
boring
no
well installed
Groundwater
sample
collected from 5-9 ft
bgs
INU or tLiiN
Teei
earoc
Electronic Filing - Received, Clerk's Office, August 11, 2008 - AS 09-1, Exhibit 4
-15-
20
25--
30
Project
Name/No
Boring
No
Start Date
Page
AmerenCIPS
Hutsonville Plant
249.03
GP-13
8/27/98
Driller
Logged
by
End
Date
Depth
to
Water
AEC
Indianapolis
IN
Steve Mueller/STMI
8/27/98
Feet
Boring
Depth
Boring
Diameter
Surface Elevation
Drill Method
Northing
10.0 Feet
2.2 Inches
447.0
Feet
Geoprobe
2693.143
Well
Depth
Well Diameter
TOC Elev
Sample
Method
Easting
na
na
na
4-ft Macro-Core
3353.985
Description
.-
.9
I-
Cl
Comments
ML
IL
sanay clayey
trace to tattue
gravel
vegetated
with farm
crops
brown moist
Topsoil
na
na
na
50
62.5
100
-10-
SAND poorly sorted
tine- to
coarse-grained
subanguler
to
subround
trace to little
gravel light
brown saturated
ML
Geoprobe boring
no
well installed
Groundwater sample
collected from 5-9 ft
bgs
.LPYY
IL
very
stnt to
nara
nonplastic
trace root/stem
fragments
trace
angular
to
subangular
coarse sand
to fine
gravel greenish
to
olive
gray
moist
______________
NU ul- bUlN iu.u teet
bQOCK
Electronic Filing - Received, Clerk's Office, August 11, 2008 - AS 09-1, Exhibit 4
CLAYhY
SILl
ciay
VIILltL
with
depth
from trace near
surface
medium
plasticity
stiff above 10 ft to soft
below brown
saturated below 10 ft
iJoesarffprefpoint
th 401t Noe
increased
resistance to
penetration
at
25 ft and 30
ft
but no soil
recovery
using
2-ft discrete
sampler
at 26-28 ft
Project Name/No
Boring
No
Start
Date
Page
AmerenCIPS
Hutsonville Plant
249.03
GP-14
8/27/98
Driller
Logged by
End
Date
Depth
to
Water
AEC
Indianapolis
IN
Steve Mueuer/STMI
8/27/98
Est 10 Feet
Boring
Depth
Boring
Diameter
Surface Elevation
Drill Method
Northing
40.0 Feet
2.2 Inches
439.9 Feet
Geoprobe
1104.830
Well
Depth
Well Diameter
TOC EIev
Sample
Method
Easting
na
na
na
4-ft Macro-Core
5752.447
Description
.2
.-
.C
Comments
ML
na
na
na
na
na
87.5
87.5
100
100
100
-10-
-15-
20--
25
30-
Geoprobe boring
no
well installed
Partial
groundwater
sample 50% volume
collected
from 28-32 ft
bgs
Electronic Filing - Received, Clerk's Office, August 11, 2008 - AS 09-1, Exhibit 4
Project
Name/No
Boring
No
Start Date
Page
AmerenCIPS
Hutsonville
Plant
249.03
GP-14
8/27/98
Driller
Logged by
End Date
Depth
to
Water
AEC
Indianapolis
IN
Steve Mueller/STMI
8/27/98
Est 10 Feet
Boring
Depth
Boring
Diameter
Surface Elevation
Drill Method
Northing
40.0 Feet
2.2 Inches
439.9 Feet
Geoprobe
1104.830
Well
Depth
Well Diameter
TOC Elev
Sample
Method
Easting
na
na
na
4-ft Macro-Core
5752.447
Description
.C
.5
.a
I-
Cl
Comments
ENDUFSORING
40.0 feet
45-
50
55
60
65
Electronic Filing - Received, Clerk's Office, August 11, 2008 - AS 09-1, Exhibit 4
25
30--
Geoprobe boring
no
well installed
Groundwater
sample
collected from 8-12 ft
bgs
Project
Name/No
Boring
No
Start
Date
Page
AmerenCiPS
Hutsonville Plant
249.03
GP-15
8/27/98
Driller
Logged by
End
Date
Depth
to Water
AEC Indianapolis
IN
Steve Mueller/STMI
8/27/98
Est
Feet
Boring
Depth
Boring
Diameter
Surface Elevation
Drill Method
Northing
18.0 Feet
2.2 Inches
449.8 Feet
Geoprobe
2790.223
Well
Depth
Well Diameter
TOC Elev
Sample
Method
Easting
na
na
na
4-ft Macro-Core
3212.610
Description
.C
.2
.2
Cl
00
Comments
90
na
ns
MU
SM
MU
CL
-10-
-15-
20
uruuJSAND/SlL
materials similar to
GP-13
tLAY/S1LTrWatºilsiiniE?
td-GP13
based on
increased
resistance to
penetration
ENITOF BORING
15.0
feerBedrock
Electronic Filing - Received, Clerk's Office, August 11, 2008 - AS 09-1, Exhibit 4
30--
MU
SM
MU
CL
lNU or ot-cur e.u jeei peuroccj
Geoprobe
boring
no
well installed
Groundwater
sample
collected
from 8-12 ft
bgs
Project
Name/No
Boring
No
Start Date
Page
AmerenClPS
Hutsonville Plant
249.03
GP-16
8/27/98
Driller
Logged by
End Date
Depth
to
Water
AEC
Indianapolis
IN
Steve Mueller/STMI
8/27/98
Est
Feet
Boring
Depth
Boring
Diameter
Surface Elevation
Drill Method
Northing
28.0 Feet
2.2 Inches
453.7 Feet
Geoprobe
2886.789
Well
Depth
Well Diameter
TOC Elev
Sample
Method
Easting
na
na
na
4-ft Macro-Core
3064.602
Description
.2
..-
-a
.c
CD
Comments
marile
p.
p.
9-
9.-
f?
na
OVLJIUPoINLllILI
simiir iQ
GP-13
CLAY/SILT
thÆtºii?lsiih Tar
t?GP13
based on increased
resistance to
penetration
ns
-10-
-15-
20--
25
Electronic Filing - Received, Clerk's Office, August 11, 2008 - AS 09-1, Exhibit 4
Project
Name/No
Boring
No
Start Date
Page
AmerenCiPS
Hutsonville Plant
249.03
GP-17
8/27/98
Driller
Logged by
End Date
Depth
to Water
AEC Indianapolis
IN
Steve
Mueller/STMI
8/27/98
Est
Feet
Boring
Depth
Boring
Diameter
Surface Elevation
Drill Method
Northing
12.0 Feet
2.2
Inches
445.6 Feet
Geoprobe
2582.997
Well
Depth
Well Diameter
TOC Elev
Sample
Method
Easting
na
na
na
4-ft Macro-Core
3541.335
Description
.-
.2
I-
Comments
20
25--
30-
urLJILofruNLnolLT
materials similar to
GP-13
na
ns
09
.09
.09
0.9
.9
.9
19
-10-
-15-
MU
SM
TLAY/SlLTæiÆtØiÆlsiræilªrtoGP13
based on increased
resistance to
CL
penetration
Geoprobe boring
no
well installed
Groundwater
sample
collected from 4-8 ft
bgs
END OF bORING
i2.U teet
becrocIc
Electronic Filing - Received, Clerk's Office, August 11, 2008 - AS 09-1, Exhibit 4
25
30
END OF bOl-iNi
3.Ib teet
bd0CK
Project
Name/No
Boring
No
Start Date
Page
AmerenCIPS
Hutsonville Plant
249.03
GP-18
8/27/98
Driller
Logged by
End Date
Depth
to Water
AEC
Indianapolis
IN
Steve
Mueller/STMI
8/27/98
Est
Feet
Boring
Depth
Boring
Diameter
Surface Elevation
Drill Method
Northing
23.75 Feet
2.2 Inches
446.0 Feet
Geoprobe
2488.262
Well
Depth
Well Diameter
TOC Elev
Sample
Method
Easting
na
na
na
4-ft Macro-Core
3677.480
Description
.r
.-
lb
.2
Cl
Comments
.9
--p
uruuijND/SlLT materials similar to
GP-13
tLAWSTLT æi?tØiT?l similª to
GP13
based on increased
resistance to
penetration
-10-
-15-
20
na
ns
MU
SM
MU
CL
Geoprobe boring
no
well installed
Groundwater
sample
collected from
8-12 ft
bgs
Electronic Filing - Received, Clerk's Office, August 11, 2008 - AS 09-1, Exhibit 4
25--
CLAY/SILT
materials similar to j-14
Increased
resistance
to
penetration
at
18 ft
Attempted
groundwater
sample
collection
at 20-24 ft and 28-32
ft
but no
yield
Project
Name/No
Boring
No
Start Date
Page
AmerenCIPS
Hutsonville Plant
249.03
GP-19
8/27/98
Driller
Logged
by
End Date
Depth
to Water
AEC
Indianapolis
IN
Steve Mueller/STMI
8/27/98
Est 10 Feet
Boring
Depth
Boring
Diameter
Surface Elevation
Drill Method
Northing
40.0 Feet
2.2 Inches
Feet
Geoprobe
Well
Depth
Well Diameter
TOC Elev
Sample
Method
Easting
na
na
na
not_sampled
Description
.2
.-
Comments
-10-
-15-
20
na
ns
MU
CL
Geoprobe boring
no
well installed No
groundwater samples
insuffient
yield
30
END OF BOlNG
32.0 teet
Electronic Filing - Received, Clerk's Office, August 11, 2008 - AS 09-1, Exhibit 4
Project
NameNo
Boring
No
Start Date
Page
AmerenCIPS
Hutsonville
Plant
249.03
GP-20
8/28/98
Driller
Logged by
End Date
Depth
to Water
AEC
Indianapolis
IN
Steve Mueller/STMI
8/28/98
Feet
Boring
Depth
Boring
Diameter
Surface Elevation
Drill Method
Northing
21.0 Feet
2.2 Inches
450.7 Feet
Geoprobe
3805.064
Well
Depth
Well Diameter
TOC Elev
Sample
Method
Easting
na
na
na
4-ft Macro-Core
5099.419
-J
Cl
Description
-J
Ca
ASH silty texture son
clark
gray
I4-n
layer
of cinder
gravel
at
ft
saturated
below ft
Fill
Comments
-10-
Ca
Cl
coal
Ash
na
na
na
na
na
na
Geoprobe boring
no
well installed
Groundwater
sample
collected
from 17-21 ft
bgs
-15-
20
100
CL
IL
trace coarse
sana
trace
fine subanular
to subround
gravel
stiff
medium
plasticity
mottled
yellow orange
light gray
moist
ENDDF BORTNG
21.0 feet
Bedi?k
25
30
Electronic Filing - Received, Clerk's Office, August 11, 2008 - AS 09-1, Exhibit 4
STLTfCLstimcFbscfoii
resistance to
penetration
END OF BORING
36.5 feet
Bedrock
Groundwater
sample
collected from 18-22
ft
bgs
Project Name/No
Boring
No
Start
Date
Page
AmerenCiPS
Hutsonville
Plant
249.03
GP-21
8/28/98
Driller
Logged by
End Date
Depth
to
Water
AEC Indianapolis
IN
Steve
Mueller/STMI
8/28/98
Feet
Boring
Depth
Boring
Diameter
Surface Elevation
Drill Method
Northing
36.5 Feet
2.2
Inches
450.7 Feet
Geoprobe
3593.599
Well
Depth
Well Diameter
TOC EIev
Sample
Method
Easting
na
na
na
4-ft Macro-Core
5239.017
Description
.2
I.
Cl
Comments
10
iri
suy
textuw
son
dark
graysaturated
below
ft
Fill
50
-10-
Geoprobe boring
no
well installed
Ash
na
na
na
na
na
na
na
-0
-15-
_0
20
ILI
SUTT
meatum
plasticity
brown
moist
25
30
50
50
CL
CL
Electronic Filing - Received, Clerk's Office, August 11, 2008 - AS 09-1, Exhibit 4
30
Geoprobe boring
no
well installed
No
groundwater sample
collected
no water in
sampler
Project
Name/No
Boring
No
Start Date
Page
AmerenCIPS
Hutsonville Plant
249.03
GP-22
8/28/98
Driller
Logged
by
End Date
Depth
to Water
AEC
Indianapolis
IN
Steve Mueller/STMI
8/28/98
11.5 Feet
Boring
Depth
Boring
Diameter
Surface Elevation
Drill Method
Northing
11.5 Feet
2.2 Inches
458.7 Feet
Geoprobe
4373.353
Well
Depth
Well Diameter
TOC Elev
Sample
Method
Easting
na
na
na
4-ft Macro-Core
5285.420
Co
Description
.2
.-
.2
.2
Comments
ML
81
kINUY
ILl
Tine
sana vegetatec
witn
grass
brown
moist
Topsoil
na
na
na
100
Coal
Ash
Coal
Ash
Ait-i silty
to
very Tine-gralnea texture
trace
fine cinder
gravel
coarsens
below
ft dark
gray
moist with wet interval 6-7 ft
Fill
ASH coarse sand to fine
gravel
size
some silt
several 1/4-5/8
pyrite pebbles
ic
-10-
-15-
20
25
NU
UI- UFiN.i
11 .b teet
i3earock
Electronic Filing - Received, Clerk's Office, August 11, 2008 - AS 09-1, Exhibit 4
lLI
/INU tine-grained
quartz
trace
to little
clay
fine
sand vegetated
with
grass
yellow orange
moist
Fill
ASH silty
to
very tine-grained
texture
trace cinder
gravel up
to 1/2 coarsens
below
13.5
It
dark
gray
wet below
ft
Fill
ASH
coarse sand to fine
gravel size
some silt
S1medium
plasticity
dark
olive
green
moist
ASH
same
as 13.5-19.8
It
lncreased
resistance to
penetration
at 31
ft
SILTYSAND ie1l oitØdffoUnØd
fine-grained quartz yellow orange
to
light
brown
saturated
lop
2-3
were
light
olive
green indicating
proximity
of ash
bottom
______
ENDOFBQRlNG34T01fBedrock
Project
Name/No
Boring
No
Start Date
Page
AmerenCIPS
Hutsonville Plant
249.03
GP-23
8/28/98
Driller
Logged by
End Date
Depth
to
Water
AEC Indianapolis
IN
Steve Mueller/STMI
8/28/98
Feet
Boring
Depth
Boring
Diameter
Surface Elevation
Drill Method
Northing
34.0 Feet
2.2 Inches
460.7 Feet
Geoprobe
4203.035
Well
Depth
Well Diameter
TOC Elev
Sample
Method
Easting
na
na
na
4-ft Macro-Core
5272.66
Description
.-
VI
CD
Comm ents
93
100
Ash
-10-
100
100
-15-
na
na
na
na
na
na
na
Coal
Ash
100
20--
---
100
Geoprobe boring
no
well installed
Groundwater
sample
collected from 18-22 ft
bgs
Jammed liner in Macro-
Core
sampler
used 1-in
l.D
by 2-It piston-tip
discrete
sampler
to
collect soil
sample
near
bedrock surface
25
Coal
Ash
30--
SP
100
Electronic Filing - Received, Clerk's Office, August 11, 2008 - AS 09-1, Exhibit 4
Description
END OF BORING
7.3 feet
Comments
Temporary well-point
with filter sock install
leachate
sample
collected from 3.3-7.3
Removed well
point
8/28/98
Electronic Filing - Received, Clerk's Office, August 11, 2008 - AS 09-1, Exhibit 4
Project
Name/No
Boring
No
Start
Date
Page
AmerenCiPS
Hutsonville Plant
249.03
LP-2
8/28/98
Driller
Logged by
End
Date
Depth
to Water
STMI
Steve Mueller/STMI
8/28/98
0.25 Feet
Boring
Depth
Boring
Diameter
Surface Elevation
Drill Method
Northing
8.0
Feet
2.37 Inches
466.24 Feet
Hand-driven
4502.022
Well
Depth
Well Diameter
TOC Elev
Sample
Method
Easting
na
na
na
not
sampled
3815.305
Co
I-
65
Cl
CS
45
.4-
na
na
Description
ASH silty
to
very
tine-grained texture
wet
below 0.25 ft
Fill
END OF BORING
8.0 feet
Coal
Ash
Comments
-5--
-10-
-15-
20.-
25
30
Temporary well-point
with
filter sock
installed
leachate
sample
collected
from
.4.0-8.0
ft
Removed well
point
8/28/98
Electronic Filing - Received, Clerk's Office, August 11, 2008 - AS 09-1, Exhibit 4
123
46
123
222
10
223
-u
oy
i-in
..
steel
stick-up casing
to 1.8
if
concrete seal 0-3 ft
Bentonite/cement
grout
3-16
if
1/4-in
bentonite
chips
16-17 ft
Sch 40 Pvc
casing
flush-threaded
to 0.01
-ii
factory-slotted
vc
screen 20.1-25.1 It
fine silica sand 17-18 It
silica
sand
pack
18-
25.5 ft
Project Name/No
Boring
No
Start Date
Page
AmerenCIPS
Hutsonville
249-3
MW-3D
10/6/98
Driller
Logged by
End Date
Depth
to Water
AEC
Indianapolis
IN
Steve
Mueller/STMI
10/6/98
Feet
Boring
Depth
Boring
Diameter
Surface Elevation
Drill
Method
Northing
25.5 Feet
Inches
453.7 Feet
HSA/air-rotary
3860.230
Well
Depth
Well
Diameter
TOC EIev
Sample
Method
Easting
25.1 Feet
2-inl.D
455.28 Feet
2-ft
split-spoon
3952.034
Description
c_
.-
DC
Comments
ML
iiuT oiLi iuuie
tine-grained gravel
trace coal
fragments
medium
stiff
dark
brown
moist
topsoil
75
88
75
63
50
a.
if
SAND
well
sorted/rounded
tine-grained
quartz
loose
light
brown
to medium
brown
saturated below
ft
S1ETYSAND
GRAVEL
poorly
sorted
SW-
medium-grained sand fine-grained
GW
subangular
to subround
gravel loose
light gray
saturated
9__o
-10-
-15-
20
25--
Ss
SANDS lONb
tIne-yJdItlu quartz
END OF5ORING -25.5fºØ
4-in
diam borehole
drilled 16-25.5 ft
using
air-hammer
30
Electronic Filing - Received, Clerk's Office, August 11, 2008 - AS 09-1, Exhibit 4
Project
Name/No
Boring
No
Start
Date
Page
AmerenCiPS
Hutsonville
249-3
MW-7D
10/5/98
Driller
Logged by
End Date
Depth
to Water
AEC
Indianapolis
IN
Steve Mueller/STMI
10/5/98
10 Feet
Boring
Depth
Boring
Diameter
Surface Elevation
Drill Method
Northing
45.0 Feet
Inches
437.5 Feet
HSA
3175.915
Well
Depth
Well Diameter
TOC Elev
Sample
Method
Easting
44.3 Feet
2-inl.D
438.45 Feet
2-ft
split-spoon
5676.110
Description
.-
52
CD
Comments
.-
L.L/YtY
LI
meaium
trace
roots fibers soft medium brown moist
saturated below 10 ft
..e
.e
.i
a.
.a ..a
ML
5-ft
by
4-in
square
steel
stick-up
casing
to 1.3
ft
concrete seal 0-3 ft
112
111
112
001
20-
25-
586
75
100
100
100
75
75
SILTY SANDºII
sorted/rounded
fine-grained
quartz grades
from
clayey
silt above loose medium
brown
saturated
SILTY SAND
.AVEL well sorted
medium-grained quartz
sand
trace
coarse sand
fine-grained angular
to
subangular
gravel
medium
dense
pale
brown
saturated
Bentonite/cement
grout
3-35 ft
SP
GP
Electronic Filing - Received, Clerk's Office, August 11, 2008 - AS 09-1, Exhibit 4
Project
NameNo
Boring
No
Start Date
Page
AmerenCiPS
Hutsonville
249-3
MW-7D
10/5/98
Driller
Logged
by
End Date
Depth
to Water
AEC
Indianapolis
IN
Steve Mueller/STMI
10/5/98
10 Feet
Boring
Depth
Boring
Diameter
Surface Elevation
Drill Method
Northing
45.0 Feet
Inches
437.5 Feet
HSA
3175.915
Well
Depth
Well Diameter
TOC Elev
Sample
Method
Easting
44.3
Feet
2-in 1.0
438.45 Feet
2-ft
split-spoon
5676.110
Description
.C
.2
.-
.2
I-
CD
Comments
Sch 40 Pvc
casing
oo
flush threaded
to
01-ir
sand
OF
factory-slotted
vc
heave
40
screen
39 3-44
ft
fine silica sand 35-38
ft
silica sand
pack
38-
45ft
___________________________
____________
16 25
ttff
LAYEY SILT medium
piastiity
trace
__________
sand
stiff brown moist
ENDOF0RING45fºe
50
55
60
65
Electronic Filing - Received, Clerk's Office, August 11, 2008 - AS 09-1, Exhibit 4
Electronic Filing - Received, Clerk's Office, August 11, 2008 - AS 09-1, Exhibit 4
see
MW-
10
Comments
5-fl
by
4-in
square
steeu
stick-up casing
to 2.0
ft
Bentonite/cement
grout
0-13
ft
1/4-in
bentonite
chips
13-14 ft
Sch 40 Pvc
casing
flush-threaded to 0.01-il
factory-slotted
vc
screen 16.3-21.3 ft
silica sand 14-15
ft
silica sand
pack
15-21
ft
based on MW-b
boring log
Project
Name/No
Boring
No
Start Date
Page
AmerenClPS
Hutsonville
249-3
MW-IOD
10/7/98
Driller
Logged by
End Date
Depth
to Water
AEC
Indianapolis
IN
Steve
Mueller/STMI
10/7/98
2.5 Feet
Boring Depth
Boring
Diameter
Surface Elevation
Drill Method
Northing
21.5 Feet
Inches
452.9 Feet
HSA
4729.427
Well
Depth
Well Diameter
TOC Elev
Sample
Method
Easting
21.3 Feet
2-inI.D
454.65 Feet
see
MW-b
log
2564.715
CD
Description
MC
LAYEY
S1L1
vegetated
with
grass
soft
dark brown to
black
moist
topsoil
SILTY
SANO
well
sorted/rounded
fine-grained quartz
loose
yellowish
orange
with
dark
orange
lamina
2-3 mm
saturated below
2.5 ft
4-
SP
Ss
-10-
-15-
20
25
SIL
SMNU weii sortewrounaea
fine-grained
quartz laminated dense
light
gray
to rust
colored predominantly
light
gray
below 7.5 ft saturated
weathered bedrock
SANDSTONE
tine-grained
quartz
becomes
medium-grained
trace
gravel
clasts increasingly
well cemented/hard
very
difficult to
auger
below
20 ft
END OFBORING 2L5fºeT
drill
cuts
501
30
Electronic Filing - Received, Clerk's Office, August 11, 2008 - AS 09-1, Exhibit 4
iiiSILT
little
tine-grained gravel
5-ft
by
4-in
square
steel
trace coal
fragments
medium stiff
stick-up casing
to
2.0
medium
brown
moist
topsoil
ft
me ium-
coarse-graine
quartz
loose
light
brown moist
SIDYSANWGR
poor
so
dense
light
brown
saturated
5. Bentonite/cement
grout
0-3
ft
1/4-in bentonite
SANLJST
chips
3-4ft
Sch 40 Pvc
casing
flush-threaded to 0.01-i
factory-slotted
vc
screen
4.5-14.5
ft
silica sand
pack
4-15 ft
Project
Name/No
Boring
No
Start Date
Page
AmerenCIPS
Hutsonville
249-3
MW-li
10/6/98
Driller
Logged by
End Date
Depth
to Water
AEC Indianapolis
IN
Steve Mueller/SIMI
10/7/98
Feet
Boring
Depth
Boring
Diameter
Surface Elevation
Drill Method
Northing
15.0 Feet
Inches
443.8
Feet
HSA
3371 .329
Well
Depth
Well Diameter
TOC EIev
Sample
Method
Easting
2-in l.D
445.45 Feet
2-ft
split-spoon
4451 .486
Description
.c
.a
Eo
.cI-
Comments
Cl
Ss
14.5 Feet
CS
23
126
25
50
63
LI
ML
SM
63
SW
GW
75
END OFBORING
15 fee
Electronic Filing - Received, Clerk's Office, August 11, 2008 - AS 09-1, Exhibit 4
23 10
12
224
123
111
122
233
i15
10 10
35
50
t-Tt
Dy
4-In
square
steei
stick-up casing
to
1.5
ft
Bentonite/cement
grout
0-3.5
ft
1/4-in bentonite
chips
3.5-5 ft
Sch 40 PVC
casing
flush-threaded to 0.01-ir
factory-slotted
PVC
screen
6.9-1 6.9
ft
fine silica sand 5-6
ft
silica sand
pack
6-17 ft
Project
Name/No
Boring
No
Start Date
Page
AmerenCIPS
Hutsonville
249-3
MW-12
10/8/98
Driller
Logged by
End Date
Depth
to Water
AEC
Indianapolis
IN
Steve Mueller/STMI
10/8/98
12 Feet
Boring
Depth
Boring
Diameter
Surface
Elevation
Drill
Method
Northing
17 Feet
Inches
455.5 Feet
HSA
4053.583
Well
Depth
Well Diameter
TOC Elev
Sample
Method
Easting
16.9 Feet
2-inl.D
456.74 Feet
2-ft
split-spoon
4637.976
Description
.C
.2
i-i
CU
CU
I-
Corn ments
111
III
63
ML
Coal
100
riur
lLl
iittie
clay
soii
oar
Drown
-moist
topsoil
ASH
silty
texture soft olive
gray
moist
SILTY SAND
GRAVEL
poorly
sorted
medium
dense light brown
moist
fill
SP
tIkiNU
weit
sorreairounaeo
nne-grainea
quartz
loose
light
brown moist
-10-
63
75
50
75
75
100
50
ANU pooriy sortea
tine- to
coarse-grained
subangular
to
subround
quartz
trace fine
gravel
loose
light
brown
saturated below 12 ft
SW
II
lvi
lL
stlrr igrit Drown moist
END OF BORING
17 feet
bedrock
20
25--
30
Electronic Filing - Received, Clerk's Office, August 11, 2008 - AS 09-1, Exhibit 4
123
122
lLi
/\llU
wirn
gravel
ioose
aar
brown moist
topsoil
SAND
well
sorted/rounded
tine- to
medium-grained quartz light
brown
saturated below
ft
t-fl
oy
a-in
square
seei
stick-up casing
to 2.0
It
concrete 0-3 ft
Bentonite/cement
grout
3-6.3
ft
1/4-in bentonite
chips
6.3-7 ft
Sch 40 Pvc
casing
flush-threaded to 0.01-il
factory-slotted
vc
screen
9-14
It
fine
silica sand 7-8
It
silica sand
pack
8-16.5
ft
Unslotted
casing/sediment
sump
14-16 ft
Project
Name/No
Boring
No
Start Date
Page
AmerenclPs
Hutsonville
249-3
MW-13
10/6/98
Driller
Logged by
End Date
Depth
to Water
AEc
Indianapolis
IN
Steve Mueller/STMI
10/6/98
Feet
Boring
Depth
Boring
Diameter
Surface Elevation
Drill Method
Northing
16.5 Feet
Inches
456.4 Feet
HSA
3961.759
Well
Depth
Well Diameter
TOC Elev
Sample Method
Easting
16.0
Feet
2-inl.D
458.03 Feet
2-ft
split-spoon
4241.200
Description
.2
.-
Eu
Cl
CD
Comments
25
SM
50
9?
SP
SW
GW
based on drill
cuttings
and
geologic log
for
geoprobe
GP-4
CLAYEYSANDGRAVEL
p?orlT
sorted
fine- to
coarse-grained
sand
fine-grained
subangular
gravel
loose
light
brown
saturated
-10-
-15-
20
25
JIl
Ss
TND OFBORING -16.5fºe
30
Electronic Filing - Received, Clerk's Office, August 11, 2008 - AS 09-1, Exhibit 4
APPENDIX
SLUG-TEST DATA
Electronic Filing - Received, Clerk's Office, August 11, 2008 - AS 09-1, Exhibit 4
K/
/\
c\
/\
Well
MW-3
Slug-Out
Test
ci
101
100
01
102
Client
AmerenCiPS
Site
Name
Hutsonville
Power
Station
Job
Number249
Diameter
of
Drilled
Hole
in
Casing
Inner
Diameter
in
Effective
Casing
Inner
Diameter
in
Screen
Length
ft
Aquifer
Thickness
ft
Depth
to
Screen
Top
ft
Hydraulic
Conductivity
0.0524891
ft/mm
Reference
Bouwer
Rice
1976
..
x_
-\
\X\/
/\
0.0
1.6
3.2
4.8
6.4
8.0
Time
minutes
Electronic Filing - Received, Clerk's Office, August 11, 2008 - AS 09-1, Exhibit 4
Well
MW-3D
Slug-In
Test
101_
__________________
Client
AmerenCIPS
Site
Name
Hutsonville
Power
Station
Job
Number249
Diameter
of
Drilled
Hole
in
100_
._
Casing
Inner
Diameter
in
Effective
Casing
Inner
Diameter
in
Screen
Length
ft
Aquifer
Thickness
15
ft
Depth
to
Screen
Top
10
ft
10.1
HydraulicConductivity
0.0010972
ft/mm
ci
Reference
Bouwer
Rice
1976
-a_
10.
0.0
4.0
8.0
12.0
16.0
20.0
Time
minutes
Electronic Filing - Received, Clerk's Office, August 11, 2008 - AS 09-1, Exhibit 4
Well
MW-3D
Slug-Out
Test
Client
AmerenCiPS
Site
Name
Hutsonville
Power
Station
Job
Number249
Diameter
of
Drilled
Hole
in
Casing
Inner
Diameter
in
Effective
Casing
Inner
Diameter
in
Screen
Length
ft
Aquifer
Thickness
15
ft
Depth
to
Screen
Top
10
ft
Hydraulic
Conductivity
0.0010181
ft/mm
Reference
Bouwer
Rice
1976
11
Ii
101
100
01
10-2
0.0
4.0
8.0
12.0
16.0
20.0
Time
minutes
Electronic Filing - Received, Clerk's Office, August 11, 2008 - AS 09-1, Exhibit 4
Well
MW-5
Slug-In
Test
Client
AmerenCiPS
Site
Name
Hutsonville
Power
Station
Job
Number249
Diameter
of
Drilled
Hole
in
Casing
Inner
Diameter
in
Effective
Casing
Inner
Diameter
in
Screen
Length
12
ft
Aquifer
Thickness
12
ft
Depth
to
Screen
Top
ft
Hydraulic
Conductivity
0.0157683
ft/mm
Reference
Bouwer
Rice
1976
Ii
101
100
10-1
10-2
?-
\/
\/
/XXV\
XY
/\
0.0
1.6
3.2
4.8
6.4
8.0
Time
minutes
Electronic Filing - Received, Clerk's Office, August 11, 2008 - AS 09-1, Exhibit 4
Well
MW-5
Slug-Out
Test
Client
AmerenCiPS
Site
Name
Hutsonville
Power
Station
Job
Number249
Diameter
of
Drilled
Hole
in
Casing
Inner
Diameter
in
Effective
Casing
Inner
Diameter
in
Screen
Length
12
ft
Aquifer
Thickness
12
ft
Depth
to
Screen
Top
ft
HydraulicConductivity
0.0157099
ft/mm
ci
Ii
101
100
10-1
102_
Reference
Bouwer
Rice
1976
0.0
1.6
3.2
4.8
6.4
8.0
Time
minutes
Electronic Filing - Received, Clerk's Office, August 11, 2008 - AS 09-1, Exhibit 4
Well
MW-6
Slug-Out
Test
101_
________________
Client
AmerenCiPS
Site
Name
Hutsonville
Power
Station
Job
Number249
Diameter
of
Drilled
Hole
in
Casing
Inner
Diameter
in
Effective
Casing
Inner
Diameter
in
Screen
Length
ft
Aquifer
Thickness
ft
Depth
to
Screen
Top
ft
HydraulicConductivity
0.062978
ft/mm
Reference
Bouwer
Rice
1976
6.4
Ii
100
01
10-2
Xy
0.0
1.6
xx
X\X
_______
3.2
4.8
Time
minutes
8.0
Electronic Filing - Received, Clerk's Office, August 11, 2008 - AS 09-1, Exhibit 4
Well
MW-7
Slug-In
Test
102
_____________________
Client
AmerenCiPS
Site
Name
Hutsonville
Power
Station
Job
Number249
Diameter
of
Drilled
Hole
in
101
Casing
Inner
Diameter
in
Effective
Casing
Inner
Diameter
in
Screen
Length
10
ft
Aquifer
Thickness
79
ft
Depth
to
Screen
Top
ft
10
HydraulicConductivity
0.000526313
ft/mm
-1
Reference
Bouwer
Rice
1976
10.2_16
Time
minutes
Electronic Filing - Received, Clerk's Office, August 11, 2008 - AS 09-1, Exhibit 4
Well
MW-7
Slug-Out
Test
Client
AmerenCIPS
Site
Name
Hutsonville
Power
Station
Job
Number249
Diameter
of
Drilled
Hole
in
Casing
Inner
Diameter
in
Effective
Casing
Inner
Diameter
in
Screen
Length
10
ft
Aquifer
Thickness
79
ft
Depth
to
Screen
Top
ft
Hydraulic
Conductivity
0.00049618
ft/mm
102
101
-I-
t1
100
101
02
Reference
Bouwer
Rice
1976
0.0
1.6
3.2
4.8
Time
minutes
6.4
8.0
Electronic Filing - Received, Clerk's Office, August 11, 2008 - AS 09-1, Exhibit 4
Well
MW-7D
Slug-In
Test
101
___________________
Client
AmerenCIPS
Site
Name
Hutsonville
Power
Station
Job
Number249
Diameter
of
Drilled
Hole
in
Casing
Inner
Diameter
in
Effective
Casing
Inner
Diameter
in
-I
10
--
----
Screen
Length
ft
Aquifer
Thickness
79
ft
Depth
to
Screen
Top
28
ft
HydraulicConductivity
0.0649104
ft/mm
Reference
Bouwer
Rice
1976
-a
101
10_2_
0.0
1.6
3.2
4.8
6.4
8.0
Time
minutes
Electronic Filing - Received, Clerk's Office, August 11, 2008 - AS 09-1, Exhibit 4
Well
MW-7D
Slug-Out
Test
lO1_
_____________________
Client
AmerenCIPS
Site
Name
Hutsoriville
Power
Station
Job
Number249
Diameter
of
Drilled
Hole
in
100
Casing
Inner
Diameter
in
Effective
Casing
Inner
Diameter
in
Screen
Length
ft
Aquifer
Thickness
79
ft
Depth
to
Screen
Top
28
ft
10
Hydraulic
Conductivity
0.13765
ft/mm
Reference
Bouwer
Rice
1976
0.0
08
1.6
24
32
4.0
Time
minutes
Electronic Filing - Received, Clerk's Office, August 11, 2008 - AS 09-1, Exhibit 4
Well
MW-9
Slug-Out
Test
101_
____________________________
Client
AmerenClPS
Site
Name
Hutsonville
Power
Station
Job
Number249
Diameter
of
Drilled
Hole
in
Casing
Inner
Diameter
in
Effective
Casing
Inner
Diameter
in
Screen
Length
ft
Aquifer
Thickness
ft
Depth
to
Screen
Top
ft
Hydraulic
Conductivity
0.0016328
ft/mm
Ii
100
01
02
Reference
Bouwer
Rice
1976
0.0
1.6
3.2
4.8
6.4
Time
minutes
8.0
Electronic Filing - Received, Clerk's Office, August 11, 2008 - AS 09-1, Exhibit 4
Well
MW-lU
Slug-In
Test
Client
AmerenCIPS
Site
Name
Hutsonville
Power
Station
Job
Number249
Diameter
of
Drilled
Hole
in
Casing
Inner
Diameter
in
Effective
Casing
Inner
Diameter
in
Screen
Length
ft
Aquifer
Thickness
ft
Depth
to
Screen
Top
ft
Hydraulic
Conductivity
0.0012328
ft/mm
Reference
Bouwer
Rice
1976
ci
Ii
101
100
10-1
10-2
?-
0.0
4.0
8.0
12.0
16.0
20.0
Time
minutes
Electronic Filing - Received, Clerk's Office, August 11, 2008 - AS 09-1, Exhibit 4
Well
MW-I
Slug-Out
Test
Client
AmerenCiPS
Site
Name
Hutsonville
Power
Station
Job
Number249
Diameter
of
Drilled
Hole
in
Casing
Inner
Diameter
in
Effective
Casing
Inner
Diameter
in
Screen
Length
ft
Aquifer
Thickness
ft
Depth
to
Screen
Top
ft
Hydraulic
Conductivity
0.00120025
ft/mm
Ii
101
100
10-1
10-2
Reference
Bouwer
Rice
1976
0.0
4.0
8.0
12.0
16.0
20.0
Time
minutes
Electronic Filing - Received, Clerk's Office, August 11, 2008 - AS 09-1, Exhibit 4
4J
Ii
102
Well
MW-IOD
Slug-In
Test
Client
AmerenCIPS
Site
Name
Hutsonville
Power
Station
Job
Number249
101
100
101
102
Diameter
of
Drilled
Hole
in
Casing
Inner
Diameter
in
Effective
Casing
Inner
Diameter
in
Screen
Length
ft
Aquifer
Thickness
14
ft
Depth
to
Screen
Top
ft
Hydraulic
Conductivity
0.000746784
ftlmin
Reference
Bouwer
Rice
1976
0.0
4.0
8.0
12.0
16.0
Time
minutes
20.0
Electronic Filing - Received, Clerk's Office, August 11, 2008 - AS 09-1, Exhibit 4
Well
MW-IOD
Slug-Out
Test
Client
AmerenCiPS
Site
Name
Hutsonville
Power
Station
Job
Number249
Diameter
of
Drilled
Hole
in
Casing
Inner
Diameter
in
Effective
Casing
Inner
Diameter
in
Screen
Length
ft
Aquifer
Thickness
14
ft
Depth
to
Screen
Top
ft
Hydraulic
Conductivity
0.000844129
ft/mm
Reference
Bouwer
Rice
1976
ci
Ii
102
101
100
10-1
02
0.0
4.0
8.0
12.0
16.0
20.0
Time
minutes
Electronic Filing - Received, Clerk's Office, August 11, 2008 - AS 09-1, Exhibit 4
Well
MW-I
Slug-Out
Test
100_
_______________________
Client
AmerenCIPS
Site
Name
Hutsonville
Power
Station
Job
Number249
Diameter
of
Drilled
Hole
in
Casing
Inner
Diameter
in
Effective
Casing
Inner
Diameter
in
-1
10
Screen
Length
ft
Aquifer
Thickness
ft
Depth
to
Screen
Top
ft
HydraulicConductivity
0.0346005
ft/mm
X/
Reference
Bouwer
Rice
1976
__________________
____________
10
\/N
1.6
32
48
64
8.0
Time
minutes
Electronic Filing - Received, Clerk's Office, August 11, 2008 - AS 09-1, Exhibit 4
Well
MW-12
Slug-Out
Test
iol
____________________
Client
AmerenCIPS
Site
Name
Hutsonville
Power
Station
Job
Number249
Diameter
of
Drifled
Hole
in
Casing
Inner
Diameter
in
Effective
Casing
Inner
Diameter
in
10
f---.---
Screen
Length
ft
Aquifer
Thickness
ft
Depth
to
Screen
Top
ft
HydraulicConductivity
0.122684
ft/mm
Reference
Bouwer
Rice
1976
.2
101
fl-2
___________________
__________________
__________________
__________________
_____________
II
0.0
0.8
1.6
2.4
3.2
4.0
Time
minutes
Electronic Filing - Received, Clerk's Office, August 11, 2008 - AS 09-1, Exhibit 4
APPENDIX
DIRECT-PUSH
WATER
QUALITY
RESULTS
Electronic Filing - Received, Clerk's Office, August 11, 2008 - AS 09-1, Exhibit 4
Sample Description
WATER
ANALYSIS REPORT CIPS Central
Laboratory
ROUTINE
Hutsonville
Power Station
EB -0
composite
__________
grab
__________
Lab ID
W98-550
Sample
Date
08/25/98
Time
Sampled
_______
Sampler
ID
____________
Report Date
09/16/98
Approved by
SD
Check
if Entered
Results
to
John
Romang
Jacque
Bush
Inorganic
Analysis
Report
Results
Units
Limit
Method
Test Date
Analyst
08/31/98
lj
08131/98
Ij
08/31/98
lj
261
ND
ND
12
ND
110
30
80
19
112
units
0.1
EPA 150.1
umho
EPA
120.1
mg/LasCaCO3
EPA31O.1
mg/L
as CaCO3
EPA 310.1
mg/L
EPA
310.1
mg/L
EPA 310.1
mg/L
EPA 310.1
mg/L
EPA 130.2
mg/L
EPA 300.0
IC
mg/L
as
CaCO3
EPA 130.2
mg/L
as
CaCO3
EPA
130.2
mg/L
as
CaCO3
EPA 130.2
mg/L
EPA 130.2
mg/L
EPA 160.2
mg/L
10
EPA 160.1
mg/L
0.001
EPA
370.2
mg/L
EPA 300.0
IC
mg/L
EPA 375.4
mg/L
0.5
EPA415.2
mg/L
EPA 1664
08/31/98
Ij
09/04/98
rrn
08/31/98
pH
lab
Sp
Conductivity
lab
Alkalinity
AlkalinityM
Bicarbonate
HCO3
Carbonate
Hydroxide
Calcium
Chloride
Hardness
total
Hardness ca
Hardness
mg
Magnesium
Residue TSS
Residue
TDS
Silica
Sulfate
Sulfate
TOO
Oil
Grease
Metals
Analysis
Aluminum
diss
Aluminum
diss
Boron
diss
Copper
diss
Ctpper
diss
Iron
diss
Iron
diss
Manganese
diss
Nickel
diss
Nickel
diss
Potassium
diss
Silica
diss
Sodium
diss
Sodium
diss
lj
08/31/98
Ij
08/31/98
Ii
08/31/98
lj
08/31/98
Ii
09/04/98
mi
Results
Report
Units
Limit
Method
Test Date
Analyst
ND
9.053
0.434
0.164
ND
0.624
total
total
total
total
total
total
total
total
total
total
total
total
total
total
______________
mg/L
_______________
mg/L
_______________
mg/L
______________
mg/L
_______________
mg/L
________________
mg/L
________________
mg/L
________________
mgJL
______________
.mg/L
______________
mg/L
_______________
mg/L
________________
mg/L
______________
mg/L
_______________
mg/L
09/16/98
Sd
0.075
0.005
0.050
0.005
0.002
0.020
0.010
0.005
0.005
0.020
0.050
0.050
0.070
0.0005
ICP EPA 200.7
GFAA EPA
202.2
ICP EPA 200.7
ICP EPA 200.7
GFM
EPA 220.2
ICP EPA
200.7
GFA EPA 236.2
ICP EPA 200.7
GFAA EPA 243.2
ICR EPA 200.7
ICP
EPA 200.7
ICR EPA 200.7
ICP EPA
200.7
GFM EPA 273.2
09/16/98
Sd
09/16/98
sd
09116/98
Sd
09/16/98
sd
09/16/98
sd
Note ND denotes
result below detection limit
Electronic Filing - Received, Clerk's Office, August 11, 2008 - AS 09-1, Exhibit 4
WATER ANALYSIS REPORT CIPS Central
Laboratory
ROUTINE
Sample
Description
HutsonviHe
Power Station
GP
-2
composite
__________
grab
__________
Lab
ID
W98-551
Sample
Date
08/25/98
Time
Sampled
_______
Sampler
ID
____________
Report
Date
09/16/98
Approved by
SD
Check if Entered
Results to
John
Romang
Jacque
Bush
Inorganic
Analysis
Report
Results
Units
Limit
Method
Test Date
Analyst
units
2220
umho
___________
ND
mg/L
as CaCO3
_________
60
mg/L
as
CaCO3
___________
_______________
mg/L
____________
________
_______________
mg/L
____________
_______
_______________
mg/L
____________
________
440
mgIL
___________
________
10
mg/L
__________
1310
mg/L
as
CaCO3
__________
1100
mg/L
as CaCO3
___________
210
mgIL
as
CaCO3
___________
50
mg/L
____________
_______________
mg/L
____________
________
2118
mg/L
__________
_______
_______________
mg/L
____________
________
1326
mgIL
__________ _______
_______________
mgIL
____________
________
______________
mg/L
_______________
mg/L
08/31198
l_
08/31/98
Ij
08/31/98
lj
0.1
10
0.001
0.5
08/31/98
lj
EPA 150.1
EPA 120.1
EPA 310.1
EPA
310.1
EPA 310.1
EPA
310.1
EPA 310.1
EPA 130.2
EPA
300.0
IC
EPA 130.2
EPA 130.2
EPA 130.2
EPA 130.2
EPA 160.2
EPA
160.1
EPA 370.2
EPA 300.0
IC
EPA 375.4
EPA
415.2
EPA 1664
09/04/98
rm
08/31/98
pH
lab
Sp
Conductivity
lab
Alkalinity
AlkalinityM
Bicarbonate
HCO3
Carbonate
Hydroxide
Calcium
Chloride
Hardness total
Hardness ca
Hardness
mg
Magnesium
Residue
TSS
Residue
TDS
Silica
Sulfate
Sulfate
TOC
Oil
Grease
Metals
Analysis
Aluminum
diss
Aluminum
diss
Boron
diss
Copper
diss
Copper
diss
Iron
diss
Iron
diss
Manganese
diss
Nickel
diss
Nickel
diss
Potassium
diss
Silica
diss
Sodium
diss
Sodium
diss
08/31/98
08/31/98
08/3 1/98
08/31/98
lj
09/04/98
rm
Report
Results
Units
Limit
Method
Test Date
Analyst
15.405
42.275
24.540
0.030
43.219
1.103
09/16/98
sd
total
mgIL
0.075
ICP
EPA
200.7
total
mg/L
0.005
GFAA EPA 202.2
total
mg/L
0.050
ICP EPA 200.7
total
mg/L
0.005
ICP EPA 200.7
total
mg/L
0.002
GFAA EPA 220.2
total
mg/L
0.020
ICP
EPA 200.7
total
mg/L
0.010
GFM EPA
236.2
total
mg/L
0.005
ICP EPA 200.7
total
.mg/L
0.005
GFAA EPA
243.2
total
mg/L
0.020
ICP EPA 200.7
total
mg/L
0.050
ICP EPA 200.7
total
mg/L
0.050
ICP EPA
200.7
total
mg/L
0.070
ICP EPA 200.7
total
mg/L
0.0005
GFAA EPA 273.2
09/16/98
sd
09/16/98
sd
09/16/98
Sd
09/1 6/98
sd
09/16/98
Sd
Note
ND denotes
result below
detection limit
Electronic Filing - Received, Clerk's Office, August 11, 2008 - AS 09-1, Exhibit 4
Sample Description
WATER ANALYSIS REPORT
CIPS Central
Laboratory
ROUTINE
Hutsonville
Power Station
GP -3
composite
__________
grab
__________
Lab
ID
W98-552
Sample
Date
08/25/98
Time
Sampled
_______
Sampler
ID
____________
Report
Date
09/16/98
Approved
by
SD
Check if Entered
Results
to
John
Romang
Jacque
Bush
Inorganic
Analysis
Report
Results
Units
Limit
Method
Test Date
Analyst
pH
lab
Sp Conductivity
lab
Alkalinity
AlkalinityM
Bicarbonate
HCO3
Carbonate
Hydroxide
Calcium
Chloride
Hardness total
Hardness ca
Hardness
mg
Magnesium
Residue
TSS
Residue
TDS
Silica
Sulfate
Sulfate
TOC
Oil
Grease
Metals
Analysis
1569
ND
320
930
800
130
31
1470
918
units
umho
mg/L
as
CaCO3
mg/L
as CaCO3
mg/L
mg/L
mg/L
mg/L
mg/L
mg/L
as CaCO3
mg/L
as
CaCO3
mg/L
as CaCO3
mg/L
mg/L
mg/L
mgIL
mg/L
mg/L
mg/L
mg/L
08/31/98
lj
08/31/98
lj
08/31/98
lj
08/31/98
Ij
09104/98
nil
08/31/98
lj
08/31/98
lj
08/31/98
lj
08/31/98
lj
0.1
10
0.001
0.5
Report
Units
Limit
EA
150.1
EPA 120.1
EPA 310.1
EPA 310.1
EPA 310.1
EPA
310.1
EPA
310.1
EPA 130.2
EPA 300.0
IC
EPA 130.2
EPA 130.2
EPA
130.2
EPA 130.2
EPA 160.2
EPA 160.1
EPA
370.2
EPA
300.0
IC
EPA 375.4
EPA
415.2
EPA 1664
Method
08/31/98
lj
09/04/98
mi
Results
Test
Date
Analyst
Aluminum
diss
total
mg/L
0.075
ICP EPA 200.7
Aluminum
diss
total
mg/L
0.005
GFAAEPA2O2.2
Boron
diss
28.235
total
mg/L
0.050
ICP EPA 200.7
Copper
diss
total
mg/L
0.005
ICP EPA 200.7
Copper
diss
total
mg/L
0.002
GFM EPA 220.2
Iron
diss
0.344
total
mg/L
0.020
ICP EPA 200.7
Iron
diss
total
mg/L
0.010
GFAA EPA 236.2
Manganese
diss
2.892
total
mg/L
0.005
ICP EPA 200.7
Nickel
diss
0.087
total
.mg/L
0.005
GFAA EPA 243.2
Nickel
diss
total
mg/L
0.020
ICP EPA
200.7
Potassium
diss
26.889
total
mg/L
0.050
ICP EPA 200.7
Silica
diss
total
mg/L
0.050
ICP EPA 200.7
Sodium
diss
15.319
total
mg/L
0.070
ICP
EPA 200.7
Sodium
diss
total
mg/L
0.0005
GFA EPA 273.2
09/16/98
Sd
09/16/98
Sd
09/16/98
sd
09/16/98
Sd
09/16/98
sd
09/16/98
sd
Note
ND denotes result below detection limit
Electronic Filing - Received, Clerk's Office, August 11, 2008 - AS 09-1, Exhibit 4
Sample Description
WATER ANALYSIS REPORT CIPS Central
Laboratory
ROUTINE
Hutsonville Power Station
GP -4
composite
__________
grab
_________
Lab
ID
W98-553
Sample
Date
08/26/98
Time
Sampled
_______
Sampler
ID
____________
Report
Date
09/16/98
Approved
by
SD
Check if Entered
Results to
John
Romang
Jacque
Bush
Inorganic Analysis
Report
Results
Units
Limit
Method
Test Date
Analyst
2190
ND
ND
384
1340
960
380
91
1688
1531
units
umho
mg/L
as
CaCO3
mg/L
as
CaCO3
mg/L
mg/L
mg/L
mg/L
mg/L
mg/L
as
CaCO3
mg/L
as CaCO3
mg/L
as
CaCO3
mg/L
mg/L
mg/L
mg/L
mg/L
mg/L
mg/L
mg/L
EPA 150.1
EPA 120.1
EPA 310.1
EPA 310.1
EPA
310.1
EPA 310.1
EPA 310.1
EPA
130.2
EPA 300.0
IC
EPA 130.2
EPA 130.2
EPA 130.2
EPA 130.2
EPA 160.2
EPA 160.1
EPA 370.2
EPA
300.0
IC
EPA 375.4
EPA 415.2
EPA
1664
0.1
10
0.001
0.5
Report
Units
Limit
pH
lab
Sp
Conductivity
lab
Alkalinity
AlkalinityM
Bicarbonate
HCO3
Carbonate
Hydroxide
Calcium
Chloride
Hardness
total
Hardness
ca
Hardness
mg
Magnesium
Residue
TSS
Residue
lOS
Silica
Sulfate
Sulfate
TOC
Oil
Grease
Metals
Analysis
Aluminum
diss
Aluminum
diss
Boron
diss
Copper
diss
Copper
diss
Iron
diss
Iron
diss
Manganese
diss
Nickel
diss
Nickel
diss
Potassium
diss
Silica
diss
Sodium
diss
Sodium
diss
08/31/98
lj
08/31/98
lj
08/31/98
lj
08/31/98
lj
09/04/98
rrn
08/31/98
lj
08/31/98
lj
08/31/98
lj
08/31/98
Ij
08/31/98
Ij
09/04/98
rm
Results
Method.
Test Date
Analyst
21 .823
2.002
5.799
0.093
10.140
17.586
09/16/98
sd
total
mgIL
0.075
ICP EPA 200.7
total
mg/L
0.005
GFAA EPA 202.2
total
mg/L
0.050
ICP EPA 200.7
total
mg/L
0.005
ICP EPA 200.7
total
mg/L
0.002
GFM EPA 220.2
total
mg/L
0.020
ICP EPA 200.7
total
mgIL
0.010
GF.AA EPA 236.2
total
mg/L
0.005
ICP EPA 200.7
total
.mg/L
0.005
GFAA EPA 243.2
total
mg/L
0.020
ICP EPA 200.7
total
mg/L
0.050
ICP EPA 200.7
total
mg/L
0.050
lOP EPA 200.7
total
mg/L
0.070
ICP EPA 200.7
total
mg/L
0.0005
GFAA
EPA 273.2
09/16/98
sd
09/16/98
sd
09/16/98
sd
09/16/98
Sd
09/16/98
sd
Note
ND denotes result below detection limit
Electronic Filing - Received, Clerk's Office, August 11, 2008 - AS 09-1, Exhibit 4
WATER ANALYSIS REPORT CIPS Central
Laboratory
ROUTINE
Sample Description
Hutsonville Power Station
GP-5
composite
__________
grab
__________
Lab
lD
W98-554
Sample
Date
08/26/98
Time
Sampled
_______
Sampler
ID
____________
Report
Date
09/16/98
Approved
by
SD
Check if Entered
Results to
John
Romang
Jacque
Bush
Inorganic Analysis
Report
Results
Units
Limit
Method
Test Date/
Analyst
2330
ND
216
556
11
1650
1390
260
62
1109
1225
08131/98
lj
08/31/98
lj
08/31/98
lj
units
0.1
EPA 150.1
umho
EPA 120.1
mg/L
as CaCO3
EPA
310.1
mg/Las
CaCO3
EPA
310.1
mg/L
EPA 310.1
mg/L
EPA
310.1
mg/L
EPA 310.1
mg/L
EPA 130.2
mg/L
EPA 300.0
IC
mg/L
as
CaCO3
EPA 130.2
mg/L
as CaCO3
EPA 130.2
mg/L
as
CaCO3
EPA
130.2
mg/L
EPA 130.2
mg/L
EPA 160.2
mg/L
10
EPA
160.1
mg/L
0.001
EPA 370.2
mg/L
EPA 300.0
IC
mg/L
EPA 375.4
mg/L
0.5
EPA 415.2
mg/L
EPA 1664
08/31/98
lj
09/04/98
rrn
08/31/98
pH
lab
Sp
Conductivity
lab
Alkalinity
Alkalinity
Bicarbonate
HCO3
Carbonate
Hydroxide
Calcium
Chloride
Hardness
total
Hardness ca
Hardness
mg
Magnesium
Residue TSS
Residue
TDS
Silica
Sulfate
Sulfate
TOC
Oil
Grease
Metals
Analysis
Aluminum
diss
Aluminum
diss
Boron
diss
Copper
diss
Copper
diss
Iron
diss
Iron
diss
Manganese
diss
Nickel
diss
Nickel
diss
Potassium
diss
Silica
diss
Sodium
diss
Sodium
diss
lj
08/31/98
Ij
08/31/98
Ii
08/31/98
Ij
08/31/98
Ij
09/04/98
Results
Report
Units
Limit
Method
Test Date
Analyst
total
total
total
total
total
total
total
total
total
total
total
total
total
total
8.821
0.049
11.078
0.160
5.782
13.190
mg/L
0.075
______________
mgIL
0.005
_______________
mgIL
0.050
_______________
mgIL
0.005
______________
mg/L
0.002
______________
mg/L
0.020
_____________
mgIL
0.010
_______________
mg/L
0.005
______________
.mg/L
0.005
_______________
mgIL
0.020
______________
mg/L
0.050
______________
mg/L
0.050
______________
mg/L
0.070
______________
mgIL
0.0005
09/16/98
sd
ICP EPA 200.7
GFAA
EPA 202.2
ICP
EPA 200.7
ICP EPA 200.7
GF1AA EPA 220.2
ICP EPA 200.7
GFAA
EPA 236.2
ICP EPA 200.7
GFAA EPA 243.2
ICP EPA 200.7
ICP EPA
200.7
ICP EPA 200.7
ICP EPA
200.7
GFAA EPA 273.2
09/16/98
Sd
09/1 6/98
sd
09/16/98
sd
09/16/98
Sd
09/1
6198
sd
Note ND denotes result below detection limit
Electronic Filing - Received, Clerk's Office, August 11, 2008 - AS 09-1, Exhibit 4
Sample
Description
WATER ANALYSIS
REPORT
CIPS Central
Laboratory
ROUTINE
Hutsonville Power Station
GP -6
composite
__________
grab
__________
Lab
W98-555
Sample
Date
08/26/98
Time
Sampled
_______
Sampler
ID
_____________
Report
Date
09/16/98
Approved by
SD
Check if Entered
Results to
John
Romang
Jacque
Bush
Inorganic
Analysis
Report
Results
Units
Limit
Method
Test Date
Analyst
922
ND
40
164
16
540
410
130
31
724
398
08/31/981
lj
08/31/98
Ij
08/31/98
Ij
units
0.1
EPA 150.1
umho
EPA 120.1
mg/L
as
CaCO3
EPA 310.1
mg/L
as
CaCO3
EPA 310.1
mg/L
EPA
310.1
mg/L
EPA 310.1
mg/L
EPA
310.1
mg/L
EPA 130.2
mg/L
EPA 300.0
IC
mg/L as
CaCO3
EPA 130.2
mg/L
as
CaCO3
EPA 130.2
mg/L
as CaCO3
EPA 130.2
mg/L
EPA 130.2
mg/L
EPA
160.2
mg/L
10
EPA 160.1
mg/L
0.00
EPA 370.2
mgfL
EPA 300.0
IC
mg/L
EPA 375.4
mg/L
0.5
EPA 415.2
mg/L
EPA
1664
08/31/98
lj
09/04/98
rrn
08/31/98
pH
lab
Sp
Conductivity
lab
Alkalinity
AlkalinityM
Bicarbonate
HCO3
Carbonate
Hydroxide
Calcium
Chloride
Hardness
total
Hardness
ca
Hardness
mg
Magnesium
Residue TSS
Residue
TDS
Silica
Sulfate
Sulfate
TOC
Oil
Grease
Metals
Analysis
Aluminum
diss
Aluminum
diss
Boron
diss
Copper
diss
Copper
diss
Iron
diss
Iron
diss
Manganese
diss
Nickel
diss
Nickel
diss
Potassium
diss
Silica
diss
Sodium
diss
Sodium
diss
Ii
08/31/98
Ij
08/31/98
lj
08/31/98
lj
08/31/98
Ij
09104/98
rrn
Results
Report
Units
Limit
Method
Test Date
Analyst
4.592
0.030
1.022
0.063
0.938
13.465
09/16/98
sd
total
mg/L
0.075
ICP EPA 200.7
total
mg/L
0.005
GFAA EPA 202.2
total
mg/L
0.050
ICP EPA
200.7
total
mg/L
0.005
lOP EPA 200.7
total
mg/L
0.002
GFAA EPA
220.2
total
mg/L
0.020
ICP EPA 200.7
total
mg/L
0.010
GFAAEPA236.2
total
mg/L
0.005
lOP EPA 200.7
total
.mg/L
0.005
GFAA
EPA 243.2
total
mg/L
0.020
lOP EPA 200.7
total
mg/L
0.050
ICP EPA
200.7
total
mg/L
0.050
ICP EPA 200.7
total
mg/L
0.070
ICP EPA
200.7
total
mgIL
0.0005
GFAA EPA 273.2
09/16/98
sd
09/16/98
Sd
09/16/98
Sd
09/16/98
Sd
09/16/98
sd
Note ND denotes
result below detection limit
Electronic Filing - Received, Clerk's Office, August 11, 2008 - AS 09-1, Exhibit 4
Sample Description
WATER ANALYSIS REPORT CIPS
Central
Laboratory
ROUTINE
Hutsonville Power Station
GP
-7
composite
_________
grab
__________
pH
lab
Sp Conductivity
lab
Alkalinity
Alkalinity
Bicarbonate
HCO3
Carbonate
Hydroxide
Calcium
Chloride
Hardness
total
Hardness
ca
Hardness
mg
Magnesium
Residue TSS
Residue
TDS
Silica
Sulfate
Sulfate
TOC
Oil
Grease
278
ND
40
40
160
100
60
14
214
71
units
umho
mg/L as
CaCO3
mg/L
as
CaCO3
mg/L
mg/L
mg/L
mg/L
mg/L
mg/L
as
CaCO3
mg/L
as
CaCO3
mg/L
as
CaCO3
mg/L
mg/L
mg/L
mg/L
mg/L
mg/L
mg/L
mg/L
0.1
10
0.001
0.5
EPA 150.1
EPA 120.1
EPA 310.1
EPA 310.1
EPA 310.1
EPA
310.1
EPA 310.1
EPA 130.2
EPA 300.0
IC
EPA 130.2
EPA 130.2
EPA 130.2
EPA 130.2
EPA 160.2
EPA 160.1
EPA 370.2
EPA 300.0
IC
EPA 375.4
EPA 415.2
EPA 1664
Lab
lD
W98-556
Sample
Date
08/26/98
Time
Sampled
_______
Sampler
ID
____________
Report
Date
09/16/98
Approved
by
SD
Check if Entered
Results to
John
Romang
Jacque
Bush
Inorganic Analysis
Report
Results
Units
Limit
Method
Test Date
Analyst
08/31/98
lj
08/31/98
lj
08/31/98
lj
08/31/98
lj
09/04/98
rm
08/31/98
Ij
08/31/98
lj
08/31/98
Ii
08/31/98
lj
08/31/98
lj
09/04/98
mi
Results
Report
Metals
Analysis
Units
Limit
Aluminum
diss
Aluminum
diss
Boron
diss
Copper
diss
Copper
diss
Iron
diss
Iron
diss
Manganese
diss
Nickel
diss
Nickel
diss
Potassium
diss
Silica
diss
Sodium
diss
Sodium
diss
Method
Test
Date
Analyst
0.388
0.118
0.165
0.006
1.808
4.876
09/16/98
sd
total
mg/L
0.075
ICP EPA
200.7
total
mg/L
0.005
GFM EPA 202.2
total
mg/L
0.050
ICP EPA 200.7
total
mg/L
0.005
ICP EPA 200.7
total
mg/L
0.002
GFAA
EPA
220.2
total
mg/L
0.020
ICP EPA 200.7
total
mg/L
0010
GFIAAEPA236.2
total
mg/L
0.005
ICP EPA 200.7
total
.mg/L
0.005
GFAA EPA
243.2
total
mg/L
0.020
ICP EPA 200.7
total
mg/L
0.050
ICP EPA 200.7
total
mg/L
0.050
ICP EPA 200.7
total
mg/L
0.070
ICP EPA 200.7
total
mg/L
0.0005
GFAA EPA 273.2
09/16/98
Sd
09/16/98
sd
09/16/98
Sd
09/16/98
Sd
09/16/98
sd
Note ND denotes
result below detection limit
Electronic Filing - Received, Clerk's Office, August 11, 2008 - AS 09-1, Exhibit 4
Sample Description
WATER ANALYSIS REPORT CIPS Central
Laboratory
ROUTINE
Hutsonville Power Station
GP -9
composite
__________
grab
__________
Lab
lD
W98-557
Sample
Date
08/26/98
Time
Sampled
_______
Sampler
ID
____________
Report
Date
09/16/98
Approved
by
SD
Check if Entered
Results
to
John
Romang
Jacque
Bush
Inorganic
Analysis
Report
Results
Units
Limit
Method
Test Date
Analyst
pH
lab
Sp Conductivity
lab
Alkalinity
Alkalinity
Bicarbonate
HCO3
Carbonate
Hydroxide
Calcium
Chloride
Hardness
total
Hardness
ca
Hardness
mg
Magnesium
Residue TSS
Residue TDS
Silica
Sulfate
Sulfate
TOC
Oil
Grease
Metals
Analysis
1226
ND
280
224
710
560
150
36
942
357
08/31/98
08/31/98
08/31/98
units
0.1
EPA
150.1
umho
EPA 120.1
mg/L
as
CaCO3
EPA 310.1
mg/L
as CaCO3
EPA
310.1
mg/L
EPA 310.1
mg/L
EPA 310.1
mg/L
EPA 310.1
mg/L
EPA 130.2
mg/L
EPA
300.0
IC
mg/L
as
CaCO3
EPA 130.2
mg/L
as CaCO3
EPA
130.2
mg/L
as
CaCO3
EPA 130.2
mg/L
EPA 130.2
mg/L
EPA
160.2
mg/L
.10
EPA 160.1
mg/L
0.00
EPA 370.2
mg/L
EPA 300.0
IC
rng/L
EPA
375.4
mg/L
0.5
EPA415.2
mg/L
EPA
1664
08/31/98
lj
09/04/98
rm
08/31/98
08/31/98
08/31/98
08/31/98
08/31/98
Ij
09/04/98
rTn
Results
Report
Units
Limit
Method
Test Date
Analyst
Aluminum
diss
total
mgiL
0.075
ICP
EPA
200.7
Aluminum
diss
total
mg/L
0.005
GFAA EPA 202.2
Boron
diss
0.882
total
mg/L
0.050
ICP EPA
200.7
Copper
diss
total
mg/L
0.005
ICP EPA 200.7
Copper
diss
total
mg/L
0.002
GFAA EPA 220.2
Iron
diss
0.056
total
mg/L
0.020
ICP EPA 200.7
Iron
diss
total
mg/L
0.010
GFAAEPA236.2
Manganese
diss
0.24
total
mg/L
0.005
ICP EPA 200.7
Nickel
diss
0.009
total
mg/L
0.005
GFAA
EPA 243.2
Nickel
diss
total
mg/L
0.020
ICP EPA 200.7
Potassium
diss
5.480
total
mg/L
0.050
ICP EPA
200.7
Silica
diss
total
mg/L
0.050
ICP EPA 200.7
Sodium
diss
6.98
total
mg/L
0.070
ICP
EPA 200.7
Sodium
diss
total
mg/L
0.0005
GFAA EPA 273.2
09/16/98
sd
09/16/98
sd
09/16/98
sd
09/16/98
sd
09/16/98
sd
09/16/98
sd
Note ND
denotes result below detection limit
Electronic Filing - Received, Clerk's Office, August 11, 2008 - AS 09-1, Exhibit 4
Sample
Description
WATER ANALYSIS REPORT CIPS Central
Laboratory
ROUTINE
Hutsonville Power Station
GP
10
__________________________
composite
__________
grab
_________
Lab
lD
W98-558
Sample
Date
08/26/98
Time
Sampled
_______
Sampler
ID
____________
Report
Date
09/16/98
Approved
by
SD
Check
ir
Entered
Results to
John
Romang
Jacque
Bush
Inorganic
Analysis
Report
Results
Units
Limit
Method
Test Date
Analyst
8040
ND
ND
440
3200
1100
2100
504
12058
7143
08/31/98
lj
08/31/98
lj
08/31/98
Ij
units
umho
mg/L
as CaCO3
mg/L
as
CaCO3
mg/L
mg/L
mg/L
mg/L
mg/L
mg/L
as
CaCO3
mg/L
as CaCO3
mg/L
as CaCO3
mg/L
mg/L
mg/L
mg/L
mg/L
mg/L
mg/L
mg/L
0.1
10
0.001
0.5
08/31/98
lj
EPA 150.1
EPA
120.1
EPA 310.1
EPA 310.1
EPA
310.1
EPA 310.1
EPA 310.1
EPA 130.2
EPA 300.0
IC
EPA 130.2
EPA 130.2
EPA 130.2
EPA 130.2
EPA
160.2
EPA 160.1
EPA 370.2
EPA
300.0
IC
EPA 375.4
EPA 415.2
EPA
1664
09/04/98
fm
08/31/98
pH
lab
Sp Conductivity
lab
Alkalinity
AlkalinityM
Bicarbonate
F-lCO3
Carbonate
Hydroxide
Calcium
Chloride
Hardness total
Hardness ca
Hardness
mg
Magnesium
Residue
185
Residue lOS
Silica
Sulfate
Sulfate
TOC
Oil
Grease
Metals
Analysis
Aluminum
diss
Aluminum
diss
Boron
diss
Copper
diss
Copper
diss
Iron
diss
Iron
diss
Manganese
diss
Nickel
diss
Nickel
diss
Potassium
diss
Silica
diss
Sodium
diss
Sodium
diss
Ii
08/31/98
08/31/98
Ii
lj
08/31/98
Ii
08/31/98
lj
09/04/98
rm
Report
Test Date
Analyst
5.821
3388.660
26.656
3.241
10.972
187.503
Results
Units
Limit
Method
total
mglL
0.075
ICP EPA 200.7
total
mg/L
0.005
GFM EPA 202.2
total
mg/L
0.050
ICP EPA
200.7
total
mg/L
0.005
ICP EPA 200.7
total
mgIL
0.002
GFM EPA 220.2
total
mg/L
0.020
ICP EPA 200.7
total
mg/L
0.010
GFAA EPA 236.2
total
mg/L
0.005
ICP EPA 200.7
total
.mg/L
0.005
GFAA
EPA 243.2
total
mg/L
0.020
ICP EPA 200.7
total
mg/L
0.050
ICP EPA
200.7
total
mg/L
0.050
lOP EPA 200.7
total
mg/L
0.070
ICP EPA
200.7
total
mg/L
0.0005
GFAA
EPA 273.2
09/16/98
Sd
09/16/98
Sd
09/16/98
sd
9/16/98
sd
09/16/98
sd
09/16/98
Sd
Note ND
denotes result below detection limit
Electronic Filing - Received, Clerk's Office, August 11, 2008 - AS 09-1, Exhibit 4
Sample
Description
WATER ANALYSIS REPORT CIPS Central
Laboratory
ROUTINE
Hutsonville Power Station
GP
1OD
composite
__________
grab
__________
Lab
ID
W98-559
Sample
Date
08/26/98
Time
Sampled
_______
Sampler
ID
____________
Report
Date
09/16/98
Approved
by
SD
Check if Entered
Results
to
John
Romang
Jacque
Bush
Inorganic
Analysis
Report
Results
Units
Limit
Method
Test Date
Analyst
8030
ND
ND
200
2100
500
1600
384
12110
7143
08/31/98
lj
08/31/98
lj
08/31/98
lj
units
umho
mg/L
as
CaCO3
mg/L
as
CaCO3
mg/L
mg/L
mg/L
mg/L
mg/L
mg/L
as CaCO3
mgIL
as
CaCO3
mg/L
as CaCO3
mg/L
mg/L
mg/L
mg/L
mg/L
mg/L
mg/L
mg/L
0.1
10
0.001
0.5
08/31/98
fj
EPA 150.1
EPA 120.1
EPA 310.1
EPA
310.1
EPA 310.1
EPA 310.1
EPA
310.1
EPA 130.2
EPA 300.0
IC
EPA
130.2
EPA 130.2
EPA 130.2
EPA
130.2
EPA 160.2
EPA 160.1
EPA
370.2
EPA
300.0
IC
EPA 375.4
EPA 41 5.2
EPA 1664
09/04/98
cm
08/31/98
pH
lab
Sp Conductivity
lab
Alkalinity
AlkalinityM
Bicarbonate
HCO3
Carbonate
Hydroxide
Calcium
Chloride
Hardness total
Hardness
ca
Hardness
mg
Magnesium
Residue
TSS
Residue
TDS
Silica
Sulfate
Sulfate
TOC
Oil
Grease
Metals
Analysis
Aluminum
diss
Aluminum
diss
Boron
diss
Copper
diss
Copper
diss
Iron
diss
Iron
diss
Manganese
diss
Nickel
diss
Nickel
diss
Potassium
diss
Silica
diss
Sodium
diss
Sodium
diss
lj
08/31/98
lj
08/31/98
lj
08/31/98
lj
08/31/98
lj
09/04/96
cm
Results
Report
Units
Limit
Method
Test Date
Analyst
5.553
3350.980
25.603
3.146
13.135
195.791
09/16/98
sd
total
mg/L
0.075
ICP EPA 200.7
total
mg/L
0.005
GEM
EPA 202.2
total
mg/L
0.050
ICP EPA 200.7
total
mg/L
0.005
ICP EPA 200.7
total
mg/L
0.002
GFAA
EPA 220.2
total
mg/L
0.020
ICP EPA
200.7
total
mg/L
0.010
GFAA EPA 236.2
total
mg/L
0.005
ICP EPA
200.7
total
.mg/L
0.005
GFAA EPA 243.2
total
mg/L
0.020
ICP
EPA 200.7
total
mg/L
0.050
ICP EPA 200.7
total
mg/L
0.050
ICP EPA
200.7
total
mg/L
0.070
ICP EPA 200.7
total
mg/L
0.0005
GEM EPA
273.2
09/16/98
sd
09/16/96
sd
sd
9/16/98
sd
09/16/98
09/16/98
sd
Note ND denotes
result below detection limit
Electronic Filing - Received, Clerk's Office, August 11, 2008 - AS 09-1, Exhibit 4
Sample
Description
WATER ANALYSIS REPORT CPS Central
Laboratory
ROUTINE
Hutsonville Power Station
GP
1OF
composite
___________
grab
__________
Lab
ID
W98-560
Sample
Date
08/26/98
Time
Sampled
_______
Sampler
ID
____________
Report
Date
09/16/98
Approved by
SD
Check if Entered
Results to
John
Romang
Jacque
Bush
Inorganic
Analysis
Report
Results
Units
Limit
Method
Test Date
Analyst
08/31/98
lj
06/31/98
lj
08/31/98
8060
ND
ND
240
2000
600
1400
336
12236
7143
lj
units
0.1
EPA 150.1
umho
EPA 120.1
mg/LasCaCO3
EPA31O.1
mg/L
as
CaCO3
EPA 310.1
mg/L
EPA 310.1
mg/L
EPA 310.1
mg/L
EPA
310.1
mg/L
EPA 130.2
mg/L
EPA 300.0
IC
mgIL
as CaCO3
EPA
130.2
mg/L
as
CaCO3
EPA 130.2
mg/L
as
CaCO3
EPA 130.2
mg/L
EPA 130.2
mg/L
EPA 160.2
mg/L
10
EPA 160.1
mg/L
0.001
EPA
370.2
mg/L
EPA 300.0
IC
mg/L
EPA 375.4
mg/L
0.5
EPA
415.2
mg/L
EPA 1664
08/31/98
Ii
09/04/98
rm
06/31/98
pH
lab
Sp Conductivity
lab
Alkalinity
AkalinityM
Bicarbonate
HCO3
Carbonate
Hydroxide
Calcium
Chloride
Hardness total
Hardness
ca
Hardness
mg
Magnesium
Residue
TSS
Residue
TDS
Silica
Sulfate
Sulfate
TOC
Oil
Grease
Metals
Analysis
Aluminum
diss
Aluminum
diss
Boron
diss
Copper
diss
Copper
diss
Iron
diss
Iron
diss
Manganese
diss
Nickel
diss
Nickel
diss
Potassium
diss
Silica
diss
Sodium
diss
Sodium
diss
Ij
08/31/98
lj
08/31/98
lj
08/31/98
lj
08/31/98
Ii
09/04/98
mi
Results
Report
Units
Limit
Method
Test
Date
Analyst
5.639
3391.560
26.135
2.710
13.276
196.860
total
total
total
total
total
total
total
total
total
total
total
total
total
total
09/16/98
sd
mgJL
mg/L
mg/L
mg/L
mg/L
mg/L
mg/L
mg/L
.mgIL
mg/L
mg/L
mg/L
mg/L
mg/L
0.075
0.005
0.050
0.005
0.002
0.020
0.010
0.005
0.005
0.020
0.050
0.050
0.070
0.0005
ICP EPA
200.7
GFAA EPA 202.2
ICP EPA 200.7
ICP
EPA 200.7
GFAA EPA 220.2
ICP
EPA 200.7
GFAA
EPA 236.2
ICP EPA 200.7
GF.AA EPA
243.2
ICP EPA 200.7
ICP EPA 200.7
ICP EPA
200.7
ICP EPA 200.7
GFAA EPA 273.2
09/16/98
sd
09/16/98
sd
9/16/98
Sd
09/16/98
sd
09/16/98
Sd
Note ND denotes
result below detection limit
Electronic Filing - Received, Clerk's Office, August 11, 2008 - AS 09-1, Exhibit 4
Sample
Description
WATER ANALYSIS REPORT CIPS Central
Laboratory
ROUTINE
Hutsonville Power Station
GP
11
composite
__________
grab
__________
Lab
ID
W98-561
Sample
Date
08/27/98
Time
Sampled
_______
Sampler
ID
____________
Report
Date
09/16/98
Approved by
SD
Check if
Entered
Results to
John
Romang
Jacue
Bush
Inorganic Analysis
Report
Results
Units
Limit
Method
Test
Date
Analyst
1707
ND
ND
72
410
180
230
55
1918
1276
units
0.1
EPA
150.1
umho
EPA
120.1
mg/L
as
CaCO3
EPA 310.1
mg/L
as
CaCO3
EPA 310.1
mg/L
EPA
310.1
mg/L
EPA 310.1
mgIL
EPA31O.1
mg/L
EPA 130.2
mg/L
EPA 300.0
IC
mg/L
as CaCO3
EPA 130.2
mg/L as
CaCO3
EPA 130.2
mg/L
as
CaCO3
EPA 130.2
mg/L
EPA
130.2
mg/L
EPA 160.2
mg/L
10
EPA16O.1
mg/L
0.001
EPA
370.2
mg/L
EPA 300.0
IC
mg/L
EPA 375.4
mgIL
0.5
EPA
415.2
mg/L
EPA 1664
08/31/98
08/31/98
08/31/98
08/31/98
Ij
09/04/98
rrn
08/31/98
08/31/98
08/31/98
08/31/98
pH
lab
Sp
Conductivity
lab
Alkalinity
AlkalinityM
Bicarbonate
HCO3
Carbonate
Hydroxide
Calcium
Chloride
Hardness
total
Hardness ca
Hardness
mg
Magnesium
Residue TSS
Residue
TDS
Silica
Sulfate
Sulfate
TOC
Oil
Grease
Metals
Analysis
Aluminum
diss
Aluminum
diss
Boron
diss
Copper
diss
Copper
diss
Iron
diss
Iron
diss
Manganese
diss
Nickel
diss
Nickel
diss
Potassium
diss
Silica
diss
Sodium
diss
Sodium
diss
08/31/98
Ij
09/04/98
mi
Report
Results
Units
Limit
Method
Test Date
Analyst
1.460
184.150
3.904
0.900
1.334
19.638
09/16/98
sd
total
mg
0.075
ICP EPA
200.7
total
mg/L
0.005
GFAA EPA 202.2
total
mgJL
0.050
ICP EPA
200.7
total
mg/L
0.005
ICP EPA 200.7
total
mg/L
0.002
GFM EPA
220.2
total
mg/L
0.020
ICP EPA 200.7
total
mg/L
0.010
GF1AA EPA 236.2
total
mgIL
0.005
ICP EPA 200.7
total
.mg/L
0.005
GFAA EPA
243.2
total
mgJL
0.020
ICP EPA
200.7
total
mg/L
0.050
ICP EPA 200.7
total
mg/L
0.050
ICP EPA
200.7
total
mgJL
0.070
ICP EPA 200.7
total
mg/L
0.0005
GFAA EPA 273.2
09/16/98
Sd
09/16/98
Sd
9/16/98
sd
09/16/98
sd
09/16/98
sd
Note ND
denotes result below detection limit
Electronic Filing - Received, Clerk's Office, August 11, 2008 - AS 09-1, Exhibit 4
Sample Description
WATER ANALYSIS
REPORT CIPS Central
Laboratory
ROUTINE
Hutsonville Power Station
GP- 12
composite
__________
grab
__________
Lab
ID
W98-562
Sample
Date
08/27/98
Time
Sampled
_______
Sampler
ID
____________
Report
Date
09/16/98
Approved
by
SD
Check if
Entered
Results to
John
Romang
Jacque
Bush
Inorganic
Analysis
Report
Results
Units
Limit
Method
Test Date
Analyst
1667
ND
ND
72
340
180
160
38
1194
867
08/31/98
Ij
08/31/98
lj
08/31/98
Ij
units
umho
mg/L
as CaCO3
mg/L
as
CaCO3
mg/L
mg/L
mg/L
mg/L
mg/L
mg/L
as CaCO3
mg/L
as
CaCO3
mg/L
as CaCO3
mg/L
mgJL
mg/L
mg/L
mgJL
mg/L
mg/L
mg/L
0.1
10
0.001
0.5
08/31/98
lj
EPA 150.1
EPA 120.1
EPA 310.1
EPA 310.1
EPA 310.1
EPA 310.1
EPA 310.1
EPA
130.2
EPA 300.0
IC
EPA 130.2
EPA
130.2
EPA 130.2
EPA 130.2
EPA
160.2
EPA 160.1
EPA 370.2
EPA
300.0
IC
EPA 375.4
EPA 415.2
EPA
1664
09/04/98
rm
08/31/98
pH
lab
Sp
Conductivity
lab
Alkalinity
AlkalinityM
Bicarbonate
HCO3
Carbonate
Hydroxide
Calcium
Chloride
Hardness total
Hardness
ca
Hardness
mg
Magnesium
Residue
TSS
Residue
TDS
Silica
Sulfate
Sulfate
TOC
Oil
Grease
Metals
Analysis
Aluminum
diss
Aluminum
diss
Boron
diss
Copper
diss
Copper
diss
Iron
diss
Iron
diss
Manganese
diss
Nickel
diss
Nickel
diss
Potassium
diss
Silica
diss
Sodium
diss
Sodium
diss
lj
08/31/98
Ii
08/31/98
lj
08/31/98
lj
08/31/98
09/04/98
rrn
Report
Results
Units
Limit
Method
Test Date
Analyst
1.234
11.931
2.626
0.781
1.490
21 .400
09/16/98
sd
total
mg/L
0.075
ICP EPA 200.7
total
mg/L
0.005
GFAA EPA 202.2
total
mgJL
0.050
ICP EPA 200.7
total
mg/L
0.005
ICP EPA 200.7
total
mg/L
0.002
GFAA EPA 220.2
total
mg/L
0.020
ICP EPA
200.7
total
mg/L
0.010
GFAA EPA 236.2
total
mg/L
0.005
ICP EPA 200.7
total
.mg/L
0.005
GFAA
EPA 243.2
total
mg/L
0.020
ICP EPA 200.7
total
mg/L
0.050
ICP EPA 200.7
total
mg/L
0.050
ICP EPA 200.7
total
mg/L
0.070
ICP EPA 200.7
total
mg/L
0.0005
GFAA EPA 273.2
09/16/98
sd
09/16/98
sd
sd
9/16/98
sd
09/16/98
09/16/98
sd
Note ND denotes result below
detection
limit
Electronic Filing - Received, Clerk's Office, August 11, 2008 - AS 09-1, Exhibit 4
Sample Description
WATER ANALYSIS REPORT CIPS Central
Laboratory
ROUTINE
Hutsonville Power Station
EB
composfte
__________
grab
__________
Lab
ID
W98-563
Sample
Date
08/27/98
Time
Sampled
_______
Sampler
ID
____________
Report
Date
09/16/98
Approved by
SD
Check
if Entered
Results
to
John
Romang
Jacque
Bush
Inorganic
Analysis
Report
Results
Units
Limit
Method
Test Date
Analyst
39
ND
ND
ND
ND
ND
ND
ND
ND
30
08/31/98
lj
08/31/98
lj
08/31/98
lj
units
0.1
EPA 150.1
umho
EPA 120.1
mg/LasCaCO3
EPA31O.1
mg/L
as
CaCO3
EPA 310.1
mg/L
EPA
310.1
mg/L
EPA 310.1
mg/L
EPA 310.1
mg/L
EPA
130.2
mg/L
EPA 300.0
IC
mg/L
as CaCO3
EPA 130.2
mg/L
as
CaCO3
EPA 130.2
mg/L
as CaCO3
EPA 130.2
mg/L
EPA
130.2
mg/L
EPA 160.2
mg/L
10
EPA 160.1
mg/L
0.00
EPA 370.2
mg/L
EPA 300.0
IC
mg/L
EPA 375.4
mg/L
0.5
EPA 415.2
mg/L
EPA 1664
08/31/98
Ij
09/04/98
08/31/98
rm
pH
lab
Sp
Conductivity
lab
Alkalinity
AlkalinityM
Bicarbonate
HCO3
Carbonate
Hydroxide
Calcium
Chlonde
Hardness
total
Hardness ca
Hardness
mg
Magnesium
Residue
TSS
Residue
TDS
Silica
Sulfate
Sulfate
TOC
Oil
Grease
Metals
Analysis
Aluminum
diss
Aluminum
diss
Boron
diss
Copper
diss
Copper
diss
Iron
diss
Iron
diss
Manganese
diss
Nickel
diss
Nickel
diss
Potassium
diss
Silica
diss
Sodium
diss
Sodium
diss
Ij
08/31/98
lj
08/31/98
lj
08/31/98
lj
08/31/98
lj
09/04/98
rm
Results
Report
Units
Limit
Method
Test Date
Analyst
ND
1.398
0.039
0.012
ND
0.211
total
total
total
total
total
total
total
total
total
total
total
total
total
total
mg/L
mg/L
mg/L
mg/L
mg/L
mg/L
mg/L
mg/L
.mg/L
mg/L
mg/L
mg/L
mg/L
mg/L
0.075
0.005
0.050
0.005
0.002
0.020
0.010
0.005
0.005
0.020
0.050
0.050
0.070
0.0005
ICP
EPA 200.7
GFAA EPA 202.2
ICP EPA 200.7
ICP EPA
200.7
GFA EPA 220.2
ICP EPA 200.7
GFAA EPA 236.2
ICP EPA 200.7
GFAA EPA 243.2
ICP EPA 200.7
ICP EPA
200.7
ICP EPA 200.7
ICP EPA 200.7
GFAA EPA 273.2
09/16/98
sd
09/16/98
sd
09/16/98
sd
9/16/98
sd
09/16/98
sd
09/16/98
sd
Note
ND denotes result below detection limit
Electronic Filing - Received, Clerk's Office, August 11, 2008 - AS 09-1, Exhibit 4
Sample Description
WATER ANALYSIS REPORT CIPS Central
Laboratory
ROUTINE
Hutsonville
Power
Station
GP
13
composite
__________
grab
__________
Lab
ID
W98-573
Sample
Date
08/27/98
Time
Sampled
_______
Sampler
ID
____________
Report
Date
09/16/98
Approved
by
SD
Check if Entered
Results to
John
Romang
Jacque
Bush
Inorganic
Analysis
Report
Results
Units
Limit
Method
Test Date
Analyst
716
ND
136
108
29
390
270
120
29
554
104
08/31/98
lj
08/31/98
lj
08/31/98
II
units
umho
mg/L as
CaCO3
mg/L
as
CaCO3
mg/L
mg/L
mg/L
mg/L
mg/L
mg/L
as
CaCO3
mg/L
as
CaCO3
mg/L
as CaCO3
mg/L
mg/L
mg/L
mg/L
mg/L
mg/L
mg/L
mg/L
0.1
10
0.001
0.5
08/31/98
lj
EPA
150.1
EPA
120.1
EPA 310.1
EPA 310.1
EPA
310.1
EPA 310.1
EPA 310.1
EPA 130.2
EPA 300.0
IC
EPA
130.2
EPA 130.2
EPA
130.2
EPA
130.2
EPA 160.2
EPA 160.1
EPA 370.2
EPA
300.0
IC
EPA 375.4
EPA 415.2
EPA 1664
09/04/98
rm
08/31/98
pH
lab
Sp
Conductivity
lab
Alkalinity
AlkalinityM
Bicarbonate
HCO3
Carbonate
Hydroxide
Calcium
Chloride
Hardness
total
Hardness
ca
Hardness
mg
Magnesium
Residue
TSS
Residue
TDS
Silica
Sulfate
Sulfate
TOC
Oil
Grease
Metals
Analysis
Aluminum
diss
Aluminum
diss
Boron
diss
Copper
diss
Copper
diss
Iron
diss
Iron
diss
Manganese
diss
Nickel
diss
Nickel
diss
Potassium
diss
Silica
diss
Sodium
diss
Sodium
diss
Ii
08/31/98
II
08/31/98
Ii
08/31198
Ii
08/31/98
lj
09/04/98
Results
rm
Report
Units
Limit
Method
Test Date
Analyst
0.226
ND
0.005
ND
0.530
3.994
09/16/98
sd
total
mg/L
0.075
ICP EPA 200.7
total
mg/L
0.005
GFAA EPA
202.2
total
mg/L
0.050
lOP EPA
200.7
total
mg/L
0.005
ICP EPA 200.7
total
mg/L
0.002
GFA EPA
220.2
total
mg/L
0.020
ICP EPA 200.7
total
mg/L
0.010
GFAA EPA 236.2
total
mg/L
0.005
ICP EPA 200.7
total
.mg/L
0.005
GF1AA EPA 243.2
total
mg/L
0.020
lOP EPA 200.7
total
mg/L
0.050
lOP EPA
200.7
total
mg/L
0.050
ICP EPA 200.7
total
mg/L
0.070
ICP EPA
200.7
total
mg/L
0.0005
GFAA EPA 273.2
09/16/98
sd
09/16/98
sd
sd
9/16/98
sd
09/16/98
09/16/98
sd
Note
ND denotes result below detection limit
Electronic Filing - Received, Clerk's Office, August 11, 2008 - AS 09-1, Exhibit 4
Sample Description
WATER ANALYSIS
REPORT CIPS Central
Laboratory
ROUTINE
Hutsonville Power Station
GP
14
composite
__________
grab
__________
Lab
ID
W98-574
Sample
Date
08/27/98
Time
Sampled
_______
Sampler
ID
____________
Report Date
09/16/98
Approved by
SD
Check if Entered
Results to
John
Romang
Jacque
Bush
Inorganic Analysis
Report
Results
Units
Limit
Method
Test Date
Analyst
units
900
umho
___________
32
mg/L
as CaCO3
___________
336
mg/L
as CaCO3
___________
_______________
rng/L
___________
_______
_______________
mg/L
___________
________
_______________
mgIL
___________
________
128
mg/L
__________
_______
26
mg/L
___________
560
mg/L
as
CaCO3
___________
320
mg/L
as CaCO3
___________
240
mgIL
as
CaCO3
___________
________
58
mg/L
___________
________
_______________
mg/L
___________
________
620
mg/L
___________
________
_______________
mg/L
___________
________
52
mg/L
__________
______
_______________
mg/L
___________
________
_______________
mg/L
___________
________
_______________
mg/L
___________
_______
08/31/98
08/31/98
08/31/98
0.1
10
0.001
0.5
08/31/98
EPA
150.1
EPA 120.1
EPA 310.1
EPA 310.1
EPA 310.1
EPA 310.1
EPA 310.1
EPA 130.2
EPA 300.0
IC
EPA
130.2
EPA 130.2
EPA 130.2
EPA 130.2
EPA 160.2
EPA 160.1
EPA
370.2
EPA 300.0
IC
EPA 375.4
EPA 415.2
EPA 1664
09/04/98
rrn
08/31/98
pH
lab
Sp
Conductivity
lab
Alkalinity
Alkalinity
Bicarbonate
HCO3
Carbonate
Hydroxide
Calcium
Chloride
Hardness
total
Hardness ca
Hardness
mg
Magnesium
Residue TSS
Residue
TDS
Silica
Sulfate
Sulfate
TOC
Oil
Grease
Metals
Analysis
Aluminum
diss
Aluminum
diss
Boron
diss
Copper
diss
Copper
diss
Iron
diss
Iron
diss
Manganese
diss
Nickel
diss
Nickel
diss
Potassium
diss
Silica
diss
Sodium
diss
Sodium
diss
08/31/98
08/31/98
08/31/98
Ii
08/31/98
lj
09/04/98
mi
Report
Results
Units
Limit
Method
Test Date
Analyst
0.066
0.126
0.925
0.014
3.499
5.28
09/16/98
Sd
total
mg/L
0.075
ICP EPA 200.7
total
mg/L
0.005
GFM EPA
202.2
total
mg/L
0.050
ICP EPA 200.7
total
mg/L
0.005
ICP EPA
200.7
total
mg/L
0.002
GFM EPA 220.2
total
mg/L
0.020
ICP EPA 200.7
total
mg/L
0.010
GFAA EPA 236.2
total
mg/L
0.005
ICP EPA 200.7
total
.mg/L
0.005
GFAA EPA 243.2
total
mg/L
0.020
ICP EPA
200.7
total
mg/L
0.050
ICP EPA 200.7
total
mg/L
0.050
ICP EPA
200.7
total
mg/L
0.070
ICP EPA 200.7
total
mg/L
0.0005
GFAA EPA
273.2
09/16/98
Sd
09/16/98
sd
9/16/98
sd
09/16/98
sd
09/16/98
sd
Note
ND denotes result below detection limit
Electronic Filing - Received, Clerk's Office, August 11, 2008 - AS 09-1, Exhibit 4
Sample Description
WATER
ANALYSIS REPORT CIPS Central
Laboratory
ROUTINE
Hutsonville Power Station
GP
15
composite
__________
grab
__________
Lab
lD
W98-575
Sample
Date
08127/98
Time
Sampled
_______
Sampler
ID
____________
Report
Date
09/16/98
Approved by
SD
Check if Entered
Results to
John
Romang
Jacque
Bush
Inorganic Analysis
Report
Results
Units
Limit
Method
Test Date
Analyst
884
ND
232
140
34
500
350
150
36
646
125
units
0.1
EPA 150.1
umho
EPA
120.1
mgIL
as
CaCO3
EPA 310.1
mg/L
as CaCO3
EPA 310.1
mg/L
EPA 310.1
mg/L
EPA 310.1
mg/L
EPA 310.1
mg/L
EPA 130.2
mg/L
EPA 300.0
IC
mgIL
as
CaCO3
EPA 130.2
mg/L
as
CaCO3
EPA 130.2
mg/L
as
CaCO3
EPA 130.2
mg/L
EPA 130.2
.mg/L
EPA 160.2
mg/L
10
EPA 160.1
mg/L
0.001
EPA 370.2
mg/L
EPA 300.0
IC
mg/L
EPA 375.4
mgJL
0.5
EPA 415.2
mgIL
EPA 1664
08/31/98
lj
08/31/98
lj
08/31/98
lj
08/31/98
lj
09/04/98
fm
08/31/98
lj
08/31/98
lj
08/31/98
lj
08/31/98
ij
pH
lab
Sp Conductivity
lab
Alkalinity
AlkalinityM
Bicarbonate
HCO3
Carbonate
Hydroxide
Calcium
Chloride
Hardness
total
Hardness ca
Hardness
mg
Magnesium
Residue TSS
Residue TDS
Silica
Sulfate
Sulfate
TOC
Oil
Grease
Metals
Analysis
Aluminum
diss
Aluminum
diss
Boron
diss
Copper
diss
Copper
diss
Iron
diss
Iron
diss
Manganese
diss
Nickel
diss
Nickel
diss
Potassium
diss
Silica
diss
Sodium
diss
Sodium
diss
08/31/98
lj
09/04/98
mi
Report
Results
Units
Limit
Method
Test Date
Analyst
0.292
0.028
0.013
ND
0.795
4.048
09/16/98
sd
total
mg/L
0.075
ICP EPA 200.7
total
mg/L
0.005
GFAA EPA 202.2
total
mg/L
0.050
ICP EPA 200.7
total
mg/L
0.005
ICP EPA 200.7
total
mg/L
0.002
GFAA EPA 220.2
total
mg/L
0.020
ICP EPA 200.7
total
mg/L
0.010
GFAA EPA 236.2
total
mg/L
0.005
ICP
EPA
200.7
total
.mg/L
0.005
GFAA EPA 243.2
total
mg/L
0.020
ICP EPA 200.7
total
mg/L
0.050
ICP EPA 200.7
total
mg/L
0.050
ICP EPA 200.7
total
mg/L
0.070
ICP EPA 200.7
total
mg/L
0.0005
GFAA EPA 273.2
09/16/98
sd
09/16/98
Sd
9/16/98
sd
09/16/98
09/16/98
Sd
Sd
Note ND
denotes result below detection limit
Electronic Filing - Received, Clerk's Office, August 11, 2008 - AS 09-1, Exhibit 4
WATER ANALYSIS REPORT CIPS Central
Laboratory
ROUTINE
Sample Description
Hutsonville Power Station
GP
16
composite
__________
grab
__________
Lab
ID
VV98-576
Sample
Date
08/27/98
Time
Sampled
_______
Sampler
ID
_____________
Report
Date
09/16/98
Approved
by
SD
Check it Entered
Results
to
John
Romang
Jacque
Bush
Inorganic
Analysis
Report
Results
Units
Limit
Method
Test Date
Analyst
units
957
umho
___________
______
ND
mgIL
as
CaCO3
_________ ______
244
mg/L
as
CaCO3
___________
______
______________
mg/L
___________
________
______________
mg/L
___________
________
______________
mg/L
___________
________
168
mg/L
__________
______
52
mg/L
___________
________
530
mg/L
as CaCO3
____________
________
420
mg/L
as
CaCO3
___________
________
110
mgILasCaCO3
_________
______
26
mg/L
___________
________
_______________
mg/L
____________
________
674
mg/L
___________
________
______________
mg/L
___________
________
104
mgIL
__________
_______
______________
mg/L
___________
________
______________
mg/L
___________
________
______________
mg/L
___________
________
08/31/98
II
08/31/98
Ii
08/31/98
Ii
0.1
10
0.001
0.5
08/3 1/98
EPA
150.1
EPA 120.1
EPA 310.1
EPA 310.1
EPA 310.1
EPA
310.1
EPA 310.1
EPA 130.2
EPA
300.0
IC
EPA
130.2
EPA 130.2
EPA 130.2
EPA
130.2
EPA 160.2
EPA
160.1
EPA 370.2
EPA 300.0
IC
EPA
375.4
EPA
415.2
EPA 1664
09/04/98
Ii
rm
08/31/98
pH
lab
Sp Conductivity
lab
Alkalinity
AlkalinityM
Bicarbonate
HCO3
Carbonate
Hydroxide
Calcium
Chloride
Hardness total
Hardness
ca
Hardness
mg
Magnesium
Residue
TSS
Residue TDS
Silica
Sulfate
Sulfate
TOC
Oil
Grease
Metals
Analysis
Aluminum
diss
Aluminum
diss
Boron
diss
Copper
diss
Copper
diss
Iron
diss
Iron
diss
Manganese
diss
Nickel
diss
Nickel
diss
Potassium
diss
Silica
diss
Sodium
diss
Sodium
diss
Ii
08/31/98
lj
08/31/98
Ii
08/3 1/98
Ij
08/31/98
lj
09/04/98
rrn
Report
Results
Units
Limit
Method
Test Date
Analyst
0.213
ND
0.012
ND
0.441
4.182
09/1 6/98
sd
total
mg/L
0.075
ICP
EPA 200.7
total
mg/L
0.005
GFAA EPA 202.2
total
mg/L
0.050
ICP EPA
200.7
total
mg/L
0.005
ICP EPA 200.7
total
mg/L
0.002
GFAA EPA 220.2
total
mg/L
0.020
ICP EPA 200.7
total
mgIL
0.010
GF1AAEPA236.2
total
mg/L
0.005
ICP EPA 200.7
total
mg/L
0.005
GFM EPA 243.2
total
mg/L
0.020
ICP EPA 200.7
total
mg/L
0.050
ICP EPA
200.7
total
mg/L
0.050
ICP EPA 200.7
total
mg/L
0.070
ICP EPA
200.7
total
mg/L
0.0005
GFAA EPA 273.2
09/16/98
sd
09/1
6/98
sd
9/16/98 sd
09/16/98
sd
09/16/98
sd
Note ND denotes
result below detection limit
Electronic Filing - Received, Clerk's Office, August 11, 2008 - AS 09-1, Exhibit 4
Sample
Description
WATER ANALYSIS REPORT CIPS Central
Laboratory
ROUTINE
HutsonviUe
Power
Station
GP
-17
composite
__________
grab
__________
pH
lab
Sp Conductivity
lab
Alkalinity
AlkalinityM
Bicarbonate
HCO3
Carbonate
Hydroxide
Calcium
Chloride
Hardness
total
Hardness ca
Hardness
mg
Magnesium
Residue TSS
Residue TDS
Silica
Sulfate
Sulfate
TOC
Oil
Grease
692
ND
104
100
36
320
250
70
17
596
83
units
umho
mg/L
as
CaCO3
mg/L
as
CaCO3
mg/L
mg/L
mg/L
mg/L
mg/L
mg/L
as
CaCO3
mg/L
as CaCO3
mg/L
as CaCO3
mg/L
mg/L
mgIL
mg/L
mg/L
mg/L
mg/L
mg/L
0.1
10
0.001
0.5
EPA 150.1
EPA 120.1
EPA 310.1
EPA 310.1
EPA 310.1
EPA 310.1
EPA
310.1
EPA 130.2
EPA 300.0
IC
EPA 130.2
EPA 130.2
EPA 130.2
EPA 130.2
EPA 160.2
EPA
160.1
EPA 370.2
EPA 300.0
IC
EPA 375.4
EPA
415.2
EPA
1664
Lab
lD
W98-577
Sample
Date
08/27/98
Time
Sampled
_______
Sampler
ID
____________
Report
Date
09/16/98
Approved by
SD
Check if Entered
Results to
John
Romang
Jacque
Bush
Inorganic Analysis
Report
Results
Units
Limit
Method
Test Date
Analyst
08/31/98
lj
08/31/98
lj
08/31/98
Ii
08/31/98
lj
09/04/98
rrn
08/31/98
08/31/98
08/31/98
08/31/98
08/31/98
Ij
09/04/98
mi
Report
Metals
Analysis
Results
Units
Limit
Method
Test Date
Analyst
Aluminum
diss
total
mg/L
0.075
ICP EPA 200.7
Aluminum
diss
total
mg/L
0.005
GFIAA EPA
202.2
Boron
diss
0.291
total
mg/L
0.050
ICP EPA 200.7
Copper
diss
total
mg/L
0.005
ICP EPA 200.7
Copper
diss
total
mg/L
0.002
GFAA EPA
220.2
Iron
diss
ND
total
mg/L
0.020
ICP EPA 200.7
Iron
diss
total
mg/L
0.010
GFAAEPA236.2
Manganese
diss
0.099
total
mg/L
0.005
ICP EPA 200.7
Nickel
diss
ND
total
mg/L
0.005
GFAA EPA
243.2
Nickel
diss
total
mg/L
0.020
ICP EPA
200.7
Potassium
diss
0.942
total
mg/L
0.050
ICP EPA 200.7
Silica
diss
total
mg/L
0.050
ICP EPA 200.7
Sodium
diss
3.444
total
mg/L
0.070
ICP EPA 200.7
Sodium
diss
total
mg/L
0.0005
GFAA
EPA 273.2
09/16/98
Sd
09/16/98
Sd
09/16/98
sd
9/16/98
sd
09/16/98
Sd
09/16/98
Sd
Note ND denotes result below detection limit
Electronic Filing - Received, Clerk's Office, August 11, 2008 - AS 09-1, Exhibit 4
Sample
Description
WATER ANALYSIS REPORT
CIPS Central
Laboratory
ROUTINE
HutsonviUe Power Station
GP -18
composite
__________
grab
__________
Lab
lD
W98-578
Sample
Date
08/27/98
Time
Sampled
_______
Sampler
ID
____________
Report
Date
09/16/98
Approved by
SD
Check if Entered
Results to
John
Romang
Jacque
Bush
Inorganic Analysis
Report
Results
Units
Limit
Method
Test Date
Analyst
742
ND
160
120
32
400
300
100
24
558
83
08/31/98
lj
08/31/98
Ii
08/31/98
lj
units
umho
mg/L
as CaCO3
mg/L as
CaCO3
mg/L
mg/L
mg/L
mg/L
mg/L
mg/L
as CaCO3
mg/L
as CaCO3
mgIL
as
CaCO3
mg/L
mg/L
mg/L
mg/L
mg/L
mg/L
mg/L
mg/L
0.1
10
0.001
0.5
08/31/98
lj
EPA 150.1
EPA
120.1
EPA 310.1
EPA 310.1
EPA
310.1
EPA 310.1
EPA 310.1
EPA 130.2
EPA 300.0
IC
EPA
130.2
EPA 130.2
EPA 130.2
EPA 130.2
EPA 160.2
EPA 160.1
EPA
370.2
EPA
300.0
IC
EPA 375.4
EPA
415.2
EPA 1664
09/04/98
rm
08/31/98
pH
lab
Sp Conductivity
lab
Alkalinity
Alkalinity
Bicarbonate
HCO3
Carbonate
Hydroxide
Calcium
Chloride
Hardness
total
Hardness
ca
Hardness
mg
Magnesium
Residue
TSS
Residue TDS
Silica
Sulfate
Sulfate
TOC
Oil
Grease
Metals
Analysis
Aluminum
diss
Aluminum
diss
Boron
diss
Copper
diss
Copper
diss
Iron
diss
Iron
diss
Manganese
diss
Nickel
diss
Nickel
diss
Potassium
diss
Silica
diss
Sodium
diss
Sodium
diss
08/31/98
08/31/98
08/31/98
08/31/98
lj
09/04/98
mi
Report
Results
Units
Limit
Method
Test Date
Analyst
0.280
ND
0.010
ND
0.547
3.471
09/1 6/98
sd
total
mg/L
0.075
ICP EPA 200.7
total
mg/L
0.005
GFAA EPA
202.2
total
mgIL
0.050
ICP EPA
200.7
total
mg/L
0.005
ICP EPA 200.7
total
mg/L
0.002
GFAA
EPA 220.2
total
mg/L
0.020
lOP EPA
200.7
total
mgIL
0.010
GFMEPA236.2
total
mgIL
0.005
lOP EPA
200.7
total
.mg/L
0.005
GFAA EPA 243.2
total
mg/L
0.020
lOP EPA 200.7
total
mg/L
0.050
ICP EPA
200.7
total
mgIL
0.050
lOP EPA 200.7
total
mg/L
0.070
ICP EPA
200.7
total
mg/L
0.0005
GFAA EPA 273.2
09/16/98
sd
09/16/98
sd
9/16198
Sd
09/16/98
sd
09/1 6/98
sd
Note ND denotes
result below detection limit
Electronic Filing - Received, Clerk's Office, August 11, 2008 - AS 09-1, Exhibit 4
Sample
Description
WATER ANALYSIS REPORT CIPS Central
Laboratory
ROUTINE
Hutsonviue
Power
Station
ES
composite
__________
grab
__________
Lab
ID
W98-579
Sample
Date
08/28/98
Time
Sampled
_______
Sampler
ID
____________
Report
Date
09/16/98
Approved
by
SD
Check
if
Entered
Results to
John
Romang
Jacque
Bush
Inorganic
Analysis
Report
Results
Units
Limit
Method
Test Date
Analyst
25
ND
ND
ND
40
10
30
ND
08/31/98
08/31/98
08/31/98
units
umho
mg/L
as
CaCO3
mg/L
as CaCO3
mg/L
mg/L
mg/L
mg/L
mgJL
mg/L
as
CaCO3
mg/L
as
CaCO3
mg/L
as
CaCO3
mg/L
mg/L
mg/L
mg/L
mg/L
mg/L
mg/L
mg/L
0.1
10
0.001
0.5
08/31/98
Ij
EPA
150.1
EPA
120.1
EPA 310.1
EPA 310.1
EPA 310.1
EPA 310.1
EPA 310.1
EPA 130.2
EPA 300.0
IC
EPA
130.2
EPA 130.2
EPA
130.2
EPA 130.2
EPA 160.2
EPA 160.1
EPA 370.2
EPA 300.0
IC
EPA
375.4
EPA
415.2
EPA 1664
09/04/98
rrn
08/31/98
pH
lab
Sp Conductivity
lab
Alkalinity
AlkalinityM
Bicarbonate
HCO3
Carbonate
Hydroxide
Calcium
Chloride
Hardness total
Hardness ca
Hardness
mg
Magnesium
Residue
TSS
Residue
TDS
Silica
Sulfate
Sulfate
TOC
Oil
Grease
Metals
Analysis
Aluminum
diss
Aluminum
diss
Boron
diss
Copper
diss
Copper
diss
Iron
diss
Iron
diss
Manganese
diss
Nickel
diss
Nickel
diss
Potassium
diss
Silica
diss
Sodium
diss
Sodium
diss
08/31/98
08/31/98
08/31/98
08/31/98
lj
09/04/96
rrn
Report
Results
Units
Limit
Method
Test Date
Analyst
0.053
ND
0.039
0.005
ND
ND
09/16/98
Sd
total
mg/L
0.075
ICP EPA 200.7
total
mg/L
0.005
GFM EPA 202.2
total
mgIL
0.050
ICP EPA
200.7
total
mg/L
0.005
ICP EPA 200.7
total
mg/L
0.002
GFAA EPA
220.2
total
mg/L
0.020
ICP EPA 200.7
total
mg/L
0.010
GFAA EPA
236.2
total
mg/L
0.005
lOP EPA 200.7
total
.mgIL
0.005
GFAA EPA 243.2
total
mg/L
0.020
ICP EPA
200.7
total
mgIL
0.050
ICP EPA 200.7
total
mg/L
0.050
lOP
EPA 200.7
total
mg/L
0.070
ICP EPA 200.7
total
mg/L
0.0005
GFAA
EPA 273.2
09/16/98
sd
09/16/98
sd
9/16/98
sd
09/1.6/98
sd
09/16/98
sd
Note
ND
denotes result below detection limit
Electronic Filing - Received, Clerk's Office, August 11, 2008 - AS 09-1, Exhibit 4
Sample Description
WATER ANALYSIS REPORT CIPS Central
Laboratory
ROUTINE
Hutsonville Power Station
GP 20
composite
__________
grab
__________
Lab
ID
W98-580
Sample
Date
06/28198
Time
Sampled
_______
Sampler
ID
_____________
Report Date
09/16/98
Approved by
SD
Check
if
Entered
Results
to
John
Romang
Jacque
Bush
Inorganic
Analysis
Report
Results
Units
Limit
Method
Test Date/
Analyst
1096
16
192
164
29
560
410
150
36
810
344
08/31/98
08/31/98
Ij
08/31/98
lj
units
umho
mg/L
as CaCO3
mg/L
as
CaCO3
mg/L
mg/L
mg/L
mg/L
mg/L
mg/L
as CaCO3
mg/L
as
CaCO3
mg/L
as CaCO3
mg/L
mg/L
mg/L
mg/L
mg/L
mg/L
mg/L
mg/L
0.1
10
0.001
0.5
08/31/98
lj
EPA 150.1
EPA
120.1
EPA 310.1
EPA 310.1
EPA
310.1
EPA 310.1
EPA
310.1
EPA 130.2
EPA 300.0
IC
EPA
130.2
EPA 130.2
EPA
130.2
EPA
130.2
EPA 160.2
EPA
160.1
EPA
370.2
EPA 300.0
IC
EPA 375.4
EPA 415.2
EPA 1664
09/04/98
rm
08/31/98
pH
lab
Sp Conductivity
lab
Alkalinity
AlkalinityM
Bicarbonate
HCO3
Carbonate
Hydroxide
Calcium
Chloride
Hardness total
Hardness
ca
Hardness
mg
Magnesium
Residue
TSS
Residue
TDS
Silica
Sulfate
Sulfate
TOC
Oil
Grease
Metals
Analysis
Aluminum
diss
Aluminum
diss
Boron
diss
Copper
diss
Copper
diss
Iron
diss
Iron
diss
Manganese
diss
Nickel
diss
Nickel
diss
Potassium
diss
Silica
diss
Sodium
diss
Sodium
diss
Ij
08/31/98
tj
08/31/98
Ii
08/31/98
Ii
08/31/98
lj
09/04/98
rTirL
Results
Report
Units
Limit
Method
Test Date
Analyst
14.878
ND
4.079
0.009
4.825
28.469
09/16/98
Sd
total
mg/L
0.075
ICP EPA
200.7
total
mg/L
0.005
GFAA EPA 202.2
total
mg/L
0.050
ICP EPA
200.7
total
mg/L
0.005
ICP EPA
200.7
total
mg/L
0.002
GFAA EPA
220.2
total
mg/L
0.020
ICP EPA 200.7
total
mg/L
0.010
GFAA EPA 236.2
total
mg/L
0.005
ICP EPA 200.7
total
.mg/L
0.005
GFAA EPA
243.2
total
mg/L
0.020
ICP EPA
200.7
total
mg/L
0.050
ICP EPA 200.7
total
mg/L
0.050
ICP EPA 200.7
total
mg/L
0.070
lOP EPA 200.7
total
mg/L
0.0005
GFM EPA
273.2
09/16/98
Sd
09/16/98
Sd
9/16/98
sd
09/16/98
Sd
09/16/98
Sd
Note ND denotes result below
detection limit
Electronic Filing - Received, Clerk's Office, August 11, 2008 - AS 09-1, Exhibit 4
Sample
Description
WATER ANALYSIS REPORT CIPS Central
Laboratory
ROUTINE
Hutsonville Power Station
GP 20D
composite
__________
grab
__________
Lab
lD
W98-581
Sample
Date
08/28/98
Time
Sampled
_______
Sampler
ID
____________
Report
Date
09/16/98
Approved
by
SD
Check if
Entered
Results
to
John
Romang
Jacque
Bush
Inorganic Analysis
Report
Results
Units
Limit
Method
Test Date
Analyst
1066
220
168
31
550
420
130
31
700
313
08/31/98
Ij
08/31/98
lj
08/31/98
Ij
units
umho
mg/L
as CaCO3
mg/L
as CaCO3
mg/L
mg/L
mgIL
mg/L
mg/L
mgJL
as
CaCO3
mgJL
as CaCO3
mg/L
as
CaCO3
mg/L
mg/L
mg/L
mg/L
mg/L
mgIL
mg/L
mg/L
08/31/98
lj
0.1
10
0.001
0.5
Report
Units
Limit
09/04/98
08/31/98
rrn
EPA 150.1
EPA 120.1
EPA
310.1
EPA 310.1
EPA 310.1
EPA 310.1
EPA
310.1
EPA 130.2
EPA
300.0
IC
EPA 130.2
EPA
130.2
EPA 130.2
EPA 130.2
EPA
160.2
EPA 160.1
EPA 370.2
EPA 300.0
IC
EPA 375.4
EPA 41 5.2
EPA
1664
Method
pH
lab
Sp Conductivity
lab
Alkalinity
AlkalinityM
Bicarbonate
HCO3
Carbonate
Hydroxide
Calcium
Chloride
Hardness
total
Hardness
ca
Hardness
mg
Magnesium
Residue TSS
Residue
TDS
Silica
Sulfate
Sulfate
TOC
Oil
Grease
Metals
Analysis
Aluminum
diss
Aluminum
diss
Boron
diss
Copper
diss
Copper
diss
Iron
diss
Iron
diss
Manganese
diss
Nickel
diss
Nickel
diss
Potassium
diss
Silica
diss
Sodium
diss
Sodium
diss
fj
08/31/98
lj
08/3 1/98
lj
08/31/98
lj
08/31/98
lj
09/04/98
rTTI
Results
Test Date
Analyst
12.868
0.029
2.020
0.007
3.810
1.397
09/16/98
Sd
total
mg/L
0.075
ICP EPA 200.7
total
mg/L
0.005
GFPA
EPA 202.2
total
mg/L
0.050
ICP EPA 200.7
total
mg/L
0.005
ICP EPA
200.7
total
mg/L
0.002
GFAA EPA 220.2
total
mg/L
0.020
lOP
EPA 200.7
total
mg/L
0.010
GFAA EPA 236.2
total
mg/L
0.005
ICP EPA 200.7
total
mg/L
0.005
GFM EPA 243.2
total
mg/L
0.020
ICP EPA 200.7
total
mg/L
0.050
ICP EPA 200.7
total
mg/L
0.050
ICP EPA 200.7
total
mg/L
0.070
ICP EPA 200.7
total
mg/L
0.0005
GFM EPA
273.2
09/16/98
sd
09/16/98
sd
9/16/98
sd
09/16/98
Sd
09/16/98
sd
Note ND denotes
result below
detection limit
Electronic Filing - Received, Clerk's Office, August 11, 2008 - AS 09-1, Exhibit 4
Sample Description
WATER ANALYSIS REPORT CIPS Central
Laboratory
ROUTINE
Hutsonville Power Station
GP
20F
composite
__________
grab
__________
pH
lab
Sp
Conductivity
lab
Alkalinity
AlkalinityM
Bicarbonate
HCO3
Carbonate
Hydroxide
Calcium
Chloride
Hardness total
Hardness ca
Hardness
mg
Magnesium
Residue
TSS
Residue
TDS
Silica
Sulfate
Sulfate
TOC
Oil
Grease
1066
224
180
29
560
420
140
34
848
302
units
umho
mg/L
as CaCO3
mg/L
as CaCO3
mgJL
mg/L
mg/L
mg/L
mgIL
mg/L
as
CaCO3
mg/L
as
CaCO3
mg/L
as CaCO3
mg/L
mg/L
mg/L
mg/L
mg/L
mg/L
mg/L
mg/L
0.1
10
0.001
0.5
EPA 150.1
EPA 120.1
EPA 310.1
EPA 310.1
EPA 310.1
EPA
310.1
EPA 310.1
EPA
130.2
EPA 300.0
IC
EPA 130.2
EPA
130.2
EPA
130.2
EPA 130.2
EPA
160.2
EPA
160.1
EPA 370.2
EPA 300.0
IC
EPA
375.4
EPA 415.2
EPA
1664
Lab lD
W98-582
Sample
Date
08/28/98
Time
Sampled
_______
Sampler
ID
____________
Report
Date
09/16/98
Approved
by
SD
check if Entered
Results to
John
Romang
Jacque
Bush
Inorganic
Analysis
Report
Results
Units
Limit
Method
Test Date
Analyst
08/31/98
08/31/98
lj
08/31/98
lj
08/31/98
lj
09/04/98
rm
08/31/98
08/3 198
Ii
08/31/98
lj
08/31/98
lj
08/31/98
lj
09/04/98
mi
Results
Report
Metals
Analysis
Units
Limit
Aluminum
diss
Aluminum
diss
Boron
diss
Copper
diss
Copper
diss
Iron
diss
Iron
diss
Manganese
diss
Nickel
diss
Nickel
diss
Potassium
diss
Silica
diss
Sodium
diss
Sodium
diss
Method
Test Date
Analyst
13.248
0.031
2.006
0.007
4.609
25.810
09/16/98
Sd
total
mg/L
0.075
ICP EPA 200.7
total
mg/L
0.005
GFAA
EPA 202.2
total
mg/L
0.050
ICP EPA 200.7
total
mg/L
0.005
ICP EPA
200.7
total
mg/L
0.002
GFM EPA
220.2
total
mg/L
0.020
ICP EPA
200.7
total
mg/I.
0.010
GFAA EPA 236.2
total
mg/L
0.005
ICP EPA
200.7
total
mg/L
0.005
GFAA EPA 243.2
total
mg/L
0.020
ICP EPA 200.7
total
mg/L
0.050
ICP EPA 200.7
total
mg/L
0.050
ICP EPA 200.7
total
mg/L
0.070
ICP EPA
200.7
total
mg/L
0.0005
GFM EPA
273.2
09/16/98
Sd
09/1 6/98
sd
9/16/98
sd
09/16/98
sd
09/16/98
sd
Note ND denotes
result below detection limit
Electronic Filing - Received, Clerk's Office, August 11, 2008 - AS 09-1, Exhibit 4
WATER ANALYSiS REPORT CIPS Central
Laboratory
ROUTINE
Sample Description
Hutsonville Power Station
GP
21
composite
__________
grab
__________
Lab
ID
W98-583
Sample
Date
08/28/98
Time
Sampled
_______
Sampler
ID
____________
Report
Date
09/16/98
Approved by
SD
Check if Entered
Results to
John
Rornang
Jacque
Bush
Inorganic
Analysis
Report
Results
Units
Limit
Method
Test Date
Analyst
units
--
1913
umho
_______
12
mg/L
as
CaCO3
________
228
mg/L
as CaCO3
________
_______________
mg/L
____________
_______
_______________
mg/L
____________
________
________________
mg/L
____________
_______
356
mg/L
___________
________
27
mg/L
___________
________
1190
mg/L
as CaCO3
___________
________
890
mg/L
as
CaCO3
___________
________
300
mg/L
as CaCO3
____________
________
72
mg/L
___________
________
_______________
mg/L
____________
________
1754
mg/L
__________ _______
________________
mg/L
____________
________
771
mg/L
___________
_______
________________
mg/L
____________
________
_______________
mg/L
______________
mg/L
08/31/98
lj
08/31/98
lj
08/31/98
lj
08/31/98
Ii
0.1
10
0.001
0.5
Report
Units
Limit
09/04/98
rm
08/31/98
pH
lab
Sp
Conductivity
lab
Alkalinity
AlkalinityM
Bicarbonate
HCO3
Carbonate
Hydroxide
Calcium
Chloride
Hardness
total
Hardness
ca
Hardness
mg
Magnesium
Residue TSS
Residue
TDS
Silica
Sulfate
Sulfate
TOC
Oil
Grease
Metals
Analysis
Aluminum
diss
Aluminum
diss
Boron
diss
Copper
diss
Copper
diss
Iron
diss
Iron
diss
Manganese
diss
Nickel
diss
Nickel
diss
Potassium
diss
Silica
diss
Sodium
diss
Sodium
diss
EPA 150.1
EPA
120.1
EPA
310.1
EPA 310.1
EPA 310.1
EPA 310.1
EPA 310.1
EPA 130.2
EPA 300.0
IC
EPA 130.2
EPA 130.2
EPA 130.2
EPA 130.2
EPA 160.2
EPA 160.1
EPA 370.2
EPA 300.0
IC
EPA 375.4
EPA 415.2
EPA 1664
Method
lj
08/31/98
Ii
06/31/98
Ij
08/31/98
Ii
08/31/98
lj
09/04/98
mi
Results
Test
Date
Analyst
13.910
0.085
5.397
0.007
0.836
1.620
09/16/98
Sd
total
mg/L
0.075
ICP EPA 200.7
total
mgJL
0.005
GEM
EPA 202.2
total
mg/L
0.050
ICP EPA 200.7
total
mg/L
0.005
ICP EPA 200.7
total
mgIL
0.002
GEM EPA 220.2
total
mg/L
0.020
ICP EPA 200.7
total
mg/L
0.010
GFAA EPA
236.2
total
mg/L
0.005
ICP EPA 200.7
total
.mg/L
0.005
GEM EPA
243.2
total
mg/L
0.020
ICP EPA 200.7
total
mg/L
0.050
ICP EPA
200.7
total
mg/L
0.050
ICP EPA 200.7
total
mg/L
0.070
lOP EPA 200.7
total
mg/L
0.0005
GFAA EPA 273.2
09/16/98
Sd
09/16/98
sd
9/16/98
sd
09/16/98
sd
09/16/98
sd
Note
ND denotes result below
detection limit
Electronic Filing - Received, Clerk's Office, August 11, 2008 - AS 09-1, Exhibit 4
Sample Description
WATER ANALYSIS REPORT
CIPS Central
Laboratory
ROUTINE
Hutsonville
Power
Station
GP
23
composite
__________
grab
__________
Lab ID
W98-584
Sample
Date
08/28/98
Time
Sampled
_______
Sampler
ID
____________
Report
Date
09/16/98
Approved
by
SD
Check if Entered
Results to
John
Romang
Jacque
Bush
In
organic Analysis
Report
Results
Units
Limit
Method
Test Date
Analyst
2330
ND
292
440
23
1440
1110
330
79
2210
927
08/31/98
08/31/98
lj
08/31/98
lj
units
umho
mg/L
as CaCO3
mg/L
as CaCO3
mg/L
mg/L
mg/L
mgIL
mg/L
mgJL
as CaCO3
mg/L
as CaCO3
mg/L
as CaCO3
mg/L
mg/L
mg/L
mg/L
mg/L
mg/L
mg/L
mg/L
0.1
10
0.001
0.5
08/31/98
lj
EPA
150.1
EPA
120.1
EPA 310.1
EPA 310.1
EPA 310.1
EPA 310.1
EPA
310.1
EPA 130.2
EPA 300.0
IC
EPA
130.2
EPA 130.2
EPA 130.2
EPA
130.2
EPA 160.2
EPA 160.1
EPA
370.2
EPA
300.0
IC
EPA 375.4
EPA
41 5.2
EPA 1664
09/04/98
rm
08/31/98
pH
lab
Sp
Conductivity
lab
Alkalinity
AlkalinityM
Bicarbonate
HCO3
Carbonate
Hydroxide
Calcium
Chloride
Hardness
total
Hardness ca
Hardness
mg
Magnesium
Residue
TSS
Residue
TDS
Silica
Sulfate
Sulfate
TOC
Oil
Grease
Metals
Analysis
Aluminum
diss
Aluminum
diss
Boron
diss
Copper
diss
Copper
diss
Iron
diss
Iron
diss
Manganese
diss
Nickel
diss
Nickel
diss
Potassium
diss
Silica
diss
Sodium
diss
Sodium
diss
lj
08/31/98
lj
08/31/98
08/31/98
lj
lj
08/31/98
lj
09/04/98
rm
Report
Results
Units
Limit
Method
Test Date
Analyst
30.207
0.402
2.680
ND
19.898
58.502
09/1
6198
Sd
total
mg/L
0.075
ICP EPA
200.7
total
mg/L
0.005
GFAA EPA 202.2
total
mg/L
0.050
ICP EPA 200.7
total
mg/L
0.005
ICP EPA
200.7
total
mgIL
0.002
GFAA EPA
220.2
total
mgIL
0.020
ICP
EPA 200.7
total
mg/L
0.010
GFAAEPA236.2
total
mg/L
0.005
ICP
EPA 200.7
total
.mg/L
0.005
GFM EPA 243.2
total
mg/L
0.020
ICP EPA 200.7
total
mg/L
0.050
ICP EPA 200.7
total
mg/L
0.050
ICP EPA
200.7
total
mg/L
0.070
ICP
EPA 200.7
total
mg/L
0.0005
GFM
EPA 273.2
09/16/98
sd
09/16/98
sd
9/16/98
sd
09/1
6198
Sd
09/1 6198
sd
Note ND denotes
result below detection limit
Electronic Filing - Received, Clerk's Office, August 11, 2008 - AS 09-1, Exhibit 4
Sample Description
WATER ANALYSIS REPORT CIPS Central
Laboratory
ROUTINE
Hutsonville Power
Station
LP
composite
_________
grab
________
Lab ID
W98-585
Sample
Date
08/28/98
Time
Sampled
_______
Sampler
ID
____________
Report
Date
09/16/98
Approved
by
SD
Check if Entered
Results
to
John
Romang
Jacque
Bush
Inorganic
Analysis
Report
Results
Units
Limit
Method
Test Date
Analyst
1955
116
136
384
42
990
960
30
1832
792
08/31/98
lj
08/31/98
lj
08/31/98
lj
units
umho
mg/L
as CaCO3
mg/L
as CaCO3
mg/L
mg/L
mg/L
mg/L
mg/L
mg/L
as
CaCO3
mg/L
as CaCO3
mg/L
as CaCO3
mg/L
mg/L
mg/L
mg/L
mg/L
mg/L
mg/L
mg/L
0.1
10
0.001
0.5
08/31/98
lj
EPA
150.1
EPA 120.1
EPA
310.1
EPA 310.1
EPA 310.1
EPA 310.1
EPA
310.1
EPA 130.2
EPA
300.0
IC
EPA 130.2
EPA
130.2
EPA 130.2
EPA
130.2
EPA 160.2
EPA 160.1
EPA 370.2
EPA 300.0
IC
EPA
375.4
EPA
41 5.2
EPA 1664
09/04/98
rrn
08/31/98
pH
lab
Sp Conductivity
lab
Alkalinity
AlkalinityM
Bicarbonate
HCO3
Carbonate
Hydroxide
Calcium
Chloride
Hardness total
Hardness ca
Hardness
mg
Magnesium
Residue
TSS
Residue TDS
Silica
Sulfate
Sulfate
TOC
Oil
Grease
Metals
Analysis
Aluminum
diss
Aluminum
diss
Boron
diss
Copper
diss
Copper
diss
Iron
diss
Iron
diss
Manganese
diss
Nickel
diss
Nickel
diss
Potassium
diss
Silica
diss
Sodium
diss
Sodium
diss
lj
08/31/98
lj
08/31/98
Ii
08/31/98
lj
08/31/98
lj
09/04/98
rrn
Report
Results
Units
Limit
Method
Test Date
Analyst
27.876
ND
0.006
0.005
85.718
31.442
09/16/98
sd
total
mg/L
0.075
ICP EPA
200.7
total
mg/L
0.005
GFi8A
EPA 202.2
total
mgJL
0.050
ICP EPA 200.7
total
mg/L
0.005
ICP
EPA 200.7
total
mg/L
0.002
GFM EPA
220.2
total
mg/L
0.020
ICP
EPA 200.7
total
mg/L
0.010
GFPAEPA236.2
total
mg/L
0.005
ICP
EPA 200.7
total
.mg/L
0.005
GFAA EPA
243.2
total
mg/L
0.020
ICP EPA
200.7
total
mg/L
0.050
ICP EPA 200.7
total
mg/L
0.050
ICP EPA
200.7
total
mg/L
0.070
ICP
EPA 200.7
total
mg/L
0.0005
GFM
EPA 273.2
09/16/98
Sd
09/16/98
sd
Sd
9/16/98
sd
09/16/98
09116/98
Sd
Note ND
denotes result below detection limit
Electronic Filing - Received, Clerk's Office, August 11, 2008 - AS 09-1, Exhibit 4
Sample Description
WATER ANALYSIS REPORT
CIPS Central
Laboratory
ROUTINE
Hutsonville Power Station
LP
composite
__________
grab
__________
pH
lab
Sp
Conductivity
lab
Alkalinity
AlkalinityM
Bicarbonate
HCO3
Carbonate
Hydroxide
Calcium
Chloride
Hardness total
Hardness ca
Hardness
mg
Magnesium
Residue TSS
Residue TDS
Silica
Sulfate
Sulfate
TOC
Oil
Grease
2330
120
164
552
32
1450
1380
70
17
2378
990
units
umho
mg/L
as CaCO3
mg/L
as CaCO3
mgIL
mg/L
mg/L
mg/L
mgIL
mg/L
as CaCO3
mg/L
as CaCO3
mg/L
as
CaCO3
mgJL
mgJL
mg/L
mg/L
mg/L
mg/L
mg/L
mg/L
0.1
10
0.001
0.5
EPA 150.1
EPA 120.1
EPA 310.1
EPA 310.1
EPA
310.1
EPA 310.1
EPA 310.1
EPA 130.2
EPA 300.0
IC
EPA
130.2
EPA 130.2
EPA
130.2
EPA
130.2
EPA 160.2
EPA
160.1
EPA
370.2
EPA
300.0
IC
EPA 375.4
EPA
415.2
EPA 1664
Lab
ID
VV98-586
Sample
Date
08/28/98
Time
Sampled
_______
Sampler
ID
____________
Report
Date
09/16/98
Approved
by
SD
if Entered
Results
to
John
Romang
Jacque
Bush
Inorganic
Analysis
Report
Results
Units
Limit
Method
Test Date
Analyst
08/31/98
lj
08/31/98
lj
08/31/98
lj
08/31/98
lj
09/04/98
08/31/98
rm
lj
08/31/98
08/31/98
lj
08/31/98
lj
08/31/98
Ii
09/04/98
mi
Report
Metals
Analysis
Results
Units
Limit
Method
Aluminum
diss
Aluminum
diss
Boron
diss
Copper
diss
Copper
diss
Iron
diss
Iron
diss
Manganese
diss
Nickel
diss
Nickel
diss
Potassium
diss
Silica
diss
Sodium
diss
Sodium
diss
Test Date
Analyst
52.896
ND
0.014
0.007
45.640
16.078
09/16198
sd
total
rngJL
0.075
ICP EPA 200.7
total
mgIL
0.005
GFAA
EPA 202.2
total
mglL
0.050
lOP EPA
200.7
total
mg/L
0.005
lOP EPA
200.7
total
mg/L
0.002
GFAA EPA
220.2
total
mg/L
0.020
ICP EPA 200.7
total
mg/L
0.010
GFAA EPA
236.2
total
mg/L
0.005
ICP EPA 200.7
total
mg/L
0.005
GFAA
EPA 243.2
total
mg/L
0.020
ICP
EPA 200.7
total
mg/L
0.050
ICP EPA
200.7
total
mg/L
0.050
ICP EPA 200.7
total
mg/L
0.070
ICP EPA 200.7
total
mg/L
0.0005
GFAA
EPA 273.2
09/16/98
sd
09/16/98
sd
9/16/98
sd
09/16/98
09/16/98
Sd
sd
Note ND
denotes result below
detection limit
Electronic Filing - Received, Clerk's Office, August 11, 2008 - AS 09-1, Exhibit 4
APPENDIX
WATER WELL LOGS
Electronic Filing - Received, Clerk's Office, August 11, 2008 - AS 09-1, Exhibit 4
ff7
-0to
ft
LOG
OF
WATER
WELL
Property
owner
__
Well
No..
Drilled
by
Year_
Depth
of
Formations
passed
through
Bottom
-I
LOG
OF
WATERWELL
prope
oer
Well
No
Drilled
by
O4
Year
Thick-
Depth
of
Formations
passed
through
ness
Bottom
i4
F/02
44
4W7
4z
-j
--s
.j
L_
fJ
JcoUNiY_o.51.e9.j
onback
if
necessary
Finished
in_.
nt_
_to
.ft
Cased
Witk_-inch_..
..._from
to
it
an_nch
ro_to____________
Size
hole
below
casing_...
...inch
Static
level
from
surf._.
__ft
Tested
capacjty_..
_gal
per
Thin
Teinperatu_..
_....F
Water
lowered
to__.
_ft__
..Jn
in..._
hrs_
._mjn
Length
of
tesL_..
hrs...
_znin
Screen....
Slot_
_Dian
_Lengti
Hotto
set
at
ft
location
in
Section
Plat
Township
name_Q442a.JLLElev
T1
Sec7
Descriptionof
location
Rgej
Signe
County.f
OD
Copy
for
Illinois
tate
Geological
Survey
Index
8N1W
ontinue
on
back
if
necessary
Finished
jn
Cased
with
1/inch
Lt.-r
.J
171441
fr1m
Sizehole
below
asing
//d
inch
Staticlevel
from
su
Tested
capacity
gal
per
mm
Teniperatur
Water
lowered
to
ft
in
iii
hrs
mm
Length
oftest
hrs
win
Screen
Slot
Diam
Length
Township
Oi-
Description
of
_____________
set
a-
ft
/7
l?cation
in
Section
Plat
lev
Sec
-c
____________
Twp/
Rge
II
location
f4n
44r
/7
CRAWFORD
u..
IItn.J
ftltieI
Survey
Index
Electronic Filing - Received, Clerk's Office, August 11, 2008 - AS 09-1, Exhibit 4
881150M6-69
14k
ILLINOIS
GEOLOGICAL
SURVEYURBANA
GEOLOGICAL
AND
WATERSURVEYS
WELLRECORD
10
Property
owner
Central
II
Public
Serv.Co
Well
No
Address
Hutsonvitte
Power
Generator
StHutsonville
IL
DrilLer
Ruester
John
License
No
102-2045
11
Permit
No
109053
Date
08/26/83
12
Water
from
alluvial
13
County
Crawford
Page
at-depth
25
to
97
ft
Sec
17
14
Screen
Diam
26
in
Twp
Length
30
ft
Slot
.5
Rye
11
Elev
440
SWc
SE
SW
SE
15
Casing
and
Liner
Pipe
350
150
Diarn
in
Kind
and
Weight
From
ft
To
ft
26
42
.375
.375
WALL
WALL
-22
57
30
16
Sizehole
below
casing
42
in
17
Static
level
15
ft
below
casing
top
which
is
ft
above
ground
level
Pumping
level
22
ft.when
pumping
at
826
gpm
for
hours
Permit
47367
mioicns
Bjom
Brown
clay
very
soft
20
Gray
clayvery
soft
20
25
Coarse
sandand
gravel
withboulders
at
40
water
bearing
25
54
Gravel
withboulders
very
loosewater
bearing
54
75
Medium
to
fine
sand
very
loose
water
bearing
75
90
Bedrock
at
90
Total
Depth
90
Plugged
back
87
Hole
record
52
30
42
30
87.5
Casing
record
42
to
30
26
to
575
Screen
record
30
of
26
Layne
Stainles
St
Shutter
type
slot
set
57.5
to
87.5
el
Gravel
pack
between
26
and
42
pipe
from
87.5
42
casing
cemented
from
30
Chief
aquifer
sandand
gravel
from
25
87
Nonpumping
level
18.02
below
measurin
pain
Pumping
level
24.29
below
measuring
loint
ifter
pumping
at
approximately
825
gpm
for
hour
Measuring
point
for
above
measurements
Hole
in
wel
housing
above
ground
level
S.S
60350
App
mile
north
of
Village
of
Hutsor
rille
near
Wabash
River
NO
ENVELOPE
18
Formations
passedthrough
Thickness
Bottom
cinders
sand
clay
med
to
soft
clay
17
22
soft
grayclay
26
f-med
gvl
bId
62
88
OMPANY
ATE
DRILLED
UTHORry
.EVATION
JCATION
UNTY
Crawford
120333386700
1708N11W
Layne-Western
Company
C.1.P.S.-Hutsonvjlle
Unit
NO.3
May
25
1976
COUNTY
NO
29913
State
Water
Survey
440T.M
350
line1630
line
SE
CRAWFORD
178N-l1W
Electronic Filing - Received, Clerk's Office, August 11, 2008 - AS 09-1, Exhibit 4
36941OM2-6727-o
ILLINOIS
GEOLOGICAL
SURVEY
URBANA
GEOLOGICAL
ANDWATER
SURVEYS
WELL
RECORD
10
Property
owner
Lingafetter
Brad
WeLL
No
Address
19961
North
1500thHutsonviLLe
IL
DrilLer
Hacker
Tim
License
No
092-6677
11
Permit
No
033-24-96
Date
11/08/96
12
Water
from
sand
13
County
Crawford
at
depth
25
to
30
ft
Sec
18
14
Screen
Diam
in
Twp
Length
ft
SLot
.02
Rge
11
ELev
ThIckness
Top
Bottom
Clay
10
10
Gnnmy
clay
andsand
Grayhardpan
Yellow
hardpan
Gray
shale
Lime
Dark
shale
14
i6
10
18
37
Li
.57
18
37
1i
S9
62
TD
Static
level
fromsurface
10
Tested
capacity
gallons
per
minute
3hot
torch
diameter
length
Bott
set
at
37
Di
am
in
Kind
and
eight
From
ft
To
ft
PVC
SDR
21
2j
16
Size
hoLe
beLow
casing
_________in
17
Static
LeveL
16
ft
below
casing
top
which
is
above
ground
Level
Purping
LeveL
ft
when
gpi
for
hours
ft
puTping
at
3D
18
Formations
passed
through
topsoil
stabiLizer
graveLLy
veL
coarse
brown
sand
with
smalLgraveL
MPANY
Eaton
RM
Johnson
Rollie
TE
DRILLEI9S1
JTKORITY
EVATION
CATION
NE
SW
NW
nTJtrrl
hard
brown
cLay
1808NllW
NO
COUNTY
NO
6b93
R_Rix...iiri
Household
Private
Crawford
120333638500
Electronic Filing - Received, Clerk's Office, August 11, 2008 - AS 09-1, Exhibit 4
Soil
gravel
Sand
gravel
with
clay
Sand
gravel
with
water
Sand
with
little
gravel
water
Coarse
gravel
and
some
sand
Static
level
from
surface
23
Tested
capacity
gallons
pe
drawdown
.OMPANy
Virgil
Eaton
and
-H
.IM
Newlin
Worgan
.1ATEDRILLEDMaTCh
1957
.UTHORITY
Virgil
Eaton
and
--tLEVATION
LOCATION
188Wliw
OUNTY
Son
NO
COUNTY
NO
Soh
2284450M9-55
Page
ILLINOIS
GEOLOGICAL
SURVEY
URBANA
Strata
Thlcknes
lop
Bottom
Page
ILLINOIS
GEOLOGICAL
SURVEY
URBANA
10
20
25
ter
32
miiute
Thlcknees
Strata
Soil
ad
clay
Yellow
clay
and
sand
Yellow
sand
nd
wter
Gray
sand
rdnan
s1i
1ouders
Grey
hrdnan
soft
t1acal
mud
lark
rreen
yeU.o\T
rlr
shle
and
slate
solid
Coal
snd
\JteT
ire
Sandy
sha
3ancy
lre
ron
shale
Top
20
01
14.0
Si
f9
o?
9L
96
cof
Bottom
20
21
140
51
6.2
95
on
oL
96
105
mr
J-0
20
25
32
37
TD
Cased
with
used
iron
nine
frc
3732920M5.6
7T
Static
Tsted
Store
lavel
from
ca-acitv
of
water
surfacer
90
gallons
in
wIl
11
per
NO
EVOPE
hou
l1oi
OMPANy
ARM
JATE
DRILLED
UTHORITy
L.EVATION
OCATION
OUNTY
Virgil
Eaton
Son
Mus
grave
William
L.No
Dec
l95
COUNTYNO
Virgil
Eaj
Approx
NE
NMN
CRAWFORD
1838
NO
F1VELOPE
1/2
of
NWSW
CRAWFORD
18-8W
11W
Electronic Filing - Received, Clerk's Office, August 11, 2008 - AS 09-1, Exhibit 4
15
Casing
nd
Liner
Pipe
SE
SE
SW
Diam
in
Kind
and
Weight
From
ft
To
ft
PLASTIC
10
SLOT
PIPE
10
14
16
Sizehole
below
casing
_________in
17
Static
level
______ft
below
casing
top
which
is
______________ft
above
ground
level
Pumping
Level
ft
when
pumping
at
______
gpm
for
hours
18
Formations
passedthrough
surface
sand
gravel
Thickness
Bottom
14
Property
rn
LOG
OF
WATERWELL
Drilled
by.
..Well
No_____
van
1c
Formations
passed
through
Thick
ness
Depth
of
Bottom
/t-o
/1
4A_
icy
11
IC0UNTYNo.2/iI
Cased
back
iSnecessary
.Finished
ir
-7--
c/
at
to
from
to
ft
Sizehole
below
casing
Tested
capacity_
Water
lowered
to
GEOLOGICAL
ANDWATER
SURVEYS
WELL
RECORD
10
Property
owner
Stephens
GiLbert
Well
No
____________
Address
R.R
Hutsonville
IL
DrilLer
Hacker
Delbert
License
No
102-2003
11
Permit
No
127747
Date
10/27/86
12
Water
from
sand
gravel
13
County
Crawford
at
depth
10
to
14
ft
Sec
18
14
Screen
Diam
in
Twp
Length
ft
Slot
.03
Rge
11
Elev
Crawford
120333418500
1808N11W
it
inch
Staticlevel
from
surf
ft
gaL
per
mm
Temperatur
hi
mm
1n
Length
of
test
hrs
nun
Screen
Township
Description
of
...Length
Bottom
set
at
ft
location
in
Section
Plat
RgeJ/d
oIogicaI
Survey
Copy
for
Illinois
Sjnpr1
im.1
?county
jt34f
Index
88N11W
Electronic Filing - Received, Clerk's Office, August 11, 2008 - AS 09-1, Exhibit 4
UESTED
AND
MAILORIGINAL
TO
TAT
JMER
HEALTh
PROTECTION
535
WEST
DO
NOT
.ETACH
GEOIflGICAL/WATER
ROPER
t?.
..
GEOLOGICAL
ANDWATER
SURVEYS
WELL
RECORD
10
Property
owner
FV
AICL4
Well
No
________
Address12-
Driller
7/
Vticense
No
0/
11
Permit
No
Date
7o
12
Water
from
.4PJ
ALICl3
County
________
Formation
at
depth___
ft
14
Screen
Diam
in
Length
_____ft
Slot_____________
GEOLOGICAL
AND
WATERSURVEYS
WELLRECORD
10
Property
owner
Earleywine
Mike
Well
No
____________
Address
R.R
Hutsonvitte
IL
Driller
Hacker
DeLbert
License
No
102-2003
11
Permit
No
127748
Date
10/27/86
12
Water
from
sand
13
county
Crawford
at
depth
18
to
20
ft
Sec
19
14
Screen
Diam
in
Twp
Length
25
ft
Slot
.03
Rge
11
El
ev
15
Casing
and
Liner
Pipe
Diam
in
Kind
.nd
Weight
From
Ft
To
Ft
pc.ptFrt
43
ii
Sec
________
Twp
gjtI
Rge
1/2
Elev
SHOW
LOCATION
IN
3?j
SECTION
PLAT
500
line
1500
line
NW
permit
16
Size
Holebelow
casing
in
17
Static
level
ft
below
casing
top
whichis_______________
ft
above
ground
level
Pumping
level
______
ft
when
pumping
at
gpm
for
_____
hours
Diam
in
Kind
and
Weight
From
ft
To
ft
PLASTIC
SLOT
PIPE
15
15
40
18
FORMATIONS
PASSED
THROUGH
THICKNESS
7c7P
So/c
yiLoUJ
LA/
cAtIL
H%
j944
19
13-
C4i
.7
16
Size
hole
below
casing
_________in
17
Static
level
______ft
belowcasing
top
which
is
above
ground
leveL
Pumping
level
ft
when
gpm
for
hours
ft
pumping
at
_______
?4J1
7s
CONTINUE
ON
SEPARATE
SHEET
IF
NECESSARY
SIGNED
CRAWFORD
18
Formations
passed
through
surface
11
18
clay
20
sand
40
gray
dirt
.A
TTTr
188N-11W
Crawford
120333418600
1908N11W
Electronic Filing - Received, Clerk's Office, August 11, 2008 - AS 09-1, Exhibit 4
36941OM2-672T-o
ILLINOIS
GEOLOGICAL
SURVEY
URBANA
Virgil
Eaton
Griffith
Walter
1950
Company
492
T.M
..-
OF
WATER
WELL
Page
01
..
19287
Finished
in1f
_ft
Cased
with
iflh_4
-_--
_frorn
__ft
Soil
and
yellow
clay
Soft
silty
mud
13
Solid
hardpan
29
Dark
gummy
hardpan
16
Sand
and
gas
Dark
gum
har4pan
26
Sand
and
water
Limestone
Total
Depth
Finished
in
sand
at
94
95
Casing
iron
pipe
from
95
slotted
from
94
95
Static
level
11
fromsurface
Tsted
capacity
g.p.m
REPORT
OF
GAS
FLJ
MEASURENT
by
W.
Mee
April
27
1971
Water
temperature
56F
through
30
gi
llon
tank
in
basement
and
100
of
buried
me
Barometer
reading
29.34
Gas
Volume
In
minutes
1/8
of
in
mason
jar
under.water
with
gallons
of
water
per
minute
passing
through
NOTE
Gas
wi1l
burn
S.S
21760
LtS
95
21
50
66
68
94
95
95
200
east
of
road
See
map
of
area
onback
of
log
NO
ENVELOPE
anl
_inch_-
froni____to_
ft
Size
hole
below
casing___-
_inch
Static
level
from
surf
_ft
Tested
capacity
._gal
per
mm
Tensperatur
_F
Water
lowered
to__
_ft
jn
jn
hrs
mm
Length
of
test_
_hrs-
_-niin
Screen
Slot.
Djani
Length
lBottoxn
set
at_
ft
location
in
Section
Plat
tElev
11
Township
Description
of
location_
TWW
Sr
3M
PANY
ARM
ATE
DRILLED
JTHORrIY
.EVATION
CATION
Ii
Tv
NO
COUNTY
NO
6496
1800
line
800
line
of
SW
CRAWFORD
Electronic Filing - Received, Clerk's Office, August 11, 2008 - AS 09-1, Exhibit 4
License
No
102-1229
Date
12/08/78
3732920M5-56
______
Pagel
ILLINOIS
GEOLOGICAL
SURVEY
URBANA
GEOLOGICAL
ANDWATER
SURVEYS
WELLRECORD
___________________________
Well
No
10
Property
owner
Storkman
Laddie
Address
Hutchsonvilte
IL
Driller
Bartmess
John
11
Permit
No
82788
12
Water
from
sand
at
depth
66
to
78
ft
14
Screen
Diarn
in
Length
ft
Slot
Sinta
Thicknese
Top
Bottom
Soil
aria
clsy
10
Yell
hr9ian
so1
10
Grp
hr1r2n
SO1
-r
cia1
muc
soft
Oreen
nii
sot
c-r
-9sn
so1i
Careen
2fl
rv
ssn
rood
suntly
iter
AL
try
ran
so1i
-ry
sn5
soft
fine
more
we
69
69
Gray
mu
sn
oravel
soft
70
7L
rpr
Cssin
from
to
7.t_
1usliron
rsvea
-ac
metbo
ise
ipe
Static
level
from
surfce
1L
TestecT
caiacity
270
l1ons
pr
oir
Stos-e
nf
ster
in
.re11
200
sl.o
is
I0
ENVOpE
13
County
Crawford
Sec
19
Twp
8N
Rge
11
Elev
400
200W
NEc
NW
15
Casing
and
Liner
Pipe
Diam
in
Kind
and
Weight
From
ft
To
ft
BLACK
20
-1
78
16
Sizehole
below
casing
6.25
in
17
Static
level
20
ft
below
casing
top
which
is
ft
above
ground
leveL
Pumping
Level
ft
when
pumping
at
______
gpm
for
hours
OMPANY
V1ril
Eaton
ARM
1iusgrave.
Hershel
JATEDRILLE
February
195-i-
UTHORITY
Virl
Eton
Son
LEVATION
OCATION
NENE
WiT
OUNTY
C1AWF0
PD
18
Formations
passedthrough
Thickness
Bottom
clay
sand
rock
36
40
softer
sand
10
50
sand
rock
16
66
water
bearing
sand
12
78
hard
sand
86
4.
COUNTY
1L72
19-8N-11W
Crawford
120333386800
1908N11W
Electronic Filing - Received, Clerk's Office, August 11, 2008 - AS 09-1, Exhibit 4
10.
Property
owner
Vandevender
Leroy
Address
HutsonvitLe
IL
DriLler
BartmesS
John
11
Permit
No
87751
12
Water
from
gravel
at
depth
76
to
81
ft
14
Screen
Diam
in
Length
______ft
SLot
_______________
Sec
19
Twp
8N
Rge
11
1ev
Property
owner
Warrpler
Duane
Address
R.R
Sullivan
IN
Welladdress
Hutsonvitte
IL
Lot
__________
Subd
____________________
Driller
Hacker
Tim
PerrniNo
033-1-97
Water
from
sand
gravel
at
depth
25
to
66
ft
Screen
Diam
12
in
Length
ft
Slot
.06
GEOLOGICAL
AND
WATERSURVEYS
WELLRECORD
Welt
No
...
.-
GEOLOGICAL
ANDWATERSURVEYS
WELLRECORD
__________________________
WelL
No
License
No
102-1229
Date
07/16/79
.13
County
Crawford
SWc
NE
NW
15
Casing
and
Liner
Pipe
200
300
Diam
in
Kind
and
BLACK
20
Weight
From
ft
To
ft
-1
81
ISWS
301186
License
No
092-6477
Date
01/15/1997
16
Sizehole
below
casing
_________in
17
Static
level
15
ft
below
casing
top
which
is
ft
above
ground
Level
Pumping
level
ft
when
pumping
at
______
gpm
for
hours
County
Crawford
Sec
20
Twp
8N
Rge
11
EL
ev
Casing
From
ft
To
ft
Diam
in
Kind
Weight
12
SCH
40
PVC
32
Sizehole
below
casing
_________in
Static
level
11
ft
belowcasing
top
which
is
above
ground
level
Pumping
level
ft.when
gpm
for
hours
18
Formations
passed
through
Thickness
Bottom
clay
18
18
sand
gravel
25
mudsand
20
45
mud
31
76
gravel
81
ft
pumping
at
1000
Formations
passed
through
Thickness
Bottom
topsoil
silty
dark
clay
17
20
gray
cLay
25
coarse
gray
sand
withfine-med
graveL
41
66
gray
clay
at
66
Crawford
120333386900
1908N11W
Irrigation
Crawford
12-033-36667-00
20-BN-11W
Electronic Filing - Received, Clerk's Office, August 11, 2008 - AS 09-1, Exhibit 4
Well
No
____________
License
No
092-6402
Date
02/10/89
County
Crawford
Property
owner
HutsonvilLe
City
of
Address
City
HalL
Hutsonville
IL
Driller
Petersen
Steven
Permit
No
132217
Water
from
Alluvial
at
depth
77
to
61
ft
14
Screen
Diam
10
in
Length
15
ft
Slot
.08
16
17
18
11
12
weLl
No
License
No
102-3092
Date
06/01/87
GEOLOGICAL
ANDWATERSURVEYS
WELLRECORD
10
Property
owner
Detnent
Margaret
Address
R.R
Box
Hudsonvilte
IL
Driller
Erwin
HaroLd
11
Permit
No
139628
12
Water
from
sand
gravel
13
at
depth______to
ft
14
Screen
Diam
16
in
Length
30
ft
Slot
.12
10
GEOLOGICAL
AND
WATERSURVEYS
WELLRECORD
Sec
20
Twp
8N
Rge
11
EL
ev
NWNW
NW
15
Casing
and
Liner
Pipe
Diam
in
Kind
and
Weight
From
ft
To
ft
16
PVC
WCSCH
80
64
16
Sizehole
beLow
casing
_________in
17
Static
level
______ft
belowcasing
top
which
is
______________ft
above
ground
Level
Pumping
leveL
ft
when
pumping
at
______
gpm
for
hours
13
County
Crawford
Sec
20
Twp
8N
Rge
11
Elev
1855
SEc
15
Casing
and
Liner
Pipe
557
Diam
in
Kind
and
Weight
From
ft
To
ft
10
STEEL
40.48/FT
-5
61
Sizehole
below
casing
24
in
Static
level
245
ft
below
casing
top
which
is
above
ground
level
Pumping
level
35
ft.when
pumping
at
400
gpii
for
hours
ft
18
Formations
passed
through
Thickness
Bottom
SS
66941
0-65
topsoil
fine
brown
sand
12
13
coarse
brown
sand
32
45
gravel
sand
19
64
Irrigation
Crawford
Formations
passed
through
Thickness
Bottom
fine
dark
brown
sand
fine
to
medium
sand
25
30
fine/med
sand
gvt
43
73
120333519600
2008N11W
Crawford
120333440500
2008N11W
Electronic Filing - Received, Clerk's Office, August 11, 2008 - AS 09-1, Exhibit 4