BEFORE THE ILLINOIS POLLUTION CONTROL BOARD
IN THE MA
TIER OF:
WATER QUALITY STANDARDS AND
EFFLUENT LIMITATIONS FOR THE
CHICAGO AREA WATERWAY SYSTEM
AND THE LOWER DES PLAINES RIVER:
PROPOSED AMENDMENTS TO
35 ILL..
ADM. CODE PARTS 301, 302, 303 and 304
)
)
)
) R08-9
) (Rulemaking - Water)
)
)
)
NOTICE OF FILING
To: see attached Service List
PLEASE TAKE NOTICE that on the 4
th
Day of August, 2008, I filed with the Office of
the Clerk of the Illinois Pollution Control Board the attached Prefiled Testimony of
Marylynn V. Yates, Ph.D., a copy of which is hereby served upon you.
PLEASE TAKE FURTHER NOTICE that pursuant to
35 Ill. Admin. Code 102.424(c),
Natural Resources Defense Council moves for a waiver
of service requirements for
Exhibits 2 and
5. Exhibit 2 is an Excel spreadsheet containing 5 megabytes of
information; is impossible to copy onto 81/2 X 11 paper; and is 434 pages long when
printed. Exhibit 7 is a CD-Rom
of the video presentation, containing more than 2
gigabytes
of information. Both exhibits would be very costly to copy and send to all
participants on the service list.
By:
_
Ann
Alexander, Natural Resources Defense Council
Dated: August 4, 2008
Ann
Alexander
Senior Attorney
Natural Resources Defense Council
101 North Wacker Drive, Suite 609
Chicago, Illinois 60606
312-780-7427
312-663-9920 (fax)
1
Electronic Filing - Received, Clerk's Office, August 4, 2008
CERTIFICATE OF SERVICE
I,
Ann
Alexander, the undersigned attorney, hereby certify that I have served the attached
Prefiled Testimony of Marylynn V. Yates on all parties of record (Service List attached),
by depositing said documents in the United States Mail, postage
pr~aid,
from 227 W.
Monroe, Chicago, IL 60606, before the hour of 5:00 p.m., on this 4 Day of August,
2008.
Ann
Alexander, Natural Resources Defense Council
2
Electronic Filing - Received, Clerk's Office, August 4, 2008
Richard J. Kissel and Roy M. Harsch
Drinker, Biddle, Gardner, Carton
191 N. Wacker Drive, Suite 3700
Chicago, IL 60606-1698
Deborah J. Williams and Stefanie N. Diers
Assistant Counsel, Division
of Legal Counsel
Illinois Environmental Protection Agency
1021 North Grand Avenue East
P.O.
Box 19276
Springfield, IL 62794-9276
Kevin G. Desharnais, Thomas W. Diamond
and Thomas V. Skinner
Mayer, Brown
LLP
71 South Wacker Drive
Chicago, IL
60606-4637
Robert VanGyseghem
City
of Geneva
1800 South Street
Geneva, IL
60134-2203
Matthew J. Dunn, Chief
O,ffice ofthe Attorney General
Environmental Bureau North
69 West Washington, Suite 1800
Chicago, IL 60602
Charles W. Wesselhoft and James T. Harrington
Ross
&
Hardies
150 North Michigan Avenue
Suite
2500
Chicago, IL 60601-7567
Jerry Paulsen and Cindy Skrukrud
McHenry County Defenders
132 Cass Street
Woodstock, IL
60098
Service List
Bernard Sawyer and Thomas Granto
Metropolitan Water Reclamation District
6001 West Pershing Road
Cicero, IL 60650-4112
James L. Daugherty, District Manager
Thorn Creek Basin Sanitary District
700 West End Avenue
Chicago Heights, IL
60411
Tracy Elzemeyer, General Counsel
American Water Company Central Region
727 Craig Road
St. Louis,
MO 63141
Claire Manning
Brown, Hay
&
Stephens LLP
700 First Mercantile Building
205 South Fifth St., P.O. Box 2459
Springfield, IL 62705-2459
Katherine D. Hodge and Monica T. Rios
Hodge Dwyer Zeman
3150 Roland Avenue
P.O. Box
5776
Springfield, IL 62705-5776
Margaret P. Howard
Hedinger
Law Office
260 I South Fifth Street-
Springfield, IL
62703
Keith
I.
Harley and Elizabeth Schenkier
Chicago Legal Clinic, Inc.
205 West Monroe, 4
th
Floor
Chicago, IL
60606
3
Electronic Filing - Received, Clerk's Office, August 4, 2008
William Richardson, Chief Legal Counsel
Illinois Department ofNatural Resources
One Natural Resources Way
Springfield, IL 62702
Lisa Frede
Chemical Industry Council of Illinois
2250 E. Devon Avenue
Suite 239
Des Plaines, IL 60018-4509
Sharon Neal
Commonwealth Edison Company
125 South Clark Street
Chicago, IL 60603
James Huff, Vice-President
Huff
&
Huff, Inc.
915 Harger Road, Suite 330
O~
Brook, IL 60523
Cathy Hudzik
City of Chicago, Mayor'sOffice of Intergovernmental Affairs
121 North laSalle Street
City Hall - Room 406
Chicago, IL 60602
Irwin Polls
Ecological Monitoring and Assessment
3206 Maple Leaf Drive
Glenview, IL 60025
Marc Miller, Senior Policy Advisor
Jamie S. Caston, Policy Advisor
Office of Lt. Governor Pat Quinn
Room 414 State House
Springfield, IL 62706
Frederick D. Keady, P.E., President
Vermillion Coal Company
1979 Johns Drive
Glenview, IL 60025
Fred L. Hubbard
Attorney at Law
16 West Madison
P.O. Box 12
Danville, IL 61834
W.C. Blanton
Blackwell Sanders LLP
480 I Main Street
Suite 1000
Kansas City, MO 64112
Traci Barkley
Prairie Rivers Networks
1902 Fox Drive
Suite 6
Champaign, IL 61820
Georgie Vlahos
Naval Training Center
2601A Paul Jones Street
Great Lakes, IL 60088-2845
Dennis L. Duffield
Director of Public Works
&
Utilities
City of Joliet, Department of Public Works & Utilities
921 E. Washington Street
Joliet, IL 60431
Ann Alexander, Senior Attorney
Natural Resources Defense Council
101 North Wacker Drive, Suite 609
Chicago, IL 60606
Beth Steinhorn
2021 Timberbrook
Springfield, IL 62702
Dr. Thomas 1. Murphy
DePaul University
2325 N. Clifton Street
Chicago, IL 60614
4
Electronic Filing - Received, Clerk's Office, August 4, 2008
Susan M. Franzetti
Nijman Franzetti LLP
10 S. LaSalle Street, Suite 3600
~hicago,
IL 60603
Vicky McKinley
Evanston Environmental Board
223 Grey Avenue
Evanston, IL 60202
Albert Ettinger, Senior Staff Attorney, and Jessica Dexter
Environmental Law and Policy Center
35 E. Wacker Drive, Suite 1300
Chicago, IL 6060 I
Tom Muth
Fox Metro Water Reclamation District
682 State Route 31
Oswego, IL 60543
Jack Darin
Sierra Club, Illinois Chapter
70 E. Lake Street, Suite 1500
Chicago, IL 60601-7447
Kay Anderson
American Bottoms RWTF
One American Bottoms Road
Sauget, IL 62201
Kristy A.N, Bulleit and Brent Fewell
Hunton
&
Williams LLC
1900 K. Street, NW
Washington, DC 20006
Jeffrey C. Fort and Ariel Tescher
Sonnenschein Nath
&
Rosenthal LLP
7800 Sears Tower
233 S. Wacker drive
Chicago, IL 60606-6404
Marie Tipsord, Hearing Officer
John Therriault, Assistant Clerk
Illinois Pollution Control Board
100 West Randoph, Suite 11-500
Chicago, IL 60601-7447
Stacy Myers-Glen
Openlands
25 East Washington, Suite 1650
Chicago, IL 60602
Susan Hedman and Andrew Armstrong, Environmental Counsel
Environnmental Bureau
Office of the Illinois Attorney General
69 West Washington, Suite 1800
Chicago, IL 60602
Kenneth W. Liss
Andrews Environmental Engineering
3300 Ginger Creek Drive
Springfield, IL 62711
Bob Carter
Bloomington Normal Water Reclamation District
P.O. Box 3307
Bloomington, IL 61702-3307
Ronald M. Hill and Margaret T. Conway
Metropolitan Water Reclamation District of Greater Chicago
100 East Erie Street, Room 301
Chicago, IL 60611
Frederic P. Andes, Carolyn S. Hesse and David T. Ballard
Barnes
&
Thornburg LLP
One North Wacker Drive, Suite 4400
Chicago, IL 60606
5
Electronic Filing - Received, Clerk's Office, August 4, 2008
BEFORE THE ILLINOIS POLLUTION CONTROL BOARD
IN THE MA
TIER OF:
WATER QUALITY STANDARDS AND
EFFLUENT LIMITATIONS FOR
THE
CHICAGO AREA WATERWAY SYSTEM
AND THE LOWER DES PLAINES RIVER:
PROPOSED AMENDMENTS TO 35 ILL.
Adm. Code Parts 301, 302, 303, and 304
)
)
)
)
)
)
)
)
R08-9
(Rulemaking - Water)
TESTIMONY OF DR. MARYLYNN V. YATES
I. Introduction and summary
My name is Dr. Marylynn V. Yates. I appreciate the opportunity to testify today on
behalf
of Natural Resources Defense Council, Environmental Law and Policy Center, Sierra
Club - lllinois Chapter, Friends
of the Chicago River, and Openlands in support of the water
quality standards regulations proposed
by the lllinois Environmental Protection Agency
("IEPA") requiring disinfection
of effluent discharged to the Chicago Area Waterway System
("CAWS") from the wastewater treatment plants ("WWTPs") operated
by the Metropolitan
Water Reclamation District ("MWRD").
My testimony today is based upon my nearly 25 years
of experience in the field of
microbiology, in which my sub-specialty is waterborne pathogen contamination; as well as
review of microbial sampling data, risk studies, and other data specifically pertinent to the
CAWS. From
my years of experience, I know that disinfection of WWTP effluent is
fundamental to public health whenever there is any appreciable human contact with the receiving
waterbody; and that such disinfection is standard practice in both major cities and many smaller
communities across the United States. From my review
of data pertinent to the CAWS,
including submissions from
MWRD in connection with the use attainability analysis ("UAA")
process preceding the IEPA rulemaking, it is clear to me that the CAWS is no exception.
Continued failure to disinfect sewage effluent discharged to the CAWS may result in a
substantial and unnecessary risk to public health.
Specifically, I have found as follows:
•
Dry-weather pathogen contamination comes from WWTPs. The CAWS contains
measurable human pathogen levels during dry-weather conditions, which are largely
attributable to
WWTP effluent discharge. Disinfection of WWTP effluent discharged to the
CAWS would thus reduce pathogen loads, and the concomitant human health risks
associated with exposure to those pathogens, during dry weather.
•
Dangerous human pathogens are very likely present in the CAWS. The levels
of indicator
bacteria present in the
CAWS downstream of the WWTP outfalls are very strong evidence
of the presence of high levels of human fecal material, which likely contains human
1
Electronic Filing - Received, Clerk's Office, August 4, 2008
pathogens. There are hundreds of different types of pathogens that can be present in
sewage-contaminated wastewater, many
of which can cause multiple types of serious
illnesses - particularly in sensitive populations such as children, pregnant women, the
elderly, and immunocompromised individuals
(u.,
people undergoing chemotherapy).
•
Previous research shows risk to recreational users. Previous studies
of waterbodies with
much lower concentrations
of indicator bacteria than the CAWS have demonstrated risk to
recreational users from waterborne pathogens, even absent primary contact
(swimming/intentional immersion) use.
•
Current efforts to re-evaluate pathogen indicator criteria have no bearing
on the question of
effluent disinfection. Although the current federal criteria for pathogen indicators are
imperfect and currently undergoing revision, the outcome of this revision process will
almost certainly not lead to a conclusion that disinfection
of MWRD WTTP effluent is
unnecessary or inappropriate. The revision is taking place out of concern that the current
criteria are insufficiently protective, such that any new standard that emerges will likely be
more protective
of public health, not less so.
•
MWRD's risk assessment has numerous flaws. The wet and dry weather risk assessment
performed by MWRD's subcontractor, Geosyntec consultants,
is rife with large and small
analytical errors that create a strong bias toward its conclusion
of no significant risk to
CAWS recreators. Among other things, the risk assessment evaluates only a small fraction
of the human pathogens typically associated with sewage-contaminated wastewater, and
only one
of many types of illness generally associated with such pathogens.
•
MWRD's epidemiological study is not a sufficient tool to assess the need for disinfection.
Regardless
of its outcome several years from now, the epidemiological study being
conducted by MWRD concerning recreational use of the CAWS will not be sufficient basis
for a decision whether disinfection is necessary.
II. Qualifications
A copy of my curriculum vitae is attached as Exhibit
1.
I am an expert in environmental microbiology. My research is concentrated in the area
of water and wastewater microbiology, focusing in particular on assessing the potential for the
contamination
of water by human pathogenic microorganisms. Among other things, I have done
substantial work concerning identification of waterborne pathogens, assessing the potential for
human pathogen contamination
of water bodies (through use of indicator bacteria and other
methods) and fate and transport of such pathogens and indicator microorganisms in the
environment. I also have experience in the area of environmental microbial risk assessment, and
have personally been involved with the United States Environmental Protection Agency
("USEPA") in the development
of methods for indicator microorganisms, specifically methods
1601 and 1602, which are used for the detection
of bacteriophages.
I received my Ph.D. in 1984 from the University of Arizona, and am currently a Professor
of Environmental Microbiology at University of California, Riverside. I also serve as statewide
Program Leader for Natural Resources and Animal Agriculture in the Division of Agriculture
and Natural Resources of the University of California system. I have additionally served as
2
Electronic Filing - Received, Clerk's Office, August 4, 2008
Chair of the Department of Environmental Sciences, and as Associate Executive Vice Chancellor
at the University of California, Riverside.
I have published more than 50 peer-reviewed scholarly articles in my field, and written or
contributed to 6 books. The articles include the following:
•
Rose,
J.R, RL. Mullinax, S.N. Singh, M.V. Yates and c.P. Gerba. 1987. Occurrence of rota
and enteroviruses in recreational waters
of Oak Creek, Arizona.
Water Research
21:1375-1381.
•
Anderson, M. A., M.H. Stewart, M.V. Yates, and
c.P. Gerba. 1998. Modeling the impact of
body-contact recreation on pathogen concentrations in a source drinking water reservoir.
Water Research 32:3293-3306.
•
Stewart, M.H., M.V. Yates, M.A. Anderson, c.P. Gerba, J.B. Rose, R DeLeon, and RL.
Wolfe. 2002. Predicted public health consequences of body-contact recreation on a potable
water reservoir.
J.
Amer. Water Works Assoc.
94:84-97.
•
Davis, K., M.A. Anderson, and M.V. Yates. 2005. Distribution
of indicator bacteria in
Canyon Lake, California.
Wat. Res., 39:1277-1288.
•
Yates, M.V., J. Malley, P. Rochelle, and R Hoffman. 2006. Effect of adenovirus
resistance on UV disinfection requirements - a report on the state
of adenovirus science. J.
Amer. Wat. Works Assoc., 98(6):93-106.
•
Yates, M.V. 2007. Classical Indicators in the 21st Century -- Far and Beyond the
Coliform.
Wat. Environ. Res. 79(3):279-286.
The books include the following:
•
Committee to Improve the U.S. Geological Survey National Water Quality Assessment
Program. 2002. Opportunities to Improve the U.S. Geological Survey National Water
Quality Assessment Program. National Academy Press, Washington, DC. 238 pp.
•
Committee on Indicators for Waterborne Pathogens. 2004. Indicators for waterborne
pathogens. National Academies Press, Washington, D.C. 315 pp.
I have participated in numerous expert workshops, including the following:
•
Invited participant, Workshop
on Indicators for Pathogens in Wastewater, Stormwater, and
Biosolids, Water Environment Research Foundation, San Antonio, TX, December 11-12,
2003
•
Invited participant, Models and Tools for Including Susceptibility, Immunity, and
Secondary Spread into Microbial Risk Assessment Workshop, Cincinnati, OH, November
18-19,2004
•
Invited participant, Major Accomplishments and Future Directions in Public Health
Microbiology Workshop, United States Geological Survey, Columbus, OH February
15-
18,2005.
•
Invited participant, Pathogens in Groundwater Experts Workshop. Toronto, Ontario,
Canada, June 5-6, 2006.
I have given dozens
of invited presentations, including the following:
3
Electronic Filing - Received, Clerk's Office, August 4, 2008
•
The Framework. Microbial Risk Factor: Recommendations to the USEPA on the Process
pf Determination of Microbial Standards in Drinking Water, Water Quality Technology
Conference, Salt Lake City, UT, November 7,2000.
•
Body-Contact Recreation: Microbial Health Risks. American Water Works Association
conference on Source-Water Protection. Las Vegas, NV, January
27,2002
•
Interpreting Results from Emerging and Traditional Methods for Detection of
Microorganisms, Major Accomplishments and Future Directions in Public Health
Microbiology Workshop, United States Geological Survey, Columbus, OH, February
16,
2005
•
Microorganisms in water: quantitative risk assessment, School
of Engineering,
Mathematics, and Science, Purdue University Calumet, Hammond, IN, July 6, 2005
•
Waterborne Viruses: Types, Health Effects, and Detection Methods. Viruses in Water
Symposium, Walkerton Clean Water Center, Toronto, Ontario, Canada, October 26,2006
•
Keynote Speaker. Adenoviruses and Ultraviolet Light: an Introduction. Adenovirus and
UV Disinfection session. World Congress on Ozone and Ultraviolet Technologies, Los
Angeles, California USA. August 27-29,2007
I have served on numerous scientific panels and professional and scientific committees,
including the following:
•
Expert Advisory Panel, Canadian Water Network Consortium on Pathogens and
Groundwater,07-present
•
Member, project advisory committee, Challenge organisms for inactivation
of viruses by
ultraviolet treatment, American Water Works Association Research Foundation-D6-
present
•
Member, Committee on Indicators
of Waterborne Pathogens, National Research Council
- 02-04
I also serve
as an Editor for
Applied
&
Environmental Microbiology,
handling more than
150 manuscripts per year. In addition, I have reviewed numerous scientific manuscripts for other
scholarly journals, and have served
as a grant proposal reviewer (ad hoc and on governmental
panels), and have served
as a reviewer and consultant in numerous other capacities.
Ill. Documents reviewed
I have reviewed, inter
ali~
the following documents concerning the CAWS in connection
with this testimony:
•
The UAA fmal report, previously submitted
as evidence in this proceeding.
•
MWRD CAWS monitoring data available on
MWRD'sweb site,
http://www.mwrdgc.dst.il.us/.
4
Electronic Filing - Received, Clerk's Office, August 4, 2008
•
The MWRD pathogen sampling data compiled by USEPA Region 5 in connection with
its Urban Rivers analysis, submitted separately as Exhibit
2.
1
•
The charts summarizing MWRD pathogen sampling data prepared by USEPA Region 5
(the "USEPA Graphs"), attached as Exhibit
3.
•
The Dry and Wet Weather Risk Assessment of Human Health Impacts of Disinfection or
No Disinfection
of the Chicago Area Waterway System (CWS)" prepared by Geosyntec
Consultants (the "Risk Assessment"), available on
MWRD's web site,
http://www.mwrdgc.dst.il.us/.
•
Review
of the Risk Analysis by USEPA ("USEPA Review"), attached as Exhibit 4.
• A videotape and powerpoint slides from an oral presentation
by Dr. Sam Dorevich of the
University
of Illinois at Chicago ("UIC") School of Public Health on February 27, 2008
concerning the epidemiological study being conducted
by UIC on behalf of MWRD (the
"Epidemiological Study"). The powerpoint slides are available on
MWRD's web site,
http://www.mwrdgc.dst.il.us/. The videotape
is submitted separately as Exhibit 5.
2
In addition, I have conducted a literature search for peer-reviewed scientific publications
concerning pathogen risk to non-primary contact recreational waterway users.
IV. MWRD WWTPs are the Predominant Dry Weather Pathogen Source
I have concluded from the documents I have reviewed in this matter that the MWRD
WWTPs are the largest source
of pathogens in the CAWS during dry weather (excluding the few
days immediately following a wet weather event when there may
be lingering pathogen
contamination from combined sewer overflows ("CSOs")). Accordingly, disinfection
of WWTP
effluent would greatly reduce pathogen contamination
of the CAWS during dry weather.
A.
MWRD Sampling Data Reflect WWTP Emuent as the Primary Source of
Pathogens During Dry Weather
As stated in the final UAA report and the Risk Assessment, the CAWS is heavily effluent
dominated, with approximately 70 percent
of the flow on dry days coming from the MWRD
WWTPs. Logically speaking, given this effluent domination and the absence
of CSOs during
dry weather, pathogens in the WWTP effluent will be the predominant source
of pathogens in the
waterway. This logical inference is borne out
by the available data.
The presence
of pathogens is generally assessed by testing for indicator bacteria - i.e.,
types
of bacteria that are typically not pathogenic (disease-causing), but which signal the
presence
of fecal contamination, and thus the likely presence of at least some pathogens. The
most commonly-used indicator bacteria, for purposes
of regulation and recreational closing
I
Counsel note -- Natural Resources Defense Council has filed a copy of Exhibits 2 and 5 with the Board, and moves
for a waiver of service requirements upon hearing participants pursuant to 35 Ill. Admin. Code 102.424(c), as
indicated in the Notice of Filing.
2 Please see footnote 1.
5
Electronic Filing - Received, Clerk's Office, August 4, 2008
determinations, are total and fecal colifonns and
E. coli;
enterococci are also used. Generally
speaking, there are a number
of potential contributors of indicator bacteria to water. These
include wastewater, direct inputs of human fecal material, and animals, both domestic and wild.
The same is true for several bacterial pathogens (e.g.,
Salmonella, Campylobacter),
as well as
certain species of
Giardia
and
Cryptosporidium.
This is not typically the case for the human
viruses
(e.g.,
enteroviruses, human adenoviruses), which are typically species-specific.
The indicator bacteria sampling data collected by MWRD in the CAWS indicates a
strong pattern during dry weather of high levels of bacterial contamination at the plant outfall,
which drops gradually
as the effluent travels downstream. For example, monitoring data from
the North Shore channel and North Branch Chicago River show that the fecal colifonn
concentrations are lower
«2000 cfu/l00
ml)
upstream of the Northside treatment plant, increase
to more than 19,000 cfu/lOO
ml
at the discharge point from the plant, then remain above the
upstream concentrations for at least 6.75 miles. A similar trend is observed in the Little Calumet
River and Cal-Sag River: upstream fecal colifonn concentrations are below 200
cfu/l00
ml,
the
concentration increases to more than 8,000 cfu/l00
ml
at the discharge point from the Calumet
plant, and the concentration remains above the upstream levels for at least 6.3 miles downstream.
This pattern is visible in the following USEPA
Graphs, for the CAWS regions near the
Northside and Calumet WWTPs, respectively:
FIGURE
1: NORTHSIDE REGION SAMPLING DATA
North Shore Channel and North Branch Chicago River
Ambient May to October 2002 Geometric Mean Fecal
Coliform
Norlhside =
19.538
12,000
10,000
-t-----------il-----i
-
-
E
...I 8,000
+---------+-l-.....--
~E
-
Cl
g
~
6,000
+---------+-l
iii:;
uu..
:. (,) 4,000
+---------+-l
-
-
-
2,000
f-- f-- f--
o
r.::=:I
D
r.:::::l.....
. ...
.[.:::::l...
Central Dempster Oakton
Tollly
Foster
Wilson
Diversey
Grand
0.75
325
42
6.75
10.5
Source: MWRDGC
General Use
30
. mean 200 r l00rri.
6
sampled t.tlnthly
• -lJi<lance
dowIslr_ all11ClMo<I1g station
fnlm
WWTP
Electronic Filing - Received, Clerk's Office, August 4, 2008
FIGURE 2: CALUMET REGION SAMPLING DATA
LltUe Calumet River and Cal-Sag River
May to OCtober 2002 Geometric Mean Fecal Coliform
Calumet =8,231
2,000
.---
1,500
E..,J
~
E
=0
-;:)
g
~
1,000
r--
rJ ...
.fU
500
.......................uu.....
....... ......... ..................
..........
..................R...................;::::::::;......
....
0
r---1
Indiana
Halsted
Ashland
Cicero
Route 83
1.3
2.3
6.3
172
Source: MWRDGC
Sampled Monthly
.................
GeneIlII USe 30 day geometric mean 200 per 100rnL limnl
• - Dstance dowlstTeem of monitoring station lrem WWTP
As illustrated, the level of indicator bacteria at the sites upstream of the WWTP outfalls is low,
increases to very high levels at the
WWTP outfall, and declines downstream of the outfall.
In
addition, many of the dry weather analyses in the CAWS for human viruses - which,
as noted above, are typically species specific and cannot be attributed to animal sources such as
seagulls and other wildlife - frequently showed higher levels of pathogens at the WWTP outfalls
as compared with the upstream levels. For example, on
8/18/05
and
8/25/05
(the only dates on
which measurable concentrations of "enteric,,3 viruses were detected) at the Northside site, the
concentrations were
<1 MPNIlOOL and 1.04 MPN/lOOL at the upstream surface sites, and 2.12
MPN/100L
and 16.07
MPN/100L
at the downstream sites.
If
the major dry-weather contributor of fecal coliforms were animal sources -
~,
seagulls and other wildlife - one would expect that the concentration would be relatively
consistent upstream and downstream
of the treatment plant. Where, as here, that is not the case,
3 The method used detects viruses that are culturable on the specific cell line used, in this case the BGM cells. The
use
of the term "enteric viruses" is not an accurate characterization of the analyses performed, but is the term used in
the Geosyntec report; thus its use here
..
7
Electronic Filing - Received, Clerk's Office, August 4, 2008
it is more likely than not that the high concentrations of fecal coliforms are due to inputs from
the wastewater treatment plant.
B. Disinfection of WWTP Emuent Would Substantially Reduce CAWS Pathogen
Loading During Dry Weather
Since MWRD WWTP effluent is the primary source of pathogens in the CAWS during
dry weather, disinfection
of that effluent will substantially reduce CAWS dry weather pathogen
loading. Conventional WWTPs that do not disinfect their effluent, such as those discharging to
the CAWS, are not specifically designed to reduce the number of human-excreted pathogens,
including excreted viruses; it
is the disinfection step that is specifically designed to decrease
pathogen concentrations (Oragui, 2003). Although disinfection affects different organisms to
different degrees, and different disinfectants may be more or less effective for each, broadly
speaking disinfection greatly reduces effluent pathogen levels. Indeed,
"Disinfection is an essential and final barrier against human exposure to disease-causing
pathogenic microorganisms, including viruses, bacteria, and protozoan parasites.
Chlorination was initiated at the beginning
of the twentieth century to provide an
additional safeguard against pathogenic microorganisms. The destruction
of pathogens
and parasites disinfection helped considerably in the reduction
of waterborne and food-
borne diseases." (Bitton, 2005)
The effectiveness
of disinfection in reducing indicator bacteria loads is well illustrated by
USEPA'sUrban Rivers analysis, prepared by USEPA Region 5, which compared indicator
bacteria levels in the
CAWS with levels in urban waterbodies where effluent disinfection is
required. The results are set forth in Figure 3 below:
FIGURE 3: URBAN RIVERS ANALYSIS
Urban Rivera Anlllysls: Comparison of Focus AraBS
WWT?
effluent data and dow nstream we rronttoring stations
8,231
19,538 10,950
2000
1500
~
...
o E
~ ~
1000
l~
u.
500
o
UttIe Cah.rrui.
CoI.sag
OIannel
(2)
Nor1Il Shore,
Nor1Il_OIlcagoR
(3)
MisslssIppI
River
F0:
River
Delawarl RNer
Tvoln Cllles.1AN
Elgil. IL
Philad_. PA
(10)
(2)
(I)
I_
WWT?
III we rronttoring station I
....pyer ..........
"ft
......
_ WWTP
_-did;
WO __'1IDIIIIlI
\~
.F_ caIIIorm
rncntollng _
... __
In
the
......
--
_11M
number•
SImpleo
01
CClIony
--
-.~,
"""*111 ..... (CFU)May-OotIbof
per 10llmL
3OdIy~_2llOporlOOTll._
(')-a-..__
01 monItDotng ..
1Ion
loom WWTP
8
Electronic Filing - Received, Clerk's Office, August 4, 2008
While the concentrations of pathogens were not measured, as noted above, it is generally true
that the greater the numbers
of indicator microorganisms present in the water, the greater the
number of pathogens present as well (Committee on Indicators for Waterborne Pathogens.
2004). In each of the three communities studied that practice disinfection described in this chart,
levels
of bacteria in the WWTP effluent were much lower than the 200 colonies/IOO
ml
general
use/primary contact standard (represented
by the dotted line), and downstream fecal coliform
levels rose only slightly higher from other urban sources (CSOs, wildlife, etc.), only in one case
marginally higher than the general use standard.
I note also that disinfection
is longstanding standard practice in most major metropolitan
areas in the U.S., and is implemented in many smaller communities as well (occasionally with
limitations based on season or other factors). Chicago is very much an outlier in implementing
this basic public health precaution that has long been in place elsewhere.
v. The Sampled Levels of Indicator Bacteria Show a Likely Presence of Dangerous
Pathogens
A. Types of Waterborne Pathogens Associated with Sewage
Effluent from WWTPs treating human sewage can potentially contain more than 100
different types
of waterborne pathogens that can cause illness in humans. These pathogens can
include bacteria, viruses, and parasites. A list of types of human pathogens that can be
transmitted through ingestion
of or contact with water can be found in Exhibit 6 (Moe, 2007).
The majority
of these organisms are associated with fecal material, although there are some
exceptions (e.g.,
Legionella).
Some of the more harmful and/or prevalent types of human pathogens associated with
fecal material, and therefore present in domestic sewage, are
as set forth in Table 1 below:
TABLE
1: HUMAN PATHOGENS ASSOCIATED WITH FECAL MATERIAL
Or2anism
Disease
Comments
Adenovirus
respiratory illness,
Highly resistant to disinfection using
conjunctivitis, vomiting,
standard UV light; used by EPA
as the
diarrhea
basis of the UV disinfection requirements
in LT2ESWTR
4
•
On EPA'sDrinking
Water Contaminant Candidate List 2.
Coxsackie A and B
meningitis, fever,
Non-polio enteroviruses are estimated to
viruses
herpangina, respiratory
cause 10-15 million symptomatic
illness, myocarditis,
infections per year in the U.S.
5
On EPA's
congenital heart anomalies,
Drinking Water Contaminant Candidate
rash, fever, pleurodynia
List 2
4 Long-Term 2 Enhanced Surface Water Treatment Rule.
S
All numbers of cases per year cited in this table are total numbers of cases reported. Not all such cases are
attributable to water.
9
Electronic Filing - Received, Clerk's Office, August 4, 2008
Echoviruses
meningitis, encephalitis,
Non-polio enteroviruses are estimated to
respiratory illness, rash,
cause
10-15 million -symptomatic
diarrhea, fever
infections
per year in the U.S. On EPA's
Drinking Water Contaminant Candidate
List
2.
Hepatitis A virus
infectious hepatitis
Among the more persistent waterborne
viruses.
High degree of asymptomatic
infections in children. Greatest danger
of
spreading the disease to others occurs
well before the onset
of symptoms. On
EPA's draft Drinking Water Contaminant
Candidate List
3.
Norovirus
vomiting and diarrhea
Estimated to cause 23 million cases of
illness per year in the U.S.; illness is
relatively mild and short-lived. No
method
to detect infective viruses has
been established.
On EPA's draft
Drinking Water Contaminant Candidate
List
3.
Rotavirus
diarrhea, vomiting
Major cause
of diarrhea in young
children; causes more than
3 million
cases
of illness per year in the U.S.
Significant cause
of childhood death in
developing countries
(-1 million/year).
Excreted
in very high numbers in feces
(-10 billion/gram).
Salmonella
typhoid, paratyphoid,
The most predominant bacterial
salmonellosis
pathogens in wastewater;
-0.1 %
population are healthy carriers and
excrete it
in their feces. Causes 2-4
million cases of illness per year in the
U.S.
Salmonella enterica
is on EPA's
draft Drinking Water Contaminant
Candidate List
3.
Shigella
bacillary dysentery
Principally a disease of humans. Has
relatively low infectious dose relative to
most enteric bacteria (-10 organisms).
Causes
-300,000 cases of illnesses per
year
in the U.S.
Shigella sonnei
is on
EPA's draft Drinking Water Contaminant
Candidate List
3.
10
Electronic Filing - Received, Clerk's Office, August 4, 2008
pathogenic
E. coli
gastroenteritis, hemolytic
Some strains cause hemolytic uremic
uremic syndrome
syndrome, and may lead to permanent
kidney damage'ormortality. Young
children and the elderly appear more
susceptible to severe illness.
E. coli
0157:H7 is on EPA's draft Drinking
Water Contaminant Candidate List 3.
CampyLobacter
gastroenteritis
Causes
-4 millions cases/year in U.S.
Infection may lead to Guillain-Barre
syndrome, an acute paralytic illness.
CampyLobacter jejuni
is
on EPA's draft
Drinking Water Contaminant Candidate
List 3.
Vibrio
cholera
This disease
is endemic in certain areas
(e.g., Asia, Bangladesh), and causes
epidemics as well, but is relatively rare in
the U.S.
Vibrio choLerae
is on EPA's
draft Drinking Water Contaminant
Candidate List 3.
Giardia Lamblia
diarrhea, malabsorption
Domestic and wild animals are reservoirs.
May
be most frequent cause of non-
bacterial diarrhea in North America.
Relatively long incubation period (1-8
weeks). Infection may last months, but
is
rarely fatal. Regulated by EPA as a
drinking water contaminant.
Cryptosporidium
diarrhea
Caused largest documented waterborne
disease outbreak in U.S. history
(>400,000 illnesses, 100 deaths).
Particularly severe in
immunocompromised populations.
Relatively resistant to removal
by
traditional drinking water treatment
processes. Regulated
by EPA as a
drinking water contaminant.
While the concentrations
of pathogens may be reduced incidentally during primary and
secondary sewage treatment processes, disinfection
is specifically designed to decrease the
concentrations of pathogenic microorganisms, as discussed above.
As noted in the table, many waterborne pathogens are considerably more dangerous for
members
of sensitive populations, i.e. those whose age or physical condition make them more
vulnerable to infection. These sensitive populations include, among others, children, the elderly,
pregnant women, and immunocompromised persons (including people undergoing chemotherapy
or taking organ transplant anti-rejection medication).
11
Electronic Filing - Received, Clerk's Office, August 4, 2008
B. Multiple Exposure Pathways From Non-Primary Contact Use
There are multiple ways that non-primary contact users of a waterway can be exposed to
waterborne pathogens that may
be present there. Water may be ingested in large amounts -
~
resulting from accidental immersion and associated involuntary gulping - or small amounts -
U"
from eating food with wet hands, or small children with high levels of hand- to- mouth
contact. Water droplets may also be inhaled, or may be absorbed through the skin - particularly
when there are skin cuts and abrasions present. Infections may also result from the exposure
of
mucous membranes to contaminated water, causing eye infections (i.e., conjunctivitis), for
example.
Illnesses associated with contact with water vary depending
on type of contact (ingestion,
inhalation, skin contact) and specific organism(s) to which exposure occurs. Ingestion can result
in gastroenteritis, which may be caused
by numerous organisms (such as those in the table
above); inhalation can result in respiratory infections, caused by organism such
as adenoviruses;
skin contact can result in dermatitis, conjunctivitis, and otitis.
The chart below (CDC,2006) summarizing recreational water-associated outbreaks
illustrates the distribution
of various types of illnesses (gastroenteritis, skin infections,
respiratory infections, etc.) for the past 26 years:
FIGURE
4: CDC SUMMARY OF RECREATIONAL WATER-ASSOCIATED OUTBREAKS
Number of recreational water-associated outbreaks
(n
=
508), by year and illness - United States, 1978-2004
45
T-----------------------.
~
30
.a
'5
o
'0
ci 15
Z
o
~
Other"
o
Skin
o
Menlngoencephal~ls
• Gastroenteritis
1978
1982
1986
1990
1994
1998
2002
Year
• Includes keratitis. conjunctivitis, otitis, b onchitls, meningitis, hepatitis.
leptospirosis, Pontiac fever, acute respiratory illness, and combined
illnesses.
Also includes data from report
0
ameba InfectIons (Source: Vlsvesvara
GS, Stehr-Green JK. Epidemiology of free-living ameba Infections.
J
Protozoal 1990:37:258-333).
12
Electronic Filing - Received, Clerk's Office, August 4, 2008
Note that gastroenteritis, associated with the ingestion exposure pathway, is not always the cause
of the majority of water recreation-associated outbreaks.
C.
High Levels of Indicator Bacteria Signal the Presence of High Levels of
Pathogens
High levels of indicator bacteria, while not providing information regarding the presence
of specific types of pathogens, are generally correlated with a higher overall level of pathogens,
as stated above. My review
of MWRD sampling data indicates a level of indicator bacteria -
both fecal coliform and
E.coli
- signaling the likely presence of human pathogens in the CAWS,
with the potential to cause illness to recreational users.
As a frame
of reference, Illinois' standard for general use waterways - i.e., those in
which primary contact is permitted - is 200 fecal coliform colony-forming units ("cfu")/l00 ml
(generally associated with the 400 cfu/100
mI
for effluent discharge as proposed in the IEPA
rulemaking). USEPA has in recent years informally applied a standard
of 5 times the primary
contact standard (sometimes as high as 10 times), or 1000 cfu/100
mI-
in evaluating proposed
state standards for recreational waters in which non-primary contact recreation takes place. (See
Exhibit 7 (EPA, 2002). By contrast, the MWRD sampling in the CAWS near its outfalls reveals
indicator bacteria levels that can be more than ten times higher than these benchmarks. See the
Northside Ambient Chart and Calumet Ambient Chart in the previous section, indicating
geometric mean fecal coliform concentrations in the Northside and Calumet effluent at levels
of
19,538 and 8,231 cfu/100
mI
respectively; and ambient levels at the nearest downstream
monitoring station of
>
8,000 and
>
1,500, respectively. Note also the red horizontal line toward
the bottom
of each chart, representing the primary contact use standard of 200 cfu/100
mI.
Many times, concentrations are reported as a geometric mean. This means that there
were times when the indicator bacteria concentrations were higher. The following USEPA
Graphs (Figure 5 pertaining to Northside, Figure 6 pertaining to Calumet) representing the level
of fecal coliform in the effluent at the Northside and Stickney WWTPs during the period
reflected in the Northside and Calumet Ambient Charts illustrate the importance of this point:
13
Electronic Filing - Received, Clerk's Office, August 4, 2008
FIGURE 5: NORTHSIDE WWTP EFFLUENT
Northside WRP Effluent
Fecal Coliform May to October 2002
•
I
III I•
• •
III
140,000
-r-------------------.
120,000
+------f--------------I
§
~OO,OOO
+--------11--------------1
~
080 000
+------I--------------~
00
'
~
§ 60,000
+-----t---+---1I---------------i
caLL
~
0 40,000 +----+----1----'--1-----1--1---------1
LL
I.
20,00~
•
I.
I I I
I I
I I
~c§JC),
~c§JC),
~'\:)'\:)C),
~c§JC),
_'fl.'\:)'\:)C),
~C),
~C),
~C),
~C),
r;::.'\:)C),
r;::.'\:)C),
~C),
~C),
<tJ~
~C),~
~~
~
....
~
;".'{V" ;".\....
~re ;".~re
~
....
~re ~rV\re ~
....
~re ~~re
....
~~re ~C),~re
Source: MNFDGC. Sarmles collected
w
eeklv.
'"
FIGURE 6: CALUMET WWTP EFFLUENT
Calumet WRP Effluent
Fecal Coliform
Ma
to October
2002
7ססoo
;--------------.......
-----------i
60000+----------------11---------1
~
E
5ססoo
-t------------II----- --------I
~
g 40000 -t--------:=-----II----- --------I
u~
~ ~ 3ססoo
-t------_r-----II----- --------I
GlC,)
IL
2ססoo
-t------_r-----II---- --------I
1
ססoo
-+------
r-.--=-1--=::-II~
.......
____.._____=_
_=::_;..________I
O-+-,..-...-..--r-T".,...
.,..-,..-.,~--r..,....,....,...e,.-...-...-..,..-....
.............,.....-..
~C),
r.::.r;;:,C),
~""
r§'''''
~""
r§''''' r§'''''
r.::.~
r§'''''
r;;:,~
r.::.r;;:,""
r.::.r;;:,""
r§'''''
rd:
v
IS-'"
~'l;
'I.{C
~'l;
~",
PJ.'"
~",
~",
fi'l;
~",
~{C
,,'Q'
~
~
~
~
~
~
~
~
~
~
~
~
~
Source: MNRDGC. Sallllies collected weekly.
"
The geometric mean concentration of fecal coliforms in the Northside effluent during this period
was 19,538 cfu/lOO ml. Note that fecal coliform bacteria levels in the Northside effluent
exceeded 40,000 cfu/lOO
ml
on several occasions, and exceeded120,OOO cfu/100
ml in
June. The
14
Electronic Filing - Received, Clerk's Office, August 4, 2008
geometric mean concentration in the Calumet effluent was 8231 fecal coliforms/l00 mI, and the
levels in the Calumet effluent at times exceeded 70,000
cfull00 ml. Thus, recreators present on
the CAWS during those times potentially would have been exposed to substantially higher levels
of fecal contamination, and by inference, higher levels of pathogenic microorganisms, than the
levels that are reflected
by the geometric mean fecal coliform numbers.
Finally, while I am aware that primary contact recreation is not one of the uses that IEPA
has proposed for the CAWS,
I
note that the levels of indicator bacteria - both fecal coliform and
E. coli
- in the CAWS are far higher than the threshold at which bathing beaches are closed.
Illinois' indicator bacteria criteria, consistent with the USEP
A's water quality criteria, are
generally used to require that bathing beaches be closed when levels
of
E.
coli
reach 235 per 100
ml.
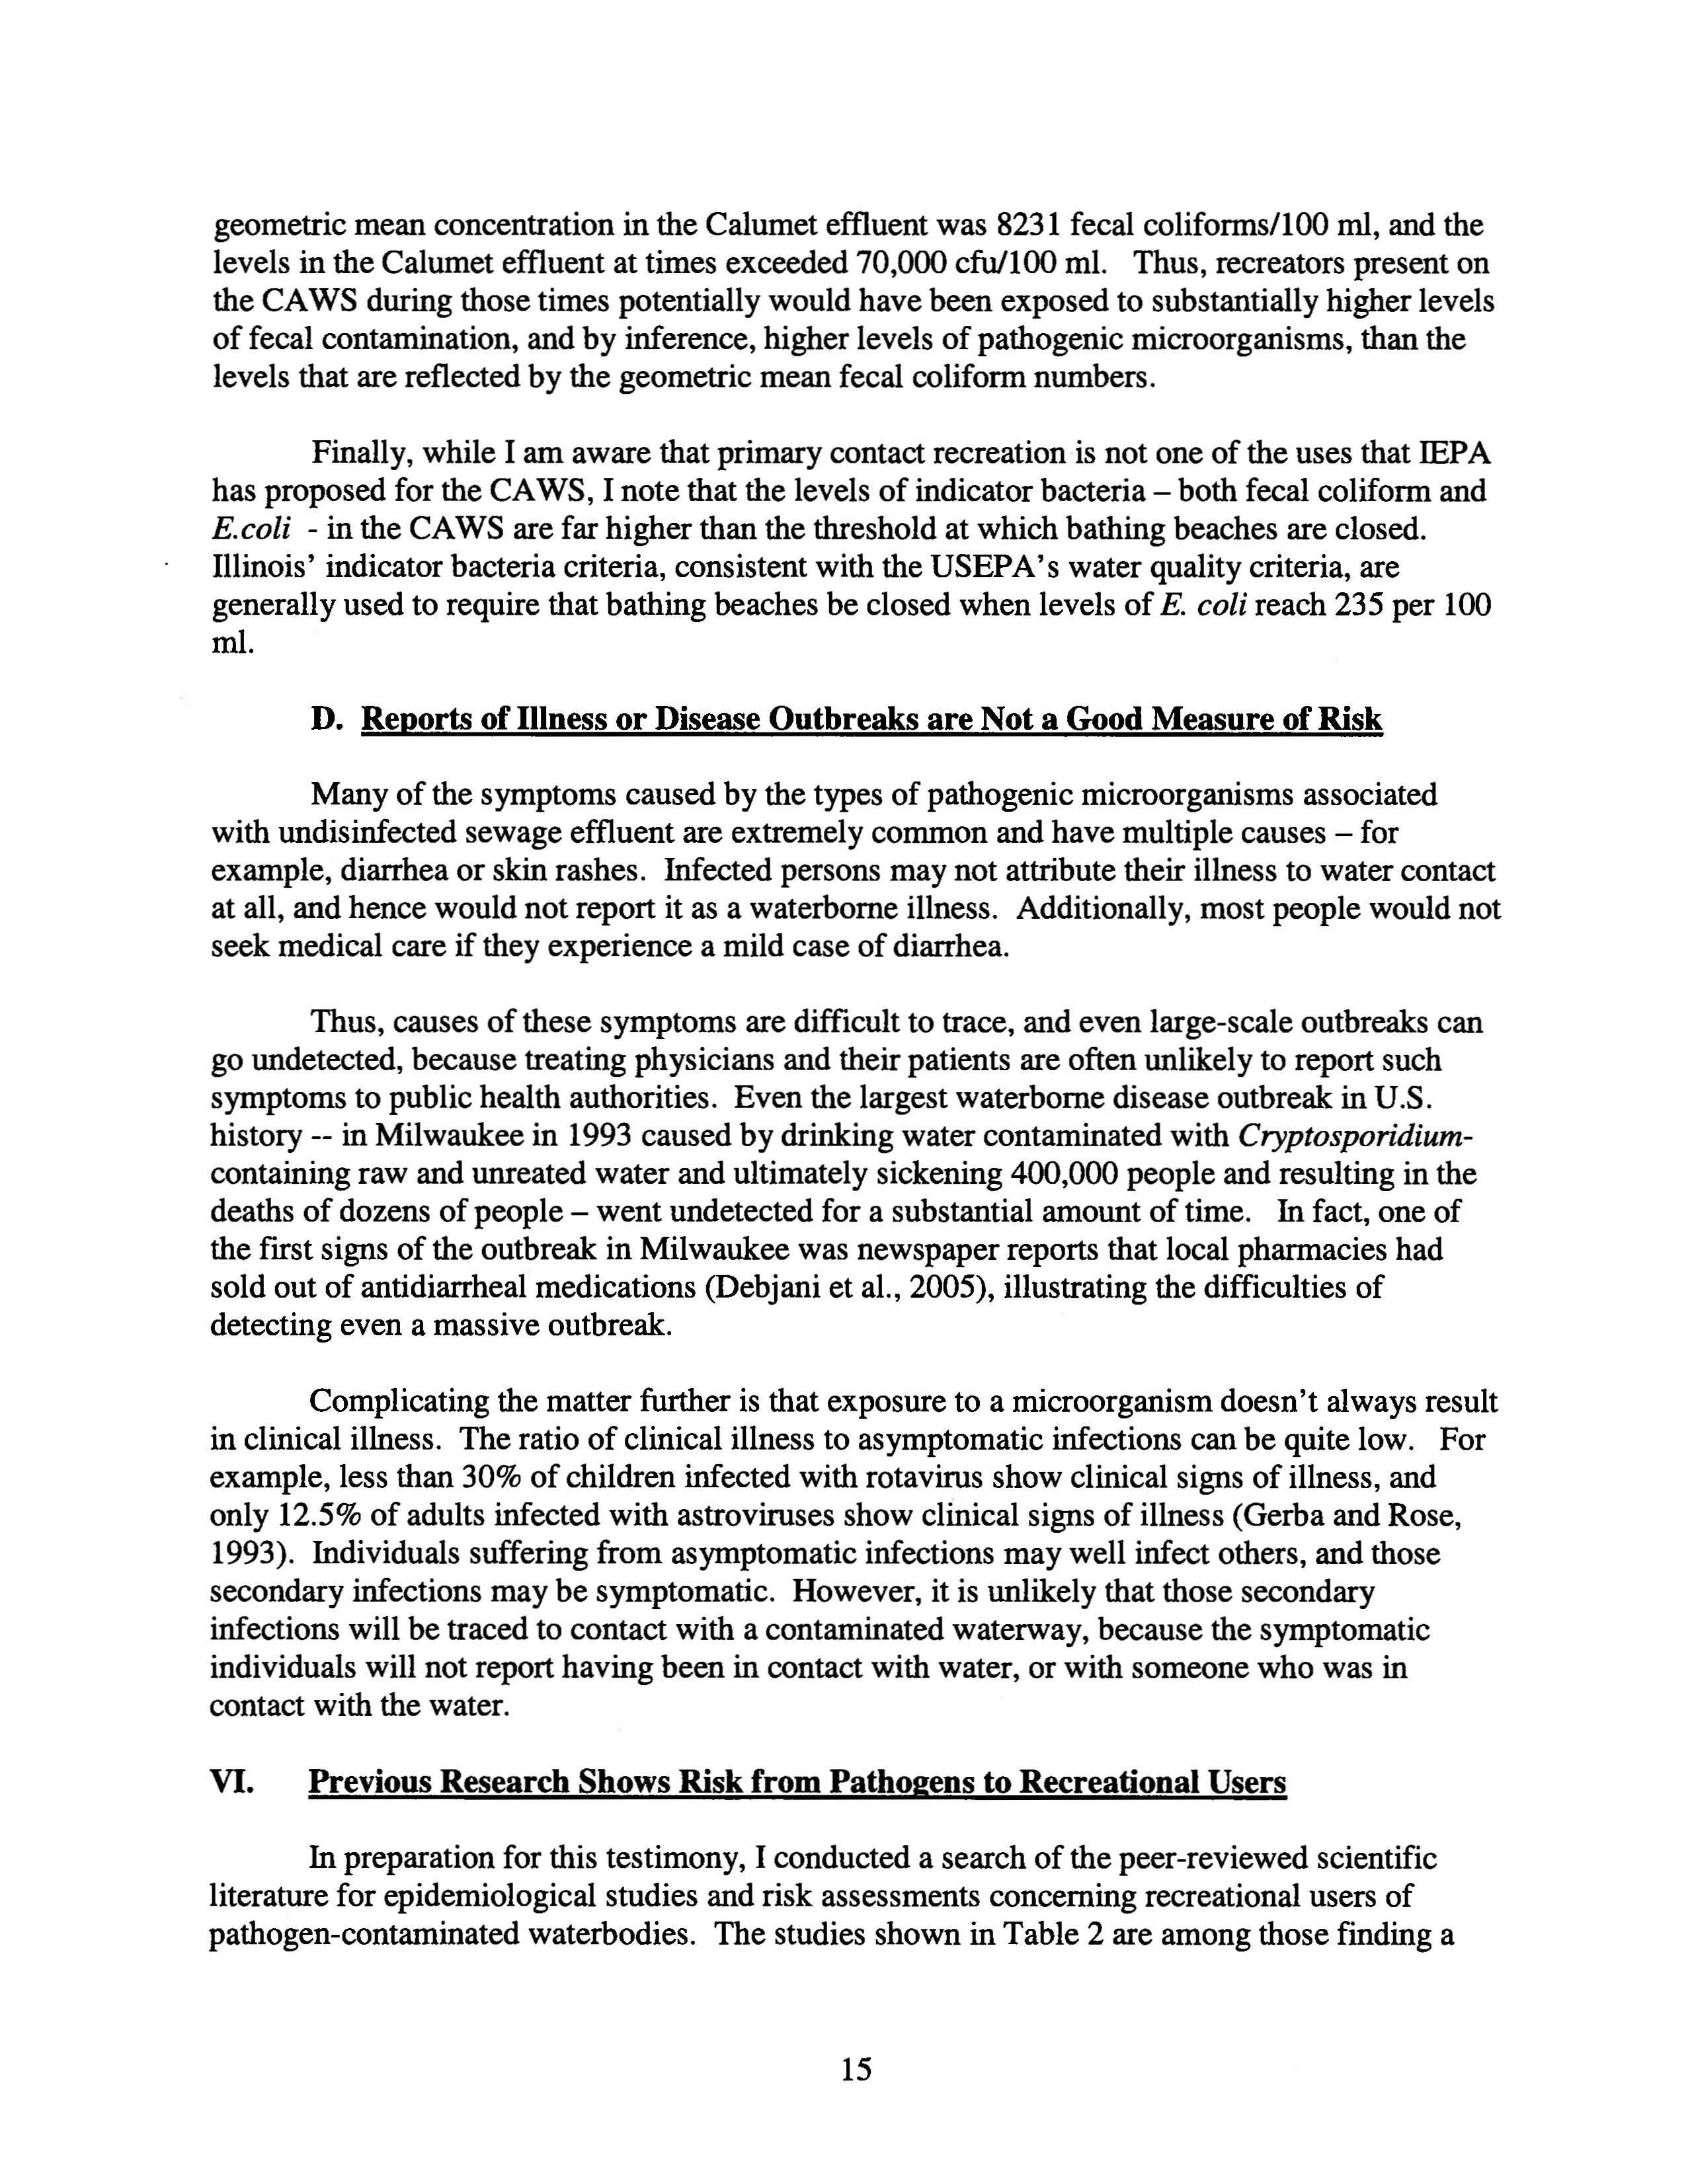
D. Reports of Illness or Disease Outbreaks are Not a Good Measure of Risk
Many of the symptoms caused by the types of pathogenic microorganisms associated
with undisinfected sewage effluent are extremely common and have multiple causes - for
example, diarrhea or skin rashes. Infected persons may not attribute their illness to water contact
at all, and hence would
not report it as a waterborne illness. Additionally, most people would not
seek medical care
if they experience a mild case of diarrhea.
Thus, causes of these symptoms are difficult to trace, and even large-scale outbreaks can
go undetected, because treating physicians and their patients are often unlikely to report such
symptoms to public health authorities. Even the largest waterborne disease outbreak in U.S.
history -- in Milwaukee in 1993 caused
by drinking water contaminated with
Cryptosporidium-
containing raw and unreated water and ultimately sickening 400,000 people and resulting in the
deaths
of dozens of people - went undetected for a substantial amount of time. In fact, one of
the fIrst signs of the outbreak in Milwaukee was newspaper reports that local pharmacies had
sold out
of antidiarrheal medications (Debjani et al., 2005), illustrating the difficulties of
detecting even a massive outbreak.
Complicating the matter further is that exposure to a microorganism doesn'talways result
in clinical illness. The ratio
of clinical illness to asymptomatic infections can be quite low. For
example, less than 30%
of children infected with rotavirus show clinical signs of illness, and
only 12.5%
of adults infected with astroviruses show clinical signs of illness (Gerba and Rose,
1993). Individuals suffering from asymptomatic infections may well infect others, and those
secondary infections may be symptomatic. However, it is unlikely that those secondary
infections will be traced to contact with a contaminated waterway, because the symptomatic
individuals will not report having been in contact with water, or with someone who was in
contact with the water.
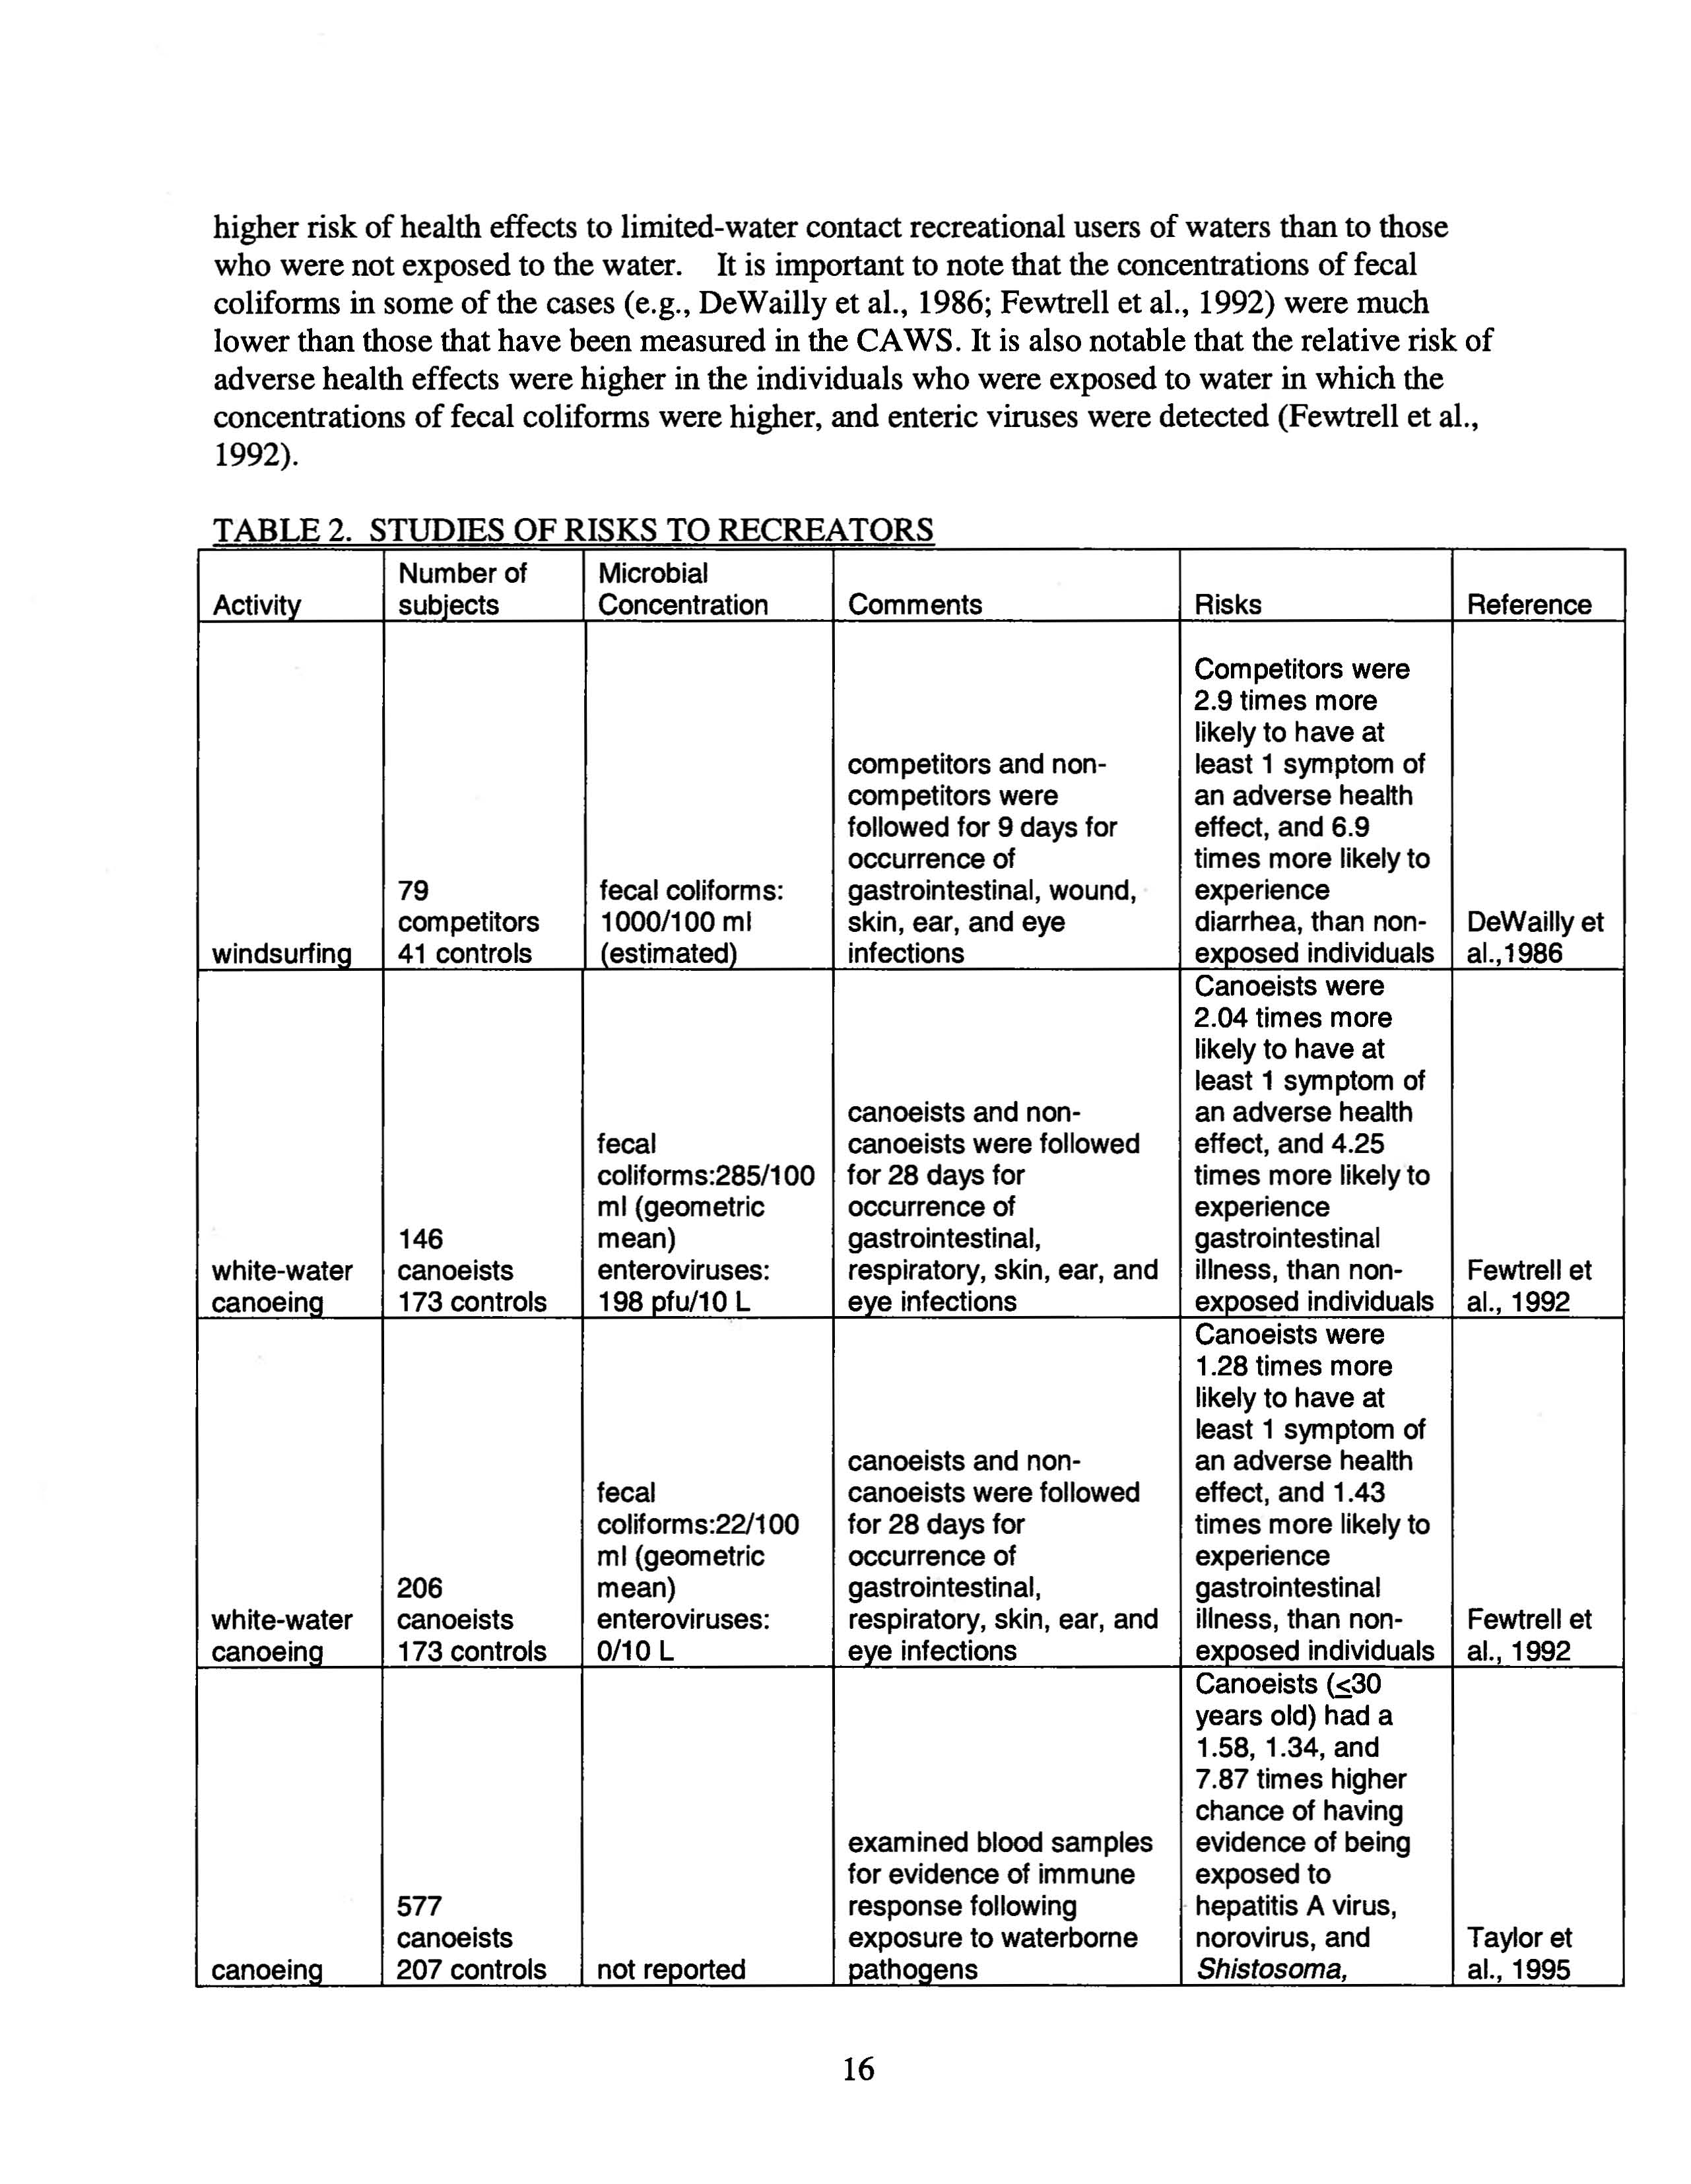
VI.
Previous Research Shows Risk from Pathogens to Recreational Users
In preparation for this testimony,
I
conducted a search of the peer-reviewed scientific
literature for epidemiological studies and risk assessments concerning recreational users
of
pathogen-contaminated waterbodies. The studies shown in Table 2 are among those finding a
15
Electronic Filing - Received, Clerk's Office, August 4, 2008
higher risk of health effects to limited-water contact recreational users of waters than to those
who were not exposed to the water. It
is important to note that the concentrations of fecal
coliforms
in
some of the cases (e.g., DeWailly et al., 1986; Fewtrell et al., 1992) were much
lower than those that have been measured
in
the CAWS.
It
is also notable that the relative risk of
adverse health effects were higher in the individuals who were exposed to water
in
which the
concentrations
of fecal coliforms were higher, and enteric viruses were detected (Fewtrell et al.,
1992).
TABLE 2 STUDIES OF RISKS TO RECREATORS
Number of
Microbial
Activitv
subiects
Concentration
Comments
Risks
Reference
Com petitors were
2.9 times more
likely to have at
competitors and non-
least 1 symptom of
com petitors were
an adverse health
followed for 9 days for
effect, and 6.9
occurrence of
times more likely to
79
fecal coliforms:
gastrointestinal, wound,
experience
competitors
1000/100 ml
skin, ear, and eye
diarrhea, than non-
DeWaillyet
windsurfina
41 controls
(estimated)
infections
exposed individuals al.,1986
Canoeists were
2.04 times more
likely to have at
least 1 symptom of
canoeists and non-
an adverse health
fecal
canoeists were followed
effect, and 4.25
coliforms:285/100 for 28 days for
times more likely to
ml (geometric
occurrence of
experience
146
mean)
gastrointestinal,
gastrointestinal
white-water
canoeists
enteroviruses:
respiratory, skin, ear, and
illness, than non-
Fewtrell et
canoeina
173 controls
198 pfu/10 L
eye infections
exposed individuals
aI., 1992
Canoeists were
1.28 times more
likely to have at
least 1 symptom of
canoeists and non-
an adverse health
fecal
canoeists were followed
effect, and 1.43
coliforms:221100
for 28 days for
times more likely to
ml (geometric
occurrence of
experience
206
mean)
gastrointestinal,
gastrointestinal
white-water
canoeists
enteroviruses:
respiratory, skin, ear, and
illness, than non-
Fewtrell et
canoeing
173 controls
0/10 L
eye infections
exposed individuals
aI., 1992
Canoeists (s30
years old) had a
1.58, 1.34, and
7.87 times higher
chance of having
examined blood samples
evidence of being
for evidence of immune
exposed to
577
response following
. hepatitis A virus,
canoeists
exposure to waterborne
norovirus, and
Taylor et
canoeina
207 controls
not reported
pathoaens
Shistosoma,
aI., 1995
16
Electronic Filing - Received, Clerk's Office, August 4, 2008
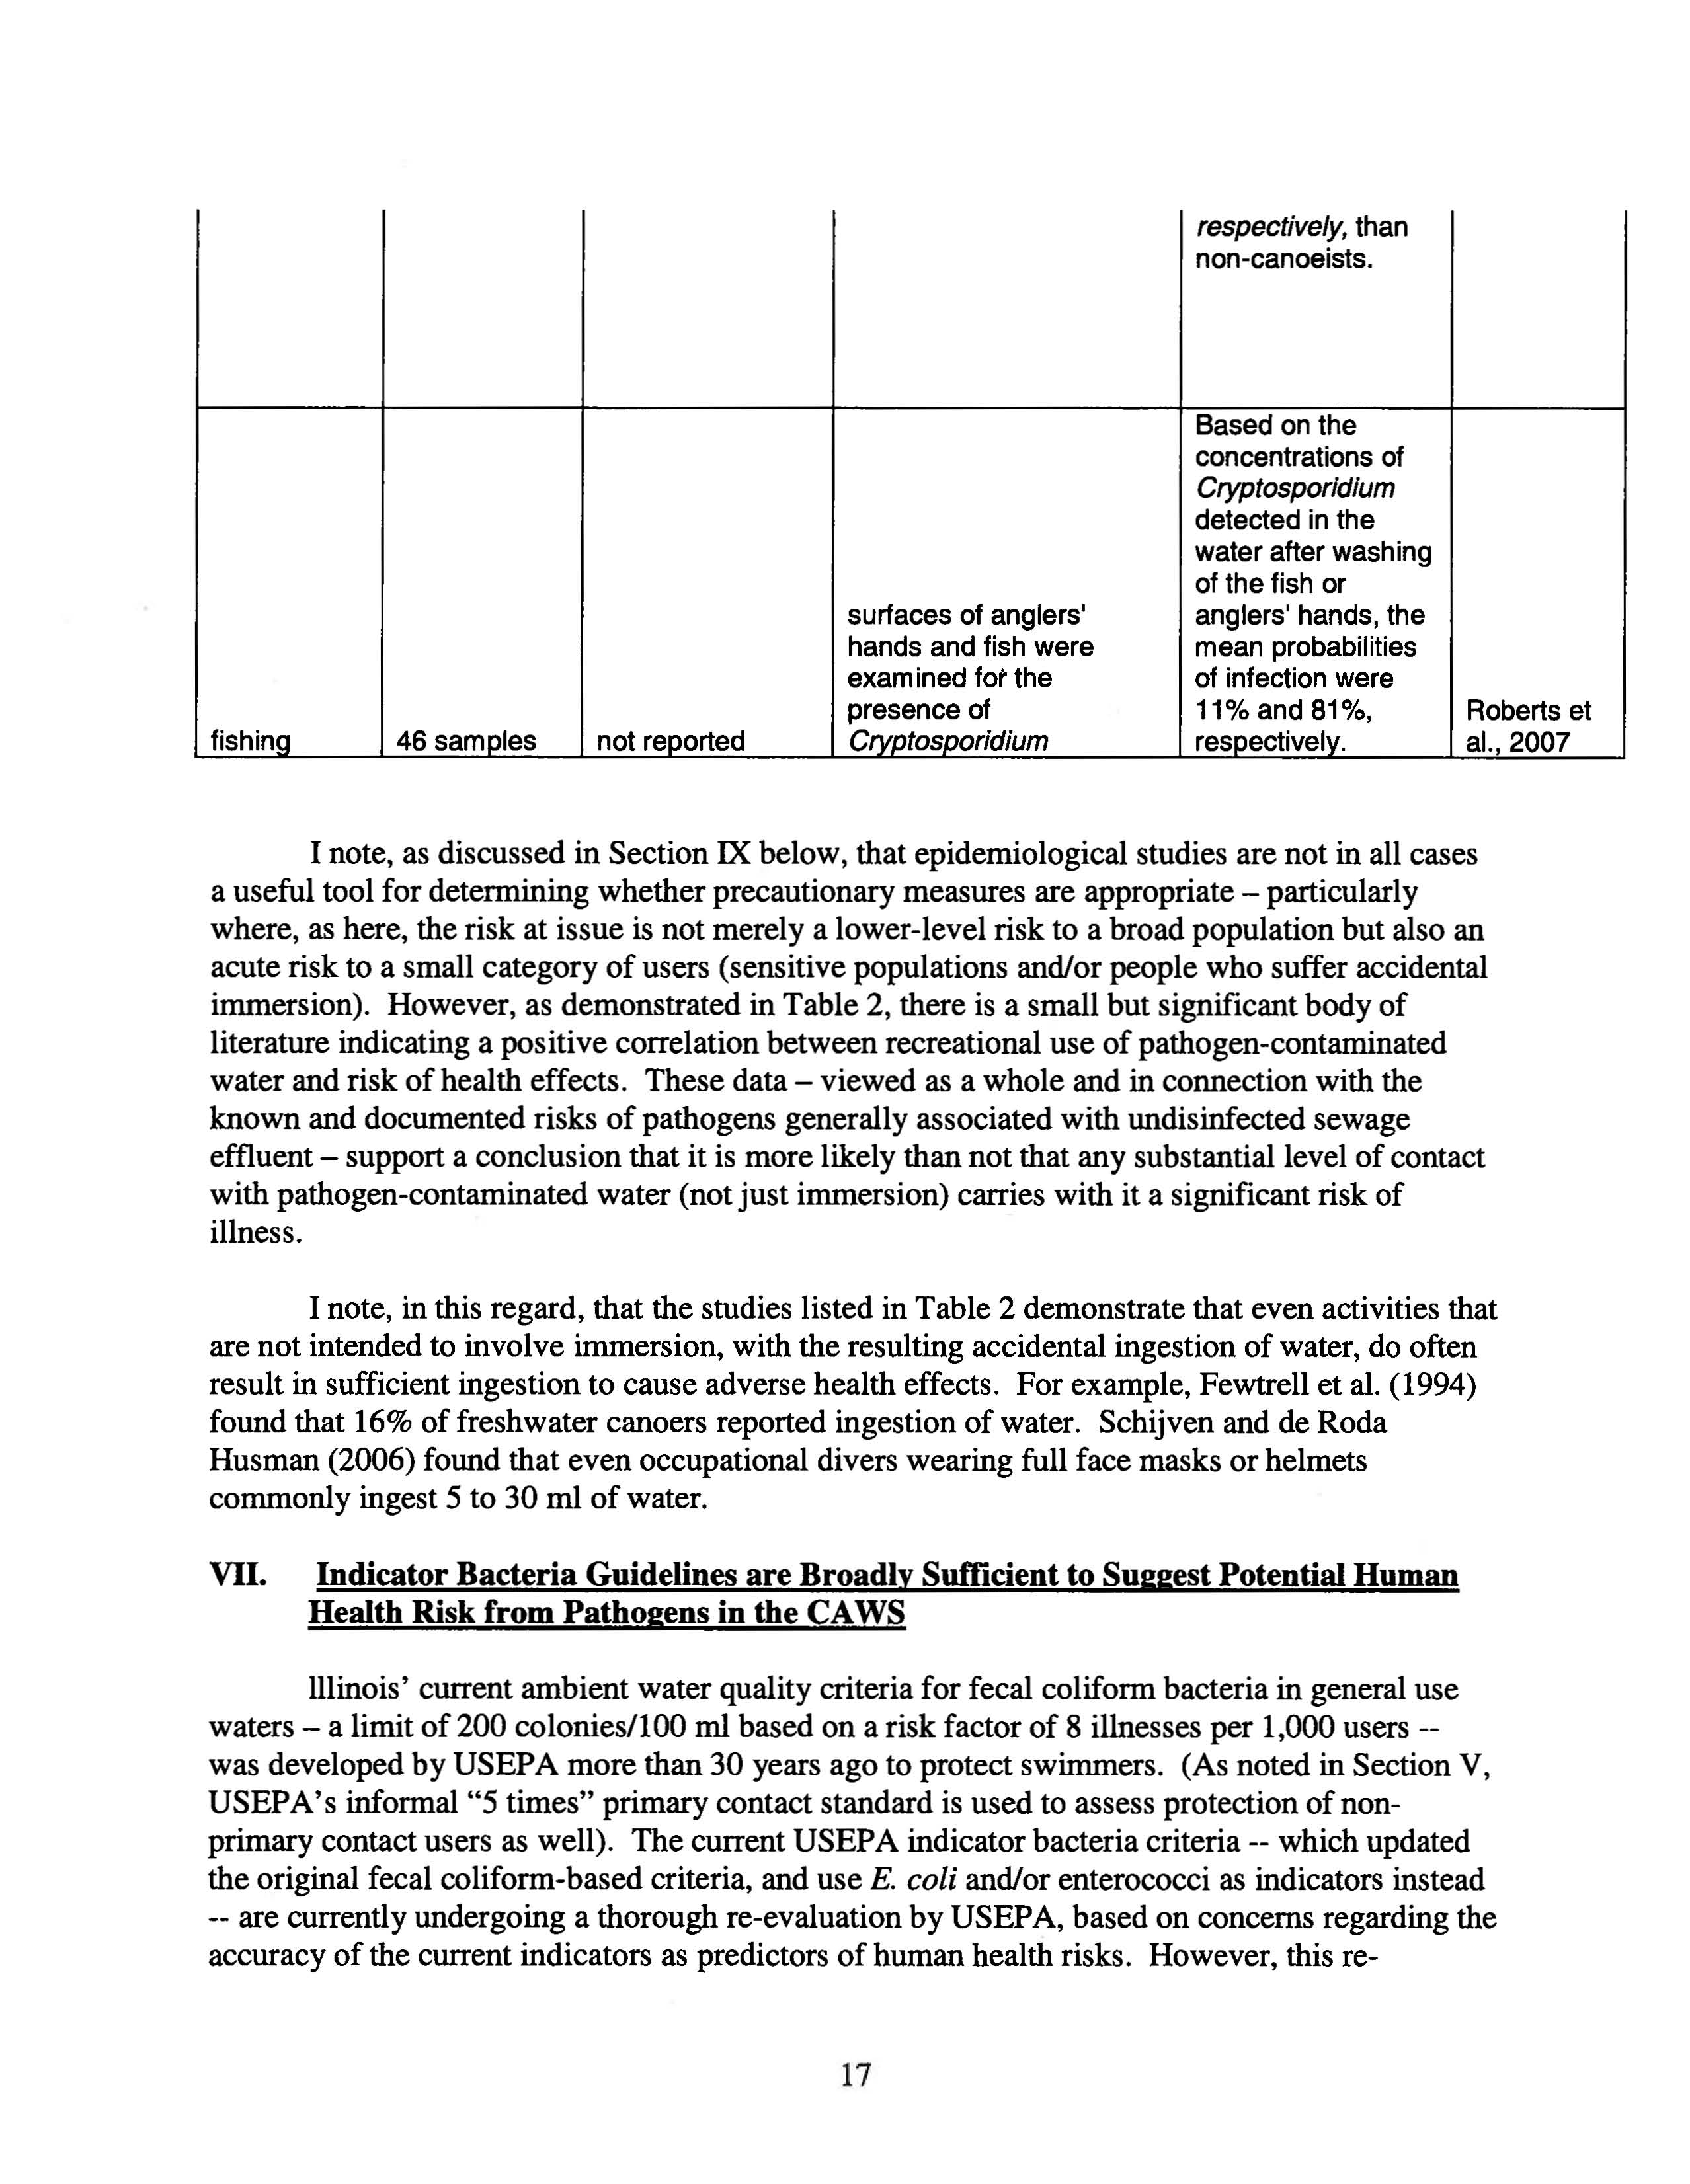
respectively,
than
non-canoeists.
Based on the
concentrations of
Cryptosporidium
detected in the
water after washing
of the fish or
surfaces of anglers'
anglers' hands, the
hands and fish were
mean probabilities
exam ined
fot the
of infection were
presence of
11% and 81%,
Roberts et
fishina
46 sam
Dies
not reDorted
Crvotosooridium
respectively.
al.,2007
I note, as discussed in Section IX below, that epidemiological studies are not in all cases
a useful tool for detennining whether precautionary measures are appropriate - particularly
where,
as here, the risk at issue is not merely a lower-level risk to a broad population but also an
acute risk to a small category of users (sensitive populations and/or people who suffer accidental
immersion). However, as demonstrated
in
Table 2, there is a small but significant body of
literature indicating a positive correlation between recreational use of pathogen-contaminated
water and risk of health effects. These data - viewed as a whole and in connection with the
known and documented risks
of pathogens generally associated with undisinfected sewage
effluent - support a conclusion that it is more likely than not that any substantial level
of contact
with pathogen-contaminated water (not just immersion) carries with it a significant risk of
illness.
I note, in this regard, that the studies listed in Table 2 demonstrate that even activities that
are not intended to involve immersion, with the resulting accidental ingestion
of water, do often
result in sufficient ingestion to cause adverse health effects. For example, Fewtrell et al. (1994)
found that 16%
of freshwater canoers reported ingestion of water. Schijven and de Roda
Husman (2006) found that even occupational divers wearing full face masks or helmets
commonly ingest 5 to 30 ml
of water.
VII.
Indicator Bacteria Guidelines are Broadly Sufficient to Suggest Potential Human
Health Risk from Pathogens in the CAWS
lllinois' currentambient water quality criteria for fecal coliform bacteria in general use
waters - a limit of 200 coionies/IOO
ml
based on a risk factor of 8 illnesses per 1,000 users --
was developed by USEPA more than 30 years ago to protect swimmers. (As noted in Section V,
USEPA's informal "5 times" primary contact standard is used to assess protection of non-
primary contact users as well). The current USEPA indicator bacteria criteria -- which updated
the original fecal coliform-based criteria, and use
E.
coli
and/or enterococci as indicators instead
-- are currently undergoing a thorough re-evaluation by USEPA, based on concerns regarding the
accuracy of the current indicators as predictors of human health risks. However, this re-
17
Electronic Filing - Received, Clerk's Office, August 4, 2008
evaluation is in no way inconsistent with a conclusion that the levels of fecal coliform found in
the CAWS indicate the potential for adverse human health effects; or that disinfection
is
appropriate to reduce that health risk.
The concern being addressed by the indicator bacteria re-evaluation is not that the
presence
of indicator bacteria
overpredicts
the risk potential from human pathogens, but rather
that it
underpredicts
the risks posed by such pathogens. While indicator bacteria may correlate
well with the presence
of some types of pathogens, especially pathogenic bacteria, USEPA's
primary concern is that the
absence
of indicator bacteria may give a false assurance of safety
when in fact there are pathogens present that would not be detected through indicator bacteria
measurement. Thus, any standard that emerges from this re-evaluation process
is likely to result,
ultimately, in more stringent controls on the presence
of human waterborne pathogens, not less
stringent controls.
A. The Water Quality Criteria Review Process is Grounded in Concern that the
Current Criteria are Insufficiently Protective
Some history regarding the use of indicator bacteria to measure the presence of human
pathogens is helpful in understanding the purpose and significance
of the current revision
process. Coliform bacteria were established as indicators
of microbiological quality of water
more than 75 years ago. This was based on early studies by the American Public Health Service
that showed that the concentration
of
Salmonella typhi
(the causative agent of typhoid fever)
could be estimated from the number
of
E. coli
(a coliform bacterium) in the water (Kerr and
Butterfield, 1943, as referenced by the Committee on Indicators for Waterborne Pathogens,
2004), and the fmding that
E. coli
were more resistant to disinfection than several bacterial
pathogens (Wattie and Butterfield, 1944,
as referenced by the Committee on Indicators for
Waterborne Pathogens, 2004). At that time, the emphasis was on ensuring that the known major
causes
of waterborne disease, which were bacteria such as
Salmonella
and
Vibrio cholerae,
were
not present in water. However, over time, concern arose that these indicators were insufficiently
protective because destruction
of the indicators did not necessarily signal destruction of certain
types
of pathogens, especially viruses and protozoan parasites:
"Problems have been identified with indicator organisms (e.g. members
of the
Enterobacteriaceae),
such as the fact that viruses and protozoa can be present and
viable when indicator bacteria are inactive. Also, coliforms and other indicator
bacteria may
be more sensitive to chlorine than some pathogenic organisms, so
the resulting treated water quality assessment can be inadequate. Many
communities have experienced waterborne disease outbreaks even though their
water supplies have met mandated coliform standards (Craun, et aI., 1997)."
(Percival et al.,
2(04)
In recent years, scientific advances have supported and reaffirmed concerns that
currently-used indicator bacteria may
be insufficiently protective. The existing ambient water
quality criteria, which were designed to protect swimmers from illnesses due to exposure to
pathogens in recreational waters, were developed more than 20 years ago (EPA, 1986). Since
that time, "
... there have been significant scientific advances, particularly in the areas of
18
Electronic Filing - Received, Clerk's Office, August 4, 2008
molecular biology, virology, and analytical chemistry. EPA believes these new scientific and
technological advances need to
be considered and evaluated for feasibility and applicability in
the development
of new or revised criteria for pathogens and pathogen indicators." (USEPA,
2007).
Indeed, the basis for the establishment of drinking water standards for microorganisms
other than colifonn bacteria during the last 20 years is the recognition and acknowledgement
by
the USEPA that the use of colifonn bacteria as the indicators of the microbiological quality of
water is inadequate to protect public health. When proposing maximum contaminant level goals
for viruses and
Giardia
in drinking water (USEPA, 1987), the EPA reviewed the status of
waterborne disease outbreaks in the U.S., with an emphasis on the relative number of individuals
involved in outbreaks associated with untreated vs. treated systems. They stated:
"EPA believes these data support the need for better control
of microbiological
contaminants in drinking water, and support the use
of treatment requirements,
specifically filtration and disinfection requirements. EPA believes that
if all surface
water systems were to comply with the requirements
of the proposed rule, most
incidences
of waterborne disease associated with these systems would be eliminated.
(Note that the only microbiological standards in place at the time were for total colifonn
bacteria.).
Based
on similar concerns, in October, 2000, the President signed into law the Beaches
Environmental Assessment and Coastal Health Act ("BEACH Act"). The BEACH Act amended
the Clean Water Act to require USEPA to conduct studies associated with pathogens and human
health, and to publish new or revised recreational water quality criteria for pathogens and
pathogen indicators based on those studies. The goal
of the legislation is to fmd more accurate
means to assess human health risks so
as to better protect the health of recreational users of U.S.
waterways.
Certainly, there are some types
of pathogens for which indicator bacteria may overpredict
the presence
of human pathogens - Le., the indicator bacteria may be present in high numbers
but the pathogens in question are not. However, there are many different pathogens whose
presence is underpredicted by the indicators, prompting USEPA's concern and ultimately the
passage
of the BEACH Act. On balance, indicator bacteria are more likely to underpredict rather
than overpredict the presence
of pathogens. This is due to the fact that many pathogenic
microorganisms, especially the viruses and protozoan parasites survive longer in the environment
compared to colifonn bacteria, thereby raising questions about the suitability of colifonns as
indicators (Committee on Indicators for Waterborne Pathogens, 2004; Rusin et aI., 2000). So,
while the presence
of colifonns might signify the presence of fecal contamination, their absence
cannot be relied upon as a defmitive signal that the water is microbiologically safe.
19
Electronic Filing - Received, Clerk's Office, August 4, 2008
B. The Likelihood that the Revised BEACH Act Pathogen Criteria Will Allow the
Level
of Contamination Now Evident
in
the CAWS is Extremely Low
For the reasons discussed above, the fecal coliform levels measured in the CAWS do not
present a complete picture of the human pathogen levels present there. Specifically, there are
likely to
be viruses and parasites present in water, even in the absence of indicator bacteria such
as fecal coliform bacteria.
E.
coli,
for which MWRD has also collected CAWS ambient data,
presents similar problems
of underprotectiveness, i.e., the possibility that there may be high
levels
of certain pathogens present, even in the absence of
E. coli.
However, notwithstanding any such uncertainty associated with indicator bacteria, it is
well established that the presence of these bacteria is likely to be correlated with at least
some
types of human pathogens - generally pathogenic bacteria - that are associated with human
health risks. Thus, even
if currently used indicator bacteria (e.g., fecal coliform bacteria,
enterococci, and
E.
coli)
may not present a perfect picture of the risk of adverse health effects
associated with all human pathogens in the CAWS, they tell us enough to know that high levels
of these indicators are likely to be correlated with diverse health effects in exposed individuals.
To the extent a better indicator bacteria or pathogen identification system may be discovered, it
will likely identify the risks with more accuracy. But it almost certainly will not result in a
determination that health risks previously found to
be associated with current levels of indicator
bacteria do not exist. Thus, the chance that the BEACH Act study process will produce a
pathogen risk assessment procedure that renders disinfection unnecessary is almost vanishingly
remote.
As an overall matter, it is important to note that the purpose
of the indicator bacteria
criteria
is to create a bright line for decisionmaking about whether to keep beaches and other
waterbodies open on any given day, given fluctuations in ambient bacterial levels that vary based
on a variety
of factors that may affect bathing beaches (storm water runoff, CSOs, waterfowl,
etc.). Local authorities need to have a fixed ambient water quality number at which they can say
a beach is safe
or unsafe on any given day; and the current revision efforts are an attempt to
ensure that this number is in fact adequately protective
of human health.
In
a decision regarding disinfection, however, this type of "fine tuning" of the ambient
indicator bacteria standard is neither relevant nor meaningful. I note at the outset that the
proposed IEPA regulation does not include any ambient standard at all; it merely requires
reduction
of pathogen loading in the effluent. More broadly speaking, the process of
disinfection itself is not susceptible to fme tuning. Its impact is binary. That is, if a WWTP does
not disinfect - as with the MWRD facilities - pathogen levels in the effluent will be high. But if
it does disinfect, pathogen levels will
be much lower. This fact is illustrated by the Urban Rivers
Analysis chart in subsection IV.B., which shows extremely low levels of indicator bacteria in the
effluent
of facilities that disinfect, in every case well under 100 cfu/lOO ml.
Thus, since we can fairly safely conclude (as discussed above in this subsection) that the
revision to the ambient indicator bacteria criteria will not allow MWRD to continue unabated its
discharge
of high levels of human pathogens, we can conclude that it is very likely that
20
Electronic Filing - Received, Clerk's Office, August 4, 2008
disinfection will be required at the conclusion of the process. The current BEACH Act revisions
of the ambient water quality criteria might conceivably affect such matters as the type of
reporting that MWRD would be required to conduct, or even the strength of the disinfection
required (for example, more intense UV irradiation
if that is the chosen disinfection method).
It
might even potentially be relevant to determining an ambient standard for the CAWS to be put
into place at a later date. But it
is unlikely that it will alter the fundamental necessity of
disinfection. Accordingly, waiting for this lengthy process to conclude would merely delay
protection
of public health without good reason.
Finally, I question whether the ambient indicator bacteria criteria, and the methodology
and assumptions
on which they are based, are really appropriate at all in the context of long-term
public health decisionmaking
of the type at issue here. The current criteria are derived from an
acceptable risk standard established
by USEPA of 8 illnesses per 1,000 swimmers.
It
is notable
that the current ambient water quality criteria present different risk levels to recreators swimming
in fresh water (8 illnesses per 1000 swimmers) compared to marine waters (19 illnesses per 1000
recreators). More importantly, as stated
by the EPA (1986), these risk levels are based on the
historically accepted risk (dating back to at least the 1976 Quality Criteria for Water), which was
arbitrarily set. This type of illness rate standard arguably makes sense when determining
whether to allow recreation in the presence
of ambient bacteria determined on any given day to
be present. Members
of the public wish to recreate, and the relevant judgment is whether it is
safe to let them. Here, however, the relevant judgment is not merely whether recreation in
current conditions will result in a risk below the currently accepted standard. It is whether that
risk can be diminished in the future through implementation
of appropriate controls. Where a
risk
is in that manner remediable in the future, the risk standard that we are willing to apply to
present conditions
is not particularly appropriate. Simply put, we may be willing to let people
spend the day at a beach known to be contaminated with pathogens
if only 8 out of 1,000 of them
are going to get sick, as an alternative to closing it to the public on a given hot summer day. But
if we know that we can permanently diminish that risk, such that in future summers only, say, 2
out
of 1,000 will get sick, we should not refuse to do so simply because the EPA has arbitrarily
established 8 out
of 1,000 as an acceptable risk for current day-to-day decisionmaking about
beach closures. That is a separate risk question altogether.
VIII. The Risk Assessment Prepared on Behalf of MWRD has Numerous Flaws
In April, 2008, Geosyntec Consultants completed the Risk Assessment concerning
recreational use
of the CAWS in wet and dry weather (available on MWRD'sweb site,
http://www.mwrdgc.dst.il.usl). The Assessment is based
on collection of samples in 2005 and
2006, which were sampled to determine ambient levels
of a select handful of human pathogens.
Based on the pathogen levels in the samples, and various assumptions
made regarding dose-
response rates for the selected pathogens and the nature
of waterway use, the Assessment
concludes that risk to non-primary contact users
of the CAWS is minimal, and that disinfection
would not have a significant impact on risk.
My review
of the Assessment leads me to the conclusion that there are so many flaws, in
multiple respects, that its conclusions are not meaningful and should not be relied upon in
making a decision regarding the need for disinfection
of WWTP effluent. The Assessment
employs several critical assumptions and methodologies that likely result in a serious
21
Electronic Filing - Received, Clerk's Office, August 4, 2008
underestimate of risk, and concomitant underestimate of the benefits of disinfection. In addition,
it contains several more minor but still significant scientific and methodological errors that may
not significantly impact the final result standing alone, but taken together seriously undercut the
credibility
of the Assessment, calling into question its overall accuracy and scientific integrity.
Finally, the Assessment contains significant gaps in information that must be supplied in order to
fully assess the accuracy and value
of the research. These flaws and omissions are detailed in the
subsections below.
I have also reviewed an analysis conducted by USEPA
of the Interim Phase I Dry
Weather Microbial Risk Assessment Report prepared by Geosyntec Consultants in November
2006. See Exhibit 4. That analysis expresses many
of the same concerns with the Assessment
that I have identified.
6
A.
Overarching Flaws
in
Methodology and Assumptions
The following are major flaws in the overarching methodology and assumptions
underlying the Risk Assessment, which separately and collectively render the conclusions
of the
Assessment unreliable:
•
Study
of exclusively gastrointestinal illness. The Risk Assessment bases all of its
conclusions solely on the study
of gastrointestinal illness. No data were factored in,
assumptions made, or risks assessed for any other type of illness that may be contracted
from contact with waterborne pathogens. This assumption is wholly unjustified. There
are
of studies that have found that respiratory, eye, and ear infections are more common
outcomes from waterborne pathogen infection than gastroenteritis. For example, Fewtrell
et al. (1992) found that, at one
of the contaminated sites, the relative risk of respiratory
symptoms among the exposed individuals was higher than that
of gastrointestinal
symptoms. The study by Taylor et al. (1995) found that the evidence of infection by
Shistosoma
(an organism that causes itchiness and rashes) among the exposed individuals
was much higher than the evidence of infection by either norovirus or hepatitis A virus.
Indeed, as set forth in Figure 4., in the Centers for Disease Control'scompilations
of
recreational water-associated outbreaks (CDC, 2006), non-gastrointestinal disease is
frequently more common than gastroenteritis (as discussed in that section, outbreaks are
not a good measure of overall risk, but they can be informative as to the nature of the
risk). Thus, the Assessment's exclusive focus on gastrointestinal illness underestimates
risk.
•
Study
of only a small subgroup of pathogens. The Assessment is based solely on the
study
of 8 pathogens or groups of pathogens (the virus assay using BGM cells can detect
a number
of viruses). As discussed in Section V, there are literally hundreds of
waterborne pathogens that are typically associated with undisinfected sewage effluent.
The stated basis for assessing only this limited universe of waterborne pathogens is
6 Note that the combined dry weather and wet weather risk assessment did partially address the issues of the
sensitivity analysis and the uncertainty analysis.
22
Electronic Filing - Received, Clerk's Office, August 4, 2008
inadequate. The authors state that this subset of sewage pathogens was selected based on
(i) the association of these pathogens with documented outbreaks, and (ii) the availability
of USEPA-approved laboratory standard operating procedures ("SOPs") for measurement
of these pathogens. Neither of these reasons, however, either adequately justifies the
decision to limit the scope
of the Assessment in this manner, nor supports the reliability
of the results. The availability of SOPs for certain pathogens have no bearing on the
question
of whether those pathogens are representative for purposes of assessing risk.
In
any event, USEPA-approved laboratory SOPs are not available for two of the pathogens
studied (adenoviruses and noroviruses), yet they were included in this analysis.
Additionally,
as discussed in Section V.D., documented outbreaks are not generally a
good measure
of the risk associated with any given pathogen. The inadequately justified
selection of a small universe of pathogens on which to base the Assessment likely results
in an underestimate
of risk.
•
Failure to take into account sensitive populations. As discussed in Section V, sensitive
populations - children, pregnant women, the elderly, and immunocompromised
persons-
are more likely to experience serious adverse health effects as a result of infection by
some waterborne pathogens. Yet the Assessment fails entirely to take this factor into
account, and makes risk calculations based solely on a healthy adult population.
•
Conflation
of upstream and downstream pathogen levels. For the pathogens (with the
exception
of
Pseudomonas)
evaluated in the Risk Assessment, the Assessment concludes
that, in dry weather conditions, concentrations downstream
of the WWTPs are often
higher than concentrations upstream of the WWTPs. Yet for purposes of determining
risk, the Assessment averages the upstream and downstream concentrations. No
information is provided
on the process used to average the concentrations.
In
any event,
this averaging causes the calculated risks associated with the higher pathogen levels
downstream
of the WWTP outfalls to be lower, by diluting them with the lower upstream
levels. The Assessment justifies this method by stating that "[t]he average pathogen
concentration along the waterway
is the best representation of the exposure that a
receptor might encounter." (Assessment
p. 122). This is, simply put, not true. There is
no basis for the assumption that recreators will necessarily use both the upstream and
downstream portions of the CAWS. Different recreators will use different locations, and
a valid risk assessment needs to determine likely illness rates at all such locations, in
particular the more heavily contaminated downstream locations.
•
Conflation
of wet and dry weather conditions. As discussed in Section IV, the sources of
pathogens, and their distribution along the CAWS, are substantially different in dry
versus wet weather.
In
dry weather, given that the CAWS is effluent dominated, the
WWTPs are the primary source of pathogens, such that disinfection of CAWS effluent
will necessarily reduce dry-weather pathogen loading. During wet weather, however,
CSOs appear to be a substantial source
of pathogens in the CAWS, such that disinfection
would not likely have nearly as significant an impact on ambient pathogen levels during
such weather. The Assessment itself concluded that, "[f]or each waterway segment the
risks associated with exposure to the wet weather concentrations were higher than those
associated with dry weather concentrations." (Assessment
p. 127). Yet for no sound
reason, the risk assessment combined wet and dry weather conditions for purposes of
23
Electronic Filing - Received, Clerk's Office, August 4, 2008
assessing post-disinfection conditions. In addition, as noted above, the upstream and
downstream concentrations are combined. Separate calculations need to be performed,
and the results for risks post-disinfection need to
be presented for wet weather and dry
weather conditions, as well as upstream and downstream locations. This unjustified
assumption greatly diminishes the assessed benefit
of disinfection.
•
Calculations are based
on limited data. The risk assessment calculations are based on the
analyses
of a limited number of samples collected during a short period of time (i.e., 5
weeks for dry weather, 3 occasions for wet weather).
It
is unknown whether the
concentrations
of pathogens detected in these samples are representative of those that
typically occur, as there are a number of factors that could influence these concentrations.
These include differences in temperature, sunlight, turbidity
of the water, etc.
B. Other Significant Flaws in Methodology and Assumptions
I have identified additional flaws in the Assessment's methodology and assumptions that
could potentially have an impact on the reliability of the study's conclusions. The following are
examples:
•
Insufficiently conservative dose-response assumptions. The Assessment makes
assumptions about the dose-response - i.e., degree
of infectivity - characteristics of the
pathogens studied that are insufficiently justified and not always conservative. The dose-
response data for echovirus was used as a surrogate for the dose-response behavior
of
adenovirus. The justification for the use of the lower infectivity values was that the only
dose-response data available for adenoviruses are based on respiratory infections caused
by adenoviruses, in which the infectivity has been found to be very high. The authors
state that, because they are only considering gastrointestinal illness, the use of the lower
infectivity values obtained for echovirus was justified (Assessment p. 108). This failure
to apply conservative assumptions skews the analysis toward a conclusion
of lower risk.
•
Invalid sampling methods. The method described by the authors that was used to
sterilize the sampling equipment does not follow EPA protocols. Per the
EPA's ICR
Manual for disinfecting equipment to be used for virus sampling (EPA, 1996. ICR
Microbiology Laboratory Manual. EPAl6001R-95/178), the concentration
of chlorine
that is to be used to disinfect sampling equipment is 0.1 %; the authors state that at least a
0.5% solution was used. In addition, after chlorination, the chlorine must be neutralized
with sodium thiosulfate. The authors state that the equipment was simply rinsed with
sterile distilled water. The failure to dechlorinate the sampling equipment with sodium
thiosulfate may have resulted in residual chlorine in the equipment, which can inactivate
microorganisms in the water samples. Thus, the validity
of the numbers of viruses
presented is unknown.
•
Insufficient information is presented to enable an accurate evaluation
of sampling results.
During dry weather, the volume
of water sampled for viruses was stated to vary from
approximately 100 liters for the outfall samples to 300 liters for the upstream and
downstream samples (no information regarding the sample volumes for the wet weather
24
Electronic Filing - Received, Clerk's Office, August 4, 2008
virus samples was provided.) However, the entire sample was not analyzed for each of
the viruses. For the culturable enteroviruses (termed "enteric viruses" by the authors) and
the adenoviruses,
no information on the actual volume of sample that was analyzed for
each
of these viruses for each sample was provided; the results are simply presented as
MPN/lOO L.
If
only 1 liter were analyzed, and no viruses were detected in that one liter,
the result would
be presented as <1 MPN/100 L. However, it is not known whether there
were viruses present in the portion
of the sample that was not analyzed. Without
knowing the volume
of sample actually analyzed, one cannot assess the magnitude of the
extrapolation that was done to arrive at the concentrations presented.
•
Extrapolation
of concentration based on examination of a small fraction of the sample. In
the case
of the noroviruses, only a small fraction of the total sample volume was actually
analyzed.
For example, for a downstream water sample, it was stated that approximately
300 liters was collected. Per Table 3.7, a typical volume of sample analyzed was 0.2
liters. This represents less than 0.1
% of the total sample collected.
If
no viruses were
detected
in that small fraction of the sample, the result was listed as negative. If, indeed,
the >99.9%
of the sample that was not analyzed did contain viruses, that information was
not determined, and thus, the sample would be listed as having no noroviruses present at
detectable levels. Therefore, the detection
of noroviruses in only 5 samples is not
surprising. Additionally, characterization
of the high calicivirus concentration found in
one sample as an outlier because
only the highest dilution of the sample was positive is
not appropriate. The distribution of viruses in the water may be highly variable, and
there is a statistical probability that a more dilute sample
may contain more viruses than a
less dilute sample; thus
the result may, indeed, be valid.
•
Lack of specificity of the adenovirus assay. The cell culture analysis for adenoviruses
appears to have produced a relatively large number of false positive results, as shown by
the subsequent polymerase chain reaction ("PCR") analyses. However, the lack of
information on the specific adenoviruses detected by the PCR assay makes it impossible
to determine whether
the conclusion that these samples did not contain adenoviruses is
appropriate.
•
Insufficient information
on input variables is provided to enable an assessment of the risk
calculations. The probability distributions of the input values are provided'foronly two
of the input variables (ingestion rate for canoeists and duration for canoeists (Assessment
Figure 5-2 and 5-3.) This information needs to
be provided for each of the input
variables to enable a thorough evaluation
of the risk assessment calculations.
•
Lack of probability distribution results. The authors go to great lengths to use a Monte
Carlo approach to make risk calculations, which evaluates data using probability ranges
to account for inherent uncertainty and variability in the input values. However, the final
results are presented as single numbers, without showing the calculated cumulative
probability distribution functions.
The fact that the authors do not even state the
probability associated
with the risk numbers they present makes it impossible to assess
the calculated risk probabilities appropriately.
25
Electronic Filing - Received, Clerk's Office, August 4, 2008
C. Gaps in Essential Information
The following are gaps in essential information regarding the methods, analysis, and
assumptions used in the Risk Assessment that must be resolved in order for the study to be
properly evaluated, let alone used as the basis for policy judgments. These questions must be
answered before the Assessment is even considered in this proceeding:
•
What primers were used for the calicivirus analyses? What caliciviruses are detected
using those primers? (Assessment
p. 25)
•
What method was used to analyze samples for adenoviruses?
It
is not until p. 42 that the
cell line used is mentioned. What serotypes
of adenoviruses are detected using that cell
line? (Assessment
p. 25)
•
The authors indicate that Blue Green Monkey cells were used for the positive and
negative virus control assays (Assessment p. 30). This is not the celrIine required
by
VSEPA for culturable virus assays.
•
The authors state that
PCR was used to confrrm the presence of adenoviruses in the
samples which were cell-culture positive, as other viruses can grow in the cell line
(Assessment
p. 50). What primers were used for this analysis? What serotypes of
adenoviruses are detected using these primers? How was this information used to
determine the concentrations
of adenoviruses in the water samples?
•
The authors state that Tables 3-5a through 3-5f present a summary
of the "total enteric
virus" analytical results (Assessment
p. 48). However, the samples were not analyzed
using a method that detects total enteric viruses - there is no established procedure for
such an assay.
•
It
is stated that the reverse transcription polymerase chain reaction (RT-PeR) results
were used to calculate the concentrations
of noroviruses in the water samples
(Assessment pp. 52-53). How were these calculations done?
•
The dose response data for
Cryptosporidium
has been documented to vary
by strain.
What
is the rationale for the values used?
•
What is the basis for changing several
of the values used for the secondary infection rates
from the interim dry weather report to the combined dry and wet weather report?
•
How was the contribution
of each pathogen to the total risk computed, given that a
distribution
of risk was calculated for each organism?
•
What were the "
... representative pathogen concentrations used as inputs for the
simulation
..."? How were they developed?
IX. The
mc
Epidemiological Study is an Inadequate Basis for a Decision Concerning
Disinfection
As noted in Section III, I have reviewed information concerning the epidemiological
study currently being conducted on behalf of the MWRD by the VIC School of Public Health. I
have no reason to believe, based on my review, that the methodology of this study is
inappropriate, or that it
is otherwise scientifically flawed in any meaningful way. I start with the
assumption that the study constitutes sound science.
26
Electronic Filing - Received, Clerk's Office, August 4, 2008
That said, based upon my knowledge of the nature of waterborne pathogens and the risks
they present, I do not believe that the epidemiological study represents an appropriate tool for
making a determination as to the magnitude
of the risk of pathogens to CAWS recreators, or
whether disinfection is appropriate to alleviate that risk. Epidemiological studies can, as a
general matter, be a useful tool for identifying risks in everyday settings. But the difficulty
of
controlling for other sources of risk in such settings counsels against excessive reliance upon
epidemiological study results, particularly when those results are negative.
The following are the major reasons why I believe excessive reliance
on results of the
VIC CAWS epidemiological study, or postponing disinfection of the MWRD WWTPs until after
its completion, would be inappropriate:
•
Difficulty
of obtaining an adequate sample size. Results of an epidemiological study are
unreliable unless the study
is based on a sufficiently large sample.
If
the sample is too
small, then the associated margin of error will be so large as to render the results
functionally meaningless. Here, even
if VIC obtains a sufficiently large overall sample
(and I am aware that there have been difficulties in this area), it still is not likely to
obtain sufficiently large samples
of the subcategories of users at most severe risk of
infection - sensitive populations and users who suffer accidental immersion. Since the
nature
of the risk of infection from secondary contact recreation is grounded in such
infrequently-occurring but nonetheless present variables, such that it is difficult or
impossible to amass a sufficient sample
of participants specifically reflecting variables,
an epidemiological study
is really not a good tool for identifying that risk.
•
Incomplete assessment
of risk. This study is going to extraordinary lengths to document
adverse health effects attributable to recreational exposure, including gastrointestinal,
wound, and eye infections. However, it will not
be able to assess the number of
recreators who become infected as a result of recreation, but do not exhibit signs and
symptoms
of that infection. As discussed previously, a significant fraction of the infected
individuals may never show any overt signs of the infection. However, they may still
serve as sources
of secondary infection to their contacts. Thus, the risks that are
determined from this, as is the case with other, epidemiologic studies will likely be an
underestimate
of the true risks.
•
Varying water conditions make risk hard to pinpoint. The level
of pathogens in water can
vary greatly with such ephemeral, constantly changing variables as the amount
of
sunlight (which can inactivate microorganisms), the temperature (which generally affects
microbial inactivation by increasing the rate at higher temperatures), and turbidity of the
water (which blocks sunlight). Different people recreating on different days or different
portions
of the water body may encounter very different pathogen loads depending on
these variables, and it
is difficult if not impossible for an epidemiological study to
meaningfully sort out those variables, even though the levels of a few pathogens are
being determined in this study. Thus, the results will not adequately account for the risk
to users during periods or in isolated locations where the pathogen load is higher.
27
Electronic Filing - Received, Clerk's Office, August 4, 2008
•
Differing levels of use. An epidemiological study can only capture, at best, risk
associated with the particular manner
in
which recreators use the body of water being
studied. Thus, for instance, while the VIC CAWS epidemiological study uses canoers on
a clean body
of water as a control group, the
manne~
in which people engage in canoeing
- in particularly their willingness to come into contact with water -
is likely to vary
widely between the users
of the clean versus contaminated water. That is, people
canoeing
on clean water are much more likely to be careful to avoid accidental
immersion and otherwise behave in a manner unlikely to result in ingestion
of water.
Accordingly, at best, an epidemiological study
of the CAWS represents an assessment of
risk of a very cautious, incomplete recreational use of the water.
•
Results must be replicated.
It
is a basic principle of any scientific study that no result is
reliable unless it can be reproduced. At the very least, one should not draw any
conclusions from the epidemiological study - particularly any conclusions with so great a
potential impact on public health as a decision whether to disinfect - unless the results
are reproduced in at least one more study.
x.
Conclusion
There are abundant data and information currently available to support a conclusion that
WWTP effluent to the CAWS should be disinfected in order to protect public health. We know
that the CAWS contains high levels of at least some sewage-related human pathogens, despite
any uncertainty as to their exact nature and level.
We know that disinfection can inactivate these
pathogens. And very importantly, we know that the types
of pathogens associated with
undisinfected sewage effluent, and hence likely present in the CAWS, are capable
of causing
potentially serious infection among the population that uses the CAWS recreationally (as well
as
those who come into contact with them).
Perhaps most importantly, we know that disinfection
of sewage effluent is a widespread
and standard practice, nearly universal in large cities. There is no reason to wait for a period
of
years pending further study when we have sufficient information today to conclude that
disinfection
of MWRD's effluent would serve to protect public health.
Marylynn V. Yates, Ph.D
28
Electronic Filing - Received, Clerk's Office, August 4, 2008
REFERENCES
Bitton,
G. 2005. Wastewater Microbiology, 3
rd
edition. Wiley
&
Sons, New Jersey. p. 174.
Centers for Disease Control and Prevention. Surveillance for Waterborne Disease and Outbreaks
Associated with Recreational Water - United States, 2003-2004. Surveillance Summaries,
MMWR 2006;55, No. SS-12.
Committee on Indicators for Waterborne Pathogens. 2004. Indicators for Waterborne
Pathogens. The National Academies Press, Washington DC.
Debjani D.,
K. Metzger, R Heffernan, S. Balter, D. Weiss, F. Mostashari. 2005. Monitoring
Over-The-Counter Medication Sales for Early Detection of Disease Outbreaks --- New York
City. Morbidity and Mortality Weekly Report, August
26,2005/ 54(Suppl);41-46.
DeWailly, E. C. Poirier, F.M. Meyer. 1986. Health Hazards associated with windsurfing on
polluted water. Am. J. Pub. Health 76(6):690-691.
EPA-823-B-02-003, Implementation Guidance for Ambient Water Quality Criteria for Bacteria,
May 2002 Draft, page 42, Table 4.1.
Fewtrell, L., A.F. Godfree,
F. Jones, D. Kay, R.L. Salmon, and M.D. Wyer. 1992. Health
effects
of whitewater canoeing. Lancet. 339:1587-1589.
.
Fewtrell,L D. Kay, RL. Salmon, M.D. Wyer, G. Newman, and G. Bowering. 1994. The
health effects
of low-contact water activities in fresh and estuarine waters. J. Institut. Wat.
Environ. Mgmt. 8(1):97-101.
Gerba,
C.
P. and J.B. Rose. 1993. Estimating viral disease risk from drinking water. In:
Comparative Environmental Risk Assessment, Lewis Publishers, Boca Raton, Florida, Chapter
9.
Moe, C.L. Waterborne transmission of infectious agents. In: Manual of Environmental
Microbiology, 3
rd
edition. C.J. Hurst, editor-in-chief. ASM Press, Washington DC, Chapter 19.
Oragui, J. 2003. Viruses in faeces. In: The Handbook of Water and Wastewater Microbiology,
Academic Press, London, Chapter 29.
Percival, S.L.,
RM. Chalmers, M. Embrey, P.R Hunter, J. Sellewood, and P. Wyn-Jones. 2004.
Microbiology of Waterborne Diseases, Elsevier, London, p. 7.
Roberts, J.D., E.K. Silbergeld, and T. Graczyk. 2007. A probabilistic risk assessment of
Cryptosporidium exposure among Baltimore anglers. J. Toxicol. Environ. Health, part A
70:1568-1576.
Rusin, P., C.E. Enriquez, D. Johnson, and C. P. Gerba, 2000. Environmentally transmitted
pathogens. In: Environmental Microbiology, Elsevier, San Diego, CA, Chapter
19.
29
Electronic Filing - Received, Clerk's Office, August 4, 2008
Schijven, J. and A.M. de Roda Husman. 2006. A survey of diving behavior and accidental
water ingestion among Dutch occupational and sports divers to asses the risk of infection with
waterborne pathogenic microorganisms. Environ. Health Perspect. 114(5):712-717.
Shuval,
H. and B. Fattal. 2003. Control of pathogenic microorganisms in wastewater recycling
and reuse in agriculture.
In:
The Handbook of Water and Wastewater Microbiology, Academic
Press, London, Chapter 15.
Taylor, M.B., P.J. Beckler,
E. Janse van Rensberg, B.N. Harris, IW. Bailey, and W.O.K.
Grabow. 1995. A serosurvey of water-borne pathogens amongst canoeists in South Africa.
Epidemiol. Infect. 115:299-307.
USEPA. 1987. National Primary Drinking Water Regulations; Filtration and Disinfection;
Turbidity; Giardia Lamblia [sic], Viruses, Legionella, and Heterotrophic Bacteria: Proposed
Rule. Federal Register: November 3, 1987, Volume 52, Number 212, pages 42178-42222.
USEPA. 2006. National Primary Drinking Water Regulations: Long Term 2 Enhanced Surface
Water Treatment
Rule, Federal Register: January 5, 2006, Volume 71, Number 3, Pages 653-
702, available at http://www.epa.gov/fedrgstrIEPA-WATERl2006/JanuarylDay-05/w04a.htm.
USEPA Office
of Water and Office of Research and Development. 2007. Critical Path Science
Plan for the development of new or revised water quality criteria, available at
http://www.epa.gov/waterscience/criteria/recreation/pian/cpspian.pdf.
30
Electronic Filing - Received, Clerk's Office, August 4, 2008
EXHIBIT 1
Electronic Filing - Received, Clerk's Office, August 4, 2008
CURRICULUM VITAE
Marylynn Villinski Yates
2008
Education
8/82 - 5/84
Department of Microbiology
&
Immunology, University of Arizona,
Tucson, Arizona.
Ph.D.
in Microbiology
1/81 - 5/82
Department of Chemistry, New Mexico Institute of Mining and
Technology, Socorro, New Mexico.
M.S.
in Chemistry
8/75 - 8/80
University
of Wisconsin, Madison, Wisconsin.
B.S.
in Nursing
Professional Positions (1987-present; a/l
at
University
of
California, Riverside)
7/07 - present
Program Leader, Natural resources and Animal Agriculture
Division of Agriculture and Natural Resources,
University of California
7/92 - present
Associate Professor/Professor of Environmental
Microbiology
Department of Environmental Sciences
12/87 - 6/05
Ground-Water Quality Specialist
Department
of Environmental Sciences
7/99 - 12/00
Chair
Department of Environmental Sciences
1/01-6/04
Associate Executive Vice Chancellor
Honors and Awards
Fellow, American Association for the Advancement of Science, 2007
Distinguished Teaching Professor, University of California, Riverside, 2006
National Associate, National Academies of Science, 2004
University of California, Riverside 2001-02 Distinguished Teaching Award
American Water Works Association 2001-02 Publication Award
American Society for Microbiology Foundation for Microbiology Lecturer, 1997 -
1999
American Water Works Association 1996 Publication Award
Outstanding Research Award, University of California Cooperative Extension,
1996
American Society for Microbiology Foundation for Microbiology Lecturer, 1990-
1991
Electronic Filing - Received, Clerk's Office, August 4, 2008
American Association for the Advancement of Science! U.S. Environmental
Protection Agency Environmental Science and Engineering Fellow, Summer
1985
PROFESSIONAL ACTIVITY AND SERVICE
PROFESSIONAL ACTIVITY (2000 - present)
Panels/Professional
and Scientific Committees
1 Expert Advisory Panel, Canadian Water Network Consortium on Pathogens and
Groundwater,
07-present
2 Review Coordinator, Water Science and Technology Board, National Academies
of Science, 06-07
3 Member, project advisory committee, Challenge organisms for inactivation
of
viruses by ultraviolet treatment, American W.ater Works Association Research
Foundation-Q6-present
4 Member, Editorial Board, Applied and Environmental Microbiology, 02-04
5 Member, Committee
on Indicators of Waterborne Pathogens, National Research
Council - 02-04
6 Member, Committee on Water System Security Research, National Research
Council - 02-03
7 Consultant, Committee
on Restoration of the Greater Everglades Ecosystem,
National Research Council - 02
8 Member, Committee to Improve the U.S.G.S. National Water Quality Assessment
Program, National Research
Council-99-02
9 Member, Peer review panel, Microbiology Research Program Relevancy Review,
National Exposure Research Laboratory, Office
of Research and Development,
U.S. EPA, Cincinnati, OH July 17-19,
2001
10 Member, Unsolicited Proposal Review Committee, American Water Works
Association Research Foundation -
01
11 Member, American Water Works Association Ground-Water Disinfection Rule
Workgroup-97-00
12 Member, ASM Public and Scientific Affairs Board, Committee
on Environmental
Microbiology-97-00
13 Member, American Water Works Association Disinfection and Microbial
Technical Advisory WOrkgroup-97-00
14 Member, project advisory committee, Study to Compare Current Fecal Bacterial
Monitoring with Fecal Coliphage Monitoring
on an Equivalent Volume Basis,
American Water Works Association Research
Foundation-97-00
15 Member, project advisory committee, Investigation
of Soil Aquifer Treatment for
Sustainable Water Reuse, American Water Works Association Research
Foundation-97-00
Electronic Filing - Received, Clerk's Office, August 4, 2008
16 Member, Committee to Improve the U.S.G.S. National Water Quality Assessment
Program, National Research
Council-99-00
Expert Workshops
1 Invited Participant, Expert Workshop on MicrobiallDisinfection By-products
Research Needs, Disinfection By-Products Research Council, Vail, CO, July 23-
25,
2001 (declined due to schedule conflict)
2 Invited Participant, Renewable Natural Resources Foundation congress, "Control
of Nonpoint Source Pollution: Options and Opportunities", Baltimore, MD,
September 18-21,2002 (declined due to schedule conflict)
3 Invited Participant, Interstate Waters Crossing Boundaries for Sustainable
Solutions Workshop, The Utton Center, University
of New Mexico, Snowbird, UT,
October 9-12,2002
4 Invited Participant, Workshop to Develop a Protocol for Reliable Genetic
Methods for the Detection of Viruses, for use in EPA's Water Programs,
Cincinnati, OH, January 15-16, 2003
5 Invited participant, Research on Microorganisms in Drinking Water, U.S. EPA,
Cincinnati,
OH, August 5-7,2003
6 Invited participant, Workshop on Indicators for Pathogens
in Wastewater,
Stormwater, and Biosolids, Water Environment Research Foundation, San
Antonio, TX, December 11-12,2003
7 Invited participant, Pathogens
in the Environment Workshop, USDAlCSREES,
Kansas City, MO, February 24-25, 2004
8 Invited participant, International Workshop on Coliphages as Indicators of Fecal
Contamination in Water and Other Environmental Media, Washington,
DC, April
20-21,2004
9 Invited participant, First International Conference on Fate of Biological Agents,
U.S. Army Edgewood Biological Center, Williamsburg, VA, June 8-10, 2004
10 Invited participant, Environmental Science and Engineering Forum, National
Decentralized Water Resources Capacity Development Project, St. Louis, MO,
October 19-20, 2004 (declined due to teaching conflict).
11 Invited participant, Models and Tools for Including Susceptibility, Immunity, and
Secondary Spread into Microbial Risk Assessment Workshop, Cincinnati, OH,
November 18-19,2004
12 Invited discussant, Methodology for Implementing a Timely Incident Response
Mechanism workshop, Water Environment Research Foundation, Alexandria,
VA, January 10-11, 2005 (declined due to prior service commitment).
13 Invited participant, Major Accomplishments and Future Directions
in Public
Health Microbiology Workshop, United States Geological Survey, Columbus,
OH
February 15 - 18, 2005.
Electronic Filing - Received, Clerk's Office, August 4, 2008
14 Invited participant, Watershed/Catchments Management Summit, American
WaterWorks Association/ Australian Water Association, Honolulu,
HI, March 10-
11,2005
15 Invited participant, State of the Science on Adenoviruses: Expert Workshop,
American WaterWorks Association, Manhattan Beach,
CA, September 26-27,
2005.
16 Invited participant, Pathogens in Groundwater Experts Workshop. Toronto,
Ontario, Canada, June 5-6, 2006.
17 Invited Participant, Water Reuse and Desalination Research Needs Workshop.
San Diego, CA, November 28-30, 2006.
Invited Presentations
1 Environmental Science, American Association of University Women First Annual
Pass Area Conference
on Math and Science for Eighth Grade Girls, Mt. San
Jacinto College, November 3, 2000
2 Detection of Coliphages
in Water: Methods 1601 and 1602. Southern Regional
Safety and Training Conference, California Water Environment Association,
Riverside, CA, November
3,2000
3 The Framework. Microbial Risk Factor: Recommendations to the USEPA on the
Process pf Determination of Microbial Standards
in Drinking Water, Water
Quality Technology Conference, Salt Lake City,
UT, November 7,2000.
4 Viruses in Ground Water. California Water Association, 59
th
Annual Meeting.
Monterey, CA, November 16,2000
5 Use of Batch Adsorption Isotherm Data to Predict Virus Transport. Department
of
Soil, Water, and Environmental Science, University of Arizona, Tucson, AZ,
March
5, 2001
6 Microbiological Contamination of Water. Soil Science faculty from National
Agricultural University, Chapingo, Mexico, UCR, March
30, 2001
7 Ground Water Risks and Protection: Monitoring and Modeling Needs. American
Society for Microbiology Annual Meeting, Orlando,
FL, May 20-24, 2001
8 Body-Contact Recreation: Microbial Health Risks. American Water Works
Association conference
on Source-Water Protection. Las Vegas, NV, January
27,2002
9 Invited Discussant, Workshop to Develop a Protocol for Reliable Genetic
Methods for the Detection of Viruses, for use
in EPA's Water Programs,
Cincinnati,
OH, January 15-16, 2003
10 Development
of a quantitative method for the detection of infective coxsackie and
echo viruses
in drinking water. Research on Microorganisms in Drinking Water,
U.S. EPA, Cincinnati,
OH, August 5-7,2003
11 Groundwater recharge using reclaimed wastewater: microbial considerations,
24
th
Biennial Groundwater Conference, UC Water Resources Center, Ontario,
CA, October
28, 2003
Electronic Filing - Received, Clerk's Office, August 4, 2008
12 Assessment of the Fate of Emerging Pathogens in Biosolids, Workshop on
Indicators for Pathogens in Wastewater, Stormwater, and Biosolids, Water
Environment Research Foundation, San Antonio, TX, December 11-12,2003
13 Coliphages as indicators of fecal contamination of ground water. International
Workshop on Coliphages as Indicators
of Fecal Contamination in Water and
Other Environmental Media, Washington,
DC, April 20-21, 2004
14 Modeling the fate and transport
of microorganisms in the subsurface, Pathogens
and Onsite Sewage Treatment Systems meeting, Sacramento, CA, May
11,
2004
15 Fate and transport of pathogens in the environment, First International
Conference on Fate
of Biological Agents, U.S. Army Edgewood Biological
Center, Williamsburg,
VA, June 8-10,2004
16 Microbiological indicators, coliphages, and ground water protection zones,
Source Water Protection Symposium on Pathogen Management Zones, Ontario
Ministry
of the Environment, Toronto, Canada, July 23, 2004
17 Environmental Factors Affecting Microbial Dose, Models and Tools for Including
Susceptibility, Immunity, and Secondary Spread into Microbial Risk Assessment
Workshop, Cincinnati,
OH, November 18-19, 2004
18 Viruses in Water: Sources and Monitoring, Source Water Protection Symposium,
Palm Beach Gardens,
FL, January 25, 2005
19 Interpreting Results from Emerging and Traditional Methods for Detection of
Microorganisms, Major Accomplishments and Future Directions
in Public Health
Microbiology Workshop, United States Geological Survey, Columbus, OH,
February 16, 2005
20 Keynote Speaker: Our Future, Our Water: Protecting Our Water Supply,
launching of the Water Institute, Purdue University, Calumet, IL, July 6, 2005
21 Microorganisms in water: quantitative risk assessment, School of Engineering,
Mathematics, and Science, Purdue University Calumet, Hammond, IN, July
6,
2005
22 Pathogen Reduction, The Compost Solution workshop. Riverside, CA,
September 12, 2005
23 Overview of Factors Affecting Subsurface Transport of Microorganisms,
Subsurface Transport of Microorganisms and other Colloids Symposium, RIVM,
Bilthoven, The Netherlands, March
16, 2006
24 Keynote Speaker, Emerging Issues in Source Water Management and Strategies
for Addressing New Drinking Water Regulations International Workshop, Central
Indiana Water Resources Partnership, Indianapolis,
IN, April 12-13, 2006
25 Waterborne Viruses: Types, Health Effects, and Detection Methods. Viruses
in
Water Symposium, Walkerton Clean Water Center, Toronto, Ontario, Canada,
October 26, 2006
26 Pathogens 101.
Waterborne Pathogens Speaker Series, Michigan State
University, East Lansing,
MI, February 9, 2007
27 Pathogens and Produce: what we know and what we need to know; Regulatory
Issues. American Society for Microbiology Annual Meeting, Toronto, Ontario,
Canada, May 23, 2007 (declined due to schedule conflict)
Electronic Filing - Received, Clerk's Office, August 4, 2008
28 Biosolids Management and Legislation: The USA Experience. Workshop on
Biosolids Management: Legislation and International Experience. Hellenic Union
of Water and Sewerage Municipal Companies, Municipality
Of
Larissa, Larissa,
Greece, May
25-26, 2007
29
Keynote Speaker. Adenoviruses and Ultraviolet Light: an Introduction.
Adenovirus and
UV Disinfection session. World Congress on Ozone and
Ultraviolet Technologies, Los Angeles, California USA. August
27-29,2007
Editorial Boards
1
Member, Editorial Board, Quantitative Microbiology,
00-02
2
Member, Editorial Board, Applied and Environmental Microbiology,
02-04
3
Editor, Applied and Environmental Microbiology,
04 -
present
Reviewer, manuscripts
1 Applied & Environmental Microbiology (58)
2 Applied Microbiology
&
Biotechnology (1)
3
Environmental Science & Technology (4)
4
Ground Water (1)
5
International Journal of Water and Health (2)
6
Journal of the American Water Works Association (1)
7
Letters in Applied Microbiology (1)
8 Water Research (1)
9 Water Resources Research (2)
10 Water Science & Technology (4)
Ad hoc
Reviewer, grant proposals
1 BARD (1)
2 Canadian Water Network (1)
3 CRDF (1)
4 Michigan Sea Grant (1)
5 New York Sea Grant (1)
6 NSF (1)
7 UC AES (2)
8 USDA (2)
9 USEPA (2)
Grant Proposal Review Panels
1 American Water Works Association Research Foundation (1)
2 Canadian Water Network (1)
3 NIH (4)
4 NOAA (1)
5 NSF (4)
6 U.S. Environmental Protection Agency (2)
7 U.S. Environmental Protection Agency (declined due
to conflict of interest)
Reviewer, other
Electronic Filing - Received, Clerk's Office, August 4, 2008
1 New River Pathogen Total Maximum Daily Load Plan, California Regional Water
Quality Control Board, Colorado River Basin -
2001
2 Fifteen-year reviews of three UC Multi-Campus Research Units: UC
Observatories/Lick, Institute of Nuclear and Particle Astrophysics and
Cosmology, White Mountain Research Station - 2002
3 Protecting Water Resources - DANR Publication - 2002
4 Regional Cooperation for Water Quality Improvement in Southwestem
Pennsylvania, Water Science
and Technology Board, National Research
Council, National Academies -
04
5 Bridges to Independence: Fostering the Independence of New Investigators in
the Life Sciences, Board of Life Science, National Research Council, National
Academies - 05
6 Globalization effects on water quality: Impact on the spread of infectious disease
in aquatic and human populations, chapter in: Globalization: Effects on Fisheries
Resources -
04
7 Draft TMDL for Bacterial Indicators in Middle Santa Ana River Watershed
Waterbodies, Santa Ana Regional Water Quality Control Board - 05
8 Where will future emerging pathogens come from? What approaches can we
use to find them, in addition to VFARS? Chapter for U.S. EPA publication on
VFARs (virulence factor activity relationships) - 05
9 Improving the Nation's Water Security: Opportunities for Research, Water
Science
and Technology Board, National Research Council, National Academies
- 06-07
Consulting
1 Expert for County of Los Angeles, California re: BEACHES Environmental
Assessment and Coastal Health Act litigation, 2007- present
2 Expert for Horton, Oberrecht
&
Kirkpatrick re: food-borne disease outbreak
litigation, 2006-07
3 Expert for Board of Water Supply, City of Honolulu, Hawaii re: water reuse, 2002-
05
4 Reviewer for Bigelow Companies, Clark County Health District Proposed
Regulations for Sanitation
and Safety for Public Accommodation Facilities, 2004
5 Expert for State of California, Department of Justice, Assessing the potential for
pathogen contamination of drinking water
at California Correctional Institute-
Tehachapi, 1999-2000
6 Consultant for Metropolitan Water District of Southern California, Lake Perris
Water Quality scoping team, 1998
7
Lead consultant for Metropolitan Water District of Southern California, Eastside
Valley Reservoir Pathogen Risk Assessment project, 1995-98
8 Consultant for Metropolitan Water District of Southern California, Pathogen
survival
dUring desalination of sea water, 1995-96
Electronic Filing - Received, Clerk's Office, August 4, 2008
PUBLICATIONS
TECHNICAL JOURNAL ARTICLES
1. Yates, M.V., J.A Brierley, C.L. Brierley, and S.E. Follin. 1983. Effect of
microorganisms
on in situ uranium mining.
Appl. Environ. Microbiol.46:779-784.
2. Yates, M.V., C.P. Gerba, and L.M. Kelley. 1985. Virus persistence in ground water.
Appl. Environ. Microbiol., 49:778-781.
3. Yates, M.V. 1985. Septic tank density and ground water contamination.
Ground
Water 23:586-591.
4. Yates, M.V., S.R. Yates, AW. Warrick, and C.P. Gerba. 1986. Use of geostatistics to
predict virus decay rates for determination of septic tank setback distances.
Appl.
Environ. Microbiol. 52:479-483.
5. Yates, M.V., S.R. Yates, J. Wagner, and C.P. Gerba. 1987.
Modeling virus
survival and transport
in the subsurface.
Journal of Contaminant Hydrology
1:329-345.
6. Rose, J.R., RL. Mullinax, S.N. Singh, M.V. Yates and C.P. Gerba. 1987. Occurrence
of rota and enteroviruses in recreational waters of Oak Creek, Arizona.
Water
Research 21:1375-1381.
7. Yates, M.V. and S.R. Yates. 1987. Comparison of geostatistical methods for
predicting virus inactivation rates in ground water.
Water Research
21: 1119-1125.
8. Yates, MV. and S.R Yates. 1987. Modeling microbial fate in the subsurface
environment.
CRC Critical Reviews in Environmental Control, 17:307-344.
9. Henson, J.M., M.V. Yates, J.W. Cochran and D.L. Shackleford. 1988. Microbial
removal of halogenated methane, ethanes and ethylenes
in an aerobic soil exposed
to methane.
FEMS Microbiology Ecology
53: 193-201.
10. Cochran, J.W.,
MV. Yates, and J.M. Henson. 1988. A modified purge-and-trap/gas
chromatography method for analysis of volatile halocarbons in microbiological
degradation studies.
J.
Microbiol. Methods 8:347-354.
11. Yates, S.R and M.V. Yates. 1988. Disjunctive kriging as an approach to
management decision making.
Soil Sci.
Soc.
Am. J. 52:1554-1558.
12. Henson, J.M., M.V. Yates, and J.W. Cochran.1989. Metabolism of chlorinated
methanes, ethanes, and ethylenes by a mixed bacterial culture growing
on methane.
J. Indusf. Microbiol.4:29-35.
13. 13. Yates, M.V. and S.R Yates.
1989. Septic tank setback distances: a way
to minimize virus contamination
of ground water.
Ground Water 27:202-208.
14. Yates, MV. and S.R Yates. 1988. Virus survival and transport in ground water.
Waf. Sci. Tech. 20:301-307.
Electronic Filing - Received, Clerk's Office, August 4, 2008
15. Yates, M.V., L.D. Stetzenbach, C.P. Gerba, and N.A. Sinclair. 1989. The effect of
indigenous bacteria on virus survival in ground water.
J. Environ. Sci. Eng.
A25:81-
100.
16. Yates, M.V. and S.R. Yates. 1990. Modeling microbial transport in soil and ground
water.
ASM News, 56:324-327.
17. Yates, M.V. and Y. Ouyang. 1992. VIRTUS: A model of virus transport in
unsaturated soils.
Appl. Environ. Microbiol. 58:1609-1616.
18. Yates, M.V., J.L. Meyer, and M.L. Arpaia. 1992. Using less fertilizer more often can
reduce nitrate leaching.
California Agriculture 46:19-21.
19. Gan, J. S.R. Yates, W.F. Spencer, and M.V. Yates. 1994. Automated headspace
analysis
of fumigants 1,3-dichloropropene and methylisothiocyanate on charcoal
sampling tubes.
J. Chromatogr.684:121-131.
20. Gan, J. , S.R. Yates, M.A. Anderson, W.F. Spencer, F.F. Ernst, and MV. Yates.
1994. Effect of soil properties on degradation and sorption of methyl bromide in soil.
Chemosphere. 29:2685-2700.
21. Yates, M.V. 1995. Field evaluation of the GWDR's natural disinfection criteria.
J.
Amer. Water Works Assoc. 87:76-85.
22. Poletika, N.N., W.A. Jury, and MV. Yates. 1995. Transport of bromide, simazine,
and MS-2 coliphage in a Iysimeter containing undisturbed, unsaturated soil.
Wat.
Resour. Res. 31:801-810.
23. Gan, J., M.A. Anderson, S.R. Yates, W.F. Spencer and M.V. Yates.
1995.
Sampling and stability
of methyl bromide on activated charcoal sampling tubes.
J.
Agric. Food Chem. 43:1361-1367.
24. Gan, J., S.R. Yates, W.F. Spencer, and MV. Yates. 1995. Optimization of methyl
bromide on charcoal sampling tubes.
J. Agric. Food Chem. 43:960-966.
25. Yates, MV. and W.A. Jury. 1995. On the use of virus transport modeling for
determining regUlatory compliance.
J. Environ. Qual.,
24: 1051-1055.
26. Yates, S.R.,
J. Gan, F.F. Ernst, A. Mutziger, and MV. Yates. 1996. Methyl bromide
emissions from a covered field. I. Experimental conditions and degradation in soil.
J. Environ. Qual.
25: 184-192.
27. Yates, S.R., F.F. Ernst, J. Gan, F. Gao, and M.V. Yates. 1996. Methyl bromide
emissions from a covered field. II. Volatilization.
J. Environ. Qual. 25:192-202.
28. Gan, J., S.R. Yates, F.F. Ernst, and MV. Yates. 1997.
Laboratory-scale
measurements and simulation of the effect of application methods on soil methyl
bromide emission.
J. Environ. Qual.
26:310-317. '
29. Gao,
F., S.R. Yates, M.V. Yates, J. Gan and F.F. Ernst. 1997. Design, fabrication
Electronic Filing - Received, Clerk's Office, August 4, 2008
and application of a dynamic chamber for measuring gas emissions from soil,
Environmental Science and Technology,
31: 148-153.
30. Jin, Y.,
MV. Yates, S.S. Thompson, and W. A Jury. 1997. Sorption of viruses
during
flow through saturated sand columns.
Environmental Science and
Technology,
31 :548-555.
31. Crohn,
D. and M.V. Yates. 1997. Interpreting negative virus results from highly
treated water.
J. Environ. Engr. 123:423-430.
32. Crohn, D., M.V. Yates, and M. Luker. 1997. Demonstrating virus treatment
efficiencies
for biosolids.
J. Environ. Engr.
123, 123:1053-1059.
33. Thompson, S.S.,
M. Flury, MV. Yates, and W.A Jury. 1998. Role of the air-water-
solid interface in bacteriophage sorption experiments.
Appl. Environ. Microbiol.
64:304-309.
34. Anderson,
M. A, M.H. Stewart, MV. Yates, and C.P. Gerba. 1998. Modeling the
impact
of body-contact recreation on pathogen concentrations in a source drinking
water reservoir.
Water Research 32:3293-3306.
35. Chendorain, M., MV. Yates, and F. Villegas. 1998. The fate and transport of viruses
through surface water constructed wetlands.
J. Environ. Qual. 27:1451-1458.
36. Thompson, S.S. and M.V. Yates. 1999. Bacteriophage inactivation at the air-water-
solid interface in dynamic batch systems.
App. Environ. Microbiol. 65:1186-1190.
37. Flury, M, MV. Yates, and W.A Jury. 1999. Numerical analysis of the effect of the
lower boundary condition on solute transport in Iysimeters.
Soil Sci. Amer. J. 63:
1493-1499.
38. Jin, Y.,
E. Pratt, and M. V. Yates. 2000. Effect of colloids on virus transport through
saturated sand columns.
J. Environ. Qual.
29(2): 532-539.
39. Chu, Y.,
Y. Jin, and M. V. Yates. 2000. Virus transport through saturated columns
as affected by different buffer solutions.
J. Environ. Qual. 29(4):1103-1110.
40. Gao, F.F., Y. Jin,
S.R Yates, S. Papiernik, M.A Anderson, and M.V.Yates. 2001.
Theory and laboratory study
of a tall passive chamber for measuring gas fluxes at
soil surface.
J. Air
&
Waste Mgmt. Assoc.,
51 :49-59.
41. Chu, Y; Jin, Y; Flury,
M; Yates, MV. 2001. Mechanisms of virus removal during
transport in unsaturated porous media.
Wat. Resour. Res., 37:253-263.
42. Wu, L., G. Liu, M.V. Yates, RL. Green, P. Pacheco, J. Gan, and S.R Yates. 2002.
Environmental fate
of metalaxyl and chlorothalonil applied to a bentgrass putting
green
under southern California climatic conditions.
Pest Mgmt. Sci. 58:335-342.
43. Wu, L., RL. Green, G. Liu, M.V. Yates, P. Pacheco, J. Gan, and S.R Yates. 2002.
Partitioning and persistence
of trichlorfon and chlorpyrifos in a creeping bentgrass
putting green.
J. Environ. Qual.,
31 :889-895.
Electronic Filing - Received, Clerk's Office, August 4, 2008
44. Frazier, C.S., RC. Graham, P.J. Shouse, M.V. Yates, and M.A Anderson. 2002. A
field study
of water flow and virus transport in weathered granitic bedrock.
Vadose
ZoneJ.1:113-124.
45. Stewart, M.H., MV. Yates, M.A Anderson, C.P. Gerba, J.B. Rose, R Deleon, and
RL. Wolfe. 2002. Predicted public health consequences of body-contact recreation
on a potable water reservoir.
J. Amer. Wafer Works Assoc. 94:84-97.
46. Chu, Y.J., Y. Jin,
T.
Baumann, M.V. Yates. 2003. Effect of soil properties on
saturated and unsaturated virus transport through columns.
J. Environ. Qual.
32:2017-2025.
47. Abd
EI Galil, K.H., M.A EI Sokkary, S.M. Kheira, AM. Salazar, M.V. Yates, W. Chen,
and A Mulchandani. 2004. A combined IMS-molecular beacon RT-PCR assay for
detection of hepatitis A virus from environmental samples.
Appl. Environ. Microbio!.,
70:4371-4374.
48. Sobsey, M.D., M.V. Yates, F.C. Hsu,
G. lovelace, D. Battigelli, A Margolin, S.D.
Pillai, and
N. Nwachuku. 2004. Development and evaluation of methods to detect
coliphages
in large volumes of water
Waf. Sci. Technol.,
50 (1): 211-217.
49. Davis,
K., M.A Anderson, and MV. Yates. 2005. Distribution of indicator bacteria in
Canyon
lake, California.
Waf. Res.,
39: 1277-1288.
50. Abd EI Galil, K.H., M. A EI Sokkary, S. M. Kheira, A M. Salazar, M. V. Yates, W.
Chen and A Mulchandani. 2005. Development of a Real-Time Nucleic Acid
Sequence-Based Amplification (NASBA) assay for the Detection
of Hepatitis A virus,
Appl. Environ. Microbiol.,
71 (11): 7113-7116.
51. Wang, A, A M. Salazar, MV. Yates, A Mulchandani, and W. Chen. 2005.
Visualization and detection
of infectious virus replication,
Appl. Environ. Microbiol.,
71 (12): 8397-8401.
52. Hwang, Y-C., W. Chen, and M.V. Yates. 2006. Use offluorescence resonance
energy transfer for rapid detection of enteroviral infection in vivo.
Appl. Environ.
Microbiol.,
72 (5): 3710-3715.
53. Yates,
MV., J. Malley, P. Rochelle, and R Hoffman. 2006. Effect of adenovirus
resistance on UV disinfection requirements - a report on the state of adenovirus
science.
J. Amer. Wat. Works Assoc., 98(6):93-106.
54. Hwang, Y.-C., a.M. leong, W. Chen, and MV Yates. 2007. Comparison of a
reported assay and immunomagnetic separation real-time RT-PCR for the detection
of enteroviruses in seeded environmental water samples.
Appl. Environ. Microbiol.,
73(7):2338-2340.
55. Yates, M.V. 2007. Classical Indicators in the 21st Century - Far and Beyond the
Coliform.
Waf. Environ. Res. 79(3):279-286.
Electronic Filing - Received, Clerk's Office, August 4, 2008
56. Wu, L., R. Green, MV. Yates, P. Pacheco, and G. Klein. Nitrate leaching in
overseeded bermudagrass fairways. Crop Sci., in press.
57. Hwang, Y.-C.,
J.J.
Chu, P.L. Yang, W. Chen, and M.V. Yates. Rapid identification of
inhibitors that interfere with poliovirus replication using a cell-based assay. Antiviral
Research,
in press.
BOOKS
1. Committee on Ground-Water Recharge. 1994. Ground Water Recharge Using
Waters of Impaired Quality. National Academy Press, Washington, DC. 283 pp.
2. Committee to Improve the U.S. Geological Survey National Water Quality
Assessment Program. 2002. Opportunities to Improve the U.S. Geological Survey
National Water Quality Assessment Program. National Academy Press,
Washington, DC. 238 pp.
3. Committee on Restoration of the Greater Everglades Ecosystem. 2002. Regional
Issues in Aquifer Storage and Recovery for Everglades Restoration: A Review of the
ASR Regional Study Project Management Plan of the Comprehensive Everglades
Restoration Plan. National Academies Press, Washington, D.C. 75 pp.
4.
L. A. Stetzenbach and M. V. Yates. 2003. Dictionary of Environmental Microbiology.
Elsevier, New York, Publishers.
5. Panel on Water system Security Research. 2004. A review of the EPA water
security research and technical support action plan. National Academies Press,
Washington, D.C. 120 pp.
6. Committee on Indicators for Waterborne Pathogens. 2004. Indicators for
waterborne pathogens. National Academies Press, Washington, D.C. 315 pp.
Electronic Filing - Received, Clerk's Office, August 4, 2008
EXHIBIT 2
Document filed with the Clerk. Waiver of service requirements upon hearing participants
requested pursuant to
35 Ill. Admin. Code l02.424(c)
Electronic Filing - Received, Clerk's Office, August 4, 2008
EXHIBIT 3
Electronic Filing - Received, Clerk's Office, August 4, 2008
279
125
••••••••••••••••••••••••••••••••••••
• ••••••••••••••••••••••••
•
59
23
48
33
I
North Shore,
Mississippi River
Fox River
Delaware River
North Branch Chicago
R.
Twin Cities, MN
Elgin, IL.
Philadelphia, PA
(3)
I
(10)
(2)
(8)
I_ WWTP g WQ rronitoring station I
Urban Rivers Analysis: Comparison of Focus Areas
WWTP effluent data and dow nstream WQ rronitoring stations
19,538 10,950
A
~
=- ......,
•
Chicago area waterways
Little Calumet,
Cal-Sag Channel
(2)
8,231
o
2000
1500
E.J
o E
~o
'8
~
1000
-::J
cau.
~O
u.
500
illinois Water Quality Standardsj
~+\1f.O sr~~d'
Note: WWTP results - effluent; wa station results - ambient
i
ft \
• Fecal coliform monitoring results are expressed in the
••••••
General Use
\.~
number of colony forming units (CFU) per 100mL
Fecal coliform:
'I>~(
PP,r1It.#
• Samples were taken monthly, May-October
30 day geometric mean 200 per 100mL limit
(#) - Distance downstream of monitoring station from WWTP
Electronic Filing - Received, Clerk's Office, August 4, 2008
12,000
10,000
E
.J
8,000
.2
=0
E
8
.....
~
6,000
'ii::)
CJLI.
.f
0
4,000
2,000
0
North Shore Channel and North Branch Chicago River
Ambient May to October 2002 Geometric Mean Fecal
Coliform
f'.iJrthside =19,538
Source: MWRDGC
Central
Dempster Oakton
Touhy
0.75
Foster
Wilson
Diversey
Grand
3.25
4.2
6.75
10.5
Sam pled Mlnthly
# -
Distance downstream of monitoring station from WWTP
Electronic Filing - Received, Clerk's Office, August 4, 2008
Little Calumet River and Cal-5ag River
May to October 2002 Geometric Mean Fecal Coliform
Calumet
=
8,231
2,000,
T
-
--~
1,500
E.J
~
L.
E
=0
-~
8
....
~
1,000
cuLL
LL
~O
500
0+
1
--
Source: MWRDGC
Indiana
Halsted
1.3
Ashland
2.3
Cicero
6.3
Route 83
17.2
Sampled Monthly
•••••••• •••••
General Use 30 day geometric mean 200 per 100mL limit
# -
Distance downstream of monitoring station from WWTP
Electronic Filing - Received, Clerk's Office, August 4, 2008
)
6
12 Miles
• MWRDGC sample
I
locati~
MWRDGC monitoring
points
Back to top
- 63 sample locations
Source: MWRDGC
Electronic Filing - Received, Clerk's Office, August 4, 2008
a
a
a
..
a
co
a
....
E..Jg
o E
a
..
.-
-
00
0
~
u:!:a
-::')a
caLLa
u 0
..
eD
a
LL
N
a
Northside WRP Effluent May to October 2002
Geometric Mean Fecal Coliform
May
June
July
Aug.
Sept.
Oct.
Source: MWRDGC
Electronic Filing - Received, Clerk's Office, August 4, 2008
•I I
I
I
I
I I I
•
I
I
Northside WRP Effluent
Fecal Coliform May to October 2002
140,000
120,000
~ ~OO,OOO
'to-
=
o
00 80000
'
u~
- 3
60,000
cau.
~
0
40,000
u.
20,000
o
\::J\::J~
f;:}\::J~
\::J\::J~
f;:}\::J~
\::J\::J~
f;:}\::J~
f;:}\::J~
f;:}\::J~
f;:}\::J~
f;:}\::J~
f;:}\::J~
f;:}\::J~
f;:}\::J~
§
~ ~ ~
#
~ ~ ~ ~ ~ ~ ~~
~
~
~
~
~
~~
~
~
~
~
~
#
Source: rv1VVRDGC. Sarmles collected weeki y •
Electronic Filing - Received, Clerk's Office, August 4, 2008
Calumet WRP Effluent May to October 2002
Geometric Mean Fecal Coliform
20,000 ',-------------------
E~
,
6 E 15,000
"'t
l
------
--J
""'"
=0
00
(.) :!::
10,000
-r-
I
-----------.
-:)
~LL
CD
0 5,000
"'1"1-----
LL
a
-+1-
May
June
July
Aug.
Sept.
Oct.
Source: MWRDGC
Electronic Filing - Received, Clerk's Office, August 4, 2008
~rv
~rv
~rv
~
\:5
~
~
~
~rv
r}~
~~
~~
~
~rv
~
~rv
'"
Calumet WRP Effluent
Fecal Coliform fv1av to October 2002
70000
+I-------------~
60000
-+I-------------~
E
E
50000 -+1-----------
.2
.- 0
"0 040000 1
I
u~
~ ~30000
1
I
(1)0
LL
20000 I
I
10000 1
I
O
1-
,
_!
,
#########
~
~
~
~
~
~
~~
~
~
~
~
~
~
~
~
~
~
Source: MVVRDGC. Samples collected weekly.
Electronic Filing - Received, Clerk's Office, August 4, 2008
EXHIBIT 4
Electronic Filing - Received, Clerk's Office, August 4, 2008
Dry Weather Risk Assessment of Human Health Impacts of Disinfection vs. No
Disinfection of the Chicago Area Waterways System
Review conducted for: US EPA Region 5, Office of Water,
Review conducted by: US EPA Office
of Research and Development
Summary:
A Quantitative Microbial Risk Assessment (QMRA)
of the Chicago Area Waterways (CAW) was
conducted to evaluate the risk
of illness posed to recreational users of the CAW with the current
practice
of not disinfecting the effluent at three wastewater treatment plants with discharges into
the CAW. Using monitoring data for pathogenic microorganisms and integrating over dose
response functions, exposure times and ingestion rates, the conclusion was made that the risk for
gastrointestinal illness was well under the
8-1011 000 currently deemed "acceptable" by the US
EPA 1986 Ambient Water Quality Criteria, and that there was therefore no need for additional
disinfection to adequately protect public health
This QMRA was only done for the Phase I "dry" weather season, and does not present results for
the wet season. So presumably any conclusions would be only applicable to the dry season until
the wet season analysis is completed.
National Health and Environmental Effects Research Laboratory
(NHEERL):
Note: This lab'sreview does not assess in detail the adequacy ofthe microbial methods, QA
procedures and sampling techniques.
Comments:
The QMRA was conducted
by a consulting group, GeoSyntec Consultants, based in Chicago,
with analytical assistance from Dr. Charles Gerba at University
ofArizona, and Dr. Jennifer
Clancey
of Clancey Environmental, among others.
The microbial sampling and characterization seems thorough and adequate. World-renowned
experts were consulted and retained to conduct the analyses for pathogenic microorganisms and
details
of the sampling scheme, rationale and methods are well described.
The general approach described for the QMRA also seems appropriate. The authors do a
thorough
job of explaining and justifying their selections of dose-response functions and their
parameters. Generally, citations from peer reviewed literature are provided to support their
decisions.
However, there are some fundamental problems in the application, presentation and interpretation
ofthe results of the QMRA. These are detailed below:
•
No justification was provided for the organisms measured or pathogens
considered in the QMRA
-.
"
Electronic Filing - Received, Clerk's Office, August 4, 2008
The risks presented are only for a few gastrointestinal pathogens. Risks were not
presented for Hepatitis A, Shigella, Camplyobacter, to name a few. Therefore risks
presented will
be biased low.
•
Only gastrointestinal illness was considered
Since
Pseudomonas
and adenovirus were found, descriptions
of non GI Illness should
also be provided to present a clear picture
ofthe actual risk associated with recreating in
the CAW
•
Conservative assumptions were not made
In nearly every case, when simplifications and assumptions were made in such a way to
ultimately minimize the estimated risk. For example, high Calicivirus measures were
dismissed as an artifact and an outlier. High infectivity parameters for adenovirus were
dismissed because they usually cause respiratory illness. The lower infectivity
of
echovirus was considered instead of rotavirus. The notable exception to this is secondary
transmission where some apparent conservative assumptions were made, but since it
is
not clear how secondary transmission was modeled and since there was no sensitivity
analysis conducted it is impossible to evaluate how these assumptions ultimately affected
the results.
There
is also some question about the activities considered. Why wasn'tfull body jet
skiing considered? Or other full body exposures even if they area rare and prohibited,
would still result in risk
of illness.
•
Inadequate reporting
of risk assessment results and methods
The actual risk assessment is brief and contains no graphs and few brieftables. It
is
unclear how microbial pathogen densities were estimated. Were distribution functions
estimated based on the observed results, or were the potential values sampled from the
actual results? Were only viable Cryptosporidium results considered? A table should be
provided listing the details
of all parameters and their ranges in used in the risk
assessment. Furthermore, it is not clear how activities were randomly assigned, were they
assigned based on their frequency
of occurrence, or were they completely random? It is
also not clear how secondary illness was modeled or incorporated into the estimate.
•
Interval estimates were not reported
This is a major failing since only one estimate
ofthe risk was reported. With the
significant amount
of assumptions and uncertainty, bounds on these estimates must be
provided (95% bounds). Complete details
ofthe Monte Carlo analysis should be provide
so the distribution
of risk can be visualized.
•
No sensitivity analysis was provided
A sensitivity analysis should describe which assumptions most affected the risk estimates
and how they affected the risk estimates. Since so many assumptions that were made
were not necessarily conservative, this is a vital aspect to a risk assessment.
Electronic Filing - Received, Clerk's Office, August 4, 2008
•
Variability and uncertainty were not discussed, evaluated or quantified
Each step
ofthe risk assessment contains variability and uncertainty. Uncertainty could
be considered in the dose-response parameters or in the microbial densities
•
Limitations were not discussed
One clear limitation is that only a few pathogens were considered and this methodology
does not characterize the cumulative risk associated with all pathogens potentially present
in an environment. Another clear limitation is the failure to discuss sensitive or
susceptible limitations, illnesses other than GI and the potential for long term sequelae
resulting from infection.
In
summary, while the QMRA methodology is appropriate, many assumptions are questionable,
important details are left out, there is no evaluation
ofthe potential range of risks, and no
sensitivity analysis. Therefore the QMRA does not provide sufficient information to support he
assertion that there
is minimal risk with the current state of no disinfection. These details should
either be provided to support the claims made,
or another, independent risk assessment should be
conducted.
Additional specific comments:
Introduction:
Did all the consultants listed contribute? While Drs. Gerba and Clancy role was clear, that
of Dr.
Jack Colford was not.
IfDr. Colford contributed specifically to this study, his role should be
clearly defined.
Page
2:
"..no outbreaks..traceable to treated wastewater... "
Statement is misleading because outbreaks are not a reliable health indicator due to problems with
consistent and reliable detection. Furthermore, statements such as these require citation from peer
reviewed literature or other outside sources to avoid the perception
of bias.
"The year round implementation
ofchlorination to disinfect the sewage treatment effluents has
been reported
to have adverse environmental effects"
The purpose
of statements such as these is unclear and their presence in the introduction of a
presumably unbiased risk assessment is concerning. While this may be true, citations from peer
reviewed literature are necessary following statements such as these to avoid the perception
of
bias. Furthermore, benefits of chlorination should also be discussed if the downsides are going to
be presented.
Page 32:
If censoring is greater than 80%, all data are statistically insignificant? Even though there was
20% detection?
Electronic Filing - Received, Clerk's Office, August 4, 2008
Page 33:
What is the point to the detailed analysis
ofthe correlation of indicator organisms? These are not
used in the risk assessment. Rather energy should have been spent on providing more details
of
the actual risk assessment.
Page 36:
Although the EC/FC differences in upstream vs. downstream samples were not statistically
significant this could be a function
of sample size-there is a consistent difference and there
could be more sophisticated measures to assess this. The p-value should be reported, not simply
stated as >0.05.
The difference in the EC:FC ratios with what the District obtained calls into question the
representativeness
of the data for the risk assessment (Fig 3-19)
Page 41:
"While levels
of potentially viable
Giardia
cysts may pose public health risk, it is important to
note that not all viable organisms are capable
of infection"
Seems to be a prejudicial statement. Not clear why this
is important to note.
Page 42:
"The results indicate that a relatively small number
of samples (23%) had detectable
concentrations
of enteric virus."
Relative to what? This could be an important contribution to pathogen exposure, but no
information
is provided to support the assertion that it is "relatively" small.
Page 44:
Citations need to be provided for statements to the effect
of that
blc
the RT PCR does not provide
infectivity information it impedes meaningful health risk evaluation. Certainly it puts bounds on
the levels
of potential risk (0% viable, to 100% viable). Other sources could be evaluated for
viability
of norovirus in wastewater.
Page 91:
Inhalation not considered
important-need citations to support this anti-conservative
simplification and assumption.
For canoeists, kayakers, this could be an important pathway
Page 92:
Activities such as water skiing, etc. were excluded because they are not allowed, but do they
occur? Is the prohibition enforced? An accurate risk assessment would consider these activities
if
they occurred especially when evaluating the potential benefit of disinfection.
Electronic Filing - Received, Clerk's Office, August 4, 2008
Jet Skis-classified as pleasure boating with minimal contact. This is problematic-also ''theRA
does not consider
jet skis that result in immersion.
Page 100:
Using echovirus (less infectious) instead
of rotavirus (the most infectious) for the dose response
relation, results in less conservative (fewer illness) estimates.
Page 101:
Was genetic immunity/susceptibility to norovirus infection considered?
Page 102:
By using the more conservative GI model for adenovirus, total health effects are underestimated.
Should also evaluate respiratory risks with the more infectious model. What is the justification for
using the less infectious parameter?
Page 105:
Again the focus on GI results
in a conservative estimate of overall risk
Page 111:
Since Monte Carlo analysis was used, why
wasn'ta risk distribution (e.g., 50
th
percentile, 90
th
percentile, etc) generated?
Details on how secondary spread was modeled are not clear.
Page 117:
How was recreation type selected in the simulation? Were they in proportion to the actual usage?
Page 134:
Risk assessment was only conducted for limited number
of GI pathogens.
National Center for Environmental Assessment (NCEA):
Note: this lab'scomments are based on a cursory review only.
Comments
There are some serious surrogacy issues -- e.g., using rotavirus data for a norovirus dose-response
is implausible.
Page 133:
Table 4-6 presents a summary
of the secondary attack rates that appear quite high. Additional
investigation
of the original references are needed to get a better idea of whether or not the values
posted are reasonable.
Electronic Filing - Received, Clerk's Office, August 4, 2008
Page 115-116:
The discussion
ofthe "disease transmission model" and secondary attack rates is very sketchy.
The authors vaguely mention "dynamic models" (which do not seem to be provided anywhere in
the document) and appear to be rather naive about the difficulty
of parameterizing such models.
They state that secondary attack rates depend on virulence, shedding rate, and environmental
stability
of the organisms. But probably human contact patterns, characteristics, and age groups
are more important.
It does appear that this risk assessment has weaknesses that could potentially be meaningful
National Exposure Research Laboratory (NERL):
Comments
Since the overall goal ofthe study is to determine whether or not to disinfect the effluent why the
protozoans were included
in this study?
The chlorine concentrations that would be used would result
in little or no inactivation of the
GtC.
However, CEC's summation ofthe protozoan results and interpretation and method
limitations were quite reasonable.
The number
of Giardia cysts is lower than some other reports for sewage; however, this may
because there are only
dry weather events in this portion of the study.
It
should be more clearly emphasized that the number of Cryptosporidium oocysts from the
samples were below the cell culture detection limit and even
if all ofthe oocysts applied were
infectious it is unlikely that a foci would develop.
The documents treatment
ofthe parasite issue was really not adequate.
The risk assessment appears to be a standard boiler plate, which is only as good as the data used
to form it.
Electronic Filing - Received, Clerk's Office, August 4, 2008
EXHIBIT 5
Document filed with the Clerk. Waiver of service requirements upon hearing participants
requested pursuant to
35 Ill. Admin. Code l02.424(c)
Electronic Filing - Received, Clerk's Office, August 4, 2008
EXHIBIT 6
Electronic Filing - Received, Clerk's Office, August 4, 2008
TABLE 1
f1Jnesses acquired by ingestion of water
Agent
Source
lncubation period
Clinical syndrome
Duration
Viruses
Asuovirus
Humanfcc~
1-4 days
Acute gastroenteritis
2-3
days; occasionalIy 1-14
days
Norovirus (Norwalk virus, Snow
Human feces"
1-3 days
Acute gastroenteritis with predominant nausea and
1-3 days
Mountain agent, and other
vomiting
related viruses)
Enteroviruses (polioviruses,
Human feces
J-14days
Febrile illness, respitatory illness, meningitis,
Variable
coxsac:lcieviruses. echoviruses)
(usual1y 5-10 days)
herpangina, pleurodynia, conjunctivitis.
myoc:acdiopathy, diarrhea, par.llytic disease,
encephalitis. ataxia. diabetes
Hepatitis A virus
Human feces
15-50 days
Fever. malaJse,
~undlce,
abdominal pain. anorexia,
1-2 wk to several months
(usual1y 25-30 days)
nausea
Hepatitis E virus
Human feces
15-65 days
Fever, malaise, jaundice, abdominal pain, anorexia,
1-2
wk to several months
(usual1y 35-40 days)
nausea
Rotavirus A
Human
feces"
1-3 days
Acute gastroenteritis with predominant nausea and
5-7 days
vomiting
Rotavirus B
Human feces"
2-3 days
Acute gasuoenteritis
J-7days
~
Bacteria
~
Ammwnas
h-ydrophila
Fresh water
Unknown
Watery diarrhea
Avg42 days
~
Campylobacrc
jejllrli
Human and animal feces
3-5 days
(1-7
days)
Acute gastroenteritis, possible blocxfy and mucoid
1-4 days, occasionally> 10
::I
0
..
a-
feces, possible Guillaill*Bam syndrome
days
III
Enterohemorrhagic.E. coli 0157:H7
Human
and
animal feces
3-8 days
Watery, then grossly bloody diarrhea, vomiting,
1-11
days (usually 7-10 days)
~
possible HUS
::I
II>
Enteroinvasive E.
coli
Human feces
2-3 days
Possible dysentery
,-
with fever
,
1-2 wlc
II>
iii'
3
Enteropathogenic E. coli
Human feces
2-6 days
Watery to
~fuse.watery
diauhea
1-3wk
o'
::J
Enteroroxigenic E.
coli
Human feces
12-72 h
Watery to profuse watery diarrhea
3-5 days
0
.....
Pksiomonas
shigrlIoides
Fresh NIface water, fish,
1-2 days
Bloody and m\lcoid diarrhea, abdominal pain,
Avg '11 days
5"
crustaceans,domestic
animals?
wild and
nausea, vomiting
if
~.
0
Salmonellae
Human and animal feces
8:-48h
Loose, watery, occasionally bloody diarrhea,
J-5days
II>
c
posslblc-teaetlve.arthrltis
>
~
-
Salmonella enteriro serovar Typhi
Human feces and urine
7-28 days (avg 14 days)
Fever. malaise. headache. cough. nausea. vomiting,
Weeks to months
::I
abdominal pain, possible pericarditis, orchitis
[if
and
splenic or liver abscesses
•
N
(ConrinUtd on
ntxt
page)
N
W
Electronic Filing - Received, Clerk's Office, August 4, 2008
TABLE
1
Illnesses acquited by ingestion of water (Conlinued)
Agent
Source
Incubation period
Clinical syndrome
Duration
Shigellae
Human feces
1-7 dnys
Possible dysentery with fever. possible reactive
4-7 days
arthritis
Vibrio cholerat
01
Human feces
9-72 h
Profuse, watery diarrhea. vomiting, rapid
Hdays
dehydration
Vibrio
choIerat
non-O1
Human feces
1-5 days
Watery diarrhec,
Hdays
Ymmia
eJ\lel'Ocolitica
Animal feces and urine
2-7
days
Abllominal pain. mucoid. occasionally bloody
1-21 days (avg, 9 days)
diarrhea. fever, (lOS$ible reactive arthritis
Parasites
Balmuidium
coli
Human and l\nimal feces
Unknown
Abdominal pain. occasional mucoid or bloody
UnKnown
diarrhea
Crypros(loridium
panrum
Human and animal feces
1-2wk
Profuse, watery diarrhea
4-21 days
ElI~ba
histolylial
Human feces
2-4wk
Abdominal pain. occasional mucoid or bloody
Weelcs
to
months
diarrhea
Giardia
lambIia
Human and animal feces
5-25 days
Abdominal pain. bloating. flatulence. loose.
1-2 wk [Q months and years
Algae
.
pale.
greasy
stools
Cyanobacteria
(Anabaena
5Pp.,
Cyanobacterial blooms in
A few hows
Toxin poisoning (blistc:rlng
of
mouth,
Variable
Aphani~mtnon
spp.,
water
gastroenteritis. pneumonia)
Microc)slis spp.)
Helminths
Dracunculus
medinensis
Larvae discharged from
8-14 rna (usually 12 mo)
Blister. localized arthritis ofjoints adjacent to
Months
(guinea wonn)
worms protruding from
site of infection
skin of-infected person
"Animal mains
of
these viruses an:
~Iit:ved
[0
be
nonpathogenic (or hUJlllll\S.
N
N
".
•
~
~
~
~
n
;;l;l
o
CO
5
r-
g
-<
Z
"tI
C
CO
r-
n
:r
~
~
:r
Electronic Filing - Received, Clerk's Office, August 4, 2008
TABLE 2 lIInesses acquired by recreational contllCt with warer"
'AgrnlS
acqul~
lhrough ingestion of
WlIl1:r
are IlOl included in [his llIble.
Agent
Viruses
Adenovirus (serotypes
J. 7, 1.4, 14)
Bacteria
Aeromona5
hydrophi1o.
legionellae
Lepwspim
spp.
Mycobaclerium
spp.
(M.
marinum.
M.
balnei,
M.
platy,
M.
Iumsasii,
M.
stulgni)
Psnulomonas
spp.
Vibrio spp. (V. algino"ticus,
V.
paraluJemol)licus,
V.
wlnifis:us.
v.
rnimicus)
Other
Cyanobacteria (Anabaena,
Aphanitomenon, and
MicTOcyslis species)
Naegieria fowleri
ACalllMmoeba species
Schulosoma
species
Source
Humans
Fresh and brackish water
Freshwater, soil
Urine from infected
domestic
and wild
animals
Marine or brackish waters.
freshwater
Water
Marine water
Cyanobacterial blooms in
marine
water or
freshwater
Freshwater in warm
climates, soil, decaying
vegetation
Water
Feces and urine of Infected
animals and birds
Incubation
period
4-12 days
8-48h
legionnaires'disease: 2-1+days
(usually 5-6 days); Pontiac
fever:
5~
h (usually 24-48
h)
2-20 days (usually 7-12 days)
2-4wk
Unknown
V.
C.'lIlnifiClIS, 24 h; V.
parahaemol,dcw. 4-48h
A
few hours
3-7 days
A
few miputes to hours
Clinical syndrome
Conjunctivitis, pharyngitis, fever
Wound infectiollS
Legionnaites'disease: pneumonia with anorexia,
malnisc. myalgia and headache, rapid fever and
chills, cough,
chest pain. abdominal pain and
diarrhea; Pondac(ever: fever, chills. myalgia,
headache
leptospirosis (headache, chills, fever, myalgia,
nausea. neck or joint pain)
Lesions ofskin or subcutaneous tissues
Dermatitis. ear infections, conjunctivitis
V.
wlnifiCU$:
acute gastroenteritis, wound
InfecdollS.,septicemia
V.
parohaemo"ricus: acute gastroenteritis,
wound Infections
Ear
infections
Dermatitis
Meningoencephalitis. headache, anorexia, fever,
nausea and vomiting; usually fatal
SubcutaDeOWI abscesaes, conjunctivitis
Dermatitis, prickly sensatiop, itching
Duration
7-15
days
Weeks to months
Legionnaires'
disease:
variable (usually weeks to
months); Ponriac fever: 2-
7days
A
few days to
J
wk
Months
Unknown
V.
wlnificw:
septicemia fatal
in 2-4 days
V. pamhaemolYlicus: usually 3
days
10 days
8 days to several months
Years
...
\0
~
iii
g-
III
3
~
II>
3
2:.
::J
o'
.....
o
5'
[
o'
C
II>
~
::J
iii"
•
N
N
V\
Electronic Filing - Received, Clerk's Office, August 4, 2008
EXHIBIT 7
Electronic Filing - Received, Clerk's Office, August 4, 2008
Pu""c
Reuiew DrtJ/'
Table 4.1
Recreation Uses., Criteria. md SultllOrtlDa ADalyaes
Designated. Vse
CrJferJola
..
-
Supporting :Analysis
Ptimtl17
ContlldReaetItio"
IdcatifirAllPopolarBeach
Criteria
baaed on risk IGVCls
of
8 or
NODe.
Areas
mwcr illDce&QallOOn swinqaam
(Jiesh waws) aDd 19 or hw
illnciiesJlOOO lwiI:Dmca (marine,
"*t's).
Ollusr
PrlQwy 001llaCt
Criteda
bucd
on rist
level
not
None.
R.ec:muioD W.tma
gmatcr
Ihan.
14 iItDcssesll0D0
.
swiJmnc:n; (frab walen) IIIIId
DOt
~
fban 19 illneaI1000 swim-
mers
(DIIirlne
WiItcU).
SeasoaaI R.ccIeati.oIi Usc
PriaI8ty
~~critcria
'
Inf<Jonation
exp1a1ning
cboice
of
ree-
.
sea~oo;
apply dwiag
8OCQDdat'y
specifiDd
contact
recrcat:ionll1
fee-
pmttures.
reation season
time
(e.g.~
of...,se
wa1l:r"
••. )•
air
~
reaticm crimM apply
rest
ofyear.
Reuetlilo"td
Use
SII1H:tIiegOl'Iu
Exc"PtiODS for
HighFlow
Bxccption to critmi••
t high f10wB
'. Usc AttBiDability ADalyJis
CODSistmlt
SYet1U
em. waterbody-by-watetbody basil
, with
40 ca.. 131. IO(g); demon-
baled on flow Palistic or
Immber
of stradon Chit
prinJary cOIdIet fCC..
exceeda1:lces aUoW8d.
reatloo is not an
existine
use.
0
Wildlife ImpaCUlcllleeaa1ion
Criteria to retlect the
~tural1eYels
Use Auamabillty
Ana1ys.U
consistcot
.
ofbacteria wbUe pr'OVidia,
pealer
with
40 CFR. 131.JO(t) and
~ea
deJn..
pro1rlc:tioo
than
cri1cria adopmd to
onstndiDg
wildlife ooum1m.lBs a sis.
pro~
4.aCCOD/J4ry
c:oDblCt
rcc-
aificaat portion of!ecaJ
c:cmtamir1~
. rcatron
usc.
~
dClDlmlUUtion
that
primary
con-
CIICt recrelt£oD
is
oat
iU1
exi&tiDg use.
Othu CtIlegorlu
0/
R6C1VNlt101l
.
SccoodaIy Contact
Qiteria
JD.fficiant to
protllct die
usa.
. Use AaainablJj'Y
Anal~1
consIBCeut
1tcc:rcatiou
May usc
IIIIIDCric
crih:rion pralCCo
with
40 CFR 131.10(a); cfemoG.
tM:
of
secooduy cODtact
S1mticm. that
primary
contact
ree-
1'CCl'ClItion(suggest
IpCcifying en-
mation is nat aD existing usc.
'mOIl expressed
as maximwn valde
or
criU!ricm
e~
as
seomeUO[c
mean fiva
times
prinwy
COD.tBCt
. recrcatioagc.OIIICtric maBn
value) DC ,
nmative cricericm.
42
Electronic Filing - Received, Clerk's Office, August 4, 2008