BEFORE THE ILLINOIS POLLUTION CONTROL BOARD
IN THE MATTER OF:
WATER QUALITY STANDARDS AND
EFFLUENT LIMITATIONS
FOR THE
CHICAGO AREA WATERWAY SYSTEM
AND THE LOWER DES PLAINES RIVER:
Adm. Code Parts 301, 302, 303 and 304
)
)
)
)
)
)
)
R08-9
(Rulemaking-
Water)
NOTICE OF FILING
To:
John Therriault, Clerk
Marie Tipsord, Hearing Officer
Illinois Pollution Control Board
Illinois Pollution Control Board
James
R.
Thompson Center
James
R.
Thompson Center
100 West Randolph Street - Suite 11-500
100
W. Randolph, Suite 11-500
Chicago,IL 60601
Chicago, IL 60601-3218
Deborah
J. Williams, Assistant Counsel
Stefanie
N. Diers, Assistant Counsel
Illinois Environmental Protection Agency
1021 N. Grand Ave. East
P.O. Box 19276
Springfield, IL 62794
Persons included on the attached
SERVICE LIST
Please take notice that on August 4,2008, we filed electronically with the Office
of the
Clerk
of the Illinois Pollution Control Board the attached Pre-Filed Testimony of James E. Huff,
P.E. and accompanying Exhibits, a copy
of which is served upon you.
CITGO PETROLEUM CORPORATION, and
PDV MIDWEST, LLC, Petitioners
BY:&~
One of Its Attorneys
Jeffrey
C.
Fort
Ariel
J.
Tesher
Sonnenschein Nath
&
Rosenthal LLP
7800 Sears Tower
233
S. Wacker Drive
Chicago,IL 60606-6404
Katherine D. Hodge
Monica
T. Rios
Hodge Dwyer Zeman
3150 Roland Avenue
P.O. Box 5776
Springfield, IL 62705-5776
12462512
Electronic Filing - Received, Clerk's Office, August 4, 2008
BEFORE THE ILLINOIS POLLUTION CONTROL BOARD
IN THE MATTER
OF:
WATER QUALITY STANDARDS AND
EFFLUENT LIMITATIONS FOR THE
CHICAGO AREA WATERWAY SYSTEM
AND THE LOWER DES PLAINES RIVER:
Adm. Code Parts 301,302,303 and 304
)
)
)
)
)
)
)
R08-9
(Rulemaking-
Water)
PRE-FILED TESTIMONY
OF JAMES E. HUFF, P.E.
My name is James
E. Huff, and I am Vice President and part owner of Huff
&
Huff, Inc., an
environmental consulting firm founded in 1979. I received a Bachelor
of Science in Chemical
Engineering in 1970 from Purdue University and was awarded a Masters
of Science in
Engineering from the Environmental Engineering Department at Purdue University in 1971. I
am a registered Professional Engineer in Illinois.
My work experience includes two years with Mobil Joliet Refining Corporation
as an Advanced
Environmental Engineer during the construction and start-up
of the Joliet Refinery. After
leaving Mobil in the fall
of 1973, I was employed for three years at lIT Research Institute in the
Chemical Engineering Department, working on advanced wastewater treatment projects. I then
spent four years with the Armak Company, now called Akzo Nobel Chemicals, where I was the
Corporate Manager
of Environmental Affairs responsible for regulatory compliance and
engineering design
of environmental systems at nine manufacturing facilities in the United States
and Canada.
For the last
28 years at Huff & Huff, Inc., I have been involved in over 40 environmental impact
studies associated with the impact
of wastewater discharges on receiving streams throughout the
United States. Many
of these studies have involved stream surveys, including the Chicago Ship
&
Sanitary Canal for the MWRDGC, Citgo, and Com Products. I was Project Manager on a
year long Fox River Ammonia Study on behalf
of most of the municipal dischargers on the Fox
River below the Chain-of-Lakes. I am currently working on a study addressing low dissolved
oxygen levels on the East Branch
of the DuPage River and Salt Creek on behalf of the DuPage
River/Salt Creek Work Group and am also currently supporting a work group studying water
quality issues on Hickory Creek. A copy
of my resume is included in Attachment 1.
1
12462512
Electronic Filing - Received, Clerk's Office, August 4, 2008
I have been retained by Citgo Petroleum Corporation (Lemont Refinery) and Com Products
International, Inc. to review the Use designation proposed by the Illinois EPA (Agency) for the
Chicago Sanitary
&
Ship Canal ("Ship Canal") and the technical justification provided by the
Agency in support
of its proposed Use designation. I have reviewed many of the reports
submitted into the record, pre-filed testimony, and transcripts from the hearings. I have also
evaluated the impact the proposed use designation will have on Citgo and Com Products.
The collection
of waterways currently under consideration represents a range of dissimilar
waterways, from natural streams to manmade canals. To some extent, the Agency's proposed
changes recognize these differences in those two different use categories, as Use A and Use B
have been proposed. My review was focused on the appropriateness
of Use B designation for
the Ship Canal. Both Com Products and Citgo operate facilities which discharge into the Ship
Canal. At the point
of their respective discharges, the Ship Canal can be described - as the
Agency has stated -
as an "effluent dominated" waterway. The uses of the Ship Canal are
demonstrably different than the use
of the other bodies of water in the CAWS and in this Use
Attainability Analysis proceeding.
The Agency is proposing to group the Ship Canal
as an Aquatic Life Use B Water that include
the North Branch Chicago River, the Chicago River, South Branch Chicago River the Calumet
River to Torrence Avenue, Lake Calumet Connecting Channel and the Lower Des Plaines River
from the Ship Canal to the Brandon Road Lock and Dam. With the exception
of the Lake
Calumet Connecting Channel, all
of the waterways in this group are natural waterways. A
proper consideration
of the uniqueness of the artificially created and physically constrained Ship
Canal is lost by including it in this grouping. The Ship Canal is further sub-divided into
Incidental Contact Recreation Waters (upstream
of the Calumet-Sag Channel confluence) and
Non-Recreational Waters down
of the Calumet-Sag Channel confluence. Aquatic Life Use B
Waters are, "capable
of maintaining aquatic life populations predominated by individuals of
tolerant types that are adaptive to the unique physical conditions, flow patterns, and operational
controls designed to maintain navigational use, flood control, and drainage functions in deep-
draft, steep-walled shipping channels." (Agency's Statement
of Reasons, page 49).
2
12462512
Electronic Filing - Received, Clerk's Office, August 4, 2008
For the reasons that I will now present to the Board, I submit that the Ship Canal is unique and is
fundamentally different in many important characteristics that distinguishes it from the other
"Use
B" waters. I would recommend the Board not include the Ship Canal in "Use B," but
recognize the Ship Canal as a separate Use and establish water quality standards that correspond
to the unique conditions.
UNIQUENESS OF THE SANITARY
&
SHIP CANAL
As the Agency noted in its Statement
of Reasons, "the environmental potential for the river was
historically deemed to be limited to the point of hopelessness (Page 17). The Pollution Control
Board has consistently recognized the challenges, variability and uniqueness
of the Chicago Area
Waterway System and Lower Des Plaines River and many
of the same challenges and limitations
that the Board recognized in the early 1970s remain valid today.
The Ship Canal extends 31.1 miles upstream from its confluence with the Des Plaines River to
the Damen Avenue Bridge in Chicago (CDM 2007). The Ship Canal is typically 200 to 300
ft.
wide with depths ranging from 27 to 50 ft. (CDM, 2007). The construction of the Ship Canal
includes vertical walls and steep embankments. The Ship Canal was completed in 1907 to divert
pollutants away from Lake Michigan, the City of Chicago primary water supply. The Ship Canal
was expanded in 1919 to its present form to increase navigation capabilities and provide
additional waste dilution. There is no other water body in the Chicago Area Waterway System
(CAWS) which has the unique physical features, commercial shipping, discharge loadings, and
lack
of appropriate habitat for aquatic life, as does the Ship Canal.
As part
of the Use Attainability Analyses (UAA), CDM conducted recreation and navigation
surveys for 28 days. No swimming, skiing, tubing, or wading was observed. A single
canoe,
sculling or hand powered boat
was observed over the 28 days. From my own experience in
conducting benthic surveys on the Ship Canal for both the Citgo Refinery as well as for the
MWRDGC, the Ship Canal is not safe for canoes, sculling or other hand powered boating
activities. When barges pass, the physical design
of the canal functions as a dangerous wave
3
12462512
Electronic Filing - Received, Clerk's Office, August 4, 2008
machine that amplifies the wake and creates very large waves when the barge wakes bounce off
the vertical walls. Where two waves cross, the amplitude doubles, and I have personally
observed waves to get progressively larger reaching wave heights in excess
of five feet before
gradually subsiding. This is an obviously a dangerous and undesirable condition. The barge
traffic itself also create safety hazards for smaller boaters that must avoid large and lengthy
vessels that move rapidly while consuming much
of the open water in the canal, leaving little
room for small craft to maneuver. Any capsized boater would have a difficult time getting out
of
the water due to the steep banks (CDM, 2007, pg 3-3). The record already reflects the dangers of
barge traffic further downstream (see exhibit 9). The nature of the Ship Canal makes it even
more dangerous-perhaps a reason why only one small watercraft was observed during the study
period cited above.
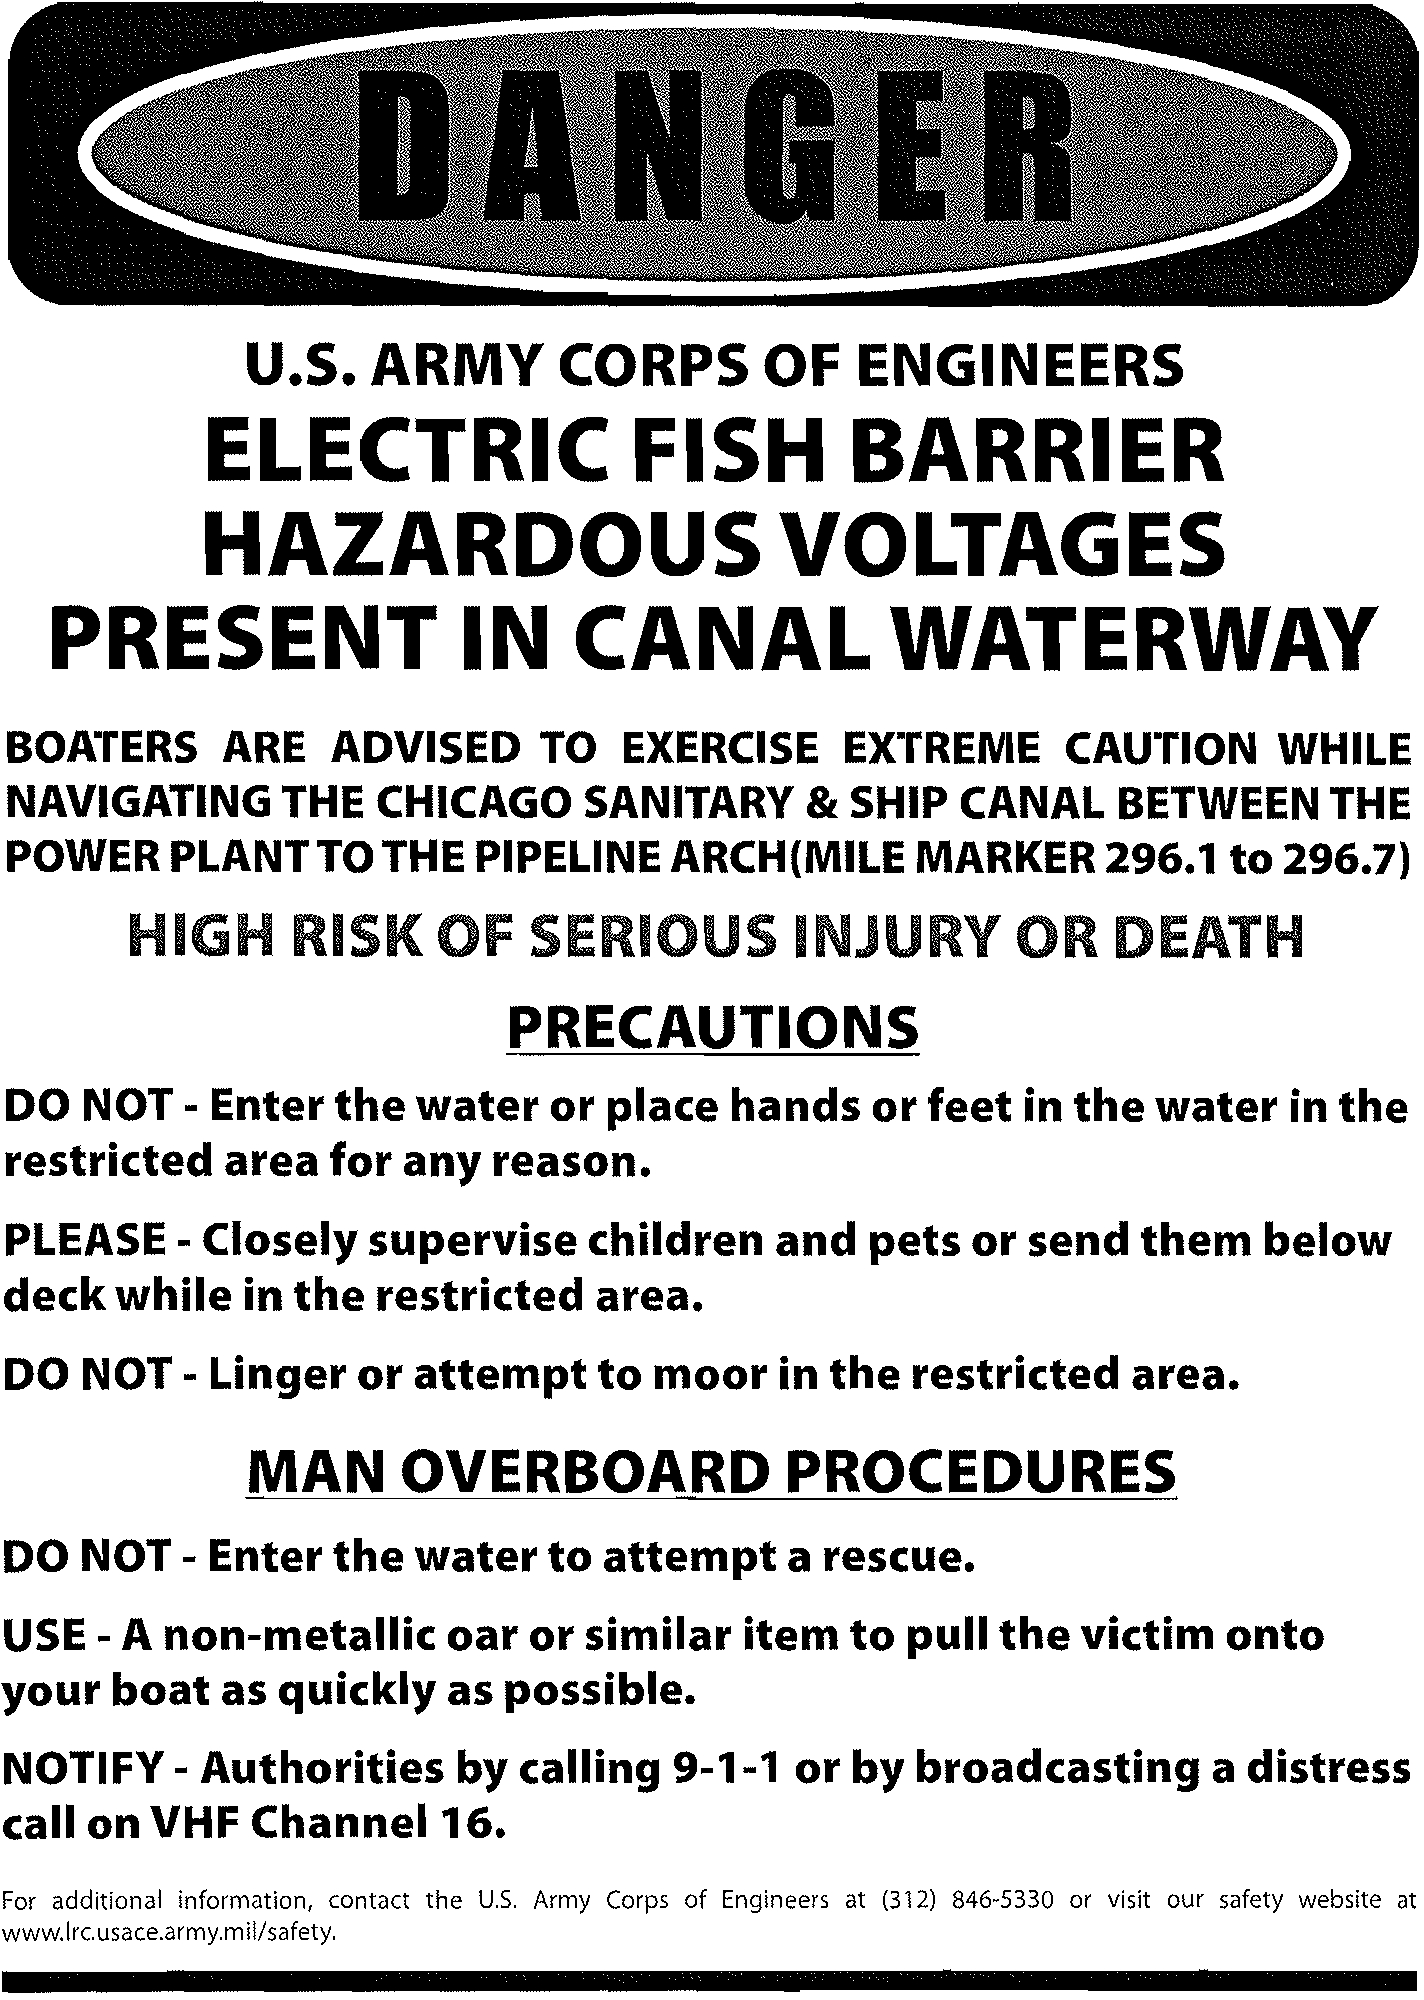
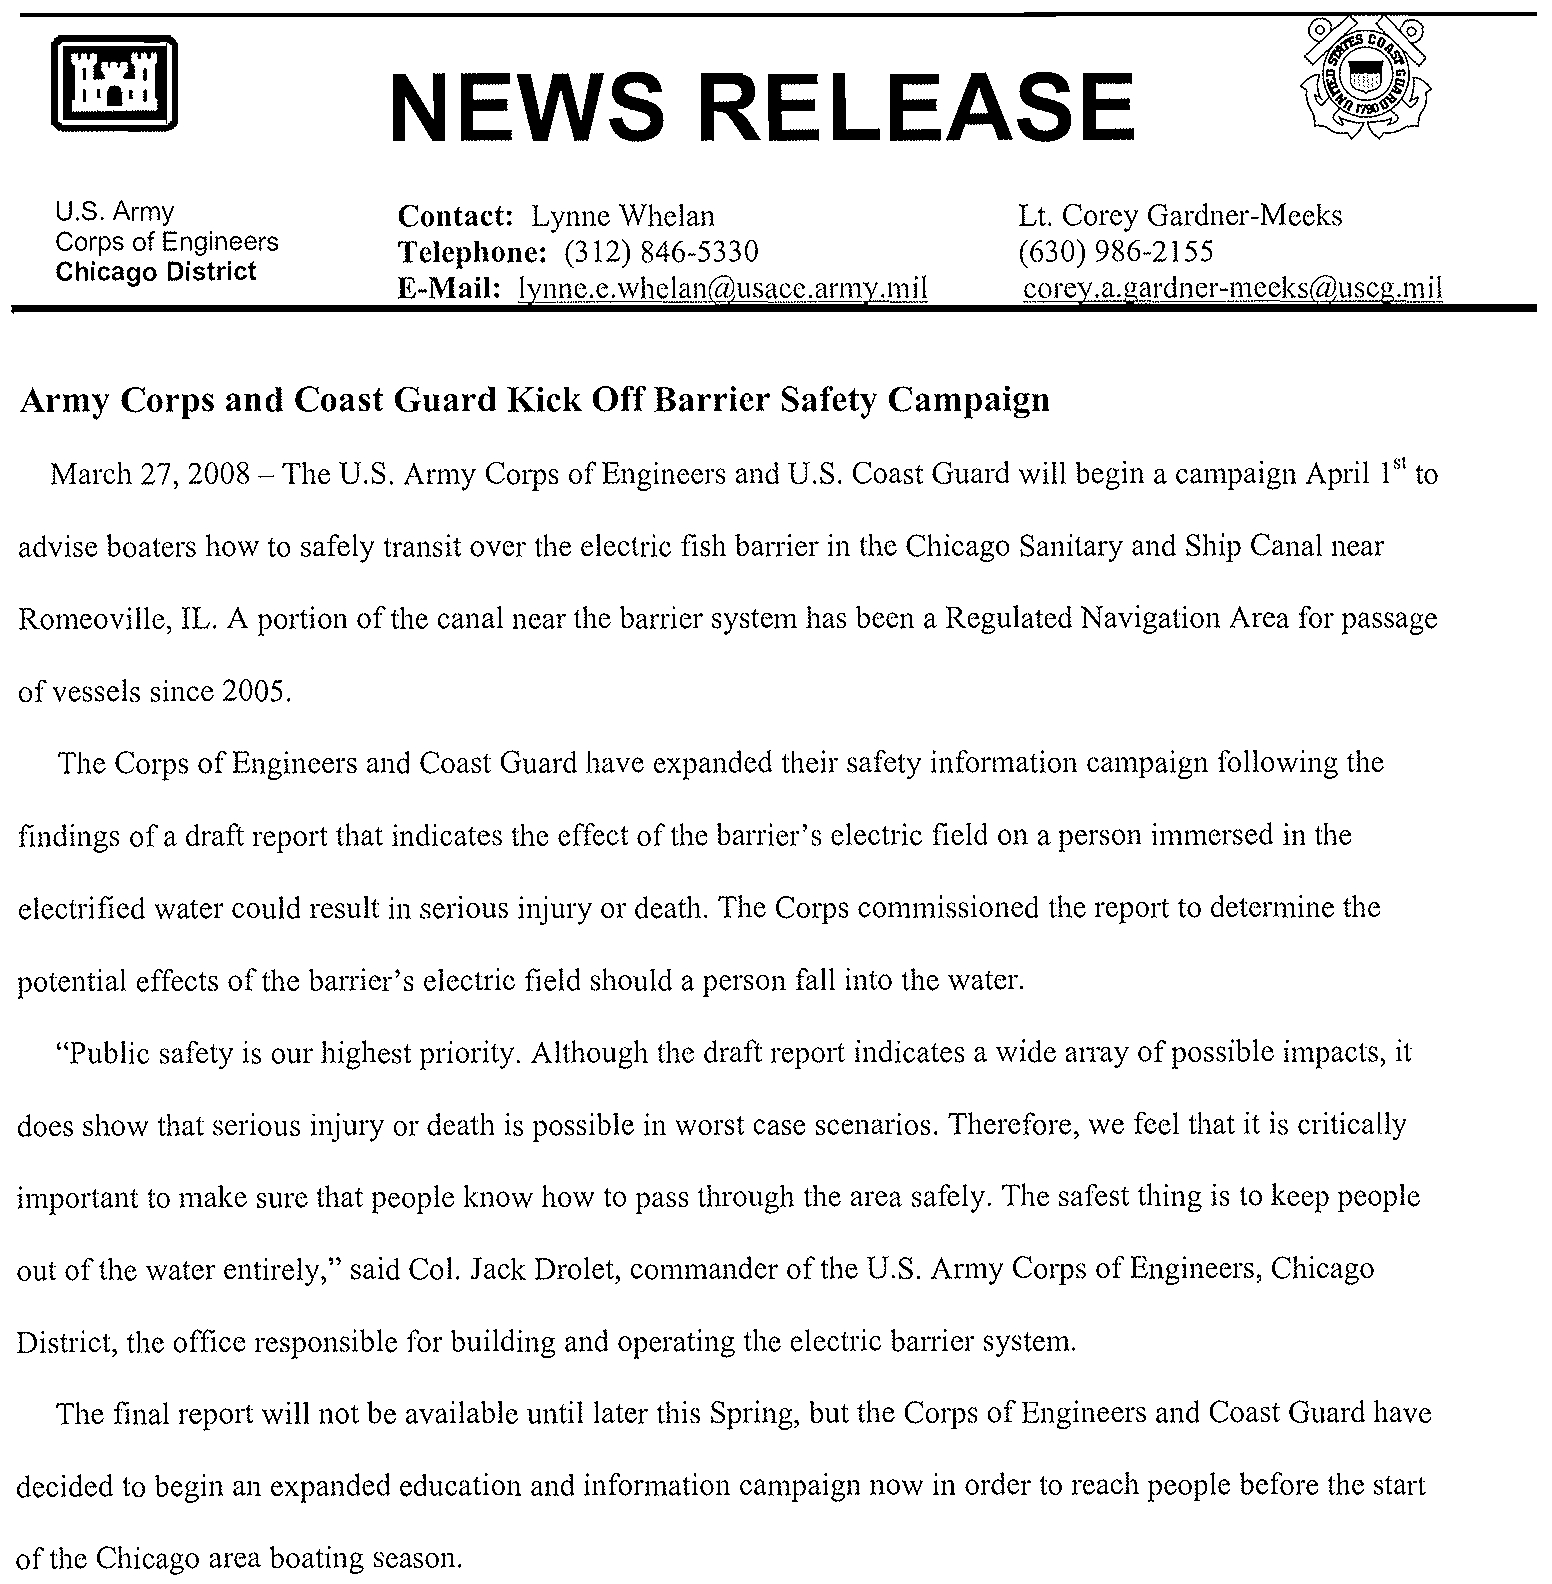
The electric barrier on the Ship Canal is another unique hazard to boaters. Anyone falling into
the water in proximity to the barrier risks serious injury or death. The U.S. Army Corps
of
Engineer's Col. Jack Drolet noted, "The safest thing is to keep people out of the water entirely"
(Attachment 2). The dangers associated with the use that this federal agency is trying to
discourage has apparently not been reconciled with the Agency's proposal to upgrade the use
designation
of the Ship Canal.
The aquatic habitat
of the Ship Canal is rated as "poor to very poor" (IEPA, 2006). Overall
stream use is designated
as
non-support
for fish consumption and aquatic life. The identified
causes
of impairment were polychlorinated biphenyls (PCBs), irons, oil and grease, D.O., total
nitrogen, and total phosphorus. Identified sources
of the impairment include combined sewer
overflows,
urban
runoff/storm
sewers,
and
impacts
from
hydrostructure
flow
regulation/modification, municipal point source discharges, and other unknown sources
In addition to the unique manmade structure, the Ship Canal is home to three coal fired power
plants that provide low cost electricity to the City
of Chicago, the remainder of the State of
Illinois, and elsewhere through the electrical power gird. The Ship Canal is effluent dominated
from the effluents from the MWRDGC facilities, including the Stickney plant, which is one
of
the largest treatment plants in the world. On an annual average, the municipal treatment plants
4
12462512
Electronic Filing - Received, Clerk's Office, August 4, 2008
contribute 70 percent of the total flow exiting the Ship Canal at Lockport. Important barge traffic
also flows along this critical artery to a wide range
of industry that is located along the Ship
Canal and several
of these industries also withdraw water from the Ship Canal and/or discharge
back into the Ship Canal. The coal fired power plants introduce a thermal loading to the Ship
Canal; however, other industries also discharge wastewater with a thermal component.
Another distinguishing factor on the Ship Canal is the electric barrier installed near the Lockport
Lock to prevent the aquatic invasive species (including the bighead carp) from migrating into the
Great Lakes
as well as migrating to the Mississippi River.
It
is my understanding that two more
electric barriers are planned, the second one is constructed, but safety issues from the electric
current have delayed placing this second barrier on-line
to date. The second electric barrier is
critical for periods when the first barrier goes down for either scheduled or unscheduled
maintenance. These barriers were authorized by Congress, with the full recognition on the part
of federal and state biologists that any positive fish migration in the Ship Canal was being
sacrificed to protect the Great Lakes
as well as the Mississippi River Basin from aquatic invasive
speCIes.
These electric barriers will not only prevent the aquatic invasive species from migrating, but will
also prevent all other fish from migrating up or down the Ship Canal at Lockport, effectively
terminating the water body at this point from a biological perspective. Normally preventing
migration is not a desirable outcome, but certainly necessary in light
of the greater goal of
protecting the biological integrity of the Great Lakes and the Mississippi River Basin.
The above description
of the Chicago Sanitary
&
Ship Canal is truly unique among the Chicago
Waterways and Lower Des Plaines River as well
as any other region in the country. The
following list summarizes the uniqueness
of the Chicago Sanitary
&
Ship Canal:
• The Ship Canal is vital to the economic well being
of the region,
• The electric barrier is vital
to protecting Lake Michigan and the Mississippi River
from aquatic invasive species, which also results in no fish migration at Lockport.
5
12462512
Electronic Filing - Received, Clerk's Office, August 4, 2008
•
The three coal fired power plants
l
provide lower cost electricity during peak
energy demand periods, which occur during prolonged hot periods during the
summer season, for the Chicago, other Illinois communities, and beyond.
•
The Ship Canal carries the treated wastewater effluents from most
of Cook
County and represents 70 percent
of the Ship Canal flow at Lockport on an
annual basis (Agency's Statement
of Reasons, page 18).
An
estimated
population equivalent
of 9.5 million people has effluent discharged through the
MWRDGC (Agency's Statement
of Reasons, page 17).
• A significant pollutant load from combined sewer overflows enters the Ship
Canal, and the reservoir portion
of the TARP program will not be completed for
at least an additional eight years. Stormwater
runoff from this highly urbanized
area also discharge to the Ship Canal.
•
The shoreline
of the Ship Canal houses many industries that rely upon the
waterway for cooling water, effluent discharge, as well as for commerce.
•
The Canal is manmade, and is unsafe for small boat traffic, from both wave
generated turbulence from barges as well as from the electric barrier(s).
•
There is a lack
of suitable physical habitat to promote a more diversified aquatic
community, as well as frequent disturbances caused
by the barge traffic.
•
Silty substrates (CDM, 2007, page 4-80)
•
Poor substrate material (CDM, 2007, page 4-80)
•
Little instream cover (CDM, 2007, page 4-80)
•
Channelization (CDM, 2007, page 4-80)
•
No sinuosity (CDM, 2007, page 4-80)
•
There are no backwater areas or tributary mouths along the Ship Canal.
•
Routine dredging is required to maintain channel depth.
1 Fisk, Crawford, and Will County. Technically Fisk is on the South Branch of the Chicago
River,
just prior to the head waters of the Ship Canal, but the physical structure and other
features are similar to the Ship Canal.
6
12462512
Electronic Filing - Received, Clerk's Office, August 4, 2008
•
The Ship Canal has minimal slope and low velocities, not optimal conditions for
aquatic habitat, but optimal conditions for sediment depositions.
•
The shoreline is predominantly commercially
owned with limited access and no
recreation potential (Agency's Statement
of Reason, page 20). Downstream from
the Calumet-Sag Channel to the confluence with the Des Plaines River, no public
access points exist (Agency's Statement
of Reason, page 33).
USE ATTAINABILITY GOALS
The approach taken towards the Use Attainability Goals rests on certain assumptions that do not
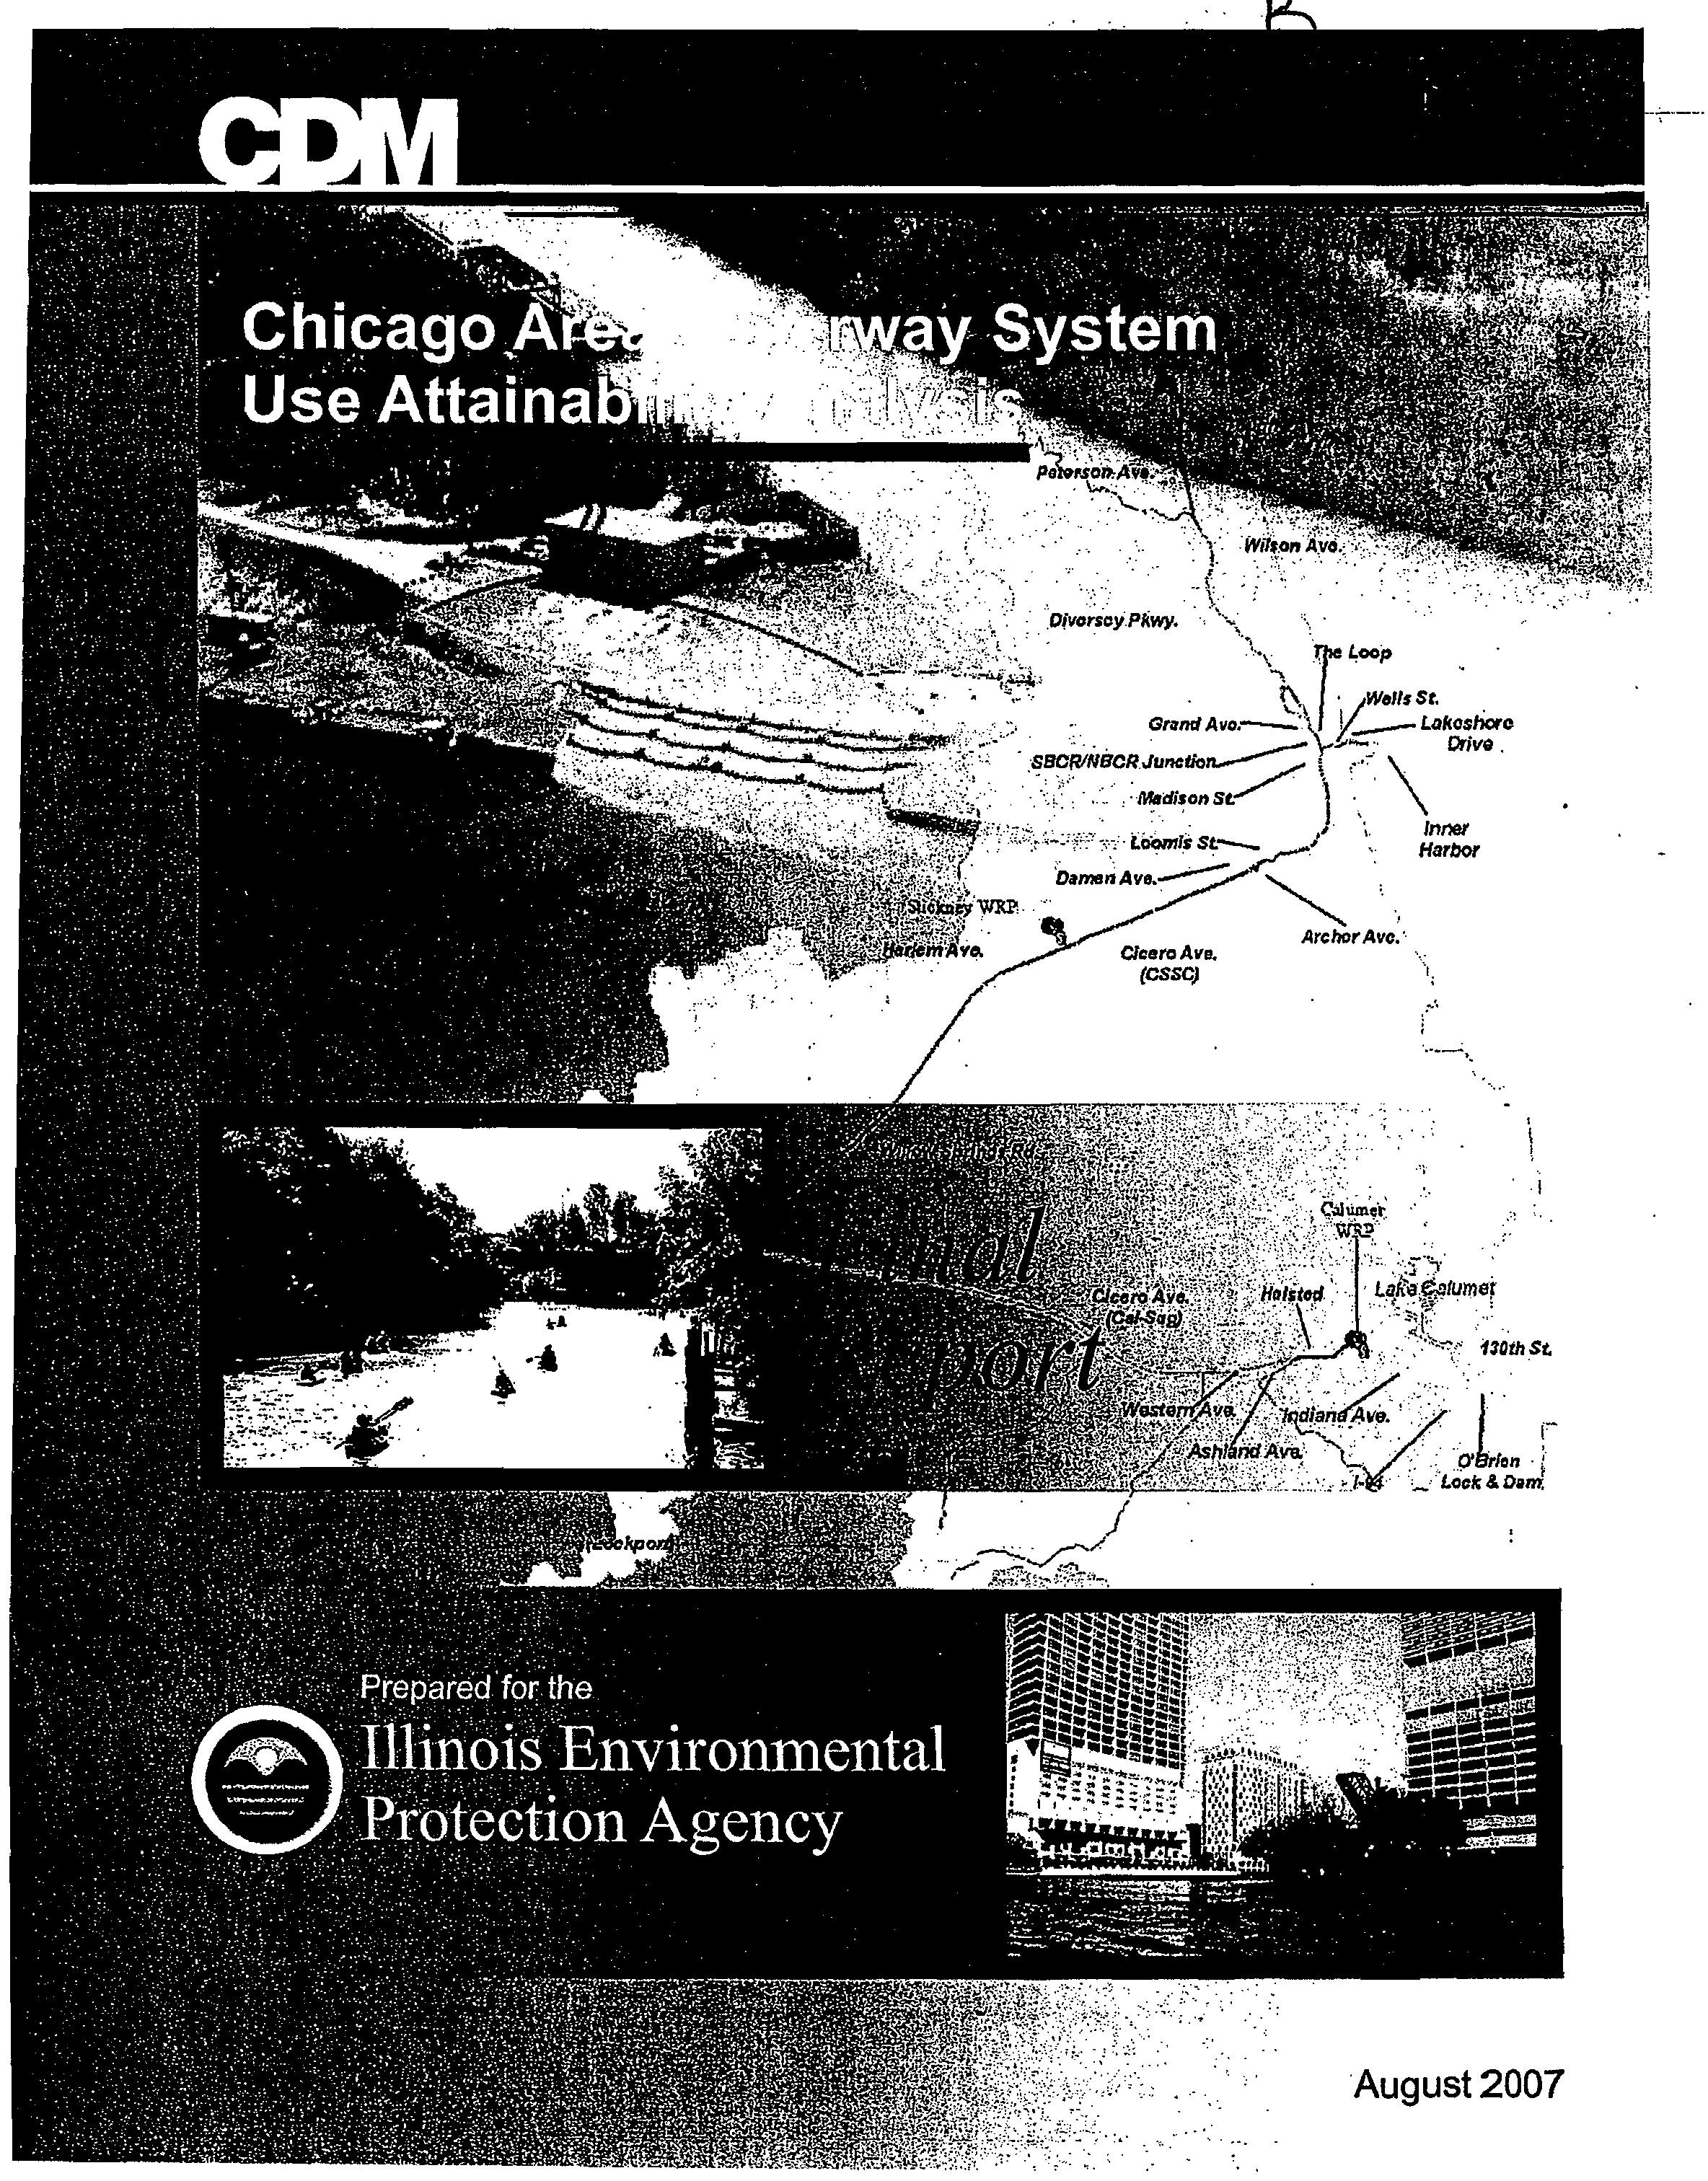
apply to the Ship Canal. In the Executive Summary
of the
Chicago Area Waterway System Use
Attainability Analysis
(CDM, 2007), the goal for Limited Warm Water Aquatic Life stretches
(including the Ship Canal) was:
Maintain water quality to meet general use criteria, where.attainable, and allow for
navigation andfish passage.
The Executive Summary then states the following objective:
To ensure D.o. and temperature criteria are met, and if unattainable, identify a
treatment alternative
to increase D.
0.
levels and reduce temperature levels.
This goal and objective seem to make two significant assumptions. First, that
fish passage
even
occurs
or second fish passage is even desirable. Congress, the
U.
S. Anny Corps of Engineers,
state and federal biologists have already determined that fish passage at Lockport is NOT
desirable,
in their attempt to keep aquatic invasive species, including the bighead carp out of the
Great Lakes and the Mississippi River Basin. Fish passage therefore is limited to above Lockport
and below Lockport,
but not through the Lockport portion of the Ship Canal. While this is
clearly
not a natural situation, it is necessary to protect more valuable aquatic resources, which
effectively precludes fish passage at Lockport. So
we have state and federal biologists working
to prevent fish passage while this
UAA goal, as stated above is to "allow for fish passage."
Given the
poor habitat of the Ship Canal, it is not clear where fish passage from Lake Michigan
would be going, nor have I seen any data presented that such fish passage is occurring or would
7
124625]2
Electronic Filing - Received, Clerk's Office, August 4, 2008
occur no matter what additional improvements
in
water quality are achieved. Lake Michigan
fish
do enter the locks at Lake Michigan from time-to-time, but there are no data to suggest they
are taking up residency in the Ship Canal. One would assume that the natural avoidance
mechanism
of fish from Lake Michigan would discourage them from swimming into the Ship
Canal, because
of the poorer habitat and lower water quality than found in Lake Michigan.
Habitat limitations suggest it improbable that any indigenous species to the Great Lakes would
establish a viable population in the Ship Canal. Therefore, establishing more stringent water
quality standards would provide little
if any improvement in the overall biological assemblage
than is currently present under existing conditions.
The poor physical habitat conditions within the Ship Canal also need to be considered when
contemplating upgrading standards. The objective to increase D.O. and reduce temperature
implies that improved fish quality will result
if these changes are made. Similarly, imposing a
chloride water quality standard
of 500 mg/L when the Ship Canal clearly does not currently
achieve this standard now implies that the aquatic community will improve
if this standard is
adopted and achieved. All
of these regulatory changes have an economic cost and the benefits
are merely assumed to occur. Given the poor habitat, any such improvement in aquatic life in the
Ship Canal is questionable. Roy Smogor testified for the Agency that improvements in the
Chicago Area Waterways can attain a "biological condition that is still somewhat imbalanced."
(R08-09, transcript, March 10
t
h,
2008 morning transcript, page 19). Whether this also applies to
the Ship Canal was not addressed. The Ship Canal is also routinely subject to unavoidable
moderate to severe sediment scouring associated with barge traffic. Scott Twait noted that the
Agency was "not promoting recreational use, only protecting the existing use." (R08-09 March
10, 2008 afternoon transcript, page 13). In the case
of the Ship Canal, the primary existing uses
would be the commercial shipping, industrial use, and carrying the treated and untreated (CSOs)
from the Chicago area away from Lake Michigan as listed in the preceding section.
By
lumping all
of the Chicago Area Waterways together in these proceedings, the uniqueness of the
Ship Canal is lost.
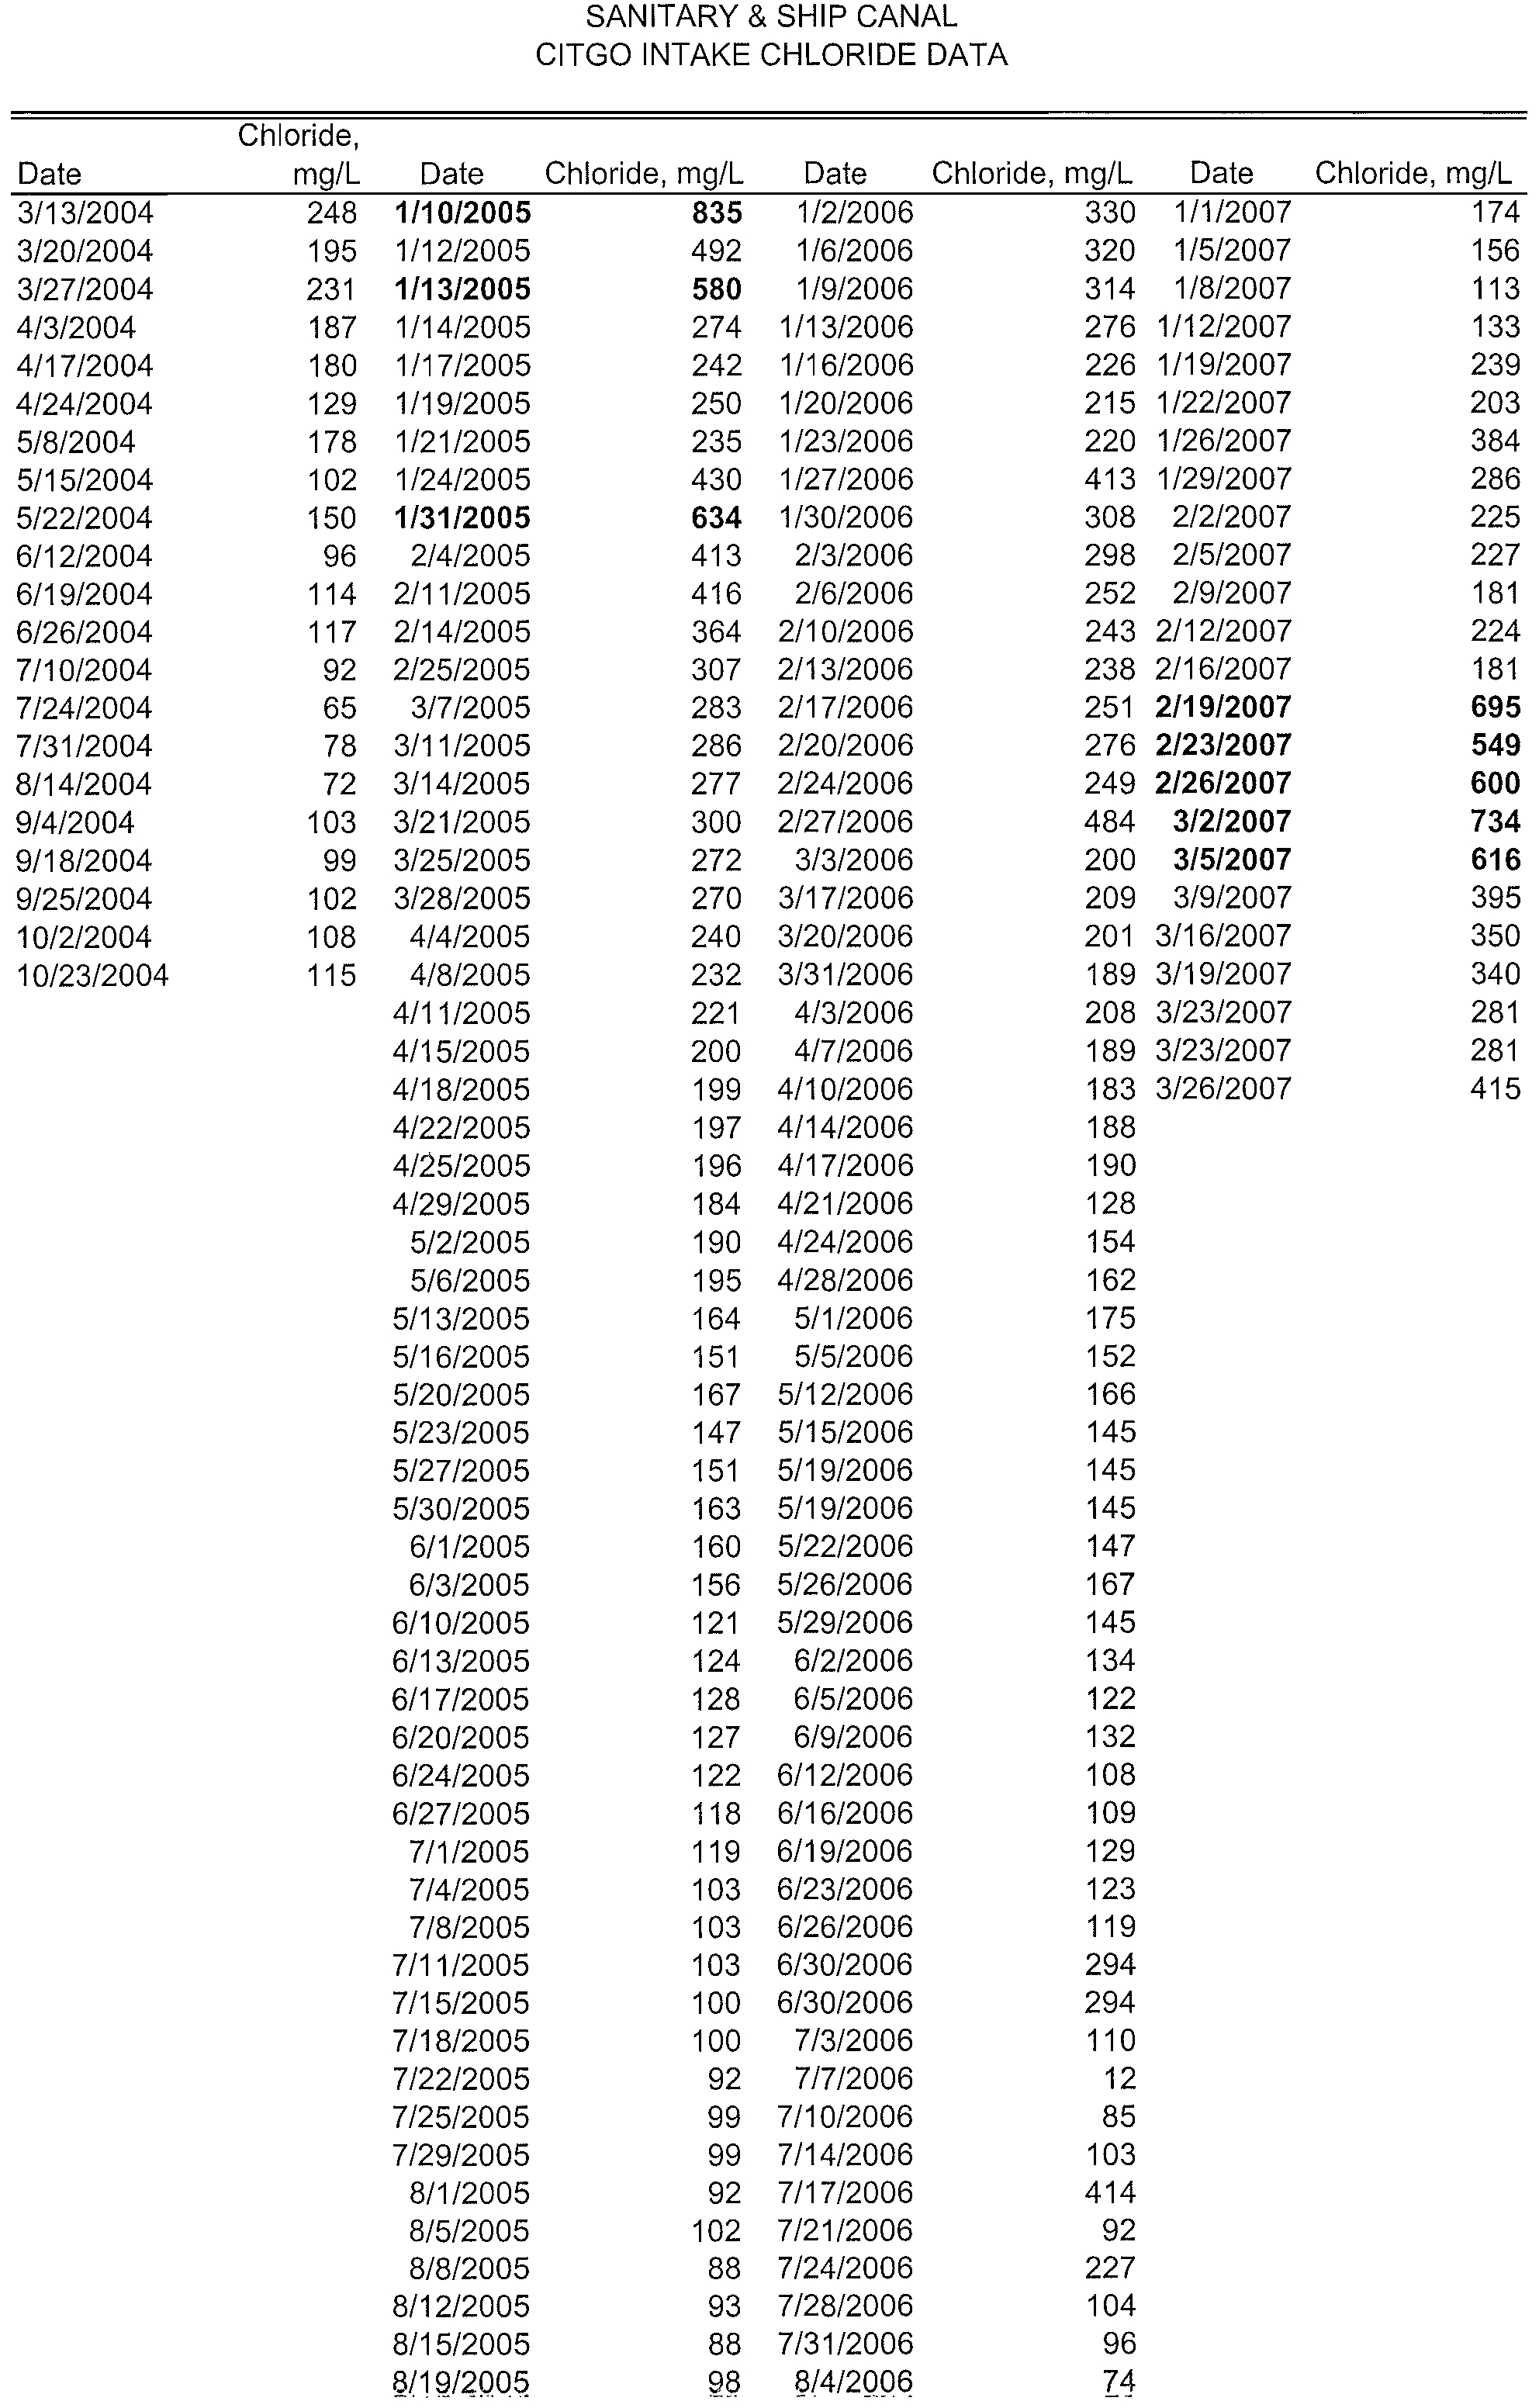
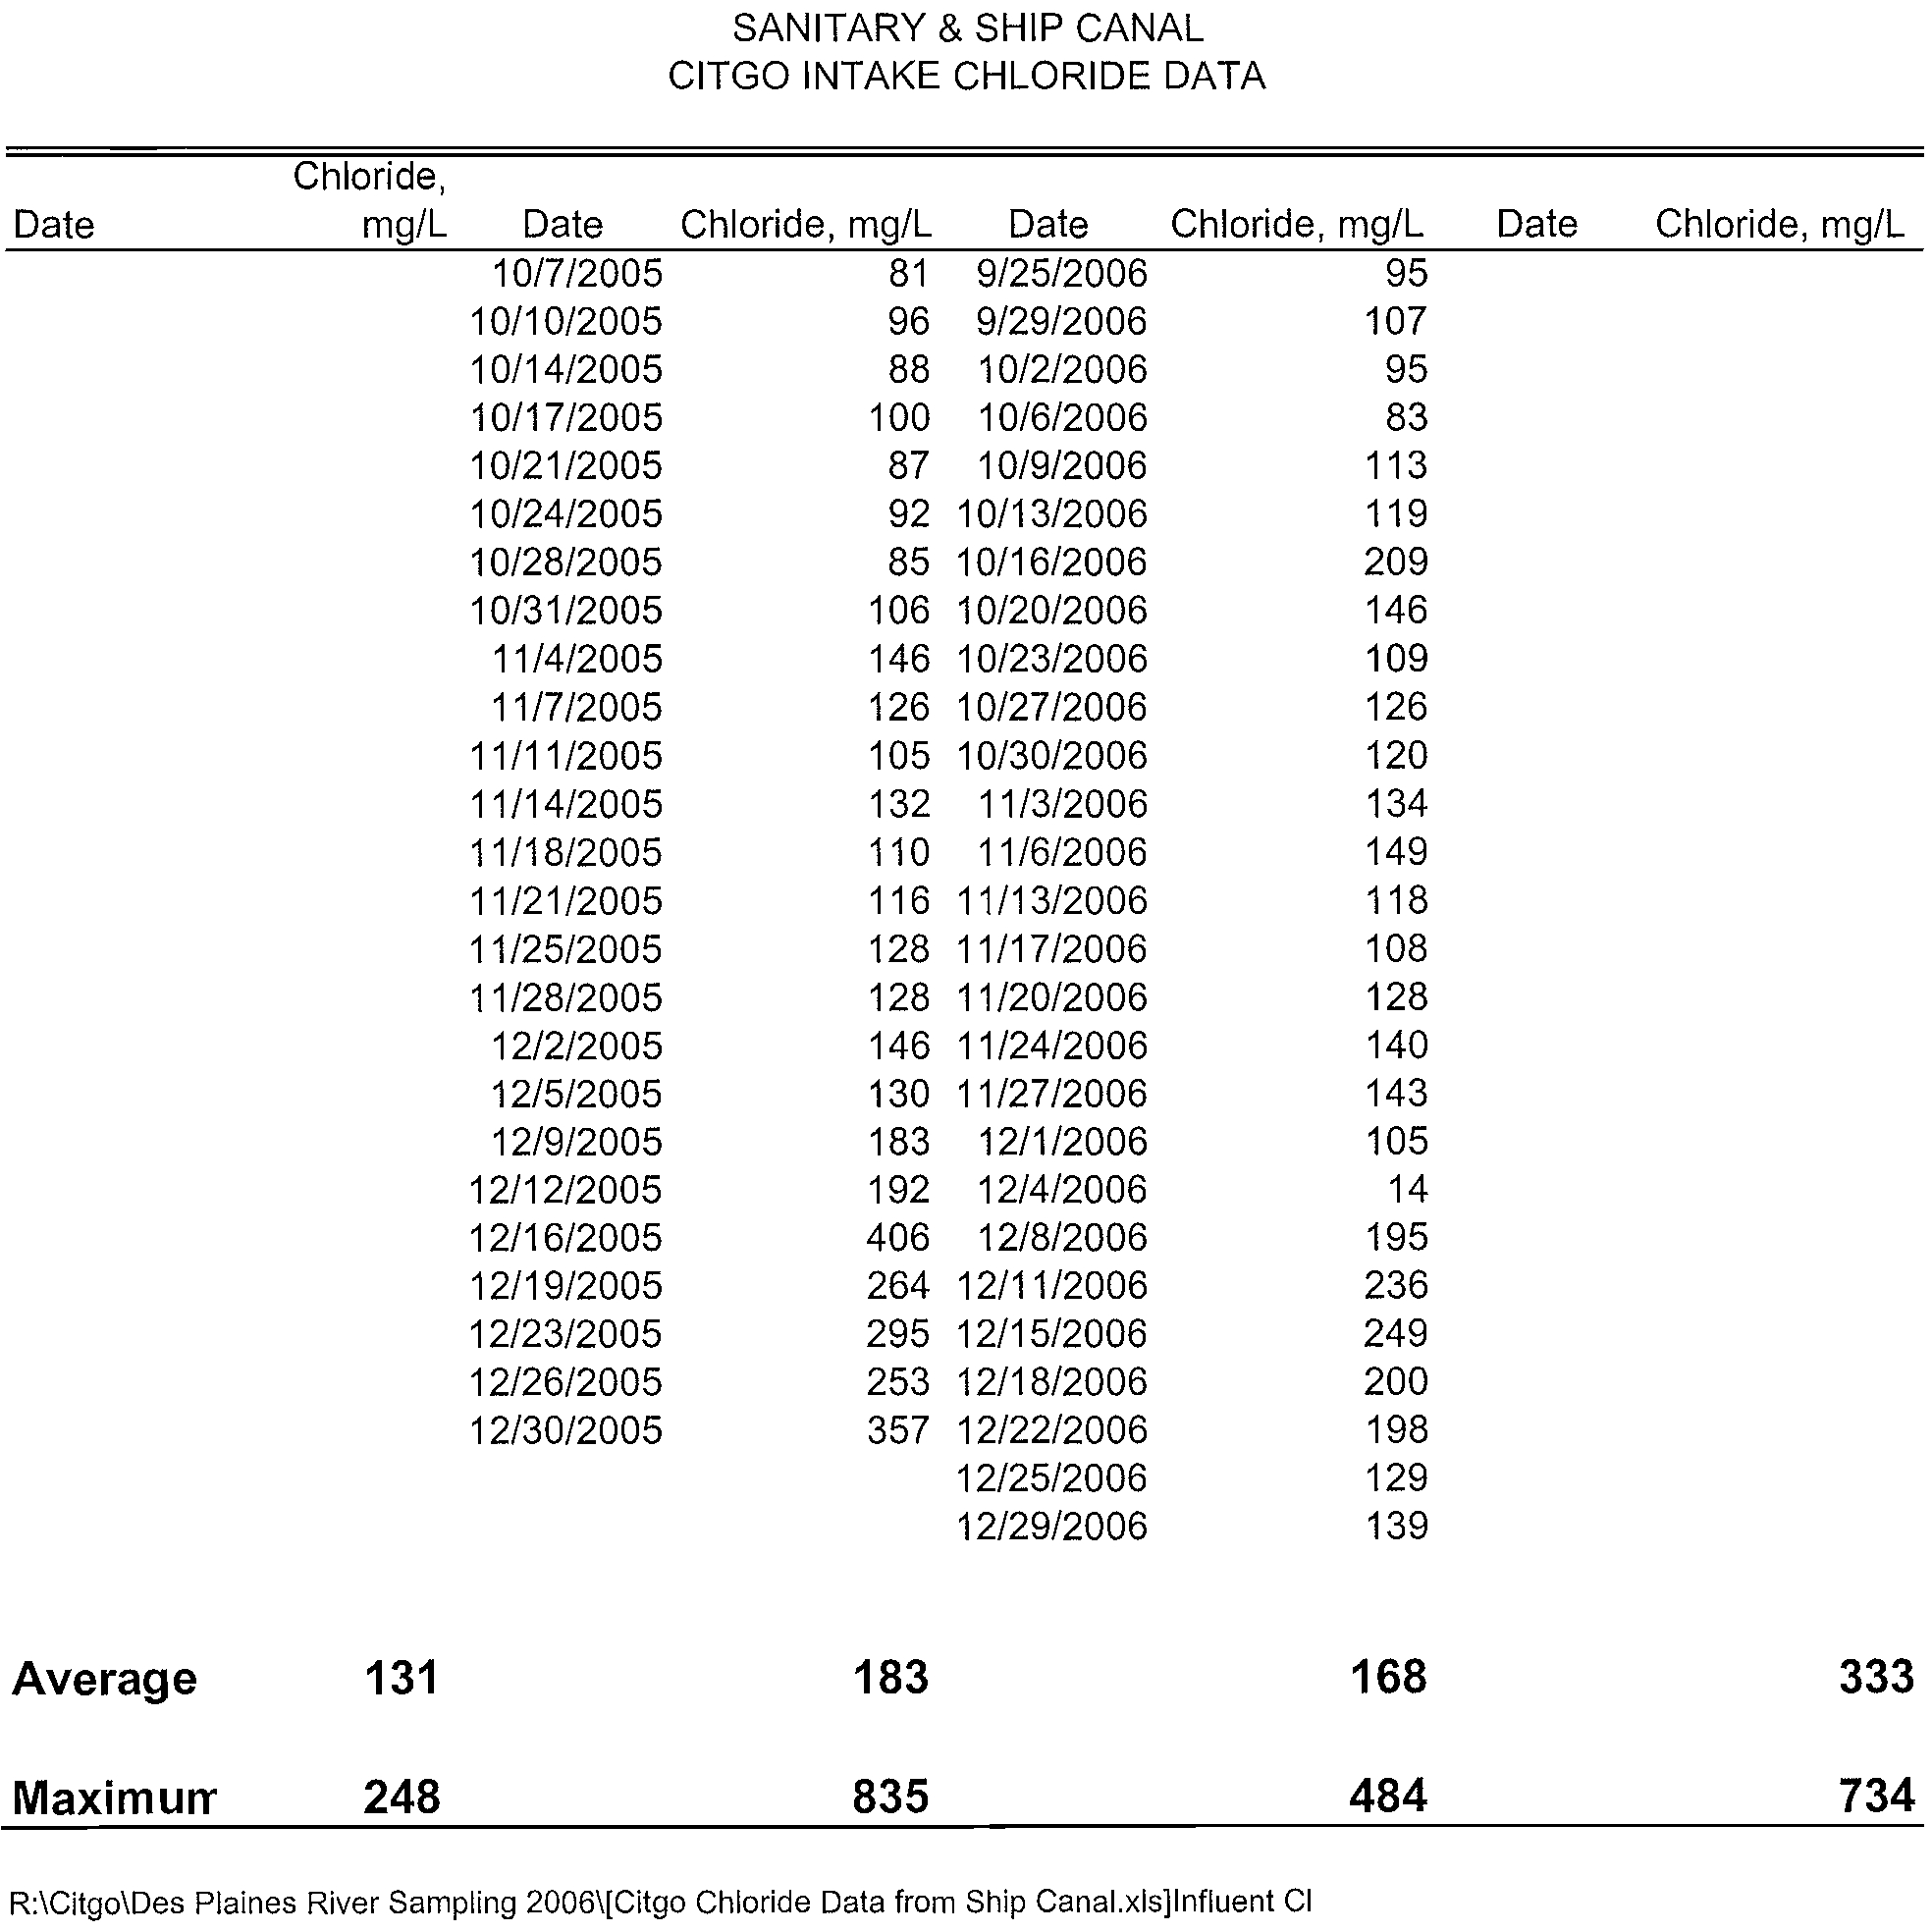
Chlorides in the Ship Canal exceed the proposed 500 mg/L routinely during snow melt
conditions (Attachment 3), due to highway deicing. This is yet another "existing use" that is
8
12462512
Electronic Filing - Received, Clerk's Office, August 4, 2008
occurring - removal of precipitation which has become laden with sodium chloride due to safety
measures relating to our winter season.
The
economIC impact of the proposed changes in thermal, chloride, and sulfate will be
significant. Industrial dischargers will lose their mixing zones for these three pollutants during
periods
of water quality violations, which will necessitate in shutting down production during
these periods. The long-term fate
of the three coal-fired power plants is also of concern. Growth
by wet industries along the Ship Canal will be precluded due to the inability to add any thermal
load, chlorides, or sulfates.
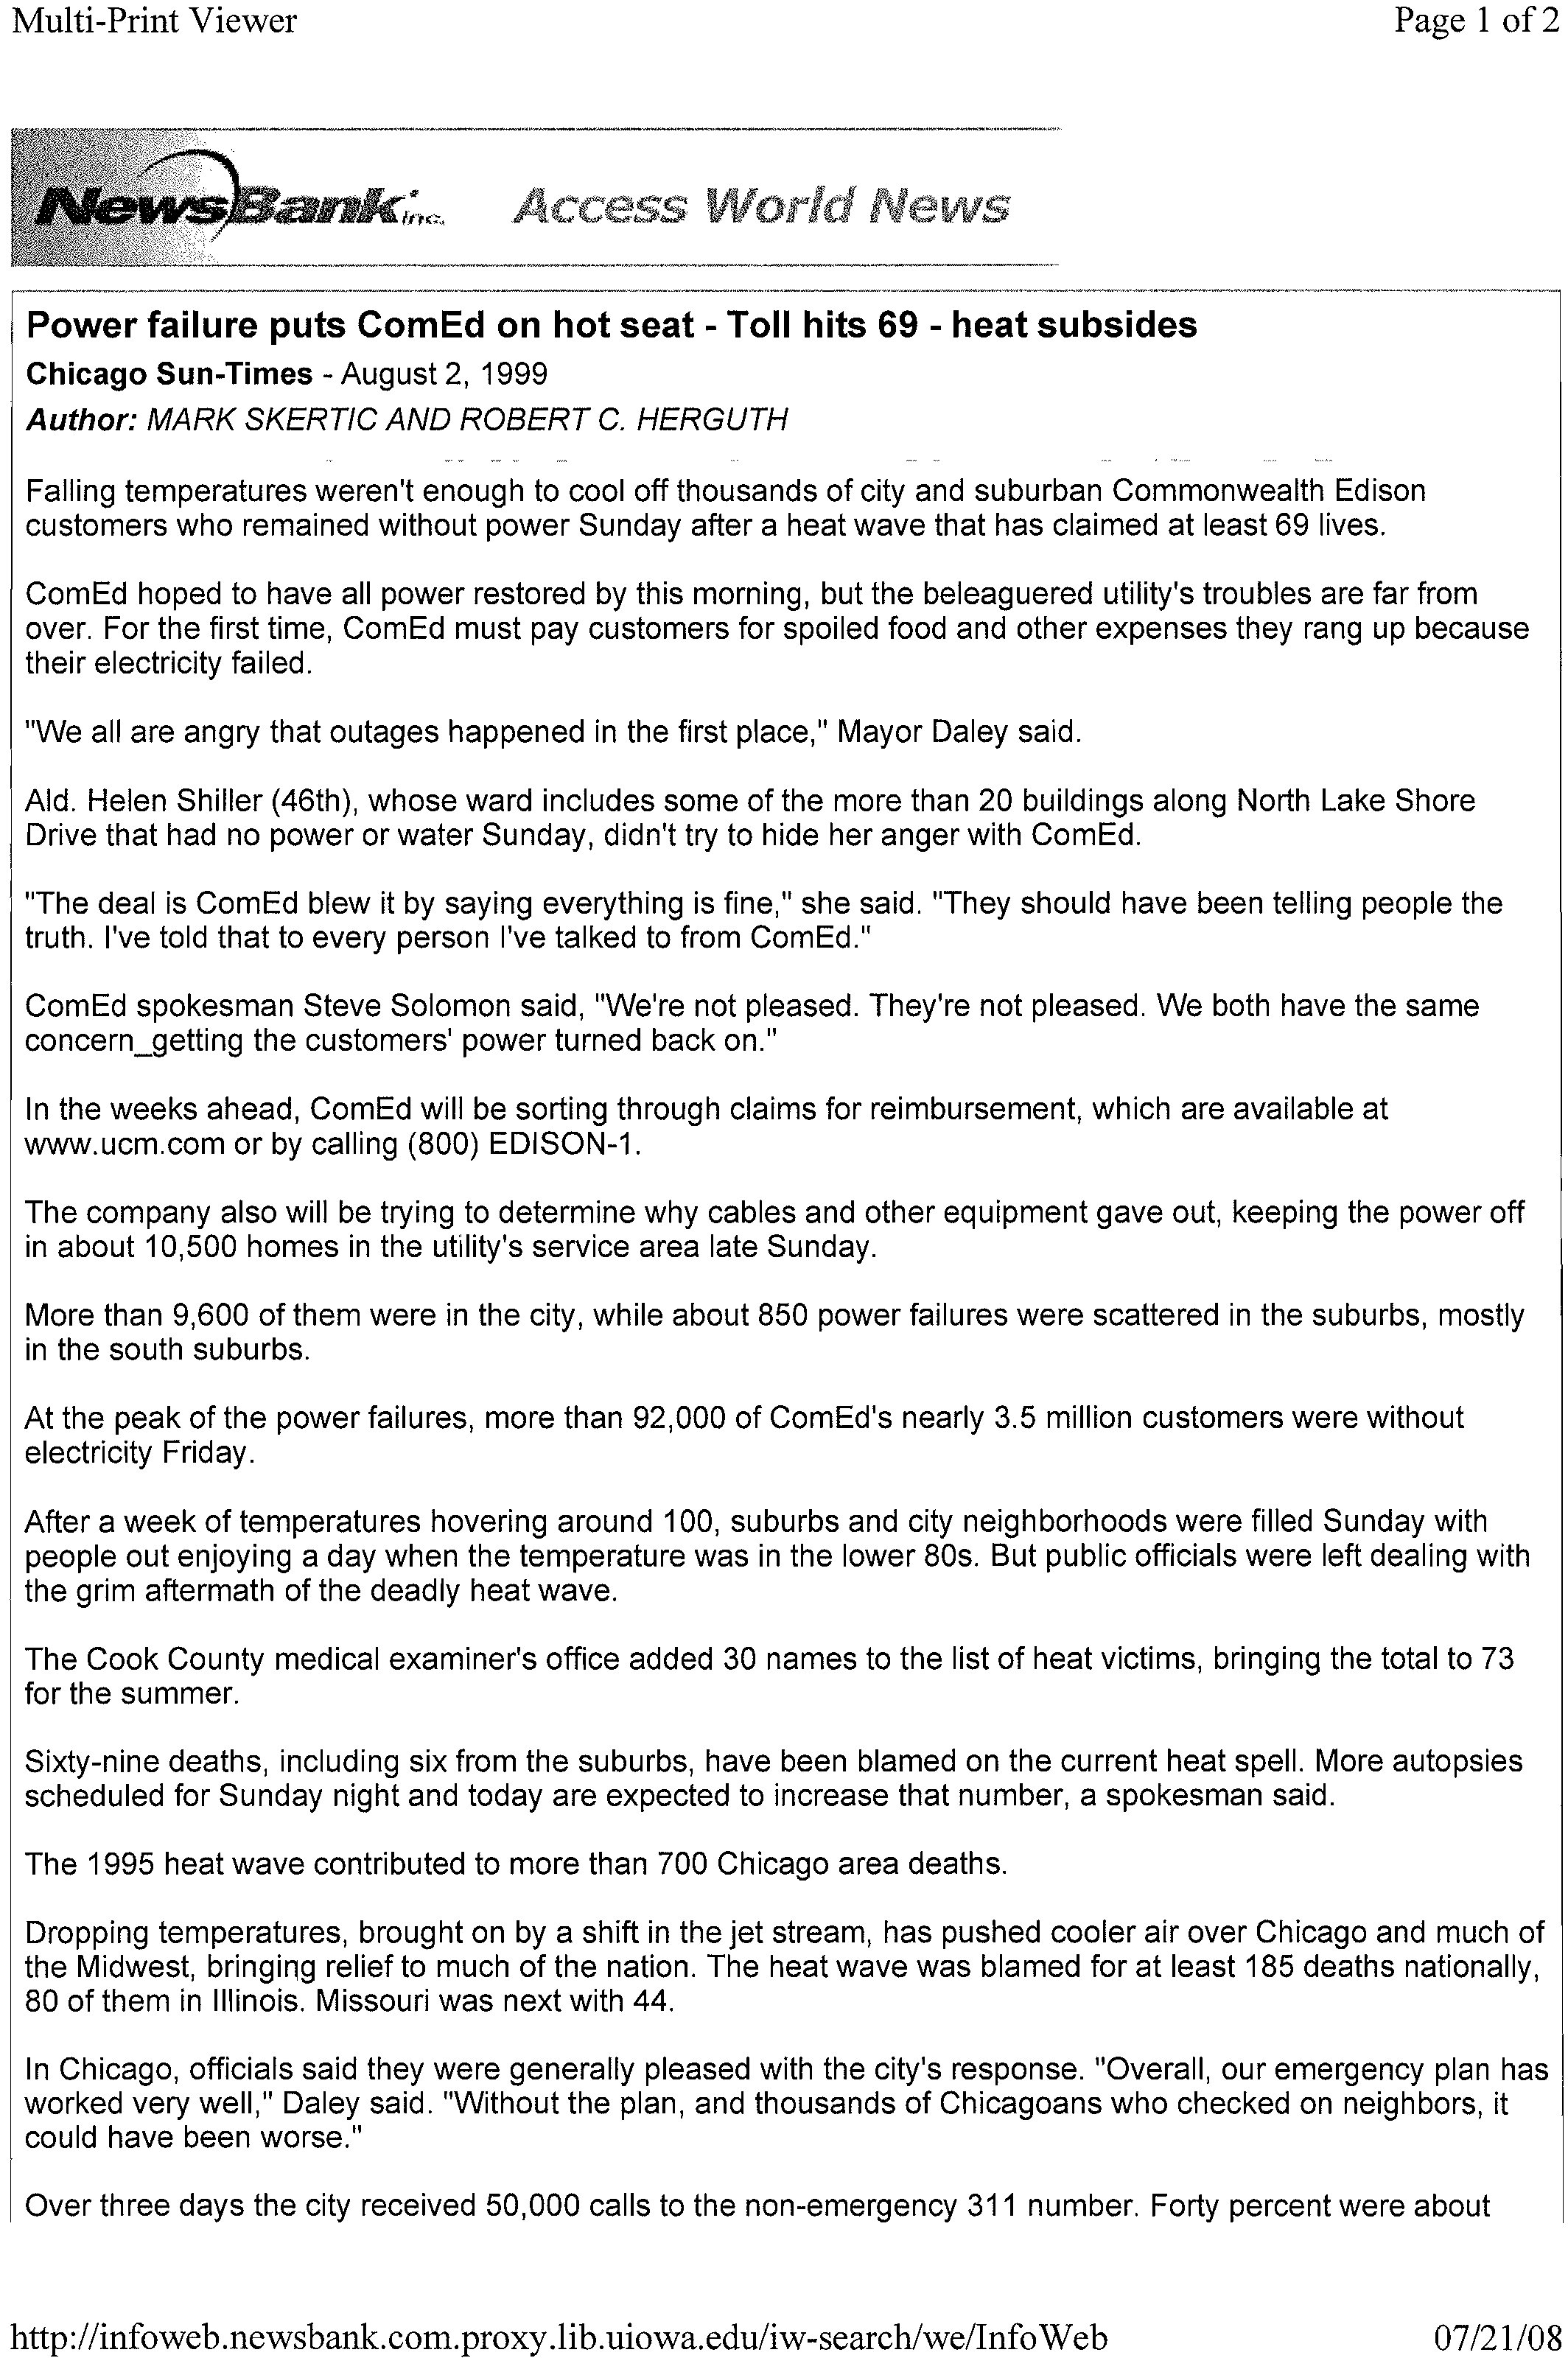
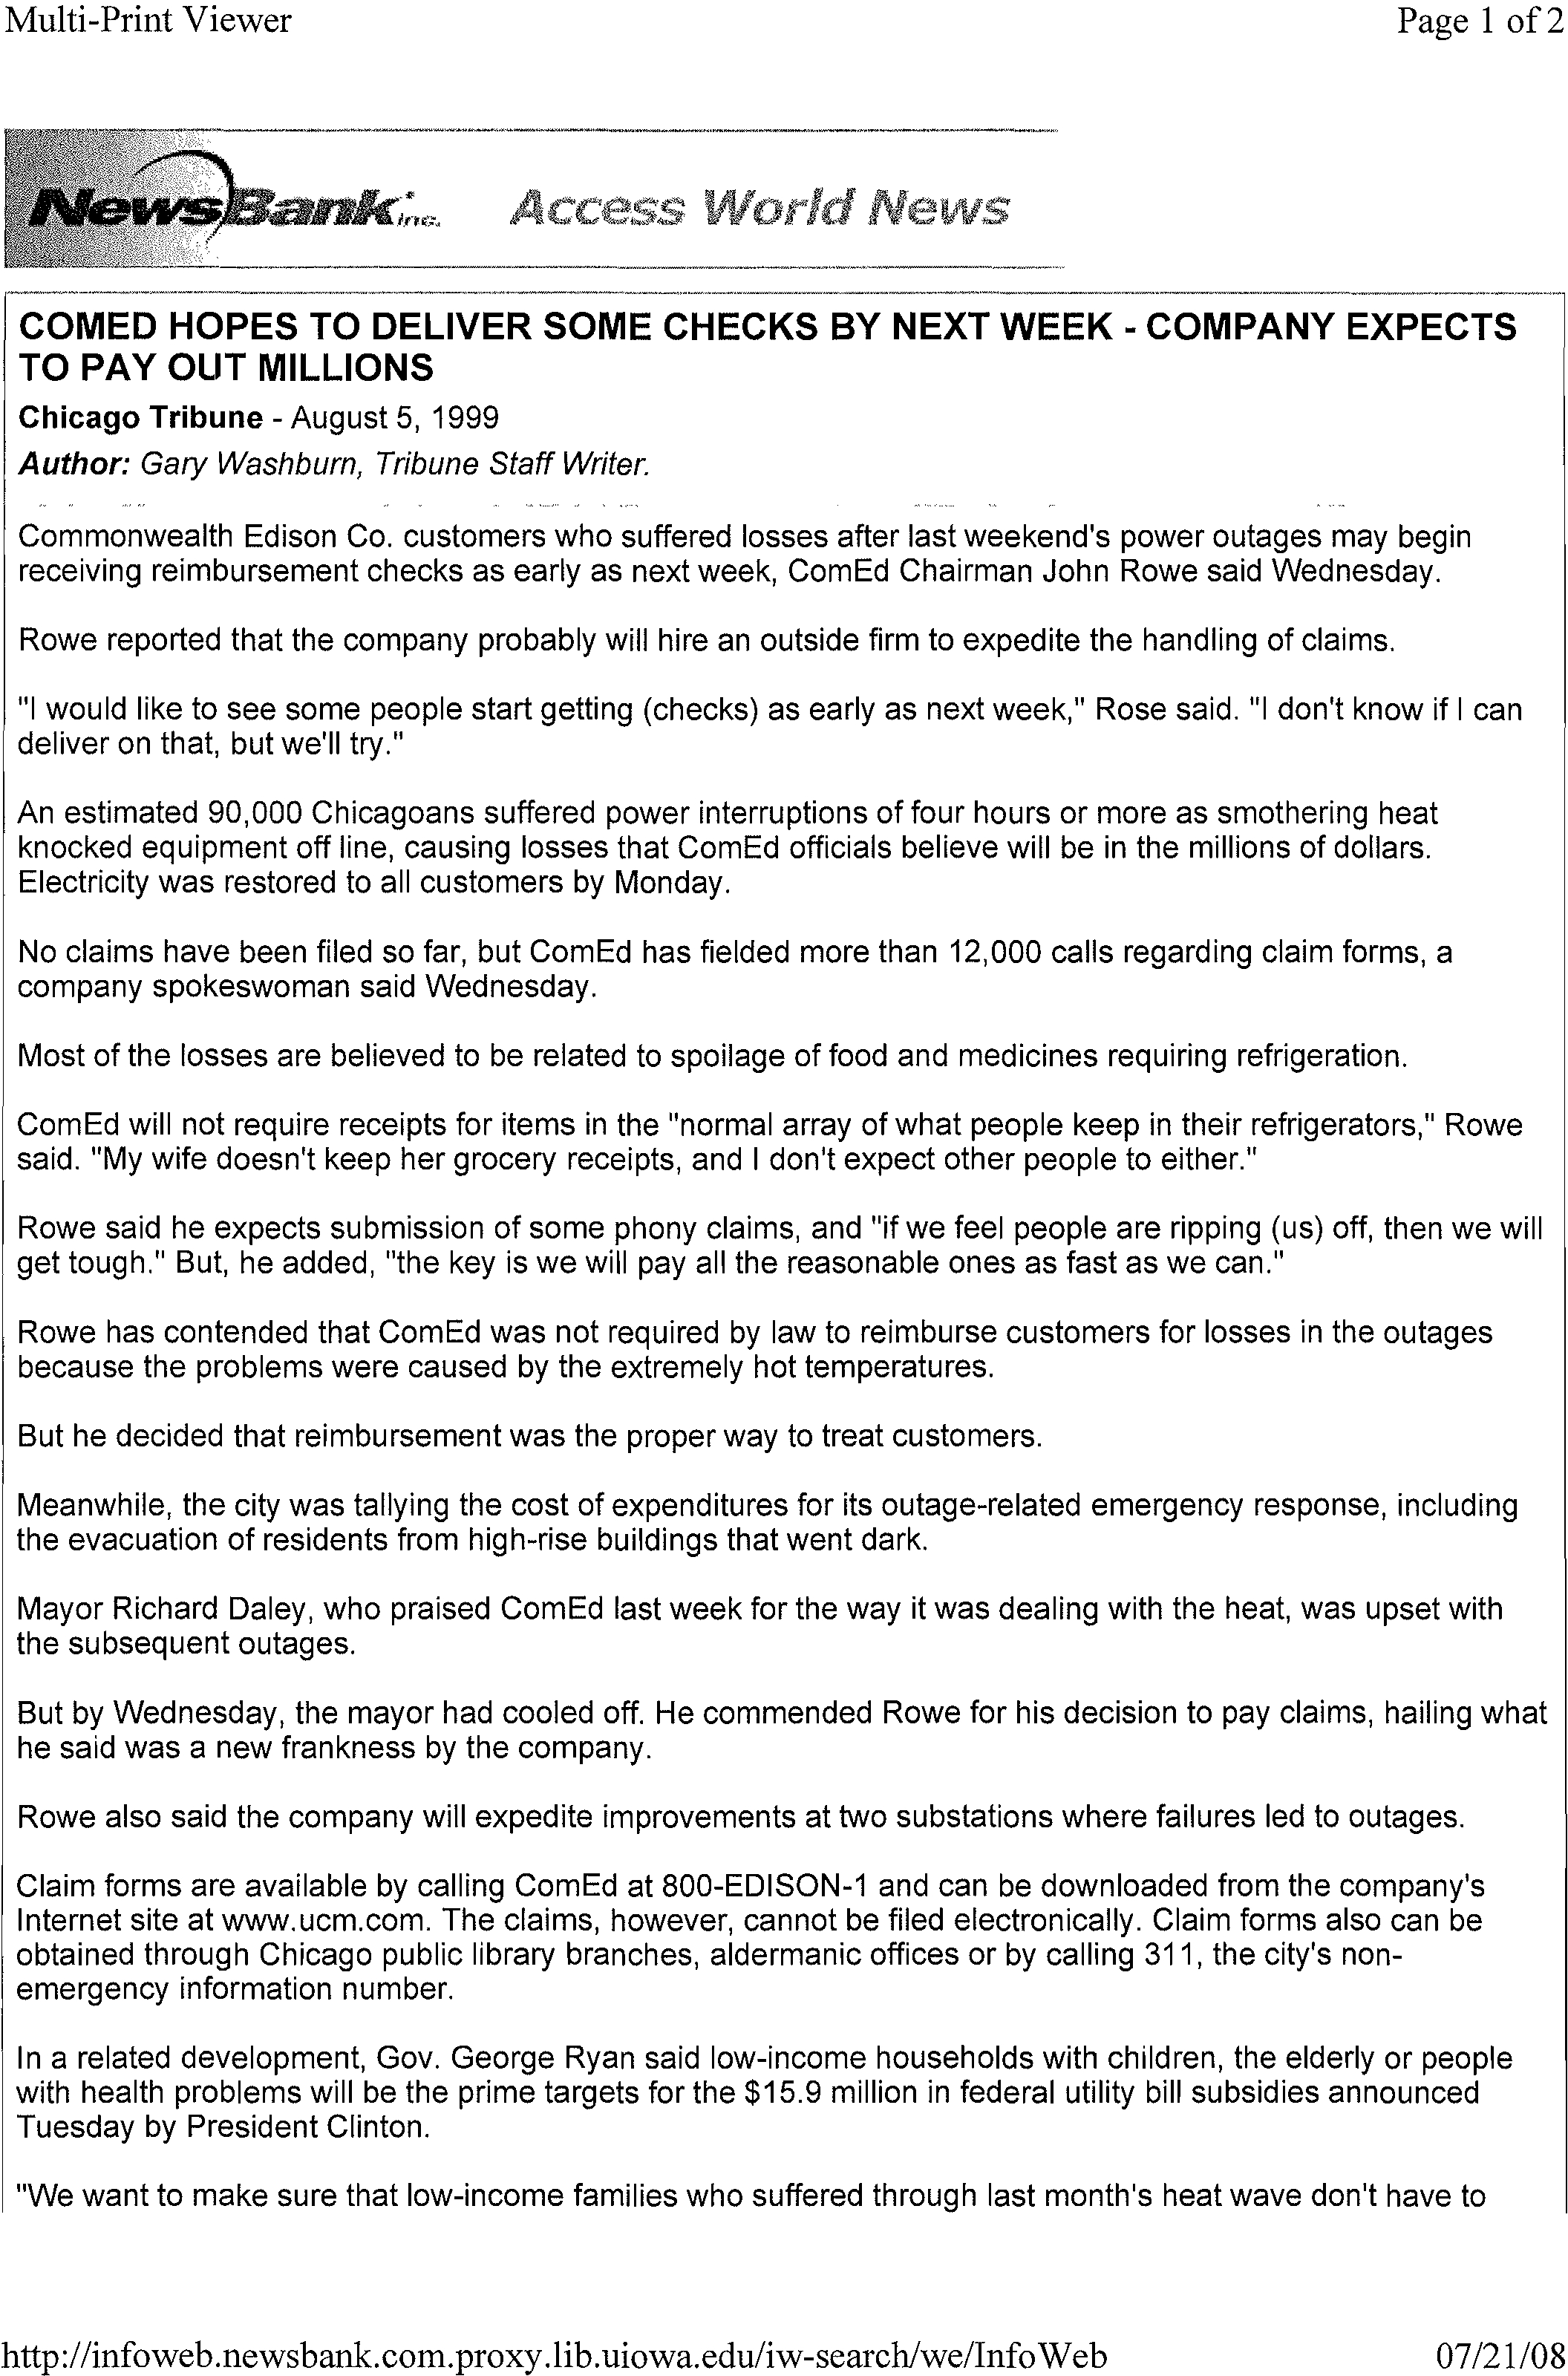
The re-designation
of the Ship Canal should also evaluate whether this is an issue which will
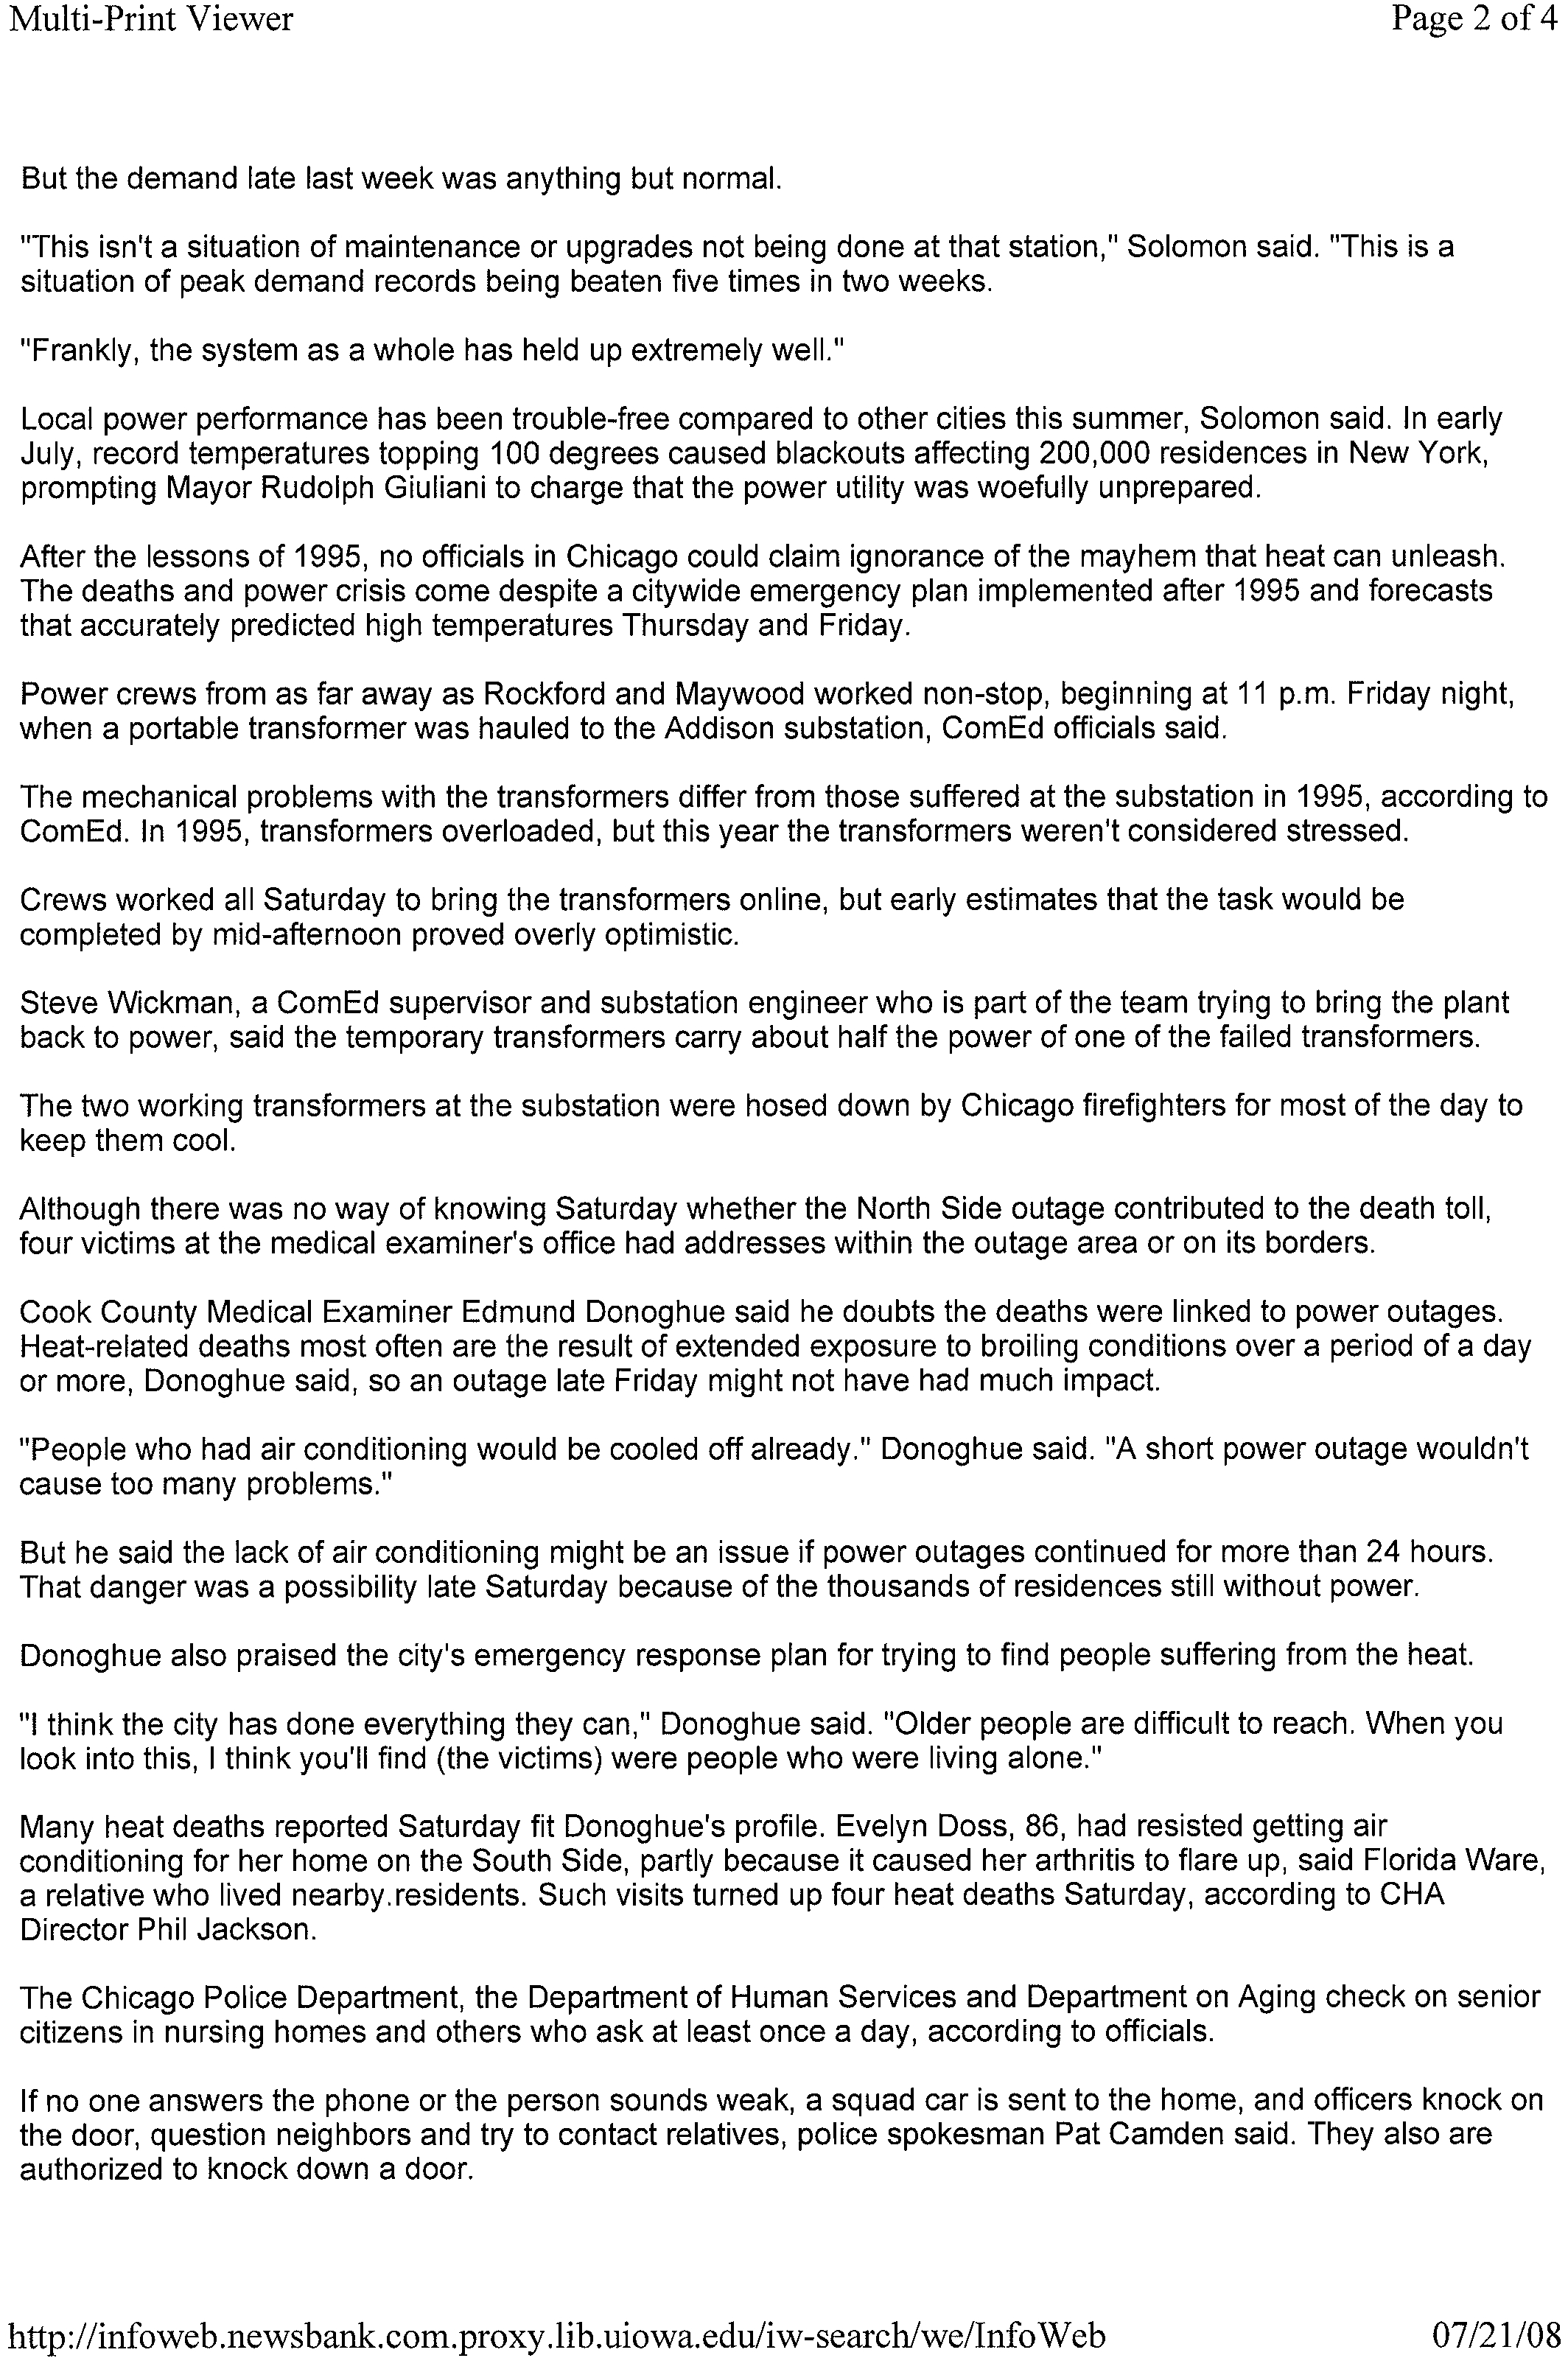
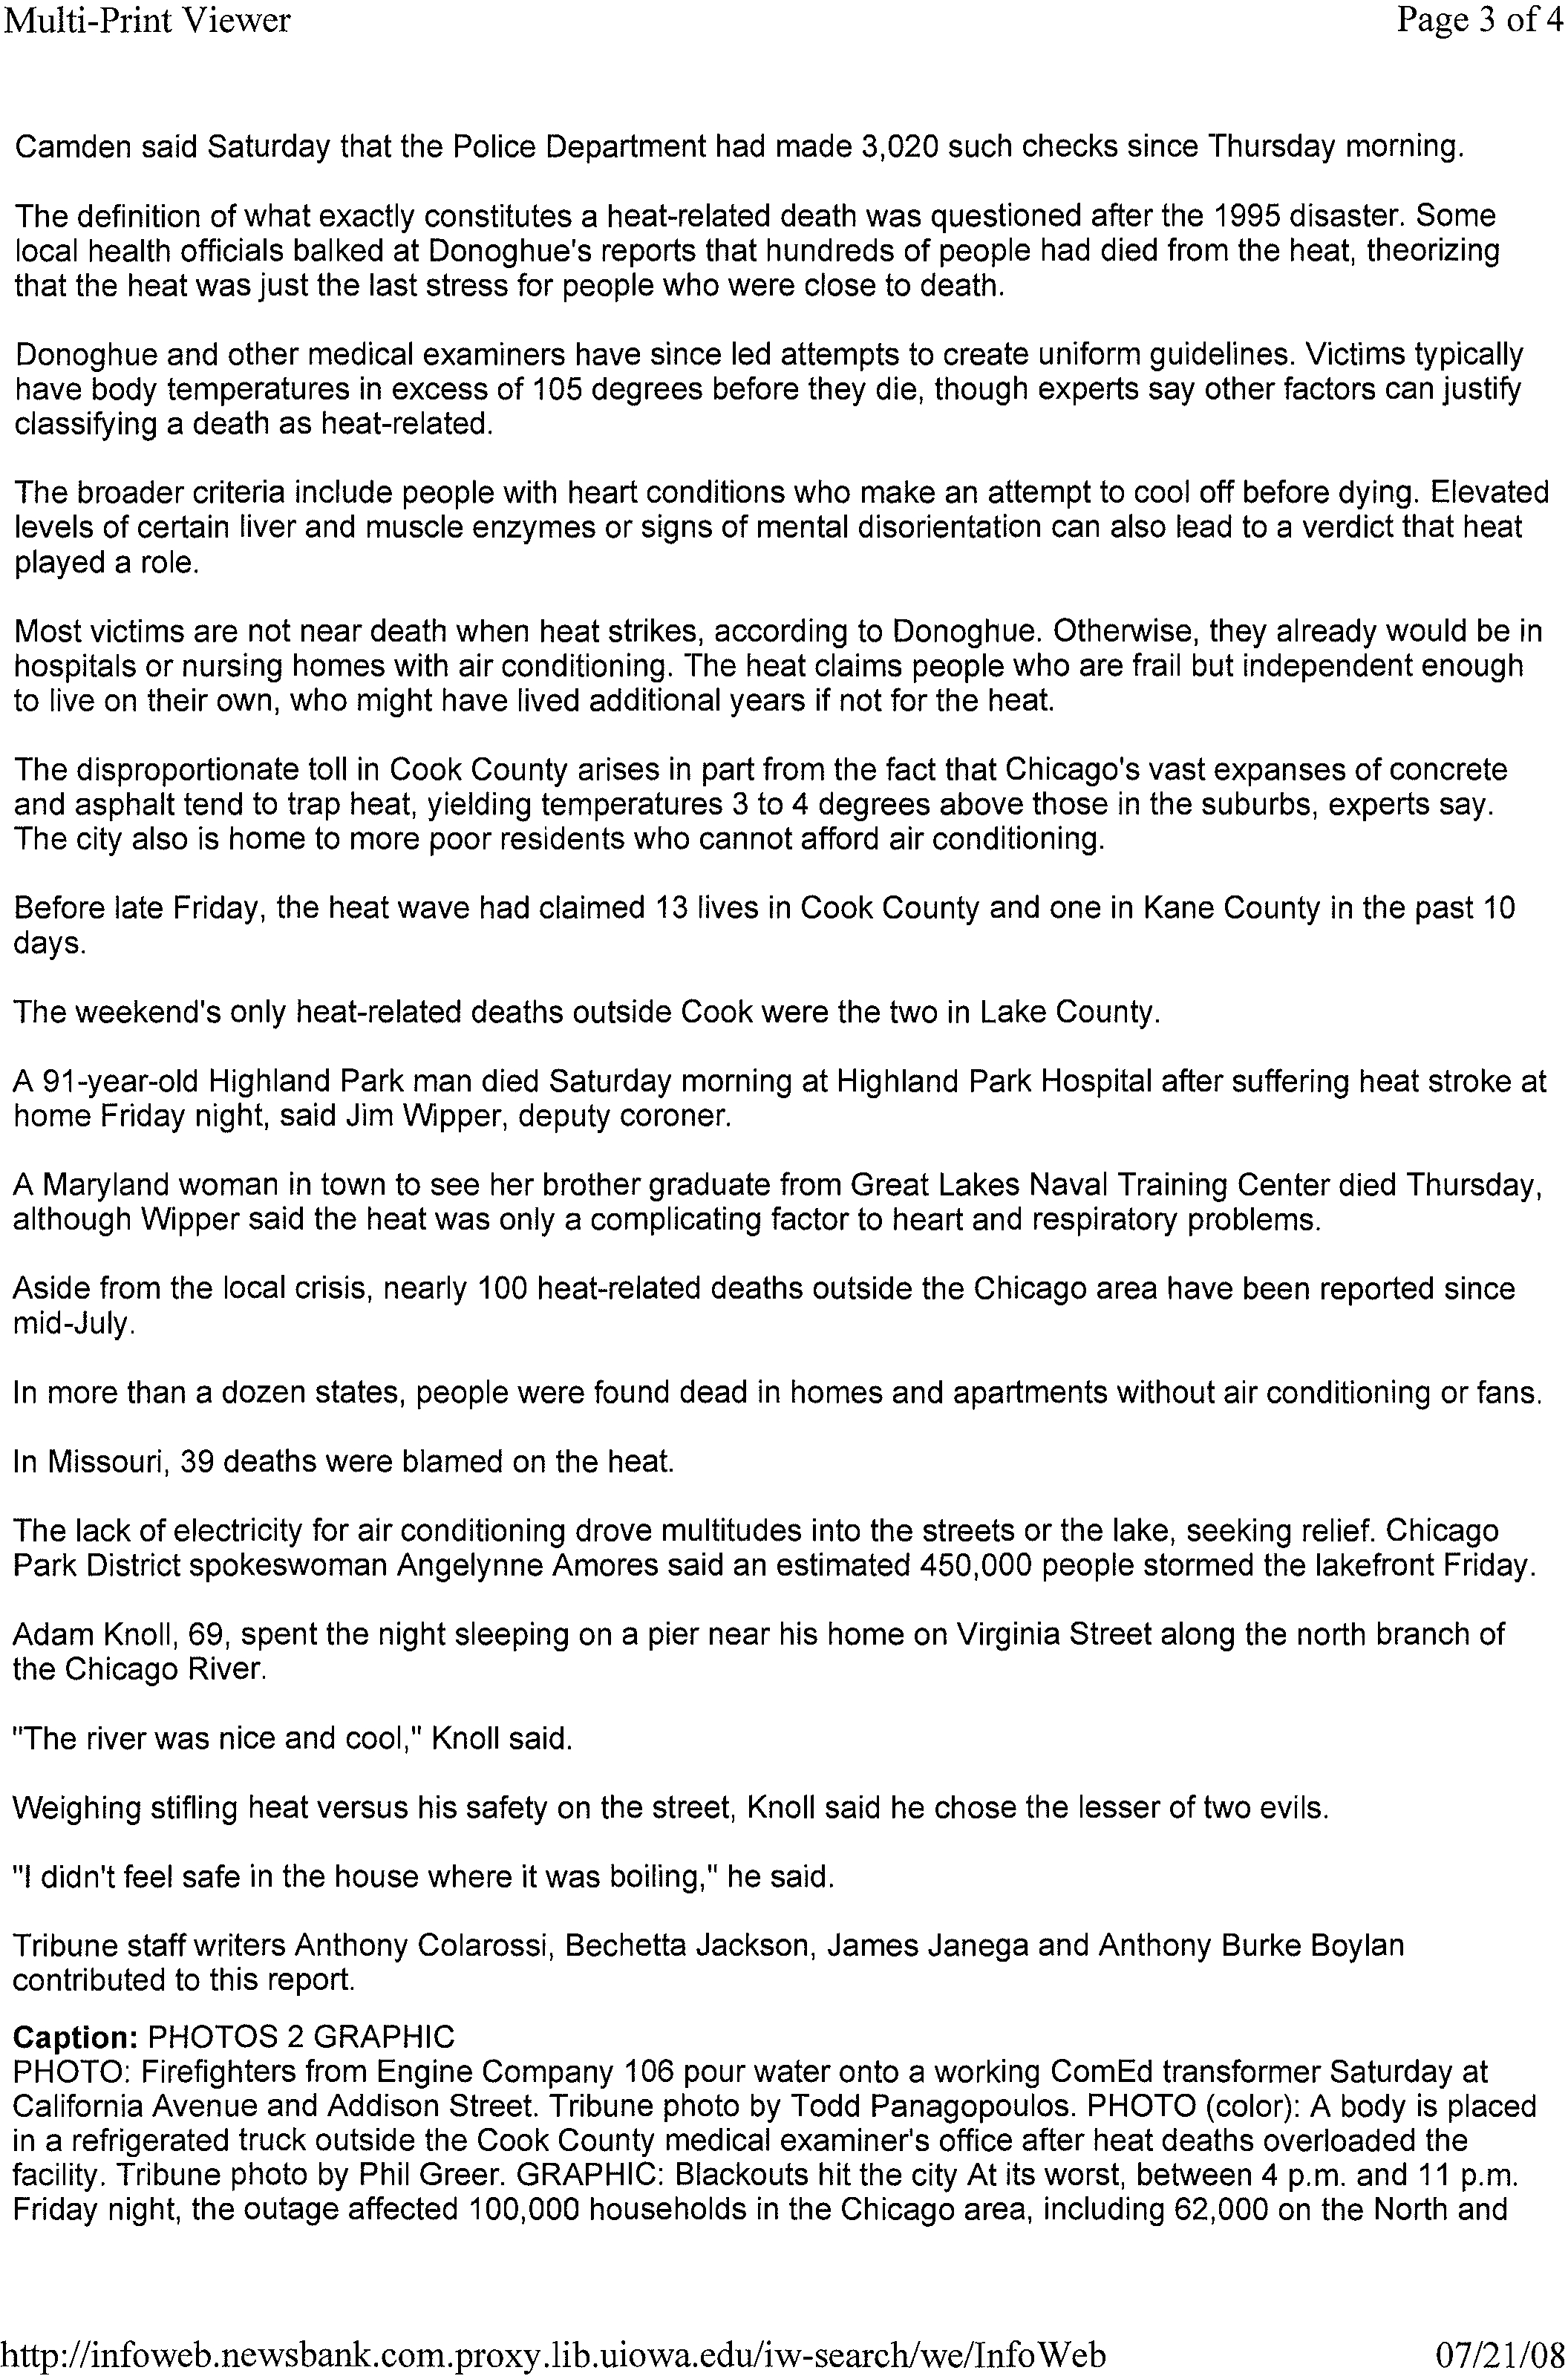
have an economic effect on residents
of the region in the form of more expensive electricity -
and the inability to use power generation facilities at precisely the time that peak power
production is needed most. Peak demand for electricity will occur when temperatures are
highest. (Attachment 4). We recommend the Board consider these other uses
of the Ship Canal.
MIXING
ZONE IMPLICATIONS, CHLORIDES, AND SULFATES
Because
of the uniqueness of the Ship Canal, a separate use category is appropriate. However,
the Agency has proposed limits for three pollutants, which we have identified as not achieving
the proposed Use B standards on the Ship Canal: thermal, chlorides, and sulfates.
2
Under 35 III
Adm Code 302.105, mixing zones and Zones of Initial Dilution (ZIDs) are allowed, subject to
certain restrictions. Section 302.105(b) (9) prohibits mixing zones for constituents where the
water quality standard is already violated in the receiving stream. Assuming for the moment that
this prohibition only applies during the period
of time the receiving water body exceeds a water
quality standard, then there will be times during each year when all dischargers adding any
chlorides, sulfates, or thermal will have to meet the water quality standards at the end
of pipe.
The Agency noted in its Statement
of Reasons (page 76) that it expects that there will be
violations
of the chloride standard during the winter months, yet offers no solution in its proposal
2
Sulfates only when the chlorides are greater than 500 mg/L, no net increase in sulfates would
be allowed.
9
12462512
Electronic Filing - Received, Clerk's Office, August 4, 2008
and does not address at all the loss of mixing zones.
It
is likely that every discharger on the Ship
Canal will be negatively impacted
by this loss of mixing zone, with significant economic
implications.
Ifwe can'tsupport industrial dischargers to the Ship Canal, where in Illinois should
industrial facilities locate?
Attachment 3 presents three years
of chloride data from the Citgo Lemont Refinery's water
intake [which is upstream
of its discharge]. Chloride levels as high as 835 mglL have been
recorded in the Ship Canal. The chloride level in the Ship Canal remained above 500 mglL from
February 19, 2007 to at least to March
5, 2007, attributed to highway de-icing runoff. The
intense population center (i.e. the City
of Chicago and suburban Cook County which are
upstream
of the Lemont Refinery) on an effluent dominated stream make achieving a 500 mglL
chloride standard not practicable without changing de-icing practices. Moreover, while ignoring
the current uses being made
of the Ship Canal, the proposal penalizes the point source
dischargers on the Ship Canal. During periods
of elevate chlorides, no discharger can contribute
any chlorides or sulfates under the proposed water quality regulations. The Board has already
granted variances relating to Total Dissolved Solids to Citgo [and changed the water quality
standard for TDS for the Exxon-Mobil Refinery] due to the snow-melt phenomena. Facilities
that use once through cooling water would not be allowed to add chlorine to control microbial
growth, nor can they add sulfite type compounds to consume any chlorine residual (de-
chlorinate) in the discharge. On an effluent dominated stream, chlorinating the incoming water is
important to prevent biological growth on the heat exchangers. To discontinue discharging
would entail ceasing operations for most industries, which has its own economic ramifications.
In addition, new dischargers to the Ship Canal would essentially be limited to operations that did
not add any heat (no once through cooling), chlorinate, de-chlorinate, use de-icing salt in the
winter, or any process that contributes chlorides or sulfates. MWRDGC would also not be
allowed to discharge during periods its effluent exceeded 500 mglL chlorides, which would
occur when the Ship Canal is also over 500 mglL.
There is no indication in the record I reviewed that the Agency has considered the loss
of mixing
zones that will occur on the Ship Canal
if the Use B designation is adopted to this waterway.
The unintended consequences
of the Agency's proposed UAA rules for chlorides and sulfates
10
12462512
Electronic Filing - Received, Clerk's Office, August 4, 2008
could be addressed by development of Best Management Practices (BMP) for chlorides and
sulfates in place
ofwinter water quality standards for these parameters.
THERMAL
The proposed Use B contains some very significant changes to the thermal limits for all ofthese
waterways. Because of the three coal-fired power plants and other industrial users that add heat
to the Ship Canal, special consideration regarding thermal limits is appropriate. The thermal
standards on the Chicago Sanitary
&
Ship Canal have been in effect for over 36 years, and
specify the temperature shall not exceed
93 degrees F more than 5 percent of the time and shall
not exceed 100 degrees F at any time
(35 III Adm Code 302.408). Water quality standards are
set
to be protective of stream uses.
There are two basic methods
of establishing thermal standards, either through laboratory testing,
exposing fish to water
of various temperatures or through the collection of field data. The
advantage
of field-based standards are that natural responses, such as acclimatization and
avoidance, can be allowed to occur, while avoidance is not an option in laboratory tests and
acclimatization is limited
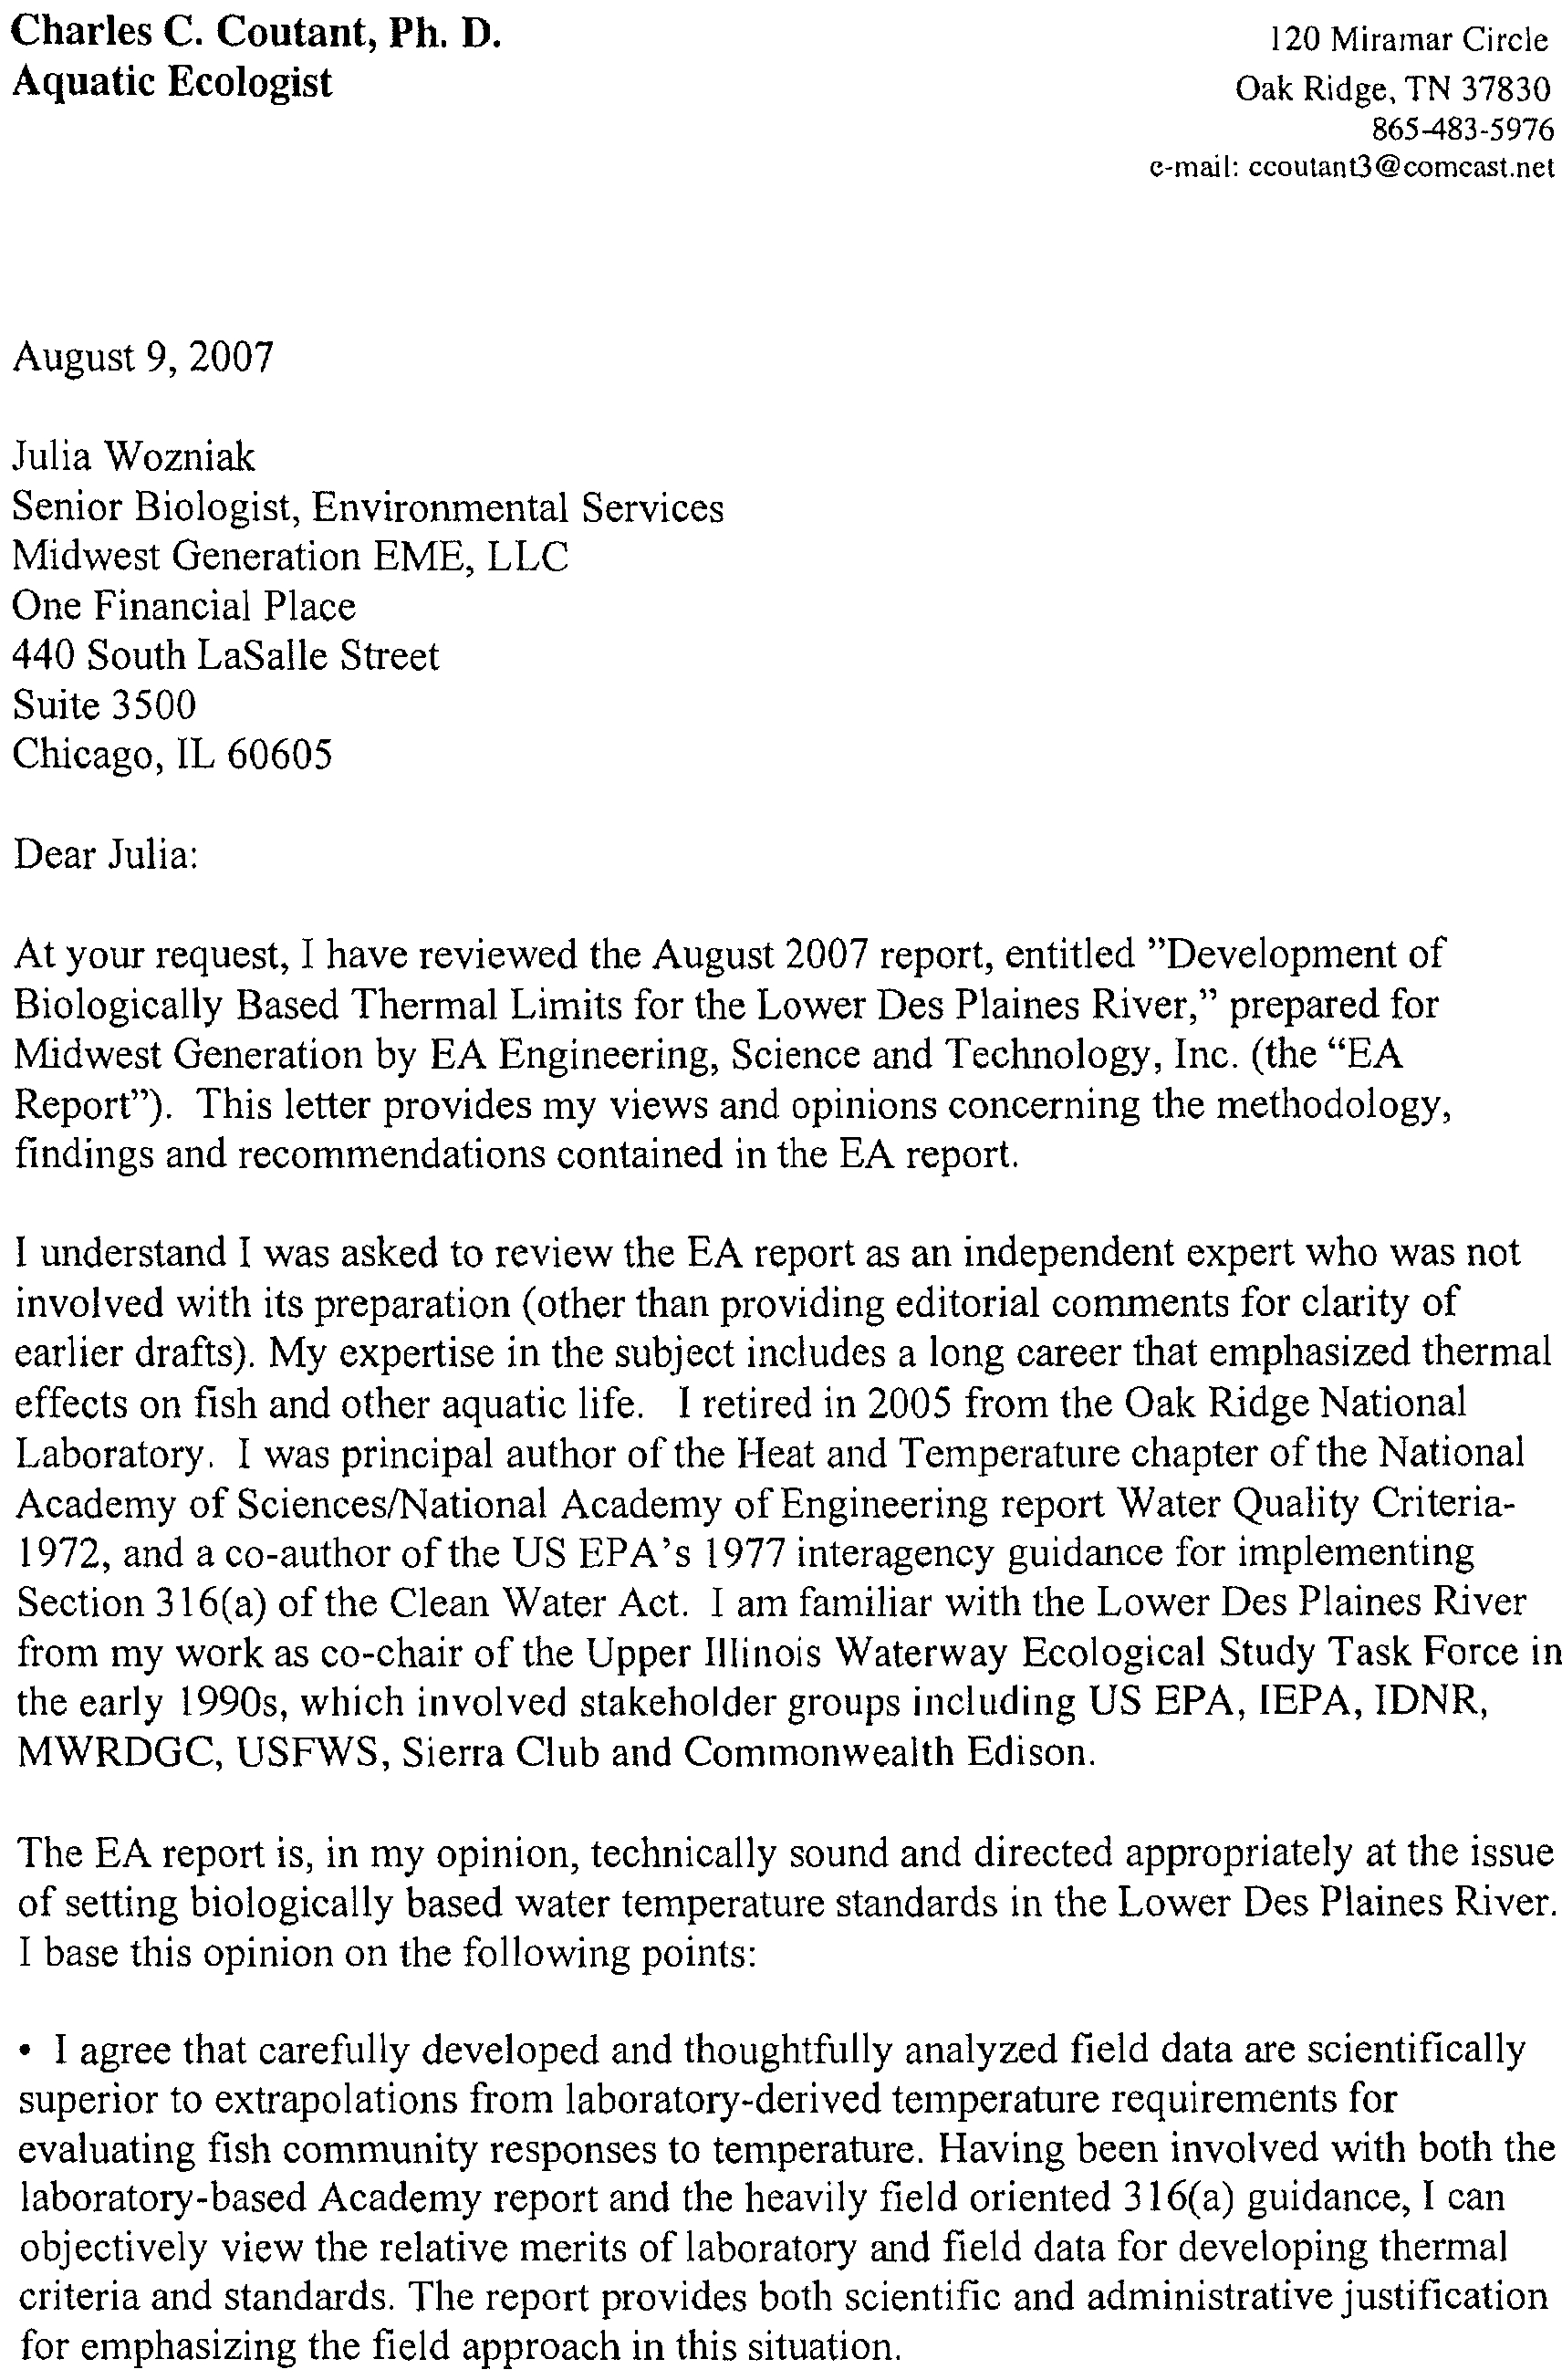
to the experimental design as to how fast the water is to be heated. Dr.
Charles Coutant, the author
of the Heat and Temperature chapter of the National Academy of
ScienceslNational Academy of Engineering report
Water Quality Crieria-1972
believes that field
data are scientifically superior to extrapolations from laboratory-derived temperature
requirements for evaluation fish community responses to temperature (Attachment 5).
The UAA process for thermal standards relied to a large extent on the data analysis
of Chris
Yoder, which was based on a literature search oflaboratory temperature studies, which were then
ranked
by a proprietary computer model to come up with growth and survival criteria of chosen
Representative Aquatic Species (RAS).
Seasonal cycles were also developed
to "protect
essential functions such
as growth, gametogenesis and spawning." (Pre-filed Testimony of Chris
O. Yoder, in R08-09, pg 11.) Mr. Yoder concludes his pre-filed testimony noting that
11
12462512
Electronic Filing - Received, Clerk's Office, August 4, 2008
"occasional exceedences of well developed thermal criteria are inevitable and may not
necessarily result in a biologically impaired use." (pg 12).
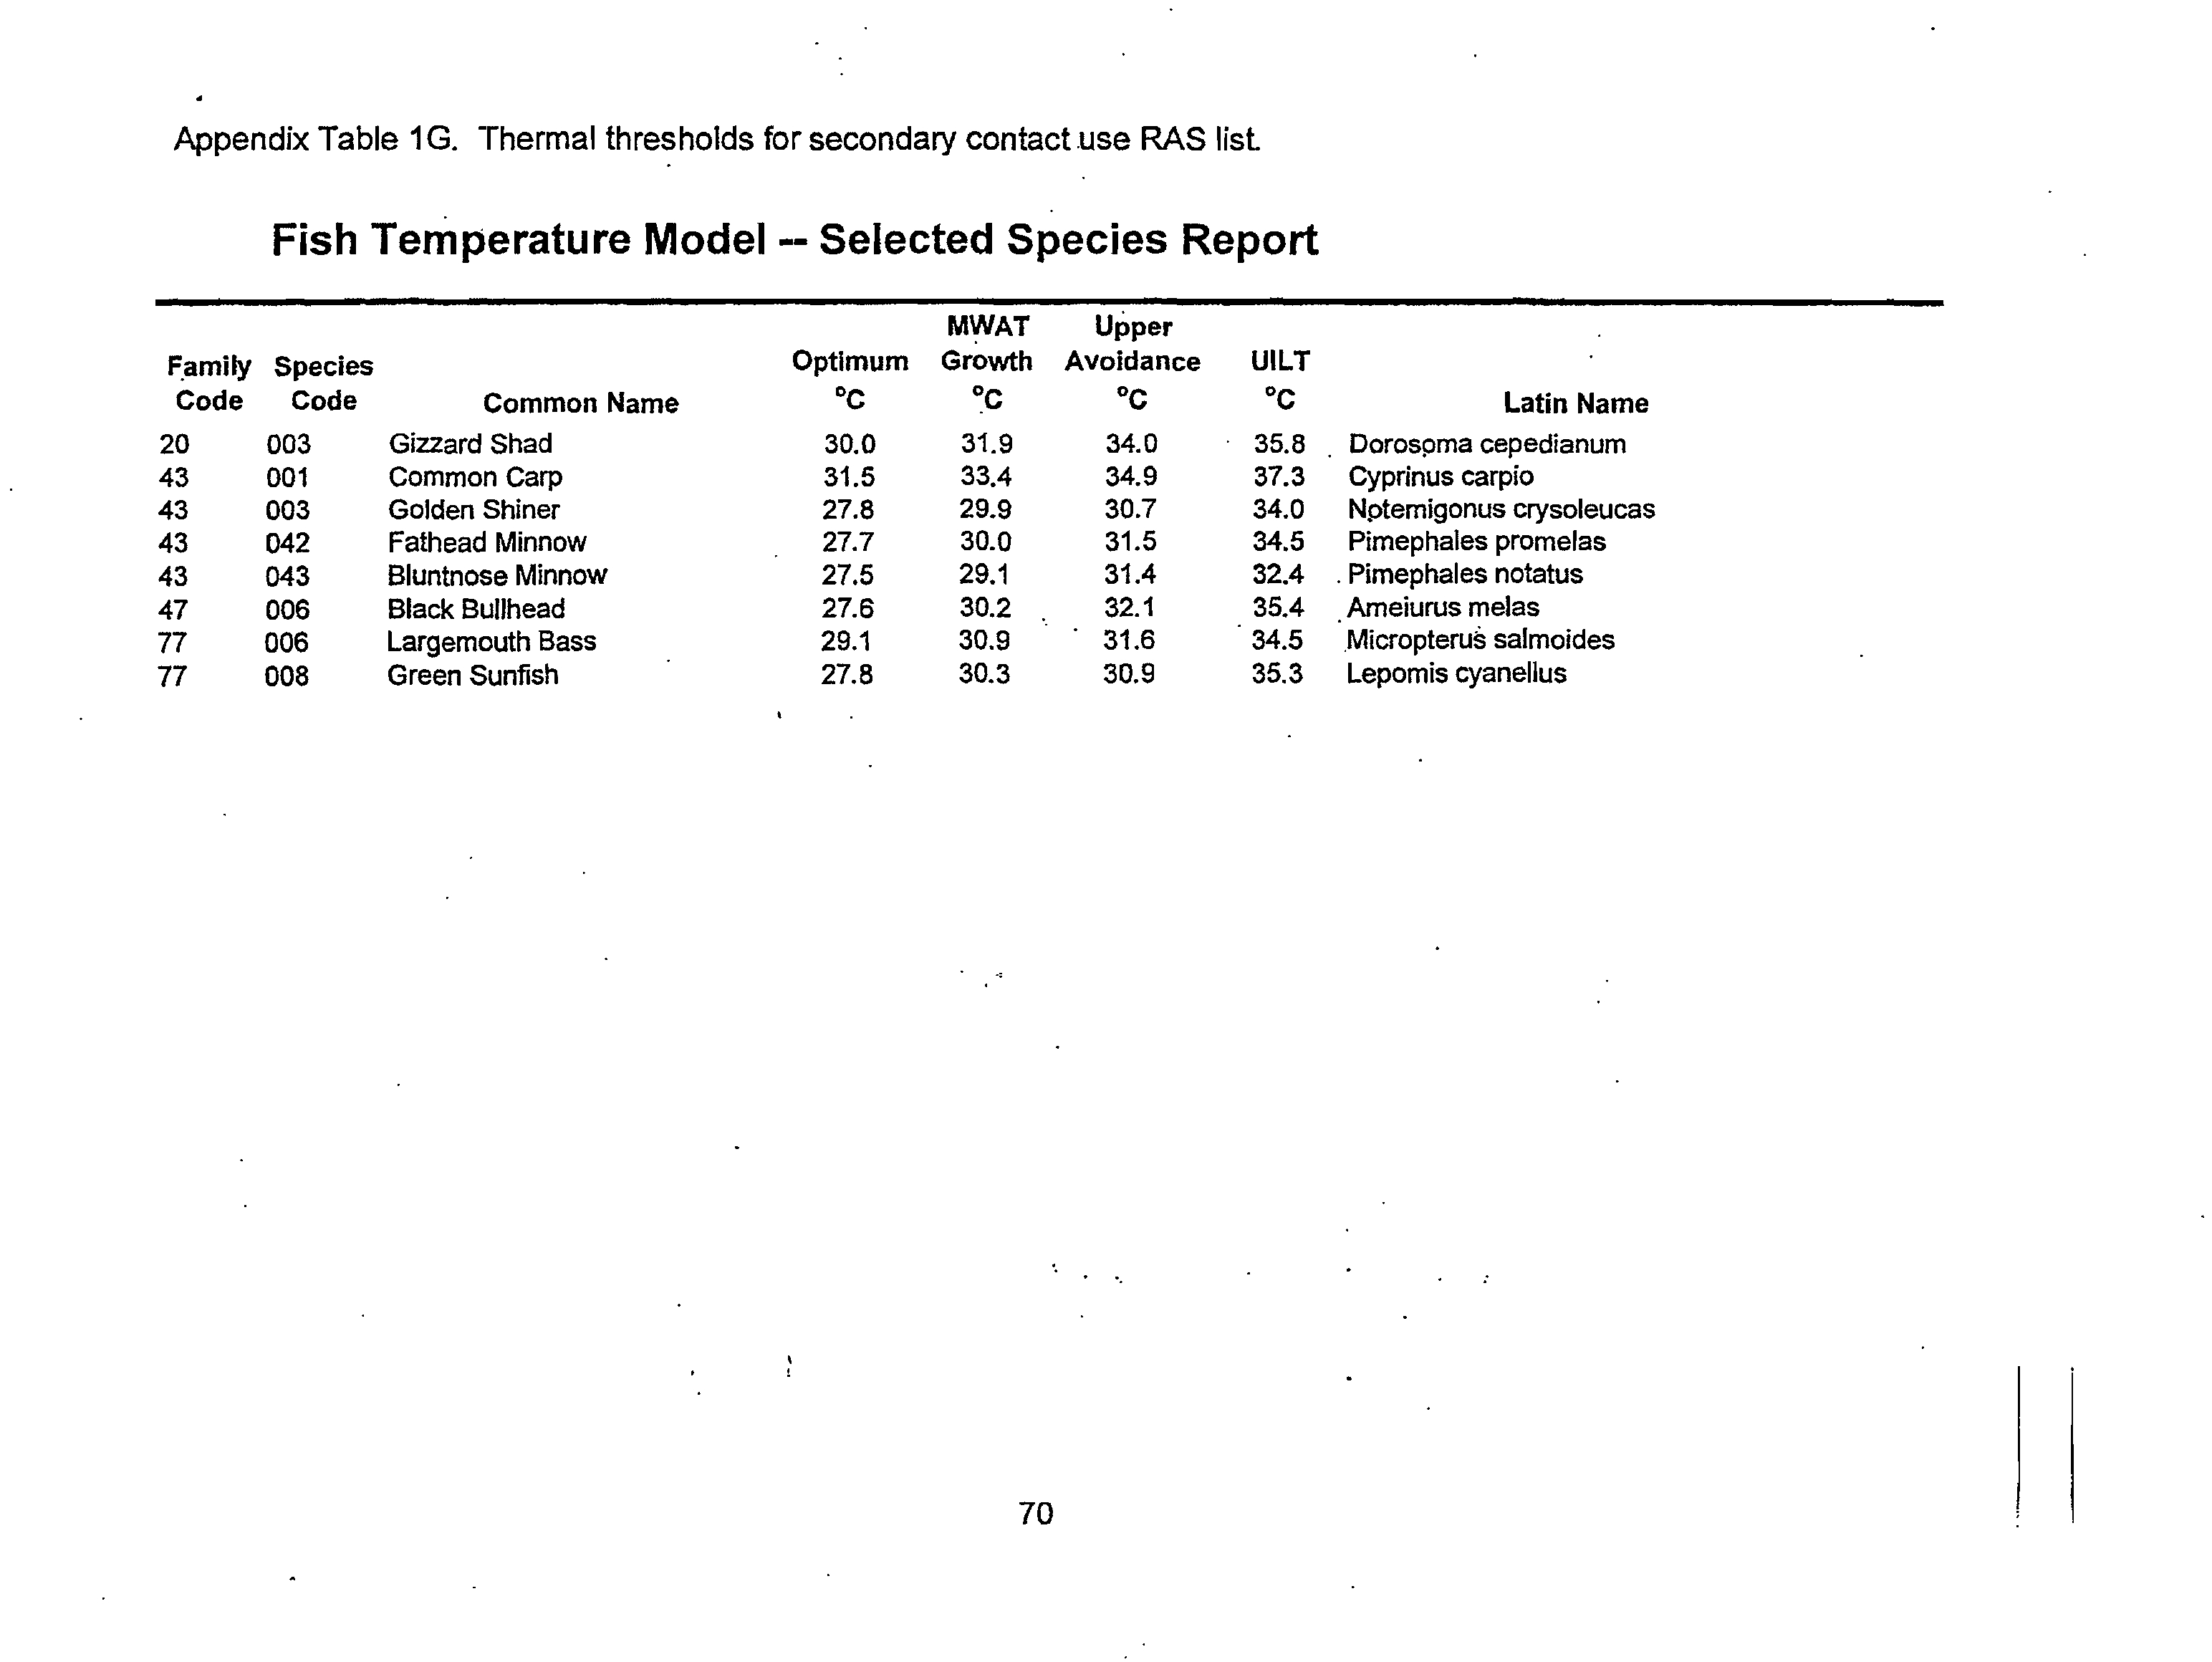
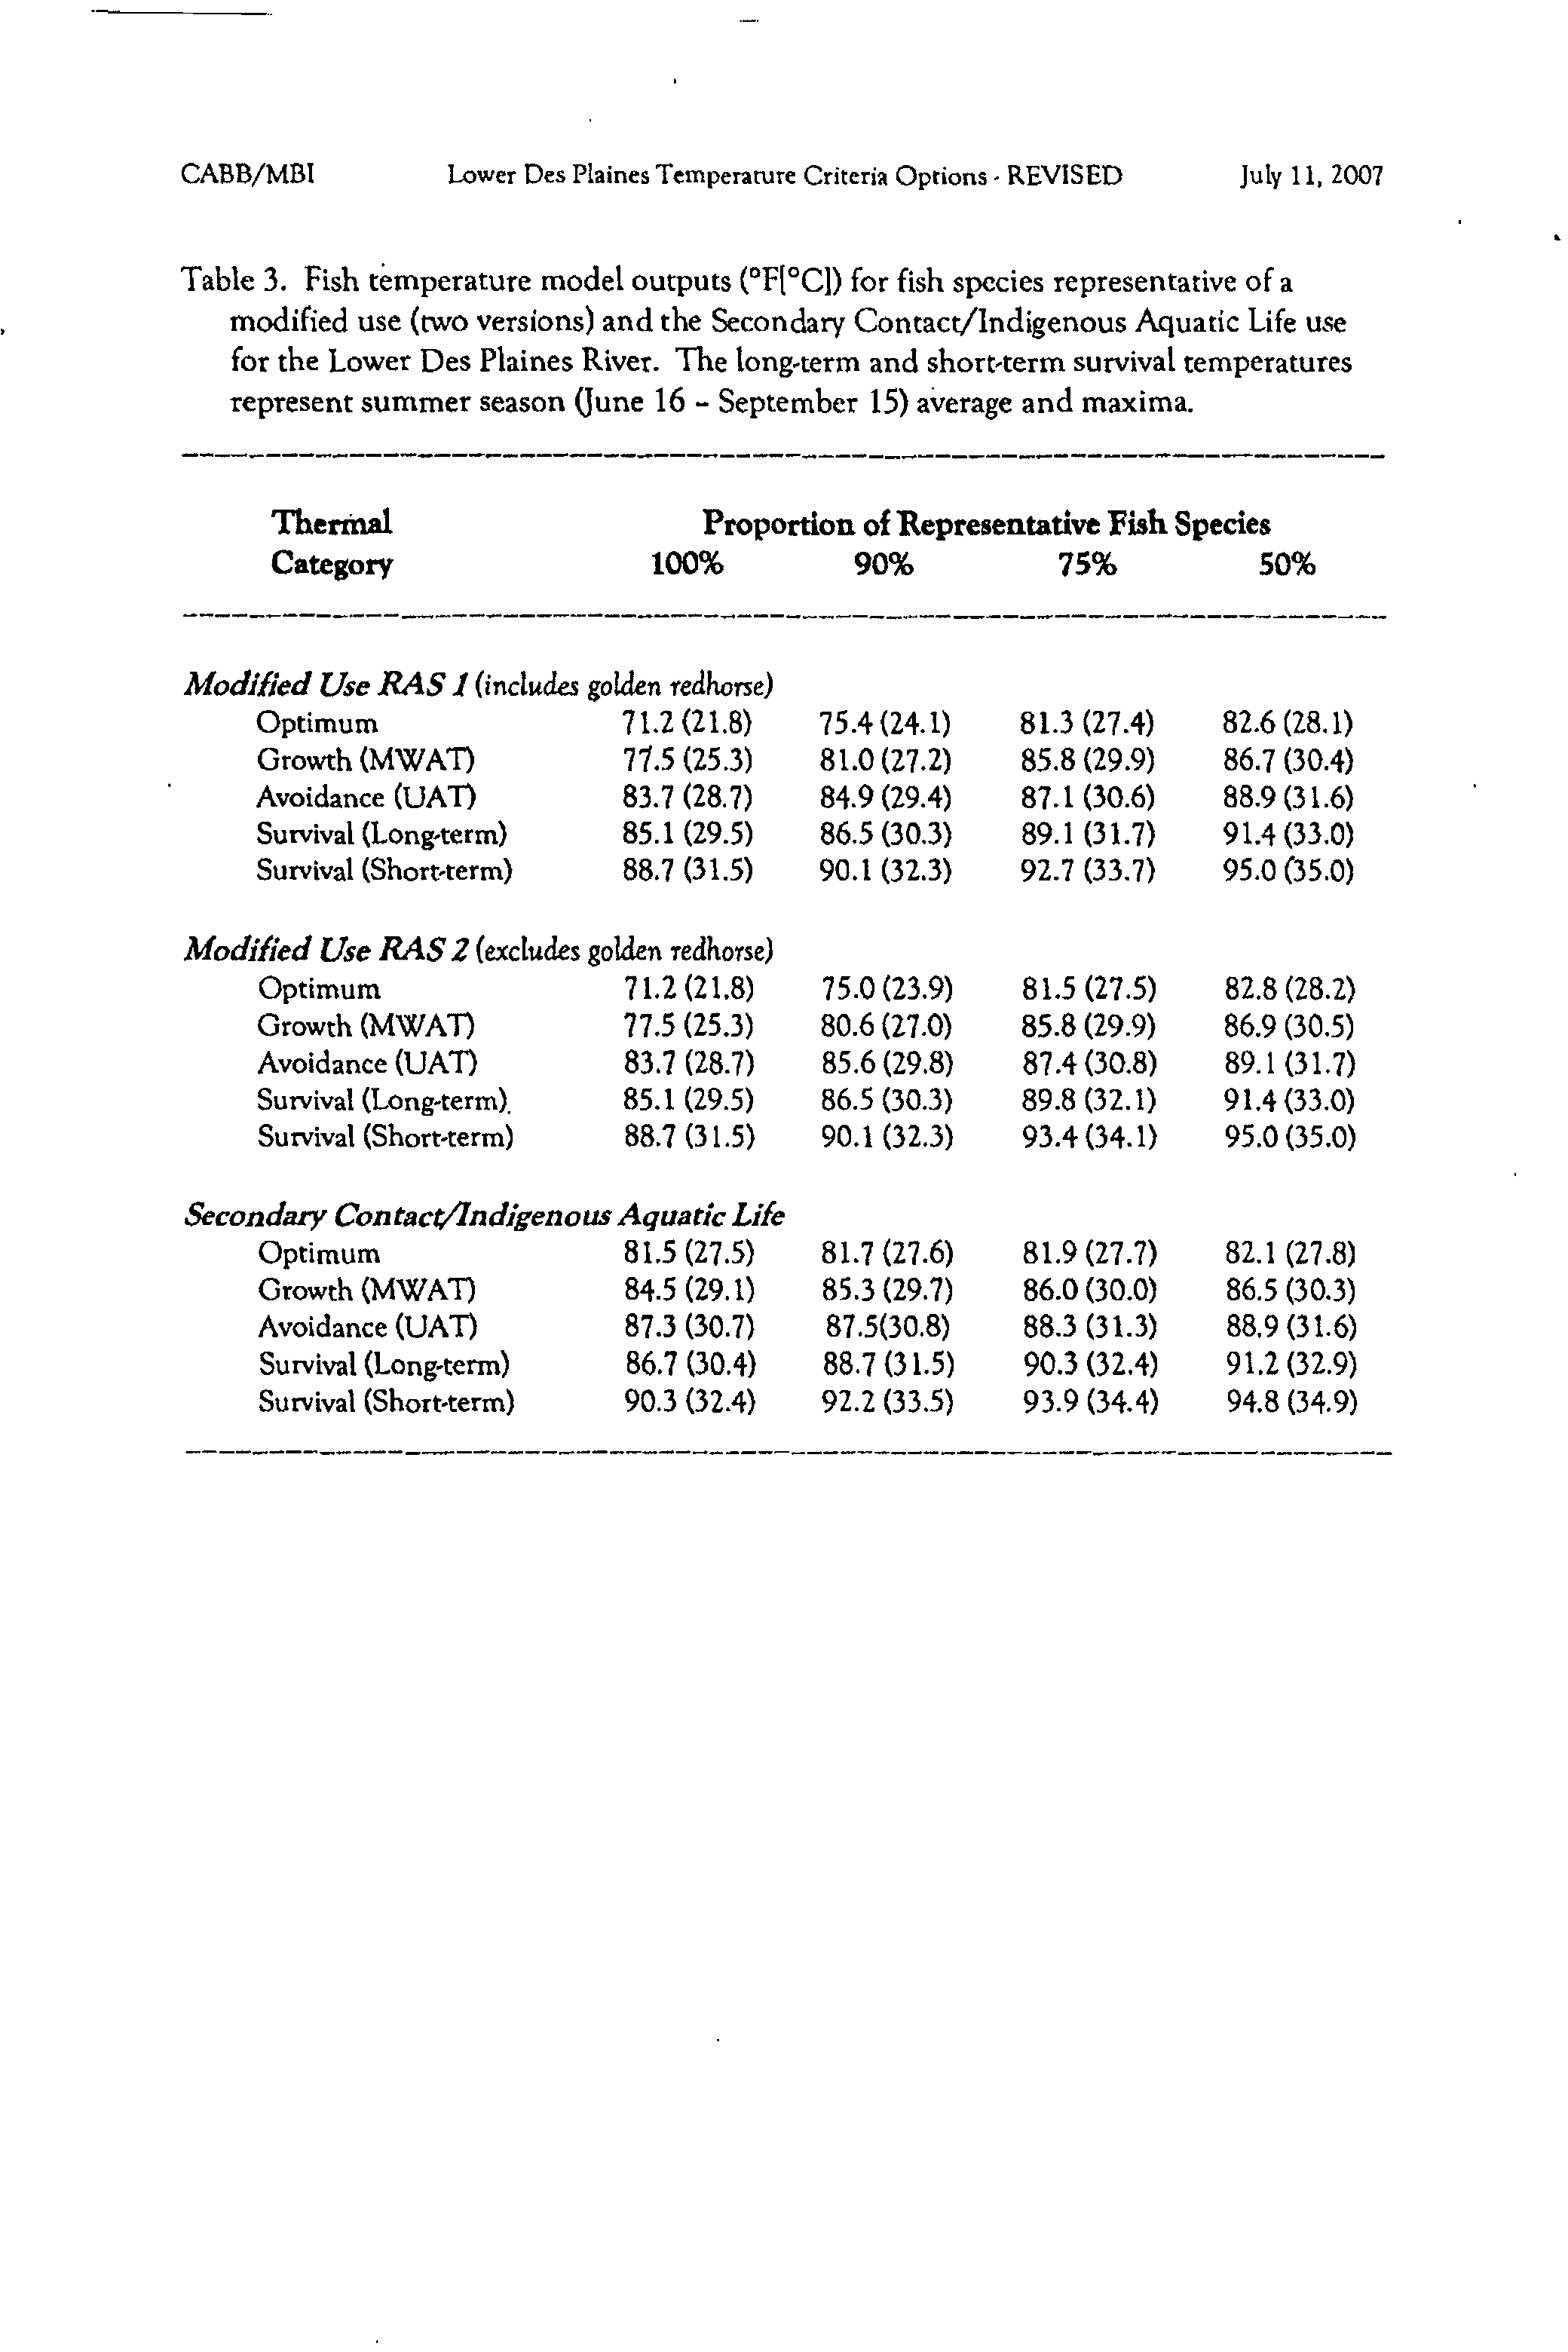
For the Secondary Contact waterways, eight fish species were utilized by Yoder
to derive
temperature limits, and these eight fish species were listed in Appendix Table 1G
of the report
Temperature Criteria Options for the Lower Des Plaines River
(Yoder, C. and
E.
T. Rankin, Nov
2005). These eight species were
as follows:
Gizzard Shad
Common Carp
Golden Shiner
Fathead Minnow
Bluntnose Minnow
Black Bullhead
Largemouth Bass
Green Sunfish
The bluntnose minnow was identified
as the most thermally sensitive of the eight fish species,
with an Upper incipient lethal temperature (UILT)
of 32.4 degrees C (or 90.3 degrees F).
The Agency then used the Yoder Report to develop the proposed thermal limits. Scott Twait's
pre-filed testimony indicates that the eight fish species used
by Yoder are "representative of the
species that would be found in water capable
of maintaining aquatic life populations
predominated
by individuals of tolerant types that are adaptive to the unique physical conditions,
flow patterns and operational controls designed to maintain navigational use, flood control and
drainage functions in deep-draft, steep-walled shipping channels." (Page 11.)
In
essence, the
thermal standards proposed appear to be based on what the Agency believes is necessary
to
protect these eight species, at least with respect to maximum (summer) temperature limits.
For the non-summer months, Mr. Twait notes, "Because the source water
of the CAWS is
composed
of the MWRDGC wastewater treatment plant effluents, the temperatures of these
12
12462512
Electronic Filing - Received, Clerk's Office, August 4, 2008
waters can be expected to exceed other measures of background or ambient temperature at
certain times
of the year. Consequently, the Agency decided to use the effluent temperature from
MWRDGC's North Side, Calumet and Stickney facilities
as the background temperature instead
of using temperatures at the Route 83 Chicago Sanitary
&
Ship Canal station during periods of
the non-summer months when the effluent temperature was higher than the background
temperature."
...Had the Agency not made this alteration to the recommendations Chris Yoder's
temperature report in developing water quality standards, the water quality standards for the
three aquatic life use designations proposed for the CAWS and Lower Des Plaines river would
have been lower than the MWRDGC effluents and would have required installation
of cooling
towers or other treatment technology to reduce the temperature
of these effluents." (Pages 13
and 14).
In
essence, the Agency discounted Mr. Yoder's analysis, and set the non-summer
temperatures
so that the MWRDGC would not have to install cooling towers. Implicit in this
decision was that the cost
of such cooling towers could not be justified, which begs the question
what about the other existing uses (industrial users) on the Ship Canal, including the three coal
fired power plants? No attempt was made to look at the Ship Canal temperatures at the edge
of
the mixing zones from these industrial discharges.
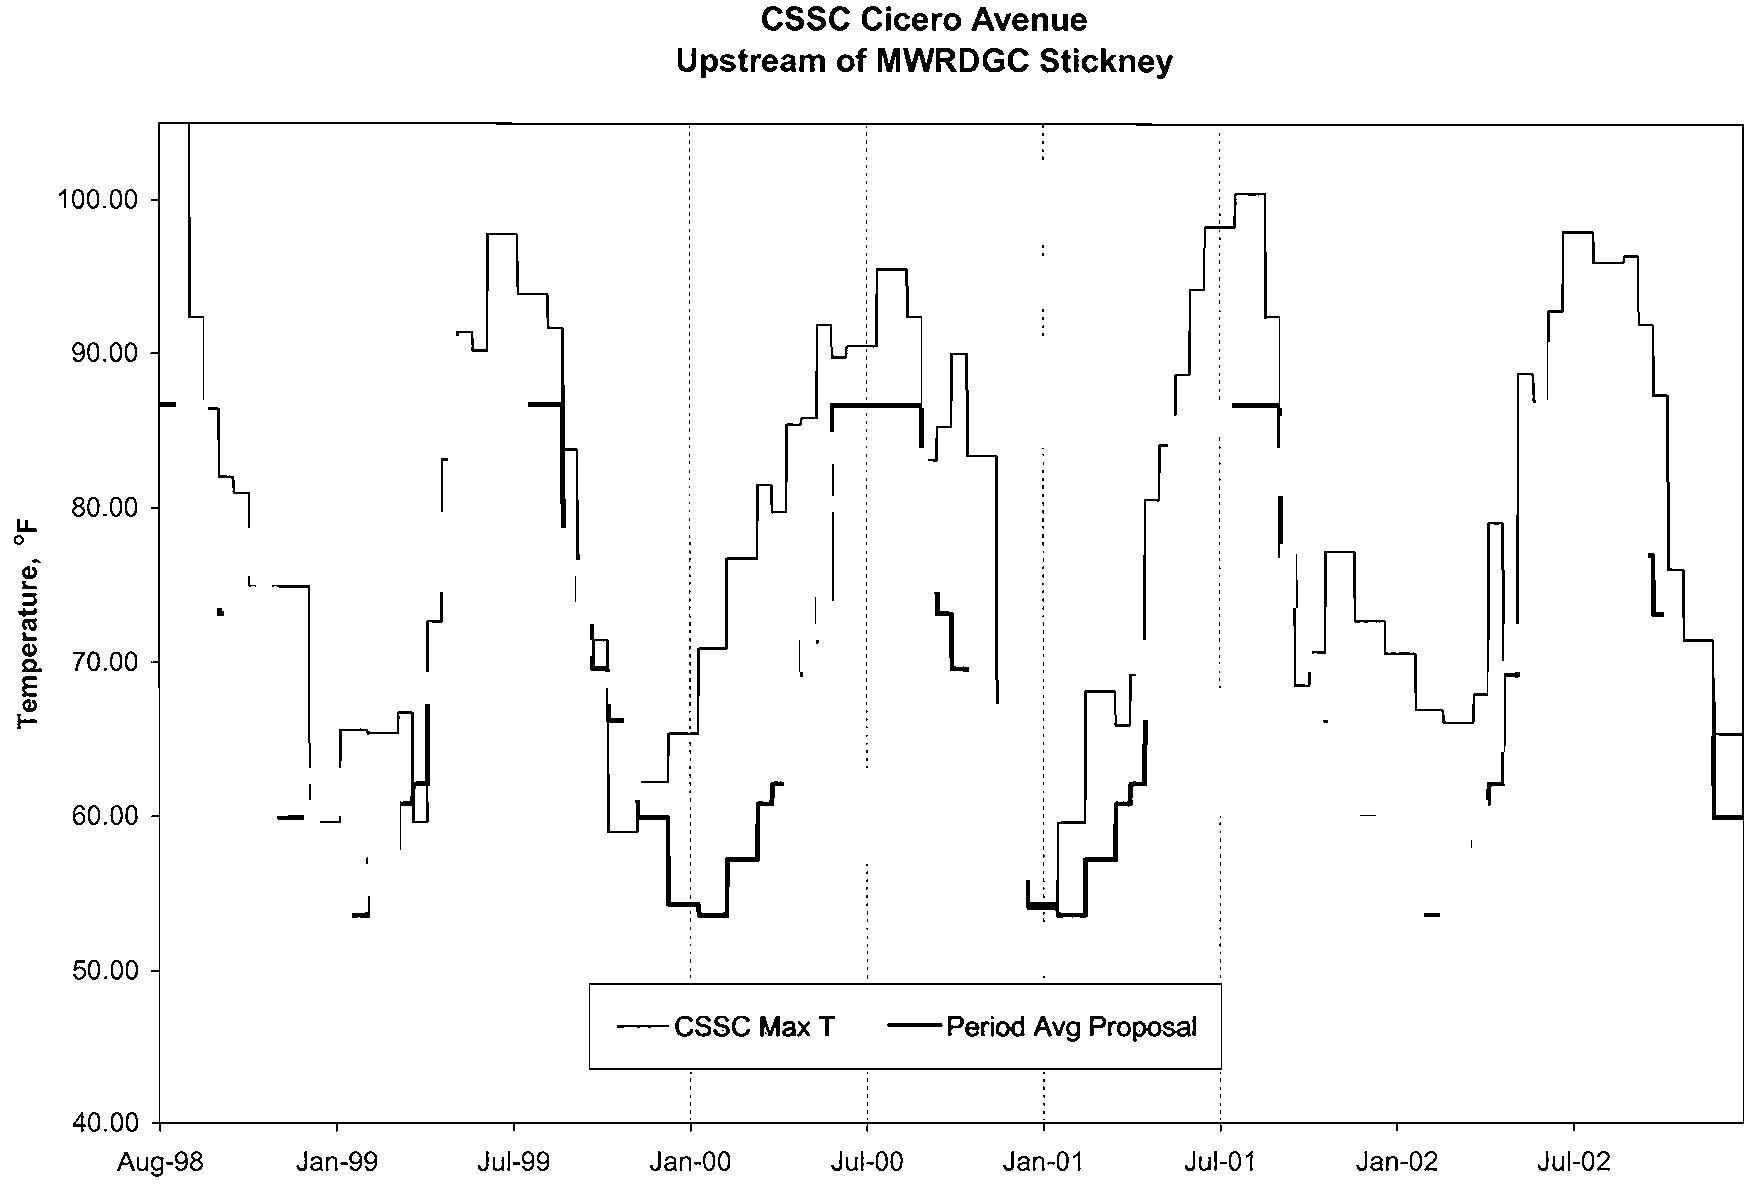
The highest temperatures on the Ship Canal are likely downstream
of the Crawford power plant,
after the contributions from both Fisk and Crawford stations. The MWRDGC has monitored
temperature at Cicero Avenue, approximately one mile downstream
of the Crawford Station
outfall. Comparing the proposed period average limits
for Use B to the period average results at
Cicero indicates extended periods when the Ship Canal at Cicero Avenue is above the Use B
proposed limits. Temperatures above 90 degrees for a period average were recorded in 2002.
Period maximum temperatures are also plotted in Attachment 6 for the Cicero Avenue data. Peak
temperatures approaching 100 degrees F were recorded in 2001, and in all summers peak
temperatures above the reported bluntnose minnow short-term survival temperature determined
by Yoder, 90.3 degrees F, have been recorded.
The Ship Canal has important functions, including commercial shipping, industrial cooling,
moving the treated effluent away from Lake Michigan, and flood control.
If we are worried
about "optimum" temperatures for fish on the Ship Canal, what about the "optimum" amount
of
13
12462512
Electronic Filing - Received, Clerk's Office, August 4, 2008
barge traffic for fish (undoubtedly zero)? Removal of the treated effluents and CSO points would
also move the Ship Canal toward more "optimal" conditions for fish. The economic burden
of
such ideas negates any serious consideration, yet the Agency's proposal summarily imposes
significant impacts on the industrial users
of the Ship Canal.
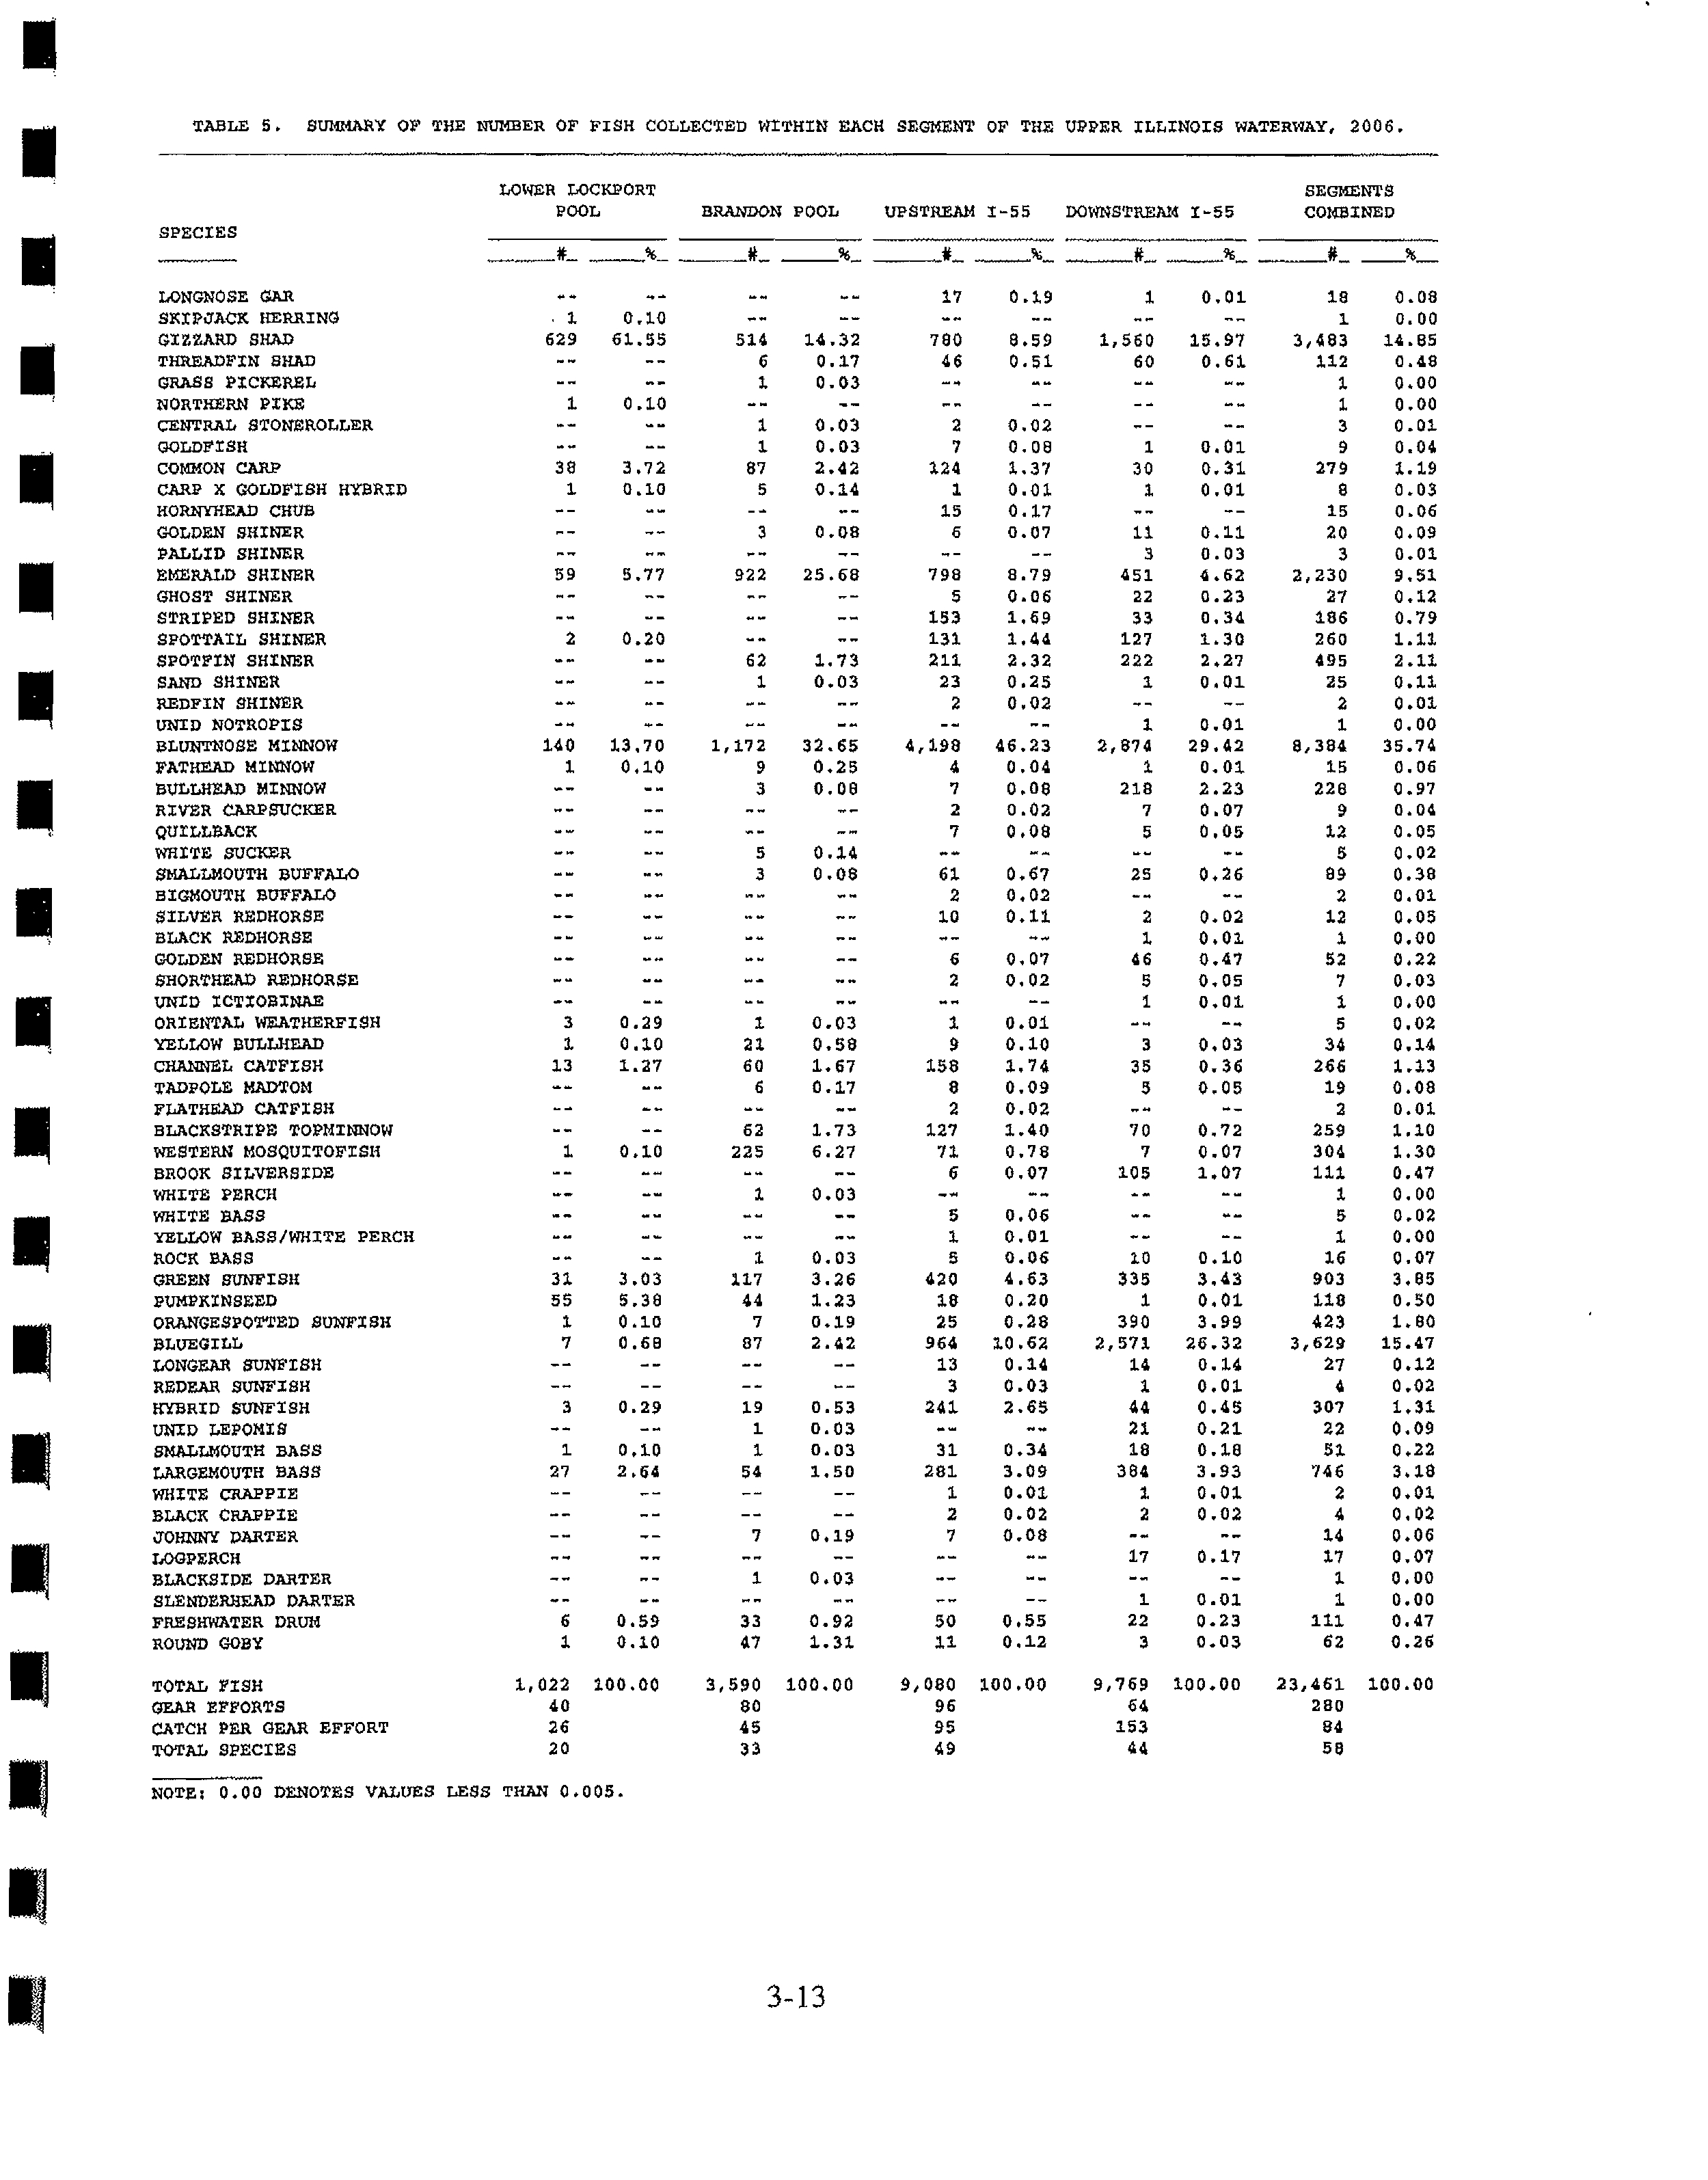
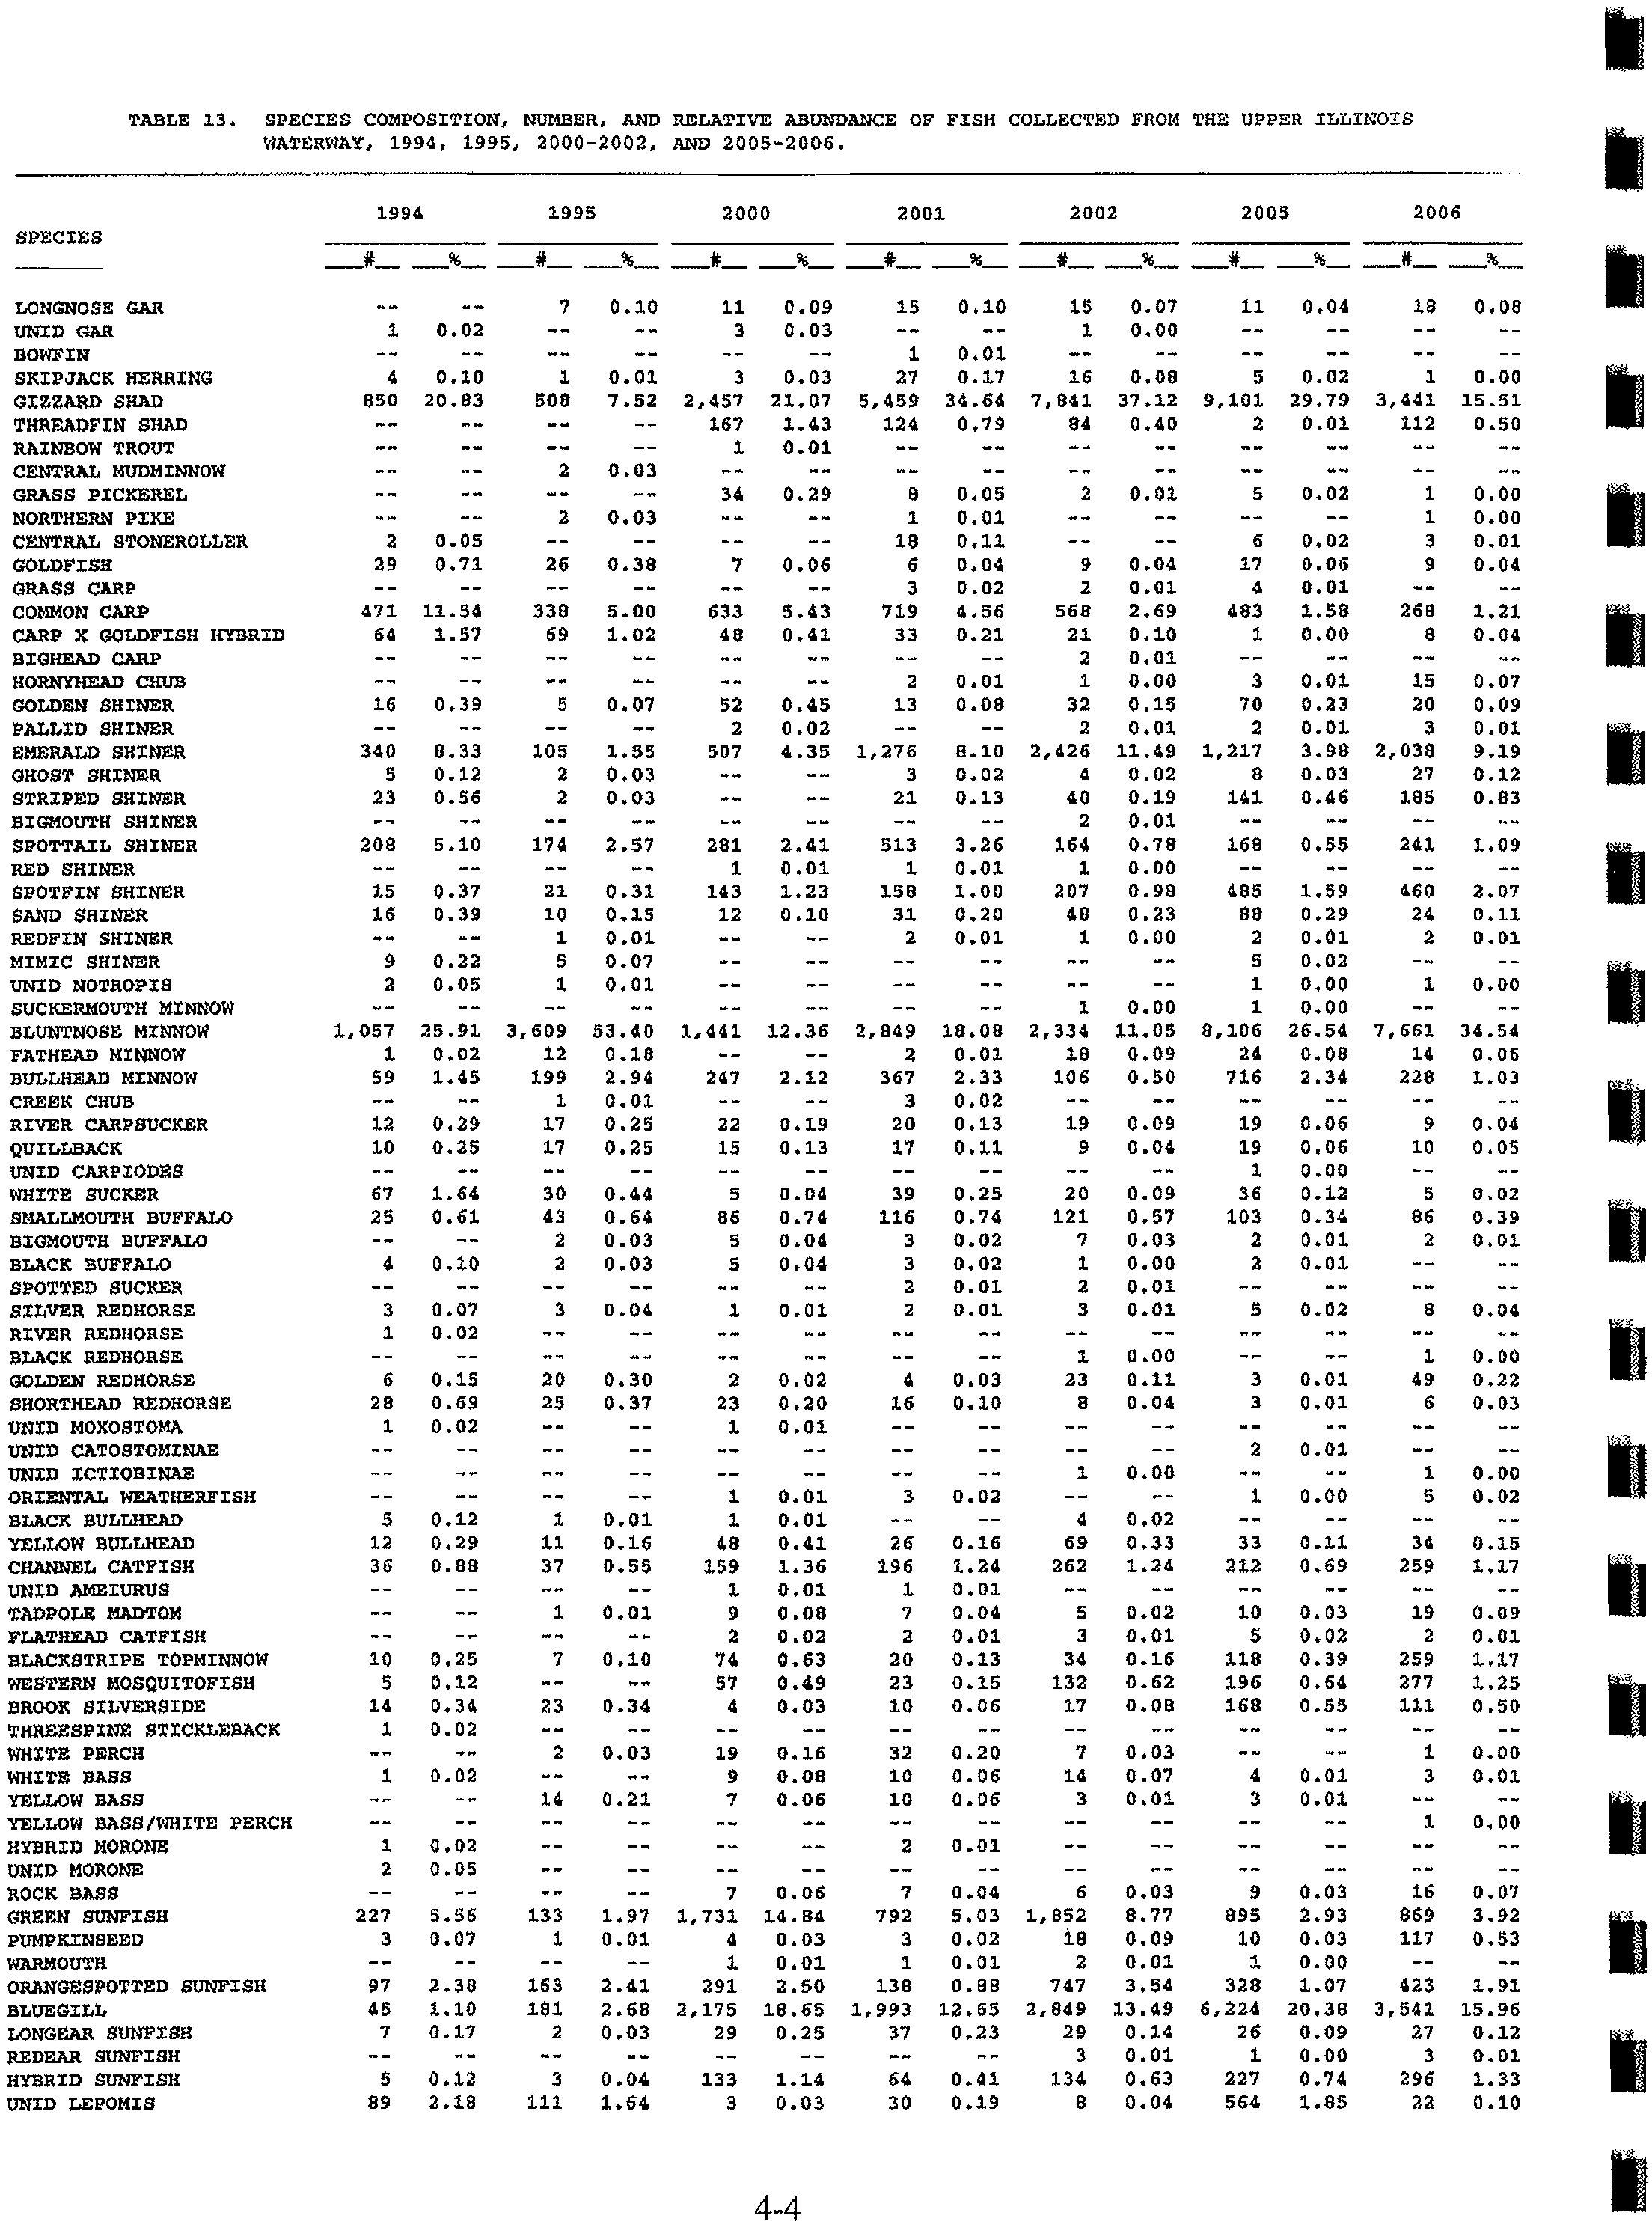
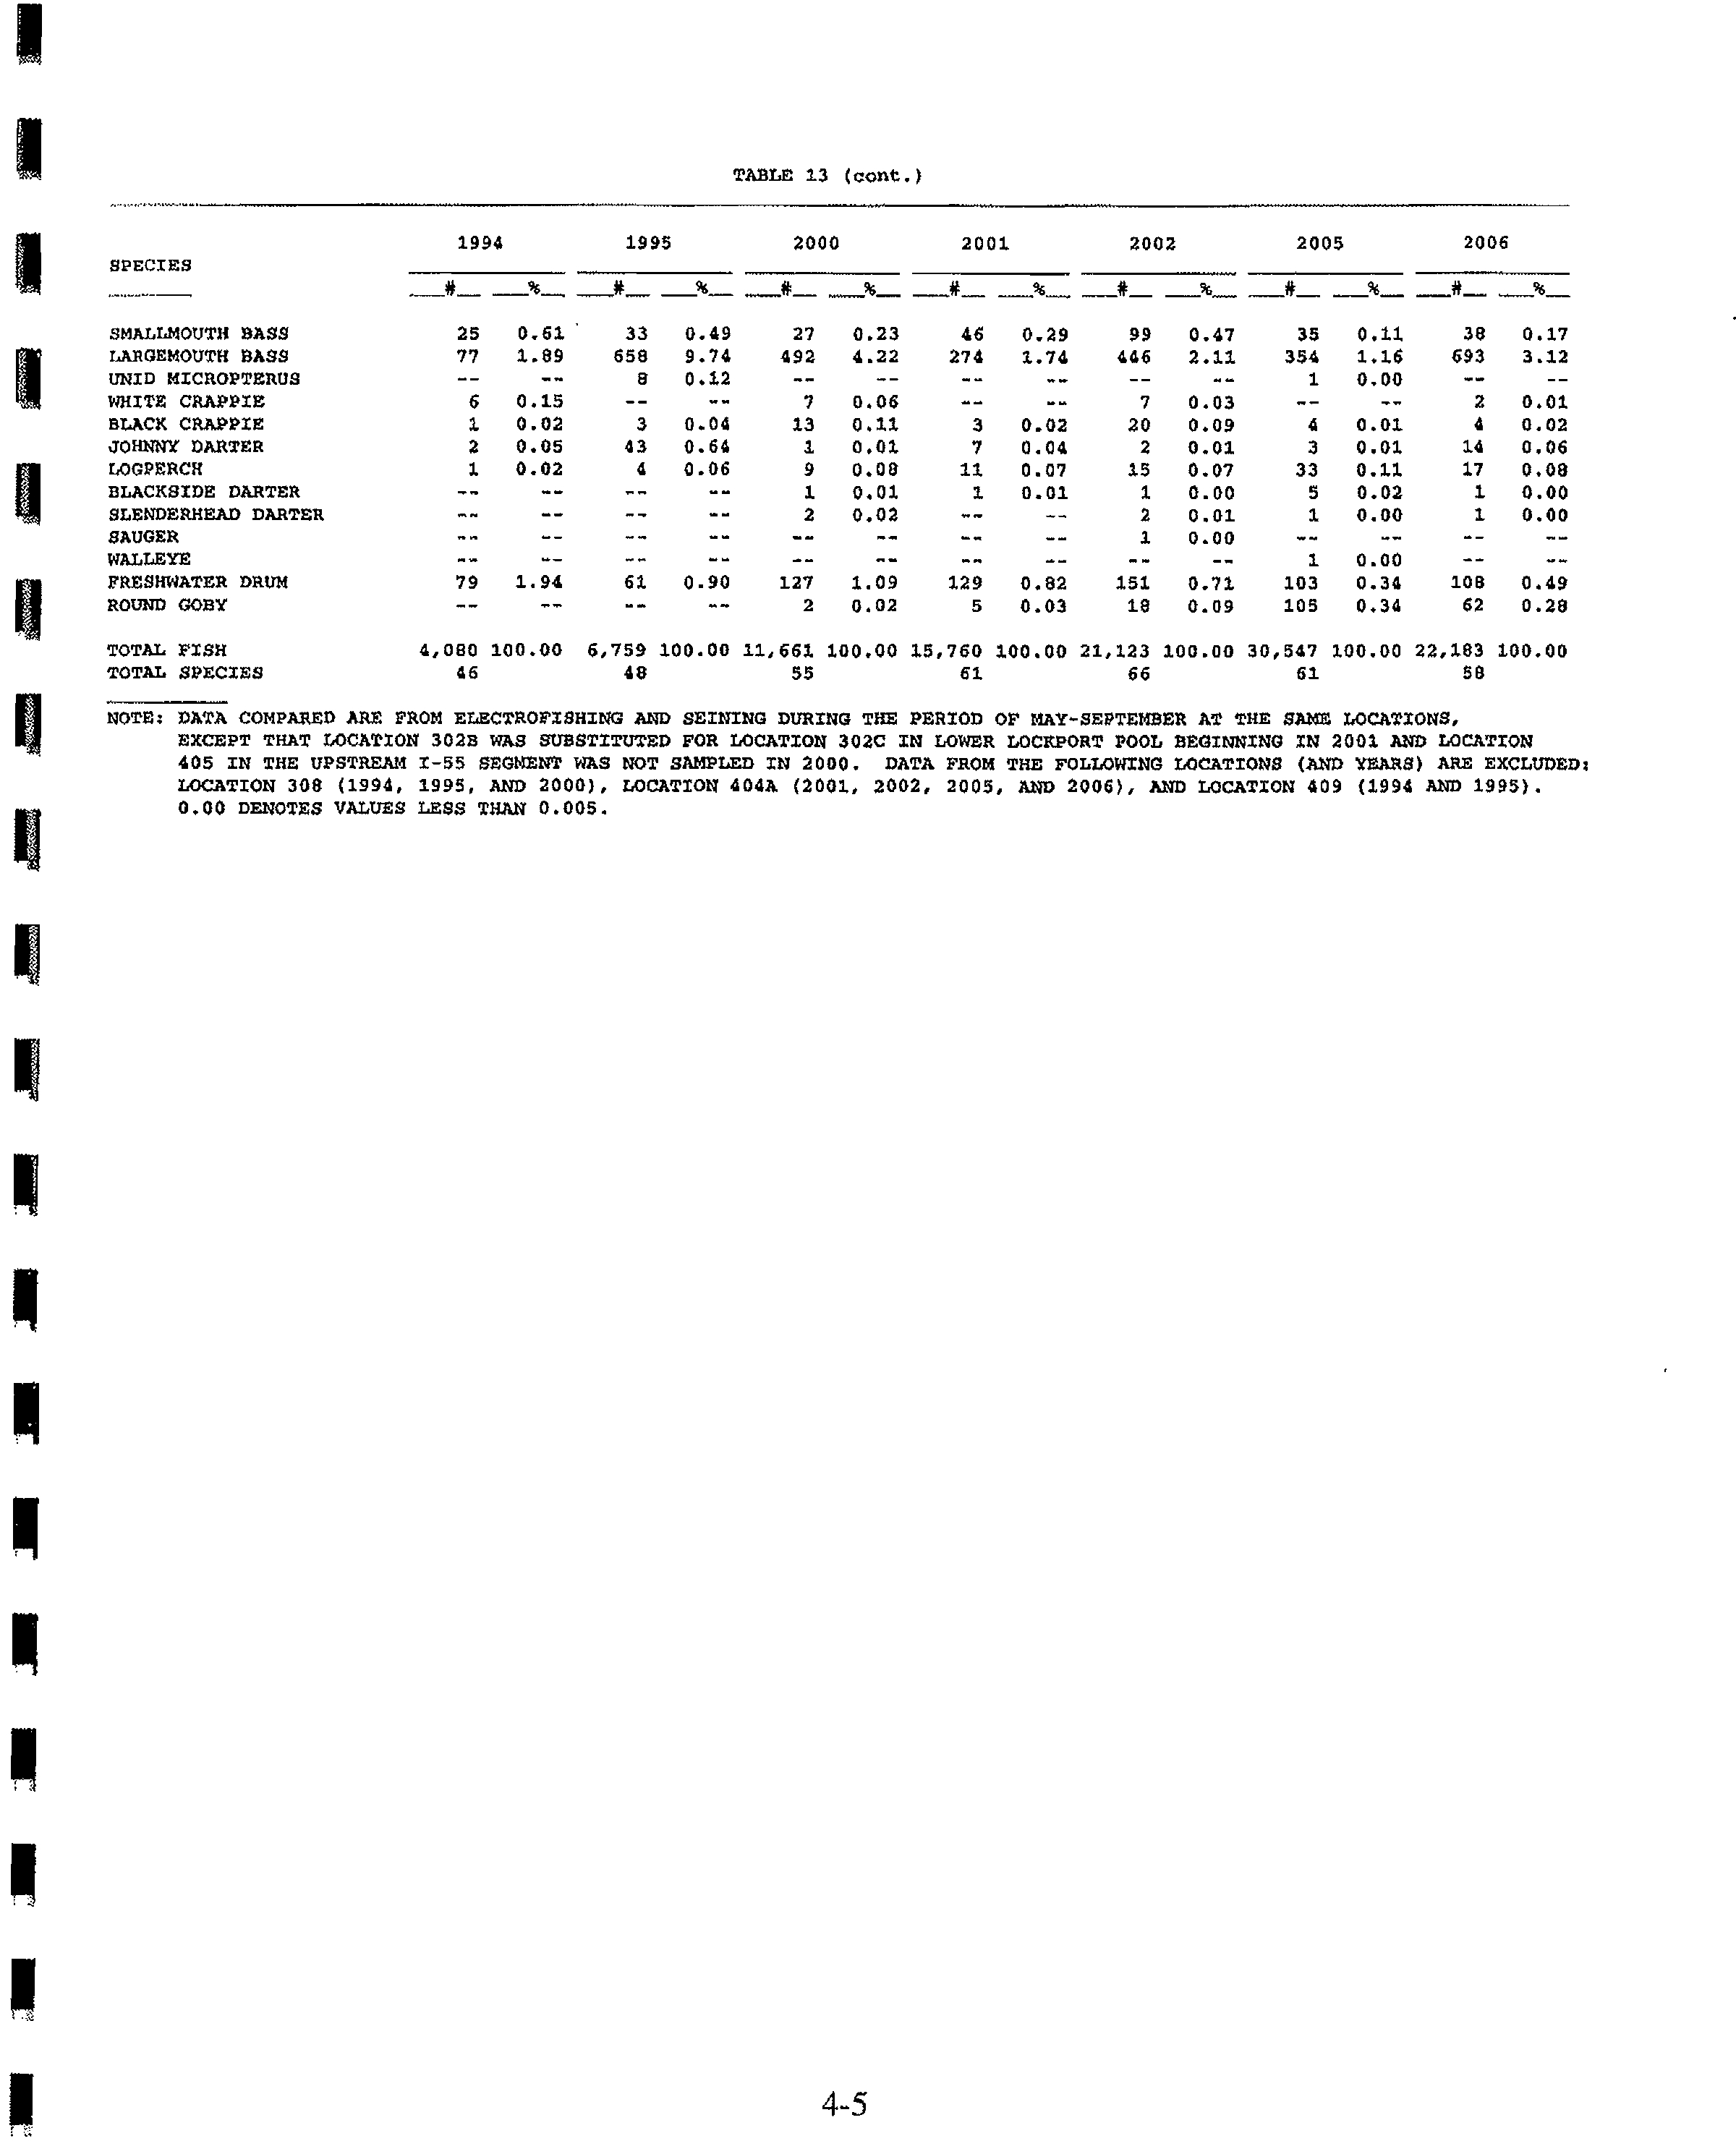
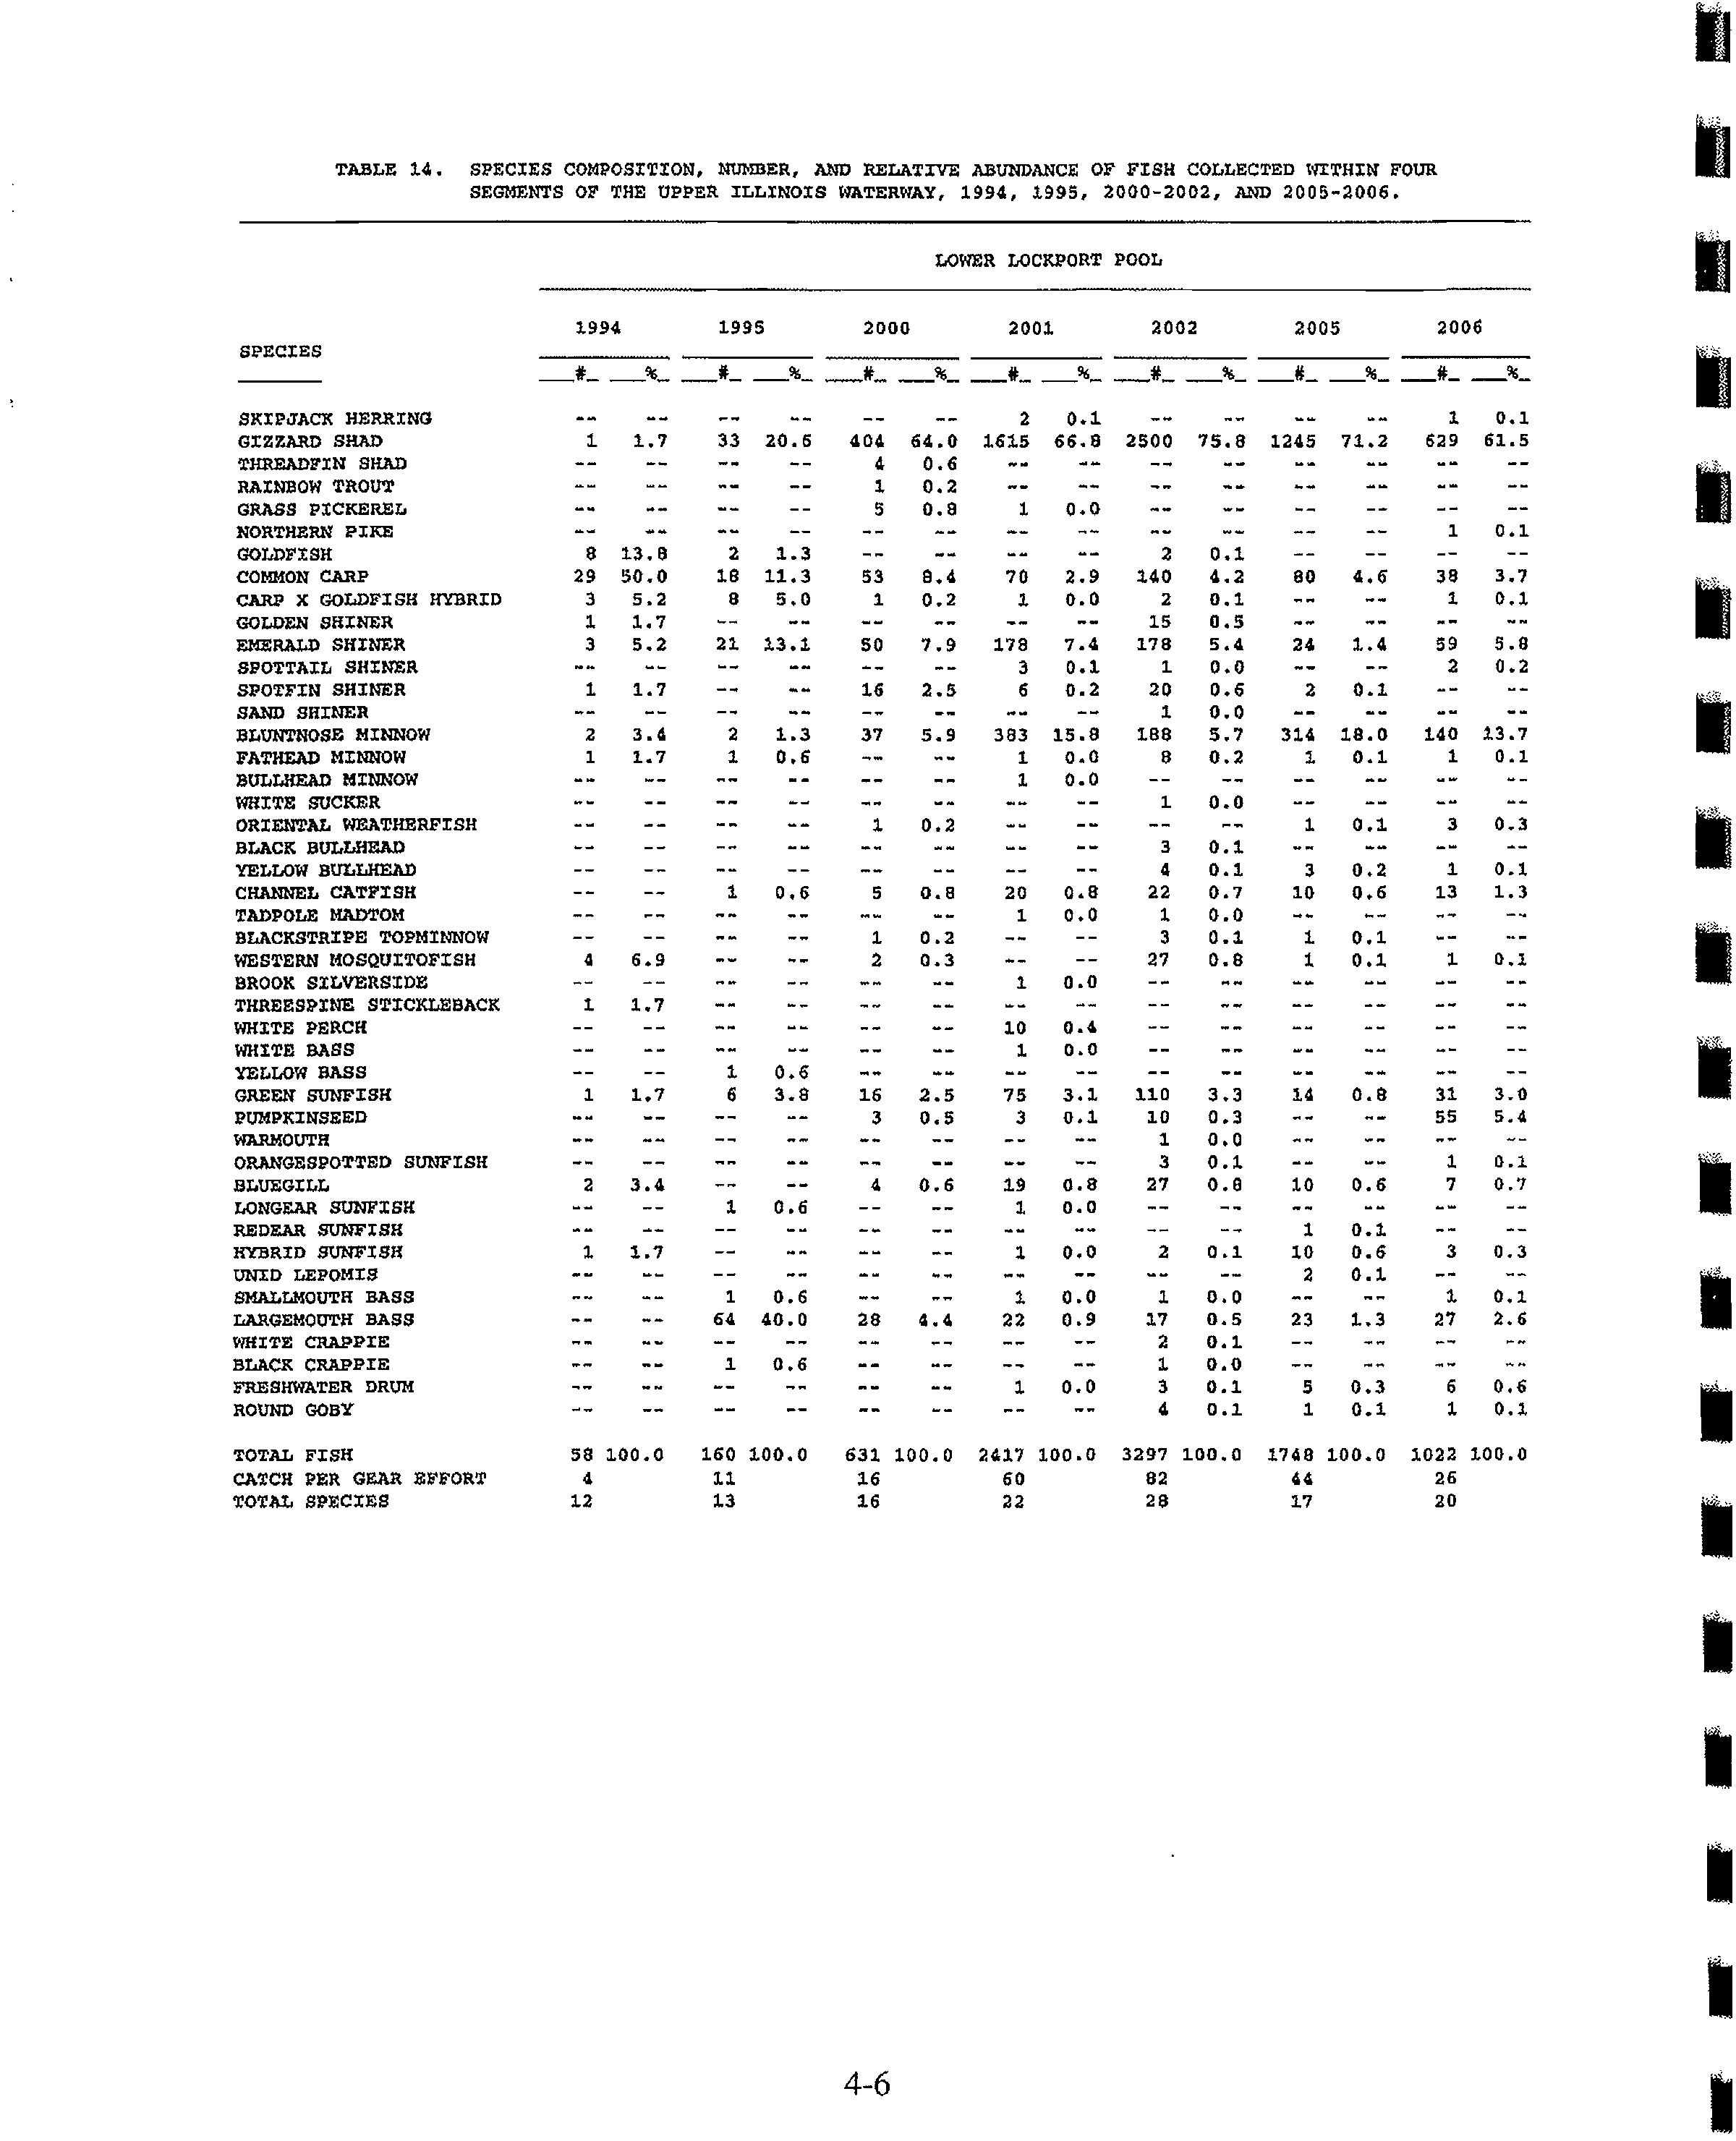
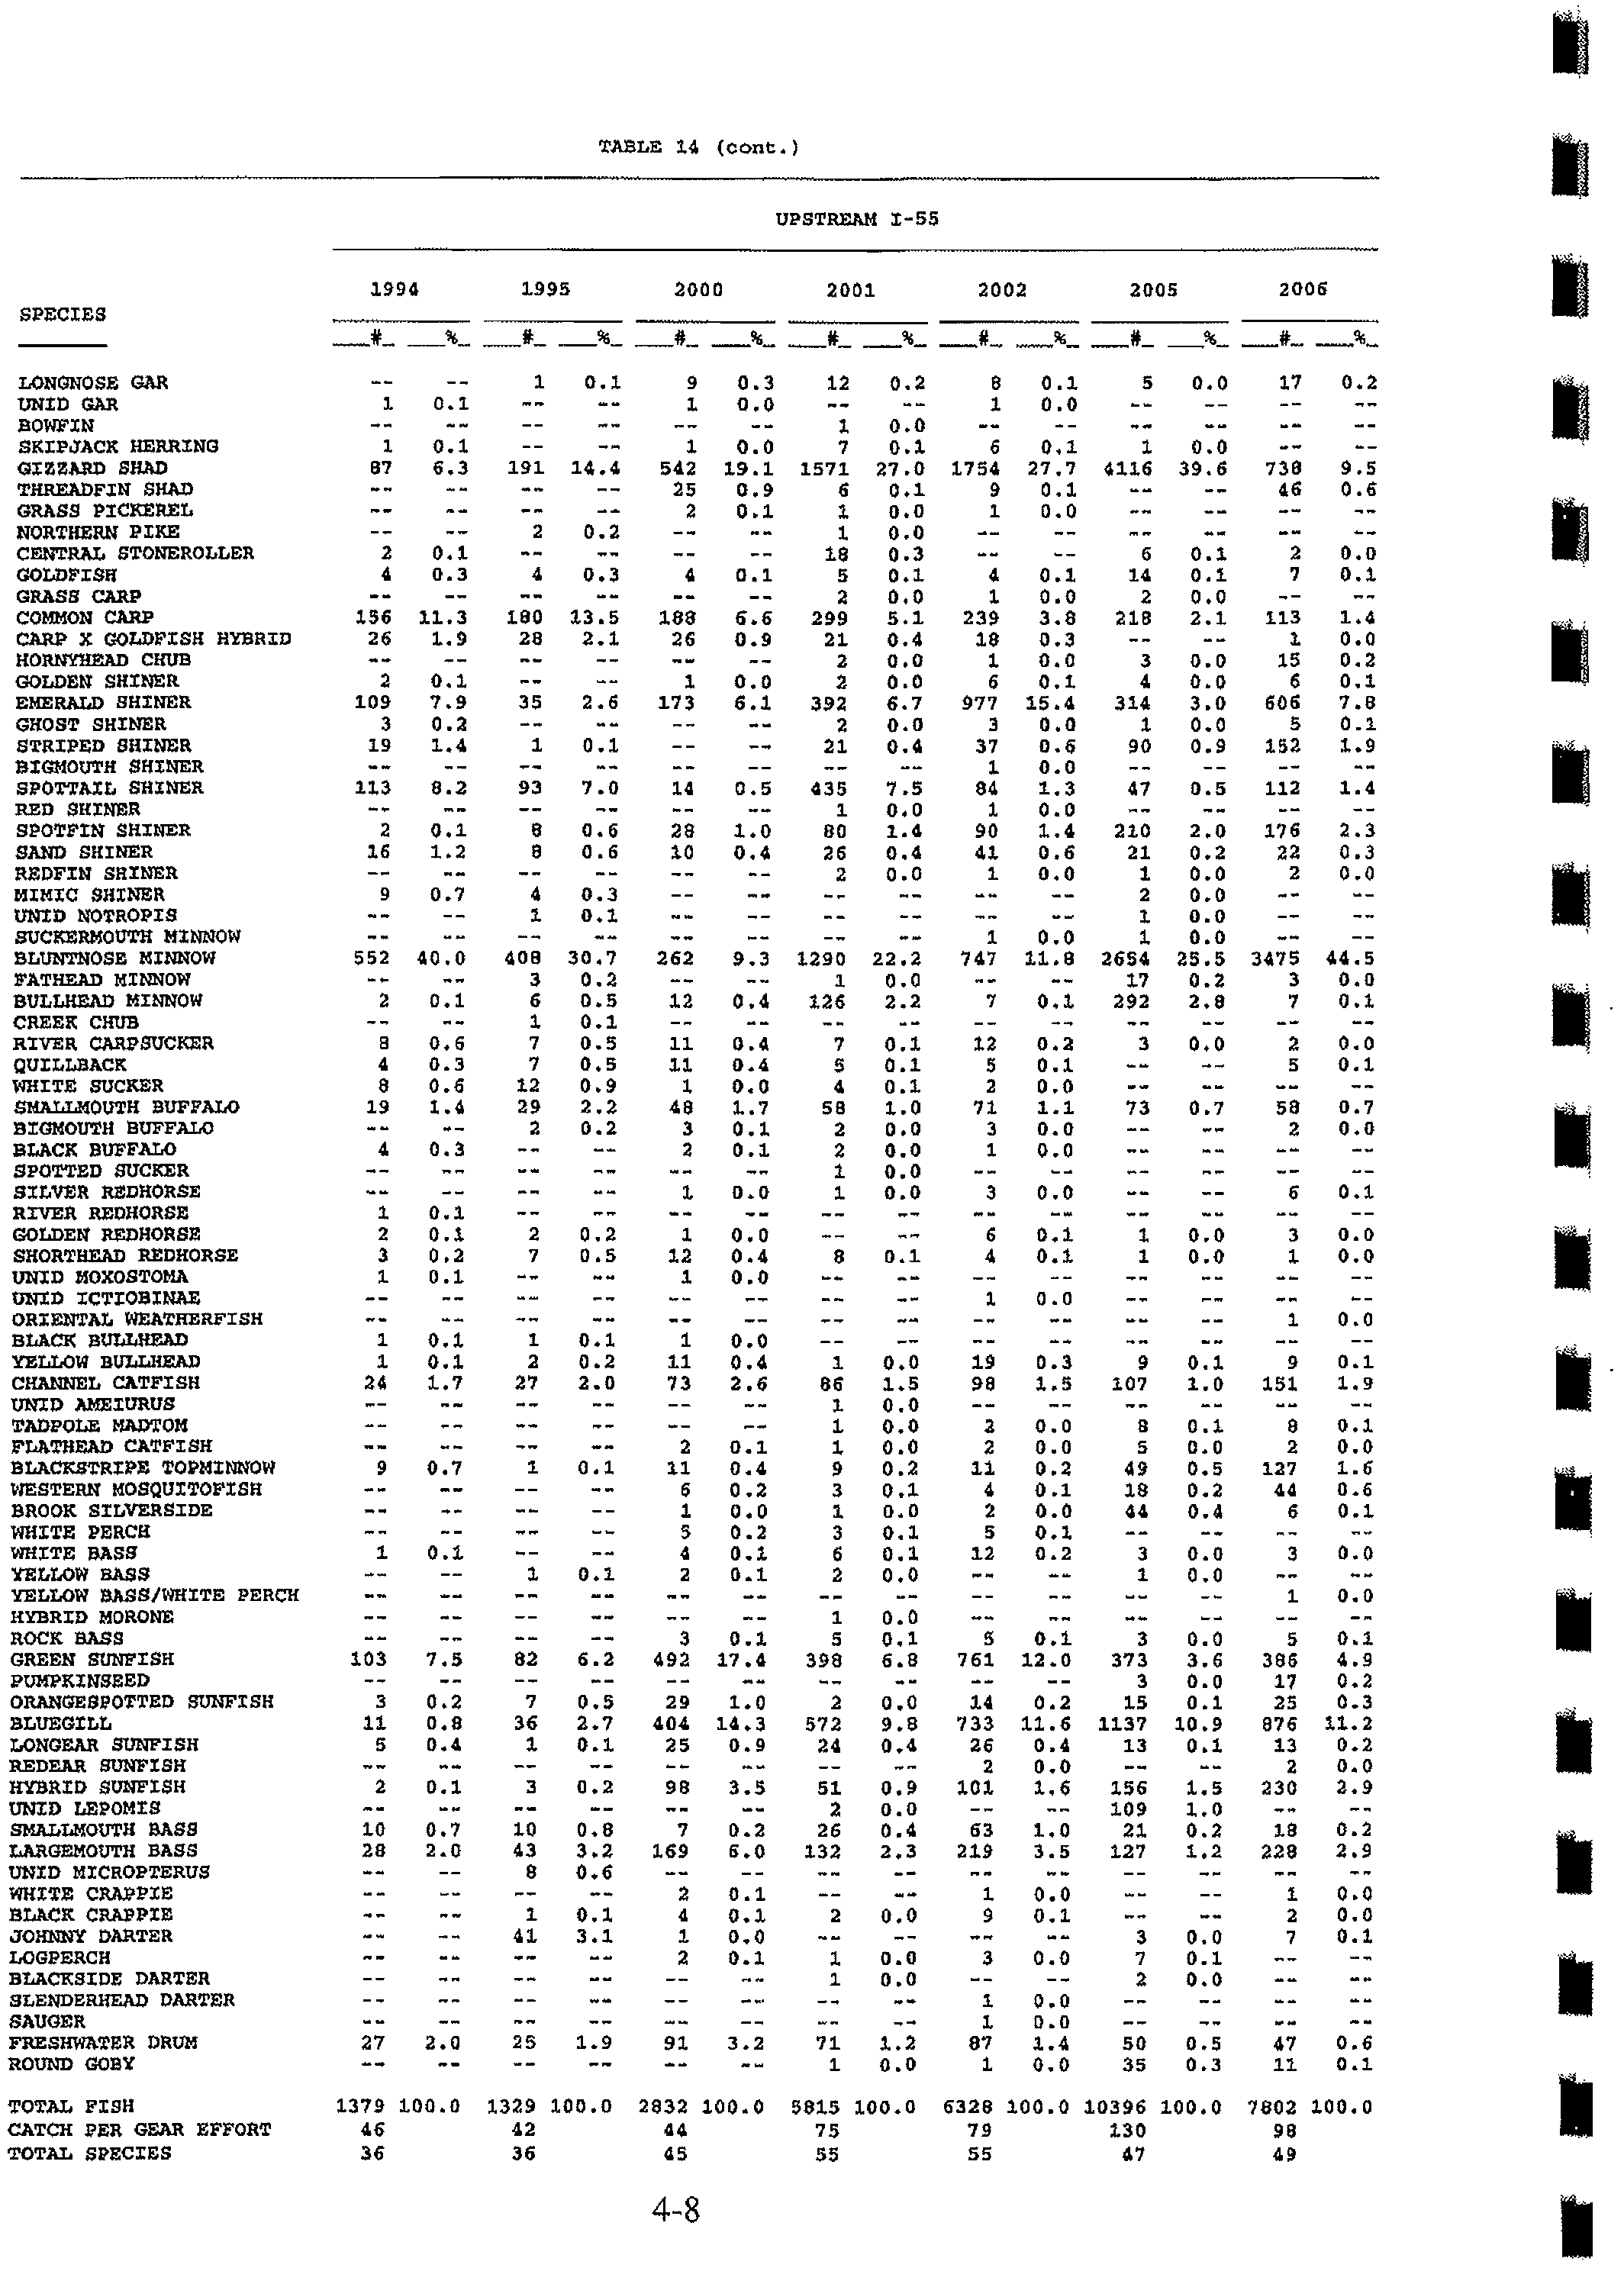
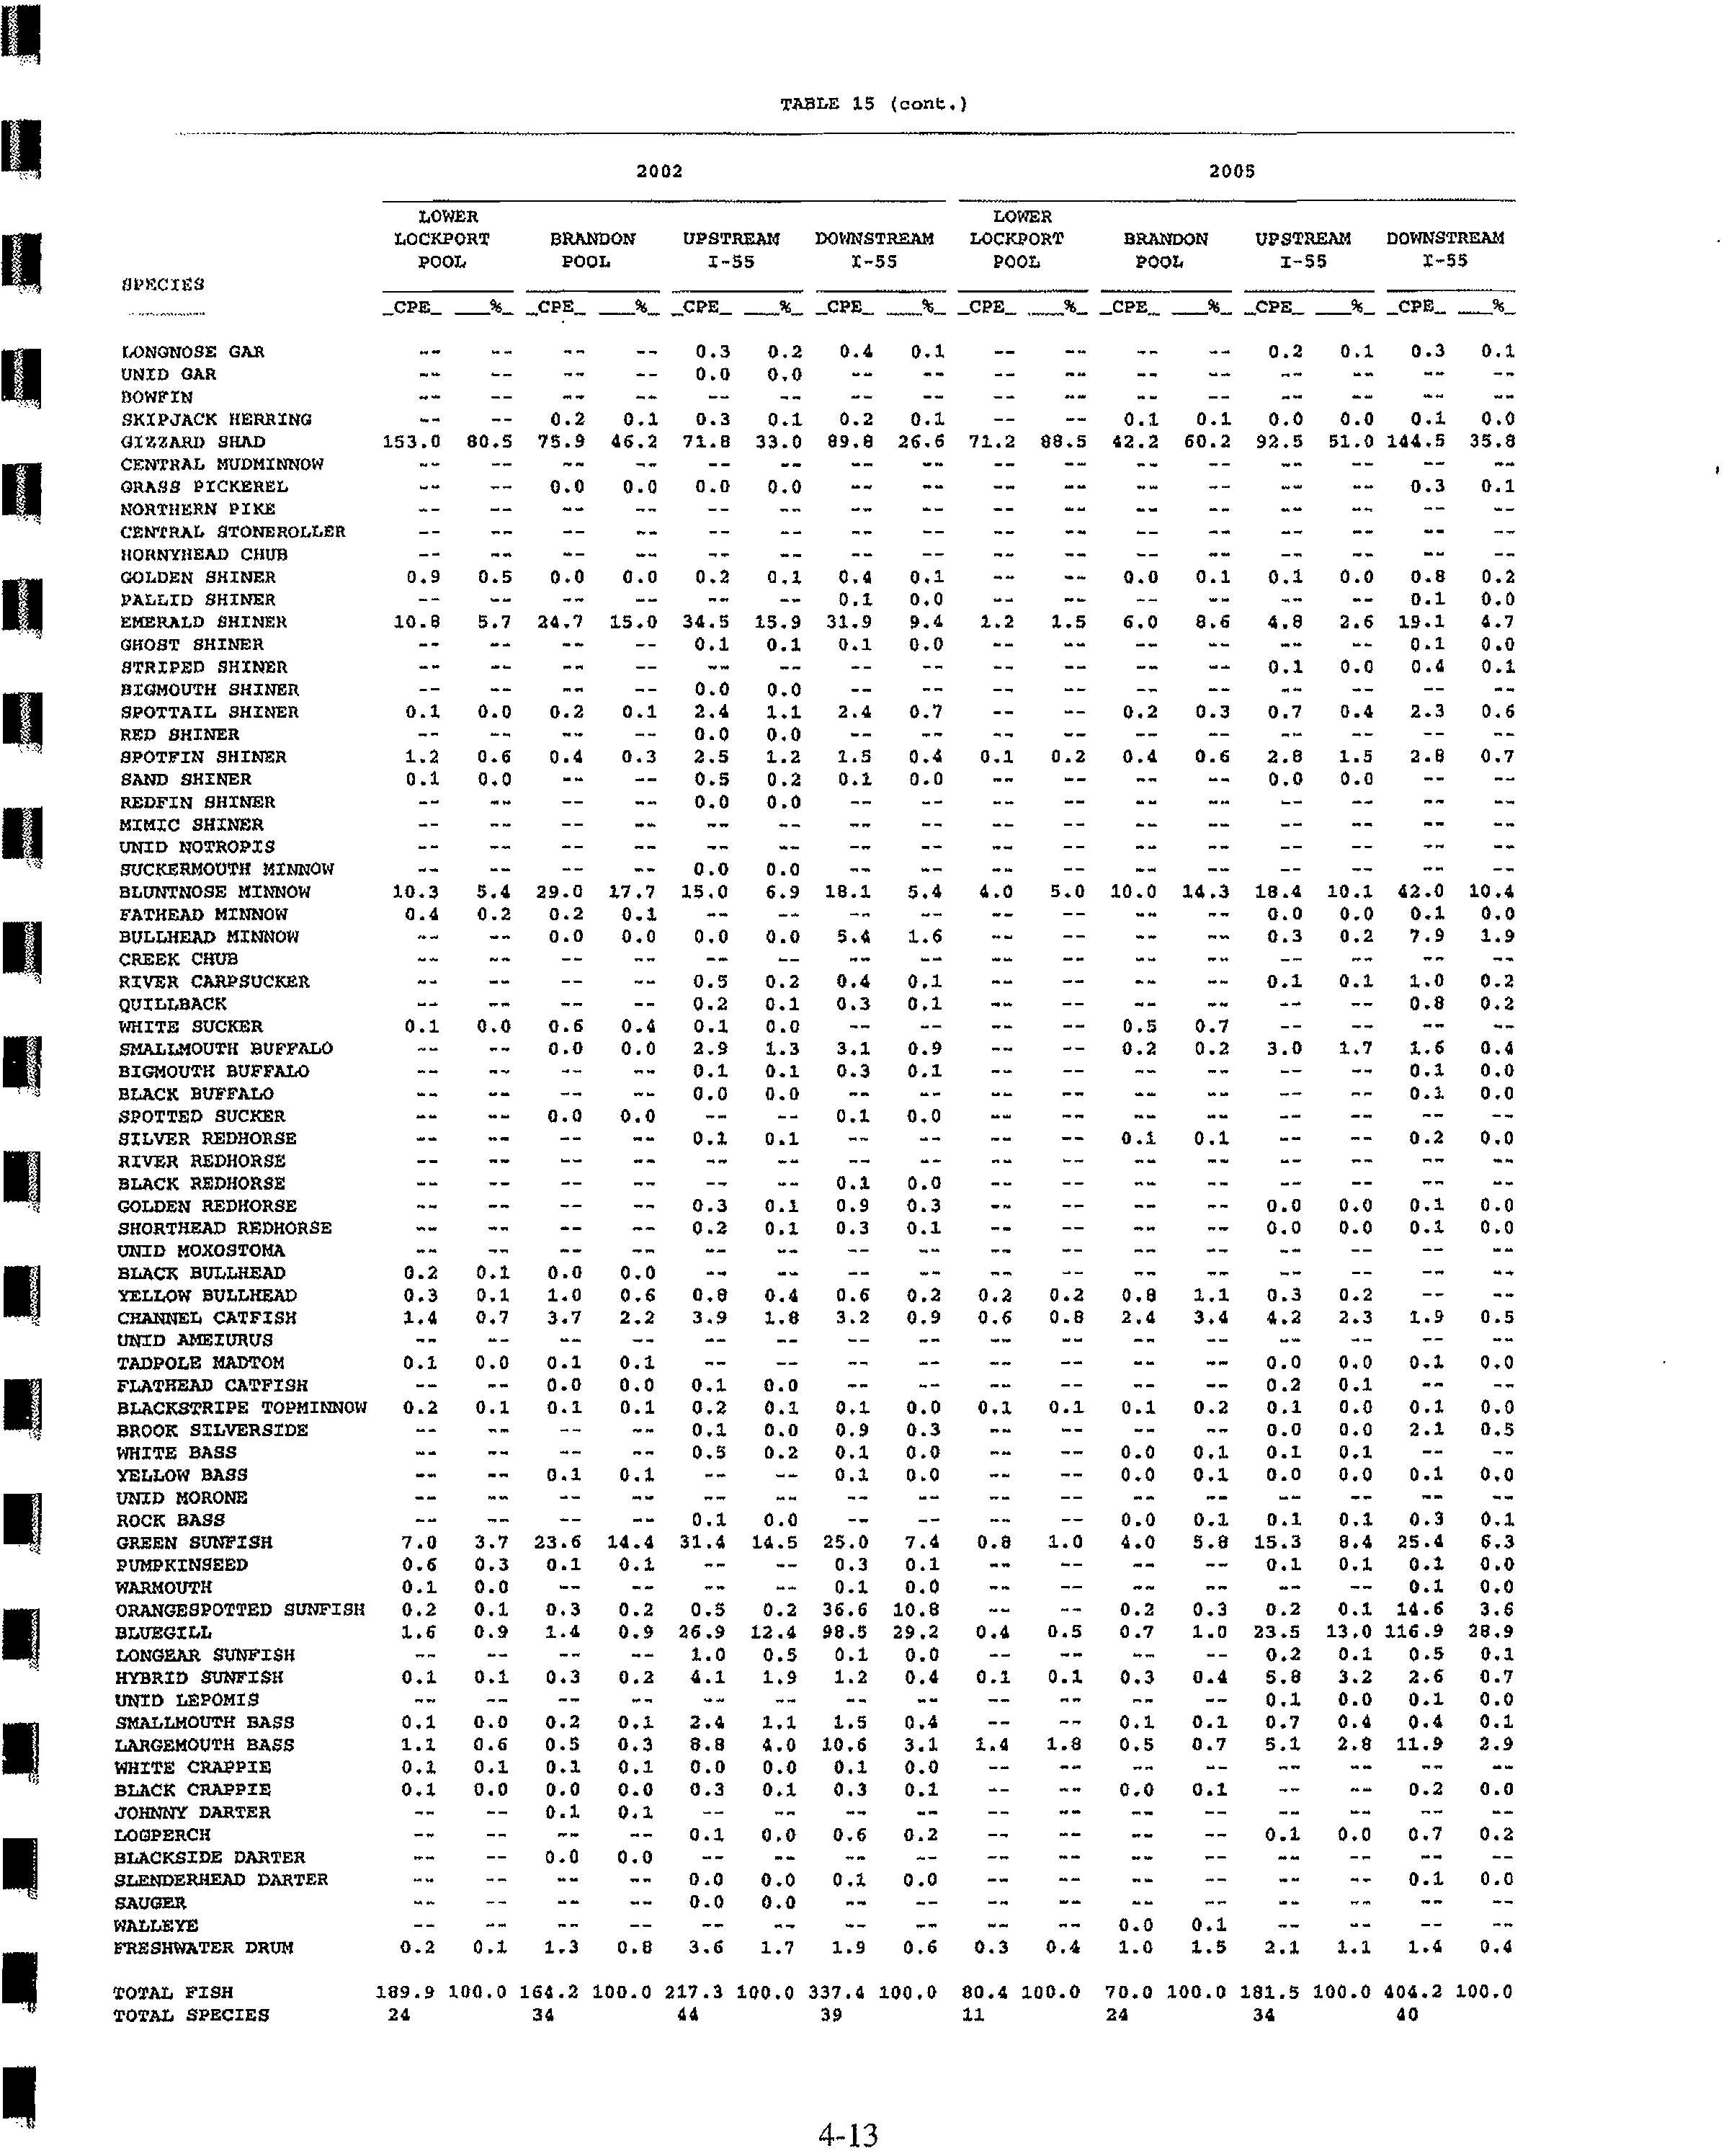
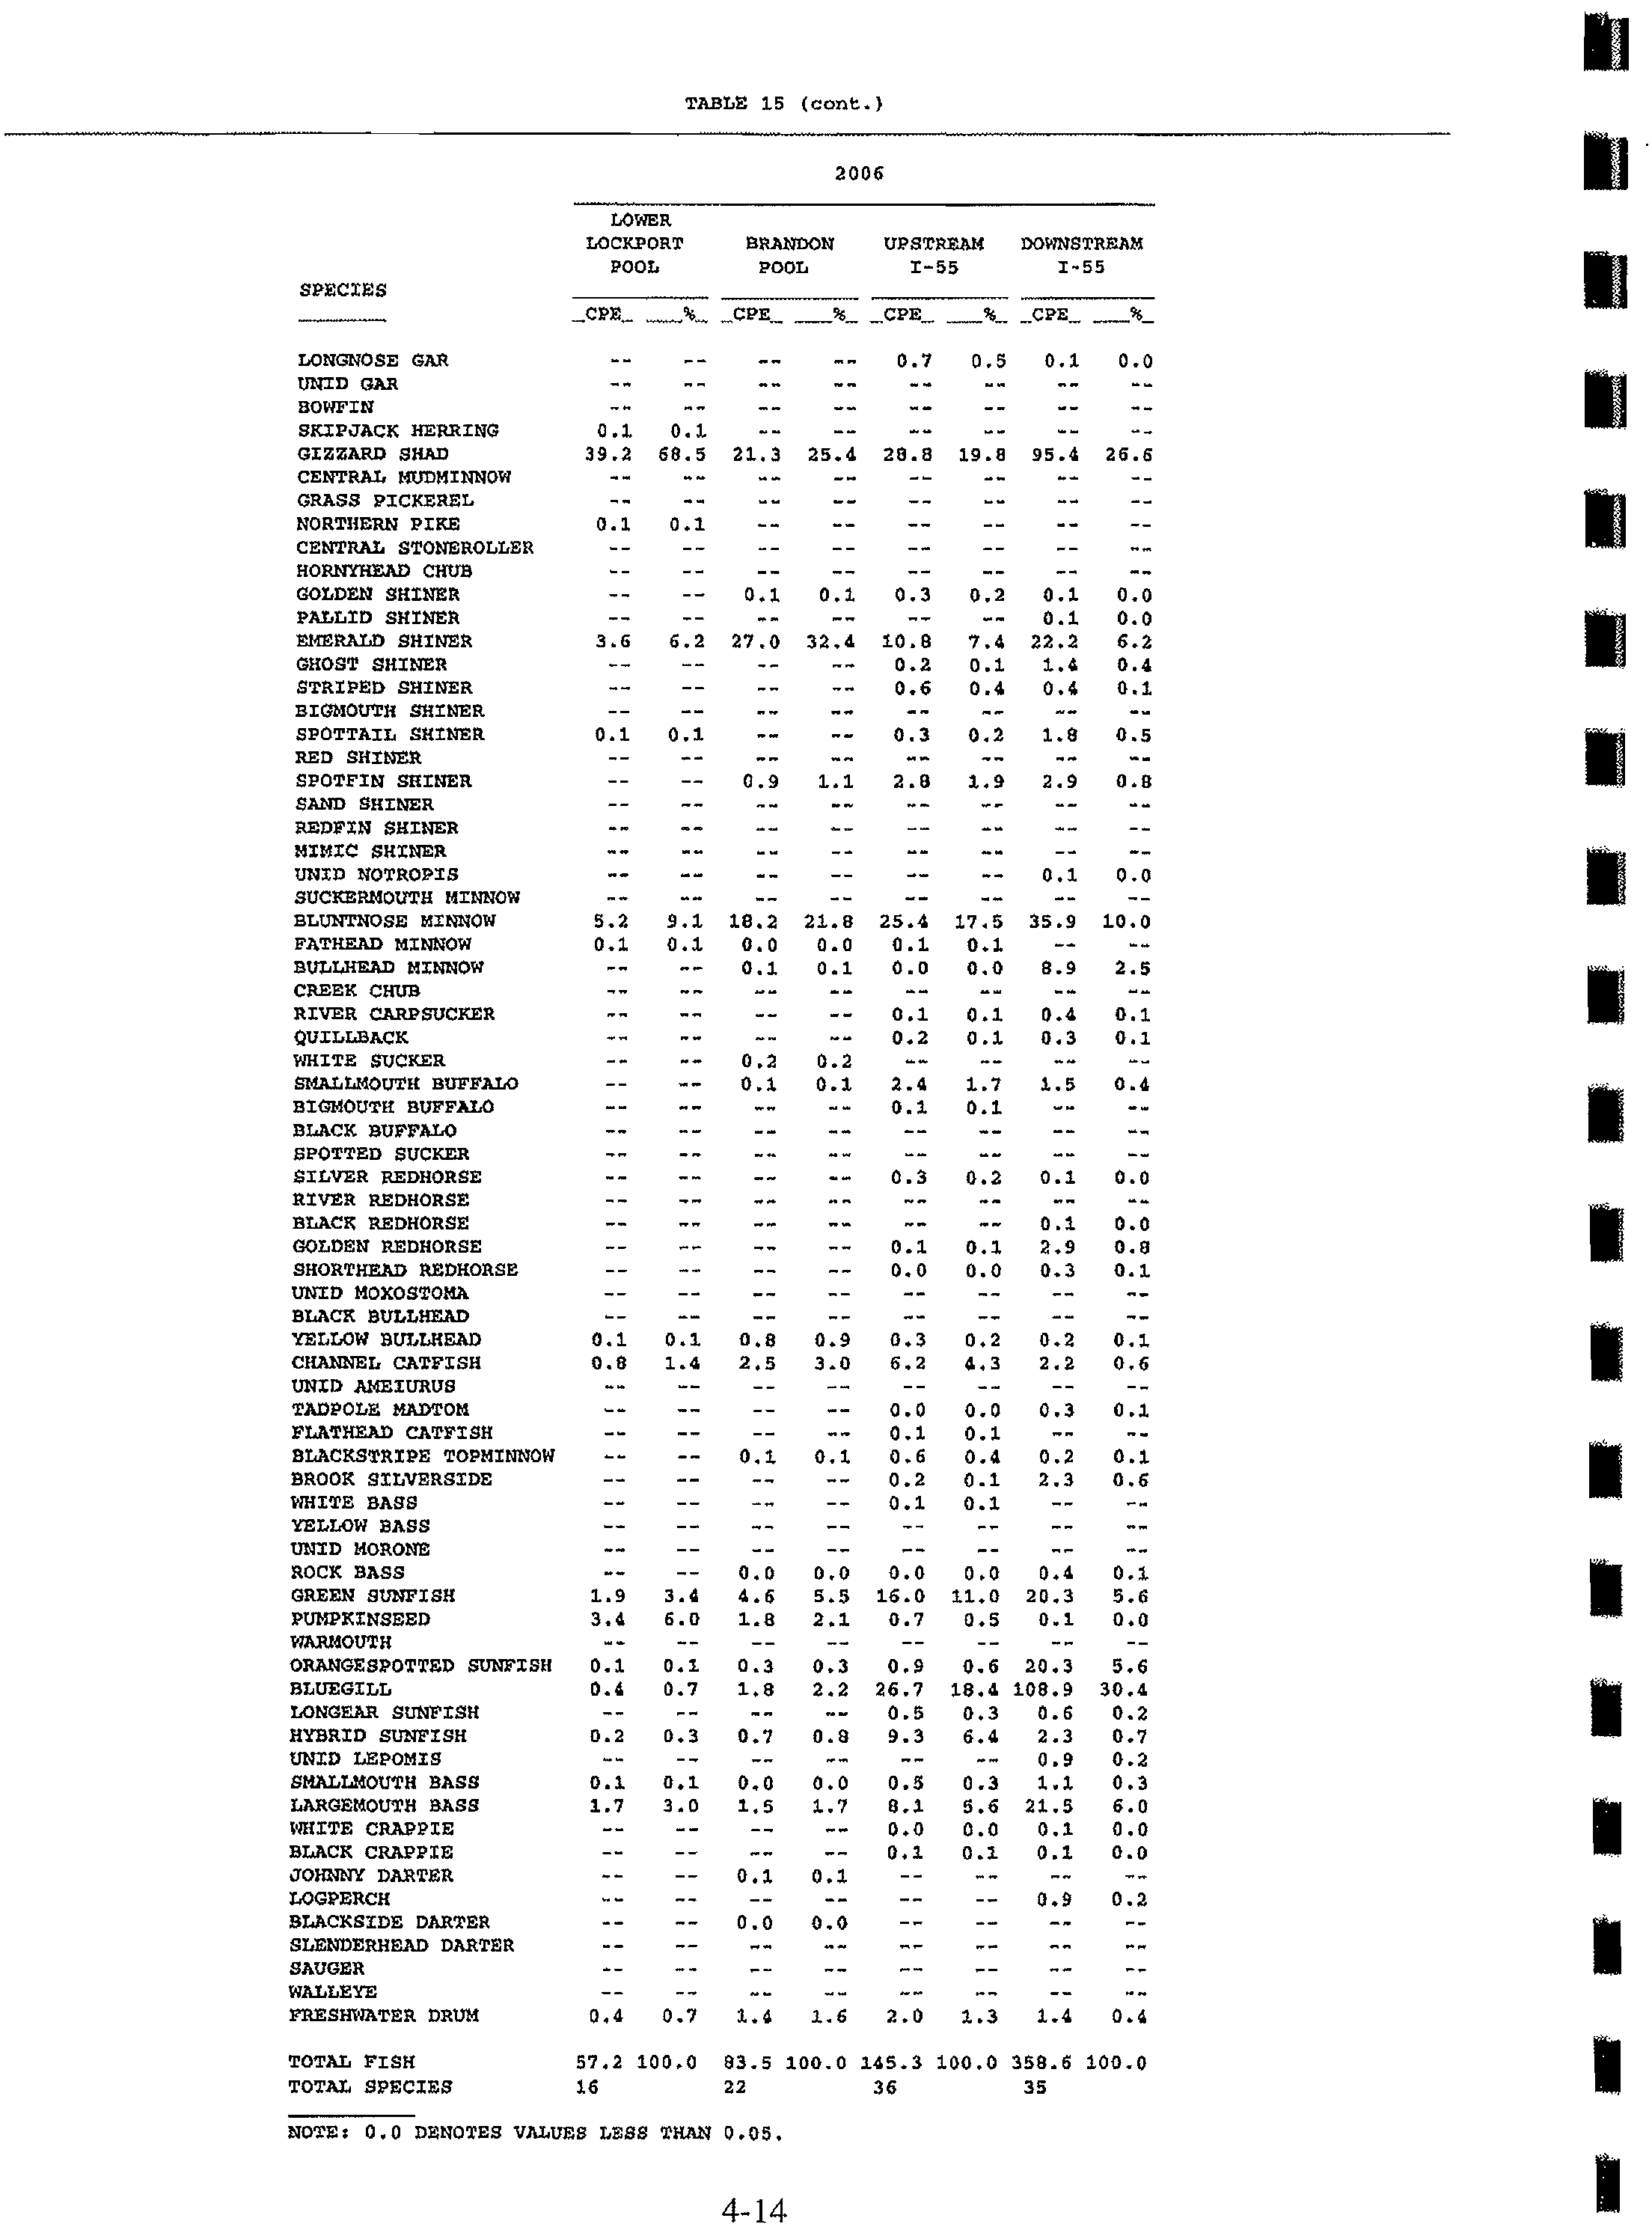
It
is instructive to review the fish community that resides in the Ship Canal currently. All eight
of the fish species listed above have been collected in the Lower Lockport Pool (the 34 miles of
the Ship Canal) over the years. Midwest Generation's fish collection data from 1994 to 2006 is
included in the Attachment
7. Interestingly, the thermally most sensitive of these species, the
bluntnose minnow, is the second most abundant species caught in the Ship Canal. Over the years
there appears to be a general increase in its population. Prior to 2000, the bluntnose minnow
represented less than 6 percent
of the total catch, while since 2001; it has represented over 13
percent of the catch. During this same period, the number of fish collected per gear effort and
number
of species collected have both also increased dramatically. There is no indication that
the bluntnose minnow or any other
of the species is being negatively affected by the current
temperature regime in the Ship Canal.
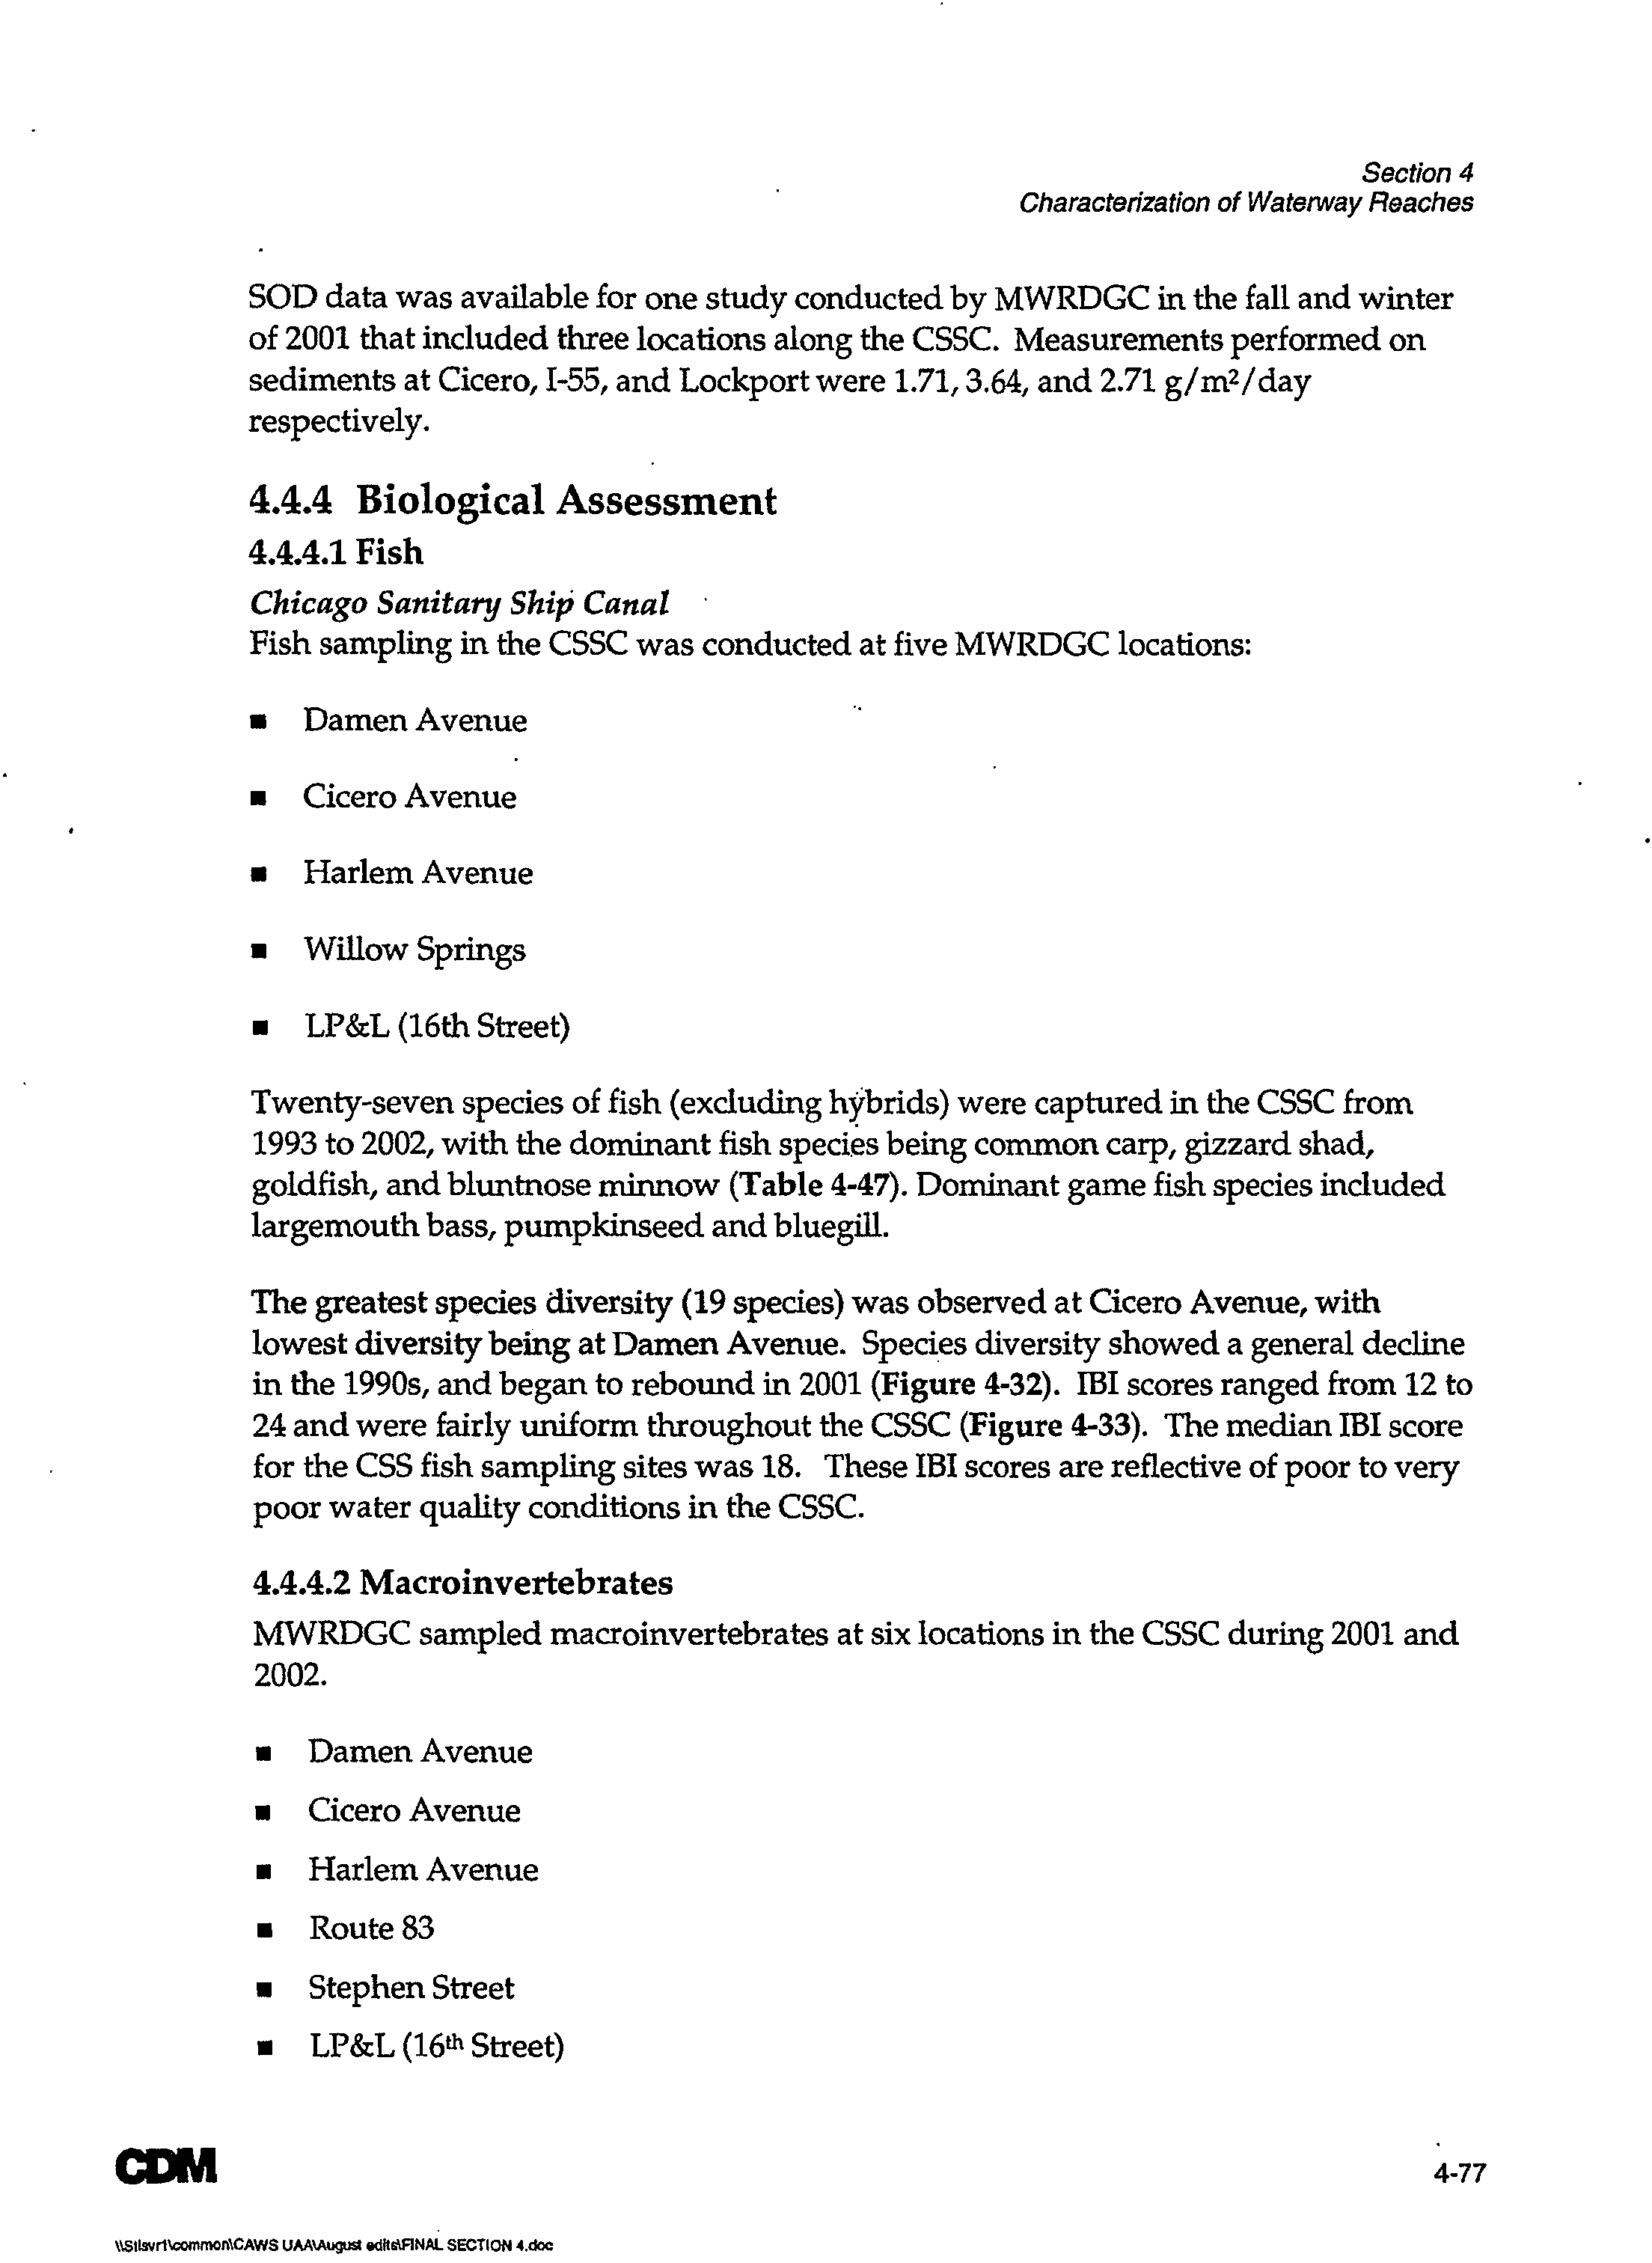
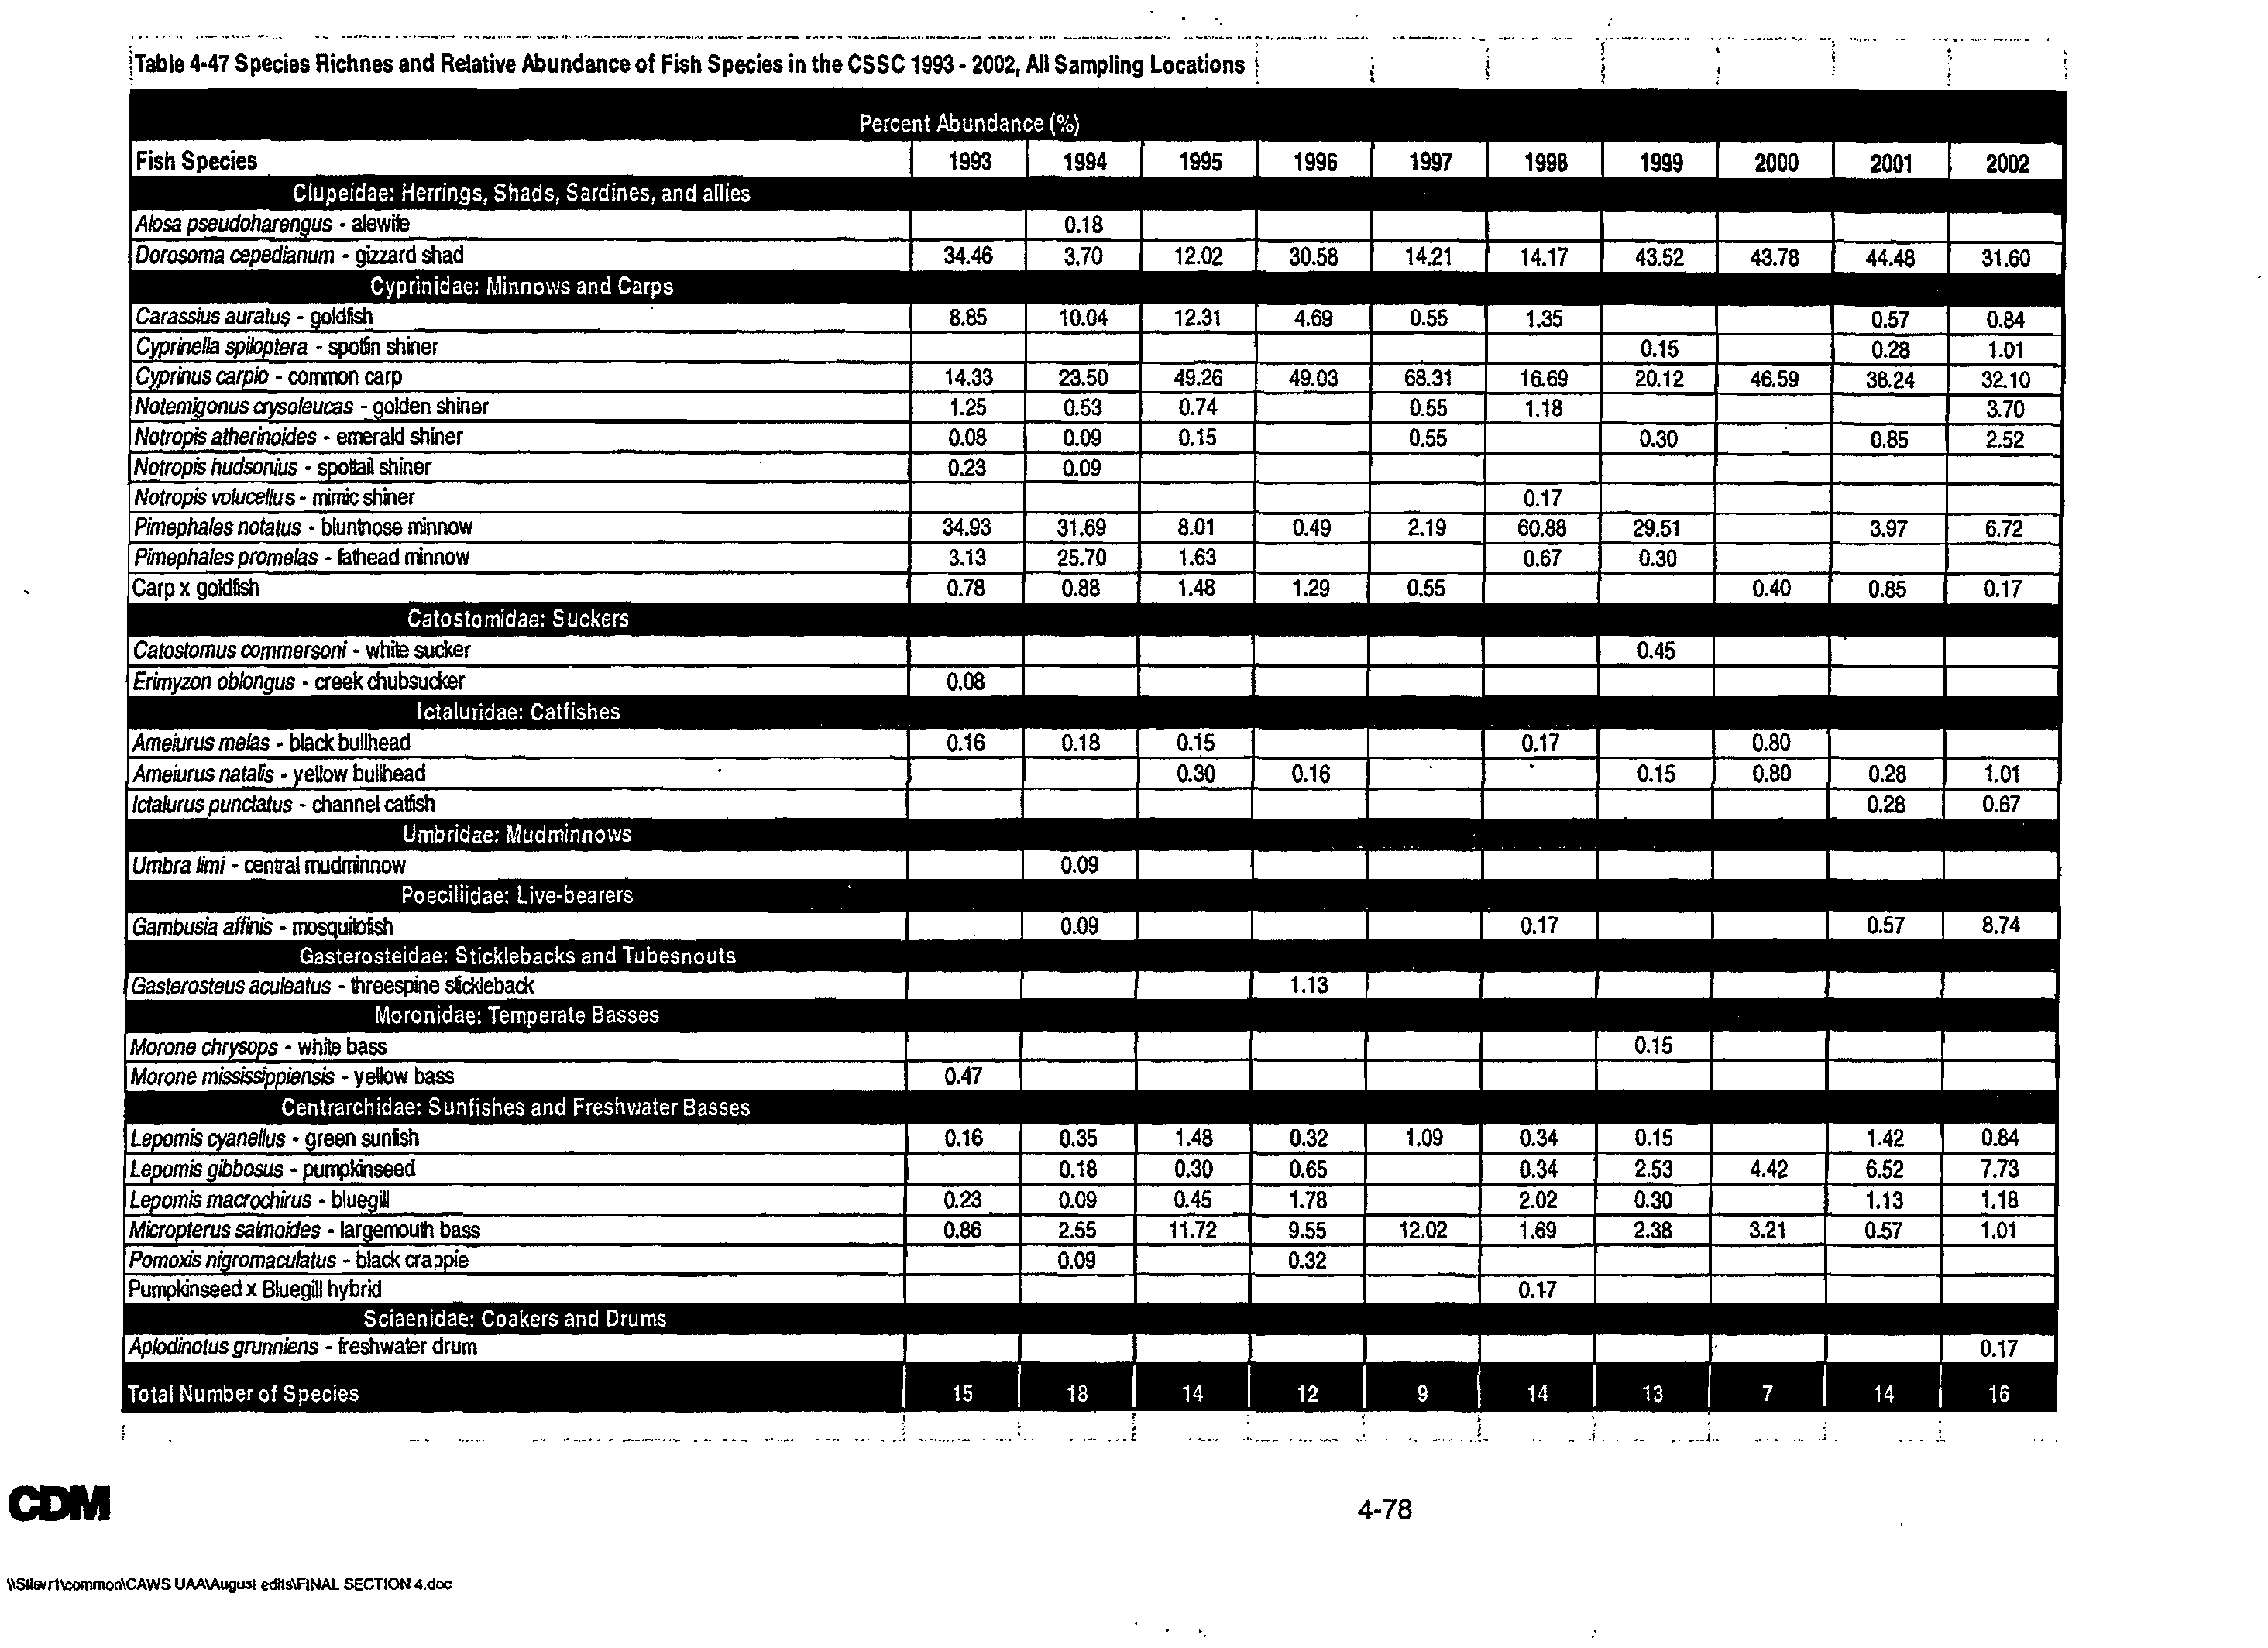
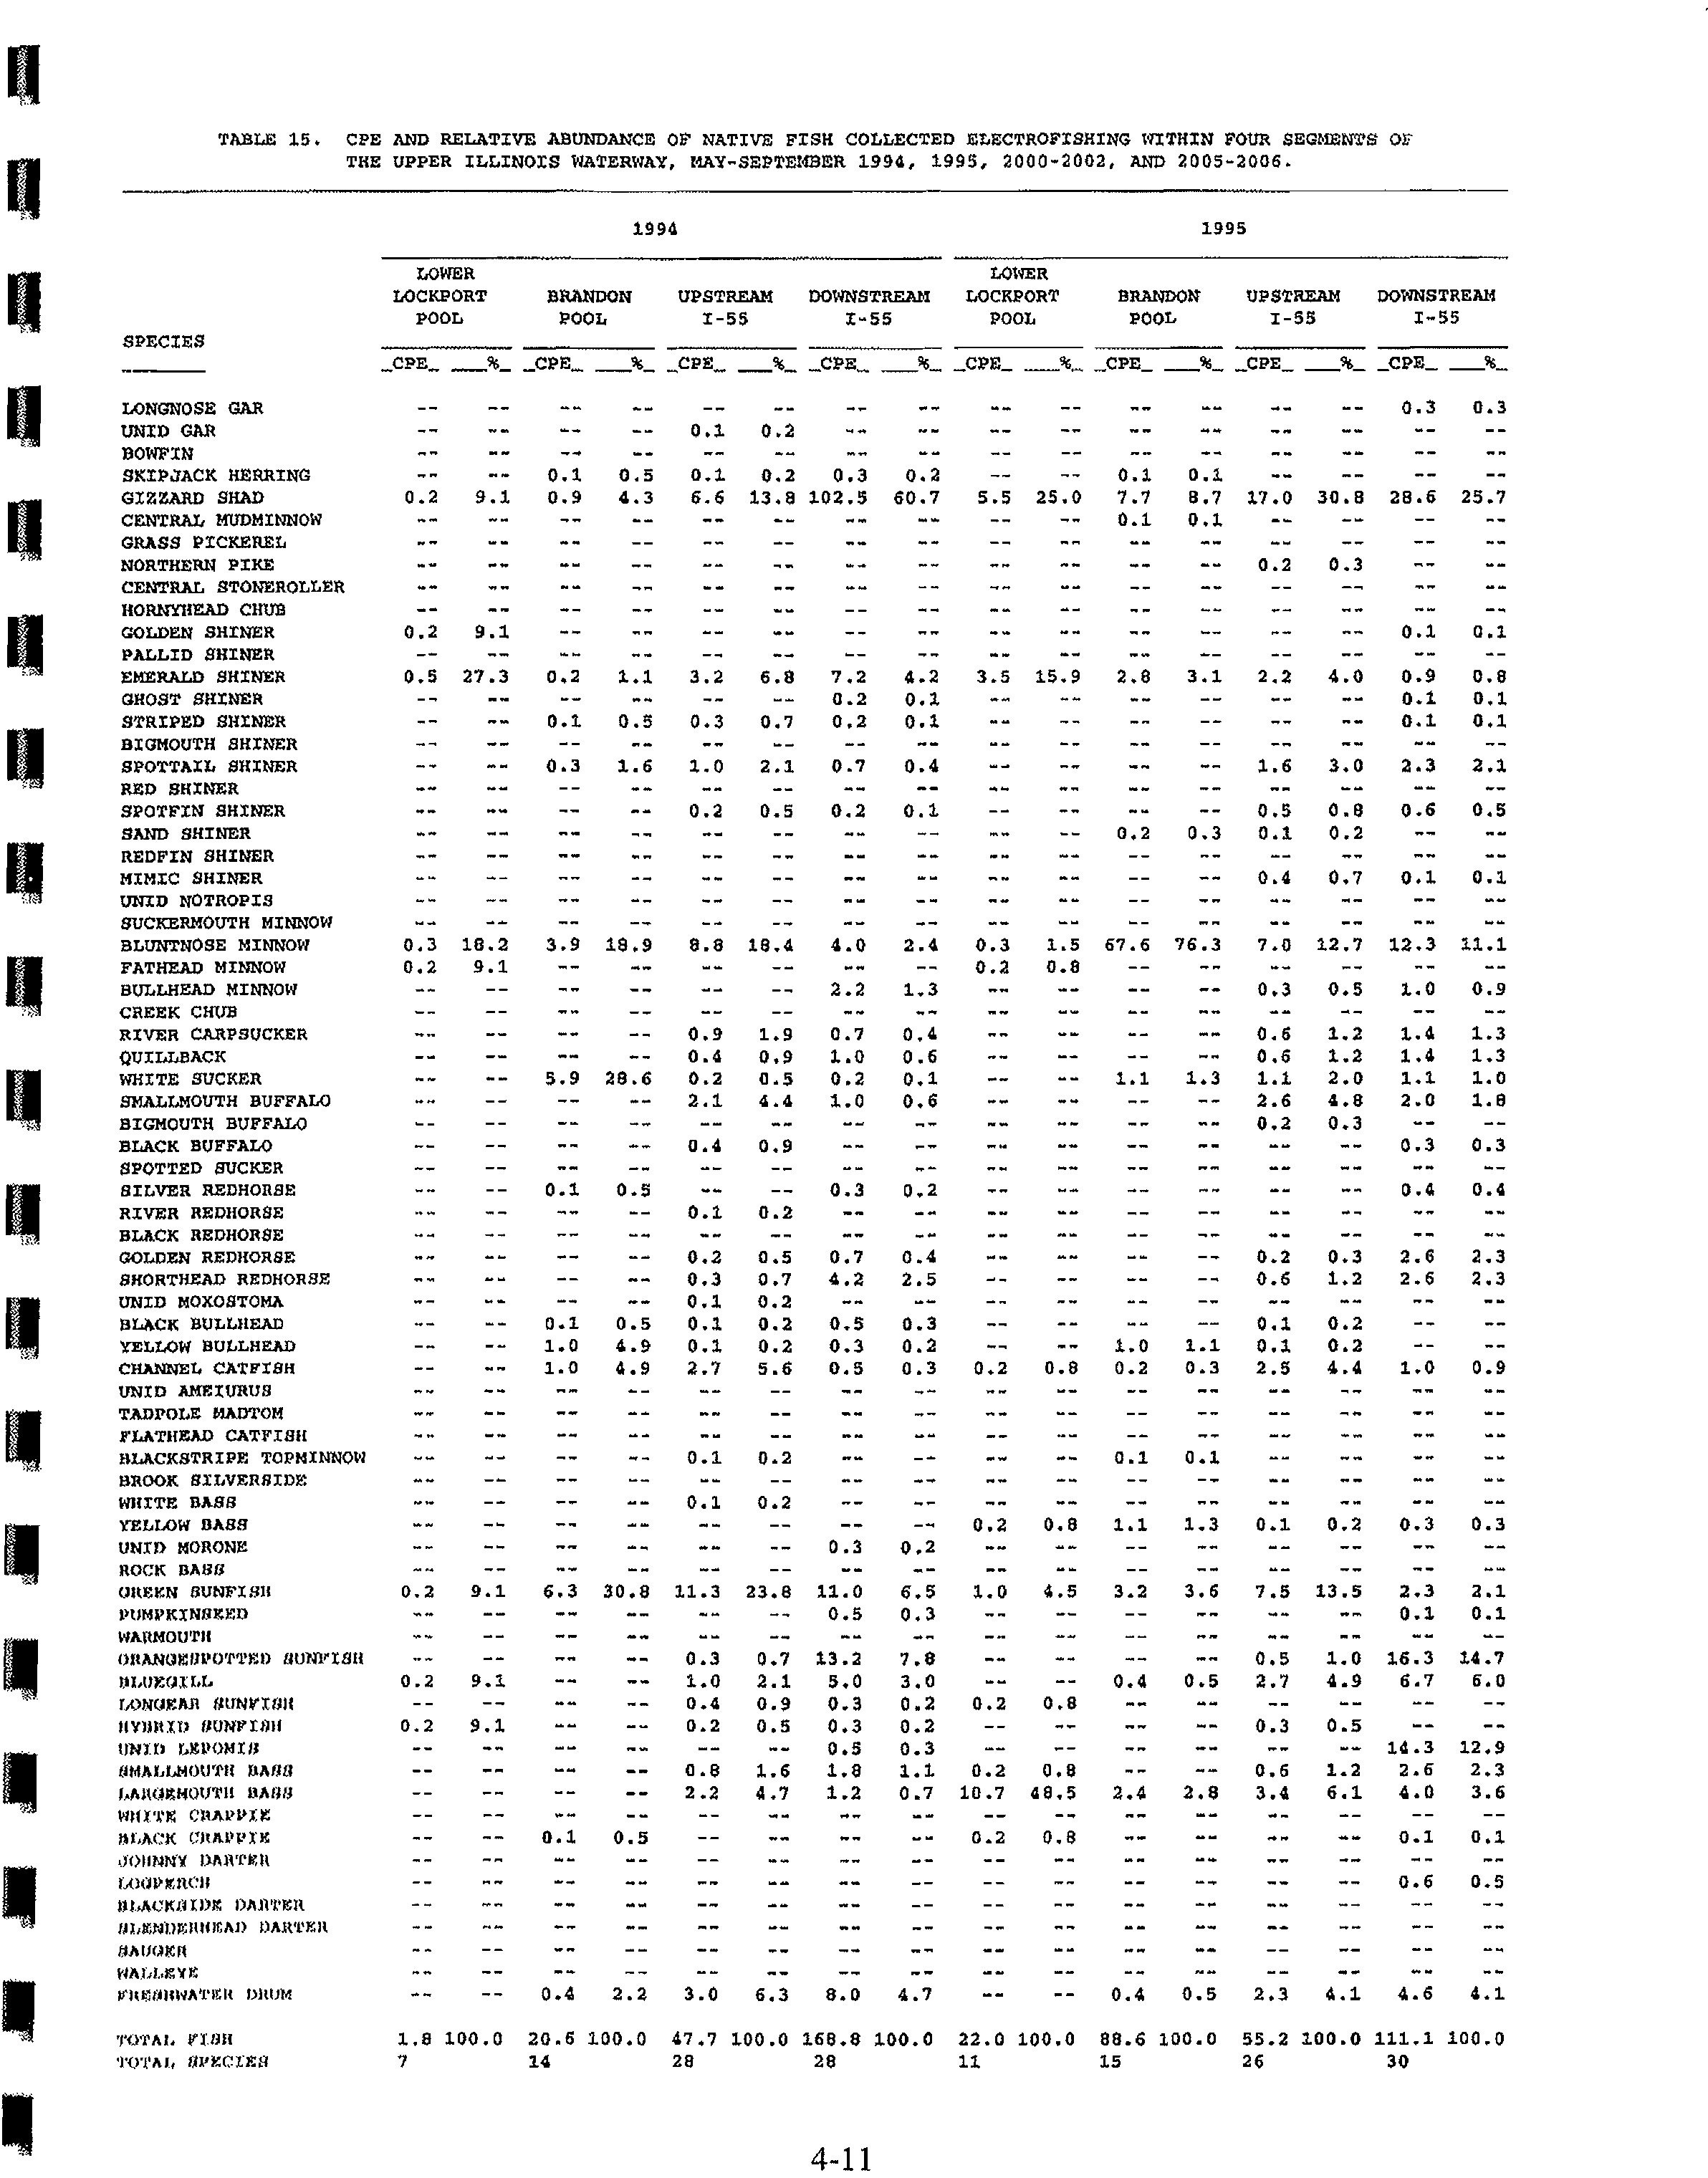
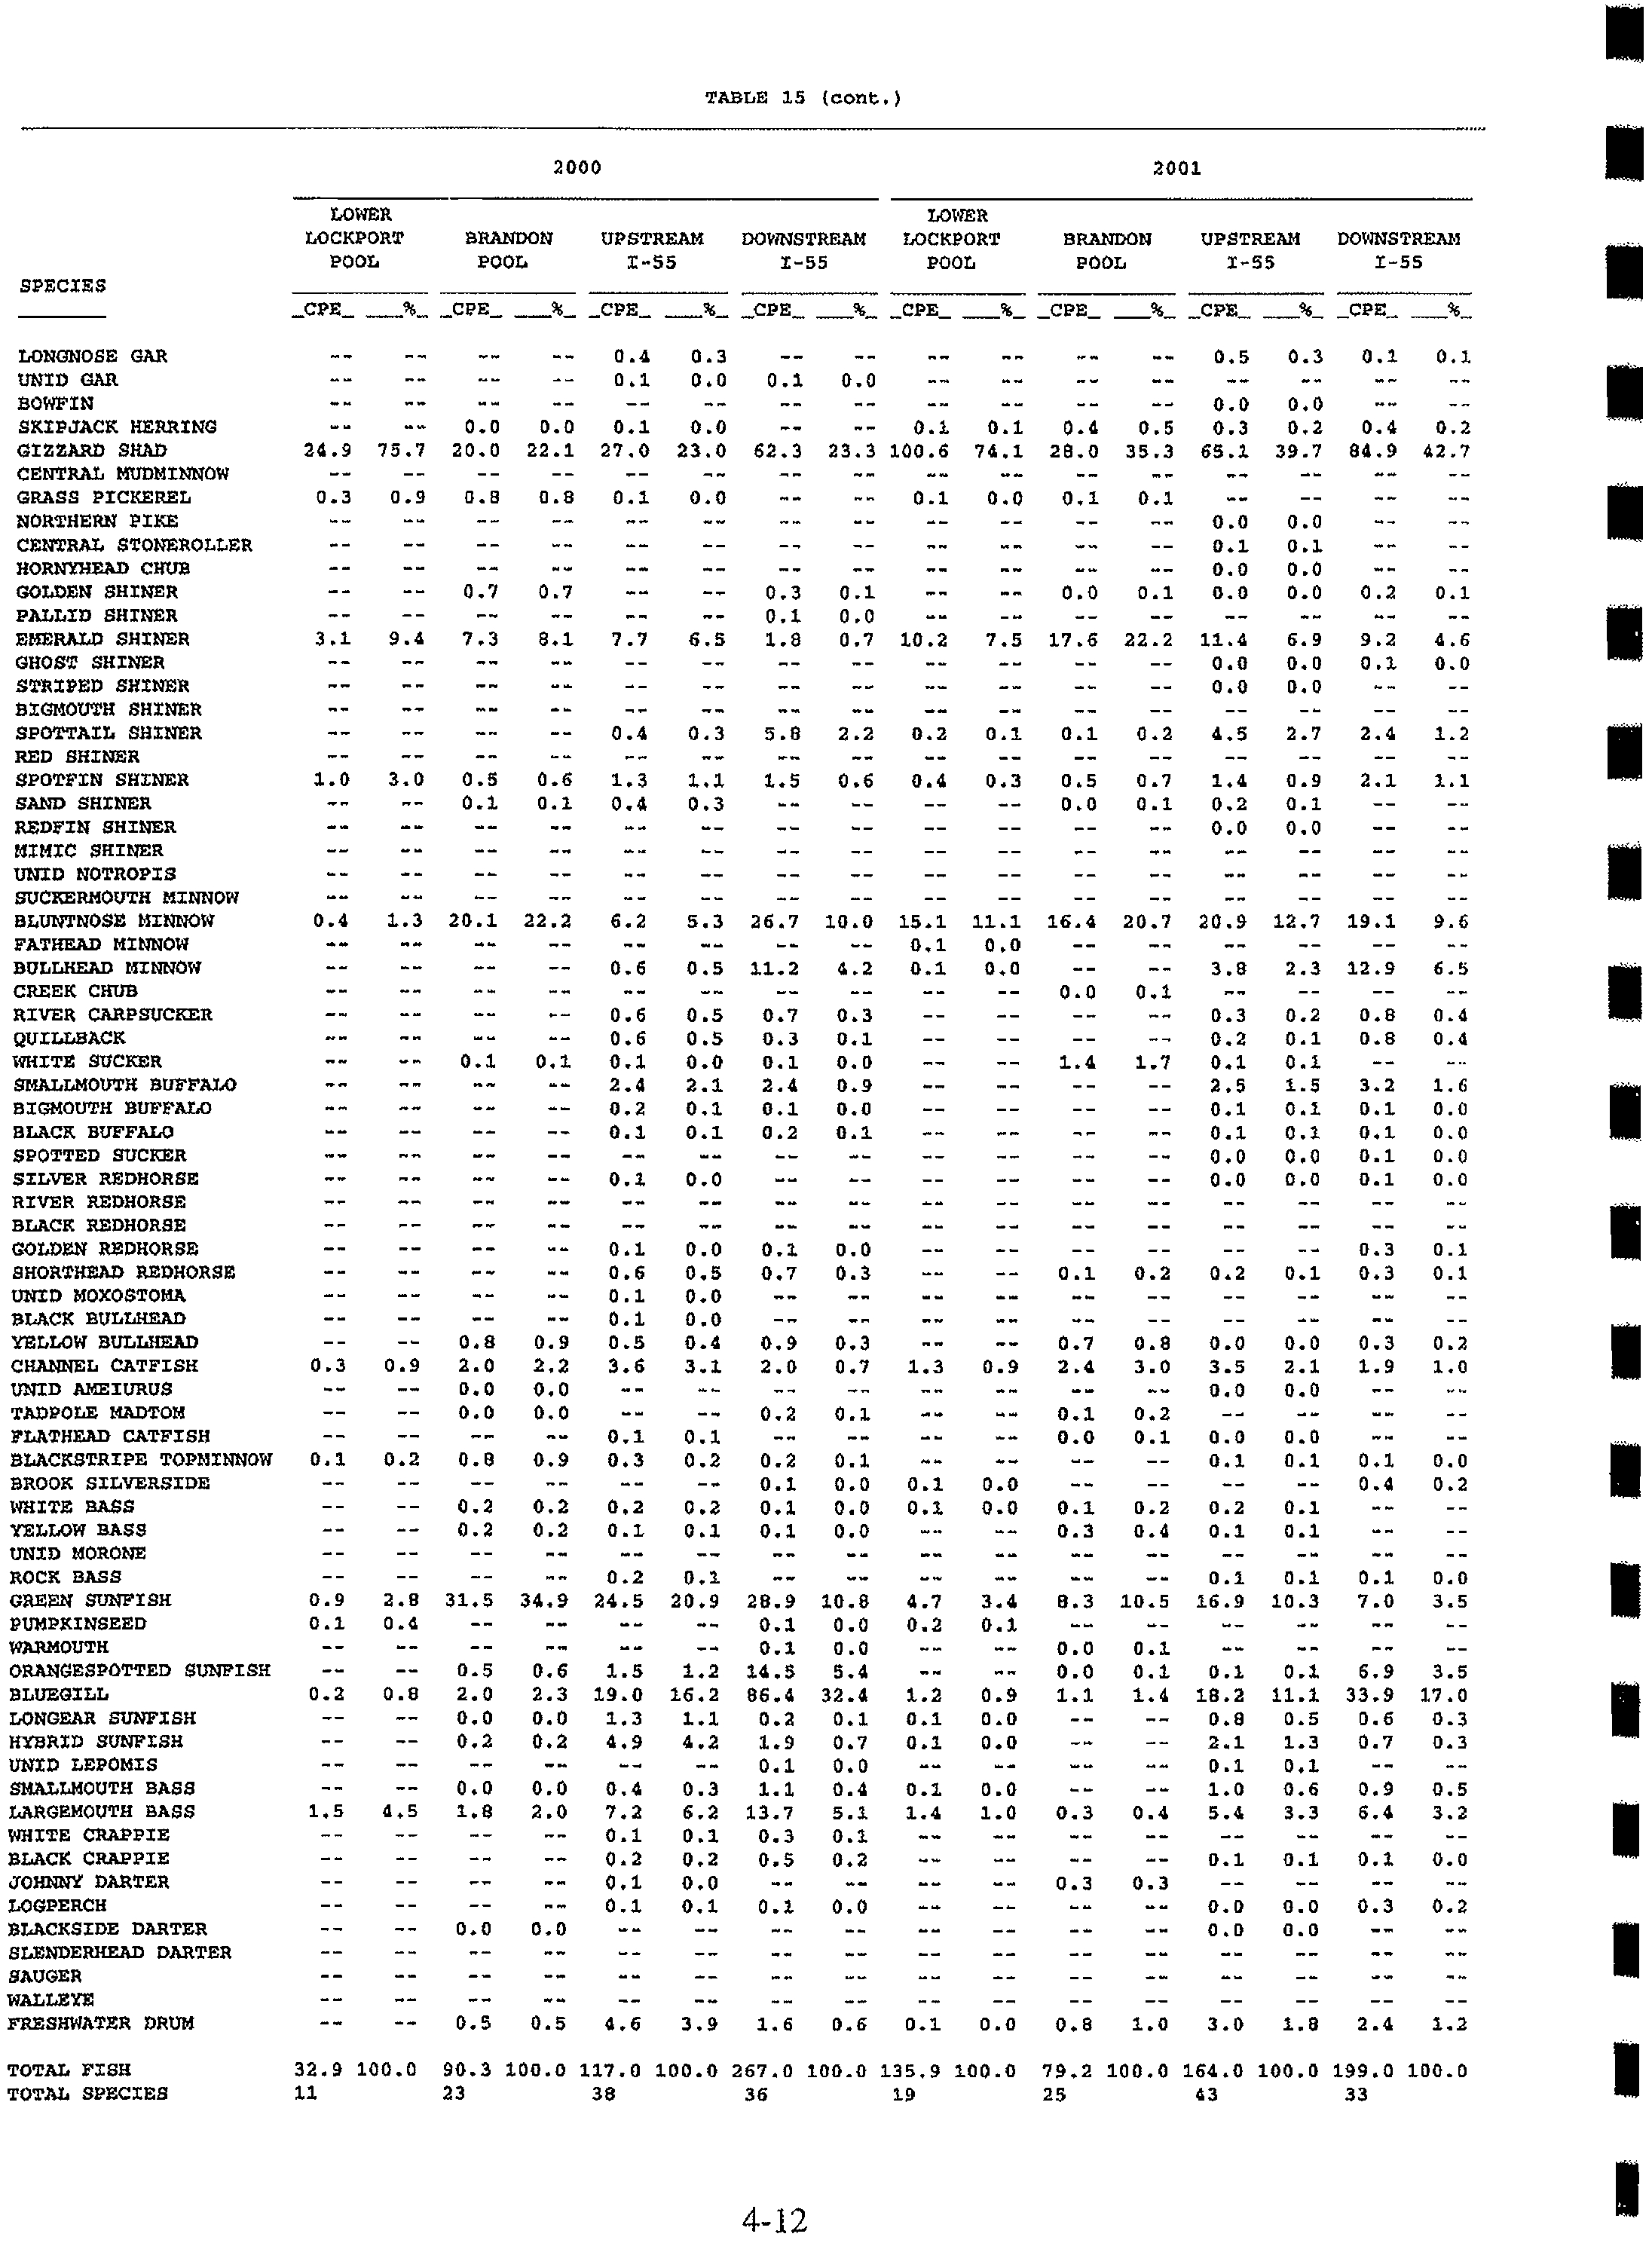
The MWRDGC has also conducted fish collection studies on the Ship Canal. All eight
of the
above fish species are present, with the gizzard shad most years representing the highest
percentage
of fish collected. However, the bluntnose minnow since 1993 has also been very well
represented, averaging 17.8 percent over the ten year period (CDM, 2007, page 4-78). Also
of
interest are the IBI scores for the Ship Canal, which CDM found, "fairly uniform throughout the
CSSC." (CDM, 2007, page 4-77).
If thermal is what is limiting the fish quality/population, then
one should see a dramatic drop in fish diversity, IBI, and fish population
at the downstream
stations. At Cicero Avenue, immediately below two
of the coal-fired power plants, the
MWRDGC found the greatest fish diversity (19 species). (CDM, 2007, page 4-77).
It
should
also be noted that IBI scores for the other CAWS
waterways, which do not have the thermal
discharges have similar IBI scores to the Ship Canal, another indication that temperature is not
the cause
of overall impairment on the Ship Canal.
Several fundamental questions arise out
of a review of Yoder's thermal endpoint data versus the
actual fish data collected within the Ship Canal.
14
12462512
Electronic Filing - Received, Clerk's Office, August 4, 2008
• If the bluntnose minnow is as sensitive to temperature as the laboratory studies
indicate, why
do they represent a significant portion ofthe fish population?
• Based upon Mr. Yoder's computed Upper incipient lethal temperature (UILT)
of
32.4 degrees C (or 90.3 degrees F), why haven't there been massive bluntnose
minnow or any other fish species temperature related fish kills been observed on
the Ship Canal?
• Why is the greatest fish diversity found at Cicero Avenue, immediately
downstream
of the Fisk and Crawford generating station outfalls?
•
If all eight fish species already exist in the waterway and are not shown through
field collection studies to be negatively impacted by the current temperature
regime, then given the documented habitat limitations on the Ship Canal, what
benefits will be derived from more restrictive temperature limitations on the Ship
Canal?
The field collected data should speak for itself. Recall that Dr. Charles Coutant noted the
preference
of using field collected data over relying on laboratory-based studies. Mr. Yoder
concluded his pre-filed testimony by noting that "occasional exceedences
of well dev,eloped
thermal criteria are inevitable and may not necessarily result in a biologically impaired use." (pg
12). This statement would appear to call into question both the derivation
of the thermal limits
as well
as its application to a real world waterway.
CONCLUSION
In
Adjusted Standard AS96-10, the Board'sopinion noted that the Agency's opinion was that the
costs
of installing additional cooling "may not be economically reasonable when compared to the
likelihood
of no improvement in the aquatic community of the UIW.,,3 (AS96-10, Opinion and
Order at page
7). If there will be no improvement in the aquatic community, then it is not clear
what benefits will occur from more restrictive thermal standards. The uniqueness
of the Ship
Canal,
as outlined in my testimony is so apparent, that a separate use category is needed that
3UIW-Upper Illinois Waterway
15
12462512
Electronic Filing - Received, Clerk's Office, August 4, 2008
recognizes the existing uses and limitations of the Canal, which factors in the actual fish data on
the Ship CanaL Where there are going to be violations
of the proposed Use B water quality
standards will not be met, which is the case for thermal, chlorides and sulfates, the Board must
consider whether any improvement
in the biological community will result from the adoption of
these more restrictive standards and what impact these proposed changes would have on the
existing uses. Since the present and highly abundant blunt-nose minnow, the most sensitive
of
the RAS species, is already the second most collected fish species and that the physical habitat is
poor and not likely to change, the fundamental basis behind changing these standards appears
flawed. and ignores the impact on existing uses. Since this set
of hearings is focused on the
proposed uses
of the CAWS, I will not go further into the appropriate water quality standards for
the Ship CanaL But I would urge the Board to separate the use designation for the Chicago
Sanitary and Ship Canal from the other "Use
B" water bodies and examine the appropriate water
quality standards based
on the unique conditions of the Ship CanaL
Thank you, this concludes
my pre-filed testimony.
16
12462512
Electronic Filing - Received, Clerk's Office, August 4, 2008
12462512
ATTACHMENT 1
RESUME OF JAMES E. HUFF, P.E.
Electronic Filing - Received, Clerk's Office, August 4, 2008
JAMES E. HUFF, P.E.
Vice President
Expertise:
Experience:
Wastewater Treatment Planning and Design
Stream Surveys/Antidegradation Analysis
Since 1980, Mr.
Huffhas been vice president of Huff & Huff, Inc. responsible for projects pertaining to
wastewater treatment, design and operation, water quality studies, hazardous waste management,
groundwater and soil remediation, and compliance assessments.
Mr.
Huffhas directed 15 municipal wastewater treatment design projects. Examples ofmunicipal design
projects are listed below:
- Belt filter press system for aerobic digested sludge, with sludge mixer and control system.
Sludge storage pad with enclosure
Bar screen
Grit, washer replacement
Tertiary filter rehabilitation
Secondary/Tertiary high flow bypass with chlorine contact tank and flow measurement and
blending
Anaerobic digester supernatant treatment for ammonia removal using SBRs (1999 ACEC-IL
Engineering Excellence Merit Award project.)
Conversion from chlorine to sodium hypochlorite disinfection
Conversion
of wet weather storage facilities to store-treat basins, with effluent disinfection
In-stream high purity oxygen injection into effluent and receiving stream for increasing stream D.O
1 million gallon excess flow storage/treatment concrete tank for new CSO with disinfection
Mr.
Huffis currently the Project Manager for preparation ofa Facilities Plan for the Village ofNew Lenox
and in 2007 completed for the Village
ofBarrington a Facilities Plan that evaluated the treatment options
for future nutrient removal and the need to upgrade to Class A sludge. Mr. Huffhas also conducted several
CSO studies including Long-term Control Plans, Nine Minimum Controls, O&M Plans, and Water Quality
Impact Studies. He is currently working on CMOM evaluations for three communities. Two novel in-
stream aeration systems, using high-purity oxygen on a shallow Illinois stream, were designed by the firm,
and have operated successfully for over twenty years.
In
stream aeration feasibility is currently being
investigated on Salt Creek under a contract with the DuPage River/Salt Creek Work Group. Mr. Huffhas
also completed two value engineering projects, one on an expanded wastewater treatment plant and the
other for an excess flow holding tank to offload the sewer system. The Galesburg Sanitary District
pretreatment ordinance and revisions have been prepared under Mr.
Huffs direction.
Mr.
Huffhas designed industrial wastewater treatment plants ranging in size from less than one thousand
gallons per day to eight million gallons per day. He has assisted two petroleum refineries with biological
nitrification issues and evaluated the impact an industrial user'ssodium sulfate discharge would have on
the POTW, including the anaerobic sludge process. Mr.
Huff directed the treatablility studies for
breakpoint chlorination for ammonia discharge in an inorganic wastewater stream from a petroleum
refinery and assisted in the full-scale start up, and directed a treatablility study evaluating another industrial
discharger'sproposed sodium sulfate discharge will have
on an Indiana POTW. Mr. Huffhas worked in a
variety
ofindustries on wastewater projects, including: petroleum refineries, cosmetics, foundries, plating,
printed circuit boards, inorganic and organic chemical plants, pharmaceutical manufacturers, and meat
packing. Examples
of industrial wastewater designs are listed below:
Electronic Filing - Received, Clerk's Office, August 4, 2008
- Sequential batch reactors (SBRs) for BODs/COD reduction at pharmaceutical plant, pretreatment
system subject to the Pharmaceutical Categorical Pretreatment Standards
- Replacement
ofa rotary drum pre-coat filter with a belt filter press for cosmetic wastewater stream,
with polymer addition
- Side stream SBR for nitrification on meat packing three-stage lagoon
- Breakpoint chlorination for ammonia removal at chemical plant, petroleum refinery and also a
meat packer
- Land application, with winter lagoon at chemical plant
- Copper removal from printed circuit board facility using sodium borohydride
- Integrated settling basin! sludge drying beds at foundry
- Completed a preliminary engineering evaluation for a chemical plant for upgrading its overloaded
wastewater land application system, which included conversion
ofthe winter storage lagoon to an
aerated lagoon with an anaerobic first stage lagoon
He has also designed cluster wastewater treatment systems with subsurface discharge for seven residential
developers/country clubs, an outdoor event facility, and a temple. These systems are typically 10,000 to
20,000 gpd, utilizing two SBRs, computer controlled, followed
by a large leach field. These unique
systems are permitted under the IDPH under a unique experimental use permit provision.
On the Fox River, Mr.
Huff was project manager for a group of municipal dischargers on a project to
collect and analyze weekly water quality samples along the river, its tributaries, and outfalls at over 30
locations to establish a better database on un-ionized ammonia levels. Mr. Huffhas directed fish, mussel,
benthic, and water quality surveys for municipal, storm water, and industrial discharges located on the
following waterways: Beaver Creek, Cedar Creek, Deep Run, Flint Creek, Mississippi River, Thorn Creek,
North Kent Creek, Tyler Creek, Kiswaukee River, Chicago Sanitary
&
Ship Canal, and Casey Fork Creek,
and has completed antidegradation studies as part
ofmany ofthese studies. Thermal studies, mixing zone
studies, and multi-part diffuser designs have been completed for a variety
ofclients. A thermal study on the
Illinois River is on-going. Sediment sampling, Sediment Oxygen Demand, and habitat evaluations have
been completed on Salt Creek and the DuPage Rivers.
From 2004 to 2007, Mr.
Huffwas the lead consultant for NIPC (now CMAP) to review FPA requests for
consistency with the Commission'sWater Quality Management Plan. Mr. Huffhas completed over 150
FPA requests, including the Facilities Plan associated with these. Antidegradation and nutrients have been
two major issues on many
of these applications. Mr. Huff serves on the Illinois Nutrient Technical
Advisory Committee, representing the American Council
ofEngineering Companies - Illinois (ACEC-IL).
Mr.
Huffhas been involved in eleven site specific rule changes and adjusted standards in Illinois. These
studies have included ammonia, D.O., BODs, TSS, TDS, and sulfates.
From 1987 through 1990, Mr.
Huff was a part-time faculty member, teaching the senior level
environmental courses in the Civil Engineering Department at IIT-West in Wheaton, Illinois.
From 1976 to 1980, Mr.
Huff was Manager of Environmental Affairs for Akzo Nobel Chemicals, a
diversified industrial chemical manufacturer. At Akzo, Mr.
Huff was responsible for all environmental
activities at eight plants located throughout the United States and Canada. Technical work included
extensive biological and chemical treatability studies as well as designing new facilities, including two
wastewater pretreatment facilities, a land application system, and an incinerator system.
Previously, Mr. Huffwas an Associate Environmental Engineer in the Chemical Engineering Section at IIT
Research Institute (IITRI). Much
of this work involved advanced wastewater treatment development,
including applying a combination
ofozone/UV treatment ofcyanide, PCB's,RDX, HMX, and TNT and the
Electronic Filing - Received, Clerk's Office, August 4, 2008
use ofcatalytic oxidation ofcyanide using powdered activated (carbon impregnated with copper in refinery
activated sludge units. At Mobil Oil's Joliet Refinery Mr.
Huff was employed as an Advanced
Environmental Engineer during the construction and start-up
of the largest grassroots refinery ever
constructed. Mr.
Huffwas responsible for wastewater training, permitting start-up, and technical support
as well as for water supply, solid waste, and noise abatement issues at the refinery from 1971 to 1973.
Membership
Illinois Association
of Wastewater Agencies
American Council
of Engineering Companies - IL
Environmental Committee 1999 - 2005
Chairman-June 2000-2004
Board
of Directors - 2005-2009
Vice President-2007-2009
Water Environment Federation Member
Illinois Water Environment Federation
National Water Well Association
Licenses:
Education:
1966-1970
1970-1971
1974-1976
Honors:
Thesis:
Registered Professional Engineer- Illinois
Class 2 Wastewater Operator-Illinois
Class K Industrial Wastewater Operator-Illinois
Purdue University, West Lafayette, Indiana
B.S. in Chemical Engineering
Purdue University, West Lafayette, Indiana
M.S.E. in Environmental Engineering
University
of Chicago
Graduate School
of Business. Part time
Omega Chi Epsilon (Chern. Engr. Honorary)
President'sAcademic Award
Graduated with Distinction
Fellowship from the Federal Water Quality Admin.
"Destabilizing Soluble Oil Emulsions Using Polymers with Activated
Carbon," Major Professor, Dr. James E. Etzel
Selected Papers:
"Ozone-D.V. Treatment
of TNT Wastewater," E.G. Fochtman and J.E. Huff, International Ozone Institute
Conference, Montreal, May 1975.
"Characterization
of Sensory Propeliies: Qualitative, Threshold, and Supra-Threshold," J.E. Huff and A.
Dravnieks, American Water Works Assoc. Seminar, Minneapolis, MN, June 1975.
"Control
of Rendering Plant Odors by Wet Scmbbers: Results of Plant Tests," R.H. Snow, lE. Huff, and W.
Boehme, APCA Conference Boston, MA, June 1975.
"Alternative Cyanide Standards in Illinois, a Cost-Benefit Analysis,"
L.L.
Huff and lE. Huff, 31st Annual
Purdue Industrial Waste Conference, Lafayette, IN, May 1976.
"Cyanide Removal from Refinery Wastewaters Using Powdered Activated Carbon," J.E. Huff,
J.M. Bigger, and
E.G. Fochtman, American Chemical Society Annual Conference, New Orleans,
LA, March 1977. Published
in
Electronic Filing - Received, Clerk's Office, August 4, 2008
Carbon Adsomtion Handbook, P.N. Cheremisinoffand F. Ellerbusch, Eds., Ann Arbor Science Publishers, Inc.,
1978.
"Industrial Discharge and/or Pretreatment
of Fats, Oils and Grease," J.E. Huff and E.F. Harp, Eighth
Engineering Foundation Conference
on Environmental Engineering, Pacific Grove, CA, February 1978.
"A Review
of Cyanide of Refinery Wastewaters," R.G. Kunz, J.E. Huff, and J.P. Casey, Third Annual
Conference
of Treatment and Disposal of Industrial Wastewater and Residues, Houston, TX, April 1978.
Published as: "Refinety Cyanides: A Regulatory Dilemma," Hydrocarbon Processing, pp 98-102, January
1978.
"Treatment
ofHigh Strength Fatty Amines Wastewater - A Case History," J.E. Huffand C.M. Muchmore, 52nd
Conference - Water Pollution Control Federation, Houston, TX, October 1979. Published JWPCF, Vol. 54, No.
1, pp 94-102, January 1982.
"A Proposal to Repeal the Illinois Pollution Control Board's Construction Permit Water Regulations," J.H.
Russell and J.E. Huff, Chicago
Bar Record, Vol. 62, No.3, pp 122-136, Nov.-Dec., 1980.
"Measurement
of Water Pollution Benefits - Do We Have the Option?" L.L. Huff, J.E. Huff, and N.B.
Herlevson, IL Water Pollution Control Assn 3rd Annual Conference, Naperville, IL, May 1983.
"Evaluation
ofAltemative Methods ofSupplementing Oxygen in a Shallow Illinois Stream," J.E. Huffand J.P.
Browning, IL Water Pollution Control Assn 6th Annual Meeting, Naperville, IL, May 7, 1985.
"Technical and Economic Feasibility
ofa Central Recovery Facility for Electroplating Wastes in Cook County,
IL," J.E.
Huff and L.L. Huff, 1986 Govemor'sConference on Science and Technology in Illinois, Rosemont, IL,
Sept. 3, 1986.
"Biomonitoring/Bioassay," J.E. Huff, Federation
of Environmental Technologists Seminar, Harvey, IL,
December 11, 1989.
"Storm Water Discharges," J.E. Huff, Federation
of Environmental Technologists Environment '90 Seminar,
Milwaukee, WI, March 7,1990.
"Engineering Aspects ofIndividual Wastewater System Design," J.E. Huff, 22nd Annual Northem Illinois
Onsite Wastewater Contractors Workshop, St. Charles, IL, Februaty 27, 1995.
"Total Maximum Daily Loadings (TMDL) and Ammonia Conditions in the Fox River Waterway,"
J. E. Huff
and S. D. LaDieu, Illinois Water '98 Conference, Urbana, IL, Nov. 16, 1998.
"The Illinois Ammonia Water Quality Standards: Effluent Implications
&
Strategies for Compliance," L.R.
Cunningham
&
J. E. Huff, Illinois Water '98 Conference, Urbana, IL, Nov. 16, 1998.
"Impact
ofa High Sulfate and TDS Industrial Discharge on Municipal Wastewater Treatment," J.L. Daugherty,
J.E. Huff, S.D. LaDieu, and
D. March, WEFTEC 2000, Anaheim, CA, October 17,2000.
"Phase II Storm Water Regulations - Compliance Strategies For The Gas Transmission/Distribution Industry,"
J.E. Huff, American Gas Association 2003 Operations Conference, Orlando, Florida, April 28, 2003.
"Endocrine Disruptors
or Better Living Through Chemistry" Illinois Association ofWastewater Agencies Fall
Meeting, Bloomington, IL, November 14,2003.
"Permitting Wastewater Treatment Plant Expansions in Northeast Illinois in the
21 st CentUlY", J.E. Huff, 28
th
Annual Illinois Water Environment Association Conference, Bloomington, IL, March 6, 2007.
Electronic Filing - Received, Clerk's Office, August 4, 2008
12462512
ATTACHMENT 2
FISH BARRIER HAZARDS
Electronic Filing - Received, Clerk's Office, August 4, 2008
u.s.
ARMY CORPS OF ENGINEERS
ELECTRIC FISH BARRIER
HAZARDOUS VOLTAGES
PRESENT IN CANAL WATERWAY
BOATERS ARE ADVISED TO EXERCISE EXTREME CAUTION WHILE
NAVIGATING
THE CHICAGO SANITARY
&
SHIP CANAL BETWEEN THE
POWER PLANT TO THE PIPELINE ARCH(MILE MARKER 296.1 to 296.7)
HIGH RISK OF SERIOUS INJURY OR DEATH
PRECAUTIONS
DO NOT - Enter the water or place hands or feet in the water in the
restricted area for any reason.
PLEASE - Closely supervise children and pets or send them below
deck while in the restricted area.
DO NOT -
Linger or attempt to moor in the restricted area.
MAN OVERBOARD PROCEDURES
DO NOT - Enter the water to attempt a rescue.
USE - A non-metallic oar or similar item to pull the victim onto
your boat as quickly as possible.
NOTIFY - Authorities by calling 9-1-1 or by broadcasting a distress
call on VHF Channel 16.
For additional information, contact the
u.s.
Army Corps of Engineers at (312) 846-5330 or visit our safety website at
www.lrc.usace.army.millsafety.
Electronic Filing - Received, Clerk's Office, August 4, 2008
NEWS RELEASE
U.S. Army
Corps
of Engineers
Chicago District
Contact:
Lynne Whelan
Telephone:
(312) 846-5330
E-Mail:
IxnnQ.e.whclan@usaQQ..armY411il
Lt. Corey Gardner-Meeks
(630) 986-2155
forey.a.
g~rdner-meeks@usCg.l11
i!
Army Corps and Coast Guard Kick Off Barrier Safety Campaign
March 27, 2008 - The U.S. Army Corps of Engineers and U.S. Coast Guard will begin a campaign April 1Sl to
advise boaters how to safely transit over the electric fish barrier in the Chicago Sanitary and Ship Canal near
Romeoville, IL. A portion of the canal near the barrier system has been a Regulated Navigation Area for passage
of vessels since 2005.
The Corps
of Engineers and Coast Guard have expanded their safety information campaign following the
findings
of a draft report that indicates the effect of the barrier's electric field on a person immersed in the
electrified water could result in serious injury or death. The Corps commissioned the report to determine the
potential effects
of the barrier's electric field should a person fall into the water.
"Public safety is our highest priority. Although the draft report indicates a wide atTay of possible impacts, it
does show that serious injury or death
is possible in worst case scenarios. Therefore, we feel that it is critically
important
to make sure that people know how to pass through the area safely. The safest thing is to keep people
out
of the water entirely," said Col. Jack Drolet, commander of the U.S. Army Corps of Engineers, Chicago
District, the office responsible for building and operating the electric barrier system.
The final report will not be available until later this Spring, but the Corps of Engineers and Coast Guard have
decided to begin an expanded education and information campaign now in order to reach people before the start
of the Chicago area boating season.
Electronic Filing - Received, Clerk's Office, August 4, 2008
"Reaching out to commercial and recreational users we initiated a workgroup to address the hazard of a
person falling in the water within the fish barrier," said CDR Paul Mehler Ill, Commanding Officer
of the U.S.
Coast Guard, Marine Safety Unit Chicago. This partnership has resulted in a campaign involving distributing
informational flyers at area locks, boat launches, bait shops, and fuel docks, and working with local and national
boating groups to pass the information to as many boaters as possible. The key message
is to inform boaters to
use extreme caution while traveling in the Sanitary and Ship Canal between River Miles 296.1
to 296.7. This
area is bounded approximately by the power plant near the Romeo Road bridge and an aerial pipeline arch.
While traveling through the area, boaters are advised
to take the following precautions:
•
Do not enter the water or place hands or feet in the water for any reason.
•
Be sure
to closely supervise children and pets or send them below deck if possible.
•
Do not linger or attempt
to moor in the area.
The Corps
of Engineers and Coast Guard are working with representatives from commercial navigation and
recreational boating groups and others to find ways
to enhance safety features in the barrier area.
An electric barrier has been operating in the Sanitary and Ship Canal since 2002. The purpose
of the barrier
system is
to stop the movement of invasive species of fish, such as the Asian carp, between the Great Lakes and
Mississippi River basins.
For additional information pertaining
to the fish barrier please visit www.lrc.usaee.army.mil/safety.
-30-
For additional information pertaining
to the fish barrier operation, please contact Lynne Whelan with the
U.S. Army Corps
of Engineers, Chicago District. For information regarding vessel safety, please contact Lt.
Corey Gardner-Meeks with the U.S. Coast Guard Marine Safety Unit Chicago. Point
of contact information is
provided on the first page of this press release.
Electronic Filing - Received, Clerk's Office, August 4, 2008
1m
U'Anny~
011"91......
Chicago Sanitary & Ship Canal
Electrical Hazard Area
Electronic Filing - Received, Clerk's Office, August 4, 2008
12462512
ATTACHMENT 3
CHLORIDE DATA IN
CHICAGO SANITARY & SHIP CANAL
AT CITGO’S WATER INTAKE
Electronic Filing - Received, Clerk's Office, August 4, 2008
SANITARY
&
SHIP CANAL
CITGO INTAKE CHLORIDE DATA
Date
3/13/2004
3/20/2004
3/27/2004
4/3/2004
4/17/2004
4/24/2004
5/8/2004
5/15/2004
5/22/2004
6/12/2004
6/19/2004
6/26/2004
7/10/2004
7/24/2004
7/31/2004
8/14/2004
9/4/2004
9/18/2004
9/25/2004
10/2/2004
10/23/2004
Chloride,
mg/L
248
195
231
187
180
129
178
102
150
96
114
117
92
65
78
72
103
99
102
108
115
Date
Chloride, mg/L
1/10/2005
835
1/12/2005
492
1/13/2005
580
1/14/2005
274
1/17/2005
242
1/19/2005
250
1/21/2005
235
1/24/2005
430
1/31/2005
634
2/4/2005
413
2/11/2005
416
2/14/2005
364
2/25/2005
307
3/7/2005
283
3/11/2005
286
3/14/2005
277
3/21/2005
300
3/25/2005
272
3/28/2005
270
4/4/2005
240
4/8/2005
232
4/11/2005
221
4/15/2005
200
4/18/2005
199
4/22/2005
197
4/25/2005
196
4/29/2005
184
5/2/2005
190
5/6/2005
195
5/13/2005
164
5/16/2005
151
5/20/2005
167
5/23/2005
147
5/27/2005
151
5/30/2005
163
6/1/2005
160
6/3/2005
156
6/10/2005
121
6/13/2005
124
6/17/2005
128
6/20/2005
127
6/24/2005
122
6/27/2005
118
7/1/2005
119
7/4/2005
103
7/8/2005
103
7/11/2005
103
7/15/2005
100
7/18/2005
100
7/22/2005
92
7/25/2005
99
7~~2005
99
8/1/2005
92
8/5/2005
102
8/8/2005
88
8/12/2005
93
8/15/2005
88
~/1
~W~Q05.
~~
Date
Chloride, mg/L
Date
1/2/2006
330 1/1/2007
1/6/2006
320 1/5/2007
1/9/2006
314 1/8/2007
1/13/2006
276 1/12/2007
1/16/2006
226 1/19/2007
1/20/2006
215 1/22/2007
1/23/2006
220 1/26/2007
1/27/2006
413 1/29/2007
1/30/2006
308 2/2/2007
2/3/2006
298 2/5/2007
2/6/2006
252 2/9/2007
2/10/2006
243 2/12/2007
2/13/2006
238 2/16/2007
2/17/2006
2512/19/2007
2/20/2006
276
2/23/2007
2/24/2006
249
2/26/2007
2/27/2006
484
3/2/2007
3/3/2006
200
3/5/2007
3/17/2006
209 3/9/2007
3/20/2006
201 3/16/2007
3/31/2006
189 3/19/2007
4/3/2006
208 3/23/2007
4/7/2006
189 3/23/2007
4/10/2006
183 3/26/2007
4/14/2006
188
4/17/2006
190
4/21/2006
128
4/24/2006
154
M28~006
162
5/1/2006
175
5/5/2006
152
5/12/2006
166
5/15/2006
145
5/19/2006
145
5/19/2006
145
~2V2006
147
5/26/2006
167
5/29/2006
145
6/2/2006
134
6/5/2006
122
6/9/2006
132
6/12/2006
108
6/16/2006
109
6/19/2006
129
6/23/2006
123
6/26/2006
119
6/30/2006
294
6/30/2006
294
7/3/2006
11 0
7/7/2006
12
7/10/2006
85
7/14/2006
103
7/17/2006
414
n21~006
92
7/24/2006
227
7/28/2006
104
7/31/2006
96
~/4/2Q96.
Z4
Chloride, mg/L
174
156
113
133
239
203
384
286
225
227
181
224
181
695
549
600
734
616
395
350
340
281
281
415
Electronic Filing - Received, Clerk's Office, August 4, 2008
SANITARY
&
SHIP CANAL
CITGO INTAKE CHLORIDE DATA
Chloride,
Date
mg/L
Date
Chloride, mg/L
Date
Chloride, mg/L
Date
Chloride, mg/L
10/7/2005
81
9/25/2006
95
10/10/2005
96 9/29/2006
107
10/14/2005
88 10/2/2006
95
10/17/2005
100 10/6/2006
83
10/21/2005
87 10/9/2006
113
10/24/2005
92 10/13/2006
119
10/28/2005
85 10/16/2006
209
10/31/2005
106 10/20/2006
146
11/4/2005
146 10/23/2006
109
11/7/2005
126 10/27/2006
126
11/11/2005
105
10/30/2006
120
11/14/2005
132
11/3/2006
134
11/18/2005
110 11/6/2006
149
11/21/2005
116 11/13/2006
118
11/25/2005
128 11/17/2006
108
11/28/2005
128 11/20/2006
128
12/2/2005
146 11/24/2006
140
12/5/2005
130 11/27/2006
143
12/9/2005
183 12/1/2006
105
12/12/2005
192 12/4/2006
14
12/16/2005
406 12/8/2006
195
12/19/2005
264 12/11/2006
236
12/23/2005
295 12/15/2006
249
12/26/2005
253 12/18/2006
200
12/30/2005
357
12/22/2006
198
12/25/2006
129
12/29/2006
139
Average
131
183
168
333
MaximulT
248
835
484
734
R:\Citgo\Des Plaines River Sampling 2006\[Citgo Chloride Data from Ship Canal.xls]lnfluent CI
Electronic Filing - Received, Clerk's Office, August 4, 2008
12462512
ATTACHMENT 4
HEAT RELATED HAZARDS FROM BROWNOUTS
Electronic Filing - Received, Clerk's Office, August 4, 2008
Multi-Print Viewer
Page 1
of2
Power failure puts CornEd on hot seat - Toll hits 69 - heat subsides
Chicago Sun-Times
- August 2, 1999
Author:
MARK SKERTIC AND ROBERT
C.
HERGUTH
Falling temperatures weren't enough to cool off thousands of city and suburban Commonwealth Edison
customers who remained without power Sunday after a heat wave that has claimed at least 69 lives.
ComEd hoped to have all power restored by this morning, but the beleaguered utility's troubles are far from
over. For the first time, ComEd must pay customers for spoiled food and other expenses they rang up because
their electricity failed.
"We all are angry that outages happened in the first place," Mayor Daley said.
Ald. Helen Shiller (46th), whose ward includes some of the more than 20 buildings along North Lake Shore
Drive that had no power or water Sunday, didn't try to hide her anger with ComEdo
"The deal is ComEd blew it by saying everything is fine," she said. "They should have been telling people the
truth. I've told that to every person I've talked to from ComEd."
ComEd spokesman Steve Solomon said, "We're not pleased. They're not pleased. We both have the same
concern_getting the customers' power turned back on."
In the weeks ahead, ComEd will be sorting through claims for reimbursement, which are available at
www.ucm.com or by calling (800) EDISON-1.
The company also will be trying to determine why cables and other equipment gave out, keeping the power off
in about 10,500 homes in the utility's service area late Sunday.
More than 9,600 of them were in the city, while about 850 power failures were scattered in the suburbs, mostly
in the south suburbs.
At the peak of the power failures, more than 92,000 of ComEd's nearly 3.5 million customers were without
electricity Friday.
After a week of temperatures hovering around 100, suburbs and city neighborhoods were filled Sunday with
people out enjoying a day when the temperature was in the lower 80s. But public officials were left dealing with
the grim aftermath of the deadly heat wave.
The Cook County medical examiner's office added 30 names to the list of heat victims, bringing the total to 73
for the summer.
Sixty-nine deaths, including six from the suburbs, have been blamed on the current heat spell. More autopsies
scheduled for Sunday night and today are expected to increase that number, a spokesman said.
The 1995 heat wave contributed to more than 700 Chicago area deaths.
Dropping temperatures, brought on by a shift in the jet stream, has pushed cooler air over Chicago and much of
the Midwest, bringing relief to much of the nation. The heat wave was blamed for at least 185 deaths nationally,
80 of them in Illinois. Missouri was next with 44.
In Chicago, officials said they were generally pleased with the city's response. "Overall, our emergency plan has
worked very well," Daley said. "Without the plan, and thousands of Chicagoans who checked on neighbors, it
could have been worse."
Over three days the city received 50,000 calls to the non-emergency 311 number. Forty percent were about
http://infoweb.newsbank.com.proxy.lib.uiowa.edu/iw-search/we/lnfoWeb
07/21/08
Electronic Filing - Received, Clerk's Office, August 4, 2008
Multi-Print Viewer
power failures.
Page 2 of2
The most widespread failures were in Chicago's Lake View neighborhood, where underground electrical cables
failed starting about 5:20 p.m. Saturday. More than 20 mid-rises and high-rises_roughly between Irving Park
Road, Belmont, the lakefront and Halsted_remained without power Sunday, officials said.
Police and fire officials estimated those buildings are home to 5,500 people, many of whom are elderly.
A 1997 state law requires ComEd to compensate customers for the costs incurred during a power failure that
lasts at least four hours and affects 30,000 or more customers.
The law requires "that someone take responsibility," said David Farrell, a spokesman for the Illinois Commerce
Commission. "This will be the first check of that."
At some buildings without power, ComEd gave away meals, flashlights, drinking water and ice.
ComEd spent $120 million earlier this year on system upgrades to avoid the kind of problems seen over several
days, Solomon said.
"Unfortunately, the combination of weather and usage will take its toll on the equipment."
Contributing: Jim Ritter, Abdon M. Pallasch
Caption:
Lake View residents sit outside their building Sunday while waiting for the power to come back on.
More than 20 high-rise and mid-rise buildings along North Lake Shore Drive had no power or water Sunday.
See related stories page 2. ROBERT A. DAVIS
Edition:
LA TE SPORTS FINAL
Section:
NEWS
Page:
1
Index Terms:
hot,. heat wave,. deaths,. Commonwealth Edison,. electricity,. outage,. power failure
,.
WEA THER
,.
ENERGY
Record Number:
CST08020025
Copyright
1999
Chicago Sun-Times, Inc.
http://infoweb
.
newsbank.com.proxy.lib.uiowa.edu/iw-searchlwe/lnfoWeb
07/21108
Electronic Filing - Received, Clerk's Office, August 4, 2008
Multi-Print Viewer
Page 1
of2
COMED
HOPES TO DELIVER SOME CHECKS BY NEXT WEEK - COMPANY EXPECTS
TO PAY OUT MILLIONS
Chicago Tribune
- August 5, 1999
Author:
Gary Washburn, Tribune Staff Writer.
Commonwealth Edison Co. customers who suffered losses after last weekend's power outages may begin
receiving reimbursement checks as early as next week, ComEd Chairman John Rowe said Wednesday.
Rowe reported that the company probably will hire an outside firm to expedite the handling of claims.
"I would like to see some people start getting (checks) as early as next week," Rose said. "I don't know if I can
deliver on that, but we'll try."
An estimated 90,000 Chicagoans suffered power interruptions of four hours or more as smothering heat
knocked equipment off line, causing losses that ComEd officials believe will be in the millions of dollars.
Electricity was restored to all customers by Monday.
No claims have been filed so far, but ComEd has fielded more than 12,000 calls regarding claim forms, a
company spokeswoman said Wednesday.
Most of the losses are believed to be related to spoilage of food and medicines requiring refrigeration.
ComEd will not require receipts for items in the "normal array of what people keep in their refrigerators," Rowe
said. "My wife doesn't keep her grocery receipts, and I don't expect other people to either."
Rowe said he expects submission of some phony claims, and "if we feel people are ripping (us) off, then we will
get tough." But, he added, "the key is we will pay all the reasonable ones as fast as we can."
Rowe has contended that ComEd was not required by law to reimburse customers for losses in the outages
because the problems were caused by the extremely hot temperatures.
But he decided that reimbursement was the proper way to treat customers.
Meanwhile, the city was tallying the cost of expenditures for its outage-related emergency response, including
the evacuation of residents from high-rise buildings that went dark.
Mayor Richard Daley, who praised ComEd last week for the way it was dealing with the heat, was upset with
the subsequent outages.
But by Wednesday, the mayor had cooled off. He commended Rowe for his decision to pay claims, hailing what
he said was a new frankness by the company.
Rowe also said the company will expedite improvements at two substations where failures led to outages.
Claim forms are available by calling ComEd at 800-EDISON-1 and can be downloaded from the company's
Internet site at www.ucm.com. The claims, however, cannot be filed electronically. Claim forms also can be
obtained through Chicago public library branches, aldermanic offices or by calling 311, the city's non-
emergency information number.
In a related development, Gov. George Ryan said low-income households with children, the elderly or people
with health problems will be the prime targets for the $15.9 million in federal utility bill subsidies announced
Tuesday by President Clinton.
"We want to make sure that low-income families who suffered through last month's heat wave don't have to
http://infoweb.newsban1<.com.proxy.lib.uiowa.edu/iw-search/we/lnfoWeb
07/21/08
Electronic Filing - Received, Clerk's Office, August 4, 2008
Multi-Print Viewer
suffer again when their electric bills come," Ryan said.
Page 2 of2
The help is available through local agencies. Applications for assistance under the program will be accepted
through Aug. 31, the governor's office said.
For information on program eligibility and where to apply, Illinois residents can call 800-252-8643. Chicago
residents also can call 312-456-4100.
The death toll in Cook County from the heat since July 29 was raised to 81 Wednesday when the Cook County
medical examiner's office reported that heat played a role in the death Tuesday of Margaret Cornils, 77, of
Evanston.
Edition:
CHICAGO SPORTS FINAL
Section:
METRO CHICAGO
Page:
1
Index Terms:
ENERGY,. UTILITY,. DEFECT,. CONSUMER,. WEA THER
,.
FOOD,. DEA TH
,.
COST
Record Number:
CTR9908050161
Copyright
1999,
Chicago Tribune
http://infoweb.newsbank.com.proxy.lib.uiowa.edu/iw-search/we/lnfoWeb
07/21/08
Electronic Filing - Received, Clerk's Office, August 4, 2008
Multi-Print Viewer
Page 1
of 4
HEAT STALKS CITY ELDERLY - DEATHS CLIMB; OFFICIALS WARN RISK NOT OVER-
RESIDENTS STEAM AS OUTAGES LINGER
Chicago Tribune
- August 1, 1999
Author:
Jeremy Manier and John Chase, Tribune Staff Writers.
In a frightening echo of 1995's heat disaster, the hottest days in the Chicago area in four years claimed as
many as 57 lives Friday and early Saturday, amid power outages that at times left up to 100,000 households
virtually defenseless against searing temperatures.
The Cook County medical examiner's office said Saturday that 25 deaths had been linked to temperatures that
topped 100 degrees and heat indexes that hovered near 120 on Thursday and Friday. Investigators also were
looking at 30 additional deaths in Cook County that they believed likely were heat related.
In addition, Lake County on Saturday reported two heat-related deaths.
Even with the new victims, the toll trails that of 1995, when 85 heat-related deaths occurred the first day after
the hottest temperatures, on the way to a total of more than 700 dead.
The danger is not past, Chicago officials said at a news conference.
"Just because it will be cooler today doesn't mean everyone will be able to get through," said Mayor Richard
Daley, who called on residents to help city workers look after the elderly and other groups at risk from the heat.
"You have to check on them, because you could save their life," Daley said.
Hope for relief came from forecasts that temperatures would drop further after a slight improvement Saturday,
with highs projected in the low 80s for Sunday and merciful lows in the mid-60s. The cooler temperatures
prompted the National Weather Service to cancel its heat advisory Saturday.
Residents and city officials on Saturday continued venting frustration with Commonwealth Edison over outages
that left 26,000 homes without power for more than 24 hours. As of 8 p.m., Com Ed officials said, 11,500 homes
citywide remained without power.
The North Side outage was caused by a transformer failure in a substation at Addison Street and California
Avenue. During the 1995 heat wave, the same substation suffered a fire that deprived 41,000 North Side
residents of power for more than a day.
Jacquelyn Heard, Daley's press secretary, said the mayor had not known the same substation was responsible
for both failures. But she expanded on Daley's comments at the earlier press conference, when he said he was
"upset" about the outage.
"I think people who lost power deserve some answers," Heard said. "The mayor was very clear he would hold
Com Ed responsible. We're going to see to it that they follow through with the work, and this is not just empty
promises."
Martin Cohen, executive director of the Citizens Utility Board, a watchdog group, was more direct in his
criticism.
"It's apparent the system on the North Side is not engineered properly," Cohen said. "That should have been
apparent four years ago. There aren't any excuses for not providing power when people most need it."
ComEd spokesman Steve Solomon said the eight transformers that failed at the station had been inspected
weekly. Some had been installed as far back as the early 1980s, he said, noting that such electrical equipment
can have a lifespan of 40 to 50 years under normal conditions.
http://infoweb.newsbank.com.proxy.lib.uiowa.edu/iw-search/we/InfoWeb
07/21/08
Electronic Filing - Received, Clerk's Office, August 4, 2008
Multi-Print Viewer
But the demand late last week was anything but normal.
Page 2 of4
"This isn't a situation of maintenance or upgrades not being done at that station," Solomon said. "This is a
situation of peak demand records being beaten five times in two weeks.
"Frankly, the system as a whole has held up extremely well."
Local power performance has been trouble-free compared to other cities this summer, Solomon said. In early
July, record temperatures topping 100 degrees caused blackouts affecting 200,000 residences in New York,
prompting Mayor Rudolph Giuliani to charge that the power utility was woefully unprepared.
After the lessons of 1995, no officials in Chicago could claim ignorance of the mayhem that heat can unleash.
The deaths and power crisis come despite a citywide emergency plan implemented after 1995 and forecasts
that accurately predicted high temperatures Thursday and Friday.
Power crews from as far away as Rockford and Maywood worked non-stop, beginning at 11 p.m. Friday night,
when a portable transformer was hauled to the Addison substation, ComEd officials said.
The mechanical problems with the transformers differ from those suffered at the substation in 1995, according to
ComEdo In 1995, transformers overloaded, but this year the transformers weren't considered stressed.
Crews worked all Saturday to bring the transformers online, but early estimates that the task would be
completed by mid-afternoon proved overly optimistic.
Steve Wickman, a Com Ed supervisor and substation engineer who is part of the team trying to bring the plant
back to power, said the temporary transformers carry about half the power of one of the failed transformers.
The two working transformers at the substation were hosed down by Chicago firefighters for most of the day to
keep them cool.
Although there was no way of knowing Saturday whether the North Side outage contributed to the death toll,
four victims at the medical examiner's office had addresses within the outage area or on its borders.
Cook County Medical Examiner Edmund Donoghue said he doubts the deaths were linked to power outages.
Heat-related deaths most often are the result of extended exposure to broiling conditions over a period of a day
or more, Donoghue said, so an outage late Friday might not have had much impact.
"People who had air conditioning would be cooled off already." Donoghue said. "A short power outage wouldn't
cause too many problems."
But he said the lack of air conditioning might be an issue if power outages continued for more than 24 hours.
That danger was a possibility late Saturday because of the thousands of residences still without power.
Donoghue also praised the city's emergency response plan for trying to find people suffering from the heat.
"I think the city has done everything they can," Donoghue said. "Older people are difficult to reach. When you
look into this, I think you'll find (the Victims) were people who were living alone."
Many heat deaths reported Saturday fit Donoghue's profile. Evelyn Doss, 86, had resisted getting air
conditioning for her home on the South Side, partly because it caused her arthritis to flare up, said Florida Ware,
a relative who lived nearby. residents. Such visits turned up four heat deaths Saturday, according to CHA
Director Phil Jackson.
The Chicago Police Department, the Department of Human Services and Department on Aging check on senior
citizens in nursing homes and others who ask at least once a day, according to officials.
If no one answers the phone or the person sounds weak, a squad car is sent to the home, and officers knock on
the door, question neighbors and try to contact relatives, police spokesman Pat Camden said. They also are
authorized to knock down a door.
http://infoweb.newsbank.com.proxy.lib.uiowa.edu/iw-search/we/lnfoWeb
07/21/08
Electronic Filing - Received, Clerk's Office, August 4, 2008
Multi-Print Viewer
Page 3
of4
Camden said Saturday that the Police Department had made 3,020 such checks since Thursday morning.
The definition of what exactly constitutes a heat-related death was questioned after the 1995 disaster. Some
local health officials balked at Donoghue's reports that hundreds of people had died from the heat, theorizing
that the heat was just the last stress for people who were close to death.
Donoghue and other medical examiners have since led attempts to create uniform guidelines. Victims typically
have body temperatures in excess of 105 degrees before they die, though experts say other factors can justify
classifying a death as heat-related.
The broader criteria include people with heart conditions who make an attempt to cool off before dying. Elevated
levels of certain liver and muscle enzymes or signs of mental disorientation can also lead to a verdict that heat
played a role.
Most victims are not near death when heat strikes, according to Donoghue. Otherwise, they already would be in
hospitals or nursing homes with air conditioning. The heat claims people who are frail but independent enough
to live on their own, who might have lived additional years if not for the heat.
The disproportionate toll in Cook County arises in part from the fact that Chicago's vast expanses of concrete
and asphalt tend to trap heat, yielding temperatures 3 to 4 degrees above those in the suburbs, experts say.
The city also is home to more poor residents who cannot afford air conditioning.
Before late Friday, the heat wave had claimed 13 lives in Cook County and one in Kane County in the past 10
days.
The weekend's only heat-related deaths outside Cook were the two in Lake County.
A 91-year-old Highland Park man died Saturday morning at Highland Park Hospital after suffering heat stroke at
home Friday night, said Jim Wipper, deputy coroner.
A Maryland woman in town to see her brother graduate from Great Lakes Naval Training Center died Thursday,
although Wipper said the heat was only a complicating factor to heart and respiratory problems.
Aside from the local crisis, nearly 100 heat-related deaths outside the Chicago area have been reported since
mid-July.
In more than a dozen states, people were found dead in homes and apartments without air conditioning or fans.
In Missouri, 39 deaths were blamed on the heat.
The lack of electricity for air conditioning drove multitudes into the streets or the lake, seeking relief. Chicago
Park District spokeswoman Angelynne Amores said an estimated 450,000 people stormed the lakefront Friday.
Adam Knoll, 69, spent the night sleeping on a pier near his home on Virginia Street along the north branch of
the Chicago River.
"The river was nice and cool," Knoll said.
Weighing stifling heat versus his safety on the street, Knoll said he chose the lesser of two evils.
"I didn't feel safe in the house where it was boiling," he said.
Tribune staff writers Anthony Colarossi, Bechetta Jackson, James Janega and Anthony Burke Boylan
contributed to this report.
Caption:
PHOTOS 2 GRAPHIC
PHOTO: Firefighters from Engine Company 106 pour water onto a working Com Ed transformer Saturday at
California Avenue and Addison Street. Tribune photo by Todd Panagopoulos. PHOTO (color): A body is placed
in a refrigerated truck outside the Cook County medical examiner's office after heat deaths overloaded the
facility. Tribune photo by Phil Greer. GRAPHIC: Blackouts hit the city At its worst, between 4 p.m. and 11 p.m.
Friday night, the outage affected 100,000 households in the Chicago area, inclUding 62,000 on the North and
http://infoweb.newsbank.com.proxy.lib.uiowa.edu/iw-search/we/lnfoWeb
07/21/08
Electronic Filing - Received, Clerk's Office, August 4, 2008
12462512
ATTACHMENT 5
LETTER FROM CHARLES C. COUTANT
TO
JULIA WOZNIAK, AUGUST 9, 2007
Electronic Filing - Received, Clerk's Office, August 4, 2008
Charles C. Coutant, Ph. D.
Aquatic Ecologist
August
9, 2007
Julia Wozniak
Senior Biologist, Environmental Services
Midwest Generation EME, LLC
One Financial Place
440 South LaSalle Street
Suite 3500
Chicago, IL 60605
Dear Julia:
120 Miramar Circle
Oak Ridge, TN 37830
865-483-5976
e-mail: ccoutant3@comcast.net
At your request, I have reviewed the August 2007 report, entitled "Development of
Biologically Based Thermal Limits for the Lower Des Plaines River," prepared for
Midwest Generation by EA Engineering, Science and Technology, Inc. (the
"EA
Report"). This letter provides my views and opinions concerning the methodology,
findings and recommendations contained in the EA report.
I understand I was asked to review the EA report as an independent expert who was not
involved with its preparation (other than providing editorial comments for clarity of
earlier drafts). My expertise in the subject includes a long career that emphasized thermal
effects on fish and other aquatic life. I retired in 2005 from the Oak Ridge National
Laboratory. I was principal author
of the Heat and Temperature chapter of the National
Academy
of ScienceslNational Academy of Engineering report Water Quality Criteria-
1972, and a co-author
of the US EPA's 1977 interagency guidance for implementing
Section 316(a)
of the Clean Water Act. I am familiar with the Lower Des Plaines River
from my work as co-chair
of the Upper Illinois Waterway Ecological Study Task Force in
the early 1990s, which involved stakeholder groups including US EPA, IEPA, IDNR,
MWRDGC, USFWS, Sierra Club and Commonwealth Edison.
The EA report is, in my opinion, technically sound and directed appropriately at the issue
of setting biologically based water temperature standards in the Lower Des Plaines River.
I base this opinion on the following points:
• I agree that carefully developed and thoughtfully analyzed field data are scientifically
superior to extrapolations from laboratory-derived temperature requirements for
evaluating fish community responses to temperature. Having been involved with both the
laboratory-based Academy report and the heavily field oriented 316(a) guidance, I can
objectively view the relative merits
of laboratory and field data for developing thermal
criteria and standards. The report provides both scientific and administrative justification
for emphasizing the field approach in this situation.
Electronic Filing - Received, Clerk's Office, August 4, 2008
• The technical analyses are appropriate and well done. Species richness and the
IWBmod are two widely accepted indices offish community health.
It
is reasonable to
compare each index with temperatures at time of fish collections. The author uses two
analytical methods for these indices, pair-wise ANOVA and Loess regression, to provide
useful weight
of evidence, rather than relying on one technique alone. The Loess
regression
is a particularly innovative way to obtain an second, independent evaluation.
The results are shown in tables and in well-prepared figures.
• The analysis
of winter thermal limits is consistent with EPA guidance, my own
development
of cold kill guidance for power plants (reference below), and the wintertime
conditions
of the Lower Des Plaines River.
• I agree with the EA report'sdiscussion
of the need for verification of data (for validity
and suitability) used for establishing water quality criteria and standards. The examples
provided from the Midwest Biodiversity Institute (MBI) report are clearly unacceptable
scientifically. To the degree that data evaluation and verification have not been done for
the database used by MBI for their recommendations to US EPA Region V and Illinois
EPA, I would put more credence on the field data and analyses given in the EA report.
• The EA report is consistent with my reading
of US EPA's overall guidance for water
quality criteria, whereby full protection of all species (including the most sensitive) is not
required and field studies are preferred (US EPA 1985, cited in the EA report).
• The EA report's numerical conclusions are supported by the technical analyses.
In summary, I found the EA report to be sound, consistent with recognized scientific
literature and administrative guidance, and with appropriate discussion justifying the
approach.
It is a valuable contribution toward development of rational thermal standards
for the Lower Des Plaines River.
Coutant,
C. C. 1977. Cold shock to aquatic organisms: guidance for power-plant siting,
design, and operation. Nucleaar Safety 18(3):329-342.
Electronic Filing - Received, Clerk's Office, August 4, 2008
Publication: HERALD-NEWS
Publication date:
08/1912002
By:
Fishermen died by drowning
CHANNAHON - Will County Coroner Patrick O'Neil'soffice ruled the
deaths of three fishermen whose bodies were found Saturday afternoon in the
Des Plaines River as drownlngs after autopsies were performed Sunday.
Rescue workers pulled the bodies
of William Weavers and Otis Brown, both
59 and from Chicago, and John M. Gaters, 58, ofDolton from the river a half-
mile upstream from Interstate
55 shortly before 5:30 p.m.
The fishermen launched a small, silver boat from
the marina at 6 a.m.,
according to eyewitness Melvin Minor of Joliet.
An hour later a barge tender saw the boat riding low in the water, and then
at
11 a.m. he spotted the capsized vessel drifting
in
the water.
Emergency personnel from Channahon, Minooka, Braidwood, Coal City,
Troy
and Wilmington fire departments, as well as Illinois Department of
Natural Resource's Conservation Police and Will County sheriffs police
joined in the
search for the missing men.
Weavers, Brown
and Gaters were not wearing life vests at the time, and
authorities do
not think they had any in the boat.
Windy weather, choppy water
and an overloaded boat probably caused the
accident, said Sgt.
Mark Simon, of the illinois Department of Natural
Resource'sConservation Police.
Gaters' son-in-law said the men were all experienced fishermen.
The coroner's office will conduct
an inquest at a later date once police reports
are completed.
5)th~~
11--9
~ot~9
V().e-/
o
?
IYlJJI
Electronic Filing - Received, Clerk's Office, August 4, 2008
~.
Center for Applied Bioassessment
&
Biocriteria
P.O. Box 21541
Columbus,
OR 43221.Q541
:
';:::·:·T~·mp'eratti.re
'Criteria
Options for the
' ..:..:: 'Lower
Des
.Plaines
River.
.
. ':,;'"
...:.....
Final Report
......
to
;,,',:;....'
lJ.~;~~D~::
V
'('~~~;':"1:\i~t.~(lJi~*~~'!!''i>
li~!f:;ii[:::"':;;
•
"i ..
::¢~:;~~!i6~;,;'
.. 7
',''}~;':} ':/~.;<:'~: ·:~,:?:(;i~·~:1:\~.:·'~~)~';'~~;:f'\(;'~1·;1;;t'4~.~!;f
i:\
,;.:.':<.:,i
( .. ::- ".: ".;:
: IllinbisEPA
·~·~·.;::l
:'. :"::'
:.:,:<.:'
;~))~/.:~~.:.~.:,<
..."
-,.
..':...
~~~~~.
;
....:.
r>
:..':':."
",: .,,::.:
;Dis
'. ;' ..
Plaines
'-
".
-..'
R.
~
below Dresden
.'.;
,"
.
:
'. ..
Dam
..' ,
(Hey&ASsoc.
.."..
2003)
,
...: .• ,.
November 23,2005
Chris O. Yoder, Research Director
Midwest Biodiversity Institute
P.O. Box
215641
Columbu~,
OH 43221.0561
and
Edward T. Rankin, Senior Research Associate
Center for Applied Bioassessment and Bioctiteria
P.O. Box
21541
Columbus,OH 43221.0541
Electronic Filing - Received, Clerk's Office, August 4, 2008
Appendix Table 1G. Thermal thresholds for secondary contact .use RAS list.
Fish Temperature Model-- Selected Species Report
MWAT
Upper
F.amily Species
Optimum. Growth Avoidance
UILT
Code
Code
Common Name
DC
DC
DC
DC
Latin Name
20
003
Gizzard Shad
30.0
31.9
34.0
35.8
Dorospma cepedianum
43
001
Common Carp
31.5
33.4
34.9
37.3
Cyprinus carpio
43
003
Golden Shiner
27.8
29.9
30.7
34.0
Nptemigonus crysoleucas
43
042
Fathead Minnow
27.7
30.0
31.5
34.5
Pimephales promelas
43
043
Bluntnose Minnow
27.5
29.1
31.4
32.4
. Pimephales notatus
47
006
Black Bullhead
27.6
30.2
32.1
35.4
Ameiurus melas
77
006
Largemouth Bass
29.1
30.9
31.6
34.5
Micropterus salmoides
77
008
Green Sunfish
27.8
30.3
30.9
35.3
Lepomis cyanellus
70
Electronic Filing - Received, Clerk's Office, August 4, 2008
CABB/MBl
Lower Des Plaines Temperature Criteria Options. REVISED
July II, 2001
Table 3. Fish temperature model outputs (OFlOC]) for fish species representative of a
modified use
(twO versions) and the Secondary Contact/Indigenous Aquatic Life use
for the Lower Des Plaines River. The long-term and short-term survival temperatures
represent
summer season (June 16 - September 15) average and maxima.
Thermal
Category
Proportion of Representative Fish Species
100%
90%
75%
50%
Modified Use RAS
1 (includes
golden redhorse)
Optimum
71.2 (21.8)
75.4
<24.1)
81.3 (27.4)
82.6 (28.1)
Growth (MWA
n
71.5 (25.3)
81.0 (27.2)
85.8 (29.9)
86.700.4)
Avoidance (UAn
83.7 (28.7)
84.9 (29.4)
87.1 (30.6)
88.9 (31.6)
Survival (Long-term)
85.1 (29.5)
86.5 (30.3)
89.1 (31.7)
91.4 (33.0)
Survival (Short-term)
88.7 (31.5)
90.1 (32.3)
92.7 (33.7)
95.0 (35.0)
Modified Use RAS
2 (excludes golden
Tedhorse)
Optimum
71.2 (21.8)
75.0 (23.9)
81.5 (27.5)
82.8 (28.2)
Growth (MWAn
77.5 (25.3)
80.6
<27.0)
85.8 (29.9)
86.900.5)
Avoidance (UA
n
83.7 (28.7)
85.6 (29.8)
87.400.8)
89.101.7)
Survival (Long-term).
85.1 (29.5)
86.500.3)
89.802.1)
91.4<33.0)
Survival (Short-term)
88.7 01.5)
90.1 02.3)
93.4 (34.1)
95.0 (35.0)
Secondary Contact/lndigenous Aquatic Life
Optimum
81.5 (27.5)
81.7 (27.6)
81.9 (27.7)
82.1 (27.8)
Growth (MWA1)
84.5 (29.1)
85.3 (29.7)
86.000.0)
86.5 (30.3)
Avoidance (UAn
87.3 (30.7)
87.500.8)
88.3 (31.3)
88.9 (31.6)
Survival (Long-term)
86.700.4)
88.7 (31.5)
90.302.4)
91.2 (32.9)
Survival (Short-term)
90.3 (32.4)
92.2 (33.5)
93.9 (34.4)
94.804.9)
Electronic Filing - Received, Clerk's Office, August 4, 2008
'l.'i\l!t.E 14.
SPECIES
SEGMENTS
COMPOSITION,
OF THE UPPER
NUMBER,
ILLINOIS
AND
WATERWAY,
RELAT~
1994,
ABUNDANCE
1995,
OF
2000-2002,
FISH COLLECTED
AND 2005-2006.
IrITHIN FOUR
-
I
1994
1995
2000
LONER
2001
LOCKPORT POOL
2002
2005
2006
I
Sl?ECIES
_*__%__*__%__
If-
_%__IL _%__
fL
_%__
fL
_%__IL _%_
I
SlUPJACK HERRING
2
0.1
1
0.1
GI:I:= SHAD
1
1.7
33
20.5
404
64.0 1615 66.8
2500
75.8 1245 71.2
629 61.5
TllREADFIN SHAD
4
0.6
RAIN:aOW TROUT
1
0.2
I
GRASS PICKEREL
5
0.8
0.0
NORTHERN PIKE
1
0.1
GOLDFISH
a
13.8
2
1.3
2
0.1
COMMON CARP
29
50.0
18
11.3
53
e.4
70
2.9
140
4.2
eo
4.6
38
3.7
CARP XGOWFISH lfYllRID
3
5.2
8
5.0
1
0.2
1
0.0
2
0.1
1
0.1
I
GOLDEN SHINER
1
1.7
15
0.5
EMERALD SHINER
3
5.2
21
13.1
50
1.9
178
7.4
178
5.4
24
1.4
59
5.8
SPOTTAlt. SHINER
3
0.1
1
0.0
2
0.2
SPOTFIN SHINER
1
1.7
16
2.5
6
0.2
20
0.6
2
0.1
SAND SHINER
1
0.0
I
BLUNTNOSE MINNOW
2
3.4
2
1.3
37
5.9
383 15.8
188
5.7
314
le.O
140 13.7
FATHEAD MINNOW
1
1.7
1
0.6
1
0.0
8
0.2
1
0.1
1
0.1
BIJLLllE.AD MINNOW
1
0.0
WHITE SUCKER
1
0.0
ORIENTAL WEATHERFISH
1
0.2
0.1
0.3
11
BLACK BIJLLllE.AD
3
0.1
YELLOW BIJLLllE.AD
4
0.1
3
0.2
1
0.1
CHANNEt. CATFISH
1
0.6
0.8
20
0.8
22
0.7
10
0.6
13
1.3
TADPOLE MADTOM
1
0.0
1
0.0
BLACKSTRIPE TOPMINNOW
1
0.01
3
0.1
1
0.1
WESTERN
I~OSQUITOFISH
6.9
2
0.3
27
0.8
1
0.1
1
0.1
I
BROOK SILVERSIDE
1
0.0
THREES PINE STICKLEBACK
1
1.7
WHITE PERCH
10
0.4
WHITE BASS
1
0.0
YELLOW BASS
1
0.6
I
GREEN SUNFISH
1
1.7
6
3.8
16
2.5
75
3.1
110
3.3
14
o.e
31
3.0
PUMPKINSEED
3
0.5
3
0.1
10
0.3
55
5.4
Wl\1\bIOUTH
1
0.0
ORANGESPOTTED SUNFISH
3
0.1
1
0.1
BLUEGILL
3.4
4
0.6
19
0.8
27
0.8
10
0.6
7
0.7
I
LONGEAR SUNFISH
1
0.6
1
0.0
REDEAR SUNFISH
1
0.1
lfYllRID SUNFISH
1
1.7
1
0.0
2
0.1
10
0.6
3
0.3
ONID LEPOMIS
2
0.1
BMALLMOUTll BASS
1
0.6
1
0.0
1
0.0
1
0.1
I
LARGEMOUTH BASS
64
40.0
2a
4.4
22
0.9
17
0.5
23
1.3
27
2.6
waITE CRAPPIE
2
0.1
BLACK CRAPPIE
1
0.6
1
0.0
FRESHWATER DRUM
1
0.0
3
0.1
5
0.3
6
0.6
ROUND GOBY
4
0.1
1
0.1
1
0.1
I
TOTAL FISll
58
100.0
160
100.0
631 100.0 2417
100.0 3297 100.0
1748
100.0 1022 100.0
CATCH PER GEAR EFFORT
4
11
16
60
82
44
26
TOTAl:. SPECIES
1Z
13
16
22
28
17
20
I
I
I
-
I
4-6
-
Electronic Filing - Received, Clerk's Office, August 4, 2008
....
-~.
""" ":'.-:.;
"
.',
August 2007
Electronic Filing - Received, Clerk's Office, August 4, 2008
Section 4
.Characterization of
Waterway Reaches
SOD data was available for one study conducted by MWRDGC in the fall and winter
of 2001 that included three locations along the esse. Measurements performed on
sediments at Cicero, I-55, and Lockport were 1.71,3.64, and 2.71 g/m
2
/day
respectively.
4.4.4 Biological Assessment
4.4.4.1 Fish
Chicago Sanitary Ship Canal
Fish sampling in the CSSC was conducted at five MWRDGe locations:
•
DamenAvenue
•
Cicero Avenue
•
Harlem Avenue
•
Willow Springs
•
LP&L (16th Street)
Twenty-seven species of fish (excluding hybrids) were captured
in the esse from
1993 to 2002, with the dominant fish species being common carp, gizzard shad,
goldfish, and bluntnose minnow (Table 4-47). Dominant game fish species included
largemouth bass, pumpkinseed and bluegill.
Th~greatest
Specie:; diversity (19species) was observed at Cicero Avenue, with
lm.vest giversicty being at Damen Avenue. Species diversity showed a general decline
in the 1990s, and began to rebound in 2001 (Figure 4-32). ffiI scores ranged from 12 to
24 and were fairly uniform throughout the esse (Figure 4-33). The median ffil score
for the ess fish sampling sites was 18. These ffiI scores are reflective of poor to very
poor water quality conditions in the esse.
4.4.4.2 Macroinvertebrates
MWRDGe sampled macroinvertebrates at six locations in the esse during 2001 and
2002.
•
Damen Avenue
•
Cicero Avenue
•
Harlem Avenue
•
Route83
•
Stephen Street
•
LP&L
(16
th
Street)
4-77
11S11svr1lcommon1CAWS UM\AUglISl odh&IFINAL SECTION 4.doc
Electronic Filing - Received, Clerk's Office, August 4, 2008
lTable 4.47 Species
Ri~h~~~'~nd-R~~;i~~-Ab~~~i~~~~~fF~~
s;;~~in-;h~
CSSC1993-:'2~~;~~i"s;;;ii~~-L~~~;i~~~"r'""'"'"'"
--"
"J"
j
.
--.. -r------
----
.
__
.
._--
.
_--
--
....
._--
._
......
-
...
--
.....v.
....."'..
I
•
0 •• _
.
..
..
•
I
•
IAJosa
pseudoharenaus
• alewie
I
I
0.18
I
I
I
I
I
I
I
DorosomaCarassius
auratus
cepedianum
- goldfish
• gizzard
.
shad
I.'
.
. .
.
34.46
8.85
10.04
3.70
I
12.02
12.31
I
30.584.69
I
14.21
0.55
I
14.171.35
I
43.52
43.78
I
44.48
0.57
31.600.84
CyprinelJa spiJoptera
-
spolin
shiner
0.15
0.28
1.01
GYDrinus caroio
•
COIlllllll
carD
14.33
23.50
49.26
49.03
68.31
16.69
20.12
46.59
38.24
32.10
Notem~onus
avsoleucas
- golden shiner
1.25
0.53
0.74
0.55
1.18
3.70
Notroois atherinoides
- emerald shiner
0.08
0.09
0.15
0.55
0.30
0.85
2.52
Notropis hudson/us
• spo1lail shiner
0.23
0.09
Notropis volucellus.
Meshiner
0.17
Pimeohales notatus
• blunlnose minnow
34.93
31.69
8.01
0.49
2.19
60.88
29.51
3.97
6.72
Pimepha/es promelas
- fathead rrinnow
3.13
25.70
1.63
0.67
0.30
Carp x goldfish
0.78
0.88
1.48
1.29
0.55
0.40
0.85
0.17
•I
I
.. '
I
Gatostomus lXJmmersoni
• while sucker
I
I
I
I
I
I
I
0.45
I
I
I
I
I
Erimyzon oblongus
• creek chubsucker
I
0.08
I
I
I
I
I
I
I
I
I
I
I.'
IAmelUrusmelas
• blackbullhead
I
0.16
I
0.18
I
0.15
I
I
I
0.17
I
I
0.80
I
I
I
Ameiurus nata6s
• yeUow bullhead
J
J
0.30
I
0.16
I
0.15
J
0.80
J
0.28
J
1.01
J
I/ctaJurus punctatus
- channel calfish
I
I
I
I
I
I
I
0.28
I
0.67
I
Umbra limi
• cenlrallllJd!tinnow
• 1.-
I
.
I
I
0.09
I
I
I
I
I
I
I
I
I
',-
I.'
• I" ...
I
Gambusia
affUJis
•
moSQuitlish
I
I
0.09
I
I
I
I
0.17
I
I
I
0.57
I
8.74
I
. .
- '0"
" .. ..
."
I
I
GasteroS/sus acu/eatus
- threespine sfckleback
I
I
I
I
1.13
I
I
I
,
J
I
J
•• I.-
. .
....
: .
I
Morone chrysops.
white bass
I
I
I
I
I
I
0.15
I
I
I
I
I
Morone mississippiensis.
yeUow bass
I
0.47
II
I
.. '
•
I
I
..
: .
Leoomis cvaneHus
• green sunish
0.16
0.35
1.48
0.32
1.09
0.34
0.15
1.42
0.84
Lepomis gibbosus
• DUIlllkinseed
0.18
0.30
0.65
0.34
2.53
4.42
6.52
7.73
Leoomis macrochirus
• blueaill
0.23
0.09
0.45
1.78
2.02
0.30
1.13
1.18
Microoterus salmoides
• Iargemoutl bass
0.86
2.55
11.72
9.55
12.02
1.69
2.38
3.21
0.57
1.01
Pomoxis niaromaculatus
- black crappie
0.09
0.32
Pumpkinseed x Bluegill hybrid
0.17
Seiaenidae: Coakers and Drums
CONI
I\SU",rl_nICAWS UMlAugusl editslANAL SECTION '.doc
.
~
..!.
4-78
.L
~
j..
.-, •. j ..
.l
Electronic Filing - Received, Clerk's Office, August 4, 2008
Figure 4-32. Temporal Trend in Fish Species Diversity in the
esse
1993.2002
20
18
18
14
!
12
'010
j
E 8
::I
Z
1993
1994
1995
1996
1997
Year
1998
1999
2000
2001
2002
CDM
Figure 4-33. IBI Scores for Fish Sampling Locations on the
esse
1992 • 2002
30
25
20
15
10
o
~ ~!G'!1>'">!1>'">
\I' \I' \I'
~ ~ ~!i>!i>!i>
~ ~ ~
9J>!1>'IJ!1>'IJ
~!1>'"
~
<9
sf'ft s>" s>" I)"
,g,
s>'l, I)'l,
~~#~~#~~#~~##~~#~##~##~~~#~#~~#~
Slmpllng Olle
1__
Damen Ave ---Cicero Ave
Harlem Ava ....... Willow Springs ....LOCkport
I
Tables 4-48 shows the relative abundance, species richness and associated MBI score
for
both MWRDGC HD and PP dredge sample collection methods. Thirty-one
species of macroinvertebrates
were collected in the esse. Species richness for the
MWRDGC
HD data set was highest at the Lockport sampling location (14 species).
4.79
\\~!IM1'~l"IfN11nmCAWS
UAA\AuauSt edits\FtNAl SECTION
4.doc
Electronic Filing - Received, Clerk's Office, August 4, 2008
Section 4
Characterization
of Waterway Reaches
Dominant taxa
in
the CSSC was Oligochaeta (82%), followed by Turbellaria and
Dicrotendipes simpsoni .
.MBI scores for HD sampling data ranged from 6.4 at Damen
Avenue to 9.6 at Cicero Avenue,
and the PP dredge MBI scores ranged from 7.0 at
Damen Avenue to 10.0 at Lockport. Additional data collected
in
2001 by MWRDGC
at Lockport, showed three caddisfly taxa present. The high MBI scores are reflective
of a
poor to very poor water quality conditions
in
the CSSe.
4.4.4.3 Habitat
Rankin's(2004) habitat evaluation showed that the CSSC instream habitat ranged
from
poor to very poor. The habitat at L, Romeoville and Willow Springs Road was
canal-like with steep sides and little functional cover for fish (Table 4-49). Limiting
factors for the
CSSC include:
•
Silty substrates
•
Poor substrate material
•
Little instream cover
•
Channelization
•
No sinuosity
The stretch
of waterway between Harlem and Cicero avenues had some shoreline
shallows
that provided suitable habitat to support a slightly better community than
found
in
the remainder of the CSSC channel (Rankin 2004). Rankin categorized the
Harlem to Cicero street section as
MWH~C,
while the other portions of the CSSC were
considered a LRW according to Ohio EPA'sclassification system.
4.4.5 IEPA Letter Response Request
As part of this UAA study, IEPA requested from communities along the CSSC
if
they
had plans for instream habitat improvements or the development of swimming areas.
There
were no responses back to IEPA from the municipalities contacted.
4.5 Calumet System
The Calumet System consists of the Calumet-Sag Channel, the east and west segments
of the Little Calumet River, North Leg, the GCR, the Calumet River and Lake
Calumet. The total segment
length is 26.2 miles.
4-80
Electronic Filing - Received, Clerk's Office, August 4, 2008
12462512
ATTACHMENT 6
MAXIMUM AND PERIOD AVERAGE TEMPERATURES
AT CICERO AVENUE ON SHIP CANAL
Electronic Filing - Received, Clerk's Office, August 4, 2008
CSSC Cicero Avenue
Upstream of MWRDGC Stickney
100.00
90.00
80.00
0
u..
or
~
-
..
::l
'"
c.
~
70.00
I-
..
E
60.00
50.00
I
-esse
Max T
-Period Avg Proposal I
Jan-99
Jul-99
Jan-OO
Jul-OO
Jan-01
Jul-01
Jan-02
Jul-02
40.00I
I
;
I
Aug-98
Electronic Filing - Received, Clerk's Office, August 4, 2008
CSSC Cicero Avenue
Upstream
of MWRDGC Stickney
110.00 I
I
100.00
90.00
0
...
.,
~
80.00
-
..
:>
~
'"
Co
E
70.00
I-
'"
60.00
50.00
1 -esse
-Period Avg Proposal
.1
i
i
~
Jan-99
Jul-99
Jan-DO
Jut-DO
Jan-01
Jut-01
Jan-02
Jul-02
40.00
I,
, I
Aug-98
Electronic Filing - Received, Clerk's Office, August 4, 2008
12462512
ATTACHMENT 7
FISH DATA ON THE UPPER ILLINOIS WATERWAY
Electronic Filing - Received, Clerk's Office, August 4, 2008
I
I
I
I
I
I
l
I
I
I
I
I
I
................................................................
2006 UPPER ILLINOIS WATERWAY
Back to top
FISHERIES INVESTIGATION
Back to top
RM 274.4-296.0
Prepared for:
Midwest Generation EME, LLC
One Financial Place
440
S. LaSalle Street, Suite 3500
Chicago, IL 60605
Prepared by:
EA Engineering, Science, and Technology
444 Lake Cook Road, Suite 18
Deerfield,
IL 60015
March 2008
Electronic Filing - Received, Clerk's Office, August 4, 2008
Electronic Filing - Received, Clerk's Office, August 4, 2008
TABLE 13.
SPECIES COMPOSITION, NUMBER. AND RELATIVE ABUNDANCE OF FISH COLLECTED FROM THE UPPER ILLINOIS
WATERWAY, 1994. 1995, 2000-2002,
AND
2005-2006.
1994
1995
2000
2001
2002
2005
2006
SPECIES
1
0.02
1
0.02
2
0.05
5
0.12
12
0.29
36
0.88
10
0.25
5
0.12
14
0.34
1
0.02
II
II
I
I
I
0.08
2.07
0.11
0.01
1.09
0.00
0.00
0.01
0.04
1.21
0.04
0.04
0.05
0.00
0.02
0.39
0.01
0.07
0.09
0.01
9.19
0.12
0.83
0.00
0.22
0.03
0.04
0.07
3.92
0.53
0.00
15.51
0.50
34.54
0.06
1.03
1.91
15.96
0.12
0.01
1.33
0.10
18
460
24
2
1
9
10
241
5
86
2
1
1
3
9
34
0.15
259
1.17
1
49
6
19
0.09
2
0.01
259
1.17
277
1.25
III
0.50
1
0.00
268
8
1
0.00
5
0.02
1
0.00
3
0.01
8
16
869
117
15
20
3
2,038
27
185
1
3,441
112
423
3,541
27
3
296
22
7.661
14
228
0.55
0.02
0.02
0.02
0.06
0.01
1.58
0.00
0.06
0.06
0.00
0.12
0.34
0.01
0.01
0.04
0.01
0.01
0.01
0.23
0.01
3.98
0.03
0.46
0.02
29.79
0.01
1.59
0.29
0.01
0.02
0.00
0.00
26.54
0.09
2.34
0.03
2.93
0.03
0.00
1.07
20.39
0.09
0.00
0.74
1.S5
6
17
4
493
1
168
5
3
3
19
19
1
36
103
2
2
5
11
10
0.03
5
0.02
119
0.39
196
0.64
168
0.55
2
0.01
4
0.01
3
0.01
1
0.00
33
0.11
212
0.69
5
9,101
2
3
70
2
1,217
9
l41
4a5
8a
2
5
1
1
8,106
24
716
9
995
10
1
328
6,224
26
1
227
564
0.09
0.57
0.03
0.00
0.01
0.01
0.01
0.09
0.04
0.07
0.00
0.08
37.12
0.40
0.00
0.11
0.04
0.04
0.01
2.69
0.10
0.01
0.00
0.15
0.01
11.49
0.02
0.19
0.01
0.78
0.00
0.98
0.23
0.00
0.00
11.05
0.09
0.50
0.03
8.77
0.09
0.01
3.54
13.49
0.14
0.01
0.63
0.04
19
9
15
1
20
121
7
1
2
3
1
23
8
2
4
0.02
69
0.33
262
1.24
7
0.03
l4
0.07
3
0.01
9
2
568
21
2
1
32
2
2,426
4
40
2
164
1
207
48
1
5
0.02
3
0.01
34
0.16
132
0.62
17
0.08
1
0.00
16
7,841
84
1
2,334
IB
106
6
1,852
18
2
747
2,849
29
3
134
8
0.01
0.08
0.05
0.01
0.11
0.04
0.02
4.56
0.21
8.10
0.02
0.13
0.10
3.26
0.01
1.00
0.20
0.01
0.03
0.10
0.25
0.74
0.02
0.02
0.01
0.01
0.01
0.17
34.64
0.79
18.08
0.01
2.33
0.02
0.13
0.11
0.01
0.41
0.19
0.04
5.03
0.02
0.01
0.8B
12.65
0.23
4
16
8
1
18
6
3
719
33
39
116
3
3
2
2
15
2
13
513
1
158
31
2
1
27
5,459
124
3
0.02
32
0.20
10
O. 06
10
O. 06
26
0.16
196
1. 24
1
0.01
7
0.04
2
0.01
20
0.13
23
0.15
10
0.06
2,849
2
367
3
20
17
1,276
3
21
64
30
2
7
792
3
1
138
1,993
37
0.06
0.09
0.03
0.29
5.43
0.41
2.41
0.01
1.23
0.10
2.12
0.45
0.02
4.35
0.01
0.04
0.74
0.04
0.04
0.19
0.13
0.02
0.20
0.01
0.03
21.07
1.43
0.01
12.36
1.14
0.03
0.06
l4.84
0.03
0.01
2.50
18.65
0.25
7
5
86
5
5
11
3
2
23
1
22
15
1
34
52
2
507
633
48
281
1
143
12
247
19
0.16
9
0.08
7
0.06
1
0.01
1
0.01
48
0.41
159
1.36
1
0.01
51
0.08
2
0.02
74
0.63
57
0.49
4
0.03
3
2,457
167
1
1,441
133
3
7
1,731
4
1
291
2,175
29
0.10
0.01
7.52
2.57
1.55
0.03
0.03
0.03
5.00
1.02
0.07
0.38
0.31
0.15
0.01
0.07
0.01
0.44
0.64
0.03
0.03
0.04
0.30
0.37
2.41
2.68
0.03
0.04
1.64
1.517
0.01
53.40
0.18
2.94
0.01
0.25
0.25
7
1
508
3
21
10
1
5
1
30
43
2
2
26
.20
25
338
59
105
2
2
174
1
0.01
2
0.03
7
0.10
2
0.03
23
0.34
3
III
14
0.21
1
0.01
11
0.16
37
0.55
133
1
163
181
2
3,609
12
199
1
17
17
0.37
0.39
5.10
0.02
0.39
0.22
0.05
8.33
0.12
0.56
0.05
0.71
0.10
0.29
0.25
1.64
0.61
0.15
0.69
0.02
0.07
0.02
5.56
0.07
2.38
1.10
0.17
0.12
2.18
0.10
20.83
11.54
1.57
25.91
0.02
1.45
97
45
7
5
89
3
1
6
28
1
67
25
2
29
12
10
16
9
2
4
15
16
1
4
850
340
5
23
471
64
208
227
3
1,057
1
59
LONGNOSE GAR
UNID GAR
BOWFIN
SKIPJACK HERRING
GIZZlUU> SliAD
THl\EADFIN SllAD
RAINBOW TROUT
CENTRAL MUDMINNOW
GRASS PICKEREL
NORTHERN PI:KE
CENTRAL S'l'ONEROLLER
GOLDFISH
GRASS CUP
COMMON CARP
CARP
~
GOLDFISH HYBRID
IlIGHEAD CARP
HOIUrfflEAD CRUll
GOLDEN SHINER
PALLID SHINER
EMERALD SH:I:NER
GHOST SRINER
STRIPED SHINER
BIGMOUTH SHINER
SPOTTAIL SHINER
RED SHINER
SPOTFIN SH:I:NER
SAND SHINER
REDFIN SHINER
MIMIC SHINER
UNID NOTROPIS
SUCKERMOUTH MINNOW
BLUNTNOSE MINNOW
FATHEAD MINNOW
BULLHEAD IUNNOW
CREEK CHUB
RJ:VER CARPSUCKER
QUILLBACK
UNID CARPIODES
WHITE SUCKER
SMALLMOUTH BUFFALO
BIGMOUTII llUFFALO
BLACK lJIUFFALO
SPOTTilO SUCKilR
SILVliIR REDHORSE
RIVER REDHORSE
BLACK REDHORSE
GOLDEN REDRORSE
SRORTKEAD lU:OHORSE
UNIO
MO~OSTOlolA
UNID CATOSTOMINAE
UNID ICTIOBINAE
ORIENTAL WEA'l'HERl!'ISH
BLACK l:IULLHEAD
YilLLOW BULLHEAD
CIlANNEL CATFISH
UNID AMEIURUS
TADPOLJ;: MADTOM
FLATHEAD CATFISH
BLACKSTRIPE TOPMINNOW
WESTERN MOSQUITOFISH
BROOK SILVERSIDE
THREESPlNE
STICKLEl:IACK
WHITE PERCH
WHITE BASS
YELLOW l:IASS
YilLLOW BASS IWHITE PERCH
HyaRID MORONE
UNID MORONE
ROCK BASS
GREEN SUNF:I:SIl
PUMPKINSEED
WAlUlOUTR
ORANGESPOTTED SUNFISH
BLUEGJ:LL
LONGEAR SUNFISH
REDEAR SUNFISH
HyaRJ:D SUNli'J:SH
UNJ:D LEPOMJ:S
4-4
Electronic Filing - Received, Clerk's Office, August 4, 2008
I
I
I
I
I
I
TABLE :1.3
(cont.)
1994
1995
2000
2001
2002
2005
2006
SPECIES
_*__
%__11__
%__
11__%__11__%__11__%__
If__
%__
If__%_
SMALlMOUTH SASS
25
0.61
33
0.49
27
0.23
46
0.29
99
0.47
35
0.11
38
0.17
l..ARGEMOUTH BASS
77
1.89
658
9.74
492
4.22
274
1.74
4046
2.11
354
1.16
693
3.12
UNID MICROPTERUS
8
0.12
1
0.00
WllITE CRAPPIE
6
0.15
7
0.06
7
0.03
2
0.01
aU<CK CRAPPIE
1
0.02
3
0.04
13
0.11
3
0.02
20
0.09
4
0.01
4
0.02
JOIDIN'Y DARTER
2
0.05
43
0.64
1
0.01
7
0.04
2
0.01
3
0.01
14
0.06
r,oOl'ERCH
1
0.02
4
0.06
9
o.oa
11
0.07
15
0.07
33
0.11
17
o.oa
BU<CKSIDE: DARTER
1
0.01
1
0.01
1
0.00
5
0.02
1
0.00
SLE:NDERHEAD DARTER
2
0.02
2.
0.01
1
0.00
1
0.00
SIIUOEn
1
0.00
WlILLEYE
1
0.00
FRESHWATER DRUM
79
1.94
61
0.90
121
1.09
129
0.82
151
0.71
103
0.34
lOB
0.49
ROUND GOBlI
2
0.02
5
0.03
18
0.09
105
0.34
62
0.29
TOTAL FISH
4,OBO 100.00 6,159 100.00
:1.1,661
100.00
15,760
100.00
21,123
100.00
30,547
100.00
22,163 100.00
TOTAL Sl'Ecn:s
46
48
55
61
66
61
56
~OTE,
DATA COMl'ARED ARE FROM
ELECTROli'ISHI~
~ SEI~~O DURI~G
THE PERIon OF
MAY~SEl'TEMBER
AT THE
S~
LOCATIONS,
EXCEPT THAT LOCATION 302B WAS
SUBSTI~ED
FOR LOCATION 302C IN LOWEn LOCKPORT POOL BEGINNING IN 2001
~
LOCATION
405 IN THE UPSTRElIM I-55 SEGMENT WAS NOT Sl\MPLED
I~
2000.
DATA FROM THE FOLLOWING
LOCATIO~S (~
YE.l\.RS)
ARE EXCLUDED'
LOCATION
308 (1994, :1.995,
~
2000),
LOCATIO~
404A (2001. 2002, 2005,
~
2006), AND LOCATION 409 (1994 AND 1995).
0.00 DENOTES VALUES LESS THAN 0.005.
4-5
Electronic Filing - Received, Clerk's Office, August 4, 2008
I
TABLE 14.
SPECIES
SEGMENTS
COMPOSITION,
OF THE UPPER
NUMBER,
ILLINOIS
AND
WATERWAY,
RELATJ;VJ;;
1994,
ABUNDANCE
1995,
OF
2000-2002,
FISIl COLLECTED
AND 2005-2006.
WITHIN FOUR
I
1994
1995
2000
LOWER LOCKPORT
2001
POOL
2002
2005
2006
11
SJ.>ECIES
_iL _%__i __%__Ie _%__11__
%__
II- _%__L _%_
_ II-
_%_
I
SKIPJACK HERRING
2
0.1
1
0.1
GIZZARD SIlAD
1
1.7
33 20.6
404
64.0 1615
66.9 2500 75.8
1245
71.2
529 61.5
TllREADFIN SHAD
4
0.6
RAINBOW TROU'l'
1
0.2
Ii
GRASS PICKEREL
5
0.8
0.0
NORTHERN PIKE
1
0.1
GOLDFISH
8
13.9
2
1.3
2
0.1
COMMON CARP
29
50.0
18 11.3
53
8.4
70
2.9
140
4.2
80
4.6
38
3.7
CARP X GQWFISH HYBRID
3
5.2
8
5.0
1
0.2
1
0.0
2
0.1
1
0.1
I
GOLDEN SHINER
1
1.7
15
0.5
EMERALD SHINER
3
5.2
21
13.1
50
7.9
178
7.4
178
5.4
24
1.4
59
5.8
SPOTTAIL SHINER
3
0.1
1
0.0
2
0.2
SPOTFIN SHINER
1
1.7
16
2.5
6
0.2
20
0.6
2
0.1
SAND SHINER
1
0.0
I
at.UNTNOSE MINNOW
2
3.4
2
1.3
37
5.9
383
15.8
188
5.7
314
18.0
140 13.7
FA'I'IlEAD MINNOW
1
1.7
1
0.6
1
0.0
8
0.2
1
0.1
1
0.1
aULr.HEA.D MINNOW
1
0.0
WHITE SUCKER
1
0.0
ORIENTAL WEATHERFISH
1
0.2
1
0.1
3
0.3
I
aLACK aULLHEAD
3
0.1
YELLOW BULIJIEAl)
4
0.1
3
0.2
1
0.1
CRANNEL CATFISH
1
0.6
0.8
20
0.8
22
0.7
10
0.6
13
1.3
TADPOLE MADTOM
1
0.0
1
0.0
BLACKSTRIPE TOPMINNOW
1
0.2
3
0.1
1
0.1
I
WESTERN MOSQUITOFISIl
6.9
2
0.3
27
0.8
1
0.1
1
0.1
SROOK SILVERSIOE
1
0.0
TIlR.EESPINE STICKLEBACK
1
1.7
WHITE PERCH
10
0.4
WIlI'rE BASS
1
0.0
YEr..WW BASS
1
0.6
I
GREEN SUNFISH
1
1.7
6
3.8
16
2.5
75
3.1
110
3.3
14
0.8
31
3.0
PUMPKIliISEED
3
0.5
3
0.1
10
0.3
55
5.4
WAllblOUTH
1
0.0
ORANGESPOTTED
SUNFISH
3
0.1
1
0.1
Bt.URGILL
3.4
4
0.6
19
0.8
27
0.8
10
0.6
7
0.7
I
LOliIGEAR SUNFISH
1
0.6
1
0.0
REDEAlt SUNFISH
1
0.1
HYBRID SUNFISH
1
1.7
1
0.0
2
0.1
10
0.6
3
0.3
UNID LEPOMIS
2
ILl
SMALLMOUTH BASS
1
0.6
1
0.0
1
0.0
1
0.1
I
LARGEMOUTIi BASS
64
40.0
28
4.4
22
0.9
17
0.5
23
1.3
27
2.6
WHITE CRAPPI:E
2
0.1
BLACK CRAPPI:E
1
0.6
1
0.0
FRESHWATER DRUM
1
0.0
3
0.1
5
0.3
6
0.6
ROUND GOBY
4
0.1
1
0.1
1
0.1
II
TOTAL FISH
58 100.0
160
100.0
631
100.0 2417
100.0
3297 100.0
1748 100.0
1022 100.0
CATCH PER G&AR EFFORT
4
11
16
60
82
44
26
TOTlIL SPECIES
12
13
16
22
28
17
20
I
I
I
-
I
4-6
I
Electronic Filing - Received, Clerk's Office, August 4, 2008
I
II
TARr.E 14
(cont.)
I
BRANDON POOr.
1994
1995
2000
2001
2002
200S
2006
SPECIES
II
_tL _%__*__..__*__%__I"- _%__*__%__IL _%__*__%_
SKIPJACK HERRING
1
0.1
1
0.0
1
0.0
10
0.4
G
0.1
2
0.1
GIZZARD SHAD
37
5.1
82
3.5
510
17.6
862
33.5 2076 42.8 13<18
39.9
514 14.3
THREAD!"IN BlIAO
31
1.1
52
2.0
22
0.5
6
0.2
II
CENTRAL MUDMINNOW
2
0.1
GRASS PICKEREr.
21
0.9
3
0.1
1
0.0
1
0.0
CENTRAL BTONEROr.r.ER
1
0.0
GOLDFISH
16
2.2
19
0.8
3
0.1
1
0.0
3
0.1
2
0.1
1
0.0
GRASS CARP
1
0.0
1
0.0
-
COMMON CARP
199
27.6
98
4.2
281
9.7
202
7.8
132
2.1
84
2.5
81
2.4
CARP X GOLDFISH H'illRIO
17
2.4
9
0.4
15
0.5
10
0.4
1
0.0
1
0.0
5
0.1
GOLlJIl:N SHINER
3
0.1
44
1.5
2
0.1
3
0.1
5
0.1
3
0.1
EMBIlALlJ SHINER
49
6.8
25
1.1
243
8.4
487 18.9
744 15.3
189
5.6
922
25.7
STRIPED SHINER
1
0.1
II
BIGMOUTH SHINER
1
0.0
SPOTTAIr. SHINER
3
0.4
3
0.1
4
0.1
9
0.3
SPOTFIN SHINER
54
1.9
22
0.9
16
0.3
70
2.1
62
1.7
SAND SHINER
2
0.1
2
0.1
3
0.1
5
0.1
1
0.0
1
0.0
UNID 1'l'OTROpIS
2
0.3
II
BL~OSE
MINNOW
253 35.1 1970
85.1
563 19.4
463
18.0
843 17.4
1136 33.6 1172
32.6
FATHEAD MINNOW
8
0.3
10
0.2
2
0.1
9
0.3
BULLHEAD MIN1'l'OW
2
0.0
1
0.0
3
0.1
CREEK CHUll
3
0.1
WHITE BUCKER
58
8.1
10
0.4
3
0.1
35
1.4
17
0.4
36
1.1
5
0.1
II
BMALLMOUTH BUFF1<LO
1
0.0
4
0.1
3
0.1
SPOTTED BUCKER
1
0.0
SILVER REDHORSE
1
0.1
2
0.1
SHORTKEAP REOHORSE
3
0.1
ORIENTAL WEATHERFISH
3
0.1
1
0.0
11
BLACK SUr.LHEAP
1
0.1
1
0.0
YEr.r.oW BUr..I.HEAD
9
1.3
9
0.4
22
0.8
20
0.8
31
0.8
21
0.6
21
0.6
CHA1'l'NEL CATFISH
9
1.3
2
0.1
49
1.7
57
2.2
90
1.9
59
:1..7
60
1.7
=0 JUolEIURUS
1
0.0
TADPOLE blAD'rOM
6
0.2
4
0.2
2
0.0
1
0.0
6
0.2
l"I.ATHEAP CATFISH
1
0.0
1
0.0
I
SLACKSTRIPE TOPMINNOW
3
0.1
47
1.6
8
0.3
13
0.3
21
0.6
62
1.7
WESTERN MOSQUITOFISH
1
0.1
47
1.6
19
0.7
101
2.1
123
3.6
225
6.3
WHITE PIl:RCH
1
0.0
13
0.4
17
0.7
2
0.0
1
0.0
WHITEBASS
4
0.1
3
0.1
1
0.0
YEI.r.oW BASS
10
0.4
4
0.1
8
0.3
2
0.0
1
0.0
II
ROCK BASS
2
0.1
1
0.0
GltEW
BU1'l'FIBH
57
7.9
29
1.3
758
26.1
204
7.9
575
11.9
103
3.1
117
3.3
PUMPKINSEED
2
0.0
4
0.1
44
1.2
WARMOUTH
1
0.0
OIlA1'l'GESPOTTED
SUNFJ:SH
14
0.5
1
0.0
10
0.2
8
0.2
7
0.2
II
SLUEGJ:I.L
5
0.2
83
2.9
30
1.2
43
0.9
32
0.9
87
2.4
LONGEAR BU1'l'FIBH
1
0.0
HYBRID SUNFISH
4
0.1
7
0.1
7
0.2
19
0.5
t1NID I.El'OMIB
1
0.1
4
0.1
1
0.0
BIIALUIOUTH BASS
1
0.0
4
0.1
2
0.1
1
0.0
II
I.ARGll:MOUTJI BASS
22
1.0
54
1.9
7
0.3
23
0.5
12
0.4
54
1.5
WllITE CRAPPIE
2
0.0
BLACK CRAPP:tE
1
0.1
1
0.0
1
0.0
JOHNNY DARTER
7
0.3
2
0.0
7
0.2
SLACKSIDE PARTll:R
1
0.0
1
0.0
1
0.0
II
WALI.EYE
1
0.0
l"RESIIWATEl\ DRUM
4
0.6
4
0.2
11
0.4
19
0.7
30
0.6
25
0.7
33
0.9
ROUND GOSlI'
2
0.1
4
0.2
13
0.3
56
1.7
41
1.3
TOTAL l"ISlI
720 100.0 2314
100.0
2899
100.0 2574 100.0
4851
100.0 3376 100.0
3590
100.0
I
CATCH PER GEAR EFFORT
24
77
36
32
61
42
45
TOTAL
sPl'\cn:s
17
20
29
33
40
34
33
I
I
I
4-7
Electronic Filing - Received, Clerk's Office, August 4, 2008
'l:'ASLE
1<1 (cont.)
I
I
SPECIES
H94
1995
2000
UPSTREAM I-55
2001
2002
2005
2006
I
LONGNOSE GAR
UNID GAR
:BOMi'XN
SKIPJACK HERRZNG
GIZZJUm SllAD
THREADFIN SllAD
GRASS
PICKEREL
NORTHERN PIKE
CEN'I'R7>.Io STONEROLLER
GOwnSH
GRASS CARP
COMMON CARl?
CARP
X
GOWFISH HYBRID
HORNYHEAD CIlUB
GOWEN SHINER
EMERALn
BHINER
Gll:OBT SHINER
STRIPED SHINER
BIGMOln'H SHINER
SPO'I"l'AIL SHINER
RED SHIm:R
SPOTFIN
SHZNER
SAND
SHINER
REDFIN SHIm:R
MIMIC SHINER
UNID NOTROPIS
SUCKERMO= MINNOW
BLUN'l'NOSE MINNOW
FATHEAD MINNOW
BULLllElID MINNOW
CREEK CIlUB
RIVER CJUU>SUCKER
QUILLBACK
WHITE SUCKER
SMALLMOUTH BUFFALO
BIGMOUTH BUFFALO
BLACK BUFFALO
SPOTTED SUCKER
SIlWER MDHORSE
RIVE.R REOHORSE
GOWEN IU!lDHORSE
SHORTHEAD REOHORSE
UNtD MOXOSTOMA
UNID
ICTIOSINAE
ORIENTAL I'lEA'rHERFISH
SLACF: Bur,I,HEAD
YELLOW BULLHEAD
CHANNEL CATFISH
UN:tD JlMEIURUS
'rAnI/OLE MADTOM
Fr..ATHEAD CATFISH
BLACKS'l.'RIPlil TOPMINNOW
~IESTERN
MOSQUITOFISH
BROOK SILVERSIDE
WHITE PERCH
WHIT!!: BASS
YELLOW BASS
YELLOW BASS/WHITE PERCH
HYBRID MOROm:
ROCK BASS
GREEN SUNFISH
PUMPKINSEED
ORANGESPOTTED SUNFISH
SLUEGILL
LONG&AR SUNFISH
RED&AR SUNFISH
HYBRID SUNFISH
UN:tD LEPOMIS
SMALLMOln'H BASS
LARGEMO= BASS
UNID MICROPTERUS
WHIT:E CRA»PIE
BLACK CRAPPIE
JOKNNY DARTER
LOGPERCH
BLACKSIDE DARTER
SLEI'lDERHEAD DAR'I.'ER
SAUGER
FllESHWl\.'l'ER DRUM
RO= GOBl{
1
1
87
2
4
156
26
2
109
3
19
113
2
16
552
8
4
8
19
4
.1
2
3
.1
.1
.1
24
1
103
3
11
5
2
10
28
27
0.1
0.1
6.3
0.1
0.3
11.3
1.9
0.1
7.9
0.2
1.4.
8.2
0.1
.1.2
0.7
40.0
0.1
0.6
0.3
0.6
1.4
0.3
0.1
0.1
0.2
0.1
0.1
0.1
1.7
0.7
0.1
7.5
0.2
0.8
0.4.
0.1
0.7
2.0
2.0
1
191
4.
180
28
35
1
93
8
8
4
1
408
3
6
1
7
7
12
29
2
2
7
1
2
21
1
1
82
7
36
1
3
10
43
8
1
4.l
25
0.1
14.4.
0.2
0.3
13.5
2.1
2.6
0.1
7.0
0.6
0.6
0.3
0.1
30.7
0.2
0.5
0.1
0.5
0.5
0.9
2.2
0.2
0.2
0.5
0.1
0.2
2.0
0.1
0.1
6.2
0.5
2.7
0.1
0.2
0.8
3.2
0.6
0.1
3.1
.1.9
9
0.3
1
0.0
1
0.0
54.2 19.1
25
0.9
2
0.1
4
0.1
188
6.6
26
0.9
1
0.0
173
6.1
14
0.5
28
1.0
10
0.4.
262
9.3
12
0.4
11
0.4
11
0.4.
1
0.0
48
1.7
3
0.1
2
0.1
1
0.0
1
O. a
12
0.4.
1
0.0
1
0.0
11
0.4
73
2.6
2
0.1
11
0.4.
6
0.2
1
0.0
5
0.2
4
0.1
2
0.1
3
0.1
492 17.4
29
1.0
4.04. 14.3
25
0.9
98
3.5
7
0.2
169
6.0
2
0.1
4
0.1
1
0.0
2
0.1
91
3.2
12
1
7
1571
6
1
1
1$
5
2
299
21
2
2
392
2
21
435
1
80
26
2
1290
1
126
7
5
4.
58
2
2
1
1
8
1
86
1
1
1
9
3
1
3
6
2
1
5
398
2
572
24
51
2
26
132
2
1
1
71
1
0.2
0.0
0.1
27.0
0.1
0.0
0.0
0.3
0.1
0.0
5.1
0.4
0.0
0.0
6.7
0.0
0.4
1.5
0.0
1.4
0.4.
0.0
22.2
0.0
2.2
0.1
0.1
0.1
1.0
0.0
0.0
0.0
0.0
0.1
0.0
1.5
0.0
0.0
0.0
0.2
0.1
0.0
0.1
0.1
0.0
0.0
0.1
6.8
0.0
9.8
0.4.
0.9
0.0
0.4
2.3
0.0
0.0
0.0
1.2
0.0
8
1
6
1754
9
1
4.
1
239
18
1
6
977
3
37
1
84
1
90
4.1
1
1
74.7
7
12
5
2
71
3
1
3
6
4
19
98
2
2
11
4
2
5
12
5
761
14
733
26
2
101
63
219
1
9
3
1
1
87
1
0.1
0.0
0.1
27.7
0.1
0.0
0.1
0.0
3.8
0.3
0.0
0.1
15.4.
0.0
0.6
0.0
1.3
0.0
1.4
0.6
0.0
0.0
11.8
0.1
0.2
0.1
0.0
1.1
0.0
0.0
0.0
0.1
0.1
0.0
0.3
1.5
0.0
0.0
0.2
0.1
0.0
0.1
0.2
0.1
12.0
0.2
11.6
0.4
0.0
1.6
1.0
3.5
0.0
0.1
0.0
0.0
0.0
1.4
0.0
5
1
4116
6
14
2
218
3
4
314
1
90
47
210
21
1
2
1
1
2654
17
292
3
73
1
1
9
107
8
5
49
18
44
3
1
3
373
3
15
1137
13
156
109
21
127
3
7
2
SO
35
0.0
0.0
39.6
0.1
0.1
0.0
2.1
0.0
0.0
3.0
0.0
0.9
0.5
2.0
0.2
0.0
0.0
0.0
0.0
25.5
0.2
2.8
0.0
0.7
0.0
0.0
0.1
1.0
0.1
0.0
0.5
0.2
0.4
0.0
0.0
0.0
3.6
0.0
0.1
10.9
0.1
1.5
1.0
0.2
1.2
0.0
0.1
0.0
0.5
0.3
17
738
46
2
7
113
1
15
6
606
5
152
112
176
22
2
34.75
3
7
2
5
58
2
6
3
1
1
9
151
8
2
127
44
6
1
5
386
17
25
876
13
2
230
18
228
1
2
7
47
11
0.2
9.5
0.6
0.0
0.1
1.4
0.0
0.2
0.1
7.8
0.1
1.9
1.4
2.3
0.3
0.0
u.s
0.0
0.1
0.0
0.1
0.7
0.0
0.1
0.0
0.0
0.0
0.1
1.9
0.1
0.0
1.6
0.6
0.1
0.0
0.0
0.1
4.9
0.2
0.3
11.2
0.2
0.0
2.9
0.2
2.9
0.0
0.0
0.1
0.6
0.1
I
I
I
TOTAL FISH
CA'I.'CH PER GEAR EFFORT
TOTAL SPECIES
1379 100.0
4.6
36
1329 100.0
4.2
36
2832 100.0
44.
45
5815 100.0
75
55
6328 100.0 10396 100.0 7802 100.0
79
130
98
55
47
49
I
Electronic Filing - Received, Clerk's Office, August 4, 2008
I
:;<:"
TABLE 14 (oont.)
....................-_......._----------------------------------
POlfflSTREAM I-55
1
'<:
~-
..
:
.
SPECIES
1994
1995
2000
2001
2002
2005
2006
I
I
I
I
····~'
......
"
I
..
.,'
<,
I
I
LONGNOSE
GJU\
omD GllJ\
SKIPJACK HERRING
GIZZARD SHAD
THREADFIN SHAD
GRASS PICKEREL
GOf.DFISH
GRASS Cll.RP
COMMON Cll.RP
CARP X
GOLDFISH HYBRID
BIGHEAD Cll.RP
GOLDEN SHINER
PALLID SHINER
EMERALD SIlINER
GHOS'l.' SHINER
STRIPED SHINER
SPOTTAIL SHINER
RED SHINER
SPOTFIN SHINER
SAND
SHINER
REDFIN SHINER
MIMIC
SHINER
tmID NOTROPIS
BL~NOSE
MINNOW
FATHEAD MINNOW
BULLHEAD MINNOW
RIVER Cll.RPBUCKER
QUILLBACK
omD CARPIODES
WHITE SUCKER
SMALLMOUTH BUFFALO
BIGMOUTH BUFFALO
BLACK BUFFALO
SPOTTED BUCKER
SILVER REDHORSE
aLACK REDHORSE
GOLlll1:N REJDHORSE
SHOR'l.'HEAD REDHORSE
UNID CATOSTOMlNAE
omD ICTIOBINAE
BLACK BULLHEAD
U:LLOW BULLHEAD
ClfANNEL CATFISH
TADPOLE MAD'rOM
BLACKSTRIPE TOPMINNOW
WESTERN MOSQUITOFISH
BROOK SILVERSIDE
WHlTE PERCH
WHITE B1;SS
YELLOW BASS
HYBRID MORONE
omD MORONE
ROCK BASS
GREEN SUNFISH
PUMPKINSEED
WARMOUTH
O~SPOTTED
SUWFISH
BLUEGILL
LONGEAR SUWFISH
REDEAR SUNFISH
HnlRID SUWFISH
omD LEPOMIS
SMALLMOUTH BASS
Lll.RGEMOUTH BASS
UNID MICROPTERl,lS
WHITE CRAPPIE
BLACK CRAPPIE
JOHNNY DARTER
LOGl.'ERCH
BLACKSIDE DARTER
sLENDERHEAD DARTER
FRESHWATER DRUM
ROUND GOBY
2
725
1
87
18
13
179
2
3
92
12
250
57
4
6
1
6
2
4
25
3
2
3
1
14
1
2
66
3
94
32
2
2
88
15
49
6
2
1
48
0.1
37.7
0.1
4.5
0.9
0.7
9.3
0.1
0.2
4.8
0.6
13.0
3.0
0.2
0.3
0.1
0.3
0.1
0.2
1.3
0.2
0.1
0.2
0.1
0.7
0.1
0.1
3.4
0.2
4.9
1.7
0.1
0.1
4.6
0.8
2.5
0.3
0.1
0.1
2.5
6
0.2
2
2
1
202
6.8 1001
107
1
0.0
42
1.4
111
24
0.8
6
2
0.1
7
2
24
0.8
41
2
0.1
1
0.0
81
2.7
267
1
13
0.4
45
1
0.0
1
0.0
1229 41.6
579
193
6.5
235
10
0.3
11
10
0.3
4
8
0.3
1
14
0.5
38
2
2
0.1
3
3
0.1
18
0.6
1
18
0.6
11
15
7
0.2
32
1
0.0
3
3
0.1
15
2
23
0.8
3
1
0.0
1
1
2
0.1
1
4
16
0.5
465
1
0.0
1
1
156
5.3
248
140
4.7 1684
3
31
111
3.8
3
22
0.7
19
529 17.9
241
5
1
0.0
9
2
0.1
4
0.1
7
2
32
1.1
25
0.0
0.0
0.0
18.9
2.0
2.1
0.1
0.1
0.0
0.8
5.0
0.0
0.8
10.9
4.4
0.2
0.1
0.0
0.7
0.0
0.1
0.0
0.2
0.3
0.6
0.1
0.3
0.0
0.1
0.0
0.0
0.0
0.1
8.8
0.0
0.0
4.7
31.8
0.1
0.6
0.1
0.4
4.5
0.1
0.2
0.1
0.0
0.5
3
0.1
8
0.2
1411 28.5
66
1.3
3
0.1
1
0.0
148
3.0
1
0.0
9
0.2
219
4.4
1
0.0
72
1.5
50
1.0
2
0.0
713 14.4
240
4.8
13
0.3
12
0.2
58
1.2
1
0.0
1
0.0
1
0.0
1
0.0
4
0.1
5
0.1
5
0.1
33
0.7
1
0.0
3
0.1
1
0.0
8
0.2
2
0.0
1
0.0
2
0.0
115
2.3
135
2.7
1372 27.7
12
0.2
12
0.2
28
0.6
19
0.4
113
2.3
1
0.0
10
0.2
38
0.8
7
4
1511
53
57
2
8
2
527
1
3
75
81
1
556
97
7
4
49
4
1
1
17
4
9
52
7
15
2
1
1
406
6
1
720
2046
3
1
24
8
31
187
2
9
12
1
31
0.1
0.1
22.7
0.8
0.9
0.0
0.1
0.0
7.9
0.0
0.0
1.1
1.2
0.0
8.4
1.5
0.1
0.1
0.7
0.1
0.0
0.0
0.3
0.1
0.1
0.8
0.1
0.2
0.0
0.0
0.0
6.1
0.1
0.0
10.8
30.8
0.0
0.0
0.4
0.1
0.5
2.8
0.0
0.1
0.2
0.0
0.5
6
2
2392
2
5
1
1
101
61
2
690
7
51
112
203
66
1
3
4002
4
423
16
19
1
26
2
2
3
2
2
2
37
1
47
54
124
1
4
405
3
1
305
5045
13
54
449
12
192
1
3
26
3
1
23
13
0.0
0.0
15.9
0.0
0.0
0.0
0.0
0.7
0.4
0.0
4.6
0.0
0.3
0.7
1.4
0.4
0.0
0.0
26.6
0.0
2.8
0.1
0.1
0.0
0.2
0.0
0.0
0.0
0.0
0.0
0.0
0.2
0.0
0.3
0.4
0.8
0.0
0.0
2.7
0.0
0.0
2.0
33.6
0.1
0.4
3.0
0.1
1.3
0.0
0.0
0.2
0.0
0.0
0.2
0.1
1
1560
60
1
30
1
11
3
451
22
33
127
222
1
1
2874
1
218
7
5
25
2
1
46
5
1
3
35
5
70
7
105
10
335
1
390
2571
14
1
44
21
18
384
1
2
17
1
22
3
0.0
16.0
0.6
0.0
0.3
0.0
0.1
0.0
4.6
0.2
0.3
1.3
2.3
0.0
0.0
29.4
0.0
2.2
0.1
0.1
0.3
0.0
0.0
0.5
0.1
0.0
0.0
0.4
0.1
0.7
0.1
1.1
0.1
3.4
0.0
4.0
26.3
0.1
0.0
0.5
0.2
0.2
3.9
0.0
0.0
0.2
0.0
0.2
0.0
I
TOTAL FISH
CATCH PER GEAR EFFORT
TOTAL SPECIES
1923 100.0
80
36
2956 100.0
114
38
5299 100.0
83
44
4954 100.0
77
41
6647 100.0 15027 100.0
104
235
45
50
9769 100.0
153
44
II
I
NOTE. DATA COMPARlilD ARlil FROM ELEC'l.'ROFISHING AND SEINING DURING THE PERIOD OF MAY-SEPTEMBER AT THE SAME
LOCATIONS, EXCEl.'T TllAT LOCATION 302B WAS SUBSTITUTED FOR LOCATION 302C
:I:N
LOWER LOCKl?ORT POOL
BEGINNING IN 2001 AND LOCATION 405 IN THE UPSTREAM I-55 SEGMENT WAS NOT SAMPLED IN 2000. DATA Fl\OM
'j'lIlt
FOLLOWZNG LOCATIONS <AND YEARS) ARE EXCLUDED' LOCATION 308 IN BRANDON
POOL (1994, 1995, AND 2000),
LOCATION 404A IN 'l.'HE UPSTRl:':.AM I-55 SEGMENT (2001, 2002, 2005, AND 2006),
AND
LOCATION 409 IN TilE
DO~rnST~1
I-55
SEm~NT
(1994 AND 1995).
0.0 DENOTES VALUES LESS THAN 0.05.
4-9
Electronic Filing - Received, Clerk's Office, August 4, 2008
Collective Abundance
(%)
of Emerald shiner, Gizzard shad,
&
Highly Tolerants
Year Lower Lockport Pool Brandon Pool Upstream I-55 Downstream I-55
2006
88
80
68
54
2005
96
87
74
51
2002
95
92
72
46
2001
96
89
69
53
2000
89
84
60
42
1995
57
98
71
52
1994
84
97
76
70
These data also suggest that the fish communities within each of the four segments have
improved somewhat compared
to 1994 and 1995 based on: 1) catch per gear effort values since
2000 are generally higher than in 1994 or 1995; 2) species richness values in each segment
during the past five study years were consistently higher than in 1994 and 1995; and
3) the
collective abundances
of emerald shiner, gizzard shad, and highly tolerant taxa within the three
downstream segments were lower during at least three
of the past five study years compared to
1994 and 1995.
4.3
LONGITUDINAL COMPARISONS OF COMMUNITY LEVEL PARAMETERS
4.3.1 Electrofishing
Electrofishing catch rates (CPE) of native species, IWBmod scores, and native species richness
values were compared among the four segments to determine whether the longitudinal patterns
of these parameters in 2006 were different than those observed during 1994 (EA 1995), 1995
(EA 1996b), 2000 (EA 2001), 2001 (EA
2002),2002 (EA 2003), or 2005 (EA 2007). As
discussed in Section 4.2, data compared are from similar locations and the same seasons.
The following relationships
of CPEs among segments were consistent for each of the seven years
compared:
1)
CPEs were significantly lower (P<0.05) upstream of Brandon Road Lock and Dam
when compared to the Downstream I-55 segment; and 2) CPEs from lower LockpOlt Pool were
significantly lower when compared to the Upstream I-55 segment (Tables 15 and 16). However,
the relationships between the Brandon Pool and Upstream I-55 segments, as well
as between the
Upstream and Downstream I-55 segments, were inconsistent among these seven years. For
example, CPEs from the Upstream I-55 segment were significantly lower than the Downstream
I-55 segment in
1994,2000,2005, and 2006, but CPEs were statistically similar between these
two segments in 1995,2001, and 2002. CPEs from Brandon Pool were significantly lower than
the Upstream I-55 segment in
1994,2001,2002,2005, and 2006, but were statistically similar in
1995 and 2000.
The inconsistent relationships between these two pairs of segments were
primarily due to the differences in the catch rates
of highly tolerant native species and gizzard
shad. For example, when CPEs are recalculated excluding highly tolerant species and gizzard
shad, the resulting longitudinal pattern becomes the same each year; significantly lower within
the two segments upstream
of the Brandon Road Lock and Dam than within the two segments
downstream
of it (Table 16). The catch rates of non-tolerant native fish (less gizzard shad) have
been higher within the General Use water downstream
of I-55 than within the Secondary Contact
water
of the Upstream I-55 segment in all study years except 2001 (Table 16).
4-10
Electronic Filing - Received, Clerk's Office, August 4, 2008
TABLE 15.
CPE lIND RELATIVE ABUNDANCE OF NATIVE FISH COLLECTED Et.ECTROFISHING WITHIN FOUR
SEG~lENTS
o.
THE UPPER ILLINOIS WATERWAY,
I~Y-SEPT~(BER
1994, 1995, 2000-2002,
AND
2005-2006.
1994
1995
I
SPECIli:S
LOWER
LOCKI10RT
POOL
llRllNDON
POOL
LOI'lER
UPSTREAM
DOWNSTREAM
LOCKPORT
I-55
I-55
POOL
BRANDON
POOL
UPSTREAM
I-55
DOWNsrREAM
I-55
0.1
0.2
3.0
6.3
8.0
4.7
4.1
12.9
2.3
3.6
0.4
0.4
0.9
0.8
0.1
0.1
a.l
a.1
0.1
0.1
0.6
0.5
0.1
0.1
0.3
0.3
1.0
0.9
1.4
1.3
1.4
1.3
1.1
1.0
2.0
1.8
0.6
0.5
4.6
12.3 11.1
0.3
a.3
14 .3
1.2
2.6
6.1
4.0
4.1
2.2
4.0
0.1
0.1
0.4
0.1
7.0 12.7
0.2
0.3
1.6
3.0
0.3
0.5
0.1
a.2
0.1
0.2
2.5
4.4
1.0
0.9
0.5
0.8
0.1
0.2
0.2
0.3
2.6
2.3
0.6
1.2
2.6
2.3
0.1
0.2
0.3
0.3
a.6
1.2
0.6
1.2
1.1
2.0
2.6
4.8
0.2
0.3
0.6
3.4
7.5 13.5
2.3
2.1
0.1
0.1
0.3
0.5
0.5
1.0 16.3 14.7
2.7
4.9
6.7
6.0
2.3
17.0 30.8 28.6 25.7
55.2 100.0 111.1 100.0
26
30
2.8
3.1
0.2
0.3
0.1
0.1
7.7
8.7
0.1
0.1
1.1
1.3
3.2
3.6
1.0
1.1
0.2
0.3
0.1
0.1
2.4
2.8
0.4
0.5
1.1
1.3
0.4
0.5
67.6 76.3
88.6 100.0
15
5.5 25.0
3.5 15.9
0.3
1.5
0.2
a.8
0.2
O.S
0.2
0.8
1.0
4.5
0.2
0.8
0.2
0.8
0.2
0.8
10.7 4S.5
22.0 100.0
11
4.2
0.1
0.1
2.4
0.4
0.1
0.4
0.6
0.1
0.6
0.4
2.5
0.3
0.2
0.3
0.7
2.2
1.3
0.2
7.2
0.2
0.2
4.0
0.7
1.0
0.2
1.0
0.3
0.2
0.5
0.3
0.5
0.7
4.2
0.3
0.2
1.9
0.9
0.5
4.4
0.5
0.7
0.2
0.2
0.2
5.6
0.1
a.2
0.3
0.2
6.6 13.8 102.5 60.7
3.2
6.8
0.3
0.7
0.2
0.5
8.8 18.4
1.0
2.1
0.1
a.2
a.9
0.4
0.2
2.1
0.4
0.9
0.2
0.3
0.1
0.1
0.1
2.7
0.1
0.2
0.1
0.2
0.3
0.7 13.2
7.8
1.0
2.1
5.0
3.0
0.4
0.9
0.3
0.2
0.2
0.5
a.3
0.2
0.5
0.3
0.8
1.6
1.8
1.1
2.2
4.7
1.2
0.7
11.3 23.8 11.0
6.5
0.5
0.3
47.7 100.0 168.8 100.0
28
28
0.1
0.5
a.3
1.6
5.9 28.6
0.1
0.5
0.1
0.5
1.0
4.9
1.0
4.9
0.1
0.5
0.2
9.1
0.9
4.3
0.5 27.3
0.2
1.1
0.2
9.1
0.3 18.2
3.9 18.9
0.2
9.1
a.l
0.5
0.4
2.2
0.2
9.1
6.3 30.8
0.2
9.1
0.2
9.1
1.8 100.0 20.6 100.0
1
14
'/'OTIlI. lfrllll
'}'(nIAJ., f,t1'J::CDt9
LONGNOSli: GAR
tmID GAR
BOWFIN
SKIPJACK HERRING
GIZZARD
SHAD
CENTRAL MUDMINNOW
GRASS PICKEREL
NORrHERN PIKE
CENTRAL STONEROLLER
HORNYlIEAD CHUB
GOLDEN SHUlER
PALLID SHINER
EMERALD
SHINER
GHOST SHI:NER
STRIPED SHINER
BIGMOUTH SHINER
SPOTTAXL SHINER
RED SHINER
SPOTFIN SHINER
SMID SHINER
REDFIN SHINER
MIMIC SHINER
tmID NOrROPIS
SUCKERMOurH MINNOW
BLUNTNOSE MINNOW
FATHEAD MINNOW
BULLHEAD MINNOW
CREEK CHUB
RIVER CARPSUCKER
QUILr.BACK
WHITE SUCKER
SMALLMOurH BUFFALO
BIGMOUTH BUFFALO
BLACK BUFFALO
SPOTTED SUCKER
SILVER REDHORSE
RIVER RECHORSE
BLACK RECHORSE
GOLDEN RJ;:DIlORSE
SIIORTHEAD RJ;:DHORSE
UNID MOXOSTOMA
llLACK BULLHEAD
¥ELLOW llU/.LHEAD
CllAmlEt. CATFISH
UNID AMEIURUS
TADl'Ot.E MADTOH
FLATHEAD CATFISH
BLACKSTRIPE TOPMINNOW
BROOK BILVJ;:RSIDE
WIlITE BASil
¥ELLOW BASS
UNrl> MaRONE
ROCK BAlla
U1t£&N BUNli'I811
l'UMPKINaltl!:l)
WAllMOU'rJI
OIlANOI;:IJPO'PTlm llUNl!ISlI
Ill.UT-(Hl./.
WNllr.1Ul /llfNlfnlll
IIYllItI11 llONI'UJIl
IINIIl i,ltIlOMIIJ
IlMJlI,l.MOIl'rl! nAIlG
I,MI(lIUiOV'l'1I BAllIJ
WIU'\'I!:
CllJ1J11l1l!:
J1l"}hGK
eJUlJ.~i-'lJt
,.H>IINNV fM1WIr.H
fA)'ll>lI:llClI
1l!.,JII.'I(IIWll: I)JlJl'l'lm
Ill,lilNllll;J\tIl1:IID I)lIlt'l'EII
tlJllJUJJ:1I
VIIIJA..ll:Vlil
IfHJj'lt~nNA'l'ltl{
f)jUJM
I
,
4-11
Electronic Filing - Received, Clerk's Office, August 4, 2008
TABLE 15 (cont.)
2000
2001
I
I
SPECIES
LOWER
LOCKPORT
POOL
BRANDON
POOL
LOWER
UPSTREAM
DO~~STREAM
LOCKPORT
I-55
I-55
POOL
BRANDON
I.'OOL
UPSTREAM
DOI'INSTREA1l
I-55
I-55
I
32.9 100.0 90.3 100.0 117.0 100.0 267.0 100.0 135.9 100.0 79.2 100.0 164.0 100.0 199.0 100.0
11
23
38
36
19
25
43
33
LONGNOSE GAR
UNID GAR
BOWFIN
SKIPJACK HERRING
GIZZARD
SHAD
CENTRAL MUDMINNOW
GRASS PICKEREL
NORTHERN PIKE
CENTRAL STON£ROLLER
HO~
ClIUll
GOLDlilN SHIN£R
PALLID SHIN£R
EmlRALO SHIN£R
GHOST SHINER
S!l'l\:tPED SHINER
BIGMOUTH SHIN£R
SPOT!l'AIL SHINER
RED SHINER
SPO!l'FJ:N SHJ:N£R
SAND SHIN£R
REDFIN SHIN£R
MIMIC SHINER
UNID
NOTROPJ:S
SUCKERMOUTH MINNOW
BI.U1'lTNOSE MINNOW
FATHEAD MINNOW
BULLHEAD MINNOW
CREEK ClIUll
RIVER
CARPSUCKER
QUJ:I.LBACK
'~iJ:TE
SUCKER
SMALLMOUTI! BUJrFAl..o
BIGMOUTH BUJrl'ALe
BLACK BUFFALO
SI.'OTTED SUCKER
SILVER REDHORSE
RIVER REDHORSlil
BLACK REDHORSE
GOLDEN REDHORSlil
SHORTHEAD REDHORSE
UNID MOlCOSTOldl\
BLACK BULLHEAD
YELLOW BULLHEAD
CHANNEL CATFI:SH
UNID
AMEIURUS
TJU)POLE ldl\DTOM
FLATHEAD CATFISH
BLACKSTRIPE
TOPMINNOW
BROOK SILVERSIDE
WHI:TE
SASS
YELLOW BASS
UN:tD
MORONE
ROCK BASS
GRESU SUNFISH
PUMPKINSEED
_OUTH
O~GESPOTTED S~ISH
BLUEGII.L
LONGEAR SUNFISI!
HYBRID SUNFISH
UNID I.EPOMIS
SMALLMOUTH BASS
LARGEMOUTH BASS
WHITE CRAPPIE
BLACK CRAPPIE
JOHNNY DAR!l'lilR
LOGPERCH
BLACKSIDE DARTER
SLENDERHEAD DARTER
SAUGER
WALLE'a:
FRESHWATl!:R DRUM
TOTAL FJ:SIl
TOTAL SPECIES
24.9
0.3
3.1
1.0
0.4
0.3
0.1
0.9
0.1
0.2
1.5
75.7
0.9
3.0
1.3
0.9
0.2
2.8
0.4
0.8
4.5
0.0
20.0
O.B
0.7
7.3
0.5
0.1
20.1
0.1
0.8
2.0
0.0
0.0
0.9
0.2
0.2
31.5
0.5
2.0
0.0
0.2
0.0
1.8
0.0
0.5
0.4
0.1
0.0
0.1
22.1 27.0
0.9
0.1
0.7
8.1
7.7
0.4
0.6
1.3
0.1
0.4
22.2
6.2
0.6
0.6
0.6
0.1
0.1
2.4
0.2
0.1
0.1
0.1
0.6
0.1
0.1
0.9
0.5
2.2
3.6
0.0
0.0
0.1
0.9
0.3
0.2
0.2
0.2
0.1
0.2
34.9 24.5
0.6
1.5
2.3 19.0
0.0
1.3
0.2
4.9
0.0
0.4
2.0
7.2
0.1
0.2
0.1
0.1
0.0
0.5
4.6
0.3
0.0
0.0
23.0
0.0
6.5
0.3
1.1
0.3
5.3
0.5
0.5
0.5
0.0
2.1
0.1
0.1
0.0
0.0
0.5
0.0
0.0
0.4
3.1
0.1
0.2
0.2
0.1
0.1
20.9
1.2
16.2
1.1
4.2
0.3
6.2
0.1
0.2
0.0
0.1
3.9
0.1
62.3
0.3
0.1
1.8
5.8
1.5
26.7
11.2
0.7
0.3
0.1
2.4
0.1
0.2
0.1
0.7
0.9
2.0
0.2
0.2
0.1
0.1
0.1
28.9
0.1
0.1
14.5
86.4
0.2
1.9
0.1
1.1
13.7
0.3
0.5
0.1
1.6
0.0
0.1
23.3 100.6
0.1
0.1
0.0
0.7 10.2
2.2
0.2
0.6
0.4
10.0 15.1
0.1
4.2
0.1
0.3
0.1
0.0
0.9
0.0
0.1
0.0
0.3
0.3
0.7
1.3
0.1
0.1
0.0
0.1
0.0
0.1
0.0
10.8
4.7
0.0
0.2
0.0
5.4
32.4
1.2
0.1
0.1
0.7
0.1
0.0
0.4
0.1
5.1
1.4
0.1
0.2
0.0
0.6
0.1
0.1
74.1
0.0
7.5
0.1
0.3
11.1
0.0
0.0
0.9
0.0
0.0
3.4
0.1
0.9
0.0
0.0
0.0
1.0
0.0
0.4
28.0
0.1
0.0
17.6
0.1
0.5
0.0
16.4
0.0
1.4
0.1
0.7
2.4
0.1
0.0
0.1
0.3
9.3
0.0
0.0
1.1
0.3
0.3
0.8
0.5
35.3
0.1
0.1
22.2
0.2
0.7
0.1
20.7
0.1
1.7
0.2
0.8
3.0
0.2
0.1
0.2
0.4
10.5
0.1
0.1
1.4
0.4
0.3
1.0
0.5
0.0
0.3
65.1
0.0
0.1
0.0
0.0
11.4
0.0
0.0
4.5
1.4
0.2
0.0
20.9
3.8
0.3
0.2
0.1
2.5
0.1
0.1
0.0
0.0
0.2
0.0
3.5
0.0
0.0
0.1
0.2
0.1
0.1
16.9
0.1
18.2
0.9
2.1
0.1
1.0
5.4
0.1
0.0
0.0
3.0
0.3
0.0
0.2
39.7
0.0
0.1
0.0
0.0
6.9
0.0
0.0
2.7
0.9
0.1
0.0
12.7
2.3
0.2
0.1
0.1
1.5
0.1
0.1
0.0
0.0
0.1
0.0
2.1
0.0
0.0
0.1
0.1
0.1
0.1
10.3
0.1
11.1
0.5
1.3
0.1
0.6
3.3
0.1
0.0
0.0
1.8
0.1
0.4
84.9
0.2
9.2
0.1
2.4
2.1
19.1
12.9
0.8
0.8
3.2
0.1
0.1
0.1
0.1
0.3
0.3
0.3
1.9
0.1
0.4
0.1
7.0
6.9
33.9
0.6
0.7
0.9
6.4
0.1
0.3
2.4
0.1
0.2
42.7
0.1
4.6
0.0
1.2
1.1
9.6
6.5
0.4
0.4
1.6
0.0
0.0
0.0
0.0
0.1
0.1
0.2
1.0
0.0
0.2
0.0
3.5
3.5
17.0
0.3
0.3
0.5
3.2
0.0
0.2
1.2
I
I
I
I
I
I
I
I
I
I
I
I
I
I
I
4-12
I
Electronic Filing - Received, Clerk's Office, August 4, 2008
TlUlLE 15
(cont.)
2002
2005
&I
(JP~~CIllS
LOWER
LOCKPORT
POOL
BRANDON
POOL
LOWER
UPSTREAM
DO~lNSTREAM
LOCKPORT
I-55
I-55
POOL
BRANDON
POOt.
UPSTREAM
DOWNSTREAM
I-55
I-55
0.2
0.1
0.3
0.1
0.2
0.1
153.0 80.5 75.9 46.2 71.8 33.0 99.9 26.6
0.0
0.0
0.1
1.3
5.7 24.7
0.6
0.7
0.2
0.0
4.7
0.0
0.1
0.2
0.0
0.5
0.5
0.0
0.0
10.4
0.0
1.9
0.1
6.3
0.0
0.0
3.6
28.9
0.1
0.7
0.0
0.1
2.9
0.3
0.1
0.7
0.3
0.1
2.8
42.0
0.1
7.9
0.8
0.1
19.1
0.1
0.4
0.1
0.1
0.1
0.0
0.1
0.0
0.1
0.0
0.2
0.0
1.6
0.4
0.1
0.0
0.1
0.0
0.4
0.2
0.0
0.1
2.1
0.3
25.4
0.1
0.1
14.6
116.9
0.5
2.6
0.1
0.4
11.9
2.6
0.1
0.0
0.4
0.0
0.0
0.0
1.5
0.0
0.2
2.3
0.0
0.1
0.0
0.0
0.1
0.0
0.1
8.4
0.1
1.1
10.1
0.0
0.2
0.1
13.0
0.1
3.2
0.0
0.4
2.9
0.2
0.1
4.8
0.1
0.7
2.8
0.0
3.0
1.7
0.3
4.2
0.0
0.0
0.0
0.2
0.1
0.0
0.1
0.0
2.1
0.1
0.0
0.1
0.1
1.0
0.2
0.8
0.2
18.4
0.0
0.3
0.2
23.5
0.2
5.8
0.1
0.7
5.1
0.1
15.3
0.1
0.7
0.2
0.1
0.1
5.9
0.2
1.1
3.4
0.1
0.1
0.3
1.0
0.4
0.1
0.1
1.5
0.1
0.7
0.4
0.6
0.2
0.3
0.0
0.1
6.0
8.6
0.8
2.4
0.1
0.5
0.2
0.0
0.0
0.1
0.0
4.0
0.0
0.3
0.2
0.7
0.1
0.5
0.0
1.0
0.1
0.1
0.0
0.0
0.1
0.0
42.2 60.2 92.5 51.0 144.5 35.8
4.0
5.0
10.0 14.3
0.1
0.2
1.2
1.5
0.2
0.2
0.6
0.8
0.1
0.1
0.8
1.0
0.1
0.1
1.4
1.8
0.4
0.5
0.3
0.4
71.2 89.5
0.1
0.4
0.0
0.1
0.0
9.4-
0.0
0.7
0.9
IL1
0.1
0.1
0.2
0.9
0.0
0.3
0.0
0.0
0.4
3.1
0.0
0.1
0.6
7.4
0.1
0.0
10.8
29.2
0.0
0.4
0.4
1.9
0.1
0.9
0.1
0.1
0.6
3.2
1.5
10.6
0.1
0.3
25.0
0.3
0.1
36.6
98.5
0.1
1.2
0.0
1.1
2.4
0.0
1.2
1.5
0.2
0.1
0.0
0.0
5.4
0.0
6.9 18.1
0.2
0.4
0.1
0.3
0.0
1.3
3.1
0.1
0.3
0.0
0.4
1.8
0.0
0.1
0.0
0.2
1.1
4.0
0.0
0.1
0.1
0.4
0.1
15.9 31.9
0.1
0.1
0.0
14.5
0.2
12.4
0.5
1.9
0.0
0.0
0.3
0.2
0.0
0.0
0.8
3.9
0.1
0.0
0.3
0.1
0.9
0.3
0.2
0.1
0.3
0.1
0.1
0.1
0.1
0.0
0.1
0.2
0.1
0.5
0.1
0.0
0.6
0.2
2.4
8.8
0.0
0.3
0.0
0.0
0.1
0.0
0.0
0.0
0.1
31.4
0.5
26.9
1.0
4.1
0.0
0.0
0.2
0.0
0.1
2.4
0.0
0.3
2.5
0.5
0.0
0.5
0.2
0.4
0.1
0.0
2.9
0.1
0.0
0.0
0.6
2.2
0.0
0.1
0.0
0.1
0.1
0.2
0.9
0.8
3.6
1.7
0.1
0.3
0.1
0.0
0.1
15.0 34.5
0.1
0.0
17.7 15.0
0.1
0.0
0.0
14.4
0.1
0.0
1.0
3.7
0.0
0.1
0.1
0.0
0.1
0.3
0.3
1.4
0.2
0.5
0.1
0.0
0.1
23.6
0.1
0.6
0.4
0.0
0.0
0.2
0.5
0.0
0.0
0.0
0.6
0.0
5.4 29.0
0.2
0.2
0.0
0.0
0.1
0.1
0.1
0.7
0.1
3.7
0.3
0.0
0.1
0.9
0.0
0.6
0.1
0.0
0.1
1.2
0.1
0.1
0.1
0.9
0.2
0.3
1.4
0.2
7.0
0.6
0.1
0.2
1.6
0.1
0.1
1.1
0.1
0.1
0.2
10.8
10.3
0.4
!,oNGNOSE GAR
UNID GAR
IlOWFIN
SKIPJACK lIERRING
GIZZARD SlIAD
CEN'l'RAL
MUDMINNOW
GRASS PICKEREL
NORTlIERN PIKE
CEN'tRAL STONEROLLER
lIORNYlIEAD CHUB
OOLDl;:N SHINER
PALLID SHINER
EMERALD SHINER
GHOST SHINER
STRIPED SlIINER
IlIGMOUTH SHINER
SPOTTAIL SHINER
RED SHINER
SPOTFIN SHINER
SAND SHINER
REDFIN SlIINER
MIIIIC SHINER
liNIO NOTROPIS
SUCl<ERMOUTlI MINNOW
BLUNTNOSE MINNOW
FATHEAD MINNOW
BULLHEAD MINNOW
CREEK CHUB
RIVER CARPSUCKER
QUILLB.II.CK
WHITE SUCKER
SMA.LLMOUTH BUFFALO
BIGMOUTH BUFFALO
BUCK BUFFALO
SPOTTED SUCl<ER
SIt.VER REDlIORSE
RIVER REDlIORSE
BL.II.CK REDlIORSE
GOLDEN REDHORSE
SlIORTHE.II.D REDHORSE
liNIO MOXOSTOMA
Bua BULLHEAD
YELLOW llULLHE.II.D
CHANNEL C.II.TFISH
liNID ANEIURUS
T.ll.DPOLE MADTOM
FUTHEAD CATFISH
llL.II.C~RIPE
TOPMINNOW
BROOK SILVERSIOE
WHITE B.II.SS
YEt.LOW B.II.SS
liNID MORONE
ROCK BASS
GREEN SUNFISH
PUMPKINSEED
WAAMOU'I'H
ORANGEBPOTTED SUNFISH
BLUEGILL
LONGEJ\R SUNFISH
IIYBRIO SUNFISH
liNIO LEPOMIS
SMA.LLMOUTH BASS
Ll\RGEMOUTIl !lASS
WHITE CRAPPIE
BL.II.CK CRAPP:l:El
JOHNNY DART:e:R
LOGPERCH
aL.II.CKSID:e: DARTER
SL:e:NDERME.II.D DARTER
SAUGER
WALLEYE
FRESHWATER DRUM
I
"
I
II
'rO'1!AL FISH
'1!OTAL SPECIES
189.9 100.0 164.2 100.0 217.3 100.0 337.4 100.0
24
34
44
39
90.4 100.0
11
70.0 100.0 181.5 100.0 404.2 100.0
24
34
40
4-13
Electronic Filing - Received, Clerk's Office, August 4, 2008
TABLE 15 (cont.)
II
LOWER
2006
I
LOCKPORT
BlUJ:>lDO"!
UPSTlUlI\.M
DOWNSTRSlIM
POOL
POOL
I-55
I-55
SPECIES
I
_ CPE_
_%__
CPE__%__CPE__%__CPE__%_
LO"!G"lOSE GAR
0.7
0.5
0.1
0.0
=D GAR
BOWFIN
I
SKIPJACK HETlRIl'lG
0.1
0.1
GIZZARD SHAD
39.2 68.5 21.3
25.<1 28.8 19.8 95.<1
26.6
CENTRAL lroDMINl'lOW
GRASS PICKEREL
NORTHERN PIKE
0.1
0.1
I
CEl'lTRAL STO"lEROLLER
HORNYHEAD CHUB
GOLDEN SHINER
0.1
0.1
0.3
0.2
0.1
0.0
PALLID SHINER
0.1
0.0
EMERALD SHINER
3.6
6.2
27.0 32.<1
10.8
7.<1
22.2
6.2
I
GHOST SHINER
0.2
0.1
1.4
0.4
STRIPED SHImR
0.6
0.4
0.4
0.1
BIGMOtrrH SHImR
SPOTTAIL SHINER
0.1
0.1
0.3
0.2
1.8
0.5
RED SHINER
I
SPOTFI"! SHImR
0.9
1.1
2.9
1.9
2.9
0.9
SAND SHINER
REDFIN SHINER
MIMIC SHI"lER
UNID NOTROPIS
0.1
0.0
I
SUCKEIUIlOtrrH MINNOW
BLUNTNOSE MINNOW
5.2
9.1 18.2 21.8 25.<1
17.5
35.9 10.0
FATHEAD MINNOW
0.1
0.1
0.0
0.0
0.1
0.1
BULLHEAD MINNOW
0.1
0.1
0.0
0.0
8.9
2.5
CREEK CHUB
I
RIVER CARPSUCKER
0.1
0.1
0.4
0.1
QUILLBACK
0.2
0.1
0.3
0.1
WHITE SUCKER
0.2
0.2
SMALLMOUTH BUFFALO
0.1
0.1
2.4
1.7
1.5
0.<1
BIGMOUTH BUFFALO
0.1
I
0.1
BLACK BUFFALO
SPOTTED
SUCKER
SILVER REDHORSE
0.3
0.2
0.1
0.0
RIVER REDHORSE
BLACK REDHORSE
0.1
0.0
I
GOLDEN REDHORSE
0.1
0.1
2.9
0.9
SHORTHEAD REPHORSE
0.0
0.0
0.3
0.1
=D MOXOSTOMA
BLACK BULLHEAD
YELLOW BULLHEAD
0.1
I
0.1
0.8
0.9
0.3
0.2
0.2
0.1
CHAN"lEL CATFISH
0.8
1.4
2.5
3.0
6.2
4.3
2.2
0.6
UNID JlMEIURUS
TADPOLE
MADTOl>1
0.0
0.0
0.3
0.1
FLATHEAD CATFISH
0.1
0.1
BLACKSTRIPE TOPl>1INNOW
0.1
0.1
0.6
0.4
0.2
0.1
I
BROOK SILVERSIDE
0.2
0.1
2.3
0.6
WHITE BASS
0.1
0.1
YELLOW BASS
UNID
MORONE
ROCK BASS
0.0
0.0
0.0
0.0
0.4
0.1
GREEN SUNFISH
1.9
3.4
4.6
5.5
16.0
11.0
20.3
5.6
I
PUMPKINSEED
3.4
6.0
1.8
2.1
0.7
0.5
0.1
0.0
_OUTH
ORANGESPOTTED SUNFISH
0.1
0.1
0.3
0.3
0.9
0.6
20.3
5.6
BLUEGILL
0.4
0.7
1.8
2.2 26.7 18.4 108.9
30.4
LONGEAR SUNFISH
0.5
0.3
0.5
0.2
I
HYBRID SUNFISH
0.2
0.3
0.7
0.8
9.3
6.4
2.3
0.7
UNID LEPOMIS
0.9
0.2
SMALLMOtrrH BASS
0.1
0.1
0.0
0.0
0.5
0.3
1.1
0.3
LARGEMOUTH BASS
1.7
3.0
1.5
1.7
S.l
5.6 21.5
1>.0
l'llUTE CRAPPIE
0.0
I
0.0
0.1
0.0
BLACK CRAPPIE
0.1
0.1
0.1
0.0
JOIlNNY DlUlTER
0.1
0.1
LOGPERCH
0.9
0.2
BLACKSIDE DARTER
0.0
0.0
SLENDERHEAD DlUlTER
I
SAUGER
WALLEYE
FRESHWATER DRUM
0.4
0.7
1.4
1.6
2.0
1.3
1.4
0.4
TOTALTOTAL
SPECIES
FISH
16
57.2 100.0
83.5
22
100.0 145.3
36
100.0 359.6
35
100.0
I
NOTE'
0.0 DENOTES VALUES LESS
THA"l 0.05.
4-14
I
Electronic Filing - Received, Clerk's Office, August 4, 2008
CERTIFICATE OF SERVICE
I, the undersigned, certify that on this 4
th
day of August, 2008, I have served
electronically the attached Pre-Filed Testimony
of James E. Huff, P.E., accompanying Exhibits,
and Notice of Filing upon the following person:
John Therriault, Clerk
Pollution Control Board
James
R. Thompson Center
100 West Randolph Street - Suite 11-500
Chicago,IL 60601
and
by U.S. Mail, first class postage prepaid, to the following persons:
Marie Tipsord, Hearing Officer
Illinois Pollution Control Board
James
R. Thompson Center
100 W. Randolph St., Suite 11-500
Chicago,IL 60601
The participants listed on the attached
SERVICE LIST
12462512
Deborah J. Williams, Assistant Counsel
Stefanie N. Diers, Assistant Counsel
Illinois Environmental Protection Agency
1021 N. Grand Avenue East
P.O. Box 19276
Springfield, IL 62794-9276
Ariel
J.
Tesher
Electronic Filing - Received, Clerk's Office, August 4, 2008
SERVICE LIST
Frederick M. Feldman
Ronald M. Hill
Margaret T. Conway
Metropolitan Water Reclamation District
of
Greater Chicago
111 E. Erie St.
Chicago,IL 60611
Bill Richardson,
Chief Legal Counsel
Illinois Department
of Natural Resources
One Natural Resources Way
Springfield,IL 62702-1271
Keith Harley
Elizabeth Schenkier
Chicago Legal Clinic, Inc.
205 W. Monroe St., 4
th
Floor
Chicago, IL 60606
Katherine D. Hodge
Monica
T. Rios
Hodge Dwyer Zeman
3150 Roland Avenue
P.O.
Box 5776
Springfield, IL 62705-5776
Dennis Duffield
Director
ofPublic Works & Utilities
City
of Joliet
921 E. Washington St.
Joliet, IL 60431
Claire Manning
Brown
Hay
&
Stephens LLP
700 First Mercantile Bank Blvd.
205 S. Fifth St.
Springfield, IL 62705-2459
12462512
Matthew Dunn, Chief
Environmental Bureau
Office
of the Attorney General
100 W. Randolph St., 12
th
Floor
Chicago, IL 60601
Ann
Alexander
Natural Resources Defense Counsel
101 N. Wacker Dr., Suite 609
Chicago, IL 60606
Thomas V. Skinner
Thomas W. Dimond
Kevin Desharnais
Jennifer A. Simon
Mayer Brown LLP
71 S. Wacker Drive
Chicago, IL 60606-4637
Albert Ettinger
Jessica Dexter
Environmental Law
&
Policy Center
35 E. Wacker Dr.
Suite 1300
Chicago,IL 60601
Richard Kissel
Roy Harsch
DrinkerBiddle
191 N. Wacker Dr., Suite 3700
Chicago, IL 60606-1698
Charles Wesselhoft
James Harrington
Ross
& Hardies
150 N. Michigan Ave.
Chicago,IL 60601-7567
Electronic Filing - Received, Clerk's Office, August 4, 2008
Frederick Keady
Vennillion Coal Company
1979 Jolms Drive
Glenview,IL 60025
Georgia Vlahos
Naval Training Center
2601A Paul Jones St.
Great Lakes, IL 60088-2845
W.e. Blanton
Blackwell Sanders LLP
4801 Main St., Suite 1000
Kansas City,
MO 64112
Jerry Paulsen
Cindy Skukrud
McHenry County Defenders
132 Cass Street
Woodstock, IL 60098
Lisa Frede
Chemical Industry Council
of Illinois
1400 E. Touhy Ave.
Suite 110
Des Plaines, IL 60018
Jack Darin
Sierra Club
70
E.
Lake St., Suite 1500
Chicago, IL 60601-7447
Tom Muth
Fox Metro Water Reclamation District
682 State Route
31
Oswego, IL 60543
Vicky McKinley
Evanston Environmental Board
223 Grey Avenue
Evanston, IL 60202
12462512
Fred L. Hubbard
P.O. Box 12
16 West Madison
Danville, IL 61834
Kay Anderson
American Bottoms
One American Bottoms Road
Sauget,IL 62201
Robert VanGyseghem
City
of Geneva
1800 South St.
Geneva,IL 60134-2203
Bernard Sawyer
Thomas Granto
Metropolitan Water Reclamation District
6001 W. Pershing Rd.
Cicero,IL 60650-4112
Fredric Andes
Erika Powers
Bames & Thornburg
1 N. Wacker Dr., Suite 4400
Chicago, IL 60606
Bob Carter
Bloomington
Nonnal Water Reclamation
P.O. Box 3307
Bloomington, IL 61711
Kenneth W. Liss
Andrews Environmental Engineering
3300 Ginger Creek Drive
Springfield, IL 62711
Marc Miller
Jamie S. Caston
Office
of Lt. Governor Pat Quinn
Room 414 State House
Springfield, IL 62706
Electronic Filing - Received, Clerk's Office, August 4, 2008
James L. Daugherty
Thorn Creek Basin Sanitary District
700 West
End Avenue
Chicago Heights, IL 60411
Tracy Elzemeyer
American Water Company
727 Craig Road
St. Louis,
MO 63141
James
Huff
Huff
&
Huff, Inc.
915 Harger Road
Suite 330
Oak Brook,
IL 60523
Kristy
A.
N. Bulleit
Brent Fewell
Hunton
&
Williams, LLP
1900 K Street,
NW
Washington, DC 20006
Dr. Thomas J. Murphy
2325 N. Clifton St.
Chicago,IL 60614
Traci Barkley
Prairie Rivers Networks
1902 Fox Drive, Suite 6
Champaign,
IL 61920
Susan Hedman
Andrew Armstrong
Environmental Counsel
Environmental Bureau
69 W. Washington St., Suite 1800
Chicago, IL 60602
12462512
Sharon Neal
Commonwealth Edison
125
S. Clark St.
Chicago,IL 60603
Irwin Polls
Ecological Monitoring and Assessment
3206 Maple
Leaf Drive
Glenview, IL 60025
Susan M. Franzetti
Nijman Franzetti LLP
10 S. LaSalle St.
Suite 3600
Chicago, IL 60603
Cathy Hudzik
City
of Chicago
Mayor's Office of Intergovernmental Affairs
121 N. LaSalle St., Room 406
Chicago, IL 60602
Beth Steinhorn
2021 Timberbrook
Springfield, IL 62702
Stacy Meyers-Glen
Openlands
25 E. Washington, Suite 1650
Chicago, IL 60602
Electronic Filing - Received, Clerk's Office, August 4, 2008