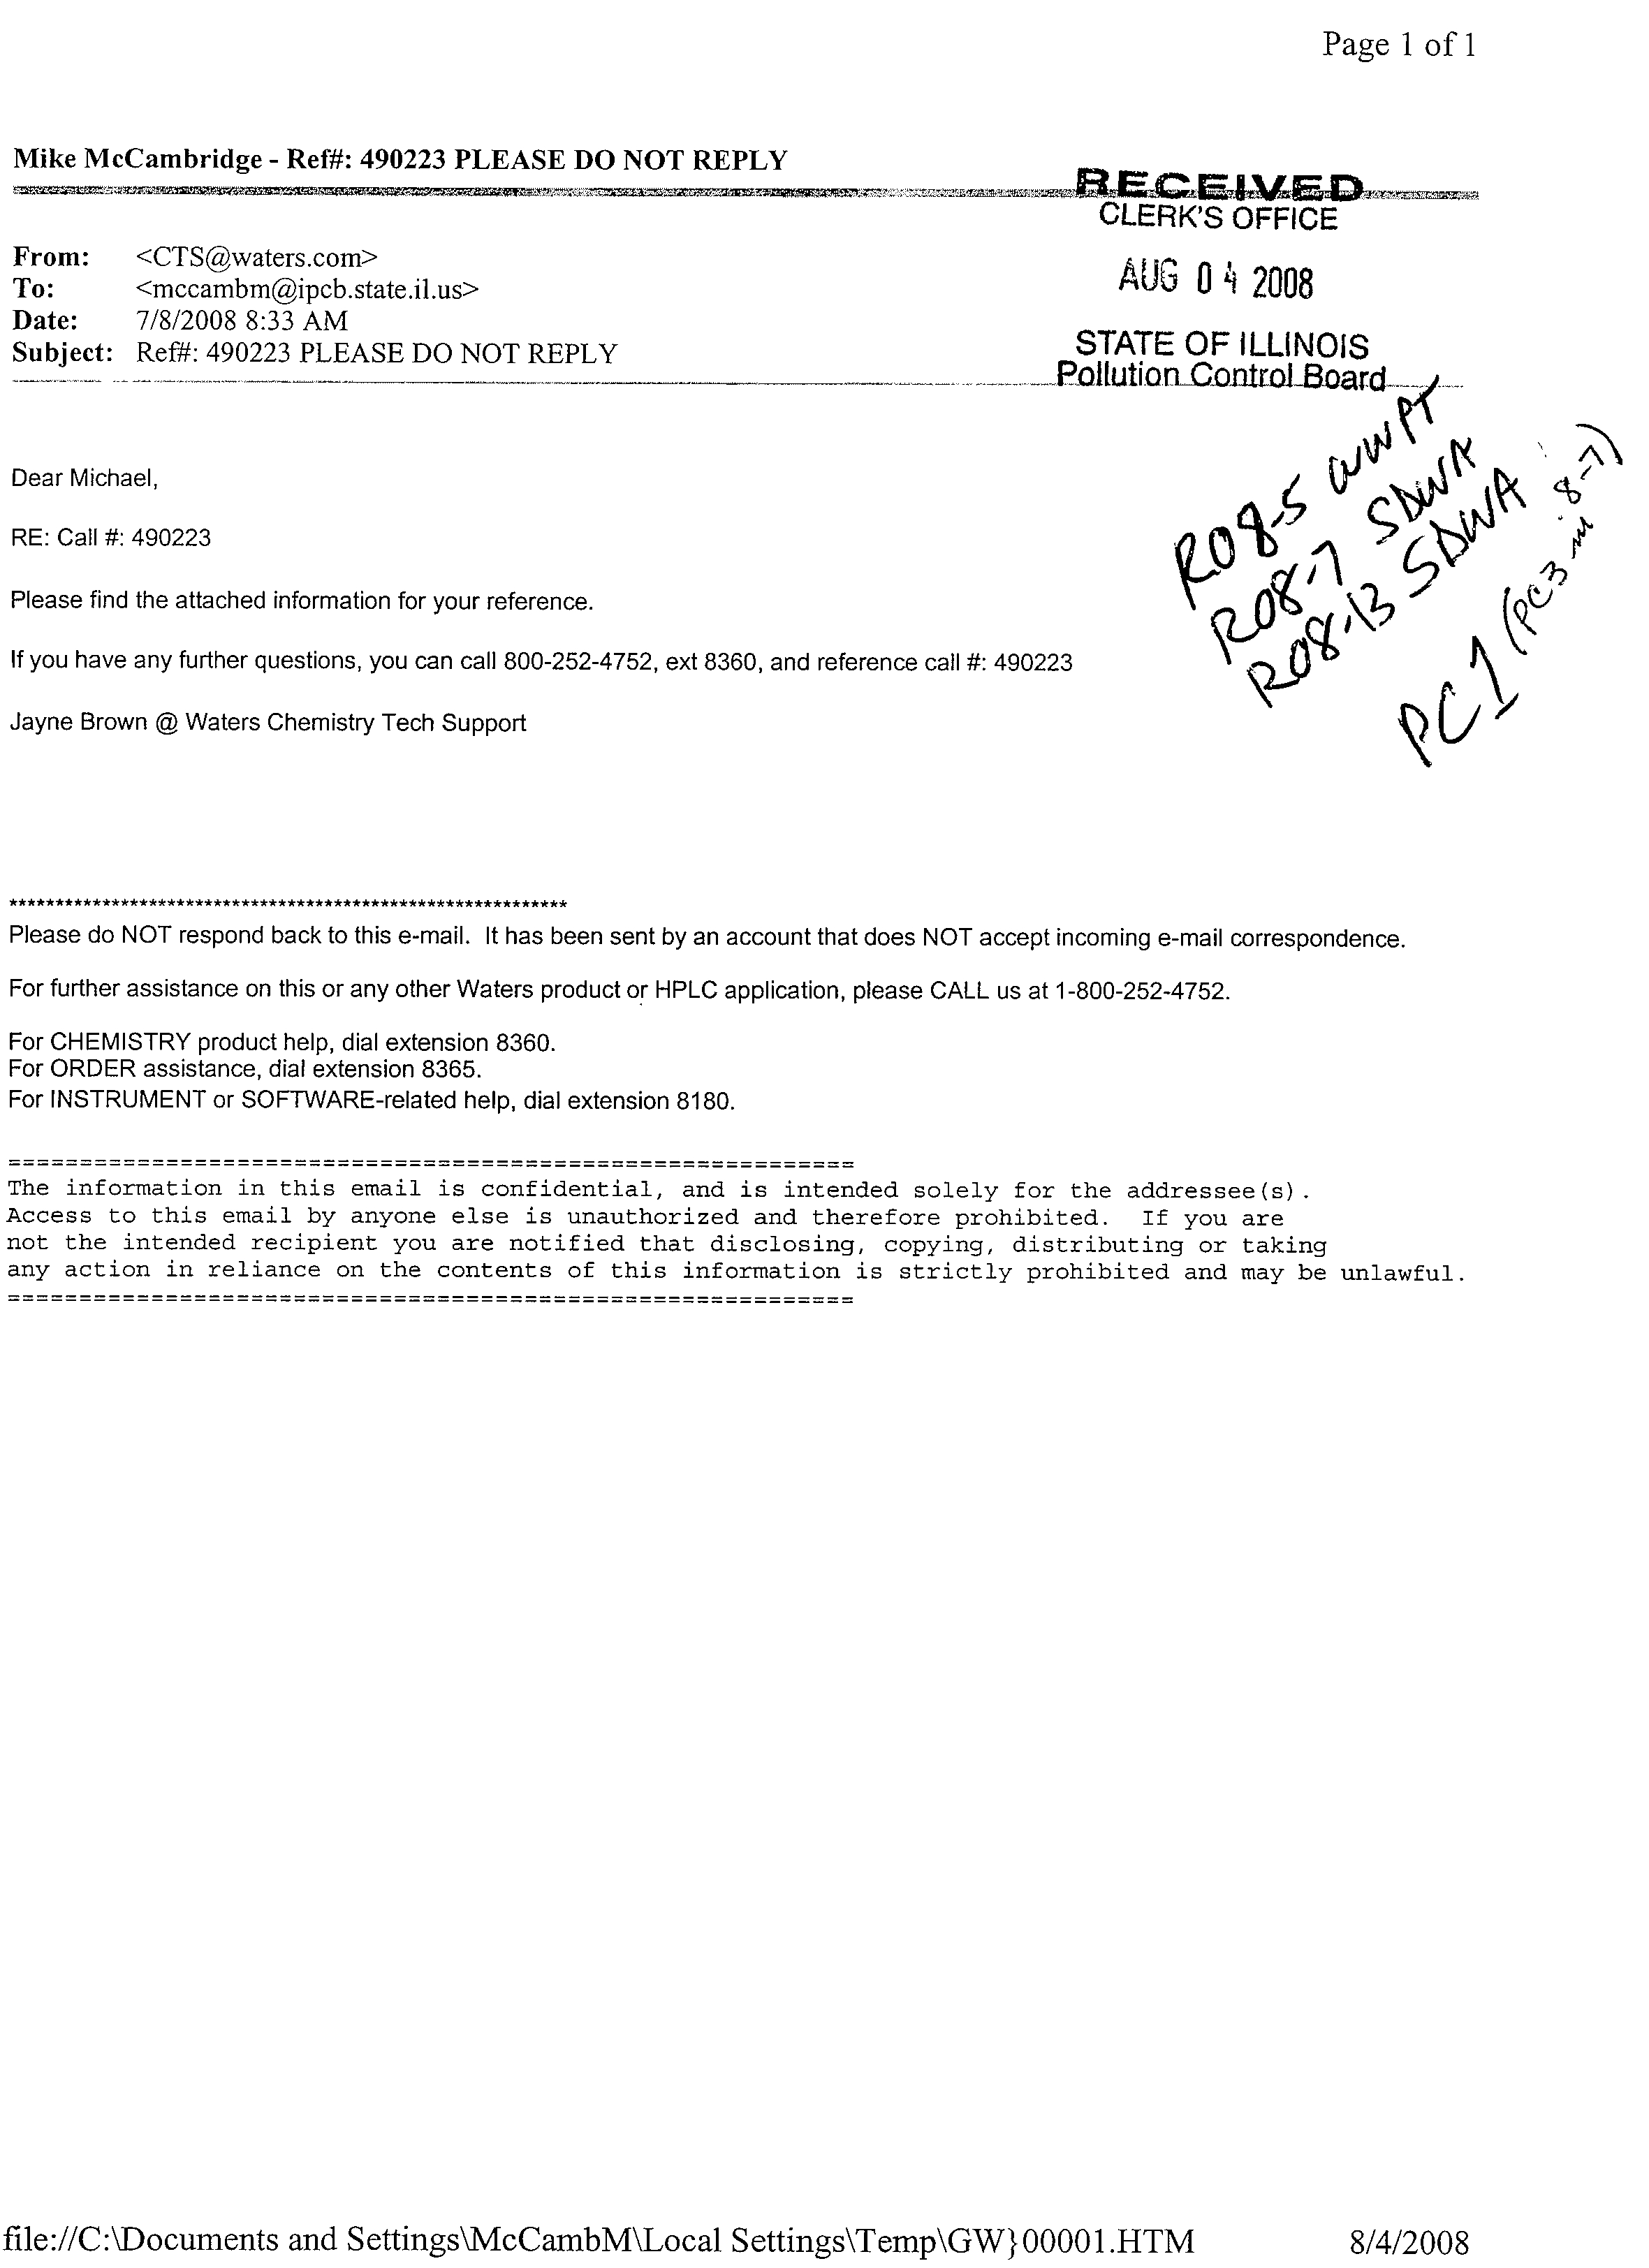
Page 1 of 1
:JELE.CIEAMEE4:1„
CLERK'S OFFICE
AUG
0 2008
STATE OF ILLINOIS
_Piollution_GontroLBoard-r
Vszi)164,7Vi\t,br
Ac
4:1
Mike McCambridge - Ref#: 490223 PLEASE DO NOT REPLY
From:
<CTS@waters.com>
To:?
<mccambm@ipcb.state.il.us>
Date:
?
7/8/2008 8:33 AM
Subject:
Re
g
: 490223 PLEASE DO NOT REPLY
Dear Michael,
RE: Call #: 490223
Please find the attached information for your reference.
If you have any further questions, you can call 800-252-4752, ext 8360, and reference call #: 490223
Jayne Brown @ Waters Chemistry Tech Support
Ir*****************9e*.********************.*****************
Please do NOT respond back to this e-mail. It has been sent by an account that does NOT accept incoming e-mail correspondence.
For further assistance on this or any other Waters product or HPLC application, please CALL us at 1-800-252-4752.
For CHEMISTRY product help, dial extension 8360.
For ORDER assistance, dial extension 8365.
For INSTRUMENT or SOFTWARE-related help, dial extension 8180.
The information in this email is confidential, and is intended solely for the addressee(s).
Access to this email by anyone else is unauthorized and therefore prohibited. If you are
not the intended recipient you are notified that disclosing, copying, distributing or taking
any action in reliance on the contents of this information is strictly prohibited and may be unlawful.
file://C:\Documents and Settings\McCambM\Local Settings\Temp\GW}00001.HTM
8/4/2008
METHOD 6500
DISSOLVED INORGANIC ANIONS IN AQUEOUS MATRICES
BY CAPILLARY ION ELECTROPHORESIS
SW-846 is not intended to be an analytical training manual. Therefore, method
procedures are written based on the assumption that they will be performed by analysts who are
formally trained in at least the basic principles of chemical analysis and in the use of the subject
technology.
In addition, SW-846 methods, with the exception of required method use for the analysis
of method-defined parameters, are intended to be guidance methods which contain general
information on how to perform an analytical procedure or technique which a laboratory can use
as a basic starting point for generating its own detailed standard operating procedure (SOP),
either for its own general use or for a specific project application. The performance data
included in this method are for guidance purposes only, and are not intended to be and must
not be used as absolute QC acceptance criteria for purposes of laboratory accreditation.
1.0 SCOPE AND APPLICATION
1.1
?
This test method is applicable for determination of the dissolved inorganic anions
in aqueous matrices (drinking water, wastewater, and ground water) using capillary ion
electrophoresis with indirect UV detection. The following analytes have been determined by this
method:
Analytes
CAS Registry No.*
Bromide
24959-67-9
Chloride
16887-00-6
Fluoride
16984-48-8
Nitrate
14797-55-8
Nitrite
14797-65-0
o-Phosphate
14265-44-2
Sulfate
14808-79-8
*Chemical Abstracts Service Registry Number
1.2 This test method is applicable to drinking water, wastewater and ground water for
the analysis of inorganic anions in the concentration range of 0.1 to 50 mg/L, except for fluoride,
which has a range of 0.1 to 25 mg/L. It is the user's responsibility to ensure the applicability of
this test method for other anion concentration ranges and other aqueous sample matrices.
1.3
?
Capillary ion electrophoresis provides a simultaneous separation and
determination of several inorganic anions using nanoliters of sample in a single injection. Only
500 pL of sample is necessary to fill the analysis vial. Analysis time is less than 5 min.
1.4?
Analysts should consult the disclaimer statement at the front of the manual and
the information in Chapter Two for guidance on the intended flexibility in the choice of methods,
apparatus, materials, reagents, and supplies, and on the responsibilities of the analyst for
6500 - 1
?
Revision 0
February 2007
demonstrating that the techniques employed are appropriate for the analytes of interest, in the
matrix of interest, and at the levels of concern.
In addition, analysts and data users are advised that, except where explicitly specified in
a regulation, the use of SW-846 methods is
not
mandatory in response to Federal testing
requirements. The information contained in this method is provided by EPA as guidance to be
used by the analyst and the regulated community in making judgments necessary to generate
results that meet the data quality objectives for the intended application.
1.5?
Use of this method is restricted to use by, or under supervision of, properly
experienced and trained personnel in the use of capillary ion electrophoresis. Each analyst
must demonstrate the ability to generate acceptable results with this method.
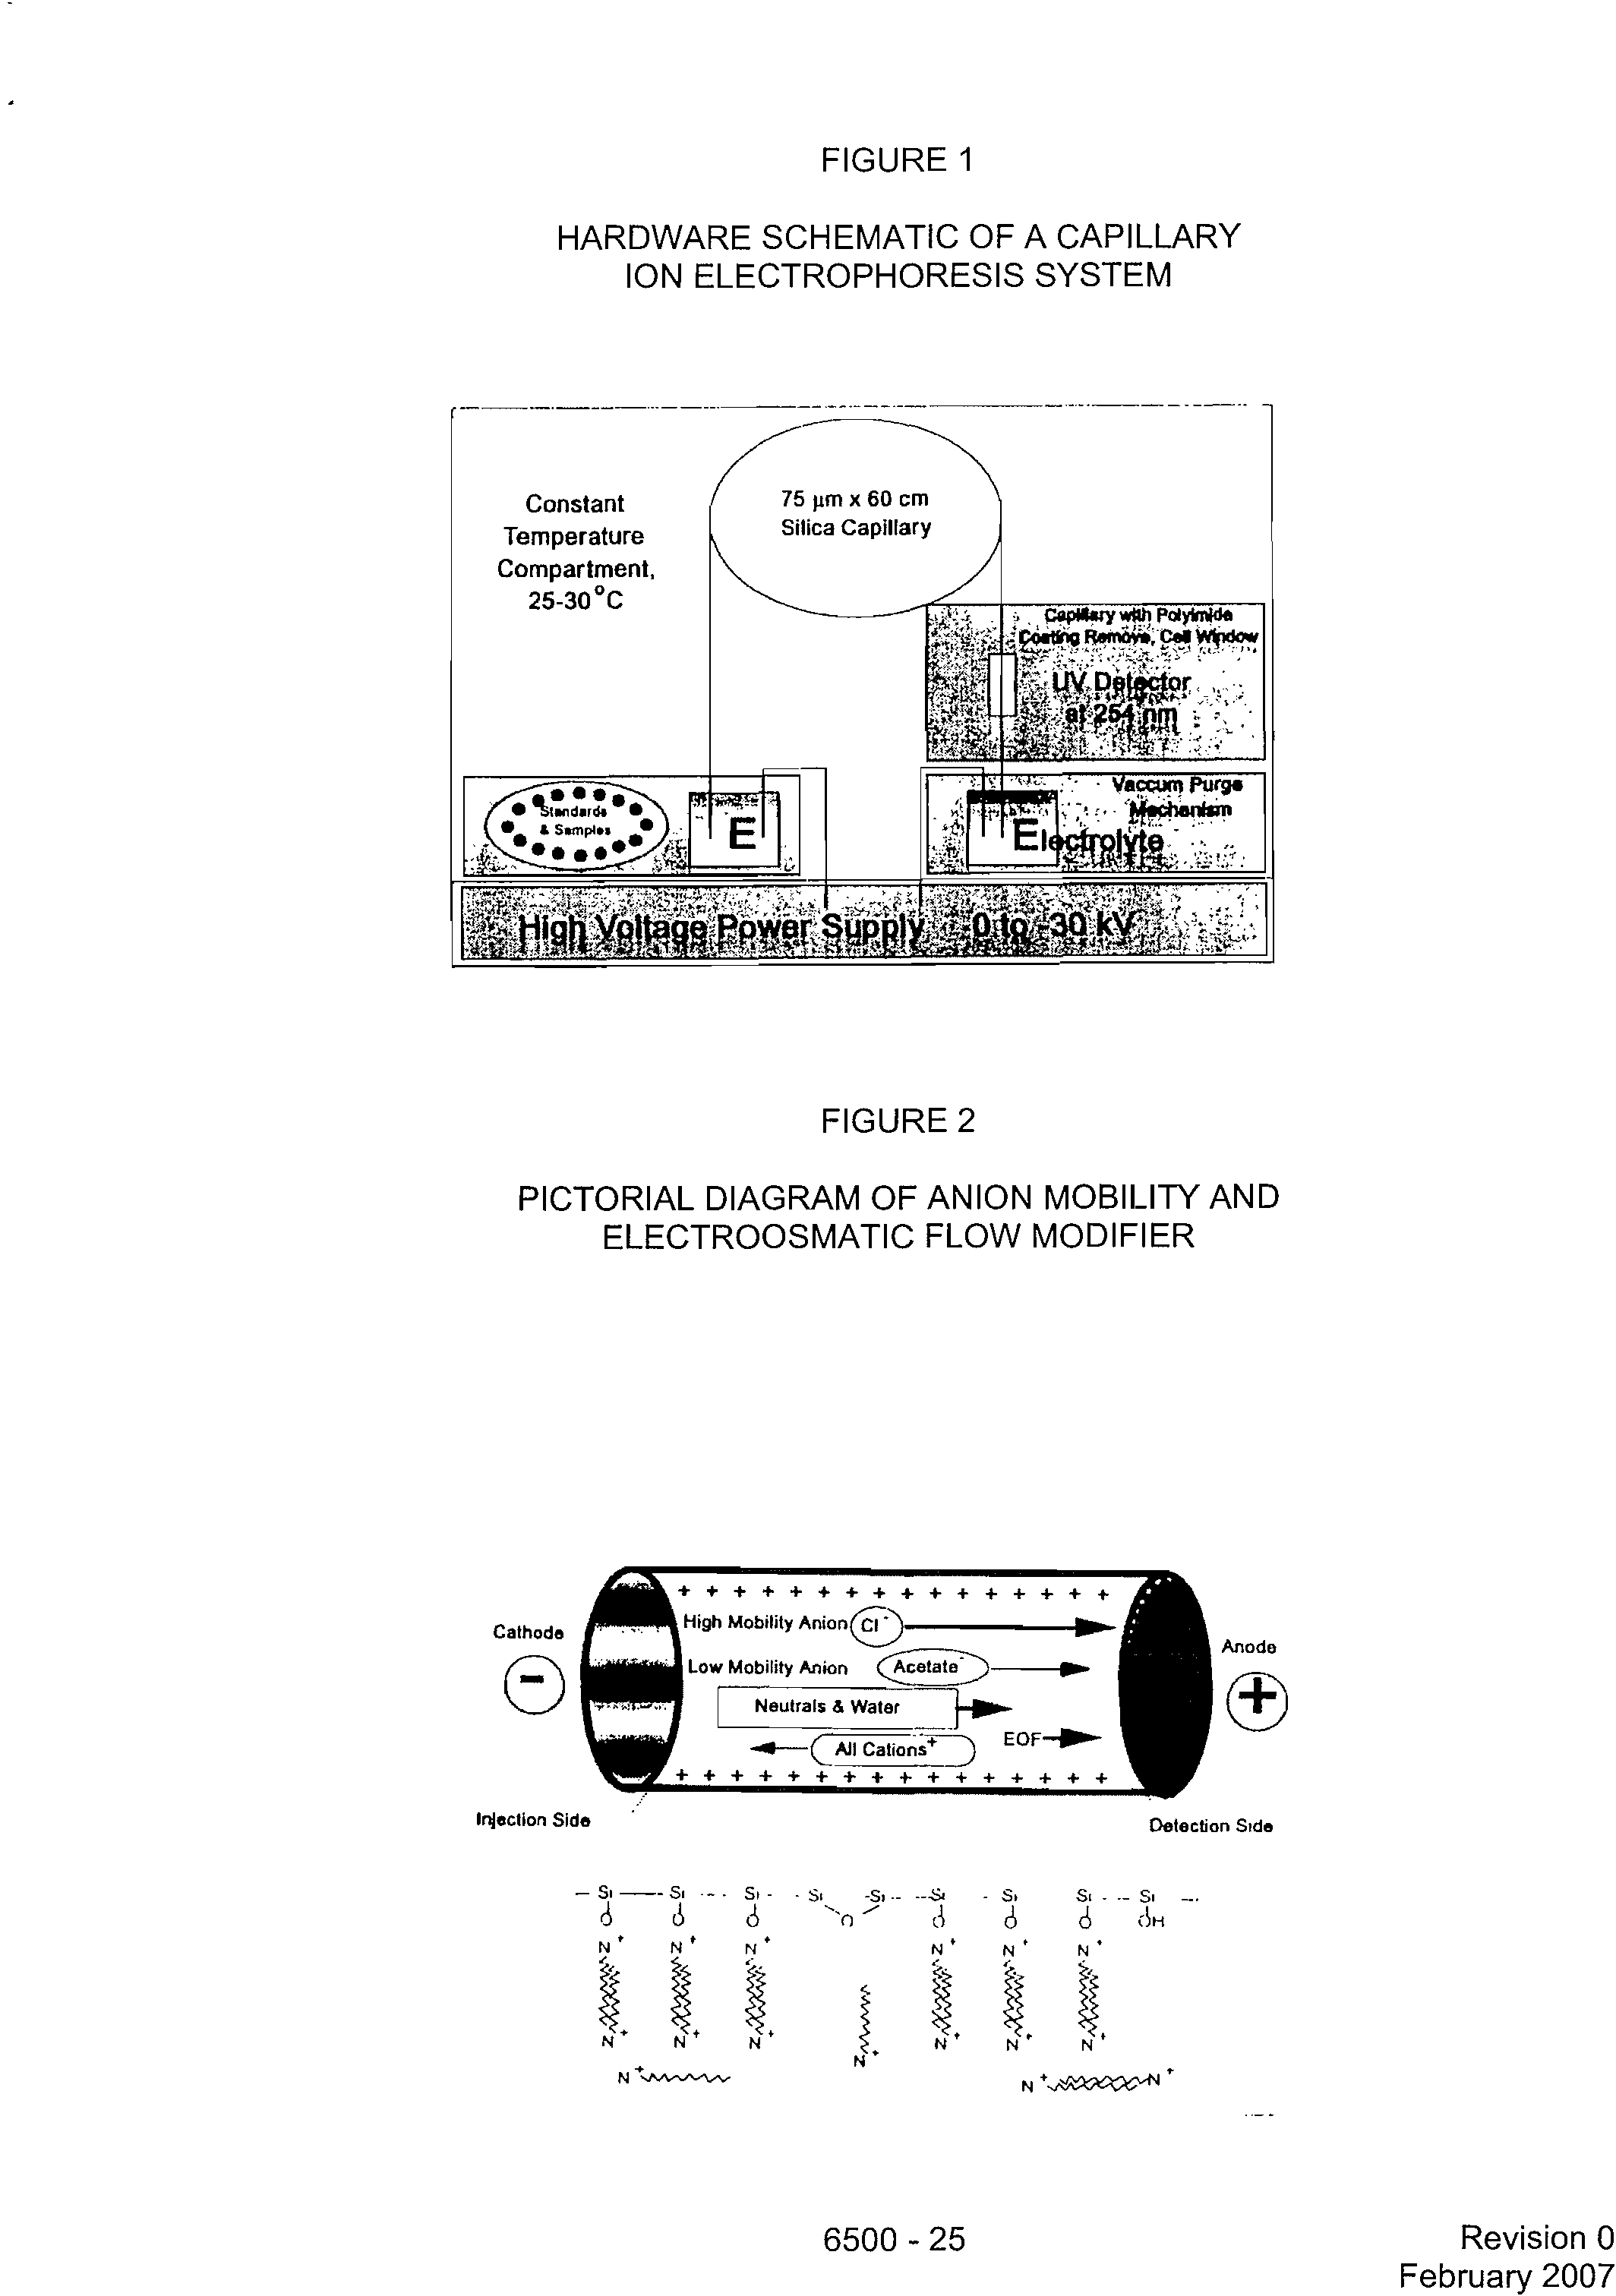
2.0 SUMMARY OF METHOD
2.1
?
Capillary ion electrophoresis (see Figs. 1 through 4) is a free-zone
electrophoretic technique optimized for the analysis of anions with molecular weights of less
than 200. The anions migrate and are separated according to their mobility in the electrolyte
when an electrical field is applied through the open tubular fused silica capillary. The
electrolyte's electroosmotic flow (EOF) modifier dynamically coats the inner wall of the capillary,
changing the surface to a net positive charge. This reversal of wall charge reverses the natural
EOF. The modified EOF in combination with a negative power supply augments the mobility of
the analyte anions towards the anode and detector, achieving rapid analysis times. Cations
migrate in the opposite direction towards the cathode and are removed from the sample during
analysis. Water and other neutral species move toward the detector at the same rate as the
EOF. The neutral species migrate slower than the analyte anions and do not interfere with
anion analysis (see Figs. 2 and 3).
2.2?
The sample is introduced into the capillary using hydrostatic sampling. The inlet
of the capillary, containing electrolyte, is immersed in the sample and the sample raised 10 cm
for 30 sec where 36 nanoliter volumes are siphoned into the capillary. After sample loading, the
capillary is immediately immersed back into the electrolyte. The voltage is applied initiating the
separation process. Pressure injection may also be used as long as the performance
specifications of this method are achievable.
2.3?
Anion detection is based upon the principles of indirect UV detection. The UV
absorbing electrolyte anion is displaced charge-for-charge by the separated analyte anion. The
analyte anion zone has a net decrease in background absorbance. This decrease in UV
absorbance is quantitatively proportional to analyte anion concentration (see Fig. 4). Detector
output polarity is reversed to provide positive mV response to the data system, and to make the
negative absorbance peaks appear positive.
2.4
?
The analysis is complete once the last anion of interest is detected. The capillary
is then vacuum purged by the system of any remaining sample, and replenished with fresh
electrolyte. The system is then ready for the next analysis.
3.0?
DEFINITIONS
See the last pages of this method for a glossary of basic capillary ion electrophoresis
and procedure-specific terms. Also refer to Chapter One, Chapter Three, and the
manufacturer's instructions for other definitions that may be relevant to this method.
6500 - 2
?
Revision 0
February 2007
4.0
?
INTERFERENCES
4.1?
Solvents, reagents, glassware, and other sample processing hardware may yield
artifacts and/or interferences to sample analysis. All of these materials must be demonstrated
to be free from interferences under the conditions of the analysis by analyzing method blanks.
Specific selection of reagents and purification of solvents by distillation in all-glass systems may
be necessary. Refer to each method to be used for specific guidance on quality control
procedures and to Chapter Three for general guidance on the cleaning of glassware.
4.2?
The most difficult quantitation and possible comigration occur when one anion is
in significant excess to other anions in close proximity. For two closely adjacent peaks, reliable
quantitation can be achieved when the concentration differential is less than 100:1. As the
resolution between two anion peaks increases so does the tolerated concentration differential.
4.3
?
Dissolved carbonate, as HCO3
1
, is an anion present in all aqueous
environmental samples, especially alkaline samples. Under the defined analysis conditions,
carbonate at less than 1000:1 concentration differential to the anions will not interfere with the
quantitation of the anions listed in Sec. 1.1.
4.4?
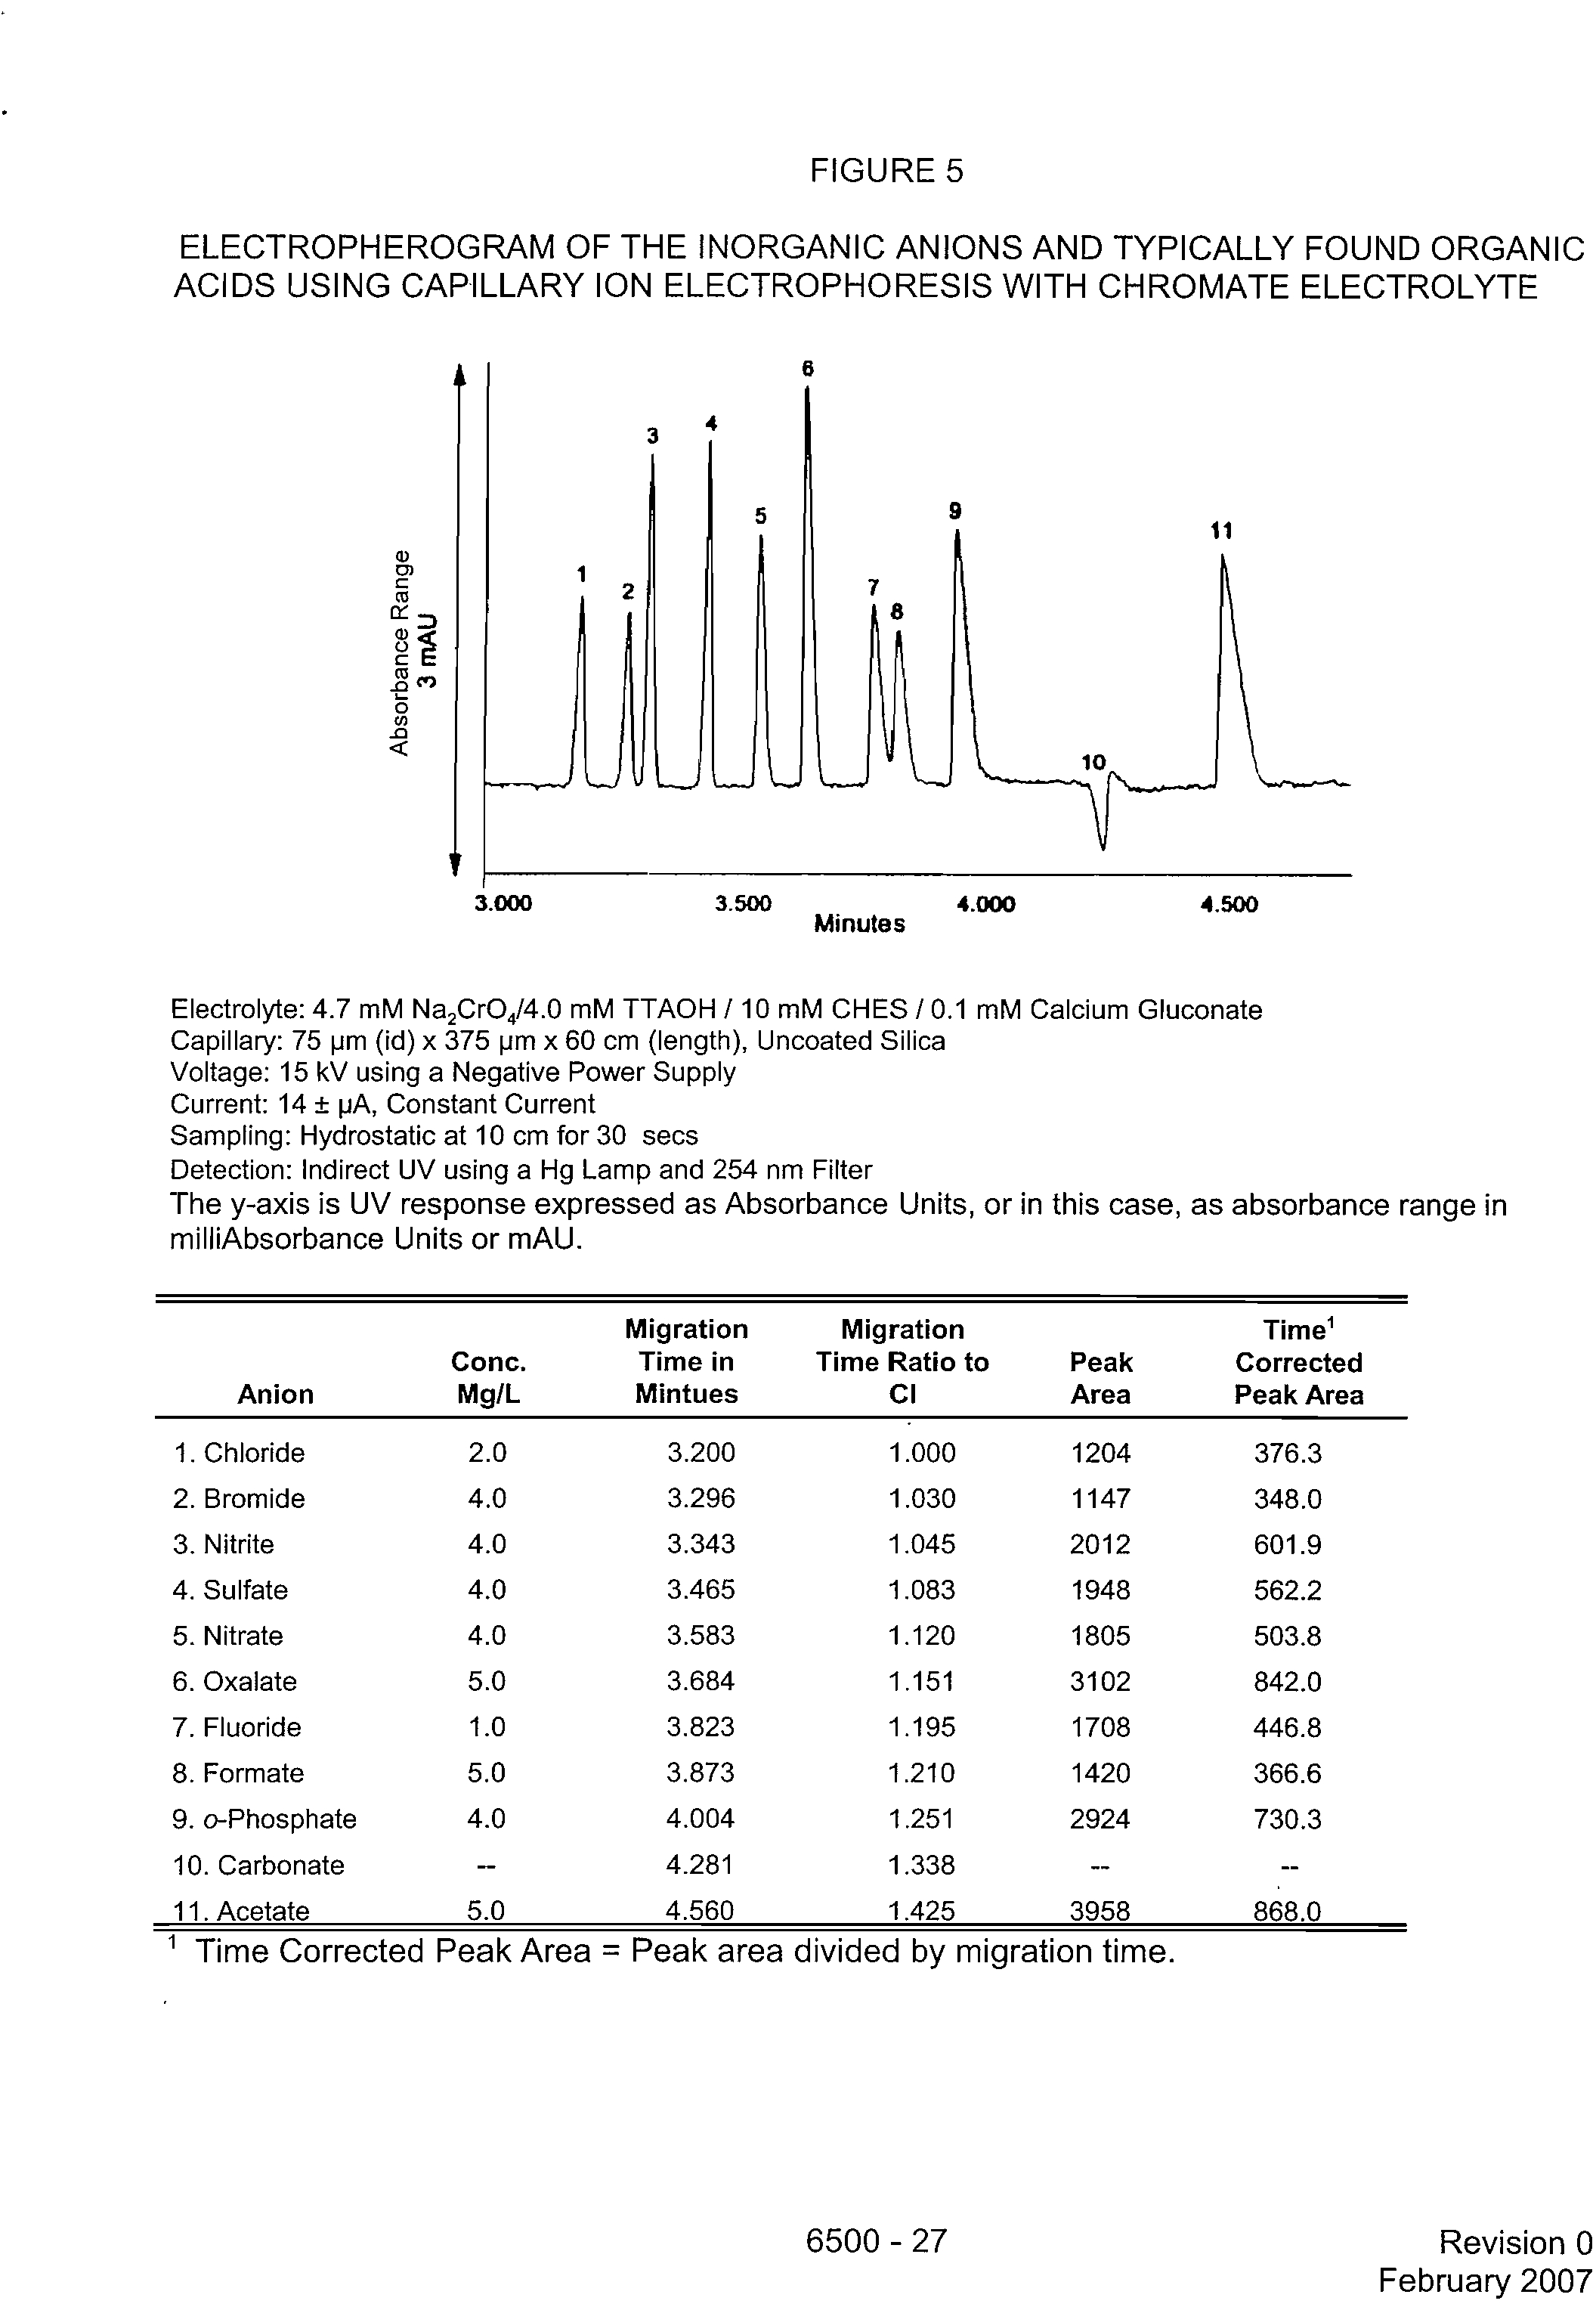
Most monovalent organic acids and neutral organic compounds commonly found
in wastewater and groundwater migrate later in the electropherogram, after carbonate, and do
not interfere with the anions listed in Sec. 1.1. Formate, a common organic acid found in
environmental samples, migrates shortly after fluoride but before phosphate. At high formate
concentrations the quantification of fluoride may be incorrectly identified. Include 5 mg/L of
formate into the mixed anion working solution to aid with fluoride identification and quantitation
(see Fig. 5).
4.5?
Other inorganic or organic anions present in the sample will be separated and
detected yielding an anionic profile of the sample. Other matrix anions commonly found in
drinking water or wastewater do not interfere with the analysis of anions given in Sec. 1.1.
However, unknown matrix anions may co-migrate or be a direct interferant with the analyte
anions of interest.
4.6
?
Divalent organic acids usually found in wastewater migrate after phosphate. At
concentrations greater than 10 mg/L, these compounds may interfere with phosphate
identification and quantitation.
4.7?
Chlorate also migrates in the phosphate region but does not interfere with
phosphate identification or quantitation at concentrations less than 3 mg/L. For chlorate
concentrations greater than 3 mg/L, add 5 mg/L of chlorate to the mixed anion working solution
to aid in identification of phosphate and chlorate.
4.8
?
As the concentration of analyte increases, the analyte peak shape becomes
asymmetrical. If adjacent analyte peaks are not baseline resolved, the data system will drop a
perpendicular line between them to the baseline. This causes a decrease in peak area for both
analyte peaks and a low bias for analyte amounts. For optimal quantitation, ensure that
adjacent peaks are fully resolved, if they are not, dilute the sample 1:1 with reagent water.
5.0 SAFETY
5.1
?
This method does not address all safety issues associated with its use. The
laboratory is responsible for maintaining a safe work environment and a current awareness file
of OSHA regulations regarding the safe handling of the chemicals listed in this method. A
6500 - 3
?
Revision 0
February 2007
reference file of material safety data sheets (MSDSs) should be available to all personnel
involved in these analyses.
5.2?
It is the responsibility of the user to prepare, handle, and dispose of electrolyte
solutions in accordance with all applicable Federal, state, and local regulations.
WARNING: This capillary electrophoresis method uses high voltage as a means for
separating the analyte anions, and can be hazardous if not used properly. Use
only those instruments with the appropriate safety features. See the
manufacturer's instructions.
6.0 EQUIPMENT AND SUPPLIES
This section does not list common laboratory glassware (e.g., beakers and flasks).
6.1
?
Capillary ion electrophoresis system -- Consists of the following components, or
equivalent.
6.1.1 High voltage power supply -- Capable of generating voltage potential
between 0 and minus 30 kV relative to ground.
6.1.2 Covered sample carousel -- To prevent environmental contamination of
the samples during a multi-sample analysis.
6.1.3 Sample introduction mechanism -- Capable of hydrostatic or pressure
sampling techniques.
6.1.4 Capillary purge mechanism -- To automatically purge the capillary after
every analysis to eliminate any cross contamination from the previous sample matrix and
to replenish the capillary with fresh electrolyte; or to clean the capillary with other
reagents, such as sodium hydroxide.
6.1.5 UV detector -- Capable of monitoring 254 nm with a time constant of 0.1
sec.
6.1.6 Fused silica capillary -- 75 pm (inner diameter) x 375 pm (outer diameter)
x 60 cm (length), having a polymer coating for flexibility, and a non-coated section to act
as the cell window for UV detection.
6.1.7 Constant temperature compartment -- To keep the samples, capillary and
electrolytes at constant temperature.
6.2?
Data system -- Computer system capable of acquiring data at 20 points per sec
and an ability to express migration time or relative migration time in minutes to 3 decimal places,
use midpoint of the analyte peak width to determine the migration time of the analyte, use
reference peaks and normalized migration time relative to the reference peak for qualitative
identification, report time corrected peak area, and express results in concentration units.
6.3?
Anion exchange cartridge, hydroxide form or equivalent.
6.4?
Plastic syringes, 20 mL disposable.
6.5?
Vacuum filtration apparatus using a 0.45 pm aqueous compatible filter.
6500 - 4
?
Revision 0
February 2007
7.0 REAGENTS AND STANDARDS
7.1
?
Reagent-grade chemicals must be used in all tests. Unless otherwise indicated,
it is intended that all reagents conform to the specifications of the Committee on Analytical
Reagents of the American Chemical Society, where such specifications are available. Other
grades may be used, provided it is first ascertained that the reagent is of sufficiently high purity
to permit its use without lessening the accuracy of the determination.
7.2
?
Reagent water -- All references to water in this method refer to reagent water
unless otherwise specified. Reagent water should be interference free.
7.3 Individual anion solution, stock standard (1000 mg/L anion) -- Individual stock
solution may be purchased from an appropriate vendor or may be prepared in the laboratory.
The use of certified 1000 ppm stock standards is recommended.
NOTE: All weights given are for anhydrous or dried salts.
7.3.1 Bromide solution, standard -- Dry approximately 0.5 g of sodium bromide
(NaBr) for 6 hrs at 150 C and cool in a desiccator. In a 100-mL volumetric flask dissolve
0.129 g of the dry salt with water, and fill to mark with water.
7.3.2?
Chloride solution, standard -- Dry approximately 0.5 g of sodium chloride
(NaCI) for 1 hr at 100 C and cool in a desiccator. In a 100-mL volumetric flask dissolve
0.165 g of the dry salt with water, and fill to mark with water.
7.3.3
?
Fluoride solution, standard -- Dry approximately 0.5 g of sodium fluoride
(NaF) for 1 hr at 100 C and cool in a desiccator. In a 100-mL volumetric flask dissolve
0.221 g of the dry salt with water, and fill to mark with water.
7.3.4?
Formate solution, standard -- Dissolve 0.151 g of sodium formate in a
100-mL volumetric flask with water, and make to volume. This chemical is not dried in a
desiccator because it may decompose at high temperatures.
7.3.5
?
Nitrate solution, standard -- Dry approximately 0.5 g of sodium nitrate
(NaNO
3
) for 48 hrs at 105 °C and cool in a desiccator. In a 100-mL volumetric flask
dissolve 0.137 g of the dry salt with water, and fill to mark with water (1000 mg/L of NO
3
=
225.8 mg/L of N-NO3).
7.3.6 Nitrite solution, standard -- Dry approximately 0.5 g of sodium nitrite
(NaNO
2
) for 24 hrs in a desiccator containing concentrated sulfuric acid. In a 100-mL
volumetric flask dissolve 0.150 g of the dry salt with water, and fill to mark with water.
Store in a sterilized glass bottle. Refrigerate and prepare monthly. (1000 mg/L NO
2
=
304.3 mg/L N-NO2.)
CAUTION: Nitrite is easily oxidized, especially in the presence of moisture. Use only
fresh reagent.
NOTE:?
Prepare sterile bottles for storing nitrite solutions by heating for 1 hr at 170 C in
an air oven.
7.3.7?
o-Phosphate solution, standard -- In a 100-mL volumetric flask dissolve
0.150 g of anhydrous dibasic sodium phosphate (Na
2 HPO
4
) with water, and fill to mark
with water. (1000 mg/L PO
4
= 326.1 mg/L P-PO4.)
6500 - 5
?
Revision 0
February 2007
7.3.8
?
Sulfate solution, standard -- Dry approximately 0.5 g of sodium sulfate
(Na
2 SO4
) for 1 hr at 105 C and cool in a desiccator. In a 100-mL volumetric flask dissolve
0.148 g of the dry salt with water, and fill to mark with water.
7.4?
Mixed anion solution, working -- Prepare a blank, and at least 3 different working
standard concentrations for the anions of interest within the desired range of analysis, typically
between 0.1 and 50 mg/L. To a pre-rinsed 100-mL volumetric flask add an appropriate aliquot
of individual anion stock standard solution (Sec. 7.3), a 0.5-mL aliquot of standard formate
solution (7.3.4) and dilute with water. The formate concentration in each working standard will
be 5 mg/L.
NOTE:?
Use 0.1 mL of individual anion stock standard solution (Sec. 7.3) per 100 mL for 1
mg/L of anion.
NOTE: Anions of no interest may be omitted.
NOTE: The mid-range mixed anion working solution of this section may be used for the
determination of migration times and resolution described in Sec. 10.1 and for the
quality control evaluation described in Sec. 9.0.
7.5?
Electrolyte reagents -- Although any electrolyte meeting the performance criteria of
this method may be used, this method was validated using a chromate-based electrolyte.
7.5.1?
Chromate concentrate (100 mM chromate) -- In a 1-L volumetric flask
dissolve 23.40 g of sodium chromate tetrahydrate (Na
2 Cr04 .4H2
0) in 500 mL of water, and
dilute to 1 L with water. This concentrate may be stored in a capped glass or plastic
container for up to 1 year.
7.5.2?
Electroosmotic flow modifier (OFM) concentrate (100 mM
tetradecyltrimethyl ammonium bromide, TTABr) In a 100-mL volumetric flask dissolve
3.365 g of tetradecyltrimethyl ammonium bromide (TTABr) in 70 mL of water, and dilute to
100 mL with water.
NOTE: TTABr needs to be converted to the hydroxide form using the anion exchange
cartridge. TTAOH is commercially available from Waters Corp. (sole source).
7.5.3
?
Buffer solution (100 mM CHES/1mM calcium gluconate) -- In a 1-L
volumetric flask dissolve 20.73 g of CHES (2-[N-cyclohexylamino]-ethane sulfonic acid)
and 0.43 g of calcium gluconate in 500 mL of water, and dilute to 1 L with water. This
concentrate may be stored in a capped glass or plastic container for up to one year.
7.5.4?
Sodium hydroxide solution (500 mM sodium hydroxide) -- In a 100-mL
volumetric flask dissolve 2 g of sodium hydroxide in 50 mL of water and dilute to 100 mL
with water.
7.5.5?
Electrolyte solution, working (4.7 mM chromate/4 mM TTAOH/10mM
CHES/0.1 mM calcium gluconate) -- Wash the anion exchange cartridge in the hydroxide
form using the 20-mL plastic syringe with 10 mL of 500 mM NaOH followed by 10 mL of
water. Discard the washings. Slowly pass 4 mL of the 100 mM OFM concentrate solution
(Sec. 7.5.2) through the cartridge into a 100-mL volumetric flask. Rinse the cartridge with
20 mL of water, adding the washing to the volumetric flask.
6500 - 6
?
Revision 0
February 2007
NOTE: The above procedure is used to convert the TTABr to TTAOH which is used in
the electrolyte. If using commercially available 100 mM TTAOH, this step is not
necessary.
Into the 100-mL volumetric flask add 4.7 mL of chromate concentrate solution
(Sec. 7.5.1) and 10 mL buffer solution (Sec. 7.5.3). Mix and dilute to 100 mL with water.
The natural pH of the electrolyte should be 9.0 ± 0.1. Filter and degass using the vacuum
filtration apparatus. Store the remaining electrolyte in a capped glass or plastic container
at ambient temperature. The electrolyte is stable for one year. This electrolyte is
commercially available from Waters Corp.
8.0 SAMPLE COLLECTION, PRESERVATION, AND STORAGE
8.1?
See the introductory material to Chapter Three, "Inorganic Analytes."
8.2?
Rinse sampling containers with the sample and discard to eliminate any
contamination from the container, fill to overflowing, and cap to exclude air.
8.3 Analyze samples as soon as possible after collection. For nitrite, nitrate, and
phosphate, refrigerate the sample at 6 C after collection and warm to room temperature
before dilution and analysis. Determine nitrite and nitrate within 48 hrs.
8.4?
Filter samples containing suspended solids through a pre-rinsed 0.45-pm aqueous
compatible membrane filter before transferring the sample to the analysis vial.
8.5?
If sample dilution is necessary, dilute with reagent water only.
9.0 QUALITY CONTROL
9.1?
Refer to Chapter One for additional guidance on quality assurance (QA) and
quality control (QC) protocols. When inconsistencies exist between QC guidelines, method-
specific QC criteria take precedence over both technique-specific criteria and those criteria
given in Chapter One, and technique-specific QC criteria take precedence over the criteria in
Chapter One. Any effort involving the collection of analytical data should include development
of a structured and systematic planning document, such as a Quality Assurance Project Plan
(QAPP) or a Sampling and Analysis Plan (SAP), which translates project objectives and
specifications into directions for those that will implement the project and assess the results.
Each laboratory should maintain a formal quality assurance program. The laboratory should
also maintain records to document the quality of the data generated. All data sheets and
quality control data should be maintained for reference or inspection.
9.2?
Initial demonstration of proficiency
Each laboratory must demonstrate initial proficiency with the entire sample preparation
and analytical procedure by generating data of acceptable accuracy and precision for target
analytes in a clean matrix. The laboratory must also repeat the demonstration of proficiency
whenever new staff members are trained or significant changes in instrumentation are made.
9.2.1?
Prepare the reference samples from a spiking solution containing each
analyte of interest. The reference sample concentrate (spiking solution) may be prepared
from pure standard materials, or purchased as certified solutions. If prepared by the
6500 - 7
?
Revision 0
February 2007
laboratory, the reference sample concentrate should be made using stock standards
prepared independently from those used for calibration.
9.2.2 To evaluate the performance of the total analytical process, the reference
samples must be handled in exactly the same manner as actual samples. See the note in
Sec. 9.3.1 for important information regarding spiking samples.
9.3
?
Before processing any samples, the analyst should demonstrate that all parts of
the equipment in contact with the sample and reagents are interference-free. This is
accomplished through the analysis of a method blank. Each time samples are analyzed, and
when there is a change in reagents, a method blank should be prepared and analyzed for the
compounds of interest as a safeguard against chronic laboratory contamination. If a peak is
observed within the retention time window of any analyte that would prevent the determination
of that analyte, determine the source and eliminate it, if possible, before processing the
samples. If the method blank does not contain the target analyte at a level that interferes with
the project-specific data quality objectives then the method blank would be considered
acceptable. In the absence of project-specific data quality objectives, if the blank is less than
the lowest level of quantitation or less than 10% of the lowest sample concentration for the
analyte, whichever is greater, then the method blank would be considered acceptable. If the
method blank cannot be considered acceptable, the method blank should be re-run once and if
still unacceptable then all samples after the last acceptable method blank must be reprepped
and reanalyzed along with the other appropriate batch QC samples.
9.4
?
Sample quality control for preparation and analysis
The laboratory must also have procedures for documenting the effect of the matrix on
method performance (precision, accuracy, method sensitivity). At a minimum, this should
include the analysis of QC samples including a method blank, a matrix spike, a duplicate, and a
laboratory control sample (LCS) in each analytical batch and the addition of surrogates to each
field sample and QC sample when surrogates are used. Any method blanks, matrix spike
samples, and replicate samples should be subjected to the same analytical procedures (Sec.
11.0) as those used on actual samples.
9.4.1
?
Documenting the effect of the matrix should include the analysis of at
least one matrix spike and one duplicate unspiked sample or one matrix spike/matrix spike
duplicate pair. The decision on whether to prepare and analyze duplicate samples or a
matrix spike/matrix spike duplicate must be based on a knowledge of the samples in the
sample batch. If samples are expected to contain target analytes, laboratories may use a
matrix spike and a duplicate analysis of an unspiked field sample. If samples are not
expected to contain target analytes, the laboratories should use a matrix spike and matrix
spike duplicate pair. Consult Method 8000 for information on developing acceptance
criteria for the MS/MSD.
9.4.2?
A laboratory control sample (LCS) should be prepared as described in
Chapter One and treated exactly as a field sample, including exposure to all glassare,
equipment, and reagents that are used with field samples. An LCS should be included
with each analytical batch. The LCS consists of an aliquot of a clean (control) matrix
similar to the sample matrix and of the same weight or volume. The LCS is spiked with
the same analytes at the same concentrations as the matrix spike, when appropriate.
When the results of the matrix spike analysis indicate a potential problem due to the
sample matrix itself, the LCS results are used to verify that the laboratory can perform the
analysis in a clean matrix. Consult Method 8000 for information on developing
acceptance criteria for the LCS.
6500 - 8
?
Revision 0
February 2007
9.4.3
?
Also see Method 8000 for the details on carrying out sample quality
control procedures for preparation and analysis. In-house method performance criteria for
evaluating method performance should be developed using the guidance found in Method
8000.
10.0 CALIBRATION AND STANDARDIZATION
10.1?
Determination of migration times -- The migration time of an anion is dependent
upon the electrolyte compositions, pH, capillary surface and length, applied voltage, the ionic
strength of the sample, and temperature. For every fresh electrolyte determine the analyte
migration time in minutes, to the third decimal place, of the mid-range mixed anion standard
working solution (Sec. 7.4), using the analysis scheme described in Sec. 11.0. Use mid-point of
analyte peak width as the determinant of analyte migration time (Fig. 5 and Table 2).
CAUTION: Analyte peak apex may be used as the migration time determinant, but potential
analyte misidentification may result with asymmetrical shape at high analyte
concentrations.
10.2 For each anion concentration (X-axis) plot the time-corrected peak area response
(Y-axis). Determine the best linear calibration line through the data points, or use the linear
regression calibration routine available in the data systems. Do not force the line through zero.
10.3
?
Initial calibration verification (ICV) -- Immediately after the calibration standards
have been analyzed, the accuracy of the calibration must be verified by the analysis of an ICV
standard. The ICV is prepared at a concentration level within the calibration range of the
method and using a second source standard (prepared using standards different from the
calibration standards) spiked into reagent water. The control limit for the ICV is ± 15% of the
true value. When the ICV exceeds the control limits, the analysis should be terminated, the
problem corrected, the instrument recalibrated, and the calibration re-verified.
10.4 Continuing calibration verification (CCV) -- Once the calibration curve has been
established, the continuing accuracy must be verified by analysis of a CCV prior to conducting
any field sample analysis, after every tenth field sample, and at the end of the analysis
sequence. The CCV can be the single mixed anion working solution (see Sec. 7.4) or CCV
concentrations can be alternated between the low- and mid-range calibration standard
concentrations. The control limit for the low-range CCV is ± 50% and for the mid-range CCV is
± 15% of the true value. When the CCV exceeds the control limits, the analysis should be
terminated, the problem corrected, the instrument recalibrated, and the calibration re-verified.
Samples that are not bracketed by acceptable CCV runs must be reanalyzed.
10.5 The calibration curve is validated if the single point calibration standard (or CCV) is
within the control limits, and if analyte migration time is ± 5% of previous migration time
determined in Sec. 10.1.
10.6 If the calibration curve is not validated, discard the spent electrolyte and replace
with a fresh electrolyte. Calibrate as described in Sec. 10.1.
NOTE: Replace the electrolyte working solution in the instrument daily.
6500 - 9
?
Revision 0
February 2007
11.0 PROCEDURE
11.1?
Set up the capillary electrophoresis system according to the manufacturer's
instructions. Fill the electrolyte reservoirs with fresh electrolyte. Transfer the blank, standard, or
sample into a prerinsed plastic sample analysis vial and place in the covered sample carousel.
11.2 Program the system according to the manufacturer's instructions using the
following instrument settings as guidelines for analysis of standards and samples.
11.2.1
?
Condition a new 75-pm i.d. x 375-pm o.d. x 60-cm capillary with 100 mM
NaOH for 5 min followed by working chromate electrolyte solution A for 5 min.
NOTE: This conditioning step should be repeated weekly in order to regenerate the
capillary surface for optimum reproducibility.
Program the system for at least a one minute purge of the capillary with electrolyte
between each standard or sample. Using a 15 psi vacuum purge mechanism, one 60 cm
capillary volume can be displaced in 30 sec.
11.2.2 Program the system for the hydrostatic sampling technique for 30 sec.
Different sampling times may be used provided that samples and standards are analyzed
identically. Approximately 1.2 nL of sample per second is siphoned into a 75-pm capillary.
11.2.3 Program the system for constant current 14 pA and a run time of 5 min; if
an anionic profile of the sample is of interest set the time to 7 min. Using a capillary 60 cm
in length, the field strength at 15 pv applied voltage is 250 V/cm.
11.2.4 Program the integrator or computer for data acquisition rate of 20 points
per second with a run time designated in Sec. 11.2.3. Set up data processing method
according to the manufacturer's instructions.
11.2.5 Monitor UV response at 254 nm. Since detector ranges are variable, the
range setting designated for analysis will depend on the concentration of anions in the
sample and should be chosen accordingly.
11.2.6 The electropherogram of the working calibration standards (Sec. 7.4)
should be similar to the inorganic anion electropherogram shown in Fig. 5.
11.3 Analyze all standards (Sec. 7.4) and samples as described in Sec. 11.2. Refer to
Figs. 5 through 9 for representative anion standard, 0.1 mg/L anion standard, drinking water,
and waste water (municipal and industrial).
12.0 DATA ANALYSIS AND CALCULATIONS
12.1 Relate the time-corrected peak area for each sample anion with the calibration
curve generated in Sec. 10.2 to determine mg/L concentration of anion. If the sample was
diluted prior to analysis, then multiply mg/L anion by the dilution factor to obtain the original
sample concentration.
Original Sample mg/L Anion = (A x SF)
where:
A = mg/L anion determined from the calibration curve
6500 - 10
?
Revision 0
February 2007
SF = scale or dilution factor
12.2 Results must be reported in units commensurate with their intended use and all
dilutions must be taken into account when computing final results.
13.0 METHOD PERFORMANCE
13.1 Performance data and related information are provided in SW-846 methods only as
examples and guidance. The data do not represent required performance criteria for users of
the methods. Instead, performance criteria should be developed on a project-specific basis,
and the laboratory should establish in-house QC performance criteria for the application of this
method. These performance data are not intended to be and must not be used as absolute QC
acceptance criteria for purposes of laboratory accreditation.
13.2 Tables 1 through 10 provide examples of collaborative design, migration time
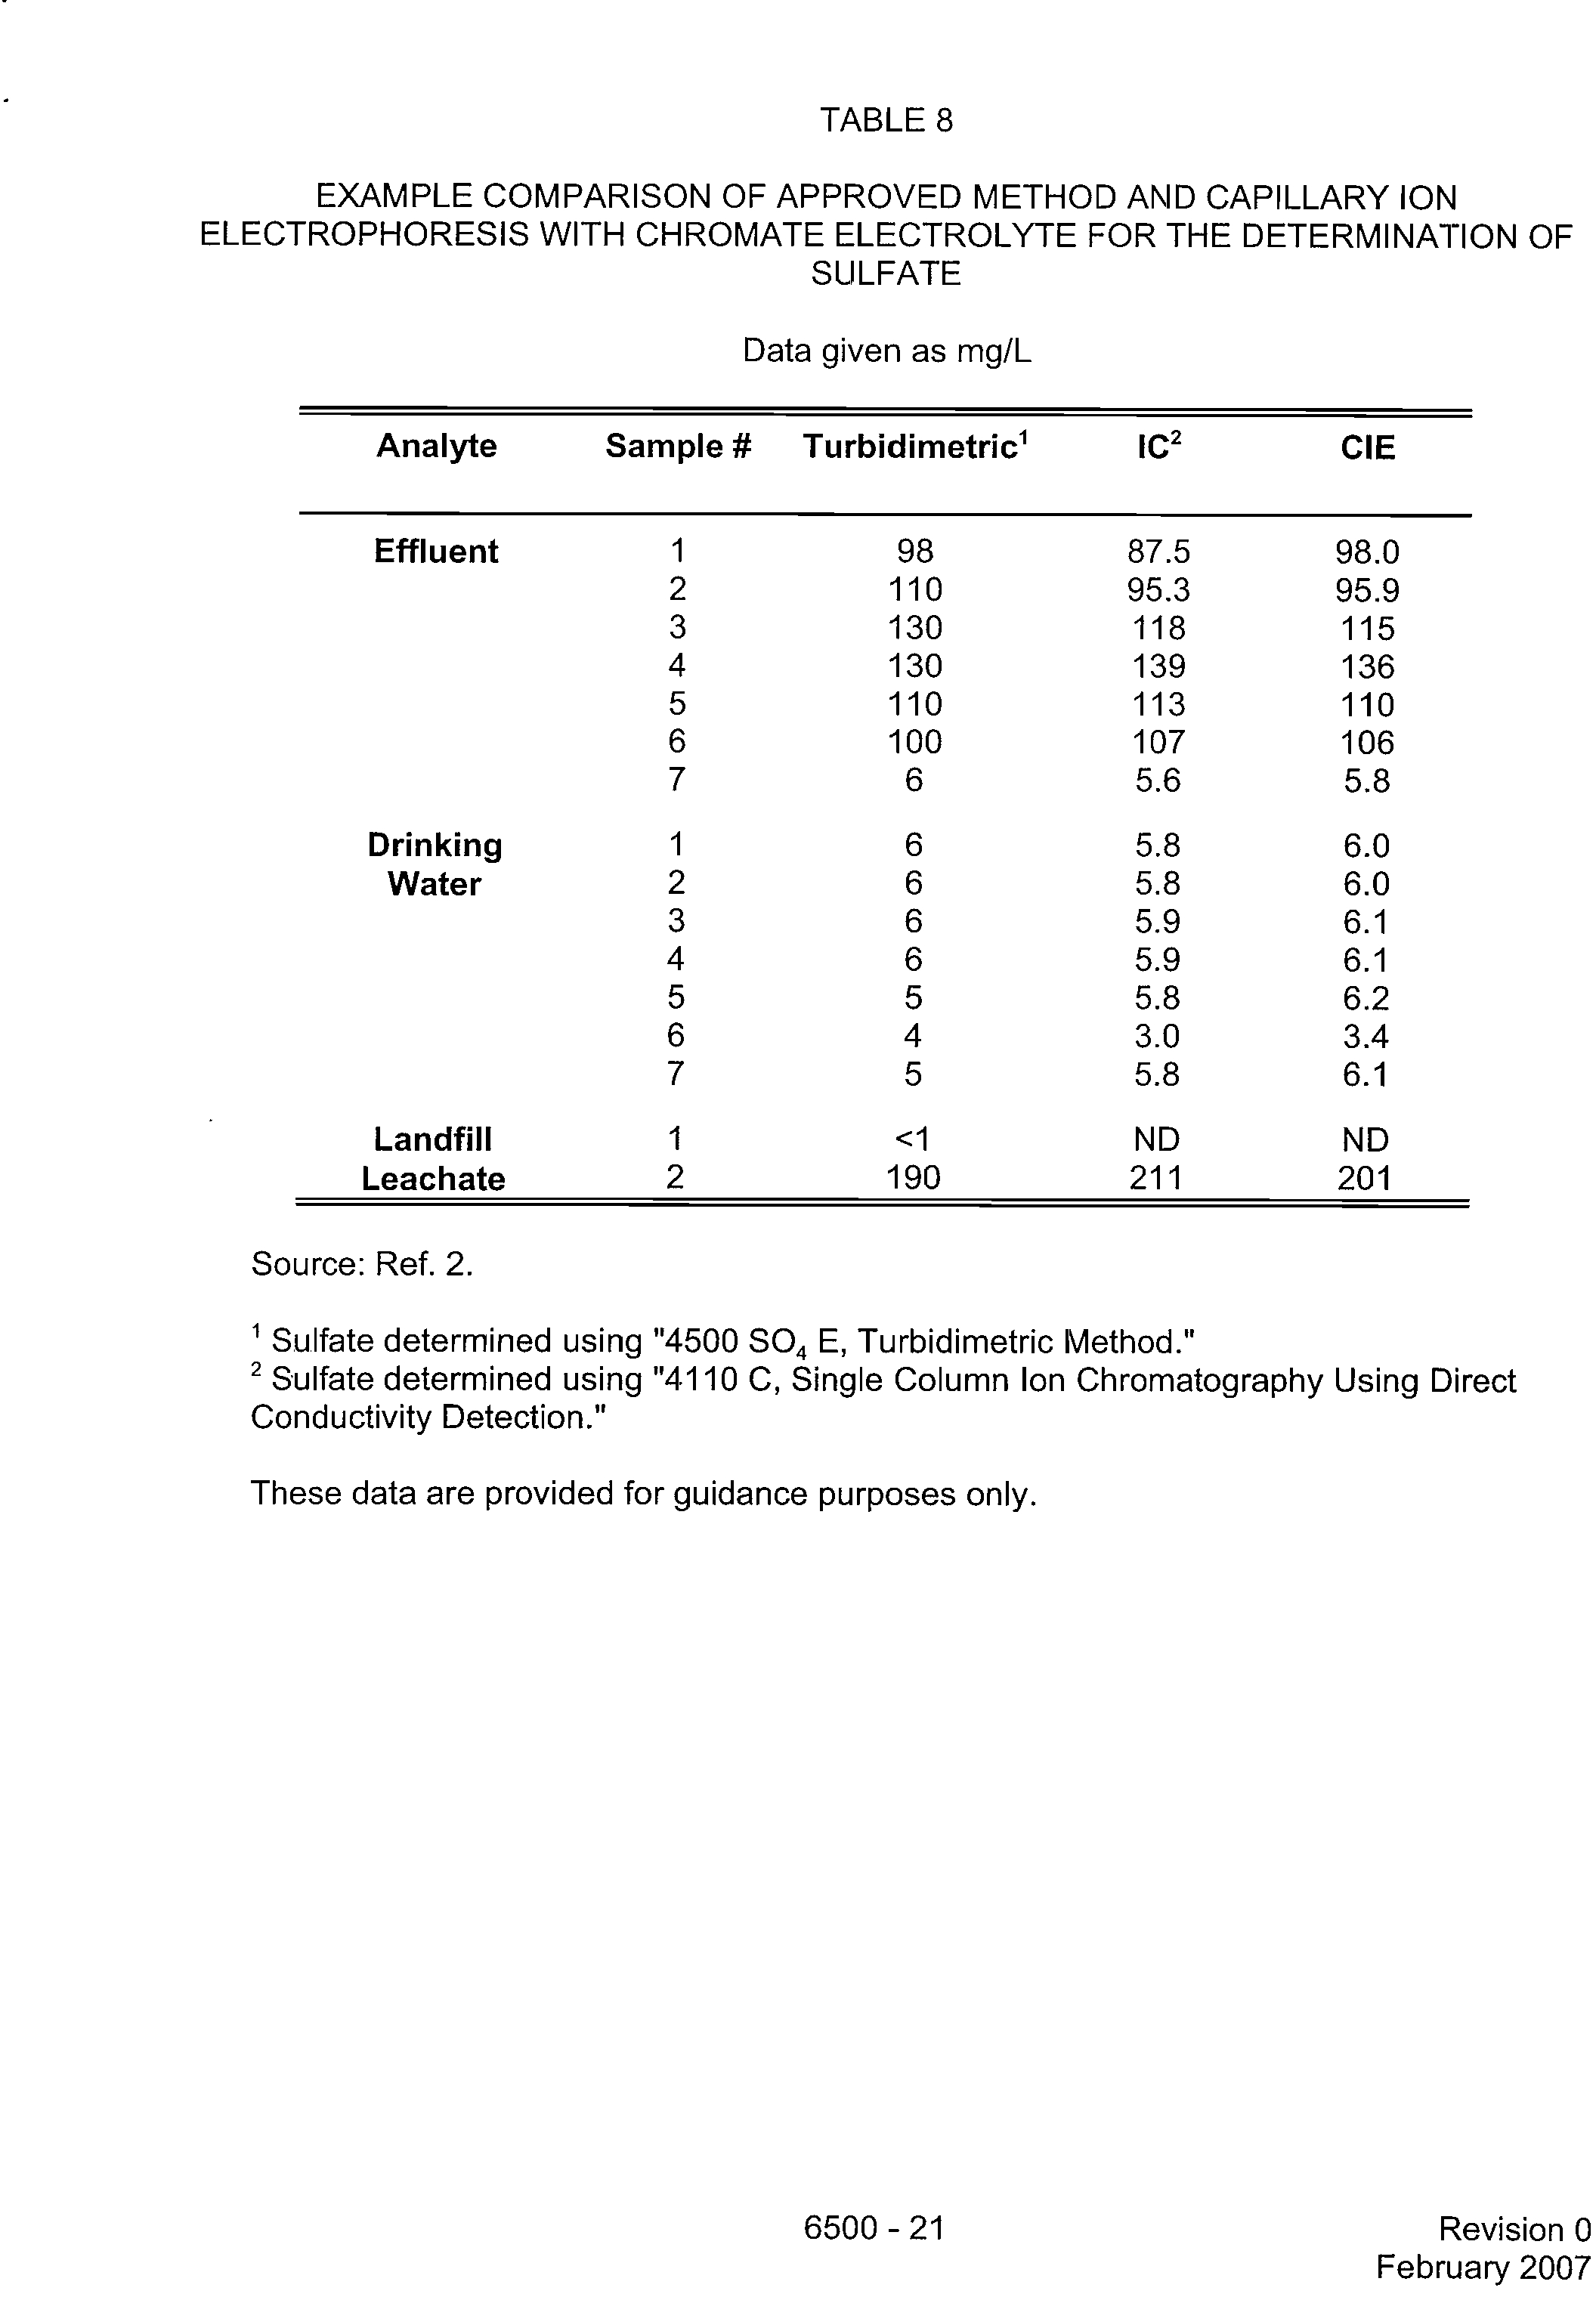
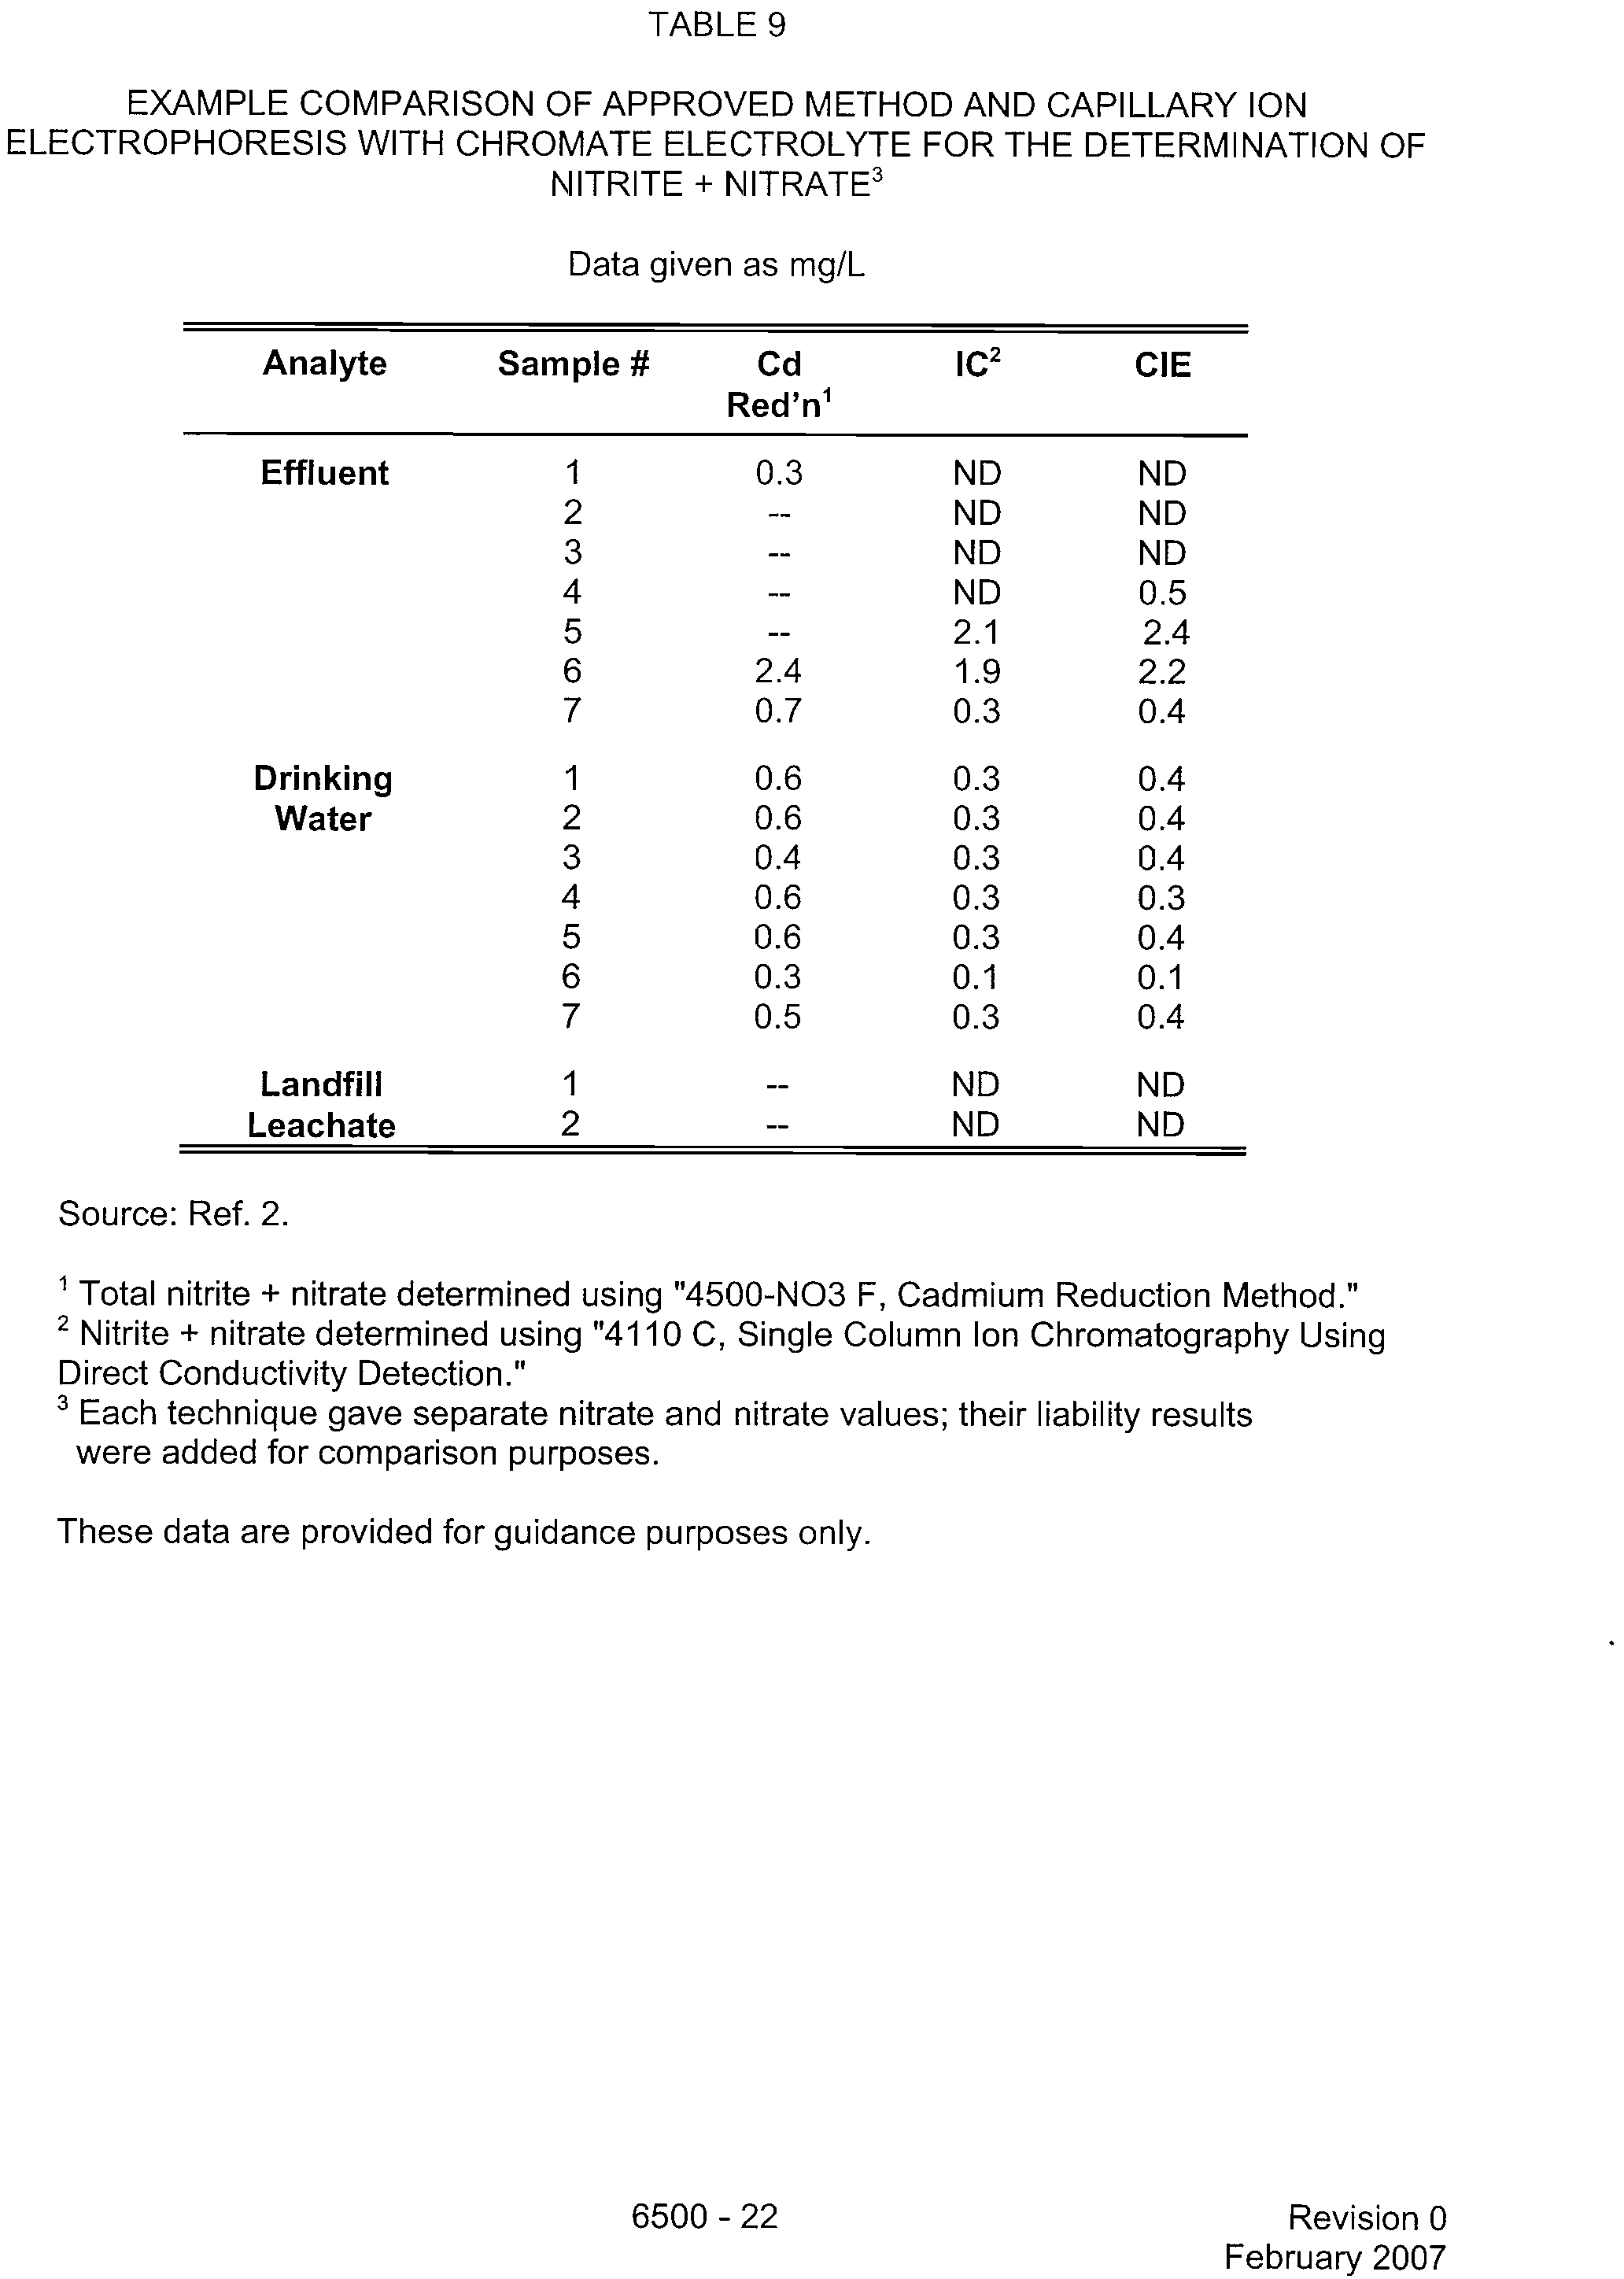
reproducibility, comparison of capillary ion electrophoresis (CIE) with other approved EPA
methods, and interlaboratory reproducibility and precision for the capillary ion electrophoresis
technique. These data are provided for guidance purposes only.
13.3 Table 11, entitled "Example Capillary Ion Electrophoresis Anion Analysis Round
Robin Using Chromate Electrolyte (mg/L)," provides example precision data in some common
environmental matrices. These data are provided for guidance purposes only.
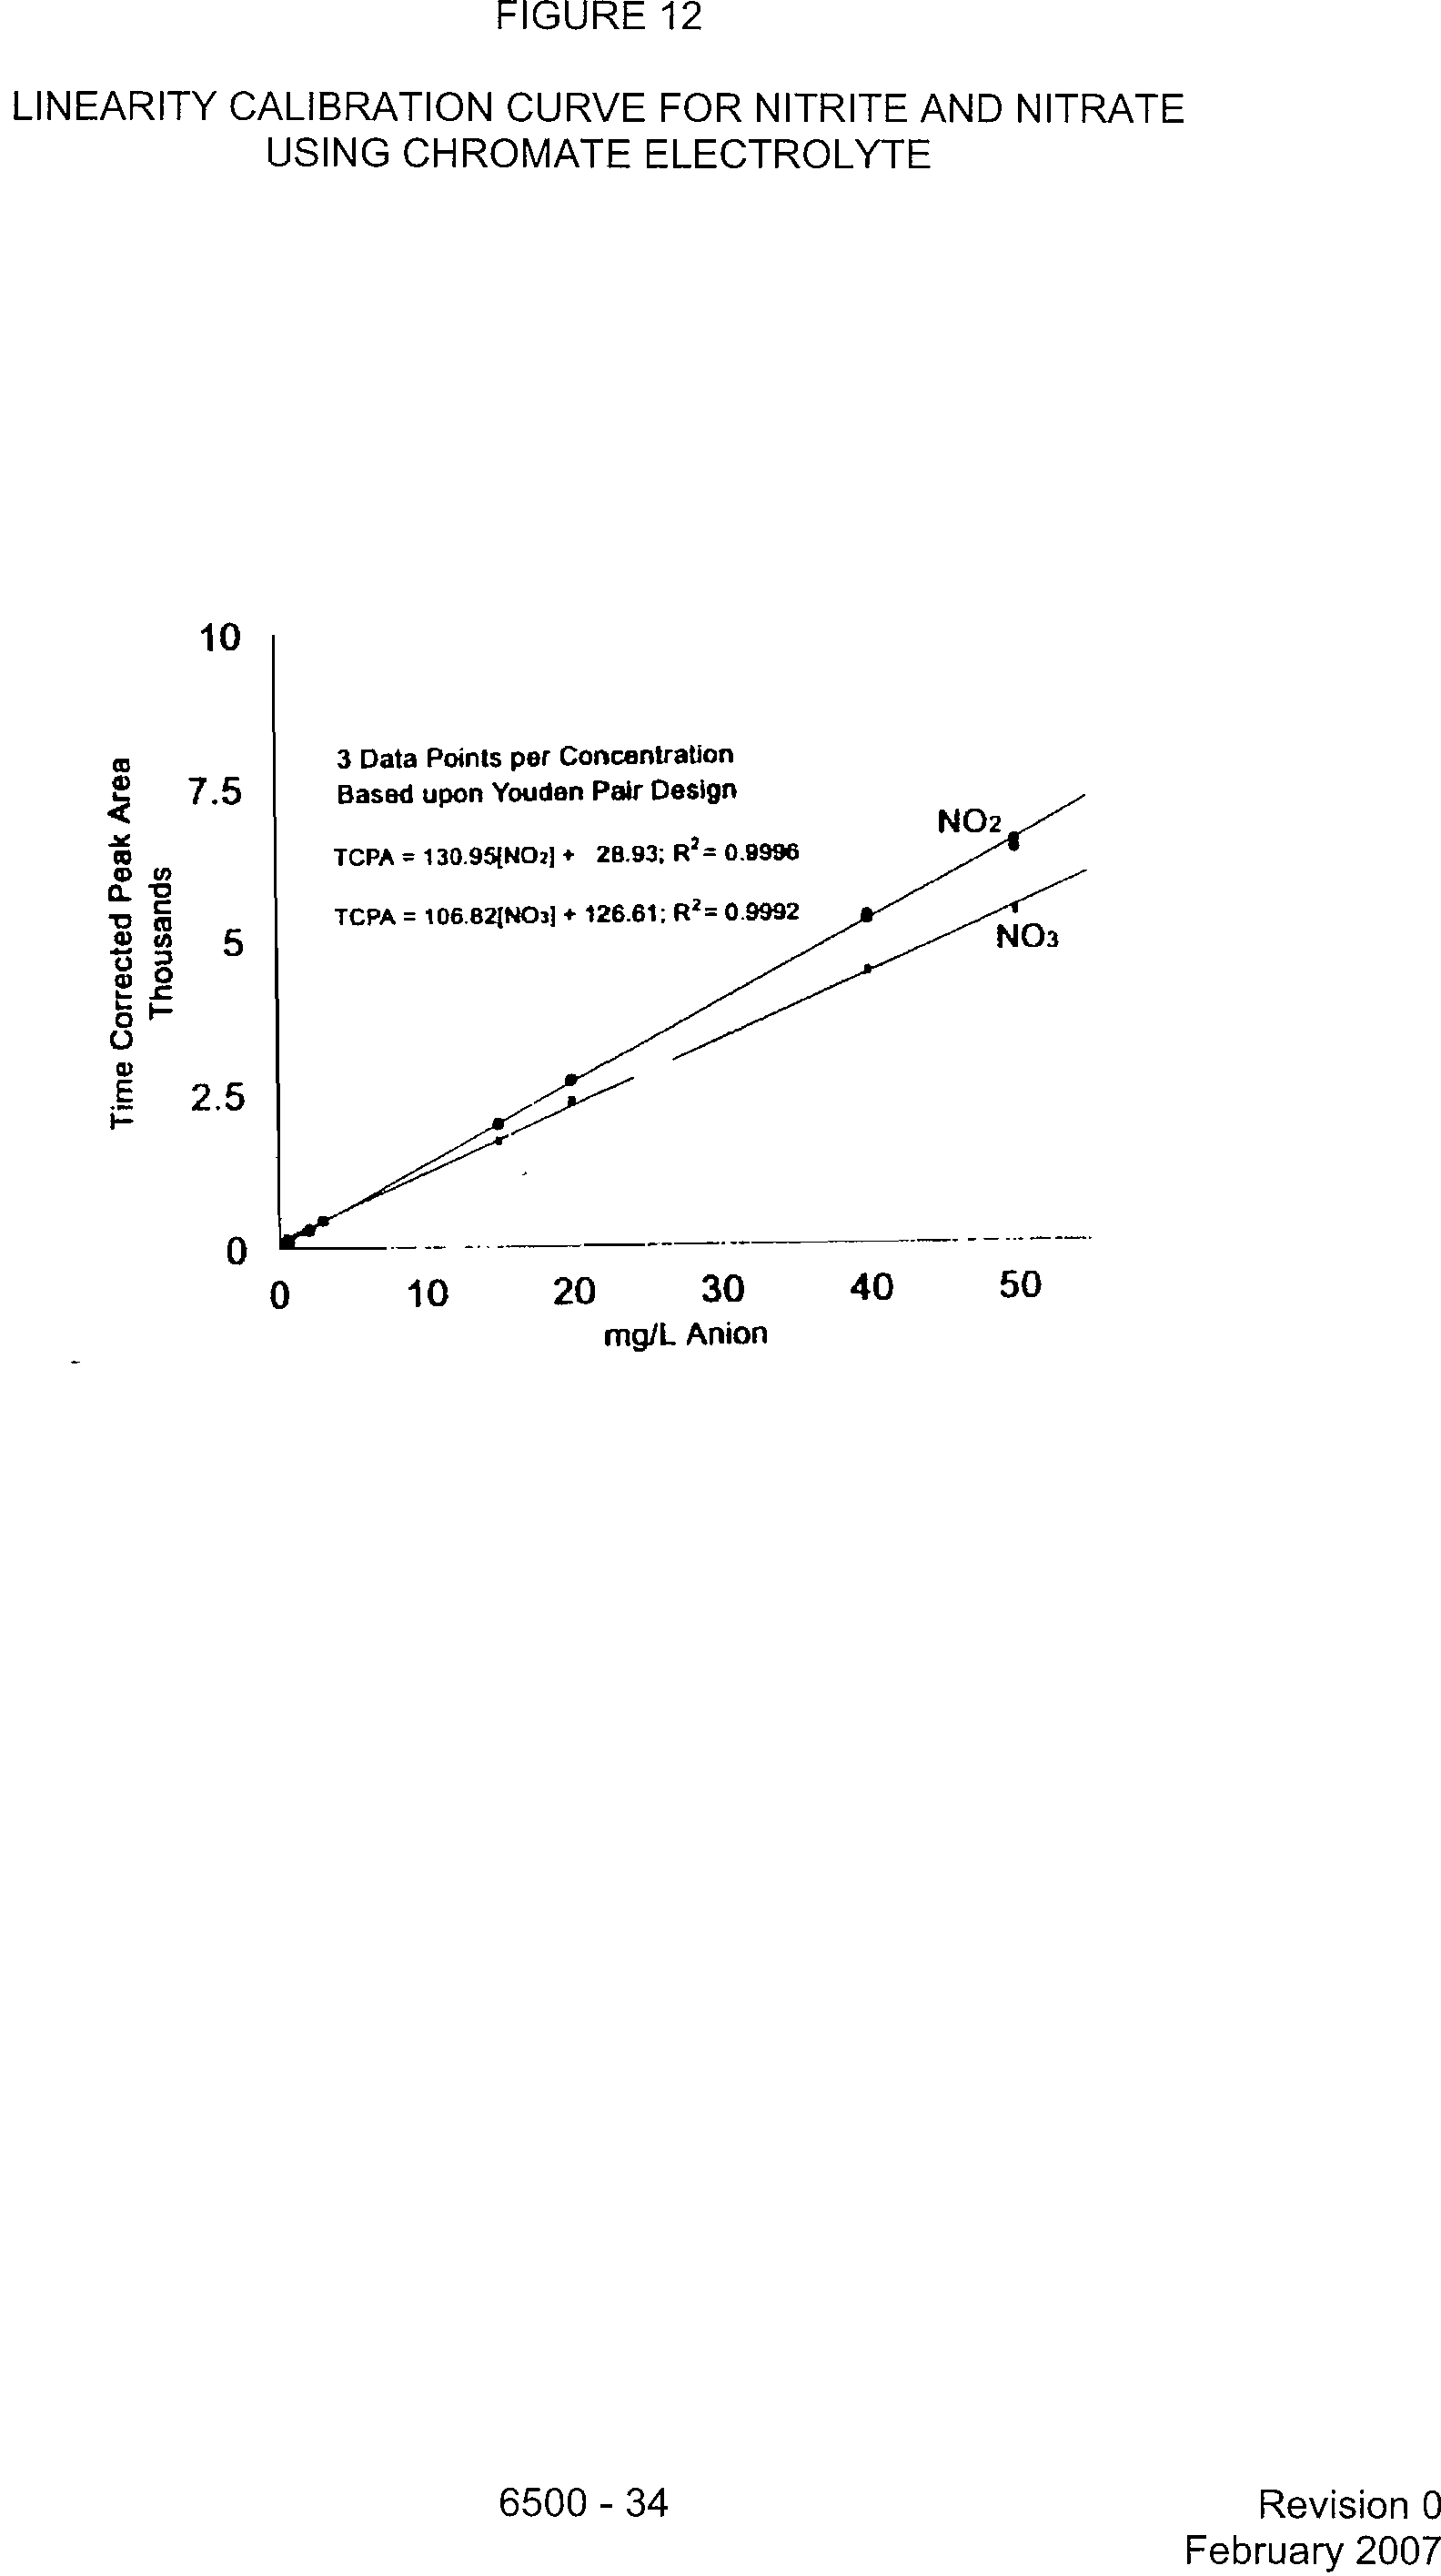
13.4 Figures 6 through 12 display representative examples of electropherograms and
linearity of calibration curves. These data are provided for guidance purposes only.
13.5 The following documents may provide additional information regarding this method
and technique:
13.5.1 J. Romano and J. Krol, "Capillary Ion Electrophoresis, An Environmental
Method for the Determination of Anions in Water,"
J. of Chromatography,
Vol. 640, 1993,
p. 403.
13.5.2 J. Romano, "Capillary Ion Analysis: A Method for Determining Ions in
Water and Solid Waste Leachates,"
Amer. Lab.,
May 1993, p. 48.
13.5.3 W. Jones, "Method Development Approaches for Ion Electrophoresis,"
J.
of Chromatography,
Vol. 640, 1993, p. 387.
13.5.4 W. Jones and P. Jandik, "Various Approaches to Analysis of Difficult
Sample Matrices for Anions using Capillary Electrophoresis,"
J. of Chromatography,
Vol.
608, 1992, p. 385.
13.5.5 G. Bondoux, P. Jandik and W. Jones, "New Approaches to the Analysis
of Low Level of Anions in Water,"
J. of Chromatography,
Vol. 602, 1992, p. 79.
13.5.6 P. Jandik, W. Jones, A. Weston and P. Brown, "Electrophoretic Capillary
Ion Analysis: Origins, Principles, and Applications," LCGC, Vol. 9, Number 9, 1991, p.
634.
13.5.7 J. Romano and P. Jackson, "Optimization of Inorganic Capillary
Electrophoresis for the Analysis of Anionic Solutes in Real Samples,"
J. of
Chromatography,
Vol. 546, 1991, p. 411.
6500 - 11
?
Revision 0
February 2007
13.5.8 P. Jandik and W. Jones, "Optimization of Detection Sensitivity in the
Capillary Electrophoresis of Inorganic Anions,"
J of Chromatography,
Vol. 546, 1991, p.
431.
13.5.9 P. Jandik and W. Jones, "Controlled Changes of Selectivity in the
Separation of Ions by Capillary Electrophoresis,"
J. of Chromatography,
Vol. 546, 1991, p
445.
13.5.10 R. Foret, et.al., "Indirect Photometric Detection in Capillary Zone
Electrophoresis,"
J. of Chromatography,
Vol. 470, 1989, p. 299.
13.5.11 S. Hjerte'n, et. al.,"Carrier-free Zone Electrophoresis, Displacement
Electrophoresis and Isoelectric Focusing in an Electrophoresis Apparatus,"
J. of
Chromatography,
Vol. 403, 1987, p. 47.
13.5.12 P. Jandik and G. Bonn, "Capillary Electrophoresis of Small Molecules and
Ions," VCH Publishers, 1993.
14.0 POLLUTION PREVENTION
14.1?
Pollution prevention encompasses any technique that reduces or eliminates the
quantity and/or toxicity of waste at the point of generation. Numerous opportunities for pollution
prevention exist in laboratory operation. The EPA has established a preferred hierarchy of
environmental management techniques that places pollution prevention as the management
option of first choice. Whenever feasible, laboratory personnel should use pollution prevention
techniques to address their waste generation. When wastes cannot be feasibly reduced at the
source, the Agency recommends recycling as the next best option.
14.2 For information about pollution prevention that may be applicable to laboratories
and research institutions consult
Less is Better: Laboratory Chemical management for Waste
Reduction
available from the American Chemical Society, Department of Government Relations
and Science Policy, 1155 16th Street, NW, Washington, DC, 20036, http://www.acs.orq.
15.0 WASTE MANAGEMENT
The Environmental Protection Agency requires that laboratory waste management
practices be conducted consistent with all applicable rules and regulations. The Agency urges
laboratories to protect the air, water, and land by minimizing and controlling all releases from
hoods and bench operations, complying with the letter and spirit of any sewer discharge permits
and regulations, and by complying with all solid and hazardous waste regulations, particularly
the hazardous waste identification rules and land disposal restrictions. For further information
on waste management, consult
The Waste Management Manual for Laboratory Personnel
available from the American Chemical Society at the address listed in Sec. 14.2.
6500 - 12
?
Revision 0
February 2007
16.0 REFERENCES
1.
Waters Chromatography, "Innovative Methods for Ion Analysis," Method N-601b, 1992.
2.
Collection of validation data for Method 6500, from J. Romano, Waters Corporation,
Waters Chromatography Division, Ion Analysis Group, Milford, Massachusetts. Data
generated in 1995, reports submitted to EPA from J. Romano on January 9, 1998.
17.0 TABLES, DIAGRAMS, FLOW CHARTS, AND VALIDATION DATA
The following pages contain the tables and figures referenced by this method. A flow
diagram of the procedure and a glossary follow the tables and figures.
6500 - 13
?
Revision 0
February 2007
TABLE 1
EXAMPLE COLLABORATIVE DESIGN AS FOUR YOUDEN PAIR SETS'
Individual Youden Pair Standards, in mg/L
1
2
3
4
5
6
7
8
CI
0.7
2.0
3.0
15.0
40.0
20.0
50.0
0.5
Br
2.0
3.0
15.0
40.0
20.0
50.0
0.7
0.5
NO2
3.0
40.0
20.0
15.0
50.0
0.5
2.0
0.7
SO
4
40.0
50.0
0.5
0.7
2.0
3.0
15.0
20.0
NO
3
15.0
20.0
40.0
50.0
0.5
0.7
2.0
3.0
F
2.0
0.7
0.5
3.0
10.0
7.0
20.0
25.0
PO4
50.0
40.0
20.0
0.5
3.0
2.0
0.7
15.0
Source: Ref. 2
1
The collaborative design is intended to demonstrate performance between 0.1 and 50
mg/L anion, except for fluoride between 0.1 and 25 mg/L. The concentrations among
anions are varied so as not to have any one standard at all low or all high anion
concentrations.
These data are provided for guidance purposes only.
6500 - 14
?
Revision 0
February 2007
TABLE 2
EXAMPLE ANION MIGRATION TIME REPRODUCIBILITY FROM YOUDEN PAIR
STANDARDS USING CHROMATE ELECTROLYTE AND CONSTANT CURRENT
Ana yte Mid-Point Migration Time, Average of Triplicate Samplings
Analyte
CI
Br
NO2
SO4
NO3
F
PO4
1
3.132
3.226
3.275
3.405
3.502
3.761
3.906
2
3.147
3.239
3.298
3.431
3.517
3.779
3.931
3
3.138
3.231
3.283
3.411
3.497
3.771
3.925
4
3.158
3.244
3.307
3.434
3.510
3.781
3.963
5
3.184
3.271
3.331
3.435
3.551
3.787
3.981
6
3.171
3.260
3.312
3.418
3.537
3.776
3.964
7
3.191
3.272
3.315
3.437
3.544
3.773
3.978
8
3.152
3.248
3.294
3.418
3.526
3.739
3.954
Std Dev
0.021
0.015
0.018
0.012
0.20
03015
0.027
%RSD
0.67%
0.46%
0.55%
0.36%
0.56%
0.40%
0.68%
Average Migration Time Std Dev = 0.018 min = 1.1 sec
?
Average %RSD = 0.53%
These data are provided for guidance purposes only.
6500 - 15
?
Revision 0
February 2007
TABLE 3
EXAMPLE COMPARISON OF CAPILLARY ION ELECTROPHORESIS WITH CHROMATE
ELECTROLYTE AND APPROVED METHODS USING A PERFORMANCE EVALUATION
STANDARD
Analyte
CI
NO2
SO4
NO3
F
PO4
Performance
True
Evaluation
Standard'
Value
in mg/L
43.00
1.77
37.20
15.37
2.69
6.29
Official
Measured
43.20
1.77
37.00
15.42
2.75
6.38
Anion
Mean'
Methods
Wet Chem
&
Measured
3.09
0.07
2.24
1.15
0.26
0.21
IC
Std Dev
CIE Using
Chromate
Ave CIE
n=18
42.51
1.78
37.34
14.06
2.63
6.34
Electrolyte3
CIE/Mean
0.984
1.006
1.009
0.911
0.956
0.994
CIE/True Value
0.989
1.006
1.003
0.945 0.978
1.008
Source: Ref. 2
1
The performance evaluation standard was purchased from APG Laboratories and diluted
1:100 with Type I DI water.
2
The measured result is the average from numerous laboratories using Approved Standard
Methods and EPA wet chemistry and ion chromatography methods
'The CIE results were determined using Method 6500 and an ASTM method under
development (no method number at the time), and are the average from four laboratories using
the Youden Pair Standards for quantitation.
These data are provided for guidance purposes only.
6500 - 16
?
Revision 0
February 2007
TABLE 4
EXAMPLE CAPILLARY ION ELECTROPHORESIS WITH CHROMATE ELECTROLYTE
INTERLABORATORY REPRODUCIBILITY AND PRECISION'
Data given as mg/L
Analyte2
CI
NO2
SO4
NO3
Lab
1
43.22 ±
1.58 ±
36.39 ±
14.57 ±
2.54 ±
n = 5
0.22
0.09
0.33
0.12
0.10
Lab
2
43.68 ±
1.58 ±
37.01±
13.94 ±
2.69 ±
n=5
0.61
0.08
0.37
0.09
0.02
Lab
3
43.93 ±
1.60 ±
37.68 ±
15.05 ±
2.69 ±
n=5
0.39
0.06
0.24
0.11
0.03
Lab
4
42.51 ±
1.78 ±
37.34 ±
14.06 ±
2.69 ±
n=3
0.22
0.06
0.19
0.07
0.02
Average Mean
43.34 ±
1.64 ±
37.11 ±
14.41 ±
2.64 ±
±
Std Dev
0.36
0.07
0.28
0.10
0.04
%
RS
D
0.83%
4.5%
0.77%
0.67%
1.61%
Results from 4 laboratories analyzing the performance evaluation standard using the
Youden Pair Standards for quantitation.
2
Only one lab reported results for PO 4
as 6.34 ± 0.02 mg/L on triplicate samplings yielding
an %RSD of 0.07%
These data are provided for guidance purposes only.
6500 - 17
?
Revision 0
February 2007
TABLE 5
EXAMPLE CAPILLARY ION ELECTROPHORESIS WITH CHROMATE ELECTROLYTE
KNOWN ADDITION RECOVERY AND PRECISION USING PERFORMANCE EVALUATION
STANDARD WITH DRINKING WATER
Analyte
CI
NO2
SO4
NO3
F
PO4
Milford
Drinking
24.27 ±
Not
7.99 ±
0.36 ±
Not
Not
Water n=3, as
ppm
0.18
Detected
0.07
0.05
Detected
Detected
%RSD
0.73%
0.91%
13.3%
Performance
43.00
1.77
37.20
15.37
2.69
6.29
Evaluation
Std'
MDW
+
PES
66.57 ±
1.74 ±
45.19 ±
15.42 ±
2.62 ±
5.55 ±
n=3, as ppm
0.34
0.03
0.17
0.12
0.07
0.31
%RSD
0.51
1.85
0.38
0.79
2.69
5.52
%
Recovery
97.9%
98.3%
100.2%
98.1%
97.4%
88.2%
Source: Ref. 2.
1
The performance evaluation standard was diluted 1:100 with Drinking Water.
These data are provided for guidance purposes only.
6500 - 18
?
Revision 0
February 2007
TABLE 6
EXAMPLE COMPARISON OF APPROVED METHOD AND CAPILLARY ION
ELECTROPHORESIS WITH CHROMATE ELECTROLYTE FOR THE DETERMINATION OF
CHLORIDE
Data given as mg/L
Analyte
Sample
#
Titration'
IC2
CIE
Effluent
1
3
149
147
2
162
161
3
153
152
4
139
140
5
111
110
6
109
107
7
3.6
3.5
Drinking
1
5.5
5.1
5.0
Water
2
5.5
5.0
4.9
3
5.3
5.2
5.1
4
5.5
5.1
5.1
5
5.3
5.0
5.0
6
5.3
4.9
4.9
7
5.5
4.9
4.9
Landfill
1
0.1
<0.1
ND
Leachate
2
230
245
240
Source: Ref. 2.
I
Chloride determined using "4500 CI C, lodometric Method."
2
Chloride determined using "4110 C, Single Column Ion Chromatography
Using Direct Conductivity Detection."
3
A dash line indicates the test was not performed. ND indicates the anion
was not detected.
These data are provided for guidance purposes only.
6500 - 19
?
Revision 0
February 2007
TABLE 7
EXAMPLE COMPARISON OF APPROVED METHOD AND CAPILLARY ION
ELECTROPHORESIS WITH CHROMATE ELECTROLYTE FOR THE DETERMINATION OF
FLUORIDE
Analyte
Sample
#
Electrode'
IC2
CIE
Effluent
1
1.7
1.2
1.5
2
0.9
0.6
0.6
3
0.8
0.5
0.6
4
0.8
0.4
0.7
5
0.9
0.5
0.8
6
0.9
0.5
0.7
7
<0.1
ND
<0.1
Drinking
1
1.2
0.9
0.9
Water
2
1.3
0.9
0.9
3
1.3
0.9
0.9
4
1.3
0.9
0.9
5
1.3
0.9
0.9
6
0.9
0.6
0.6
7
1.3
0.9
0.9
Landfill
1
<0.2
ND
ND
Leachate
2
16
10.6
10.9
Source: Ref. 2.
1
Fluoride determined using "4500-F C, Ion Selective Electrode Method."
2
Fluoride determined using "4110 C, Single Column Ion Chromatography Using
Direct Conductivity Detection."
These data are provided for guidance purposes only.
6500 - 20
?
Revision 0
February 2007
TABLE 8
EXAMPLE COMPARISON OF APPROVED METHOD AND CAPILLARY ION
ELECTROPHORESIS WITH CHROMATE ELECTROLYTE FOR THE DETERMINATION OF
SULFATE
Data given as mg/L
Analyte
Sample
#
Turbidimetric'
IC2
CIE
Effluent
1
98
87.5
98.0
2
110
95.3
95.9
3
130
118
115
4
130
139
136
5
110
113
110
6
100
107
106
7
6
5.6
5.8
Drinking
1
6
5.8
6.0
Water
2
6
5.8
6.0
3
6
5.9
6.1
4
6
5.9
6.1
5
5
5.8
6.2
6
4
3.0
3.4
7
5
5.8
6.1
Landfill
1
<1
ND
ND
Leachate
2
190
211
201
Source: Ref. 2.
'Sulfate determined using "4500 SO 4
E, Turbidimetric Method."
2
Sulfate determined using "4110 C, Single Column Ion Chromatography Using Direct
Conductivity Detection."
These data are provided for guidance purposes only.
6500 - 21
?
Revision 0
February 2007
TABLE 9
EXAMPLE COMPARISON OF APPROVED METHOD AND CAPILLARY ION
ELECTROPHORESIS WITH CHROMATE ELECTROLYTE FOR THE DETERMINATION OF
NITRITE + NITRATE'
Data given as mg/L
Analyte
Sample
#
Cd
IC2
CIE
Red'n1
Effluent
1
0.3
ND
ND
2
ND
ND
3
ND
ND
4
ND
0.5
5
2.1
2.4
6
2.4
1.9
2.2
7
0.7
0.3
0.4
Drinking
1
0.6
0.3
0.4
Water
2
0.6
0.3
0.4
3
0.4
0.3
0.4
4
0.6
0.3
0.3
5
0.6
0.3
0.4
6
0.3
0.1
0.1
7
0.5
0.3
0.4
Landfill
1
ND
ND
Leachate
2
ND
ND
Source: Ref. 2.
Total nitrite + nitrate determined using "4500-NO3 F, Cadmium Reduction Method."
2
Nitrite + nitrate determined using "4110 C, Single Column Ion Chromatography Using
Direct Conductivity Detection."
3
Each technique gave separate nitrate and nitrate values; their liability results
were added for comparison purposes.
These data are provided for guidance purposes only.
6500 - 22
?
Revision 0
February 2007
TABLE 10
EXAMPLE COMPARISON OF APPROVED METHOD AND CAPILLARY ION
ELECTROPHORESIS WITH CHROMATE ELECTROLYTE FOR THE DETERMINATION OF
ORTHO-PHOSPHATE
Data given as mg/L
Analyte
Sample
#
Ascorbic
IC2
CIE
Acid'
Effluent
1
3.4
ND
2.8
2
4.9
ND
4.4
3
4.7
ND
4.5
4
5.3
ND
4.2
5
3.0
ND
3.0
6
2.9
ND
2.3
7
<0.1
ND
<0.1
Drinking
1
<0.1
ND
ND
Water
2
<0.1
ND
ND
3
ND
ND
4
<0.1
ND
ND
5
<0.1
ND
ND
6
ND
ND
7
ND
ND
Landfill
1
<0.1
ND
<0.1
Leachate
2
2.2
1.6
1.4
Source: Ref. 2.
1 Phosphate determined using "4500 PO
4 E, Ascorbic Acid Method."
2
Phosphate determined using "4110 C, Single Column Ion Chromatography Using Direct
Conductivity Detection."
The values of "ND" were not given by the source reference.
These data are provided for guidance purposes only.
6500 - 23
?
Revision 0
February 2007
TABLE 11
EXAMPLE CAPILLARY ION ELECTROPHORESIS ANION ANALYSIS ROUND ROBIN'
USING CHROMATE ELECTROLYTE (mg/L)
Sample
Chloride
Bromide
Nitrite
Sulfate
Nitrate
Fluoride
Phosphate
1. Bleach waste
<0.046
<0.046
<0.072
0.30±0.37
<0.84
<0.020
<0.041
2. Creek water
3.06±0.27
<0.046
<0.072
3.00±0.30
0.37±0.19
0.11±0.09
<0.061
3. Wastewater
24.6±0.62
<0.046
<0.072
2.02±0.56
<0.084
0.08±0.08
3.74±0.75
4. Wastewater
59.7±2.9
0.85±0.52
<0.072
109±4.4
44.9±1.6
0.988±0.21
4.94±1.32
5. Wastewater
63.8±2.0
0.68±0.52
<0.072
115±3.9
44.3±1.06
1.04±0.17
4.78±1.55
6. Wastewater
72.0±5.4
0.05±0.01
<0.072
144±11.8
5.38±2.57
0.57±0.21
1.18±1.01
7. Wastewater
139±10.0
<0.046
4.0±1.3
584±35
353±25.5
3.01±0.80
9.34±5.17
8. Wastewater
51.4±7.7
<0.046
<0.072
40.2±6.1
39.9±7.9
1.17±0.24
6.99±1.31
9. Wastewater
29.9±4.3
<0.046
2.14±1.35
217±19
13.9±4.9
1.33±0.28
9.95±5.04
10. Wastewater
766±44
<0.046
<0.072
489±46
12.9±6.9
<0.020
41.3±8.5
11. Surface water
3.71±0.39
<0.046
<0.072
2.70±0.39
0.23±0.20
0.11±0.097
<0.041
12. Wastewater
22.1±0.62
8.47±0.30
<0.072
133±4.4
<0.084
0.76±0.11
<0.041
13. Drinking water
5.15±0.35
<0.046
<0.072
2.64±0.26
0.50±0.27
0.59±0.097
<0.041
14. Drinking water
4.95±0.24
<0.046
<0.072
2.62±0.21
0.54±0.25
0.56±0.09
<0.041
Source: Ref. 2.
1
Five-laboratory interlaboratory precision. These data are provided for guidance purposes only.
6500 - 24
?
Revision 0
February 2007
Constant
Temperature
Compartment,
25-30°C
75 pm X 60 cm
Silica Capillary
++++++++
++++++++
High Mobility Anion
Low Mobility Anion Qkcetate'D--/e.
Neutrals & Water
?
fir-
-4—CAll
?
Cations+
9 E0E—al
■
+ + + + + + + + + + + + + + + +
Cathode
Injection Side
-
s,
s. .- •
6
6
N
.11
?
N
N
6.
?
6.1
Detection Side
S .
?S.?
S.
?
S.
3?
6
N
Anode
FIGURE 1
HARDWARE SCHEMATIC OF A CAPILLARY
ION ELECTROPHORESIS SYSTEM
FIGURE 2
PICTORIAL DIAGRAM OF ANION MOBILITY AND
ELECTROOSMATIC FLOW MODIFIER
N
?
N
6500 - 25
?
Revision 0
February 2007
FIGURE 3
SELECTIVITY DIAGRAM OF ANION MOBILITY
USING CAPILLARY ION ELECTROPHORESIS
All
Cations
Inorganic
Anions
CI, Br,
NO2,SO4,
NO3.
DiValent
Org Acids,
Oxymetals
F, PO4,
CIO2, CI03,
Formate
co
0
-2
MonoValent
Organic Acids
C2thru Cs
Water
and All
Neutral
Organics
SO3, 5203
Migration Time
?
--..-
MT=0 High Mobility
?
Low Mobility MT >7 min
Anions
?
Anions
FIGURE 4
PICTORIAL DIAGRAM OF INDIRECT UV DETECTION
A
a;"8 e
e
e?
e
eeeeeA?
A A A e e
?
e e e e e
3
0
iu
:eeeeeA
AA A
e
?
e
e e
e e?
e
3
a
a
U
a
?
?
High
ElectrolyteUV
Absorbing
0
Analyte ion (A) displaces electrolye ion (e)
charge for charge or transfer ratio causing
a net decrease In background absorbance.
The change in absorbance is directly
related to Analyte concentration.
6500 - 26
Revision 0
February 2007
5
9
7
18
FIGURE 5
ELECTROPHEROGRAM OF THE INORGANIC ANIONS AND TYPICALLY FOUND ORGANIC
ACIDS USING CAPILLARY ION ELECTROPHORESIS WITH CHROMATE ELECTROLYTE
3
1
2
3.000
?
3.500
?
4.000? 4.500
Minutes
Electrolyte: 4.7 mM Na
2 CrO4/4.0 mM TTAOH / 10 mM CHES / 0.1 mM Calcium Gluconate
Capillary: 75 pm (id) x 375 pm x 60 cm (length), Uncoated Silica
Voltage: 15 kV using a Negative Power Supply
Current: 14 ± pA, Constant Current
Sampling: Hydrostatic at 10 cm for 30 secs
Detection: Indirect UV using a Hg Lamp and 254 nm Filter
The y-axis is UV response expressed as Absorbance Units, or in this case, as absorbance range in
milliAbsorbance Units or mAU.
Anion
Conc.
Mg/L
Migration
Time in
Mintues
Migration
Time Ratio to
CI
Peak
Area
Time'
Corrected
Peak Area
1. Chloride
2.0
3.200
1.000
1204
376.3
2. Bromide
4.0
3.296
1.030
1147
348.0
3. Nitrite
4.0
3.343
1.045
2012
601.9
4. Sulfate
4.0
3.465
1.083
1948
562.2
5. Nitrate
4.0
3.583
1.120
1805
503.8
6. Oxalate
5.0
3.684
1.151
3102
842.0
7. Fluoride
1.0
3.823
1.195
1708
446.8
8. Formate
5.0
3.873
1.210
1420
366.6
9. o-Phosphate
4.0
4.004
1.251
2924
730.3
10. Carbonate
-
4.281
1.338
--
11. Acetate
5.0
4.560
1.425
3958
868.0
1 Time Corrected Peak Area = Peak area divided by migration time.
Revision 0
February 2007
6500 - 27
FIGURE 6
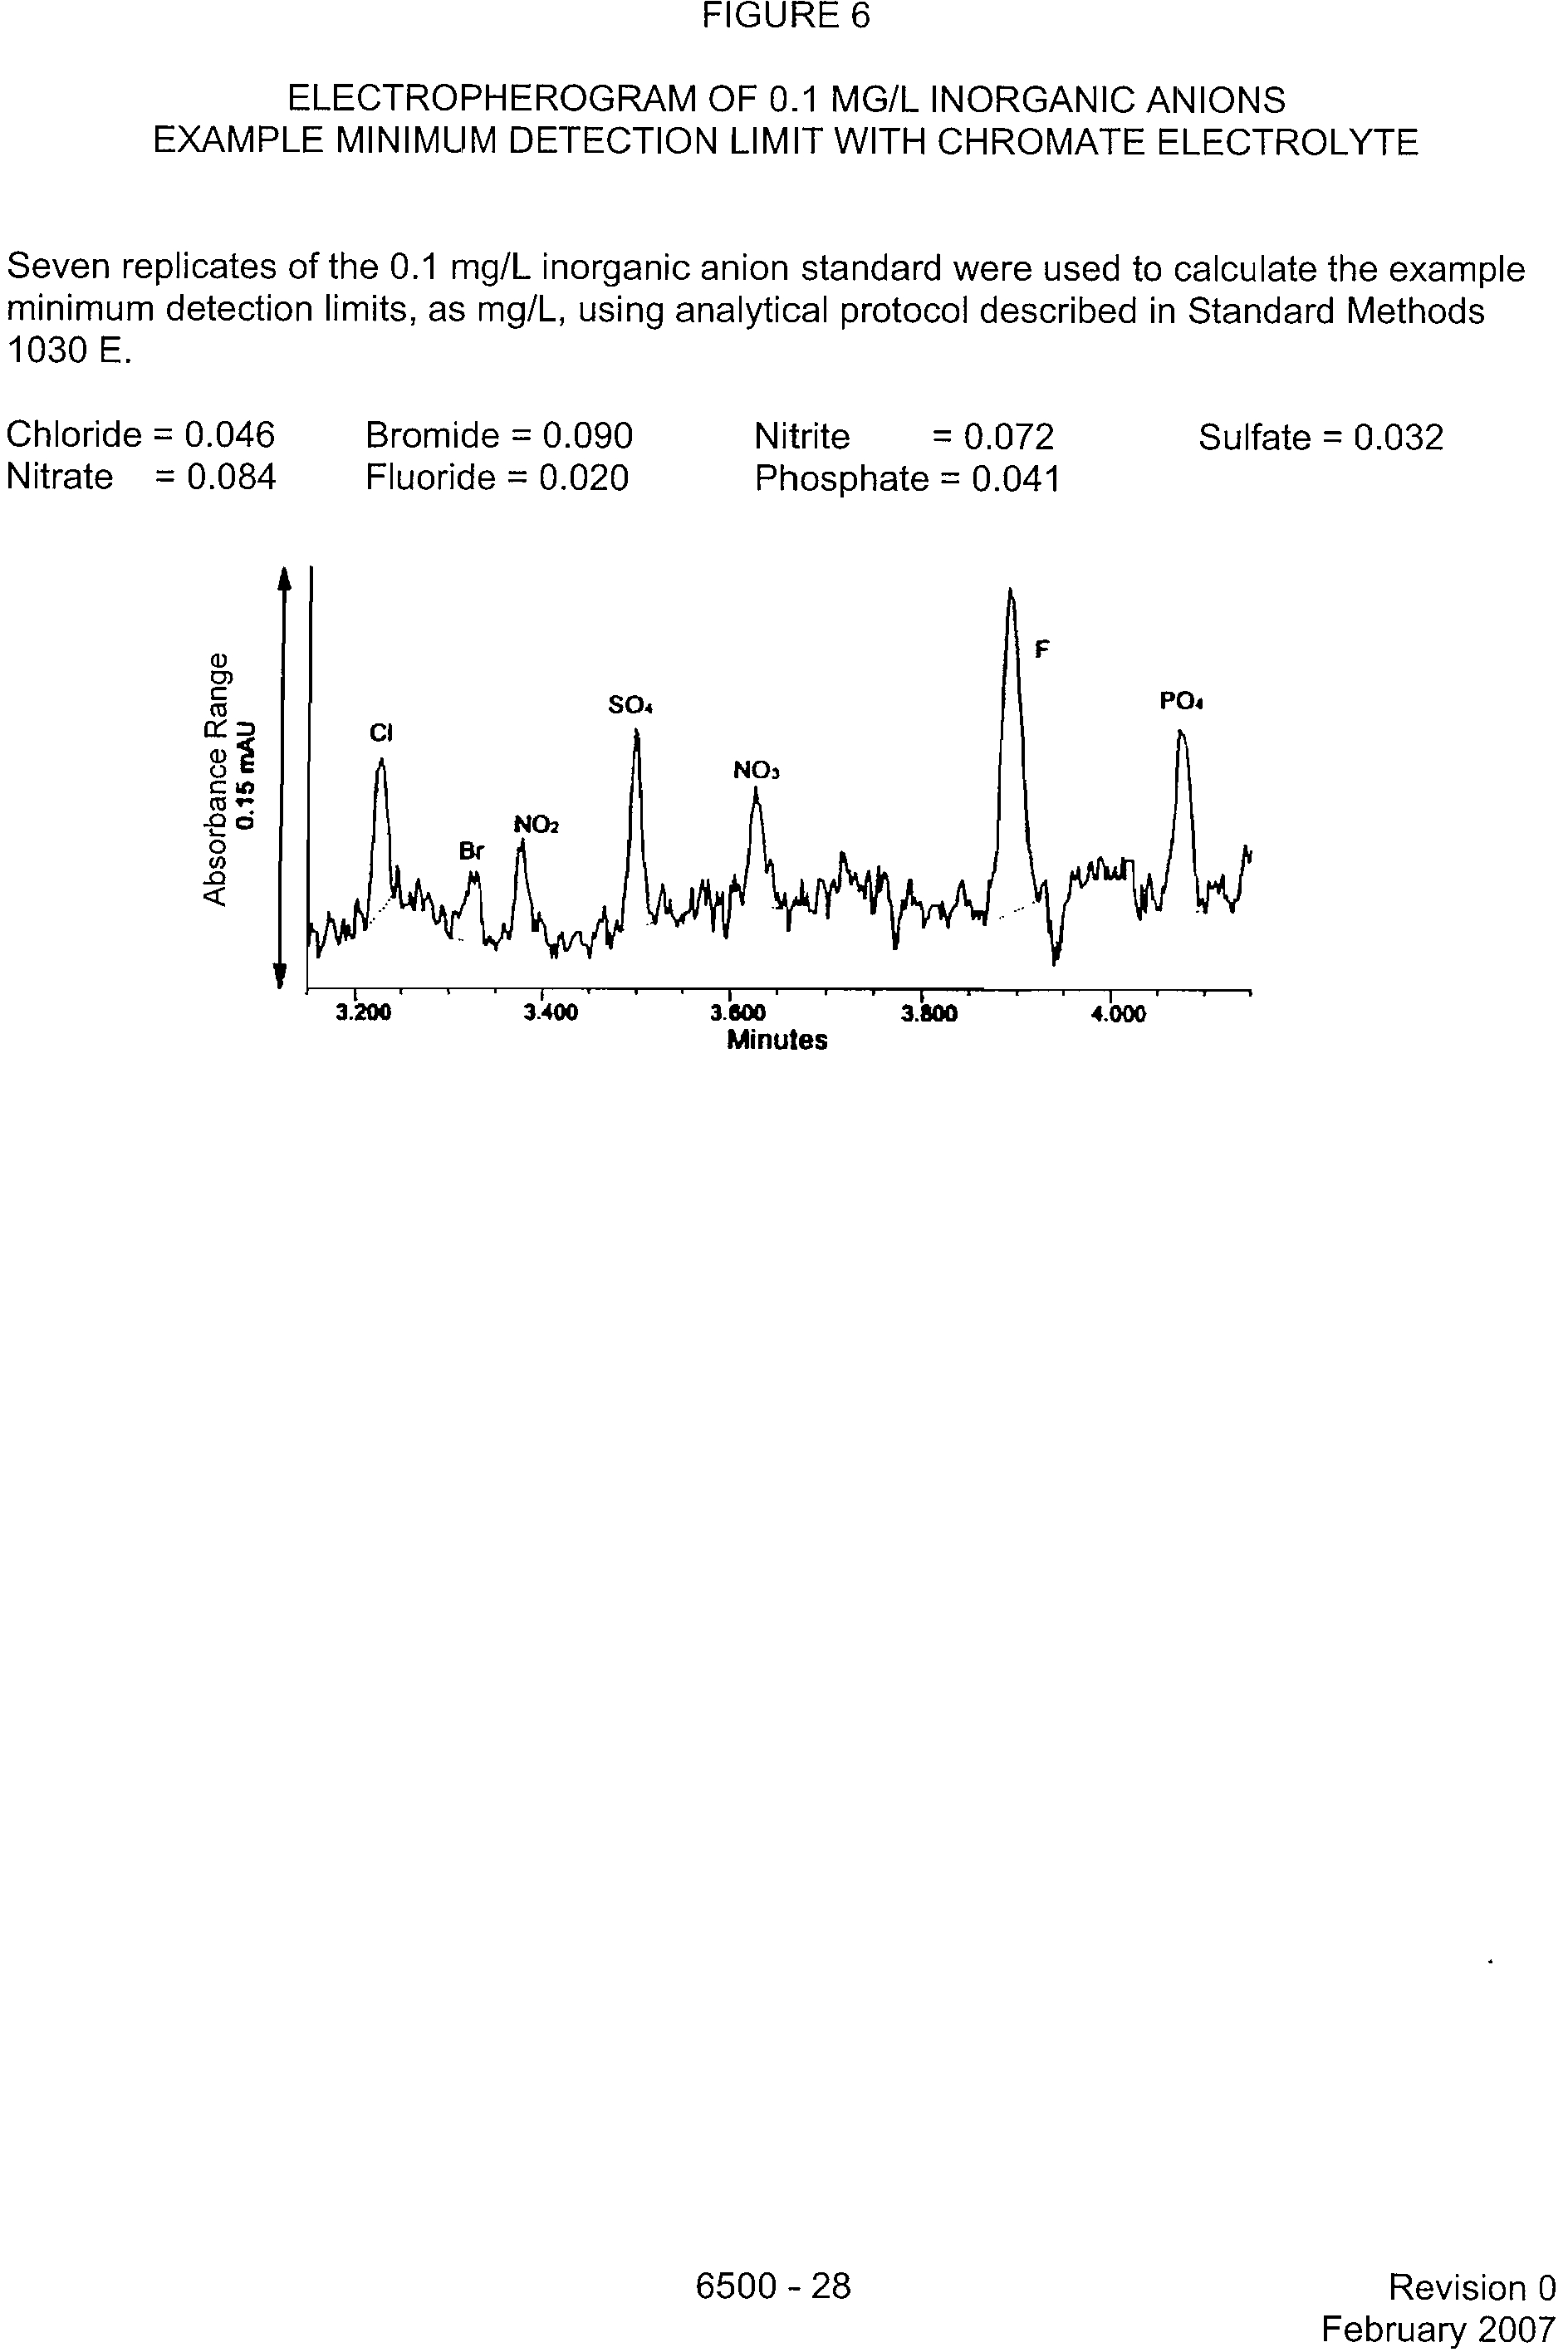
ELECTROPHEROGRAM OF 0.1 MG/L INORGANIC ANIONS
EXAMPLE MINIMUM DETECTION LIMIT WITH CHROMATE ELECTROLYTE
Seven replicates of the 0.1 mg/L inorganic anion standard were used to calculate the example
minimum detection limits, as mg/L, using analytical protocol described in Standard Methods
1030 E.
Chloride = 0.046
?
Bromide = 0.090
?
Nitrite?
= 0.072?
Sulfate = 0.032
Nitrate = 0.084
?
Fluoride = 0.020?
Phosphate = 0.041
3.
1
200
3.400
3.600
Minutes
•? •
3.800
4.000
6500 - 28
?
Revision 0
February 2007
FIGURE 7
ELECTROPHEROGRAM OF TYPICAL DRINKING WATER
USING CHROMATE ELECTROLYTE
CI = 24.72 mg/L
SO. = 7.99
NO. = 0.36
F < 0.10
HCO. = Natural
HCO3
SO.
NO3
3.000
?
3.500
4.000?
4.500
Minutes
6500 - 29
Revision 0
February 2007
3
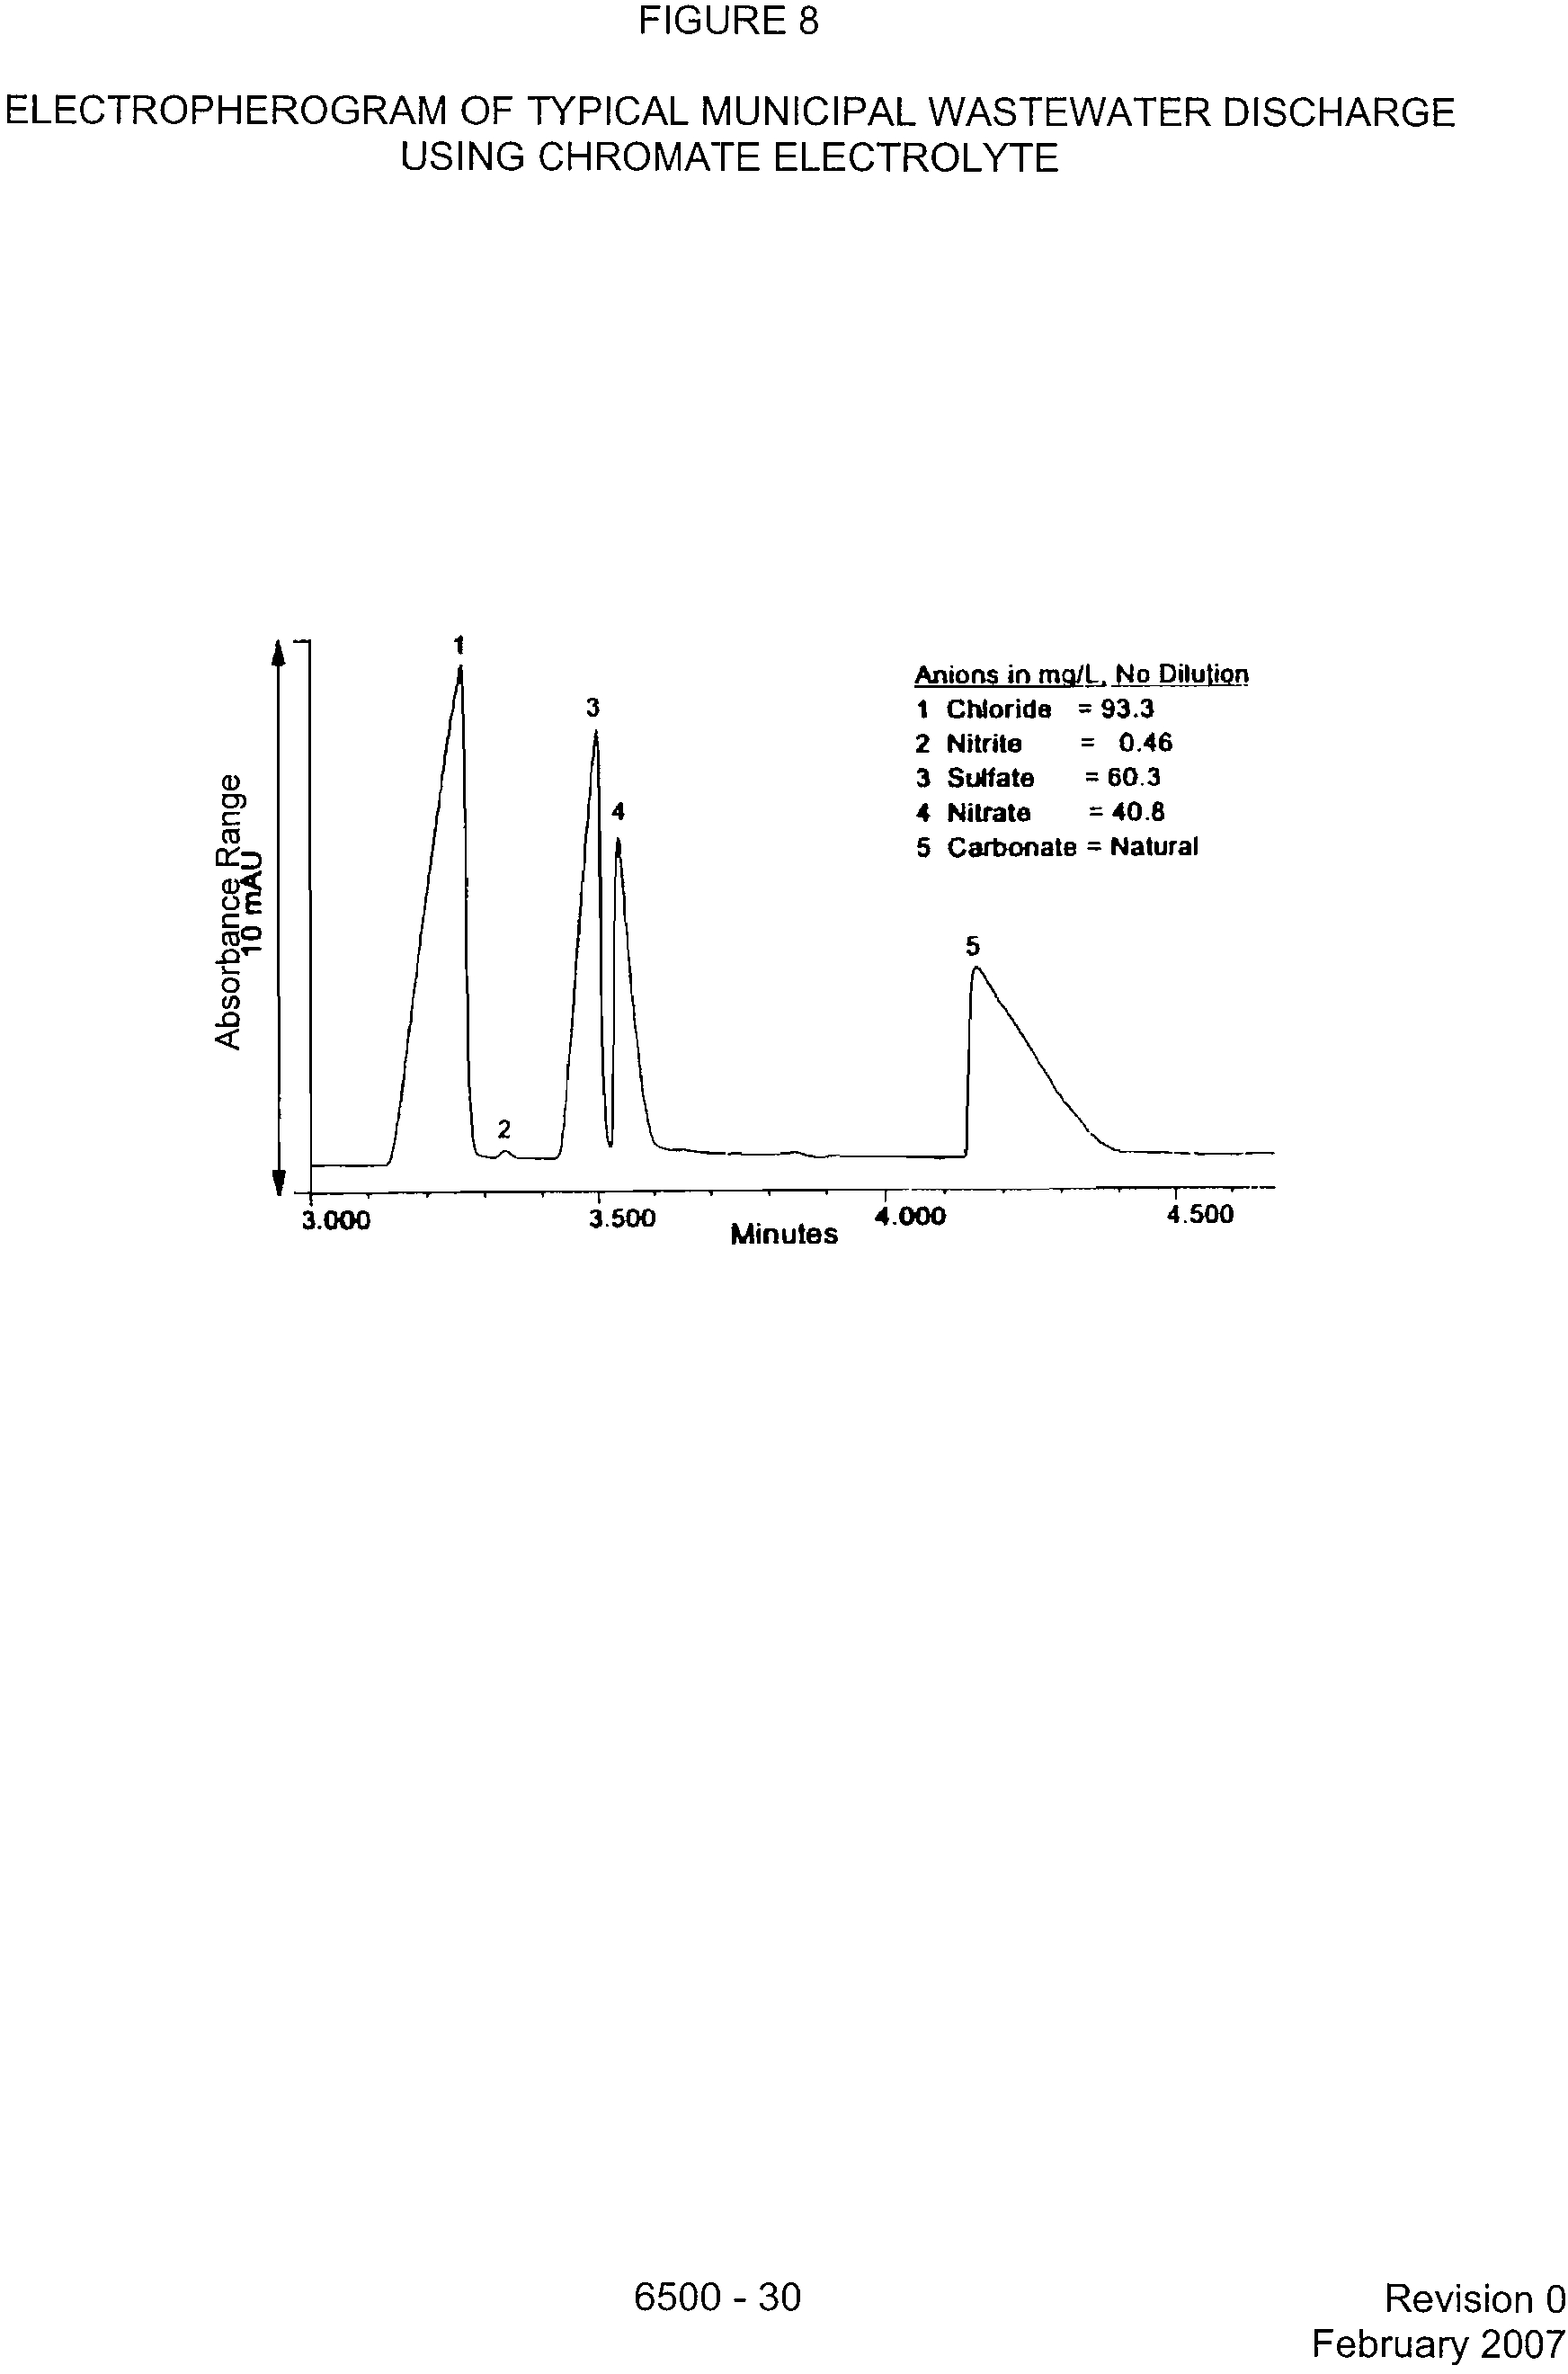
FIGURE 8
ELECTROPHEROGRAM OF TYPICAL MUNICIPAL WASTEWATER DISCHARGE
USING CHROMATE ELECTROLYTE
Anions in md/L No
Dilution
1 Chloride = 93.3
2 Nitrite?
= 0.46
3 Sulfate
?
= 60.3
4 Nitrate?
= 40.8
5 Carbonate = Natural
3.000?
3.500
?
Minutes 4.000
?
4.500
a)
rn
co
UE
coo
0
Revision 0
February 2007
6500 - 30
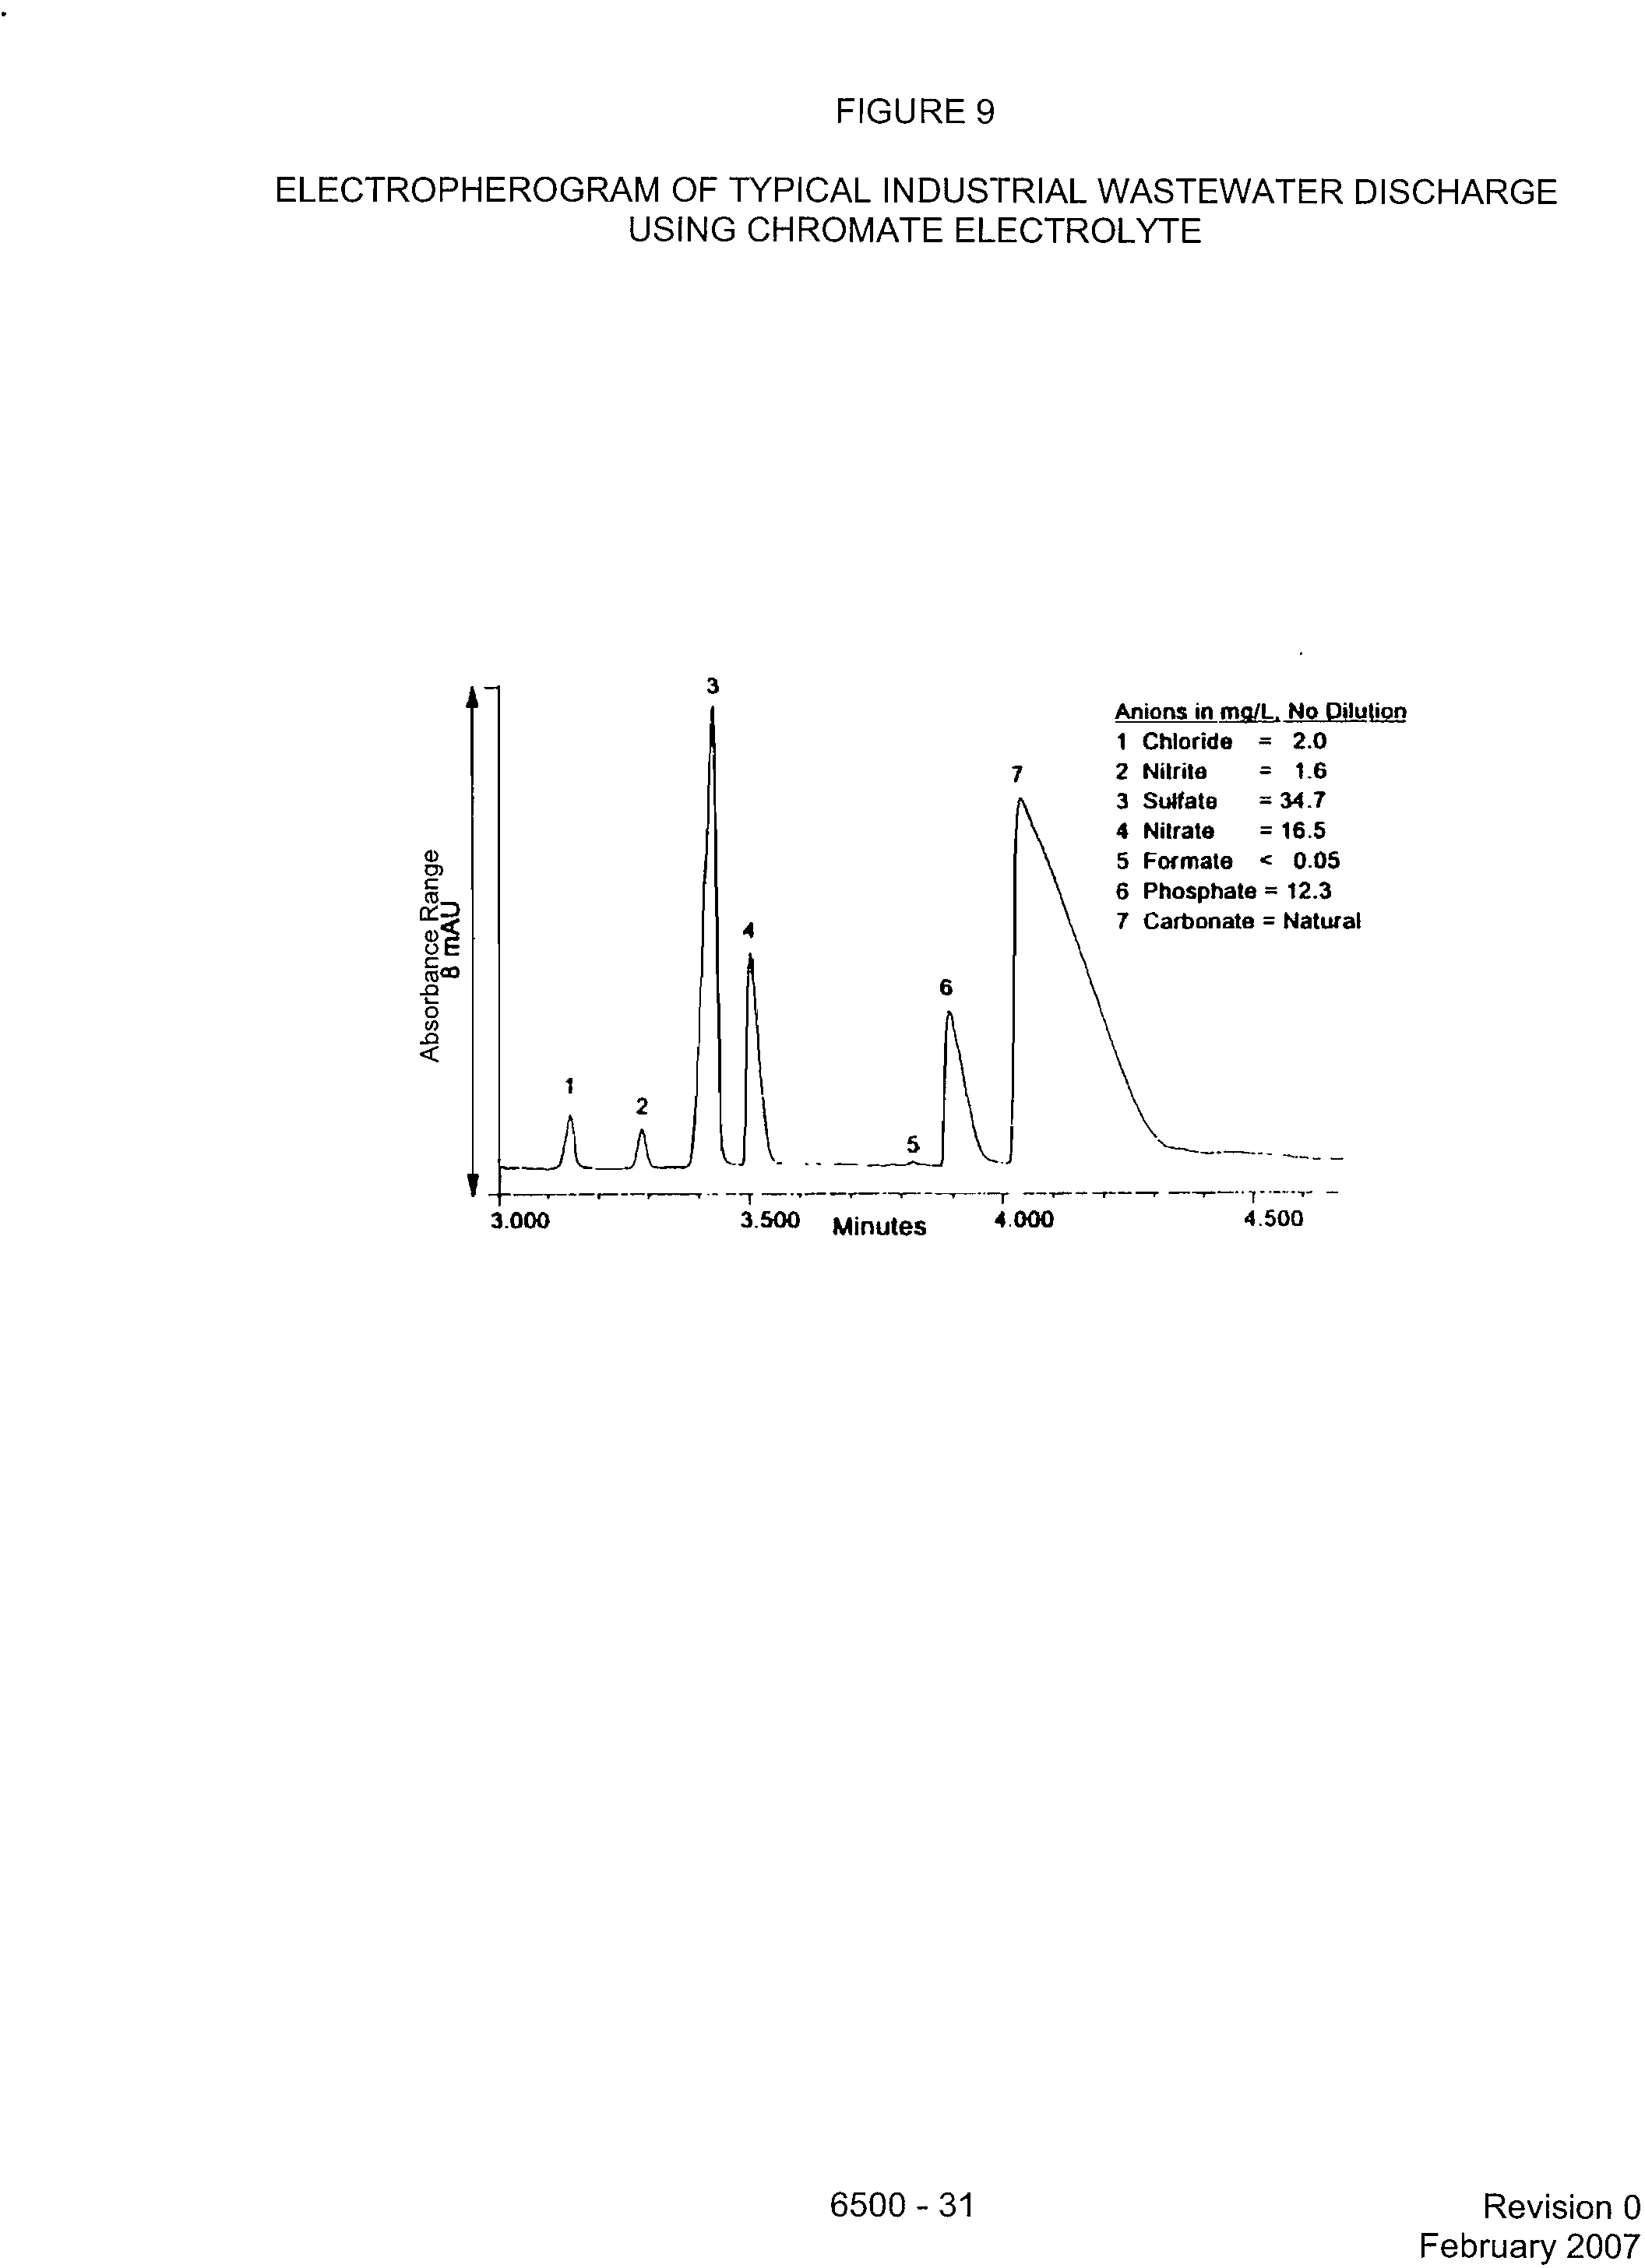
FIGURE 9
ELECTROPHEROGRAM OF TYPICAL INDUSTRIAL WASTEWATER DISCHARGE
USING CHROMATE ELECTROLYTE
O
47)
C
3
4
Anions in mW1_,
No Dilullen
=
?
2.0
=?
1.6
= 34.7
= 16.5
<?
0.05
= 12.3
= Natural
1 Chloride
7?
2 Nitrite
3 Sulfate
4 Nitrate
5 Formate
6 Phosphate
7 Carbonate
cum
O
co
_o
5
_
3.000?
3.500
Minutes?
4.000
4.500
Revision 0
February 2007
6500 - 31
TCPA = 167.621C1j+
32.93; R
2
=
0.9996
TCPA = 126.76[5041-16.12;
R2
=
0.9998
TCPA = 78.23(Br) + 11.76;
R 2
=
0.9995
CI
3 Data Points per Concentration
Based upon Youden Pair Design
T?
"?I
10?
20?
30?
40?
50
mg/L Anion
SO4
FIGURE 10
LINEARITY CALIBRATION CURVE FOR CHLORIDE, BROMIDE, AND SULFATE
USING CHROMATE ELECTROLYTE
10
6500 - 32
?
Revision 0
February 2007
10
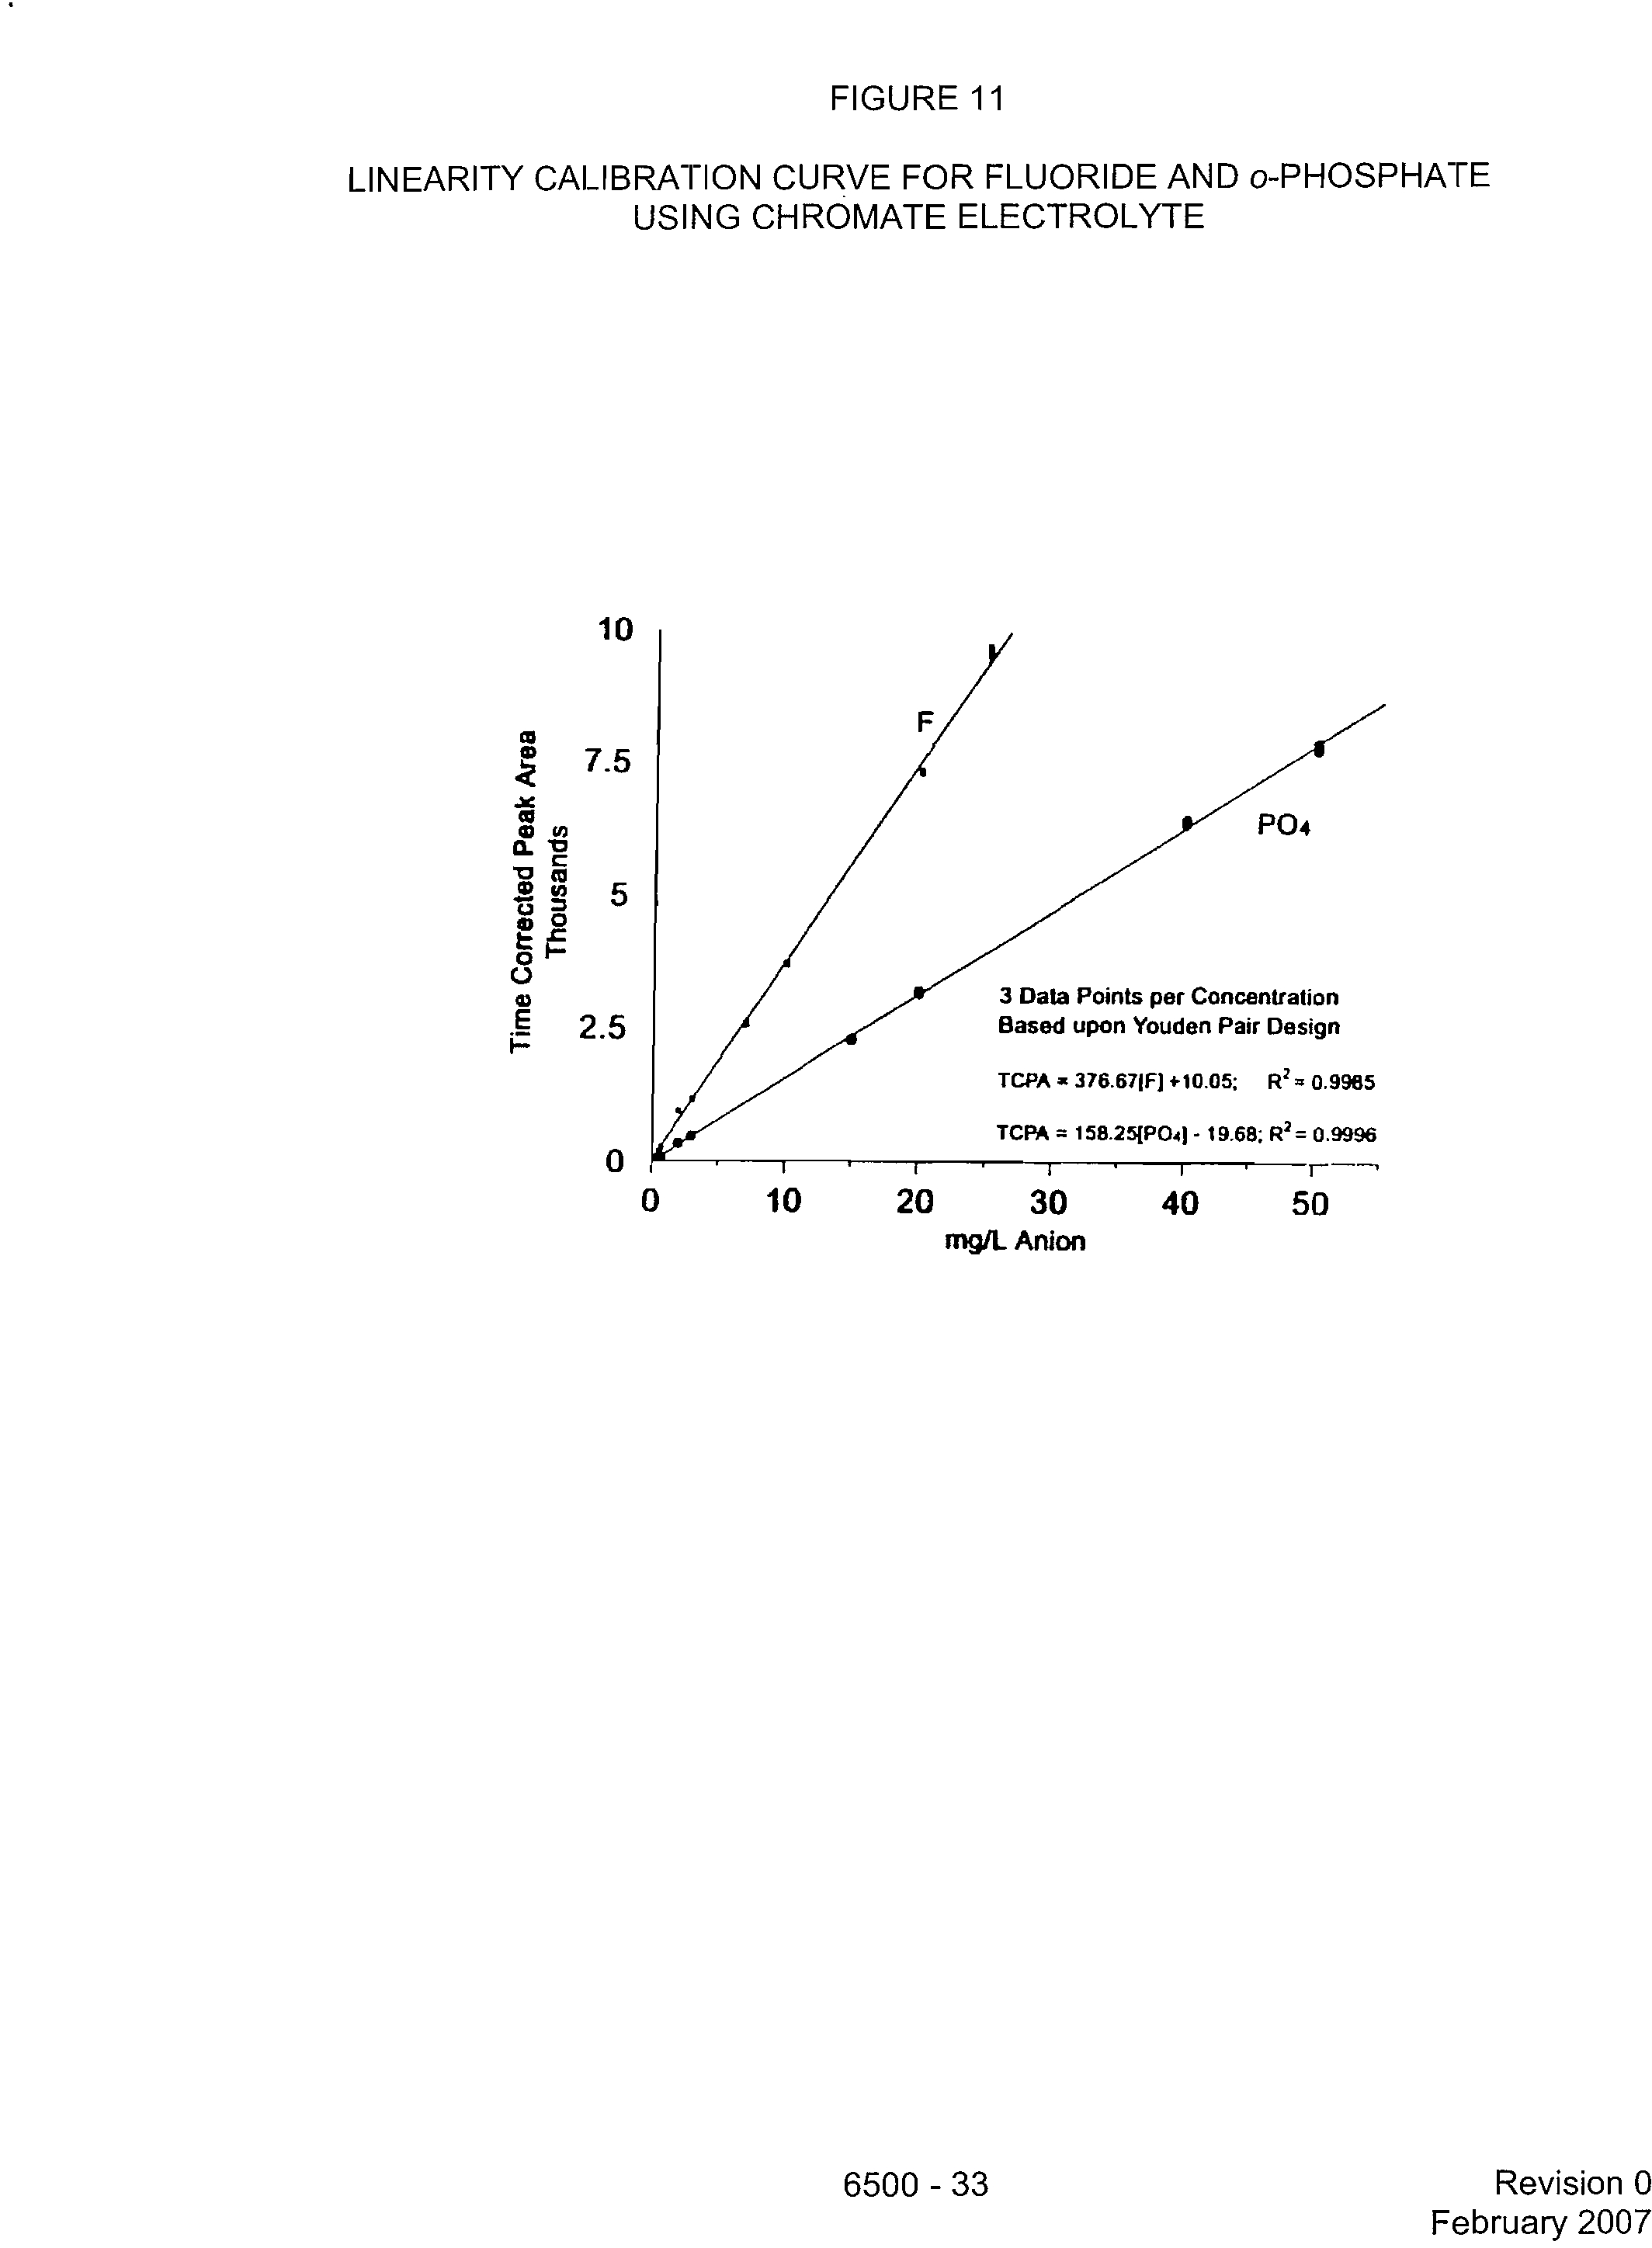
FIGURE 11
LINEARITY CALIBRATION CURVE FOR FLUORIDE AND o-PHOSPHATE
USING CHROMATE ELECTROLYTE
PO4
3 Data Points per Concentration
Based upon Youden Pair Design
TCPA 376.671F1 +10.05; R
2
= 0.9985
TCPA = 158.25{PO41- 19.68; R
2
=
0.9996
0
?
10?
20?
30
?
40?
50
mg/L Anion
6500 - 33
?
Revision 0
February 2007
FIGURE 12
LINEARITY CALIBRATION CURVE FOR NITRITE AND NITRATE
USING CHROMATE ELECTROLYTE
10
3 Data Points per Concentration
Based upon Youden Pair Design
NO2
TCPA = 130.950404+
28.93; R
2
=
0.9996
TCPA =
106.821NO31 + 126.61; R
2
=
0.9992
?
NO3
0?
10
?
20
?
30
?
40?
50
mgJL Anion
6500 - 34
Revision 0
February 2007
7.5
5
2.5
METHOD 6500
DISSOLVED INORGANIC ANIONS IN AQUEOUS MATRICES
BY CAPILLARY ION ELECTROPHORESIS
c
startD
11.1 Set-up Capillary
Electrophoresis system
according to manufacturer's
instructions.
11.2.1 Condition capillary
with NaOH for 5 min.
followed by chromate
electrolyte soln. for 5 min.
'V
11.2.2 Program system for
hydrostatic sampling for
30 seconds.
11.2.3 Program system for
constant current 14 IV+, and
a run time of 5 min.
11.2.4 Program system for
data acquisition rate of
20 points per second.
11.2.5 Monitor UV response
at 254 nm.
11.3 Analyze all standards
and samples.
Stop
6500 - 35
Revision 0
February 2007
GLOSSARY
Capillary ion electrophoresis -- An electrophoretic technique in which a UV absorbing electrolyte
is placed in a 75-pm fused silica capillary. Voltage is applied through the capillary causing
electrolyte and anions to migrate towards the anode and through the capillary UV detector
window. Anions are separated based upon the anion's differential rates of migration in the
electrical field which is directly related to the anion's equivalent ionic conductance. Anion
detection and quantitation are based upon the principles of indirect UV detection.
Electrolyte -- A combination of a UV absorbing salt and an electroosmotic flow modifier placed
inside the capillary, used as a carrier for the analytes, and for anion detection and quantitation.
The UV absorbing portion of the salt must be anionic and have an electrophoretic mobility similar
to the analyte anions of interest.
Electroosmotic flow (EOF) -- The direction and velocity of electrolyte solution flow within the
capillary under an applied electrical potential (voltage); the velocity and direction of flow is
determined by electrolyte chemistry, power supply polarity and applied voltage.
Electroosmotic flow modifier (OFM) -- A cationic amine in the electrolyte that dynamically coats
the negatively charged silica wall reversing the direction of the electrolyte's natural
electroosmotic flow and directing it towards the anode and detector. This modifier augments
anion migration and enhances speed of analysis. See Fig. 2.
Electrophoretic mobility -- The specific velocity of a charged analyte in the electrolyte under
specific electroosmotic flow conditions. The mobility of an analyte is directly related to the
analyte's equivalent ionic conductance and applied voltage, and is the primary mechanism of
separation.
Electropherogram -- A graphical presentation of UV detector response versus time of analysis;
the x axis is the migration time which is used to qualitatively identify the anion, and the y axis is
the UV response which can be converted to time corrected peak area for quantification.
Hydrostatic sampling -- A sample introduction technique in which the capillary with electrolyte is
immersed in the sample, and both are elevated to a specific height, typically 10 cm, above the
receiving electrolyte reservoir for a preset amount of time, typically less than 60 secs.
Nanoliters of sample are siphoned into the capillary by differential head pressure and gravity.
Indirect UV detection -- A form of UV detection in which the analyte displaces an equivalent net
charge amount of the highly UV absorbing component of the electrolyte causing a net decrease
in background absorbance. The magnitude of the decreased absorbance is directly proportional
to analyte concentration. Detector output polarity is switched in order to obtain a positive mV
response.
Migration time -- The time designated for a specific analyte to migrate through the capillary to the
detector. The migration time in capillary ion electrophoresis is analogous to retention time in
chromatography.
Time corrected peak area (normalized peak area) -- Peak area divided by migration time. CIE
principles state that peak area is dependant on migration time, i.e. for same concentration of
analyte, as migration time increases (decreases) peak area increases (decreases). Timed
corrected peak area accounts for these changes.
6500 - 36
?
Revision 0
February 2007
Midpoint of peak width -- CIE peaks are typically asymmetrical with the peak apex shifting with
increasing concentration, and peak apex may not be indicative of true analyte migration time.
Midpoint of peak width is the midpoint between the analyte peak's start and stop integration.
6500 - 37
?
Revision 0
February 2007