BEFORE THE ILLINOIS
POLLUTION
CONTROL BOARD
IN THE MATTER OF:
WATER QUALITY STANDARDS AND
EFFLUENT
LIMITATIONS
FOR THE
CHICAGO AREA WATERWAY SYSTEM
AND THE LOWER DES PLAINES RIVER:
PROPOSED AMENDMENTS TO 35 Ill.
Adm. Code Parts 301, 302, 303 and 304
R08-9
(Rulemaking - Water)
NOTICE OF FILING
To:
ALL COUNSEL OF RECORD
(Service List Attached)
PLEASE TAKE NOTICE that on the 41h day of August, 2008, I electronically filed with
the Office of the Clerk of the Illinois Pollution Control Board:
1.
Pre-Filed Testimony of Richard Lanyon;
2.
Pre-Filed Testimony of William J. Stuba on behalf of the Metropolitan
Water Reclamation District of Greater Chicago concerning recreational
designations of the Chicago Area Waterway System;
3.
Pre-Filed
Testimony of Samuel G. Dennison on Behalf of the
Metropolitan
Water Reclamation District of Greater Chicago concerning
justification for an additional aquatic life use tier for Bubbly Creek (south
fork of the South Branch Chicago River);
4.
Pre-Filed Testimony of Samuel G. Dennison on behalf of the Metropolitan
Water Reclamation District of Greater Chicago concerning Dissolved
Oxygen (DO) standards proposed for protecting aquatic life in the
Designated Aquatic Life Use A Waters and Aquatic Life Use B Waters of
the Chicago Area Waterway System;
5.
Pre-Filed Testimony of Samuel G. Dennison on behalf of the Metropolitan
Water
Reclamation
District of
Greater
Chicago
concerning the
classification of the Calumet-Sag Channel as an Aquatic Life Use B
Water;
[This filing submitted on recycled paper as defined in 35 Ill. Adm. Code 101.2021
6.
Pre-Filed Testimony of Samuel G. Dennison on behalf of the Metropolitan
Water Reclamation District of Greater Chicago concerning recreational
designations of the Chicago Area Waterway System;
7.
Pre-Filed Testimony of Susan O'Connell;
8.
Pre-Filed Testimony of Geeta Rijal;
9.
Pre-Filed Testimony of Thomas E. Kunetz, P. E.;
10.
Pre-Filed Testimony of Thomas Granato - Aquatic Life Uses and Criteria;
11.
Pre-Filed
Testimony of Thomas Granato - Recreational Uses and
Standards;
12.
Pre-Filed Testimony of Jennifer Wasik - Sediment Sample Collection;
13.
Pre-Filed Testimony of Jennifer Wasis - Chronic Cyanide Standard;
14.
Pre-Filed Testimony of Chriso Petropoulou;
15.
Pre-Filed Testimony of Charles P. Gerba;
16.
Pre-Filed Testimony of Keith Tolson;
17.
Pre-Filed Testimony of Samuel Dorevitch;
18.
Pre-Filed Testimony of Ernest R. BlatchIey III;
19.
Pre-Filed Testimony of Charles N. Haas;
20.
Pre-Filed Testimony of David R. Zenz - Dissolved Oxygen Enhancement
Studies;
21.
Pre-Filed Testimony of David R. Zenz - Effluent Disinfection Studies;
22.
Pre-Filed
Testimony of Stephen F.
McGowan - Environmental
Assessment of Supplemental Aeration Technologies for Increasing
Dissolved Oxygen Concentration in the Chicago Area Waterways;
23.
Pre-Filed
Testimony of Stephen F. McGowan - Implementation of
Disinfection Requirement;
24.
Pre-Filed Testimony of John Mastracchio - Impacts of Aeration Stations;
25.
Pre-Filed
Testimony of John Mastracchio - Impacts of Disinfection
Requirements;
[This filing submitted on recycled paper as defined in 35111. Adm. Code 101.2021
2
26,
Pre-Filed Testimony of Adrienne D. Nemura;
27.
Pre-Filed Testimony of Charles S. Melching;
28.
Pre-Filed Testimony of Scudder D. Mackey;
29.
Pre-Filed Testimony of Marcelo H. Garcia, Phd; and
30.
Pre-Filed Testimony of Paul L. Freedman., P.E., BCEE,
copies of which are hereby served upon you by CD Disc.
Dated: August 4, 2008
METROPOLITAN WATER RECLAMATION
DISTRICT OF GREATER CHICAGO
B
Fredric P. Andes
Carolyn
S. Hesse
David T. Ballard
BARNES & THORNBURG LLP
Suite 4400
One North Wacker Drive
Chicago,
Illinois 60606
(312) 357-1313
478615v!
[This
filing submitted
on recycled
paper as defined
i
n 35111
.
Adm. Code 101.2021
3
PROOF
OF SERVICE
The undersigned, a non-attorney, certifies, under penalties of perjury pursuant to 735
ILCS 511-109, that true copies of the forgoing Notice of Filing and:
1.
Pre-Filed Testimony of Richard Lanyon;
2.
Pre
-Filed Testimony of William
J.
Stuba on
behalf of
the
Metropolitan
Water
Reclamation District of Greater
Chicago
concerning recreational
designations
of the Chicago Area Waterway
System;
3.
Pre-Filed
Testimony of Samuel G. Dennison on Behalf of the
Metropolitan
Water Reclamation District of Greater Chicago concerning
justification for an additional aquatic life use tier for Bubbly Creek (south
fork of the South Branch Chicago River);
4.
Pre-Filed Testimony of Samuel G. Dennison on behalf of the Metropolitan
Water Reclamation District of Greater Chicago concerning Dissolved
Oxygen (DO) standards proposed for protecting aquatic life in the
Designated Aquatic Life Use A Waters and Aquatic Life Use B Waters of
the Chicago Area Waterway System;
5.
Pre-Filed Testimony of Samuel G. Dennison on behalf of the Metropolitan
Water
Reclamation District of
Greater Chicago
concerning the
classification of the Calumet-Sag Channel as an Aquatic Life Use B
Water;
6.
Pre-Filed Testimony of Samuel G. Dennison on behalf of the Metropolitan
Water Reclamation District of Greater Chicago concerning recreational
designations of the Chicago Area Waterway System;
7.
Pre-Filed Testimony of Susan O'Connell;
8.
Pre-Filed Testimony of Geeta Rijal;
9.
Pre-Filed Testimony of Thomas E. Kunetz, P. E.;
10.
Pre-Filed Testimony of Thomas Granato - Aquatic Life Uses and Criteria;
11.
Pre-Filed
Testimony of Thomas Granato - Recreational Uses and
Standards;
12.
Pre-Filed Testimony of Jennifer Wasik - Sediment Sample Collection;
[This filing submitted on recycled paper as defined
i
n 35 Ili. Adm. Code 101.2021
4
13,
Pre-Filed Testimony of Jennifer Wasis - Chronic Cyanide Standard;
14.
Pre-Filed Testimony of Chriso Petropoulou;
15.
Pre-Filed Testimony of Charles P. Gerba;
16.
Pre-Filed Testimony of Keith Tolson;
17.
Pre-Filed Testimony of Samuel Dorevitch;
18.
Pre-Filed Testimony of Ernest R. Blatchley Ill;
19.
Pre-Filed Testimony of Charles N. Haas;
20.
Pre-Filed Testimony of David R. Zenz - Dissolved Oxygen Enhancement
Studies;
21.
Pre-Filed Testimony of David R. Zenz - Effluent Disinfection Studies;
22.
Pre-Filed
Testimony
of Stephen F.
McGowan - Environmental
Assessment of Supplemental Aeration Technologies for Increasing
Dissolved Oxygen Concentration in the Chicago Area Waterways;
23.
Pre-Filed
Testimony of Stephen F. McGowan - Implementation of
Disinfection Requirement;
24.
Pre-Filed Testimony of John Mastracchio - Impacts of Aeration Stations;
25.
Pre-Filed
Testimony of John Mastracchio - Impacts of Disinfection
Requirements;
26.
Pre-Filed Testimony of Adrienne D, Nemura;
27.
Pre-Filed Testimony of Charles S. Melching;
28.
Pre-Filed Testimony of Scudder D. Mackey;
29.
Pre-Filed Testimony of Marcelo H. Garcia, Phd; and
30.
Pre-Filed Testimony of Paul L. Freedman, P.E., BCEE
[This filing submitted on recycled paper as defined in 35 Ill, Adm. Code 101.2021
5
were served on CD Disc and mailed via U.S
.
Mail, first class postage prepaid
,
from One North
Wacker Drive
,
Suite 4400
,
Chicago, Illinois to All Counsel of Record on the attached Service
List
,
on this 4`E' day August, 2008.
[This filing submitted on recycled paper as defined in 35 Ill. Adm
.
Code 101.2021
6
BEFORE THE ILLINOIS POLLUTION CONTROL BOARD
IN THE MATTER OF:
WATER QUALITY STANDARDS AND
EFFLUENT LIMITATIONS FOR THE
CHICAGO AREA WATERWAY SYSTEM
AND THE LOWER DES PLAINES RIVER:
PROPOSED AMENDMENTS TO 35 III.
Adm. Code Parts 301, 302, 303 and 304
R08-9
(Rulemaking - Water)
PRE-FILED
TESTIMONY OF RICHARD LANYON
My name is Richard Lanyon. I am the General Superintendent of the Metropolitan Water
Reclamation District of Greater Chicago (District). I have been the General Superintendent since
June 2, 2006 and I am responsible for the day-to-day operations of the District, overseeing the
work of 2,000 employees and the administration of our statutory responsibilities and $1.4 billion
budget.
Prior to becoming General Superintendent, I was the Director of Research and
Development (R&D) for 7 years.
My career at the District began in 1963 and I have served in
managerial positions in the Engineering and Maintenance and Operations Departments as well as
in R&D.
I received Bachelor and Master of Civil Engineering degrees from the University of
Illinois at Urbana-Champaign (UIUC). I received the American Society of Civil Engineer's
National Government Civil Engineer of the Year Award in 1999 and Distinguished Alumnus of
the Department of Civil and Environmental Engineering at the UIUC in 2003. I am also a past
President of the Illinois Section of the American Society of Civil Engineers (ASCE) and have
been involved in a variety of technical activities for ASCE, the Water Environment Federation,
the Illinois Association of Wastewater Agencies, the U.S. Geological Survey and the National
Association of Clean Water Agencies.
Currently, I serve on the Board of Directors of the National Association of Clean Water
Agencies and I am the Chair of the National Biosolids Partnership's Steering Committee and
Chair of the Water Environment Federation's SustainabiIity Community of Practice.
My testimony provides an overview of the Chicago Area Waterway System (CAWS),
including its history and physical attributes; its current uses; and past, present and future efforts
by the District to improve conditions.
CAWS Overview: History and Physical Attributes
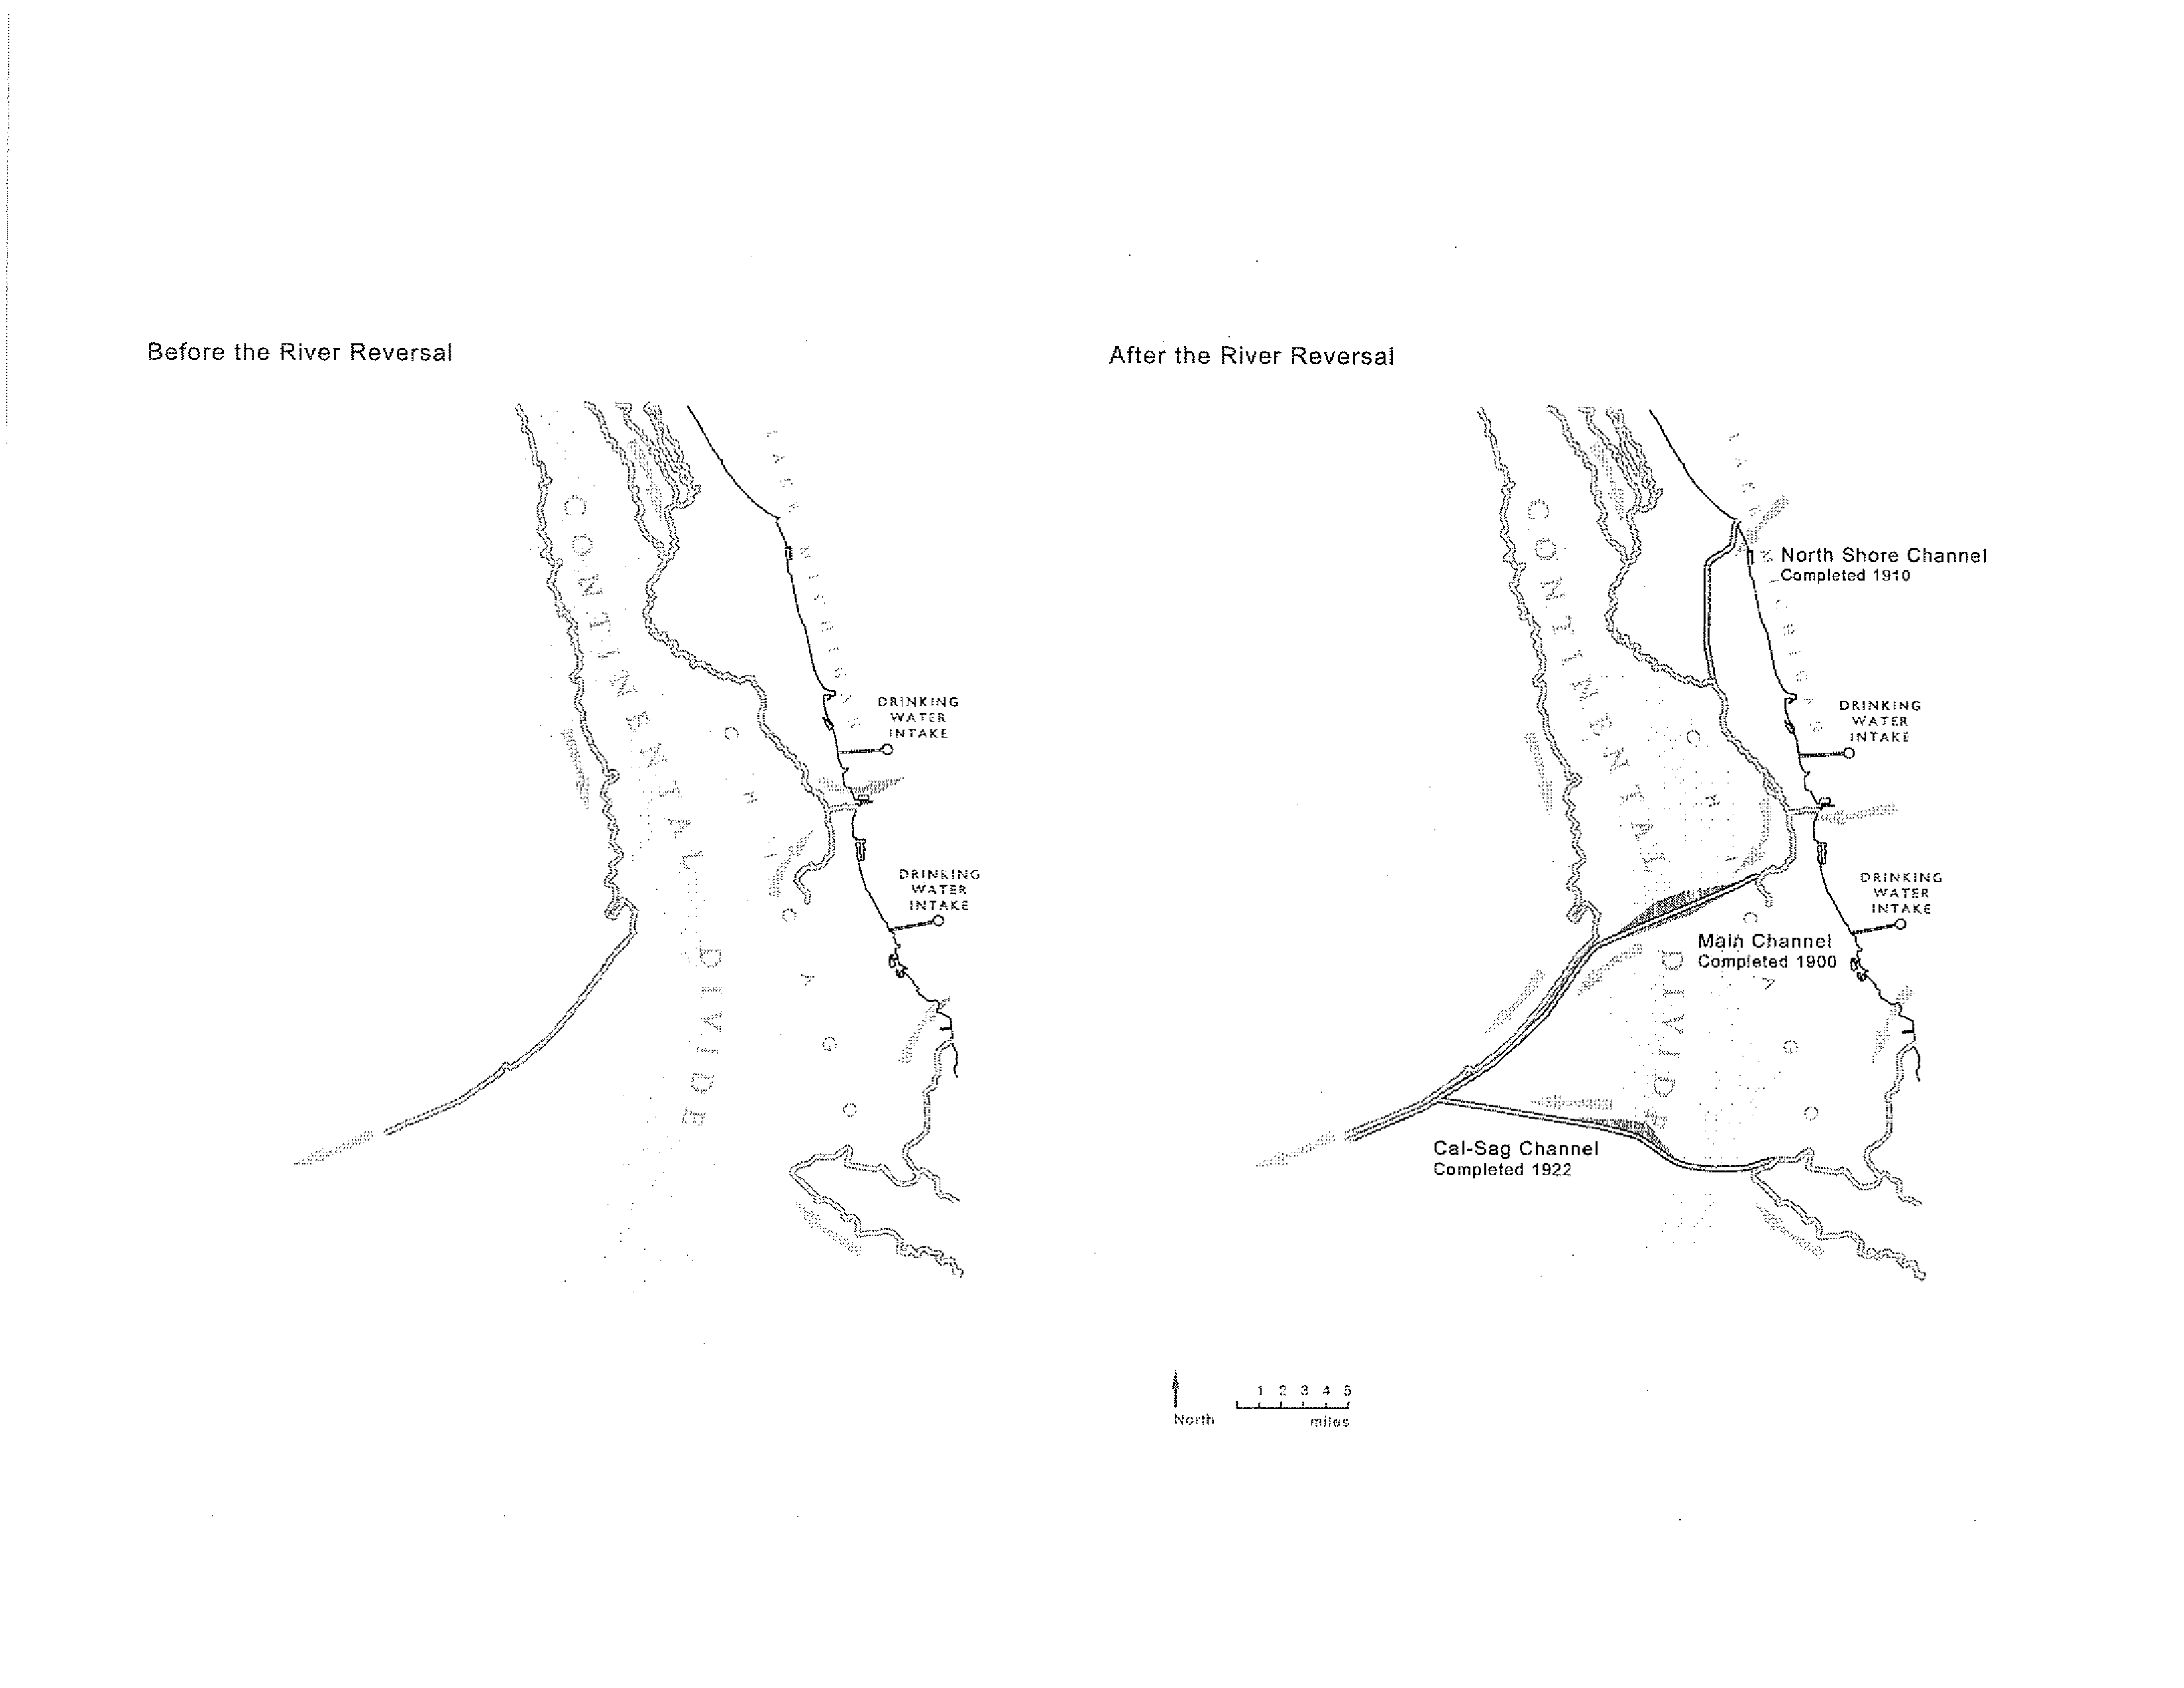
The evolution of the CAWS, through the alteration of its natural rivers and the
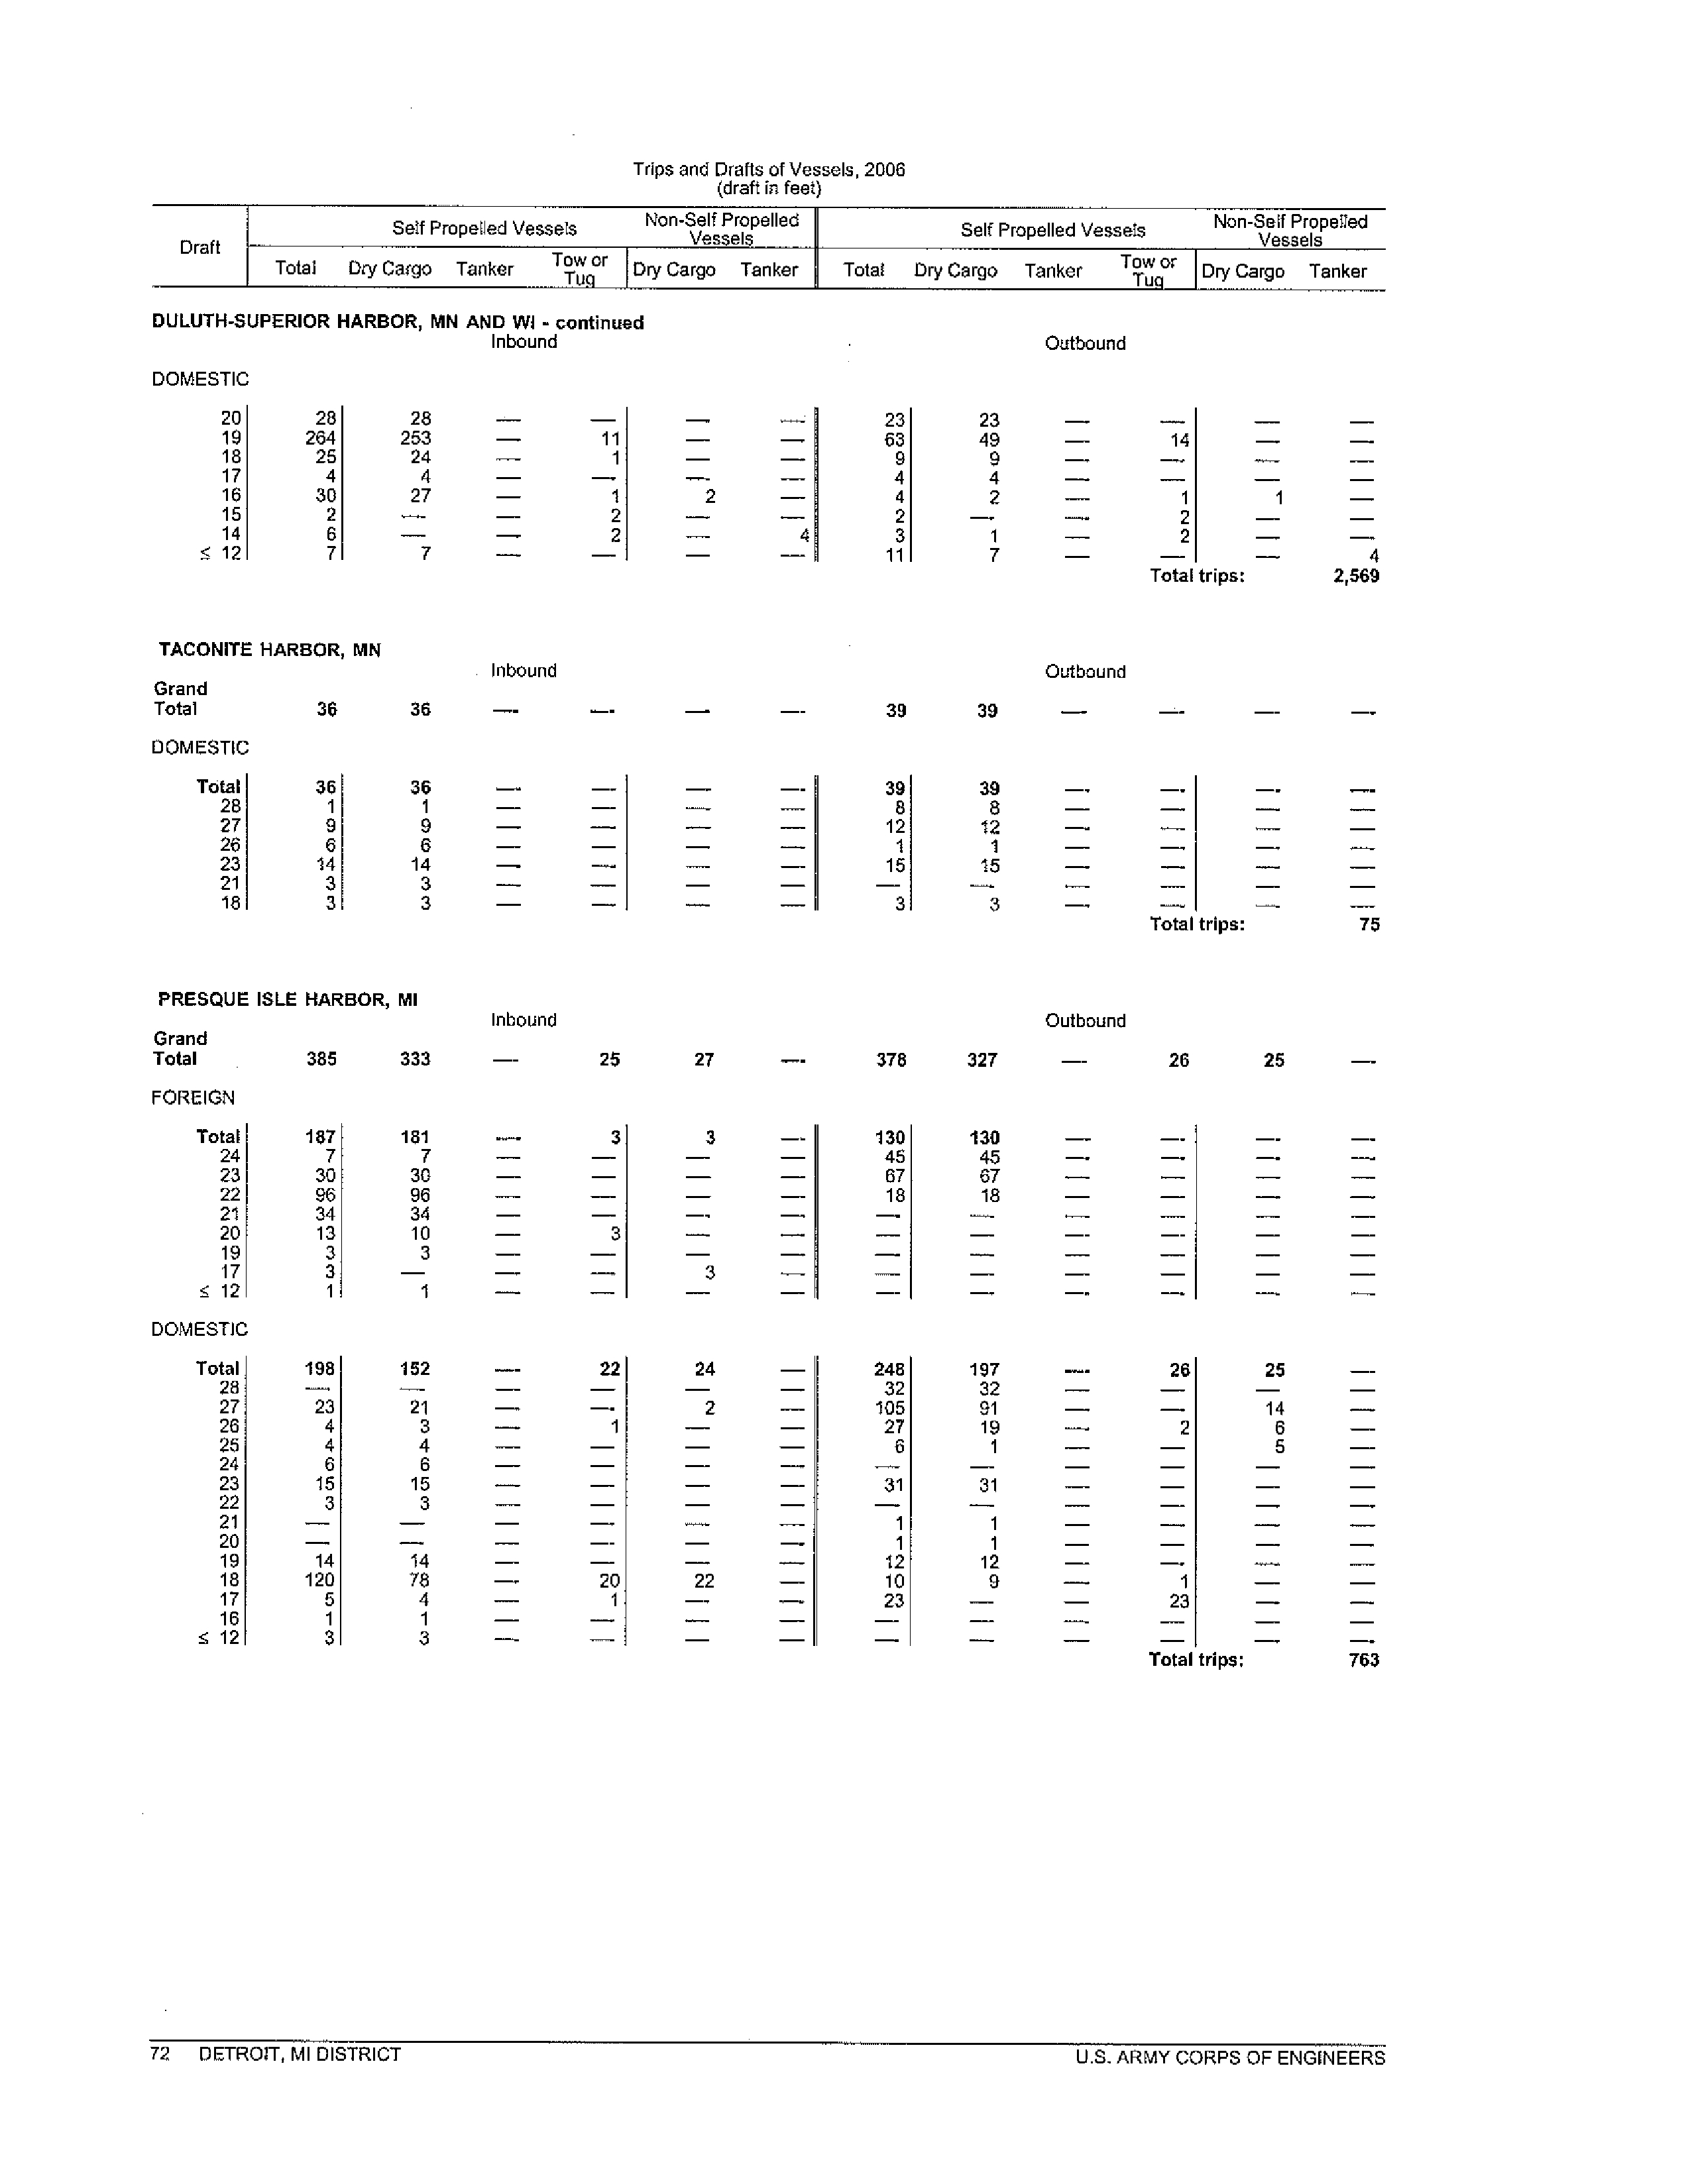
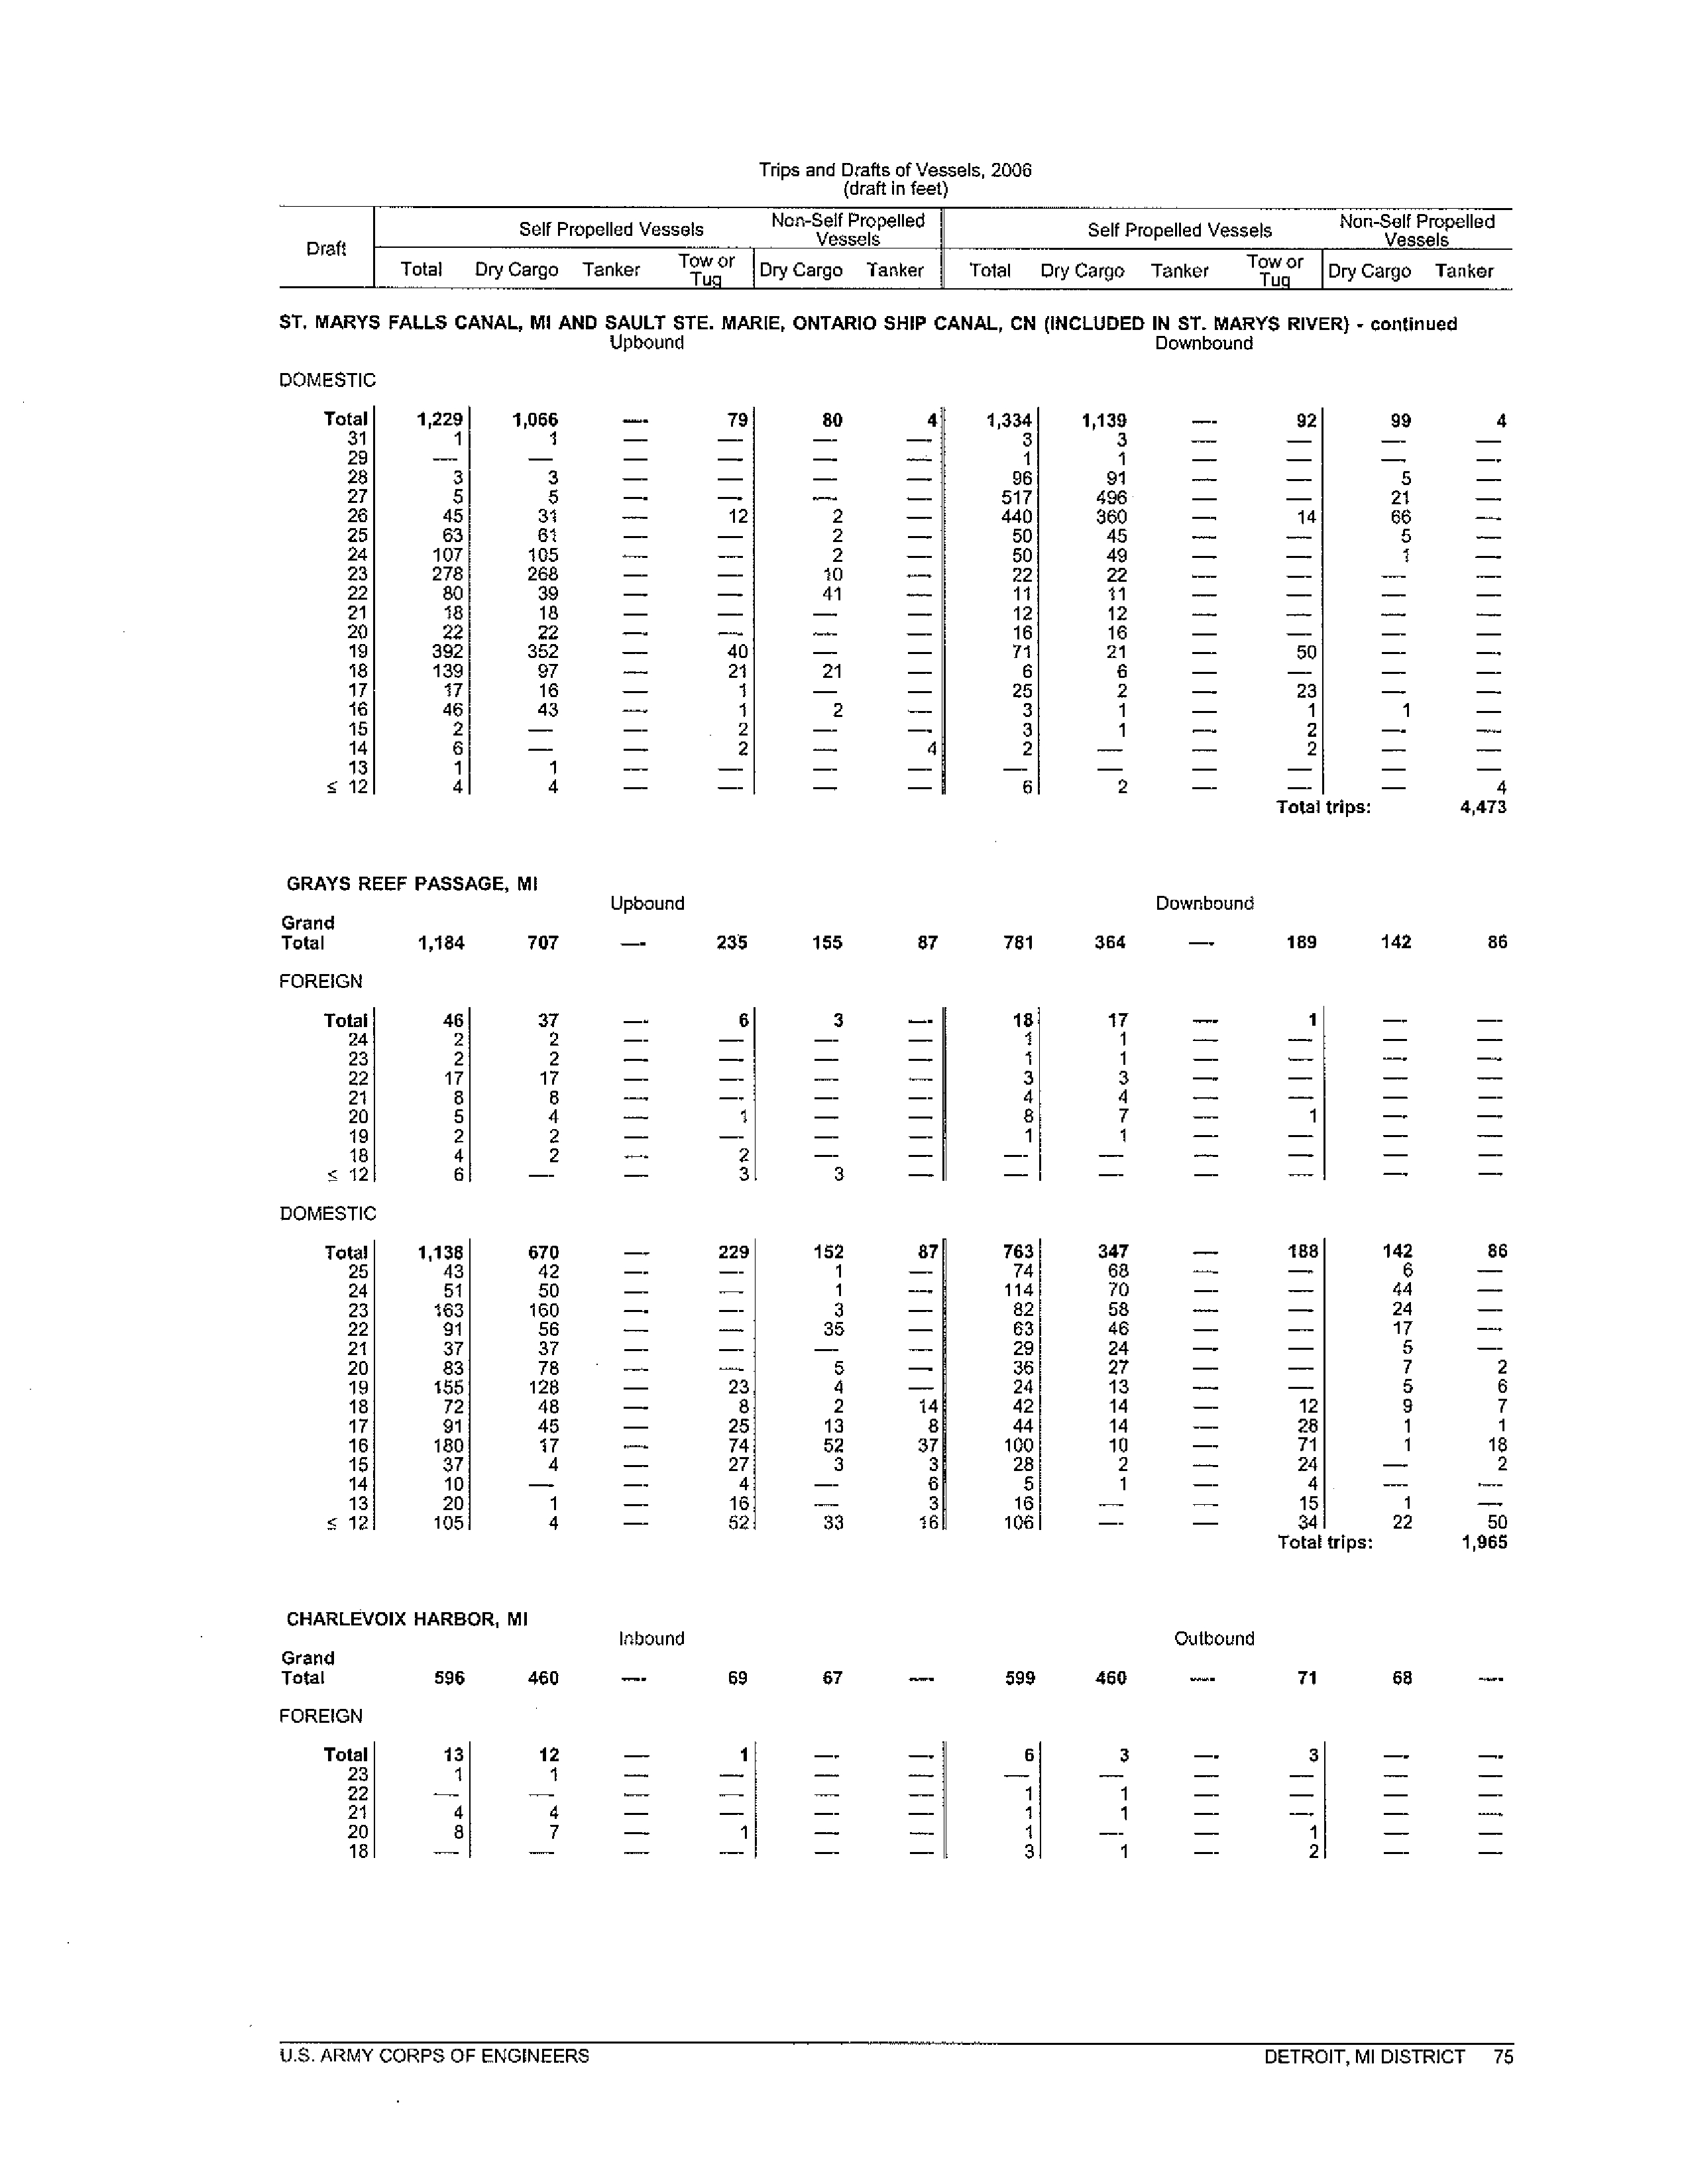
construction of artificial channels, allowed Chicago to prosper and expand. Construction of the
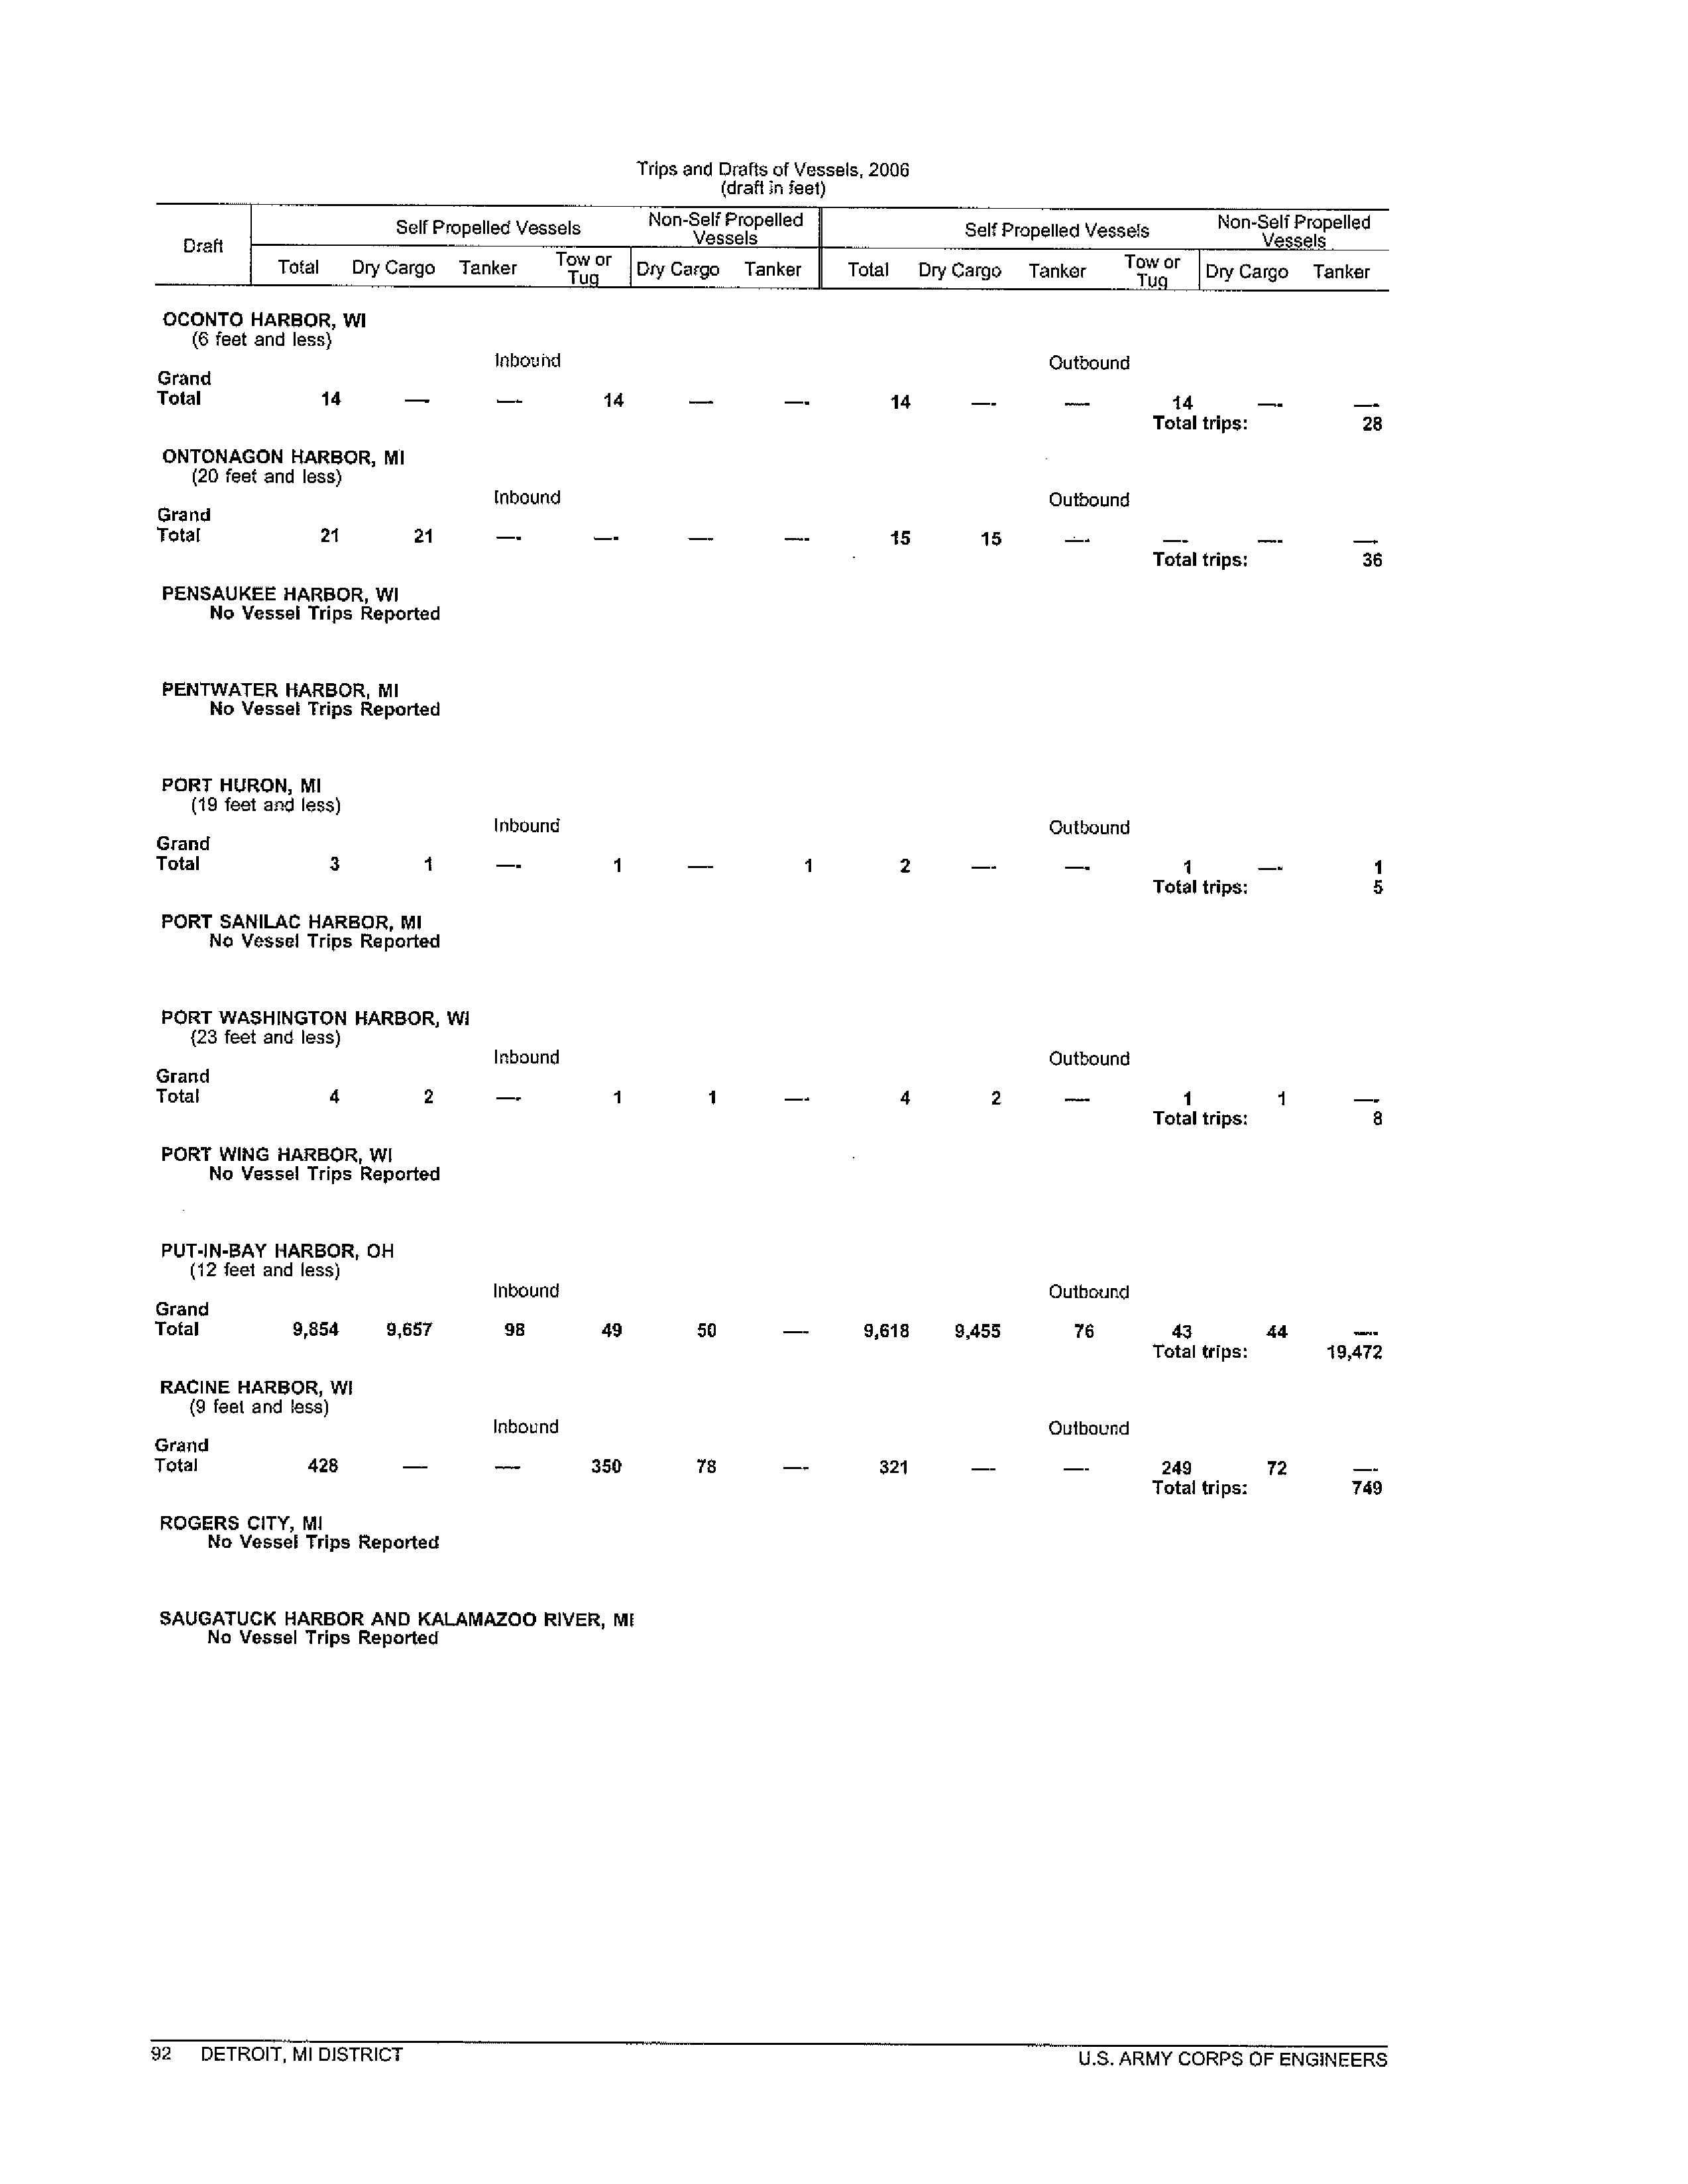
Chicago Sanitary and Ship Canal was completed in 1900, reversing the flow of the Chicago
River and South Branch away from Lake Michigan. The river, which historically acted as an
open sewer receiving the discharge of sewage from city sewers, flowed directly into Lake
Michigan before the Ship Canal was built. During storms, water from the Chicago River would
move further into Lake Michigan near the drinking water intakes for the city, threatening
outbreaks of waterborne illnesses.
During dry weather, it was a source of odors and a public
nuisance.
The North Shore Channel and Wilmette Pumping Station and control gates were
completed in 1910, through which Lake Michigan water was diverted to dilute and flush
wastewater downstream through the North Branch of the Chicago River, which was deepened to
accommodate the additional flow. The North Shore Channel also conveyed the discharge from
sewers in Evanston, formerly draining to Lake Michigan. Upon the completion of the Calumet-
Sag Channel and the Blue Island Lock in 1922, the Calumet River was also reversed to flow
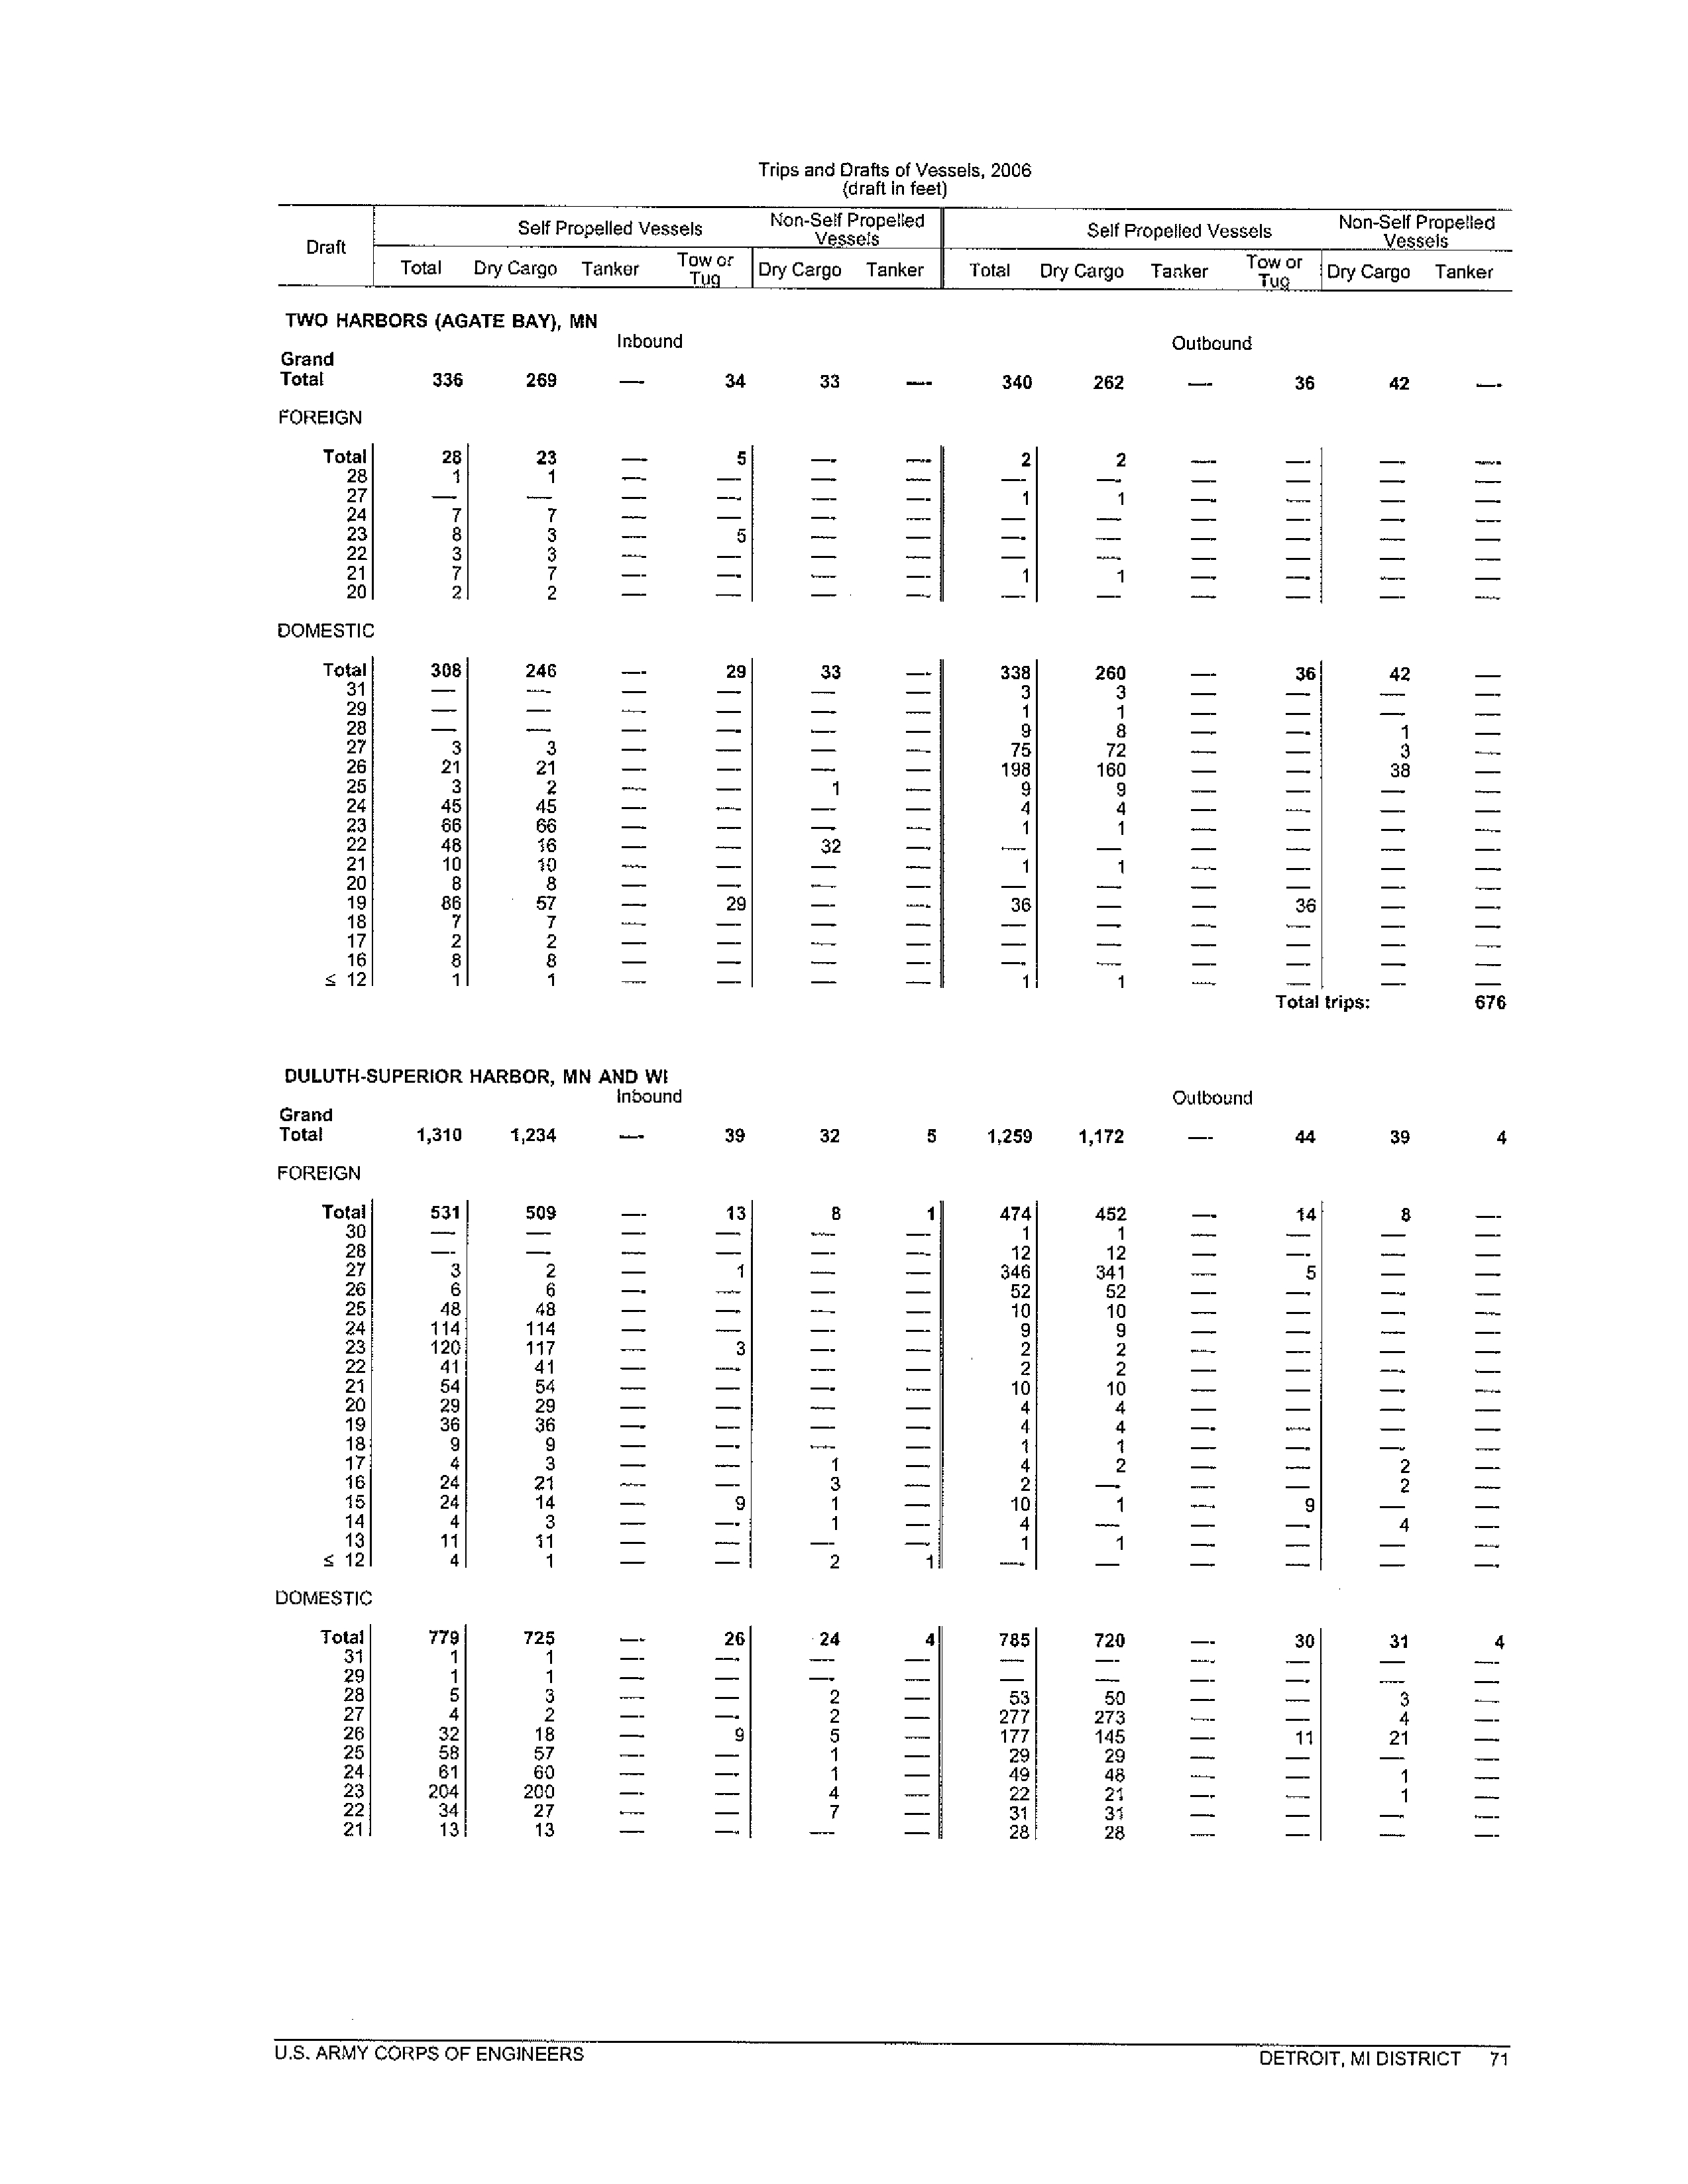
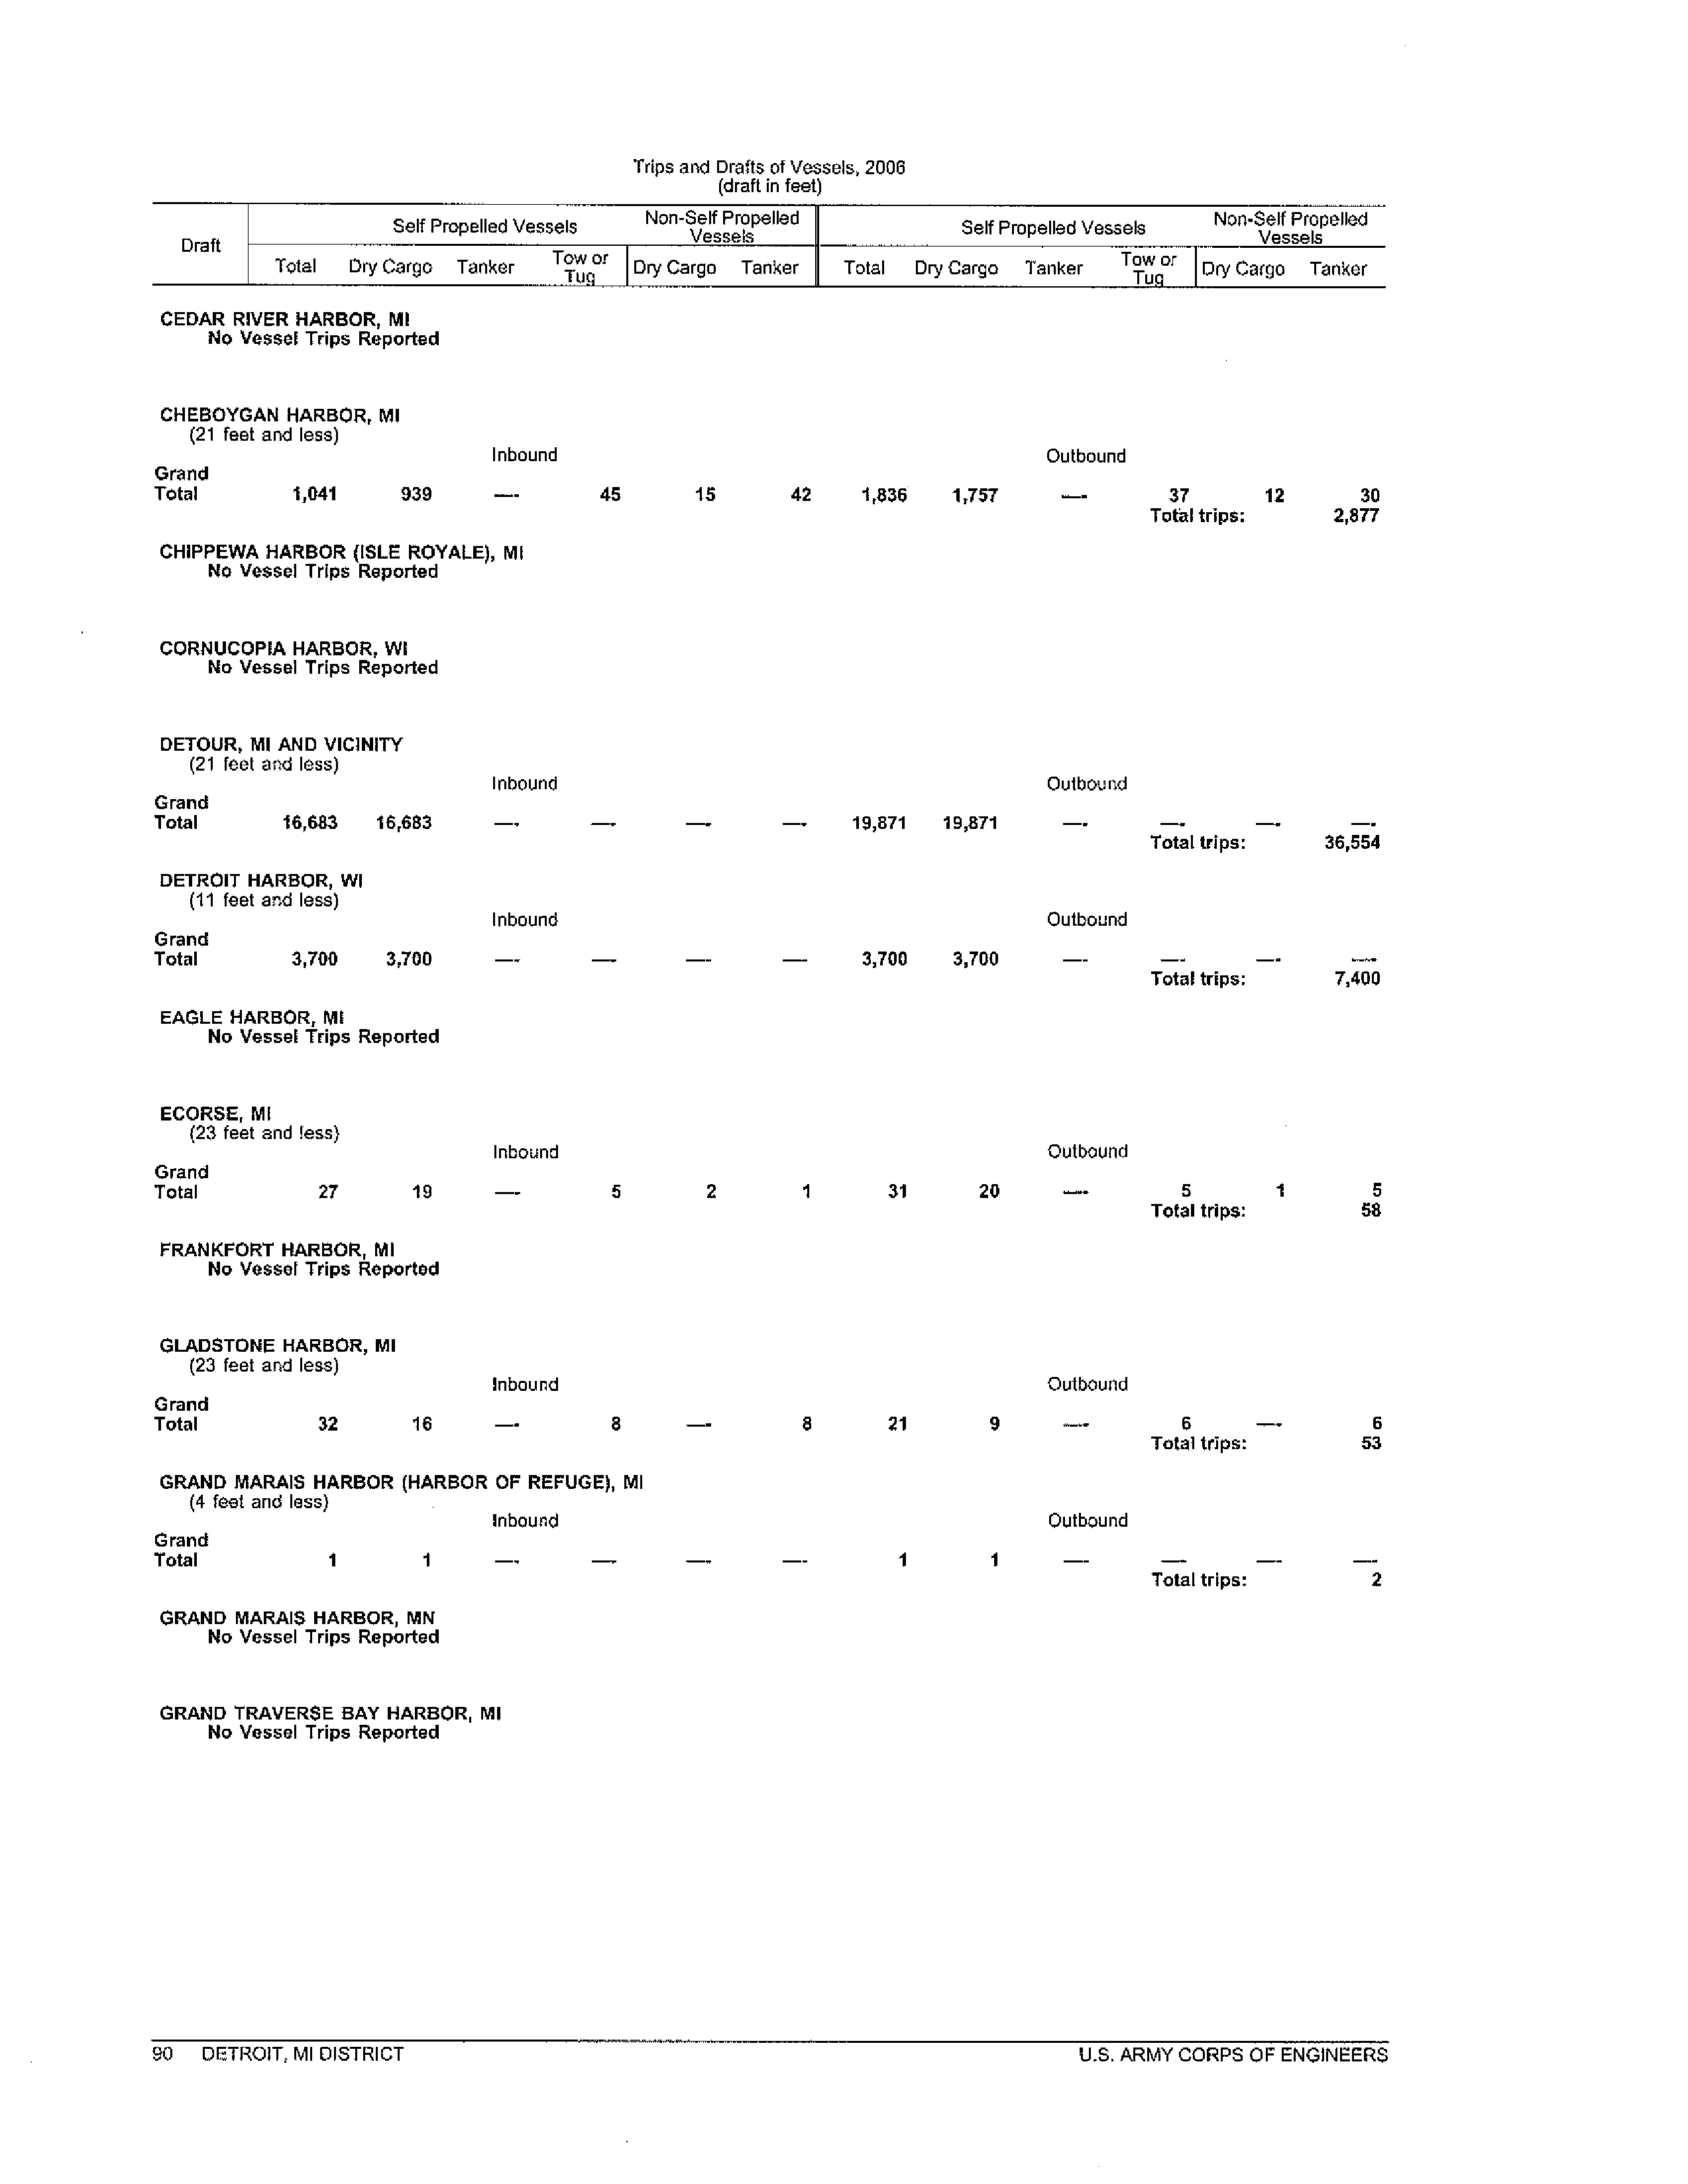
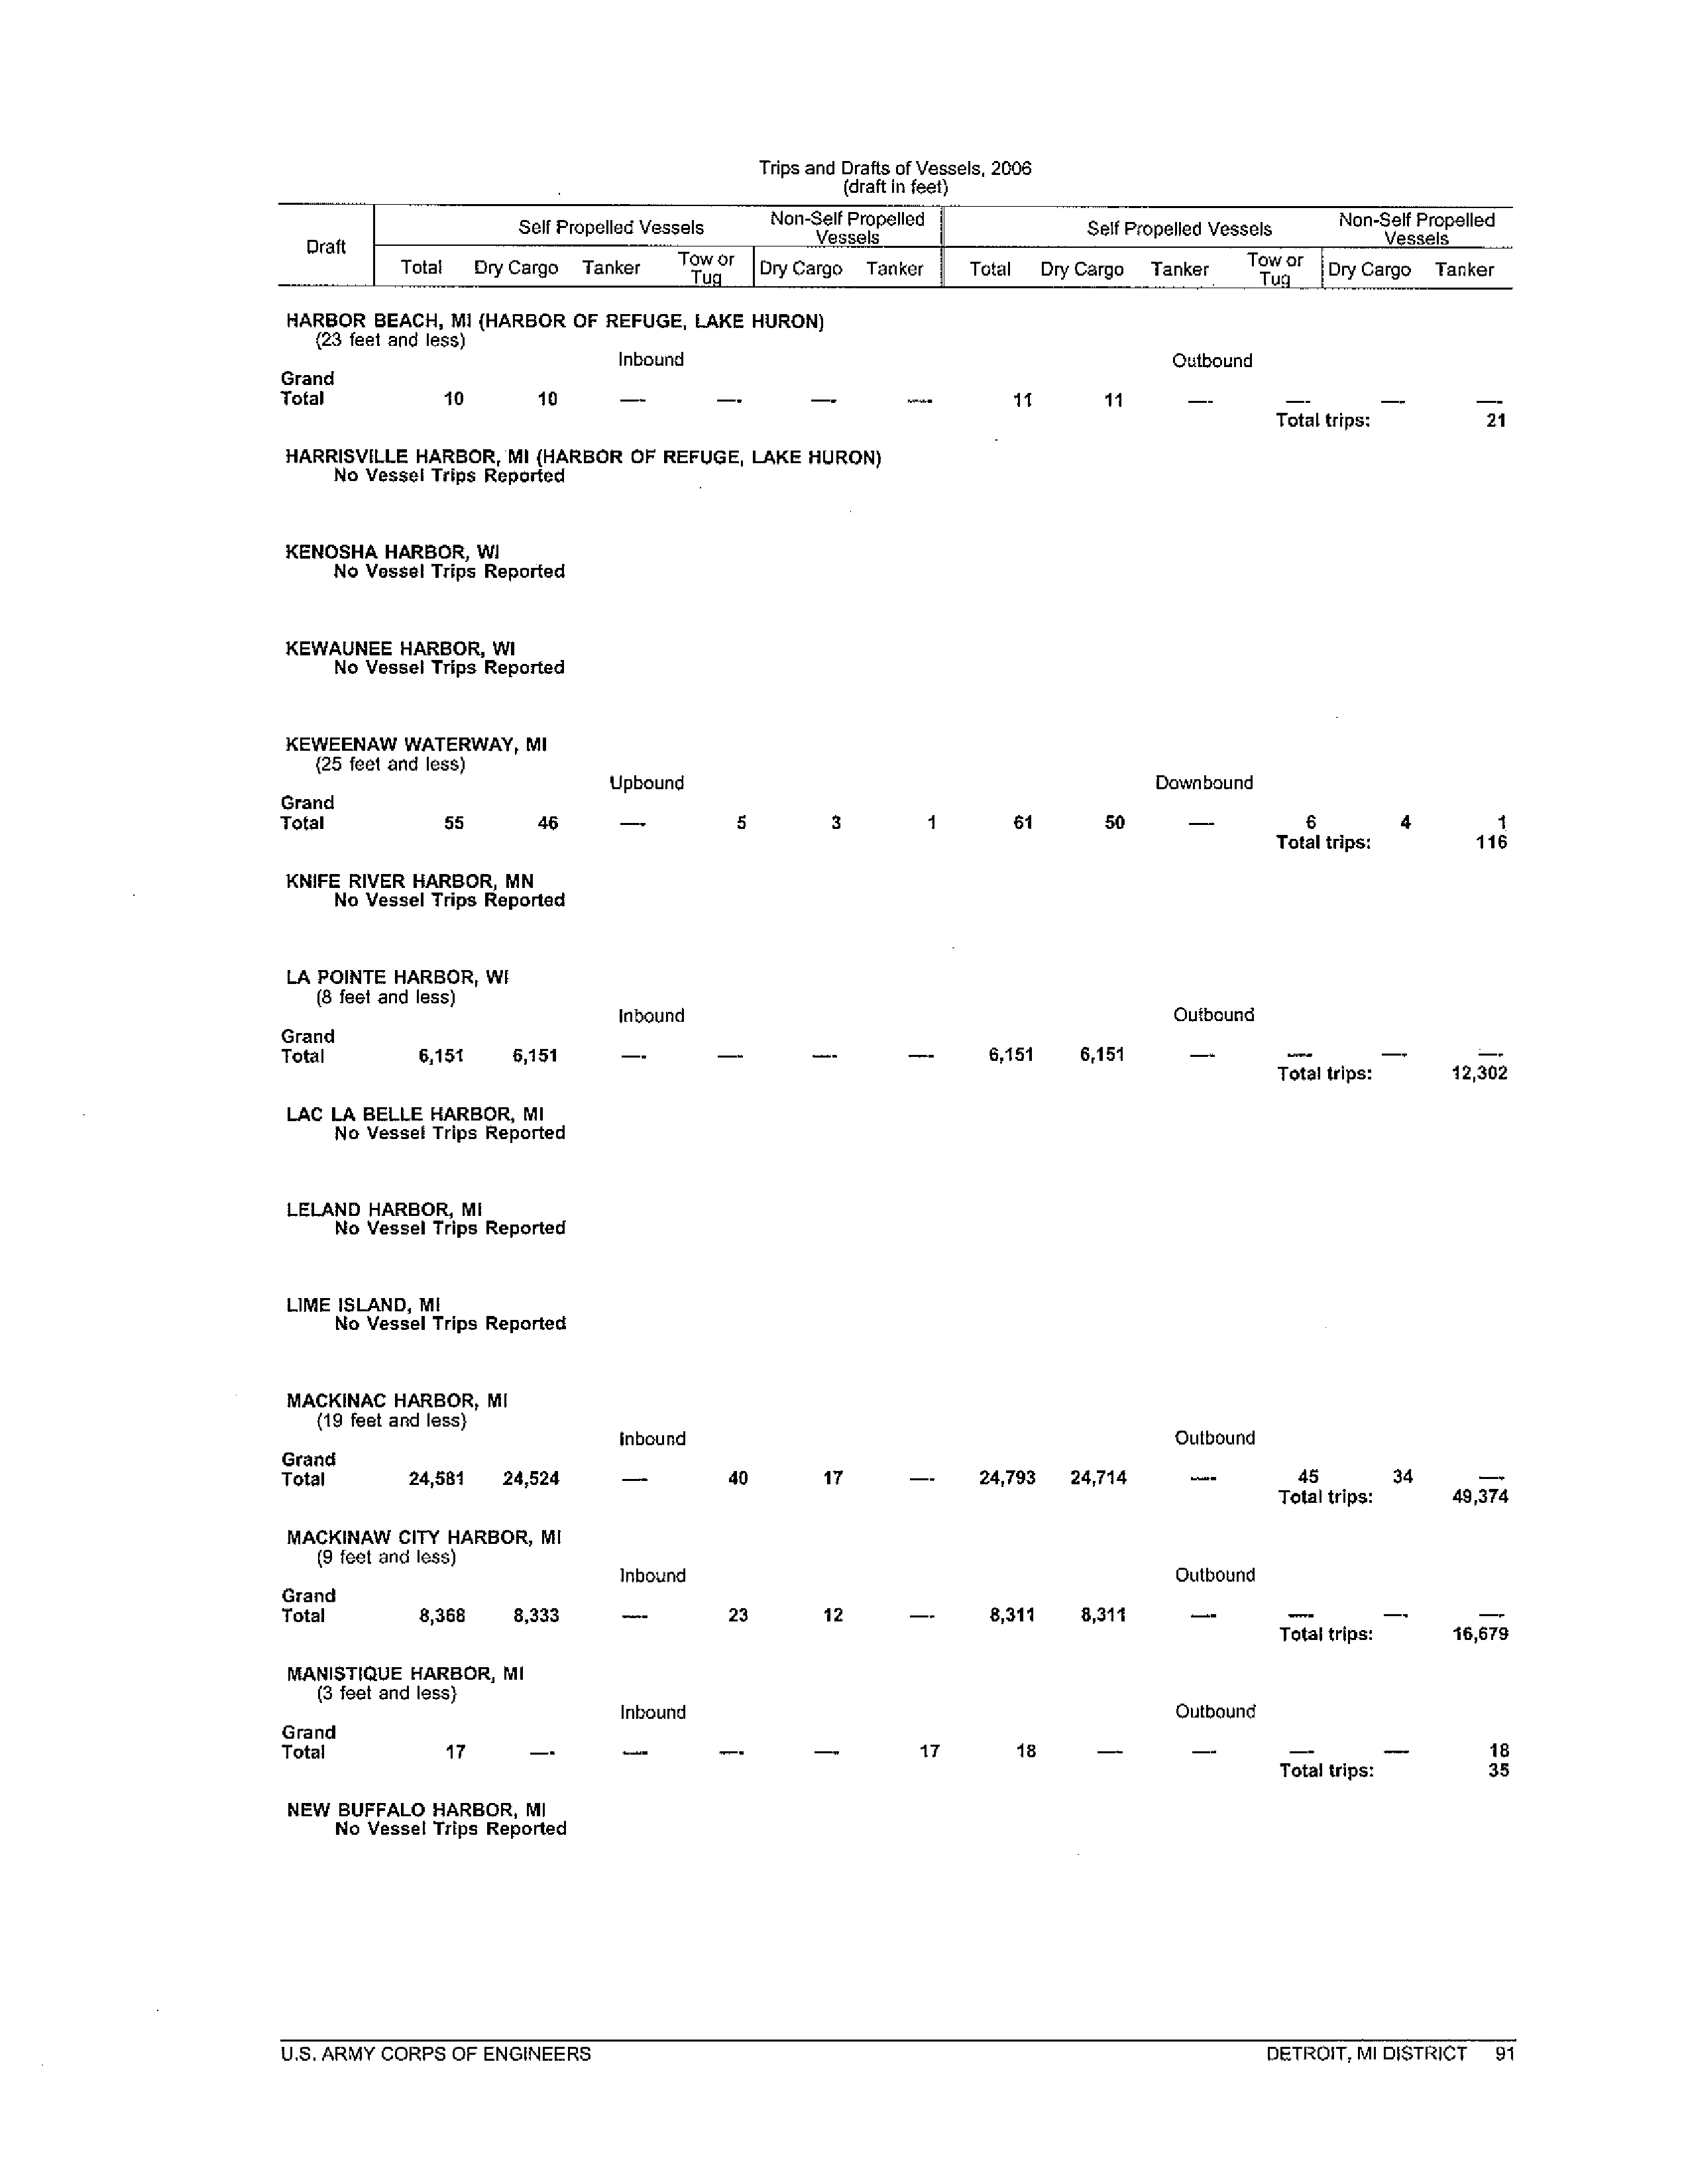
away from Lake Michigan. Attachments 1, 2 and 3, respectively, provide a current map of the
CAWS; a photograph showing construction of one of the channels; and diagram of the flow
reversal.
Channel construction and modifications to the CAWS established a navigable
2
connection between the Great Lakes and the Illinois River, making Chicago a commercial center.
Today, most of the CAWS is park of the Illinois Waterway, a federal navigation project under the
oversight of the U.S. Army Corps of Engineers and the U.S. Coast Guard. Constructing channels
also allowed for the drainage of sewage before sewage treatment was employed, and ultimately,
for the drainage of treated wastewater.
Most significantly, man-made channels facilitated the
reversal of the Chicago and Calumet Rivers, away from Lake Michigan, so that Chicagoans
could be provided safe and reliable drinking water. At the time, the CAWS was not constructed
or altered with recreational or aquatic life uses in mind.
While other purposes have evolved over
time, it is important to remember that, above all, the CAWS must still support these commercial
navigation and urban drainage functions that are so crucial to the public health and commercial
success of Chicago.
Currently, the District manages the flow in the CAWS, which consists of 78 miles of
canals and serves the Chicago area to drain urban stormwater runoff and treated municipal
wastewater effluent, and support commercial navigation.
Approximately 57 of the 78 miles of
waterways controlled by the District are man-made where no natural river channel previously
existed.
The other 21 miles have been deepened, straightened, and/or widened to such an extent
that they no longer resemble a natural river channel.
The flow of water in the CAWS is
artificially controlled by hydraulic structures.
While flow in the CAWS is managed by the
District, it
must meet the requirements of a U.S. Supreme Court Decree concerning allowable
diversions from Lake Michigan, and federal regulations' providing for the maintenance of
navigable depths to support commercial navigation.
' 33 CFA § 207.420 and 207.425.
3
The Chicago River Controlling Works was constructed by the District in the late 1930s
and was put into operation January 1, 1939 in compliance with the U.S. Supreme Court Decree
governing the diversion of Lake Michigan water. This facility is currently maintained and
operated by the U.S.
Army
Corps of Engineers and serves as one of three CAWS lakefront
control structures.
The O'Brien Lock and Dam was constructed by the U.S. Army Corps of Engineers in
1960 as part of the Calumet-Sag Channel widening project. This structure replaced the Blue
Island Controlling
Works located at the east end of the Calumet-Sag Channel. The O'Brien
Lock and Dam controls the volume of water diverted from Lake Michigan and the flow in the
Calumet-Sag Channel. The flow in the Channel moves downstream into the Ship Canal where
the flow is controlled by other lock and dam structures at Lockport. Operation of the control
structures can result in wide fluctuations in flow velocity and depth in the Channel. High flows
can impair aquatic life uses when habitat is destroyed and aquatic organisms are swept
downstream. These fluctuations are not natural; rather they result from the District's operation
of the waterway system to provide for navigation, urban drainage and flood damage reduction.
During waterway draw downs, in anticipation of storm events, water levels and depth decrease
with increased flow in the downstream reaches of the waterway system, whereas, in a natural
river, the water level will rise and depth increase with an increase in flow. Further, flow regime
variations occur entirely within the restricted rectangular or trapezoidal prism of the various
reaches of this man-made channel system. There is no overbank expansion of the waterway with
flow increases which would occur in the floodway and floodplain of a natural river.
All outflow exits the CAWS at the Lockport Powerhouse and Lock and Lockport
Controlling
Works. However, there are several sources of inflow to the CAWS. These include
4
treated effluent from water reclamation plants, discretionary diversion from Lake Michigan,
water to operate the navigation locks, and leakage through control walls, tributary streams, storm
runoff, and combined sewer overflows (CSOs). Over 70 percent of the annual flow in the system
is from the discharge of treated municipal wastewater effluent from the Calumet, Lemont, North
Side, and Stickney plants owned and operated by the District.
During dry weather periods
mainly in the winter months, virtually 100 percent of the flow is from these plants and other
water reclamation plants on the tributary streams.
During wet weather periods and in the
summer months when lake diversion is occurring, about 50 percent of the flow is from the water
reclamation plants.
A comprehensive description of the CAWS's operations, facilities, and
individual waterways can be found in Attachment 4.
Features of a natural river, such as gradually sloping banks, varied sediment size, bends,
aquatic vegetation, riffles, and a mix of shallows and deep pool areas, are absent in most of the
CAWS. The physical characteristics of the CAWS present safety issues that may render
activities, such as, swimming, wading, and hand-powered boating hazardous to individuals. The
man-made waterways do not have a shallow area along the banks; the depth drops off very
rapidly; sediments are soft and unstable, many banks are lined with high walls consisting of
vertical sheet piling, concrete, wood or large limestone rocks; periodic draw downs of water
levels cause unexpected, rapid increases in stream velocity; and there is frequent barge and large
power boat traffic.
A rapid draw down of water levels in the CAWS before or during a large
storm is a necessary action for draining storm runoff to protect streets and basements in Cook
County from flooding.
A diagram comparing the characteristics of a natural river versus the
CAWS can be found in Attachment 5.
5
Further impacting the CAWS is the extremely high percentage of impervious surfaces in
the watershed area. Aquatic environments, including the CAWS, are negatively impacted by the
abundance of impervious surfaces (ground that does not absorb rain water) in their drainage
areas, as well as the lack of riparian zone (area immediately surrounding waterway) habitat.
Several literature sources suggest that there is a sharp decrease in aquatic habitat quality and a
strong correlation to decreased aquatic biodiversity when impervious surfaces cover greater than
10 to 15 percent of the watershed.2 Percent watershed imperviousness beyond 30 percent results
in "severely degraded conditions for aquatic life in the form of either reduced benthic
communities or the absence of fish life. ,3 The 2001 National Land Cover Dataset, which is
presented in Attachment 6, indicates that impervious surfaces cover about 42 percent of Cook
County. In a U.S. EPA report, imperviousness was related to the use attainability of streams as
follows:
Recently, the imperviousness of the watershed has been suggested as
an indicator that is correlated with use attainability. If the frequently
cited threshold of 25% impermeability is used, streams in watersheds
with greater than this value could be considered unlikely to ever attain
a beneficial use regardless of site- and reach-specific factors.4
Furthermore, vertical limestone or steel sheet piling walls do not provide shallow habitat
along the channel banks where light can penetrate and aquatic plants can grow. This lack of in-
stream cover and protection limits fish spawning, diversity, and abundance, and growth of larval
fish.
By definition, channels are void of sinuosity (bends) - a property essential for normal
2 Booth,
Derek and C. Rhett Jackson, 1997. "Urbanization of Aquatic Systems---Degradation Thresholds,
Stormwater Detention, and the Limits of Mitigation."
Journal of the American Water Resources Assocation. 22(5),
1077-1090.
Klein, R., 1979. "Urbanization and Stream Quality Impairment."
Journal of the American Water
Resources Association
15(4), 948-963.
SchueIer, T.R., 1994. "The Importance of Imperviousness."
Watershed
Protection Techniques
1(3), 100-111.
'
Klein, 1979.
4
Yoder, Chris O., Robert J. Miltner, and Dale White, 2000. "Using Biological Criteria to Assess and Classify
Urban Streams and Develop Improved Landscape Indicators."
Proceedings of the National Conference on Tools for
Urban Water Resource Management and Protection February 7-10,2000, Chicago, Illinois.
EPA/625/R-001001.
6
sediment transport and the development of riffle, run, and pool sequences found in natural
streams.
CAWS Current Uses
Other factors in the Chicago area, like industrial land use and commercial barge traffic
also impact the safety of activities such as wading and small hand-powered boating. Much of the
CAWS consists of roan-made, deep, trapezoidal-shaped channels that experience heavy barge
traffic.
Approximately 17,000 barges locked through Lockport Lock and Dam, and over 9,000
barges locked through O'Brien Lock and Dam in 2006.5 United States Army Corp of Engineers
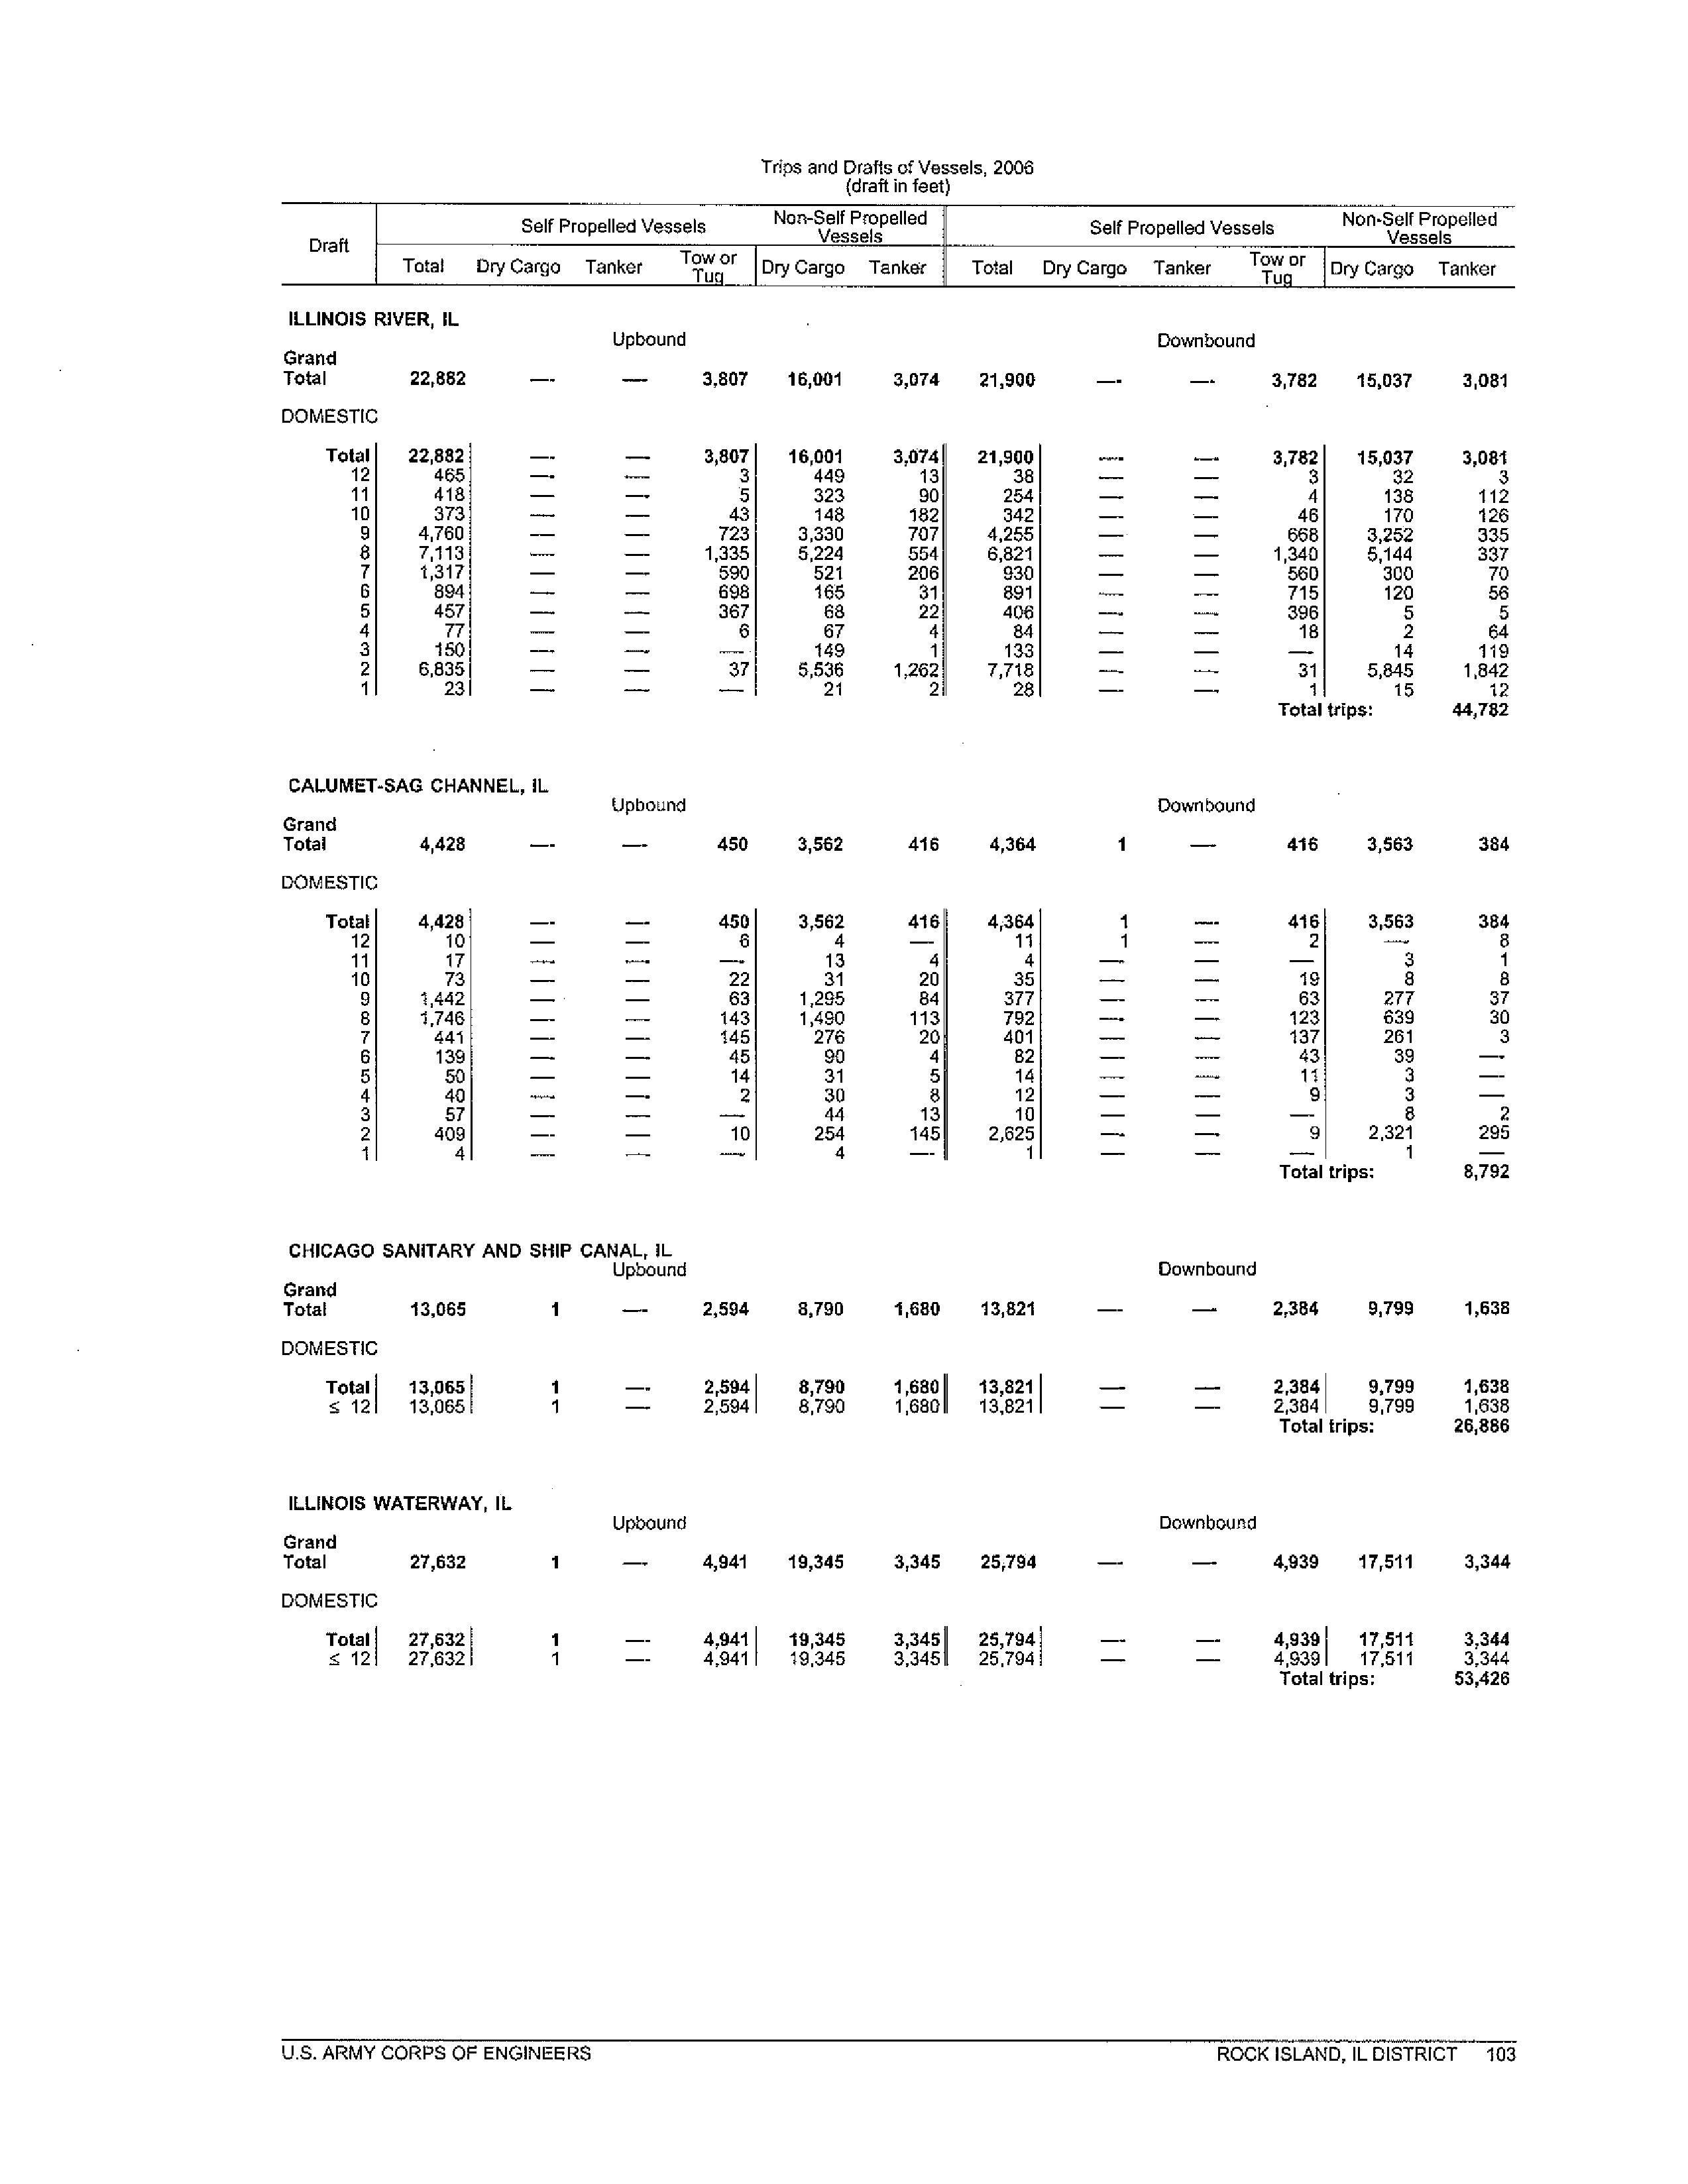
data indicates that 8,792 barges traveled along the Calumet-Sag Channel in 2006. Attachment 7
presents barge statistics for various waterways. In addition to this barge traffic, there is a high
volume of associated commercial offloading throughout the CAWS. Finally, industrial riparian
land use is common along the CAWS, which is no surprise for a system designed for the
conveyance of treated wastewater effluent and stormwater and commercial navigation.
District
'
s
Efforts to Protect and Improve
Water Quality in the CAWS
Since
i
ts Creation
From the 1830s to the latter part of the 19'' Century, the rapidly growing City of Chicago
was beleaguered with numerous epidemics of waterborne diseases. During that time, the city's
mortality rate was among the highest in the world. This contributed to the creation of the District,
along with a desire to eliminate the nuisance of the odorous Chicago River and develop a
navigation link with the Illinois River. Initially, the main role of the District was to protect Lake
Michigan as the primary source of drinking water for the Chicago
area
.
This was accomplished
by building the channel from Chicago to Joliet and using Lake Michigan water to dilute the
sewage. By the close of the District's canal building era in 1922, sewage treatment was already
S Lockage data is available on USACE website: hq://www.iwr.usace.army.mil/nde/112ms/lock2006web.htm.
7
underway with the construction of the intercepting sewer system and sewage treatment plants.
Construction of the Calumet, North Side and Stickney Water Reclamation Plants was completed
in the 1920s through the 1940s. Since the District's inception in 1889, there have been a number
of improvements and advancements in the protection of water quality that the District has
pioneered and introduced, not the least of which is the construction and operation of its seven
water reclamation plants. Consequently, there have been dramatic improvements in the water
quality and the public health in the Chicago area. The District's efforts to protect and improve
the water quality of the CAWS since its creation are described in Attachment 8.
The District's water reclamation plants are a well-engineered system that combines
primary treatment (settleable and floatable solids removal) and secondary treatment (activated
sludge and clarification) to achieve a high level of treatment with consistently good performance
meeting all NPDES permit limits. Furthermore, degradation and assimilation processes occur in
the CAWS which help to reduce the remaining organic constituents in stormwater and treated
effluent without harm to fresh water aquatic life. The District's treated wastewater has been
demonstrated to have relatively low levels of pathogenic microorganisms.
Moreover, the
pathogenic microorganisms do not thrive well outside the human body and the freshwater's
natural disinfection process is aided by exposure to indigenous bacteria and sunlight.
In addition to management of the reclamation plants, the District is also responsible for
completion and operation of the Tunnel and Reservoir Plan (TARP). Construction of the first
TARP tunnel began in 1975 and construction of all 109 miles of tunnels was completed in March
2006.
One of three reservoirs (the O'Hare Chicago Underflow Plan Reservoir) has been
completed and has been in operation since 1998. Construction of the two remaining reservoirs is
underway.
The Thornton Reservoir is expected to be completed by 2014. Stage 1 of the
8
McCook Reservoir is expected to be complete by 2015 and Stage 2 by 2024. TARP has
significantly reduced the number of CSOs to the CAWS and backflows to Lake Michigan. As of
2006, TARP cumulatively captured 885 billion gallons of combined sewage that would
otherwise have discharged to the CAWS. All captured combined sewage was given complete
secondary treatment.
Between 2002 through 2006, the District was averaging 43 days per year
of CSO discharges, less than half the number experienced prior to the tunnels being placed in
operation 1985. It is expected that the completion of the TARP reservoirs will further reduce
CSOs to the waterways and lower the accompanying risks. Furthermore, capital improvements
for the District's three largest plants, which are nearly 80 years old, and investment for the
construction of TARP have to be implemented in the next twenty years to maintain the high
quality of the treated wastewater from the region and to protect the drinking water source. These
capital improvement investments will cost billions of dollars to implement.
The District's leadership role is described by Blatchely et al (2007) in an article published
in
Water Environment Research:
Leadership within the Metropolitan Water Reclamation District of
Greater Chicago has often challenged conventional thinking on topics
relating to municipal wastewater treatment; in several cases, the
approaches taken by the MWRDGC to solve wastewater treatment
and water quality problems have resulted in important innovations that
have subsequently been adopted by other municipalities.6
In addition, the 2003 report of the Environmental Law & Policy Center attests to the substantial
improvement trends in Illinois
Water Quality since 19727
.
Furthermore, U.S. EPA Region 5
6 Blatchley
et. al.
(2007
).
"
Effects of Wastewater Disinfection on Waterborne Bacteria and Viruses
,"
Water
Environment Research
,
Volume 79, Number 1, pp 81-92.
7
Environmental Law & Policy Center
.
"
Illinois
Water Quality and the Clean Water
Act. A
Report of the
Environmental Law & Policy Center
,"
October 2003.
9
published a State of the Waters 2002 Report, which stated that water quality trends indicate a
general improvement in Illinois streams and rivers.8
While the District's efforts have brought about substantial improvements in water quality,
which now largely meets General Use standards, there is a misconception that the waterways
have become the equivalent of natural General Use river systems and have the potential to
support unlimited recreational and aquatic life uses.
However, the physical configuration and
properties of the system, which was not designed to support recreation or aquatic life use, are
now the primary limitation to further use attainment in the system. The District is proud of what
it has accomplished over its 119 year history and is pleased that the CAWS that it created is now
viewed as an asset and source of pride for the community. However, we must caution that any
serious attempt to assess the use potential of the system must look beyond current, or anticipated
future, water quality and must realistically consider the substantial and widespread modifications
to the existing physical configuration and properties of the system that would be necessary to
actually enable recreational uses to safely flourish or aquatic life uses to significantly improve.
As has been our proud tradition, the District is prepared to take on new challenges to
further improve our treatment plant effluent quality and water quality in the CAWS if sound
scientific and engineering studies demonstrate feasibility, significant benefit and economic
reasonableness.
As it currently stands, we do not see that the IEPA's proposal has clearly
demonstrated any of these important criteria. In order to assist the IEPA and the Board in
completing the UAA study, the District has undertaken numerous landmark studies that will
provide a sound basis for evaluating feasibility, benefit, and economic reasonableness. A list of
these studies is included as Attachment 9. Some of the studies are complete and will be presented
a
US. EPA
Region 5. "State of the Waters
2002," September 2002.
10
in testimony to follow. Others are underway and will be completed within the next two years. I
am confident that you will understand the significance of these studies and the implications of
moving ahead with a rulemaking in the absence of their results as the following testimony is
presented.
I thank you for the opportunity to present this testimony and I am hopeful that we will
proceed with the best interests of all of the District's constituents in mind.
11
Respectfully
submitted,
By: Richard
:
Lanyon
Testimony Attachments
1.
Current CAWS Map and Photographs of Reaches
2.
A Photograph showing Construction of one of the Channels
3.
Chicago River Reversal Diagram
4.
R&D Report No. 08-15.
Description of the Chicago Waterway System for the Use
Attainability Analysis.
5.
Comparison of the CAWS and a Natural River Diagram
6.
2001 National Land Cover Data Set Map of Impervious Surfaces in Cook County
7.
US Army Corp of Engineers Barge Data from 2005
8.
Timeline of District Improvements on the CAWS
9.
UAA Timeline
12
A
ttachm
e
nt 1
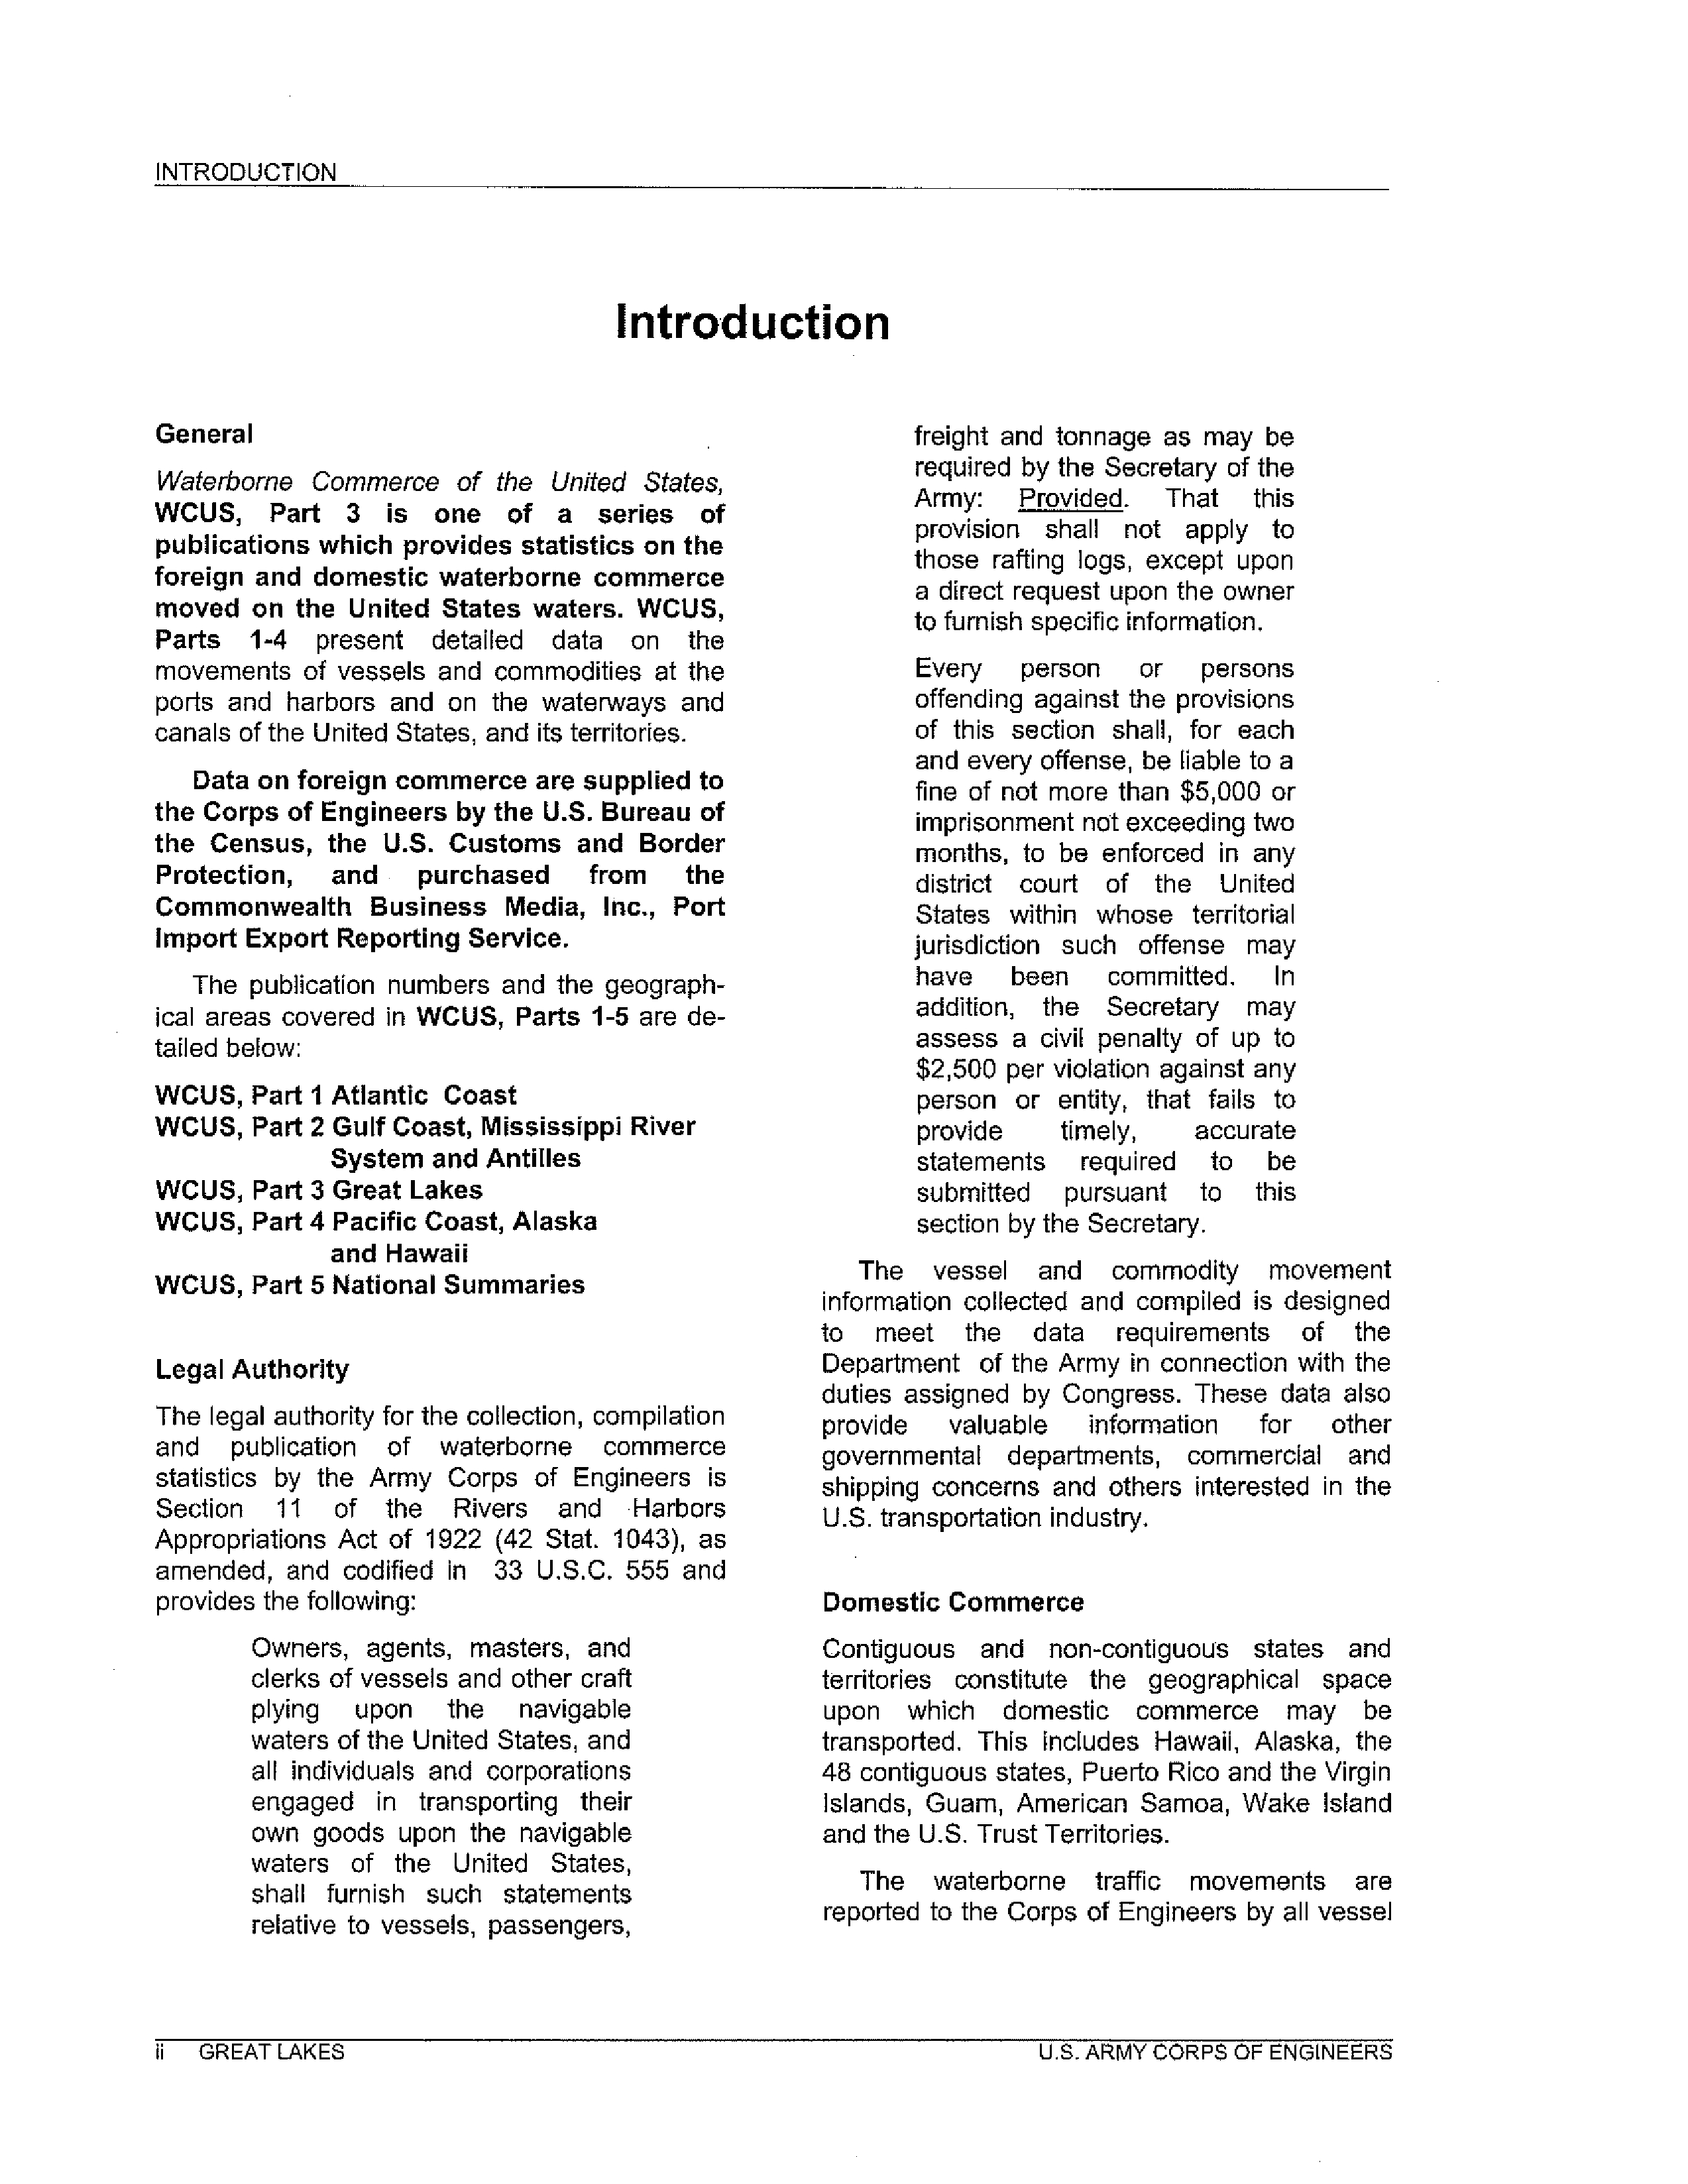
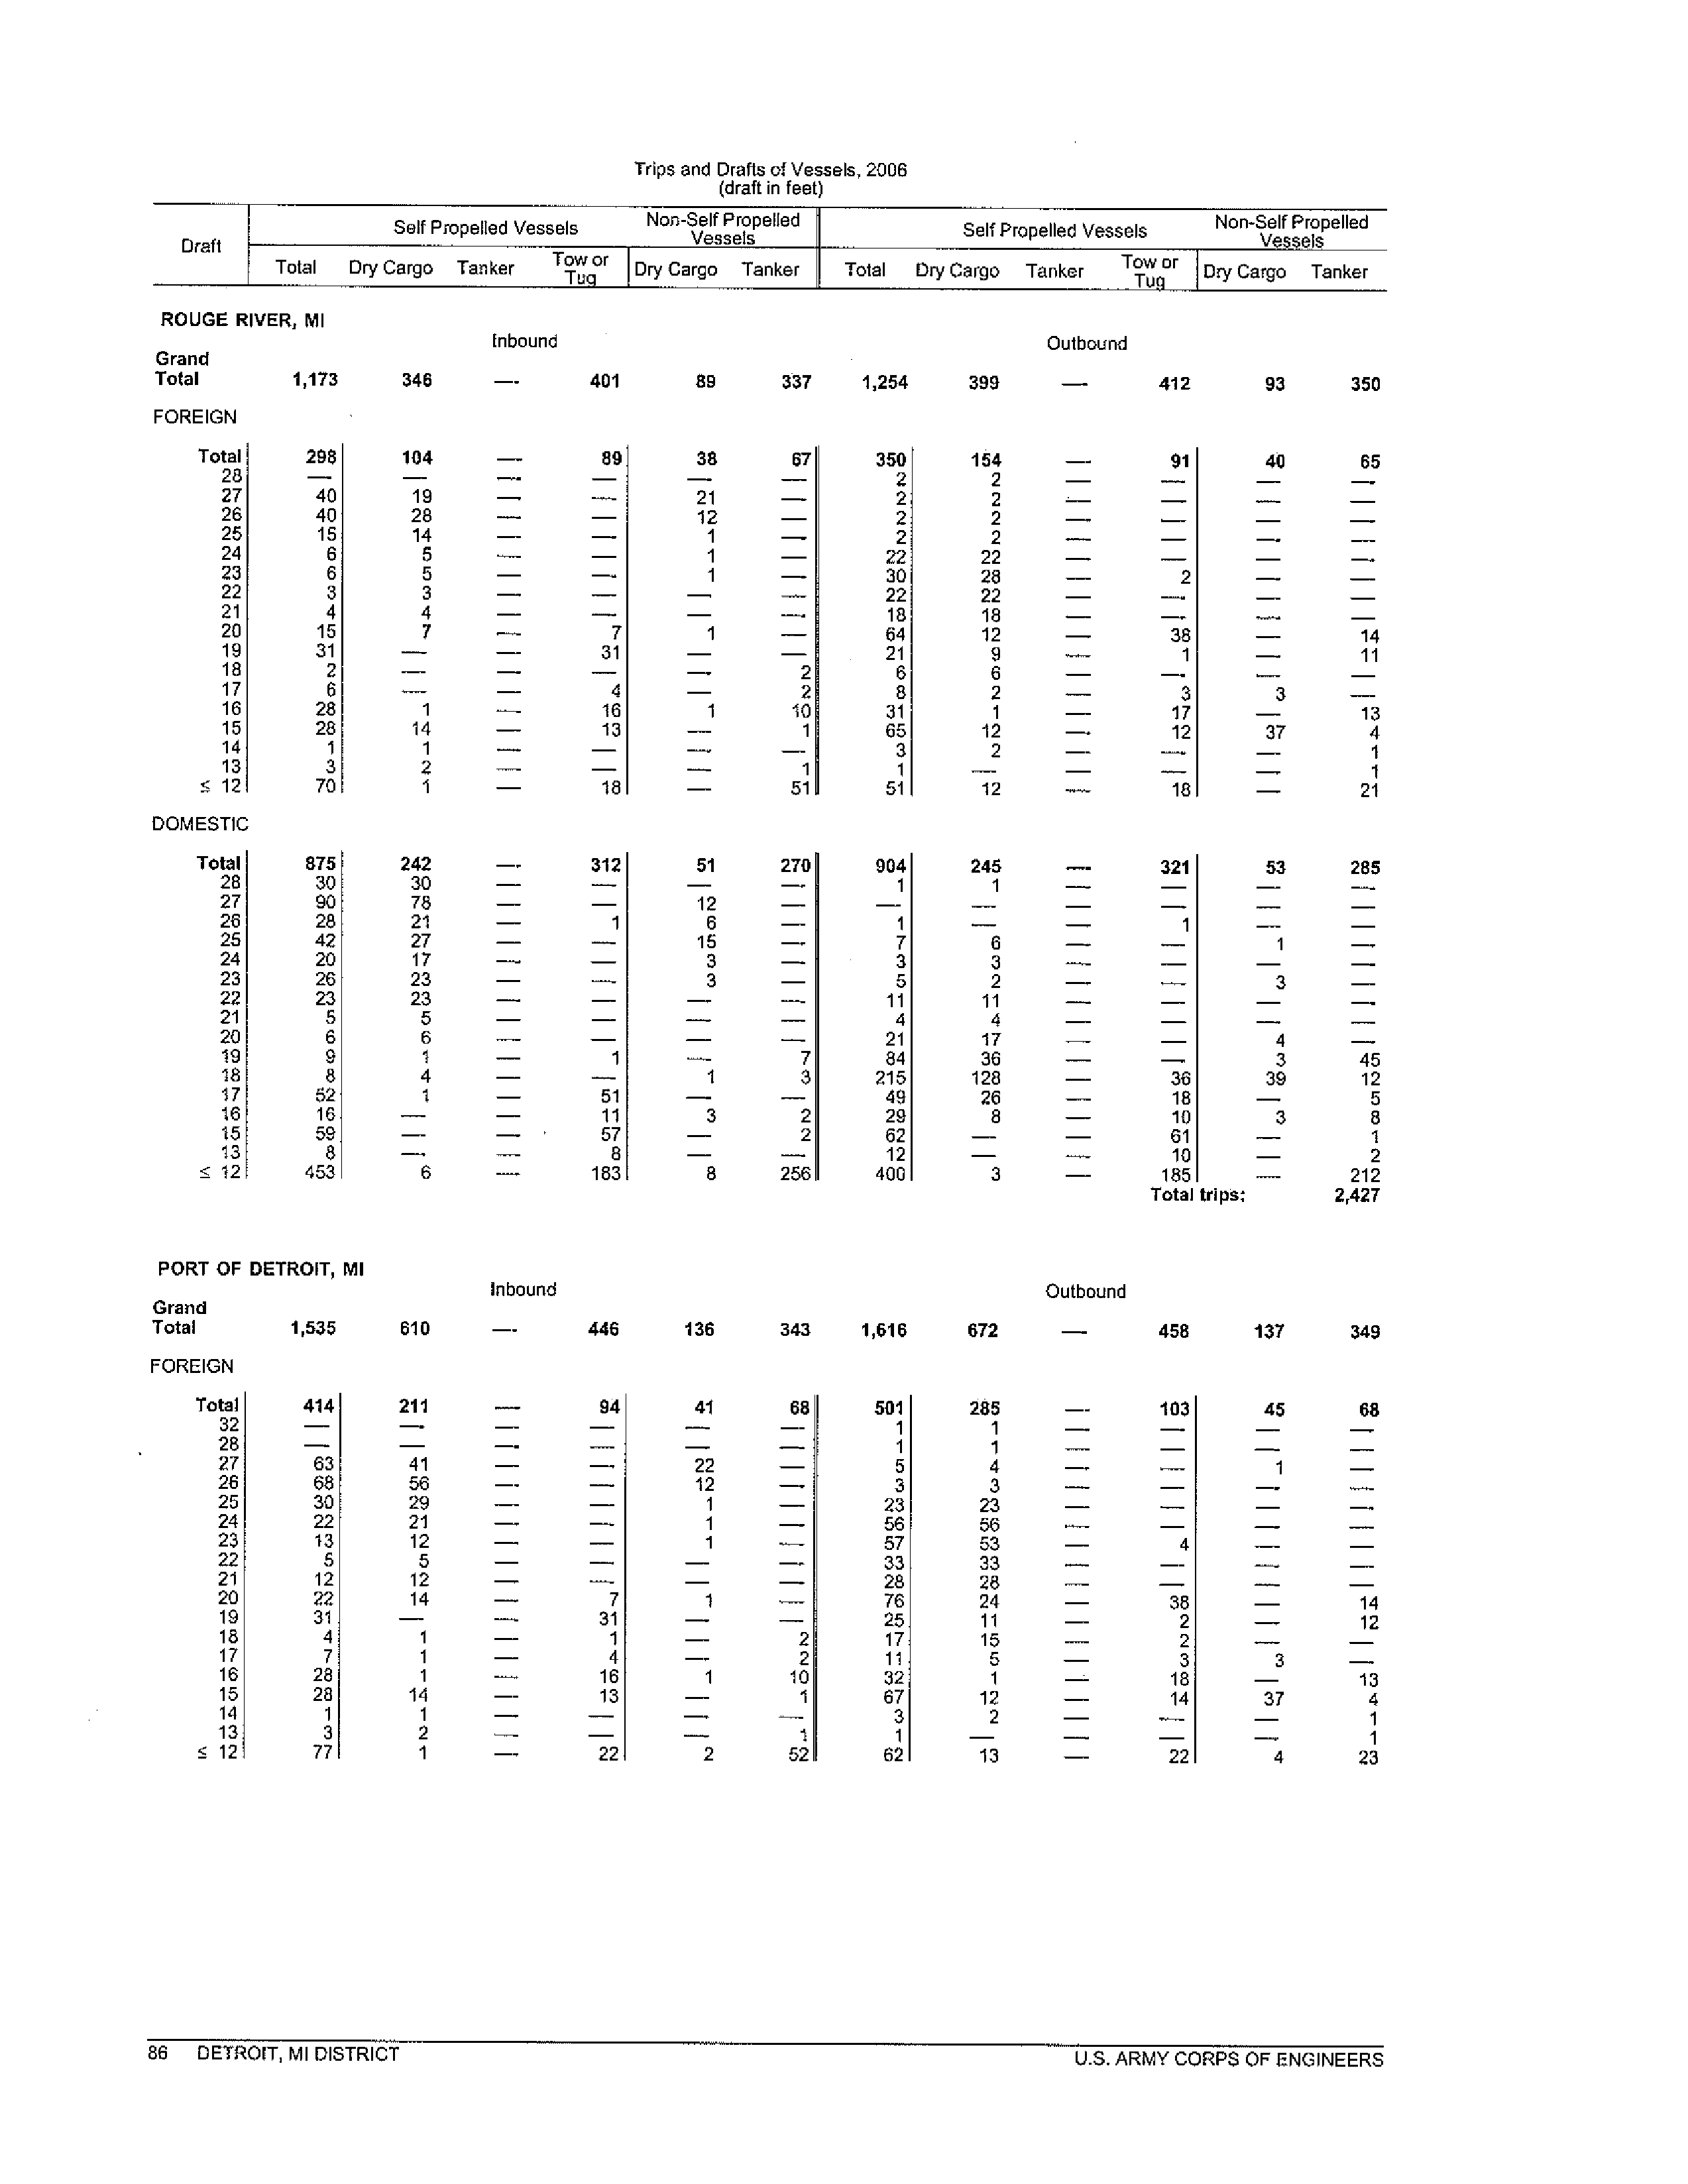
FIGURE 1: CHICAGO WATERWAY SYSTEM
LEGEND
• MAJOR WRP INFLOW
n
MINOR WRP INFLOW
CHICAGO WATERWAY
SYSTEM SECONDARY
CONTACT
- OTHER WATERWAYS
GENERAL USE
wou
CHICAGO WATERWAY
SYSTEM GENERAL USE
9.9 MILES UPSTREAM OF
LOCKPORT
CONFLUENCE
WITH THE
DES PLAINES RIVER
-1.1
JOLIET
SCALE
IN MILES
2
CHICAGO RIVER
CONTROLLING WORKS
36.0
A
tt
ac
hm
e
nt 2
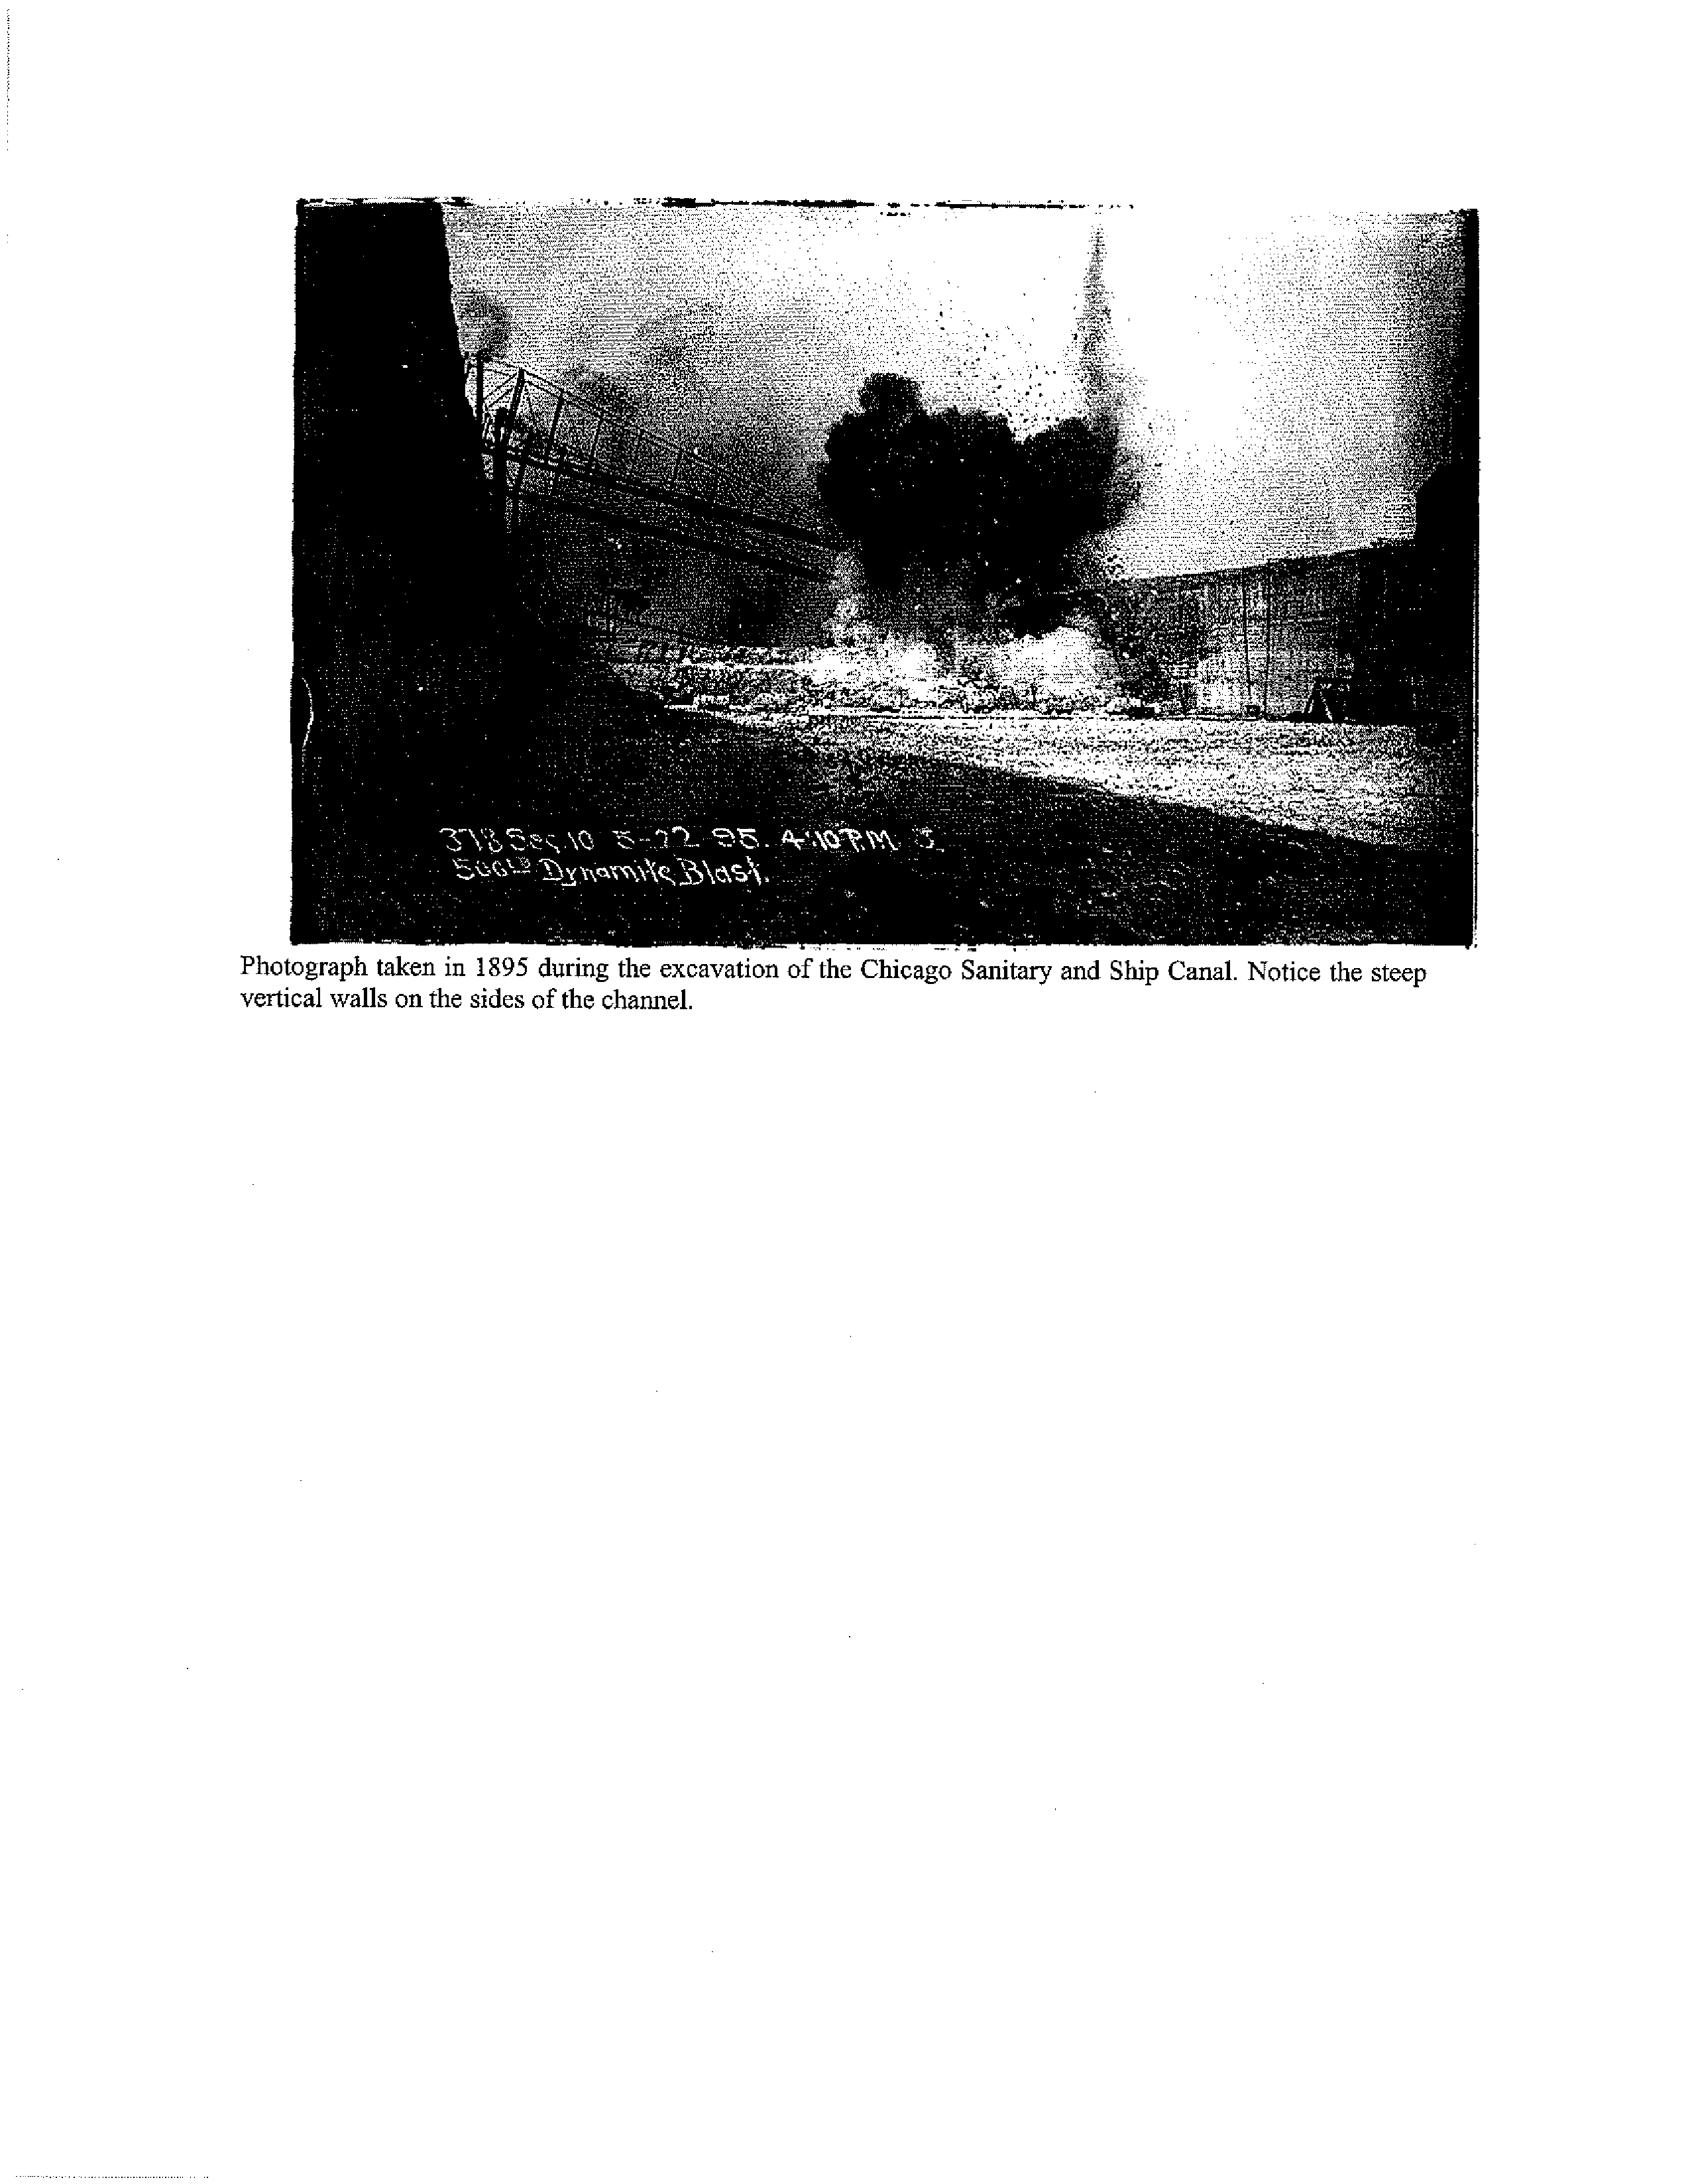
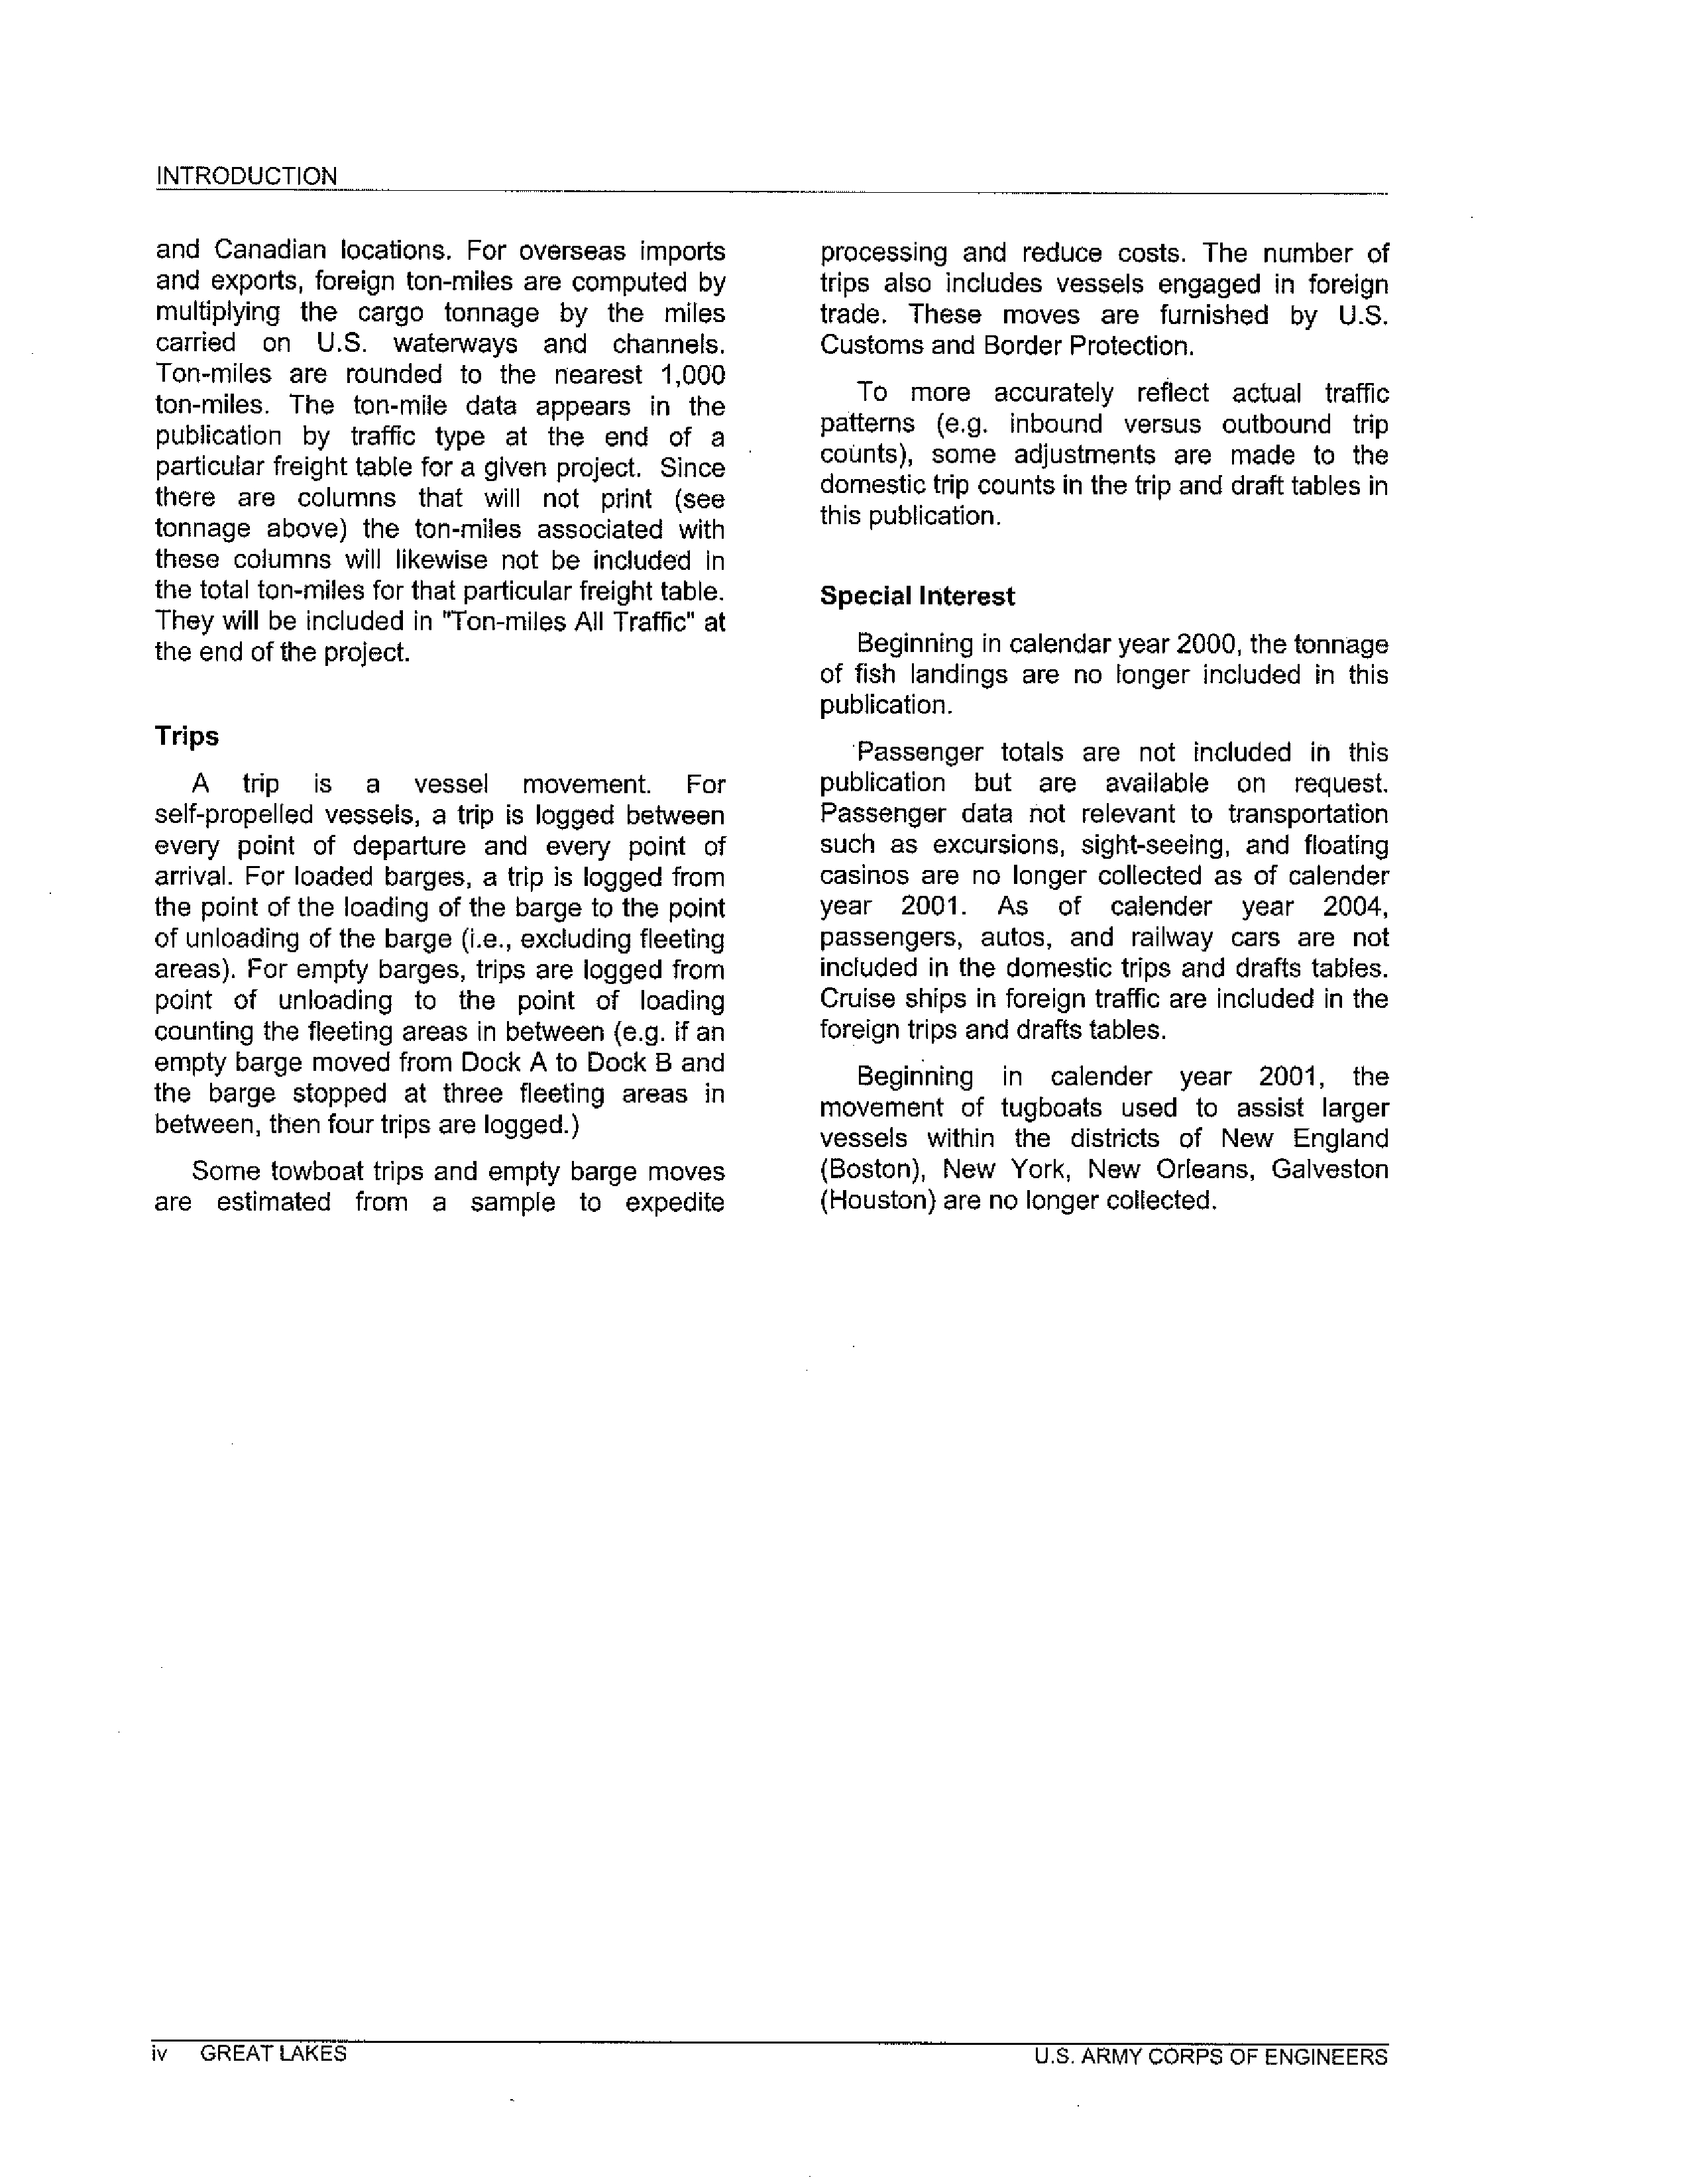
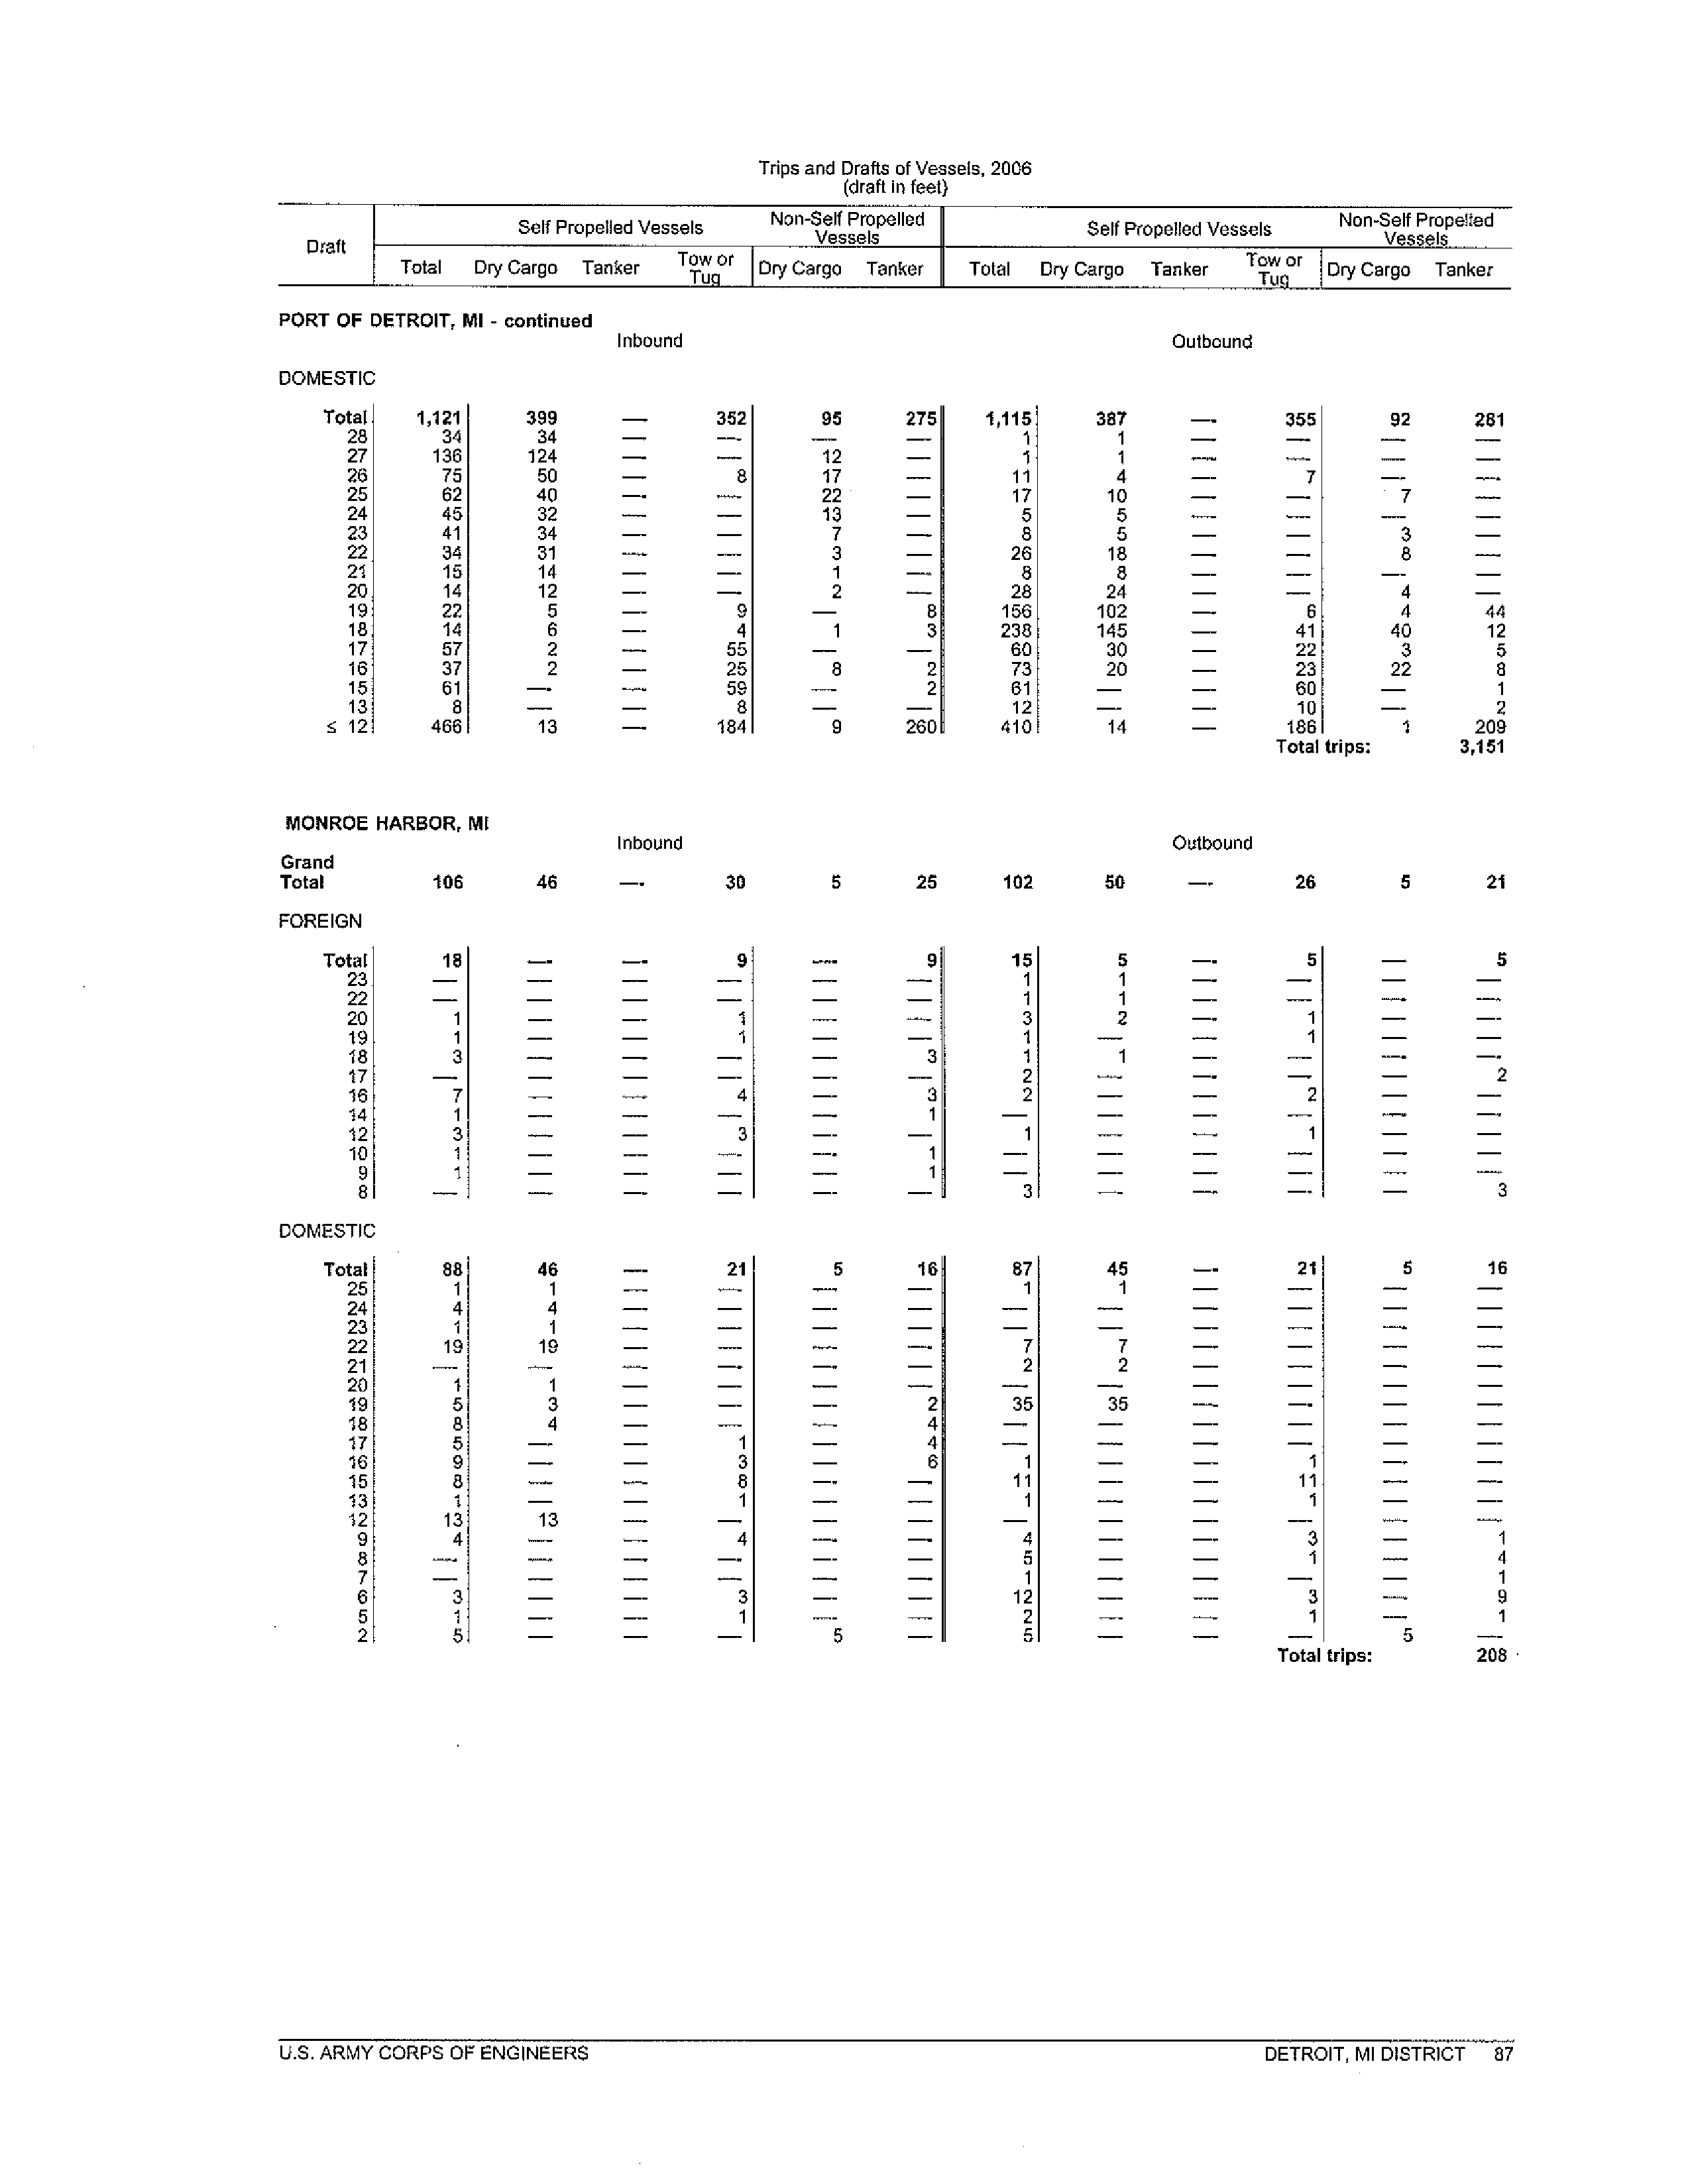
Photograph taken in 1895 during the excavation of the Chicago Sanitary and Ship Canal. Notice the steep
vertical walls on the sides of the channel.
A
tt
ac
hm
e
nt
3
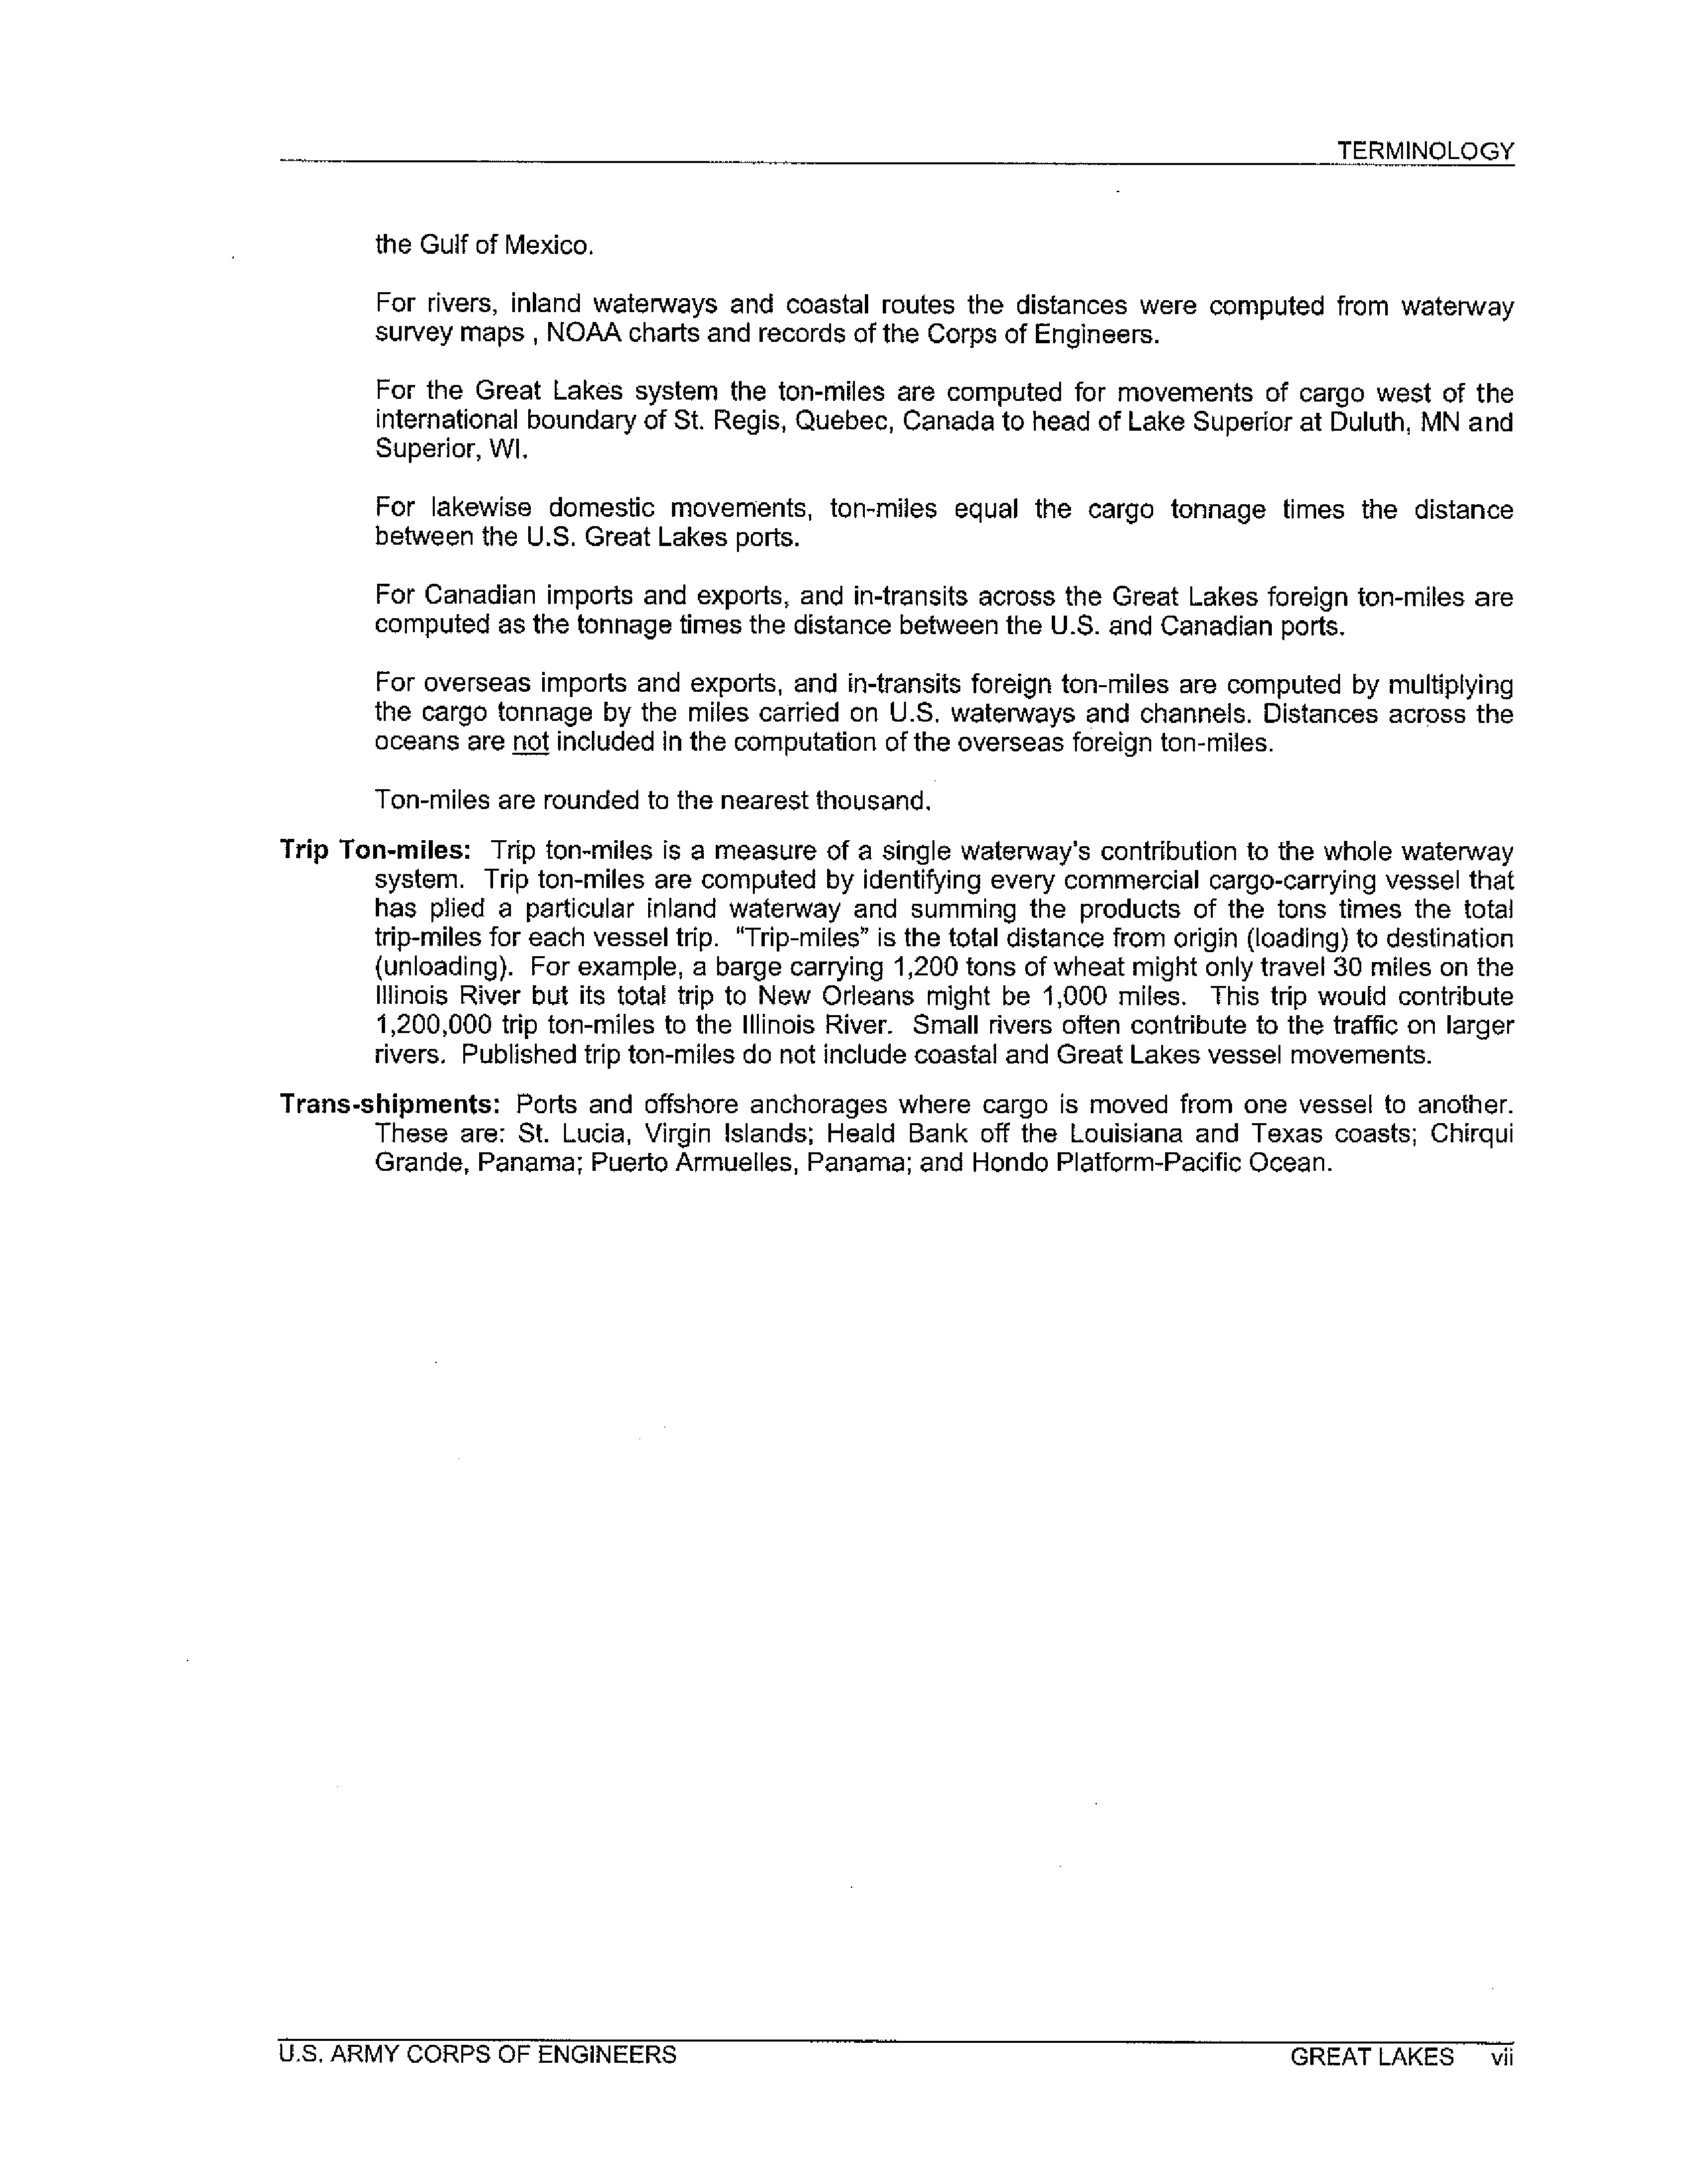
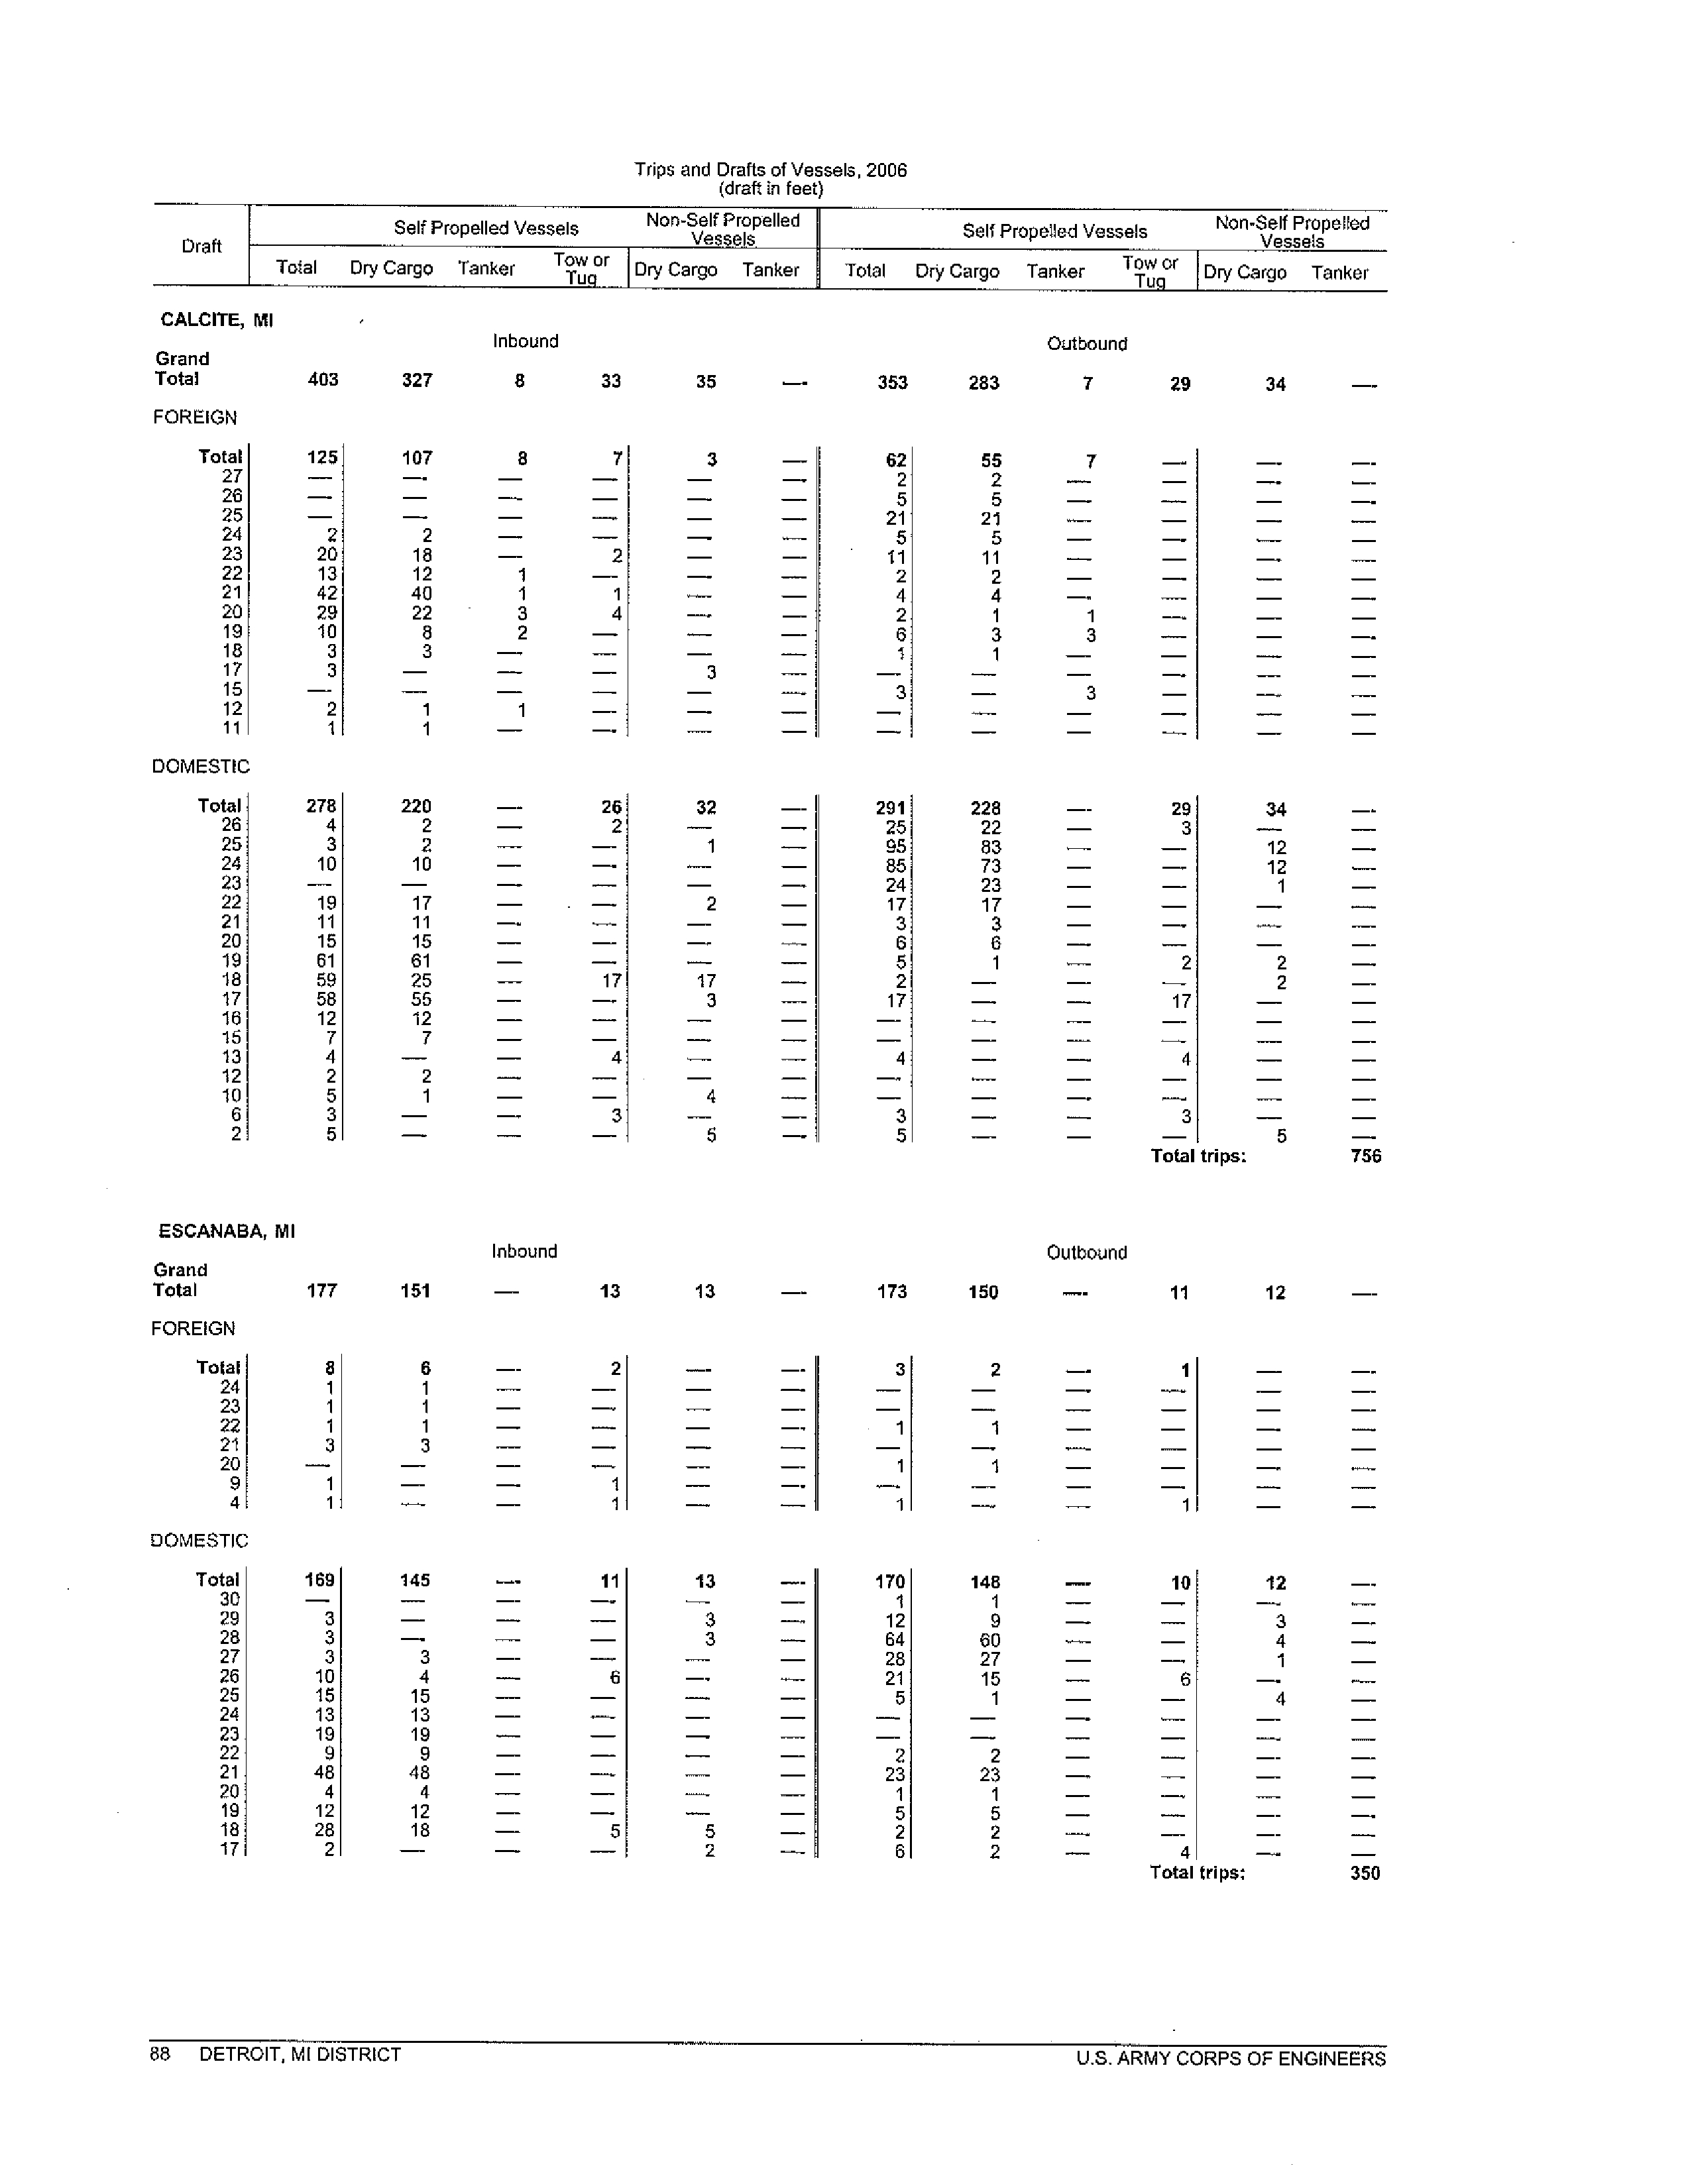
Before the River Reversal
After the River Reversal
WATER
WATIR
INTAKE
INTAKE
`i
3
4
5
A
tta
c
hm
e
nt 4
A
Protecting Our
Water
Environment
Metropolitan
Water
Reclamation
District of Greater Chicago
RESEARCH AND DEVELOPMENT
DEPARTMENT
REPORT NO 08-15
DESCRIPTION OF THE CHICAGO WATERWAY SYSTEM
FOR THE USE ATTAINABILITY ANAL YSIS
March 2008
METROPOLITAN WATER RECLAMATION DISTRICT OF GREATER CHICAGO
100 East Erie Street
Chicago, IL 60611-2803
(312) 751-5600
DESCRIPTION OF THE CHICAGO WATERWAY SYSTEM
FOR THE
USE ATTAINABILITY ANALYSIS
Research and Development Department
Louis Kollias, Director
March 2008
TABLE OF CONTENTS
P
AU-
LIST OF FIGURES
iv
CHICAGO WATERWAY SYSTEM
1
System Description
I
Chicago River System
I
Calumet River System
3
Tributaries to the Chicago Waterway System
3
Control and Management of Flow
3
Inflow and Outflow
4
Outflow
4
Water
Reclamation Plant Effluent
4
Discretionary Diversion
5
Navigation and Leakage
5
Tributaries
6
Storm Runoff
6
Combined Sewer Overflow
6
Major Pumping Stations
6
PHYSICAL DESCRIPTION OF WATERWAYS
7
Chicago
River System
7
North Shore Channel
7
North Branch Chicago River
North Branch Canal
9
i
TABLE OF CONTENTS
(Continued)
Page
Chicago River
10
South Branch Chicago River
11
South Fork South Branch Chicago River
12
Chicago Sanitary and Ship Canal
13
Calumet River System
14
Little Calumet River
14
Calumet
-
Sag Channel
15
Use Classification
16
General Use Waters
16
Secondary Contact Waters
16
Facility Descriptions
16
Chicago River Controlling Works
16
Lockport Controlling Works
16
Lockport Powerhouse and Lock
16
O'Brien Lock and Dam
17
Wilmette Pumping Station
17
Instream and Sidestream Elevated Pool Aeration Stations
17
Operation Plan
18
Dry Weather Conditions
18
Wet Weather Conditions
18
ii
TABLE OF CONTENTS
(Continued)
Page
Measurement of Discharge and Water
Level
19
United States Geological Survey
19
Metropolitan
Water
Reclamation District of Greater
Chicago
19
Monitoring
of Water Quality
19
Illinois Environmental Protection Agency
19
Metropolitan Water Reclamation District of Greater Chicago
19
United States Environmental Protection
Agency
19
United States
Army
Corps of Engineers
19
ACRONYM LIST
20
CHICAGO WATERWAY SYSTEM LISTING OF FACILITY INFLOW AND
MONITORING LOCATIONS
21
III
LIST OF FIGURES
Figure
No.
Page
1
Chicago Waterway System
2
iv
CHICAGO WATERWAY SYSTEM
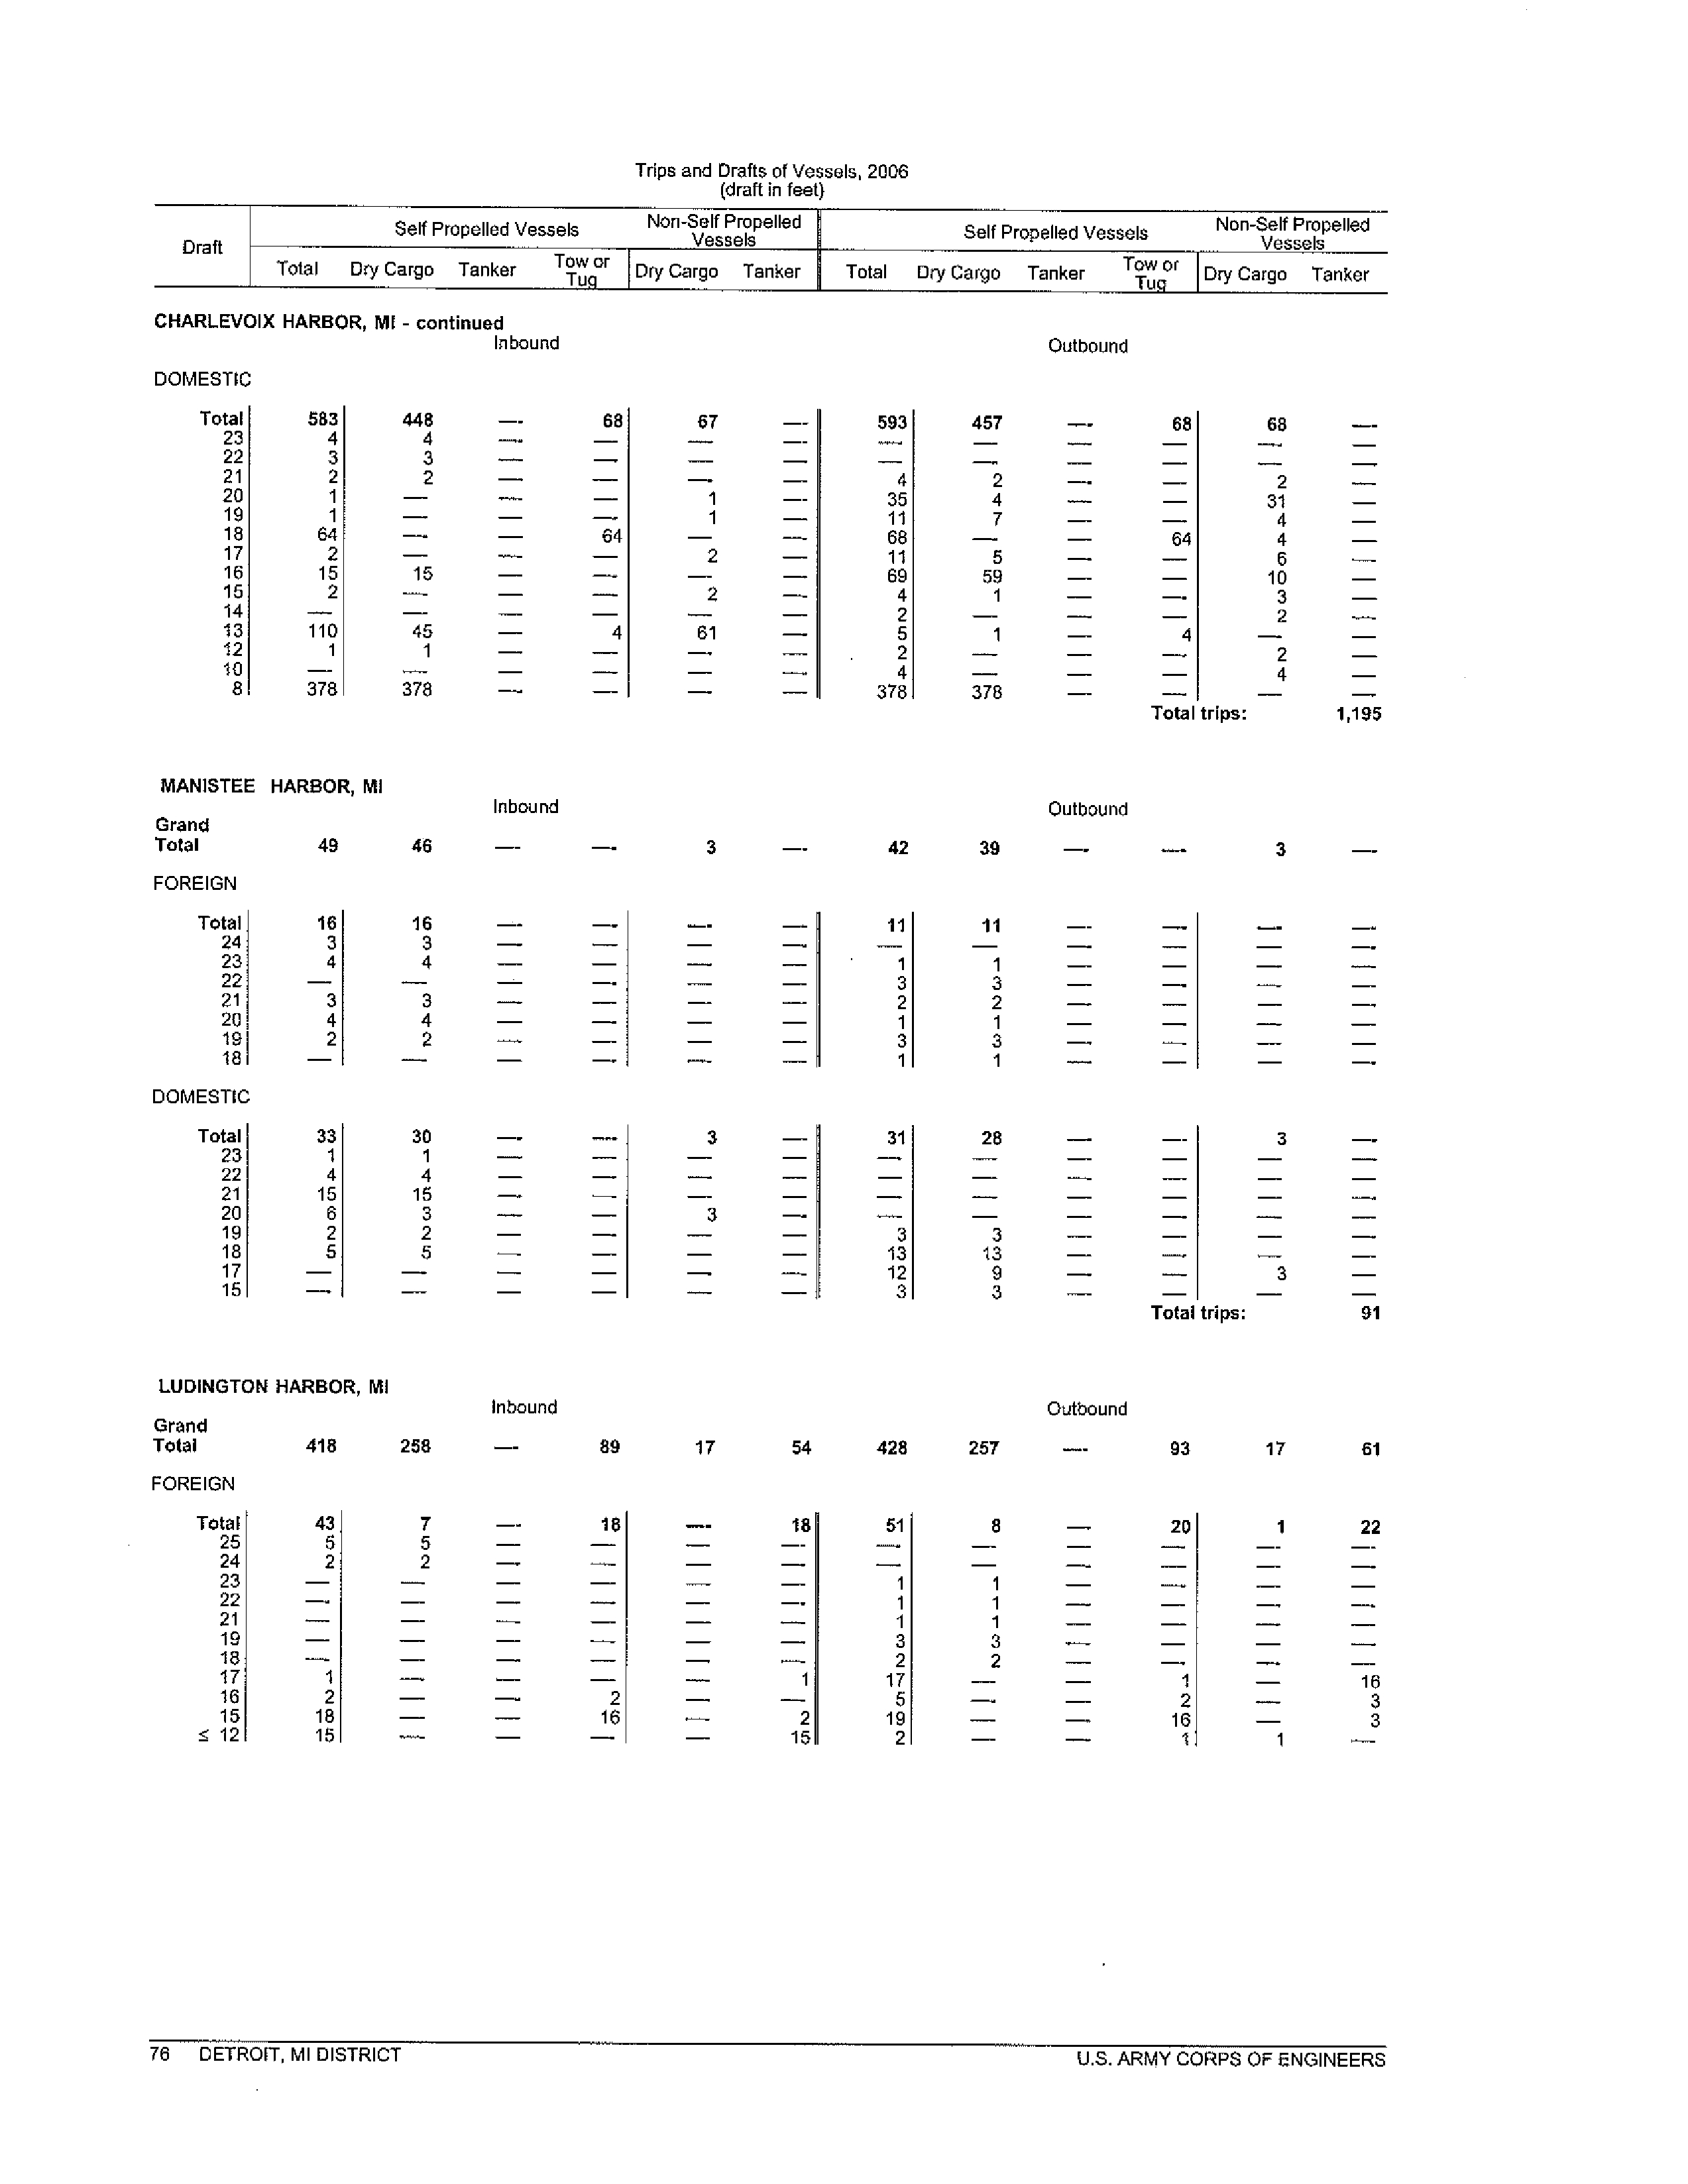
The Chicago Waterway System (CWS) consists of 78 miles of canals, which serve the
Chicago area for two principal purposes, the drainage of urban storm water runoff and treated
municipal wastewater effluent, and the support of commercial navigation.
While the CWS was
not constructed with recreational or aquatic life uses in mind, other purposes have evolved over
time including recreational boating, fishing, streamside recreation and, where possible, aquatic
habitat for wildlife. Approximately 75 percent of the length are man-made canals where no wa-
terway existed previously and the remainder are natural streams that have been deepened,
straightened and/or widened to such an extent that reversion to the natural state is not possible.
The flow of water in the CWS is artificially controlled by hydraulic structures (see Figure 1
)
.
Due to the artificial nature of the CWS, its ability to support aquatic life and recreational
uses are inherently limited. The absence of gradual sloping banks, shallow littoral zone habitat,
and bends result in a limited habitat for aquatic biota. Homogenous silt sediments that severely
restrict
macroinvertebrate and fish populations are deposited throughout much of the CWS due
to the unnatural stream flow dynamics. Some recreational activities can be hazardous in the
CWS, due to the extent of commercial traffic, as well as the lack of safe exit points from the
water.
System Description
The Lockport Controlling Works (LCW) is one of two outlet control structures for the
CWS. All flow from the CWS's 744 square mile watershed discharges from the Chicago Sani-
tary and Ship Canal (CSSC) to the Des Plaines River north of the city of Joliet. The confluence
is 1.1 miles downstream of the Lockport Powerhouse and Lock (LP&L). This reach is the upper
end of the Brandon Road navigation pool. The LP&L is the single outlet control for the CWS. It
should be noted that on Figure 1, distances on the CWS are measured from the LP&L. The CWS
has two river systems, the Calumet River System and the Chicago River System.
The Calumet River System is 23.1 miles in length and includes the Calumet-Sag Channel
(CSC) and the Little Calumet River (LCR) (also called the LCR North). The Chicago River Sys-
tem consists of 55.1 miles of waterways and includes the Chicago River, CSSC, North Branch,
North Branch Canal (NBC), North Shore Channel (NSC), South Branch, and South Fork. The
South Fork is commonly known as Bubbly Creek.
Each river system will be described
separately.
Chicago River System. The CSSC extends upstream from the confluence with the Des
Plaines River for a distance of 31.1 miles to South Damen Avenue in the city of Chicago (Chi-
cago).
The waterway then becomes the South Branch, extending upstream for 4.5 miles to the
junction of the Chicago River and the North Branch. The South Fork flows into the South
Branch and extends upstream for 1.3 miles, ending at 38th Street in Chicago. The Chicago River
extends upstream from the junction of the North and South Branches for 1.5 miles and ends at
1
FIGURE 1: CHICAGO WATERWAY SYSTEM
Dr
Cs
►k
ryr
C .
Cw
^
f'
P'HpRE
i
•+^
^
LEGEND
• MAJOR WRP INFLOW
n
MINOR WRP INFLOW
-. CHICAGO WATERWAY
SYSTEM
SECONDARY
CONTACT
--- OTHER WATERWAYS
GENERAL USE
CHICAGO WATERWAY
SYSTEM GENERAL USE
9.9 MILES UPSTREAM OF
LOCKPORT
CONFLUENCE WITH THE
DES PLAINES RIVER
-1.1 JOLIET
LOCKPORT POWERHOUSE
AND LOCK .
0.0
CHICAGO RIVER
CONTROLLING WORKS
36:0
2
the Chicago River Controlling Works
(CROW).
The North Branch extends upstream from the
junction of the Chicago River and South Branch for 7.7 miles to the North Branch Dam
,
located
south of Foster Street in Chicago. The NBC is an alternate route around Goose Island between
Chicago and North Avenues and is 1.0 mile long. At the North Branch Dam, the waterway be-
comes the NSC, extending upstream
for 7.7
miles, ending at the Wilmette Pumping Station
(WPS).
Calumet River System
.
The CSC extends upstream from its junction with the CSSC
(Sag Junction) for 16.
2 miles
to the LCR. At this
point
, the waterway becomes the LCR and ex-
tends upstream 6.9 miles, ending at the O'Brien Lock and Dam (OL&D). It should be noted that
the Calumet River extends upstream of the OL&D to Lake Michigan. However, since the Calu-
met River is directly connected to Lake Michigan,
it is
not considered part of the CWS. The wa-
ter level and flow in the Calumet River can not be controlled the way that the CWS is controlled.
Tributaries to the Chicago Waterway System
.
There are several streams that contrib-
ute flow to the CWS. These include the Grand Calumet River, LCR above its confluence with
the CWS (also called LCR South), the North Branch above the North Branch Dam and numerous
small watersheds
along
the CSC and CSSC. In addition, there are
numerous
small stormwater
drainage inputs along the CWS, including areas served by storm sewers, parking lots, street ends,
rooftop drains, etc.
Control and Management of Flow
Flow in the CWS is managed by the Metropolitan Water Reclamation District of Greater
Chicago (District), but is subject to regulation under U. S. Supreme Court Decree and 33 CFR
Parts 207.420 and 207.425. The CFR provides for the maintenance of navigable depths to sup-
port commercial navigation. The Chicago River at the CRCW and the LCR at the OL&D must
be maintained between -0.5 feet, Chicago City Datum (CCD) and -2.0 feet, CCD water levels per
Code of Federal Regulations during normal conditions. The water level at the Sag Junction must
be maintained between -4.0 feet, CCD and -1.8 feet, CCD. The lower limits allow the federal
navigation project depths to be maintained throughout the CWS above the LP&L, while the up-
per limit prevents unintentional reversal into Lake Michigan.
The ideal water elevation at
CRCW and the OL&D is -2.00 feet, CCD. This water elevation provides the greatest level of
flood protection by maintaining the highest allowable capacity available for the transportation of
stormwater runoff without requiring permission from the United States Army Corps of Engineers
(USAGE) to further lower the water elevation. The upper limit of -1.80 feet, CCD and -2.00 feet,
CCD at the Sag Junction and the LCW, respectively, are set to prevent washout of the soil banks
of the canal at the LP&L.
The U.
S. Supreme Court Decree governs the quantity of water from Lake Michigan that
is diverted out of the Great Lakes Basin into the Mississippi River Basin by the State of Illinois
(Illinois
).
Within Illinois
,
this quantity is subject to regulation by the Illinois Department of
Natural Resources
,
Division of Water Resources
(
DWR). The DWR issues allocation orders for
3
annual average quantities of diversion.
Most of the diversion is allocated to municipalities for
domestic consumption. The District has an order that allows it to divert water for improvement
of water quality and this is referred to as discretionary diversion.
Currently and through 2014,
the District allocation is for an annual average of 270 cubic feet per second (cfs). In 2015, it is
scheduled to be reduced to an annual average of 101 cfs.
An additional annual average of 35 cfs is allocated to the District for navigation makeup.
This is necessary to restore the CWS to the required water level for navigation following a sys-
tem draw down for wet weather operations.
There are two other diversion categories which do not have a specific allocation, but for
which the DWR maintains a reserve quantity. An approximate annual average of 100 cfs is the
reserve needed for operation of the locks at CRCW and OL&D for passage of navigation traffic.
Another approximate annual average of 50 cfs is reserved for leakage through the walls
and structures separating the lake and river. The actual amount of each of these reserves varies
with the level of Lake Michigan.
Accounting for the amount of water diverted from Lake Michigan is the responsibility of
the DWR and the USAGE, Chicago District. The measurement of quantities of diversion and the
method of accounting are specified in the U. S. Supreme Court Decree and in a 1996 Memo of
Understanding between the U. S. Department of Justice and the several states bordering the
Great Lakes.
Inflow and Outflow
All outflow exits the CWS at the LP&L and the LCW. However, there are several
sources of inflow to the CWS. These include WRP effluent, discretionary diversion, navigation
and leakage, tributaries, storm runoff, and combined sewer overflows (CSO).
Outflow. The average annual flow leaving the CWS in Water Year (WY) 2005 was
2,725 cfs as measured by the U. S. Geological Survey (USGS) at Romeoville Road. Maximum
and minimum daily discharge during WY 2005 was 13,973 and 1,287 cfs, respectively. Since
1986, the maximum and minimum WY annual average discharges have been 4,113 and 2,342
cfs, respectively.
The maximum instantaneous discharge was 19,500 cfs on February 21, 1997.
There are periods of zero and negative discharge due to operations at the LP&L and the hydrau-
lic peculiarities of the CWS.
Water
Reclamation Plant Effluent
.
Over 70 percent of the annual flow in the system is
from the discharge of treated municipal wastewater effluent from the Calumet, Lemont, North
Side, and Stickney Water Reclamation Plants (WRPs) owned and operated by the District. Dur-
ing the winter months, virtually 100 percent of the flow is from these WRPs; during the summer
4
months, about 50 percent of the flow is from the WRPs. The WRPs are also shown on Figure 1.
During 2006, these WRPs had the following flow characteristics:
WRP
Average Annual
Flow (MGD*)
Design Average
Flow (MGD*)
Design Maximum
Flow (MGD*)
Calumet
283
354
430
Lemont
2.31
2.3
4.0
North Side
244
333
450
Stickney
729
1,200
1,440
*MGD=million
gallons per
day (1 MGD = 1.547 cfs).
Discretionary Diversion
.
Discretionary diversion is introduced into the system from
Lake Michigan to maintain adequate water quality. This occurs at three locations, WPS, CROW,
and OL&D, shown on Figure 1.
Discretionary diversion is seasonal and is scheduled such that most flow is during warm
weather months of June through October. Some flow is scheduled throughout the year for the
NSC due to more sensitive water quality conditions. Discretionary diversion flows for calendar
year 2006 were as follows:
Inflow Facility
Average Annual
Monthly
(cfs)
Minimum (cfs)
Maximum (cfs)
WPS
40.4
0
129
CROW
127.5
0
428
OL&D
83.5
0
303
Navigation and Leakage
. This flow consists of discharge to support navigation in the
operation of locks and leakage through structures and walls separating the lake and river. There
is no navigation traffic at the WPS. It should be noted that navigation flows are seasonal. In ad-
dition, the quantity is dependent on the lake level, since flow at CRCW and OL&D is by gravity
only.
Leakage, formerly a significant quantity at CROW, has been reduced through repair of
gates and construction of new walls.
The average annual, monthly maximum, and monthly
minimum flows at each of these facilities for calendar year 2006 were as follows:
Facility
Navigation
Lockage
Leakage
Average
Annual
(cfs)
Monthly
Max
(cfs)
Monthly
Min
(cfs)
Average
Annual
(cfs)
Monthly
Max
(cfs)
Monthly
Min
(cfs)
Average
Annual
(cfs)
Monthly
Max
(cfs)
Monthly
Min
(cfs)
WPS
0
0
0
0
0
0
1.3
2.2
0.0
CRCW
27.4
101
0
13.8
32
1.0
14
19
10.0
OL&D
8.7
52
0
19.1
43
4.0
8.9
10
7.0
5
The average
annual discharge
for WY
2006 measured
by the USGS downstream from
CRCW is 155 cfs. Due to a lack of
funding, the gauges at the other two intake
facilities,
OL&D
and WPS
are no longer active.
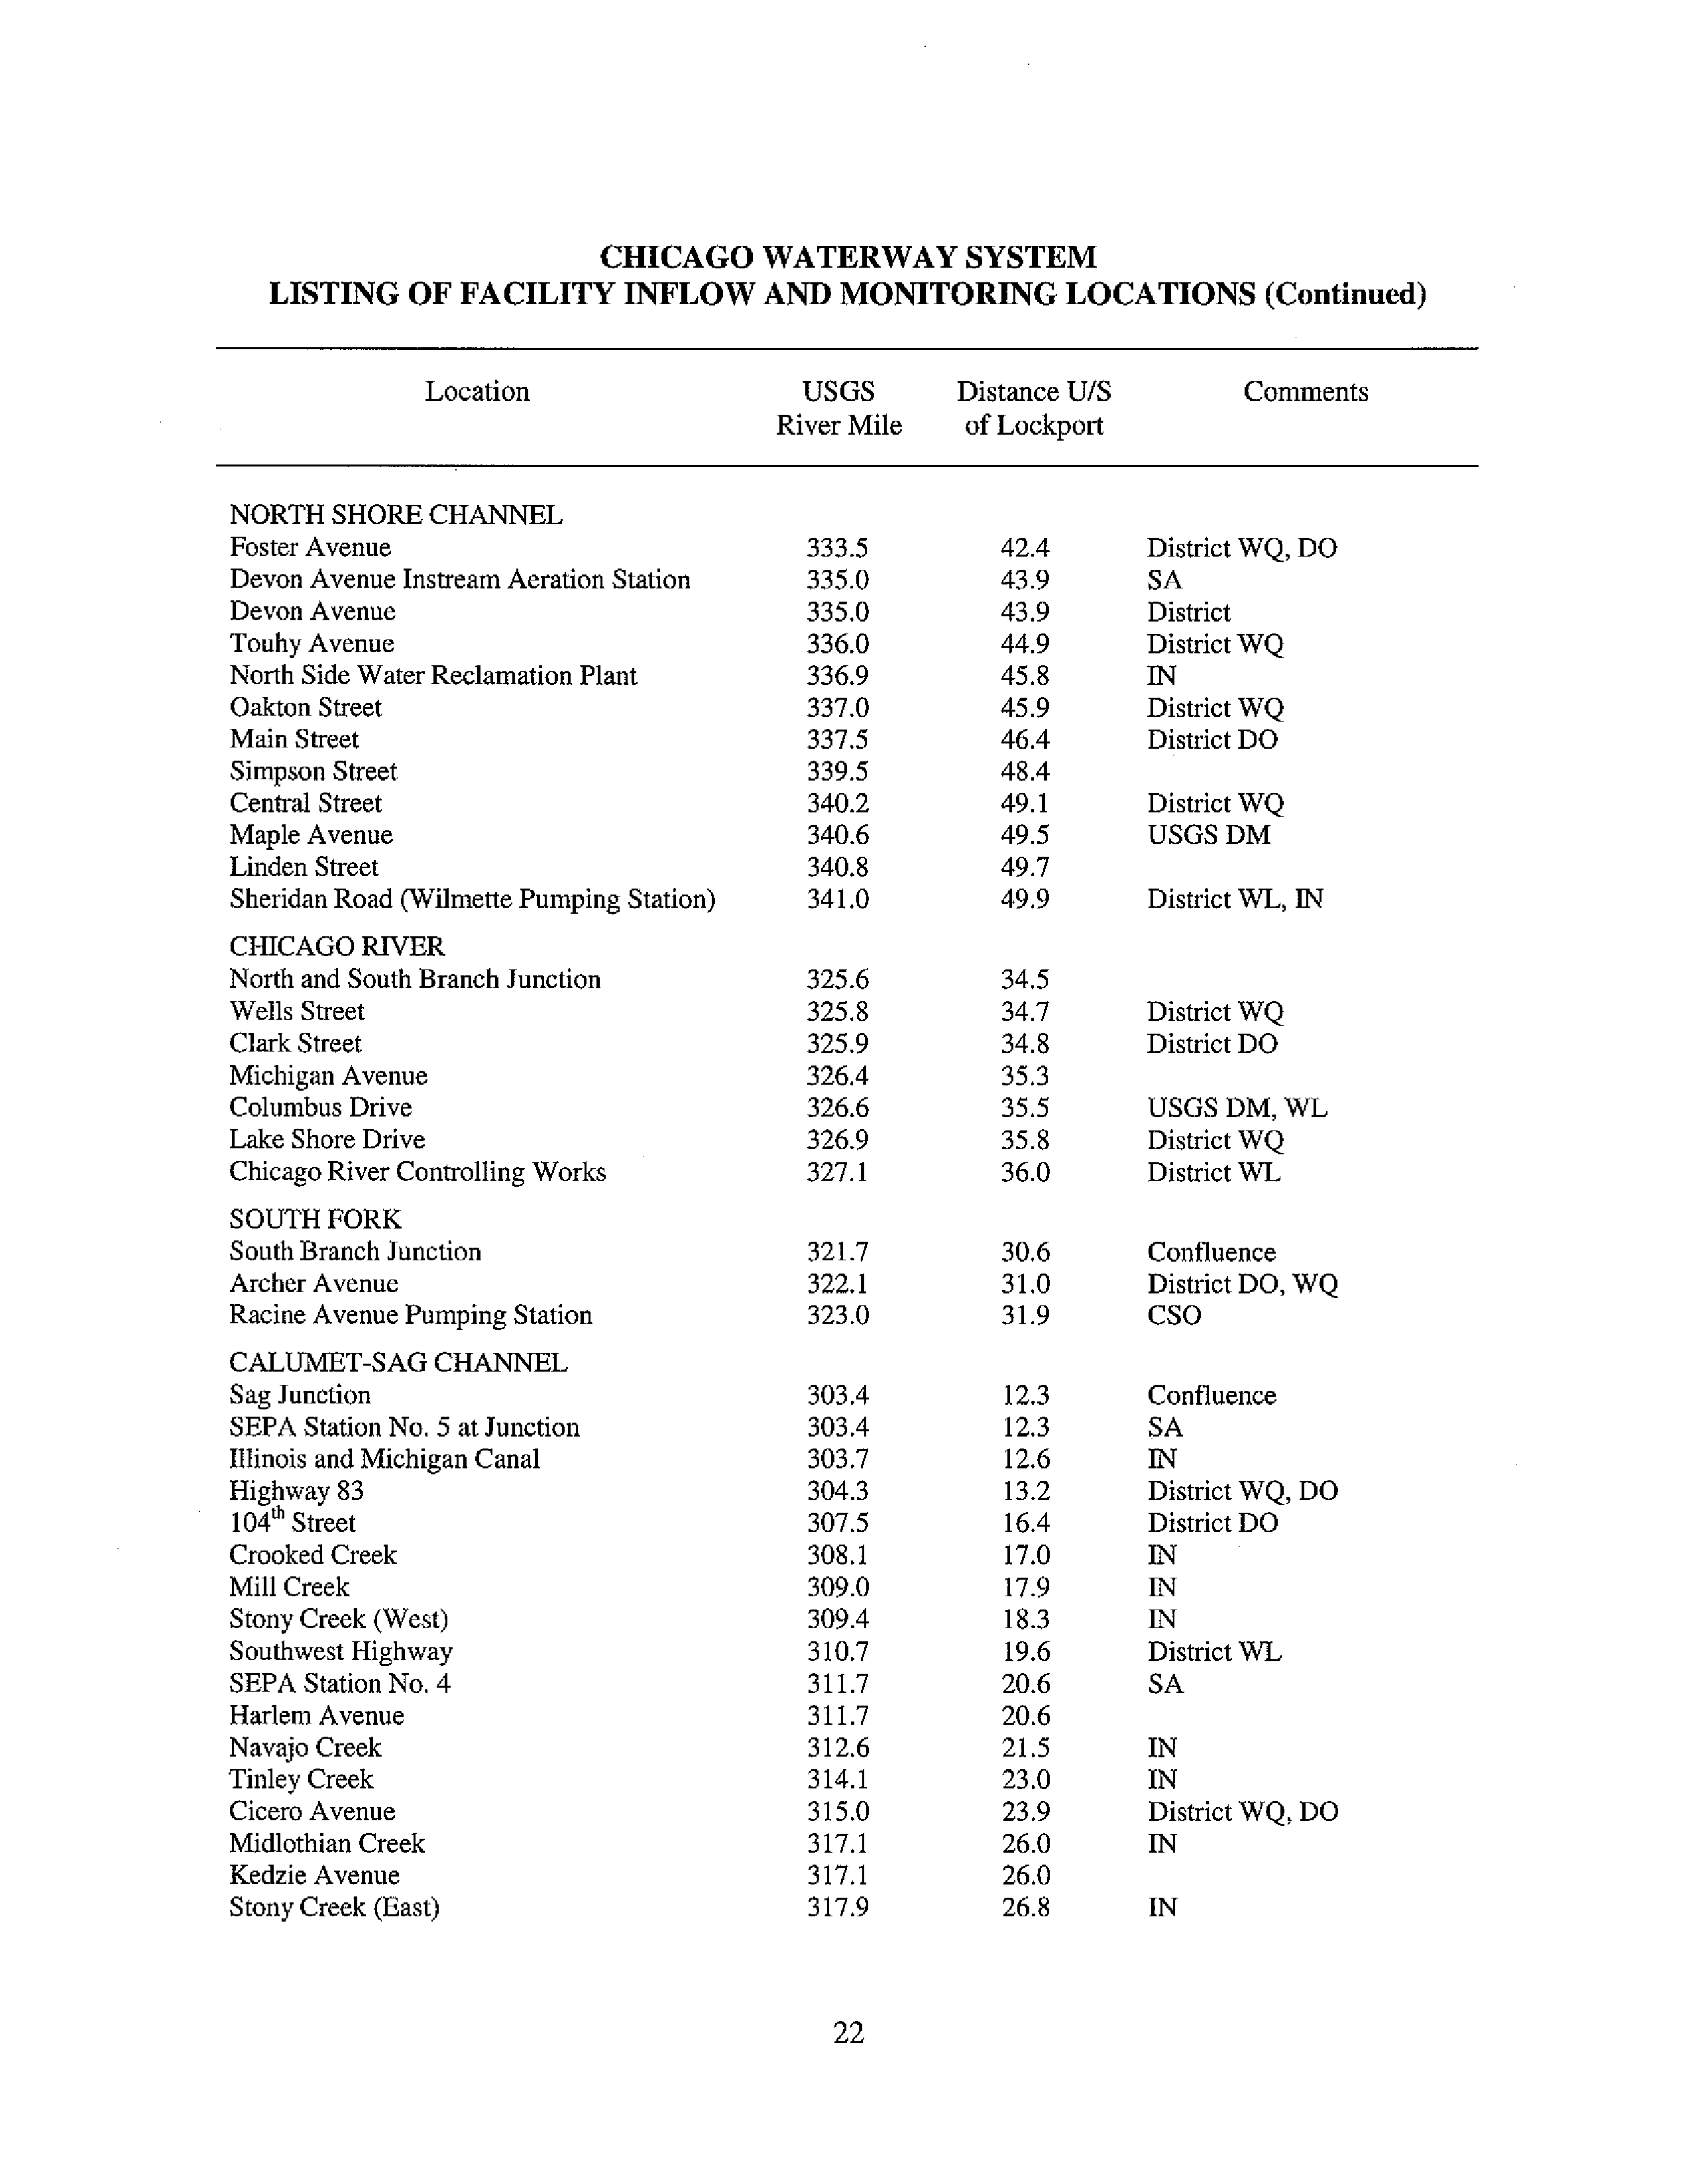
Tributaries
.
The major tributaries to the CWS are the LCR, which has a watershed area
of over 210 square miles, and the North Branch Chicago River, with a watershed area of 113
square miles.
Other tributaries discharging into the CSC include Crooked Creek, East Stony
Creek, Illinois and Michigan Canal, Midlothian Creek, Mill Creek, Navajo Creek, Saganashkee
Slough, Tinley Creek, and West Stony Creek. Tributaries discharging into the CSSC include the
Illinois and Michigan Canal diversion ditches and Summit-Lyons Conduit. Please refer to the
CWS Listing of Facilities, Inflows, and Monitoring Locations (CWS List) located at the end of
this report.
Storm
Runoff. Numerous storm sewers discharge to the CWS from several municipali-
ties and Illinois Department of Transportation drainage facilities. A complete inventory of these
facilities is not available.
Combined Sewer Overflow
.
The combined sewer area within the District serves a col-
lection area of approximately 375 square miles, which includes most of the city of Chicago.
There are 177 National Pollutant Discharge Elimination System (NPDES) permitted CSOs that
discharge to the CWS from about 40 municipalities and the District. The District has a compre-
hensive CSO outfall inventory available at www.mwrd.org,
Major Pumping Stations
.
The CSO outfalls include five major pumping stations (PS)
which serve a collection
area
of about 54.8 square
miles.
These stations include the Racine Ave-
nue PS, which discharges into the South Fork of the South Branch of the Chicago River (also
known as Bubbly Creek); the 95`h Street PS, which discharges into the Calumet River; the 122'd
Street PS, which discharges into the Calumet River; the 125th Street PS, which discharges into
the Little Calumet River, and the North Branch PS which discharges into the North Branch of the
Chicago River.
The pumping capacities of these major pumping stations to the CWS during
storm events are detailed below:
Pumping Station
Pumping
Capacity to the CWS
During
Storm Events (cfs)
North Branch
PS
1,500
Racine
Avenue PS
3,125
95` Street PS
855
122° Street PS
375
125" Street PS
1,140
6
PHYSICAL
DESCRIPTION OF THE
WATERWAYS
Chicago River System
North Shore ChanneL (Photograph 1) This man-made channel is 7.7 miles in length
and is straight throughout except for four bends in alignment near Devon and Central Avenues
and Emerson and Linden Streets. It has steep earthen side slopes and a width of 90 feet. The
depth varies from 5 to 10 feet. The NSC was completed in 1910 in order to divert water from
Lake Michigan to dilute and flush wastewater downstream through the North Branch Chicago
River. It also served as a conveyance for wastewater from communities north of Chicago.
Land use along the NSC is generally urban commercial and residential. In-stream aquatic
habitat is often present along the partly shaded banks, in the form of aquatic plants, tree roots,
and brush debris jams. Presently, there are often stagnant flow conditions in the NSC above the
North Side WRP discharge. In the northernmost reaches of the NSC, near Central Avenue, a va-
riety of sediment types are present and the depth of fines is generally one foot or less. Just up-
stream of the North Side WRP, at Oakton Avenue, silt makes up the majority of sediment
composition, with deeper depth of fines than the upstream reaches (2-4 feet). In the reach di-
rectly downstream of the North Side WRP, near Touhy Avenue, a majority of the sediment is
comprised of sand.
Depth of fines range from under a foot up to 5 feet. Near Foster Avenue,
approaching the confluence with the North Branch Chicago River, sediment is mixed and depth
of fines is less than a foot.
Photograph 1: Aerial view of the North Shore Channel with Howard Street Bridge in the foreground.
7
North Branch Chicago River
.
(Photograph 2) From the junction of the Chicago River
and the South Branch upstream to Belmont Avenue, a distance of 5.1 miles, the river follows its
original course and has several bends. The North Branch is a natural portion of the CWS that
was historically straightened, widened, and dredged to accommodate increased volume of diluted
wastewater from the man-made NSC. The width varies from 150 to 300 feet and the depth var-
ies from 10 to 15 feet. In several reaches, vertical dock walls have been constructed and are in
various states of disrepair.
From Belmont Avenue to the North Branch Dam, 2.6 miles, the
channel has been either straightened or relocated into fairly straight segments with steep earthen
side slopes.
The width is generally 90 feet and the depth is approximately 10 feet in the center
part of the channel.
Today, the northern deep-draft portion of the North Branch Chicago River by Wilson
Avenue has mostly urban residential land use and contains in-stream habitat with logs, boulders,
and an under-cut bank. In these upstream reaches, sediment is comprised mostly of cobble and
sand, with fine sediments usually less than a foot deep. Further downstream, near Diversey
Avenue, land use changes to mostly commercial/industrial, and there is decreased canopy cover.
Sediment consists mostly of silt with scoured concrete in some areas, and depth of fines ranges
from approximately 1-3 feet. There is limited in-stream habitat near the banks, including debris
jams, boulders and tree roots.
As the North Branch approaches downtown Chicago, physical
habitat is further degraded.
Near Grand Avenue, land use is primarily industrial/commercial,
with periodic vertical sheet pile walls and concrete "banks." There is a lack of in-stream habitat
and little canopy cover. Sediment is comprised primarily of silt with depth of fines ranging from
1 to greater than 5 feet.
Photograph 2: North Branch Chicago River, west from Halsted Street Bridge.
8
North Branch Canal. (Photograph 3) This canal was man-made in the 1870s. It forms
the east side of Goose Island, has a straight alignment and is one mile in length. The width varies
from 80 to 120 feet and the depth from 4 to 8 feet.
PhotoUaph 3: North Branch Canal, northwest from Halsted Street Bridge.
9
Chicago
River
.
(Photograph 4) The Chicago River, 1.5 miles in length, is 200 feet wide
west of Michigan Avenue and wider, up to 400 feet wide, east thereof. It has vertical side walls
throughout its length. It is 20 feet deep at the west end and 26 feet deep at the east end. The
river alignment is generally straight with three bends near Michigan Avenue and State and
Orleans Streets. The Chicago River historically flowed into Lake Michigan, but was reversed by
the construction of the CSSC, and the mouth of the river was altered where it met Lake Michi-
gan. Its entire length was also dredged, widened, and straightened so that shipping vessels could
travel through it in the 1800s and to facilitate urban development of the downtown area.
Currently, the Chicago River contains extreme physical limitations to recreation and
aquatic habitat, as it flows right through downtown Chicago and contains steep vertical sheet pil-
ing walls.
There are no shallow areas and there is very little to no canopy cover. Fine grained
silt sediments predominate.
Because of the temperature and salinity differential between the
warmer, more saline water from the NBCR and the colder, less saline water of Lake Michigan,
density currents are sometimes established in the Chicago River. These density currents can re-
sult in simultaneous bi-directional flow in the Chicago River. In addition, the gradient of the bed
is very small, making it difficult to push the water out of the Chicago River.
t.
Photograph
61^!1 'i1 ,L{...` Vii
4: The Chicago
j
River
,
looking east
.
Wells Street Bridge in toreground.
10
South Branch Chicago River
.
(Photograph 5) This 4.5 mile long segment generally
follows its original course and has several bends, though it was somewhat straightened and
channelized between 1928-1929 for the convenience of navigation.
A short reach between
Roosevelt Road and 18'h Street was relocated in 1928 to eliminate a major bend. The South
Branch has vertical dock walls throughout most of its length. The width varies from 200 to 250
feet and the depth from 15 to 20 feet.
Today, there is very little in-stream habitat or canopy cover along the South Branch and
urban industrial and commercial land uses predominate. Near Madison Street in downtown Chi-
cago, the sediment is almost entirely made up of silt, with about one foot depth of fines. Down-
stream at Loomis Street, the side channels are mostly scoured bedrock with silt and sludge
deposits in the center. Depth of fines range from 3-5 feet in these center sediments.
Photograph ,):
Northeastern aerial view of the South Branch Chicago River. Loomis Street Bridge in the fore-
ground.
11
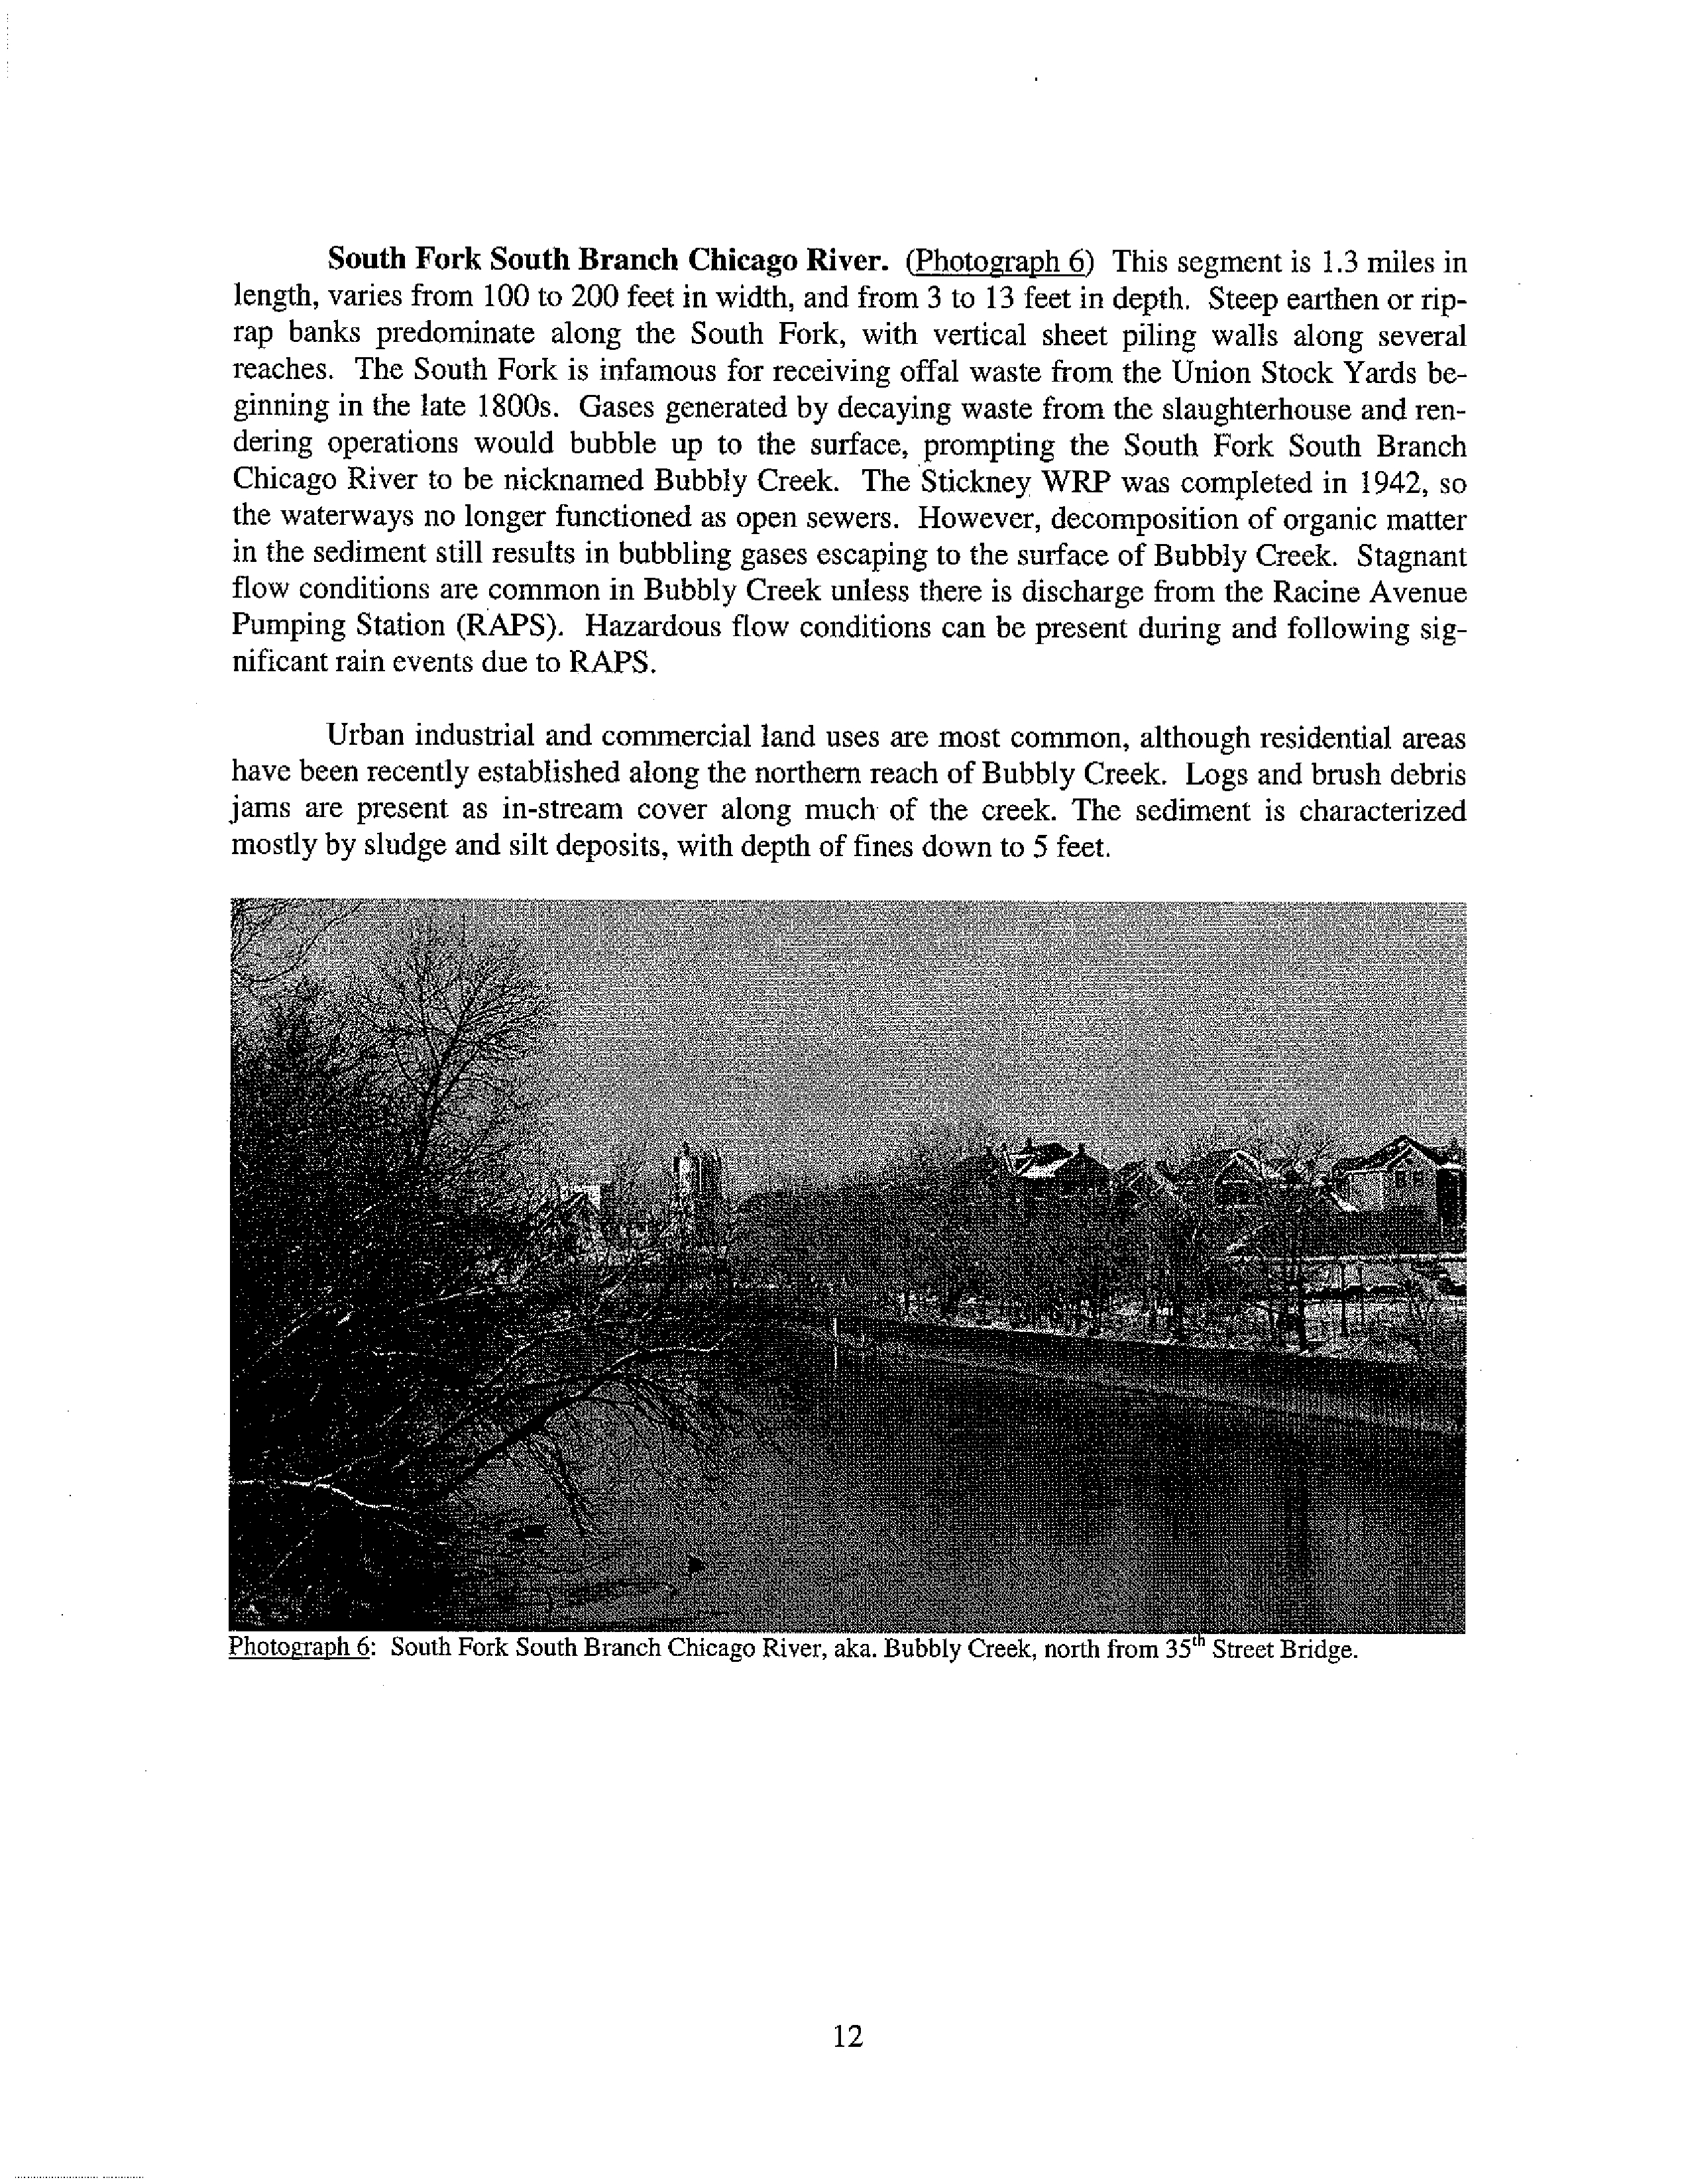
South Fork South Branch Chicago River. (Photograph 6) This segment is 1.3 miles in
length, varies from 100 to 200 feet in width, and from 3 to 13 feet in depth. Steep earthen or rip-
rap banks predominate along the South Fork, with vertical sheet piling walls along several
reaches.
The South Fork is infamous for receiving offal waste from the Union Stock Yards be-
ginning in the late 1800s. Gases generated by decaying waste from the slaughterhouse and ren-
dering operations would bubble up to the surface, prompting the South Fork South Branch
Chicago River to be nicknamed Bubbly Creek. The Stickney WRP was completed in 1942, so
the waterways no longer functioned as open sewers. However, decomposition of organic matter
in the sediment still results in bubbling gases escaping to the surface of Bubbly Creek. Stagnant
flow conditions are common in Bubbly Creek unless there is discharge from the Racine Avenue
Pumping Station (RAPS). Hazardous flow conditions can be present during and following sig-
nificant rain events due to RAPS.
Urban industrial and commercial land uses are most common, although residential areas
have been recently established along the northern reach of Bubbly Creek. Logs and brush debris
jams are present as in-stream cover along much of the creek. The sediment is characterized
mostly by sludge and silt deposits, with depth of fines down to 5 feet.
Photograph 6: South Fork South Branch Chicago River, aka. Bubbly Creek, north from 35th Street Bridge.
12
Chicago Sanitary and Ship Canal
.
(Photograph 7)
This 31.1 mile long man-made
channel has many different shapes and sizes. Its alignment is straight throughout its length, ex-
cept for four bends, near Harlem Avenue, La Grange and Romeoville Roads, and in Lockport.
Downstream of the LP&L, a reach of 1.1 miles, the depth is 10 feet and the width is 200 feet.
Upstream of the LP&L, the depth varies from 20 to 27 feet. The reach immediately upstream of
the LP&L, 2.4 miles in length, varies in width from 160 to 300 feet. The east bank of this reach
is a vertical concrete wall. The west bank varies from vertical dock wall to a steep rockfill em-
bankment. The next 14.6 miles of the CSSC have vertical concrete or rock walls 160 feet apart.
The last 13.0 miles have a trapezoidal shape, 220 feet wide, with steep earth or rock side slopes.
There are several areas with vertical dock walls in this last reach.
Excavation of the CSSC from the South Branch Chicago River to Lockport was com-
pleted in 1900. Its construction facilitated the reversal of the Chicago River such that Chicago's
wastewater no longer flowed into Lake Michigan. Industrial and commercial land use dominates
the riparian zone along most of the CSSC. There is little to no canopy cover and in-stream habi-
tat for aquatic life is limited to snags and debris accumulated near bridge abutments. Silt and
sludge comprises a majority of the sediment at Damen Avenue, with depth of fines ranging from
<1-9 feet.
At Cicero Avenue, deposited sediments are comprised of mostly silt and sludge, with
<1-4 feet depth of fines. Sediment was slightly more variable at Harlem Avenue, where silt pre-
dominated, but there was also sand, gravel, cobble, and boulders near the bridge. The bedrock
was exposed due to scouring near Route 83 and Stephen Street, with some scattered silt deposits.
Areas of scouring, as well as pockets of deep silty sediments also occur near Lockport, although
habitat improves slightly near the sunken barges on the west bank. Aquatic vegetation and snags
are present in this shallow area with deep sand and silt deposits.
Photograph 7; Aerial view of the Chicago Sanitary and Ship Canal, upstream of Calumet-Sag junction, near
McCook Reservoir (under construction).
13
Calumet River System
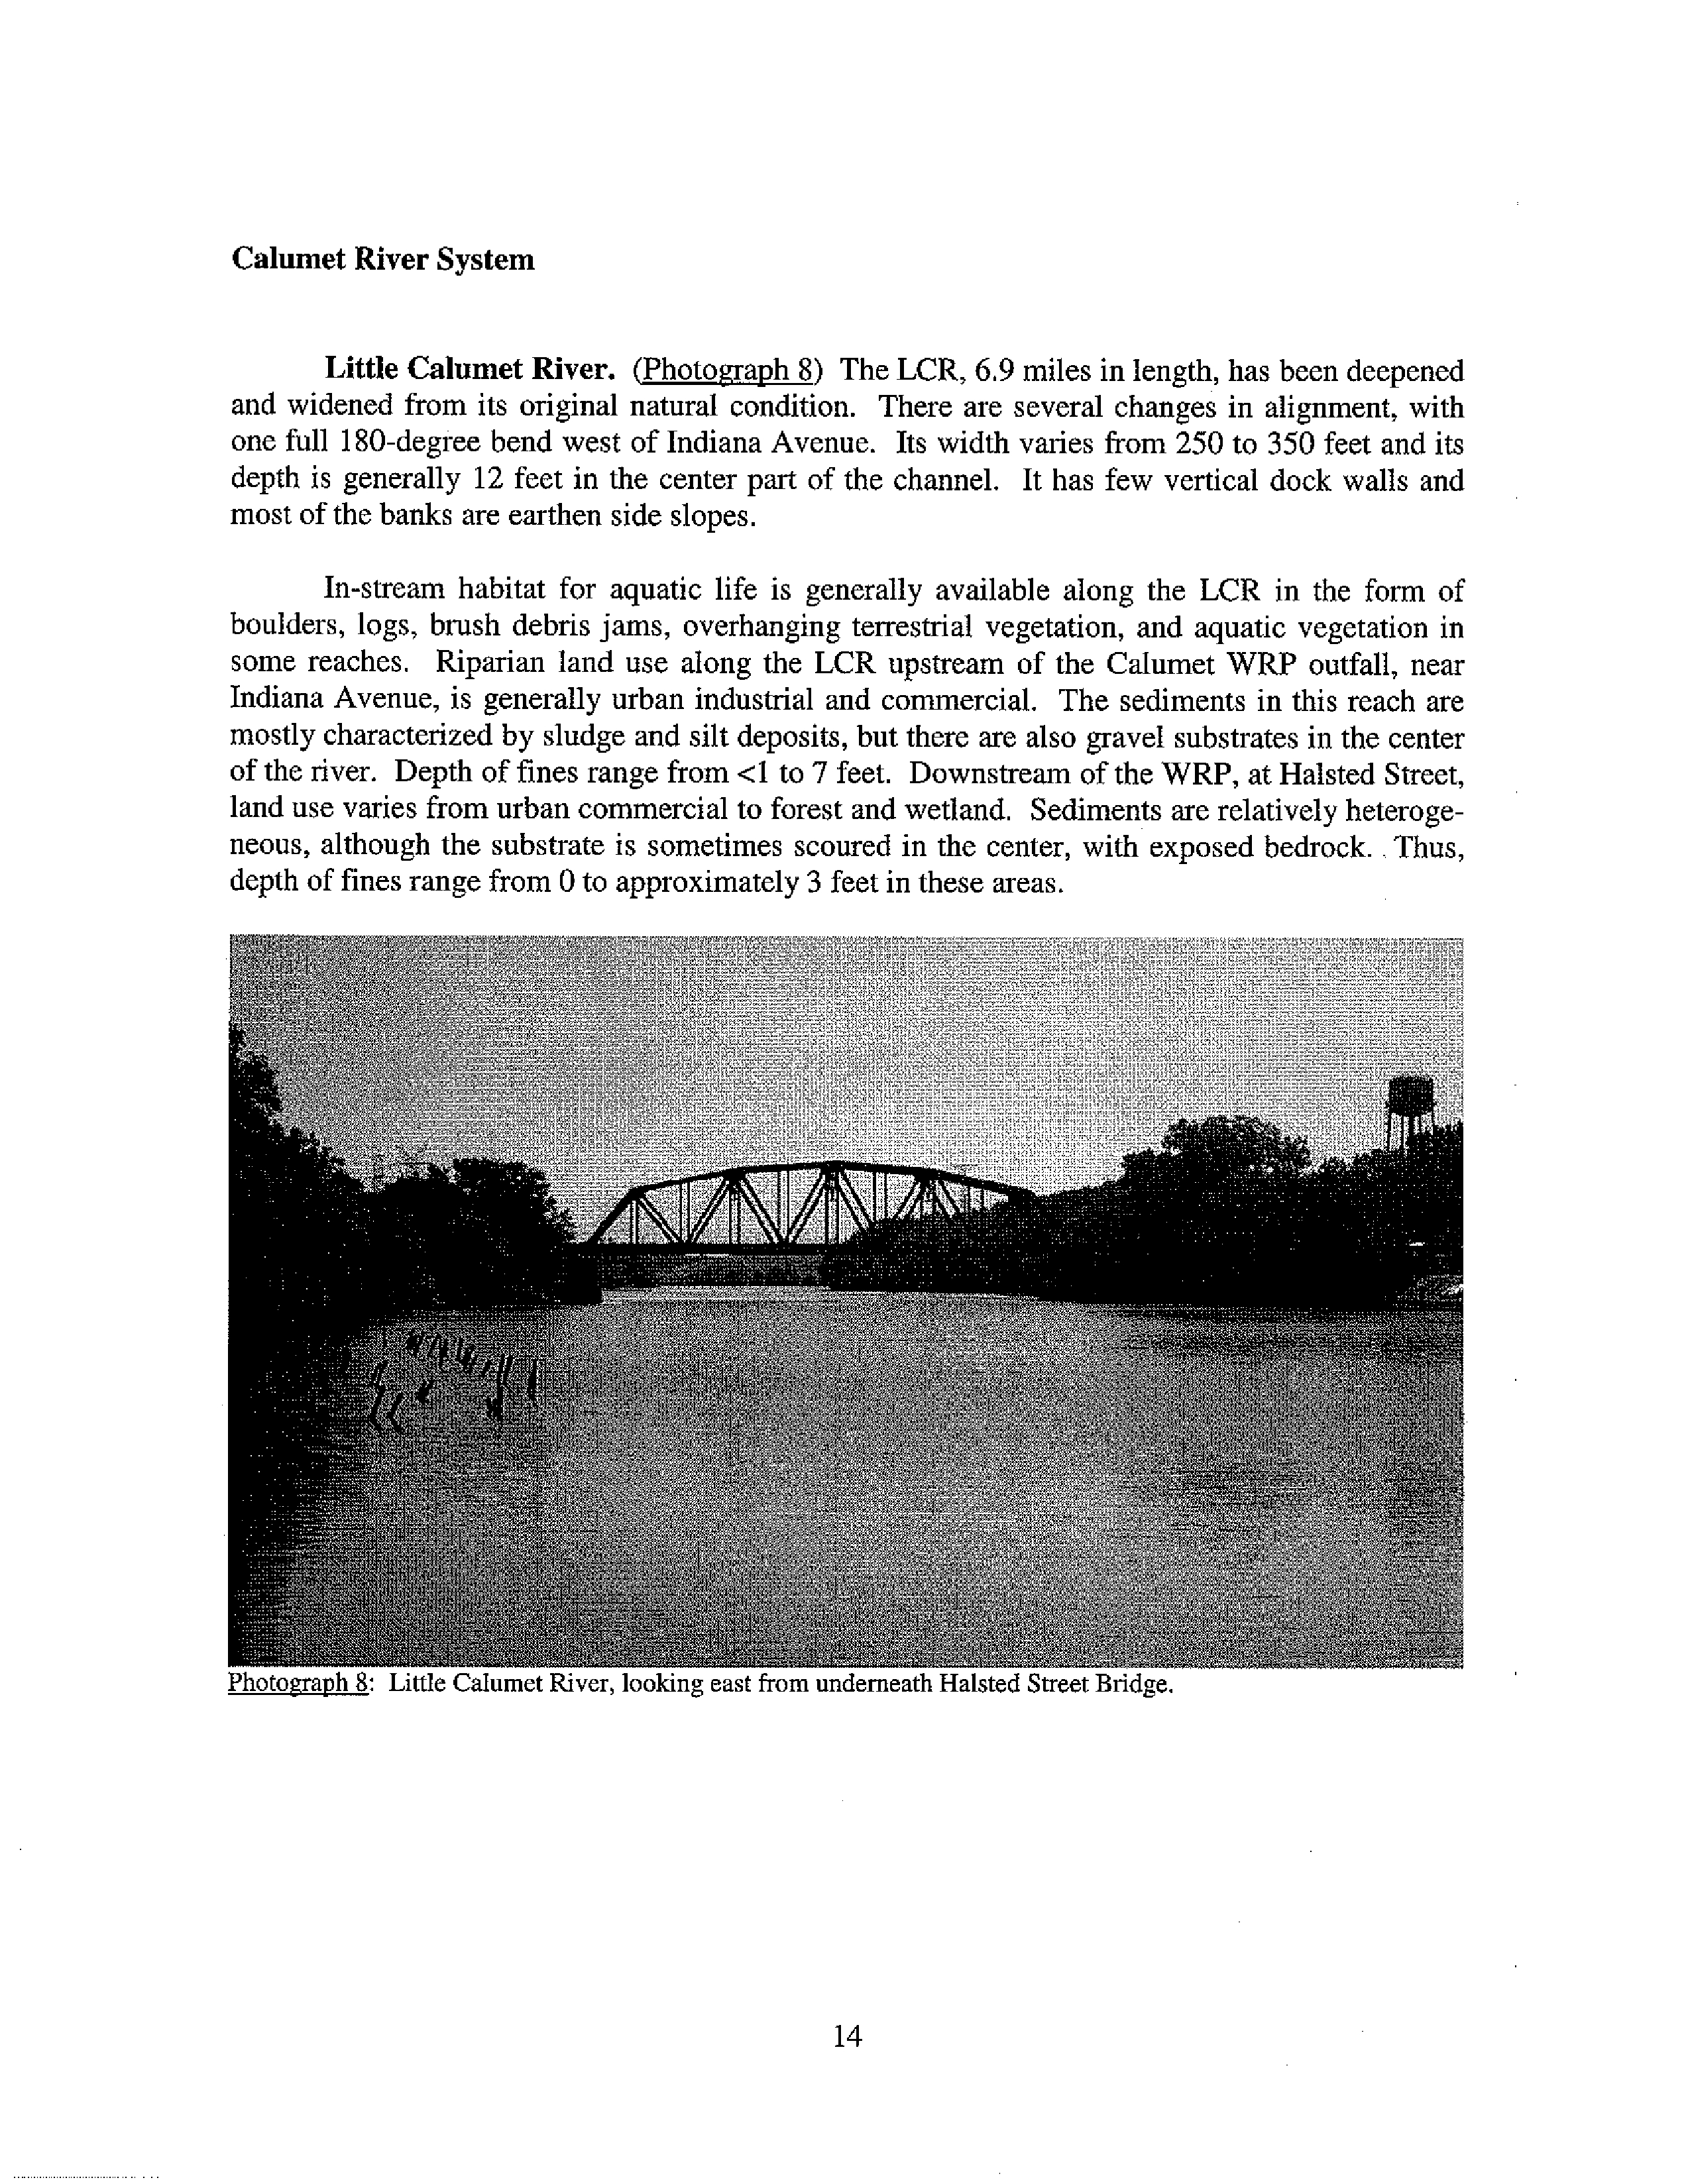
Little Calumet
River
.
(Photograph 8) The LCR, 6.9 miles in length, has been deepened
and widened from its original natural condition. There are several changes in alignment, with
one full 180-degree bend west of Indiana Avenue. Its width varies from 250 to 350 feet and its
depth is generally 12 feet in the center part of the channel. It has few vertical dock walls and
most of the banks are earthen side slopes.
In-stream habitat for aquatic life is generally available along the LCR in the form of
boulders, logs, brush debris jams, overhanging terrestrial vegetation, and aquatic vegetation in
some reaches.
Riparian land use along the LCR upstream of the Calumet WRP outfall, near
Indiana Avenue, is generally urban industrial and commercial. The sediments in this reach are
mostly characterized by sludge and silt deposits, but there are also gravel substrates in the center
of the river.
Depth of fines range from <1 to 7 feet. Downstream of the WRP, at Halsted Street,
land use varies from urban commercial to forest and wetland. Sediments are relatively heteroge-
neous, although the substrate is sometimes scoured in the center, with exposed bedrock.. Thus,
depth of fines range from 0 to approximately 3 feet in these areas.
Photograph 8: Little Calumet River, looking east from underneath Halsted Street Bridge.
14
Calumet-Sag
Channel
.
(Photograph 9) A man-made channel, completed in 1922 to re-
verse the flow of the Calumet River, the CSC is 16.2 miles long with a generally trapezoidal
shape, 225 feet wide and approximately 10 feet deep.
In some
sections, the north bank is a verti-
cal
wall.
The alignment is generally straight with three bends near Western, Crawford, and
Ridgeland Avenues, and thus there is no riffle, run, or pool development. The channel was ex-
cavated through limestone and bedrock, so current conditions constitute mostly silt and sludge
deposited on a hard consolidated substrate.
Near its eastern terminus, sediments from Ashland
Avenue are mostly silt with depth of fines from 1-2 feet. Logjams and boulders are found on the
bank, and there is no aquatic vegetation other than attached green algae. In its mid-section,
sediment at Cicero Avenue is mostly comprised of sludge and silt, with depths of fines ranging
from 3-9 feet. There is an open canopy with logs and boulders on the side bank.
Upstream of Southwest Highway, land use is generally urban industrial, however, near its
western terminus, shortly upstream of the confluence with the CSSC, land is leased to and man-
aged by the Forest Preserve District of Cook County. Substrate at Route 83 is mostly comprised
of silt and sludge, with a depth of fines of 1-7 feet. In this reach, some parts of the south bank
have boulders and small rock ledge, while the north bank is vertical limestone wall.
Photograph 9: The Calumet-Sag Channel, east from 104" Street Bridge.
15
Use Classification
General Use Waters. This use classification has been designated by the Illinois Pollu-
tion Control Board (IPCB) for the 1.6 mile length of the Chicago River and the 4.0 mile reach of
the NSC from the North Side WRP outfall to the WPS. The General Use standards are found at
35 Illinois Administrative Code (IAC) Section 202.200 and are established to protect aquatic life,
wildlife, body-contact recreation (swimming), water supply, and Secondary Contact uses.
Secondary Contact
Waters. All other portions of the CWS have been designated by the
IPCB for this use classification. The Secondary Contact standards are found at 35 IAC Section
302.400 and are established to protect indigenous species, non-contact recreation (boating), and
commercial navigation.
Facility
Descriptions
Chicago River Controlling
Works. The CRCW controls the flow of water between the
lake and Chicago River. This facility was built by the District in 1938 and was maintained and
operated by them until 1984. In this year, the maintenance and operation responsibilities were
transferred to the USACE. It consists of walls separating the river and the lake, a navigation
lock, two
sets
of sluice gates, and a pumping station. The lock is 80 feet wide by 600 feet long,
with a normal lift of 2.0 feet in size. The two sets of underwater sluice gates consist of four gates
each, each gate being 10- by 10-feet in size. The sluice gates allow gravity flow from Lake
Michigan to the Chicago River when the lake level is higher than the Chicago River. The pump-
ing station has three pumps of 30 cfs each. The pumps can only discharge from the river to the
lake and were installed in 2000 for the purpose of returning excess leakage and lockage water to
the lake. The pumps have yet to be used for this purpose.
Lockport Controlling
Works. The LCW is owned and operated by the District. It is an
auxiliary facility used during storm operations to discharge flood waters to the Des Plaines
River. It is located two miles upstream of the LP&L and is used when discharge above the ca-
pacity of the LP&L is needed. It has seven sluice gates, each being 30 feet wide and 20 feet
high. The gate sill is at elevation -15.0 feet, CCD.
Lockport Powerhouse and Lock
.
The powerhouse is owned and operated by the Dis-
trict.
It was
built in 1907 and is currently licensed for two hydroelectric generating units with a
total capacity of 13,500 kilowatts, nine submerged sluice gates for the discharge of storm water
and one surface
sluice gate
for flushing debris. The lock is owned and operated by the USACE
and was built in 1933. It is 110 feet wide and 600 feet long with a normal lift of 37 feet.
16
Newly licensed generating units have a combined capacity of 5,000 cfs. Each submerged
sluice gate is capable of a maximum discharge of 2,500 cfs. A fill or empty event for the lock
during normal water levels causes a discharge of 2,000 cfs over a 20-minute period. During
storm operations, the discharge capacity through the facility is increased to facilitate the drainage
of stormwater. This lowers the upstream water level and increases water velocities in the
channel.
O'Brien Lock and Dam
. This facility was built in 1960 and is owned and operated by
the USACE. The lock is 110 feet wide and 1,000 feet long with a normal lift of 2.0 feet. Flow
regulation from Lake Michigan to the Calumet River is accomplished with four submerged
sluice gates, each 10- by 10-feet in
size
. The gate opening for flow regulation is under the direc-
tion
of the District and the actual operation is performed by the USACE.
Wilmette Pumping Station
. The WPS is located beneath,
and is
integral with, the
Sheridan Road Bridge and controls the flow of water between Lake Michigan and the NSC. It
was built in 1910 and is owned and operated by the District. Lake water is brought into the
channel for augmenting low flows for water quality maintenance. The station has four horizontal
screw pumps rated at 250 cfs at a lift of 3.0 feet. The pump propellers are 9.0 feet in diameter
and located in tunnels that run under the floor of the station from the Wilmette Harbor to the
channel. Pumping is necessary when lake levels are low.
Adjacent to the south side of the pumping station is a concrete channel and sluice gate to
allow for the passage of water by gravity when pumping is not necessary (when the lake level is
higher than the level in the NSC). The channel is 30 feet wide and 11 feet deep. During storm
operations, when the channel surcharges and the water level nears 5.0 feet, CCD, the sluice gate
can be opened to relieve the channel to the lake.
Five temporary pumps with an aggregate capacity of 50 cfs were installed in 2000 due to
non-operation of the large original pumps. In 2002, one of the original pumps was rehabilitated
for use since the five temporary pumps have insufficient capacity for water quality maintenance.
Instrearn and Sidestream Elevated Pool Aeration Stations. Instream aeration
stations
are located on the North Shore Channel at Devon Avenue and on the North Branch Chicago
River at Webster Avenue. The Devon and Webster Avenue stations have been in service since
1979 and 1980, respectively. These facilities are operated as needed by the District
to maintain
dissolved oxygen in the northern Chicago River System.
The sidestream elevated pool aeration (SEPA) stations are owned and operated by the
District. There are three SEPA stations on the CSC, and one each on the Little Calumet and
Calumet Rivers.
Water from the channel is lifted 12- to 15-feet and allowed to drop over a series
of weirs to create a waterfall and add oxygen to the waterway. SEPA stations have been operat-
ing since 1994 to help overcome dissolved oxygen sags in the Calumet River System. These sta-
tions are not operated in the winter months.
17
Operation Plan
Dry Weather
Conditions
. Dry weather conditions are typically characterized by flat
water levels, below average flows from the WRPs, normal intake from the lake, and a flow of
approximately 1,800 cfs through the LP&L. Normal dry weather discharge is released from the
CWS through hydroelectric generating units and the navigation lock at the LP&L. The water
level in the Chicago River at the CRCW and in the LCR at the OL&D is ideally maintained at -
2.0 feet, CCD. Discretionary diversion is brought into the CWS at the CROW, OL&D, and WPS
per the planned schedule.
Wet Weather Conditions.
When weather forecasts indicate that rainfall is likely to
occur, the CWS is readied for wet weather operations. Discretionary diversion, if in progress, is
curtailed and discharge at the LP&L is increased. This lowers the water level in the lower
reaches of the CWS to provide storage for incoming storm flow and increases the hydraulic gra-
dient to move more water through and out of the CWS. If no or very light rainfall occurs, the
operations are returned to the dry weather mode. Light rainfall, less than 0.33 inches, normally
causes little disruption in operations.
If rainfall is moderate, 0.33 to 0.67 inches, most CSOs are initially captured by the Tun-
nel and Reservoir Plan (TARP) and only reach the CWS through increased discharge from the
WRPs. However, direct inflow of other storm runoff does occur under these conditions.
Additional discharge at the LP&L is achieved by increasing the discharge through the LP&L's
two generating units to their maximum capacity. Discharge necessary beyond the maximum dis-
charge of the generating units (5,000 cfs) is put thorough sluice pit gates at the LP&L and, if
necessary, the LCW.
Water levels in the upper part of the CWS will rise due to storm inflow and
increased
WRP discharge. After the peak water level is reached, the water levels begin to sub-
side.
Discharge at the LP&L is gradually reduced by closing gates as the CWS returns to dry
weather conditions.
When -2.0 feet, CCD, is reached at the CRCW and/or OL&D, discretionary
diversion is resumed, if appropriate.
If rainfall is heavy, 0.67 to 1.5 inches, TARP will fill and excess CSOs will be discharged
to the CWS from pumping stations and CSO outfalls. Other storm runoff from tributary water-
sheds and storm sewers is significant and imposes an additional hydraulic load on the CWS. The
operation of the CWS will be similar to the above description, with the exception that increased
discharges at the LP&L are initiated more rapidly.
Excessive rainfall, 1.5 inches or greater, especially if preceded by antecedent rainfall, will
likely cause extreme water levels in the upper part of the CWS. If water levels reach 3.5 feet,
CCD, at the CRCW and the OL&D and are rising, it will be necessary to relieve the CWS by
discharging excess flood water to Lake Michigan at those points. If the water level at WPS
reaches 4.5 to 5.0 feet, CCD, it is necessary to relieve the CWS at the WPS. The decision to pro-
vide for such relief at each facility is made based on the potential for continued area rainfall and
on the water level conditions at each facility.
18
Measurement of Discharge and Water Level
United States Geological
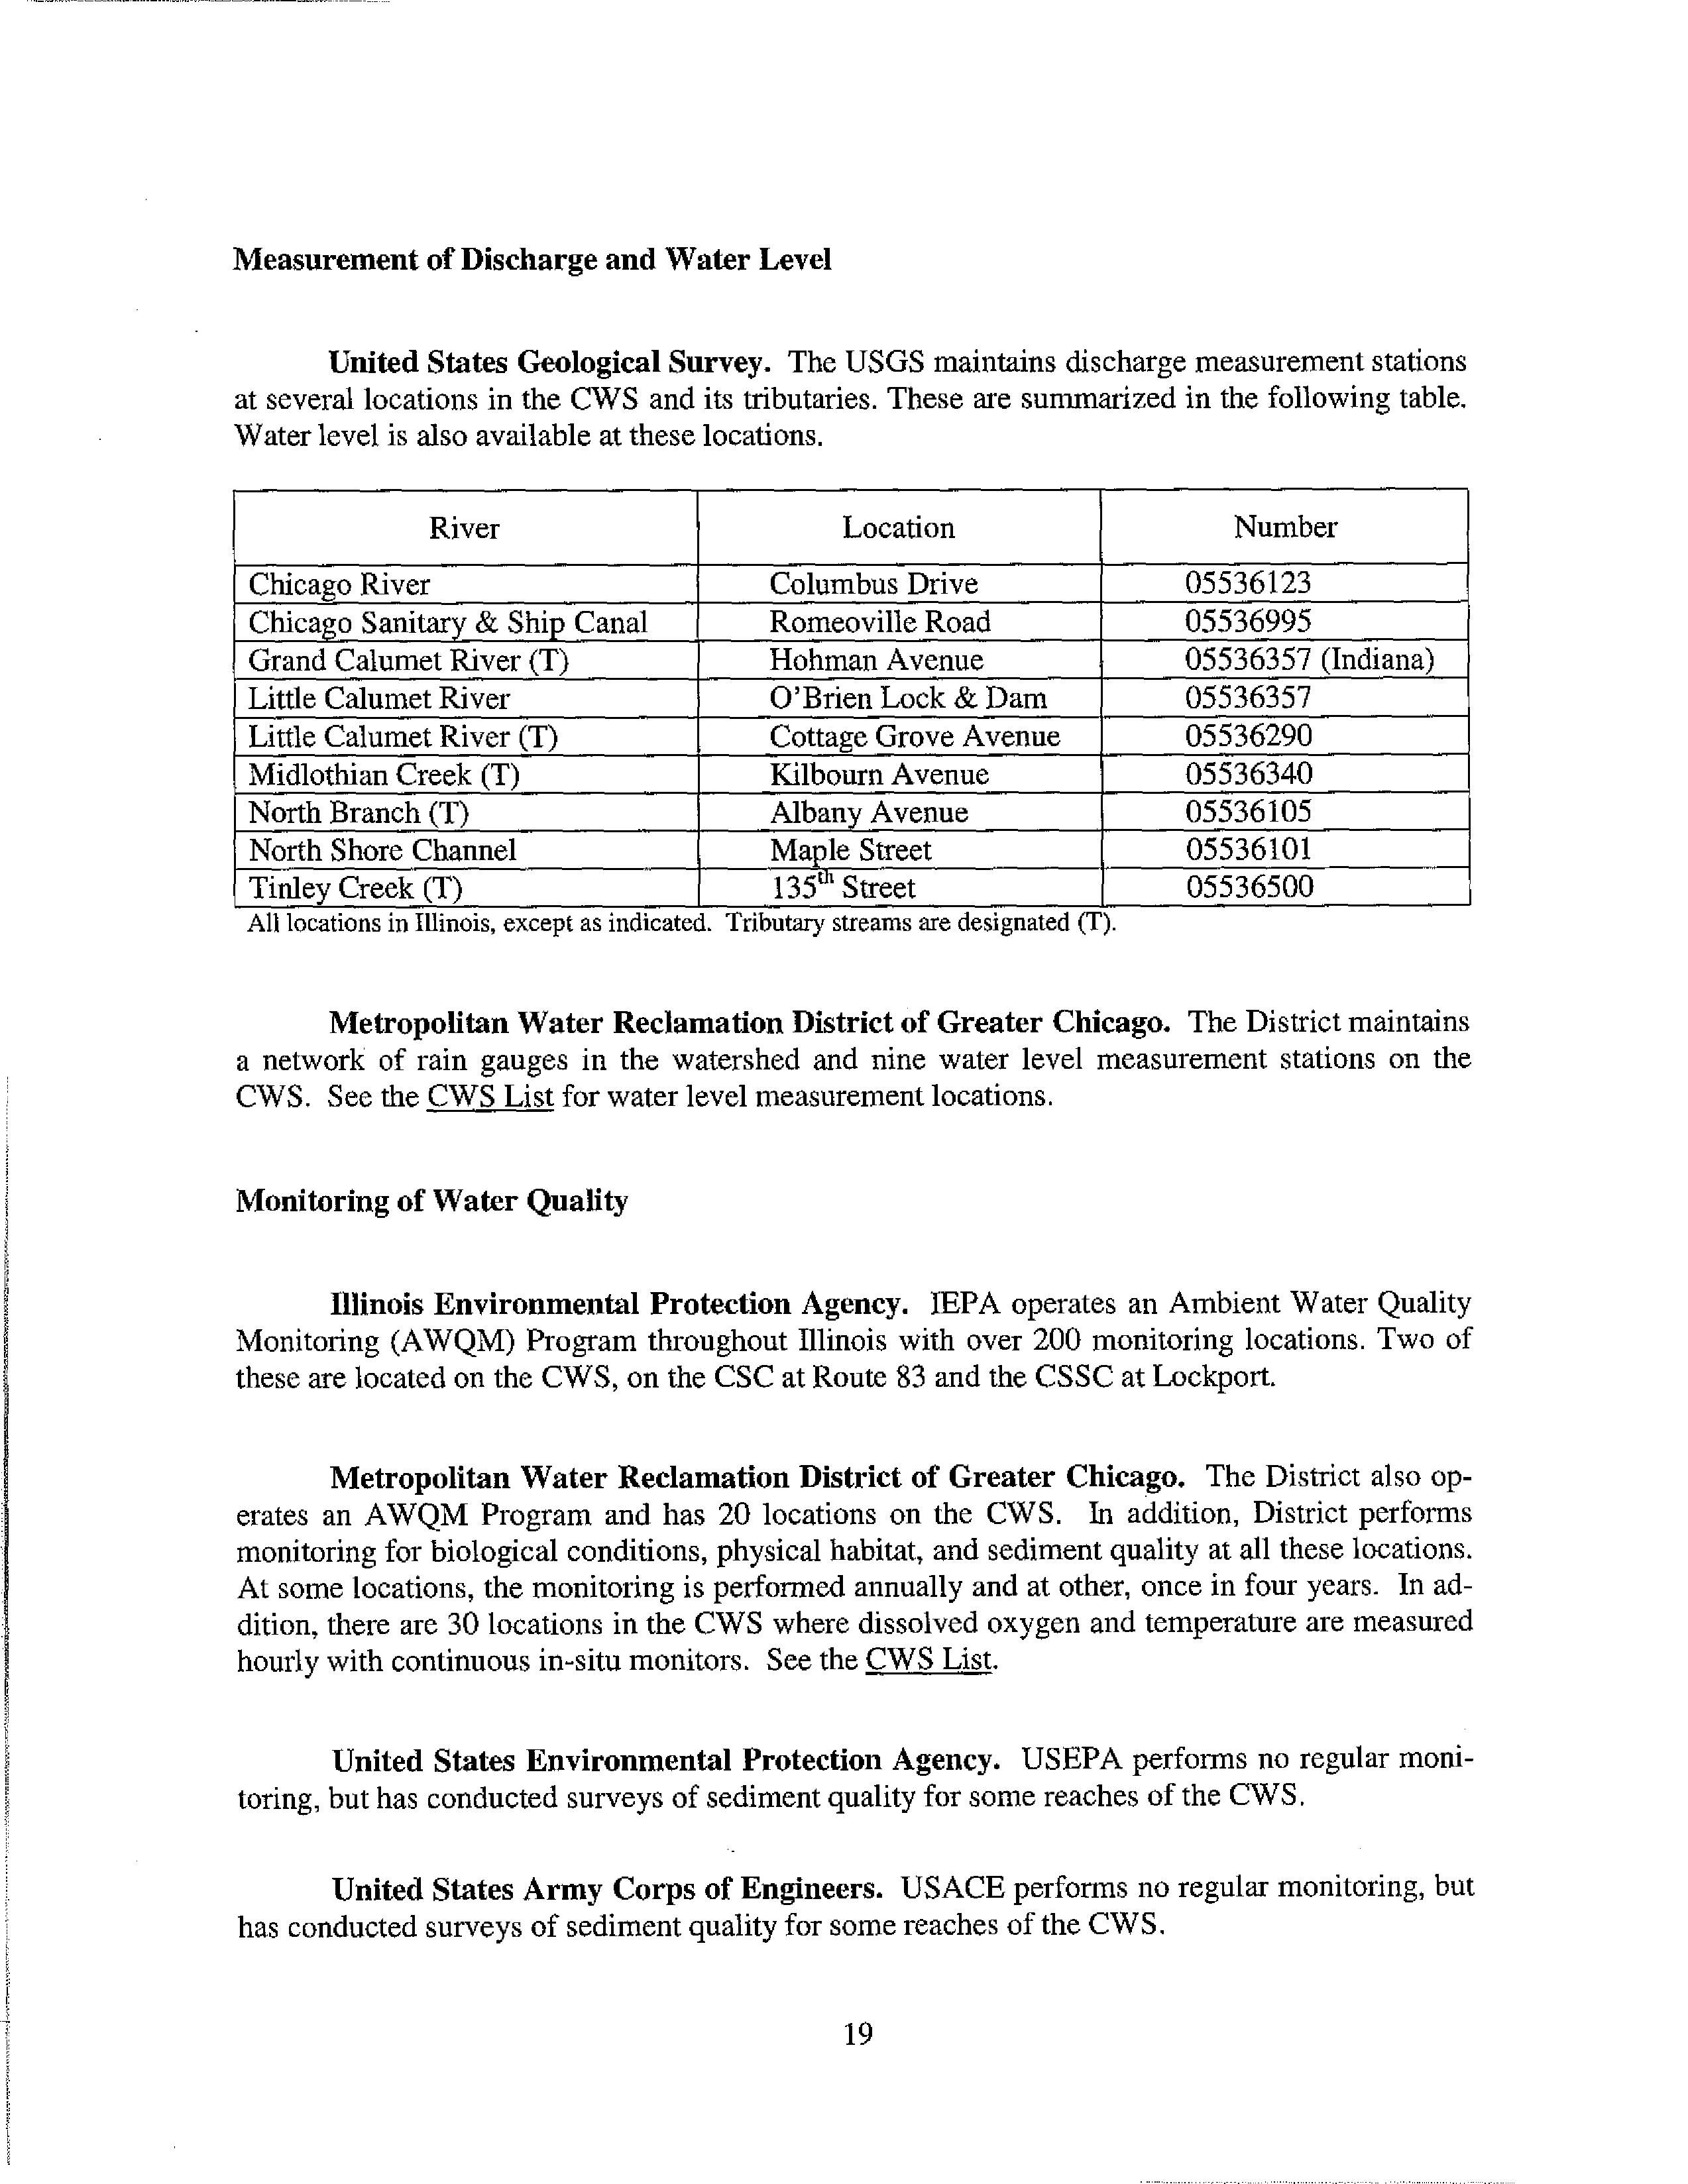
Survey. The USGS maintains discharge measurement stations
at several locations in the CWS and its tributaries. These are summarized in the following table.
Water level is also available at these locations.
River
Location
Number
Chicago River
Columbus Drive
05536123
Chicago Sanitary & Ship Canal
Romeovilie Road
05536995
Grand Calumet River (T)
Hohman Avenue
05536357 (Indiana)
Little Calumet River
O'Brien Lock & Dam
05536357
Little Calumet River (T)
Cottage Grove Avenue
05536290
Midlothian Creek (T)
Kilbourn Avenue
05536340
North Branch (T)
Alban Avenue
05536105
North Shore Channel
Ma le Street
05536101
Tinley Creek (T)
135` Street
05536500
Ali locations in Illinois
,
except as indicated
.
Tributary
streams are designated (T).
Metropolitan
Water
Reclamation District
of Greater
Chicago
.
The District maintains
a network of rain gauges in the watershed and nine water level measurement stations on the
CWS. See the CWS List for water level measurement locations.
Monitoring
of Water Quality
Illinois Environmental Protection
Agency. IEPA operates an Ambient Water Quality
Monitoring (AWQM) Program throughout Illinois with over 200 monitoring locations. Two of
these are located on the CWS, on the CSC at Route 83 and the CSSC at Lockport.
Metropolitan Water Reclamation District
of Greater
Chicago
.
The District also op-
erates an AWQM Program and has 20 locations on the CWS. In addition, District performs
monitoring for biological conditions, physical habitat, and sediment quality at all these locations.
At some locations, the monitoring is performed annually and at other, once in four years. In ad-
dition, there are 30 locations in the CWS where dissolved oxygen and temperature are measured
hourly with continuous in-situ monitors. See the CWS List.
United
States Environmental Protection
Agency. USEPA performs no regular moni-
toring, but has conducted surveys of sediment quality for some reaches of the CWS.
United States Army Corps
of Engineers
.
USAGE performs no regular monitoring, but
has conducted surveys of sediment quality for some reaches of the CWS.
19
ACRYONYM LIST
AWQM
Ambient Water Quality Monitoring
CCD
Chicago City Datum
CFR
Code of Federal Regulations
cfs
Cubic feet per second
CRCW
Chicago River Controlling Works
CSC
Calumet-Sag Channel
CSO
Combined sewer overflow
CSSC
Chicago Sanitary and Ship Canal
CWS
Chicago Waterway System
District
Metropolitan Water Reclamation District of Greater Chicago
DWR
Illinois Department of Natural Resources, Division of Water Resources
IAC
Illinois
Administrative Code
IEPA
Illinois Environmental Protection Agency
IPCB
Illinois Pollution Control Board
LCR
Little Calumet River
LCW
Lockport Controlling Works
LP&L
Lockport Powerhouse and Lock
MGD
Million Gallons per Day
NBC
North Branch Canal
NPDES
National Pollutant Discharge Elimination System
NSC
North Shore Channel
OL&D
O'Brien Lock and Dam
RAPS
Racine Avenue Pumping Station
SEPA
Sidestrearn Elevated Pool Aeration
TARP
Tunnel and Reservoir Plan
USACE
United States Army Corps of Engineers
USEPA
United States Environmental Protection Agency
USGS
United States Geological Survey
WPS
Wilmette Pumping Station
WRP
Water Reclamation Plant
WY
Water Year (October 1 through September 30)
20
CHICAGO WATERWAY SYSTEM
LISTING OF FACILITY INFLOW AND MONITORING LOCATIONS
Location
USGS
River Mile
Distance U/S
of Lockport
Comments
CHICAGO SANITARY & SHIP CANAL
Des Plaines River Confluence
290.1
-1.1
Lockport Powerhouse & Lock
291.1
0.0
Flow District WL, WQ, DO
Lockport Controlling Works
293.2
2.1
District WL
Will County Power Plant, Cooling Water
296.0
49
OU, IN
Romeoville Road
296.2
5.1
USGS DM
Citgo Petroleum Corporation
298.0
6.9
Stephens Street
300.5
9.4
District
WQ
Lemont Water Reclamation Plant
300.6
9.5
IN
Argonne Laboratory
302.3
11.2
USGS, DM, OU, IN
Illinois and Michigan Canal Connector Ditch
303.0
11.9
IN
Sag Junction
303.4
12.3
Confluence
Highway 83
304.1
13.0
District WQ, DO
Baltimore & Ohio Railroad
312.3
21.2
District DO
Summit-Lyons Conduit Inflow
313.3
22.2
IN
Harlem Avenue
314.0
22.9
District WQ
Stickney Water Reclamation Plant
315.5
24.4
IN
Cicero Avenue
317.3
26.2
District
WQ, DO
Crawford Power Plant, Cooling Water
318.5
27.4
OU, IN
Western Avenue
SOUTH BRANCH
320.6
29.5
District WL
Damen Avenue
321.1
30.0
South Fork
321.7
30.6
Confluence
Loomis Street
321.9
30.8
District DO, WQ
Fisk Power Plant, Cooling Water
322.0
30.9
OU, IN
Jackson Boulevard
325.0
33.9
Madison Street
325.3
34.2
District WQ
North Branch & Chicago River Junction
SOUTH FORK
325.6
34.5
Confluence
Interstate Route 55
321.9
30.8
District DO, WQ
36th Street
322.5
31.4
District DO
Racine Avenue Pumping Station
NORTH BRANCH
322.8
31.7
CSO
Kinzie Street
325.8
34.7
District DO
Grand Avenue
326.0
34.9
District
WQ
Division Street
327.3
36.2
District
Webster Avenue Instream Aeration Station
238.9
37.8
SA
Fullerton Avenue
329.4
38.3
District DO
Diversey Parkway
330.1
39.0
District
WQ
Addison Street
331.3
40.2
District DO
Wilson Avenue
332.6
41.5
District
WQ
Lawrence Avenue
3329
41.8
District WL
North Branch Pump Station
333.1
42.0
CSO
North Branch Dam
333.3
42.2
Tributary IN
21
CHICAGO WATERWAY SYSTEM
LISTING OF FACILITY INFLOW AND MONITORING LOCATIONS (
Continued)
Location
USGS
River Mile
Distance U/S
of Lockport
Comments
NORTH SHORE CHANNEL
Foster Avenue
333.5
42.4
District
WQ, DO
Devon Avenue Instream Aeration Station
335.0
43.9
SA
Devon Avenue
335.0
439
District
Touhy Avenue
336.0
449
District
WQ
North Side Water Reclamation Plant
336.9
45.8
IN
Oakton Street
337.0
45.9
District WQ
Main Street
337.5
46.4
District DO
Simpson Street
339.5
48.4
Central Street
340.2
49.1
District WQ
Maple Avenue
340.6
49.5
USGS DM
Linden Street
340.8
49.7
Sheridan Road (Wilmette Pumping Station)
CHICAGO RIVER
341.0
49.9
District WL, IN
North and South Branch Junction
325.6
34.5
Wells Street
325.8
34.7
District
WQ
Clark Street
325.9
34.8
District DO
Michigan Avenue
326.4
35.3
Columbus Drive
326.6
35.5
USGS DM, WL
Lake Shore Drive
326.9
35.8
District
WQ
Chicago River Controlling Works
SOUTH FORK
327.1
36.0
District WL
South Branch Junction
321.7
30.6
Confluence
Archer Avenue
322.1
31.0
District DO, WQ
Racine Avenue Pumping Station
CALUMET-SAG CHANNEL
323.0
31.9
CSO
Sag Junction
303.4
12.3
Confluence
SEPA Station No. 5 at Junction
303.4
12.3
SA
Illinois and Michigan Canal
303.7
12.6
IN
Highway 83
304.3
13.2
District WQ, DO
104`h Street
307.5
16.4
District DO
Crooked Creek
308.1
17.0
IN
Mill Creek
309.0
17.9
IN
Stony Creek (West)
309.4
18.3
IN
Southwest Highway
310.7
19.6
District WL
SEPA Station No. 4
311.7
20.6
SA
Harlem Avenue
311.7
20.6
Navajo Creek
312.6
21.5
IN
Tinley Creek
314.1
23.0
IN
Cicero Avenue
315.0
23.9
District WQ, DO
Midlothian Creek
317.1
26.0
IN
Kedzie Avenue
317.1
26.0
Stony Creek (East)
317.9
26.8
IN
22
CHICAGO WATERWAY SYSTEM
LISTING OF FACILITY INFLOW AND MONITORING LOCATIONS (
Continued)
Location
USGS
River Mile
Distance U/S
of Lockport
Comments
SEPA Station No. 3
318.0
26.9
SA
Division Street
318.0
27.5
Ashland Avenue
319.1
28.0
District WQ
Little Calumet River Junction
Little Calumet River
319.6
28.5
Tributary IN
Halsted Street
320.1
29.0
District WQ, DO
SEPA Station No. 2
321.3
30.2
SA
Calumet Water Reclamation Plant
321.4
30.3
IN
125`h Street Pump Station
321.4
30.3
CSO
Indiana Avenue
322.4
31.3
District WQ
C & WI Railroad
322.6
31.5
District WQ
Conrail Railroad
325.4
34.3
Grand Calumet River
325.7
34.6
IN
O'Brien Lock and Dam
326.5
35.4
USGS DM District WL
WL=water level measurement.
WQ=water quality sampling location.
DM=discharge measurement location.
OU=outflow.
IN=inflow.
CSO=combined sewer overflow pumped inflow during storms.
DO=continuous dissolved oxygen monitoring location.
SA=supplemental aeration.
District=Metropolitan Water Reclamation District of Greater Chicago.
USGS=United States Geological Survey.
23
A
tt
ac
hm
e
nt 5
Comparison of the Chicago Area Waterway System
(CAWS)
and a Natural Rig
TYPICAL CHICAGO
AREA
WATERWAY
Deep Draft
The CAWS was constructed
specifically to facilitate urban
drainage and commercial barge
traffic. The steep sides allow for
maximum volume capacity and
barge navigation, but provide little
habitat for fish.
Impaired Sediments
conducive to healthy invertebrate
or fish communities, and are
generally more likely to be
associated with organic and
heavy metal contaminates.
dominate the
CAVVE: These
fine-grain sediments are not
Lack of Shade
The CAWS receives little shade
from trees relative to the overall
channel widths, especially in
areas of urban or industrial
land-use. These conditions
encourage algae growth and
discourage fish colonization.
i
urno ^ ^arrnu
It
sediments
Barge Traffic
Channelized Waterways
Most of the CAWS was
constructed or modified to be
straight with little variation in
width and depth. It was
designed specifically for
wastewater conveyance and
commercial navigation, without
accounting for any aquatic life
or recreational uses. There is no
riffle
or pool development.
Comme-dal ba ges arc
prevalent b iiuGh of the CAWS.
In 2006
,
over 12 million tons of
commercial goods were
shipped up through Lockport
Lock into the Chicago Sanitary
and Ship Canal on barges.
TYPICAL NATURAL RIVER
Gradually Sloping Banks
Canopy Cover
Natural banks allow light to
Trees provide shade for aquatic
penetrate to aquatic plants. They
life, keep the temperature down,
also offer a safer exit pathway
and limit algae growth.
for recreators.
variety of aquatic invertebrates.
with substrate for aquatic insects.
Coarse sediments are more stable
and not usually associated with
chemical contamination.
Heterogeneous
sedirr rit I
I -Strear i habil•at'j,r :w ,Jes shelter
are able to support a diverse
a
nd
spawn, rig area for fish, along
Varied Sediment Size
Rocks and Aquatic Vegetation
Controlled Flow
Hydrologic control structures
(locks, dams, etc.) adjust water
levels in the CAWS based on
anticipated rain events to protect
public health and prevent floedin
of homes and businesses. Most
of the time, flow in the CAWS is
much slower than that of a nature
river of comparable size. During
rain events, however, rapid
draw-down in water levels can
lead to unsafe flow conditions.
Sinuous Path
A natural river meanders around
curves and has varying depths,
widths, and flow velocities. This
variety functions to support a
diverse assemblage of fish and
invertebrates. Riffles increase thf
amount of oxygen in the water.
A
tta
c
hm
e
nt 6
Counties
HUC 10 Watersheds
2001 % Imperviousness
High : 100
Low : 0
Imperviousness from 2001 National Land Cover Dataset
A
tt
ac
hment
7
WATE
RBOR
NE
C
O
MME
R
CE
O
F T
H
E
UN
IT
E
D
S
T
A
T
ES
Calendar Year 2006
Part 3-
Waterways and Harbors
Great Lakes
Compiled under the supervision of
the Insitute for Water Resources
U.S. Army Corps of Engineers
Alexandria, Virginia
IWR-WCUS-06-3
ART 4
V
OFa"praphl
*^al ,tt*ae Ga send gy.
uay^r6¢rn*Ge4nrm^rd^
41o^epa
:
Qi^trlloatiane
d CRA.RT M
CNT ^ I" T H r ^.RM Y GCtiR
R4 O I' C NG! N C CR4
f1AJNy Nr44 1!d
n
Fa Ium ft
Wimb mA
j
by
djgF
pin. 0(&d Ad Fun daddal
P A
RT 4
IAAsyf1=(C OCEbH
,40
fW.SM.I I
D
WktIRW
RNICO&MMIM!
TH9 UMITID:£TATG$
Pirt"1
-
Airnuo.
,
wi s;t
pin 2.Ou Itoni t%
Mi s tIalpp I Rim Systun en>knillli
d"
i
Plrts - Oro tLIMI
pirt+ - NoI-Mm Caoi#^PI^"
^M[ ^ii^ xiwr[I
Ps rtp."-
S isrhorni
"
4omnrnr"uf7n
U
nlt}dShi's"
Summiry.)
Pik RT 5
r ^k R,T
2
ATL4 M7YC.OCEA IV
PLl ERTO
"RICO
1i4 RISL^.MDBw^
a
d
ti
crxaec^w^e,
^
CONTENTS
CONTENTS
Page
Introduction
. .
.. . . . . . . . . . ... . . .. . . . . . . . . ...... . . . . . . . .. . . ... ii
Terminology
. . .
. . . . . . . . . . . . . . . . . . . . . . . . . . . . . . . . . . . . . . . . . . . v
Commodity Classification
List ... . . . . . . . . . . . . . . . ... . . . . . . . . . . . .
.
viii
Table 1 - Ton
-
Mileage of United States Freight Carried on the Great Lakes by Area . .
.. . . . ,
x
Table 2 - Freight Tons of United States Traffic Carrried on the Great Lakes by Area . . . . . . . xi
Table 3 - Net Summary of Foreign and Domestic Freight Carried on the
Great Lakes
,
by Type of Traffic and Commodity
. ... . . . . .. . . .... . ... . .
xii
Freight Traffic
Chicago, IL . . . . . . . . . . . . . . . . . . . . . . . . . . . . . . . . . . . . . . . . . . . . . . 3
Detroit,
MI .. . . . . . . . . . . . . . . . . . . . . . . . . . . . . . . . . . . . . . . . . . . . . . 15
Buffalo,
NY . . . . . . . . . . . . . . . . . . . . . . . . . . . . . . . . . . . . . . . . . . . . . 48
Rock
Island
, IL . . . . . . . . . . . . . . . . . . . . . . . . . . . . . . . . . . . . . . . . . . . 58
Trips and Drafts
Chicago, IL . . . . . . . . . . . . . . . . . . . . . . . . . . . . . . . . . . . . . . . . . . . . . 67
Detroit, Ml .. . . . . . . . . . . . . . . . . . . . . . . . . . . . . . . . . . . . . . . . . . . . . . 71
Buffalo, NY . . . . . . . . . . . . . . . . . . . . . . . . . . . . . . . . . . . . . . . . . . . . . 95
Rock Island, IL . . . . . . . . . . . . . . . . . . . . . . . . . . . . . . . . . . . . . . . . . 103
Freight Traffic Index
. . . .
. . . . . . . . .
... . . . . . . . . . . . . . . . . . . . . . .. . . .
104
Trips and Drafts Index .. . . . . . . . . . .. . . . . . . . . . . ... . . . .. . . . . .. . . . 108
U.S. ARMY CORPS OF ENGINEERS
GREAT LAKES i
INTRODUCTION
Introduction
General
Waterborne
Commerce of the
United
States,
WCUS,
Part
3 is one of a series of
publications which provides statistics on the
foreign and domestic waterborne commerce
moved on the United States waters. WCUS,
Parts
1-4
present
detailed data on the
movements of vessels and commodities at the
ports and harbors and on the waterways and
canals of the United States, and its territories.
Data on foreign commerce are supplied to
the Corps of Engineers by the U.S. Bureau of
the Census
,
the U
.
S. Customs and Border
Protection
,
and
purchased
from
the
Commonwealth Business Media
,
Inc., Port
Import Export Reporting Service.
The publication numbers and the geograph-
ical areas covered in WCUS,
Parts
1-5 are de-
tailed below:
WCUS
,
Part 1 Atlantic Coast
WCUS
,
Part 2 Gulf Coast
,
Mississippi River
System and Antilles
WCUS
,
Part 3 Great Lakes
WCUS
,
Part 4 Pacific Coast
,
Alaska
and Hawaii
WCUS
,
Part 5 National Summaries
Legal Authority
The legal authority for the collection, compilation
and publication of
waterborne
commerce
statistics by the Army Corps of Engineers is
Section
11
of the Rivers and Harbors
Appropriations Act of 1922 (42 Stat. 1043), as
amended, and codified in 33 U.S.C. 555 and
provides the following:
Owners, agents, masters, and
clerks of vessels and other craft
plying
upon
the
navigable
waters of the United States, and
all individuals and corporations
engaged in transporting their
own goods upon the navigable
waters of the United States,
shall furnish such statements
relative to vessels, passengers,
freight and tonnage as may be
required by the Secretary of the
Army:
Provided.
That
this
provision shall not
apply to
those rafting logs, except upon
a direct request upon the owner
to furnish specific information.
Every
person
or
persons
offending
against
the provisions
of this section shall, for each
and every offense, be liable to a
fine of not more than $5,000 or
imprisonment not exceeding two
months, to be enforced in any
district court of the United
States within whose territorial
jurisdiction such offense may
have
been
committed.
In
addition, the Secretary
may
assess a
civil
penalty of up to
$2,500 per violation against any
person or entity, that fails to
provide
timely,
accurate
statements
required
to
be
submitted
pursuant to
this
section by the Secretary.
The vessel and commodity movement
information collected and compiled is designed
to
meet the data requirements of the
Department of the Army in connection with the
duties assigned by Congress. These data also
provide
valuable
information
for
other
governmental
departments, commercial
and
shipping concerns and others interested in the
U.S. transportation industry.
Domestic
Commerce
Contiguous and non-contiguous states and
territories
constitute the geographical space
upon which
domestic commerce may be
transported. This includes Hawaii, Alaska, the
48 contiguous states, Puerto Rico and the Virgin
Islands, Guam, American Samoa, Wake Island
and the U.S. Trust Territories.
The waterborne traffic movements are
reported to the Corps of Engineers by all vessel
ii
GREAT LAKES
U.S. ARMY CORPS
OF ENGINEERS
INTRODUCTION
operators of record on ENG Forms 3925 and
3925b (or equivalent) approved by the Office of
Management and Budget under the Paperwork
Reduction Act (44 U.S.C. 3510(x)). The reports
are
generally
submitted
on the basis of
individual
vessel
movements completed. For
movements with cargo, the point of loading and
the point
of
unloading
of each individual
commodity must be delineated. Cargo moved for
the military agencies in commercial vessels is
reported as ordinary commercial cargo; military
cargo
movements in Department of Defense
vessels are not collected.
In
summarizing the domestic commerce
certain movements are excluded: Cargo carried
on general ferries; coal and petroleum products
loaded from shore facilities directly into bunkers
of vessels for fuel; and insignificant amounts of
government
materials (less than 100 tons)
moved on government owned equipment in
support of Corps projects.
Foreign Commerce
Foreign commerce is waterborne import, export
and in-transit traffic between the United States,
Puerto Rico and the Virgin Islands and any
foreign country. These statistics do not include
traffic
between any foreign country and the
United
States Territories
and
Possessions
(American
Samoa, Guam,
North
Mariana
Islands and U.S. Outlying Islands).
Beginning
with the calendar year 2000
publication, foreign
waterborne import, export
and in-transit
cargo statistics
are derived
primarily from data purchased from the Port
Import Export Reporting Service, a division of
the Commonwealth
Business Media
,
Inc.
and
supplemented by data furnished to the Corps of
Engineers by the U.S. Bureau of the Census
and the U.S. Customs and Border Protection .
Foreign cargo is matched to vessel moves to
improve geographic specificity.
The Republic of Panama is considered a
foreign
country.
However, individual vessel
movements with origin and destination at United
States ports traveling via the Panama Canal are
considered domestic traffic.
Alaskan crude oil
(origin at Valdez, AK) shipped via the Panama
pipeline (west to east) and destined for gulf and
east coast ports is also considered domestic
commerce.
Import and export shipments for use of the
United States Armed Forces abroad are not
reported to the Waterborne Commerce Statistics
Center (WCSC). Beginning with calendar year
1989 shipments under the military assistance
program of the Department of Defense are
included in the statistics under the appropriate
commodity code. In prior years these cargoes
were given as commodity code 9999.
Commodity Descriptions
The first two digits of the WCSC publication
codes correspond with the Lock Performance
Monitoring System (LPMS) commodity codes.
Both
LPMS
and
WCSC codes were
standardized to reflect the hierarchical structure
of
the
Standard
International
Trade
Classification
(SITC) Revision
3 commodity
codes. SITC, Rev. 3 commodity codes conform
to the Harmonized Commodity Description and
Coding System (HS). Using SITC, Rev. 3 allows
direct comparisons with U.S. Imports, exports,
and in-transits, as well as, with commodity
movements of other countries.
Tonnage
The tonnage figures provided throughout the
WCUS
,
Parts
14 represent short tons (2,000
pounds).
Tonnage figures are rounded to the
nearest 1,000 tons.
A zero represents less than 500 tons but
more than zero. A dash means no tonnage.
Columns and rows may not add up exactly to
totals and subtotals due to rounding.
Some freight tables have "Total" and "Grand
Total".
The "Total"
means that
in some cases it
is the total for domestic or foreign and Canadian
traffic.
The "Grand Total" specifically represents
the sum total of all the different traffics, including
all
domestic and foreign traffic. If a particular
column or traffic type has only dashes and
zeroes in the tonnage fields for that entire freight
table then that column (traffic type) will not print.
Ton-Miles
For domestic movements, ton-miles equal
the cargo tonnage times the distance between
the point of loading on the water and the point of
unloading on the water. For U.S. - Canada
movements on the Great Lakes, ton-miles equal
the tonnage times the distance between the U.S.
U.S. ARMY CORPS OF ENGINEERS
GREAT LAKES iii
INTRODUCTION
and Canadian locations. For overseas imports
and exports, foreign ton-miles are computed by
multiplying the cargo tonnage by the miles
carried
on U.S.
waterways and channels.
Ton-miles are rounded to the nearest 1,000
ton-miles.
The ton-mile data appears in the
publication
by traffic type at the end of a
particular freight table for a given project. Since
there are columns that will not print (see
tonnage above) the ton-miles associated with
these columns will likewise not be included in
the total ton-miles for that particular freight table.
They will be included in "Ton-miles All Traffic" at
the end of the project.
Trips
A trip is a vessel movement. For
self-propelled vessels, a trip is logged between
every point of departure and every point of
arrival. For loaded barges, a trip is logged from
the point of the loading of the barge to the point
of unloading of the barge (i.e., excluding fleeting
areas). For empty barges, trips are logged from
point
of unloading to the point of loading
counting the fleeting areas in between (e.g. if an
empty barge moved from Dock A to Dock B and
the barge stopped at three fleeting areas in
between, then four trips are logged.)
Some towboat trips and empty barge moves
are estimated from a sample to expedite
processing and reduce costs. The number of
trips also includes vessels engaged in foreign
trade.
These moves are furnished by U.S.
Customs and Border Protection.
To
more accurately reflect actual traffic
patterns (e.g. inbound versus outbound trip
counts), some adjustments are made to the
domestic trip counts in the trip and draft tables in
this publication.
Special Interest
Beginning in calendar year 2000, the tonnage
of fish landings are no longer included in this
publication.
Passenger totals are not included in this
publication
but
are available on request.
Passenger data not relevant to transportation
such as excursions, sight-seeing, and floating
casinos are no longer collected as of calender
year
2001.
As of calender year 2004,
passengers, autos, and railway cars are not
included in the domestic trips and drafts tables.
Cruise ships in foreign traffic are included in the
foreign trips and drafts tables.
Beginning
in
calender year
2001, the
movement of tugboats
used to assist larger
vessels within the districts of New England
(Boston), New York, New Orleans, Galveston
(Houston) are no longer collected,
iv
GREAT LAKES
U.S. ARMY CORPS OF ENGINEERS
TERMINOLOGY
Terminology
Types of Traffic
Foreign
Inbound
:
Includes waterborne imports and inbound in4ransit merchandise.
Imports
Overseas
:
Inbound merchandise originating in foreign countries other than Canada and
arriving by marine vessel for direct U.S. consumption and entries into custom bonded
storage and manufacturing warehouses.
Canadian
:
Inbound merchandise originating in Canada and arriving by marine vessel for
direct
U.S. consumption and entries into custom bonded storage and manufacturing
warehouses.
Inbound In
-transits.
Merchandise coming into the United States by marine vessel from a
foreign country and shipped to a foreign country without having been entered as an import.
In-transit merchandise is treated as inbound when unloaded from a marine vessel.
Outbound
:
Includes waterborne exports and outbound in-transit merchandise.
Exports
Overseas
:
Outbound domestic merchandise and re-export of foreign merchandise from a
U.S. foreign trade zone shipped by marine vessel to foreign countries other than Canada.
Canadian
:
Outbound domestic merchandise and re-export of foreign merchandise from a
U.S. foreign trade zone shipped by marine vessel to Canada.
Outbound In-transits
:
Merchandise coming into the United States from a foreign country and
shipped by marine vessel to a foreign country without having been entered as an import.
In-transit merchandise is treated as outbound when loaded onto a marine vessel.
Domestic
Coastwise
:
Domestic traffic receiving a carriage over the ocean, or the Gulf of Mexico,(e.g. New
Orleans to Baltimore, New York to Puerto Rico, San Francisco to Hawaii, Alaska to Hawaii).
Traffic between Great Lakes ports and seacoast ports, when having a carriage over the ocean, is
also termed
Coastwise.
Lakewise:
Waterborne traffic between the United States ports on the Great Lakes System. The
Great Lakes System is treated as a separate waterway system rather than as a part of the inland
waterway system. In comparing historical data for the Great Lakes System, one should note that
prior to calendar year 1999, marine products, and sand and gravel being moved from the Great
Lakes to Great Lake destinations were classified as local traffic. From 1999 on, these activities
are classified as lakewise traffic.
Internal
:
Vessel movements (origin and destination) which take place solely on inland waterways.
An inland waterway is one geographically located within the boundaries of the contiguous 48
states or within the boundaries of the State of Alaska.
The term "internal traffic" is also applied to these vessel movements: those which involve
carriage on both inland waterways and the Great Lakes; those occurring between offshore areas
and inland waterways (e.g., oil rig supplies and fish); and those taking place within Delaware Bay,
Chesapeake Bay, Puget Sound, and San Francisco Bay, which are considered internal bodies of
water rather than arms of the ocean.
U.S. ARMY CORPS
OF ENGINEERS
GREAT LAKES v
TERMINOLOGY
Intraport
:
Movement of freight within the confines of a port whether the port has one or several
arms or channels included in the port definition. This traffic type will not include car-ferries and
general ferries moving within a port.
Through
:
Movements transiting a waterway, or stretch thereof, as defined in the project description
of individual
tables
, and having origins and destinations outside of the defined area.
Intra
-
waterway
:
Shipments and receipts within the limits of a river, waterway or canal. This traffic
will not include car-ferries and general ferries moving within a waterway or Corps project.
Intra
-
territory
:
Traffic between ports in Puerto Rico and the Virgin Islands, which are considered a
single unit.
Traffic
Direction
Waterways
Upbound
:
Traffic that moves in an upstream direction. For waterways without a characteristic
monodirectional flow (e.g. the Gulf Intracoastal Waterway), "upbound" means in a northerly or
easterly direction.
Downbound
:
Traffic that moves in a downstream direction. For waterways without a characteristic
monodirectional flow, "downbound" means in a southerly or westerly direction.
Inbound
:
Traffic moving from one waterway into another where the destination is on the subject
waterway.
Outbound
:
Traffic moving from one waterway into another where the origin is on the subject
waterway.
Ports
Receipts
:
Traffic moving from one location to another where the destination is within the limits of the
subject port.
Shipments
:
Traffic moving from one location to another where the origin is within the limits of the
subject port.
Commodity Descriptions
:
The first two digits of the Waterborne Commerce Statistics Center (WCSC)
publication codes correspond with the Lock Performance Monitoring System (LPMS) commodity
codes. Both LPMS and WCSC codes were standardized to reflect the hierarchical structure of
the Standard International Trade Classification (SITC) Revision 3 commodity codes. SITC, Rev.
3 commodity codes conform to the Harmonized Commodity Description and Coding System (HS).
Using SITC, Rev. 3 allows direct comparisons with U.S. imports and exports, as well as with
commodity movements of other countries.
Tons: The tonnage
figures
provided throughout the Waterborne
Commerce of the United
States,
WCUS,
Parts
1-5 represent short tons (2,000 pounds).
Where noted, tonnage figures are rounded to the nearest thousand tons. A zero represents less
than 500 tons but more than zero. Dashes mean zero tons. Columns and rows may not add up
exactly to totals and subtotals due to rounding.
Ton-miles:
Water carriage ton-miles were first compiled and published in calendar year 1962. The
distances
used
are statute miles. The ton-mile parameter measures the total activity on a
waterway or channel. Ton-miles are not computed for ports.
Domestic ton-miles are calculated by multiplying the tons of commerce being moved by the
number of miles actually moved on the water from the point of loading onto the vessel to the point
of unloading off of the vessel. Coastwise ton-miles includes the distance across open ocean and
vi
GREAT LAKES
U.S. ARMY CORPS OF ENGINEERS
TERMINOLOGY
the Gulf of Mexico.
For rivers, inland waterways and coastal routes the distances were computed from waterway
survey maps , NOAA charts and records of the Corps of Engineers.
For the Great Lakes system the ton-miles are computed for movements of cargo west of the
international boundary of St. Regis, Quebec, Canada to head of Lake Superior at Duluth, MN and
Superior, WI.
For lakewise domestic movements, ton-miles equal the cargo tonnage times the distance
between the U.S. Great Lakes ports.
For Canadian imports and exports, and in-transits across the Great Lakes foreign ton-miles are
computed as the tonnage times the distance between the U.S. and Canadian ports.
For overseas imports and exports, and in-transits foreign ton-miles are computed by multiplying
the cargo tonnage by the miles carried on U.S. waterways and channels. Distances across the
oceans are not included in the computation of the overseas foreign ton-miles.
Ton-miles are rounded to the nearest thousand.
Trip Ton-miles: Trip ton-miles is a measure of a single waterway's contribution to the whole waterway
system. Trip ton-miles are computed by identifying every commercial cargo-carrying vessel that
has plied a particular inland waterway and summing the products of the tons times the total
trip-miles for each vessel trip. "Trip-miles" is the total distance from origin (loading) to destination
(unloading). For example, a barge carrying 1,200 tons of wheat might only travel 30 miles on the
Illinois
River but its total trip to New Orleans might be 1,000 miles. This trip would contribute
1,200,000 trip ton-miles to the Illinois River. Small rivers often contribute to the traffic on larger
rivers. Published trip ton-miles do not include coastal and Great Lakes vessel movements.
Trans-shipments: Ports and offshore anchorages where cargo is moved from one vessel to another.
These are. St. Lucia, Virgin Islands; Heald Bank off the Louisiana and Texas coasts; Chirqui
Grande, Panama; Puerto Armuelles, Panama; and Hondo Platform-Pacific Ocean.
U.S. ARMY CORPS OF ENGINEERS
GREAT LAKES
vii
COMMODITY CLASSIFICATION LIST
Commodity Classification List
Major Grouping
Major Grouping
Minor
Grouping
Minor Groupni
Pub Group Pub Name
Pub Group Pub Name
3282 Pigments & Paints
00 units
3283
Coloring Mat. NEC
0200 Vehicles
3284 Medicines
0300 Passengers
3285 Perfumes
&
Cleansers
3286 Plastics
10 Coal
3291
Pesticides
1100 Coal
&
Llgnite
3292
Starches
,
Gluten,Glue
1200
Coal Coke
3293
Explosives
3297
Chemical Additives
20 Petroleum
&
Petroleum Products
3298 Wood & Resin Chem.
21 Crude Petroleum
3299
Chem. Products NEC
2100 Crude Petroleum
22-29 Petroleum Products
40 Crude Materials, Inedible Except Fuels
2211
Gasoline
41
Forest Products, Wood and Chips
2221
Kerosene
2330 Distillate Fuel Oil
2340 Residual Fuel Oil
2350 Lube Oil & Greases
2410
Petro. Jelly & Waxes
2429 Naphtha & Solvents
4110
4150
4161
4170
4189
4190
Rubber & Gums
Fuel Wood
Wood Chips
Wood in the Rough
Lumber
Forest Products NEC
2430 Asphalt, Tar & Pitch
42 Pulp and Waste Paper
2540
Petroleum Coke
4225 Pulp & Waste Paper
2640 Hydrocarbon & Petrol Gases,
43 Soil, Sand, Gravel, Rock and Stone
Liquefied and Gaseous
2990 Petro. Products NEC
30 Chemicals and Related Products
4310
4322
4323
4327
Building Stone
Limestone
Gypsum
Phosphate Rock
31
Fertilizers
3110 Nitrogenous Fert.
3120
Phosphatic Fert.
3130 Potassic Fert.
4331
4333
4335
4338
Sand & Gravel
Dredged Material
Waterway Improv. Mat
Soil & Fill Dirt
3190 Fert. & Mixes NEC
44 Iron Ore and Scrap
32 Other Chemicals and
4410 Iron Ore
Related Products
4420 Iron & Steel Scrap
3211 Acyclic Hydrocarbons
45 Marine Shells
3212 Benzene & Toluene
4515 Marine Shells
3219 Other Hydrocarbons
46 Non-Ferrous Ores and Scrap
3220
Alcohols
4630
Copper Ore
3230 Carboxylic Acids
4650 Aluminum Ore
3240
Nitrogen Func. Camp.
4670
Manganese Ore
3250 Organo-Inorganic Comp.
4680
Non-Ferrous Scrap
3260
Organic Comp. NEC
4690
Non-Ferrous Ores NEC
3271 Sulphur (Liquid)
47 Sulphur, Clay and Salt
3272
Sulphuric Acid
4741 Sulphur, (Dry)
3273
Ammonia
4782
Clay & Refrac. Mat.
3274 Sodium Hydroxide
4783 Salt
3275
Inorg. Elem.,Oxides,
48 Slag
& Halogen Salts
4860 Slag
3276
Metallic Salts
49 Other Non-Metal. Min.
3279
Inorganic Chem. NEC
4900 Non-Metal. Min. NEC
3281
Radioactive
Material
viii
GREAT LAKES
U.S. ARMY CORPS OF ENGINEERS
COMMODITY CLASSIFICATION LIST
Commodity Classification
List (Continued)
MaJor Grouping
Minor Grouping
P.Lib
soup Pub Name
50
Primary Manufactured Goods
51
Paper Products
5110
Newsprint
5120
Paper & Paperboard
5190
Paper Products NEC
52 Lime, Cement and Glass
5210 Lime
5220
Cement & Concrete
5240
Glass & Glass Prod.
5290 Misc. Mineral Prod.
53 Primary Iron and Steel Products
5312 Pig Iron
5315
Ferro Alloys
5320 I&S Primary Forms
5330 I&S Plates & Sheets
5360 I&S Bars & Shapes
5370 I&S Pipe & Tube
5390 Primary I&S NEC
54 Primary Non-Ferrous Metal Products
5421 Copper
5422
Aluminum
5429 Smelted Prod. NEC
5480 Fab. Metal Products
55 Primary Wood Products; Veneer
5540 Primary Wood Prod.
60
Food and Farm Products
61 Fish
6134 Fish
(
Not Shellfish)
6136 Shellfish
62-64
Grain
6241
Wheat
6344
Corn
6442
Rice
6443 Barley & Rye
6445
Oats
6447
Sorghum Grains
65 Oilseeds
6521 Peanuts
6522 Soybeans
6534 Flaxseed
6590
Oilseeds NEC
66 Vegetable Products
6653
Vegetable Oils
6654
Vegetables & Prod.
67 Processed Grain and Animal Feed
6746 Wheat Flour
6747
Grain Mill Products
6781
Hay
&
Fodder
6782
Animal Feed, Prep.
68 Other Agricultural Products
6811
Meat
,
Fresh, Frozen
6817
Meat
,
Prepared
MaJor Grouping
Minor
Grouping
Pub Group
„
P_ub Name
6822
Dairy Products
6835 Fish, Prepared
6838 Tallow, Animal Oils
6839 Animals & Prod. NEC
6856 Bananas
&
Plantains
6857 Fruit & Nuts NEC
6858 Fruit Juices
6861
Sugar
6865 Molasses
6871 Coffee
6872
Cocoa Beans
6885
Alcoholic Beverages
6887
Groceries
6888
Water & Ice
6889 Food Products NEC
6891
Tobacco
&
Products
6893 Cotton
6894
Natural Fibers NEC
6899 Farm Products NEC
70 All
Manufactured Equipment, Machinery
and Products
7110 Machinery (Not Elec)
7120
Electrical Machinery
7210
Vehicles & Parts
7220
Aircraft & Parts
7230 Ships & Boats
7300
Ordnance & Access.
7400 Manufac. Wood Prod.
7500
Textile Products
7600
Rubber & Plastic Pr.
7800 Empty Containers
7900 Manufac. Prod. NEC
80
Waste and Scrap NEC
8900
Waste and Scrap NEC
90
Unknown or Not Elsewhere Classified
99 Unknown or Not Elsewhere Clsfd
9900
Unknown or NEC
U.S. ARMY CORPS OF ENGINEERS
GREAT LAKES ix
TABLE 1-TON-MILEAGE OF UNITED STATES FREIGHT CARRIED ON THE GREAT LAKES BY AREA
Ohni-nnri inn-mil-)
Forei n
Domestic
Area
Area Totals
Overseas
Canadian
Coastwise
Lakewise
Internal
Intra ort
In/Out
Through
In/Out
Through
In/Out
Through
In/Out
Through
in/Out
Throu h
In/Out
DETROIT RIVER,
MI
2,042
,
653
15,253
139,957
63,192
911
,
710
-
245,231
664
,
697
2
,
311
301
- -
'LAKE
"LAKE
LAKE HURONERIEMICHIGAN
24,785,07913,28622,640
,
,
470507
1
,
096,7135421,926
,782
1,
1,232379,488
,
665-
3,7864,163,955750
,
,
752251
74,493,121
,
434,967
3
,
034
--
-
-
14,674,
24,458
,
673,583
,
954872
102
,
,
407,179898,266592,753
171,070
,
909
-
7,630
94,186--
-LAKE ONTARIO
7,846
,
448
953
2,895
,
015
60
,
143
4
,
882,583
- 4,245
3
,
509
-
--
ST.
LAKE
CLAIR
SUPERIORRIVER,
MI
26,4622,799,893
,
606
840
,
190
--
176,075
5,145,9277,198
1
,
470,347295,966
-
-
20,005,890170,138
1
,
239,479251
-
1
1,037-
--
""ST.
WELLAND
ST. MARYS
LAWRENCE
CANAL,
RIVER,
CANADARIVER
MI
4,8742,102720,960
,
,
234960
---
-
827139200,939
,
,
986712
306
,
,
419046
-
11,243,990
,
203,195519,233
--
1,211295-
32,692--
3,491,943493-
----
--
---
NET UNITED STATES TRAFFIC ON THE GREAT LAKES
107.561
.
810
9.489 .655
36,378
,
996
8,785
61,559,929
14
,
808
109,637
'Including Upper Niagara River
-Including th
e Port of Chicago (Chicago Harbor,
North Branch
,
South Branca
, Sanitary Ship Canal, Calumet-
Sag Channel
, Lake Calumet and Calumet Harbor and River); excludes Port of Chicago internal traffic
-Including Lower Niagara River
""Between International
boundary line and Lake Ontario
TABLE 2-FREIGHT TONS OF UNITED STATES TRAFFIC CARRIED ON THE GREAT LAKES BY AREA
Forei n
Domestic
Area
Area Totals
Overseas
Canadian
Coastwise
Lakewise
Internal
Intra ort
In/Out
Through
In/Out
Throu h
In1Out Throu h
In1Out
Throu h
InfOut
Through
In/Out
*LAKE
DETROIT
ERIERIVER,
MI
72,72980,366
2,197730
4,5155,245
22,9793
,
648
19,08229
,
410
---11
-
23,19412
,
770
21,4424
,
312
20510
-10
3,337-
**LAKE
LAKE HURONMICHIGAN
111,33964,411
2,3216
4,508
93,196
,
465
29,589
-
---
3518,861
,
226
558
,
,
608153 2,950----
-27
5,840-
***LAKE ONTARIO
27,475
15
7,442
764
19
,
225
-
11
18
0
-
-
--
LAKE SUPERIOR
77,473
2,187
14,586
2
,
658
-
-
57,975
13
1
53
****ST.
ST.
ST.
CLAIR
MARYS
LAWRENCE
RIVER,RIVER
MI
,
RIVER
Ml
77,48181,29918,755
-
--
4,5152,1877,457
298629157
233011,130
,
,
252922
---
--11
19
,
,
607000
-
3154,562
,
782
--
---
--
-
27
-
-
WELLAND
NET UNITED
CANAL,
STATES
CANADA
TRAFFIC ON THE GREAT LAKES
173.013
26,
684
-
7
.457
7
,
442
---
56.
215
19
,
212
-
11
11
---
96. 934
18
2
.
673
9.723
-
*fncluding Upper
Niagara River
*Including the
Port of Chicago (Chicago Harbor,
North Branch
,
South Branch, Sanitary Ship Canal, Calumet-Sag Channel, Lake Calumet and Calumet Harbor and River); excludes Port of Chicago internal traffic
Including Lower Niagara River
**"*Between International
boundary line and Lake Ontario
x
TABLE 3 - NET SUMMARY OF FOREIGN AND DOMESTIC FREIGHT CARRIED ON THE GREAT LAKES
BY TYPE OF TRAFFIC AND COMMODITY
Comparative Statement of
Traffic (
thousand short tons)
Year
Total
Year
Total
Year
Total
Year
Total
1997
188,579
2000
187,489
2003
156,
484
:
2006
=
173,013 `
1998
192,235
2001
171,359
2004
178,434
1999
182,862
2002
167,226
2005
169,411
Freight Traffic, 2006 (thousand short tans)
Foreign
Domestic
Commodity
Grand Total
Inbound
Outbound
"A
adjan Ove
ns-211
Coastwise Lakewise
Internal Intraport
Total
,.
ah commodities
173,013
22;519
3,605
33,696
3,852
11 96,934
2,673
9,723.
Total coal
44,896
1,280
135
- 181612
41
21,200
805
2,823
1100 coal &
lignite
42,824
783
-
18,266
20,839
115
2 822
1200 coal coke
2,073
497
135
346
41
361
691
,
2
.................
...
Total petroleum and petroleum products
5,067
676
0
1,692
.:
59
11
1,469
320 .' 841
2100
Subtotal
Subtotal
crude petroleum
petroleum
crude petroleumproducts
4,952115
115
676
0
1,577
115
115
-
-59
11
1,469
320
841
2211 gasoline
537
-
215
6
11
291
11
3
2221
2330 distillate
kerosenefuel
oil
78332
221-
----0
13232
--
125
63
242
2340 residual
fuel oil
530
294
-
29
114
52
41
2429
2350
naphtha
lube oil &
&
greasessolvents
334
4
-
8
7
19
2430 asphalt, tar & pitch
1,031
4
-
54
-
764
169
39
2540 petroleum coke
1,988
156
-
1,110
53
165
13
490
2640 hydrocarbon & petrol gases, liquefied and
1
1
a
0
gaseous
2990 petro. products nec
13
1
4
7
Total
'.
chemicals and related
'
products
990
277
38
- 334 -
-139
55
1
,
46.
3110
Subtotal
nitrogenous
fertilizers
fort.
270
47
215
-
6
6
-
-
-
---
42
49
-
3120 phosphatic fert.
5
5
3130 potassic Pert.
216
215
-
-
1
3190 fort. &
mixes nec
2
2
Subtotal other chemicals and related
720
63
32
334
139
6
146
products
3211 acyclic hydrocarbons
12
-
12
0
3212 benzene & toluene
78
--
-
78
3219 other hydrocarbons
37
-
9
-
-
-
28
3220 alcohols
21
0
6
15
3250 organo - inorg. comp.
0
0
3260 organic comp. nec
6
6
3274 sodium hydroxide
16
16
3275 inorg. elem., oxides, & halogen salts
128
63
0
65
3276 metallic salts
421
23
155
139
-
103
3282 pigments & paints
0
0
3285 perfumes & cleansers
0
0
3286 plastics
0
0
3299 chem, products nec
0
-
-
0
Total crude naterlals,
:
Inedibte
except fuels
- 105,111
16,814
433
111,
355
464
69,381
979
5,684
Subtotal forest products, wood and chips
171
96
41
33
-
0
0
4170 wood in the rough
53
18
1
33
-
0
-
0
4190
4189
4225
Subtotal
Subtotal
lumberforest
pulp &
products
soil,
pulp
waste
sand,
and
papernec
waste
gravel,
paperrock
and stone
37,157
118
122
1220
5,459--
78
122
122
--
-
40
4,074--
-
0
-
-
43
-
25,029
0
278
-
2,274
-
4322
4310
limestonebuilding
stone
30,90841
3,854-
--
3,22141
-
23,812
-
21
4323
4331 sand
gypsum&
gravel
5,192927
1,5978
--
693119
43
521643
2780
2,215-
4335 waterway improv, mat
90
53
-
37
4338 soil & fill dirt
0
-
0
0
Subtotal iron ore and scrap
58,848
5,770
-
6,438
230
42,895
227
3,288
4410 iron ore
58,573
5,653
6,429
230
42,830
177
3,254
4420 iron & steel scrap
275
117
-
9
65
50
34
4650
4670
Subtotal
manganese
aluminum
non-ferrous
oreore
ores and scrap
204
616
10
208
1185
249
-84
132
--
--
21
-
-
52
6
-
-
4680
4690
non-ferrous
non-ferrous
scrapores
nec
248154
831
165-
132--
21
Subtotal sulphur, clay and salt
419
141
13
25
170
9
59
--
4782 clay & refrac. mat.
419
141
13
25
170
9
59
--
Subtotal slag
2,181
1,052
--
184
537
407
2
4860 slag
2,181
1,052
--
184
-
537
407
2
Subtotal other non-metal
.
min.
5,597
4,088
7
469
-
910
1
1122
4900 non-metal, min. nec
5,597
4,086
7
469
910
1
122
xii GREAT LAKES
U.S. ARMY CORPS
OF ENGINEERS
TABLE 3 - NET SUMMARY OF FOREIGN AND DOMESTIC FREIGHT CARRIED ON THE GREAT LAKES
BY TYPE OF TRAFFIC AND COMMODITY
Freight Traffic,
2006 - continued
(thousand short tons)
Foreign
Domestic
Commodity
Grand Tota
Inbound
Outbound
Canadian' Overseas" Canadian Overseas
Coastwise Lakewise Internal
Intraport
Total primary
'
manufactured goods
2,840
123
4,253
430
214
Subtotal paper products
1
-
1
0
5120 paper & paperboard
1
-
1
5190 paper products nec
0
-
Q
Subtotal
lime, cement
and glass
7,223
3,018
0
122
4,028
6
49
5210
5220
limecement
& concrete
7,15154
3,002-
122
3,97454
-5
-49
5240 glass & glass prod.
0
---
-
0
5290
Subtotal
misc. mineral
primary
prod.
iron and steel products
3,68718
21817
2,6710
0
0
224
0
413
2
160
-
5312 pig iron
483
173
79
116
112
3
5320 i&s primary forms
1,395
34
1,355
-
4
1
5330 i&s plates & sheets
1,336
5
986
-
-
0
244
101
5360 i&s bars & shapes
200
-
189
0
-
0
9
2
5370
5390 primary
i&s pipe
i&s
& tubenec
21657
-5
576
-0
--
1080
-44
-54
Subtotal primary non
-
ferrous metal
277
87
168
1
5
1
11
5
products
$422
5480
5429
€ab.
aluminumsmelted
metal
prod.
productsnec
205703
6918
16602
-01
--5
-01
-100
-5
Total food
,
and farm
`
products
5,498
149' :
88
.
1,562
:: :
3,2741
.344
81
Subtotal fish
0
0
6134
Subtotal
fish
(not
grainshellfish)
3,8710
149
15
933
2,405
342
0
-
26
6241 wheat
1,636
50
15
153
1,333
81
3
6344 corn
1,675
-
-
780 1,072
-
23
6445
Subtotal
oats
oilseeds
1,231360
99
-
594
-
594
-
261
2
-
42
6522 soybeans
1,161
594
553
2
12
6590
6534 flaxseedoilseeds
nec
4129
- 41
-
29
6654
Subtotal
Subtotal
vegetables
vegetable
processed
& prod.
productsgrain
and animal food
834283
--
-
-
30
838312
6747 grain miff products
42
30
12
Subtotal other agricultural products
271
73
4
180
14
6822 dairy products
0
0
6861
6835 fish,
sugarprepared
950
73
-0
-9
14
6865
6889
6885
6899
molassesalcoholic
farm
food products
products
beveragesneenec
172320
-
-
03
2
172-
-
-
Total.
all manufact
ured equipment,
203
1
33
19
9
126
3
14
machinery and. products
7110 machinery (not olec)
78
1
29
7
8
17
2
14
7120
7230
7210
electrical
ships
vehicles
& boats&
machineryparts
931
0
001
028
-0
00
-
0
-
-
7400 manufac. wood prod.
0
0
-
0
0
7500 textile products
1
0
-
1
7900
7600
manufac,
rubber & plastic
prod, necpr.
1110
0
30
01
-
107
0
Total
unknown or
not elsewhere
classified
60
38 -
22
9900 unknown or nec
60
38
22
Tons
All Traffic
(x1000
)
173,013
Total Trip
-
ton-miles Internal and Intraport
(
x1000
)
3,023,994
Includes 13,436 tons of
foreign
inbound In-transits.
Includes through traffic.
U.S. ARMY CORPS OF ENGINEERS
xiii
Section 1
Freight Traffic
U.S. ARMY CORPS OF ENGINEERS
GREAT LAKES 1
2
GREAT LAKES
U.S. ARMY CORPS OF ENGINEERS
WAUKEGAN HARBOR, IL
Section Included: Artificial harbor basin of about 13.5 acres and entrance channel from Lake Michigan approximately 2,200 feet in length. Project
Depth: 22 feet in entrance channel; 18 feet between piers and inner basin; 8 feet in anchorage area of approximately 6 acres.
Comparative Statement of Traffic (thousand short tons)
Year
Total
Year
Total
Year
Total
year
Total
1997
473
2000
740
2003
641
2006
_
606
1998
555
2001
518
2004
571
1999
560
2002
552
2005
643
Freight Traffic, 2006 (thousand short tons)
Total,
all
commodities
Commodity
Total crude` materials, inedible
except
fuels -
Subtotal soil, sand, gravel, rock and stone
4323
gypsum
4335
waterway improv. mat
Total pnmary
.
manufaatured
.goods
-
Subtotal lime
,
cement and glass
5220
cement &
concrete
Grand Total
Domestic
Lakewise
Receipts
Shipments
Internal
Intraport
595
10
262
2
.1:
262
2
1
2611
-2
1
=333
8
333
8
333
8
CHICAGO RIVER (MAIN AND NORTH
BRANCH
), IL (INCLUDED IN PORT OF CHICAGO)
Section Included
:
Main River from Rush Street to junction of North and South Branch; North Branch to North Avenue. Project Depth
:
21 feet from
Rush Street in the Main River to North Avenue in the North Branch, including the North Branch Canal and the North Turning Branch Basin.
Comparative Statement of Traffic
(
thousand short tons)
Year
Total
Year
Total
Year
Total
Year
Total
1997
733
2000
1,178
2003
1,828
2006
`
1,754:
1998
935
2001
1,413
2004
1,730
1999
949
2002
1,269
2005
1,662
Freight
Traffic, 2006 (
thousand short tons)
Total, all
commodities
Commodity
Total: petroleum and petroleum products
Subtotal petroleum
products
Grand Total
2330
2540
distillate fuel oil
petroleum coke
Total :chemicals
and `related
products
77
Subtotal fertilizers
1
3110
nitrogenous fart.
1
Subtotal other chemicals and
related
products
76
3276
metallic salts
76
Total-
crude
-
materials;=inedible
except:fuels
1,613
Subtotal soil
,
sand
,
gravel, rock
and stone
1,251
4322
limestone
6
4331
sand & gravel
1,244
Subtotal iron ore and scrap
251
4420
iron & steel scrap
251
Subtotal slag
4
4860
slag
4
Subtotal other non-metal. min.
107
4900
non-metal. min. nec
107
Total primary manufactured goods
26
Subtotal lime, cement and glass
21
5220
cement & concrete
21
Subtotal primary iron and steel products
4
5315
Ferro alloys
3
5330
As plates & sheets
1
Ton-miles (
x1000)
947
Tons All Traffic (x1000)
1,754
Ton-miles All Traffic (
x1000)
947
Total Trip-ton-miles
Internal and Intraport
(
x1000
)
445,735
Internal
Inbound
Outbound
Through
Unbound Downbnd Upbound Downbnd
1
76
76
1,354
249
1,251
--
1,244
-
6
246
--
5
246
5
3
2
32
104
3
104
3
13
10
11
10
11
10
2
--
3
2-
2
--
1
702
245
0
0
U.S. ARMY CORPS OF ENGINEERS
CHICAGO, IL DISTRICT
3
CHICAGO RIVER, SOUTH BRANCH, IL
(INCLUDED IN
PORT OF CHICAGO, ALSO INCLUDED IN STATISTICS FOR ILLINOIS WATERWAY)
Section Included
:
Damen Avenue to Lake Street
.
Maintained
D
epth: 9 feet at low water stages.
Comparative Statement of
Traffic (
thousand short tons)
Year
Total
Year
Total
Year
Total
Year
Total
1997
1,247
2000
1,598
2003
3,946
2006 -
4;116
1998
1,500
2001
2,286
L
2004
3,616
1999
1,680
2002
2,197
2005
3,515
Freight Traffic, 2006 (
thousand short tons)
Commodity
Grand Total
Internal
Inbound
Outbound
Through
Upbound
Downbnd
Upbound
Downbnd
total
, a[I`commoditles
Total coal
1100
coal & lignite
Total
petroleum
and petroleum
products
Subtotal petroleum products
2330
distillate fuel oil
2540
petroleum coke
Total.chemlcais and relatedproducts
Subtotal fertilizers
3110
nitrogenous fert.
Subtotal other chemicals and related products
3276
metallic salts
Total crude.
materiala, inedible
except fuels
Subtotal soil
,
sand
,
gravel
,
rock and stone
4322
limestone
4331 sand & gravel
Subtotal iron ore and scrap
4420
iron & steel scrap
Subtotal slag
4660
slag
Subtotal other non-metal. min.
4900
non-metal. min, nec
total iprimary',
mamufac
'
t
i
urad goods
Subtotal lime, cement and glass
5220
cement & concrete
Subtotal primary iron and steel products
5315
ferro alloys
5330
i&s plates & sheets
5390
primary i&s nec
Ton-miles (
x1000)
Tons
All Traffic (
x1000)
4,116
Ton-miles
All Traffic (
x1000
)
11,971
Total Trip-ton-
miles Internal and Intraport
(
x1000
)
1,009,298
4,116
994
994
77
1
1
76
76
2,732
2,190
6
2,184
427
427
6
6
108
106
275
269
269
6
3
1
2
11,971
2,184
177
1,397
357
994
994
18
. 20
18
20
75
11
15
1
76
1
1
76
76
943
176
1,362
251
940
940
--
176--
1,251
1,24456
246--
-
-
176
5
246
2
--
--
4
2--
4
1
-
107
1
-
107
-
247
2
15
10
247
-
11
10
247
-
11
10
--
2
4
-
2
-31
---
3,202
0
6,986
1,783
LAKE CALUMET, IL (INCLUDED IN PORT OF CHICAGO)
Section Included
:
Entrance channel from
the Calumet River
to a harbor area at south end of lake with a channel extending northward for a distance of
3,000 feet and a width of 1,000 feet. Project Depth
: 27 feet.
Comparative
Statement of
Traffic (
thousand short tons)
Year
Total
Year
Total
Yoar
Total
Year
Total
1997
1,845
2000
1,924
2003
963
2006
`
1,804 '
1998
2,354
2001
1,153
2004
1,366
1999
1,986
2002
1,078
2005
1,692
Freight Traffic, 2006
(thousand short tons)
Foreign
Canadian
Domesti
C
Commodit
G
d T t l
y
ran
o
a
Total
Lakewise
Internal
Inbound
Inbound Outbound
R
i
hi
Inbound Outbound
ece pts S
pments
Upbound
Downbnd
Total, Oil
Commodities
1,804!
12
70
fi6i 1, 657
516
34
1,014
_
92
Total petroleum and petroleum
, products
66
331
33
6
7
21
Subtotal petroleum products
66
-
33
33
6
7
21
2330 distillate fuel oil
32
-
32
6
7
20
2429 naphtha & solvents
1
1
2540 petroleum coke
33
-
33
-
-
CHICAGO, IL DISTRICT
U.S. ARMY CORPS OF ENGINEERS
LAKE CALUMET, IL (INCLUDED IN PORT OF CHICAGO)
Freight Traffic,
2006 - continued
(thousand short tons)
Foreign
Canadian
Domestic
Commodit
Grand T t l
y
o a
Total
Lakewise
Internal
Inbound
Inbound Outbound
R
it Shi
t
ece p s
pmen s
Inbound
Outbound
U bound Downbnd
>76W' chemicals and related
procducts
32
32
25
Subtotal other chemicals and related products
32
32
7
25
3219 other hydrocarbons
3
3
3
3220 alcohols
29
29
4
25
............. .
Total crude
materials, inedible
except fuels
04
33
72
42
27
Subtotal soil
,
sand
,
gravel
,
rock and stone
49
33
17
17
4331 sand &
gravel
44
33
11
11
4335 waterway improv. mat
5
5
5
Subtotal iron ore and scrap
54
54
3
25
27
4410 iron ore
24
24
24
4420 iron & steel scrap
31
31
3
1
27
Subtotal sulphur, clay and salt
1
1
1
4782 clay & refrac. mat.
1
1
1
Total primary
'
manufactured
goods
1,506
12
38
1,457
508
27
883
39
Subtotal lime, cement and glass
435
435
402
-
15
1a
5220 cement & concrete
435
435
402
15
18
Subtotal primary iron and steel products
1,051
12
38
1,001
106
27
847
20
5312 pig iron
455
455
-
27
427
---
5360
5390
5320
5315
5330
ferro
primary
As
i&s
As
primary
plates
bars
alloysi&s
&
&
shapesformsnecsheets
24921370632
75
335
2082496325
2
106---
--
-
20812325632
----20
Subtotal primary non-ferrous metal products
20
20
-
-
20
- -
5480
5429
5422 aluminumsmelted
fab. metal
prod.
productsnec
1821
18
21
-
-
18
21
--
-
Total
food and farm
'.
products
92^
30
62
62
Subtotal oilseeds
30
30
6522 soybeans
30
30
Subtotal vegetable products
21
21
21
6653 vegetable oils
21
21
21
Subtotal other agricultural products
40
40
40
6861 sugar
40
40
40
Total all ntanufacturedcequipment, machinery and
3
products
7110 machinery (
not elec)
1
1
7230 ships & boats
2
2
Ton-miles
1,443
0
29
63 1,351
514
7
741
90
(x1000)
Tons All Traffic (
x1000)
1,804
Ton-miles All Traffic
(
x1000)
1,443
Total Trip-
ton-miles Internal and Intraport
(
x1000
)
1,394,918
CALUMET HARBOR AND RIVER, IL AND IN (INCLUDED IN PORT OF CHICAGO)
Section Included: Calumet Harbor and River to
turning basin
no. 5 (130th Street Bridge). Project Depth: 29 feet in approach
channel, 28 feet in outer
harbor anchorage area, 27 feet
in river entrance channel to E. J. & E. R
.
R. Bridge, and
27 feet in river
to and including Basin No
. 5, (130th Street
Bridge).
Comparative Statement of Traffic (thousand short tons)
Year
Total
Year
Total
Year
Total
Ycar
Total
1997
16,552
2000
13,925
2003
11,213
1'2006
14596
1998
16,703
2001
11,481
2004
15,396
1999
15,895
2002
11,034
2005
14,770
Freight Traffic, 2006 (thousand short tons)
Commodity
Total coal
1100 coal &
lignite
1200 coal coke
Total
318
176
142
Foreign
Inbound
Outbound
Through
Downbnd
Canadian
Inbound Outbound
-
Through
Upbound Downbnd
Total petroleum
and' petroleum
products
877
Subtotal petroleum products
877
2330 distillate fuel oil
20
2340 residual fuel oil
4
2350 lube oil & greases
4
15
795
33: .
15
795
33
12
8
--
4-
4-
U.S. ARMY CORPS
OF ENGINEERS
CHICAGO, IL DISTRICT
5
CALUMET HARBOR AND RIVER, IL AND IN (INCLUDED IN PORT OF CHICAGO)
Freight Traffic, 2006 - continued
(thousand short tons)
Foreign
Canadian
commodit
y
Tota!
Through
Th
h
Inbound Outbound
roug
Inbound Outbound
Downbnd
Upbound
qownbnd
2430 asphalt, tar & pitch
2540 petroleum coke
Total
`
6hern !cats and
related products
Subtotal other chemicals and related products
3219 other hydrocarbons
15
833
Total crude
materials, inedible except
fuels
1,190
Subtotal soil
,
sand
,
gravel
,
rock and stone
244
4322 Limestone
126
4331 sand & gravel
118
Subtotal iron ore and
scrap
127
4410 iron ore
127
Subtotal non-ferrous ores and scrap
30
4650 aluminum ore
30
Subtotal sulphur
,
clay and salt
65
4782 clay & refrac. mat.
65
Subtotal slag
31
4860 slag
31
Subtotal other non-metal
.
min.
693
4900 non-metal. min. nec
693
Total primary manufactured
goods --
392:
Subtotal
primary
iron and steel products
389
5320 As primary forms
149
5330 t&s plates & sheets
203
5360 As bars & shapes
14
5370 i&s pipe & tube
16
5390 primary i&s nec
6
Subtotal primary non-ferrous metal products
3
5429 smelted prod. nec
1
5480 fab. metal products
2
Total food.and farm products
375
Subtotal grain
226
6344 corn
226
Subtotal
oilseeds
119
6522 soybeans
ti9
Subtotal processed grain and animal feed
30
6747 grain mill products
30
Total all' manufactured
equipment, machi
products
7110 machinery (not elec.)
7230 ships & boats
TotaY:
unknown or not elsewhere
classified
9900 unknown or nec
Ton-miles (x1000)
Foreign
&
Canadian
34
3
15
763
33
1,098
60
33
151
60
-
33
12626
-60 -- -33
127127
30
-----
--
--
--
--
--
30
65 -
-
-
-
--
693
693
31
6531
-
-
--
---
-
-
-
-
-
--
-
Lakewise
Commodity
Total
Through
Receipts
Shipments
Upbound Downbnd
Total, all
commodities
5,255
1,170
3,535
34
:
516.1
Total r coal
2,986
2;986
1100
coal & lignite
2,713
-•
2,713
1200
coal coke
273
273
Total
petroleum
and pe'troleurn products
176
12
152
Subtotal petroleum products
176
12
152
7
6
2330
distillate fuel oil
12
7
6
2430
asphalt, tar & pitch
9
9
2540
petroleum coke
155
3
152
Total
crude materials
, inedible except fuels
869
an
57:
Subtotal soil, sand
, gravel, rock
and stone
743
712
30
4322
limestone
743
712
30
Subtotal
iron ore and scrap
20
18
3
4410
iron ore
15
15
4420
iron & steel scrap
6
3
3
Subtotal sulphur, clay and salt
9
9
4782
clay & refrac. mat.
9
9
Subtotal other non-metal. min.
97
97
4900
non-metal. min. nec
97
97
CHICAGO, IL DISTRICT
U.S. ARMY CORPS OF ENGINEERS
CALUMET HARBOR AND RIVER, IL AND IN (INCLUDED IN PORT OF CHICAGO)
Freight Traffic,
2006 - continued
(thousand short tons)
Lakewise
Commodity
Total
Through
Receipts Shipments
Unbound Downbnd
:Total primary manufactured goods
1,224
348
340
27
5N'
Subtotal lime
,
cement and glass
1,051
348
301
--
402
5220 cement &
concrete
1,051
348
301
-
402
Subtotal primary iron and steel products
172
--
39
27
106
53905312
primary
pig iron
Ks nee
10864
372
-27
106-
Total
food
and farm products
2
Subtotal oilseeds
2
2
6522 soybeans
2
2
Ton-miles
(
x1000)
22,896
3,631
16
,
142
40
3,082
Lakewise
Commodity
Total, all
commodities
Total coal
1100
coal & lignite
1200
coal coke
Total: petroleum and petroleutn:
products
Subtotal petroleum products
2211
gasoline
2330
distillate fuel oil
2340
residual fuel oil
2429
naphtha & solvents
2430
asphalt, tar & pitch
2540
petroleum coke
2990
petro. products nee
Total
chemicals and'rolated
products
Subtotal fertilizers
3110
nitrogenous fert.
3120
phosphatic fert.
3130
potassic fert.
3190
fert. & mixes nee
Subtotal other
chemicals and related products
3220
alcohols
3275
inorg, elem., oxides
, & halogen salts
3276
metaihc salts
3279
inorganic chem. nee
3299
chem. products nee
Total crude materials, i
nedible
'-
except fuels
Subtotal forest products, wood and chips
4161
wood chips
4190
forest products nee
Subtotal soil, sand
,
gravel
,
rock and stone
4322
limestone
4323 gypsum
4331
sand & gravel
Subtotal iron ore and scrap
4410
iron ore
4420
iron & steel scrap
Subtotal non
-
ferrous ores and scrap
4650
aiuminum ore
4670
manganese ore
4690
non-ferrous ores nee
Subtotal sulphur
,
clay and salt
4782
clay & refrac. mat.
Subtotal slag
4860
slag
Subtotal other non-metal, min.
4900
non-metal. min. nec
Total primary
.
manufactured goods
Subtotal lime, cement and glass
5220
cement &
concrete
5290
misc.
mineral prod.
Subtotal primary iron and steel products
5312
pig iron
5315
Ferro alloys
5320
i&s primary forms
5330
As plates & sheets
5360
i&s bars &
shapes
5390
primary As nee
Internal
Total
Inbound
Outbound
Through
Intfa
Upbound Downbnd Downbnd Upbound Downbnd Downbnd_
6,175
2,496
5
817
1,929
927
939
127
--
5 ,
807
713226
11017
--
32
692115
-----
1,368
938
--
12
4
133
171
2
1,368
938
- -
124
133
171
2
1,08121
9886
56
11
863-202411
-----
112---27
-50322767
-467234145
-----2
14 -
-
3
10
1 -
17.9
85
-
13.,
55
26
78
29
-
-
49
--
675
26
-
-
425
-
11
100
5
56
3
-
13
2
6
-
26
4419
26
19
13
6
-
29
3
26
55
33
T,669
326
;...
3
.
.
364
644
331
88
66
22
307
27
2
278
19
19
278
621
9
498
-
349
2
278
201
-
--
23
273
46
-
50
168
9
347
3
-
29B
33
14
13976
432112
7080
382012
-
----
--
--
--
-
-
59
25
6
-
-
--
-
424
139
80
3
-
--
-
14
98
59
309
-
424
3
-
14
98
309
95
91
3
1
--
1,726
95
1,01491
.23
117-
2451
348=-
163
48
--
109
3
3
162
48
-
109
2
3
2
2
---
1,431
849
2
8
231
341
358177
243175
-2
-1
115--
-----
33
27
-
-
4
1
566
218
----
4
88
256
84
74
----
---
8
2
213
113
-
3
16
82
U.S. ARMY CORPS
OF ENGINEERS
CHICAGO, IL DISTRICT
7
CALUMET HARBOR AND RIVER, IL AND IN (INCLUDED IN PORT OF CHICAGO)
Freight Traffic, 2006 - continued
(thousand short tons)
Commodity
Subtotal primary non-ferrous metal products
5422
aluminum
5429
smelted prod. nee
5480
fab.
metal products
Total"food
and farm
.
products
Subtotal grain
6241
wheat
6344
corn
Subtotal oilseeds
6522
soybeans
6590
oilseeds nee
Subtotal other agricultural products
6861
sugar
6865
molasses
total all manufactured.
equipmenf
:'m
'achtnery
`
and products
7110
machinery (not elec)
7600
rubber & plastic pr.
7900
manufac. prod. nee
Ton-miles (x1000)
Internal
Internal
Inbound
Outbound
Through
Infra
Unbound Downbnd Downbnd Unbound Downbnd Downbnd
Tons
All Traffic (
x1000
)
14,596
Ton-miles
All Traffic (
x1000
)
59,980
Total Trip-
ton-miles Internal and lntraport
(
x1000
)
5,703,861
117
10
4
22923
---
---
-100
-4
PORT OF CHICAGO, IL
Section Included: Chicago Harbor
,
Chicago River
,
Main and North Branch, Chicago River
,
South Branch
,
Chicago Sanitary and Ship Canal,
Calumet-Sag Channel and Lake Calumet
,
IL, Calumet Harbor and River, IL and IN
.
Project Depth
:
See Chicago Harbor, Chicago River, Main and
North Branch
,
Chicago River
,
South Branch, Chicago Sanitary and Ship Canal, Calumet-Sag Channel and Lake Calumet
,
IL, Calumet Harbor and
River
,
IL and IN.
Comparative Statement of Traffic (thousand short tons)
Year
Total
Year
Total
Year
Total
Year
Total
1997
24,868
2400
23,929
2003
22,610
2046
25,706
1998
25,979
2001
21,976
2004
24,602
1999
28,602
2002
20,403
2005
25,821
Freight Traffic,
2006
(
thousand short tons)
Commodity
Total' coal
1100
coal & lignite
1200
coal coke
-Total
petroleum
=
and 'petroleum
.:
products'
Subtotal petroleum products
2330
distillate fuel oil
2340
residual fuel oil
2350
tube oil & greases
2430
asphalt, far & pitch
2540
petroleum coke
Tota I
Foreign
Inbound
Outbound
Canadian
Inbound
Outbound
.`
.Total chemicals and r
e
lated p
rod ucts
Subtotal other chemicals and related products
3219
other hydrocarbons
9
Total crude materlals inedible except fuels
1.190
1,131
60
Subtotal soft, sand, gravel
,
rock and stone
244
184
60
43224331
sand
limestone&
gravel
118
126
12658
-60
Subtotal iron ore and scrap
127
127
- -
44104650
Subtotal
aluminum
iron
non-ferrous
ore
ore
ores and scrap
127
30
30
12730
30
--
-
Subtotal sulphur
,
clay and salt
65
65
490047824860
Subtotal
Subtotal
day
slagnon-metal.
other
slag
& refrac.
non-metal.
min.
mat.nee
min.
693
693316531
693
693
3165
31
--
-
--
--
8
CHICAGO, IL DISTRICT
U.S. ARMY CORPS OF ENGINEERS
PORT OF CHICAGO, IL
Freight Traffic, 2006
-
continued
(thousand short tons)
Commodity
Total primary
manufactured goods
Subtotal primary iron and steel products
5320
i&s primary forms
5330
As plates &
sheets
5360
i&s bars & shapes
5370
As pipe & tube
5390
primary i&s nee
Subtotal primary non-ferrous metal products
5429
smelted prod. nee
5480
fab.
metal products
Total
food and farm products
Subtotal grain
6344 corn
Subtotal oilseeds
6522 soybeans
Subtotal processed grain and animal feed
6747 grain mill products
Total all riianufactured
...
equipment
, machinery and products
7110
machinery (not elec)
7230
ships & boats
Total unknown or .not elsewhere classified
9900
unknown or nee
Commodity
Total coal
1100
coal & lignite
1200
coal coke
Total
petroleum and petroleum products
Subtotal petroleum products
2211
gasoline
2221
kerosene
2330
distillate
fuel oil
2340
residual fuel oil
2350
lube oil & greases
2429
naphtha & solvents
2430
asphalt, tar & pitch
2540
petroleum coke
2640
hydrocarbon & petrol gases, liquefied and gaseous
2990
petro. products nec
Totaf chemicals
and related
products
Subtotal fertilizers
3110
nitrogenous fert.
3190
Pert. & mixes nee
Subtotal other chemicals and related products
3212
benzene & toluene
3219 other hydrocarbons
3220
alcohols
3260
organic comp. nee
3274
sodium hydroxide
3275
inorg. elem., oxides, & halogen salts
3276
metallic salts
3279
inorganic chem. nec
3297
chemical additives
3299
chem. products nec
Total.-crude-matorials, Inedible-,except fuels
Subtotal forest products
,
wood and chips
4161
wood chips
4190
forest products nee
Subtotal soil, sand
,
gravel
,
rock and stone
4322
limestone
4331
sand & gravel
4335
waterway improv. mat
Subtotal iron ore and scrap
4410
iron ore
4420
iron & steel scrap
Subtotal non
-
ferrous ores and scrap
4650
aluminum ore
4670
manganese ore
4690
non-ferrous ores nee
Total
Tl
Foreign
Canadian
ota
Inbound
Outbound
Inbound
Outbound
392
349
43
389
346
43
149
116
33
203
198
5
14
14
16
16
6
1
6
33
11
22
Lakewise
Receipts
Shipments I
67
93
152-
1,504
34
30
3
1,471
102
107
692
11
391
44
ill
5
3
3
6;892
115
113
2
4,840
768
4,060
11
946
134
812
70
20
38
12
811
57=
712
30
712
30
3
18
--
15
33
91
91
91
t7amestto-
Internal
Receipts
Shipments
284
135
135
119
119
30
30
Intraport
8,563
31622
5,201
138-
86
2,772,
114
2-772
23
1,580
1,127
583
1,580
1,127
583
101
-
2
239
-
365
18
145
-
156
96
19
10490
358
-5
245
114
18
631
479
394
113
-13
--
1,186
274
44=
34
--
--
1,152
303
274
--
--
44
4837
5542
-28
500
176
15
11
-
39111044
---
--1
2,619353
1,151--1
2,253
--
115
--
--
113
1,5572
320-
2,220-
1,52626
320----
2,214-
5-
6
79
814
33
70
50
-----
10
764
$3
70
-
--
20
-
-
3812 -- --
U.S. ARMY CORPS OF ENGINEERS
CHICAGO, IL DISTRICT
9
PORT OF CHICAGO, IL
Freight Traffic, 2006 - continued
(thousand short tons)
Domestic
Commodity
Total
Lakewise
Internal
Receipts
Shipments
Receipts
Shipments
Intraport
Subtotal sulphur, clay and salt
4782
clay & refrac. mat.
Subtotal slag
4860
slag
Subtotal other non
-
metal, min.
4900
non-metal. min. nec
Total .
prmnary
'
manufactured
goods
Subtotal lime, cement and glass
5220
cement & concrete
Subtotal primary iron and steel products
5312
pig iron
5315
ferro alloys
5320
t&s primary forms
5330
t&s plates & sheets
5360
i&s bars & shapes
5370
Ks pipe & tube
5390
primary 1&s nec
Subtotal primary non-ferrous metal products
5422
aluminum
5429
smelted prod. nee
5480
fab.
metal products
' Total food and: farm products
Subtotal grain
6241 wheat
6344
corn
Subtotal oilseeds
6522
soybeans
Subtotal vegetable products
6653
vegetable
oils
Subtotal processed grain and animal feed
6782 animal feed, prep.
Subtotal other agricultural
products
6861
sugar
6865
molasses
T661 ail manufactured equipment
,
machinery and products
7110
machinery (not elec)
7600
rubber & plastic pr.
7800
empty containers
7900
manufac. prod. nec
90
9
80
--
90
22
9
80
5
-
17
22
5
17
810
97
713
810
97
713
-
4,345
856
367-
2,450'
123
49
1,957
750
311
768
89
49
1,957
750
301
768
89
49
2,202
73818052
106
64
66
1,996
672
180
52
33
31
-
--
-
548
543
5
2604148
106
2
260281
a
-
-25
186
1244518
186
1244518
-
---
322
09
231
182
182
44
44
138
138
14
2
13
14
2
13
21
-
21
21
-
21
31
--
--
31
31
-
31
74
-
68
6
6410
--
644
-6
30
--
29
1-
1
10
-
10
18
-
18
11
INDIANA HARBOR, IN
Section Included: Approach channel, outer harbor and canal entrance channel to the first E. J. & E. R. R. Bridge: Indiana Harbor Canal, including the
Calumet River Branch to Columbus Drive Bridge and the Lake George Branch to 0.2 miles past Indianapolis Blvd. Project Depth: 29 feet in approach
channel, 28 feet in harbor basin, 27 feet in canal entrance channel, and 22 feet in remainder of canal to 0.2 miles past Indianapolis Blvd. on Lake
George Branch and Columbus Drive on Calumet River Branch.
Comparative Statement of Traffic (thousand short tons)
Year
Total
Year
Total
Year
Total
Year
Total
1997
16,524
2000
16,187
2003
14,133
20o6=-
16,164 P'
199B
14,910
2001
13,579
2004
18,226
1999
15,127
2002
13,839
2005
14,120
Freight Traffic, 2006 (thousand short tons)
Total, all
commodities =
Commodity
Total"
petroleumn
and petroleum
products
Subtotal petroleum products
2330
distillate fuel oil
2540
petroleum coke
..Total-crude
ma ter ia ls,
i
nedible ex cep t fu els:
Total
Foreign
Canadian
Inbound
Inbound
Outbound
..
:
Subtotal iron ore and scrap
481,
377
84
397
377
4410
iron ore
377
377
Subtotal non
-
ferrous ores and scrap
90
84
5
4650
aluminum ore
84
84
4670
manganese ore
5
5
Subtotal slag
14
14
4866
slag
14
14
10
CHICAGO, IL DISTRICT
U.S. ARMY CORPS OF ENGINEERS
INDIANA HARBOR, IN
Freight Traffic, 2006 -
continued
(thousand
short tons)
Domestic
Commodity
Total
Lakewise
Internal
Receipts
Shipments
Receipts
_ -Shipments
Intraport
:Total
,
all
commodities
--Total coal
1100
coal & lignite
1200
coal coke
Total petroleum and petroleum
Subtotal petroleum products
2211
gasoline
2330
distillate fuel oil
2340
2429
2430
2540
2990
residual fuel oil
naphtha & solvents
asphalt, tar & pitch
petroleum coke
petro. products nec
Total .
crude
-
materials;
.
inedible
`
except fuels
13,738
12,869
238
370
261
4322
Subtotal
limestonesoil,
sand, gravel,
rock
and stone
1,7431,465
1,4331,433
3232
278
--
4323
Subtotal
gypsum
iron ore and scrap
11,278484
11,417
-
27844
-23
4410
iron ore
11,433
11,396
-
28
9
4420 Iron & steel scrap
51
22
-
16
14
4650
Subtotal
aluminum
non-formus
ore
ores and scrap
2
6
-
-
-
2
6
-
4670
Subtotal
manganese
slag
ore
485
5
--
-
206
-
415
238-
4860 slag
485
-
206
41
238
Subtotal other non-metal, min.
19
19
4900
non-metal. min. nec
19
19
-
Total primary
.`
manufactured goods.
215.
21
9
186
Subtotal time, cement and glass
3
3
5220
cement & concrete
3
-
3
Subtotal primary iron and steel products
212
21
9
183
5312
pig iron
9
9
5330
i&s plates & sheets
101
101
5390
primary i&s nec
102
21
82
BURNS WATERWAY HARBOR, IN
Section Included
:
Approach channel
,
outer harbor
,
and two harbor arms
.
Project Depth
:
30 feet in approach channel, 28 feet in outer harbor, and 27
feet in the east and west harbor arms.
Comparative Statement of
Traffic (
thousand short tons)
Year
Total
Year
Total
Year
Total
Year
Total
1997
10,414
2060
9,346
2003
8,069
X
2006
8,954t''-
1998
9,006
2001
8,735
2004
9,802
1999
7,456
2002
8,621
2005
9,812
Freight
Traffic, 2006 (
thousand short tons)
Total;
all commodities
Total coal
1200
coal coke
Total petroleum and petroloum
Subtotal petroleum products
2330
distillate fuel oil
2340
residual fuel oil
2540
petroleum coke
Total
Total
:'
chemicals and related
..products
125
Subtotal fertilizers
63
3130
potassic fort.
63
Subtotal other
chemicals and
related products
63
3275
inorg. elem., oxides, & halogen salts
63
Total crude materials Inedible except
.#uels
1,122.:
Subtotal soil, sand
,
gravel
,
rock and stone
43
4322
limestone
15
4331
sand & gravel
29
Subtotal
i
ron ore and scrap
1,021
4410
iron ore
1,021
Subtotal other
non-metal
. min.
58
4900
non-metal. min. nec
58
U.S. ARMY CORPS OF ENGINEERS
Commodity
Foreign
Inbound
Outbound
Canadian
Inbound
Outbound
CHICAGO, IL DISTRICT
11
BURNS WATERWAY HARBOR, IN
Freight Traffic,
2006 - continued
(thousand short tons)
Commodity
Total primary manufactured goods'
Subtotal lime, cement and glass
5290
misc. mineral prod.
Subtotal primary iron and steel products
5312
pig iron
5320
i&s primary forms
5330
i&s plates &
sheets
5360
i&s bars & shapes
5370
1&s pipe & tube
5390
primary i&s nec
Subtotal
primary
non-ferrous metal products
5429
smelted prod. nec
5480
fab.
metal
products
Total food and farm
products
Subtotal grain
6344 corn
Total all manufactured equipment
, machinery and products
7110
machinery (not elec)
7120
electrical machinery
7900
manufac. prod. nec
Total
unknown
ornot_elsewhere classified
9900
unknown or nec
Foreign
Canadian
Total
Inbound
Outbound
Inbound
Outbound
846
837
00
00
805
801
4
33
476
475
1
289
289
21
21
12
12
44
40
36
4
00
40
36
4
101
39
62
101
39
62
101
39
62
84
7
34
00
0
00
0
19
19=
19
19
Commodity
Total, all commodities
Total coal
1100
coal & lignite
1200
coal coke
Total
petroleum and petroleum products
Subtotal petroleum products
2340
residual fuel oil
2430
asphalt, tar & pitch
2540
petroleum coke
2990
petro. products nee
Total chem
icals and related
"
products
Subtotal fertilizers
3110
nitrogenous fert.
3120
phosphatic fert.
3130 potassic fart.
3190 fart. & mixes nec
Subtotal other chemicals and
related
products
3220
alcohols
3276
metallic salts
Total `
crude materials inedible e'x'cept fuels
Subtotal soli, sand
,
gravel
,
rock and stone
4322
limestone
Subtotal iron ore and scrap
4410
iron ore
4420
iron & steel scrap
Subtotal sulphur, clay and salt
4782
clay & refrac. mat.
Subtotal slag
4860
slag
Subtotal other non-metal. min.
4900
non-metal. min. nec
e.Total primary manufactured: gooW
Subtotal lime, cement and glass
5220
cement & concrete
5290
misc, mineral prod.
Subtotal
primary
iron and steel products
5312
pig iron
5320
i&s primary forms
5330
1&s plates & sheets
5360
i&s bars & shapes
5390
primary i&s nec
Subtotal
primary
non-ferrous metal products
5429
smelted prod, nec
5480
tab.
metal products
Total
Lakewise
Dom
estic
Internal
Receipts
Shipments
5;643
Receipts_ Shipments
7
38
98
55
49
49
42
42
55
11
22
49
43
6
66
43
43
5,958
5,595
233
130
898
896
898
898
4,721
4,635
67
18
4,703
4,630
67
6
18
6
12
59
59
59
59
217
166
50
217
166
50
63
62
1
63
62
1
323
12
230
82
3
3
--
31722
12
22322
--82
1181704
12
106894
--81
9
a1
153
153
---
03
03
---
12
CHICAGO, IL DISTRICT
U.S. ARMY CORPS
OF ENGINEERS
BURNS WATERWAY HARBOR, IN
Freight Traffic, 2006 - continued
(thousand short tons)
Dom estic
Commodity
Total
Lakewise
Internal
Receipts
Shipments Recei is Shi menu
Total :
food and far
m .products
Subtotal grain
6344
corn
Subtotal oilseeds
6590
oilseeds nec
Subtotal other agricultural products
6861
sugar
Total all
manufactured equipment, machinery and products
7110
machinery (
not elec)
U.S. ARMY CORPS
OF ENGINEERS
CHICAGO, IL DISTRICT
13
Harbor or Waterway
Other Harbors and Waterways 2606
Commodity
Project
CHICAGO HARBOR, IL (INCLUDED IN PORT OF CHICAGO)
MICHIGAN CITY
HARBOR, IN
Nan-project
BUFFINGTON
HARBOR, IN
GARY HARBOR, IN
2330 distillate fuel oil
2540 petroleum coke
3276 metallic salts
4420 iron & steel scrap
4860 slag
4900 non-metal. min. nec
5315 Ferro alloys
5330 i&s plates & sheets
Total Tons(
x1000)
Total
Ton-miles
(
x1000)
Total Trip-
ton-miles Internal and Intraport
(
x7000)
.I No Commerce Reported
2540 petroleum coke
4322 limestone
4650 aluminum ore
Total Tons
(
x1000)
1100 coal & lignite
1200 coal coke
2540 petroleum coke
4322 limestone
4331 sand & gravel
4410 iron ore
4420 iron & steel scrap
4650 aluminum ore
4690 non-ferrous ores nec
4860 slag
5312 pig iron
5320 i&s primary forms
5330 i&s plates & sheets
5360 i&s bars & shapes
5390 primary As nec
5480 fab. metal products
7900 manufac. prod. nec
Total Tons(
xi000)
Thousand
Short Tons
12
26
76
5
2
3
2
1
125
125
44,399
33
1,426
30
1,489
101
60
28
244
22
8,159
25
57
1
147
40
1
70
1
87
4
62
9,112
14
CHICAGO, IL DISTRICT
U.S. ARMY CORPS OF ENGINEERS
TWO HARBORS (AGATE BAY), MN
Section Included: Entire harbor. Controlling Depth: 28 feet except for a 26 foot area along the east pro{ect line. Project Depth: 28 feet in inner basin
and 30 feet near entrance.
Comparative Statement of Traffic (thousand short tons)
Year
Total
Year
Total
Year
Total
Year
Total
1997
13,508
2000
13,060
2003
13,033
2006
13,420'`
1998
13,223
2001
11,875
2004
13,473
1999
11,872
2002
14,895
2005
10,959
Freight Traffic,
2006
(
thousand short tons)
Canadian
Domestic
Commodity
Grand Total
Total
Lakewise
Outbound
Receipts
Shipments
Total, all commodities
13,4201
-58
13,362
76
13,286
Total crude materials, inudible except fuels=
43,358
58
13,300
76
` .
13,225
Subtotal soil, sand
,
gravel, rock and stone
31
31
31
4322
limestone
31
31
31
Subtotal iron ore and scrap
13,290
58
13,232
26
13,206
4410
iron ore
13,290
58
13,232
26
13,206
Subtotal other non-metal. min.
38
38
19
19
4900 non-melal. min. nec
38
38
19
19
Total all manufactured
equipment
,:
machinery
and products
62
62
62
7900
manufac. prod, nec
621
62
-
62
DULUTH-SUPERIOR HARBOR, MN AND WI
Section Included; Superior Bay and its tributaries, St. Louis Bay and St. Louis River, and Allouez Bay. Controlling Depth: 32 feet in lake approaches,
diminishing to a minimum of 20 feet in certain inner channels; there are numerous 1-2 foot shoals scattered in portions of the Duluth and Superior
Harbor Basins. Project Depth: 32 feet in lake approaches; 27 feet in Duluth and Superior Harbor Basins, superior front channel, and in ore-channel
routes through north and south channels to D. M. & 1. R. R.Y. ore docks; 27 feet in Howards Bay and Allouez Bay; 23 feet in remaining portion of
south, upper, and Minnesota channels to Hallet Dock No. 6; and 20 feet from thence to northerly end of Clough Island. Navigation Season: April 3 to
January 11.
Comparative Statement of
Traffic (
thousand short tons)
Year
Total
Year
Total
Year
Total
Year
Total
1997
41,929
2000
41,678
2003
38,
295
" 3006
46,974`x_
1998
42,443
2001
39,811
2004
45,393
1999
42,297
2002
44,161
2005
44,722
Freight Traffic,
2006
(
thousand short tons)
Foreign
Canadian
Domestic
Commodity
Grand Total
Total
Lakewise
Internal
Inbound Outbound
Inbound
Outbound
Receipts Shipments
Intraport
Total, all
commodities
46,9741
22
2,1651
505
11,771 ] 32,511
3,753
28,708
50
Total coal
21,534
46
7,108 14;390
214
14,115:
so
1100 coal & lignite
21,510
23
7,108
14,380
214
14,115
50
1200 coal coke
23
23
-
--
1
Total chemicals and 'related products -
s2
32
32
Subtotal other chemicals and related products
32
32
32
3276 metallic salts
32
32
32
Total crude
;
mateHals
, inedible except fuels
22,672
4211
300
4,426
17,525
3,275
14,251
Subtotal forest products
,
wood and chips
49
16
33
4170 wood in the rough
49
16
33
Subtotal soil, sand, gravel, rock and stone
3,048
3,048
3,048
--
4322 limestone
3,048
3,048
3,048
---
Subtotal iron ore and scrap
18,764
230
4,235 14,299
67
14,232
4410 iron ore
18,764
230
4,235 14,299
67
14,232
Subtotal non
-
ferrous ores and scrap
152
21
132
4690 non-ferrous ores nec
152
21
132
Subtotal sulphur
,
clay and salt
196
170
25
4782 clay & refrac.
mat.
196
170
25
Subtotal slag
64
64
64
---
4860 slag
64
64
64
--
Subtotal other non-metal
.
min.
399
285
115
95
19
4900 non-metal. min. nec
,399
285
115
95
19
Total primary manufactured
goods
404
15
158
232 =
232
Subtotal lime, cement and glass
389
158
232
232
5220 cement & concrete
389
158
232
232
Subtotal primary iron and steel products
15
15
5330 As plates & sheets
15
15
Subtotal primary
non-ferrous metal products
0
0
0
5480 fab. metal products
0
0
0
U.S. ARMY CORPS
OF ENGINEERS
DETROIT, MI DISTRICT
15
DULUTH-SUPERIOR HARBOR, MN AND WI
Freight Traffic, 2006 - continued
(thousand short tons)
Commodity
Total food
and .farm: products
Subtotal grain
6241 wheat
6344 corn
6445 oats
Subtotal oilseeds
6522 soybeans
6534 flaxseed
Subtotal vegetable products
6654 vegetables & prod.
Subtotal other agricultural products
6861 sugar
6899 farm products nec
Total
all manufactured
equipment, rnachinc
and.products
7110 machinery (not elec)
7120 electrical machinery
7210 vehicles & parls
7900 manufac. prod. nec
Grand Total
Foreign
Inbound Outbound
2,322
1,824
1,547
16
261
234
193
41
83
83
180
9
172
8
0
1
0
Canadian
Inbound Outbound
1,742
1,329
1,313
16
150
109
41
83
83
180
9
172
73
62
0
a
i -
-
TACONITE HARBOR, MN
NON-CORPS PROJECT
Comparative
Statement of
Traffic (
thousand short tons)
Domestic
Total
Lakewise
Receipts Shipments
2381:_ -342
153
342
153
81
261
85 --
85
-
Year
Total
Year
Total
Year
Total
Year
Total
1997
8,607
2000
8,505
2003
852
2006:.
21089.
1998
8,761
2001
2,243
2004
1,209
1999
8,366
2002
645
2005
2,508
Freight Traffic, 2006 (thousand short tons)
Internal
Intraport
342
342
61
261
Lakewise
Commodity
Grand Total
Receipts
Shipments
Total, allCommodities
2,0813
991
1,098
.
.Total coal
991
991
1100
coal & lignite
-.91
991
Total
crude
.
materials inedible except fuels
1,098
1,098
Subtotal
i
ron ore and scrap
1,098
1,098
4410
iron are
1,098
1,098
PRESQUE ISLE HARBOR, Mt
Section Included: Entire harbor. Controlling and Project Depths: 30 feet in approach and 28 feet in basin. Navigation Season: March 31 to January
21.
Comparative Statement of Traffic (thousand short tons)
Year
Total
Year
Total
Year
Total
Year
Total
1997
11,201
2000
10,742
2003
_
8,776
2006
9;074 ?
1998
10,483
2001
9,475
2004
10,134
1999
9,531
2002
10,592
2005
10,983
Freight Traffic,
2006
(
thousand short tons)
Commodity
Total, all commodities
Total coal
1100
coal & lignite
Total Crude materials, tnedtbte
'exaept fuels
Subtotal sail, sand, gravel, rock and stone
4322
limestone
Subtotal iron ore and scrap
4410
Iron ore
Canadian
- Domestic
Grand Total
Ob
d
Total
Lakewise
ut oun
Receipts
Shipments
9.074 1
2,1361
6,938
2,164
4,774.:
2.060
2,080
2,060
7,r
2,080
,OGO
6,994
:
2,136
41858
84
4,774.
84
--
84
84
84
-
84
84
6,910
2
,136
4,774
4,774
6,910
2,136
4,774
4,774
16
DETROIT, MI DISTRICT
U.S. ARMY CORPS OF ENGINEERS
MARQUETTE HARBOR, MI
Section Included: Entire harbor. Controlling Depth: 26 feet. Project Depth: 27 feet. Navigation Season: May 14 to November 22.
Comparative Statement of Traffic (thousand short tons)
Year
Total
Year
Total
Year
Total
Year
Total
1997
689
2000
912
2003
1,
206
2006
839
1998
869
2001
976
2004
1,538
1999
818
2002
923
2005
1,121
Freight Traffic,
2006
(
thousand short tons)
Commodity
Total,
all Commodities
.... .............
Total co71
1100
coal & lignite
Total crude materials, inedible except fuels
Subtotal
soil, sand,
gravel, rock and stone
4322
limestone
Grand Total
Canadian
Inbound
Domestic
Lakewise
Receipts
777
176
176
601''
601
601
DRUMMOND ISLAND, MI (INCLUDED tN ST. MARYS RIVER)
Section Included: Private loading dock on St. Marys River at Drummond Island, Ml. Controlling Depths: 30 feet to and from Lake Huron; 27.0 feet to
and from Lake Superior; 27,0 feet to Lake Superior; 23 feet at dock. Project Depth: See St. Marys River.
Comparative Statement of Traffic (thousand short tons)
Year
Total
Year
Total
Year
Total
Year
Total
1997
1,560
2000
1,358
2003
1,401
3006
1;23E `-
1998
1,582
2001
1,198
2004
1,716
1999
1,732
2002
1,221
2005
1,460
Freight Traffic, 2006 (thousand short tons)
Canadian
Domestic
Commodity
Grand Total
Lakewise
Outbound
Shipments
Total,
,all' comiaodities
1,238
237
1,090.-
Total.erude
`matorials; inedible.. except fuels
1,233
237
1,000
Subtotal soil
,
sand
,
gravel
,
rock and stone
1,238
237
1,000
4322
limestone
1,216
237
979
4331 sand & gravel
22
22
U.S. ARMY CORPS
OF ENGINEERS
DETROIT, MI DISTRICT
17
ST. MARYS RIVER, MI
Section Included: Entire length of St. Marys River from Lake Superior to Lake Huron, including American ports of Sault Ste. Marie, Raber, Lime
Island, Drummond Island, and Detour, Michigan.
Name of Canal
Project
Depth
Controlling
Depth
Gros Cap Reefs
30.0 ........ 30.0
Point Iroquois Shoal Channel
30.0
........
29.4
Point Iroquois Anchorage areas
29.0 ........ 21.0
Birch Point Course
28.0-30.0 ..... 30.0
Brush Point Course
28.0..... ...
30.0
Vidal
Point
Shoals
Louise ChannelChannel
28.0........28.0
Locks and Canal (
see report
for St. Marys Fall Canal)
28.0..... ... 28.0
Bayfield Channel Course 1
28.0...... ..28.0
Anchorage
Little
Rapids
and
Courses
maneuver2
and
area
3
angle courses 1 and 2
28.5........28.527.0........27.0
Lake Nicolet Channel
29.0........29.0
Lake NicolLt Anchorage
28.0...... ..28.0
Middle Neebish Channel
27.0-28.0 ...
27.0
West Nebish Channel
27.5-26.5 ...
27.5
Lake Munuscong Channel
28.0........28.0
Lime Island Channel
29.0...... ..29.0
Detour Passage
30.0 ........29.0
Pipe Island Course
29.0........29.0
Watson Reef Course
30.0........30.0
Crab Island
30.0........30.0
Comparative
Statement
of Traffic (thousand short tons)
Year
Total
Year
Total
Year
Total
Year
Total
1997
83,822
2000
84,925
2003
71,
921
2006
81,299--
1998
82,235
2001
74,916
2004
83,122
1999
81,315
2002
80,330
2005
79,910
Freight Traffic, 2006
(thousand short tons)
Commodity
Total, all
commodities
Total coal
-
1100
coal & lignite
1200
coal coke
Total
25,737 1
9,318
9,240
79
Foreign
Through
Upbound Downbnd
Canadian
Inbound
Outbound
Through
Upbound Downbnd
..
. .
Total.
petroleum arid. petroleum
.
products
199
Subtotal petroleum products
199
2430
asphalt, tar & pitch
4
2540
petroleum coke
195
Total ihemtcalsantl;related products --
Subtotal fertilizers
3130
potassic fart.
Subtotal other
chemicals
and related products
3274
sodium hydroxide
3276
metallic salts
256
215
215
41
16
25
Total`
crude materials
,
inedible except
fuels
12,315
Subtotal forest products
,
wood and chips
80
4170
wood in the rough
2
4189
lumber
78
Subtotal soil, sand, gravel, rock and stone
4,478
4310
building stone
23
4322
limestone
3,604
4331
sand & graves
851
Subtotal iron ore and scrap
6,709
4410
iron ore
6,695
4420
iron & steel scrap
14
Subtotal non-ferrous ores and scrap
152
4690
non-ferrous ores nec
152
Subtotal sulphur, clay and
salt
307
4782
clay & refrac. mat.
307
Subtotal slag
163
4860
slag
163
Subtotal
other non-
metal. min.
425
4900
non-metal. min. nec
425
'Total primary manufactured
"
goods
1,535
Subtotal lime, cement and glass
1,482
5220
cement & concrete
1,482
Subtotal primary iron and steel products
53
5320
i&s primary forms
33
5330
i&s plates & sheets
20
Subtotal primary non-ferrous metal products
0
5480
fab.
metal products
0
2,165
421
230
230
21
21
170
170
75
--
15
0
-
0
00
61
237
3,194
20,058
--
1;590
7,729
,
1,543
7,697
-
47
32
195
4
195
4
4
195
-
41
41
-
16
25
215:
215
215
61
237
1,183
10*s3 -
80
2
78
237
854
3,386
237
-
686
23
2,681
-
-
146
705
61
61
9
6,471
-
96,4665
132
--
132
-
137
-
137
--
163
-
163
319
45
319
45
182
1,337,
182
1,300
182
1,300
--
38
-
33
--
5
18
DETROIT, Ml DISTRICT
U.S. ARMY CORPS OF ENGINEERS
ST. MARYS RIVER, MI
Freight Traffic, 2006 - continued
(thousand short tons)
Commodity
Total food` and .farm products
Subtotal grain
6241
wheat
6344
corn
6445
oats
Subtotal oilseeds
6522
soybeans
6534 flaxseed
Subtotal vegetable products
6654
vegetables & prod.
Subtotal other agricultural products
6861
sugar
6899
farm products nee
Total all manufactured equipment, machinery and
products
7110
machinery (not elec)
7120
electrical machinery
7210
vehicles & parts
7230
ships & boats
7900
manufac. prod. nec
Ton-miles (
x1000)
Foreign & Canadian
Foreign
Canadian
Total
Through
Through
Upbound
_
IDownbnd
Inbound
Outbound
Upbound
Downbnd
2,102
1,742
359,
1,604
1,329
1
274
1,489
1,313
176
17
16
1
99
99
234
150
85
193
109
85
41
41
83
83
83
83
180
180
99
172
172
862
00
1
1
22
00
0
1,349,600
1,398
138,588
2,800
3,619
145,
068 1
,058,126
Lakewise
Commodity
Total
Shipments
-
Through
......
Upbound Downbnd
Totat, all commodities
55,562
1,000
5,076
49,486
Total coal - -
12,183
1,125
11,058
1100
coal & lignite
12.183
1, 1'2 ^
11:058
Total chemicals and related
products
32
32
Subtotal other chemicals
and re€atcd products
32
32
3276
metallic salts
3`
32
Total crude inaterials, Inedible except fuels
42,711
1,000
3,667
38;024
43314322
Subtotal
Subtotal
sand
limestone
soil,
iron
& gravel
ore
sand,
and
gravel,
scraprock
and stone
38,0724,461
4,43922
1,000
97922
3,461
3,461
-
67
38,065
-
-
-
4410
iron ore
38,072
67
38,005
4860
Subtotal
slag
slag
64
64
-
64
64
--
--
Subtotal other
non-metal, min.
114
95
19
4900
non-metal. min. nec
114
95
19
Total prlmary -manufactured goods
232
232
Subtotal lime, cement and glass
232
2$2
5220 cement & concrete
232
232
:,Total
.
food
..
and farr&
.products
342
342
Subtotal grain
342
342
6241
wheat
81
81
6445 oats
261
261
Total
all
manufactured' uquipmoat, machinery,and.:products
62
62.
7900
manufac. prod, nec
62
62
Ton-miles
(
0000)
3,524,634
32,692
324,868 3,167,074
Lakewise
Tons All Traffic
(
x11000
)
81,299
Ton-miles All Traffic (
x1000
)
4,874,234
U.S. ARMY CORPS OF ENGINEERS
DETROIT, MI [DISTRICT
19
ST. MARYS FALLS CANAL, MI AND SAULT STE, MARIE, ONTARIO SHIP CANAL, CN (INCLUDED IN ST. MARYS RIVER)
Section Included
: American and
Canadian Navigation Canals and
Locks at St. Marys Falls,
Sault Ste
.
Marie, Mt
.
and Ontario.
Controlling Depths:
Sabin Lock 23.1, Davis Lock 23.
1,
Macarthur
Lock 31.0, Poe Lock 32.0 and 16.
8 feet Canadian Canal.
Project Depth:
See St
.
Marys River.
Comparative Statement of
Traffic (thousand short tons)
Year
Total
Year
Total
Year
Total
Year
Total
1997
79,850
2000
77,956
2003
65,680
2006
=-
74,218
1996
78,296
2001
68,179
2004
:74,971
1999
76,675
2002
73,968
2005
72,979
Freight Traffic
, 2006
(
thousand short tons)
Commodity
Grand Total
Upbound Downbnd
Total
;
all commodities
74,218
22
2,165
Total coal ;
20,044 }
-_
1200
1100 coal
coal
&
cokelignite
20,021
-
-
1
2540
.Total
Subtotal
petroleum
petroleumpetroleum
cokeand
products
petroleum
products
195195
19523
-
-
-
-
-
Total.chemieals
and -related products
280
3130
Subtotal
potassic
fertilizers
fert.
215
215
-
-
-
-----
3276
3274
.Total:crudeSubtotal
sodium
metallic
other
hydroxidesalts
.
materials.
chemicals
Inedible
and
except
related
fuelsproducts
49,521
49
65
16
---
----
421--
--
4322
4170
4331
4189
Subtotal
Subtotal
Subtotal
limestone
lumbersand
wood
&
in
soil,
forest
iron
gravelthe
sand
rough
ore
productsand
,
gravelscrap
,
wood
,
rock
and
and
chipsstone
44,731
3,826
3,855
7829
80
2
--
-
--
--
-
-
230
-
-
--
-
-
4410 iron ore
44,731
-
230
Subtotal non
-
ferrous ores and scrap
152
--
21
4690 non-ferrous ores nec
152
21
Subtotal
sulphur, clay and salt
196
--
170
4782 clay & refrac. mat.
196
-
170
4860
Subtotal
slag
slag
64
64
--
--
4900
Total
Subtotal
non-metal.
prlmaryother
.
manufacturod
min.
non-metal
nec
,
min.
,goods``
1,683444
444
--
-
15.
-
-
0
5220
5330
Subtotal
Subtotal
Subtotal
i&s
cement
plates
primary
primary
lime,
& concrete&
sheets
cement
noniron
-
ferrous
and
and
steel
glassmetal
productsproducts
1,668
1,668
15
15
0
-
-
15
150
-
----
-
0
5480 tab, metal products
0
0
0
Total food and
: farm "
products
2,421
--
1,742)
Subtotal grain
1,924
--
1,329
6241 wheat
1,547
-
1,313
6344 corn
17
-
16
6445
Subtotal
oats
oilseeds
360
234
-
-
150
-
6522 soybeans
193
-
109
6534 Flaxseed
41
-
41
Subtotal vegetable products
83
--
83
6654 vegetables & prod.
83
83
Subtotal other agricultural products
180
180
6861 sugar
9
-
9
6899 farm products nec
172
-
172
Total alt manufactured equipment, machinery and
74
7
.products
7110 machinery (not elec)
.
8
6
2
7120 electrical machinery
0
-
0
7210 vehicles & pads
1
1
7900
7230
manufac.
ships & boatsprod.
nec
622
-0
Ton-miles (
x1000
)
4,220
,1601
1,376 136,422
Tons All Traffic (
x1000
)
74,218
Ton-miles
All Traffic (
x1000
)
4,220,160
I
Upbound DownbndJ
Throug
U
h
pbound DOwnbnd
972
16,
193 .54
,
865
5,380
49,486.
165
7,697
12,183
1
,
125
11,058`.
141
7,697
12,183
1,125
11,058
23
_.._
-
-
406
'.
6
,
680 42
,
014
3,991
-
38,024
--
--
2962
90
6,429-
--
6a
782
38,0723,764
3,764
-
-----
3,764
3,764
--
-
-
67 38,005
----
-
-
6,429
38,072
67
38,005
--
132
132
25
-
-
--
-
-
-
-
25!
64
-
-
64
-
316
14
114
64
64
95
-
19
316
14
114
95
19
170170170
7r
11266
1,1,266
266
232
232
232
232
232232
-,
--
336
342
--
342`
1
252
342
--
342
153
81
81
1
99 261
-
261
85
85
--
-
62
-62
2
0
62
62
8,629 901,181
3,172,
5
54,962 3
,117,58
51
9
Domestic
Throuqh
I
Total
Lakewise
20
DETROIT, MI DISTRICT
U.S. ARMY CORPS OF ENGINEERS
GRAYS REEF PASSAGE, MI
Section Included: East channel, 3,000 feet wide and about 2 miles long. Controlling and project depths: 25 feet.
Comparative Statement of Traffic (thousand short ions)
Year
Total
Year
Total
Year
Total
Year
Total
1997
8,677
2000
12,497
2003
11,290
`-'`
2006
10
,
1391L
"
1998
10,489
2001
13,010
2004
11,848
1999
10,586
2002
11,799
2005
11,136
Freight Traffic, 2006 (
thousand short tons)
Canadian
Domestic
Commodity
Grand Total
Through
Total
Lakewise
Internal
Through
Through
Upbound Downbnd
Uobound Downbnd
tlobound Downbnd
Total, all aommodities
Total coal
1100 coal &
lignilo
1200 coal cake
Total petroleum and petroleum
581
.products
Subtotal petroleum products
581
2211 gasoline
145
2330 distillate fuel oil
73
2340 residual fuel oil
5
2429 naphtha & solvents
8
2430 asphalt, tar & pitch
216
2540 petroleum coke
134
Total chemicals
and related products
91
Subtotal other chemicals and related
91
products
3276 metallic salts
91
Total crude matpria[s, inedibic oxcupt-
> 6.051
fuels
Subtotal soil, sand
,
gravel
,
rock and
4,720
stone
4322 limestone
4,301
4323 gypsum
251
4331 sand & gravel
168
Subtotal iron ore and scrap
716
4410 iron ore
678
4420 iron & steel scrap
38
Subtotal slag
217
4860 slag
217
Subtotal other non-metal
.
min.
399
4900 non-metal. min. nec
399
Total
primary
'
manufactured
goods
1,731
Subtotal lime, cement and glass
1,692
5210 lime
16
5220 cement & concrete
1,676
Subtotal primary iron and steel
38
products
5312 pig iron
31
5330 i&s plates & sheets
3
5390 primary As nec
5
Total
all
manufactured
`
equipme
rnachinery
and products
7110 machinery (
not elec)
0
Ton-miles
(
x1000)
1,593,601
Tons
All Traffic (
x1000)
Ton-miles All Traffic
(
x1000)
Total
Trip-ton-miles
Internal and [ntraport
(
x1000)
10,891
1,593,601
20,429
61
174
61
77
-
12
61
65
97
97
5
5
.10,651
2,666
7,959
2,437:
813
'1,623
2,130
515
,615
30C
238
8
581
145
73
5
8
216
134
91
91
91
443
106
30
2
183
122
91
91
91
115
115
38
29
3
8
33
3
5,816
1,279
4,537;
4,582
1
,
184
3,398
4,289
1,153
3,135
251
-
251
43
30
12
716
15
701
678
15
664
38
-
38
120
80
39
120
80
39
399
---
399
399
-
399
1,726
39
1,683
1,692
28
1,665
16
-
16
1,676
28
1,649
33
12
19
7
7
0
10
1,843
4,320
U.S. ARMY CORPS
OF ENGINEERS
DETROIT, Ml DISTRICT
21
CHARLEVOIX HARBOR, MI
Section Included: Entrance channel and entire area of Round Lake and Lake Charlevoix, including Advance, Boyne City and East Jordan. Controlling
Depth: 18 feet. Project Depth: 23 feet.
Comparative
Statement of
Traffic
(thousand short tons)
Year
Total
Year
Total
Year
Total
11
Year
Total
1997
1,529
2000
1,748
2003
1,305
2ooo -
1,420 =?
1998
1,281
2001
1,533
2004
1,463
1999
1,489
2002
1,343
2005
1,295
Freight Traffic, 2006 (thousand short tons)
Canadian
Domestic
Commodity
Grand Total
Total
Lakewise
Inbound
Receipts
Shipments
11, .1
alllcommoditias
..................
Total
::coal "
1100
coal & lignite
1200
coal coke
TOWt
crude materials inedible except fuels
Subtotal slag
4860
slag
.............................
Total, primary
goods.
Subtotal lime, cement and glass
5220
cement & concrete
Total
unknovtn or not
elsewhere classified
9900
unknown or nec
17
17
17
8
17
8
MANISTEE HARBOR, MI
Section Included: Entrance channel and entire area of Manistee Lake, including Filer City. Controlling Depths: 24 feet over the entrance bar, through
the outer basin and in the channel between the piers; thence 23 feet in the river channel, narrowing to a minimum width of about 100 to 140 feet to
Manistee Lake. Project Depths: 25 feet in the outer basin and 23 feet in the river to Manistee Lake. Navigation season: March 30 to December 31.
Comparative Statement of Traffic (thousand short tons)
Year
Total
Year
Total
Year
Total
Year
T01
al
1997
477
2000
370
2003
1,
175
2006
`
_-
-
559 >.
1998
435
2001
1,227
2004
940
1999
421
2002
1,457
2005
573
Freight Traffic,
2006 (thousand short tons)
Commodity
Total; all.commodtties
Total coal
1100
coa
s liynilu
Total petroleum and petroleum products
Subtotal petroleum products
2540
petroleum coke
Sotal crude materials
, '
Inedible
'except fuels-
Subtotal soil, sand, gravel
,
rock and stone
4322
limestone
4331
sand & gravel
Subtotal slag
4860
slag
Subtotal other non-metal. min,
4900
non-metal,
min. nec
Grand Total
Canadian
Inbound
Domestic
La kewise
Receipts
22
DETROIT, MI DISTRICT
U.S. ARMY CORPS
OF ENGINEERS
LUDINGTON HARBOR, MI
Section Included: Entrance channel and entire area of Pere Marquette Lake. Controlling Depths: 26 feet in the outer entrance bar and 27 feet in the
channel to Pere Marquette Lake. Project Depths: Outer entrance channel, 30 feet; inner entrance channel, 29.5 feet; channel to Pere Marquette Lake,
29 feet; north and south mooring basins, 18 feet. Navigation season: April 2 to December 31.
Comparative Statement of Traffic (thousand short tons)
Year
Total
Year
Total
Year
Total
Total
1997
864
2000
512
2003
548
(1
06
618
1998
1,075
2001
631
2004
453
1999
493
2002
492
2005
628
[!:
Freight Traffic,
2006
(
thousand short tons)
Commodity
Total
; all commodities
Total chemicals and
related
. products
Subtotal other chemicals and related
products
3276
metallic salts
Grand Total
.Total crude
-
materials
:
inedible
:
except
'
fuels
205
Subtotal soil, sand
,
gravel
,
rock
and stone
141
4322
limestone -
100
4331
sand & gravel
40
Subtotal slag
64
4860
slag
64
'Total primary..
manufactured goods
16
Subtotal lime, cement and glass
16
5210
lime
16
Canadian
Inbound
Outbound
61
21
40
37
37
Total
Domestic
Lakewise
Receipts
Shipments
Internal
Shipments
MUSKEGON HARBOR, MI
Section Included:
Entrance channel and entire area
of Muskegon Lake. Controlling
Depths
: 29.0 feet through the outer portion of project and 27 feet
in channel to Muskegon
Lake. Project Depth: Varying from 29.0 feet at harbor entrance
to 28 feet between breakwaters
and 27 feet in inner channel.
Navigation season
:
April 7 to December 31.
Comparative Statement of
Traffic (
thousand short tons)
Year
Total
Year
Total
Year
Total
Year
Total
1997
2,061
2000
2,435
2003
2,
545
2006
2;230.
1998
1,936
2001
2,324
2004
2,684
1999
1,925
2002
2,187
2005
2,063
Freight Traffic, 2006 (thousand short tons)
Canadian
Domestic
Commodity
Grand Total
Total
Lakewise
Inbound
Receipts
Shipments
Total;' all.. commodities
Total coal
1100
coal &. lignite
Total: crude materials, inedible except.fuels
Subtotal soil, sand
,
gravel
,
rock and stone
4322
limestone
43,31
sand & gravel
Subtotal sulphur, clay and salt
4782
clay & refrac. mat.
Subtotal slag
4860
slag
Subtotal other non-metal. min.
4900
non-metal.
min. nec
total primary
manufactured goods
128
Subtotal lime, cement and glass
128
5220 cement & concrete
128
- 226
226
55
21
34
2,003
1,407
1,467
1,407
469
446
23
369
347
23
369
347
23
99
909
909
---
90
90
128
121
7.
128
121
7
128
121
7
U.S. ARMY CORPS OF ENGINEERS
DETROIT, MI DISTRICT
23
GRAND HAVEN HARBOR AND GRAND RIVER, MI
Section Included: Entire harbor, including Ferrysburg and Spring Lake; and Grand River from Grand Trunk RY. Bridge at Ferrysburg to Bass River
about 15 miles. Controlling Depths: 22 feet in entrance channel; 21 feet to the mouth of the south channel; 21 feet to the sag; 20 feet to Grand Trunk
RY. Bridge at Ferrysburg; 18 feet in the Turning Basin; 17 feet in channel to Spring Lake; thence 8 feet to mile 17.0 and 5 feet to the end of the project.
Project Depths: 23 feet in entrance channel; 21 feet to Ferrysburg; 18 feet in channel to Spring Lake; 8 feet to mouth of Bass River. Navigation
season
:
March 1 to December 31.
Comparative Statement of
Traffic (
thousand short tans)
Year
Total
Year
Total
Year
Total
Year
Total
1997
986
2000
1,555
2003
1,093
Z2tl06--
988 -
1998
1,014
2001
1,794
2004
1,757
1999
1,110
2002
883
2005
1,475
Freight Traffic, 2006 (thousand short tons)
Commodity
................. .
Total, all commodities -
Grand Total
s:-Total coal
127
1100
clkd & ligrule
197
Canadian
Inbound
Outbound
Domestic
Total
Lakewise
Receipts
Shipments
.Total crude materials, inedible except fuels
776
562
465
97
Subtotal soil, sand
,
gravel
,
rock and stone
492
390
310
80
43224331
sand
limestone&
gravel
311181
289100
28920
--80
Subtotal iron ore and scrap
3
3
4420
iron & steel scrap
3
3
Subtotal slag
172
172
155
17
4860
slag
172
172
156
17
Subtotal other non
-
metal. min.
108
108
4900
non-metal. min. nee
108
106
Total
. primary
man ufactured `goods
85
23
61
59
2
Subtotal lime, cement and glass
85
23
61
59
2
5220 cement & concrete
85
23
61
59
2
HOLLAND HARBOR, MI
Section Included: Controlling Depths: Entrance channel - 23 feet decreasing to 20 feet at the outer end of the inner pier; thence a controlling depth of
19 feet for a channel through Lake Macalawa to the wharves in Holland, Michigan, a Turning Basin 18 feet deep, a channel in Black River 21 feet deep
and a settling basin with a project depth of 17 feet above the Black River channel to the State Street Bridge. Navigation season: March 13 to
December 31.
Comparative Statement of
Traffic (
thousand short tons)
Year
Total
Year
Total
Year
Total
Year
Total
1997
398
2000
389
2003
560
2006
453 -
1998
476
2001
443
2004
544
1999
453
2002
621
2005
634
Freight Traffic,
2006
(
thousand short tons)
Commodity
Total, all commodities --
Total coal.
1100 coal kenit_
Total crude=materials,'
inedible
except=fuels=
Subtotal
soil, sand, gravel,
rock and stone
4322
limestone
Subtotal iron ore and scrap
4420
iron & steel scrap
Subtotal slag
4860
slag
Subtotal other non-metal. min.
4900
non-metal. min. nee
Grand Total
Canadian
Outbound
11
11
i1
11
TotaE
primary manufactured goods
22
22
22
Subtotal
lime, cement
and glass
22
22
22
5210
lime
22
22
22
Domestic
Total
Lakewise
Receipts
Shipments
24
DETROIT, MI DISTRICT
U.S. ARMY CORPS OF ENGINEERS
ST. JOSEPH HARBOR, MI
Section Included: Entrance channel and lower portion of St. Joseph River to and including Benton Harbor Canal. Controlling Depth: 24 feet at
entrance; 21 feet between entrance piers and in the river to the mouth of the Paw Paw River; with miscellaneous of shoaling along the channel limits;
17 feet in the Turning
Basin
;
and 16 feet at
Benton Harbor Canal. Project Depths: 24 feet at entrance, and 21 feet in channel and river to the mouth of
the Paw Paw River; 18 feet in turning basins and the Benton Harbor Canal.
Navigation season
:
March 7 to December 31.
Comparative Statement of Traffic (thousand short tons)
Year
Total
Year
Total
Year
Total
Year
Total
1997
609
2000
735
2003
738
_
7
1006
541
'.
1998
747
2001
1,015
2004
748
1999
510
2002
602
2005
531
Freight Traffic, 2006 (thousand short tons)
Canadian
Domestic
Commodity
Grand Total
Total
Lakewise
Inbound
Receipts
Shipments
Total,
alt commodities
541
44
497
496
2.
Total crud
e
materials, inedible
..except.fuels
299
441
256
254
.2
Subtotal soil, sand
,
gravel, rock and stone
256
256
254
2
433543224331
sand
waterway
limestone&
gravelimprov.
mat
1816411
1816411
181
649
-
-
2
Subtotal
other
non-metal. min.
44
44
4900
non-metal. min. nec
44
44
Total
: primary manufactured goods'
242
242
242
Subtotal lime, cement and glass
242
242
242
5220 cement & concrete
242
242
242
MILWAUKEE HARBOR, WI
Section Included: Lake Approach Channel, outer harbor, Milwaukee River to Buffalo Street, lower 2 miles
of Menomonee
River, lower 2 miles of
Kinnickinnic River and South Menomonee and Burnham Canals. Controlling and project depths: 30 feet in Lake Approach Channel, 28 feet in the
entrance
channel and the south outer harbor, 21 feet in the north cuter harbor, 27 feet in the Kinnickinnic River to the Chicago and North Western
Railway Bridge at mile 1.0, thence 21 feet to South Kinnickinnic Avenue Bridge; 27 feet in Milwaukee River to the Chicago and North Western Railway
Bridge at mile 0.21, thence 21 feet to East Buffalo Street Bridge; 21 feet in Menomonee River and South Menomonee and Burham Canals.
Comparative
Statement of
Traffic (
thousand
short tons)
Year
Total
Year
Total
Year
Total
Year
Total
1997
3,265
2000
3,539
2003
3,002
':
2006
4 007-;
1998
3,108
2001
3,373.
2004
3,156
1999
3,531
2002
3,127
2005
3,805
Freight Traffic, 2006 (thousand short tons)
Commodity
Total
Fo_ reign
Canadian
Total,.
a [L commodities
....................................
.......
.Total chemicals
-and_relatedproducts -
Subtotal other chemicals
and related products
3275
inorg. elem., oxides, & lialogon sa'Is
Total crude.
mateiials
i
inddlible
except fuels _
Subtotal other non-metal. min.
4900
non-metal
.
min. nec
total primary
manufactured goods
Subtotal
primary iron
and steel products
5320
i&s primary forms
5330
i&s plates &
sheets
5360
i&s bars & shapes
5370
i&s pipe & tube
5390
primary As nec
Subtotal primary non-ferrous
metal products
5429
smelted prod. nec
5480
fab. metal products
Total:;
food
and.farm products -
Subtotal grain
6344 corn
Subtotal oilseeds
6522 soybeans
Subtotal processed grain and animal feed
6747 grain
mill products
683
683
681,
224
201
81
97
22
0
0
22
1
21
495
323
323
160
160
12
12
Totalall manufactured equipment
,
machinery and products
11
7110
machinery (not eteo}
11
7210
vehicles & parts
0
7230
ships &
boats
0
7600
rubber & plastic pr.
0
7900
manufac. prod. nec
0
Inhound Outbound
Inbound Outbound
174
56
56
118
118
U.S. ARMY CORPS OF ENGINEERS
DETROIT, MI DISTRICT
25
MILWAUKEE HARBOR, WI
Freight Traffic,
2006 - continued
(thousand short tons)
Commodity
Total
Foreign
Inbound
Outbound
Canadian
Total unknown or not elsewhere classified
9900
unknown or nec
Inbound
Outbound
Domestic
Commodity
Total
Lakewise
Intern
al
Receipts
Shipments
Receipts
Shipme
nts
Intraport
Total
,
all oommodif es
2,5891
2,545
14.
26-
Total coal
1,108
1,108
1100
coal
lignite
1,108
1,ii i$
-
Total petroleumn and petroleum products
183
183
= 1
Subtotal petroleum
products
2430
asphalt, tar & pitch
183
18'
183
]]
-
Total crude
maferlals,
'
inedible
except fuels
257
253
4
433548604322
Subtotal
Subtotal
slagwaterway
limestone
slagsoil
,
sand
improv.
,
gravel
mat
,
rock and stone
79
86
14
14
7
82
1479143
--
4
4
-
--
---
--
---
--
--
-
4900Subtotal
non-metal.
other
non-metal.
min. nec
min.
156156
156
156
--
--
-
-
-
-
Total - primary- manufactured '
goads .
994.
992
O i
2
0
5220
Subtotal
Subtotal
cement
primary
lime,
& concrete
cement
iron and
and
steel
glassproducts
992
992
1
992
992
-
0
-
1
--
-
--
-
-0
53305360
i&s
i&s
plates
bars &
&
shapessheets
00
-
00
--
--
-0
5390
primary i&s nec
1
Subtotal
primary
non-ferrous metal products
1
5480
fab. metal products
1
Total,food'
and farm products
28:1
26
Subtotal grain
14
14
6241
wheat
3
3
6344
corn
11
11
Subtotal oilseeds
14
2
12
6522 soybeans
14
2
12
Total all manufactured equipment
,
machinery and
products
113`
7110
machinery (not elec)
18
MANITOWOC HARBOR, WI
Section Included: Outer harbor and lower 2 miles of river. Controlling and project depths: 21 feet in the Lake Approach Channel, the outer harbor,
and in the river channel to the Third Railway Bridge.
Comparative Statement of Traffic (thousand short tons)
Year
Total
Year
Total
Year
Total
Year
Total
1997
407
2000
287
2003
383
2006
335
1998
414
2001
408
2004
282
1999
379
2002
421
2005
428
Freight Traffic, 2006 (
thousand short tons)
Commo dity
Grand Total
Lakewise
Receipts
Shipments
Total,
all commodities
336
309
30
Total coal
90
90
1100
Cold & lignite
90
90
Total crude materials, inedible except fuels
41
11
30
Subtotal soil
,
sand
,
gravel, rock and stone
41
11
30
43354322
waterway
limestone
improv. mat
3011
11
-30
Total primary
manufactured goods
208
205
Subtotal lime, cement and glass
208
208
5220 cement & concrete
208
208
26
DETROIT, MI DISTRICT
U.S. ARMY CORPS OF ENGINEERS
GREEN BAY HARBOR, WI
Section Included:
Outer channel
, channel through the city of Green Bay and upper
river channel
to city of De Pere.
Controlling and
project depths: 26
feet in outer
channel to Grassy
Island
; 24 feet in the
entrance channel and river channel
to a point 1,700 feet upstream from the C. & N. W. R. R.
Bridge; 24 feet
in the turning
basin at the
mouth of the East
River; 20 feet in the
turning basin
above the C. & N. W. R. R
. Bridge; 18 feet
in the upper
river channel and turning basin at the
city of De Pere.
Comparative Statement of
Traffic (
thousand short tons)
Year
Total
Year
Total
Year
Tota!
Year
Total
1997
2,130
2000
1,551
2003
2,
084 ; 2006
2,618 :J
1998
2,353
2001
2,242
2004
2,361
1999
2,333
2002
2,078
2005
2,728
Freight Traffic, 2006 (thousand short tons)
Foreign
Canadian
Domestic
Commodity
Grand Total
Total
Lakewise
Inbound
Inbound
Receipts
Shipments
Tot al,' all commodities.
Total coal
--
1100
coal & lignite
Total pefrolourn
and petroleum
products
Subtotal petroleum products
2330
distillate fuel oil
2430
asphalt, tar & pitch
Total chemicals
and related products
Subtotal other chemicals and related products
3276
metallic salts
Total crude
.
naterials
;'
Inedihle
.except fuels
Subtotal forest products
, wood and chips
4189
lumber
Subtotal pulp and waste paper
4225
pulp & waste paper
Subtotal soil
,
sand
,
gravel
,
rock and stone
4322
limestone
Subtotal other non-metal. min.
4900
non-metal, min. nec
5
5
Total prima
rymanufactured
goods
473
Subtotal lime, cement and glass
416
5220
cement & concrete
416
Subtotal
primary iron
and steel products
57
5312
pig iron
57
Subtotal primary non-ferrous metal products
0
5422
aluminum
0
Total all manufactured
'
equlpment
.
machineryand products=.
0'
7110
machinery (not elec)
0
340
5
5
648
585
585
40
40
23
23
23
436
5
411
5
411
5
27
--
27
U.S. ARMY CORPS OF ENGINEERS
DETROIT, MI DISTRICT
27
ALPENA HARBOR, MI
Section Included: Lower 4,000 feet of river and private harbors north of mouth of Thunder Bay River. Controlling Depth: 21 feet in the bay section; 17
feet in river; 15 feet in turning basin. Project Depths: channel 21 feet deep from that depth In Thunder Bay to a point 2,500 feet lakeward of the
lighthouse; thence 18.5 feet in river narrowing to 100-fool width at a point 700 feet upstream from the lighthouse; thence 100 feet wide and 18.5 feet
deep to the Second Ave. Bridge; thence 18.5 feet deep and 75 feet wide to the upper limits of the project; a turning tasin 15 feet deep by 3.7 acres at
the upper end of project; and a turning basin 18.5 feet deep at the river mouth. Navigation season: March 15 to December 17.
Comparative Statement of Traffic (thousand short Ions)
Year
Total
Year
Total
Year
Total
Year
Total
1997
2,901
2000
3,405
2003
3,000
2006
-
3,330
1998
3,078
2001
3,268
2004
3,275
1999
3,947
2002
3,218
2005
3,229
Freight Traffic, 2006 (
thousand short ions)
Commodity
Total
,
all:commodities
Total
-
coal
1100
coal & lignite
1200
coal coke
Total
:
crude materials
;
inedible.except fuels
Subtotal soil, sand
,
gravel
,
rock and stone
4322
limestone
Subtotal iron ore and scrap
4410
iron ore
Subtotal slag
4860
slag
Subtotal other non-metal. min.
4900
non-metal, min, nec
Total primary manufactured goods
Subtotal lime
,
cement and glass
5220
cement & concrete
Grand Total
3
-122
3
122
3
122
Domestic
Total
Lakewise
Receipts
Shipments
as
88
18
18
18
18
15
15
15
15
55
55
55
55
2,50-1
11
2,490
2,501
11
2,490
2,501
11
2,490
MENOMINEE HARBOR AND RIVER, MI AND WI
Section Included: Entrance channel and lower 2.0 miles of Menominee River. Controlling and project deplhs: 20 feet controlling depth, 23 feet project
depth in the Approach Channel; 18 feet controlling depth, 21 feet project depth in the entrance and river channels, 19 feet in the river adjacent to the
Marinette Marine Corp., 12 feet to the end of the project, and 18.5 feet controlling depth, 21 feet project depth in the Turning Basin.
Comparative Statement of Traffic (thousand short tons)
Year
Total
Year
Total
Year
Total
Year
Total
1997
260
2000
51
2003
356
2006
411
1998
388
2001
196
2004
401
1999
165
2002
429
2005
342
Freight Traffic, 2006 (thousand short tons)
Foreign
Canadian
Domestic
Commodity
Grand Total
Total
Lakewise
Inbound
Inbound
Receipts
Shipments
Total;' all
commodities
Total coal
1100
coal & lignite
Total
crude materiats
,:
inedible
except fuels
171
Subtotal forest products, wood and chips
10
4170
wood in the rough
3
4189
lumber
7
Subtotal pulp and waste paper
106
4225
pulp & waste paper
106
Subtotal soil, sand
,
gravel, rock and stone
17
4322
limestone
17
Subtotal iron ore and scrap
3
4420
iron & steel scrap
3
Subtotal other non-metal
.
min.
35
4900
non-metal. min. noc
35
Total primary manufactured
goods -
209
Subtotal primary
iron and steel products
209
5312 pig iron
209
5360 i&s bars & shapes
0
Canadian
Inbound
Outbound
17
17
3
-
17
17
-
-3
33
37
„7
37
37
37
37
00
28
DETROIT, MI DISTRICT
U.S. ARMY CORPS
OF ENGINEERS
SAGINAW RIVER, MI
Section Included: From the mouth of the river up to and including Sagainaw, Michigan. Controlling Depths: 27 feet from the 25 foot contour in
Saginaw Bay to 26 feet at the river mouth, 4 feet miscellaneous shoaling along channel limits; thence 24 feet to the Grand Trunk R.R. Bridge; thence
22 feet to the C&O R.R. Bridge in Saginaw, Michigan; thence 14 feet to the Holland Street Bridge; thence about 7 feet over a width of 100 feet
upstream to Green Point (this section not maintained). Controlling depths in turning basins are: Essexville - 23 feet north side, 22 feet south side;
Airport - 21 feet; Carrollton - 19 feet; Sixth Street - 20 feet; basin at 19 mile point - 15 feet. Project Depths: 27 feet from the deep water in Saginaw
Bay to the river mouth; thence 26 feet for 0.4 mile; thence 25 feet to the Grand Trunk R.R. Bridge; thence 22 feet to the C&O R.R. Bridge in Saginaw;
thence 16.5 feet to the upstream limits at Green Point. 20 and 25 feet in Essexville Turning Basin; 22 feet in the Airport turning basin; 20 feet in the
Carrollton Turning Basin; 20 feet in the Sixth Street Turning Basin and 15 feet In the Turning Basin at the 19 mile point. Navigation season: March 24
to December 31.
Comparative Statement of Traffic (thousand short tons)
Year
Total
Year
Total
Year
Total
11
Year
Total
1997
5,730
2000
4,609
2003
5,404
2006
4,160
1998
5,609
2001
5,839
2004
5,516
1999
5,290
2002
5,819
2005
5,625
Freight Traffic, 2006 (thousand short tons)
Foreign
Canadian
Domestic
Commodity
Grand Total
Total
I-a kewise
Internal
Inbound
Inbound
Outbound
Intra
Receipts
Downbnd
.Total,
all commodities
:Total coal
_
295
1100
coal & lignite
295
Total
.
petroleum
and-petroleum
products
,;
-
208.
Subtotal petroleum products
208
2211
gasoline
32
2340
residual fuel oil
36
2430
asphalt, tar & pitch
140
Total chemicals and re-166d
"
products
92
Subtotal fertilizers
33
3130
potassic Pert.
33
Subtotal other chemicals and related products
58
3276
metallic salts
58
Total.crude materials,
inn' dible
'
except
fuels
-2,984
Subtotal soil, sand, gravel
,
rock and stone
2,650
4322
limestone
2,538
4323 gypsum
8
4331
sand & gravel
104
Subtotal slag
68
4860
slag
68
Subtotal other non-metal
.
min.
265
4900
non-metal. min. nec
265
Total^pnma
'
ry.`'manufactured goods
576
Subtotal lime
,
cement and glass
576
5210 lime
11
5220
cement & concrete
566
`,;Total food and farm
.products
6
Subtotal other agricultural products
6
6861
sugar
Tons All Traffic (
x1o00)
4,160
Total Trip-
ton-miles Internal and Intraport (x1000)
243
614
316
230
8
77
45
45
253
253
476
476
I
32
32
32
2,985
2,952:
34
295
295.
--
29n
2951
-
.2,369
2,336.:
34`.
2,334
2,313
21
2,308
2,286
21
27
27
23
23
23
23
12
--
12
12
-
12
U.S. ARMY CORPS OF ENGINEERS
DETROIT, MI DISTRICT
29
ST. CLAIR RIVER, MI
Section Included: Entire length of St. Clair River and Black River up to Washington Avenue in Port Huron. Controlling Depths: 27 to 30 feet in St.
Clair River at Port Huron and 20 feet in Black River.
Comparative
Statement
of Traffic (thousand short tons)
Year
Total
Year
Total
Year
Total
Year
Total
1997
79,777
2000
85,078
2003
68,067
2006
77,481
1998
84,238
2001
79,143
2004
76,241
1999
79,910
2002
79,341
2005
77,321
Freight Traffic, 2006 (
thousand short tons)
Commodity
Total coal
1100
coal & lignite
1200
coal coke
Total petroleum and petroleum
.
products
Subtotal crude petroleum
2100
crude petroleum
Subtotal petroleum products
2211
gasoline
2330
distillate fuel oil
2340
residual fuel oil
2350
lube oil &
greases
2430
asphalt, tar & pitch
2540
petroleum coke
Total chcrnicals
and related products -
Subtotal fertilizers
3130
potassic ferl.
Subtotal other chemicals and related products
Total
1,315
70
254
156
4
19
811
351
119
119
232
Foreiqn
Canadian
Through
Through
Upbound Downbnd
Inbound
Urtound* Down
1,793_
2,722 :
--
629
9,438
21,484.
48
4,725
8155'.
48
4,6
7,873
87
282
5
242
1,135.
115
115
0
53
242
1,020
-
-
38
32
0
-
148
106
-
-
50
106
--
4
- -
19
-
53
6
752
9
139
202:
--
--
119
-
-
119
9
--
139
83
--
3
-
-
60
18
-9
--
6
--0
---
-6316
--56
239
464
581
_3
1
546
9,8151
26
---
--
--
78
241
--
78
122
122
--
-
-43
581
289
4,146
- -
17
460
194
3,349
-
43
121-
878
779-
-
230
--
1,971
4,528
-
230
-
1,971
4,523
--
5
84
21
--
125
132
84
-
1185
-
21
1
132
-
170
--
15
87
-
170
-
15
87
265
69
265
69
7
882
775
7
-
882
775
1,495
775
1,217.
0
634
1,276
634
1,276
1,434
0
--
-
1410
-
672
5997158285
--
-
---
13451
--
61
5
0
1
0
--
1
602
-5
0
3211
acyclic hydrocarbons
3
3212
benzene & toluene
78
3219
other hydrocarbons
9
3260
organic comp. nec
6
3274
sodium hydroxide
16
3275
inorg. elem., oxides, & halogen salts
63
3276
metaflic salts
56
Total crude materials; inedible except
fuels
14,645
Subtotal forest
products,
wood and chips
104
4170
wood in the rough
1
4189
lumber
102
Subtotal pulp and waste paper
122
4225
pulp & waste paper
122
Subtotal soil
,
sand
,
gravel, rock
and stone
5,059
4310
building stone
17
4322
limestone
4,003
4323
gypsum
8
4331
sand & gravel
1,030
Subtotal iron ore and scrap
6,729
4410
iron ore
6,724
4420
iron & steel scrap
5
Subtotal non
-
ferrous ores and scrap
362
4650
aluminum ore
202
4670
manganese ore
5
4690
non-ferrous ores nec
154
Subtotal sulphur, clay and
salt
272
4782
clay & refrac. mat.
272
Subtotal slag
333
4860
slag
333
Subtotal other non-metal
.
min.
1,664
4900
non-metal. min. nec
1,664
Total primary
manufactured
goods
3;552
Subtotal lime, cement and glass
1,910
5220
cement & concrete
1,910
5240
glass & glass prod.
0
5290
misc. mineral prod.
0
Subtotal
primary iron
and steel products
1,574
5312
pig iron
205
5320
i&s primary forms
674
5330
i&s plates & sheets
599
5360
i&s bars & shapes
58
5370
i&s pipe & tube
28
5390
primary i&s nec
10
Subtotal
primary
non-ferrous metal products
67
5422
aluminum
1
5429
smelted prod. nec
2
5480
fab.
metal products
65
30
DETROIT, MI DISTRICT
U.S. ARMY CORPS OF ENGINEERS
ST. CLAIR RIVER, MI
Freight Traffic,
2006 - continued
(thousand short tons)
Commodity
Total food
.
and.farm
.products'
Subtotal grain
6241
wheat
6344
corn
6445
oats
Subtotal oilseeds
6522 soybeans
6534 flaxseed
Subtotal vegetable products
6654
vegetables & prod.
Subtotal processed grain and animal feed
6747 grain
mill products
Subtotal other agricultural products
6861
sugar
6899
farm products nee
Tatai.aiFinar ufactured
:
eg .. .
.
nt,.maoIIinory and products
7110
machinery (
not else)
7120
electrical
machinery
7210
vehicles & parts
7230
ships & boats
7400
manufac, wood prod.
7600
rubber & plastic pr.
7900
manufac. prod, nee
Totat...unknown or not elsewhere classified
9900
unknown or nec
Ton-miles
(x1000)
Foreign & Canadian
Commodity
Total,
all commodities
Total
coal
1100
coal & lignite
1200
coal coke
Total petroleum and 'petroleum
`
products
Subtotal petroleum products
2211
gasoline
2330
distillate fuel oil
2340
residual fuel all
2429
naphtha & solvents
2430
asphalt, tar & pitch
2540
petroleum coke
Total chemicals and related products
Subtotal other chemicals and related products
3276
metallic salts
Total crude materials, inedible
except fuels
Subtotal soil
,
sand
,
gravel
,
rock and stone
4322
limestone
4323 gypsum
4331 sand & gravel
Subtotal iron ore and scrap
4410
iron ore
4420
iron & steel scrap
Subtotal slag
4860
slag
Subtotal other non-metal
.
min.
4900
non-metal. min. nee
Total primary manufactured goods
Subtotal lime, cement and glass
5210
time
5220
cement & concrete
Subtotal primary Iron and steel products
5312
pig iron
5330
i&s plates & sheets
Subtotal
primary
non-ferrous metal products
5480
fab.
metal products
Total food
and farm products
Subtotal grain
6241 wheat
6445 oats
Foreign
Canadian
Total
Through
Through
Upbound
Inbound
Downbnd
Upbound" Downbnd
3,066
.1
-
6
2,193-
894£
2,271
-
1,726
3
542
1,503
---
1,313
190
669
-
413
3
253
99
-
99
513
-
192
321
472
-
151
321
41
-
41
63
-
83
83
-
63
42
-
12
-
30
42
-
12
-
-
30
187
6
180
-
--
17215
-6
1729
--
--
--
44
23
a
7
_ 7
35
21
7
-
7
0
8
0
0-0
6
1
1
-
--
0
00
-0
--
--
-0
0
0---
0
2020i
20
20
-
-
0
1,389,239
69,916
106,159
7,198
368
,
100
837,866
Domestic
akewlse
Internal
Total
Throu gh
Through
Receipts
Shipments
Unbound
Downbnd I Upbound
Downhnd
41,415
9,578
29
3,514
28;267
12,460
8,296
.
'
29
2,470
1665
12,291
8,296
29
2,462
1,504
169
-
-
8
161
448
29
195
201
17
7
448
29
195
201
17
7
79
79
101
29
45
14
7
7
27
27
88
77
33
43
157
3
144
10
-
0
0_
0
--
0
0-
0
27,619.;
1,254
830
25,535
7,797
1,238
132
6,427
7,273
1,238
132
5,903
249
-
-
249
275
-
---
275
19,191
-
84
19,106
19,154
-
46
19,108
136
38
-
16
120
38
-
-
136
16
120
494
--
494
-
494
494
-
546'
--
19
524
512
--
--
512
6-
6
507
-
-
507
33
--
19
12
3
31
-
19
12
3-
3
0
--
0
0
--
0
942
--
342
342
--
342
81
-
81
261
-
261
U.S. ARMY CORPS
OF ENGINEERS
DETROIT, MI DISTRICT
31
ST. CLAIR RIVER, MI
Freight Traffic
,
2006 - continued
(thousand short tons)
Commodity
Total
;Total 31I manufactured equipment, machinery and
products
7110
machinery (
not elec)
Ton-miles (x1000
)
1,410,654
Domestic
Receipts
Shipments
V
169,419
719
137,047 1,102,432
Lakewise
Upbound Downbnd
Domestic
Through
Internal
Through
Up-hound
Downbnd
0
Tons All Traffic (
x1000
)
77,481
Ton-miles
All Traffic (
x1000
)
2,799,893
Total Trip-
ton-miles Internal and Intraport
(
x1000
)
20,429
'Includes 30 tons
of Canadian
upbound through
in-transits.
757
280
MARYSVILLE, MI (INCLUDED IN ST. CLAIR RIVER)
Section Included
:
West bank of St. Clair River at Marysville, MI. Controlling Depth: 27.4 feet. Project Depth:
at low-water datum
; 27.4 feet to and
from Lake Huron; 27.1 feet downbound to Lake St. Clair.
Comparative
Statement
of Traffic (
thousand short tons)
Year
Total
Year
Total
Year
Total
Year
Total
1997
1,142
2000
1,227
2003
1,213
2006
1,316'
1998
1,282
2001
1,503
2004
1,362
1999
1,357
2002
1,323
2005
1,259
Freight Traffic, 2006 (
thousand
short tons)
Commodity
Total
,
all commodities
Total coal
1100
coal & lignite
.Total.`.
crude
.:
materials
,
inedible except fuels
Subtotal soil, sand,
gravel
,
rock and stone
4322
limestone
4331
sand & gravel
Subtotal slag
4860
slag
Grand Total
ST. CLAIR, Mi (INCLUDED IN ST. CLAIR RIVER)
Section Included
:
West bank of St. Clair River
at St. Clair,
MI Controlling Depth
:
27.3 feet
.
Project Depth
: 27.3 feet.
Comparative Statement of
Traffic (
thousand short tons)
Canadian
Inbound
530
48
46
482
482
361
121
Year
Total
Year
Total
Year
Total
Year
Total
1997
5,699
2000
5,553
2003
4,254
2006
41901
1998
5,533
2001
4,818
2004
5,281
1999
5,326
2002
4,506
2005
4,151
Freight Traffic,
2006
(
thousand short tons)
Commodity
Total; .
all commodities
Total coal
1100
cea# & lignite
.Total
' petroleum and petroleum products
Subtotal petroleum products
2330
distillate fuel oil
Grand Total
Domestic
Lakewise
Receipts
786
163
163
623
607
607
16
16
Lakewise
Receipts
S_h_pmenis
4,873
29.
4,844
29
4,844
29
29
29
29
32
DETROIT, MI DISTRICT
U.S. ARMY CORPS
OF ENGINEERS
MARINE CITY,
MI (INCLUDED
IN ST. CLAIR RIVER)
Comparative Statement of Traffic (thousand short tons)
Year
Total
Year
Total
Total
Year
Total
1997
4,001
2000
3,987
3,585
'
'''
2006
4
'
019
::'.
."
:
..
1998
4,252
2001
3,896
r2004
4,077
1999
3,652
2002
3,713
4,225
Freight Traffic,
2006
(
thousand short tons)
Commodity
.
Total coal
1100
coal & ignite
Total
crude materials
, Inedible except.fuels--
Subtotal soil, sand
, gravel,
rock and stone
4322
limestone
Grand Total
Canadian
Inbound
Domestic
Lakew€se
Receipts
CHANNELS IN LAKE ST. CLAIR
Section Included: Improved ship channels connecting St. Clair River and Detroit River across Lake St. Clair, entrance channels to mouth of Clinton
River and the Canadian channel to the mouth of the Thames River. Controlling Depths: 27.0 feet in the main channel with 8 feet in channel to Clinton
River. Project Depths: 27.5 feet in main channel and 8 feet in Clinton River channel.
Comparative Statement of Traffic (thousand short tons)
Year
Total
Year
Total
Year
Total
Year
Total
1997
68,211
2000
73,490
2003
58,004
2006
67,007 '
1998
71,970
2001
68,035
2004
L
66,558
1999
67,912
2002
68,697
2005
66,767
Freight Traffic
, 2006
(
thousand
short tons)
Commodity
Total,'
all commodities
Total coal
1100
coal & lignite
1200
coal coke
total .
petroleum and petroleum
products
Subtotal crude petroleum
2100
crude petroleum
Subtotal petroleum products
2211
gasoline
2330
distillate fuel oil
2340
residual fuel oil
2430
asphalt, tar & pitch
2540
petroleum coke
Total
chemicals and related products
Subtotal fertilizers
3130
potassic fert.
Subtotal
other
chemicals and related products
3211
acyclic hydrocarbons
3212
benzene & toluene
3219
other hydrocarbons
3260
organic comp, nec
3274
sodium hydroxide
3275
inorg, elem., oxides, & halogen salts
3276
metallic salts
Totat crude materials,
`
inedible
' except fuels
Subtotal forest products
,
wood
and chips
4170
wood in the rough
4189
lumber
Subtotal pulp and waste paper
4225
pulp & waste paper
Subtotal soil, sand, gravel
,
rock and stone
4322
limestone
4323 gypsum
4331
sand & gravel
Subtotal
I
ron ore and scrap
4410
iron ore
4420
iron & steel scrap
Foreign
Canadian
Total
Through
Through
Upbound Downbnd U 2 bound` Downbnd
34,460
,793
2;722
9,248
20,698
12,723
4,674
,
8,049
12,354
4,587
7,767
370
87
282
1,187
.
531
69
1,065
115
--
115
115
--
115
1,072
0
53
69
950
11638
0
2338
-92
107
5
102
44
808
53
3
752
351
139 •: ':
202
,
119
119
119
119
232
9
139
83
3
-3
78
60
18
99
6
6
16
1fi
63
0
63
56
56
13,487
239
464
3,580
9,204
104
26
--
--
78
102
1
241
-
78
122
122
--
122
122
--
3,901
--
43
322
3,535
3,059
227
2,832
8348
43
678
704-
6,729
230
1,971
4,528
6,724
230
4,971
4,523
55
U.S. ARMY CORPS
OF ENGINEERS
DETROIT, MI DISTRICT
33
CHANNELS IN LAKE ST. CLAIR
Freight Traffic,
2006 - continued
(thousand short tons)
Commodity
Subtotal
non-ferrous
ores and scrap
4650
aluminum ore
4670
manganese ore
4690
non-ferrous ores nec
Subtotal
sulphur,
clay and salt
4782
clay & refrac. mat.
Subtotal slag
4860
slag
Subtotal other non-metal. min.
4900
non-metal. min. nec
Total
primary
-manufactured-goods
Subtotal lime, cement and glass
5220
cement & concrete
5240
glass & glass prod.
5290
misc. mineral prod.
Subtotal primary iron and steel products
5312
pig iron
5320
1&s primary forms
5330
i&s plates & sheets
5360
i&s bars & shapes
5370
As pipe & tube
5390
primary i&s nec
Subtotal
primary
non-ferrous metal products
5422
aluminum
5429
smelted prod. nec
5480
fab.
metal products
Total food "
and Ifarm products
Subtotal grain
6241
wheat
6344
corn
6445
oats
Subtotal oilseeds
6522
soybeans
6534 flaxseed
Subtotal vegetable products
6654
vegetables & prod.
Subtotal processed grain and animal feed
6747
grain mill products
Subtotal other agricultural products
6861
sugar
6899
farm products nec
Total all manufactured
-
equipmerit
, machinery:
and..products
7110
machinery (not elec)
7120
electrical machinery
7210
vehicles & parts
7230
ships & boats
7400
manufac. wood prod.
7600
rubber & plastic pr.
7900
manufac. prod. nec
Total unknown or not elsewhere
classified
9900
unknown or nec
Ton-miles (
x1000)
Foreign
&
Canadian
Foreign
Canadian
Total
Through
Through
Upbound
Downbnd
U p bound` Downbnd
362
84
21
125
132
202
84
118
55
154
21
1
132
272
170
15
87
272
170
15
87
333
265
69
333
265
69
1,664
7
882
775
1,664
7
882
775
3,552
1
,
4S5
.
.'; ..
775
1,277
1,910
0
634
1,276
1,910
634
1,276
00
0
0
-
1,574
205674
1,434
67271
141
1341
-
-
-
599
599
58
58
28
28
10
5
5
67
61
5
0
1
10
1
2
2
65
60
5
0
3,096
6
2,193
_ 3
894
2,271
-
1,726
3
542
1,503
-
1,313
-
190
669
-
413
3
253
99
-
99
513
192
321
472
-
151
-
321
41
83
-
41
83
-
-
83
42
83
12
-
-
-
30
42
12
30
187
17215
-
a6
180
172
9
-
---
-
44
23
:
8
7
7`
35
21
7
7
0
80006
11-
0
00
0
-
0
00
11-
0
20
"r
20
'.. ..,
20
20
0
620,280
32,269
48,997 166,458 372,556
Commodity
Total, '
allcommodities
Total coal
11DO
coal & lignite
1200
coal coke
Total petroleum and petroleum
products
Subtotal petroleum products
2211
gasoline
2330
distillate fuel oil
2340
residual fuel oil
2429
naphtha & solvents
2430
asphalt, tar & pitch
2540
petroleum coke
-Total chemicals and related products
Subtotal other chemicals and related products
3276
metallic salts
Total
32,547
4307
4,138
169
446
448
79
101
27
8
77
157
0
0
0
Lakewise
Thrcuoh
Dom
stir
Internal
Through
Upbcund Downbnd Upbound
Downbnd
4,224
28,296
2,614
11693
2,606
1,532
8
161
223
201
17
7
223
201
17
7
7973
-14
7
7
27338
--
43
3
144
10
a
0
0
34
DETROIT, MI DISTRICT
U.S. ARMY CORPS
OF ENGINEERS
CHANNELS IN LAKE ST. CLAIR
Freight Traffic
,
2006 - continued
(thousand short tons)
Domestic
Comm dit
T
l
o
y
ota
Lakewise
Internal
Through
Through
Upbound
Downbnd Upbound
Downbnd
Total crudo
materials
,
inedible
except fuels
26,903,
1,368
25,535
Subtotal soil, sand
,
gravel
,
rock and stone
7,097
670
6,427
4322
limestone
6,573
670
5,903
4323 gypsum
249
-----
249
4331
sand & gravel
275
-
275
Subtotal iron are and scrap
19,191
84
19,108
4410
iron ore
19,154
46
19,108
4420
iron & steel scrap
38
38
Subtotal slag
120
120
4860
Subtotal
slag
other non-metal
.
min.
494
120
494
120
-
4900
non-metal. min. nec
494
494
.................... .
Total primary manufactured
'
goods
546
19
524
Subtotal lime, cement and glass
512
-
512
5210
lime
6
-
6
5220
cement & concrete
507
-
507
Subtotal primary iron and steel products
33
19
12
3
5312
pig iron
31
19
12
5330
1&s plates & sheets
3
3
Subtotal primary non-ferrous metal products
0
0
5480
fab.
metal products
0
D
...T.....................
.
otal food ;and farm. products
342
342
Subtotal grain
342
342
6241 wheal
81
81
6445
oats
261
261
...
Total
-
all
manufactured equipment machinery and products
7110
hi
I
0
mac nery (
not e
ec)
0
0
Ton-miles
(
x1000)
585,844
76,033
509,333
349
129
Domestic
Tons All Traffic (
x1000
)
67,007
Ton-miles All Traffic (x1000
)
1,206,124
Total Trip-ton
-
miles Internal and Intraport
(
x1000
)
20,429
*Includes 30 tons of Canadian upbound through in-transits.
DETROIT RIVER, MI
Section Included: Entire length of Detroit River and Rouge River to head of project. Controlling Depths: 25 to 28.5 feet and 21 1025 feet, respectively
with 5 feet o€ shoaling along the channel limits of the lower Livingstone and east outer channel and with project depth in the regularly traveled shipping
lanes.
Comparative Statement of Traffic (thousand short tons)
Year
Total
Year
Total
Year
Total
Year
Tatal
1997
75,939
2000
80,508
2003
63,
961
%:2006
72,729
1998
82,842
2001
74,278
2004
72,456
1999
75,242
2002
74,653
2005
71,915
Freight Traffic, 2006 (thousand short tons)
Commodity
Total
Total
, '
alI commodities
38,343)
Total coal
13;470
1100 coal &
lignite
12,881
1200 coal coke
589
Total
petroleum
and petroleum
`ptoducts
1,457
Subtotal crude petroleum
115
2100 crude petroleum
115
Subtotal petroleum products
1,342
2211 gasoline
38
2330 distillate fuel oil
128
2340 residual fuel oil
122
2430 asphalt, tar & pitch
24
2540 petroleum coke
1,030
Total chemical-,,
and related
products
371
Subtotal fertilizers
119
3130 potassic fert.
119
U.S. ARMY CORPS OF ENGINEERS
Forekin
Inbound
Outbound
Through
Upbound Downbnd
689
-41
41
41
1;793
2,722
Canadian
Through
Inbound
Outbound
Upbound Downbnd
3,099=
549
10,225 =
19,185
724
270
4,905
7,534.
510
247
4,841 7,284
210
23
64
250
74
257
82
992
--
--
115
--
-
115
74
257
82
877
38
----
14
12
23
78
48
16
5
53
4
6
21019
150
746-
21
139
202
--
119
119
DETROIT, MI DISTRICT
35
DETROIT RIVER, Ml
Freight Traffic,
2006 - continued
(thousand
short tons)
Foreign
Canadian
Commodity
Total
I
Through
Through
nbound Outbound
Upbound Downbnd
Inbound
Outbound
Upbound' Downtand
Subtotal other chemicals and related
253
0
9
21
139
83
products
3211 acyclic hydrocarbons
3
-
3
3212 benzene & toluene
78
60
18
3219 other hydrocarbons
9
0
9
3260 organic comp, nec
6
-
-
6
3276
3274
3275
metaMc
sodium
inorg. elem.,
hydroxidesalts
oxides, & halogen salts
835616
0
---21
-631
fi
--56
Total crude materials
, inedible except fuels
15,482
239
464
1,571
4,213
8,989
Subtotal forest products
,
wood and chips
104
26
-
--
-
--
78
4189
4170
lumberwood
in the rough
1021
241
--
78
4225
Subtotal
Subtotal
pulp &
soil,
pulp
waste
sandand
paper
waste
,
gravelpaper
,
rock and stone
4,719122
122
122122--
--43
300
-
946
3,430
4322 limestone
3,601
171
-
692
2,737
4323 gypsum
8
8
-
4331 sand & gravel
1,110
43
129
-
245
692
Subtotal iron ore and scrap
6,893
230
164
--
1,971
4,528
4410 iron ore
6,886
230
164
1,971
4,523
4420 iron & steel scrap
5
5
Subtotal non-forous ores and scrap
362
84
21
--
--
125
132
4650 aluminum ore
202
84
118
4670 manganese ore
5
5
4690 non-ferrous ores nec
154
21
1
132
Subtotal sulphur
,
clay and salt
286
170
---
-- -
15
101
4782 clay & refrac. mat.
286
170
15
101
Subtotal slag
760
495
--
265
--
4860
Subtotal
slag
other non
-
metal. min.
2,236
760
7
495
612
-
265
897
721
-
4900 non-metal. min. nec
2,236
7
612
-
897
721
Total primary manufactured goods
4,265
688
1,495
735
775
568
Subtotal lime, cement and glass
1,936
0
735
--
634
567
5220 cement & concrete
1,936
735
-
634
567
5240 glass & glass prod.
0
5290 misc. mineral prod.
0
0
5312
Subtotal
pig iron
primary iron and steel products
2,257
205
683
1,434
71
141
134
-
-
5320
5330
i&s
i&s
primary
plates &
formssheets
1,162698
48899
599672
--
-
1
-
5360 i&s bars & shapes
154
96
58
5370 i&s pipe & tube
28
28
5390 primary i&s nec
11
0
5
5
Subtotal primary non-ferrous metal
72
5
61
5
0
0
1
products
5422 aluminum
1
a
-
1
5429
5480 fab.
smelted
metal
prod.
productsnec
692
5
602
-5
0
0
Total food
and farm products
3,192
2,193
99
:
894.
Subtotal grain
2,346
1,726
79
542
6241 wheat
1,503
1,313
190
6344 corn
744
413
79
253
6445 oats
99
-
99
Subtotal oilseeds
534
192
21
321
6522 soybeans
493
151
21
321
6534 flaxseed
41
41
Subtotal vegetable products
83
83
6654 vegetables & prod.
83
83
Subtotal processed grain and animal feed
42
12
30
6747 grain mill products
42
12
30
Subtotal other agricultural products
187
6
180
6861 sugar
15
6
9
6899 farm products nec
172
172
'"-total all
manufactured
equipment machinery
451
23
8
and products
7110 machinery (
not elec)
0
0
21
7
7
0
7120 electrical machinery
0
0
0
0
6
7210 vehicles & parts
1
0
7230 ships & boats
0
7400 manufac. wood prod.
0
7600 rubber & plastic pr.
0
7900 manufac. prod, nec
0
1
0
Total unknown or not
'
elsewhem
classified
9900 unknown or nec
Ton-miles
Foreign & Canadian
(
x1000)
36
DETROIT, MI DISTRICT
U.S. ARMY CORPS
OF ENGINEERS
DETROIT RIVER, MI
Freight Traffic, 2006 - continued
(thousand short tons)
Commodity
Total
Lakewise
Receipts
Shipments
Through
Upbound
Downbnd
12,186
583
3
,995
17,447`
Total coal
1100
coal & ±i•anite
1200
c--al co^e
Total petroleum and-petroleum,
products
Subtotal petroleum
products
2211
gasoline
2330
distillate fuel oil
2340
residual fuel oil
2429
naphtha & solvents
2430
asphalt, tar & pitch
2540
petroleum coke
%Total'chemicals and related products
Subtotal other chemicals and related products
3276
metallic salts
;`Total
- -crude materials,'-
inedible except fuels
Subtotal soil, sand
,
gravel
,
rock and stone
4322
limestone
4323
gypsum
4331 sand & gravel
Subtotal iron ore and scrap
4410
iron ore
4420
iron & steel scrap
Subtotal slag
4860
slag
Subtotal other non
-
metal. min.
4900
non-metal. min. nec
Total primary'
manufactured goods
Subtotal lime
,
cement and glass
5210
lime
5220
cement & concrete
Subtotal primary
iron and steel products
5312
pig iron
Subtotal primary
non-ferrous metal products
5480
€ab. metal products
Total food
'and farm products
Subtotal grain
6241
wheat
6445
oats
Total
0
0
0
27,045
7,118
6,573
249
296
19,236
19,181
54
120
120
571
571
553
522
6
517
31
$1
0
0
342
342
81
261
909,928
1,378
17
2
,
597
1504
1,312
9
2,597
1.409
66
d
-
95
18
405
155
195
78
405
155
195
79
-
12
6
34
18
344
9
45
14
23
8
43
139
0
0
0
Ton-miles
(
x1000)
Lakewise
Commodity
Total
,.
all commodities
Total petroleum and petroleum
products
Subtotal petroleum products
2330
distillate fuel oil
2340
residual fuel oil
2430
asphalt, tar & pitch
2540
petroleum coke
Total primary manufactured goods
Subtotal primary iron and steel products
5330
As plates & sheets
Ton-miles
(
x1000)
Internal
Tons All Traffic (x1000)
72,729
Ton-miles
All Traffic (
x1000
)
2,042,653
Total Trip-ton-
miles Internal and Intraport
(
x1000
)
20,617
`Includes 30 tons of Canadian upbound through in-transits.
294
212
212
51
36
115
10
a
3
3
2,606
10,455
161
1,224
15,205
2,165
-
670
4,283
2,123
-
670
3,780
- - - 249
43
-
-
253
8,212
81
20
10,923
8,212
27
20
10,923
--
--77
2654
2654
440
-94
94
-
-
-
--
77
54
440
-
335
-
19:
199:
335
--
187
6
335
-
----
182
--
19
12
19
12
0
342
342
81
261
236,331
8,900
123,836
540,661
Internal
Outbound
Through
Infra
Upbound Unbound
Downbnd Upbound Downbnd
17
3
7 -
as
101'-
17
-
7
_
88
101
17
--
7
88
101
--7
---
--7
363714
101--
10 -
- -
3
3
182
89
212
354
1,769
U.S. ARMY CORPS OF ENGINEERS
DETROIT, MI DISTRICT
37
DETROIT HARBOR, MI (INCLUDED IN PORT OF DETROIT)
Section Included: U.S. bank of Detroit River from Lake St. Clair 1o western extreme of Zug Island. Controlling Depth: Channel north of Belie Isle 21
feet, remainder of river 25-28.5 feet. Project Depth: 28.5 feet except channel north
of Belle Isle
, 21 feet.
Comparative Statement of Traffic (thousand short tons)
Year
Total
Year
Total
Year
Total
Year
Total
1997
5,689
2000
7,116
2003
3,770
2006 j -
6,250 1i
1998
5,882
2001
6,053
2004
4,499
1999
8,257
2002
5,810
2005
5,705
Freight Traffic, 2006
(
thousand short tons)
Foreign
Canadian
Domestic
Commodity
Grand Total
Total
Lakewise
Inbound
Inbound
Outbound
Receipts
Shipments
.. Total coal
1100
coal & lignite
1200
coal coke
Total chemicals
and related'products
Subtotal other chemicals and related
products
3219 other hydrocarbons
Total ;
crude
'
materials
, _
inedible except
fuels
5,039
Subtotal soil, sand
, gravel, rock
and stone
713
4322
limestone
666
4331
sand & gravel
47
Subtotal iron ore and scrap
4,115
4410
iron ore
4,115
Subtotal slag
133
4860
slag
133
Subtotal other non-metal
,
min.
77
4900
non-metal. min. nec
77
Total
primary manufactured
''
goads
1,029.
Subtotal lime, cement and glass
356
5220
cement & concrete
356
Subtotal primary iron and steel products
668
5320
i&s primary forms
488
5330
As plates & sheets
84
5360
As bars & shapes
96
5390
primary i&s nec
0
Subtotal primary
non-ferrous metal products
5
5480
fab. metal products
5
Total,
alI. manufactured
equipment, machinery
products
7110
machinery (
not eiec)
0
7120
electrical
machinery
0
7900
manufac
.
prod. nec
0
Total `
unknown or not elsewhore
`.
classified
1
9900
unknown or nec
4,326
4,773
53
607
58621
586
607
21
---
-
-
4,115
4,089
27
4,115
4,089
27
26
-
26
26
-
26
7777
7777
--
ROUGE RIVER, MI (INCLUDED IN PORT OF DETROIT)
Section Included: From the mouth of the Short Cut Canal to the Ford Motor Company. Controlling Depth: 20 feet for a minimum width of 100 feet
from the mouth of the short cut to Dix Avenue Bridge, with the exception of some shoal areas, and 20 feet in the turning basin, except near the shore.
Project Depth: 21.0 feet from mouth of Short Cut Canal to and including the turning basin in main channel.
Comparative Statement of Traffic (thousand short tons)
Year
Total
year
Total
Year
Total
Year
Total
1997
11,996
2000
9,243
2003
9,740
20116
10,707
1998
12,626
2001
10,036
2004
11,170
1999
8,190
2002
10,018
2005
11,020
Freight Traffic
, 2006
(
thousand short tons)
Foreign
Canadian
Domestic
Commodity
Grand Total
Total
Lakewise
Internal
Outbound Inbound Outbound
Receipts
Shipments Shipments
Intraport
Total a1t
'comrnodities '.
10,707
41
2,656
4651 -7,545
6,819
521
188`
Total coal
2,075
41
658
194
1
,182
1,174
8.
1100 coal & lignite
1,741
448
182
1,111
1,111
1200 coal coke
334
41
210
12
71
63
8C
36
DETROIT, MI DISTRICT
U.S. ARMY CORPS OF ENGINEERS
ROUGE RIVER, MI (INCLUDED IN PORT OF DETROIT)
Freight Traffic, 2006 - continued
(thousand short tons)
Commodity
................................................. .
Total
`
petroleum and petroleum
products
Subtotal petroleum products
2330 distillate fuel oil
2340 residual fuel oil
2430 asphalt, tar & pitch
2540 petroleum coke
..................................................... .
Total
"chemicals and related products
Grand Total
Subtotal other chemicals and related
21
products
3275 inorg. elem., oxides, & halogen salts
21
Foreign
Outbound
Total
crude materials, inedible except;
Weis
6,946:
Subtotal soil
,
sand
,
gravel, rock and stone
1,629
4322 limestone
1,574
4331 sand & gravel
54
Subtotal Iron ore and
scrap
4,342
4410 iron ore
4,288
4420 iron & steel scrap
54
Subtotal slag
388
4860 slag
388
Subtotal
other
non-metal
.
min.
587
4900 non-melal. min, noc
587
Total
:,
primary
:
manufactured
`
goods
714
Subtotal lime, cement and glass
714
$220 cement & concrete
714
Canadian
Inbound Outbound
74
74
14
48
4
6
250
250
12
8
19
210
21
Total
Lakewise
628
628
78
54
471
24
5,730
1,498
1,498
4,178
4,124
54
388
388
533
533
709
709
709
54
54
5
5
5
Domestic
Receipts Shipments
internal
Shipments Intraport
18
405
17- 188
18
405
17
188
-
34
7
37
-
18
- 36
12
$44
-
115
6
9
10-
5,622
1081
1,498
1,498
4,124
54
4,124-
-54
54
54
PORT OF DETROIT, MI
Section Included
:
Detroit Harbor
,
Rouge River
,
Ecorse, Wyandotte
,
Riverview and Trenton. Controlling and Project Depths
:
See aforementioned
project descriptions.
Comparative Statement of Traffic (thousand short tons)
Year
Total
Year
Total
Year
Total
Year
Total
1997
18,135
2000
17,295
2003
14,
308
2006
17
,
352
1998
19,454
2001
16,991
2004
16,858
1999
16,948
2002
17,306
2005
17,448
Freight Traffic, 2006 (thousand short tons)
Commodity
Total,
all commodities
Total coal
1100
coal &
lignite
1200
coal
ccr:e
Total petroleum and petroleum, products
Subtotal petroleum
products
2330
distillate fuel oil
2340
residual fuel oil
2430
asphalt, tar & pitch
2540
petroleum coke
Total chemicals and related
'
products
Subtotal other chemicals and related products
3219
other hydrocarbons
3275
inorg. elem., oxides, & halogen salts
Total crude materials, Inedible
-except fuels
Subtotal soil, sand, gravel
,
rock and stone
4322
limestone
4331
sand & gravel
Subtotal iron ore and scrap
4410
iron ore
Subtotal slag
4860
slag
Subtotal other non
-
metal. min.
4900
non-metal. min. nee
Total primarymanufactured goods
Subtotal lime, cement and glass
5220
cement & concrete
Subtotal primary iron and steel products
5320
i&s primary forms
5330
i&s plates & sheets
5360
i&s bars & shapes
5390
primary i&s nee
Total
689
41
549
270'
247
23
21
21
21
0
21
0
0
21
21
1,571
1,571
300
300
171
171
129
129
164
164
164
164
495
495
495
495
612
512
612
612
1,422
688
735
735
735
735
735
683
683
488
488
99
99
96
96
00
Foreign
Inbound
Outbound
Canadian
Inbound
Outbound
U.S. ARMY CORPS OF ENGINEERS
DETROIT, MI DISTRICT
39
PORT OF DETROIT, MI
Freight Traffic,
2006 - continued
(thousand short tons)
C
dit
ommo y
Total
Foreign
Canadian
Inbound
Outbound
Inbound
Outbound
Subtotal primary non
-
ferrous metal products
5
5
0
5480
fab, metal products
5
5
0
Total all
manufactured
..:equipmont; .
machinery
and products
7110
machinery (not elec)
7120
electrical
machinery
7900
manufac. prod. nee
.Total
unknown or
::
not..elsawhere
..
classified
1
9900
unknown ornec
1
Commodity
Total coal
1100
coal & lignite
1200
coal coke
Total petroleum
and petroleum
products
Subtotal petroleum products
2330
distillate fuel oil
2340
residual
fuel oil
2430
asphalt, tar & pitch
2540
petroleum coke
Total
crude materials
,
inedible except fuels
Subtotal soil, sand
,
gravel,
rock and stone
4322
limestone
4331
sand & gravel
Subtotal iron or* and scrap
4410
iron ore
4420
iron
& steel scrap
Subtotal slag
4860
slag
Subtotal other non-metal. min.
4900
non-metal. min. nee
Total primary manufactured goods
Subtotal lime, cement and glass
5220
cement & concrete
17
188
17
188
7
37
-
36
-
115
10
-
MONROE HARBOR, MI
Section Included: Channel in Lake Erie and 16,000 feet above Raisin River.Controlling depth: 20 feet to turning basin over a center width of 150 feet;
16.5 feet in turning basin except near the shore; 5.5 feet in 9 foot channel. Project Depth: 21 feet to the turning basin; 18 feet in the turning basin; 9
feet to lower docks at Monroe. Navigation
season
:
Approximately 20 April to 14 December.
Comparative Statement of Traffic (thousand short tons),
Year
Total
Year
Total
Year
Total
Year
Total
1997
2,750
2000
915
2003
1,077
2005
1,379
1998
1,929
2001
766
2004
948
1999
1,771
2002
1,008
2005
1,587
Freight
Traffic,
2006
(
thousand short tons)
Commodity
Total,
all commodities
Total coal
1100
coal & lignite
1200
coal coke
..Total petroleum and petroleum products
Subtotal
petroleum products
2430
asphalt, tar & Pilch
2540
petroleum coke
_.Total: primary manufactured goods
Subtotal primary non-ferrous metal products
5480
fab, metal products
Canadian
Inbound
43
1,336-
1,201
1,186
15
40
135
40
135
89
40
46
0
20
20
40
DETROIT, MI DISTRICT
U.S. ARMY CORPS OF ENGINEERS
Total
Receipts
12,974
12,186
1395
1,378
:,321 !
1,312
T1
66
6281
18
628
18
4717854
--12
24
6
10,617
10,455
2,165
2
,
165
2,123
2,123
43
43
8,294
8,212
8,239
8,212
54
26
-
13126
-77
131
77
335 .
335
335
335
335
335
Lakewlse
$hipm
Grand Total
Domestic
Internal
nts Shipments
Intraport
405
405
34
18
344
9
161
---
--
81
27
54
26
26
54
54
--
--
-
Domestic
La kewise
Receipts
CALCITE, MI
NON-CORPS PROJECT
Comparative Statement of Traffic (thousand short tons)
Year
Total
Year
Total
Year
Total
Year
Total
1997
10,036
2000
8,475
2003
6,
832
2006
6,428
1998
9,389
2001
8,317
2004
8,949
1999
9,533
2002
8,575
2005
7,288
Freight Traffic,
2006 (thousand short tons)
Commodity
Total
;
all commodities
Total-petroleum
and petroleum products
Subtotal petroleum
products
2330
distillate fuel oii
Grand Total
Total crude _
materials,iinedible
.except fuels
6,387:
Subtotal soil, sand
,
gravel
,
rock and stone
6,290
4322
limestone
6,290
Subtotal
iron ore
and scrap
96
4410
iron ore
96
'Total primary
manufactured goods
Subtotal primary non-ferrous metal products
5480
fab, metal products
ESCANABA, MI
NON-CORPS PROJECT
Canadian
Inbound
Outbound
0
0
0
Comparative Statement of Traffic (thousand short tons)
Domestic
Total
Lakewise
Receipts
Shipments
0
0
Year
Total
Year
Total
Year
Total
Year
Total
1997
7,261
2000
8,647
2003
4,
582
"2006
5,889
1998
8,530
2001
6,980
2004
6,620
1999
8,511
2002
4,645
2005
5,073
0
0
0
Freight Traffic, 2006 (thousand short tons)
Canadian
Domestic
Commodity
Grand Total
Total
Lakewise
Internal
Inbound
Receipts
Shipments
I ntraport
Total,
all commodities
:..Total coal
1100
coal & ligriitr:
Total
crude materials, inedible except fuels
5,346
Subtotal soil
,
sand
,
gravel, rock and stone
721
4322
limestone
721
Subtotal iron ore and scrap
4,591
4410
iron ore
4,591
Subtotal slag
17
4860
slag
17
Subtotal other non-metal
.
min.
17
4900
non-metal. min, nee
17
Total:
primary
:
manufactured goods
21
Subtotal primary iron and steel products
21
5312
pig iron
21
171
1.7
17
17
5,67"a
322
22
5;330
721
4,544
721
721
721
721
4,591
4,591
--
--
1717
----
4,527
4,527
17
17
21
-
21
21
21
21
-
21
64
64
U.S. ARMY CORPS OF ENGINEERS
DETROIT, MI DISTRICT
41
STONEPORT, MI
NON-CORPS PROJECT
Comparative
Statement of Traffic (
thousand short tons)
Year
Total
Year
Total
Year
Total
Year
Total
1997
8,101
2000
7,842
2003
6,445
2006
6,865 :.
1998
9,114
2001
8,118
2004
7,754
1999
8,873
2002
7,455
2005
6,785
Freight Traffic, 2006 (thousand short tons)
Canadian
Domestic
Commodity
Grand Total
Ib
d
Total
Lakewise
n oun
Outbound
Receipts
Shipments
:Total, all`tommociities
6,865
21
90
6,753
150
6,604
Total: crude.materials, inedible
except fuels
6,865
21
-
90
6,753
150
6,604:
Subtotal soil
,
sand
,
gravel, rock and stone
6,865
21
90
6,753
150
6,604
4322
limestone
6,853
21
90
6,741
150
6,591
4331
sand & gravel
13
13
-
13
42
DETROIT, MI DISTRICT
U.S. ARMY CORPS
OF ENGINEERS
Other Harbors and Waterways 2006
Harbor or Waterway
Commodity
Thousand Short Tons
Project
ALGOMA HARBOR, Wt
ALGONAC, MI (INCLUDED IN ST. CLAIR RIVER)
No Commerce Reported
No Commerce Reported
ASHLAND HARBOR, WI
7230 ships & boats
0
AU SABLE HARBOR AND RIVER (OSCODA), MI
Total Tons
(
x1000)
No Commerce Reported
0
BAYFIELD HARBOR, WI
2211 gasoline
0
2330 distillate fuel oil
0
2640 hydrocarbon & petrol gases, liquefied and
gaseous
0
4170 wood in the rough
0
4331 sand &
gravel
1
5480 fab. metal products
0
7230 ships & boats
0
7900 manufac. prod. nec
9
BIG BAY HARBOR, MI
BLACK RIVER HARBOR, MI
CASEVILLE, MI
CEDAR RIVER HARBOR, MI
Total Tons(x1000)
No Commerce Reported
No Commerce Reported
No Commerce Reported
No Commerce Reported
11
CHEBOYGAN HARBOR, MI
2211 gasoline
148
2330 distillate fuel oil
31
2,340 rosidual fuoi oil
2
4322 limestone
12
7900 manufac. prod. nec
1
CHIPPEWA HARBOR (ISLE ROYALE), MI
CLINTON RIVER, MICHIGAN
CORNUCOPIA HARBOR, WI
DETOUR, MI AND VICINITY (INCLUDED IN ST. MARYS
RIVER)
Total Tons(
x1000)
No Commerce Reported
No Commerce Reported
No Commerce Reported
No Commerce Reported
193
DETROIT HARBOR, Wt
2211 gasoline
1
2330 distillate fuel oil
1
2640 hydrocarbon & petrol gases, liquefied and gaseous
0
4170 wood in the rough
0
U.S. ARMY CORPS
OF ENGINEERS
DETROIT, MI DISTRICT
43
Other Harbors and Waterways 2006 - continued
Harbor or Waterway
Commodity
Thousand Short Tons
Project
DETROIT HARBOR, WI - continued
6134 fish {not shellfish)
0
9900 unknown or nec
5
EAGLE HARBOR, MI
Total Tons
(
X1000)
No Commerce Reported
7
ECORSE, MI (INCLUDED IN PORT OF DETROIT)
1200 coal coke
3
2340
residual fuel oil
8
4322 limestone
43
4331 sand & gravel
71
4900 non-metal. min. nec
78
5330 Ms plates & sheets
15
7110 machinery (not elec)
0
FRANKFORT HARBOR, MI
Total Tons(
x1000)
No Commerce Reported
218
GLADSTONE HARBOR, MI
1100 coal &
lignite
79
2430 asphalt, tar & pitch
50
4,322 limestone
14
4866 slag
11
4900 non-metal. min. nec
59
GRAND MARAIS HARBOR (HARBOR OF REFUGE), MI
GRAND MARAIS HARBOR, MN
GRAND TRAVERSE BAY HARBOR, MI
Total
Tons(
x1000)
No Commerce Reported
No Commerce Reported
No Commerce Reported
214
HARBOR BEACH, MI (HARBOR OF REFUGE, LAKE
HURON)
1100 coat & lignite
74
HARRISVILLE HARBOR, MI (HARBOR OF REFUGE, LAKE
HURON)
KENOSHA HARBOR, WI
KEWAUNEE HARBOR, WI
Total
Tons
(
x1000)
No Commerce Reported
No Commerce Reported
No Commerce Reported
74
KEWEENAW WATERWAY, MI
2211 gasoline
2330 distillate fuel oil
5
G
3220 alcohols
0
4170 wood in the rough
0
4189 lumber
0
4331 sand & gravel
0
4420 iron & steel scrap
0
4900 non-metal.
min. nec
14
44
DETROIT, MI DISTRICT
U.S. ARMY CORPS
OF ENGINEERS
Other Harbors and Waterways 2006 - continued
Harbor or Waterway
Commodity
Thousand Short Tons
Project
KEWEENAW WATERWAY, MI - continued
5290 misc. mineral prod.
0
5370 i&s pipe & tube
0
5480 fab, metal products
0
7110 machinery (not elec)
0
7210 vehicles & parts
0
7500 textile products
1
7900 manufac. prod. nec
0
Total Tons
(
x1060)
21
Total Ton
-
miles(x1000)
193
KNIFE RIVER HARBOR, MN
Total Trip-ton-
tulles Internal and Intraport
(
x1000)
No Commerce Reported
0
LA POINTE HARBOR, WI
2211 gasoline
0
2330 distillate
fue$ oil
0
2640 hydrocarbon & petrol gases, liquefied and gaseous
0
7900 manufac. prod. nec
9
LAC LA BELLE HARBOR, MI
LELAND HARBOR, MI
LIME ISLAND, MI (INCLUDED IN ST. MARYS RIVER)
Total Tons(
x1000)
No Commerce Reported
No Commerce Reported
No Commerce Reported
10
MACKINAC HARBOR, MI
4322 limestone
11
7900 manufac, prod. nec
35
MACKINAW CITY HARBOR, MI
Total Tons
(
xi 000)
No Commerce Reported
46
MANISTIQUE HARBOR, MI
2211 gasoline
1
2330 distillate
fuel oil
1
NEW BUFFALO HARBOR MI
OCONTO HARBOR, WI
Total
Tons(
x1000)
No Commerce Reported
No Commerce Reported
1
ONTONAGON HARBOR, MI
1100 coal & lignite
231
PENSAUKEE HARBOR, WI
PENTWATER HARBOR, MI
TotalTons(
x1000)
No Commerce Reported
No Commerce Reported
231
U.S. ARMY CORPS
OF ENGINEERS
DETROIT, MI DISTRICT
45
Harbor or Waterway
Project
Other Harbors and Waterways
2006 - continued
Commodity
PORT HURON, MI (INCLUDED IN ST. CLAIR RIVER)
PORT SANILAC
HARBOR, MI
PORT WASHINGTON HARBOR, WI
PORT WING HARBOR, WI
PUT-IN-BAY HARBOR, OH
RACINE HARBOR, WI
ROGERS CITY, MI
SAUGATUCK
HARBOR AND
KALAMAZOO
RIVER, MI
No Commerce Reported
No Commerce
Reported
5480 fab. metal products
7110 machinery (
not elec)
7900 manufac
.
prod. nee
Thousand Short Tons
1
0
1
Total Tons(
x1000)
2
No Commerce
Reported
2211 gasoline
2330 distillate fuel oil
4322 limestone
7900 manufac. prod. nee
1
1
26
1
Total Tons(
x1000)
4335 waterway improv. mat
7110 machinery (not elec)
Total Tons(
x1000)
No Commerce Reported
No Commerce Reported
29
12
0
12
SAULT STE. MARIE, MI (INCLUDED IN ST. MARYS RIVER) 4900 non-metal. min. nec
Total Tons(x1000)
SEBEWAING, MI
No Commerce Reported
SHEBOYGAN HARBOR, WI
No Commerce Reported
SOUTH HAVEN HARBOR, Mt
4335 waterway improv. mat
Total Tons{x1000)
ST. JAMES (BEAVER ISLAND), MI
STURGEON BAY AND LAKE MICHIGAN SHIP CANAL, WI
61
fit
2
2
2211 gasoline
2330 distillate fuel oil
9900 unknown or nec
Total Tons(
x1000)
4335 waterway improv. mat
4420 iron & steel scrap
5220 cement R concrete
18
1
3
3
Total Tons(
x1000)
Total
Ton-miles(0000)
7
24
46
DETROIT, MI DISTRICT
U.S. ARMY CORPS OF ENGINEERS
Harbor or Waterway
Project
Other Harbors
and Waterways 2006 - continued
Commodity
TRAVERSE CITY HARBOR, MI
TRENTON, MI (INCLUDED IN PORT OF DETROIT)
TWO RIVERS HARBOR, WI
WARROAD
HARBOR, MN
WHITE LAKE HARBOR, MI
WHITEFISH POINT HARBOR, MI
WYANDOTTE, MI (INCLUDED IN PORT Of DETROIT)
Non-project
MARBLEHEAD, OH
PORT DOLOMITE, MI
PORT GYPSUM, MI
PORT INLAND, MI
SILVER BAY, MN
2211 gasoline
2330 distillate fuel oil
Total Tons
(x1000)
1100 coal & lignite
Total Tons
(
x1000)
No Commerce Reported
No Commerce Reported
No Commerce Reported
No Commerce Reported
1100 coal & lignite
4322 limestone
Total Tons(
x1000)
Thousand Short Tons
134
15
448
69
M
408
1100 coal & lignite
4322 limestone
4331 sand & gravel
Total Tons(
x1000)
4310 building stone
4322 limestone
5210 lime
Total Tons(
xl000)
4323 gypsum
Total Tons
(
xIOOO)
4310 building stone
4322 limestone
4323 gypsum
4331 sand & gravel
4900 non-metal. min. nec
5210 lime
Total Tons(
X1000)
1100 coal & lignite
4410 iron ore
Total Tons
(x1000)
19
3,669
70
3,758
17
2,533
32
2,582
'500
500
23
5,429
10
22
16
22
5,523
467
4,722
5,188
U.S. ARMY CORPS OF ENGINE=ERS
DETROIT, MI DISTRICT
47
TOLEDO HARBOR, OH
Section Included: Channel in Lake Erie and 7 miles in lower Maumee River. Controlling Depths: 28 feet in the Bay Channel; 27 feet in The River
Channel to the turning basin apposite the Mid-States Terminals, Inc. dock; thence 14 feet to the turning basin at the upper project limits with 13 feet in
the turning basin; 20 feet in the turning basin at mile 3 and 27 feet in the turning basin at mile 6.5, project depths: 26 feet in bay and 27 feet in the river
channel to the turning basin opposite the Mid-States Terminals, Inc. dock; thence 25 feet to the turning basin at upstream limits of the project with 18
feet in the turning basin; 20 feet in the turning basin at mile 3 and 27 feet in turning basin at mile 6.5. Navigation season: Approximately March 1 to
December 31.
Comparative Statement of
Traffic (
thousand short tons)
Year
Total
Year
Total
Year
Total
Year
Total
1997
14,422
2000
13,322
2003
9,
864
2006
--
11,162
1
1,',-
1998
13,229
2001
10,535
2004
9,862
1999
12,327
2002
11,115
2005
10,504
Freight Traffic, 2006 (thousand
short tons)
Commodity
Grand Total
.......i......
Total
,.alt commodities
11,1621
Total coal
2,761
1100 coal & lignite
2,743
1200 coal coke
19
Total
petroleum
-
and petroleum
products
639
Subtotal petroleum products
639
2211 gasoline
258
2221 kerosene
32
2330 distillate fuel oil
85
2340 residual fuel oil
103
2429 naphtha & solvents
8
2430 asphalt, tar & pitch
51
2540 petroleum coke
103
Total chemicals
'
an
'
d related products
170
Subtotal fertilizers
102
3110 nitrogenous fort.
6
3130 potassic Pert.
97
Subtotal other chemicals and related
products
67
3275 inorg.
elem., oxides
, & halogen salts
44
3276 metallic salts
23
Total crude
'
materials, inedible except fuels
5150
Subtotal forest products
,
wood and
chips
94
4189 lumber
94
Subtotal soil, sand
,
gravel
,
rock and stone
882
4322 limestone
702
4331 sand & gravel
180
Subtotal iron ore and scrap
3,790
4410 iron ore
3,790
Subtotal sulphur, clay and salt
9
4782 clay & refrac. mat.
9
Subtotal slag
39
4860 slag
39
Subtotal other non
-
metal
.
min.
335
4900 non-metal. min. nec
335
Tgtai primary manufactured goods
381
Subtotal paper products
1
5120 paper & paperboard
1
Subtotal lime, cement and glass
205
5220 cement & concrete
205
Subtotal
primary
iron and steel products
120
5312 pig iron
46
5320 1&s primary forms
13
5330 i&s plates & sheets
40
5370 i&s pipe & tube
21
Subtotal
primary
non-ferrous metal products
55
5422 aluminum
55
Total food and farm products
2,058
Subtotal grain
11,316
6241 wheat
43
6344 corn
1,175
6445 oats
99
Subtotal oilseeds
675
6522 soybeans
675
Subtotal other agricultural
products
67
6861 sugar
67
.`Total all
manufactured equipment, machinery
3
and products
7110 machinery (not elec)
3
Foreign
Inbound Outbound
29
6
6
23
23
25
16
16
9
9
84:
1
1
83
8
13
40
21
67
1,482
680
- 20
- 659
67
67
402
402
3
3
Canadian
Inbound Outbound
'17
249
17
249
-
-16232
8
27
-6
20
9
--
97
44
97 -
--
97
-
44
44
4',289
76
78
762
612
151
3,305
3,305
331
29
29
144
4
144
4
205
113
113
37
37
55
55
121
121
23
99
788
515
515
272
272
Total Coastwise
2,294
11;
'
990
1.292.
1,032
42
990
1,032
42
990
368
11
130
226,
368
11
130
226
90
11
-
79
50
6
45
94
-
94
8
-8
9331
3193
--
803
736
67
90
90
90
9D
-
-
485
456
28
485
458
28
39
39
39
39
188
188
168
188
91
83
91
83
9
91
83
9
Shipments
ents
Domestic
Lakewise
Recei is Shi ments
48
BUFFALO, NY DISTRICT
U.S. ARMY CORPS OF ENGINEERS
KELLEYS ISLAND, OH
Section Included: Entire area of Kelleys Island, Ohio. Controlling Depth: Unimproved, natural depths unknown. Project depth: Approach channel, 12
feet; Entrance channel, 10 feet; and remainder of channel, 8 to 10 feet.
Comparative Statement of Traffic (thousand short tons)
Year
Total
Year
Total
Year
Total
Year
Total
1997
1,170
2000
798
2003
1,071
=
2006
1,116
1998
1,173
2001
1,050
2004
621
1999
1,081
2002
1,289
2005
818
Freight Traffic, 2006 (thousand short tons)
C
di
ommo ty
Grand Total
Lakewise
Receipts
Shipments
Total; all commodities -
1,116
1,114
Total crude materlals;-inedible
except fuels
1,116
3
1,114
Subtotal soil
,
sand
,
gravel
,
rock and stone
1,116
3
1,114
4322
limestone
1,116
3
1,114
SANDUSKY HARBOR, OH
Section Included: Southeasterly portion of Sandusky Bay to and including passenger docks on Cedar Point. Controlling Depth: Mosely Channel, 26
feet; Bay Channel and Straight Channel from Mosely Channel to junction with Bay Channel, 25.0 feet; turning basin, 24 feet; Dock channel, 21 feet;
Straight channel from dock channel to junction with Bay Channel, 21 feet. Project Depths: Mosely Channel, 26 feet; bay channel and Straight
Channel from Mosely Channel to junction with Bay Channel, 25 feet; turning basin, 24 feet; Dock channel, 22 feet; and straight channel from dock
channel to junction with Bay Channel, 21 feet.
Comparative Statement of Traffic (thousand short tons)
Year
Total
Year
Total
Year
Total
Year
Total
1997
4,403
2000
3
,
645
2003
4
,
183
2006
3,790
1998
4,334
2001
4,649
2004
3,404
1999
4,898
2002
4,
455
2005
3,555
Freight Traffic,
2006 (thousand short tons)
Commodity
Total coal
1100
cual & lignita
Total crude..
materials
, inedible except fuels
Subtotal soil, sand, gravel, rock and stone
4331
sand & gravel
Subtotal Iron ore and scrap
4410
iron ore
Subtotal other
non-metal. min.
4900
non-metal. min. nee
Grand Total
Canadian
Outbound
Domestic
Total
Lakewise
Receipts
Shipments
U.S. ARMY CORPS OF ENGINEERS
BUFFALO, NY DISTRICT
49
HURON HARBOR, OH
Section Included: Lake approach channel from
deep water
to a point opposite
the outer end of east breakwater
; entrance channel from its junction with
the approach channel to its junction with the River Channel; River channel
and turning
basin to within 1,500 feet of the Penn Central
Railroad Bridge.
Controlling Depths: Lake approach
and entrance channel
, 27.5 feet; river channel, 27 feet; turning
basin, 21 feet
.
Project Depths: Lake approach and
entrance channels
, 29 feet;
river channel
to Slip No. 1, 28 feet; from Slip No. 1 through eastern portion of the turning basin,
28 feet; turning basin, 22
feet.
Comparative Statement of
Traffic
(thousand short tons)
Year
Total
Year
Total
Year
Total
Year
Total
1997
856
2000
1,275
2003
1,291
2008
`.:
845 '
1998
1,192
2001
1,260
2004
B60
1999
1,154
2002
898
2005
1,032
Freight Traffic, 2006 (
thousand short tons)
Canadian
Domestic
Commodity
Grand Total
Lakowlse
Outbound
Rests
Total, all commodities
845
27
824
............................
Total crude materials
, inedible excepE.fuels
834
10
824.
Subtotal soil, sand
,
gravel
,
rock and stone
516
10
506
4322
limestone
506
506
4331 sand & gravel
10
10
Subtotal iron ore and scrap
317
317
4410
iron ore
317
317
Total food
and farip products
12
12
Subtotal grain
12
12
6344 corn
12
12
LORAIN HARBOR, OH
Section tncluded: Outer Harbor and Black River from mouth to and including United States Steel Corp., National Tube Division dock, 3 miles.
ControlfngDapths: Lake Approach channel, 27.0 feet; A channel 800 feet wide through the Outer Harbor, 27 feet; remainder of Outer Harbor, 25 feet;
lower 2,200 feet of River Channel, 25 feet; remainder of River Channel 24 feet except turning basinjust downstream of the 21st Street Bridge which is
12 to 19 feet and the returning Basin opposite the U. S. Steel Corp., National Tube Division which is 12 to 20 feet. Project Depths: Lake Approach
Channel, 29 feet; a channel 800 feet wide through the Outer Harbor, 28 feet; remainder of Outer Harbor, 25 feet; lower 2,200 feet of River Channel, 28
feet; remainder of River Channel, 27 feet; except Mining basin downstream of 21st Street Bridge, 20 feet and turning basin opposite U. S. Steel Corp.,
National Tube Division Dock, 21 feet.
Comparative Statement of Traffic (
thousand short tons)
Year
Total
Year
Total
Year
Total
Year
Total
1997
15,955
2000
14,180
2003
2,154
2006
3,617
1998
14,166
2001
7,865
2004
3,007
1999
12,968
2002
6,672
2005
3,055
Freight Traffic, 2006 (
thousand short tons)
Foreign
Canadian
Domestic
Commodity
Grand Total
Total
Lakewise
Inbound Inbound
Outbound
Receipts Shipments
Total coal
1200
coal --oke
..Total chofmcals
and related products
18
Subtotal fertilizers
18
3130
potassic fert.
18
Total.
crude
.
materials
inedible except fuals
3,231
Subtotal soil, sand
,
gravel
,
rock and stone
1,206
4322
$imestone
922
4323
gypsum
245
4331
sand & gravel
39
Subtotal iron ore and scrap
1,910
4410
iron ore
1,883
4420
iron & steel scrap
27
Subtotal sulphur
,
clay and salt
24
4782
clay & refrac. mat.
24
Subtotal slag
80
4860
slag
80
Subtotal other non-metal. min.
11
4900
non-metal. min. nec
11
Total primary manufactured goods
19
Subtotal
primary iron
and steel products
19
5312
pig iron
19
Total all manufactured equip ment
„
machinery and products
7110
machinery (
not elec)
50
BUFFALO, NY DISTRICT
U.S. ARMY CORPS OF ENGINE=ERS
CLEVELAND HARBOR, OH
Section Included: Outer Harbor, Old River and Cuyahoga River from mouth to and including Upper Republic Steel Corp. Dock, immediately
downstream from Norfolk & Western Railway Bridge, 5.8 miles. Controlling Depth: Lake Approach Channel, 29 feet; entrance channel, West Basin
and westerly 800 feet of East Basin, 28 feet; easterly 3800-foot length of East Basin, 27 feet; 500-toot channel through East Outer Harbor, 25 feet;
channel between piers to Conrail Railroad Bridge, 27.0 feet; channel in Cuyahoga River from Penn Central Railroad to upperproject limit, 22 feet;
turning basin upstream from E.l. Dupont De Nemours And Company, Inc., Grasselli Chemical Division Dock, 19.5 feet; Old River to Sand Products
Corporation Dock, 23 feet; remainder of Old River to upper project limit, 14 feet. Project Depth: Lake Approach Channel, 29 feet; West Basin,
entrance channel and west end of East Basin, 28 feet; remaining 3800-foot length of East Basin, 27 feet; 500-foot channel through East Outer
Harbor,25 feet; lower Cuyahoga River from lakeward ends of the piers to immediately above junction with Old River, 27 feet; Old River to upper project
limit, 27 feet; remainder of Cuyahoga River, 23 feet; turning basin upstream from E.I. Dupont De Nemours and Company, Inc., Grasseii Chemical
Division Dock, 18 feet.
Comparative Statement of
Traffic (
thousand short tons)
Year
Total
Year
Total
Year
Total
Year
Total
1997
18,113
2000
14,391
2003
12,521
2006
' _
151
1998
17,865
2001
11,938
2004
15,775
1999
15,540
2002
11,412
2005
13,641
Freight Traffic,
2006
(
thousand short tons)
Tatal
;.all-commodities
:':Total .coal
1200
coal coke
Commodity
Total petroleum
and petroleum products
Subtotal petroleum products
2330
distillate fuel oil
2340
residual fuel oil
Total-
crude materials
;
Inedible except
-fuels
Subtotal soil, sand
,
gravel
,
rock and stone
4322
limestone
4331
sand & gravel
Subtotal iron ore and scrap
4410
iron ore
Subtotal slag
4860
slag
Subtotal other non-metal. min.
4900
non-metal, min, nec
Total
132 -
132
63
69
2;077
1,648
878
774
176
176
78
78
174
174
.......
_
_..__
Total primary manufactur4d'goods
1,484
Subtotal lime, cement and glass
904
5220
cement & concrete
887
5290
misc. mineral prod.
17
Subtotal
primary
iron and steel
products
472
5320
Ms primary forms
181
5330
i&s plates & sheets
248
5360
i&s bars & shapes
35
5370
i&s pipe & tube
7
5390
primary i&s nec
0
Subtotal primary
non-ferrous metal products
108
5429
smelted prod. nec
1
5480
fab, metal products
108
I otai alt manutacturea
:
equipment
,
macmnery ana proaucts
- -
1
7110
machinery (not elec)
1
7120
electrical machinery
0
7900
manufac. prod. nec
0
Total upknov+n or not elsewhere classified
17
9900
unknown or nec
17
Total,
'
aR caEnmoditfes
Total coal
1200
coal coke
Commodity
Total petroleum and petr
oleum products
Subtotal petroleum products
2330
distillate fuel oil
2340
residual fuel oil
2430
asphalt, tar & pitch
2540
petroleum coke
f.
Total chemicals
and related
products
Subtotal other chemicals and related products
3276
metallic salts
Total
11,4671
80
80
213
213
20
86
102
5
0
0
Lakewise
Receipts
Shipments
0
0
Foreign
Inbound'
Domestic
Canadian
Inbound Outbound
Internal
Receipts
Shipments
Intraport
U.S. ARMY CORPS
OF ENGINEERS
BUFFALO, NY DISTRICT
51
CLEVELAND HARBOR, OH
Freight Traffic, 2006 - continued
(thousand shod tons)
Domestic
Commodity
Total
Lakewise
Internal
,
Receipts
Shipments
Receipts
Shipments
Intraport
Total
crude materials, inedible except fuels
-
11,064
6,934
808
3,322.
Subtotal soil, sand
,
gravel, rock and stone
3,068
2,938
118
11
4322
limestone
2,886
2,758
117
11
4331 sand & gravel
181
180
1
Subtotal
i
ron ore and scrap
7,128
3,938
3,190
4410
iron ore
7,128
3,938
3,190
Subtotal slag
55
55
4860
slag
55
55
Subtotal other non-metal
.
min.
814
57
635
122
4900
non-metal. min. nec
814
57
635
122
=Total primary
manufactured
goods -
11e
99
7
Subtotal lime, cement and glass
95
88
7
5220
cement & concrete
95
88
7
Subtotal
primary iron and steel products
15
12
--
3
53305312
As
pig
plates
iron
& streets
123
12
-
3
'Includes 13,436 tons
of foreign inbound in-transits.
.FAIRPORT HARBOR, OH
Section Included: Outer harbor and Grand River from mouth to and including Diamond Alkali Company Stone Dock, 1.5 miles. Controlling Depths:
Entrance Channel, 24 feet; Outer Harbor, 24.0 feet; Grand River to upstream of Republic Steel, 19.0 feet; remaining length of Grand River to the upper
project limit, 19 feet; except for 1,000 feel of the upstream end of the west side of the channel, 5 feet; turning basin, 15 feet. Maintenance Depths:
Entrance channel and outer harbor, 25 feet; Grand River to upstream of Republic Steel, 24 feet; remaining length of Grand River to the upper project
limits, 21 feet: turning basin, 18 feet.
Comparative Statement of Traffic (thousand short tons)
Year
Total
Year
Total
Year
Total
Year
Total
1997
3,296
2000
2,539
03
2,526
206fi
"
2,411
1998
2,860
2001
2,942
[72004
2,772
1999
2,553
2002
2,326
05
2,452
Freight Traffic, 2006 (thousand short tons)
Canadian
Domestic
Commodity
Grand Total
Total
Lakewise
Inlernaf
Inbound
Outbound
Receipts
Shipments
Intraport
Total, all commodities
2;411 1
441
366
1,605
1,390
204
10
. Total coal
23
23
1100
coal & lignite
23
Total crude materials, inedible
except.fuels
2,388
441
343
1,605
1,390
204
10
Subtotal soil, sand, gravel
,
rock and stone
1,822
389
12
1,421
1,390
21
10
4322
limestone
1,694
356
1,338
1,328
-
10
4331
sand & gravel
128
33
12
83
62
21
Subtotal sulphur, clay and salt
52
52
4782
clay & refrac. mat.
52
52
Subtotal other non-metal. min.
514
331
183
-
183
4900
non-metal,
min. nec
514
331
183
-
183
52
BUFFALO, NY DISTRICT
U.S. ARMY CORPS
OF ENGINEERS
ASHTABULA HARBOR, OH
Section Included: Outer harbor and Ashtabula River from mouth to and including city of Ashtabula Dock (Former Great Lakes Engineering Works
Dock), 1.75 mires. Controlling Depth;
Westerly portion of outer harbor to inner breakwater& approach channel to docks east of inner breakwater, 26.0
feet turning basin in front of inner breakwater 21.5 feet; the approach to the Penn. Central Railroad Company's
slip and the
lower 2,000 feet of the
Ashtabula River, 23 feet; thence to car ferry slip, 10 feet; thence to a point 1,550 feet upstream from turning basin and including turning tasin, 3 feet.
Project Depth:
Entrance
channel, 29 feet; westerly portion of outer harbor to inner breakwater, 28 feet; Approach Channel to docks east of inner
breakwater, 28 feet; turning basin in the easterly portion of the outer harbor, 22 feet; channel from inside
the Inner Breakwater
to mouth of river and
2,000 feet upstream and approach channel to Penn, Central Railroad Company's slip, 27 feet; thence to car ferry slip, 18 feet; thence to a point 1,550
feet upstream from turning basin and including turning basin, 16 feet.
Comparative
Statement of
Traffic (thousand short tons)
Year
Total
Year
Total
Year
Total
Year
Total
1997
11,929
2000
12,322
2003
10,427
-2006
6;822 is
1998
15,602
2001
10,934
2004
10,938
1999
10,495
2002
9,838
2005
9,714
Freight Traffic
, 2006
(t
housand short tons)
Commodity
Total,
all coinrnadities
Total coal
1100
coal & lignite
.Total chemicals and related
:.products
Subtotal fertilizers
3130
potassic fert.
Grand Total
6,822
4,873.
1,873
4
4
4
Total crude materials, inedible except
fuels
1,944
Subtotal soil, sand
,
gravel, rock and stone
487
4322
limestone
473
4323
gypsum
15
Subtotal iron ore and scrap
994
4410
iron ore
994
Subtotal non
-
ferrous ores and scrap
248
4680
non-ferrous scrap
248
Subtotal sulphur, clay and salt
4
4782
clay & refrac. mat.
4
Subtotal
slag
121
4860
slag
121
Subtotal other non
-
metal. min.
9o
4900
non-metal, min. nec
90
Total primary manufactured goods
2
Subtotal primary iron and steel products
2
5312
pig iron
2
Forelq n
Inbound
169
169
165
165
4
4
Canadian
Inbound
Outbound
296
4;051::
Domestic
Total
Lakewise
Receipts
Shipments
2,307
1,804
311
311
503
503,
503
9
4,051
813
9
4,05' :
813
4
282
83
83
121
121
78
78
2
2
1,493
1,493
487
487
473
473
15
15
994
994
994
994
13
13
13
13
CONNEAUT HARBOR, OH
Section Included: Outer harbor and Conneaut River 2,450 feet upstream of the outer end of the West Pier. Controlling Depth: Westerly portion of
outer harbor, 20.5 feet; access.channef to city dock, 7.5 feet; easterly portion of outer harbor 23 feet. Inner Harbor, 28. feet; Project Depth: Easterly
portion of outer harbor, 28 feet; westerly portion of outer harbor, 22 feet; access channel to city dock 8 feet: Inner Harbor, 27 feet.
Comparative Statement of Traffic (thousand short tons)
Year
Total
Year
Total
Year
Total
Year
Total
1997
6,205
2000
10,603
2003
6,705
c 2006
7'368
1998
7,786
2001
10,485
2004
8,027
1999
8,868
2002
10,474
2005
7,405
Freight Traffic, 2006 (thousand short tons)
Canadian
Domestic
Commodity
Grand Total
Ibd
b
Total
Lakewise
n oun
Out
ound
Receipts
Shipments
.Total. all commodities
7,368
137
2,627
4,605
3,767
838
Total coal
3,334
2 507
827
827
1100
coal & lignite
3,271
',41.1
627
827
1200
coal coke
n:i
rj
Totalcrude materials, inediblo except fuels
4,029
137
119
3,772
3,761
11
Subtotal soil
,
sand
,
gravel
,
rock and stone
520
--
119
400
389
11
4322
limestone
389
389
389
4323
gypsum
130
-
119
11
-
11
441044204900
Subtotal
Subtotal
non-metal,
ironiron
other
iron
ore&
steel
ore
non-metal
min.
scrap
and
nec
scrap
.
min.
3,372
3,479
107
31
31
107
107
3131
----
3,3723,372
3,3723,372
----
U.S. ARMY CORPS OF
ENGINEERS
BUFFALO, NY DISTRICT
53
CONNEAUT HARBOR, OH
Freight Traffic,
2006 - continued
(thousand short tons)
Canadian
Domestic
Commodity
Grand Total
Total
Lakewise
Inbound
Outbound
Receipts
Shipments
'Jutal,primary manufactured. goods
Subtotal lime, cement and glass
6
D
6
5210
lime
6
6
6
ERIE HARBOR, PA
Section Included: Southerly side of Erie Harbor and Lake Erie water frontage from harbor entrance eastward to and including Sun Oil Co dock, 3.5
mites.
Controlling Depth: Entrance channel, 29 feet; channel to easterly coal and ore docks, 27 feet; and 27 feet to the Port Authority Dock; harbor
basin, 21 feet; westerly portion of harbor, 18 feet. Project Depth: Entrance channel, 29 feet; Approach Channel to easterly coal and ore docks, 28
feet; approach to Port Authority Docks, 27 feet; Harbor Basin, 21 feet; westerly portion of Harbor Basin, 18 feet. The approach channel from the 28
foot channel to and including turning basin at westerly docks has been authorized, but never completed and considered inactive at the present time.
Comparative Statement of Traffic (thousand short tons)
Year
Total
Year
Total
Year
Total
Year
Total
1997
1,163
2000
1,501
2003
1,
121
2006
7,U74
1998
1,296
2001
1,159
2004
1,100
1999
1,136
2002
1,362
2005
1,066
Freight Traffic, 2006 (thousand short tons)
Commodity
Total all
.
commodities
Total crude materials,
,
Inedible except fuels
Subtotal soil, sand
,
gravel
,
rock and stone
4322
limestone
4331 sand & gravel
Subtotal other non-metal, min.
4900
non-metal, min. nec
Total'all '
manufactured equipment
machinery
and products
7900
manufac. prod. nec
Canadian
Inbound
Outbound
Domestic
Lakewise
Receipts
BUFFALO HARBOR, NY (INCLUDED IN PORT OF BUFFALO)
Section Included
:
Outer harbor
,
Lackawanna Canal, Union Canal
.
Buffalo Riverfrom mouth to Conrail R. Y. Bridge
,
5.5 miles
.
Buffalo Ship Canal,
and Black Rock Canal to the Black
Rock Lock. Controlling Depths:
Outer area of south entrance channel
,
30 feet; south entrance channel 29
.
0 feet;
southern portion of outer harbor
,
28 feet; 900 feet wide section adjacent to the south breakwater beginning 2
,
000 feet north of the south breakwater
and proceeding
northerly 4,
200 feet, 23 feet
;
thence 27 feet to the International Salt Company and 23 feet
i
n the remainder of the outer harbor to the
north;
new north entrance channel, 25
feet; Black Rock Canal,
21 feet
;
Buffalo River Entrance, Buffalo River and Buffalo Ship Canal
,
22 feet
.
Project
Depth
:
Outer area of south entrance channel
,
30 feet; south entrance channel 29 feet; southern portion of outer harbor, 28 feet; 900 feet wide section
adjacent to the south breakwater beginning 2
,
000 feet north of the south breakwater and proceeding
northerly 4,
200 feet, 23 feet
.
Middle section of
the outer harbor
, 27 feet; north outer harbor, 23 feet;
north entrance channel
, 25 feet;
Buffalo River entrance
,
Buffalo River and Buffalo Ship Canal, 22
feet
.
Black Rock Canal, 21 feet.
Comparative Statement of
Traffic (
thousand short tons)
Year
Total
Year
Total
Year
Total
Year
Total
1997
1,631
2000
1,769
2003
1,117
2006
1345
1998
2,072
2001
959
2004
1,206
1999
1,804
2002
1,268
2005
1,386
Freight Traffic
,
2006
(
thousand short tons)
Foreign
Canadian
Domestic
Commodity
Grand Total
Lakewise
Inbound
Outbound
Inbound
Outbound
Receipts
Total `crude
materials, inedible except fuels
315
Subtotal soil
,
sand,
gravel, rock and stone
315
4322
limestone
233
4331
sand & gravel
82
Total primary
manufactured goods
124
Subtotal lime, cement and glass
124
5220
cement & concrete
124
Subtotal primary non
-
ferrous metal products
0
5480
fab.
metal products
0
64
BUFFALO, NY DISTRICT
0
0
U.S. ARMY CORPS
OF ENGINEERS
BUFFALO HARBOR, NY (INCLUDED IN PORT OF BUFFALO)
Freight Traffic, 2006 - continued
(thousand short tons)
Foreign
Canadian
Domestic
Commodity
Grand Total
Lakewise
Inbound
Outbound
Inbound
Outbound
Receipts
.Total ,food, aod,farm products
Subtotal grain
6241
wheat
6445
oats
Total
all. manufactured
,
equipment
,"'machinery and products
7110
machinery (
not elec)
PORT OF BUFFALO, NY
Section Included: Outer harbor, Lackawanna Canal, Union Canal, Buffalo River from mouth to Conrail RY Bridge 5.5 miles, Buffalo Ship Canal, Black
Rock Canal, Black Rock Lock, Black Rock Channel, Niagara River, and Tonawanda to and including Buffalo Oil Terminal, Inc. Dock, located about
2,000 feel north of turning basin, Tonawanda inner Harbor, and Tonawanda Creek Channel from mouth to Main Street Bridge. Controlling and Project
Depths: See Buffalo Harbor, Niagara River and Tonawanda.
Comparative Statement
of Traffic (
thousand short tons)
Year
Total
Year
Total
Year
Total
Year
Total
1997
1,894
2000
2,169
2003
1,427
`.
2006
11558
:
1998
2,341
2001
1,215
2004
1,592
1999
2,075
2002
1,686
2005
1,611
Freight Traffic,
2006
(
thousand short tons)
Commodity
Total all `commodities
(.Total coal.
1100 coal & lignite
Totalpetroleum and petroleum
products
Subtotal petroleum products
2340 residual fuel oil
2430 asphalt, tar & pitch
Total
crude materials; inedible except
fuels
Subtotal soil, sand
,
gravel
,
rock and
stone
4322 limestone
4331 sand & gravel
Total primary
manufactured goods
Subtotal
lime, cement and glass
5220 cement & concrete
Subtotal
primary non
-
ferrous metal
products
5480 fab. metal products
":Total food
and farm
:products
Subtotal
grain
6241 wheat
6445 oats
Grand Total
Foreign
Inbound Outbound
Canadian
Inbound
Outbound
315
233
82
124.
306
124
106
124
106
00
00
385
15
27
385
1s
27
124
15
27
261
Total all manufactured
.. equipment,
t
machinery: and products
7110 machinery (
not elec)
1
Domestic
Total
Lakewise_J
Recei ots
315
315
315
315
233
233
82
82
17
17'
17
17
17
17
342
342
342
342
81
81
261
261
Internal
Intraoort
4
4
U.S. ARMY CORPS OF ENGINEERS
BUFFALO, NY DISTRICT
55
OSWEGO HARBOR, NY
Section Included: Outer Harbor and Oswego River from mouth to Seneca Street. Controlling Depths: Lake approach channel, 27 feet; channel
through outer harbor, 24 feet; east and west side of outer harbor, 21 feet; Oswego River channel, 24 feet. Project Depths: Lake approach channel, 27
feet; channel through outer harbor, 25 feet; lower 1,600 feet of Oswego River channel, 24 feet; remainder of Oswego River channel and Oswego
Harbor, 21 feet.
Comparative Statement of
Traffic (
thousand short tons)
Year
Total
Year
Total
Year
Total
Year
Total
1997
640
2000
589
2003
715
2000
Q33
1998
471
2001
393
2004
856
1999
805
2002
324
2005
670
Freight Traffic, 2006 (thousand short tons)
Foreign
Canadian
Domestic
Commodity
Grand Total
Lakewise
Inbound
Inbound
Receipts
Total, all commodities
633
15
600
18'
1.Total..petroleum and petroleum products
239
221
1$_
Subtotal petroleum products
239
221
18
2340
residual fuel oil
123
123
2430
asphalt, tar & pitch
18
18
2540
petroleum coke
98
98
9Total crude
materials inedible except fuels
Subtotal
other non-
metal. min.
4900
non-metal. min. nec
Total p4mary manufactured
goods'
Subtotal lime, cement and glass
5220
cement & concrete
Subtotal primary
non-ferrous metal
products
5422
aluminum
5480
fab. metal products
Total all manufactured equipment
,
machinefy
and products
7110
machinery (
not elec)
4
4
7900
manufac. prod. nec
1
1
56
BUFFALO, NY DISTRICT
U.S. ARMY CORPS OF ENGINEERS
Other Harbors and Waterways 2006
Harbor or Waterway
Commodity
Thousand Short Tons
Project
BARCELONA HARBOR, NY
CAPE VINCENT, NY
DUNKIRK HARBOR, NY
GREAT SODUS BAY HARBOR, NY
IRONDEQUOIT BAY HARBOR, NEW YORK
NIAGARA FALLS, NY
No Commerce
Reported
No Commerce Reported
No Commerce Reported
No Commerce Reported
No Commerce Reported
No Commerce Reported
NIAGARA RIVER, NY (INCLUDED IN PORT OF BUFFALO)
1100 coal & lignite
58
2340 residual fuel oil
8
2430 asphalt
, tar & pitch
147
Total Tons
(
x1000)
213
Total Ton-mlles
(
x1000)
1,533
Total Trip-ton
-
miles Internal and Intraport
(
x1000)
4
OGDENSBURG HARBOR, NY
4900 non-metal
.
min. nec
157
PORT CLINTON HARBOR, OH
Total Tons(
xl000)
No Commerce Reported
157
ROCHESTER (CHARLOTTE) HARBOR, NY
5220 cement &
concrete
164
Total Tons(xl000)
164
SACKETS HARBOR, NY
2211 gasoline
0
3211 acyclic hydrocarbons
0
4189 lumber
0
5290 misc.
mineral prod.
0
5330 Ms plates & sheets
0
5422 aluminum
0
7910 machinery (
not elec)
0
7210 vehicles & parts
0
7900 manufac. prod. nec
0
TONAWANDA HARBOR, NY (INCLUDED IN PORT OF
BUFFALO) (PRINT ONLY)
VERMILION HARBOR, OH
WADDINGTON HARBOR, NY
Total Tons
(
x1000)
No Commerce Reported
No Commerce Reported
No Commerce Reported
0
U.S. ARMY CORPS
OF ENGINEERS
BUFFALO, NY DISTRICT
57
ILLINOIS RIVER, IL (INCLUDED IN THE ILLINOIS WATERWAY CONSOLIDATED)
Section Included: Mouth of Illinois River, Grafton, IL to Lockport, IL, 291.9 miles. Maintained Depth: 9 feet.
Comparative Statement of Traffic (thousand short tons)
Year
Total
Year
Total
Year
Total
Year
Total
19971998
38,641`38,619
20012000
40,33341,491
20042003
40,20939,494
200637,55Q.
1999
40,685
2002
40,204
2005
38,395
"Revised after original year of publication
Freight Traffic, 2006 (thousand short tons)
Internal
Commodity
Grand Total
Inbound
Outbound
Through
Intra
U bound Downbnd U bound Downbnd U bound Downbnd U bound Downbnd
Total, all
commodities .
37,550
7,215
720
-2,386
15,080
7,796
2,991
1,243
118:
Total coal
3,395
1,135
2
'13
643
86
1,212
4
1100 coal & lignite
2,576
1,127
-
-
2
229
2
1,212
4
1200 coal coke
819
8
-
2
11
714
85
-
....-
Total petroleurn and petroleum products
5,591
97.2
153
780
.
1,898.
722
936
18
112
2100
Subtotal
Subtotal
crude petroleum
petroleum
crude petroleumproducts
5,571
20
20
95220
20
153
-
780
-
1,898-
-
722
-
-
936
-
-
18°-
112-
-
2221
2211
2330
2340 residual
gasolinekerosenedistillate
fuel
fuel
oiloil
1,06775917835
88443917
--9018
--9010
427417-27
194108-82
257-795
---7
---41
2430
2350
2429
tube
naphtha
asphalt,
oil &
tar
&
greasessolvents&
pitch
1,141227440
120125182
---78
140-10
5481269
908688
168-28
--12
--60
2540
2640
petroleum
hydrocarbon
gaseous
coke&
petrol gases
, liquefied and
1,36411
..
9
-
-
31
529
-
337
-
57
11
390
-
-
-
11
-
2990 petro. products nec
348
328
-
-
7
6
8
-
Total chemicals
:
and related products
4,021
2,198
60
105
404
.1;034
214
6 '
Subtotal
fertilizers
967
880
--
--
1
83
-
2
3110 nitrogenous Pert.
538
463
-
-
1
72
-
2
3190
3120
3130
phosphatic
potassic
fart. & mixes
fort.fert.nec
27012732
26512627
---
---
---
551
-------
------
Subtotal other chemicals and related
3,055
1,318
60
105
403
951
214
4
products
3212
3211 acyclic
benzene
hydrocarbons&
toluene
11933
337
---
--
-10
-48
-55
3219 other hydrocarbons
735
656
23
-
--
37
19
3220 alcohols
1,142
70
37
105
389
401
139
3260
3273 ammoniaorganic
comp. nec
35630
35216
--
---
-3
----11
-
4
3274 sodium hydroxide
421
30
-
-
-
391
3275 inorg: elem., oxides, & halogen salts
60
16
-
-
-
44
3276 metallic salts
48
39
-
-
1
8
3279 inorganic chem. nec
70
66
-
-
-
5
3297 chemical additives
3
--
-
-
3
1
3299 chem. products nec
36
33
-
---
-
3
Total crude.
materials,
`
medible except fuels5,901.
11045
330
..
1;498
97-
1,770
1,153
4190
4225
4161
Subtotal
Subtotal
Subtotal
forest
wood
pulp &
chipsproducts
soilpulp
forest
waste
,
sand,
and
paper
products
nec
waste
gravel,
,
paperwood
rock
and
and
chipsstone
2,477
303
3064
43
299191
189
4
4
1
320
-
-
-
1
,
487
-
-
-
--
--
-
-
-16
115349
113
-
2
-
--
--
7
4323
4322
gypsumlimestone
28478
-52
--
----
-6
27826
---
4331 sand & gravel
2,109
247
320
1,487
9
40
-
7
4335 waterway improv. mat
5
Subtotal iron ore and
scrap
1,338
134
11
10
82
275
826
4410 iron ore
302
5
-
--
----
238
59
4420 iron & steel scrap
1,036
129
11
10
82
37
767
Subtotal non-ferrous ores and scrap
108
32
-
76
4690
4782
4650
4670
Subtotal
Subtotal
manganese
aluminum
non-ferrous
clay &
slagsulphurr
refrac.
oreores
oremat.
clay
nec
and salt
443
151
151
543816
1311
1111
17
4
-
-
--
-
--
-
-
-
-
--
2-
-
----
--
-
101
140
140
43
21
12
327--
-
---
4860 slag
443
13
-
2
-
101
327
4900
Subtotal
non-metal.
other
min.
non-metat.
nec
min.
1,075
1,076
361361
---
-
-
715715
---
:Total primary manufactured
goods
5,5391
1,767
1.64
1
112
3,191
304
Subtotal lime
,
cement and glass
1,365
498
1
3
769
92
5220 cement & concrete
1,363
498
-
1
3
768
92
5290 misc. mineral prod.
2
-
-
2
-
68
ROCK ISLAND, IL DISTRICT
U.S. ARMY CORPS OF ENGINEERS
ILLINOIS RIVER, IL (INCLUDED IN THE ILLINOIS WATERWAY CONSOLIDATED)
Freight Traffic,
2006 - continued
(thousand short tons)
Commodity
Grand Total
Internal
Inbound
Outbound
Through
Intra
Upbound Downbnd Upbound Downbnd Upbound Downbnd Upbound Downbnd
Subtotal primary iron and steel products
3,957
5312 pig iron
1,926
5315 Ferro alloys
187
5320 As primary forms
68
5330 i&s plates & sheets
951
5360 As bars & shapes
380
5370 As pipe & tube
8
5390 primary i&s nec
437
Subtotal primary non-ferrous metal products
215
5422 aluminum
18
5429 smelted prod. nec
47
5480 fab, metal products
151
Subtotal primary wood products
2
5540 primary wood prod.
2
Total food and farm.
products
Subtotal grain
6241 wheat
6344 corn
Subtotal oilseeds
6522 soybeans
6590 oilseeds nec
Subtotal vegetable products
6653 vegetable oils
6654 vegetables & prod.
Subtotal processed grain and animal feed
6747 grain mill products
6782 animal feed, prep.
Subtotal other
agricultural products
6861 sugar
6865 molasses
6885 alcoholic beverages
Total all manufactured
equipment
machinery
54
and products
7110 machinery (not elec)
7500 textile products
7600 rubber & plastic pr.
7800 empty containers
7900 manufac. prod. nec
Ton-miles
(x1000)
10
18
1,281,
960
59
,
819 115
,472 2,780,973
2,268,553 870
,467 111
,826
9,922
Tons
All Traffic (
x1000
)
37,550
Ton-miles All Traffic
(
x1000
)
7,498,992
Total Trip
-
ton-miles Internal and Intraport
(
x1000
)
38,400,313
CALUMET-SAG CHANNEL, IL (INCLUDED IN PORT OF CHICAGO, ALSO INCLUDED IN STATISTICS FOR ILLINOIS WATERWAY)
Section Included
:
Calumet-Sag Channel from its junction with Chicago Sanitary and Ship Canal to Blue Island
,
Little Calumet and Calumet Rivers to
Turning Basin No. 5 (130th Street Bridge
).
Maintained Depth
:
9 feet.
Comparative
Statement of Traffic
(
thousand short tons)
Year
Total
Year
Total
Year
Total
Year
Total
1997
10,041
2000
8,007
2003
6,
576
2006
7
,716 "'.
1998
8,808'
2001
6,022
2004
8,560
1999
7,449
2002
6,749
2005
8,483
"Revised after original year of publication
Commodity
Total,
all commodities
Total coal
1100
coal & lignite
1200
coal coke
Total petroleum and petroleum products
Subtotal petroleum products
2211
gasoline
2330
distillate fuel oil
2340
residual fuel oil
2350
lubo oil & greases
2429
naphtha & solvents
2430
asphalt, tar & pitch
13,048
9,384
167
9,217
2,371
2,312
59
34
27
7
1,092
38
1,054
167
77
63
28
1,254
160
--
107
2
,
225
211
1,1437
--
-
----
784180
-1
538
1031
--
62
63157
157-
15
1
-
94
268
1
28
54
-
5
297
53
13
4
2
197
--
- - - -
18
-13
2
-
-4
------
-2
13445
--
93
2
-
-
12
,551-
132- .270-
8
--
--
9,166
-
208
119
-
47
8
-
-
9,046
--
161
2
29
--
--
2,287
29
25
2,287
-
25
29
1
-
--
--
-
-----
11
21
29
-
1 - -
4
21
7-
2
--
1,060
31
- - -
38
2
--
-
1,022
31
52
--
- -
28
82
6
77
52
4
6
28
5
Freight Traffic, 2006 (thousand short tons)
Internal
Grand Total
Inbound
Outbound
Through
U bound Downbnd U bound Downbnd
7,716
411
30
5,439
1,336
i
939
934
5
225
2
713
710
3
1,513
1i8
1,092
295
1,513
118
1,092
295
94
83
6
5
130
24
56
48
568
8
56
-
22
8
14
98
20
78
U.S. ARMY CORPS
OF ENGINEERS
ROCK ISLAND, IL DISTRICT
59
CALUMET-SAG CHANNEL, IL (
INCLUDED IN
PORT OF CHICAGO, ALSO INCLUDED IN STATISTICS FOR ILLINOIS WATERWAY)
Freight Tra
ffic, 2006 - continued
(thousand short tons)
Commodity
2540
petroleum coke
2640
hydrocarbon & petrol gases, liquefied and
gaseous
2990
petro. products nec
Total chemicals
and related products
Subtotal fertilizers
3110
nitrogenous fert.
3120
phosphatic fort.
3130
potassic fart.
3190
fart.
& mixes nee
Subtotal other chemicals and related products
3219
other hydrocarbons
3220
alcohols
3275
inorg. elem., oxides, &
halogen salts
3276
metallic salts
3279
inorganic chem, nee
3297
chemical additives
3299
chem. products nee
Total::crude materials,
inedible
!
except fuels
Subtotal forest products
,
wood and chips
4161
wood chips
4190
forest products nee
Subtotal soil, sand
,
gravel, rock
and stone
4322
limestone
4323 gypsum
4331
sand & gravel
4335
waterway improv. mat
Subtotal iron ore and scrap
4410
iron ore
4420
iron & steel scrap
Subtotal non
-
ferrous ores and scrap
4650
aluminum ore
4670
manganese ore
4690
non-ferrous
ores nee
Subtotal sulphur, clay and salt
4782
clay & refrac. mat.
Subtotal stag
4860
slag
Subtotal other non
-
metal. min.
4900
non-metal. min. nee
-Total primary manufactured goods
Subtotal
time, cement and glass
5220
cement & concrete
5290
misc. mineral prod.
Subtotal primary iron and steel products
5312
pig iron
5315
Ferro alloys
5320
i&s primary forms
5330
i&s plates & sheets
5360
4s bars & shapes
5390
primary i&s nee
Subtotal
primary
non-ferrous metal products
5422
aluminum
5429
smelted prod. nec
5480
fab. metal products
Total
food
and farm products
Subtotal graln
6241 wheat
6344 corn
Subtotal oilseeds
6522
soybeans
6590
oilseeds nee
Subtotal vegetable products
6653
vegetable oils
Subtotal
other
agricultural products
6861 sugar
6865
molasses
..
=Total all manufa tiured equipment
,
machinery
'
and products
7110
machinery (not elec)
7600
rubber & plastic pr.
7900
manufac. prod. nee
Ton-miles (
x1000)
Internal
Grand Total
Inbound Outbound
Through
Upbound Downbnd Upbcund Downbnd
1,080
933
146
11
11
14
10
4
383
155
17
147
64
80
1
--
78
--
303
6955
1
154
---1
----
17
67
68
551
----
64
2423
152-
-17
353
-38
2919
-
-
193
-26
S1
5
-
33
1,863
128
1,012
723.
88
442
6
2
119
321
62
--
2
27813919
119
2781919
--2
673
5
274
5
398
-
297
238
59
376
37
339
76
76
--
140
432112
140
432112
---
--
424
140
140
101
323
-
424
101
323
101
101
9
9
92
92
-
-
2,655
2,-142
504
205
8
66
131
203
8
65
131
2,299
2
2
1,928
2
370
-
786
2
785
177
176
1
58
57
1
774
514
260
147
145
2
356
251
105
152
147
4
4
4-
12423
12023
-4
337
109
222
200
--
200
47
-
47
153
-
153
51
29
22
22
----
22
29
21
29
21
-
--
5421
64
10
6
6
5421
58
4
--
-
-
26
4
22
14
2
12
10
-
10
1
1-
180,549
5,518
428
130,533
44,071
Tons
All Traffic (
x1000)
7,716
Ton-miles
All Traffic (
x1000
)
180,549
Total Trip-
tan-miles Internal
and Intraport (
x1000
)
7,464,221
60
ROCK ISLAND, IL DISTRICT
U.S. ARMY CORPS OF ENGINEERS
CHICAGO SANITARY AND SHIP CANAL, IL
(INCLUDED IN PORT OF CHICAGO, ALSO INCLUDED IN STATISTICS FOR ILLINOIS WATERWAY)
Section Inducted: Chicago Sanitary and Ship Canal. Damen Avenue, Chicago to Lockport, IL. Maintained Depth: 9 feet at low water
stages.
Comparative Statement of Traffic (thousand short tons)
Year
Total
Year
Total
Year
Total
Year
Total
1997
18,900
2000
17,983
2003
19,465
200fi
19 927::=':`
1998
18,185"
2001
16,905
2004
20,571
1999
17,500
2002
17,059
2005
21,044
"Revised after original year of publication
Freight Traffic, 2006 (thousand short tons)
Internal
Commodity
Grand Total
_
Upbound
InboundDownbnd
Upbound
Outbound
Downbnd
.
Upbound
Through,,.Downbnd
Upbound
Intra^Downbnd
Total, all commodities
19.927
4,132
180 - 3,183
1,
688
6
,187°
2,084
2,411
61
`Total coal
3,303
11
--
994
82
934
5
-1,777
1100 coal & lignite
3,002
4
--
994
--
225
2
:.777
1200 coal coke
801
6
82
71(1
:3
--
Tota[
`
petroleurn and petroleum
products
-3,402
350
68
459
952
711
195
137
29
Subtotal petroleum products
3,402
850
68
459
952
711
195
137
29
2340
2211
2221
2430
2330
2350
2429
gasolinekerosenedistillate
residual
asphalt,
naphtha
tube oil &
tar
fuel
fuel
&
greasessolvents&
oiloilpitch
4317662861151509818
224146192902190
----25147
----4421
352109114-35182
--242520877
---551658
112---843
------4
2540 petroleum coke
1,506
83
22
412
312
533
109
10
26
2640 hydrocarbon
gaseous
& petrol gases, liquefied and
11
-
-
-
-
11
-
-
-
2990 Petro. products nee
20
3
-
-
11
4
3
'.Total chemicals.and.related products
1,559
869
76
227
3
02
' '49
.
51
32
3110
3120
Subtotal
nitrogenous
phosphatic
fertilizers
fert.fort.
72
83
5
2
2
-
-
-
-
-
-
81
70
-
-
-
-
-
3130 potassic fort.
1
3190 fert. & mixes nec
5
Subtotal other chemicals and related
1,476
867
76
227
221
49
5
32
products
3212 benzene & toluene
102
48
-
-
55
-
-
-
-
3219 other hydrocarbons
107
34
-
-
42
3
-
-
28
3220 alcohols
698
325
-
129
186
49
4
4
3276
3260
3275
3279
3274 sodium
metallic
inorganic
organic
inorg. elem.,
hydroxidecomp.
saltschem.
oxides,
neenec
& halogen salts
39111144115
391253111
---76
--
---
--193
----
--1
---
3297
3299
chemical
chem. products
additivesnee
33
1
-
--
-1
31
--
--
--
Total crude materials,
inodible
;except fuels
7,005
1,554
30
'1,727
366
1,717
1,117
492
Subtotal forest products
,
wood and chips
115
107
--
--
--
8
---
--
4190
4161
Subtotal
forest
wood chipsproducts
soil
,
sand,
nee
gravel
,
rock and stone
4,375
1132
933
107
--
--
1
,
727
-
320
--
904
26
-
-
-
492
--
4323
4322
4331 sand
limestonegypsum&
gravel
4,06027826
933--
--
1,727--
320--
27659526
--
486--
4$35 waterway improv. mat
11
-
-
-
-
5
-
6
Subtotal iron ore and scrap
1,155
9
30
-
49
277
790
-
4410
4420
iron
iron
ore&
steel scrap
858297
-9
--30
--
-49
23840
73159
----
Subtotal non-ferrous ores and scrap
76
-
-
76
--
-
4690
4650
4670
Subtotal
non-ferrous
aluminum
manganese
sulphur
oreoreores
,
clay
nee
and salt
140
432112
--
---
---
140
432112
---
-
---
4782 clay & refrac. mat.
140
--
-
-
140
-
--
Subtotal slag
430
--
-
--
103
327
--
4860 slag
430
103
327
--
4900
Subtotal
non-metal.
other
min.
non-metal.
nee
min.
715715
505
505
-
-
-
-
210
210
--
-
-
--
5290
r`Total
5220
Subtotal
Subtotal
cement
misc.
primary=mineral
time,
primary
& concrete
manufacturedcement
prod.
iron and
and
steel
:
glass
god'ds
products
3,712
2,600912
9102
325481
481295
-6
66
---3
3
----
--
2,410
1,930332
3312
468
371
92
92
--
---
-
5315
5330
5312
5320
Ferro
pig
i&s
As
ironplates
primary
alloys&
formsshoots
78689218058
117--
------
-31
--
51478418057
260-11
---
U.S. ARMY CORPS OF ENGINEERS
ROCK ISLAND, IL DISTRICT
61
CHICAGO SANITARY AND SHIP CANAL, IL
(INCLUDED IN PORT OF CHICAGO, ALSO INCLUDED IN STATISTICS FOR ILLINOIS WATERWAY)
Freight Traffic,
2006 - continued
(thousand short tons)
Internal
Commodity
Grand Total
Inbound
Outbound
Through
Intra
IUb_ound.Downbnd Upbound Downbnd Upbound Downbnd Upbound Downbnd
5360 As bars
& shapes
271
124
-
-
-
145
2
5390
5370 i&s
primary
pipe
As
& tubenee
4038
468
--
-
--
251-
106-
Subtotal primary non
-
ferrous metal products
201
49
--
-
--
147
4
5480
5422
5429
aluminumsmelted
fab. metal
prod.
productsnee
1394518
221413
---
---
---
120234
--4
Total food
.
and farm products
402
24
42
109
228
Subtotal grain
208
-
-
--
8
-
200
6241 wheat
47
-
----
47
6344 corn
161
-
-
8
-
153
Subtotal oilseeds
54
--
--
3
29
22
6522 soybeans
25
-
-
-
3
-
22
6653
6590
6782
Subtotal
Subtotal
vegetable
oilseeds
animal
vegetable
feed,
processed
necoilsprep.
productsgrain
and animal feed
312921
3121
-
-
-
-
-
--
--
-
-
-
-
-
-31
31
-
21
21
29
-
-
-
-
Subtotal other agricultural products
87
24
--
--
--
58
6
6861
6865 molassessugar
7710
24
-
544
-6
Total all
manufactured
'
equipment, machinery
44
18
4
22
and products
7110 machinery (not elec)
14
12
7600 rubber &
plastic pr.
10
10
7800 empty containers
18
18
7900 manufac. prod, nee
1
1
Ton-miles
288,5391
37
,
700
1
,
986
72
,
268
14
,
258
80
,
081
28,484
53,163
601
(x1000)
Tons All Traffic (
x1000
)
19,927
Ton-miles All Traffic (
x1000
)
288,539
Total Trip-tan-
miles Internal and Intraport
(
x1000
)
13,336,758
ILLINOIS
WATERWAY, 11- (CONSOLIDATED REPORT FOR ENTIRE WATERWAY)
Section Included: Illinois River, Grafton, IL to confluence
of Desplaines
and Kankakee Rivers thence
Desplames
River to Lockport, IL; Chicago
Sanitary and Ship Canal, Lockport, IL to Damen Avenue in Chicago; Chicago River (
South Branch
),
Damen Avenue to Lake Street;
Calumet-Sag
Channel from its junction with the Chicago Sanitary and Ship Canal to
Blue Island; and
the Little Calumet River and Calumet River to Turning Basin
No, 5 (130th Street Bridge).
See reports
for Illinois River, Chicago Sanitary and Ship Canal, Calumet-Sag Channel, and Chicago River
,
South Branch.
Maintained Depth
:
9 feet at low water stages.
Comparative Statement of Traffic (thousand short tons)
Year
Total
Year
Total
Year
Total
Year
Total
1997
42,994
2000
44,231
2003
45,
009
2006
""
43,583 <
1998
41,795"
2001
43,490
2004
45,235
1999
43,724
2002
43,032
2005
44,018
`Revised after original year of publication
Freight Traffic, 2006 (
thousand short tons)
Commodity
Grand Total
Total
,
all.commodities
43,583
Total coal
6,1671
1100 coal & :ignite
5.34?.
1200 coal coke
411 a i
Total
:
petroleum
'
and 'petroleuir
r
products
6,402,
Subtotal crude petroleum
20
2100 crude
petroleum
20
Subtotal petroleum products
6,381
2211 gasoline
180
2221 kerosene
35
2330 distillate
fuel oil
1,280
2340 residual
fuel oil
795
2350 lube oil &
greases
227
2429 naphtha &
solvents
459
2430 asphalt, tar & pitch
1,176
2540 petroleum coke
1,863
2640 hydrocarbon & petrol gases, liquefied and
11
gaseous
2990 petro. products nee
355
-.
_.._......_, ....
Internal
Inbound
Outbound
Through
- Intra
abound Downbnd Upbound Downbnd Upbound Downbnd Upbound Downbnd
94
1,679
89
980
2,723
20
20
1,659
89
980
2,723
140
27
17
294
30
44
693
110
-
11
$25
211
9
261
14
1
155
229
7
20
662
55
39
904
635
11
---
331
17
2,234
16
;460
4
;
545
1;669
61998
688
933
5
3,984
4.
225
V
3,9841
4
74
166
416
274.
74
166
416
274
6
52-
-
-
18
-
12 123
86
16
-
92
41
-
7
-
13
7
-
55 139
64
41
93
47
51
43
62
ROCK ISLAND, IL DISTRICT
U.S. ARMY CORPS OF ENGINEERS
ILLINOIS
WATERWAY, IL (CONSOLIDATED REPORT FOR ENTIRE WATERWAY)
Freight Traffic
,
2006 - continued
(thousand short tons)
Internal
Commodity
Grand Total
Inbound
Outbound
Through
Intra
Upbound Downbnd Upbound Downbnd Upbound Downbnd Unbound Downbnd
Total chemicals :and related:: products
4,168
3,113
87
594
147
25
120
81..
Subtotal fertilizers
967
884
1
80
-
2
-
3110 nitrogenous fart.
538
466
1
69
-
2
3120
3130
phosphatic
potassic fert.fort.
12732
12627
-
51
-
-
-
3190
Subtotal
fart. &
other
mixes
chemicals
nec
and related
3,201
270
2,230
265
-
87
-
1
592
-
67
5
-
25
118
- ---
81
products
3211
3219
3212
acyclic
other
benzene
hydrocarbonshydrocarbons&
toluene
76311933
6905533
---
---
-6519
--3
---
---
--51
3220 alcohols
1,157
439
11
1
504
34
25
113
30
3260
3273 ammoniaorganic
comp. nec
35630
35227
--
--
3
--
--
-4
-
3275
3274
3276
inorg.sodium
metallic
elem.,
hydroxidesalts
oxides
,
&
halogen salts
42115160
4214270
--76
--
-1
-193
-----
--1
---
3279
3299
3297
Total
chemical
chem.
inorganic
crudeproducts
materials
additiveschem.
necnec
, inedible except.fuels
8,154
36703
1,69166333
---32
1,246---
314--1
1,128-36
936---
2,477---
323---
4190
4161
4225
Subtotal
Subtotal
Subtotal
forest
wood
pulp &
chipsproducts
forest
soil,
pulp
waste
sandand
products
papernec
waste
, gravel,
,
paperwood
rock
and
and
chipsstone
4,697
303
306
43
4
320
297
298
441
----
---
1,242--
--
--
-
-
16
330
--6
8
2
----
-
-
2
,470-
-
--
320
--
---
4331
4322
4323
limestonegypsumsand
& gravel
4,323
284
78
268-52
--
1,242--
-69
2782621
-
--2,464--
320--
4335 waterway improv, mat
11
Subtotal iron are and scrap
1,370
135
32
2
298
276
610
8
8
4410
4420
iron
iron
ore&
steel scrap
1,069302
1305
--32
---2
298-
238
38
55159 8
- -8
4650
4690
4670
Subtotal
Subtotal
aluminum
non-ferrous
manganese
sulphurnon
ore-
ferrous
oreores
,
clay
nec
ores
and
and
saltscrap
151
108
543816
321711114
------
----
----
14076214312
-----
----
-----
4782 clay & refrac. mat.
151
11
-
-
- 140
-
-
-
Subtotal slag
443
14
--
2
--
100
327
--
4860
Subtotal
slag
other non
-
metal. min.
1,075
443
876
14
-
--
2
--
- 100
199
327
-
-
- -
-
4900 non-metal. min. nec
1,075
876
-
-
- 199
-
-
-
Total prirnary manbfactured
.'
goods
5,591
-2,848
170
5
113
2;
152
302
Subtotal lime, cement and glass
1,413
1,234
6
1
3
76
92
5220 cement & concrete
1,412
1,234
6
1
3
74
92
5290
Subtotal
misc. mineral
primary
prod.
iron and steel products
3,960
2
1,550
160
-
-
3
108
-
1
,
929
2
210
-
5315
5312
Ferro
pig ironalloys
1,929187
1,1447
----
-3
-
-
782180
-1
5320 i&s primary forms
68
8
1
-
2
57
-
5330 i&s plates & sheets
951
171
103
1
6
514
157
5360 i&s bars & shapes
380
138
1
-
94
145
1
5390
5370
primary
i&s pipe
i&s
& tubenec
4378
748
54
--
-6
251-
-51
productsSubtotal
primary non-ferrous metal
215
62
4
--
2
147
-
5422 aluminum
18
13
-
-
-
4
5429 smelted prod. nec
47
22
-
-
2
23
5480
5540
Subtotal
primary
fab. metal
primary
wood
productsprod.wood
products
1512
2
27
2
2
4
-
-
120
-
,total food
and-farm
products
13,046
117-
12,599
199
222
2
Subtotal grain
9,384
8
9,173
--
200
2
6241 wheat
167
119
-
47
6344 corn
9,217
8
9,054
153
2
Subtotal oilseeds
2,371
29
2,290
29
22
6522 soybeans
2,312
2,290
-
22
6653
6590
6654
Subtotal
Subtotal
vegetable
vegetables
oilseeds
processed
vegetable
necoils&
prod.
productsgrain
and animal feed
1,092
27
34597
29
1
1
2
1,090
-
11
4
7
-
21
29
21
---
-
-
-
6747
6782
Subtotal
grain
animal
mill
other
feed,
productsprep.
agricultural products
1,054
167
38
762
1,05338
33
-
58
--
--
6861
6885
6865 molassesalcoholic
sugar
beverages
28
77
63
5224
-286
-544
---
U.S. ARMY CORPS
OF ENGINEERS
ROCK ISLAND, IL DISTRICT
63
ILLINOIS
WATERWAY,
IL (CONSOLIDATED REPORT FOR
ENTIRE WATERWAY)
Freight Traffic
,
2006 - continued
(thousand short tons)
Internal
Commodity
Grand Total
Inbound
Outbound
Through
intra
U bound Downbnd U bound Downbnd U bound Downbnd U bound Downbnd
:
Total alt
manufactured
equipment,
54
23
machinery and products
7110 machinery (not elec)
19
4
12
-
-
2
0
7600
7500
rubber
textile products&
plastic pr.
151
1
-
-5
-
10
7800 empty containers
18
18
7900 manufac. prod. nec
2
1
1
Ton-miles
7,980,052
2,274,
896
24
,
773 100
,
870
3,184
,
533 1,476,888
542
,
300 316 549
59
244
(x1000)
,
,
Tons
All Traffic (
x1000)
43,583
Ton-miles
All Traffic (
x1000)
7,980,052
Total Trip-
ton-miles Internal and Intraport
(
x1000)
38,559,924
64
ROCK ISLAND, IL DISTRICT
V.S. ARMY CORPS OF ENGINEERS
Section 2
Trips and Drafts of Vessels
U.S. ARMY CORPS OF ENGINEERS
GREAT LAKES 65
66 GREAT LAKES
U.S. ARMY CORPS OF ENGINEERS
Trips and Drafts of Vessels, 2006
(draft in feet)
Draft
Self Propelled Vessels
Total
Dry Cargo Tanker
WAUKEGAN HARBOR, IL
Grand
Total
160
35
DOMESTIC
Total
18
17
16
15
13
5 12
160
13
22
63
1
2
59
Tow
Tuc
OY
Non-Self Propelled
Vessels
Dry Cargo
Tanker
Inbound
CHICAGO RIVER
(MAIN AND NORTH
BRANCH), IL
Grand
Total
1,513
DOMESTIC
Total
1,513
12
1,513
14
1,484
1,484
Tow or
Tug
Outbound
Non-Self Propelled
Vessels
Dry Cargo Tanker
63
61
-
36
2922
----
-23
63
115
61
22271
-
--
--
-
3
-
Total
-
24
trips:
23
6
320-
-
1
--
349
1,130
4
1
-
349
1,130
4
Total trips:
2,997
CHICAGO RIVER
,
SOUTH BRANCH, IL
Upbound
Downbound
Grand
Total
3,125
1
-
439
2,681
4
3,105
-
-
406
2,682
17
DOMESTIC
3,11251
1
4391
2,681
To 121
3,125
1
-
439
2
,681
4I
3,105
-
-
44061
2682
17
06
2,682
17
Total trips:
6,230
LAKE CALUMET, IL
Upbound
Upbound
Downbound
Grand
Total
1,387
36
-
463
829
59
1,215
56
427
675
57
FOREIGN
Total
27
25
24
23
22
21
20
19
18
17
16
<_ 12
DOMESTIC
Total
23
22
21
20
19
18
17
16
15
14
13
5 12
35
1
13
8
1
12
4
1
2
1
64
61
64
11
5
23
25
fit
1
4
32
2
22
Self Propelled Vessels
Total
Dry Cargo
Tanker
160
36
160
13
41
47
3
6
50
Downbound
359
1
,
137
17
1
,
484
1
-
349
1,130
4
359
1,137
17
359
1,137
17
5
1
1
5
1,373
1
10
2
15
14
1
15
1
1
32
1
10
1
7
13
4
1,309
4
458
13
1
1
4
4 39
14
12
1
1
828
55
1
54
1,176
2
3
2
19
8
1
35
1,106
25
2
1
3
6
7
1
3
1
1
833
11
3
1
4
1
1
1
1
31
-
419
2
1
8
672
54
3
2
-
---
15
2
1
1
19
-
6
10
--
1
-
397
655
53
Total trips:
2,602
U.S. ARMY CORPS OF ENGINEERS
CHICAGO, IL DISTRICT
67
Trips and Drafts
of Vessels, 2006
(draft in feet)
Draft
Self Propelled Vessels
Total
Dry Cargo
Tanker
Tow or
T up
Non-Self Propelled
Vessels
Dry Cargo
Tanker
Self Propelled Vessels
Total
Dry Cargo
Tanker
Tow or
Tug
Vessels
Dry Cargo
Tanker
Non-Self Propelled
CALUMET HARBOR AND RIVER
, IL AND IN
Upbound
Downbound
Grand
Total
8,851
412
2
4,584
3
,
628
225
7
,
663
344
2
3
,
708
3
,
402
207
FOREIGN
Total
222
181
2
23
5
11
130
94
2
18
4
12
2724252326
25221814
9
252018149
-----
1
1
2211141818
2010
14
14
18
---
-
1
21
1
-
-2
22
40
38
1
1
9
8
1
212019
3916
36117
--1
21
2
3
4
44
244
---
1
1
1892-6
1
5
4
1
173
1-
22
1
1
1611
8
3
6
5
1
152
1
1
5
3
2
14
1
1
<_ 12
6
5
1
7
4
3
DOMESTIC
Total
8,629
231
- 4,561
3,623
214
7,533
250
--
3
,
690
3,398
195
2625
1511
103
---
-12
-
1
-
14
6
41
--
13
-2
-
24
2322
342233
29
2319
-
-
-
-
-
1143
-
292130
221111
-----
---
10188
--
21201918
30532653
5038
18
2
---
-
-
--17
151263
--1
27269019
59252410
----
-23
6931
---2
1617
5626
68
--
3613
117
1
6280
4231
--
3510
1210
-2
15
5
3
2
-
10
6
-
3
1
-----
14
8
53
81-
51
1
1213
8,098
159
196
--
4,345130
3,53510
212 6,994117
-3
--
3,464117 3,317-
-190
Total trips
:
16,514
PORT OF CHICAGO, IL
Ib
d
Grand
Total
18,296
1,045
n oun
2
6,288
9,351
Outbound
1
,
610
18,291
1,124
2
6,429
9,084
1,652
FOREIGN
Tota 1
130
94
2
18
4
12
222
181
2
23
5
11
2324252726
1822
14
1118
2014141018
----1
--211
---2
252218149
2520
14
189
--
-
--
1
1
22
9
8
1
40
38
1
1
21
4
4
-
39
36
-
3
20
4
4
-
16
11
1
2
2
19
4
2-
1
1
8
7-
1
185
4
192-6
1
172
1
13
1-
2
166
5
111
$
3
155
3
22
1
1
51214
71
4
-
3
1
-
6
5
1
68
CHICAGO, IL DISTRICT
U.S. ARMY CORPS
OF ENGINEERS
Trips and Drafts of Vessels, 2006
(draft in feet)
Draft
Self Propelled Vessels
Non-Self Propelled
Vessels
Self Propelled V
essels
Total
Dry Cargo
Tanker
PORT OF CHICAGO,
IL - continued
DOMESTIC
Tow or
Tug
Inbound
Dry Cargo
Tanker
Total
Dry Cargo
Tanker
Tow or
Tug _
Outbound
Non-Self Propelled
Vessels
Dry Cargo
Tanker
Total
18,166
951
6,270
9,347
1,598
18,069
943
--
6,406
9,079
1,641
22
26
24202523
21
2327224029146
26321412114
1
13
18102981
-
34225333551511
295238231019
3
---
-
---
---
12
15113341
-
-----
18
19
8827
2457
24
36
-
1
2930
174
--
-18
126
-2
1514171316
1185966109
401551
11837103
7
12911.
---21
15826
58
10
6
19871
----
129391373
1011823
-----
5 12
17,628
709
6,058
9,267
1,594
17,527
713
6,185
8,990
1,639
Total trips
:
36,587
INDIANA HARBOR, IN
Ib
d
Otb
d
Grand
n oun
u oun
Total
3,011
FOREIGN
355
--
1
,
505
961
190
2,996
340
-
1,502
958
196
Total
24
18
3
3
17
10
4
3
27
8
8
26
8
8
25
1
1
23
2
1
22
7
21
1
1
20
2
2
19
1
1
18
1
1
1
1
17
1
1
16
1
1
3
3
< 12
DOMESTIC
2
1
12
11
Total
2,987
337
1,502
961
187
11
2,979
330
1,498
958
193
30
1
1
29
13
10
3
2
2
28
88
83
5
6
1
5
27
148
148
-
-
1
1
26
86
73
10
3
-
21
9
9
3
25
11
7
4
-
1
1
24
4
4
1
1
23
1
1
-
-
72
72
22
5
4
1
-
13
12
1
21
2
2
--
-
116
116
20
2
1
1
12
12
19
5
3
2
-
71
61
-
-
10
18
4
1
3
87
34
5
6
42
17
23
20
1
2
25
15
-
10
16
33
18
15
55
10
20
-
25
15
30
27
3
30
29
-
1
13
30
29
--
1
34
33
-
1
< 12
2,501
1,398
940
163
2,432
1,387
Total
941
104
trips:
6,007
U.S. ARMY CORPS OF ENGINEERS
CHICAGO, IL DISTRICT
69
Trips and Drafts of Vessels, 2006
(draft in feet)
Draft
Self Propelled Vessels
Total
Dry Cargo
Tanker
Tow or
Tuq
Non-Self Propelled
Vessels
Dry Cargo
Tanker
Self Propelled Vessels
Total
Dry Cargo
Tanker
Tow or
Tuq
Non-Self Propelled
Vessels
BURNS WATERWAY
HARBOR, IN
Dry Cargo
Tanker
Inbound
Outbound
Grand
Total
1
,
065
280
376
361
48
947
208
336
361
42
FOREIGN
Total
162
145
0
1
8
76
73
1
1
1
27
19
19
6
6
26
11
11
6
6
25
22
22
1
1
24
19
19
3
3
23
29
29
7
7
22
26
26
12
12
21
8
8
17
17
20
8
8
14
14
19
2
2
7
7
17
1
1
165
3
2
1
1
15
1
1
13
1
1
<_
12
10
4
1
5
2
1
1
DOMESTIC
Total
903
135
368
360
40
871
135
335
360
41
31
1
1
28
18
18
27
49
49
26
18
18
25
25
23
2
1
1
24
6
6
1
1
23
4
4
47
47
22
1
1
3
3
212019
32
1
32
1
35
88
33
6
7
--
221
--
18
17
3
10
3
8
2
22
7
16
5
3
-
21
-
1-
-2
1
8
12
35
23
5 1213
14
15
7133537
3233534
355
353
67932
4
5
1
29032
4
4
--._.-
-
351
-
---38
CHICAGO HARBOR IL
Total trips:
2,012
,
(16 feet and less)
Upbound
Downbound
Grand
Total
865
706
99
50
10
861
706
--
94
50
11
Total trips:
1,726
MICHIGAN CITY HARBOR, IN
No Vessel Trips
Reported
BUFFINGTON HARBOR, IN
(27 feet and less)
Inbound
Outbound
Grand
Total
55
55
-
--
-
51
51
Total trips:
106
GARY HARBOR, IN
(31 feet and less)
Inbound
Outbound
Grand
Total
890
167
393
325
5
832
154
343
330
5
Total trips:
1,722
70
CHICAGO, IL DISTRICT
U.S. ARMY CORPS
OF ENGINEERS
Trips and Drafts of Vessels, 2006
(draft in feet)
Draft
Self Propelled Vessels
Total
Dry Cargo
Tanker
Tow or
Tug
Non-Self Propelled
Vessels
Dry Cargo Tanker
Self Propelled
Vessels
Total
Dry Cargo
Tanker
Tow or
Tuq
Vessels
Dry Cargo
Tanker
Non-Self Propelled
TWO HARBORS
(
AGATE BAY), MN
Inbound
Outbound
Grand
Total
336
269
34
33
340
262
36
42
FOREIGN
Total
28
23
5
--
2
2
28
1
1
27
1
1
24
7
7
2322
83
33
5
-
21
7
7
1
1
20
2
2
DOMESTIC
Total
308
246
29
33
338
260
36
42
31
3
3
29
1
1
28
9
a
1
27
3
3
75
72
3
26
21
21
198
160
38
2532
1
9
9
24
45
45
4
4
23
66
66
1
1
22
46
16
32
21
10
10
1
1
20
8
8
19
86
57
29
36
36
18
7
7
17
2
2
16
8
8
< 12
1
1
1
1
Total trips:
676
DULUTH-SUPERIOR HARBOR
,
MN AND WI
Inbound
Outbound
Grand
Total
1,310
1,234
--
39
32
5
1,259
1,172
--
44
39
4
FOREIGN
Total
531
509
13
B
1
474
452
14
8
30
1
1
28
12
12
27
3
2
1
346
341
5
26
6
6
52
52
25
48
48
10
10
24
114
114
9
9
23
120
117
3
2
2
22
41
41
2
2
21
54
54
10
10
20
29
29
4
4
19
36
36
4
4
18
9
9
1
1
17
4
3
1
4
2
-2
16
24
21
3
2
2
15
24
14
9
1
10
1
9
14
4
3
1
4
4
13
11
11
1
1
12
4
1
2
1
DOMESTIC
Total
779
725
26
24
411
785
720
30
31
4
31
1
1
29
1
1
28
5
3
-2
53
50
3
27
4
2
2
277
273
4
26
32
18
9
5
177
145
11
21
25
5B
57
1
29
29
24
61
60
1
49
48
1
23
204
200
4
22
21
1
22
34
27
7
31
31
21
13
13
28
28
U.S. ARMY CORPS
OF ENGINEERS
DETROIT, MI DISTRICT
71
Trips and Drafts of Vessels, 2006
(draft in feet)
D ft
Self Propelled Vessels
Non-Self
VesselsPropelled
Self Propelled Vessels
Non-Self Propelled
ra
Vessels
Total
Dry Cargo
Tanker
Tow or
Tun
Dry Cargo
Tanker 0
Totai
Dry Cargo
Tanker
Tow or
Tug
Dry Cargo
Tanker
DULUTH
-
SUPERIOR HARBOR
,
MN AND WI
-
continued
Inbound
Outbound
DOMESTIC
20
28
28
-
23
23
19
264
253
11
63
49
14
18
25
24
1
9
9
17
4
4
4
4
161514
302
6
27
221
2
4
2
4
3
21
2
21
-1
--
< 12
7
7
11
7
4
Total trips:
2,569
TACONITE HARBOR, MN
Ib
d
Grand
n oun
Outbound
Total
DOMESTIC
36
36
39
39
Total
36
36
39
39
26
1
1
8
8
27
9
9
12
12
26
6
6
1
1
23
14
14
15
15
21
3
3
18
3
3
3
3
Total trips:
75
PRESQUE ISLE HARBOR, MI
Ib
d
Ob
Grand
n
oun
ut ound
Total
FOREIGN
385
333
25
27
- -
378
327
--
26
25
Total
187
181
3
3
130
130
24
7
7
45
45
23
30
30
67
67
22
96
96
18
18
21
34
34
20
13
10
3
19
3
3
17
3
3
< 12
DOMESTIC
1
1
Total
198
152
22
24
246
197
- -
26
25
2827
23
21
2
10532
9132
--
--
14
26
4
3
1
2719
2
6
25
4
4
6
1--
5
24
6
6
2322
153
153
31
31
-
-
2021
1918
12014
78
14
20
22
121011
12911
----
---1
17
5
4
1
23
-
-
23
16
1
1
S 12
3
3
Total trips:
763
72
DETROIT, MI DISTRICT
U.S. ARMY CORPS
OF ENGINEERS
Trips and Drafts of Vessels, 2006
(draft in feet)
D ft
Self Propelled Vessels
Non-Self Propelled
Vessels
Self Propelled Vessels
Non-Self Propelled
ra
Vessels
Total
Dry Cargo
. ..................
Tanker
Tow or
Tug
Dry Cargo Tanker
Tow or
Total
Dry Cargo
Tanker
Tug
Dry Cargo Tanker
MARQUETTE HARBOR, MI
Ib
d
Grand
Total
54
34
n oun
11
9
Outbound
43
28
7
a
FOREIGN
Total
11
6
--
3
2
1
24
3
2-
1
2322
41
4
-
-
1
21
1
1
20
2
2
19
1
1
DOMESTIC
Total
43
28
--
8
7
p
42
27
7
0
26
8--
8
-
7
7
2523
131
7
1
-
-
-
-
p
6
6
22
13
12
-
-
1
1
_@
2
2
21
7
7
19
1
1
14
14
18
13
13
-
Total
trips:
-
-
97
DRUMMOND ISLAND, MI
Inb nd
O tb nd
Grand
Total
19,959
19,927
ou
-
15
17
u ou
16,760
16
,
730
--
12
18
FOREIGN
Total
26
24
--
2
16
16
25
2
2
24
1
1
3
3
23
5
5-
-
9
9
22
1
1-
-
1
1
21
5
4-
1
20
7
6-
1
191817
223
322
--
--
1
1
DOMESTIC
Total
19,933
19,903
13
17
16,744
16,714
12
18
26
13
13
12
12
25
2
2
24
2
2
23
5
28
18
10
228
168
8
21
1
1
20
19
11
11
11
18
9
9
17
15
11
4
15
1
1
5 12
19,871
19,871
16,682
16,682
Total
trips:
36,719
ST. MARYS
Grand
Total
RIVER, MI
80
,411
79,957
Upbound
59
185
Downbound
10 46,246 45,640
5
28
162
11
FOREIGN
Total
1,453
1,222
155
70
6
1,112
903
5
135
62
7
3029
2
2
1
1
-
-
28
1
1
13
13
--
27
12
10
1
1
441
414
--
5
22
U.S. ARMY CORPS
OF ENGINEERS
DETROIT, MI DISTRICT
73
Trips and Drafts of Vessels, 2006
(draft in feet)
Draft
Self Propelled Vessels
Non-Self Propelled
Vessels
Self Propelled Vessels
Non-Self Propelled
Vessels
Total
Dry Cargo Tanker
Tow or
Tug
Dry Cargo
Tanker
Total
Dry Cargo
Tanker
Tow
€Ugor
Dry Cargo
Tanker
ST. MARYS RIVER
,
MI - continued
Upbound
FOREIGN
Downbound
26
22
22
112
98
-
-
14
2325
24
28215166
271
149
66
82
2
1
1017347
947142
------
---1
551
--2
2122
241162
239
160
1
2
1
-
-
6838
3364
-
51
3
-
20
158
98
57
$
-
64
48
-
9
7
19
68
66
43
9
-
34
18
54
38
15
-
1
18
4
---
14
17
28
20
1
4
3
10
8
1
1
16
66
20
44
1
1
47
-
-
45
2
15
92
44
2
46
-
7
1
1
4
1
1443
1
2
11
<
13
12
35
9
9
2
23
10
252
21
11
-15
5
2
DOMESTIC
Total
62,059
61,836
104
115
4
62,033
61,836
93
100
4
31
1
1
3
3
29
1
1
28
3
3
96
91
5
27
5
5
517
496
21
26
69
31
36
2
440
360
14
66
25
64
62
2
50
45
5
24
109
107
2
50
49
1
23
304
281
23
22
22
22
99
41
58
11
11
21
19
19
12
12
20
23
23
16
16
19
18
403148
363
106
4021
21
71
6
21
6
50
-
-
14
17
15
16
32463
27431
2
1
1
42
2533
211
2321
--1
---
13
6
1
1
2
42
2--
5 12
60,724
60,722
1
1
60,705
60,699
1
Total
14
trips
:
126,657
ST. MARYS FALLS CANAL, MI AND
SAULT STE. MARIE, ONTARIO
SHIP CANAL
,
CN (INCLUDED IN ST. MARYS RIVER)
Grand
Upbound
Downbound
Total
2,321
1,991
FOREIGN
190
134
6
2,152
1,818
3
187
139
5
Total
1,092
925
111
54
2
818
679
3
95
40
1
302827
101
91
1
390
12
1
36512
1
-----
-
-
-
-
5
20
26
12
12
70
60
-
-
10
25
52
52
14
13
-
-
1
24
137
135
2
64
62
-
1
1
23
206
198
8
B5
82
-
-
3
22
162
161
1
40
39
--
-
1
2021
121130
12971
50
1
2214
14
16
-
-----
-
4
-2
19
47
47
39
7
-
32
18
19
16
3
5
2
--
3
17
23
17
1
3
2
6
4
1
1
16
64
20
44
45
-
-
45
15
89
43
1
45
4
1
1
2
144
3
1
1
-1
<1312
69
92
4
51
-
1
1
-
1
2
1
74
DETROIT, MI DISTRICT
U.S. ARMY CORPS
OF ENGINEERS
Trips and Drafts of Vessels, 2006
(draft in feet)
Draft
Self Propelled Vessels
Total
Dry Cargo
Tanker
Tow or
Tug
Non-Self Propelled
Vessels
Dry Cargo Tanker
Self Propelled Vessels
Total
Dry Cargo
Tanker
Tow or
Tug
Non-Self Propelled
Vessels
Dry Cargo
Tanker
ST. MARYS FALLS
CANAL
,
MI AND SAULT STE. MARIE
,
ONTARIO SHIP CANAL
,
CN (INCLUDED IN ST. MARY$ RIVER
) -
continued
Upbound
Downbound
DOMESTIC
Total
1,229
1,066
79
80
4
1,334
1,139
92
99
4
31
1
1
3
3
29
1
1
28
3
3
96
91
5
27
5
5
517
496
21
26
45
31
12
2
440
360
14
66
25
63
61
2
50
45
5
24
107
105
2
50
49
1
23
278
268
10
22
22
22
80
39
41
11
11
21
18
18
12
12
20
22
22
16
16
19
392
352
40
71
21
50
18
139
97
21
21
6
6
17
17
16
1
25
2
23
16
46
4,3
1
2
3
1
1
1
152
2
31
2
14
6
2
4
2
2
13
1
1
5 12
4
4
6
2
- 1-
4
Total trips:
4,473
GRAYS REEF PASSAGE, MI
Ub d
D
b d
Grand
Total
p oun
1,184
707
235
155
87
781
364
own oun
189
142
86
FOREIGN
Total
46
37
6
3
18
17
1
24
2
2
1
1
23
2
2
1
1
22
17
17
3
3
21
8
8
4
4
20
5
4
1
8
7
1
19
2
2
1
1
18
4
2
2
< 12
6
3
3
DOMESTIC
Total
1,138
670
229
152
87
763
347
-
188
142
86
24
25
4351
4250
1
1
114
74
68
70
-
--
-
44
6
-
-
2223
163
91
160
56
353
--
6382
58
46
-
-
-
24
17
-
-
21
37
37
-
29
24
-
-
5
--
20
83
78
5
36
27
-
-
7
2
19
155
126
23
4
-
24
13
-
-
5
6
18
72
48
8
2
14
42
14
-
12
9
7
17
91
45
25
13
8
44
14
-
28
1
1
16
180
17
74
52
37
100
10
-
71
1
18
15
37
4
27
3
3
28
2
-
24
-
2
< 121413
1052010
41
5216
4
--
-
33
166
3
106
16
5
---1
--
34154
-221
-50
Total trips:
1,965
CHARLEVOIX HARBOR, MI
Inbo nd
O tbo nd
Grand
Total
u
596
460
69
67
--
599
460
uu
71
68
FOREIGN
Total
13
12
6
3
3
23
1
1
22
1
1
21
4
4
1
1
20
8
7
1
1
1
18
31
2
U.S. ARMY CORPS
OF ENGINEERS
DETROIT
,
MI DISTRICT
75
Trips and Drafts of Vessels, 2006
(draft in feet)
Draft
Self Propelled Vessels
Non-Self Propelled
Vessels
Self Propelled Vessels
Non-Self Propelled
Total
Dty Cargo
Tanker
Tow ar
Tug
CHARLEVOIX HARBOR,
MI - continued
Inbound
DOMESTIC
Dry Cargo
Tanker
Total
Dry Cargo
Tanker
Tow or
Tuo
Outbound
Vessels
Dry Cargo
Tanker
Total
563
448
68
67
593
457
68
68
23
4
4
22
3
3
2122
4
2
2
20
1
1
35
4
31
191
1
117
4
18
64
64
68
64
4
172
2
115
6
16
15
15
69
59
10
152
z
41
3
14
2
2
13
110
45
4
61
5
1
4
12
1
1
2
2
10
4
8
378
378
378
378
4
Total
trips:
1,195
MANISTEE HARBOR, MI
Inbound
Grand
Total
49
46
3
--
42
39
Outbound
3
FOREIGN
Total
16
16
11
11
24
3
3
23
4
4
1
1
22
3
3
21
3
3
2
2
20
4
4
1
1
19
2
2
3
3
18
1
1
DOMESTIC
Total
33
30
3
31
28
3
23
1
1
22
4
4
21
15
15
20
6
3
3
19
2
2
3
3
18
5
5
13
13
17
15
12
3
93
-
3
-
Total trips:
91
LUDINGTON
HARBOR, MI
In boun
d
Grand
Total
418
258
89
17
54
428
257
Outbound
93
17
61
FOREIGN
Total
43
7
18
18
51
8
20
1
22
25
5
5
24
2
2
23
1
1
22
1
1
21
1
1
19
3
3
18
2
2
17
1
1
17
1
16
162
2
5
23
15
18
16
2
19
16
3
512
15
15
2
1
1
76
DETROIT, MI DISTRICT
U.S. ARMY CORPS OF ENGINEERS
Trips and Drafts of Vessels, 2006
(draft in feet)
Self Pro
elled Ves l
Non-Self Propelled
Non-Self Propelled
Draft
p
se s
Vessels
Self Propelled Vessels
Vessels
Total
Dry Cargo
Tanker
Tow or
Tug
Dry Cargo
Tanker
Total
Dry Cargo
Tanker
Tow or
Tuo
Dry Cargo
Tanker
LUDINGTON HARBOR
,
MI - continued
Inbound
Outbound
DOMESTIC
Total
375
251
71
17
36
377
249
73
16
39
25
1
1
24
1
1
23
5
5
21
1
1
19
247
244
3
242
242
18
2
2
11
17
41
3
16
9
9
15
10
-
5
1415
1113
1311
1419
1014
--
-9
13
10
10
11
9
-
2
S 12
76
28
12
36
70
4
30
16
20
Total trips:
846
MUSKEGON
HARBOR, MI
Inbound
Grand
Total
170
97
4
37
147
2
Outbound
0
34
1
FOREIGN
Total
18
18
13
13
26
3
3
25
3
3
24
2
2
23
8
8
4
4
22
1
1
5
5
21
1
1
1
1
20
1
1
19
2
2
DOMESTIC
Total
152
79
34
37
2
134
m
30
34
1
27
11
11
2526
165
154
11
-
1
1
24
8
8
1
1
23
7
7
2
2
2266
21
1
2143
1
77
20
12
6
6
-
9
6
1
19
13
11
2
-
14
14
18
3
3-
9
9
151716
3057
31
1
1541
143
---
28247
1742
144
1233
--
S 1213
10
15
3
10
4
6
2
228
3
84
-14
1
Total trips:
317
GRAND HAVEN HARBOR AND GRAND RIVER, MI
Upbound
Downbound
Grand
Total
123
69
--
22
32
108
58
-
20
30
FOREIGN
Total
35
24
7
4
- II
25
22
--
2
1
25
1
1
24
4
4
23
3
3
22
7
6
1
--
6
6
2185
3
4
4
2074
12
53
11
19
1
1
-
4
4
183
3
55
s 121
1
1
1
U.S. ARMY CORPS OF ENGINEERS
DETROIT, MI DISTRICT
77
Trips and Drafts of Vessels, 2006
(draft in feet)
Draft
Self Propelled Vessels
Total
Dry Cargo
Tanker
Tow or
Tuq
Non-Self Propelled
Vessels
Self Propelled Vessels
Dry Cargo
Tanker
A
Total
Dry Cargo
Tanker
GRAND HAVEN HARBOR AND GRAND RIVER
,
MI - continued
Upbound
DOMESTIC
Tow or
Tuq
Downbound
Non-Self Propelled
Vessels
Dry Cargo
Tanker
Total
88
45
15
28
83
36
18
29
25
3
3
24
1
1
23
1
1
22
16
10
6
21
12
6
6
9
9
2015
19
171618
1116841
10553
10
311
1
1
21121621
10391
----
---13
-12211
-----
14
2
2
2
2
2
2-
13
7
1
5
1
19
51
4
10
5 124
4
1
-
Total
1-
trips:
231
HOLLAND
HARBOR, MI
Inbound
Outbound
Grand
Total
56
32
FOREIGN
12
12
55
27
--
14
14
Tota 1
1
1
5
1
2
2
24
1
1
22
1
1
20
1
1
16
1
1
10
DOMESTIC
2
2
Total
55
31
12
12
-II
50
26
12
12
23
2
2
_
21
4
4
8
8
20
19
16
3
{{
3
3
19
8
2
6
---I
1
_
1
18
1
1
6
6
17
4
4
9
9
15
1
1
14
3
3
13
12
12
11
11
12
10
1
1
9
11
1
-
1
I
11
-
Total trips:
111
ST. JOSEPH HARBOR, MI
Upbound
Grand
Downbound
Total
100
33
FOREIGN
--
36
31
89
32
--
30
27
Total
4
4
1
1
21
1
1
20
3
3
19
DOMESTIC
-
11
Total
96
29
36
31
88
31
--
301
27
23
2
2
201819
18
27
132
1
2
531
92
4
4
71
--
-2
-1
-
-
1617
8
6
2
22
15
--
5
2
-
15
30
1
17
13
1
37
1
18
1
19 -
131
1
1
--
1
5 12
27
11
10
6
12
3
-
4
--
--
Total
trips:
5
-
189
78
DETROIT, MI DISTRICT
U.S. ARMY CORPS OF ENGINEERS
Trips and Drafts of Vessels, 2006
(draft in feet)
Draft
Setf Propelled Vessels
Total
Dry Cargo
Tanker
Tow or
Tug
Non-Self Propelled
Vessels
Dry Cargo Tanker
Self Propelled Vessels
Total
Dry Cargo
Tanker
Tow or
Tug
Vessels
Dry Cargo Tanker
Non-Self Propelled
MILWAUKEE HARBOR, WI
Inbound
Outbound
Grand
Total
1,265
242
568
426
29
1,238
235
550
426
27
FOREIGN
Total
128
128
121
121
28
1
1
27
5
5
17
17
26
20
20
10
14
25
6
6
4
4
24
13
13
12
12
23
20
20
7
7
22
26
26
32
32
21
11
11
23
23
20
14
14
9
9
19
3
3
3
3
18
4
4
1
1
17
2
2
1
1
16
1
1
15
1
1
1
14
1
1
1
1
DOMESTIC
Total
1,137
114
568
426
2911
1,117
114
--
550
426
27
242625
61113
34103
---
---
271
--
-1
1
23
35
24
-
-
11
-
3
2
-
-
1
20212218
19
17
4524
26
13
4
6
-112495
------
----2715
1533321
--1521
-32551869
3221
s
65
--
----
-3011
-
-
-44
-
---1
1516
70
10
-
43
8
9
93
6
-
41
46
-
14
14
1
--
-
12
1
1
1
13
1
- -
12
1 -
13
102
1
-
100
1
--
< 12
722
1
-
370
350
-1
761125
22
14
--
36788
35415
-26
Total trips:
2,503
MANITOWOC HARBOR, WI
Inbound
Outbound
Grand
Total
560
253
176
131
597
253
--
213
131
DOMESTIC
Total
560
253
176
131
597
253
213
131
21
5
5
5
5
20
18
3
15
1
1
19
244
242
2
244
244
18
30
29
1
26
26
17
1
1
1672
5
3
1315
682
1
631
4
1
951
-2
--
681
-25
---
_<
12
185
83
102
222
--
----
117
105
Total trips:
1,157
U.S. ARMY CORPS OF ENGINEERS
DETROIT, MI DISTRICT
79
Trips and Drafts of Vessels, 2006
(draft in feet)
Draft
Self Propelled Vessels
Total
Dry Cargo
Tanker
Tow or
Tuq
Non-Self Propelled
Vessels
Dry Cargo Tanker
Self Propelled Vessels
Total
Dry Cargo
Tanker
Tow Or
Tug
Non-Self Propelled
Vessels
GREEN BAY HARBOR, WI
Dry Cargo
Tanker
Upbound
Downbound
Grand
Total
262
185
8
35
32
2
228
156
7
32
31
2
FOREIGN
Total
72
63
8
1
54
45
7
1
1
27
24
21
232225
1113
18
121
18
11
12121
-
---
-»-
-
--
-
1
1413
6
21
13142
6
1
-
-
--
-
201918
15
125
27
53
--
7
4
4
1
4
4
1
--
-7
5 12
2
1
1
DOMESTIC
Total
190
122
34
32
2
174
111
31
30
2
27
-
1
1
261
1
1
1
22242120
23
181716
19
23
23
2237
23
1214139
322118
19
1113
6
147
4
-
5
545261
1
------1
1
342823
25
13
15
371
-2234
14
12137
3
1
-
-
------
-
-
-
1247
------
-
152111
-
-
-----
15
13
7
1
5
1
2
-
4
8
3
-
4
1
-
4
-
12
5
2
2
1-
11
1-
2
6
2
Total trips:
490
ALPENA HARBOR, MI
Ib
d
Grand
Total
377
n oun
191
92
94
Outbound
--
360
163
-
97
100
FOREIGN
Total
75
71
1
38
36
2
26
1
1
25
2
2
24
1
1
4
4
23
3
3
5
5
22
14
14
1
1
21
15
14
1
3
3
20
26
23
2
1
8
6
2
19
4
4
9
9
18
9
9
4
4
17
2
2
15
1
1
5 12
1
1
DOMESTIC
Total
302
120
89
93
322
127
95
100
28
1
1
26
1
1
24
8
1
7
103
49
54
23
18
13
5
47
27
20
22
17
14
3
12
4
a
21
19
16
3
12
9
3
20
73
69
4
10
4
6
19
6
3
3
9
7
2
18
11
2
8
1
18
5
12
1
17
21
1
18
2
39
18
18
3
16
125
63
62
67
1
65
1
153
3
22
14
1
1
s 12
1
1
Total trips:
737
80
DETROIT, MI DISTRICT
U.S. ARMY CORPS OF ENGINEERS
Trips and Drafts of Vessels, 2006
(draft in feet)
Draft
Self Propelled Vessels
Non-Self Propelled
Vessels
Self Propelled Vessels
Non-Self Propelled
Vessels
Total
Dry Cargo Tanker
Tow or
Tug
Dry Cargo Tanker
Total
Dry Cargo
Tanker
Tow or
Tug
Dry Cargo
Tanker
MENOMINEE HARBOR AND RIVER
,
MI AND WI
Inbound
Outbound
Grand
Total
71
41
15
75
65
39
13
13
FOREIGN
Total
40
38
1
1
35
35
25
2
2
1
1
24
14
14
23
13
13
6
6
22
5
5
4
4
21
4
4
13
13
20
2
2
19
2
2
18
2
2
17
3
3
16
1
1
14
1
1
1
1
5 12
1
1
DOMESTIC
Total
31
3
14
14
30
4
13
13
22
1
1
21
1
1
20
19
5
4
1
4
4
11
18
1
1
33
17
1
1
121413
108
104
4
169
1
Total
4
9trips:
-
121
-
-
-
136
SAGINAW RIVER, MI
U bound
Downbound
Grand
Total
349
181
p
6
76
So
36
393
219
6
83
47
38
FOREIGN
Total
88
67
6
8
3
4
89
67
6
9
5
2
2322262425
1651
16
51
-
--
--
-
-
-
166
741
167
6
41
-
-
---
--
-
-
21
8
8
-
25
23
1
1
20
13
13
-
-
14
8
-
1
5
18
19
1017
159
-2
1
2
1
1
1
--
-
-
1
17
5
-
4-
1
2-
1-
1
16
-
2-
-
2
15
14
11
1
1
2
-
2
-
5 1213
11
5
3
3
61
-
11
-5
DOMESTIC
Total
261
114
68
47
32
304
152
--
74
42
36
2625
198
19
8
22
17
6
--
-22
-11
---
232422
325
23
32
382825
23
38
20
--
-
-
--
-
82
-
-
202119
21125
2152
37
171913
181015
----
--
321
--
18
35
33
1
1
16
2
-
-
2
12
17
56
43
3
9
17
1
--
3
3
10
16
16
5
8
3
24
9
-
9
1
5
1415
242
242
26
4
--
--
262
--
-2
13
3
3
5
-
-
3-
2
5 12
50
8
11
31
33
10
-
9
9
5
Total trips:
742
U.S. ARMY CORPS OF ENGINEERS
DETROIT, MI DISTRICT
81
Trips and Drafts
of Vessels, 2006
(draft in feet)
Draft
Self Propelled Vessels
Total
Dry Cargo
Tanker
Tow or
Tuq
Non-Self Propelled
Vessels
Dry Cargo Tanker
Self Propelled Vessels
Total
Dry Cargo Tanker
Tow Or
Tug
Non-Self Propelled
Vessels
ST. CLAIR RIVER, MI
Dry Cargo Tanker
Vpbound
Downbound
Grand
Total
4,737
3,605
69
555
301
207
3
,481
2
,
487
63
482
259
190
FOREIGN
Total
3,283
2,608
69
351
112
143
1,960
1,399
63
283
74
141
30
1
29
5
2
3
-
4
-
4
--
2628272125222423
3853242673525291339012
321495369259345129908
---445332
----29291
42231
1
-^---1
4901361071171641789714
463109157168124999314
------2&A2
----2511
22134A61
------6
20
336
241
15
79
1
-
96
70
3
17
4
2
19
179
150
20
5
4
92
45
3
42
-
2
18
99
79
-
14
6
71
30
6
15
3
17
17
67
21
2
8
24
12
47
14
$
5
2
18
16
151
25
-
108
1
17
132
3
-
99
---
30
15
136
43
7
32
48
6
62
7
24
28
-
3
14
16
6
-
-
2
8
5
2
1
----
-
2
13
13
6
-
5
2
8
1
-
5
^--
2
5 12
189
19
1
59
23
87
139
2
-
63
15
59
DOMESTIC
Total
1,454
997
204
189
64
1,521
1,088
--
199
185
49
2827
4
4
34253
323
50
-
-
-
19
3
-
--
252126202322241918
2453671498438324563
80
345131135285773233910
513612
225227
18
104
4
65
-
-
--
-
-672
326175124405459336719
261
123
5056313494365
---------
----33197
3032521146452
--------2
17
133
90
27
8
8
69
7
-
61
-
1
16
95
45
27
17
6
45
3
-
27
1
14
15
12
5
6
1
9
13
12
11
1
---
12
- -
11 -
1
12
95
12
34
14
35
94
14
-
33
16
31
Total trips:
8,218
MARYSVILLE, MI
Grand
Total
91
61
Inbound
-
5
15
0
57
Outbound
--
5
17
1
FOREIGN
Total
41
30
8
3
41
28
--
8
4
1
28
1
1
27
13
13
265
4
1
1
-
1
25
6
4
2
4
2
--
2
222423
11
11
361
fi31
---
----
20
21
4
4
41
3
74
45
--
-2
192
1
1
42-
2
18
3
3
7
4
-
3
17
3
1-
-
1
1
16
1
-
-
1
< 12
1
1
82
DETROIT, MI DISTRICT
U.S. ARMY CORPS OF ENGINEERS
Trips and Drafts of Vessels, 2006
(draft in feet)
Draft
Self Propelled Vessels
Total
Dry Cargo
Tanker
Tow or
Tug
MARYSVILLE,
MI - continued
DOMESTIC
Inbound
Non-Self Propelled
Vessels
Dry Cargo
Tanker
Self Propelled Vessels
Total
Dry Cargo
Tanker
Tow or
Tug
Outbound
Non-Self Propelled
Vessels
Dry Cargo
Tanker
Total
50
31
7
12
49
29
7
13
26
84
31
3
3
25113
8
1
1
2464
2
1
1
23
3
3
2254
1
6
4
21
5
5
2
20
3
3
2
2
19
5
5
7
7
18
13
6
3
4
17
4
4
1B
10
1
1
5-
Total trips:
181
ST. CLAIR, MI
Grand
Inbound
Outbound
Total
139
99
DOMESTIC
20
20
135
95
20
20
Total
139
99
20
2011
135
95
20
20
28
1
1
27
64
64
26
13
13
25
10
10
24
7
7
1
1
23
1
1
-
5
5
22
-
-
21
21
20
1
1
-
2
2
19
2
2
39
39
16
--
-
5
5
< 12
40
20
20
62
22
20
Total
^
-
2a
trips:
274
MARINE
CITY, MI
Ib
d
Grand
n oun
Outbound
Total
120
67
FOREIGN
26
27
-
125
64
-
30
31
Total
8
6
1
1
15
5
5
5
27
2
2
26
2
2
1
1
25
2
2
24
1
1
23
3
3
201
1
3
3
19
1
1
18
1
1
17
DOMESTIC
6
15
Total
112
61
25
26
110
59
25
26
28
15
15
27
34
34
2611
8
21
3
21
25
15
1
14
24
12
2
10
2
2
23
2
1
1
52
52
19
1
1
-
18
48
4
21
1
23
17
23
23
4
2
2
Total trips:
245
U.S. ARMY CORPS
OF ENGINEERS
DETROIT, MI DISTRICT
83
Trips and Drafts
of Vessels, 2006
(draft in feet)
Draft
Self Propelled Vessels
Non-Self Propelled
Vessels
Self Propelled Vessels
Non-Self Propelled
Vessels
Total
Dry Cargo
Tanker
Tow or
Tua
Dry Cargo
Tanker
Total
Dry Cargo
Tanker
Tow or
Tug
Dry Cargo
Tanker
CHANNELS IN LAKE ST. CLAIR
Upbound
Downbound
Grand
Total
3,292
2,536
30
377
225
124
2
,
876
2
,
169
20
358
216
113
FOREIGN
Total
2,052
1,688
30
202
72
60
1,567
1,249
20
178
56
64
3029
4
2
2
-
3
1
-1
-3
-
2126272823252422
23622024430815968647
24022521729415467645
--222121
----10291
3211
--
1
466120154147
86
83B213
44111614913581797913
--------231
----2115
22124421
------
20
227
168
3
55
1
-
7B
67
1
8
1
1
19
113
102
9
1
86
44
3
38
-
1
18
49
41
-
B
39
20
1
8
1
9
17
31
19
1
4
2
5
26
13
-
3
-
10
16
96
21
-
66
1
8
82
2
-
66
-
14
15
115
43
4
18
47
3
26
4
5
16
-
1
14
9
5
-
-
1
3
4
2
1
-
----
1
1376-
1
3
1-
1
1
5 12
95
15
1
27
13
39
66
2
-
29
9
26
DOMESTIC
Total
1,240
848
175
153
64
1,309
920
180
160
49
28272526
3157
4
2310
4
31
213
--
30724414837
22524410934
----
-32
3931193
-------
22232120241819
3211897645359373
2991254828697539
2912
2528184756
------627
105613857325019
4730328434515
------
---197
211042653
------2
17
116
80
25
3
8
51
7
-
43
-
1
16
90
40
27
17
6
45
3
-
27
1
14
1315
12
12
5
116
11
---
129
----1
--
118
--
-1
< 12
86
3
34
14
35
94
14
-
33
16
31
Total trips:
6,168
DETROIT RIVER, MI
Ub
d
Grand
Total
p oun
5,845
4
,
055
30
905
272
Downbound
583
3
,
872
2
,
784
20
539
266
263
FOREIGN
Total
3,687
3,124
30
321
103
109
2,215
1,751
20
247
73
124
32
2
2
30
1
1
262724252829
20730613213348
29920012813226
2221
31
4
44
-
-
480182140154143
-44815113517014
---331
------51
27122
1
---
232221
419513581
491410558
221
2019
81
-1
164
182
194
175190154
---2
-81
64
--
20
521
425
3
79
4
10
116
92
1
11
1
11
19
225
187
9
24
-
5
132
75
3
41
-
13
18
105
94
11
63
37
1
15
1
9
17
52
30
1
8
7
6
39
22
-
6
1
10
16
112
21
78
2
11
110
3
-
81
-
26
15
144
55
4
33
47
5
62
21
5
31
-
5
14
10
6
1
3
7
4
1-
-
2
13
8
7
1
85-
1-
2
<_ 12
205
71
44
21
68
164
54
-
46
18
46
84
DETROIT, MI DISTRICT
U.S. ARMY CORPS OF ENGINEERS
Trips and Drafts of Vessels, 2006
(draft in feet)
Draft
Self Propelled Vessels
Totat
Dry Cargo
Tanker
Tow or
Tug
DETROIT RIVER,
MI - continued
DOMESTIC
Total
2,158
931
28
1
1
27
4
4
26
57
23
25
36
10
24
37
31
23
119
100
22
92
68
21
52
46
20
82
74
19
324
301
18
197
130
17.
132
82
16
111
41
15
70
5
13
16
< 12
626
15
DETROIT HARBOR, MI
Grand
Total
317
232
FOREIGN
Total
95
93
27
22
22
26
28
26
25
14
14
24
14
14
23
3
3
22
1
1
21
5
5
20
5
5
19
18
1
1
17
15
5 12
2
DOMESTIC
Total
222
139
28
4
4
27
46
46
26
47
29
25
20
13
24
25
15
23
12
8
22
10
7
21
7
6
20
6
4
19
10
1
181716
204
4
-
-
1
512
7
5
Non-Self Propelled
Vessels
Dry Cargo
Tanker
Upbound
584
31
12
30
39
39
63
14
356
169
474
26241963
66
--
-
-
-
-2
47
28
9
38
24
7
11
11
18
439
Inbound
40
45
39
44
7
11
7
10
4
3
1
-
___
2
-9
-4
-4
-
14
5
-1
1-
Self Propelled Vessels
Total
Dry Cargo
Tanker
Tow or
T.
Downbound
Non-Self Propelled
Vessels
Dry Cargo
Tanker
1,657
1,033
292
193
139
307244150109
60
3858
244225
111
86
543551
----32
233931
19
394
--
--
------
112
4734
423832
-20
525
--49
128
73
22
19
14
78
9
61
2
6
79
4
40
15
20
69
1
66
-
2
16
14
-
2
128
28
37
Total
17
46
trips:
9,717
Outbound
329
243
42
44
119
108
7
4
22
11
21
21
34
34
22
20
2
99
88
77
11
4
3
1
22
22
6
2
4
210
135
35
40
1
1
10
4
6
10
4
6
22
33
13
5
8
44
77
67
61
5
1
21
15
5
1
81
4
3
I
43
9
14
20
21
19
1
Total
1
trips:
1
-
646
U.S. ARMY CORPS OF ENGINEERS
DETROIT, MI DISTRICT
85
Trips and Drafts of Vessels, 2006
(draft in feet)
Draft
Self Propelled Vessels
Non-Self Propelled
Vessels
Self Propelled Vessels
Non-Self Propelled
Vessels
Total
Dry Cargo Tanker
Tow or
Dry Cargo
Tanker
Total
Dr
Y
Caro9
TOW or
Tug
Tanker
Tug
Dr Car o Tanker
yg
ROUGE RIVER, MI
I
_._._......
nbound
Grand
Total
1
,173
346
401
89
337
1,254
399
Outbound
412
93
350
FOREIGN
Total
298
104
191
38
67
350
154
91
40
65
28
-
-
2
2
27
40
19
21
-
2
2
26
40
28
12
-
2
2
25
15
14
1
2
2
24
6
5
1
-
22
22
23
6
5
1
-
30
28
2
22
3
3
-
22
22
2120
154
47
7
-1
-
6418
1812
--
-38
14
19
31
31
-
-
21
9
^---
1
11
18
17
62
4
-
22
68
26
--
-3
3
16
28
1
16
1
10
31
1
-
17
13
15
28
14
13
-
1
65
12
-
12
37
4
14
1
1
3
2---
1
1332
-11
1
<12
70
1
18
-
51
51
12
18
21
DOMESTIC
Total
875
242
312
51
270
904
245
--
321
53
285
2827
3090
3078
12
1
1
-
-
20262423212225
42262028235
23232127175
1
1533
6
11
4
5731
-11
6
342
---
-
---
-
--1
----3
1
---
-
--
19
6
9
6
1
21
17
--
-
4
-
18
8
1
4
7
13
84
215
36
128
-
-
36
3
45
39
12
17
52
1
51
49
26
-
18
-
5
16
16
11
3
2
29
8
-
10
3
8
15
59
57
2
62
-
-
61
-
1
13
8
8
12
-
-
10
-
2
12
453
6
183
8
256
400
3
-
185
--
212
Total
trips;
2,427
PORT OF DETROIT, MI
In bound
Grand
Total
1,535
610
446
136
343
1
,
616
672
Outbound
-
458
137
349
FOREIGN
Total
414
211
94
41
68
501
285
103
45
fib
32
1
1
28
1
1
27
63
41
22
5
4
1
26
68
56
12
3
3
25
30
29
1
23
23
24
22
21
1
56
56
23
13
12
1
57
53
4
22
5
5
33
33
21
12
12
28
28
20
22
14
7
1
76
24
38
14
19
31
31
25
11
2
12
18
4
1
1
-
2
17
15
2
1617
287
11
164
1
102
3211
51
183
-3
-13
15
28
14
13
1
67
12
14
37
4
1411
32
-1
13
3
2
1
1
--
1
5 12
77
1
22
2
52
62
13
22
4
23
86
DETROIT, MI DISTRICT
U.S. ARMY CORPS
OF ENGINEERS
Trips and Drafts of Vessels, 2006
(draft in feet)
Draft
Self Propelled Vessels
Total
Dry Cargo Tanker
Tow or
Tug
PORT OF DETROIT,
MI - continued
DOMESTIC
Inbound
Non-Self Propelled
Vessels
Dry Cargo Tanker
Self Propelled Vessels
Total
Dry Cargo
Tanker
Tow or
Tug
Outbound
Non-Self Propelted
Vessels
Dry Cargo Tanker
Total
1,121
399
352
95
275
1,115
387
355
92
281
28
34
34
1
1
27
136
124
12
-
1
1
26
75
50
8
17
-
11
4
-
7
25
62
40
22
-
17
10
-
-
7
24
45
32
13
-
5
5
-
-._.-
23
41
34
7
-
8
5
3
22212019
34221415
3112145
9
-321
--8
15628268
10224188
----
--6
-448
---44
18
14
6
4
1
3
238
145
-
41
40
12
17
57
2
55
60
30
-
22
3
5
16
37
2
25
8
2
73
20
-
23
22
8
15
61
59
---
2
61
-
-
60
-
1
13
8
8
12
10
-
2
5 12
466
13
184
9
260
410
14
186
Total
1
209
trips:
3,151
MONROE HARBOR, Ml
I b nd
Otb nd
Grand
n ou
u ou
Total
106
FOREIGN
46
30
5
25
102
50
26
5
21
Total
18
0
15
5
5
5
23
1
1
22
1
1
20
1
1
32
1
19
1
1
1
1
18
3
3
1
1
17
2
2
167
4
32
2
14
1
1
123
3
1
1
10
1
1
9
1
1
8
33
DOMESTIC
Total
88
46
21
5
161
87
45
21
5
16
25
1
1
1
1
24
4
4
23
22
1
9
1
19
7
7
21
1
22
20
1
1
19
5
3
2
35
35
18
8
4
4
175
1
4
1615
98
83
6
111
111
--
---
13
1
1
1
1
-
--
12
13
13
94
4
4
3-1
8
5
1-4
7
1
--1
63
3
12
3-9
5
2
1
5
1
S
2
5
11
5
--
Total trips:
208
U.S. ARMY CORPS
OF ENGINEERS
DETROIT, MI DISTRICT
87
Draft
Trips
and Drafts of Ve
(draft in feet
ssels, 2006
)
Self Propelled Vessels
Non-Self Propelled
Vessels
Self Propelled Vessels
Non-Self
VesselsPropelled
Total
Dry Cargo
Tanker
Tow or
Tug
Dry Cargo Tanker
Total
Dry Cargo Tanker
Dry Cargo Tanker
CALCITE, MI
Grand
Total
403
327
Inbound
8
Outbound
33
35
353
283
7
29
34
FOREIGN
Total
125
107
8
7
3
62
55
7
272625
2152
2125
--
2423202221
294220132
402218122
--311
--241
115
2
24
114251
----1
19
10
8
2
-
6
3
3
18
17
33
3
-
3
1
1
-
15
3
3
12
2
1
1
11
1
1
-
DOMESTIC
Total
278
220
26
32
291
228
29
34
26
4
2
2
2522
3
25
3
2
1
95
83
12
24
10
10
85
73
12
23
24
23
1
22
19
17
2
17
17
21
11
11
3
3
20
15
15
6
6
19
61
61
5
1
2
2
18
59
25
17
17
2
2
17
58
55
3
17
17
16
12
12
15
7
7
134
4
4
4
12
2
2
10
5
1
4
6
2
3
5
3
5
3
5
3
1
-
5
Total trips:
756
ESCANABA, MI
Inbound
Outbound
Grand
Total
177
151
-
13
13
--
173
150
- -
11
12
FOREIGN
Total
8
6
2
3
2
--
1
24
1
1
23
1
1
22
1
1
1
1
21
3
3
20
-
1
1
91
1
41
1
1
1
DOMESTIC
Total
169
145
--
11
13
170
148
10
12
30
1
1
293
3
12
9
3
28
3
3
64
60
4
27
3
3
28
27
1
26
10
4
6
21
15
6
25
15
15
5
1
4
24
13
13
23
19
19
22
9
9
2
2
21
48
48
23
23
20
4
4
1
1
19
12
12
5
5
18
28
18
5
5
2
2
17
2
2
6
2
Total
4
trips:
-
350
Tow or
Tuq
88
DETROIT, MI DISTRICT
U.S. ARMY CORPS OF ENGINEERS
Trips and Drafts of Vessels, 2006
(draft in feet)
Draft
Self Propelled
Vessels
Non-Self Propelled
Vessels
Self Propelled Vessels
Non-Self Propelled
Vessels
Total
Dry Cargo
Tanker
Tow or
Tu4
Dry Cargo Tanker
Total
Dry Cargo
Tanker
Tow
Tuqor
Dry Cargo
Tanker
STONEPORT, MI
Grand
Total
436
62
Inbound
5
99
15
246
Outbound
6
93
FOREIGN
Total
45
43
2
19
18
1
26
1
1
24
1
1
5
5
23
8
8
22
2
2
21
12
11
1
5
5
20
14
13
1
7
7
19
1
1
18
6
6
17
1
1
16
1
1
DOMESTIC
Total
391
219
73
99
396
228
75
93
28
1
1
26
48
1
46
1
61
13
46
2
25
49
19
30
129
78
51
24
20
13
7
62
46
16
23
20
5
15
38
30
8
22
33
25
8
31
30
1
21
2
2
17
16
1
20
33
33
11
11
19
30
30
18
81
48
12
21
21
2
5
14
17
58
33
8
17
15
15
16
4
4
1
1
1592
7
9
9
12
4
4
Total trips:
851
ALGOMA HARBOR, WI
No Vessel Trips
Reported
ALGONAC, MI
No Vessel Trips Reported
ASHLAND HARBOR, WI
(12 feet
and less)
Grand
Total
2
2
Inbound
Outbound
22
Total trips:
4
AU SABLE HARBOR AND RIVER
(
OSCODA), MI
No Vessel Trips Reported
BAYFIELD HARBOR, WI
(8 feet and less)
Grand
Total
6,
185
6,185
BIG BAY HARBOR, MI
No Vessel Trips Reported
BLACK RIVER
HARBOR, MI
No Vessel
Trips
Reported
CASEVILLE, MI
No Vessel
Trips
Reported
Inbound
Outbound
6,185
6,185
Total trips:
12,370
U.S. ARMY CORPS
OF ENGINEERS
DETROIT, M€ DISTRICT
89
Trips and Drafts of Vessels, 2006
(draft in feet)
Draft
Self Propelled Vessels
Non-Self Propelled
Vessels
Total
Dry Cargo
Tanker
TTUa f I Dry Cargo
Tanker
CEDAR RIVER HARBOR, MI
No Vessel
Trips
Reported
CHEBOYGAN HARBOR, MI
(21 feet and less)
Grand
Total
1,
041
939
Inbound
CHIPPEWA
HARBOR
(ISLE ROYALE), MI
No Vessel Trips
Reported
CORNUCOPIA HARBOR, Wl
No Vessel
Trips
Reported
DETOUR
,
MI AND VICINITY
(21 feet and less)
Grand
Total
16
,
683 16,683
DETROIT
HARBOR, WI
(11 feet and less)
Grand
Total
3,700
3,700
EAGLE H
ARBOR, Ml
No Vessel
Trips
Reported
ECORSE, MI
(23 feet and less)
Inbound
19,871 19,871
Outbound
Inbound
Outbound
Inbound
Outbound
Total trips:
36,554
Total trips:
7,400
Grand
Total
27
19
--
5
2
1
31
20
-
5
1
5
Total trips:
58
FRANKFORT HARBOR, MI
No Vessel Trips Reported
GLADSTONE
HARBOR, MI
(23 feet and less)
Grand
Total
32
16
Self Propelled Vessels
Total
Dry Cargo
Tanker
Tow or
Tug
Outbound
Non-Self Propelled
Vessels
Dry Cargo
Tanker
45
1s
42
1,836
1
,
757
--
37
12
30
Total trips:
2,877
E3
GRAND MARAIS HARBOR
(
HARBOR OF REFUGE), MI
(4 feet and less)
Inbound
Grand
Total
1
1
GRAND MARAI
S
HARBOR, MN
No Vessel Trips Reported
GRAND TRAVERSE BAY HARBOR, MI
No Vessel Trips Reported
Inbound
Outbound
3,700
3,700
a
21
9
----
6
---
6
Total trips:
53
Outbound
Total
trips:
2
90
DETROIT, MI DISTRICT
U.S. ARMY CORPS OF ENGINEERS
Trips and Drafts of Vessels, 2006
(draft in feet)
Draft
Self Propelled Vessels
Total
Dry Cargo Tanker
Tow or
Tup
Non-Self Propelled
Vessels
Dry Cargo Tanker
HARBOR BEACH
,
MI (HARBOR OF REFUGE
,
LAKE HURON)
(23 feet and less)
Inbound
Grand
Total
10
10
HARRISVILLE HARBOR
,
MI (HARBOR OF REFUGE
,
LAKE HURON)
No Vessel Trips Reported
KENOSHA HARBOR, Wt
No Vessel Trips
Reported
KEWAUNEE HARBOR, WI
No Vessel
Trips
Reported
KEWEENAW
WATERWAY, MI
(25 feet and less)
Upbound
Downbound
Grand
Total
55
46
5
3
1
61
50
-
6
4
1
Total trips:
116
KNIFE RIVER HARBOR, MN
No Vessel Trips Reported
LA POINTE HARBOR, WI
(8 feet and less)
Grand
Total
6,151
6,151
LAC LA BELLE
HARBOR, MI
No Vessel
Trips
Reported
LELAND HARBOR, MI
No Vessel Trips Reported
LIME ISLAND, MI
No Vessel Trips Reported
MACKINAC HARBOR, MI
(19 feet and less)
Inbound
Outbound
Self Propelled Vessels
Total
Dry Cargo
Tanker
Tow or
Tug
Outbound
6,151
6,151
Inbound
Outbound
Grand
Total
24,
581
24
,
524
-
40
17
MACKINAW CITY HARBOR, MI
(9 feet and less)
24,793 24,714
Inbound
Outbound
Grand
Total
8,
368
8
,333
--
23
12
MANISTIQUE
HARBOR, MI
(3 feet and less)
Grand
Total
17
NEW BUFFALO HARBOR, MI
No Vessel Trips Reported
8,311
8,311
Non-Self Propelled
Vessels
Dry Cargo
Tanker
Total trips:
21
Total
trips:
12,302
45
34
--
Total trips:
49,374
Total trips:
16,679
Inbound
Outbound
17
18
-
--
--
-
18
Total trips:
35
U.S. ARMY CORPS OF ENGINEERS
DETROIT, MI DISTRICT
91
Trips and Drafts
of Vessels, 2006
(draft
i
n feet)
Draft
Self Propelled Vessels
Total
Dry Cargo Tanker
OCONTO HARBOR, WI
(6 feet and less)
Grand
Total
14
ONTONAGON HARBOR, MI
(20 feet and less)
Grand
Total
21
21
PENSAUKEE HARBOR, WI
No Vessel Trips Reported
PENTWATER
HARBOR, MI
No Vessel
Trips
Reported
PORT
HURON, MI
(19 feet and less)
Tow or
Tug
Inbound
Inbound
Non-Self Propelled
Vessels
Dry Cargo
Tanker
14
Self Propelled Vessels
Total
Dry Cargo
Tanker
Tow or
__ Tug
14
Outbound
Outbound
Non-Self Propelled
Vessels
Dry Cargo
Tanker
Total
14
trips:
-
-
28
15
15
--
--
Total trips:
36
Inbound
Outbound
Grand
Total
3
1
1
-
1
2
--
-
1
1
Total trips:
5
PORT SANILAC HARBOR, MI
No Vessel Trips Reported
PORT WASHINGTON HARBOR, Wl
(23 feet and less)
Inbound
Grand
Total
4
2
-
1
1
PORT WING HARBOR, WI
No Vessel Trips Reported
PUT-IN-BAY HARBOR, OH
(12 feet and less)
Outbound
4
2-
1
1
--
Total trips:
8
Inbound
Outbound
Grand
Total
9,
854
9
,
657
98
49
50
--
9,618
9,455
76
43
44
Total trips:
19,472
RACINE HARBOR, WI
(9 feel and less)
Inbound
Outbound
Grand
Total
428
-
-
350
78
ROGERS CITY, Ml
No Vessel Trips Reported
SAUGATUCK HARBOR AND KALAMAZOO RIVER, MI
No Vessel Trips Reported
321
249
72
Total trips:
749
92
DETROIT, MI DISTRICT
U.S. ARMY CORPS OF ENGINEERS
Trips and Drafts of Vessels, 2006
(draft in feet)
Draft
Self Propelled Vessels
Total
Dry Cargo
Tanker
Tow or
Tug
$AULT
STE, MARIE, MI
(25 feel and less)
Grand
Total
33,945
33,932
SEBEWAING, MI
No Vessel Trips Reported
SHEBOYGAN HARBOR, WI
No Vessel Trips Reported
SOUTH
HAVEN HARBOR, MI
(11 feet and less)
Inbound
Nan-Self Propelled
Vessels
Dry Cargo Tanker
10
3
Self Propelled Vessels
Total
Dry Cargo
Tanker
36,929
36,915
Tow or
Tug
Non-Self Propelled
Vessels
Dry Cargo Tanker
Outbound
Inbound
Outbound
Grand
Total
3
--
--
2
1
ST. JAMES (
BEAVER ISLAND), MI
(8 feet and less)
2
Inbound
Outbound
11
3
---
Total trips
:
70,874
Total
1
trips:
1
-5
Grand
Total
396
378
--
18
395
378
--
--
-
17
Total trips:
791
STURGEON BAY AND DIKE MICHIGAN SHIP CANAL, WI
(23 feet and less)
Upbound
Downbound
Grand
Total
385
1
--
192
192
--
447
28
--
212
204
3
Total trips:
832
TRAVERSE CITY HARBOR, MI
(20 feet and less)
Inbound
Outbound
Grand
Total
72
1
--
29
42
71
-
-
29
-
42
Total trips:
143
TRENTON, MI
(23 feet and less)
Inbound
Outbound
Grand
Total
5
5
--
--
-
-
7
7
TWO RIVERS HARBOR, WI
No Vessel Trips Reported
WARROAD HARBOR, MN
No Vessel
Trips
Reported
WHITE LAKE
HARBOR, MI
No Vessel Trips Reported
WHITEFISH POINT HARBOR, MI
No Vessel Trips Reported
Total trips:
12
U.S. ARMY CORPS OF ENGINEERS
DETROIT, MI DISTRICT
93
Trips and Drafts of Vessels, 2006
(draft in feet)
Draft
Self Propelled Vessels
Total
Dry Cargo
Tanker
Tow Or
Tuo
WYANDOTTE, MI
(22 feet and less)
Grand
Total
8
8
Inbound
MARBLEHEAD, OH
(26 feet and less)
Inbound
Non-Self Propelled
Vessels
Self Propelled Vessels
Dry Cargo
Tanker I Total
Dry Cargo
Tanker
Grand
Total
7,071
6,811
112
148
PORT
DOLOMITE, MI
(28 feet and less)
Inbound
Tow Or
Tuo_
Non-Self Propelled
Vessels
Dry Cargo
Tanker
Outbound
Outbound
Outbound
Total trips:
20
123
162
--
Total trips:
14,177
Grand
Total
142
114
15
13
--
148
122
13
13
--
Total
trips:
290
PORT GYPSUM, MI
(21 feet and less)
Grand
Total
55
55
PORT INLAND, MI
(28 feet and less)
Inbound
Outbound
12
12
7,106
6,821
39
39
Inbound
Outbound
Total
trips:
94
Grand
Total
290
235
-
27
28
--
318
258
--
31
29
----
Total trips:
608
SILVER BAY, MN
(28 feet and less)
Grand
Total
Inbound
Outbound
198
195
--
1
2
164
161
--
1
2
Total trips:
CLINTON RIVER
,
MICHIGAN
No Vessel Trips Reported
362
94
DETROIT, MI DISTRICT
U.S. ARMY CORPS
OF ENGINEERS
Trips and Drafts of Vessels, 2006
(draft in feet)
Draft
Self Propelled Vessels
Total
Dry Cargo
Tanker
Tow or
Tug
Non-Self Propelled
Vessels
Dry Cargo
Tanker
Total
Dry Cargo
Tanker
Tow or
Tug
Self Propelled Vessels
Vessels
Dry Cargo
Tanker
Non-SeEf Propelled
TOLEDO HARBOR, OH
Inbound
Outbound
Grand
Total
768
507
9
124
37
91
842
559
9
136
36
102
FOREIGN
Total
514
372
9
71
14
48
614
452
9
83
16
54
272629
117
116
-
1
-
8721
8621
---
1
--
26
63
62
--
-
-
1
31
29
-
2
25
42
41
-
-
-
1
24
22
-
2
24
28
26
--
1
-
1
50
49
-
1
23
49
47
-
-
-
2
108
104
-
4
22
21
16
-
-
-
5
68
62
-
1
5
21
26
14
1
1
-
10
31
23
-
8
20
13
10
-
-
-
3
39
26
2
4
7
19
20
11
-
8
-
1
32
17
3
9
3
18
20
11
2
5
1
1
12
5
1
4
2
17
8
3
-
4
--
1
12
5
-
5
2
16
34
6
-
17
1
10
39
1
-
25
1
12
15
21
5
4
11
1
31
14
3
11
1
2
14
5
3
1-
1
10
3-
2
1
4
13
13
1
-
11
1
14
1
-
13
12
34
-
1
13
11
9
23
2
9
11
1
DOMESTIC
Total
254
135
53
23
43
228
107
53
20
48
28
1
1
1
1
27
11
11
26
5
4
1
2524
33
32
1
51
5
1
-
23
11
11
10
10
22
10
10
15
15
21
8
8
8
7
20
8
8
12
10
2
19
26
23
--
3
31
27
4
18
43
40
2
-
1
31
20
1
1
9
17
17
6
6
4
1
26
6
7
2
11
16
58
4
29
15
10
48
4
28
13
3
15
6
6
6
5-1
S 12
44
4
10
2
28
34
2
12
2
18
Total
trips:
1,610
KELLEYS
ISLAND, OH
Ib d
Grand
Total
8
,
370
8,143
n oun
108
119
8,340
8,106
Outbound
--
111
123
DOMESTIC
Total
8
,
370
8,143
108
119
8,349
8,106
911
123
196-
6
8
8
16
97
-
97
100
100
15
95
95
98
98
12
-
10
10
10--
3
3
9
13
-
13
13
13
8
94
91
3
93
91
-2
7
6,612
6,612
6,612
6,612
4
1,440
1,440
1,403
1,403
3
13
13
Total
trips
:
16,710
U.S. ARMY CORPS
OF ENGINEERS
BUFFALO, NY DISTRICT
95
Trips and Drafts of Vessels, 2006
(draft in feet)
D ft
Self Propelled Vessels
Non-Self Propelled
Vessels
Self Propelled Vessels
Non-Self Propelled
ra
Vessels
Total
Dry Cargo
Tanker
TowqorT.
Dry Cargo
Tanker
Total
Dry Cargo
Tanker
ToTuq
w or
- --
Dry Cargo
Tanker
SANDUSKY HARBOR, OH
Inbound
Outbound
Grand
Total
1,636
1,604
13
19
1,956
1,923
12
21
FOREIGN
Total
94
94
160
157
--
3
2720212524232226
2424112
2
31
2424112321
4521111919822
4521111919227
---------
------1
19
2
2
6
4-
2
1218
241
241
24
3
243
--
--
DOMESTIC
Total
1,542
1,510
13
19
1,796
1,766
9
21
23
19
19
22
5
5
20
18
2
21
12
11
1
20
19
15
45
15
45
12
10
10
10
2
18
30
30
22
22
17
11
6
5
1
1
16
4
4
15
2
2
12
1,430
1,403
13
14
1,700
1,675
Total
91trips:
16
3,592-
HURON HARBOR, OH
I b und
Outb und
Grand
Total
46
12
no
16
o
i6
47
13
16
18
FOREIGN
Total
2
2
4
3
-
1
2021
22
21
--
-1
18
2
2
DOMESTIC
Total I
44
10
16
18
43
10
15
18
--
2527
26
19
134
4
16
439
1972
--
--
-15
247
---
24222019171816
------8
6
2
42331
11
-
4
211
1
----
--
---
-
--
--
23
--
-
-
-
-
Total trips:
93
LORAIN HARBOR, OH
lnbound
Outbo nd
Grand
Total
213
135
34
u
43
1
231
156
33
41
1
FOREIGN
Total
45
38
4
2
1
70
64
4
1
1
27
3
3
4
4
26
14
13
1
2
1
1
25
6
6
1
1
24
6
6
4
4
23
6
6
10
10
22
1
1
19
19
21
1
1
10
9
1
20
1
1
7
7
96
BUFFALO, NY DISTRICT
U.S. ARMY CORPS OF ENGINEERS
Trips and Drafts of Vessels, 2006
(draft in feet)
S lf P
ll d V
l
Non-Self Propelled
Nan-Self Propelled
D ft
e
rope e
esse s
Vessels
Self Propelled Vessels
ra
Vessels
Total
Dr
Car o
Tanker
Tow or
Dr
Car
o Tanker
Total
D C
y
g
Tk
Tow or
DC
Tk
Tug
y
g
ry
argo
aner
Tug
ry
argo
an
er
LORAIN HARBOR
,
OH - continued
FOREIGN
Inbound
Outbound
19
2
1
1
10
9
1
1821
1
1
1
17
1
1
161
1
1
1
12
DOMESTIC
2
11
Total
168
97
--
30
41
161
92
29
40
26
65
57
-
1
7
8
4
1
3
25127
5
1
1
24
17
10
7
1
1
23
4
3
1
22
2
2
201819
11
1014
8
9
1422
45377
457
8
-
--
--
8
--
21
17
13
1
10
2
28
19
-
1
8
<_
16131512
1451
145
1
158
6
5
-81
---
Total-
-145I
---
trips:
6
-
444
CLEVELAND HARBOR, OH
Inbound
Outbound
Grand
Total
FOREIGN
1,283
784
6
235
205
53
1,345
854
6
231
202
52
Total
390
294
6
64
13
13
485
385
6
67
13
14
2927
571
521
-----
-----
5
31
21
--
--
1
2526
4229
4129
--
--
1
2
1
21
-
-
22242123
40233042
29383918
---4
--11
311
47605624
24475956
-----
----
1
20
22
19
1
1
1
60
50
-
10
19
29
15
--
9
1
4
39
39
---°-
-----
18
15
10
-
3
2
69
66
-
3
17
4
3
-
-
1
14
13
-
-
1
--
16
46
-
-
44
2
44
-
--
42
-
2
5 1215
5
-
1
3
1
45
24
6
6
9
-
DOMESTIC
5
-
--
2
1
2
20
1
-
6
1
12
Total
893
490
171
192
40
860
469
164
189
38
262827
66
571
6452
--
-3
221
---
241
--1
----
--3
-21
----
21252224232019
86
265944263719
483332
72
19
17
16
-
-
-
-
-
-
-
-----
-
11112793
5
-
-----12
16031352351184
15847292822174
-----
-----
----46131
-------2
18
99
38
8
48
5
117
31
-
22
62
2
171615
123
95
35
62106
----
1122317
-----9
a
3
2
1
123
11341
791417
---
106179
-2510
----
13
3
-
-
2
--
1
3
--
2
1
512
117
21
-
6
74
16
134
22
-
5
Total
73
34
trips:
2,628
U.S. ARMY CORPS OF ENGINEERS
BUFFALO, NY DISTRICT
97
Trips and Drafts of Vessels, 2006
(draft in feet)
Draft
Self Propelled Vessels
Total
Dry Cargo
Tanker
FAIRPORT HARBOR, OH
Tow or
..Tug
Non-Self Propelled
Vessels
Dry Cargo Tanker
Self Propelled Vessels
Total
Dry Cargo Tanker
Tow or
Tug
Non-Self Propelled
Vessels
Dry Cargo Tanker
Inbound
Outbound
Grand
Total
407
287
49
71
395
290
38
67
FOREIGN
Total
52
42
6
4
49
39
--
5
5
26242325
1931
1931
2923
3282
----
---
1
22
16
12
1
3
6
4
-
-
2
213
1
11
33
20
4
4
10
9
-
1
1819
51
2
31
39
53
--
-4
15
2
2
DOMESTIC
Total
355
245
43
67
346
251
33
62
26
4
4
3
3
25
9
4
5
24
16
1
15
4
2
2
23
27
17
10
11
8
3
22
86
2
32
1
21
6
6
1
1
2033
1
1
192
1
1
22
18
11
7
4
4B
25
9
14
17
15
2
11
2
25
8
1
16
16
1
1
2
2
15
9
9
9
9
13
12
243
1
197
16
1
28
2361
201
10
1
-
25
Total trips:
802
ASHTABULA HARBOR, OH
Ib
d
Otb
d
Grand
Total
n oun
247
245
2
291
287
u oun
--
1
3
FOREIGN
Total
ii
157
157
202
200
1
29I
-
4
4
281
--
-
19
19
27^
6
6
109
109
26
10
10
1
1
25
28
28
4
4
24
58
58
7
7
23
49
49
8
8
22
4
4
11
11
21
1
1
17
17
20
1
1
11
10
1
19
-
----
6
8
18 - -
2
2
< 12
1
1
DOMESTIC
Total
90
86
2
89
87
2
27
16
16
26
15
15
25
15
15
24
18
18
3
3
23
1
1
8
8
22
1
1
4
4
2111
87
1
20
2
2
20
19
1
19
11
11
27
27
18
1
1
9
9
1753
2
44
16
1
1
5
5
15
3
3
12
1
1
Total trips:
538
93
BUFFALO
,
NY DISTRICT
U.S. ARMY CORPS OF ENGINEERS
Trips and Drafts of Vessels, 2006
(draft i
n feet)
Draft
Setf Propelled Vessels
Total
Dry Cargo
Tanker
Tow or
Tug
Non-Self Propelled
Vessels
Dry Cargo Tanker
Self Propelled Vessels
Total Dry Cargo Tanker
Tow or
Tug
Vessels
Dry Cargo
Tanker
Non-Self Propelled
CONNEAUT HARBOR, OH
Inbound
Outbound
Grand
Total
301
210
45
41
5
333
238
50
40
5
FOREIGN
Total
159
101
30
23
5
195
123
40
27
5
29
1
1
28
1
1
4
4
27
2
2
68
68
26
2
2
a
a
25
22
22
2
2
24
29
29
9
8
1
23
33
33
15
11
4
222
2
9
8
1
2176
1
65
1
20
3
1
2
32
4
325
1951
1
352
3
18
2
1
1
3
2
1
172
1
1
1
1
16
1
1
4
13
15
4
3
13
3
14
1
1
s 12
44
23
21
24
24
DOMESTIC
Total
142
109
15
18
136
115
10
13
28
2
2
27
11
10
1
3
3
26
66
59
7
6
6
2588
2
2
24
7
7
12
12
23
42
41
1
22
17
11
6
21
1
1
76
1
20
12
12
19
20
8
10
2
23
14
7
2
18
11
10
1
2
2
176
4
2
7
7
16
1
1
15
1
1
1
1
< 1213
53
5
3
3
1
3
1
--
Total trips:
634
ERIE HARBOR, PA
Inbound
Outbound
Grand
Total
294
291
1
2
329
326
-
1
2
FOREIGN
Total
11
11
18
18
27
3
3
26
4
4
1
1
25
2
2
1
1
24
1
1
23
2
2
22
1
1
1
1
21
2
2
20
5
5
19
2
2
18
2
2
17
1
1
< 12
1
1
DOMESTIC
Total
283
280
1
2
311
308
1
2
27
1
1
26
6
6
25
15
13
2
2
2
24
9
9
23
1
1
22
1
1
U.S. ARMY CORPS
OF ENGINEERS
BUFFALO, NY DISTRICT
99
Trips and Drafts of Vessels, 2006
(draft in feet)
Draft
Self Propelled Vessels
Total
Dry Cargo
Tanker
ERIE HARBOR
,
PA - continued
DOMESTIC
21
20
19
18
17
16
15
14
13
<_ 12
1
3
3
240
1
2
1
2
3
240
1
2
BUFFALO HARBOR, NY
Grand
Total
96
94
FOREIGN
Total
29
28
27
26
25
24
23
22
21
2a
19
18
< 12
DOMESTIC
Total
26
25
24
23
22
21
20
19
18
17
16
5 12
40
19
15
3
3
38
19
15
3
1
Tow or
Tug_
Inbound
Upbound
Non-Self Propelled
Vessels
Dry Cargo
Tanker
Self Propelled Vessels
Total
Dry Cargo
Tanker
Tow or
Tuq
Outbound
1
2
12
5
10
4
3
30
243
2
11
-
1
3010543
-----
-----
243
-
Total
- I
trips:
-
-
623
Non-Self Propelled
Vessels
Dry Cargo
Tanker
Downbound
1
1
--
91
89
i
1
44
1
1
1
1
47
2
5
3
16
6
5
2
2
6
44
45
2
5
3
16
6
5
2
1
1
6
11
1
Total
trips:
187
PORT OF BUFFALO, NY
Grand
Total
153
96
FOREIGN
Total
29
28
27
26
25
24
23
22
21
20
19
47
8
1
1
3
13
12
1
1
1
45
Inbound
Outbound
29
1
27
160
100
--
31
1
28
1
1
66
1
2
15
1
1
2
5
5
6
1
56
1
2
15
1
1
2
5
5
6
1
55
100
BUFFALO, NY DISTRICT
U.S. ARMY CORPS OF ENGINEERS
Trips and Drafts of Vessels, 2006
(draft in feet)
Draft
Self Propelled
Vessels
Non-Self Propelled
Vessels
Self Propelled Vessels
Non-Self Propelled
Vessels
Total
Dry Cargo
Tanker
Tow or
Tug
Dry Cargo
Tanker
Total
Dry Cargo
Tow or
Tanker
Tug
Dry Cargo Tanker
PORT OF BUFFALO
,
NY - continued
FOREIGN
Inbound
Outbound
18
2
1
15
15
161
1
5
5
15
1
1
12
2
2
7
2
5
DOMESTIC
Total
106
51
28
1
2611
94
44
26
1
23
26
2
2
25
5
5
24
3
3
23
17
17
22
6
6
21
6
6
20
5
5
19
19
19
19
19
18
5
5
20
20
1751
4
-94
5
162
1
1
41
21
15
23
23
-
18
18
13
1
1
12
7
6
1
-24
11
Total
-
23
trips:
313
OSWEGO HARBOR, NY
Ub d
Grand
p oun
Downbound
Total
179
FOREIGN
80
21
38
21
19
179
79
21
38
19
22
Total
168
80
21
32
21
14
173
79
21
35
19
19
26
25
1
1
41
41
-
---
212322
2
22
2
2
2
66
139
51135
-154
----
20
3
3
11
3
1
7
19
6
2
4-
8
1
1
6
18
79
68
6
4
-
1
6
1
--
5
17
18
5
11
-
2
13
11
2
16
20
6
14
16
16
S 12
DOMESTIC
35
-
3
21
11
26
3
19
4
Total
11
0
5
6
3
3
19
2
2
18
1
1
173
3
3
3
16
3
3
< 12
5
5
Total
trips:
358
BARCELONA HARBOR, NY
No Vessel Trips Reported
CAPE VINCENT, NY
No Vessel
Trips
Reported
DUNKIRK HARBOR, NY
No Vessel Trips Reported
GREAT SODUS BAY HARBOR, NY
No Vessel Trips Reported
U.S. ARMY CORPS
OF ENGINEERS
BUFFALO, NY DISTRICT
101
Trips and Drafts of Vessels, 2006
(draft in feet)
Draft
Self Propelled Vessels
Total
Dry Cargo
Tanker
Tow or
Tuq
IRONDEQUOIT BAY HARBOR, NEW YORK
No Vesse
l
Trips Reported
NIAGARA FALLS, NY
No Vessel
Trips
Reported
NIAGARA RIVER, NY
(23 feet and less)
Grand
Total
65
6
OGDENSBURG HARBOR, NY
(27 feet and less)
Grand
Total
8
8
PORT CLINTON HARBOR, OH
(7 feet and less)
Upbound
Non-Self Propelled
Vessels
Dry Cargo
Tanker
Taw or
Tup
Downbound
Non-Self Propelled
Vessels
Dry Cargo
Tanker
34
-
29
61
7
--
28
-
26
Total trips:
126
Inbound
Outbound
Self Propelled
Vessels
Total
Dry Cargo
`
Tanker
9
9
Total
-
trips:
-
-
17
Inbound
Outbound
Grand
Total
2
,
428
2,395
-
12
21
ROCHESTER
(CHARLOTTE)
HARBOR, NY
(22 feet and less)
Inbound
2,439
2,395
Total
29
trips:
24
4,867-
Outbound
Grand
Total
43
43
--
-
--
--
42
42
--
Total
--
trips:
--
-
85
SACKETS
HARBOR, NY
(3 feet and less)
Inbound
Outbound
Grand
Total
16
16
--
-
-
--
is
15
TONAWANDA HARBOR, NY
No Vessel Trips Reported
VERMILION HARBOR, OH
No Vessel Trips Reported
WADDINGTON HARBOR, NY
No Vessel
Trips
Reported
Total trips:
31
102
BUFFALO, NY DISTRICT
U.S. ARMY CORPS
OF ENGINEERS
Trips and Drafts of Vessels, 2006
(draft in feet)
Draft
Self Propelled Vessels
Total
Dry Cargo
Tanker
Tow or
Tup
Non-Self Propelled
Vessels
Dry Cargo
Tanker
Self Propelled Vessels
Total
Dry Cargo
Tanker
Tow or
Tup
Non-Self Propelled
Vessels
ILLINOIS RIVER, IL
Dry Cargo Tanker
Upbound
Downbound
Grand
Total
22,882
-
3,807
16,001
3,074
21,900
3,782
15,037
3,081
DOMESTIC
Total
22,882
3,807
16,001
3,074
21,900
3,782
15,037
3,081
12
465
3
449
13
38
3
32
3
11
418
5
323
90
254
4
138
112
10
373
43
148
182
342
46
170
126
9
4,760
723
3,330
707
4,255
668
3,252
335
8
7,113
1,335
5,224
554
6,821
1,340
5,144
337
7
1,317
590
521
206
930
560
300
70
6
894
698
165
31
891
715
120
56
5
457
367
68
22
406
396
5
5
4
77
6
67
4
84
18
2
64
3
150
149
1
133
-
14
119
2
6,835
37
5,536
1,262
7,718
31
5,845
1,842
1
23
21
2
28
1
15
12
Totaltrlps
:
44,782
CALUMET
-SAG CHANNEL, IL
Upbound
D
b nd
Grand
Total
4,428
-
450
3,562
416
4,364
1
own ou
416
3
,
563
384
DOMESTIC
Total
4,428
450
3,562
416
4,364
1
--
416
3,563
384
12
10
6
4
-
11
1
-
2
8
11
17
13
4
4
3
1
10
73
22
31
20
35
19
8
8
9
1,442
63
1,295
84
377
63
277
37
6
1,746
143
1,490
113
792
123
639
30
7
441
145
276
20
401
137
261
3
6
139
45
90
4
82
43
39
--
5
5fl
14
31
5
14
11
3
-
43
4057
2
3044
138
1012
9
a3
-2
2
409
10
254
145
2,625
9
2,321
295
1
4
4
--
1
1
-
CHICAGO SANITARY AND SHIP CANAL, IL
Upbound
Total trips:
8,792
Downbound
Grand
Total
13,065
1
--
2,594
8,790
1
,
680
13,821
2,384
9
,
799
1,638
DOMESTIC
Total
13,065
1
2,594
8,790
1,680
13,821
-
2,384 1
9,799
1,638
<_
12
13,065
1
-
2,594
8,790
1,680
13,821
-
2,384
9,799
1,638
Total trips:
26,886
ILLINOIS WATERWAY, IL
Upbound
Downbound
Grand
Total
27,632
1
4,941
19
,
345
3,345
25,794
- 4,939 17,511
3,344
DOMESTIC
Total
27,632
1
4,941
19,345
3,345
25,794
4,939
17
,
511
3,344
5 12
27,632
1
4,941
19,345
3,345
25,794
4,939
17,511
3,344
Total trips:
53,426
U.S. ARMY CORPS
OF ENGINEERS
ROCK ISLAND, IL DISTRICT
103
FREIGHT TRAFFIC INDEX
A
ALGOMA HARBOR, WI . . . . . . . . . . . . . . . . . . . . . . . . . . . . . . . . . . . . . . . . . . . . . . 43
ALGONAC,MI
ALPENA HARBOR,
MI . . . . . . . . .
.......................................43
. . . . . . . . . . . . . . . . . . . . . . . . . . . . . . . . . . .
.
28
ASHLAND HARBOR, WI . . . . . . . . . . . . . . . . . . . . . . . . . . . . . . . . . . . . . . . . . . . . . . 43
ASHTABULA HARBOR, OH . . . . . . . . . . . . . . . . . . . . . . . . . . . . . . . . . . . . . . . . . . . 53
AU SABLE HARBOR AND RIVER (OSCODA), MI . . . . . . . . . . . . . . . . . . . . . . . . . . . . . . . . . 43
B
BARCELONA HARBOR, NY . . . . . . . . . . . . . . . . . . . . . . . . . . . . . . . . . . . . . . . . . . . . 57
BAYFIELD HARBOR, WI . . . . . . . . . . . . . . . . . . . . . . . . . . . . . . . . . . . . . . . . . . . . . . 43
BIG BAY HARBOR, MI . . . . . . . . . . . . . . . . . . . . . . . . . . . . . . . . . . . . . . . . . . . . . . . 43
BLACK RIVER HARBOR, MI . . . . . . . . . . . . . . . . . . . . . . . . . . . . . . . . . . . . . . . . . . . . 43
BUFFALO HARBOR, NY . . . . . . . . . . . . . . . . . . . . . . . . . . . . . . . . . . . . . . . . . . . . . 54
BUFFALO, NY DISTRICT . . . . . . . . . . . . . . . . . . . . . . . . . . . . . . . . . . . . . . . . . . . . . 55
BUFFALO, NY, PORT OF . . . . . . . . . . . . . . . . . . . . . . . . . . . . . . . . . . . . . . . . . . . . . 55
BUFFALO HARBOR, NY . . . . . . . . . . . . . . . . . . . . . . . . . . . . . . . . . . . . . . . . . . . 54
NIAGARA RIVER, NY . . . . . . . . . . . . . . . . . . . . . . . . . . .
. . . . . . . . . . . . . . . . 57
BUFFINGTON HARBOR, IN . . . . . . . . . . . . . . . . . . . . . . . . . .
. . . . . . . . . . . . . . . . 14
BURNS WATERWAY HARBOR, IN . . . . . . . . . . . . . . . . . . . . . . . . . . . . . . . . . . . . . . . . 11
C
CALCITE,CALUMET
MI
HARBOR
....................................................41
AND RIVER, IL AND
IN . . . . . . . . . . . . . . . . . . . . . . . . . . . . . . . . . . . . 5
CALUMET-SAG CHANNEL, IL . . . . . . . . . . . . . . . . . . . . . . . . . . .
.
59
CAPE VINCENT, NY . . . . . . . . . . . . . . . . . . . . . . . . . . . . . . . . . . . . . . . . . . . . . . . . 57
CASEVILLE, MI . . . . . . .
. . . . . 43
CEDAR RIVER HARBOR,
MI
. . . . . . . . . . . . . . . . . . . . . . . . . . . . . . . . . . . . . . . . . 43
CHANNELS IN LAKE ST. CLAIR . . . . . . . . . . . . . . . . . . . . . . . . . . . . . . . . . . . . . . . . . 33
CHARLEVOIX
HARBOR
,
MI . . . . . . . . . . . . . . . . . . . . . . . . . . . . . . . . . . . . . . . . . . . . 22
CHEBOYGAN HARBOR,
MI . . . . . . . . . . . . . . . . . . . . . . . . . . . . . . . . . . . . . . . . . . . . 43
CHICAGO
HARBOR
, IL . . . . .
. . . . . . . . . . . . . . . . . . . . . . . . . . . . . . . . . . . . . . 14
CHICAGO RIVER (
MAIN AND
NORTH BRANCH), L. .
. . . . . . . . . . . . . . . . . . . . . . . . . . . . 3
CHICAGO
RIVER
, (SOUTH BRANCH), IL . . . . . . . . . . . . . . . . . . . . . . . . . . . . . . . . . . . . . 4
CHICAGO SANITARY AND SHIP CANAL, IL . . . . . . . . . . . . . . . . . . . . . . . . . . . . . . . . . . . 61
CHICAGO, IL DISTRICT
. . . . . . . . . . . . . . . . . . . . . . . . . . . . . . . . . . . . . . . . . . . . . . 8
CHICAGO,
CALUMET
IL,
HARBOR
PORT OF
AND
. . .
RIVER,
. . . . . . .
IL
.
AND
. . . . .
IN
. .
.
.
.
.
.
.
.
.
. .
.
.
.
.
.
.
.
.
.
.
.
.
.
.
.
.
.
.
.
. .
............
. . . . . . . . . . . . . . .
5
8
CALUMET-SAG CHANNEL, IL . . . . . . . . . . . . . . . . . . . . . . . . . . . . . . . . . . . . . . .
59
CHICAGO
HARBOR
, IL . . . . . . . . . . . . . . . . . . . . . . . . . .
. . .
.
. . . . . . . 14
CHICAGO RIVER (
MAIN AND
NORTH BRANCH), IL . . . . . . . . . . . . . . . . . . . . . . . . . . . 3
CHICAGO RIVER, (SOUTH BRANCH), IL . . .
. . . . . . . . .
. . . . . . . . . . . . . . . . . 4
CHICAGO SANITARY AND SHIP CANAL, IL . . . . . . . . . . . . . . . . . . . . . . . . . . . . . . . . . 61
LAKE CALUMET, IL . . . . . . . . . . . . . . . . . . . . . . . . . . . . . . . . . . . . . . . . . . . . . . 4
CHIPPEWA HARBOR (ISLE ROYALE), MI . . . . . . . . . . . . . . . . . . . . . . . . . . . . . . . . . . . 43
CLEVELAND HARBOR, OH . . . . . . .
. . . . . . . . . . . . . . . . . . . . . . . . . . . . . . . . . 51
CLINTON RIVER, MICHIGAN
. . . . . . . . . . . . . . . . . . . . . . . . . . . . . . . . 43
CONNEAUT HARBOR, OH . . .
. . . . . . . . . . . . . . . . . . . . . . . . . . . . . . . . 53
CORNUCOPIA
HARBOR
, WI . . . . . . . . . . . . . . . . . . . . . . . . . . . . . . . . . . . . . . . . . . 43
D
DETOUR, MI AND VICINITY. . . . . . . . . .
. . . . . . . . . . . . . . . . . . . . . . . . . . . . . . 43
DETROIT HARBOR, MI . . . . . . . . . . . . . . . . . . . . . . . . . . . . . . . . . . . . . . . . . . . . . .
38
DETROIT HARBOR, WI . . . . . . . . .
. .
. . . . . . . . . .
. . . . . . . . . . 43
DETROIT RIVER,
MI , . . .
. .
. . . . . . . . . . . . . . . . . . . . . . . . . . 35
DETROIT, MI DISTRICT . . . . . . . . . . . . . . . . . . . . . . . . . . . . . . . . . . . . . . . . . . . . . . 39
DETROIT, MI, PORT OF . . . . . . . . . . . . . . . . . . . . . . . . . . . . . . . . . . . . . . . . . . . . . 39
DETROIT HARBOR, MI . . . . . . . . . . . . . . . . . . . . . . . . . . . . . . . . . . . . . . . . . . . . 43
ECORSE, MI. . . . . . . . .
. . . . 44
ROUGE RIVER,
MI . . . . . . . . . . . . . . . . . . . . . . . . . . . . . . . . . . .
. . . . 38
TRENTON, MI . . . . . . . .
. . . . . . . . . . . . . . . . . . . . . . .
. . . . 47
DULUTH-SUPERIOR
DRUMMONDISLAND,
WYANDOTTE,MI
HARBOR,
MI........MN
AND WI
............................................47
.
................................17
. . . . . . . . . . . . . . . . . . . . . . . . . . . . . 15
DUNKIRK HARBOR, NY . . . . . . . . . . . .
. . . . . . . . . . . . . . . . . . . . . . . . . . . . . . . . 57
E
EAGLE HARBOR, MI. . . . . . . . . . . . . . . . . . . . . . . .
. . . . .
. . . , . . 44
ECORSE, MI . . . . . . . . . . . . . . . . . . . . . . . . . . . . .
. . . . . . 44
ERIE HARBOR, PA . . . . . . . . . . . . . . . . . . . . . . . . . . . . . . . . .
54
ESCANABA, MI . . . . . . . . . . . . . . . . . . . . . . . . . . . . . . . . .
. . . . . . . . . 41
104
U.S
.
ARMY CORPS OF ENGINEERS
FREIGHT TRAFFIC INDEX
F
FAIRPORT HARBOR, OH . . . . . . . . . . . . . . . . . . . . . . . . . . . . . . . . . . . . . . . . . . . . . 52
FRANKFORT HARBOR, MI . . . . . . . . . . . . . . . . . . . . . . . . . . . . . . . . . . . . . . . . . . . . 44
FREIGHT TONS CARRIED ON GREAT LAKES BY AREA . . . . . . . . . . . . . . . . . . . . . . . . . . . . . xi
FREIGHT TONS CARRIED ON GREAT LAKES BY TYPE OF TRAFFIC AND COMMODITY . . . . . . . . . . xii
G
GARY HARBOR, IN
. . . . . . . . . . . . . . . . . . . . . . . . . . . . .
. . . . . . . . . . . . 14
GLADSTONE HARBOR, MI . . . . . . . . . . . . . . . . . . . . . . . . . . . . .
. . . . . . . . . . . . . 44
GRAND HAVEN HARBOR AND GRAND RIVER, MI . . . . . . . . . . . . . . . . . . . . . . . . . . . . . . 24
GRAND MARAIS HARBOR (HARBOR OF REFUGE), MI . . . . . . . . . . . . . . . . . . . . . . . . . . . . . 44
GRAND MARAIS HARBOR,
MN . . . . . . . . . . . . . . . . . . . . . . . . . . . . . . . . . . . . . . . . . . 44
GRAND TRAVERSE BAY HARBOR, MI . . . . . . . . . . . . . . . . . . . . . . . . . . . . . . . . . . . . . . 44
GRAYS REEF PASSAGE, MI . . . . . . . . . . . . . . . . . . . . . . . . . . . . . . . . . . . . . . . . . . . 21
GREAT SODUS BAY HARBOR, NY . . . . . . . . . . . . . . . . . . . . . . . . . . . . . . . . . . . . . . . . 57
GREEN BAY HARBOR, WI . . . . . . . . . . . . . . . . . . . . . . . . . . . . . . . . . . . . . . . . . . . . 27
H
HARBOR BEACH, MI (HARBOR OF REFUGE, LAKE HURON) . . . . . . . . . . . . . . . . . . . . . . . . . 44
HARRISVILLE HARBOR, MI (HARBOR OF REFUGE, LAKE HURON) . . . . . . . . . . . . . . . . . . . . . . 44
HOLLAND HARBOR, MI . . . . . . . . . . . . . . . . . . . . . . . . . . . . . . . . . . . . . . . . . . . . . . 24
HURON HARBOR, OH ...............................................50
I
ILLINOIS RIVER
,
IL . . . . . . . . . ... . . . . . . . . . . . . . . . . . . . . . . . . . . . . . . . . . . . . 58
ILLINOIS WATERWAY
,
IL (CONSOLIDATED REPORT
)
. . . . . . . . . . . . . . . . . . . . . . . . . . . . .
62
CALUMET-SAG CHANNEL
,
IL . . . . . . . . . . . . . . . . . . . . . . . . . . . . . . . . . . . . . . . . 59
CHICAGO RIVER
, (
SOUTH BRANCH
), IL . . . . . . . . . . . . . . .
. . . . . . . . . . . . . . . . . . 4
CHICAGO SANITARY AND SHIP
CANAL,
IL . . . . . . . . . . . . . . . . . . . . . . . . . . . . . . . . 61
ILLINOIS RIVER
,
IL . . . . . . . . . . . . . . . . . . . . . . . . . . . . . . . . . . . . . . . . . . . . . . 58
INDIANA HARBOR
,
IN . . . . . . . . . . . . . . . . . . . . . . . . . . . . . .
. . . . . . 10
IRONDEQUOIT BAY HARBOR
,
NEW YORK
. . . . . . . . . . . . . . . . . . . . . . . . . . . . . . . . . . .
57
K
KELLEYS ISLAND, OH . . . . . . . . . . . . . . . . . . . . . . . . . . . . . . . . . . . . . . . . . . . . . . 49
KENOSHA HARBOR
,
WI . . . . . . . . . . . . . . . . . . . . . . . . . . . . . . . . . . . . . . . . . . . . . . 44
KEWAUNEE
HARBOR
,
WI. . . . . . . . . . . . . . . . . . . . . . . . . . . . .
. . . . . . . . . . . . 44
KEWEENAW WATERWAY, MI . . . . . . . . . . . . . . . . . . . . . . . . . .
. . . . . . . . . . . . 44
KNIFE RIVER HARBOR
,
MN . . . . . . . . . . . . . . . . . . . . . . . . . . . . . . .
45
L
LA POINTE HARBOR, WI . . . . . . . . . . . . . . . . . . . . . . . . . . . . . . . . . . . . . . . . . . . . 45
LAC LA BELLE HARBOR, MI . . . . . . . . . . . .
. . . . . . . . . . . . . . . . . . . . . . . . . . . . 45
LAKE CALUMET, IL. . . . . . . . . . . . . . . . . . .
. . . . . . .
. . . . . . . . . . . . . . . . . . . . 4
LELAND HARBOR, MI . . . . . . . . . . . . . . . .
. . . . . . . . .
. . . . . . . . . . . . . . . . . . 45
LIME
LORAIN
ISLAND,HARBOR,
MI
OH
..............................................45
. . . . . . . . . . . . . .
. . . . . . . .
. . . . . . . . . . . . . . . . . . 50
LUDINGTON HARBOR, MI . . . . . . . . . . . . .
.
.
. . . . . . . . . . . . . . .
. .
. . . . . .
23
M
MACKINAC HARBOR, Ml . . . . . . . . . . . . . . . . . .
. . . . . . . . . . . . . . . . . . . 45
MACKINAW CITY HARBOR, MI . . . . . . . . . . . . .
. . . . . . . . . .
. . .
.
45
MANISTEE HARBOR,
MI . . . . . . . . . . . .
. . . . . . . . . . . . . . . . . . . .
. 22
MANISTIQUE HARBOR, MI . . . . . . . . . . . .
. . . . . . . . . . . . . . . . .
.
45
MANITOWOC HARBOR, WI . . . . . . . . . . . . . . . . . . . . . . . . . . . . . .
. . . . 26
MARBLEHEAD,OH
MARINE CITY, MI . . . . . . . . . .
................................................47
. . . . . . . . . . . . . . . . . . . . . . . . . . . . . . . . . . . . . . 33
MARQUETTE HARBOR, MI . . . . . . . . . . . . . . . . . . . . . . . . . . . . . . . . . . . . . . . . . . 17
MARYSVILLE, MI . . . . . . . . . . . . . . . . . . . . . . . . . . . . . . . . . . . . . . . . . . . . . . . . 32
MENOMINEE
HARBOR AND RIVER, MI AND WI . . . . . . . . . . . . . . . . . . . . . . . . . . . . . . . . . 28
MICHIGAN CITY HARBOR, IN . . . . . . . . . . . . . . . . . . . . . . . . . . . . . . . . . . . . . . . . . . 14
MILWAUKEE HARBOR, WI . . . . . . . . . . . . . . . . . . . . . . . . . . . . . . . . . . . . . . . . . . . . 25
MONROEHARBOR,
MUSKEGON HARBOR, MI . . . . .
MI
. . . .
.............................................40
. . . . . . . . . . . . . . . . . . . . . . . . . . . . . . . . . . . . 23
N
NEW BUFFALO HARBOR,
MI . . . . . . . . . . .
. .
. .
. .
. . . . . . . . . . . . . . . . . . . . . . . 45
NIAGARA FALLS, NY . . . . . . . . . . . . . . . . . . . . . . . . . . . . . . . . . . . . . . . . . . . . . . . 57
NIAGARA RIVER, NY . . . . . . . . . . . . . . . . . . . . . . . . . . . . . . . . . . . . . . . . . . . . . . . 57
U.S. ARMY CORPS OF ENGINEERS
106
FREIGHT TRAFFIC INDEX
O
OCONTO HARBOR, WI ........................................45
OGDENSBURG
HARBOR, NY . . . . . . . . . . . . . . . . . . . . . . . . . . . . . . . . . . . . . . . . . . 57
ONTONAGON HARBOR,
MI. . . . . . .
. . . . . . . . . . . . . . . . . . . . . . . . . . . 45
OSWEGO HARBOR, NY ..............................................56
P
PENSAUKEE HARBOR, WI . . . . . . . . . . . . . . . . . . . . . . . . . . . . . . . . . . . . . . . . . . . . 45
PENTWATER HARBOR, MI . . . . . . . . . . . . . . . . . . . . . . . . . . . . . . . . . . . . . . . . . . . 45
PORT CLINTON HARBOR, OH . . . . . . . . . . . . . . . . . . . . . . . . . . . . . . . . . . . . . . . . . . 57
PORT DOLOMITE, MI . . . . . . . . . . . . . . . . . . . . . . . . . . . . . . . . . . . . . . . . . . . . . . . 47
PORT
PORT
GYPSUM,
HURON, MI
MI
................................................46...............................................47
PORT
PORT OF BUFFALO,
INLAND,
NY .
MI
. . . .
................................................47
. . . . . . . . . . . . . . . . . . . . . . . . . . . . . . . . . . . . . . . 55
PORT OF CHICAGO, IL . . . . . . . . . . . . . . . . . . . . . . . . . . . . . . . . . . . . . . . . . . . . . . . 8
PORT OF DETROIT,
MI . . . . . . . . . . . . . . . . . . . . . . . . . . . . . . . . . . . . . . . . . . . . . 39
PORT SANILAC HARBOR, MI . . . . . . . . . . . . . . . . . . . . . . . . . . . . . . . . . . . . . . . . . . . 46
PORT WASHINGTON HARBOR, WI . . . . . . . . . . . . . . . . . . . . . . . . . . . . . . . . . . . . . . . 46
PORT WING HARBOR, WI . . . . . . . . . . . . . . . . . . . . . . . . . . . . . . . . . . . . . . . . . . . . 46
PRESQUE ISLE HARBOR,
MI . . . . . . . . . . . . . . . . . . . . . . . . . . . . . . . . . . . . . . . . . . . 16
PUT-IN-BAY HARBOR, OH . . . . . . . . . . . . . . . . . . . . . . . . . . . . . . . . . . . . . . . . . . . . 46
R
RACINE HARBOR,
WI . . . . . . . . . . . . . . . . . . . . . . . . . . . . . . . . . . . . . . . . . . . . . . . 46
ROCHESTER (CHARLOTTE) HARBOR, NY . . . . . . . . . . . . . . . . . . . . . . . . . . . . . . . . . . . 57
ROCK ISLAND, IL DISTRICT . . . . . . . . . . . . . . . . . . . . . . . . . . . . . . . . . . . . . . . . . . .
58
ROGERS
ROUGE RIVER,CITY,
MI
MI
.................................................46...........................................
... 38
S
SACKETS HARBOR, NY . . . . . . . . . . . . . . . . . . . . . . . . . . . . . . . . . . . . . . . . . . . . . . 57
SAGINAW RIVER,
MI . . . . . . . . . . . . . . .
. . . . .
. . . 29
SANDUSKY HARBOR, OH . . . . . . . . . . . . . . . . . . . . . . . . . . . . . .
. . . 49
SAUGATUCK HARBOR AND KALAMAZOO RIVER,
ml . . . . . . . . . . . . . . . . . . . . . . . . . . . . . 46
SAULT STE. MARIE,
MI . . . . . . . . . . . . . . . . . . . . . . . . . . . . . . . . . . . . . . . . . . . . 46
SEBEWAING,
MI . . . . . . . . . . . . . . . . . . . . . . . . . . . . . . . . . . . .
. . 46
SHEBOYGAN HARBOR, WI . . . . . . . . . . . . . . . . . . . . . . . . . . . . . . . . . . . . . . . . . . .
46
SOUTH
SILVER
HAVEN
BAY,
HARBOR,
MN . . . .
MI
. .
.
.
.
.
.
.
.
.
.
. . . . .
...............................
. . . . . . . . . . . . . . . . . . . . . . . . . . . .
.
.
.
. .
.
.
47
46
ST. CLAIR RIVER,
MI . . . . . . . . . . . . . . . . . . . . . . . . . .
................
. . .
30
ST. CLAIR,
MI . . . . . . . . . . . . . . . . . . .
. .
. . . . . . . . . . .
..............
. .
32
ST. JAMES BEAVER ISLAND),
MI . . . . . . . . . . . .
. . . . . . . . . . . . . . . . . . . . 46
ST. JOSEPH HARBOR,
Mi . . . . . . . . . . . . . . . . . . . . . . . . . .
25
ST. MARYS FALLS CANAL,
MI AND
SAULT STE.
MARIE
, ONTARIO SHIP CANAL„ CN
(INCLUDED IN ST. MARYS RIVER) . . . . . . . . . . . . . . . . . . . . . . . . . . . . . . . . . . . . 20
ST. MARYS RIVER,
MI . . . . . . . . . . . . . . . . . . . . . . . . . . . . . . . .
. . . . . . . . . . 18
STONEPORT, MI . . . . . . . . . . . . . . . . . . . . . . .
. . . . . .
. . . . . . . . . . . . . 42
STURGEON BAY AND LAKE MICHIGAN SHIP CANAL, WI . . . . . . . . . . . . .
. . . . . . . 46
SUMMARY OF GREAT LAKES TRAFFIC:
FREIGHT TONS CARRIED ON GREAT LAKES BY AREA . . . . . . . . . . . . . . . . . . . . . . . . . . A
FREIGHT TONS CARRIED ON GREAT LAKES BY TYPE OF TRAFFIC AND COMMODITY . . . . . . . . xii
TON-MILEAGE OF FREIGHT CARRIED ON GREAT LAKES BY AREA . . . . . . . . . . . . . . . . . . .
x
T
TACONITE HARBOR,
MN . . . . . . . . . . . . . . . . . . . . . . . . . . . . . . . . . . . . . . . . . . . . . 16
TOLEDO HARBOR,
OH . . . . . . . . . . . . . . . . . . . . . . . . . . . . . . . . . . . . . . . . . . . . . . 48
TONAWANDA HARBOR, NY . . . . . . . . .
57
TON-MILEAGE OF FREIGHT CARRIED ON GREAT LAKES BY AREA .
. .
x
TRAVERSE CITY HARBOR, MI . . . . . . . . . . . . .
. . . . . . . . . . . 47
TRENTON,MI
TWO HARBORS (AGATE BAY),
MN
..................................................47
. . . . . . . . . . . . . . . . . . . . . . . . . . . . . . . . . . . . . . 15
TWO RIVERS HARBOR, WI . . . . . . . . . . . . . . . . . . . . . . . . . . . . . . . . . . . . . . . . . . . . 47
V
VERMILION HARBOR
,
OH . . . . . . . . . . . . . . . . . . . . . . . . . . . .
. . . . . . . . . . . 57
106
U.S
.
ARMY CORPS
OF ENGINEERS
FREIGHT TRAFFIC INDEX
W
WADDINGTON
HARBOR
,
NY . . . . . . . . . . . . . . . . . . . . . . . . . . . . . . . . . . . . . . . . . . . 57
WARROAD HARBOR, MN . . . . . . . . . . . . . . . . . . . . . . . . . . . . . . . . . . . . . . . . . . . . . 47
WAUKEGAN
HARBOR
, IL . . . . . . . . . . . . . . . . . . . . . . . . . . . . . . . . . . . . . . . . . . . . . . 3
WHITE LAKE
HARBOR
,
MI . . . . . . . . . . . . . . . . . . . . . . . . . . . . . . . . . . . . . . . . . . . 47
WHITEFISH POINT
HARBOR, MI
. . . . . . . . . . . . . . . . . . . . . . . .
.
47
WYANDOTTE,
MI ................................................47
U.S. ARMY CORPS OF
ENGINEERS
107
TRIPS AND DRAFTS INDEX
A
ALGOMA HARBOR,
WI . . . . . . . . . . . . . . . . . . . . . . . . . . . . . . . . . . . . . . . . . . . . . . 89
ALGONAC,MI ..................................................
89
ALPENA HARBOR,
MI . . . . . . . . . . . . . . . . . . . . . . . . . . . . . . . . . . . . . . . . . . . . . . 80
ASHLAND HARBOR,
WI . . . . . . . . . . . . . . . . . . . . . . . . . . . . . . . . . . . . . . . . . . . . . . 89
ASHTABULA HARBOR
,
OH . . . . . . . . . . . . . . . . . . . . . . . . . . . . . . . . . . . . . . . . . . . 98
AU SABLE HARBOR AND RIVER (OSCODA),
MI . . . . . . . . . . . . . . . . . . . . . . . . . . . . . . . . . 89
B
BARCELONA HARBOR, NY . . . . . . . . . . . . . . . . . . . . . . . . . . .
. . . . . . . .
. . . . . . 101
BAYFIELD HARBOR, WI . . . . . . . . . . . . . . . . . . . . . . . . . . . . . . . . . . . . . . . . . . . . . . 89
BIG BAY HARBOR, MI . . . . . . . . . . . . . . . . . . . . . . . . . . . . . . . . . . . . . . . . . . . . . . . 89
BLACK RIVER HARBOR, MI . . . . . . . . . . . . . . . . . . . . . . . . . . . . . . . . . . . . . . . . . . . . 89
BUFFALO HARBOR, NY . . . . . . . . . . . . . . . . . .
. . . . . . . . .
. . . . . . .
. . . . . . .
100
BUFFALO, NY DISTRICT . . . . . . . . . . . . . . . . . . . . . . . . .
. .
. . . . . . 100
BUFFALO, NY, PORT OF . . . . . . . . . . . . . . . . . . . . . . . . . . . . . . . . . . . . . . . . . . . . 100
BUFFALO HARBOR, NY . . . . . . . . . . . . . . . . . . . . . . . . . . . . . . . . . . . . . . . . . . 100
NIAGARA RIVER, NY . . . . . . . . . . . . . . . . . . . . . . . . . . . . . . . . . . . . . . . . . . . . 102
BUFFINGTON HARBOR, IN . . . . . . . . . . . . . . . . . . . . . . . . . . . . . . . . . . . . . . . . . . . . 70
BURNS WATERWAY HARBOR, IN . . . . . . . . . . . . . . . . . . . . . . . . . . . . . . . . . . . . . . . . 70
C
CALCITE, MI ....................................................
88
CALUMET HARBOR AND RIVER, IL AND IN . . . . . . . . . . . . . . . . . . . . . . . . . . . . . . . . . . .
68
CALUMET-SAG CHANNEL, IL . . . . . . . . . . . . . . . . . . . . . . . . . . . . . . . . . . . . . .
103
CAPE VINCENT, NY . . . . . . .
. . . . . . . . . . . . . . . . . . . . . . . . . . . . . . . . .
101
CASEVILLE,
MI . . . . . . . . . . . . . . . . . . . . . . . . . . . . . . . . . . . . . . . . . . . . . . . . . . 89
CEDAR RIVER
HARBOR
,
MI . . . . . . . . .
.......................
. . . . . . . . . . 90
CHARLEVOIXCHANNELS
IN
HARBOR
LAKE
,
ST.
MI
CLAIR
. . . . .
.
.
.
.
. .
.
.
.
.
.
.
.
. .
.
.
.
.
. . . . .
.................
. . . . . . . . . . . . .
. . .
. .
.
.
.
. .
.
.
.
. .
.
.
.
. 75
84
CHEBOYGAN HARBOR,
MI . . . . . . . . . . . . . . . . . . . . . . . . . . . . . .
. . . . . . . . . . 90
CHICAGO HARBOR, IL . . . . . . . . . . . . . . . . . . . . . . . . . . . . . . . . . . . . . . . . . . . . . . 70
CHICAGO RIVER (MAIN AND NORTH
BRANCH
), IL . . . . . . . . . . . . . . . . . . . . . . . . . . . . . . 67
CHICAGO RIVER, (SOUTH BRANCH), IL . . . . . . . . . . . . . . . . . . . . . . . . . . . . . . . . . . . . 67
CHICAGO SANITARY AND SHIP CANAL, IL . . . . . . . . . . . . . . . . . . . . . . . . . . . . . . . . . 103
CHICAGO. IL DISTRICT . . . . . . . . . . . . . . . . . . . . . . . . . . . . . . . . . . . . . . . . . . . . .
68
CHICAGO, IL, PORT
OF . . . . . . . . . . . . . . . . . . . .
. . . . . . . . . . . . . . . . . . . . . . . 68
CALUMET HARBOR AND RIVER, IL AND IN
. . . . . . . . . . . . . . . . . . . . . . . . . . . . . . . . 68
CALUMET-SAG CHANNEL, IL . . . . . . . . . . . . .
. . . . . . . . . . . . . . . . . . . . . . . . 103
CHICAGO HARBOR, IL . . . . . . . . . . . . . . . . . . . . . . . . . . . . . . . . . . . . . . . . . . . 70
CHICAGO RIVER (MAIN AND NORTH BRANCH), IL . . . . . . . . . . . . . . . . . . . . . . . . . . . 67
CHICAGO RIVER, (SOUTH BRANCH), IL . . . . . . . . . . . . . . . . . . . . . . . . . . . . . . . . . . 67
LAKE
CHICAGO
CALUMET,
SANITARY AND
IL
SHIP
. . . .
CANAL,
. . . . .
IL
.
.
. . .
.
. . .
.
.
.
.
.
.
.
.
.
.
.
.
.
.
.
. .
............
. . . . . . . . . .
.
. .
.
.
.
. .
.
.
.
. .
.
. 67103
CHIPPEWA HARBOR (ISLE ROYALE),
MI . . . . . . . . . . . . . . . . . . .
.............
. . .
90
CLEVELAND
HARBOR
,
OH . . . . . . . . . . . . . . . . . . . . . . . . . . . . . . . . . . . . . . . . . . . 97
CLINTON RIVER, MICHIGAN . . . . . . . . . . . . . . . . . . . . . . . . . . . . . . . . . . . . . . . . . . . 94
CONNEAUT HARBOR,
OH . . . . . . . . . . . . . . . . . . . . . . . . . . . . . . . . . . . . . . . . . . . . 99
CORNUCOPIA HARBOR, WI . . . . . . . . . . . . . . . . . . . . . . . . . . . . .
. . . . . . . . . . . 90
D
DETOUR, MI AND VICINITY . . . . . . . . . . . . . . . . . . . . . . . . . . . . . . . . . . . . . . . . . . .
90
DETROIT HARBOR,
MI . . . . . . . . . . . . . . . . . . . . . . . . . . . . . . . . . . . . . . . . . . . . . 85
DETROIT HARBOR,
WI . . . . . . . . . . . . . . . . . . . . .
. . . . . . . . . . . . . . . . . . . . . 90
DETROIT
RIVER, MI . . . . . . . . . . . . . . . . . . . . . . . . . . . . . . . . . . . . . . . . . . . . . . . . 84
DETROIT, MI DISTRICT
. . . .
. . .
. . . . . . . . . . . . . . . . . . . . . . . . . . . . . . . . . . . . . . 86
DETROIT, M1, PORT
OF . . . . . . . . . . . . . . . . . . . . . . . . . . . . . . . . . . . . . . . . . . . . 86
DETROIT
HARBOR
,
MI . . . . . . . . . . . . . . . . . . . . . . . . . . . . . . . . . . . . . . . . . . . 90
ECORSE
,
MI ..................................,...90
ROUGE RIVER
,
MI ..............................................86
TRENTON,
MI .................................................93
WYANDOTTE,
MI . . . . . . . . . . . . . . . . . . . . . . . . . . . . . . . . . . . . . . . . . . . . . . . 94
DRUMMOND
DULUTH-
SUPERIOR
ISLANDHARBOR
,
MI
,
.............................................73MN
AND WI
. . . . . . . . . . . . . . . . . . . . . . . . . . . . . . . . . . . 71
DUNKIRK HARBOR
,
NY . . . . . . . . . . . . . . . . . . . . . . . . . . . . . . . . . . . . . . . . . . . . . 101
E
EAGLE HARBOR, MI . . . . . . . . . . . . . . . . . . . . . . . . . . . . . . . . . . . . . . . . . . . . . . . . 90
ECORSE,MI
ERIE HARBOR, PA . . . .
...............................................90
. . . . . . . . . . . . . . . . . . . . . . . . . . . .
. . . . . . . . . . . . . 99
ESCANABA, MI . . . . . . . . . . . . . . . . . . . . . . . . . . . . . . . . . . . . . . . . . . . . . . . . . . 88
108
U.S. ARMY CORPS OF ENGINEERS
TRIPS AND DRAFTS INDEX
F
FAIRPORT HARBOR,
OH . . . . . . . . . . . . . . . . . . . . . . . . . . . . . . . . . . . . . . . . . . . . . 98
FRANKFORT HARBOR,
MI . . . . . . . . . . . . . .
. . . . . . . . . . . . . . . . 90
G
GARY HARBOR, IN . . . .
GLADSTONE HARBOR, MI . . . . . . . . . . . . . . . . . . . . . .
...................
. . . . . . . . . . . . . . . . . . . . .
..
. 9070
GRAND HAVEN HARBOR AND GRAND RIVER, MI . . . . . . . . . . . . . . . .
. . . .
77
GRAND MARAIS HARBOR (HARBOR OF REFUGE), MI . . . . . . . . . . . . . . . . . . . . . . . . . . . . 90
GRAND MARAIS HARBOR; MN . . . . . . .
. . . . . . . . . . . . . . . . . . . . . . . . . . . . . . . . . 90
GRAND TRAVERSE BAY HARBOR, MI. . . . . . . . . . . . . . . . . . . . . . . . . . . . . . . . . . . . . . 90
GRAYS REEF PASSAGE, MI . . . . . . . . . . . . . . . . . . . . . . . . . . . . . . . . . . . . . . . . . . . 75
GREAT SODUS BAY HARBOR, NY . . . . . . . . . . . . . . . . . . . . . . . . . . . . . . . . . . . . . 101
GREEN BAY HARBOR, WI . . . . . . . . . . . . . . . . . . . . . . . . . . . . . . . . . . . . . . . . . . . . 80
H
HARBOR BEACH, MI (HARBOR OF REFUGE, LAKE HURON) . . . . . . . . . . . . . . . . . . . . . . . . . 91
HARRISVILLE HARBOR, MI (HARBOR OF REFUGE, LAKE HURON) . . . . . . . . . . . . . . . . . . . . . . 91
HOLLAND HARBOR, MI . . . . . . . . . . . . . . . . . . . . . . . . . . . . . . . . . . . . . . . . . . . . 78
HURON HARBOR, OH ...............................................96
I
ILLINOIS RIVER, IL . . . . . . . . . . . . . . . . . . . . . . . . . . . . . . . . . . . . . . . . . . . . . . . . 103
ILLINOIS WATERWAY, IL (CONSOLIDATED REPORT) . . . . . . . . . . . . . . . . . . . . . . . . . . . . 103
CALUMET-SAG CHANNEL, IL . . . . . . . . . . . . . . . . . . . . . . . . . . . . . . . . . . . . . . . 103
CHICAGO RIVER, (SOUTH BRANCH), IL . . . . . . . . . . . . . . . . . . . . . . . . . . . . . . . . . . 67
CHICAGO SANITARY AND SHIP CANAL, IL . . . . . . . . . . . . . . . . . . . . . . . . . . . . . . . . 103
ILLINOIS RIVER, IL . . . . . . . . . . . . . . . . . . . . . . . . . . . . . . . . . . . . . . . . . . . . 103
INDIANA HARBOR, IN . . . . . . . . . . . . . . . . . . . . . . . . . . . . . . . . . . . . . . . . . . . . . . . 69
IRONDEQUOIT BAY HARBOR, NEW YORK . . . . . . . . . . . . . . . . . . . . . . . . . . . . . . . . . . . 102
K
KELLEYS ISLAND,
OH . . . . . . . . . . . . . . . . . . . . . . . . . . . . . . . . . . . . . . . . . . . . . . . 95
KENOSHA HARBOR, WI . . . . . . . . . . . . . . . . . . . . . . . . . . . . . . . . . . . . . . . . . . . . . . 91
KEWAUNEE HARBOR, WI . . . . . . . . . . . . . . . . . . . . . . . . . . . . . . . . . . . . . . . . . . . . 91
KEWEENAW WATERWAY,
MI . . . . . . . . . . . . . . . . . . . . . . . . . . . . . . . . . . . . . . . . . . 91
KNIFE RIVER HARBOR,
MN . . . . . . . . . . . . . . . . . . . . . . . . . . . . . . . . . . . . . . . . . . . 91
L
LA POINTE HARBOR, WI
. . . . . . . . . . . . . . . . . . . . . . . . . . . . . . . . . . . . . . 91
LAC LA BELLE HARBOR,
MI . . . . . . . . . . . . . . . . . . . . . . . . . . . . . . . . . . . . . . . . . . 91
LAKE CALUMET, IL . . . . . . . . . . . . . . . . . . . . . . . . . . . . . . . . . . . . . . . . . . . . . . . . 67
LELAND HARBOR,
MI . . . . . . . . . . . . . . . . : . . . . . . . . . . . . . . . . . . . . . . . . . . . . . . 91
LIME
LORAIN
ISLAND,HARBOR,
MI
OH
..................................................91
. . . . . . . . . . . . . . . . . . . . . . . . . . . . . . . . . . . . . . . . . . . . . . . 96
LUDINGTON HARBOR,
MI . . . . . . . . . . . . . . . . . . . . . . . . . .
. . . . . . . . . . . . . . . . 76
M
MACKINAC HARBOR
,
MI . . . . . . . . . . . . . . . . . . . . . . . . . . .
. . . . . . . 91
MACKINAW CITY
HARBOR
,
MI . . . . .
MANISTEE HARBOR
,
MI . . . . . . . . . . . . . . . . . . . . . . . . . . . . . . . . . . . . . . . . . . . 76
MANISTIQUE HARBOR
,
MI . . . . . . . . . . . . . . . . .
. . .
. . . . . . . 91
MANITOWOC HARBOR
,
WI. . . . . . . . . . . . . . . . . . . . . . . . . . . . . . . . . . . . . . . . . 79
MARBLEHEAD
,
OH . . . . . . . . . . . . . . . . . . . . . . . . . . . . . . . . . . . . . . . . . . . . . . . . 94
MARINE
CITY, MI . . . . . . . . . . . . . . . . . . . . . . . .
. . . . . . . . . . . . . . . .
. . . .
83
MARQUETTE HARBOR
,
MI . . . . . . . . . . . . . . . . . . .
. . . . . . . . . . . . . . . . . . . . 73
MARYSVILLE, MI . . . . . . . . . . . . . . . . . . . . . . . .
. . . . . . . . . . , . . . . . . . . . . . 82
MENOMINEE HARBOR AND RIVER
,
MI AND WI . . . . . . . .
. . . . . . . . . . . . . . . . . . . . . . . 81
MICHIGAN CITY HARBOR, IN . . . . . . . . . . . . . . . . .
. . . . . . . . . . . . . . . . . . . . . . . 70
MILWAUKEE HARBOR
,
WI . . . . . . . . . . . . . . . . . . . . . . . . . . . . . . . . . . . . . . . . . . . . 79
MONROE
MUSKEGON
HARBORHARBOR,
,
MI
MI
. .
.............................................87
. . . . . . . . . . . . . . . . . . . . . . . . . . . . . . . . . . . . . . . . . . . 77
N
NEW BUFFALO
HARBOR
,
MI . . . . . . . . . . . . . . . . . . . . . . . . . . . . . . . . .
. . . . . . . 91
NIAGARA FALLS, NY . . . . . . . . . . . . . . . . . . . . . . . . . . . . . . . . . . . . . . . . . . . . . . 102
NIAGARA RIVER, NY . . . . . . . . . . . . . . . . . . . . . . . . . . . . . . . . . . . . . . . . . . . . . . 102
U.S. ARMY CORPS
OF ENGINEERS
109
TRIPS AND DRAFTS INDEX
O
OCONTO HARBOR, WI . . . . . . . . . . . .
. . . . . . . . . . . . . . . . . . . . . . . . . . . . . . . 92
OGDENSBURG
HARBOR, NY . . . . . . . . . . . . . . . . . . . . . . . . . . . . . . . . .
. . . . . . . 102
ONTONAGON
HARBOR
,
MI . . . . . . . . . . . . . . . . . . . . . . . . . . . . . . . . . . . . . . . . . . . . 92
OSWEGO HARBOR, NY .............................................101
P
PENSAUKEE HARBOR, WI . . . . . . . . . . . . . . . . . . . . . . . . . . . . . . . . . . . . . . . . . . . . 92
PENTWATER HARBOR
,
MI . . . . . . . . . . . . . . . . . . . . . . . . . . . . . . . . . . . . . . . . . . . . 92
PORT CLINTON HARBOR, OH . . . . . . . . . . . . . . . . . . . .
. . . . . . . . . , . 102
PORT DOLOMITE,
MI . . . . . . . . . . . . . . . . . . . . . . . . . . . . . . . . . . . . . . . . . . . . . . 94
PORT
PORT
PORT HURON,GYPSUM,INLAND,
MI
Ml
MI
...............................................92......................................
. . . . . . . . . . . . . . . . . . . . . . . . . . . . . . . . . . . . . . . . . . . . . .
....
. . .
9494
PORT OF BUFFALO, NY . . . . . . . . . . . . . . . . . . . . . . . . . . . . . . . . . . . . . . . . . . . . 100
PORT OF CHICAGO, IL . . . . . . . . . . . . . . . . . . . . . . . . . . . . . . . . . . . . . . . . . . . . . .
68
PORT OF DETROIT,
MI . . . . . . . . . . . . . . . . . . . . . . . . . . . . . . . . . . . . . . . . . . . . . . 86
PORT SANILAC HARBOR,
MI . . . . . . . . . . . . . . . . . . . . . . . . . . . . . . . . . . . . . . . . . . 92
PORT WASHINGTON HARBOR, WI . . . . . . . . . . . . . . . . . . . . . . . . . . . . . . . . . . . . . . 92
PRESQUE
PORT WING
ISLE
HARBOR,
HARBOR,
WI .
MI
. .
.
.
.
.
.
.
.
.
.
.
.
.
.
.
.
.
.
.
.
.
.
.
.
.
.
.
.
.
.
.
.
.
.
.
.
.
.
.
.
.
.
.
.
.
.
.
.
.
.
.
.
.
.
..............
. . . . . . . . . . . . . .
92
. 72
PUT-IN-BAY HARBOR, OH . . . . . . . . . . . . . . . . . . . . . . . . . . . . . . . . . . . . . . . . . . . . 92
R
RACINE
HARBOR
,
WI . . . . . . . . . . . . . . . . . . . . . . . . . . . . . . . . . . . . . . . . . .
92
ROCHESTER (CHARLOTTE)
HARBOR
,
NY . . . . . . . . . . . . . . . . . . . . . . . . . . . . . . .
102
ROCK ISLAND, IL DISTRICT . . . . . . . . . . . . . . . . . . . . . . . . . . . . . . . . . . . . . . . . . . . 103
ROGERS
ROUGE RIVER,CITY,
MI
MI
................................................92...................................86
S
SACKETS HARBOR, NY . . . . . . . . . . . . . . . . . . . . . . . . . . . . . . . . . . . . . . . . . . . 102
SAGINAW RIVER,
MI . . . . . . . . . . . . . . . . . . . . . . . . . . . . . . . . . . . . . . . . . . . . . . . 81
SANDUSKY HARBOR, OH . . . . . . . . . . . . . . . . . . . . . . . . . . . . . . . . . . . . . . . . . . . .
96
SAUGATUCK HARBOR AND KALAMAZOO RIVER,
MI. . . . . . . . . . . .
. . . . . . . . . . . . . . . . 92
SAULT STE.
MARIE
,
MI . . . . . . . . . . . . . . . . . . . . . . . . . . . . . . . . . . . . . . . . . . . . . 93
SEBEWAING,SHEBOYGAN
MI
HARBOR,
..............................................93
WI . . . . . . . . . . . . . . . . . . . . . . . . . . . . . .
. . . . . . . . . . . 93
SILVER BAY,
MN . . . . . . . . . . . . . . . . . . . . . . . . . . . . . . . . . . . . . . . . . . . . . . . . . 94
SOUTH HAVEN
HARBOR, MI . . . . . . . . . . . . . . . . . . . . . . . . . . . . . . . . . . . . . . . . . . . 93
ST. CLAIR RIVER,
M] . . . . . . . . . . . . . . . . . . . . . . . . . . . . . . . . . . . . . . . . . . . . . . . 82
ST. CLAIR,
MI . . . . . . . . . . . . . . . . . . . . . . . . . .
.....................
. . .
83
ST. JAMES (BEAVER ISLAND).
MI . . . . . . . . . . . . . . . . . . . . . . . . . . . . . . . . . . . . . . . . 93
ST. JOSEPH HARBOR,
MI . . . . . . . . . . . . . . . . . . . . . . . . . . . . . . . . . . . . . . . . . . . . . 78
ST. MARYS FALLS CANAL, MI AND SAULT STE. MARIE, ONTARIO SHIP CANAL, CN
(INCLUDED IN ST. MARYS RIVER) . . . . . . . . . . . . . . . . . . . . . . . . . . . . . . . . . . . . . 74
ST. MARYS RIVER, MI . . . . . . . . . . . . . . . . . . . . . . . . . . . . . . . . . . . . . . . . . . . . . . 73
STONEPORT,
MI . . . . . . . . . . . . . . . . . . . . . . .
.................
. . . .
. . . . 89
STURGEON BAY AND LAKE MICHIGAN SHIP CANAL,
Wl . . . . . . . . . . . . . . . . . . . . . . . . . . . 93
T
TACONITE HARBOR
,
MN . . . . . . . . . . . . . . . . . . . . . . . . . . . . . . . . . . . . . . . . . . . . . 72
TOLEDO HARBOR
,
OH . . . . . . . . . . . . . . . . . . . . . . . . . . . . . . . . . . . . . . . .
.
95
TONAWANDA HARBOR, NY . . . . . . . . . . . . . . . . . . . . . . . .
102
TRAVERSE CITY HARBOR
,
MI . . . . . . . . . . . . . . . . . . . . . . . . . . . . . . . . . . . . . . . . . . 93
TWO
TRENTONHARBORS
,
MI........
(AGATE BAY),....
MN
..............
. . . . . . . . . . . . . . .
........................93
. . . . . . . . . . . . . . . . . . . . . . . . 71
TWO RIVERS HARBOR
,
WI . . . . . . . . . . . . . . . . . . . . . . . . . . . . . . . . . . . . . . . . . . . . 93
V
VERMILION HARBOR, OH
. . . . . . . . . . . . . . . . . . . . . . . . . . .
. . . . . . . . . . . .
102
W
WADDINGTON HARBOR, NY . . . . . . . . . . . . .
. . . . . . . . . . . .
. . . . . . . . . . . . 102
WARROAD HARBOR,
MN ..............................
93
WAUKEGAN HARBOR, IL . . . . . . . . . . . . . . . . . . . . . . . . . . . . . . . . . . . . . . . . . . . 67
WHITE LAKE HARBOR,
MI . . . . . . . . . . . . . . . . . . . .
. . . . . . . . . . . . .
93
WHITEFISH POINT HARBOR,
MI . . . . . . . . . . . . . . . . .
. . . . . . . . . . . . .
93
WYANDOTTE,
MI .................................................94
110
U.S. ARMY CORPS
OF ENGINEERS
ORDERING GUIDE FOR THE NAVIGATION
DATA
CENTER REPORTS
Waterborne Commerce
,
Vessel and Lacks Statistics
Title
Sales Price
Waterborne Commerce of the United States (WCUS)
Part 5
WCUS,
National Summaries . . . . . . . . . . . . . . . . . . . . . . . . . . .
4.00
1st Class Postage . . . . . . . . . . . . . . . . . . . . . . . . . . . . . . . .
3.00
Waterborne Transportation Lines of the United States
(WTLUS)
Volume 1 National Summaries
. . . . . . . . . . . . . . . . . . . . . . . . . . . . . . .
2.00
1st Class Postage .
. . . . . . . . . . . . . . . . . . . . . . . . . . . . . . .
2.00
Complimentary Copies
The U.
S. Waterway
System - FACTS
Tonnage for Selected United States Ports
State Tonnage Report
(Total
waterborne commerce by state)
Waterborne Commerce National Totals and Selected Inland Waterways for Multiple Years
Summary
of United
States Flag Vessels
Material
may be ordered from Waterborne Commerce Statistics Center, U.S. Army Corps
of Engineers,
P.O. Box 61280, New Orleans, LA 70161-1280. Checks or money orders should be made out to FA&Q0.
Call (504) 862-1426 or (504) 862 -1404, or FAX (504) 862-1423.
For a review of other services provided through the Waterborne Commerce Statistics Center,
please
contact the
Internet Access WCSC Home Page at hftp://www.iwr.usace.army.mil/ndc/wcsc.htm or for E-mail:
CEIWR-NDCWCSO.WEBMASTER@.usace.army.mil.
(11/30/2005)
Ordering Guide for Port Series Reports
NO.
Date of
Publication
Sal.
Pric
1
Portland, ME, and Portsmouth, NH; and Ports on the Kennebec and Penobscot River, ME
2001
$ 18.
3
4
Boston, MA
Ports of Southern New England (Bridgeport, CT; New Haven, CT; Connecticut River, CT; New London, CT;
1994
20
Providence, RI; Fall River, MA; New Bedford, MA; Fairhaven, MA)
1994
24.
5
New York, NY, and NJ, and Ports on Long Island, NY
1999
56.
6
Albany and Ports on the Hudson River, NY
1996
18.
8
Philadelphia, PA; Camden, NJ; Wilmington, DE; and Ports
on Delaware
River
1998
25.
10
Baltimore, MD
2000
22.
11
Ports of Hampton Roads, and Ports on the James and York Rivers, VA
1993
36.
12
Wilmington and Morehead City, NO
1997
24.
13
Charleston and Georgetown, SC
1997
15.
14
Savannah and Brunswick, GA
2000
21.
15
Jacksonville and Fernandina
Beach
, FL
1997
15.
16
Miami,
Port Everglades, Palm Beach, and Port Canaveral, FL
1999
40.
17
The Ports of Tampa and
Port Manatee
, FIL
1996
21.
18
Mobile, AL
1998
11
19
Panama City and Penscola, FL; Pascagoula and Gulfport, MS; and Ports on the Apalachicola,
Chattahoochee, and Flint Rivers
1998
25.
20
New Orleans, LA
2002
38.
20A
Mississippi River Ports Below and Above New Orleans, LA
2003
40.
21
Baton Rouge and Lake Charles, LA
2002
39.
22
Port Arthur, Beaumont, and Orange, TX
2001
33.
23
Galveston and Texas City, TX
1996
21.
24
Houston, TX
1999
36-
25
Corpus Christi, TX
2003
26.
26
Freeport, Point Comfort/Port Lavaca, Brownsville, and Ports along Gulf Intracoastal Waterway, TX
2003
36.
27
28
San Diego, CA
The Ports of Long Beach, Los Angeles and Port Hueneme, CA
1998
1996
29
28.
30
San Francisco, Redwood City, and Humboldt Bay, CA
2000
17.
31
Oakland, Alameda, Richmond, and Ports on Carquinez Strait, CA
2000
22.
32
Sacramento, Stockton, Pittsburg and Antioch, Ca
1996
28.
33
Ports on the Oregon Coast
2001
13.
34
Port of Portland, OR and Ports on the Columbia-Snake River System (Astoria, The Dallas, Boardman, and
1996
44.
35
Umatilla, OR; Longview,
Kalama
,
Vancouver, Pasco/ Kennewick, Wilma, and Clarkston, WA; and Lewiston, ID)
Tacoma, Olympia and Grays Harbor, WA
2003
21.
36
Seattle,WA
2002
25.
37
Port Angeles, Port Townsend, Everett, Anacortes, and Bellingham, WA.
1998
12.
38
Southeast Alaska (Metlakatla, Ketchikan, Hollis, Thorne Bay, Hydaburg, Craig, Klawock, Wrangell,
Petersburg, Kake, Juneau, Angoon, Haines, Skagway, Sitka, Pelican, Gustavus, Hoonah, and Yakutat)
2003
37.
39
Ports of Southwest and Western Alaska
2005
41.
41
Buffalo, Rochester, Oswego, and Ogdensburg, NY
2001
18.
42
U.S. Ports on Lake Erie (Erie, PA; and Conneaut, Ashtabula, Fairport Harbor, Lorain, Huron, and Sandusky, OH)
2001
20.
43
Cleveland, OH
2000
11..
44
Toledo, OH
2000
11.1
45
Detroit and Monroe, and Ports on the Saginaw River, MI
1996
31.1
46
Chicago, IL
1995
28.1
48
Milwaukee, WI and Ports on Lake Michigan
1995
32.
49
Duluth, MN; Superior, WI; Taconite Harbor, Silver Bay, and Two Harbors, MN; and Ashland, WI
2000
14.1
50
Ports of Hawaii (Honolulu, Port Allen, Nawiliwili, Kaunakakai,
Kaumaiapau
,
Kahului, Kawaihae, and Hilo)
1999
19.
60
Pittsburgh, PA, and Ports on the Ohio, Monongahela, and Allegheny Rivers, PA
1992
17.1
61
Huntington, WV, Ports on Ohio River (Miles 40-317), and Kanawha River, WV
1992
17.1
62
Cincinnati, OH, and Ports on Ohio River (Miles 317-560)
1991
12.1
63
Louisville, KY, Ports on Ohio River (Miles 560-980), and Cumberland and Green Rivers
1992
14.1
64
Ports on Tennessee River, Tennessee-Tombigbee and Black Warrior-Tombigbee Waterways, and Alabama River
1998
46.1
65
Ports on Illinois Waterway (Miles 0-291), Grafton to Lockport, IL
2005
28.1
68
Ports on the Arkansas, Red and Ouachita River Systems and Missouri River
2002
34.1
69
Minneapolis-St. Paul, MN, and Ports on Upper Mississippi River (Miles 300-860 AOR)
2004
40.1
70
St. Louis, MO, and Ports on Upper Mississippi River (Miles 0-300 AOR)
1992
13.1
71
Memphis, TN; Helena, AR; and Ports on Lower Mississippi River (Miles 620-954 AHP)
1993
14.1
72
Natchez, Vicksburg, and Greenville, MS, and Ports on Lower Mississippi River (Miles 255-620 AHP)
1991
11.1
Port Series reports may be ordered from the Navigation Data Center (CEIWR-NDC-N), 7701 Telegraph Road, Casey Building, Alexandria, VA
22315-3868_ Federal law requires advance payment for all purchases. Check or money order (in U.S. funds) should be made payable to the
Superintendent of Documents. Telephoneltelefax orders are accepted and can be charged to Visa, Master Card, DiscoverlNovus, American ExI
and Superintendent of Documents accounts- (Publications are mailed postpaid (4th Class Mail) on the same day that order is received unless a I
alternate delivery method is specified. Prices are subject to change without notice.
Contact: Navigation Data Center - voice: (703) 428-9061 FAX: (703) 428-6047
For a review of other services provided through the Navigation Data Center, please contact the Internet Access NDC Home Page at
http://www.iwr.usace.army.mil/ndc or for E-mail: CEIWR-NDC.WEBMASTER@usace.army.mil.
(10/20/2005)
REPORT DOCUMENTATION PAGE
Form Approved
OMB No. 0704-0188
The
gathering
information1215
public
Jefferson
and
,
reporting
including
maintaining
Davis Highwayburden
suggestions
the
for
data
,
Suite
this
far
neededcollection
reducing
1204
,
and
,
Arlington,
the
completing
of information
burden
VA
,
and
to
22202Department
reviewing
is estimated
-
4302.
the
Respondents
of
to
collection
Defenseaverage
,
of
1
Washington
should
hour
informationper
be aware
responseHeadquarters
.
Send
that
,
comments
notwithstanding
including
Servicesregarding
the
,
lime
Directorate
any
for
this
other
reviewing
burden
for
provision
Information
estimate
instructionsof
law,
or
Operations
any
,
no
searching
other
person
and
aspect
shall
existing
Reportsof
be
this
subject
data
(
0704-0188collectionsourceeto
or
penalty for faiiing to comply with a collection of information if it does not display a currently valid OMB control number.
PLEASE DO NOT RETURN YOUR FORM TO THE ABOVE ADDRESS.
1.
REPORT DATE
(DD-MM-YYYY)
2.
REPORT TYPE
3.
DATES COVERED
(From - Tat
0 1 10212 0 0 8
Annual
01/01/2006 - 31/12/2006
4.
TITLE AND SUBTITLE
5a
.
CONTRACT NUMBER
Waterbome Commerce of the United States
Calendar Year - 2006
5b. GRANT NUMBER
P
art 3, Waterways and Harbors, Great Lakes
5c. PROGRAM ELEMENT NUMBER
6.
AUTHOR
(
S)
5d. PROJECT NUMBER
Department of the Army
5e. TASK NUMBER
Corps of Engineers
5f.
WORK UNIT NUMBER
7.
PERFORMING ORGANIZATION NAME
(
S) AND ADDRESS
(
ES)
8. PERFORMING ORGANIZATION
U.S. Army Corps of Engineers
REPORT NUMBER
Waterbome Commerce Statistics Center
New Orleans, LA 70161-1280
P.O. Box 61280
CEIWR-WCUS-06-3
9.
SPONSORING/MONITORING AGENCY NAME
(
S) AND ADDRESS
(
ES)
10
.
SPONSORIMONITOR
'
S ACRONYM(S)
U.S. Army Corps of Engineers
Headquarters
441 G. Street
11. SPONSORIMONITOR
'
S REPORT
Washington D.C. 20314-1000
NUMBER(S)
12. DISTRIBUTION
IAVAILABILITY
STATEMENT
Unclassified/Unlimited
13. SUPPLEMENTARY NOTES
14. ABSTRACT
Waterborne Commerce of the United States (WCUS), Part 3, Calendar Year 2006, is one of a
series of five (5) publications containing statistics on the commercial movement of foreign
and domestic cargo. WCUS, Part 3, presents detailed data by commodity and traffic for the
waterways and harbors of the Great Lakes, The statistics include commodities given in short
tons
(2000 lbs) and vessel trips for the harbors and waterways.
15. SUBJECT TERMS
Waterbome Commerce Statistics, Domestic Commerce, Water Transportation, Freight Traffic,
Commodity Flows
16. SECURITY CLASSIFICATION
OF:
17.
LIMITATION OF
18. NUMBER
19a. NAME OF RESPONSIBLE PERSON
a. REPORT
b.
ABSTRACT
c. THIS PAGE
ABSTRACT
OF
PAGES
David L. Penick
Director/WCSC
,
Unelas
Unclas
Unclas
U
nl
127
196
,
TELEPHONE NUMBER
pnclude area
code!
(504) 862-1400
Standard Form 298
(Rev. 8198)
Prescribed by ANSI Std. Z39.18
A
tt
a
chm
e
nt 8
THE DISTRICT
'
S EFFORTS TO PROTECT AND IMPROVE THE WATER
QUALITY
OF THE CAWS SINCE ITS CREATION
1889
Illinois
General Assembly adopted the Sanitary District of Chicago Enabling Act.
This resulted in the creation of the Sanitary District of Greater Chicago, now known
as the Metropolitan Water Reclamation District of Greater Chicago.
1900
The Chicago Sanitary and Ship Canal (CSSC) connecting the North Branch of the
Chicago River with the Des Plaines River was completed.
1910
The North Shore Channel (NSC) from Wilmette to the North Branch of the Chicago
River was completed.
1922
The Calumet-
Sag Channel
(
CSC) connecting
the Little Calumet River with the CSSC
was completed.
1920s
Calumet Imhoff treatment plant
(1922).
North Side secondary treatment plant (1928).
1930s
West Side Imhoff treatment plant placed in operation
(
1930).
Calumet activated sludge treatment plant (1935).
Southwest activated sludge treatment plant
(
1939).
1940s
West
Side
Imhoff
tank effluent to Southwest plant
(
1948).
Expanded the West-Southwest secondary
treatment
plant with
addition
of Battery C
(1949).
1950s
Added primary tanks at the Calumet treatment plant (1952).
Rehabilitation of Battery A at North Side treatment plant (1959).
Intercepting sewer system expanded.
1960s
Rehabilitation of aeration tanks at Calumet and North Side plants (1960).
Lemont treatment plant placed in service (1961).
North Side treatment plant expanded with addition of Battery D (1962).
1
Industrial
Waste Ordinance adopted to regulate industrial wastes discharged to
District
'
s sewerage system
(1962).
Expanded secondary
treatment
capacity at the Calumet
treatment
plant with addition
of Battery C
(I
966).
Chlorination of effluent at the North Side (1967) and Calumet (1968) plants.
New ordinance for the Control of Sewage and Industrial Waste adopted (1969).
1970s
Chlorination of effluent at the West-Southwest plant (1970).
District developed local discharge limits (1971).
District Board adopted long-range Tunnel and Reservoir Plan (TARP) for control of
combined sewer overflows (1972).
Monitoring of Illinois Waterway from Lockport to Peoria initiated (1972).
Conducted preliminary nitrification studies at Calumet and North Side plants (1975).
Expanded secondary treatment plant capacity at West-Southwest (Stickney) with
addition of Battery D (1975).
Nitrification at West-Southwest plant (1976).
In-stream aeration station constructed on North Shore Channel (1979).
Partial nitrification at North Side plant (1970s).
1980s
In-stream aeration station constructed on the North Branch of the Chicago River
(1980).
Illinois Pollution Control Board (IPCB) granted variance to discontinue disinfection
of Calumet effluent (1983).
IPCB granted variance to discontinue disinfection of discharges into Secondary
Contact Waters (1984).
Discontinued chlorination
at North
Side
and West-Southwest
plants
(1984).
Calumet TARP Pump
Station and Mainstream
TARP
pump station on line
(1985).
Mainstream
TARP Tunnel
System completed
(
1985).
2
Des Plaines
TARP Tunnel
System under construction.
Expanded secondary treatment plant capacity at Calumet
WRP with
addition of
Batteries E1 and E2 (1985).
USEPA approved District's Pretreatment Program (1985).
Nitrification of Calumet effluent evident (1987).
Cal-Sag Leg Calumet TARP System completed (1986).
1990s
Design of the Thornton Composite Reservoir and McCook Reservoir underway.
Construction of portions of the Calumet TARP Tunnel System.
Improved nitrification at the Stickney, Calumet, and North Side WRPs.
Side-stream elevated pool aeration (SEPA) stations along the Calumet-Sag Channel
(1992 and 1994).
SEPA stations along Calumet River and Little Calumet River on line (1994).
O'Hare Chicago Underflow Plan Reservoir completed (1998).
Des Plaines TARP Tunnel System completed (1999).
2000s
Completed Stickney Master Plan (2004).
Completed Calumet Master Plan (2005).
Completed Calumet TARP Tunnel System (2006).
Completed Phase I of TARP (2006)
Completed North Side Master Plan (2007).
Design and construction of various components of the Master Plans.
2014
Anticipated completion of the Thornton Composite Reservoir (7.9 billion gallons).
2015
Anticipated completion of Stage 1 of the McCook Reservoir (3.5 billion gallons).
2024
Anticipated completion of Stage 2 of the McCook Reservoir (6.5 billion gallons).
3
A
ttachm
e
nt 9
UAA Timeline
Initiatives - k
WRD (unless otherwi
s
e
noted)
__-_,_-.,._ -._.__
_
-
__-_-
2000
2001
,,,..,_,_,_,
200
11 2006__ -
2007.-__
200$__
-
2009
-
_..
2010
2011
Ambient Water Quality Monitoring Program initiated to
O
O
---
support
--
UAA
--------- ---- --
........................................................................------------
CAWS UAA Begins
(
IEPA Initiative)
O
C
Draft UAA Report issued
-
cites proposed microbial water
quality standards
(
IEPA inrtiative)_
Fecal Coliform Distribution
Study
U
7,17
r
0^
--
-
Disinfection Evaluation
(
TM t WQ
)
,O
J
4
Wa
Expert Panel reviews EPA Bacterial criteria and its
l0
y
^1
applicability to the CAWS
Expert Panel report recommending a microbial risk
Quantitative
assessment and
Microbial
epidemiological
._
Risk Assessment
study
.,
issuedbegins
;
study
--
l
v
o-
f
t 7 '
O
prolonged due to
dry
weather in 2005
End of Pipe Combined Sewer Overflow
(
CSO) Treatment
.
lC
Supplemental Aeration of the North and South
Branches
\O
O
of the Chicago River
(
TM_ i INQ
).-.-._ ........................ ------ -----
Flow Augmentation of the Upper North Shore Channel
!O
O^
Flow Augmentation and Supplemental Aeration of the
South Fork of the South Branch of the Chicago River
- -------------- - -
Literature search conducted on effluent
properties
^O
O
affecting
-,
disinfection efficiencies
-_--.,.-.,.-.-.
Survey of POTWs currently using UV/ozone disinfection
technologies
conducted
----------- ------ -_.
Ol
Monitoring
study initiated to assess effluent suitability
y
for UV disinfection
at 7
MWRD plants
{^
u`1
Development of a Framework for an Integrated
Water
O
Quality Strategy for the CAWS (TM-7WO)
Chicago Health
,
Environmental Exposure, and
O
O
.,Recreation 5tudy
_(
CHEERSi
.
ePidemlalogical
study
Habitat Study to determine potential of
the CAWS
O
O
physicaI habitat to support,_ag_uatc
.
life_
Integrated Strategy to Meet
©
O Water
Quality Standards
O
O
for the Chicago Area Waterways
(
TM-SWQ)
Disinfection Cost Study
NSWRP
Economic and Environmental Assessment of Water
LEGEND:
O
O
Quality Improvements in the CAWS, and Floatable
_Control
,.
jvaluation
,.._
NBPS
_-(
07-659
-
1--......... ..
......................... .. .
Solid Bar
Completed Project
Floatable Control Evaluation
,
RAPS
Shaded B ar- Project
in Progress
Disinfection Cost Study SWRP
__...._
.,...
pilot UV technology evaluation at Hanover
Park WRP
TT
0
_
--------
FF
UAA Timeline
noted)
2000
2001
2002
2003
2004
2005
2006
2007
2008
2009
2010
2011