BEFORE THE ILLINOIS POLLUTION CONTROL BOARD
IN THE MATTER OF:
WATER QUALITY STANDARDS AND
EFFLUENT LIMITATIONS FOR THE
CHICAGO AREA WATERWAY SYSTEM
AND THE LOWER DES PLAINES RIVER:
PROPOSED AMENDMENTS TO 35 Ill.
Adm. Code Parts 301, 302, 303 and 304
R08.9
(Rulemaking - Water)
PRE-FILED TESTIMONY OF SAMUEL G. DENNISON ON BEHALF OF THE
METROPOLITAN WATER RECLAMATION DISTRICT OF GREATER CHICAGO
CONCERNING
DISSOLVED
OXYGEN (DO) STANDARDS
PROPOSED FOR
PROTECTING AQUATIC LIFE IN THE DESIGNATED AQUATIC LIFE USE A
WATERS AND AQUATIC LIFE USE B WATERS
OF THE
CHICAGO AREA
WATERWAY SYSTEM
My name is Samuel G. Dennison.
I am a Biologist
IV in the Environmental Monitoring
and Research Division of the Research and Development Department of the Metropolitan Water
Reclamation District of Greater Chicago (District). I received a Bachelor of Arts degree with a
major in Biology from Saint Mary's University in Winona, Minnesota, a Master of
Science
degree in
Fisheries Biology from Iowa State University in Ames, Iowa, and a Doctor of
Philosophy degree in Biology from the Illinois
Institute
of Technology in Chicago,
Illinois. I airy
a Certified Fisheries Professional with the American Fisheries Society and
also a
Past President
of the Illinois Chapter of the American Fisheries Society.
I
have been employed
by
the District
since
1971.
My primary responsibility from 1974
through 2003 was monitoring the fish populations in Chicago
area
waterways.
Since 2003, I
have served as Head of the Aquatic Ecology and Water Quality Section within the
Environmental Monitoring and Research Division, where I supervise a staff of ten persons. As
Section Head I have had the responsibility of continuing the District's Continuous Dissolved
Oxygen Monitoring Program that was
initiated
in August 1998.
My testimony today will discuss the District's continuous DO monitoring program and
demonstrate that the various waters in the Chicago Area Waterway System do not always meet
the proposed DO standards.
Over the years, increased pollutant loading from urbanization throughout the Chicago
metropolitan area and low stream velocities in Chicago area deep-draft waterways have caused
dissolved oxygen (DO) concentrations to fall below DO standards established by the Illinois
Pollution Control Board (IPCB).
More than 30 years ago, the Metropolitan Water Reclamation
District of Greater Chicago (District) determined that applicable IPCB DO standards for Chicago
area waterways could not be met exclusively by advanced wastewater treatment at its three major
regional
water reclamation plants (WRPs), Calumet, North Side, and Stickney, and by the
capture and treatment of combined sewer overflows (CSOs). In order to increase the DO
concentration in the Chicago and Calumet River Systems, the District designed and constructed
artificial
aeration systems (instream diffuser and sidestream elevated pool aeration [SEPA]
stations) during the late 1970s and early 1990s, respectively.
Currently there are 19 continuous DO monitoring stations in the deep-draft waterways of
the Chicago River System, Des Plaines River System, and Calumet River. These monitoring
stations are shown in Figure I of Attachment 1.
The continuous water quality monitors used to collect these data were manufactured by
YSI Incorporated (YSI) of Yellow Springs, Ohio.
DO was measured hourly using the YSI
Model 6920 or Model 6600 monitor. In order to protect and safeguard the monitors from marine
navigation and vandalism, the monitors were deployed in the field in stainless steel pipes. Two
different installation designs were employed: (1) a 3-foot length of 8-inch diameter stainless steel
pipe secured to shore by means of a chain, was positioned on the bottom of the waterway and
2
oriented downstream such that the water passed through the pipe, and (2) a fixed length of 8-inch
diameter stainless steel pipe, with multiple 2-inch circular openings, was vertically mounted on
the side of a bridge abutment.
Servicing the monitors followed a weekly schedule.
District Industrial
Waste Division
personnel retrieved each monitor from the field following seven days of continuous monitoring.
Prior to retrieval, a water sample for chemical DO analysis using the Winkler titration method
was collected next to the protective housing.
An additional monitor, that had been previously
calibrated and serviced in the laboratory, was then deployed to replace the retrieved monitor.
The retrieved monitors were returned to the laboratory for data downloading, exterior cleaning,
servicing, and calibration of the DO sensors. The monitors were temporarily stored in holding
tanks containing tap water for subsequent deployment during the following week.
Hourly DO data were directly exported electronically from individual monitors to a
specially designed
Microsoft Access computer database for data processing and storage.
Following data downloading, the weekly DO data were carefully reviewed for accuracy. using a
method outlined in ATTACHMENT 1. After careful review of the DO data, weekly summary
statistics (mean,
minimum, maximum, and percent observations above DO standard) and
individual line drawings for each monitoring station showing hourly DO concentrations were
prepared. (Program description from Polls, 2002).
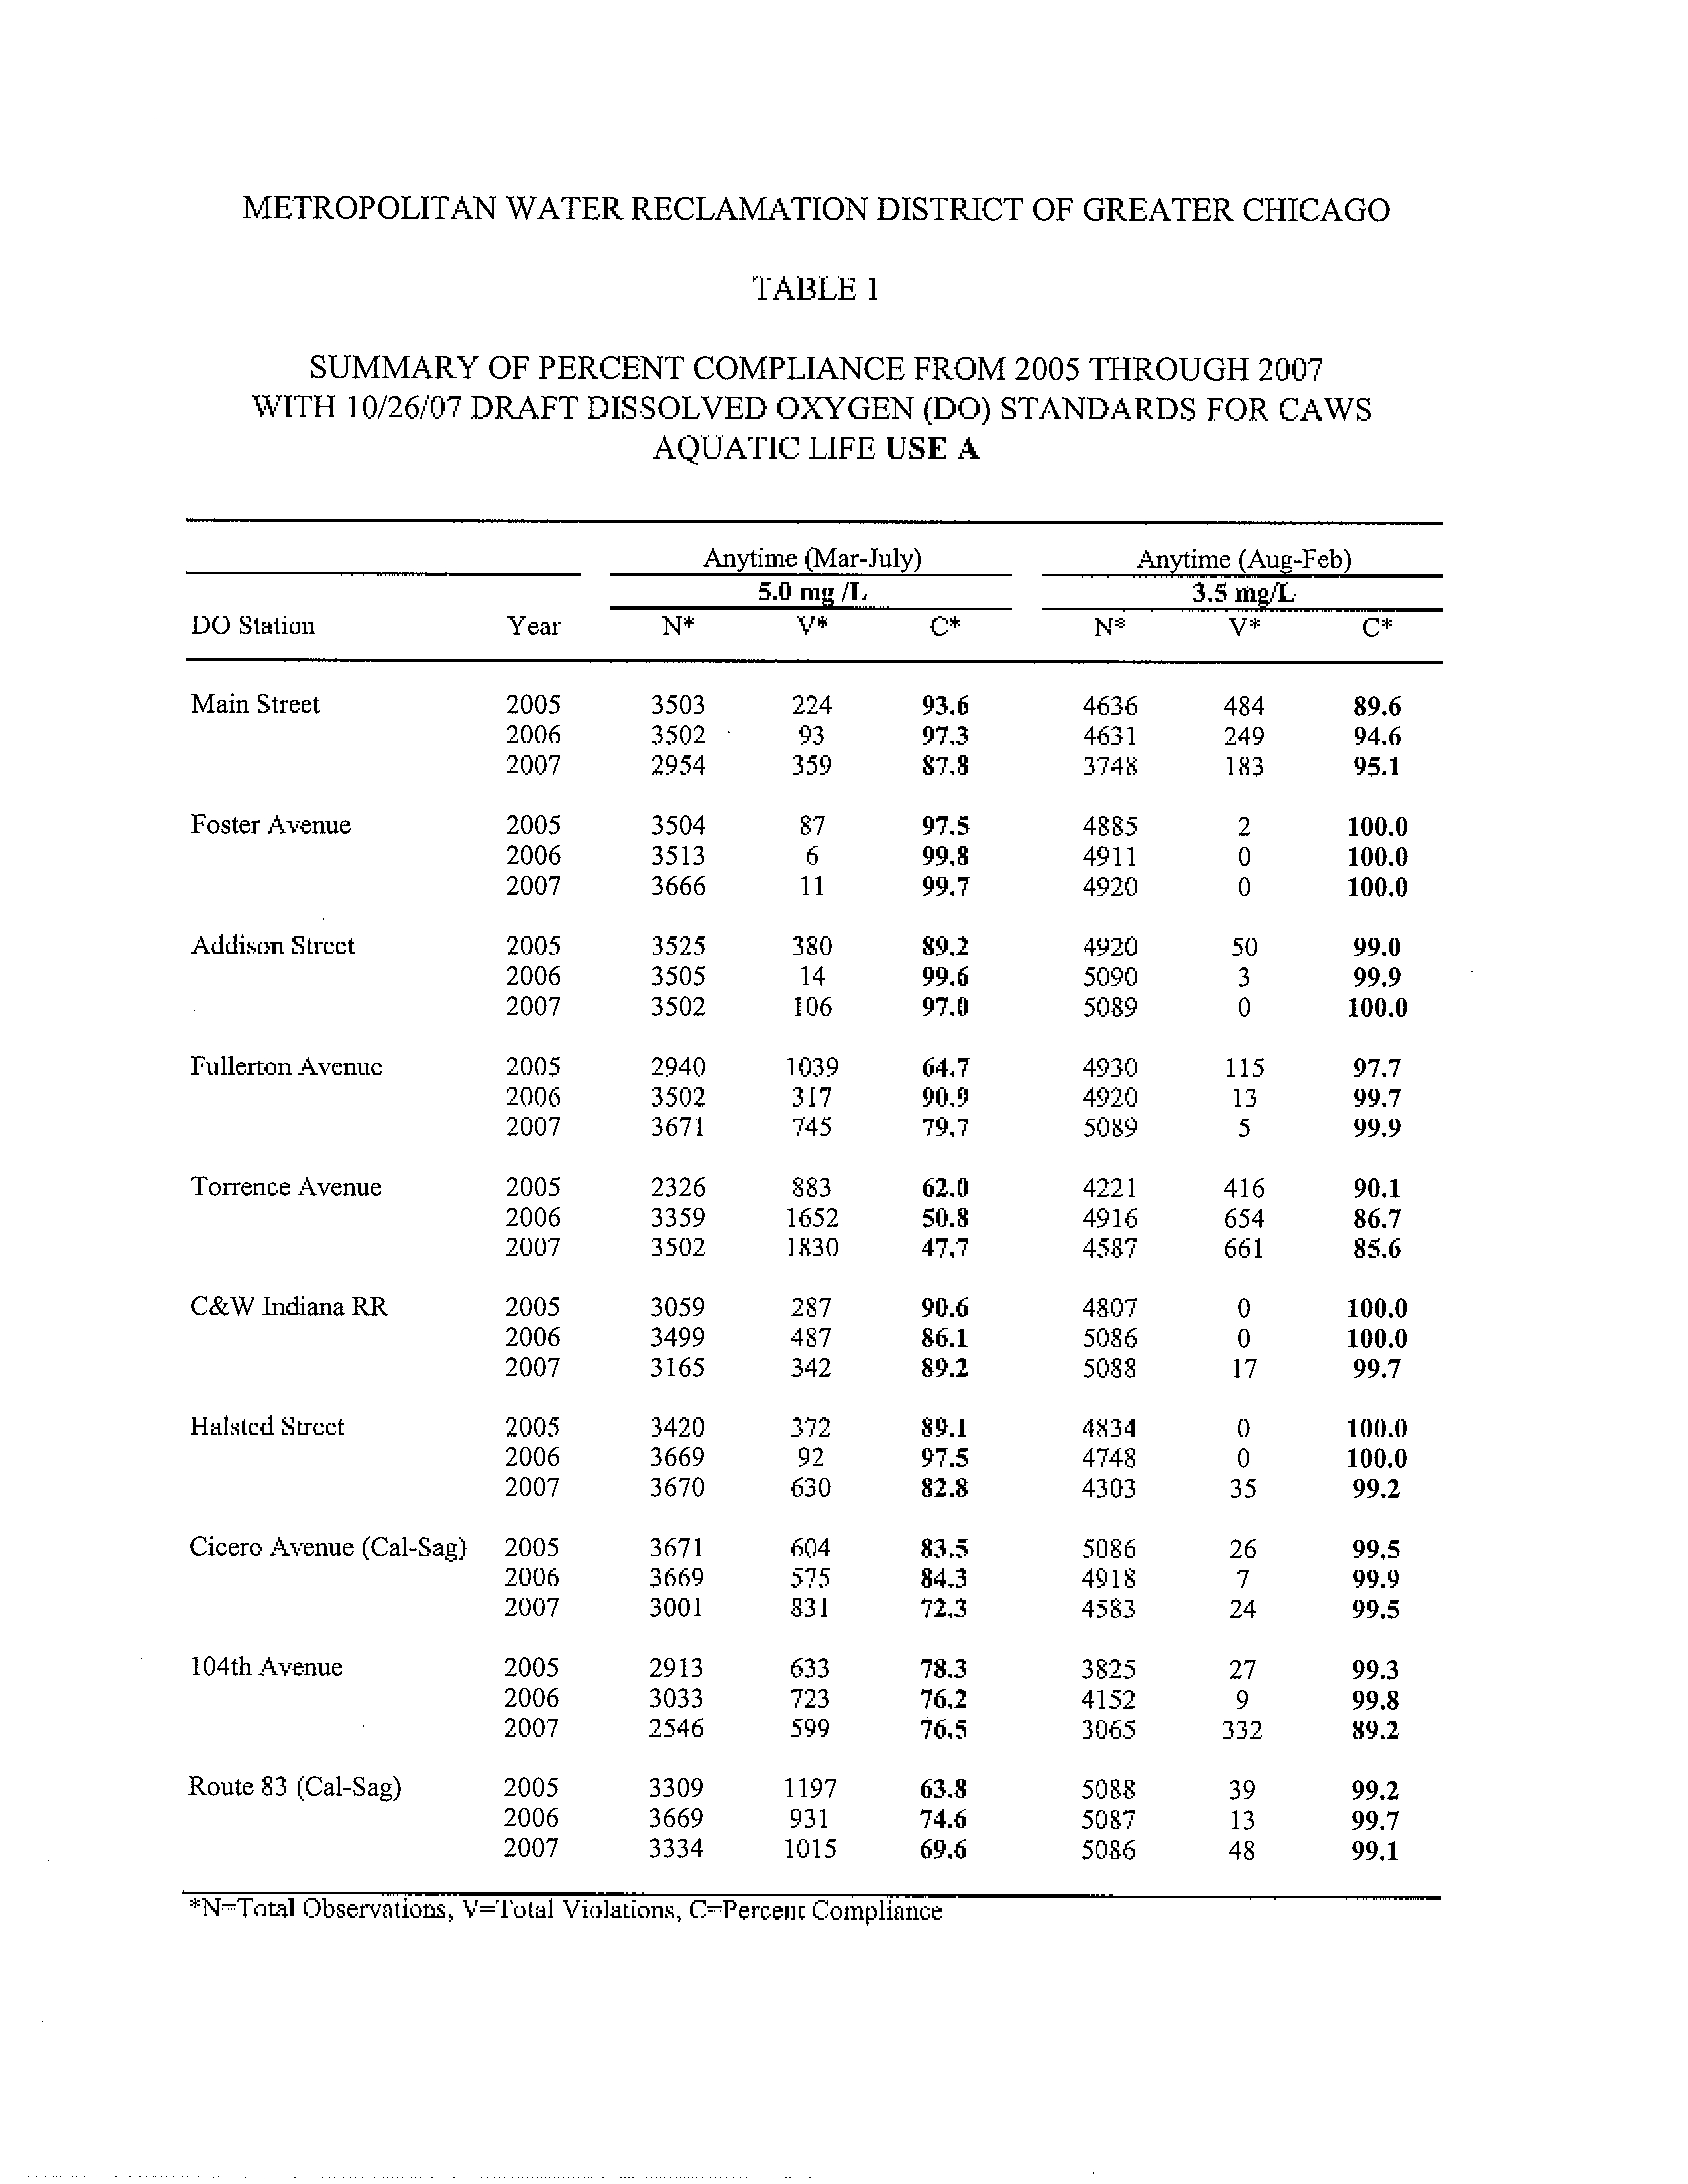
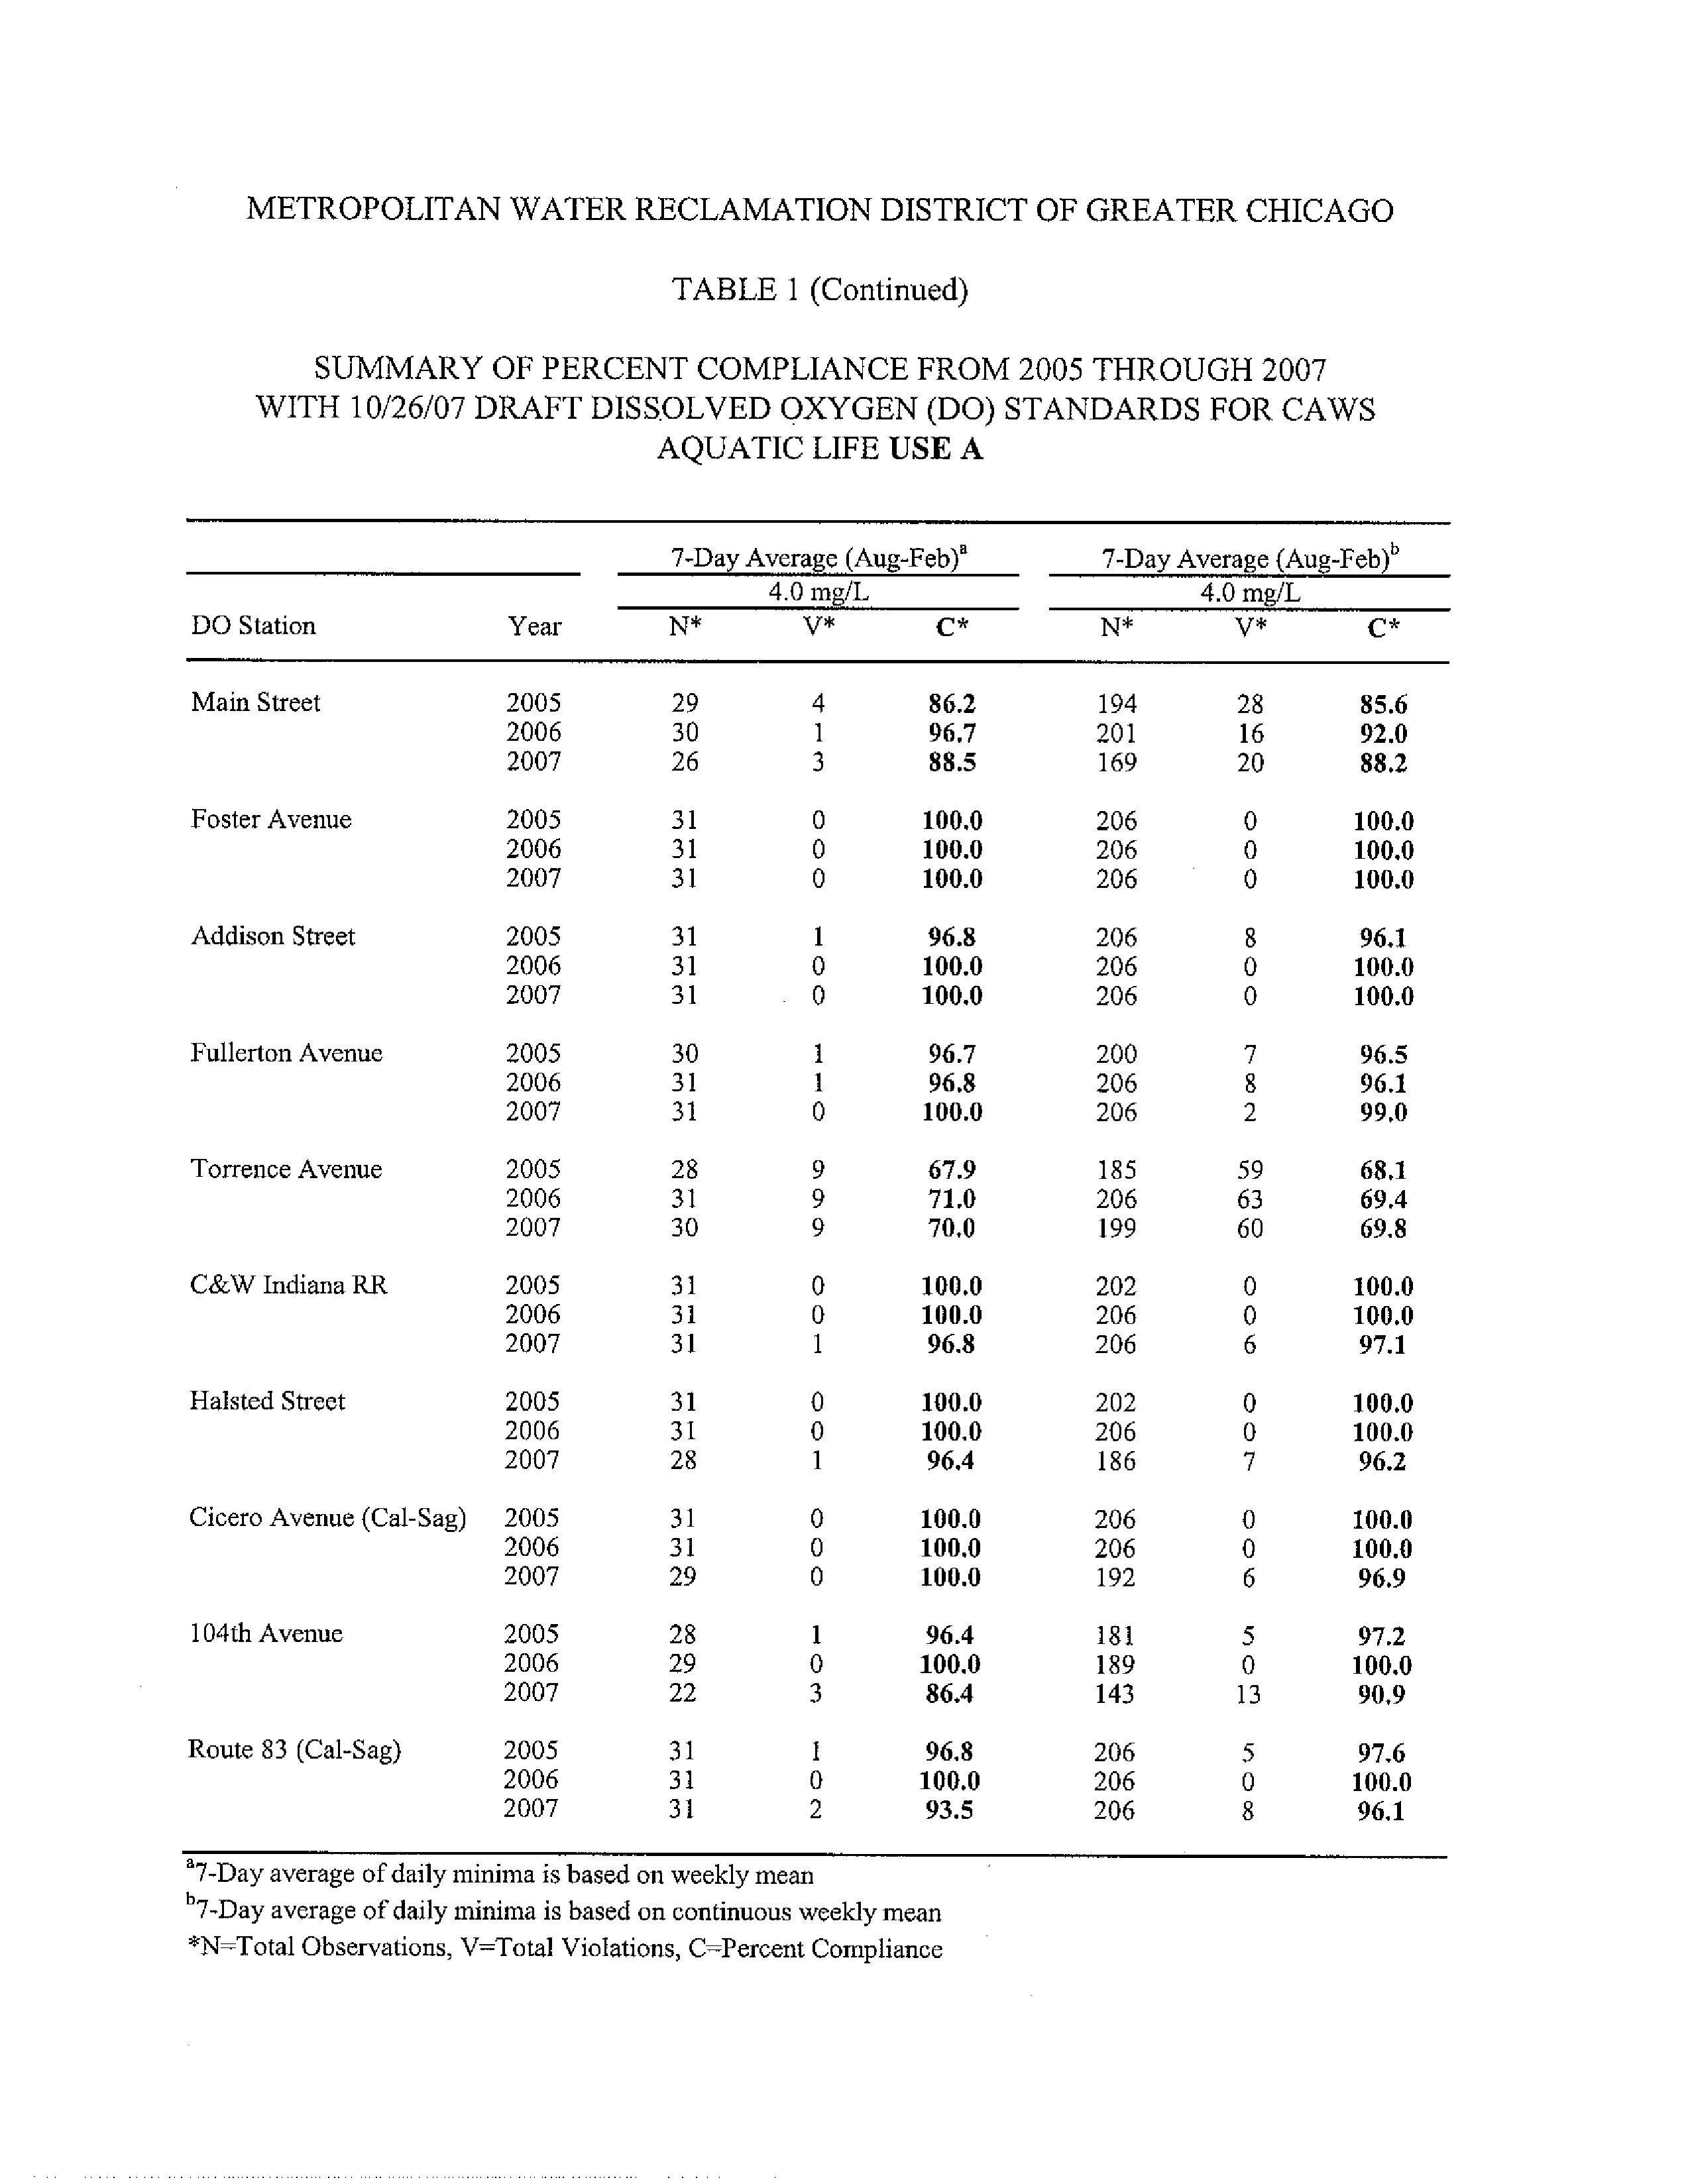
Results from the Continuous Dissolved Oxygen Monitoring Program show that man
waterways in the CAWS do not comply with the DO standards proposed b IEPA. Table 1 in
ATTACHMENT 2 was generated comparing District DO data from January, 2005 through
December, 2007 to the proposed Aquatic Life Use A DO standard. Continuous DO monitors at
six stations throughout the Calumet River System indicated limited compliance with the 5.0
3
mg/L proposed seasonal standard.
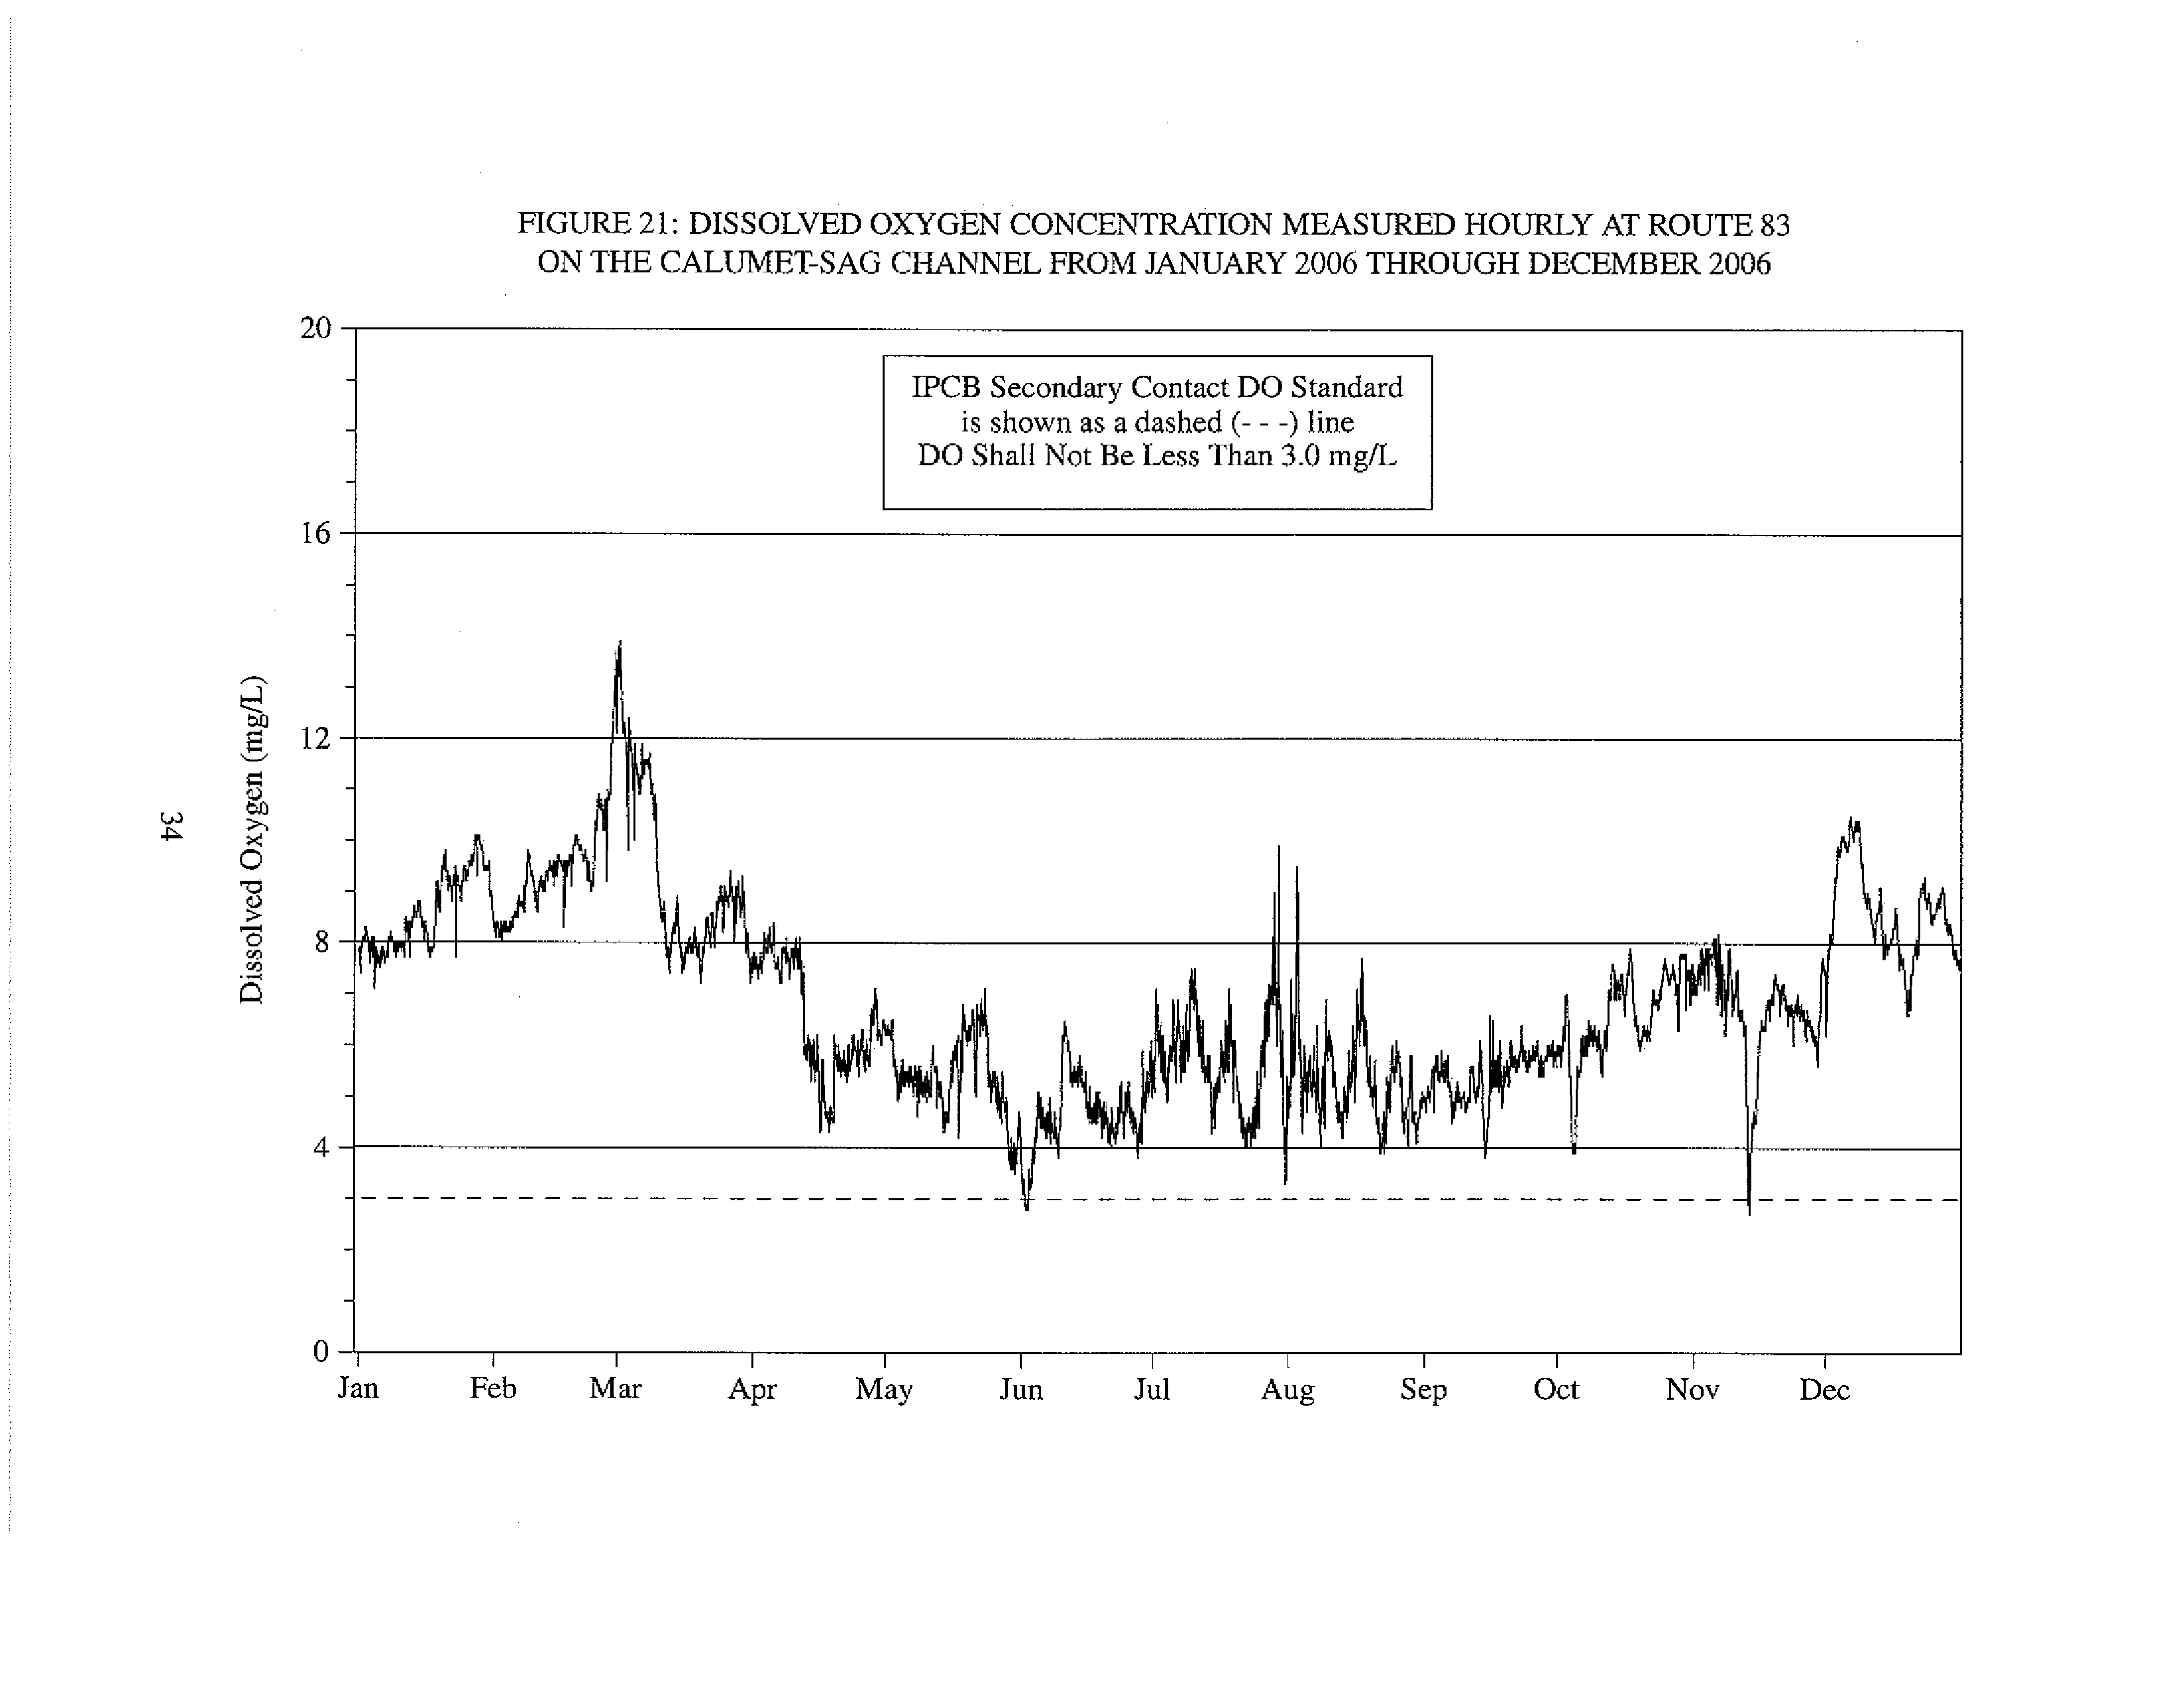
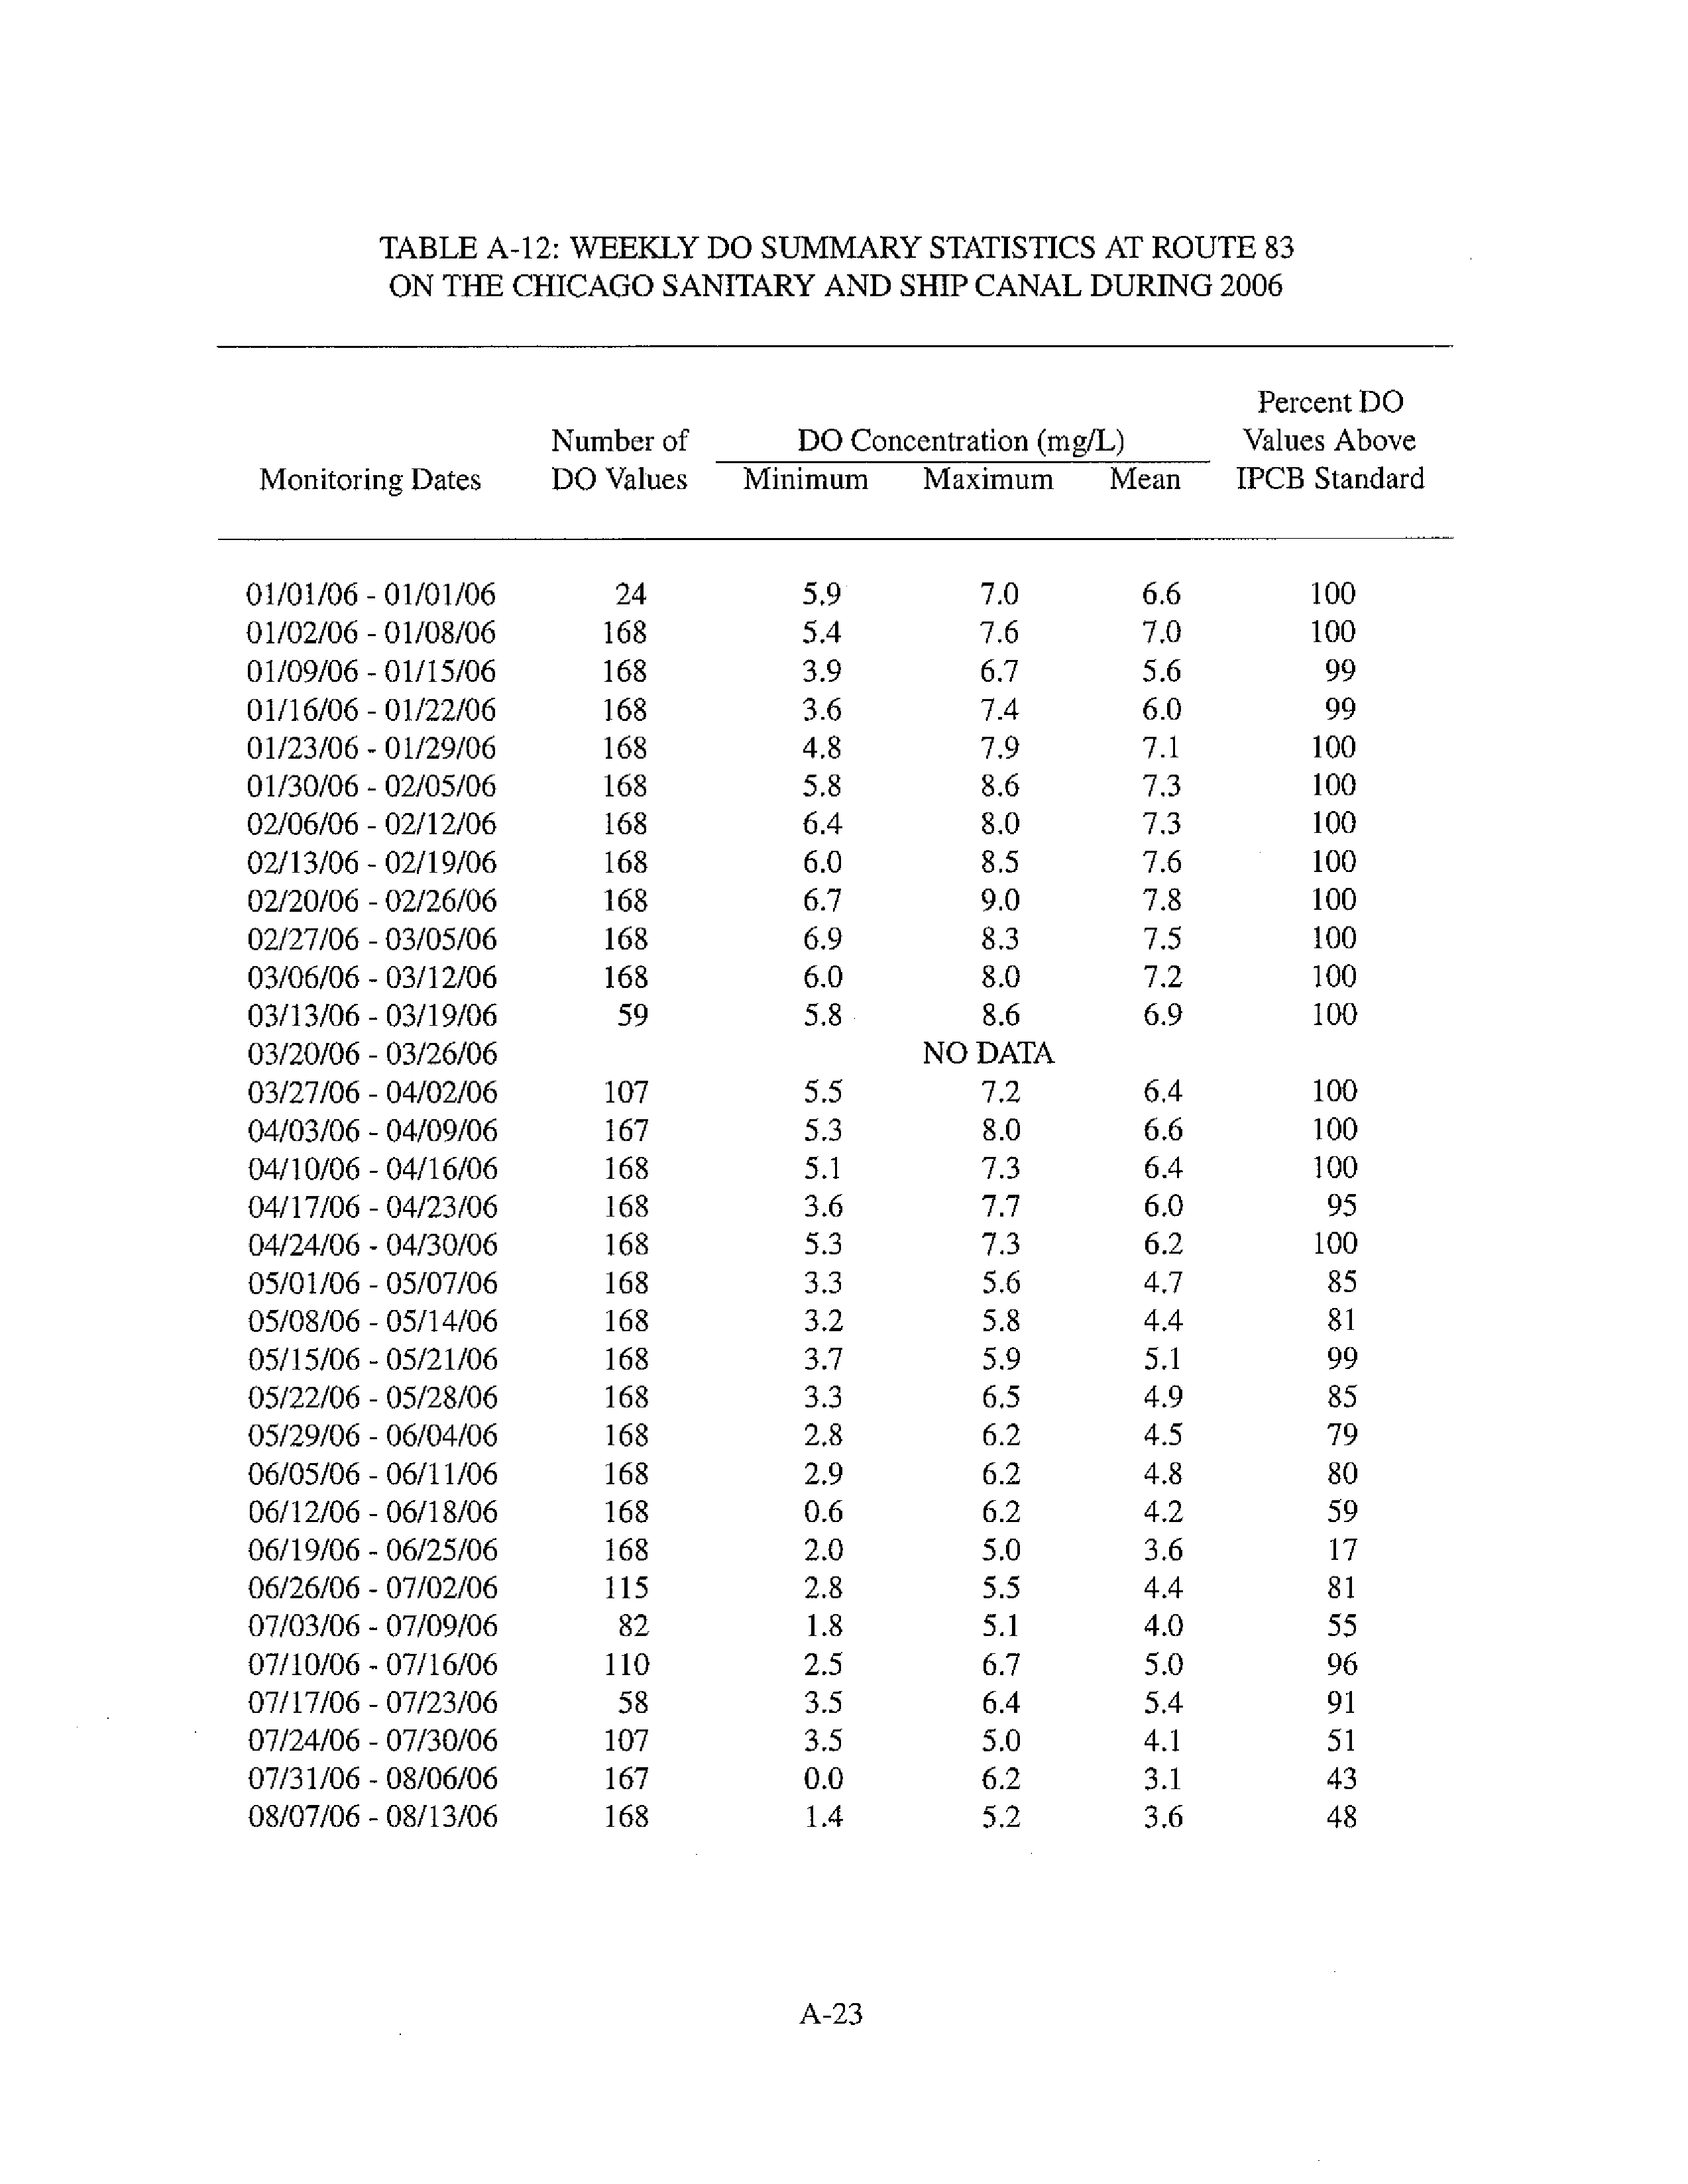
Continuous DO monitors at Route 83 on the Calumet-Sag
Channel show that the annual compliance with the 5.0 mg/L seasonal standard would have been
as low as 63.8 percent in 2005.
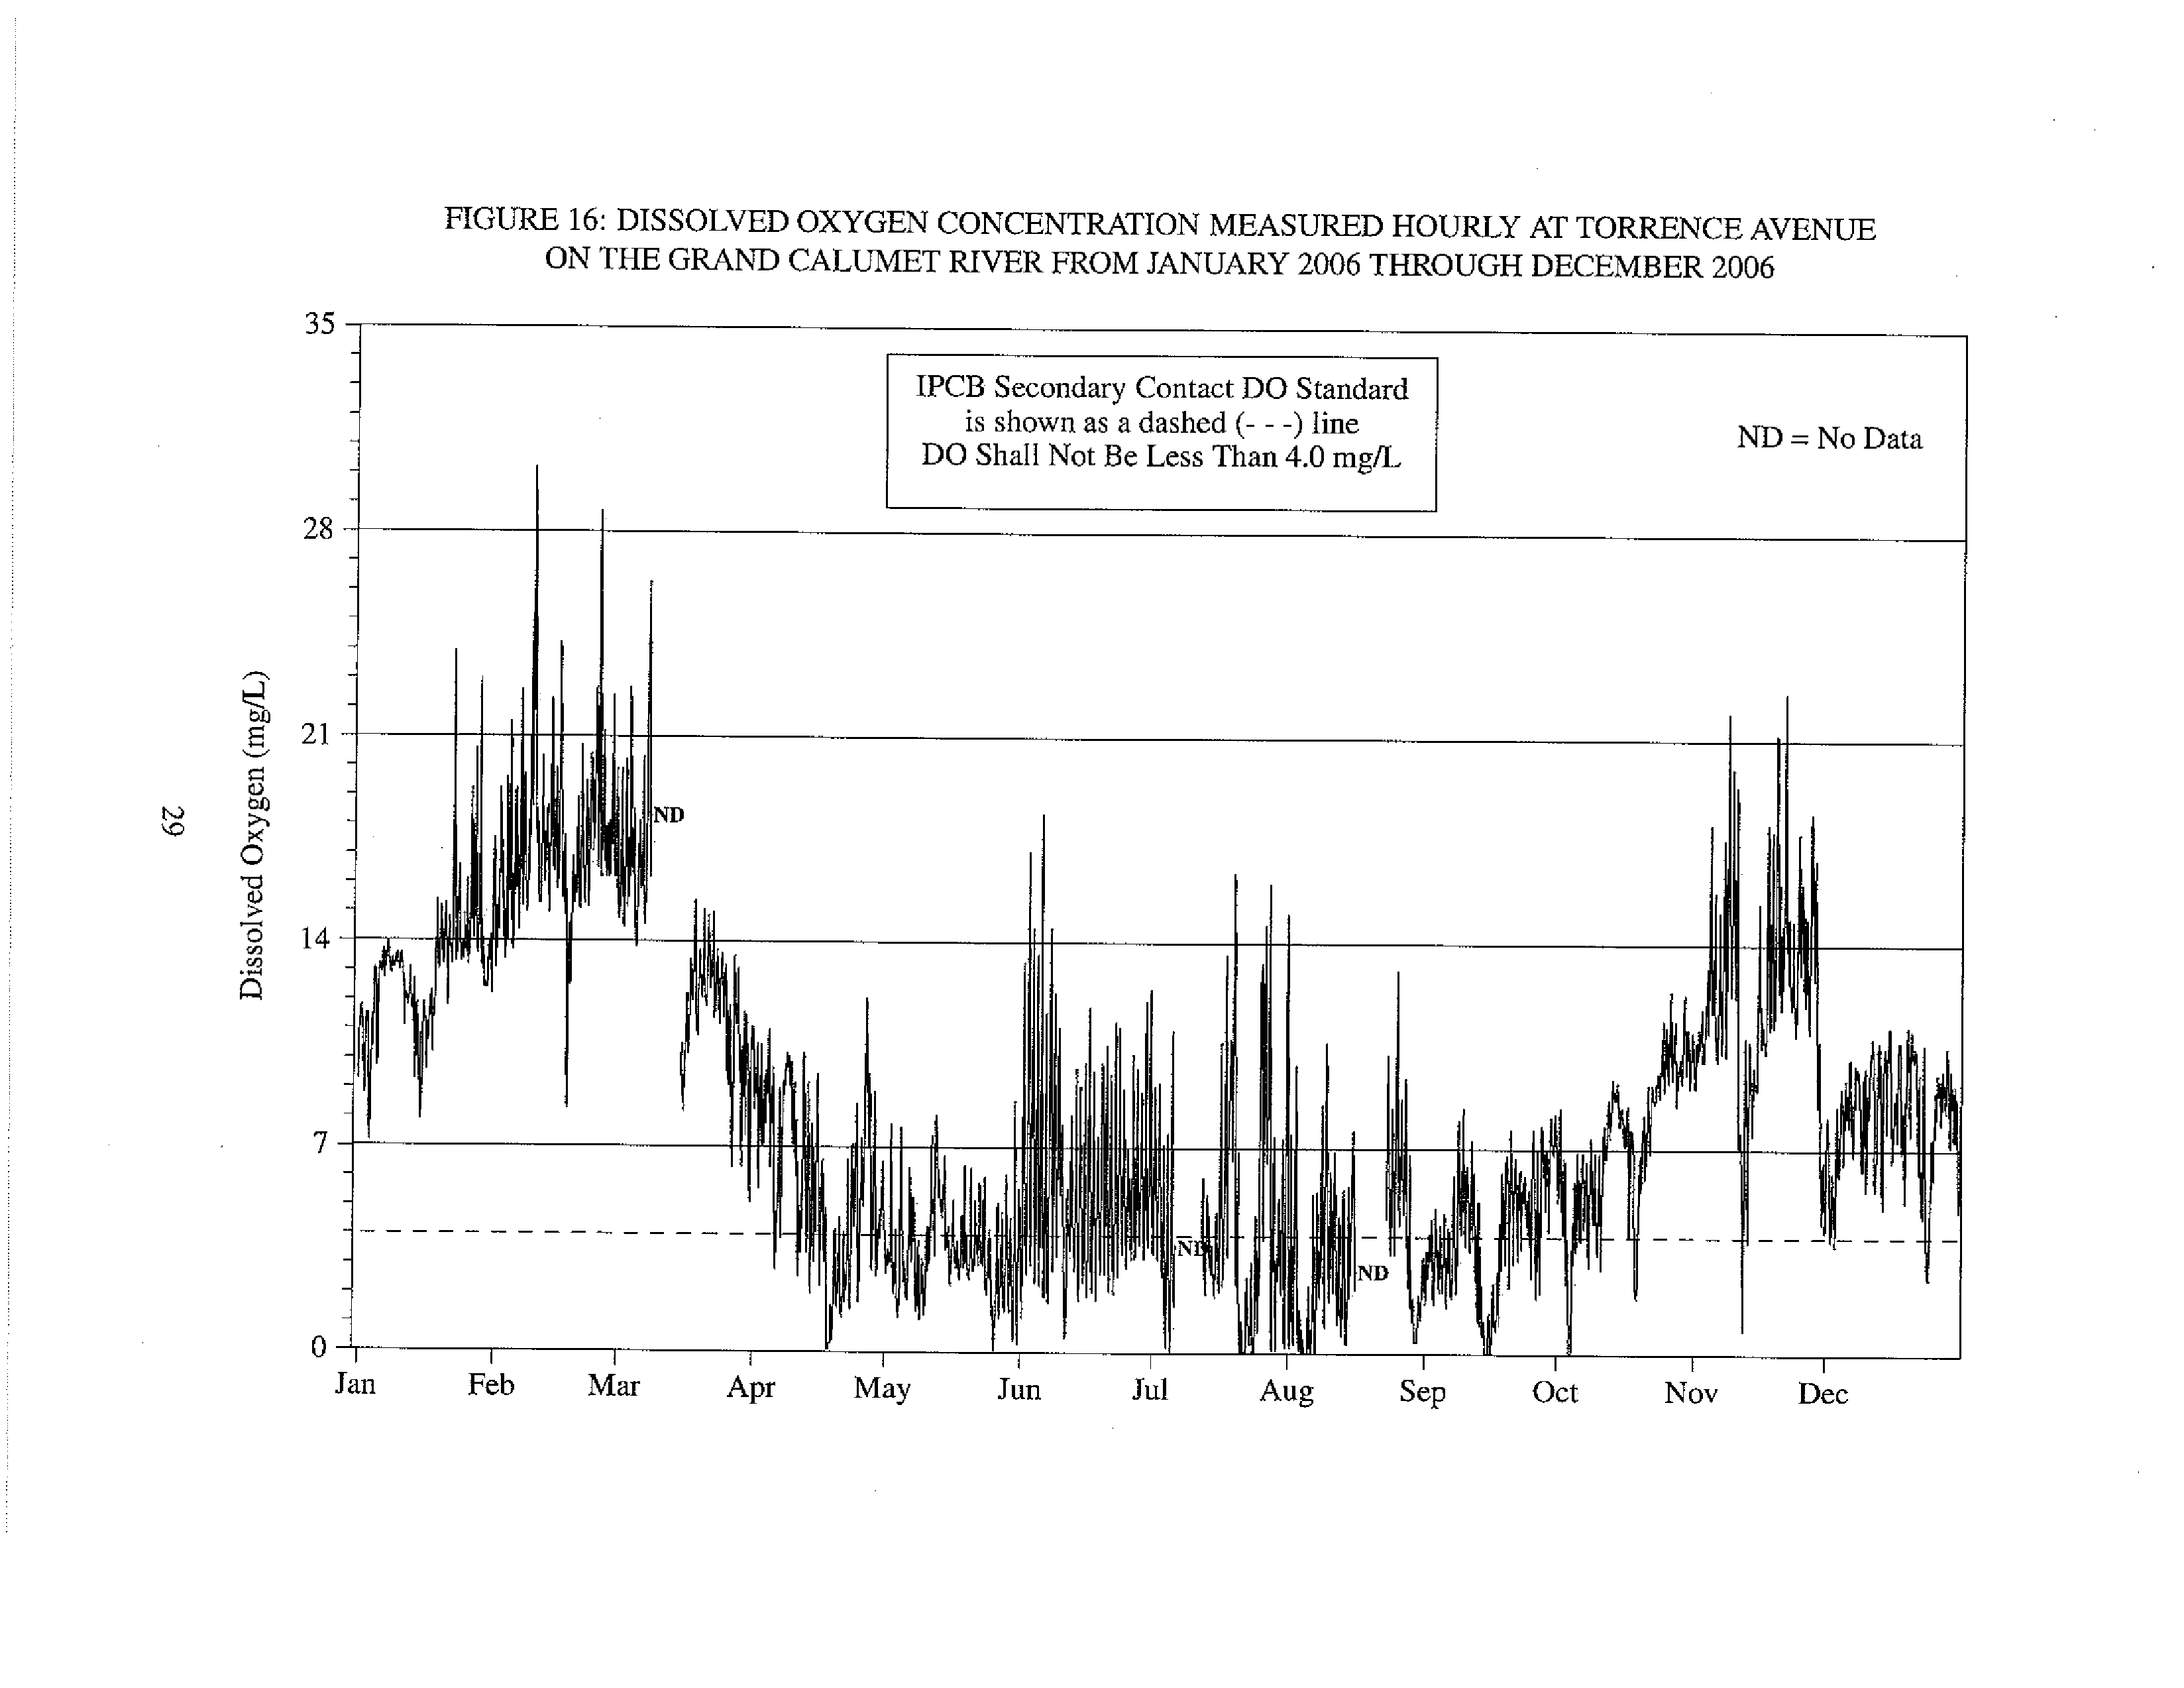
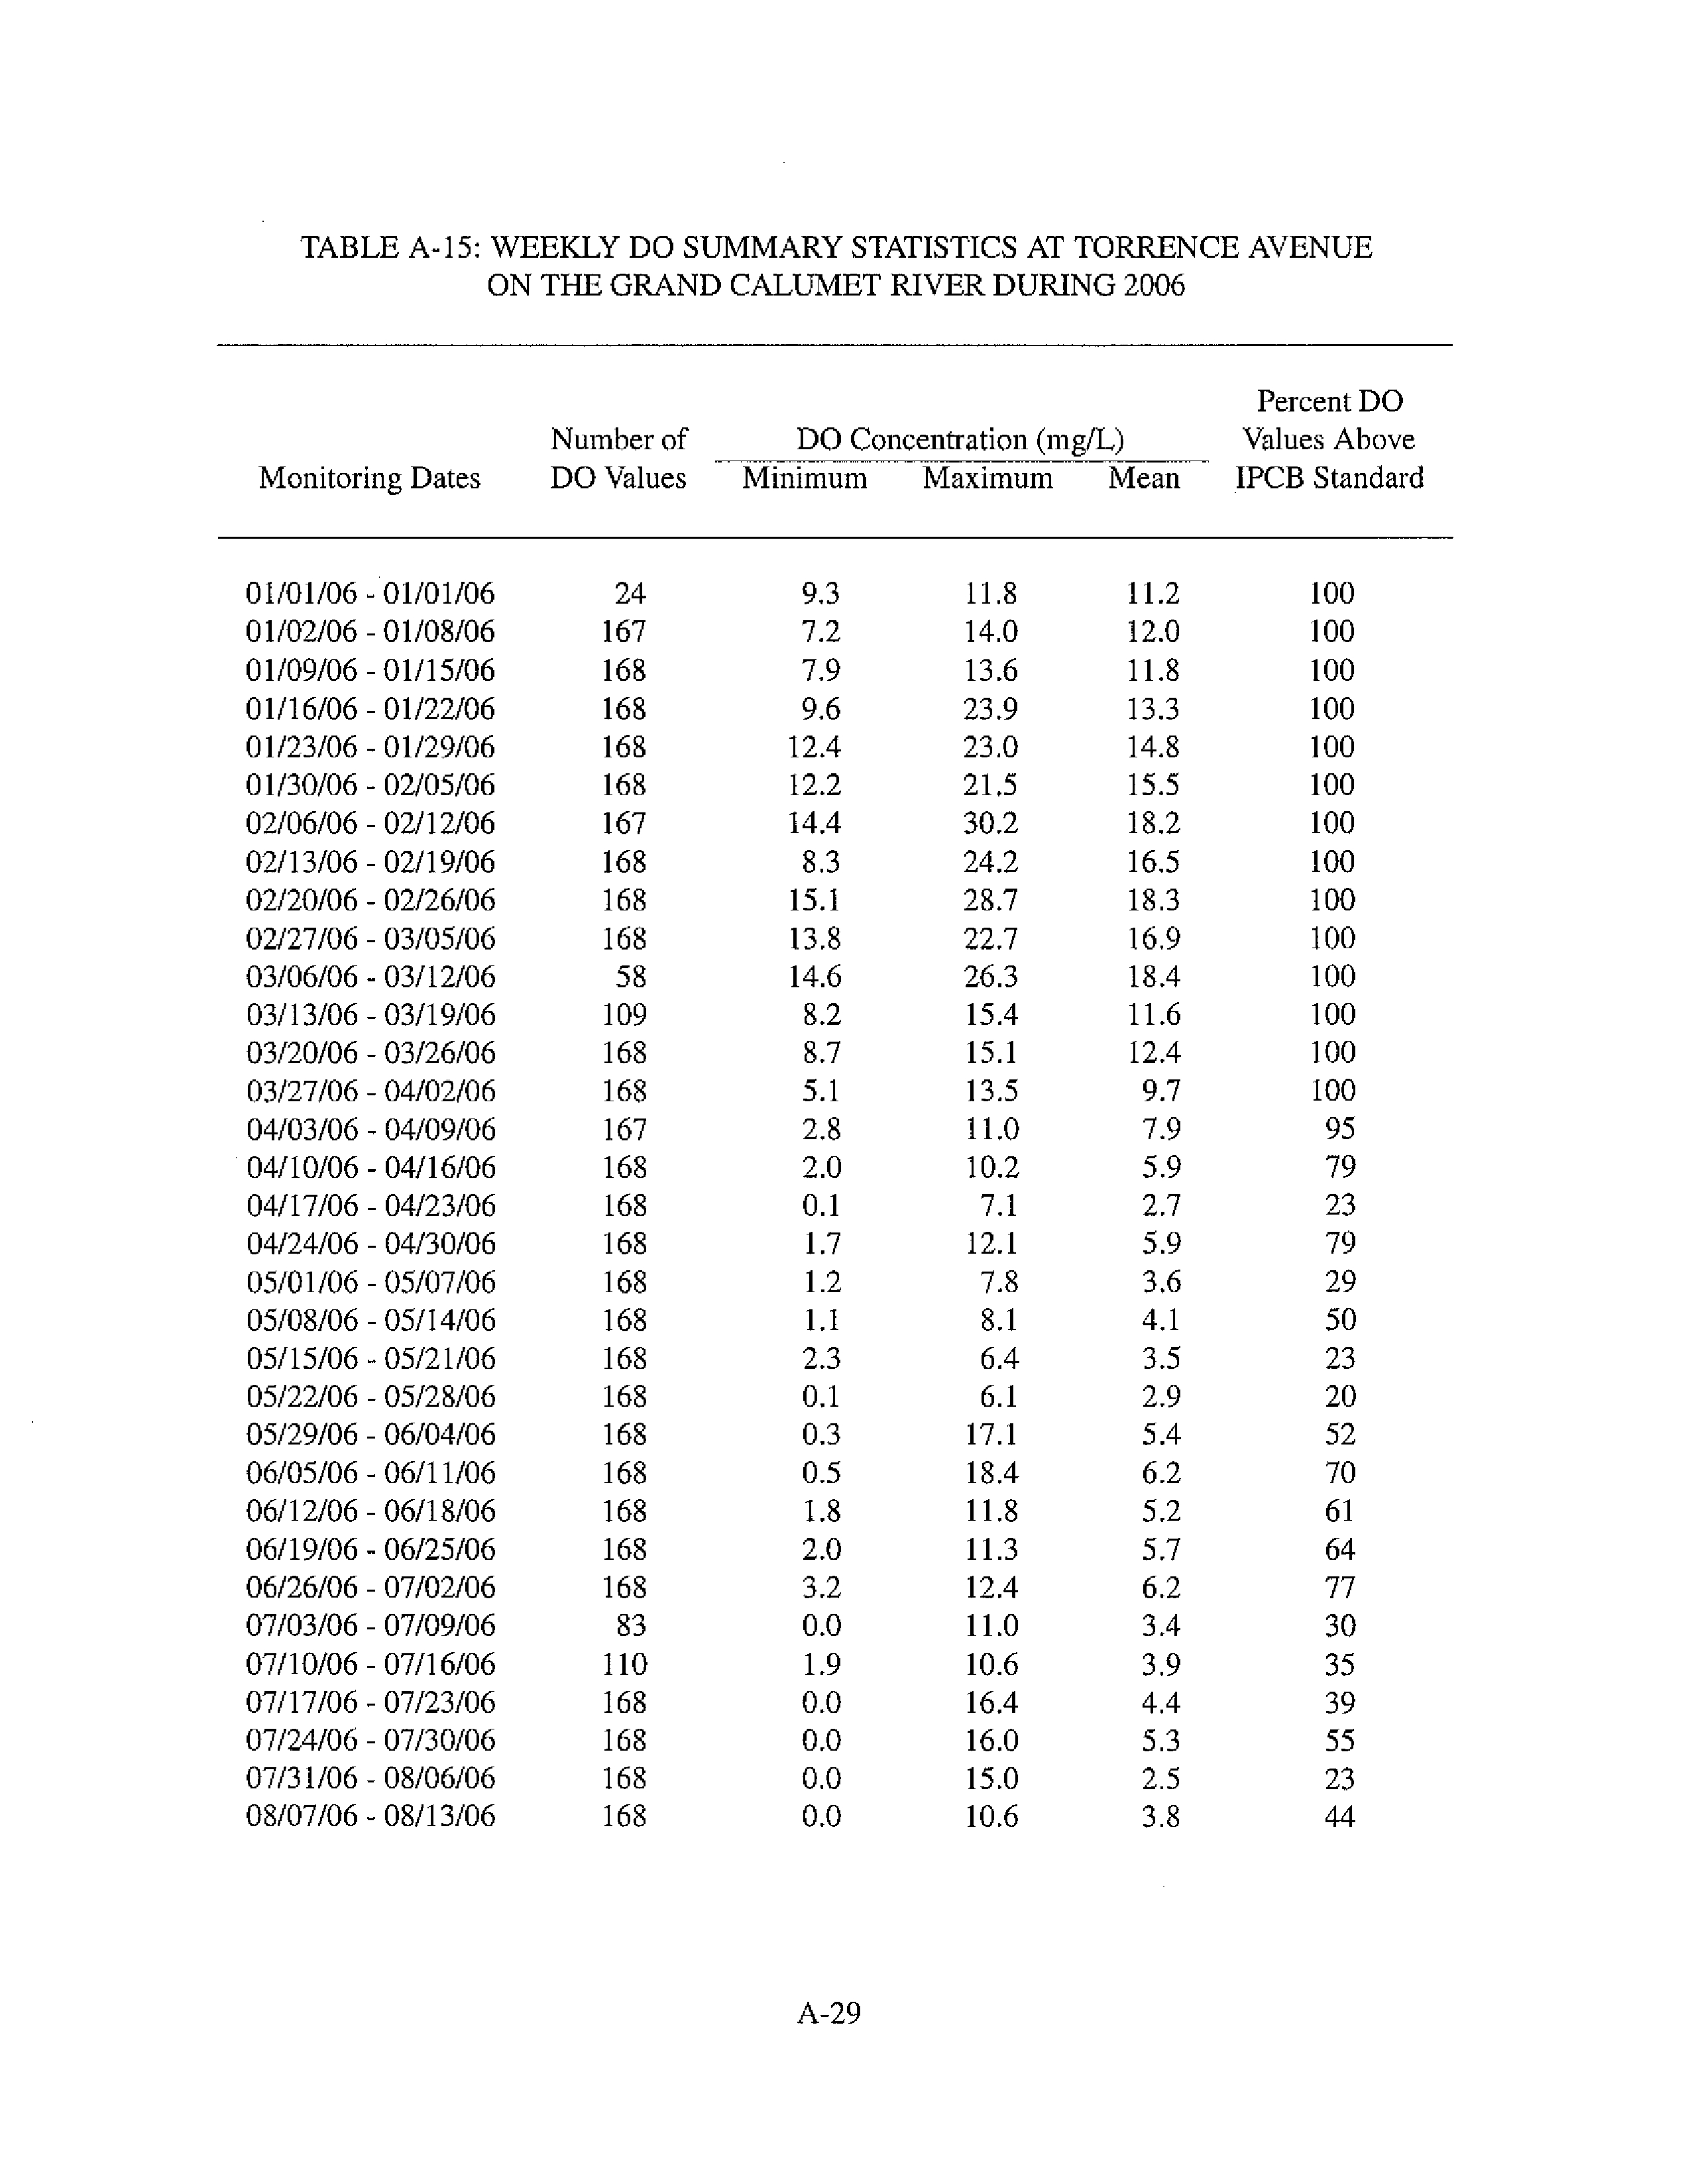
At Torrence Avenue on the Grand Calumet River, annual
compliance with the proposed 5.0 mg/L DO standard would have ranged between 47.7-62.0
percent between 2005-2007.
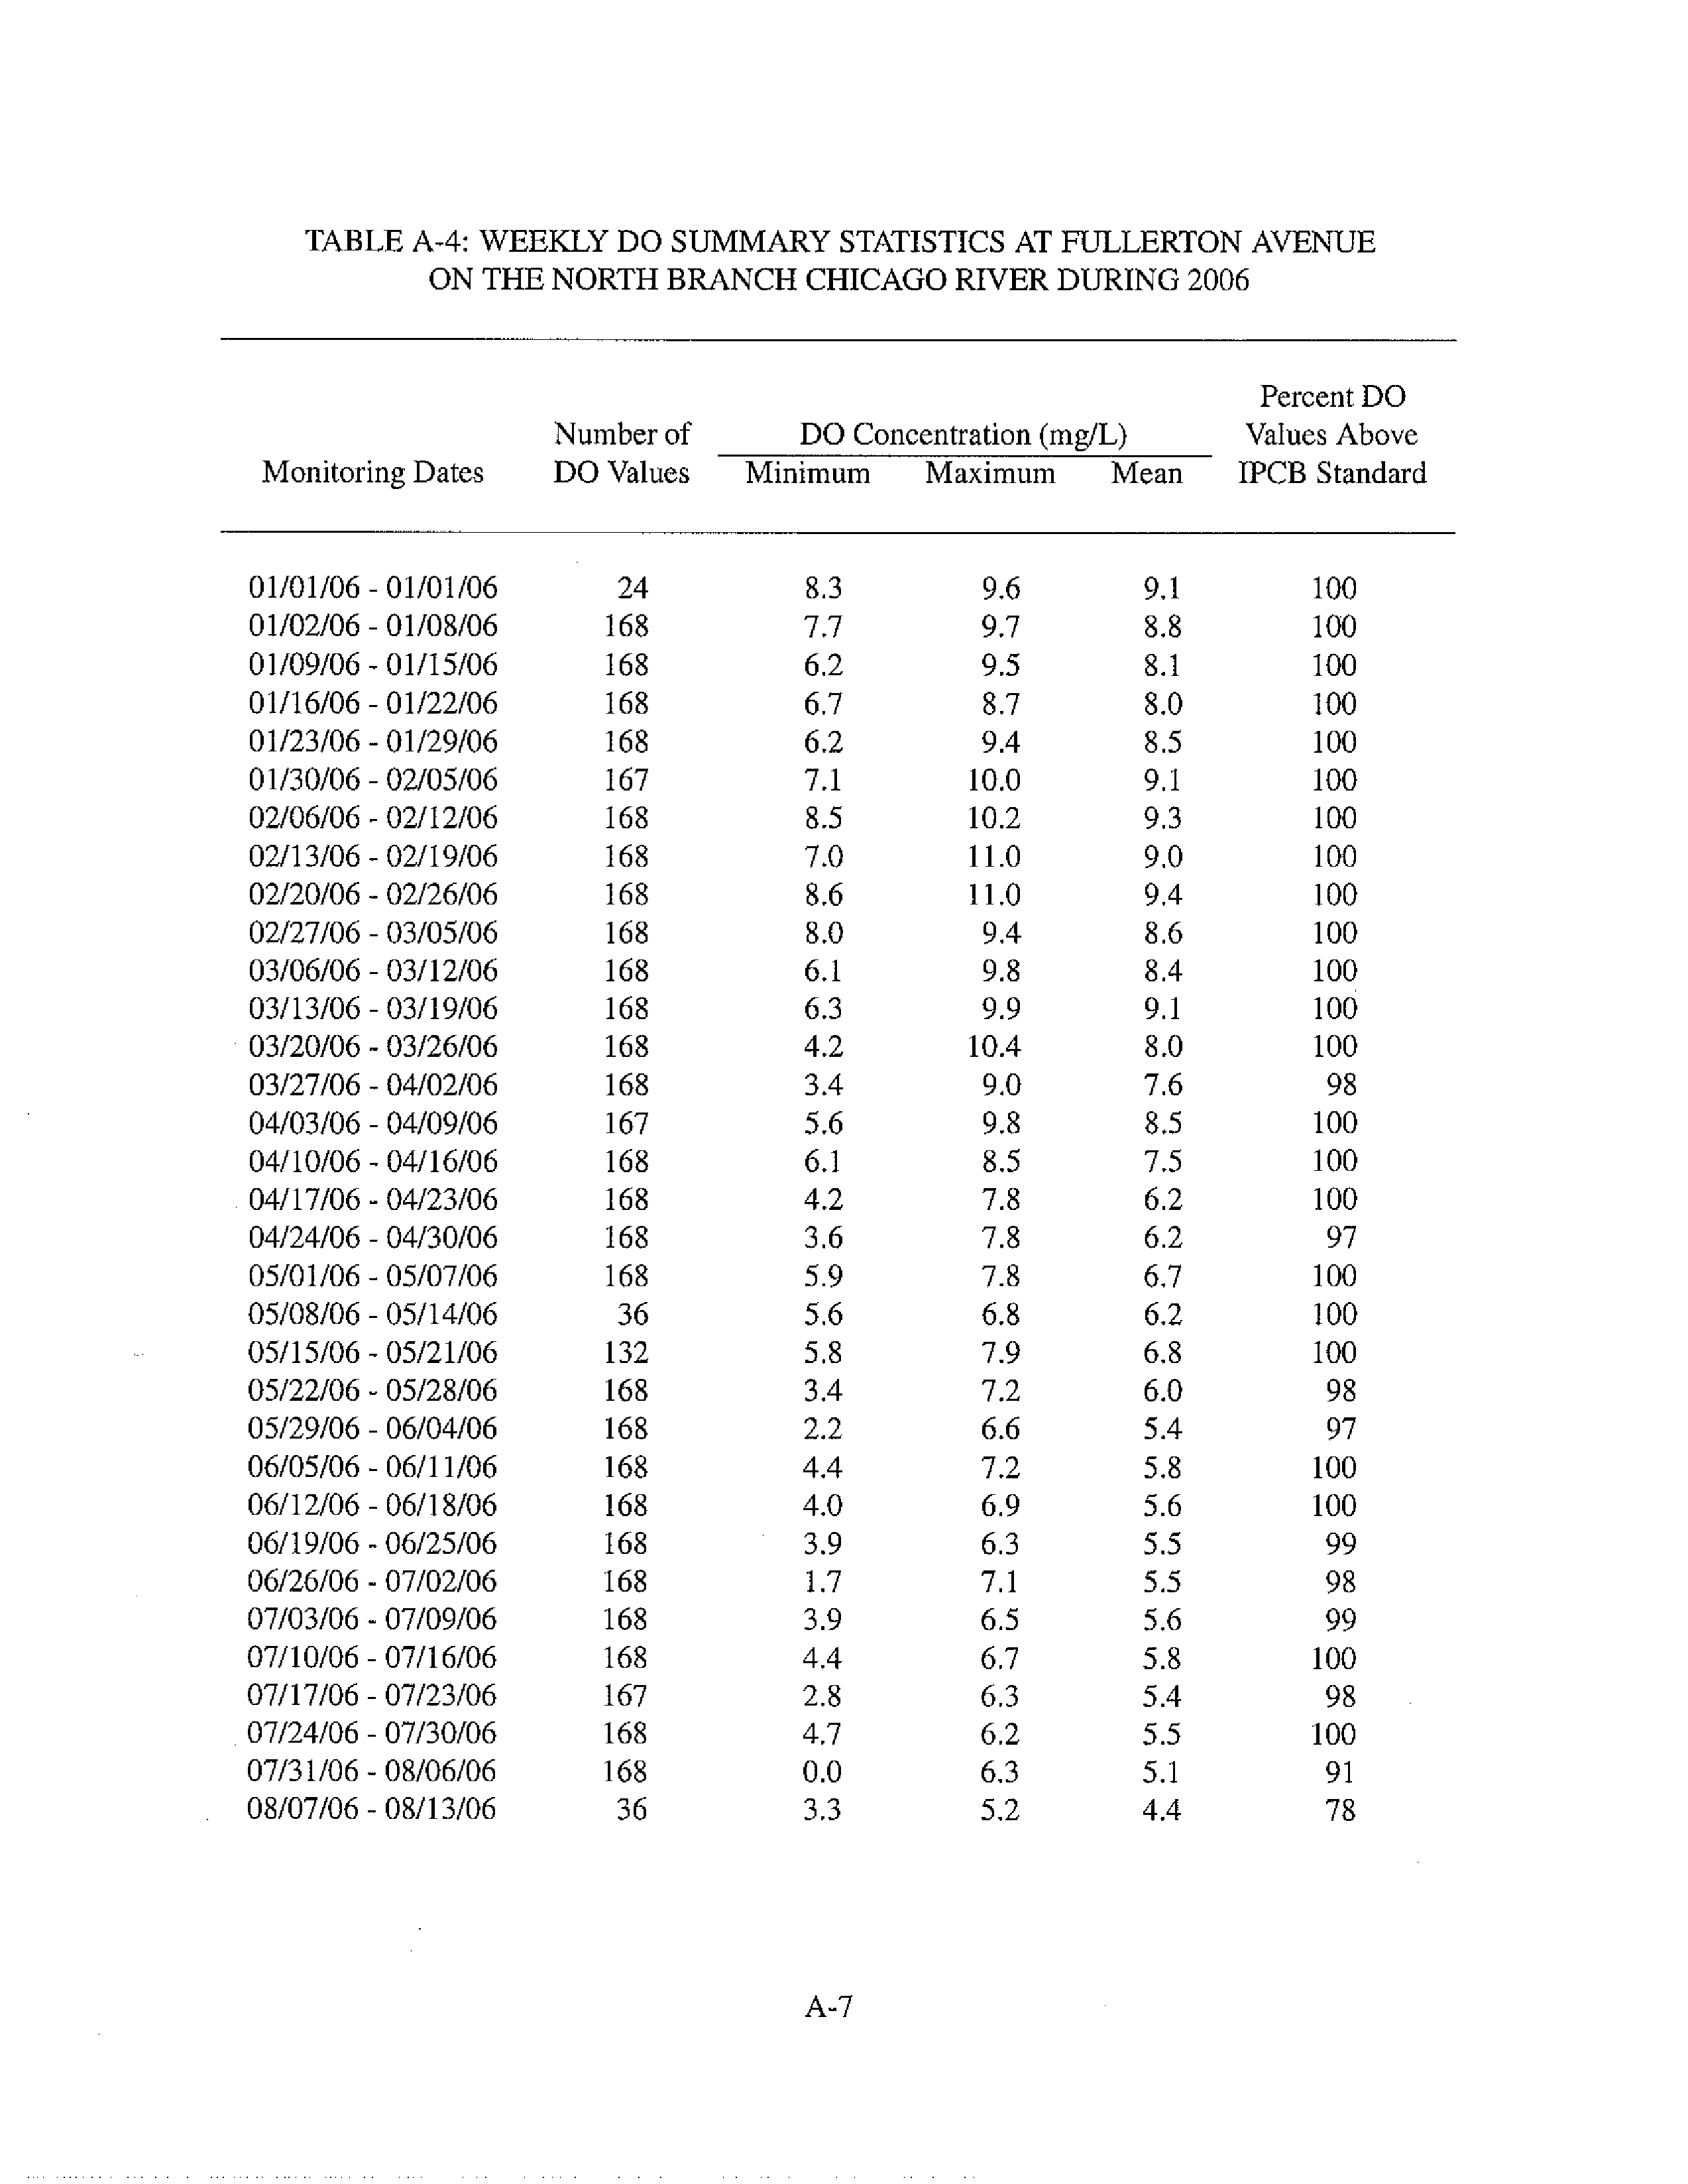
In the North Branch of the Chicago River at Fullerton Avenue, compliance with the
Aquatic Life Use A seasonal DO standard of 5.0 mg/L would have only been 65 percent during
2005, which was a very dry year.
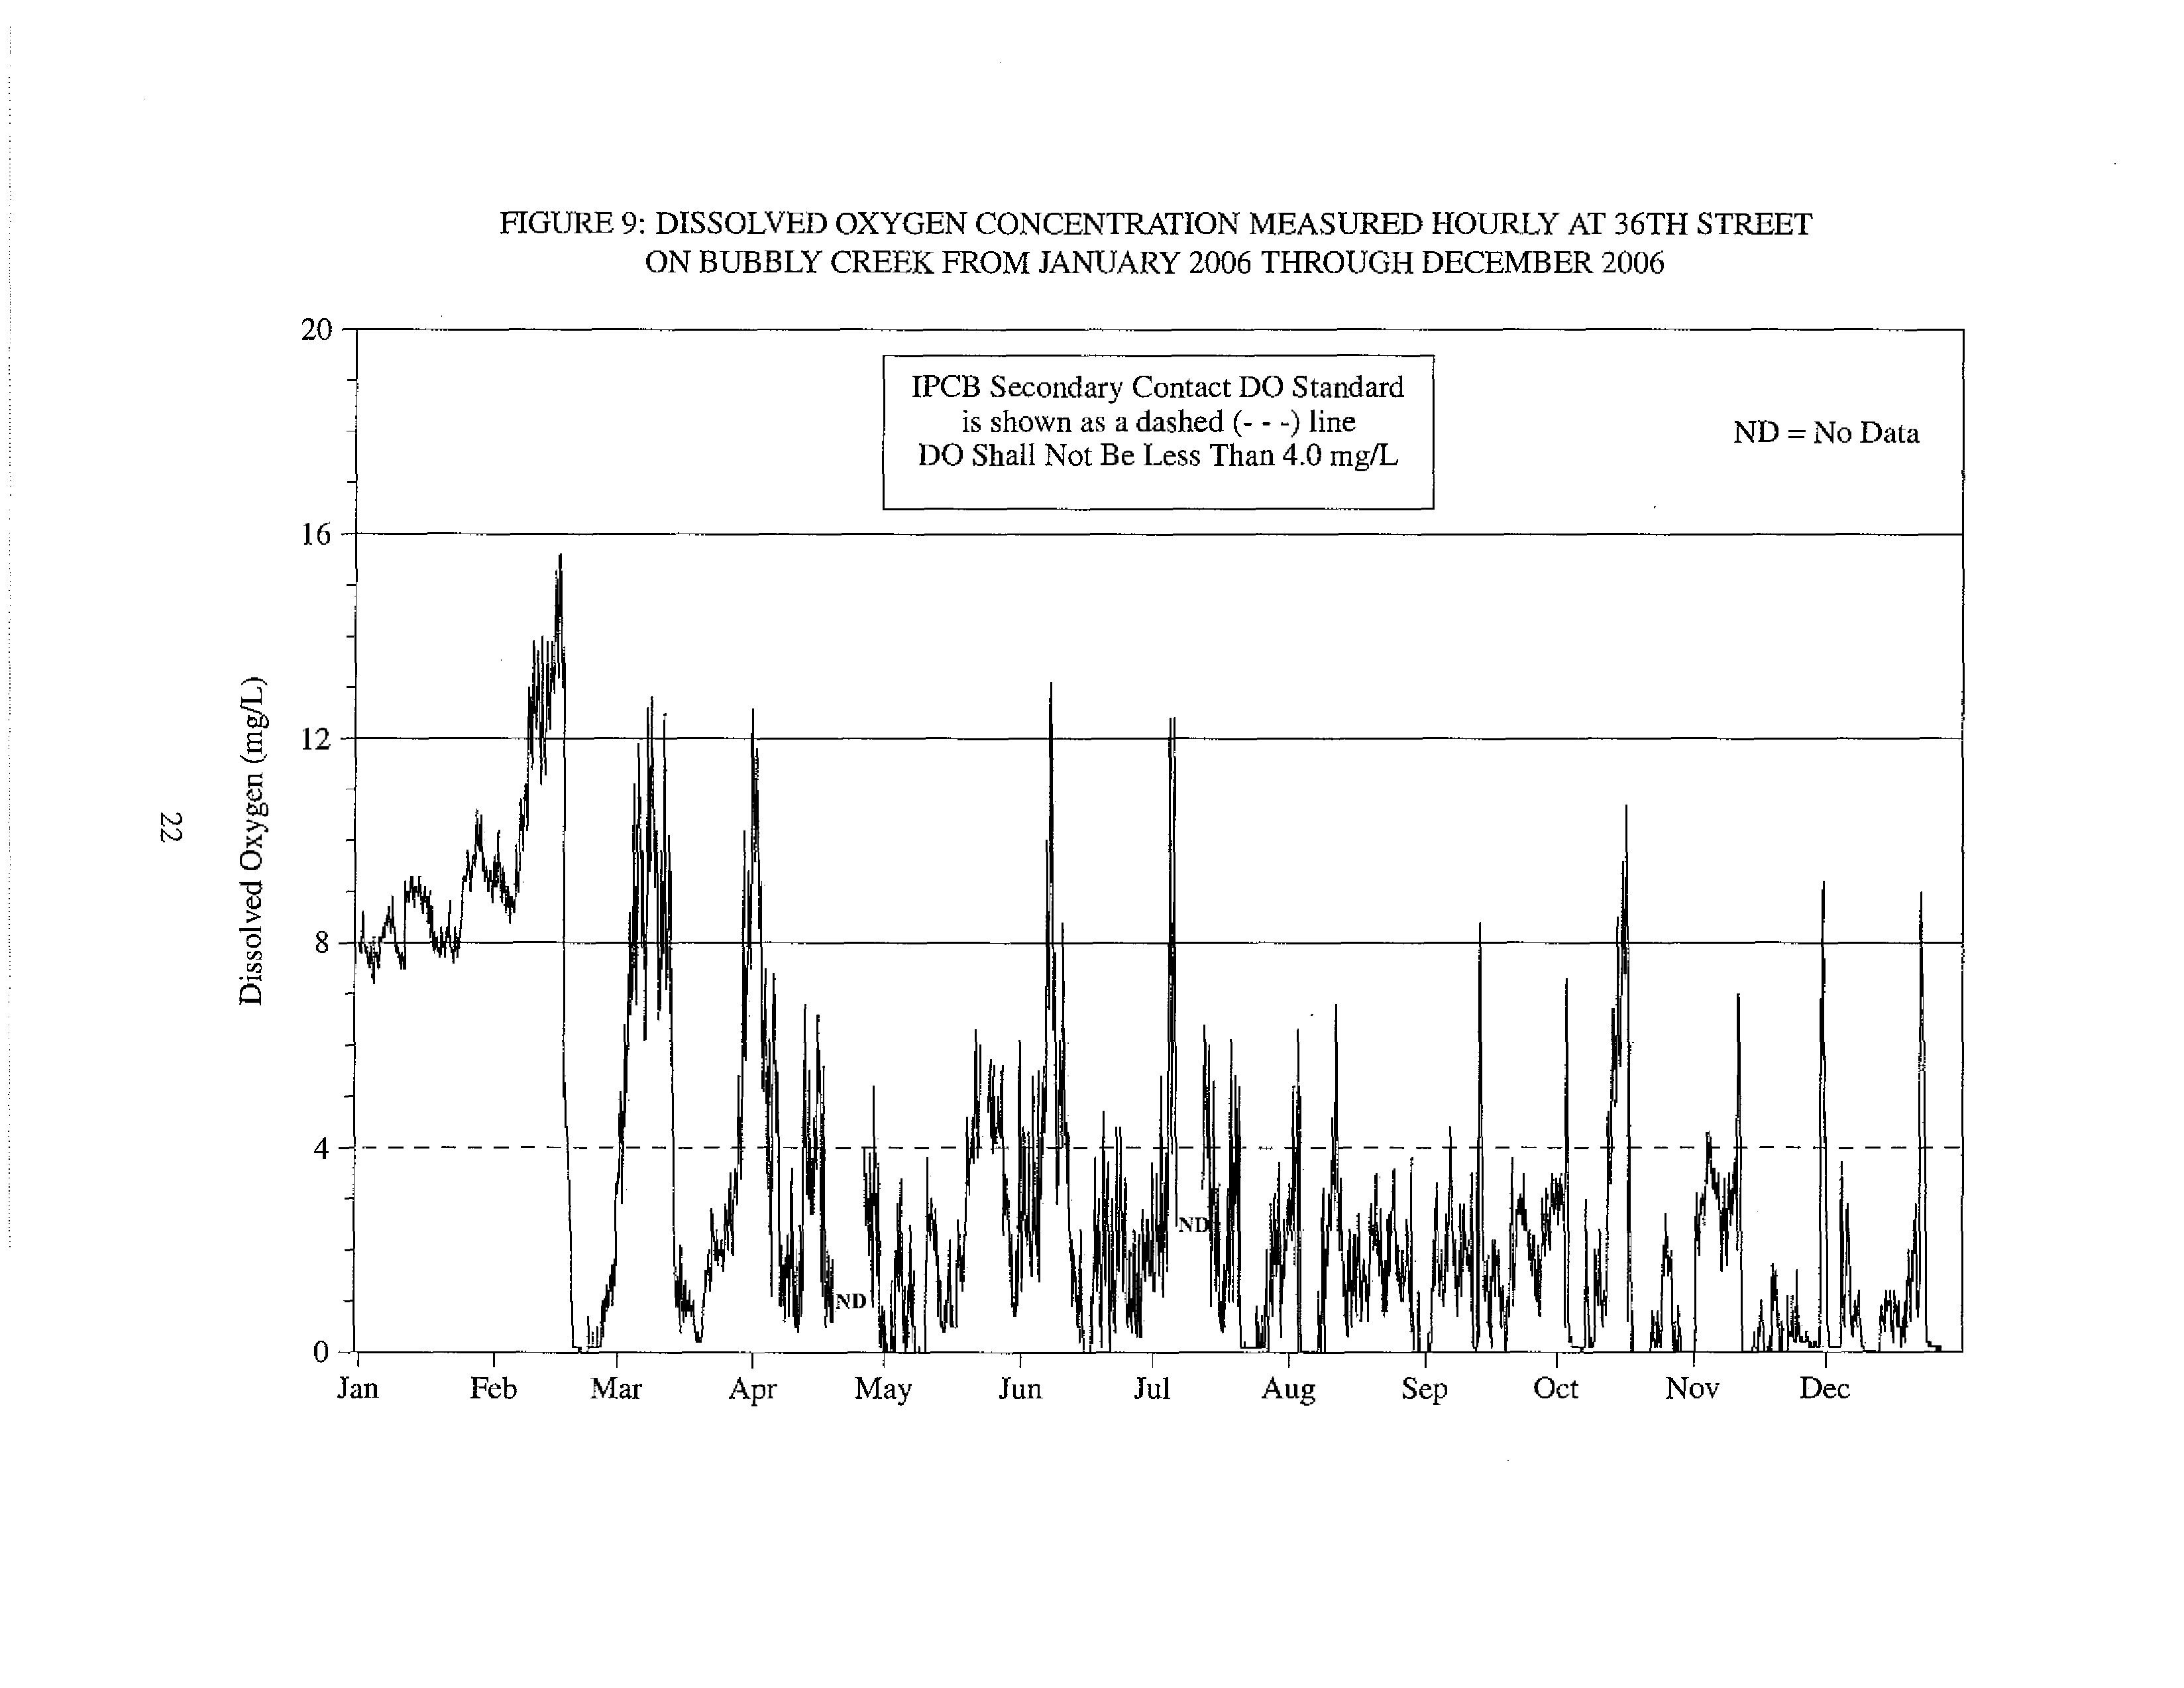
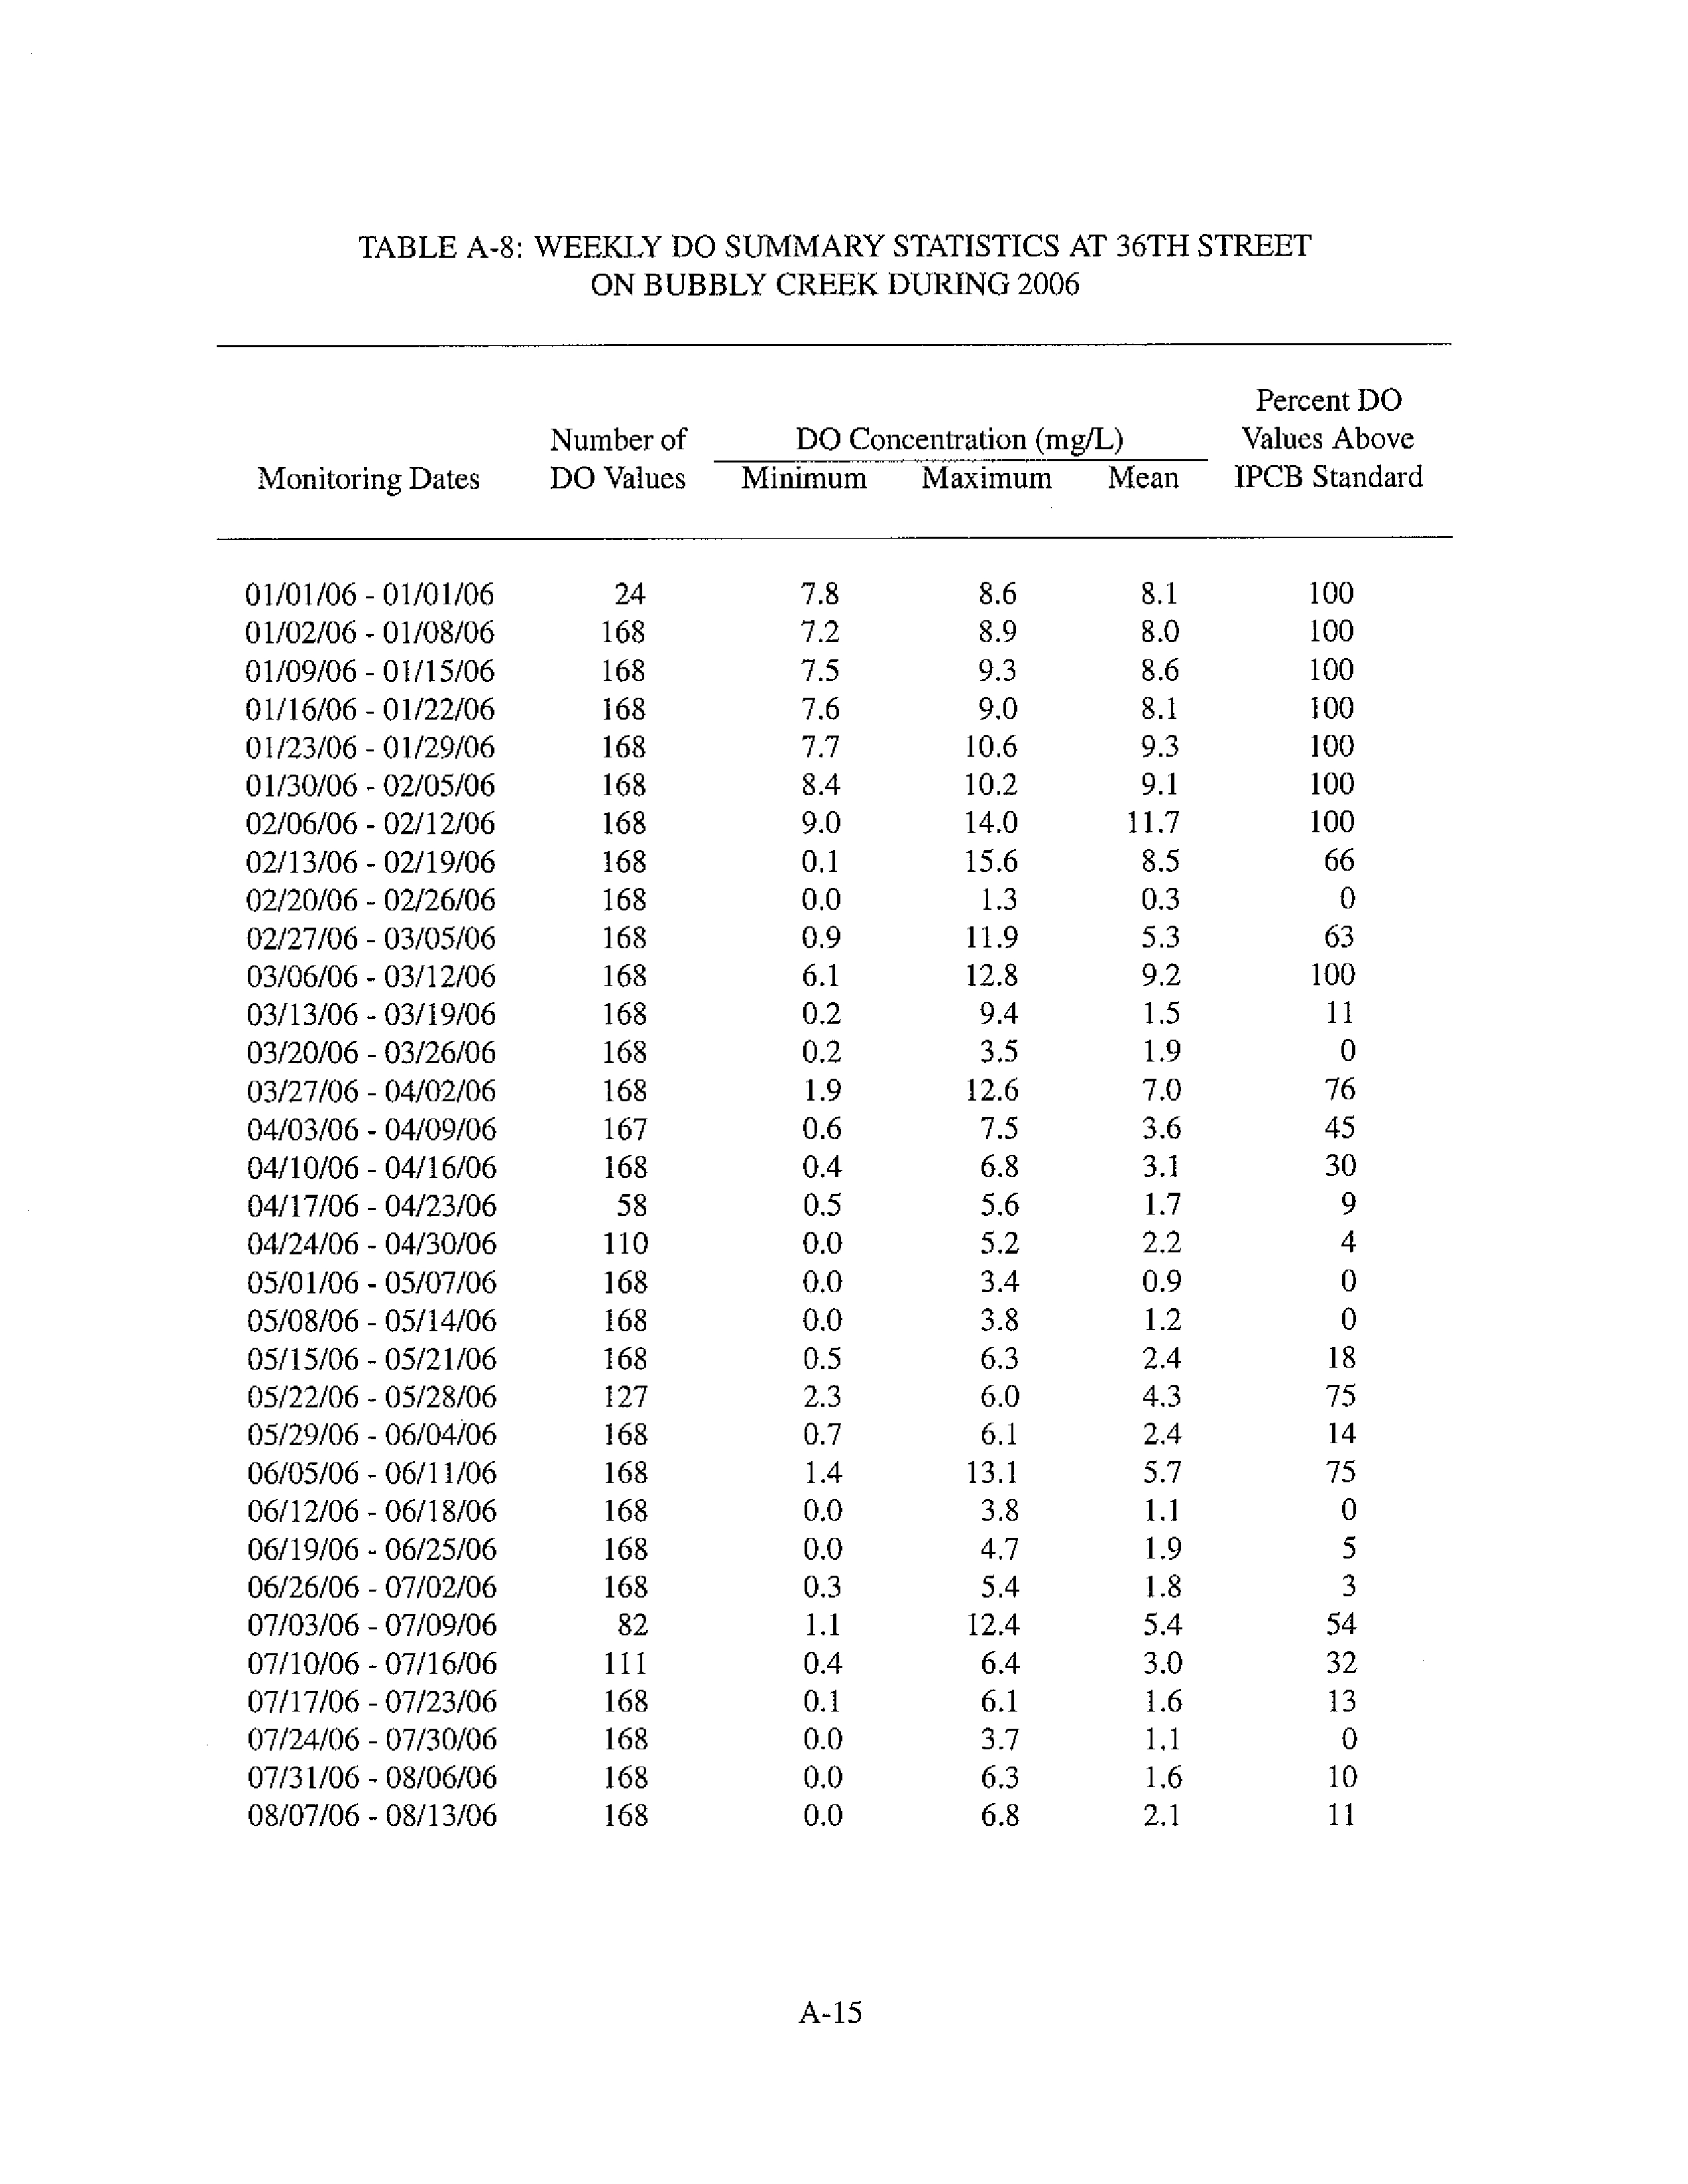
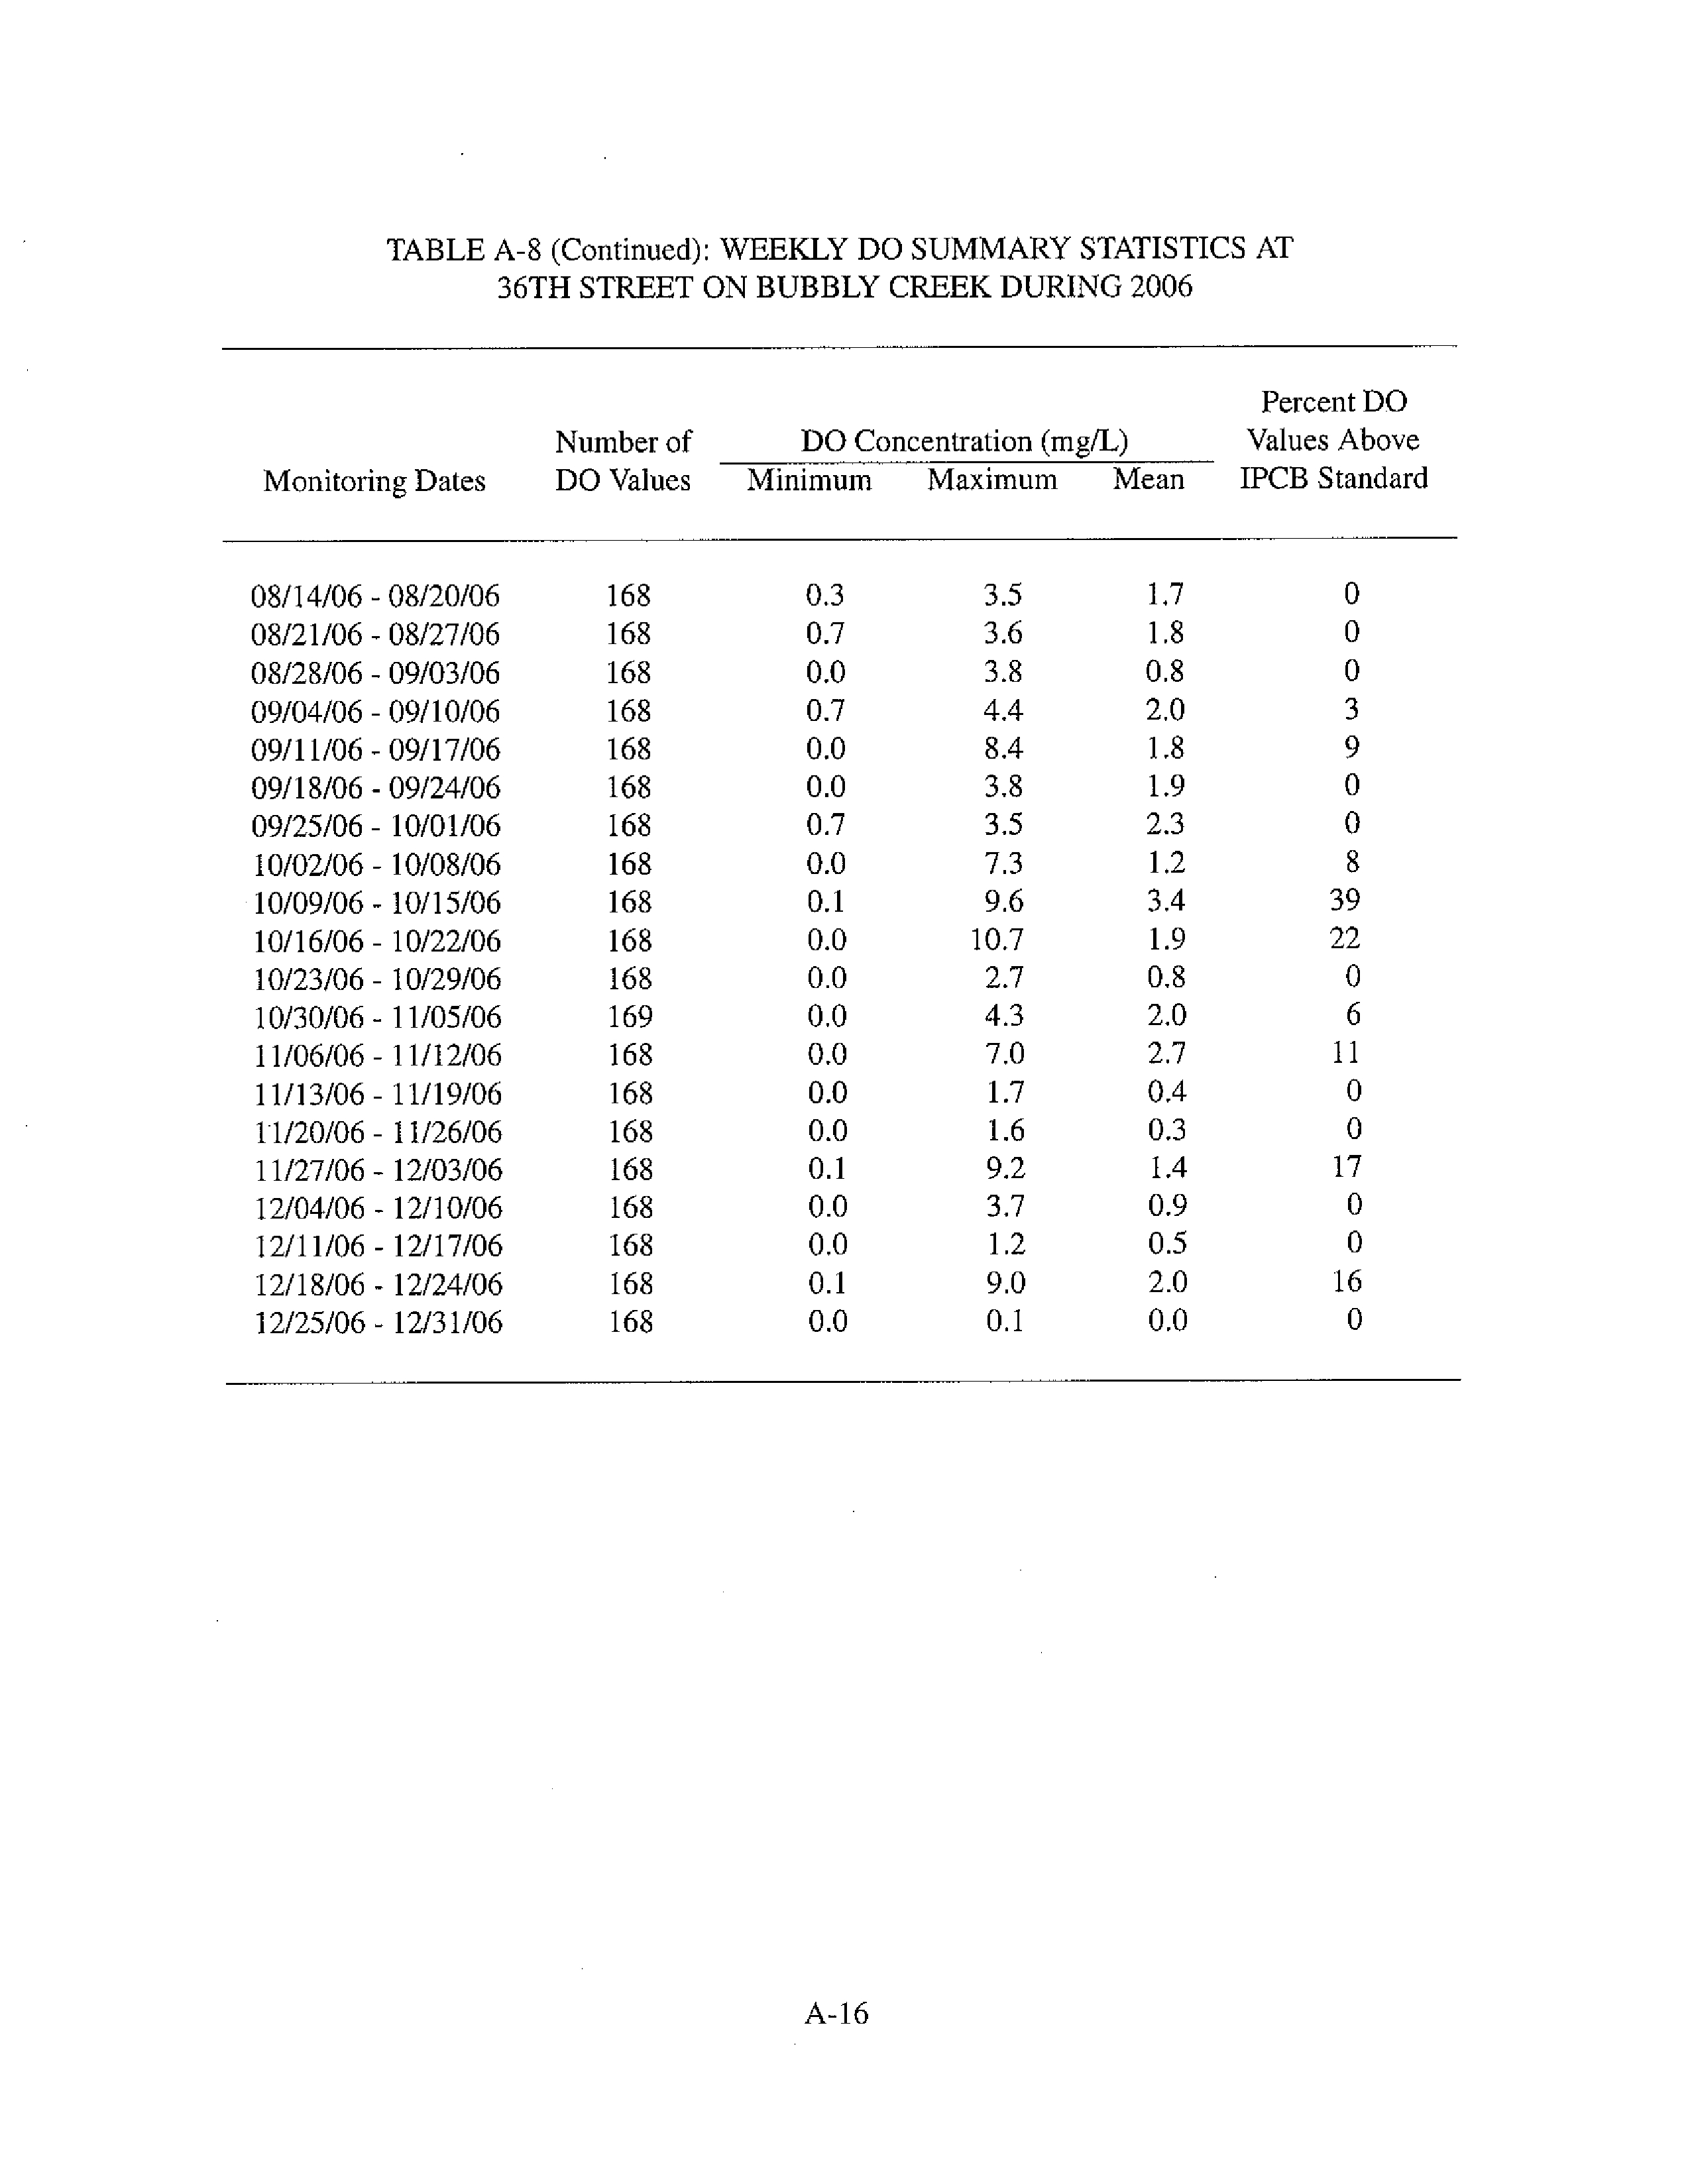
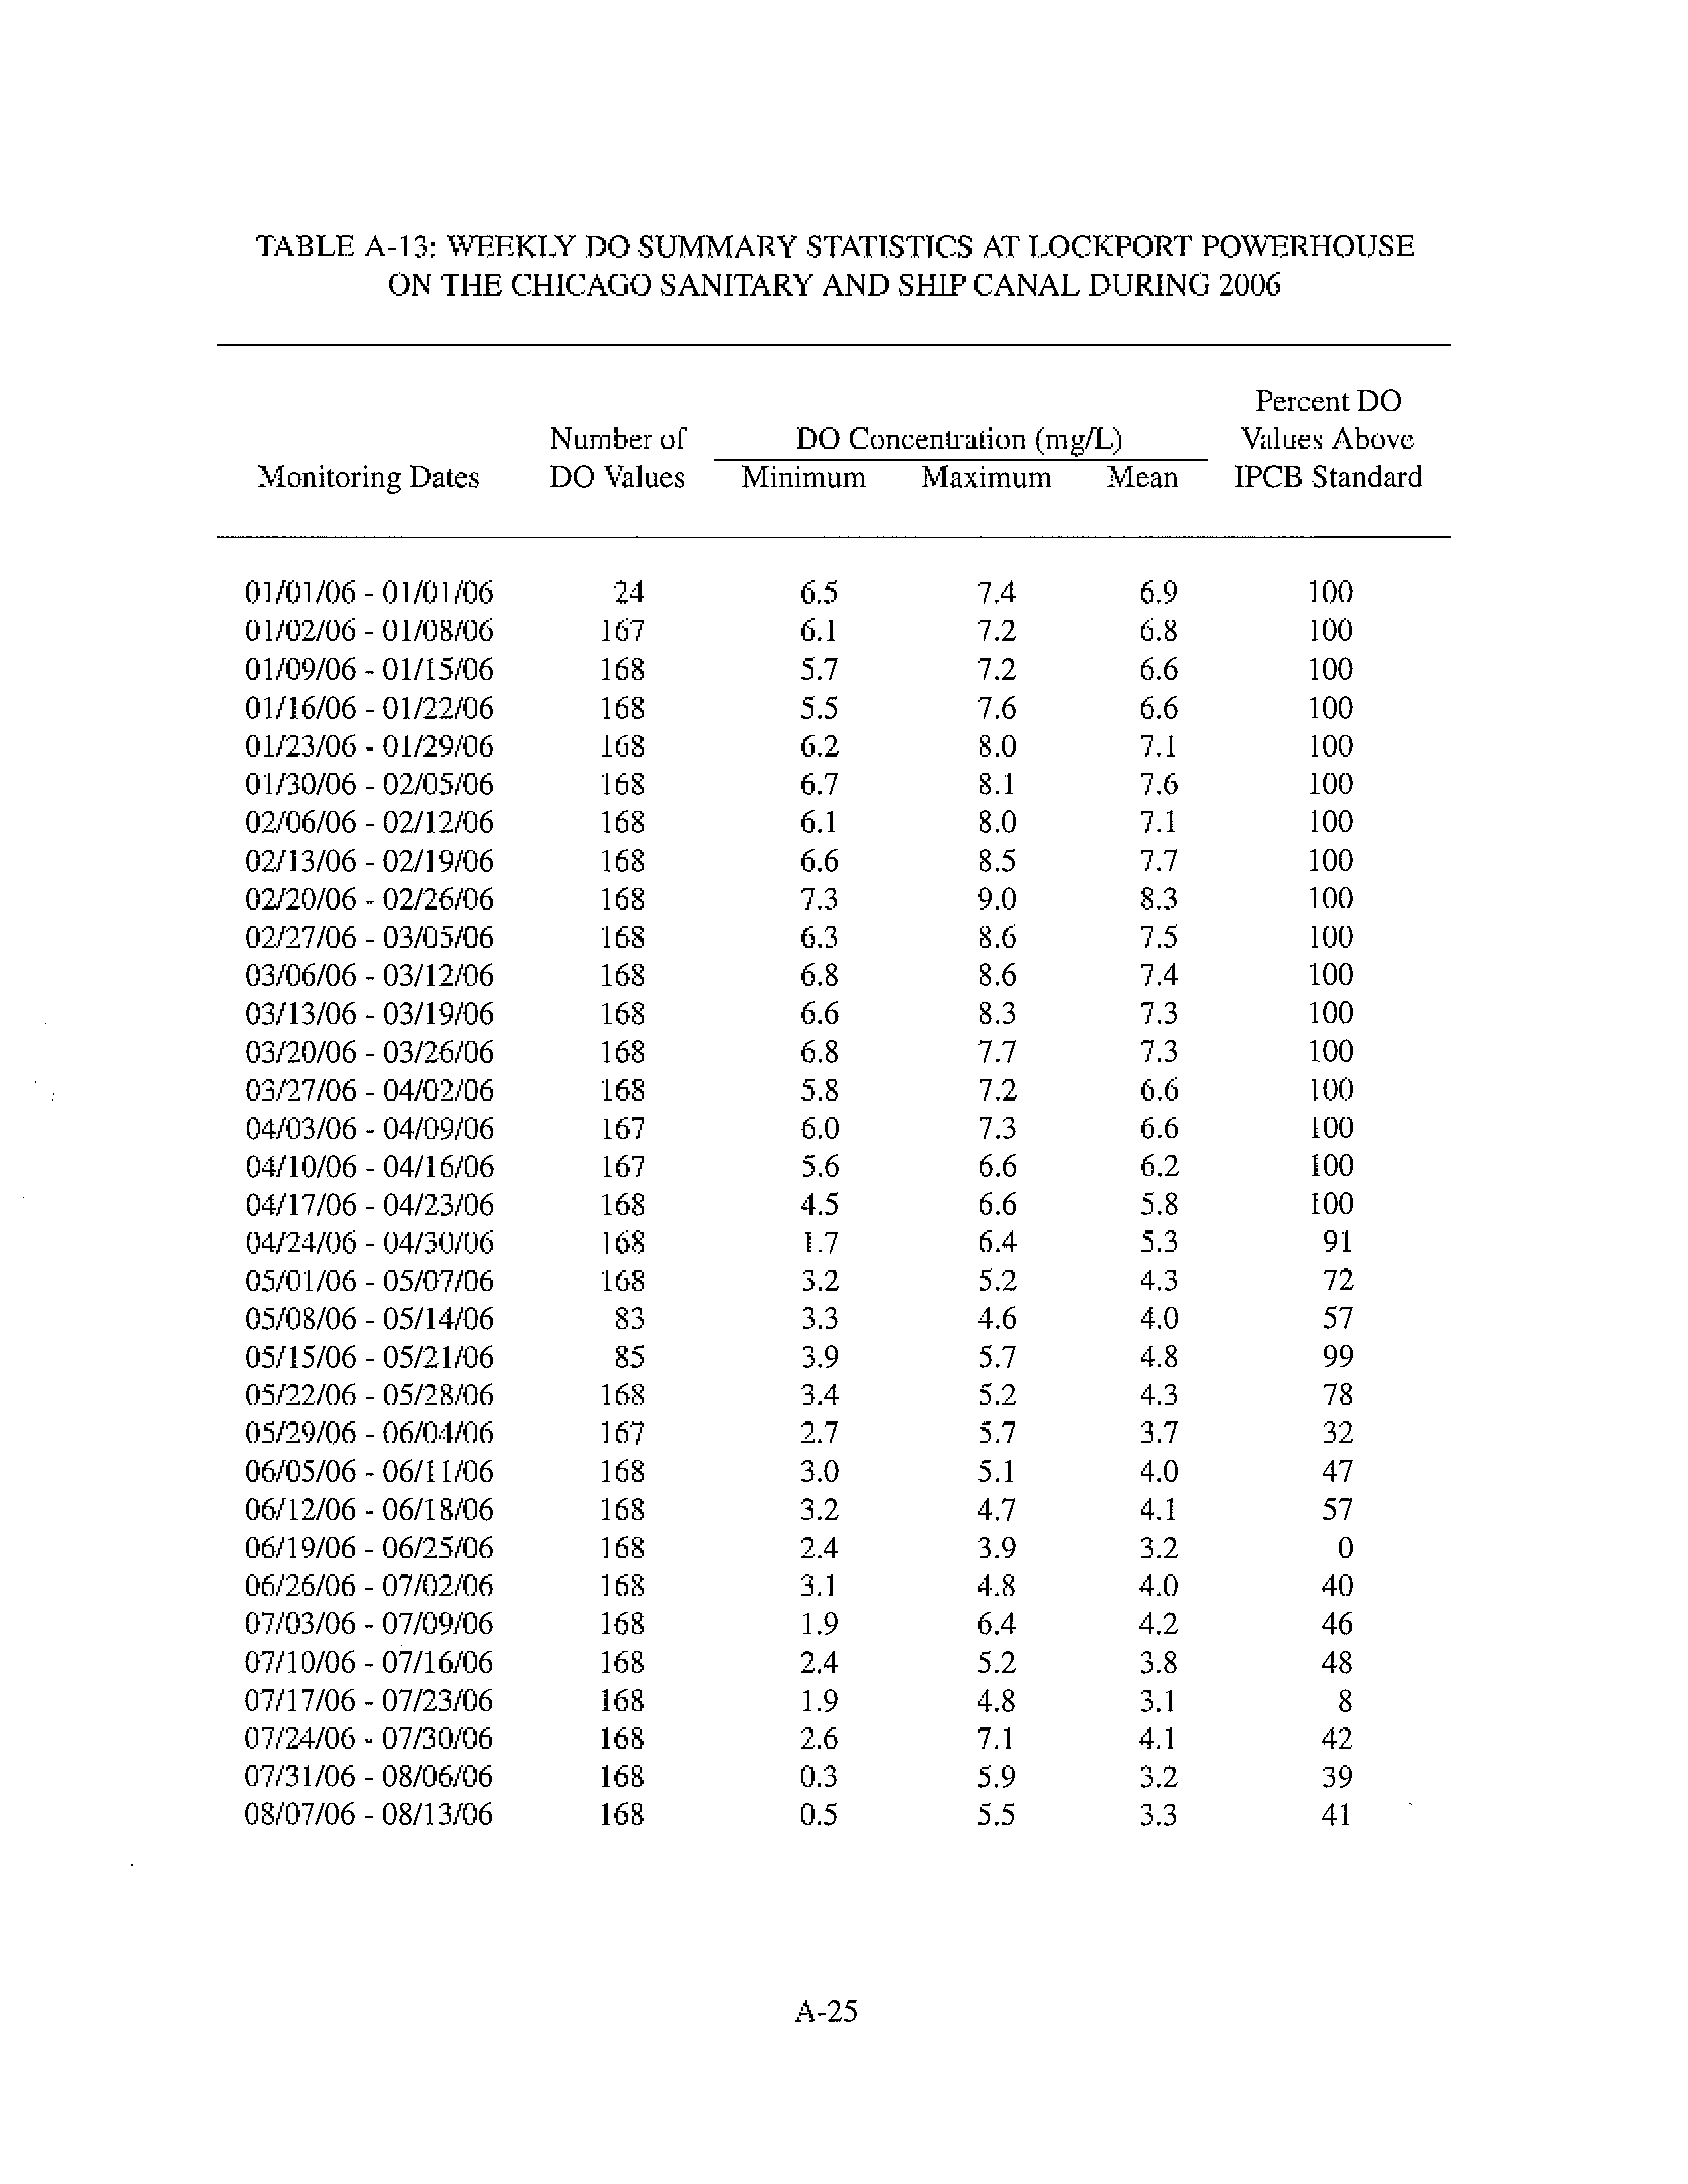
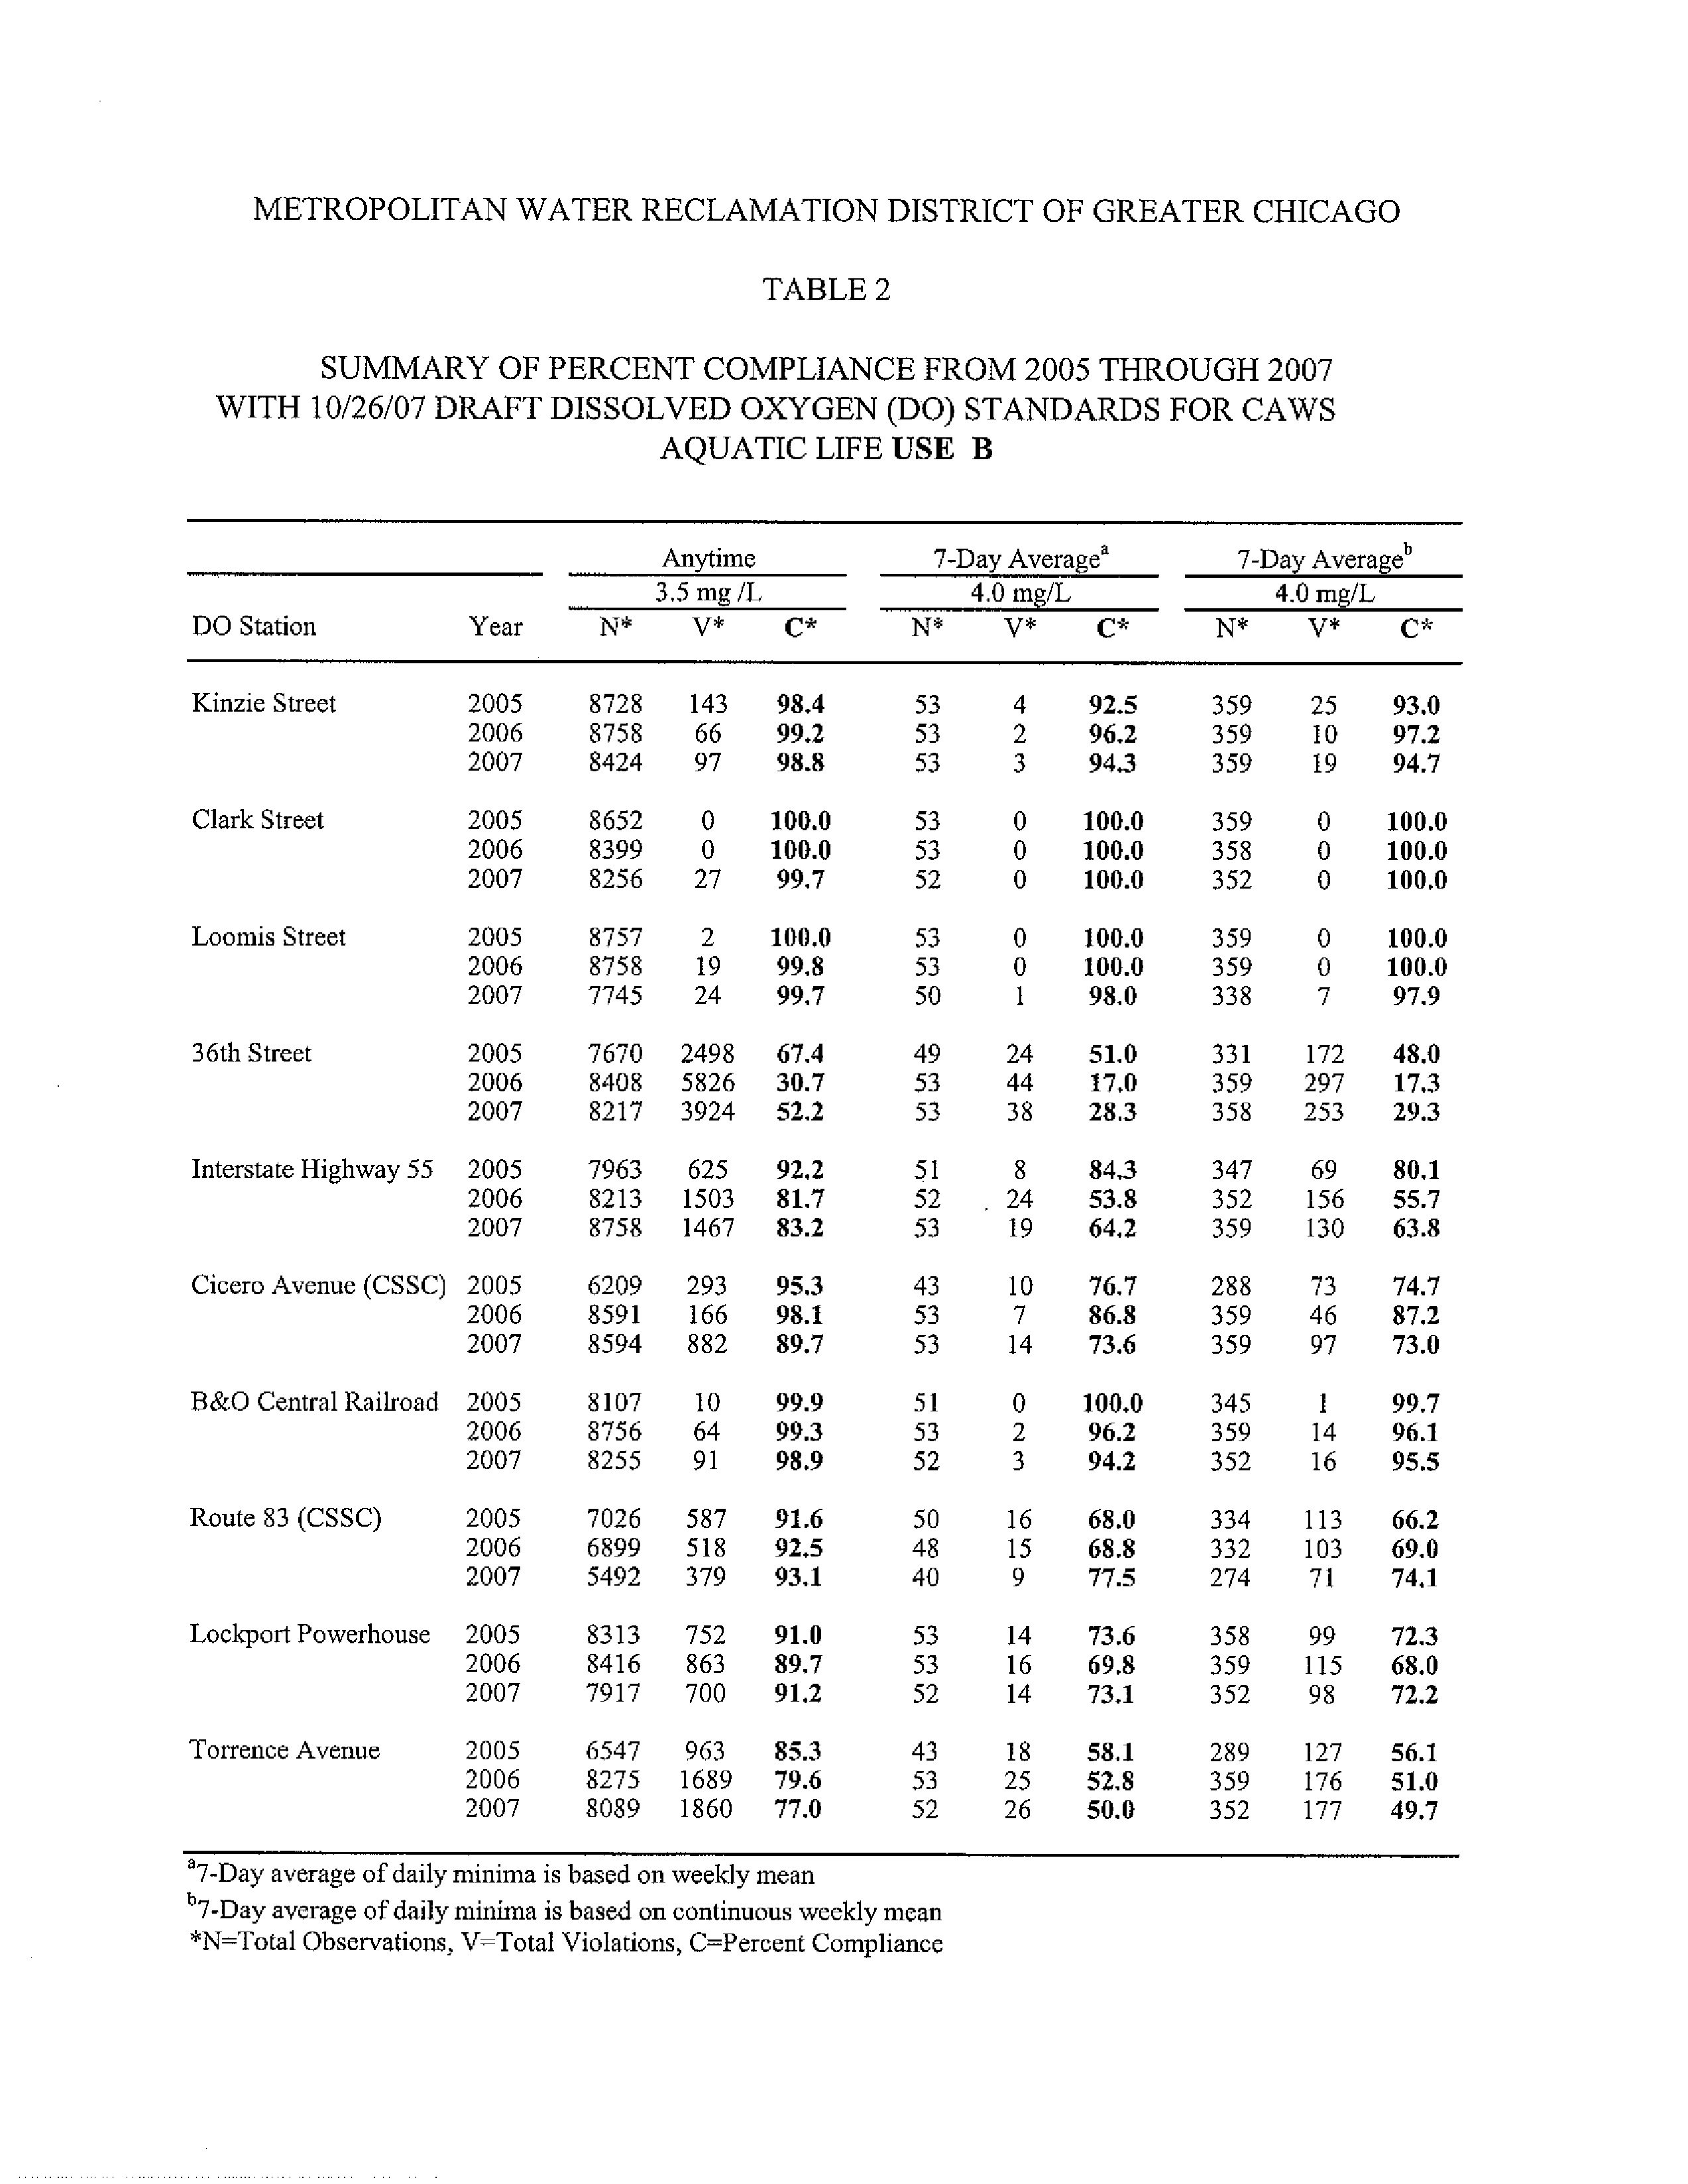
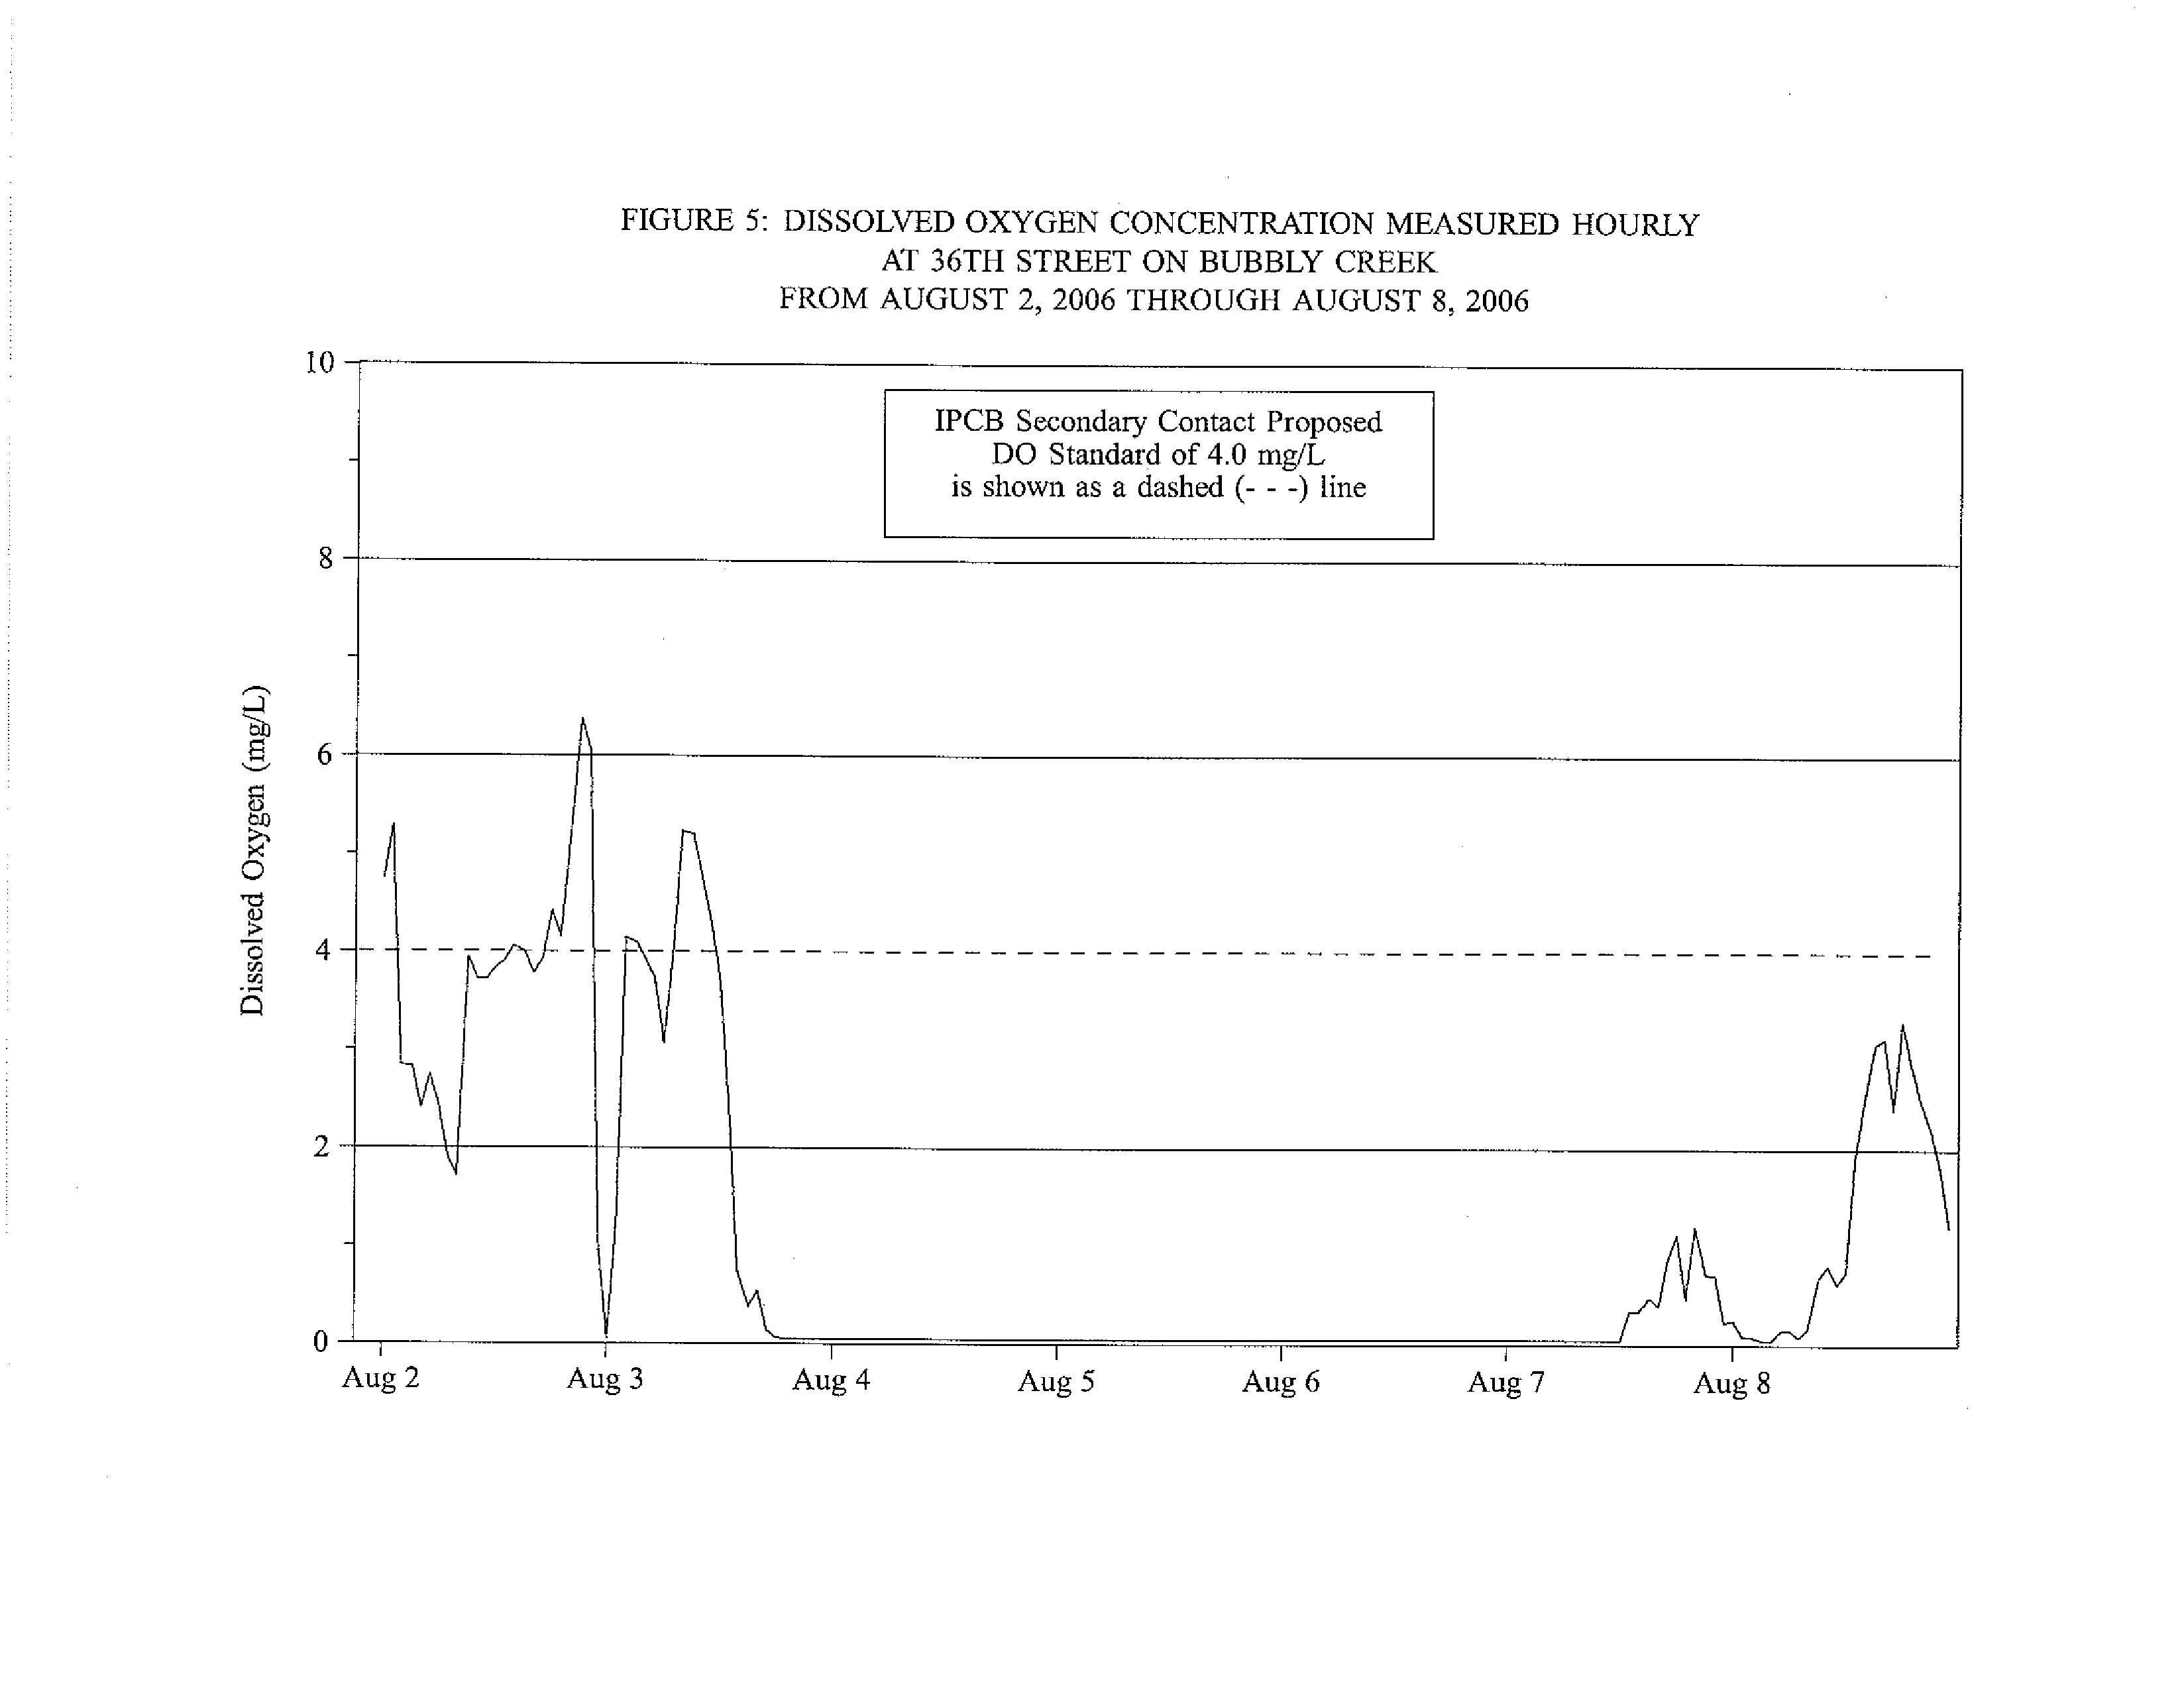
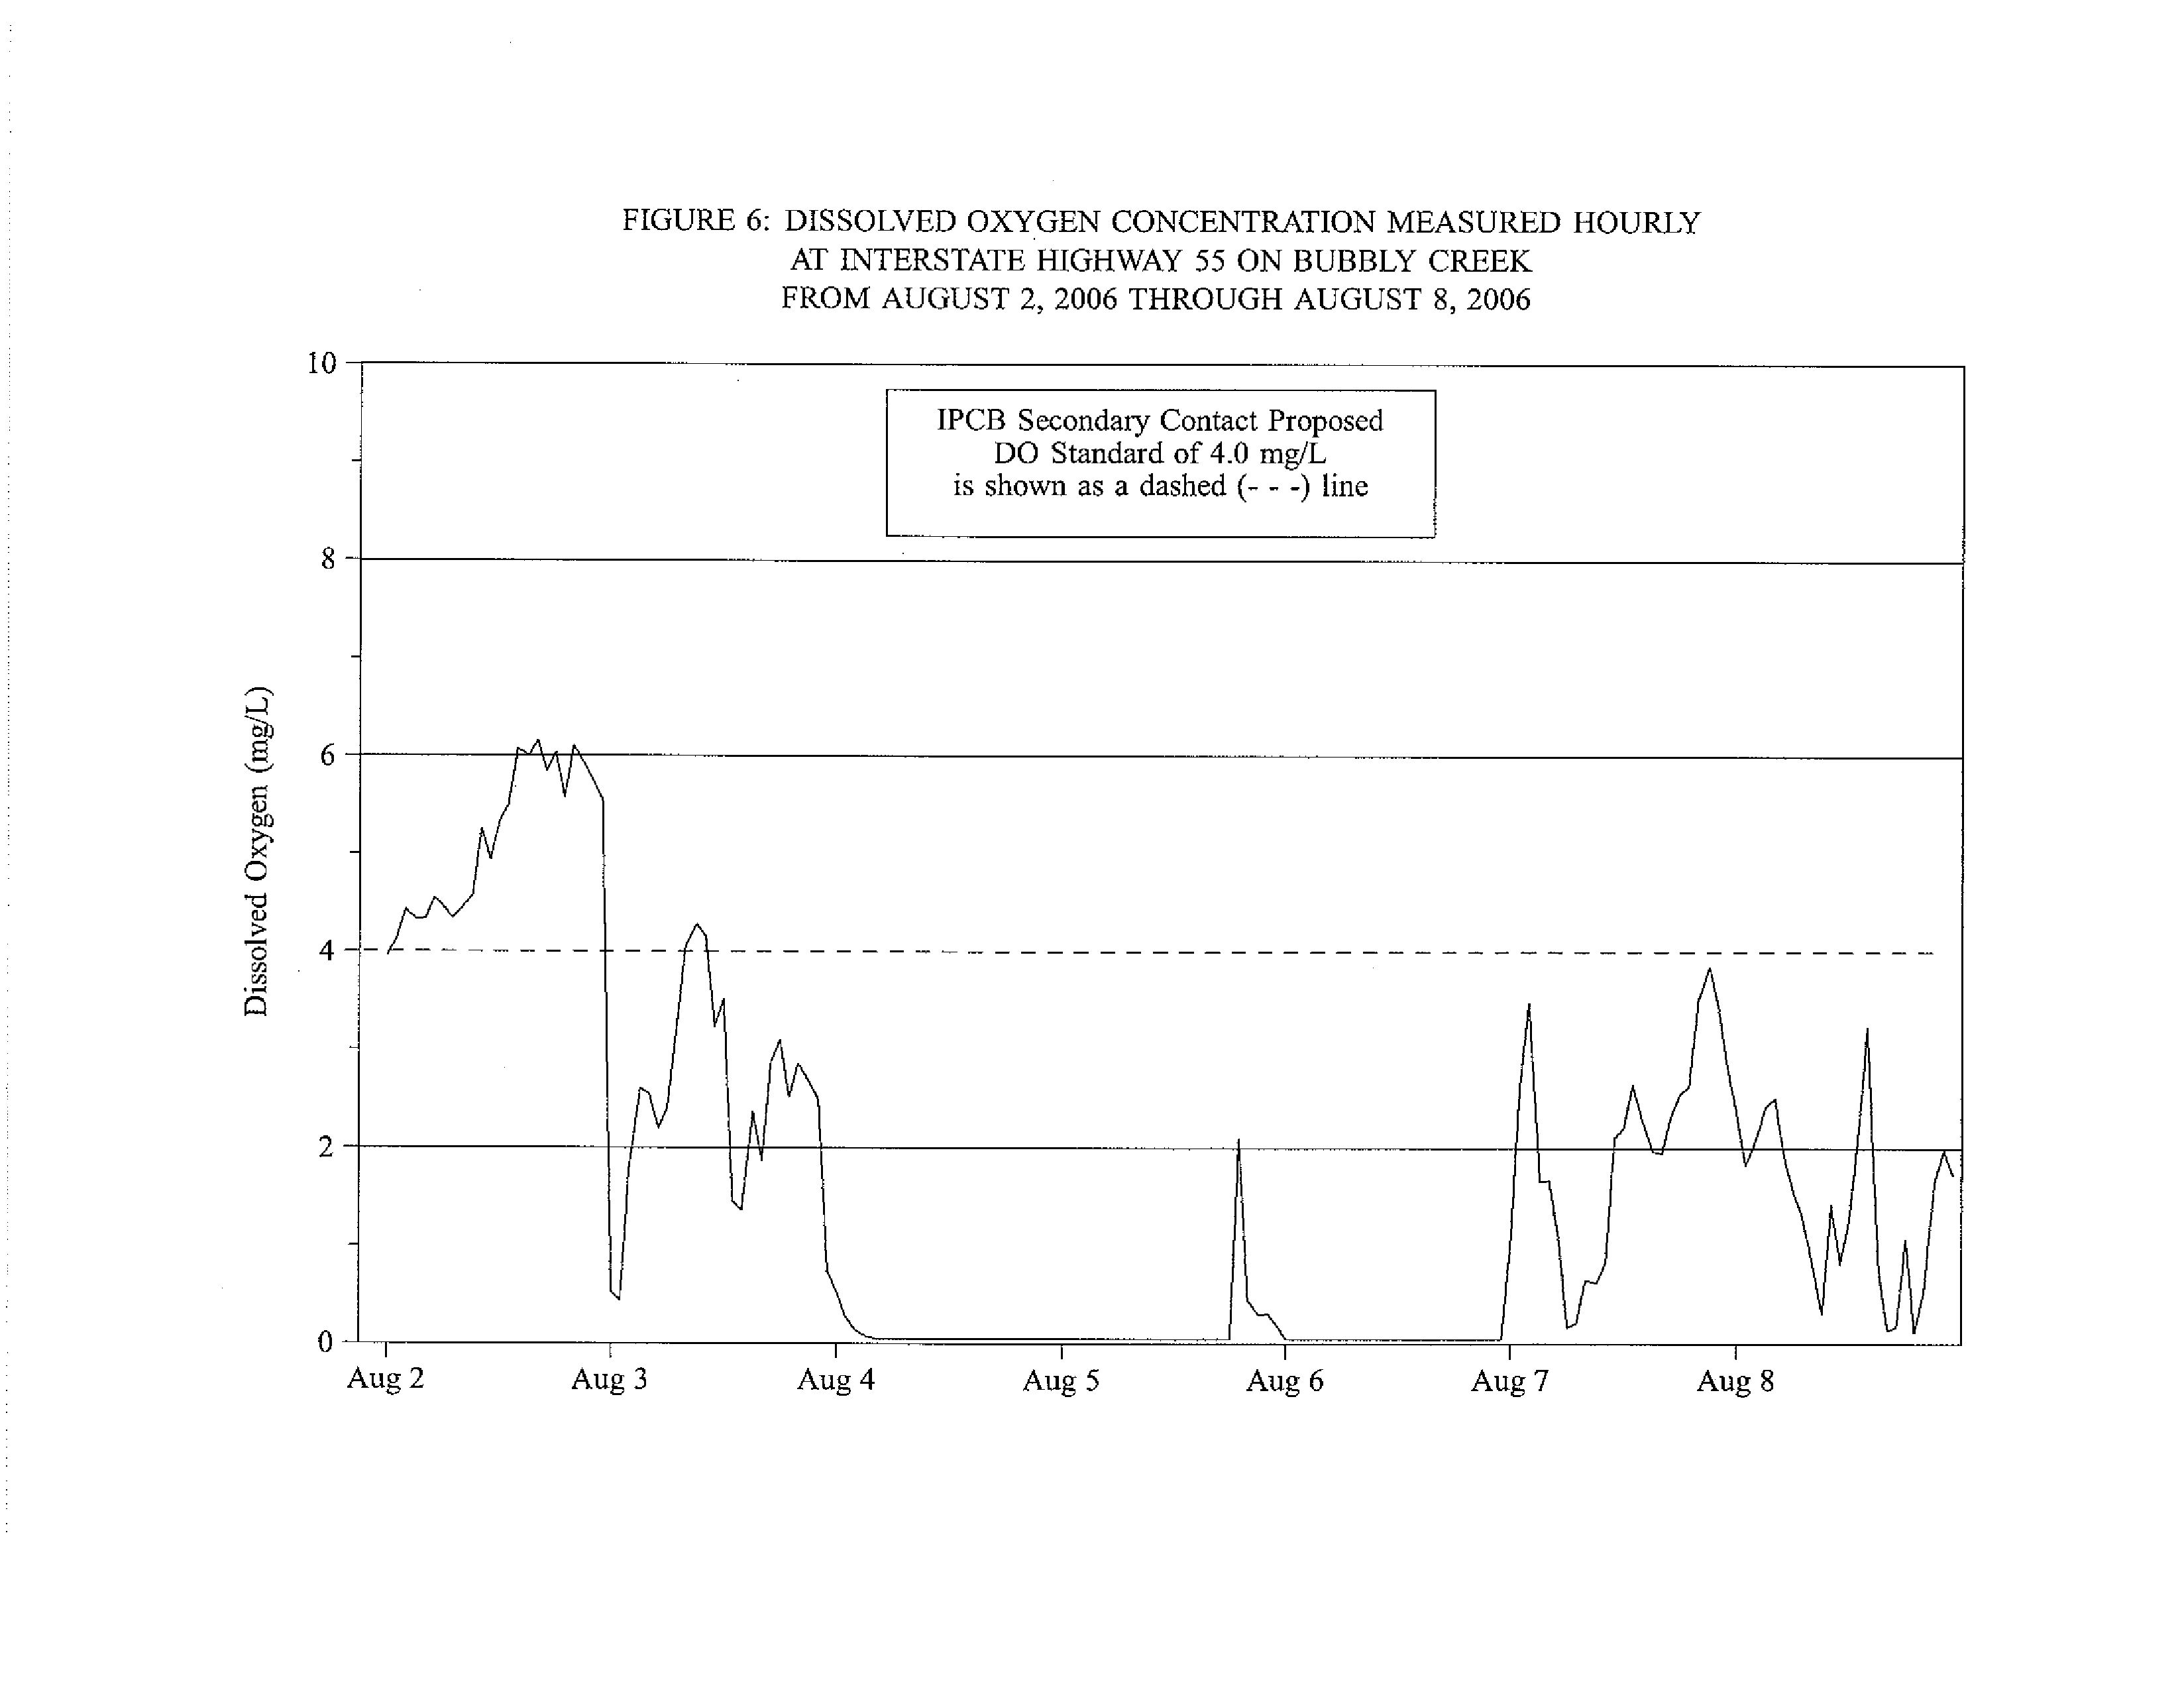
Table 2 in ATTACHMENT 2 indicates annual compliance with the proposed 7-day mean
of daily minima DO standard of 4.0 mg/L was as low as 17.3 percent at 36th Street in Bubbly
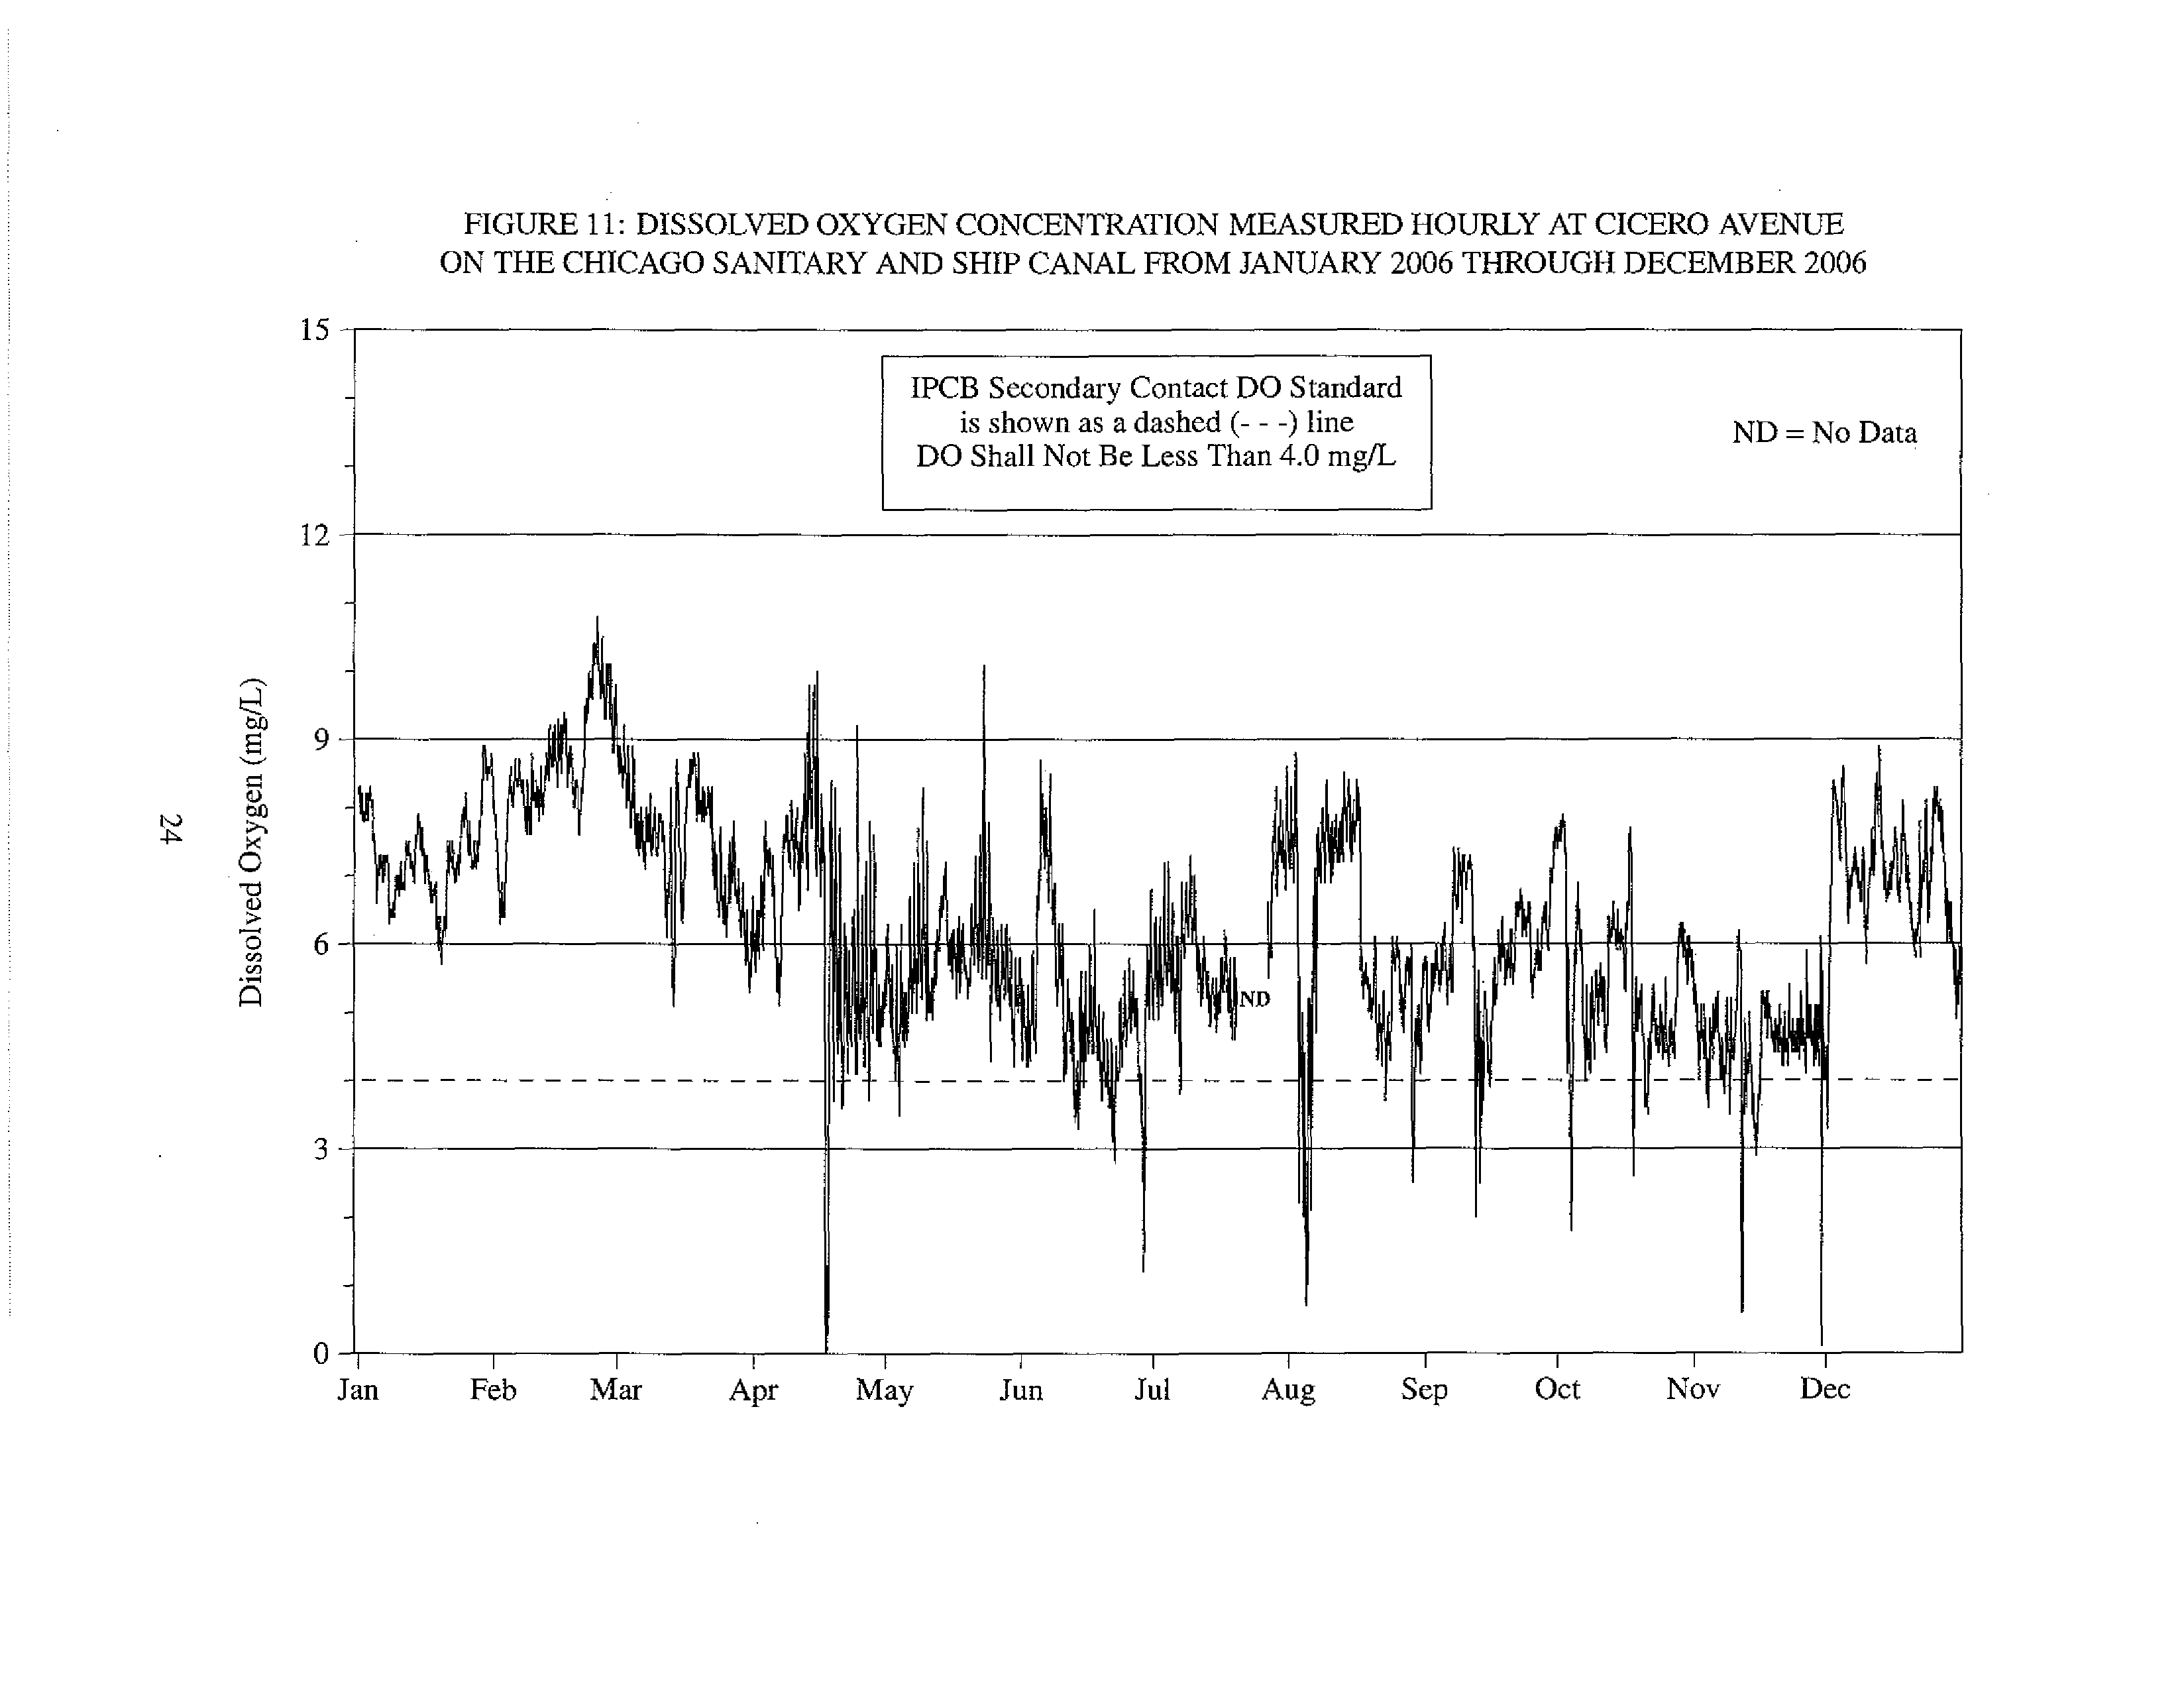
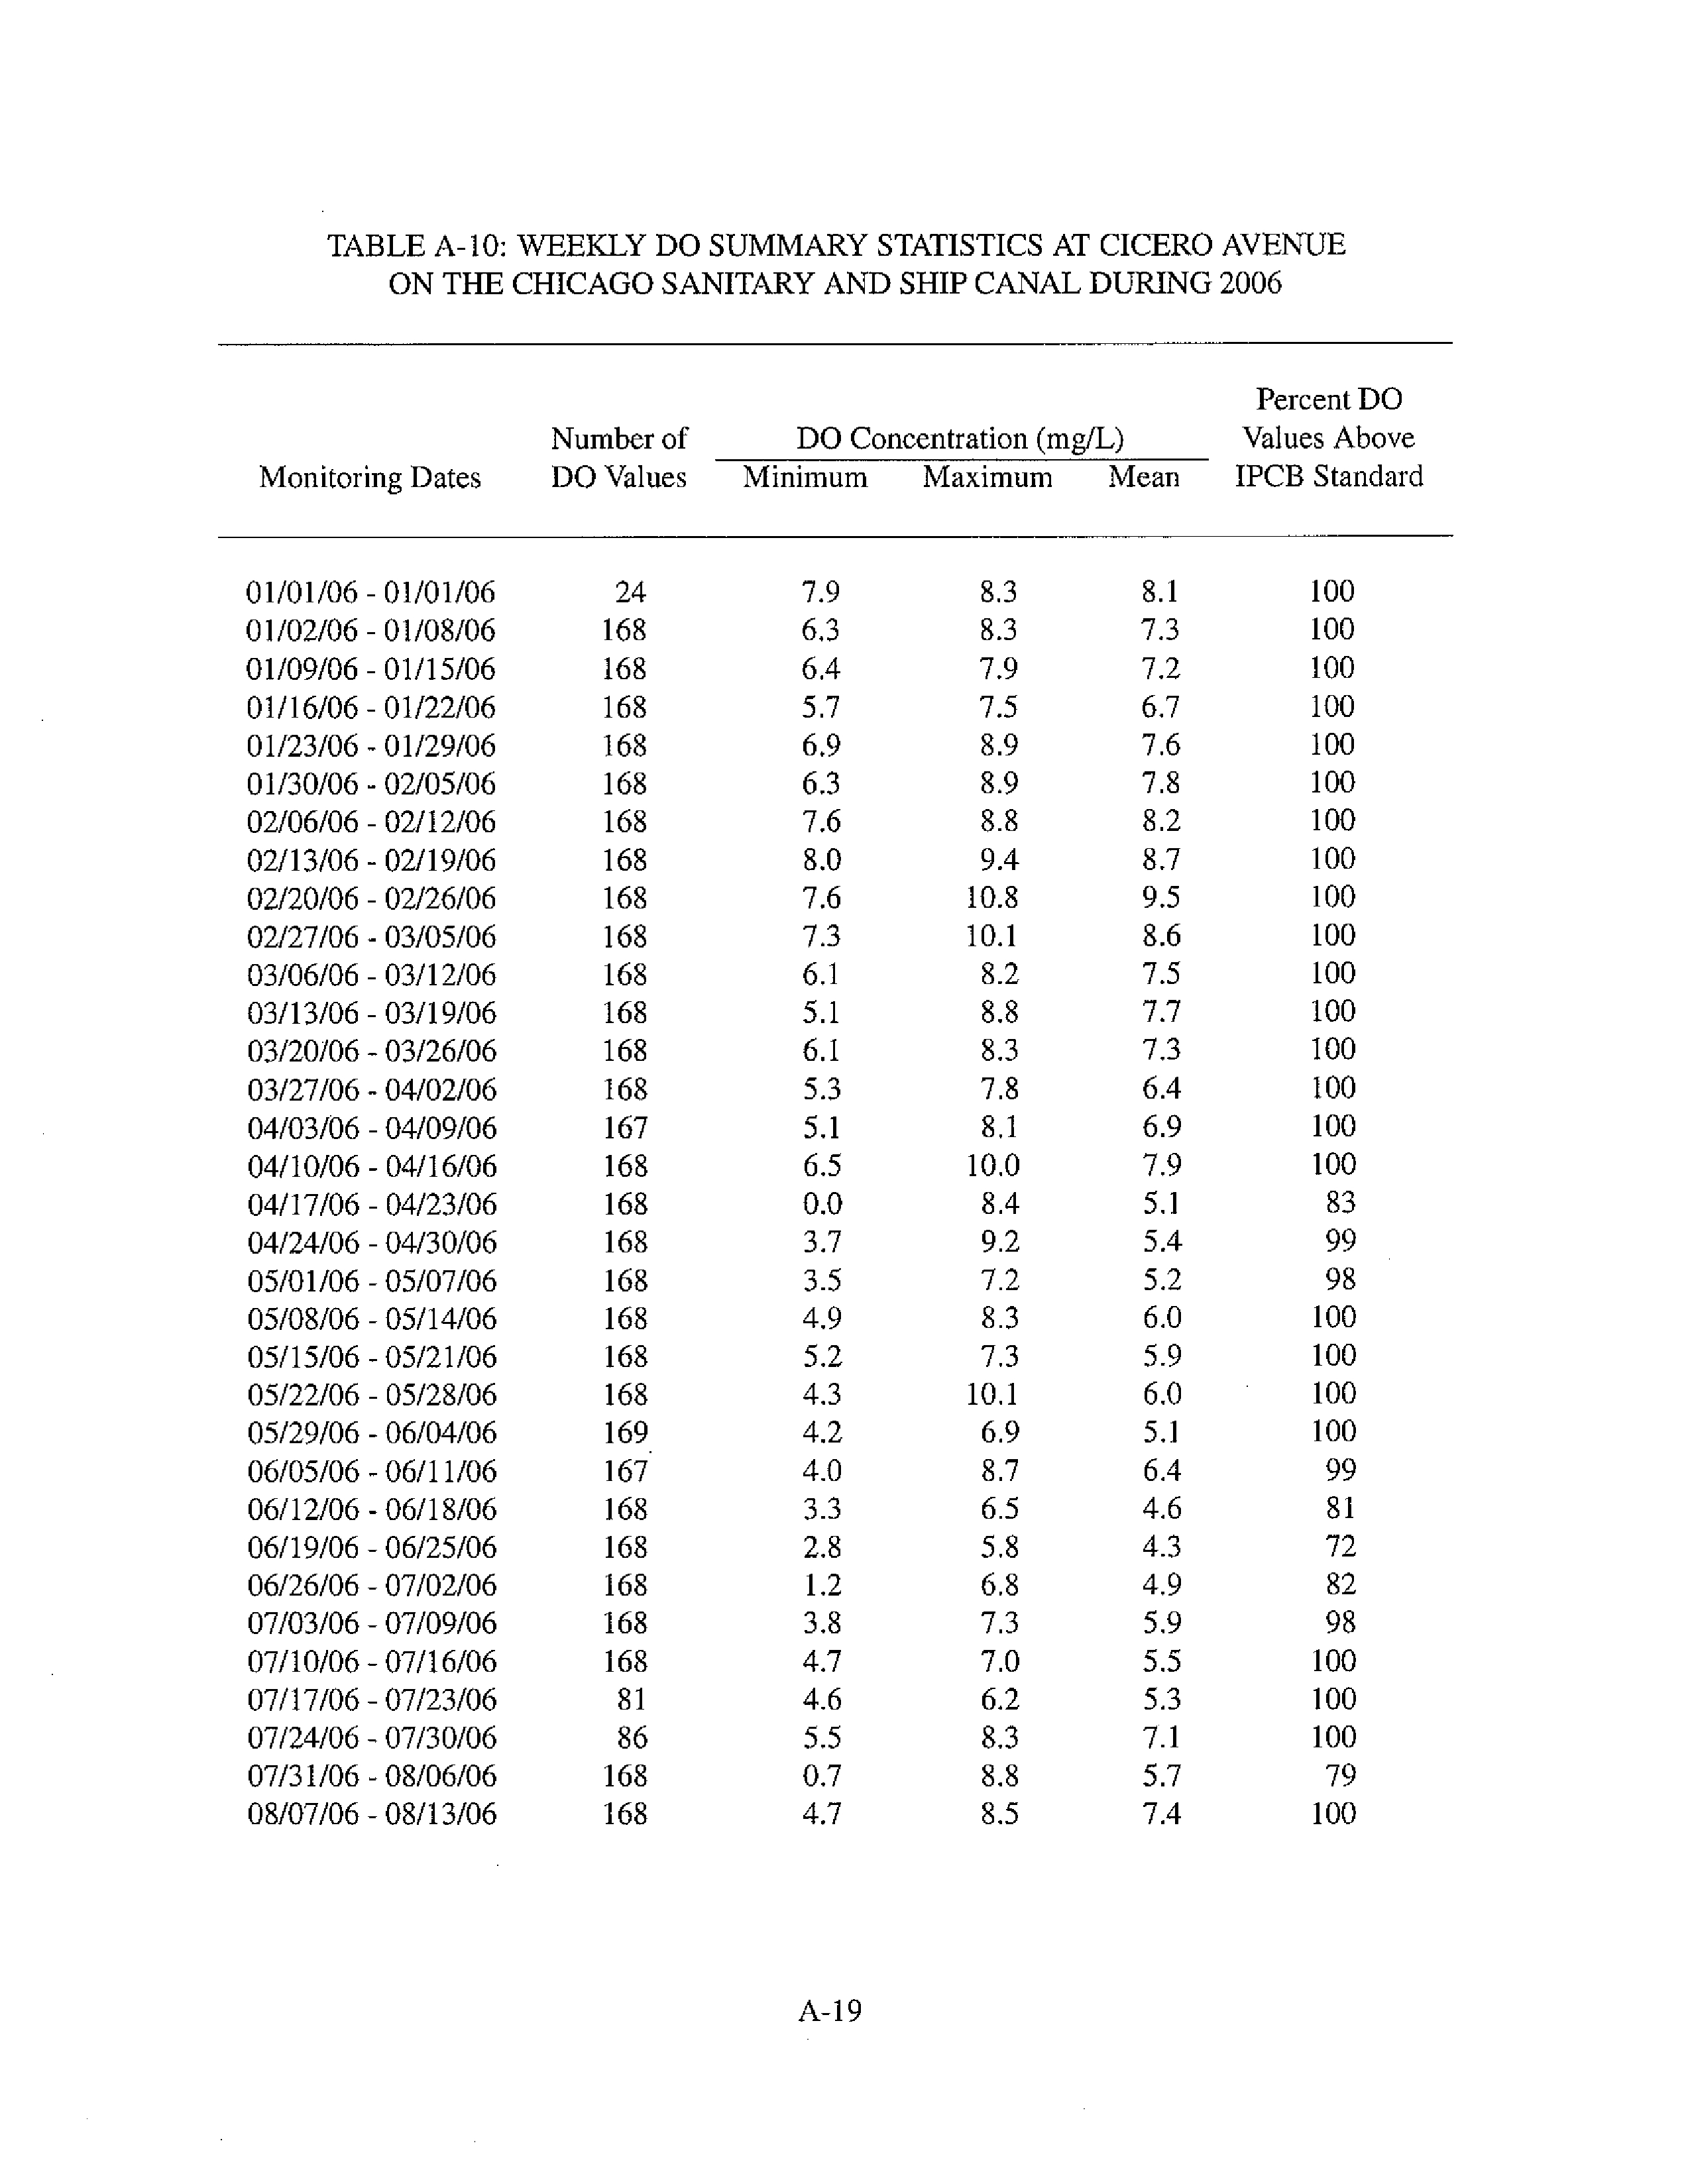
Creek during 2006. Annual compliance with this proposed DO standard in the Chicago Sanitary
and Ship Canal ranged from 73.0-87.2 percent at Cicero Avenue, and 68.0-72.3 percent at
Lockport powerhouse during 2005-2007.
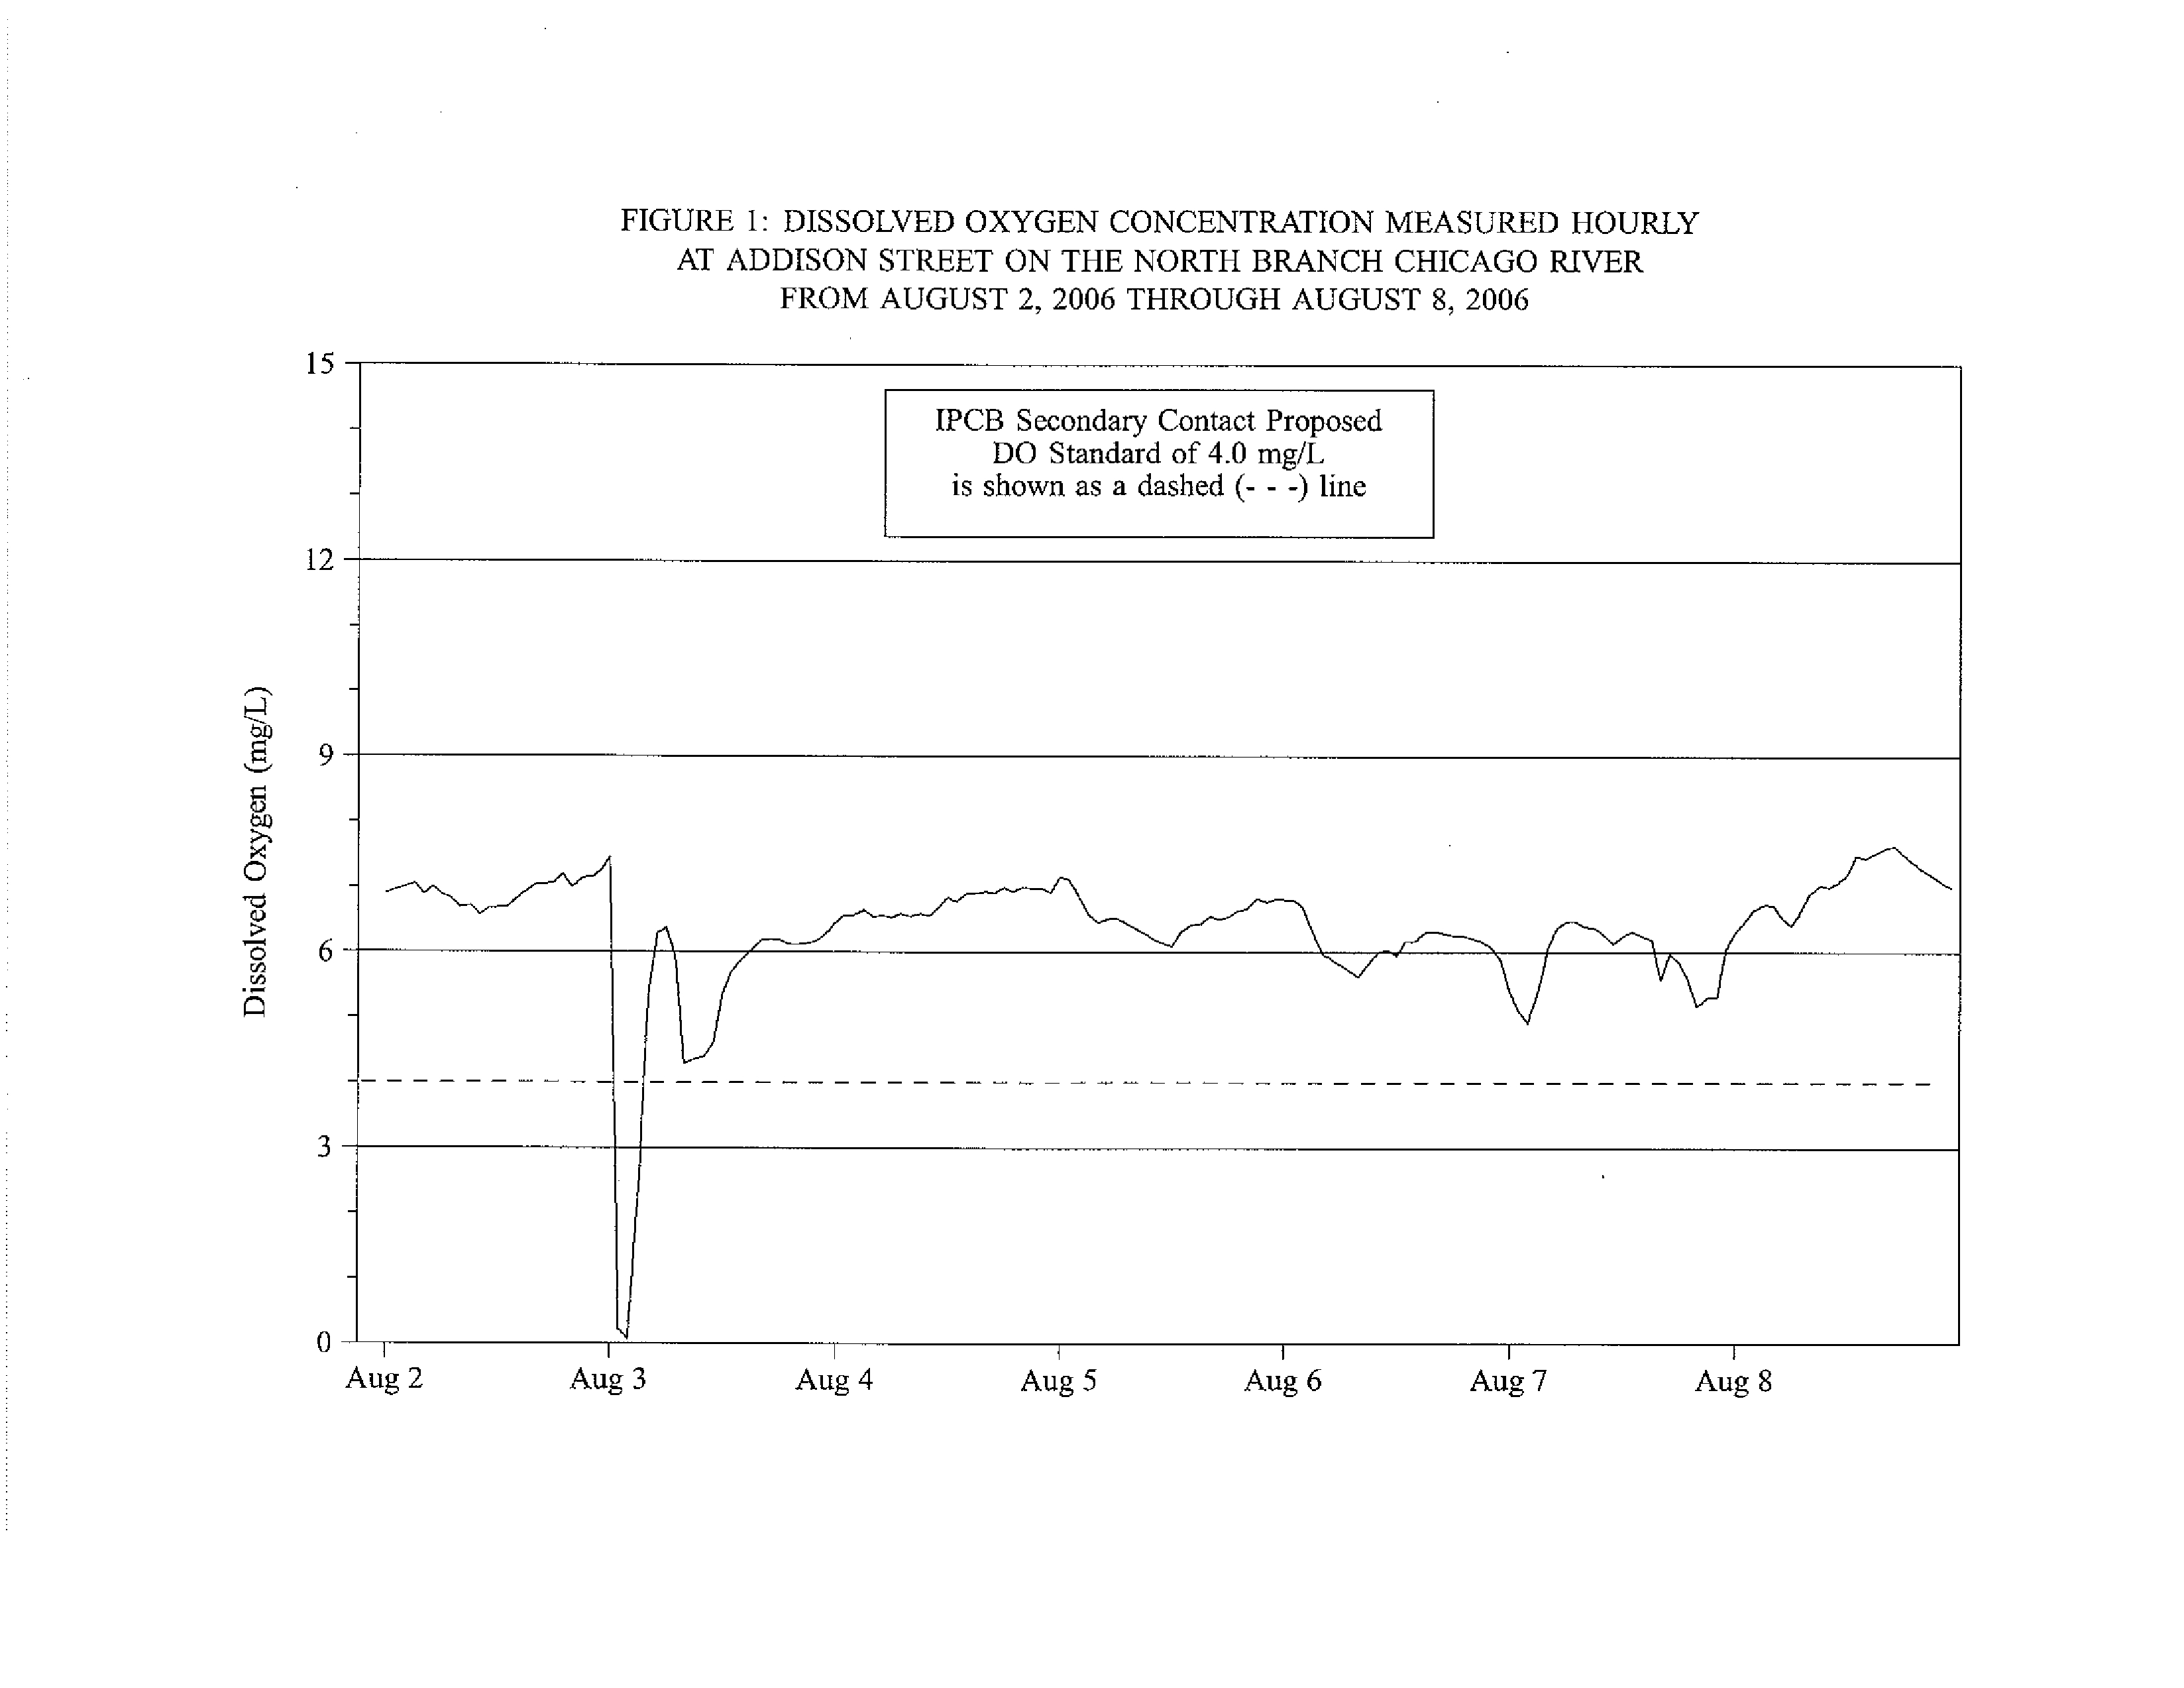
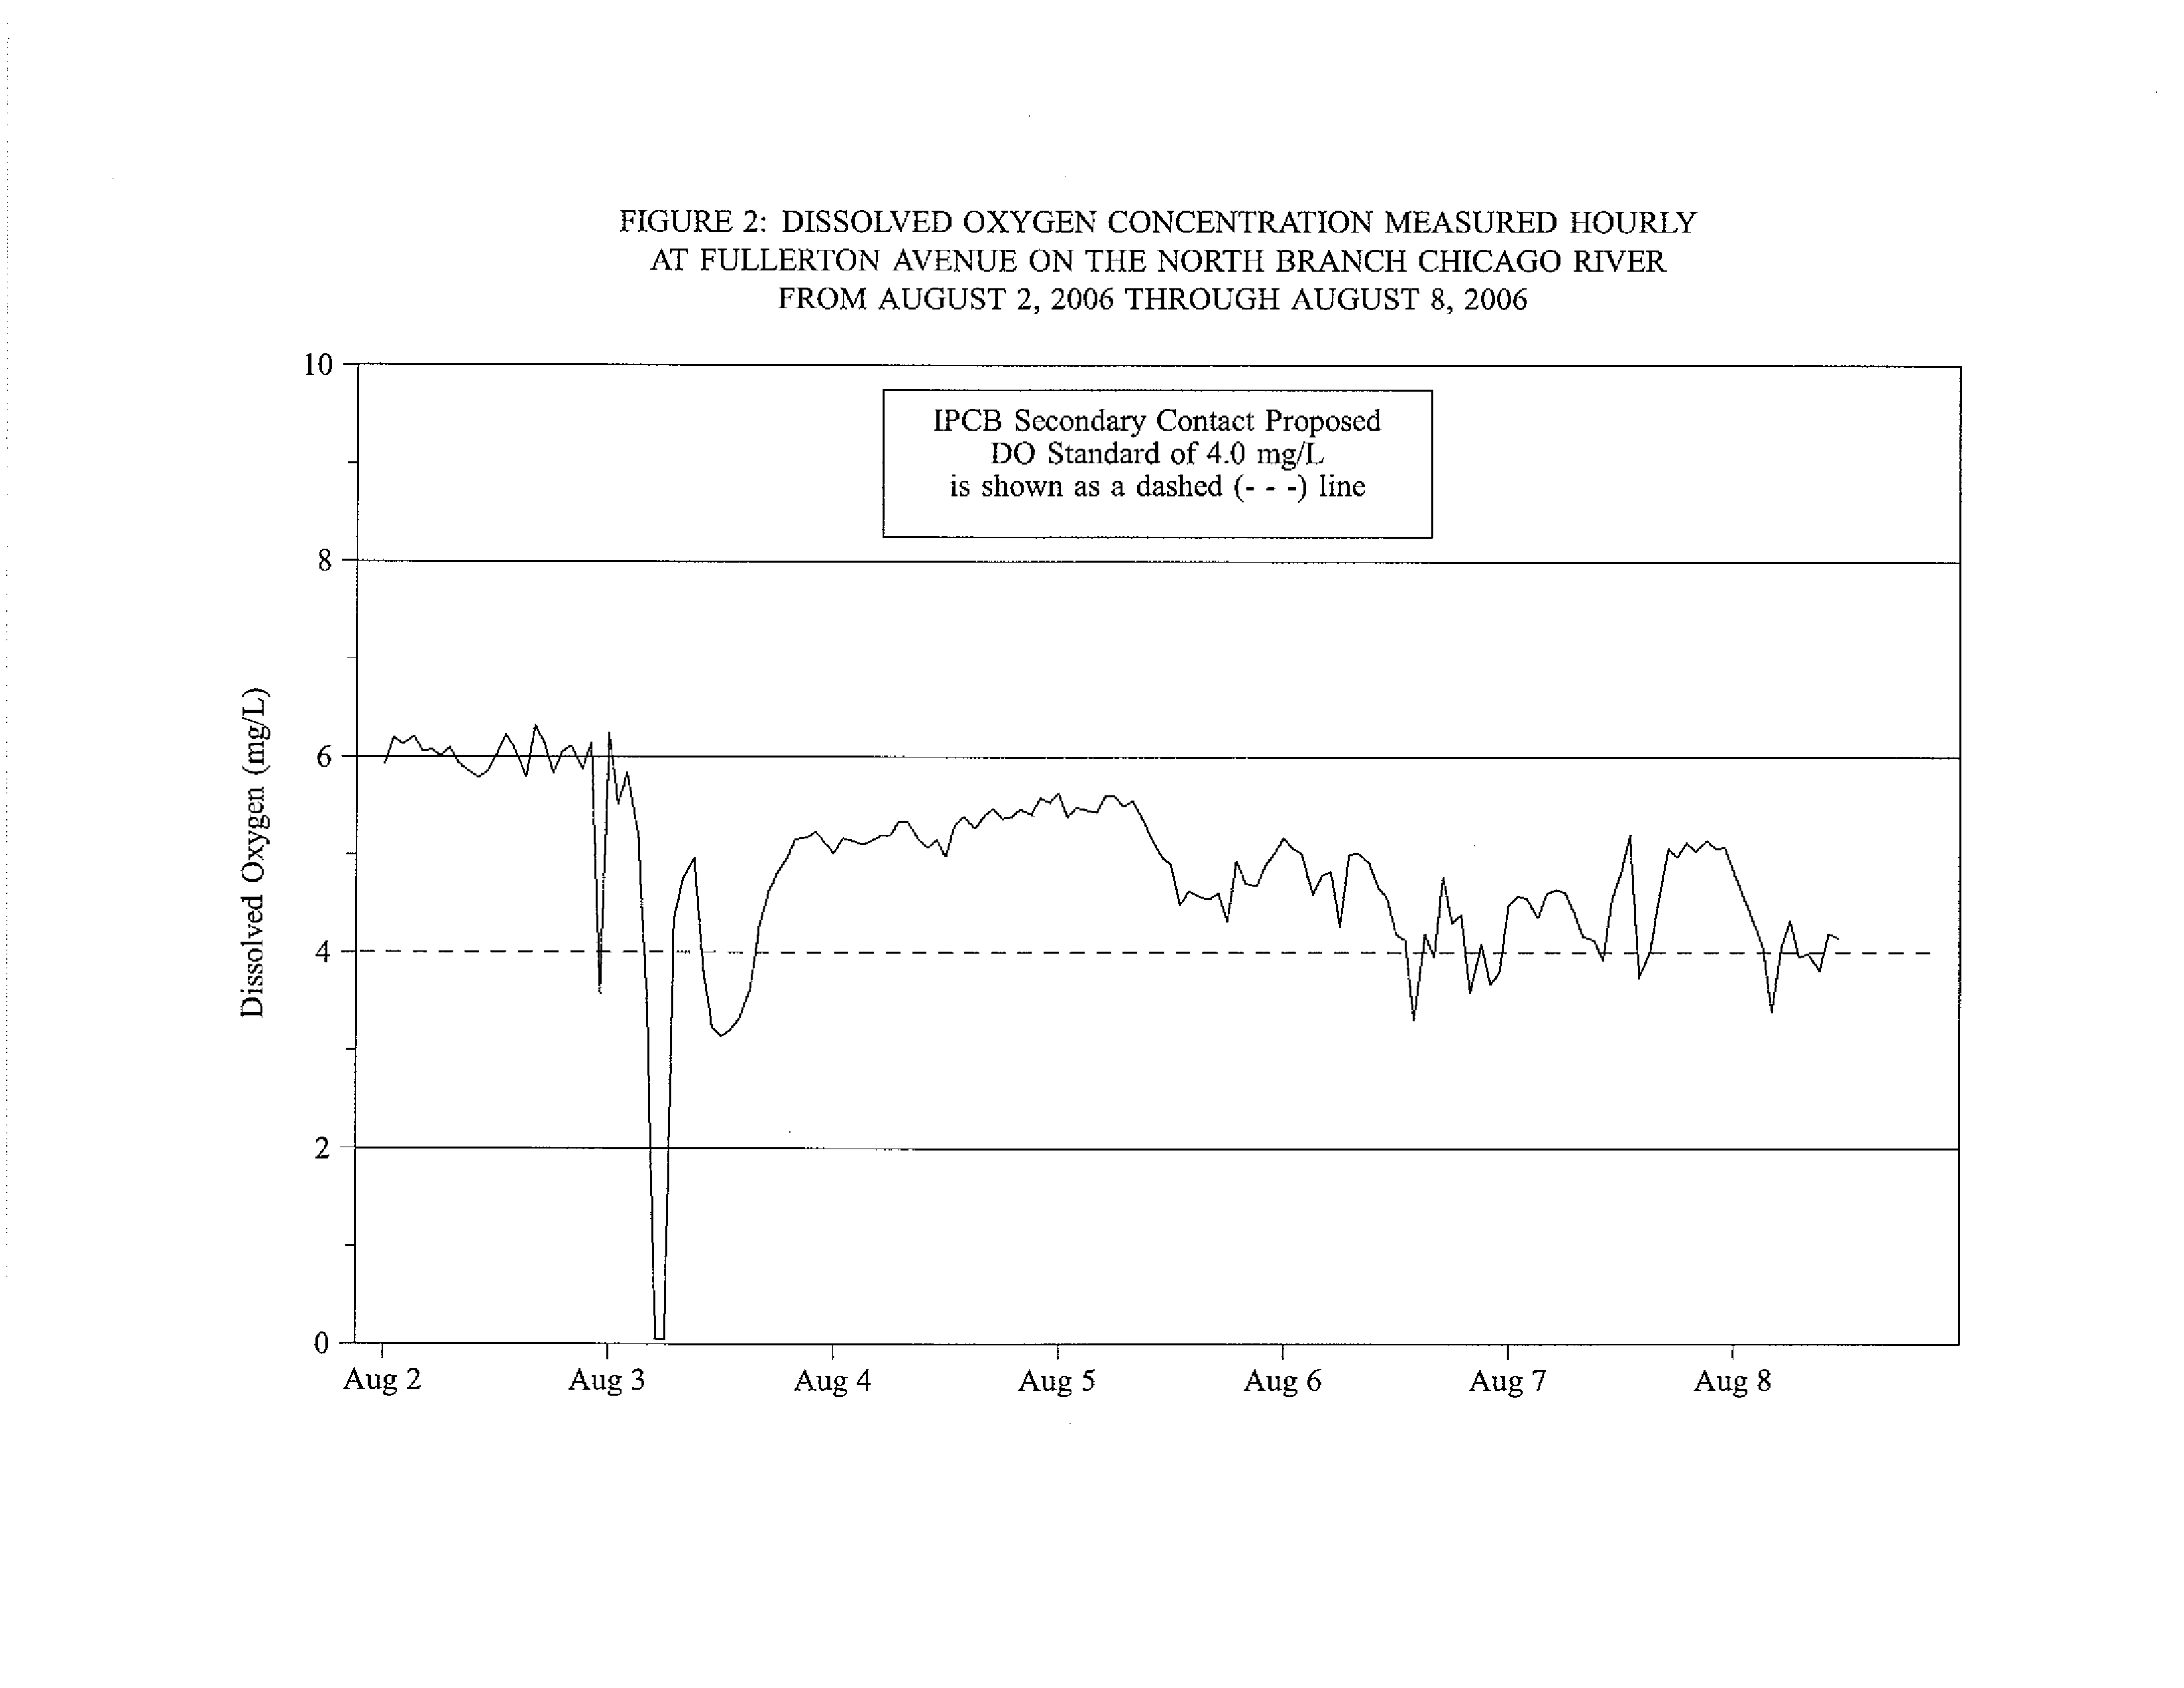
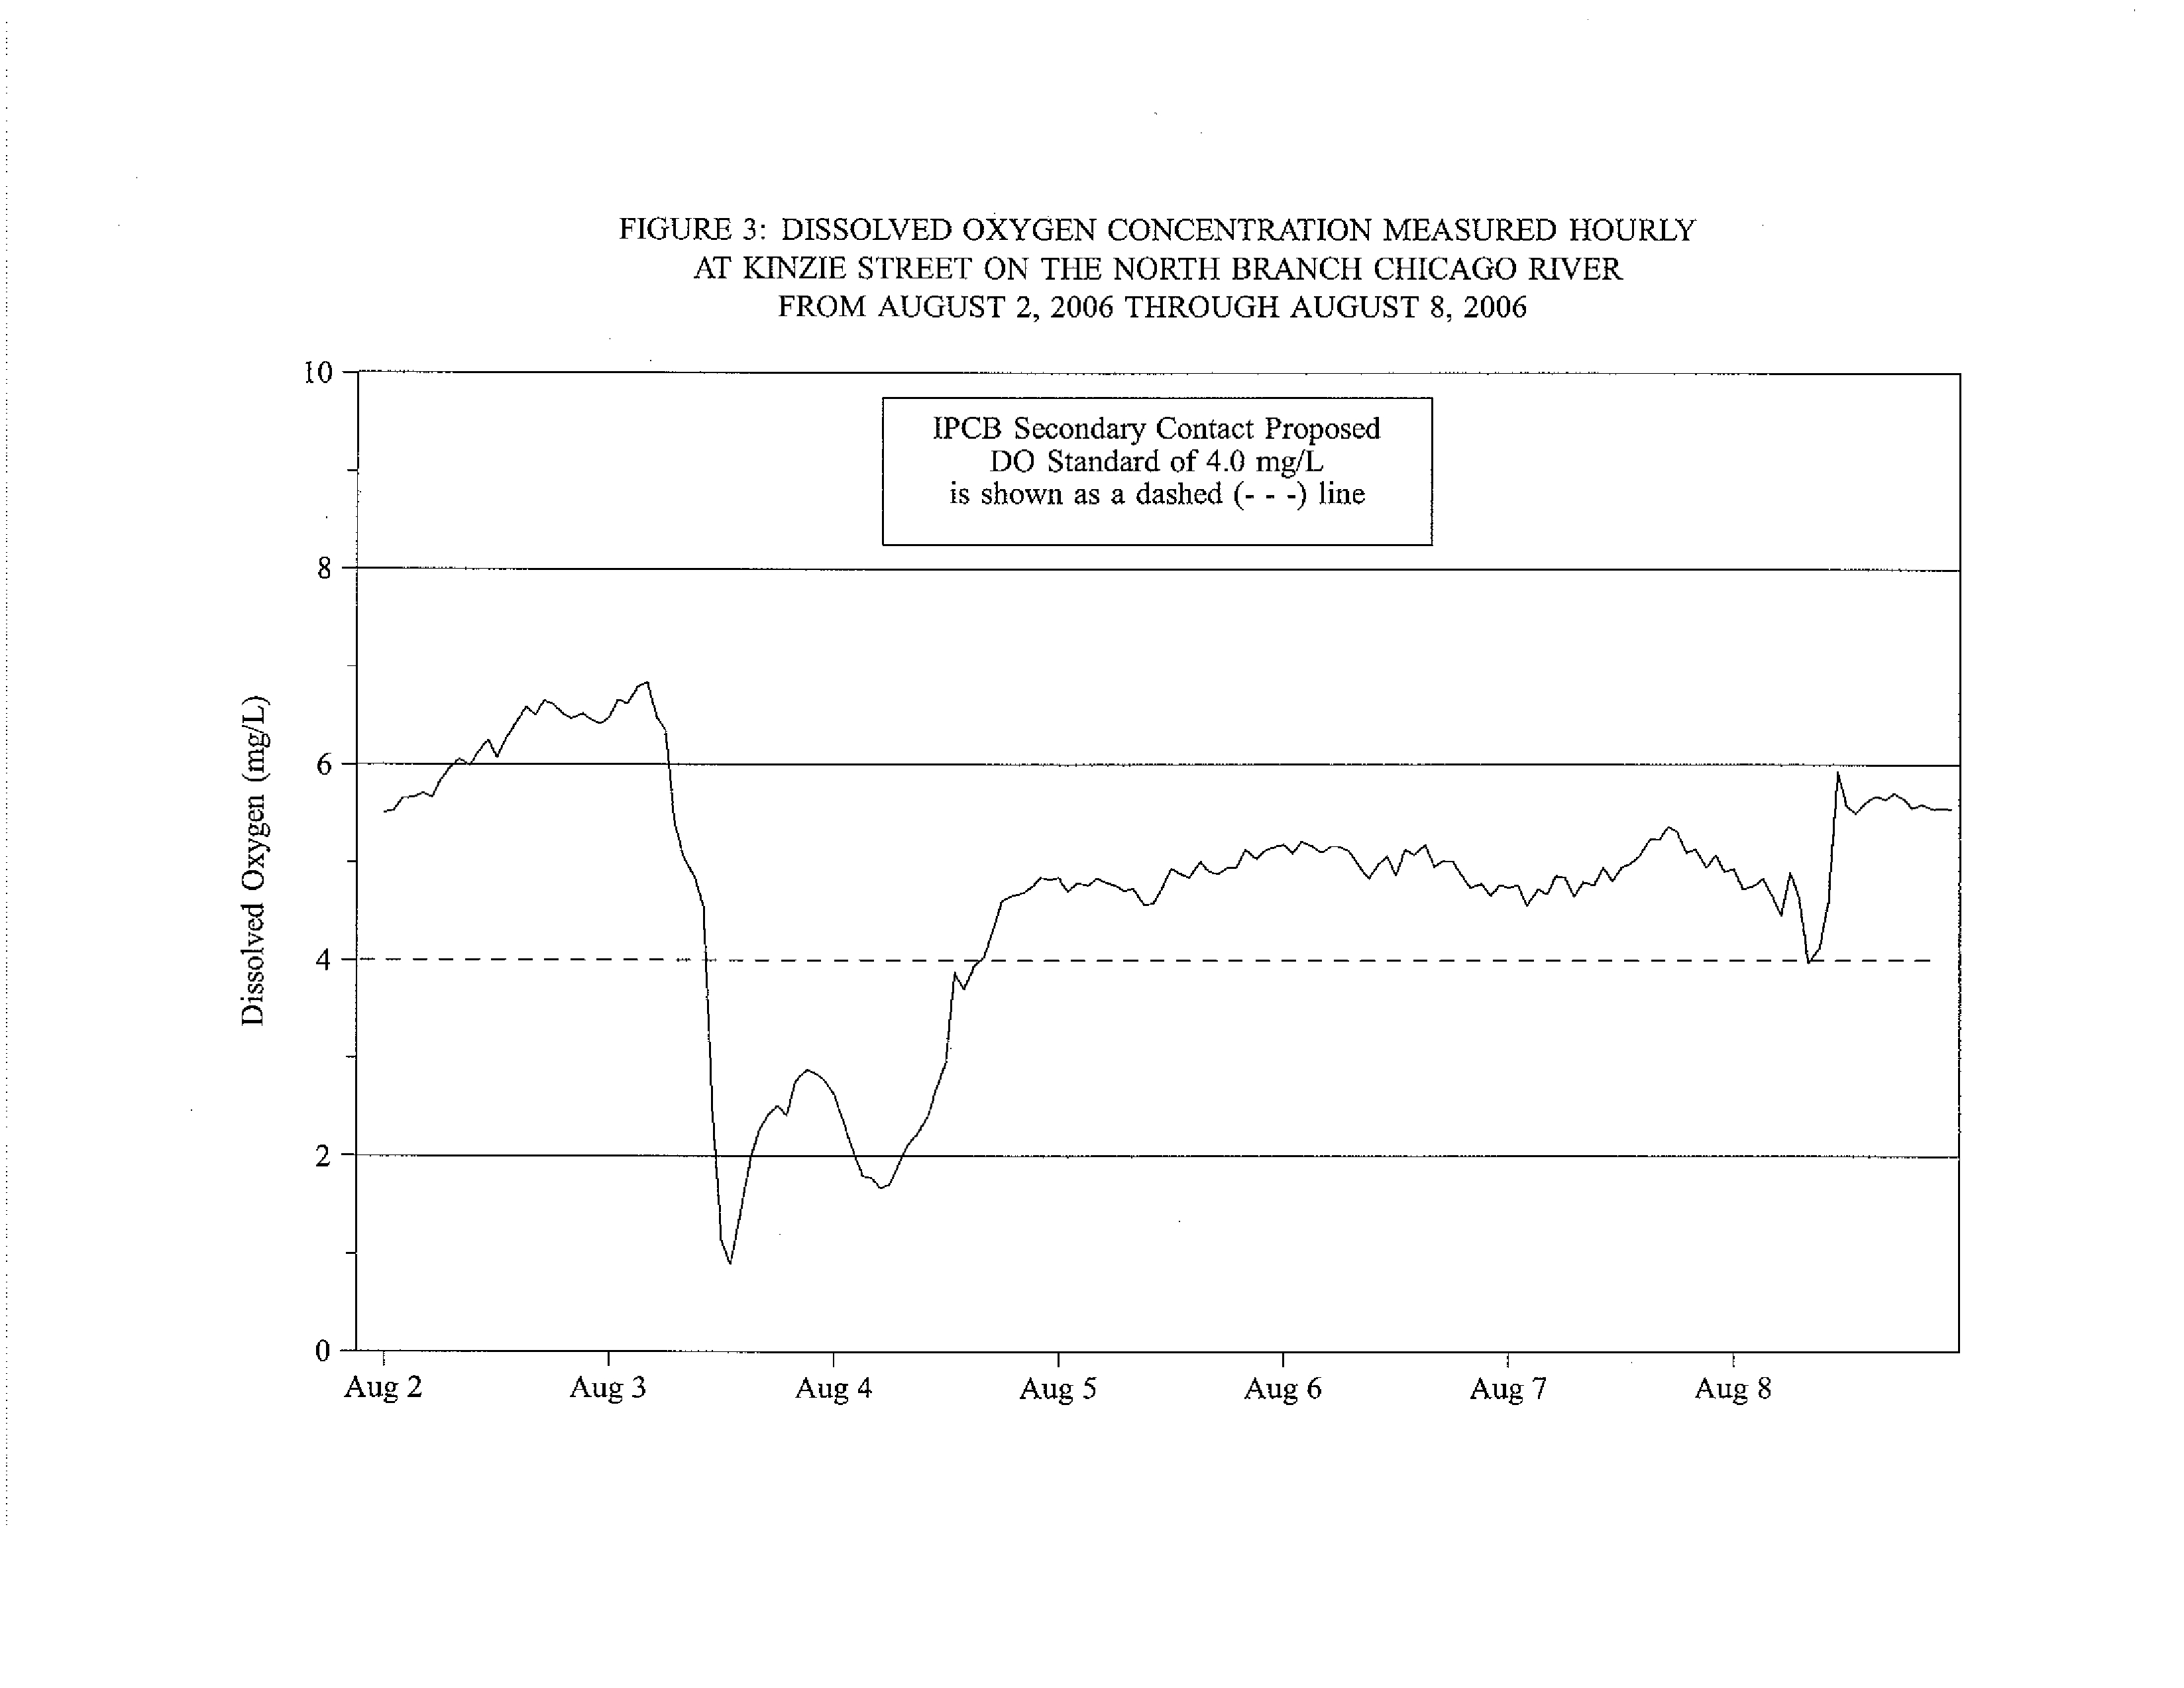
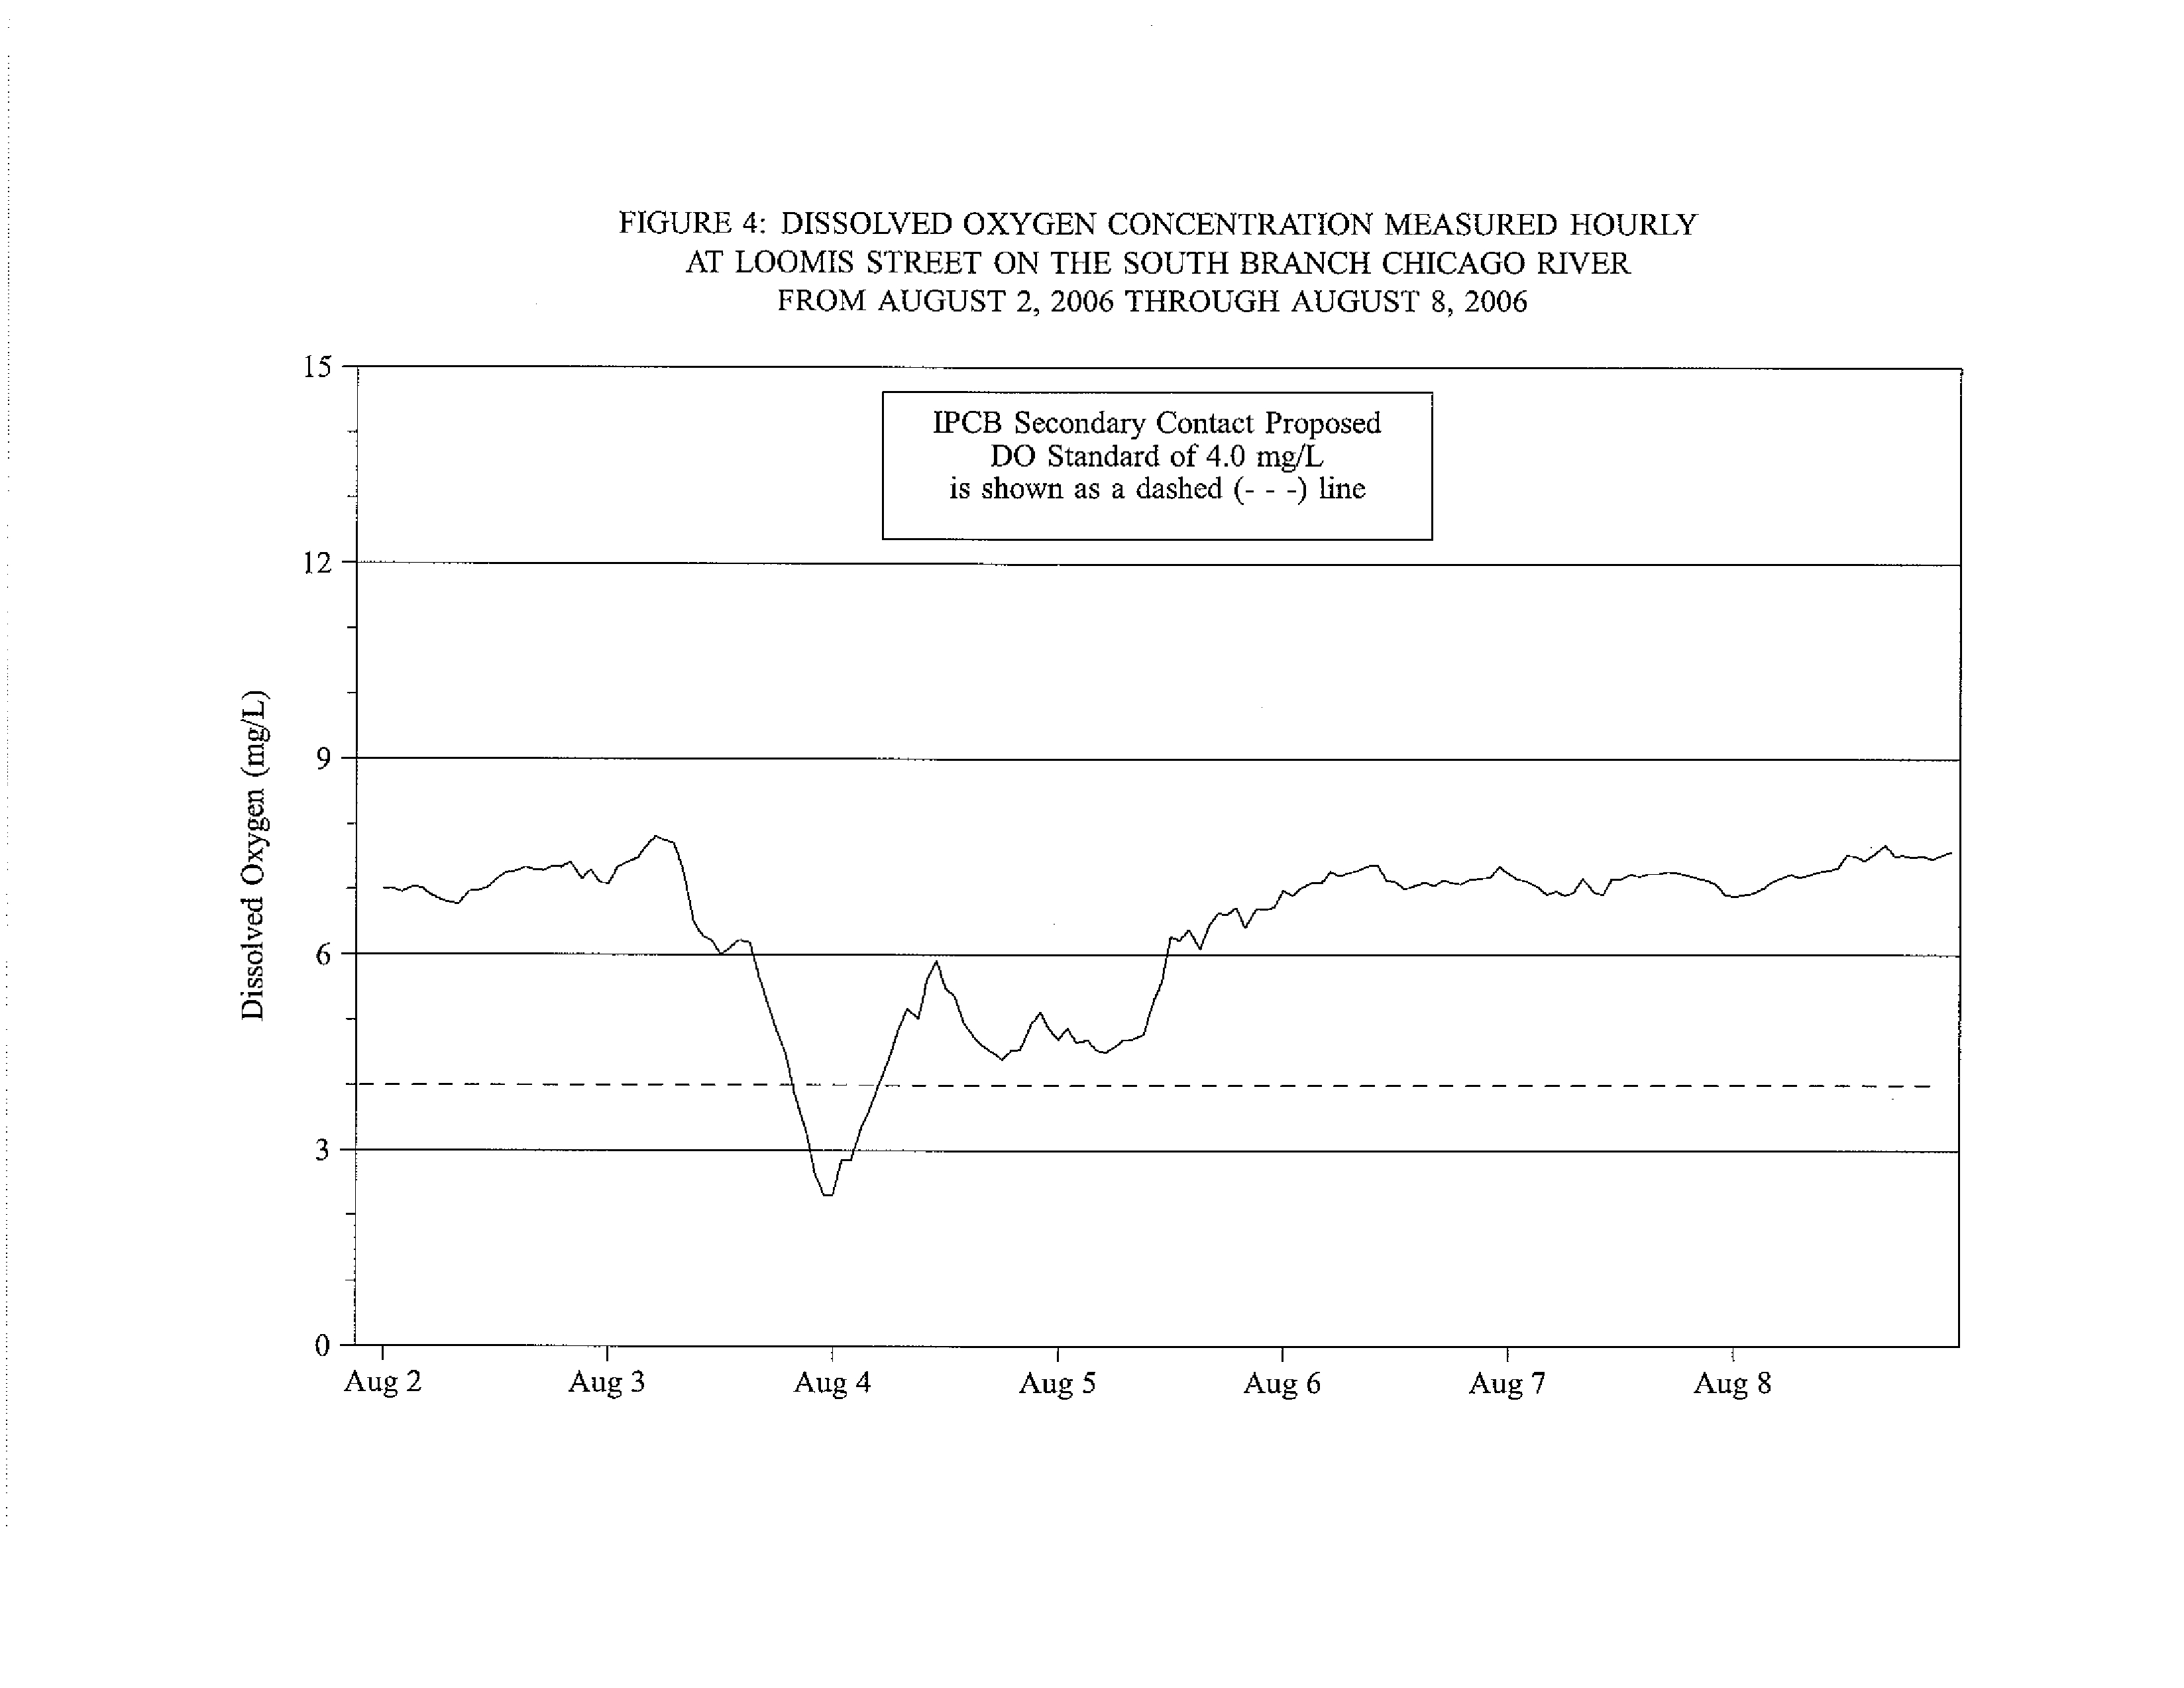
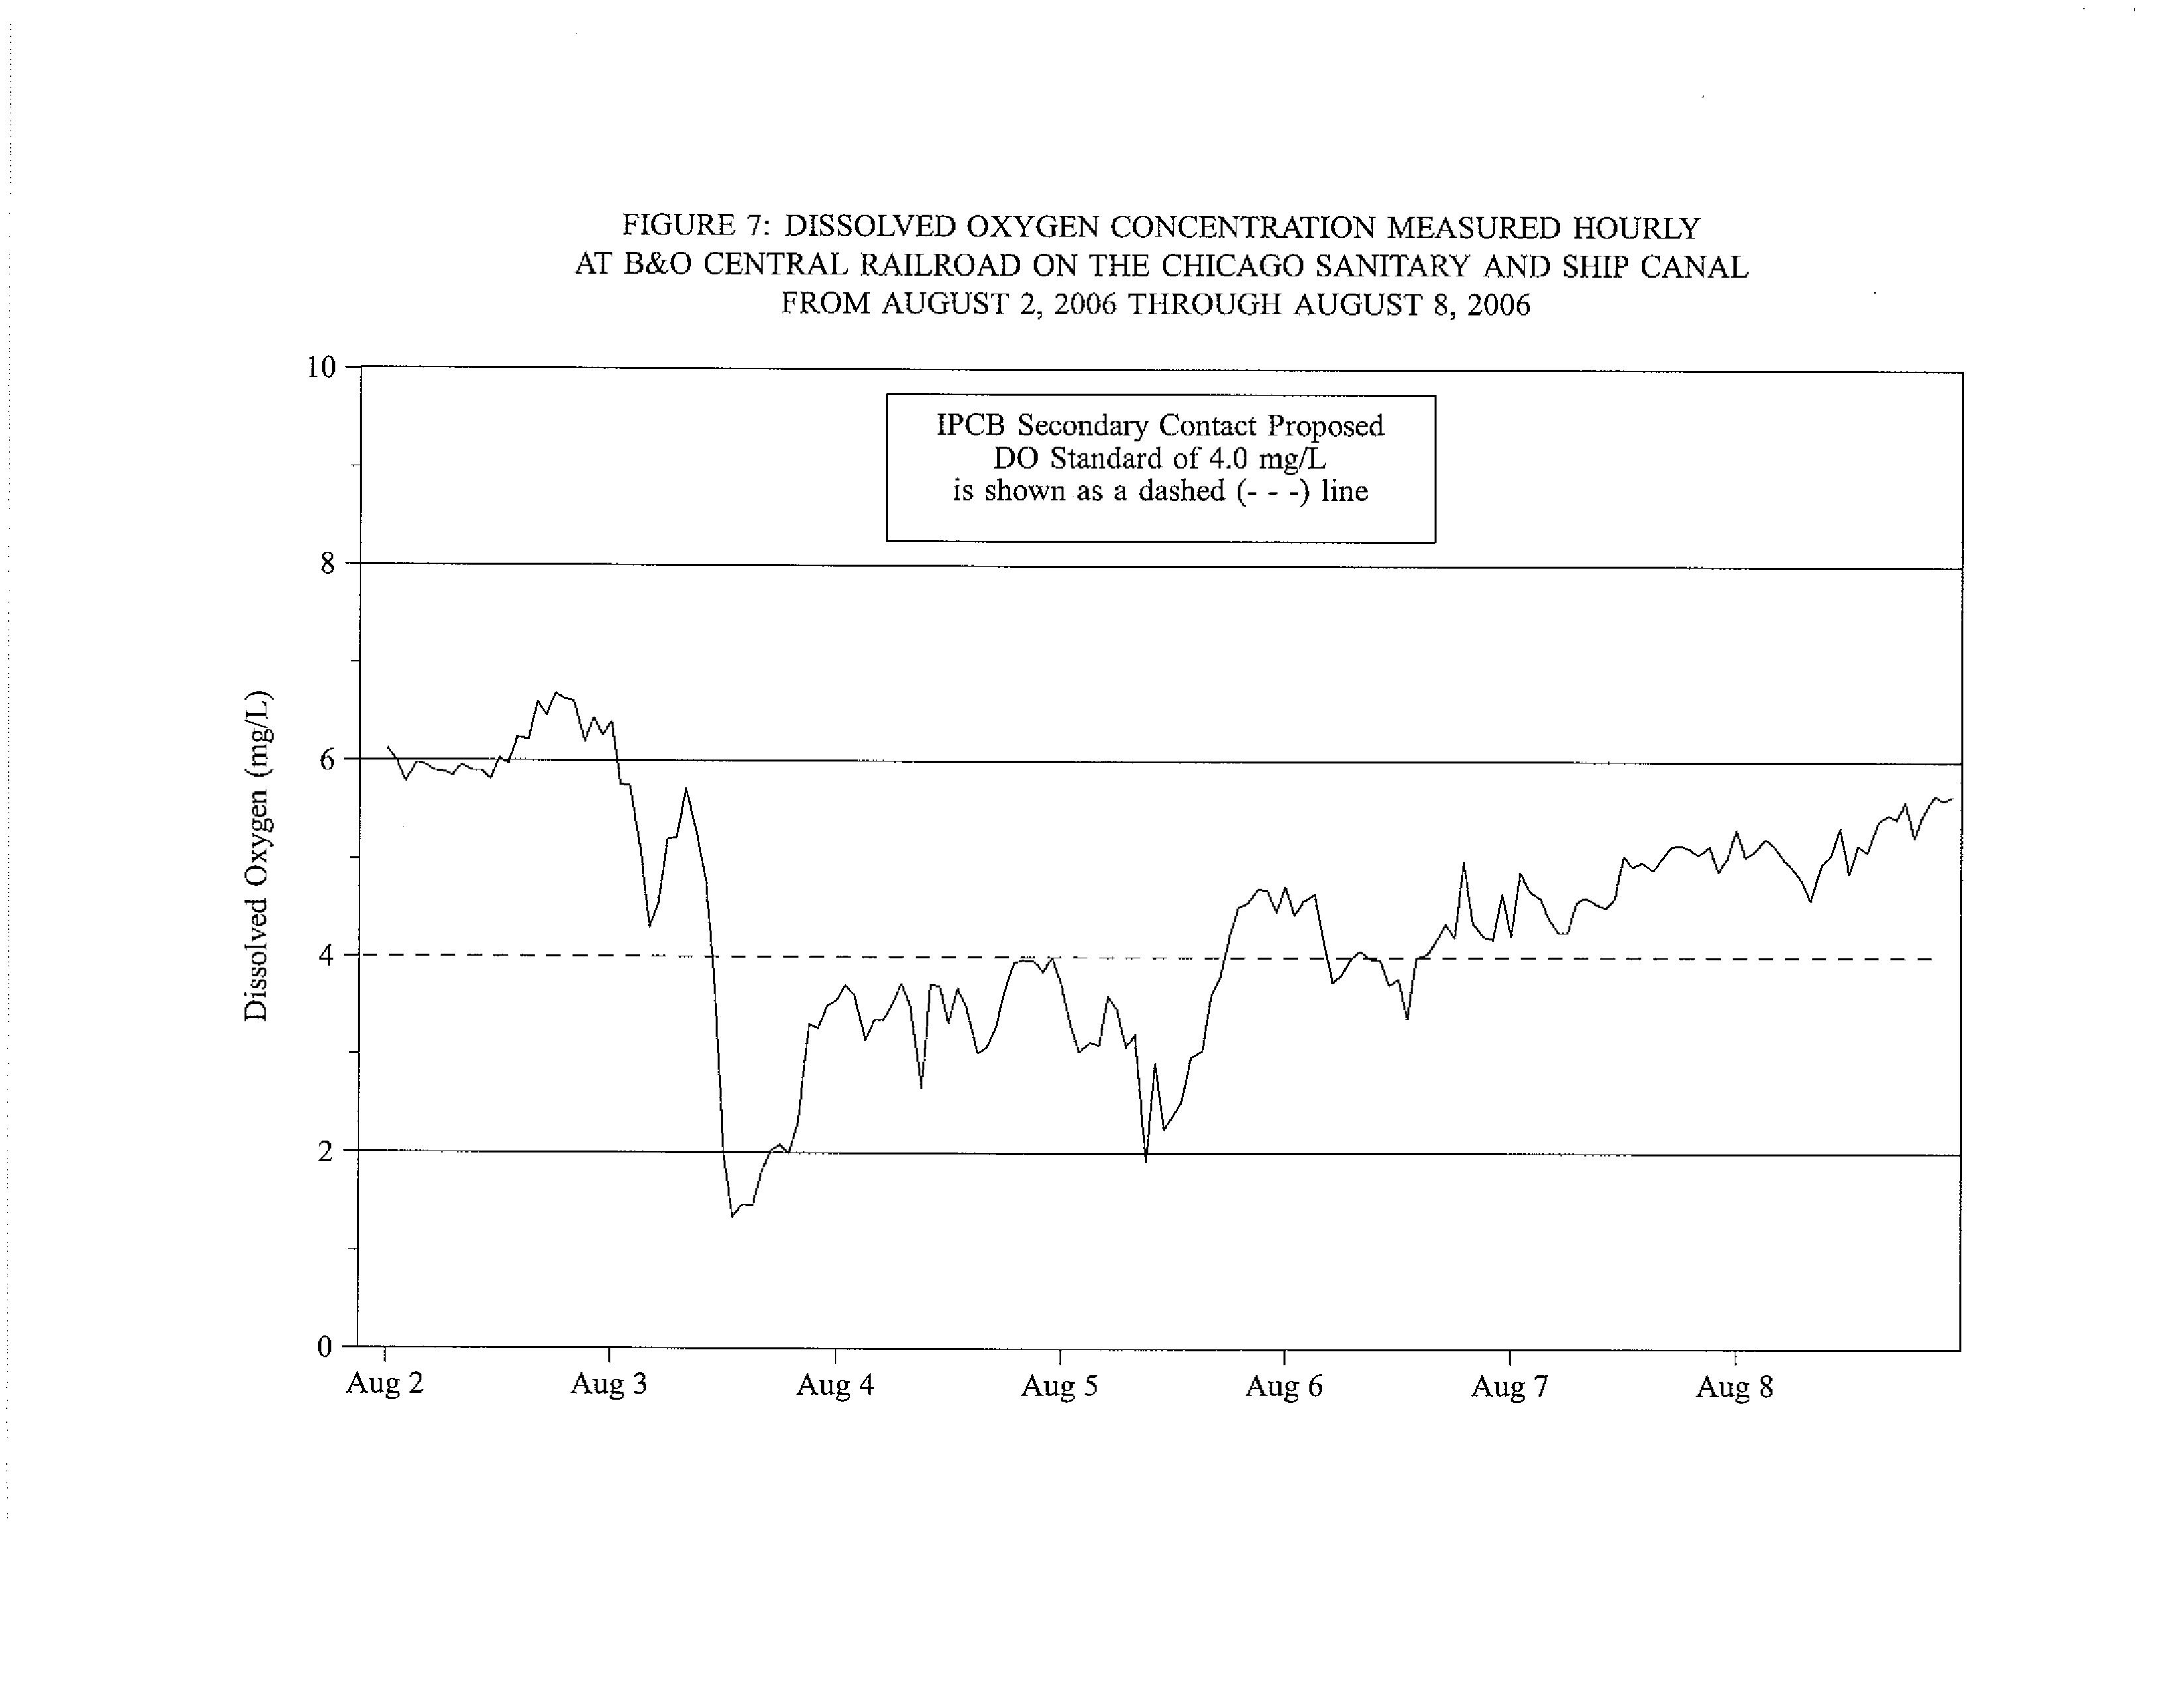
During wet weather, the DO in the waterways can be severely impacted and elicit DO
concentrations of less than 3 mg/L.
ATTACHMENT 3 shows DO at various stations in the
Chicago Area Waterway System during an example rain event in August, 2006. The effect on
DO in the CAWS from combined sewer overflows and especially District pumping stations can
last for days following a storm event. Comparing the DO graphs in ATTACHMENT 3 helps to
illustrate that CSOs do not impact all of the CAWS at the same time or in the same manner
following rain events.
This may explain why there are not frequent fish kills throughout the
system, since fish are likely to practice avoidance of the low DO segments.
With the severe aquatic habitat limitations of the Chicago Area Waterway System,
requiring an enhanced seasonal 5.0 mg/L minimum DO standard in the Chicago Area Waterway
System will merely increase the District's energy consumption and involve construction of many
additional aeration systems without substantially increasing the likelihood that fish populations
will become any more self sustaining than they are now.
5
Respectfully
submitted,
By:
Samuel G. Dennison
Testimony Attachments
1.
R&D Report No. 07-25. 2007 DO report
2.
Summary Compliance with proposed DO Standard
3.
Wet weather DO recovery graphs for the CAWS
References
Polls, Irwin. 2002. Continuous Dissolved Oxygen Monitoring from Wilmette to Lockport in the
Chicago Waterway System During August 1998 through July 2000. District R&D Report No.
02-11.
6
A
tt
a
chm
e
nt 1
etr
D putt
Water-
Reclamation
District of Greater
RESEARCH AND
DEVELOPMENT
DEPARTMENT
REPORT NO. 07-25
CONTINUOUS DISSOLVED OXYGEN MONITORING
IN THE DEEP-DRAFT CHICAGO WATERWAY SYSTEM
DURING 2006
May 2007
Metropolitan Water Reclamation District of Greater Chicago
100 East Erie Street Chicago, Illinois 60611-2803 312-751-5600
CONTINUOUS DISSOLVED OXYGEN MONITORING
IN THE DEEP-DRAFT CHICAGO WATERWAY SYSTEM
DURING 2006
By
Thomas A. Minarik, Jr.
Biologist I
Jennifer L. Wasik
Biologist II
Michael Sopcak
Biologist III
Samuel G. Dennison
Biologist IV
Research and Development
Department
Louis
Kollias,
Director
May 2007
TABLE OF CONTENTS
PPae
LIST OF TABLES
ii
LIST OF FIGURES
iv
ACKNOWLEDGEMENT
vi
DISCLAIMER
vi
INTRODUCTION
I
MONITORING STATIONS
2
Locations
and Descriptions
2
Designated Uses
2
Water Quality
Standards
2
MATERIALS AND METHODS
3
Water Quality
Monitor
3
Data Management and Review
3
Verification of Representative Data
4
RESULTS
5
DO Fluctuations
5
REFERENCES
35
APPENDIX:
A
Weekly DO Summary
Statistics at all Deep-Draft Monitoring
Stations
A-1
During 2006
i
LIST OF TABLES
Table
No.
Page
1
Deep-Draft Continuous Dissolved Oxygen Monitoring Stations
6
2
Minimum, Maximum, and Mean Hourly Dissolved Oxygen Concentra-
tions
10
3
Number and Percent of Dissolved Oxygen Values Not Meeting Accep-
tance Criteria
11
4
Number and Percent of Dissolved Oxygen Values Measured Above the
Illinois Pollution Control Board's Water Quality Standard
12
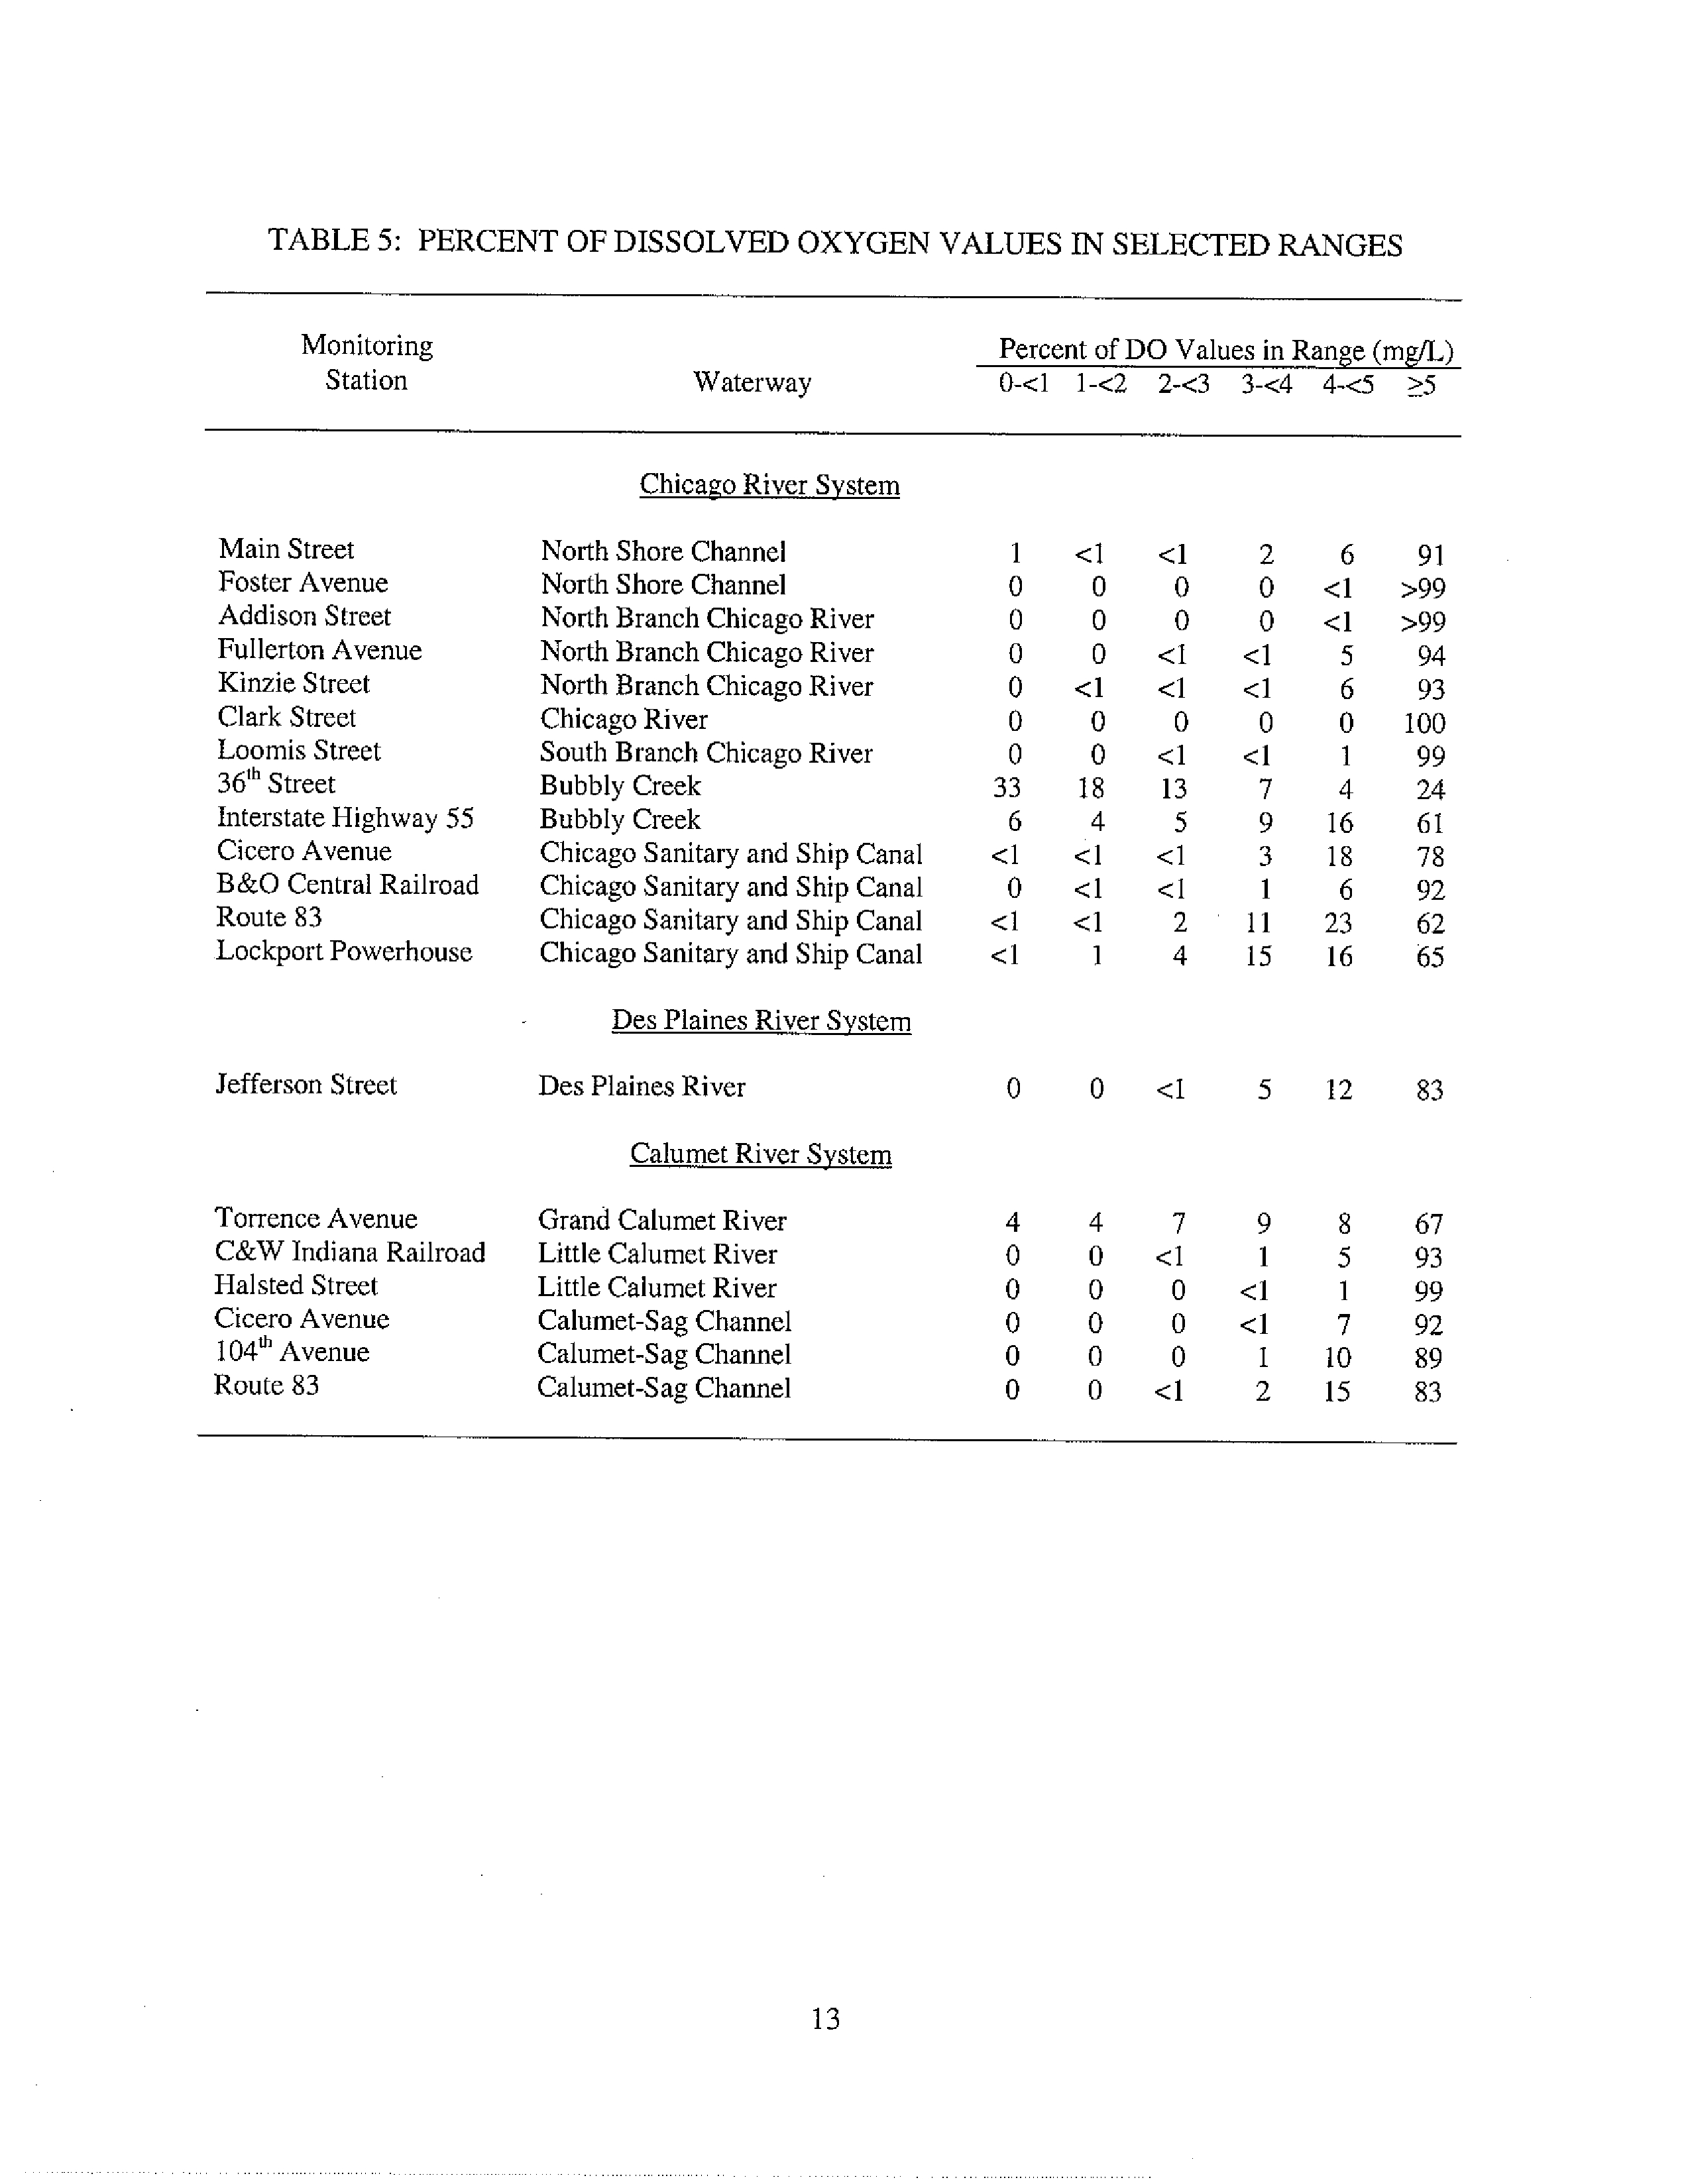
5
Percent of Dissolved Oxygen Values in Selected Ranges
13
A-1
Weekly DO Summary Statistics at Main Street on the North Shore Chan-
nel During 2006
A-1
A-2
Weekly DO Summary Statistics at Foster Avenue on the North Shore
Channel During 2006
A-3
A-3
Weekly DO Summary Statistics at Addison Street on the North Branch of
the Chicago River During 2006
A-5
A-4
Weekly DO Summary Statistics at Fullerton Avenue on the North Branch
of the Chicago River During 2006
A-7
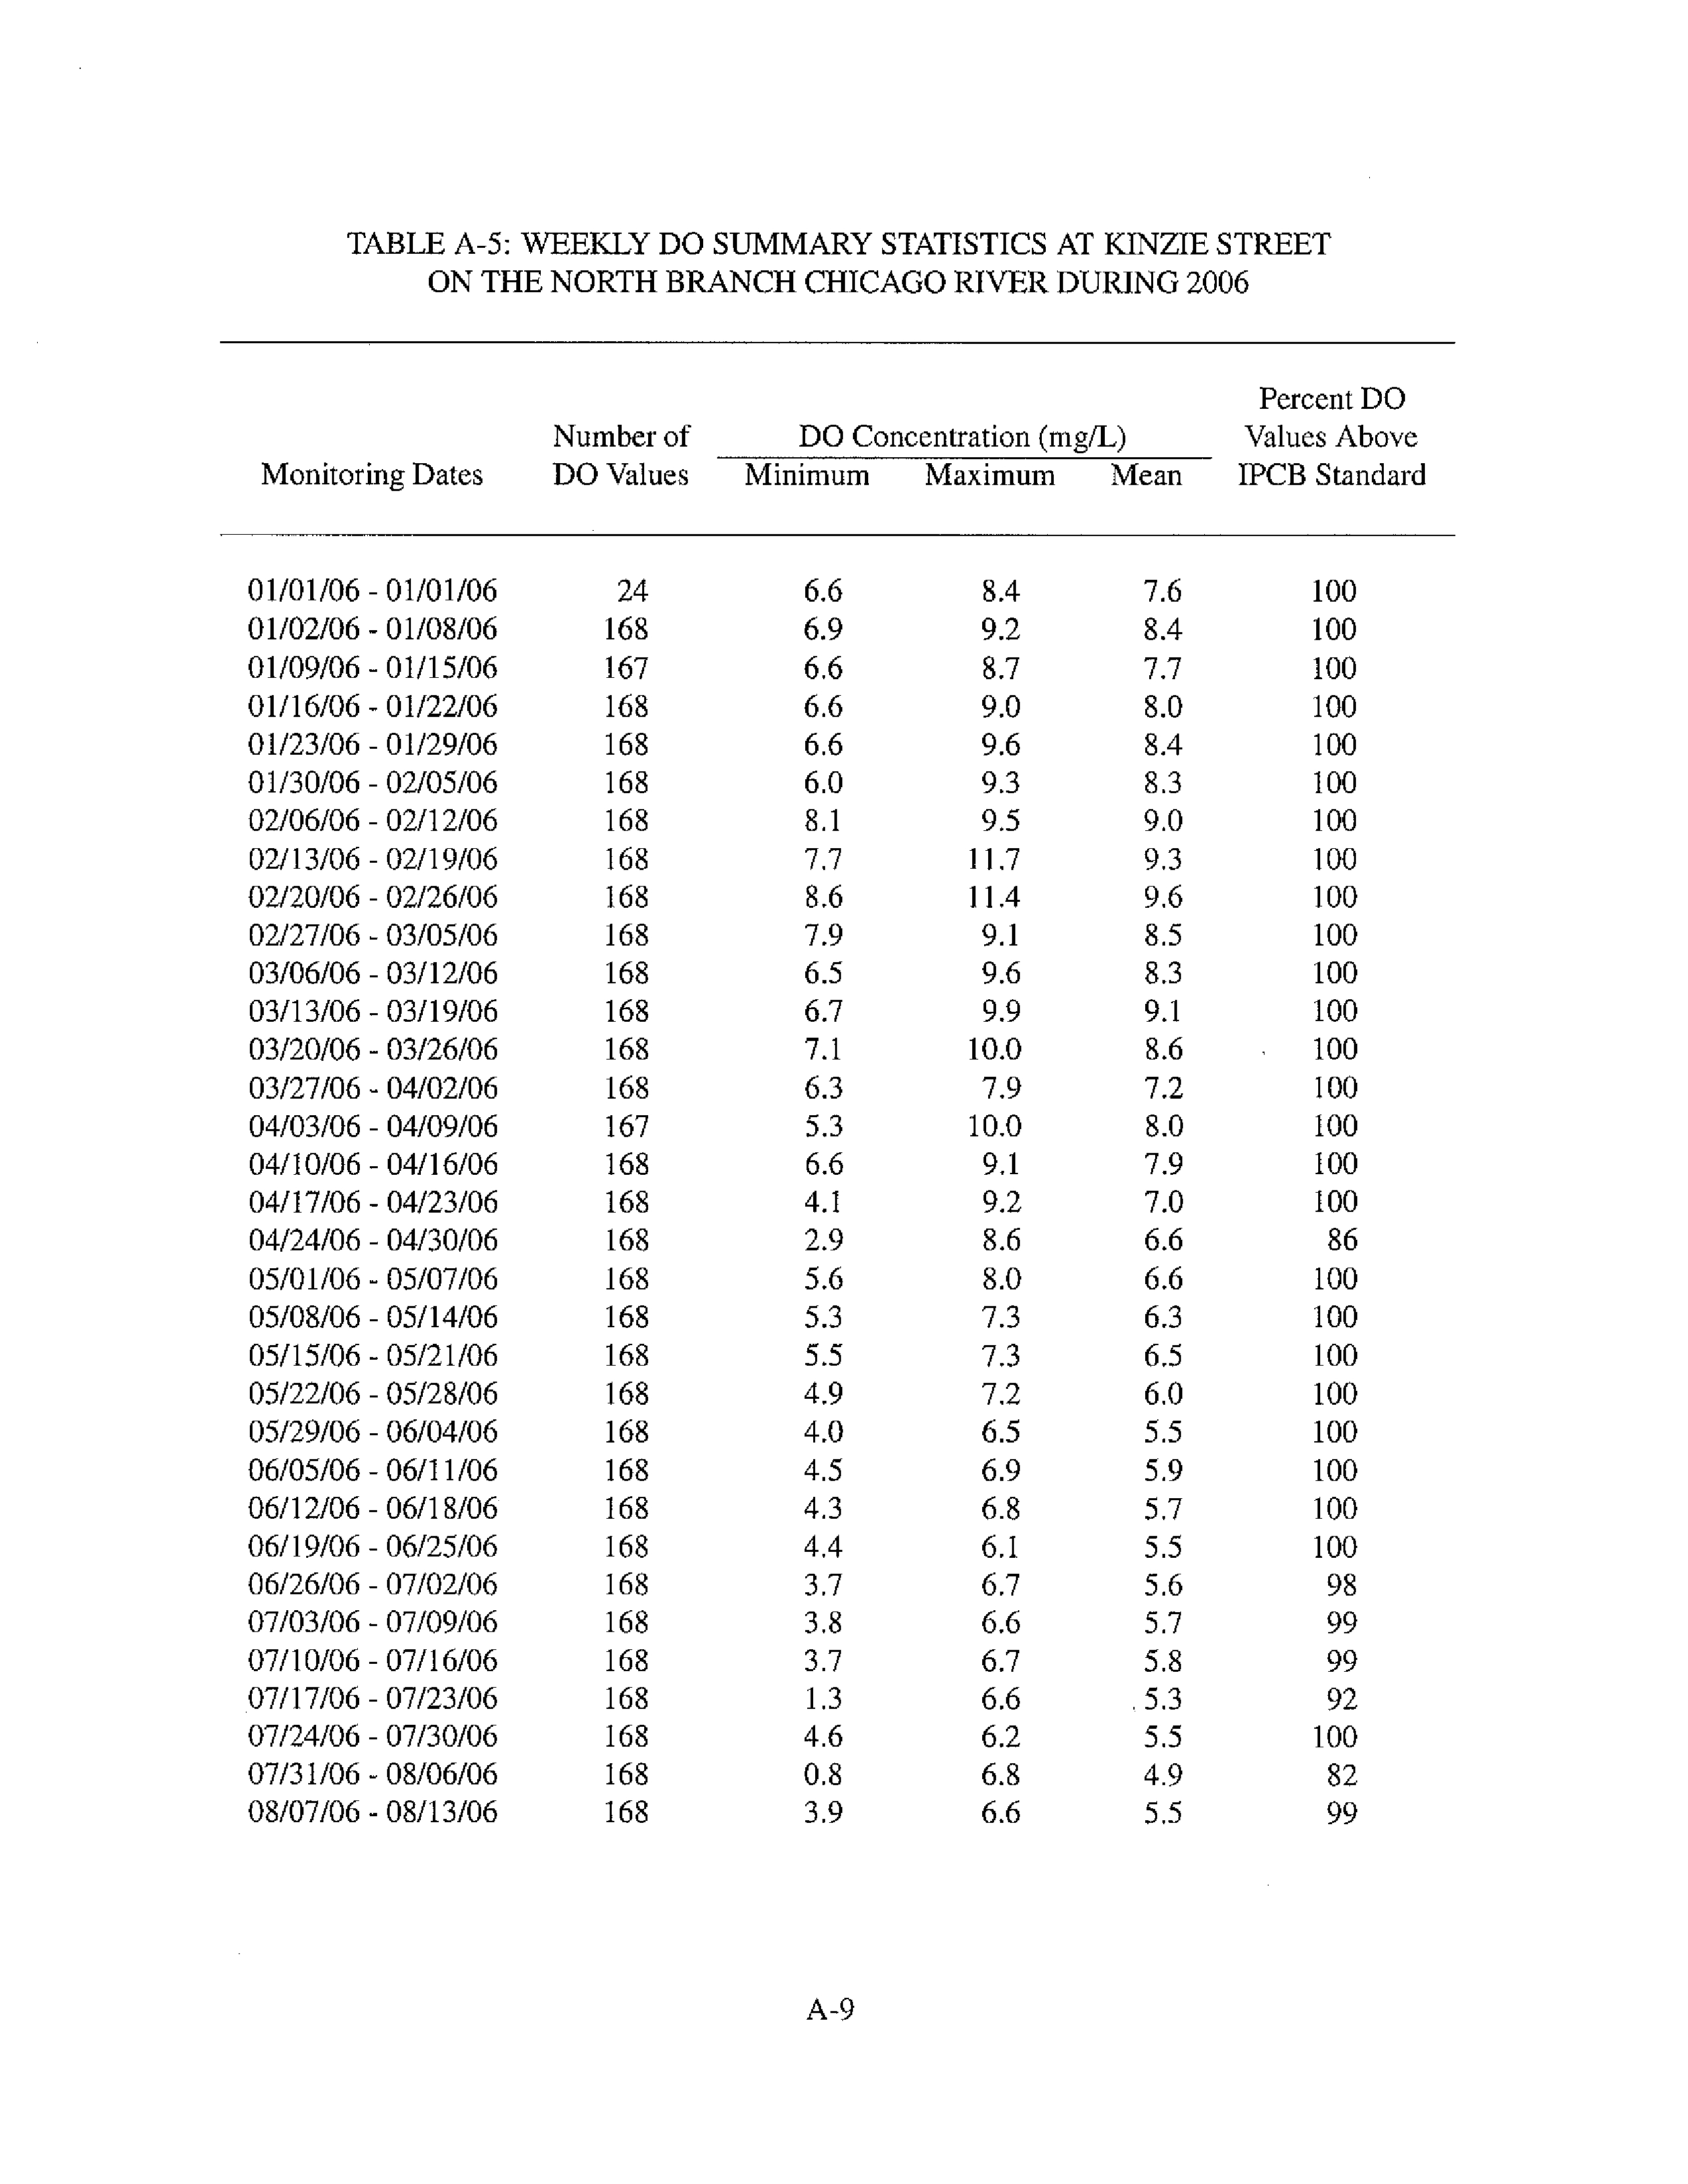
A-5
Weekly DO Summary Statistics at Kinzie Street on the North Branch of
the Chicago River During 2006
A-9
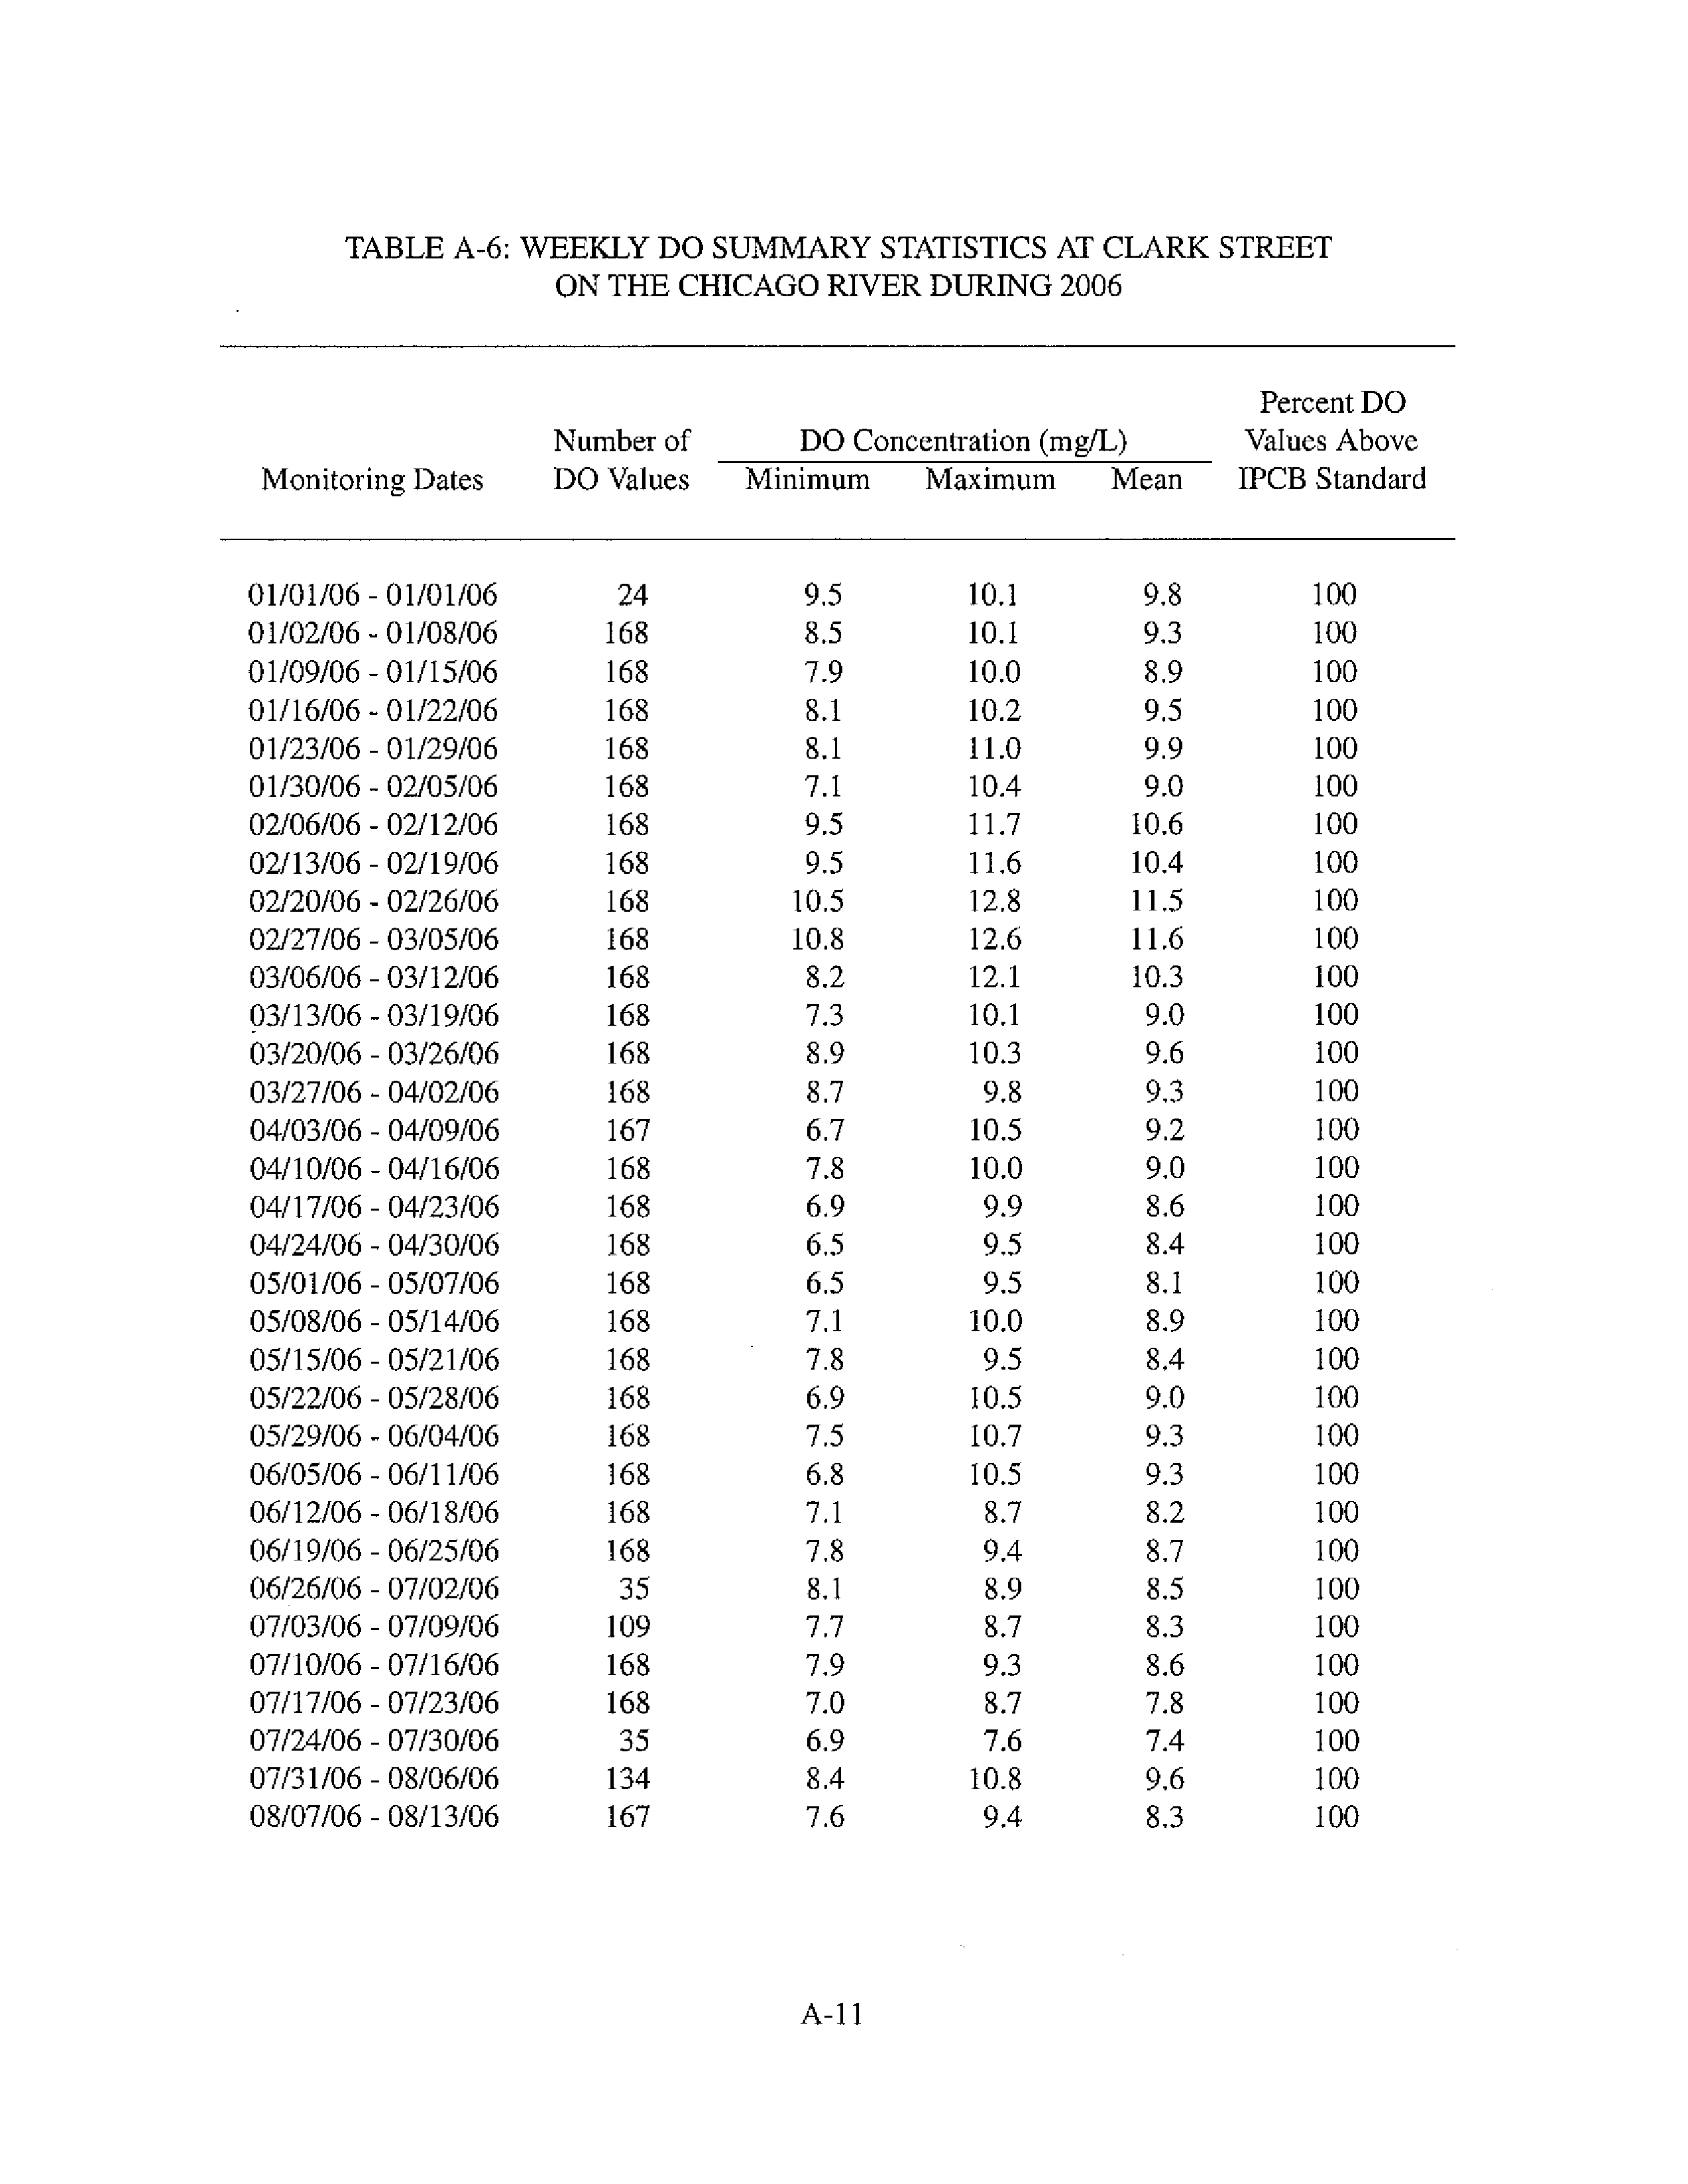
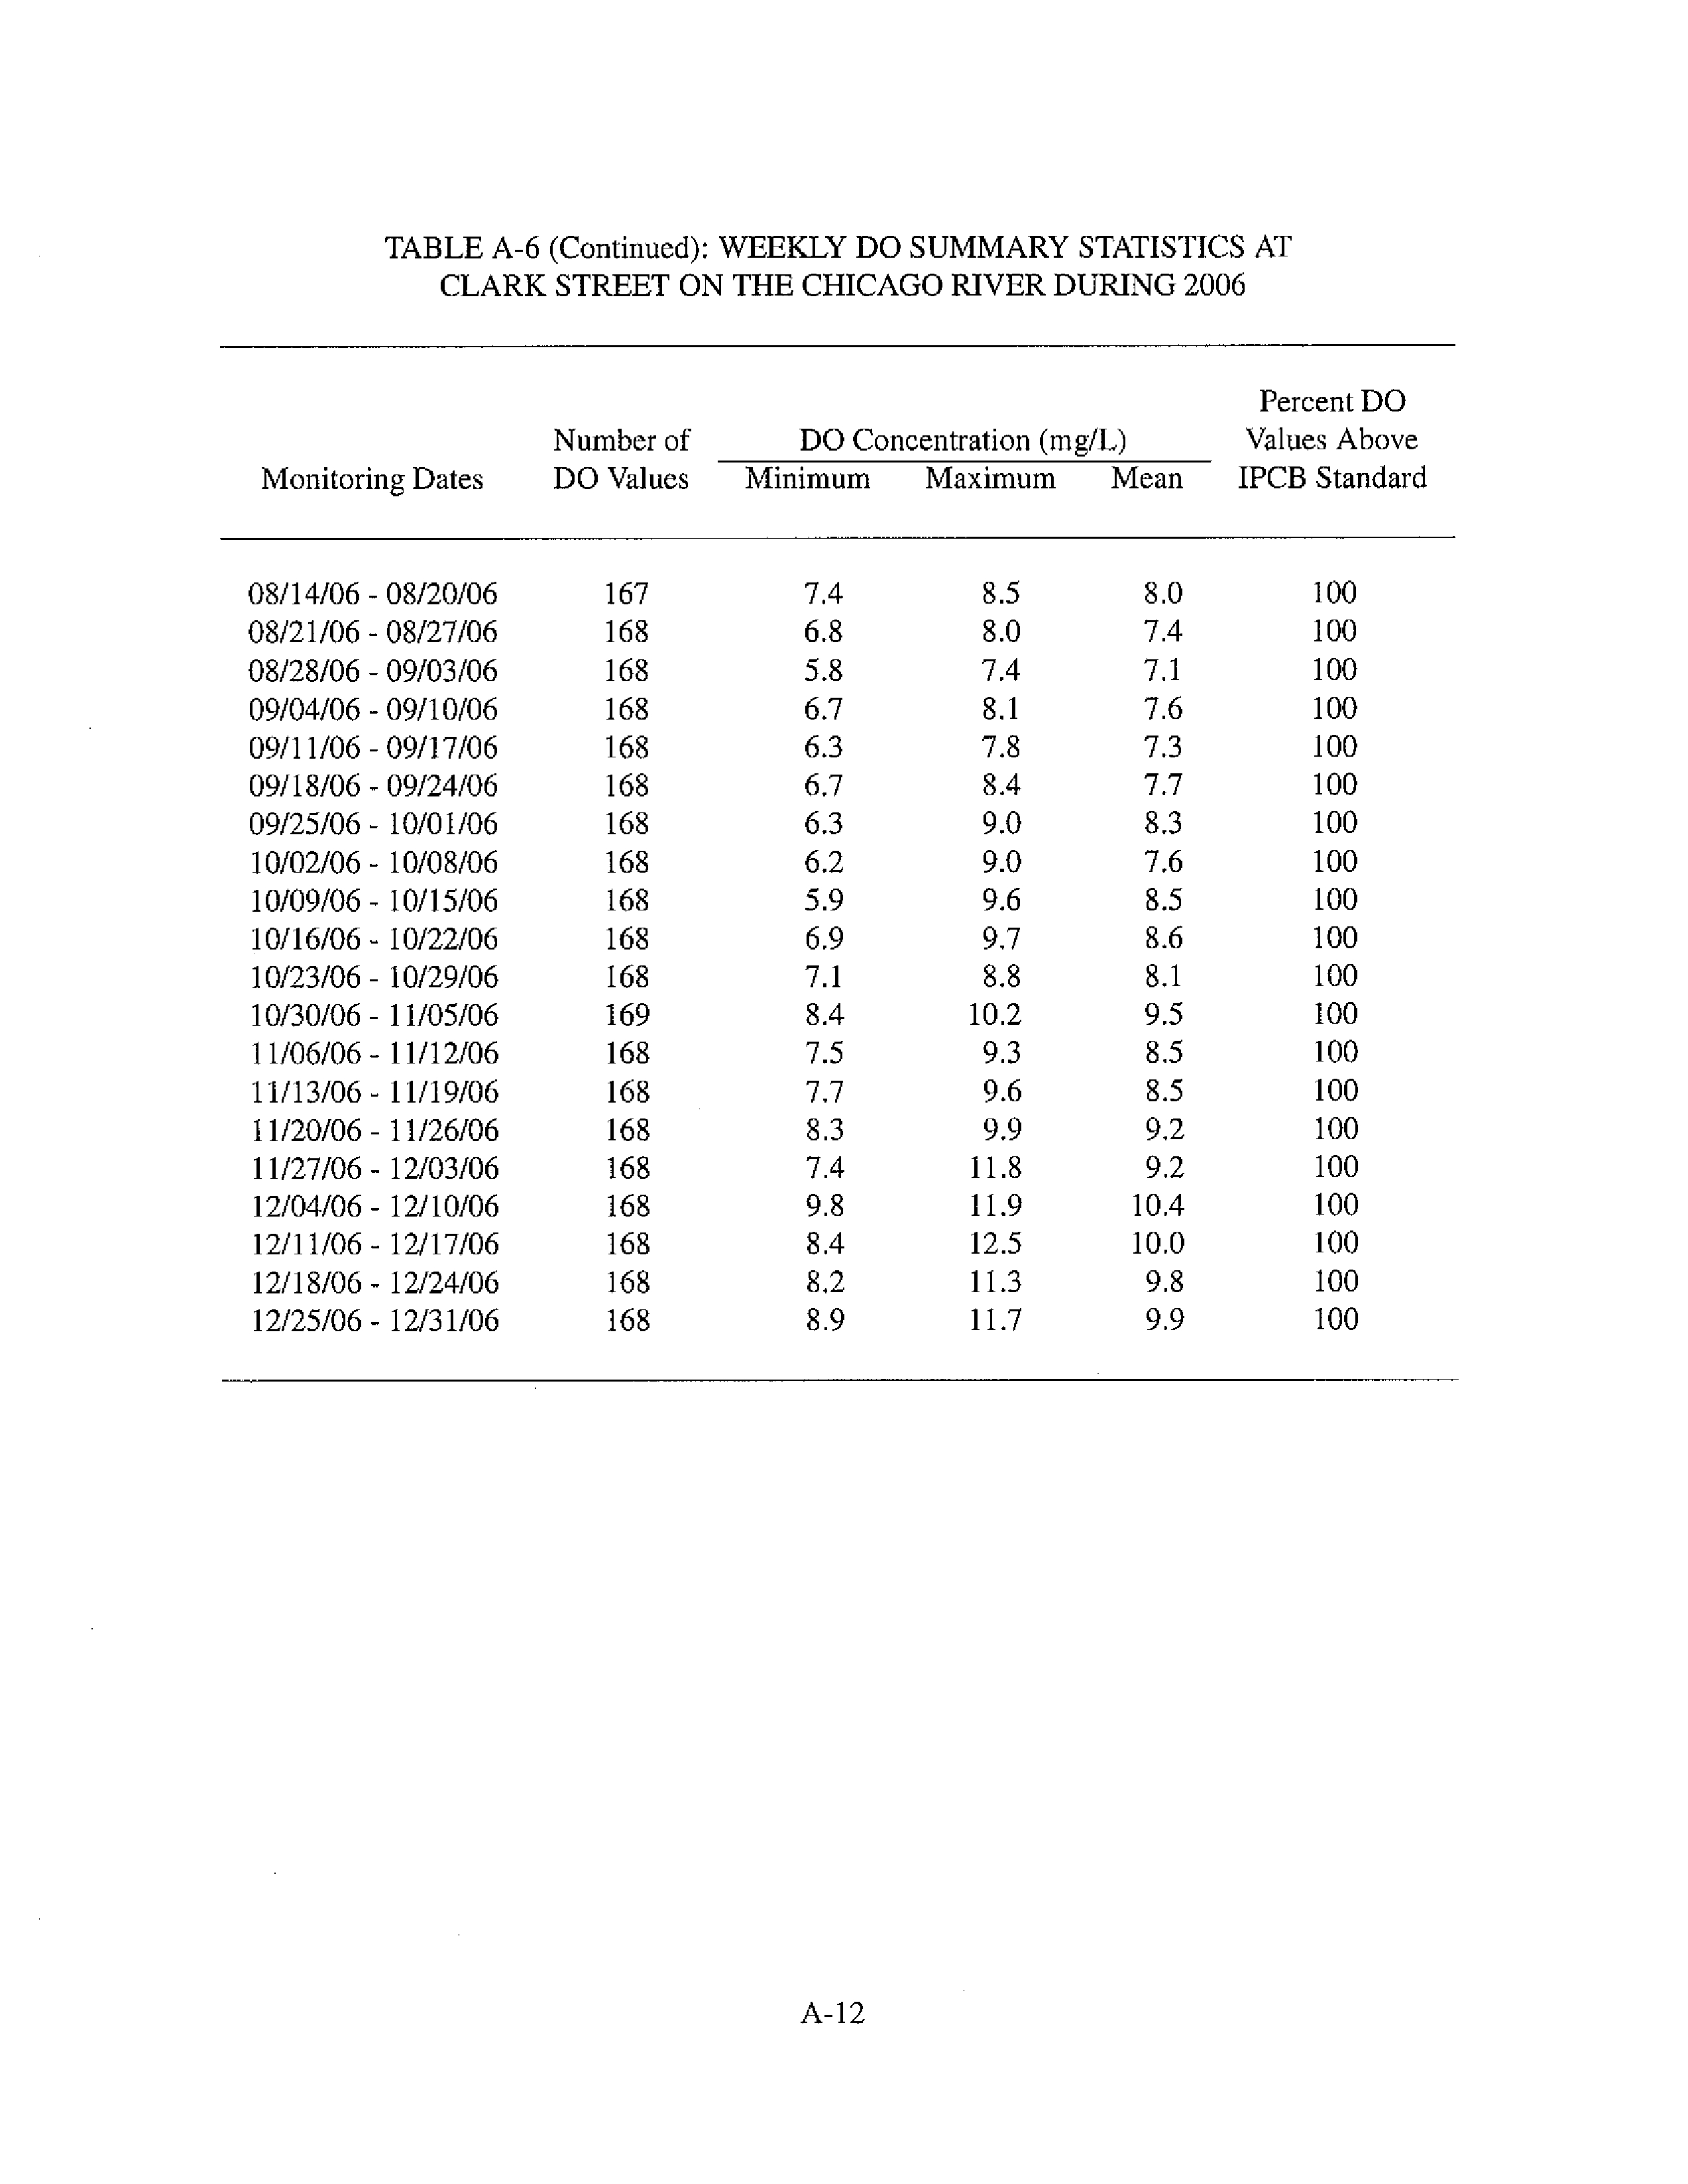
A-6
Weekly DO Summary Statistics at Clark Street on the Chicago River
During 2006
A-11
A-7
Weekly DO Summary Statistics at Loomis Street on the South Branch of
the Chicago River During 2006
A-13
A-8
Weekly DO Summary Statistics at 36th Street on Bubbly Creek During
A-15
2006
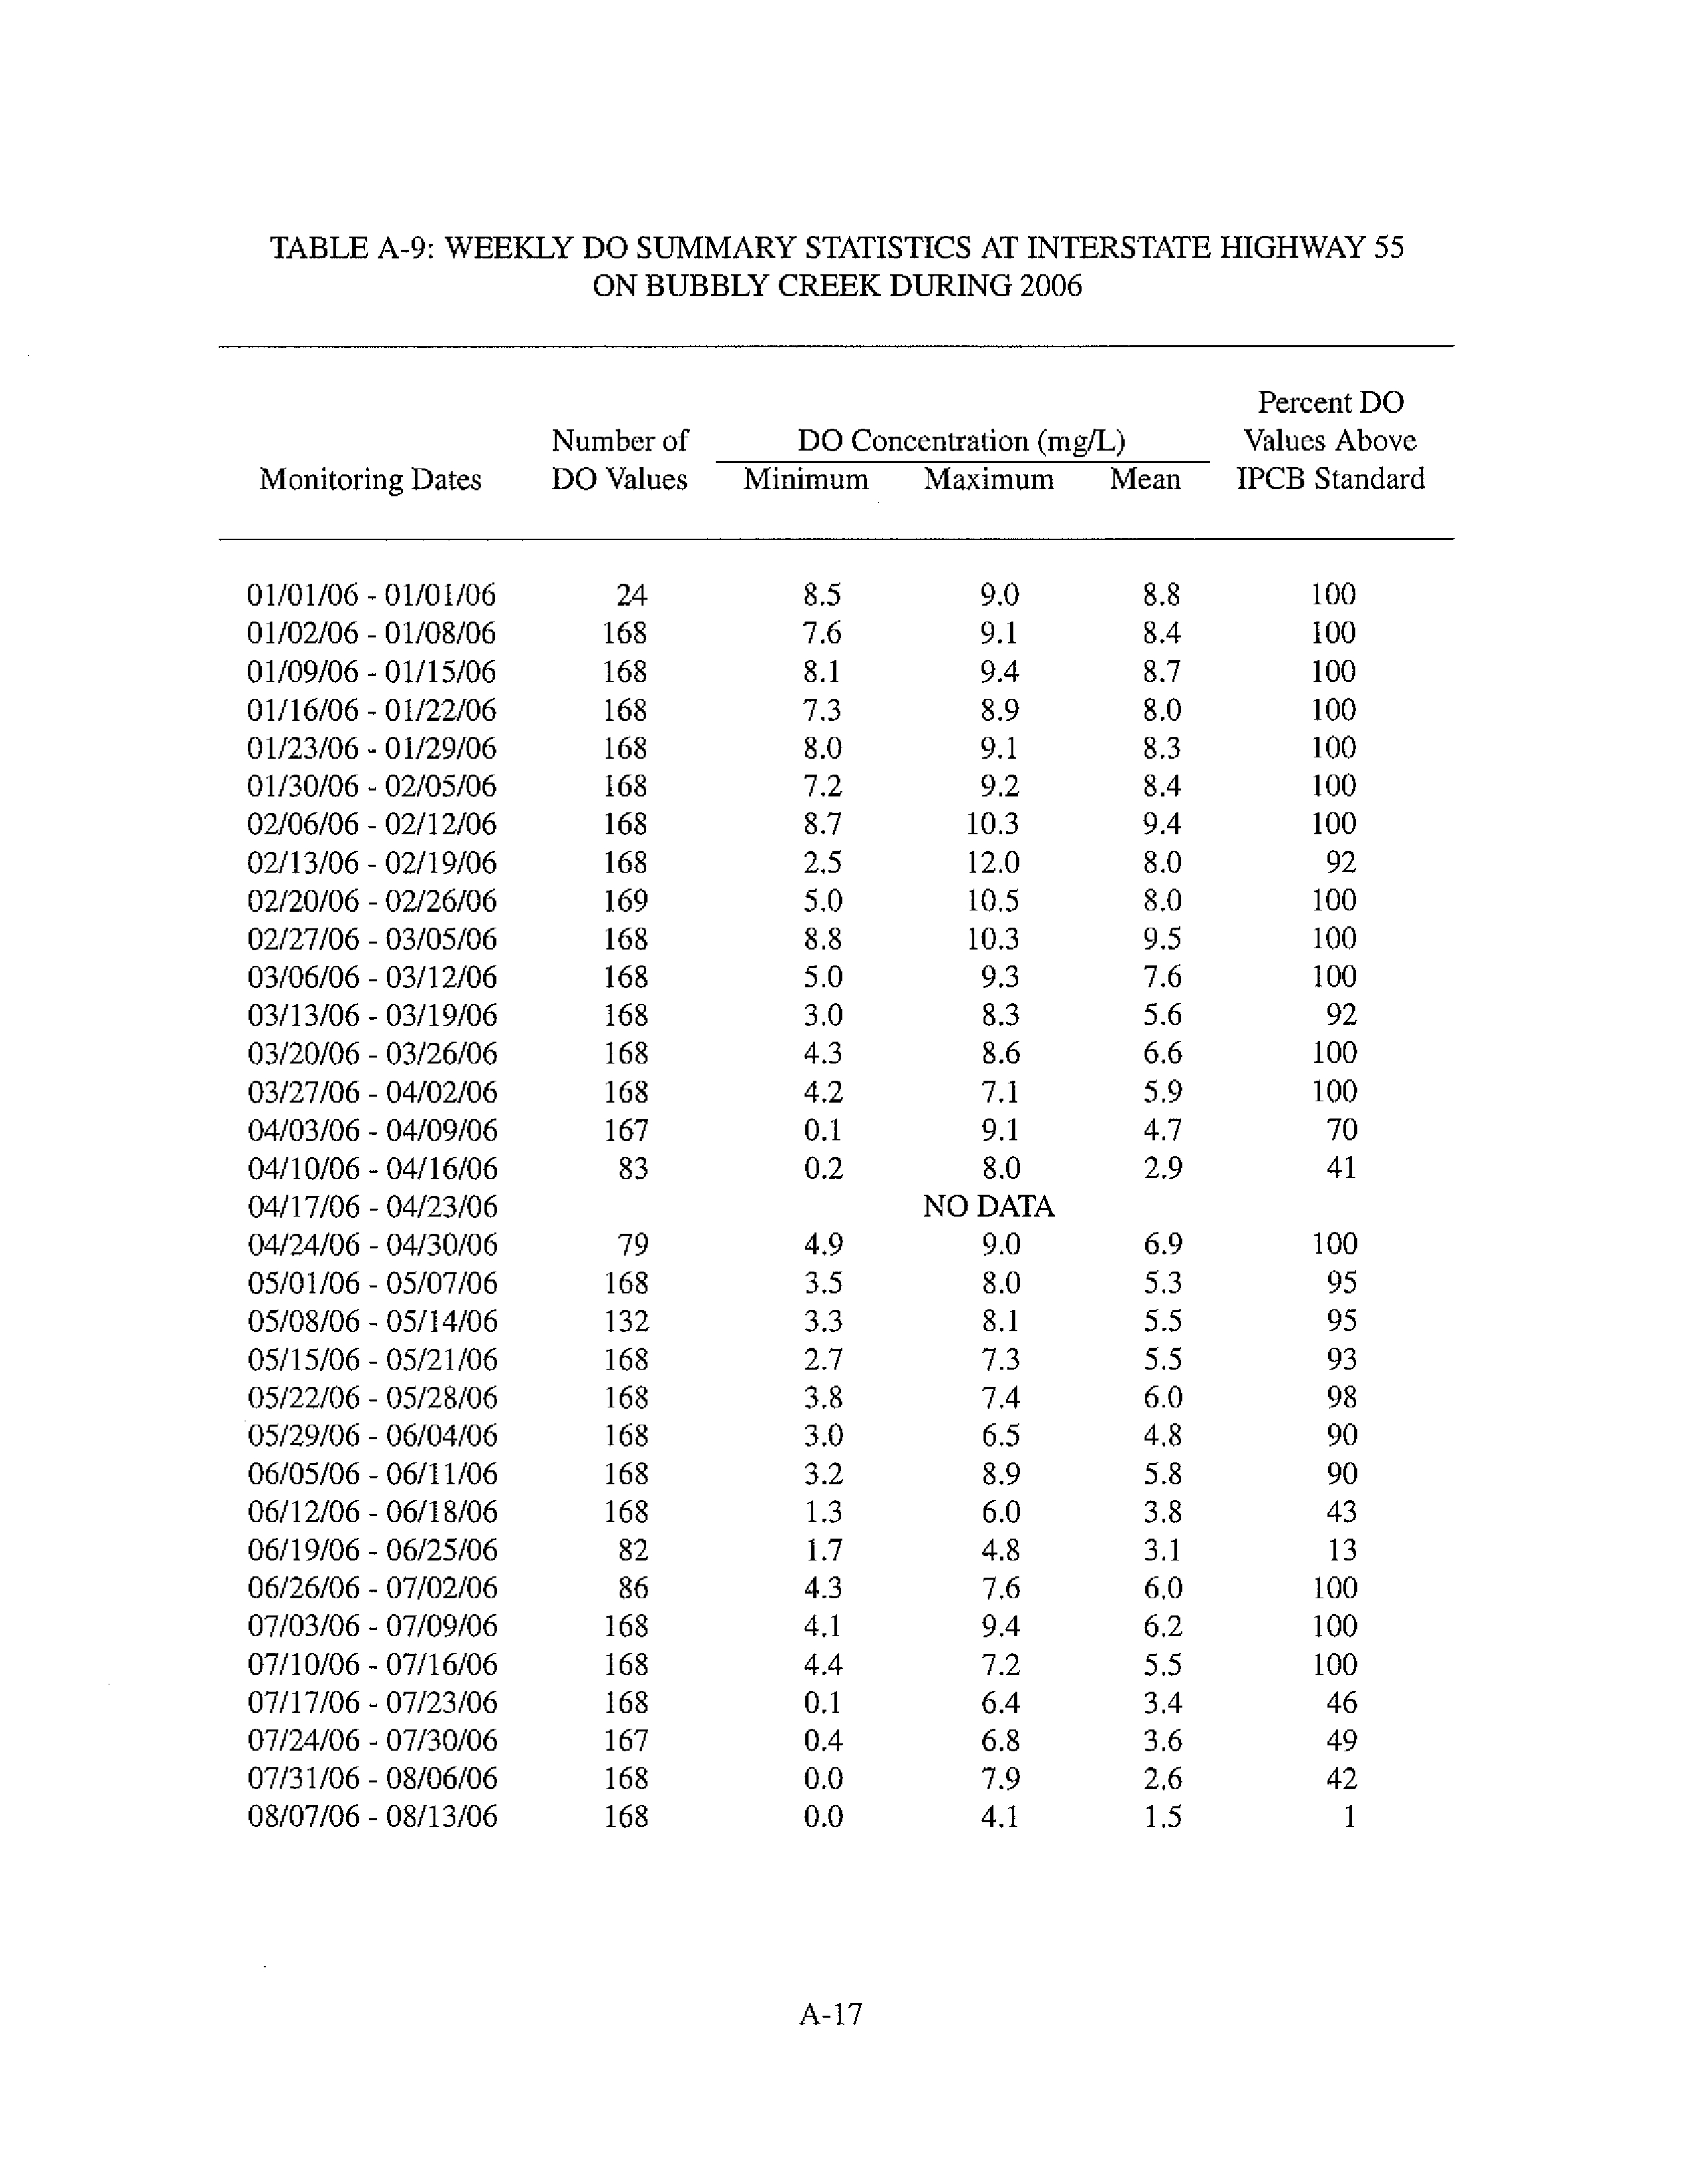
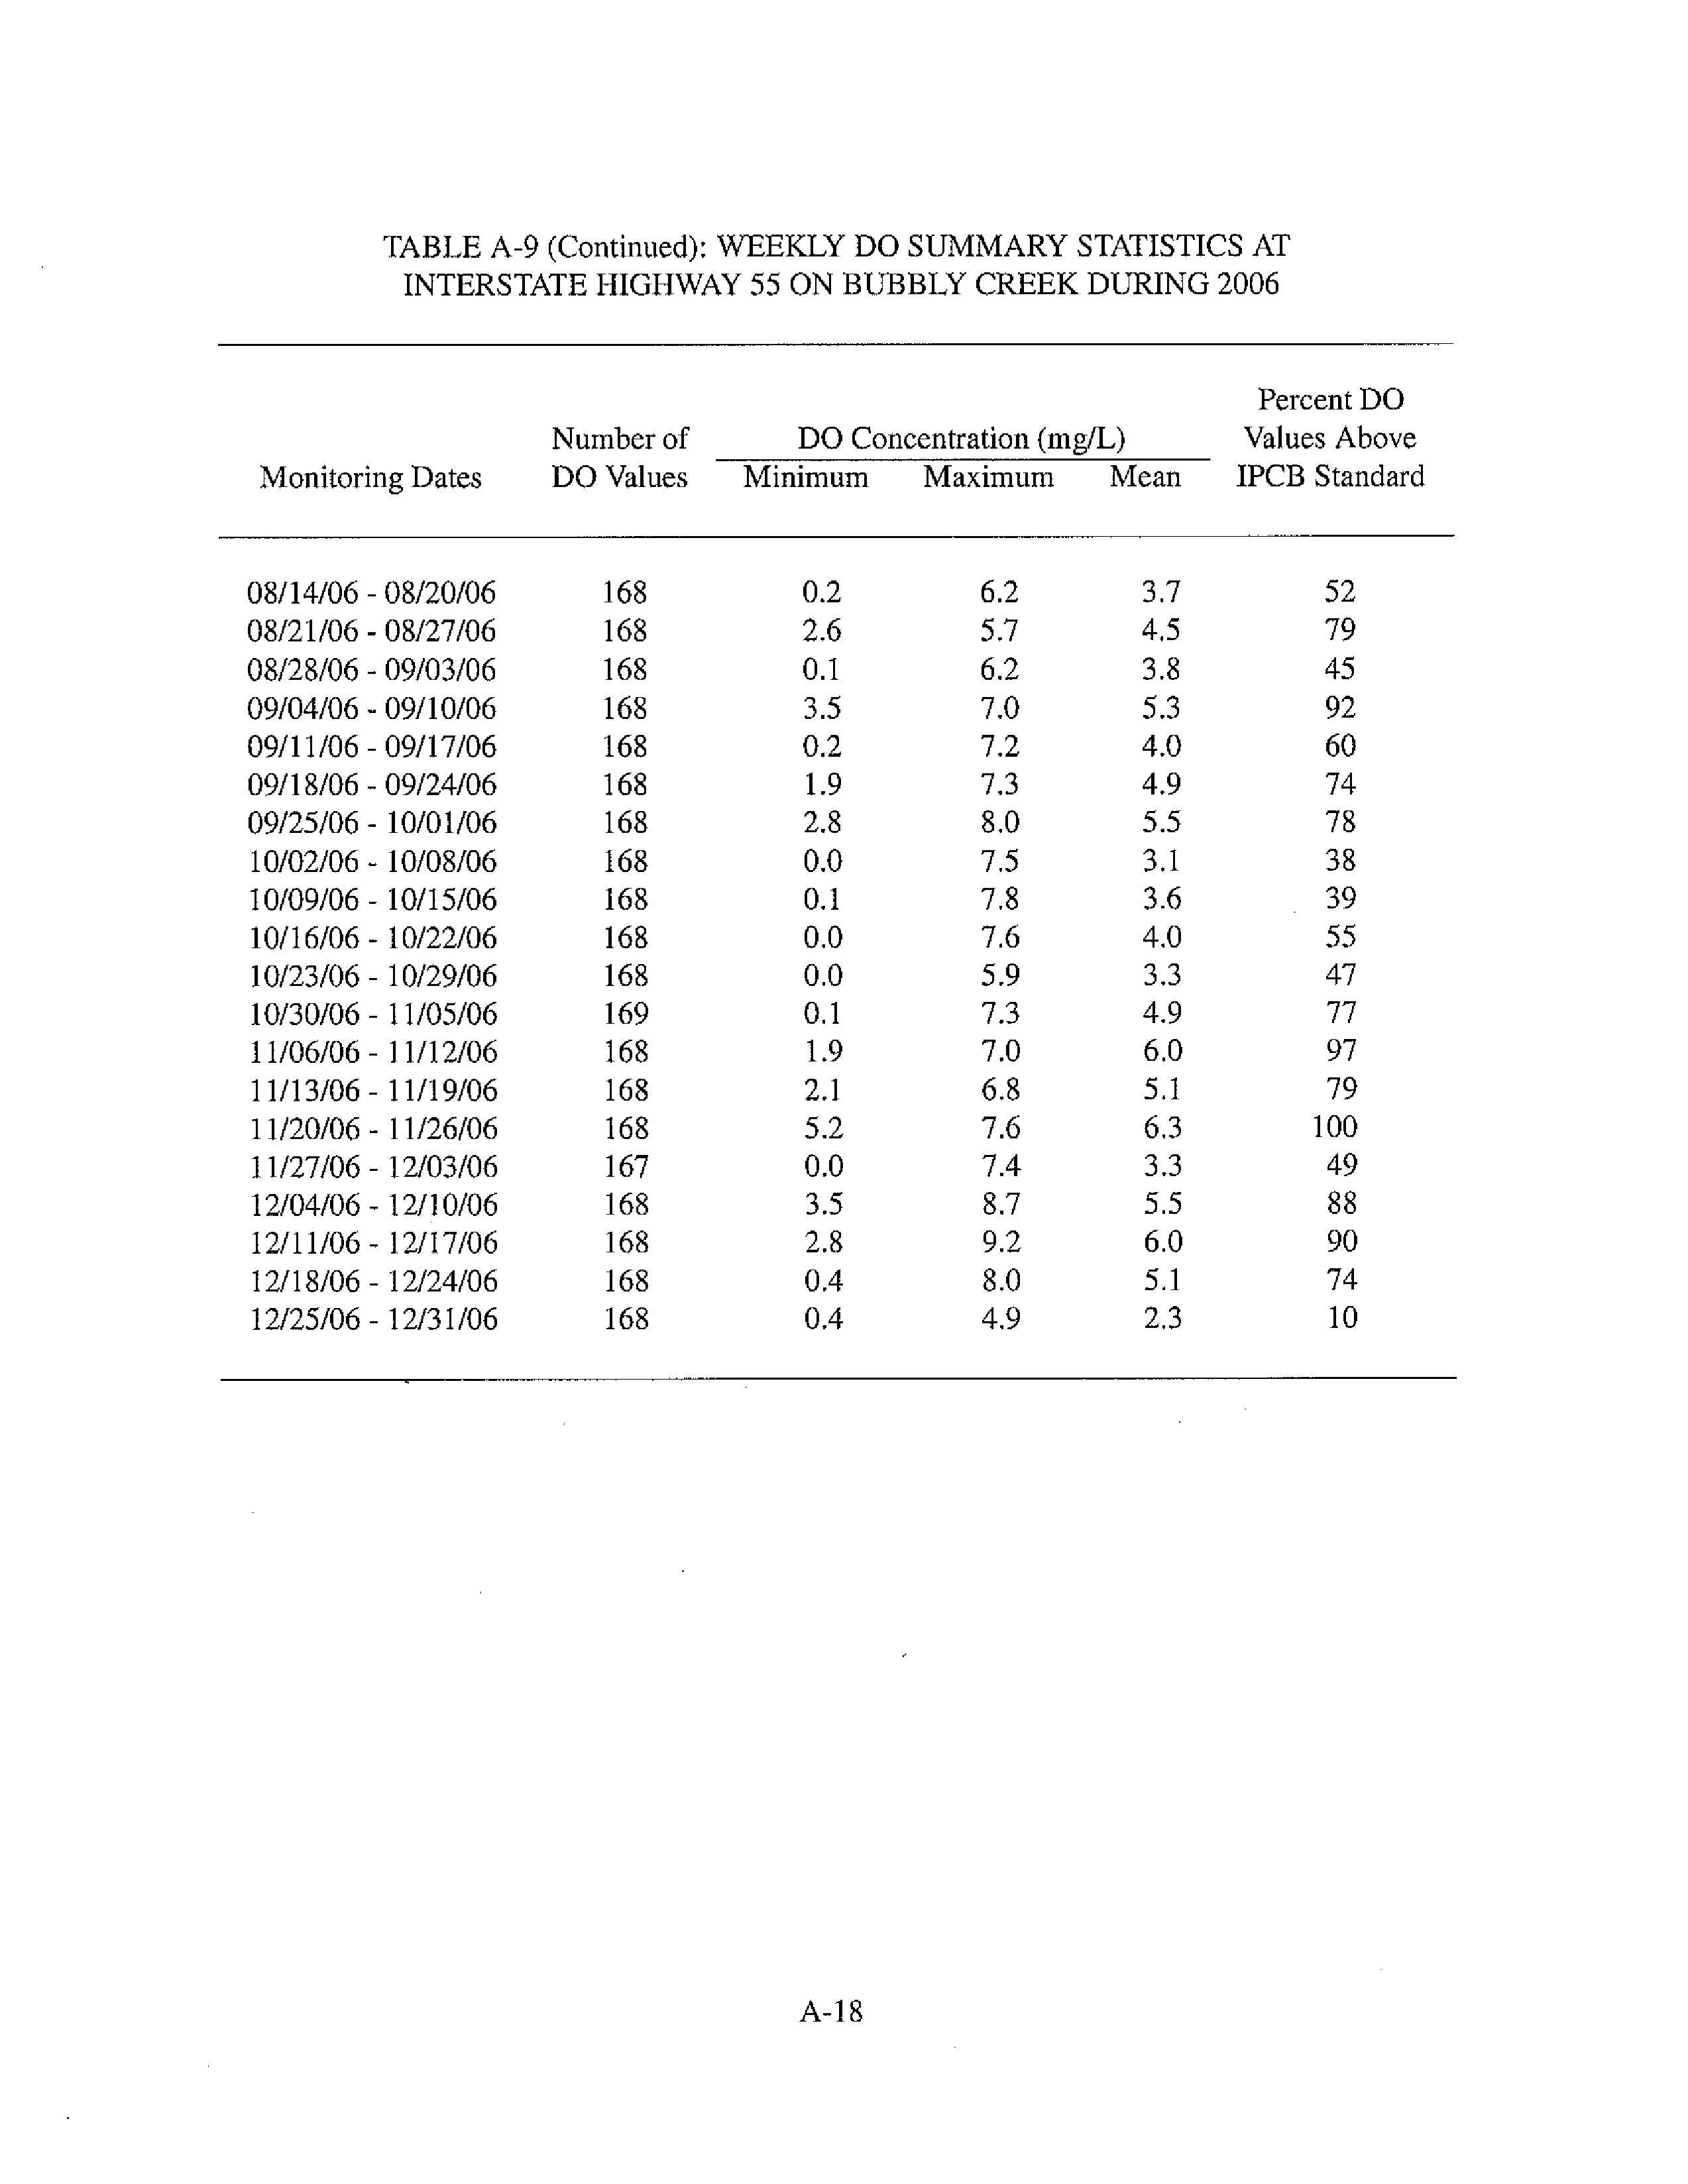
A-9
Weekly DO Summary Statistics at Interstate Highway 55 on Bubbly
Creek During 2006
A-17
ii
LIST OF TABLES (
Continued)
Table
No,
Page
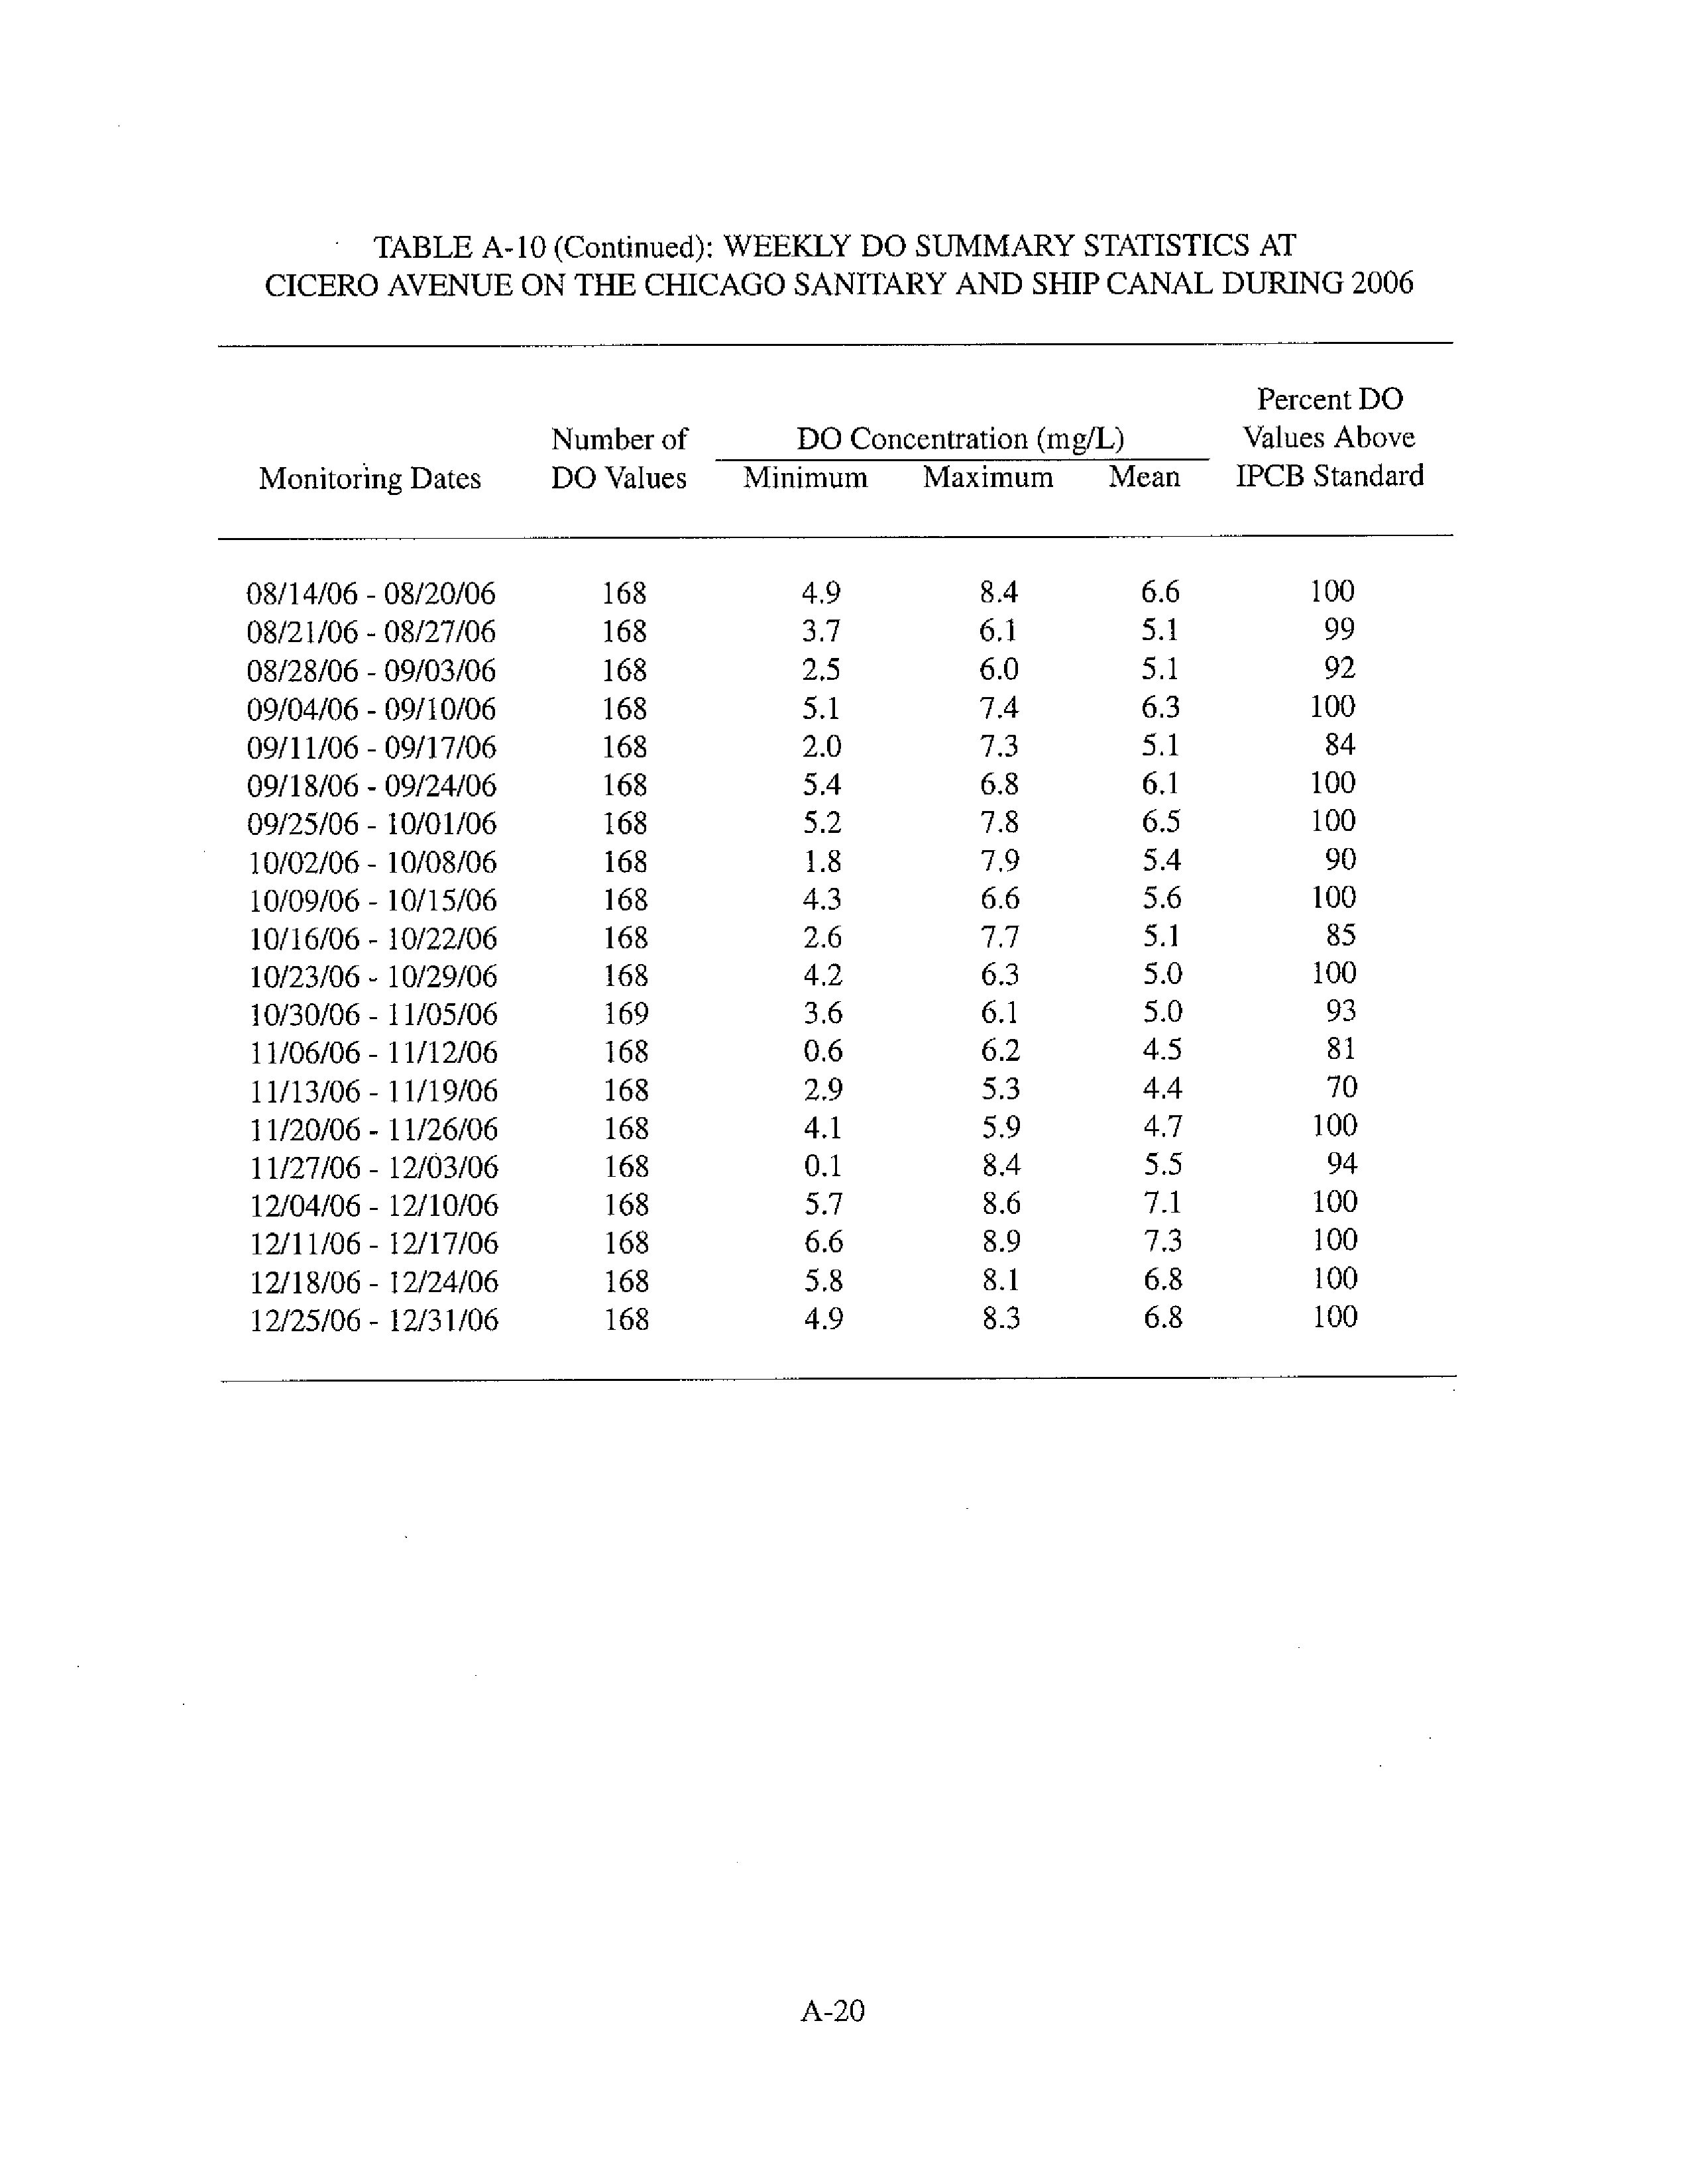
A-10
Weekly DO Summary Statistics at Cicero Avenue on the Chicago Sani-
tary and Ship Canal During 2006
A-19
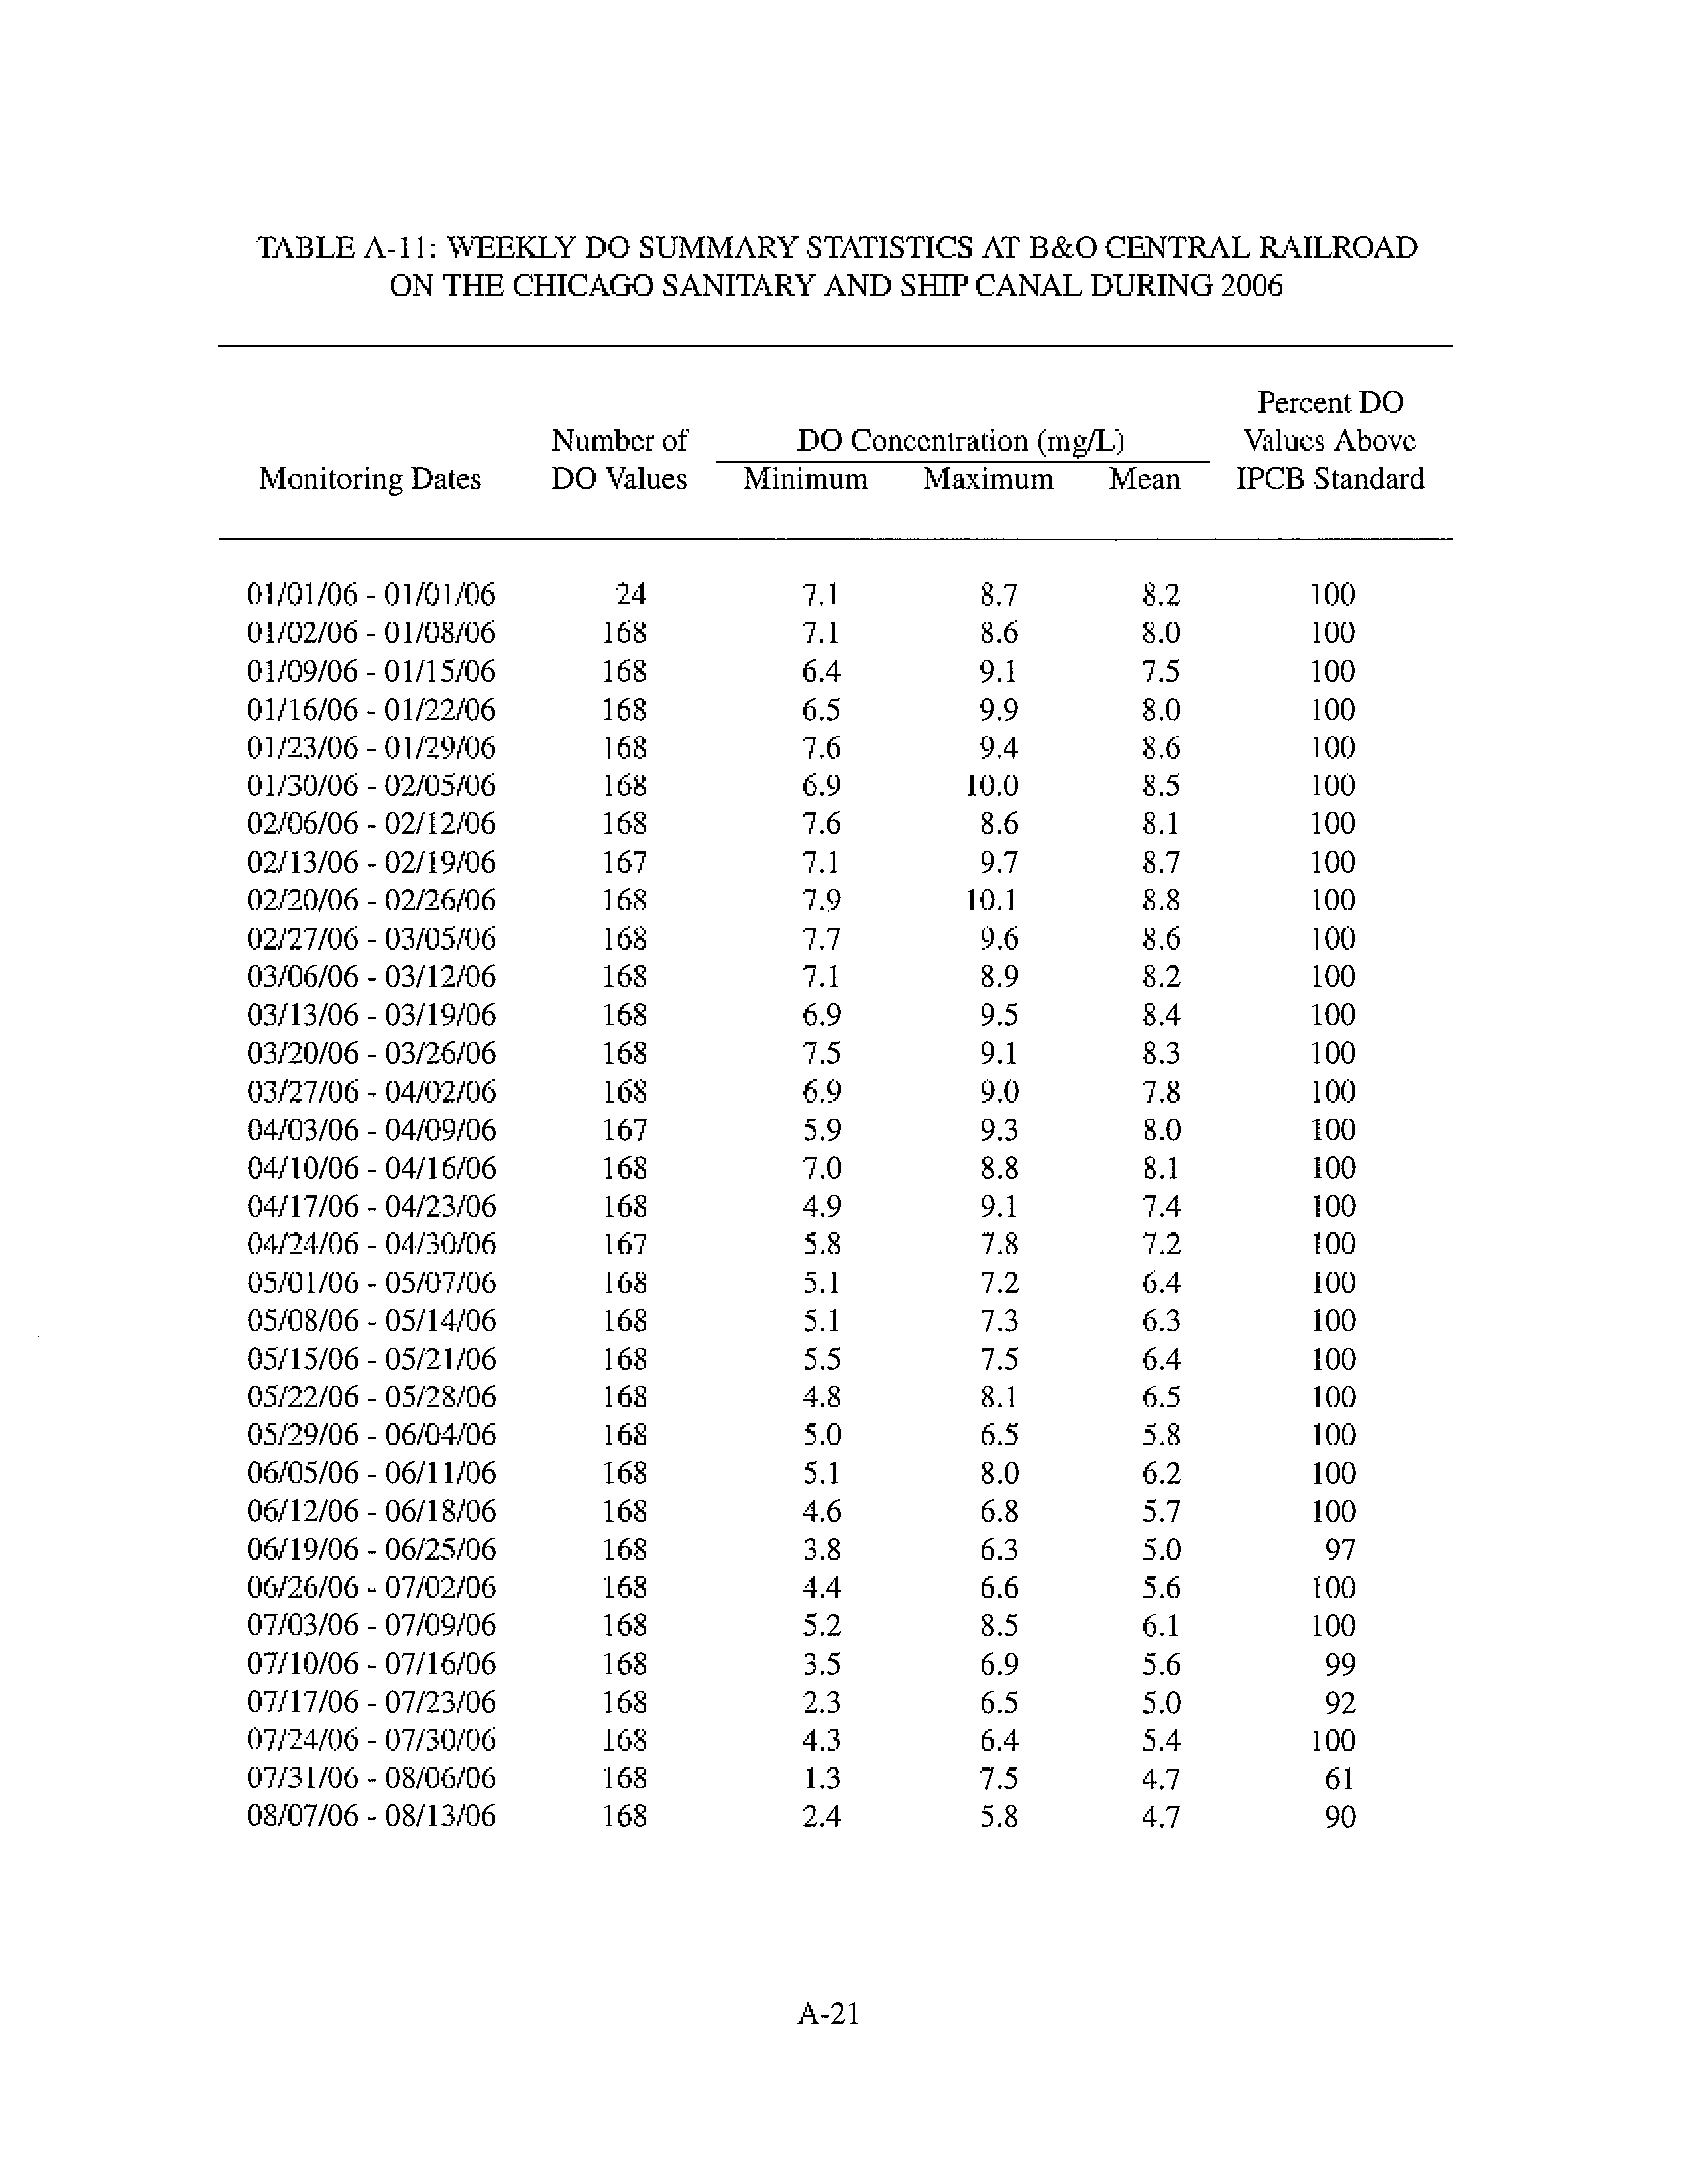
A-11
Weekly DO Summary Statistics at B&O Central Railroad on the Chicago
Sanitary and Ship Canal During 2006
A-21
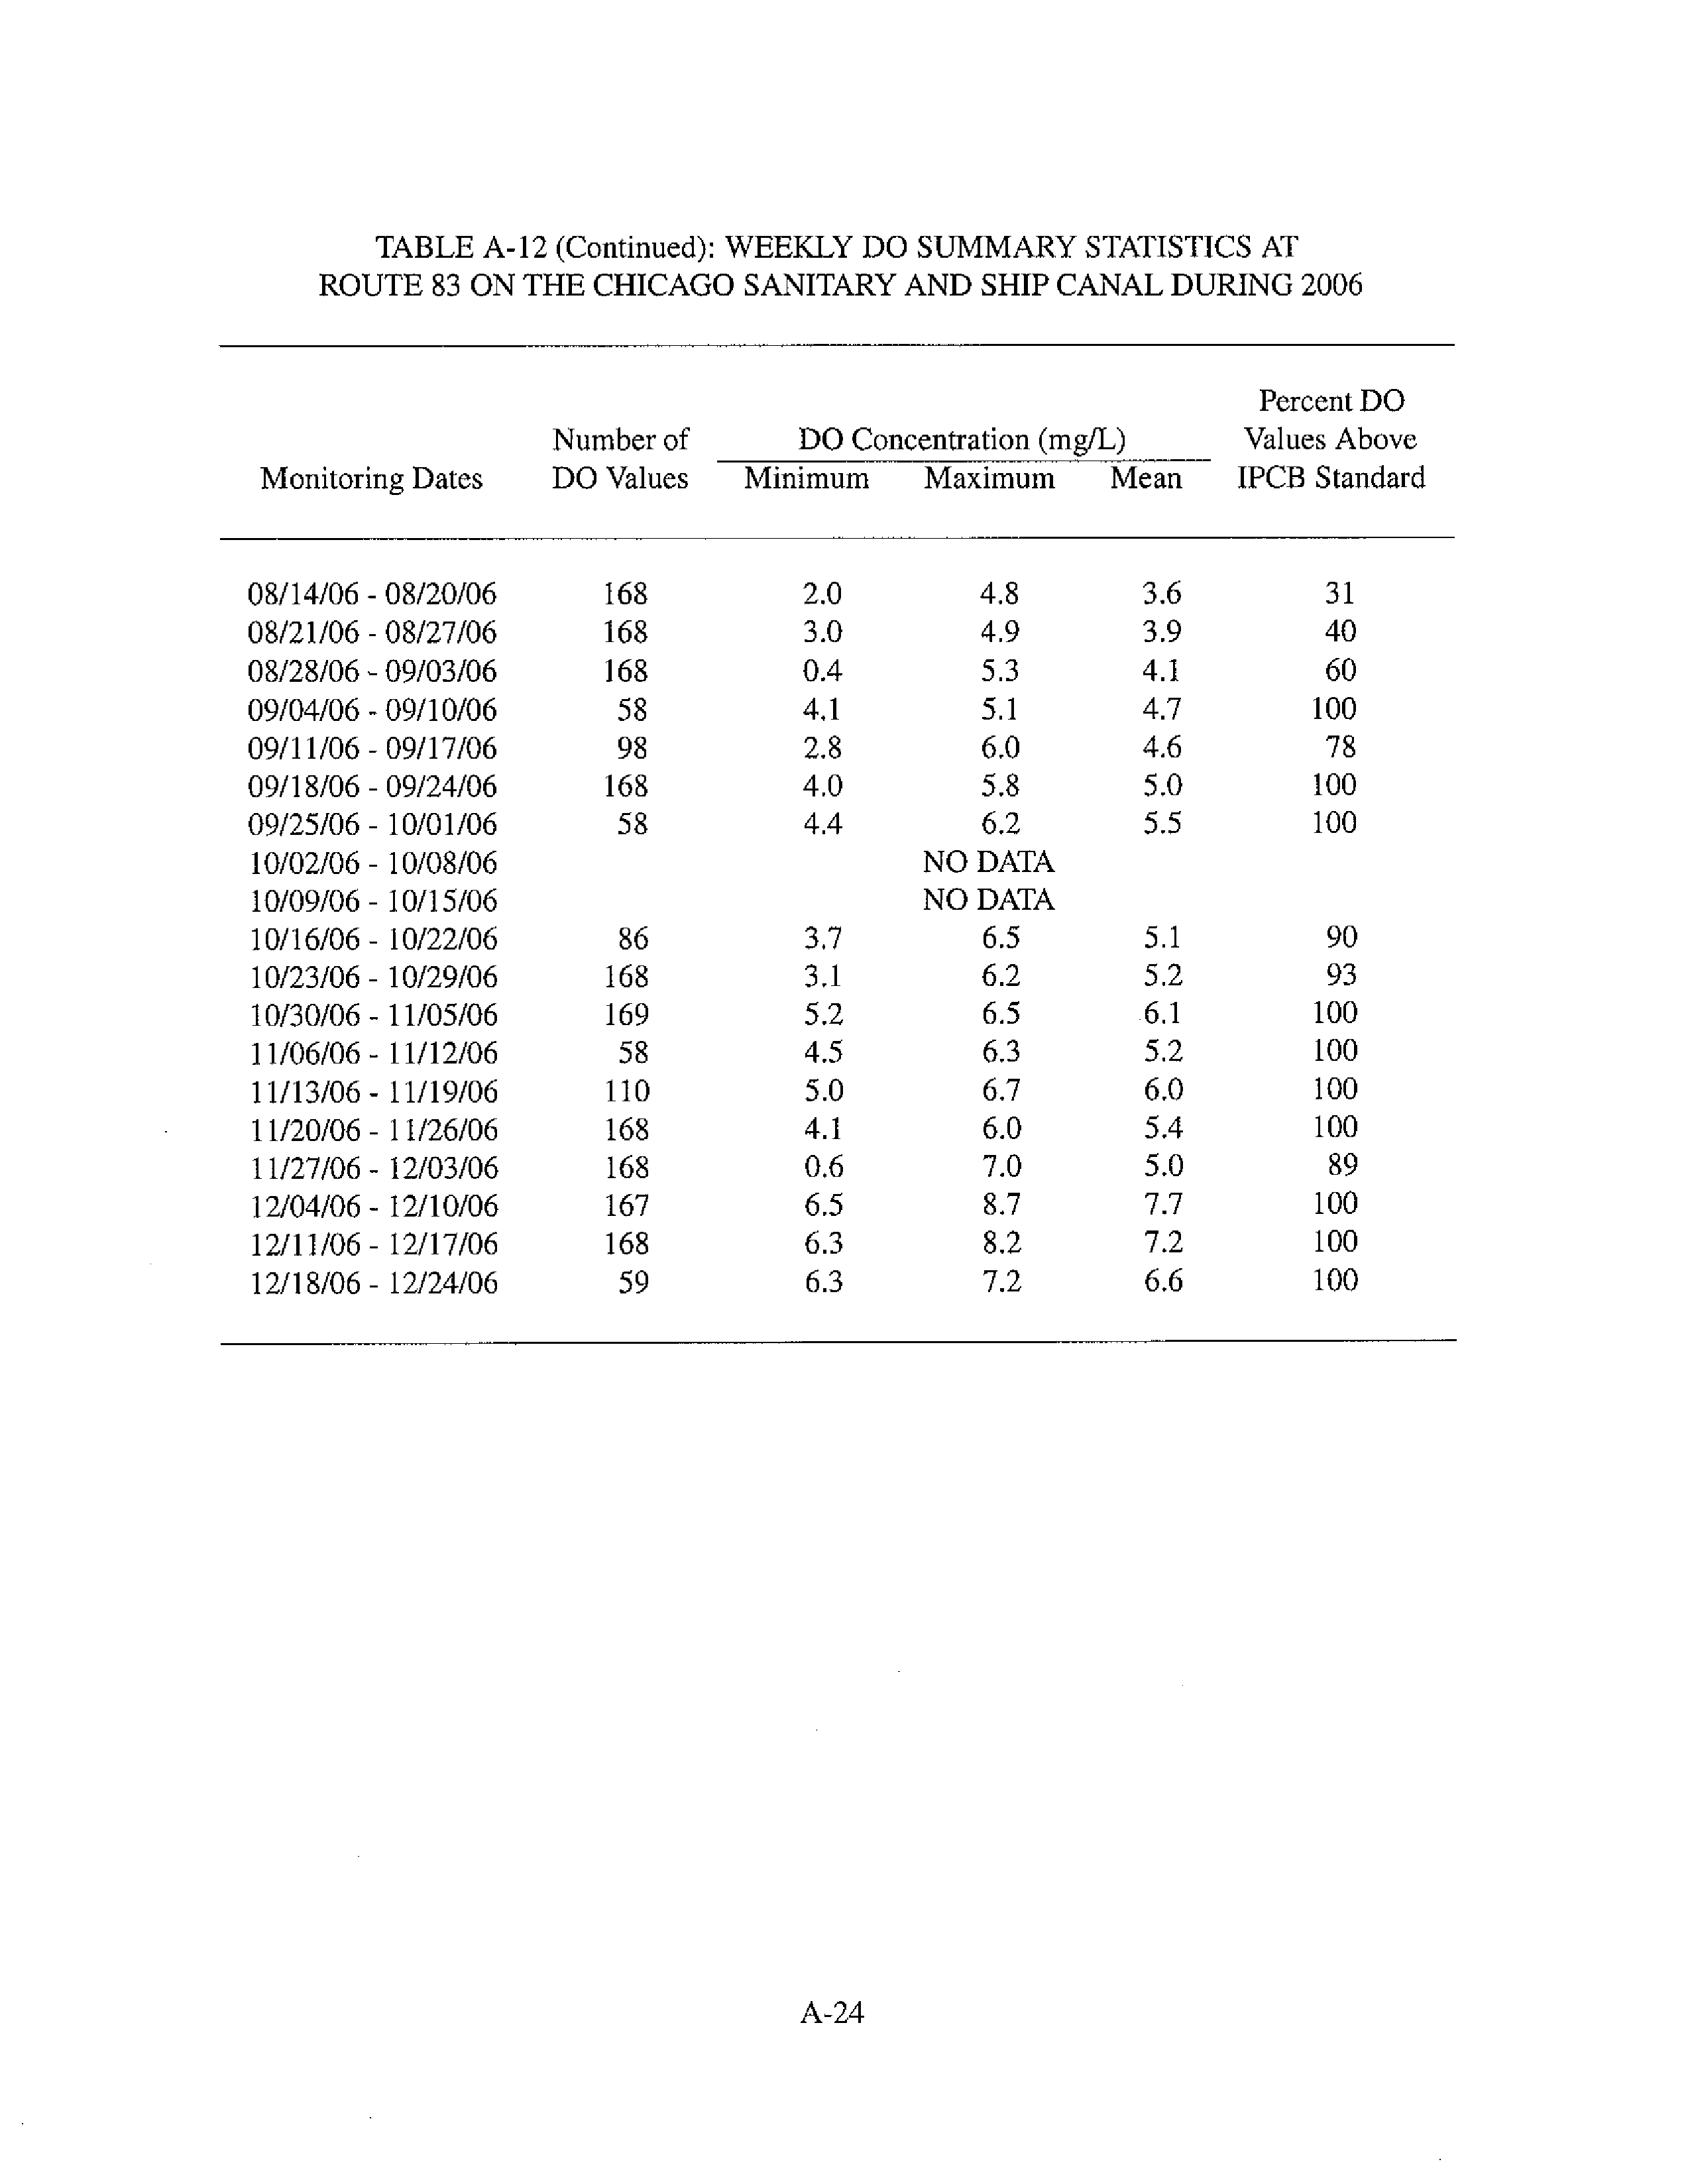
A-12
Weekly DO Summary Statistics at Route 83 on the Chicago Sanitary and
Ship Canal During 2006
A-23
A-13
Weekly DO Summary Statistics at the Lockport Powerhouse on the Chi-
cago Sanitary and Ship Canal During 2006
A-25
A-14
Weekly DO Summary Statistics at Jefferson Street on the Des Plaines
River During 2006
A-27
A-15
Weekly DO Summary Statistics at Torrence Avenue on the Grand Calu-
met River During 2006
A-29
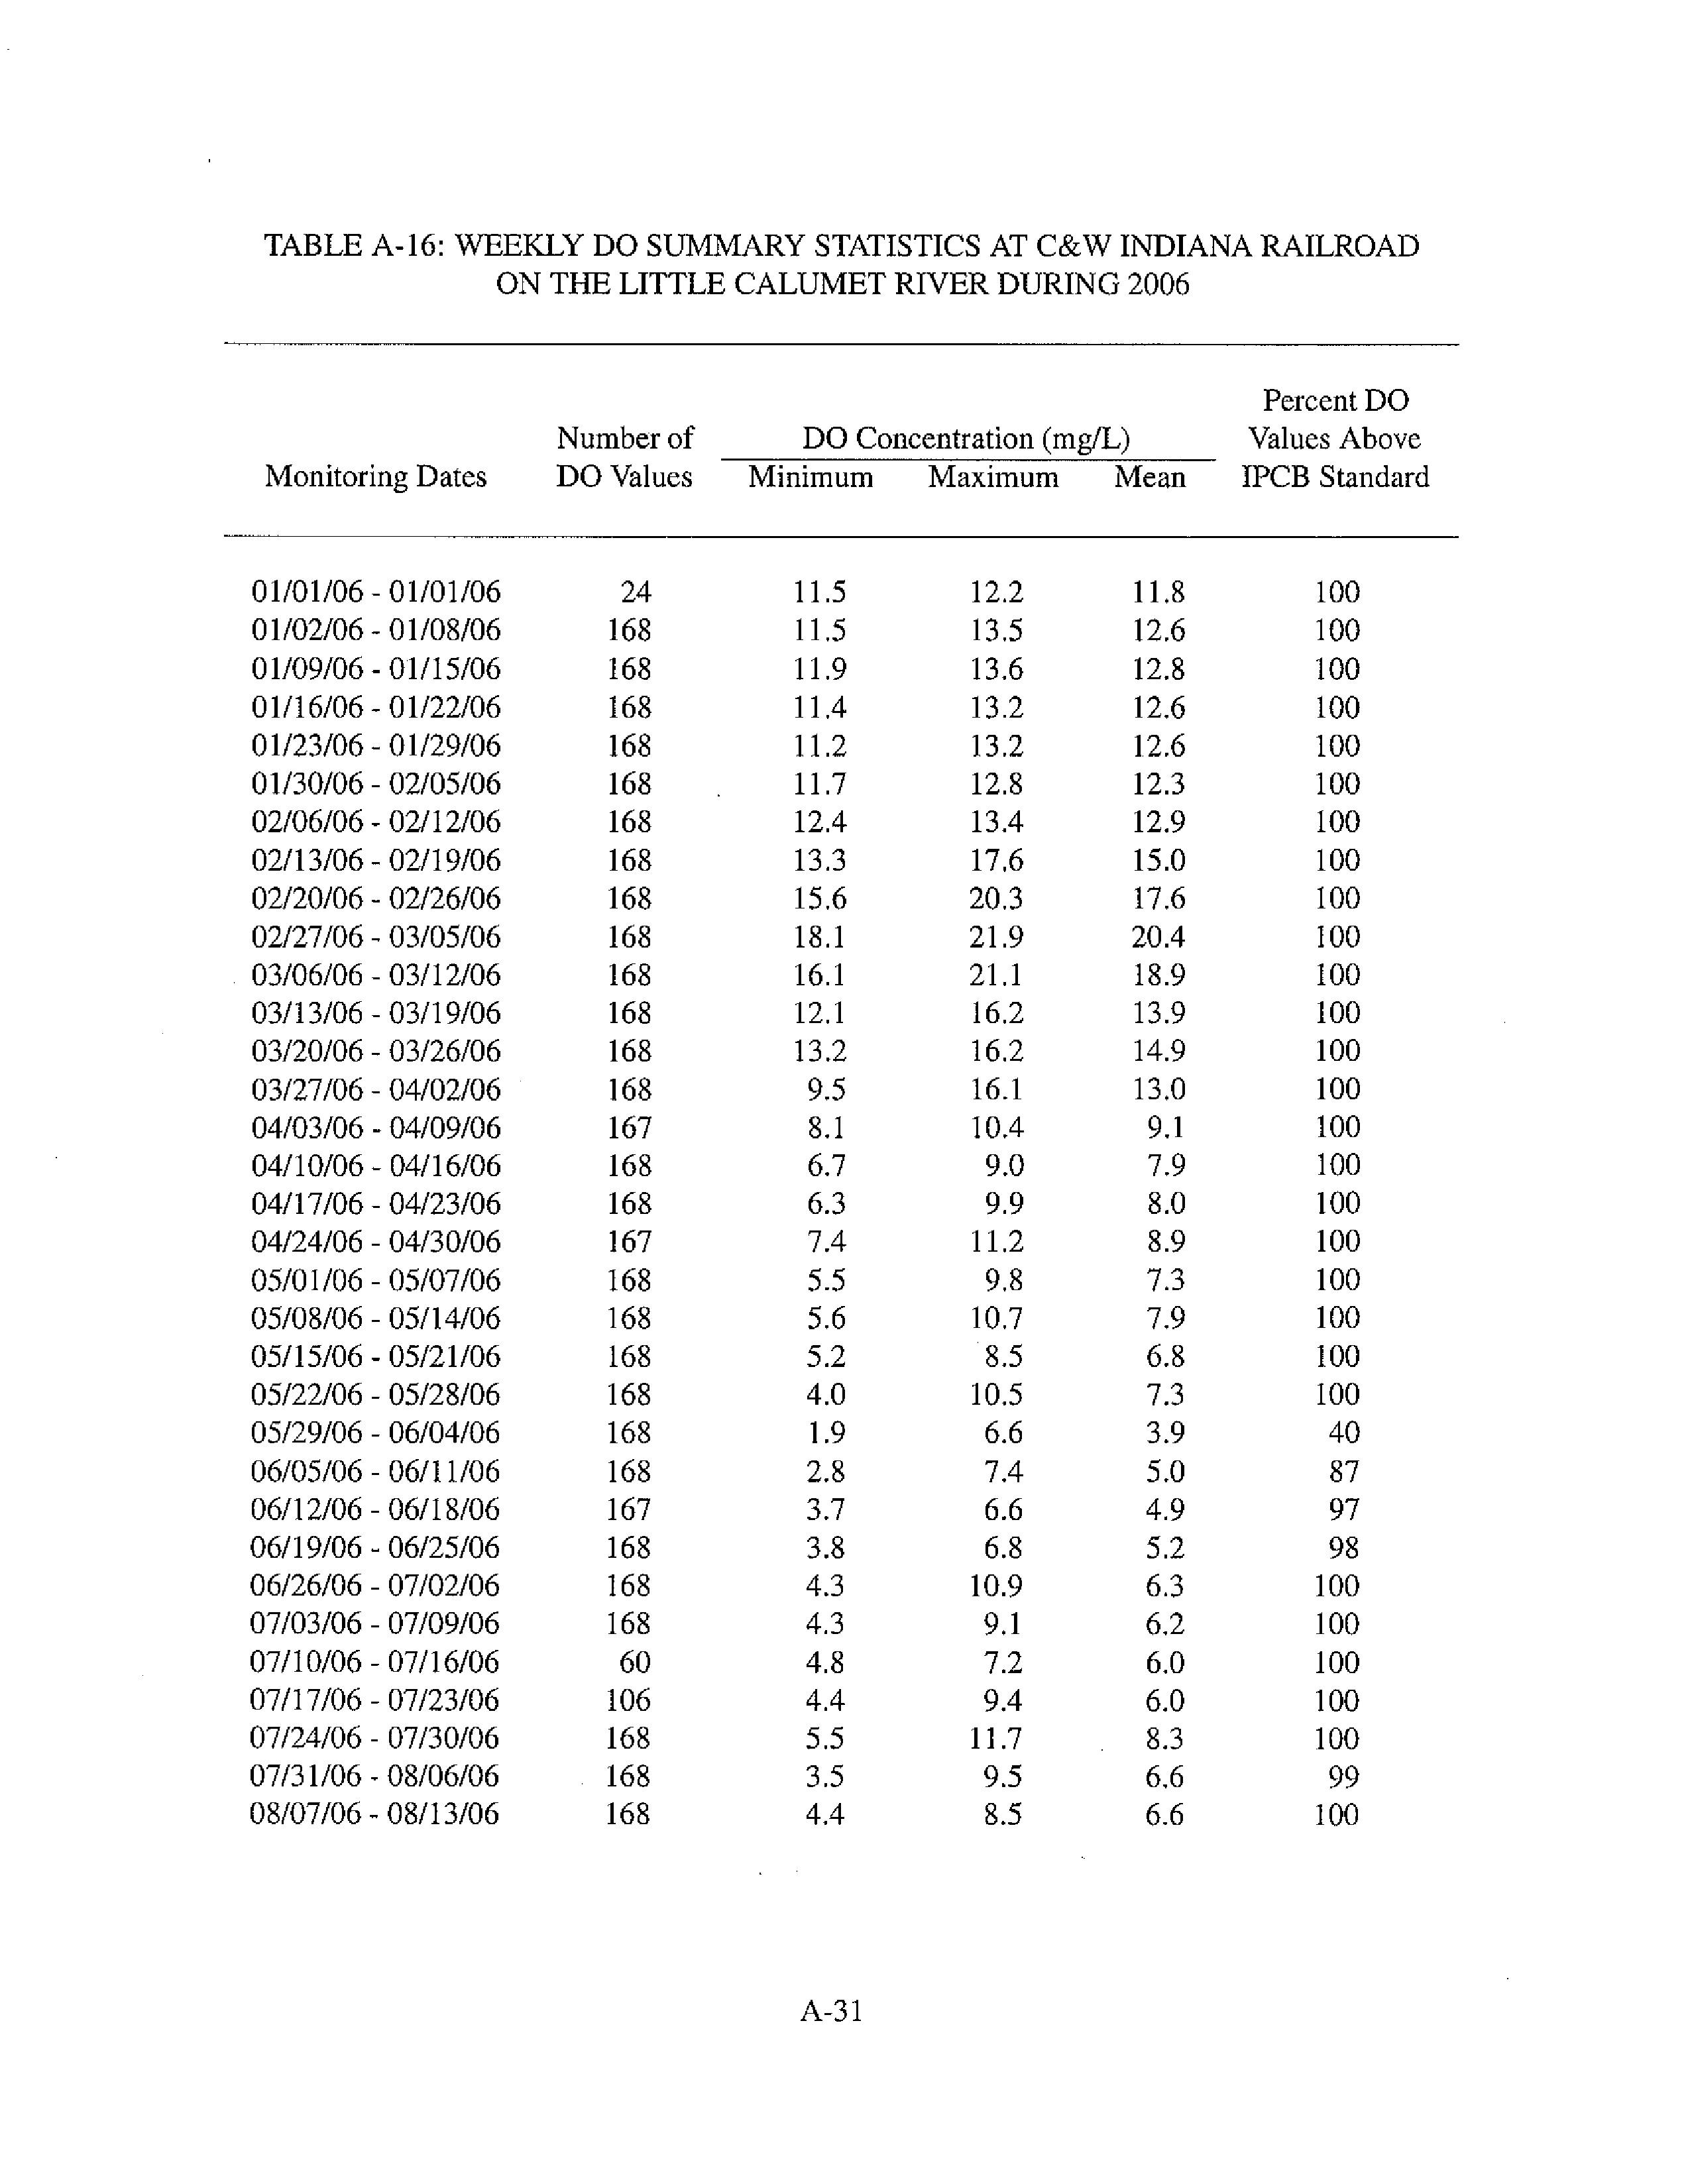
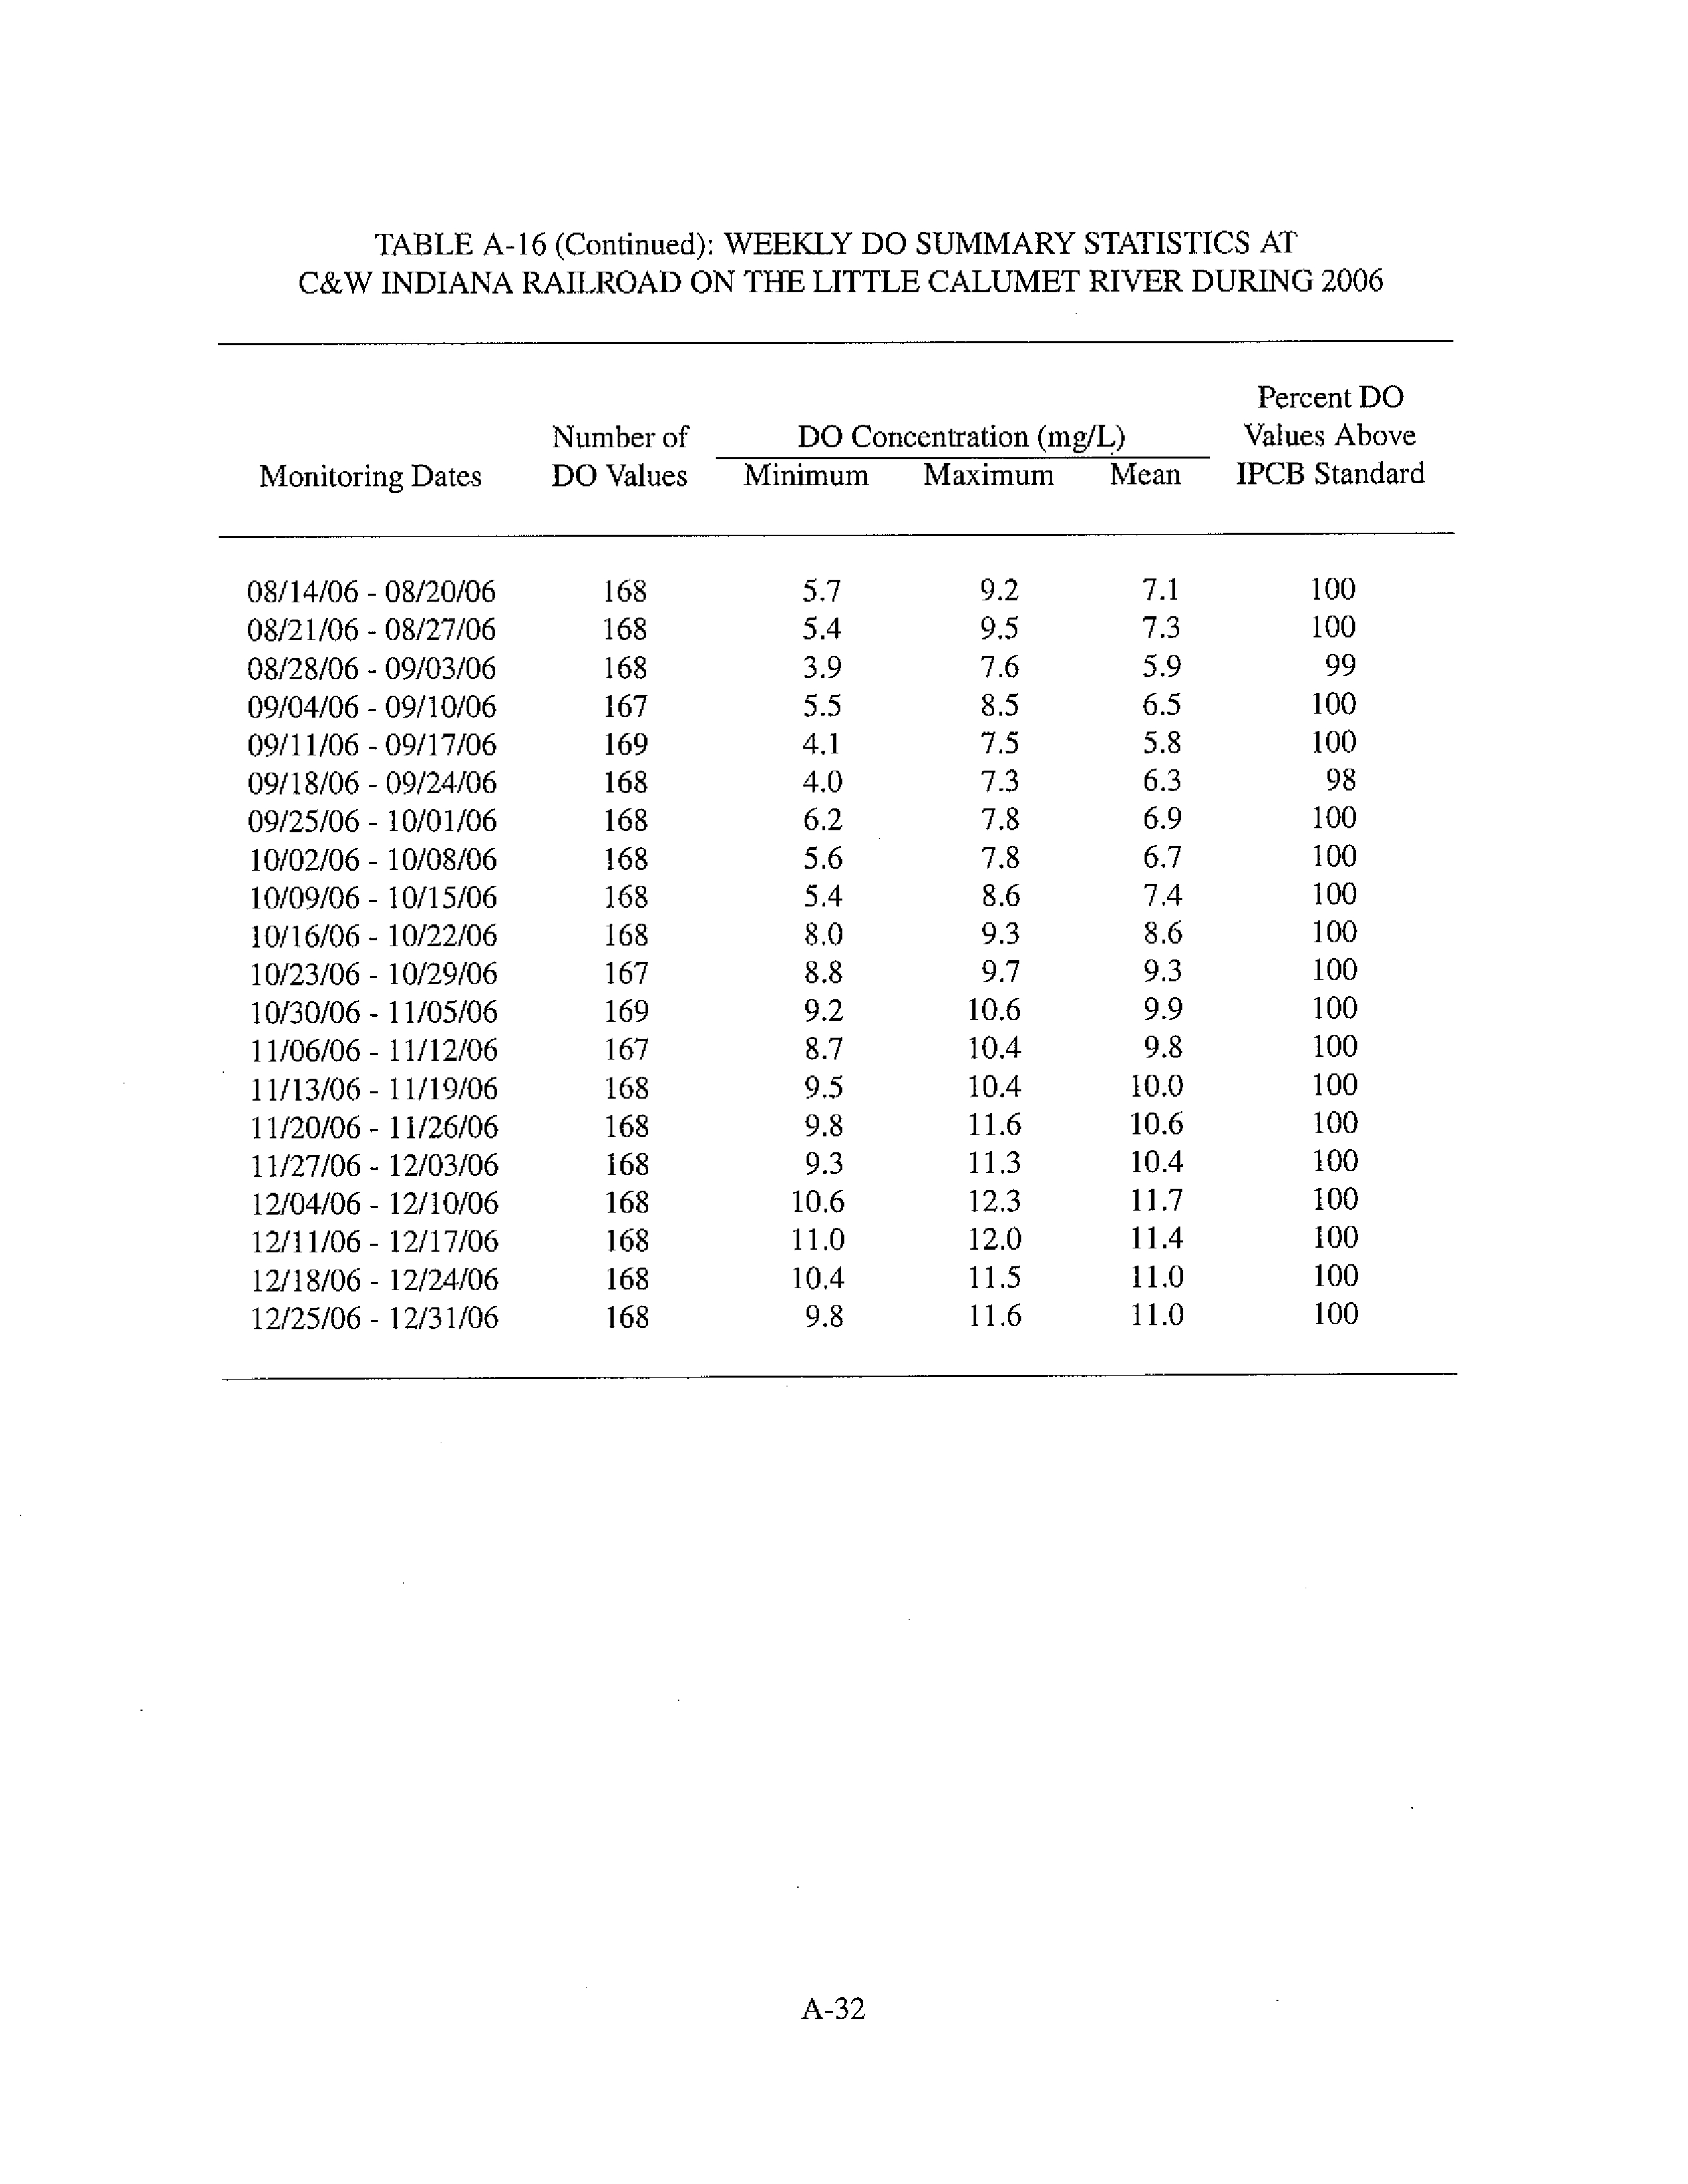
A-16
Weekly DO Summary Statistics at C&W Indiana Railroad on the Little
Calumet River During 2006
A-31
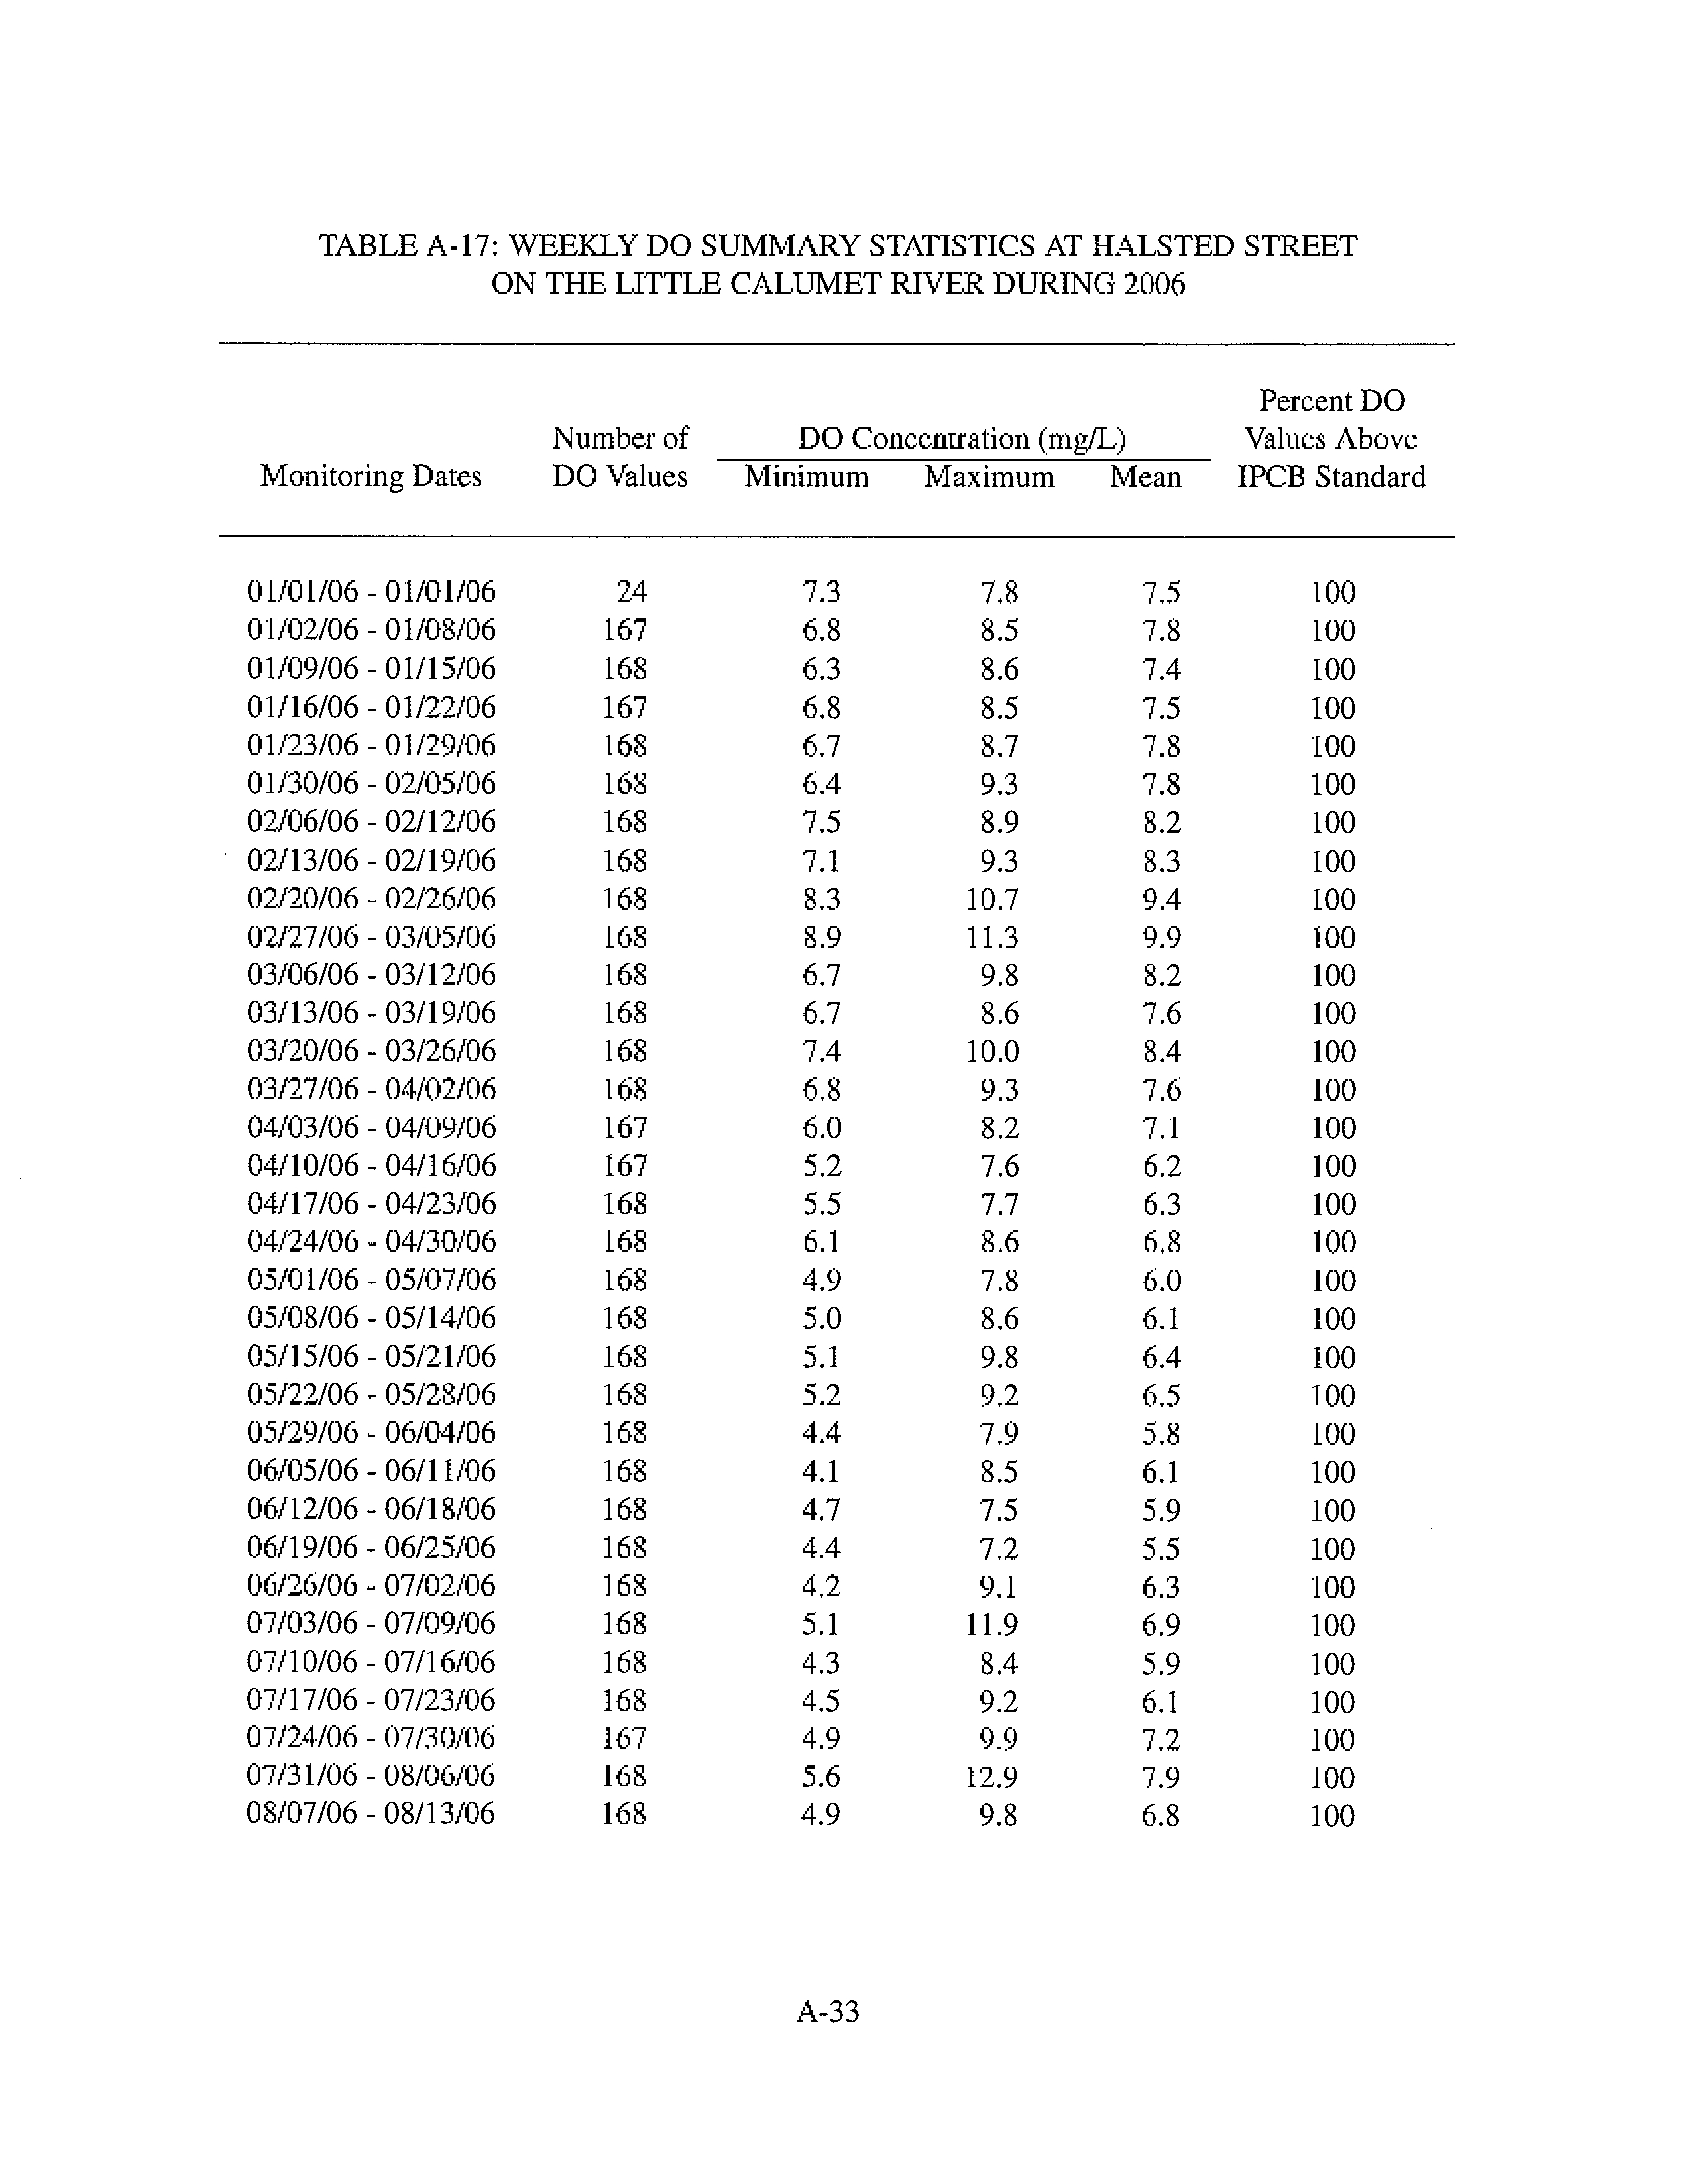
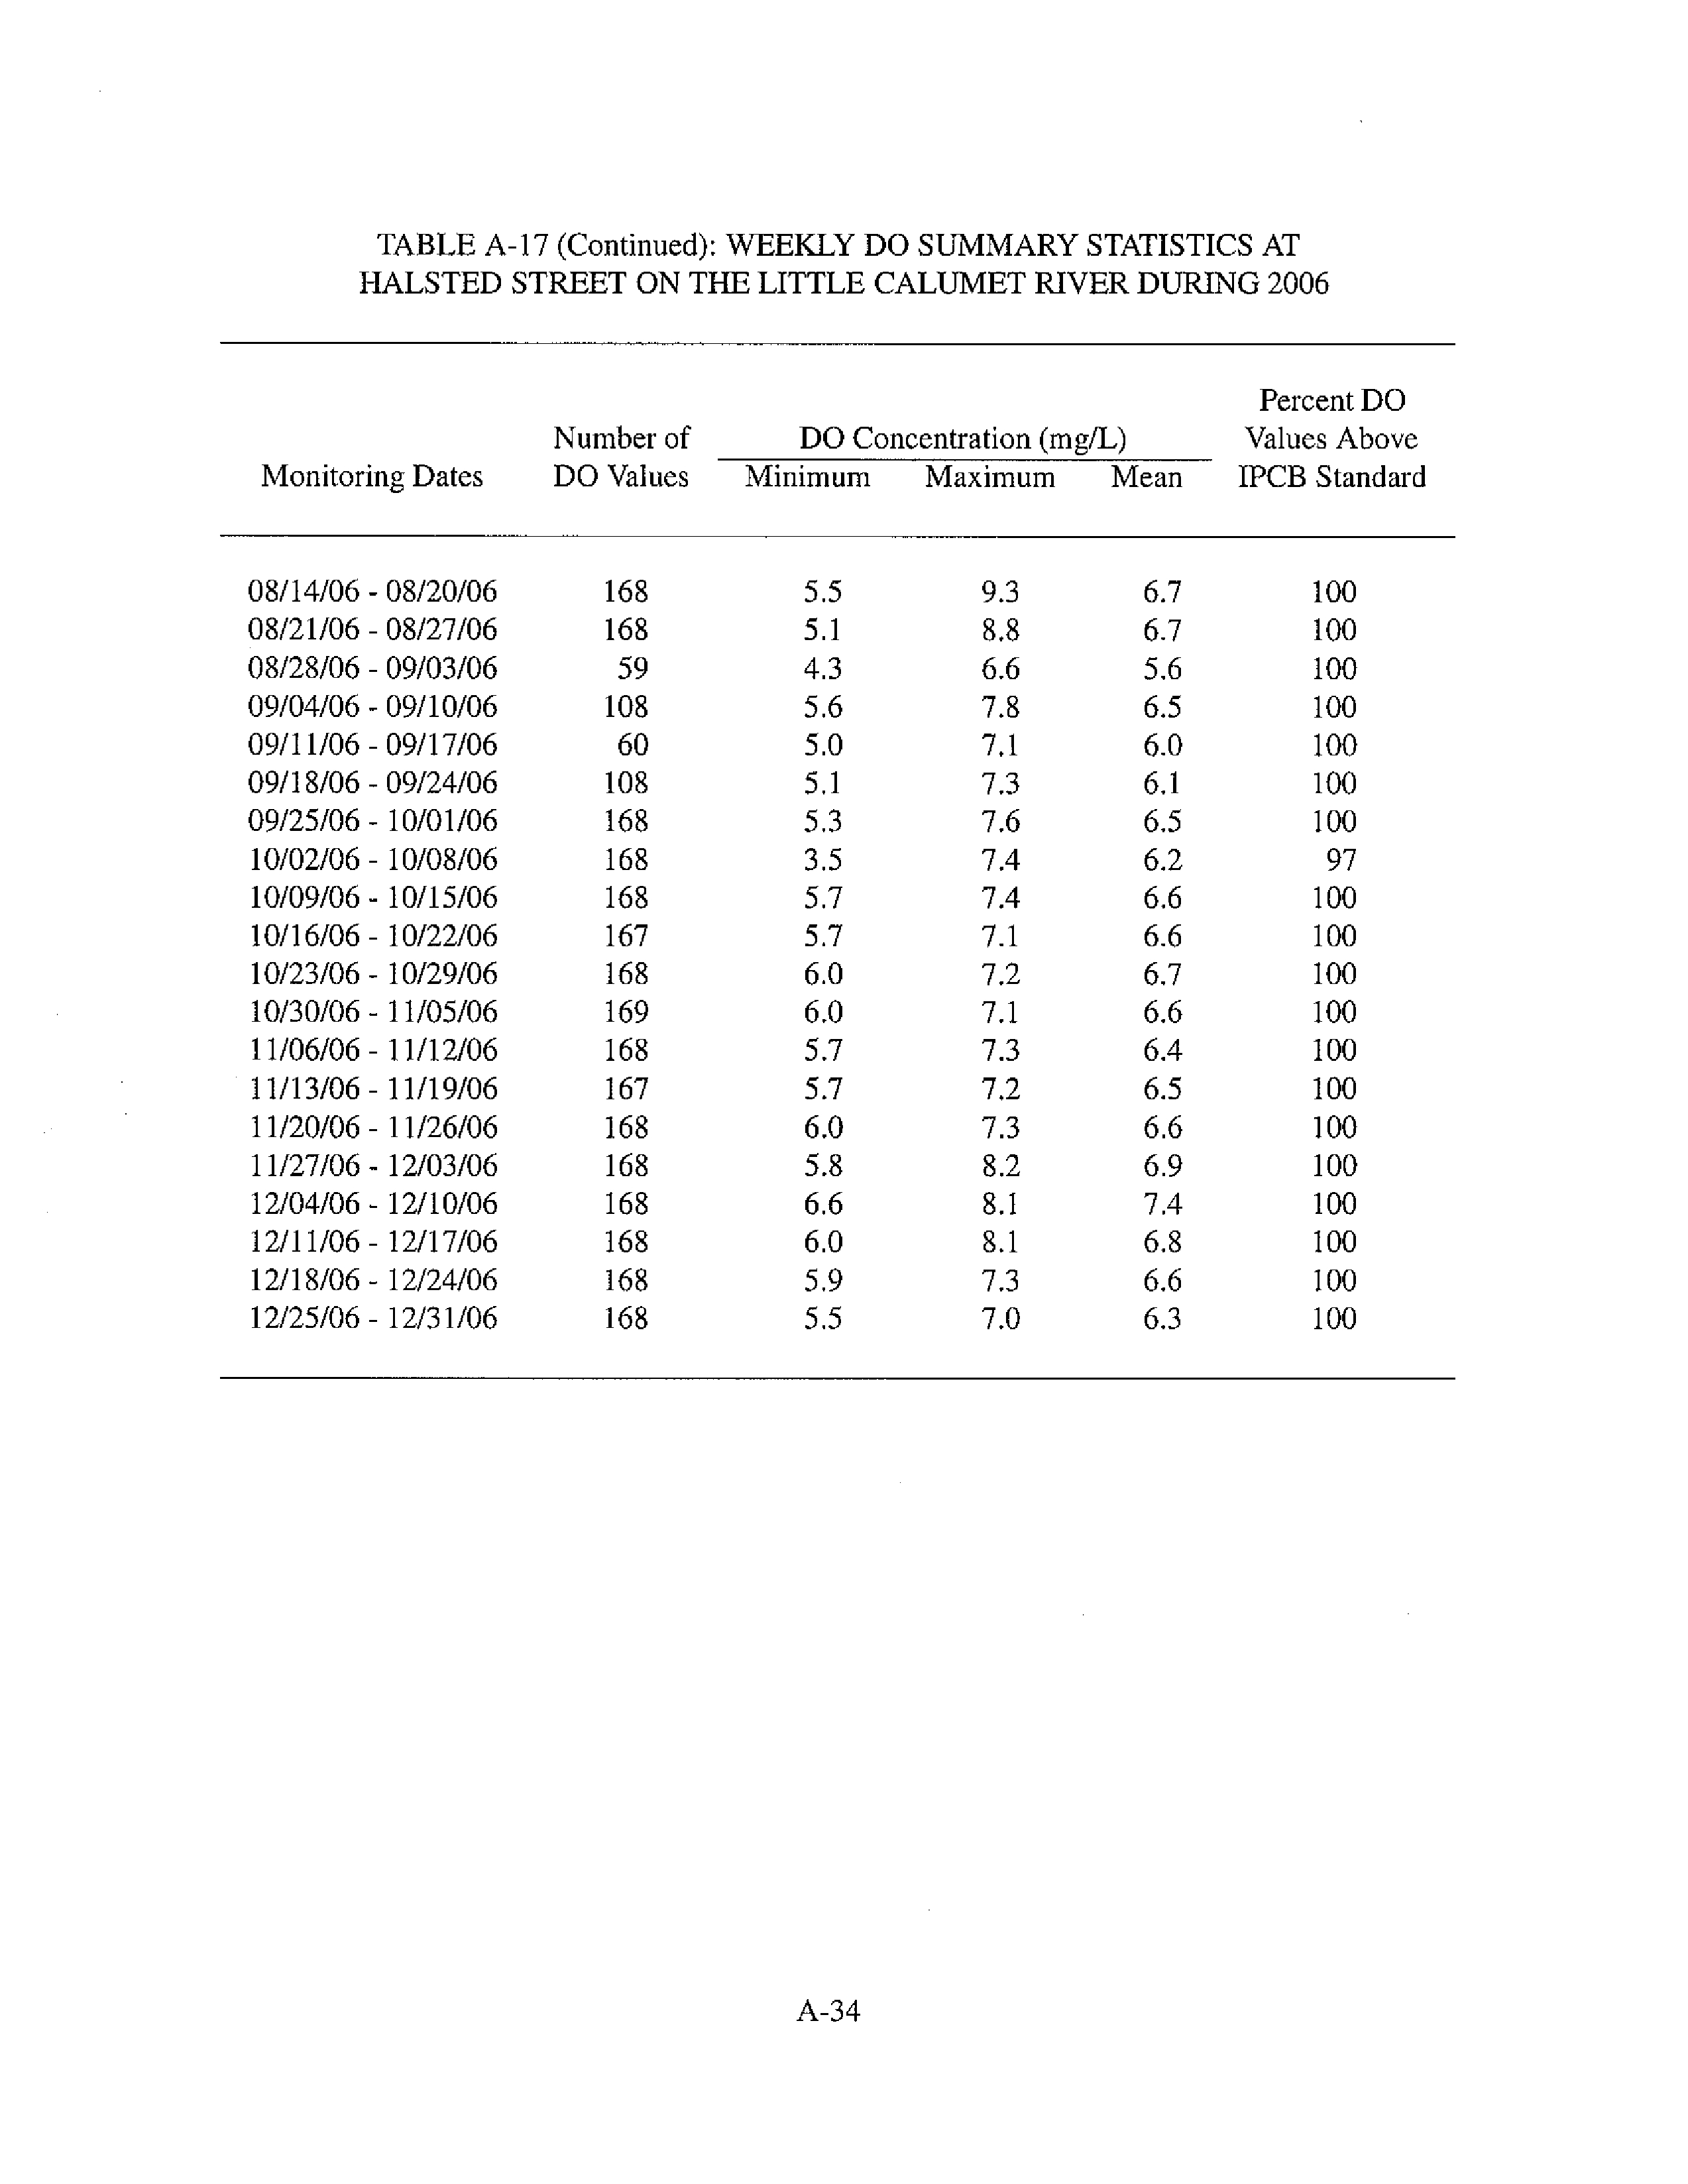
A-17
Weekly DO Summary Statistics at Halsted Street on the Little Calumet
River During 2006
A-33
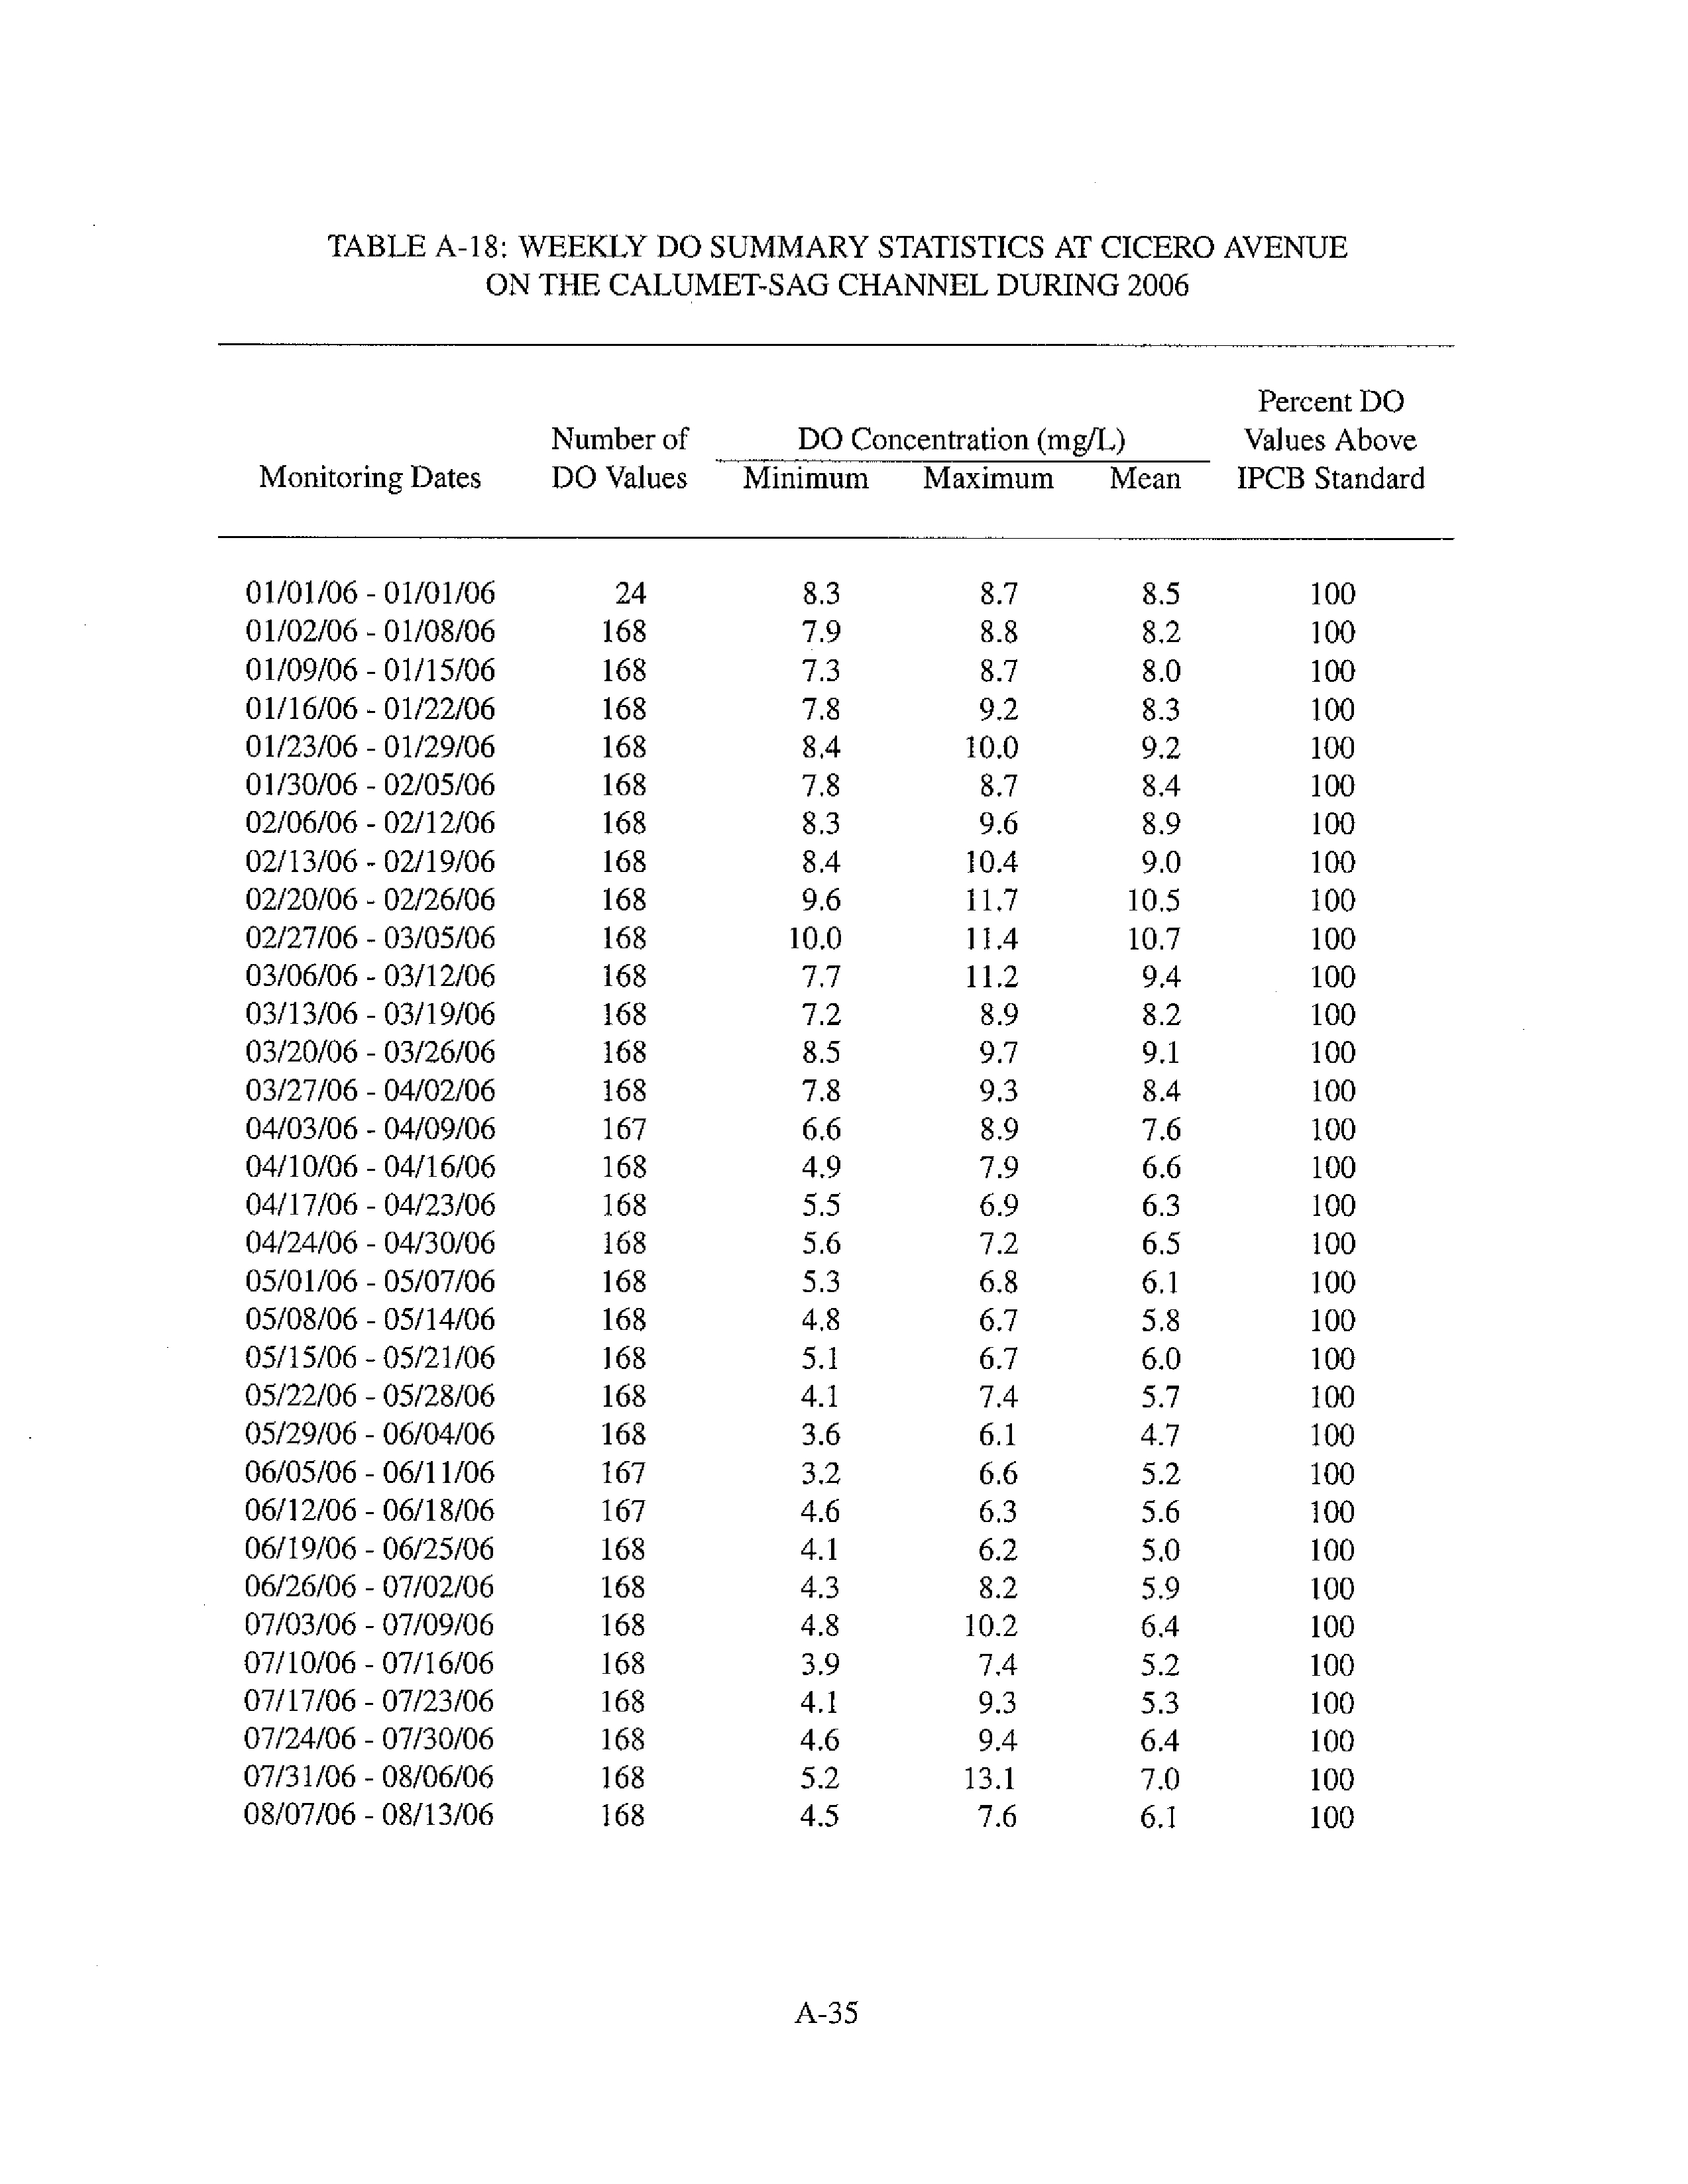
A-18
Weekly DO Summary Statistics at Cicero Avenue on the Calumet-Sag
Charnel During 2006
A-35
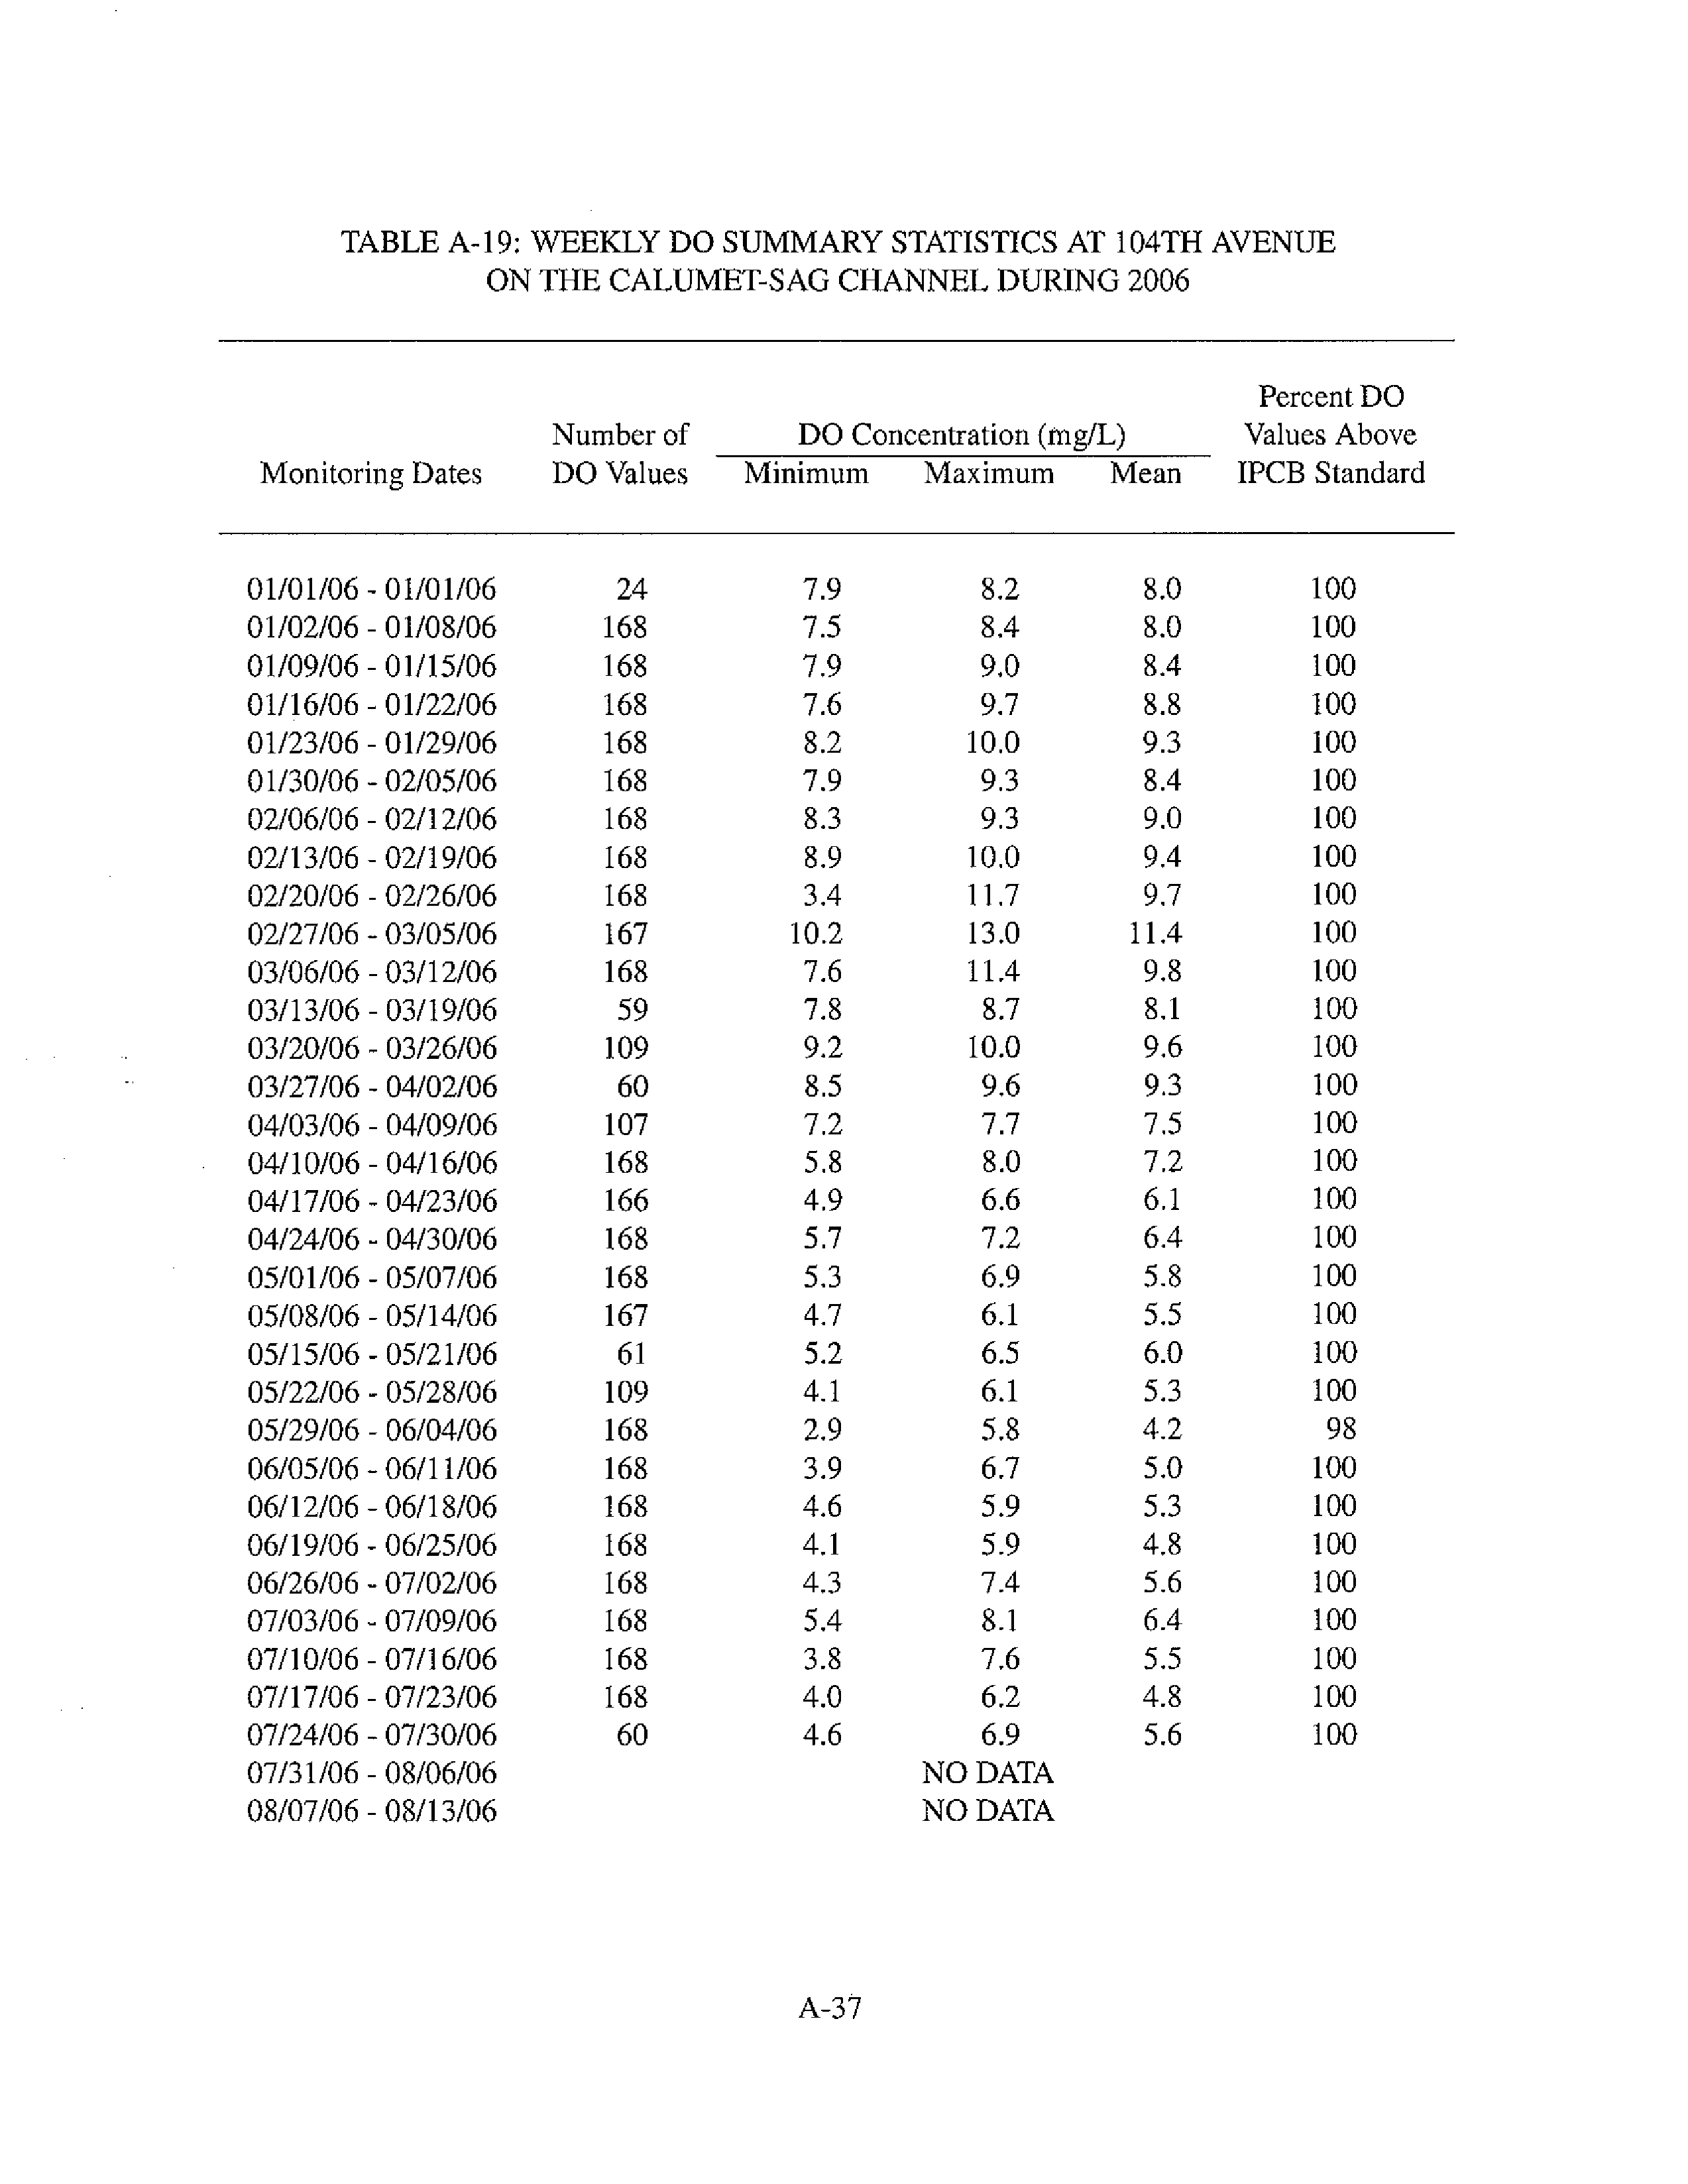
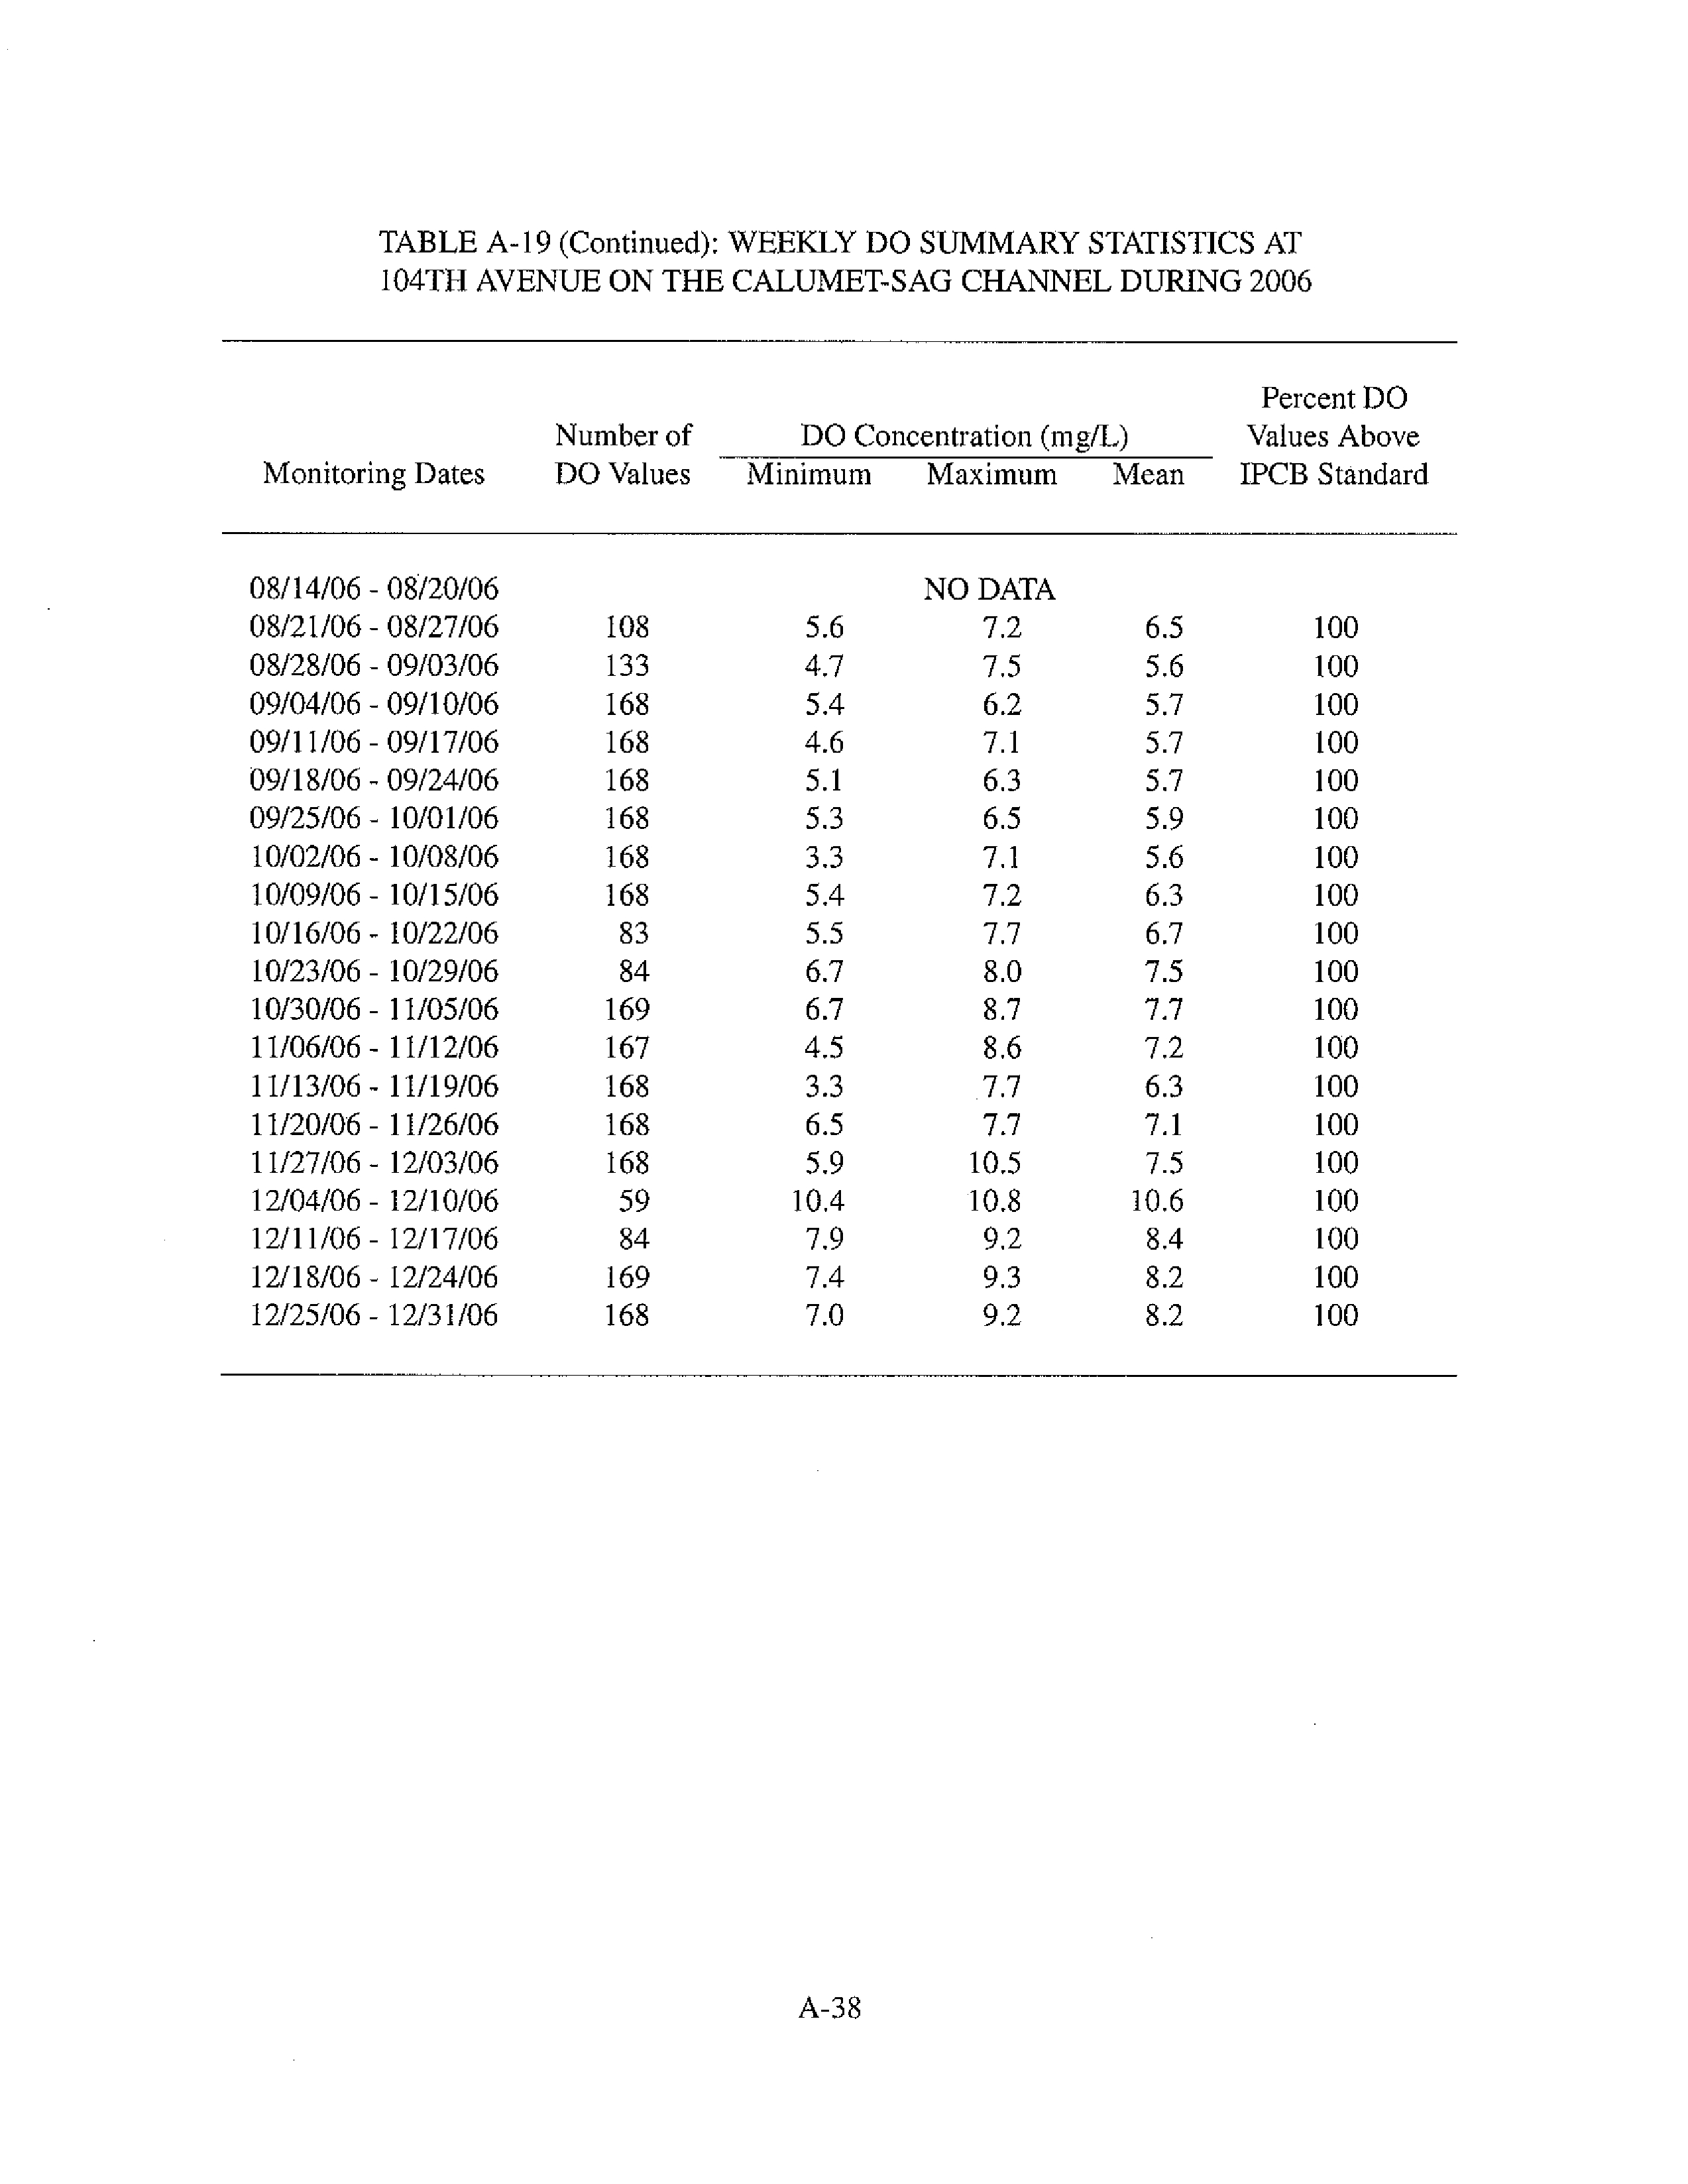
A-19
Weekly DO Summary Statistics at 104th Avenue on the Calumet-Sag
Channel During 2006
A-37
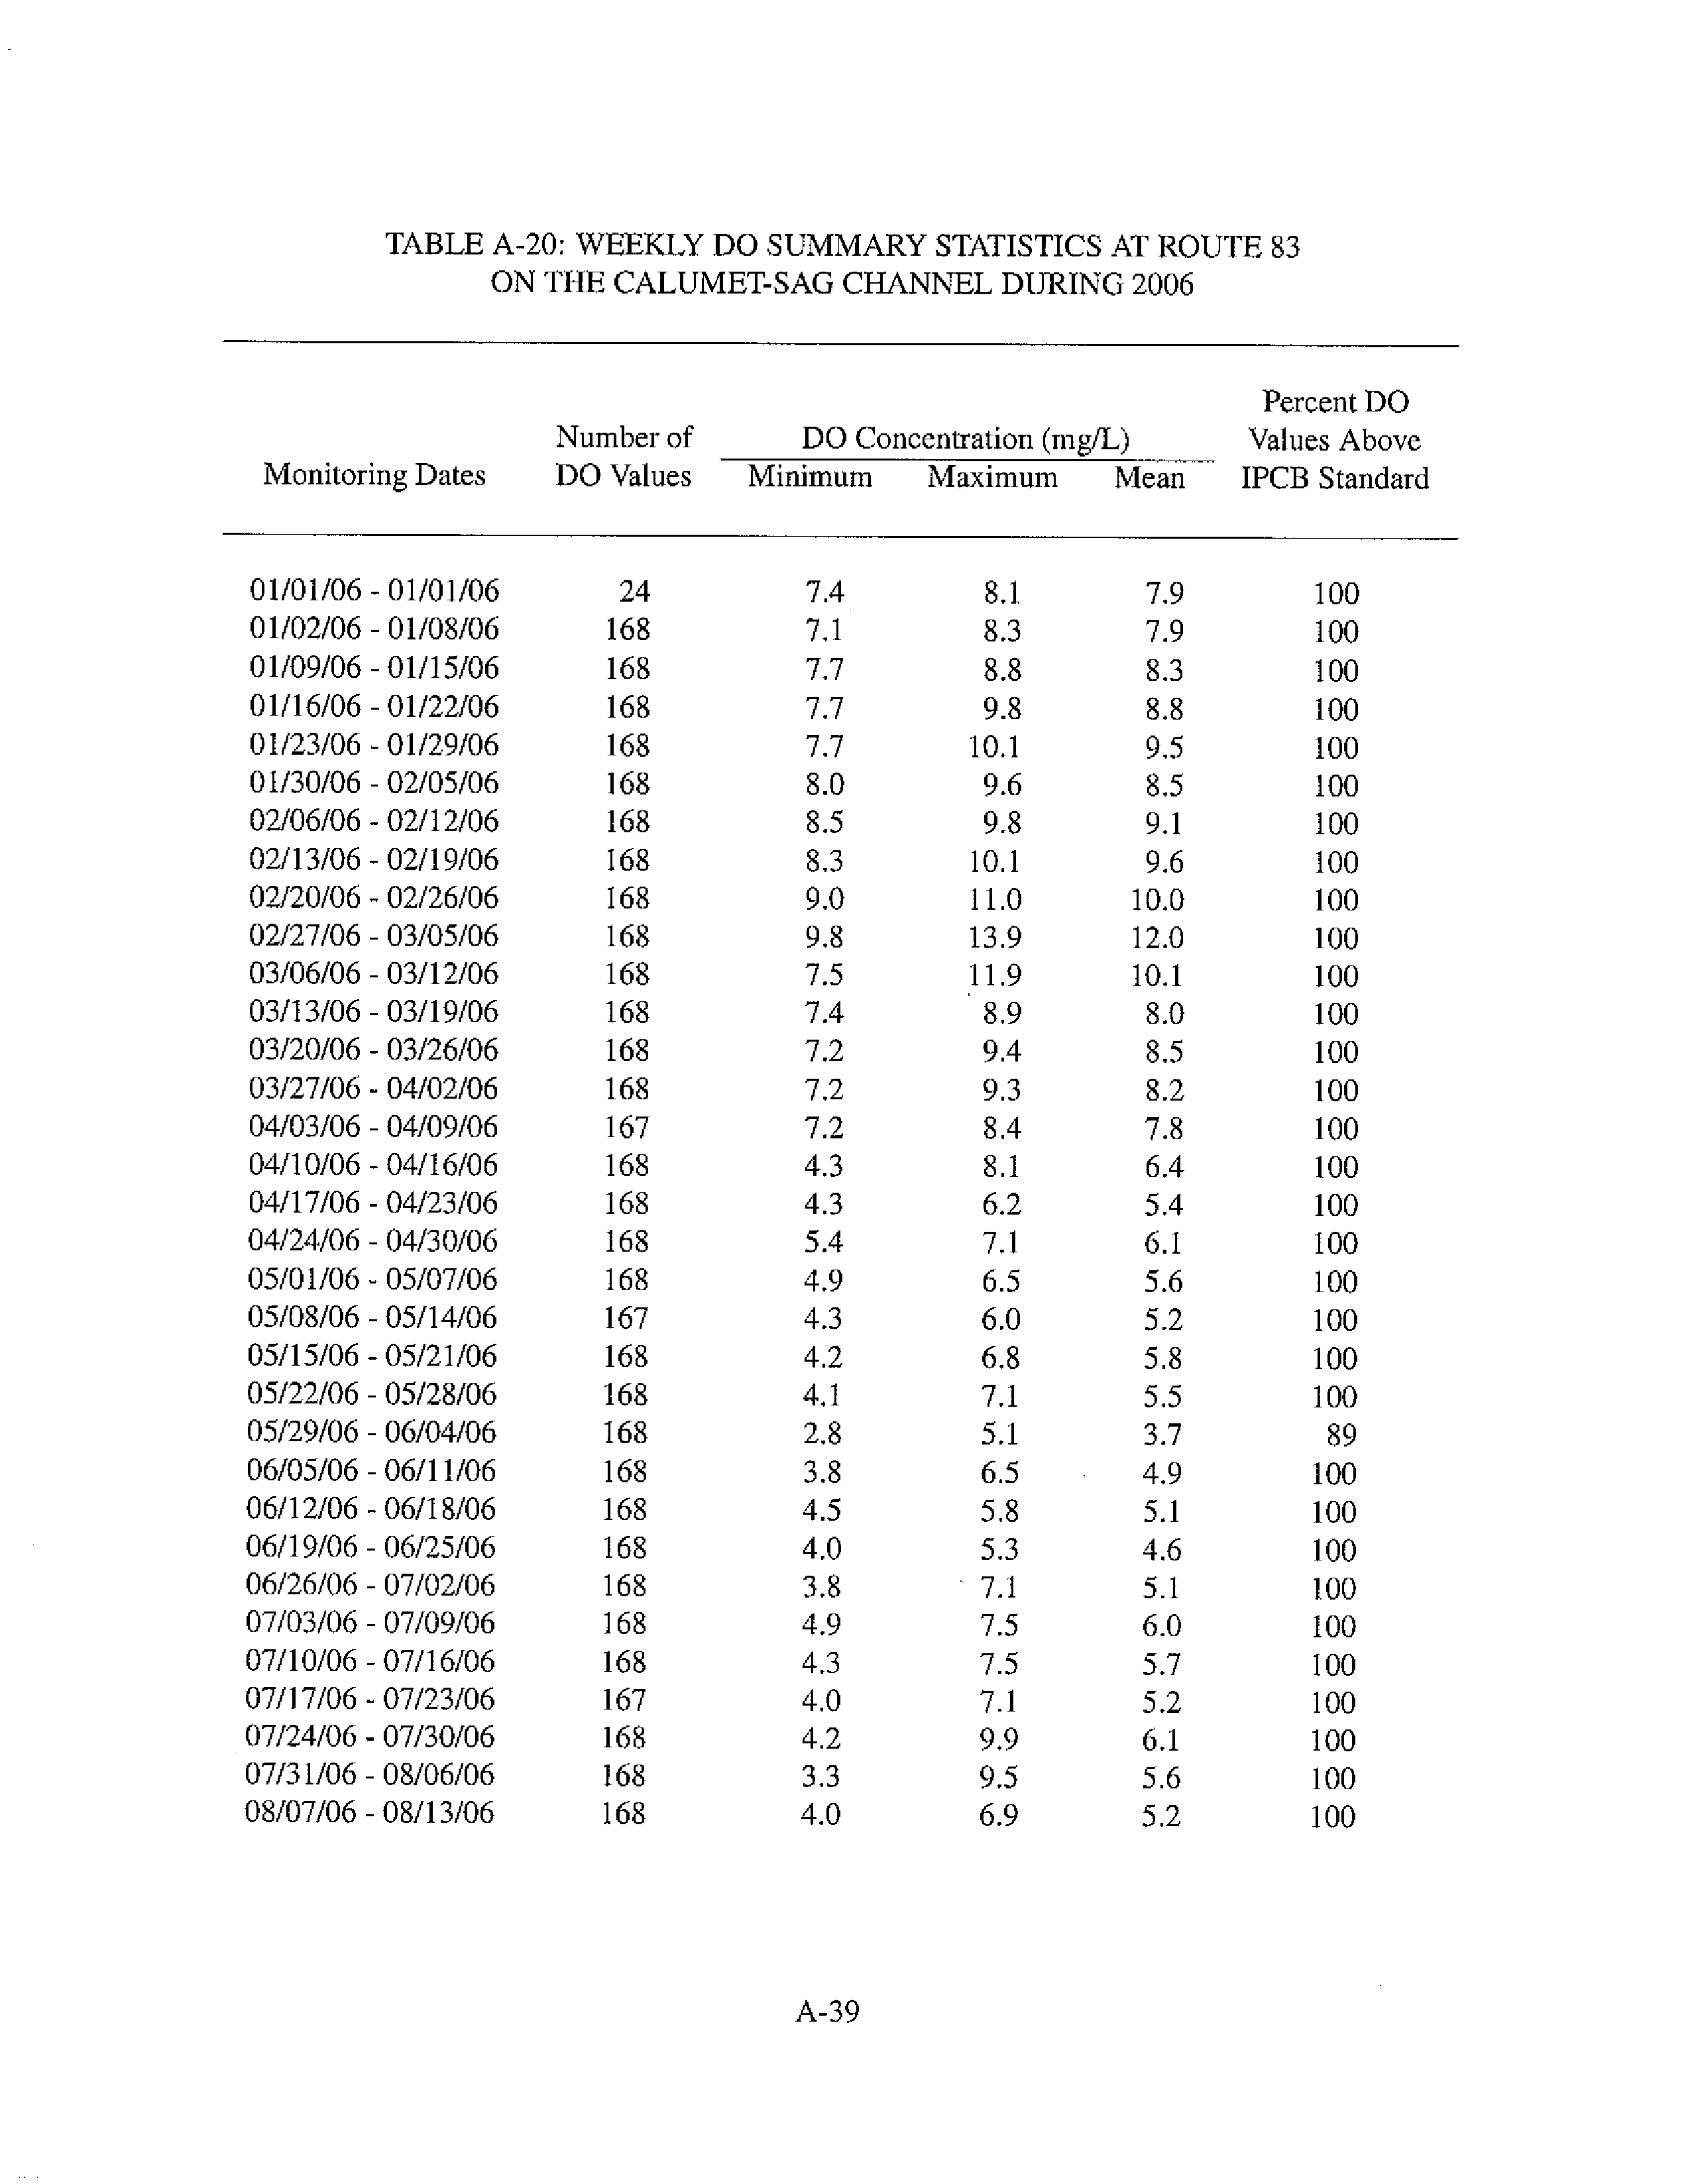
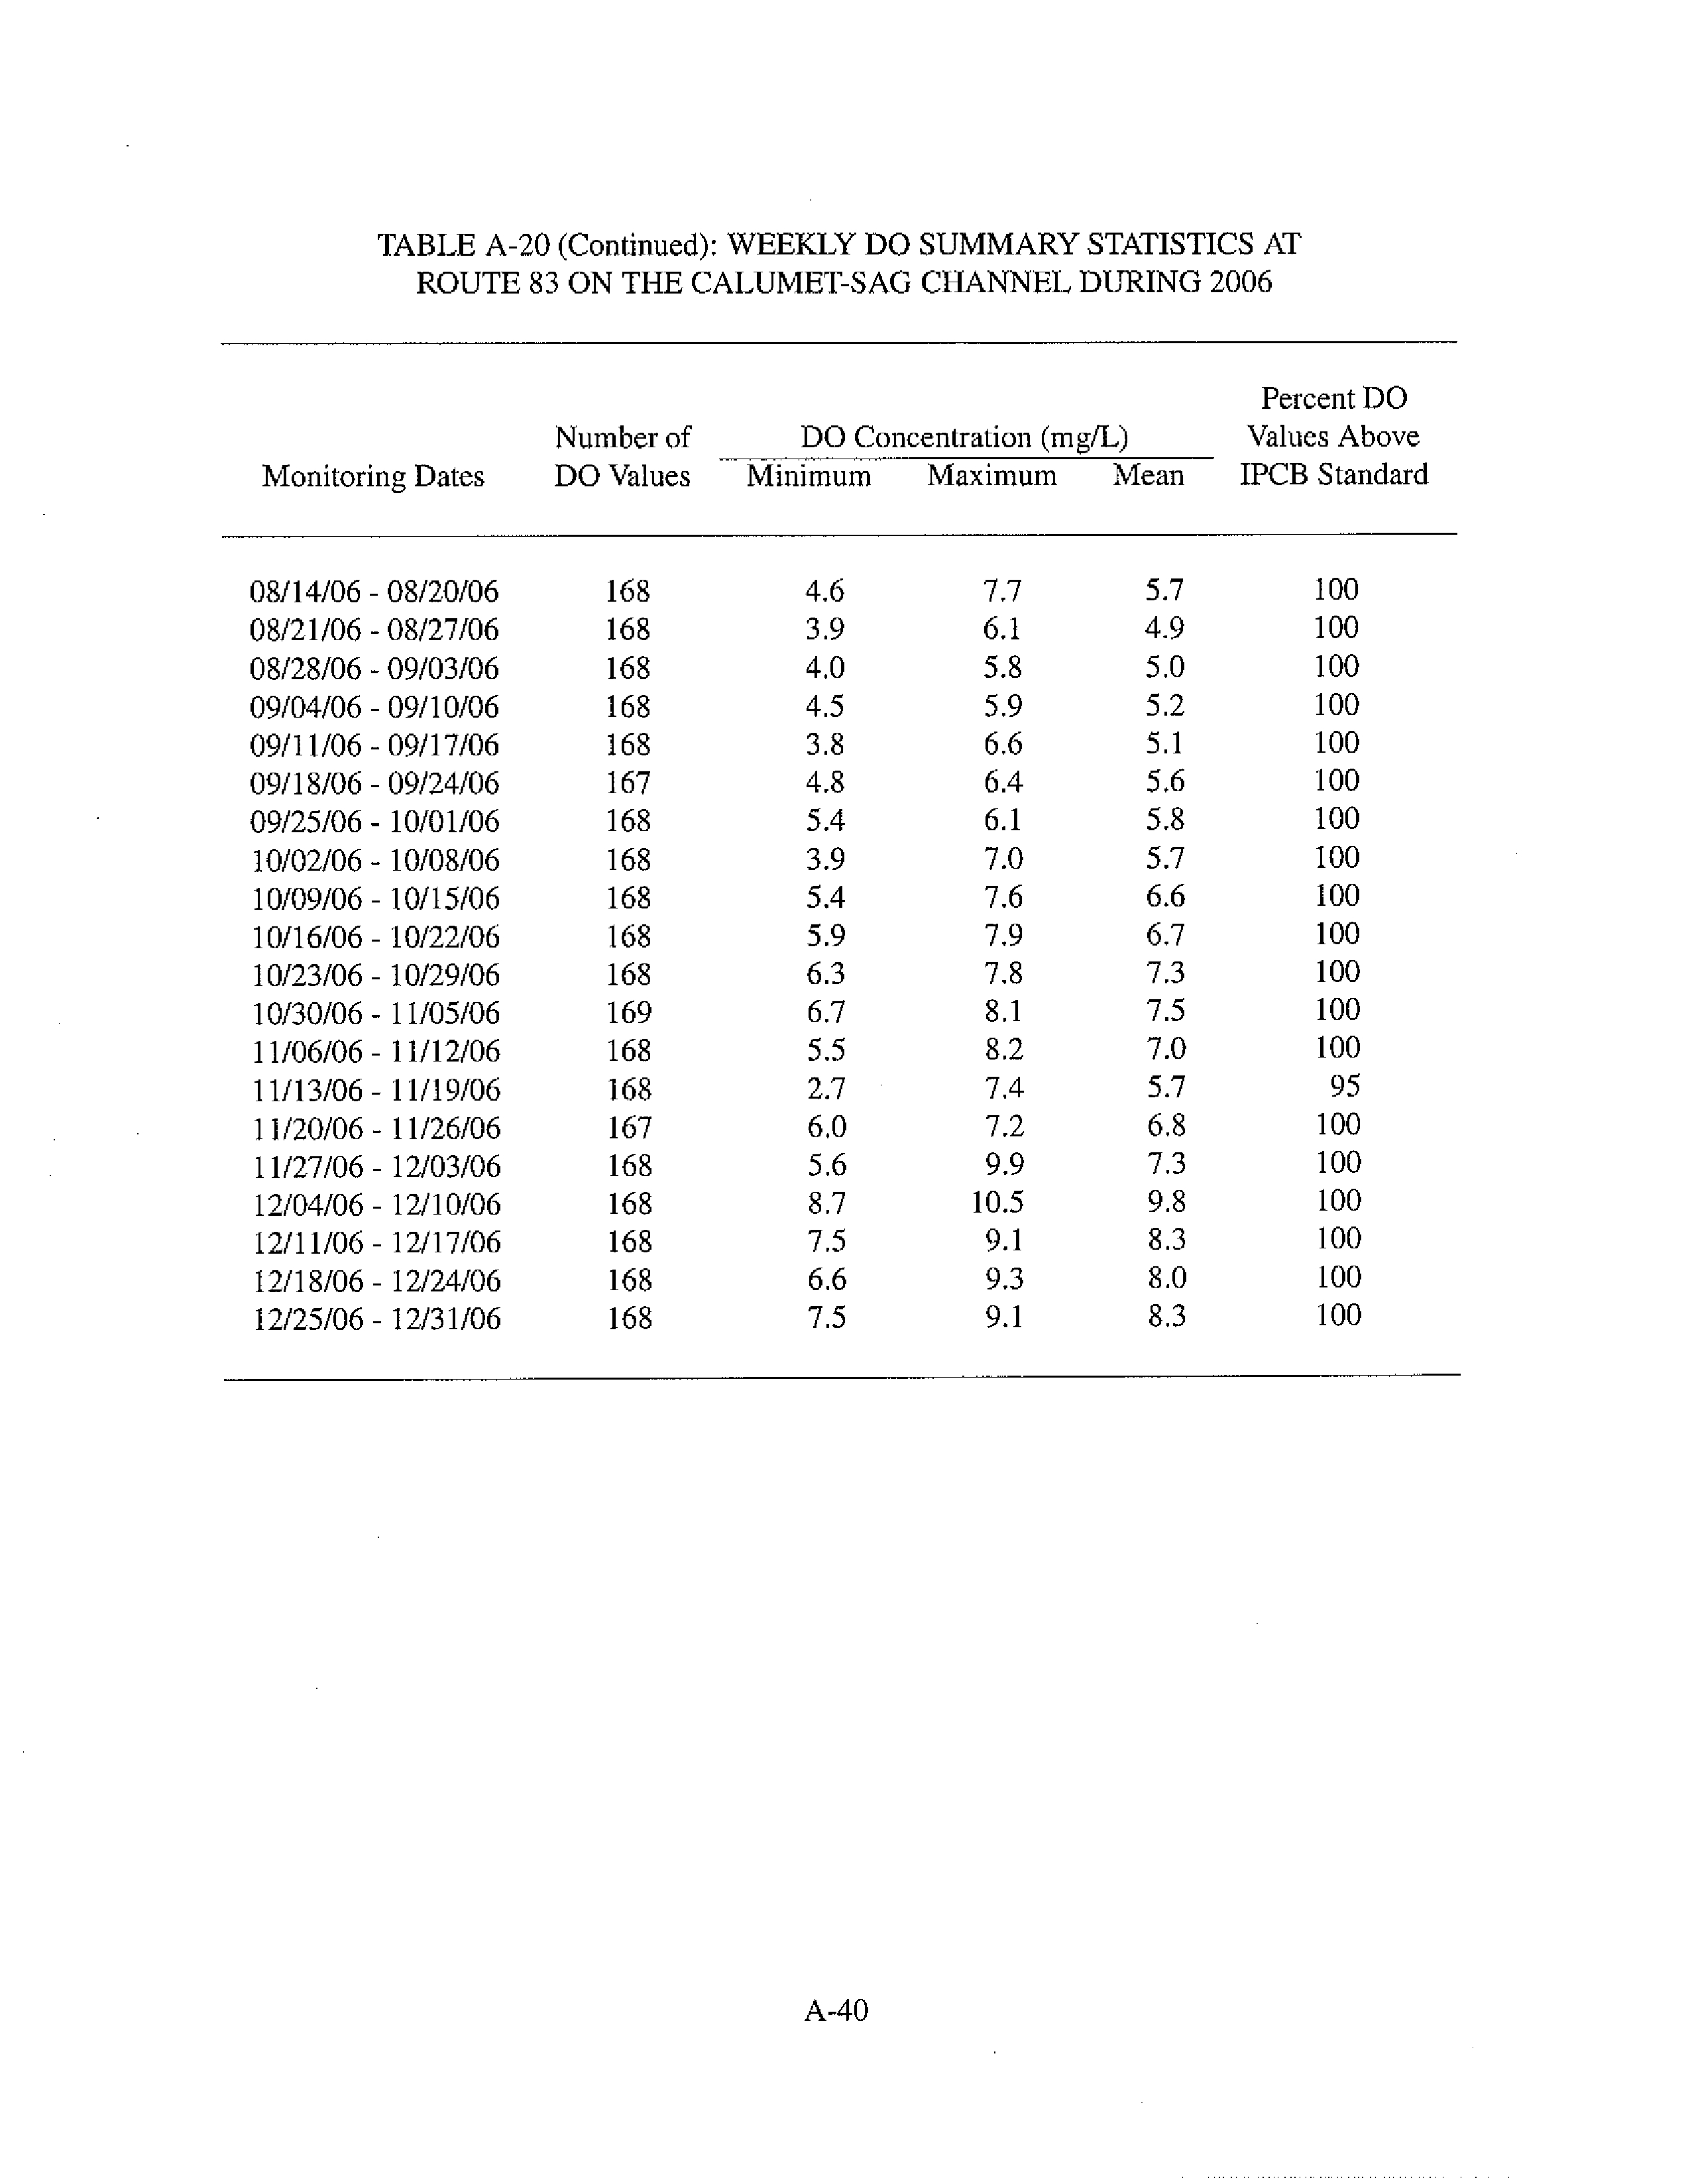
A-20
Weekly DO Summary Statistics at Route 83 on the Calumet-Sag Channel
During 2006
A-39
iii
LIST OF FIGURES
Figure
No.
Page
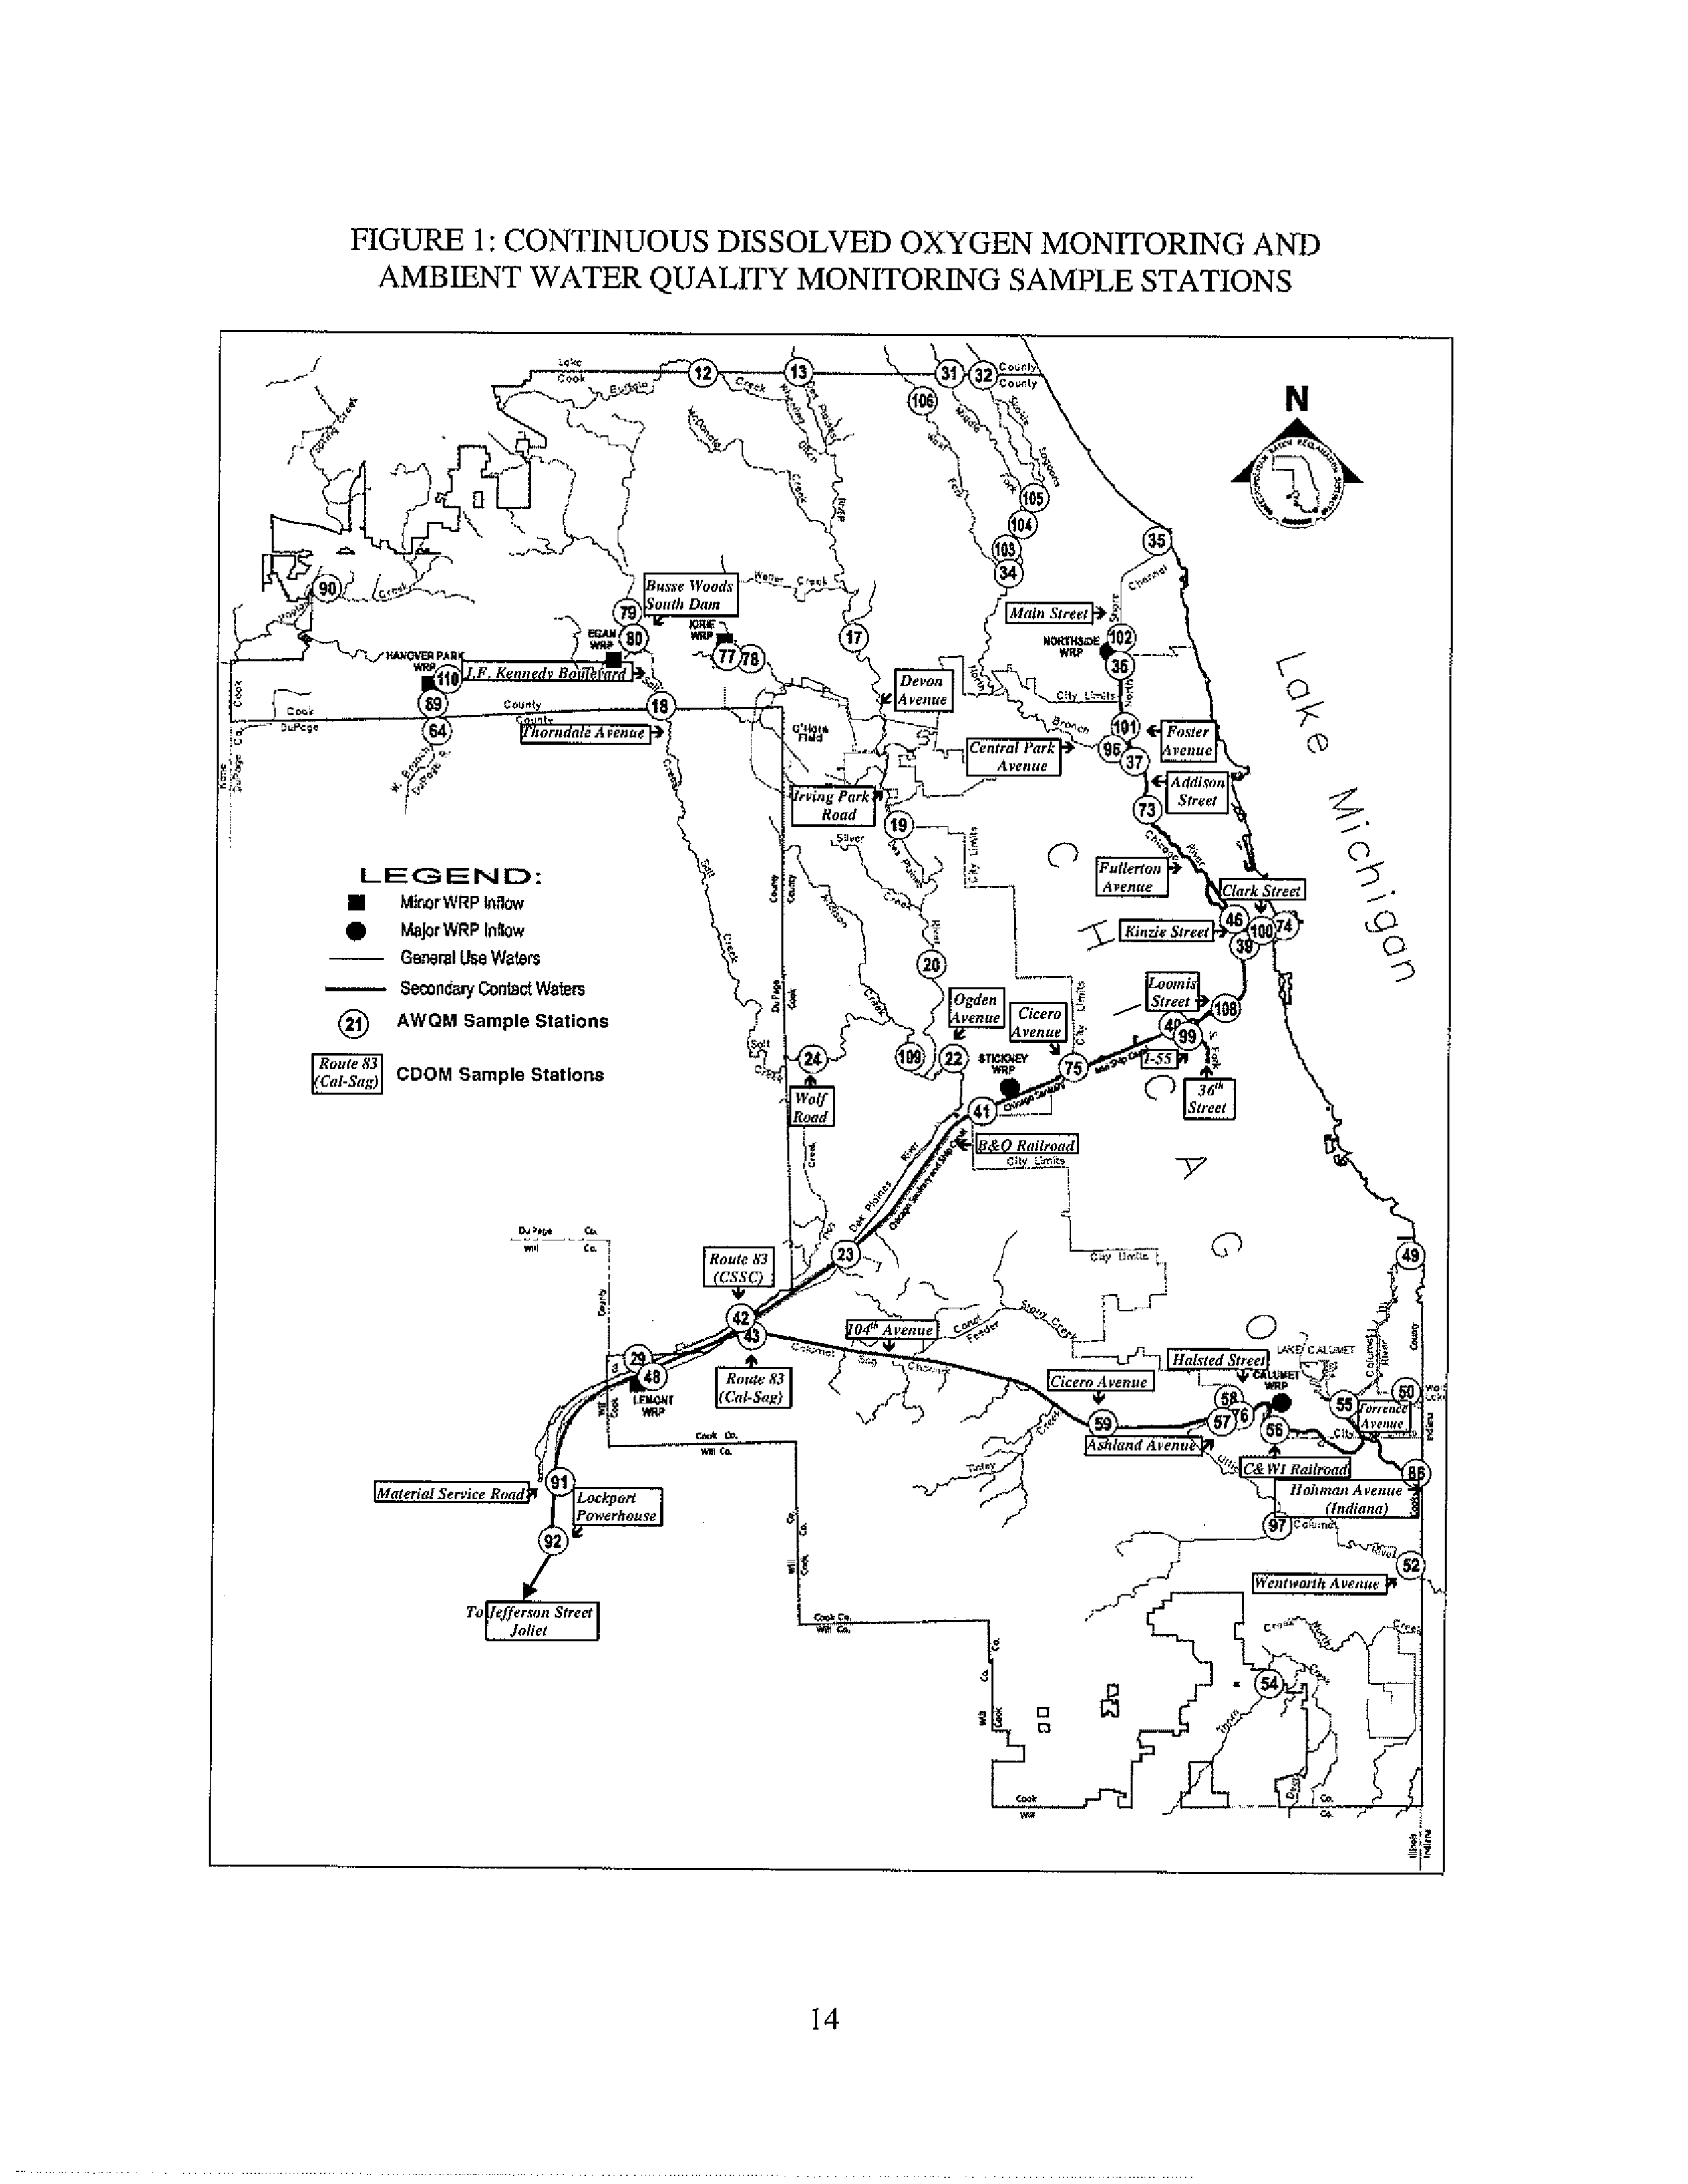
1
Continuous Dissolved
Oxygen
Monitoring and Ambient
Water Quality
14
Monitoring Sample Stations
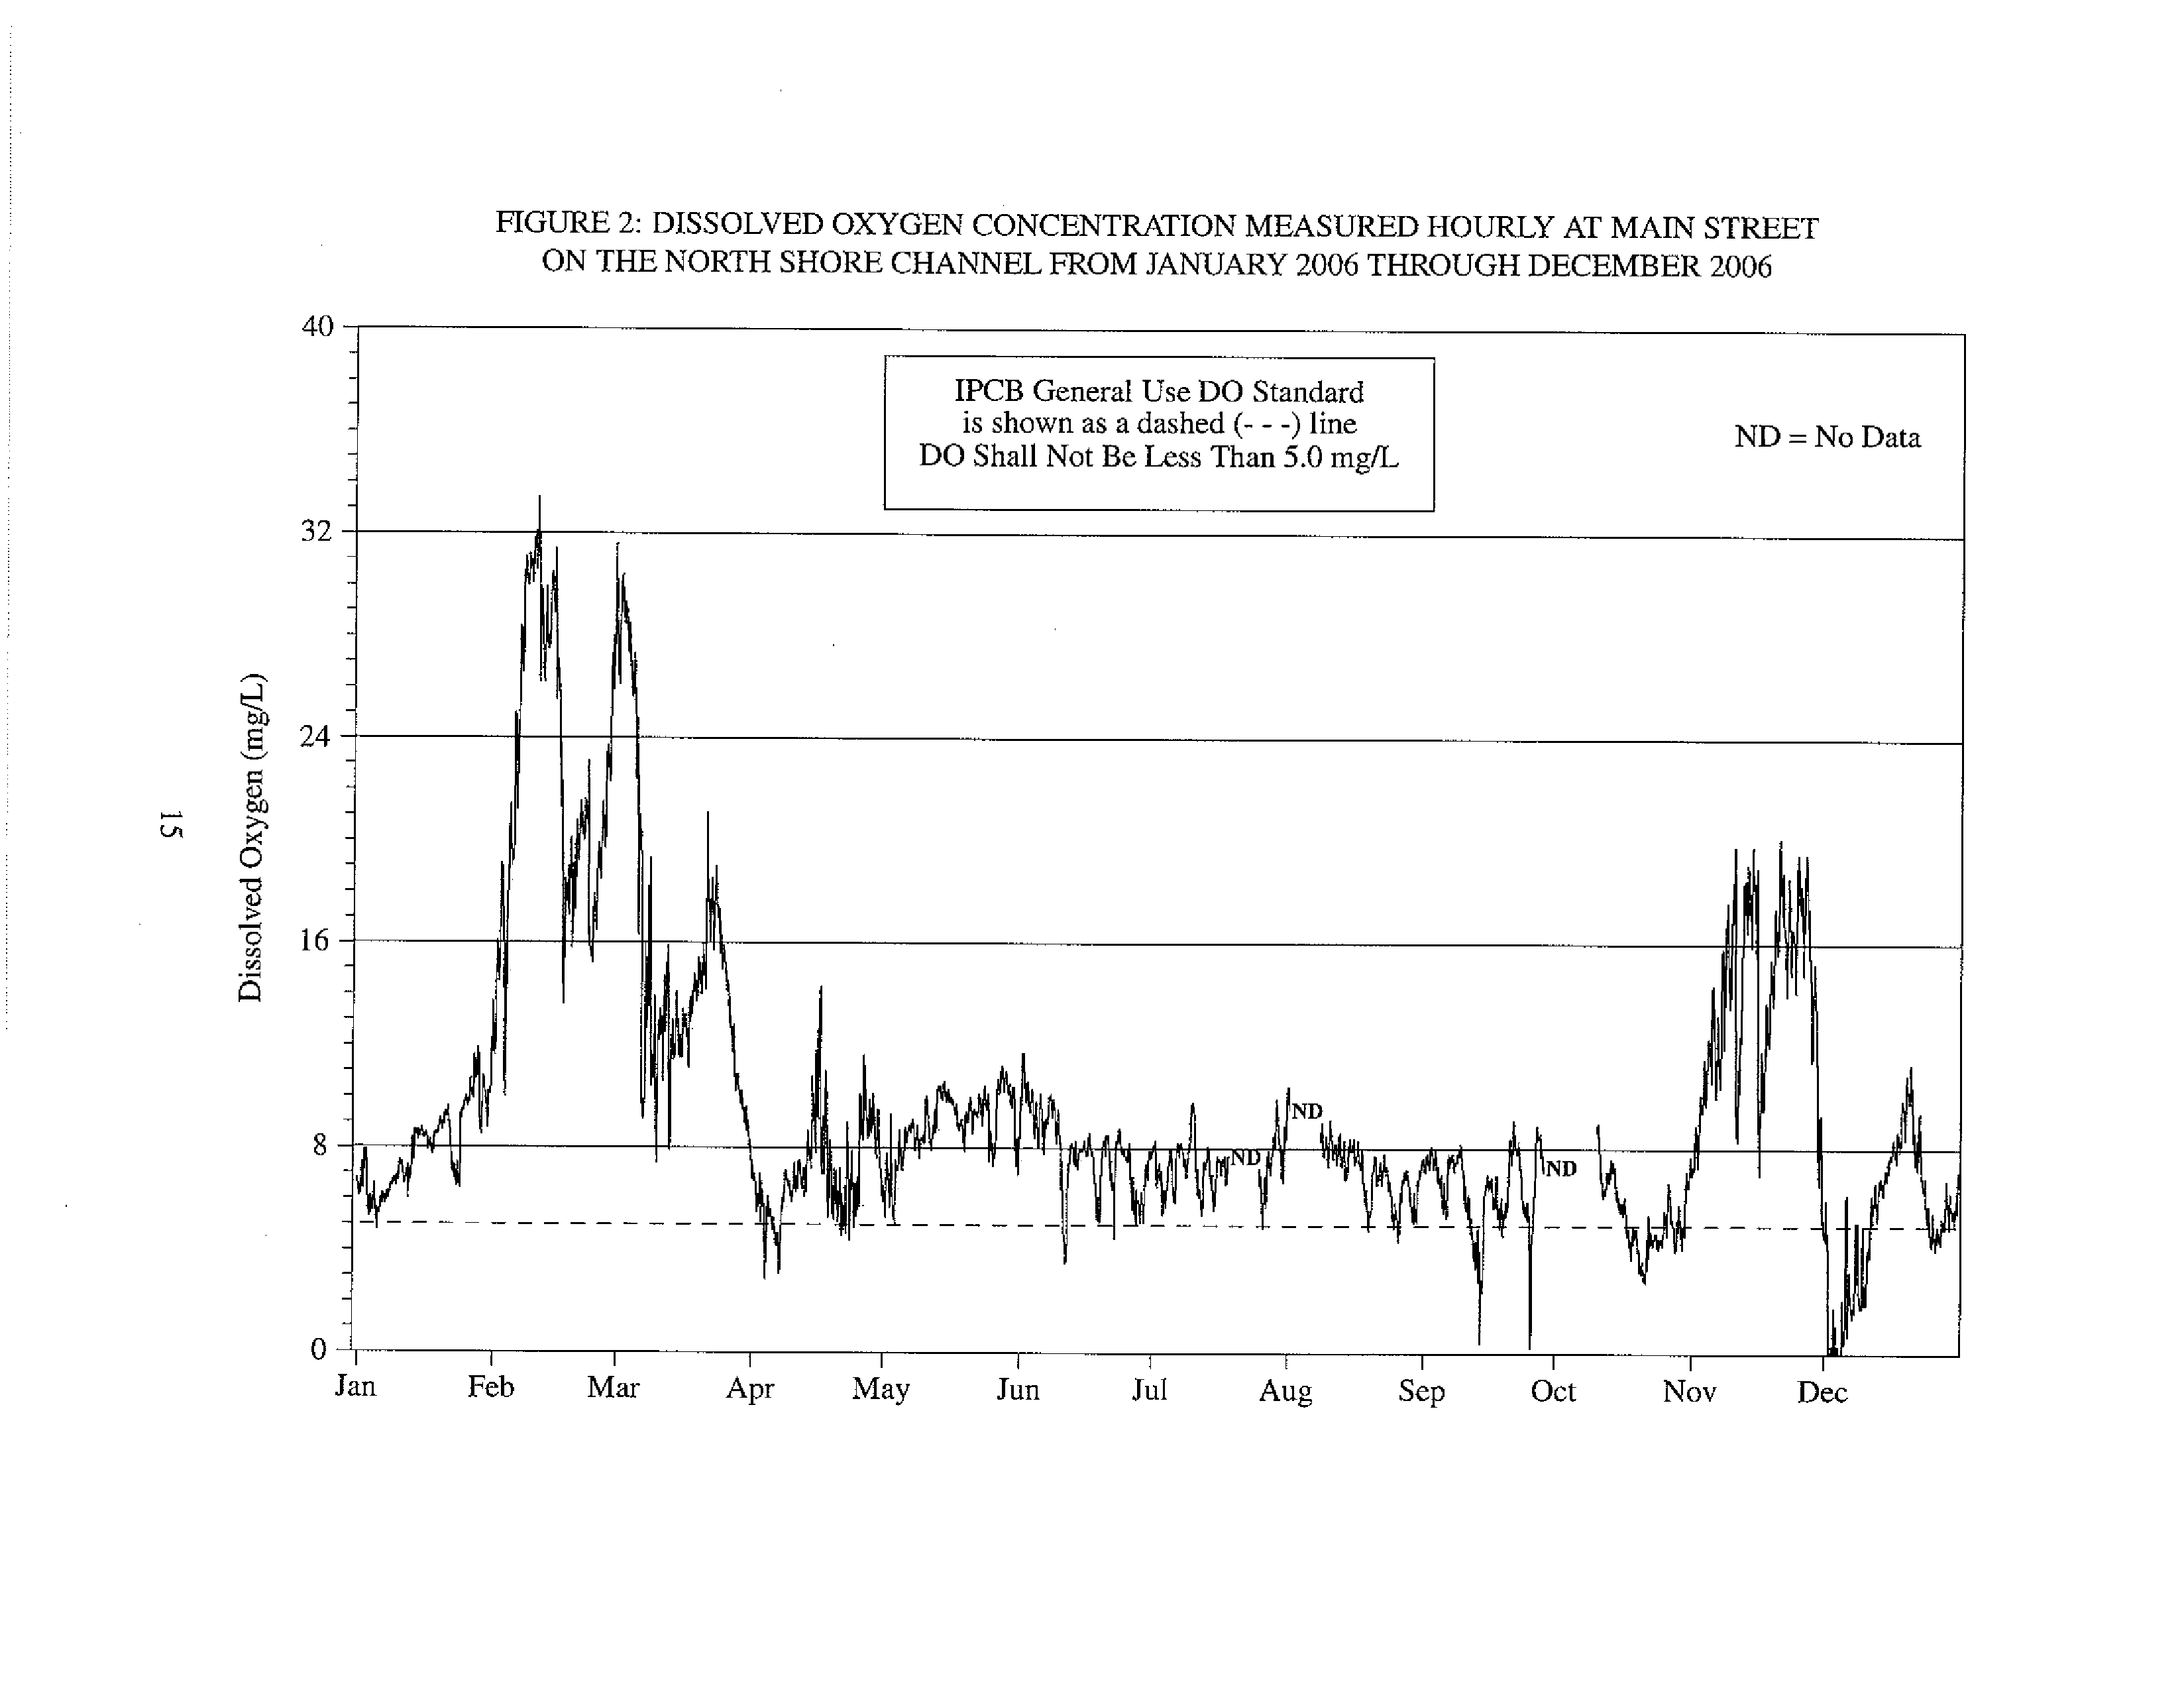
2
Dissolved Oxygen Concentration Measured Hourly at Main Street on the
15
North Shore Channel From January 2006 Through December 2006
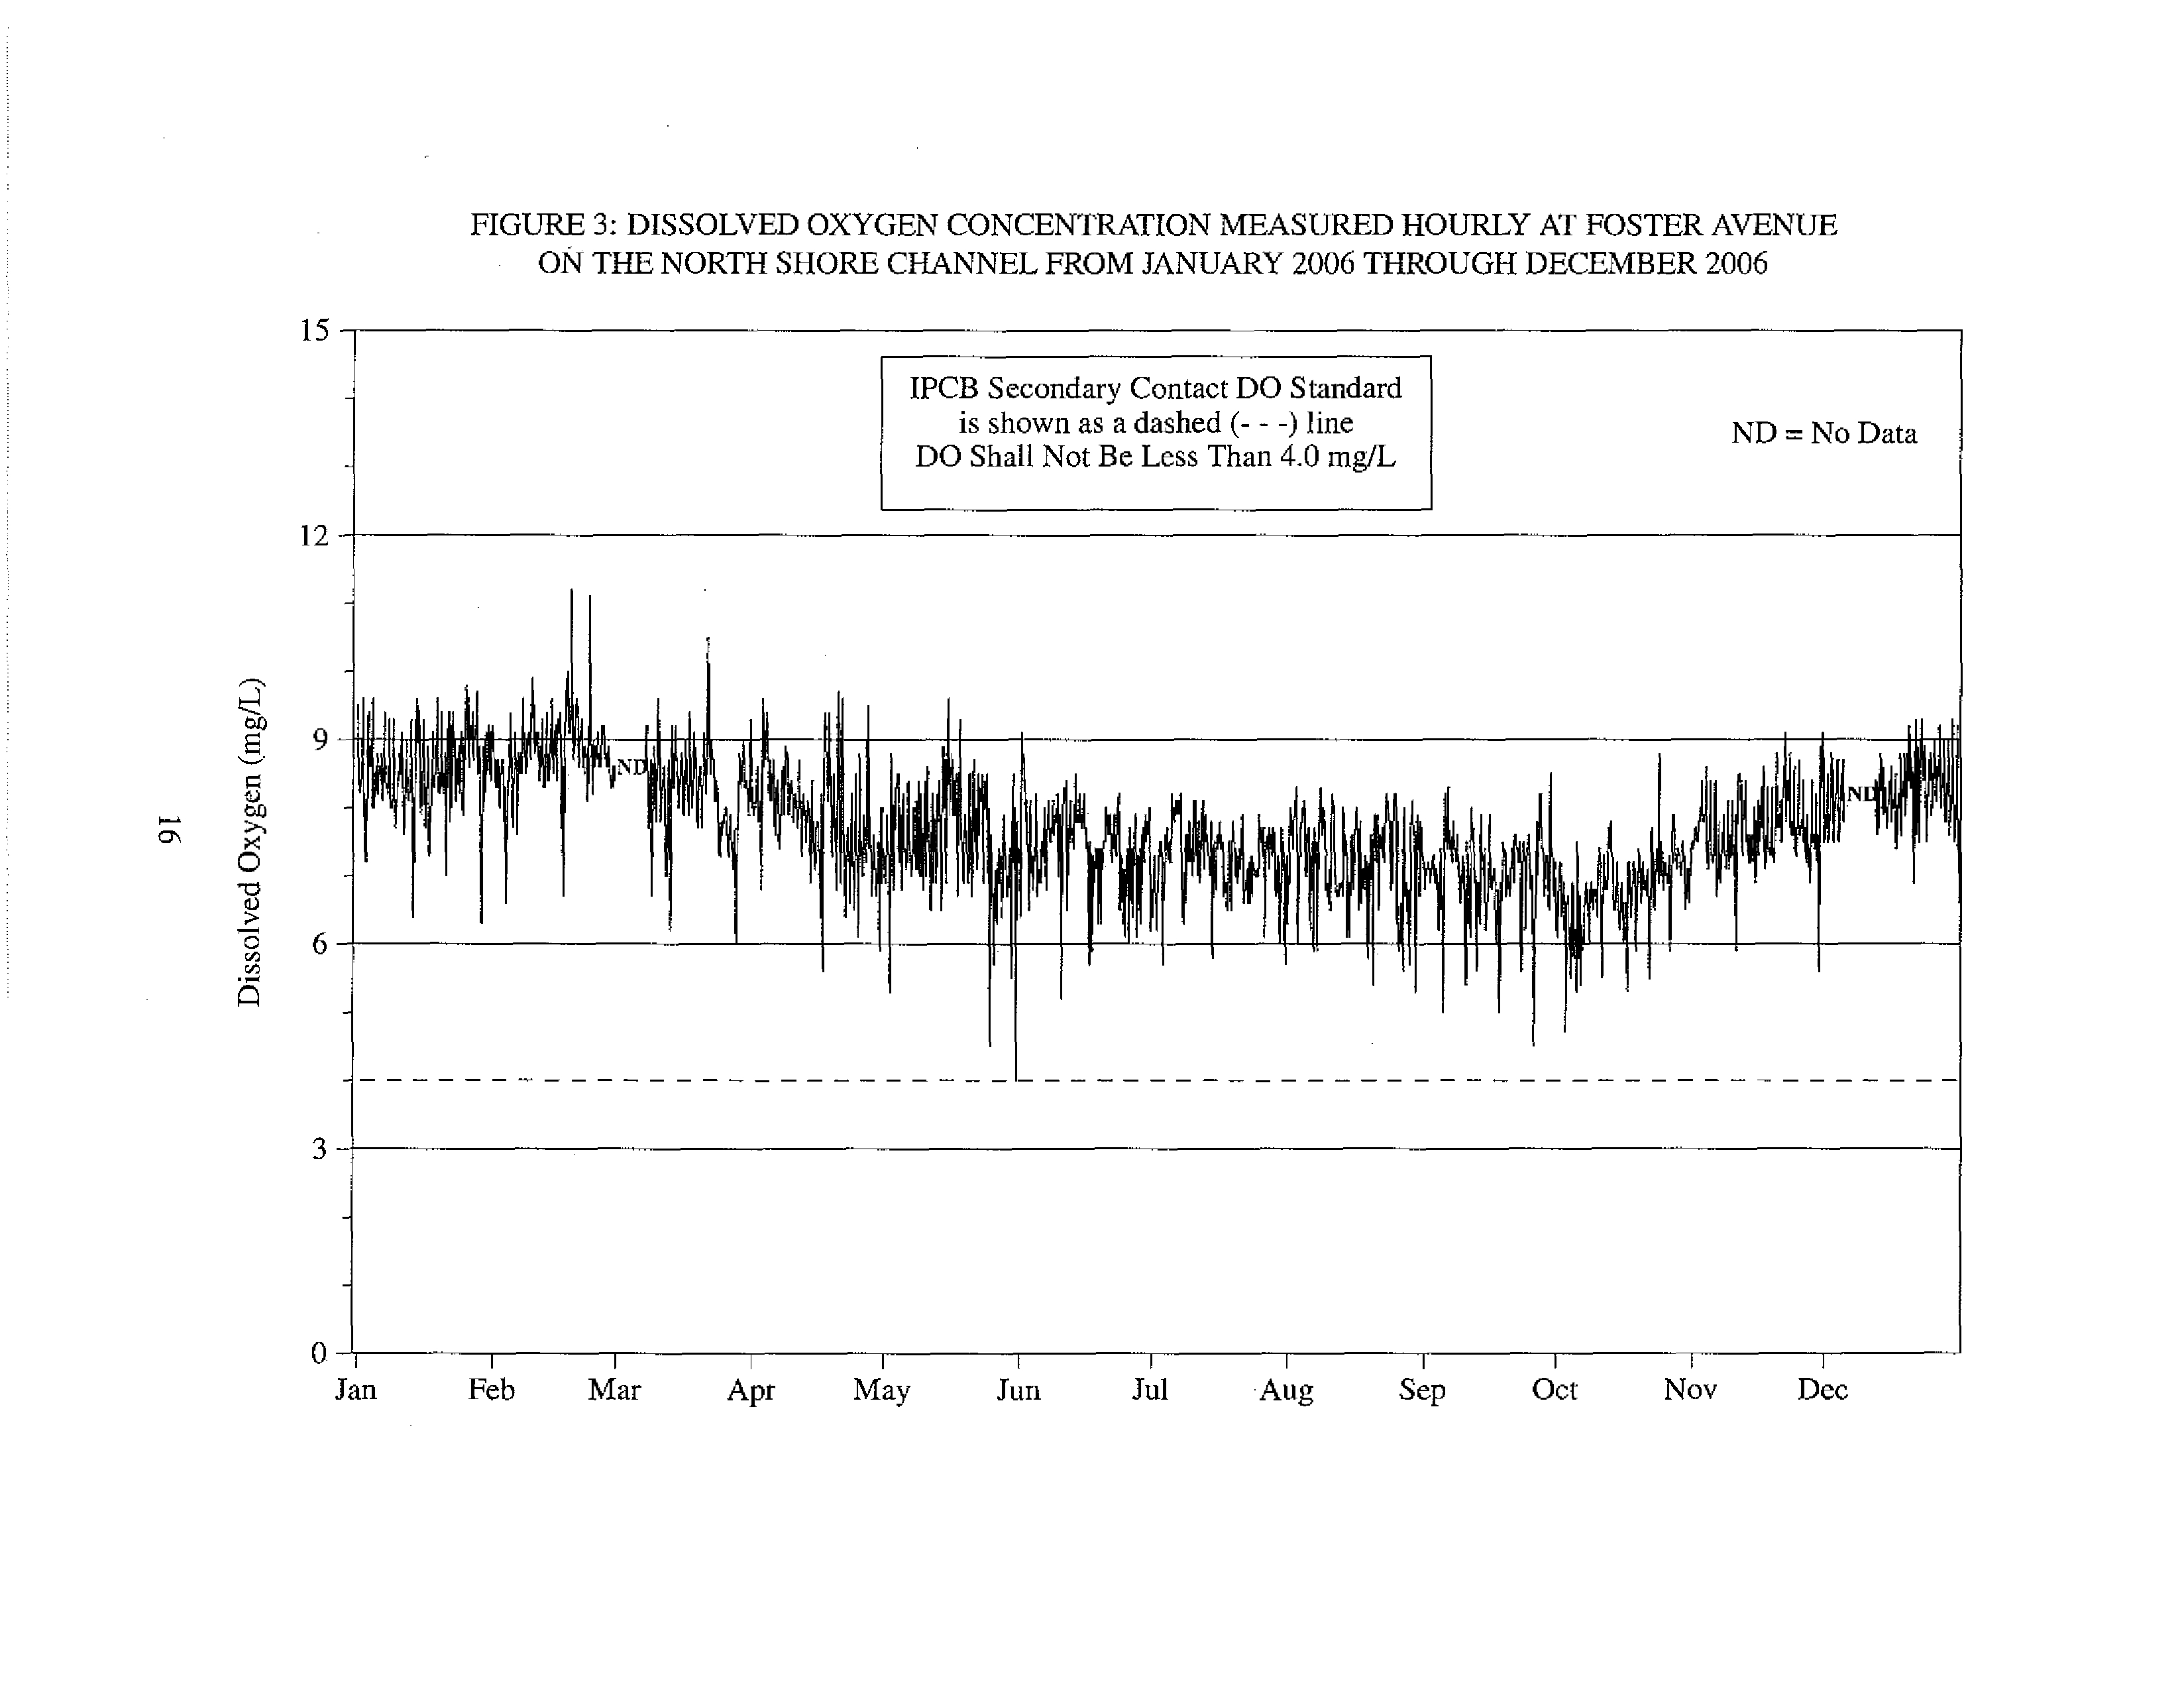
3
Dissolved Oxygen Concentration Measured Hourly at Foster Avenue on
16
the North Shore Channel From January 2006 Through December 2006
4
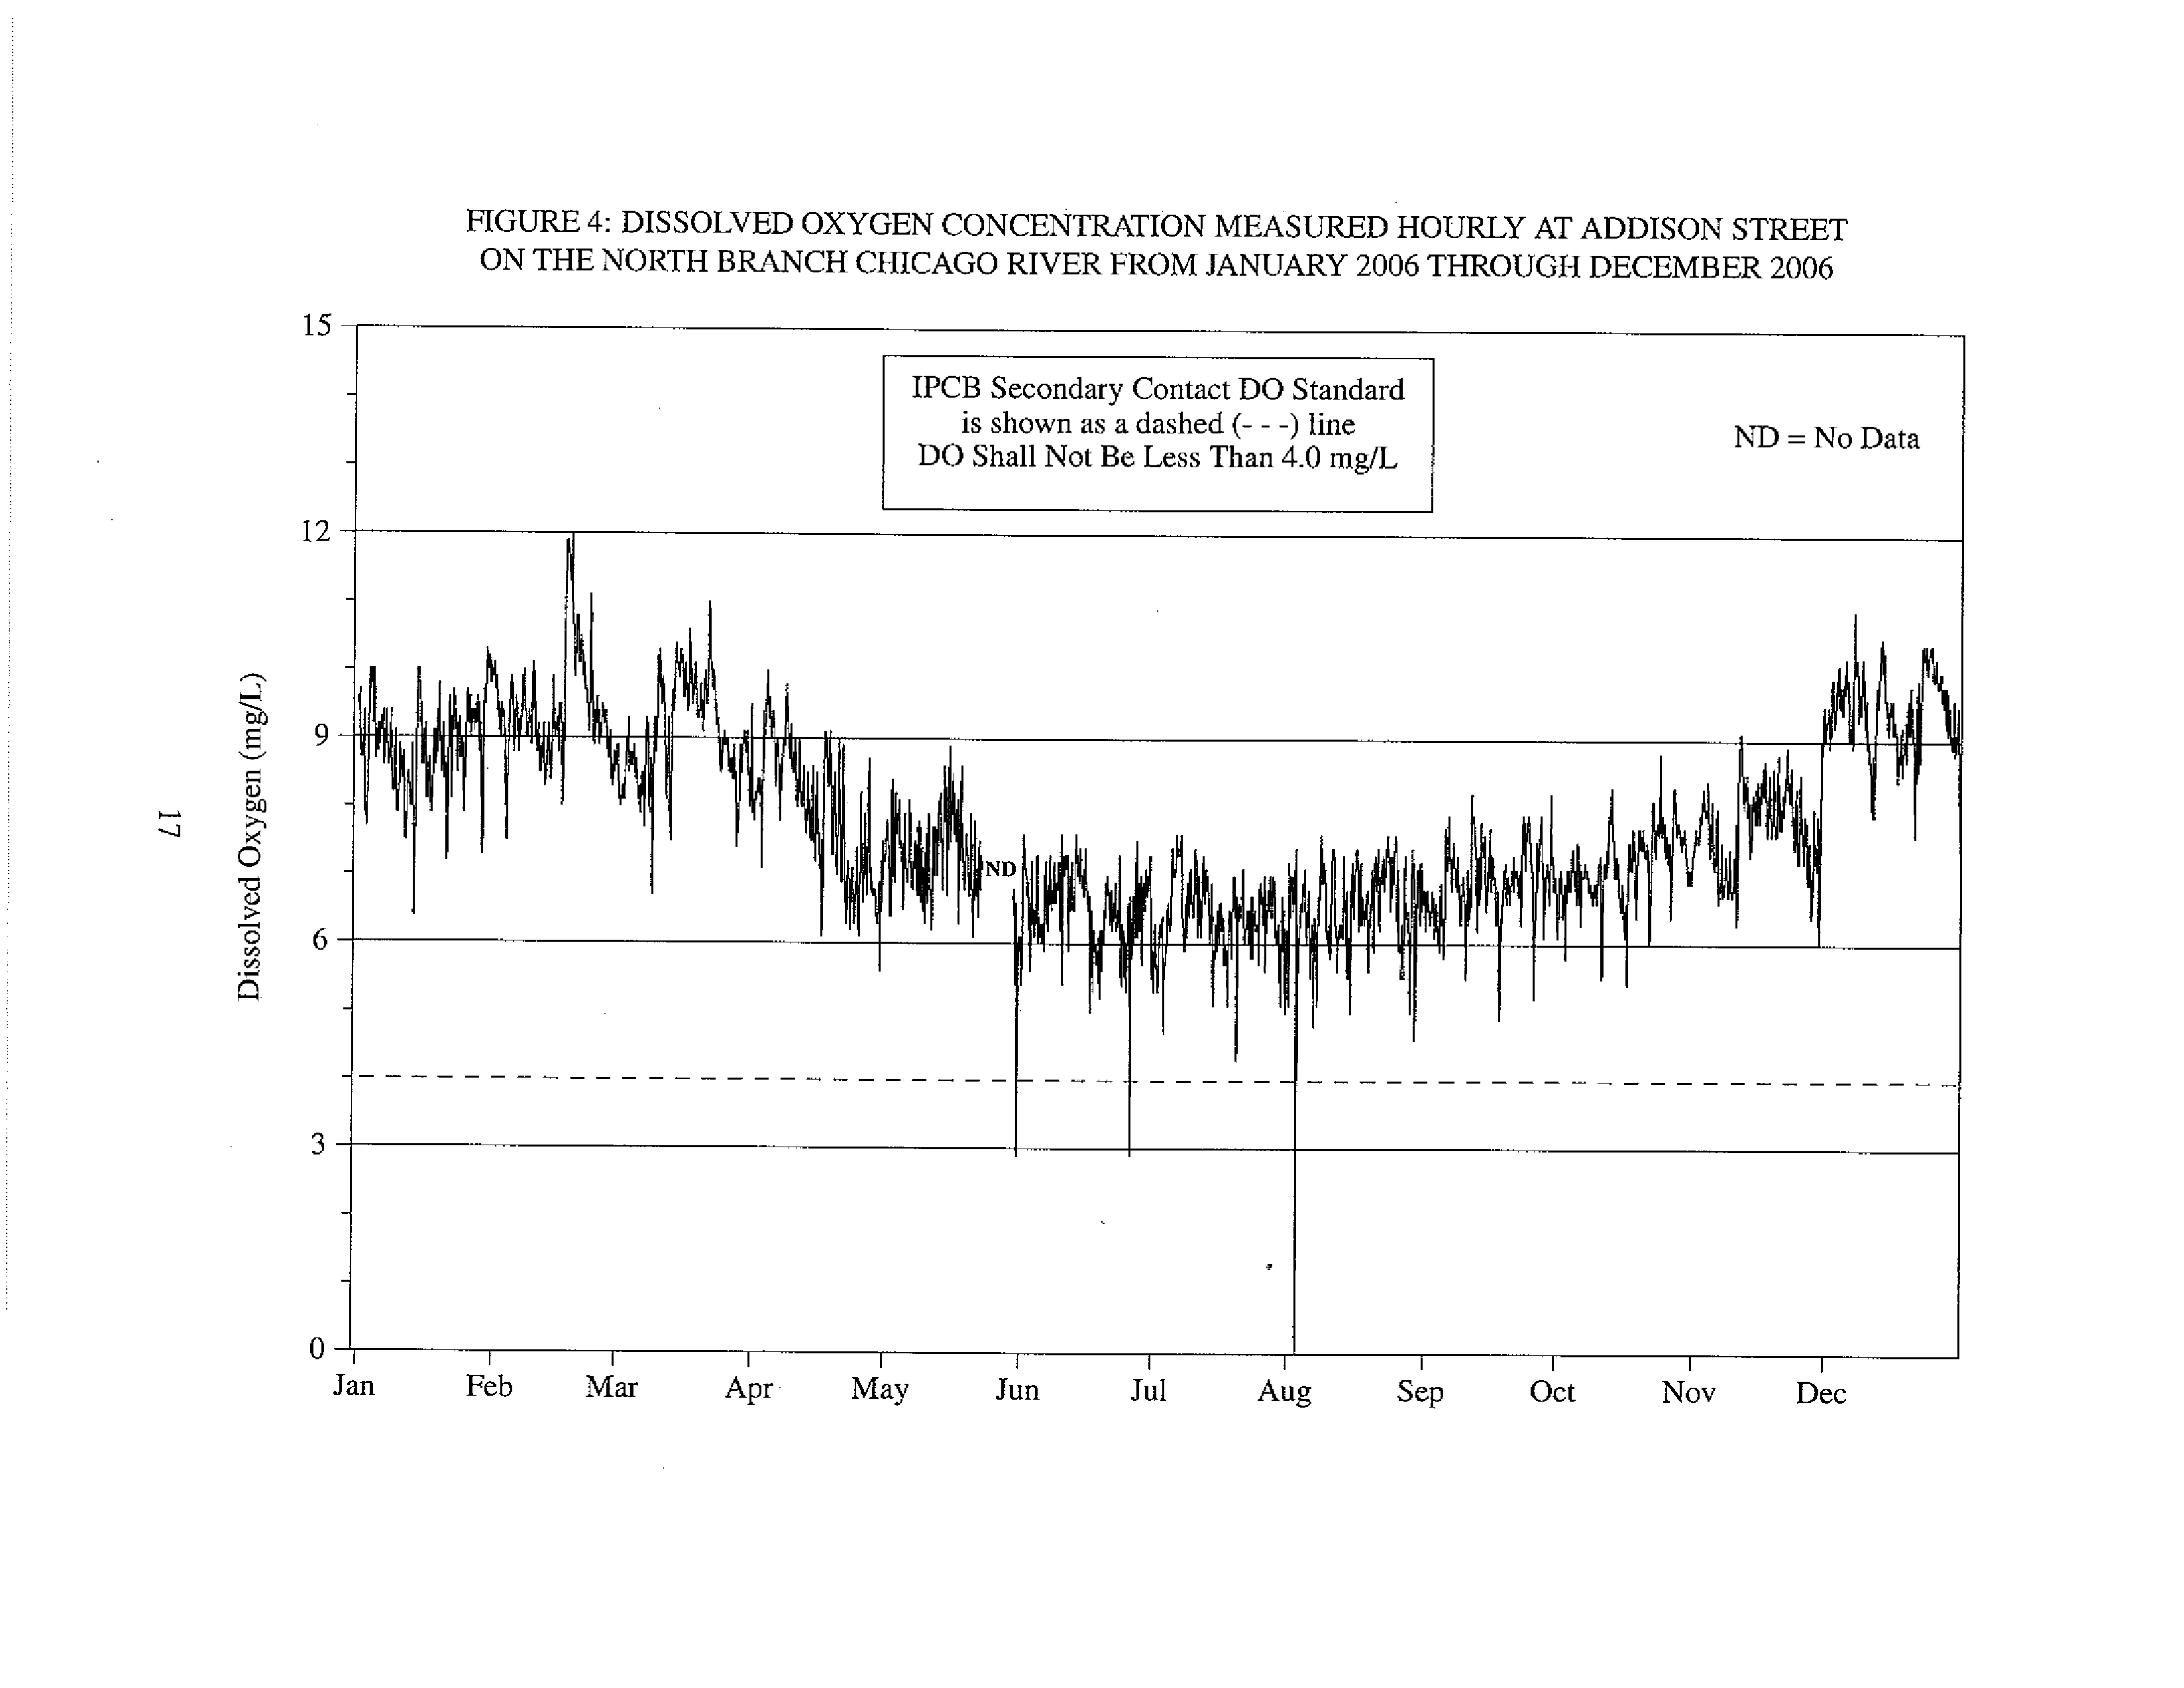
Dissolved Oxygen Concentration Measured Hourly at Addison Street on
17
the North Branch Chicago River From January 2006 Through December
2006
5
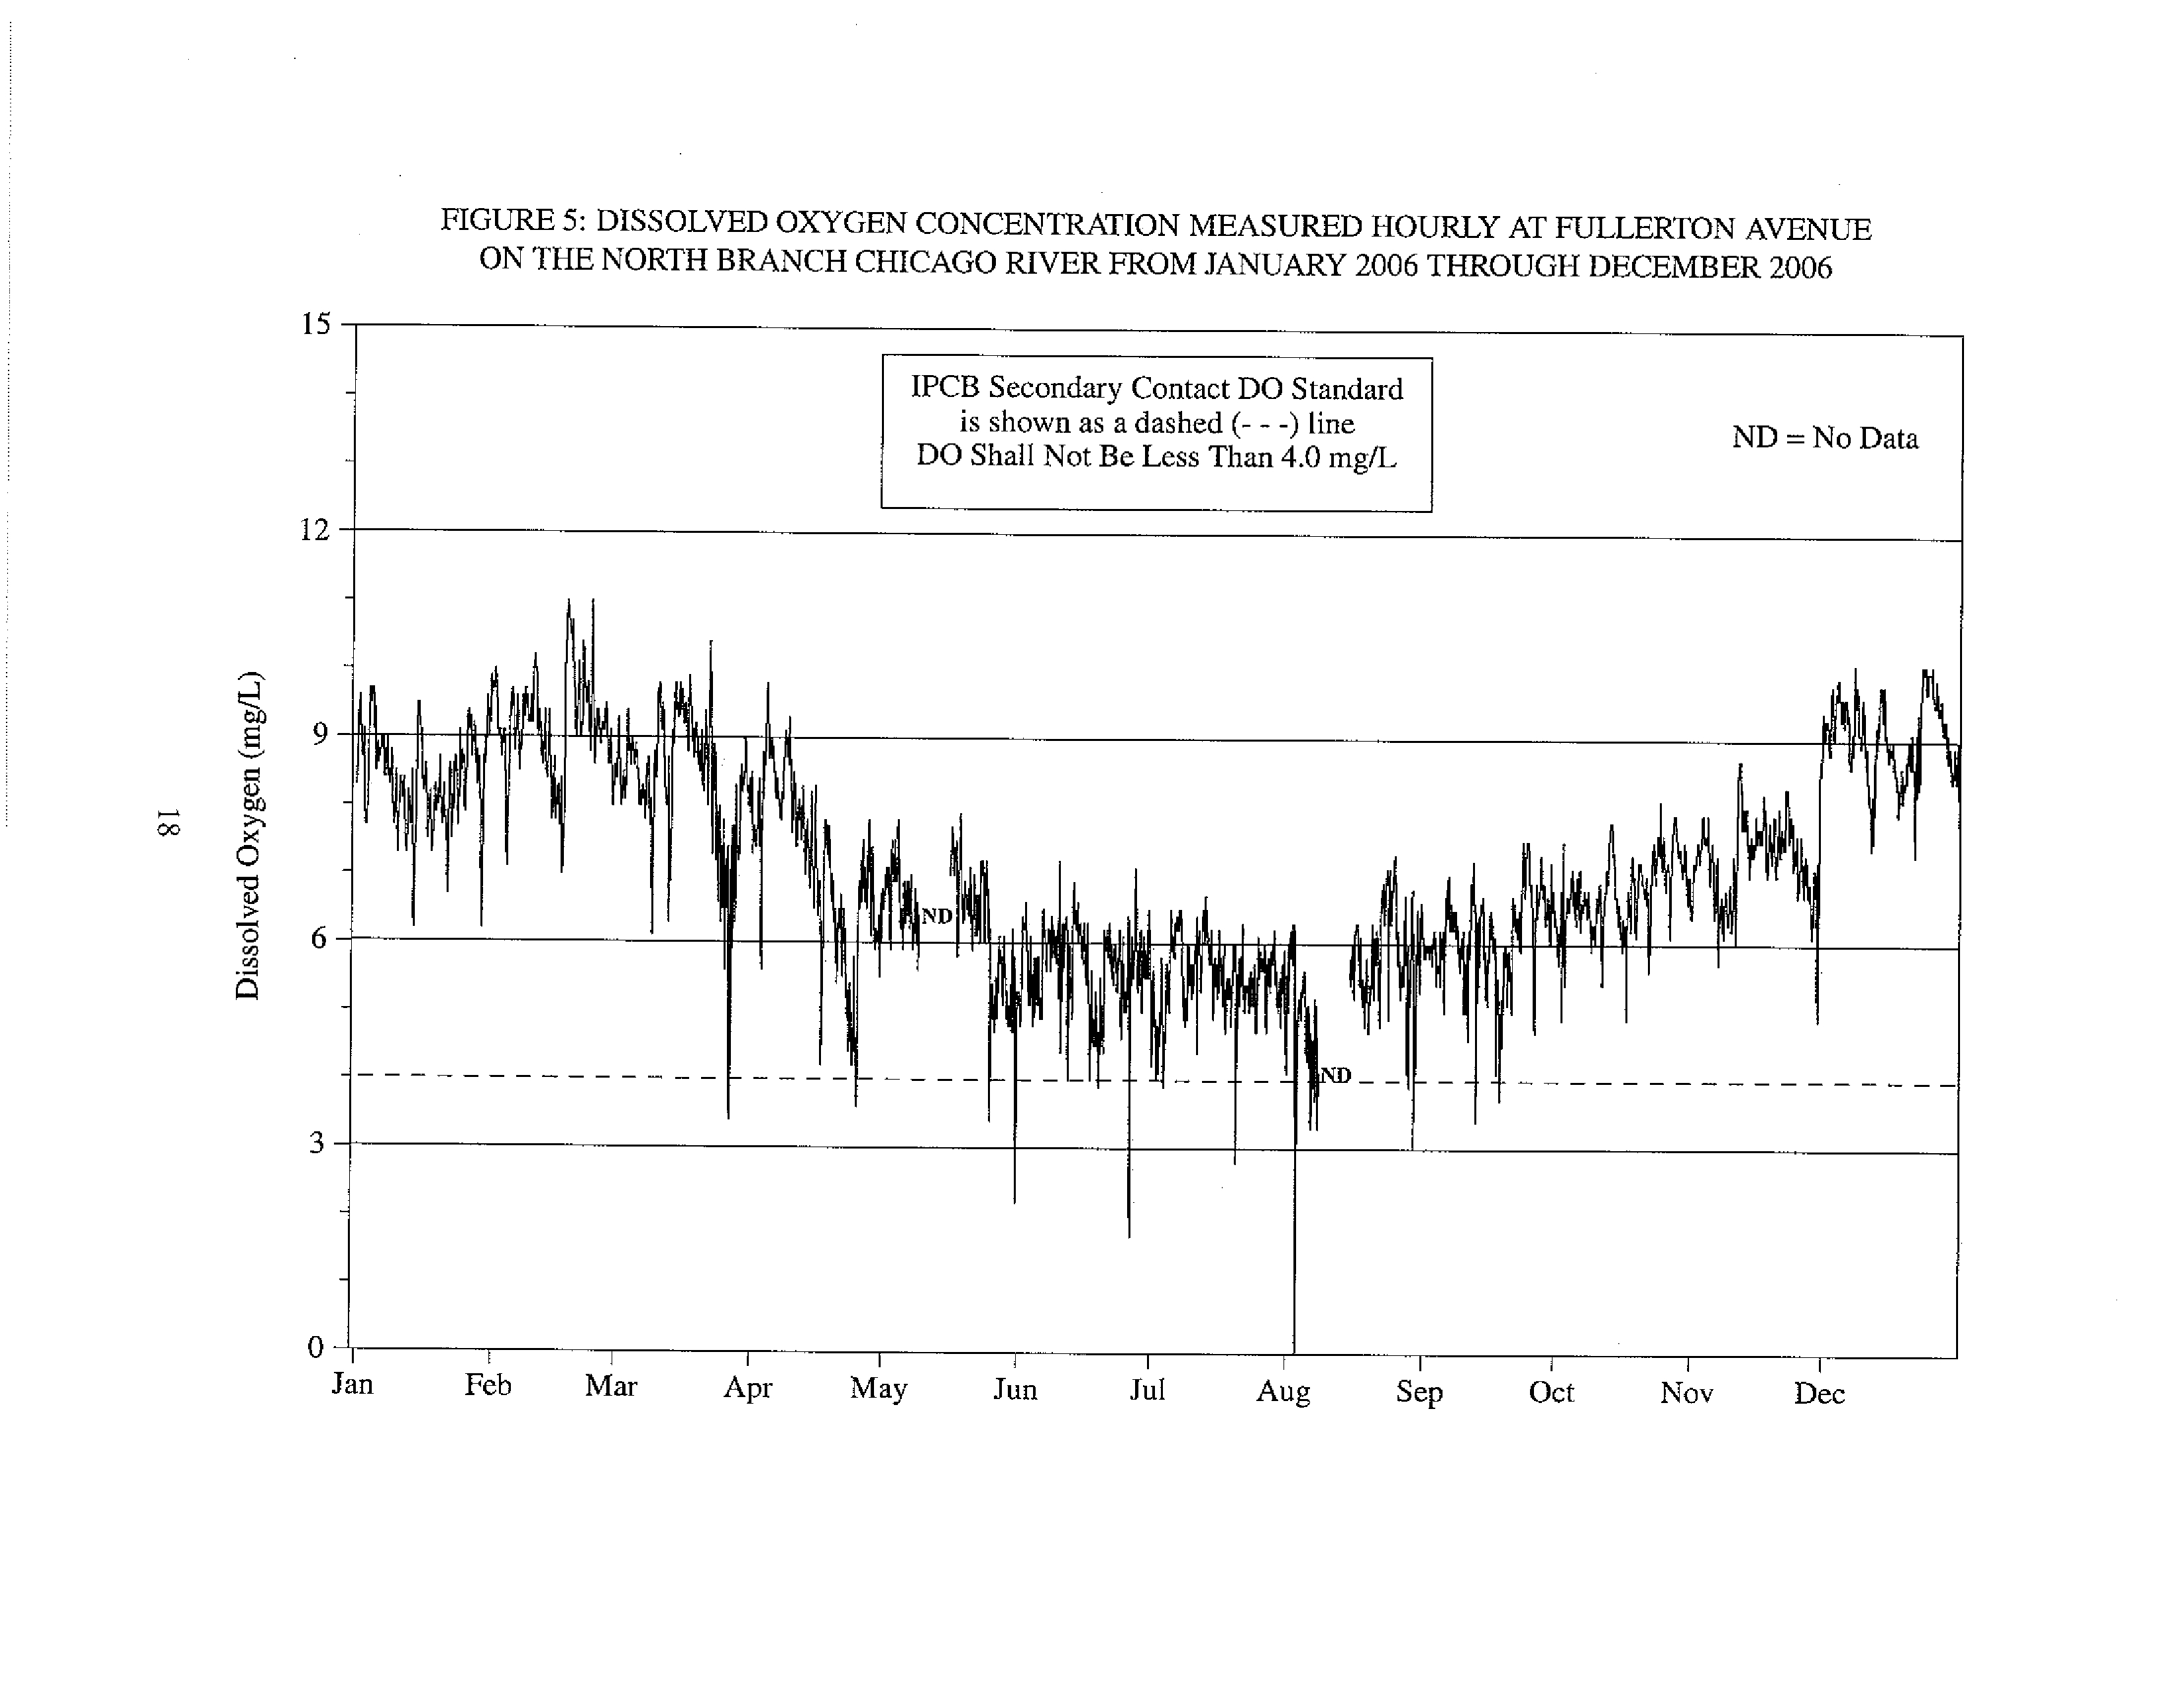
Dissolved Oxygen Concentration Measured Hourly at Fullerton Avenue
18
on the North Branch Chicago River From January 2006 Through Decem-
ber 2006
6
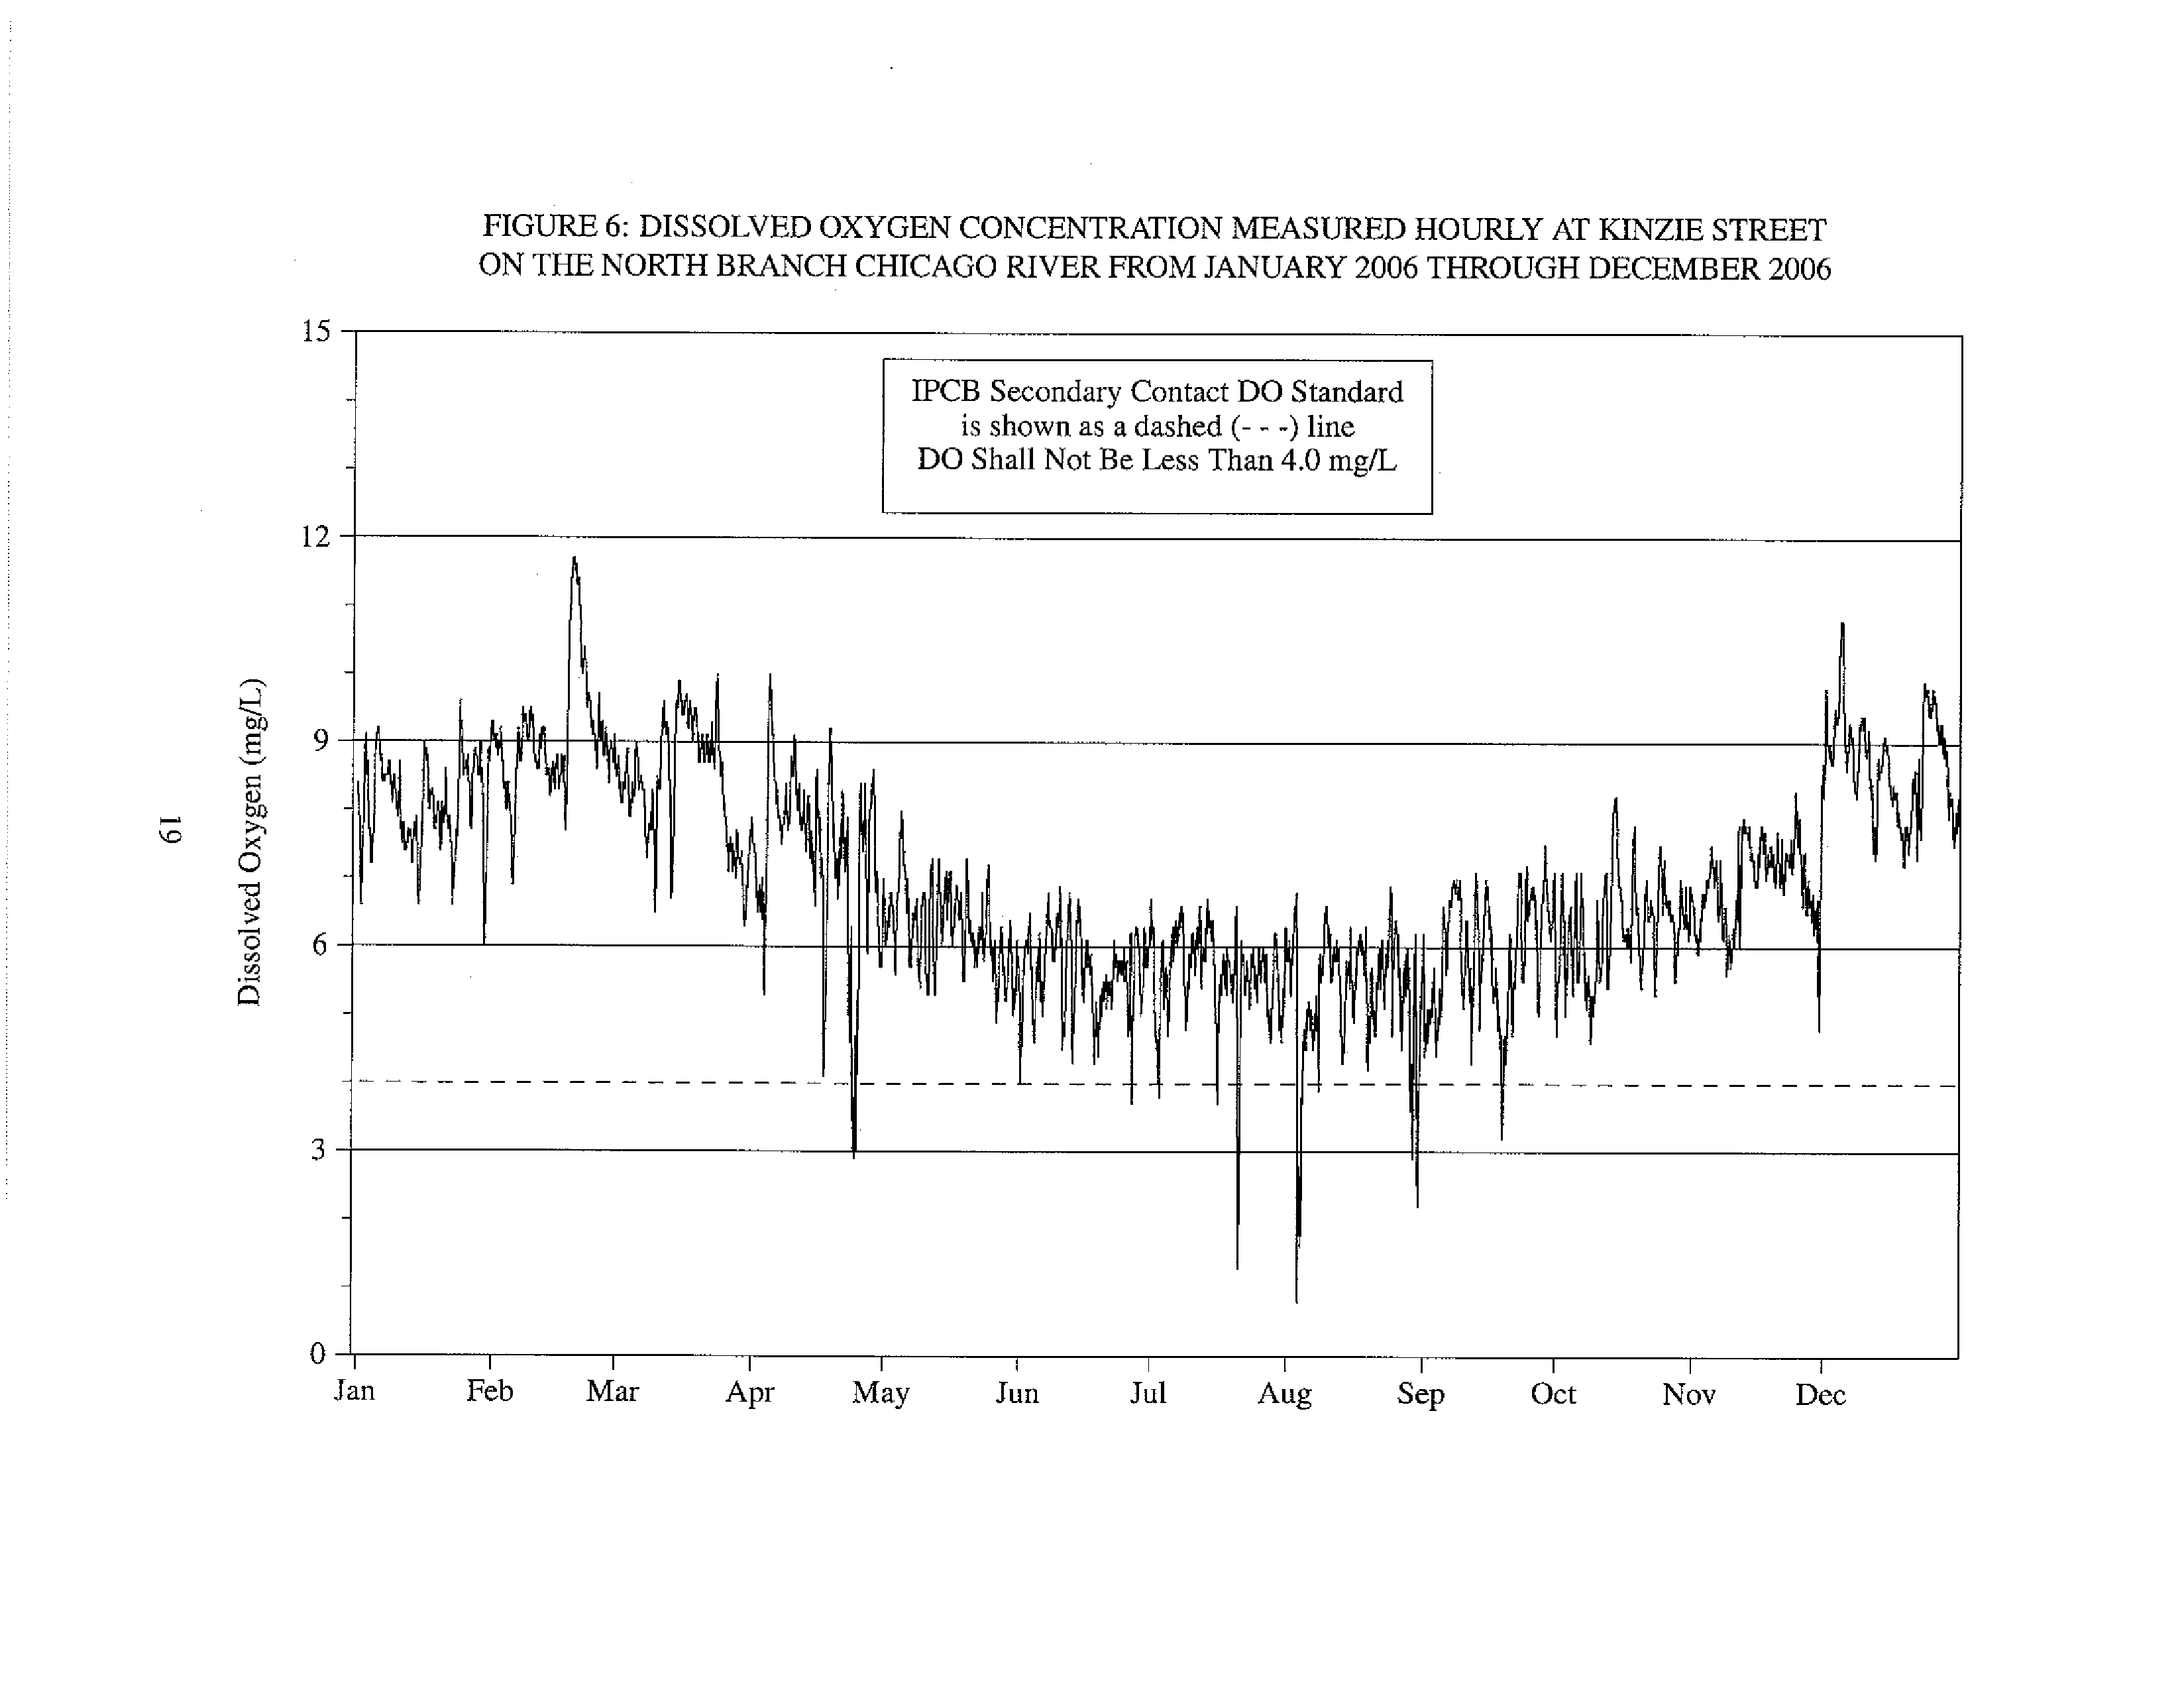
Dissolved Oxygen Concentration Measured Hourly at Kinzie Street on
19
the North Branch Chicago River From January 2006 Through December
2006
7
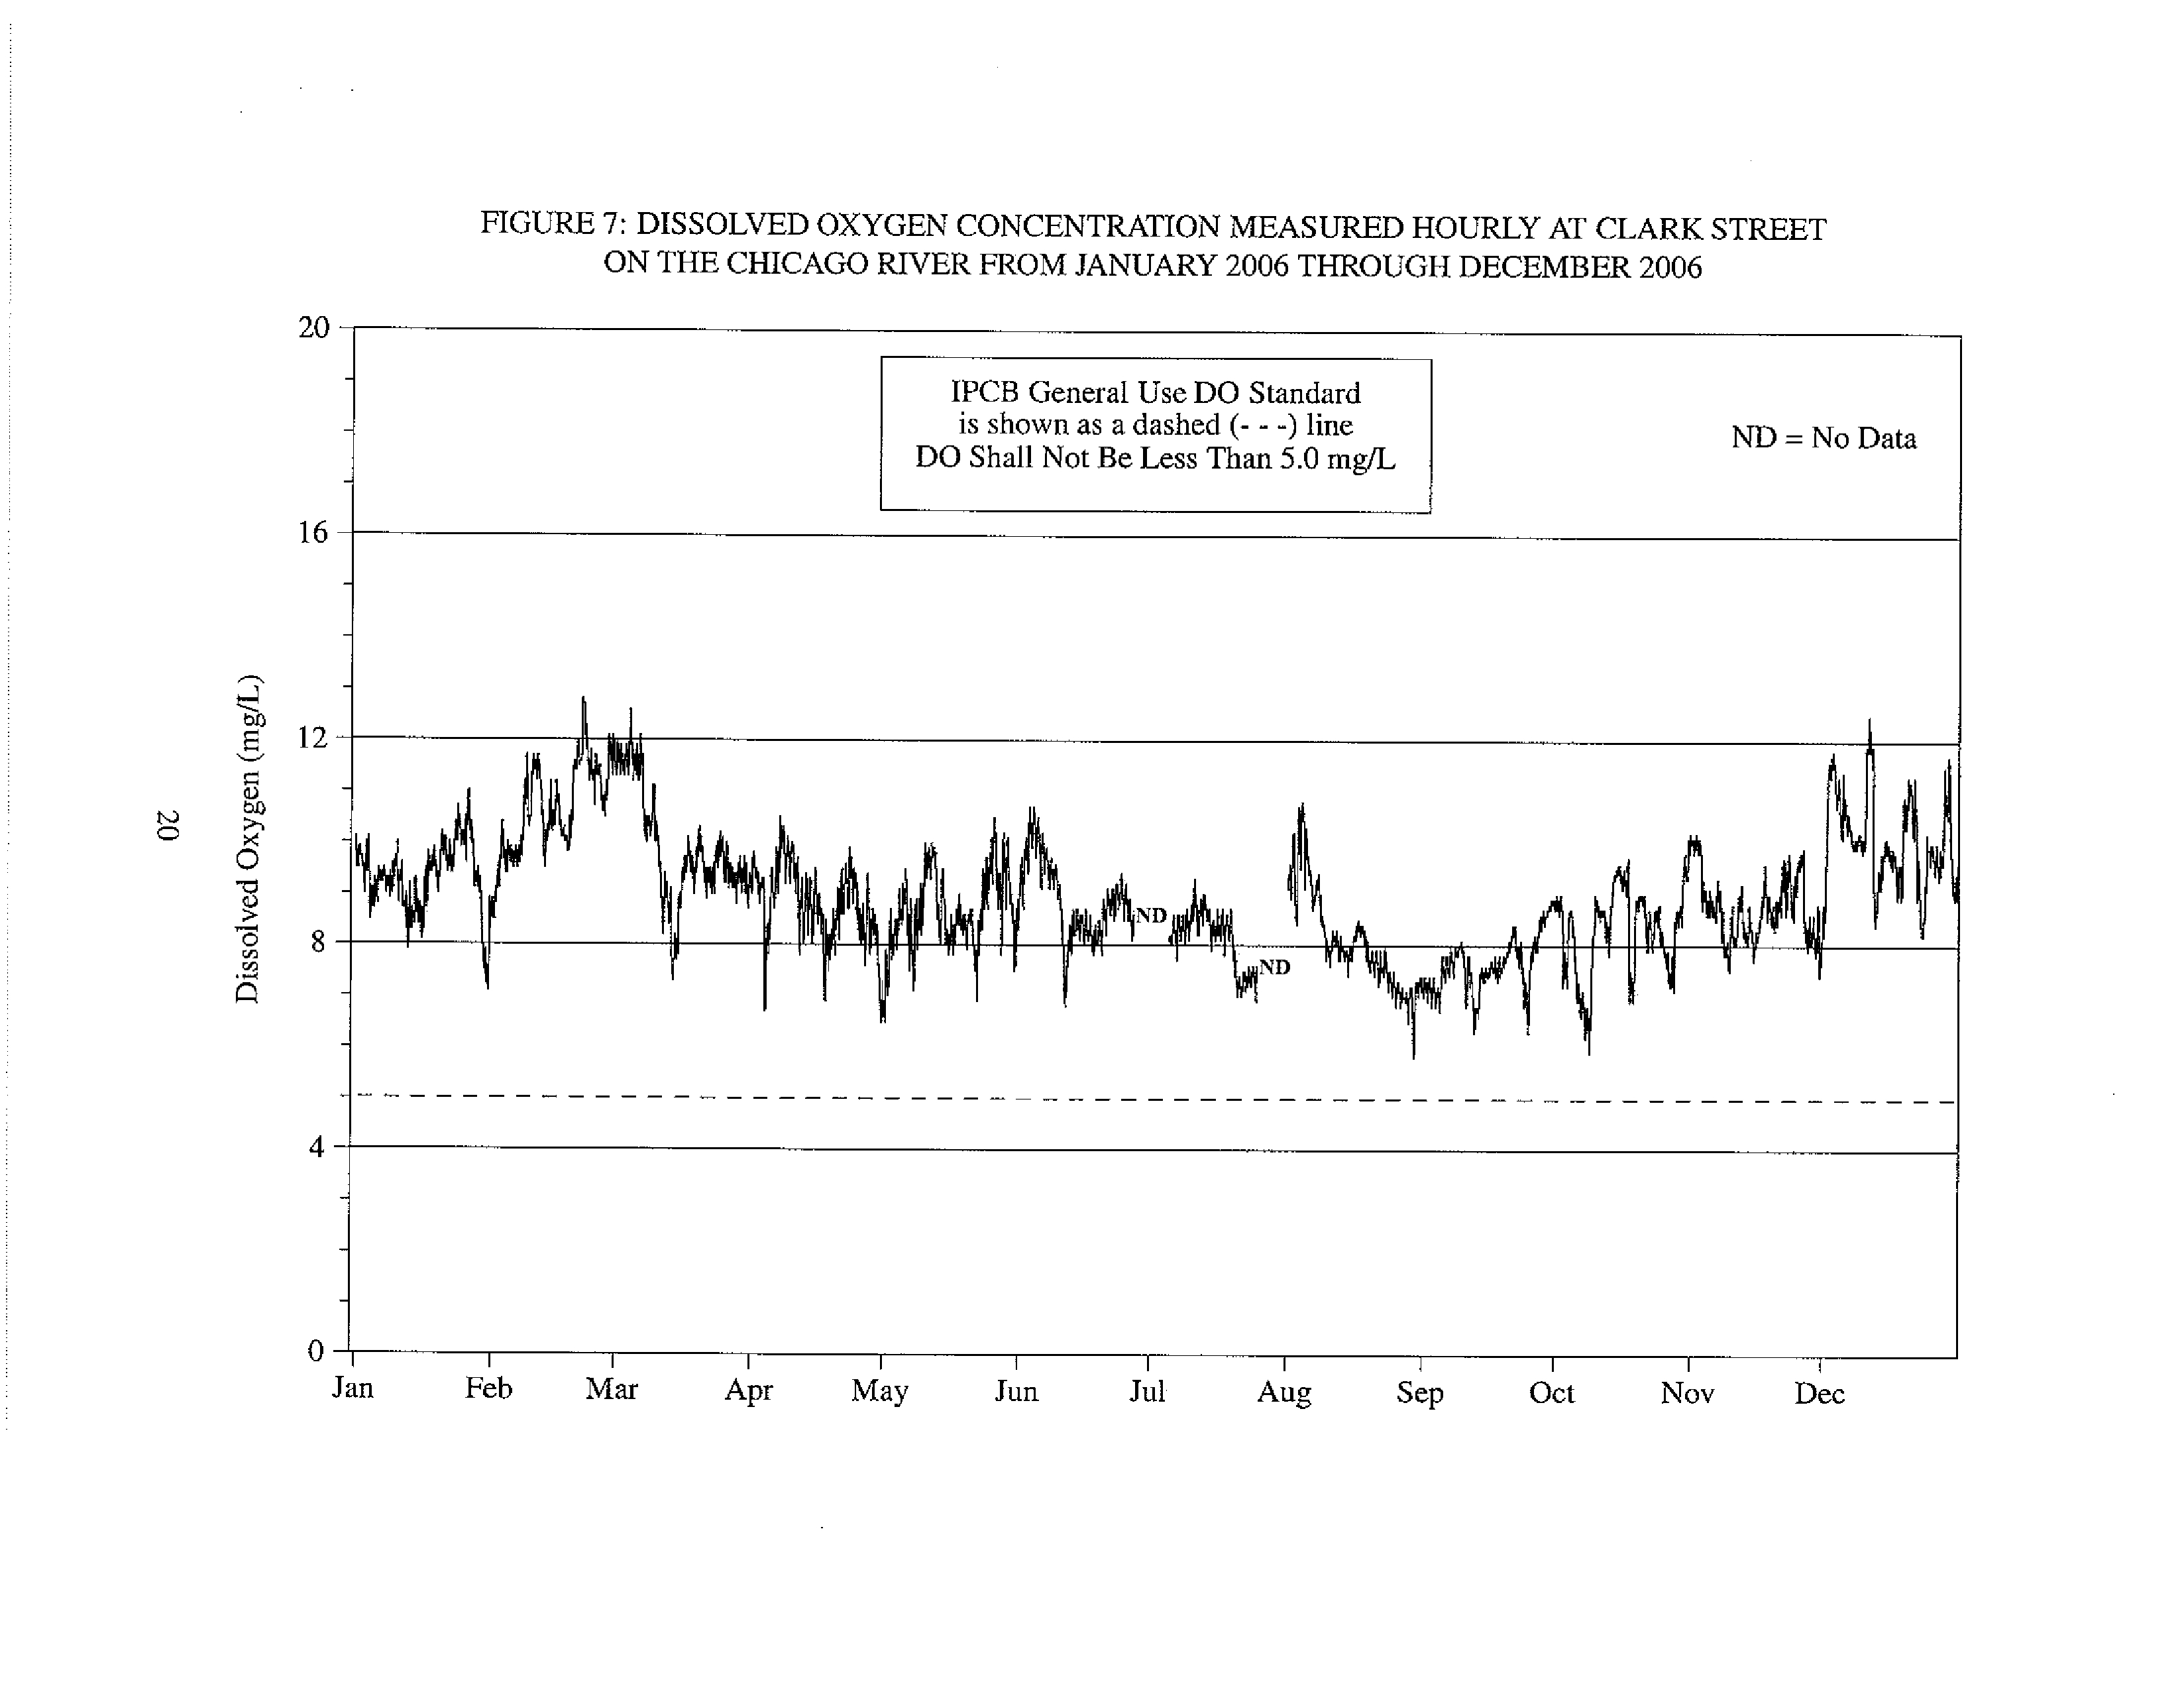
Dissolved Oxygen Concentration Measured Hourly at Clark Street on the
20
Chicago River From January 2006 Through December 2006
8
Dissolved Oxygen Concentration Measured Hourly at Loomis Street on
21
the South Branch Chicago River From January 2006 Through December
2006
9
Dissolved Oxygen Concentration Measured Hourly at 36th Street on
22
Bubbly Creek From January 2006 Through December 2006
10
Dissolved Oxygen Concentration Measured Hourly at Interstate Highway
23
55 on Bubbly Creek From January 2006 Through December 2006
11
Dissolved Oxygen Concentration Measured Hourly at Cicero Avenue on
24
the Chicago Sanitary and Ship Canal From January 2006 Through De-
cember 2006
iv
LIST OF FIGURES (
Continued)
Figure
No.
Page
12
Dissolved Oxygen Concentration Measured Hourly at B&O Central
25
Railroad on the Chicago Sanitary and Ship Canal From January 2006
Through December 2006
13
Dissolved Oxygen Concentration Measured Hourly at Route 83 on the
26
Chicago Sanitary and Ship Canal From January 2006 Through De-
cember 2006
14
Dissolved Oxygen Concentration Measured Hourly at Lockport Pow-
27
erhouse on the Chicago Sanitary and Ship Canal From January 2006
Through December 2006
15
Dissolved Oxygen Concentration Measured Hourly at Jefferson Street
28
on the Des Plaines River From January 2006 Through December 2006
16
Dissolved Oxygen Concentration Measured Hourly at Torrence Ave-
29
nue on the Grand Calumet River From January 2006 Through Decem-
ber 2006
17
Dissolved Oxygen Concentration Measured Hourly at C&W.Indiana
30
Railroad on the Little Calumet River From January 2006 Through De-
cember 2006
18
Dissolved Oxygen Concentration Measured Hourly at Halsted Street
31
on the Little Calumet River From January 2006 Through December
2006
19
Dissolved Oxygen Concentration Measured Hourly at Cicero Avenue
32
on the Calumet-Sag Channel From January 2006 Through December
2006
20
Dissolved Oxygen Concentration Measured Hourly at 104th Avenue
33
on the Calumet-Sag Channel From January 2006 Through December
2006
21
Dissolved Oxygen Concentration Measured Hourly at Route 83 on the
34
Calumet-Sag Channel From January 2006 Through December 2006
v
ACKNOWLEDGMENT
Thanks are extended to staff from the Industrial Waste Division who deployed and re-
trieved the water quality monitors weekly during the study. Special thanks to Richard Schackart,
Justin Vick, Dustin Gallagher, Donald Rohe, Angel Whitington, Panu Lansiri, and Colleen Joyce
for downloading and servicing the monitors.
Thanks are also extended to Dr. Thomas Granato, Assistant Director of Research and
Development, Environmental
Monitoring and Research Division, for his helpful review
comments.
We thank Robert Larson, Illinois State Water Survey, for designing the Access° database
program, and Roger Smith, Senior Program Analyst, Information Technology Department for
modifying the database program. Their help with the Access® program is greatly appreciated.
We thank Dr. Zainul Abedin, Biostatistician, for modifying the database program and for
performing the calculations for the data summaries used in this report.
Particular thanks are due to Joan Scrima for reviewing, formatting, and typing the report.
DISCLAUVIER
Mention of proprietary equipment
and chemicals
in this report
does not constitute
endorsement
by the Metropolitan Water
Reclamation
District of Greater Chicago.
vi
INTRODUCTION
The Chicago Waterway System (CWS) consists of 78 miles of canals, which serve the
Chicago area for two principal purposes, the drainage of urban storm water runoff and treated
municipal wastewater effluent and the support of commercial navigation. Approximately 75 per-
cent of the length is composed of man-made canals where no waterway existed previously, and
the remainder is composed of natural streams that have been deepened, straightened and/or wid-
ened to such an extent that reversion to the natural state is not possible. The flow of water in the
CWS is artificially controlled by hydraulic structures. The CWS has two river systems, the
Calumet River System and the Chicago River System (Lanyon, 2002).
Over the years, increased pollutant loading from urbanization throughout the Chicago
metropolitan area and low stream velocities in Chicago area deep-draft waterways have caused
dissolved oxygen (DO) concentrations to fall below DO standards established by the Illinois Pol-
lution Control Board (IPCB). More than 30 years ago, the Metropolitan Water Reclamation Dis-
trict of Greater Chicago (District) determined that applicable IPCB DO standards for Chicago
area waterways could not be met exclusively by advanced wastewater treatment at its three major
regional water reclamation plants (WRPs), Calumet, North Side, and Stickney, and by the cap-
ture and treatment of combined sewer overflows (CSOs). In order to increase the DO concentra-
tion in the Chicago and Calumet River Systems, the District designed and constructed artificial
aeration systems (instream diffuser and sidestream elevated pool aeration [SEPA] stations) dur-
ing the late 1970s and early 1990s, respectively.
From October 1994 through May 1996, the Research and Development Department
(R&D) conducted weekly DO surveys in the Chicago River System. Water samples were col-
lected manually, chemically fixed in the field, and returned to the laboratory for titration. The
results from these surveys showed that DO concentrations in selected waterway reaches were
less than IPCB DO standards applicable to these reaches.
In August 1996, R&D began developing a comprehensive field-monitoring program in
order to locate and identify reaches in the Chicago River System where the DO concentration is
less than the applicable IPCB DO standard. Initially, the program was to focus on the Chicago
River System for a two-year period and has since been extended. Subsequently, the scope of the
monitoring program was first expanded to include the Calumet River System, and then later the
Chicago area wadeable streams. The resulting data have been used for the calibration and verifi-
cation of a water quality model for the CWS.
Data in this report are from the 20 deep-draft continuous DO monitoring stations of the
District's Continuous Dissolved Oxygen Monitoring (CDOM) Program. This report covers the
monitoring results for the period January 2006 through December 2006 for the deep-draft
waterways of the Chicago River System, Des Plaines River System, and Calumet River System.
1
MONITORING STATIONS
Locations and Descriptions
The CDOM Program and the Ambient Water Quality Monitoring
(AWQM)
Program
supply the District with water quality data throughout the year for both the wadeable and deep-
draft waterways within its jurisdiction
.
All stations for both programs are shown in Figure 1.
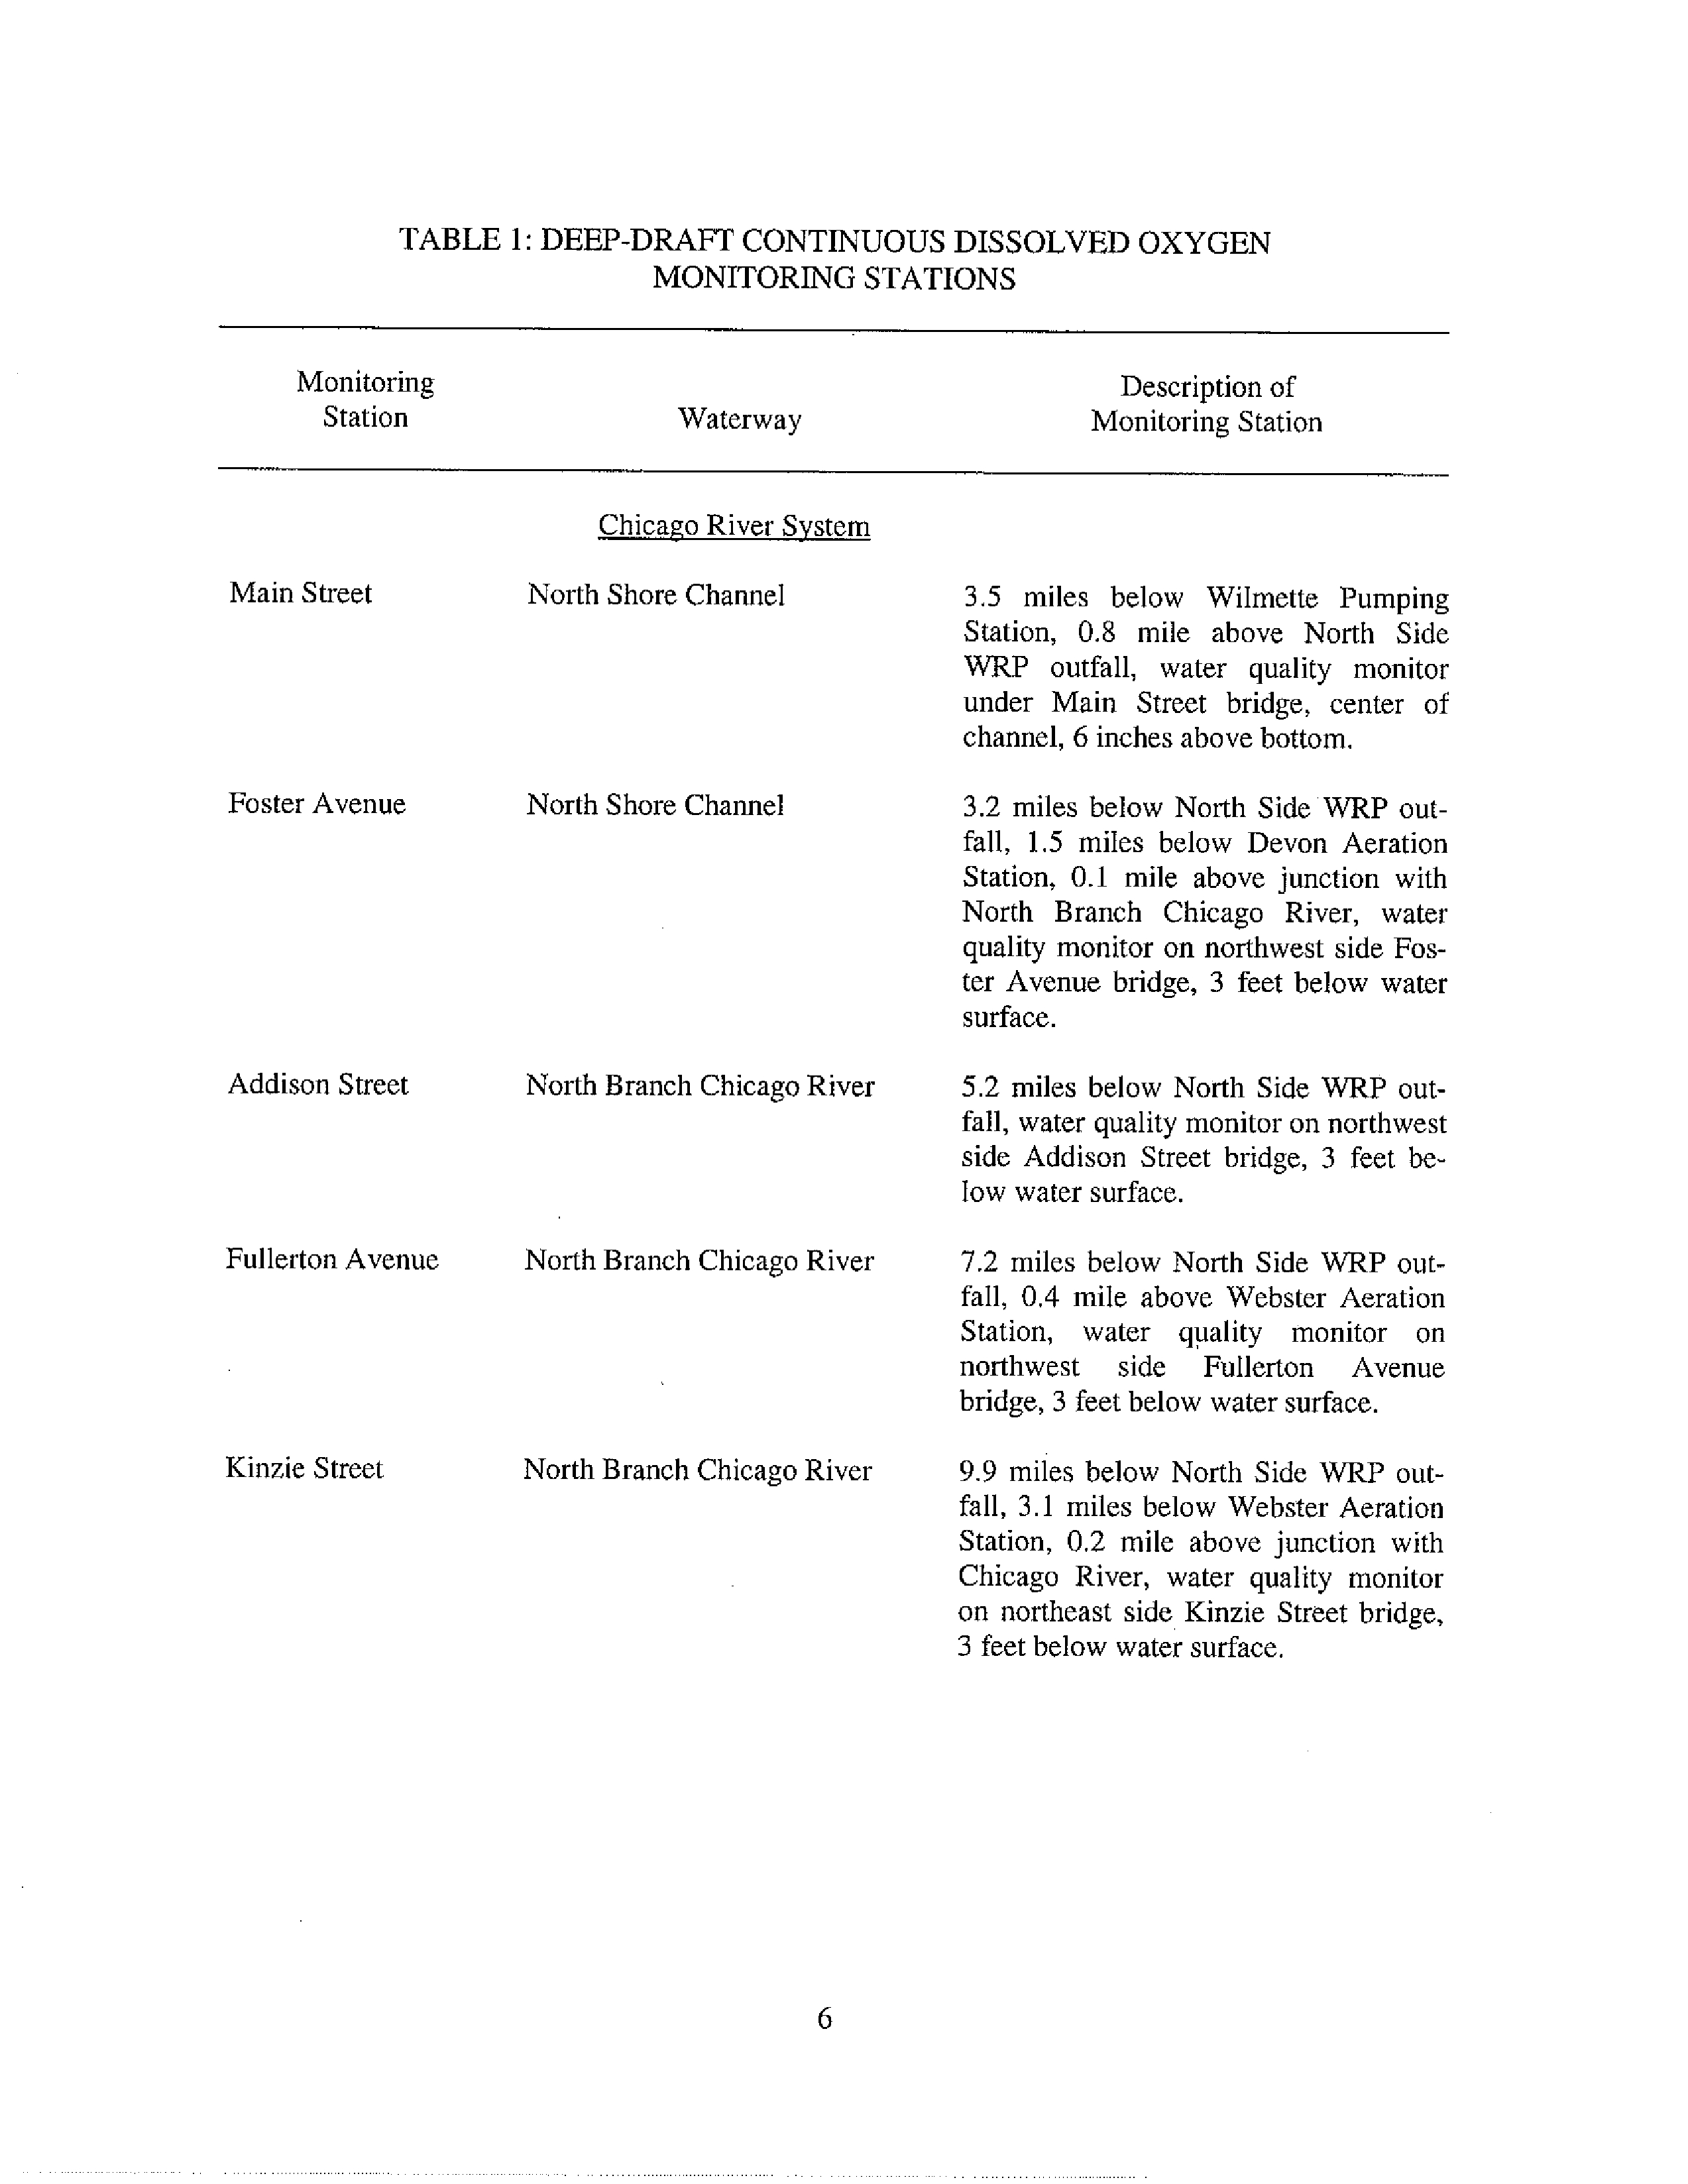
Descriptions of the locations for the deep-draft monitoring stations are listed in Table 1.
Designated Uses
The IPCB has assigned water uses for specific water bodies within the state of Illinois.
All waters in Illinois are designated for General Use, except those selected as Secondary Contact
and Indigenous Aquatic Life Waters (Secondary Contact)
In the Chicago and Calumet River Systems, General Use Waters include the North Shore
Channel from Lake Michigan to the North Side WRP, and the Chicago and Calumet Rivers.
Secondary Contact Waters include the North Shore Channel from the North Side WRP to
the North Branch of the Chicago River, the North Branch of the Chicago River from the North
Shore Channel to the Chicago River, the South Branch of the Chicago River, Bubbly Creek, the
Chicago Sanitary and Ship Canal, the Grand Calumet River, the deep-draft portion of the Little
Calumet River, the Calumet-Sag Channel, and the Des Plaines River from its confluence with the
Chicago Sanitary and Ship Canal to the Interstate Highway 55 bridge southwest of Joliet.
Water
Quality Standards
The IPCB has established water quality standards for DO in both General Use and Sec-
ondary Contact Waters. In General Use Waters, the DO shall not be less than 6.0 mg/L during 16
hours of any 24-hour period, nor less than 5.0 mg/L at any time. In Secondary Contact Waters,
the DO shall not be less than 4.0 mg/L at any time, except in the Calumet-Sag Channel where the
DO shall not be less than 3.0 mg/L at any time. For this report, we have selected the 5.0 mg/L
DO standard when calculating percent compliance for General Use Waters.
2
MATERIALS AND METHODS
Water Quality Monitor
The continuous water quality monitors (monitor) used to collect this data were manufac-
tured by YSI Incorporated (YSI) of Yellow Springs, Ohio. DO was measured hourly using the
YSI Model 6920 or Model 6600 monitor. In order to protect and safeguard the monitors from
marine navigation and vandalism, the monitors were deployed in the field in stainless steel pipes.
Two different installation designs were employed: (1) a 3-foot stainless steel pipe was positioned
on the bottom of the waterway and oriented downstream such that the water passed through the
pipe, and (2) a fixed length of pipe, with multiple 2-inch circular openings, was vertically
mounted on the side of a bridge abutment.
Servicing the monitors followed a weekly schedule. Industrial Waste Division personnel
retrieved each monitor from the field following seven days of continuous monitoring. Prior to
retrieval, a water sample for DO analysis was collected next to the protective housing. An addi-
tional
monitor, that had been previously calibrated and serviced in the laboratory, was then de-
ployed to replace the retrieved monitor. The retrieved monitors were returned to the laboratory
for data downloading, exterior cleaning, servicing, and calibration of the DO sensors. The moni-
tors
were temporarily stored in holding tanks containing tap water for subsequent deployment
during the following week.
Data Management and Review
Hourly DO data were directly exported electronically from individual monitors to a spe-
cially designed Accesso database for data processing and storage. Following data downloading,
the weekly DO data were carefully reviewed for accuracy.
The review
process included the following:
1.
Comparing a grab sample DO concentration measured in the field with a DO
concentration recorded by a retrieved monitor (DO rejection criteria = differ-
ence greater than 2.0 mg/L).
2.
Comparing the last hourly DO concentration measured by a retrieved monitor
with the first hourly DO concentration recorded by a deployed monitor (DO
rejection criteria = difference greater than 2.0 mg/L).
3.
Comparing a DO concentration measured in a laboratory holding tank and a
DO concentration recorded by a retrieved monitor (DO rejection criteria = dif-
ference greater than 1.0 mg/ L).
Criterion 3 would entail rejection of all hourly readings; criteria 1 and 2 may or may not
reject all readings.
3
After careful review of the DO data, weekly summary statistics (mean, minimum, maxi-
mum, and percent observations above DO standard) and individual line drawings for each moni-
toring station showing hourly DO concentrations were prepared.
Verification
of Representative Data
During the spring, summer, and fall of 2006, cross-sectional DO surveys were conducted
in the CWS to determine if a fixed continuous monitoring location represented the DO concentra-
tion across the waterway. Verification was achieved by comparing the DO concentrations meas-
ured in grab samples at multiple fixed locations and depths across the waterway with the fixed
monitor measurements. The results from the cross-sectional surveys clearly showed that the dif-
ferences across the waterway were minimal and equivalent to the DO concentration measured by
the monitor at the fixed locations.
4
RESULTS
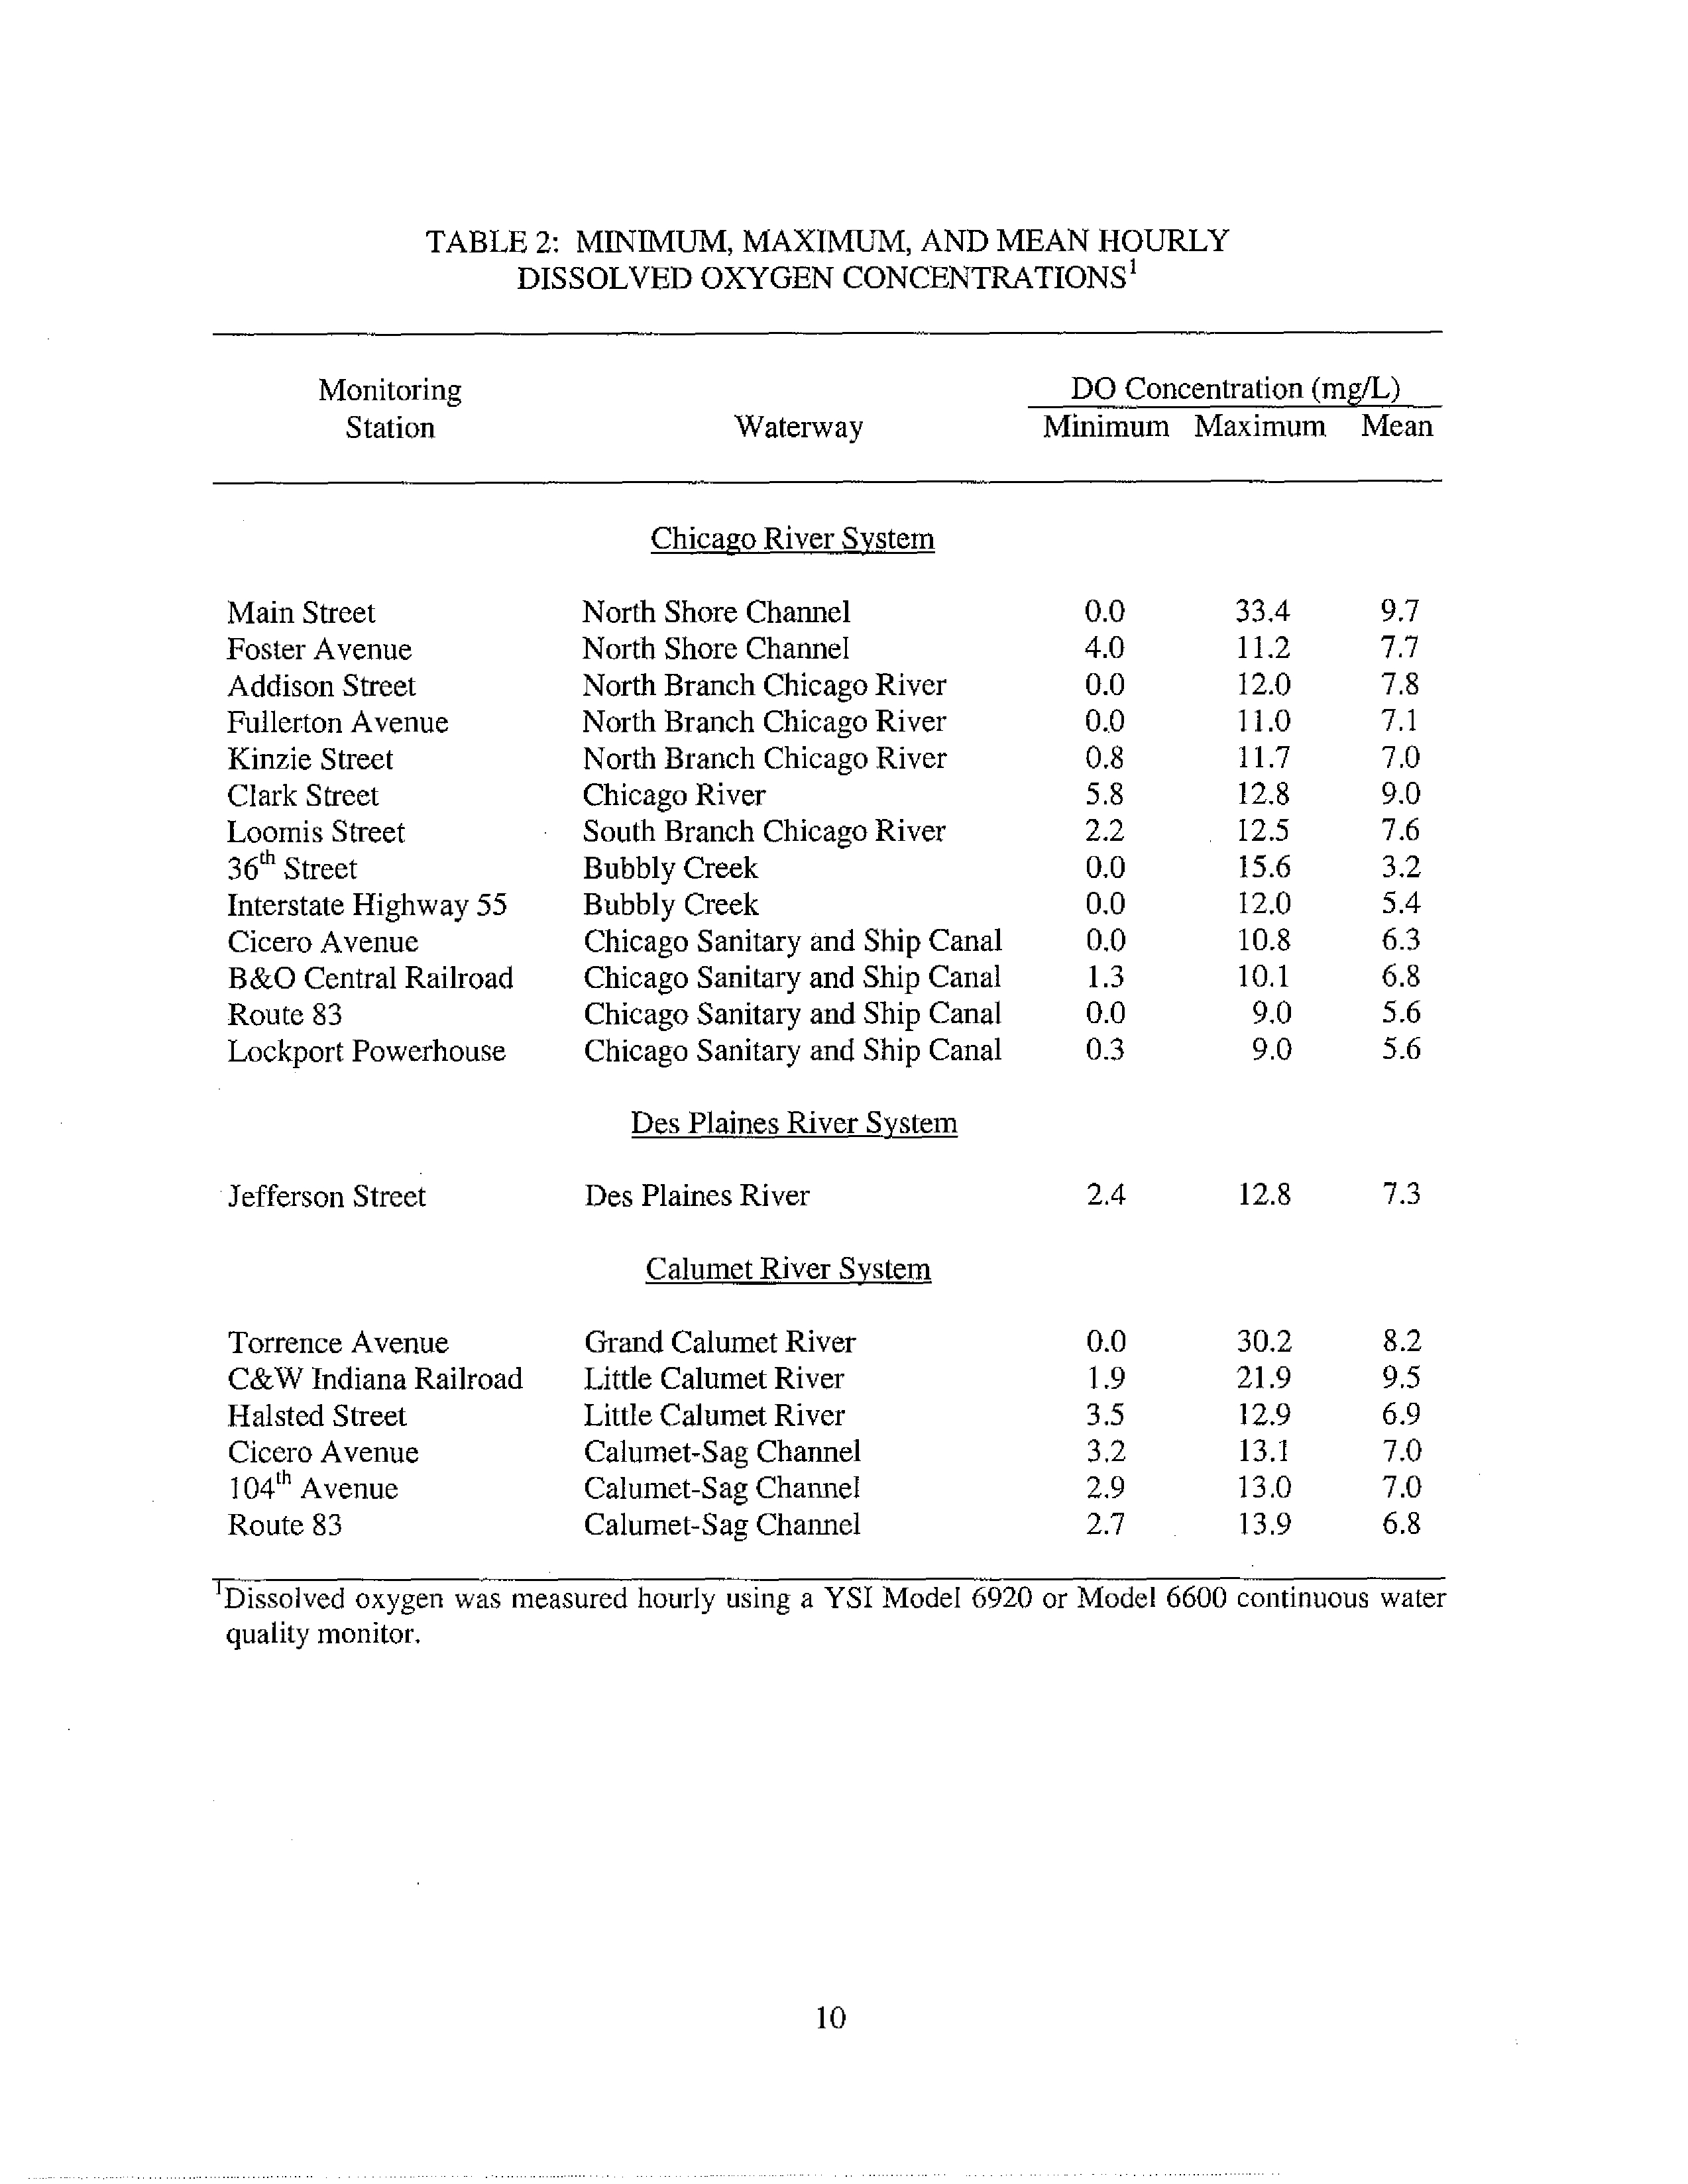
The annual minimum
,
maximum
,
and mean DO concentrations measured at all 20 sta-
tions during 2006 are shown in Table 2.
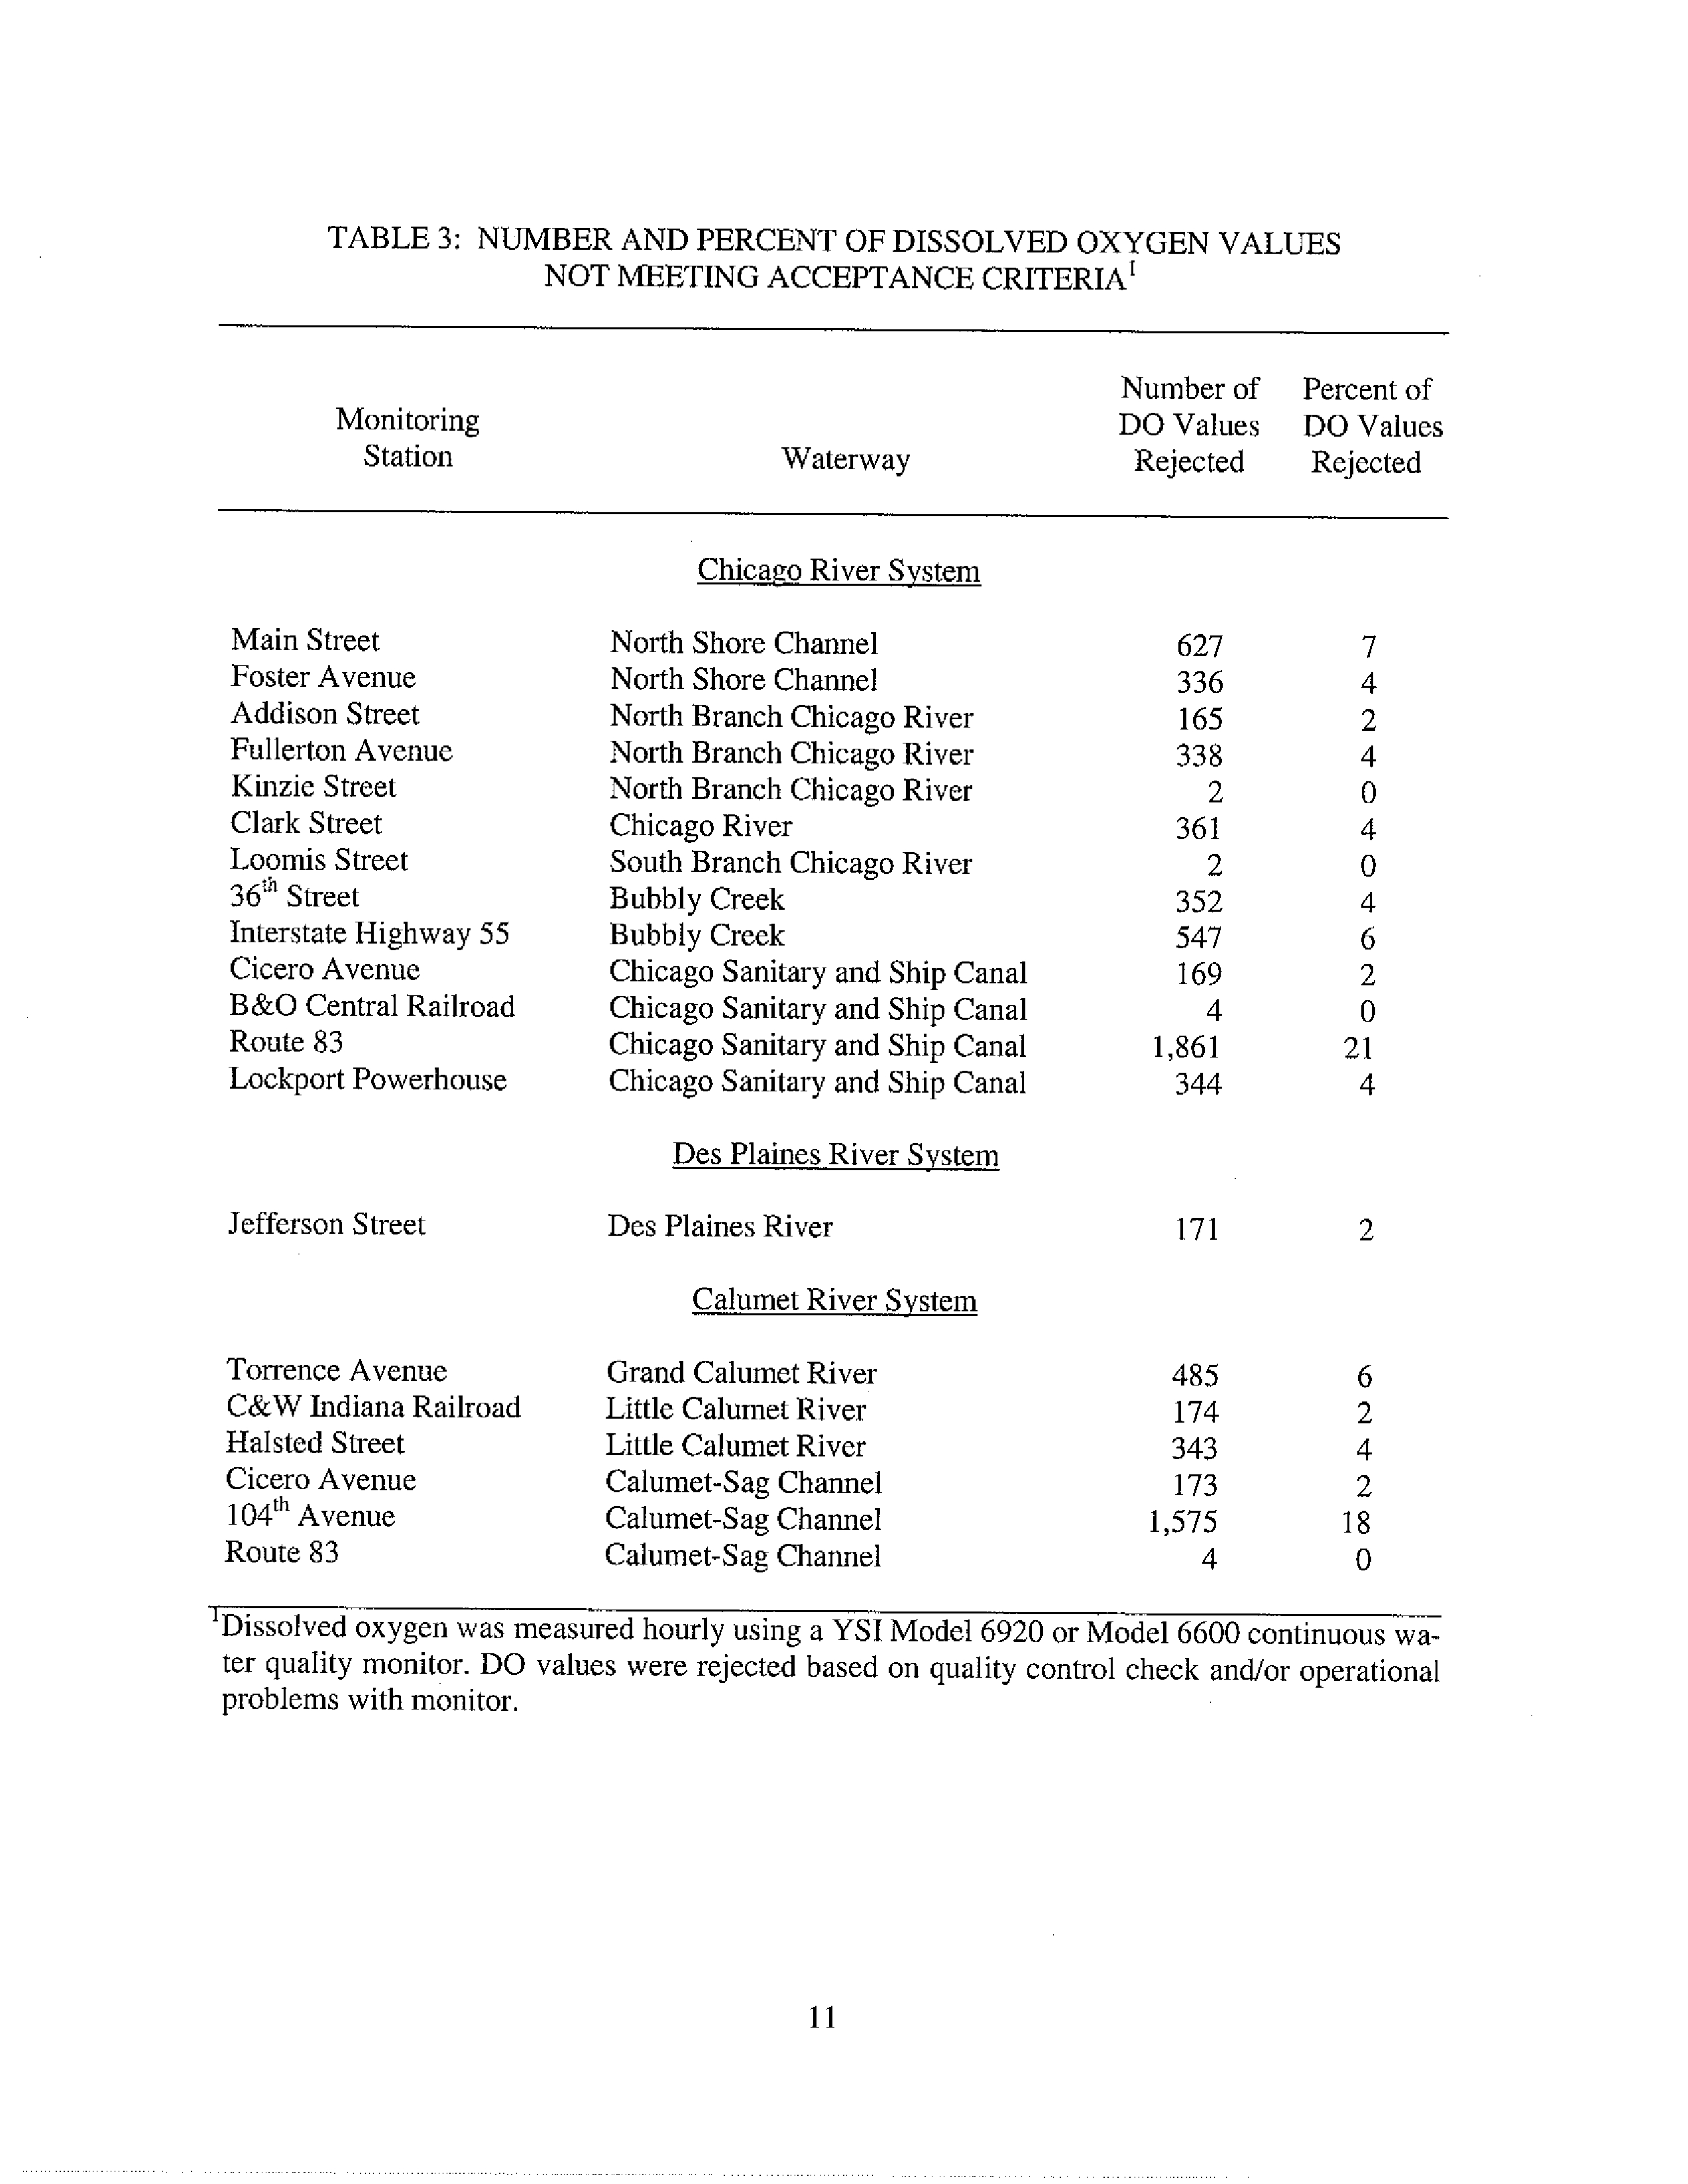
The number and percent of measured DO concentrations rejected and removed from the
Access° database following review during 2006 are summarized in Table 3.
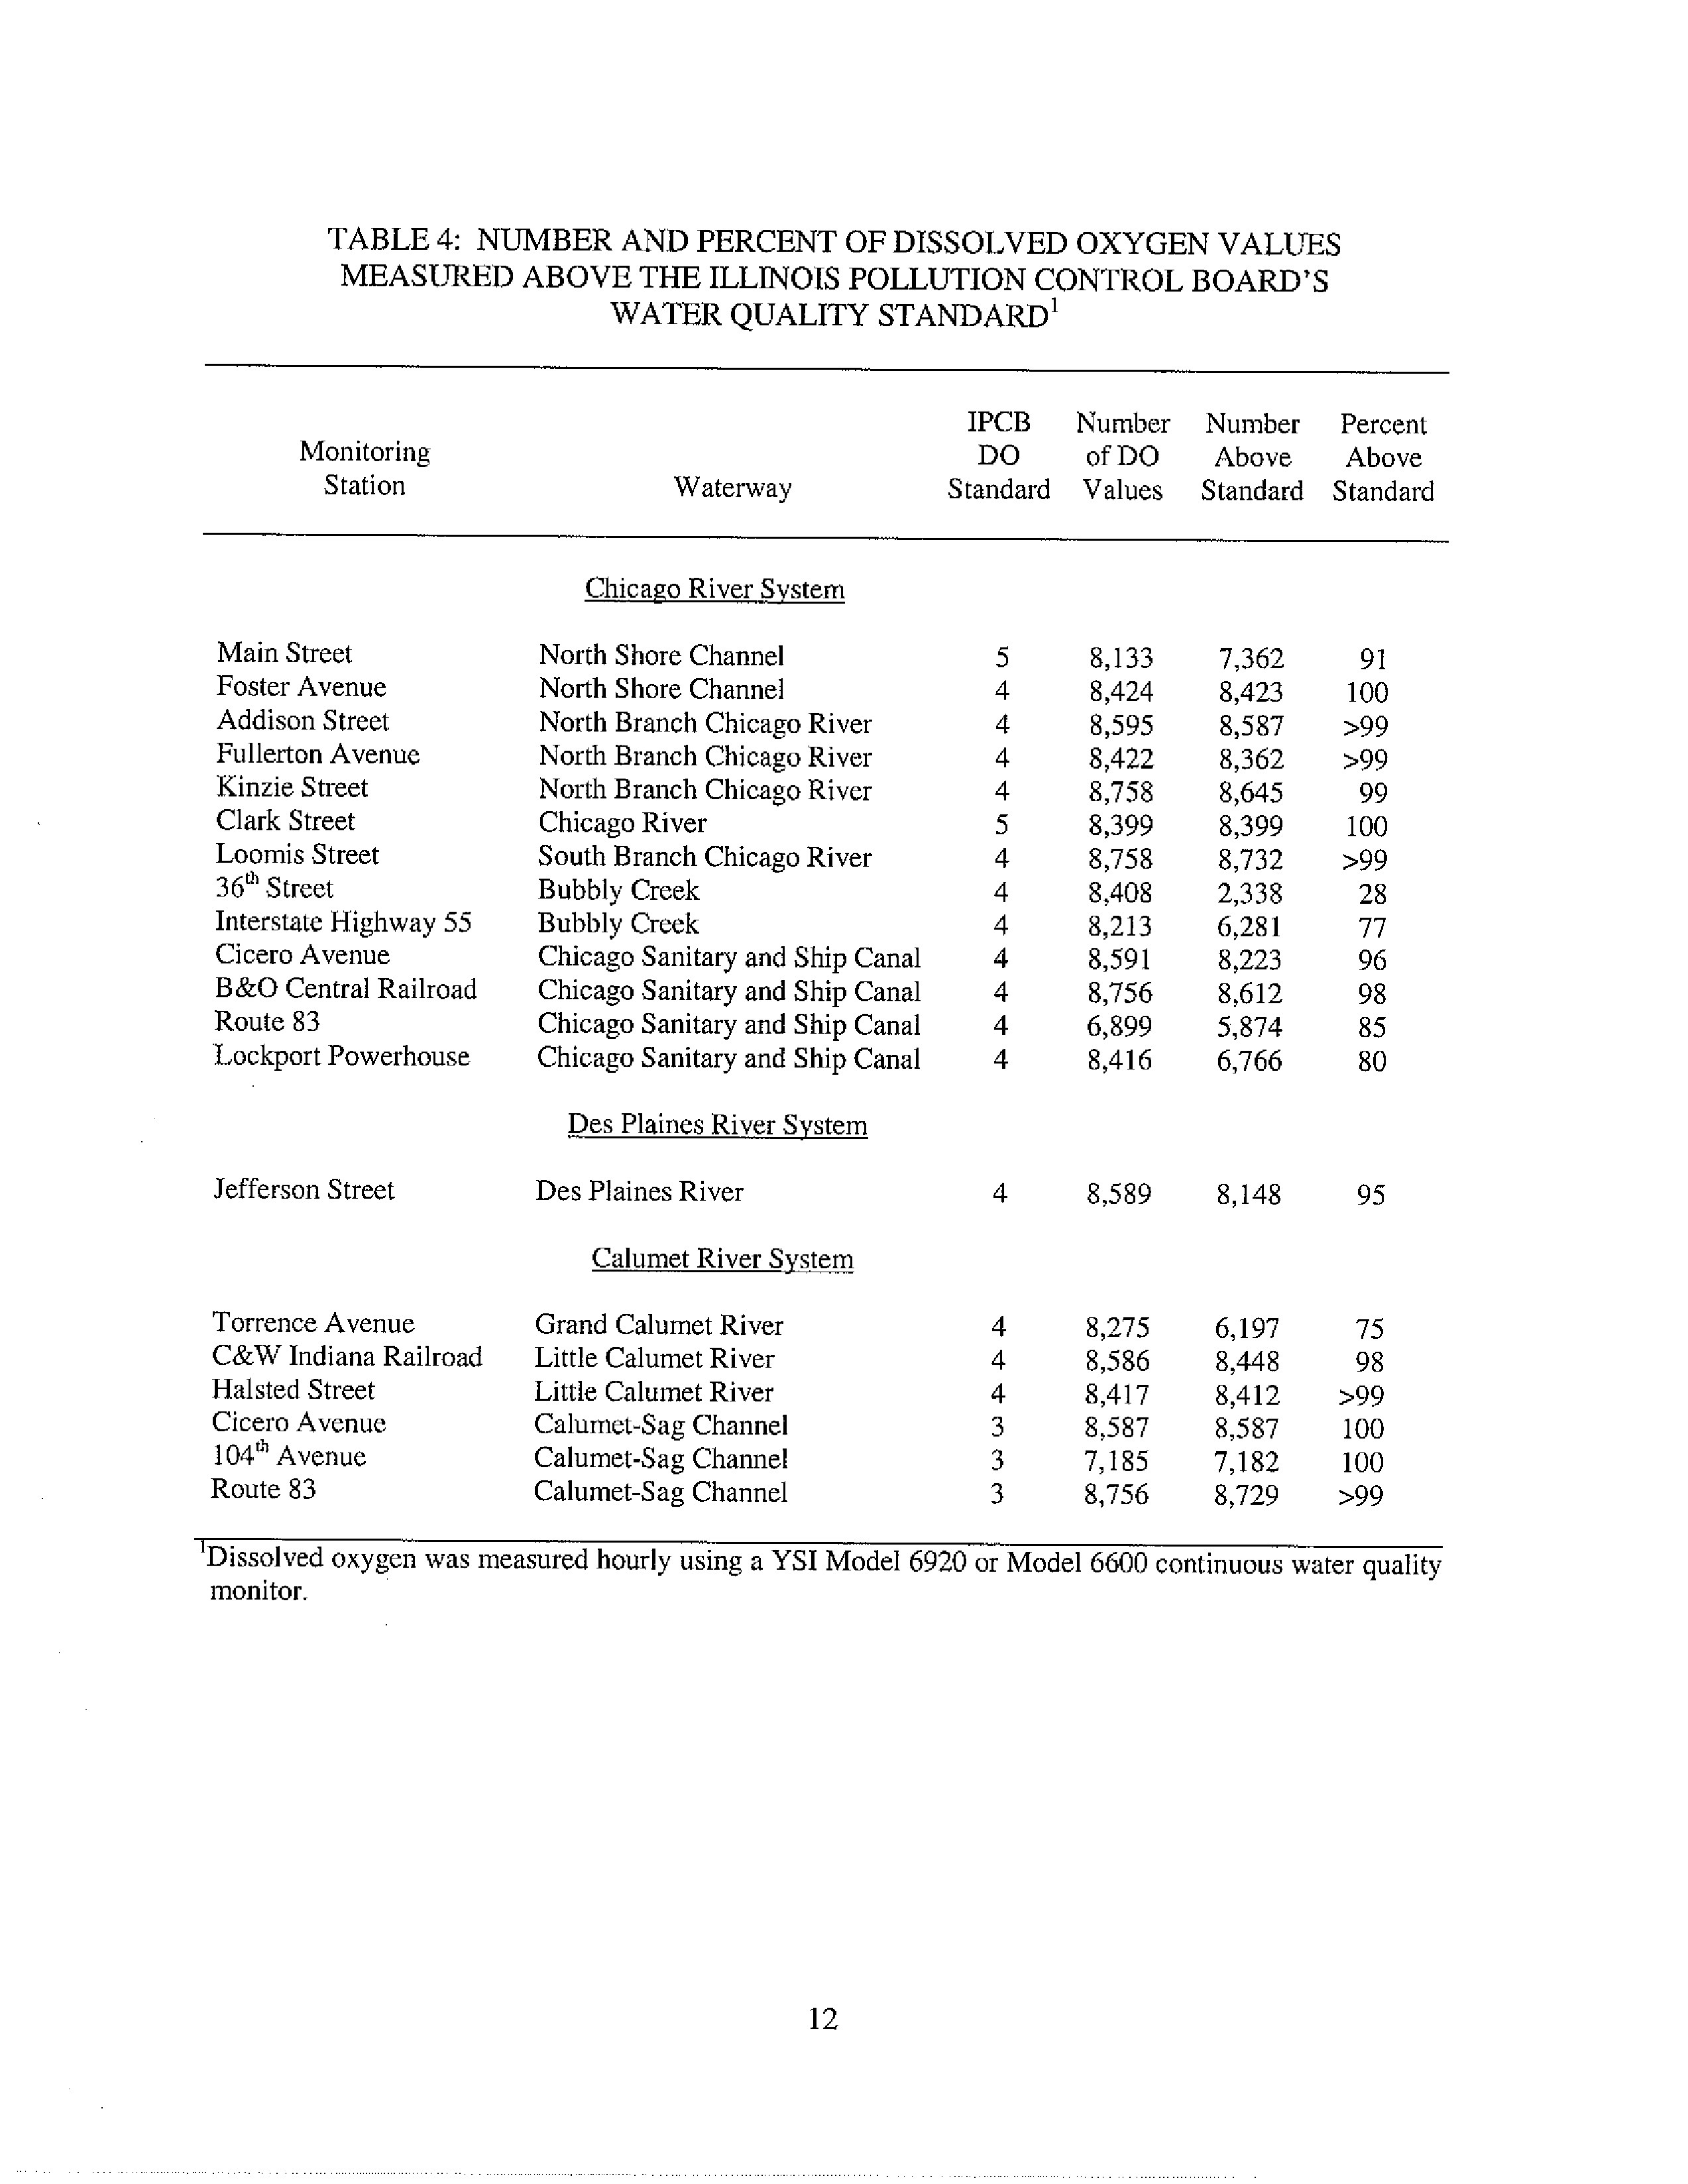
The number and percent of DO concentrations above the applicable 1PCB DO standard
for each waterway during 2006 are presented in Table 4. The DO data shown in Table 4 do not
include the DO concentrations rejected during the data review.
Table 5 shows the percent distribution
of DO
concentrations from <1.0 mg/L to >5.0
mg/L
at the 20 monitoring stations during 2006. The current national one-day minimum DO cri-
terion for adult life stages of fish is 3.0
mg/L (
Chapman, 1986).
Individual line drawings showing hourly DO concentrations at each monitoring station
are indicated in Fi
g
ures 2 through 21.
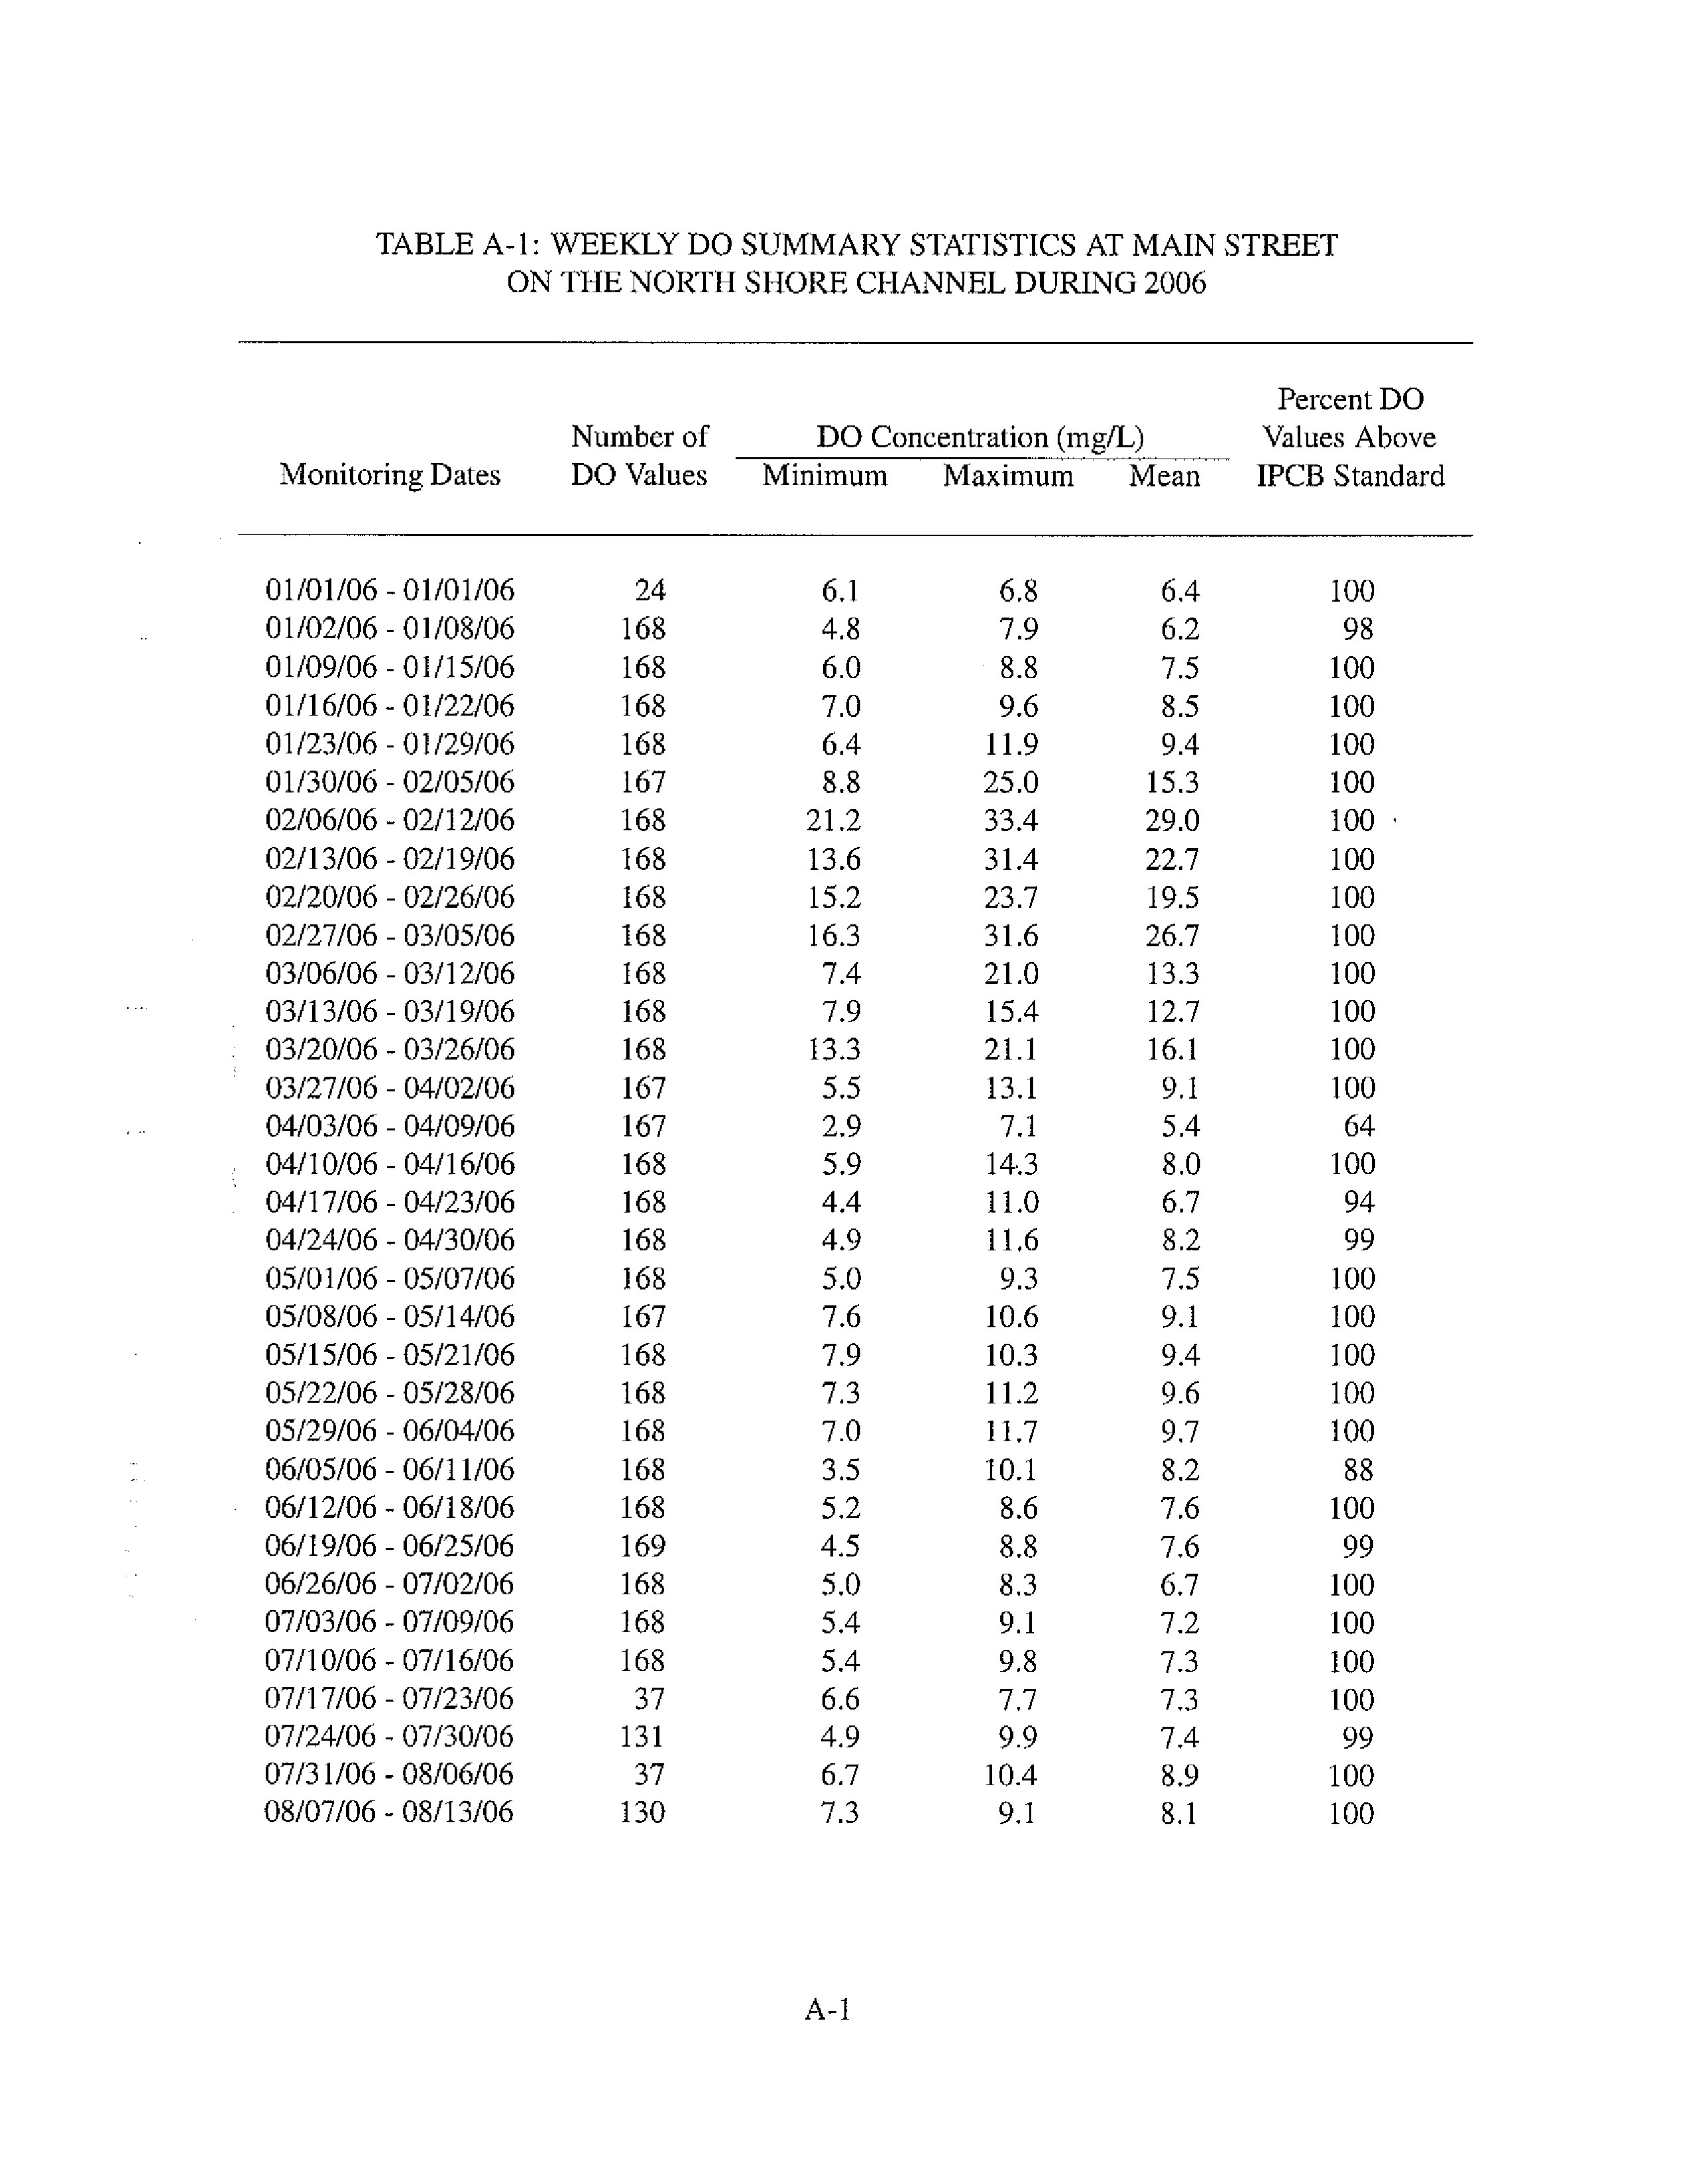
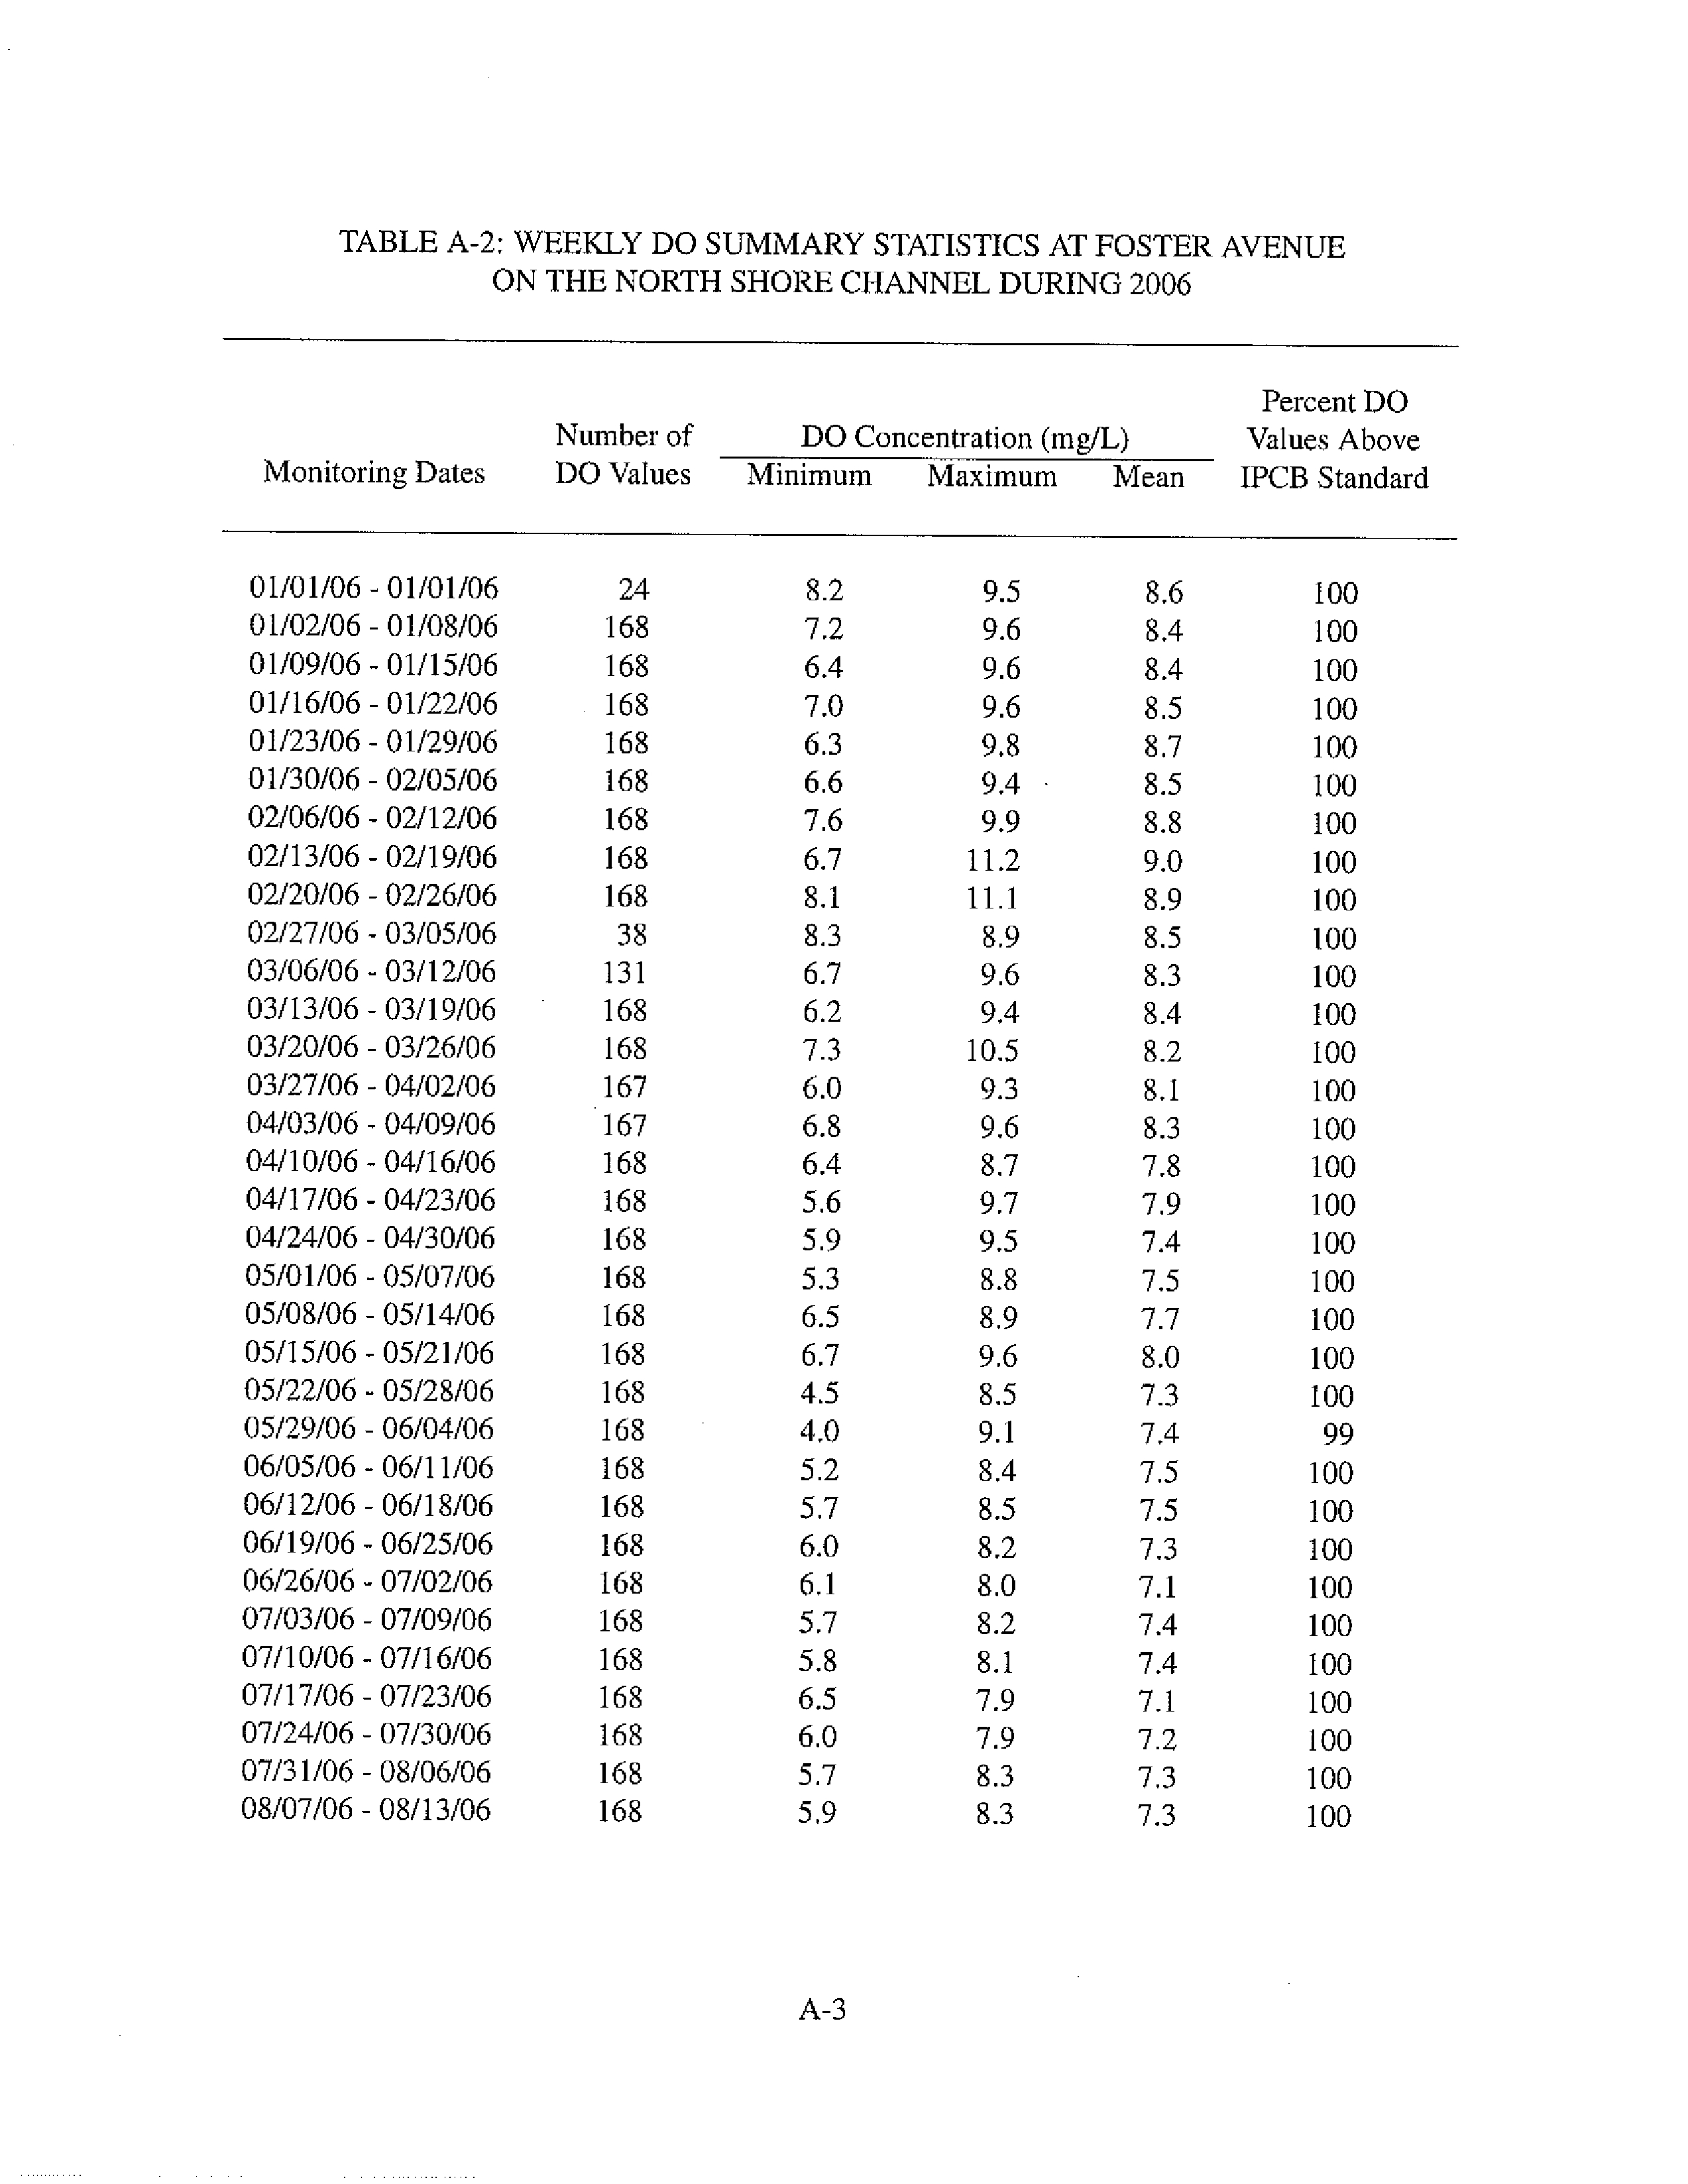
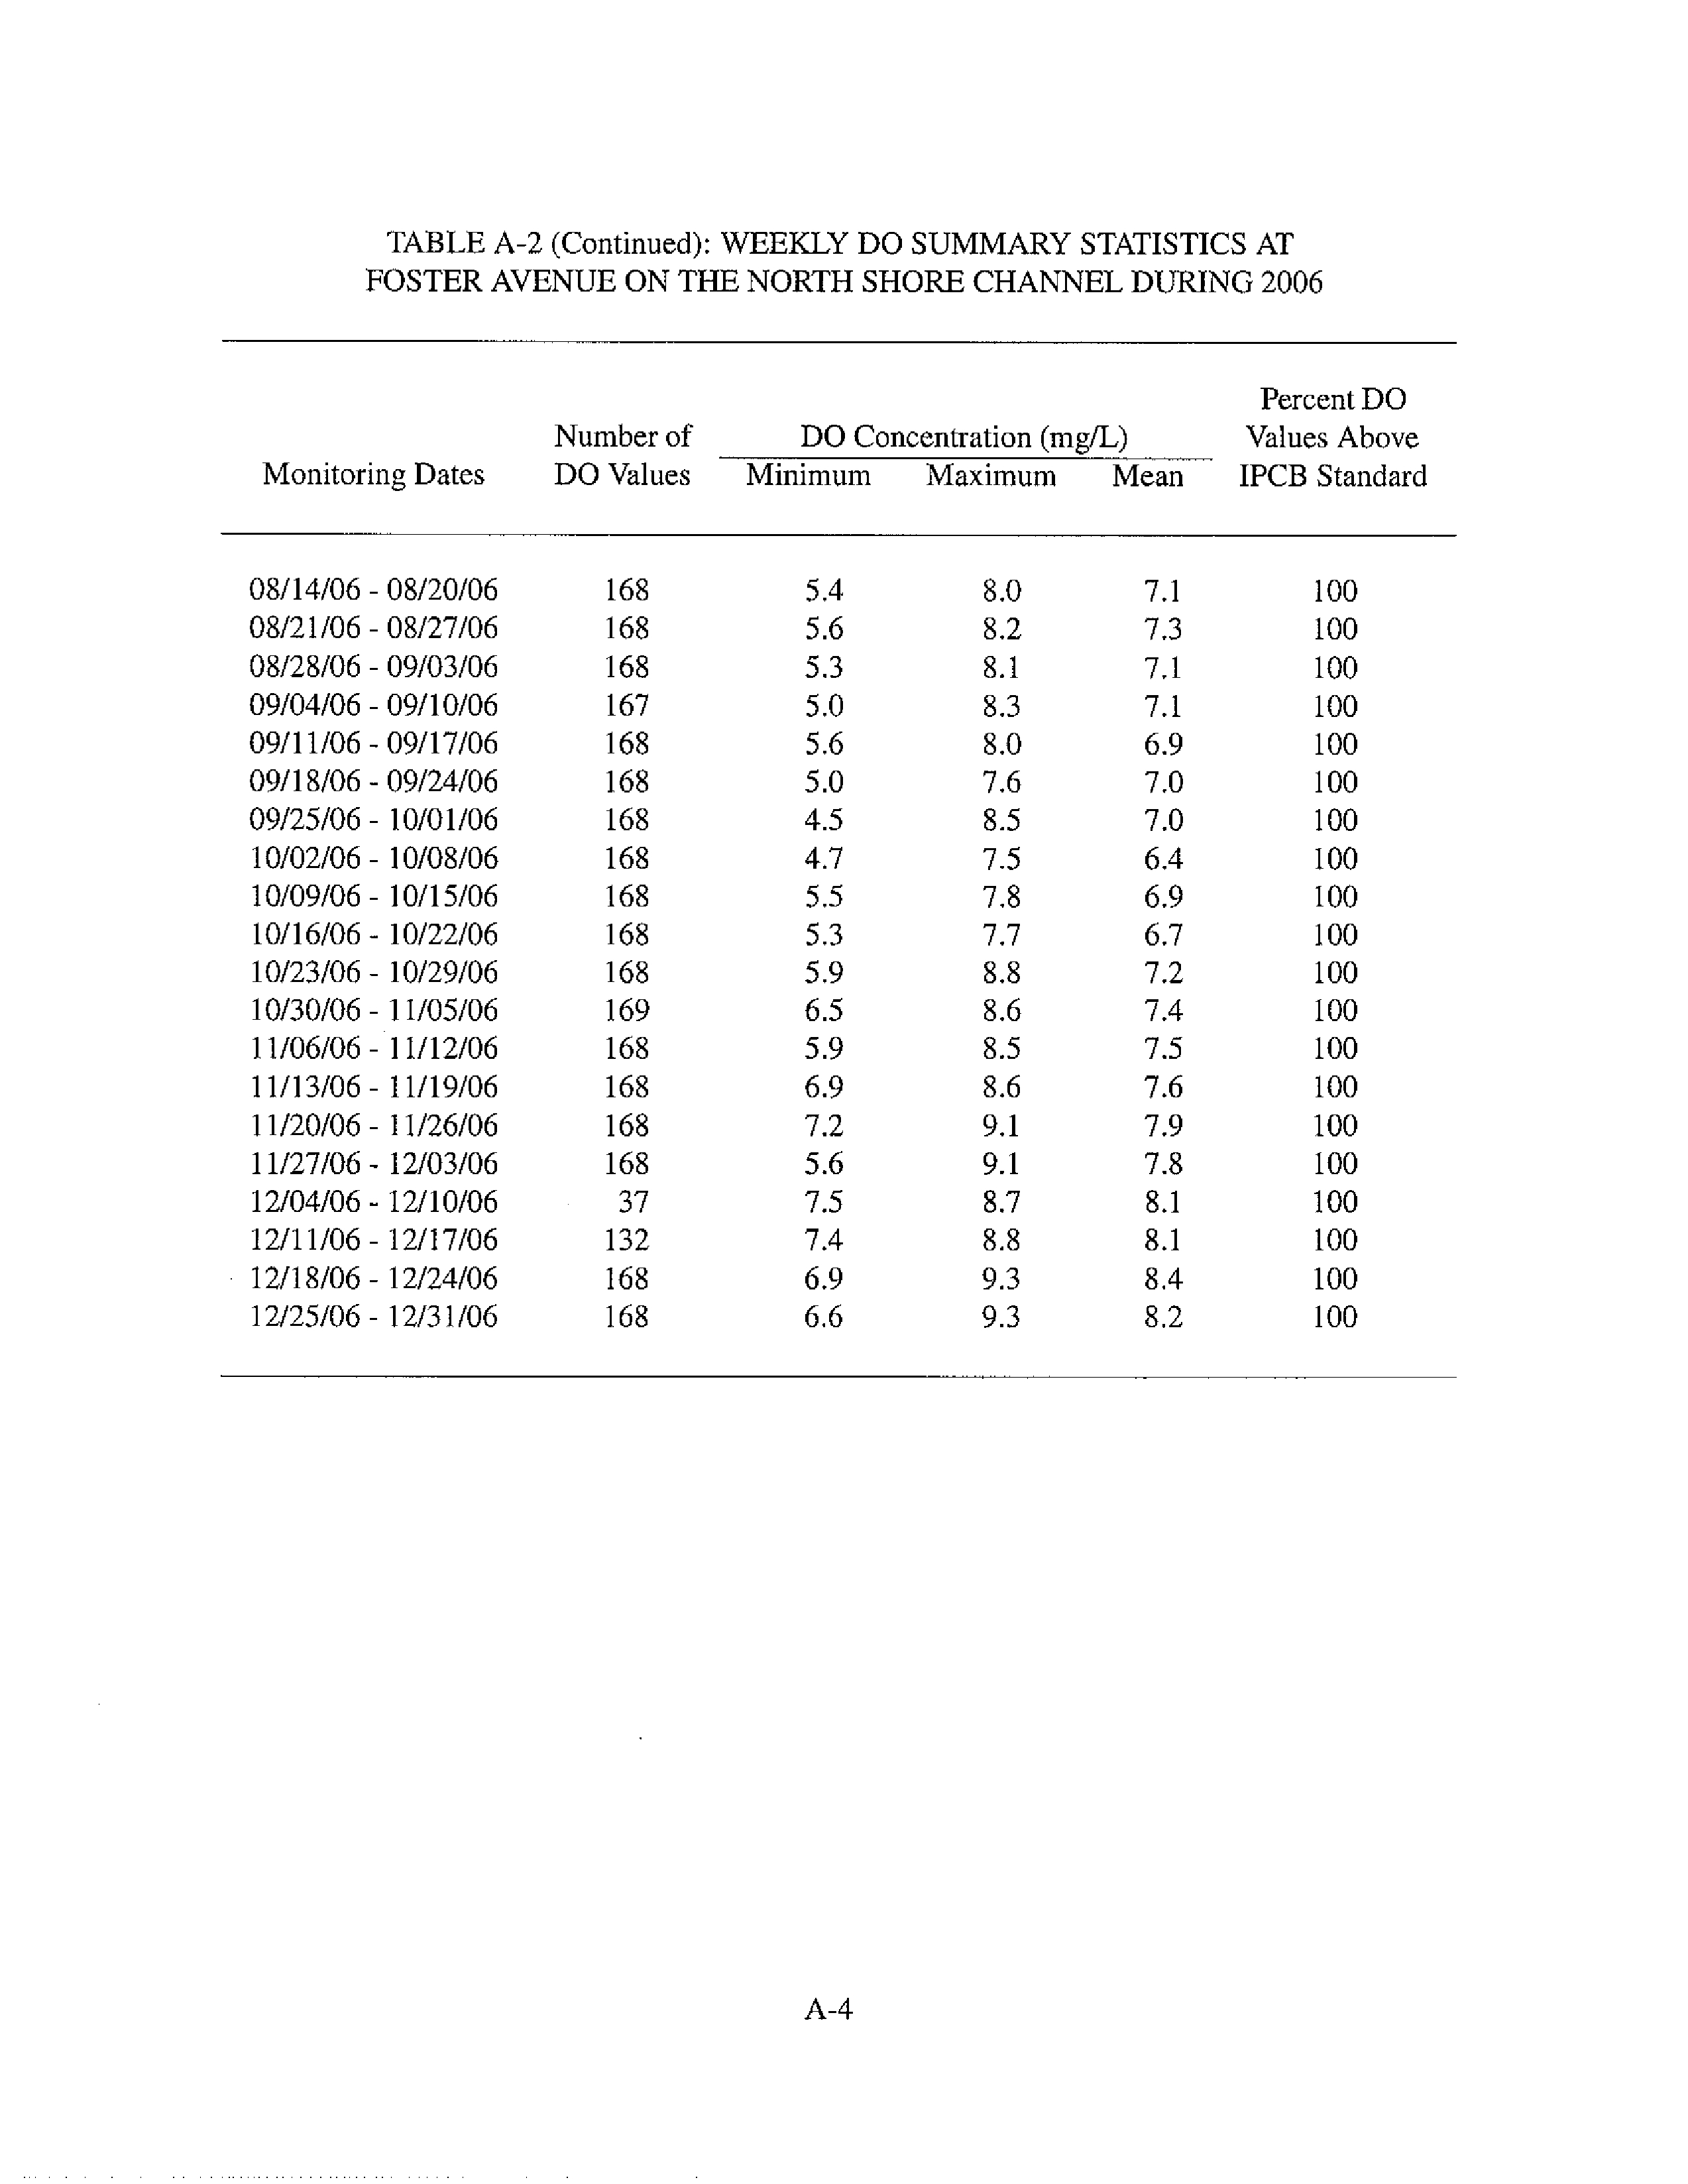
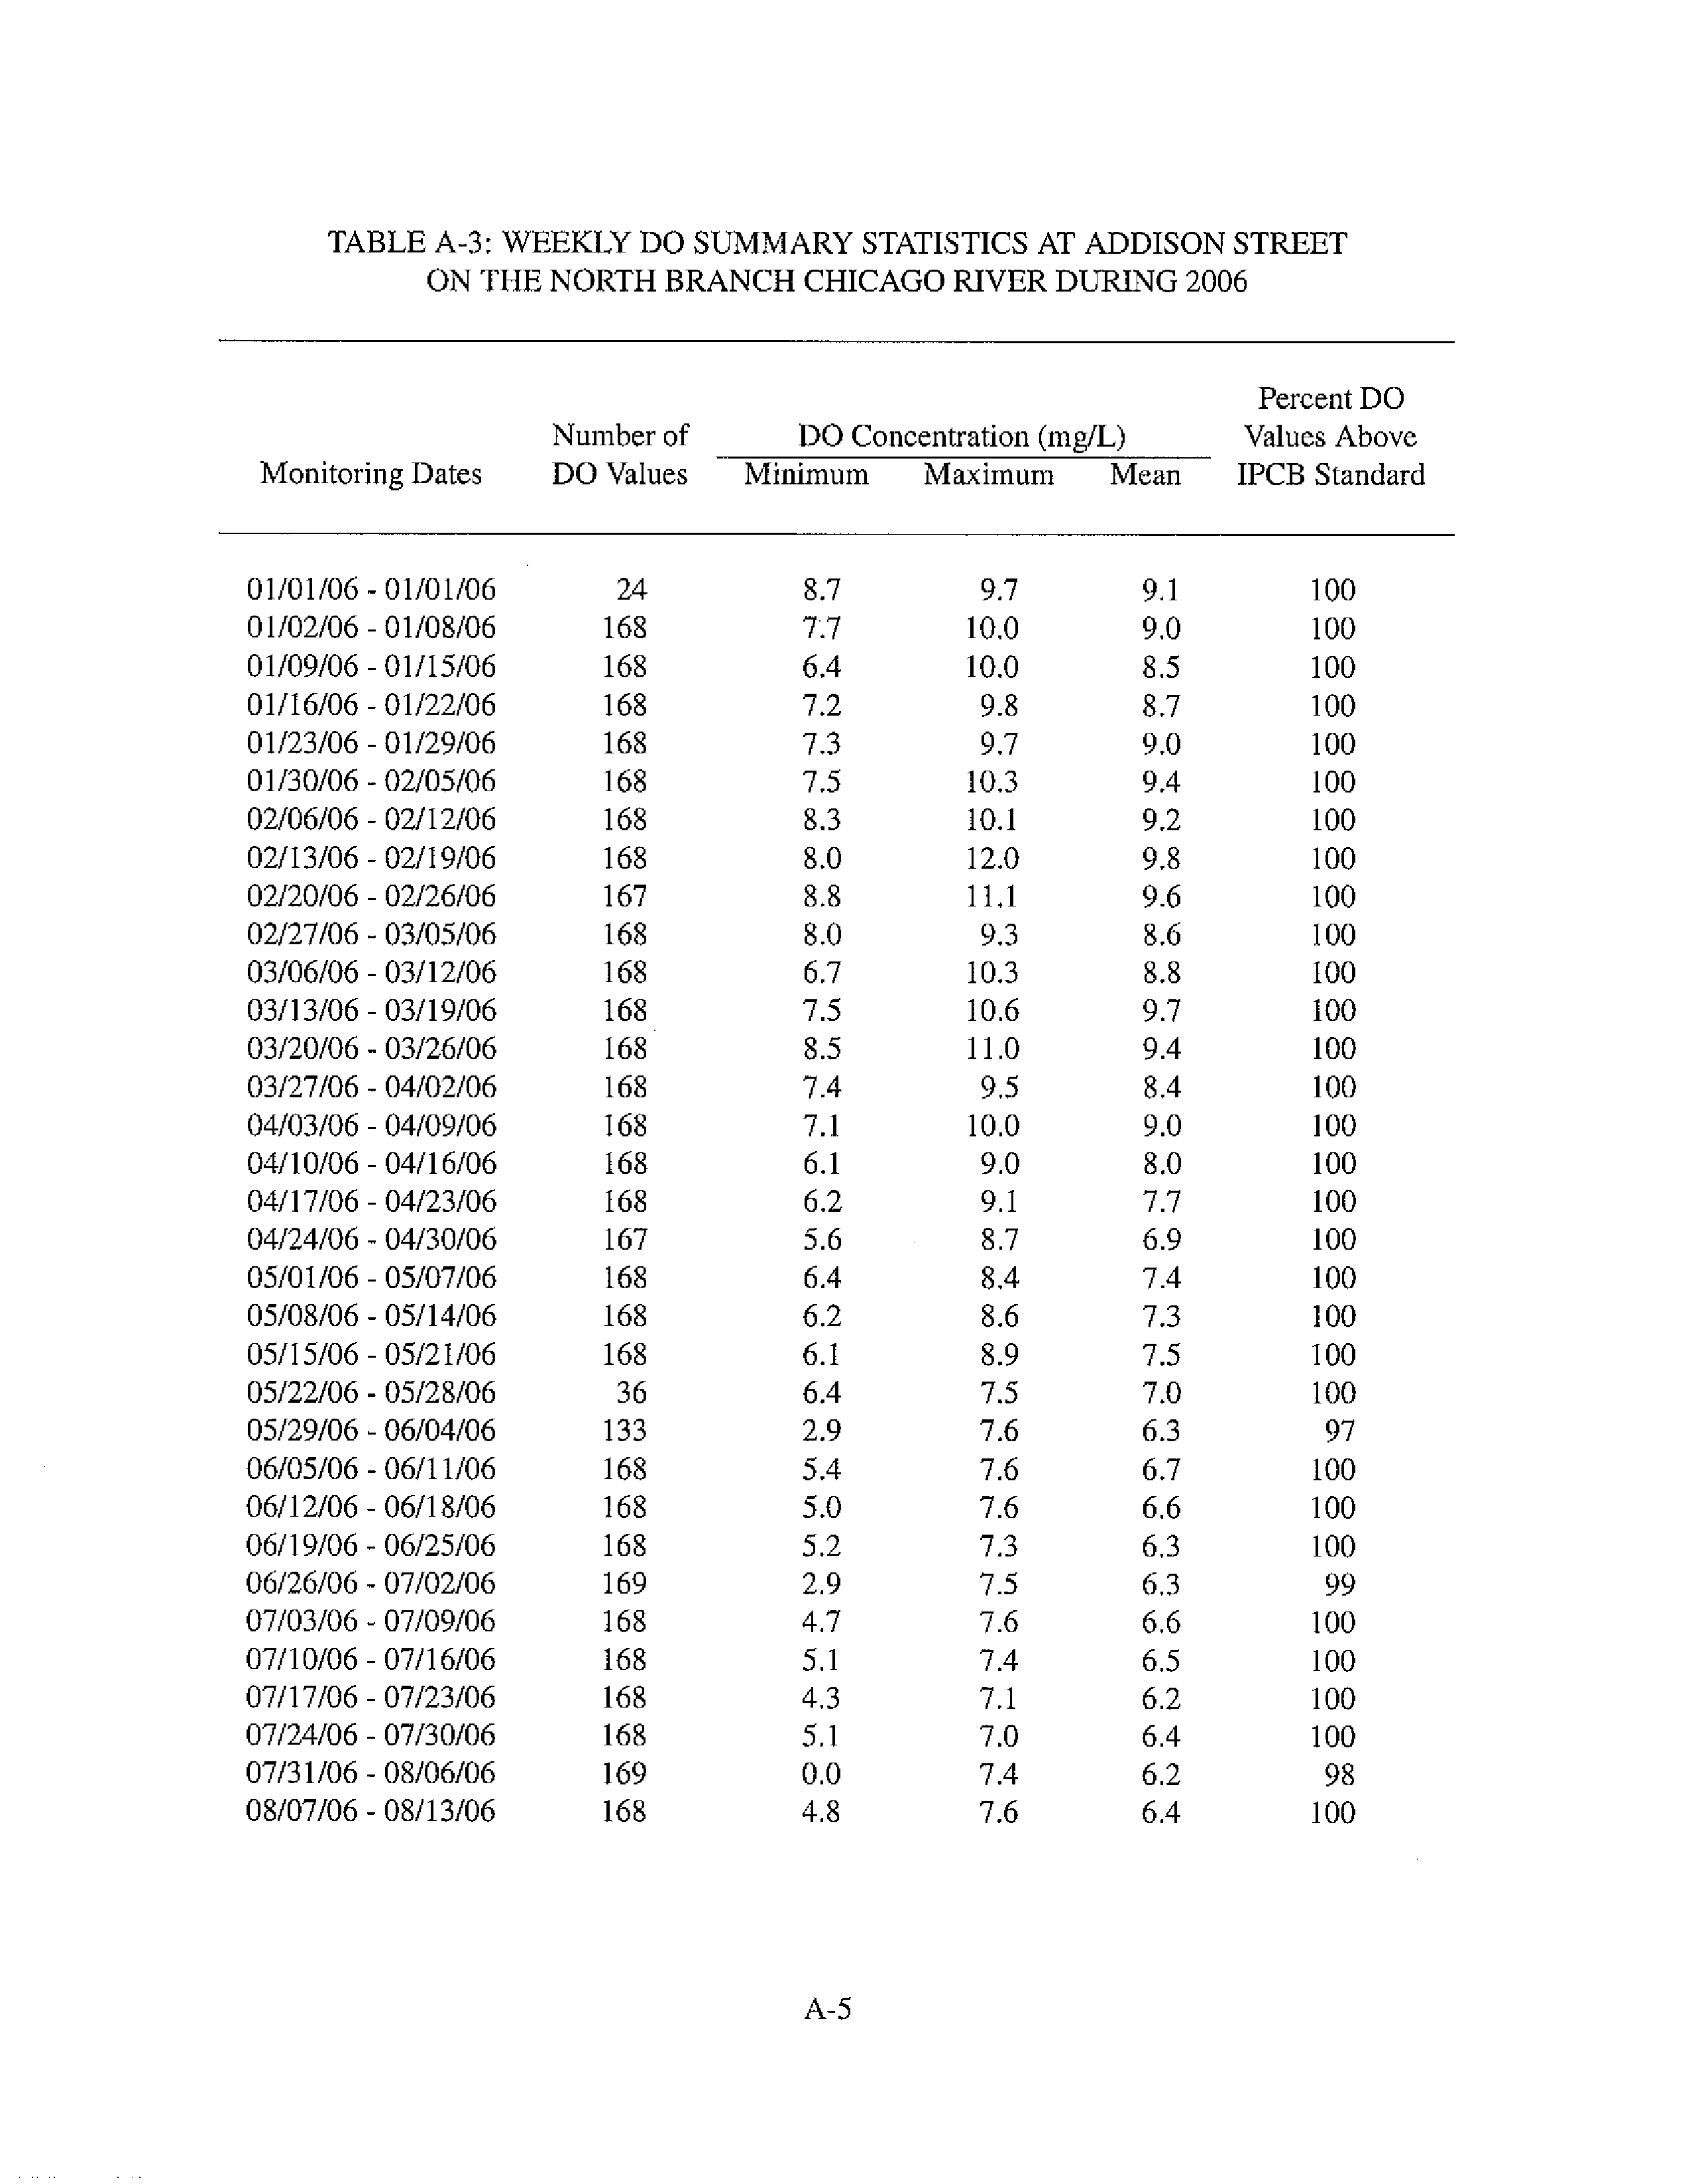
Weekly
DO summary statistics during 2006 are presented for each monitoring station in
Appendix A, Tables A-1, through A-20.
DO Fluctuations
DO concentrations fluctuate seasonally and daily in the aquatic environment
.
Cold water
holds more DO than warm water, a trend that can typically be seen in annual DO graphs where
the colder months have higher mean DO concentrations than the warmer months. Daily fluctua-
tions in DO can be caused by photosynthesis during daylight hours causing a surplus of DO, and,
conversely
,
respiration by aquatic plants and algae during the night
,
resulting in a deficiency of
DO. Other deficiencies of DO can occur when oxygen demanding materials are introduced into
a waterway or by thermal discharges. Oxygen demanding materials enter the CWS most often
through wastewater treatment effluents
,
stormwater run-off, and CSOs.
Wastewater treatment
effluents and CSOs contain organic materials that are decomposed by microorganisms which
consume DO in the process
.
Stormwater run-off also can flush organic materials into the water-
way either directly from the land adjacent to the CWS, or indirectly through the combined sewer
system.
This is most evident during heavy rain storms that result in CSO events containing un-
treated waste and stormwater
.
The District Web site
(
mwrd.org) has information regarding CSO
events which can be found in the Public Interest Section under the titles
"
CSO Event Synopsis
Report" and
"
Combined Sewer Overflow
."
Most low DO excursions reported for the deep-draft
sections of the CWS in this report are associated with the occurrence of a CSO event during
2006.
5
TABLE 1: DEEP-DRAFT CONTINUOUS DISSOLVED OXYGEN
MONITORING STATIONS
Monitoring
Description of
Station
Waterway
Chicago River System
Monitoring Station
Main Street
North Shore Channel
3.5
miles below
Wilmette Pumping
Station,
0.8
mile above North Side
WRP outfall, water quality monitor
under
Main Street bridge, center of
channel, b inches above bottom.
Foster Avenue
North Shore Channel
3.2 miles below North Side WRP out-
fall, 1.5
miles below Devon Aeration
Station, 0.1
mile above junction with
North Branch Chicago River, water
quality monitor on northwest side Fos-
ter
Avenue bridge, 3 feet below water
surface.
Addison Street
North Branch Chicago River
Fullerton Avenue
North Branch Chicago River
Kinzie Street
North Branch Chicago River
5.2 miles below North Side WRP out-
fall,
water quality monitor on northwest
side Addison Street bridge, 3 feet be-
low water surface.
7.2 miles below North Side WRP out-
fall, 0.4
mile above Webster Aeration
Station,
water
quality
monitor
on
northwest
side
Fullerton
Avenue
bridge, 3 feet below water surface.
9.9 miles below North Side WRP out-
fall, 3.1
miles below Webster Aeration
Station, 0.2 mile above junction with
Chicago River, water quality monitor
on northeast side Kinzie Street bridge,
3 feet below water surface.
6
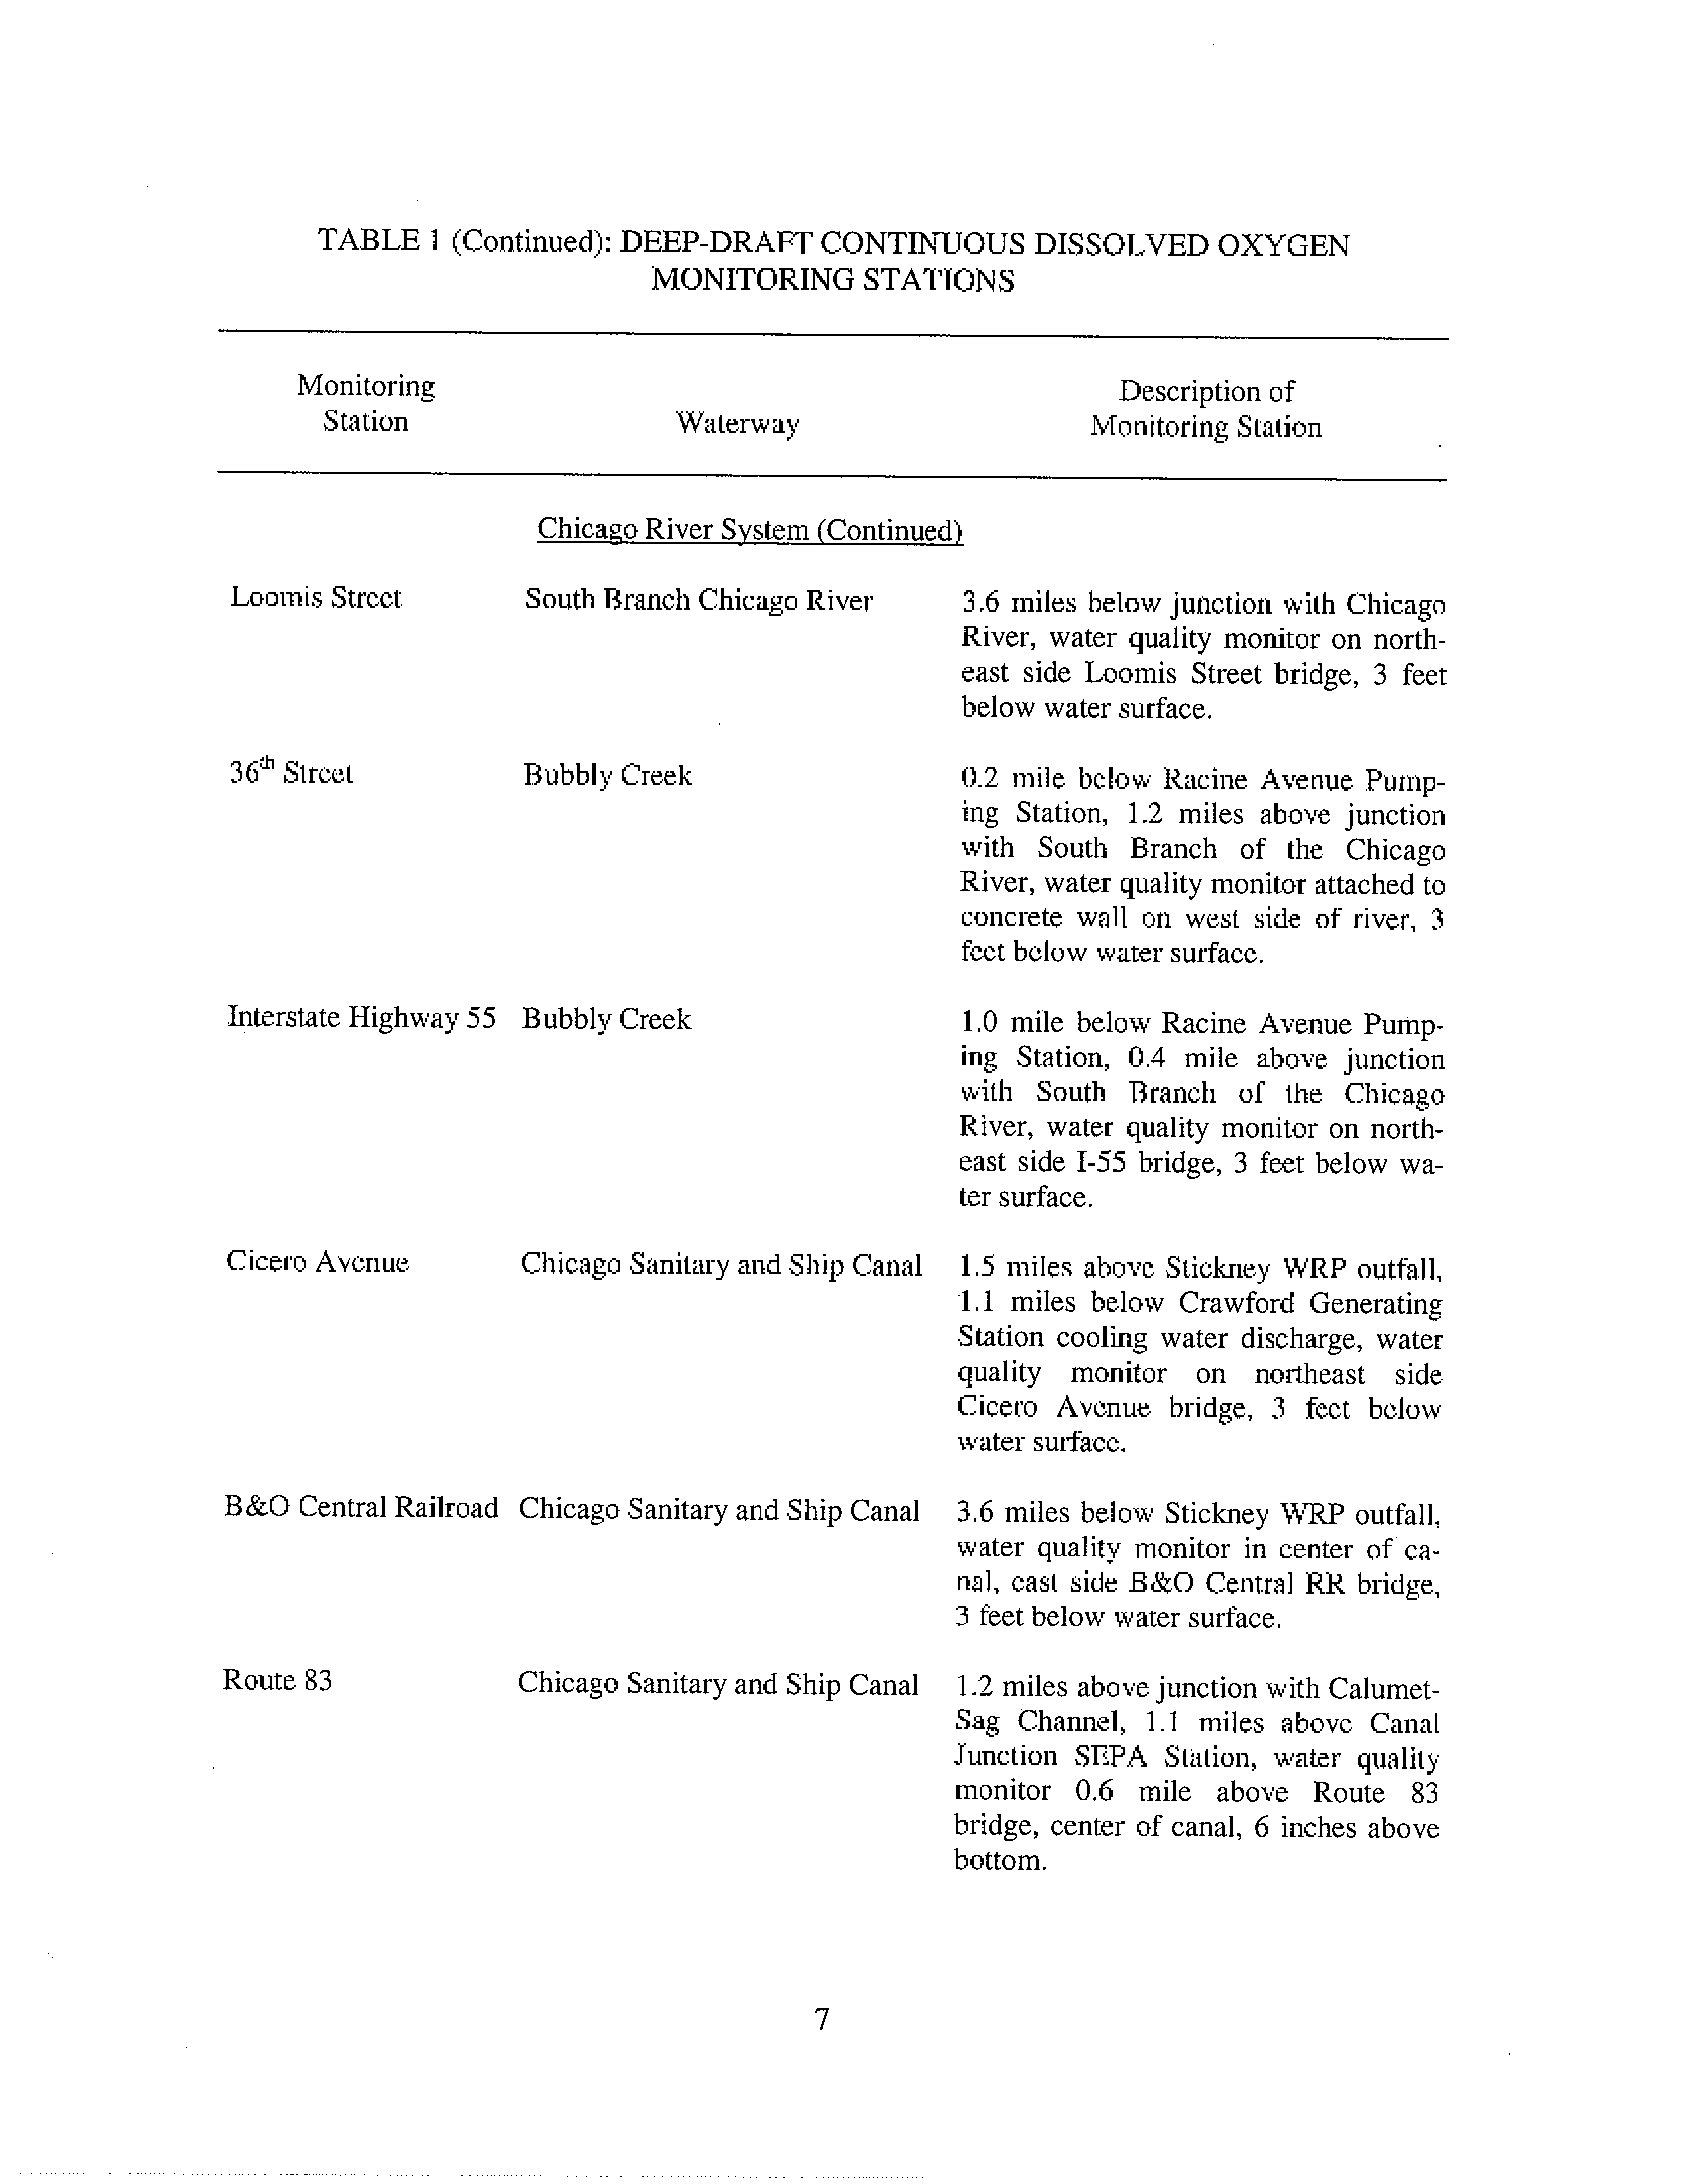
TABLE 1 (Continued): DEEP-DRAFT CONTINUOUS DISSOLVED OXYGEN
MONITORING STATIONS
Monitoring
Description of
Station
Waterway
Chicago River System (Continued)
Monitoring Station
Loomis Street
South Branch Chicago River
3.6 miles below junction with Chicago
River, water quality monitor on north-
east side Loomis Street bridge, 3 feet
below water surface.
36'' Street
Bubbly Creek
0.2
mile below Racine Avenue Pump-
ing Station, 1.2 miles above junction
with South Branch of the Chicago
River, water quality monitor attached to
concrete wall on west side of river, 3
feet below water surface.
Interstate Highway 55
Bubbly Creek
1.0
mile below Racine Avenue Pump-
ing Station, 0.4 mile above junction
with South Branch of the Chicago
River, water quality monitor on north-
east side I-55 bridge, 3 feet below wa-
ter surface.
Cicero Avenue
Chicago Sanitary and Ship Canal
1.5
miles above Stickney WRP outfall,
1.1
miles below Crawford Generating
Station cooling water discharge, water
quality
monitor
on northeast side
Cicero
Avenue bridge, 3 feet below
water surface.
B&O Central Railroad Chicago Sanitary and Ship Canal
3.6 miles below Stickney WRP outfall,
water quality monitor in center of ca-
nal, east side B&O Central RR bridge,
3 feet below water surface.
Route 83
Chicago Sanitary and Ship Canal
1.2 miles above junction with Calumet-
Sag Channel, 1.1 miles above Canal
Junction SEPA Station, water quality
monitor 0.6
mile above Route 83
bridge, center of canal, 6 inches above
bottom.
7
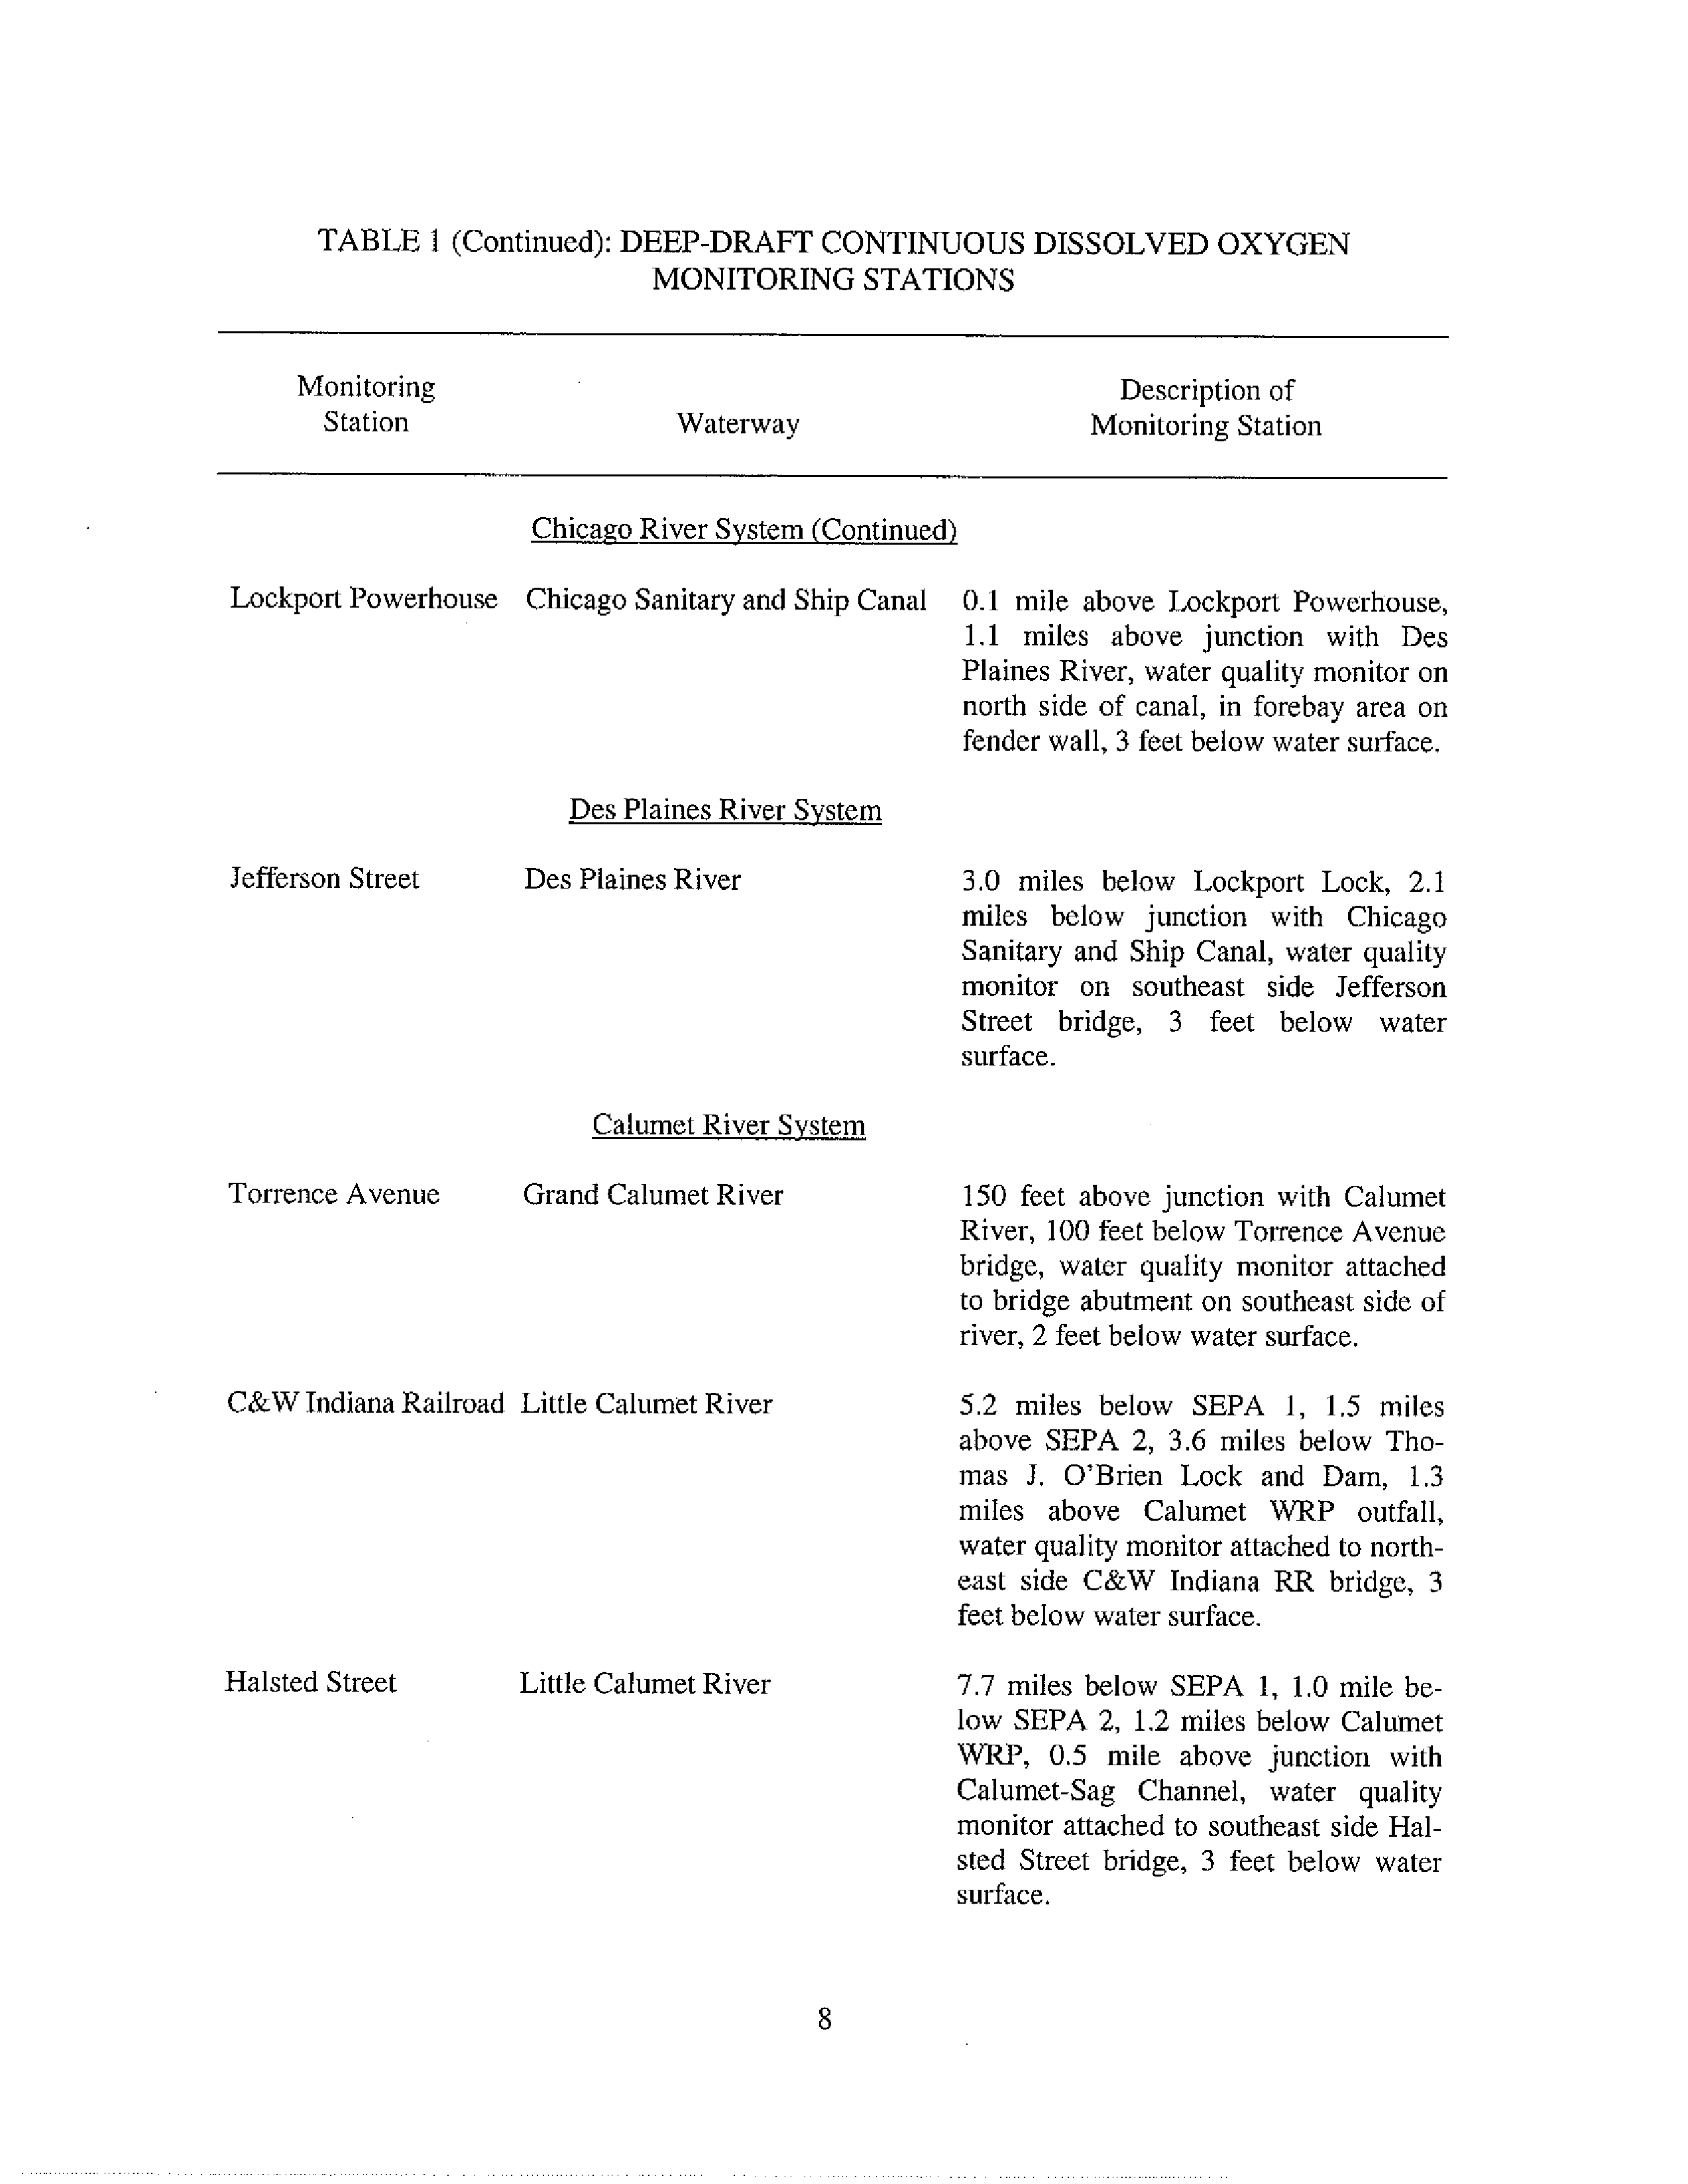
TABLE I (Continued): DEEP-DRAFT CONTINUOUS DISSOLVED OXYGEN
MONITORING STATIONS
Monitoring
Description of
Station
Waterway
Monitoring Station
Chicago River System (Continued)
Lockport Powerhouse
Chicago Sanitary and Ship Canal
0.1
mile above Lockport Powerhouse,
1.1
miles above junction with Des
Plaines River, water quality monitor on
north side of canal, in forebay area on
fender wall, 3 feet below water surface.
Des Plaines River System
Jefferson Street
Des Plaines River
3.0
miles below Lockport Lock, 2.1
miles below junction with Chicago
Sanitary and Ship Canal, water quality
monitor on southeast side Jefferson
Street
bridge, 3 feet below water
surface.
Calumet River System
Torrence Avenue
Grand Calumet River
150 feet above junction with Calumet
River, 100 feet below Torrence Avenue
bridge,
water quality monitor attached
to bridge abutment on southeast side of
river, 2 feet below water surface.
C&W Indiana Railroad Little Calumet River
5.2
miles below SEPA 1, 1.5 miles
above SEPA 2, 3.6 miles below Tho-
mas J. O'Brien Lock and Dam, 1.3
miles above Calumet
WRP outfall,
water quality monitor attached to north-
east side C&W Indiana RR bridge, 3
feet below water surface.
Halsted Street
Little Calumet River
7.7
miles
below SEPA 1, 1.0 mile bc-
low SEPA 2, 1.2 miles below Calumet
WRP, 0.5 mile above junction with
Calumet-Sag Channel, water quality
monitor
attached to southeast side Hal-
sted Street bridge, 3 feet below water
surface.
8
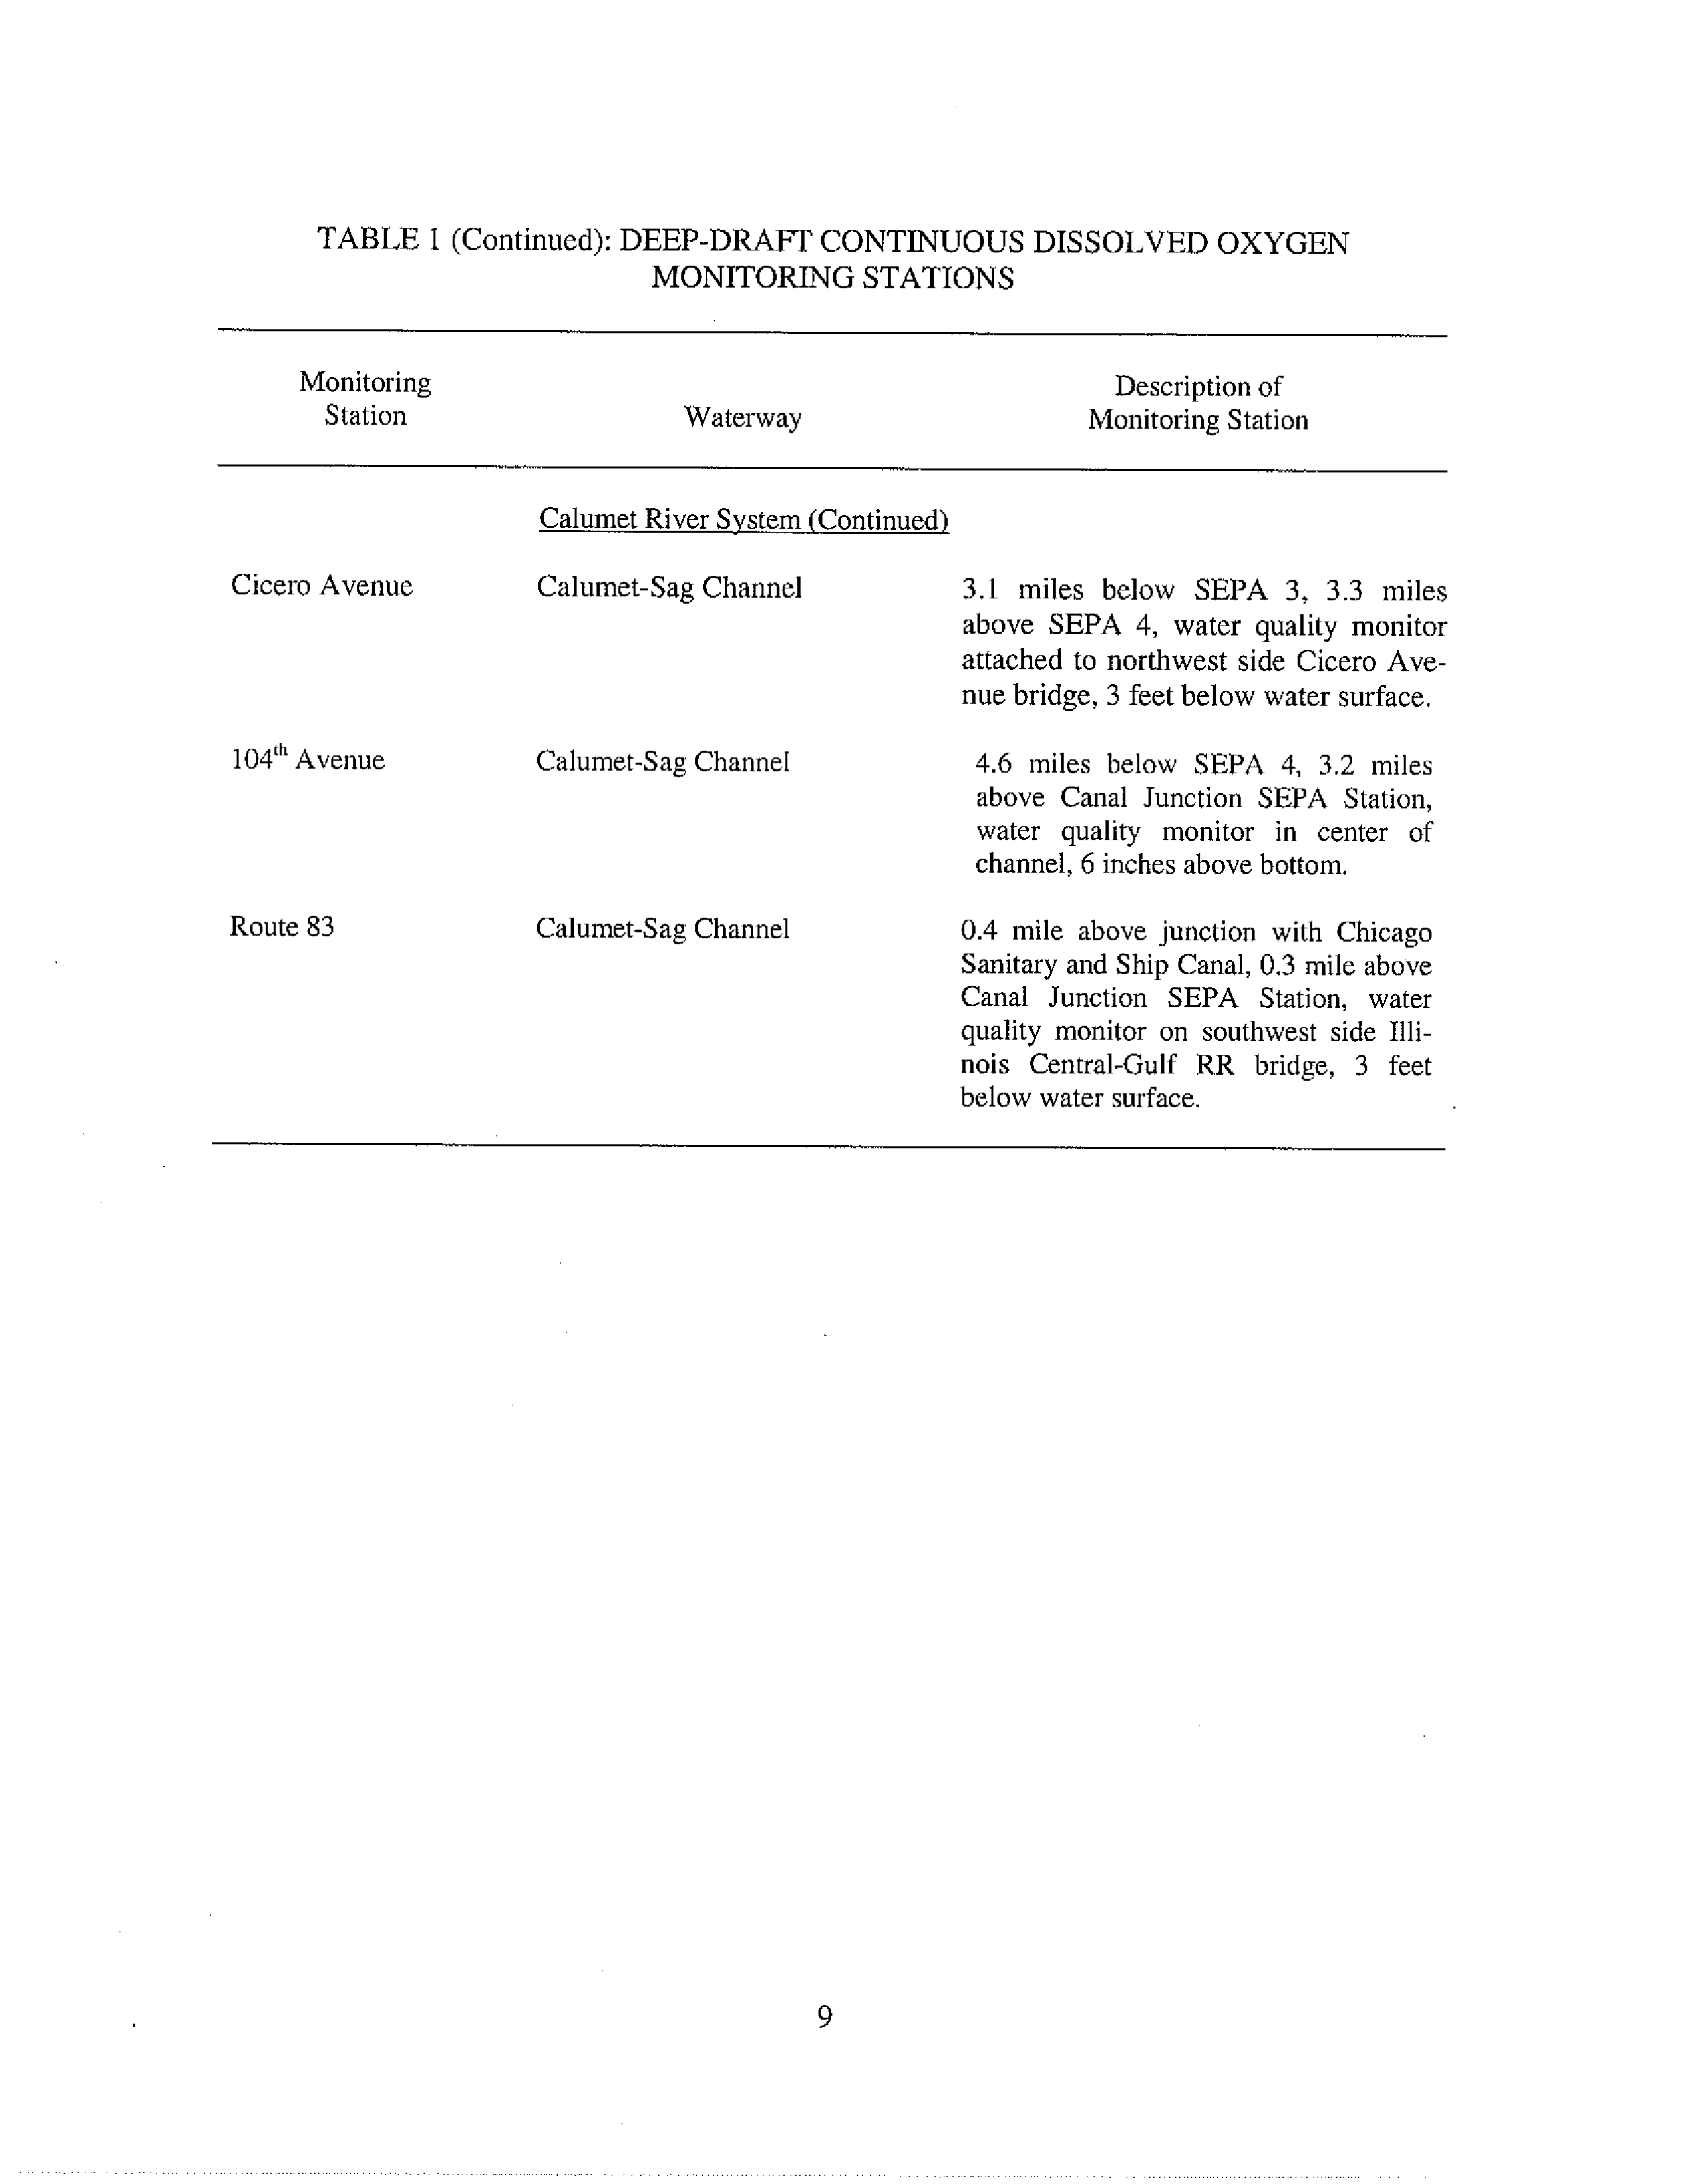
TABLE I (Continued): DEEP-DRAFT CONTINUOUS DISSOLVED OXYGEN
MONITORING STATIONS
Monitoring
Station
Waterway
Calumet River System (Continued)
Cicero Avenue
Calumet-Sag Channel
104`' Avenue
Calumet-Sag Channel
Route 83
Calumet-Sag Channel
Description of
Monitoring Station
3.1 miles
below SEPA
3, 3.3 miles
above
SEPA 4, water quality
monitor
attached to northwest
side Cicero Ave-
nue bridge
,
3 feet below water surface.
4.6
miles below SEPA 4, 3.2 miles
above Canal Junction SEPA Station,
water quality
monitor in center of
channel, 6 inches above bottom.
0.4
mile above junction with Chicago
Sanitary and Ship Canal, 0.3 mile above
Canal Junction SEPA Station, water
quality
monitor on southwest side Illi-
nois Central-Gulf
RR bridge, 3 feet
below water surface.
9
TABLE 2: MINIMUM, MAXIMUM, AND MEAN HOURLY
DISSOLVED OXYGEN CONCENTRATIONS'
Monitoring
DO Concentration {mg(L)
Station
Waterway
Minimum
Maximum Mean
Chicago River System
Main Street
North Shore Channel
0.0
33.4
9.7
Foster Avenue
North Shore Channel
4.0
11.2
7.7
Addison Street
North Branch Chicago River
0.0
12.0
7.8
Fullerton Avenue
North Branch Chicago River
0.0
11.0
7.1
Kinzie Street
North Branch Chicago River
0.8
11.7
7.0
Clark Street
Chicago River
5.8
12.8
9.0
Loomis Street
South Branch Chicago River
2.2
12.5
7.6
Vh Street
Bubbly Creek
0.0
15.6
3.2
Interstate Highway 55
Bubbly Creek
0.0
12.0
5.4
Cicero Avenue
Chicago Sanitary and Ship Canal
OA
10.8
6.3
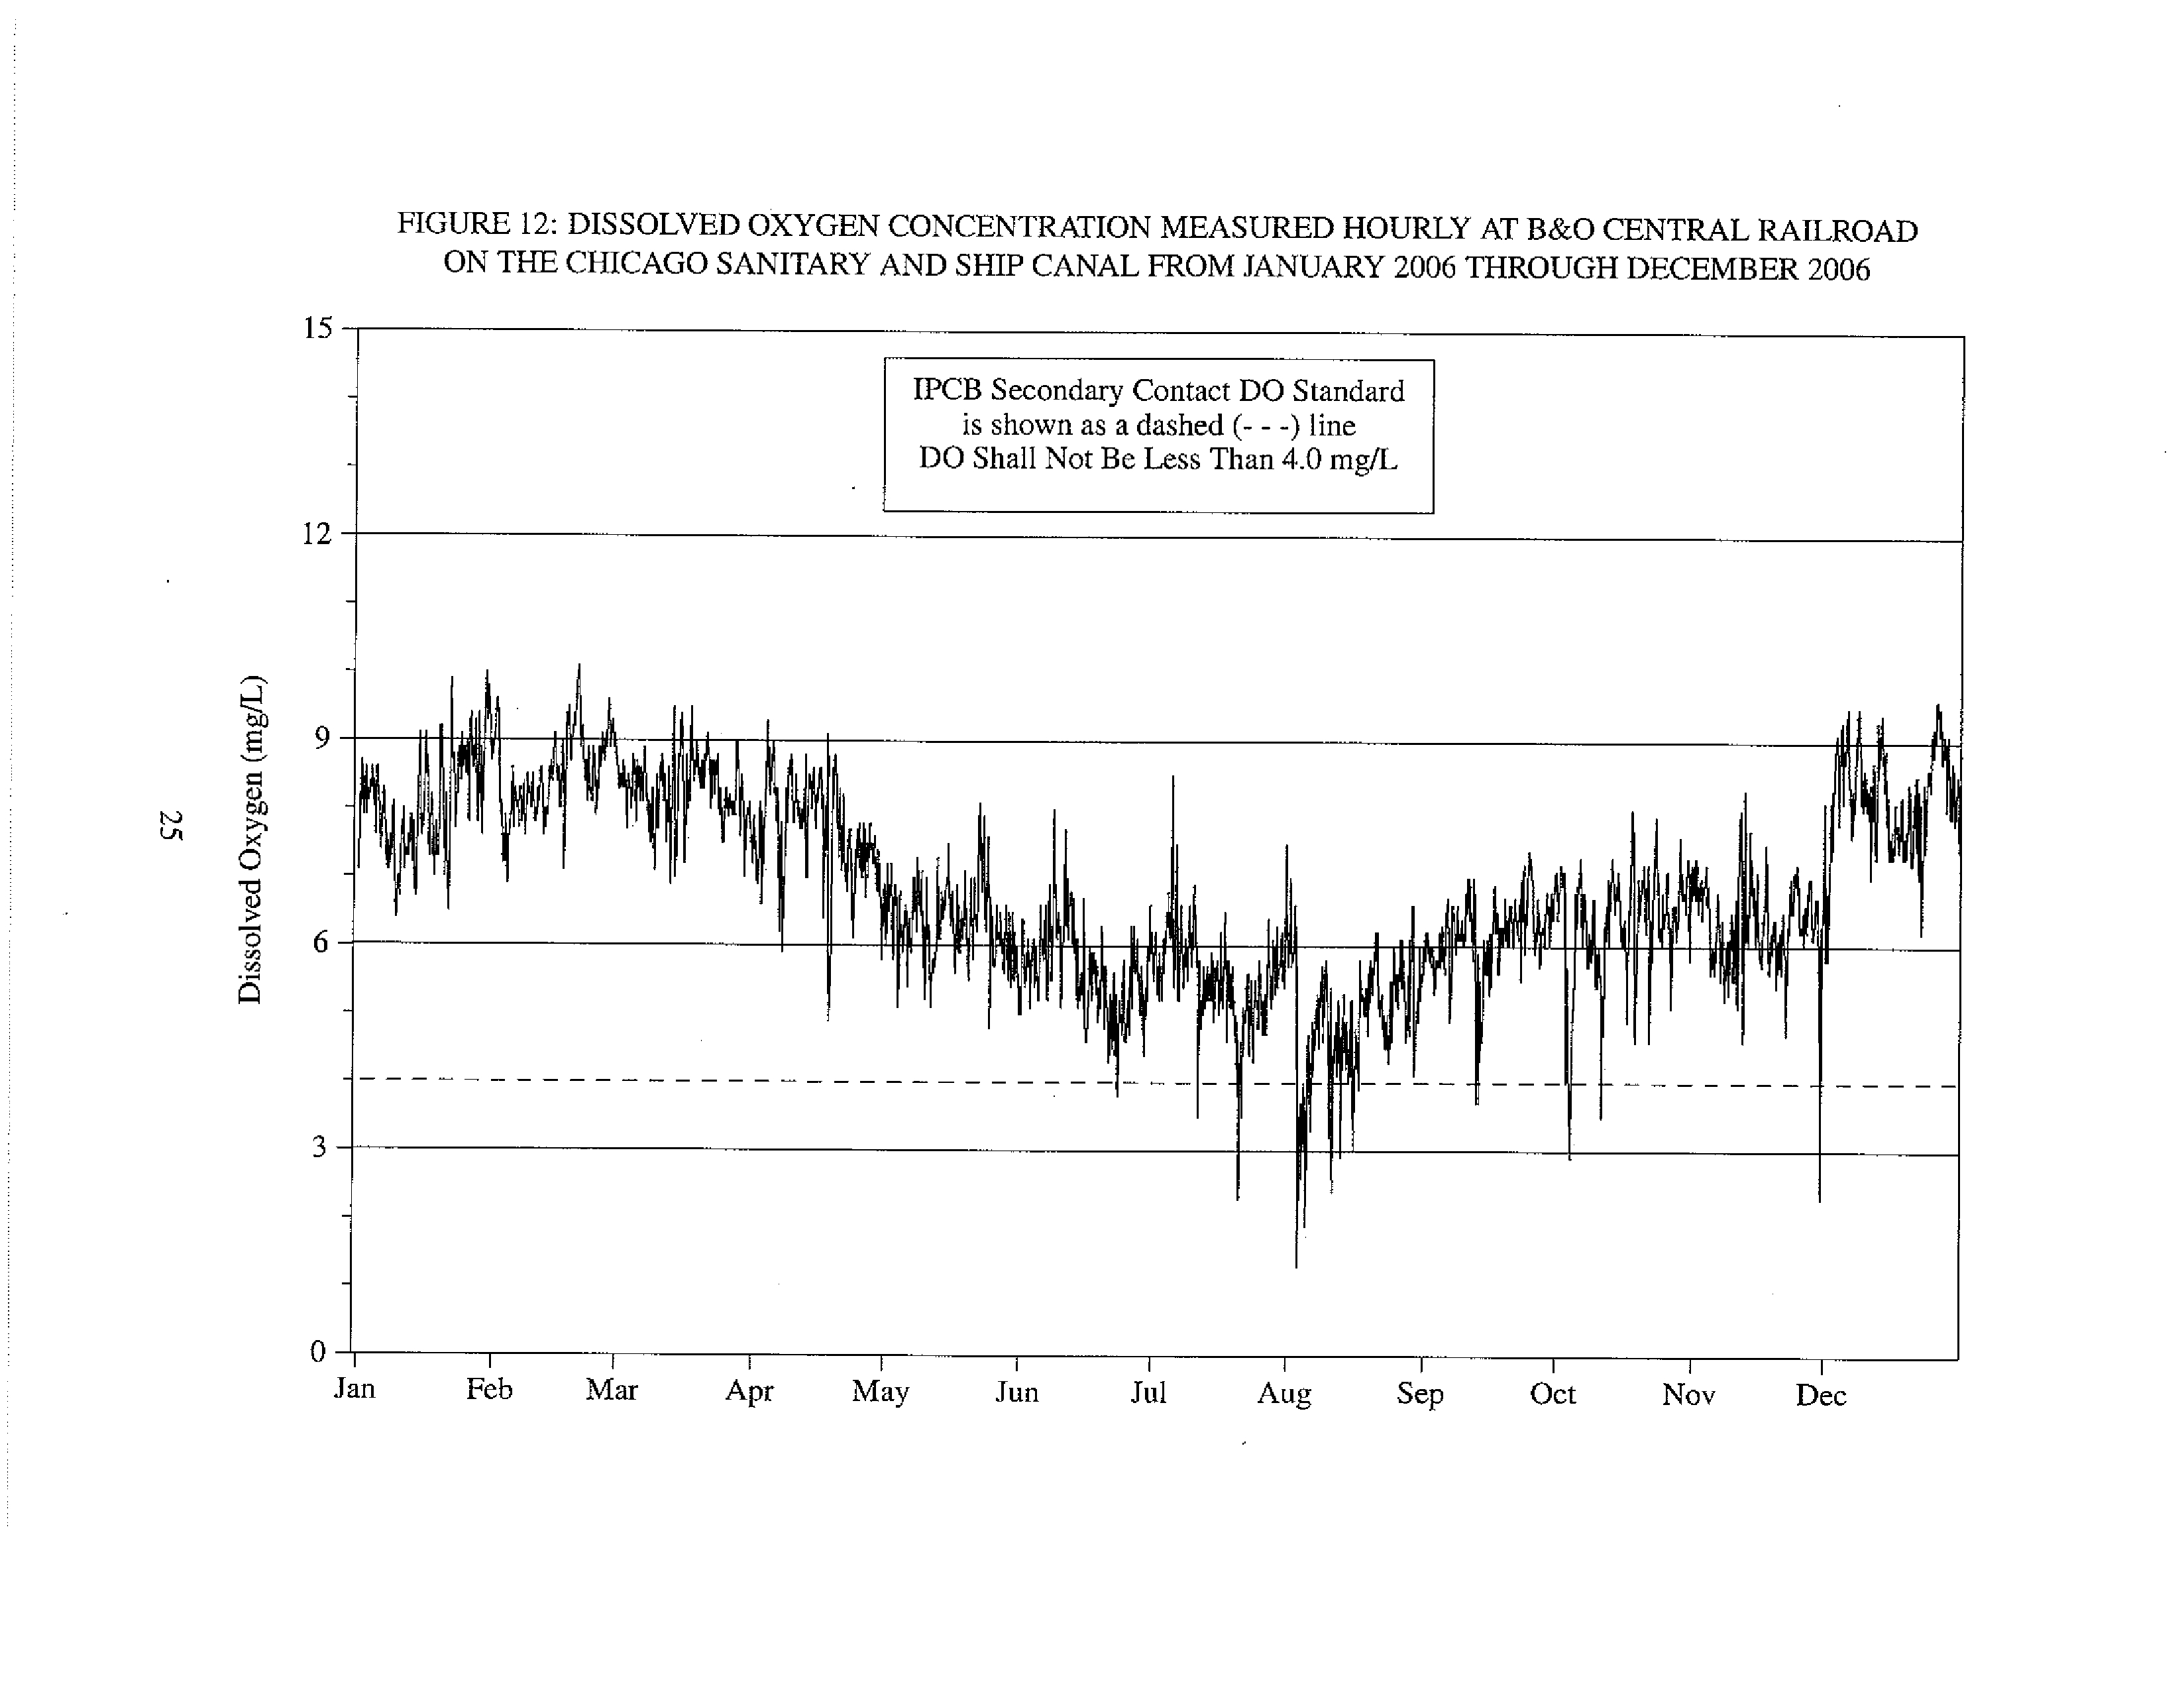
B&O Central Railroad
Chicago Sanitary and Ship Canal
1.3
10.1
6.8
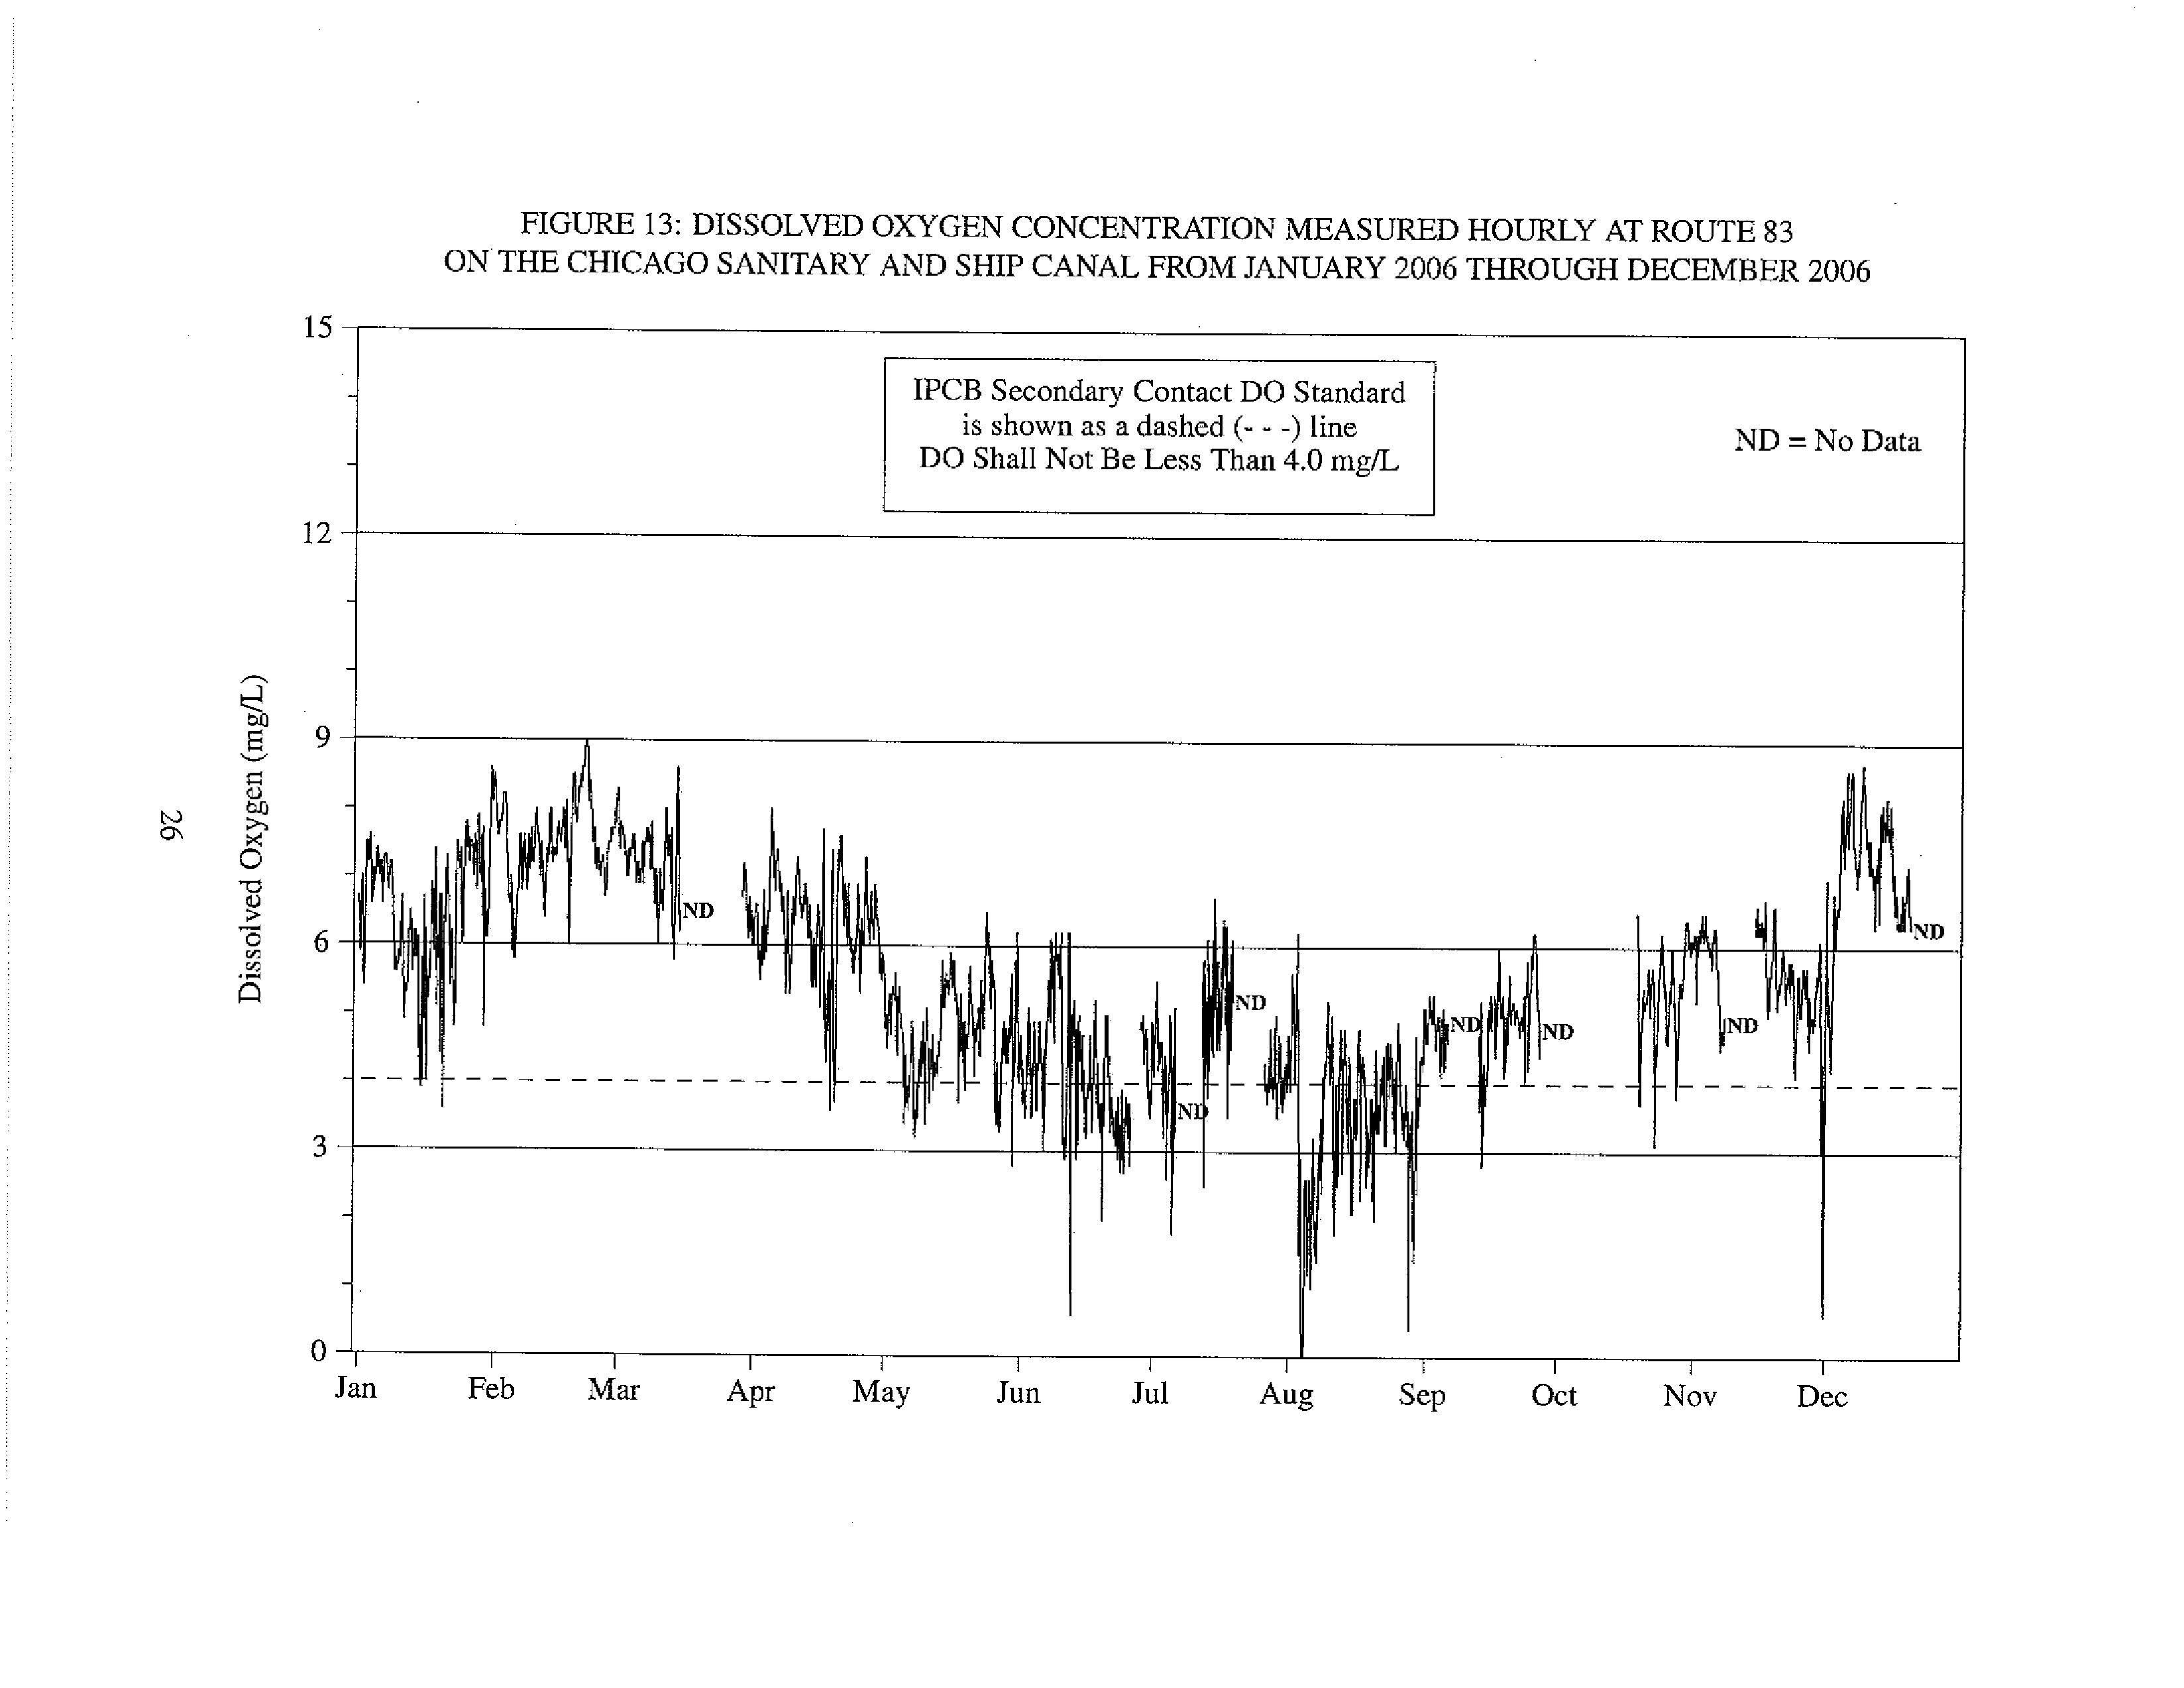
Route 83
Chicago Sanitary and Ship Canal
0.0
9.0
5.6
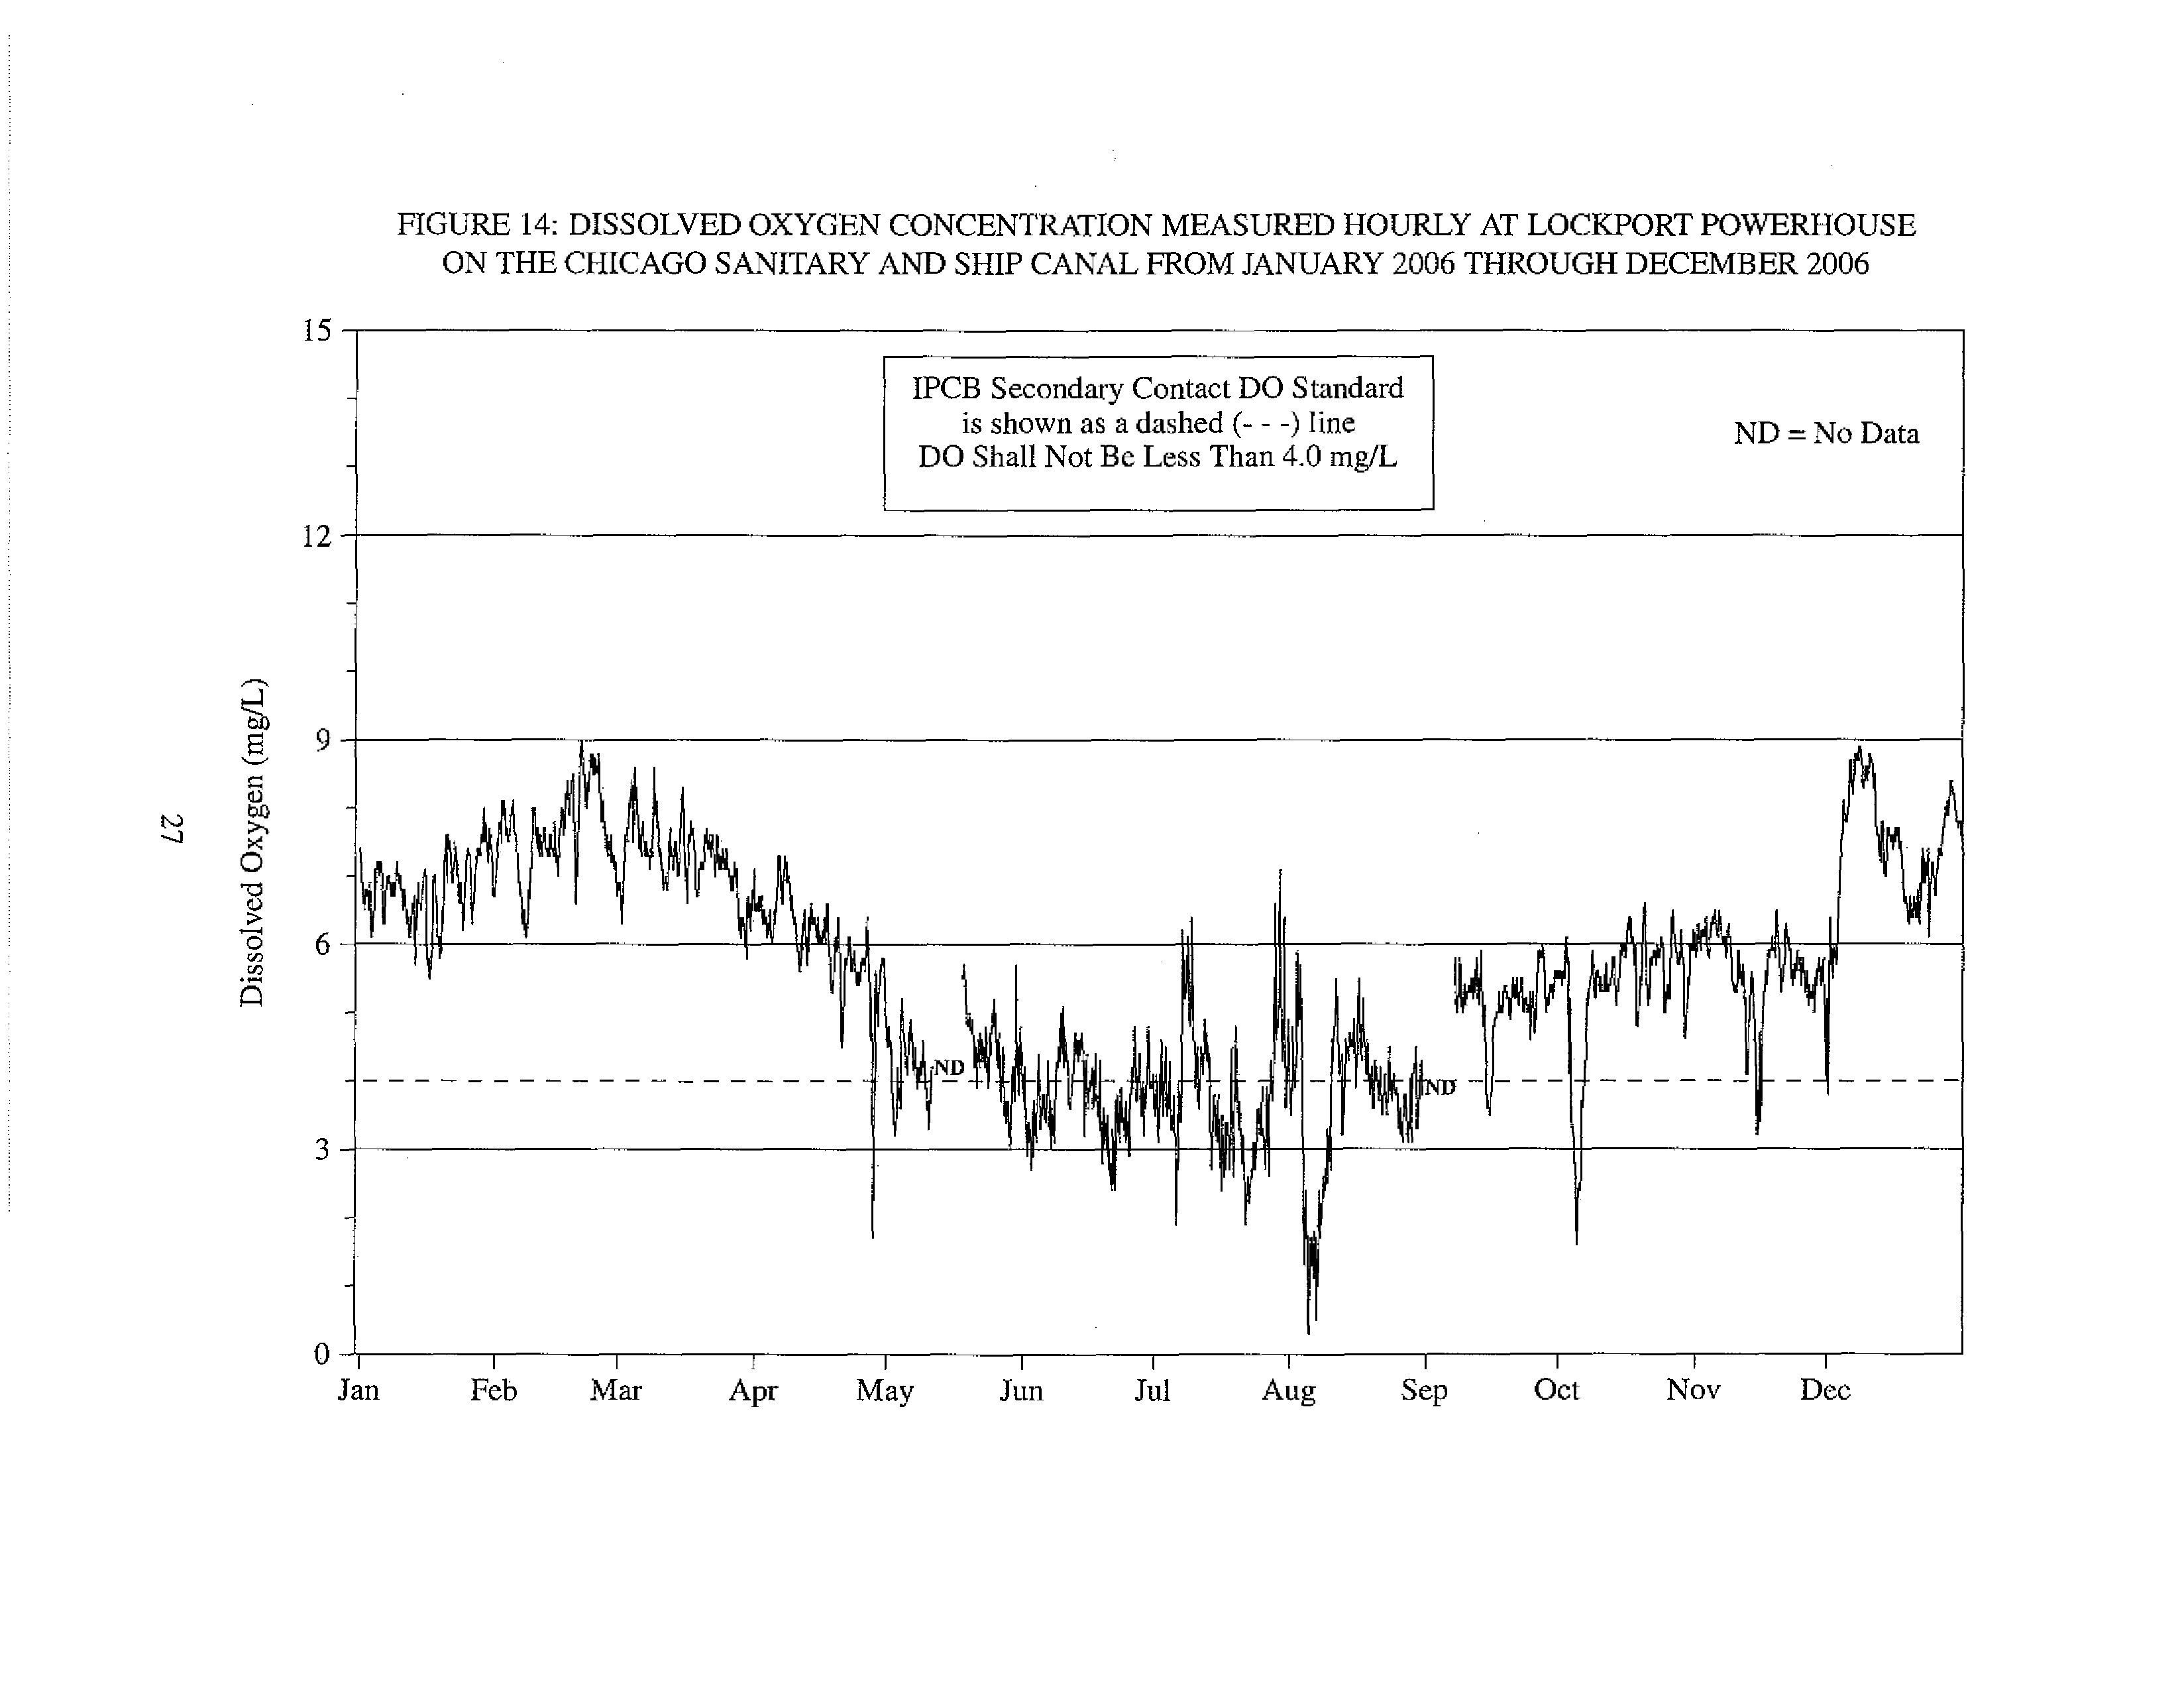
Lockport Powerhouse
Chicago Sanitary and Ship Canal
0.3
9.0
5.6
Des Plaines River System
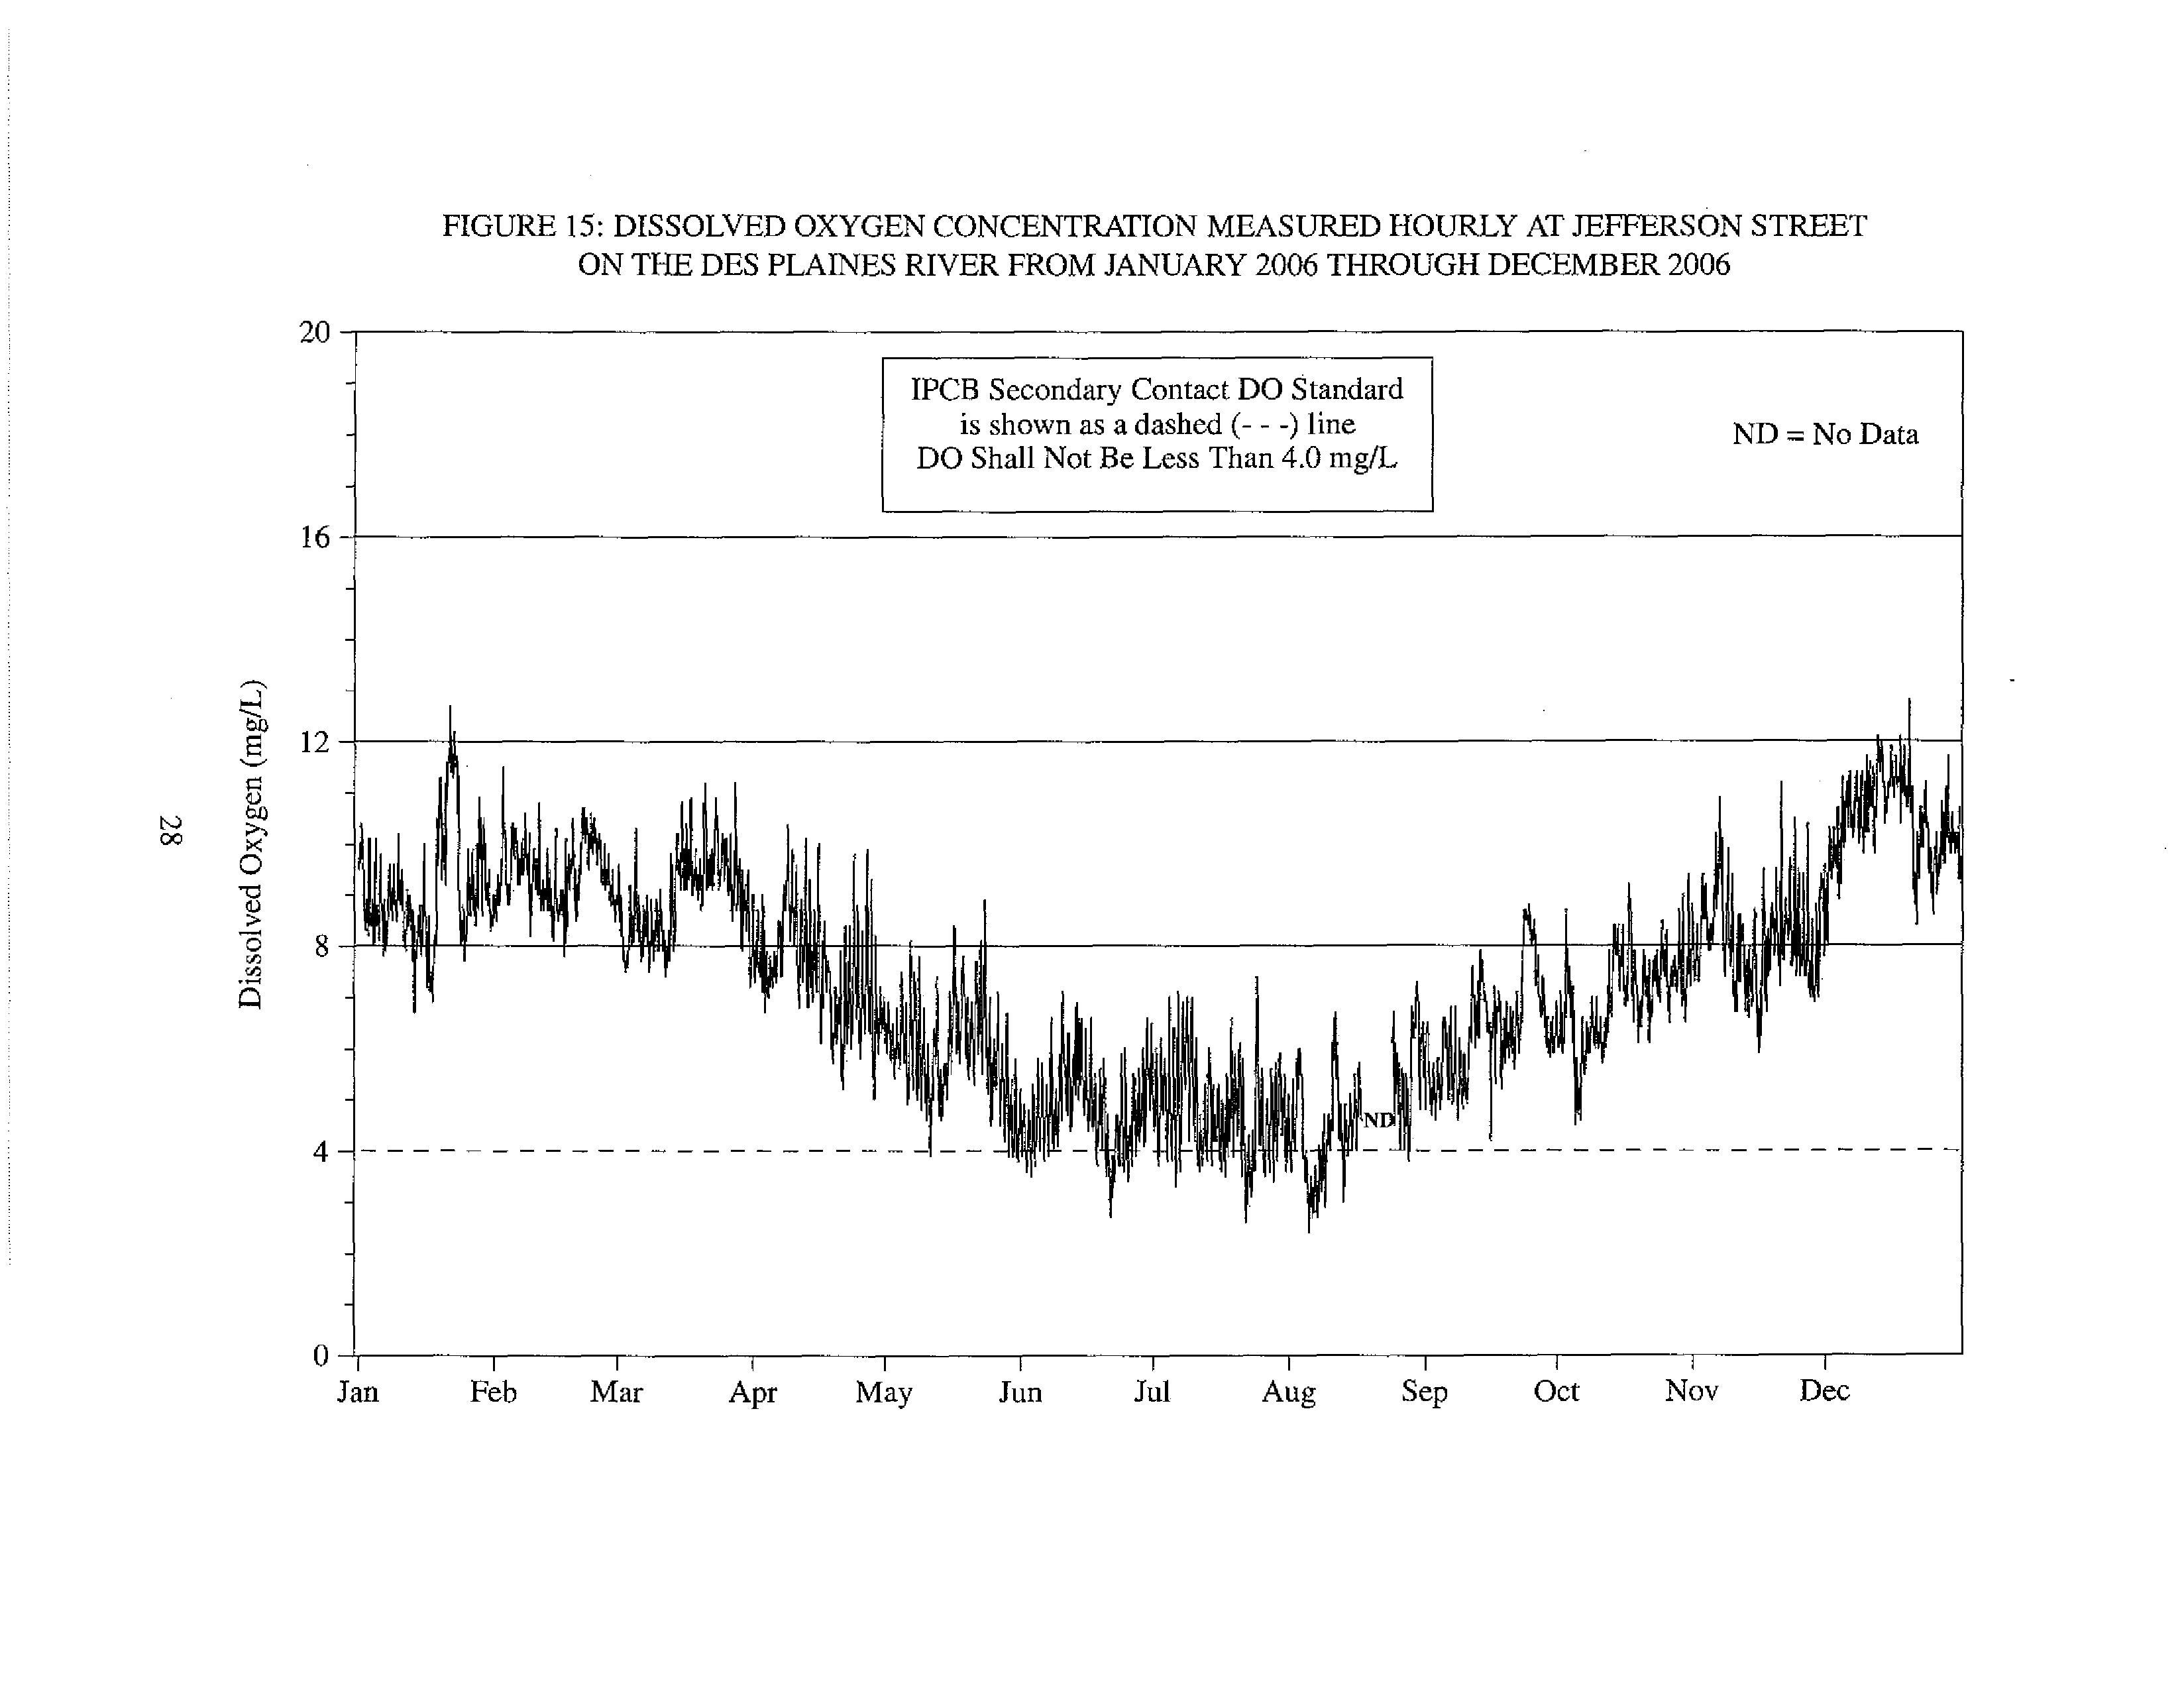
Jefferson Street
Des Plaines River
2.4
12.8
7.3
Calumet River System
Torrence Avenue
Grand Calumet River
0.0
30.2
8.2
C&W Indiana Railroad
Little Calumet River
1.9
21.9
9.5
Halsted Street
Little Calumet River
3.5
12.9
6.9
Cicero Avenue
Calumet-Sag Channel
3.2
13.1
7.0
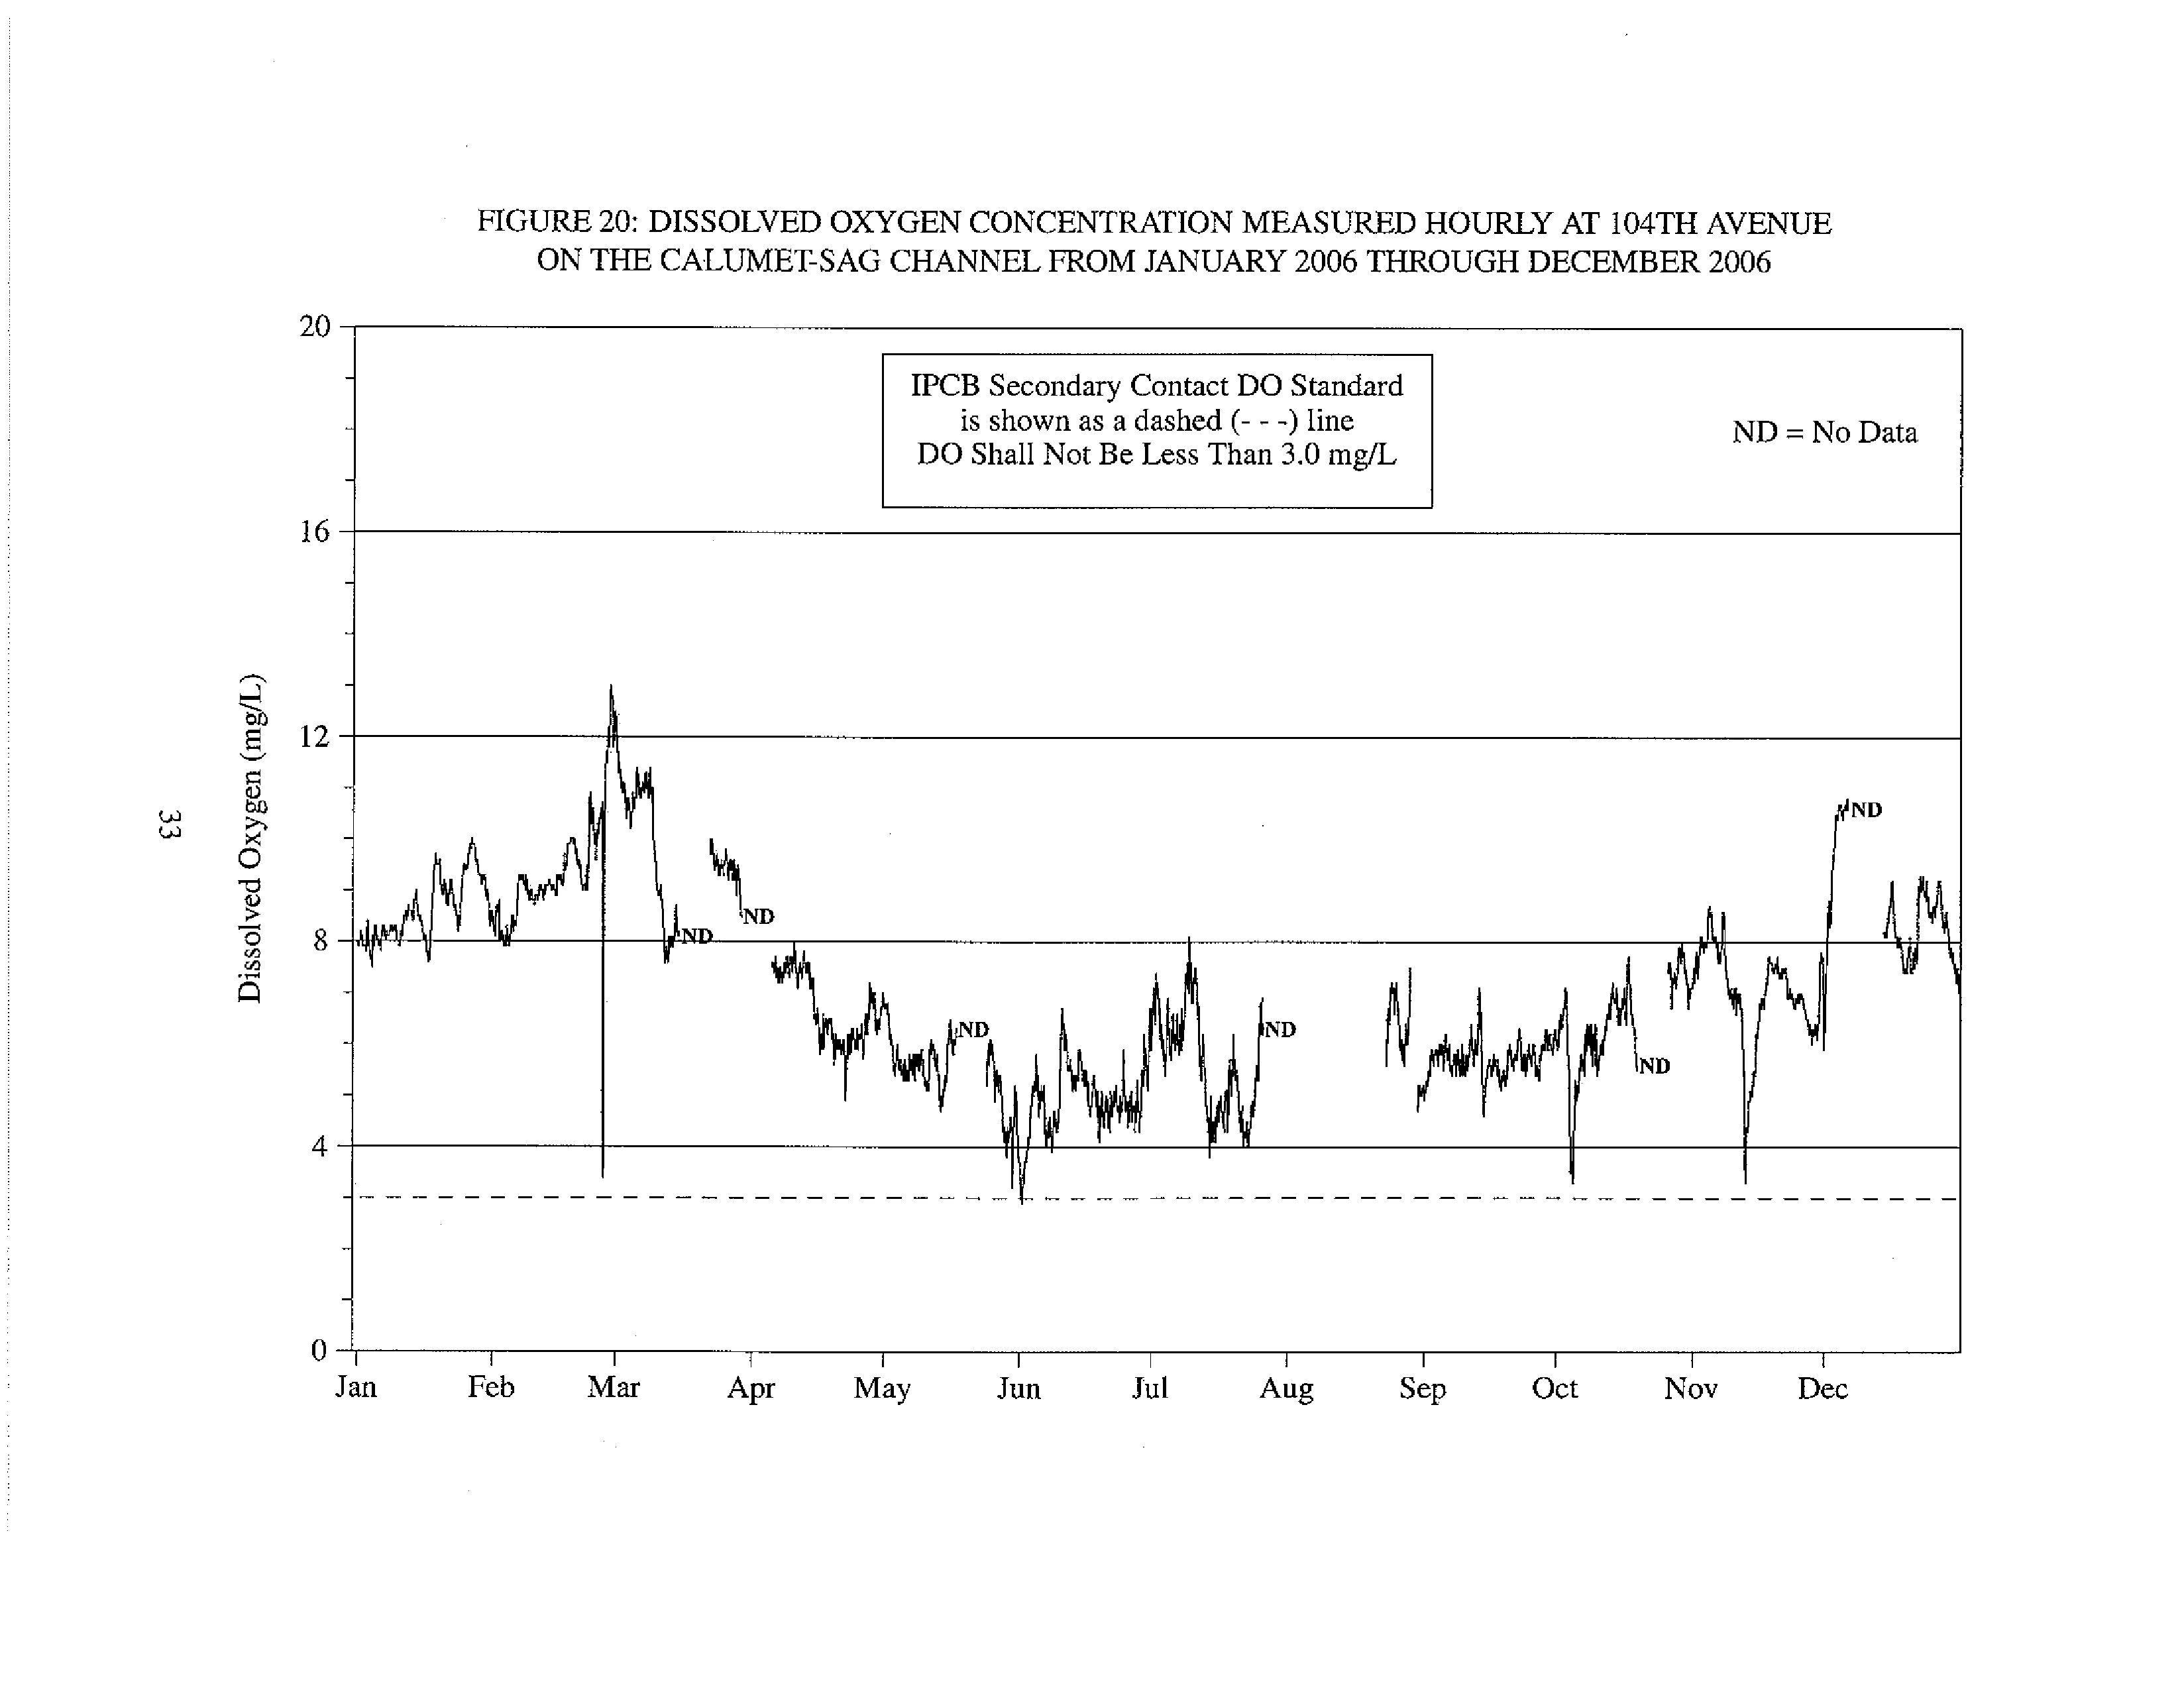
104`h Avenue
Calumet-Sag Channel
2.9
13.0
7.0
Route 83
Calumet-Sag Channel
2.7
13.9
6.8
ssolved
Di
oxygen was measured hourly using a YSI Model 6920 or Model 6600 continuous water
quality monitor.
10
TABLE 3: NUMBER AND PERCENT OF DISSOLVED OXYGEN VALUES
NOT MEETING ACCEPTANCE CRITERIA'
Monitoring
Station
Waterway
Number of
Percent of
DO Values
DO Values
Rejected
Rejected
Chicago River System
Main Street
North Shore Channel
627
7
Foster Avenue
North Shore Channel
336
4
Addison Street
North Branch Chicago River
165
2
Fullerton Avenue
North Branch Chicago River
338
4
Kinzie Street
North Branch Chicago River
2
0
Clark Street
Chicago River
361
4
Loomis Street
South Branch Chicago River
2
0
36th Street
Bubbly Creek
352
4
Interstate Highway 55
Bubbly Creek
547
6
Cicero Avenue
Chicago Sanitary and Ship Canal
169
2
B&O Central Railroad
Chicago Sanitary and Ship Canal
4
0
Route 83
Chicago Sanitary and Ship Canal
1,861
21
Lockport Powerhouse
Chicago Sanitary and Ship Canal
Des Plaines River System
344
4
Jefferson Street
Des Plaines River
Calumet River System
171
2
Torrence Avenue
Grand Calumet River
485
6
C&W Indiana Railroad
Little Calumet River
174
2
Halsted Street
Little Calumet River
343
4
Cicero Avenue
Calumet-Sag Channel
173
2
104th Avenue
Calumet-Sag Channel
1,575
18
Route 83
Calumet-Sag Channel
4
0
Dissolved oxygen was measured hourly using a YSI Model 6920 or Model 6600 continuous wa-
ter quality monitor. DO values were rejected based on quality control check and/or operational
problems with monitor.
11
TABLE 4: NUMBER AND PERCENT OF DISSOLVED OXYGEN VALUES
MEASURED ABOVE THE ILLINOIS POLLUTION CONTROL BOARD'S
WATER QUALITY STANDARD'
Monitoring
Station
IPCB
Number
Number
Percent
DO
of DO
Above
Above
Waterway
Standard
Values
Standard
Standard
Chicago River Syste
Main Street
North Shore Channel
5
8,133
7,362
91
Foster Avenue
North Shore Channel
4
8,424
8,423
100
Addison Street
North Branch Chicago River
4
8,595
8,587
>99
Fullerton Avenue
North Branch Chicago River
4
8,422
8,362
>99
Kinzie Street
North Branch Chicago River
4
8,758
8,645
99
Clark Street
Chicago River
5
8,399
8,399
100
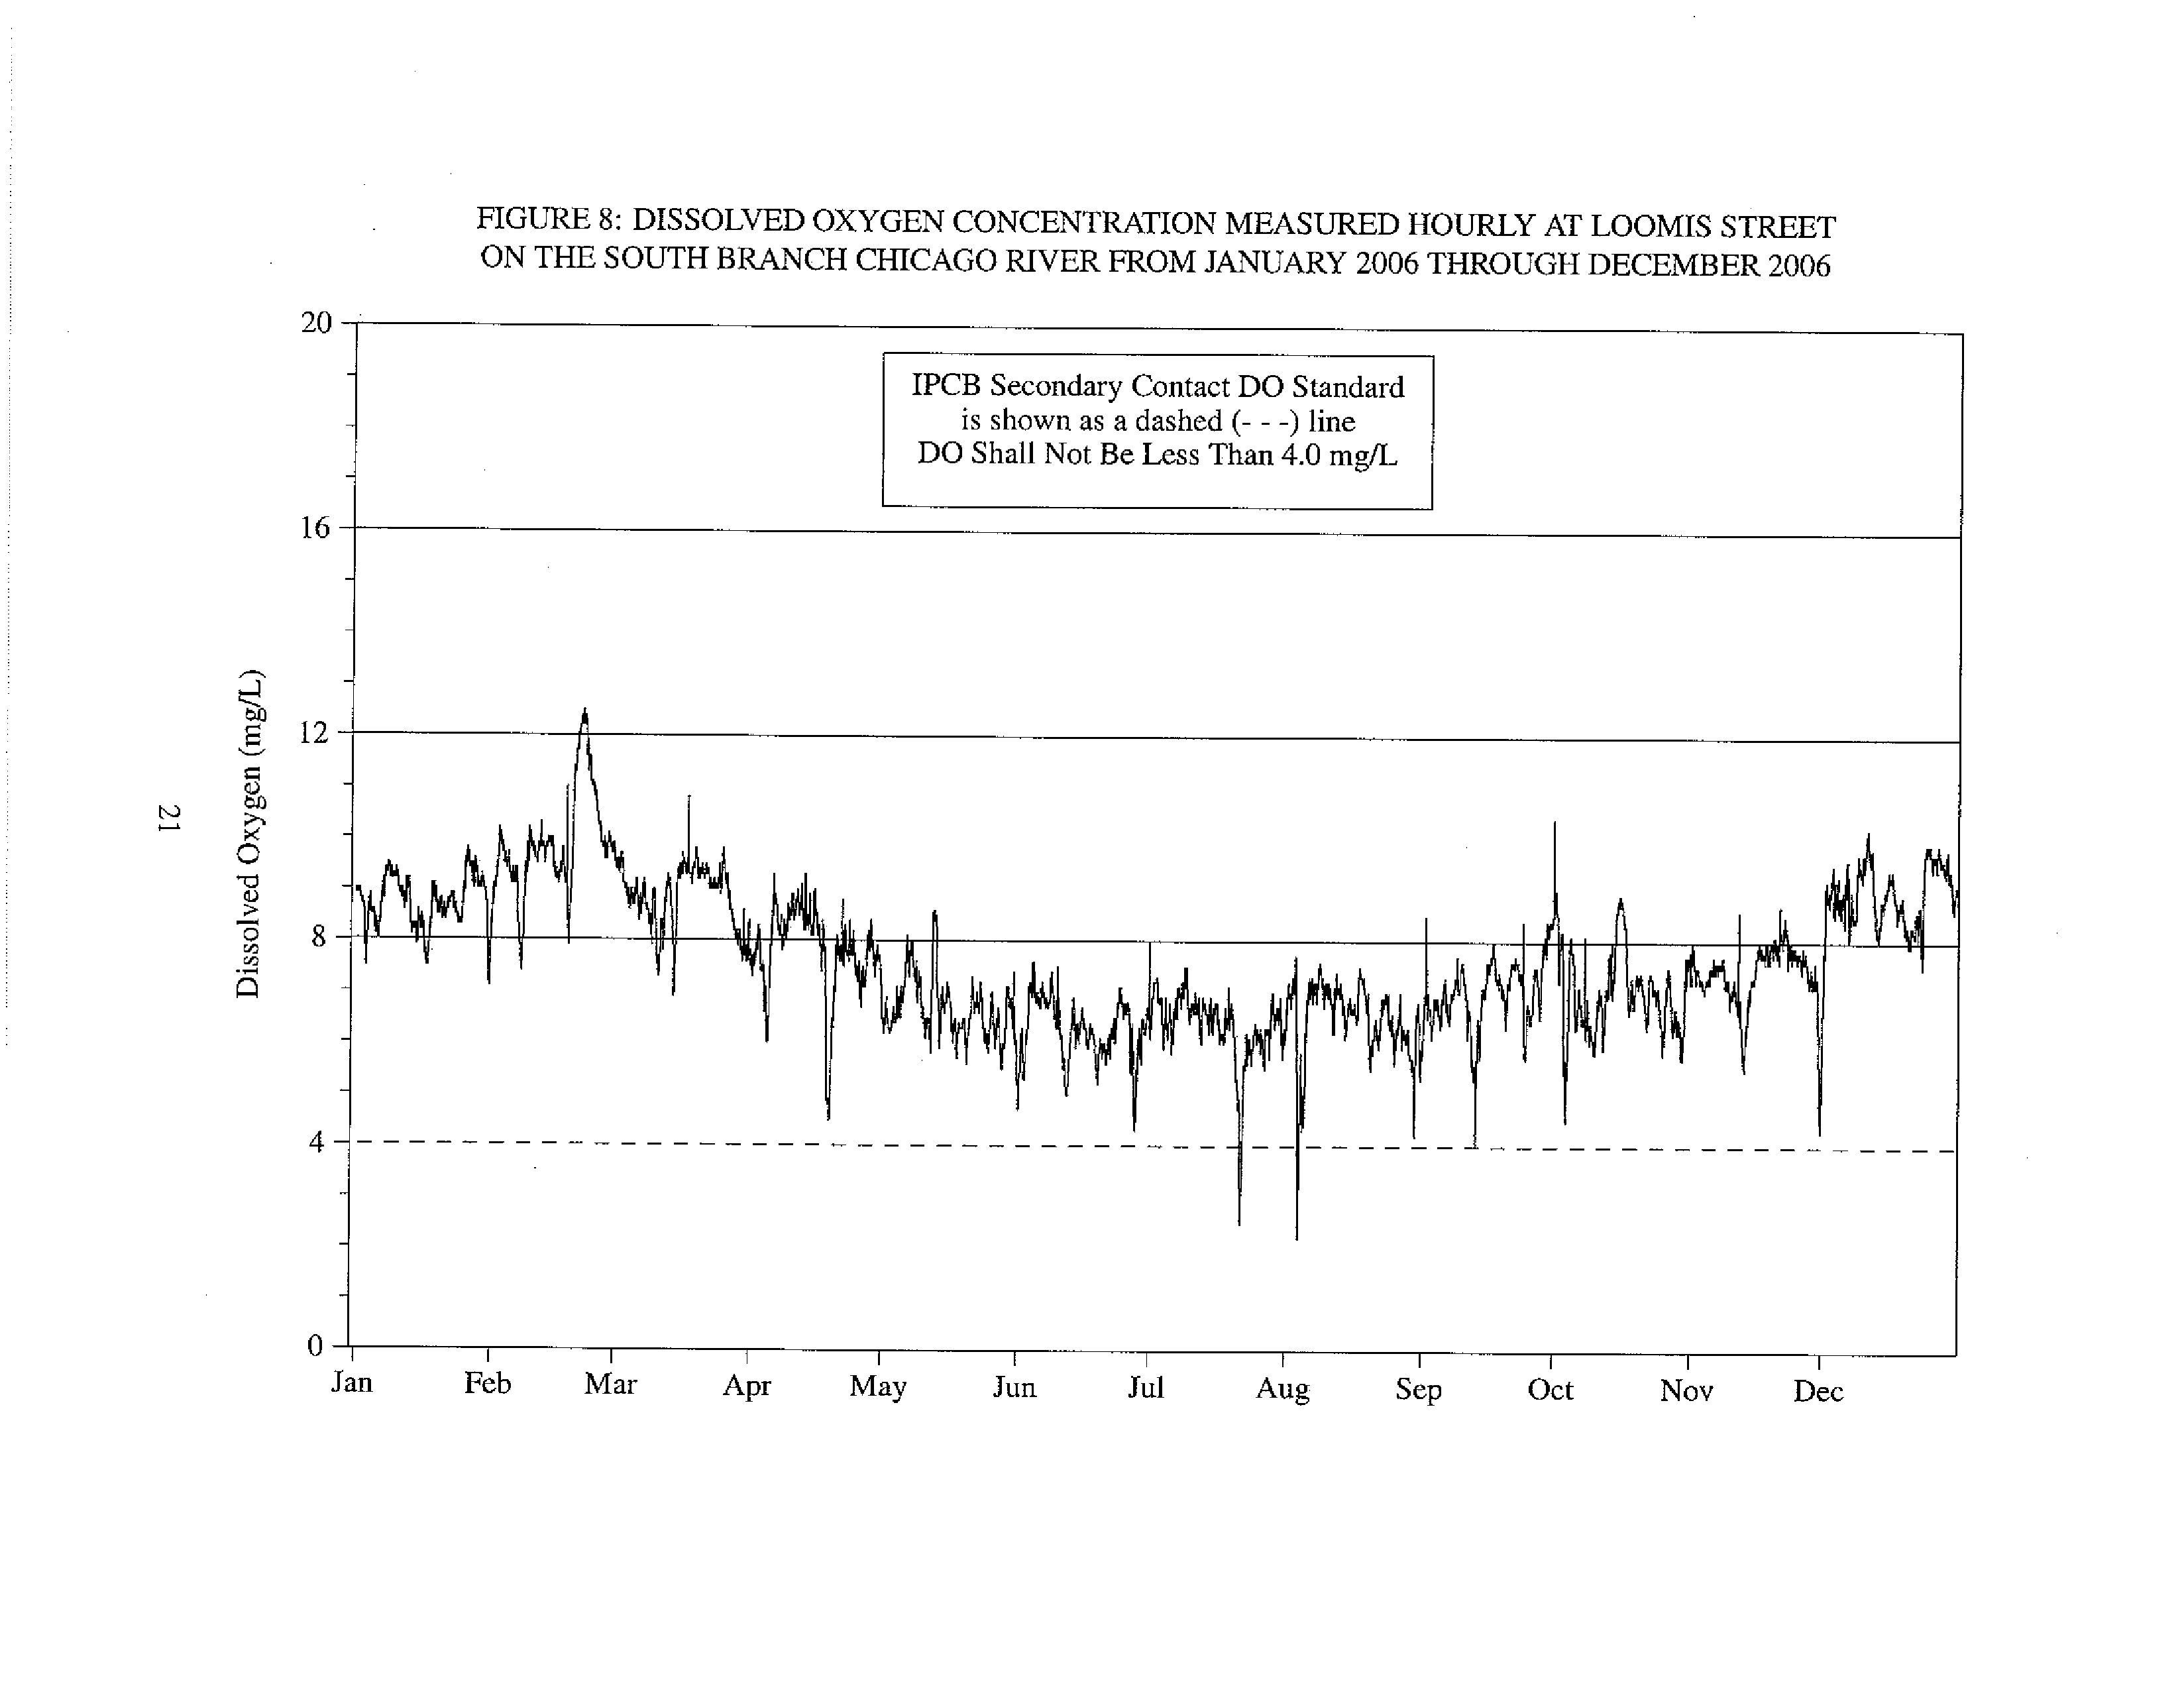
Loomis Street
South Branch Chicago River
4
8,758
8,732
>99
36"' Street
Bubbly Creek
4
8,408
2,338
28
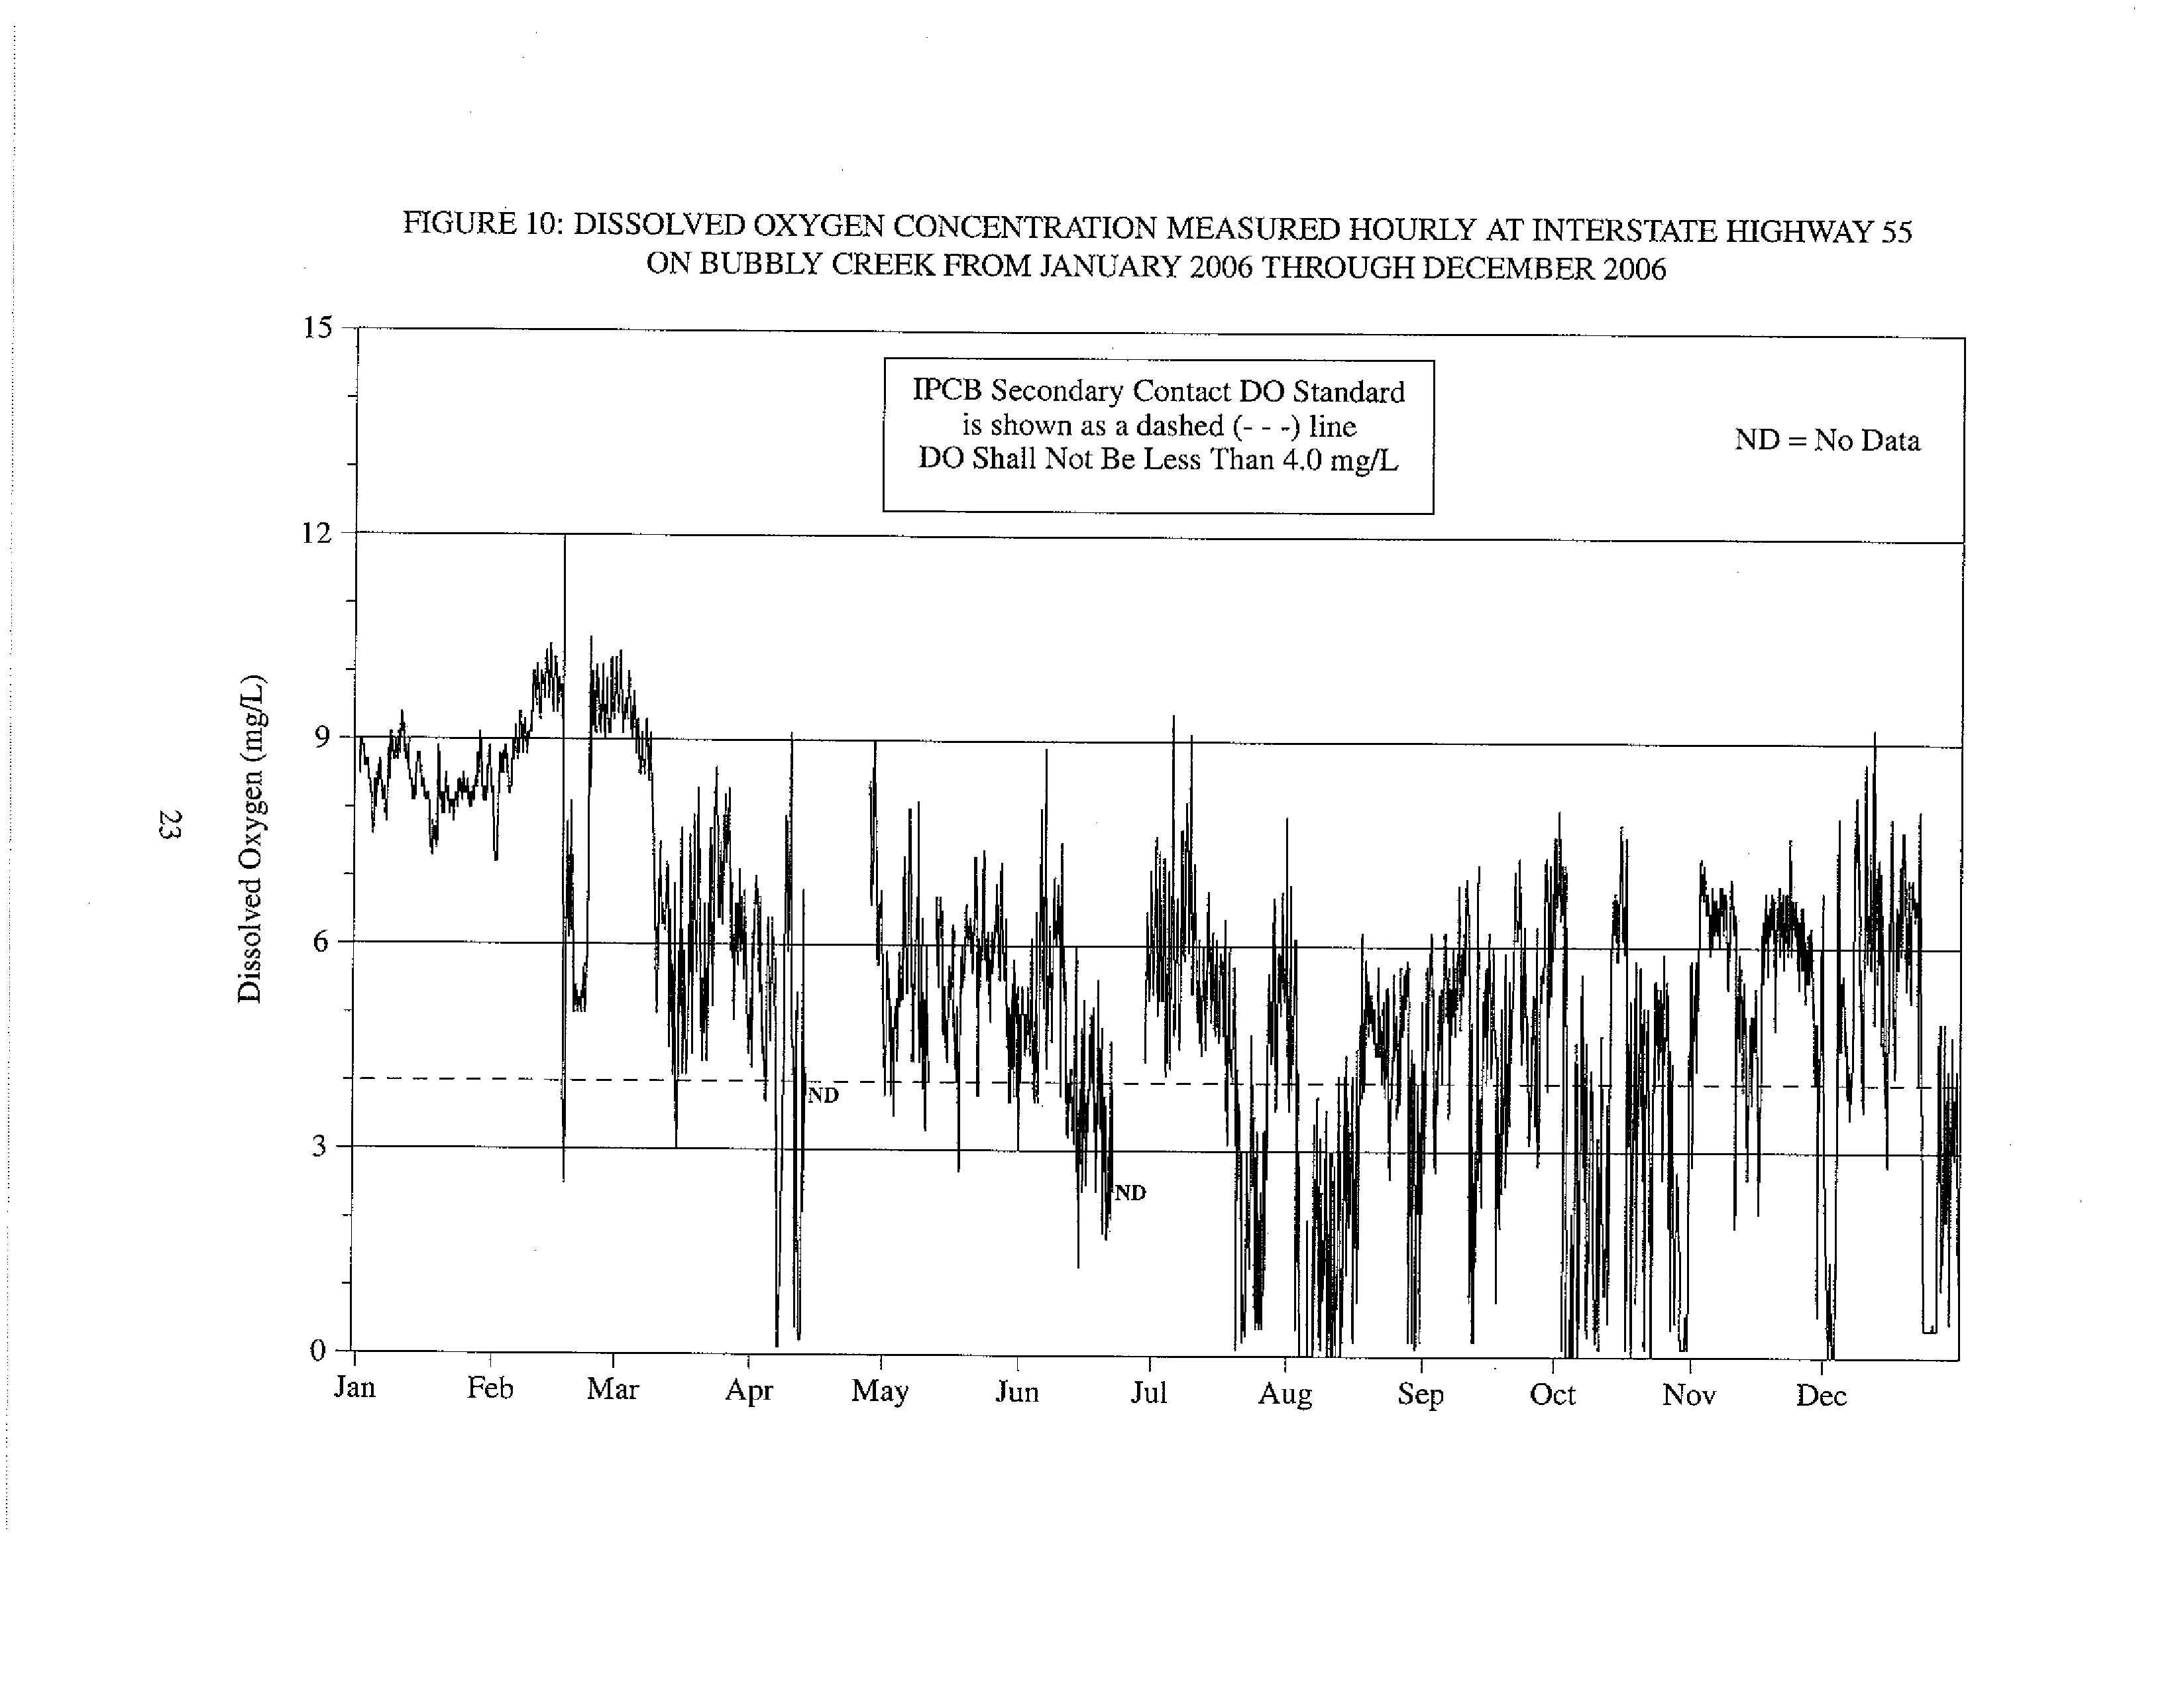
Interstate Highway 55
Bubbly Creek
4
8,213
6,281
77
Cicero Avenue
Chicago Sanitary and Ship Canal
4
8,591
8,223
96
B&O Central Railroad
Chicago Sanitary and Ship Canal
4
8,756
8,612
98
Route 83
Chicago Sanitary and Ship Canal
4
6,899
5,874
85
Lockport Powerhouse
Chicago Sanitary and Ship Canal
4
8,416
6,766
80
Des Plaines River System
Jefferson Street
Des Plaines River
4
8,589
8,148
95
Calumet River System
Torrence Avenue
Grand Calumet River
4
8,275
6,197
75
C&W Indiana Railroad
Little Calumet River
4
8,586
8,448
98
Halsted Street
Little Calumet River
4
8,417
8,412
>99
Cicero Avenue
Calumet-Sag Channel
3
8,587
8,587
100
104"' Avenue
Calumet-Sag Channel
3
7,185
7,182
100
Route 83
Calumet-Sag Channel
3
8,756
8,729
>99
Dissolved oxygen was measured hourly using a YSI Model 6920 or Model 6600 continuous water quality
monitor.
12
TABLE 5: PERCENT OF DISSOLVED OXYGEN VALUES IN SELECTED RANGES
Monitoring
Percent of DO Values in Range (mglL)
Station
Waterway
0-<1 1-<2
2-<3
3-<4
4-<5
>5
Chicago River System
Main Street
North Shore Channel
1
<1
<1
2
6
91
Foster Avenue
North Shore Channel
0
0
0
0
<1
>99
Addison Street
North Branch Chicago River
0
0
0
0
<1
>99
Fullerton Avenue
North Branch Chicago River
0
0
<1
<1
5
94
Kinzie Street
North Branch Chicago River
0
<1
<1
<1
6
93
Clark Street
Chicago River
0
0
0
0
0
100
Loomis Street
South Branch Chicago River
0
0
<1
<1
1
99
36th Street
Bubbly Creek
33
18
13
7
4
24
Interstate Highway 55
Bubbly Creek
6
4
5
9
16
61
Cicero Avenue
Chicago Sanitary and Ship Canal
<1
<1
<1
3
18
78
B&O Central Railroad
Chicago Sanitary and Ship Canal
0
<1
<1
1
6
92
Route 83
Chicago Sanitary and Ship Canal
<1
<1
2
11
23
62
Lockport Powerhouse
Chicago Sanitary and Ship Canal
<1
1
4
15
16
65
Des Plaines River System
Jefferson Street
Des Plaines River
0
0
<1
5
12
83
Calumet River System
Torrence Avenue
Grand Calumet River
4
4
7
9
8
67
C&W Indiana Railroad
Little Calumet River
0
0
<1
1
5
93
Halsted Street
Little Calumet River
0
0
0
<1
1
99
Cicero Avenue
Calumet-Sag Channel
0
0
0
<1
7
92
104th Avenue
Calumet-Sag Channel
0
0
0
1
10
89
Route 83
Calumet-Sag Channel
0
0
<1
2
15
83
13
FIGURE 1: CONTINUOUS DISSOLVED OXYGEN MONITORING AND
AMBIENT WATER QUALITY MONITORING SAMPLE STATIONS
IRusFe Woo
ds
loath Dam
0'_'
LEC-;ENE:):
n
MinorWRPMow
Ma*WRP Inflow
- General Use Waters
Secondary Contact Waters
211)
AWOM
Sample Stations
r
oute 83
Ca-Sag)
CDOM Sample Stations
Wolf
Road
Route 83
C( SSC)
Lockport
Powerhouse
T,o[Wersnn Street
f
.roue,
14
Material Service Road
^ tar .'-,
ae{c
Central Park
Avenue
Ogden
Avenue
w-
Cicero
lvenue
Rnirrna
Fullerton
Avenue
Foster
avenue
Addi-wn
Street
Kinzie Street
and Avenu
Clark Street
& wl Railroa
Ilnhrrran Avenue
1.
lrrdiana
97 ce
FIGURE 2: DISSOLVED OXYGEN CONCENTRATION MEASURED HOURLY AT MAIN STREET
ON THE NORTH SHORE CHANNEL FROM JANUARY 2006 THROUGH DECEMBER 2006
40
32
24
16
8
0
Jan
Feb
Mar
IPCB General Use DO Standard
is shown as a dashed (- - -) line
DO Shall Not Be Less Than 5.0 mg/L
ND - No Data
ND
ND
------------
Apr
May
Jun
Jul
Aug
Sep
Oct
Nov
Dec
FIGURE 3: DISSOLVED OXYGEN CONCENTRATION MEASURED HOURLY AT FOSTER AVENUE
ON THE NORTH SHORE CHANNEL FROM JANUARY 2006 THROUGH DECEMBER 2006
Q
15
12
3
0
IPCB Secondary Contact DO Standard
is shown as a dashed (- - -) line
DO Shall Not Be Less Than 4.0 mg/L
ND = No Data
I
N
-------------------------------------------------------------
Jan
Feb
Mar
Apr
May
Jun
Jul
.Aug
Sep
Oct
Nov
Dec
FIGURE 4: DISSOLVED OXYGEN CONCENTRATION MEASURED HOURLY AT ADDISON STREET
ON THE NORTH BRANCH CHICAGO RIVER FROM JANUARY 2006 THROUGH DECEMBER 2006
1S
12
9
I
IPCB Secondary Contact DO Standard
is shown as a dashed (--- ) line
DO Shall Not Be Less Than 4.0 rng/L
4
---------------------
NN
I
i
ND = No Data
d
A
0
Jan
Feb
Mar
Apr
May
Jun
Jul
Aug
Sep
Oct
Nov
Dec
FIGURE 5: DISSOLVED OXYGEN CONCENTRATION MEASURED HOURLY AT FULLERTON AVENUE
ON THE NORTH BRANCH CHICAGO RIVER FROM JANUARY 2006 THROUGH DECEMBER 2006
15
12
M
0
IBCB Secondary Contact DO Standard
is shown as a dashed
(--- )
line
DO Shall Not Be Less Than 4.0 mg/L
ND
i6
N
ND = No Data
vW
r
i
Jan
Feb
Mar
Apr
May
Jun
Jul
Aug
Sep
Oct
Nov
Dec
FIGURE 6: DISSOLVED OXYGEN CONCENTRATION MEASURED HOURLY AT KINZIE STREET
ON THE NORTH BRANCH CHICAGO RIVER FROM JANUARY 2006 THROUGH DECEMBER 2006
15
IPCB Secondary Contact DO Standard
is shown as a dashed (- - -) line
DO Shall Not Be Less Than 4.0 mg/L
12
I
w
I
I
I
0
Jan
+
Feb
Mar
Apr
May
Jun
Jul
Aug
Sep
Oct
Nov
Dec
FIGURE 7: DISSOLVED OXYGEN CONCENTRATION MEASURED HOURLY AT CLARK STREET
ON THE CHICAGO RIVER FROM JANUARY 2006 THROUGH DECEMBER 2006
20 -
IPCB General Use DO Standard
is shown as a dashed (- - -)
line
DO Shall Not Be Less Than 5.0 mg(L
16
12
R
A
N
ND
ND = No Data
N
0
Jan
Feb
Mar
Apr
May
Jun
Jul
Aug
Sep
Oct
Nov
Dec
FIGURE 8: DISSOLVED OXYGEN CONCENTRATION MEASURED HOURLY AT LOOMIS STREET
ON THE SOUTH BRANCH CHICAGO RIVER FROM JANUARY 2006 THROUGH DECEMBER 2006
20
IPCB Secondary Contact DO Standard
is shown as a dashed (- - -)
line
DO Shall Not Be Less Than 4.0 mg/L
16
12
0
Jan+
---------------------------
Feb
Mar
Apr
May
Jun
Jul
Aug
Sep
Oct
Nov
Dec
FIGURE 9: DISSOLVED OXYGEN CONCENTRATION MEASURED HOURLY AT 36TH STREET
ON BUBBLY CREEK FROM JANUARY 2006 THROUGH DECEMBER 2006
IPCB Secondary Contact DO Standard
is shown as a dashed (--- ) line
DO Shall Not Be Less Than 4.0 mg/L
ND = No Data
--------- ---
N
ND
20
16
12
S
4
0
Jan
Feb
Mar
Apr
May
Jun
Jul
Aug
Sep
Oct
Nov
Dec
FIGURE 10: DISSOLVED OXYGEN CONCENTRATION MEASURED HOURLY AT INTERSTATE HIGHWAY 55
ON BUBBLY CREEK FROM JANUARY 2006 THROUGH DECEMBER 2006
Jan.
IPCB Secondary Contact DO Standard
is shown as a dashed (- - -) line
DO Shall Not Be Less Than 4.0 mg/L
Feb
Mar
Apr
May
Jun
Jul
Aug
Sep
Oct
Nov
Dec
FIGURE 11: DISSOLVED OXYGEN CONCENTRATION MEASURED HOURLY AT CICERO AVENUE
ON THE CHICAGO SANITARY AND SHIP CANAL FROM JANUARY 2006 THROUGH DECEMBER 2006
15
12
6
0
Jan
IPCB Secondary Contact DO Standard
is shown as a dashed (- - -) line
DO Shall Not Be Less Than 4.0 mg/L
ND - No Data
fig
I
NA
------------------
------
Feb
Mar
Apr
May
Jun
Jul
Aug
Sep
Oct
Nov
Dec
FIGURE 12: DISSOLVED OXYGEN CONCENTRATION MEASURED HOURLY AT B&O CENTRAL RAILROAD
ON THE CHICAGO SANITARY AND SHIP CANAL FROM JANUARY 2006 THROUGH DECEMBER 2006
15
IPCB Secondary Contact DO Standard
is shown
as a dashed (--- ) line
DO Shall Not Be Less Than 4.0 mg/L
12
i
11
I
R
a
0
Jan
Feb
Mar
Apr
May
Jun
Jul
Aug
Sep
Oct
Nov
Dec
FIGURE 13: DISSOLVED OXYGEN CONCENTRATION MEASURED HOURLY AT ROUTE 83
ON THE CHICAGO SANITARY AND SHIP CANAL FROM JANUARY 2006 THROUGH DECEMBER 2006
15
12
6
3
0
IPCB Secondary Contact DO Standard
is shown as a dashed (- _ -) line
DO Shall Not Be Less Than 4.0
mg/L
ND - No Data
ND
NA
ND
ND
k-
Nr
ND
N
Jan
Feb
Mar
Apr
May
Jun
Jul
Aug
Sep
Oct
Nov
Dec
FIGURE 14: DISSOLVED OXYGEN CONCENTRATION
MEASURED
HOURLY AT LOCKPORT
POWERHOUSE
ON THE CHICAGO SANITARY AND SHIP CANAL FROM JANUARY
2006 THROUGH DECEMBER 2006
IPCB Secondary Contact DO Standard
is shown as a dashed (- - -) line
DO Shall Not Be Less Than 4.0 mg/L
ND = No Data
0
Jan
Feb
Mar
Apr
May
Jun
Jul
Aug
Sep
Oct
Nov
Dec
FIGURE 15: DISSOLVED OXYGEN CONCENTRATION MEASURED HOURLY AT JEFFERSON STREET
ON THE DES PLAINES RIVER FROM JANUARY 2006 THROUGH DECEMBER 2006
20
IPCB Secondary Contact DO Standard
is shown as a dashed (- - -) line
DO Shall Not Be Less Than 4.0 mg/L
16
12
I
S
ppl
I
ND = No Data
Q
Jan
Feb
Mar
Apr
May
Jun
Jul
Aug
Sep
Oct
Nov
Dec
FIGURE 16: DISSOLVED OXYGEN CONCENTRATION MEASURED HOURLY AT TORRENCE AVENUE
ON THE GRAND CALUMET RIVER FROM JANUARY 2006 THROUGH DECEMBER 2006
IFCB Secondary Contact DO Standard
is shown as a dashed (- - -)
line
DO Shall Not Be Less Than 4.0 mg/L
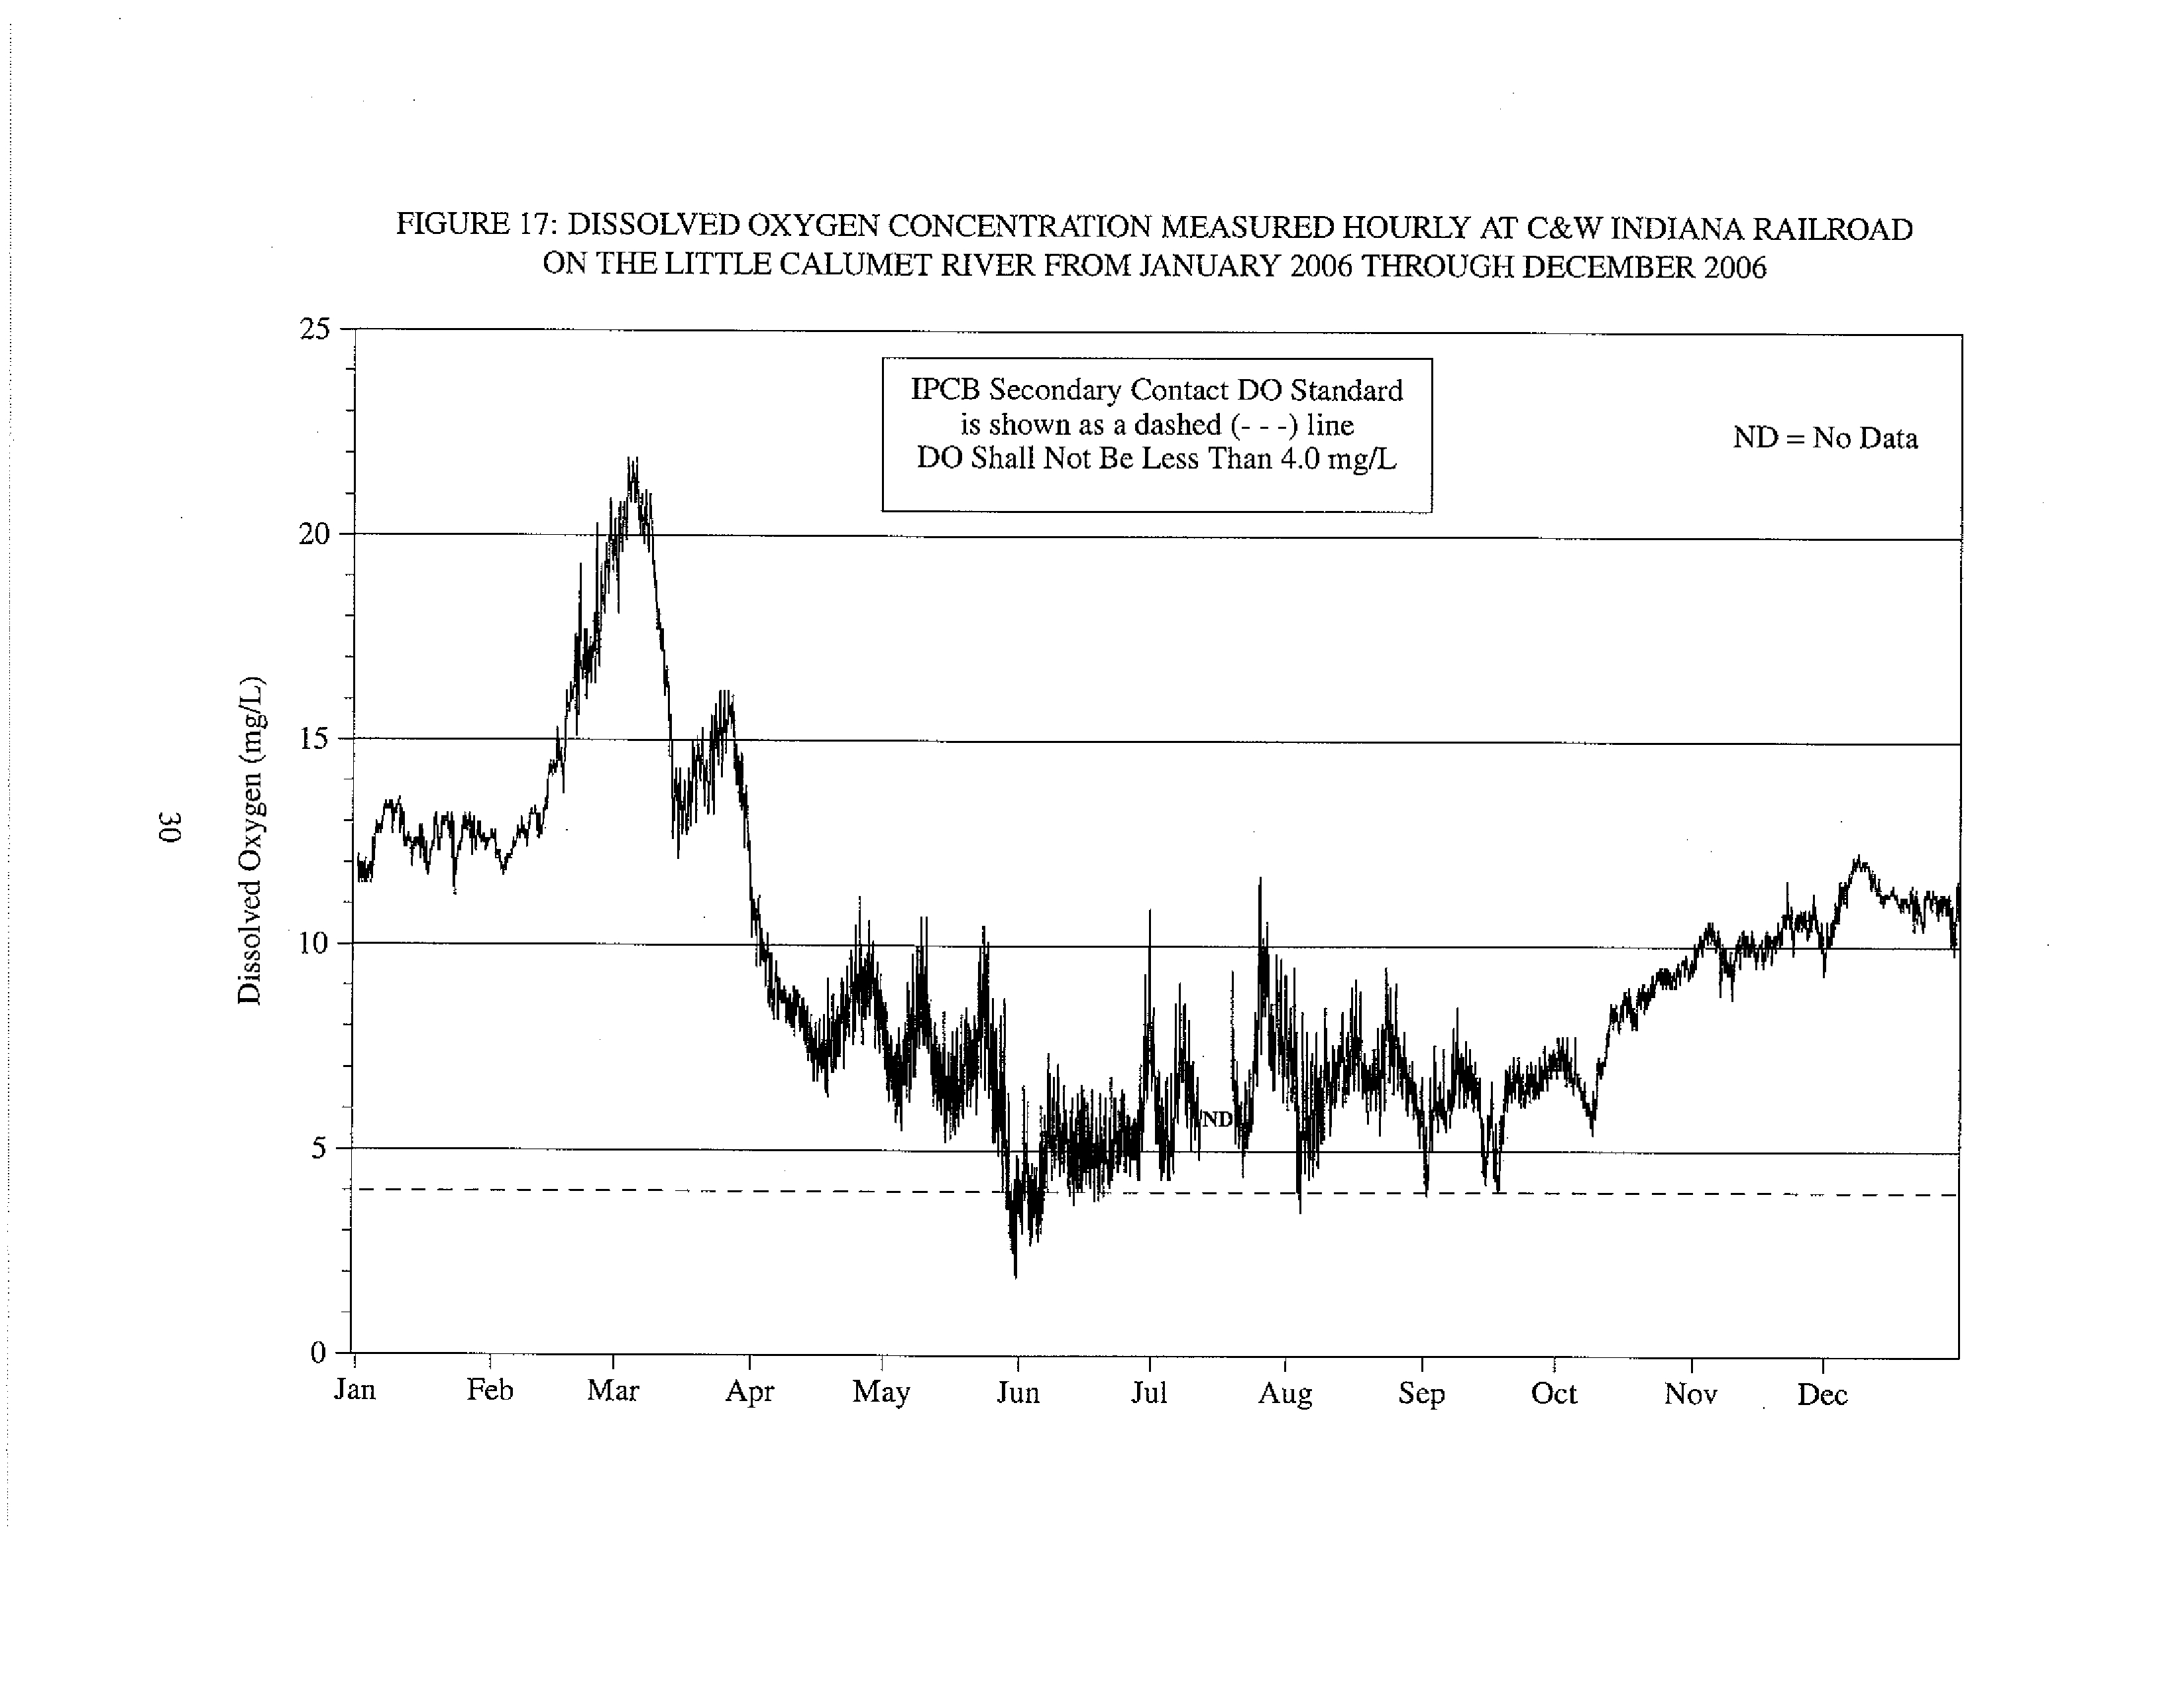
FIGURE 17: DISSOLVED OXYGEN CONCENTRATION MEASURED HOURLY AT C&W INDIANA RAILROAD
ON THE LITTLE CALUMET RIVER FROM JANUARY 2006 THROUGH DECEMBER 2006
25
20
5 15
A
5
0
A
IPCB Secondary Contact DO Standard
is shown as a dashed (--- ) line
DO Shall Not Be Less Than 4.0 mg/L
ND = No Data
ND
A
- - - - - - - - - - - - - - - -
Jan
Feb
Mar
Apr
May
Jun
Jul
Aug
Sep
Oct
Nov
Dec
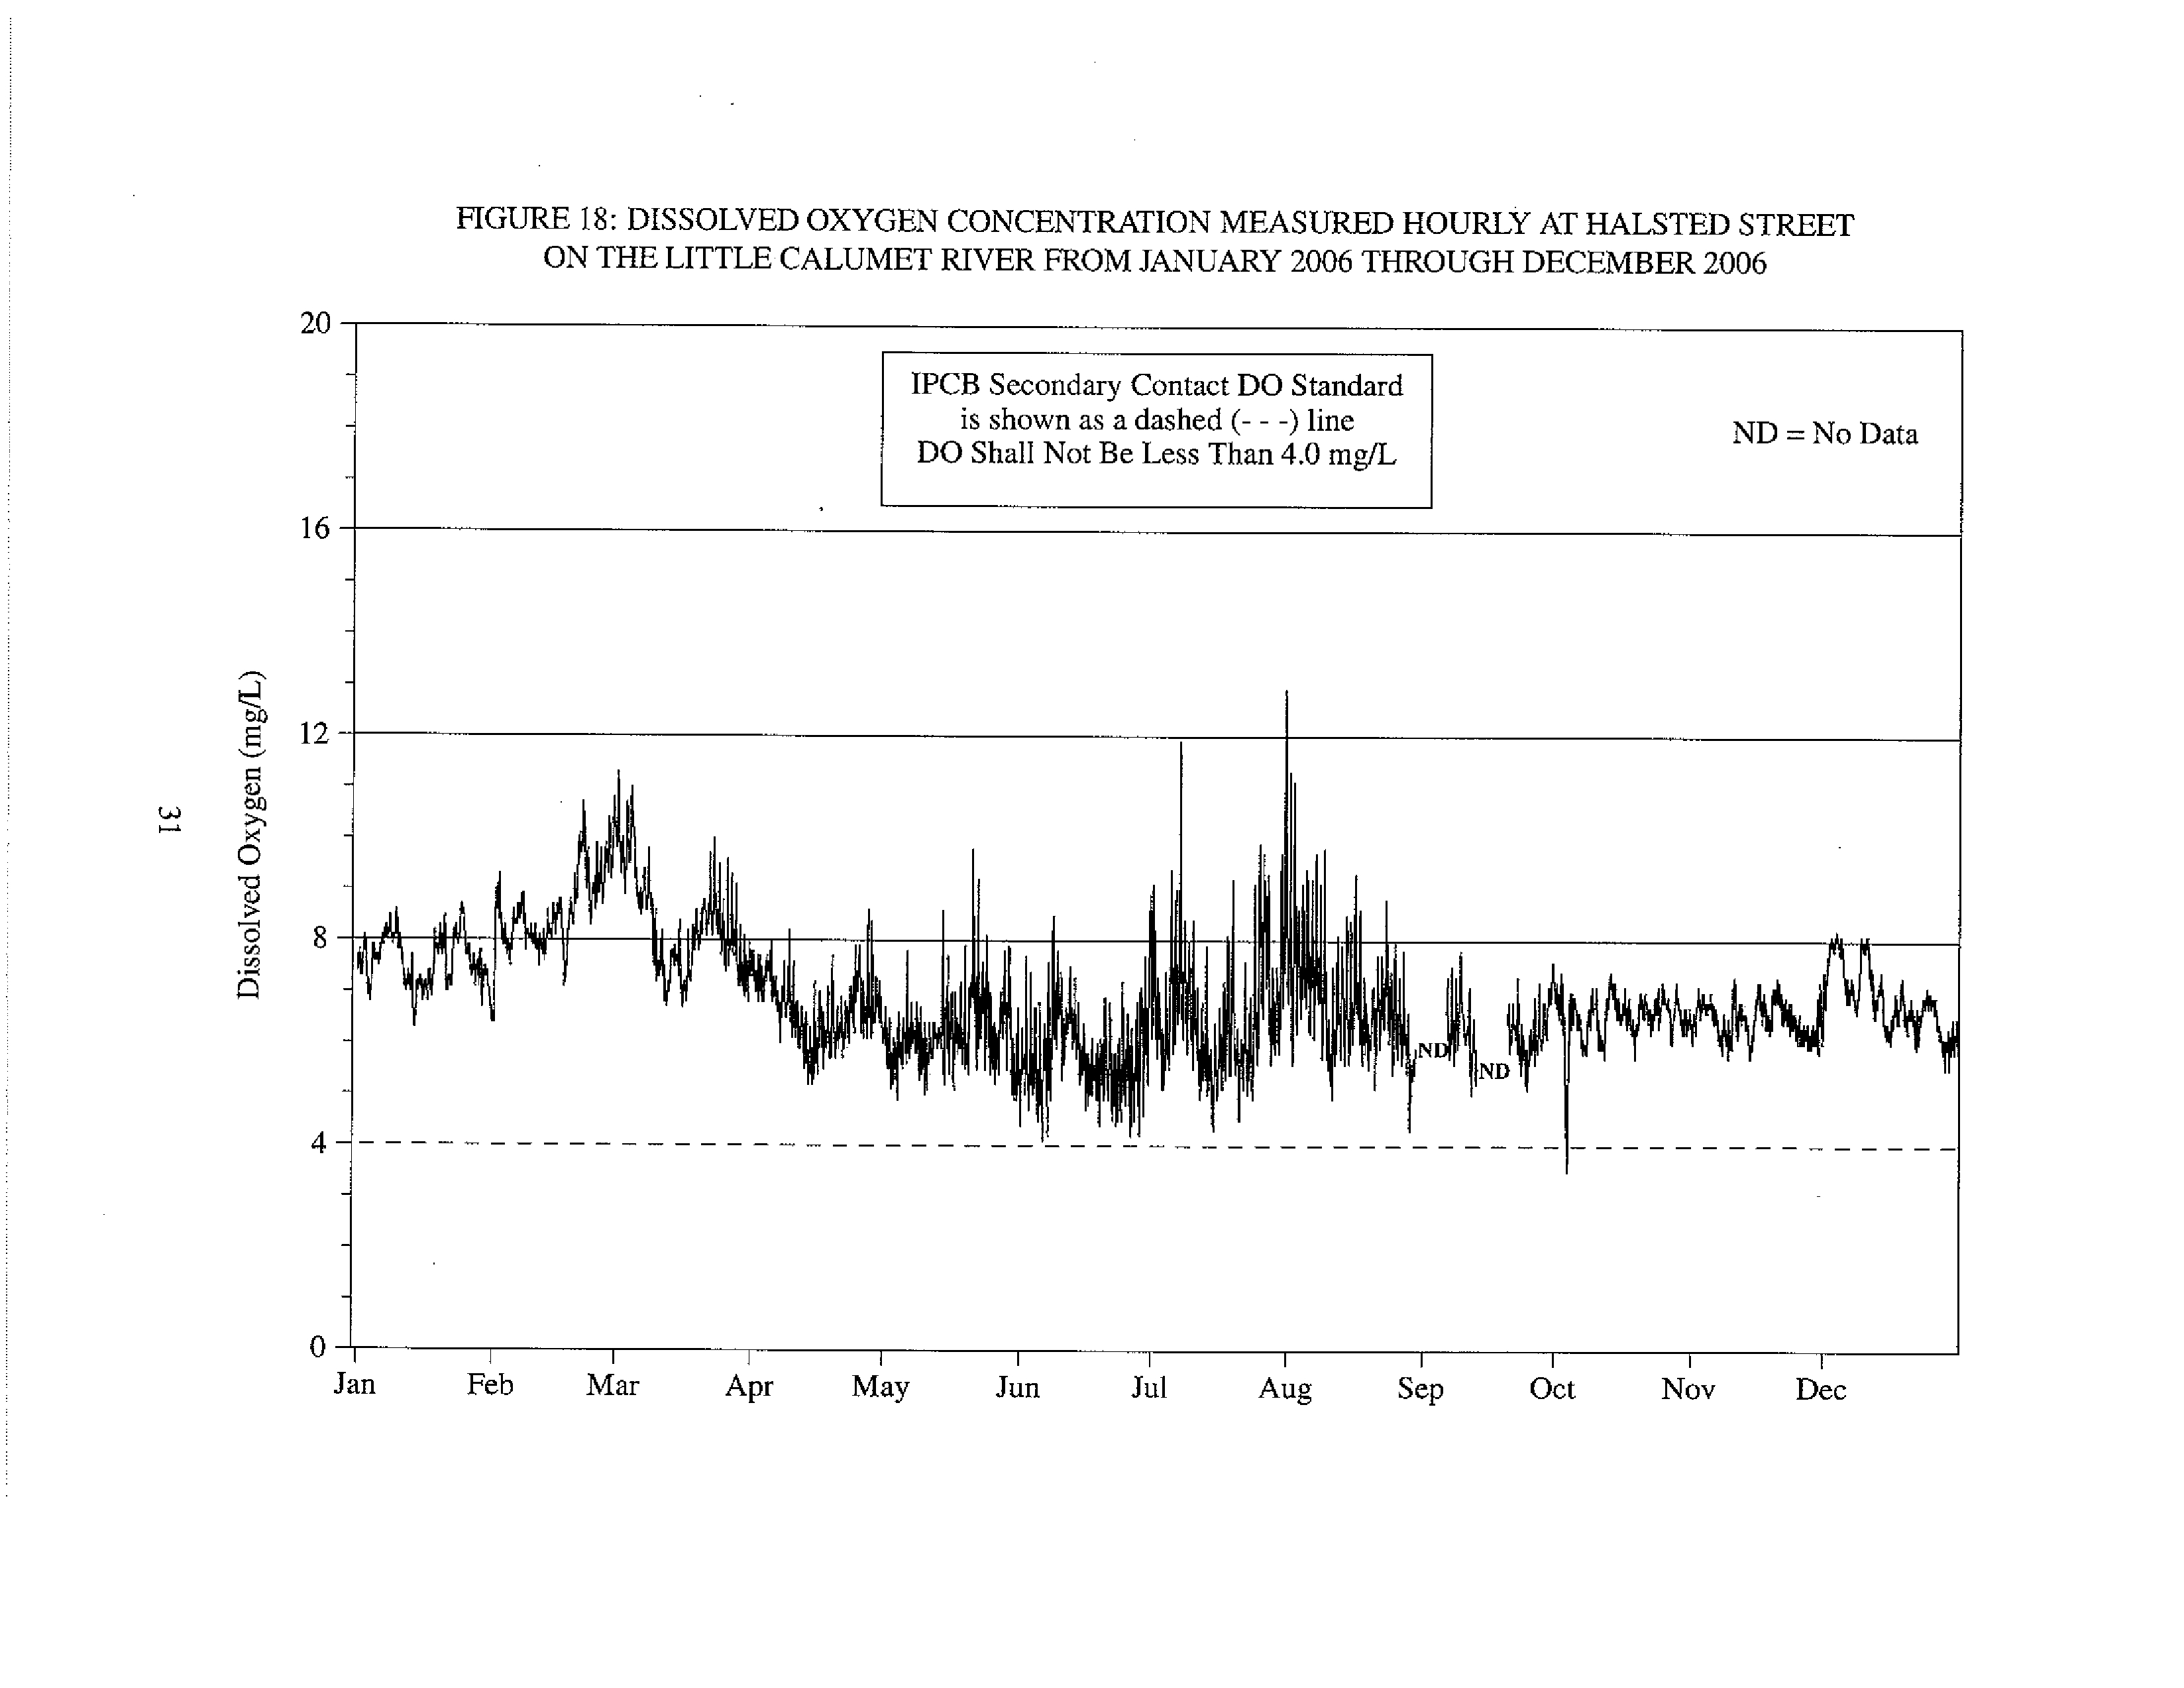
FIGURE 18: DISSOLVED OXYGEN CONCENTRATION MEASURED HOURLY AT HALSTED STREET
ON THE LITTLE CALUMET RIVER FROM JANUARY 2006 THROUGH DECEMBER 2006
20
16
12
8
4
0
IPCB Secondary Contact DO Standard
is shown as a dashed (- - -) line
DO Shall Not Be Less Than 4.0 mg/L
ND - No Data
,yT.1W.jrT ^
W" NO
ND
------------------------------
-------------------------------
------------
Jan
Feb
Mar
Apr
May
Jun
Jul
Aug
Sep
Oct
Nov
Dec
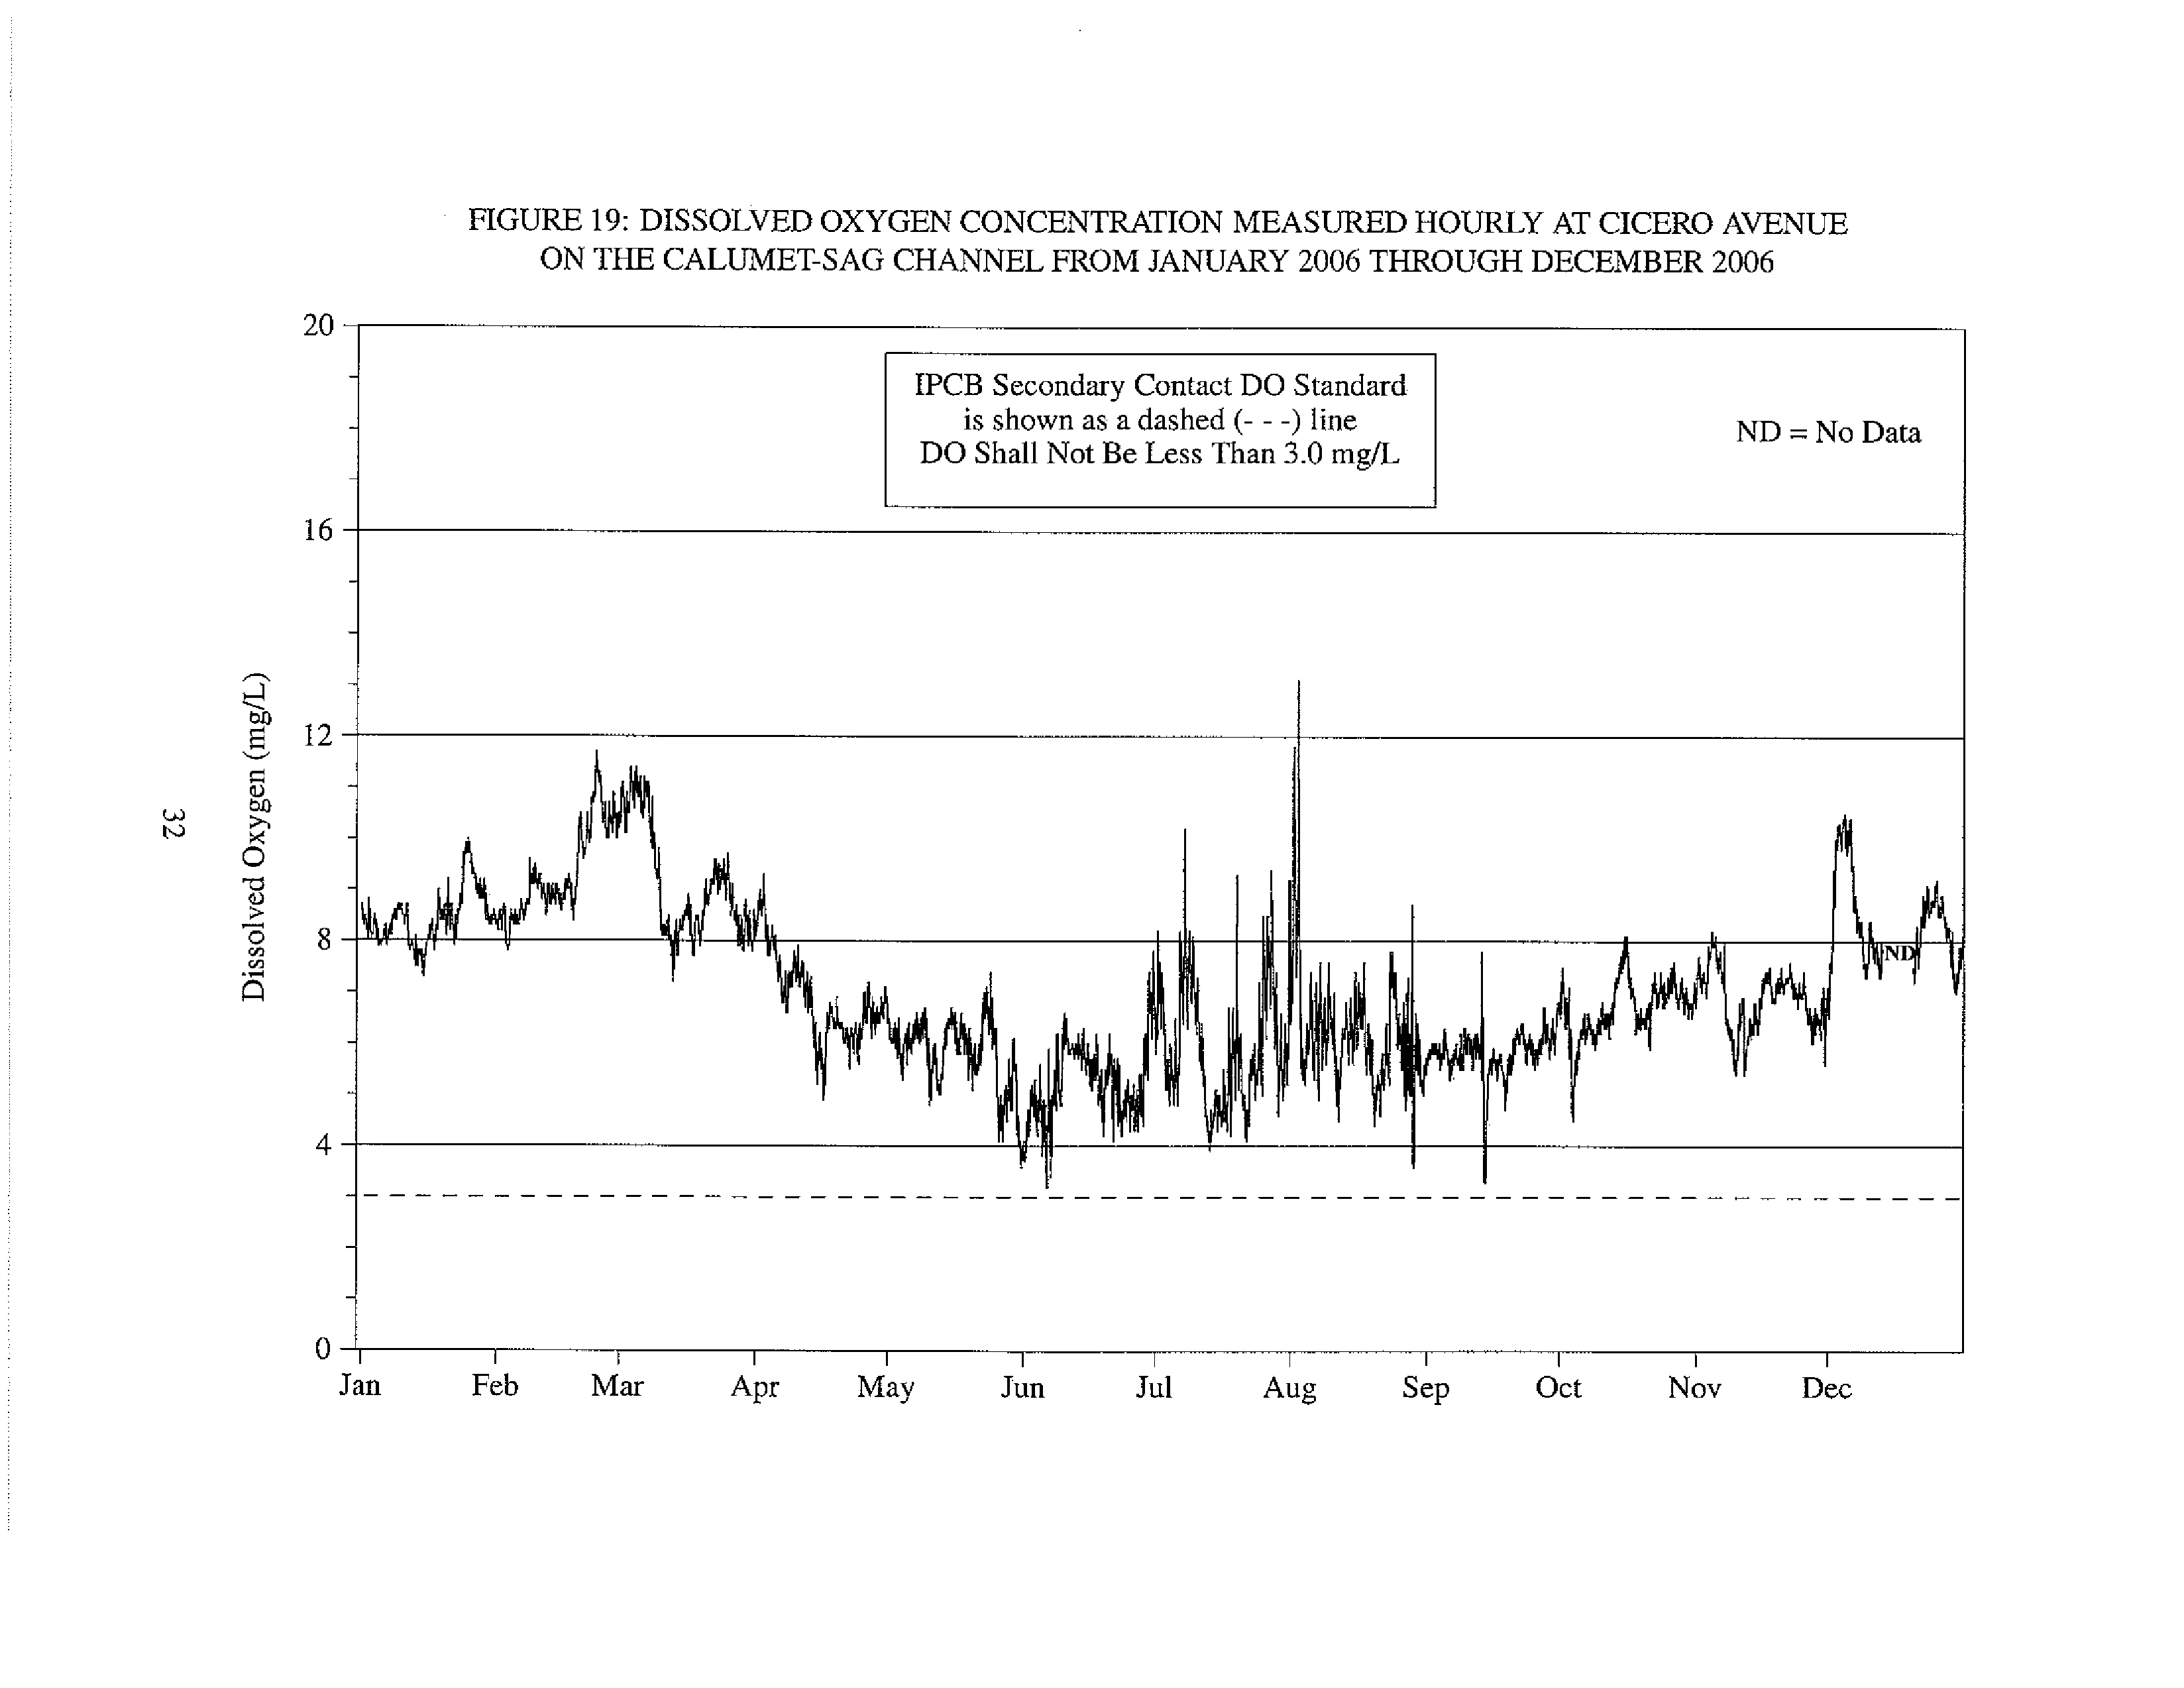
FIGURE 19: DISSOLVED OXYGEN CONCENTRATION MEASURED HOURLY AT CICERO AVENUE
ON THE CALUMET-SAG CHANNEL FROM JANUARY 2006 THROUGH DECEMBER 2006
20 -
IPCB Secondary Contact DO Standard
is shown as a dashed (- - -) line
DO Shall Not Be Less Than 3.0 mg/L
6
0
Q
0
0
ND = No Data
0
Jan
Feb
Mar
Apr
May
Jun
Jul
Aug
Sep
Oct
Nov
Dec
FIGURE 20: DISSOLVED OXYGEN CONCENTRATION MEASURED HOURLY AT 104TH AVENUE
ON THE CALUMET-SAG CHANNEL FROM JANUARY 2006 THROUGH DECEMBER 2006
20
16
12
8
4
0
IPCB Secondary Contact DO Standard
is shown as a dashed (- - -) line
DO Shall Not Be Less Than 3.0 mg/L
ND No Data
ND
^
ND
i
Al
km
ND
ND
ND
Jan
Feb
Mar
Apr
May
Jun
Jul
Aug
Sep
Oct
Nov
Dec
FIGURE 21:
DISSOLVED
OXYGEN CONCENTRATION
MEASURED
HOURLY AT ROUTE 83
ON THE CALUMET-SAG CHANNEL
FROM
JANUARY
2006 THROUGH DECEMBER 2006
20
IPCB Secondary Contact DO Standard
is shown as a dashed (- - -) line
DO Shall Not Be Less Than 3.0 mg/L
16
12
A
I
0
m+
h
ti
0
Jan
Feb
Mar
Apr
May
Jun
Jul
Aug
Sep
Oct
Nov
Dec
REFERENCES
Chapman, G., "Water Quality Criteria for Dissolved Oxygen," EPA 44015-86-003, United States
Environmental Protection Agency, Office of Water Regulations and Standards, Washington, D.C.,
1986.
Lanyon, R., "Description of the Chicago Waterway System," Use Attainability Analysis Study
Conducted by Illinois Environmental Protection Agency in Cooperation with Metropolitan Water
Reclamation District of Greater Chicago, Illinois, May 2002.
35
APPENDIX A
WEEKLY DO SUMMARY STATISTICS AT ALL DEEP-DRAFT
MONITORING STATIONS DURING 2006
TABLE A-1: WEEKLY DO SUMMARY STATISTICS AT MAIN STREET
ON THE NORTH SHORE CHANNEL DURING 2006
Number of
DO Concentration
(mg/L)
Percent DO
Values Above
Monitoring Dates
DO Values
Minimum
Maximum
Mean
1PCB Standard
01/01/06
-
01/01/06
24
6.1
6.8
6.4
100
01/02/06
-
01
/
08/06
168
4.8
7.9
6.2
98
01/09/06 - 01/15/06
168
6.0
8.8
7.5
100
01/16/06
- 01/22/06
168
7.0
9.6
8.5
100
01/23/06 -
01/29
/
06
168
6.4
11.9
9.4
100
01130/06 - 02
/
05/06
167
8.8
25.0
15.3
100
02/06/06 - 02/12/06
168
21.2
33.4
29.0
100
02/13/06 -
02/19/
06
168
13.6
31.4
22.7
100
02/20/06
- 02/26/06
168
15.2
23.7
19.5
100
02/27
/
06 - 03
/
05/06
168
16.3
31
.
6
26.7
100
03/06/06 - 03/12/06
168
7.4
21.0
13.3
100
03/13/06 - 03/19/06
168
7.9
15.4
12.7
100
03/20/06 - 03/26/06
168
13.3
21.1
16.1
100
03/27/06 - 04/02/06
167
5.5
13.1
9.1
100
04/03/06 -
04/09/06
167
2.9
7.1
5.4
64
04/10/06 - 04/16/
06
168
5.9
143
8.0
100
04/17106 - 04/23/
06
168
4.4
11.0
6.7
94
04/24/06 - 04
/
30/06
168
4.9
11,6
8.2
99
05/01/06 - 05/07/06
168
5.0
9.3
7.5
100
05/08/06 - 05/14/06
167
7.6
10.6
9.1
100
05/15
/
06 -
05
/
21/06
168
7.9
10
.
3
9.4
100
05/22
/
06 - 05/28/06
168
7.3
11.2
9.6
100
05129/06 - 06/04/06
168
7.0
11.7
9.7
100
06/05
/
06
- 06/11/06
168
3.5
10.1
8.2
88
06/12/06 - 06/18
/
06
168
5.2
8.6
7.6
100
06/19/06 - 06
/
25/06
169
4.5
8.8
7.6
99
06/26
/
06 - 07
/
02/06
168
5.0
8.3
6.7
100
07/03/06 - 07/09/06
168
5.4
9.1
7.2
100
07/10/06 - 07/16106
168
5.4
9.8
7.3
100
07/17/06 - 07/23/06
37
6.6
7.7
73
100
07/24/06 - 07/30/06
131
4.9
9.9
7.4
99
07/31/06 - 08/06/06
37
6.7
10.4
8.9
100
08/07/06 - 08/13/06
130
7.3
9.1
8.1
100
TABLE A-1 (Continued): WEEKLY DO SUMMARY STATISTICS AT
MAIN STREET ON THE NORTH SHORE CHANNEL DURING 2006
Number of
DO Concentration (mg/L)
Percent DO
Values Above
Monitoring Dates
DO Values
Minimum
Maximum
Mean
IPCB Standard
08/14/06 - 08/20/06
168
4.8
8.4
7.1
98
08/21/06
- 08/27/06
168
4.4
7.8
6.4
93
08/28/06 - 09/03/06
168
5.1
8.1
6.9
100
09/04/06 - 09/10/06
168
5.3
8.2
7.0
100
09/ 11 /06
- 09/17/06
168
0.4
7.0
5.2
58
09/18106 - 09/24/06
168
4.6
9.1
6.6
97
09/25106 - 10/01/06
85
0.2
8.9
6.6
75
10/02106 - 10/08/06
NO DATA
10/09/06 - 10/15/06
131
5.5
9.0
6.9
100
10/16/06 - 10/22/06
168
2.8
6.1
4.4
21
10/23/06 - 10/29/06
168
4.0
6.7
4.9
39
10/30/06 - 11/05106
169
4.6
14.4
8.9
93
11/06/06 - 11/12/06
168
8.3
19.8
13.9
100
11/13/06 - 11/19/06
168
7.0
19.8
14.5
100
11/20/06
- 11/26/06
168
14.0
20.1
17.2
100
11/27/06 - 12/03/06
168
OA
18.4
7.4
59
12/04/06 - 12/10/06
168
0.0
6.2
2.1
5
12/11/06 - 12/17/06
168
3.7
8.7
6.7
91
12/18/06 - 12/24/06
168
4.7
11.3
8.2
98
12/25/06 - 12/31/06
168
4.1
7.1
5.3
58
TABLE A-2: WEEKLY DO SUMMARY STATISTICS AT FOSTER AVENUE
ON THE NORTH SHORE CHANNEL DURING 2006
Number of
DO Concentration (mg/L)
Percent DO
Values Above
Monitoring Dates
DO Values
Minimum
Maximum
Mean
/
PCB Standard
01/01/06
- 01/01/06
24
8.2
9.5
8.6
100
01/02/06
-
01/08
/
06
168
7.2
9.6
8.4
100
01/09/06 -
01/15/
06
168
6.4
9.6
8.4
100
01/16/06
- 01/22/
06
168
7.0
9.6
8.5
100
01/23/06
-
01/29/06
168
6.3
9.8
8,7
100
01/30/06
-
02/05
/
06
168
6.6
9.4
8.5
100
02/06/06
-
02/12
/
06
168
7.6
9.9
8.8
100
02/13/06
- 02/19/06
168
6.7
11.
2
9.0
100
02/20/06
- 02/26/06
168
8.1
11.1
8.9
100
02/27/
06 -
03/05
/
06
38
8.3
8.9
8.5
100
03/06/06 -
03/12/06
131
6.7
9.6
8.3
100
03/13/06
-
03
/
19/06
168
6.2
9.4
8.4
100
03/20/06 -
03/26/06
168
7.3
10.5
8.2
100
03/27/06 -
04/02/06
167
6.0
9.3
8.1
100
04/03
/
06 - 04/09
/
06
167
6.8
9.6
8.3
100
04/10/06
-
04/16/06
168
6.4
8.7
7.8
100
04/17/06 -
04/23/06
168
5.6
9.7
7.9
100
04/24/06
-
04/30/06
168
5.9
9.5
7.4
100
05/01/06 -
05/07/06
168
5.3
8.8
7.5
100
05/08/06
- 05
/
14/06
168
6.5
8.9
7.7
100
05/15/06 - 05
/
21/06
168
6.7
9
.
6
8.0
100
05/22/06
- 05/28/06
168
4.5
8.5
7.3
100
05/29/06
- 06/04106
168
4.0
9.1
7.4
99
06/05
/
06 - 06
/
11/06
168
5.2
8.4
7.5
100
06/12/06
- 06
/
18/06
168
5.7
8.5
7.5
100
06/19/06 - 06/25
/
06
168
6.0
8.2
7.3
100
06/26
/
06 -
07
/
02/06
168
6.1
8.0
7.1
100
07/03/06 -
07/09/06
168
5.7
8.2
7.4
100
07/10/06
-
07/16/06
168
5.8
8.1
7.4
100
07/17/06
- 07
/23/06
168
6.5
7.9
7.1
100
07/24/06
- 07/30/06
168
6.0
7.9
7.2
100
07/31/06
- 08/06/06
168
5
.7
8.3
7.3
100
08/07/06
- 08
/
13/06
168
5,9
8.3
7.3
100
TABLE A-2 (
Continued
):
WEEKLY DO SUMMARY STATISTICS AT
FOSTER AVENUE ON THE NORTH SHORE CHANNEL DURING 2006
Number of
DO Concentration (mg/L)
Percent DO
Values Above
Monitoring Dates
DO Values
Minimum
Maximum
Mean
IPCB Standard
08/14/06
- 08/20/06
168
5.4
8.0
7.1
100
08/21/06 - 08/27/06
168
5.6
8.2
7.3
100
08/28/06 - 09/03/06
168
5.3
8.1
7.1
100
09/04/06 - 09/10/06
167
5.0
8.3
7.1
100
09/11/06 - 09/17/06
168
5.6
8.0
6.9
100
09/18/06
- 09/24/06
168
5.0
7.6
7.0
100
09/25/06 - 10/01/06
168
4.5
8.5
7.0
100
10/02/06 - 10/08/06
168
4.7
7.5
6.4
100
10/09/06 - 10/15/06
168
5.5
7.8
6.9
100
10/16/06
- 10/22/06
168
53
7.7
6.7
100
10/23/06
- 10/29/06
168
5.9
8.8
7.2
100
10/30/06 - 11/05/06
169
6.5
8.6
7.4
100
11/06/06 - 11/12/06
168
5.9
8.5
7.5
100
11/13/06 - 11/19/06
168
6.9
8.6
7.6
100
11/20/06 - 11/26/06
168
7.2
9.1
7.9
100
11/27/06 - 12/03/06
168
5.6
9.1
7.8
100
12/04106
- 12/10/06
37
7.5
8.7
8.1
100
12/11/06 - 12/17/06
132
7.4
8.8
8.1
100
12/18/06
- 12/24/06
168
6.9
9.3
8.4
100
12/25/06
- 12/31/06
168
6.6
9.3
8.2
100
TABLE A-3: WEEKLY DO SUMMARY STATISTICS AT ADDISON STREET
ON THE NORTH BRANCH CHICAGO RIVER DURING 2006
Number of
DO Concentration (mg/L)
Percent DO
Values Above
Monitoring Dates
DO Values
Minimum
Maximum
Mean
IPCB Standard
01/01/06
-
01/01/06
24
8.7
9.7
9.1
100
01/02/06 - 01/08/06
168
7.7
10.0
9.0
100
01/09/06 -
01/15/06
168
6.4
10.0
8.5
100
01/16/06 - 01/22/06
168
7.2
9.8
8.7
100
01/23/06 - 01/29/06
168
7.3
9.7
9.0
100
01/30/06 -
02/05/06
168
7.5
10.3
9.4
100
02/06/06 - 02/12/06
168
8.3
10.1
9.2
100
02/13/06 - 02/19/06
168
8.0
12.0
9.8
100
02/20/06 - 02/26/06
167
8.8
11.1
9.6
100
02/27/06 -
03/05/06
168
8.0
9.3
8.6
100
03/06/06 - 03/12/06
168
6.7
10.3
8.8
100
03/13/06 - 03/19/06
168
7.5
10.6
9.7
100
03/20/06 - 03/26/06
168
8.5
11.0
9.4
100
03/27/06 - 04/02/06
168
7.4
9.5
8.4
100
04/03/06 - 04/09/06
168
7.1
10.0
9.0
l00
04/10/06 - 04/16106
168
6.1
9.0
8.0
100
04/17/06
-
04/23106
168
6.2
9.1
7.7
100
04/24/06 - 04/30/06
167
5.6
8.7
6.9
100
05/01/06 - 05/07/06
168
6.4
8.4
7.4
100
05/08/06 - 05/14/06
168
6.2
8.6
7.3
100
05/15/06 - 05/21/06
168
6.1
8.9
7.5
100
05/22/06 - 05/28/06
36
6.4
7.5
7.0
100
05/29/06
-
06/04/06
133
2.9
7.6
6.3
97
06/05/06 - 06/11/06
168
5.4
7.6
6.7
100
06/12/06
- 06/18/06
168
5.0
7.6
6.6
100
06/19/06 - 06/25/06
168
5.2
7.3
6.3
100
06/26/06 - 07/02/06
169
2.9
7.5
6.3
99
07/03/06 - 07/09/06
168
4.7
7.6
6.6
100
07/10/06 - 07/16/06
168
5.1
7.4
6.5
100
07/17/06 - 07/23/06
168
4.3
7.1
6.2
100
07/24/06 - 07130/06
168
5.1
7.0
6.4
100
07/31/06 - 08/06/06
169
0.0
7.4
6.2
98
08/07/06 -
08/13/06
168
4.8
7.6
6.4
100
TABLE A-3 (Continued): WEEKLY DO SUMMARY STATISTICS AT
ADDISON STREET ON THE NORTH BRANCH CHICAGO RIVER DURING 2006
Number of
DO Concentration
(
mg/L)
Percent DO
Values Above
Monitoring Dates
DO Values
Minimum
Maximum
Mean
IPCB Standard
08/14/06 - 08/20/06
168
5.0
7.4
6.5
100
08/21/06
- 08/27
/
06
168
5.5
7.6
6.9
100
08/28
/
06 - 09
/
03/06
168
4.6
7.4
6.5
100
09/04
/
06 - 09/10
/
06
168
5.5
7.9
6.8
100
09/11
/
06 - 09
/
17/06
168
6.2
8.2
7.1
100
09/18
/
06 - 09
/
24/06
168
4.9
79
6.9
100
09/25
/
06 - 10/01
/
06
168
5.2
8.2
6.9
100
10/02
/
06 - 10/08/06
168
5.8
7.5
6.9
100
10/09/06
-
10/15/06
168
5.5
8.3
7.0
100
10/16/06 - 10
/
22/06
168
5.4
8.0
7.1
100
10/23/06 - 10
/
29/06
168
6.4
8.8
7.6
100
10/30/06
-
11/05/06
169
6.9
8.4
7.6
100
11/06/06 - 11
/
12/06
168
6.3
9.1
7.4
100
11/13/06 - 11
/
19/06
168
7.3
8.7
8.0
100
11/20/06
-
11/26/06
168
7.2
8.9
7.9
100
11/27/06 - 12/03/06
168
6.0
10.1
8.4
100
12/04/06
-
12/10/06
168
8.7
10.9
9.6
100
12/11/06 - 12/17/06
169
7.9
10.5
9.3
100
12/18/06 - 12/24/06
168
7.6
10.4
9.4
100
12/25/06 - 12/31/06
168
7.4
10.4
9.4
100
TABLE A-4: WEEKLY DO SUMMARY STATISTICS AT FULLERTON AVENUE
ON THE NORTH BRANCH CHICAGO RIVER DURING 2006
Number of
DO Concentration (mg/L)
Percent DO
Values Above
Monitoring Dates
DO Values
Minimum
Maximum
Mean
IPCB Standard
01/01/
06 - 01/01/06
24
8.3
9.6
9.1
100
01/02/06
-
01/08/06
168
7
.
7
9.7
8.8
100
01/09/06
- 01/15/06
168
6.2
9.5
8.1
100
01/16/06
-
01/22/06
168
6.7
83
8.0
100
01/23/06 - 01
/
29/06
168
6.2
9.4
8.5
100
01/30/06 - 02/05/06
167
7.1
10.0
9.1
100
02/06
/
06
- 02
/
12/06
168
8.5
10.2
9.3
100
02/13/06 - 02/19/06
168
7.0
11.0
9.0
100
02/20
/
06 - 02
/
26/06
168
8.6
11.0
9.4
100
02/27/06 - 03/05/06
168
8.0
9.4
8.6
100
03/06
/
06 - 03
/
12/06
168
6.1
9.8
8.4
100
03113/06 - 03
/
19/06
168
6.3
9
.
9
9.1
100
03/20
/
06
- 03
/
26/06
168
4
.
2
10.4
8.0
100
03/27
/
06 - 04
/
02/06
168
3.4
9.0
7.6
98
04/03/06 - 04/09/06
167
5.6
9.8
8.5
100
04/10/06 - 04
/
16/06
168
6.1
8.5
7.5
100
04/17/06 - 04/23/
06
168
4.2
7.8
6.2
100
04/24/06
- 04/30/06
168
3.6
7.8
6.2
97
05/01/06 - 05
/
07/06
168
5.9
7.8
6.7
100
05/08
/
06 - 05
/
14/06
36
5.6
6.8
6.2
100
05/15/06
-
05/21
/
06
132
5.8
7.9
6.8
100
05/22
/
06 - 05
/
28/06
168
3.4
7.2
6.0
98
05/29
/
06 - 06
/
04/06
168
2.2
6.6
5.4
97
06/05/06
- 06
/
11/06
168
4.4
7.2
5.8
100
06112
/
06 - 06
/
18/06
168
4.0
6.9
5.6
100
06/19
/
06 - 06/25
/
06
168
3.9
6.3
5.5
99
06/26/06 - 07/02/06
168
1.7
7.1
5.5
98
07/03
1
06
-
07
/
09/06
168
3
.
9
6.5
5.6
99
07/10/06 - 07/16/06
168
44
6.7
5.8
100
07/17/06 - 07/23/06
167
2.8
6.3
5.4
98
07/24/06 - 07/30106
168
4.7
6.2
5.5
100
07/31/06 - 08/06
/
06
168
0.0
6.3
5.1
91
08/07/06 - 08/13/06
36
3.3
5.2
4.4
78
TABLE A-4 (Continued): WEEKLY DO SUMMARY STATISTICS AT
FULLERTON AVENUE ON THE NORTH BRANCH CHICAGO RIVER DURING 2006
Number of
DO Concentration (mg/L)
Percent DO
Values Above
Monitoring Dates
DO Values
Minimum
Maximum
Mean
IPCB Standard
08/14/06 - 08
/
20/06
132
4.7
6.3
5.6
100
08/21/06
- 08/27/06
168
4.8
73
6.2
100
08/28
1
06
- 09
/
03/06
168
3.0
6.8
5.8
98.
09/04
/
06 - 09
/
10/06
167
5.0
7,0
6.0
100
09/11/06
- 09/17/06
168
3
.
4
7.2
6.0
99
09/18/06
- 09/24/06
168
3.7
7.5
6.0
98
09/25/06 - 10/01/06
168
4.7
7.5
6.5
100
10/02/06 - 10/08
/
06
168
4.9
7.5
6.5
100
10/09/06
-
10/15/06
168
5.4
7.8
6.7
100
10/16/06 - 10/22/06
168
4.9
7.3
6.5
100
10/23
/
06 - 10/29/06
168
6.1
8.1
7.3
100
10/30/06 - 11/05/06
169
6.4
7.9
7.2
100
11/06/06 - 11/12/06
168
5.7
8.7
7.0
100
11/13/06 - 11/19/06
168
7.0
8.2
7.6
100
11/20/06 - 11/26/06
168
6.7
8.3
7.4
100
11/27/06 - 12/03/06
168
4.9
9.8
8.0
100
12/04/06
-
12/10/06
168
8.4
10.1
9.3
100
12/11/06 - 12/17/06
169
7.4
9
.8
8.8
100
12/18/06 - 12/24
/
06
168
7.3
10.1
8.9
100
12/25/06 - 12/31/06
168
7.5
10
.1
9.1
100
TABLE A-5: WEEKLY DO SUMMARY STATISTICS AT KINZIE STREET
ON THE NORTH BRANCH CHICAGO RIVER DURING 2006
Number of
DO Concentration
(mg/L)
Percent DO
Values Above
Monitoring Dates
DO Values
Minimum
Maximum
Mean
IPCB Standard
01/01/06
-
01/01/06
24
6.6
8.4
7.6
100
01/02
/
06
- 01/08
/
06
168
6.9
9.2
8.4
100
01/09/06 - 01/15/06
167
6.6
8.7
7.7
100
01/16/06
-
01/22/06
168
6.6
9.0
8.0
100
01/23/06
- 01/29/06
168
6.6
9.6
8.4
100
01/30/06
-
02/05
/
06
168
6.0
9.3
8.3
100
02/06
/
06
- 02
/
12/06
168
8.1
9.5
9.0
100
02/13/06
- 02/19/06
168
7.7
11.7
9.3
100
02/20/06 - 02
/
26/06
168
8.6
11A
9.6
100
02/27/
06 - 03
/
05/06
168
7.9
9.1
8.5
100
03/06
/
06 - 03
/
12/06
168
6.5
9.6
8.3
100
03/13106 - 03
/
19/06
168
6.7
9.9
9.1
100
03/20/06
-
03/26
/
06
168
7.1
10.0
8.6
100
03/27/06
- 04/02/06
168
6.3
7.9
7.2
100
04/03/06 - 04/09/06
167
5.3
10.0
8.0
100
04/10/06
- 04/16/06
168
6
.
6
9.1
7.9
100
04/17
/
06 - 04
/
23/06
168
4.1
9.2
7.0
100
04/24/06 - 04
/
30/06
168
2.9
8.6
6.6
86
05/01/06 - 05/07
/
06
168
5.6
8.0
6.6
100
05/08/06 - 05/14/06
168
5.3
7.3
6.3
100
05/15106 - 05/21/06
168
5.5
7.3
6.5
100
05/22/06 - 05/28/06
168
4.9
7.2
6.0
100
05/29
/
06 - 06
/
04/06
168
4.0
6
.
5
5.5
100
06/05
/
06 - 06
/
11/06
168
4.5
6.9
5.9
100
06/12
/
06 - 06
/
18/06
168
4.3
6
.
8
5.7
100
06/19/06 - 06/25/06
168
4.4
6.1
5.5
100
06/26/06
- 07/02/06
168
3.7
6.7
5.6
98
07/03/06 - 07/09/06
168
3.8
6.6
5.7
99
07/10/06 - 07/16/06
168
3.7
6.7
5.8
99
07/17/06 - 07/23
/06
168
1.3
6.6
. 5.3
92
07/24/06 - 07/30/
06
168
4.6
6.2
5.5
100
07/31/06 - 08/06
/
06
168
0.8
6.8
4.9
82
08/07/06 - 08/13/06
168
3.9
6.6
5.5
99
TABLE A-5 (Continued): WEEKLY DO SUMMARY STATISTICS AT
KINZIE STREET ON THE NORTH BRANCH CHICAGO RIVER DURING 2006
Number of
DO Concentration (mg/L)
Percent DO
Values Above
Monitoring Dates
DO Values
Minimum
Maximum
Mean
IPCB Standard
08/14/06 - 08/20/06
168
4.2
63
5.5
100
08121/06 - 08/27/06
168
4.5
6.9
5.7
100
08/28/06 - 09/03/06
168
2.2
6.2
4.8
84
09/04/06 - 09/10/06
168
4.4
7.0
6.1
100
09/11/06 - 09/17/06
168
4.3
7.1
5.9
100
09/18/06 - 09/24/06
168
3.2
7.2
5.5
93
09/25/06- 10/01/06
168
4.7
7.5
6.3
100
10/02/06- 10/08/06
168
4.7
7.1
6.0
100
10/09/06 - 10/15/06
168
4.6
82
6.4
100
10/16/06- 10/22/06
168
5.4
7.8
6.4
100
10/23/06- 10/29/06
168
5.3
7.5
6.5
100
10/30/06- 11/05/06
169
5.9
7.5
6.6
100
11/06/06 - 11/12/06
168
5.6
79
6.6
100
11/13/06 - 11/19/06
168
6.9
7.8
7.4
100
11/20/06 - 11/26/06
168
6.6
8.3
73
100
11/27/06 - 12/03/06
167
4.8
9.8
7.7
100
12/04/06 - 12/10/06
168
8.2
10.8
9.2
100
12/11/06 - 12/17/06
168
7.3
9.2
8.4
l00
12/18/06 - 12/24/06
168
7.2
9.9
8.3
100
12/25/06 - 12/31/06
168
7.5
9.8
8.7
100
TABLE A-6: WEEKLY DO SUMMARY STATISTICS AT CLARK STREET
ON THE CHICAGO RIVER DURING 2006
Number of
DO Concentration (mg/L)
Percent DO
Values Above
Monitoring Dates
DO Values
Minimum
Maximum
Mean
IPCB Standard
01/01/06
- 01101106
24
9.5
10.1
9.8
100
01/02/06 -
01/08/06
168
8.5
10.1
9.3
100
01/09/06 - 01/15/06
168
7.9
10.0
8.9
100
01/16/06 - 01/22/06
168
8.1
10.2
9.5
100
01/23/06 - 01/29/06
168
8.1
11.0
9.9
100
01/30/06 - 02/05/06
168
7.1
10.4
9.0
100
02/06/06 - 02112/06
168
9.5
11.7
10.6
100
02/13/06 - 02/19/06
168
9.5
11.6
10.4
100
02/20/06 - 02/26/06
168
10.5
12.8
11.5
100
02/27/06
- 03/05/06
168
10.8
12.6
11.6
100
03106/06 - 03/12/06
168
8.2
12.1
10.3
100
03/13/06 - 03/19/06
168
7.3
10.1
9.0
100
03/20/06 - 03/26/06
168
89
10.3
9.6
100
03/27/06
-
04/02/06
168
8.7
9.8
9.3
100
04/03/06 - 04/09/06
167
6.7
10.5
9.2
100
04/10/06 - 04/16/06
168
7.8
10.0
9.0
100
04/17/06 - 04/23/06
168
6.9
9.9
8.6
100
04/24/06 - 04/30/06
168
6.5
9.5
8.4
100
05/01/06 - 05/07/06
168
6.5
9.5
8.1
100
05/08/06 - 05/14/06
168
7.1
10.0
8.9
100
05/15/06 - 05/21/06
168
7.8
9.5
8.4
100
05/22/06 - 05/28/06
168
6.9
10.5
9.0
100
05/29/06 - 06/04/06
168
7.5
10.7
9.3
100
06/05/06 - 06/11/06
168
6.8
10.5
9.3
100
06/12/06 -
06/18/06
168
7.1
8.7
8.2
100
06/19/06
-
06/25/06
168
7.8
9.4
8.7
100
06/26/06 -
07/02/06
35
8.1
8.9
8.5
100
07/03/06 - 07/09/06
109
7.7
8.7
8.3
100
07/10/06
-
07/16/06
168
7.9
9.3
8.6
100
07/17/06
- 07/23/06
168
7.0
8.7
7.8
100
07/24/06 -
07/30/06
35
6.9
7.6
7.4
100
07/31/06
- 08/06/06
134
8.4
10.8
9.6
100
08/07/06 - 08/13/06
167
7.6
9.4
8.3
100
TABLE A-6 (Continued): WEEKLY DO SUMMARY STATISTICS AT
CLARK STREET ON THE CHICAGO RIVER DURING 2006
Number of
DO Concentration (mg/L)
Percent DO
Values Above
Monitoring Dates
DO Values
Minimum
Maximum
Mean
IPCB Standard
08/14/06 - 08/20/06
167
7.4
8.5
8.0
100
08/21/06 - 08/27/06
168
6.8
8.0
7.4
100
08/28/06 - 09/03/06
168
5.8
7.4
7.1
100
09/04/06 - 09/10/06
168
6.7
8.1
7.6
100
09/11/06 - 09/17/06
168
6.3
7.8
7.3
100
09/18/06 - 09/24/06
168
6.7
8.4
7.7
100
09/25/06- 10/01/06
168
6.3
9.0
8.3
100
10/02/06- 10/08/06
168
6.2
9.0
7.6
100
10/09/06 - 10/15/06
168
5.9
9.6
8.5
100
10/16/06- 10/22/06
168
6.9
9.7
8.6
100
10/23/06 - 10/29/06
168
7.1
8.8
8.1
100
10/30/06 - 11/05/06
169
8.4
10.2
9.5
100
11/06/06 - 11/12/06
168
7.5
9.3
8.5
100
11/13/06 - 11/19/06
168
7.7
9.6
8.5
100
11/20/06 - 11/26/06
168
8.3
9.9
9.2
100
11/27/06 - 12/03/06
168
7.4
11.8
9.2
100
12/04/06 - 12/10/06
168
9.8
11.9
10.4
100
12/11/06 - 12/17/06
168
8.4
12.5
10.0
100
12/18/06 - 12/24/06
168
8.2
11.3
9.8
100
12/25/06 - 12/31/06
168
8.9
11.7
99
100
TABLE A-7: WEEKLY DO SUMMARY STATISTICS AT LOOMIS STREET
ON THE SOUTH BRANCH CHICAGO RIVER DURING 2006
Number of
DO Concentration (mg/L)
Percent DO
Values Above
Monitoring Dates
DO Values
Minimum
Maximum
Mean
IPCB Standard
01/01/06
- 01/01/06
24
8.9
9.0
8.9
100
01/02/06 - 01/08/06
168
7.5
9.5
8.7
100
01/09/06
- 01115/06
168
7.9
9.4
8.8
100
01/16/06 - 01/22/06
168
7.5
9.1
8.5
100
01/23/06
- 01/29/06
168
8.3
9.8
9.0
100
01/30/06 -
02/05/06
168
7.1
10.2
9,1
100
02/06/06 - 02/12/06
168
7.4
10.3
9.3
100
02/13/06 -
02119/06
168
7.9
11.4
9.6
100
02/20/06 -
02/26106
168
9.6
12.5
11.2
100
02/27/06
- 03/05/06
168
8.6
10.1
9.3
100
03/06/06
- 03/12/06
168
7.3
9.2
8.5
100
03/13106 - 03/19/06
168
6.9
10.8
9.1
100
03/20/06 - 03/26/06
168
8.9
9.8
9.2
100
03/27/06
- 04/02/06
168
7.3
9.0
8.0
100
04/03/06
- 04/09/06
167
6.0
9.3
7.9
100
04/10/06
- 04/16/06
168
7.9
9.3
8.5
100
04/17/06
- 04/23/06
168
4.5
8.8
7.2
100
04/24/06
- 04/30/06
168
6.7
8.4
7.6
100
05/01/06
- 05/07/06
168
6.2
8.1
6.9
100
05/08/06 - 05/14/06
168
5.8
8.6
7.0
100
05/15/06
- 05/21/06
168
5.6
7.3
6.5
100
05/22/06
- 05/28/06
168
5.5
7.2
6.4
100
05/29/06
- 06/04/06
168
4.7
7.6
6.4
100
06/05/06
- 06/11/06
167
5.4
7.5
6.7
100
06/12/06
- 06/18/06
168
5.0
6.9
6.1
100
06/19/06 - 06125/06
168
5.2
7.1
6.2
100
06/26/06 - 07102/06
168
4.3
8.0
6.2
100
07/03/06 - 07/09/06
168
5.8
7.5
6.7
100
07/10/06 - 07/16/06
168
6.0
7.0
6.6
100
07/17/06 - 07/23/06
168
2.5
7.1
5.7
91
07124/06 - 07/30/06
168
5.5
7.0
6.3
100
07/31/06
-
08/06/06
168
2.2
7.7
6.1
94
08/07106
- 08/13/06
168
6.2
7.6
7.0
100
TABLE A-7 (Continued): WEEKLY DO SUMMARY STATISTICS AT
LOOMIS STREET ON THE SOUTH BRANCH CHICAGO RIVER DURING 2006
Number of
DO Concentration (mg/L)
Percent DO
Values Above
Monitoring Dates
DO Values
Minimum
Maximum
Mean
IPCB Standard
08/14/06 - 08/20/06
168
5.5
7.5
6.7
100
08/21/06
- 08/27/06
168
5.6
7.0
6.4
100
08/28
/
06 - 09/03/06
168
4.2
8.5
6.2
100
09/04/06 - 09/101
06
168
6.3
7.7
7.0
100
09/11/06
- 09
/
17/06
168
4.0
8.0
6.7
99
09/18
/
06 - 09
/
24/06
168
5.7
8.4
7.1
100
09/25
/
06 - 10/01
/
06
168
6.4
10.4
7.7
100
10/02/06 - 10
/
08/06
168
4.5
8.2
6.8
100
10/09/06
-
10/15
/
06
168
5.8
8.9
7.0
100
10116
/
06 - 10/22
/
06
168
6.3
8.9
73
100
10/23/06
- 10/29/06
168
5.7
7.5
6.7
100
10/30/06
- 11/05/06
169
5.7
8.0
73
100
11/06/06
-
11/12/06
168
5.9
8.6
7.2
100
11/13/06
- 11/19/06
168
5.5
8.0
7.3
100
11/20106 - 11/26/06
168
7.4
8.7
7.9
100
11/27/06 - 12/03/06
168
4.3
9.5
7.5
100
12/04/06
- 12/
10/06
167
8.0
9
.
9
9.0
100
12/11/06 - 12
/
17/06
168
8.0
10.2
9.0
100
12/18/06
- 12/24/06
168
7.5
9.9
8.5
100
12/25/06
-
12131/06
168
8.6
9.9
9.4
100
TABLE A-8: WEEKLY DO SUMMARY STATISTICS AT 36TH STREET
ON BUBBLY CREEK DURING 2006
Number of
DO Concentration (mg/L)
Percent DO
Values Above
Monitoring Dates
DO Values
Minimum
Maximum
Mean
IPCB Standard
01/01/06 - 01/01/06
24
7.8
8.6
8.1
100
01/02/06 - 01/08/06
168
7.2
8.9
8.0
100
01/09/06 - 01/15/06
168
7.5
9.3
8.6
100
01/16/06
- 01/22/06
168
7.6
9.0
8.1
100
01/23/06 - 01/29/06
168
7.7
10.6
9.3
100
01/30/06 - 02/05/06
168
8.4
10.2
9.1
100
02/06/06
-
02/12/06
168
9.0
14.0
11.7
100
02/13/06 - 02/19/06
168
0.1
15.6
8.5
66
02/20/06 - 02/26/06
168
0.0
1.3
0.3
0
02/27/06 - 03/05/06
168
0.9
11.9
5.3
63
03/06/06 - 03/12/06
168
6.1
12.8
9.2
100
03/13/06 - 03/19/06
168
0.2
9.4
1.5
11
03/20/06 -
03/26/06
168
0.2
3.5
1.9
0
03/27/06 -
04/02/06
168
1.9
12.6
7.0
76
04/03/06 - 04/09106
167
0.6
7.5
3.6
45
04/10/06
-
04/16/06
168
04
6.8
3.1
30
04/17/06 - 04/23/06
58
0.5
5.6
1.7
9
04/24/06 - 04/30/06
110
0.0
5.2
2.2
4
05/01/06 - 05/07/06
168
0.0
3.4
0.9
0
05/08/06 - 05/14/06
168
0.0
3.8
1.2
0
05/15/06
- 05/21/06
168
0.5
6.3
2.4
18
05/22/06 - 05/28/06
127
2.3
6.0
4.3
75
05/29/06 - 06/04/06
168
0.7
6.1
2.4
14
06/05/06 -
06/11/06
168
1.4
13.1
5.7
75
06112/06 - 06/18/06
168
0.0
3.8
1.1
0
06/19/06
-
06/25106
168
0.0
4.7
1.9
5
06/26/06
- 07/02/06
168
0.3
5.4
1.8
3
07/03/06 - 07/09/06
82
1.1
12.4
5.4
54
07/10/06
- 07/16/06
111
0.4
6.4
3.0
32
07/17/06 - 07/23/06
168
0.1
6.1
1.6
13
07/24/06 - 07/30/06
168
0.0
3.7
1.1
0
07/31/06 - 08/06/06
168
0.0
6.3
1.6
10
08/07106 - 08/13/06
168
0.0
6.8
2.1
11
TABLE A-8 (Continued): WEEKLY DO SUMMARY STATISTICS AT
36TH STREET ON BUBBLY CREEK DURING 2006
Number of
DO Concentration (mg/L)
Percent DO
Values Above
Monitoring Dates
DO Values
Minimum
Maximum
Mean
IPCB Standard
08/14/06
- 08/20/06
168
0.3
3.5
1.7
0
08/21/06
- 08/27/06
168
0.7
3.6
1.8
0
08/28106 - 09/03/06
168
0.0
3.8
0.8
0
09/04/06 - 09/10/06
168
0.7
4.4
2.0
3
09/11/06 - 09/17/06
168
0.0
8.4
1.8
9
09/18/06
- 09/24/06
168
0.0
3.8
1.9
0
09/25/06
- 10/01/06
168
0.7
3.5
2.3
0
10102/06 - 10/08/06
168
0.0
7.3
1.2
8
10/09/06
- 10/15/06
168
0.1
9.6
3.4
39
10/16/06
- 10/22/06
168
0.0
10.7
1.9
22
10/23/06 - 10/29/06
168
0.0
2.7
0.8
0
10/30/06
- 11/05/06
169
0.0
4.3
2.0
6
11/06106
- 11/12/06
168
0.0
7,0
2.7
11
11/13/06
- 11119/06
168
0.0
1.7
0.4
0
11/20/06 - 11126/06
168
0.0
1.6
0.3
0
11/27/06 - 12/03/06
168
0.1
9.2
1.4
17
12/04/06 - 12/10/06
168
0.0
3.7
0.9
0
12/11/06
- 12/17/06
168
0.0
1.2
0.5
0
12/18/06 - 12/24/06
168
0.1
9.0
2.0
16
12/25/06
- 12/31/06
168
0.0
0.1
0.0
0
TABLE A-9: WEEKLY DO SUMMARY STATISTICS AT INTERSTATE HIGHWAY 55
ON BUBBLY CREEK DURING 2006
Number of
DO Concentration
(
mg/L)
Percent DO
Values Above
Monitoring Dates
DO Values
Minimum
Maximum
Mean
IPCB Standard
01/01/06
-
01
/
01/06
24
8.5
9
.
0
8.8
100
01/02106 - 01/08/06
168
7.6
9.1
8.4
100
01/09/06
-
01/15
/
06
168
8.1
9.4
8.7
100
01/16/06 - 01/22/06
168
7
.
3
8.9
8.0
100
01/23
/
06 - 01/29
/
06
168
8.0
9.1
8.3
100
01/30/06 - 02/05/06
168
7.2
9.2
8.4
100
02/06/06 - 02
/
12/06
168
8.7
10.3
9.4
100
02/13/06 - 02/19
/
06
168
2.5
12.0
8.0
92
02/20
/
06 - 02/26
/
06
169
5.0
10.5
8.0
100
02/27/
06 - 03
/
05/06
168
8.8
10.3
9.5
100
03/06
/
06 - 03/12
/
06
168
5.0
9.3
7.6
100
03/13/06
-
03/19/06
168
3.0
8.3
5.6
92
03/20
/
06 - 03
/
26/06
168
4.3
8.6
6.6
100
03/27/06 - 04/02/06
168
4.2
7.1
5.9
100
04/03/06 - 04/09/06
167
0.1
9.1
4.7
70
04/10/06 - 04/16
/
06
83
0.2
8.0
2.9
41
04/17/06 - 04/23/06
NO DATA
04/24/06 - 04/30/06
79
4.9
9.0
6.9
100
05/01/06
- 05/07/
06
168
3.5
8.0
5.3
95
05/08/06 - 05/14/06
132
3.3
8.1
5.5
95
05/15/06 - 05/21/06
168
2.7
7.3
5.5
93
05/22/06 - 05/28/06
168
3.8
7.4
6.0
98
05/29/
06 - 06
/
04/06
168
3.0
6.5
4.8
90
06/05
/
06
- 06
/
11/06
168
3.2
8.9
5.8
90
06/12/06
-
06/18
/
06
168
1.3
6.0
3.8
43
06/19
/
06 - 06/25
/
06
82
1.7
4.8
3.1
13
06/26
/
06 - 07
/
02/06
86
4.3
7.6
6.0
100
07/03/06
- 07/09/06
168
4.1
9.4
6.2
100
07/10/06 - 07/16106
168
4.4
7.2
5.5
100
07/17/06
-
07/23
/
06
168
0.1
6.4
3.4
46
07/24/06 - 07/30/06
167
0.4
6.8
3.6
49
07/31/06 -
08/06/06
168
0.0
7.9
2.6
42
08/07
/
06 - 08
/
13106
168
0.0
4.1
1.5
1
TABLE A-9 (Continued): WEEKLY DO SUMMARY STATISTICS AT
INTERSTATE HIGHWAY 55 ON BUBBLY CREEK DURING 2006
Number of
DO Concentration
(
mg/L)
Percent DO
Values Above
Monitoring Dates
DO Values
Minimum
Maximum
Mean
IPCB Standard
08/14
/
06 - 08/20/06
168
0.2
6
.2
3.7
52
08/21/06 - 08/27/06
168
2.6
5.7
4.5
79
08/28
/
06 - 09
/
03/06
168
0.1
6.2
3.8
45
09/04/06
- 09/10/06
168
3.5
7.0
5.3
92
09/11/06 - 09/17/06
168
0.2
7.2
4.0
60
09/18
/
06 - 09/24/06
168
1
.
9
7.3
4.9
74
09/25/06
- 10/01/06
168
2.8
8.0
5.5
78
10/02/06 - 10/08/06
168
0.0
7.5
3.1
38
10/09/06 - 10/15/06
168
0.1
7.8
3.6
39
10/16/06 - 10/22/06
168
0.0
7.6
4.0
55
10/23/06 - 10/29/06
168
0.0
5.9
3.3
47
10/30/06 - 11/05/06
169
0.1
7.3
4.9
77
11/06/06 - 11/12/06
168
1.9
7.0
6.0
97
11/13/06 - 11/19/06
168
2.1
6.8
5.1
79
11/20/06
- 11/26/06
168
5.2
7.6
6.3
100
11/27/06 - 12/03/06
167
0.0
7.4
3.3
49
12/04
/
06
- 12/10/06
168
3.5
8.7
5.5
88
12/11/06
- 12/17/06
168
2.8
9.2
6.0
90
12/18/06
- 12/24/06
168
0.4
8.0
5.1
74
12/25/06 - 12/31/06
168
0.4
4.9
2.3
10
TABLE A-10: WEEKLY DO SUMMARY STATISTICS AT CICERO AVENUE
ON THE CHICAGO SANITARY AND SHIP CANAL DURING 2006
Number of
DO Concentration
(
mg/L)
Percent DO
Values Above
Monitoring Dates
DO Values
Minimum
Maximum
Mean
IPCB Standard
01/01/06
-
01/01
/
06
24
7.9
8.3
8.1
100
01/02/06
-
01/08/06
168
6.3
8.3
7.3
100
01/09/06
-
01/15/06
168
6.4
7.9
7.2
100
01/16/06
-
01/22/06
168
5.7
7.5
6.7
100
01/23/06 - 01/29/06
168
6.9
8.9
7.6
100
01/30/06
-
02/05/06
168
6.3
8.9
7.8
100
02/06
/
06 - 02/12/06
168
7.6
8.8
8.2
100
02/13/06
- 02/19/06
168
8.0
9.4
8.7
100
02/20/06 - 02/26/06
168
7.6
10.8
9.5
100
02/27/
06 - 03/05/06
168
7.3
10.1
8.6
100
03/06
/
06 -
03/12/06
168
6.1
8.2
7.5
100
03/13/06 - 03/19/06
168
5.1
8.8
7.7
100
03/20106 - 03/26/06
168
6.1
8.3
73
100
03127/
06 - 04
/
02/06
168
5.3
7.8
6.4
100
04/03/06
- 04/09/06
167
5.
1
8.1
6.9
100
04/10/06 - 04/16/06
168
6.5
10.0
7.9
100
04/17/06
- 04/23/06
168
0.0
8.4
5.1
83
04/24/06 - 04/30/06
168
3.7
9.2
5.4
99
05/01/06 - 05/07/06
168
3.5
7.2
5.2
98
05/08
/
06 - 05
/
14/06
168
4.9
8.3
6.0
100
05/15/06 - 05/21/06
168
5.2
7.3
5.9
100
05/22
/
06 - 05
/
28/06
168
4.3
10.1
6.0
100
05/29/06 - 06/04/06
169
4.2
6.9
5.1
100
06/05/06
- 06/11/06
167
4.0
8.7
6.4
99
06/12/06
-
06/18
/
06
168
3.3
6.5
4.6
81
06/19
/
06 - 06/25/06
168
2.8
5.8
4.3
72
06/26
/
06
- 07
/
02/06
168
1.2
6.8
4.9
82
07/03
/
06 - 07
/
09/06
168
3
.
8
7.3
5.9
98
07/10/06
- 07/16/06
168
4.7
7.0
5.5
100
07/17/06 - 07/
23/06
81
4
.
6
6.2
5.3
100
07/24/06 - 07/30106
86
5.5
8.3
7.1
100
07/31/06 - 08/06
/
06
168
0.7
8
.8
5.7
79
08/07
/
06 - 08/13
/
06
168
4.7
8
.
5
7.4
100
.
TABLE
A-10 (Continued
):
WEEKLY DO SUMMARY STATISTICS AT
CICERO AVENUE
ON THE
CHICAGO SANITARY AND SHIP CANAL DURING 2006
Number of
DO Concentration
(
mg/L)
Percent DO
Values Above
Monitoring Dates
DO Values
Minimum
Maximum
Mean
IPCB Standard
08/14
/
06 - 08/20/06
168
4.9
8.4
6.6
100
08/21/06 - 08/27
/
06
168
3.7
6.1
5.1
99
08/28/06 - 09/03
/
06
168
2.5
6
.
0
5.1
92
09/04/06 - 09/10/06
168
5.1
74
6.3
100
09/11106 - 09/17
/
06
168
2.0
7.3
5.1
84
09/18/06
-
09/24
/
06
168
5.4
6.8
6.1
100
09/25/
06- 10/01
/
06
168
5.2
7.8
6.5
100
10/02/06- 10/08/06
168
1.8
7.9
5.4
90
10/09/06 - 10/15/06
168
4.3
6.6
5.6
100
10/16/06 - 10/22/06
168
2.6
7.7
5.1
85
10/23/06
- 10/29/06
168
4.2
6.3
5.0
100
10/30/06
- 11/05/06
169
3.6
6.1
5.0
93
11/06/06
- 11/12106
168
0.6
6.2
4.5
81
11/13/06 - 11/19/06
168
2.9
5.3
4.4
70
11/20106 - 11/26/06
168
4.1
5.9
4.7
100
11/27/06
- 12/03/06
168
0.1
8.4
5.5
94
12/04/06
- 12/10/06
168
5.7
8.6
7.1
100
12/11/06 - 12/17/06
168
6.6
8.9
7.3
100
12/18/06 - 12/24
/
06
168
5.8
8
.
1
6.8
100
12/25/06 - 12/31/06
168
4.9
8.3
6.8
100
TABLE A-11: WEEKLY DO SUMMARY STATISTICS AT B&O CENTRAL RAILROAD
ON THE CHICAGO SANITARY AND SHIP CANAL DURING 2006
Number of
DO Concentration
(
mg/L)
Percent DO
Values Above
Monitoring Dates
DO Values
Minimum
Maximum
Mean
IPCB Standard
01/01/06 - 01/01/06
24
7.1
8.7
8.2
100
01/02
/
06 - 01/08
/
06
168
7.1
8.6
8.0
100
01/09
/
06
- 01/15
/
06
168
6.4
9.1
7.5
100
01/16/06
-
01/22/
06
168
6.5
9.9
8.0
100
01/23
/
06 - 01/29/06
168
7.6
9.4
8.6
100
01/30/06 - 02/05
/
06
168
6.9
10.0
8.5
100
02/06
/
06 -
02
/
12/06
168
7.6
8
.
6
8.1
100
02/13/06
- 02/19/06
167
7.1
9.7
8.7
100
02/20
/
06
- 02/26/06
168
7.9
10.1
8.8
100
02/27
/
06 - 03/05/06
168
7.7
9.6
8.6
100
03/06
/
06 - 03
/
12/06
168
7.1
8.9
8.2
100
03/13/06 - 03/19/06
168
6
.
9
9.5
8.4
100
03/20
/
06 - 03/26/06
168
7.5
9.1
8.3
100
03/27/06
-
04/02106
168
6.9
9.0
7.8
100
04/03
/
06 - 04
/
09/06
167
5
.
9
9.3
8.0
100
04/10/06
- 04/16/06
168
7.0
8
.
8
8.1
100
04/17
/
06 - 04/23106
168
4.9
9.1
7.4
100
04/24/06 - 04/30/06
167
5.8
7.8
7.2
100
05/01/06 - 05/07106
168
5.1
7.2
6.4
100
05/08
/
06
-
05
/
14/06
168
5.1
7.3
6.3
100
05/15/06 - 05/21/06
168
5.5
7.5
6.4
100
05/22
/
06
-
05
/
28/06
168
4.8
8.1
6.5
100
05/29
/
06 - 06
/
04/06
168
5.0
6.5
5.8
100
06/05
/
06
-
06/11/06
168
5.1
8.0
6.2
100
06/12/06 - 06/18/06
168
4.6
6.8
5.7
100
06/19
/
06 -
06
/
25/06
168
3.8
6.3
5.0
97
06/26
/
06 -
07/02/06
168
4
.
4
6.6
5.6
100
07/03/06
-
07/09
/
06
168
5.2
8.5
6.1
100
07/10
/
06
-
07
/
16/06
168
3.5
6
.
9
5.6
99
07/17/06
- 07/23/06
168
2.3
6.5
5.0
92
07/24/06 - 07/30/06
168
4.3
6.4
5.4
100
07/31/06
-
08/06/06
168
1.3
7.5
4.7
61
08/07
/
06 -
08
/
13/06
168
2.4
5.8
4.7
90
TABLE A-11
(Continued
):
WEEKLY DO SUMMARY STATISTICS AT B&O CENTRAL
RAILROAD ON THE CHICAGO SANITARY AND SHIP CANAL DURING 2006
Number of
DO Concentration (mg/L)
Percent DO
Values Above
Monitoring Dates
DO Values
Minimum
Maximum
Mean
IPCB Standard
08/14/06 - 08/20/06
168
3.0
6.0
4.9
89
08/21/06 - 08/27/06
167
4.3
6.2
5.3
100
08/28/06 - 09/03/06
168
4.1
6.6
5.5
100
09/04/06
- 09/10/06
168
4.9
6.8
6.1
100
09/11/06 - 09/17/06
168
3.7
7.0
5.9
98
09/18/06 - 09/24/06
168
5.5
7.4
6.4
100
09/25/06
- 10/01/06
168
5.7
7.3
6.5
100
10/02/06
- 10/08/06
168
2.9
7.3
5.9
90
10/09/06
- 10/15/06
168
3.5
7.3
6.2
98
10/16/06 - 10/22/06
168
4.6
8.0
6.4
100
10/23/06
- 10/29/06
168
5.1
7.9
6.6
100
10/30/06
- 11/05/06
169
5.6
7.3
6.7
100
11/06/06
- 11/12/06
168
4.6
8.3
6.1
100
11/13/06
- 11/19/06
168
5.6
7.7
6.4
100
11/20106- 11/26/06
168
4.7
7.2
6.3
100
11/27/06- 12/03/06
168
2.3
9.1
6.9
98
12/04/06- 12/10/06
168
7.6
9.5
8.5
100
12/11/06 - 12/17/06
167
7.0
9.4
8.1
100
12/18/06- 12/24/06
168
6.2
8.6
7.8
100
12/25/06- 12/31/06
168
7.4
9.6
8.7
100
TABLE A-12: WEEKLY DO SUMMARY STATISTICS AT ROUTE 83
ON THE CHICAGO SANITARY AND SHIP CANAL DURING 2006
Number of
DO Concentration
(
mg/L)
Percent DO
Values Above
Monitoring Dates
DO Values
Minimum
Maximum
Mean
IPCB Standard
01/01/06
-
01/01/06
24
5.9
7.0
6.6
100
01/02/06 - 01/08
/
06
168
5.4
7.6
7.0
100
01/09/06 - 01/15106
168
3.9
6.7
5.6
99
01116/06 - 01/22/06
168
3
.
6
7.4
6.0
99
01/23/06 - 01/29/06
168
4.8
7.9
7.1
100
01/30
/
06 -
02
/
05/06
168
5
.
8
8.6
7.3
100
02/06
/
06 -
02/12/06
168
6.4
8.0
7.3
100
02/13/06 - 02/19
/
06
168
6.0
8.5
7.6
100
02/20
/
06 - 02/26/06
168
6
.
7
9.0
7.8
100
02127106
- 03
/
05/06
168
6.9
8.3
7.5
100
03/06
/
06 - 03/12/06
168
6.0
8.0
7.2
100
03/13/06
-
03/19/06
59
5.8
8.6
6.9
100
03/20/06 - 03/26/06
NO DATA
03/27/06 - 04/02/06
107
5.5
7.2
6.4
100
04/03
/
06 - 04
/
09/06
167
5.3
8.0
6.6
100
04/10/06 - 04/16/06
168
5.1
7.3
6.4
100
04/17/06 - 04/23/06
168
3.6
7.7
6.0
95
04/24
/
06
- 04/30/06
168
5.3
7.3
6.2
100
05/01/06 - 05/07/06
168
3.3
5.6
4.7
85
05/08
/
06
- 05
/
14106
168
3.2
5.8
4.4
81
05/15/06
- 05/21/06
168
3.7
5.9
5.1
99
05/22
/
06 - 05
/
28/06
168
3.3
6,5
4.9
85
05/29/06 - 06/04/06
168
18
6.2
4.5
79
06/05
/
06 - 06
/
11/06
168
2.9
6.2
4.8
80
06/12/06 - 06/18/06
168
0.6
6.2
4.2
59
06/19
/
06 - 06/25/06
168
2.0
5.0
3.6
17
06/26
/
06 - 07
/
02/06
115
2.8
5.5
4.4
81
07/03/06
- 07/09/06
82
1.8
5.1
4.0
55
07/10/06 - 07/16/06
110
2.5
6.7
5.0
96
07/17/06 - 07/23/06
58
3.5
6.4
5.4
91
07/24/06 - 07/30/06
107
3.5
5.0
4.1
51
07/31
/
06 - 08/06
/
06
167
0
.
0
6.2
3.1
43
08/07/06 - 08/13/06
168
1.4
5.2
3.6
48
TABLE A-12 (Continued): WEEKLY DO SUMMARY STATISTICS AT
ROUTE 83 ON THE CHICAGO SANITARY AND SHIP CANAL DURING 2006
Number of
DO Concentration
(mg/L)
Percent DO
Values Above
Monitoring Dates
DO Values
Minimum
Maximum
Mean
IPCB Standard
08/14/06 - 08/20/06
168
2.0
4.8
3.6
31
08/21/06 - 08/27/06
168
3.0
49
3.9
40
08128/06
- 09/03/06
168
0.4
5.3
4.1
60
09/04/06 - 09/10/06
58
4.1
5.1
4.7
100
09/11/06
- 09/17/06
98
2.8
6.0
4.6
78
09/18/06 - 09/24/06
168
4.0
5.8
5.0
100
09/25/06 - 10/01/06
58
4.4
6.2
5.5
100
10/02/06
- 10/08/06
NO DATA
10/09/06 - 10/15106
NO DATA
10/16/06
- 10/22/06
86
3.7
6.5
5.1
90
10/23106 - 10/29/06
168
3.1
6.2
5.2
93
10/30/06 - 11/05/06
169
5.2
6.5
6.1
100
11/06/06
- 11/12/06
58
4.5
6.3
5.2
100
11/13/06
- 11/19/06
110
5.0
6.7
6.0
100
11/20/06 - 11/26/06
168
4.1
6.0
5.4
100
11/27/06- 12/03/06
168
0.6
7.0
5.0
89
12/04/06- 12/10/06
167
6.5
8.7
7.7
100
12/11/06 - 12/17/06
168
6.3
8.2
7.2
100
12/18/06- 12/24/06
59
6.3
7.2
6.6
100
TABLE A-13: WEEKLY DO SUMMARY STATISTICS AT LOCKPORT POWERHOUSE
ON THE CHICAGO SANITARY AND SHIP CANAL DURING 2006
Number of
DO Concentration
(mg/L)
Percent DO
Values Above
Monitoring Dates
DO Values
Minimum
Maximum
Mean
IPCB Standard
01/01/06 - 01/01/06
24
6.5
7.4
6.9
100
01/02/06 - 01/08/06
167
6.1
7.2
6.8
100
01/09/06 - 01/15/06
168
5.7
7.2
6.6
100
01/16/06
- 01/22/06
168
5.5
7.6
6.6
100
01/23106 - 01/29/06
168
6.2
8.0
7.1
100
01/30/06 - 02/05/06
168
6.7
8.1
7.6
100
02/06/06 - 02/12/06
168
6.1
8.0
7.1
100
02/13/06 - 02/19/06
168
6.6
8.5
7.7
100
02/20/06 - 02/26/06
168
7.3
9.0
8.3
100
02/27/06 - 03/05/06
168
6.3
8.6
7.5
100
03/06/06 - 03/12/06
168
6.8
8.6
7.4
100
03/13/06 - 03/19/06
168
6.6
8.3
7.3
100
03/20/06 - 03/26/06
168
6.8
7.7
7.3
100
03/27/06 - 04/02/06
168
5.8
7.2
6.6
100
04/03/06 - 04/09/06
167
6.0
7.3
6.6
100
04/10/06
- 04/16/06
167
5.6
6.6
6.2
100
04/17/06 - 04/23/06
168
4.5
6.6
5.8
100
04/24/06 - 04/30/06
168
1.7
6.4
5.3
91
05/01/06 - 05/07/06
168
3.2
5.2
4.3
72
05/08/06 - 05/14/06
83
3.3
4.6
4.0
57
05/15/06 - 05/21/06
85
3.9
5.7
4.8
99
05/22106 - 05/28/06
168
3.4
5.2
4.3
78
05/29106 - 06/04/06
167
2.7
5.7
3.7
32
06/05/06 - 06/11/06
168
3.0
5.1
4.0
47
06/12/06
-
06/18/06
168
3.2
4.7
4.1
57
06/19/06 - 06/25/06
168
2.4
3.9
3.2
0
06/26/06 - 07/02/06
168
3.1
4.8
4.0
40
07/03/06 - 07/09/06
168
1.9
6.4
4.2
46
07/10/06 - 07/16/06
168
2.4
5.2
3.8
48
07/17/06 - 07/23/06
168
1.9
4.8
3.1
8
07/24/06
- 07/30/06
168
2.6
7.1
4.1
42
07/31/06 - 08/06/06
168
0.3
5.9
3.2
39
08/07/06
- 08/13/06
168
0.5
5.5
3.3
41
TABLE A-13 (
Continued
):
WEEKLY DO SUMMARY STATISTICS AT LOCKPORT
POWERHOUSE ON THE CHICAGO SANITARY AND SHIP CANAL DURING 2006
Number of
DO Concentration (mg/L)
Percent DO
Values Above
Monitoring Dates
DO Values
Minimum
Maximum
Mean
IPCB Standard
08/14/06 - 08/20/06
168
3.6
5.5
4.4
88
08/21/06 - 08/27/06
167
3.1
4.5
3.7
17
08/28/06 - 09/03/06
78
3.1
4.5
3.8
35
09/04/06 - 09/10/06
85
5.0
5.8
5.3
100
09/11/06 - 09/17/06
168
3.5
5.9
4.9
82
09/18/06 - 09/24/06
168
4.6
5.5
5.2
100
09/25/06 - 10/01/06
169
4.7
6.0
5.4
100
10/02/06 - 10/08/06
168
1.6
6.1
4.2
57
10/09/06 - 10/15/06
168
5.1
6.0
5.5
100
10/16/06
- 10/22/06
168
4.8
6.6
5.8
100
10/23/06 - 10/29/06
168
4.6
6.5
5.7
100
10/30/06 - 11/05/06
169
4.7
6.5
6.0
100
11/06/06
- 11/12/06
168
4.1
6.5
5.7
100
11/13/06 - 11/19/06
168
3.2
6.5
5.1
87
11/20/06 - 11/26/06
168
5.1
6.3
5.7
100
11/27/06 - 12/03/06
168
3.8
7.0
5.5
99
12/04/06 - 12/10/06
168
7.1
8.9
8.3
100
12111/06
- 12/17/06
168
7.0
8.7
7.7
100
12/18/06
- 12/24/06
168
6.1
7.4
6.7
100
12/25/06 - 12/31/06
168
63
8.4
7.7
100
TABLE A-14: WEEKLY DO SUMMARY STATISTICS AT JEFFERSON STREET
ON THE DES PLAINES RIVER DURING 2006
Number of
DO Concentration (mg/L)
Percent DO
Values Above
Monitoring Dates
DO Values
Minimum
Maximum
Mean
IPCB Standard
01/01/06 - 01/01/06
24
9.5
10.4
9.9
100
01/02/06 - 01/08/06
168
7.8
10.1
8.8
100
01/09/06 - 01/15/06
167
6.7
10.2
8.5
100
01/16/06
- 01/22/06
168
6.9
12.7
9.7
100
01/23/06 - 01/29/06
168
7.7
11.7
9.4
100
01/30/06 - 02/05/06
168
8.3
11.5
9.4
100
02/06/06 - 02/12/06
168
8.2
10.8
9.5
100
02/13/06 - 02/19/06
168
7.8
10.5
9.1
100
02/20/06 - 02/26/06
168
8.9
10.7
9.9
100
02/27/06 - 03/05/06
168
7.5
10.3
8.6
100
03/06/06 - 03/12/06
168
7.4
9.1
8.2
100
03/13/06 - 03/19/06
168
7.7
10.9
94
100
03/20/06 - 03/26/06
168
8.7
11.2
9.7
100
03/27/06 - 04/02/06
168
7.1
11.2
8.6
100
04/03/06 - 04/09/06
167
6.7
10.4
8.1
100
04/10/06 - 04/16/06
168
6.1
10.1
8.0
100
04/17/06 - 04/23/06
168
5.2
9.8
7.0
100
04/24/06 - 04/30/06
167
5.0
9.9
7.0
100
05/01/06
- 05/07/06
168
4.9
8.1
6.2
100
05/08/06 - 05/14/06
168
3.9
7.8
5.5
99
05/15/06 - 05/21/06
168
5.0
8.4
6.5
100
05/22/06 - 05/28/06
168
4.2
8.9
6.0
100
05/29/06 - 06/04/06
167
3.5
6.1
4.5
77
06/05/06 - 06/11/06
168
3.8
7.1
5.0
95
06/12/06 - 06/18/06
168
3.7
6.9
5.2
99
06/19/06 - 06/25/06
168
23
6.0
4.2
58
06/26/06
- 07/02/06
168
3.7
6.6
5.0
96
07/03/06
- 07/09/06
168
3.3
7.1
5.3
89
07/10/06 - 07/16/06
168
3.6
6.3
4.6
79
07/17/06
- 07/23/06
168
2.6
6.6
4.4
66
07/24/06
- 07/30/06
168
3.4
7.4
4.7
76
07/31106 - 08/06/06
168
2.4
6.0
4.2
50
08/07/06 - 08/13/06
168
2.7
6.7
4.3
61
TABLE A-14 (Continued): WEEKLY DO SUMMARY STATISTICS AT
JEFFERSON STREET ON THE DES PLAINES RIVER DURING 2006
Number of
DO Concentration
(mg/L)
Percent DO
Values Above
Monitoring Dates
DO Values
Minimum
Maximum
Mean
IPCB Standard
08/14/06
- 08/20/06
83
3.9
5.7
4.6
88
08/21/06
- 08/27/06
85
4.0
6.7
5.2
99
08/28/06
- 09/03/06
168
3.8
7.3
5.7
98
09/04/06 - 09110/06
168
4.6
6.8
5.6
100
09/11/06
- 09/17106
168
4.2
7.9
6.7
100
09/18/06
- 09/24/06
168
5.2
8.8
6.9
100
09/25/06 - 10/01/06
168
5.8
8.5
6.8
100
10102/06
- 10/08/06
168
4.5
8.7
6.2
100
10/09/06 - 10/15/06
168
5.7
8.4
6.9
100
10/16/06
- 10/22/06
168
6.1
9.2
7.3
100
10/23106 - 10/29/06
168
6.5
9.0
7.5
100
10/30/06 - 11/05/06
169
6.5
9.4
8.1
100
11/06/06 - 11/12/06
168
6.7
10.9
8.4
100
11/13/06
- 11/19/06
168
5.9
9.5
7.7
100
11/20/06
- 11/26/06
168
7.2
11.2
8.3
100
11/27/06 - 12/03/06
168
6.9
10.7
8.7
100
12/04/06 - 12/10/06
168
8,9
11.7
10.6
100
12/11/06
- 12/17/06
168
9.8
12.1
11.2
100
12/18/06
- 12/24/06
168
8.4
12.8
10.4
100
12/25/06 - 12/31/06
168
8.6
11.7
9.9
100
TABLE A-15: WEEKLY DO SUMMARY STATISTICS AT TORRENCE AVENUE
ON THE GRAND CALUMET RIVER DURING 2006
Number of
DO Concentration (mg/L)
Percent DO
Values Above
Monitoring Dates
DO Values
Minimum
Maximum
Mean
IPCB Standard
01/01/06 - 01/01/06
24
9.3
11.8
11.2
100
01/02/06
-
01/08/06
167
7.2
14.0
12.0
100
01/09/06 - 01/15/06
168
7.9
13.6
11.8
100
01/16/06 - 01/22/06
168
9.6
23.9
13.3
100
01/23/06 - 01/29/06
168
12.4
23.0
14.8
100
01/30/06 - 02/05/06
168
12.2
21.5
15.5
100
02/06/06 -
02/12/06
167
14.4
30.2
18.2
100
02/13/06 - 02/19/06
168
8.3
24.2
16.5
100
02/20/06 - 02/26/06
168
15.1
28.7
18.3
100
02/27/06 - 03/05/06
168
13.8
22.7
16.9
100
03/06/06 - 03/12/06
58
14.6
26.3
18.4
100
03/13/06
- 03/19/06
109
8.2
15.4
11.6
100
03/20/06 - 03/26/06
168
8.7
15.1
12.4
100
03/27/06
- 04/02/06
168
5.1
13.5
9.7
100
04/03/06 - 04/09/06
167
2.8
11.0
7.9
95
04/10106 - 04/16/06
168
2.0
10.2
5.9
79
04/17/06
-
04/23/06
168
0.1
7.1
2.7
23
04/24/06 - 04/30/06
168
1.7
12.1
5.9
79
05/01/06 - 05/07/06
168
1.2
7.8
3.6
29
05/08/06
-
05/14/06
168
1.1
8.1
4.1
50
05/15/06 - 05/21/06
168
2.3
6.4
3.5
23
05/22/06
-
05/28/06
168
0.1
6.1
2.9
20
05/29/06 - 06/04/06
168
0.3
17.1
5.4
52
06/05/06 - 06/11/06
168
0.5
184
6.2
70
06/12/06 - 06/18/06
168
1.8
11.8
5.2
61
06/19/06
-
06/25/06
168
2.0
11.3
5.7
64
06/26/06 - 07/02/06
168
3.2
12.4
6.2
77
07/03/06
- 07/09/06
83
0.0
11.0
3.4
30
07/10/06 - 07/16/06
110
1.9
10.6
3.9
35
07/17/06 - 07/23/06
168
0.0
16.4
4.4
39
07/24/06 - 07/30/06
168
0.0
16.0
5.3
55
07/31/06 - 08/06/06
168
0.0
15.0
2.5
23
08/07/06 - 08/13/06
168
0.0
10.6
3.8
44
TABLE A-15 (Continued); WEEKLY DO SUMMARY STATISTICS AT
TORRENCE AVENUE ON THE GRAND CALUMET RIVER DURING 2006
Number of
DO Concentration
(
mg/L)
Percent DO
Values Above
Monitoring Dates
DO Values
Minimum
Maximum
Mean
IPCB Standard
08/14/06
- 08/20
/
06
59
0
.
3
7.6
3.6
44
08/21/06 - 08/27/06
110
3.4
13.1
6.7
92
08/28
/
06 - 09
/
03/06
168
0.4
6.8
2.5
14
09/04/06
- 09/10/
06
168
1.6
8.4
4.2
50
09/11/06 - 09/17/06
167
0.0
7.3
2.3
20
09/18/06
- 09
/
24/06
168
1.0
7.7
5.1
85
09/25
/
06 - 10/01
/
06
165
1
.
9
8.4
6.1
87
10/02/06
-
10/08/06
168
0.0
7.4
4.4
65
10/09/06 - 10/15/06
168
2.9
9.4
7.1
94
10/16/06
-
10/22/06
168
1.9
9.2
6.6
88
10/23
/
06 - 10129/06
168
8.5
12
.
4
9.9
100
10/30
/
06 - 11/05
/
06
169
9
.
1
18.1
11.2
100
11106/06 - 11/12/06
168
0.8
21.9
12.1
95
11/13/06 - 11/19/06
168
3.8
21.2
11.8
98
11/20/06
- 11
/
26/06
168
109
22.6
14.0
100
11/27/06 - 12/03/06
168
3
.
7
18.5
8.8
98
12/04/06
- 12/10/06
168
5.6
10.1
8.3
100
12/11/06
- 12/17/06
168
5.0
11.2
9.0
100
12/18
/
06 - 12/24
/
06
168
2.6
11
.
2
7.6
88
12/25/06
-
12/31/06
168
4.9
10.5
8.2
100
TABLE A-16: WEEKLY DO SUMMARY STATISTICS AT C&W INDIANA RAILROAD
ON THE LITTLE CALUMET RIVER DURING 2006
Number of
DO Concentration (mg/L)
Percent DO
Values Above
Monitoring Dates
DO Values
Minimum
Maximum
Mean
IPCB Standard
01/01/06
- 01/01/06
24
11.5
12.2
11.8
100
01/02/06 - 01/08/06
168
11.5
13.5
12.6
100
01/09/06 - 01/15/06
168
11.9
13.6
12.8
100
01/16/06 - 01/22/06
168
11.4
13.2
12.6
100
01/23/06 - 01/29/06
168
11.2
13.2
12.6
100
01/30/06
- 02/05/06
168
11.7
12.8
12.3
100
02106106 - 02/12/06
168
12.4
13.4
12.9
100
02/13106 - 02/19/06
168
13.3
17.6
15.0
100
02/20/06 - 02/26/06
168
15.6
20.3
17.6
100
02/27/06 - 03/05/06
168
18.1
21.9
20.4
100
03/06/06
- 03/12/06
168
16.1
21.1
18.9
100
03/13/06 - 03/19/06
168
12.1
16.2
13.9
100
03/20/06 - 03/26/06
168
13.2
16.2
14.9
100
03127/06 - 04/02/06
168
9.5
16.1
13.0
100
04/03/06 - 04/09/06
167
8.1
10.4
9.1
100
04/10/06
- 04/16/06
168
6.7
9.0
7.9
100
04/17/06 - 04/23/06
168
6.3
9.9
8.0
100
04/24/06 - 04/30/06
167
7.4
11.2
8.9
100
05/01/06
- 05/07/06
168
5.5
9.8
7.3
100
05/08/06 - 05/14/06
168
5.6
10.7
7.9
100
05/15/06 - 05/21/06
168
5.2
8.5
6.8
100
05/22/06 - 05/28/06
168
4.0
10.5
7.3
100
05/29/06 - 06/04/06
168
1.9
6.6
3.9
40
06/05/06 - 06/11106
168
2.8
7.4
5.0
87
06/12/06
-
06/18/06
167
3.7
6.6
4.9
97
06/19/06 - 06/25/06
168
3.8
6.8
5.2
98
06/26/06
-
07/02/06
168
4.3
10.9
6.3
100
07/03/06 - 07/09/06
168
4.3
9.1
6.2
100
07/10/06
-
07/16/06
60
4.8
7.2
6.0
100
07/17/06 - 07/23/06
106
4.4
9.4
6.0
100
07/24/06
-
07/30/06
168
5.5
11.7
8.3
100
07131/06 - 08/06/06
168
3.5
9.5
6.6
99
08/07/06 - 08/13/06
168
4.4
8.5
6.6
100
TABLE A-16 (Continued): WEEKLY DO SUMMARY STATISTICS AT
C&W INDIANA RAILROAD ON THE LITTLE CALUMET RIVER DURING 2006
Number of
DO Concentration (mg/L)
Percent DO
Values Above
Monitoring Dates
DO Values
Minimum
Maximum
Mean
IPCB Standard
08/14/06 -
08/20/06
168
5.7
9.2
7.1
100
08/21/06 -
08/27/06
168
5.4
9.5
7.3
100
08/28/06
- 09103/06
168
3.9
7.6
5.9
99
09/04/06 - 09/10/06
167
5.5
8.5
6.5
100
09/11/06 - 09/17/06
169
4.1
7.5
5.8
100
09/18/06
- 09/24/06
168
4.0
7.3
6.3
98
09/25/06
- 10/01/06
168
6.2
7.8
6.9
100
10/02/06
- 10/08/06
168
5.6
7.8
6.7
100
10/09/06 - 10/15/06
168
5.4
8.6
7.4
100
10/16/06
- 10/22106
168
8.0
9.3
8.6
100
10/23/06 - 10/29/06
167
8.8
9.7
9.3
100
10/30/06
- 11/05/06
169
9.2
10.6
9.9
100
11 /06106
- 11/12/06
167
8.7
10.4
9.8
100
11/13/06
- 11/19/06
168
9.5
10.4
10.0
100
11/20/06 - 11/26/06
168
9.8
11.6
10.6
100
11/27/06
- 12/03/06
168
9.3
11.3
10.4
100
12/04/06
- 12/10/06
168
10.6
12.3
11.7
100
12/11/06 - 12/17/06
168
11.0
12.0
11.4
100
12/18/06
- 12/24/06
168
10.4
11.5
11.0
100
12/25/06 - 12/31/06
168
9.8
11.6
11.0
100
TABLE A-17: WEEKLY DO SUMMARY STATISTICS AT HALSTED STREET
ON THE LITTLE CALUMET RIVER DURING 2006
Number of
DO Concentration
(mg/L)
Percent DO
Values Above
Monitoring Dates
DO Values
Minimum
Maximum
Mean
IPCB Standard
01/01/06
-
01/01/06
24
7.3
7.8
7.5
100
01/02/06
- 01108/06
167
6.8
8.5
7.8
100
01/09/06 - 01/15/06
168
6.3
8.6
7.4
100
01/16/06 - 01/22/06
167
6.8
8.5
7.5
100
01/23/06 - 01129/06
168
6.7
8.7
7.8
100
01/30/06 - 02/05/06
168
6.4
9.3
7.8
100
02/06/06 - 02/12/06
168
7.5
8.9
8.2
100
02/13106 -
02119/06
168
7.1
9.3
8.3
100
02/20/06 -
02/26/06
168
8.3
10.7
9.4
100
02/27/06 - 03105/06
168
8.9
11.3
9.9
100
03/06/06 - 03/12/06
168
6.7
9.8
8.2
100
03/13/06
-
03/19/06
168
6.7
8.6
7.6
100
03/20/06 - 03/26/06
168
7.4
10.0
8.4
100
03/27/06 - 04/02/06
168
6.8
9.3
7.6
100
04/03/06 - 04/09/06
167
6.0
8.2
7.1
100
04/10/06 - 04/16/06
167
5.2
7.6
6.2
100
04/17/06 - 04/23106
168
5.5
7.7
6.3
100
04/24/06
-
04/30/06
168
6.1
8.6
6.8
100
05/01/06 - 05/07/06
168
4.9
7.8
6.0
100
05/08/06 - 05/14/06
168
5.0
8.6
6.1
100
05/15/06 - 05/21/06
168
5.1
9.8
6.4
100
05/22/06 - 05/28/06
168
5.2
9.2
6.5
100
05/29/06 -
06/04/06
168
4.4
7.9
5.8
100
06/05/06 - 06/11/06
168
4.1
8.5
6.1
100
06/12/06
- 06/18/06
168
4.7
7.5
5.9
100
06/19/06 - 06/25106
168
4.4
7.2
5.5
100
06/26/06 -
07/02/06
168
4.2
9.1
6.3
100
07/03/06
- 07/09/06
168
5.1
11.9
69
100
07/10/06
- 07/16/06
168
4.3
8.4
5.9
100
07/17/06 -
07/23/06
168
4.5
9.2
6.1
100
07/24/06 -
07/30/06
167
4.9
9.9
7.2
100
07/31/06
- 08/06/06
168
5.6
12.9
7.9
100
08/07/06
- 08/13/06
168
49
9.8
6.8
100
TABLE A-17 (
Continued
):
WEEKLY DO SUMMARY STATISTICS AT
HALSTED STREET ON THE LITTLE CALUMET RIVER DURING 2006
Number of
DO Concentration (mg/L)
Percent DO
Values Above
Monitoring Dates
DO Values
Minimum
Maximum
Mean
IPCB Standard
08/14/06 - 08/20/06
168
5.5
9.3
6.7
100
08/21/06
- 08/27/06
168
5.1
8.8
6.7
100
08/28/06
- 09/03/06
59
4.3
6.6
5.6
100
09/04/06 - 09/10/06
108
5.6
7.8
6.5
100
09/11/06 - 09/17/06
60
5.0
7.1
6.0
100
09/18/06 - 09124/06
108
5.1
7.3
6.1
100
09/25/06 - 10/01/06
168
5.3
7.6
6.5
100
10/02/06 - 10/08/06
168
3.5
7.4
6.2
97
10/09/06 - 10/15/06
168
5.7
7.4
6.6
100
10/16/06 - 10/22/06
167
5.7
7.1
6.6
100
10/23/06 - 10/29/06
168
6.0
7.2
6.7
100
10/30/06
- 11/05/06
169
6.0
7.1
6.6
100
11/06/06 - 11/12/06
168
5.7
7.3
6.4
100
11/13/06
- 11/19/06
167
5.7
7.2
6.5
100
11/20/06 - 11/26/06
168
6.0
7.3
6.6
100
11/27/06 - 12/03/06
168
5.8
8.2
6.9
100
12/04/06 - 12/10/06
168
6.6
8.1
7.4
100
12/11/06 - 12/17/06
168
6.0
8.1
6.8
100
12/18/06 - 12/24/06
168
5.9
7.3
6.6
100
12/25/06
- 12/31/06
168
5.5
7.0
6.3
100
TABLE A-18: WEEKLY DO SUMMARY STATISTICS AT CICERO AVENUE
ON THE CALUMET SAG CHANNEL DURING 2006
Number of
DO Concentration
(mg/L)
Percent DO
Values Above
Monitoring Dates
DO Values
Minimum
Maximum
Mean
IPCB Standard
01/01/06
-
01101/06
24
8.3
8.7
8.5
100
01/02/06 -
01/08/06
168
7.9
8.8
8.2
100
01/09/06 - 01/15/06
168
7.3
8.7
8.0
100
01/16/06 -
01/22/06
168
7.8
9.2
8.3
100
01/23/06 - 01/29/06
168
8.4
10.0
9.2
100
01/30/06 - 02/05/06
168
7.8
8.7
8.4
100
02/06/06 - 02/12/06
168
8.3
9.6
8.9
100
02/13/06 - 02/19/06
168
8.4
10.4
9.0
100
02/20106 -
02/26/06
168
9.6
11.7
10.5
100
02/27/06 - 03/05/06
168
10.0
11.4
10.7
100
03/06/06 - 03/12/06
168
7.7
11.2
9.4
100
03/13/06
-
03/19/06
168
7.2
8.9
8.2
100
03/20/06 -
03126/06
168
8.5
9.7
9.1
100
03/27/06 -
04/02/06
168
7.8
93
8.4
100
04/03/06 - 04/09/06
167
6.6
8.9
7.6
100
04/10/06 -
04/16/06
168
4.9
7.9
6.6
100
04/17/06
-
04/23/06
168
5.5
6.9
6.3
100
04/24/06
- 04/30/06
168
5.6
7.2
6.5
100
05/01/06
- 05/07/06
168
5.3
6.8
6.1
100
05/08/06 - 05/14/06
168
4.8
6.7
5.8
100
05/15/06
- 05/21/06
168
5.1
6.7
6.0
100
05/22/06 - 05/28/06
168
4.1
7.4
5.7
100
05/29/06
- 06/04/06
168
3.6
6.1
4.7
100
06/05/06 - 06/11/06
167
3.2
6.6
5.2
100
06/12/06 - 06/18/06
167
4.6
6.3
5.6
100
06/19/06
- 06/25/06
168
4.1
6.2
5.0
100
06/26/06
- 07/02/06
168
4.3
8.2
5.9
100
07/03/06 - 07/09/06
168
4.8
10.2
6.4
100
07/10/06
- 07/16/06
168
3.9
7.4
5.2
100
07/17/06 - 07/23/06
168
4.1
9.3
5.3
100
07/24/06
- 07/30/06
168
4.6
9.4
6.4
100
07/31/06 - 08/06/06
168
5.2
13.1
7.0
100
08/07/06
- 08/13/06
168
4.5
7.6
6.1
100
TABLE A-18 (Continued): WEEKLY DO SUMMARY STATISTICS AT
CICERO AVENUE ON THE CALUMET SAG CHANNEL DURING 2006
Number of
DO Concentration (mg/L)
Percent DO
Values Above
Monitoring Dates
DO Values
Minimum
Maximum
Mean
IPCB Standard
08/14/06 - 08/20/06
168
4.4
7.6
6.1
100
08/21/06 - 08/27/06
168
4.6
7.8
6.1
100
08/28/06 - 09/03/06
168
3.6
8.7
5.6
100
09/04/06 -
09/10/06
168
5.3
6.3
5.8
100
09/11/06 -
09/17/06
168
3.3
7.8
5.5
100
09/18/06
- 09/24/06
167
4.7
6.4
5.8
100
09/25/06 - 10/01/06
168
5.5
7.5
6.2
100
10/02/06 - 10/08/06
168
4.5
7.1
6.1
100
10/09/06 - 10/15/06
168
5.9
8.1
6.8
100
10/16/06 - 10/22/06
168
5.9
8.1
6.8
100
10/23/06 - 10/29/06
168
6.6
7.6
7.0
100
10/30/06 - 11/05/06
169
6.5
8.2
7.3
100
11/06/06 - 11/12/06
168
5.4
8.0
6.5
100
11/13/06 - 11/19/06
168
6.0
7.5
6.8
100
l 1 /20/06 - 11/26/06
168
6.4
7.6
7.0
100
11/27/06 - 12/03/06
168
5.6
10.3
7.4
100
12/04/06 - 12/10/06
168
7.3
10.5
8.9
100
12/11/06 - 12/17/06
59
7.3
8.1
7.8
100
12/18/06
- 12/24/06
107
7.2
9.1
8.3
100
12/25/06 - 12/31106
168
7.0
9.2
8.1
100
TABLE A-19: WEEKLY DO SUMMARY STATISTICS AT 104TH AVENUE
ON THE CALUMET-SAG CHANNEL DURING 2006
Number of
DO Concentration
(
mg/L)
Percent DO
Values Above
Monitoring Dates
DO Values
Minimum
Maximum
Mean
IPCB Standard
01/01/06 - 01/01/06
24
7.9
8.2
8.0
100
01/02/06
-
01/08/06
168
7.5
8.4
8.0
100
01/09/06
-
01/15/06
168
7.9
9.0
8.4
100
01/16
/
06
-
01/22/06
168
7.6
9
.
7
8.8
100
01/23
/
06 - 01/29
/
06
168
8.2
10.0
9.3
100
01/30/06
- 02/05/06
168
7.9
9
.
3
8.4
100
02/06/06 - 02
/
12/06
168
8.3
9.3
9.0
100
02/13/06 - 02
/
19/06
168
8.9
10.0
9.4
100
02/20
/
06 - 02
/
26/06
168
3.4
11.7
9.7
100
02/27/06 -
03/05
/
06
167
10.2
13.0
11.4
100
03/06/06 - 03/12/06
168
7.6
11.4
9.8
100
03/13
/
06 - 03
/
19/06
59
7.8
8.7
8.1
100
03/20/06 - 03
/
26/06
109
9.2
10.0
9.6
100
03/27/06
-
04/02
/
06
60
8
.
5
9.6
9.3
100
04/03/06 - 04/09/06
107
7.2
7.7
7.5
100
04/10/06 - 04/16/06
168
5.8
8.0
7.2
100
04/17/06 - 04123/06
166
49
6.6
6.1
100
04/24
/
06
- 04
/
30/06
168
5.7
7.2
6.4
100
05/01/06 - 05
/
07/06
168
5.3
6.9
5.8
100
05/08/06
- 05/14/06
167
4.7
6.1
5.5
100
05/15/06
-
05/21
/
06
61
5
.
2
6.5
6.0
100
05/22
/
06 - 05
/
28/06
109
4.1
6.1
5.3
100
05/29/06
- 06
/
04/06
168
2.9
5.8
4.2
98
06/05
/
06
- 06
/
11/06
168
3.9
6.7
5.0
100
06/12
/
06 - 06
/
18/06
168
4.6
5.9
5.3
100
06/19/06 - 06/25/06
168
4.1
5.9
4.8
100
06/26/06 - 07/02/06
168
4.3
7.4
5.6
100
07/03/06 - 07/09/06
168
5.4
8.1
6.4
100
07/10/06 - 07
/
16/06
168
3.8
7.6
5.5
100
07/17/06 - 07/
23/06
168
4.0
6.2
4.8
100
07/24
/
06 - 07/30
/
06
60
4.6
6.9
5.6
100
07/31/06 -
08/06/06
NO DATA
08/07/06
-
08
/13/06
NO DATA
TABLE A-19 (Continued): WEEKLY DO SUMMARY STATISTICS AT
104TH AVENUE ON THE CALUMET SAG CHANNEL DURING 2006
Number of
DO Concentration (mg/L
)
Percent DO
Values Above
Monitoring Dates
DO Values
Minimum
Maximum
Mean
IPCB Standard
08/14/06 - 08
/20/06
NO DATA
08/21/06 - 08
/
27/06
108
5.6
7.2
6.5
100
08/28/06 - 09/03/06
133
4.7
7.5
5.6
100
09/04/06 - 09/10/06
168
5.4
6.2
5.7
100
09/11/06 - 09/17/06
168
4.6
7.1
5.7
100
09/18/06
-
09/24/06
168
5.1
6.3
5.7
100
09/25/06- 10/01/06
168
5.3
6.5
59
100
10/02/06-
10/08/06
168
3.3
7.1
5.6
100
10/09/06-
10/15/06
168
5.4
7.2
6.3
100
10/16/06-
10/22/06
83
5.5
7.7
6.7
100
10/23/06-
10/29
/
06
84
6
.
7
8.0
7.5
100
10/30/06-
11/05/06
169
6.7
8.7
7.7
100
11/06/06- 11/12/06
167
4.5
8.6
7.2
100
11/13/06 -
11/19/06
168
3.3
7.7
6.3
100
11/20/06 - 11/26/06
168
6.5
7.7
7.1
100
11/27/06 - 12/03/06
168
5.9
10.5
7.5
100
12/04/06- 12/10/06
59
10.4
10.8
10.6
100
12/11/06 - 12/17/06
84
7.9
9.2
8.4
100
12/18/06- 12/24/06
169
7.4
9.3
8.2
100
12/25/06 - 12/
31/06
168
7.0
9
.
2
8.2
too
TABLE A-20: WEEKLY DO SUMMARY STATISTICS AT ROUTE 83
ON THE CALUMET SAG CHANNEL DURING 2006
Number of
DO Concentration
(
mg/L)
Percent DO
Values Above
Monitoring Dates
DO Values
Minimum
Maximum
Mean
IPCB Standard
01/01/06 -
01/01/06
24
7.4
8.1
7.9
100
01/02
/
06
- 01108
/
06
168
7.1
8.3
7.9
100
01/09/06 - 01
/
15/06
168
7.7
8.8
8.3
100
01/16/06 - 01/22
/
06
168
7.7
9.8
8.8
100
01/23/06
-
01/29/06
168
7.7
10.1
9.5
100
01/30/06
-
02/05/06
168
8.0
9.6
8.5
100
02/06
/
06
- 02/12/06
168
8.5
9.8
9.1
100
02/13/
06 - 02
/
19/06
168
8.3
10.1
9.6
100
02/20
/
06
- 02
/
26/06
168
9.0
11
.
0
10.0
100
02127
/
06
- 03
/
05/06
168
9.8
13.9
12.0
100
03/06
/
06 - 03
/
12/06
168
7
.
5
11.9
10.1
100
03/13/06 - 03/19
/
06
168
7.4
8.9
8.0
100
03/20
1
06
- 03
/
26/06
168
7
.
2
9.4
8.5
100
03/27
/
06 - 04
/
02/06
168
7.2
9.3
8.2
100
04/03/06 - 04/09/06
167
7.2
8.4
7.8
100
04/10/06 - 04
/
16/06
168
4.3
8.1
6.4
100
04/17
/
06 - 04
/
23/06
168
4.3
6.2
5.4
100
04/24
/
06
- 04
/
30/06
168
5.4
7.1
6.1
100
05/01/06
- 05/07
/
06
168
4.9
6.5
5.6
100
05/08
/
06 - 05
/
14/06
167
4.3
6.0
5.2
100
05/15
/
06 - 05
/
21/06
168
4.2
6.8
5.8
100
05/22
/
06
-
05/28106
168
4.1
7.1
5.5
100
05/29
/
06 - 06
/
04/06
168
2.8
5.1
3.7
89
06/05
/
06 - 06
/
11/06
168
3.8
6.5
4.9
100
06/12/06 - 06/18
/
06
168
4.5
5.8
5.1
100
06/19/06
- 06
/
25/06
168
4.0
5.3
4.6
100
06/26/06
- 07/02/06
168
3.8
7.1
5.1
100
07/03/06 - 07/
09/06
168
4.9
7.5
6.0
100
07/10/06 -
07/16/06
168
4.3
7.5
5.7
100
07/17/06
-
07/23/06
167
4.0
7.1
5.2
100
07/24
/
06
- 07
/
30/06
168
4.2
9.9
6.1
100
07/31/06
- 08/06
/
06
168
3.3
9.5
5.6
100
08/07
/
06 - 08/13/06
168
4.0
6.9
5.2
100
TABLE A-20 (Continued): WEEKLY DO SUMMARY STATISTICS AT
ROUTE 83 ON THE CALUMET-SAG CHANNEL DURING 2006
Number of
DO Concentration (mg/L)
Percent DO
Values Above
Monitoring Dates
DO Values
Minimum
Maximum
Mean
IPCB Standard
08/14/06 -
08/20/06
168
4.6
73
5.7
100
08/21/06 -
08/27/06
168
3.9
6.1
4.9
100
08/28/06 -
09/03/06
168
4.0
5.8
5.0
100
09/04/06 - 09/10/06
168
4.5
5.9
5.2
100
09/11/06 -
09/17/06
168
3.8
6.6
5.1
100
09/18/06
- 09/24/06
167
4.8
6.4
5.6
100
09/25/06
- 10101/06
168
5.4
6.1
5.8
100
10/02/06
- 10/08/06
168
3.9
7.0
5.7
100
10/09/06 - 10/15/06
168
5.4
7.6
6.6
100
10/16/06
- 10/22/06
168
5.9
7.9
6.7
100
10/23/06 - 10/29/06
168
6.3
7.8
7.3
100
10/30/06
- 11/05/06
169
63
8.1
7.5
100
11/06/06
- 11/12/06
168
5.5
8.2
7.0
100
11/13/06
- 11/19/06
168
2.7
7.4
5.7
95
11/20/06
- 11/26/06
167
6.0
7.2
6.8
100
11/27/06
- 12/03/06
168
5.6
9.9
7.3
100
12/04/06
- 12/10/06
168
8.7
10.5
9.8
100
12/11/06
- 12/17/06
168
7.5
9.1
8.3
100
12/18/06
- 12/24/06
168
6.6
9.3
8.0
100
12/25/06 - 12/31/06
168
7.5
9.1
8.3
100
A
ttachm
e
nt 2
METROPOLITAN WATER RECLAMATION DISTRICT OF GREATER CHICAGO
TABLE 1
SUMMARY OF PERCENT COMPLIANCE FROM 2005 THROUGH 2007
WITH 10/26/07 DRAFT DISSOLVED OXYGEN (DO) STANDARDS FOR CAWS
AQUATIC LIFE USE A
Anytime (Mar-July)
Anytime (Aug-Feb)
5.0 mg /L
3.5 mglL
DO Station
Year
N*
V*
C*
N*
V*
C*
Main Street
2005
3503
224
93.6
4636
484
89.6
2006
3502
93
97.3
4631
249
94.6
2007
2954
359
87.8
3748
183
95.1
Foster Avenue
2005
3504
87
97.
5
4885
2
100.0
2006
3513
6
9918
4911
0
100.0
2007
3666
11
99
.
7
4920
0
100.0
Addison Street
2005
3525
380
89.2
4920
50
99.0
2006
3505
14
99.6
5090
3
99.9
2007
3502
106
97.
0
5089
0
100.0
Fullerton Avenue
2005
2940
1039
64.7
4930
115
97.7
2006
3502
317
90
.9
4920
13
99.7
2007
3671
745
79.7
5089
5
999
Torrence Avenue
2005
2326
883
62
.0
4221
416
90.1
2006
3359
1652
50.8
4916
654
86.7
2007
3502
1830
47.7
4587
661
85.6
C&W Indiana RR
2005
3059
287
90
.
6
4807
0
100.0
2006
3499
487
86.1
5086
0
100.0
2007
3165
342
89
.2
5088
17
99.7
Halsted Street
2005
3420
372
89.
1
4834
0
100.0
2006
3669
92
97.5
4748
0
100.0
2007
3670
630
82.8
4303
35
99.2
Cicero Avenue (Cal-Sag)
2005
3671
604
83.5
5086
26
99,5
2006
3669
575
84.3
4918
7
99.9
2007
3001
831
72.3
4583
24
995
104th Avenue
2005
2913
633
78.3
3825
27
99.3
2006
3033
723
76.
2
4152
9
99.8
2007
2546
599
76.5
3065
332
89.2
Route 83 (Cal-Sag)
2005
3309
1197
63.8
5088
39
99.2
2006
3669
931
74.6
5087
13
99.7
2007
3334
1015
69.6
5086
48
99.1
*N=Total
Observations
,
V=Total Violations, C=Percent Compliance
METROPOLITAN WATER RECLAMATION DISTRICT OF GREATER CHICAGO
TABLE 1 (
Continued)
SUMMARY OF PERCENT COMPLIANCE FROM 2005 THROUGH 2007
WITH 10/26/07 DRAFT DISSOLVED OXYGEN (DO) STANDARDS FOR CAWS
AQUATIC LIFE USE A
7-Day Average (Aug-Feb)a
7-Day Average (Aug-Feb)e
4.0 mg/L
4.0 mg/L
DO Station
Year
N*
V*
C*
N*
V*
C*
Main Street
2005
29
4
86.2
194
28
85.6
2006
30
1
96.7
201
16
92.0
2007
26
3
88.5
169
20
88.2
Foster Avenue
2005
31
0
100
.
0
206
0
100.0
2006
31
0
100.0
206
0
100.0
2007
31
0
100.0
206
0
100.0
Addison Street
2005
31
1
96.8
206
8
96.1
2006
31
0
100
.0
206
0
100.0
2007
31
0
100.0
206
0
100.0
Fullerton Avenue
2005
30
1
96.7
200
7
96.5
2006
31
1
96.8
206
8
96.1
2007
31
0
100
.0
206
2
99.0
Torrence Avenue
2005
28
9
67.9
185
59
68.1
2006
31
9
71.0
206
63
69.4
2007
30
9
70,
0
199
60
69.8
C&W Indiana RR
2005
31
0
100.0
202
0
100.0
2006
31
0
100
.
0
206
0
100.0
2007
31
1
96.8
206
6
97.1
Halsted Street
2005
31
0
100
.
0
202
0
100.0
2006
31
0
100.0
206
0
100.0
2007
28
1
96.4
186
7
96.2
Cicero Avenue (Cal-Sag)
2005
31
0
100.0
206
0
100.0
2006
31
0
100
.
0
206
0
100.0
2007
29
0
100.0
192
6
96.9
104th Avenue
2005
28
1
96.4
181
5
97.2
2006
29
0
100.0
189
0
100.0
2007
22
3
86.4
143
13
90,9
Route 83 (Cal-Sag)
2005
31
1
96.8
206
5
97.6
2006
31
0
100.0
206
0
100.0
2007
31
2
93.5
206
8
96.1
a7-Day average of daily minima is based on weekly mean
e7-Day average of daily minima is based on continuous weekly mean
*N-Total Observations
, V=Total
Violations
,
C=Percent Compliance
METROPOLITAN WATER RECLAMATION DISTRICT OF GREATER CHICAGO
TABLE 2
SUMMARY OF PERCENT COMPLIANCE FROM 2005 THROUGH 2007
WITH 10126107 DRAFT DISSOLVED OXYGEN (DO) STANDARDS FOR CAWS
AQUATIC LIFE USE B
Anytime
7-Day Average"
7-Day Averageb
3.5 mg IL
4.0 mg/L
4.0 mg/L
DO Station
Year
N* V*
C*
N*
V*
C*
N* V*
C*
Kinzie Street
2005
8728
143
98.4
53
4
92.5
359
25
93.0
2006
8758
66
99.2
53
2
96.2
359
10
97.2
2007
8424
97
98.8
53
3
94.3
359
19
94.7
Clark Street
2005
8652
0
100.0
53
0
100.
0
359
0
100.0
2006
8399
0
100.0
53
0
100.0
358
0
100.0
2007
8256
27
99.7
52
0
100.0
352
0
100.0
Loomis Street
2005
8757
2
100
.0
53
0
100.0
359
0
100.0
2006
8758
19
99
.8
53
0
100.0
359
0
100.0
2007
7745
24
99.7
50
1
98.0
338
7
97.9
36th Street
2005
7670
2498
67.4
49
24
51.0
331
172
48.0
2006
8408
5826
30.7
53
44
17.0
359
297
17.3
2007
8217
3924
52.2
53
38
28.3
358
253
29.3
Interstate
Highway 55
2005
7963
625
92,
2
51
8
84
3
347
69
80.1
2006
8213
1503
81.7
52
24
53.8
352
156
55.7
2007
8758
1467
83.2
53
19
64.2
359
130
63.8
Cicero Avenue (CSSC)
2005
6209
293
95.3
43
10
76.7
288
73
74.7
2006
8591
166
98
.1
53
7
86.8
359
46
87.2
2007
8594
882
89
.7
53
14
73.6
359
97
73.0
B&O Central Railroad
2005
8107
10
99.9
51
0
100.0
345
1
99.7
2006
8756
64
99.3
53
2
96.2
359
14
96.1
2007
8255
91
98
.9
52
3
94.2
352
16
95.5
Route 83 (CSSC)
2005
7026
587
91.6
50
16
68.0
334
113
66.2
2006
6899
518
92
.5
48
15
68.8
332
103
69.0
2007
5492
379
93.1
40
9
77.5
274
71
74.1
Lockport Powerhouse
2005
8313 752 91.0
53
14
73.6
358
99
72.3
2006
8416
863
89.7
53
16
69
.8
359
115
68.0
2007
7917
700
91.2
52
14
73.1
352
98
72.2
Torrence Avenue
2005
6547
963
85.3
43
18
58.1
289
127
56.1
2006
8275
1689
79.6
53
25
52.8
359
176
51.0
2007
8089
1860
77.0
52
26
50.0
352
177
49.7
37-Day average of daily minima is based on weekly mean
b7-Day average of daily minima
is based on continuous
weekly mean
*N=Total Observations, V-Total Violations, C=Percent Compliance
A
tt
a
chm
e
nt 3
FIGURE 1: DISSOLVED OXYGEN CONCENTRATION MEASURED HOURLY
AT ADDISON STREET ON THE NORTH BRANCH CHICAGO RIVER
FROM AUGUST 2, 2006 THROUGH AUGUST 8, 2006
15
IPCB Secondary Contact Proposed
DO Standard of 4.0 mg/L
is shown as a dashed (- - -) line
12
9
6
3
0I
Aug 2
A
i
Aug 3
Aug 4
Aug 5
Aug 6
Aug 7
Aug 8
FIGURE 2: DISSOLVED OXYGEN CONCENTRATION MEASURED HOURLY
AT FULLERTON AVENUE ON THE NORTH BRANCH CHICAGO RIVER
FROM AUGUST 2, 2006 THROUGH AUGUST 8, 2006
10
IPCB Secondary Contact Proposed
DO Standard of 4.0 mg/L
is shown as a dashed
( - - -)
line
=
1
t
Aug 2
Aug 3
Aug 4
Aug 5
Aug 6
Aug 7
Aug 8
FIGURE 3: DISSOLVED OXYGEN CONCENTRATION MEASURED HOURLY
AT KINZIE STREET ON THE NORTH BRANCH CHICAGO RIVER
FROM AUGUST 2,
2006
THROUGH AUGUST 8, 2006
IO
IPCB Secondary Contact Proposed
DO Standard of 4.0 mg/L
is shown as a dashed (- - -) line
8
6
4
2
0
Aug 2
Aug 3
Aug 4
Aug 5
Aug 6
Aug 7
Aug 8
FIGURE 4. DISSOLVED OXYGEN CONCENTRATION MEASURED HOURLY
AT LOOMIS STREET ON THE SOUTH BRANCH CHICAGO RIVER
FROM AUGUST 2, 2006 THROUGH AUGUST 8, 2006
15
IPCB Secondary Contact Proposed
DO Standard of 4.0 mg/L
is shown as a dashed
(- - -)
line
12
9
6
3
0
I
Aug 2
I
Aug 3
1
Aug 4
1
Aug 5
1
Aug 6
I
Aug 7
I
Aug 8
FIGURE 5: DISSOLVED OXYGEN CONCENTRATION MEASURED HOURLY
AT 36TH STREET ON BUBBLY CREEK
FROM AUGUST 2, 2006 THROUGH AUGUST S, 2006
IO
IPCB Secondary Contact Proposed
DO Standard of 4.0 mg/L
is shown as a dashed (- - -) line
Aug 2
Aug 3
Aug 4
Aug 5
Aug 6
Aug 7
Aug 8
FIGURE 6: DISSOLVED OXYGEN CONCENTRATION MEASURED HOURLY
AT INTERSTATE HIGHWAY 55 ON BUBBLY CREEK
FROM AUGUST 2, 2006 THROUGH AUGUST 8, 2006
10
IPCB Secondary Contact Proposed
DO Standard of 4.0 mg/L
is shown as a dashed (-- -) line
Aug 2
Aug 3
Aug 4
Aug 5
Aug 6
Aug 7
Aug 8
FIGURE 7: DISSOLVED OXYGEN CONCENTRATION MEASURED HOURLY
AT B&O CENTRAL RAILROAD ON THE CHICAGO SANITARY AND SHIP CANAL
FROM AUGUST 2, 2006 THROUGH AUGUST 8, 2006
10
IPCB Secondary Contact Proposed
DO Standard of 4.0 mg/L
is shown as
a dashed (- - -)
line
Aug 2
Aug 3
Aug 4
Aug 5
Aug 6
Aug 7
Aug 8