BEFORE THE ILLINOIS POLLUTION CONTROL BOARD
IN THE MATTER OF:
WATER QUALITY STANDARDS AND
EFFLUENT LIMITATIONS FOR THE
CHICAGO AREA WATERWAY SYSTEM
AND THE LOWER DES PLAINES RIVER:
PROPOSED AMENDMENTS TO 35 Ill.
Adm. Code Parts 301, 302, 303 and 304
R08-9
(Rulemaking
-
Water)
PRE-FILED TESTIMONY OF SAMUEL G. DENNISON ON BEHALF OF THE
METROPOLITAN WATER RECLAMATION DISTRICT OF GREATER CHICAGO
CONCERNING JUSTIFICATION FOR AN ADDITIONAL AQUATIC LIFE USE TIER
FOR BUBBLY CREEK (SOUTH FORK OF THE SOUTH BRANCH CHICAGO RIVER)
My name is Samuel G. Dennison. I am a Biologist IV in the Environmental Monitoring
and Research Division of the Research and Development Department of the Metropolitan Water
Reclamation District of Greater Chicago (District). I received a Bachelor of Arts degree with a
major in Biology from Saint Mary's University in Winona, Minnesota, a Master of Science
degree in Fisheries Biology from Iowa State University in Ames, Iowa, and a Doctor of
Philosophy degree in Biology from the Illinois Institute of Technology in Chicago, Illinois. I am
a Certified Fisheries Professional with the American Fisheries Society and also a Past President
of the Illinois Chapter of the American Fisheries Society.
I
have been employed by the District since 1971. My primary responsibility from 1974
through 2003 was monitoring the fish populations in Chicago area waterways. Since 2003, I
have served as Head of the Aquatic Ecology and Water Quality Section within the
Environmental Monitoring and Research Division, where I supervise a staff of ten persons.
My testimony today focuses on deficiencies and flaws in the IEPA's approach for aquatic
life use designation and subsequent development of standards for the South Fork of the South
Branch Chicago River, which I will refer to as Bubbly Creek. The District's position is that the
IEPA did not adequately or properly consider Bubbly Creek in its Use Attainability Study and
1
that Bubbly Creek should have been placed into an Aquatic Life Use tier that is lower than
Aquatic Life Use B.
In pre-settlement Chicago, Bubbly Creek was once a meandering creek that slowly
drained a five square mile area of marshland. This portion of the Chicago Area Waterway
System has been severely altered by human development. In the early 1860s, the Union Stock
Yards were constructed along the banks of Bubbly Creek and this small stream became an open
sewer for the meatpacking industry for nearly a century. The channel of Bubbly Creek has been
systematically straightened, deepened, and widened to allow for more efficient urban drainage
and some commercial navigation. The extensive wetlands that were formerly drained by the
stream have been entirely filled in, resulting in complete loss of dry weather flow in present day
Bubbly Creek.
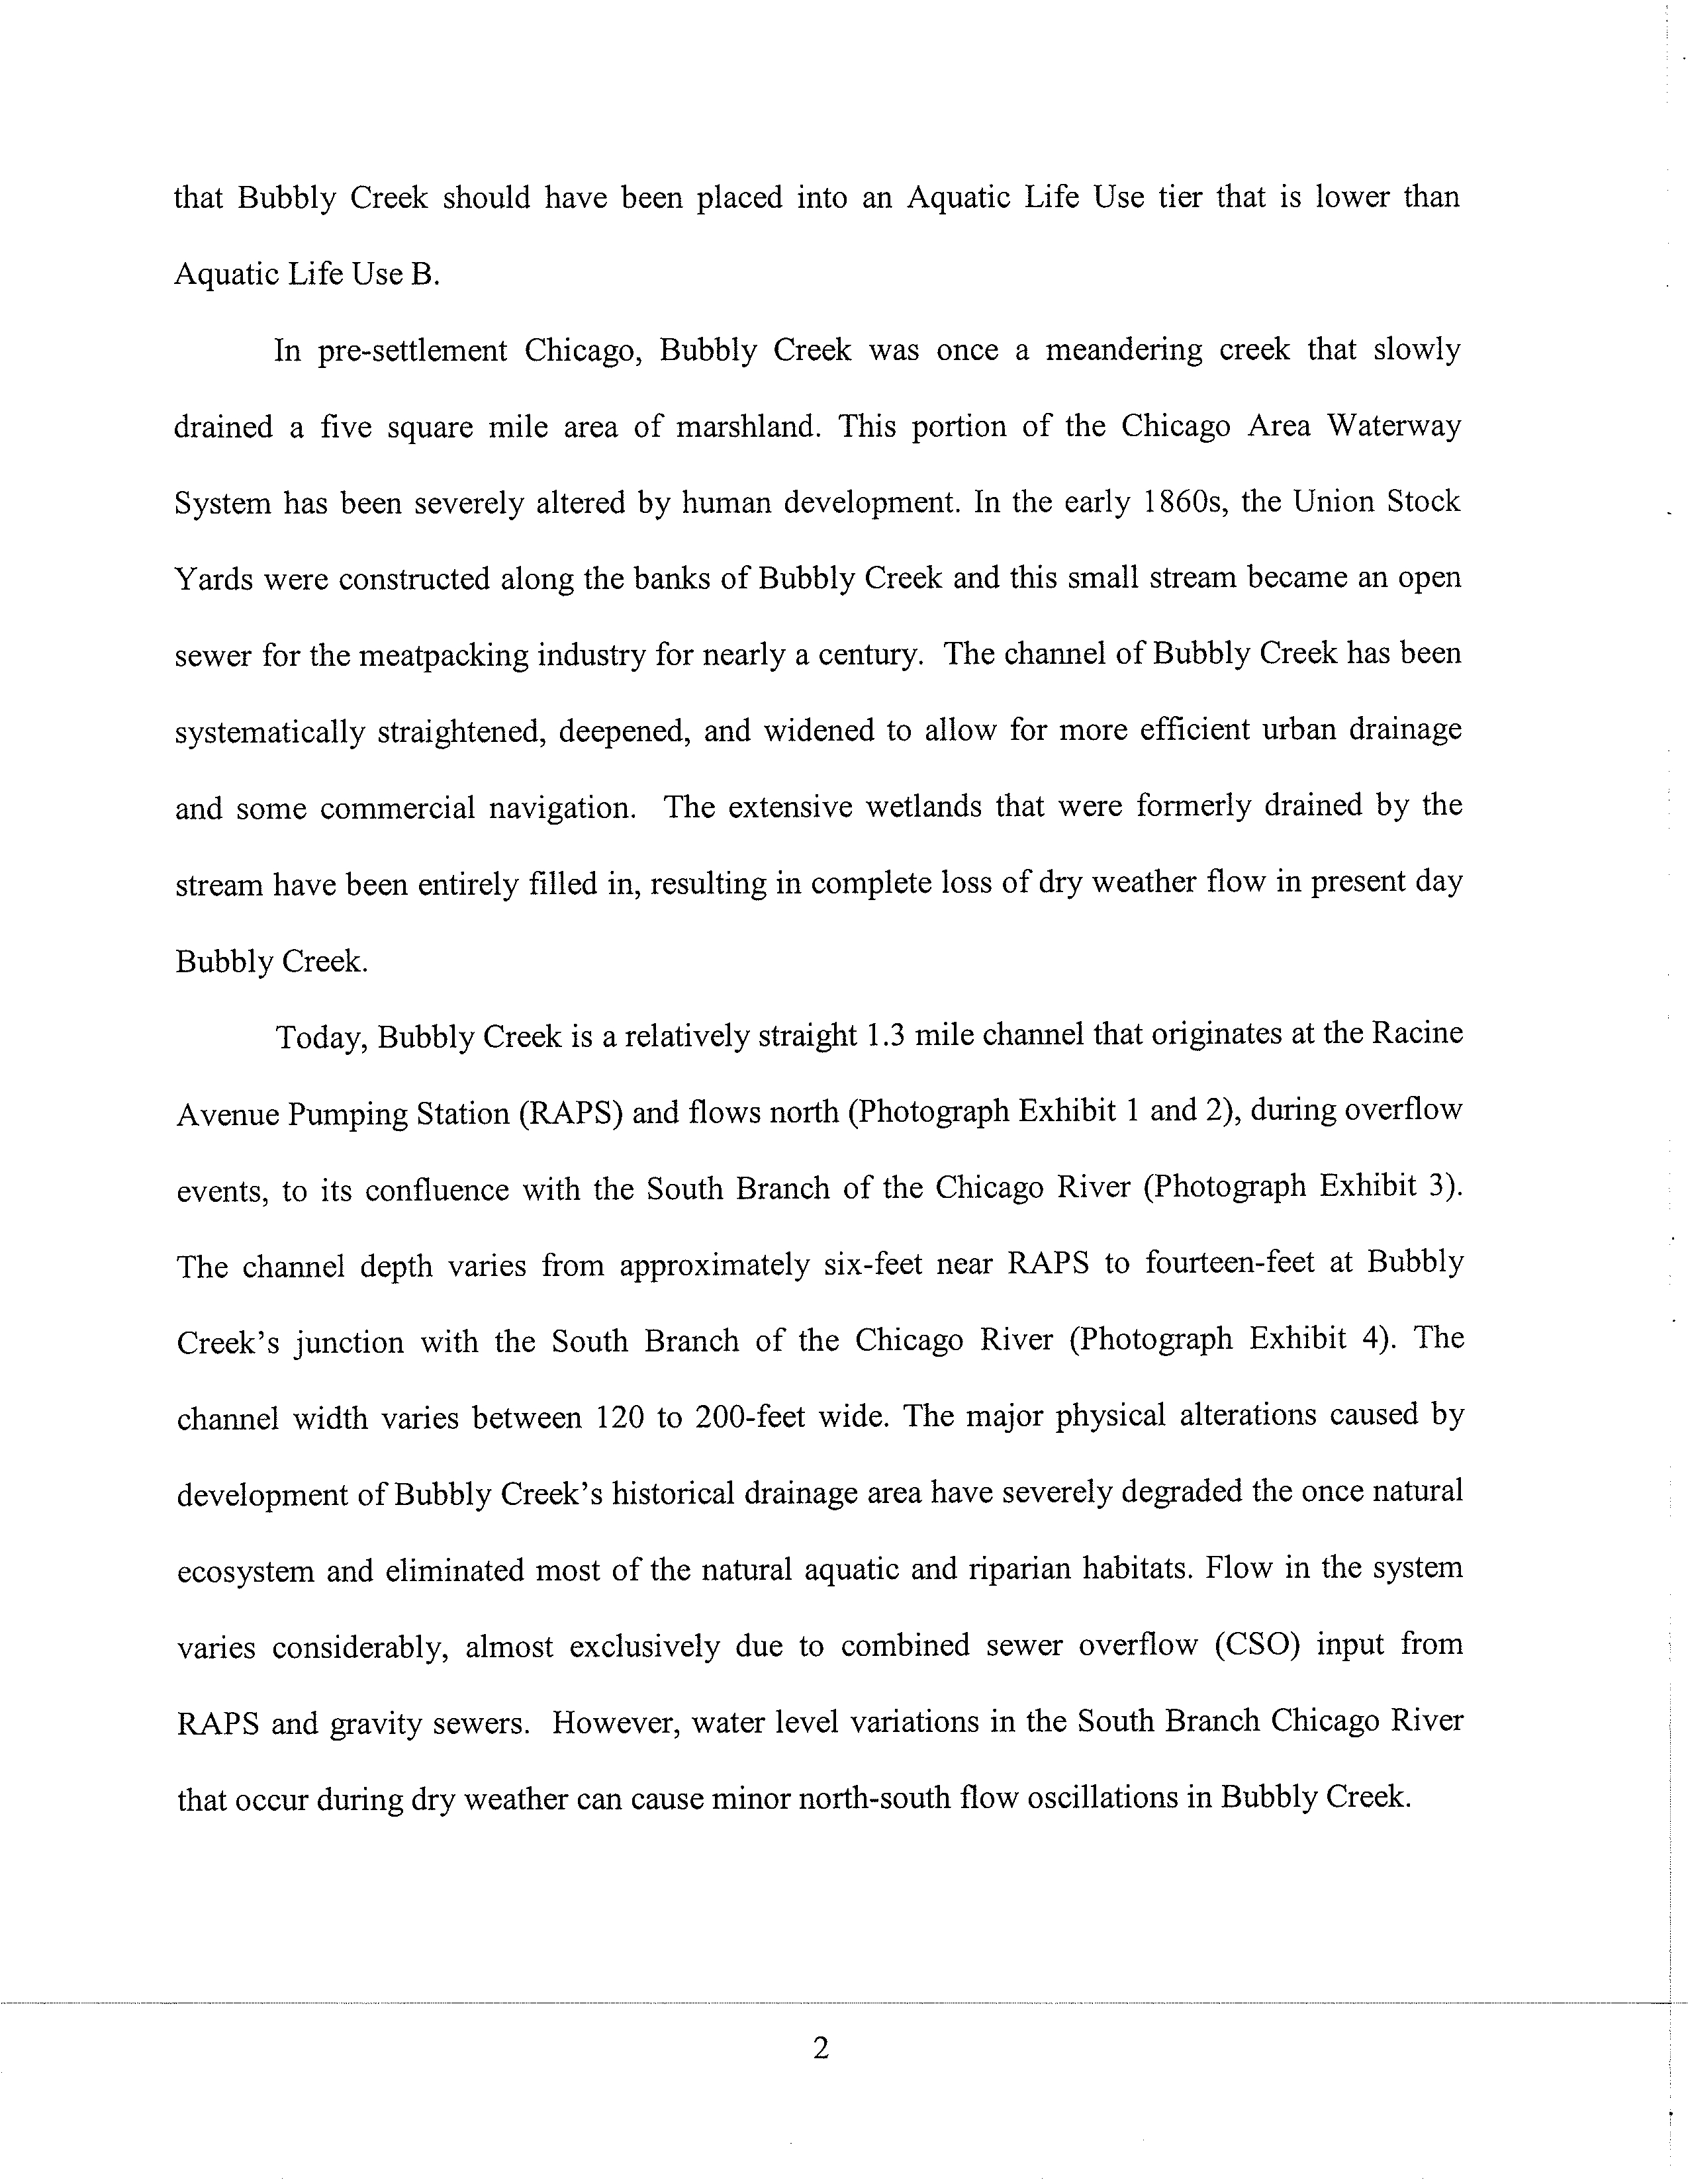
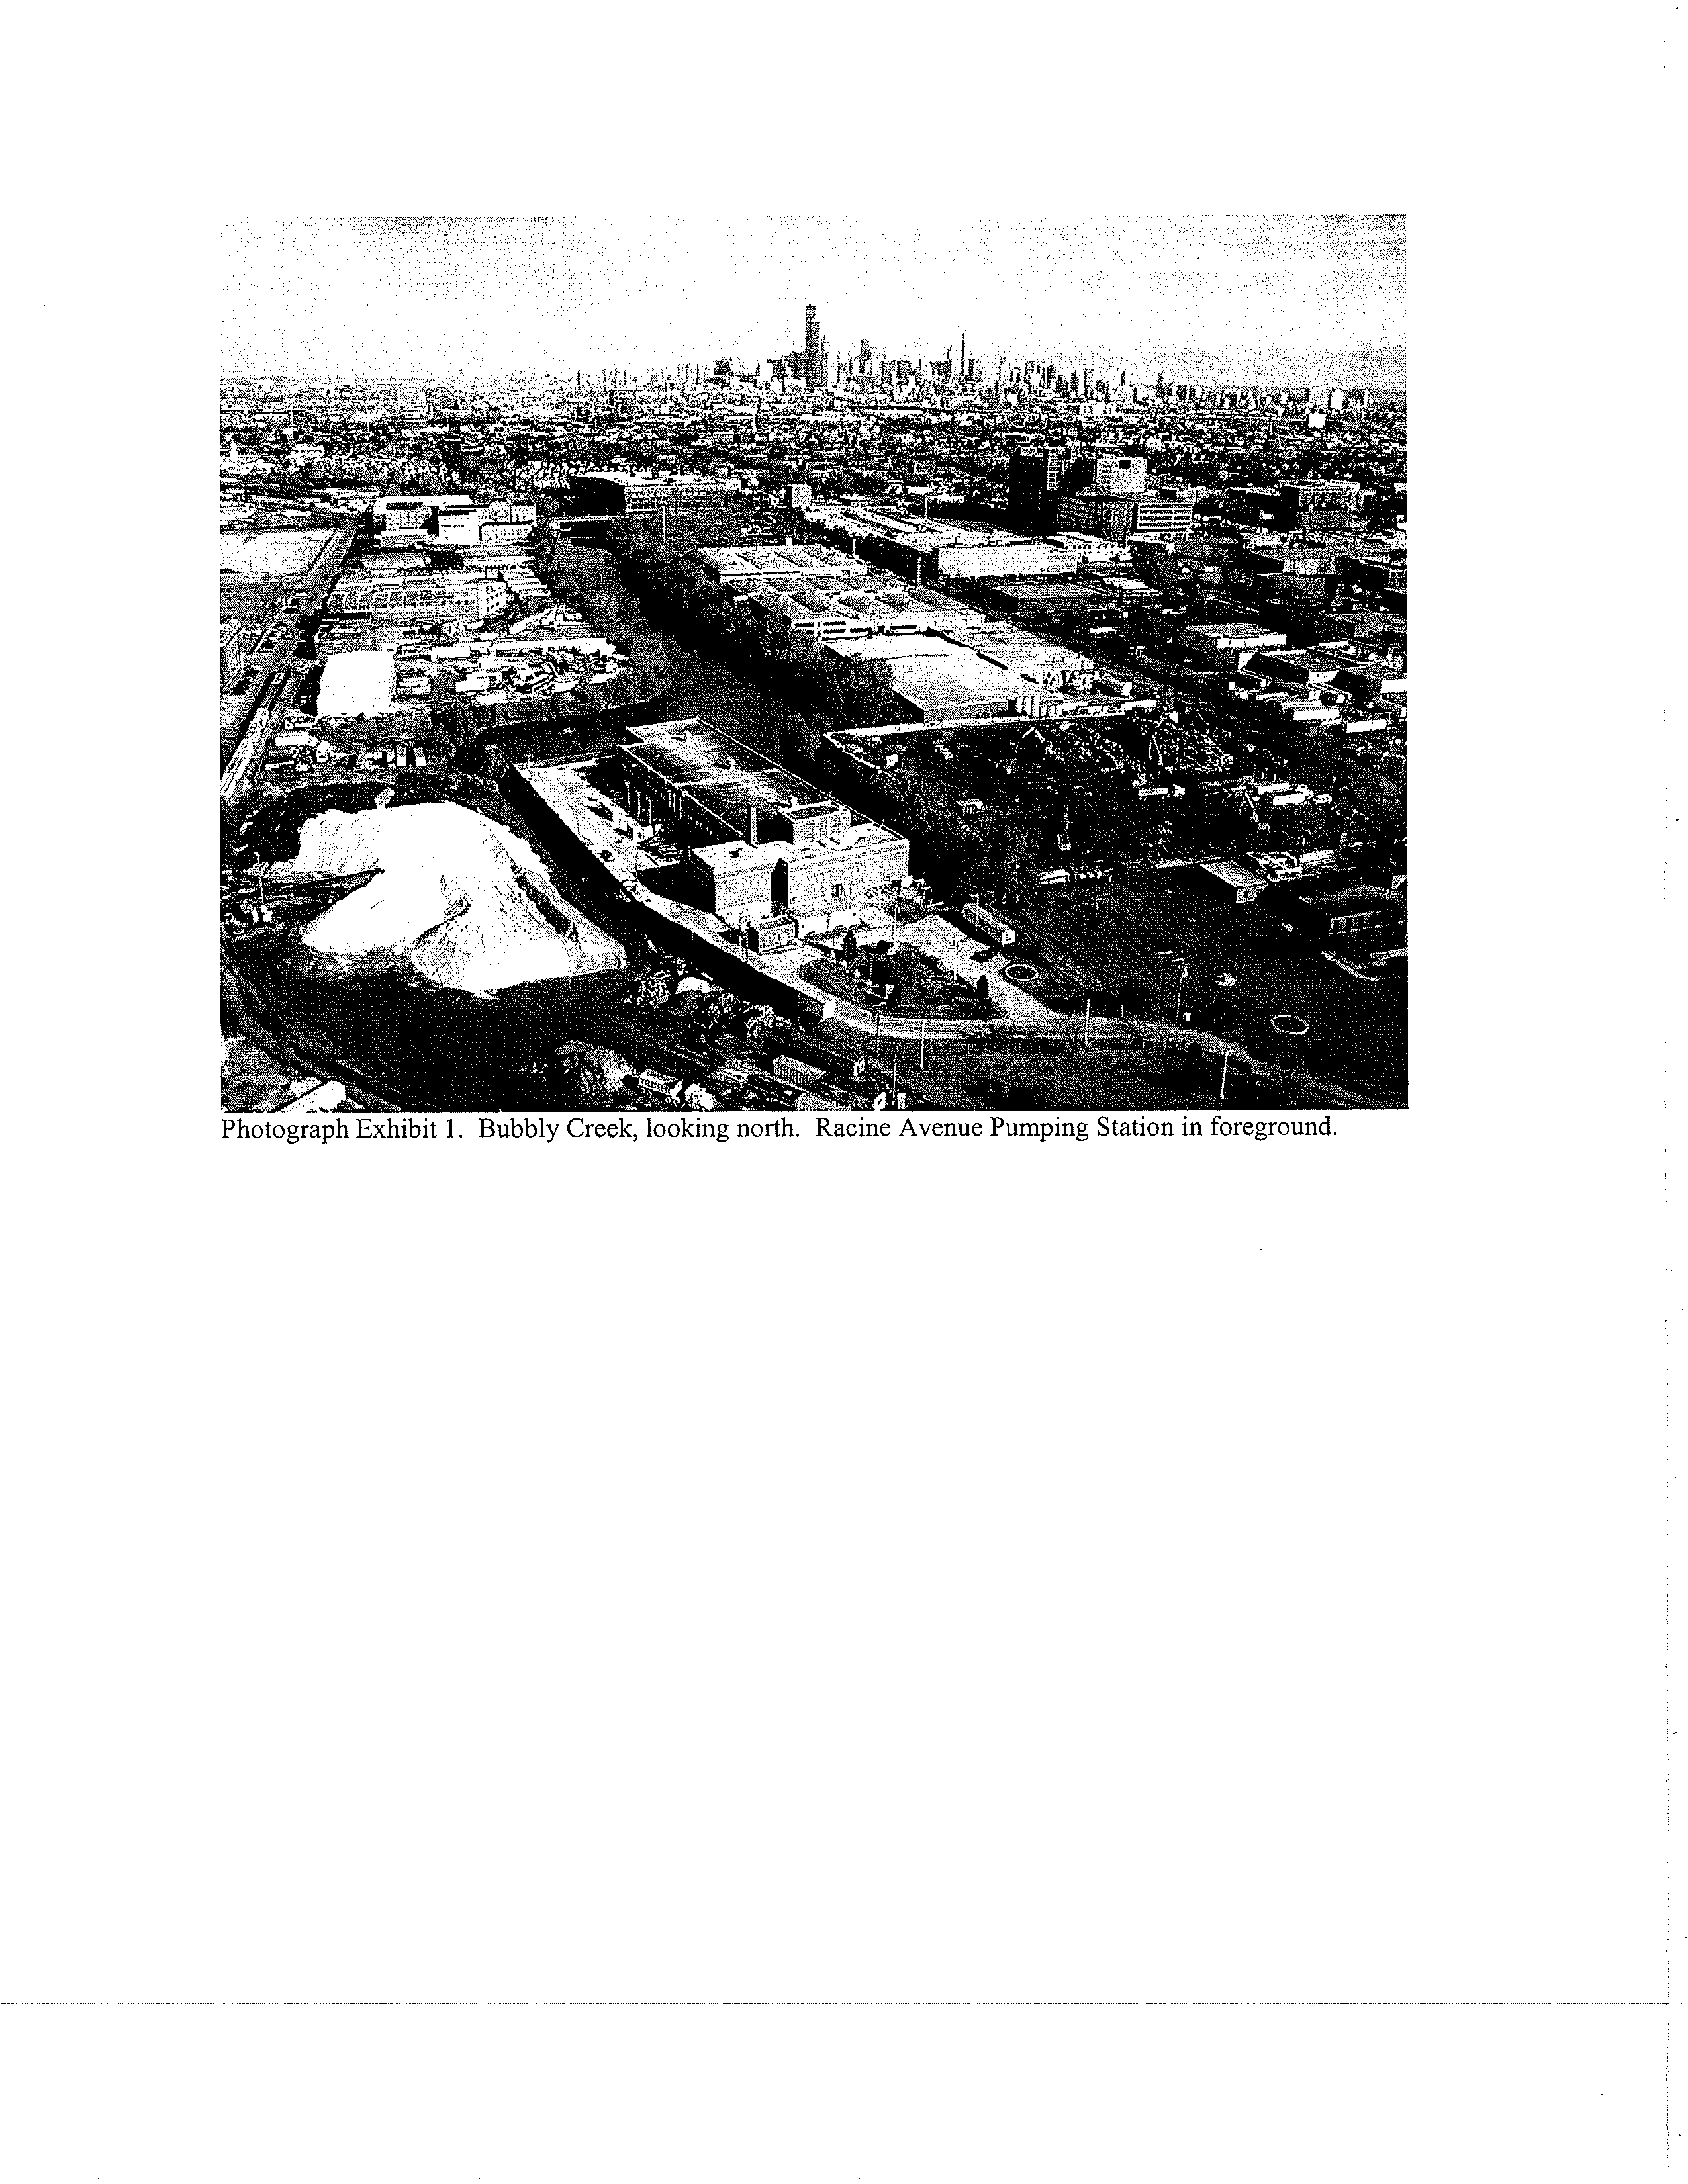
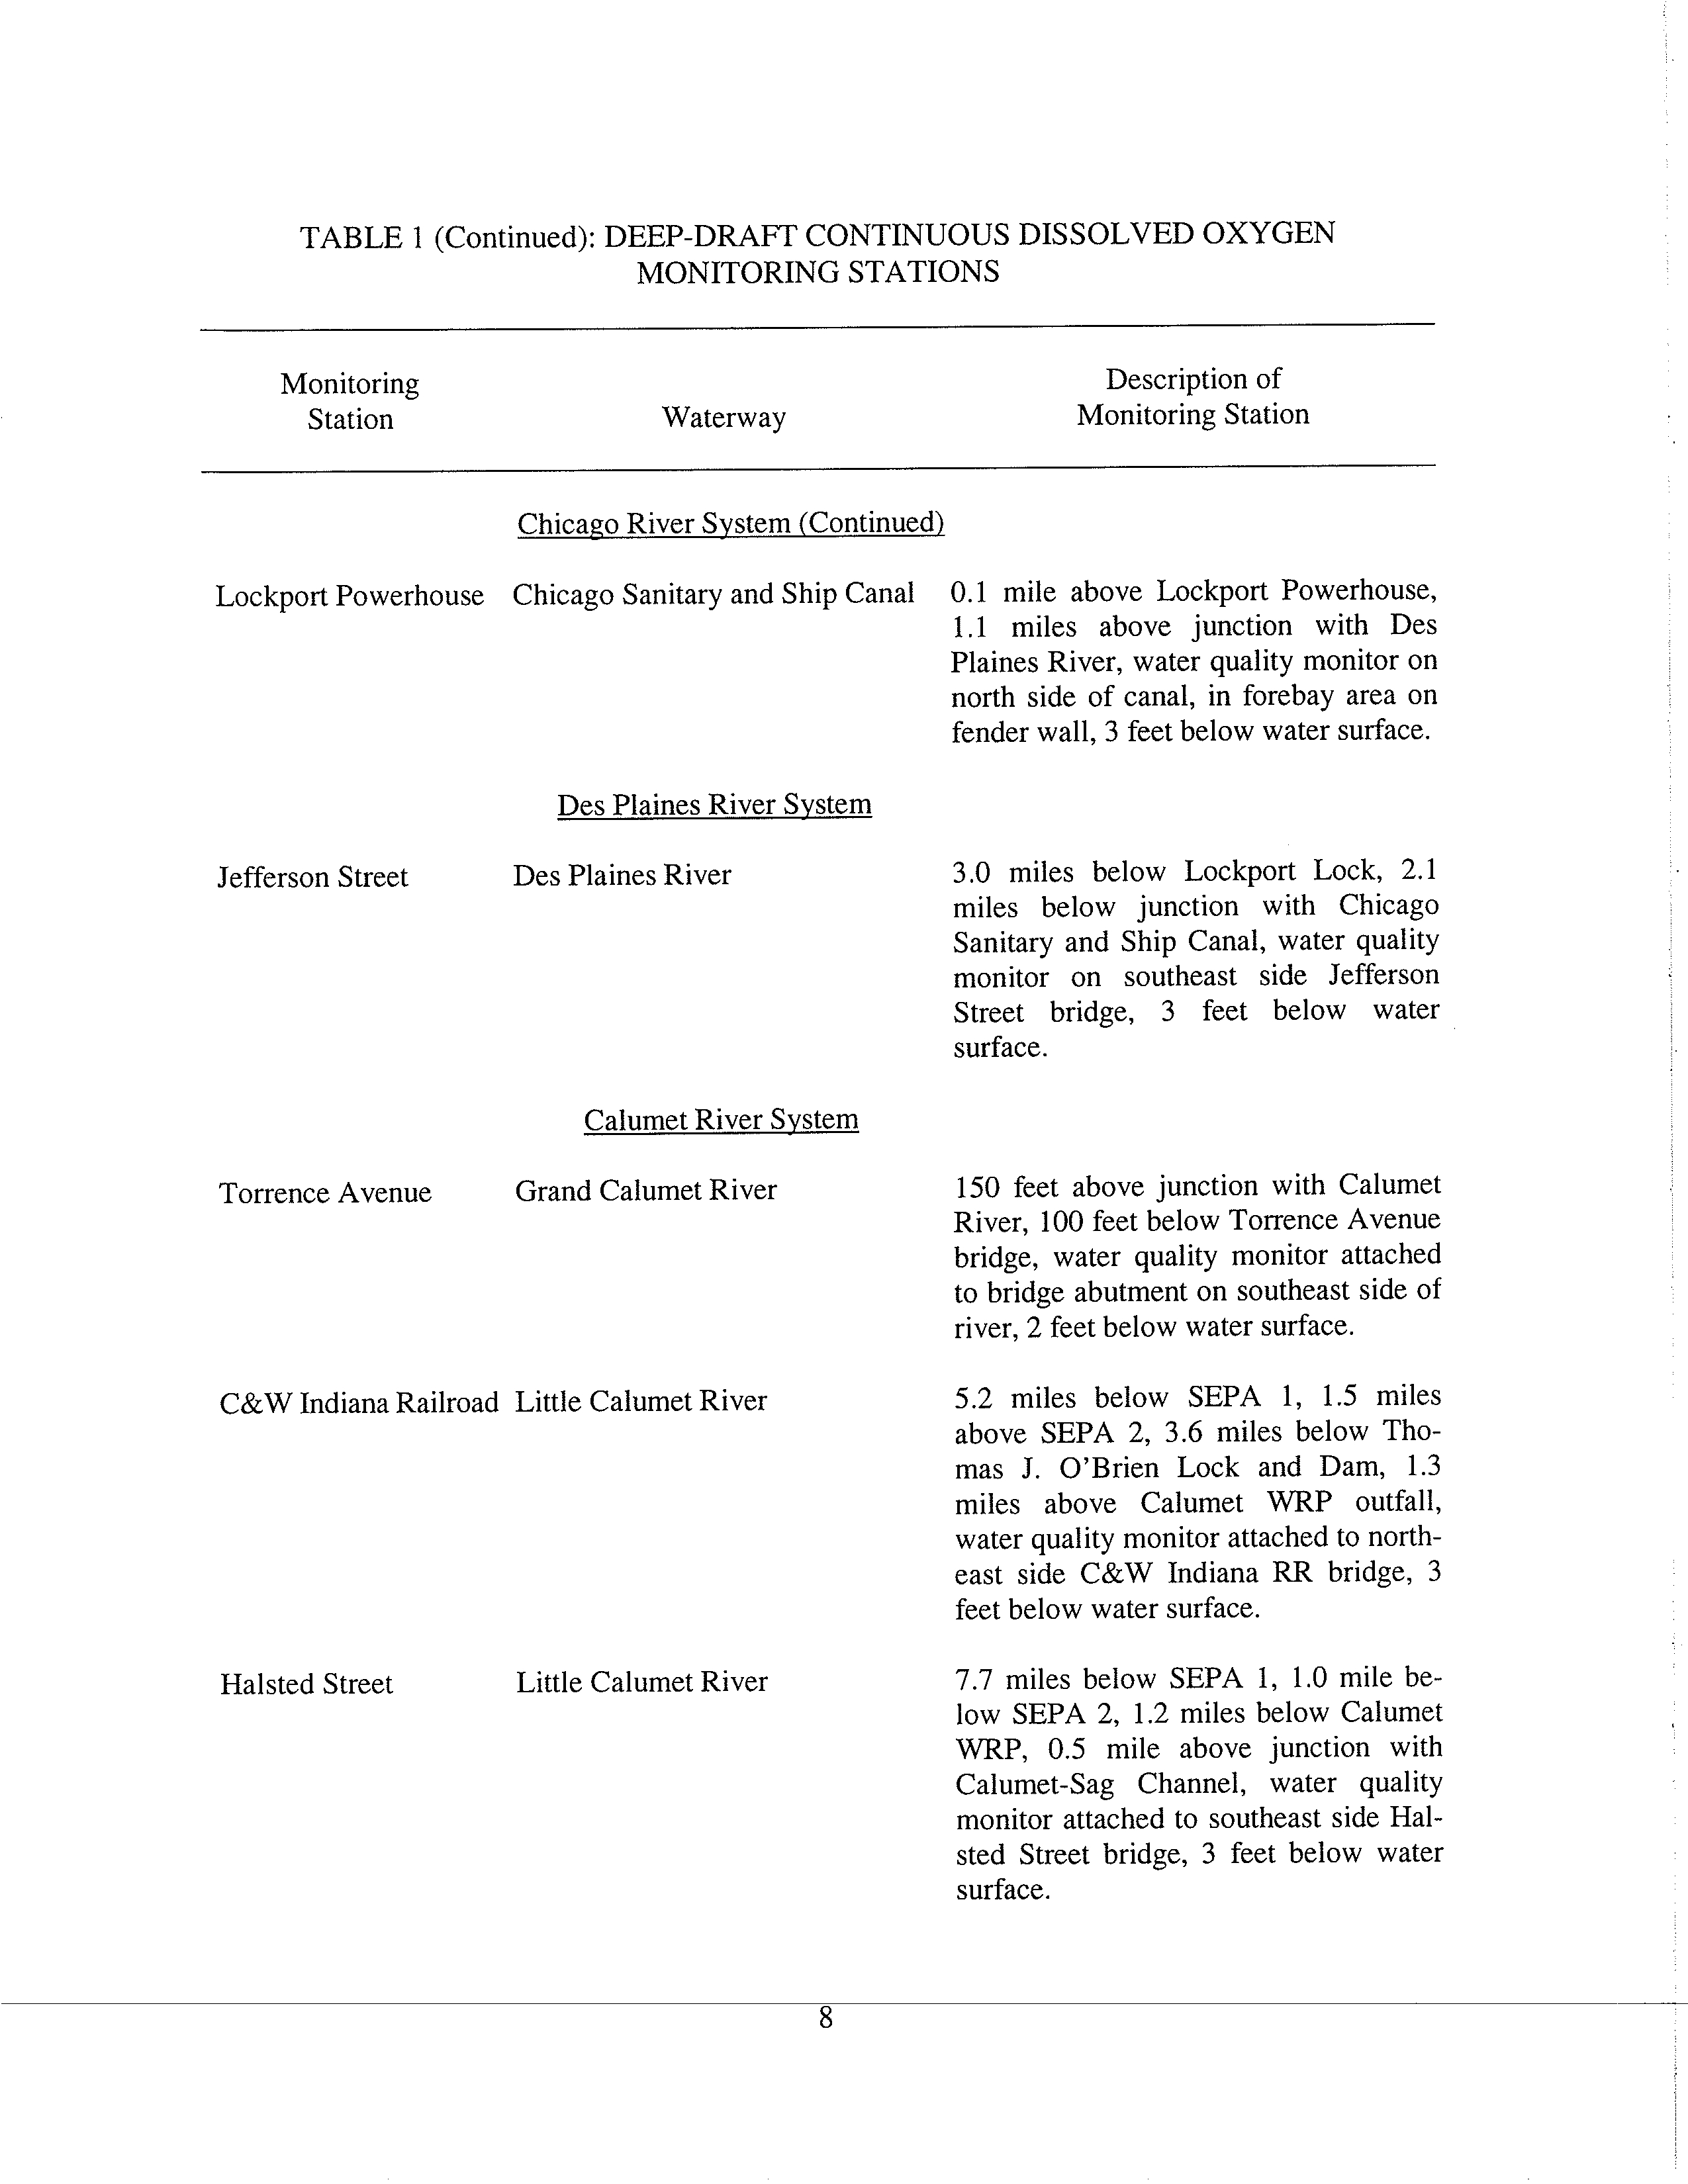
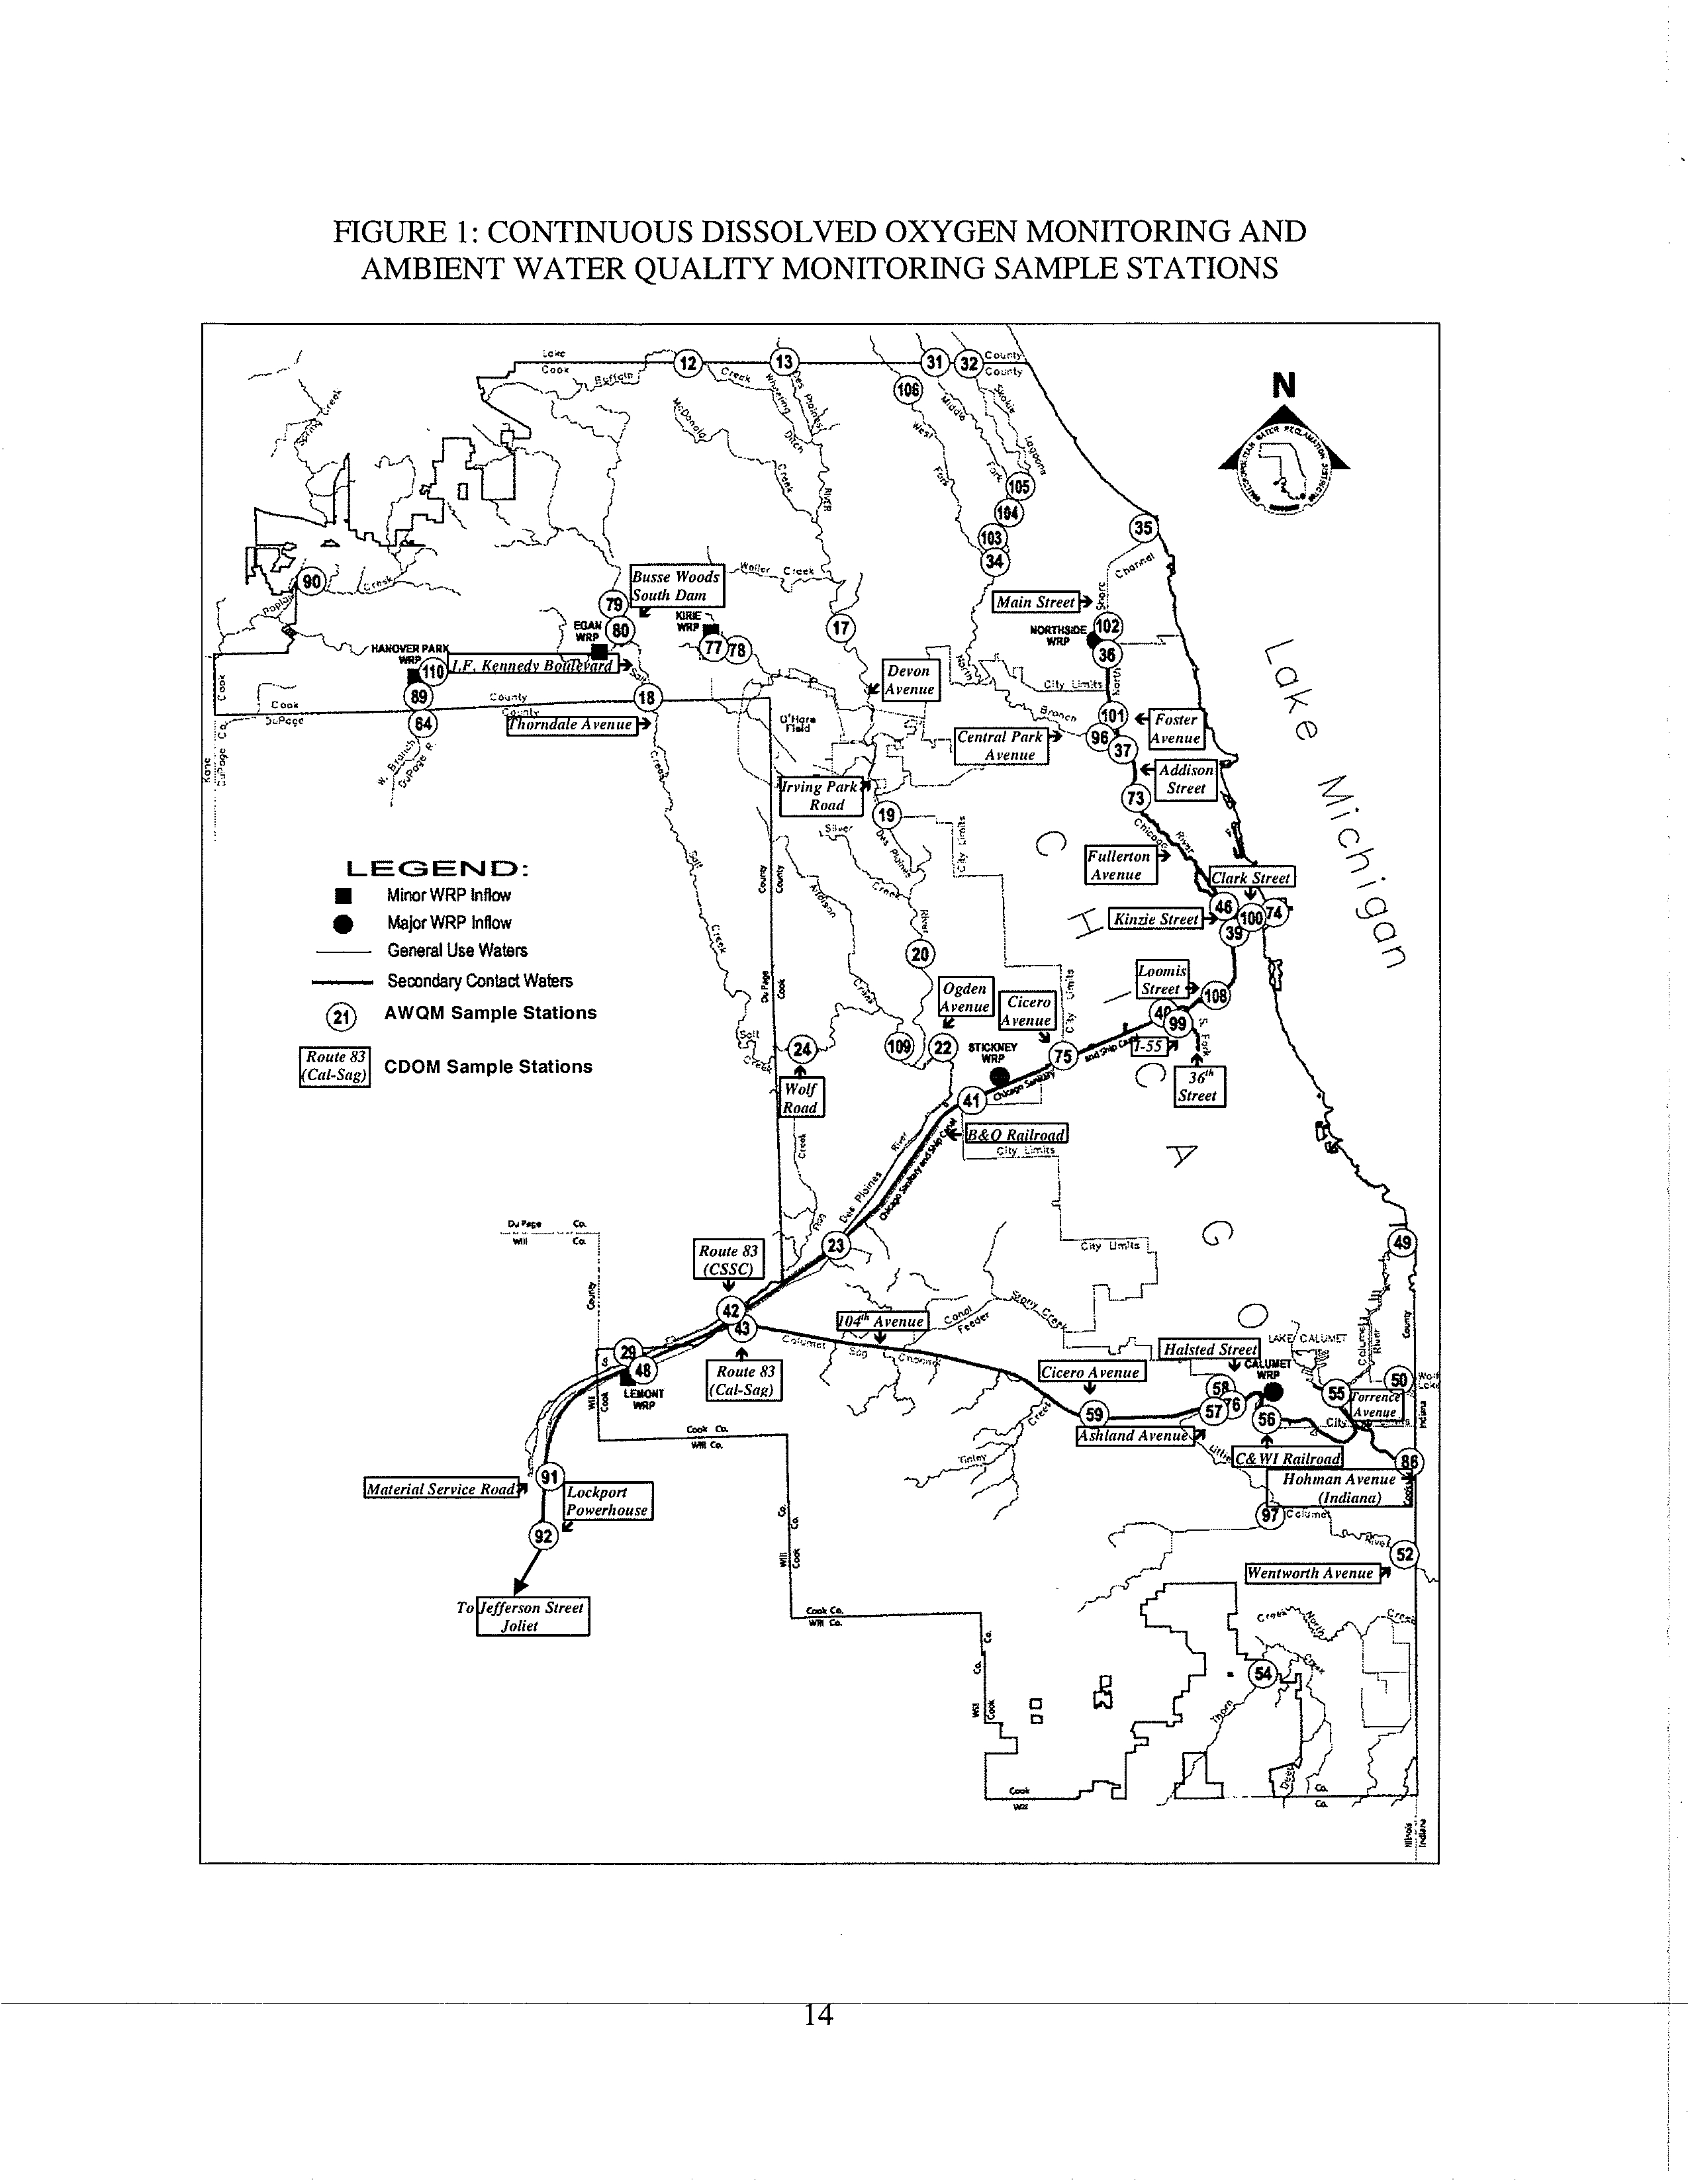
Today, Bubbly Creek is a relatively straight 1.3 mile channel that originates at the Racine
Avenue Pumping Station (RAPS) and flows north (Photograph Exhibit 1 and 2), during overflow
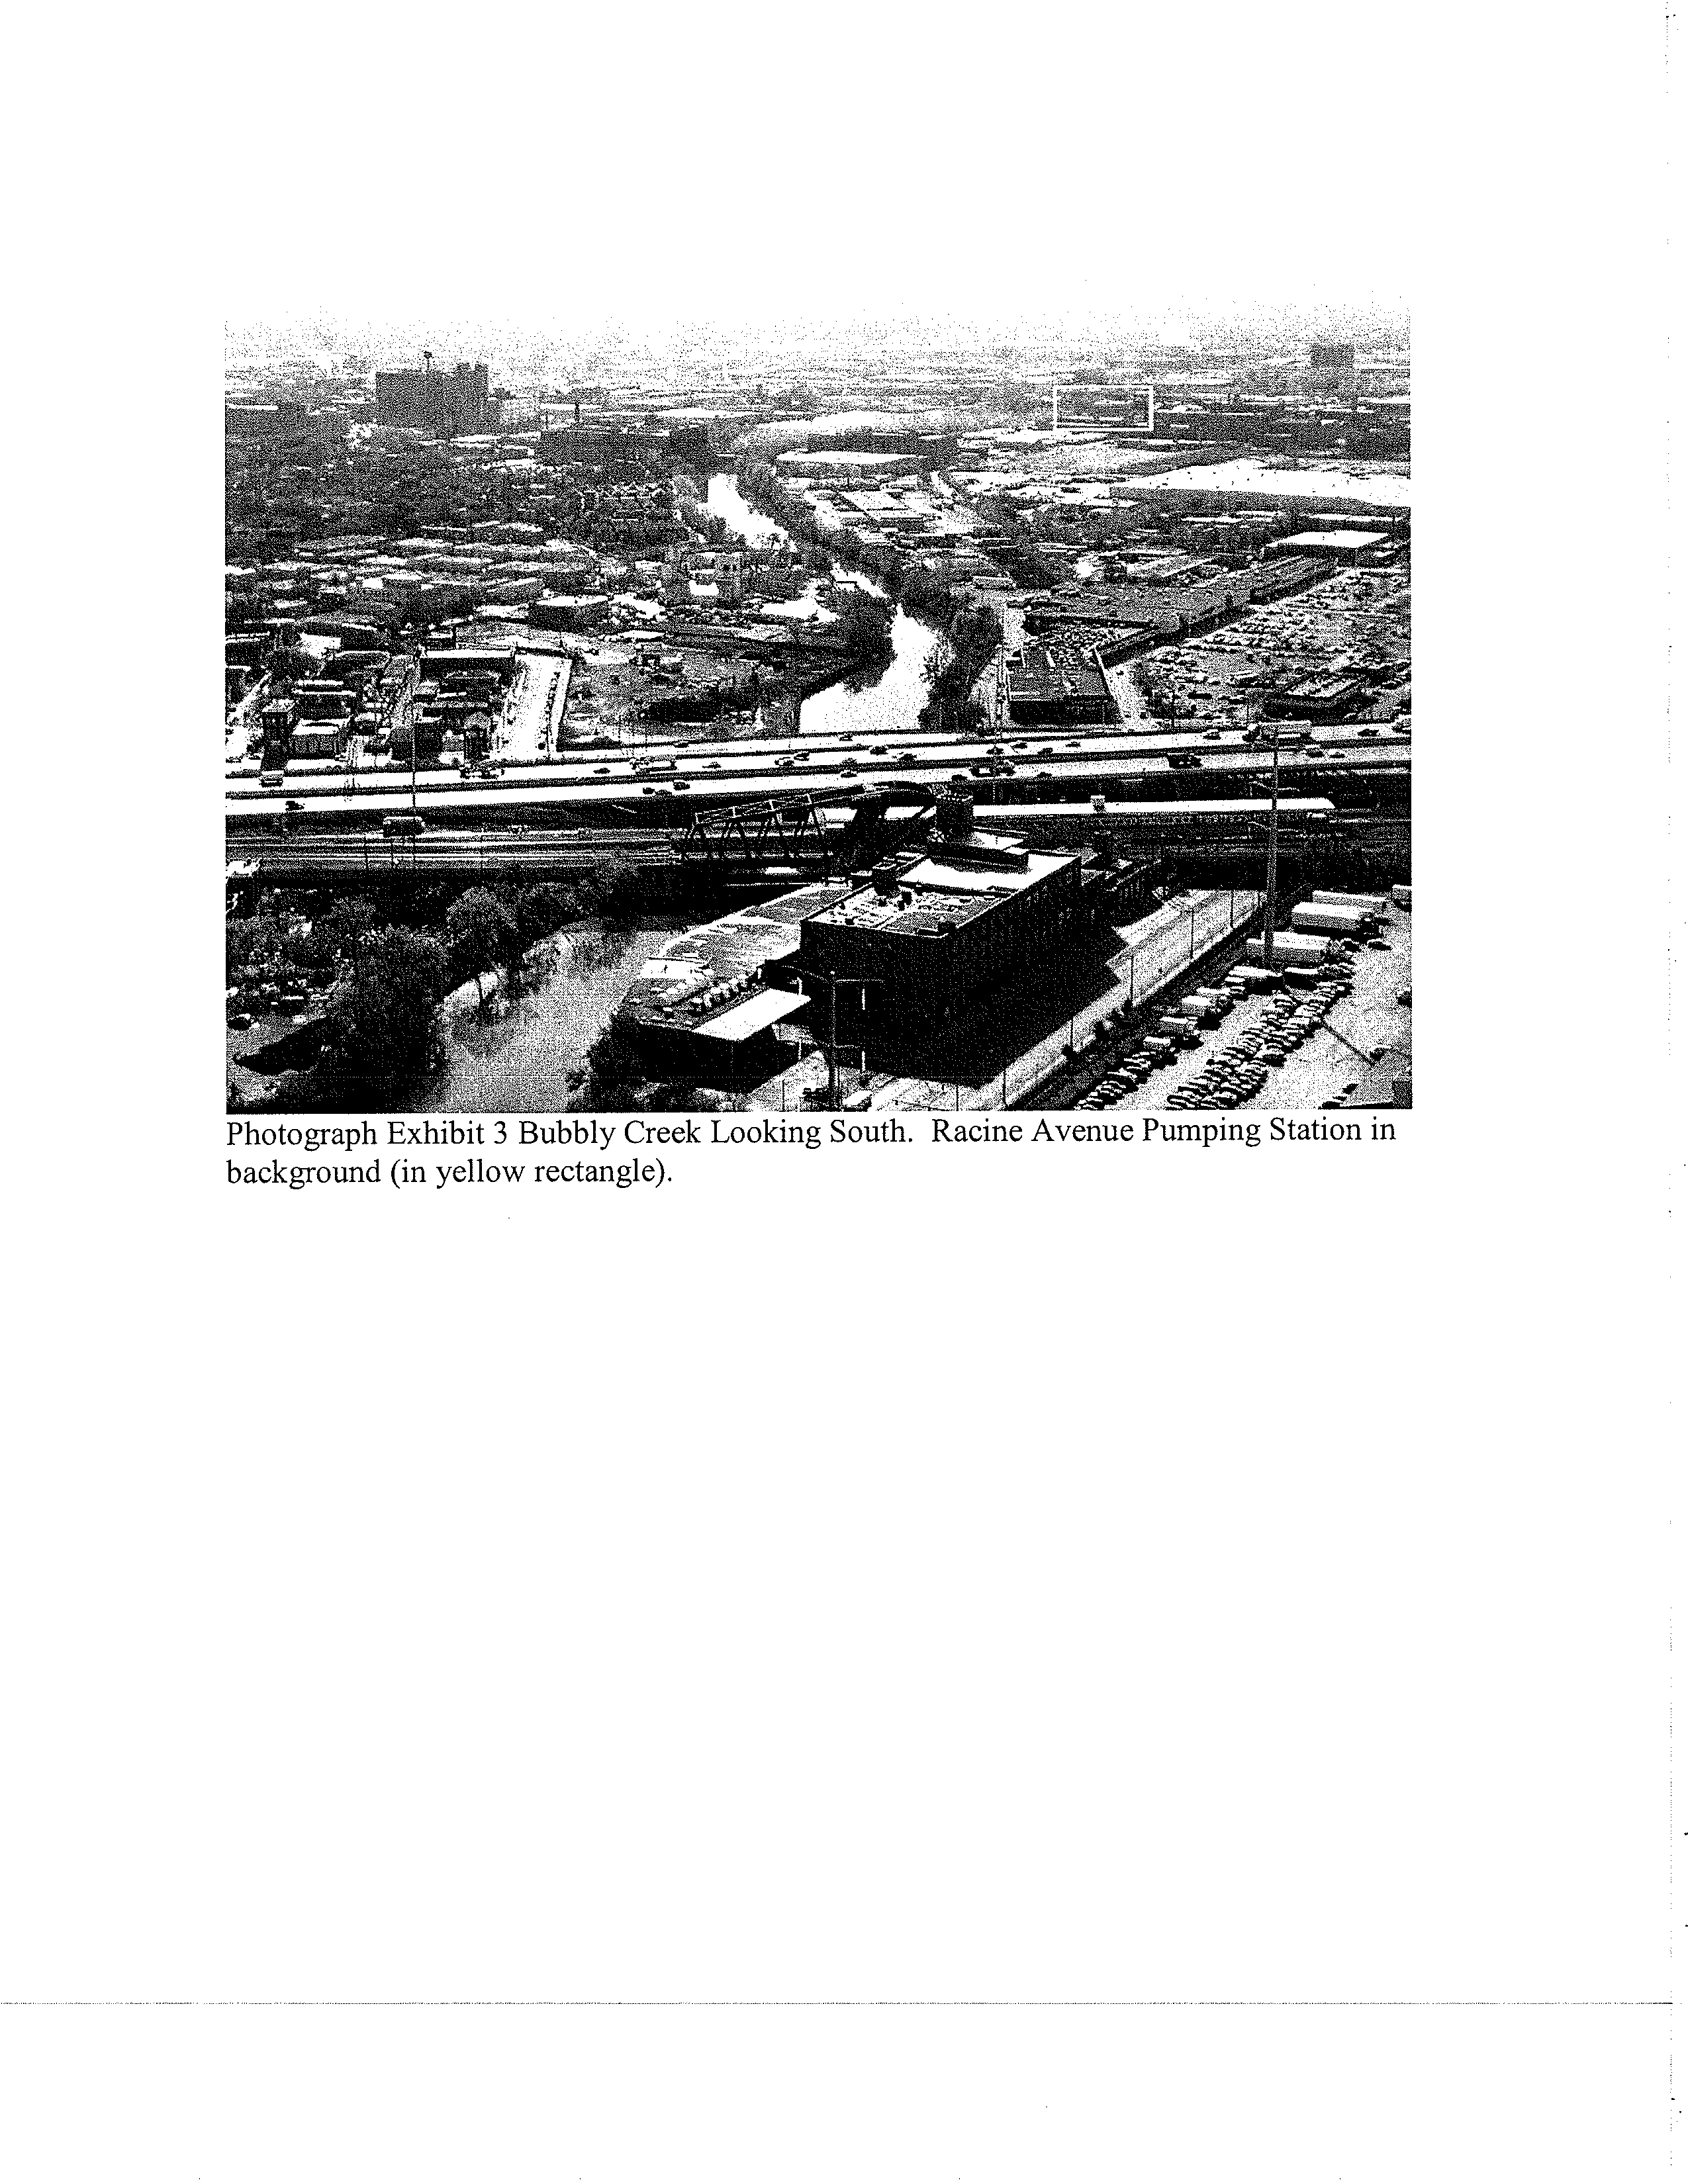
events, to its confluence with the South Branch of the Chicago River (Photograph Exhibit 3).
The channel depth varies from approximately six-feet near RAPS to fourteen-feet at Bubbly
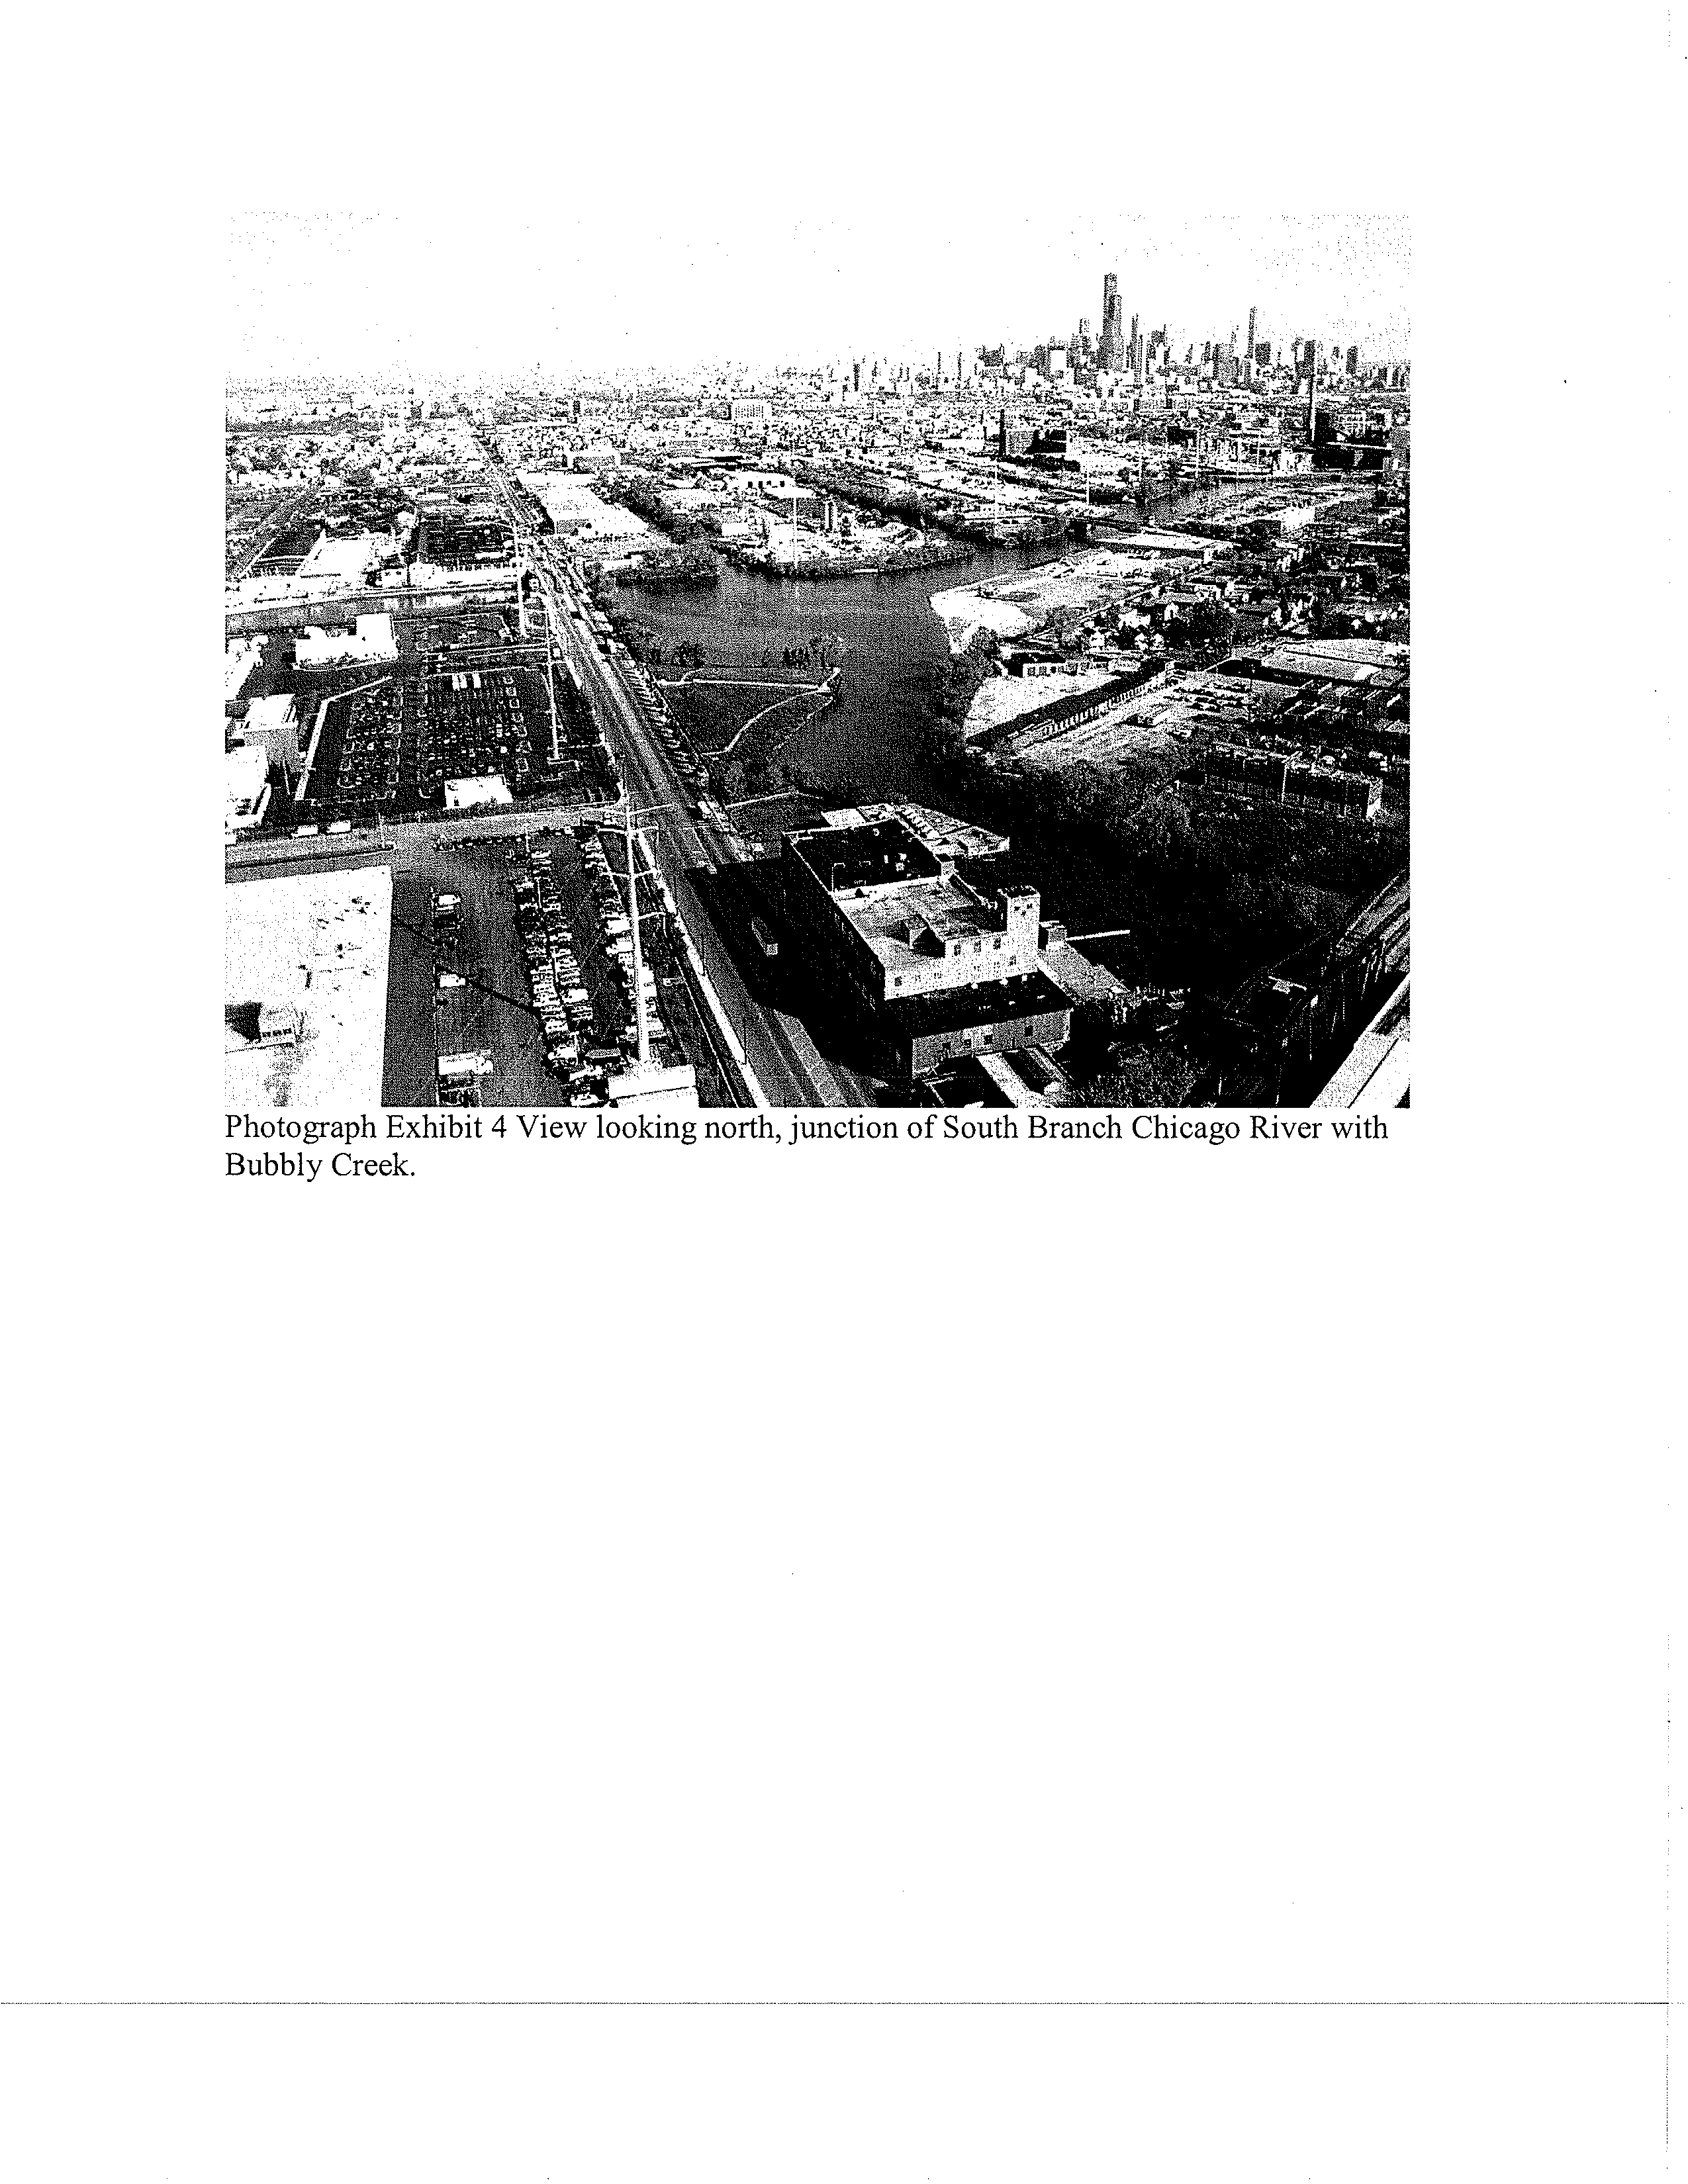
Creek's junction with the South Branch of the Chicago River (Photograph Exhibit 4). The
channel width varies between 120 to 200-feet wide. The major physical alterations caused by
development of Bubbly Creek's historical drainage area have severely degraded the once natural
ecosystem and eliminated most of the natural aquatic and riparian habitats. Flow in the system
varies considerably, almost exclusively due to combined sewer overflow (CSO) input from
RAPS and gravity sewers. However, water level variations in the South Branch Chicago River
that occur during dry weather can cause minor north-south flow oscillations in Bubbly Creek.
2
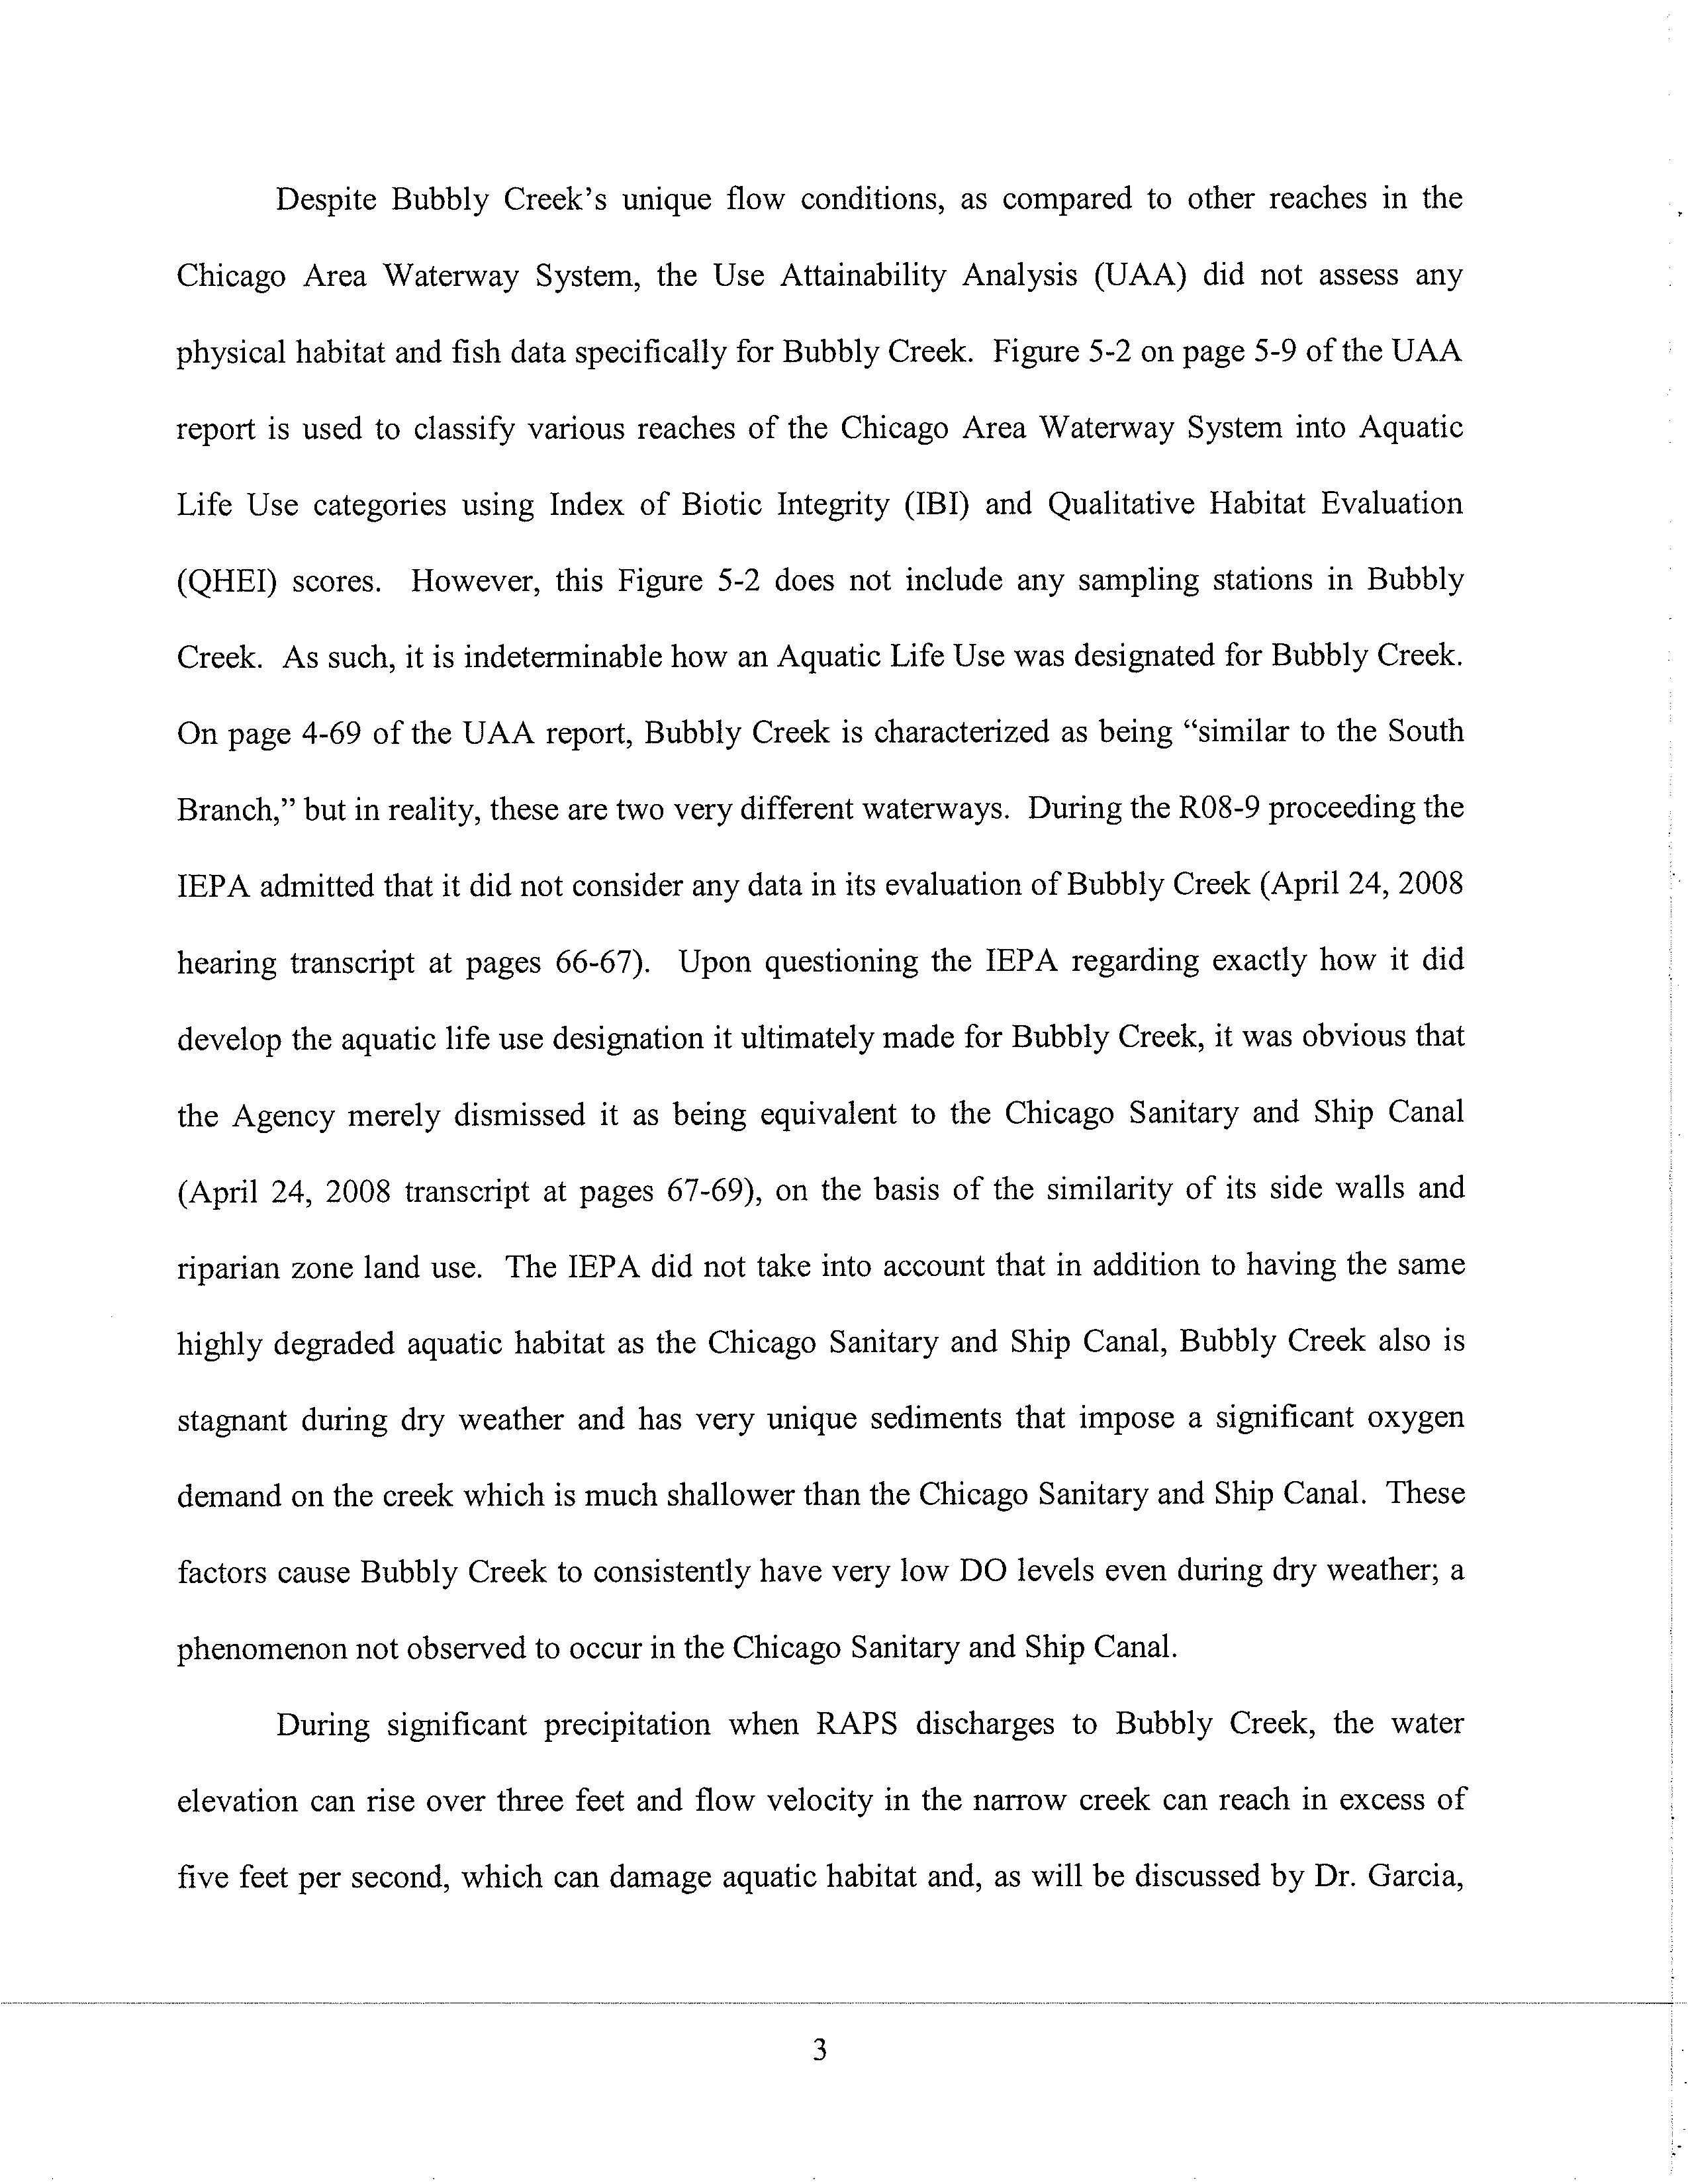
Despite Bubbly Creek's unique flow conditions, as compared to other reaches in the
Chicago Area Waterway System, the Use Attainability Analysis (UAA) did not assess any
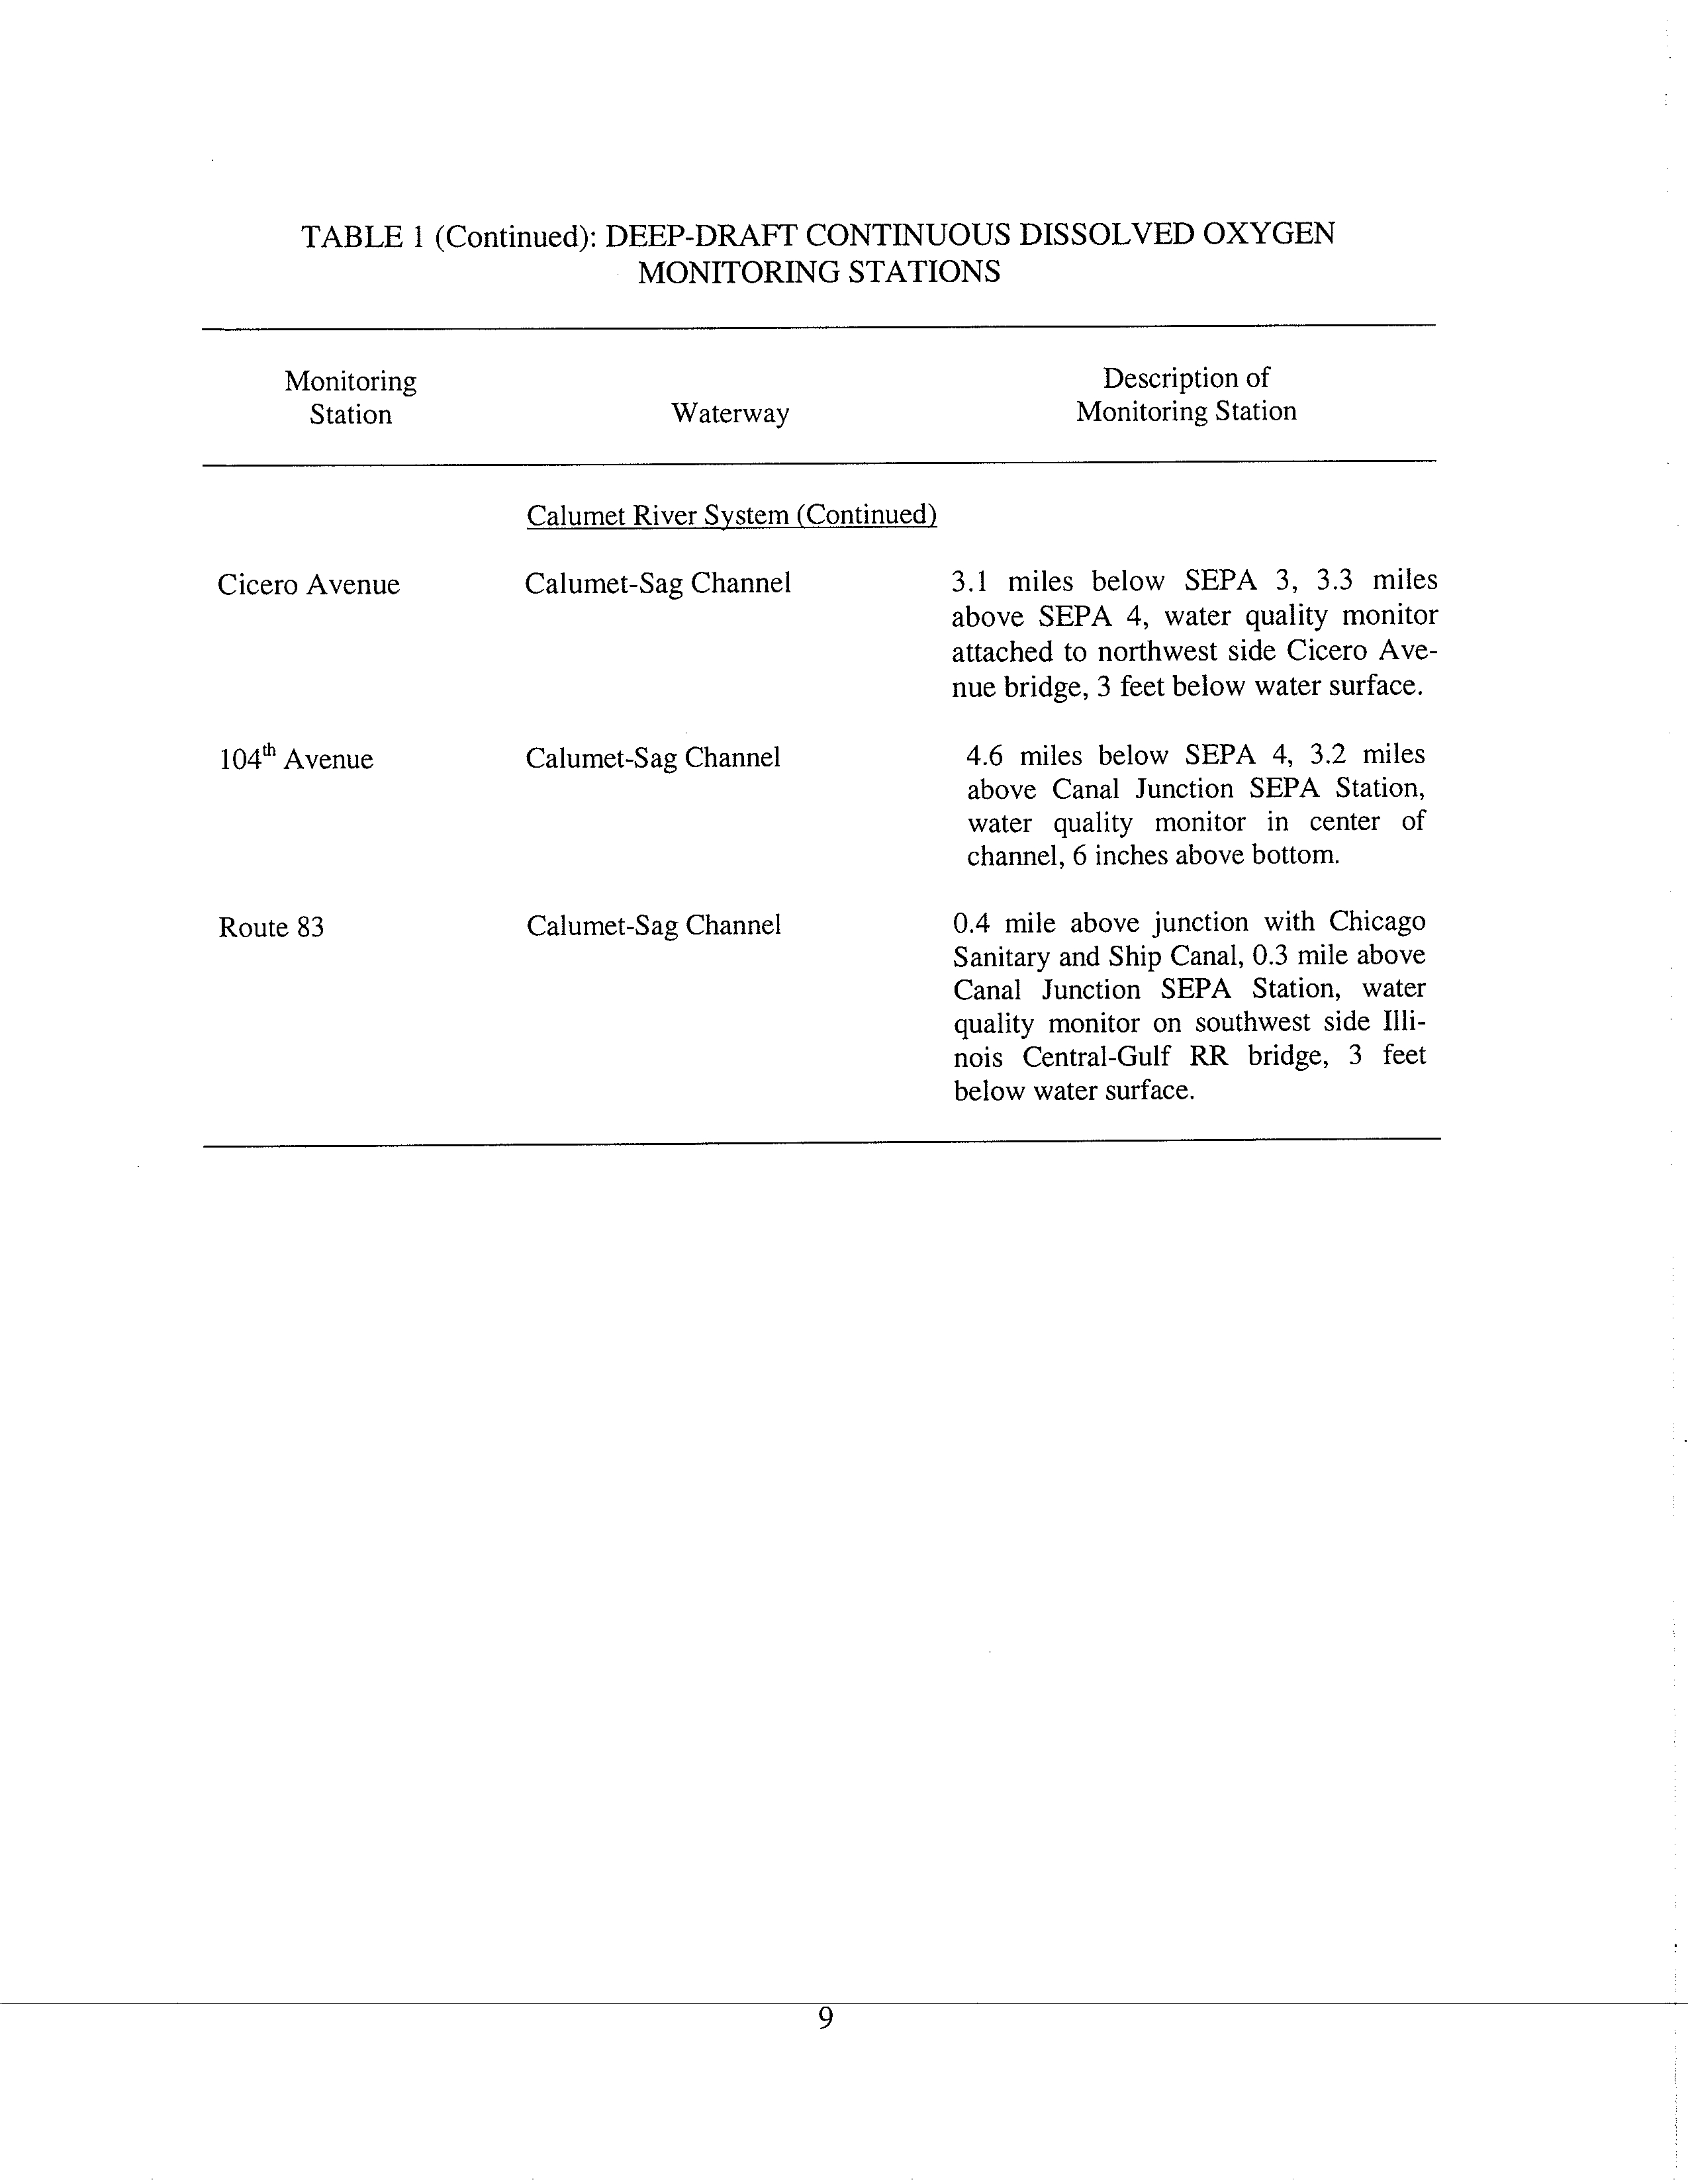
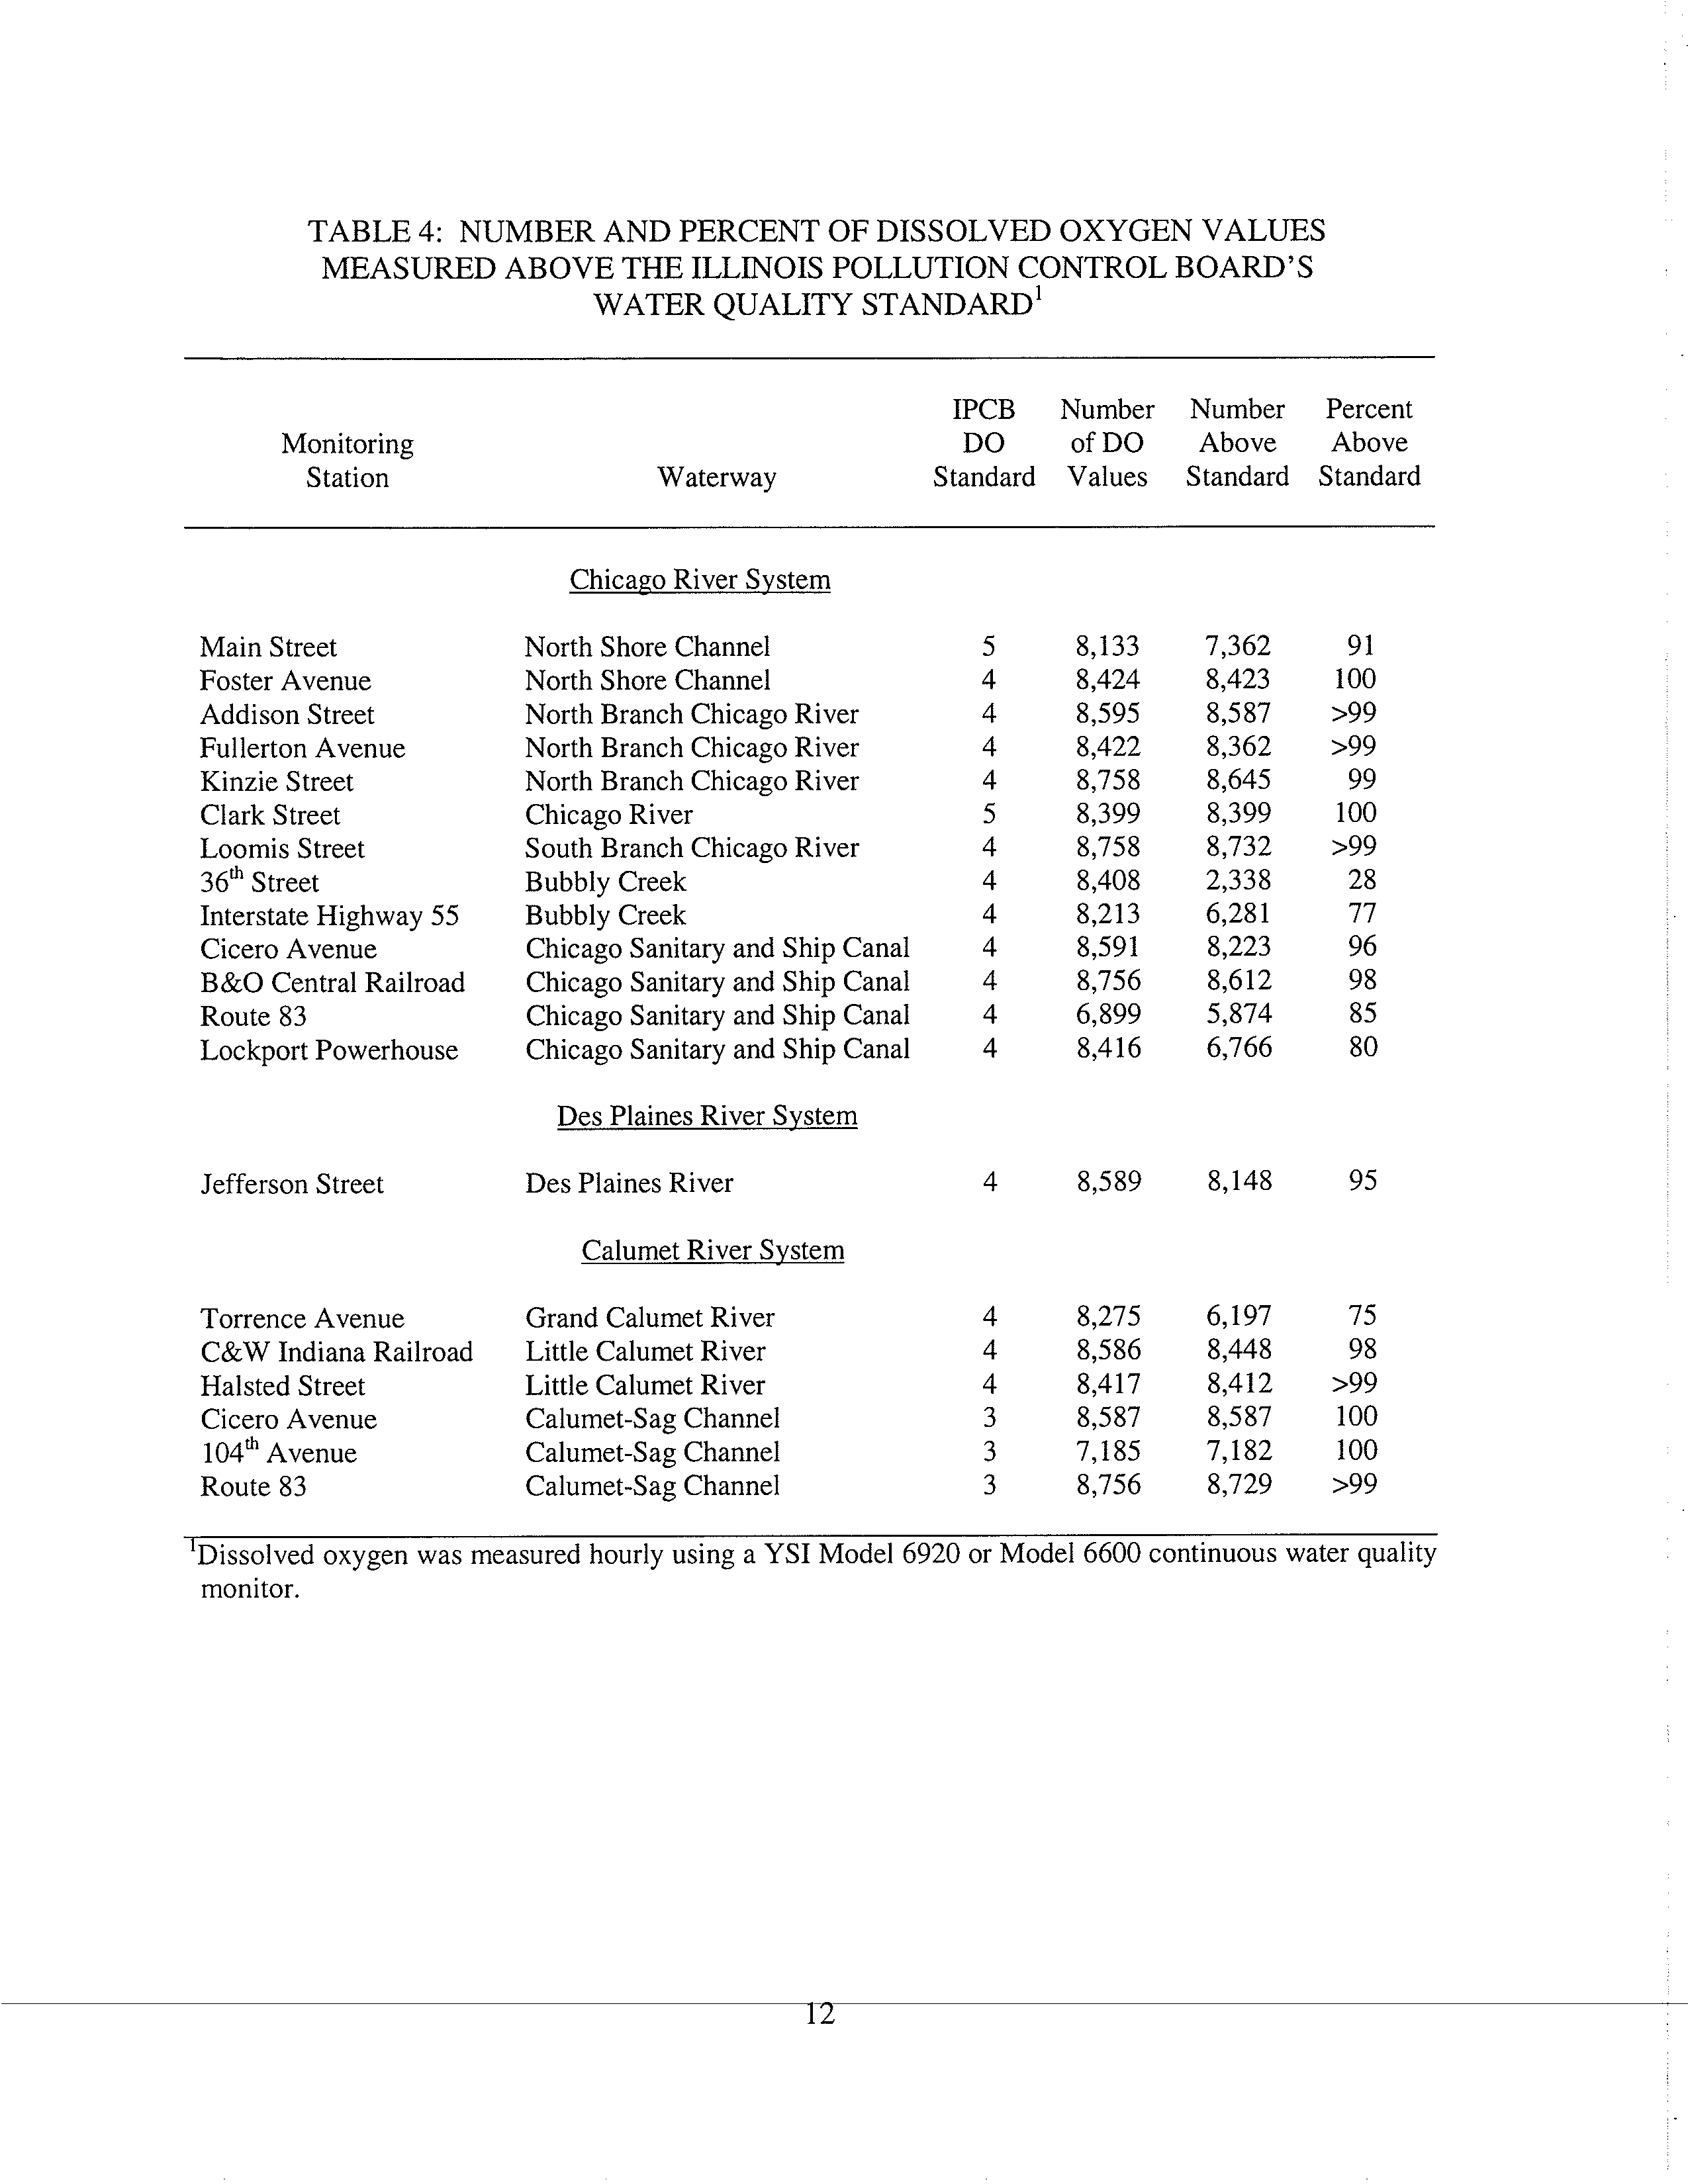
physical habitat and fish data specifically for Bubbly Creek. Figure 5-2 on page 5-9 of the UAA
report is used to classify various reaches of the Chicago Area Waterway System into Aquatic
Life Use categories using Index of Biotic Integrity (IBI) and Qualitative Habitat Evaluation
(QHEI) scores.
However, this Figure 5-2 does not include any sampling stations in Bubbly
Creek.
As such, it is indeterminable how an Aquatic Life Use was designated for Bubbly Creek.
On page 4-69 of the UAA report, Bubbly Creek is characterized as being "similar to the South
Branch," but in reality, these are two very different waterways. During the R08-9 proceeding the
IEPA admitted that it did not consider any data in its evaluation of Bubbly Creek (April 24, 2008
hearing transcript at pages 66-67).
Upon questioning the IEPA regarding exactly how it did
develop the aquatic life use designation it ultimately made for Bubbly Creek, it was obvious that
the Agency merely dismissed it as being equivalent to the Chicago Sanitary and Ship Canal
(April 24, 2008 transcript at pages 67-69), on the basis of the similarity of its side walls and
riparian zone land use. The IEPA did not take into account that in addition to having the same
highly degraded aquatic habitat as the Chicago Sanitary and Ship Canal, Bubbly Creek also is
stagnant during dry weather and has very unique sediments that impose a significant oxygen
demand on the creek which is much shallower than the Chicago Sanitary and Ship Canal. These
factors cause Bubbly Creek to consistently have very low DO levels even during dry weather; a
phenomenon not observed to occur in the Chicago Sanitary and Ship Canal.
During significant precipitation when RAPS discharges to Bubbly Creek, the water
elevation can rise over three feet and flow velocity in the narrow creek can reach in excess of
five feet per second, which can damage aquatic habitat and, as will be discussed by Dr. Garcia,
3
can resuspend bottom sediments. Following a CSO discharge from RAPS
,
the organic content of
the flow from RAPS and the resuspended sediment settles into Bubbly Creek and exhibits an
oxygen demand for a number of days, severely impacting the dissolved oxygen (DO) in the
channel.
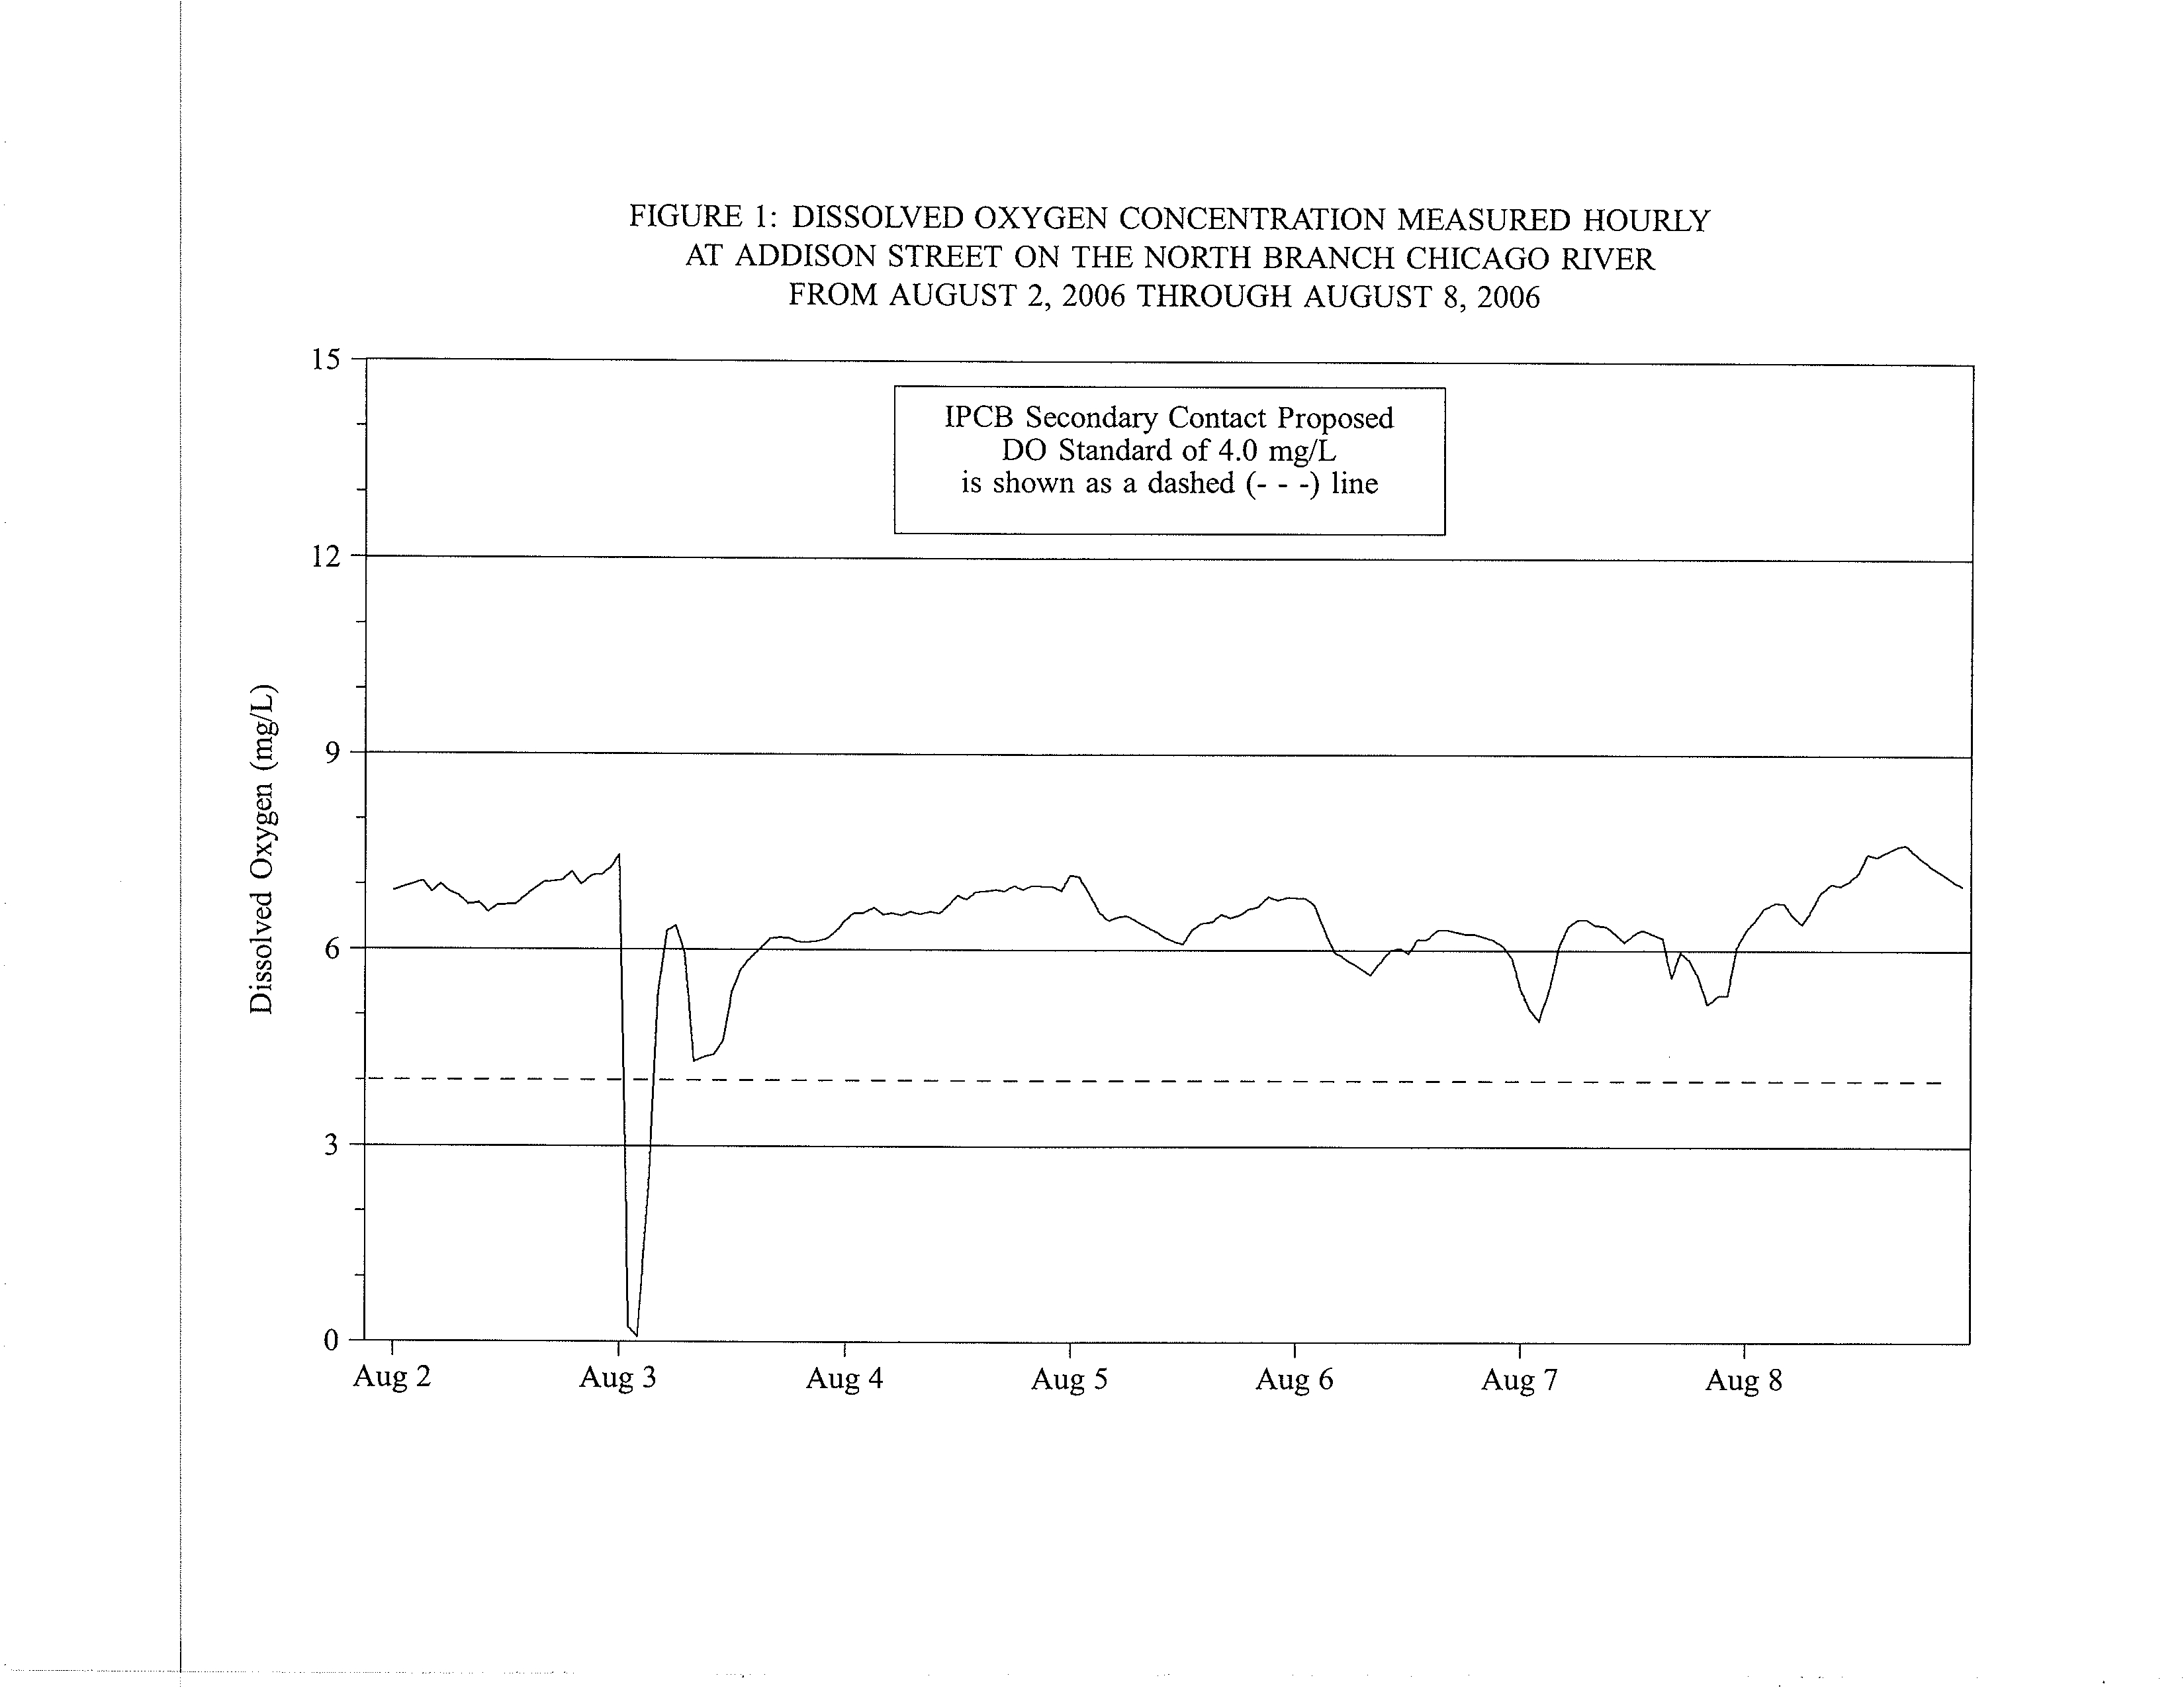
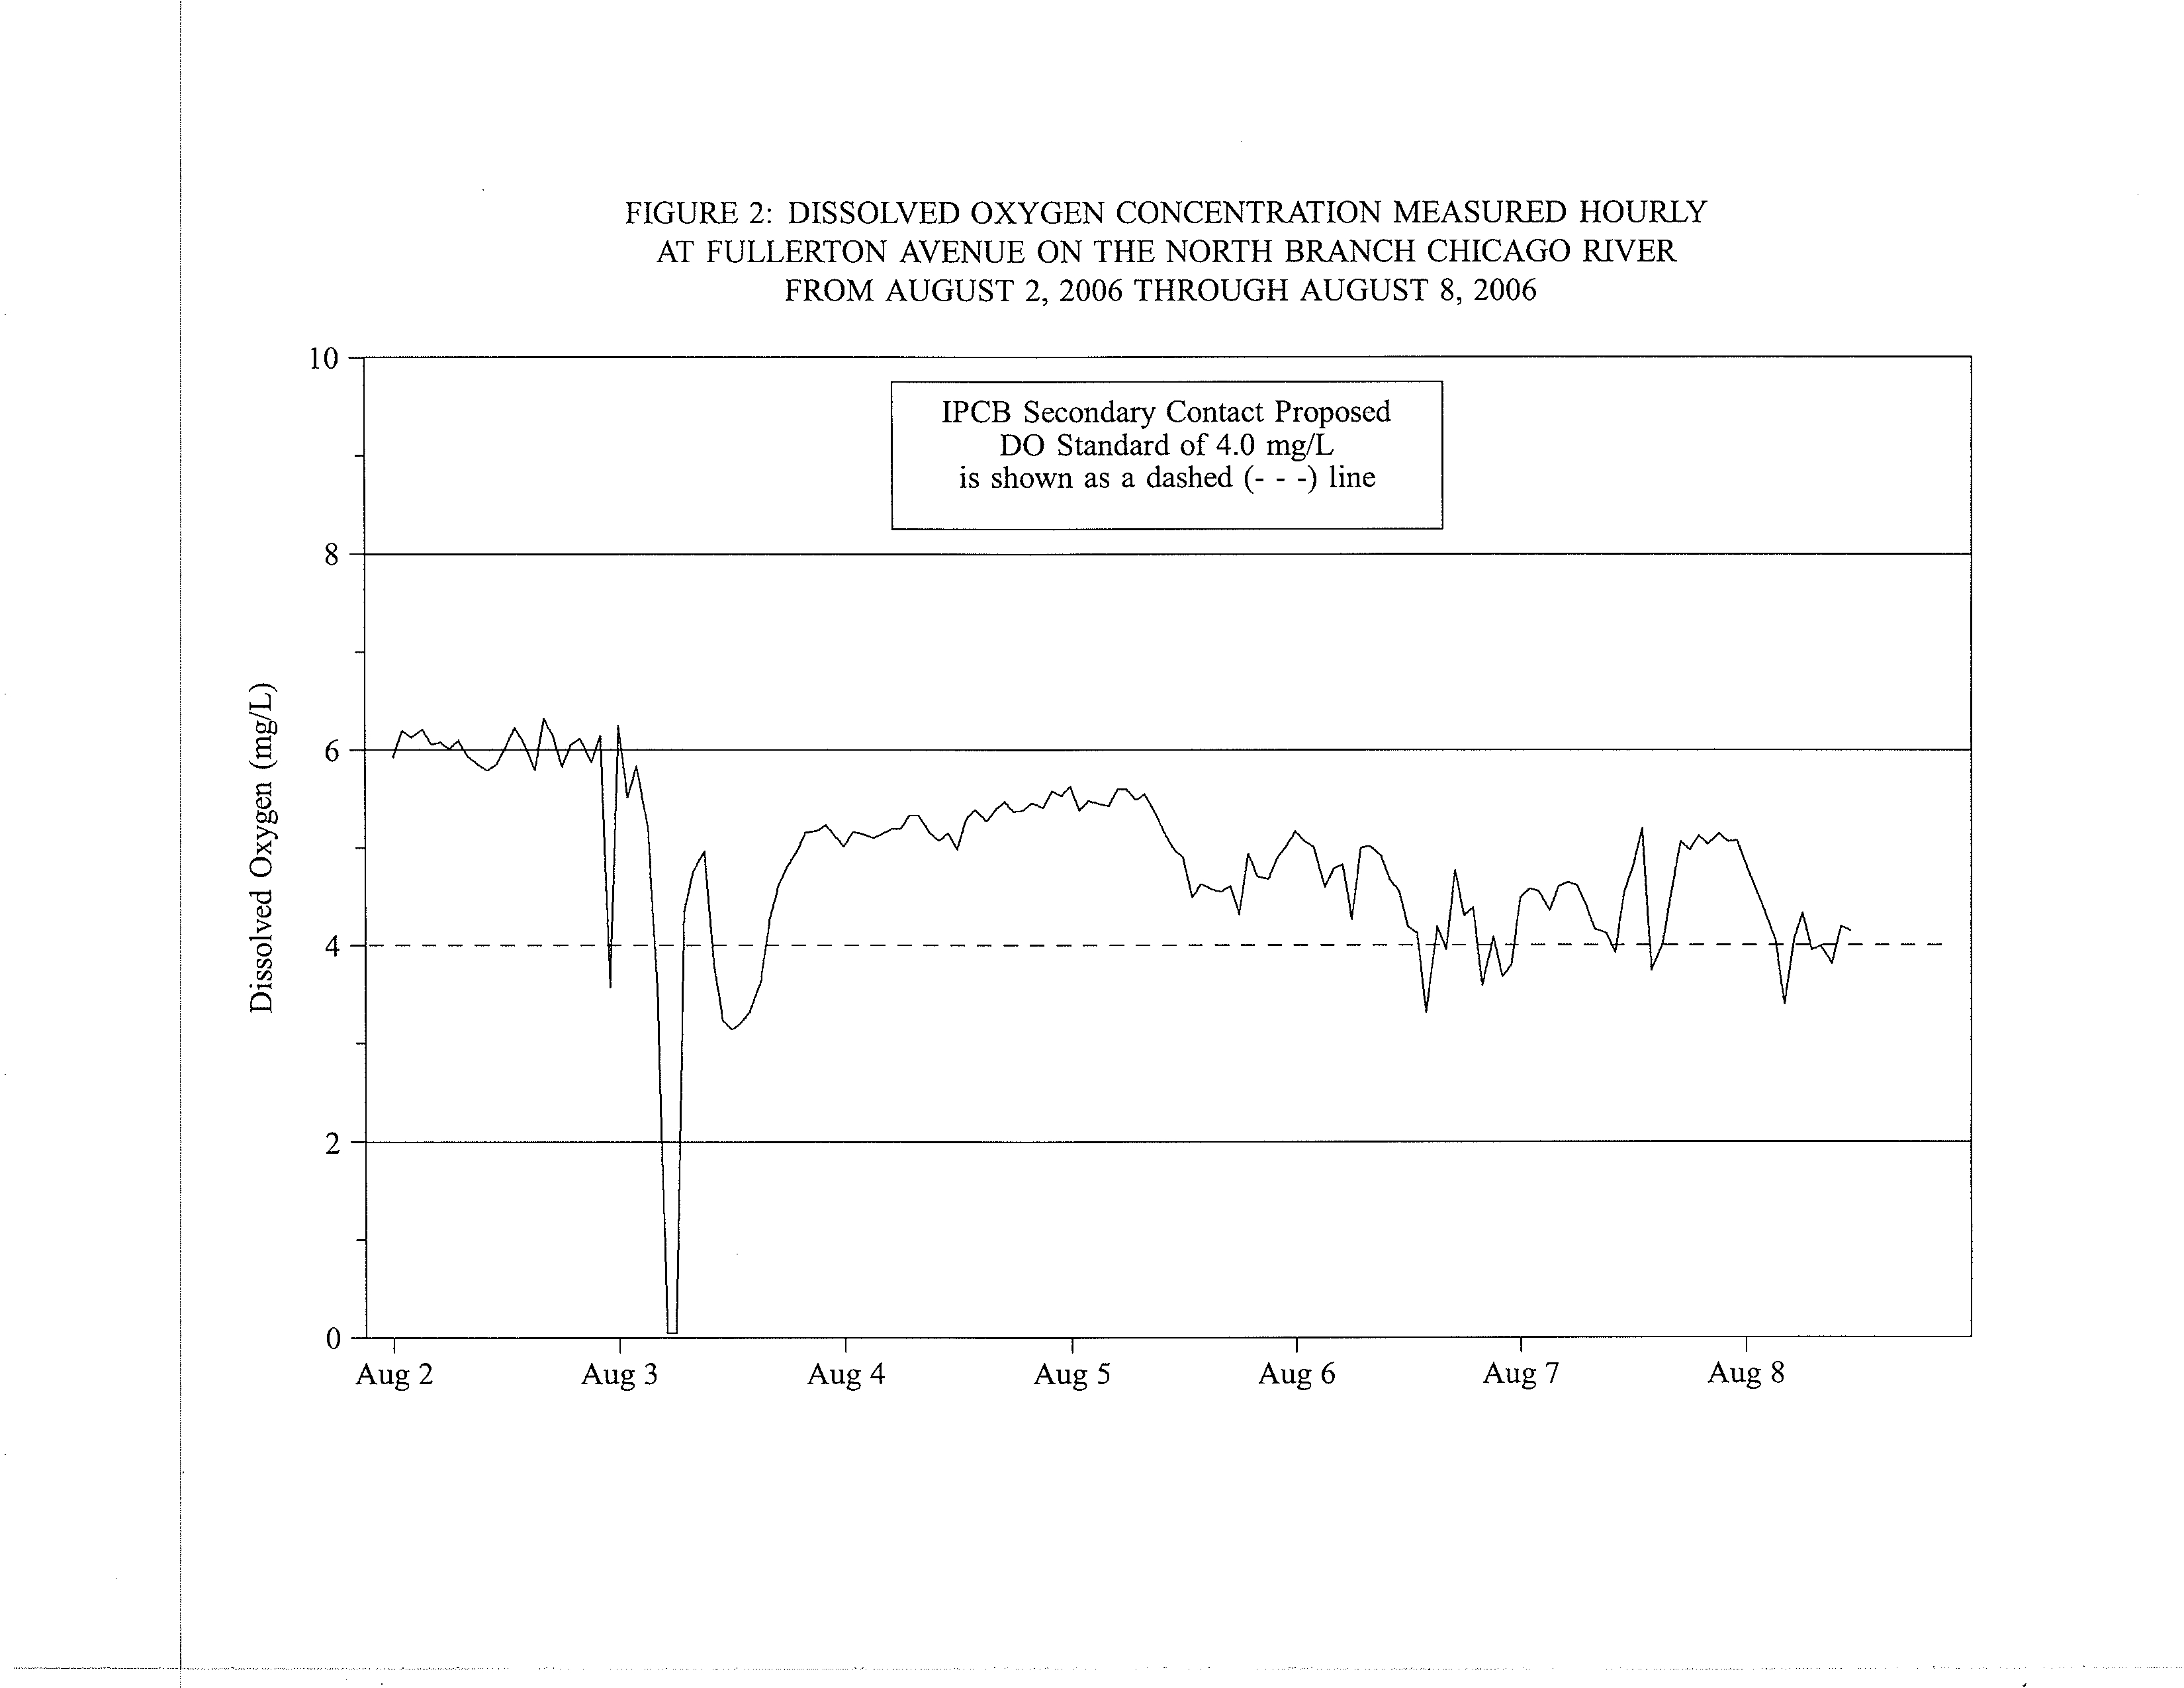
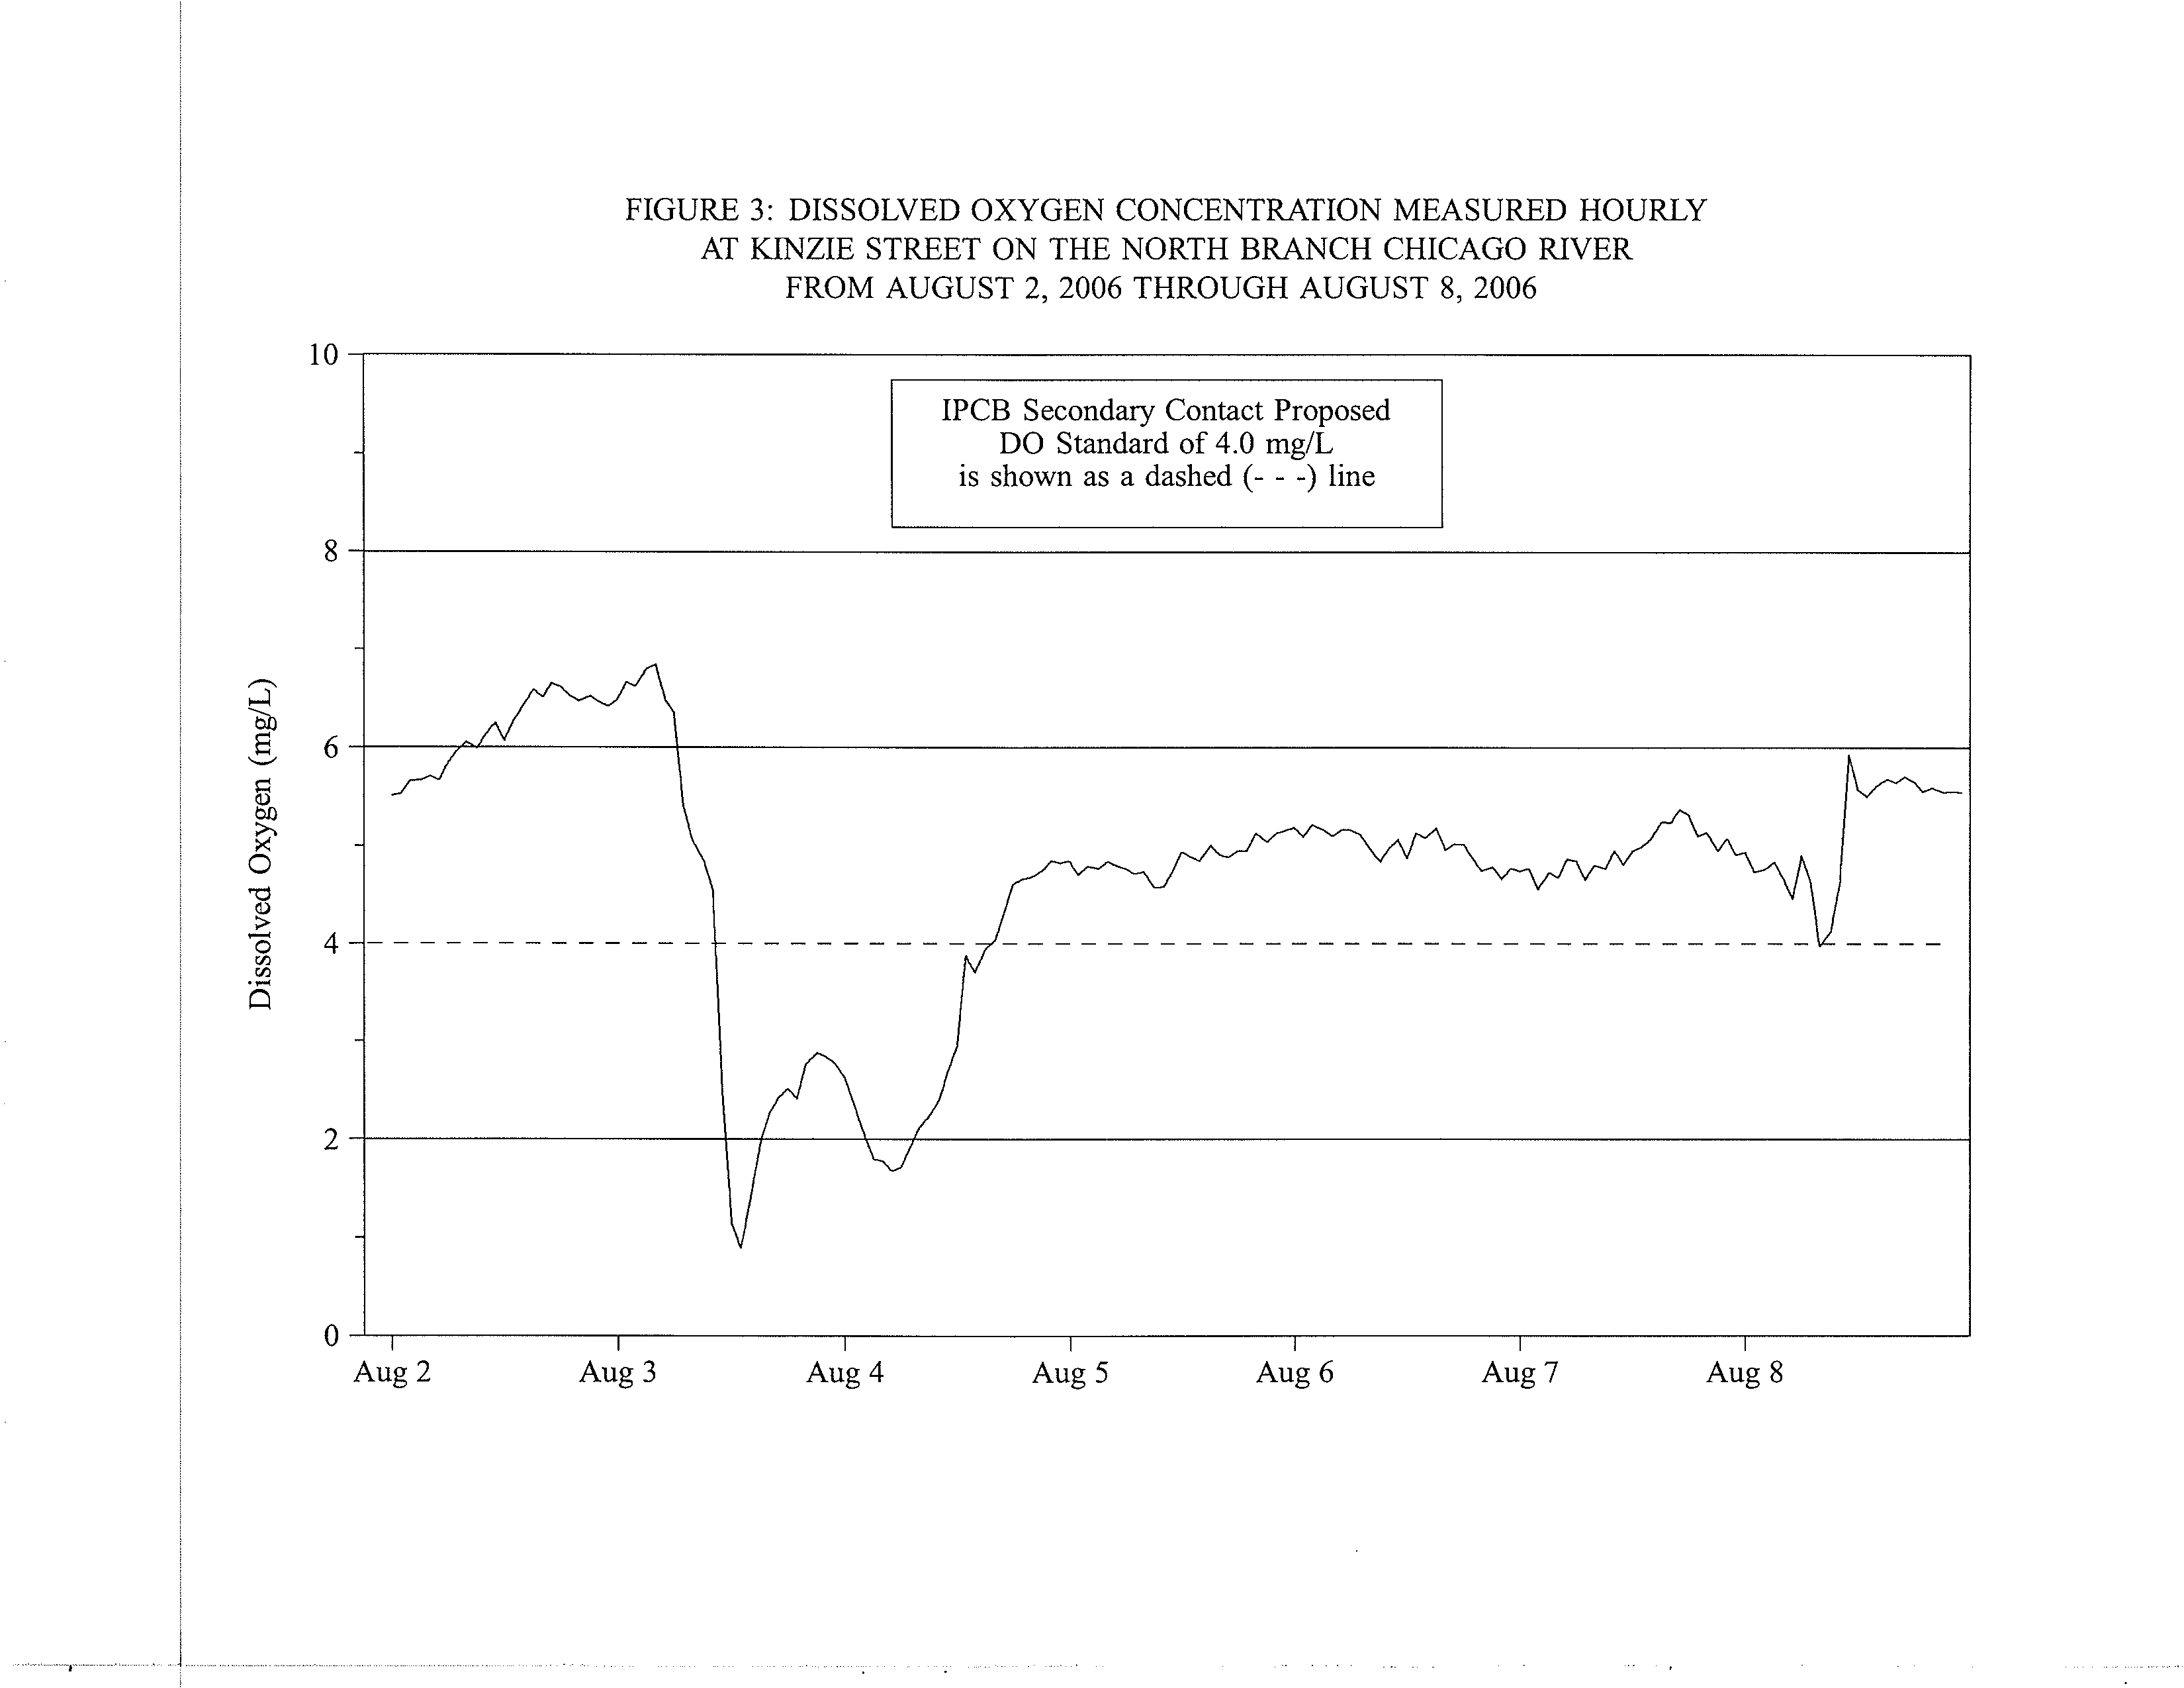
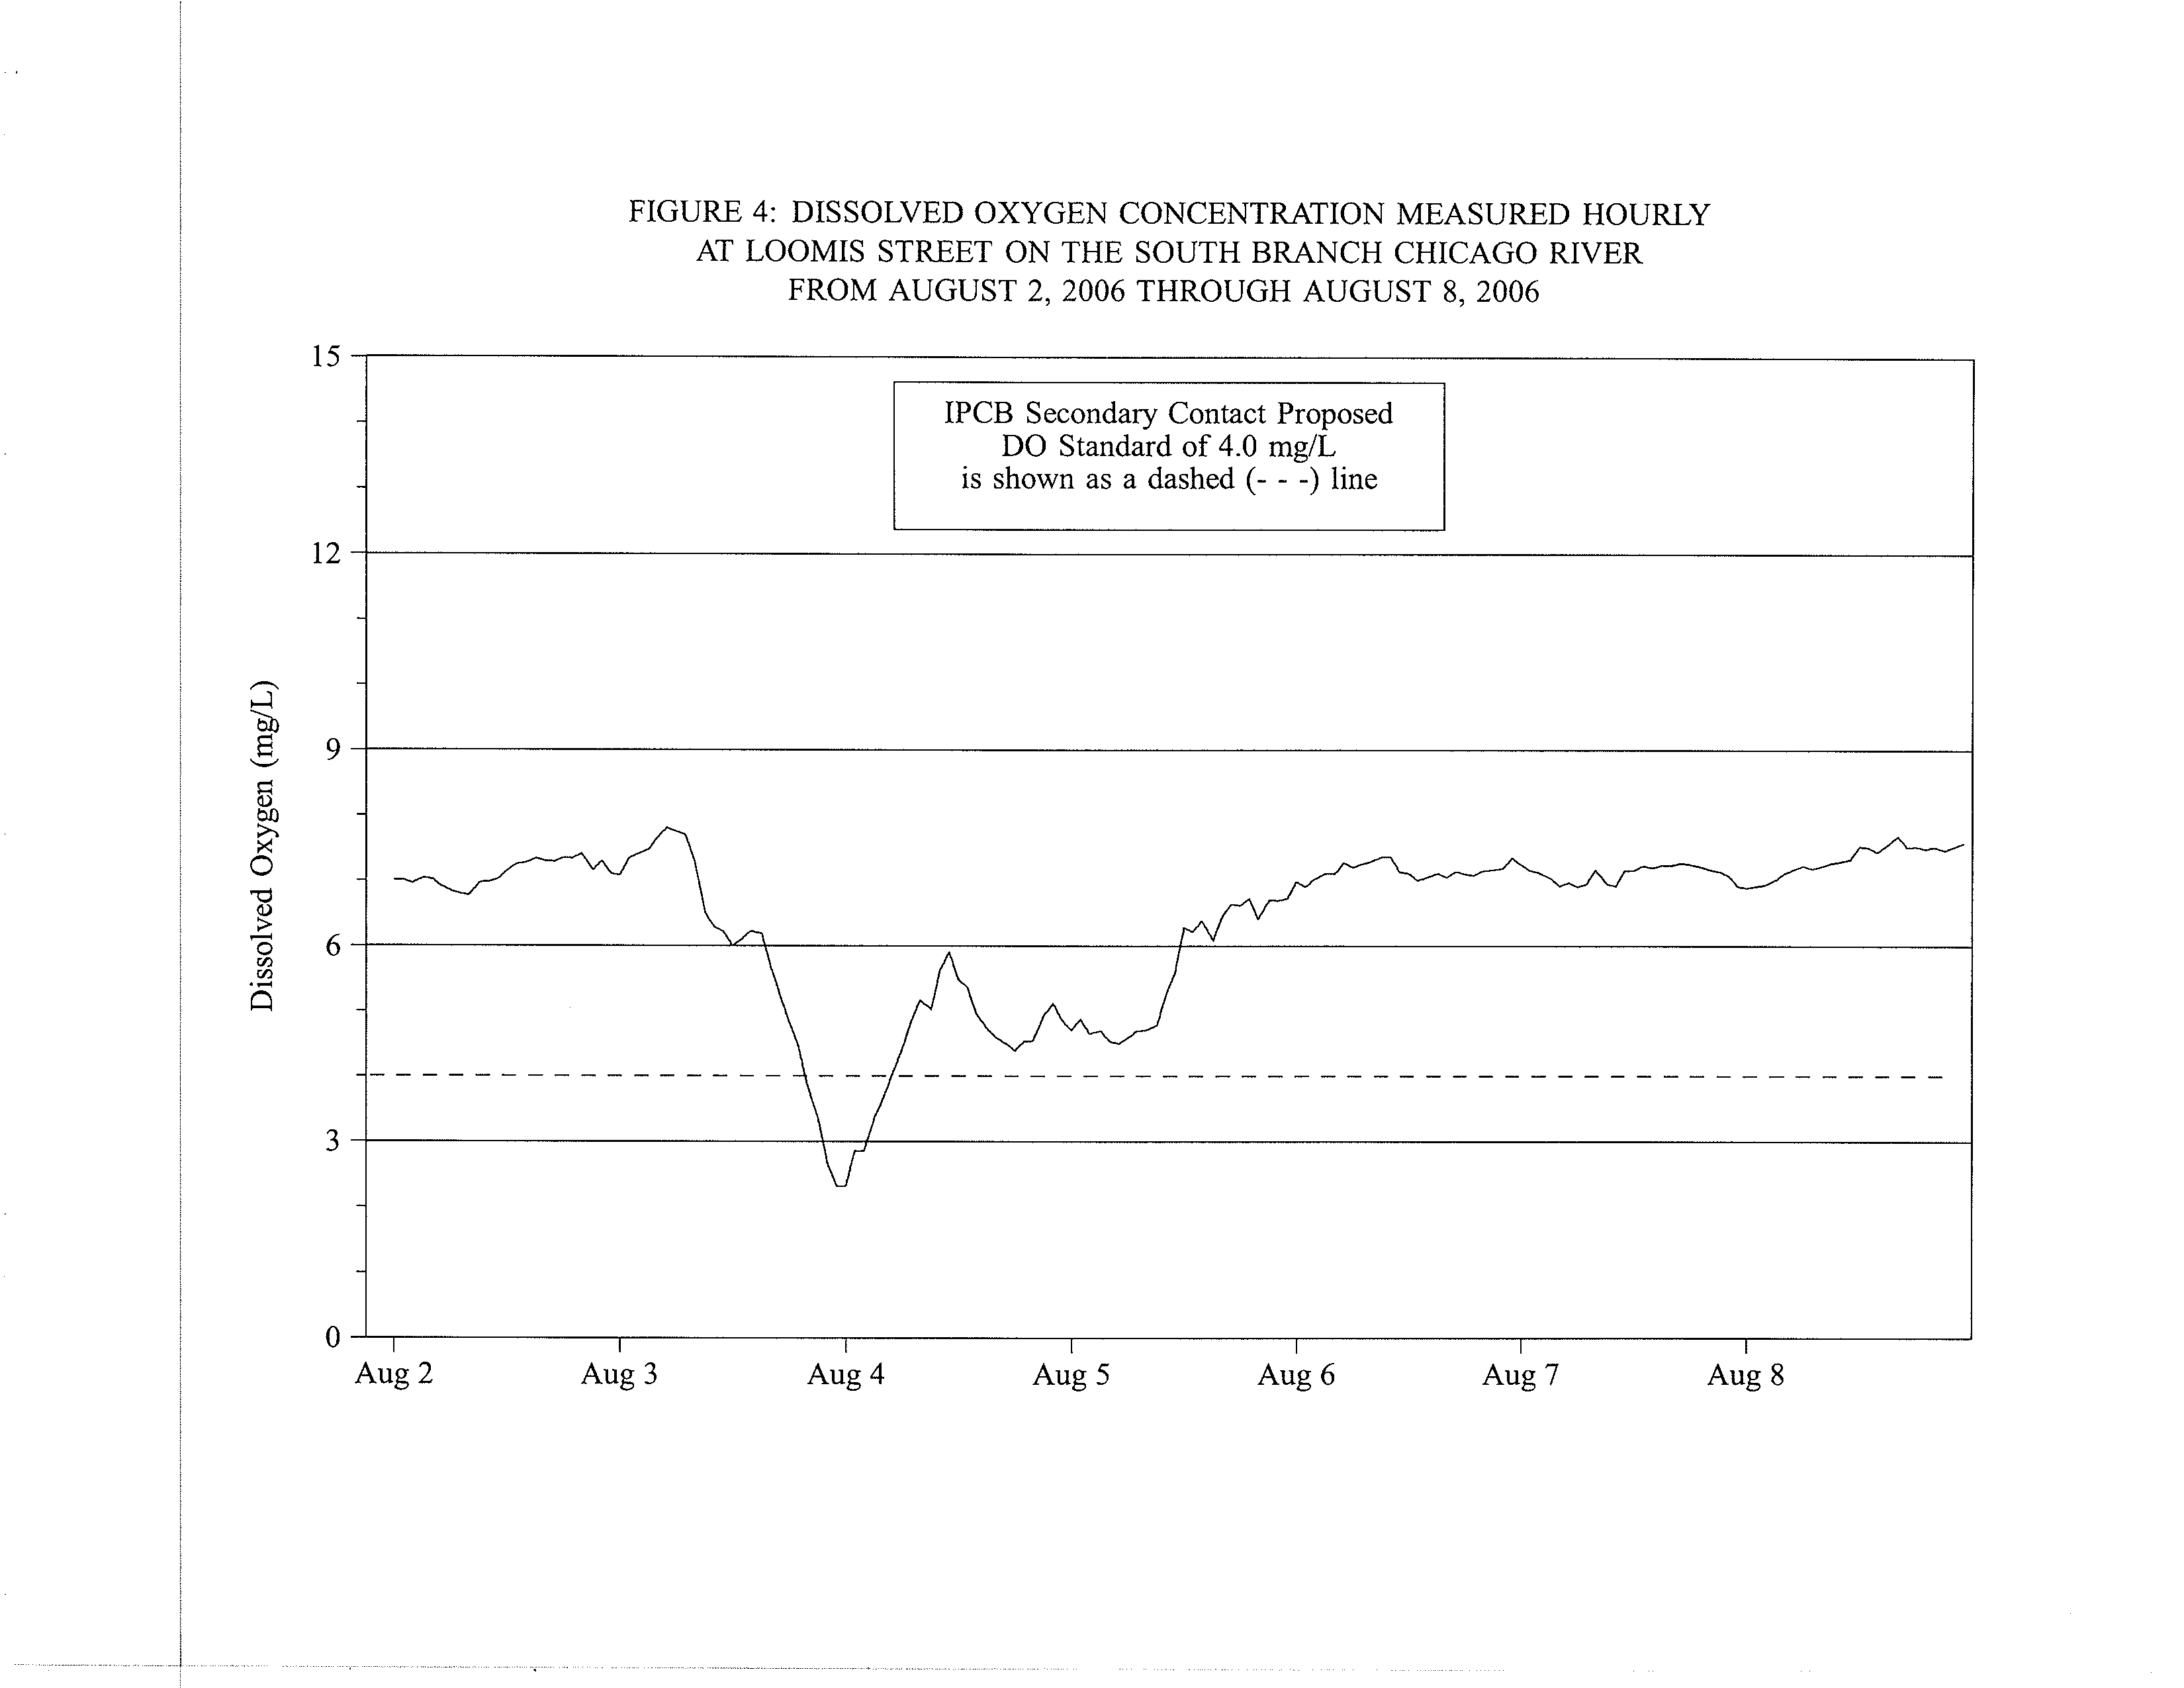
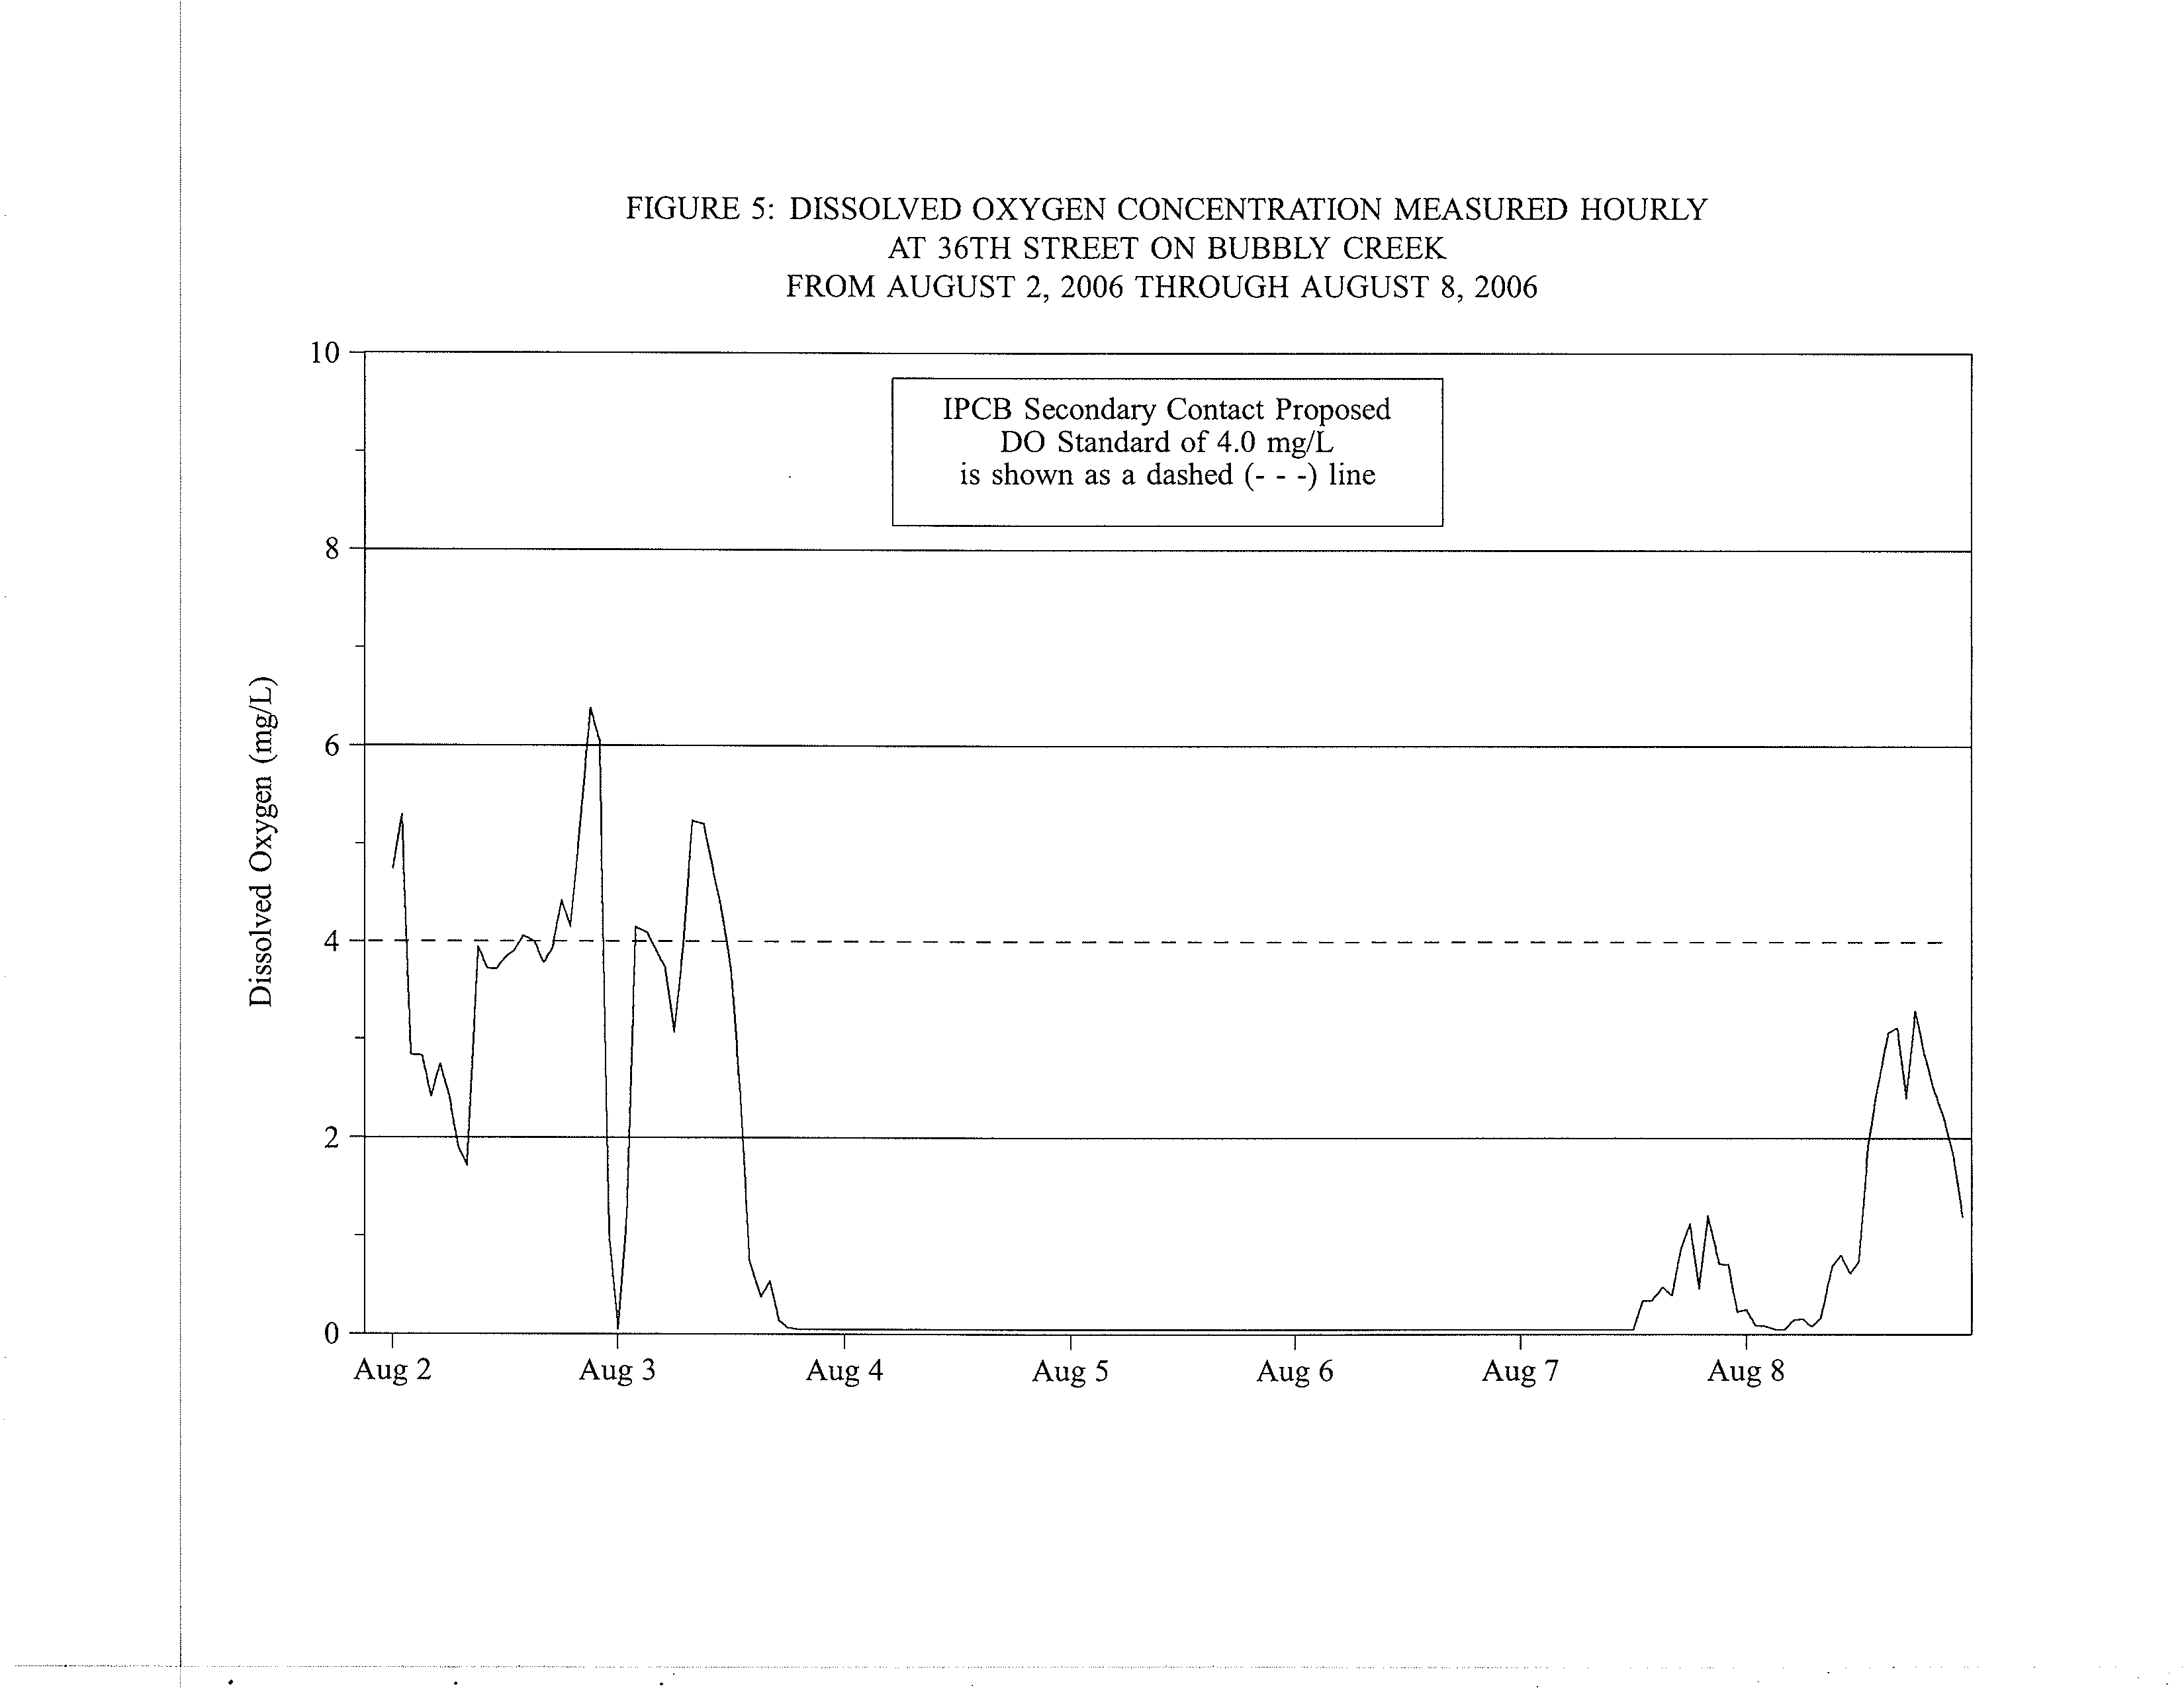
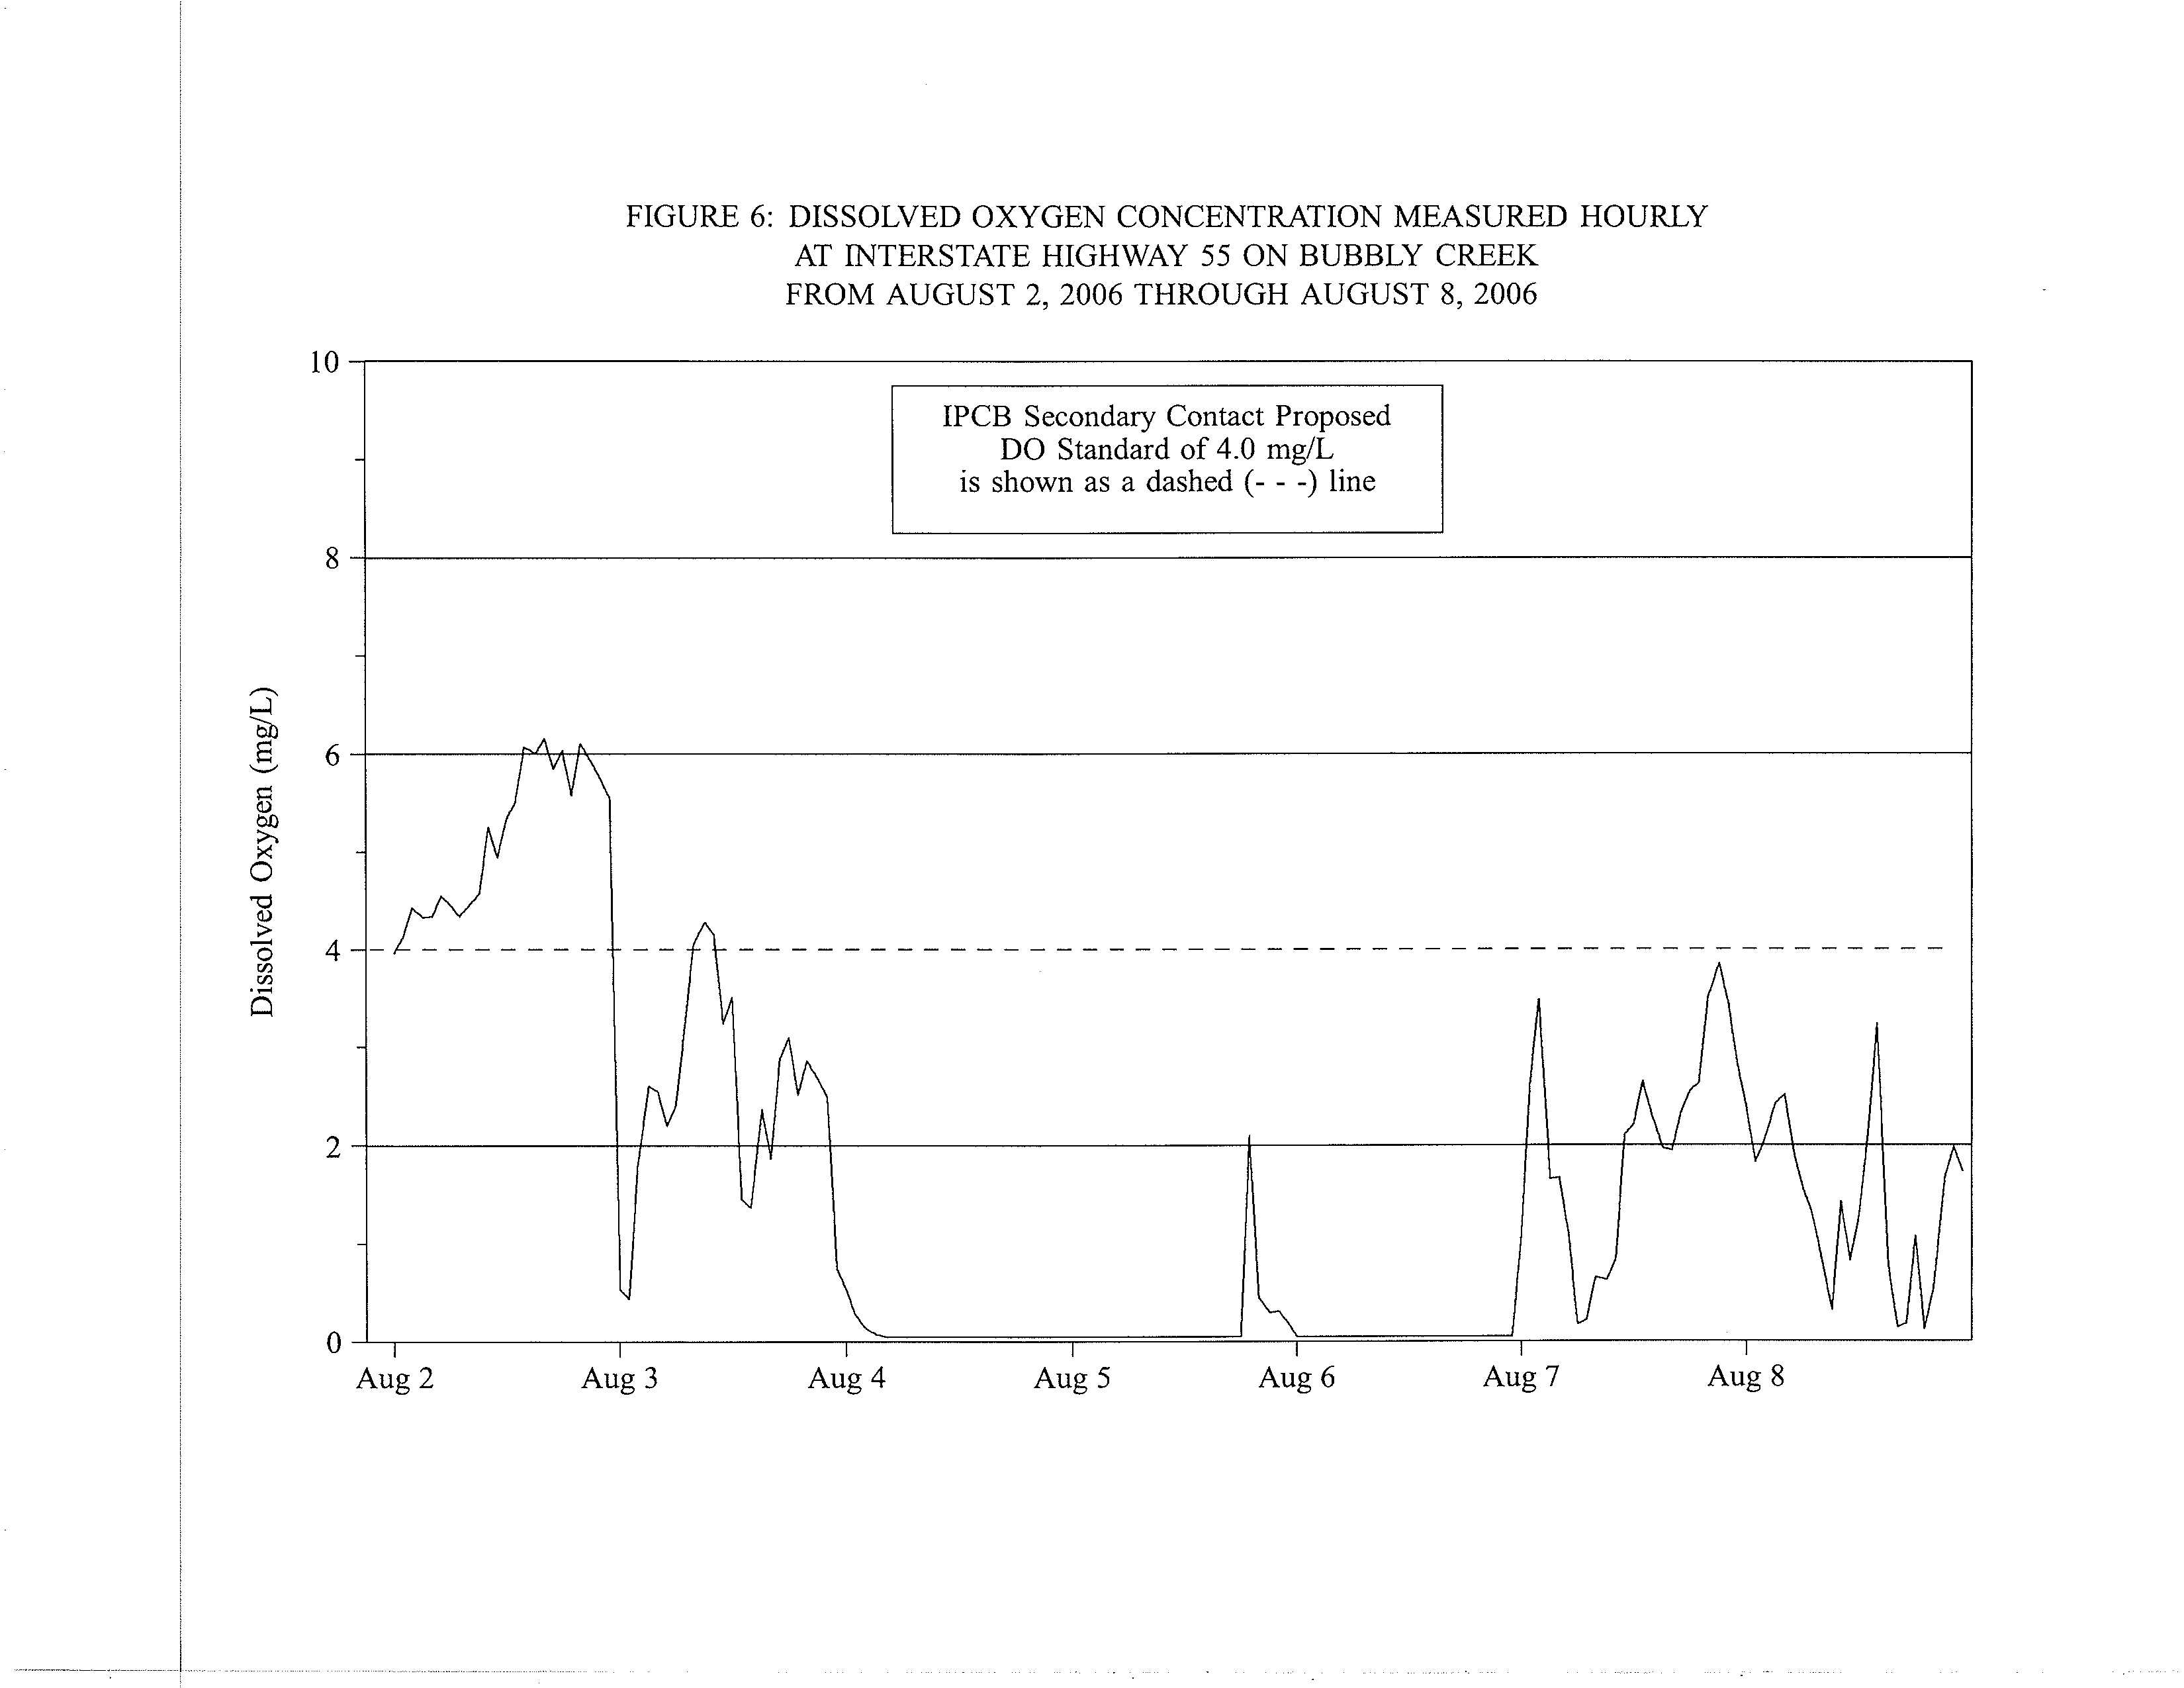
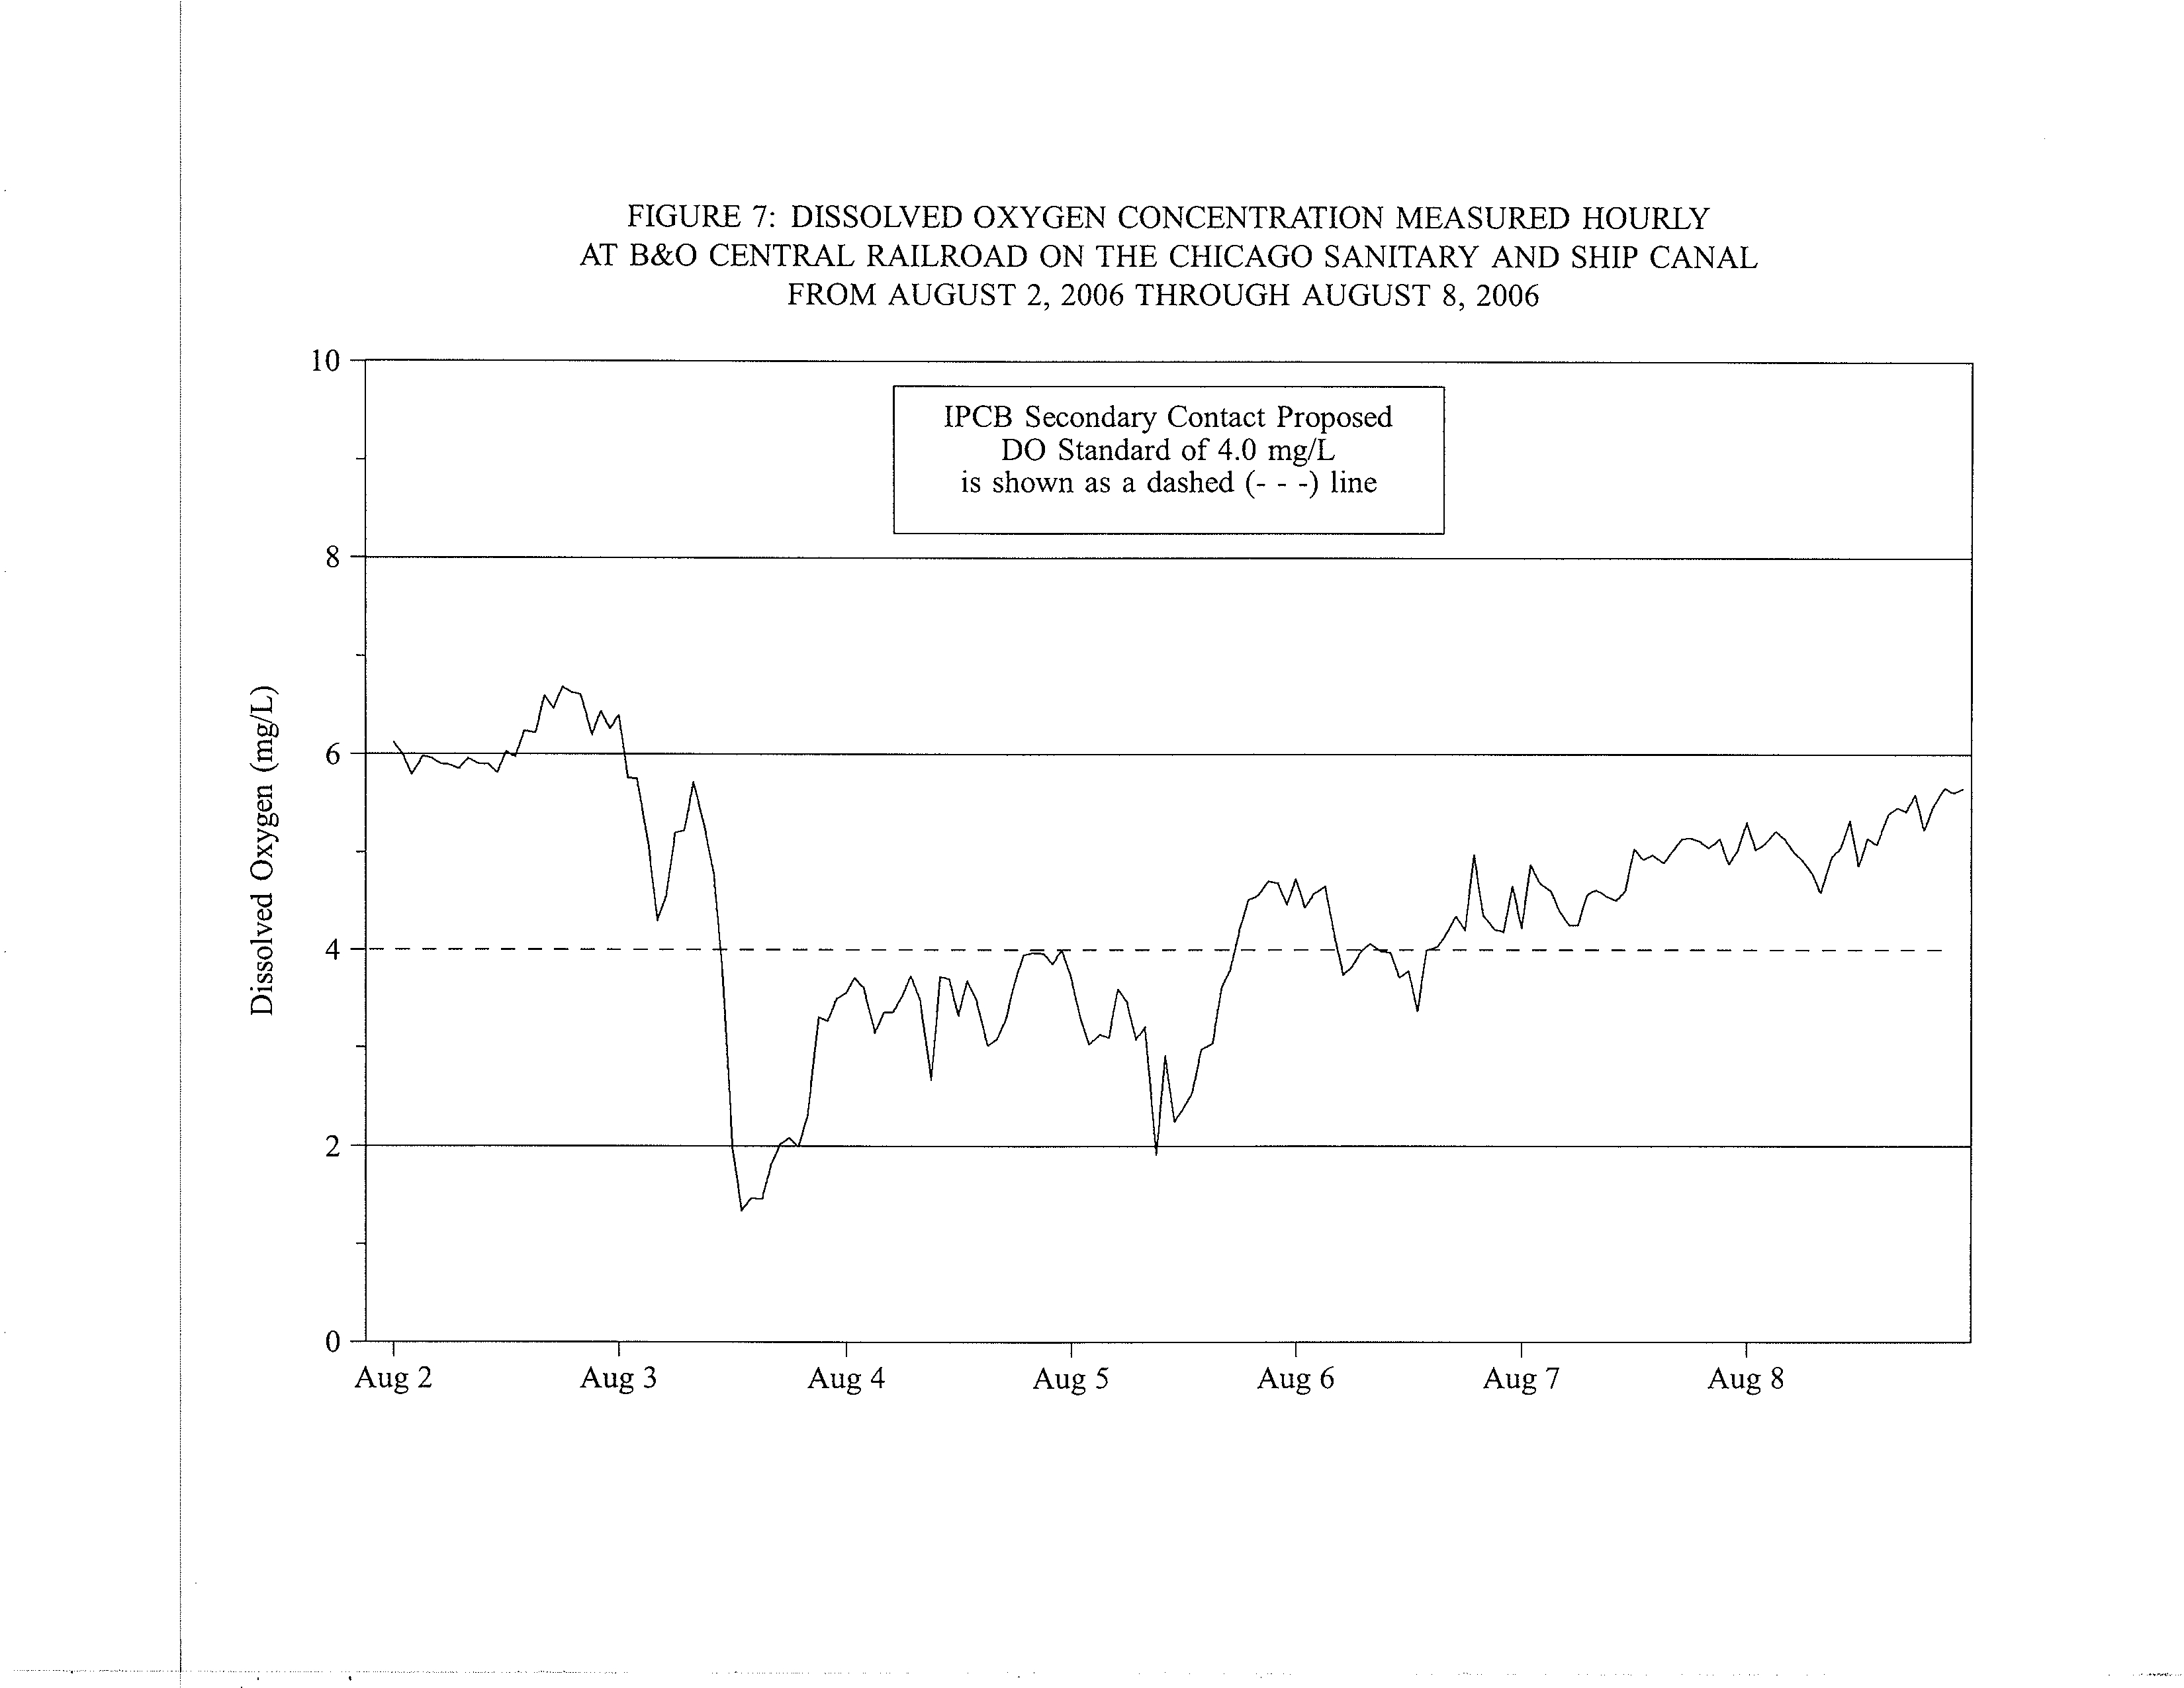
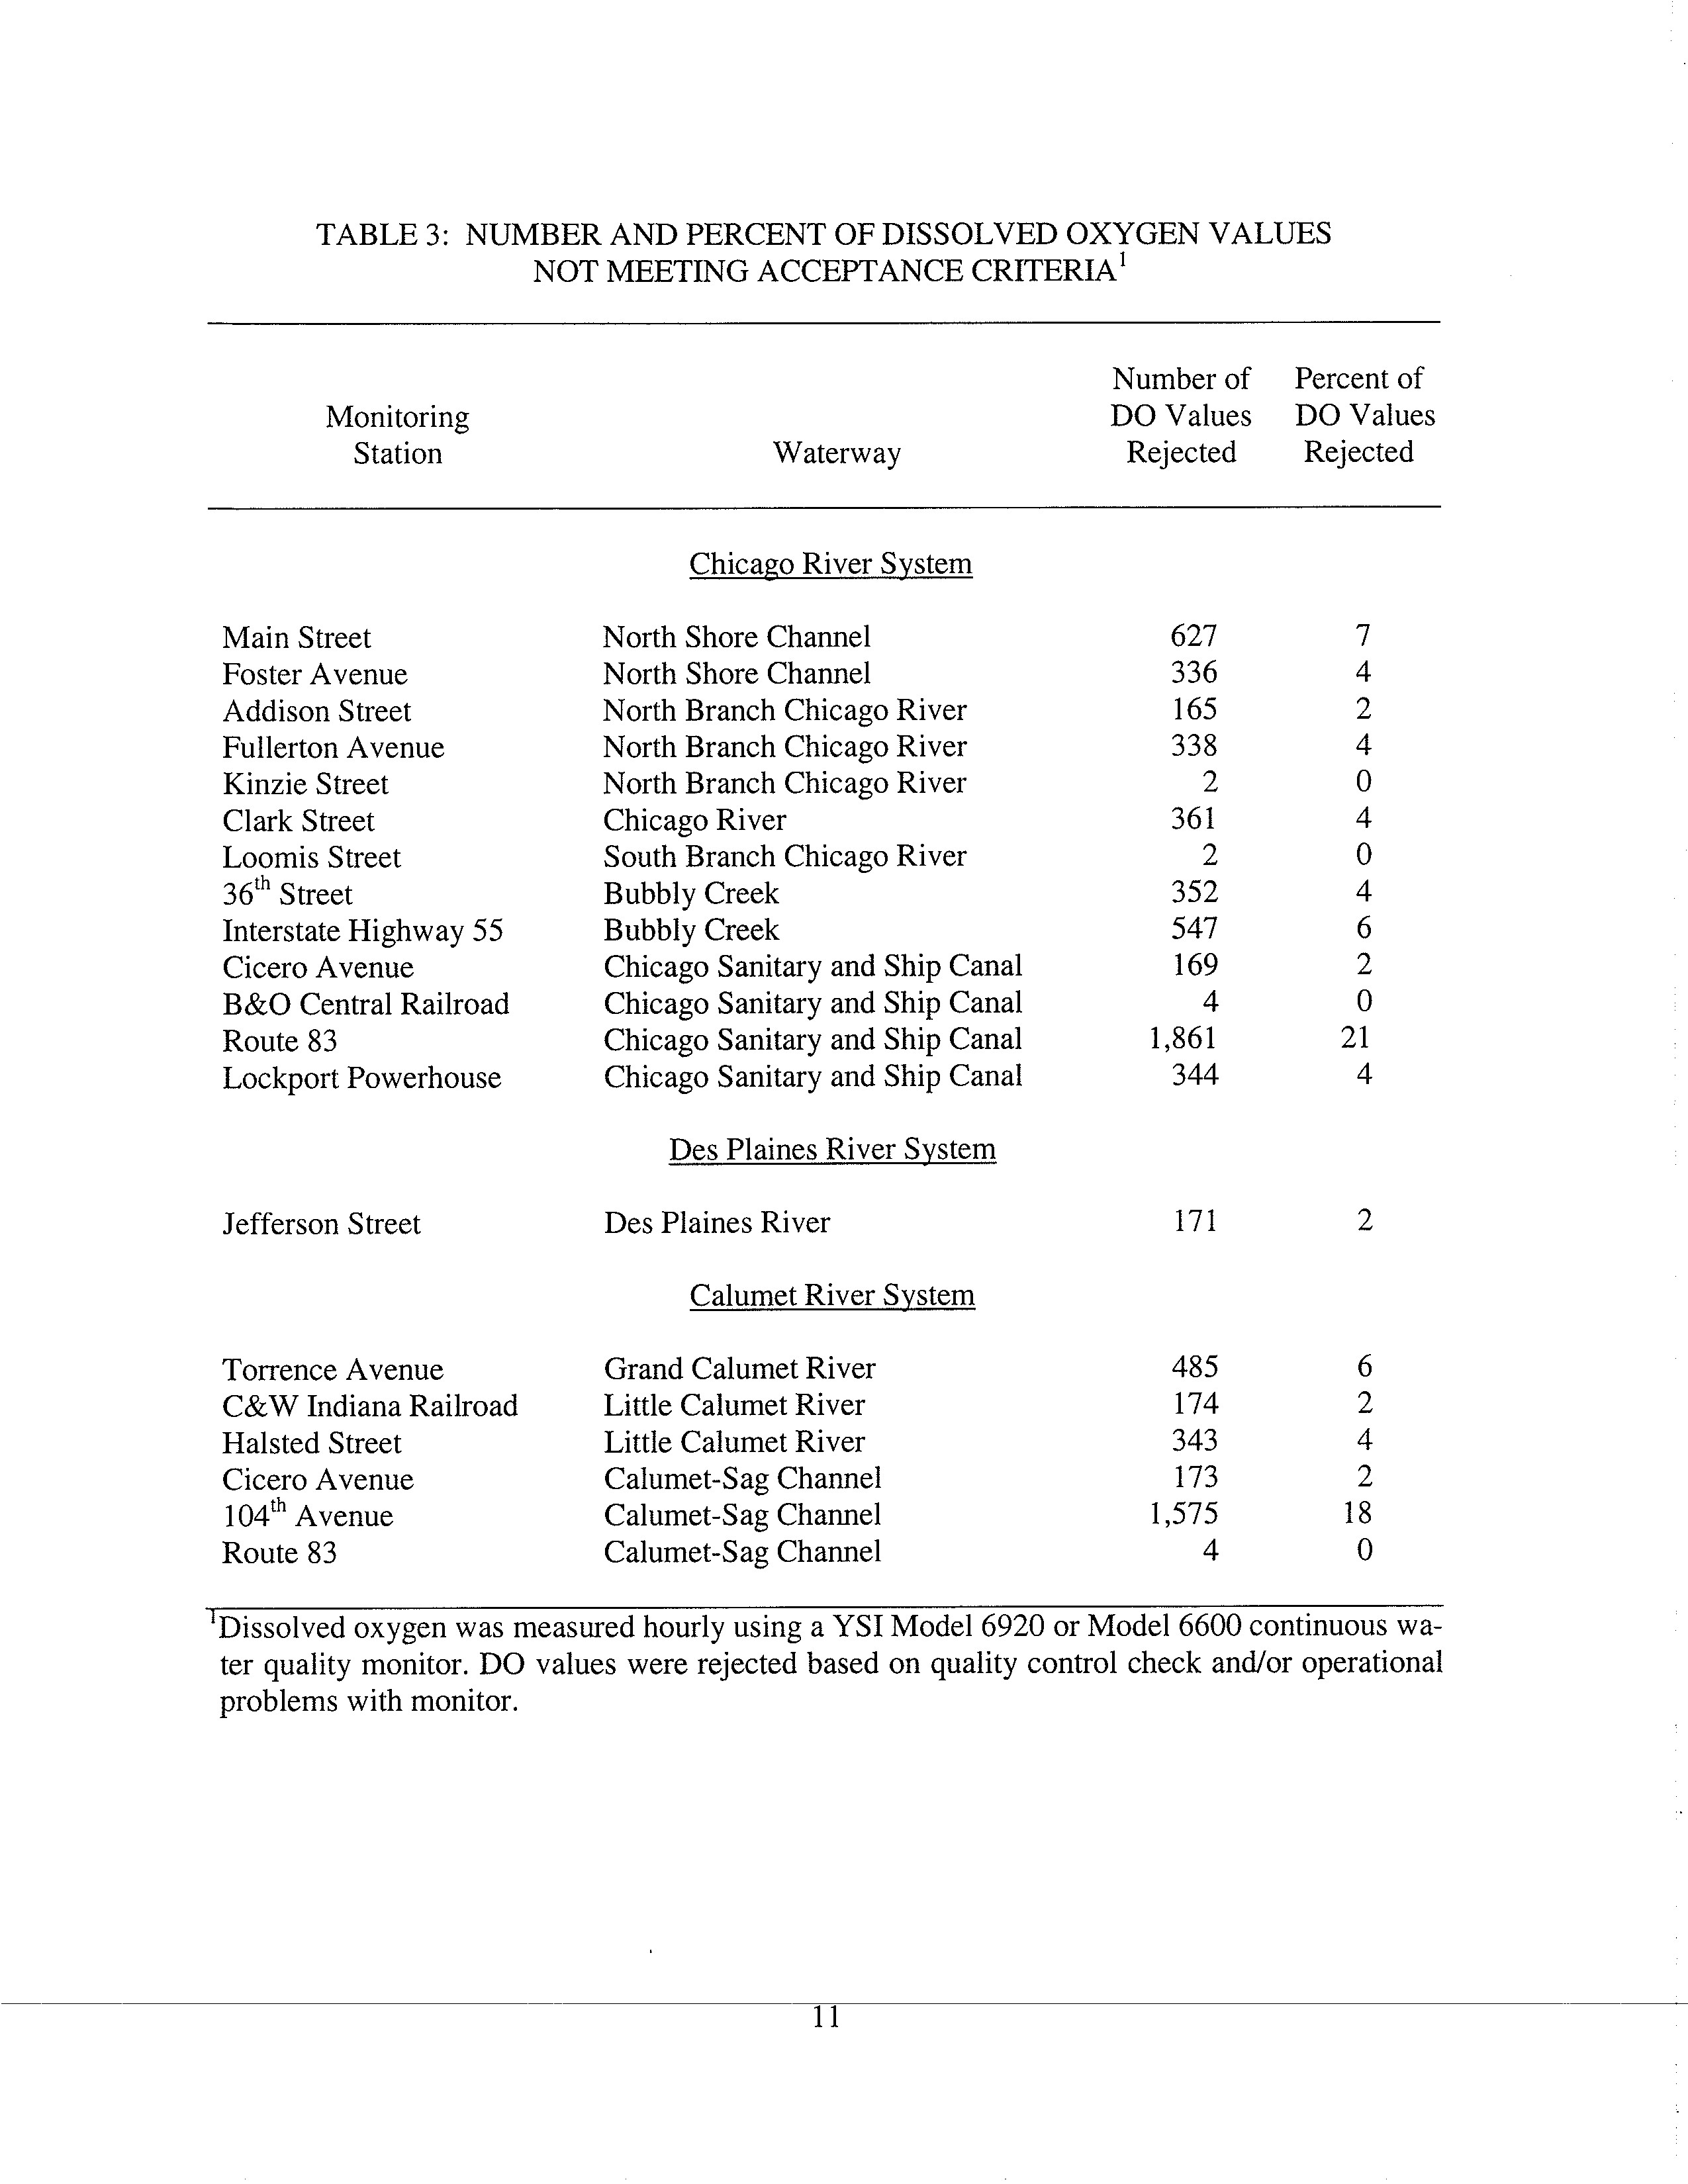
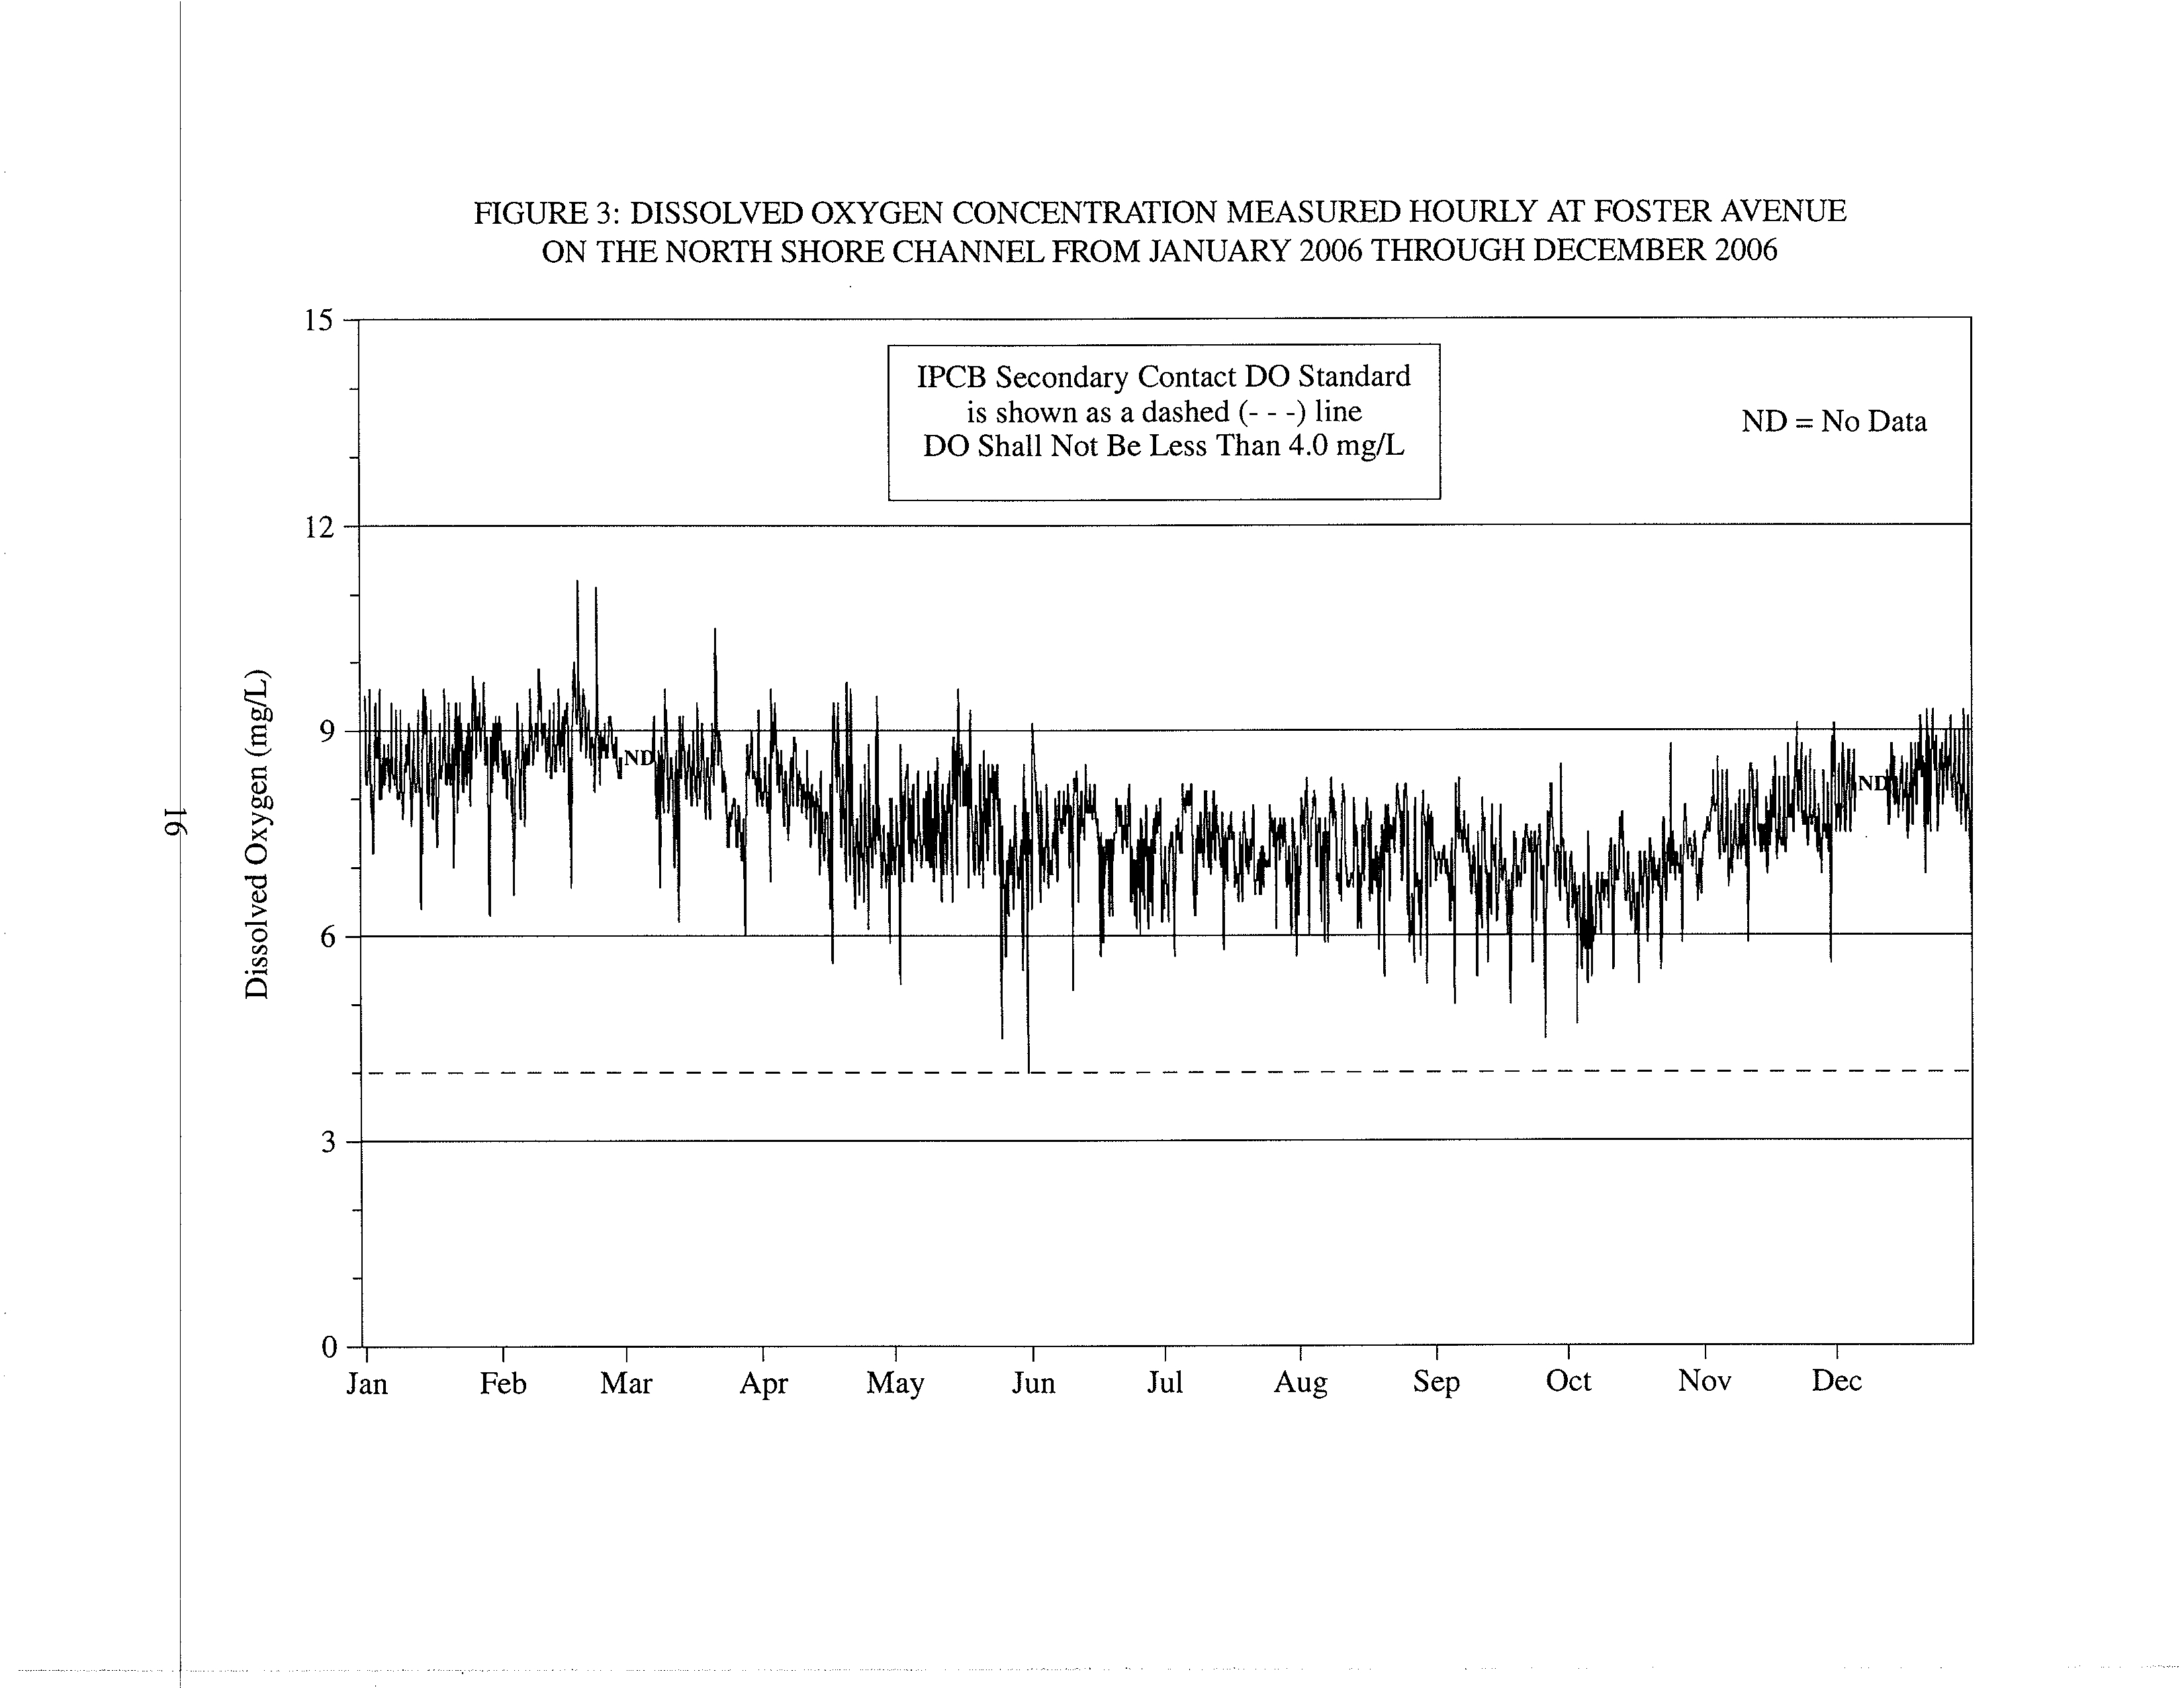
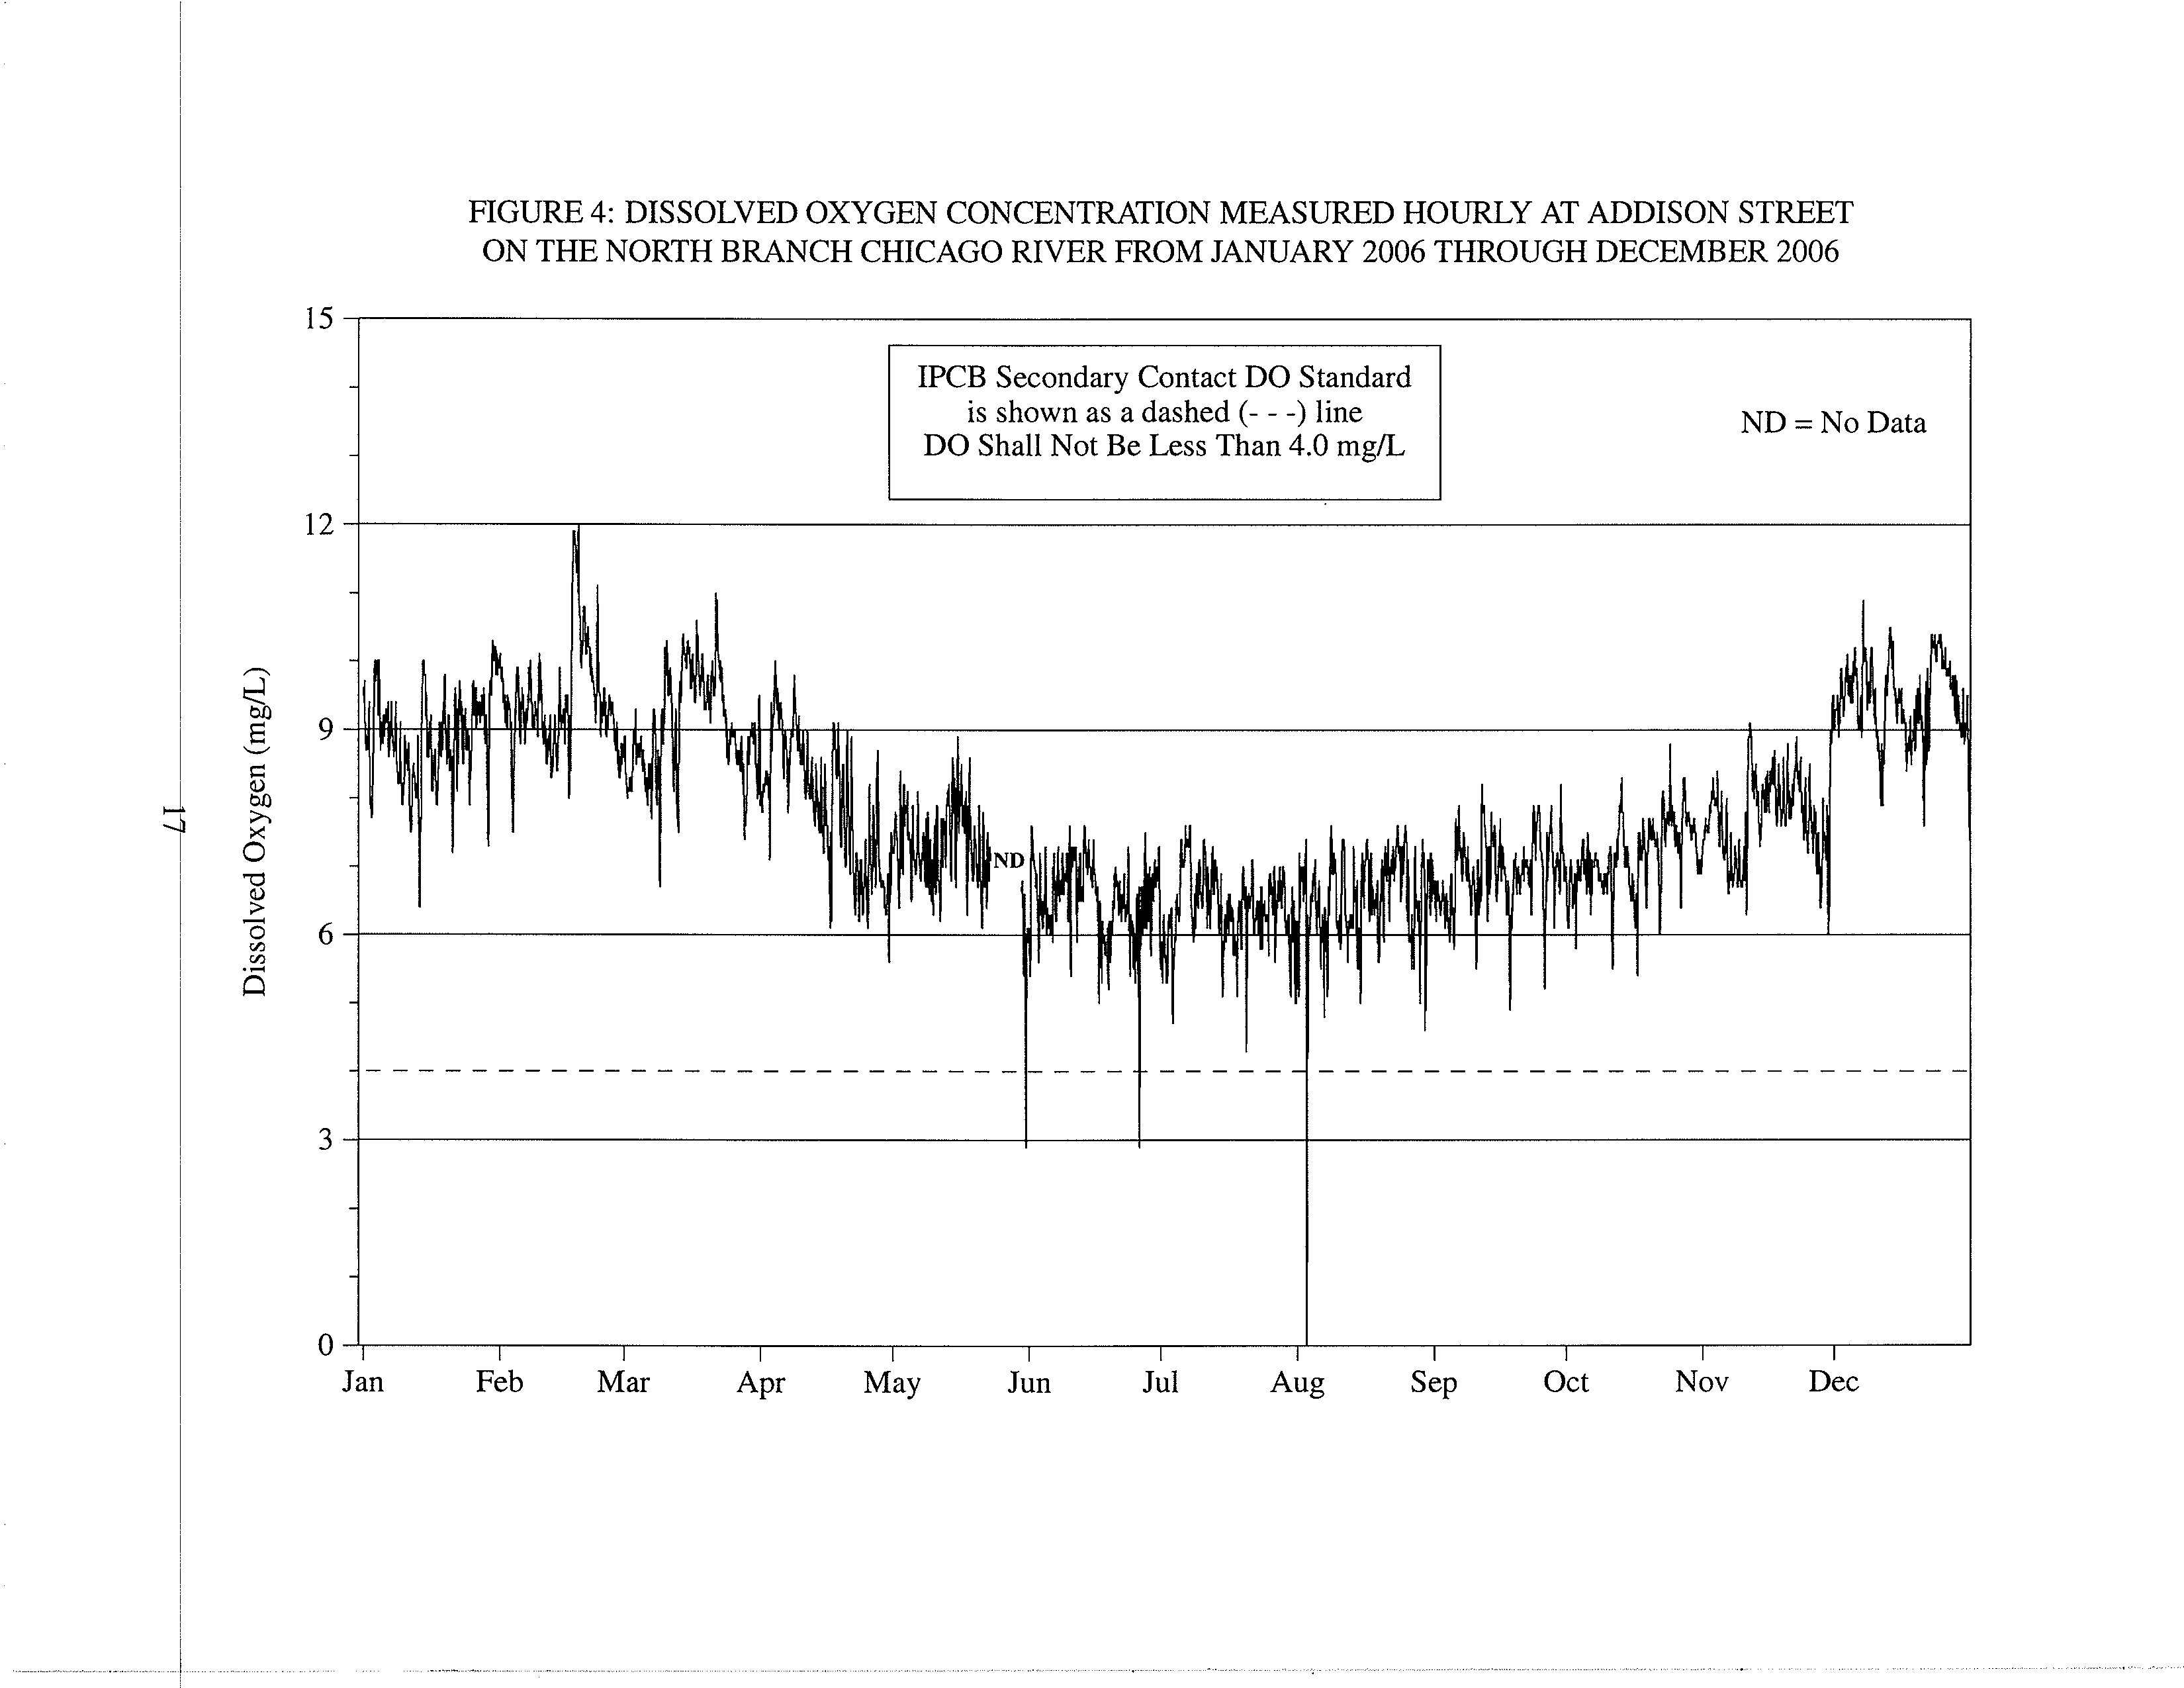
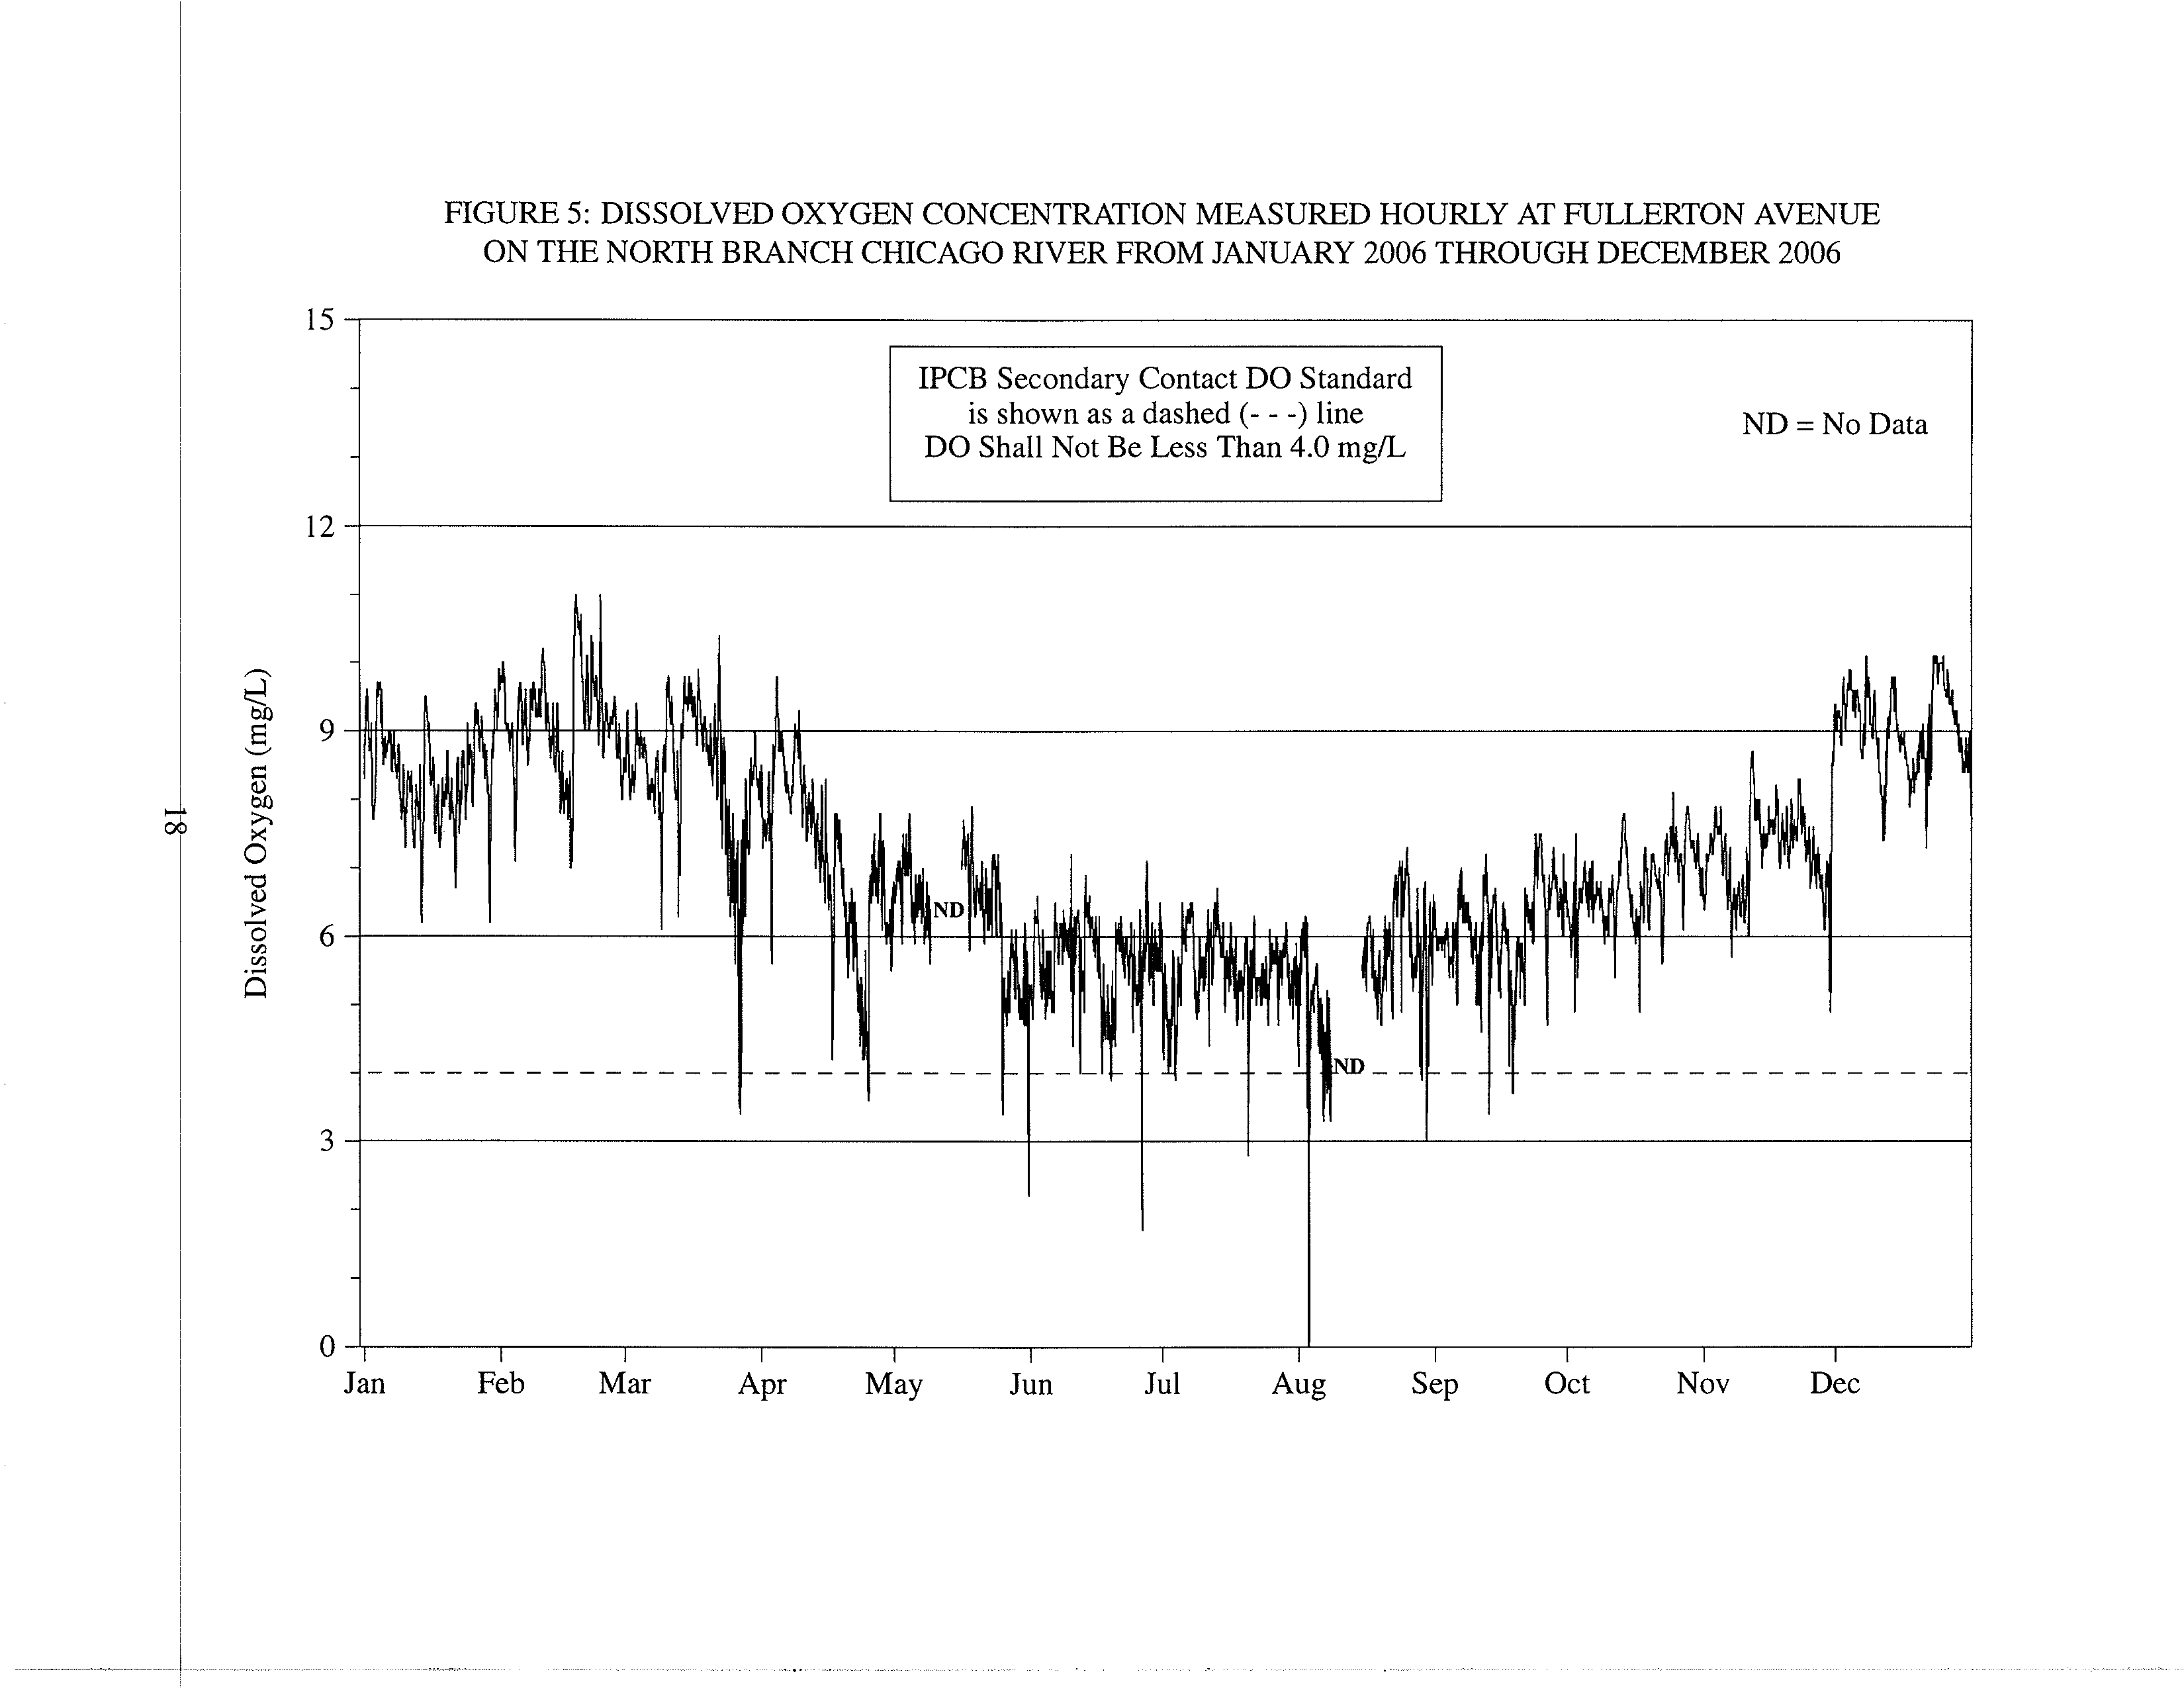
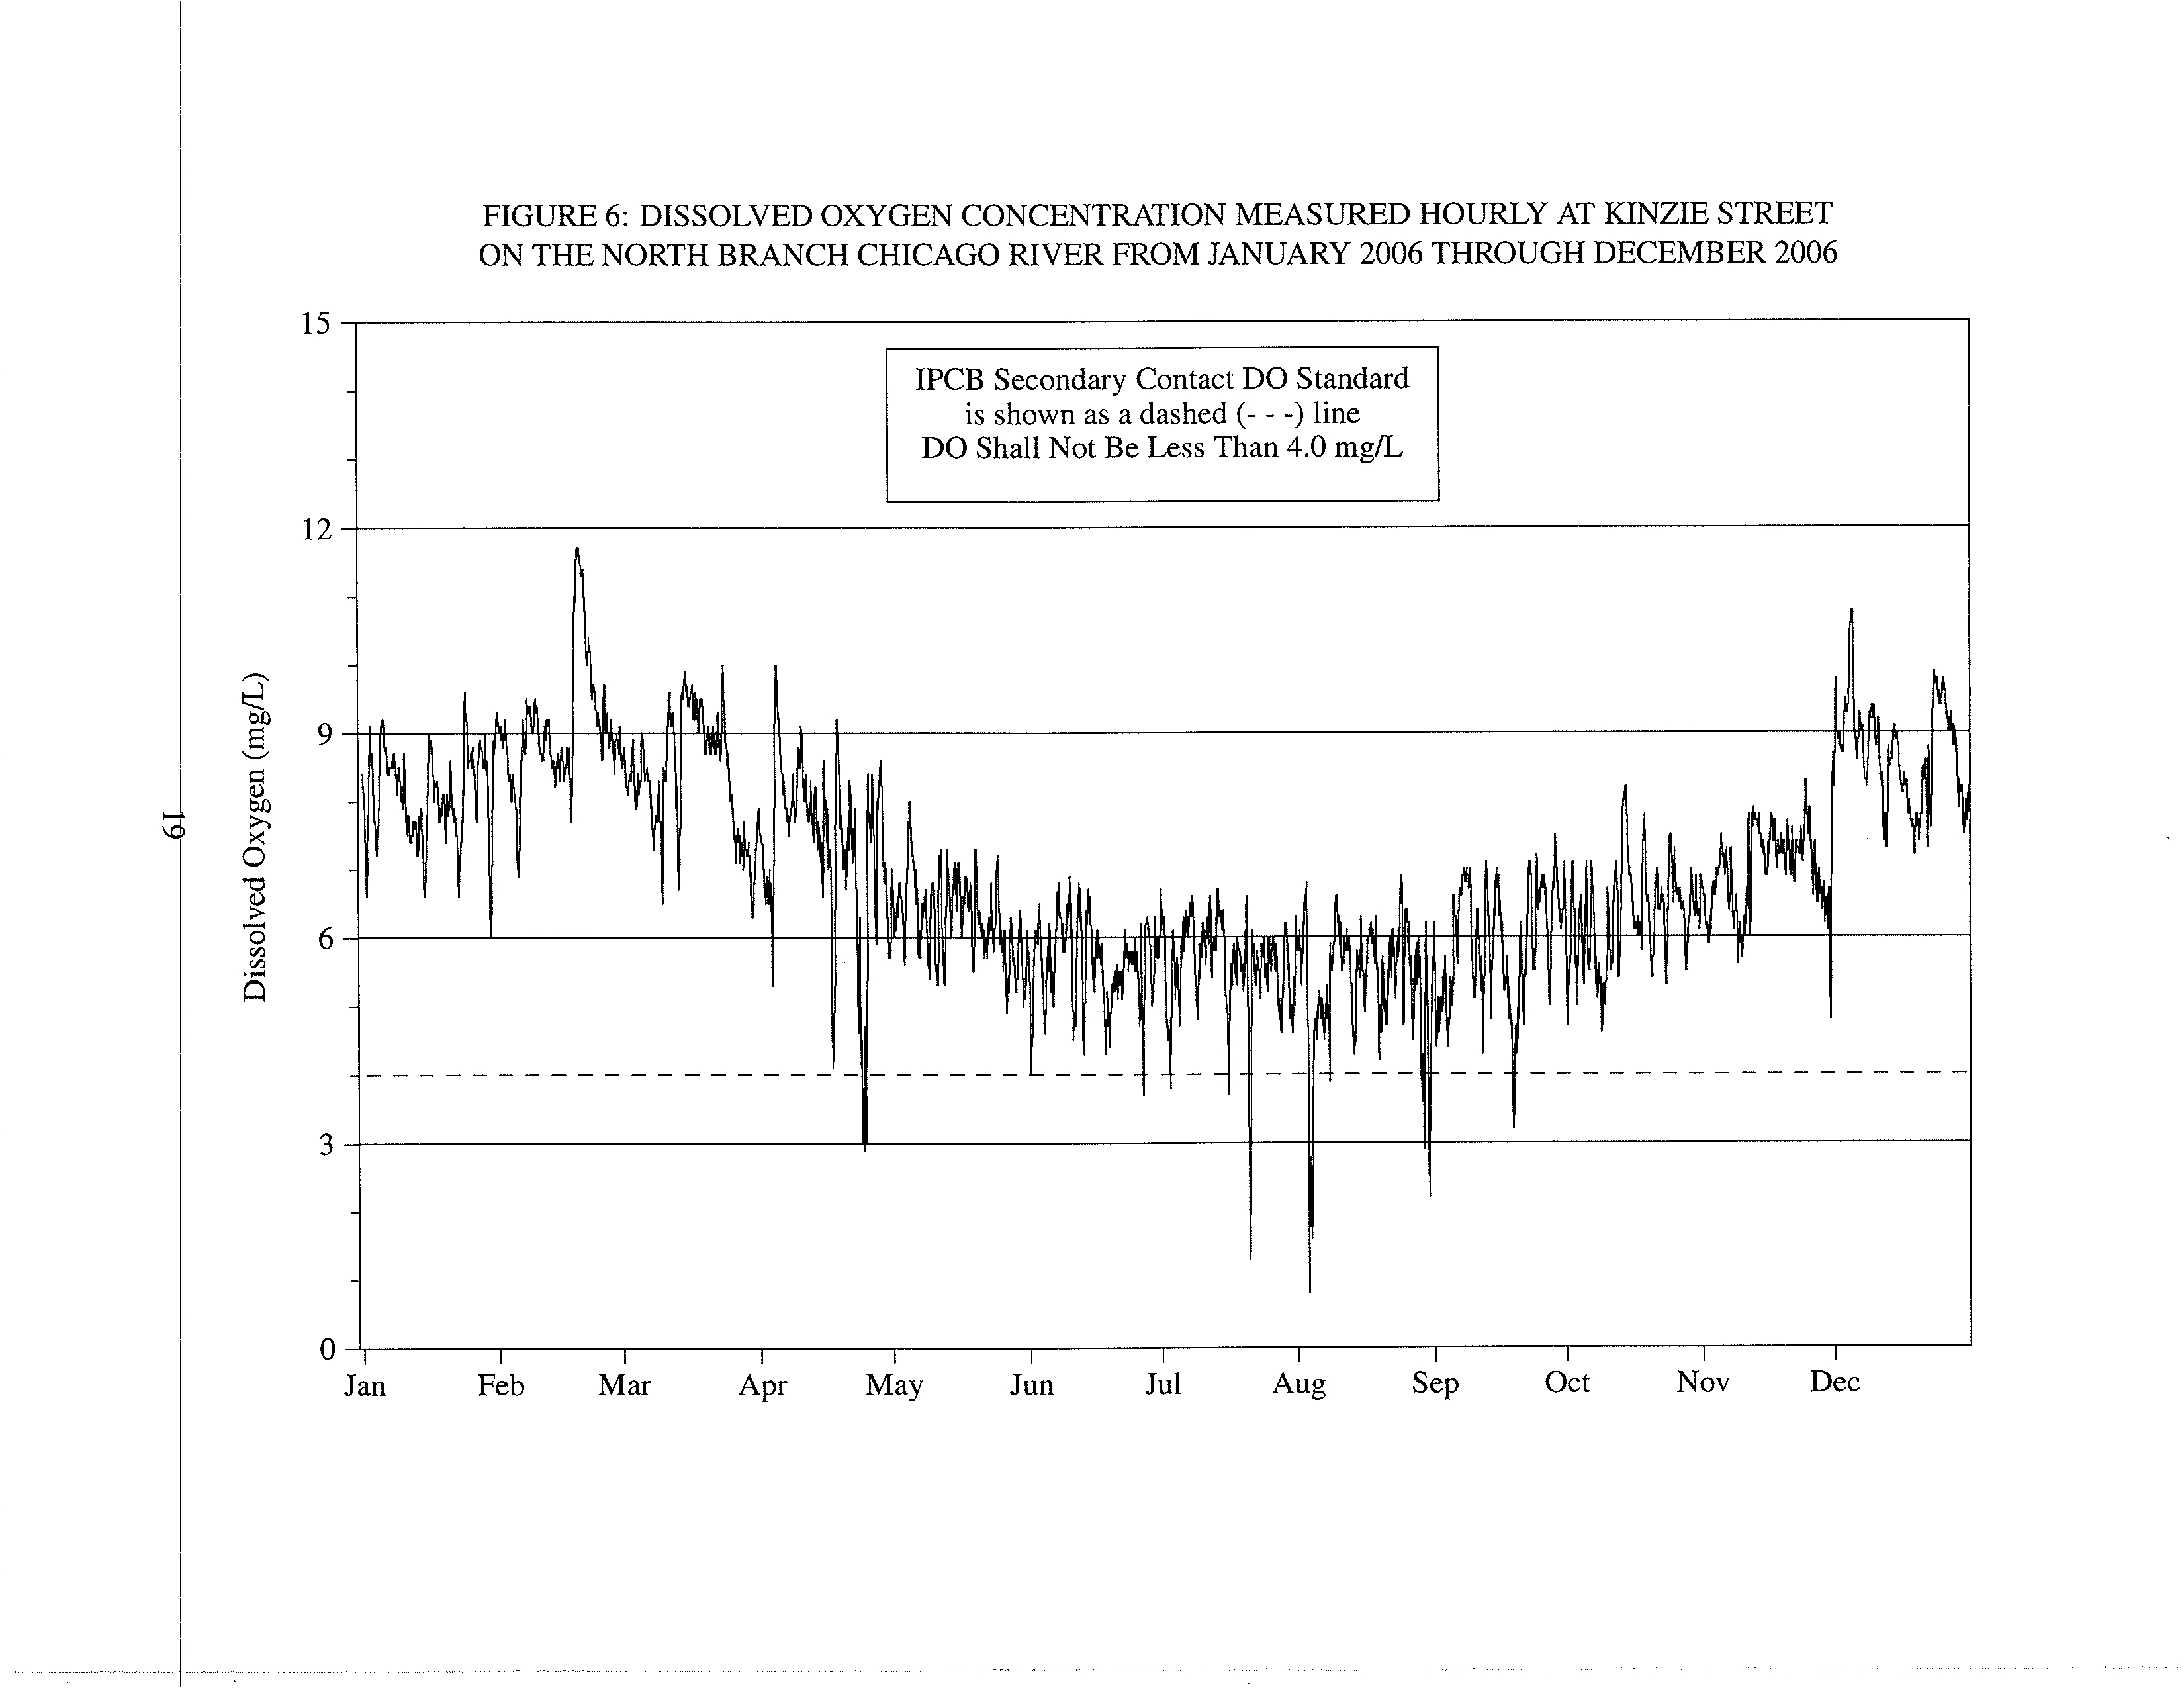
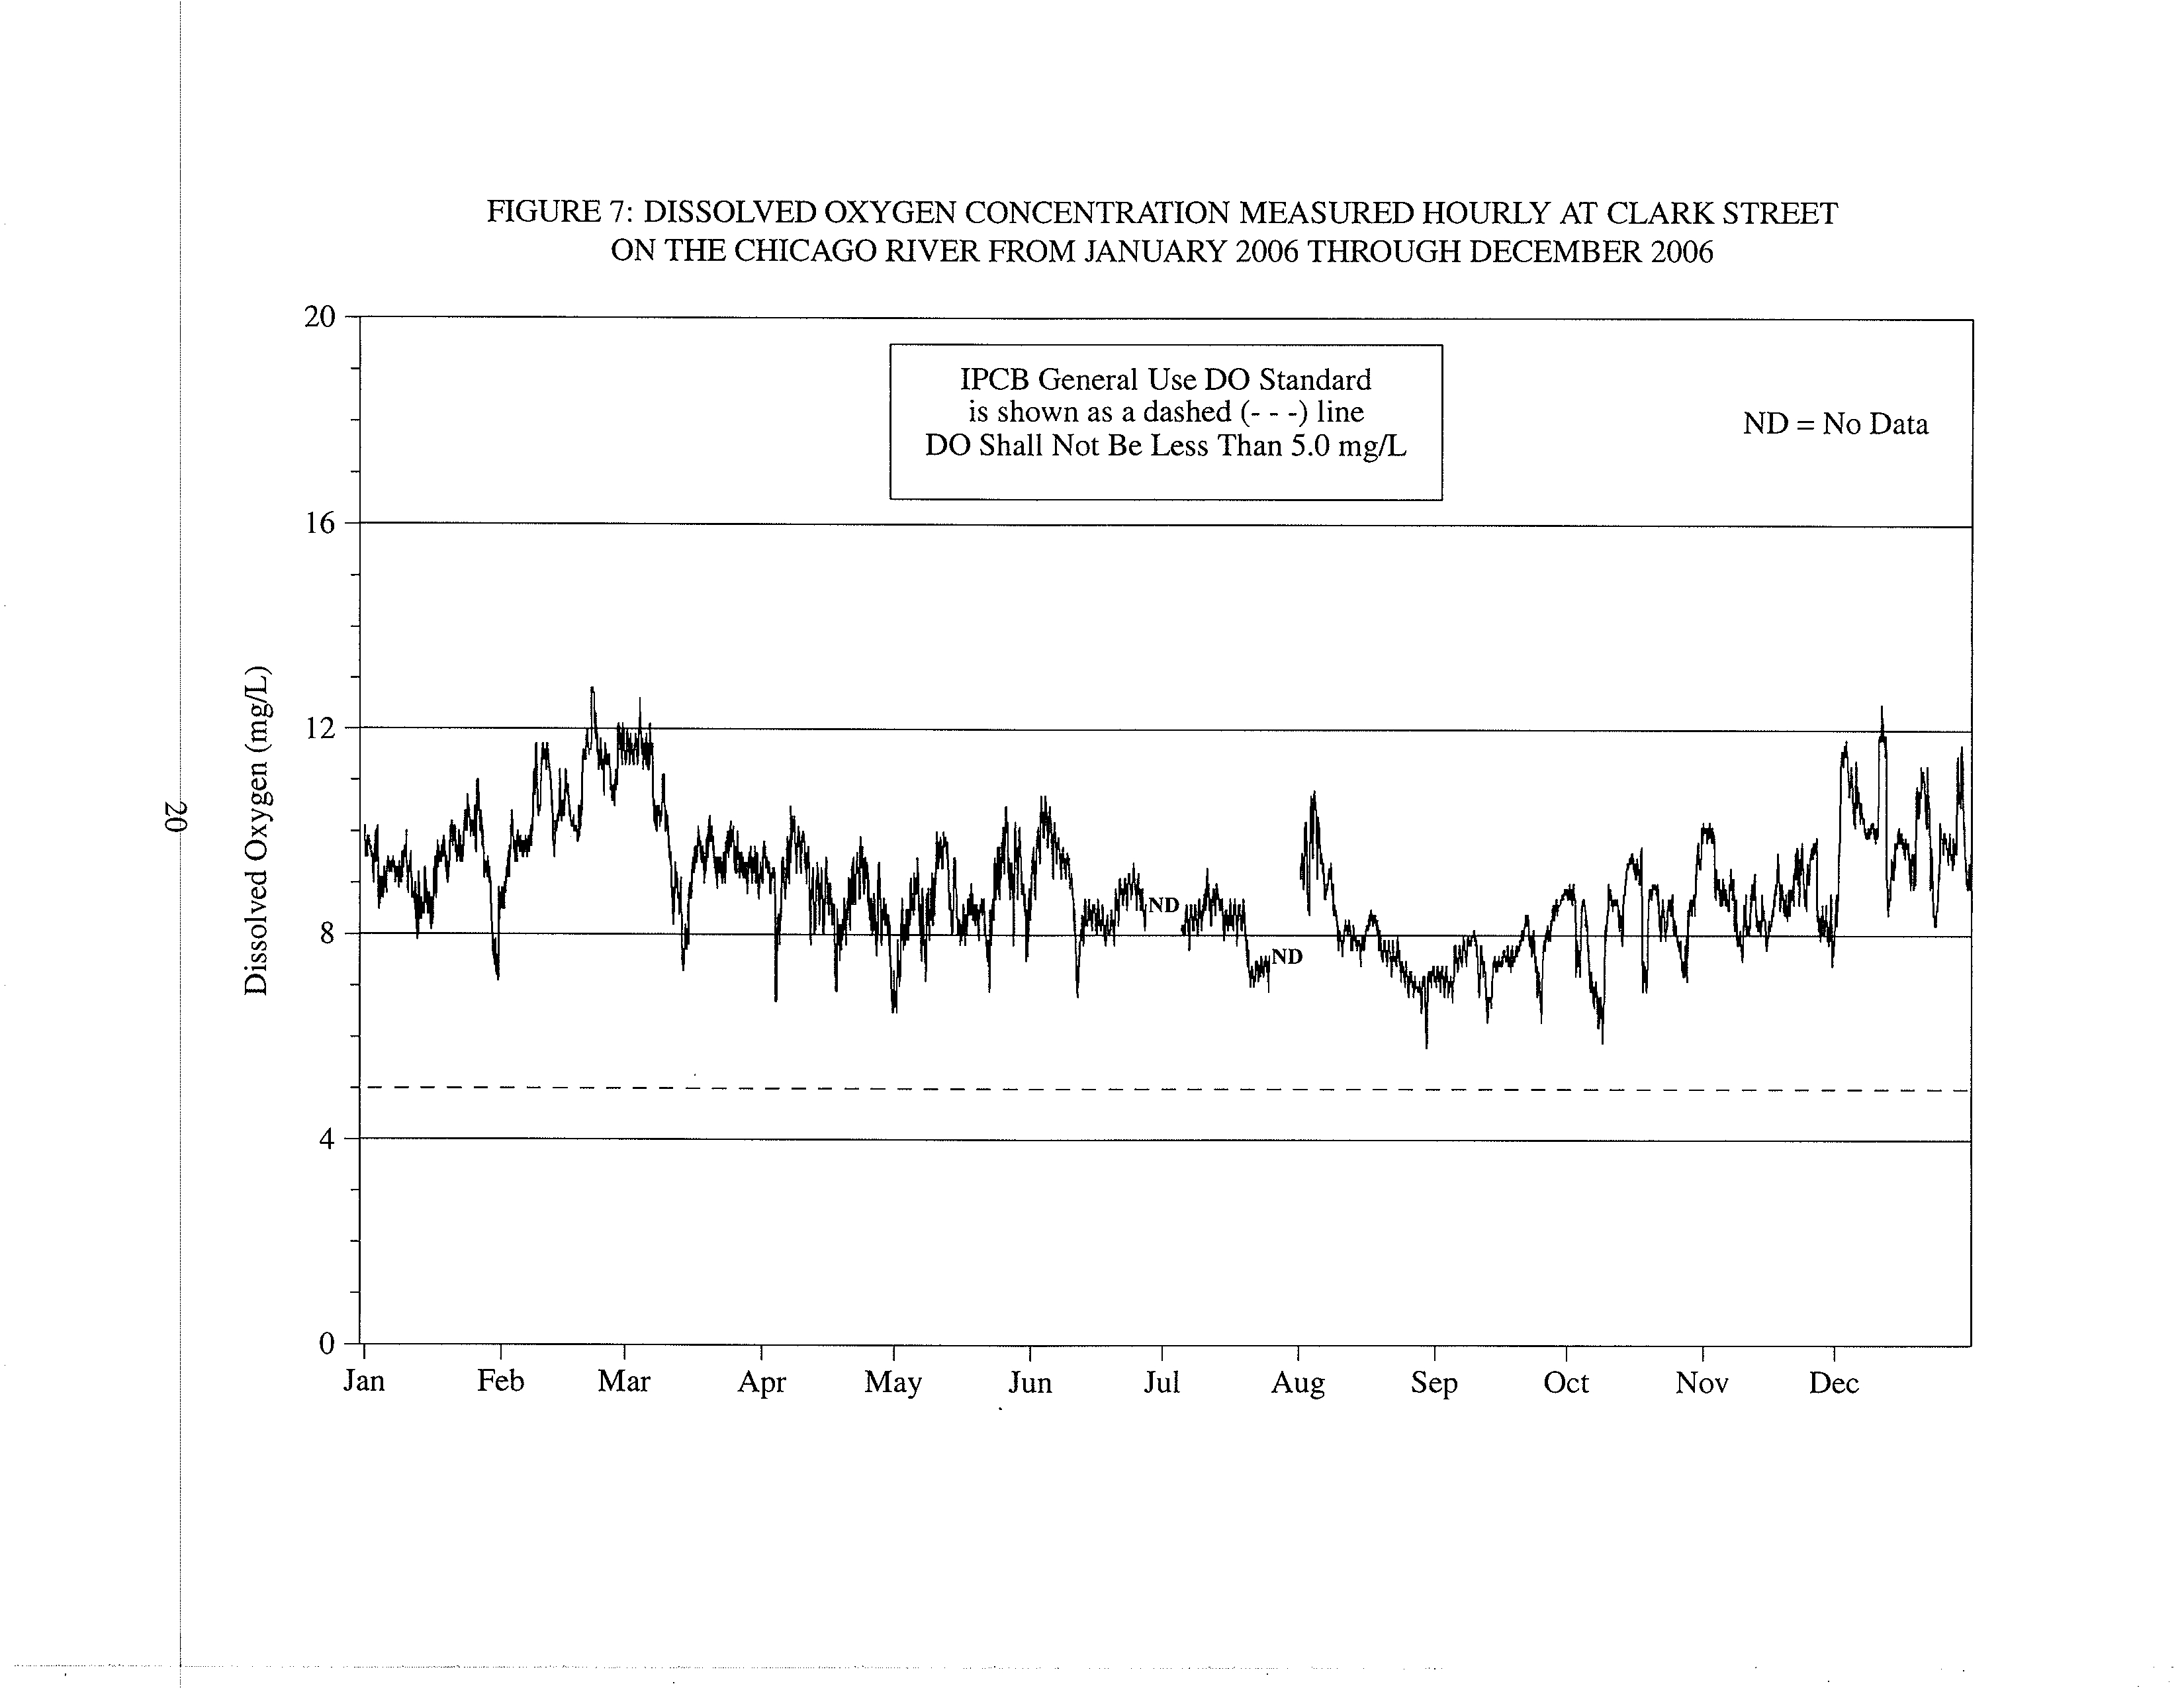
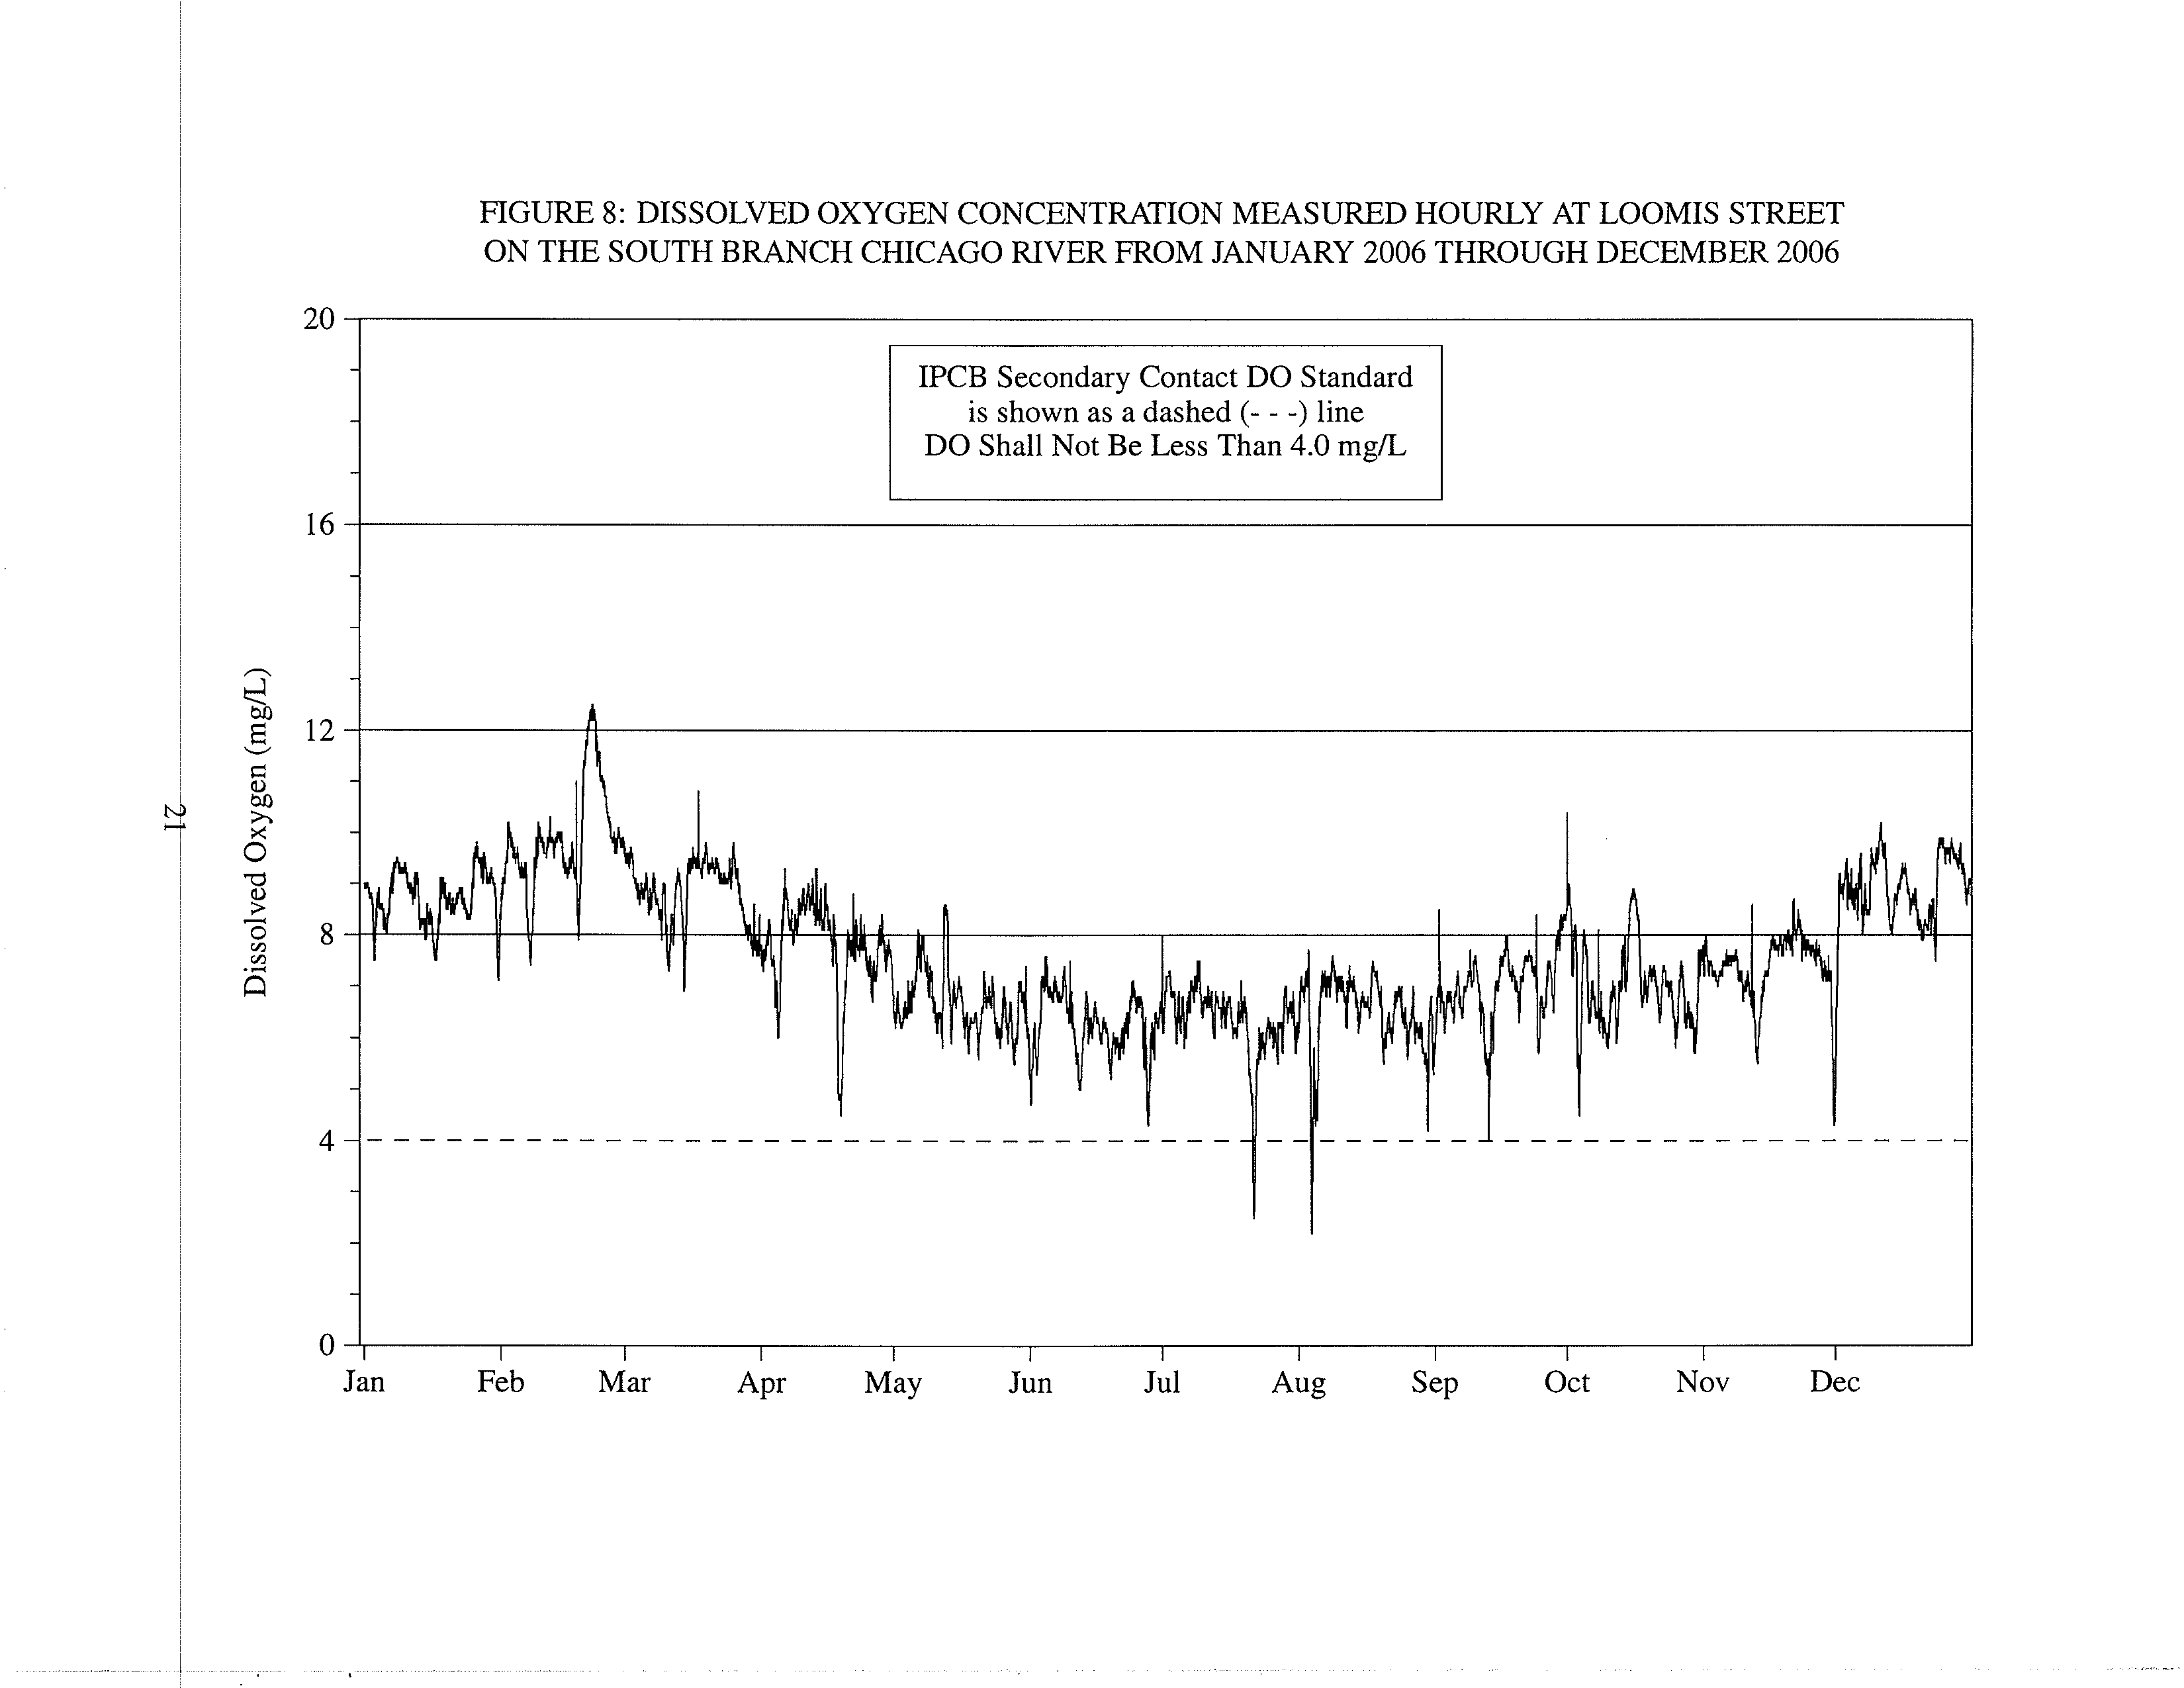
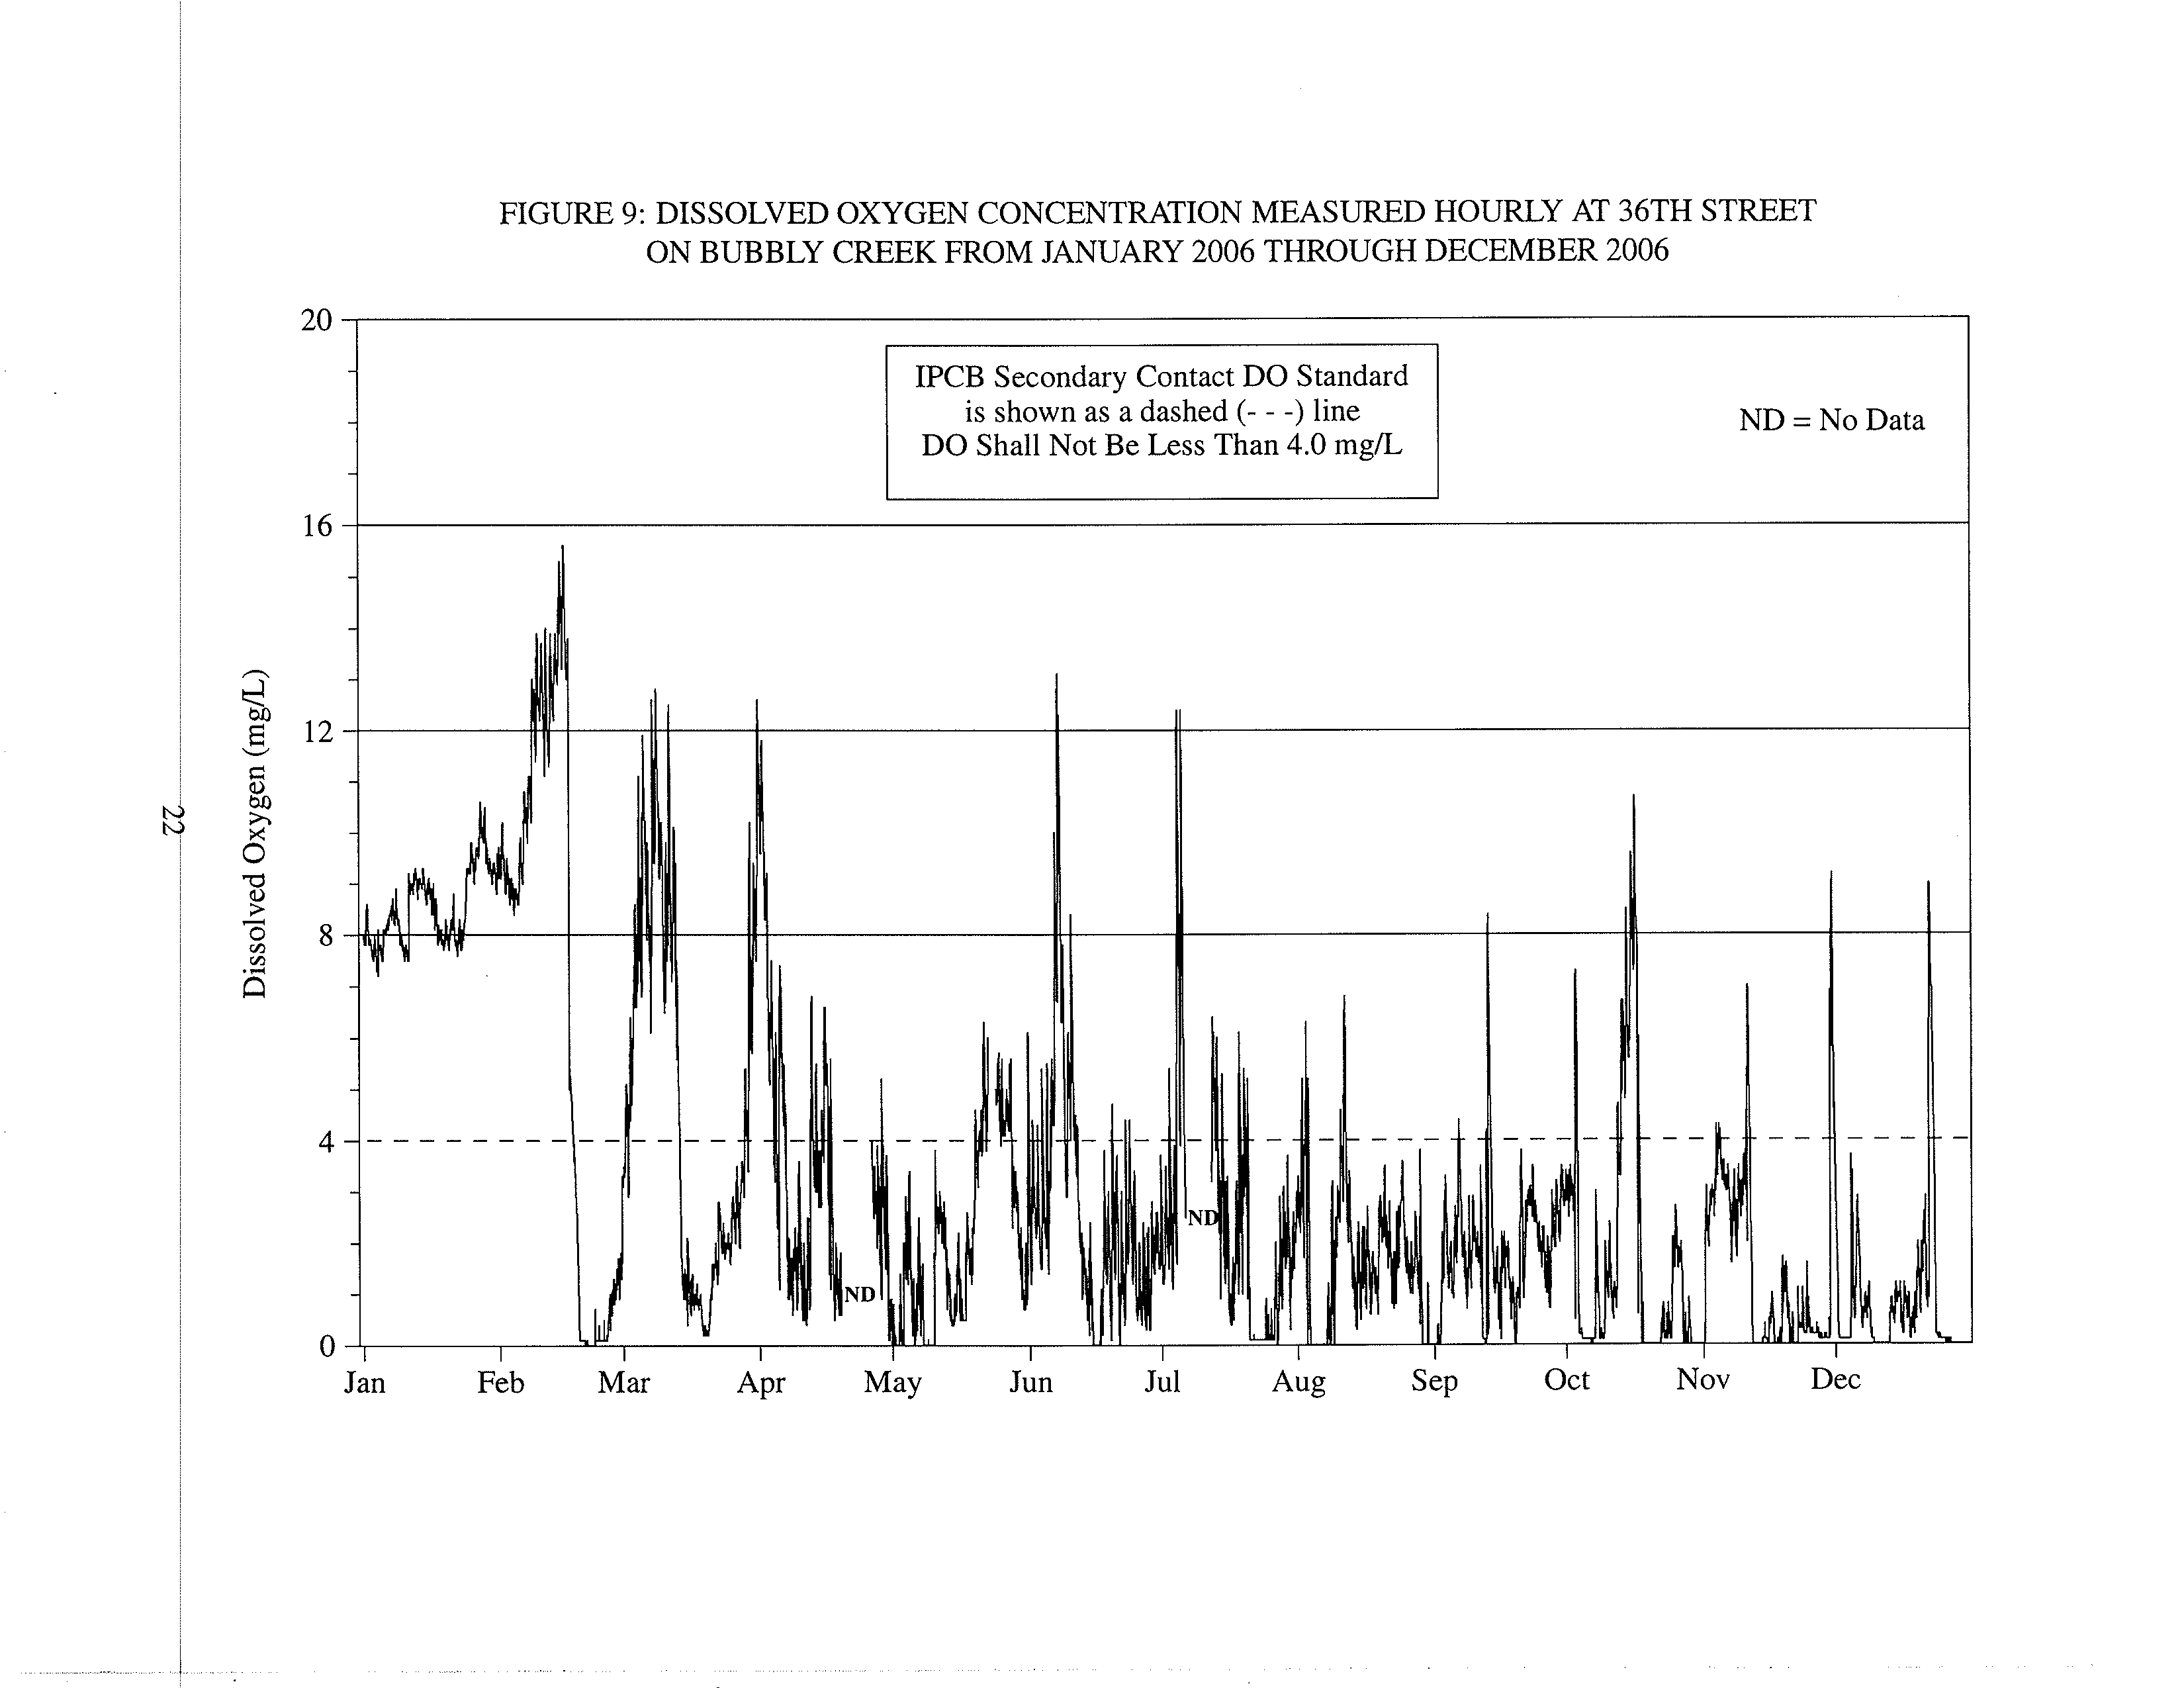
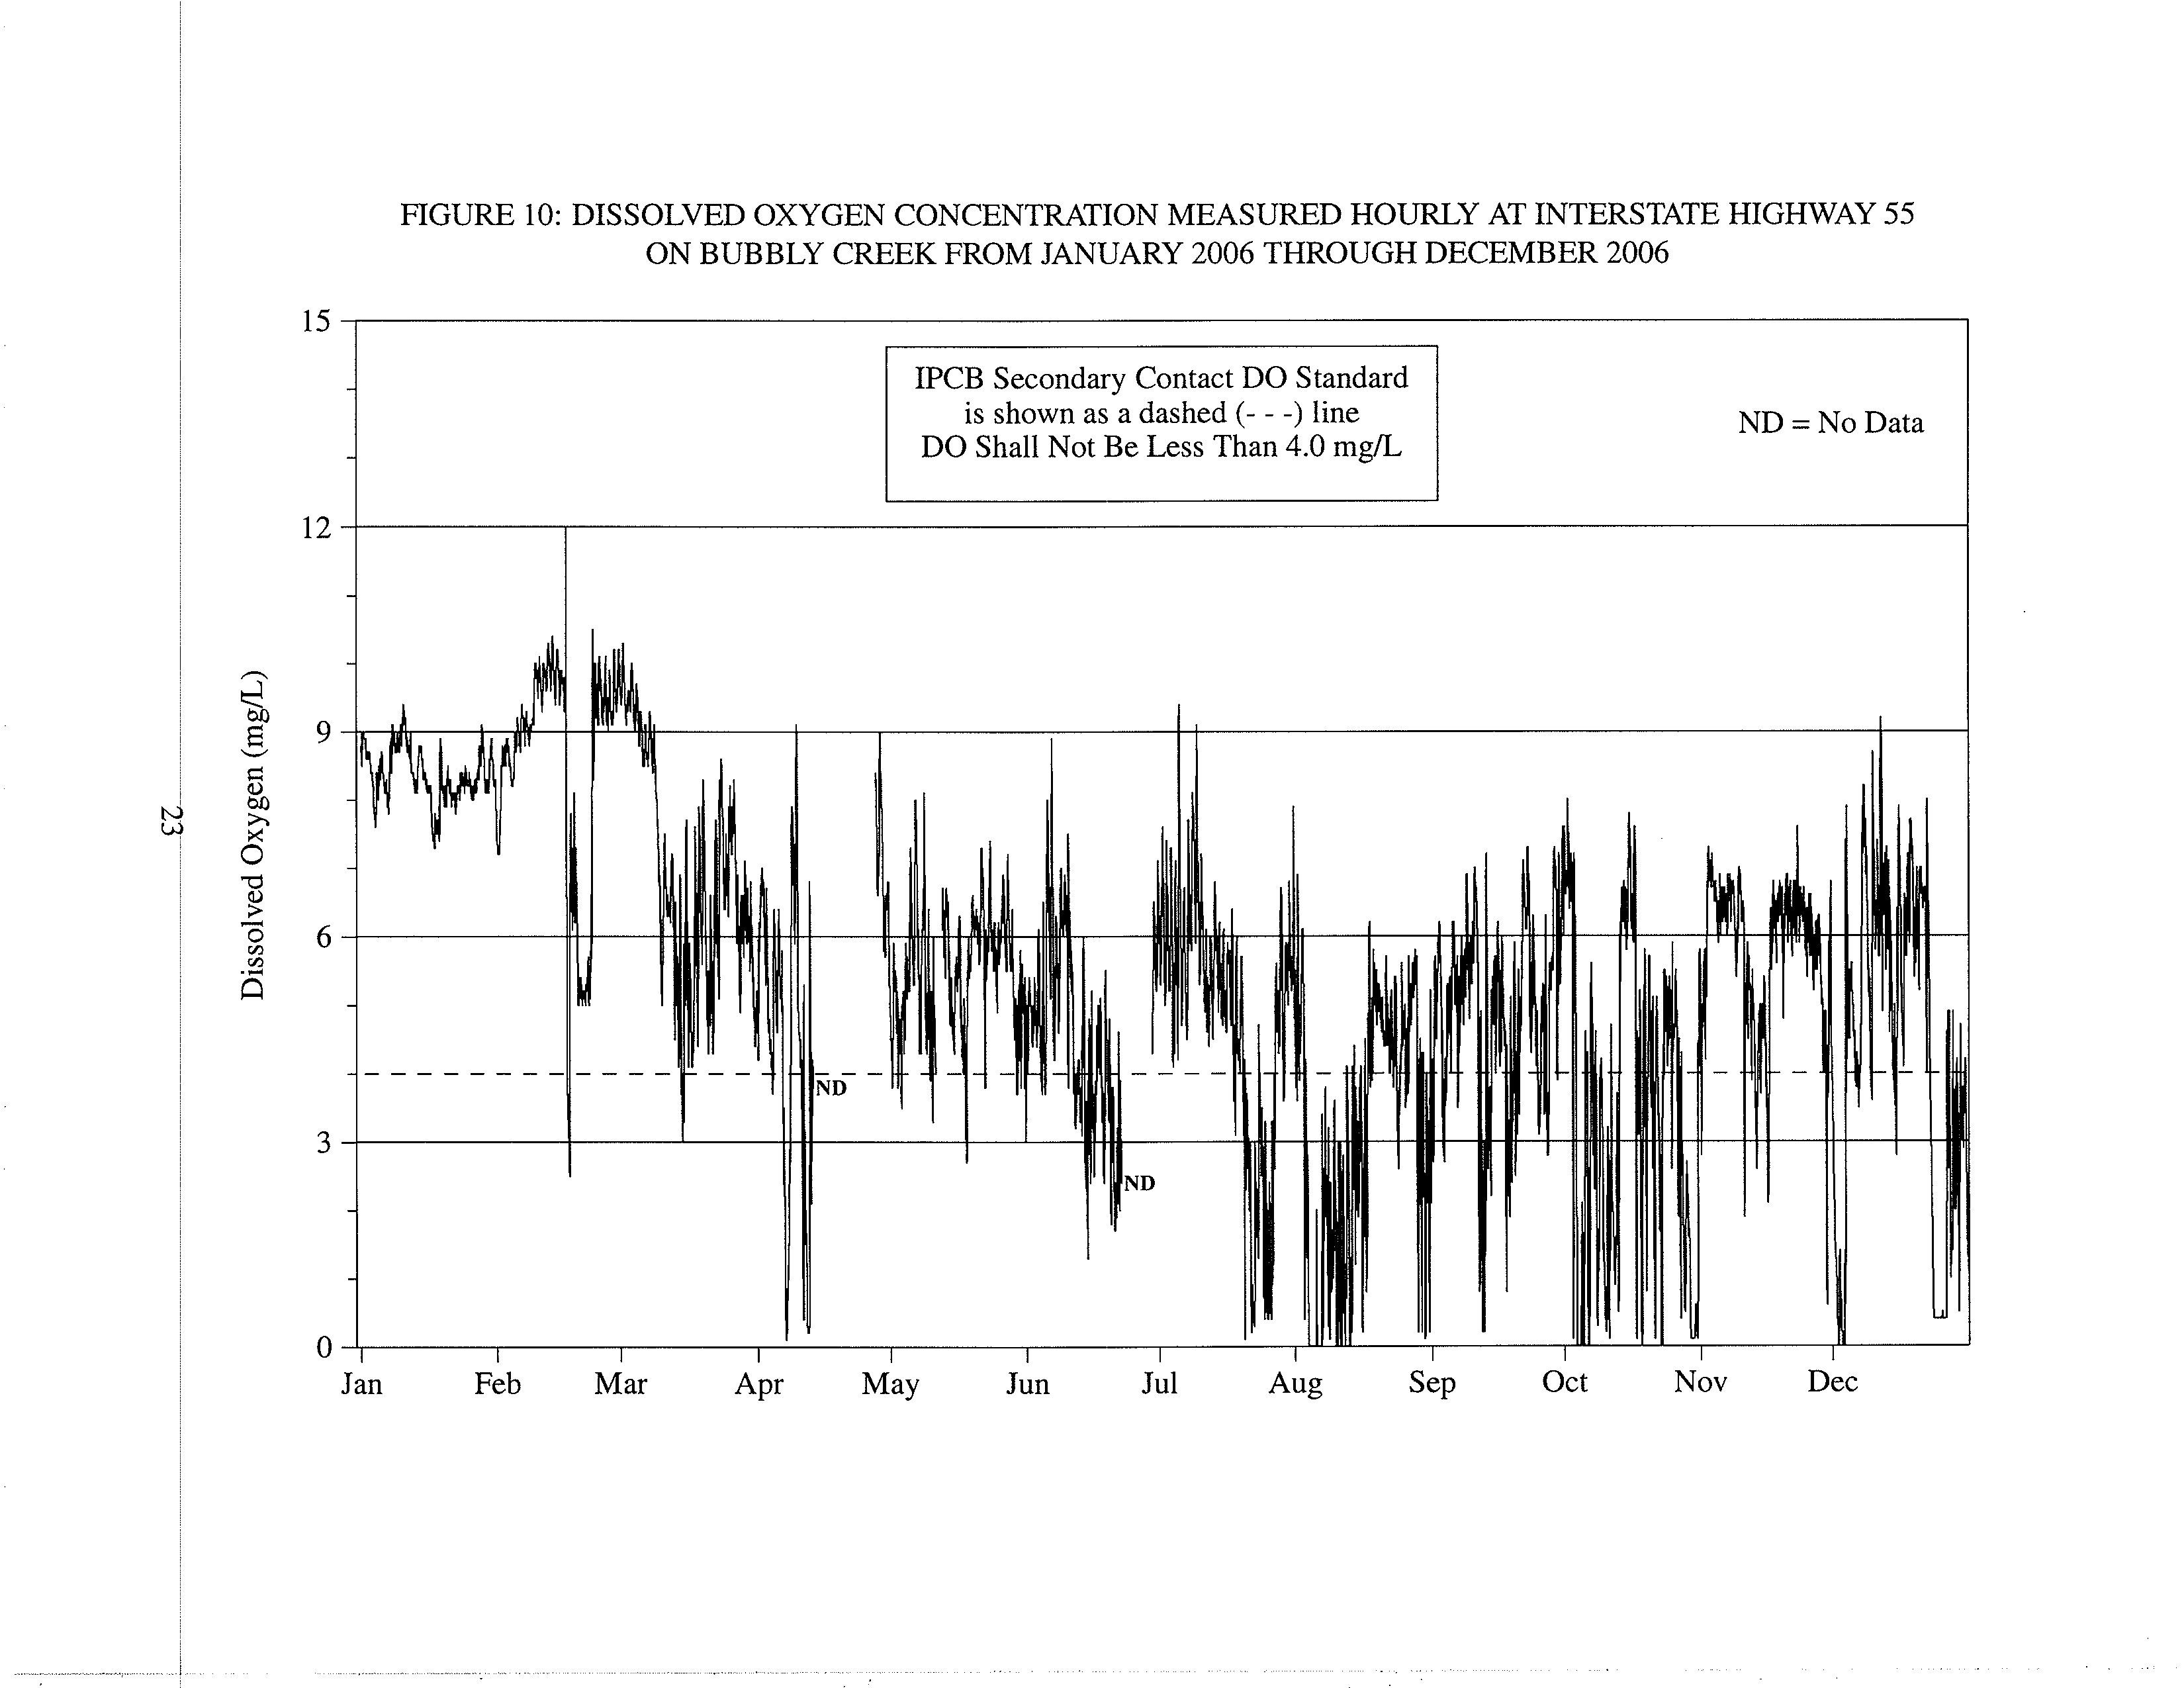
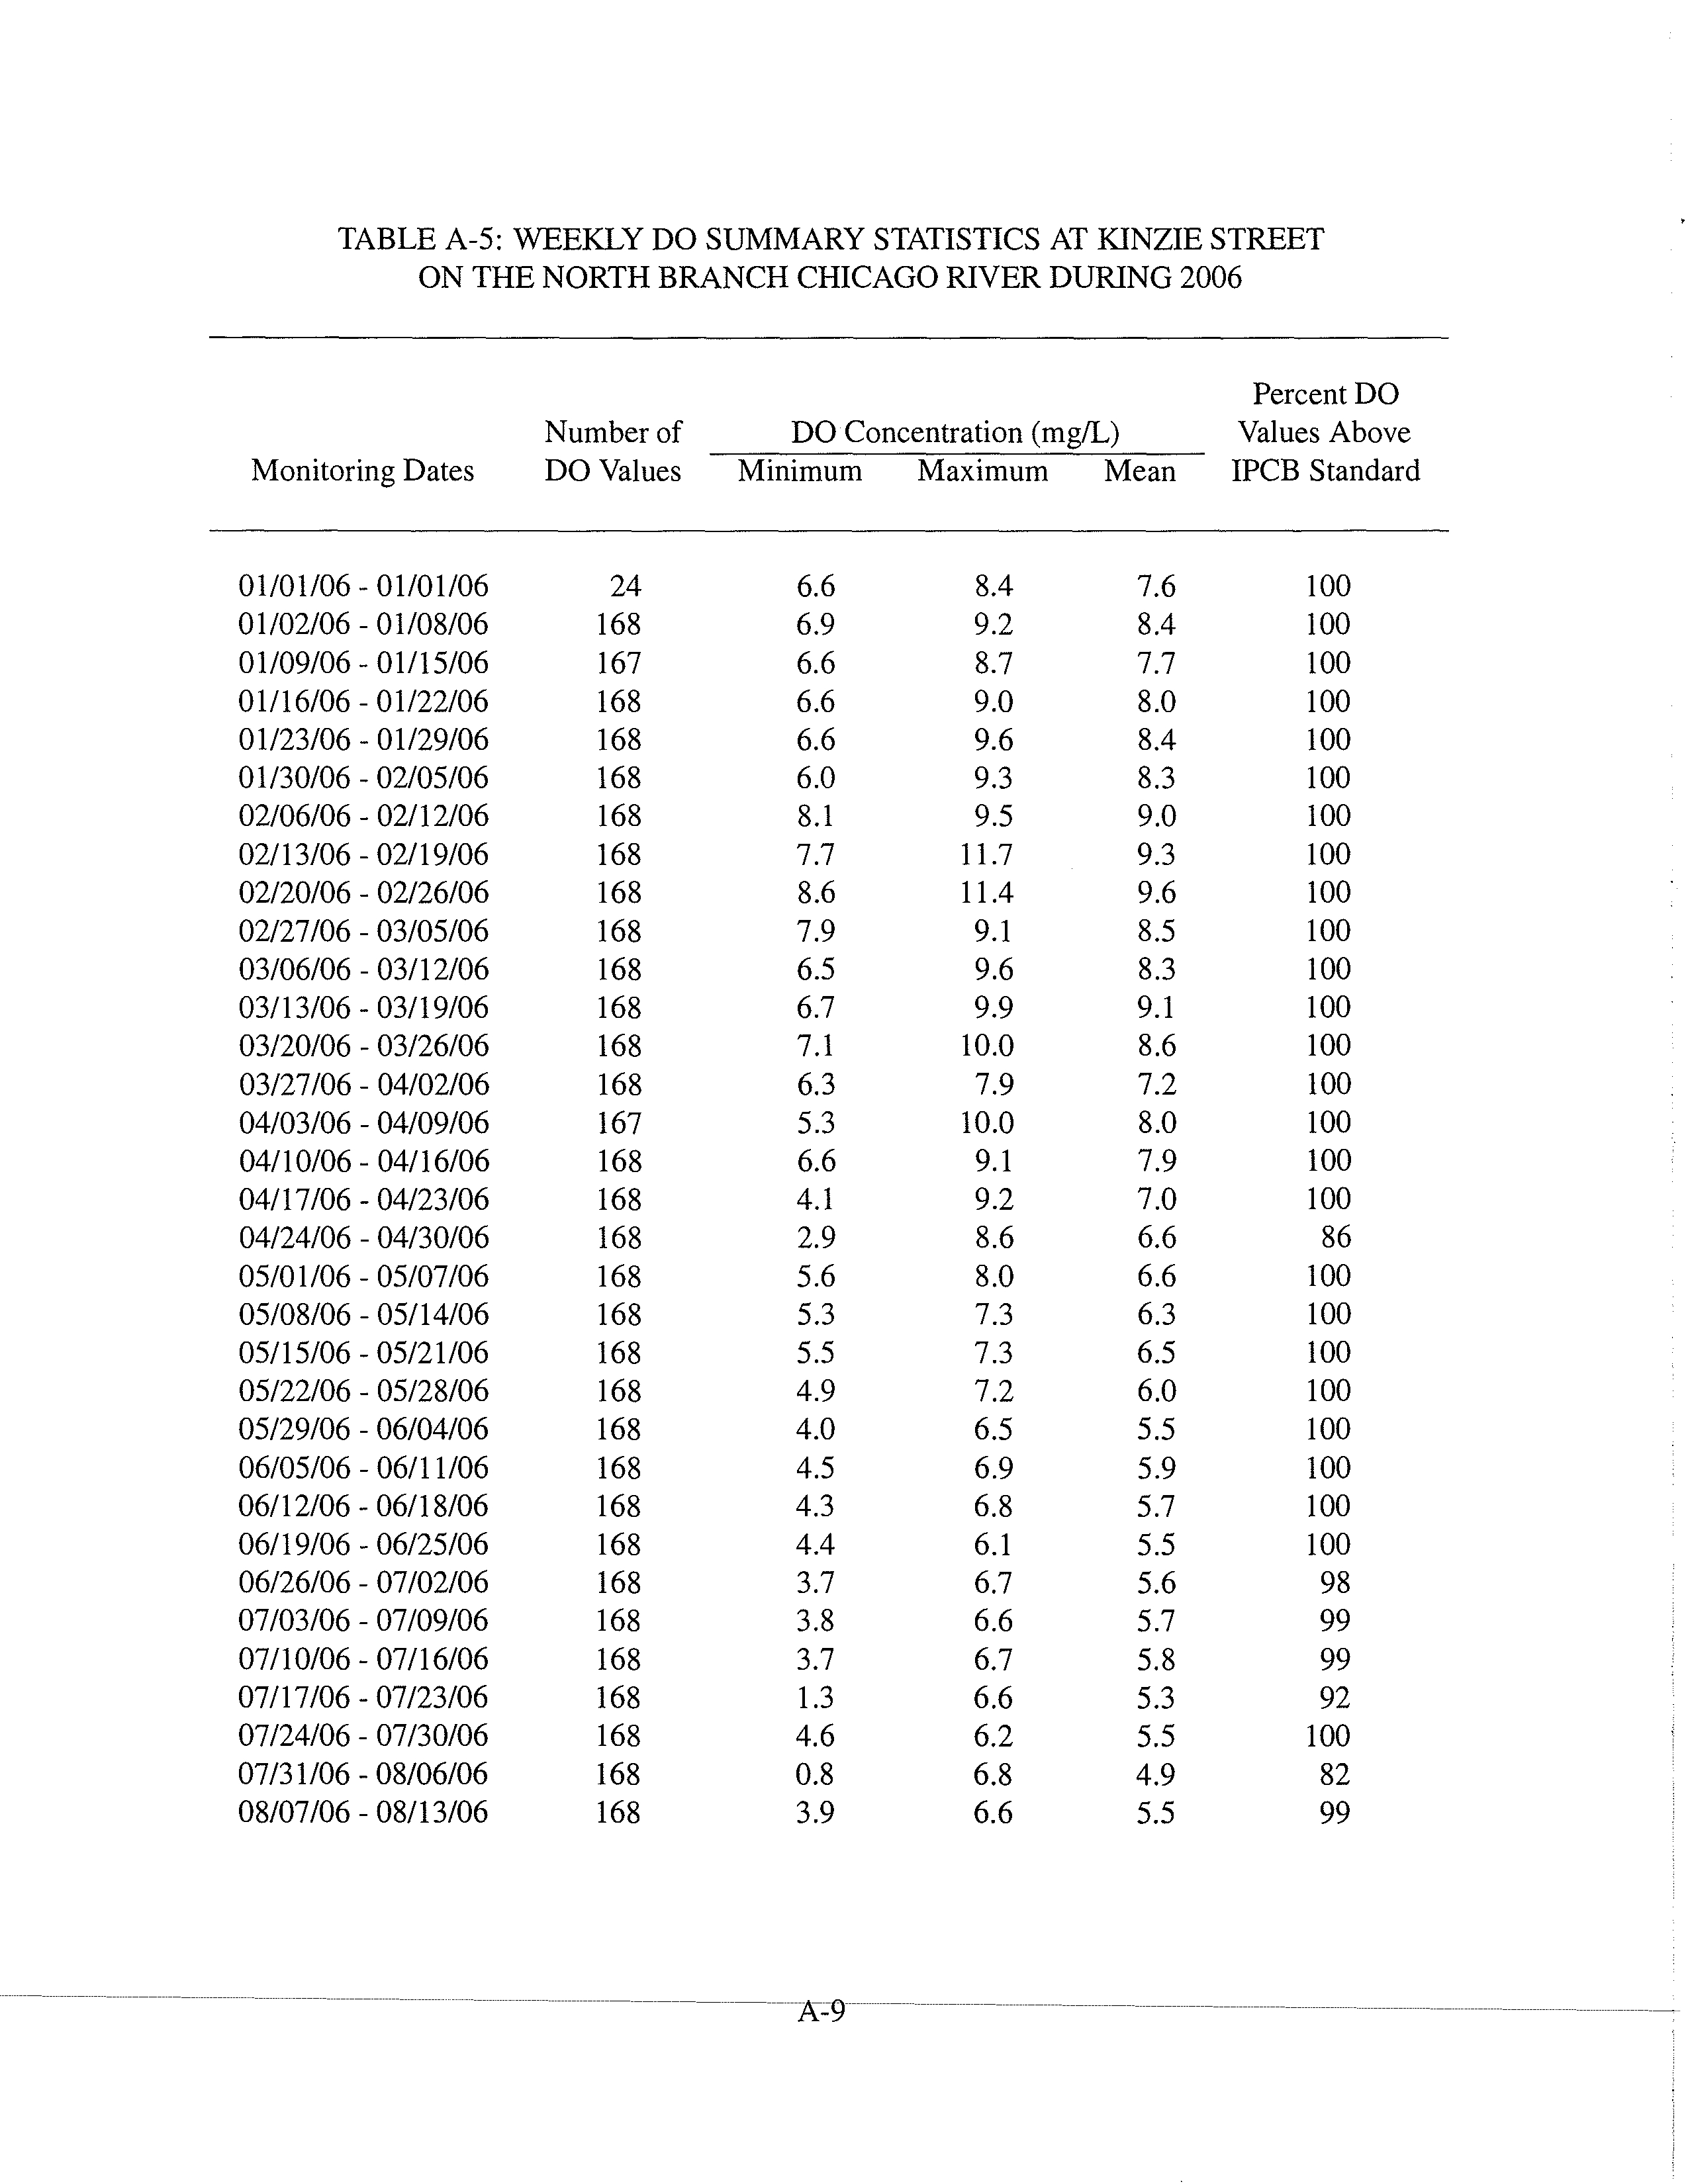
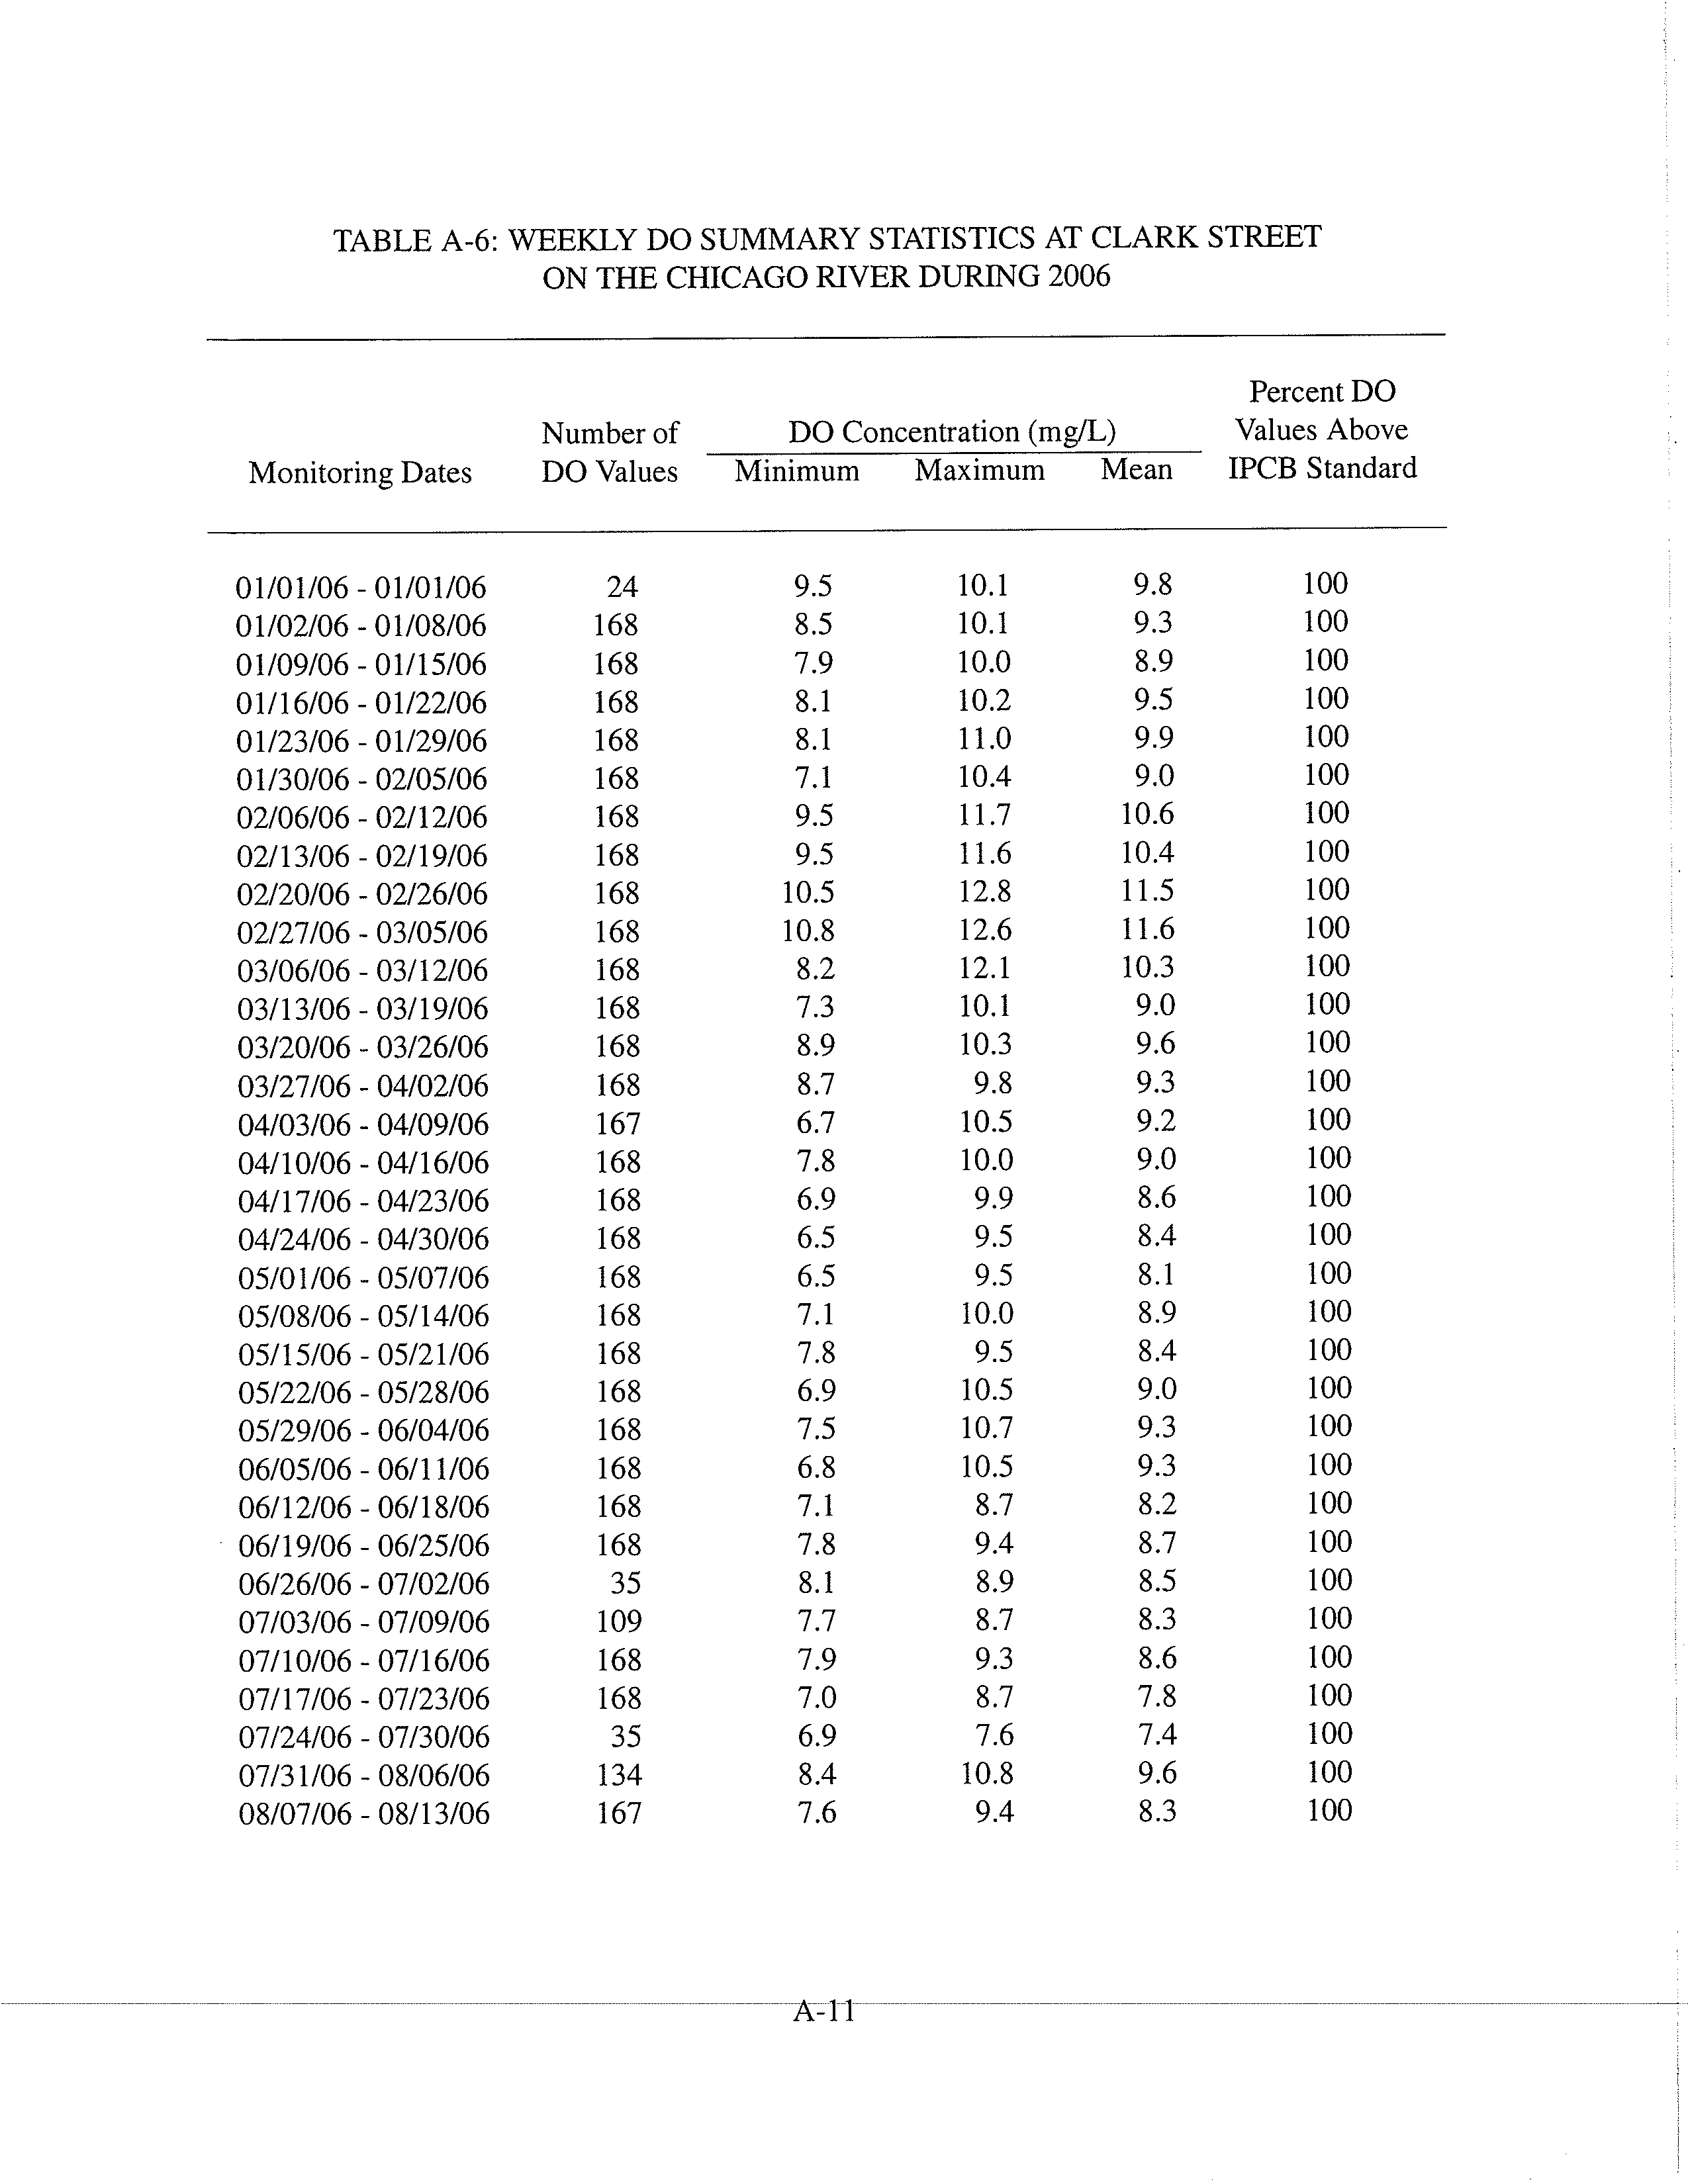
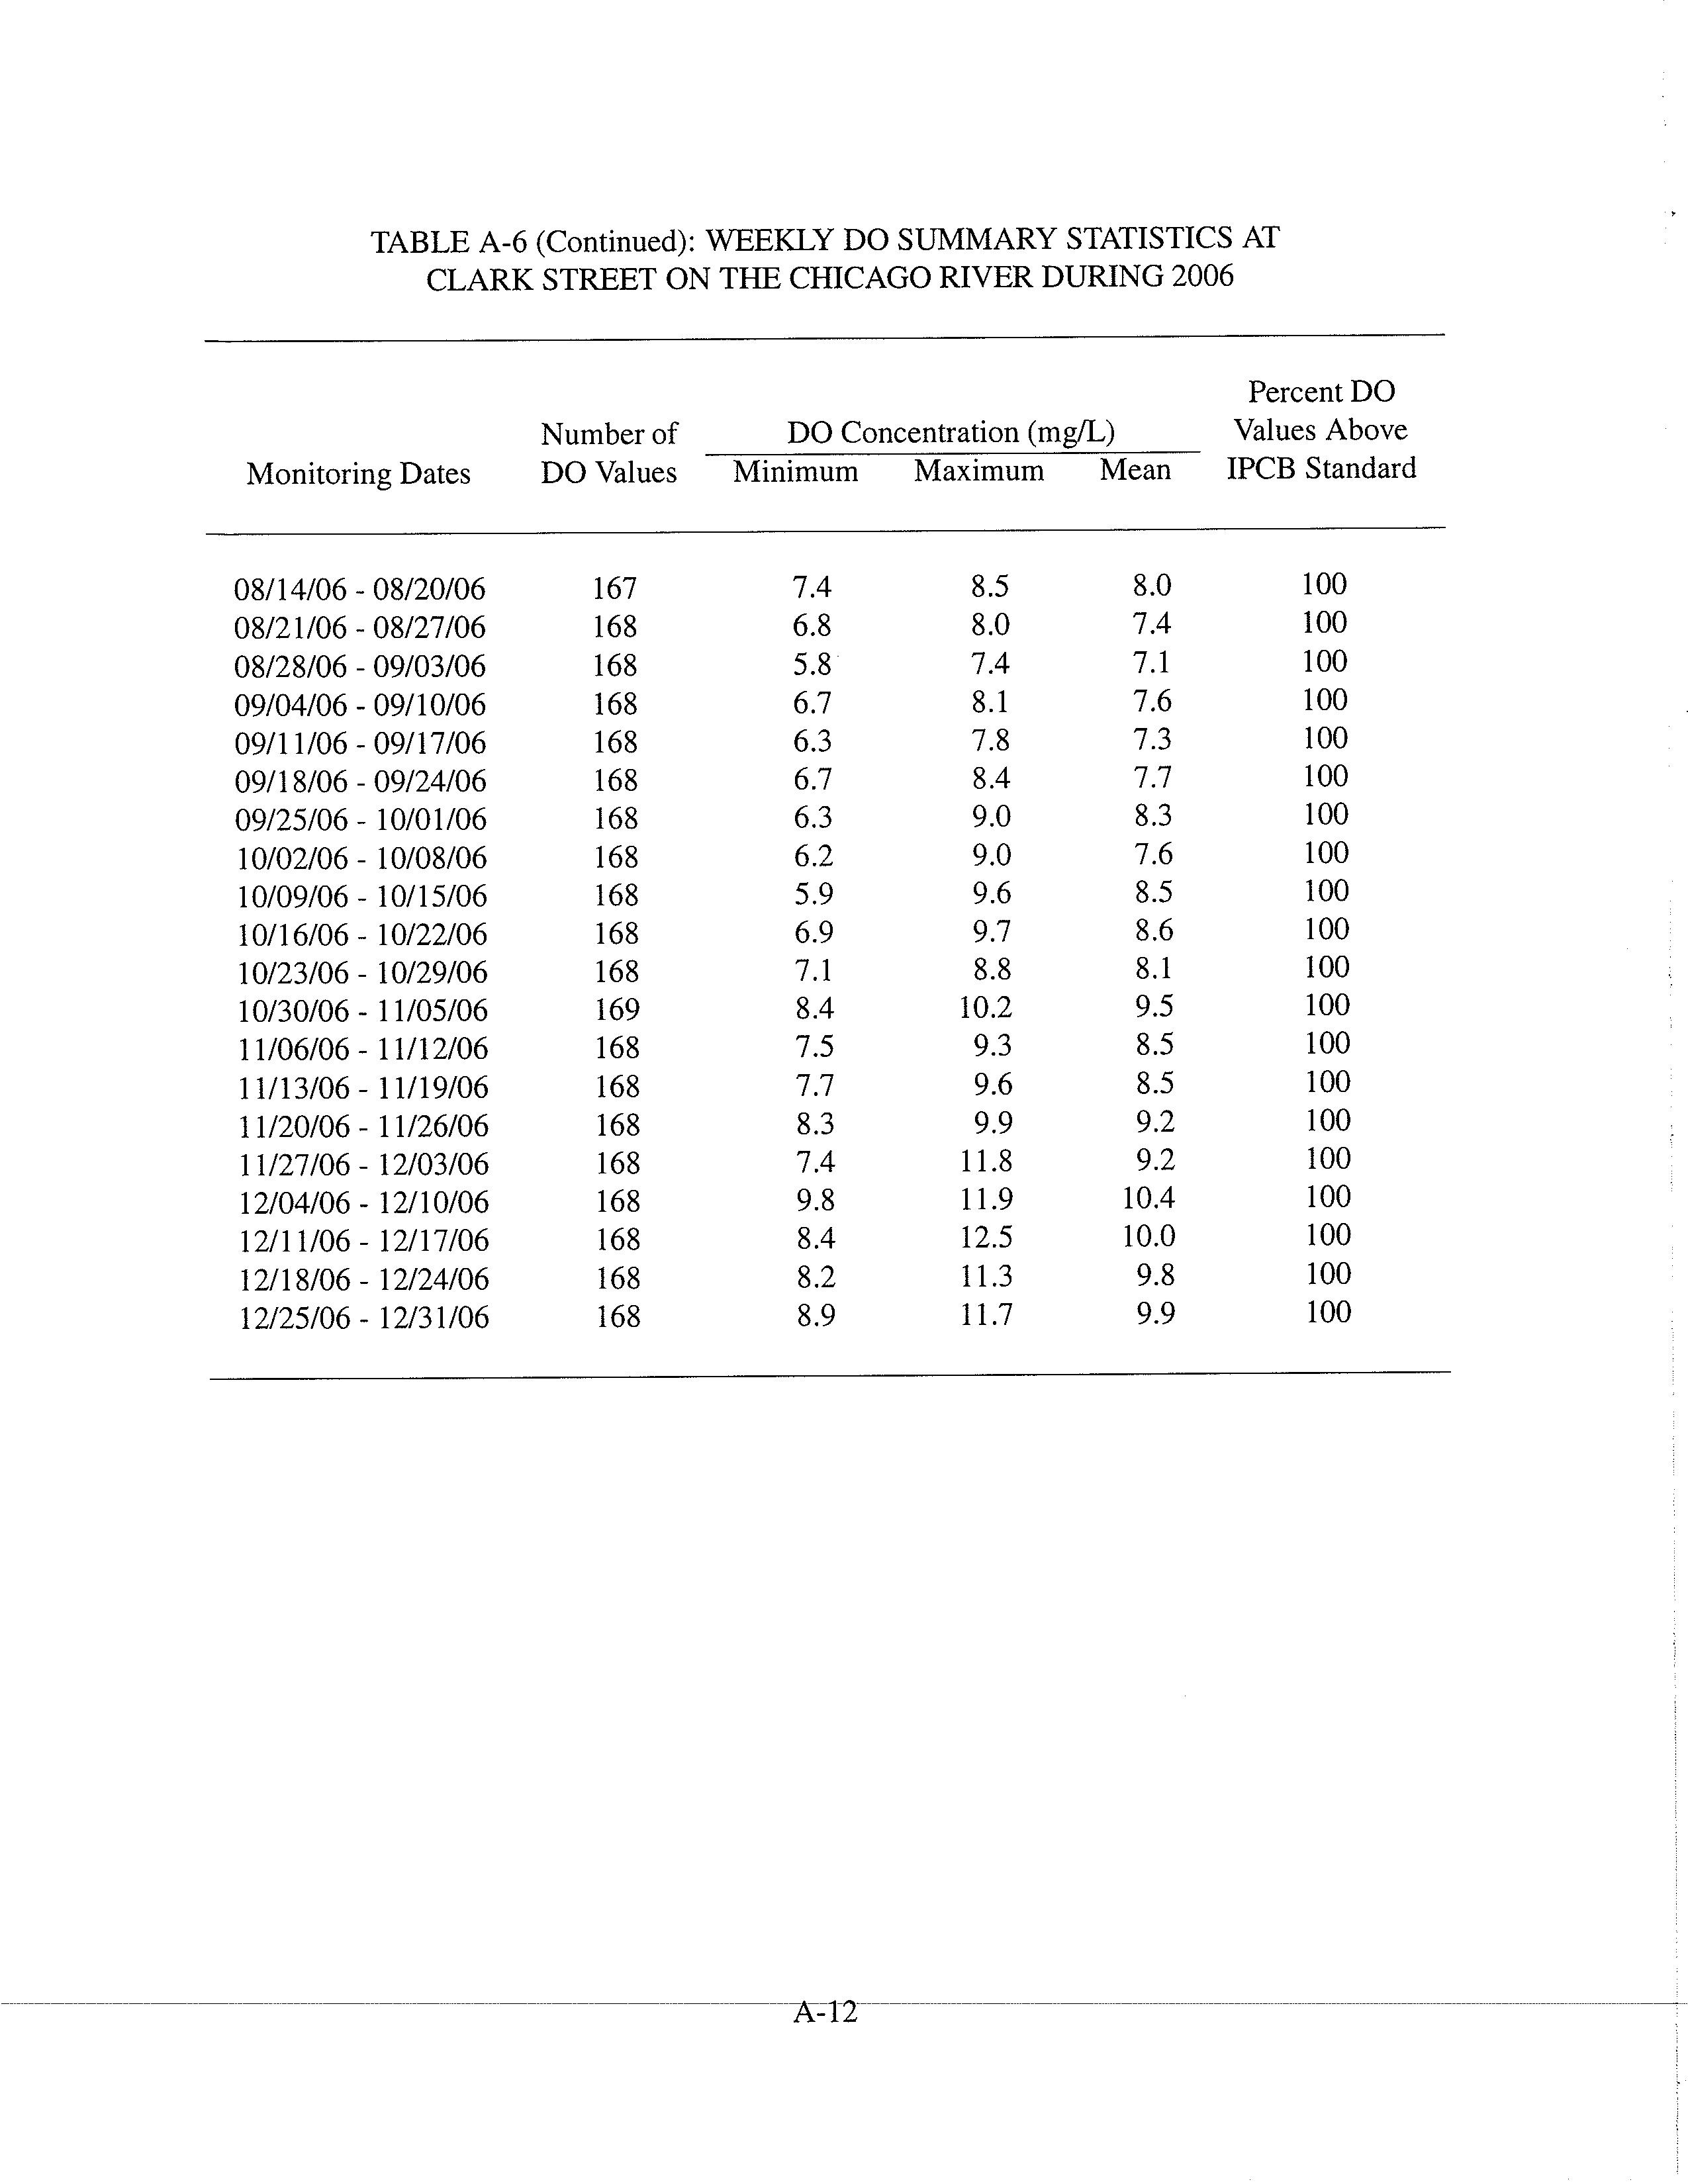
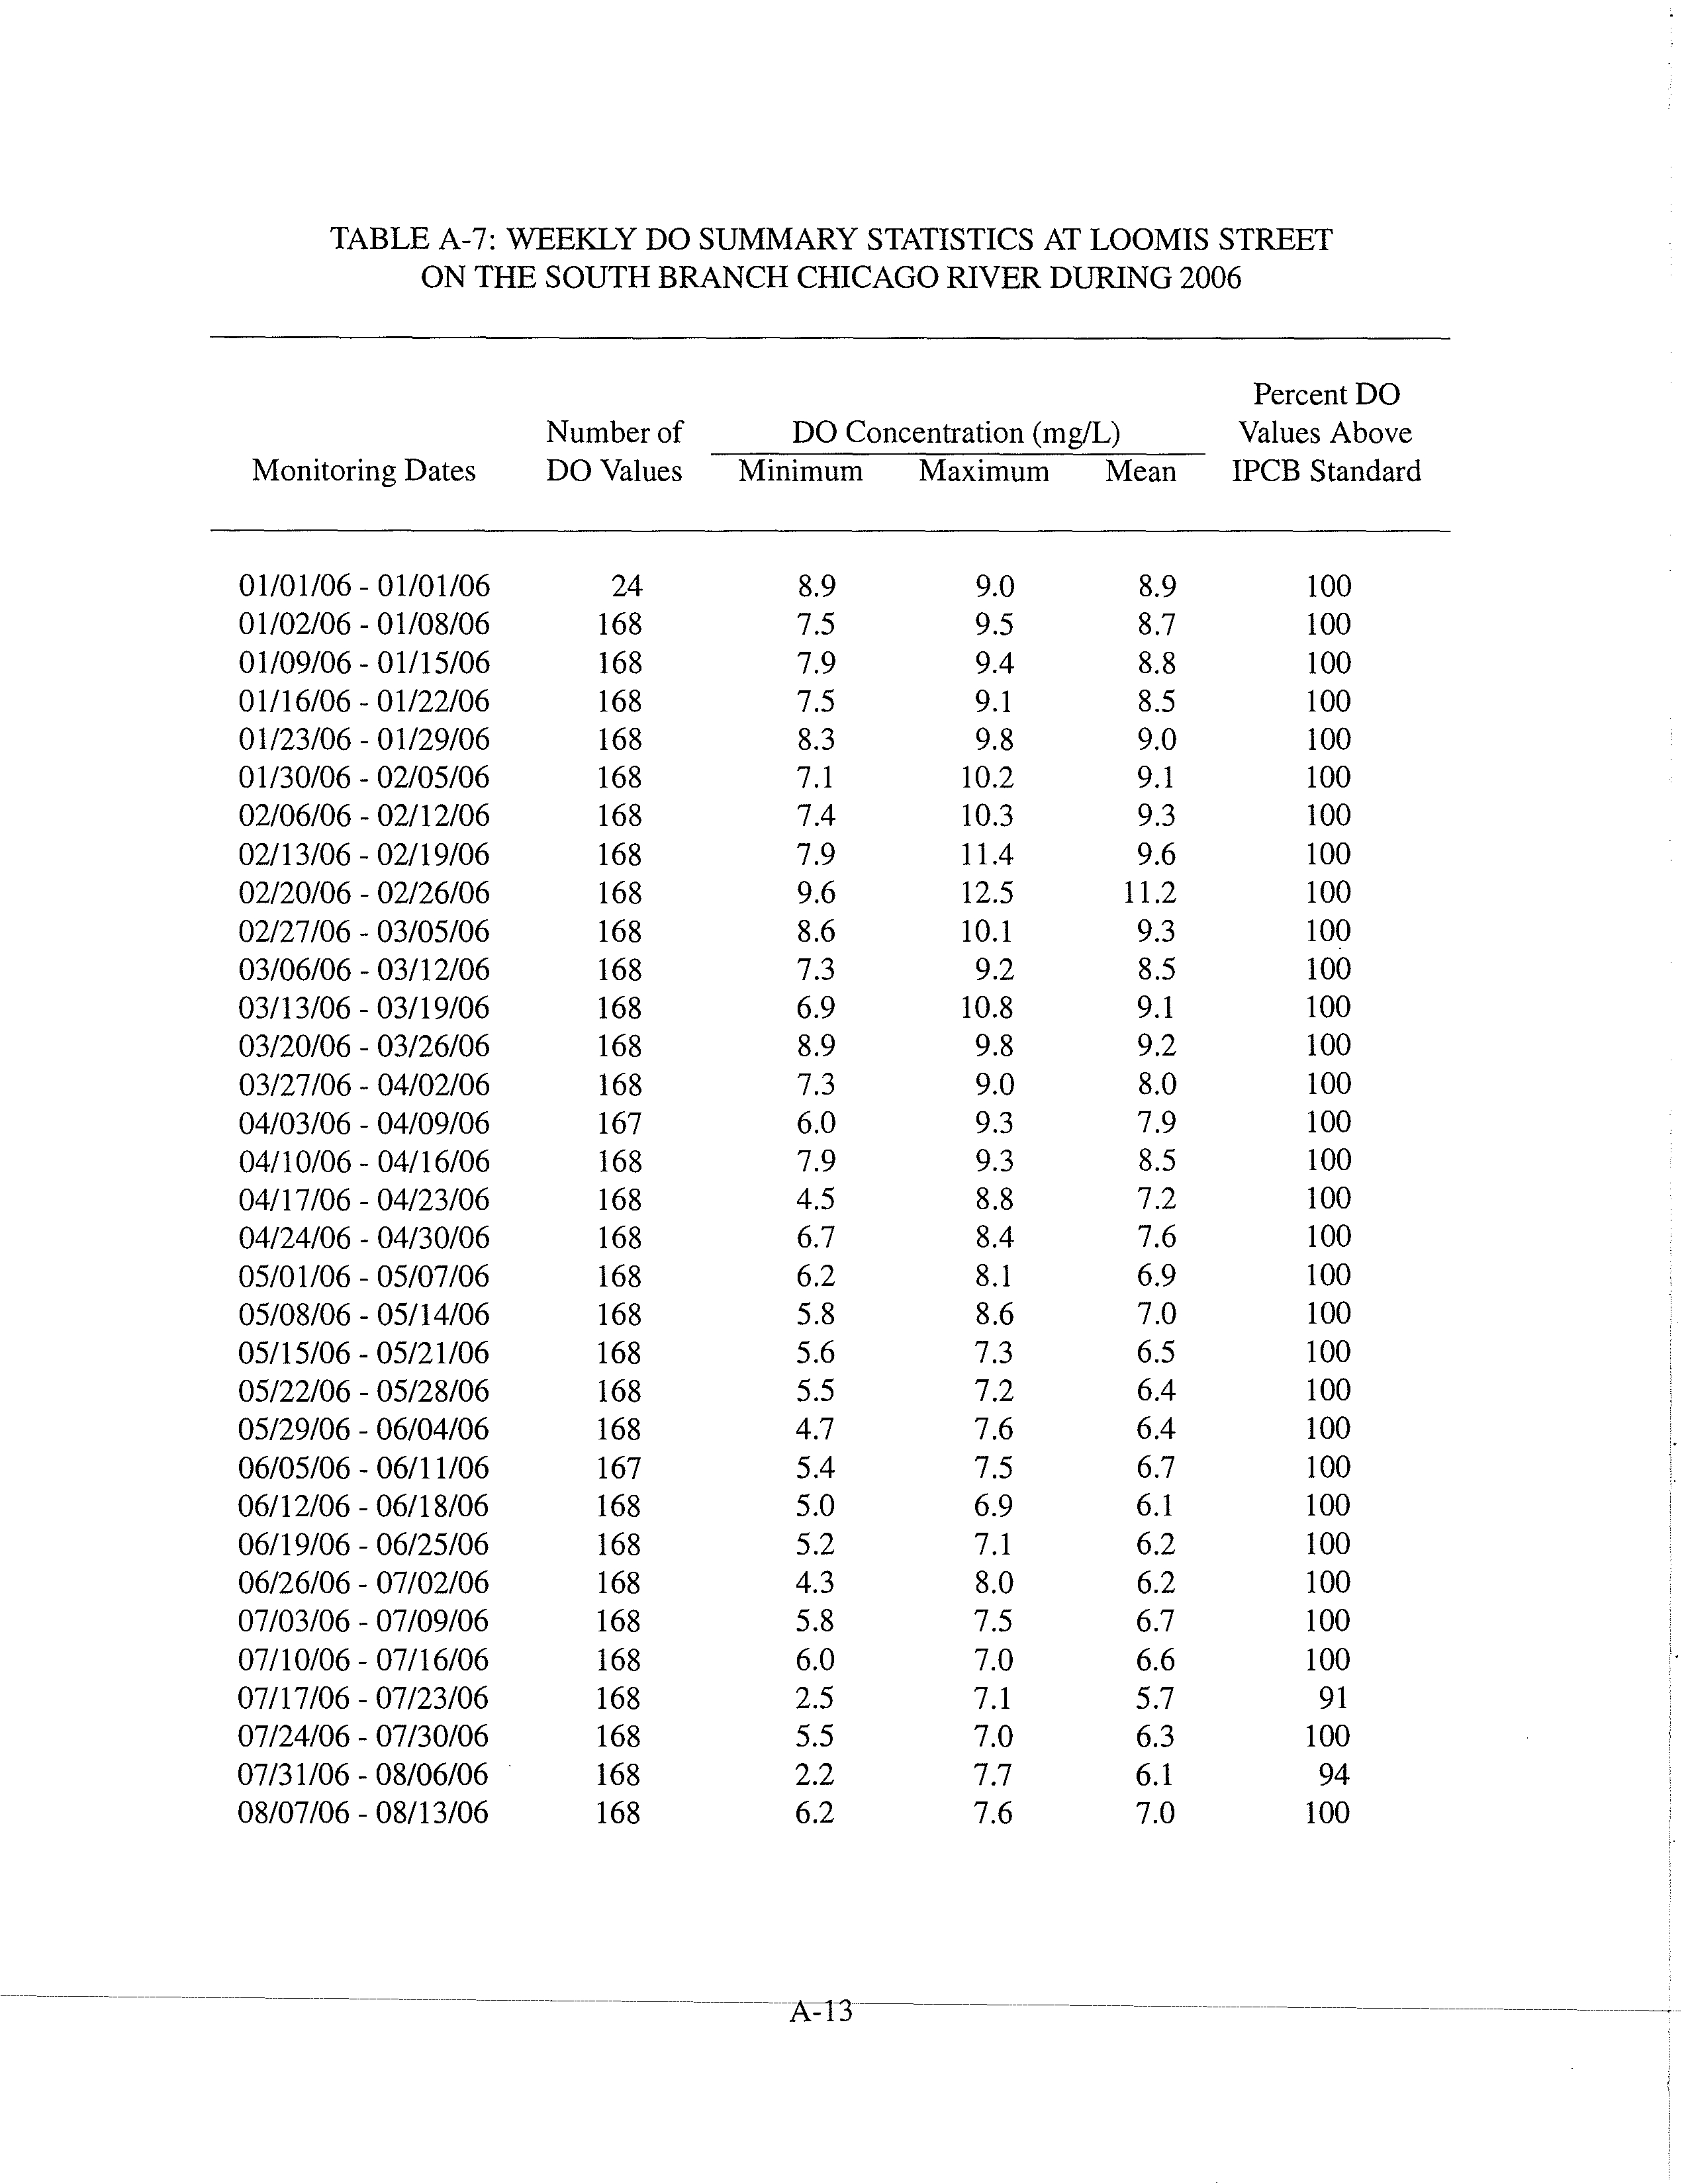
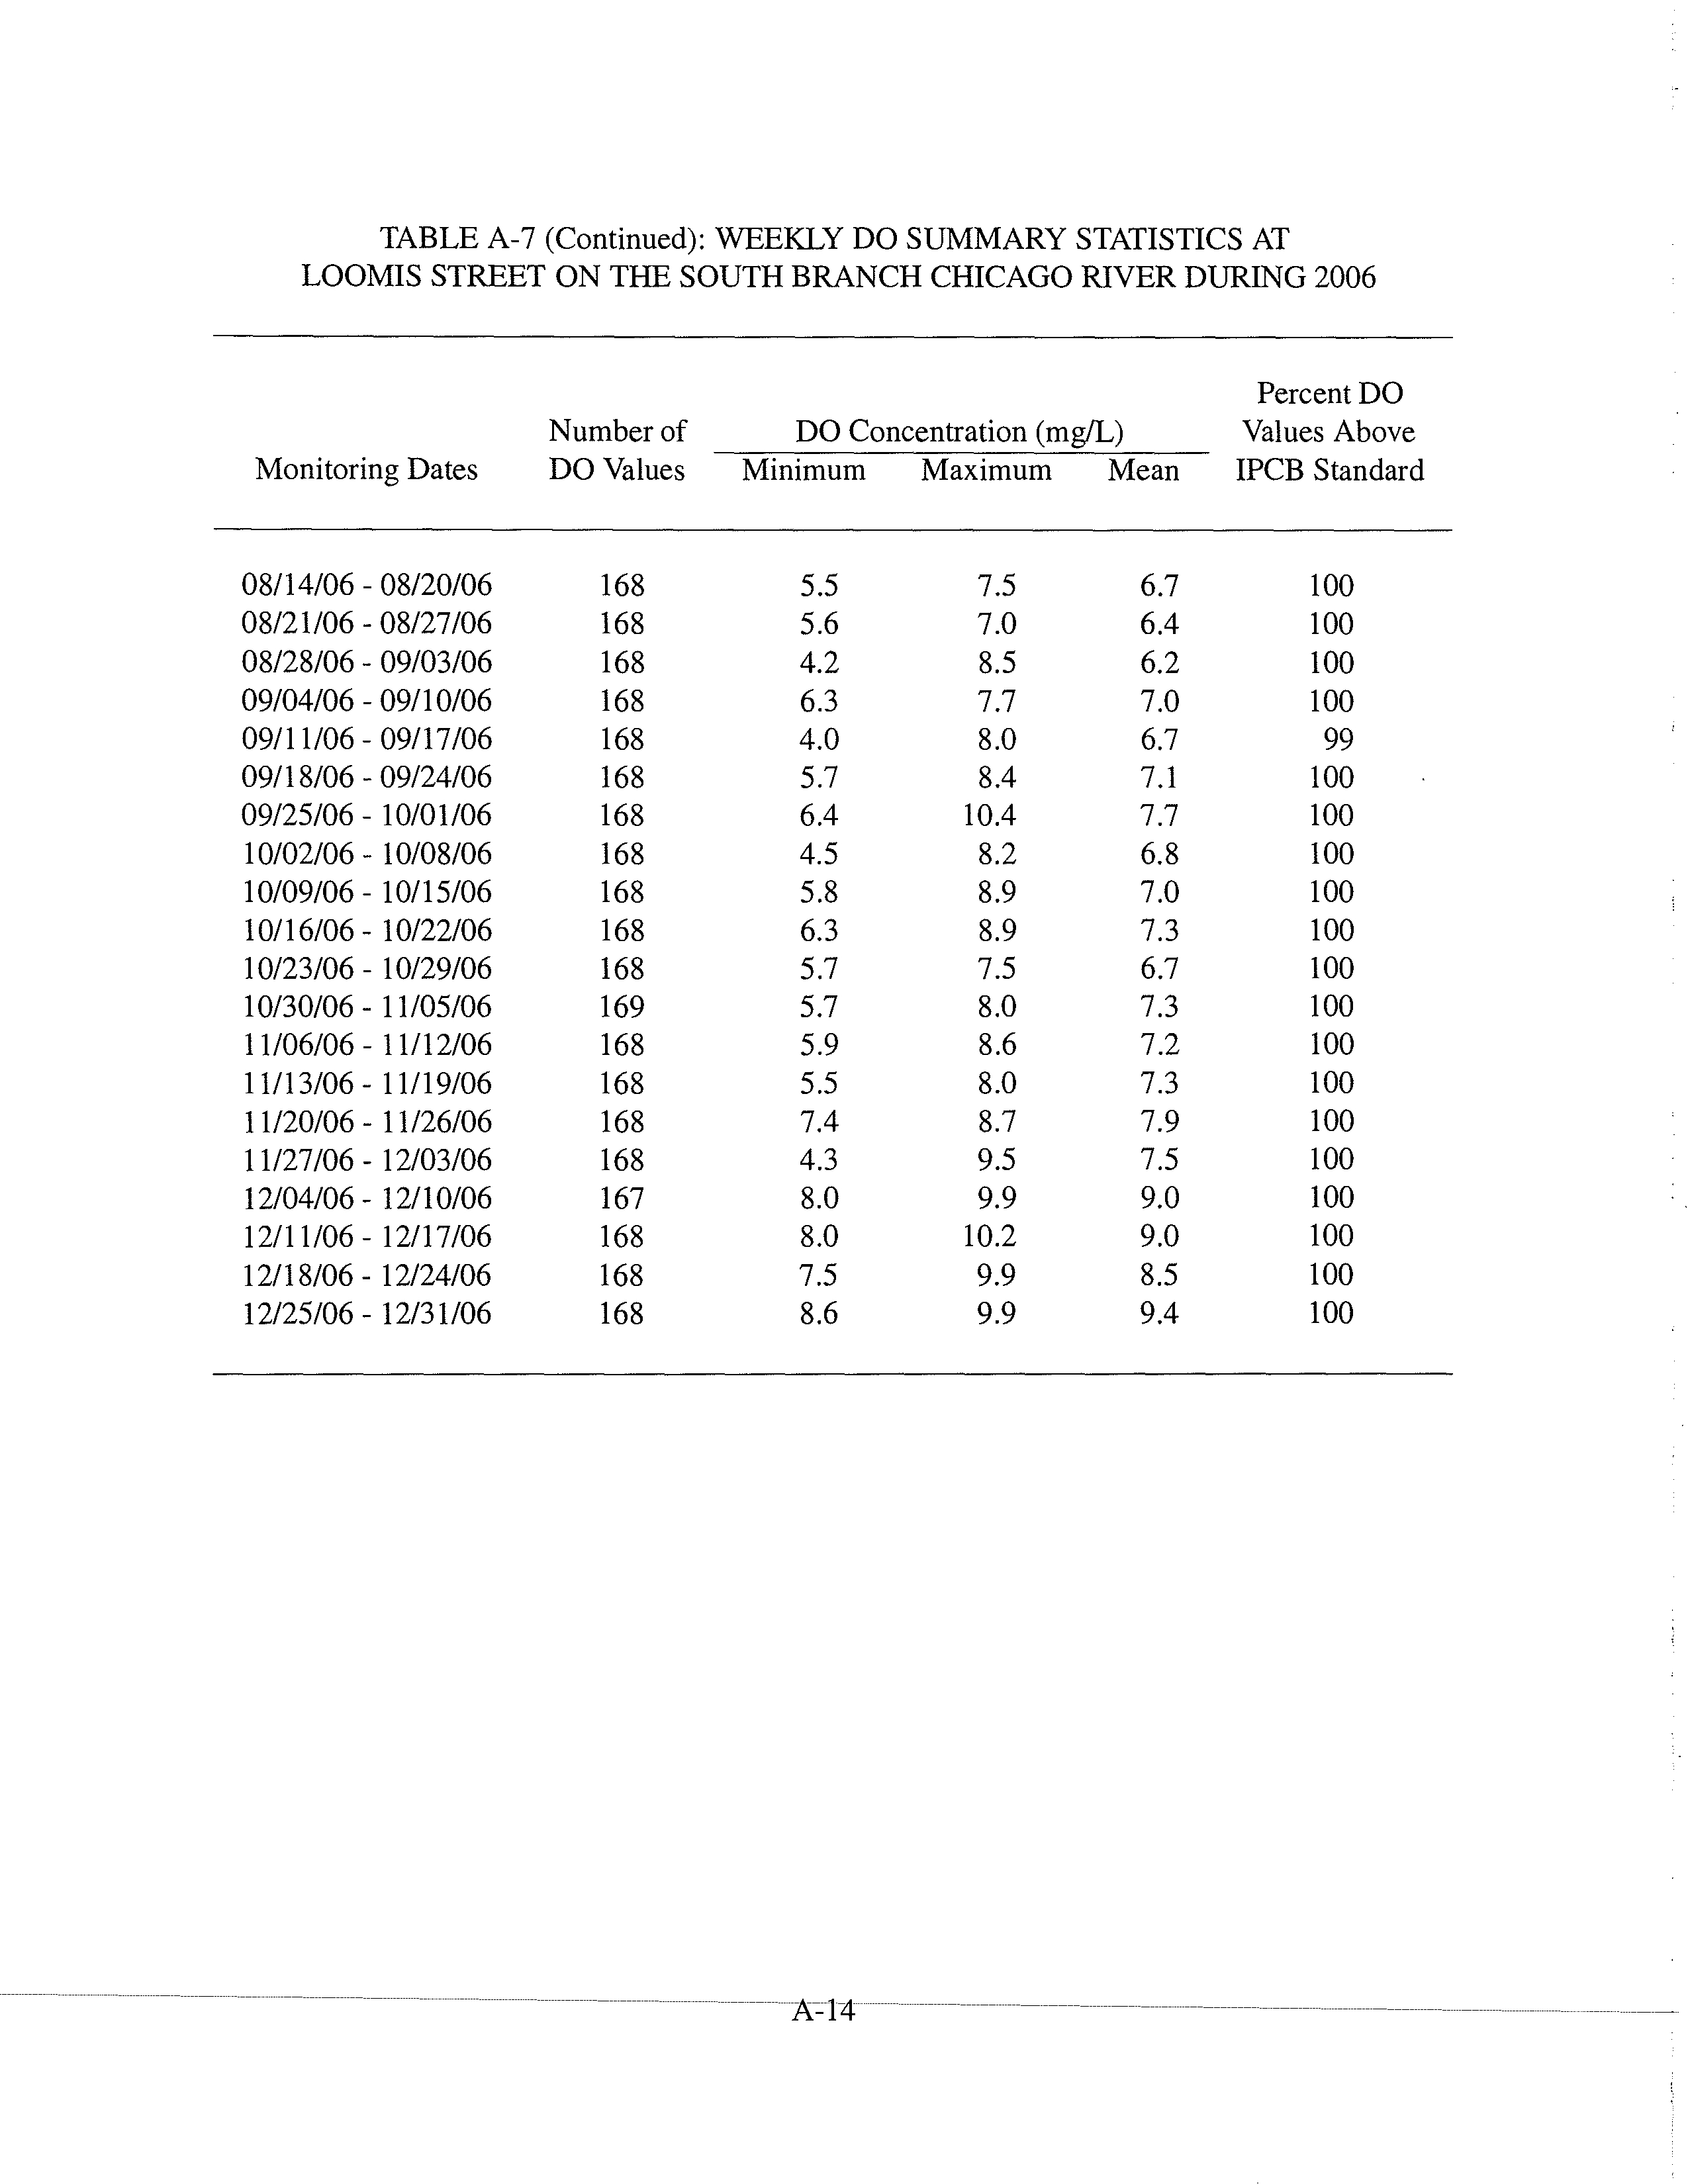
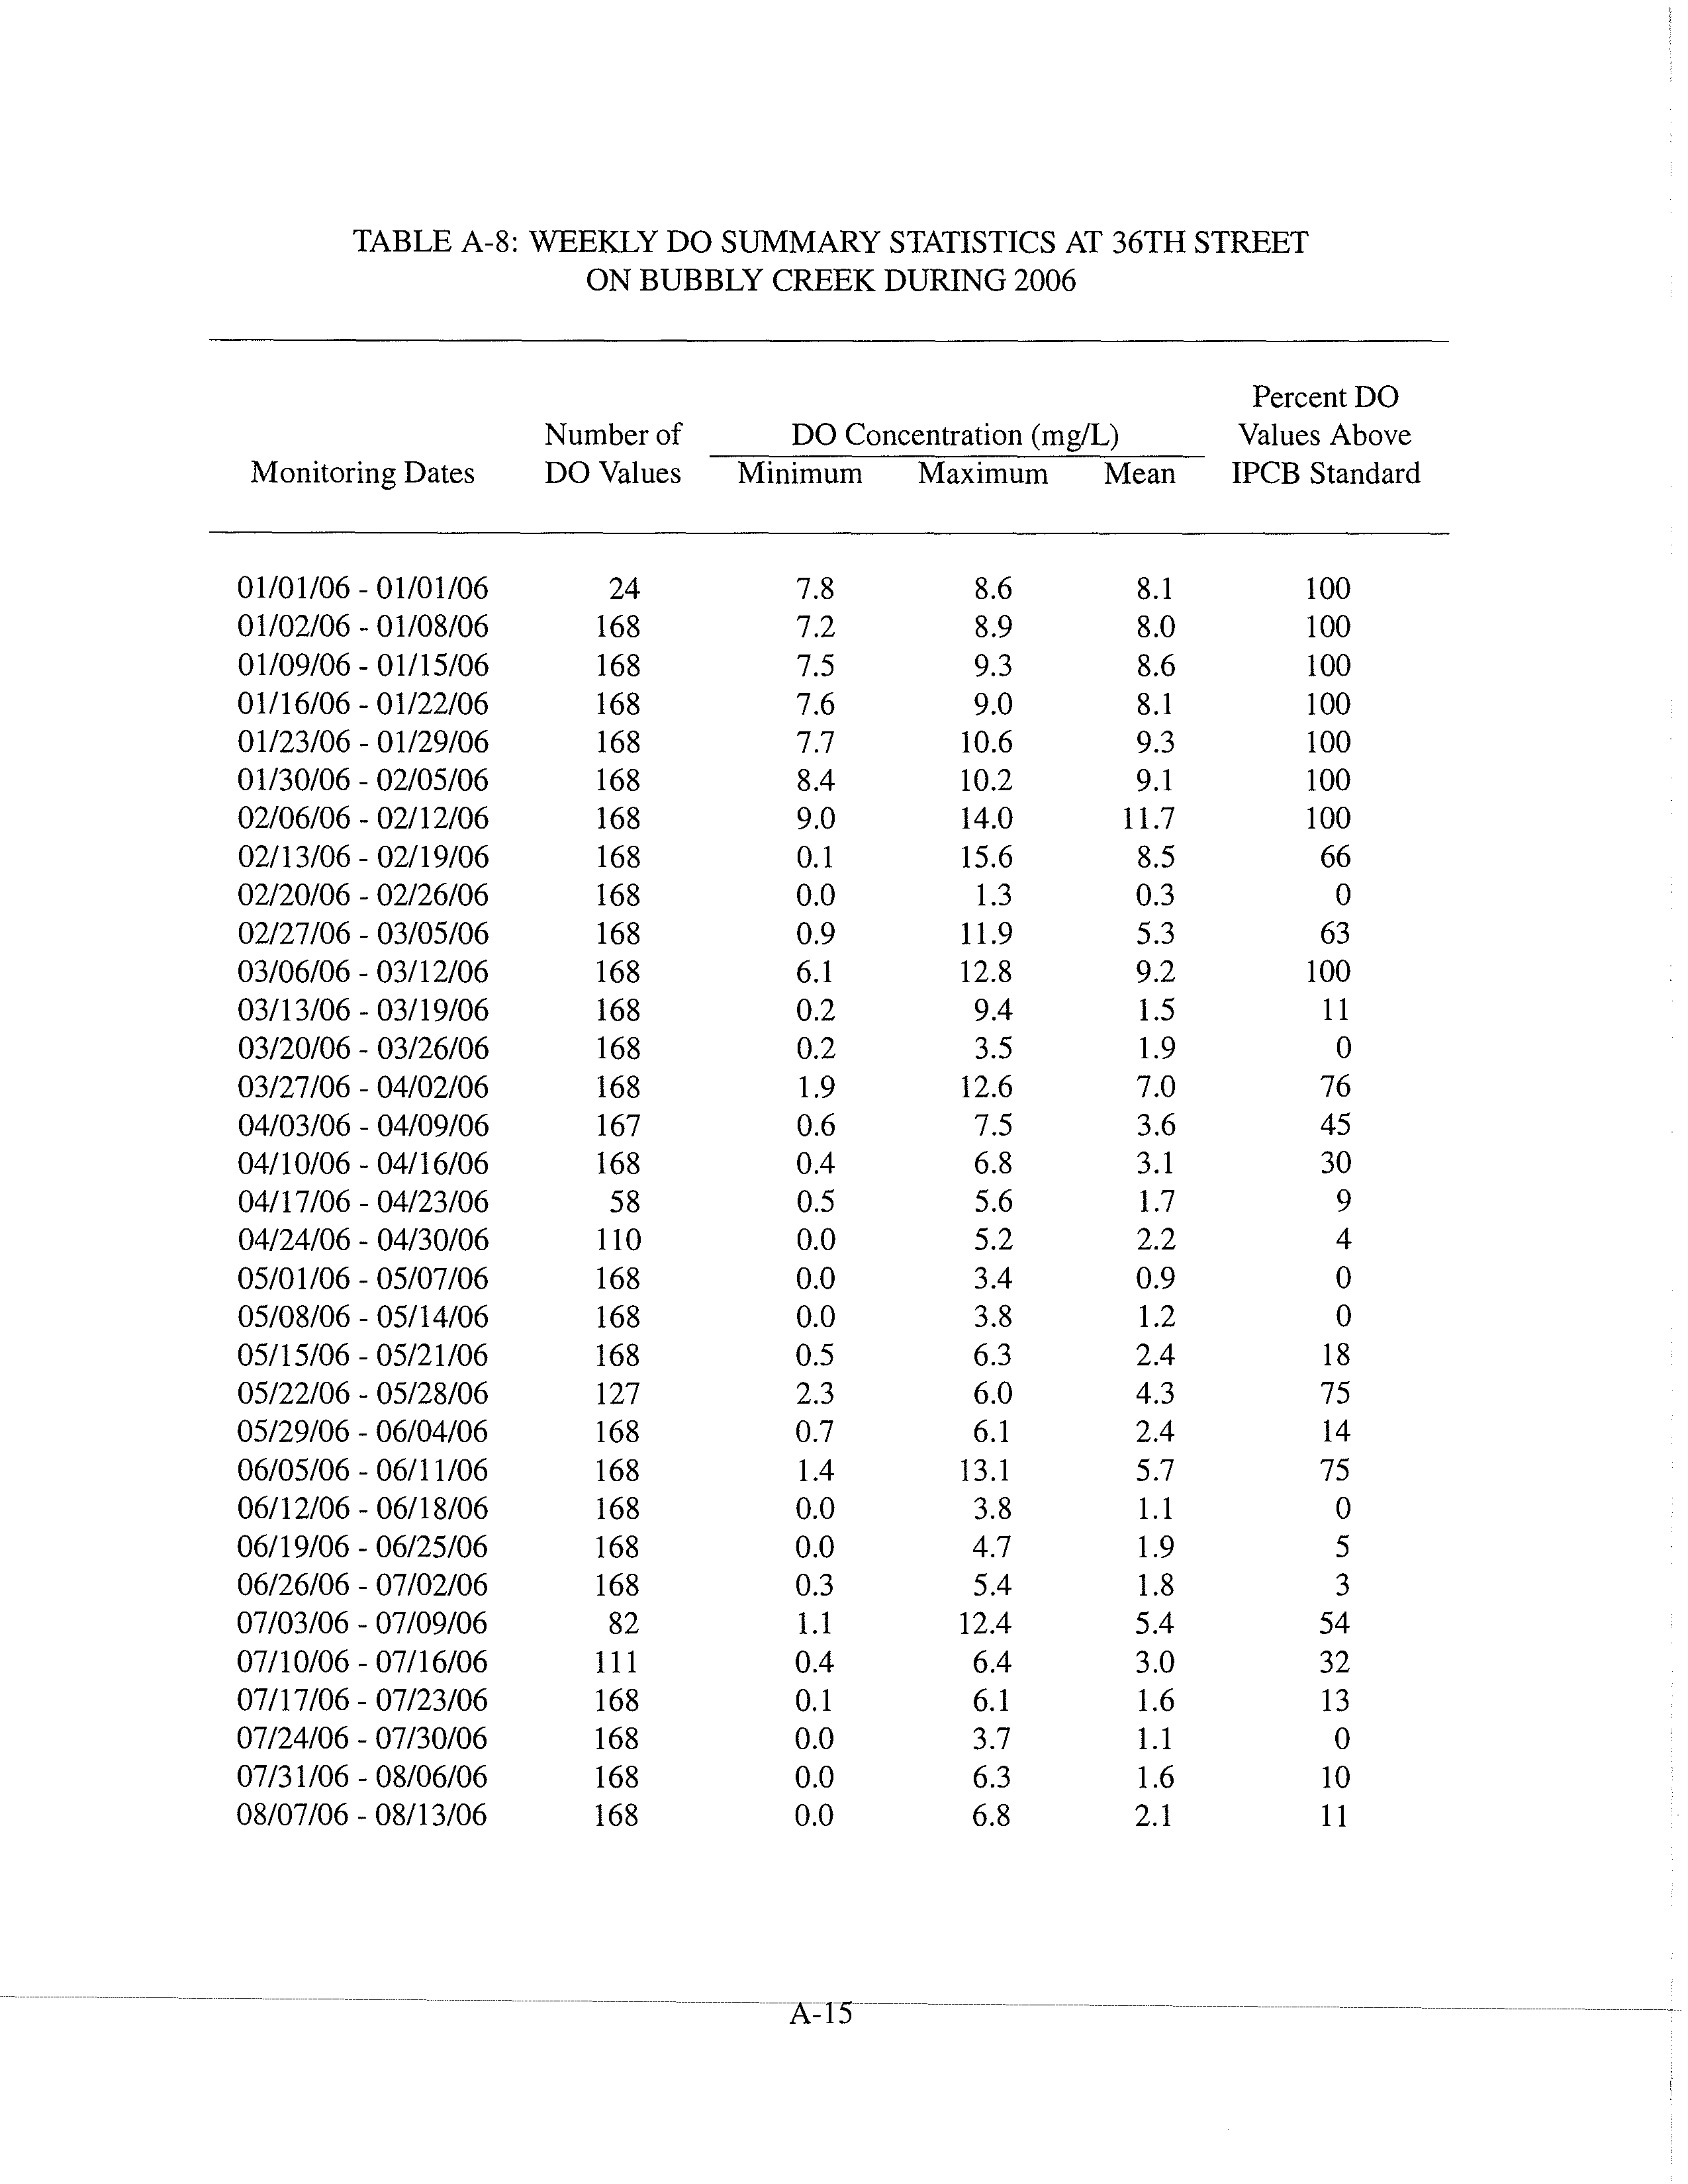
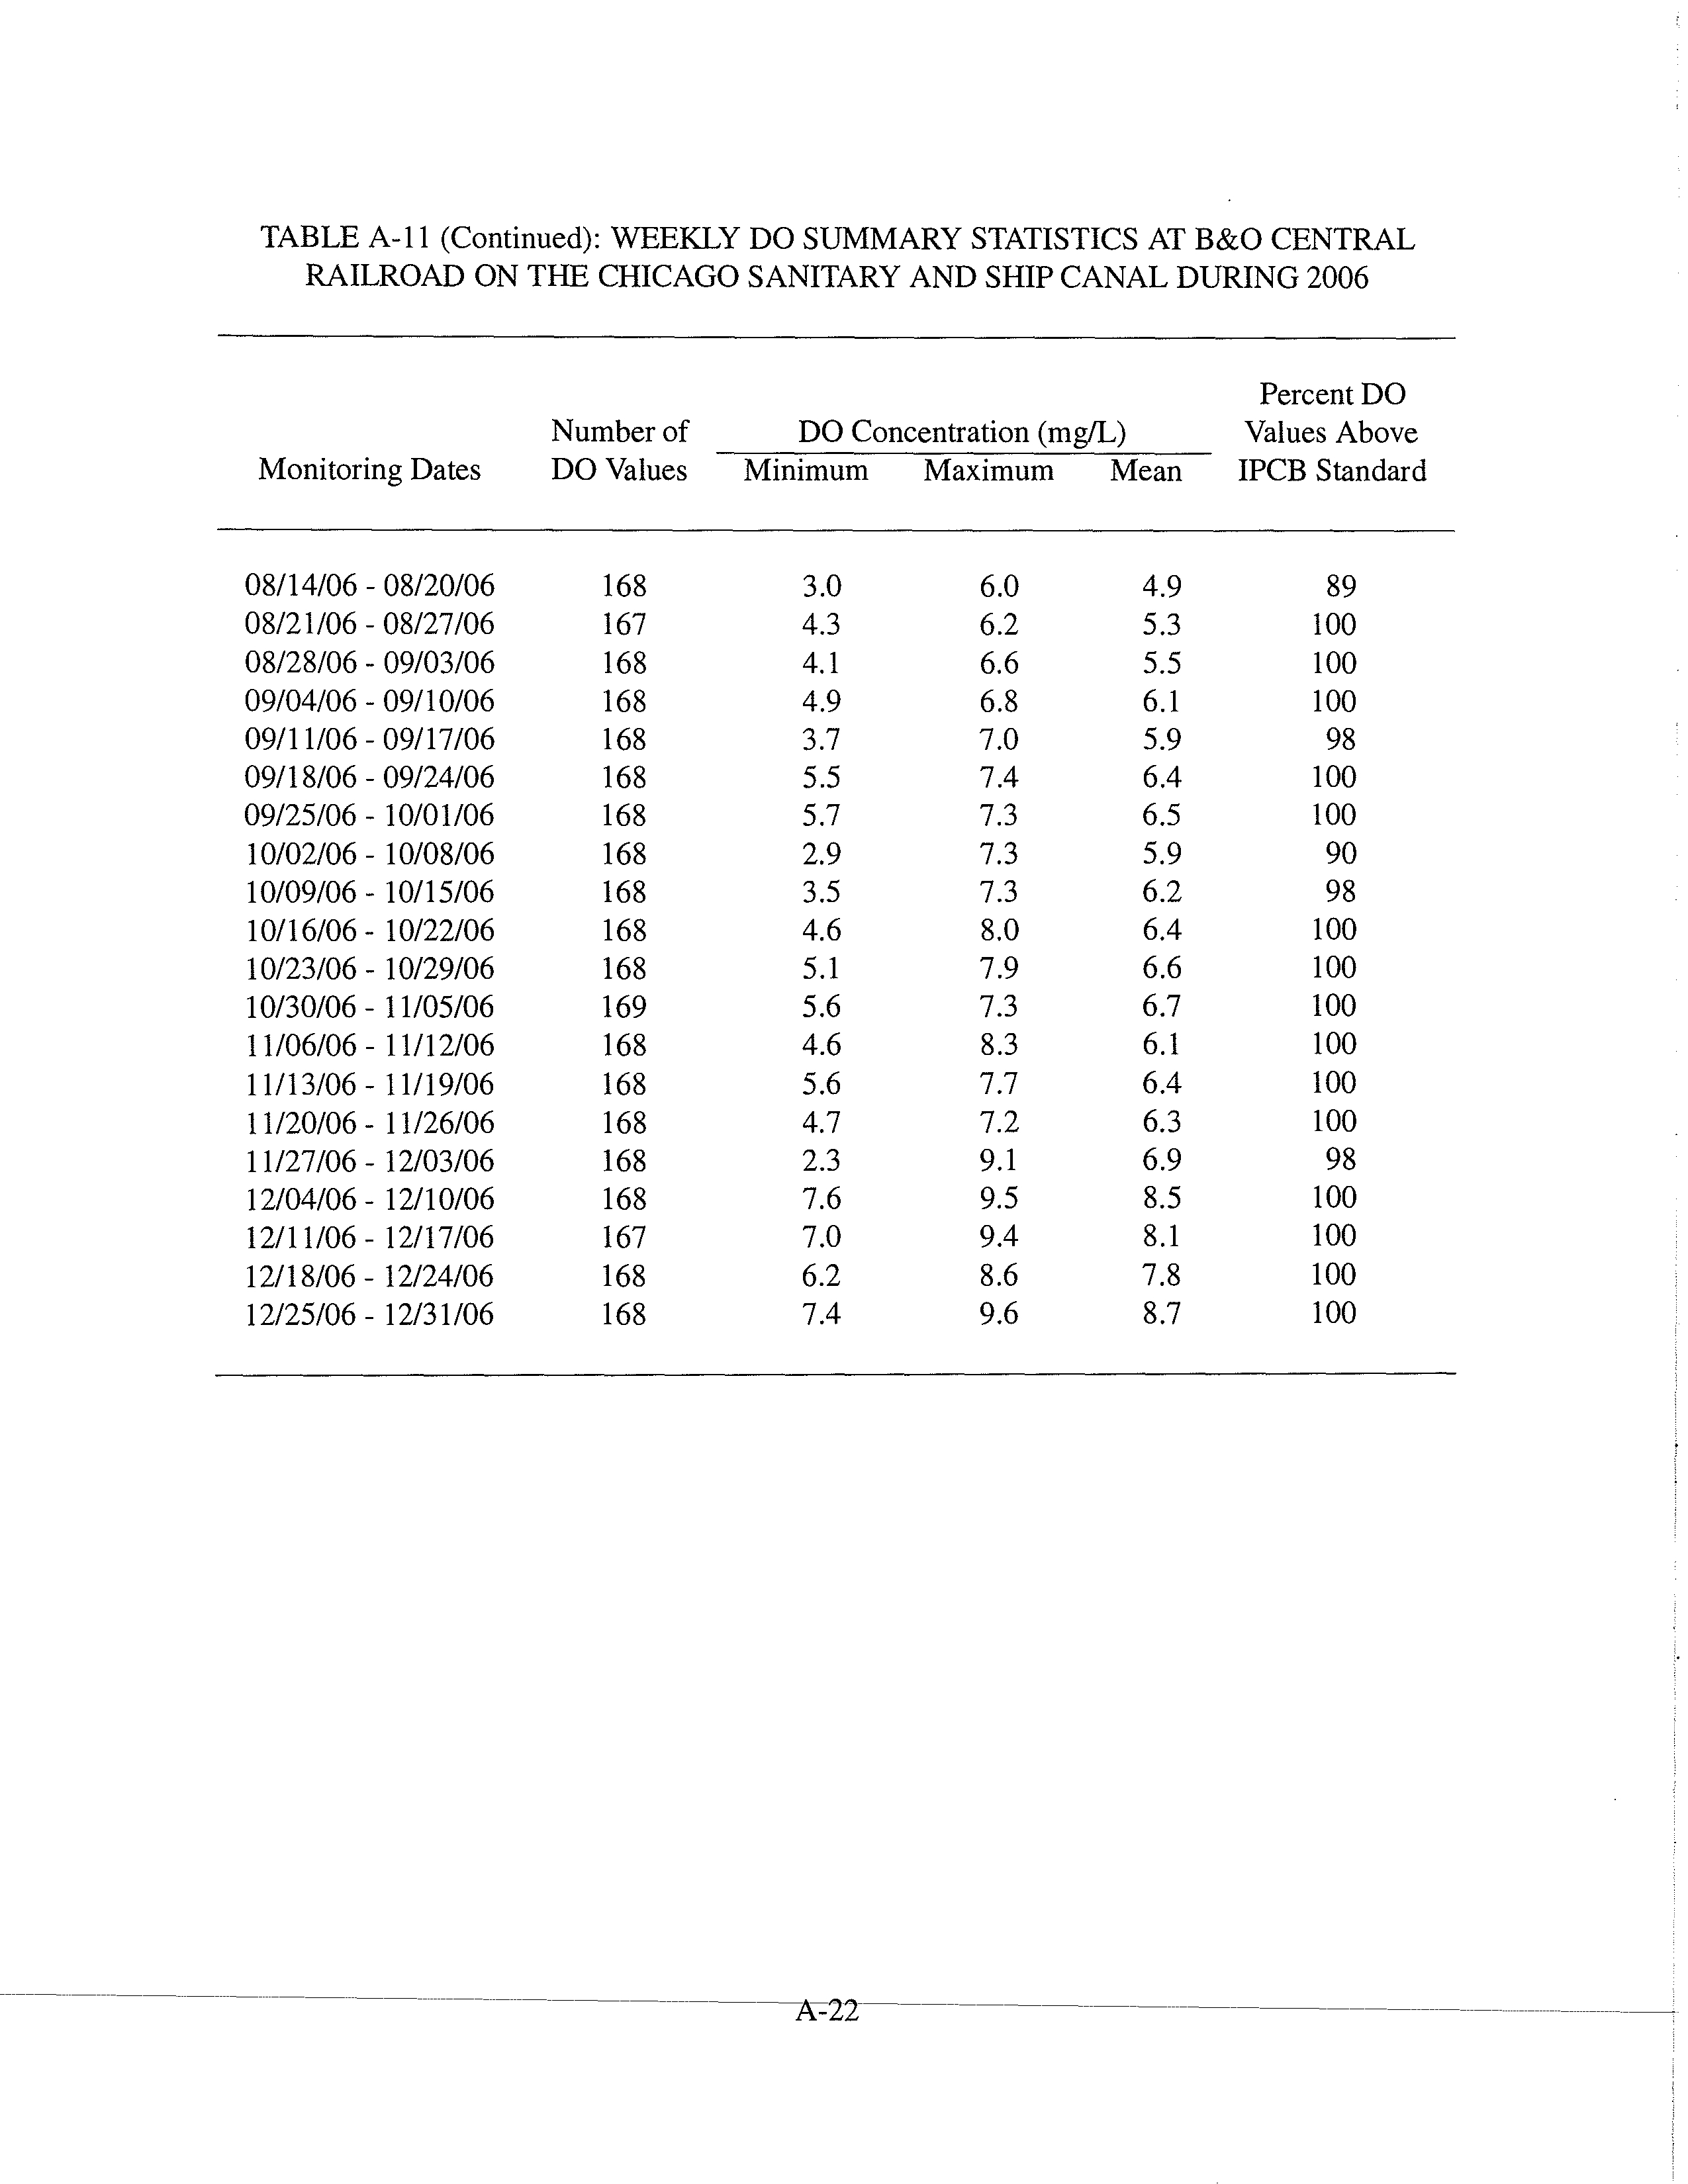
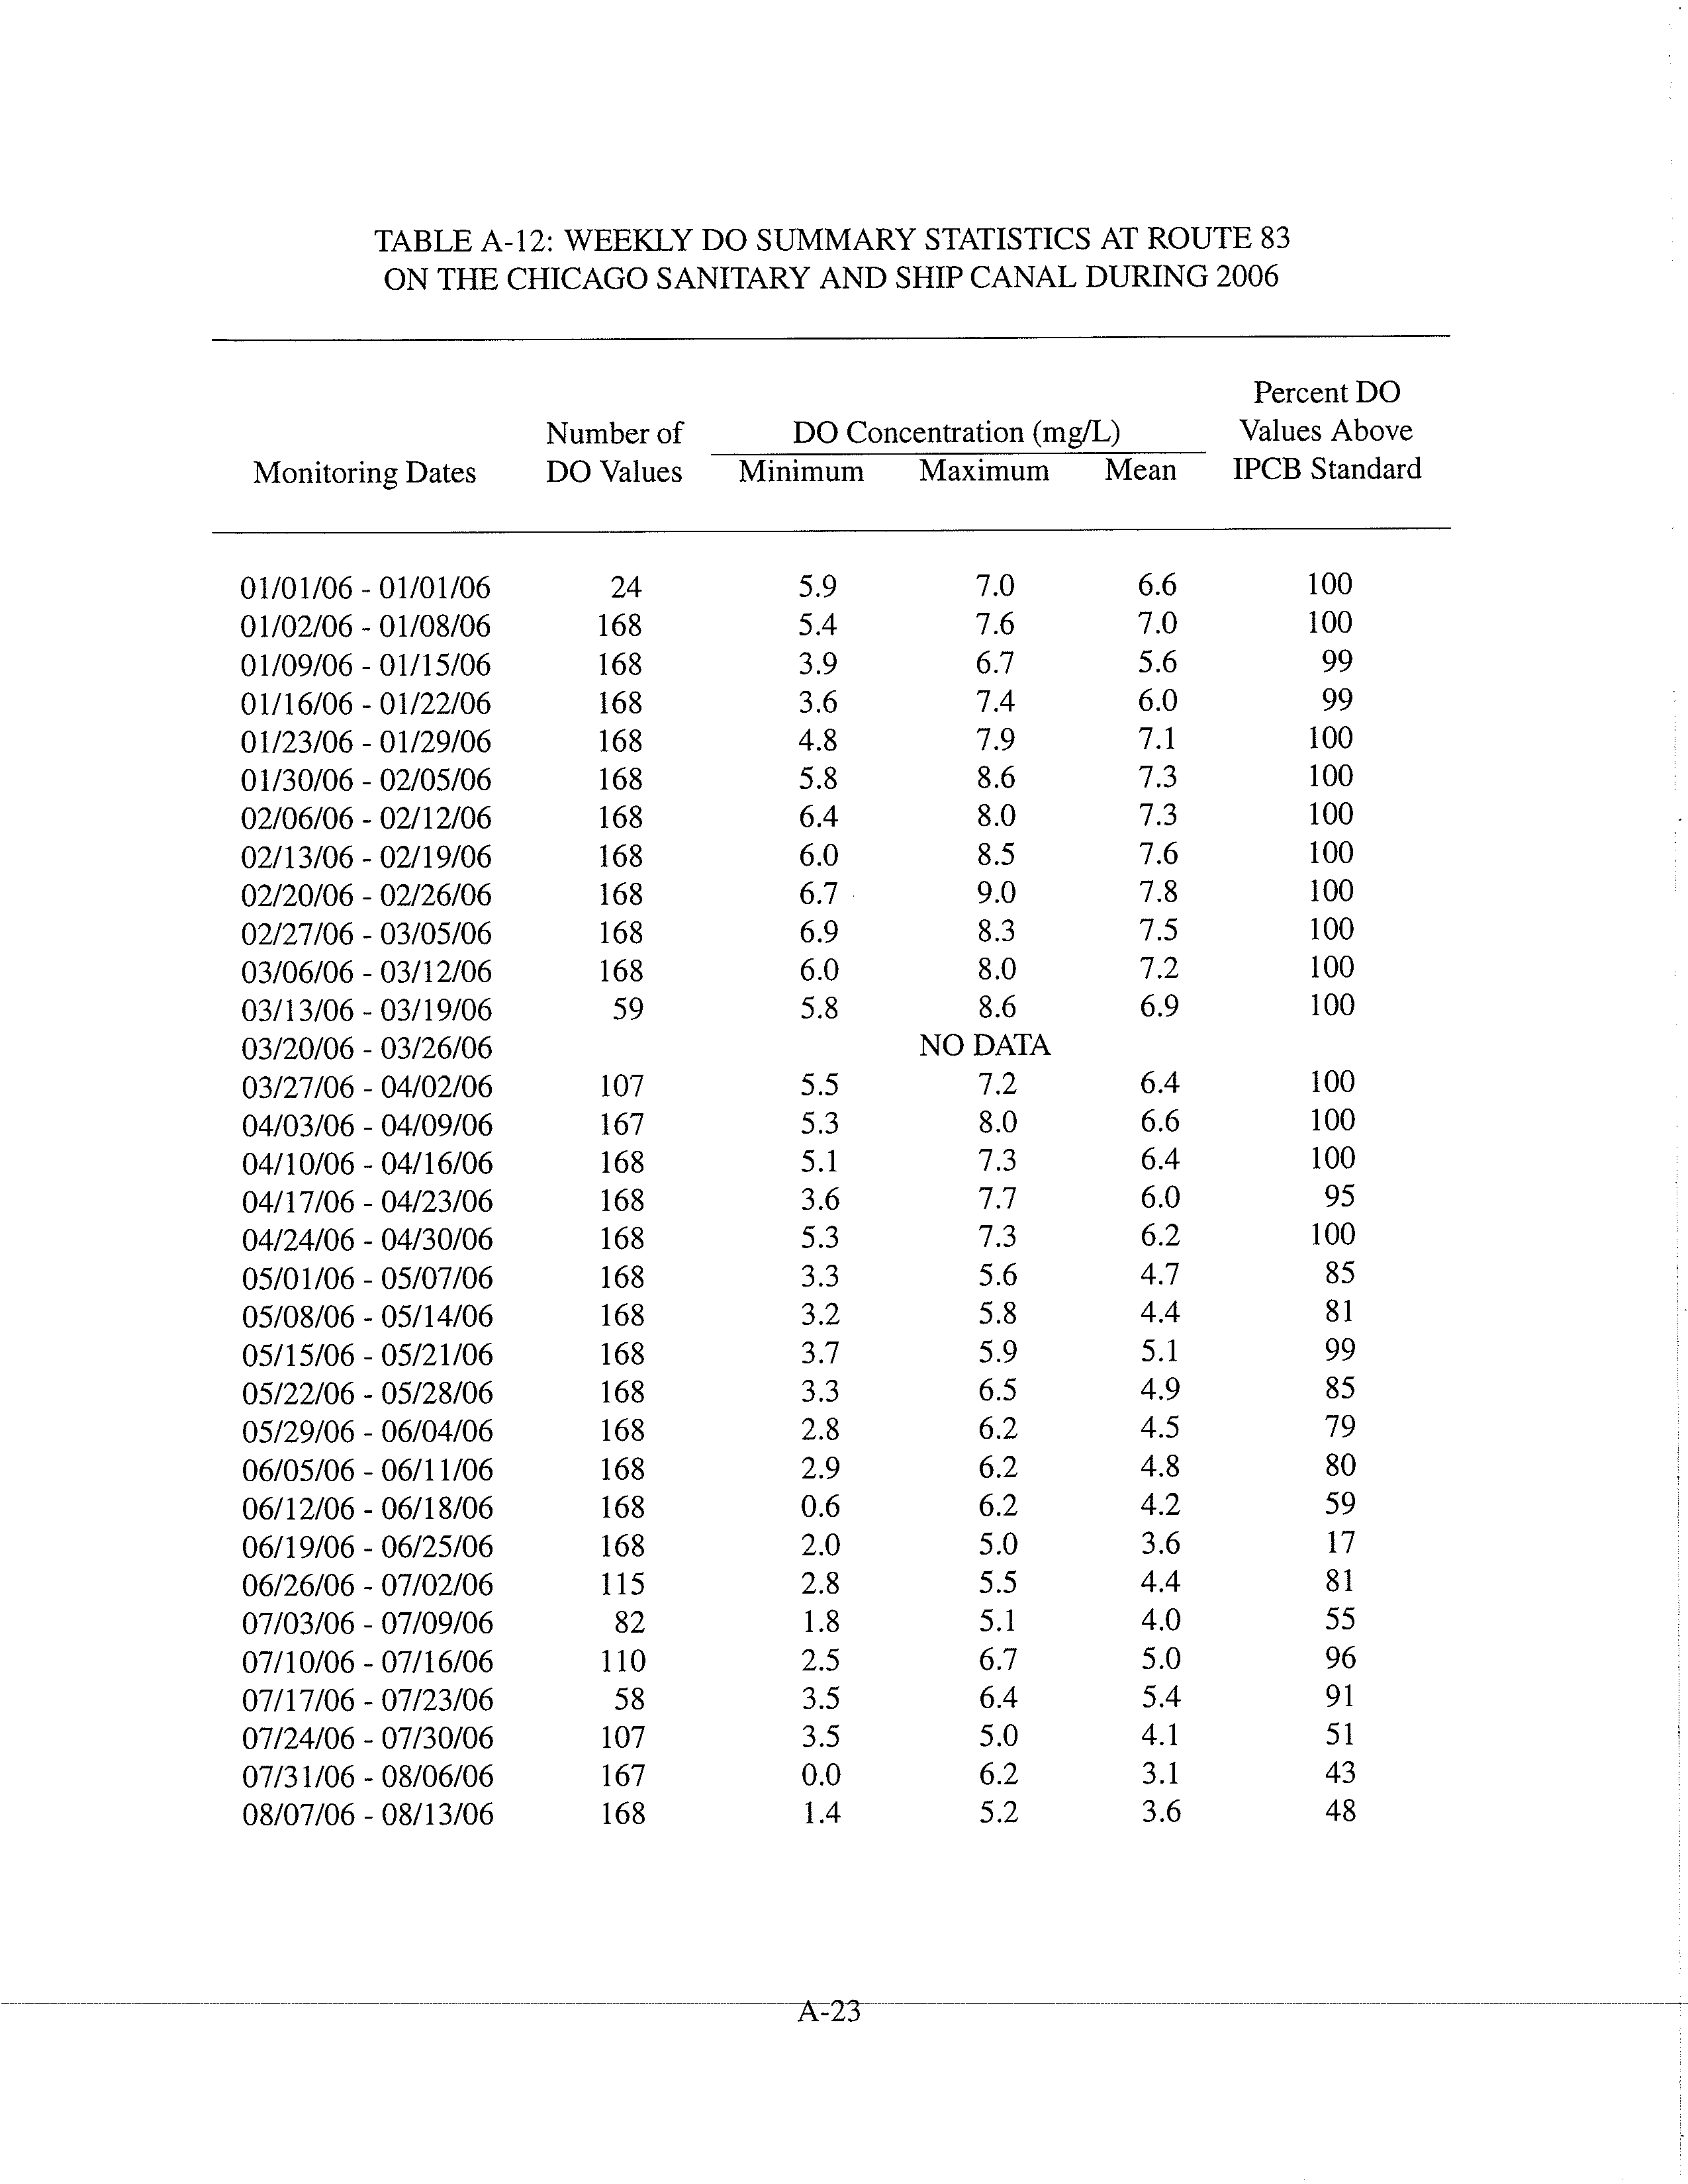
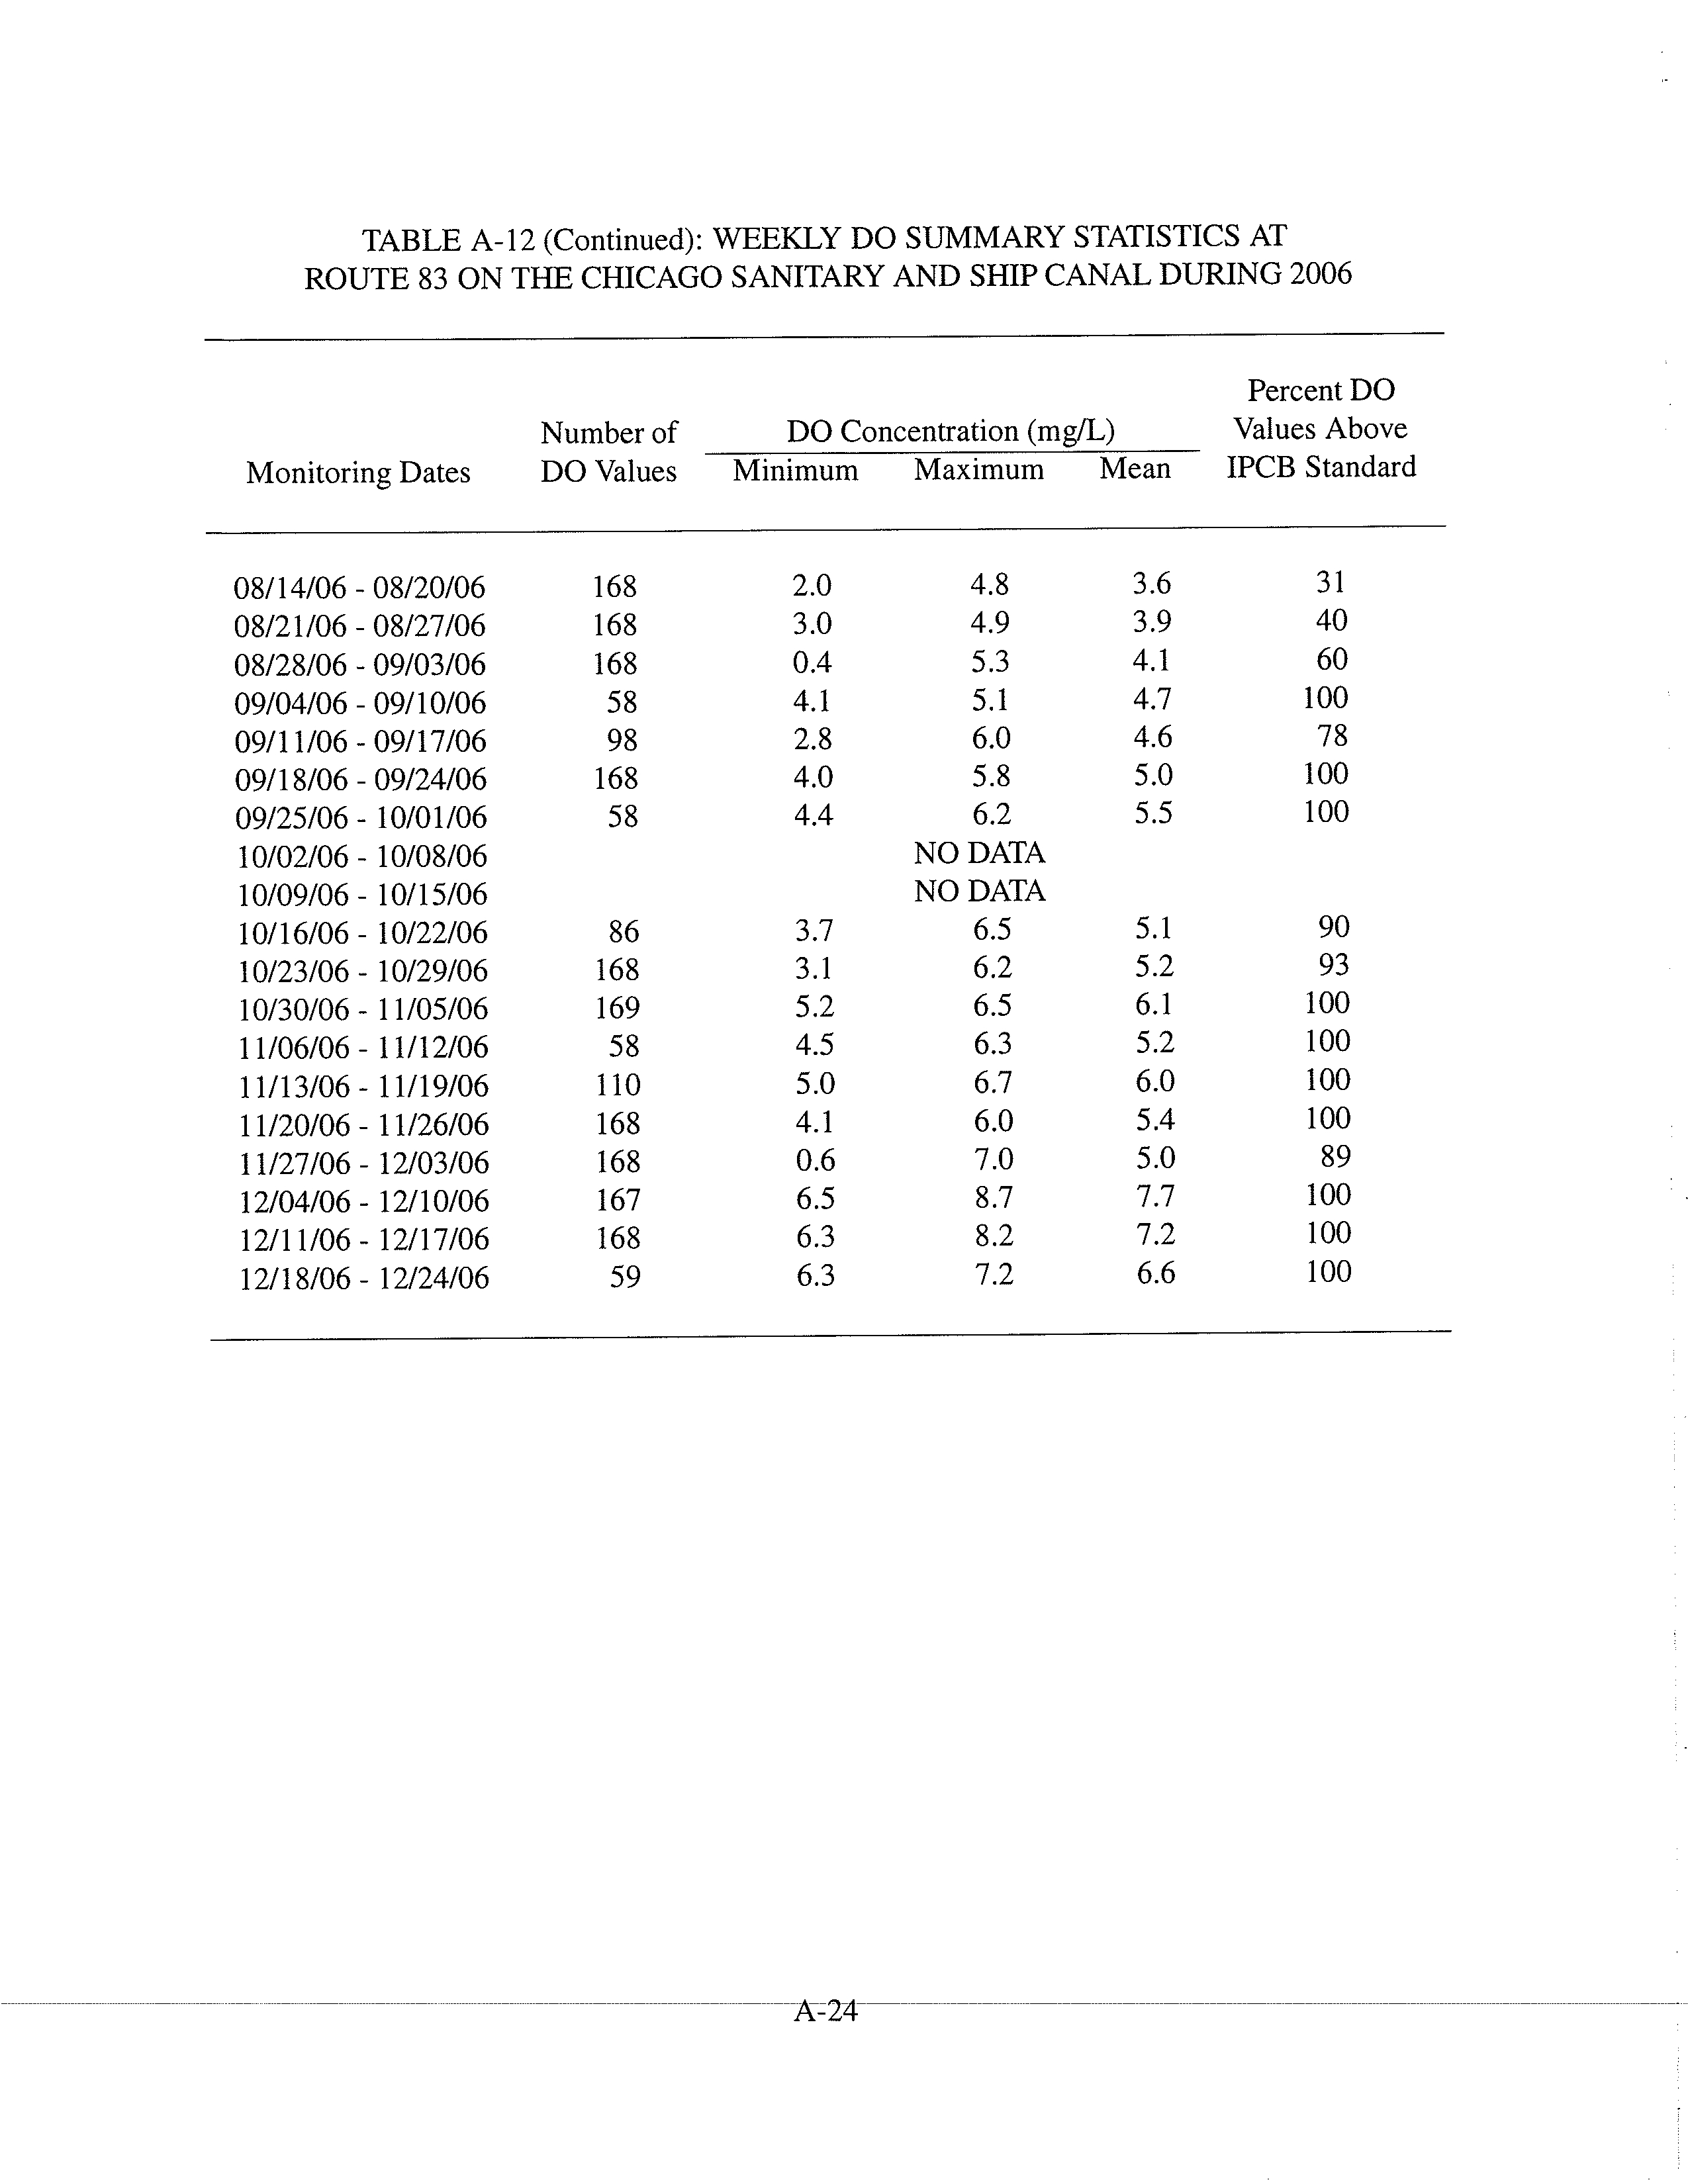
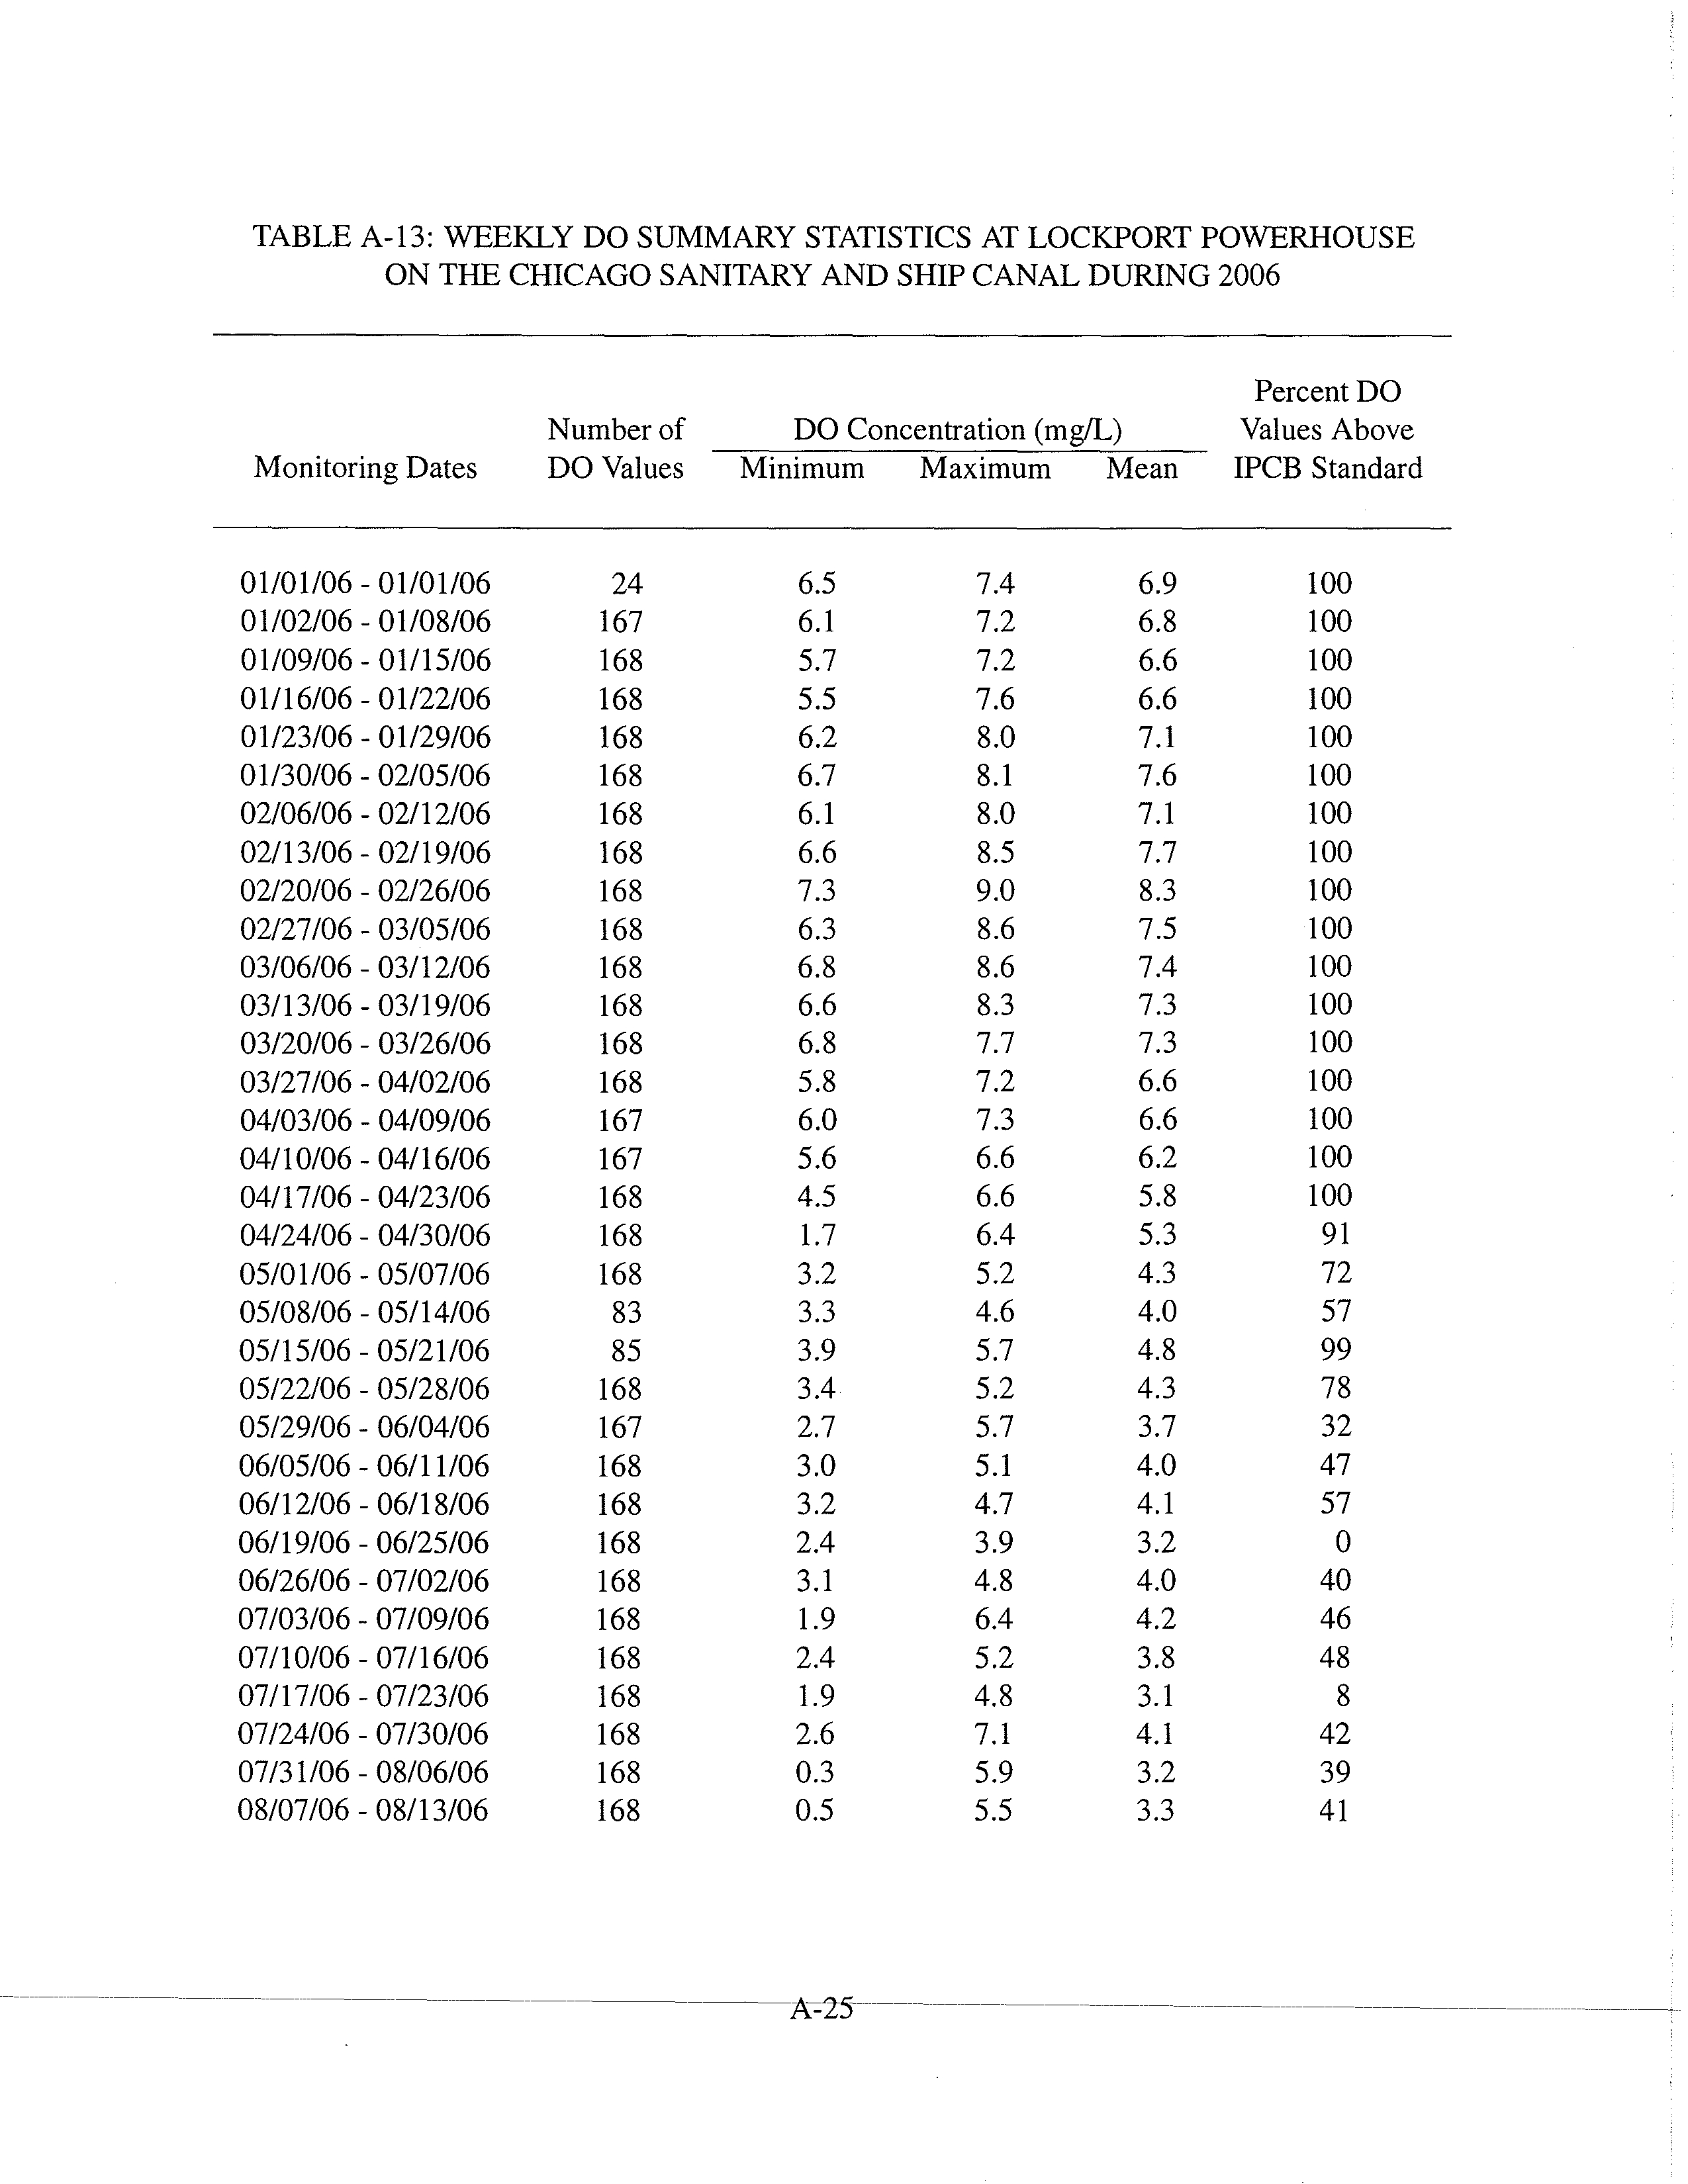
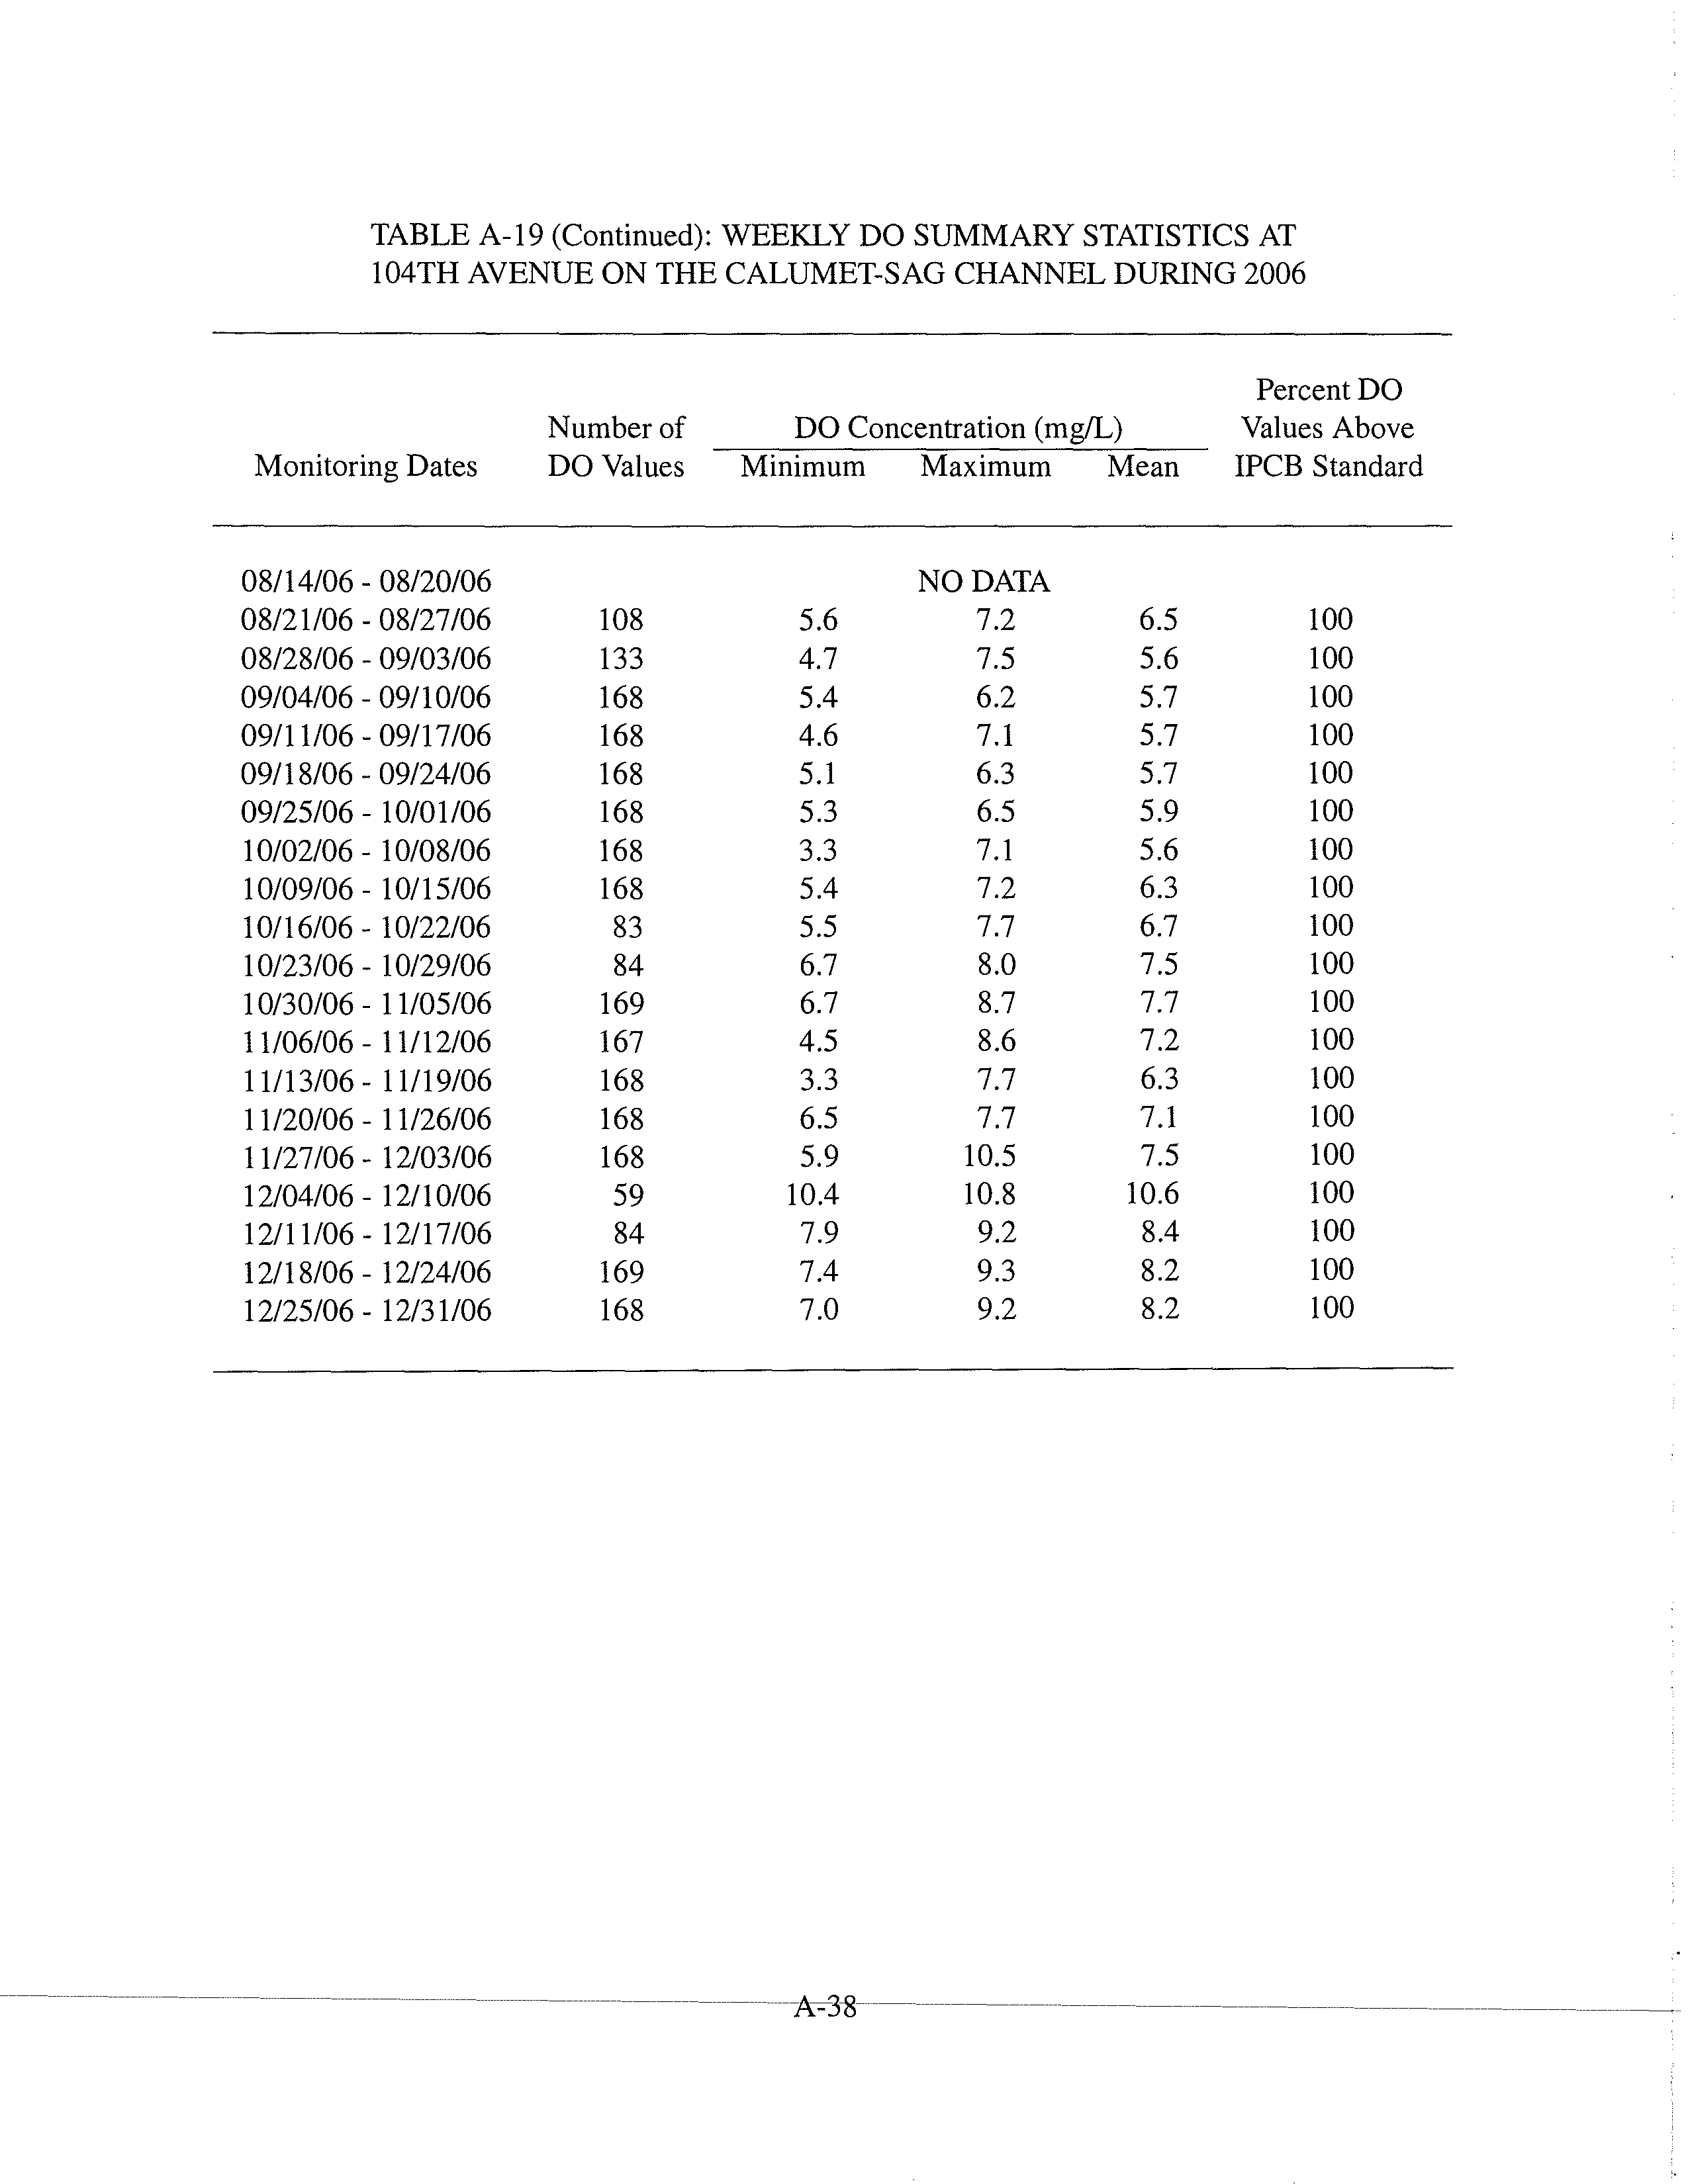
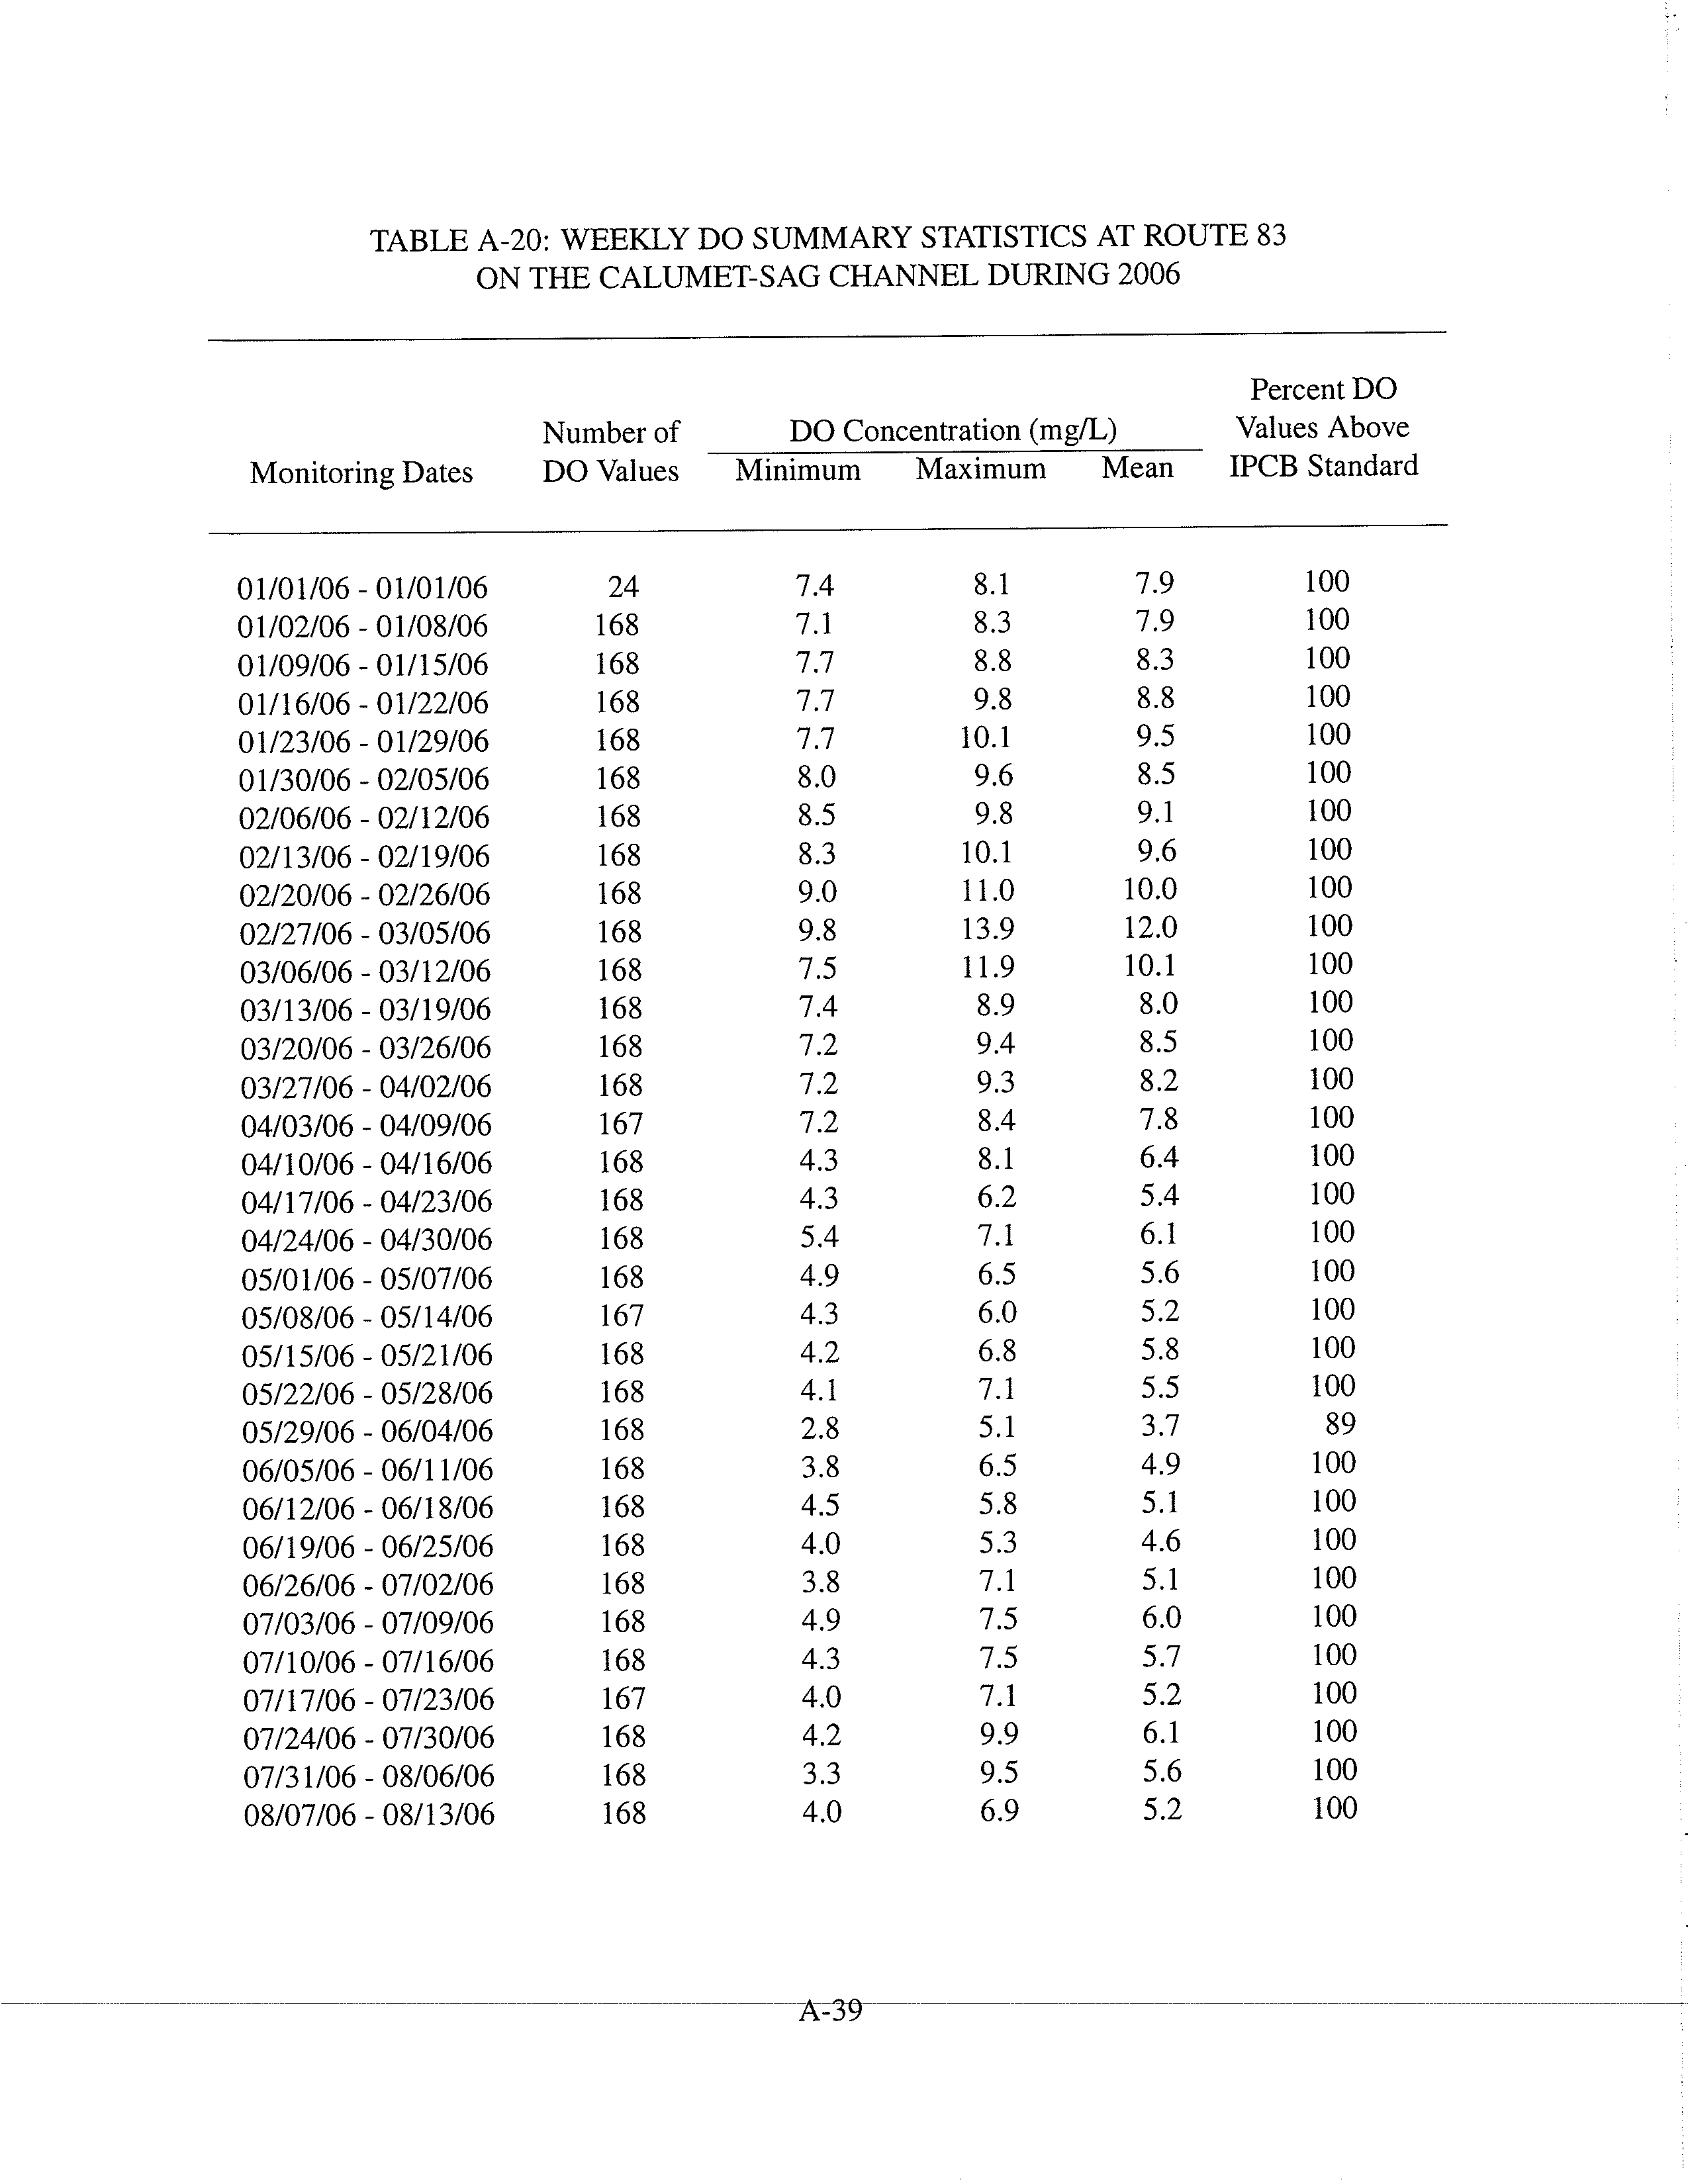
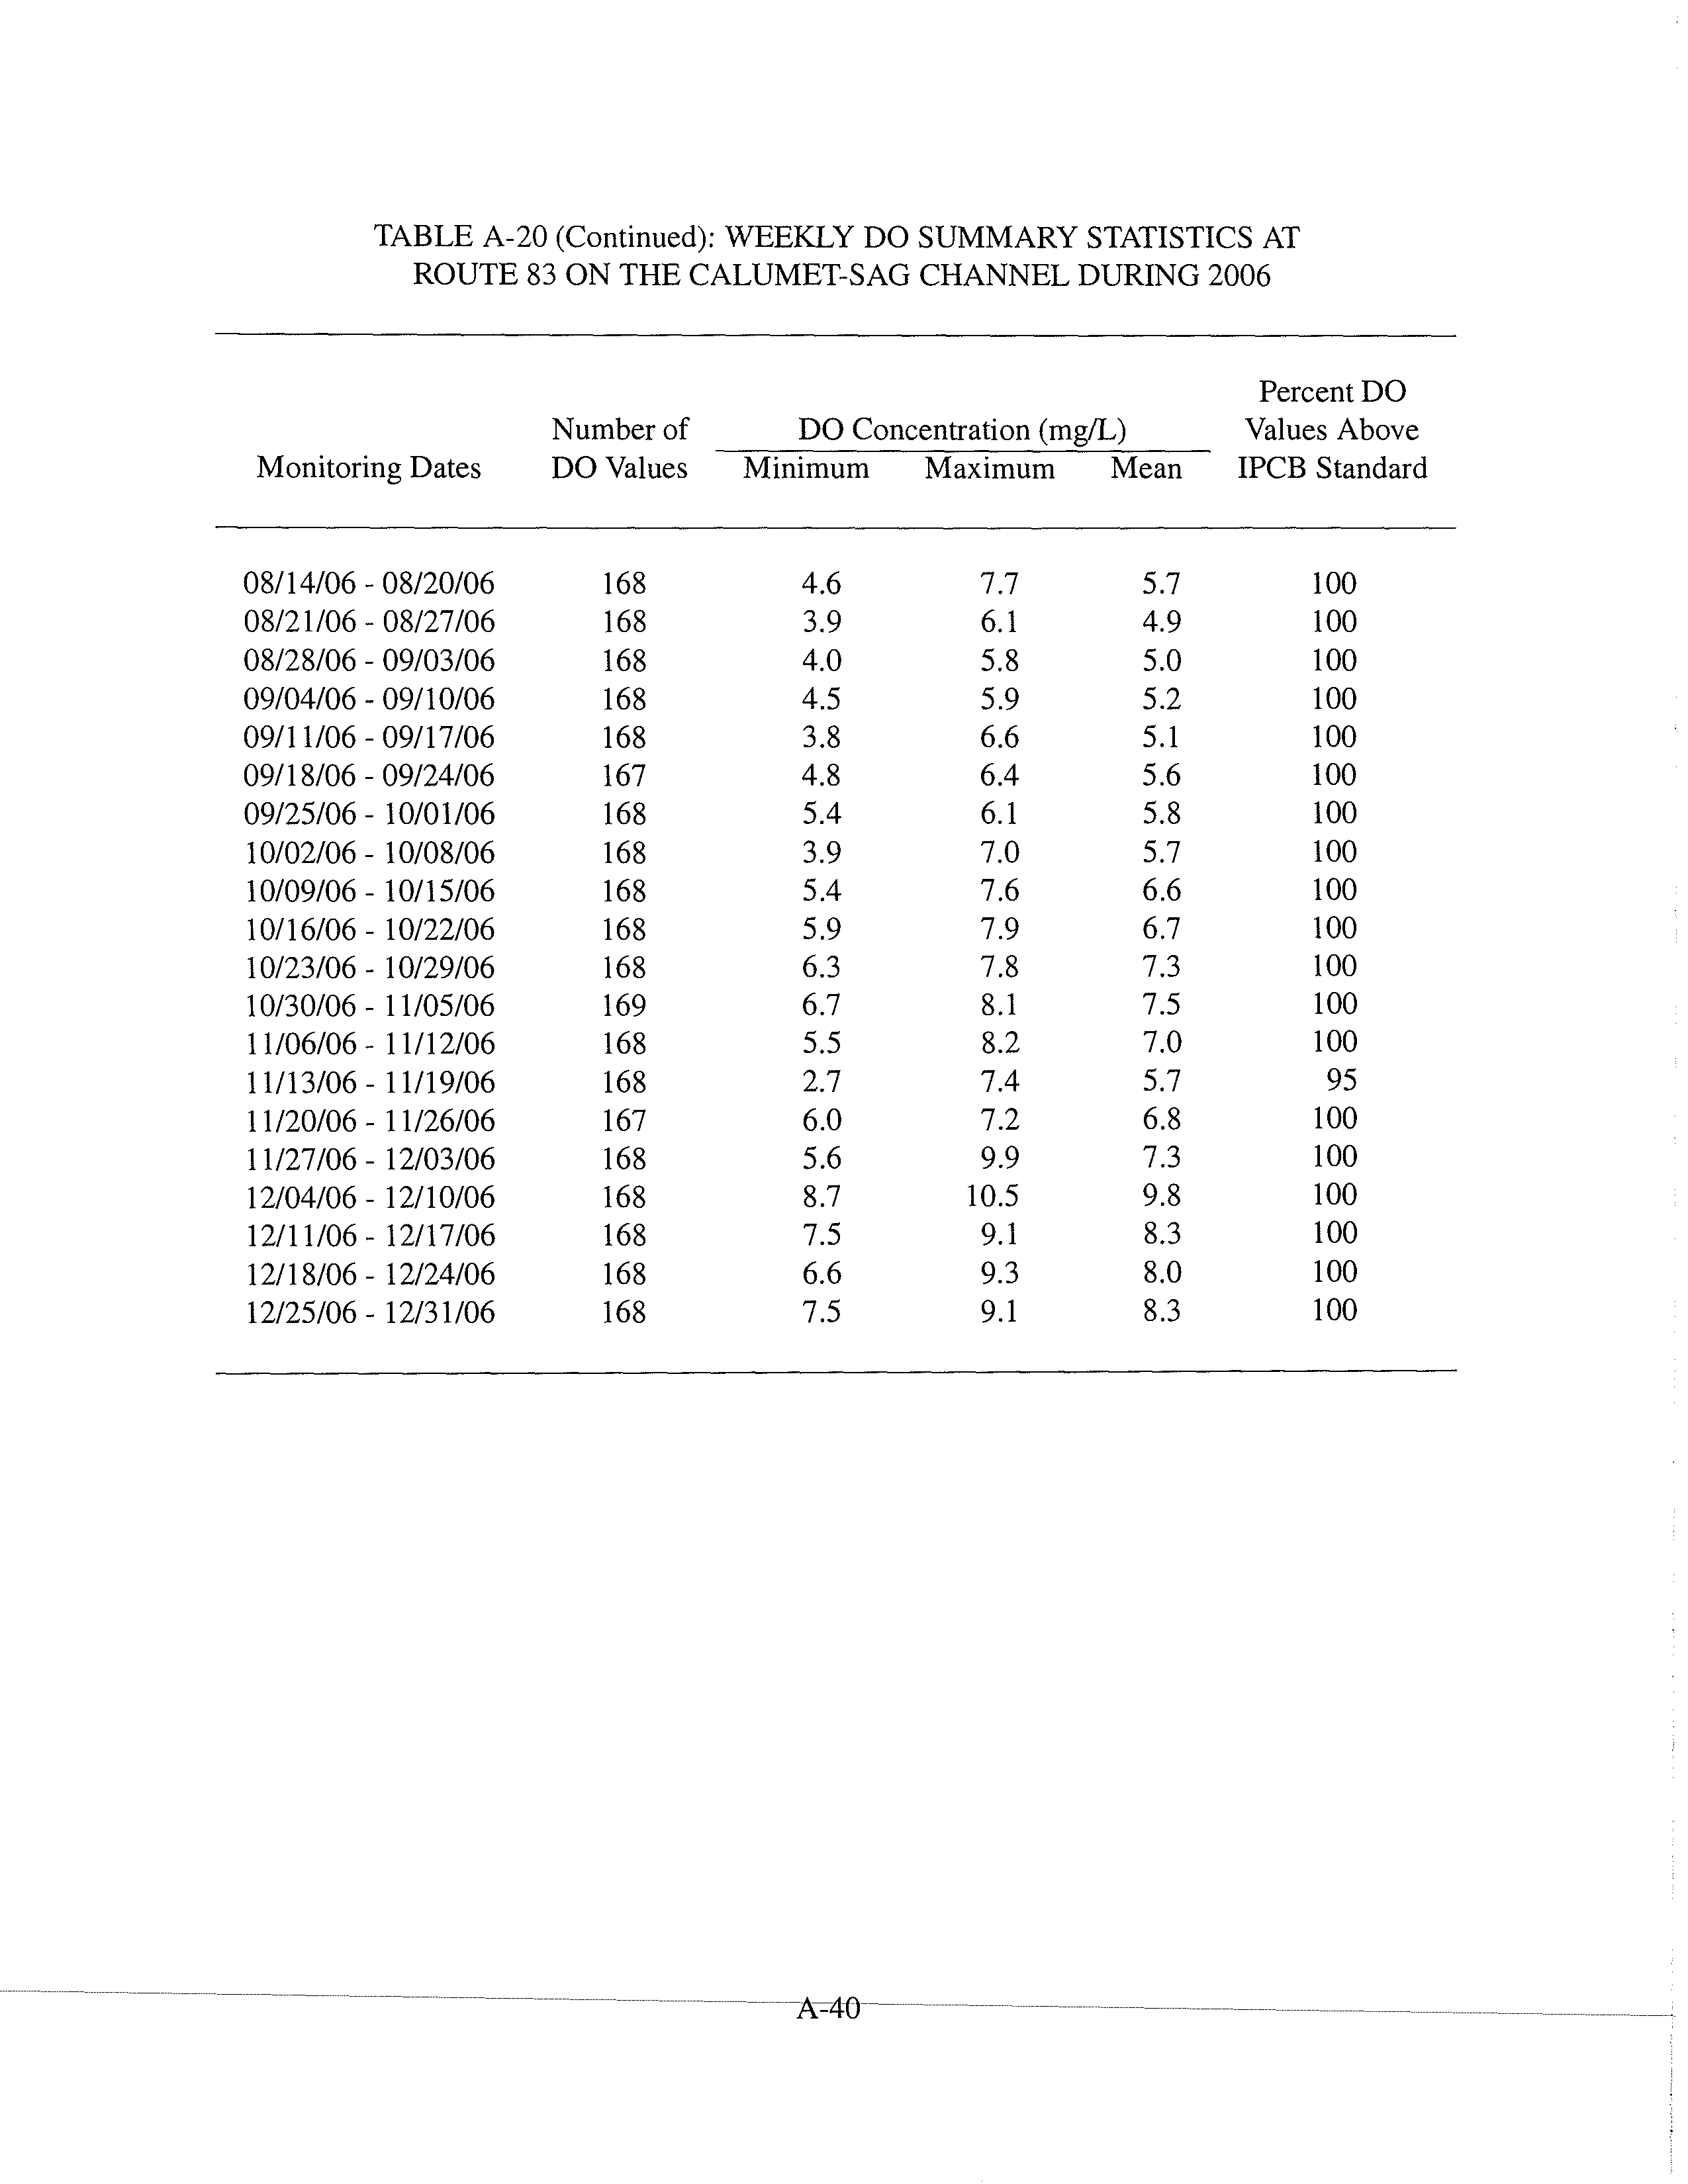
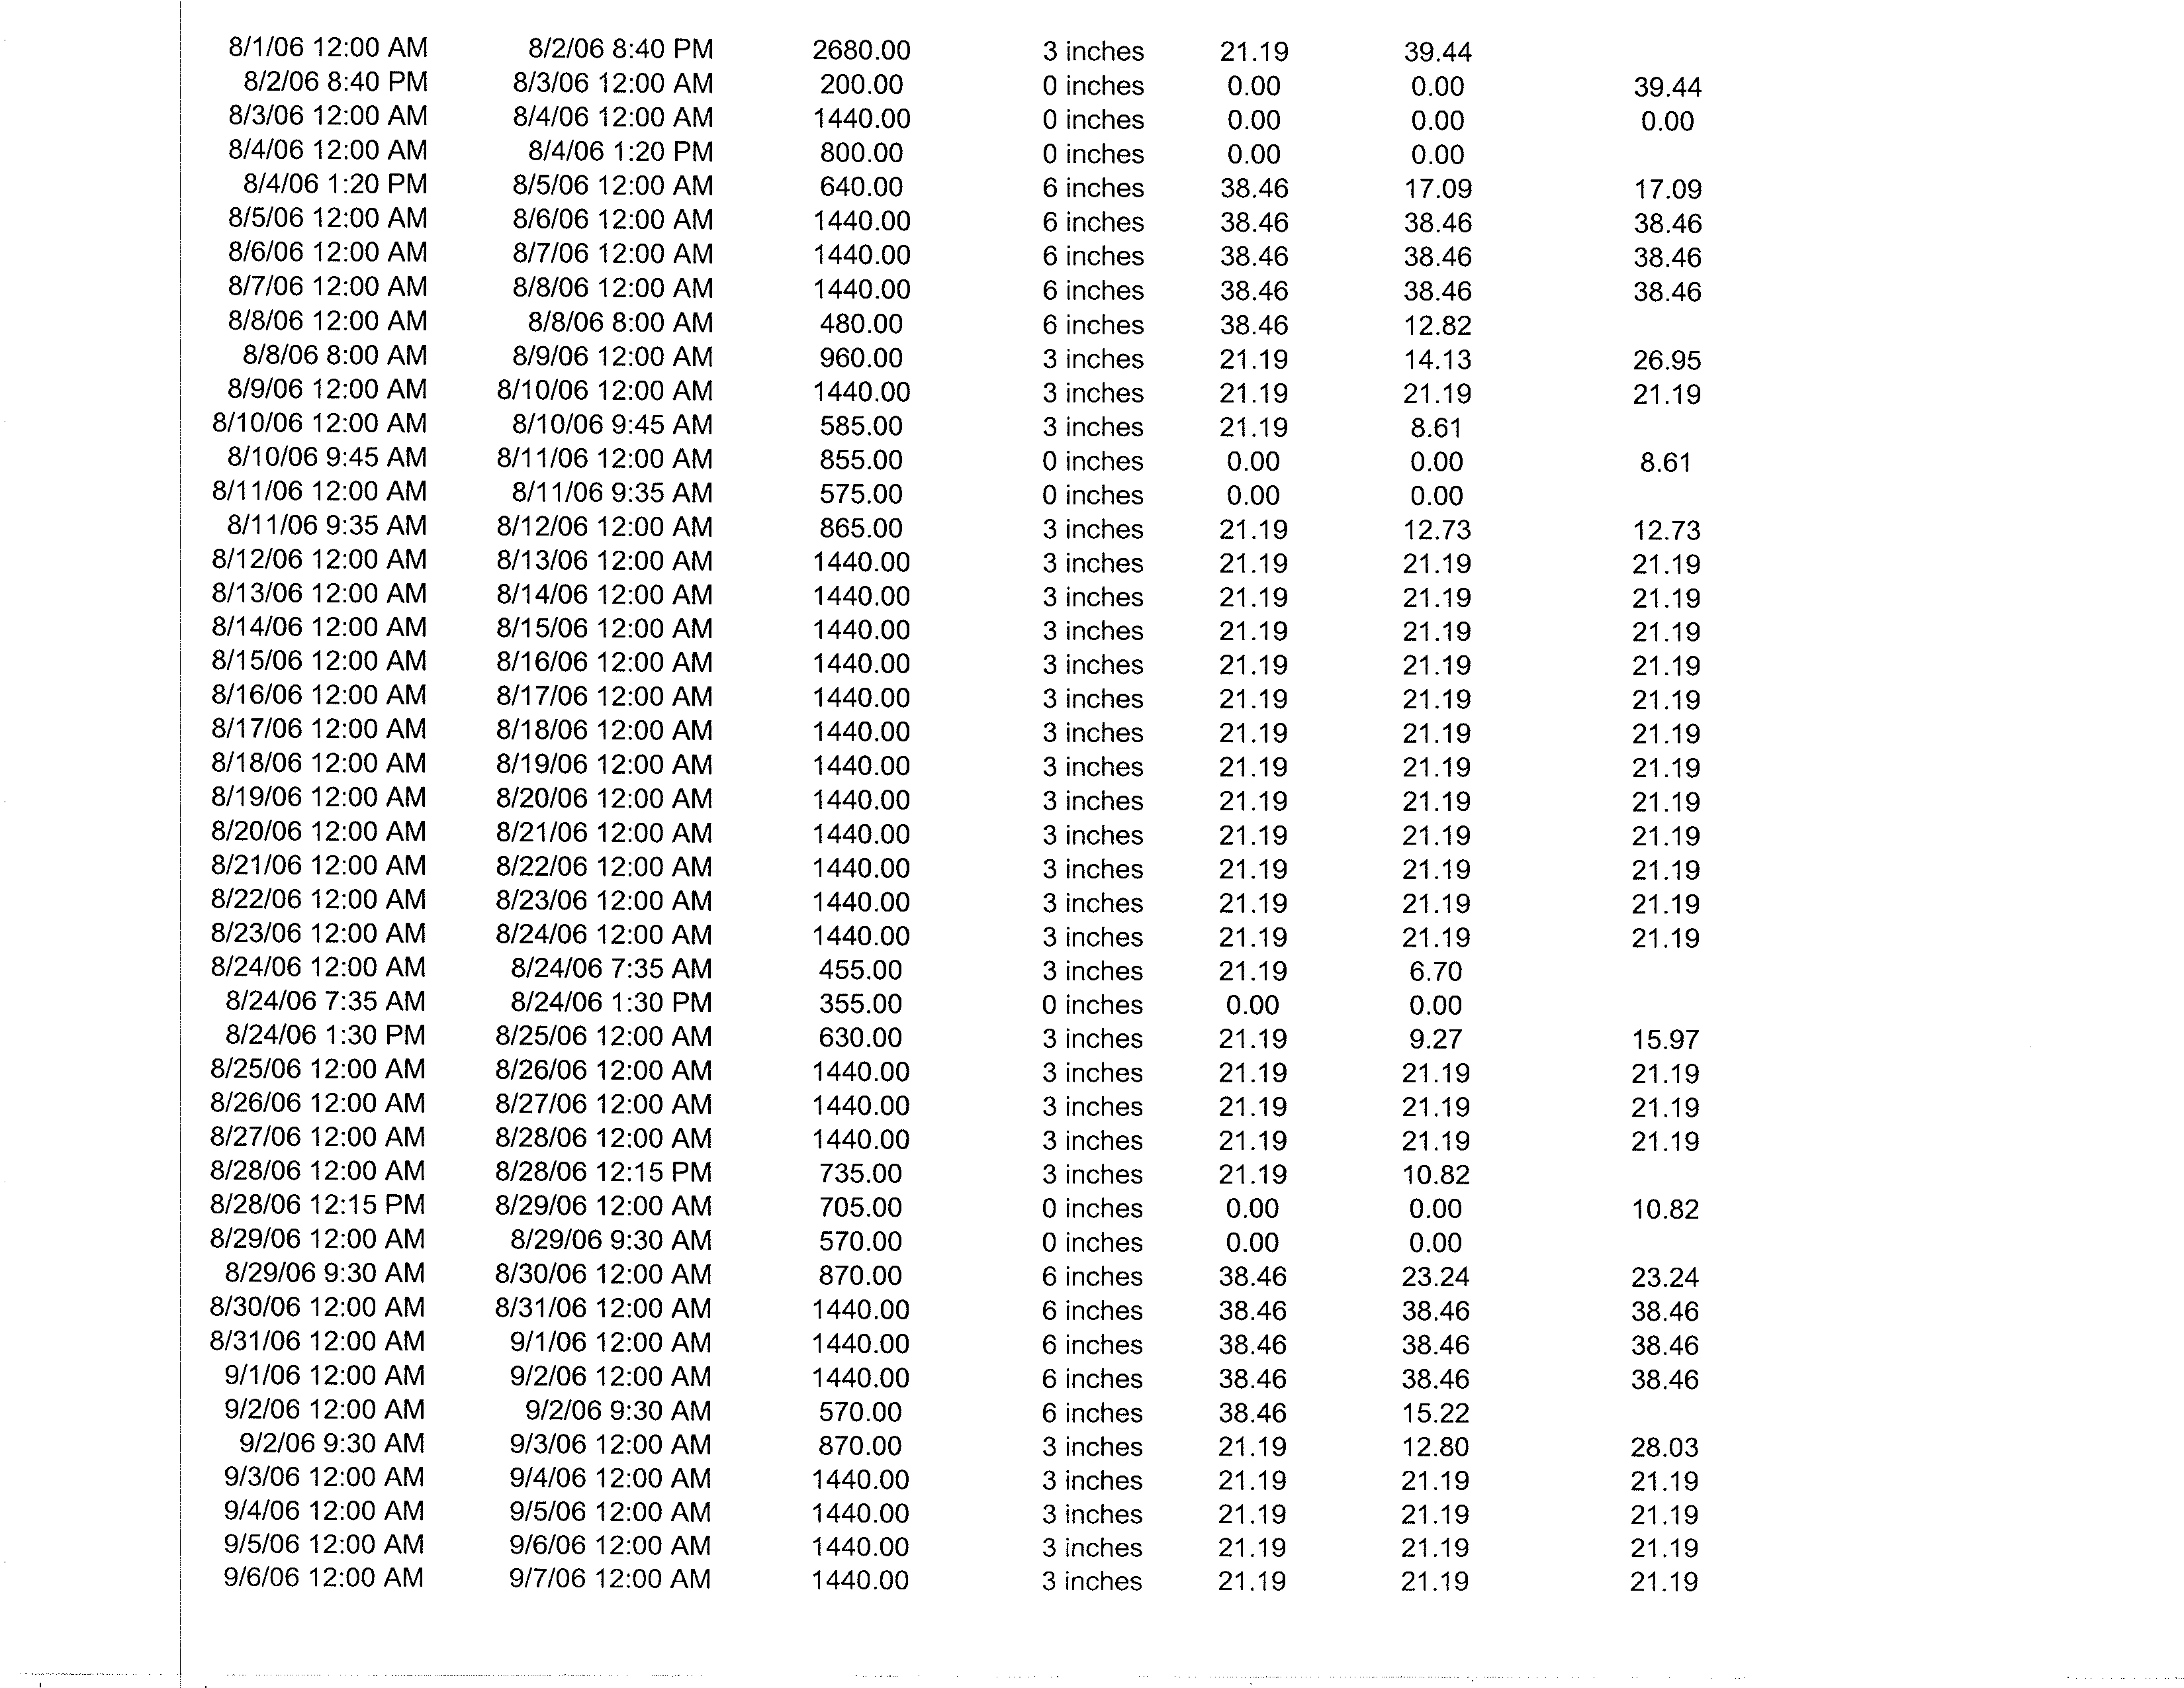
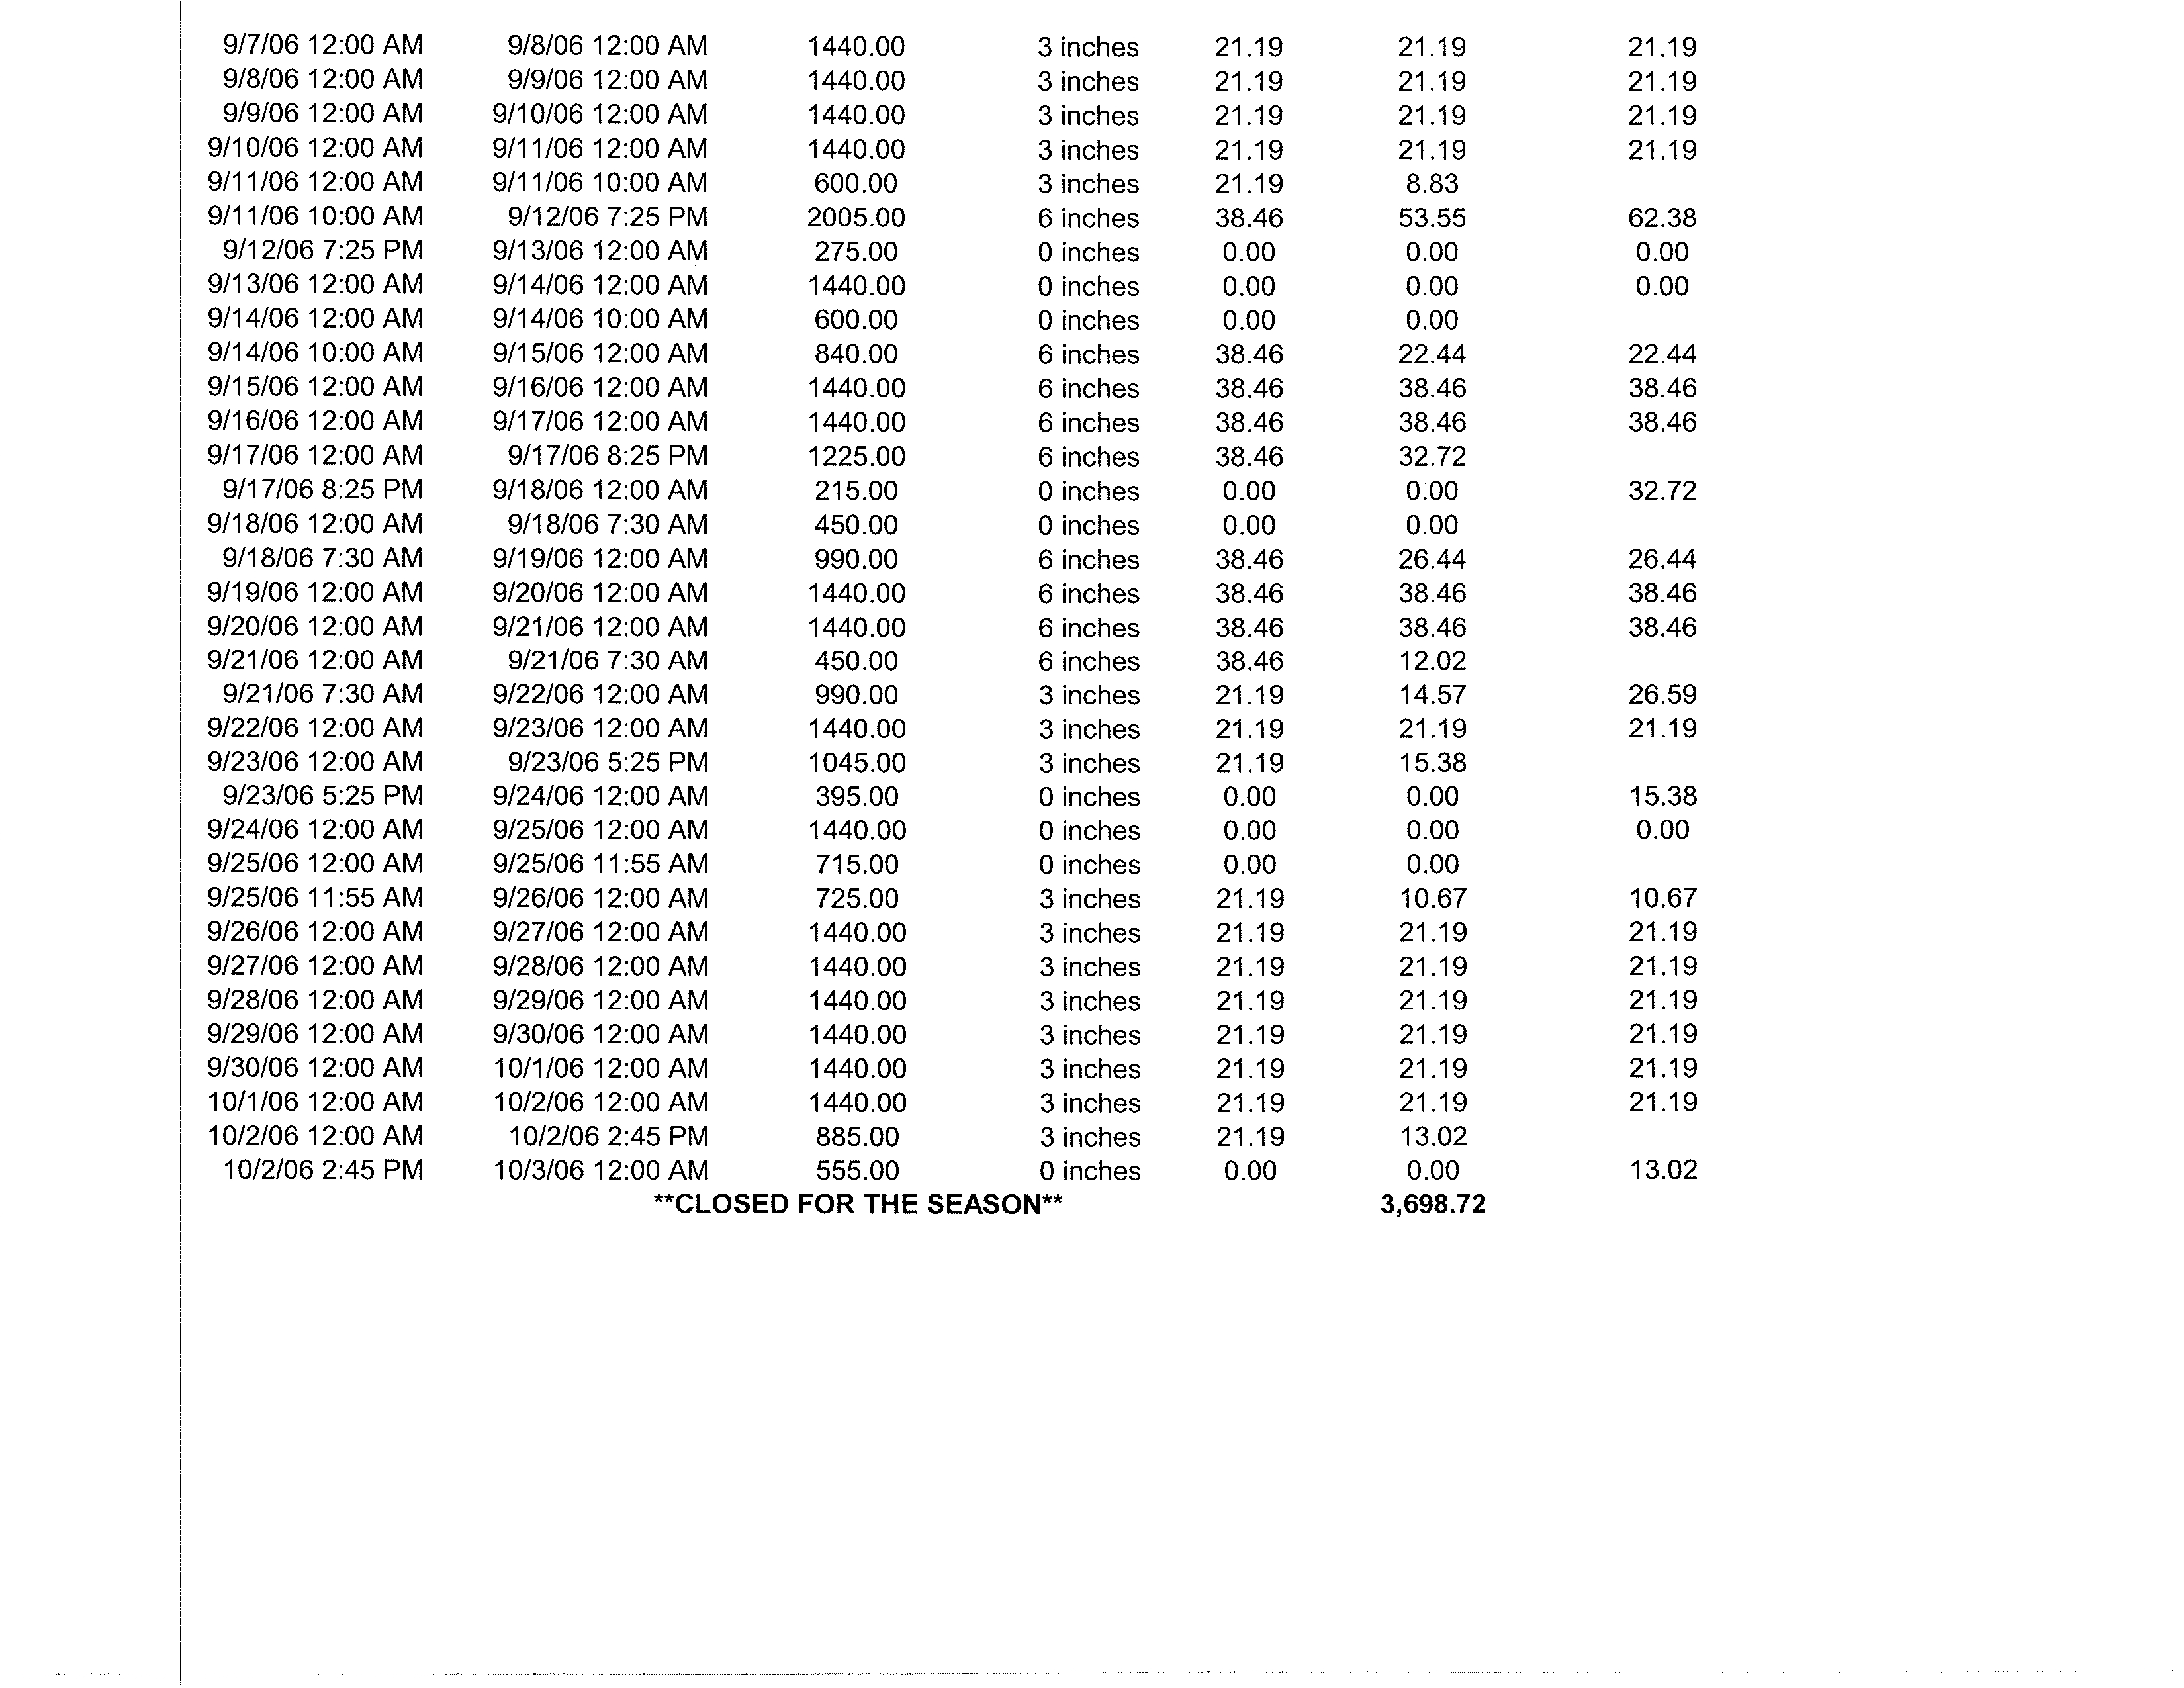
The District's continuous DO data indicate that DO recovery at Bubbly Creek stations
sometimes takes several days longer than at other stations in the Chicago Area Waterway
System.
ATTACHMENT
1
shows DO at various stations in the Chicago Area Waterway
System during an example rain event in August
,
2006. Figure
5 in ATTACHMENT
1 indicates
that DO at 36th Street on Bubbly Creek declines to 0 mg/L for over 3 days following rain events.
During dry weather, Bubbly Creek is stagnant and its DO can often plummet to zero.
The fine sediments deposited throughout most of the creek exhibit a heavy oxygen demand. In
2001, the District measured a sediment oxygen demand
(
SOD) of 3.64 g/m2/day at Interstate
Highway 55 on Bubbly Creek
,
which was the 2°d highest value measured in the Chicago Area
Waterway System.
District field measurements near the Archer Avenue Bridge over Bubbly
Creek have shown that fine sediments extend to a depth of 54 inches below the top of the
sediment. In addition
,
chemical analyses of the sediments in Bubbly Creek have detected legacy
organic contaminants
,
such as polycyclic aromatic hydrocarbons
(PAHs
),
polychlorinated
biphenyls
(
PCBs
),
volatile organic compounds
(VOCs),
and heavy metals
(USACE, Chicago
District
,
2006, ATTACHMENT
2).
High phytoplankton levels, sustained by abundant nutrient
loads from CSOs and stagnant waterway conditions
,
also contribute to oxygen demand as they
respire and eventually decay.
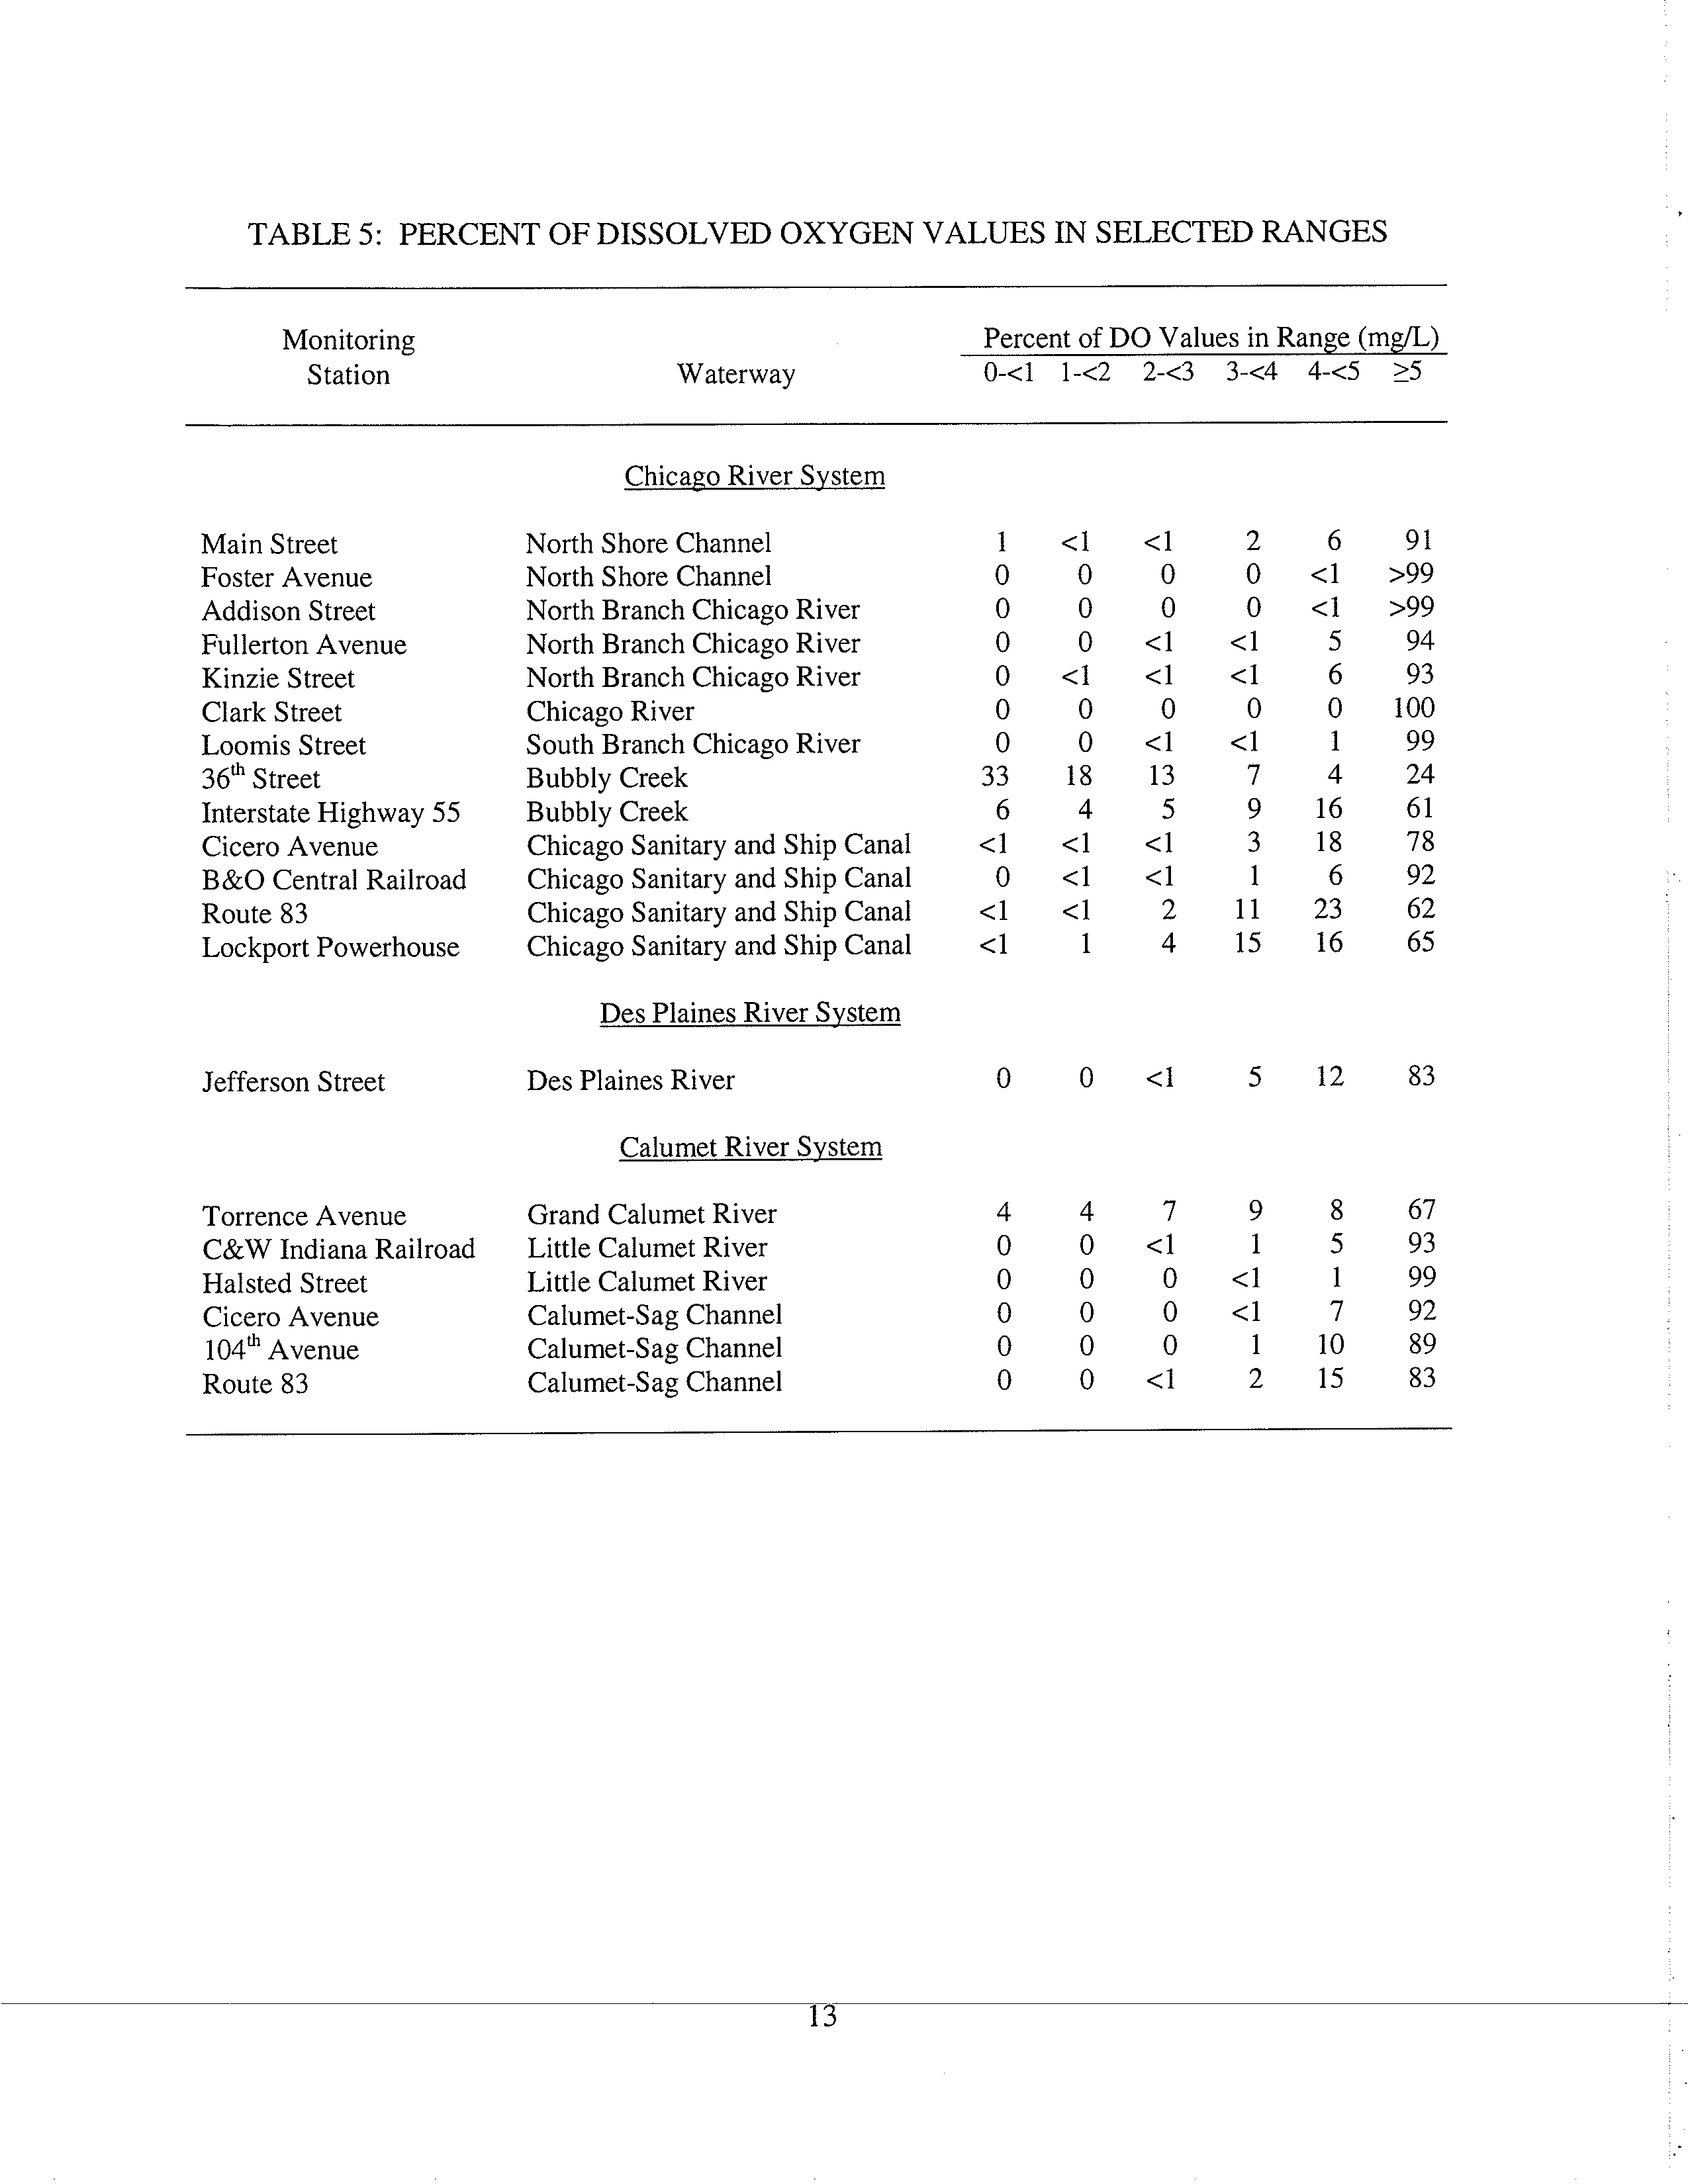
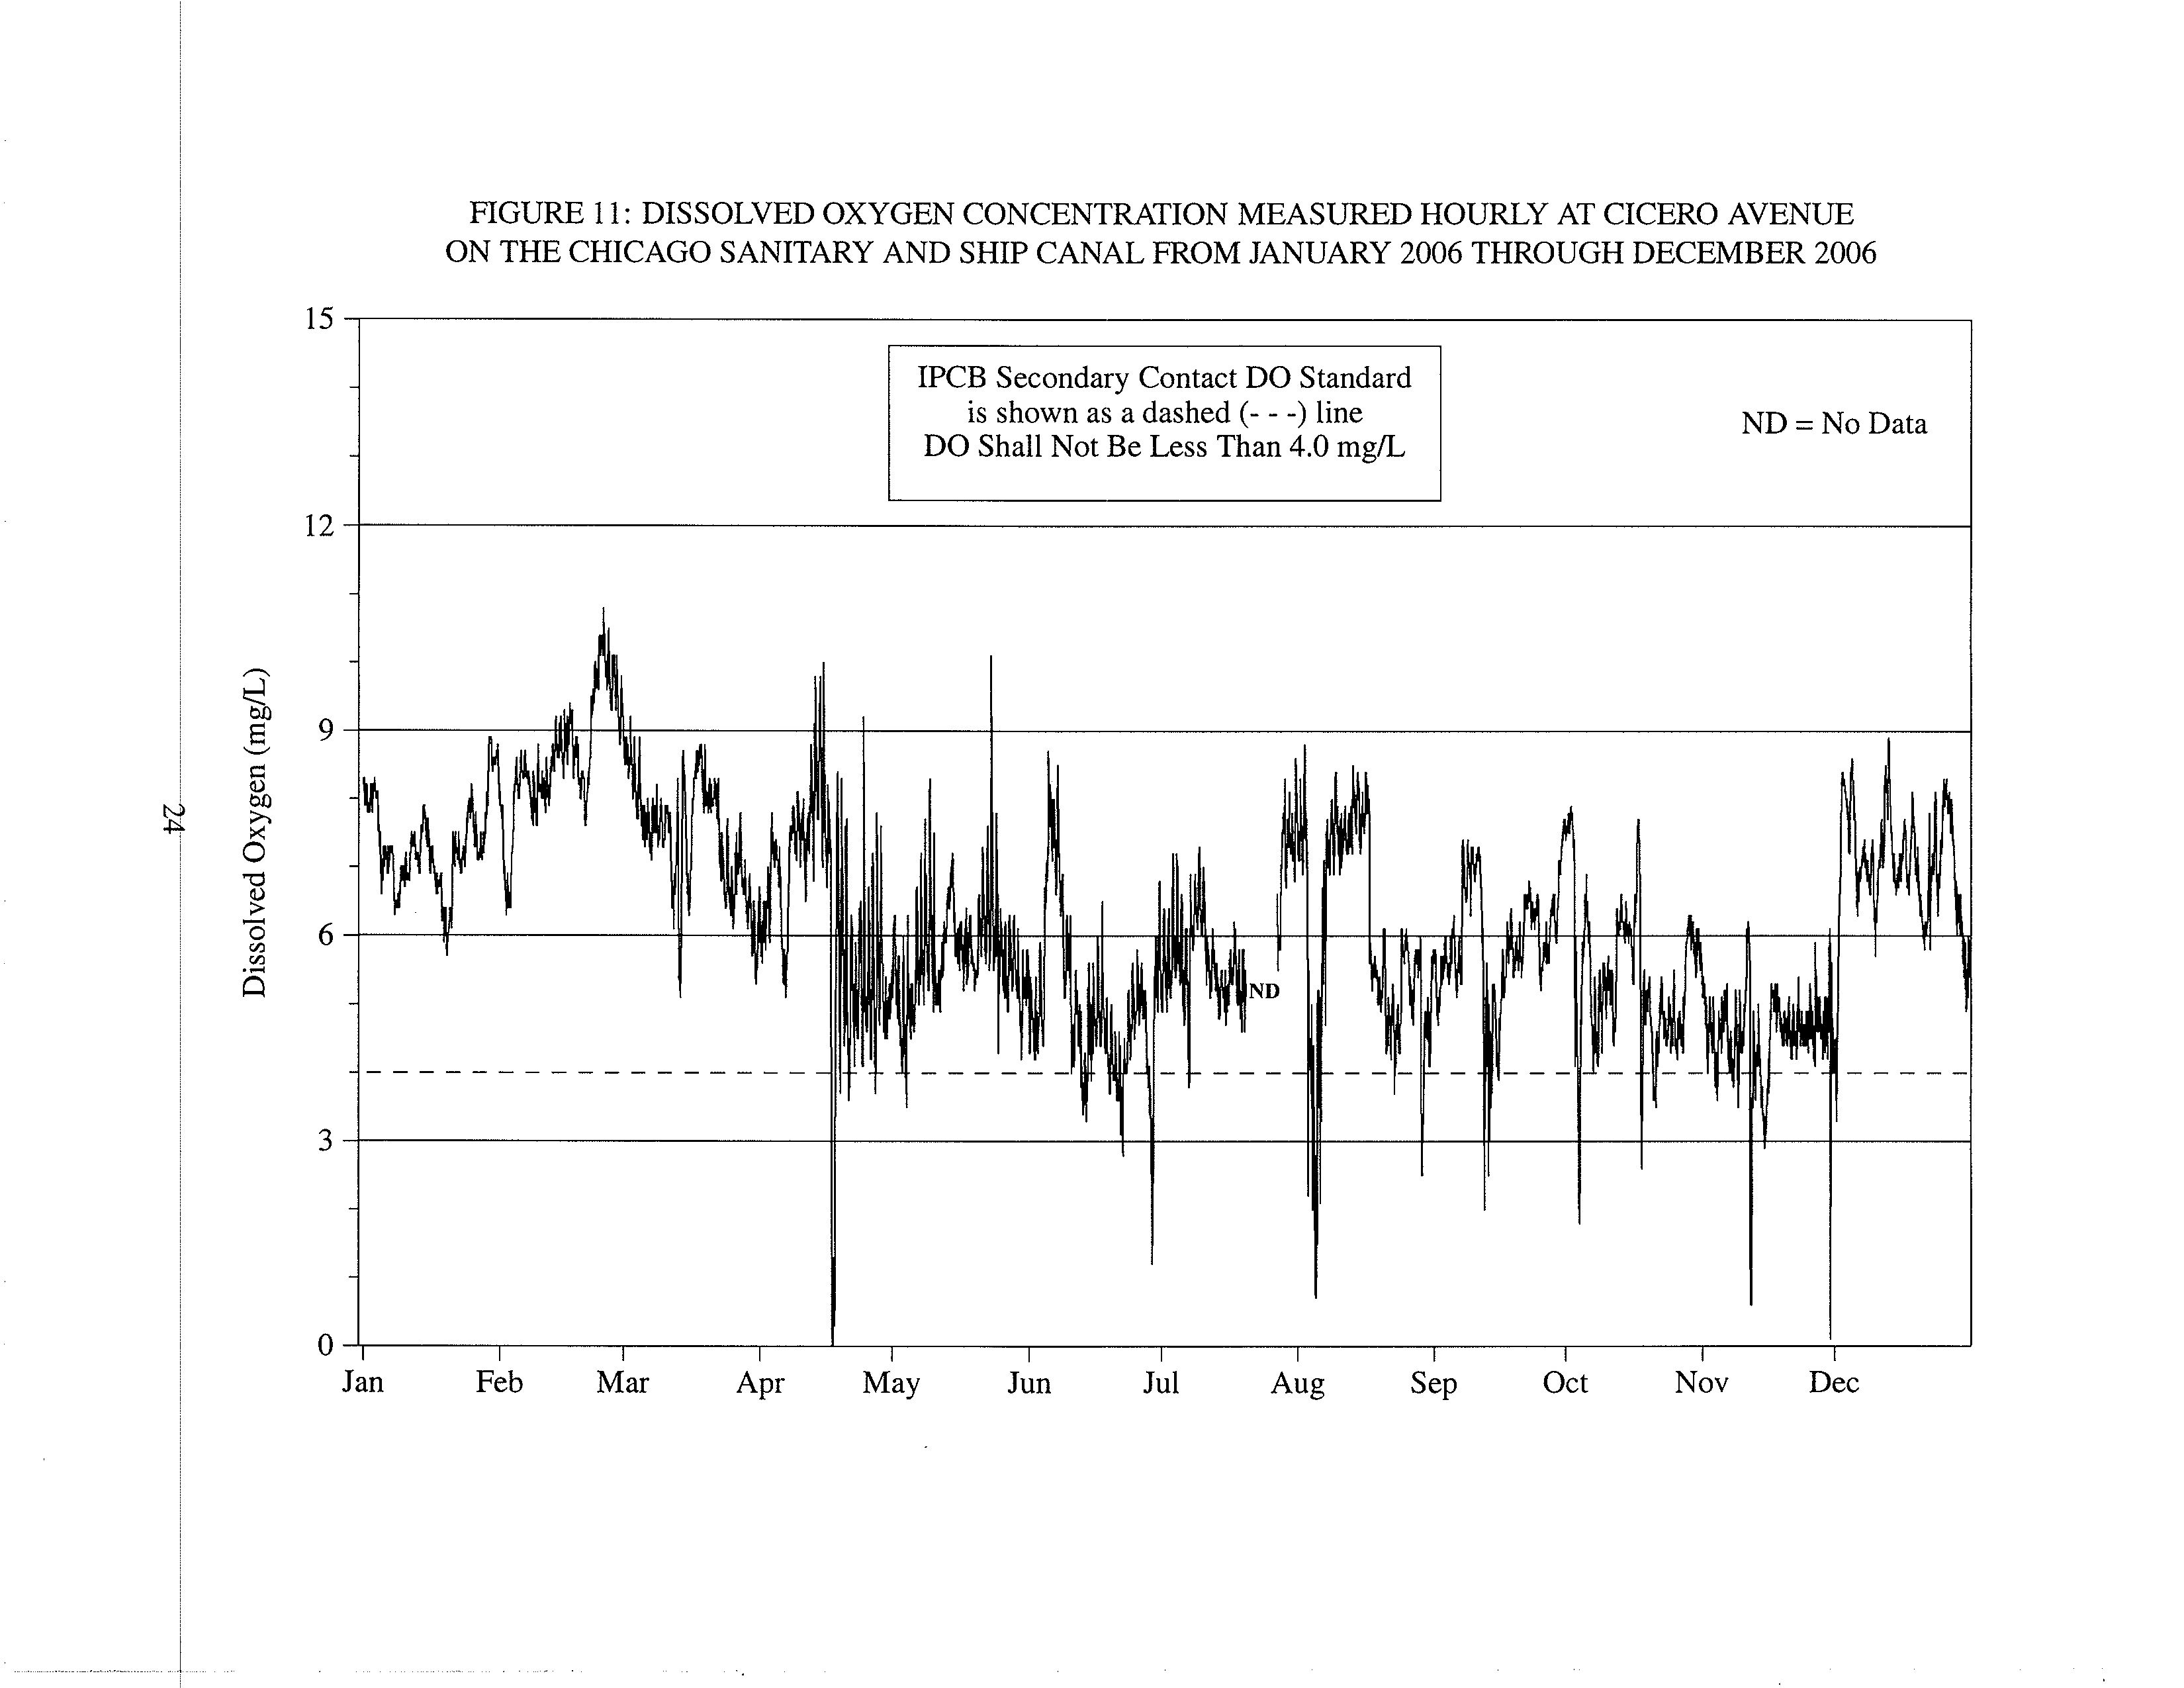
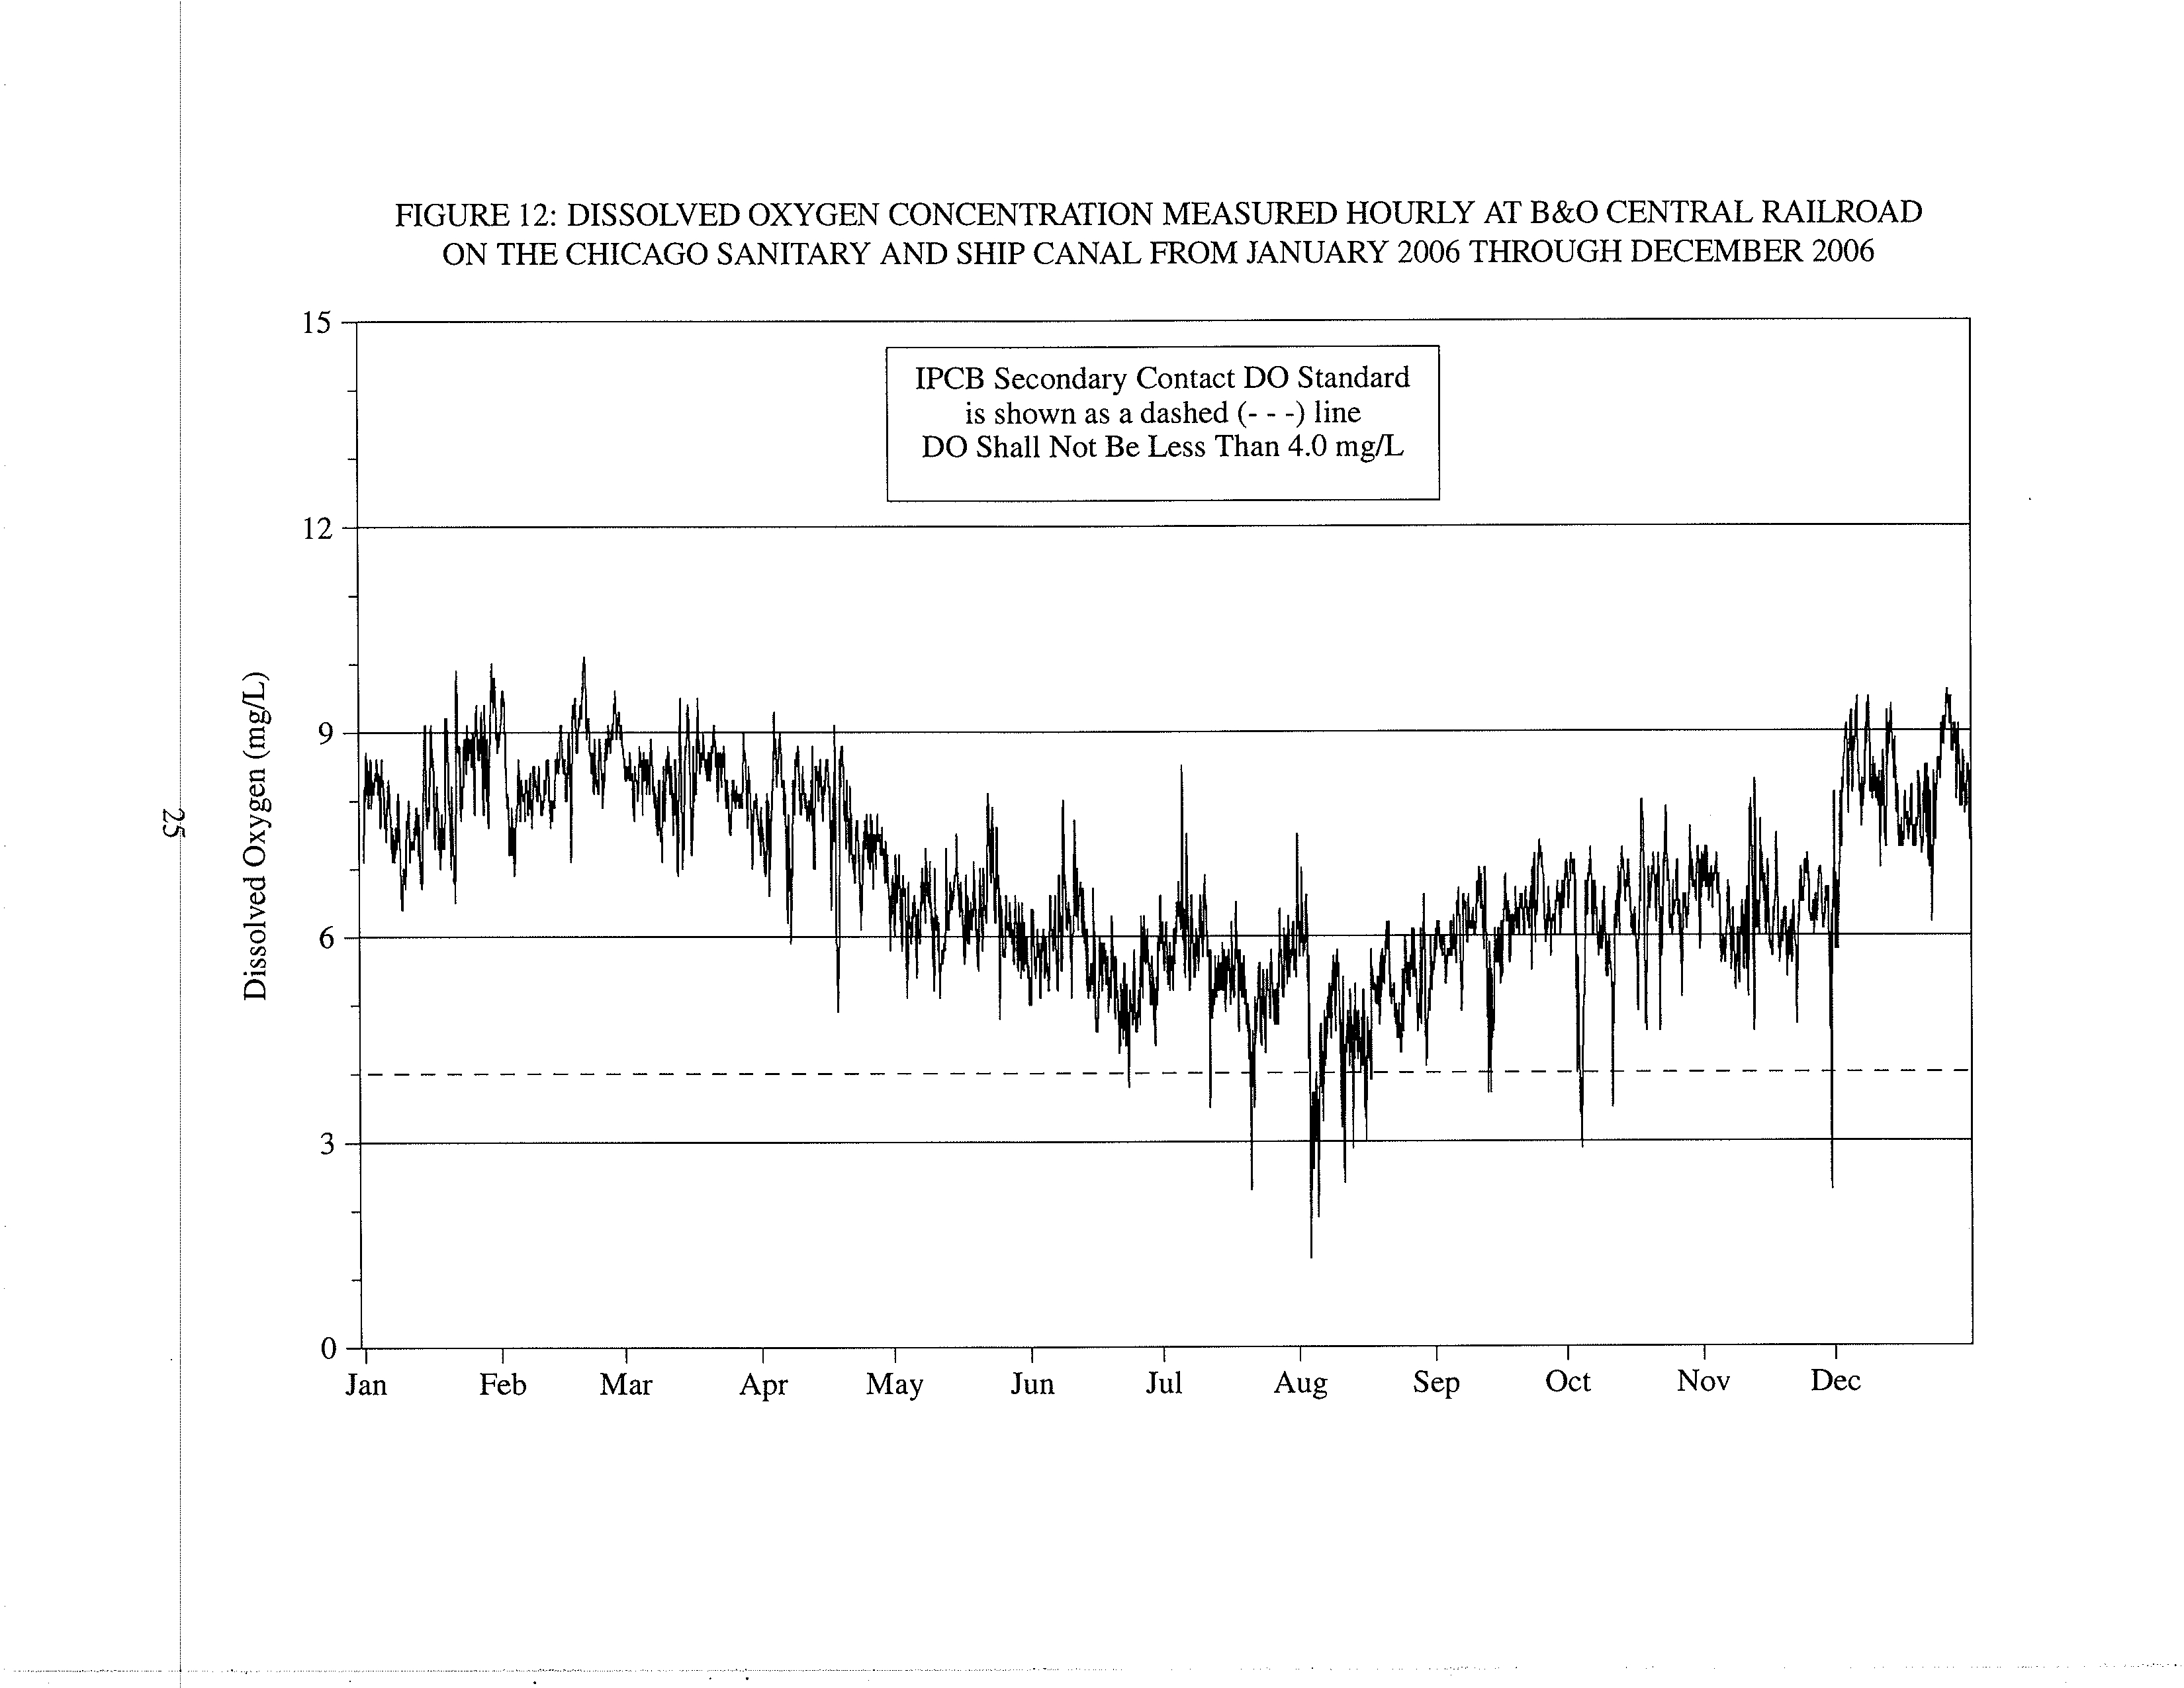
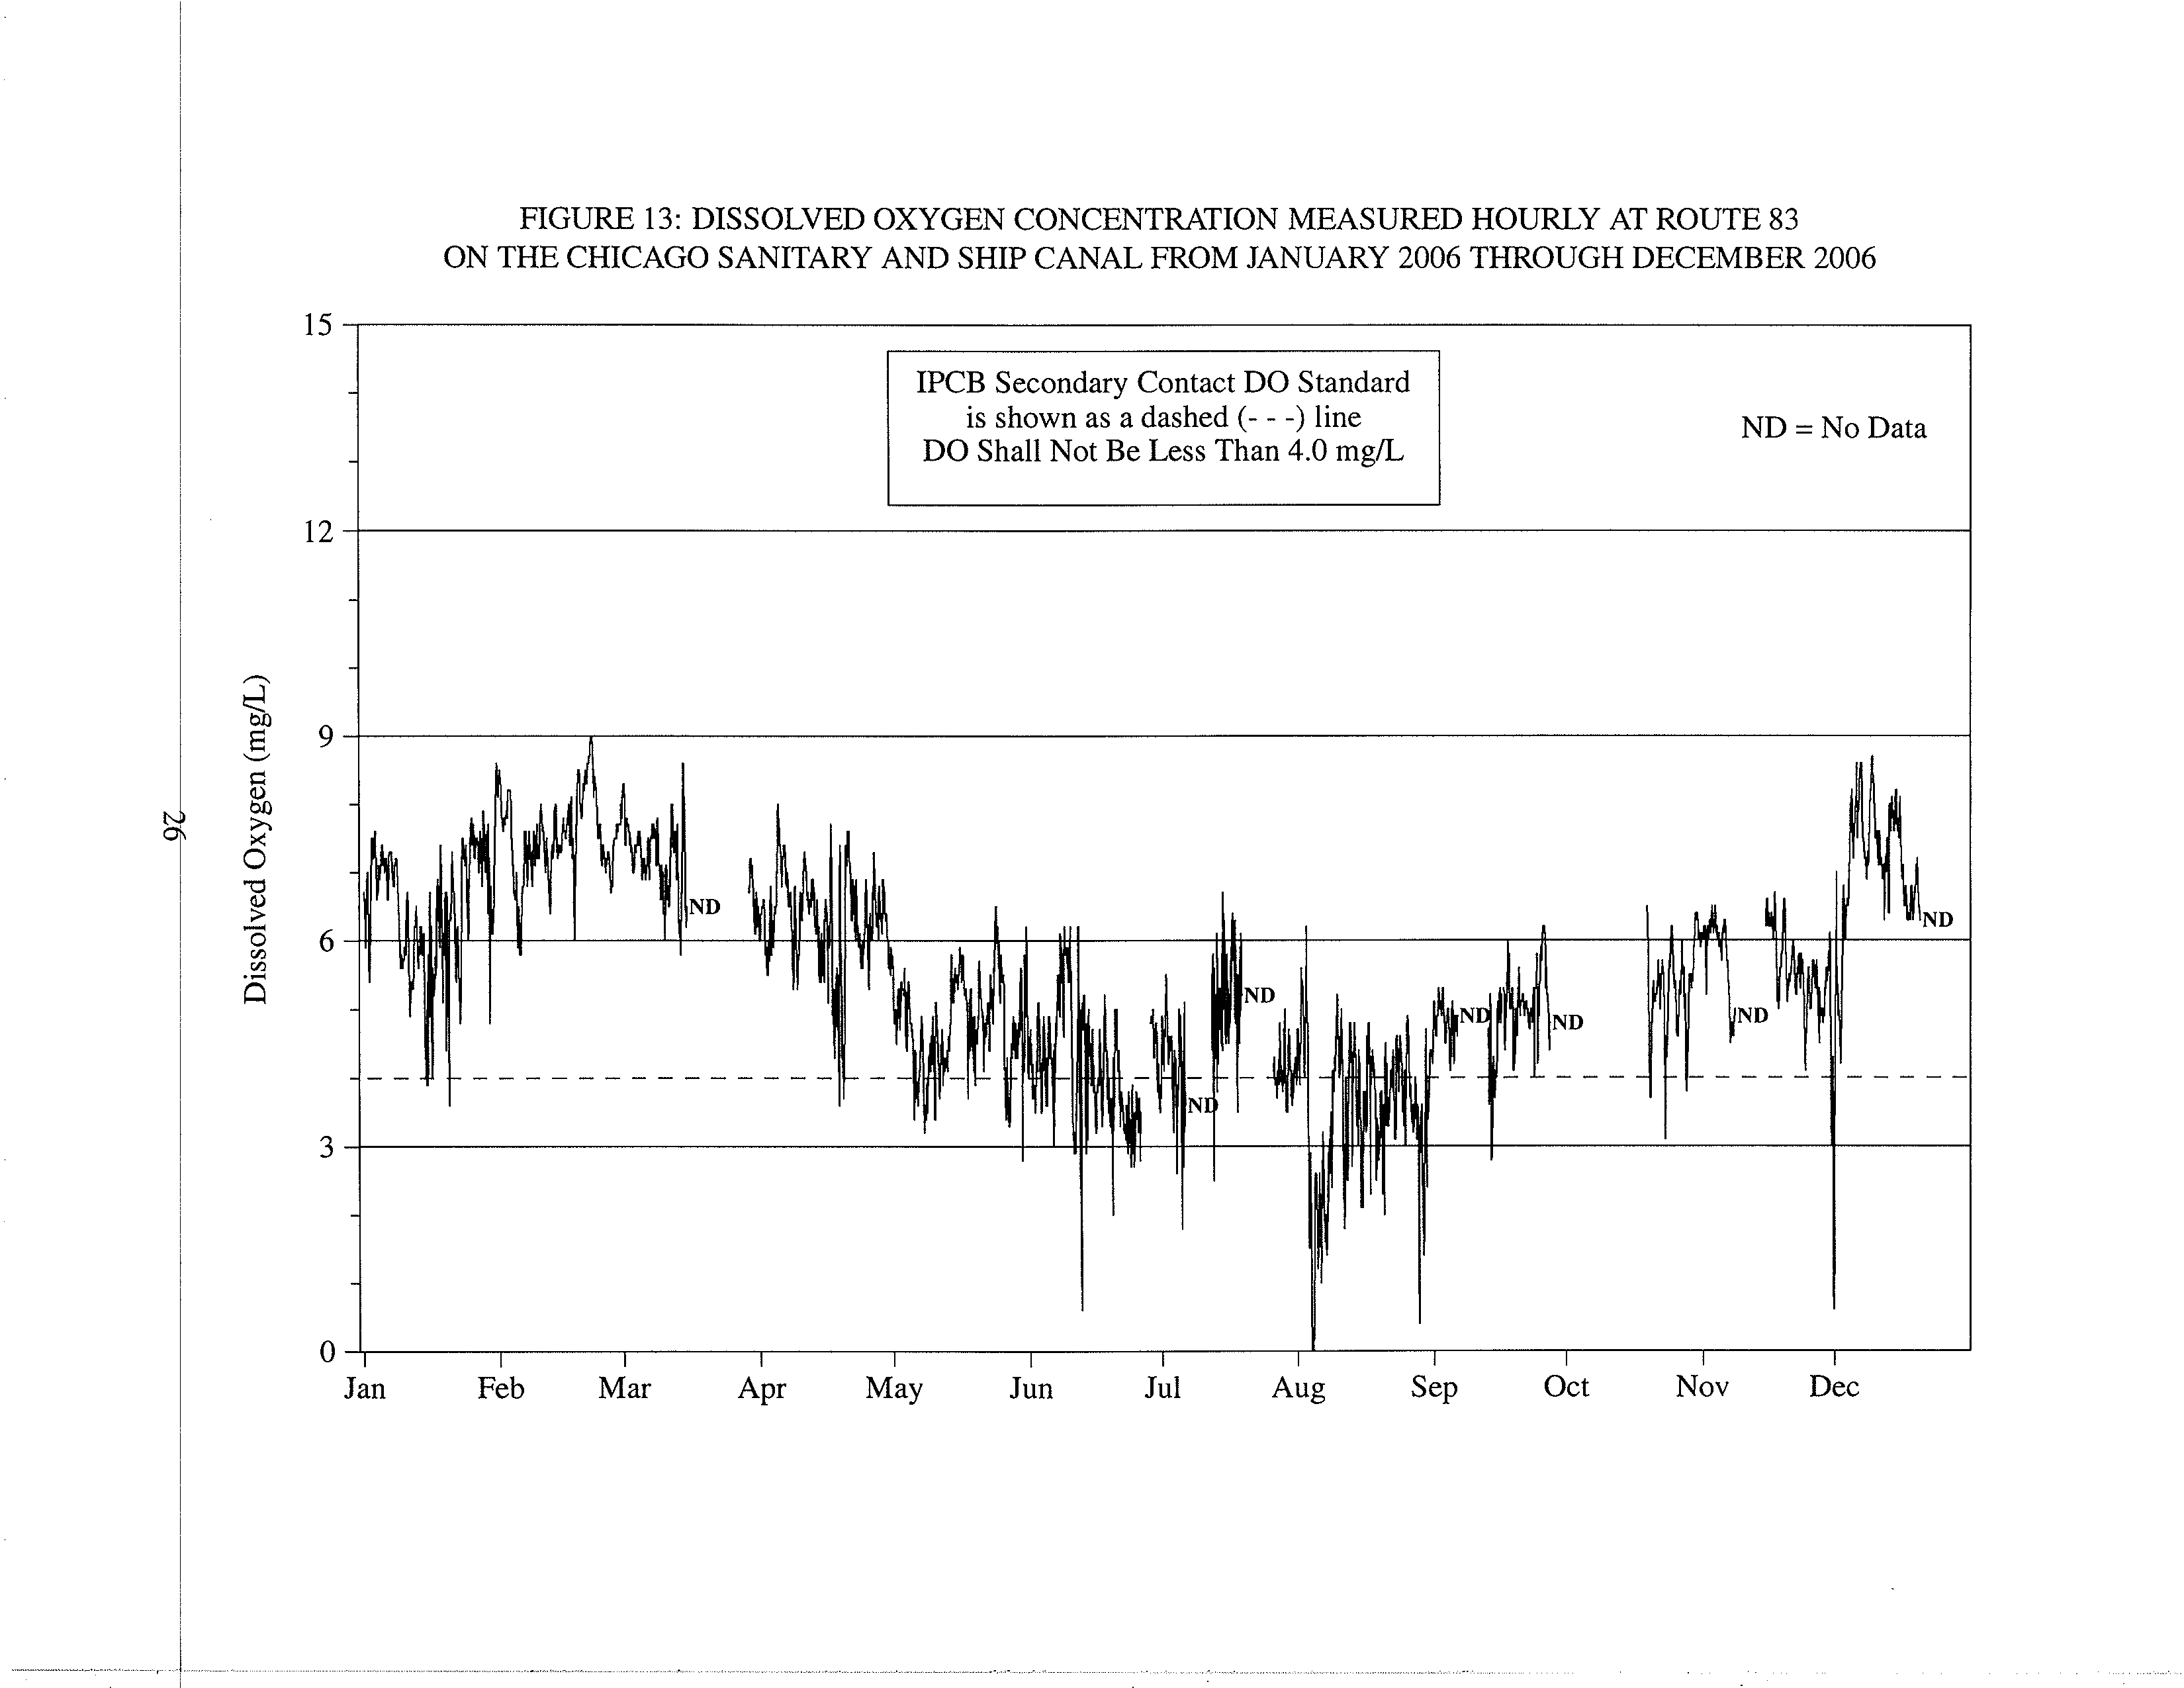
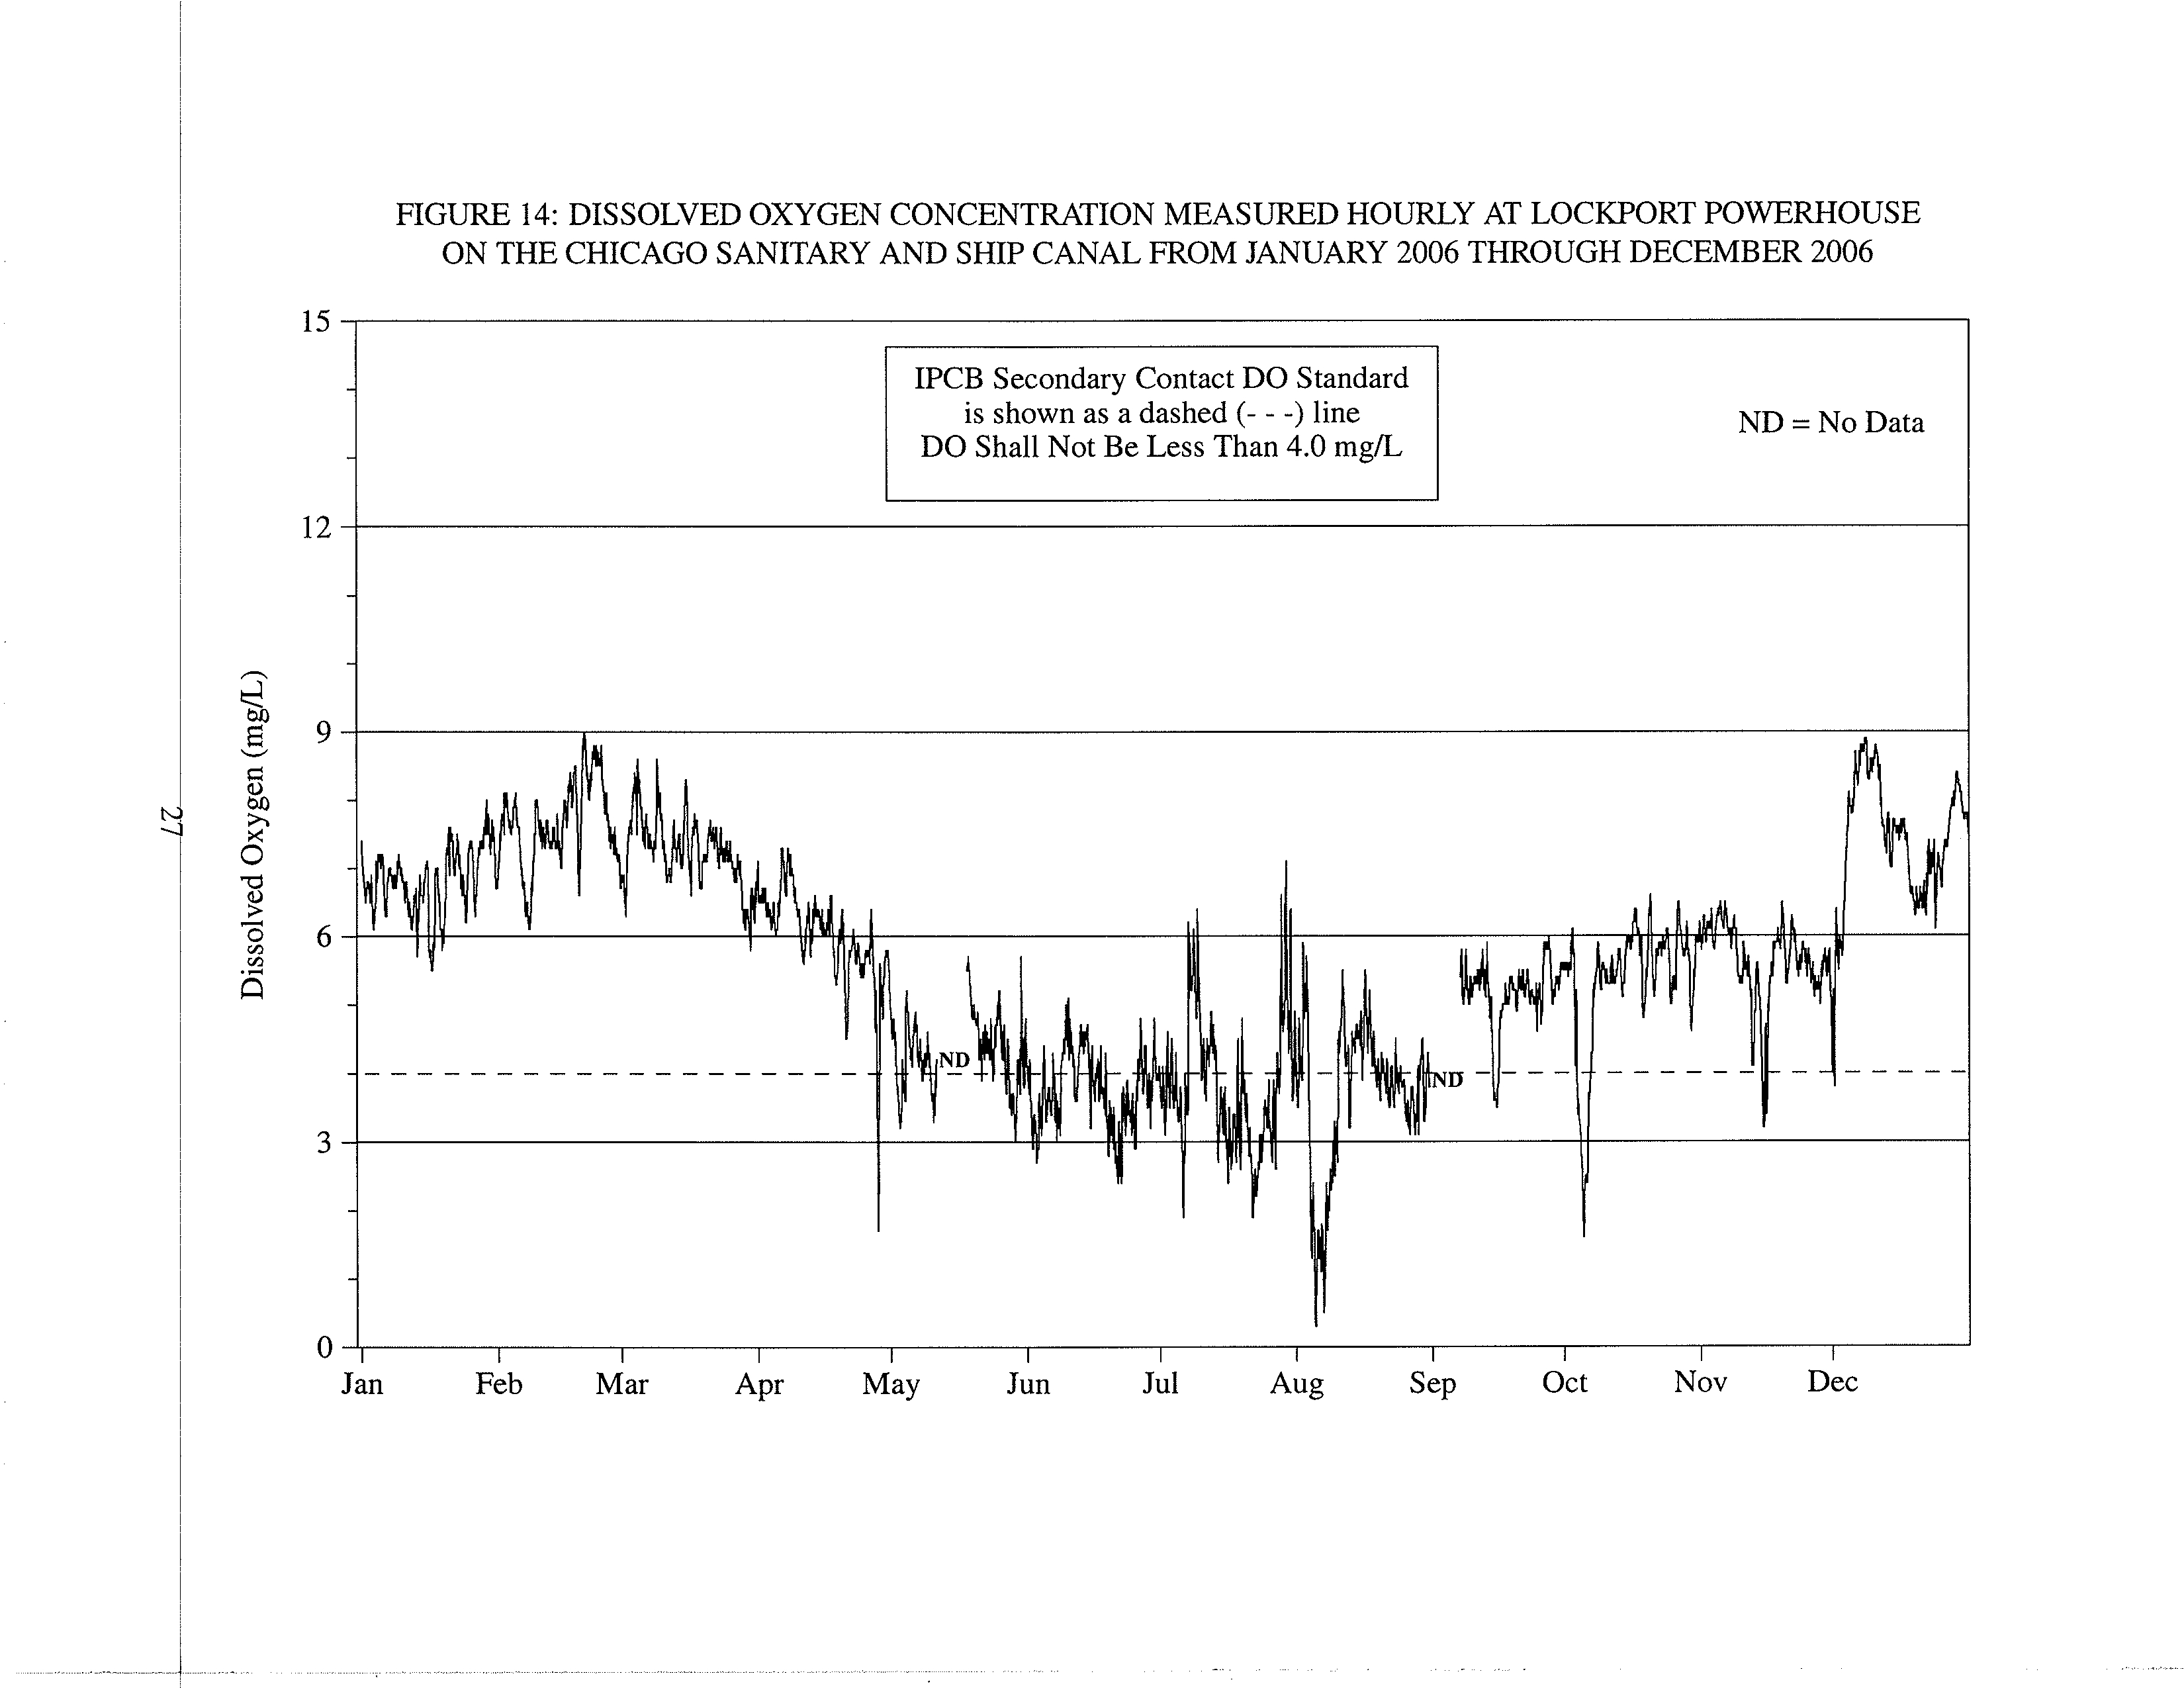
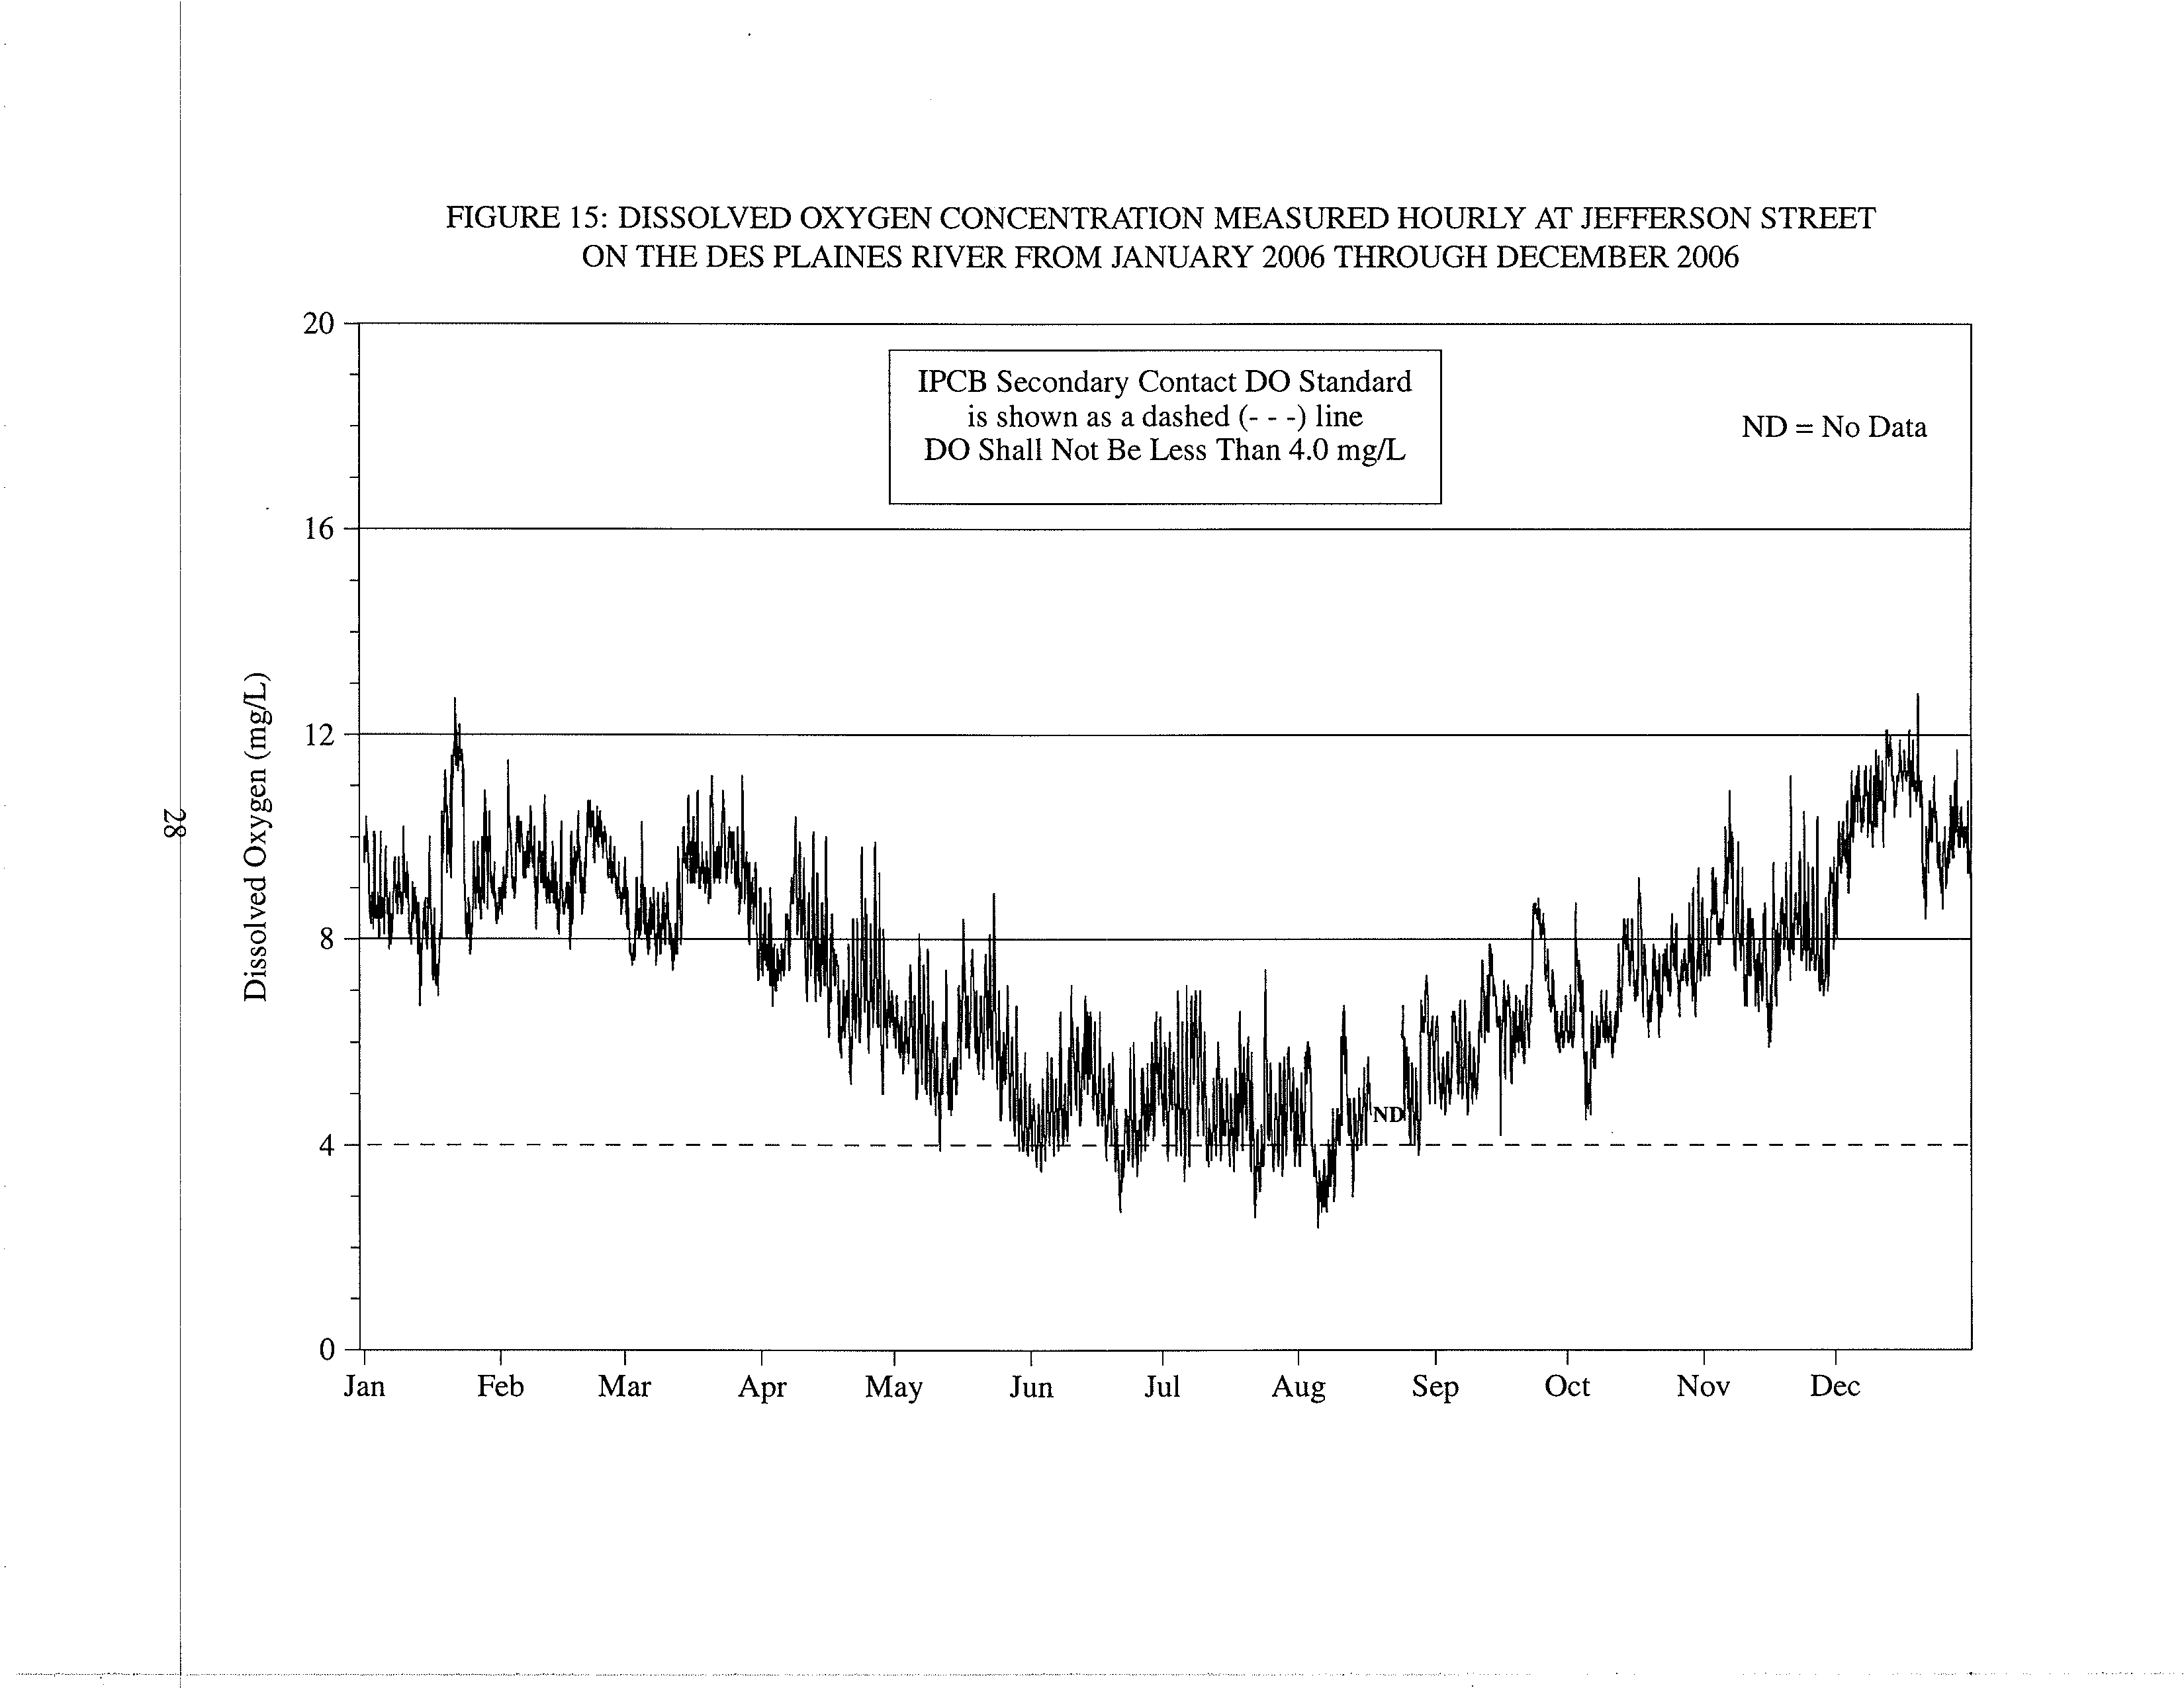
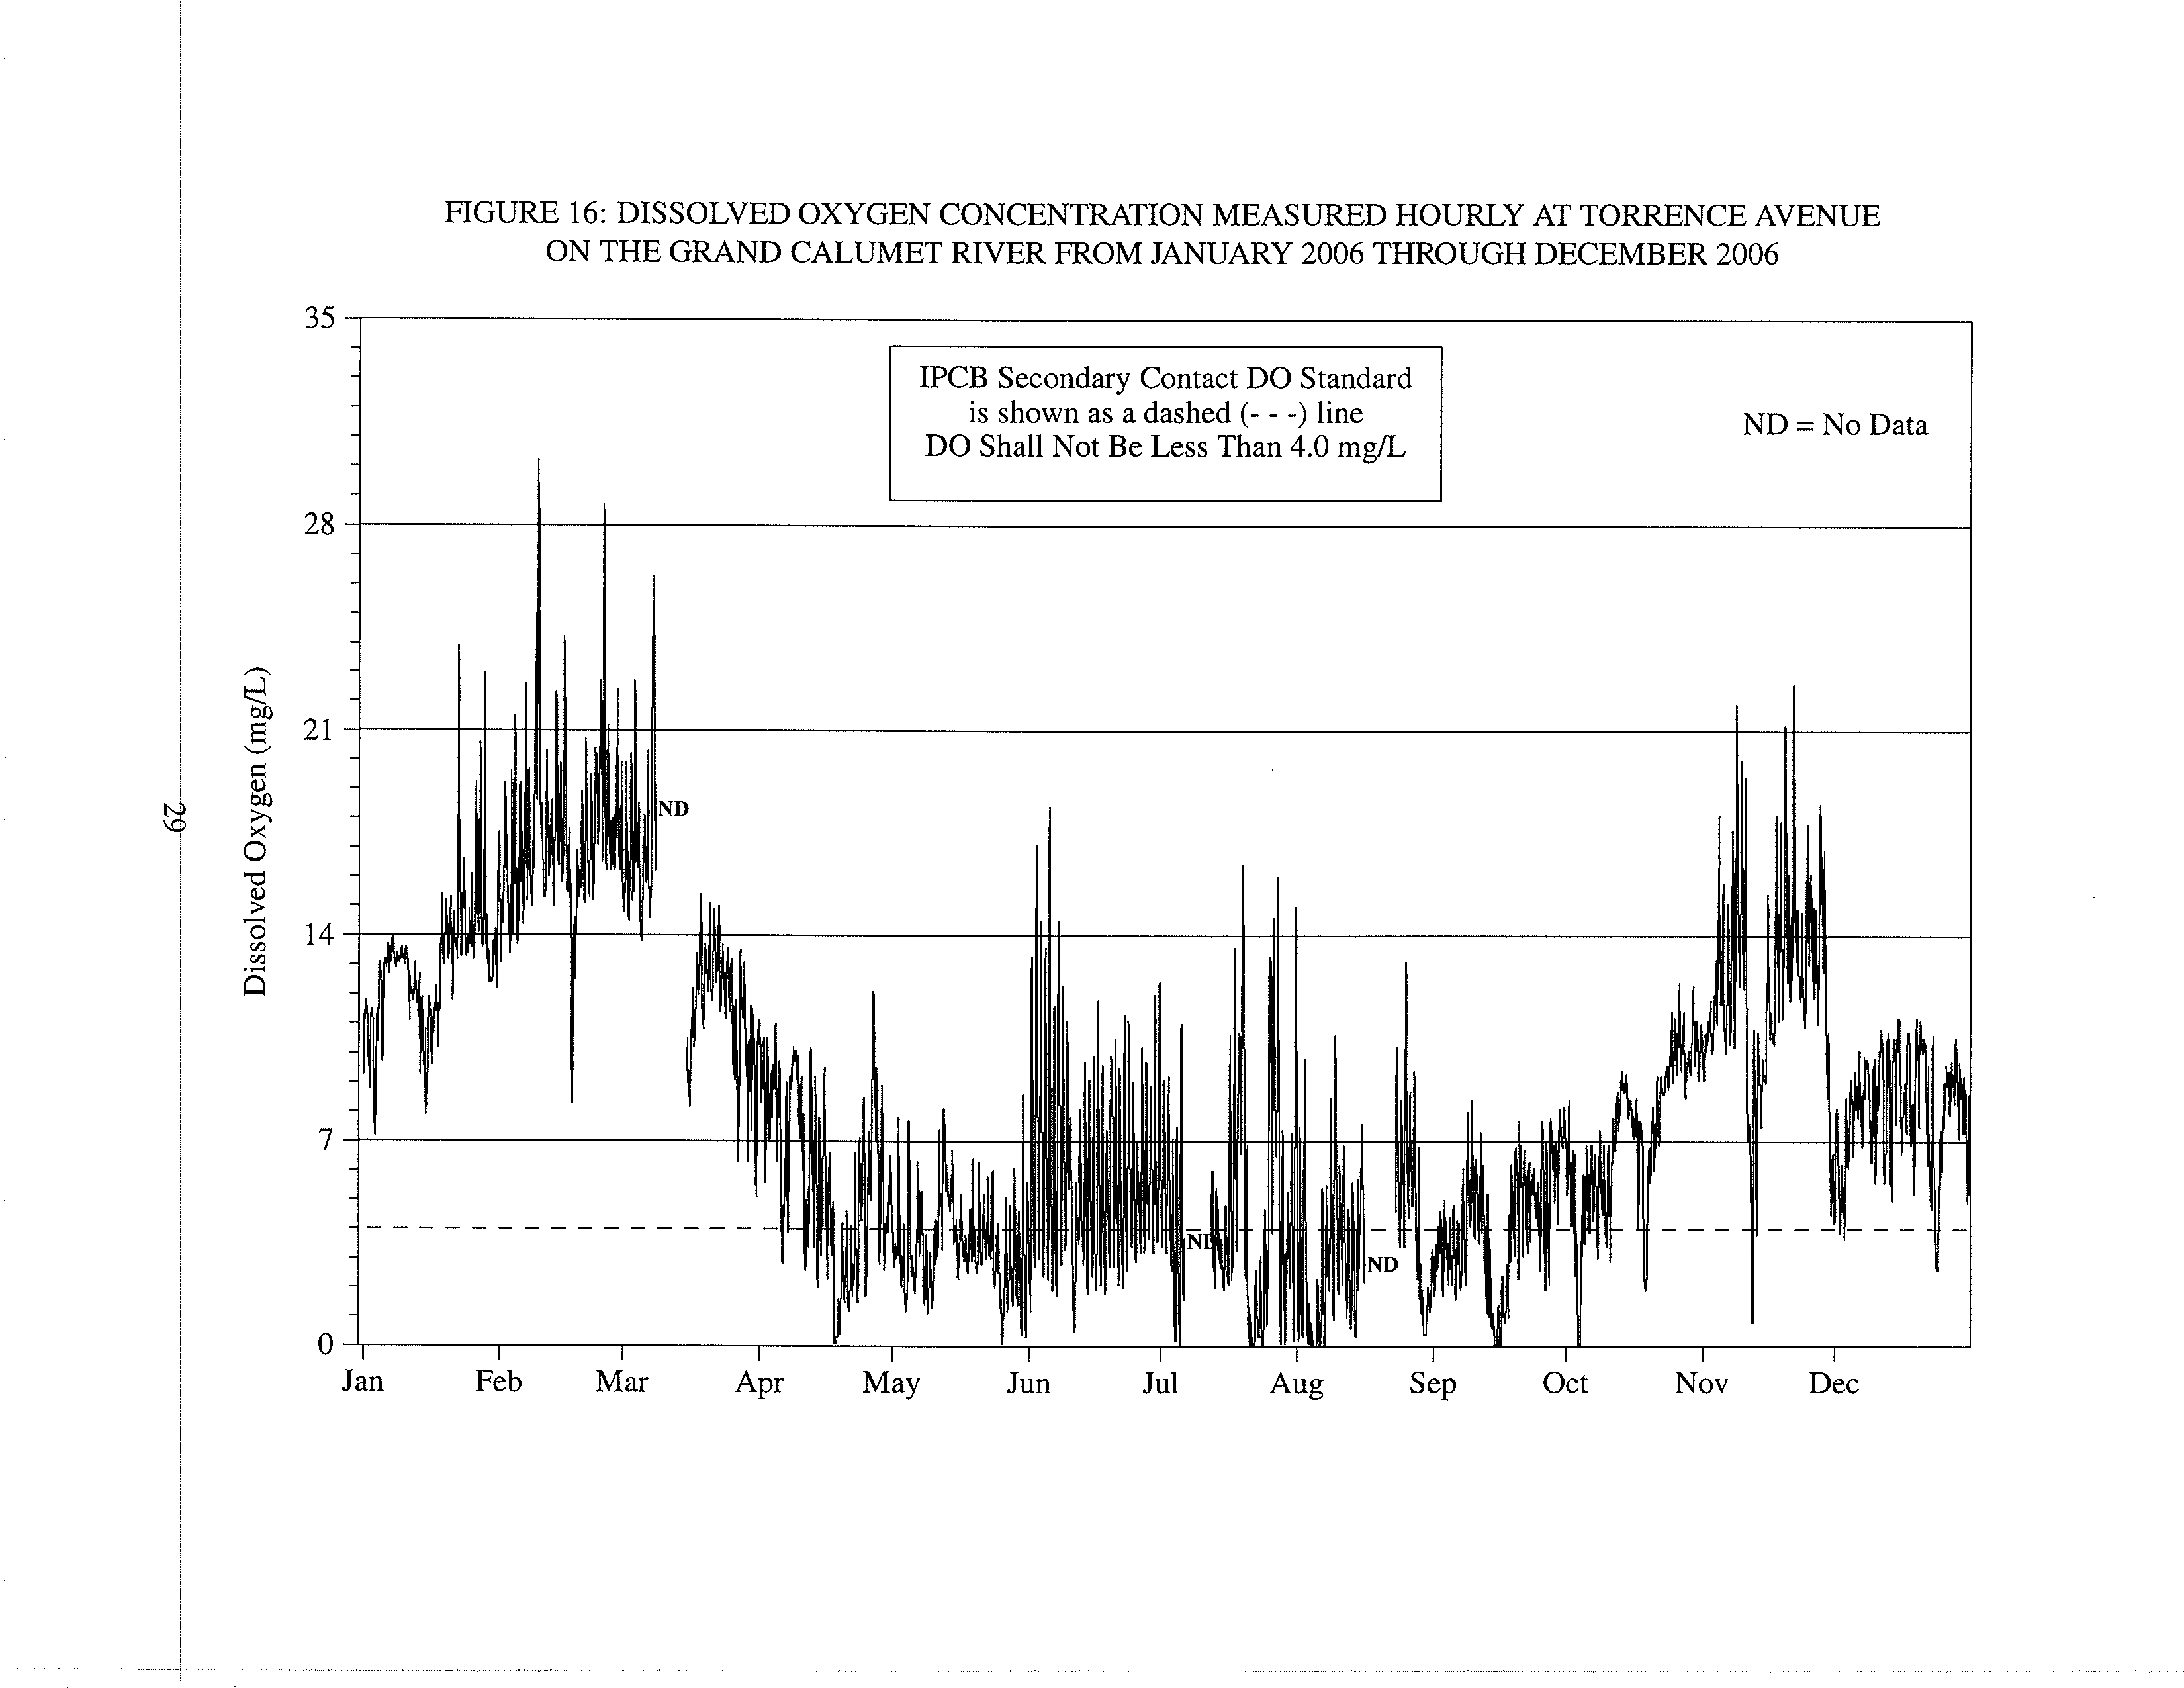
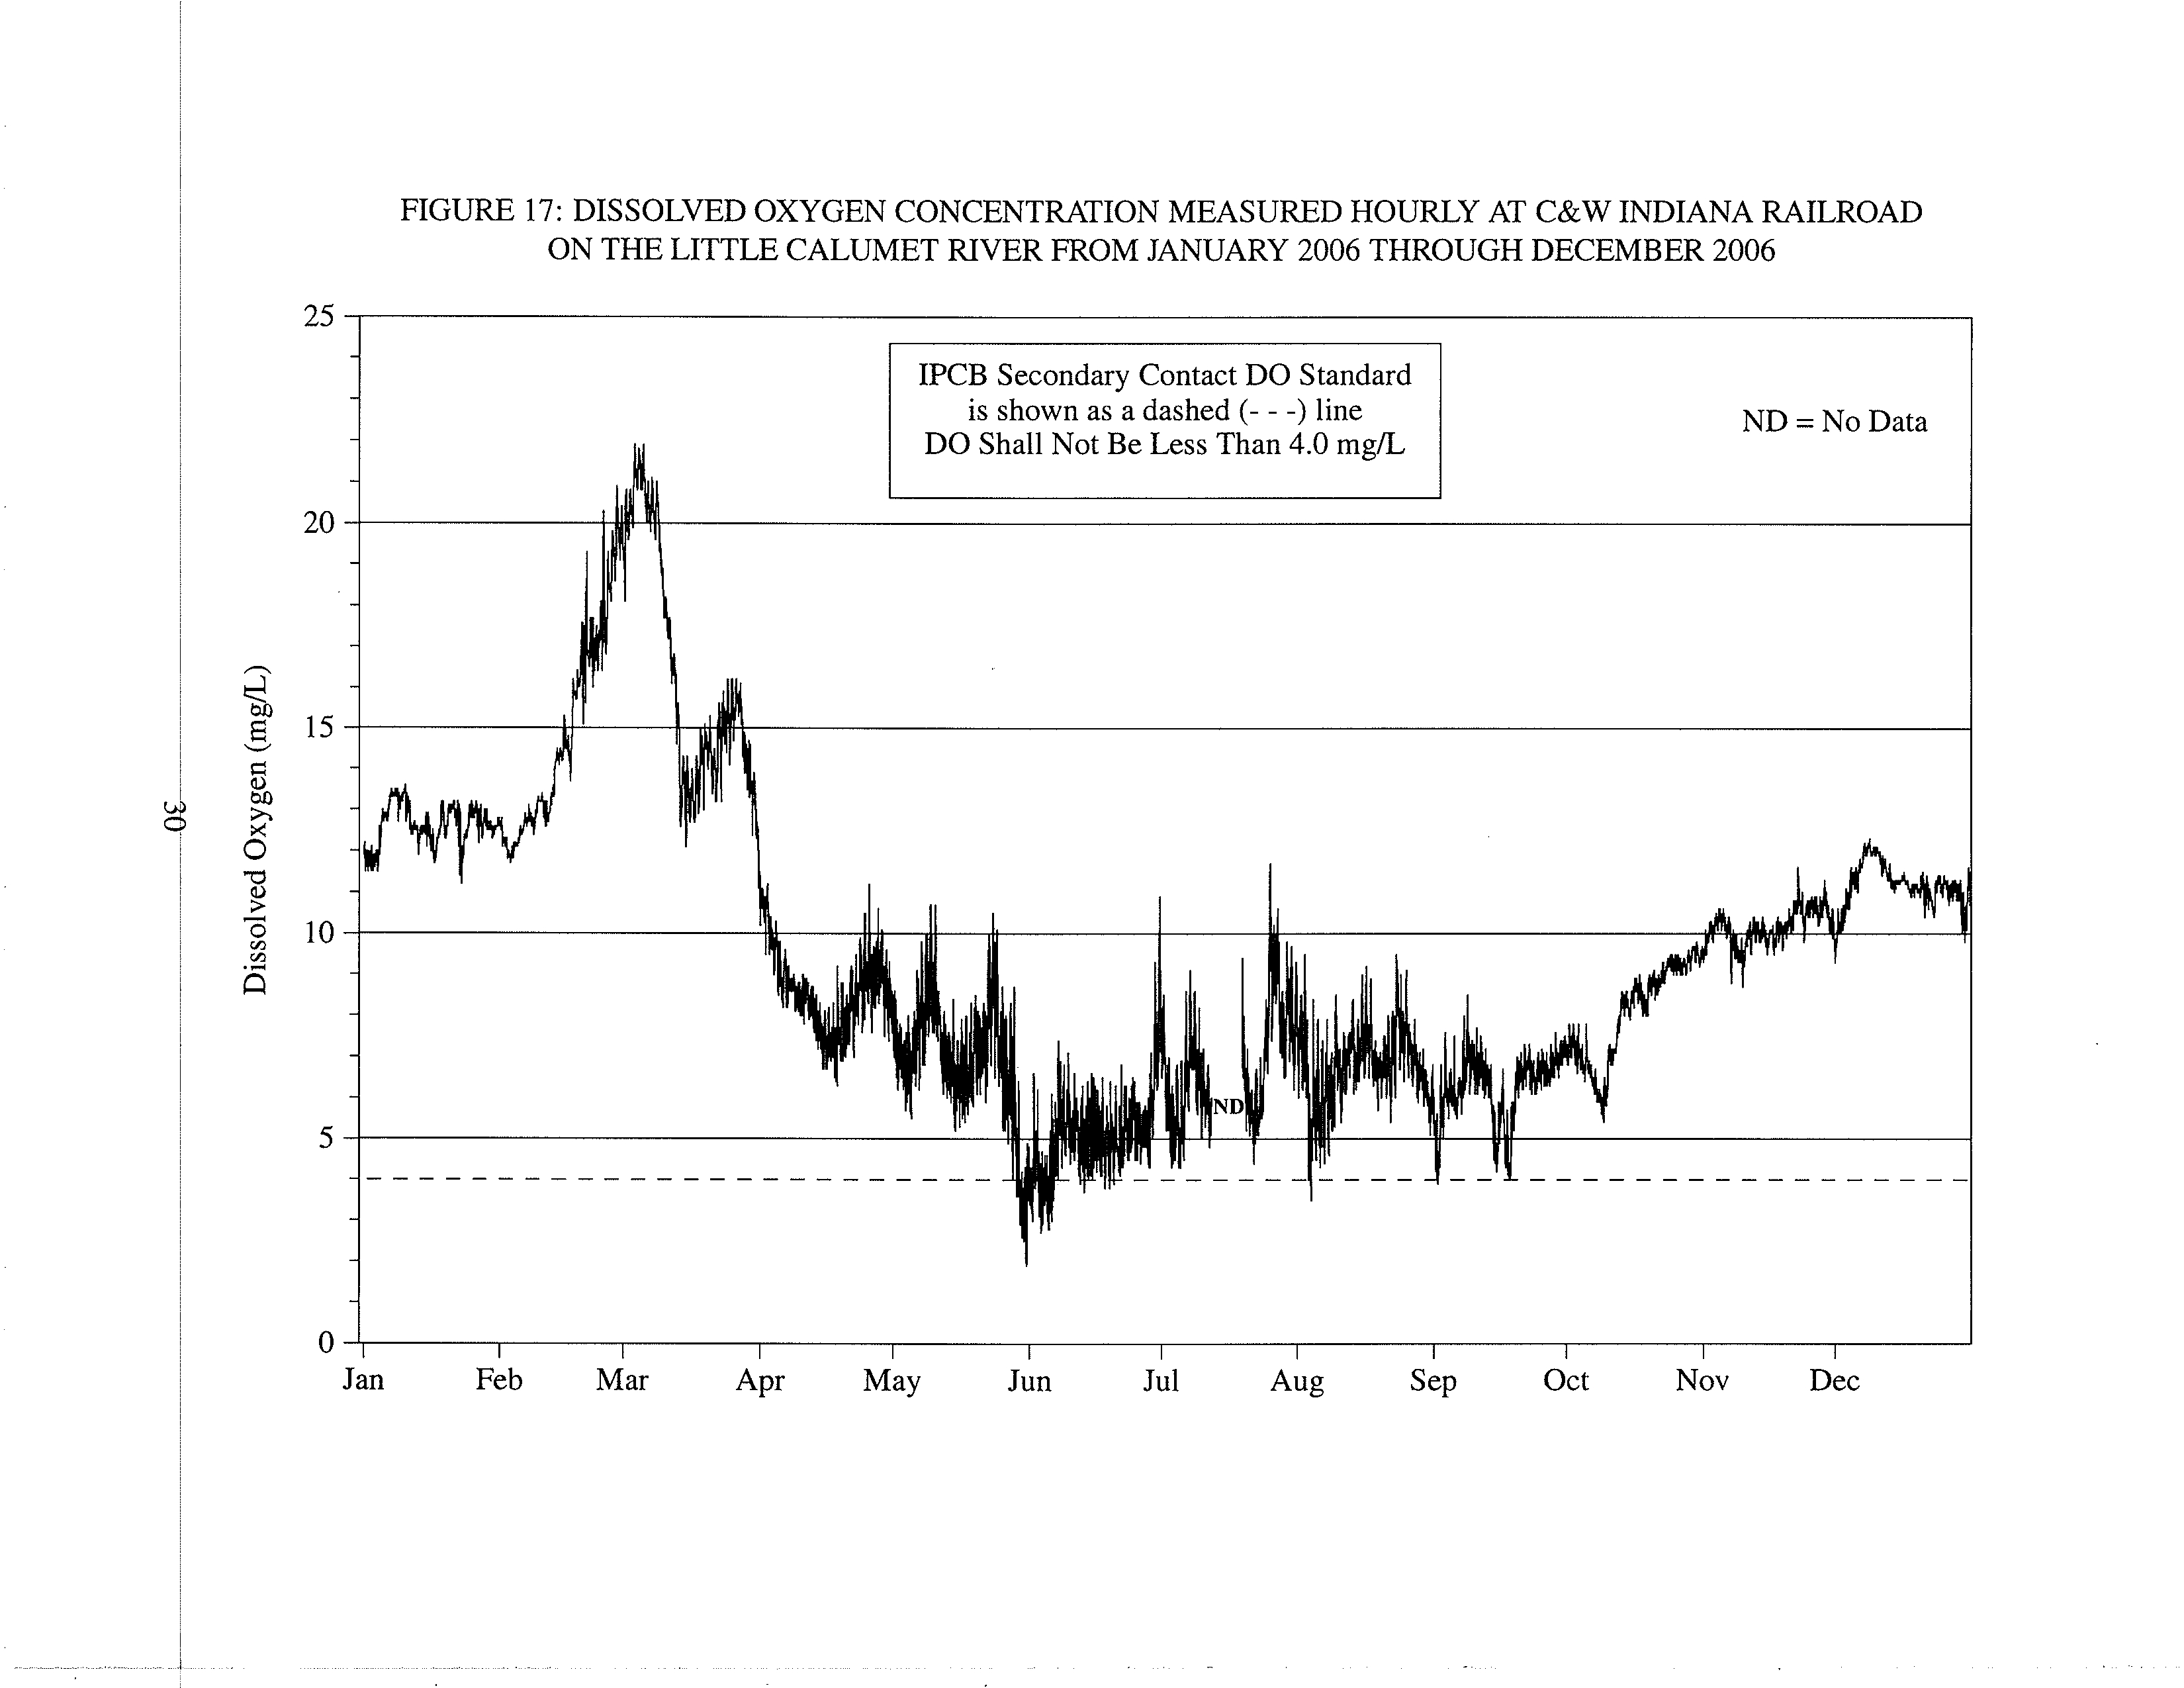
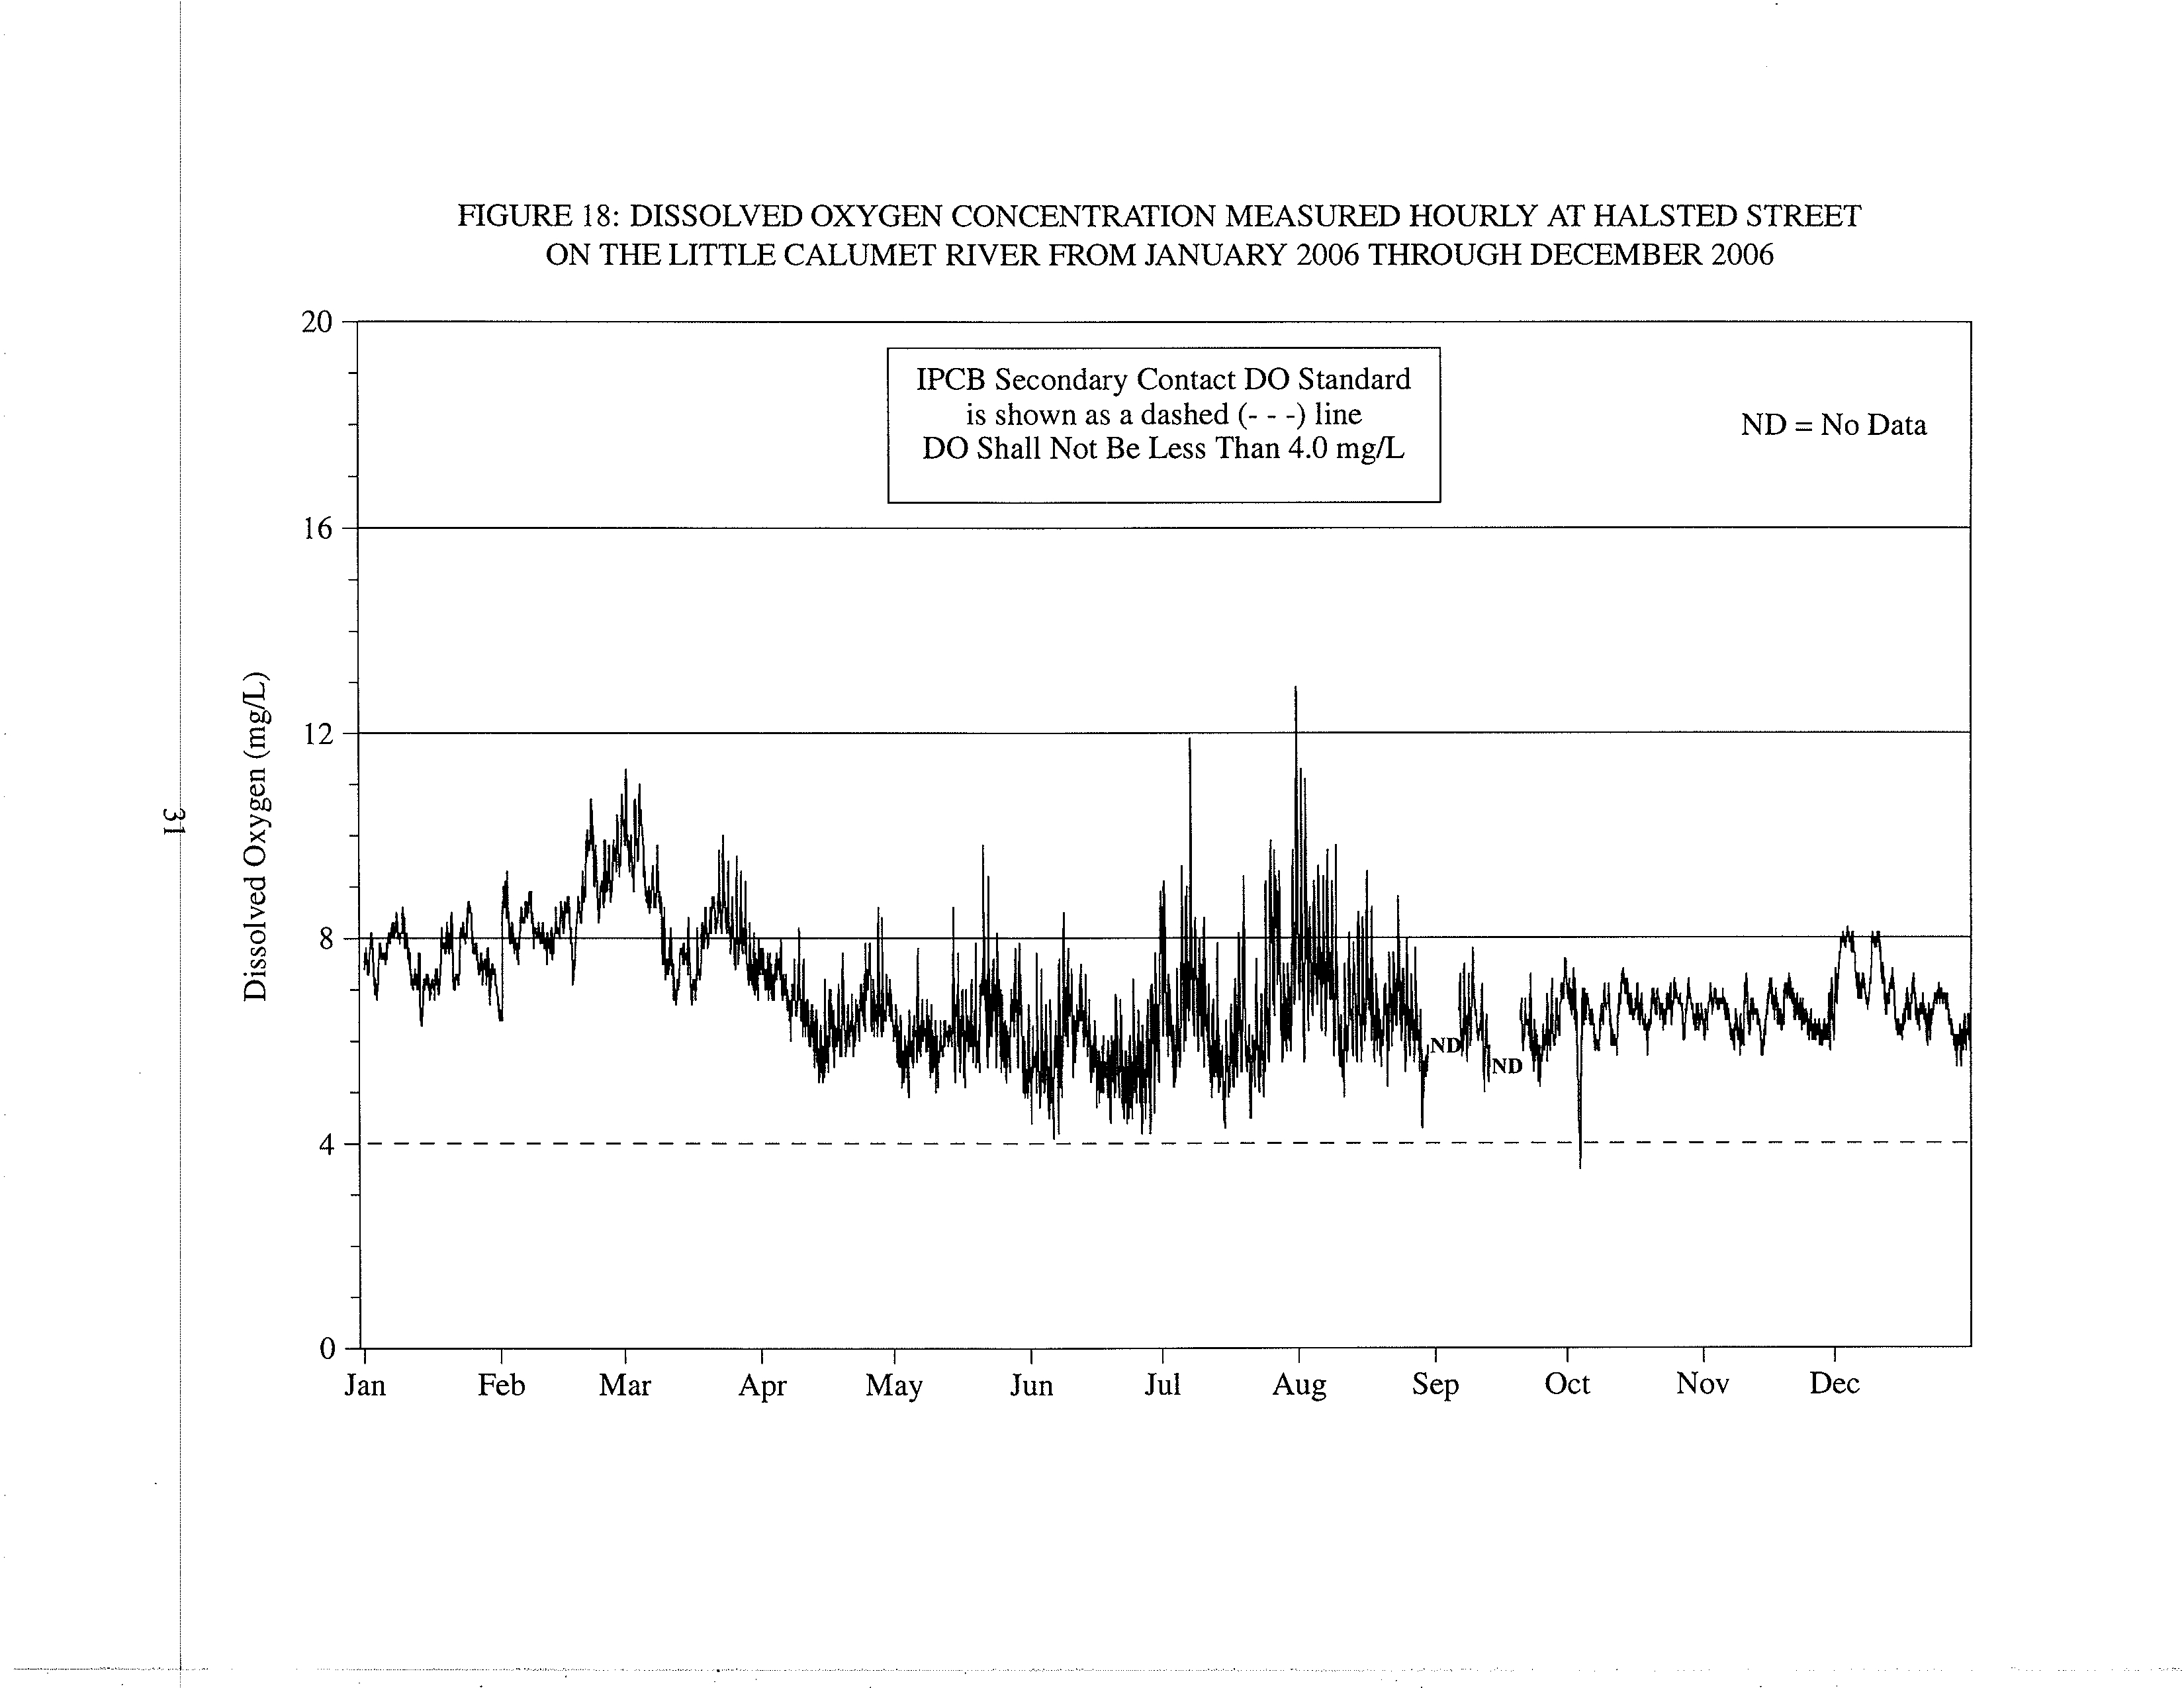
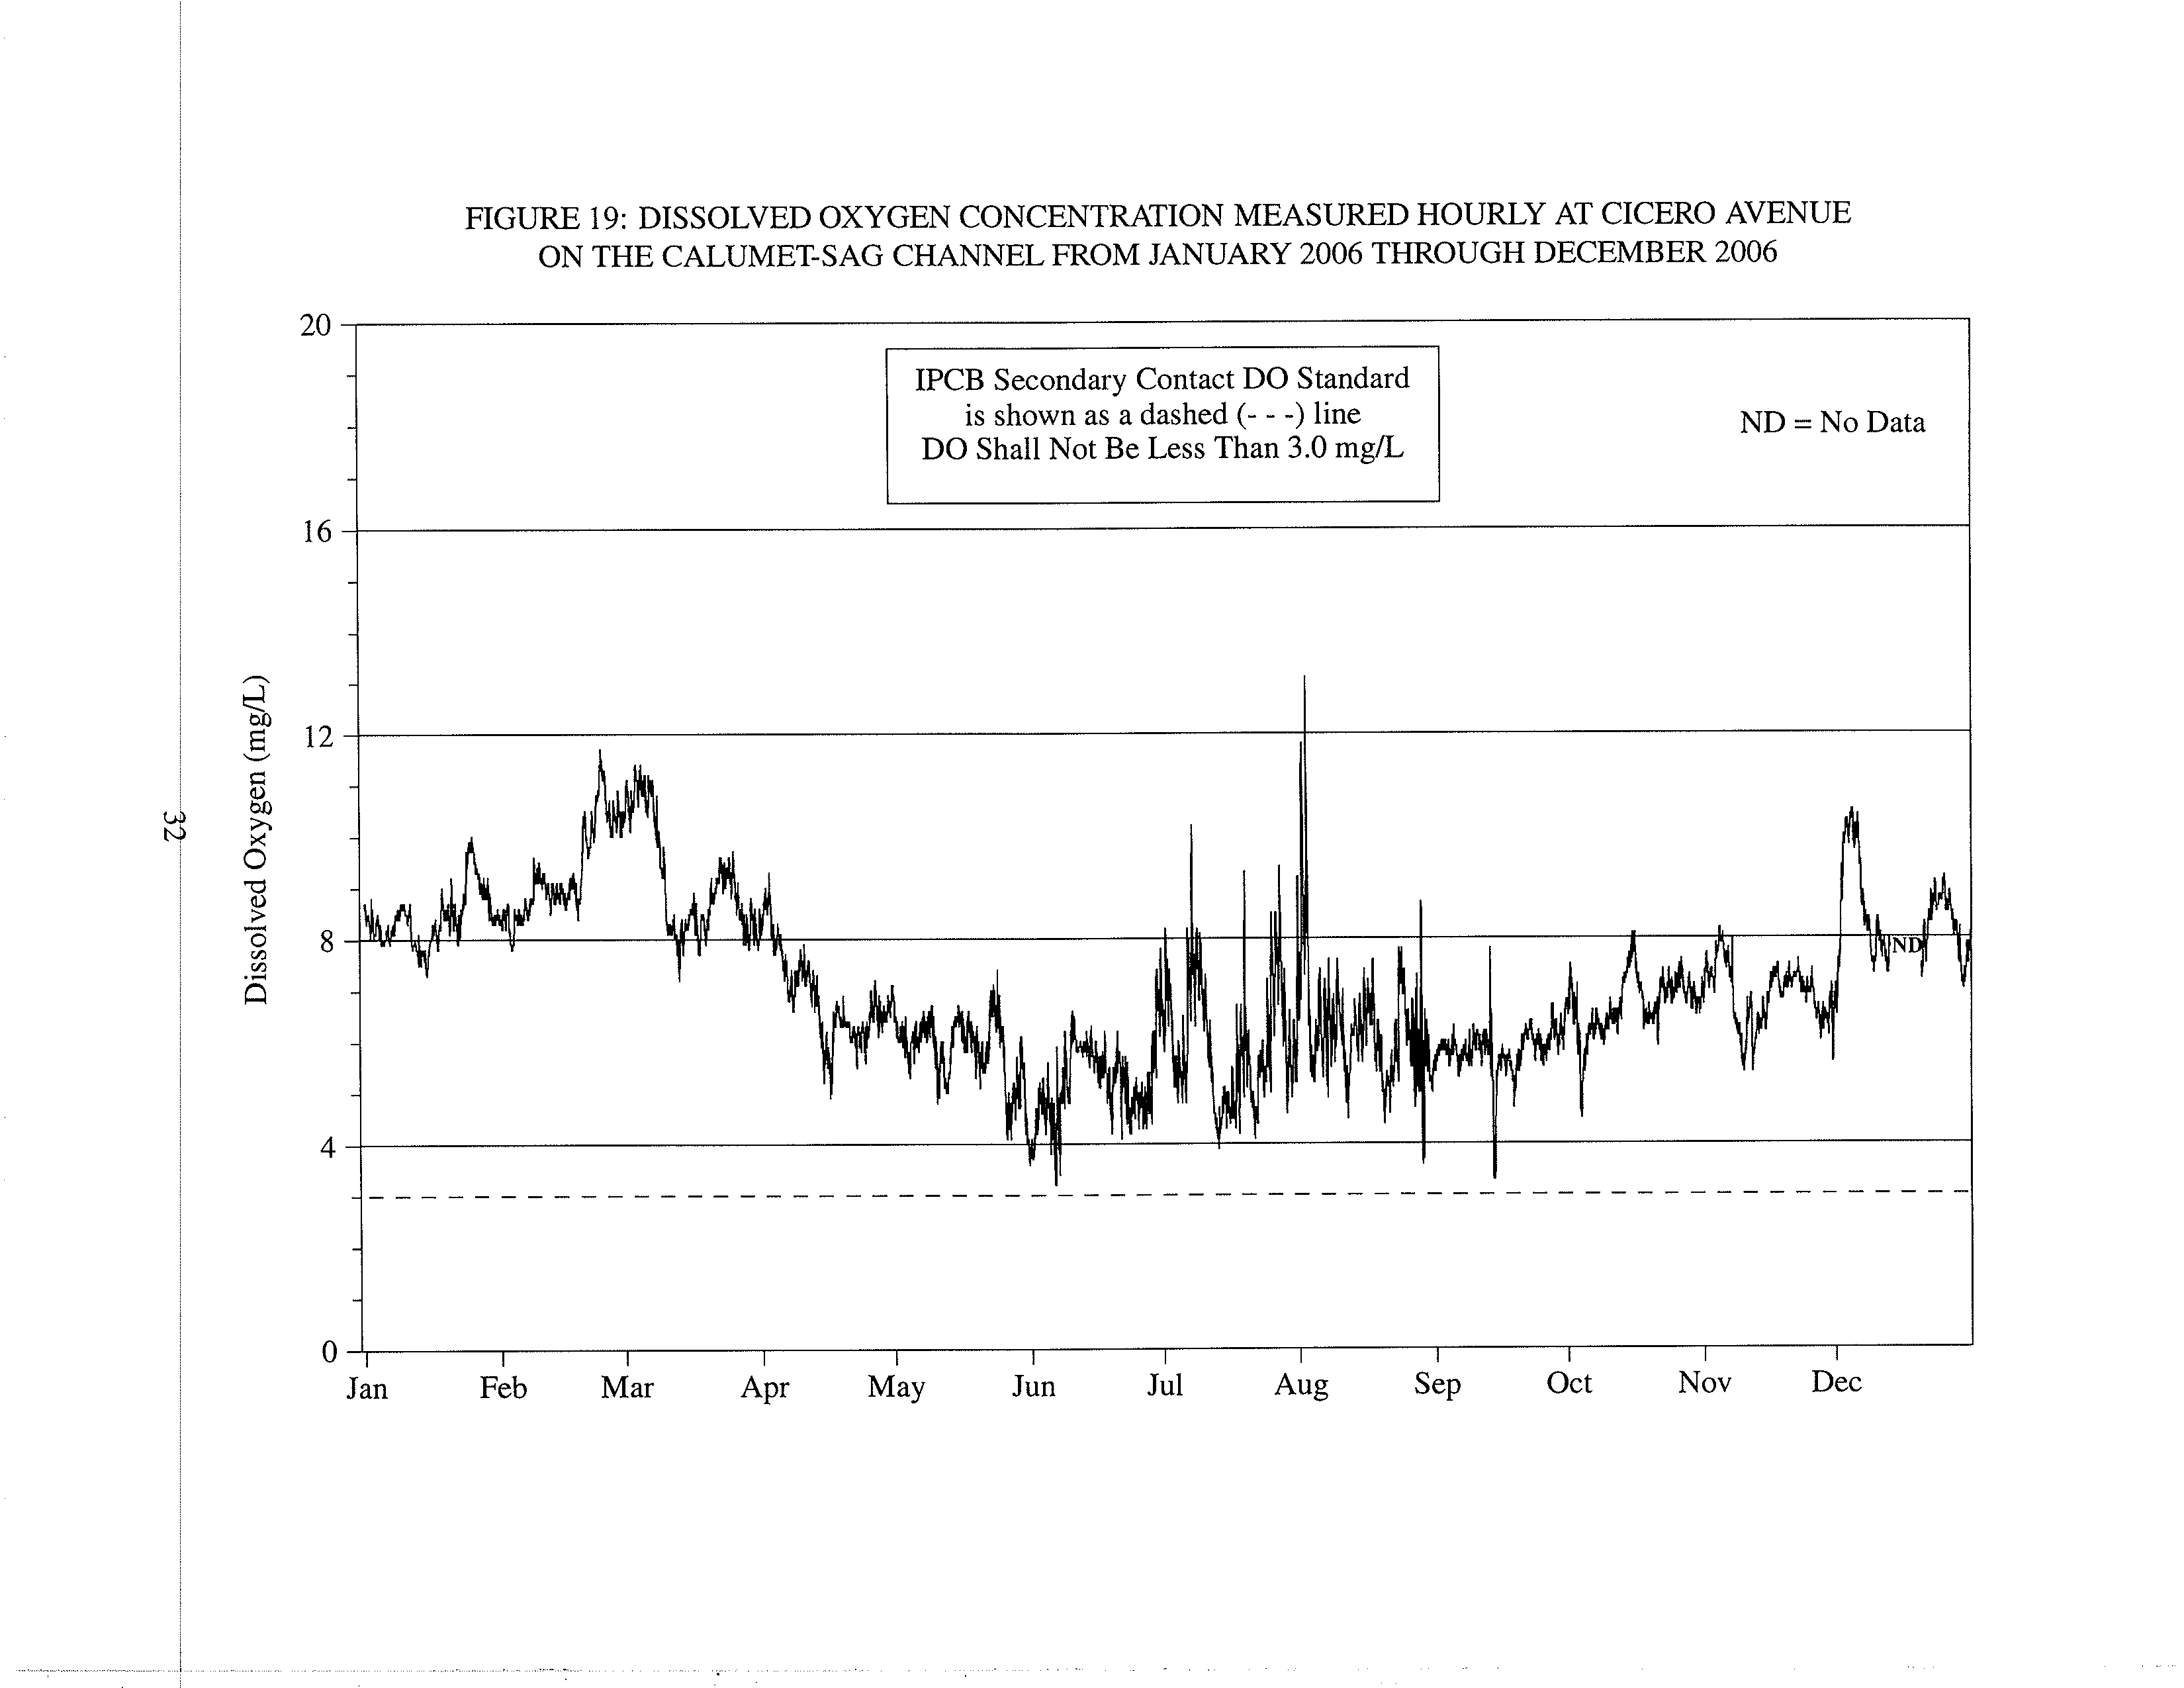
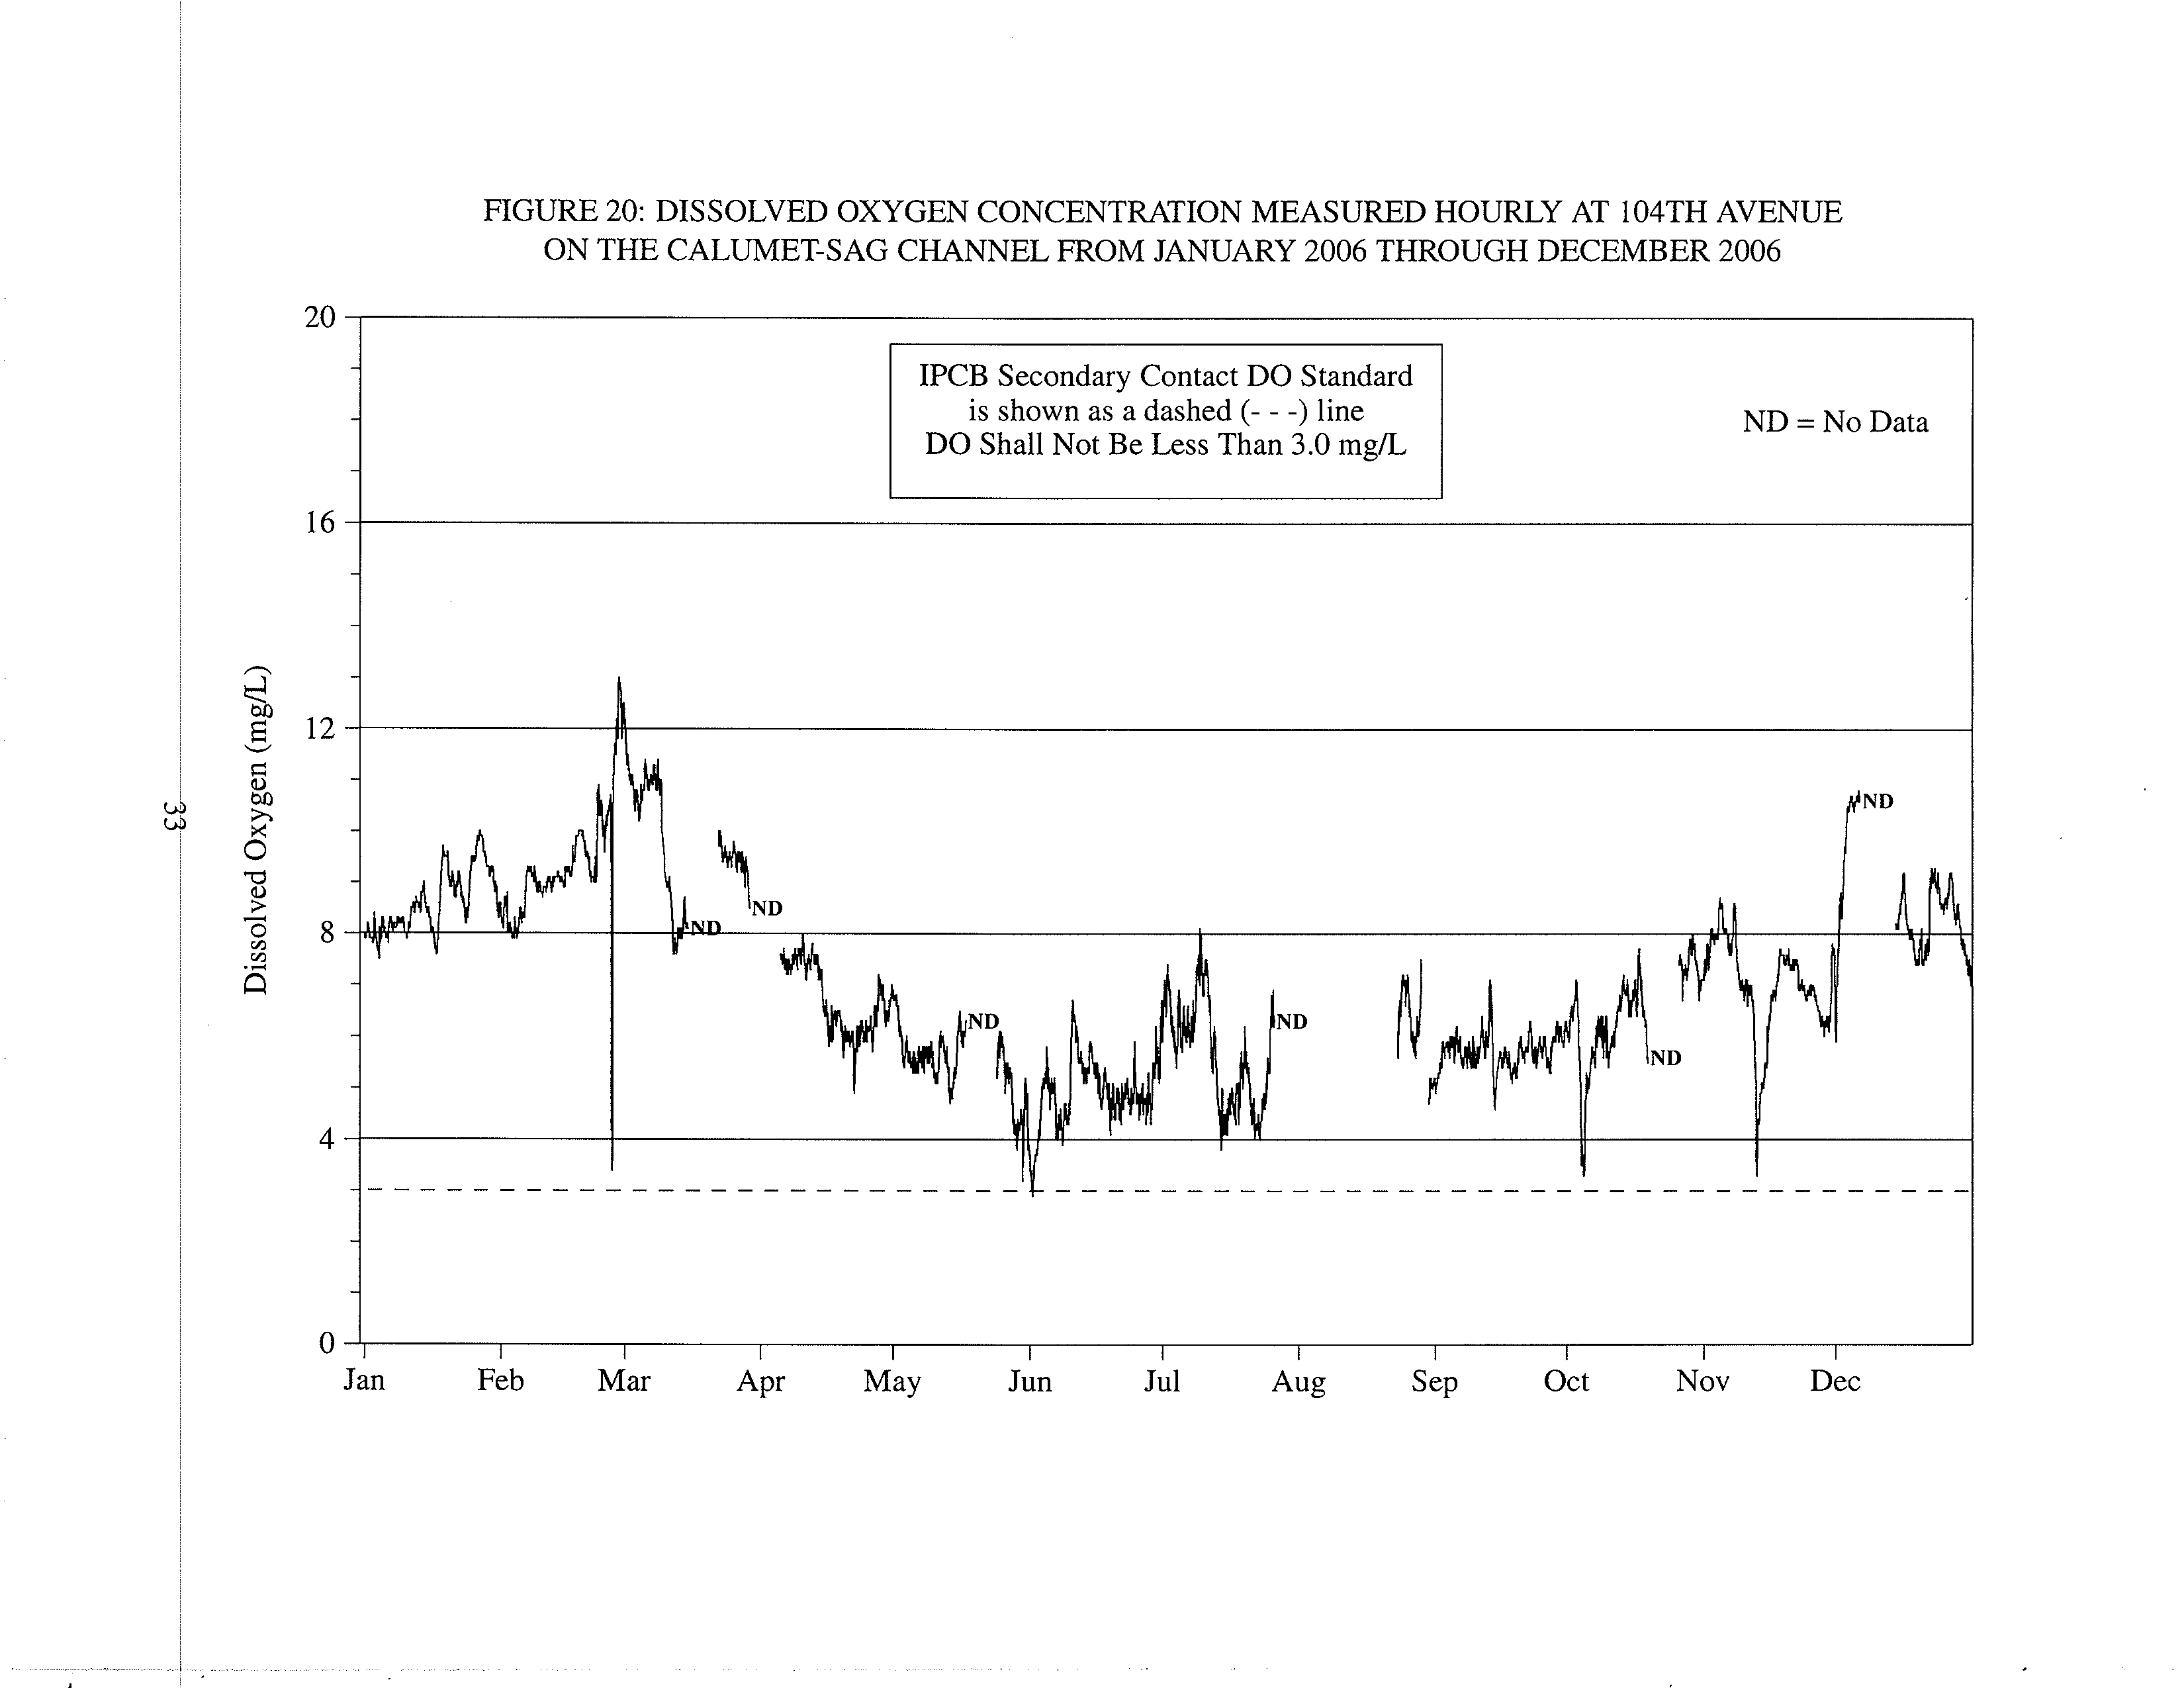
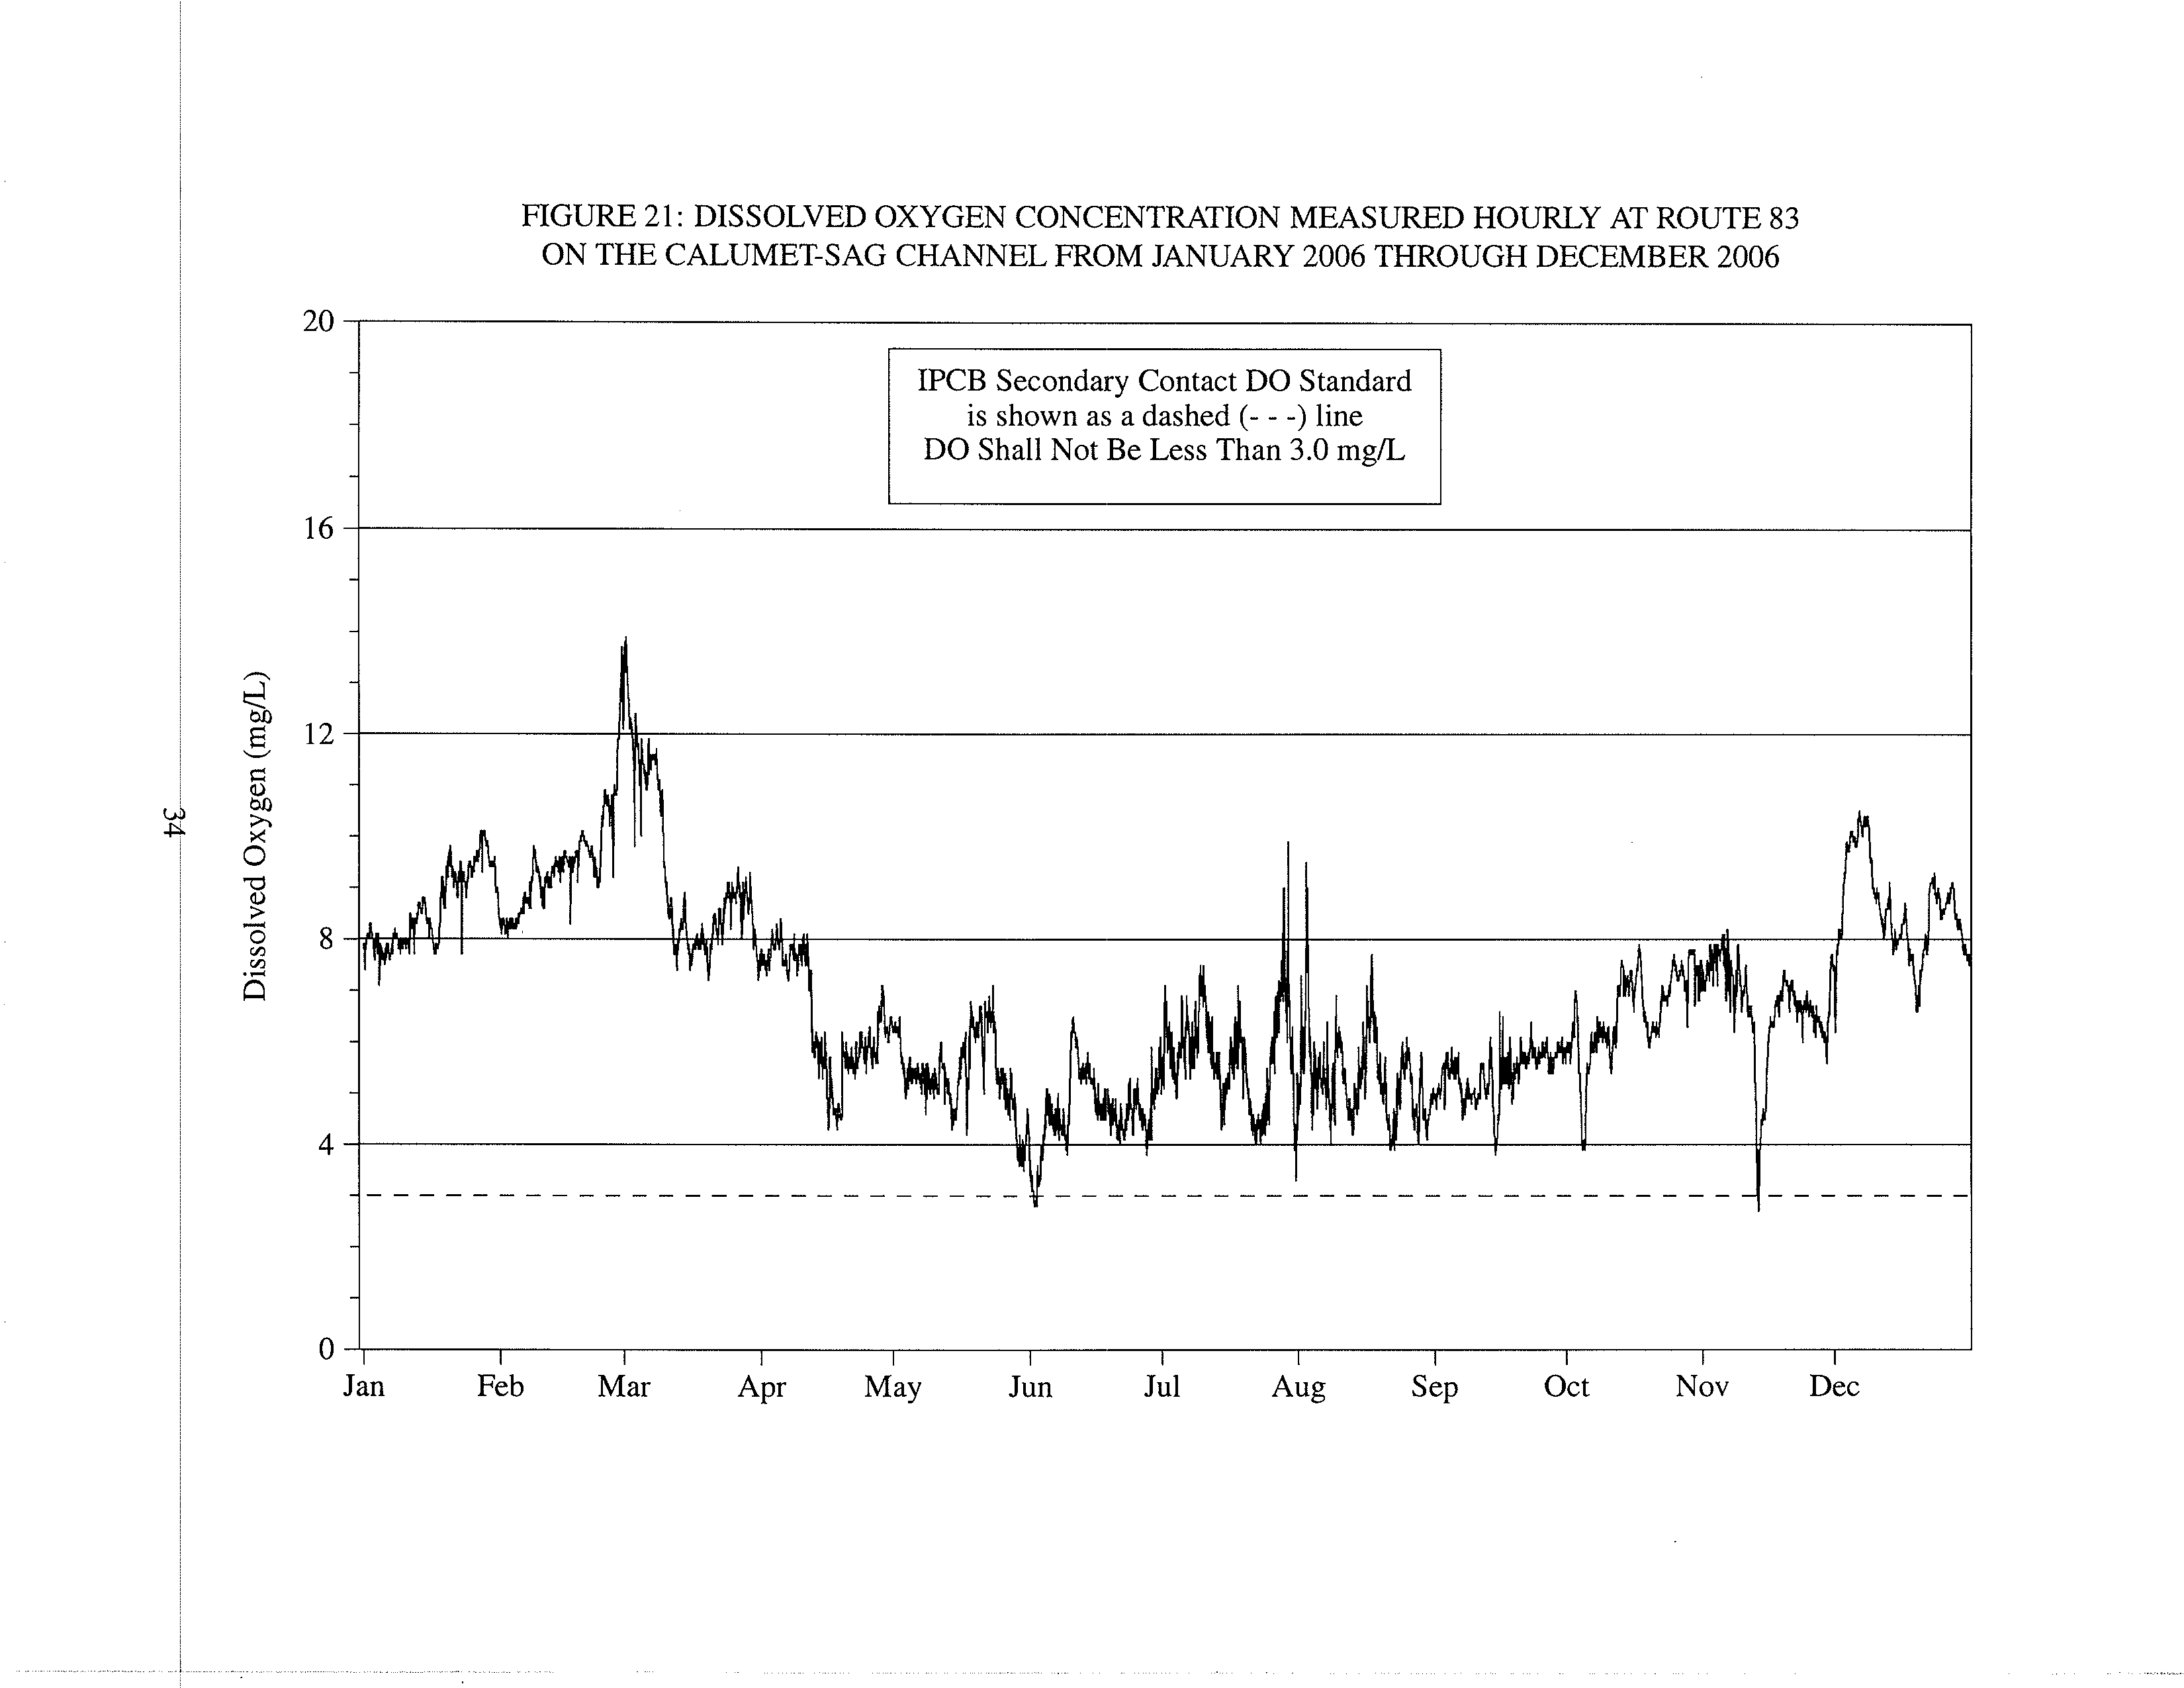
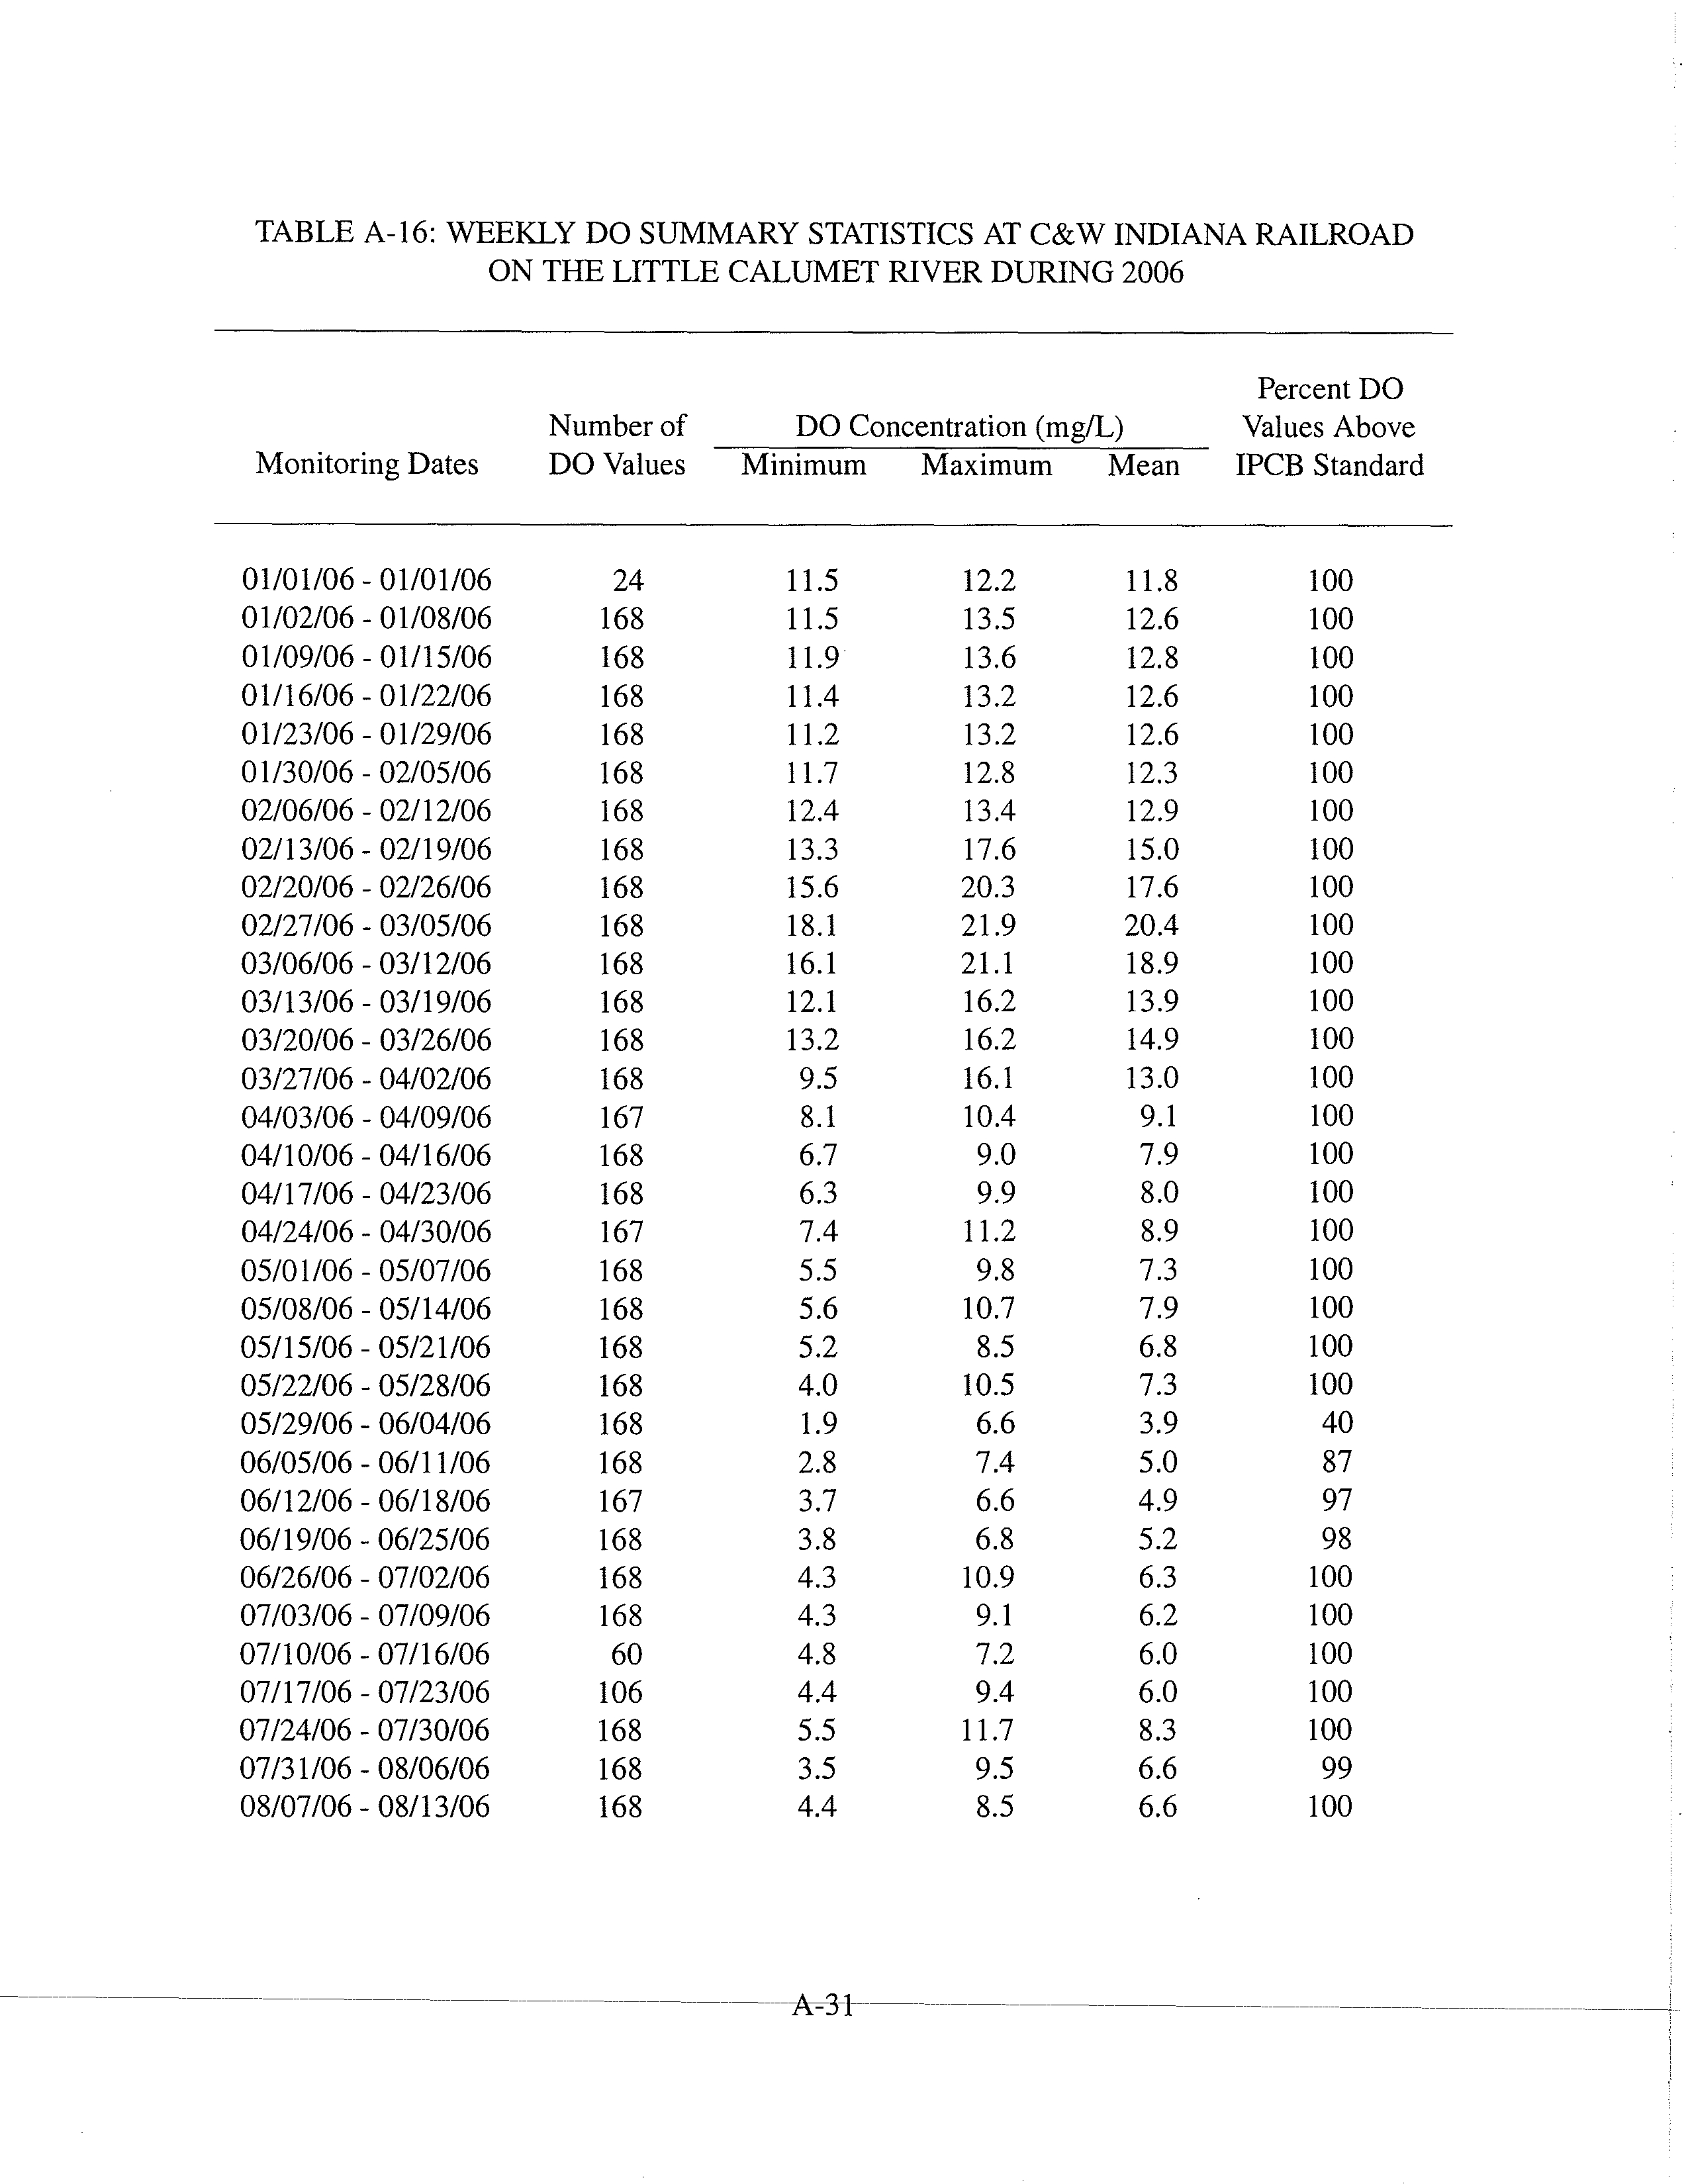
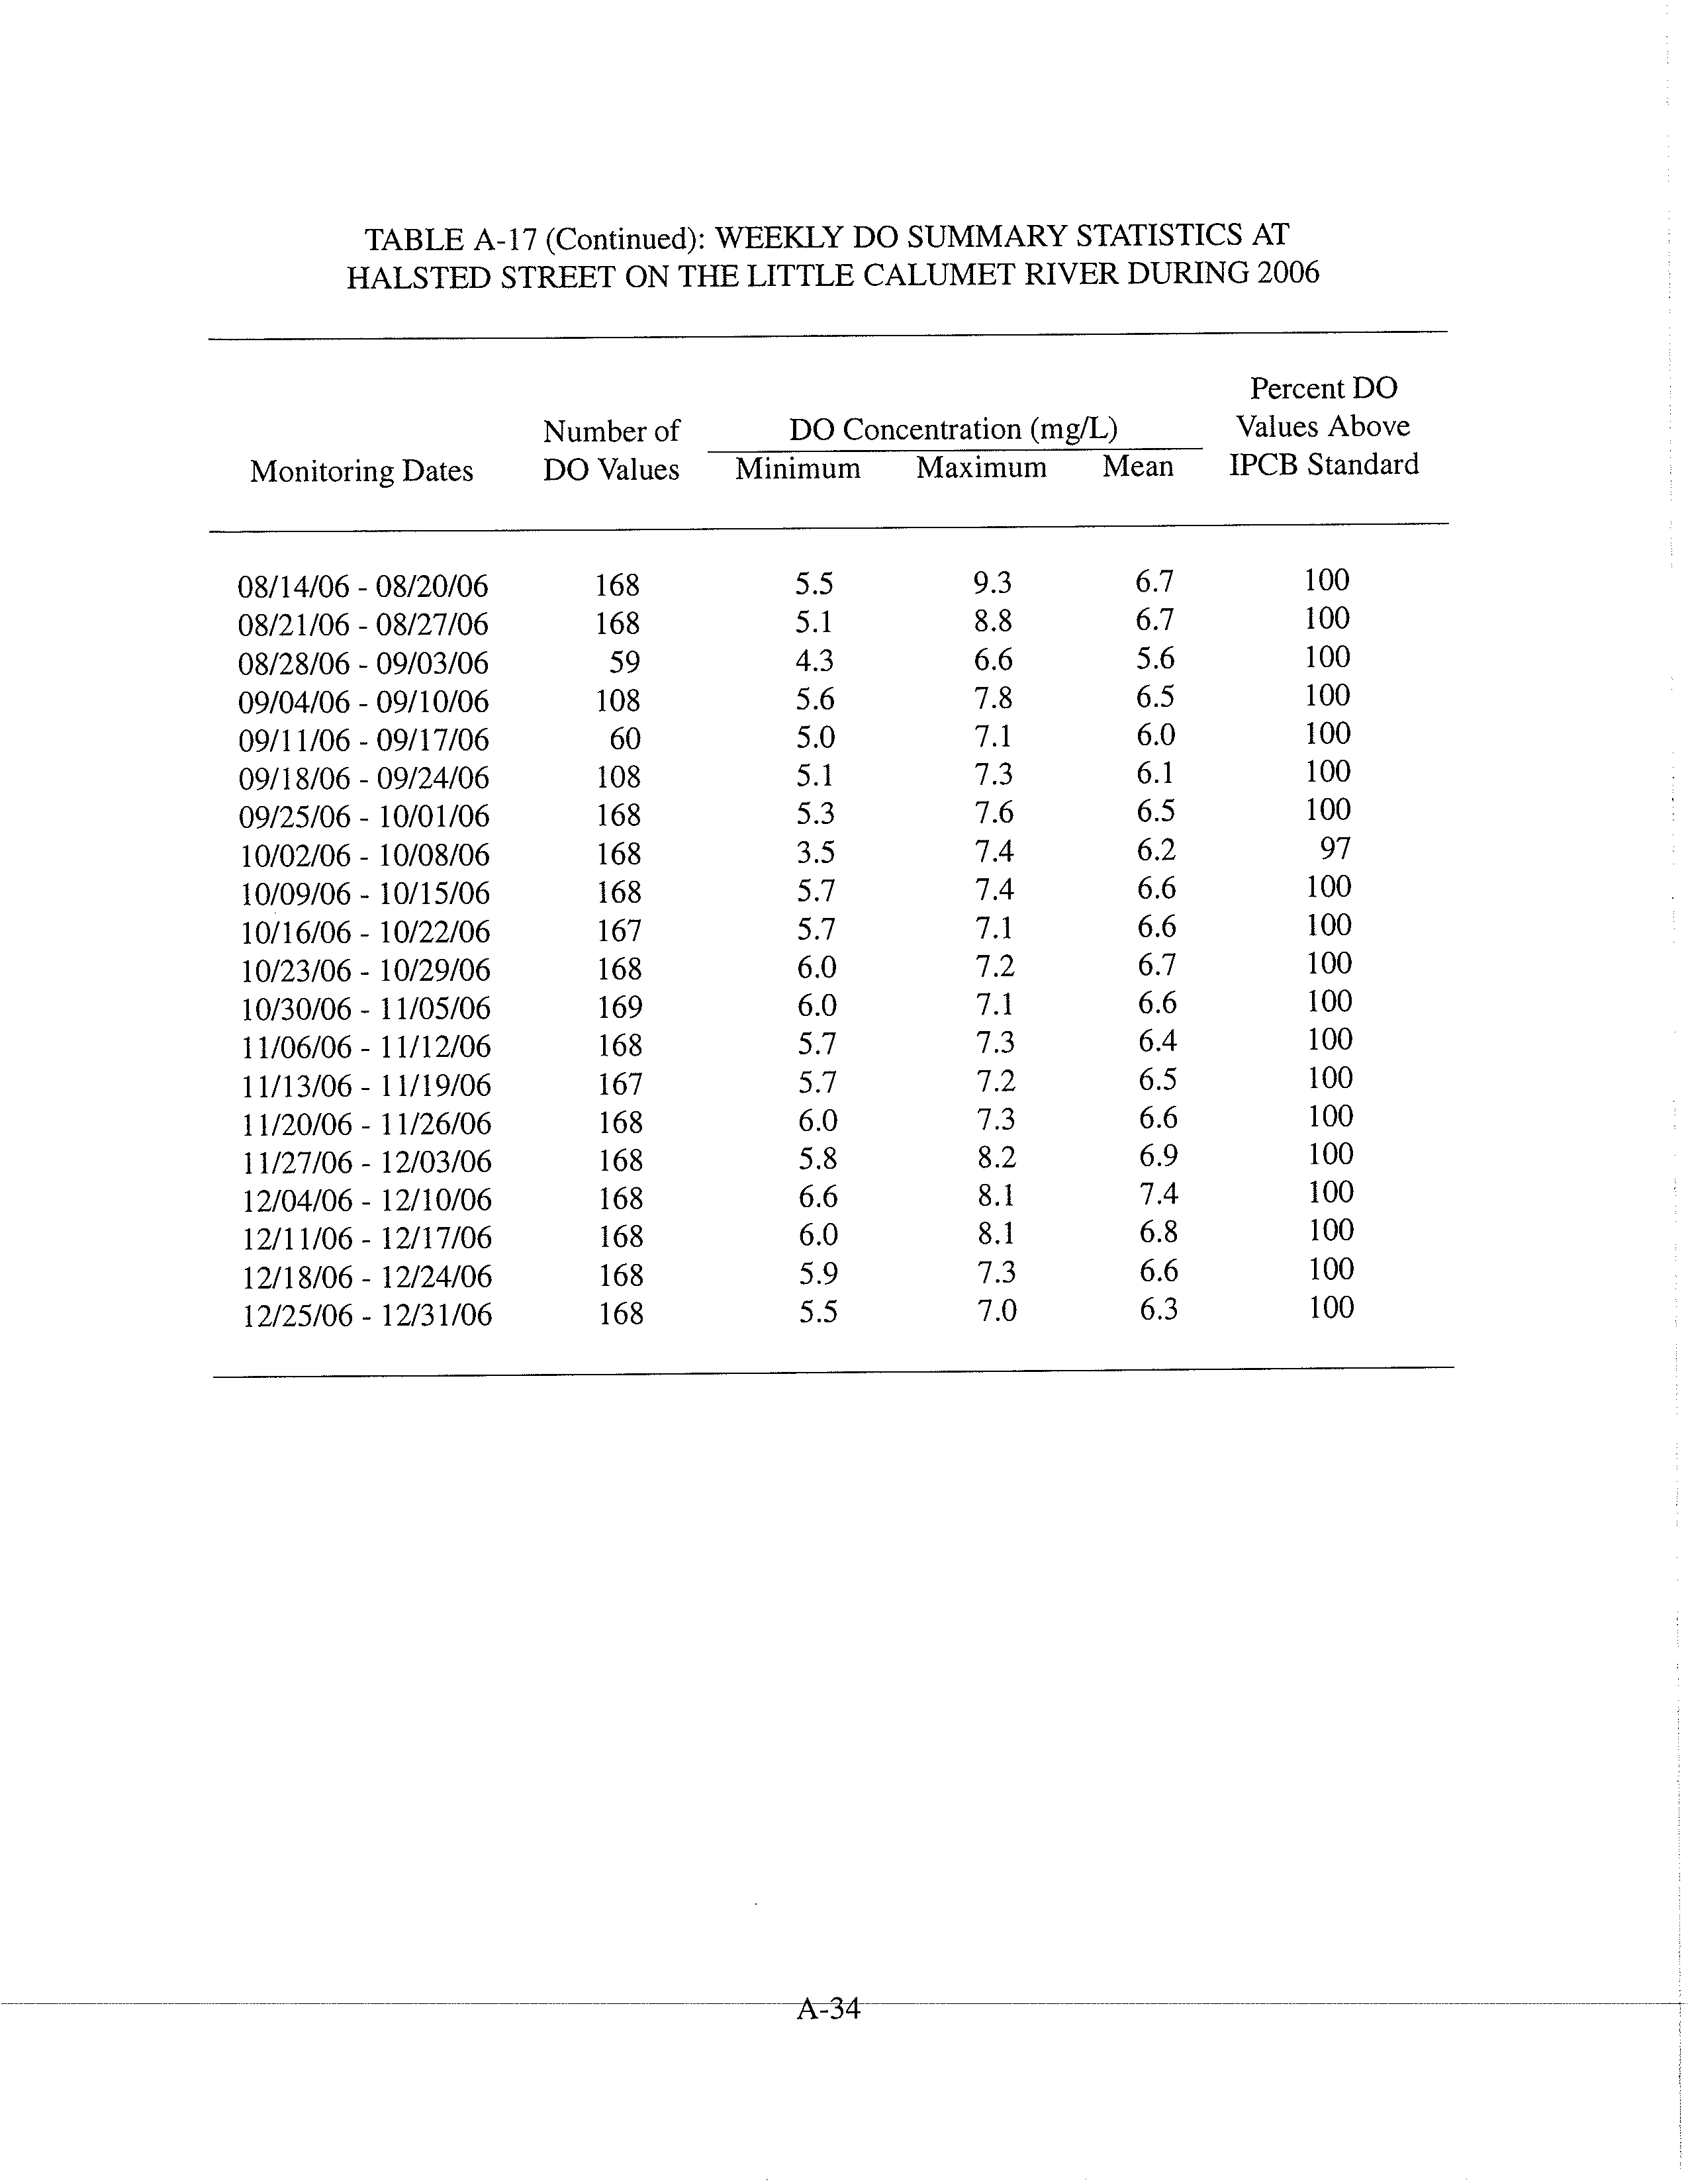
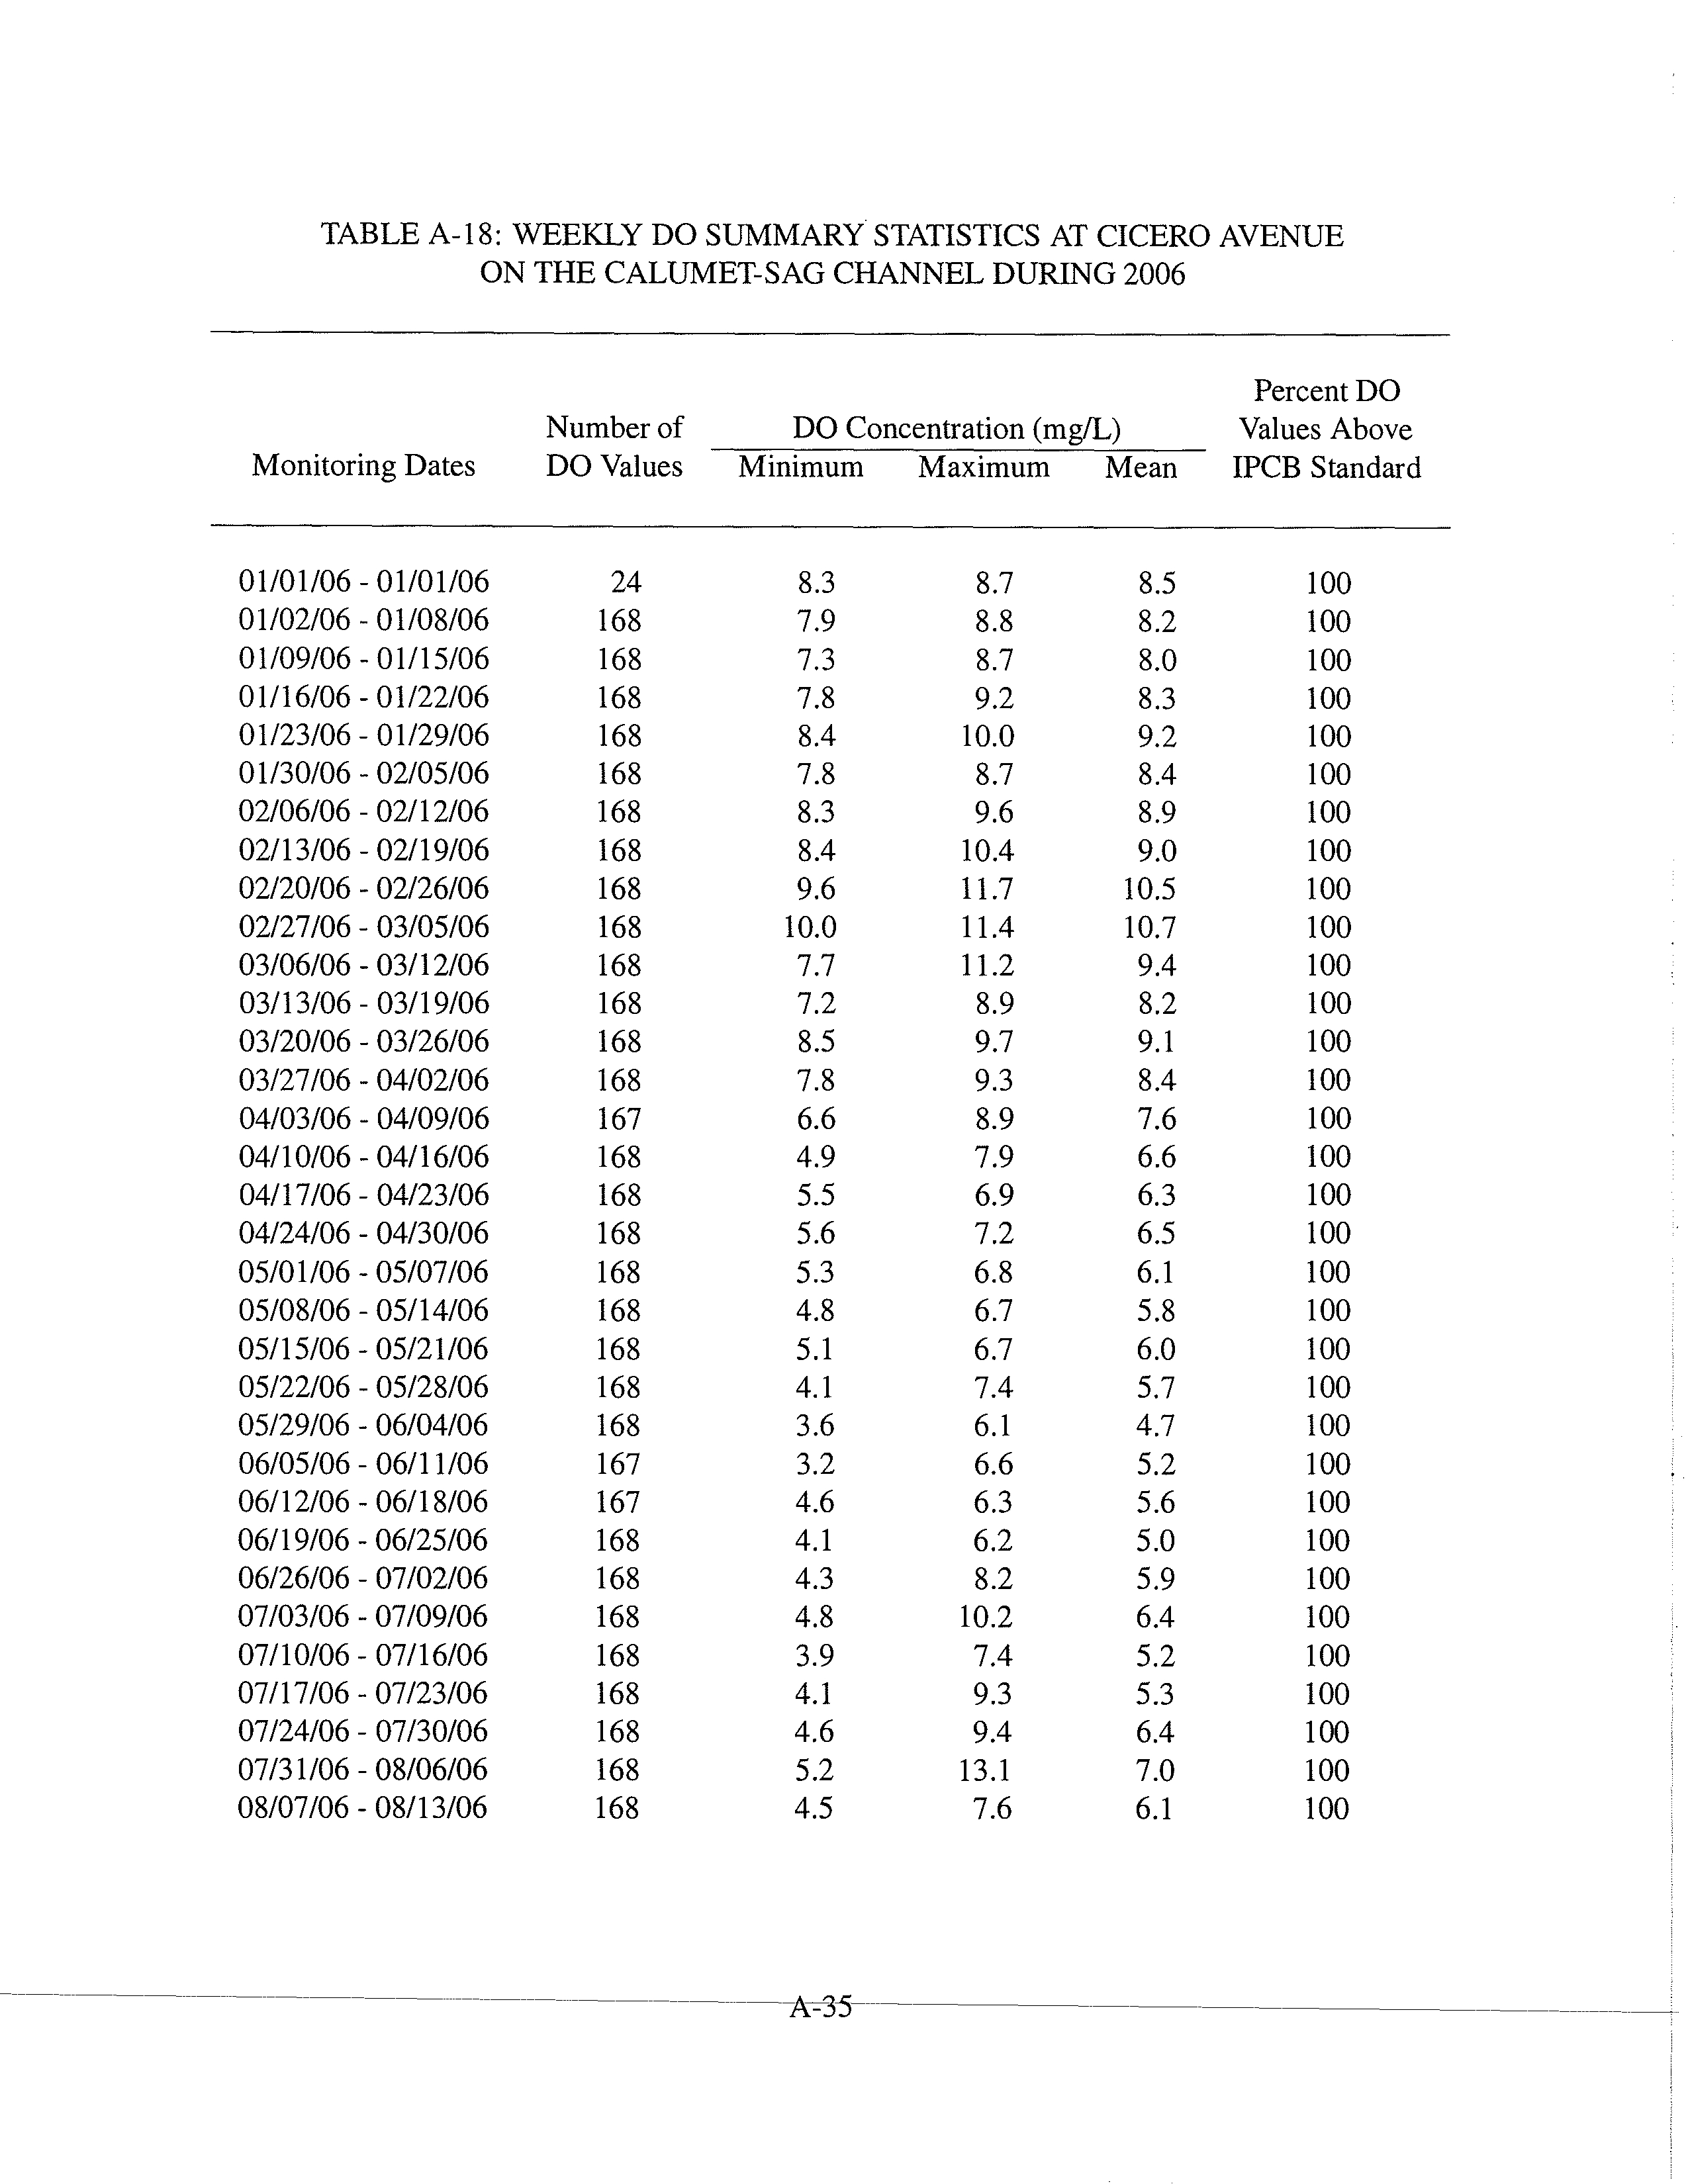
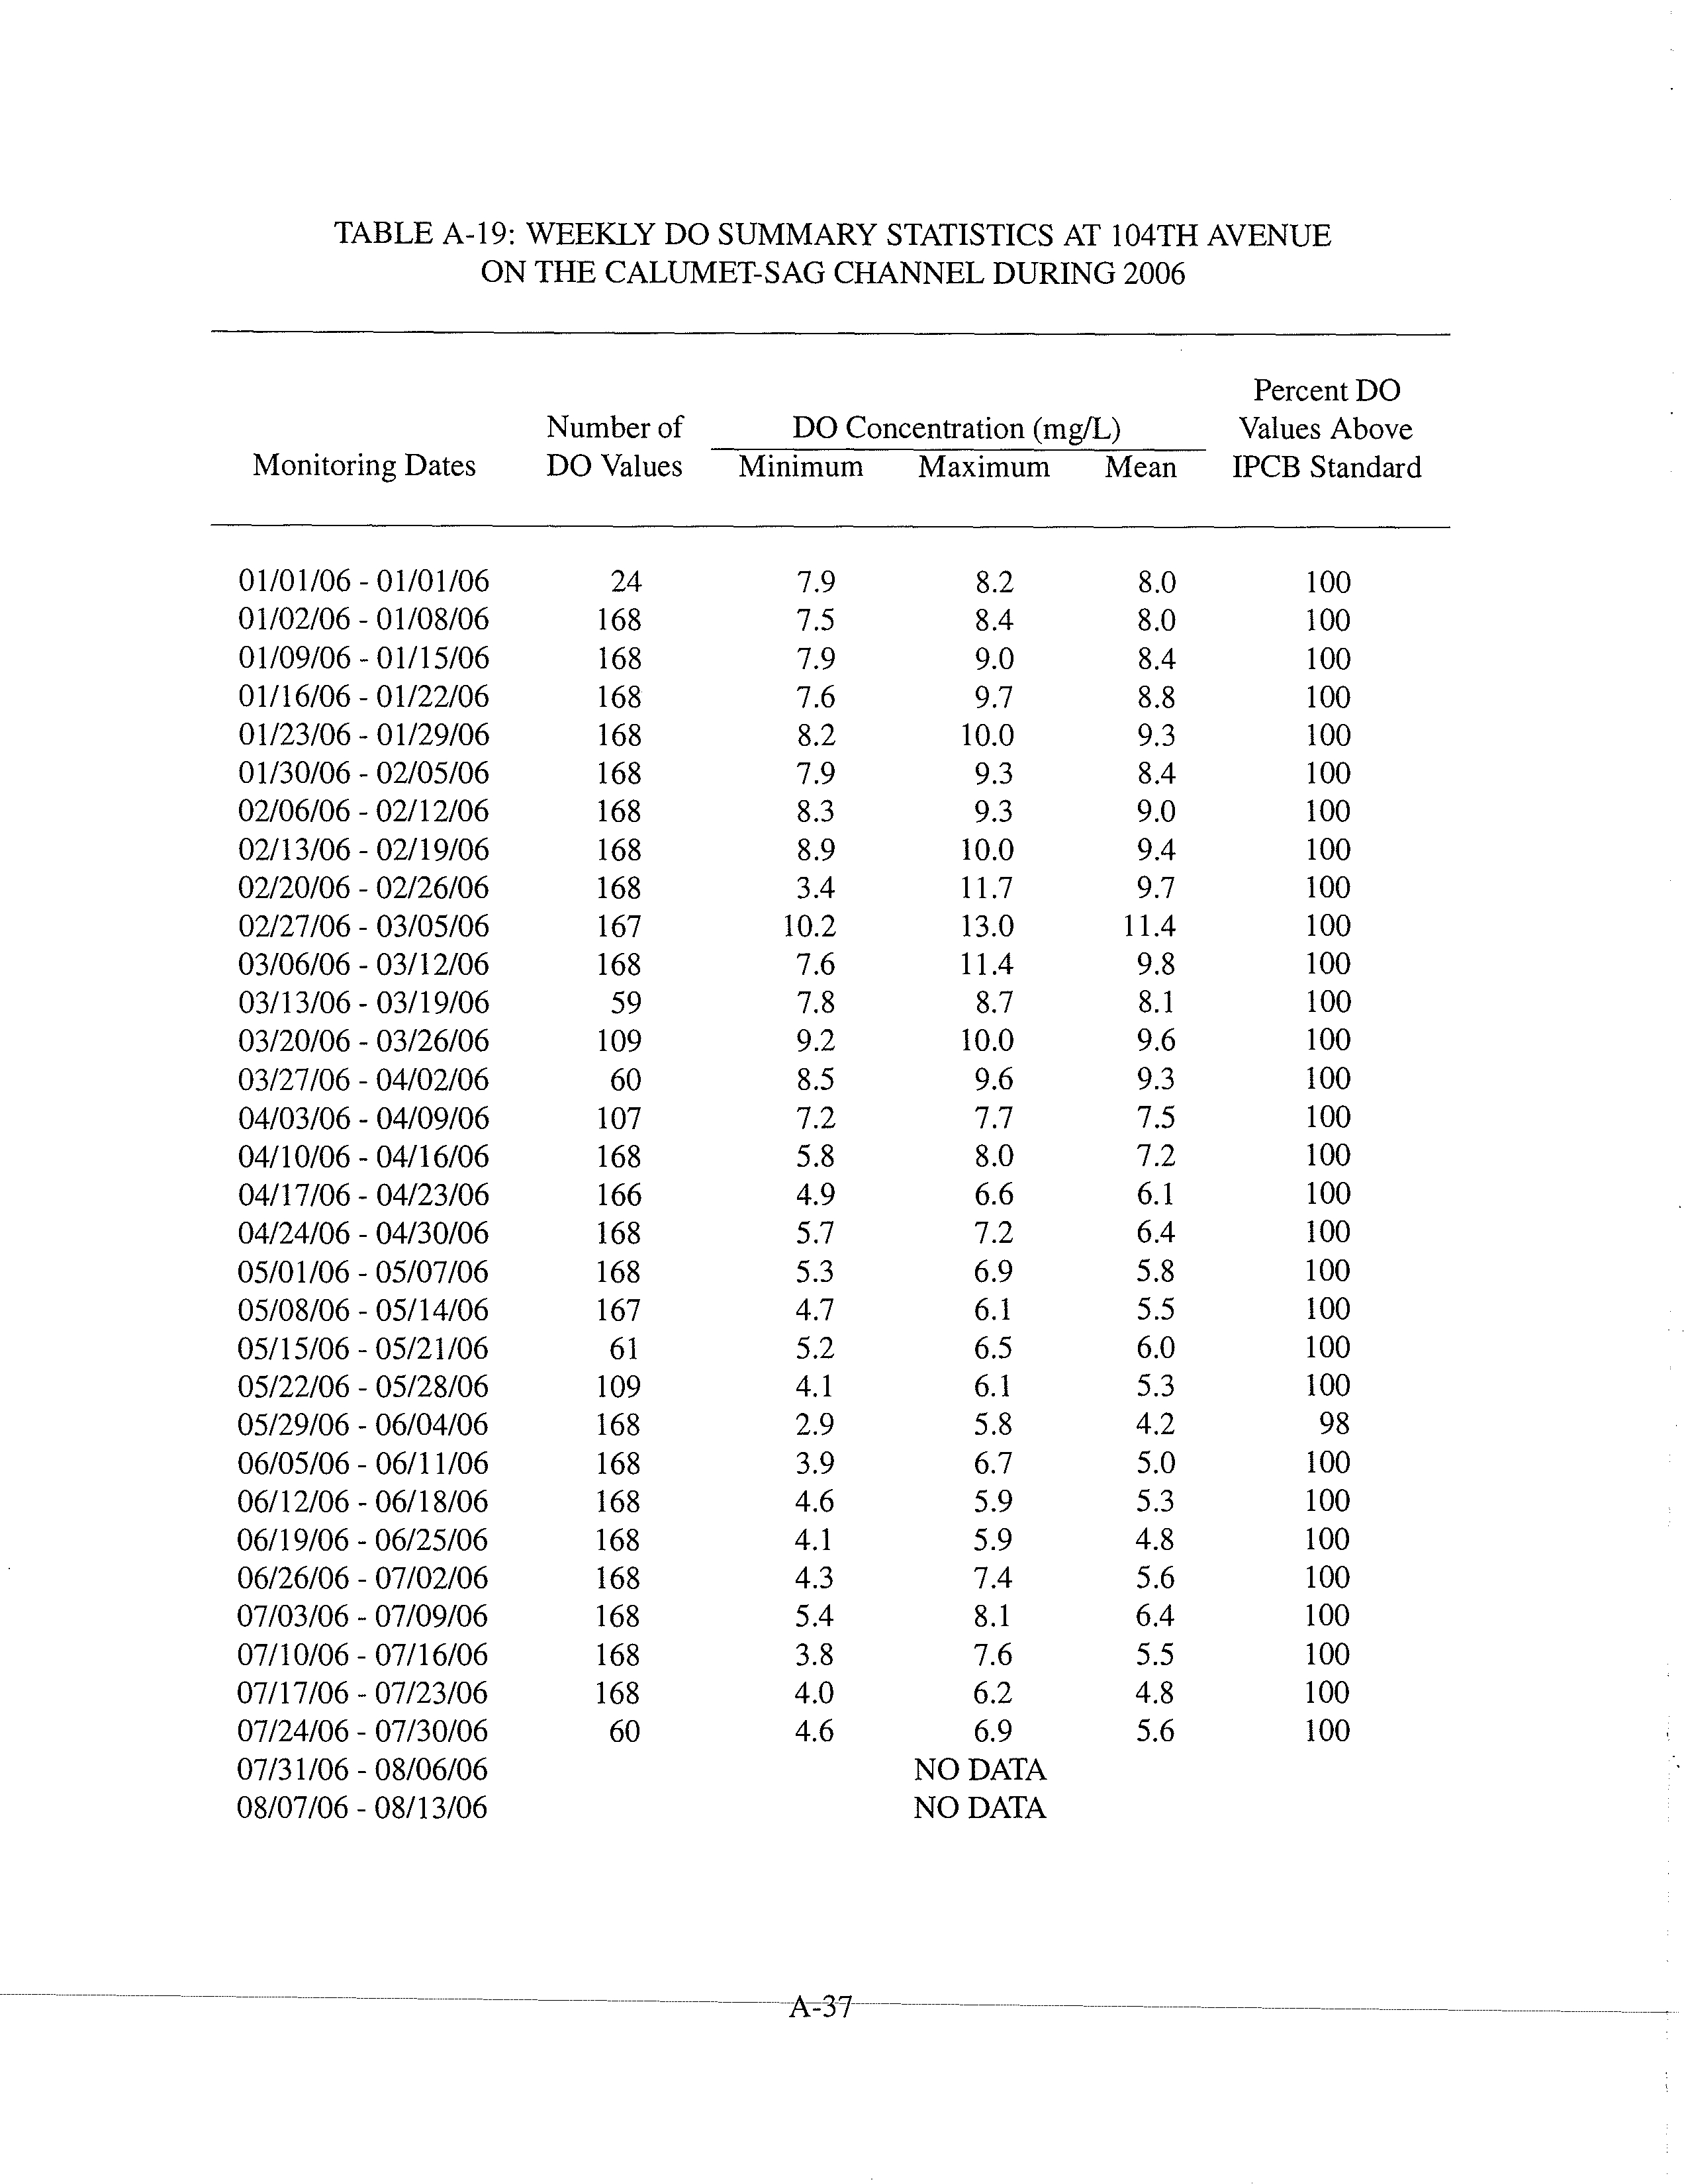
During 2006
,
DO was below the IPCB Secondary Contact DO
standard
of 4.0
mg/L in Bubbly Creek
for 72
percent of the time at 36th Street and 23 percent of
the time at Interstate Highway 55 (Minarik et al., 2007
- ATTACHMENT
3).
Figures 9 and 10
4
on pages 22
and 23 of ATTACHMENT
3, display DO concentrations throughout the year in
Bubbly Creek.
These low DO concentrations prevailed in Bubbly Creek during 2006 in spite of the
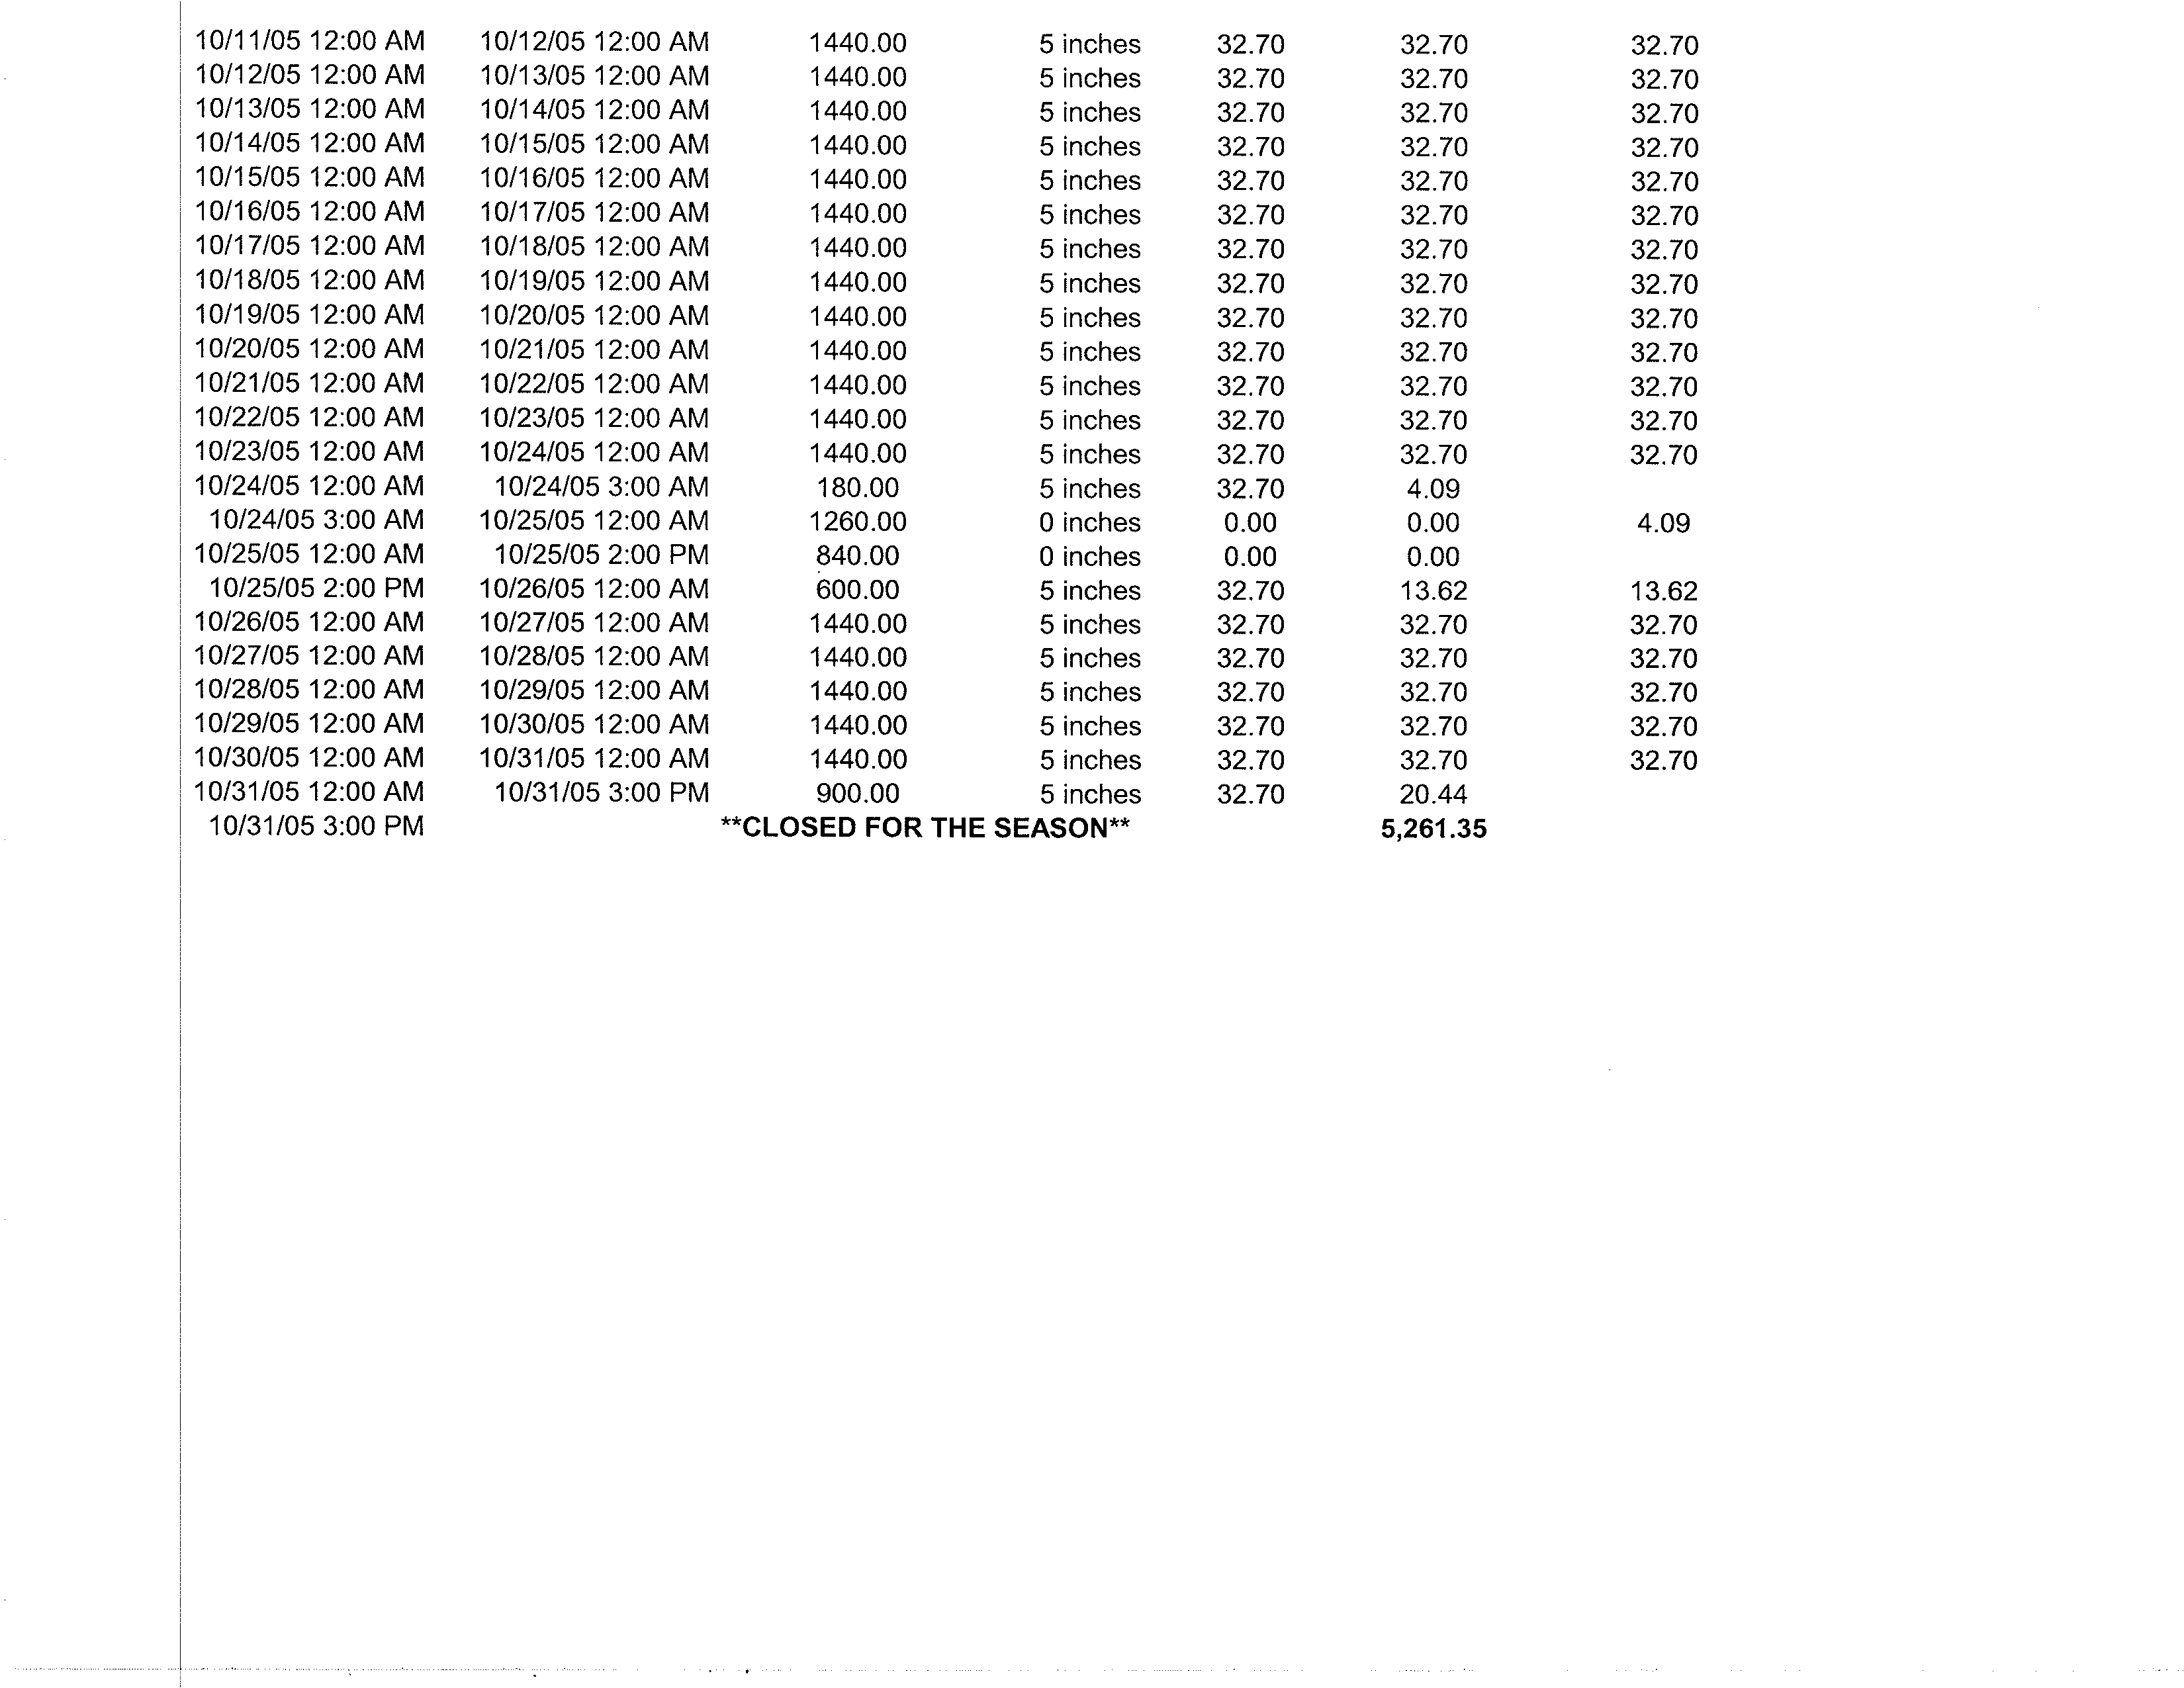
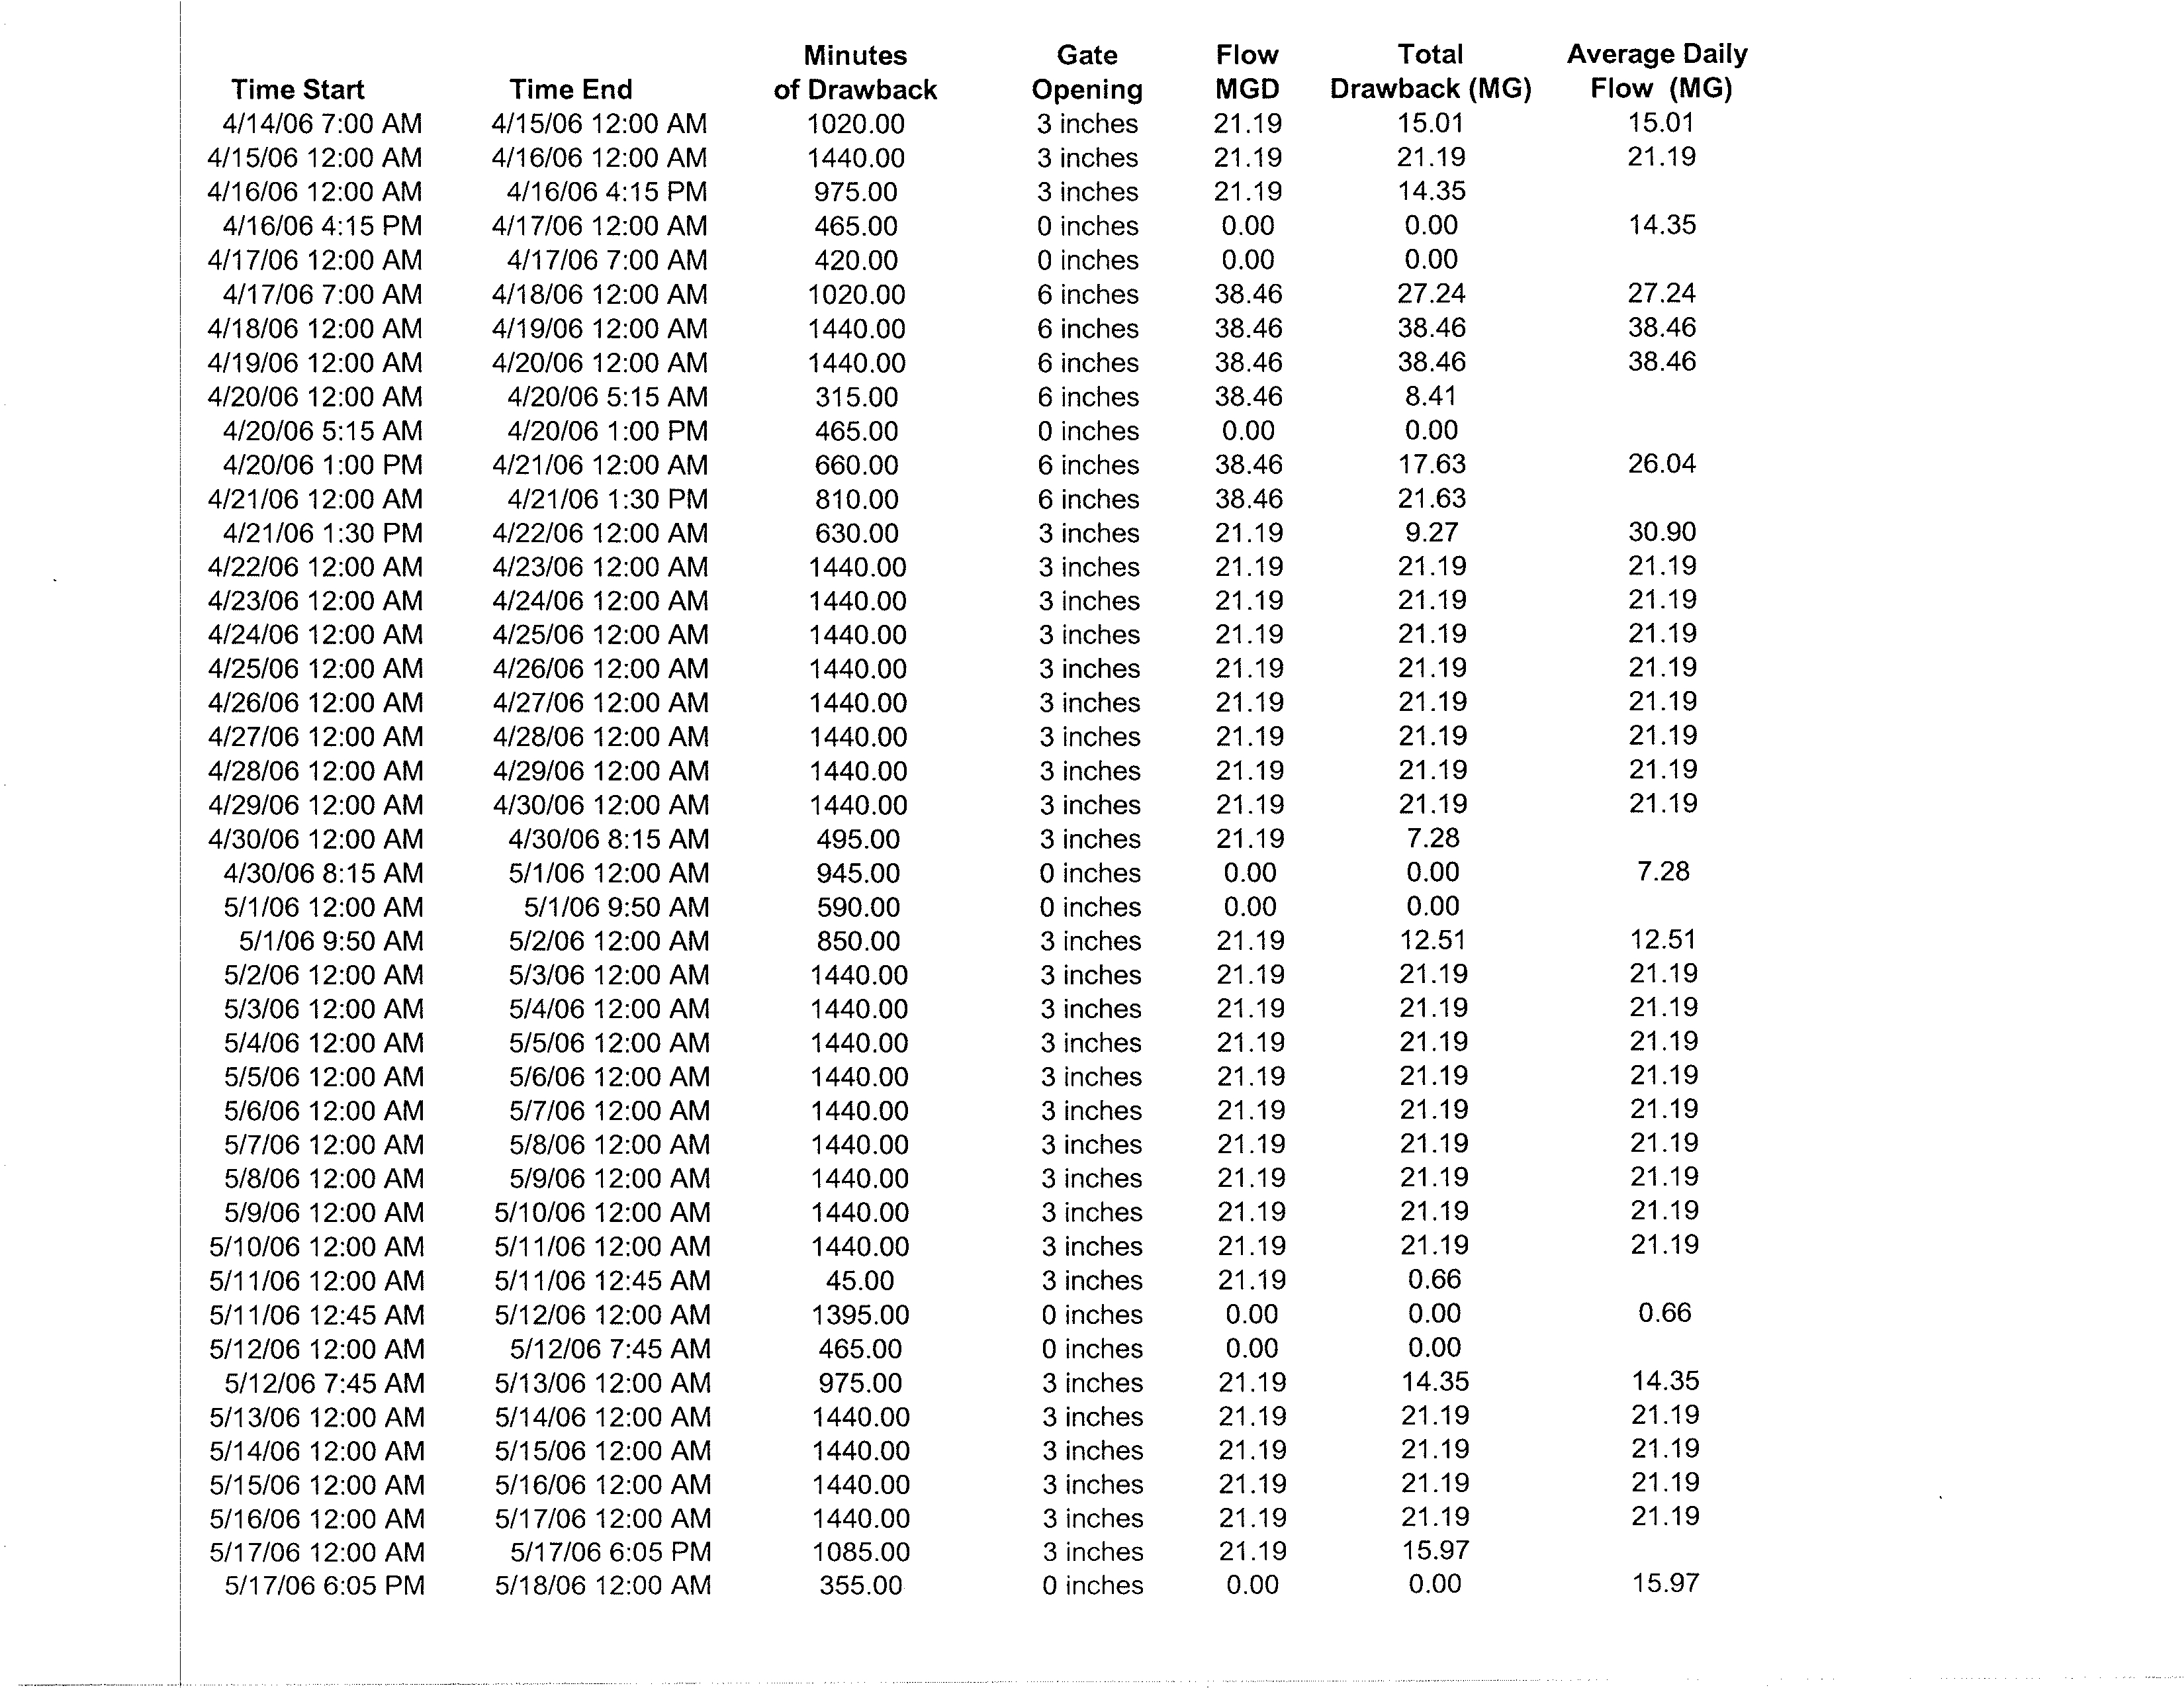
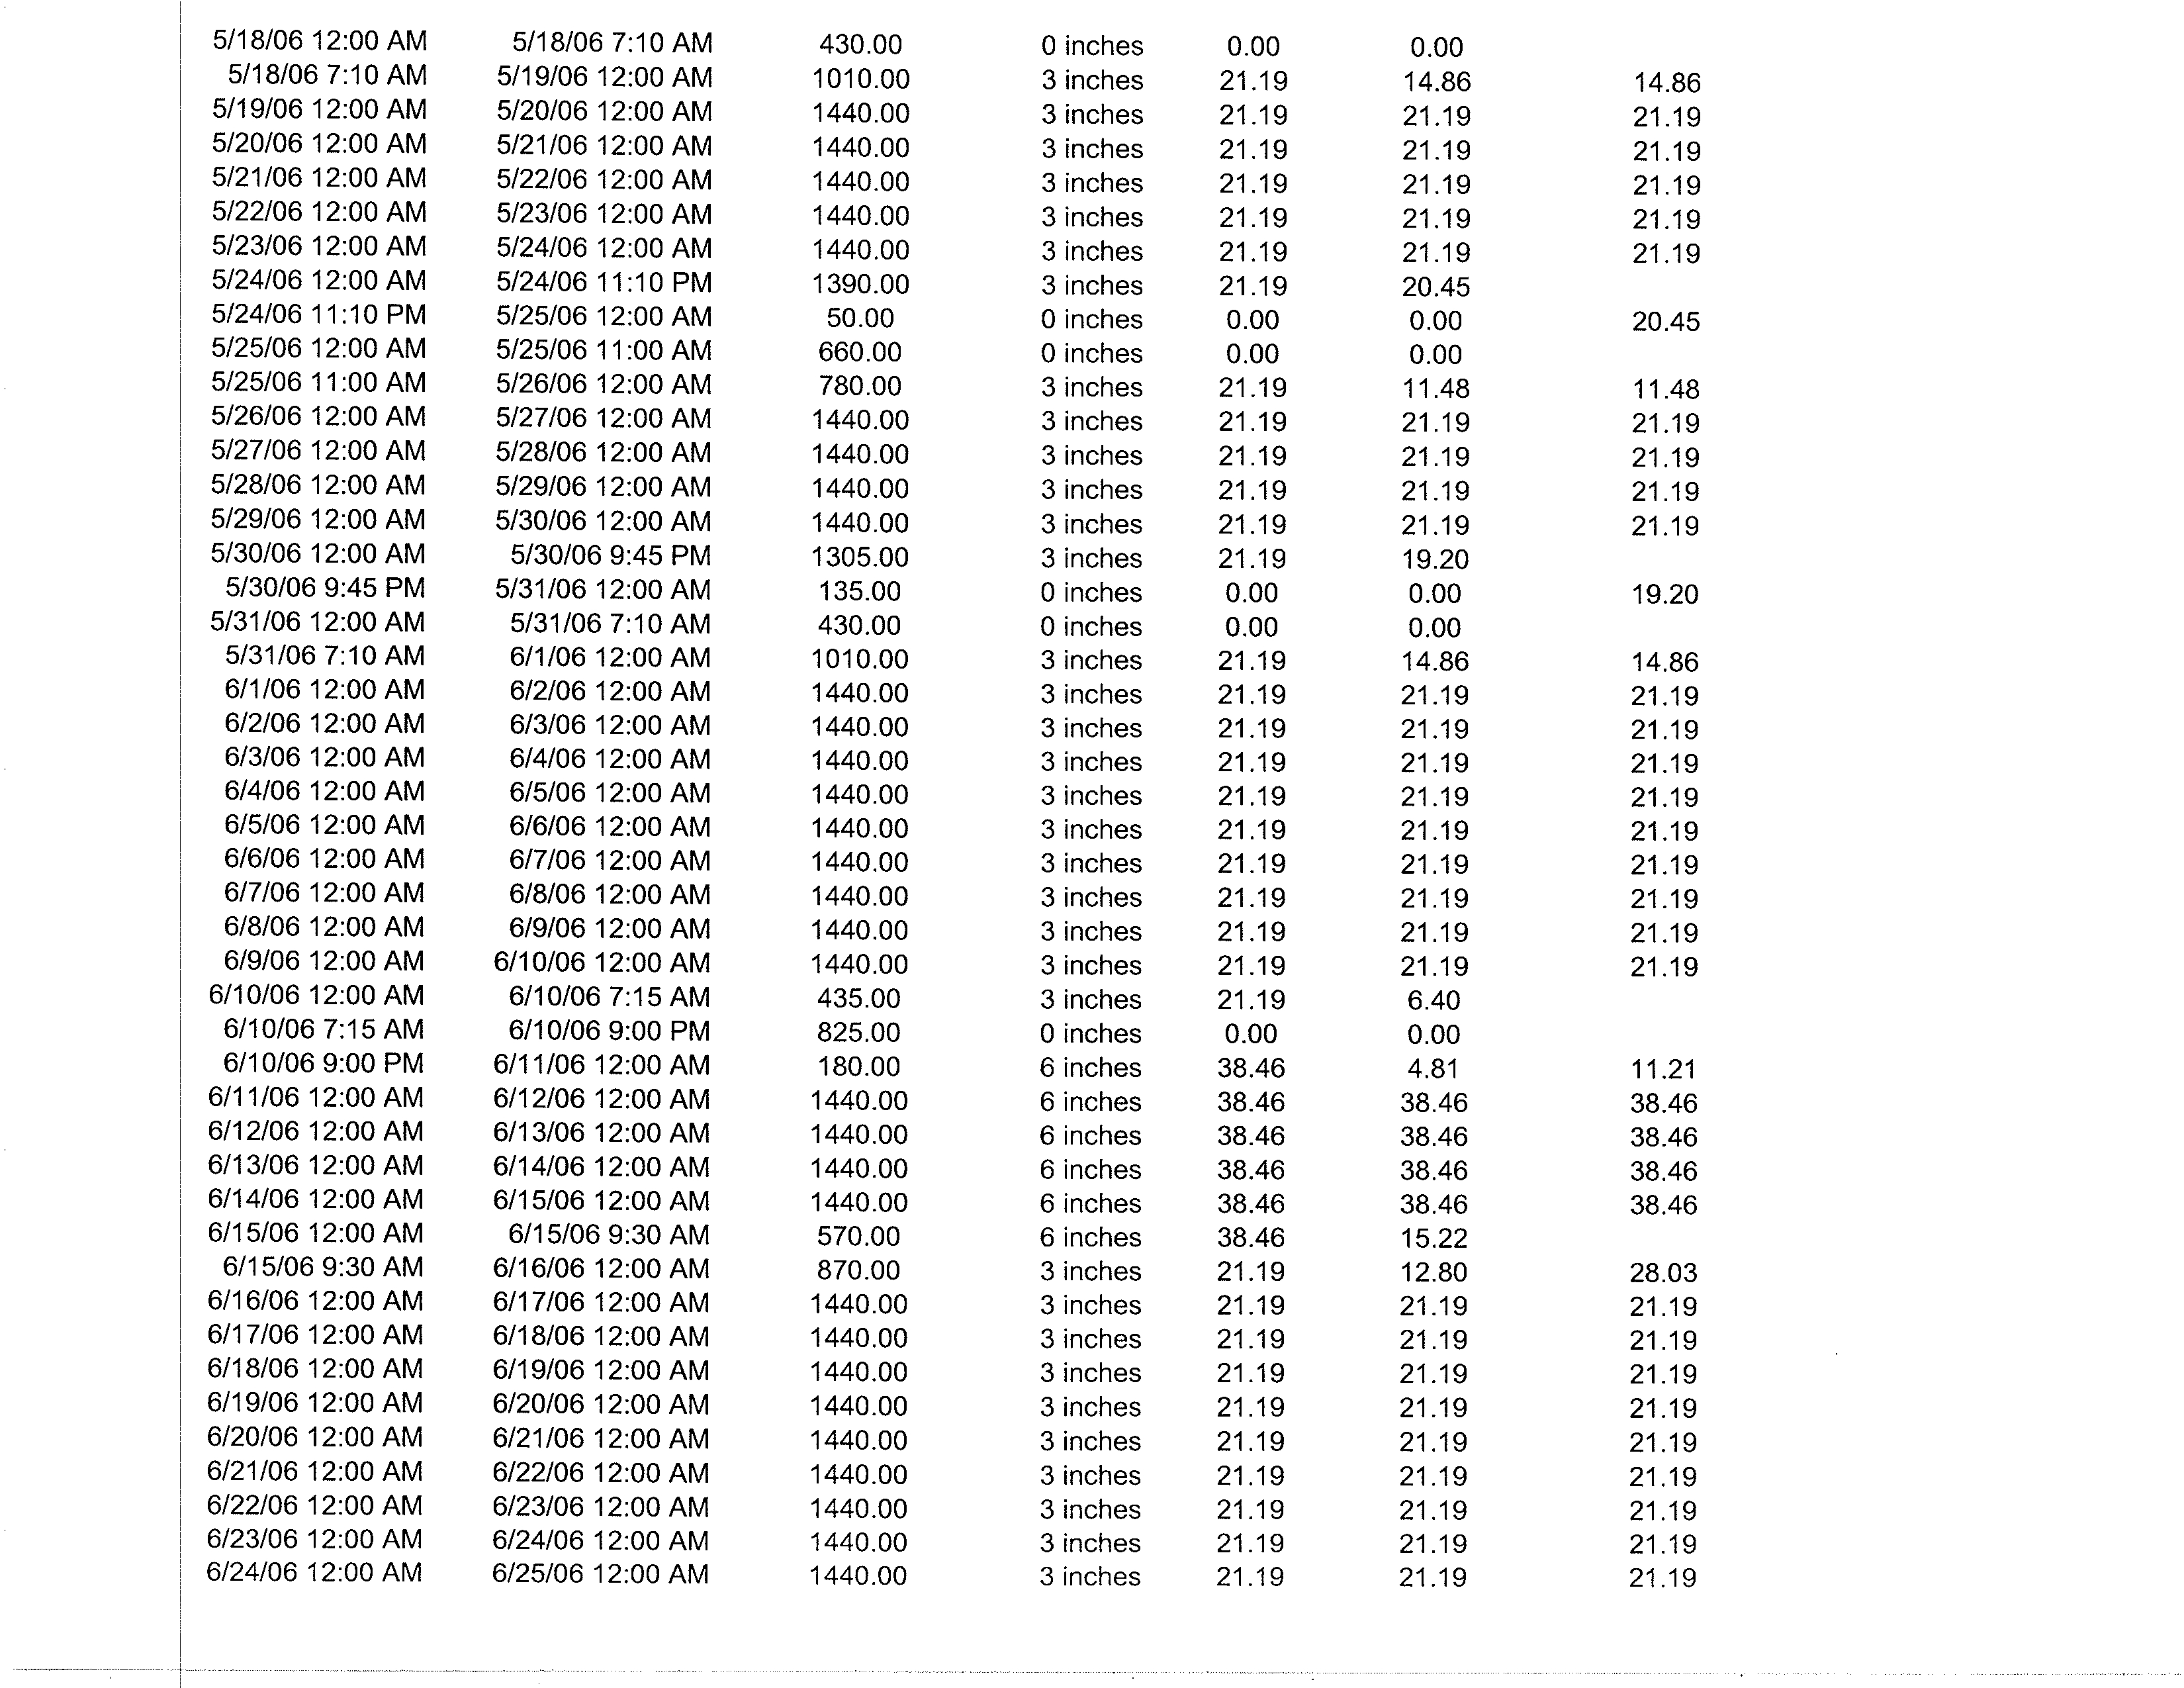
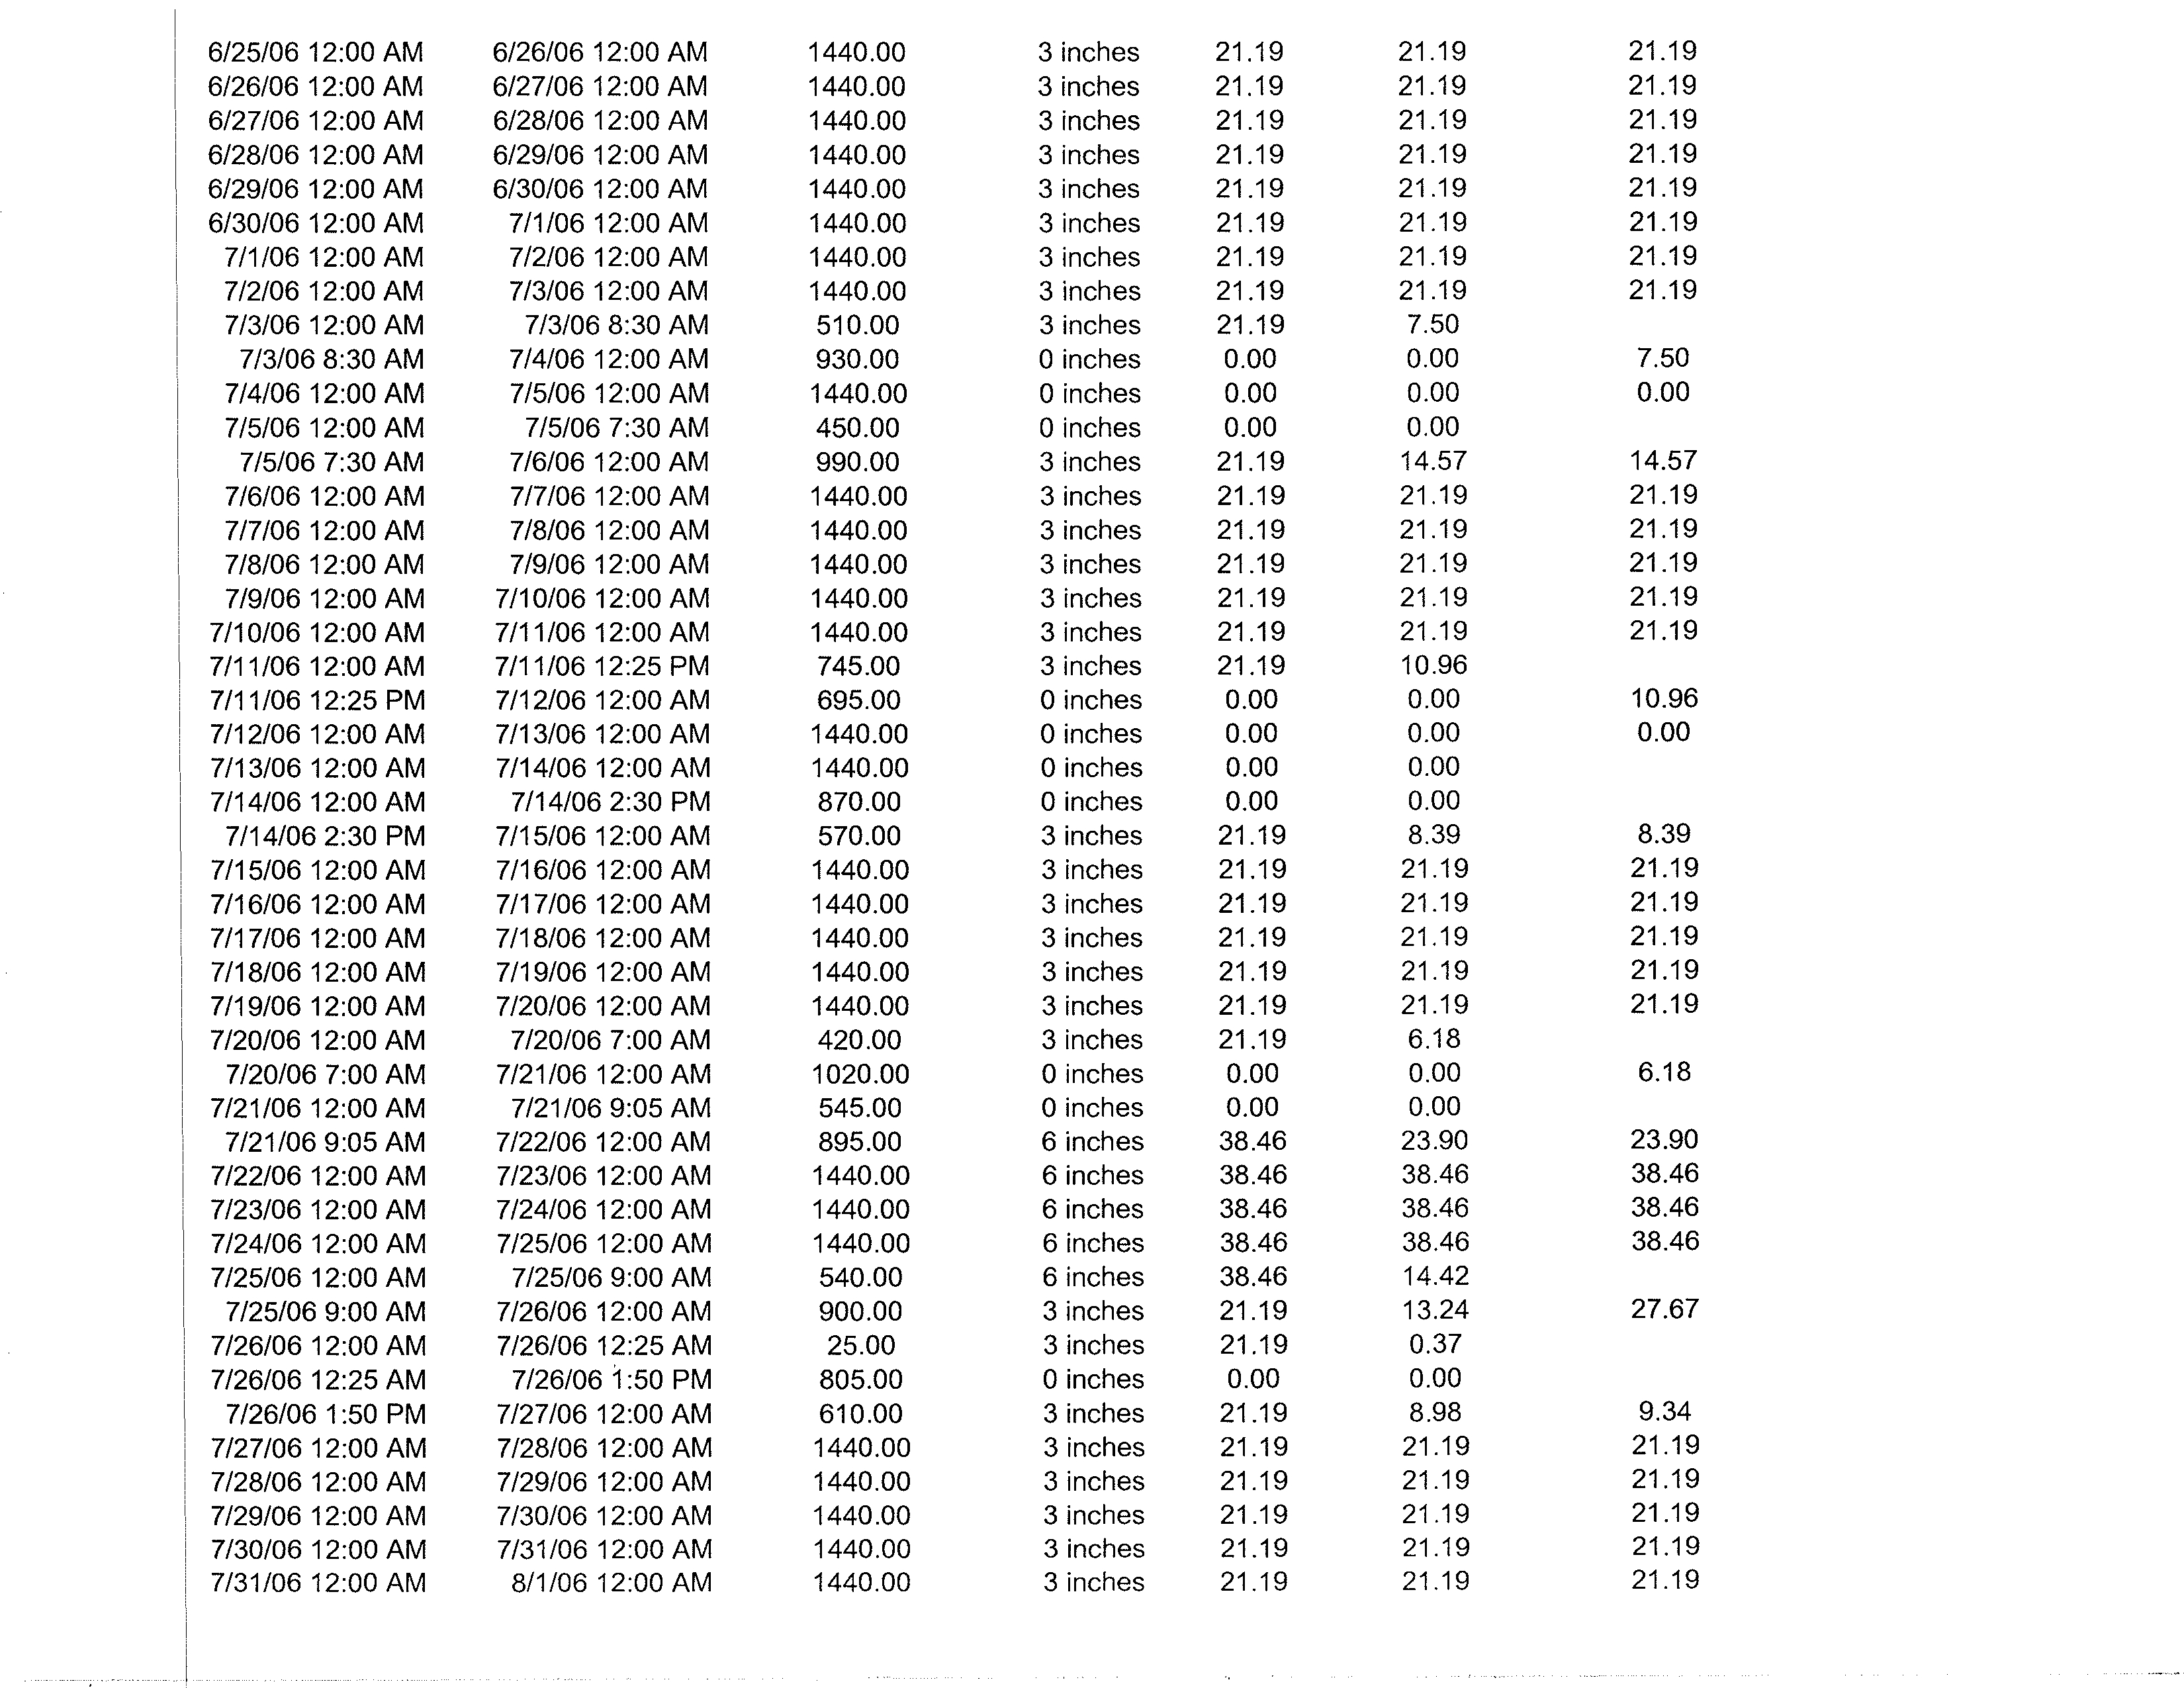
District's efforts to limit stagnation by drawing Bubbly Creek water back through RAPS.
Between April and September
,
the District pumped 3.7 billion gallons of Bubbly Creek water
back through
RAPS
to the Stickney Water Reclamation Plant for treatment.
RAPS drawback
data are outlined
in ATTACHMENT
4,
which includes date, duration, and volume of drawback
events during 2005 and 2006.
More information about the District's efforts to reduce stagnation
in Bubbly Creek by drawback through RAPS can be found in Research and Development
Department Reports No. 03-1 (Lanyon
,
2003) and No. 04-8 (Sopcak, 2004
).
This
information
suggests that it does not appear that flow augmentation will enable Bubbly Creek to attain the
DO standard that IEPA proposed for it in R08-9 even under dry weather conditions.
The District also assessed the use of supplemental aeration to help meet the proposed DO
water quality standards for Bubbly Creek
.
Technical concerns, environmental impacts, and
compliance costs involved in that option are discussed in the testimony of Dr. Zenz, Mr.
McGowan, Mr
.
Mastracchio, and Dr
.
Garcia.
Increasing DO in Bubbly Creek by the use of artificial controls could make the waterway
an "attractive nuisance
"
to fish
.
Higher DO levels and relatively low flow velocities resulting
from diversion may increase fish populations in Bubbly Creek.
These increased populations
which would result from fish entering Bubbly Creek from the connecting South Branch of the
Chicago River would be at risk from sudden, high volume, low DO, CSOs from RAPS.
Resulting fish
-
kills could create an odor problem that would be offensive to the area residents
and would be
very
difficult to rectify
.
The proposed high-volume pump station that would be
5
required to transfer South Branch Chicago River water to the south end of Bubbly Creek may
create a situation of fish colliding with screens (impingement) and/or being sucked into pumps
(entrainment), as well.
On page 1-8 of the UAA report, it states, "The South Fork is a stagnant waterbody that
receives no flow unless the Racine Avenue Pump Station, storm sewers or other CSOs are
discharging." It further describes the extensive DO compliance issues in Bubbly Creek. IEPA
has acknowledged the unusual conditions in Bubbly Creek, however they have not accounted for
them in their UAA proposal for the Chicago Area Waterway System. In light of the impaired
sediment, wet-weather characteristics, and the extreme flow variations, the District suggests that
Bubbly Creek be classified as Aquatic Life Use C. Bubbly Creek is unique in that it is a side
fork and it is not even necessary to maintain DO for fish passage through the Chicago Area
Waterway System. To this end the District recommends a narrative DO standard be developed
that prevents fish kills and maintains aesthetics (prevents nuisance odors).
This would be
appropriate until such time as the sediments are capped, removed or remediated and the
frequency of discharge at RAPS is diminished sometime after 2024. If a numerical DO standard
is deemed imperative, then the IPCB should consider the testimonies of Mr. Paul Freedman and
Dr. Marcelo Garcia as a basis for such a standard.
Respectfully
submitted,
By:
Samuel G. Dennison
Testimony Attachments
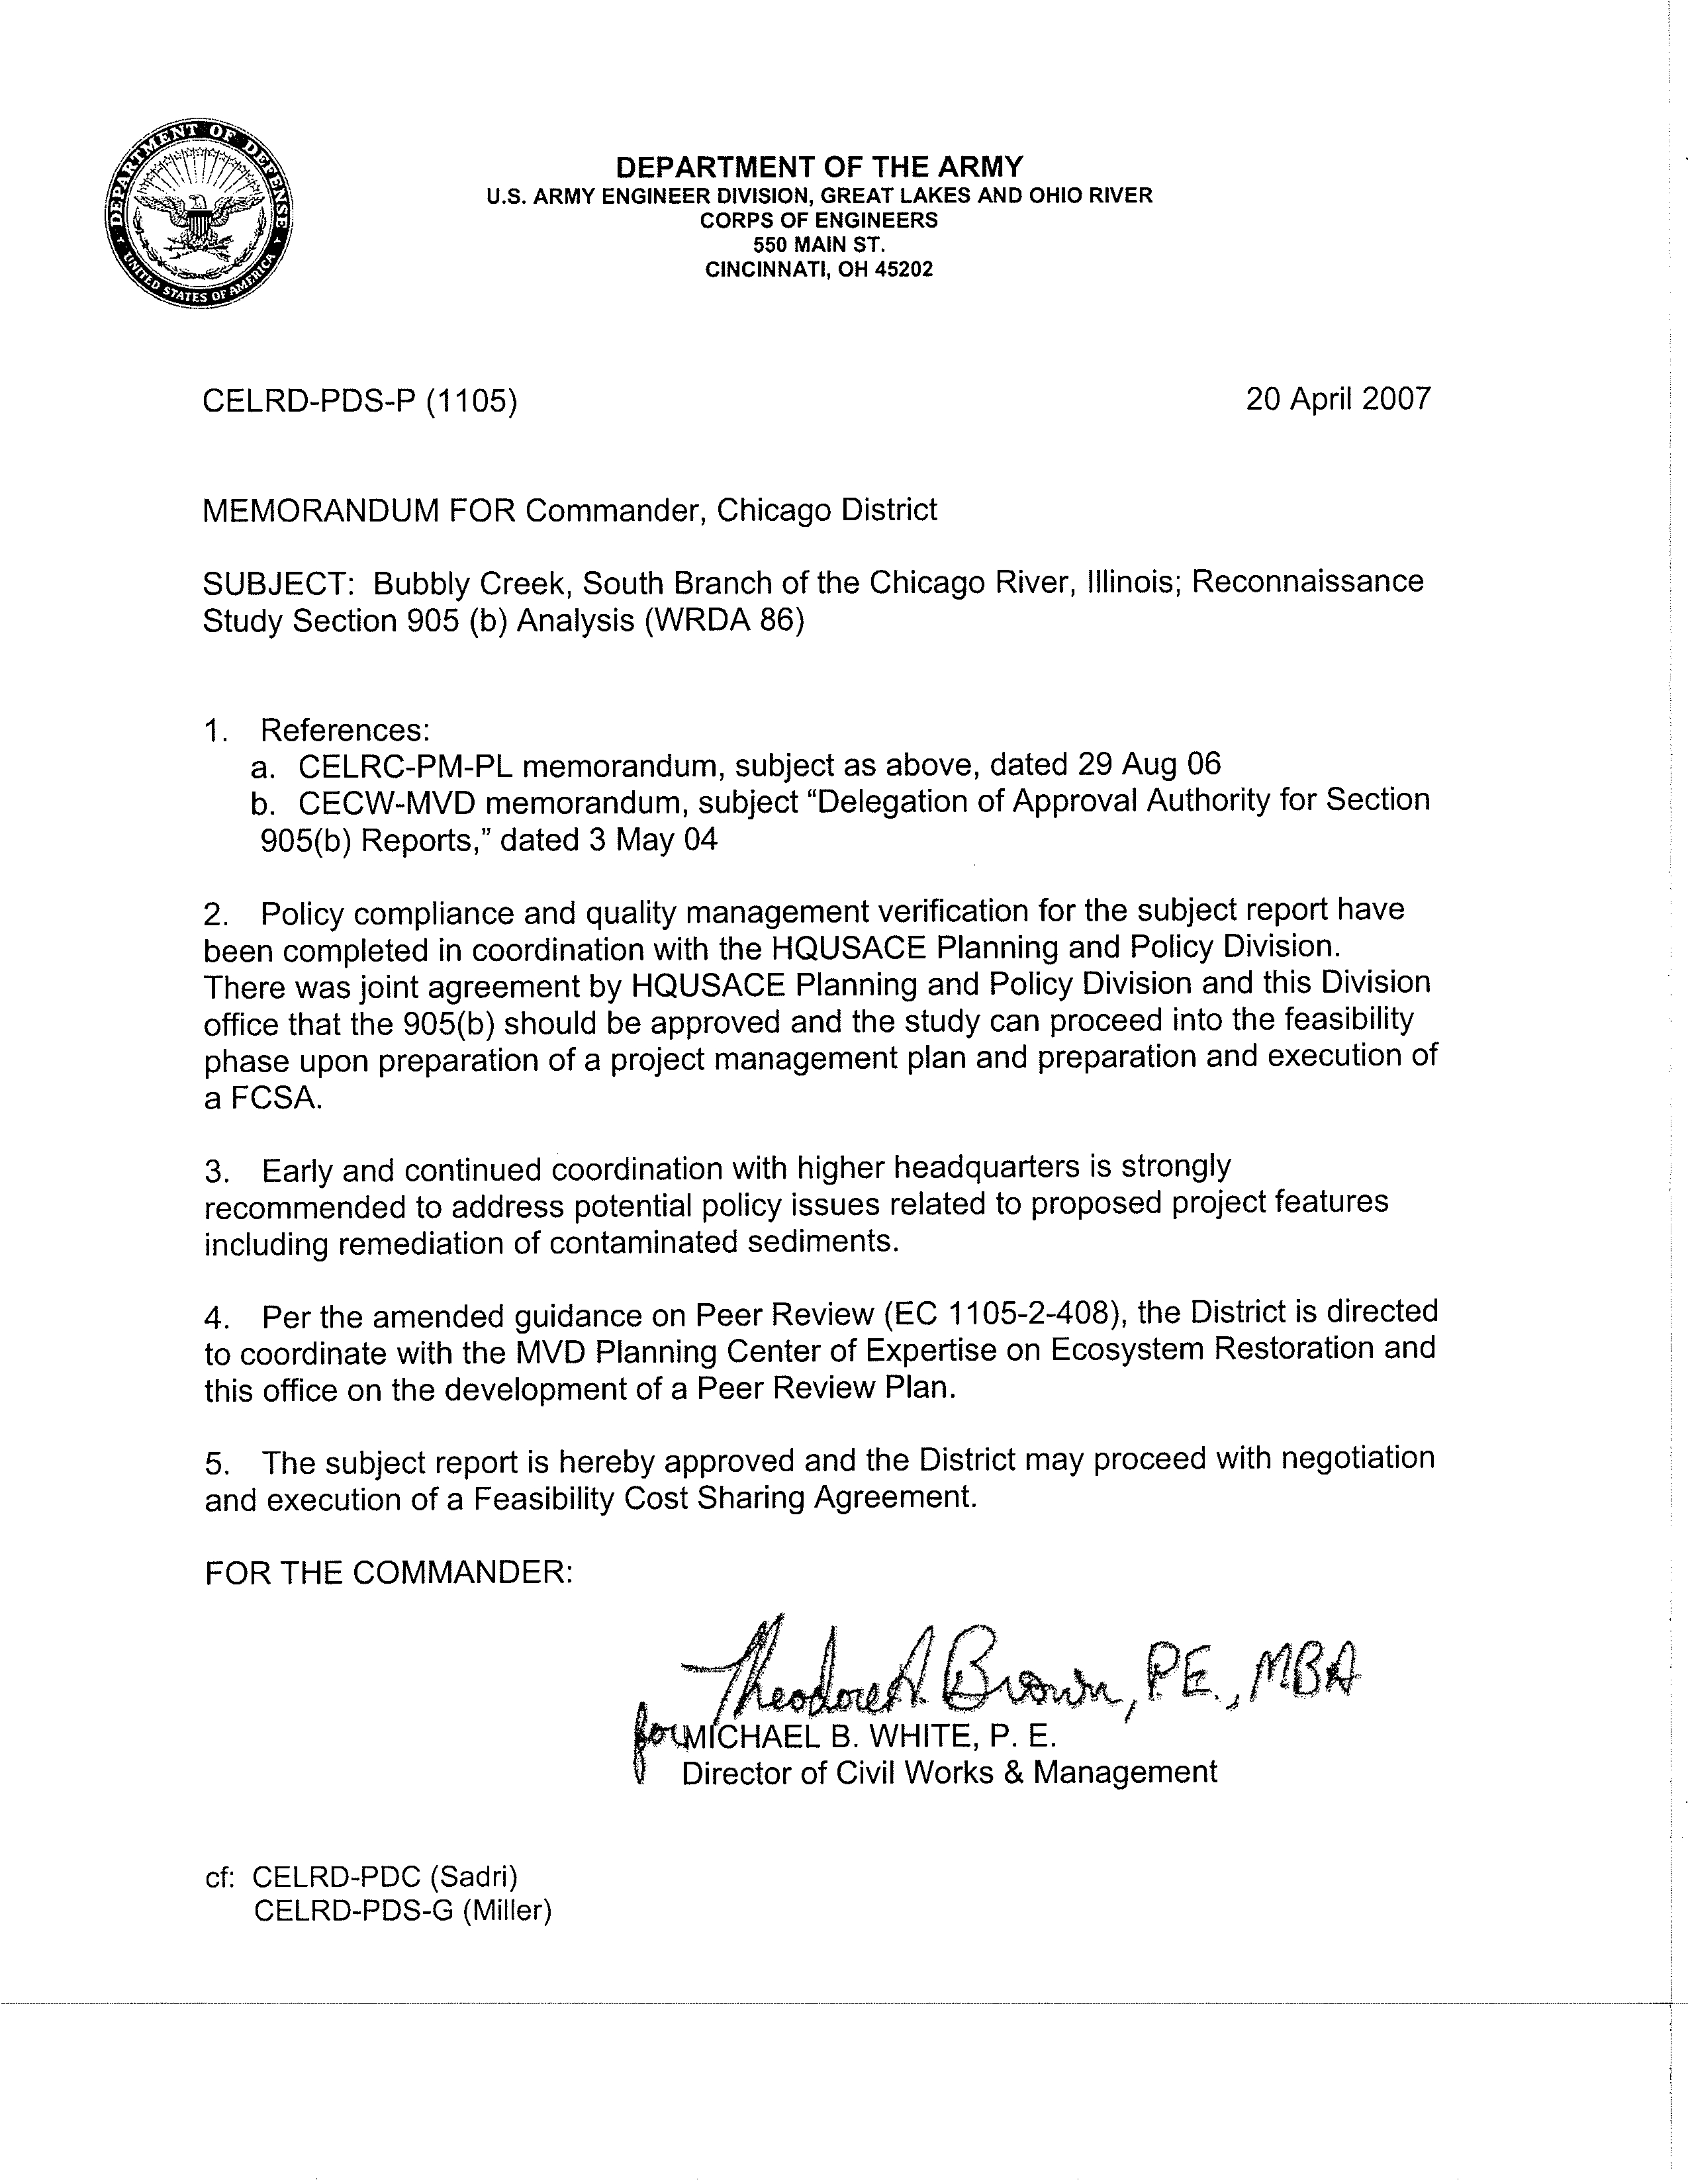
1.
DO Recovery Graphs
2.
USACE (U.S. Army Corps of Engineers), Reconnaissance Study, Section 905(b)
(WRDA 86) Analysis, Bubbly Creek, South Branch of the Chicago River, 18 August
2006
3.
District R&D Report No. 07-25 Continuous Dissolved Oxygen Monitoring in the
Deep Draft Chicago Waterway System During 2006, The Metropolitan Water
Reclamation District of Greater Chicago, May 2007.
4.
2005-2006 RAPS Drawback Data
References
Lanyon, R., "Bubbly Creek Water Quality Improvement, A Demonstration Project in 2002,"
Research and Development Department Report No. 03-1, Metropolitan Water Reclamation
District of Greater Chicago, January 2003.
Sopcak, M., "2003 Bubbly Creek Water Quality Improvement Demonstration Project," Research
and Development Department Report No. 04-8, Metropolitan Water Reclamation District of
Greater Chicago, June 2004.
Metropolitan
Water Reclamation District of Greater Chicago, 2007. "Technical Memorandum
6WQ: Flow Augmentation and Supplemental Aeration of the South Fork of the South
Branch of the Chicago River (Bubbly Creek)." Prepared by CTE.
UAA Report (Attachment B of proposed rule R08-9)
Photograph Exhibits
Photograph Exhibit 1. Bubbly Creek, looking north. Racine Avenue Pumping Station in
foreground.
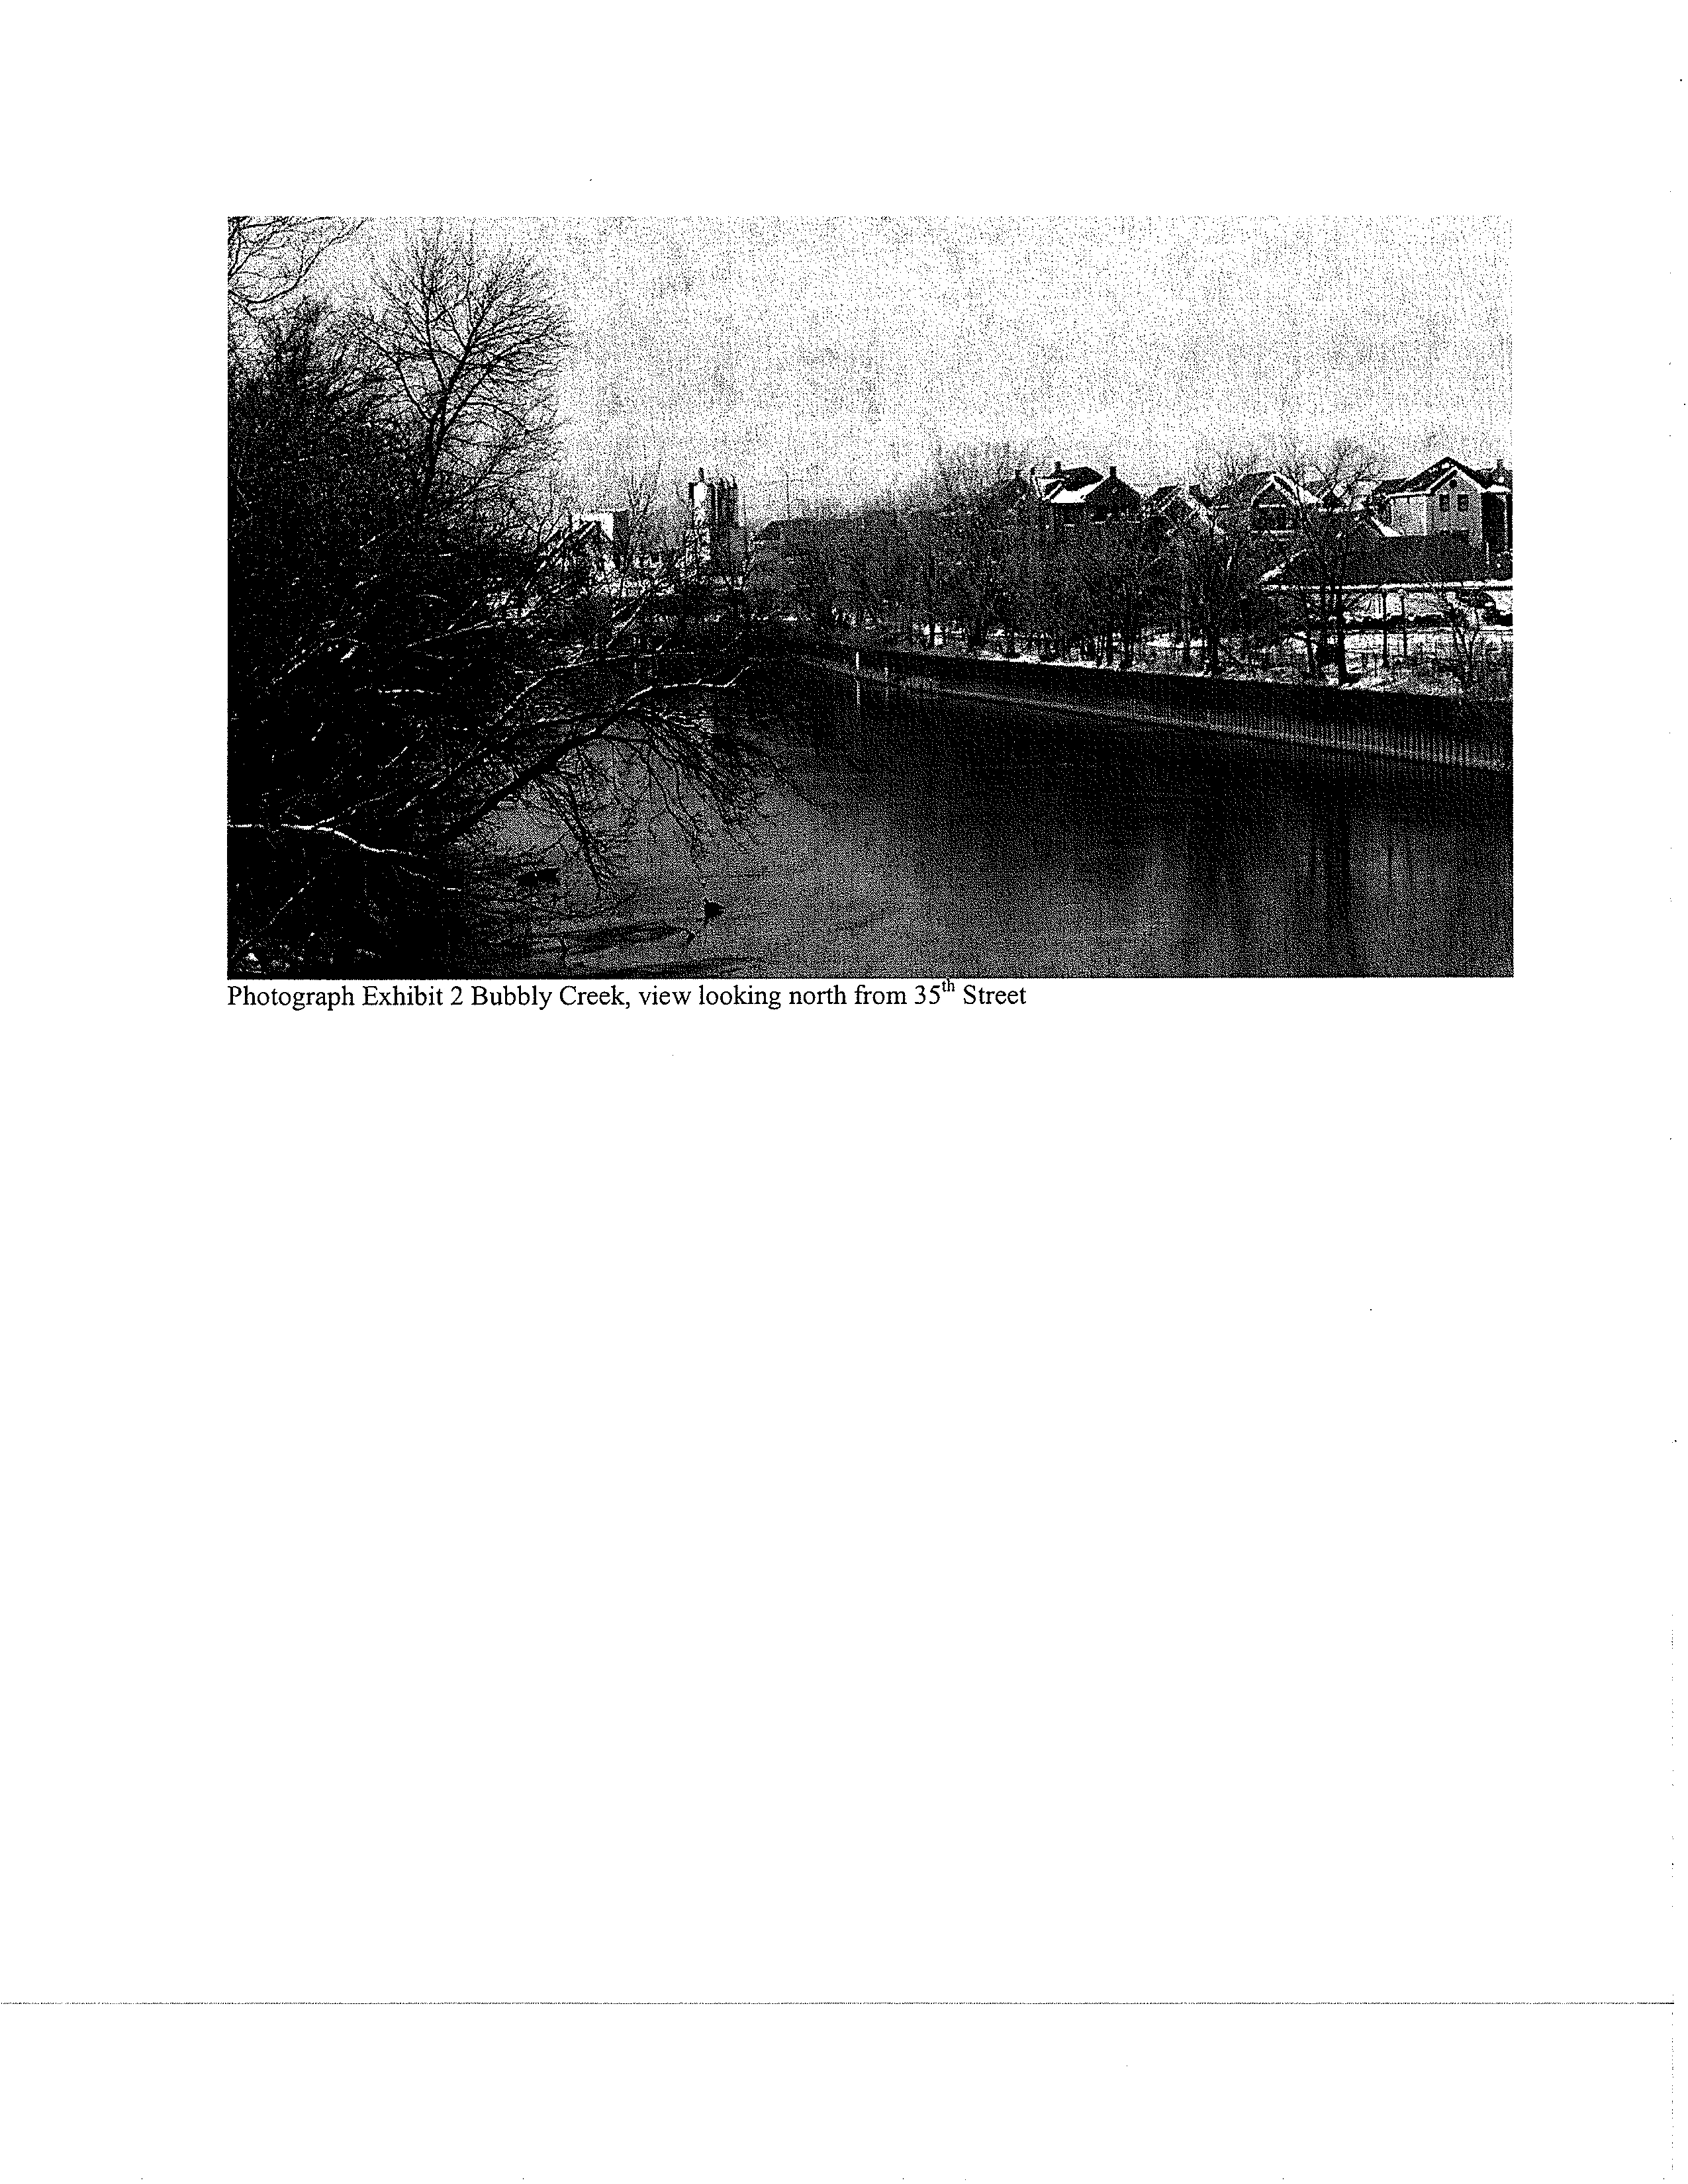
Photograph Exhibit 2 Bubbly Creek, view looking north from 35`h Street
Photograph Exhibit 3 Bubbly Creek Looking South. Racine Avenue Pumping Station in
background (in yellow rectangle)
Photograph Exhibit 4 View looking north, junction of South Branch Chicago River with Bubbly
Creek.
7
Photograph Exhibit 1. Bubbly Creek, looking north. Racine Avenue
Pumping Station
in foreground.
Photograph Exhibit 2 Bubbly Creek, view looking north from 35"' Street
Photograph Exhibit 3 Bubbly Creek Looking South. Racine Avenue Pumping Station in
background (in yellow rectangle).
Photograph Exhibit 4 View looking north, junction of South Branch Chicago River with
Bubbly Creek.
A
tt
ac
hm
e
nt 1
FIGURE 1: DISSOLVED OXYGEN CONCENTRATION MEASURED HOURLY
AT ADDISON STREET ON THE NORTH BRANCH CHICAGO RIVER
FROM AUGUST 2, 2006 THROUGH AUGUST 8, 2006
15
IPCB Secondary Contact Proposed
DO Standard of 4.0 mg/L
is shown as a dashed (- - -) line
12
9
6
3
0
1
Aug 2
n
Aug 3
Aug 4
Aug 5
Aug 6
Aug 7
Aug 8
FIGURE 2: DISSOLVED OXYGEN CONCENTRATION MEASURED HOURLY
AT FULLERTON AVENUE ON THE NORTH BRANCH CHICAGO RIVER
FROM AUGUST 2, 2006 THROUGH AUGUST 8, 2006
10
IPCB Secondary Contact Proposed
DO Standard of 4.0 mg/L
is shown as a dashed (- - -) line
Aug 2
Aug 3
Aug 4
Aug 5
Aug 6
Aug 7
Aug 8
FIGURE 3: DISSOLVED OXYGEN CONCENTRATION MEASURED HOURLY
AT KINZIE STREET ON THE NORTH BRANCH CHICAGO RIVER
FROM AUGUST 2, 2006 THROUGH AUGUST 8, 2006
10
IPCB Secondary Contact Proposed
DO Standard of 4.0 mg/L
is shown as a dashed (- - -) line
Aug 2
Aug 3
Aug 4
Aug 5
Aug 6
Aug 7
Aug 8
FIGURE 4: DISSOLVED OXYGEN CONCENTRATION MEASURED HOURLY
AT LOOMIS STREET ON THE SOUTH BRANCH CHICAGO RIVER
FROM AUGUST 2, 2006 THROUGH AUGUST 8, 2006
15
IPCB Secondary Contact Proposed
DO Standard of 4.0 mg/L
is shown as a dashed (- - -) line
12
9
6
3
0
Aug 2
Aug 3
I
Aug 4
I
Aug 5
I
Aug 6
I
Aug 7
I
Aug 8
FIGURE 5: DISSOLVED OXYGEN CONCENTRATION MEASURED HOURLY
AT 36TH STREET ON BUBBLY CREEK
FROM AUGUST 2, 2006 THROUGH AUGUST 8, 2006
10
IPCB Secondary Contact Proposed
DO Standard of 4.0 mg/L
is shown as a dashed (- - -) line
11
Aug 2
Aug 3
Aug 4
Aug 5
Aug 6
Aug 7
1-
Aug 8
FIGURE 6: DISSOLVED OXYGEN CONCENTRATION MEASURED HOURLY
AT INTERSTATE HIGHWAY 55 ON BUBBLY CREEK
FROM AUGUST 2, 2006 THROUGH AUGUST 8, 2006
10
IPCB Secondary Contact Proposed
DO Standard of 4.0 mg/L
is shown as a dashed (- - -) line
Aug 2
Aug 3
Aug 4
Aug 5
Aug 6
Aug 7
Aug 8
FIGURE 7: DISSOLVED OXYGEN CONCENTRATION MEASURED HOURLY
AT B&O CENTRAL RAILROAD ON THE CHICAGO SANITARY AND SHIP CANAL
FROM AUGUST 2, 2006 THROUGH AUGUST 8, 2006
10
IPCB Secondary Contact Proposed
DO Standard of 4.0 mg/L
is shown as a dashed (- - -) line
Aug 2
Aug 3
Aug 4
Aug 5
Aug 6
Aug 7
Aug 8
Attac
h
ment 2
DEPARTMENT OF THE ARMY
U.S. ARMY ENGINEER DIVISION
,
GREAT LAKES AND OHIO RIVER
CORPS OF ENGINEERS
550 MAIN ST.
CINCINNATI
,
OH 45202
CELRD-PDS-P (1105)
20 April 2007
MEMORANDUM FOR Commander, Chicago District
SUBJECT: Bubbly Creek, South Branch of the Chicago River,
Illinois;
Reconnaissance
Study Section 905 (b) Analysis (WRDA 86)
1.
References:
a. CELRC-
PM-PL memorandum
,
subject as above
,
dated 29 Aug 06
b.
CECW-
MVD memorandum
,
subject
"
Delegation of
Approval Authority
for Section
905(b
)
Reports
,"
dated 3 May 04
2.
Policy compliance and quality management verification for the subject report have
been completed in coordination with the HQUSACE Planning and Policy Division.
There was joint agreement by HQUSACE Planning and Policy Division and this Division
office that the 905(b) should be approved and the study can proceed into the feasibility
phase upon preparation of a project management plan and preparation and execution of
a FCSA.
3.
Early and continued coordination with higher headquarters is strongly
recommended to address potential policy issues related to proposed project features
including remediation of contaminated sediments.
4.
Per the amended guidance on Peer Review (EC 1105-2-408), the District is directed
to coordinate with the MVD Planning Center of Expertise on Ecosystem Restoration and
this office on the development of a Peer Review Plan.
5.
The subject report is hereby approved and the District may proceed with negotiation
and execution of a Feasibility Cost Sharing Agreement.
FOR THE COMMANDER:
Director of Civil Works & Management
cf:
CELRD-PDC (Sadri)
CELRD-PDS-G (
Miller)
RECONNAISSANCE STUDY
Section 905(b
) (
WRDA 86) Analysis
Bubbly Creek
,
South Branch of the Chicago River
18 August 2006
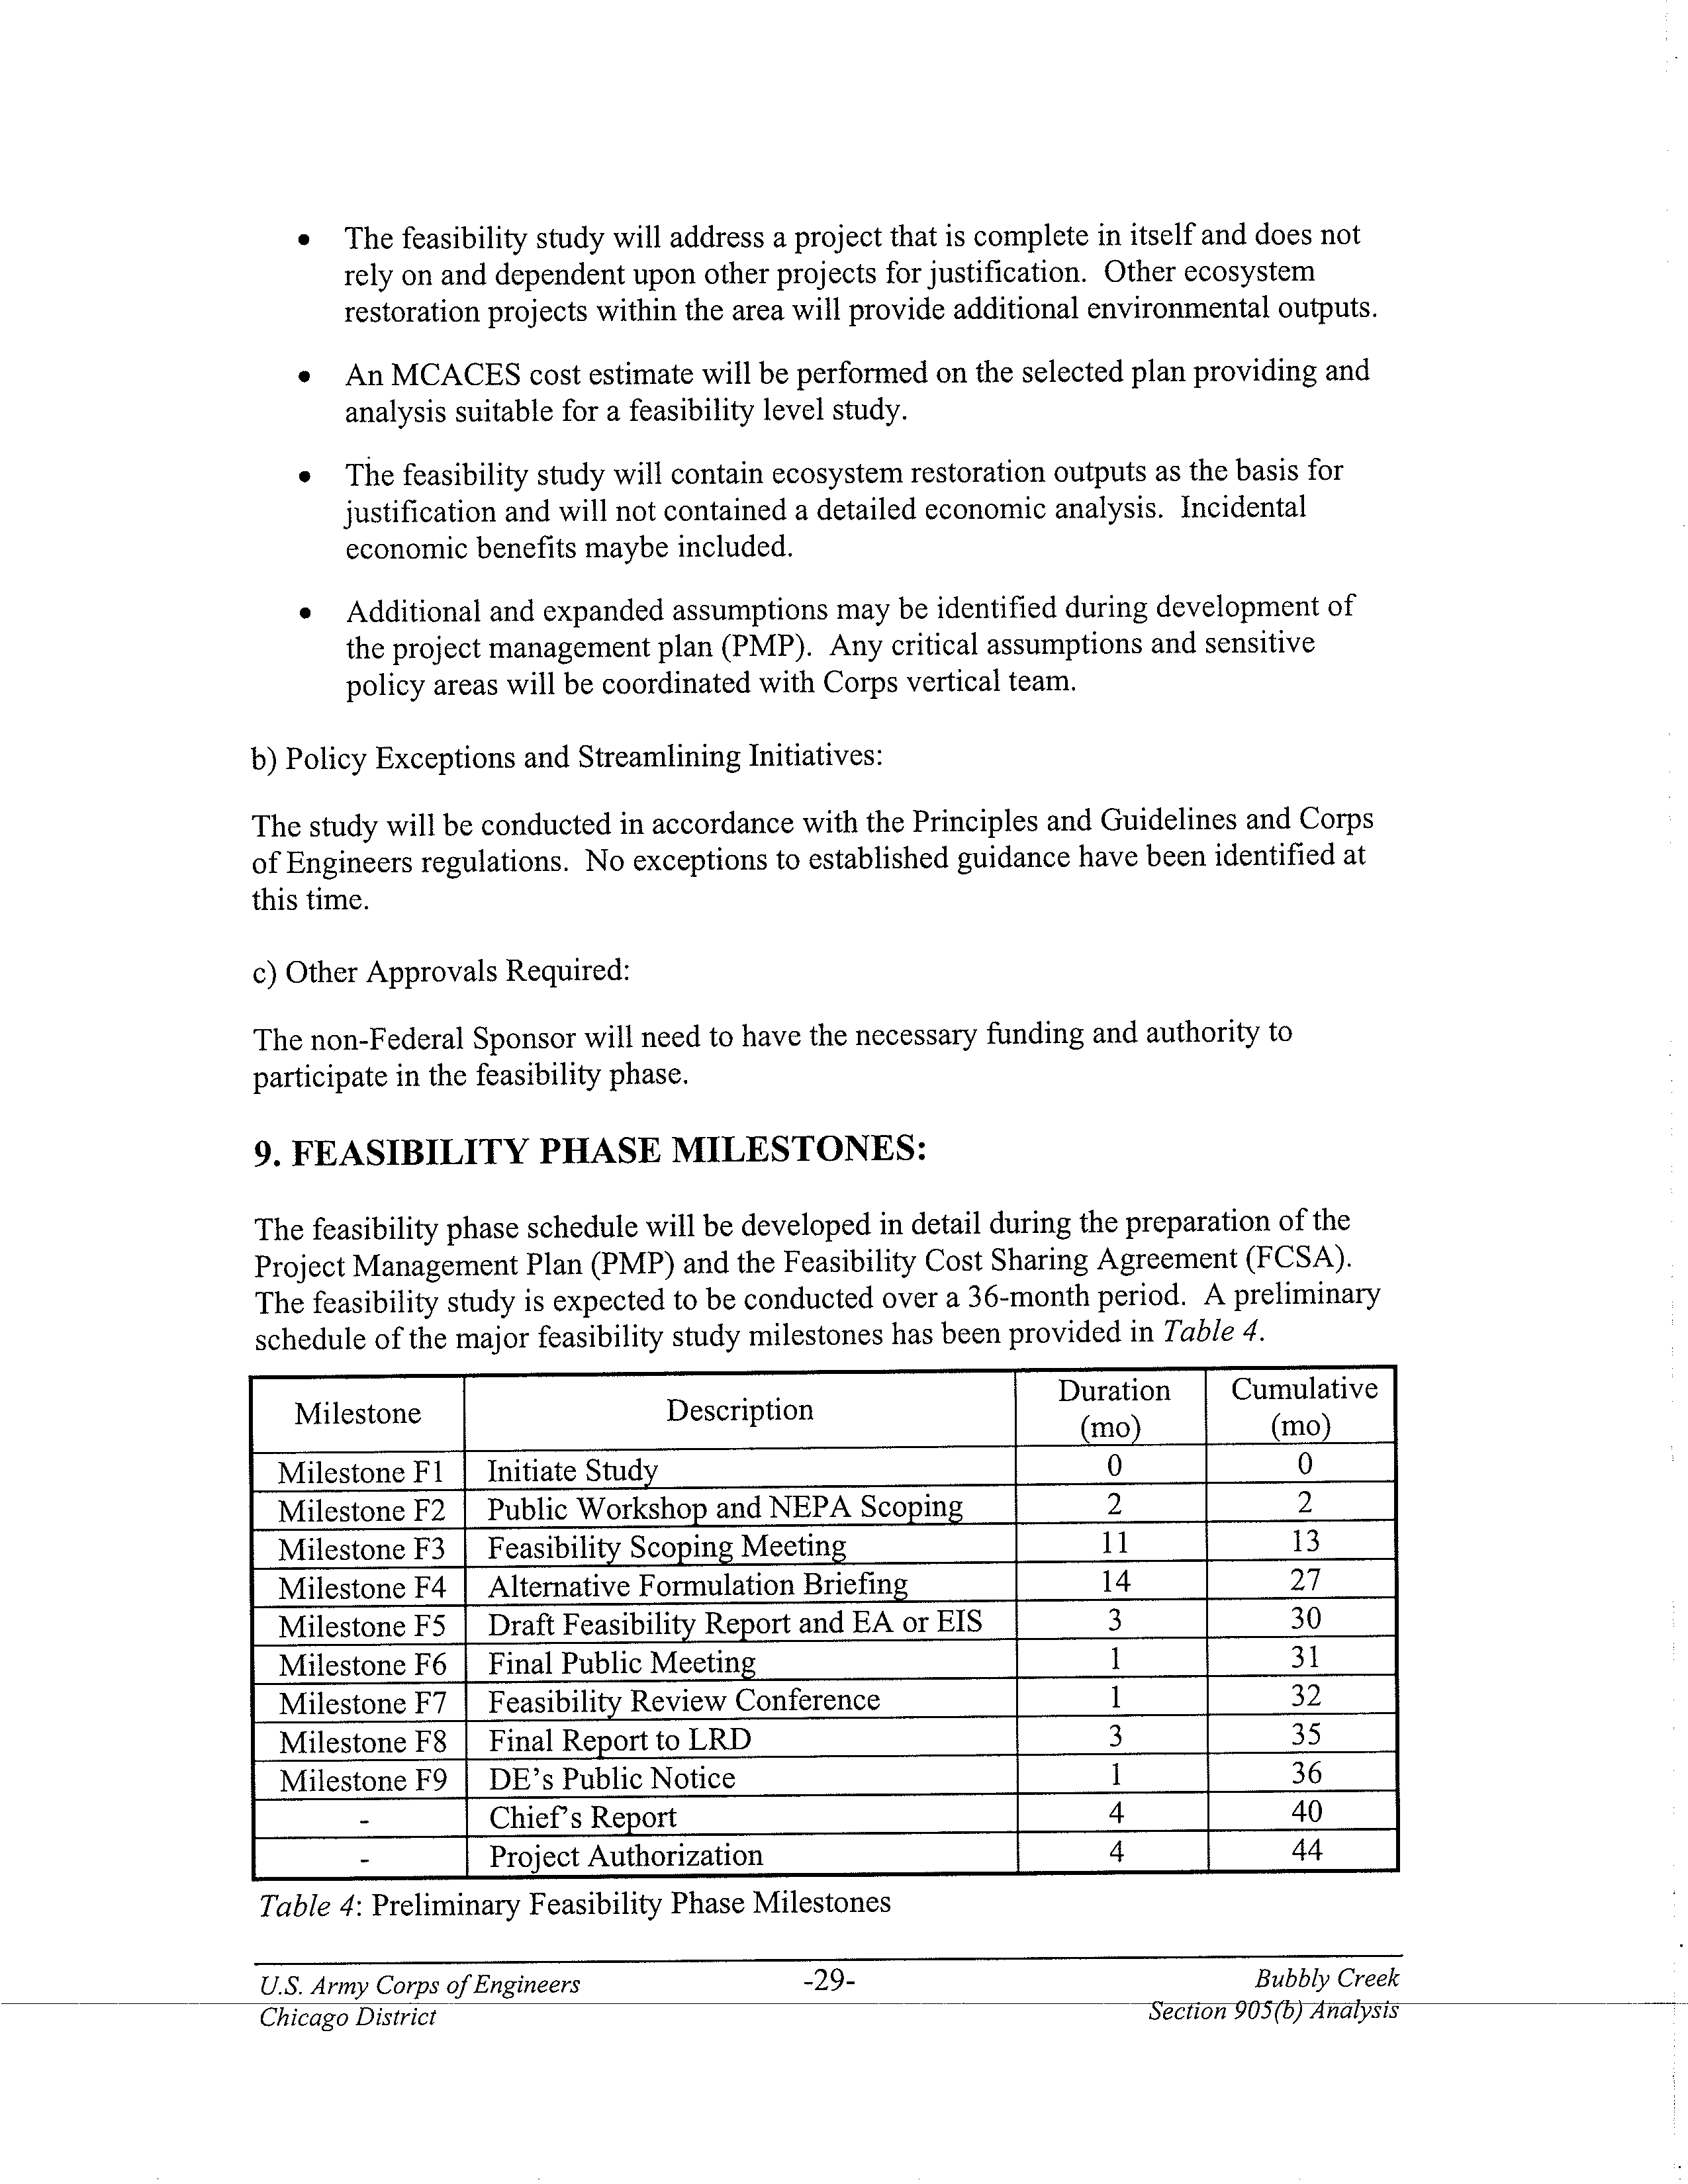
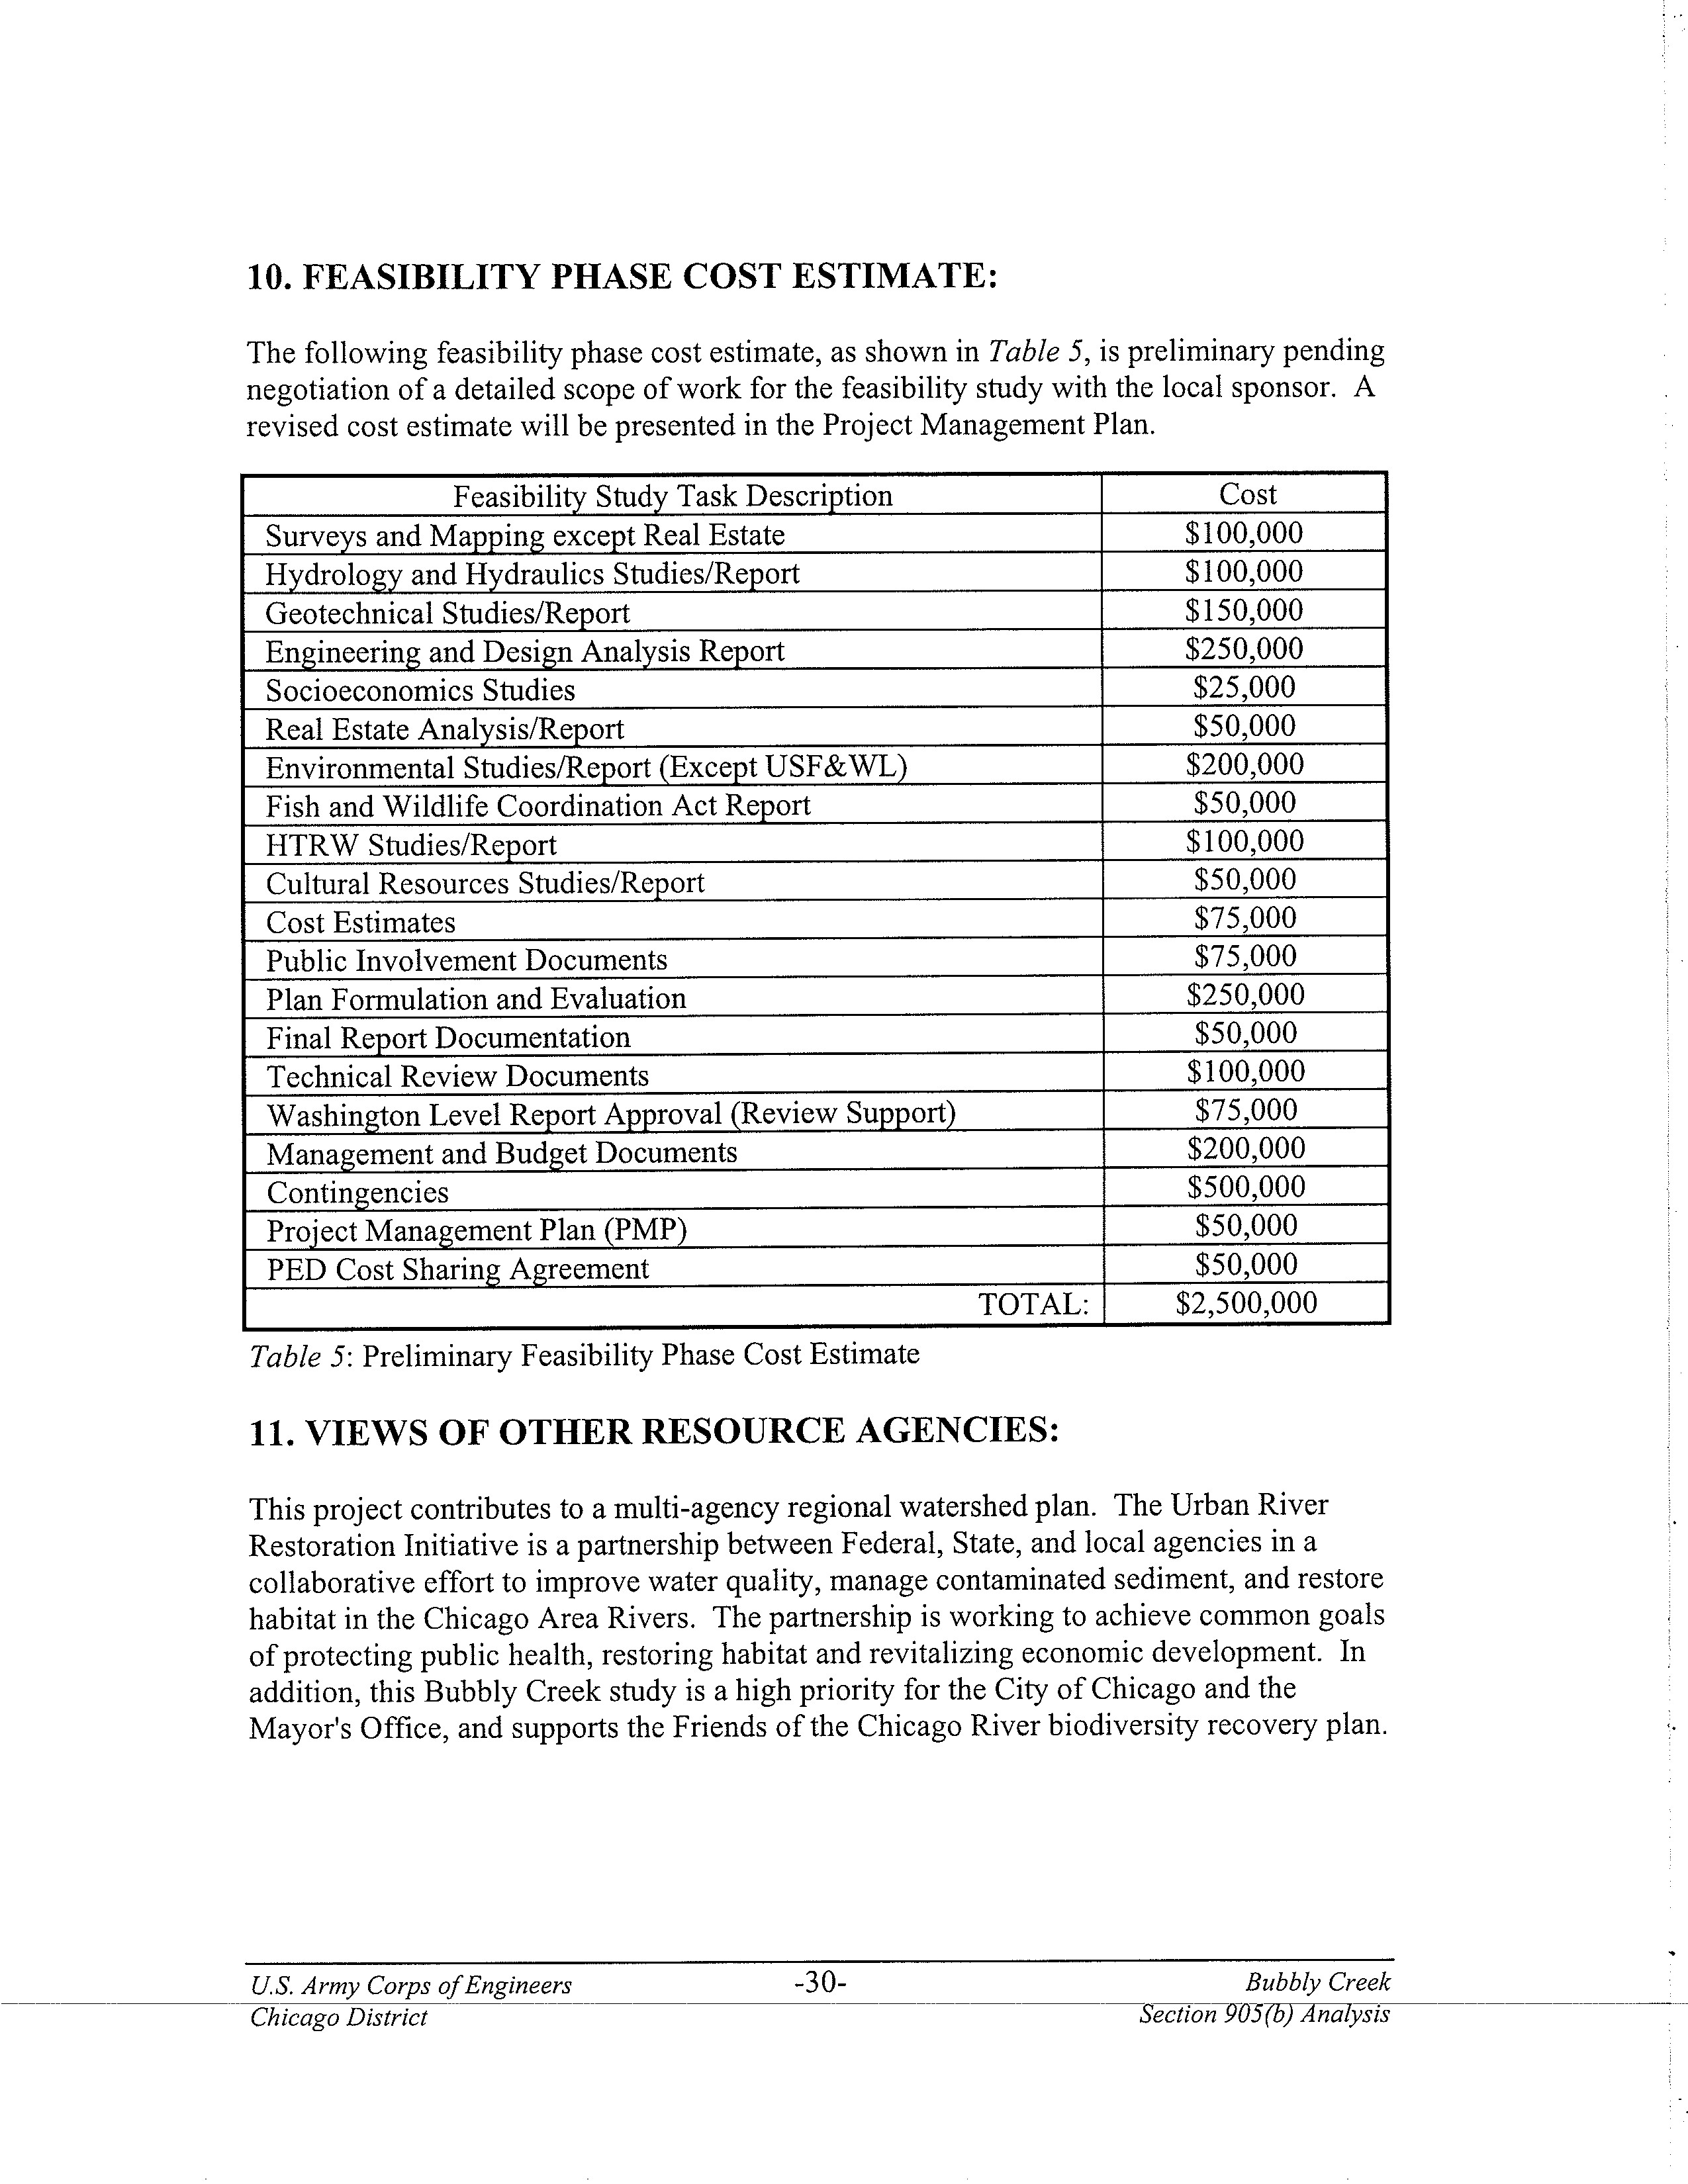
1. STUDY AUTHORITY:
a) This study is being conducted in accordance with the study resolution adopted by the
Committee on Environment and Public Works, United States Senate
,
July 20, 2005. The
study resolution authority reads as follows:
"Resolved by the Committee on Environment and Public Works of the United States
Senate, that, the Secretary of the Army, is requested to review the report of the Chief of
Engineers on the Illinois River, Illinois submitted in Senate Document
Numbered 126,
Seventy-first Congress
,
second session
,
and other pertinent reports, to determine whether
any modifications to the South Fork of the South Branch of the Chicago River (commonly
known as Bubbly Creek
)
for ecosystem restoration is advisable at this time. "
b) Funds in the amount of $200
,
000 were appropriated by Congress in Fiscal Year 2006
to conduct the reconnaissance phase of the study
.
Any remaining funds will be carried
over to FY07 to initiate feasibility once approval is received.
2. STUDY PURPOSE:
The purpose of this reconnaissance study is to identify ecosystem restoration
opportunities that the Federal Government would have an interest in studying further
based on policy guidance for the Corps of Engineers
.
In response to the study authority,
the reconnaissance study was initiated in January 2006. The reconnaissance study has
resulted in the finding that there is a Federal interest in participating in a cost
-
shared
feasibility phase study to investigate ecosystem restoration improvements to the South
Fork of the South Branch of the Chicago River. The purpose of this Section 905(b)
Analysis is to document the basis for this finding and establish the scope of the feasibility
phase. As the document that establishes the scope of the feasibility study, the Section
905(b
)
Analysis is used as the chapter of the Project Management Plan that presents the
reconnaissance overview and formulation rationale
.
Further detailed analysis to
determine ecosystem restoration measures will be provided in the feasibility phase.
3. LOCATION OF STUDY
,
NON-FEDERAL SPONSOR AND
CONGRESSIONAL DISTRICT:
a) Study Area: The study area includes the entire 1.25 mile channel of the South Fork of
the South Branch of the Chicago River, colloquially referred to as "Bubbly Creek"
located entirely within the City of Chicago, Cook County, Illinois. A once sluggishly
U. S. Army Corps of Engineers
-1-
Bubbly Creek
icago District
_
Section 905
(
b)-Analysis
flowing channel that drained an area of 5 square miles of wetlands has since been
severely altered by human development. Bubbly Creek was once a pristine wetland
system that provided natural aquatic and terrestrial habitats for fish, bird, and mammal
species.
Bubbly Creek has endured major physical alterations including deepening and
widening of the channel, creation of sheet pile banks, complete filling of wetlands within
the original drainage area, severe hydrologic alterations, and introduction of polluted
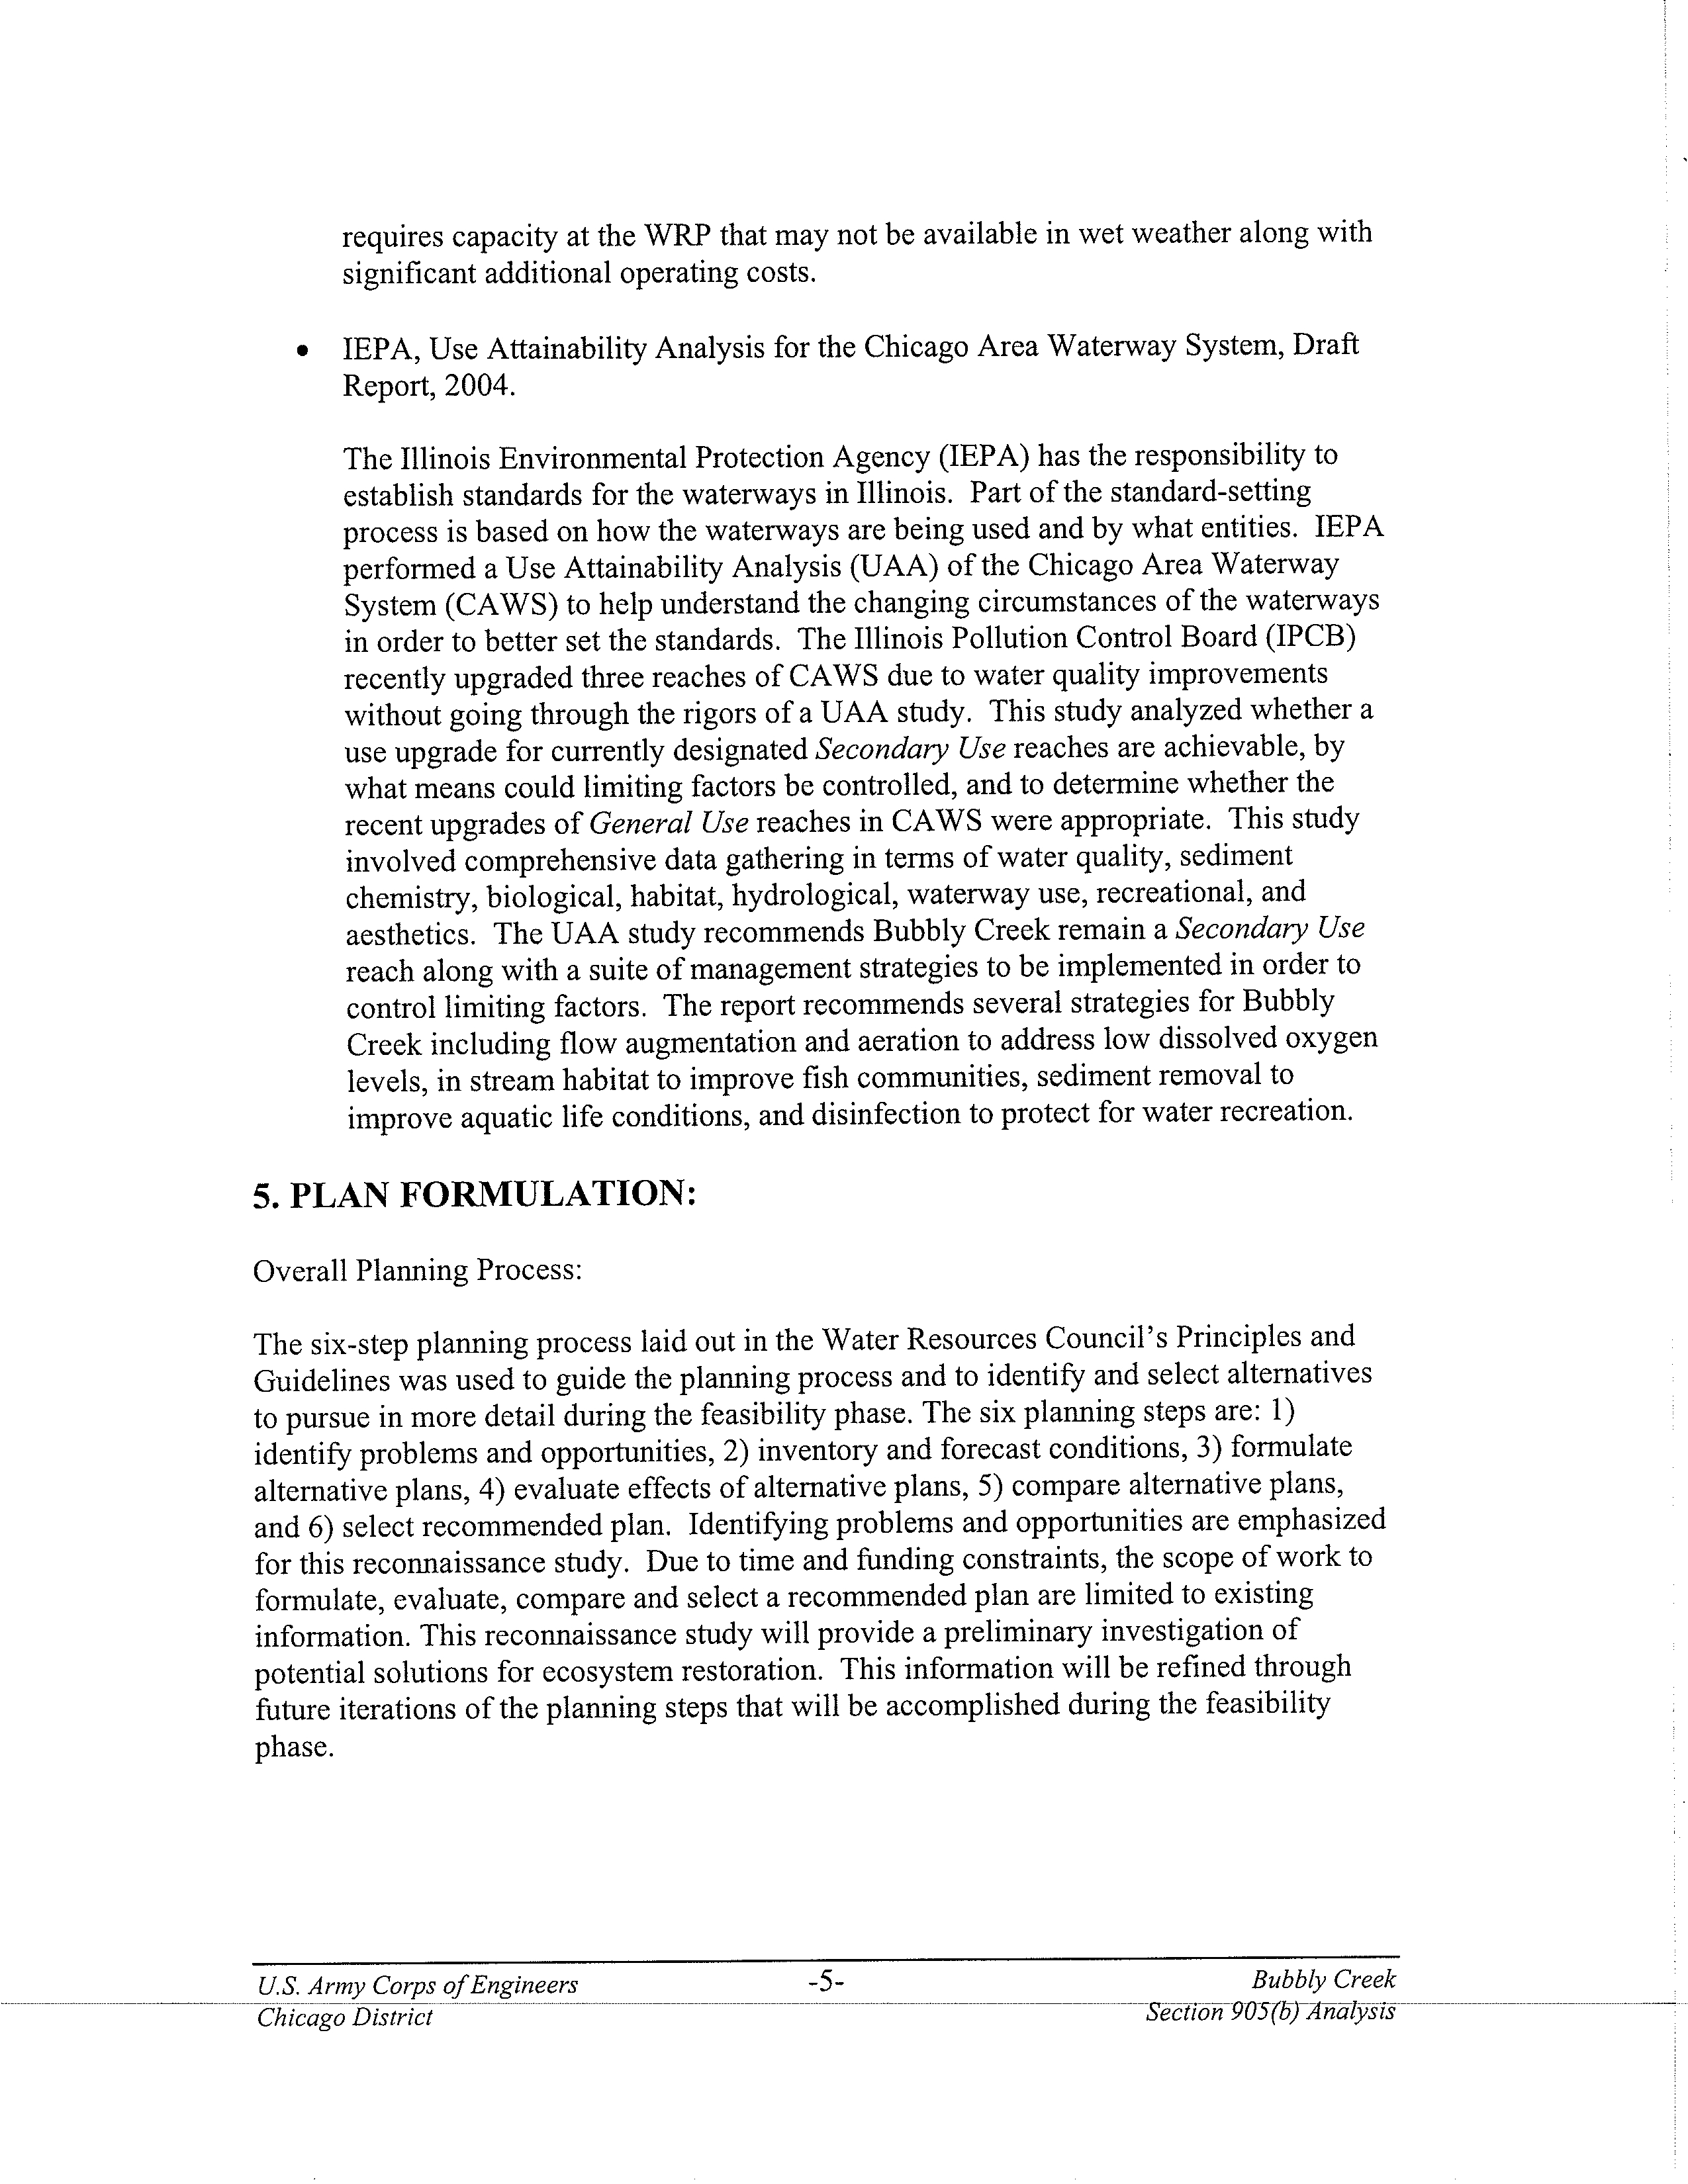
sediments and runoff. Today, the Bubbly Creek channel begins near Racine Avenue and
38th Street at the Racine Avenue Pumping Station (RAPS) and flows north into the South
Branch of the Chicago River near Ashland Avenue as shown in
Figure 1
below.
P
~ _.
^
OF CHICAGO I
27th STREET
TURNING
BASIN I
LEGEND
F CHICAGO COMBINED SEWER
OUTFALLS (
9 Outfalls)
• DROP SHAFTS
A DO MONITOR
♦
DO MONITOR AND WATER QUALITY
SAMPLING LOCATION
s
35th STREET
n
BUBBLY CREEK
STUDY AREA MAP
37th STREET
RACINE AVENUE-
PUMPING STATION
38th ST.
39th STREET
PERSHING ROAD
MWRO OUTFALL /
Figure 1:
Bubbly Creek Study Area Map
1
38th STREET
38th PLACE
1
US Army Corps
of Engineers
Chicago District
FIGURE 1
U.S. Army Corps of Engineers
-2-
Bubbly Creek
Chicago District
ection
na ysis
b) Non-Federal Sponsor:
City of Chicago, Department of Environment (DOE)
c) Congressional District:
3`d Congressional District, Congressman Daniel Lipinski
4th Congressional District, Congressman Luis Gutierrez
U.S. Senators Richard Durbin and Barack Obama
4. PRIOR REPORTS AND EXISTING PROJECTS:
a) Corps of Engineers reports:
•
USACE, Chicago District,
Section 206 Preliminary Restoration Plan for the
South Fork of the South Branch of the Chicago River (Bubbly Creek), Chicago
Illinois,
2003.
The Chicago District received a letter from the City of Chicago, Department of
Environment in July 2002 requesting assistance under Section 206 of the
Continuing Authorities Program (CAP) to address problems with degraded
aquatic habitat in the Chicago River in the vicinity of Bubbly Creek. The District
produced a preliminary restoration plan for Bubbly Creek recommending further
study under the CAP Section 206 authority. During the feasibility phase of the
Section 206 study, the estimated costs of the project were determined to exceed
the Section 206 authority project limits and the project was converted to a general
investigation study.
• USACE, Chicago District,
Collection and Analysis of Sediment Samples from the
South Fork South Branch, Chicago River, Draft Final Report,
2004.
One of the first activities performed by the CAP Section 206 feasibility phase was
to characterize the existing sediments within Bubbly Creek. Limited sediment
characterization was available by the Illinois Environmental Protection Agency
(IEPA) and the Metropolitan Water Reclamation District of Greater Chicago
(MWRDGC). The Chicago District contracted with Camp Dresser and McKee
Engineers (CDM) to perform sediment core sampling and analysis of the bottom
sediments. Thirteen core samples and five grab samples along the entire length of
Bubbly Creek were sampled and analyzed. Results from the analysis concluded
that the material was not found to be characteristically toxic, corrosive or reactive
under RCRA, but further analysis of ignitability is required.
b) Other studies and reports pertaining to the study area:
•
City of Chicago, Department
of Planning and Development
,
Chicago River
Corridor Development Plan,
1999.
U.S. Army Corps of Engineers
-3-
Bubbly Creek
Chicago District
Section-_n 905(b) Analysis
The Chicago River Corridor Development Plan and Design Guidelines are the
result of a collaborative effort among government agencies, private sector
developers, and non-profit organizations to create a blueprint for the future of the
Chicago River. The goal of the plan is to enhance the river's attractiveness as a
natural and recreational resource while respecting the needs of residential and
business developments. Approved by the Chicago Planning Commission in 1998,
the plan sets forth a shared vision for the river and outlines specific
recommendations to be completed over the next 10 years. Components of the plan
include specific recommendations for improvements to public and private land
that support the goals of the plan, and strategies for preserving and enhancing the
river's natural areas.
• MWRDGC, Research
and Development Department
,
Bubbly Creek Water Quality
Improvement
Demonstration
Project in 2002,
Report 03-01, 2003.
This report provides results of a demonstration project performed in the summer
of 2002 by the Metropolitan Water Reclamation District of Greater Chicago
(MWRDGC) with the goal of improving water quality in Bubbly Creek. The
demonstration project involved opening a gate at the Racine Avenue Pumping
Station (RAPS) to allow water from Bubbly Creek to discharge through the
intercepting sewer system, thereby establishing a flow in the creek when
otherwise it would have been stagnant. The demonstration project lasted about 3
months where approximately 2.5 billion gallons were drawn through the creek
and treated at their water reclamation plant (WRP) at an estimated cost of
$625,000.
Water quality monitoring showed a marked improvement to dissolved
oxygen (DO) during dry weather flows and recommendations for further
demonstration project operations were made.
•
MWRDGC, Research and Development Department, 2003
Bubbly Creek Water
Quality Improvement Demonstration Project,
Report 04-08, 2004.
This report provides results of a second-year demonstration project performed by
the Metropolitan Water Reclamation District of Greater Chicago (MWRDGC)
with the goal of improving water quality in Bubbly Creek. This additional
demonstration project investigated a wider range of flows than the initial study.
The demonstration project lasted 6 months where approximately 2.1 billion
gallons were drawn through the creek at an estimated cost of $525,000.
Hydrologic conditions varied greatly in the second-year demonstration project
over the first-year project in that combined sewer overflow (CSO) discharges
numbered eight overflow events versus two the previous year.
Water quality
monitoring showed marked improvements to dissolved oxygen (DO) during dry
weather flows and reductions in periods of low DO following CSO events.
Recommendations for further study of sediment oxygen uptake and the impact of
algal respiration on DO levels were made. The report also states that the method
of artificial flow creation used in this demonstration project cannot be used as a
long-term solution for the water quality improvements in Bubbly Creek since it
-
U.S. Army Corps of Engineers
-4-
Bubbly Creek
Chicago District
--- Section 905(b) Analysis
requires capacity at the WRP that may not be available in wet weather along with
significant additional operating costs.
•
IEPA, Use Attainability Analysis for the Chicago Area Waterway System, Draft
Report, 2004.
The Illinois Environmental Protection Agency (IEPA) has the responsibility to
establish standards for the waterways in Illinois. Part of the standard-setting
process is based on how the waterways are being used and by what entities. IEPA
performed a Use Attainability Analysis (UAA) of the Chicago Area Waterway
System (CAWS) to help understand the changing circumstances of the waterways
in order to better set the standards. The Illinois Pollution Control Board (IPCB)
recently upgraded three reaches of CAWS due to water quality improvements
without going through the rigors of a UAA study. This study analyzed whether a
use upgrade for currently designated
Secondary Use
reaches are achievable, by
what means could limiting factors be controlled, and to determine whether the
recent upgrades of
General Use
reaches in CAWS were appropriate. This study
involved comprehensive data gathering in terms of water quality, sediment
chemistry, biological, habitat, hydrological, waterway use, recreational, and
aesthetics.
The UAA study recommends Bubbly Creek remain
a Secondary Use
reach along with a suite of management strategies to be implemented in order to
control limiting factors. The report recommends several strategies for Bubbly
Creek including flow augmentation and aeration to address low dissolved oxygen
levels, in stream habitat to improve fish communities, sediment removal to
improve aquatic life conditions, and disinfection to protect for water recreation.
5. PLAN FORMULATION:
Overall
Planning Process:
The six-step planning process laid out in the Water Resources Council's Principles and
Guidelines was used to guide the planning process and to identify and select alternatives
to pursue in more detail during the feasibility phase. The six planning steps are: 1)
identify problems and opportunities, 2) inventory and forecast conditions, 3) formulate
alternative plans, 4) evaluate effects of alternative plans, 5) compare alternative plans,
and 6) select recommended plan. Identifying problems and opportunities are emphasized
for this reconnaissance study. Due to time and funding constraints, the scope of work to
formulate, evaluate, compare and select a recommended plan are limited to existing
information. This reconnaissance study will provide a preliminary investigation of
potential solutions for ecosystem restoration. This information will be refined through
future iterations of the planning steps that will be accomplished during the feasibility
phase.
U.S. Army Corps of Engineers
-5-
Bubbly Creek
Chicago District
ectron
na
Y
sis
a) National Objective:
The Corps has a national objective for ecosystem restoration in response to legislation
and administration policy. The National Ecosystem Restoration (NER) objective is to
contribute to the restoration of the Nation's ecosystems through implementation of
ecosystem restoration projects, with contributions measured by changes in the amounts of
ecological outputs.
b) Public Concerns:
During the preparation of this report, several meetings were held with the potential
sponsor and several other federal, state, regional, and local stakeholders including:
•
City of Chicago, Department of the Environment (DOE); potential local sponsor
•
U.S. Environmental Protection Agency, Region V (USEPA)
•
Illinois Environmental Protection Agency (IEPA)
•
City of Chicago, Department of Planning and Development (DPD)
•
City of Chicago, Mayor's Office (MO)
•
City of Chicago, Department of Water Management (DWM)
•
Metropolitan Water Reclamation District of Greater Chicago District
(MWRDGC)
•
Friends of the Chicago River (FCR)
•
The Wetlands Initiative (TWI)
A number of public concerns regarding Bubbly Creek have been identified during these
discussions. The public concerns are related to the establishment of planning objectives
and planning constraints. The following public concerns were identified:
•
Majority of the time Bubbly Creek is stagnant due to major hydrologic alterations,
which contribute to low water quality and aquatic habitat degradation.
•
Bubbly Creek receives combined sewer overflows from RAPS and other CSO
outfalls along the channel during major rain events. These CSOs contribute to
water quality degradation, aquatic habitat degradation, increased solids loadings,
and the introduction of floating debris.
•
The sediments contained within Bubbly Creek are the remnants of raw sewage
and waste from previous meatpacking industries that lined its banks. These
sediments contain high levels of organics that continually decompose
anaerobically producing methane and hydrogen sulfide gas in bubble form thus
contributing to water quality and aquatic habitat degradation.
•
Bubbly Creek is critical for providing flood relief to a 30 square mile area of the
south side of Chicago by receiving overflows. The conveyance capacity of the
channel must remain viable to accept the 6,000-cfs maximum overflows from
RAPS and additional overflow capacity from nine CSO overflows along the
channel.
Maintaining existing channel conveyance capacity in order to not induce
additional flooding must be taken into account throughout the planning process.
U.S. Army Corps of Engineers
-6-
Bubbly Creek
Chicago District
section
na ysts
_ -
- -
•
Due to water quality problems, Bubbly Creek is classified as a secondary use
water body for limited contact. Plans to revitalize the surrounding area are
limited by its current degraded state.
•
Bubbly Creek offers limited recreational opportunities for millions of residents of
the local surrounding community.
•
Currently, Bubbly Creek is not aesthetically pleasing as the channel produces
frequent foul odors and collects unsightly floating debris following a CSO event.
c) Problem Identification:
General / Background -
Historically, the Chicago River system was essentially a wetland complex that sluggishly
flowed east into Lake Michigan. The drainage area of the Chicago River was unique in
that its boundary with the Des Plaines River to the west formed a continental divide
separating the Great Lakes and St. Lawrence River watershed from the Mississippi River
drainage basin. One location of the continental divide called Mud Lake, just two miles
west of Bubbly Creek, was quite low and ill-defined allowing sporadic overflows to the
Mississippi River basin during spring floods, which periodically connected these great
basins.
This unique topographic characteristic allowed for a permanent connection
between the two basins possible. In 1848 the completion of the Illinois and Michigan
Canal, which originated at the confluence of Bubbly Creek and the South Branch of the
Chicago River, created an efficient water trade route between the basins sparking the
rapid growth and development of the Chicago area. In 1900, a larger connection was
created with the completion of the Chicago Sanitary and Ship Canal, which in turn
permanently reversed the flow of the Chicago River and its drainage from Lake Michigan
to the Illinois River and down the Mississippi River.
The South Fork of the South Branch of the Chicago River and its tributaries were once
clear meandering creeks that slowly drained the vast marshland that occurred within its
original 5 square mile drainage area. This once pristine ecosystem provided natural
aquatic and terrestrial habitats for many fish, bird, and mammal species. Over a period of
several decades, this pristine ecosystem was severely altered by human development. In
the early 1860's the Union Stock Yards were constructed along the banks of the South
Fork and this small stream became an open sewer and disposal site for large quantities of
blood, offal, hair, and other animal wastes from the meatpacking industry. The channel
was systematically deepened and widened to allow for drainage and disposal of wastes
from the nearby meatpacking industries. Biochemical reactions caused by decomposing
animal waste continuously produce methane and hydrogen sulfide bubbles. To this day
these bubbles constantly float to and break at the water surface, for which the name
"Bubbly Creek" is colloquially given. In 1923, the last tributary to Bubbly Creek, West
Arm of the South Fork, was completely filled in as a remediation solution to the vast
quantities of waste dumped in that channel. The Union Stockyards closed in 1971 after
105 years of meat production. The impact which the Union Stockyards have on the
landscape and its vast physical alterations to Bubbly Creek and the surrounding area
remains today.
U.S. Army Corps of Engineers
-7-
Bubbly Creek
Chicago District
Section 905(bT- na ysts
During the development of Chicago in the late 1800s and early 1900s, a vast sewer
system was constructed to collect sanitary waste and storm runoff and convey it via
massive underground combined sewers to the areas river system. A 30-square mile area
of the central and south side of the City of Chicago originally drained to Bubbly Creek by
gravity.
Conditions in the channel degraded to a point where a bypass connection was
constructed to pump fresh water from Lake Michigan to flush the system during dry
weather. In 1939, the worlds largest pump station, Racine Avenue Pumping Station
(RAPS), was constructed and dry weather flows were diverted to the Stickney Water
Reclamation Plant (WRP) for treatment instead of directly discharging raw sewage to
Bubbly Creek. Over the years, increases to treatment capacity at the WRP have reduced
the amount of overflows that occur. The construction of the Tunnel and Reservoir Plan
(TARP), which encompasses a system of deep tunnels and massive reservoirs used to
store overflows, have drastically reduced the amount of combined sewer overflows
(CSOs) to area rivers. Currently the tunnel portion of the project is complete, thus
reducing the number of CSOs at RAPS to approximately 17 times per year.
Unfortunately, even with the TARP project completed, with construction of the McCook
reservoir currently scheduled for 2023 completion, overflow capacity will still be
required at RAPS, albeit less frequently, in order to prevent local flooding and basement
backup during large storm events.
Today, Bubbly Creek is a relatively straight 6,600-foot channel that originates at the
RAPS and flows north during overflow events to its confluence with the South Branch of
the Chicago River. The channel is mostly lined with vertical walls made of steel sheet
pile, concrete, or wood and few areas of steep rocky soils as shown in
Figure
2 below. A
mix of land uses are found along the banks of Bubbly Creek including industrial plants,
trucking terminals, rail yards, and construction material yards which are giving way to
new commercial and residential development. Channel depths vary from approximately
6-feet near RAPS to 14-feet at its mouth and channel widths vary between 120 to 200-
feet wide. The major physical alterations caused by development has severely degraded
the natural ecosystem and eliminated most of the natural aquatic and terrestrial habitats.
Due to hydrologic alterations, existing bottom sediments, combined sewer overflows, and
lack of riparian and in-stream habitats, Bubbly Creek remains a severely impaired
ecosystem with vast opportunities for restoration. Unfortunately, Bubbly Creek has been
altered and degraded so severely that simply restoring aquatic and terrestrial vegetation,
reintroducing natural bottom substrates, altering the channel form, and creating wetlands
will not work on their own. Sustainable conditions must be met in order for ecosystem
restoration to take hold and succeed.
Below is a discussion of specific problems that contribute to the degradation of Bubbly
Creek and which must be solved in order to allow for successful ecosystem restoration.
The first four problems identified below including stagnant flow conditions, combined
sewer overflows, poor sediment quality and poor water quality all contribute to the
degradation of habitat and biological integrity and must be addressed in order to provide
sustainable conditions for ecosystem restoration. Successful ecosystem restoration is
dependent upon restoring the conditions needed for sustainability. Bubbly Creek faces a
U.S. Army Corps of Engineers
-8-
Bubbly Creek
Chicago District
Section 903
(b)-An-a^ysrs --_- - _
complex series of problems, which in turn will require an equally complex set of
restoration solutions.
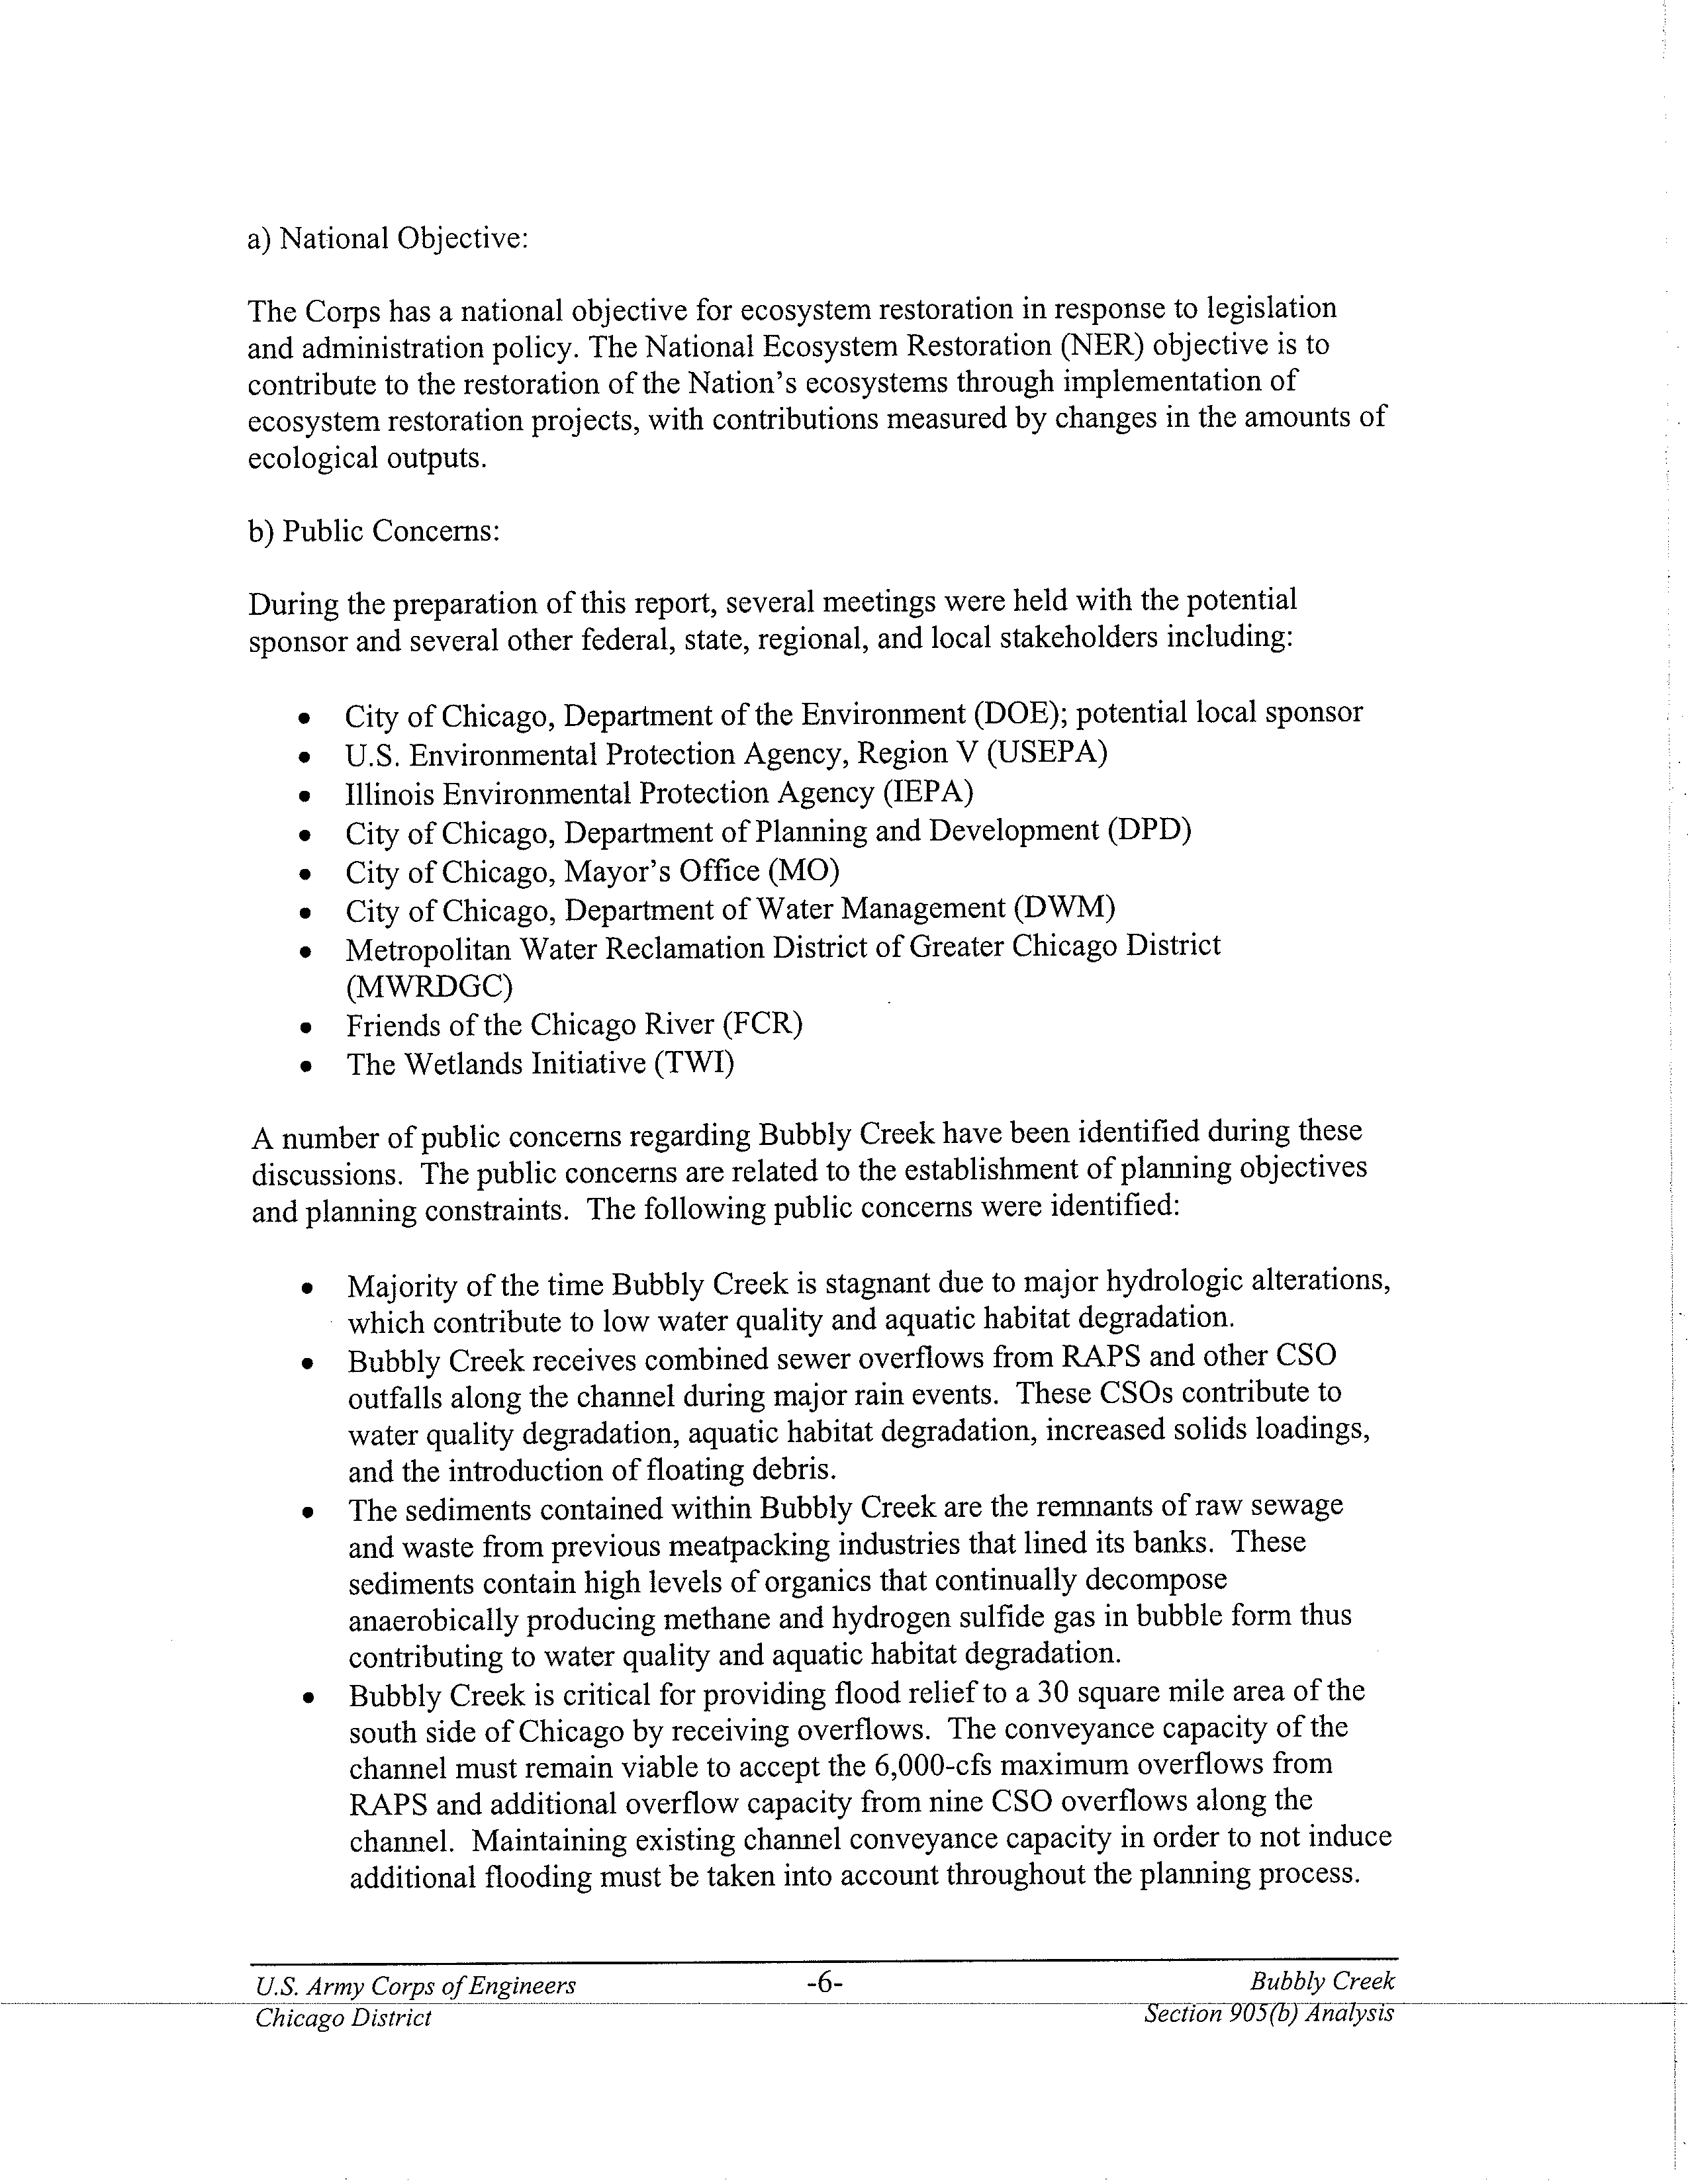
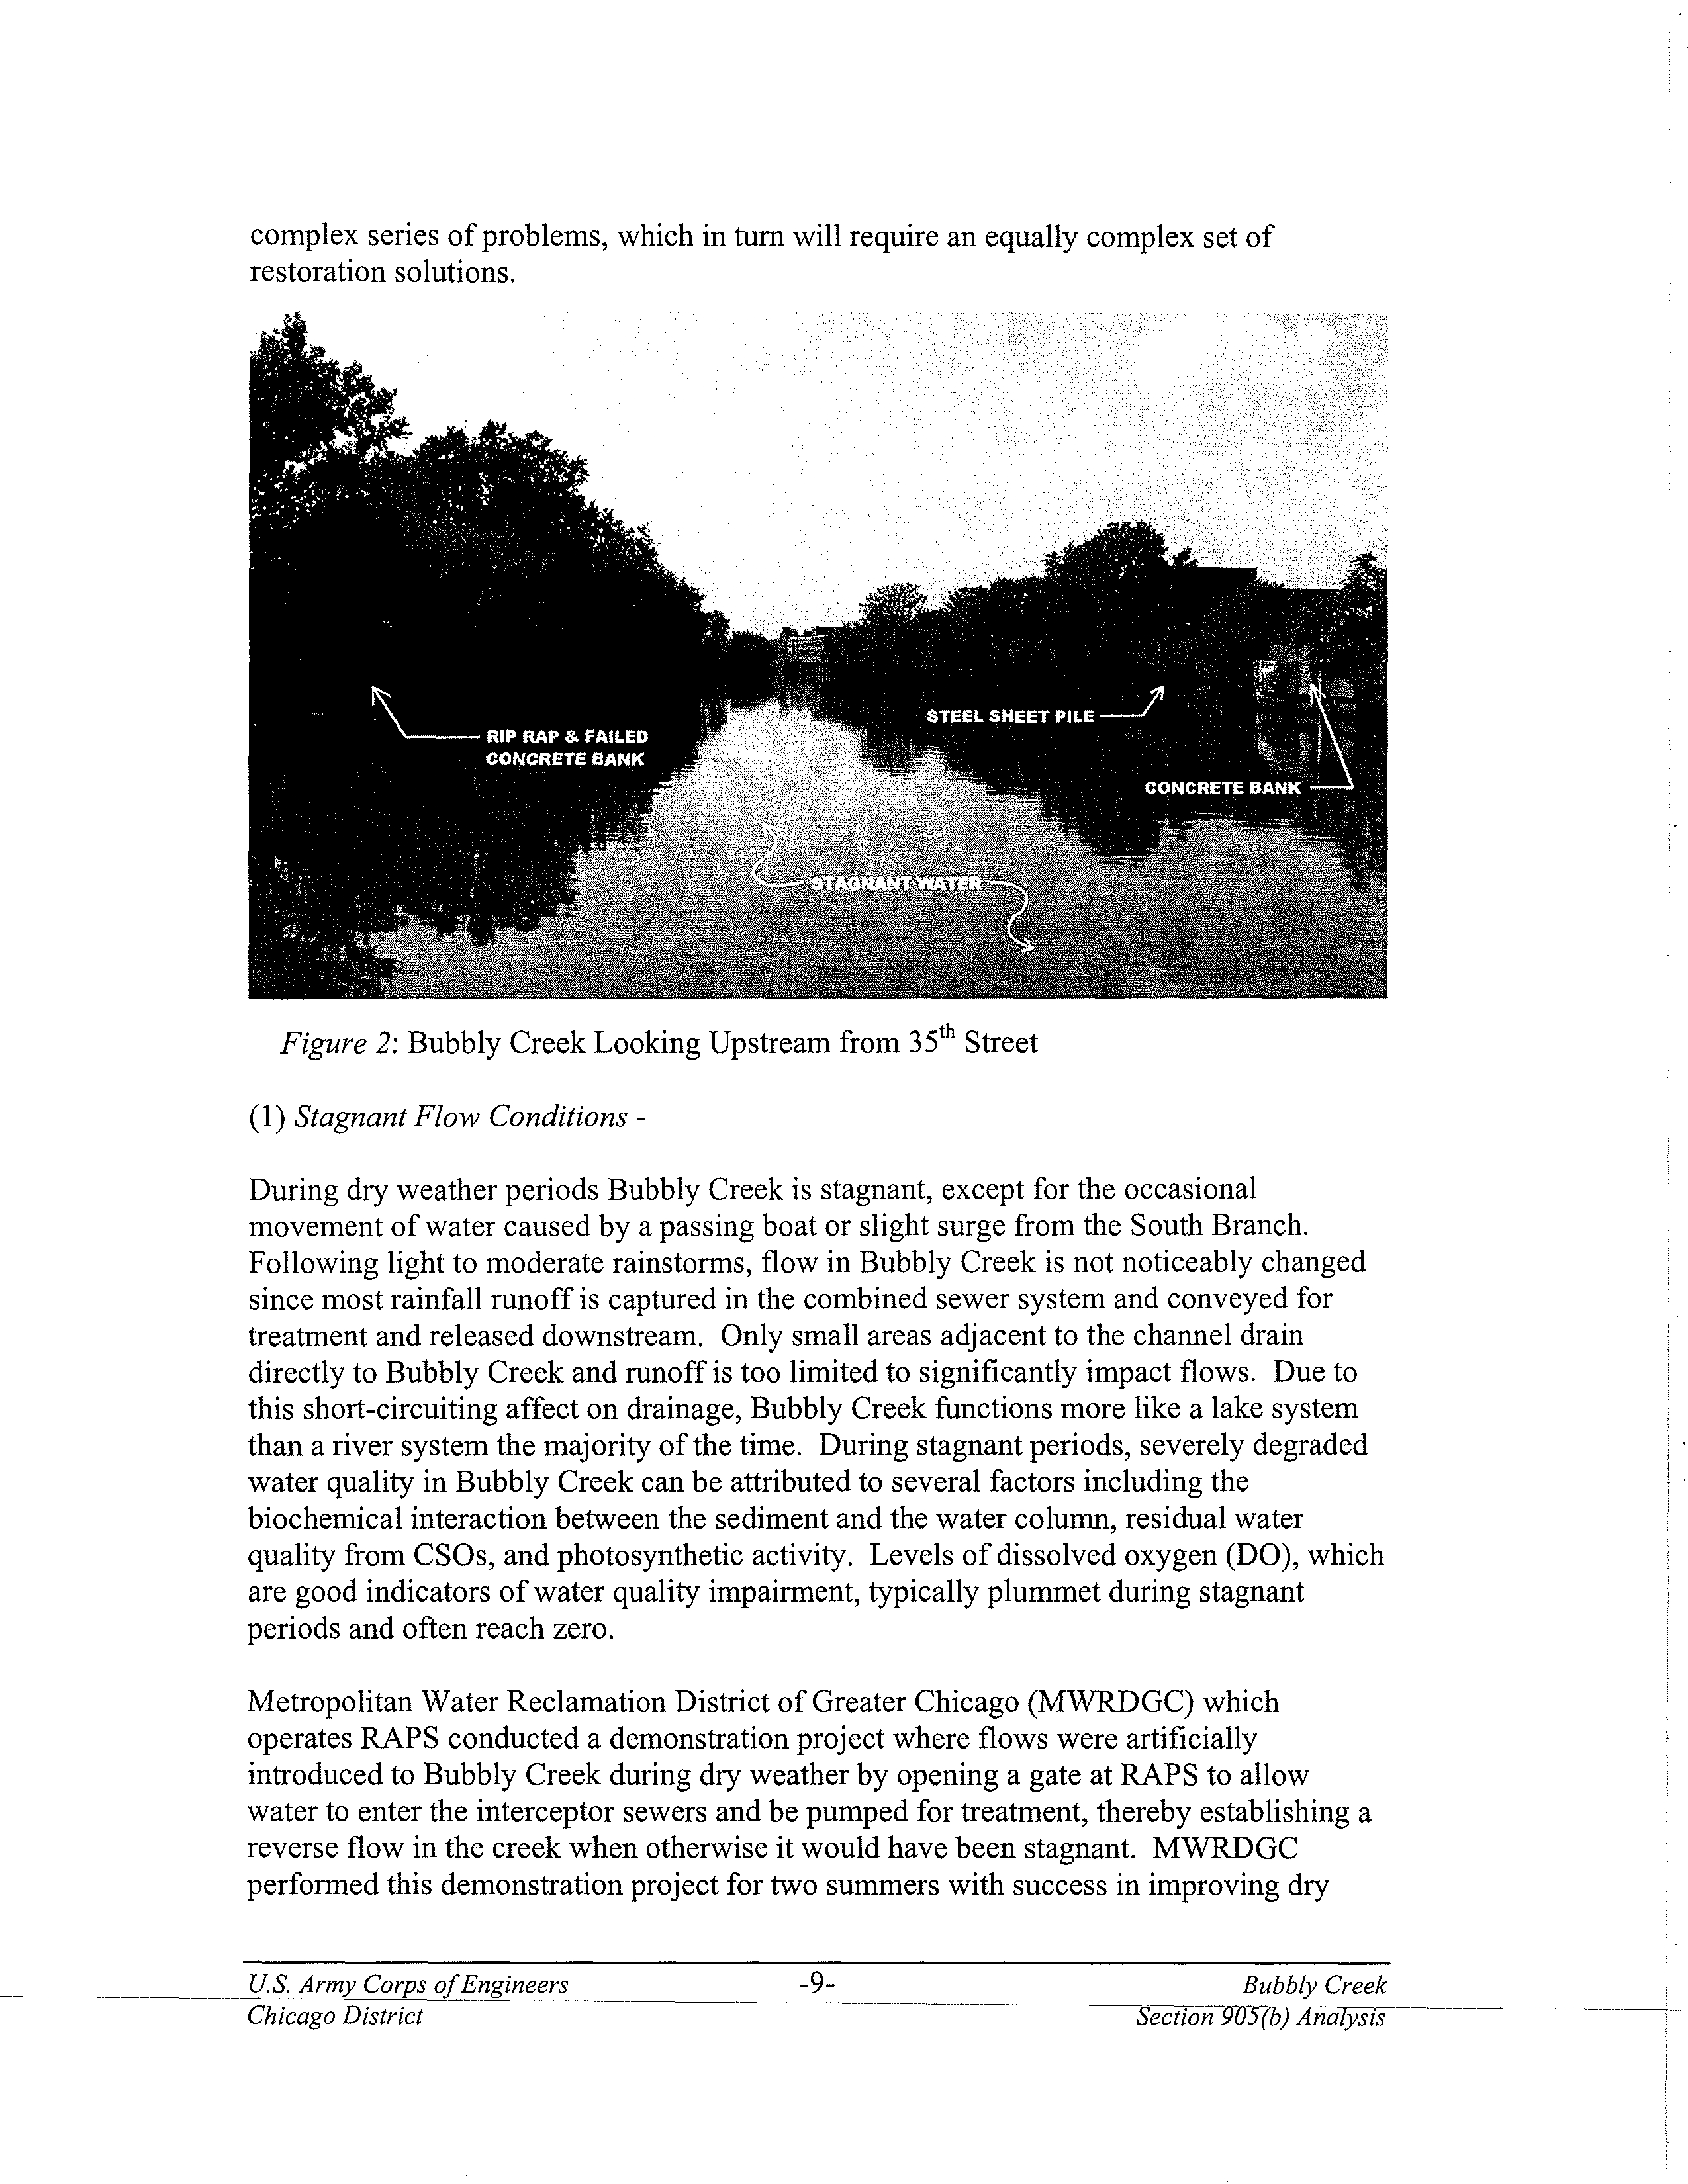
Figure 2:
Bubbly Creek Looking Upstream from 35th Street
(1) Stagnant Flow Conditions -
During dry weather periods Bubbly Creek is stagnant, except for the occasional
movement of water caused by a passing boat or slight surge from the South Branch.
Following light to moderate rainstorms, flow in Bubbly Creek is not noticeably changed
since most rainfall runoff is captured in the combined sewer system and conveyed for
treatment and released downstream. Only small areas adjacent to the channel drain
directly to Bubbly Creek and runoff is too limited to significantly impact flows. Due to
this short-circuiting affect on drainage, Bubbly Creek functions more like a lake system
than a river system the majority of the time. During stagnant periods, severely degraded
water quality in Bubbly Creek can be attributed to several factors including the
biochemical interaction between the sediment and the water column, residual water
quality from CSOs, and photosynthetic activity. Levels of dissolved oxygen (DO), which
are good indicators of water quality impairment, typically plummet during stagnant
periods and often reach zero.
Metropolitan Water Reclamation District of Greater Chicago (MWRDGC) which
operates RAPS conducted a demonstration project where flows were artificially
introduced to Bubbly Creek during dry weather by opening a gate at RAPS to allow
water to enter the interceptor sewers and be pumped for treatment, thereby establishing a
reverse flow in the creek when otherwise it would have been stagnant. MWRDGC
performed this demonstration project for two summers with success in improving dry
U.S. Army Corps of Engineers
-97
Bubbly Creek
Chicago District
-
Section 90
_W na ysts ----
weather water quality at a cost of nearly $1.2 million dollars in added operating costs. It
was determined that the creation of an artificial flow during dry weather flows can
drastically improve water quality, but the method of artificial flow creation used in this
project cannot be used as a long-term solution for the water quality improvements in
Bubbly Creek since it requires additional treatment capacity that may not be available in
wet weather and entails significant additional operating costs.
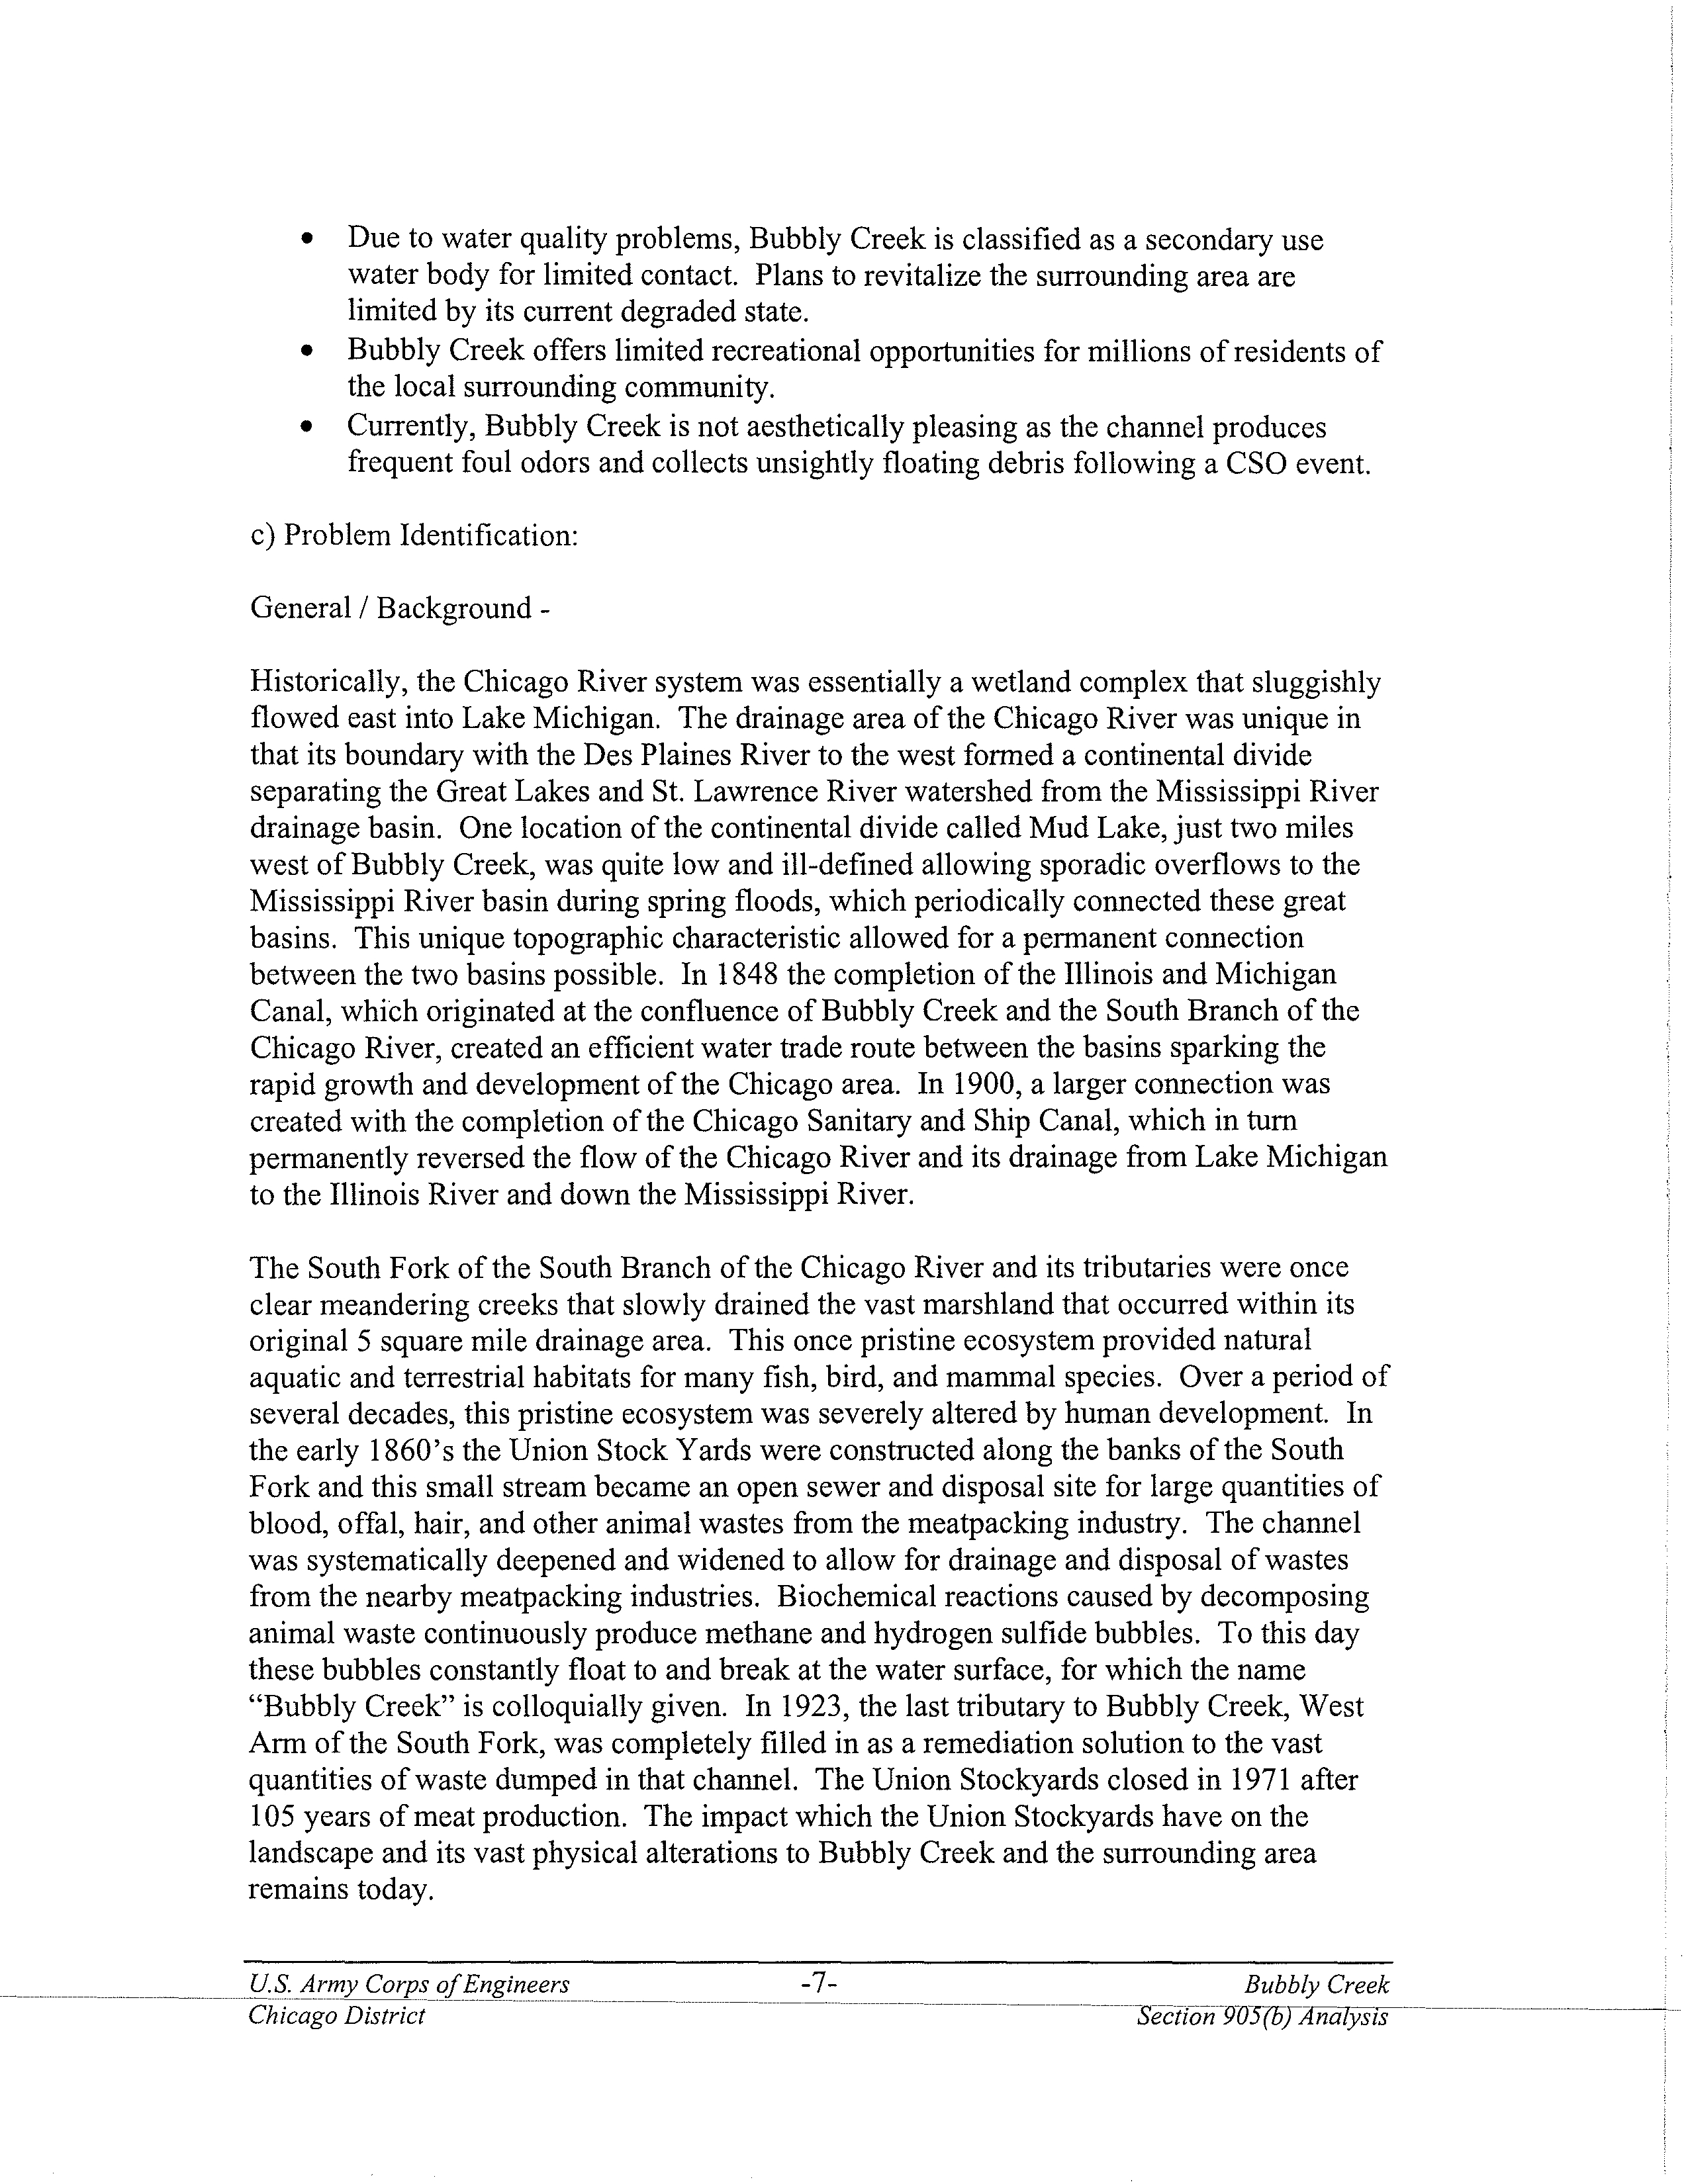
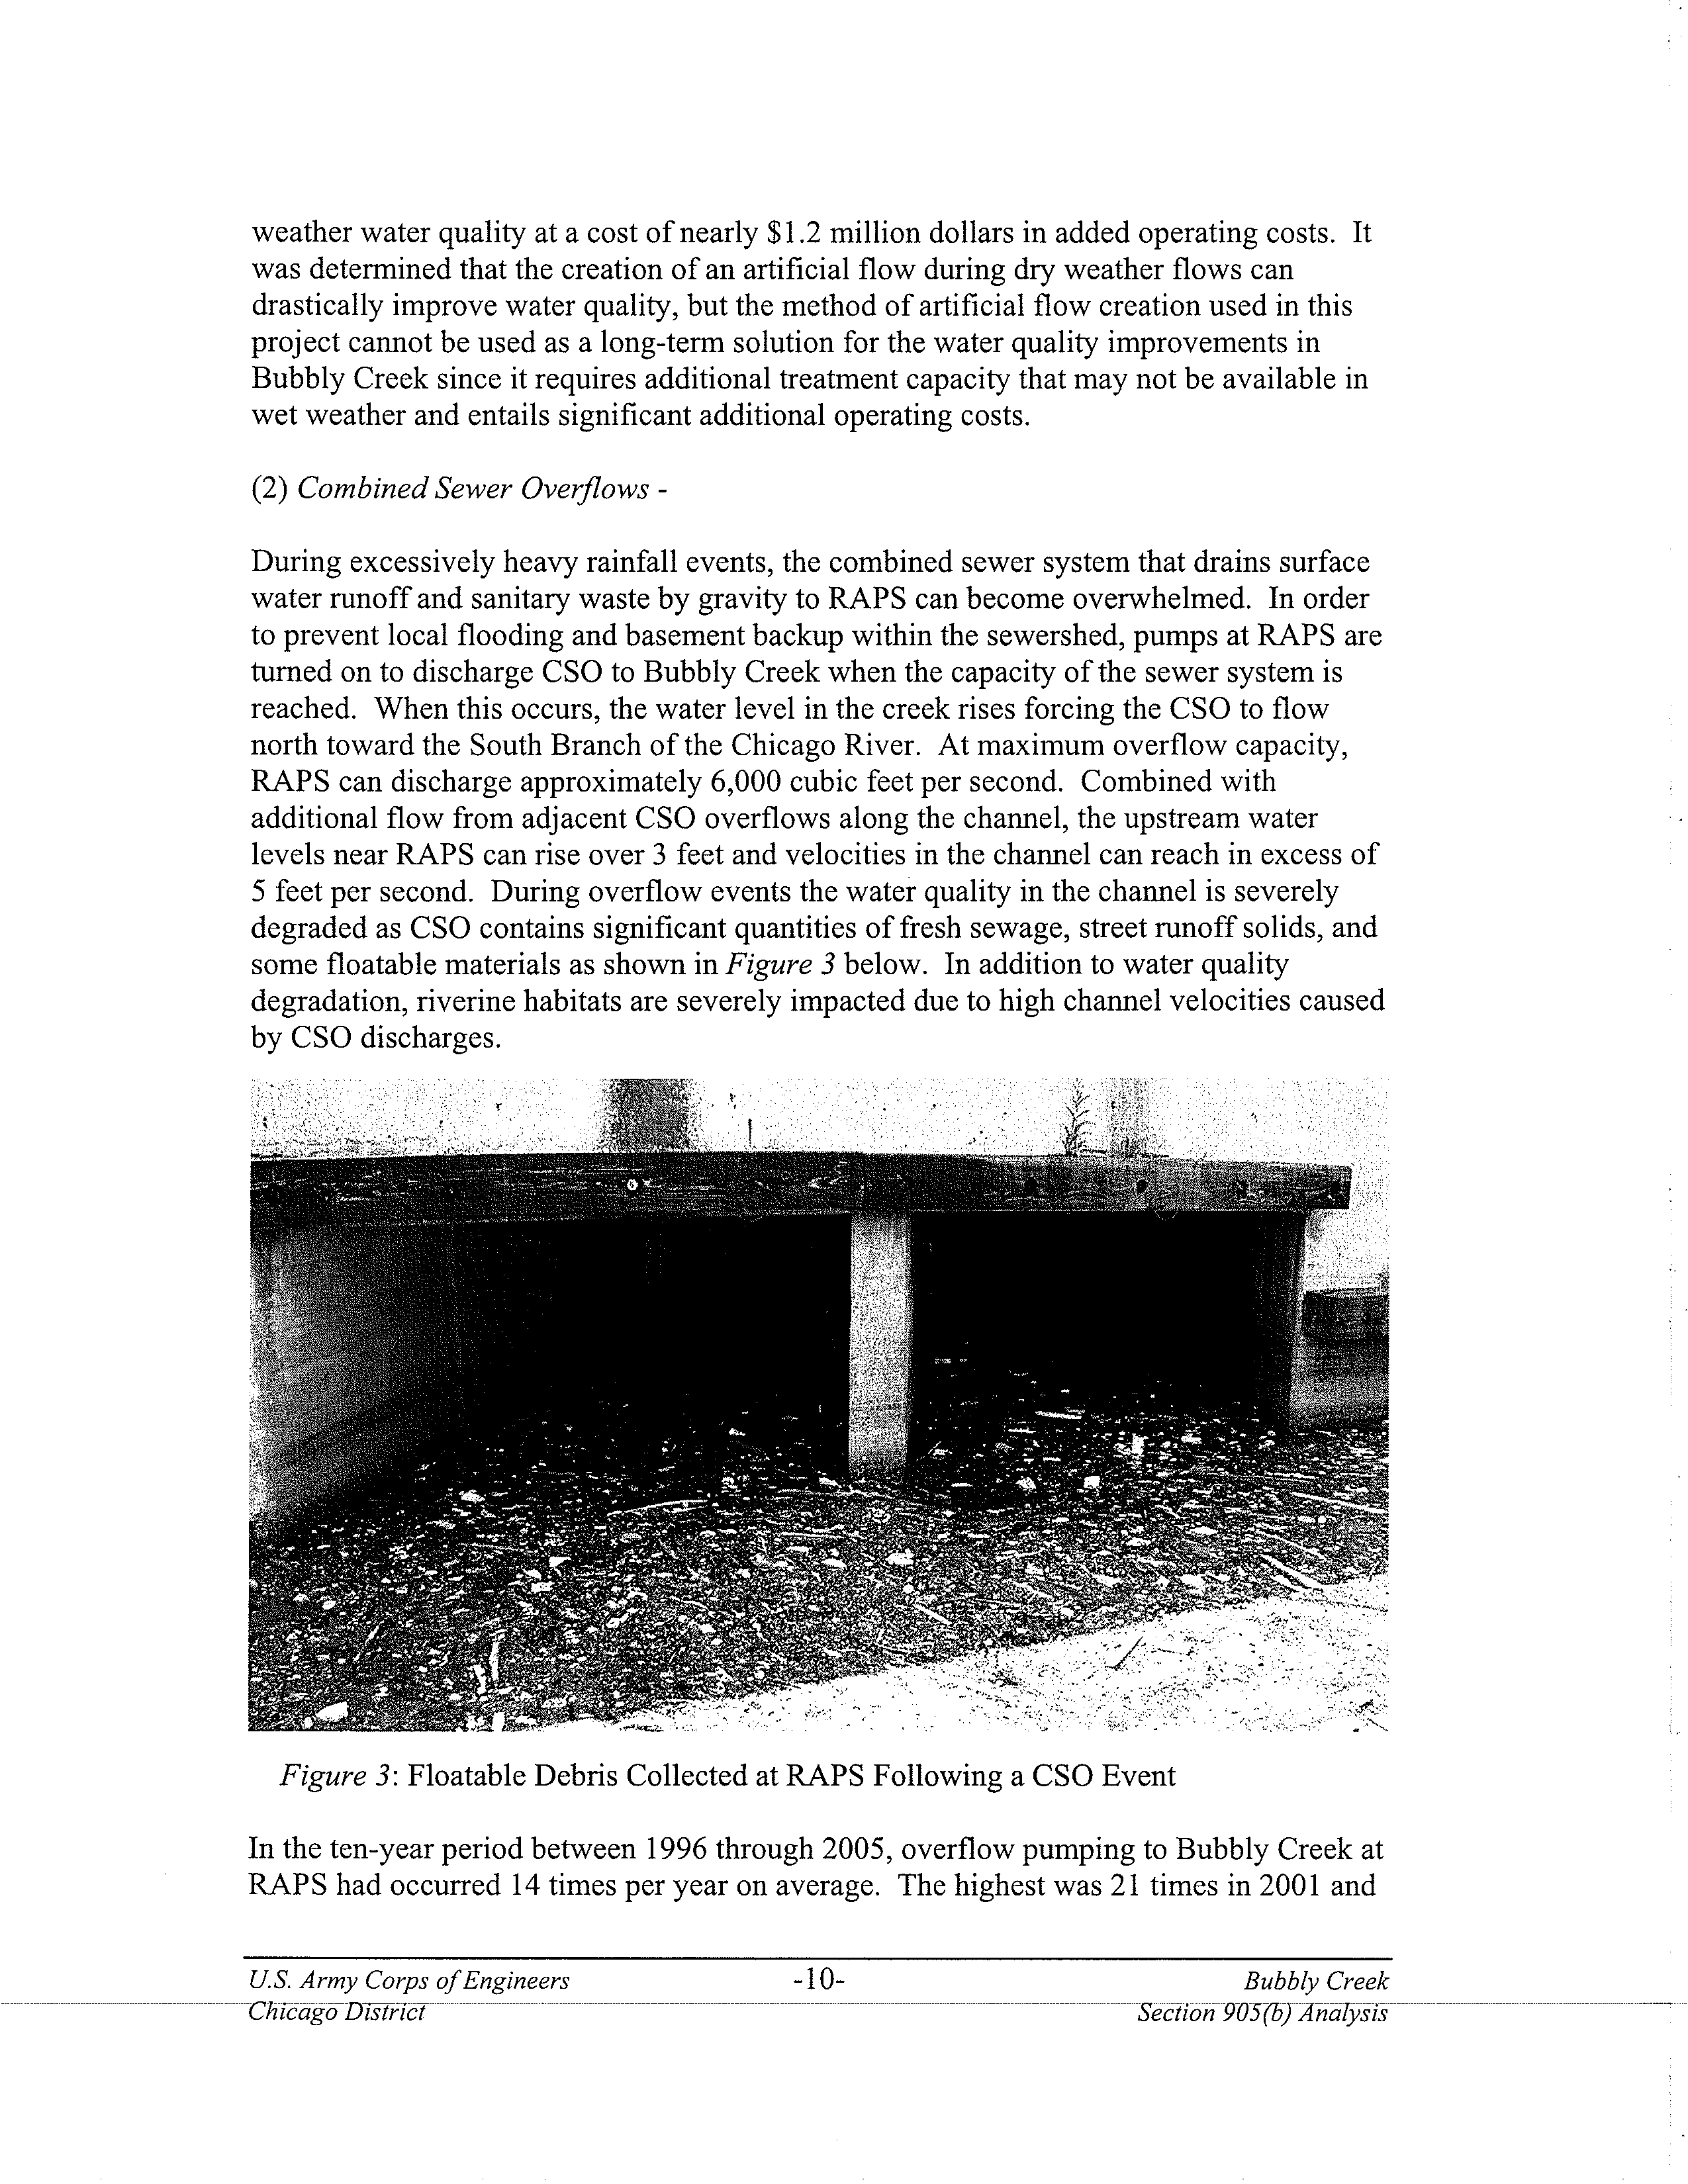
(2) Combined Sewer Overflows -
During excessively heavy rainfall events, the combined sewer system that drains surface
water runoff and sanitary waste by gravity to RAPS can become overwhelmed. In order
to prevent local flooding and basement backup within the sewershed, pumps at RAPS are
turned on to discharge CSO to Bubbly Creek when the capacity of the sewer system is
reached. When this occurs, the water level in the creek rises forcing the CSO to flow
north toward the South Branch of the Chicago River. At maximum overflow capacity,
RAPS can discharge approximately 6,000 cubic feet per second. Combined with
additional flow from adjacent CSO overflows along the channel, the upstream water
levels near RAPS can rise over 3 feet and velocities in the channel can reach in excess of
5 feet per second. During overflow events the water quality in the channel is severely
degraded as CSO contains significant quantities of fresh sewage, street runoff solids, and
some floatable materials as shown in
Figure
3 below. In addition to water quality
degradation, riverine habitats are severely impacted due to high channel velocities caused
by CSO discharges.
Figure 3:
Floatable Debris Collected at RAPS Following a CSO Event
In the ten-year period between 1996 through 2005, overflow pumping to Bubbly Creek at
RAPS had occurred 14 times per year on average. The highest was 21 times in 2001 and
U.S. Army Corps of Engineers
-10-
Bubbly Creek
Chicago District
Section 905(b) Analysis
the lowest was 9 times in 2005. The duration of pumping varied from a few hours to a
day or more, depending on the amount and duration of rainfall. The completion of the
Tunnel and Reservoir Plan (TARP), which encompasses a system of deep tunnels and
massive reservoirs used to store overflows, will reduce the frequency of overflows to
Bubbly Creek. In the interim period before the completion of TARP, the City of Chicago
is implementing a plan to reduce the volume of stormwater entering the combined sewer
system by utilizing Best Management Practices (BMPs) citywide. Unfortunately, the
TARP project will not eliminate all CSOs, therefore pumping from RAPS will continue
to occur when intense storms with large rainfall amounts hit the south side of Chicago.
(3) Sediment Quality -
The sediments within the Bubbly Creek channel contain remnants of animal wastes such
as carcasses
,
hair
,
and offal from the meat processing plants that previously lined its
banks, raw sewage once directly dumped into the channel
,
and solids contained in
combined sewer overflows still released
by RAPS
and other CSO outfalls along the
channel
.
The Illinois Environmental Protection
Agency (IEPA
),
U.S. Environmental
Protection
Agency (USEPA),
Metropolitan Water Reclamation District of Greater
Chicago
(MWRDGC), and USACE
have all performed past sediment sampling and bulk
chemistry analyses are consistent among these sampling events. The Chicago District
collected the bulk of sediment information available in the spring of 2004. Thirteen core
samples and five grab samples along the entire length of Bubbly Creek were sampled and
analyzed
.
Sediment depths ranged between 5.5 and 16.8 feet and consisted primarily of
sand and clay. Results of bulk chemistry and Toxicity Characteristic Leaching Procedure
(TCLP)
testing show that sampled sediment does not exceed toxicity criteria established
under the Resource Conservation and Recovery
Act (RCRA),
or maximum allowable
polychlorinated biphenyl
(
PCB) concentrations established under Toxic Substances
Control
Act (TSCA).
Sediment samples all showed elevated levels of polycyclic aromatic hydrocarbons
(PAHs) and heavy metals. Other detected contaminants included semi volatile organic
compounds (SVOCs), volatile organic compounds (VOCs), polychlorinated biphenyls
(PCBs), oil and grease, and nutrients. A close examination of existing sediment quality
will be completed during the feasibility study as disposal locations and costs can
significantly alter the feasibility of measures addressing sediment quality. Additional
sediment sampling may be needed depending on measures considered during the
feasibility study.
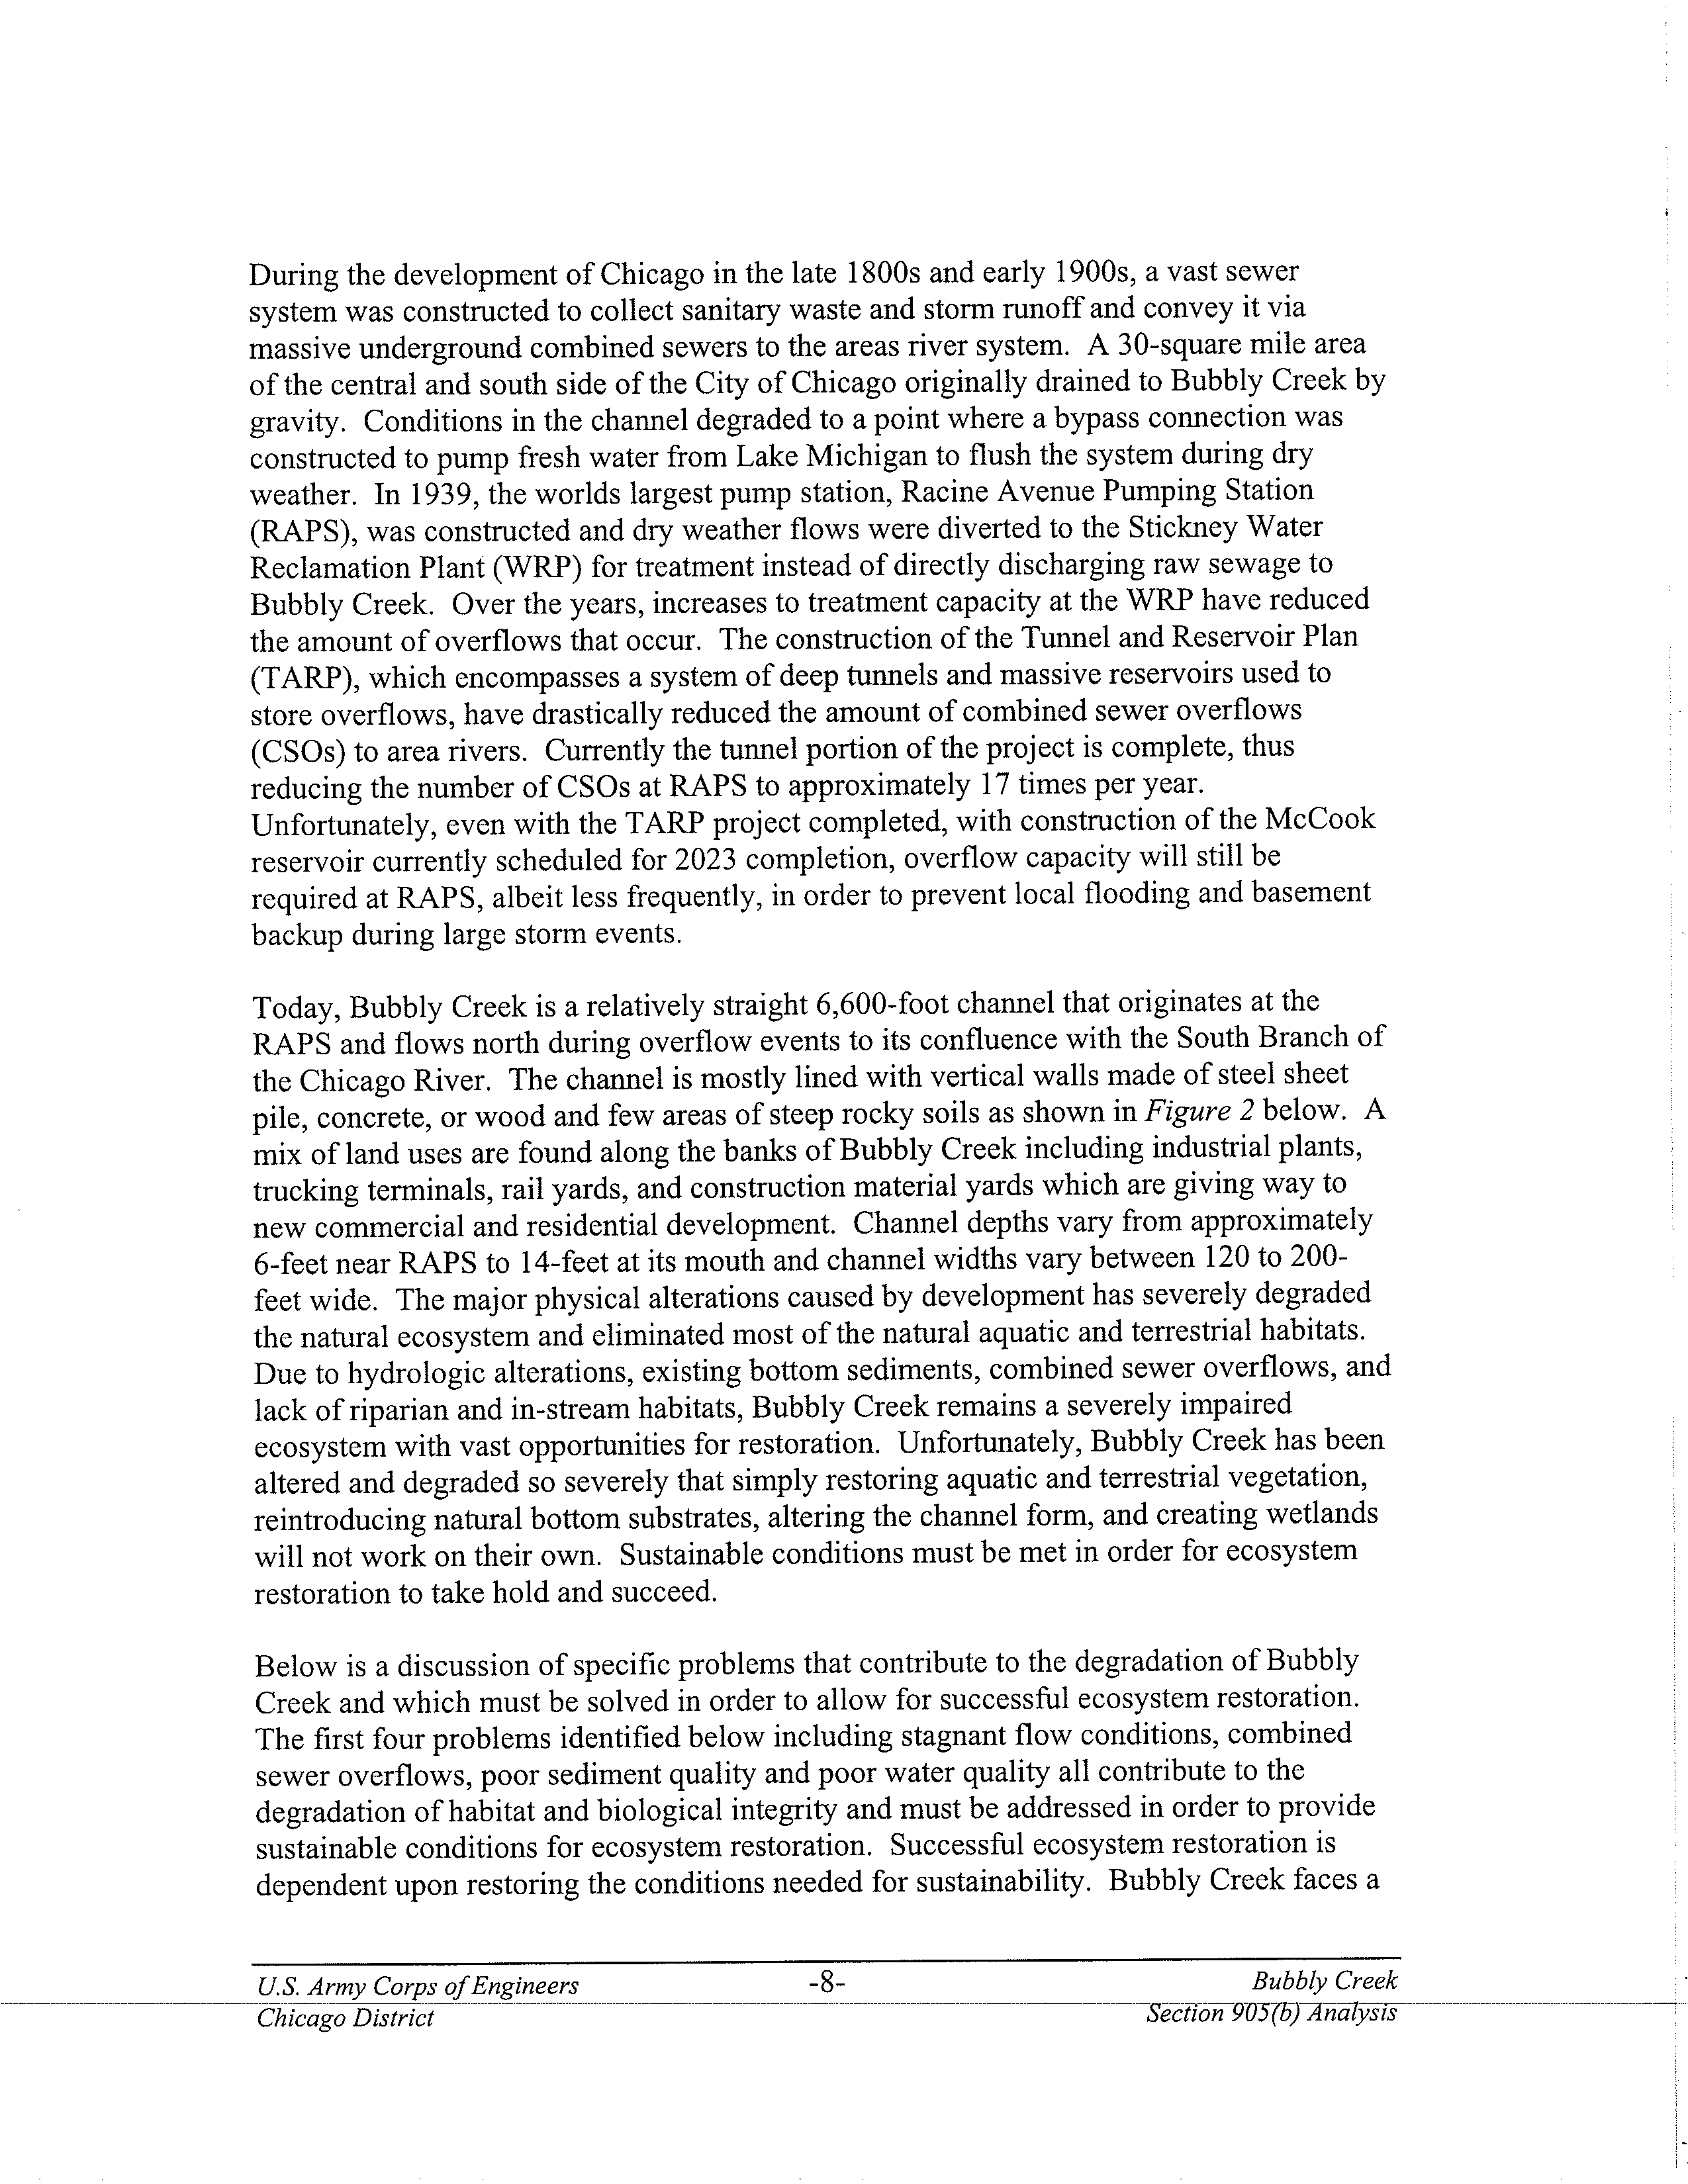
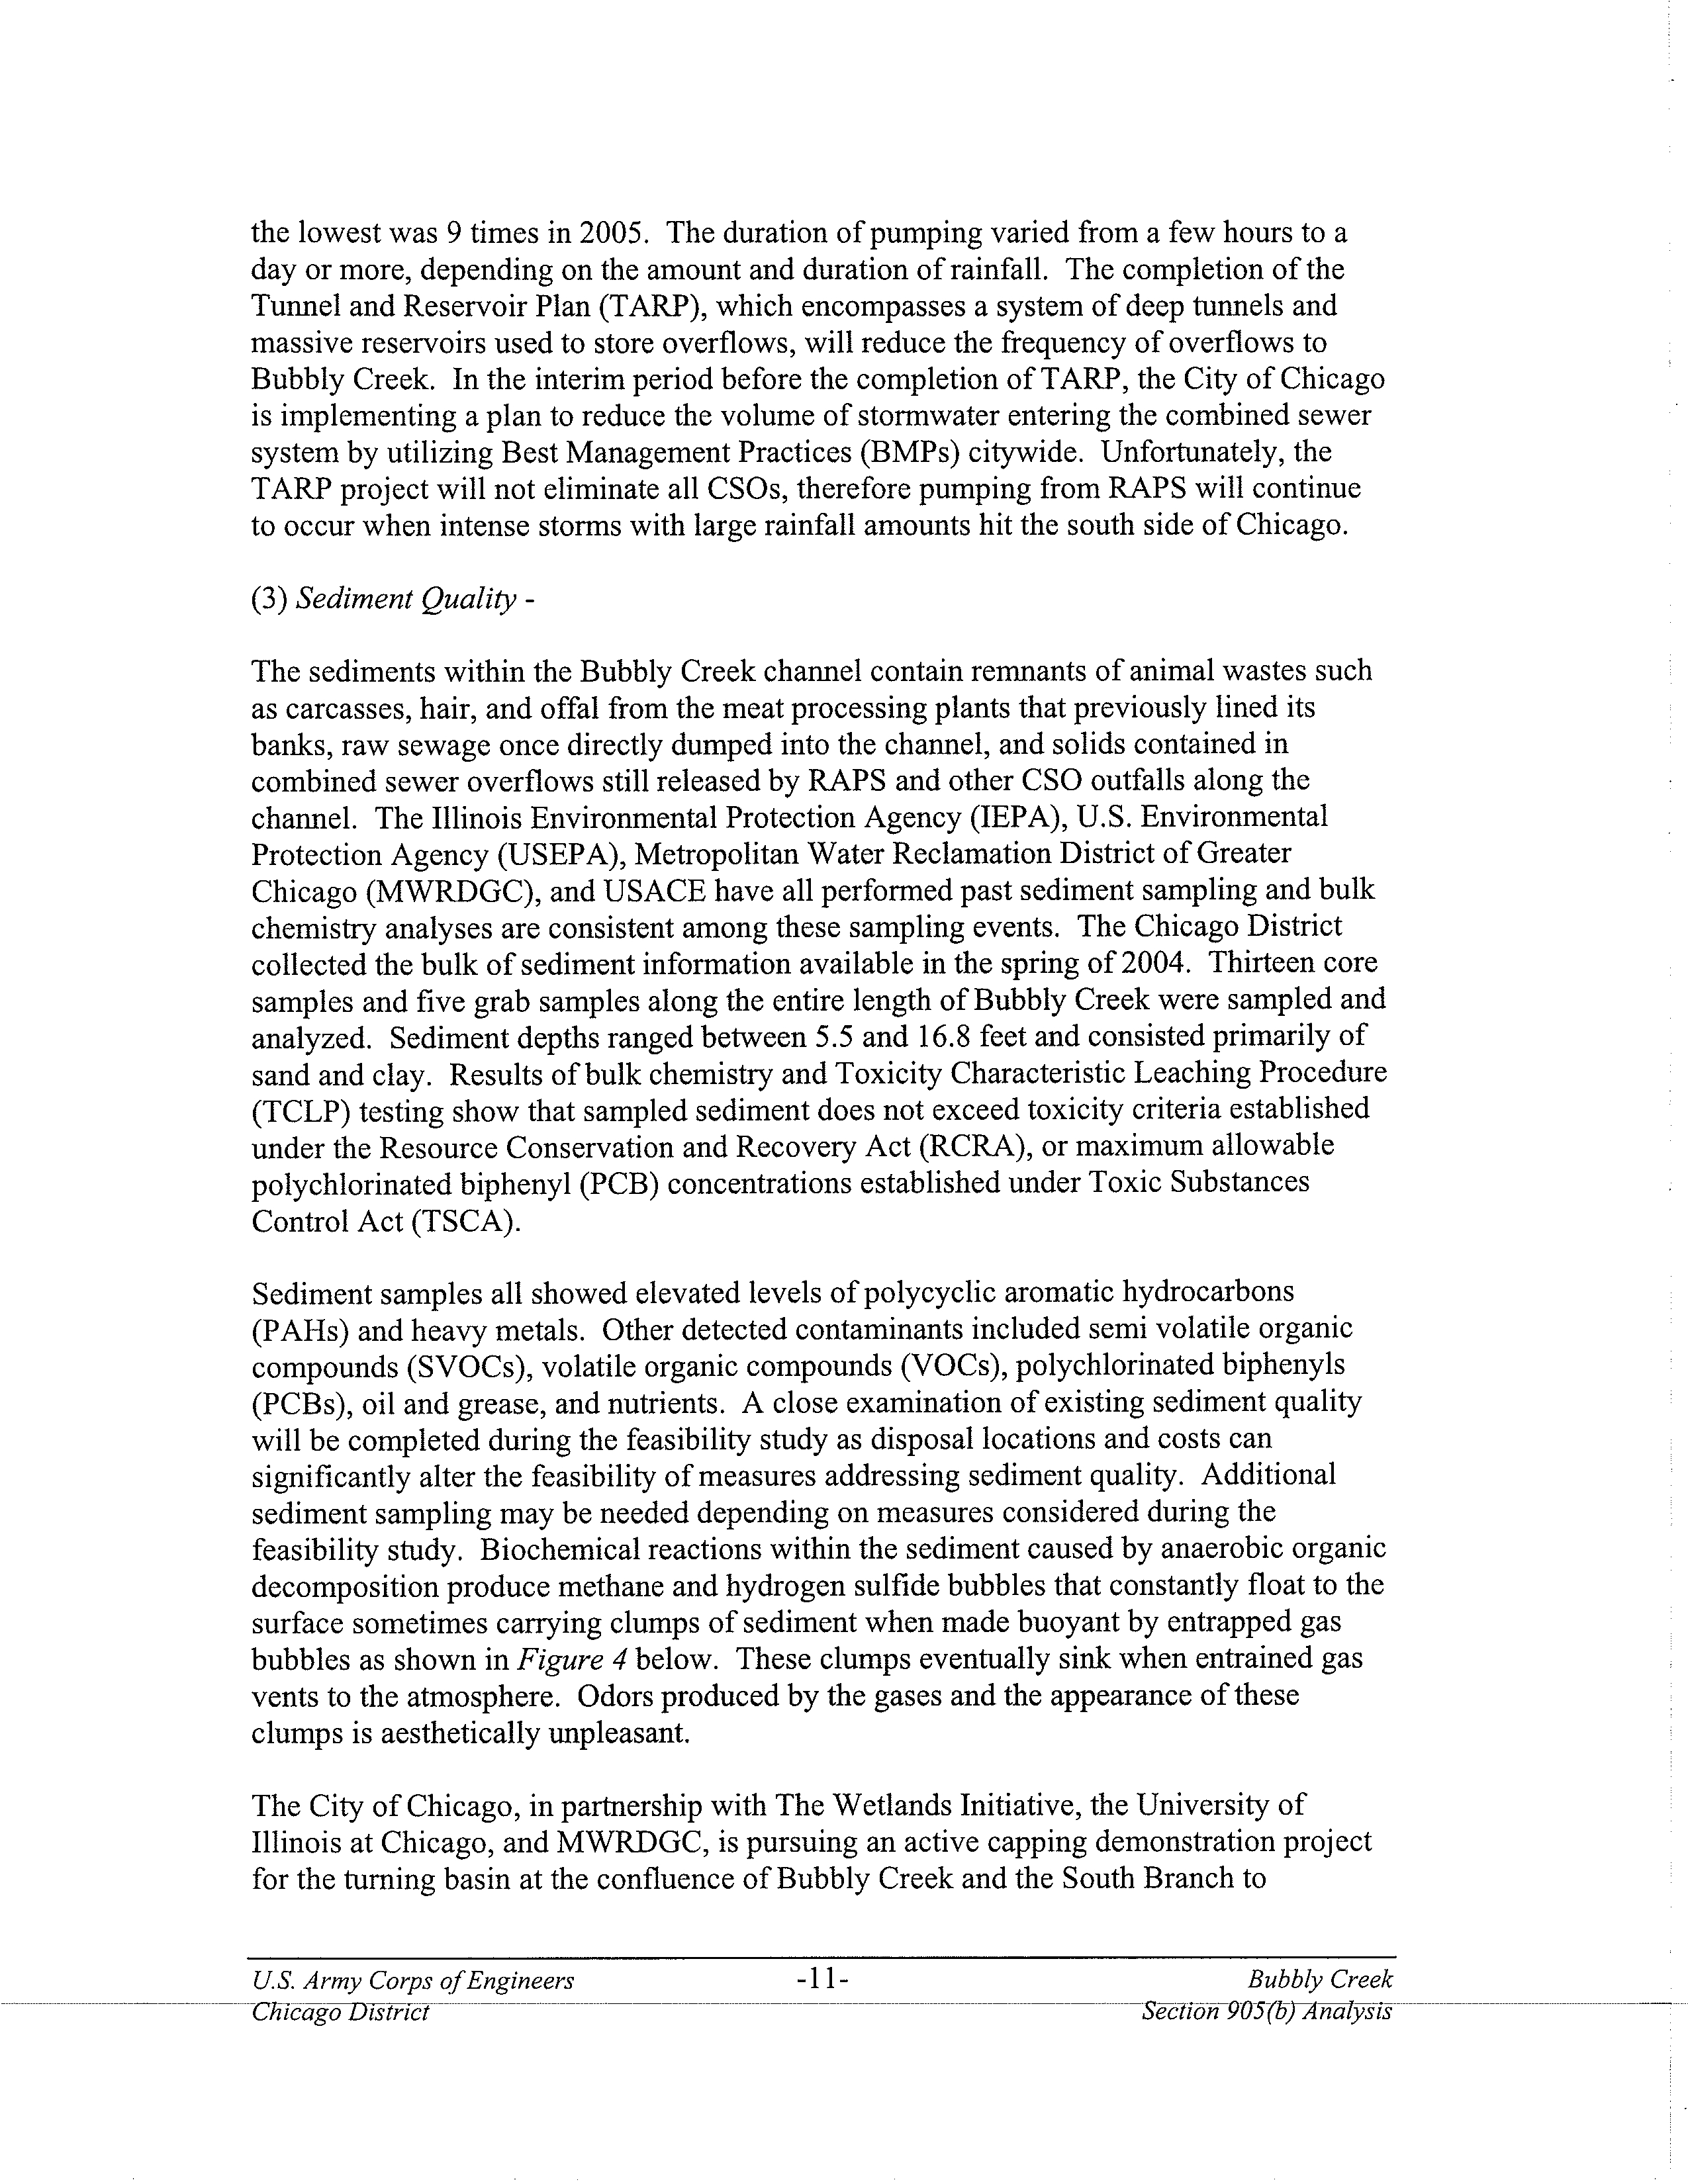
Biochemical reactions within the sediment caused by anaerobic organic
decomposition produce methane and hydrogen sulfide bubbles that constantly float to the
surface sometimes carrying clumps of sediment when made buoyant by entrapped gas
bubbles as shown in
Figure
4 below. These clumps eventually sink when entrained gas
vents to the atmosphere. Odors produced by the gases and the appearance of these
clumps is aesthetically unpleasant.
The City of Chicago, in partnership with The Wetlands Initiative, the University of
Illinois at Chicago, and MWRDGC, is pursuing an active capping demonstration project
for the turning basin at the confluence of Bubbly Creek and the South Branch to
U.S. Army Corps of Engineers
-11-
Bubbly Creek
Chicag-o-Rislrict
Section 905(hrAnalysis-
demonstrate contaminant sequestration and reduction of exposure to the contaminated
sediments.
Results from this project could provide invaluable information that would be
used in the formulation and evaluation of sediment remediation measures for the entire
channel during feasibility phase.
Figure 4:
Clumps
of Sediment and Gas Bubbles at the Surface
of Bubbly Creek
(4)
Water Quality -
In general, the water quality in the Chicago Waterway system is marginal, but constantly
improving. Bubbly Creek is classified for
Secondary Use
by the Illinois Pollution
Control Board (IPCB), which indicates the water is only suitable for limited contact
activities such as boating and fishing. Bubbly Creek is also listed as an impaired stream
by IEPA according the Section 303(d) of the Clean Water Act. The listed causes of
impairment include high pH, low dissolved oxygen, and high total phosphorus with
combined sewer overflows as the primary source of impairment. Stagnant flow
conditions and the biochemical interaction with contaminated sediments also contribute
to water quality degradation.
Water quality is critical to maintaining high quality habitats
needed to support diverse fish and wildlife populations. Poor water quality severely
limits the aquatic habitat and communities within Bubbly Creek
(5)
Habitat and Biological Integrity -
Currently, Bubbly Creek no longer maintains hydro-geomorphic function that historically
provided the means for a broad diversity of habitats to exist. Thus, this system no longer
supports healthy and rich plant and animal communities. The health of the Bubbly Creek
ecosystem has severely declined in response to a loss of habitat to support various life
stages of aquatic and terrestrial biota and a reduction in habitat quality due to several
factors.
The lack of flow diversity caused stagnant flow conditions and high velocities
from combined sewer overflows has resulted in severe habitat degradation. Poor
U.S. Army Corps of Engineers
-12-
Bubbly Creek
-Ch Cago District
-
-
-
-
-
-
Section 905(h)-A nalysis _ -
sediment quality and the biochemical reactions from organic decomposition further
degrade the aquatic habitat for fish and macroinvertebrates. Poor water quality caused by
combined sewer overflows, hydrologic alterations, and reactions with underlying
sediments also contribute to habitat degradation. The channel is absent of any aquatic
vegetation, physical structure, or lotic characteristics, which would provide the basis for
healthy and diverse riverine communities.
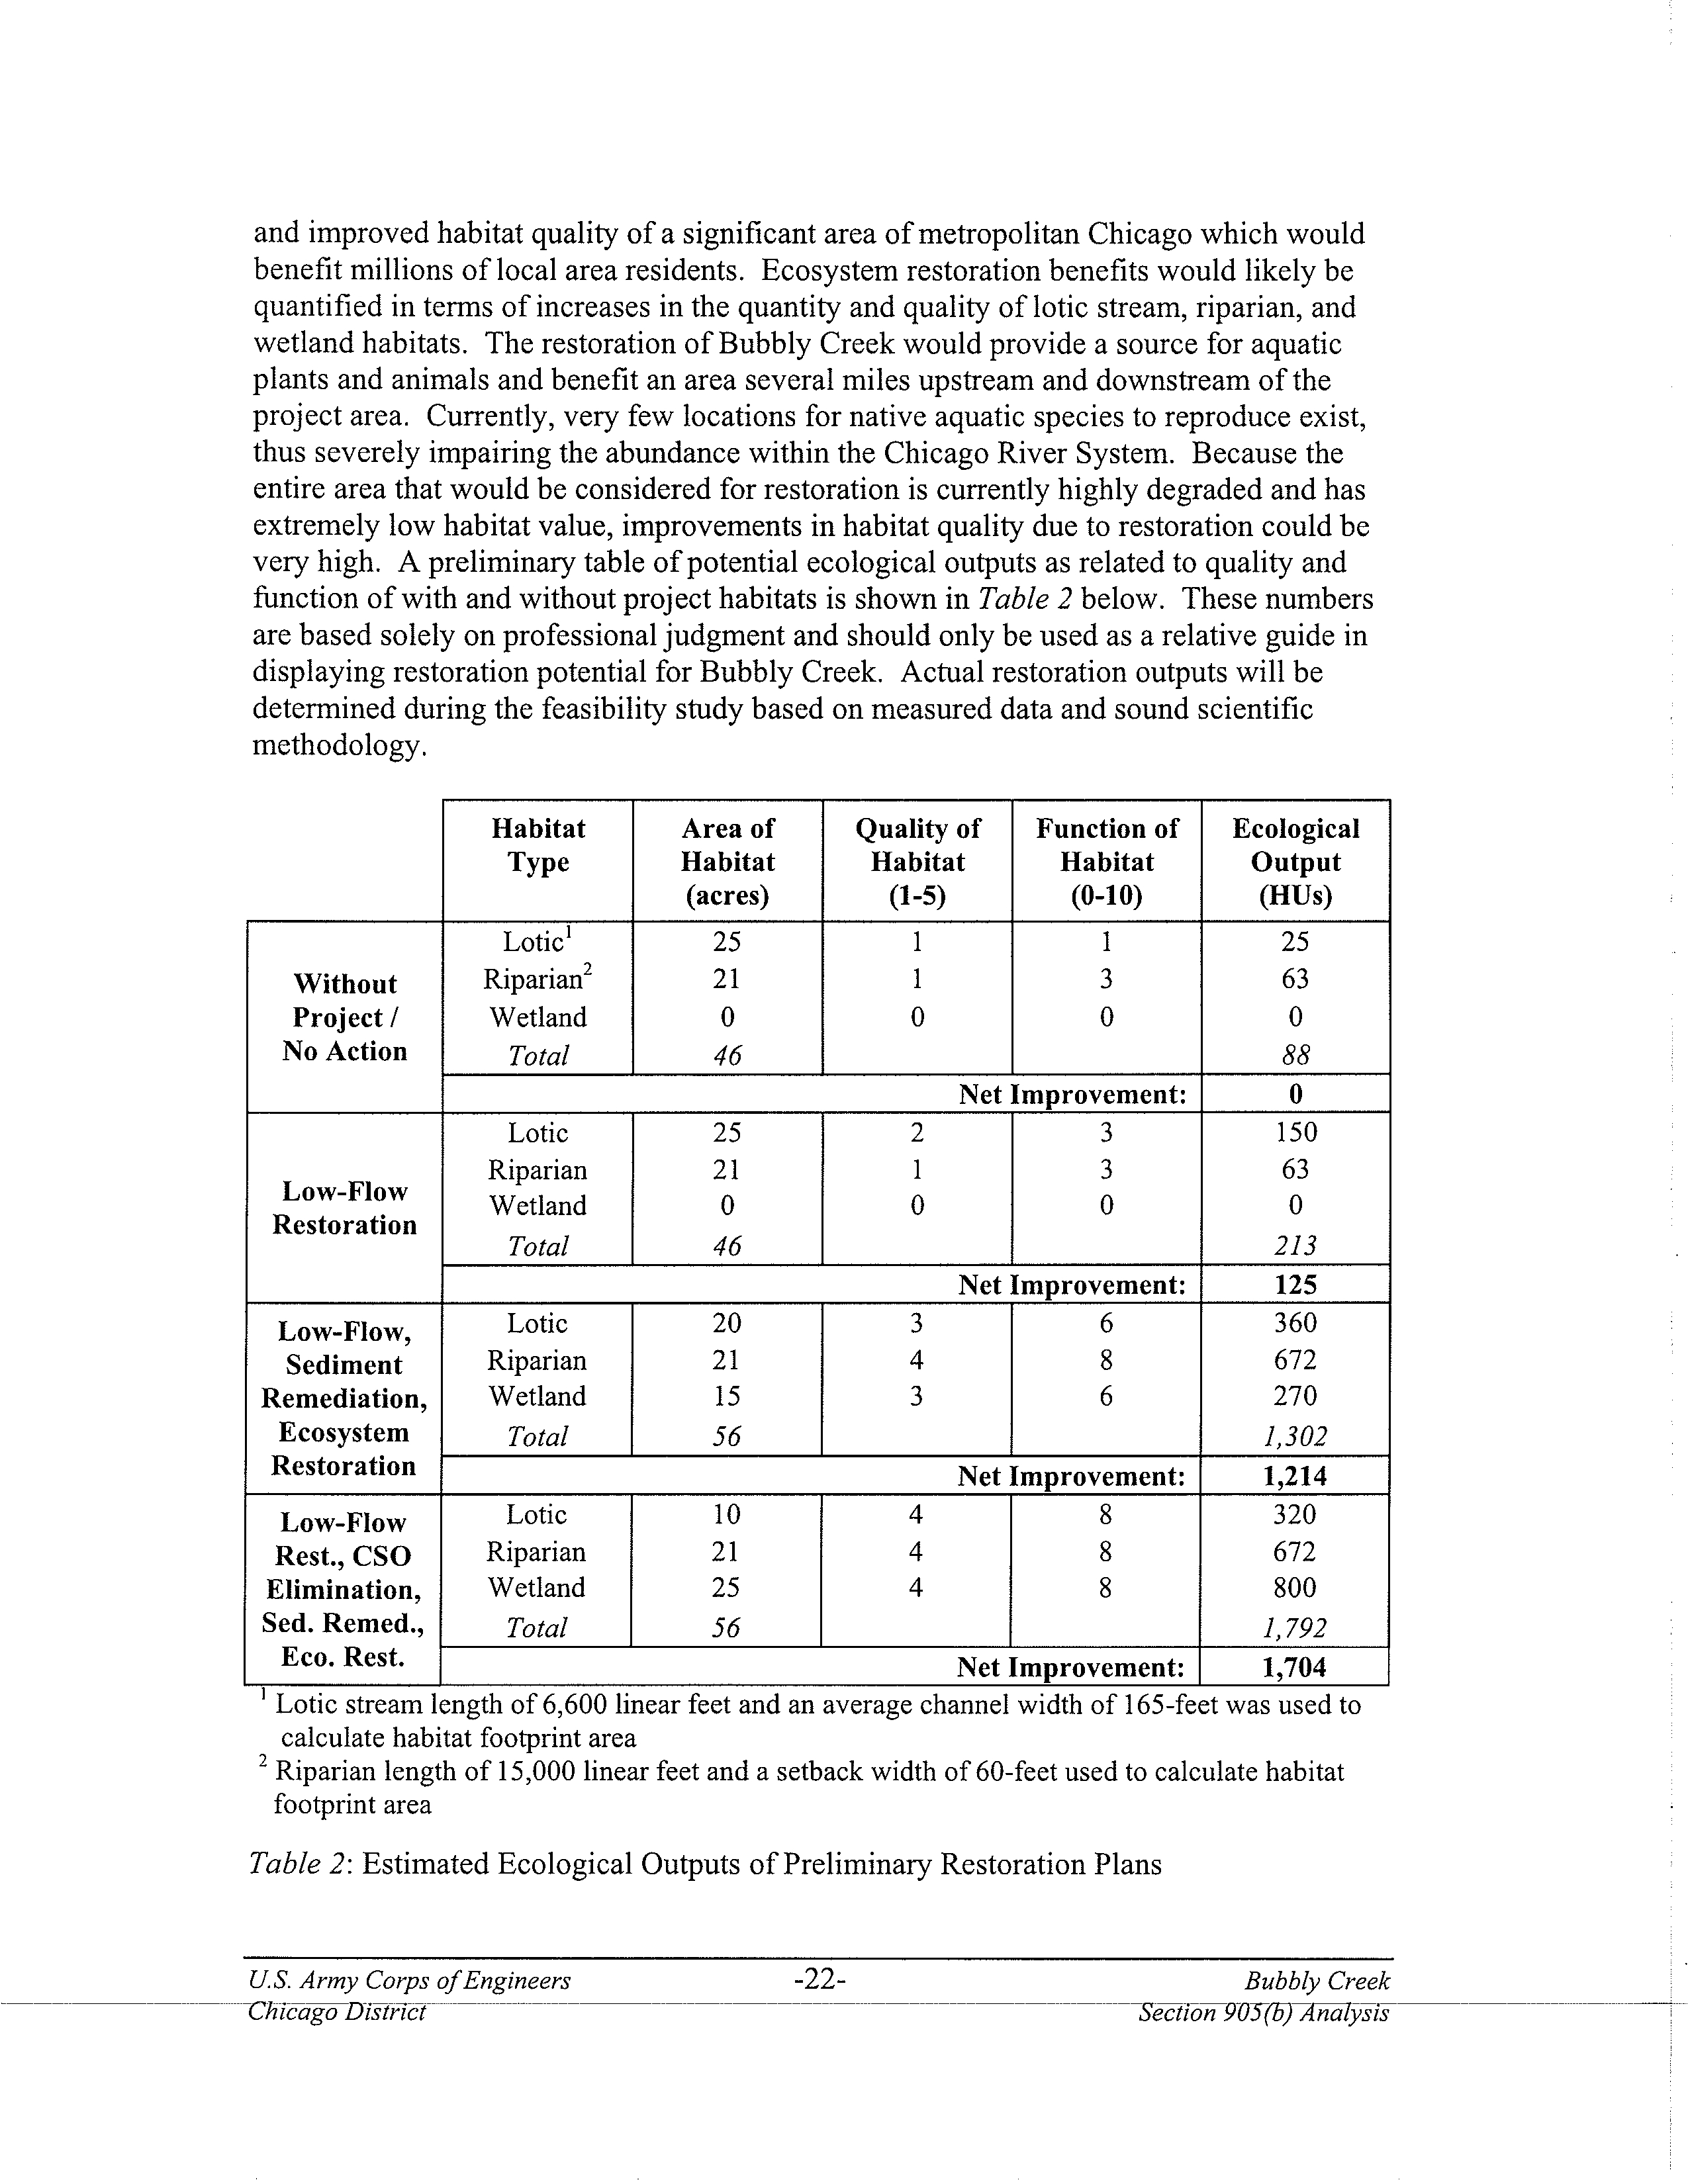
An Index of Biotic Integrity (IBI) was used to assess the status and probable
improvements to the riverine ecosystem of Bubbly Creek in lieu of ecological restoration.
This IBI may be viewed as a quantitative empirical index for rating the health of a
riverine ecosystem with a scale between 0 and 60. A spring fish survey was performed
where six species were collected, all consisting of tolerant and / or non-native species.
Based on structural, compositional, and functional components of the fish community
surveyed, Bubbly Creek received an IBI score of 10. This score corresponds to a very
poor rating and is characterized as an imperiled aquatic ecosystem in which biotic
integrity has been severely reduced.
(6) Recreation -
Limited recreational activities occur along Bubbly Creek. At the confluence with the
South Branch of the Chicago River, the South Chicago Rowing Center has a small boat
launch. Bank fishing is also common at the confluence of Bubbly Creek. Many new
developments that are being constructed along the Chicago River including Bridgeport
Village, a new single-family residential development area along a portion of the east bank
of Bubbly Creek. Many of these developments are creating river walks to connect the
waterways to residents. Due to the poor water quality and the lack of aquatic habitat and
biological integrity, additional recreational opportunities are limited. Foul odors and
unsightly floating debris can also limit recreational user of from Bubbly Creek.
d) Opportunities:
Improve Stagnant Flow Conditions
- Feasibility phase and other studies can provide
opportunities to restore flow to the channel during normal and dry weather conditions.
The introduction of flows to the channel can significantly improve water quality, increase
and improve riverine habitat, provide environmental benefits for fish and wildlife, and
improve the aesthetics of the channel.
Reduce Combined Sewer Overflows
- Feasibility phase and other studies can provide
opportunities to reduce impacts of combined sewer overflows. Reduced combined sewer
overflows can significantly improve water quality by helping to control point sources of
pollution and provide environmental benefits for fish and wildlife. In addition, reducing
extremely high flow velocities experienced during overflow events can greatly benefit the
aquatic ecosystem by allowing natural structure to establish and remain intact.
Improve Sediment Quality -
Feasibility phase and other studies can provide opportunities
to reduce contaminant migration from existing sediments. Removal or capping of bottom
U.S. Army Corps of Engineers
-13-
Bubbly Creek
Chicago-acstrtct __
-
ection-
_. na ysts -- _ ___-
sediments can significantly improve water quality by controlling contaminant migration,
increase and improve substrates and macroinvertebrate habitats, and provide
environmental benefits for fish and wildlife.
Improve Water Quality
- Feasibility phase and other studies can provide opportunities to
benefit water quality. Increased water quality can significantly increase and improve fish
community habitat, provide environmental benefits for fish and wildlife, and improve the
aesthetics of the channel.
Increase Habitat and Biological Integrity -
Feasibility phase and other studies can
provide opportunities to increase or improve riverine habitat, improve riparian habitat
along the channel, restore native plant communities within the river corridor, restore
wetlands, and restore stream processes to a more natural condition allowing for increased
biological integrity.
Increase Recreational Opportunities - A
future ecosystem restoration project would
provide important opportunities for development of public recreation. Both land-based
and water based facilities could be incorporated into a restoration plan and would provide
an opportunity for State, city, and local entities to implement some of their recreation
plans and ideas. The project could also provide the opportunity for cultural, historic, and
scenic preservation.
e) Expected Future Without-Project Conditions:
The future without-project condition of Bubbly Creek is expected to remain in a highly
degraded state. Stagnant conditions, combined sewer overflows, and contaminated
sediments will continue to contribute to poor water quality, severe habitat degradation,
and continued loss of habitats that support various life stages of aquatic and terrestrial
biota.
Water quality is projected to slightly improve once the TARP system is fully
operational due to less frequent CSO events. Since overflows will not be completely
eliminated by TARP, water quality degradation from CSO discharges will continue.
Without major restoration, Bubbly Creek will remain classified as a limited contact water
body also contributing to major limitations on recreational opportunities.
f) Planning Objectives:
The following planning objectives are specific to Bubbly Creek:
•
Improve normal flow conditions
•
Reduce impacts of combined sewer overflows
•
Reduce exposure to and environmental impacts from bottom sediments
•
Improve water quality since it is the limiting factor to habitat restoration
•
Provide diverse aquatic and related habitats
•
Improve river corridor aesthetics
•
Provide recreational opportunities
U.S. Army Corps of Engineers
-14-
Bubbly Creek
--
-
_ Chicago istrict
-Secfion 905(6) Ana ysis --- - ---
g) Planning Constraints:
•
Bubbly Creek provides conveyance to combined sewer overflows from RAPS and
adjacent sewers. These overflows provide additional capacity to the combined
sewer system that drains a major portion of the central and south sides of
Chicago, thus eliminating local flooding and basement backups. The conveyance
capacity of Bubbly Creek must be maintained so that additional flooding is not
induced.
•
Flow velocities during CSO events can reach high levels thus limiting the design
of in-channel measures. Channel improvements, sediment capping, aquatic
vegetation, and other restoration activities must be designed to withstand these
flow velocities unless a separate conveyance for CSOs is developed.
•
In many areas, development exists right up to the edge of the channel.
Restoration efforts will be constrained in many locations mentioned above unless
land titles or easements are purchased.
•
Many properties surrounding Bubbly Creek either house current businesses or
once did. Impacts to current businesses should be minimized where possible.
Due to the historic nature of businesses along Bubbly Creek, a high potential for
brownfield contamination exists and should be avoided where possible.
•
The City of Chicago is currently in the process of developing an urban renewal
plan for the neighborhood that surrounds Bubbly Creek. Project features should
be planned in accordance with local land use and development plans.
•
Numerous laws, regulations, Executive Orders, and policies must be considered,
such as National Environmental Protection Act (NEPA), Endangered Species Act
(ESA), Clean Water Act (CWA), Clean Air Act (CAA), National Historic
Preservation Act (NHPA), Comprehensive Environmental Response,
Compensation, and Liability Act (CERCLA), Resource Conservation and
Recovery Act (RCRA), Toxic Substances Control Act (TSCA), and Corps of
Engineers Planning and Engineering guidance.
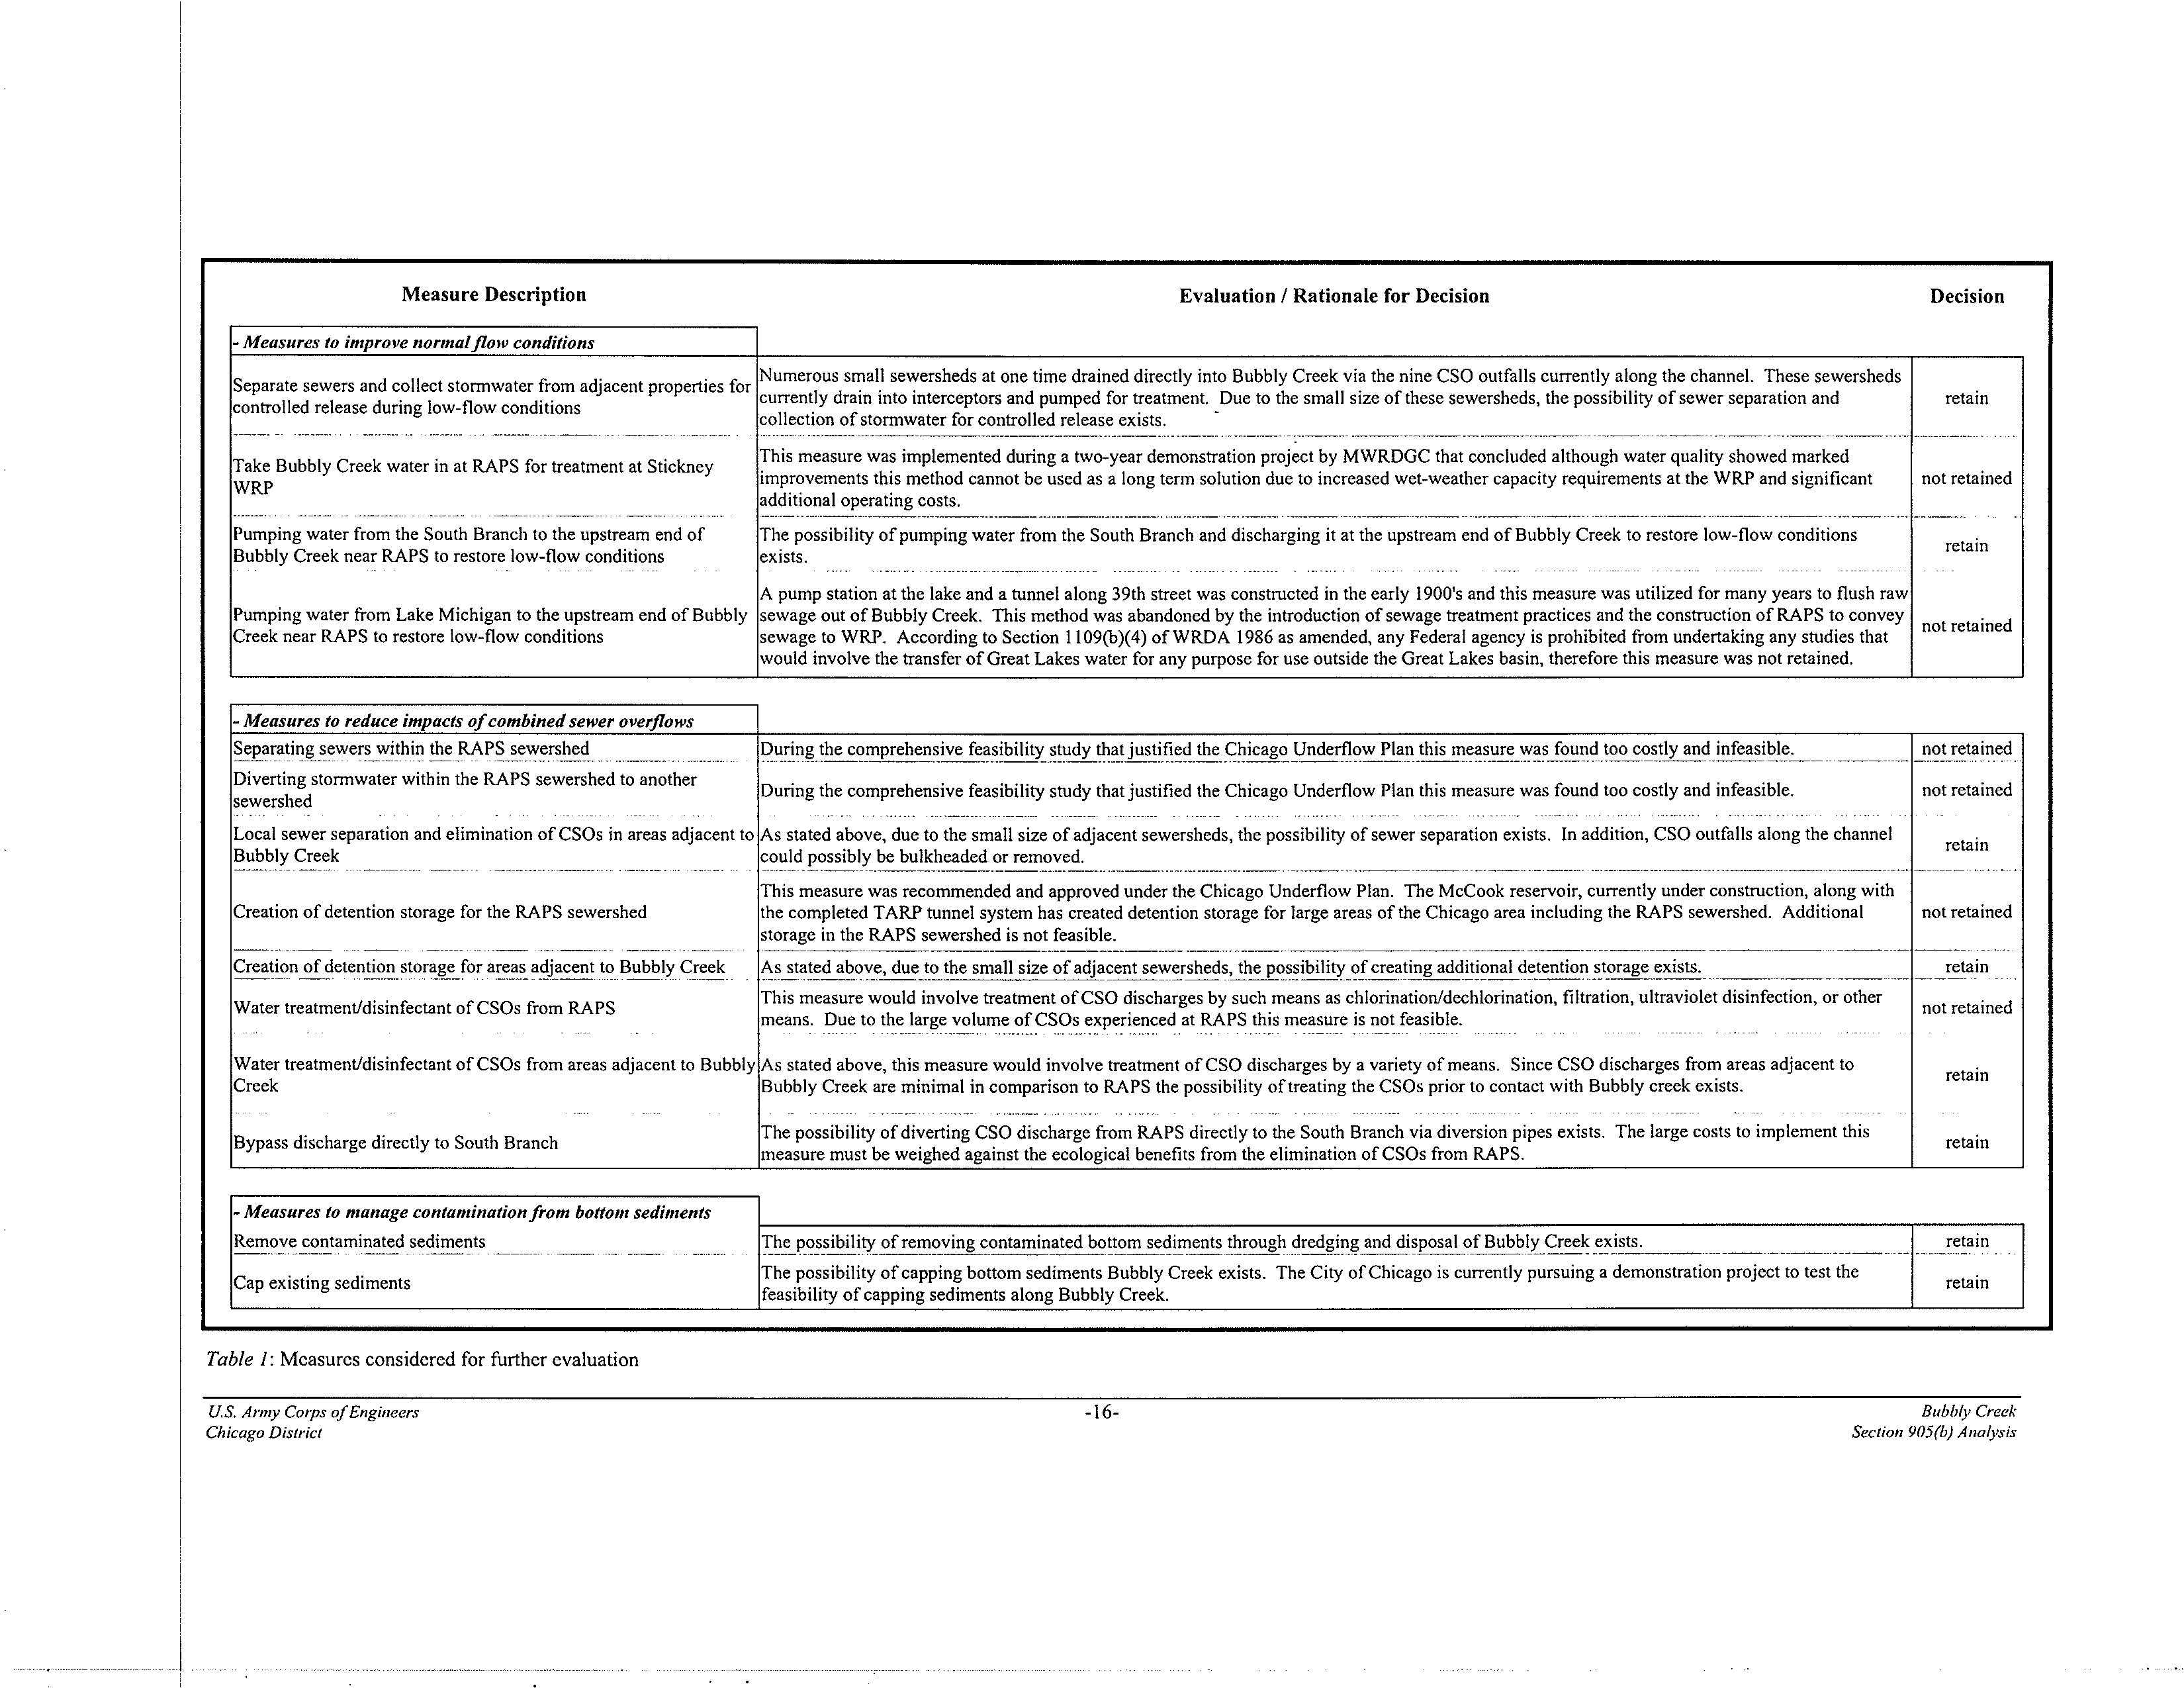
h) Measures to Address Identified Planning Objectives:
A management measure is a feature or activity at a site, which addresses one or more of
the planning objectives. A wide variety of measures were considered, some of which
were found to be infeasible due to technical, economic or environmental constraints.
Each measure was assessed and a determination made regarding whether it should be
retained for future consideration in the formulation of alternative plans. The potential
measures that were considered are listed in
Table I
below.
U.S. Army Corps of Engineers
-15-
Bubbly Creek
Chicago District
Section 9aS(b7s
Measure Description
Evaluation
/
Rationale for Decision
Decision
- Measures to improve normal flow conditions
Separate sewers and collect stormwater from adjacent properties for
Numerous small sewersheds at one time drained directly into Bubbly Creek via the nine CSO outfalls currently along the channel. These sewersheds
controlled release during low-flow conditions
currently drain into interceptors and pumped for treatment. Due to the small size of these sewersheds, the possibility of sewer separation and
retain
collection of stormwater for controlled release exists.
Take Bubbly Creek water in at RAPS for treatment at Stickney
This measure was implemented during a two-year demonstration project by MWRDGC that concluded although water quality showed marked
WRP
improvements this method cannot be used as a long term solution due to increased wet-weather capacity requirements at the WRP and significant
not retained
......
_.-
----
-- --
additional operating costs.
Pumping water from the South Branch to the upstream end of
The possibility
.----
of pumping water from the South Branch and discharging it at the upstream end of Bubbly Creek to restore low-flow conditions
Bubbly Creek near RAPS to restore low-flow conditions
exists.
retain
A pump station at the lake and a tunnel along 39th street was constructed in the early 1900's and this measure was utilized for many years to flush raw
Pumping water from Lake Michigan to the upstream end of Bubbly
sewage out of Bubbly Creek. This method was abandoned by the introduction of sewage treatment practices and the construction of RAPS to convey
not retained
Creek near RAPS to restore low-flow conditions
sewage to WRP. According to Section 1109(b)(4) of WRDA 1986 as amended, any Federal agency is prohibited from undertaking any studies that
would involve the transfer of Great Lakes water for any purpose for use outside the Great Lakes basin, therefore this measure was not retained.
- Measures to reduce
impacts of
combined
sewer overflows
Separating sewers within the RAPS sewershed
During the comprehensive feasibility study that justified the Chicago Underflow Plan this measure was found too costly and infeasible.
---
---
not retained
Diverting stormwater within the RAPS sewershed to another
--
During the comprehensive feasibility study that justified the Chicago Underflow Plan this measure was found too costly and infeasible.
not retained
sewershed
Local sewer separation and elimination of CSOs in areas adjacent to
As stated above, due to the small size of adjacent sewersheds, the possibility of sewer separation exists. In addition, CSO outfalls along the channel
Bubbly Creek
could possibly be bulkheaded or removed.
retain
This measure was recommended and approved under the Chicago Underflow Plan. The McCook reservoir, currently under construction, along with
Creation of detention storage for the RAPS sewershed
the completed TARP tunnel system has created detention storage for large areas of the Chicago area including the RAPS sewershed. Additional
not retained
storage in the RAPS sewershed is not feasible.
Creation of detention storage for areas adjacent to Bubbly Creek
As stated above, due to the small size of adjacent sewersheds, the possibility of creating additional detention storage exists
.
retain
Water treatment/disinfectant of CSOs from RAPS
This measure would involve treatment of CSO discharges by such means as chlorination/dechlorination, filtration, ultraviolet disinfection, or other
not retained
means. Due to the large volume of CSOs experienced at RAPS this measure is not feasible.
Water treatment/disinfectant of CSOs from
areas
adjacent to Bubbly
As stated above, this measure would involve treatment of CSO discharges by a variety of means. Since CSO discharges from areas adjacent to
Creek
Bubbly Creek are minimal in comparison to RAPS the possibility of treating the CSOs prior to contact with Bubbly creek exists.
retain
Bypass discharge directly to South Branch
The possibility of diverting CSO discharge from RAPS directly to the South Branch via diversion pipes exists. The large costs to implement this
retain
measure must be weighed against the ecological benefits from the elimination of CSOs from RAPS.
- Measures to manage contamination
from bottom sediments
Remove contaminated sediments
The possibility of removing contaminated bottom sediments through dredging and disposal of Bubbly Creek exists.
-----
-
--
- -----
-- - -- ----
----
retain
Cap existing sediments
The possibility of capping bottom sediments Bubbly Creek exists. The City of Chicago is currently pursuing a demonstration project to test the
retain
feasibility of capping sediments along Bubbly Creek.
Table
1:
Measures considered
for further
evaluation
US. Arnry
Crops
of Engineers
-16-
Bubbly Creek
Chicago District
Section
905(b) Analysis
- Measures
to improve
water quality
(in addition to other Measures that also address objective)
The possibility of creating in-stream aeration to improve the water quality of Bubbly Creek exists.
MWRDGC has constructed several sidestream
In-stream aeration
elevated pool aeration (SEPA) stations along the Chicago Waterway System to improve water quality by lifting canal water and allowing it to drop
retain
over a series of weirs to create a waterfall and add oxygen to the waterway.
Implementation of Best Management Practices (BMPs)
The possibility of implementing BMPs such as bioswales, bio-infiltration basins, and wetponds to divert clean stormwater into Bubbly Creek exists.
retain
The City of Chicago has established a 60-foot stormwater setback to allow implementation of stormwater BMPs along the channel.
- Measures to restore aquatic and terrestrial habitats
Reconfigure channel cross-sectional form
The possibility of reconfiguring the channel geometry to create flow diversity exists. Special attention in regards to sediment disturbance, handling,
retain
and disposal must be carefully considered with this measure.
Streambank recontouring, native plantings, and restoration
The possibility of streambank restoration through recontouring and establishment of native plant communities exist
.
retain
In-channel wetland restoration
The possibility of restoring wetlands within the channel exists. Current high flow conditions caused by CSOs from RAPS constrain the restoration of
retain
in-channel wetlands.
Substrate introduction and streambed restoration
The possibility of restoring the natural substrate diversity exists. This measure could be incorporated with sediment removal or capping measures
retain
stated above.
Placement of snags and large woody debris
The possibility of restoring natural structure diversity in the form of snags or large woody debris exists.
retain
Riparian native plant restoration
The possibility of restoring natural plant communities along the riparian areas of Bubbly Creek exists.
retain
- Measures
to improve
river corridor aesthetics
(in addition to other Measures that also address objective)
Screen floatable debris from channel
The possibility of screening and removing floatable debris introduced by CSO discharges into Bubbly Creek exists.
retain
Due to the ecosystem restoration authority of this project, repair or replacement of existing deteriorated bank treatments such as
steel
sheet pile and
Repair or replace deteriorated bank treatments
concrete
walls is
not considered appropriate.
Measures to restore streambanks through recontouring and native plant restoration as stated above are
not retained
recommended.
- Measures
to provide additional recreational opportunities
Small boat and canoe launch
The possibility of providing compatible water access points to Bubbly Creek in the form of a small boat and canoe launch exists.
-.----
retain
River access walking trail
The possibility of providing compatible recreational opportunities through walking trails along the banks of Bubbly Creek exists.
retain
Interpretive silmage
The possibility of providing compatible recreational opportunities by constructing interpretive displays featuring the rich history of Bubbly Creek and
retain
surrounding areas and the urban restoration initiatives currently underway.
Table 1:
Measures considered for further evaluation (continued)
U.S. Army Corps gfEngineers
-17-
Bubbly Creek
Chicago District
Section 905(b) Analysis
i) Preliminary Plans for further consideration:
Preliminary plans are formulated by combining the various retained measures that meet
the objectives of the study. During the feasibility study these plans will be evaluated and
the most cost effective and best-buy plans will be developed in further detail.
Preliminary plans include:
No action.
The Corps is required to consider the option of "No Action" as one of the
alternatives. No Action assumes that no project would be implemented by the Federal
Government (Corps of Engineers) to achieve the planning objectives. No Action, which
is synonymous with the "Without Project Condition", forms the basis from which all
other alternative plans are measured.
Low-Flow Restoration.
This plan would consider measures to restore low flows to
Bubbly Creek during normal and dry weather periods. The restoration of low flows
could be accomplished by pumping water from the South Branch and introducing that
flow to the upstream end of Bubbly Creek near RAPS. The introduction of low flows
would improve water quality, a limiting factor in the restoration of the Bubbly Creek
ecosystem, as shown by the demonstration projects performed by MWRDGC. Without
addressing the other limiting factors, few opportunities for aquatic habitat restoration
would exist due to contamination by CSO and bottom sediments. Major aesthetic
improvements can be achieved by reducing the amount of floatable debris that collects
within the channel and by reducing foul odors that stagnant waters now produce.
Low-Flow Restoration and Sediment Remediation with Ecosystem Restoration.
This plan
would consider measures to restore low flows to Bubbly Creek during normal periods
and reduce contamination from bottom sediments along with the restoration of aquatic
and associated habitats. Low flow restoration would be accomplished in the same
manner as the plan above. Sediment remediation measures for consideration include
removal and capping. Since anaerobic decomposition of the bottom sediments produce
large amounts of gas and high velocities occur in the channel during overflows,
challenges exist with sediment capping at this site. Field demonstrations are
recommended to assist or provide valuable information in the selection of capping
materials, placement methods, and gas collection and treatment systems. Alterations to
channel cross sections could be configured to allow for areas of low velocities that could
sustain aquatic vegetation necessary for ecosystem restoration.
Major alterations to the
channel could include reconfiguring the channel to mimic natural streams where deeper
portions of the channel provide the main flow conveyance, while shallow edges and
floodplain areas provide calmer waters for fish spawning, rearing, and feeding. Stream
bank alterations including riparian habitat restoration along with river access points,
trails, and other recreational features could be part of the channel alterations. A rendering
of Bubbly Creek restored following this plan is shown in
Figure
S below.
U.S. Army Corps of Engineers
-18-
Bubbly Creek
Chicago District
ection 05
(Y) Ana ysis -
Figure S:
Low
-Flow Restoration and Sediment Remediation with Ecosystem Restoration
Preliminary Plan (figure provided
by Chicago
Department of Planning and Development)
U.S. Army Corps of Engineers
-19-
Bubbly Creek
Chicago District
Section 9-OW na
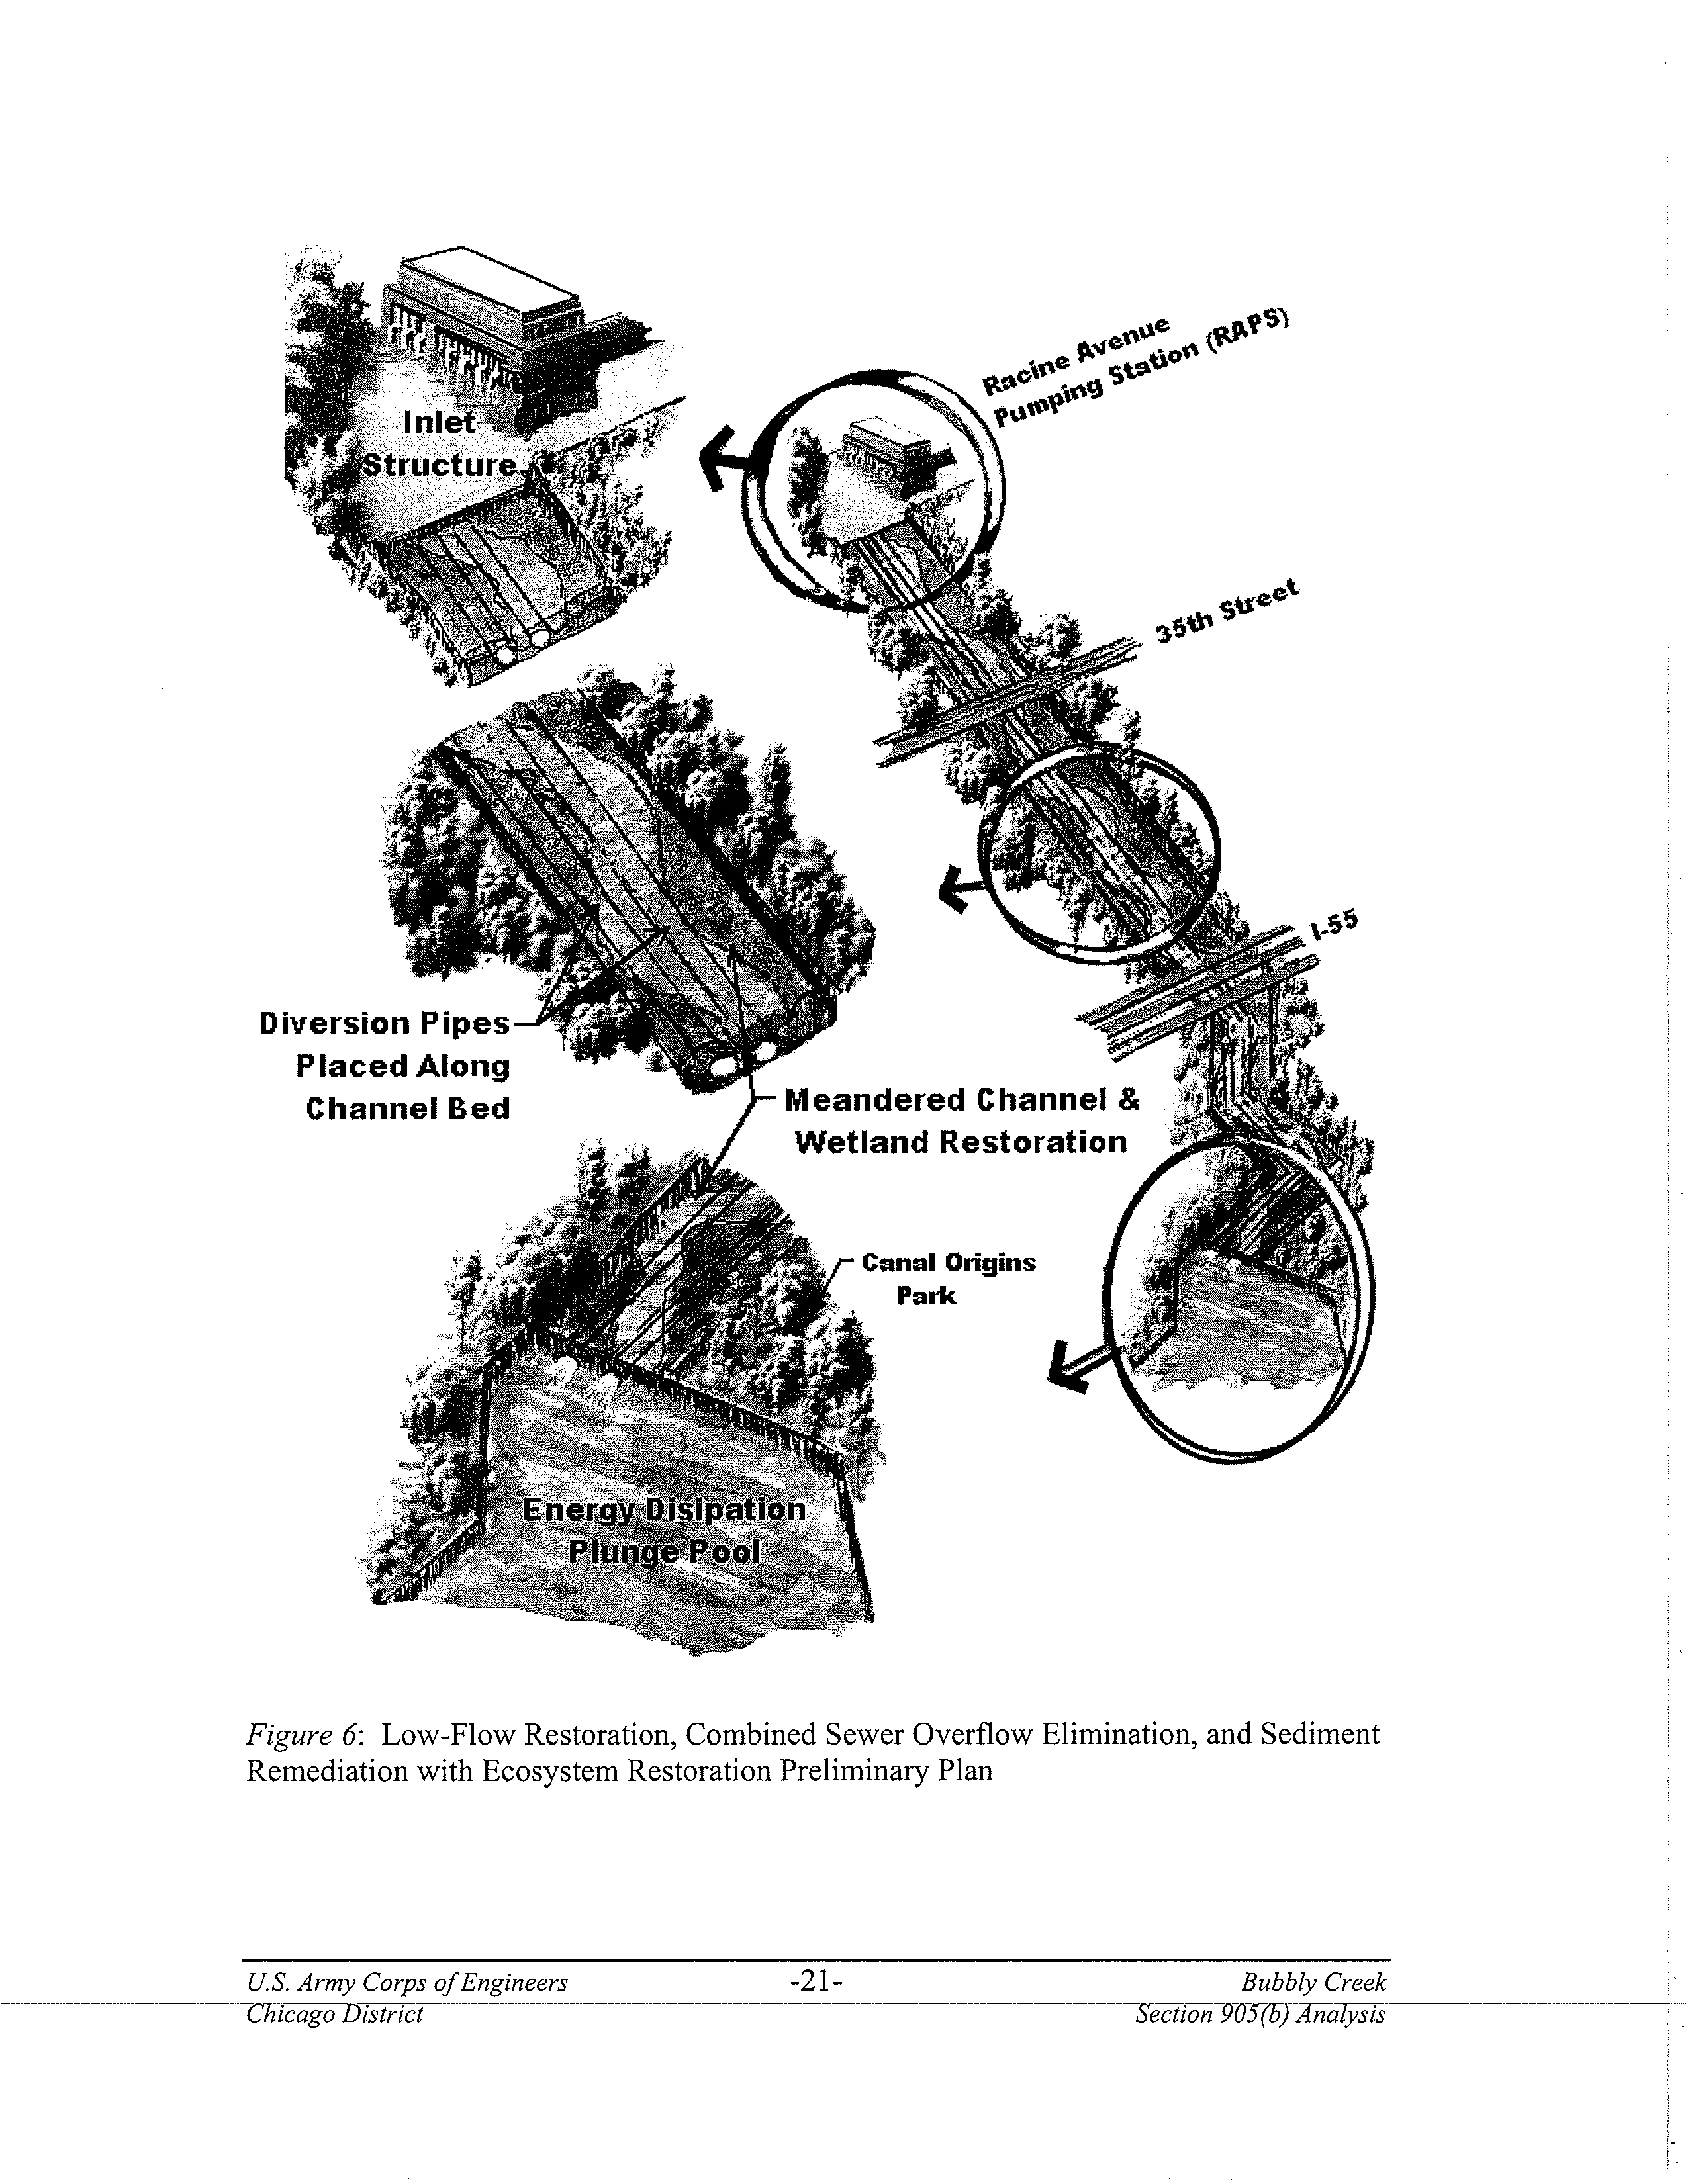
Low-Flow Restoration. Combined Sewer Overflow Elimination, and Sediment
Remediation with Ecosystem Restoration.
This plan would consider measures to restore
low flows to Bubbly Creek during normal periods, eliminate combined sewer overflow
discharges and reduce contamination from bottom sediments along with the restoration of
aquatic and terrestrial habitats. This ambitious plan would allow for complete restoration
of Bubbly Creek to mimic a natural meandering stream with associate wetland margins.
Low flow restoration would be accomplished in the same manner as the plans above, but
to less of a scale since this plan involves significantly reducing the size of the stream
channel. The amount of flow needed to maintain water quality would be less when
channel size is reduced. Elimination of CSO discharge could be accomplished by
diverting overflows directly to the South Branch via large pipes. An inlet manifold
would be necessary at RAPS in order to direct flow into the diversion pipes. Other
connections between adjacent CSOs along the channel, if not eliminated, and the
diversion pipe may be required. At the downstream end, where discharges are
reintroduced to the South Branch, an energy dissipating plunge pool would be necessary
to control erosion. The diversion pipes could be placed in the existing channel in order to
reduce excavation and land acquisition costs. Once CSOs are diverted from Bubbly
Creek, complete ecosystem restoration would be possible. Since maintaining channel
overflow conveyance capacity would be unnecessary, the cross-sectional area of the
channel can be drastically reduced and reconfigured. The existing channel could be
replaced with several wetland areas connected by a small meandered stream containing a
series of riffle and pool complexes. The riparian area would also be drastically increased
by reducing the width of the channel. Diverse aquatic and riparian habitats can be
restored by this plan. Sediment remediation would be accomplished by capping and
filling.
Since bottom sediments can be capped with a thicker layer and substrate
materials due to the removal of channel conveyance limitations and high channel
velocities, sediment remediation under this plan is considered less complicated. A sketch
of Bubbly Creek restored following this plan is shown in
Figure
6 below.
j) Conclusions from Preliminary Screening:
At this time, limited information is available at the reconnaissance level to screen
alternatives.
More in-depth conclusions for the preliminary screening will be drawn in
the feasibility phase when more information is available for further analysis and
alternatives have been reformulated and screened out. Due to funding and time
constraints of the reconnaissance phase, only limited and informal coordination has been
conducted with other agencies.
The preliminary screening indicates the plan that provides low flow restoration and
sediment remediation with ecosystem restoration has the greatest potential for
implementation. The low-flow restoration plan does not address other limiting factors
caused by contamination from CSOs and bottom sediments leaving few opportunities for
aquatic habitat restoration. Inclusion of a separate means of conveyance for CSOs to
bypass Bubbly Creek as included in the low-flow restoration, combined sewer overflow
elimination, and sediment remediation with ecosystem restoration is expected to be cost
prohibitive.
Benefits to ecosystem restoration would include increased habitat quantity
U.S. Army Corps of Engineers
-20-
Bubbly Creek
Chicag^istrict
-Section 905(b) Analysis
Diversion Pipes
Placed Along
Channel Bed
Meandered Channel &
Wetland Restoration
Figure 6:
Low-
Flow Restoration
,
Combined Sewer Overflow Elimination, and Sediment
Remediation with Ecosystem Restoration Preliminary Plan
U.S. Army Corps of Engineers
-21-
Bubbly Creek
Chicao District
Section 905(b) Anal
and improved habitat quality of a significant area of metropolitan Chicago which would
benefit millions of local area residents. Ecosystem restoration benefits would likely be
quantified in terms of increases in the quantity and quality of lotic stream, riparian, and
wetland habitats. The restoration of Bubbly Creek would provide a source for aquatic
plants and animals and benefit an area several miles upstream and downstream of the
project area. Currently, very few locations for native aquatic species to reproduce exist,
thus severely impairing the abundance within the Chicago River System. Because the
entire area that would be considered for restoration is currently highly degraded and has
extremely low habitat value, improvements in habitat quality due to restoration could be
very high. A preliminary table of potential ecological outputs as related to quality and
function of with and without project habitats is shown in
Table
2 below. These numbers
are based solely on professional judgment and should only be used as a relative guide in
displaying restoration potential for Bubbly Creek. Actual restoration outputs will be
determined during the feasibility study based on measured data and sound scientific
methodology.
Habitat
Area of
Quality of
Function of
Ecological
Type
Habitat
Habitat
Habitat
Output
(acres)
(1-5)
(0-10)
(HUs)
Lotic'
25
1
1
25
Without
Riparian2
21
1
3
63
Project
/
Wetland
0
0
0
0
No Action
Total
46
88
Net Improvement:
0
Lotic
25
2
3
150
Riparian
21
1
3
63
Low-Flow
Wetland
0
0
0
0
Restoration
Total
46
213
Net
Improvement:
125
Low-Flow
,
Lotic
20
3
6
360
Sediment
Riparian
21
4
8
672
Remediation
,
Wetland
15
3
6
270
Ecosystem
Total
56
1,302
Restoration
Net Improvement:
1,214
Low-Flow
Lotic
10
4
8
320
Rest.
,
CSO
Riparian
21
4
8
672
Elimination
,
Wetland
25
4
8
800
Sed. Remed
.,
Total
56
1,792
Eco. Rest.
Net
Improvement:
1,704
'
Lotic stream length of 6,600 linear feet and an average channel width of 165-feet was used to
calculate habitat footprint area
2
Riparian length of 15,000 linear feet and a setback width of 60-feet used to calculate habitat
footprint area
Table 2:
Estimated Ecological Outputs of Preliminary Restoration Plans
U.S. Army Corps of Engineers
-22-
Bubbly Creek
Chic ago District _
- -
-- -
_-
- -
- - _--
-
---
- -Section 90^(b^Anaysis
Preliminary implementation costs have been developed based on other ecosystem
restoration projects in the area and professional judgment. Since the causes of
degradation facing Bubbly Creek are quite unique, complex solutions are necessary for
restoration.
Many unit cost values from other projects were not available for use because
some technologies proposed for Bubbly Creek are new and have not been implemented
elsewhere. For example, sediment capping costs can vary greatly depending on the
materials used and thickness required for this application. The preliminary
implementation costs as shown in
Table 3
below are meant to provide a relative basis for
comparison only. A detailed and more reliable cost estimate will be developed during the
feasibility phase.
Cost
Plan
Construction
Activity
(x $1,000)
Low Flow Restoration
2,500
0 0
(Pump, Conveyance Pipe, and Inlet/Outlet Structures)
w l
Sub-Total
2,500
3 °
Contingency (25%)
625
o
Estimated Total Construction
3,125
Low Flow Restoration
2,500
0
(Pump, Conveyance Pipe, and Inlet/Outlet Structures)
0 0 d
Sediment Capping
15,000
0
o
Limited Sediment Dredging and Disposal
k
2,000
Riparian Site Prep and Earthwor
1 ,500
Riparian and Wetland Vegetation
3,000
G°
Sub-Total
24,000
3 b j
Contingency (25%)
6,000
Estimated Total Construction
30,000
Low Flow Restoration
1,500
0
(Pump, Conveyance Pipe, and Inlet/Outlet Structures)
0
.
y0
CSO Diversion Structures
84,000
2
(Channel Diversion Pipes and Inlet/Outlet Structures)
Sediment Capping and Meander Channel Construction
10,000
Riparian Site Prep and Earthwork
1,500
o w
Riparian and Wetland Vegetation
3,000
w O^ F o
U4
Sub-Total
100,000
o
U
^
Contingency (25%)
25,000
Estimated Total Construction
125,000
Table 3:
Estimated Construction Costs of Preliminary Restoration Plans
U.S. Army Corps of Engineers
-23-
Bubbly Creek
Chicago District
ection 9a^(b Analysis
k) Project Significance:
Statements of significance provide qualitative information and help decision makers
evaluate whether the value of the resources restored are worth the costs necessary to
restore them. The Bubbly Creek ecosystem restoration project will provide substantial
benefits of local, regional, and national significance. The significance of restoration
outputs are recognized in terms of institutional, public, and/or technical importance as
discussed below.
Institutional Recognition - The Bubbly Creek ecosystem restoration project is significant
based on institutional recognition meaning that the importance of the environmental
resource is acknowledged in the laws, adopted plans, and other policy statements of
public agencies, tribes, or private groups as listed below:
•
Fish and Wildlife Conservation Act of 1958, as amended -
All Federal
departments and agencies to the extent practicable and consistent with the
agencies authorities should conserve and promote conservation of non-game fish
and wildlife. The Bubbly Creek project will help conserve Chicago River
ecosystems including the non-game fish and wildlife within the existing
authorities of the Corps of Engineers.
•
National Environmental Policy Act of 1969, as amended-
It is national policy to
promote efforts, which will prevent or eliminate damage to the environment. The
Bubbly Creek project will restore damaged aquatic habitat and enhance the public
use of the natural resource.
•
North American Wetlands Conservation
Act of 1968,
as amended
-
Provides for
implementation of the North American Waterfowl Management Plan and the
Tripartite Agreement on wetlands between Canada, U.S
.
and Mexico. The
Chicago River and Bubbly Creek are along the Illinois River segment of the
Mississippi River migratory bird flyway
.
Over 300 species of birds migrate
through these river valleys in spring and fall and is used by more than 40 percent
of the migratory waterfowl traversing the United States and 60 percent of all bird
species in North America. The proposed project will increase and restore wetland
and riparian habitats that are used by migratory birds along the flyway.
•
National Historic Preservation Act of 1966, as amended -
Preservation of
significant historical features (buildings, objects and sites) through grants and
establishment of the National Register of Historic Places. Two historic landmarks
are located within the project area. The Old Stone Gate of Chicago Union
Stockyards, which is the last remaining feature of the Union Stockyards, is listed
on the National Register and the Canal Origins Park located at the mouth of
Bubbly Creek is the site where the I&M Canal began and is designated as a
Chicago landmark. The Bubbly Creek project would help to restore areas
adjacent to historic landmarks, thus aiding in cultural heritage of the area.
U.S. Army Corps of Engineers
-24-
Bubbly Creek
Chicago District
Section 903
Analysis
• Illinois and
Michigan Canal National Heritage Corridor Act of 1984,
as amended
- Creation
of the
nation
'
s first national heritage area, the I&M National Heritage
Corridor
has goals of preservation
,
conservation
,
recreation
,
and economic
development
.
The Bubbly
Creek project falls within the corridor and would help
to restore and preserve the area in concert with national heritage goals.
•
Executive Order 11514: Protection and Enhancement of Environmental Quality -
Federal policy aimed at protecting and enhancing the quality of the Nation's
environment. The Bubbly Creek project will restore a polluted and stagnant
section of the Chicago River System.
•
Executive Order 11593: Protection and Enhancement of the Cultural
Environment -
Federal policy aimed at preserving, restoring and maintaining the
historic and cultural environment of the Nation. The Bubbly Creek project will
help restore an area rich in historic and cultural significance. As stated above, the
project area is the site of the Union Stockyards, origin of the I&M canal, and falls
within the I&M Canal National Heritage Corridor.
•
Executive Order 12962: Recreational Fisheries
-
Federal policy aimed to
conserve, restore, and enhance aquatic ecosystems to provide for increased
recreational fishing opportunities nationwide. The Bubbly Creek project will
enhance the local fisheries by providing spawning and foraging habitat for yellow
perch, large mouth bass, sunfishes and other various non-game species.
•
Memorandum of Understanding: Urban Rivers Restoration Initiative
-
The
purpose of the URRI is meant to facilitate collaborative efforts between
government agencies, states and stakeholders to improve water quality and habitat
of degraded urban rivers. The agreement was signed between the USEPA and
USACE. The Chicago Area Rivers Restoration Initiative (CARRI) was
nominated for national pilot status. Bubbly Creek and the Chicago River Corridor
Development plan are specifically mentioned in CARRI.
•
City of Chicago: Chicago River Corridor Development Plan
-
The Chicago River
Corridor Development Plan is the result of a collaborative effort among
government agencies, private sector developers, and non-profit organizations to
create a blueprint for the future of the Chicago River. Approved by the Chicago
Plan Commission in 1998, the plan sets forth a shared vision for the river and
outlines specific recommendations to be completed over the next 10 years. The
Bubbly Creek project supports the goals of the plan to enhance the river's
attractiveness as a natural and recreational resource.
•
Friends of
the Chicago River: Clean Water Campaign
-
The Clean Water
Campaign has the goal of developing a strategy for how to improve the water
quality of the Chicago River to the highest possible standard
.
Improving water
quality has the biggest impact on the overall health of the Chicago River. Without
clean water, the establishment of healthy wildlife populations and the potential of
U.S. Army Corps of Engineers
-25-
Bubbly Creek
Chicago District
Section 905(b)-Awa7yszs
the Chicago River for recreation will not be realized. The Bubbly Creek project
supports the Clean Water Campaign by improving water quality and restoring
natural aquatic and related habitats.
•
City of Chicago: Bubbly Creek Vision Plan
-
The Bubbly Creek Vision Plan,
which is currently being developed by the City of Chicago and the Bridgeport
neighborhood, aims at creating a development and restoration plan for the
neighborhood surrounding and including Bubbly Creek. The Bubbly Creek
project is the cornerstone of this plan.
Public Recognition - The Bubbly Creek ecosystem restoration project is significant based
on public recognition meaning a segment of the general public recognizes the importance
of an environmental resource, as evidenced by people engaged in activities that reflect an
interest or concern for that particular resource as listed below:
•
The Bubbly Creek project is locally significant for its ecological value to the City
of Chicago and surrounding neighborhoods. Bubbly Creek is located within a
heavily populated area of metropolitan Chicago. Based on 2000 U.S. Census
data, over 104 thousand people live within 1 mile of the project area that would
directly benefit from the proposed project. Additionally, over 1.4 million people
live within 5 miles of Bubbly Creek that would benefit from additional natural
space, which is severely lacking in this area.
•
The Friends of the Chicago River (FCR) is the only organization solely dedicated
to the Chicago River. Since 1979, FCR has been working to improve the health
of the Chicago River for the benefit of people and wildlife and by doing so, has
laid the foundation for the river to be a beautiful, continuous, easily accessible
corridor of open space in Metropolitan Chicago. FCR has conducted numerous
river rescue days and other activities that benefit the Chicago River. FCR are
solely funded by private donations and have been actively involved in the Bubbly
Creek project and will continue to provide support during the feasibility study.
• The Chicago River Rowing and Paddling Club (CRRPC) is the oldest boat club
on the Chicago River. Founded in 1979, CRRPC has pioneered recreational use
of the Chicago River by demonstrating and promoting the potential of the river
for canoeing, rowing and kayaking. CRRPC currently maintains a canoe launch
at the mouth of Bubbly Creek and supports the Bubbly Creek project and will be
involved in formulating compatible water access and recreational opportunities.
Technical Recognition - The Bubbly Creek ecosystem restoration project is significant
based on technical recognition. This means the resource qualifies as significant based on
its "technical" merits, which are based on scientific knowledge or judgment of critical
resource characteristics as listed below:
U.S. Anny Corps of Engineers
-26-
Bubbly Creek
Chicago District
SecTion05-(b7 Antes
•
Scarcity - The Bubbly Creek project would restore in-stream habitat, side stream
wetlands, and naturalized hydraulic regimes, which are extremely rare within the
Chicago River system.
•
Representation - The Bubbly Creek project aims to restore stream and wetland
features that are representative of what was present nearly 200 years ago. The
project area was once comprised of a series of sluggishly flowing channels and
connected wetlands.
•
Connectivity - The restoration of Bubbly Creek would begin the process of
reconnecting sustainable habitats within the Chicago River. Habitats restored
with this project would connect with other ecosystem restoration projects
currently being developed within the Chicago River system.
• Status and Trends - Bubbly Creek has been severely altered by human
intervention, which has caused serious degradation to the ecosystem.
Without
intervention, the project area will remain in an imperiled state. The Bubbly Creek
project has the ability to recover and restore this unique and important resource.
•
Limiting Habitat - Bubbly Creek is currently devoid of any natural habitat. This
project would restore in-stream habitat, side stream wetlands, and native riparian
plant communities, which are currently extirpated from the project area.
•
Biodiversity - The Bubbly Creek restoration project would significantly increase
the biodiversity of flora and fauna within the project area. The project will
increase the biodiversity of macroinvertebrate, fish, and bird species. Restoration
of Bubbly Creek would provide a natural area to allow for fish species to spawn
and disperse throughout the Chicago River system, which is currently devoid of
quality spawning habitat. This project will also increase the biodiversity and
abundance of fish outside the project area within the Chicago River system.
In summary, the proposed Bubbly Creek ecosystem restoration project is significant in
terms of institutional, public, and technical recognition. The significance and high value
of the resources to be restored lay the foundation for Federal interest in conducting a
feasibility study.
1)
Establishment of a Plan Formulation Rationale:
The Corps is required to consider the option of "No Action" as one of the alternatives in
order to comply with the requirements of the National Environmental Policy Act
(NEPA). No Action assumes that no project would be implemented by the Federal
Government (Corps of Engineers) to achieve the planning objectives. No Action, which
is synonymous with the "Without Project Condition", forms the basis from which all
other alternative plans are measured.
U.S. Army Corps of Engineers
-27-
Bubbly Creek
Chicago District
ec^l0
Analysis
The conclusions from the preliminary screening form the basis for the next iteration of
the planning steps that will be conducted in the feasibility phase. The likely array of
alternatives that will be considered in the next iteration includes: no action; pumping
from South Branch to provide low-flow restoration; low-flow restoration along with
sediment capping with channel, wetland, and riparian restoration; low-flow restoration
along with combined sewer overflow diversion, sediment remediation by capping and
filling with channel remeandering, wetland, and riparian restoration; and locally-
developed plans. Future screening and reformulation will be based on the following
factors: priorities of the non-Federal sponsor regarding project purposes; input from
stakeholders including landowners, interest groups and other government agencies,
during the public scoping process for the feasibility phase; and the results of detailed
investigations conducted during the feasibility phase.
6. FEDERAL INTEREST:
Since ecosystem restoration is a high priority budget output and the primary outputs of
the alternatives are ecosystem restoration, there is strong Federal interest in conducting a
feasibility study.
Based on preliminary information, there are potential project
alternatives that would be consistent with current Corps policies regarding costs, benefits,
and environmental impacts. There are opportunities within the study area to develop a
cost effective environmentally justified project that would achieve well-integrated
ecosystem restoration within a complicated system and provide limited compatible
recreation to the extent possible within an area that could directly benefit millions of local
area residents.
7. PRELIMINARY FINANCIAL ANALYSIS:
As the potential non-Federal sponsor, the City of Chicago Department of Environment
(DOE) would be required to provide 50 percent of the cost of the feasibility phase. DOE
is also aware of the cost sharing requirements for potential project implementation. A
letter of intent from DOE stating a willingness to pursue the feasibility study and to share
in its costs is included as Enclosure A.
8. SUMMARY OF FEASIBILITY STUDY ASSUMPTIONS:
a) Feasibility Phase Assumptions:
•
The without-project conditions serve as the baseline for estimating and evaluating
the beneficial and adverse effects of a potential water resource project. Since the
Bubbly Creek watershed is fully developed and the future without project
condition can be reasonably predicted with confidence, the planning period for the
environmental analysis will be over a 50-year period.
U.S. Army Corps of Engineers
-28-
Bubbly Creek
Chicago District
ection 903(b) A-naIysrs
•
The feasibility study will address a project that is complete in itself and does not
rely on and dependent upon other projects for justification. Other ecosystem
restoration projects within the area will provide additional environmental outputs.
•
An MCACES cost estimate will be performed on the selected plan providing and
analysis suitable for a feasibility level study.
•
The feasibility study will contain ecosystem restoration outputs as the basis for
justification and will not contained a detailed economic analysis. Incidental
economic benefits maybe included.
•
Additional and expanded assumptions may be identified during development of
the project management plan (PMP). Any critical assumptions and sensitive
policy areas will be coordinated with Corps vertical team.
b) Policy Exceptions and Streamlining Initiatives:
The study will be conducted in accordance with the Principles and Guidelines and Corps
of Engineers regulations. No exceptions to established guidance have been identified at
this time.
c) Other Approvals Required:
The non-Federal Sponsor will need to have the necessary funding and authority to
participate in the feasibility phase.
9. FEASIBILITY PHASE MILESTONES:
The feasibility phase schedule will be developed in detail during the preparation of the
Project Management Plan (PMP
)
and the Feasibility Cost Sharing Agreement
(FCSA).
The feasibility study is expected to be conducted over a 36-month period
.
A preliminary
schedule of the major feasibility study milestones has been provided in
Table 4.
Milestone
Description
Duration
(mo
Cumulative
(mo
Milestone Fl
Initiate Stud
0
0
Milestone F2
Public Workshop and NEPA Sco in
2
2
Milestone F3
Feasibility Sco in
Meeting
11
13
Milestone F4
Alternative Formulation Briefing
14
27
Milestone F5
Draft Feasibility Report and EA or EIS
3
30
Milestone F6
Final Public Meeting
1
31
Milestone F7
Feasibility Review Conference
1
32
Milestone F8
Final Report to LRD
3
35
Milestone F9
DE's Public Notice
1
36
-
Chief's Report
4
40
-
Project Authorization
4
44
Table 4:
Preliminary Feasibility Phase Milestones
U.S. Army Corps of Engineers
-29-
Bubbly Creek
Chicago District
-Sec9D5(b)- na ysis
10. FEASIBILITY PHASE COST ESTIMATE:
The following feasibility phase cost estimate, as shown in
Table 5,
is preliminary pending
negotiation of a detailed scope of work for the feasibility study with the local sponsor. A
revised cost estimate will be presented in the Project Management Plan.
Feasibili
ty
Stud
Task Descri
p
tion
Cost
Surve
y
s and Ma
pp
in
g
exce
p
t
Real Estate
$
100,000
H
y
drolo
gy
and H
y
draulics Studies
/
Re ort
$100,000
Geotechnical Studies/Re ort
$150,000
En
g
ineerin
g
and Desi
g
n Anal
y
sis Re
p
ort
$250,000
Socioeconomics Studies
$25,000
Real Estate Anal
y
sis/Re
p
ort
$50,000
Environmental Studies
/
Re ort
(
Exce
pt USF
&WL
$200,000
Fish and Wildlife Coordination Act Re
p
ort
$50,000
HTRW Studies/Re ort
$
100,000
Cultural Resources Studies
/
Re ort
$50,000
Cost Estimates
$
75,000
Public Involvement Documents
$
75,000
Plan Formulation and Evaluation
$
250,000
Final Re
p
ort Documentation
$
50,000
Technical Review Documents
$100,000
Washin
g
ton Level Re
p
ort A
pp
roval
Review Su
pp
ort
)
Mana
g
ement and Bud
g
et Documents
$
200,000
Contin
g
encies
$
500,000
Project Mana
g
ement Plan PMP
)
$
50,000
PED Cost Sharin
g
A
g
reement
$50,000
TOTAL
:
$2,500,000
Table 5:
Preliminary Feasibility Phase Cost Estimate
11. VIEWS
OF OTHER RESOURCE
AGENCIES:
This project contributes to a multi-agency regional watershed plan. The Urban River
Restoration Initiative is a partnership between Federal, State, and local agencies in a
collaborative effort to improve water quality, manage contaminated sediment, and restore
habitat in the Chicago Area Rivers. The partnership is working to achieve common goals
of protecting public health, restoring habitat and revitalizing economic development. In
addition, this Bubbly Creek study is a high priority for the City of Chicago and the
Mayor's Office, and supports the Friends of the Chicago River biodiversity recovery plan.
U.S. Army Corps of Engineers
-30-
Bubbly Creek
Chicago District
Section 903
na ysis
12. POTENTIAL ISSUES AFFECTING INITIATION OF
FEASIBILITY PHASE:
Continuation of this study into the cost-shared feasibility phase is contingent upon an
executed Feasibility Cost Sharing Agreement (FCSA). Issues that could impact the
initiation of the feasibility phase include the lack of funds by the Federal government.
The City of Chicago Department of Environment provided a letter dated August 1, 2006,
as attached, noting their intention to be a local sponsor and willingness to enter into a
feasibility cost sharing agreement.
The tentative schedule for signing the
FCSA
is July 2007
.
Based on the schedule of
milestones laid out in Section 9 above; completion of the feasibility report would be in
August 2010
,
with a potential Congressional Authorization in WRDA 2012.
13. PROJECT AREA MAP:
A map of the study area is provided as Figure 1.
14. RECOMMENDATIONS:
It is recommended that this 905(b) Preliminary Analysis report be approved as a basis for
developing the Project Management Plan (PMP) for the Bubbly Creek feasibility study,
finalizing the Feasibility Cost Sharing Agreement (FCSA) with the non-Federal sponsor,
and proceeding with more detailed planning and engineering study to determine an
appropriate, coordinated, implementable solution to the identified water resources
problems and opportunities.
Z5
Date
A"
D. Drolet
el,
Corps of Engineers
District Engineer
U.S. Army Corps of Engineers
-31-
Bubbly Creek
Chicago District
Section-905 - Ana ysis
August 1, 2006
City of Chicago
Richard M
.
Daley, Mayor
Department of Environment
Sadhu A.
Johnston
Commissioner
Twenty-fifth Floor
30 North LaSalle Street
Chicago, Illinois 60602-2575
(312) 744-7606 (Voice)
(312) 744.6451 (FAX)
(312) 744-3586 (TTY)
htip://www.cilyofchicago.org
John D. Drolet
Colonel, U.S. Army
District Commander
11 I N. Canal Street, Suite 600
Chicago, IL 60606-7206
SUBJECT:
Bubbly Creek Feasibility
Study -
Letter of Intent
Dear Colonel Drolet:
The U.S. Army Corps of Engineers, Chicago District is currently conducting a
reconnaissance study of the South Fork of the South Branch of the Chicago
River. The primary focus of the study is ecosystem restoration.
We have met
several times with representatives of the Chicago District to discuss this study.
Overall, water quality in the Chicago River has been improving and land along
the river is currently being redeveloped. Several activities are"currently
underway
or planned
to improve the water quality. However, additional work is
needed to improve nuisance conditions caused by sewer overflows, to restore
habitat, and to continue to improve general appearance and water quality which
is jeopardized by a century of slaughter house pollution resting on the creek
bottom. Ecosystem
restoration
will improve water quality, protect public health,
restore habitat and revitalize economic development.
We understand that participation by the Corps of Engineers to conduct a more
detailed feasibility study of the SFSB of the Chicago River requires a local
sponsor capable and willing to enter into a feasibility cost sharing agreement.
Our understanding is that tinder current regulations
,
cost sharing of the study is
50% federal and 50% local
.
By this letter, the
City of
Chicago intends to be a
local sponsor for this ecosystem restoration feasibility study project.
We look forward to working with the
Army Corps
on this important project. If
you have any questions
,
please call Renante Marante at
312 742-0123.
Sincerely,
Sadhu A. Johnston
Commissioner
Chicago Department of Environment
cc:
Cathy
.
Hudzik (M.O.)
Kirston Buczak
(
A.C.O.E.)
David Bucaro
(A.C.O.E.)
A
tt
ac
hm
e
nt
3
Metropoff n Wafer
Reclamation Dtstrtct of Greater Chicago
RESEARCH
AND DEVELOPMENT
DEPARTMENT
REPORT NO. 07-25
CONTINUOUS DISSOLVED OXYGEN MONITORING
IN THE DEEP-DRAFT CHICAGO WATERWAY SYSTEM
DURING 2006
May 2007
Metropolitan Water Reclamation District of Greater Chicago
100 East Erie Street Chicago
,
Illinois 60611-2803 312-751-5600
CONTINUOUS DISSOLVED OXYGEN MONITORING
IN THE DEEP-DRAFT CHICAGO WATERWAY SYSTEM
DURING 2006
By
Thomas A. Minarik, Jr.
Biologist I
Jennifer
L. Wasik
Biologist II
Michael Sopcak
Biologist III
Samuel G. Dennison
Biologist IV
Research and Development Department
Louis
Kollias,
Director
May 2007
TABLE OF CONTENTS
Page
LIST OF TABLES
ii
LIST OF FIGURES
iv
ACKNOWLEDGEMENT
vi
DISCLAIMER
vi
INTRODUCTION
1
MONITORING STATIONS
2
Locations and Descriptions
2
Designated Uses
2
Water Quality Standards
2
MATERIALS AND METHODS
3
Water Quality Monitor
3
Data Management and Review
3
Verification of Representative Data
4
RESULTS
5
DO Fluctuations
5
REFERENCES
35
APPENDIX:
A
Weekly DO Summary Statistics at all Deep-Draft Monitoring Stations
A-1
During 2006
i
LIST OF TABLES
Table
No.
Page
1
Deep-Draft Continuous Dissolved Oxygen Monitoring Stations
6
2
Minimum, Maximum, and Mean Hourly Dissolved Oxygen Concentra-
tions
10
3
Number and Percent of Dissolved Oxygen Values Not Meeting Accep-
tance Criteria
4
Number and Percent of Dissolved Oxygen Values Measured Above the
Illinois Pollution Control Board's Water Quality Standard
12
5
Percent of Dissolved Oxygen Values in Selected Ranges
13
A-1
Weekly DO Summary Statistics at Main Street on the North Shore Chan-
nel During 2006
A-1
A-2
Weekly DO Summary Statistics at Foster Avenue on the North Shore
Channel During 2006
A-3
A-3
Weekly DO Summary Statistics at Addison Street on the North Branch of
the Chicago River During 2006
A-5
A-4
Weekly DO Summary Statistics at Fullerton Avenue on the North Branch
of the Chicago River During 2006
A-7
A-5
Weekly DO Summary Statistics at Kinzie Street on the North Branch of
the Chicago River During 2006
A-9
A-6
Weekly DO Summary Statistics at Clark Street on the Chicago River
During 2006
A-11
A-7
Weekly DO Summary Statistics at Loomis Street on the South Branch of
the Chicago River During 2006
A-13
A-8
Weekly DO Summary Statistics at 36th Street on Bubbly Creek During
A-15
2006
A-9
Weekly DO Summary Statistics at Interstate Highway 55 on Bubbly
Creek During 2006
A-17
11
LIST OF TABLES (
Continued)
Table
No.
Page
A-10
Weekly
DO Summary Statistics at Cicero Avenue on the Chicago Sani-
tary and Ship Canal During 2006
A-19
A-11
Weekly
DO Summary Statistics at B&O Central Railroad on the
Chicago
Sanitary and Ship Canal During 2006
A-21
A-12
Weekly
DO Summary Statistics at Route 83 on the Chicago Sanitary
and
Ship Canal During 2006
A-23
A-13
Weekly
DO Summary Statistics at the Lockport Powerhouse on the
Chi-
cago Sanitary and Ship Canal During 2006
A-25
A-14
Weekly
DO Summary Statistics at Jefferson Street on the Des Plaines
River During 2006
A-27
A-15
Weekly
DO Summary Statistics at Torrence Avenue on the Grand
Calu-
met River During 2006
A-29
A-16
Weekly
DO Summary Statistics at C&W Indiana Railroad on the
Little
Calumet River During 2006
A-31
A-17
Weekly
DO Summary Statistics at Halsted Street on the
Little Calumet
River During 2006
A-33
A-18
Weekly
DO Summary Statistics at Cicero Avenue on the Calumet
-Sag
Channel During 2006
A-35
A-19
Weekly
DO Summary Statistics at 104th Avenue on the Calumet
-Sag
Channel During 2006
A-37
A-20
Weekly
DO Summary Statistics at Route 83 on the Calumet
-
Sag Channel
During 2006
A-39
in
LIST OF FIGURES
Figure
No.
Page
1
Continuous Dissolved Oxygen Monitoring and Ambient Water Quality
14
Monitoring Sample Stations
2
Dissolved Oxygen Concentration Measured Hourly at Main Street on the
15
North Shore Channel From January 2006 Through December 2006
3
Dissolved Oxygen Concentration Measured Hourly at Foster Avenue on
16
the North Shore Channel From January 2006 Through December 2006
4
Dissolved Oxygen Concentration Measured Hourly at Addison Street on
17
the North Branch Chicago River From January 2006 Through December
2006
5
Dissolved Oxygen Concentration Measured Hourly at Fullerton Avenue
18
on the North Branch Chicago River From January 2006 Through Decem-
ber 2006
6
Dissolved Oxygen Concentration Measured Hourly at Kinzie Street on
19
the North Branch Chicago River From January 2006 Through December
2006
7
Dissolved Oxygen Concentration Measured Hourly at Clark Street on the
20
Chicago River From January 2006 Through December 2006
8
Dissolved Oxygen Concentration Measured Hourly at Loomis Street on
21
the South Branch Chicago River From January 2006 Through December
2006
9
Dissolved Oxygen Concentration Measured Hourly at 36th Street on
22
Bubbly Creek From January 2006 Through December 2006
10
Dissolved Oxygen Concentration Measured Hourly at
Interstate
Highway
23
55 on Bubbly Creek From January 2006 Through December 2006
11
Dissolved Oxygen Concentration Measured Hourly at Cicero Avenue on
24
the Chicago Sanitary and Ship Canal From January 2006 Through De-
cember 2006
IV
LIST OF FIGURES (
Continued)
Figure
No.
Page
12
Dissolved Oxygen Concentration Measured Hourly at B&O Central
25
Railroad on the Chicago Sanitary and Ship Canal From January 2006
Through December 2006
13
Dissolved Oxygen Concentration Measured Hourly at Route 83 on the
26
Chicago Sanitary and Ship Canal From January 2006 Through De-
cember 2006
14
Dissolved Oxygen Concentration Measured Hourly at Lockport Pow-
27
erhouse on the Chicago Sanitary and Ship Canal From January 2006
Through December 2006
15
Dissolved Oxygen Concentration Measured Hourly at Jefferson Street
28
on the Des Plaines River From January 2006 Through December 2006
16
Dissolved Oxygen Concentration Measured Hourly at Torrence Ave-
29
nue on the Grand Calumet River From January 2006 Through Decem-
ber 2006
17
Dissolved Oxygen Concentration Measured Hourly at C&W Indiana
30
Railroad on the Little Calumet River From January 2006 Through De-
cember 2006
18
Dissolved Oxygen Concentration Measured Hourly at Halsted Street
31
on the Little Calumet River From January 2006 Through December
2006
19
Dissolved Oxygen Concentration Measured Hourly at Cicero Avenue
32
on the Calumet-Sag Channel From January 2006 Through December
2006
20
Dissolved Oxygen Concentration Measured Hourly at 104th Avenue
33
on the Calumet-Sag Channel From January 2006 Through December
2006
21
Dissolved Oxygen Concentration Measured Hourly at Route 83 on the
34
Calumet-Sag Channel From January 2006 Through December 2006
v
ACKNOWLEDGMENT
Thanks are extended to staff from the Industrial Waste Division who deployed and re-
trieved the water quality monitors weekly during the study. Special thanks to Richard Schackart,
Justin
Vick,
Dustin Gallagher
,
Donald Rohe, Angel Whitington
,
Panu Lansiri
,
and Colleen Joyce
for downloading and servicing the monitors.
Thanks are also extended to Dr. Thomas Granato, Assistant Director of Research and
Development, Environmental
Monitoring and Research Division, for his helpful review
comments.
We thank Robert Larson, Illinois State Water Survey, for designing the Access° database
program, and Roger Smith, Senior Program Analyst, Information Technology Department for
modifying the database program. Their help with the Access® program is greatly appreciated.
We thank Dr. Zainul Abedin, Biostatistician, for modifying the database program and for
performing the calculations for the data summaries used in this report.
Particular thanks are due to Joan Scrima for reviewing, formatting, and typing the report.
DISCLAIMER
Mention of proprietary equipment and chemicals in this report does not constitute
endorsement by the Metropolitan Water Reclamation District of Greater Chicago.
vi
INTRODUCTION
The Chicago Waterway System (CWS) consists of 78 miles of canals, which serve the
Chicago area for two principal purposes, the drainage of urban storm water runoff and treated
municipal wastewater effluent and the support of commercial navigation. Approximately 75 per-
cent of the length is composed of man-made canals where no waterway existed previously, and
the remainder is composed of natural streams that have been deepened, straightened and/or wid-
ened to such an extent that reversion to the natural state is not possible. The flow of water in the
CWS is artificially controlled by hydraulic structures. The CWS has two river systems, the
Calumet River System and the Chicago River System (Lanyon, 2002).
Over the years, increased pollutant loading from urbanization throughout the Chicago
metropolitan area and low stream velocities in Chicago area deep-draft waterways have caused
dissolved oxygen (DO) concentrations to fall below DO standards established by the Illinois Pol-
lution Control Board (IPCB). More than 30 years ago, the Metropolitan Water Reclamation Dis-
trict of Greater Chicago (District) determined that applicable IPCB DO standards for Chicago
area waterways could not be met exclusively by advanced wastewater treatment at its three major
regional water reclamation plants (WRPs), Calumet, North Side, and Stickney, and by the cap-
ture and treatment of combined sewer overflows (CSOs). In order to increase the DO concentra-
tion in the Chicago and Calumet River Systems, the District designed and constructed artificial
aeration systems (instream diffuser and sidestream elevated pool aeration [SEPA] stations) dur-
ing the late 1970s and early 1990s, respectively.
From October 1994 through May 1996, the Research and Development Department
(R&D) conducted weekly DO surveys in the Chicago River System. Water samples were col-
lected manually, chemically fixed in the field, and returned to the laboratory for titration. The
results from these surveys showed that DO concentrations in selected waterway reaches were
less than IPCB DO standards applicable to these reaches.
In August 1996, R&D began developing a comprehensive field-monitoring program in
order to locate and identify reaches in the Chicago River System where the DO concentration is
less than the applicable IPCB DO standard. Initially, the program was to focus on the Chicago
River System for a two-year period and has since been extended. Subsequently, the scope of the
monitoring program was first expanded to include the Calumet River System, and then later the
Chicago area wadeable streams. The resulting data have been used for the calibration and verifi-
cation of a water quality model for the CWS.
Data in this report are from the 20 deep-draft continuous DO monitoring stations of the
District's Continuous Dissolved Oxygen Monitoring (CDOM) Program. This report covers the
monitoring results for the period January 2006 through December 2006 for the deep-draft
waterways of the Chicago River System, Des Plaines River System, and Calumet River System.
1
MONITORING STATIONS
Locations and Descriptions
The CDOM Program and the Ambient Water Quality Monitoring (AWQM) Program
supply the District with water quality data throughout the year for both the wadeable and deep-
draft waterways within its jurisdiction.
All stations for both programs are shown in Figure 1.
Descriptions of the locations for the deep-draft monitoring stations are listed in Table 1.
Designated Uses
The IPCB has assigned water uses for specific water bodies within the state of Illinois.
All waters in Illinois are designated for General Use, except those selected as Secondary Contact
and Indigenous Aquatic Life Waters (Secondary Contact)
In the Chicago and Calumet River Systems, General Use Waters include the North Shore
Channel from Lake Michigan to the North Side WRP, and the Chicago and Calumet Rivers.
Secondary Contact Waters include the North Shore Channel from the North Side WRP to
the North Branch of the Chicago River, the North Branch of the Chicago River from the North
Shore Channel to the Chicago River, the South Branch of the Chicago River, Bubbly Creek, the
Chicago Sanitary and Ship Canal, the Grand Calumet River, the deep-draft portion of the Little
Calumet River, the Calumet-Sag Channel, and the Des Plaines River from its confluence with the
Chicago Sanitary and Ship Canal to the Interstate Highway 55 bridge southwest of Joliet.
Water Quality
Standards
The IPCB has established water quality standards for DO in both General Use and Sec-
ondary Contact Waters. In General Use Waters, the DO shall not be less than 6.0 mg/L during 16
hours of any 24-hour period, nor less than 5.0 mg/L at any time. In Secondary Contact Waters,
the DO shall not be less than 4.0 mg/L at any time, except in the Calumet-Sag Channel where the
DO shall not be less than 3.0 mg/L at any time. For this report, we have selected the 5.0 mg/L
DO standard when calculating percent compliance for General Use Waters.
2
MATERIALS AND METHODS
Water Quality
Monitor
The continuous water quality monitors (monitor) used to collect this data were manufac-
tured by YSI Incorporated (YSI) of Yellow Springs, Ohio. DO was measured hourly using the
YSI Model 6920 or Model 6600 monitor. In order to protect and safeguard the monitors from
marine navigation and vandalism, the monitors were deployed in the field in stainless steel pipes.
Two different installation designs were employed: (1) a 3-foot stainless steel pipe was positioned
on the bottom of the waterway and oriented downstream such that the water passed through the
pipe, and (2) a fixed length of pipe, with multiple 2-inch circular openings, was vertically
mounted on the side of a bridge abutment.
Servicing the monitors followed a weekly schedule. Industrial Waste Division personnel
retrieved each monitor from the field following seven days of continuous monitoring. Prior to
retrieval, a water sample for DO analysis was collected next to the protective housing. An addi-
tional
monitor, that had been previously calibrated and serviced in the laboratory, was then de-
ployed to replace the retrieved monitor. The retrieved monitors were returned to the laboratory
for data downloading, exterior cleaning, servicing, and calibration of the DO sensors. The moni-
tors
were temporarily stored in holding tanks containing tap water for subsequent deployment
during the following week.
Data Management and Review
Hourly DO data were directly exported electronically from individual monitors to a spe-
cially designed Access ° database for data processing and storage. Following data downloading,
the weekly DO data were carefully reviewed for accuracy.
The review process included the following:
1.
Comparing a grab sample DO concentration measured in the field with a DO
concentration recorded by a retrieved monitor (DO rejection criteria = differ-
ence greater than 2.0 mg/L).
2.
Comparing the last hourly DO concentration measured by a retrieved monitor
with the first hourly DO concentration recorded by a deployed monitor (DO
rejection criteria = difference greater than 2.0 mg/L).
3.
Comparing a DO concentration measured in a laboratory holding tank and a
DO concentration recorded by a retrieved monitor (DO rejection criteria = dif-
ference greater than 1.0 mg/L).
Criterion 3 would entail rejection of all hourly readings; criteria 1 and 2 may or may not
reject all readings.
3
After
careful review of the DO data, weekly summary statistics
(
mean, minimum, maxi-
mum, and percent observations above DO standard
)
and individual line drawings for each moni-
toring station showing hourly DO concentrations were prepared.
Verification of Representative Data
During the spring, summer, and fall of 2006, cross-sectional DO surveys were conducted
in the CWS to determine if a fixed continuous monitoring location represented the DO concentra-
tion across the waterway. Verification was achieved by comparing the DO concentrations meas-
ured in grab samples at multiple fixed locations and depths across the waterway with the fixed
monitor measurements. The results from the cross-sectional surveys clearly showed that the dif-
ferences across the waterway were minimal and equivalent to the DO concentration measured by
the monitor at the fixed locations.
4
RESULTS
The annual minimum, maximum, and mean DO concentrations measured at all 20 sta-
tions during 2006 are shown in Table 2.
The number and percent of measured DO concentrations rejected and removed from the
Access@ database following review during 2006 are summarized in Table 3.
The number and percent of DO concentrations above the applicable IPCB DO standard
for each waterway during 2006 are presented in Table 4. The DO data shown in Table 4 do not
include the DO concentrations rejected during the data review.
Table 5 shows the percent distribution of DO concentrations from <1.0 mg/L to >5.0
mg/L at the 20 monitoring stations during 2006. The current national one-day minimum DO cri-
terion for adult life stages of fish is 3.0 mg/L (Chapman, 1986).
Individual line drawings showing hourly DO concentrations at each monitoring station
are indicated in Figures 2 through 21.
Weekly DO summary
statistics
during 2006
are presented for each monitoring station in
Appendix A, Tables A-1 through A-20.
DO Fluctuations
DO concentrations fluctuate seasonally and daily in the aquatic environment. Cold water
holds more DO than warm water, a trend that can typically be seen in annual DO graphs where
the colder months have higher mean DO concentrations than the warmer months. Daily fluctua-
tions in DO can be caused by photosynthesis during daylight hours causing a surplus of DO, and,
conversely, respiration by aquatic plants and algae during the night, resulting in a deficiency of
DO. Other deficiencies of DO can occur when oxygen demanding materials are introduced into
a waterway or by thermal discharges. Oxygen demanding materials enter the CWS most often
through wastewater treatment effluents, stormwater run-off, and CSOs.
Wastewater treatment
effluents and CSOs contain organic materials that are decomposed by microorganisms which
consume DO in the process. Stormwater run-off also can flush organic materials into the water-
way either directly from the land adjacent to the CWS, or indirectly through the combined sewer
system.
This is most evident during heavy rain storms that result in CSO events containing un-
treated waste and stormwater. The District Web site (mwrd.org) has information regarding CSO
events which can be found in the Public Interest Section under the titles "CSO Event Synopsis
Report" and "Combined Sewer Overflow." Most low DO excursions reported for the deep-draft
sections of the CWS in this report are associated with the occurrence of a CSO event during
2006.
5
TABLE 1: DEEP-DRAFT CONTINUOUS DISSOLVED OXYGEN
MONITORING STATIONS
Monitoring
Description of
Station
Waterway
Chicago River System
Monitoring Station
Main Street
North Shore Channel
3.5
miles below
Wilmette Pumping
Station,
0.8
mile above North Side
WRP outfall, water quality monitor
under
Main Street bridge, center of
channel, 6 inches above bottom.
Foster Avenue
North Shore Channel
3.2 miles below North Side WRP out-
fall,
1.5
miles below Devon Aeration
Station, 0.1
mile above junction with
North Branch Chicago River, water
quality monitor on northwest side Fos-
ter
Avenue bridge, 3 feet below water
surface.
Addison Street
North Branch Chicago River
5.2 miles below North Side WRP out-
fall,
water quality monitor on northwest
side Addison Street bridge, 3 feet be-
low water surface.
Fullerton Avenue
North Branch Chicago River
7.2 miles below North Side WRP out-
fall, 0.4
mile above Webster Aeration
Station,
water
quality
monitor
on
northwest
side
Fullerton
Avenue
bridge, 3 feet below water surface.
Kinzie Street
North Branch Chicago River
9.9 miles below North Side WRP out-
fall, 3.1
miles below Webster Aeration
Station, 0.2 mile above junction with
Chicago River, water quality monitor
on northeast side Kinzie Street bridge,
3 feet below water surface.
6
TABLE 1 (Continued): DEEP-DRAFT CONTINUOUS DISSOLVED OXYGEN
MONITORING STATIONS
Monitoring
Description of
Station
Waterway
Chicago River System (Continued)
Monitoring Station
Loomis Street
South Branch Chicago River
3.6 miles below junction with Chicago
River, water quality monitor on north-
east side Loomis Street bridge, 3 feet
below water surface.
360' Street
Bubbly Creek
0.2 mile below Racine Avenue Pump-
ing Station, 1.2 miles above junction
with South Branch of the Chicago
River, water quality monitor attached to
concrete wall on west side of river, 3
feet below water surface.
Interstate Highway 55
Bubbly Creek
1.0
mile
below Racine Avenue Pump-
ing Station
,
0.4
mile above
junction
with South
Branch
of the Chicago
River, water quality
monitor on north-
east side
I-55 bridge, 3 feet below wa-
ter surface.
Cicero Avenue
Chicago Sanitary and Ship Canal
1.5
miles above Stickney WRP outfall,
1.1
miles below Crawford Generating
Station cooling water discharge, water
quality
monitor
on
northeast
side
Cicero
Avenue bridge, 3 feet below
water surface.
B&O Central Railroad Chicago Sanitary and Ship Canal
3.6 miles below Stickney WRP outfall,
water quality monitor in center of ca-
nal, east side B&O Central RR bridge,
3 feet below water surface.
Route 83
Chicago Sanitary and Ship Canal
1.2 miles above junction with Calumet-
Sag Channel, 1.1 miles above Canal
Junction SEPA Station, water quality
monitor 0.6
mile above Route 83
bridge, center of canal, 6 inches above
bottom.
7
TABLE 1 (Continued): DEEP-DRAFT CONTINUOUS DISSOLVED OXYGEN
MONITORING STATIONS
Monitoring
Description of
Station
Waterway
Chicago River System (Continued)
Monitoring Station
Lockport Powerhouse
Chicago Sanitary and Ship Canal
0.1
mile above Lockport Powerhouse,
1.1
miles above junction with Des
Plaines River, water quality monitor on
north side of canal, in forebay area on
fender wall, 3 feet below water surface.
Des Plaines River System
Jefferson Street
Des Plaines River
3.0
miles below Lockport
Lock, 2.1
miles
below junction with Chicago
Sanitary and Ship Canal, water quality
monitor on southeast side Jefferson
Street
bridge,
3
feet
below
water
surface.
Calumet River System
Torrence Avenue
Grand Calumet River
150 feet above junction with Calumet
River, 100 feet below Torrence Avenue
bridge,
water quality monitor attached
to bridge abutment on southeast side of
river, 2 feet below water surface.
C&W Indiana Railroad Little Calumet River
5.2
miles below SEPA 1, 1.5 miles
above SEPA 2, 3.6 miles below Tho-
mas J. O'Brien Lock and Dam, 1.3
miles above Calumet
WRP outfall,
water quality monitor attached to north-
east side C&W Indiana RR bridge, 3
feet below water surface.
Halsted Street
Little Calumet River
7.7 miles below SEPA 1, 1.0 mile be-
low SEPA 2, 1.2 miles below Calumet
WRP, 0.5 mile above junction with
Calumet-Sag Channel, water quality
monitor attached to southeast side Hal-
sted Street bridge, 3 feet below water
surface.
8
TABLE 1 (Continued): DEEP-DRAFT CONTINUOUS DISSOLVED OXYGEN
MONITORING STATIONS
Monitoring
Station
Waterway
Calumet River System (Continued)
Cicero Avenue
Calumet-Sag Channel
104`h Avenue
Calumet-Sag Channel
Route 83
Calumet-Sag Channel
Description of
Monitoring Station
3.1
miles below SEPA 3, 3.3 miles
above SEPA 4, water quality monitor
attached to northwest side Cicero Ave-
nue bridge, 3 feet below water surface.
4.6
miles below SEPA 4, 3.2 miles
above Canal Junction SEPA Station,
water quality
monitor in center of
channel, 6 inches above bottom.
0.4
mile above junction with Chicago
Sanitary and Ship Canal, 0.3 mile above
Canal Junction SEPA Station, water
quality
monitor on southwest side Illi-
nois
Central-Gulf RR bridge, 3 feet
below water surface.
9
TABLE 2: MINIMUM, MAXIMUM, AND MEAN HOURLY
DISSOLVED OXYGEN CONCENTRATIONS'
Monitoring
Station
Waterway
DO Concentration (mg/L)
Minimum Maximum
Mean
Chicago River System
Main Street
North Shore Channel
0.0
33.4
9.7
Foster Avenue
North Shore Channel
4.0
11.2
7.7
Addison Street
North Branch Chicago River
0.0
12.0
7.8
Fullerton Avenue
North Branch Chicago River
0.0
11.0
7.1
Kinzie Street
North Branch Chicago River
0.8
11.7
7.0
Clark Street
Chicago River
5.8
12.8
9.0
Loomis Street
South Branch Chicago River
2.2
12.5
7.6
36th Street
Bubbly Creek
0.0
15.6
3.2
Interstate Highway 55
Bubbly Creek
0.0
12.0
5.4
Cicero Avenue
Chicago Sanitary and Ship Canal
0.0
10.8
6.3
B&O Central Railroad
Chicago Sanitary and Ship Canal
1.3
10.1
6.8
Route 83
Chicago Sanitary and Ship Canal
0.0
9.0
5.6
Lockport Powerhouse
Chicago Sanitary and Ship Canal
Des Plaines River System
0.3
9.0
5.6
Jefferson Street
Des Plaines River
Calumet River System
2.4
12.8
7.3
Torrence Avenue
Grand Calumet River
0.0
30.2
8.2
C&W Indiana Railroad
Little Calumet River
1.9
21.9
9.5
Halsted Street
Little Calumet River
3.5
12.9
6.9
Cicero Avenue
Calumet-Sag Channel
3.2
13.1
7.0
104th Avenue
Calumet-Sag Channel
2.9
13.0
7.0
Route 83
Calumet-Sag Channel
2.7
13.9
6.8
Dissolved oxygen was measured hourly using a YSI Model 6920 or Model 6600 continuous water
quality monitor.
TABLE 3: NUMBER AND PERCENT OF DISSOLVED OXYGEN VALUES
NOT MEETING ACCEPTANCE CRITERIA'
Monitoring
Number of
DO Values
Percent of
DO Values
Station
Waterway
Rejected
Rejected
Chicago River System
Main Street
North Shore Channel
627
7
Foster Avenue
North Shore Channel
336
4
Addison Street
North Branch Chicago River
165
2
Fullerton Avenue
North Branch Chicago River
338
4
Kinzie Street
North Branch Chicago River
2
0
Clark Street
Chicago River
361
4
Loomis Street
South Branch Chicago River
2
0
36th Street
Bubbly Creek
352
4
Interstate Highway 55
Bubbly Creek
547
6
Cicero Avenue
Chicago Sanitary and Ship Canal
169
2
B&O Central Railroad
Chicago Sanitary and Ship Canal
4
0
Route 83
Chicago Sanitary and Ship Canal
1,861
21
Lockport Powerhouse
Chicago Sanitary and Ship Canal
344
4
Des Plaines River System
Jefferson Street
Des Plaines River
171
2
Calumet River System
Torrence Avenue
Grand Calumet River
485
6
C&W Indiana Railroad
Little Calumet River
174
2
Halsted Street
Little Calumet River
343
4
Cicero Avenue
Calumet
-
Sag Channel
173
2
104th Avenue
Calumet-Sag Channel
1,575
18
Route 83
Calumet-Sag Channel
4
0
'Dissolved oxygen was measured hourly using a YSI Model 6920 or Model 6600 continuous wa-
ter quality monitor. DO values were rejected based on quality control check and/or operational
problems with monitor.
11
TABLE 4: NUMBER AND PERCENT OF DISSOLVED OXYGEN VALUES
MEASURED ABOVE THE ILLINOIS POLLUTION CONTROL BOARD'S
WATER QUALITY STANDARD'
Monitoring
Station
IPCB
Number
Number
Percent
DO
of DO
Above
Above
Waterway
Standard
Values
Standard
Standard
Chicago River System
Main Street
North Shore Channel
5
8,133
7,362
91
Foster Avenue
North Shore Channel
4
8,424
8,423
100
Addison Street
North Branch Chicago River
4
8,595
8,587
>99
Fullerton Avenue
North Branch Chicago River
4
8,422
8,362
>99
Kinzie Street
North Branch Chicago River
4
8,758
8,645
99
Clark Street
Chicago River
5
8,399
8,399
100
Loomis Street
South Branch Chicago River
4
8,758
8,732
>99
36'' Street
Bubbly Creek
4
8,408
2,338
28
Interstate Highway 55
Bubbly Creek
4
8,213
6,281
77
Cicero Avenue
Chicago Sanitary and Ship Canal
4
8,591
8,223
96
B&O Central Railroad
Chicago Sanitary and Ship Canal
4
8,756
8,612
98
Route 83
Chicago Sanitary and Ship Canal
4
6,899
5,874
85
Lockport Powerhouse
Chicago Sanitary and Ship Canal
4
8,416
6,766
80
Des Plaines River System
Jefferson Street
Des Plaines River
4
8,589
8,148
95
Calumet River System
Torrence Avenue
Grand Calumet River
4
8,275
6,197
75
C&W Indiana Railroad
Little Calumet River
4
8,586
8,448
98
Halsted Street
Little Calumet River
4
8,417
8,412
>99
Cicero Avenue
Calumet-Sag Channel
3
8,587
8,587
100
104"' Avenue
Calumet-Sag Channel
3
7,185
7,182
100
Route 83
Calumet-Sag Channel
3
8,756
8,729
>99
Dissolved oxygen was measured hourly using a YSI Model 6920 or Model 6600 continuous water quality
monitor.
TABLE 5: PERCENT OF DISSOLVED OXYGEN VALUES IN SELECTED RANGES
Monitoring
Percent of DO Values in Range (mg/L)
Station
Waterway
0-<1
1-<2
2-<3
3-<4
4-<5
>5
Chicago River System
Main Street
North Shore Channel
1
<1
<1
2
6
91
Foster Avenue
North Shore Channel
0
0
0
0
<1
>99
Addison Street
North Branch Chicago River
0
0
0
0
<1
>99
Fullerton Avenue
North Branch Chicago River
0
0
<1
<1
5
94
Kinzie Street
North Branch Chicago River
0
<1
<1
<1
6
93
Clark Street
Chicago River
0
0
00
0
100
Loomis Street
South Branch Chicago River
0
0
<1
<1
1
99
36'h Street
Bubbly Creek
33
18
13
7
4
24
Interstate Highway 55
Bubbly Creek
6
4
5
9
16
61
Cicero Avenue
Chicago Sanitary and Ship Canal
<1
<1
<1
3
18
78
B&O Central Railroad
Chicago Sanitary and Ship Canal
0
<1
<1
1
6
92
Route 83
Chicago Sanitary and Ship Canal
<1
<1
2
11
23
62
Lockport Powerhouse
Chicago Sanitary and Ship Canal
<1
1
4
15
16
65
Des Plaines River System
Jefferson Street
Des Plaines River
0
0
<1
5
12
83
Calumet River System
Torrence Avenue
Grand Calumet River
4
4
7
9
8
67
C&W Indiana Railroad
Little Calumet River
0
0
<1
1
5
93
Halsted Street
Little Calumet River
0
0
0
<1
1
99
Cicero Avenue
Calumet-Sag Channel
0
0
0
<1
7
92
104"' Avenue
Calumet-Sag Channel
0
0
0
1
10
89
Route 83
Calumet-Sag Channel
0
0
<1
2
15
83
13
FIGURE 1: CONTINUOUS DISSOLVED OXYGEN MONITORING AND
AMBIENT WATER QUALITY MONITORING SAMPLE STATIONS
HANOM PAY]
T110
LEG ENC):
n
Minor WRP inflow
0 Major
WRP Inflow
General Use Waters
Secondary Contact Waters
AWQM Sample Stations
tusse Woods
ouch Daln
WRP r
Lockport
Powerhouse
efferson Street
Joliet
Route R3
(Cnl-Sak)
Devon
Avenue
Central Park
Avenue
Cicero
[venue
Foster
{venue
Addison
Street
o
oluls
Street
I
R
^
I
fd°
,'.,is
/y•Y
I
1
^'
c^ly uT^l°
T
"f
4' Avenue
^°^ee^
`
^`cG^^ _j
L-1
Cicero
Avenue
land Avenu
Clark Street
rrenc
Avenue
._Clty
C&Wl Railroad
Hohlnan Avenue
Indiana
cmA
Wentworth Avenue
1-
FIGURE 2: DISSOLVED OXYGEN CONCENTRATION MEASURED HOURLY AT MAIN STREET
ON THE NORTH SHORE CHANNEL FROM JANUARY 2006 THROUGH DECEMBER 2006
40
IPCB General Use DO Standard
is shown as a dashed (--- ) line
DO Shall Not Be Less Than 5.0 mg/L
ND = No Data
32
E 24
Q
1
n
ti
N
N
ti
o
I
Y
Jan
Feb
Mar
Apr
May
Jun
Jul
Aug
Sep
Oct
Nov
Dec
FIGURE 3: DISSOLVED OXYGEN CONCENTRATION MEASURED HOURLY AT FOSTER AVENUE
ON THE NORTH SHORE CHANNEL FROM JANUARY 2006 THROUGH DECEMBER 2006
Q
15
12
3
0
Jan
IPCB Secondary Contact DO Standard
is shown as a dashed (- - -) line
DO Shall Not Be Less Than 4.0 mg/L
ND - No Data
!^N
N
-------------------------------------------------------------
Feb
Mar
Apr
May
Jun
Jul
Aug
Sep
Oct
Nov
Dec
FIGURE 4: DISSOLVED OXYGEN CONCENTRATION MEASURED HOURLY AT ADDISON STREET
ON THE NORTH BRANCH CHICAGO RIVER FROM JANUARY 2006 THROUGH DECEMBER 2006
15
12
IPCB Secondary Contact DO Standard
is shown as a dashed (--- ) line
DO Shall Not Be Less Than 4.0 mg/L
ti
ND = No Data
0 -4-
Jan
Feb
Mar
Apr
May
Jun
Jul
Aug
Sep
Oct
Nov
Dec
FIGURE 5: DISSOLVED OXYGEN CONCENTRATION MEASURED HOURLY AT FULLERTON AVENUE
ON THE NORTH BRANCH CHICAGO RIVER FROM JANUARY 2006 THROUGH DECEMBER 2006
Q
15
12
3
0
-
J n
IPCB Secondary Contact DO Standard
is shown as a dashed (- - -) line
DO Shall Not Be Less Than 4.0 mg/L
ND = No Data
A^
A
ND
------------------------
-- - -
- ------ ----- -----------------
Feb
Mar
Apr
May
Jun
IJul
Aug
Sep
Oct
Nov
Dec
FIGURE 6: DISSOLVED OXYGEN CONCENTRATION MEASURED HOURLY AT KINZIE STREET
ON THE NORTH BRANCH CHICAGO RIVER FROM JANUARY 2006 THROUGH DECEMBER 2006
15
IPCB Secondary Contact DO Standard
is shown as a dashed (- - -) line
DO Shall Not Be Less Than 4.0 mg/L
12
I
I
11
I
I
0
Jan
Feb
Mar
Apr
May
Jun
Jul
Aug
Sep
Oct
Nov
Dec
FIGURE 7: DISSOLVED OXYGEN CONCENTRATION MEASURED HOURLY AT CLARK STREET
ON THE CHICAGO RIVER FROM JANUARY 2006 THROUGH DECEMBER 2006
20
16
12
8
4
0
IPCB General Use DO Standard
is shown as a dashed (- - -) line
DO Shall Not Be Less Than 5.0 mg/L
ND = No Data
ND
ND
-------------------------------------------------------------
Jan
Feb
Mar
Apr
May
Jun
Jul
Aug
Sep
Oct
Nov
Dec
FIGURE 8: DISSOLVED OXYGEN CONCENTRATION MEASURED HOURLY AT LOOMIS STREET
ON THE SOUTH BRANCH CHICAGO RIVER FROM JANUARY 2006 THROUGH DECEMBER 2006
20
16
12
Abu
u
IPCB Secondary Contact DO Standard
is shown as a dashed (- - -) line
DO Shall Not Be Less Than 4.0 mg/L
t
Vry
V^
o
I
N
A
d
0
Jan
Feb
Mar
Apr
May
Jun
Jul
Aug
Sep
Oct
Nov
Dec
FIGURE 9: DISSOLVED OXYGEN CONCENTRATION MEASURED HOURLY AT 36TH STREET
ON BUBBLY CREEK FROM JANUARY 2006 THROUGH DECEMBER 2006
20
16
12
8
4
0
IPCB Secondary Contact DO Standard
is shown as a dashed (- - -) line
DO Shall Not Be Less Than 4.0 mg/L
ND = No Data
--------
--------- - --- --
N
ND
Jan
Feb
Mar
Apr
May
Jun
Jul
Aug
Sep
Oct
Nov
Dec
FIGURE 10: DISSOLVED OXYGEN CONCENTRATION MEASURED HOURLY AT INTERSTATE HIGHWAY 55
ON BUBBLY CREEK FROM JANUARY 2006 THROUGH DECEMBER 2006
15
IPCB Secondary Contact DO Standard
is shown as a dashed (- - -) line
ND = No Data
DO Shall Not Be Less Than 4.0 mg/L
12
V
ND
0
N
0 -' -
Jan
Feb
Mar
Apr
May
Jun
Jul
I
III
I
^^^^ ^ ^
^^ ^ ^
^
N
Sep
Oct
Nov
Dec
FIGURE 11: DISSOLVED OXYGEN CONCENTRATION MEASURED HOURLY AT CICERO AVENUE
ON THE CHICAGO SANITARY AND SHIP CANAL FROM JANUARY 2006 THROUGH DECEMBER 2006
15
IPCB Secondary Contact DO Standard
is shown as a dashed (--- ) line
DO Shall Not Be Less Than 4.0 mg/L
12
I
h
r
4
f
0
Jan
Feb
Mar
Apr
May
Jun
Jul
Aug
Sep
Oct
Nov
Dec
ND = No Data
u.
FIGURE 12: DISSOLVED OXYGEN CONCENTRATION MEASURED HOURLY AT B&O CENTRAL RAILROAD
ON THE CHICAGO SANITARY AND SHIP CANAL FROM JANUARY 2006 THROUGH DECEMBER 2006
15
IPCB Secondary Contact DO Standard
is shown as a dashed
(- - -) line
DO Shall Not Be Less Than 4.0 mg/L
12
11
I
ti
d
0
Jan
Feb
Mar
Apr
May
Jun
Jul
Aug
Sep
Oct
Nov
Dec
FIGURE 13: DISSOLVED OXYGEN CONCENTRATION MEASURED HOURLY AT ROUTE 83
ON THE CHICAGO SANITARY AND SHIP CANAL FROM JANUARY 2006 THROUGH DECEMBER 2006
15
12
9
6
3
0
IPCB Secondary Contact DO Standard
is shown as a dashed (- - -) line
DO Shall Not Be Less Than 4.0 mg/L
ND - No Data
ND
ND
ND
N
N
ND
ND
loll
Jan
Feb
Mar
Apr
May
Jun
Jul
Aug
Sep
Oct
Nov
Dec
FIGURE 14: DISSOLVED OXYGEN CONCENTRATION MEASURED HOURLY AT LOCKPORT POWERHOUSE
ON THE CHICAGO SANITARY AND SHIP CANAL FROM JANUARY 2006 THROUGH DECEMBER 2006
Q
15
12
3
0
IPCB Secondary Contact DO Standard
is shown as a dashed (- - -) line
DO Shall Not Be Less Than 4.0 mg/L
ND - No Data
ND
Jan
Feb
Mar
Apr
May
Jun
Jul
Aug
Sep
Oct
Nov
Dec
FIGURE 15: DISSOLVED OXYGEN CONCENTRATION MEASURED HOURLY AT JEFFERSON STREET
ON THE DES PLAINES RIVER FROM JANUARY 2006 THROUGH DECEMBER 2006
20
IPCB Secondary Contact DO Standard
is shown as a dashed
(- - -) line
DO Shall Not Be Less Than 4.0 mg/L
16
12
I
S
i
1
4-I----------------------I--4
ND = No Data
I
N
^.
U
0
Jan
Feb
Mar
Apr
May
Jun
Jul
Aug
Sep
Oct
Nov
Dec
FIGURE 16: DISSOLVED OXYGEN CONCENTRATION MEASURED HOURLY AT TORRENCE AVENUE
ON THE GRAND CALUMET RIVER FROM JANUARY 2006 THROUGH DECEMBER 2006
35
IPCB Secondary Contact DO Standard
is shown as a dashed (- - -) line
DO Shall Not Be Less Than 4.0 mg/L
28
21
ND
14
ND
0
ND = No Data
Jan
Feb
Mar
Apr
May
Jun
Jul
Aug
Sep
Oct
Nov
Dec
FIGURE 17: DISSOLVED OXYGEN CONCENTRATION MEASURED HOURLY AT C&W INDIANA RAILROAD
ON THE LITTLE CALUMET RIVER FROM JANUARY 2006 THROUGH DECEMBER 2006
25
20
15
10
5
0
IPCB Secondary Contact DO Standard
is shown as a dashed (- - -) line
DO Shall Not Be Less Than 4.0 mg/L
ND - No Data
ND
-- -----------------
Jan
Feb
Mar
Apr
May
Jun
Jul
Aug
Sep
Oct
Nov
Dec
FIGURE 18: DISSOLVED OXYGEN CONCENTRATION MEASURED HOURLY AT HALSTED STREET
ON THE LITTLE CALUMET RIVER FROM JANUARY 2006 THROUGH DECEMBER 2006
20
16
12
8
4
0
Jan
IPCB Secondary Contact DO Standard
is shown as a dashed (- - -) line
DO Shall Not Be Less Than 4.0 mg/L
ND = No Data
N
ND
--------------------------------------------------------------
Feb
Mar
Apr
May
Jun
Jul
Aug
Sep
Oct
Nov
Dec
FIGURE 19: DISSOLVED OXYGEN CONCENTRATION MEASURED HOURLY AT CICERO AVENUE
ON THE CALUMET-SAG CHANNEL FROM JANUARY 2006 THROUGH DECEMBER 2006
20
16
12
8
4
0
Jan
IPCB Secondary Contact DO Standard
is shown as a dashed (- - -) line
DO Shall Not Be Less Than 3.0 mg/L
ND - No Data
N
-------------------------------------------------------------
Feb
Mar
Apr
May
Jun
Jul
Aug
Sep
Oct
Nov
Dec
FIGURE 20: DISSOLVED OXYGEN CONCENTRATION MEASURED HOURLY AT 104TH AVENUE
ON THE CALUMET-SAG CHANNEL FROM JANUARY 2006 THROUGH DECEMBER 2006
W
W
20
16
12
8
4
0
Jan
IPCB Secondary Contact DO Standard
is shown as a dashed (- - -) line
DO Shall Not Be Less Than 3.0 mg/L
ND - No Data
ND
^
ND
ND
ND
ND
-------------------------
----------------------------------
Feb
Mar
Apr
May
Jun
Jul
Aug
Sep
Oct
Nov
Dec
FIGURE 21: DISSOLVED OXYGEN CONCENTRATION MEASURED HOURLY AT ROUTE 83
ON THE CALUMET-SAG CHANNEL FROM JANUARY 2006 THROUGH DECEMBER 2006
20
IPCB Secondary Contact DO Standard
is shown as a dashed (- - -) line
DO Shall Not Be Less Than 3.0 mg/L
16
12
W
4
A
V
Y
0
Jan
Feb
Mar
Apr
May
Jun
Jul
Aug
Sep
Oct
Nov
Dec
REFERENCES
Chapman, G., "Water Quality Criteria for Dissolved Oxygen," EPA 440/5-86-003, United States
Environmental Protection Agency, Office of Water Regulations and Standards, Washington, D.C.,
1986.
Lanyon, R., "Description of the Chicago Waterway System," Use Attainability Analysis Study
Conducted by Illinois Environmental Protection Agency in Cooperation with Metropolitan Water
Reclamation District of Greater Chicago, Illinois, May 2002.
APPENDIX A
WEEKLY DO SUMMARY STATISTICS AT ALL DEEP-DRAFT
MONITORING STATIONS DURING 2006
TABLE A-1: WEEKLY DO SUMMARY STATISTICS AT MAIN STREET
ON THE NORTH SHORE CHANNEL DURING 2006
Number of
DO Concentration (mg/L)
Percent DO
Values Above
Monitoring Dates
DO Values
Minimum
Maximum
Mean
IPCB Standard
01/01/06 - 01/01/06
24
6.1
6.8
6.4
100
01/02/06 -
01/08/06
168
4.8
7.9
6.2
98
01/09/06
- 01/15/06
168
6.0
8.8
7.5
100
01/16/06
- 01/22/06
168
7.0
9.6
8.5
100
01/23/06
- 01/29/06
168
6.4
11.9
9.4
100
01/30/06
- 02/05/06
167
8.8
25.0
15.3
100
02/06/06
- 02/12/06
168
21.2
33.4
29.0
100
02/13/06
- 02/19/06
168
13.6
31.4
22.7
100
02/20/06 -
02/26/06
168
15.2
23.7
19.5
100
02/27/06
-
03/05/06
168
16.3
31.6
26.7
100
03/06/06
- 03/12/06
168
7.4
21.0
13.3
100
03/13/06 -
03/19/06
168
7.9
15.4
12.7
100
03/20/06
- 03/26/06
168
13.3
21.1
16.1
100
03/27/06
- 04/02/06
167
5.5
13.1
9.1
100
04/03/06 -
04/09/06
167
2.9
7.1
5.4
64
04/10/06 -
04/16/06
168
5.9
14.3
8.0
100
04/17/06
-
04/23/06
168
4.4
11.0
6.7
94
04/24/06 -
04/30/06
168
4.9
11.6
8.2
99
05/01/06 -
05/07/06
168
5.0
9.3
7.5
100
05/08/06
-
05/14/06
167
7.6
10.6
9.1
100
05/15/06 -
05/21/06
168
7.9
10.3
9.4
100
05/22/06
- 05/28/06
168
7.3
11.2
9.6
100
05/29/06
- 06/04/06
168
7.0
11.7
9.7
100
06/05/06 -
06/11/06
168
3.5
10.1
8.2
88
06/12/06
-
06/18/06
168
5.2
8.6
7.6
100
06/19/06
-
06/25/06
169
4.5
8.8
7.6
99
06/26/06 -
07/02/06
168
5.0
8.3
6.7
100
07/03/06
- 07/09/06
168
5.4
9.1
7.2
100
07/10/06
- 07/16/06
168
5.4
9.8
7.3
100
07/17/06
-
07/23/06
37
6.6
7.7
7.3
100
07/24/06 -
07/30/06
131
4.9
9.9
7.4
99
07/31/06
- 08/06/06
37
6.7
10.4
8.9
100
08/07/06
- 08/13/06
130
7.3
9.1
8.1
100
TABLE A-1 (
Continued
): WEEKLY DO SUMMARY STATISTICS AT
MAIN STREET ON THE NORTH SHORE CHANNEL DURING 2006
Number of
DO Concentration
(
mg/L)
Percent DO
Values Above
Monitoring Dates
DO Values
Minimum
Maximum
Mean
IPCB Standard
08/14
/
06 - 08
/
20/06
168
4.8
8.4
7.1
98
08/21/06 - 08/27/06
168
4.4
7.8
6.4
93
08/28/06 - 09
/
03/06
168
5.1
8.1
6.9
100
09/04/06 - 09/10/06
168
5.3
8.2
7.0
100
09/11/06 - 09/17/06
168
0.4
7.0
5.2
58
09/18/06 - 09/24/06
168
4.6
9.1
6.6
97
09/25/06- 10/01/06
85
0.2
8.9
6.6
75
10/02/06 - 10/08/06
NO DATA
10/09
/
06 - 10/15/06
131
5.5
9.0
6.9
100
10/16/06 - 10/22/06
168
2.8
6.1
4.4
21
10/23/06 - 10/29/06
168
4.0
6.7
4.9
39
10/30/06 - 11/05/06
169
4.6
14.4
8.9
93
11/06/06 - 11
/
12/06
168
8.3
19.8
13.9
100
11/13/06 - 11/19/06
168
7.0
19.8
14.5
100
11/20/06 - 11/26/06
168
14.0
20.1
17.2
100
11/27/06- 12/03/06
168
0.0
18.4
7.4
59
12/04/06 - 12/10/06
168
0.0
6.2
2.1
5
12/11/06- 12/17/06
168
3.7
8.7
6.7
91
12/18/06- 12/24/06
168
4.7
11.3
8.2
98
12/25/06 - 12/31/06
168
4.1
7.1
5.3
58
TABLE A-2: WEEKLY DO SUMMARY STATISTICS AT FOSTER AVENUE
ON THE
NORTH SHORE
CHANNEL DURING 2006
Number of
DO Concentration (mg/L)
Percent DO
Values Above
Monitoring Dates
DO Values
Minimum
Maximum
Mean
IPCB Standard
01/01/06
- 01/01/06
24
8.2
9.5
8.6
100
01/02/06 -
01/08/06
168
7.2
9.6
8.4
100
01/09/06 -
01/15/06
168
6.4
9.6
8.4
100
01/16/06
-
01/22/06
168
7.0
9.6
8.5
100
01/23/06 -
01/29/06
168
6.3
9.8
8.7
100
01/30/06
-
02/05/06
168
6.6
9.4
8.5
100
02/06/06 - 02/12/06
168
7.6
9.9
8.8
100
02/13/06
-
02/19/06
168
6.7
11.2
9.0
100
02/20/06 - 02/26/06
168
8.1
11.1
8.9
100
02/27/
06 -
03
/
05/06
38
8.3
8.9
8.5
100
03/06/06 - 03/12/06
131
6.7
9.6
8.3
100
03/13/06 - 03/19/06
168
6.2
9.4
8.4
100
03/20/06 -
03/26/06
168
7.3
10.5
8.2
100
03/27/06 - 04/02/06
167
6.0
9.3
8.1
100
04/03/06
-
04/09/06
167
6.8
9.6
8.3
100
04/10/06
-
04/16/06
168
6.4
8.7
7.8
100
04/17/06 - 04/23/06
168
5.6
9.7
7.9
100
04/24/06
- 04/30/06
168
5.9
9.5
7.4
100
05/01/06 -
05/07/06
168
5.3
8.8
7.5
100
05/08
/
06
- 05/14/06
168
6.5
8.9
7.7
100
05/15/06 - 05/21/06
168
6.7
9.6
8.0
100
05/22/06 - 05/28/06
168
4.5
8.5
7.3
100
05/29/06
-
06/04/06
168
4.0
9.1
7.4
99
06/05
/
06 - 06
/
11/06
168
5.2
8.4
7.5
100
06/12/06
-
06/18/06
168
5.7
8.5
7.5
100
06/19/06
- 06/25/06
168
6.0
8.2
7.3
100
06/26/06 - 07/02/06
168
6.1
8.0
7.1
100
07/03/06
- 07/09/06
168
5.7
8.2
7.4
100
07/10/06
- 07/16/06
168
5.8
8.1
7.4
100
07/17/06
-
07
/23/06
168
6.5
7.9
7.1
100
07/24/06 - 07/30/06
168
6.0
7.9
7.2
100
07/31/06
- 08/06/06
168
5.7
8.3
7.3
100
08/07/06
- 08/13/06
168
5.9
8.3
7.3
100
A_3_
TABLE A-2 (Continued): WEEKLY DO SUMMARY STATISTICS AT
FOSTER AVENUE ON THE NORTH SHORE CHANNEL DURING 2006
Number of
DO Concentration (mg/L)
Percent DO
Values Above
Monitoring Dates
DO Values
Minimum
Maximum
Mean
IPCB Standard
08/14/06 - 08/20/06
168
5.4
8.0
7.1
100
08/21/06 - 08/27/06
168
5.6
8.2
7.3
100
08/28/06 - 09/03/06
168
5.3
8.1
7.1
100
09/04/06 - 09/10/06
167
5.0
8.3
7.1
100
09/11/06 - 09/17/06
168
5.6
8.0
6.9
100
09/18/06 - 09/24/06
168
5.0
7.6
7.0
100
09/25/06 - 10/01/06
168
4.5
8.5
7.0
100
10/02/06 - 10/08/06
168
4.7
7.5
6.4
100
10/09/06- 10/15/06
168
5.5
7.8
6.9
100
10/16/06 - 10/22/06
168
5.3
7.7
6.7
100
10/23/06 - 10/29/06
168
5.9
8.8
7.2
100
10/30/06- 11/05/06
169
6.5
8.6
7.4
100
11/06/06 - 11/12/06
168
5.9
8.5
7.5
100
11/13/06 - 11/19/06
168
6.9
8.6
7.6
100
11/20/06 - 11/26/06
168
7.2
9.1
7.9
100
11/27/06- 12/03/06
168
5.6
9.1
7.8
100
12/04/06- 12/10/06
37
7.5
8.7
8.1
100
12/11/06 - 12/17/06
132
7.4
8.8
8.1
100
12/18/06 - 12/24/06
168
6.9
9.3
8.4
100
12/25/06 - 12/31/06
168
6.6
9.3
8.2
100
TABLE A-3: WEEKLY DO SUMMARY STATISTICS AT ADDISON STREET
ON THE NORTH BRANCH CHICAGO RIVER DURING 2006
Number of
DO Concentration (mg/L)
Percent DO
Values Above
Monitoring Dates
DO Values
Minimum
Maximum
Mean
IPCB Standard
01/01/06 -
01/01/06
24
8.7
9.7
9.1
100
01/02/06
-
01/08/06
168
7.7
10.0
9.0
100
01/09/06
-
01/15/06
168
6.4
10.0
8.5
100
01/16/06 -
01/22/06
168
7.2
9.8
8.7
100
01/23/06
-
01/29/06
168
7.3
9.7
9.0
100
01/30/06
-
02/05/06
168
7.5
10.3
9.4
100
02/06/06 - 02/12/06
168
8.3
10.1
9.2
100
02/13/06 - 02/19/06
168
8.0
12.0
9.8
100
02/20/06
-
02/26/06
167
8.8
11.1
9.6
100
02/27/06
- 03/05/06
168
8.0
9.3
8.6
100
03/06/06 - 03/12/06
168
6.7
10.3
8.8
100
03/13/06
- 03/19/06
168
7.5
10.6
9.7
100
03/20/06 - 03/26/06
168
8.5
11.0
9.4
100
03/27/06 - 04/02/06
168
7.4
9.5
8.4
100
04/03/06 - 04/09/06
168
7.1
10.0
9.0
100
04/10/06
- 04/16/06
168
6.1
9.0
8.0
100
04/17/06 - 04/23/06
168
6.2
9.1
7.7
100
04/24/06
-
04/30/06
167
5.6
8.7
6.9
100
05/01/06
- 05/07/06
168
6.4
8.4
7.4
100
05/08/06 - 05/14/06
168
6.2
8.6
7.3
100
05/15/06 - 05/21/06
168
6.1
8.9
7.5
100
05/22/06
-
05/28/06
36
6.4
7.5
7.0
100
05/29/06 - 06/04/06
133
2.9
7.6
6.3
97
06/05/06
-
06/11/06
168
5.4
7.6
6.7
100
06/12/06 - 06/18/06
168
5.0
7.6
6.6
100
06/19/06 - 06/25/06
168
5.2
7.3
6.3
100
06/26/06
-
07/02/06
169
2.9
7.5
6.3
99
07/03/06 - 07/09/06
168
4.7
7.6
6.6
100
07/10/06
-
07/16/06
168
5.1
7.4
6.5
100
07/17/06
- 07/23/06
168
4.3
7.1
6.2
100
07/24/06 -
07/30/06
168
5.1
7.0
6.4
100
07/31/06
-
08/06/06
169
0.0
7.4
6.2
98
08/07/06
-
08/13/06
168
4.8
7.6
6.4
100
-A=S
TABLE A-3 (Continued): WEEKLY DO SUMMARY STATISTICS AT
ADDISON STREET ON THE NORTH BRANCH CHICAGO RIVER DURING 2006
Number of
DO Concentration
(
mg/L)
Percent DO
Values Above
Monitoring Dates
DO Values
Minimum
Maximum
Mean
IPCB Standard
08/14/06 - 08/20
/
06
168
5.0
7.4
6.5
100
08/21/06 - 08
/27/06
168
5.5
7.6
6.9
100
08/28
/
06 - 09
/
03/06
168
4.6
7.4
6.5
100
09/04/06 - 09/10/06
168
5.5
7.9
6.8
100
09/11/06 - 09/17/06
168
6.2
8.2
7.1
100
09/18/06 - 09
/
24/06
168
4.9
7.9
6.9
100
09/25/06 - 10/01
/
06
168
5.2
8.2
6.9
100
10/02/06 - 10/08/06
168
5.8
7.5
6.9
100
10/09/06 - 10/15
/
06
168
5.5
8.3
7.0
100
10/16/06 - 10/22/06
168
5.4
8.0
7.1
100
10/23/06- 10/29/06
168
6.4
8.8
7.6
100
10/30/06 - 11/05/06
169
6.9
8.4
7.6
100
11/06/06 - 11/12/06
168
6.3
9.1
7.4
100
11/13/06 - 11/19/06
168
7.3
8.7
8.0
100
11 /20/06 - 11/26/06
168
7.2
8.9
7.9
100
11/27/06 - 12/03/06
168
6.0
10.1
8.4
100
12/04
/
06 - 12/10
/
06
168
8.7
10.9
9.6
100
12/11/06- 12/17/06
169
7.9
10.5
9.3
100
12/18/06 - 12/24/06
168
7.6
10.4
9.4
100
12/25/06 - 12/31/06
168
7.4
10.4
9.4
100
A=6
TABLE A-4: WEEKLY DO SUMMARY STATISTICS AT FULLERTON AVENUE
ON THE NORTH BRANCH CHICAGO RIVER DURING 2006
Number of
DO Concentration (mg/L)
Percent DO
Values Above
Monitoring Dates
DO Values
Minimum
Maximum
Mean
IPCB Standard
01/01/06 - 01/01/06
24
8.3
9.6
9.1
100
01/02/06 - 01/08/06
168
7.7
9.7
8.8
100
01/09/06
-
01/15/06
168
6.2
9.5
8.1
100
01/16/06 - 01/22/06
168
6.7
8.7
8.0
100
01/23/06 - 01/29/06
168
6.2
9.4
8.5
100
01/30/06 - 02/05/06
167
7.1
10.0
9.1
100
02/06/06 -
02/12/06
168
8.5
10.2
9.3
100
02/13/06 - 02/19/06
168
7.0
11.0
9.0
100
02/20/06
-
02/26/06
168
8.6
11.0
9.4
100
02/27/06 - 03/05/06
168
8.0
9.4
8.6
100
03/06/06 - 03/12/06
168
6.1
9.8
8.4
100
03/13/06
- 03/19/06
168
6.3
9.9
9.1
100
03/20/06
- 03/26/06
168
4.2
10.4
8.0
100
03/27/06
- 04/02/06
168
3.4
9.0
7.6
98
04/03/06 - 04/09/06
167
5.6
9.8
8.5
100
04/10/06
- 04/16/06
168
6.1
8.5
7.5
100
04/17/06 - 04/23/06
168
4.2
7.8
6.2
100
04/24/06 - 04/30/06
168
3.6
7.8
6.2
97
05/01/06
-
05/07/06
168
5.9
7.8
6.7
100
05/08/06
- 05/14/06
36
5.6
6.8
6.2
100
05/15/06
- 05/21/06
132
5.8
7.9
6.8
100
05/22/06 - 05/28/06
168
3.4
7.2
6.0
98
05/29/06
- 06/04/06
168
2.2
6.6
5.4
97
06/05/06 -
06/11/06
168
4.4
7.2
5.8
100
06/12/06 - 06/18/06
168
4.0
6.9
5.6
100
06/19/06
-
06/25/06
168
3.9
6.3
5.5
99
06/26/06 - 07/02/06
168
1.7
7.1
5.5
98
07/03/06
-
07/09/06
168
3.9
6.5
5.6
99
07/10/06 - 07/16/06
168.
4.4
6.7
5.8
100
07/17/06
- 07/23/06
167
2.8
6.3
5.4
98
07/24/06 - 07/30/06
168
4.7
6.2
5.5
100
07/31/06
- 08/06/06
168
0.0
6.3
5.1
91
08/07/06
-
08/13/06
36
3.3
5.2
4.4
78
TABLE A-4 (Continued): WEEKLY DO SUMMARY STATISTICS AT
FULLERTON AVENUE ON THE NORTH BRANCH CHICAGO RIVER DURING 2006
Number of
DO Concentration (mg/L)
Percent DO
Values Above
Monitoring Dates
DO Values
Minimum
Maximum
Mean
IPCB Standard
08/14/06 - 08/20/06
132
4.7
6.3
5.6
100
08/21/06 - 08/27/06
168
4.8
7.3
6.2
100
08/28/06 - 09/03/06
168
3.0
6.8
5.8
98
09/04/06 -
09/10/06
167
5.0
7.0
6.0
100
09/11/06 - 09/17/06
168
3.4
7.2
6.0
99
09/18/06 - 09/24/06
168
3.7
7.5
6.0
98
09/25/06
- 10/01/06
168
4.7
7.5
6.5
100
10/02/06 - 10/08/06
168
4.9
7.5
6.5
100
10/09/06 - 10/15/06
168
5.4
7.8
6.7
100
10/16/06- 10/22/06
168
4.9
7.3
6.5
100
10/23/06- 10/29/06
168
6.1
8.1
7.3
100
10/30/06 - 11/05/06
169
6.4
7.9
7.2
100
11/06/06 - 11/12/06
168
5.7
8.7
7.0
100
11/13/06 - 11/19/06
168
7.0
8.2
7.6
100
11 /20/06 - 11/26/06
168
6.7
8.3
7.4
100
11/27/06
- 12/03/06
168
4.9
9.8
8.0
100
12/04/06- 12/10/06
168
8.4
10.1
9.3
100
12/11/06- 12/17/06
169
7.4
9.8
8.8
100
12/18/06 - 12/24/06
168
7.3
10.1
8.9
100
12/25/06- 12/31/06
168
7.5
10.1
9.1
100
TABLE A-5: WEEKLY DO SUMMARY STATISTICS AT KINZIE STREET
ON THE NORTH BRANCH CHICAGO RIVER DURING 2006
Number of
DO Concentration
(
mg/L)
Percent DO
Values Above
Monitoring Dates
DO Values
Minimum
Maximum
Mean
IPCB Standard
01/01/06 - 01/01/06
24
6.6
8.4
7.6
100
01/02/06 - 01/08/06
168
6.9
9.2
8.4
100
01/09/06
-
01/15/06
167
6.6
8.7
7.7
100
01/16/06
- 01/22/06
168
6.6
9.0
8.0
100
01/23
/
06 -
01/29/06
168
6.6
9.6
8.4
100
01/30/06 - 02/05
/
06
168
6.0
9.3
8.3
100
02/06
/
06 - 02
/
12/06
168
8.1
9.5
9.0
100
02/13/06
-
02/19/06
168
7.7
11.7
9.3
100
02/20
/
06 - 02
/
26/06
168
8.6
11.4
9.6
100
02/27/06 - 03/05/06
168
7.9
9.1
8.5
100
03/06
/
06 - 03
/
12/06
168
6.5
9.6
8.3
100
03/13/06 - 03
/
19/06
168
6.7
9.9
9.1
100
03/20/06 - 03/26/06
168
7.1
10.0
8.6
100
03/27/06 - 04/02/06
168
6.3
7.9
7.2
100
04/03/06 - 04/09/06
167
5.3
10.0
8.0
100
04/10/06
- 04/16/06
168
6.6
9.1
7.9
100
04/17/06
- 04/23/06
168
4.1
9.2
7.0
100
04/24/06
-
04/30/06
168
2.9
8.6
6.6
86
05/01/06
- 05
/
07/06
168
5.6
8.0
6.6
100
05/08/06 - 05/14/06
168
5.3
7.3
6.3
100
05/15/06 - 05/21/06
168
5.5
7.3
6.5
100
05/22/06 - 05/28/06
168
4.9
7.2
6.0
100
05/29
/
06
- 06
/
04/06
168
4.0
6.5
5.5
100
06/05
/
06
-
06
/
11/06
168
4.5
6.9
5.9
100
06/12/06 - 06
/
18/06
168
4.3
6.8
5.7
100
06/19/06 -
06/25/06
168
4.4
6.1
5.5
100
06/26/06 - 07/02/06
168
3.7
6.7
5.6
98
07/03/06
- 07/09/06
168
3.8
6.6
5.7
99
07/10/06 - 07/16/06
168
3.7
6.7
5.8
99
07/17/06 - 07/23
/06
168
1.3
6.6
5.3
92
07/24/06
-
07/30/06
168
4.6
6.2
5.5
100
07/31/06
-
08/06/06
168
0.8
6.8
4.9
82
08/07
/
06 - 08/13/06
168
3.9
6.6
5.5
99
---A=9 --
TABLE A-5 (
Continued
): WEEKLY DO SUMMARY STATISTICS AT
KINZIE STREET ON THE NORTH BRANCH CHICAGO RIVER DURING 2006
Number of
DO Concentration
(
mg/L)
Percent DO
Values Above
Monitoring Dates
DO Values
Minimum
Maximum
Mean
IPCB Standard
08/14/06 - 08
/
20/06
168
4.2
6.3
5.5
100
08/21/06 - 08/27/06
168
4.5
6.9
5.7
100
08/28
/
06 - 09/03/06
168
2.2
6.2
4.8
84
09/04/06 - 09/10/06
168
4.4
7.0
6.1
100
09/11/06 - 09/17/06
168
4.3
7.1
5.9
100
09/18/06 - 09/24/06
168
3.2
7.2
5.5
93
09/25/06 - 10/01/06
168
4.7
7.5
6.3
100
10/02/06 - 10/08/06
168
4.7
7.1
6.0
100
10/09/06 - 10/15/06
168
4.6
8.2
6.4
100
10/16/06- 10/22/06
168
5.4
7.8
6.4
100
10/23/06 - 10/29/06
168
5.3
7.5
6.5
100
10/30/06- 11/05/06
169
5.9
7.5
6.6
100
11/06/06- 11/12/06
168
5.6
7.9
6.6
100
11/13/06 - 11/19/06
168
6.9
7.8
7.4
100
11/20/06 - 11/26/
06
168
6.6
8.3
7.3
100
11/27/06- 12/03/06
167
4.8
9.8
7.7
100
12/04/06 - 12/10/06
168
8.2
10.8
9.2
100
12/11/06- 12/17/06
168
7.3
9.2
8.4
100
12/18/06
- 12/24/
06
168
7.2
9.9
8.3
100
12/25/06 - 12/31/06
168
7.5
9.8
8.7
100
------------
A-1-
-- --------
TABLE A-6: WEEKLY DO SUMMARY STATISTICS AT CLARK STREET
ON THE CHICAGO RIVER DURING 2006
Number of
DO Concentration
(
mg/L)
Percent DO
Values Above
Monitoring Dates
DO Values
Minimum
Maximum
Mean
IPCB Standard
01/01/06 - 01/01/06
24
9.5
10.1
9.8
100
01/02/06 - 01/08/06
168
8.5
10.1
9.3
100
01/09/06 - 01/15/06
168
7.9
10.0
8.9
100
01/16/06 -
01/22/06
168
8.1
10.2
9.5
100
01/23/06
-
01/29/06
168
8
.
1
11.0
9.9
100
01/30/06 - 02/05/06
168
7.1
10.4
9.0
100
02/06/06 -
02/12/06
168
9.5
11.7
10.6
100
02/13
/
06 - 02/19/06
168
9.5
11.6
10.4
100
02/20/06
- 02/26/06
168
10.5
12.8
11.5
100
02/27/06
- 03/05/06
168
10.8
12.6
11.6
100
03/06/06
- 03/12/06
168
8.2
12.1
10.3
100
03/13/06 - 03/19/06
168
7.3
10.1
9.0
100
03/20/06 -
03/26/06
168
8.9
10.3
9.6
100
03/27
/
06 -
04/02/06
168
8.7
9.8
9.3
100
04/03/06 - 04/09/06
167
6.7
10.5
9.2
100
04/10
/
06
- 04/16/06
168
7.8
10.0
9.0
100
04/17/06
- 04
/
23/06
168
6.9
9.9
8.6
100
04/24/06
- 04/30/06
168
6.5
9.5
8.4
100
05/01/06 -
05/07/06
168
6.5
9.5
8.1
100
05/08/06 - 05
/
14/06
168
7.1
10.0
8.9
100
05/15/06 - 05
/
21/06
168
7.8
9
.
5
8.4
100
05/22/06 -
05/28/06
168
6.9
10.5
9.0
100
05/29/06 - 06/04/06
168
7.5
10.7
9.3
100
06/05
/
06 - 06
/
11/06
168
6.8
10.5
9.3
100
06/12
/
06 - 06/18/06
168
7.1
8.7
8.2
100
06/19/06 - 06/25
/
06
168
7.8
9.4
8.7
100
06/26/06 - 07
/
02/06
35
8.1
8.9
8.5
100
07/03/06
- 07/09/06
109
7.7
8.7
8.3
100
07/10/06 - 07/16/06
168
7.9
9.3
8.6
100
07/17/06
-
07/23/06
168
7.0
8.7
7.8
100
07/24/06
- 07/30/06
35
6.9
7.6
7.4
100
07/31/06
- 08/06/06
134
8.4
10.8
9.6
100
08/07/06 - 08/13/06
167
7.6
9.4
8.3
100
--- -
TABLE A-6 (Continued): WEEKLY DO SUMMARY STATISTICS AT
CLARK STREET ON THE CHICAGO RIVER DURING 2006
Number of
DO Concentration (mg/L)
Percent DO
Values Above
Monitoring Dates
DO Values
Minimum
Maximum
Mean
IPCB Standard
08/14/06 - 08
/
20/06
167
7.4
8.5
8.0
100
08/21/06 - 08/27/06
168
6.8
8.0
7.4
100
08/28
/
06 - 09
/
03/06
168
5.8
7.4
7.1
100
09/04
/
06 - 09
/
10/06
168
6.7
8.1
7.6
100
09/11/06 - 09/17/06
168
6.3
7.8
7.3
100
09/18/06 - 09/24/06
168
6.7
8.4
7.7
100
09/25
/
06- 10/01
/
06
168
6.3
9.0
8.3
100
10/02/06- 10/08/06
168
6.2
9.0
7.6
100
10/09/06 - 10/15/06
168
5.9
9.6
8.5
100
10/16/06- 10/22/06
168
6.9
9.7
8.6
100
10/23/06- 10/29/06
168
7.1
8.8
8.1
100
10/30/06 - 11/05/06
169
8.4
10.2
9.5
100
11/06/06 - 11/12/06
168
7.5
9.3
8.5
100
11/13/06 - 11/19/06
168
7.7
9.6
8.5
100
11/20/06 - 11/26/06
168
8.3
9.9
9.2
100
11/27/06- 12/03/06
168
7.4
11.8
9.2
100
12/04/06 - 12/10/06
168
9.8
11.9
10.4
100
12/11/06 - 12/17/06
168
8.4
12.5
10.0
100
12/18/06 - 12/24/06
168
8.2
11.3
9.8
100
12/25/06- 12/31/06
168
8.9
11.7
9.9
100
--
-
- --
TABLE A-7: WEEKLY DO SUMMARY STATISTICS AT LOOMIS STREET
ON THE SOUTH BRANCH CHICAGO RIVER DURING 2006
Number of
DO Concentration (mg/L)
Percent DO
Values Above
Monitoring Dates
DO Values
Minimum
Maximum
Mean
IPCB Standard
01/01/06
-
01/01
/
06
24
8.9
9.0
8.9
100
01/02/06
- 01/08/06
168
7.5
9.5
8.7
100
01/09/06
-
01/15
/
06
168
7.9
9.4
8.8
100
01/16/06 - 01/22/06
168
7.5
9.1
8.5
100
01/23/06
-
01/29/06
168
8.3
9.8
9.0
100
01/30/06 - 02
/
05/06
168
7.1
10.2
9.1
100
02/06
/
06 -
02/12/06
168
7.4
10.3
9.3
100
02/13/06
-
02
/
19/06
168
7.9
11.4
9.6
100
02/20
/
06 -
02/26/06
168
9.6
12.5
11.2
100
02/27
/
06 - 03/05/06
168
8.6
10
.
1
9.3
100
03/06
/
06 -
03
/
12/06
168
7.3
9.2
8.5
100
03/13/06
-
03/19/06
168
6.9
10.8
9.1
100
03/20
/
06 - 03
/
26/06
168
8.9
9.8
9.2
100
03/27/06 - 04
/
02/06
168
7.3
9.0
8.0
100
04/03
/
06
-
04/09/06
167
6.0
9.3
7.9
100
04/10/06 - 04
/
16/06
168
7.9
9
.
3
8.5
100
04/17/06
-
04/23/06
168
4.5
8.8
7.2
100
04/24/06 -
04
/
30/06
168
6.7
8.4
7.6
100
05/01/06
-
05/07/06
168
6.2
8
.
1
6.9
100
05/08
/
06 - 05/14/06
168
5.8
8.6
7.0
100
05/15/06
-
05/21
/
06
168
5.6
7.3
6.5
100
05/22/06
-
05
/
28/06
168
5.5
7.2
6.4
100
05/29
/
06 - 06
/
04/06
168
4.7
7.6
6.4
100
06/05
/
06 -
06
/
11/06
167
5
.
4
7.5
6.7
100
06/12/06
-
06/18/06
168
5.0
6.9
6.1
100
06/19/06
-
06
/
25/06
168
5.2
7.1
6.2
100
06/26/06 - 07
/
02/06
168
4.3
8.0
6.2
100
07/03/06
- 07
/
09/06
168
5
.
8
7.5
6.7
100
07/10/06
-
07/16/06
168
6.0
7.0
6.6
100
07/17/06 - 07/23
/
06
168
2.5
7
.
1
5.7
91
07/24/06
-
07
/
30/06
168
5.5
7.0
6.3
100
07/31/06 - 08/06/06
168
2.2
7.7
6.1
94
08/07
/
06 - 08
/
13/06
168
6.2
7.6
7.0
100
-----------A-4 -
TABLE A-7 (Continued): WEEKLY DO SUMMARY STATISTICS AT
LOOMIS STREET ON THE SOUTH BRANCH CHICAGO RIVER DURING 2006
Number of
DO Concentration (mg/L)
Percent DO
Values Above
Monitoring Dates
DO Values
Minimum
Maximum
Mean
IPCB Standard
08/14/06 - 08/20/06
168
5.5
7.5
6.7
100
08/21/06 - 08/27/06
168
5.6
7.0
6.4
100
08/28/06 - 09/03/06
168
4.2
8.5
6.2
100
09/04/06 - 09/10/06
168
6.3
7.7
7.0
100
09/11/06 - 09/17/06
168
4.0
8.0
6.7
99
09/18/06 - 09/24/06
168
5.7
8.4
7.1
100
09/25/06 - 10/01/06
168
6.4
10.4
7.7
100
10/02/06- 10/08/06
168
4.5
8.2
6.8
100
10/09/06 - 10/15/06
168
5.8
8.9
7.0
100
10/16/06- 10/22/06
168
6.3
8.9
7.3
100
10/23/06 - 10/29/06
168
5.7
7.5
6.7
100
10/30/06 - 11/05/06
169
5.7
8.0
7.3
100
11/06/06 - 11/12/06
168
5.9
8.6
7.2
100
11/13/06 - 11/19/06
168
5.5
8.0
7.3
100
11/20/06 - 11/26/06
168
7.4
8.7
7.9
100
11/27/06 - 12/03/06
168
4.3
9.5
7.5
100
12/04/06 - 12/10/06
167
8.0
9.9
9.0
100
12/11/06 - 12/17/06
168
8.0
10.2
9.0
100
12/18/06 - 12/24/06
168
7.5
9.9
8.5
100
12/25/06 - 12/31/06
168
8.6
9.9
9.4
100
A-14
TABLE A-8: WEEKLY DO SUMMARY STATISTICS AT 36TH STREET
ON BUBBLY CREEK DURING 2006
Number of
DO Concentration (mg/L)
Percent DO
Values Above
Monitoring Dates
DO Values
Minimum
Maximum
Mean
IPCB Standard
01/01/06
-
01/01/06
24
7.8
8.6
8.1
100
01/02/06 -
01/08/06
168
7.2
8.9
8.0
100
01/09/06 -
01/15/06
168
7.5
9.3
8.6
100
01/16/06
- 01/22/06
168
7.6
9.0
8.1
100
01/23/06 - 01/29/06
168
7.7
10.6
9.3
100
01/30/06
-
02/05/06
168
8.4
10.2
9.1
100
02/06/06 - 02/12/06
168
9.0
14.0
11.7
100
02/13/06
-
02/19/06
168
0.1
15.6
8.5
66
02/20/06 -
02/26/06
168
0.0
1.3
0.3
0
02/27/06
-
03/05/06
168
0.9
11.9
5.3
63
03/06/06
-
03/12/06
168
6.1
12.8
9.2
100
03/13/06 -
03/19/06
168
0.2
9.4
1.5
11
03/20/06 - 03/26/06
168
0.2
3.5
1.9
0
03/27/06
-
04/02/06
168
1.9
12.6
7.0
76
04/03/06 - 04/09/06
167
0.6
7.5
3.6
45
04/10/06
-
04/16/06
168
0.4
6.8
3.1
30
04/17/06
-
04/23/06
58
0.5
5.6
1.7
9
04/24/06 -
04/30/06
110
0.0
5.2
2.2
4
05/01/06
- 05/07/06
168
0.0
3.4
0.9
0
05/08/06
-
05/14/06
168
0.0
3.8
1.2
0
05/15/06
-
05/21/06
168
0.5
6.3
2.4
18
05/22/06 -
05/28/06
127
2.3
6.0
4.3
75
05/29/06
-
06/04/06
168
0.7
6.1
2.4
14
06/05/06 -
06/11/06
168
1.4
13.1
5.7
75
06/12/06 - 06/18/06
168
0.0
3.8
1.1
0
06/19/06 - 06/25/06
168
0.0
4.7
1.9
5
06/26/06
-
07/02/06
168
0.3
5.4
1.8
3
07/03/06
- 07/09/06
82
1.1
12.4
5.4
54
07/10/06 - 07/16/06
111
0.4
6.4
3.0
32
07/17/06
-
07/23/06
168
0.1
6.1
1.6
13
07/24/06
- 07/30/06
168
0.0
3.7
1.1
0
07/31/06 -
08/06/06
168
0.0
6.3
1.6
10
08/07/06 - 08/13/06
168
0.0
6.8
2.1
11
--- -
- - ----- --
TABLE A-8 (Continued): WEEKLY DO SUMMARY STATISTICS AT
36TH STREET ON BUBBLY CREEK DURING 2006
Number of
DO Concentration (mg/L)
Percent DO
Values Above
Monitoring Dates
DO Values
Minimum
Maximum
Mean
IPCB Standard
08/14/06 - 08/20/06
168
0.3
3.5
1.7
0
08/21/06 - 08/27/06
168
0.7
3.6
1.8
0
08/28/06 - 09/03/06
168
0.0
3.8
0.8
0
09/04/06 - 09/10/06
168
0.7
4.4
2.0
3
09/11/06 - 09/17/06
168
0.0
8.4
1.8
9
09/18/06 - 09/24/06
168
0.0
3.8
1.9
0
09/25/06- 10/01/06
168
0.7
3.5
2.3
0
10/02/06 - 10/08/06
168
0.0
7.3
1.2
8
10/09/06- 10/15/06
168
0.1
9.6
3.4
39
10/16/06 - 10/22/06
168
0.0
10.7
1.9
22
10/23/06- 10/29/06
168
0.0
2.7
0.8
0
10/30/06- 11/05/06
169
0.0
4.3
2.0
6
11/06/06 - 11/12/06
168
0.0
7.0
2.7
11
11/13/06 - 11/19/06
168
0.0
1.7
0.4
0
11/20/06 - 11/26/06
168
0.0
1.6
0.3
0
11/27/06 - 12/03/06
168
0.1
9.2
1.4
17
12/04/06 - 12/10/06
168
0.0
3.7
0.9
0
12/11/06 - 12/17/06
168
0.0
1.2
0.5
0
12/18/06 - 12/24/06
168
0.1
9.0
2.0
16
12/25/06 - 12/31/06
168
0.0
0.1
0.0
0
--X:16
TABLE A-9: WEEKLY DO SUMMARY STATISTICS AT INTERSTATE HIGHWAY 55
ON BUBBLY CREEK DURING 2006
Number of
DO Concentration (mg/L)
Percent DO
Values Above
Monitoring Dates
DO Values
Minimum
Maximum
Mean
IPCB Standard
01/01/06 -
01/01/06
24
8.5
9.0
8.8
100
01/02/06
- 01/08/06
168
7.6
9.1
8.4
100
01/09/06
- 01/15/06
168
8.1
9.4
8.7
100
01/16/06 - 01
/
22/06
168
7.3
8.9
8.0
100
01/23/06 -
01/29/06
168
8.0
9.1
8.3
100
01/30/06
- 02/05/06
168
7.2
9.2
8.4
100
02/06/06
- 02/12/06
168
8.7
10.3
9.4
100
02/13/06
- 02/19/06
168
2.5
12.0
8.0
92
02/20/06
- 02/26/06
169
5.0
10.5
8.0
100
02/27
/06 - 03
/
05/06
168
8.8
10.3
9.5
100
03/06/06
- 03/12/06
168
5.0
9.3
7.6
100
03/13/06
- 03
/
19/06
168
3.0
8.3
5.6
92
03/20
/
06 - 03
/
26/06
168
4.3
8.6
6.6
100
03/27/06
-
04/02/06
168
4.2
7.1
5.9
100
04/03/06 - 04/09/06
167
0.1
9.1
4.7
70
04/10/06
- 04/16/06
83
0.2
8.0
2.9
41
04/17/06
-
04/23/06
NO DATA
04/24/06
- 04/30/06
79
4.9
9.0
6.9
100
05/01/06 -
05/07/06
168
3.5
8.0
5.3
95
05/08/06
- 05/14/06
132
3.3
8.1
5.5
95
05/15/06
- 05/21/06
168
2.7
7.3
5.5
93
05/22/06 - 05
/
28/06
168
3.8
7.4
6.0
98
05/29
/
06
- 06/04/06
168
3.0
6.5
4.8
90
06/05/06
- 06
/
11/06
168
3.2
8.9
5.8
90
06/12/06
- 06/18/06
168
1.3
6.0
3.8
43
06/19/06
- 06/25/06
82
1.7
4.8
3.1
13
06/26/06
- 07/02/06
86
4.3
7.6
6.0
100
07/03/06
- 07/09/06
168
4.1
9.4
6.2
100
07/10/06
-
07/16/06
168
4.4
7.2
5.5
100
07/17/06 -
07/23/06
168
0.1
6.4
3.4
46
07/24/06 - 07/30/06
167
0.4
6.8
3.6
49
07/31/06
- 08/06/06
168
0.0
7.9
2.6
42
08/07
/
06
- 08/13/06
168
0.0
4.1
1.5
1
-A
-17
TABLE A-9 (Continued): WEEKLY DO SUMMARY STATISTICS AT
INTERSTATE HIGHWAY 55 ON BUBBLY CREEK DURING 2006
Number of
DO Concentration (mg/L)
Percent DO
Values Above
Monitoring Dates
DO Values
Minimum
Maximum
Mean
IPCB Standard
08/14/06 - 08
/
20/06
168
0
.2
6.2
3.7
52
08/21/06 -
08/27/06
168
2.6
5.7
4.5
79
08/28
/
06
-
09
/
03/06
168
0.1
6
.
2
3.8
45
09/04/06
- 09/10/06
168
3.5
7.0
5.3
92
09/11/06 - 09/17/06
168
0.2
7.2
4.0
60
09/18/06
- 09/24/06
168
1.9
7.3
4.9
74
09/25
/
06 - 10/01/06
168
2.8
8.0
5.5
78
10/02/06
- 10/08/06
168
0.0
7.5
3.1
38
10/09/06
- 10/15/06
168
0
.
1
7.8
3.6
39
10/16/06
- 10/22/06
168
0.0
7.6
4.0
55
10/23/06
- 10/29/06
168
0.0
5.9
3.3
47
10/30/06
- 11/05/06
169
0.1
7.3
4.9
77
11/06/06
- 11/12/06
168
1.9
7.0
6.0
97
11/13/06
- 11/19/06
168
2.1
6.8
5.1
79
11/20/06
- 11/26/06
168
5.2
7.6
6.3
100
11/27/06
- 12/03/06
167
0.0
7.4
3.3
49
12/04/06
- 12/10/06
168
3.5
8.7
5.5
88
12/11/06
- 12/17/06
168
2.8
9.2
6.0
90
12/18/06
- 12/24/06
168
0.4
8.0
5.1
74
12/25/06
- 12/31/06
168
0.4
4.9
2.3
10
A- S
TABLE A-10: WEEKLY DO SUMMARY STATISTICS AT CICERO AVENUE
ON THE CHICAGO SANITARY AND SHIP CANAL DURING 2006
Number of
DO Concentration (mg/L)
Percent DO
Values Above
Monitoring Dates
DO Values
Minimum
Maximum
Mean
IPCB Standard
01/01/06
- 01/01/06
24
7.9
8.3
8.1
100
01/02/06 -
01/08/06
168
6.3
8.3
7.3
100
01/09/06
- 01/15/06
168
6.4
7.9
7.2
100
01/16/06
- 01/22/06
168
5.7
7.5
6.7
100
01/23/06 -
01/29/06
168
6.9
8.9
7.6
100
01/30/06 -
02/05/06
168
6.3
8.9
7.8
100
02/06/06 -
02/12/06
168
7.6
8.8
8.2
100
02/13/06 -
02/19/06
168
8.0
9.4
8.7
100
02/20/06
-
02/26/06
168
7.6
10.8
9.5
100
02/27/06 -
03/05/06
168
7.3
10.1
8.6
100
03/06/06
-
03/12/06
168
6.1
8.2
7.5
100
03/13/06
- 03/19/06
168
5.1
8.8
7.7
100
03/20/06 -
03/26/06
168
6.1
8.3
7.3
100
03/27/06
-
04/02/06
168
5.3
7.8
6.4
100
04/03/06
-
04/09/06
167
5.1
8.1
6.9
100
04/10/06 -
04/16/06
168
6.5
10.0
7.9
100
04/17/06
-
04/23/06
168
0.0
8.4
5.1
83
04/24/06 -
04/30/06
168
3.7
9.2
5.4
99
05/01/06 -
05/07/06
168
3.5
7.2
5.2
98
05/08/06 -
05/14/06
168
4.9
8.3
6.0
100
05/15/06
- 05/21/06
168
5.2
7.3
5.9
100
05/22/06 -
05/28/06
168
4.3
10.1
6.0
100
05/29/06
- 06/04/06
169
4.2
6.9
5.1
100
06/05/06 - 06/11/06
167
4.0
8.7
6.4
99
06/12/06 -
06/18/06
168
3.3
6.5
4.6
81
06/19/06
- 06/25/06
168
2.8
5.8
4.3
72
06/26/06 -
07/02/06
168
1.2
6.8
4.9
82
07/03/06
- 07/09/06
168
3.8
7.3
5.9
98
07/10/06 -
07/16/06
168
4.7
7.0
5.5
100
07/17/06 -
07/23/06
81
4.6
6.2
5.3
100
07/24/06 -
07/30/06
86
5.5
8.3
7.1
100
07/31/06
- 08/06/06
168
0.7
8.8
5.7
79
08/07/06
- 08/13/06
168
4.7
8.5
7.4
100
TABLE A-10 (Continued): WEEKLY DO SUMMARY STATISTICS AT
CICERO AVENUE ON THE CHICAGO SANITARY AND SHIP CANAL DURING 2006
Number of
DO Concentration (mg/L)
Percent DO
Values Above
Monitoring Dates
DO Values
Minimum
Maximum
Mean
IPCB Standard
08/14/06 - 08/20/06
168
4.9
8.4
6.6
100
08/21/06 - 08/27/06
168
3.7
6.1
5.1
99
08/28/06 - 09/03/06
168
2.5
6.0
5.1
92
09/04/06 - 09/10/06
168
5.1
7.4
6.3
100
09/11/06 - 09/17/06
168
2.0
7.3
5.1
84
09/18/06 - 09/24/06
168
5.4
6.8
6.1
100
09/25/06 - 10/01/06
168
5.2
7.8
6.5
100
10/02/06- 10/08/06
168
1.8
7.9
5.4
90
10/09/06 - 10/15/06
168
4.3
6.6
5.6
100
10/16/06- 10/22/06
168
2.6
7.7
5.1
85
10/23/06 - 10/29/06
168
4.2
6.3
5.0
100
10/30/06 - 11/05/06
169
3.6
6.1
5.0
93
11/06/06 - 11/12/06
168
0.6
6.2
4.5
81
11/13/06 - 11/19/06
168
2.9
5.3
4.4
70
11/20/06 - 11/26/06
168
4.1
5.9
4.7
100
11/27/06 - 12/03/06
168
0.1
8.4
5.5
94
12/04/06 - 12/10/06
168
5.7
8.6
7.1
100
12/11/06 - 12/17/06
168
6.6
8.9
7.3
100
12/18/06 - 12/24/06
168
5.8
8.1
6.8
100
12/25/06- 12/31/06
168
4.9
8.3
6.8
100
TABLE A-11: WEEKLY DO SUMMARY STATISTICS AT B&O CENTRAL RAILROAD
ON THE CHICAGO SANITARY AND SHIP CANAL DURING 2006
Number of
DO Concentration (mg/L)
Percent DO
Values Above
Monitoring Dates
DO Values
Minimum
Maximum
Mean
IPCB Standard
01/01/06 - 01/01/06
24
7.1
8.7
8.2
100
01/02/06 - 01/08/06
168
7.1
8.6
8.0
100
01/09/06 - 01/15/06
168
6.4
9.1
7.5
100
01/16/06 -
01/22/06
168
6.5
9.9
8.0
100
01/23/06 - 01/29/06
168
7.6
9.4
8.6
100
01/30/06 - 02/05/06
168
6.9
10.0
8.5
100
02/06/06
-
02/12/06
168
7.6
8.6
8.1
100
02/13/06 - 02/19/06
167
7.1
9.7
8.7
100
02/20/06 - 02/26/06
168
7.9
10.1
8.8
100
02/27/06
-
03/05/06
168
7.7
9.6
8.6
100
03/06/06 - 03/12/06
168
7.1
8.9
8.2
100
03/13/06 - 03/19/06
168
6.9
9.5
8.4
100
03/20/06
-
03/26/06
168
7.5
9.1
8.3
100
03/27/06 -
04/02/06
168
6.9
9.0
7.8
100
04/03/06 - 04/09/06
167
5.9
9.3
8.0
100
04/10/06
- 04/16/06
168
7.0
8.8
8.1
100
04/17/06
-
04/23/06
168
4.9
9.1
7.4
100
04/24/06 - 04/30/06
167
5.8
7.8
7.2
100
05/01/06 - 05/07/06
168
5.1
7.2
6.4
100
05/08/06 -
05/14/06
168
5.1
7.3
6.3
100
05/15/06 - 05/21/06
168
5.5
7.5
6.4
100
05/22/06 - 05/28/06
168
4.8
8.1
6.5
100
05/29/06 - 06/04/06
168
5.0
6.5
5.8
100
06/05/06 - 06/11/06
168
5.1
8.0
6.2
100
06/12/06 - 06/18/06
168
4.6
6.8
5.7
100
06/19/06 - 06/25/06
168
3.8
6.3
5.0
97
06/26/06 -
07/02/06
168
4.4
6.6
5.6
100
07/03/06 - 07/09/06
168
5.2
8.5
6.1
100
07/10/06 - 07/16/06
168
3.5
6.9
5.6
99
07/17/06
- 07/23/06
168
2.3
6.5
5.0
92
07/24/06
- 07/30/06
168
4.3
6.4
5.4
100
07/31/06 - 08/06/06
168
1.3
7.5
4.7
61
08/07/06
- 08/13/06
168
2.4
5.8
4.7
90
-
----
------
TABLE A-11 (Continued): WEEKLY DO SUMMARY STATISTICS AT B&O CENTRAL
RAILROAD ON THE CHICAGO SANITARY AND SHIP CANAL DURING 2006
Number of
DO Concentration (mg/L)
Percent DO
Values Above
Monitoring Dates
DO Values
Minimum
Maximum
Mean
IPCB Standard
08/14/06 - 08/20/06
168
3.0
6.0
4.9
89
08/21/06 - 08/27/06
167
4.3
6.2
5.3
100
08/28/06 - 09/03/06
168
4.1
6.6
5.5
100
09/04/06 - 09/10/06
168
4.9
6.8
6.1
100
09/11/06 - 09/17/06
168
3.7
7.0
5.9
98
09/18/06 - 09/24/06
168
5.5
7.4
6.4
100
09/25/06 - 10/01/06
168
5.7
7.3
6.5
100
10/02/06 - 10/08/06
168
2.9
7.3
5.9
90
10/09/06 - 10/15/06
168
3.5
7.3
6.2
98
10/16/06 - 10/22/06
168
4.6
8.0
6.4
100
10/23/06 - 10/29/06
168
5.1
7.9
6.6
100
10/30/06 - 11/05/06
169
5.6
7.3
6.7
100
11/06/06 - 11/12/06
168
4.6
8.3
6.1
100
11/13/06 - 11/19/06
168
5.6
7.7
6.4
100
11/20/06- 11/26/06
168
4.7
7.2
6.3
100
11/27/06 - 12/03/06
168
2.3
9.1
6.9
98
12/04/06- 12/10/06
168
7.6
9.5
8.5
100
12/11/06 - 12/17/06
167
7.0
9.4
8.1
100
12/18/06 - 12/24/06
168
6.2
8.6
7.8
100
12/25/06- 12/31/06
168
7.4
9.6
8.7
100
TABLE A-12: WEEKLY DO SUMMARY STATISTICS AT ROUTE 83
ON THE CHICAGO SANITARY AND SHIP CANAL DURING 2006
Number of
DO Concentration (mg/L)
Percent DO
Values Above
Monitoring Dates
DO Values
Minimum
Maximum
Mean
IPCB Standard
01/01/06 -
01/01/06
24
5.9
7.0
6.6
100
01/02/06 -
01/08/06
168
5.4
7.6
7.0
100
01/09/06 -
01/15/06
168
3.9
6.7
5.6
99
01/16/06
- 01/22/06
168
3.6
7.4
6.0
99
01/23/06 -
01/29/06
168
4.8
7.9
7.1
100
01/30/06 - 02/05/06
168
5.8
8.6
7.3
100
02/06/06
- 02/12/06
168
6.4
8.0
7.3
100
02/13/06
- 02/19/06
168
6.0
8.5
7.6
100
02/20/06
- 02/26/06
168
6.7
9.0
7.8
100
02/27/06 -
03/05/06
168
6.9
8.3
7.5
100
03/06/06
-
03/12/06
168
6.0
8.0
7.2
100
03/13/06
-
03/19/06
59
5.8
8.6
6.9
100
03/20/06
- 03/26/06
NO DATA
03/27/06
-
04/02/06
107
5.5
7.2
6.4
100
04/03/06
-
04/09/06
167
5.3
8.0
6.6
100
04/10/06
-
04/16/06
168
5.1
7.3
6.4
100
04/17/06
- 04/23/06
168
3.6
7.7
6.0
95
04/24/06 -
04/30/06
168
5.3
7.3
6.2
100
05/01/06
- 05/07/06
168
3.3
5.6
4.7
85
05/08/06 -
05/14/06
168
3.2
5.8
4.4
81
05/15/06
-
05/21/06
168
3.7
5.9
5.1
99
05/22/06 -
05/28/06
168
3.3
6.5
4.9
85
05/29/06 -
06/04/06
168
2.8
6.2
4.5
79
06/05/06 - 06/11/06
168
2.9
6.2
4.8
80
06/12/06 -
06/18/06
168
0.6
6.2
4.2
59
06/19/06 -
06/25/06
168
2.0
5.0
3.6
17
06/26/06 -
07/02/06
115
2.8
5.5
4.4
81
07/03/06
-
07/09/06
82
1.8
5.1
4.0
55
07/10/06
- 07/16/06
110
2.5
6.7
5.0
96
07/17/06
- 07/23/06
58
3.5
6.4
5.4
91
07/24/06
- 07/30/06
107
3.5
5.0
4.1
51
07/31/06
- 08/06/06
167
0.0
6.2
3.1
43
08/07/06 - 08/13/06
168
1.4
5.2
3.6
48
TABLE A-12 (Continued): WEEKLY DO SUMMARY STATISTICS AT
ROUTE 83 ON THE CHICAGO SANITARY AND SHIP CANAL DURING 2006
Number of
DO Concentration (mg/L)
Percent DO
Values Above
Monitoring Dates
DO Values
Minimum
Maximum
Mean
IPCB Standard
08/14/06 - 08/20/06
168
2.0
4.8
3.6
31
08/21/06 - 08/27/06
168
3.0
4.9
3.9
40
08/28/06 - 09/03/06
168
0.4
5.3
4.1
60
09/04/06 - 09/10/06
58
4.1
5.1
4.7
100
09/11/06 - 09/17/06
98
2.8
6.0
4.6
78
09/18/06 - 09/24/06
168
4.0
5.8
5.0
100
09/25/06- 10/01/06
58
4.4
6.2
5.5
100
10/02/06 - 10/08/06
NO DATA
10/09/06 - 10/15/06
NO DATA
10/16/06- 10/22/06
86
3.7
6.5
5.1
90
10/23/06 - 10/29/06
168
3.1
6.2
5.2
93
10/30/06- 11/05/06
169
5.2
6.5
6.1
100
11/06/06 - 11/12/06
58
4.5
6.3
5.2
100
11/13/06 - 11/19/06
110
5.0
6.7
6.0
100
11/20/06 - 11/26/06
168
4.1
6.0
5.4
100
11/27/06 - 12/03/06
168
0.6
7.0
5.0
89
12/04/06 - 12/10/06
167
6.5
8.7
7.7
100
12/11/06 - 12/17/06
168
6.3
8.2
7.2
100
12/18/06 - 12/24/06
59
6.3
7.2
6.6
100
- A=24
TABLE A-13: WEEKLY DO SUMMARY STATISTICS AT LOCKPORT POWERHOUSE
ON THE CHICAGO SANITARY AND SHIP CANAL DURING 2006
Number of
DO Concentration (mg/L)
Percent DO
Values Above
Monitoring Dates
DO Values
Minimum
Maximum
Mean
IPCB Standard
01/01/06
-
01/01/06
24
6.5
7.4
6.9
100
01/02/06
-
01/08/06
167
6.1
7.2
6.8
100
01/09/06
-
01/15/06
168
5.7
7.2
6.6
100
01/16/06
-
01/22/06
168
5.5
7.6
6.6
100
01/23/06
-
01/29/06
168
6.2
8.0
7.1
100
01/30/06 -
02/05/06
168
6.7
8.1
7.6
100
02/06/06 -
02/12/06
168
6.1
8.0
7.1
100
02/13/06 -
02/19/06
168
6.6
8.5
7.7
100
02/20/06
-
02/26/06
168
7.3
9.0
8.3
100
02/27/06 - 03/05/06
168
6.3
8.6
7.5
100
03/06/06
-
03/12/06
168
6.8
8.6
7.4
100
03/13/06 - 03/19/06
168
6.6
8.3
7.3
100
03/20/06
-
03/26/06
168
6.8
7.7
7.3
100
03/27/06 - 04/02/06
168
5.8
7.2
6.6
100
04/03/06
- 04/09/06
167
6.0
7.3
6.6
100
04/10/06 -
04/16/06
167
5.6
6.6
6.2
100
04/17/06 - 04/23/06
168
4.5
6.6
5.8
100
04/24/06
-
04/30/06
168
1.7
6.4
5.3
91
05/01/06 - 05/07/06
168
3.2
5.2
4.3
72
05/08/06
-
05/14/06
83
3.3
4.6
4.0
57
05/15/06
-
05/21/06
85
3.9
5.7
4.8
99
05/22/06
-
05/28/06
168
3.4
5.2
4.3
78
05/29/06 - 06/04/06
167
2.7
5.7
3.7
32
06/05/06 - 06/11/06
168
3.0
5.1
4.0
47
06/12/06
-
06/18/06
168
3.2
4.7
4.1
57
06/19/06 - 06/25/06
168
2.4
3.9
3.2
0
06/26/06
-
07/02/06
168
3.1
4.8
4.0
40
07/03/06 - 07/09/06
168
1.9
6.4
4.2
46
07/10/06 - 07/16/06
168
2.4
5.2
3.8
48
07/17/06
-
07/23/06
168
1.9
4.8
3.1
8
07/24/06 -
07/30/06
168
2.6
7.1
4.1
42
07/31/06
-
08/06/06
168
0.3
5.9
3.2
39
08/07/06 - 08/13/06
168
0.5
5.5
3.3
41
TABLE A-13 (
Continued
): WEEKLY DO SUMMARY STATISTICS AT LOCKPORT
POWERHOUSE ON THE CHICAGO SANITARY AND SHIP CANAL DURING 2006
Number of
DO Concentration (mg/L)
Percent DO
Values Above
Monitoring Dates
DO Values
Minimum
Maximum
Mean
IPCB Standard
08/14/06 - 08
/
20/06
168
3.6
5.5
4.4
88
08/21/06 - 08
/27/06
167
3.1
4.5
3.7
17
08/28/06 - 09/03/06
78
3.1
4.5
3.8
35
09/04/06 - 09/10/06
85
5.0
5.8
5.3
100
09/11/06 - 09/17/06
168
3.5
5.9
4.9
82
09/18/06 - 09/24/06
168
4.6
5.5
5.2
100
09/25/06 - 10/01/06
169
4.7
6.0
5.4
100
10/02/06 - 10/08/06
168
1.6
6.1
4.2
57
10/09/06- 10/15/06
168
5.1
6.0
5.5
100
10/16/06 - 10/22/06
168
4.8
6.6
5.8
100
10/23/06 - 10/29/06
168
4.6
6.5
5.7
100
10/30/06 - 11/05/06
169
4.7
6.5
6.0
100
11/06/06 - 11/12/06
168
4.1
6.5
5.7
100
11/13/06 - 11/19/06
168
3.2
6.5
5.1
87
11/20/06 - 11/26/06
168
5.1
6.3
5.7
100
11/27/06 - 12/03/06
168
3.8
7.0
5.5
99
12/04/06- 12/10/06
168
7.1
8.9
8.3
100
12/11/06- 12/17/06
168
7.0
8.7
7.7
100
12/18/06 - 12/24/06
168
6.1
7.4
6.7
100
12/25/06- 12/31/06
168
6.7
8.4
7.7
100
-----------------------
A-26-
---
TABLE A-14: WEEKLY DO SUMMARY STATISTICS AT JEFFERSON STREET
ON THE DES PLAINES RIVER DURING 2006
Number of
DO Concentration (mg/L)
Percent DO
Values Above
Monitoring Dates
DO Values
Minimum
Maximum
Mean
IPCB Standard
01/01/06 - 01/01/06
24
9.5
10.4
9.9
100
01/02/06 - 01/08/06
168
7.8
10.1
8.8
100
01/09/06
-
01/15/06
167
6.7
10.2
8.5
100
01/16/06 - 01/22/06
168
6.9
12.7
9.7
100
01/23/06
-
01/29/06
168
7.7
11.7
9.4
100
01/30/06 - 02/05/06
168
8.3
11.5
9.4
100
02/06/06 - 02/12/06
168
8.2
10.8
9.5
100
02/13/06 - 02/19/06
168
7.8
10.5
9.1
100
02/20/06 - 02/26/06
168
8.9
10.7
9.9
100
02/27/06
-
03/05/06
168
7.5
10.3
8.6
100
03/06/06 - 03/12/06
168
7.4
9.1
8.2
100
03/13/06 - 03/19/06
168
7.7
10.9
9.4
100
03/20/06
-
03/26/06
168
8.7
11.2
9.7
100
03/27/06 - 04/02/06
168
7.1
11.2
8.6
100
04/03/06 - 04/09/06
167
6.7
10.4
8.1
100
04/10/06 -
04/16/06
168
6.1
10.1
8.0
100
04/17/06
- 04/23/06
168
5.2
9.8
7.0
100
04/24/06 - 04/30/06
167
5.0
9.9
7.0
100
05/01/06 - 05/07/06
168
4.9
8.1
6.2
100
05/08/06 - 05/14/06
168
3.9
7.8
5.5
99
05/15/06 - 05/21/06
168
5.0
8.4
6.5
100
05/22/06
-
05/28/06
168
4.2
8.9
6.0
100
05/29/06 - 06/04/06
167
3.5
6.1
4.5
77
06/05/06 - 06/11/06
168
3.8
7.1
5.0
95
06/12/06
-
06/18/06
168
3.7
6.9
5.2
99
06/19/06 -
06/25/06
168
2.7
6.0
4.2
58
06/26/06 - 07/02/06
168
3.7
6.6
5.0
96
07/03/06 - 07/09/06
168
3.3
7.1
5.3
89
07/10/06
- 07/16/06
168
3.6
6.3
4.6
79
07/17/06
- 07/23/06
168
2.6
6.6
4.4
66
07/24/06
- 07/30/06
168
3.4
7.4
4.7
76
07/31/06
- 08/06/06
168
2.4
6.0
4.2
50
08/07/06
-
08/13/06
168
2.7
6.7
4.3
61
---------------
------------ -
TABLE A-14 (Continued): WEEKLY DO SUMMARY STATISTICS AT
JEFFERSON STREET ON THE DES PLAINES RIVER DURING 2006
Number of
DO Concentration (mg/L)
Percent DO
Values Above
Monitoring Dates
DO Values
Minimum
Maximum
Mean
IPCB Standard
08/14/06 - 08/20/06
83
3.9
5.7
4.6
88
08/21/06 - 08/27/06
85
4.0
6.7
5.2
99
08/28/06 - 09/03/06
168
3.8
7.3
5.7
98
09/04/06 - 09/10/06
168
4.6
6.8
5.6
100
09/11/06 - 09/17/06
168
4.2
7.9
6.7
100
09/18/06 - 09/24/06
168
5.2
8.8
6.9
100
09/25/06 - 10/01/06
168
5.8
8.5
6.8
100
10/02/06 - 10/08/06
168
4.5
8.7
6.2
100
10/09/06 - 10/15/06
168
5.7
8.4
6.9
100
10/16/06 - 10/22/06
168
6.1
9.2
7.3
100
10/23/06- 10/29/06
168
6.5
9.0
7.5
100
10/30/06 - 11/05/06
169
6.5
9.4
8.1
100
11/06/06 - 11/12/06
168
6.7
10.9
8.4
100
11/13/06 - 11/19/06
168
5.9
9.5
7.7
100
11/20/06 - 11/26/06
168
7.2
11.2
8.3
100
11/27/06- 12/03/06
168
6.9
10.7
8.7
100
12/04/06- 12/10/06
168
8.9
11.7
10.6
100
12/11/06 - 12/17/06
168
9.8
12.1
11.2
100
12/18/06 - 12/24/06
168
8.4
12.8
10.4
100
12/25/06 - 12/31/06
168
8.6
11.7
9.9
100
---------
A::28--
--
-
TABLE A-15: WEEKLY DO SUMMARY STATISTICS AT TORRENCE AVENUE
ON THE GRAND CALUMET RIVER DURING 2006
Number of
DO Concentration (mg/L)
Percent DO
Values Above
Monitoring Dates
DO Values
Minimum
Maximum
Mean
IPCB Standard
01/01/06 -
01/01/06
24
9.3
11.8
11.2
100
01/02/06
- 01/08/06
167
7.2
14.0
12.0
100
01/09/06 -
01/15/06
168
7.9
13.6
11.8
100
01/16/06 - 01/22/06
168
9.6
23.9
13.3
100
01/23/06
-
01/29/06
168
12.4
23.0
14.8
100
01/30/06 - 02/05/06
168
12.2
21.5
15.5
100
02/06/06
-
02/12/06
167
14.4
30.2
18.2
100
02/13/06 -
02/19/06
168
8.3
24.2
16.5
100
02/20/06 - 02/26/06
168
15.1
28.7
18.3
100
02/27/06
- 03/05/06
168
13.8
22.7
16.9
100
03/06/06 - 03/12/06
58
14.6
26.3
18.4
100
03/13/06
- 03/19/06
109
8.2
15.4
11.6
100
03/20/06 - 03/26/06
168
8.7
15.1
12.4
100
03/27/06 - 04/02/06
168
5.1
13.5
9.7
100
04/03/06
- 04/09/06
167
2.8
11.0
7.9
95
04/10/06 - 04/16/06
168
2.0
10.2
5.9
79
04/17/06
-
04/23/06
168
0.1
7.1
2.7
23
04/24/06 - 04/30/06
168
1.7
12.1
5.9
79
05/01/06 - 05/07/06
168
1.2
7.8
3.6
29
05/08/06
-
05/14/06
168
1.1
8.1
4.1
50
05/15/06
-
05/21/06
168
2.3
6.4
3.5
23
05/22/06 - 05/28/06
168
0.1
6.1
2.9
20
05/29/06 - 06/04/06
168
0.3
17.1
5.4
52
06/05/06 - 06/11/06
168
0.5
18.4
6.2
70
06/12/06 - 06/18/06
168
1.8
11.8
5.2
61
06/19/06
-
06/25/06
168
2.0
11.3
5.7
64
06/26/06
-
07/02/06
168
3.2
12.4
6.2
77
07/03/06
- 07/09/06
83
0.0
11.0
3.4
30
07/10/06
-
07/16/06
110
1.9
10.6
3.9
35
07/17/06
-
07/23/06
168
0.0
16.4
4.4
39
07/24/06 - 07/30/06
168
0.0
16.0
5.3
55
07/31/06
- 08/06/06
168
0.0
15.0
2.5
23
08/07/06 - 08/13/06
168
0.0
10.6
3.8
44
TABLE A-15 (Continued): WEEKLY DO SUMMARY STATISTICS AT
TORRENCE AVENUE ON THE GRAND CALUMET RIVER DURING 2006
Number of
DO Concentration (mg/L)
Percent DO
Values Above
Monitoring Dates
DO Values
Minimum
Maximum
Mean
IPCB Standard
08/14/06 - 08/20
/
06
59
0.3
7.6
3.6
44
08/21/06 - 08/27/06
110
3.4
13.1
6.7
92
08/28
/
06 - 09
/
03/06
168
0.4
6.8
2.5
14
09/04/06 - 09/10/06
168
1.6
8.4
4.2
50
09/11/06 - 09
/17/06
167
0.0
7.3
2.3
20
09/18/06 - 09/24/06
168
1.0
7.7
5.1
85
09/25/06- 10/01/06
165
1.9
8.4
6.1
87
10/02/06- 10/08/06
168
0.0
7.4
4.4
65
10/09/06 - 10/15/06
168
2.9
9.4
7.1
94
10/16/06- 10/22/06
168
1.9
9.2
6.6
88
10/23
/
06 - 10/29
/
06
168
8.5
12.4
9.9
100
10/30/06 - 11/05
/
06
169
9.1
18.1
11.2
100
11/06/06 - 11/12/06
168
0.8
21.9
12.1
95
11/13/06 - 11/19/06
168
3.8
21
.
2
11.8
98
11/20/06 - 11/26/06
168
10.9
22.6
14.0
100
11/27/06- 12/03/06
168
3.7
18.5
8.8
98
12/04/06- 12/10/06
168
5.6
10.1
8.3
100
12/11/06 - 12/17/06
168
5.0
11.2
9.0
100
12/18/06- 12/24/06
168
2.6
11.2
7.6
88
12/25/06- 12/31/06
168
4.9
10.5
8.2
100
TABLE A-16: WEEKLY DO SUMMARY STATISTICS AT C&W INDIANA RAILROAD
ON THE LITTLE CALUMET RIVER DURING 2006
Number of
DO Concentration
(
mg/L)
Percent DO
Values Above
Monitoring Dates
DO Values
Minimum
Maximum
Mean
IPCB Standard
01/01/06 -
01/01/06
24
11.5
12.2
11.8
100
01/02/06
-
01/08/06
168
11.5
13.5
12.6
100
01/09/06
-
01
/
15/06
168
11.9
13.6
12.8
100
01/16/06
-
01/22/06
168
11.4
13.2
12.6
100
01/23/06 - 01/29/06
168
11.2
13.2
12.6
100
01/30/06 - 02/05/06
168
11.7
12.8
12.3
100
02/06/06 - 02/12/06
168
12.4
13.4
12.9
100
02/13/06
- 02/19/06
168
13.3
17.6
15.0
100
02/20/06 - 02/26/06
168
15.6
20.3
17.6
100
02/27
/
06
- 03
/
05/06
168
18.1
21
.
9
20.4
100
03/06
/
06 - 03/12/06
168
16.1
21.1
18.9
100
03/13/06 - 03/19/06
168
12.1
16.2
13.9
100
03/20/06
-
03/26/06
168
13.2
16.2
14.9
100
03/27/06 - 04/02/06
168
9.5
16.1
13.0
100
04/03/06
- 04/09/06
167
8.1
10.4
9.1
100
04/10/06 - 04/16/06
168
6.7
9.0
7.9
100
04/17/06
-
04/23/06
168
6.3
9.9
8.0
100
04/24/06 - 04/30/06
167
7.4
11.2
8.9
100
05/01/06
- 05/07/06
168
5.5
9.8
7.3
100
05/08
/
06
-
05/14/06
168
5.6
10.7
7.9
100
05/15/06 - 05/21/06
168
5.2
8.5
6.8
100
05/22
/
06
- 05
/
28/06
168
4.0
10.5
7.3
100
05/29/06 - 06/04/06
168
1.9
6.6
3.9
40
06/05/06 - 06/11/06
168
2.8
7.4
5.0
87
06/12/06
-
06/18/06
167
3.7
6.6
4.9
97
06/19/06 - 06/25
/
06
168
3.8
6.8
5.2
98
06/26/06
- 07/02/06
168
4.3
10.9
6.3
100
07/03/06 - 07/09/06
168
4.3
9.1
6.2
100
07/10/06 - 07/16/06
60
4.8
7.2
6.0
100
07/17/06 - 07/23/06
106
4.4
9.4
6.0
100
07/24/06 - 07/30/06
168
5.5
11.7
8.3
100
07/31/06 - 08/06/06
168
3.5
9.5
6.6
99
08/07/06
- 08/13/06
168
4.4
8.5
6.6
100
TABLE A-16 (Continued): WEEKLY DO SUMMARY STATISTICS AT
C&W INDIANA RAILROAD ON THE LITTLE CALUMET RIVER DURING 2006
Number of
DO Concentration (mg/L)
Percent DO
Values Above
Monitoring Dates
DO Values
Minimum
Maximum
Mean
IPCB Standard
08/14/06 - 08/20/06
168
5.7
9.2
7.1
100
08/21/06 - 08/27/06
168
5.4
9.5
7.3
100
08/28/06 - 09/03/06
168
3.9
7.6
5.9
99
09/04/06 - 09/10/06
167
5.5
8.5
6.5
100
09/11/06 - 09/17/06
169
4.1
7.5
5.8
100
09/18/06 - 09/24/06
168
4.0
7.3
6.3
98
09/25/06 - 10/01/06
168
6.2
7.8
6.9
100
10/02/06- 10/08/06
168
5.6
7.8
6.7
100
10/09/06 - 10/15/06
168
5.4
8.6
7.4
100
10/16/06 - 10/22/06
168
8.0
9.3
8.6
100
10/23/06 - 10/29/06
167
8.8
9.7
9.3
100
10/30/06 - 11/05/06
169
9.2
10.6
9.9
100
11/06/06 - 11/12/06
167
8.7
10.4
9.8
100
11/13/06 - 11/19/06
168
9.5
10.4
10.0
100
11/20/06 - 11/26/06
168
9.8
11.6
10.6
100
11/27/06- 12/03/06
168
9.3
11.3
10.4
100
12/04/06- 12/10/06
168
10.6
12.3
11.7
100
12/11/06 - 12/17/06
168
11.0
12.0
11.4
100
12/18/06 - 12/24/06
168
10.4
11.5
11.0
100
12/25/06 - 12/31/06
168
9.8
11.6
11.0
100
-A-32- - ---- - - -
TABLE A-17: WEEKLY DO SUMMARY STATISTICS AT HALSTED STREET
ON THE LITTLE CALUMET RIVER DURING 2006
Number of
DO Concentration (mg/L)
Percent DO
Values Above
Monitoring Dates
DO Values
Minimum
Maximum
Mean
IPCB Standard
01/01/06
- 01/01/06
24
7.3
7.8
7.5
100
01/02/06
- 01/08/06
167
6.8
8.5
7.8
100
01/09/06
- 01/15/06
168
6.3
8.6
7.4
100
01/16/06
-
01
/
22/06
167
6.8
8.5
7.5
100
01/23/06
- 01
/
29/06
168
6.7
8.7
7.8
100
01/30/06
-
02/05/06
168
6.4
9.3
7.8
100
02/06
/
06 - 02
/
12/06
168
7.5
8.9
8.2
100
02/13/06 -
02/19/06
168
7.1
9.3
8.3
100
02/20/06
- 02
/
26/06
168
8.3
10.7
9.4
100
02/27
/
06 - 03
/
05/06
168
8.9
11.3
9.9
100
03/06
/
06 -
03/12/06
168
6.7
9.8
8.2
100
03/13/06
- 03/19/06
168
6.7
8.6
7.6
100
03/20
/
06 -
03/26/06
168
7.4
10.0
8.4
100
03/27
/
06
- 04
/
02/06
168
6.8
9.3
7.6
100
04/03
/
06 - 04
/
09/06
167
6.0
8.2
7.1
100
04/10/06
- 04
/
16/06
167
5.2
7.6
6.2
100
04/17/06
- 04/23/06
168
5.5
7.7
6.3
100
04/24
/
06
- 04
/
30/06
168
6.1
8.6
6.8
100
05/01/06
-
05/07/06
168
4.9
7.8
6.0
100
05/08
/
06
- 05
/
14/06
168
5.0
8.6
6.1
100
05/15/06
- 05/21/06
168
5.1
9.8
6.4
100
05/22
/
06
- 05/28/06
168
5.2
9.2
6.5
100
05/29/06
- 06
/
04/06
168
4.4
7.9
5.8
100
06/05
/
06 - 06
/
11/06
168
4.1
8.5
6.1
100
06/12/06
-
06/18/06
168
4.7
7.5
5.9
100
06/19/06
-
06/25/06
168
4.4
7.2
5.5
100
06/26/06 -
07/02/06
168
4.2
9.1
6.3
100
07/03
/
06 - 07
/
09/06
168
5.1
11.9
6.9
100
07/10/06
- 07/16/06
168
4.3
8.4
5.9
100
07/17/06
- 07
/
23/06
168
4.5
9.2
6.1
100
07/24
/
06 -
07
/
30/06
167
4.9
9.9
7.2
100
07/31
/
06
- 08
/
06/06
168
5.6
12.9
7.9
100
08/07
/
06 - 08
/
13/06
168
4.9
9.8
6.8
100
A-- 33
TABLE A-17 (Continued): WEEKLY DO SUMMARY STATISTICS AT
HALSTED STREET ON THE LITTLE CALUMET RIVER DURING 2006
Number of
DO Concentration (mg/L)
Percent DO
Values Above
Monitoring Dates
DO Values
Minimum
Maximum
Mean
IPCB Standard
08/14/06 - 08/20/06
168
5.5
9.3
6.7
100
08/21/06 - 08/27/06
168
5.1
8.8
6.7
100
08/28/06 - 09/03/06
59
4.3
6.6
5.6
100
09/04/06 - 09/10/06
108
5.6
7.8
6.5
100
09/11/06 - 09/17/06
60
5.0
7.1
6.0
100
09/18/06 - 09/24/06
108
5.1
7.3
6.1
100
09/25/06- 10/01/06
168
5.3
7.6
6.5
100
10/02/06 - 10/08/06
168
3.5
7.4
6.2
97
10/09/06 - 10/15/06
168
5.7
7.4
6.6
100
10/16/06 - 10/22/06
167
5.7
7.1
6.6
100
10/23/06- 10/29/06
168
6.0
7.2
6.7
100
10/30/06 - 11/05/06
169
6.0
7.1
6.6
100
11/06/06- 11/12/06
168
5.7
7.3
6.4
100
11/13/06 - 11/19/06
167
5.7
7.2
6.5
100
11/20/06 - 11/26/06
168
6.0
7.3
6.6
100
11/27/06- 12/03/06
168
5.8
8.2
6.9
100
12/04/06 - 12/10/06
168
6.6
8.1
7.4
100
12/11/06 - 12/17/06
168
6.0
8.1
6.8
100
12/18/06- 12/24/06
168
5.9
7.3
6.6
100
12/25/06 - 12/31/06
168
5.5
7.0
6.3
100
---------------------------
TABLE A-18: WEEKLY DO SUMMARY STATISTICS AT CICERO AVENUE
ON THE CALUMET-SAG CHANNEL DURING 2006
Number of
DO Concentration (mg/L)
Percent DO
Values Above
Monitoring Dates
DO Values
Minimum
Maximum
Mean
IPCB Standard
01/01/06
-
01/01/06
24
8.3
8.7
8.5
100
01/02/06 -
01/08/06
168
7.9
8.8
8.2
100
01/09/06 - 01/15/06
168
7.3
8.7
8.0
100
01/16/06 -
01/22/06
168
7.8
9.2
8.3
100
01/23/06 -
01/29/06
168
8.4
10.0
9.2
100
01/30/06 - 02/05/06
168
7.8
8.7
8.4
100
02/06/06
-
02/12/06
168
8.3
9.6
8.9
100
02/13/06 -
02/19/06
168
8.4
10.4
9.0
100
02/20/06 - 02/26/06
168
9.6
11.7
10.5
100
02/27/06
-
03/05/06
168
10.0
11.4
10.7
100
03/06/06 -
03/12/06
168
7.7
11.2
9.4
100
03/13/06 - 03/19/06
168
7.2
8.9
8.2
100
03/20/06
-
03/26/06
168
8.5
9.7
9.1
100
03/27/06 - 04/02/06
168
7.8
9.3
8.4
100
04/03/06 - 04/09/06
167
6.6
8.9
7.6
100
04/10/06 - 04/16/06
168
4.9
7.9
6.6
100
04/17/06 - 04/23/06
168
5.5
6.9
6.3
100
04/24/06
- 04/30/06
168
5.6
7.2
6.5
100
05/01/06 - 05/07/06
168
5.3
6.8
6.1
100
05/08/06 - 05/14/06
168
4.8
6.7
5.8
100
05/15/06 - 05/21/06
168
5.1
6.7
6.0
100
05/22/06 - 05/28/06
168
4.1
7.4
5.7
100
05/29/06 - 06/04/06
168
3.6
6.1
4.7
100
06/05/06 - 06/11/06
167
3.2
6.6
5.2
100
06/12/06
-
06/18/06
167
4.6
6.3
5.6
100
06/19/06 - 06/25/06
168
4.1
6.2
5.0
100
06/26/06 - 07/02/06
168
4.3
8.2
5.9
100
07/03/06 - 07/09/06
168
4.8
10.2
6.4
100
07/10/06 - 07/16/06
168
3.9
7.4
5.2
100
07/17/06
- 07/23/06
168
4.1
9.3
5.3
100
07/24/06 - 07/30/06
168
4.6
9.4
6.4
100
07/31/06 - 08/06/06
168
5.2
13.1
7.0
100
08/07/06 - 08/13/06
168
4.5
7.6
6.1
100
TABLE A-18
(Continued
):
WEEKLY DO SUMMARY STATISTICS AT
CICERO AVENUE ON THE CALUMET-SAG CHANNEL DURING 2006
Number of
DO Concentration
(
mg/L)
Percent DO
Values Above
Monitoring Dates
DO Values
Minimum
Maximum
Mean
IPCB Standard
08/14/06 - 08/20/06
168
4.4
7.6
6.1
100
08/21/06 - 08/27/06
168
4.6
7.8
6.1
100
08/28
/
06 - 09
/
03/06
168
3.6
8.7
5.6
100
09/04/06 - 09
/
10/06
168
5.3
6.3
5.8
100
09/11/06 - 09/17/06
168
3.3
7.8
5.5
100
09/18/06 - 09/24/06
167
4.7
6.4
5.8
100
09/25
/
06- 10/01
/
06
168
5.5
7
.
5
6.2
100
10/02/06 - 10/08/06
168
4.5
7.1
6.1
100
10/09/06- 10/15/06
168
5.9
8.1
6.8
100
10/16/06 - 10/22/06
168
5.9
8.1
6.8
100
10/23/06 - 10/29/06
168
6.6
7.6
7.0
100
10/30/06- 11/05/06
169
6.5
8.2
7.3
100
11 /06/06 - 11/12/06
168
5.4
8.0
6.5
100
11/13/06 - 11/19/06
168
6.0
7.5
6.8
100
11 /20/06 - 11/26/06
168
6.4
7.6
7.0
100
11/27/06- 12/03/06
168
5.6
10.3
7.4
100
12/04/06- 12/10/06
168
7.3
10.5
8.9
100
12/11/06- 12/17/06
59
7.3
8.1
7.8
100
12/ 18/06 - 12/24/06
107
7.2
9.1
8.3
100
12/25/06 - 12/31/06
168
7.0
9.2
8.1
100
TABLE A-19: WEEKLY DO SUMMARY STATISTICS AT 104TH AVENUE
ON THE CALUMET-SAG CHANNEL DURING 2006
Number of
DO Concentration
(
mg/L)
Percent DO
Values Above
Monitoring Dates
DO Values
Minimum
Maximum
Mean
IPCB Standard
01/01/06 -
01/01/06
24
7.9
8.2
8.0
100
01/02/06 - 01/08/06
168
7.5
8.4
8.0
100
01/09/06
-
01
/
15/06
168
7.9
9.0
8.4
100
01/16/06 -
01/22/06
168
7.6
9.7
8.8
100
01/23/06 - 01/29/06
168
8.2
10.0
9.3
100
01/30/06
-
02/05/06
168
7.9
9.3
8.4
100
02/06/06 - 02/12/06
168
8.3
9.3
9.0
100
02/13/06 - 02/19/06
168
8.9
10.0
9.4
100
02/20/06 - 02/26/06
168
3.4
11.7
9.7
100
02/27/06 - 03/05/06
167
10.2
13.0
11.4
100
03/06/06
- 03/12/06
168
7.6
11.4
9.8
100
03/13/06 - 03/19/06
59
7.8
8.7
8.1
100
03/20/06 - 03/26/06
109
9.2
10.0
9.6
100
03/27/06 - 04/02/06
60
8.5
9.6
9.3
100
04/03/06 - 04/09/06
107
7.2
7.7
7.5
100
04/10/06 - 04/16/06
168
5.8
8.0
7.2
100
04/17/06
- 04/23
/
06
166
4.9
6.6
6.1
100
04/24/06 - 04/30/06
168
5.7
7.2
6.4
100
05/01/06
-
05
/
07/06
168
5.3
6.9
5.8
100
05/08/06 - 05/14/06
167
4.7
6.1
5.5
100
05/15/06
- 05/21/06
61
5.2
6.5
6.0
100
05/22/06
- 05/28/06
109
4.1
6.1
5.3
100
05/29/06
-
06/04/06
168
2.9
5.8
4.2
98
06/05/06 - 06/11/06
168
3.9
6.7
5.0
100
06/12/06 - 06/18/06
168
4.6
5.9
5.3
100
06/19/06 - 06/25/06
168
4.1
5.9
4.8
100
06/26/06 - 07/02/06
168
4.3
7.4
5.6
100
07/03
/
06 - 07/09/06
168
5.4
8.1
6.4
100
07/10/06
-
07/16/06
168
3.8
7.6
5.5
100
07/17/06 - 07/23/06
168
4.0
6.2
4.8
100
07/24
/
06 - 07
/
30/06
60
4.6
6.9
5.6
100
07/31/06
- 08/06/06
NO DATA
08/07/06 -
08/13/06
NO DATA
TABLE A-19 (Continued): WEEKLY DO SUMMARY STATISTICS AT
104TH AVENUE ON THE CALUMET-SAG CHANNEL DURING 2006
Number of
DO Concentration (mg/L)
Percent DO
Values Above
Monitoring Dates
DO Values
Minimum
Maximum
Mean
IPCB Standard
08/14/06 - 08/20/06
NO DATA
08/21/06 - 08/27/06
108
5.6
7.2
6.5
100
08/28/06 - 09/03/06
133
4.7
7.5
5.6
100
09/04/06 - 09/10/06
168
5.4
6.2
5.7
100
09/11/06 - 09/17/06
168
4.6
7.1
5.7
100
09/18/06 - 09/24/06
168
5.1
6.3
5.7
100
09/25/06 - 10/01/06
168
5.3
6.5
5.9
100
10/02/06 - 10/08/06
168
3.3
7.1
5.6
100
10/09/06- 10/15/06
168
5.4
7.2
6.3
100
10/16/06 - 10/22/06
83
5.5
7.7
6.7
100
10/23/06 - 10/29/06
84
6.7
8.0
7.5
100
10/30/06- 11/05/06
169
6.7
8.7
7.7
100
11/06/06 - 11/12/06
167
4.5
8.6
7.2
100
11/13/06 - 11/19/06
168
3.3
7.7
6.3
100
11/20/06 - 11/26/06
168
6.5
7.7
7.1
100
11/27/06- 12/03/06
168
5.9
10.5
7.5
100
12/04/06 - 12/10/06
59
10.4
10.8
10.6
100
12/11/06 - 12/17/06
84
7.9
9.2
8.4
100
12/18/06 - 12/24/06
169
7.4
9.3
8.2
100
12/25/06- 12/31/06
168
7.0
9.2
8.2
100
----------
A-8-
TABLE A-20: WEEKLY DO SUMMARY STATISTICS AT ROUTE 83
ON THE CALUMET-SAG CHANNEL DURING 2006
Number of
DO Concentration (mg/L)
Percent DO
Values Above
Monitoring Dates
DO Values
Minimum
Maximum
Mean
IPCB Standard
01/01/06
- 01/01/06
24
7.4
8.1
7.9
100
01/02/06
- 01/08/06
168
7.1
8.3
7.9
100
01/09/06 -
01/15/06
168
7.7
8.8
8.3
100
01/16/06 -
01/22/06
168
7.7
9.8
8.8
100
01/23/06
-
01/29/06
168
7.7
10.1
9.5
100
01/30/06
- 02/05/06
168
8.0
9.6
8.5
100
02/06/06 -
02/12/06
168
8.5
9.8
9.1
100
02/13/06 -
02/19/06
168
8.3
10.1
9.6
100
02/20/06 -
02/26/06
168
9.0
11.0
10.0
100
02/27/06
-
03/05/06
168
9.8
13.9
12.0
100
03/06/06
- 03/12/06
168
7.5
11.9
10.1
100
03/13/06 -
03/19/06
168
7.4
8.9
8.0
100
03/20/06 -
03/26/06
168
7.2
9.4
8.5
100
03/27/06
-
04/02/06
168
7.2
9.3
8.2
100
04/03/06 -
04/09/06
167
7.2
8.4
7.8
100
04/10/06
-
04/16/06
168
4.3
8.1
6.4
100
04/17/06
-
04/23/06
168
4.3
6.2
5.4
100
04/24/06 -
04/30/06
168
5.4
7.1
6.1
100
05/01/06 -
05/07/06
168
4.9
6.5
5.6
100
05/08/06
-
05/14/06
167
4.3
6.0
5.2
100
05/15/06
- 05/21/06
168
4.2
6.8
5.8
100
05/22/06
-
05/28/06
168
4.1
7.1
5.5
100
05/29/06 -
06/04/06
168
2.8
5.1
3.7
89
06/05/06
-
06/11/06
168
3.8
6.5
4.9
100
06/12/06
- 06/18/06
168
4.5
5.8
5.1
100
06/19/06
-
06/25/06
168
4.0
5.3
4.6
100
06/26/06 -
07/02/06
168
3.8
7.1
5.1
100
07/03/06
- 07/09/06
168
4.9
7.5
6.0
100
07/10/06
- 07/16/06
168
4.3
7.5
5.7
100
07/17/06
- 07/23/06
167
4.0
7.1
5.2
100
07/24/06
-
07/30/06
168
4.2
9.9
6.1
100
07/31/06
-
08/06/06
168
3.3
9.5
5.6
100
08/07/06
- 08/13/06
168
4.0
6.9
5.2
100
TABLE A-20 (Continued): WEEKLY DO SUMMARY STATISTICS AT
ROUTE 83 ON THE CALUMET-SAG CHANNEL DURING 2006
Number of
DO Concentration (mg/L)
Percent DO
Values Above
Monitoring Dates
DO Values
Minimum
Maximum
Mean
IPCB Standard
08/14/06 - 08/20/06
168
4.6
7.7
5.7
100
08/21/06 - 08/27/06
168
3.9
6.1
4.9
100
08/28/06 - 09/03/06
168
4.0
5.8
5.0
100
09/04/06 - 09/10/06
168
4.5
5.9
5.2
100
09/11/06 - 09/17/06
168
3.8
6.6
5.1
100
09/18/06 - 09/24/06
167
4.8
6.4
5.6
100
09/25/06 - 10/01/06
168
5.4
6.1
5.8
100
10/02/06 - 10/08/06
168
3.9
7.0
5.7
100
10/09/06 - 10/15/06
168
5.4
7.6
6.6
100
10/16/06 - 10/22/06
168
5.9
7.9
6.7
100
10/23/06 - 10/29/06
168
6.3
7.8
7.3
100
10/30/06- 11/05/06
169
6.7
8.1
7.5
100
11/06/06 - 11/12/06
168
5.5
8.2
7.0
100
11/13/06- 11/19/06
168
2.7
7.4
5.7
95
11/20/06 - 11/26/06
167
6.0
7.2
6.8
100
11/27/06- 12/03/06
168
5.6
9.9
7.3
100
12/04/06 - 12/10/06
168
8.7
10.5
9.8
100
12/11/06 - 12/17/06
168
7.5
9.1
8.3
100
12/18/06- 12/24/06
168
6.6
9.3
8.0
100
12/25/06 - 12/31/06
168
7.5
9.1
8.3
100
-- -- -A=40-
At
t
ac
hm
e
nt 4
Minutes
Gate
Flow
Total
Average Daily
Time Start
Time End
of Drawback
Opening
MGD
Drawback (MG)
Flow (MG)
5/2/05 7:00 AM
5/3/05 12:00 AM
1020.00
3 inches
21.19
15.01
15.01
5/3/05 12:00 AM
5/4/05 12:00 AM
1440.00
3 inches
21.19
21.19
21.19
5/4/05 12:00 AM
5/5/05 12:00 AM
1440.00
3 inches
21.19
21.19
21.19
5/5/05 12:00 AM
5/6/05 12:00 AM
1440.00
3 inches
21.19
21.19
21.19
5/6/05 12:00 AM
5/7/05 12:00 AM
1440.00
3 inches
21.19
21.19
21.19
5/7/05 12:00 AM
5/8/05 12:00 AM
1440.00
3 inches
21.19
21.19
21.19
5/8/05 12:00 AM
5/9/05 12:00 AM
1440.00
3 inches
21.19
21.19
21.19
5/9/05 12:00 AM
5/10/05 12:00 AM
1440.00
3 inches
21.19
21.19
21.19
5/10/05 12:00 AM
5/11/05 12:00 AM
1440.00
3 inches
21.19
21.19
21.19
:5/11/05
12:00 AM
5/12/05 12:00 AM
1440.00
3 inches
21.19
21.19
21.19
5/12/05
12:00 AM
5/13/05 12:00 AM
1440.00
3 inches
21.19
21.19
21.19
5/13/05 12:00 AM
5/14/05 12:00 AM
1440.00
3 inches
21.19
21.19
21.19
5/14/05 12:00 AM
5/15/05 12:00 AM
1440.00
3 inches
21.19
21.19
21.19
5/15/05
12:00 AM
5/16/05 12:00 AM
1440.00
3 inches
21.19
21.19
21.19
5/16/05
12:00 AM
5/17/05 12:00 AM
1440.00
3 inches
21.19
21.19
21.19
5/17/05
12:00 AM
5/18/05 12:00 AM
1440.00
3 inches
21.19
21.19
21.19
5/18/05 12:00 AM
5/19/05 12:00 AM
1440.00
3 inches
21.19
21.19
21.19
5/19/05 12:00 AM
5/19/05 7:00 AM
420.00
3 inches
21.19
6.18
5/19/05 12:30 PM
5/20/05 12:00 AM
690.00
3 inches
21.19
10.15
16.33
5/20/05 12:00 AM
5/20/05 7:40 AM
460.00
3 inches
21.19
6.77
5/20/05 7:40 AM
5/21/05 12:00 AM
980.00
6 inches
38.46
26.17
32.94
5/21/05 12:00 AM
5/22/05 12:00 AM
1440.00
6 inches
38.46
38.46
38.46
5/22/05 12:00 AM
5/23/05 12:00 AM
1440.00
6 inches
38.46
38.46
38.46
5/23/05 12:00 AM
5/24/05 12:00 AM
1440.00
6 inches
38.46
38.46
38.46
5/24/05 12:00 AM
5/24/05 7:00 AM
420.00
6 inches
38.46
11.22
5/24/05 7:00 AM
5/25/05 12:00 AM
1020.00
3 inches
21.19
15.01
26.23
5/25/05 12:00 AM
5/26/05 12:00 AM
1440.00
3 inches
21.19
21.19
21.19
5/26/05 12:00 AM
5/27/05 12:00 AM
1440.00
3 inches
21.19
21.19
21.19
5/27/05 12:00 AM
5/28/05 12:00 AM
1440.00
3 inches
21.19
21.19
21.19
5/28/05 12:00 AM
5/29/05 12:00 AM
1440.00
3 inches
21.19
21.19
21.19
5/29/05 12:00 AM
5/30/05 12:00 AM
1440.00
3 inches
21.19
21.19
21.19
5/30/05 12:00 AM
5/31/05 12:00 AM
1440.00
3 inches
21.19
21.19
21.19
5/31/05 12:00 AM
6/1/05 12:00 AM
1440.00
3 inches
21.19
21.19
21.19
6/1/05 12:00 AM
6/2/05 12:00 AM
1440.00
3 inches
21.19
21.19
21.19
6/2/05 12:00 AM
6/3/05 12:00 AM
1440.00
3 inches
21.19
21.19
21.19
6/3/05 12:00 AM
6/4/05 12:00 AM
1440.00
3 inches
21.19
21.19
21.19
6/4/05 12:00 AM
6/4/05 3:30 PM
930.00
3 inches
21.19
13.69
13.69
6/5/05 12:00 AM
6/6/05 12:00 AM
0.00
0.00
0.00
0.00
6/6/05 8:30 AM
6/7/05 12:00 AM
930.00
3 inches
21.19
13.69
13.69
6/7/05 12:00 AM
6/8/05 12:00 AM
1440.00
3 inches
21.19
21.19
21.19
6/8/05 12:00 AM
6/9/05 12:00 AM
1440.00
3 inches
21.19
21.19
21.19
6/9/05 12:00 AM
6/10/05 12:00 AM
1440.00
3 inches
21.19
21.19
21.19
6/10/05 12:00 AM
6/11/05 12:00 AM
1440.00
3 inches
21.19
21.19
21.19
6/11/05 12:00 AM
6/12/05 12:00 AM
1440.00
3 inches
21.19
21.19
21.19
6/12/05 12:00 AM
6/13/05 12:00 AM
1440.00
3 inches
21.19
21.19
21.19
6/13/05 12:00 AM
6/14/05 12:00 AM
1440.00
3 inches
21.19
21.19
21.19
6/14/05 12:00 AM
6/15/05 12:00 AM
1440.00
3 inches
21.19
21.19
21.19
6/15/05 12:00 AM
6/15/05 7:15 AM
435.00
3 inches
21.19
6.40
6/15/05 7:15 AM
6/16/05 12:00 AM
1005.00
5 inches
32.7
22.82
29.22
6/16/05 12:00 AM
6/17/05 12:00 AM
1440.00
5 inches
32.7
32.70
32.70
6/17/05 12:00 AM
6/18/05 12:00 AM
1440.00
5 inches
32.7
32.70
32.70
6/18/05 12:00 AM
6/19/05 12:00 AM
1440.00
5 inches
32.7
32.70
32.70
6/19/05 12:00 AM
6/20/05 12:00 AM
1440.00
5 inches
32.7
32.70
32.70
6/20/05 12:00 AM
6/21/05 12:00 AM
1440.00
5 inches
32.7
32.70
32.70
6/21/05 12:00 AM
6/22/05 12:00 AM
1440.00
5 inches
32.7
32.70
32.70
6/22/05 12:00 AM
6/23/05 12:00 AM
1440.00
5 inches
32.7
32.70
32.70
6/23/05 12:00 AM
6/24/05 12:00 AM
1440.00
5 inches
32.7
32.70
32.70
6/24/05 12:00 AM
6/25/05 12:00 AM
1440.00
5 inches
32.7
32.70
32.70
6/25/05 12:00 AM
6/26/05 12:00 AM
1440.00
5 inches
32.7
32.70
32.70
6/26/05 12:00 AM
6/27/05 12:00 AM
1440.00
5 inches
32.7
32.70
32.70
6/27/05 12:00 AM
6/28/05 12:00 AM
1440.00
5 inches
32.7
32.70
32.70
6/28/05 12:00 AM
6/29/05 12:00 AM
1440.00
5 inches
32.7
32.70
32.70
6/29/05 12:00 AM
6/29/05 2:15 PM
855.00
5 inches
32.7
19.42
6/29/05 2:15 PM
6/29/05 9:30 PM
435.00
3 inches
21.19
6.40
6/29/05 9:30 PM
6/30/05 12:00 AM
150.00
5 inches
32.7
3.41
29.22
6/30/05 12:00 AM
7/1/05 12:00 AM
1440.00
5 inches
32.7
32.70
32.70
7/1/05 12:00 AM
7/2/05 12:00 AM
1440.00
5 inches
32.7
32.70
32.70
7/2/05 12:00 AM
7/3/05 12:00 AM
1440.00
5 inches
32.7
32.70
32.70
7/3/05 12:00 AM
7/4/05 12:00 AM
1440.00
5 inches
32.7
32.70
32.70
7/4/05 12:00 AM
7/5/05 12:00 AM
1440.00
5 inches
32.7
32.70
32.70
7/5/05 12:00 AM
7/6/05 12:00 AM
1440.00
5 inches
32.7
32.70
32.70
7/6/05 12:00 AM
7/7/05 12:00 AM
1440.00
5 inches
32.7
32.70
32.70
7/7/05 12:00 AM
7/8/05 12:00 AM
1440.00
5 inches
32.7
32.70
32.70
7/8/05 12:00 AM
7/9/05 12:00 AM
1440.00
5 inches
32.7
32.70
32.70
7/9/05 12:00 AM
7/10/05 12:00 AM
1440.00
5 inches
32.7
32.70
32.70
7/10/05 12:00 AM
7/11/05 12:00 AM
1440.00
5 inches
32.7
32.70
32.70
7/11/05 12:00 AM
7/12/05 12:00 AM
1440.00
5 inches
32.7
32.70
32.70
7/12/05 12:00 AM
7/13/05 12:00 AM
1440.00
5 inches
32.7
32.70
32.70
7/13/05 12:00 AM
7/14/05 12:00 AM
1440.00
5 inches
32.7
32.70
32.70
7/14/05 12:00 AM
7/15/05 12:00 AM
1440.00
5 inches
32.7
32.70
32.70
7/15/05 12:00 AM
7/16/05 12:00 AM
1440.00
5 inches
32.7
32.70
32.70
7/16/05 12:00 AM
7/17/05 12:00 AM
1440.00
5 inches
32.7
32.70
32.70
7/17/05 12:00 AM
7/18/05 12:00 AM
1440.00
5 inches
32.7
32.70
32.70
7/18/05 12:00 AM
7/19/05 12:00 AM
1440.00
5 inches
32.7
32.70
32.70
7/19/05 12:00 AM
7/20/05 12:00 AM
1440.00
5 inches
32.7
32.70
32.70
7/20/05 12:00 AM
7/21/05 12:00 AM
1440.00
5 inches
32.7
32.70
32.70
7/21/05 12:00 AM
7/22/05 12:00 AM
1440.00
5 inches
32.7
32.70
32.70
7/22/05 12:00 AM
7/23/05 12:00 AM
1440.00
5 inches
32.7
32.70
32.70
7/23/05 12:00 AM
7/24/05 12:00 AM
1440.00
5 inches
32.7
32.70
32.70
7/24/05 12:00 AM
7/25/05 12:00 AM
1440.00
5 inches
32.7
32.70
32.70
7/25/05 12:00 AM
7/25/05 11:35 AM
695.00
5 inches
32.70
15.78
7/25/05 11:35 AM
7/25/05 4:20 PM
285.00
0 inches
0.00
0.00
7/25/05 4:20 PM
7/26/05 12:00 AM
460.00
5 inches
32.70
10.45
26.23
7/26/05 12:00 AM
7/26/05 6:25 PM
1105.00
5 inches
32.70
25.09
7/26/05 6:25 PM
7/27/05 12:00 AM
335.00
0 inches
0.00
0.00
25.09
7/27/05 12:00 AM
7/27/05 3:10 AM
190.00
0 inches
0.00
0.00
7/27/05 3:10 AM
7/28/05 12:00 AM
1250.00
5 inches
32.70
28.39
28.39
7/28/05 12:00 AM
7/29/05 12:00 AM
1440.00
5 inches
32.7
32.70
32.70
7/29/05 12:00 AM
7/30/05 12:00 AM
1440.00
5 inches
32.7
32.70
32.70
7/30/05 12:00 AM
7/31/05 12:00 AM
1440.00
5 inches
32.7
32.70
32.70
7/31/05 12:00 AM
8/1/05 12:00 AM
1440.00
5 inches
32.7
32.70
32.70
8/1/05 12:00 AM
8/2/05 12:00 AM
1440.00
5 inches
32.7
32.70
32.70
8/2/05 12:00 AM
8/3/05 12:00 AM
1440.00
5 inches
32.7
32.70
32.70
8/3/05 12:00 AM
8/4/05 12:00 AM
1440.00
5 inches
32.7
32.70
32.70
8/4/05 12:00 AM
8/5/05 12:00 AM
1440.00
5 inches
32.7
32.70
32.70
8/5/05 12:00 AM
8/6/05 12:00 AM
1440.00
5 inches
32.7
32.70
32.70
8/6/05 12:00 AM
8/7/05 12:00 AM
1440.00
5 inches
32.7
32.70
32.70
8/7/05 12:00 AM
8/8/05 12:00 AM
1440.00
5 inches
32.7
32.70
32.70
8/8/05 12:00 AM
8/9/05 12:00 AM
1440.00
5 inches
32.7
32.70
32.70
8/9/05 12:00 AM
8/10/05 12:00 AM
1440.00
5 inches
32.7
32.70
32.70
8/10/05 12:00 AM
8/11/05 12:00 AM
1440.00
5 inches
32.7
32.70
32.70
8/11/05 12:00 AM
8/11/05 11:25 AM
685.00
5 inches
32.7
15.56
8/11/05 11:25 AM
8/12/05 12:00 AM
755.00
0
0
0.00
15.56
8/12/05 12:00 AM
8/12/05 1:20 AM
80.00
0
0
0.00
8/12/05 10:20 AM
8/13/05 12:00 AM
820.00
5 inches
32.7
18.62
18.62
8/13/05 12:00 AM
8/13/05 1:00 PM
780.00
5 inches
32.7
17.71
8/13/05 1:00 PM
8/14/05 12:00 AM
660.00
0
0
0.00
17.71
8/14/05 12:00 AM
8/14/05 6:00 AM
360.00
0
0
0.00
8/14/05 6:00 AM
8/15/05 12:00 AM
1080.00
5 inches
32.7
24.53
24.53
8/15/05 12:00 AM
8/16/05 12:00 AM
1440.00
5 inches
32.7
32.70
32.70
8/16/05 12:00 AM
8/17/05 12:00 AM
1440.00
5 inches
32.7
32.70
32.70
8/17/05 12:00 AM
8/18/05 12:00 AM
1440.00
5 inches
32.7
32.70
32.70
8/18/05 12:00 AM
8/18/05 1:50 PM
830.00
5 inches
32.7
18.85
8/18/05 1:50 PM
8/19/05 12:00 AM
610.00
0
0
0.00
18.85
8/19/05 12:00 AM
8/19/05 3:10 PM
910.00
0
0
0.00
8/19/05 3:10 PM
8/20/05 12:00 AM
530.00
5 inches
32.7
12.04
12.04
8/20/05 12:00 AM
8/20/05 1:20 AM
80.00
5 inches
32.7
1.82
8/20/05 1:20 AM
8/21/05 12:00 AM
1360.00
0
0
0.00
1.82
8/21/05 12:00 AM
8/21/05 10:45 AM
645.00
0
0
0.00
8/21/05 10:45 AM
8/22/05 12:00 AM
795.00
5 inches
32.7
18.05
18.05
8/22/05 12:00 AM
8/23/05 12:00 AM
1440.00
5 inches
32.7
32.70
32.70
8/23/05 12:00 AM
8/24/05 12:00 AM
1440.00
5 inches
32.7
32.70
32.70
8/24/05 12:00 AM
8/25/05 12:00 AM
1440.00
5 inches
32.7
32.70
32.70
8/25/05 12:00 AM
8/26/05 12:00 AM
1440.00
5 inches
32.7
32.70
32.70
8/26/05 12:00 AM
8/27/05 12:00 AM
1440.00
5 inches
32.7
32.70
32.70
8/27/05 12:00 AM
8/28/05 12:00 AM
1440.00
5 inches
32.7
32.70
32.70
8/28/05 12:00 AM
8/29/05 12:00 AM
1440.00
5 inches
32.7
32.70
32.70
8/29/05 12:00 AM
8/30/05 12:00 AM
1440.00
5 inches
32.7
32.70
32.70
8/30/05
12:00 AM
8/31/05 12:00 AM
1440.00
5 inches
32.7
32.70
32.70
8/31/05
12:00 AM
9/l/05 12:00 AM
1440.00
5 inches
32.7
32.70
32.70
9/l/05
12:00 AM
9/2/05 12:00 AM
1440.00
5 inches
32.7
32.70
32.70
9/2/05 12:00 AM
9/3/05 12:00 AM
1440.00
5 inches
32.7
32.70
32.70
9/3/05 12:00 AM
9/4/05 12:00 AM
1440.00
5 inches
32.7
32.70
32.70
9/4/05 12:00 AM
9/5/05 12:00 AM
1440.00
5 inches
32.7
32.70
32.70
9/5/05 12:00 AM
9/6/05 12:00 AM
1440.00
5 inches
32.7
32.70
32.70
9/6/05
12:00 AM
9/7/05 12:00 AM
1440.00
5 inches
32.7
32.70
32.70
9/7/05 12:00 AM
9/8/05 12:00 AM
1440.00
5 inches
32.7
32.70
32.70
9/8/05 12:00 AM
9/9/05 12:00 AM
1440.00
5 inches
32.7
32.70
32.70
9/9/05 12:00 AM
9/10/05 12:00 AM
1440.00
5 inches
32.7
32.70
32.70
9/10/05 12:00 AM
9/11/05 12:00 AM
1440.00
5 inches
32.7
32.70
32.70
1
9/11/05
12:00 AM
9/12/05 12:00 AM
1440.00
5 inches
32.7
32.70
32.70
9/12/05
12:00 AM
9/13/05 12:00 AM
1440.00
5 inches
32.7
32.70
32.70
9/13/05 12:00 AM
9/14/05 12:00 AM
1440.00
5 inches
32.7
32.70
32.70
9/14/05 12:00 AM
9/15/05 12:00 AM
1440.00
5 inches
32.7
32.70
32.70
9/15/05 12:00 AM
9/16/05 12:00 AM
1440.00
5 inches
32.70
32.70
32.70
9/16/05 12:00 AM
9/17/05 12:00 AM
1440.00
5 inches
32.70
32.70
32.70
9/17/05 12:00 AM
9/18/05 12:00 AM
1440.00
5 inches
32.70
32.70
32.70
9/18/05 12:00 AM
9/19/05 12:00 AM
1440.00
5 inches
32.70
32.70
32.70
9/19/05 12:00 AM
9/20/05 12:00 AM
1440.00
5 inches
32.70
32.70
32.70
9/20/05 12:00 AM
9/21/05 12:00 AM
1440.00
5 inches
32.70
32.70
32.70
9/21/05 12:00 AM
9/22/05 12:00 AM
1440.00
5 inches
32.70
32.70
32.70
9/22/05 12:00 AM
9/23/05 12:00 AM
1440.00
5 inches
32.70
32.70
32.70
9/23/05 12:00 AM
9/24/05 12:00 AM
1440.00
5 inches
32.70
32.70
32.70
9/24/05 12:00 AM
9/25/05 12:00 AM
1440.00
5 inches
32.70
32.70
32.70
9/25/05 12:00 AM
9/26/05 12:00 AM
1440.00
5 inches
32.70
32.70
32.70
9/26/05 12:00 AM
9/27/05 12:00 AM
1440.00
5 inches
32.70
32.70
32.70
9/27/05 12:00 AM
9/28/05 12:00 AM
1440.00
5 inches
32.70
32.70
32.70
9/28/05 12:00 AM
9/28/05 6:15 PM
1095.00
5 inches
32.70
24.87
9/28/05 6:15 PM
9/29/05 12:00 AM
345.00
0 inches
0.00
0.00
24.87
9/29/05 12:00 AM
9/29/05 7:25 AM
445.00
0 inches
0.00
0.00
9/29/05 7:25 AM
9/30/05 12:00 AM
995.00
5 inches
32.70
22.59
22.59
9/30/05 12:00 AM
10/l/05 12:00 AM
1440.00
5 inches
32.70
32.70
32.70
10/l/05 12:00 AM
10/2/05 12:00 AM
1440.00
5 inches
32.70
32.70
32.70
10/2/05 12:00 AM
10/3/05 12:00 AM
1440.00
5 inches
32.70
32.70
32.70
10/3/05 12:00 AM
10/4/05 12:00 AM
1440.00
5 inches
32.70
32.70
32.70
10/4/05 12:00 AM
10/5/05 12:00 AM
1440.00
5 inches
32.70
32.70
32.70
10/5/05 12:00 AM
10/6/05 12:00 AM
1440.00
5 inches
32.70
32.70
32.70
10/6/05 12:00 AM
10/7/05 12:00 AM
1440.00
5 inches
32.70
32.70
32.70
10/7/05 12:00 AM
10/8/05 12:00 AM
1440.00
5 inches
32.70
32.70
32.70
10/8/05 12:00 AM
10/9/05 12:00 AM
1440.00
5 inches
32.70
32.70
32.70
10/9/05 12:00 AM
10/10/05 12:00 AM
1440.00
5 inches
32.70
32.70
32.70
10/10/05 12:00 AM
10/11/05 12:00 AM
1440.00
5 inches
32.70
32.70
32.70
10/11/05
12:00 AM
10/12/05 12:00 AM
1440.00
5 inches
32.70
32.70
32.70
10/12/05
12:00 AM
10/13/05
12:00 AM
1440.00
5 inches
32.70
32.70
32.70
10/13/05
12:00 AM
10/14/05 12:00 AM
1440.00
5 inches
32.70
32.70
32.70
10/14/05
12:00 AM
10/15/05
12:00 AM
1440.00
5 inches
32.70
32.70
32.70
10/15/05 12:00 AM
10/16/05
12:00 AM
1440.00
5 inches
32.70
32.70
32.70
10/16/05
12:00 AM
10/17/05 12:00 AM
1440.00
5 inches
32.70
32.70
32.70
10/17/05
12:00 AM
10/18/05
12:00 AM
1440.00
5 inches
32.70
32.70
32.70
10/18/05 12:00 AM
10/19/05
12:00 AM
1440.00
5 inches
32.70
32.70
32.70
10/19/05
12:00 AM
10/20/05 12:00 AM
1440.00
5 inches
32.70
32.70
32.70
10/20/05 12:00 AM
10/21/05
12:00 AM
1440.00
5 inches
32.70
32.70
32.70
10/21/05 12:00 AM
10/22/05 12:00 AM
1440.00
5 inches
32.70
32.70
32.70
10/22/05 12:00 AM
10/23/05 12:00 AM
1440.00
5 inches
32.70
32.70
32.70
10/23/05 12:00 AM
10/24/05
12:00 AM
1440.00
5 inches
32.70
32.70
32.70
10/24/05 12:00 AM
10/24/05 3:00 AM
180.00
5 inches
32.70
4.09
10/24/05 3:00 AM
10/25/05 12:00 AM
1260.00
0 inches
0.00
0.00
4.09
10/25/05 12:00 AM
10/25/05 2:00 PM
840.00
0 inches
0.00
0.00
10/25/05 2:00 PM
10/26/05 12:00 AM
600.00
5 inches
32.70
13.62
13.62
10/26/05 12:00 AM
10/27/05 12:00 AM
1440.00
5 inches
32.70
32.70
32.70
10/27/05 12:00 AM
10/28/05 12:00 AM
1440.00
5 inches
32.70
32.70
32.70
10/28/05 12:00 AM
10/29/05 12:00 AM
1440.00
5 inches
32.70
32.70
32.70
10/29/05 12:00 AM
10/30/05 12:00 AM
1440.00
5 inches
32.70
32.70
32.70
10/30/05 12:00 AM
10/31/05 12:00 AM
1440.00
5 inches
32.70
32.70
32.70
10/31/05 12:00 AM
10/31/05 3:00 PM
900.00
5 inches
32.70
20.44
10/31/05 3:00 PM
"CLOSED FOR THE SEASON"
5,261.35
Time Start
Time End
Minutes
of Drawback
Gate
Opening
Flow
MGD
Total
Drawback
(
MG)
Average Daily
Flow (MG)
4/14/06 7:00 AM
4/15/06 12:00 AM
1020.00
3 inches
21.19
15.01
15.01
4/15/06 12:00 AM
4/16/06 12:00 AM
1440.00
3 inches
21.19
21.19
21.19
4/16/06 12:00 AM
4/16/06 4:15 PM
975.00
3 inches
21.19
14.35
4/16/06 4:15 PM
4/17/06 12:00 AM
465.00
0 inches
0.00
0.00
14.35
4/17/06 12:00 AM
4/17/06 7:00 AM
420.00
0 inches
0.00
0.00
4/17/06 7:00 AM
4/18/06 12:00 AM
1020.00
6 inches
38.46
27.24
27.24
4/18/06 12:00 AM
4/19/06 12:00 AM
1440.00
6 inches
38.46
38.46
38.46
4/19/06 12:00 AM
4/20/06 12:00 AM
1440.00
6 inches
38.46
38.46
38.46
4/20/06 12:00 AM
4/20/06 5:15 AM
315.00
6 inches
38.46
8.41
4/20/06 5:15 AM
4/20/06 1:00 PM
465.00
0 inches
0.00
0.00
4/20/06 1:00 PM
4/21/06 12:00 AM
660.00
6 inches
38.46
17.63
26.04
4/21/06 12:00 AM
4/21/06 1:30 PM
810.00
6 inches
38.46
21.63
4/21/06 1:30 PM
4/22/06 12:00 AM
630.00
3 inches
21.19
9.27
30.90
4/22/06 12:00 AM
4/23/06 12:00 AM
1440.00
3 inches
21.19
21.19
21.19
4/23/06 12:00 AM
4/24/06 12:00 AM
1440.00
3 inches
21.19
21.19
21.19
4/24/06 12:00 AM
4/25/06 12:00 AM
1440.00
3 inches
21.19
21.19
21.19
4/25/06 12:00 AM
4/26/06 12:00 AM
1440.00
3 inches
21.19
21.19
21.19
4/26/06 12:00 AM
4/27/06 12:00 AM
1440.00
3 inches
21.19
21.19
21.19
4/27/06 12:00 AM
4/28/06 12:00 AM
1440.00
3 inches
21.19
21.19
21.19
4/28/06 12:00 AM
4/29/06 12:00 AM
1440.00
3 inches
21.19
21.19
21.19
4/29/06 12:00 AM
4/30/06 12:00 AM
1440.00
3 inches
21.19
21.19
21.19
4/30/06 12:00 AM
4/30/06 8:15 AM
495.00
3 inches
21.19
7.28
4/30/06 8:15 AM
5/1/06 12:00 AM
945.00
0 inches
0.00
0.00
7.28
5/1/06 12:00 AM
5/1/06 9:50 AM
590.00
0 inches
0.00
0.00
5/1/06 9:50 AM
5/2/06 12:00 AM
850.00
3 inches
21.19
12.51
12.51
5/2/06 12:00 AM
5/3/06 12:00 AM
1440.00
3 inches
21.19
21.19
21.19
5/3/06 12:00 AM
5/4/06 12:00 AM
1440.00
3 inches
21.19
21.19
21.19
5/4/06 12:00 AM
5/5/06 12:00 AM
1440.00
3 inches
21.19
21.19
21.19
5/5/06 12:00 AM
5/6/06 12:00 AM
1440.00
3 inches
21.19
21.19
21.19
5/6/06 12:00 AM
5/7/06 12:00 AM
1440.00
3 inches
21.19
21.19
21.19
5/7/06 12:00 AM
5/8/06 12:00 AM
1440.00
3 inches
21.19
21.19
21.19
5/8/06 12:00 AM
5/9/06 12:00 AM
1440.00
3 inches
21.19
21.19
21.19
5/9/06 12:00 AM
5/10/06 12:00 AM
1440.00
3 inches
21.19
21.19
21.19
5/10/06 12:00 AM
5/11/06 12:00 AM
1440.00
3 inches
21.19
21.19
21.19
5/11/06 12:00 AM
5/11/06 12:45 AM
45.00
3 inches
21.19
0.66
5/11/06 12:45 AM
5/12/06 12:00 AM
1395.00
0 inches
0.00
0.00
0.66
5/12/06 12:00 AM
5/12/06 7:45 AM
465.00
0 inches
0.00
0.00
5/12/06 7:45 AM
5/13/06 12:00 AM
975.00
3 inches
21.19
14.35
14.35
5/13/06 12:00 AM
5/14/06 12:00 AM
1440.00
3 inches
21.19
21.19
21.19
5/14/06 12:00 AM
5/15/06 12:00 AM
1440.00
3 inches
21.19
21.19
21.19
5/15/06 12:00 AM
5/16/06 12:00 AM
1440.00
3 inches
21.19
21.19
21.19
5/16/06 12:00 AM
5/17/06 12:00 AM
1440.00
3 inches
21.19
21.19
21.19
5/17/06 12:00 AM
5/17/06 6:05 PM
1085.00
3 inches
21.19
15.97
5/17/06 6:05 PM
5/18/06 12:00 AM
355.00
0 inches
0.00
0.00
15.97
5/18/06 12:00 AM
5/18/06 7:10 AM
430.00
0 inches
0.00
0.00
5/18/06 7:10 AM
5/19/06 12:00 AM
1010.00
3 inches
21.19
14.86
14.86
5/19/06 12:00 AM
5/20/06 12:00 AM
1440.00
3 inches
21.19
21.19
21.19
5/20/06 12:00 AM
5/21/06 12:00 AM
1440.00
3 inches
21.19
21.19
21.19
5/21/06 12:00 AM
5/22/06 12:00 AM
1440.00
3 inches
21.19
21.19
21.19
5/22/06 12:00 AM
5/23/06 12:00 AM
1440.00
3 inches
21.19
21.19
21.19
5/23/06 12:00 AM
5/24/06 12:00 AM
1440.00
3 inches
21.19
21.19
21.19
5/24/06 12:00 AM
5/24/06 11:10 PM
1390.00
3 inches
21.19
20.45
5/24/06 11:10 PM
5/25/06 12:00 AM
50.00
0 inches
0.00
0.00
20.45
5/25/06 12:00 AM
5/25/06 11:00 AM
660.00
0 inches
0.00
0.00
5/25/06 11:00 AM
5/26/06 12:00 AM
780.00
3 inches
21.19
11.48
11.48
5/26/06 12:00 AM
5/27/06 12:00 AM
1440.00
3 inches
21.19
21.19
21.19
5/27/06 12:00 AM
5/28/06 12:00 AM
1440.00
3 inches
21.19
21.19
21.19
5/28/06 12:00 AM
5/29/06 12:00 AM
1440.00
3 inches
21.19
21.19
21.19
5/29/06 12:00 AM
5/30/06 12:00 AM
1440.00
3 inches
21.19
21.19
21.19
5/30/06 12:00 AM
5/30/06 9:45 PM
1305.00
3 inches
21.19
19.20
5/30/06 9:45 PM
5/31/06 12:00 AM
135.00
0 inches
0.00
0.00
19.20
5/31/06 12:00 AM
5/31/06 7:10 AM
430.00
0 inches
0.00
0.00
5/31/06 7:10 AM
6/1/06 12:00 AM
1010.00
3 inches
21.19
14.86
14.86
6/1/06 12:00 AM
6/2/06 12:00 AM
1440.00
3 inches
21.19
21.19
21.19
6/2/06 12:00 AM
6/3/06 12:00 AM
1440.00
3 inches
21.19
21.19
21.19
6/3/06 12:00 AM
6/4/06 12:00 AM
1440.00
3 inches
21.19
21.19
21.19
6/4/06 12:00 AM
6/5/06 12:00 AM
1440.00
3 inches
21.19
21.19
21.19
6/5/06 12:00 AM
6/6/06 12:00 AM
1440.00
3 inches
21.19
21.19
21.19
6/6/06 12:00 AM
6/7/06 12:00 AM
1440.00
3 inches
21.19
21.19
21.19
6/7/06 12:00 AM
6/8/06 12:00 AM
1440.00
3 inches
21.19
21.19
21.19
6/8/06 12:00 AM
6/9/06 12:00 AM
1440.00
3 inches
21.19
21.19
21.19
6/9/06 12:00 AM
6/10/06 12:00 AM
1440.00
3 inches
21.19
21.19
21.19
6/10/06 12:00 AM
6/10/06 7:15 AM
435.00
3 inches
21.19
6.40
6/10/06 7:15 AM
6/10/06 9:00 PM
825.00
0 inches
0.00
0.00
6/10/06 9:00 PM
6/11/06 12:00 AM
180.00
6 inches
38.46
4.81
11.21
6/11/06 12:00 AM
6/12/06 12:00 AM
1440.00
6 inches
38.46
38.46
38.46
6/12/06 12:00 AM
6/13/06 12:00 AM
1440.00
6 inches
38.46
38.46
38.46
6/13/06 12:00 AM
6/14/06 12:00 AM
1440.00
6 inches
38.46
38.46
38.46
6/14/06 12:00 AM
6/15/06 12:00 AM
1440.00
6 inches
38.46
38.46
38.46
6/15/06 12:00 AM
6/15/06 9:30 AM
570.00
6 inches
38.46
15.22
6/15/06 9:30 AM
6/16/06 12:00 AM
870.00
3 inches
21.19
12.80
28.03
6/16/06 12:00 AM
6/17/06 12:00 AM
1440.00
3 inches
21.19
21.19
21.19
6/17/06 12:00 AM
6/18/06 12:00 AM
1440.00
3 inches
21.19
21.19
21.19
6/18/06 12:00 AM
6/19/06 12:00 AM
1440.00
3 inches
21.19
21.19
21.19
6/19/06 12:00 AM
6/20/06 12:00 AM
1440.00
3 inches
21.19
21.19
21.19
6/20/06 12:00 AM
6/21/06 12:00 AM
1440.00
3 inches
21.19
21.19
21.19
6/21/06 12:00 AM
6/22/06 12:00 AM
1440.00
3 inches
21.19
21.19
21.19
6/22/06 12:00 AM
6/23/06 12:00 AM
1440.00
3 inches
21.19
21.19
21.19
6/23/06 12:00 AM
6/24/06 12:00 AM
1440.00
3 inches
21.19
21.19
21.19
6/24/06 12:00 AM
6/25/06 12:00 AM
1440.00
3 inches
21.19
21.19
21.19
6/25/06 12:00 AM
6/26/06 12:00 AM
1440.00
3 inches
21.19
21.19
21.19
6/26/06 12:00 AM
6/27/06 12:00 AM
1440.00
3 inches
21.19
21.19
21.19
6/27/06 12:00 AM
6/28/06 12:00 AM
1440.00
3 inches
21.19
21.19
21.19
6/28/06 12:00 AM
6/29/06 12:00 AM
1440.00
3 inches
21.19
21.19
21.19
6/29/06 12:00 AM
6/30/06 12:00 AM
1440.00
3 inches
21.19
21.19
21.19
6/30/06 12:00 AM
7/1/06 12:00 AM
1440.00
3 inches
21.19
21.19
21.19
7/1/06 12:00 AM
7/2/06 12:00 AM
1440.00
3 inches
21.19
21.19
21.19
7/2/06 12:00 AM
7/3/06 12:00 AM
1440.00
3 inches
21.19
21.19
21.19
7/3/06 12:00 AM
7/3/06 8:30 AM
510.00
3 inches
21.19
7.50
7/3/06 8:30 AM
7/4/06 12:00 AM
930.00
0 inches
0.00
0.00
7.50
7/4/06 12:00 AM
7/5/06 12:00 AM
1440.00
0 inches
0.00
0.00
0.00
7/5/06 12:00 AM
7/5/06 7:30 AM
450.00
0 inches
0.00
0.00
7/5/06 7:30 AM
7/6/06 12:00 AM
990.00
3 inches
21.19
14.57
14.57
7/6/06 12:00 AM
7/7/06 12:00 AM
1440.00
3 inches
21.19
21.19
21.19
7/7/06 12:00 AM
7/8/06 12:00 AM
1440.00
3 inches
21.19
21.19
21.19
7/8/06 12:00 AM
7/9/06 12:00 AM
1440.00
3 inches
21.19
21.19
21.19
7/9/06 12:00 AM
7/10/06 12:00 AM
1440.00
3 inches
21.19
21.19
21.19
7/10/06 12:00 AM
7/11/06 12:00 AM
1440.00
3 inches
21.19
21.19
21.19
7/11/06 12:00 AM
7/11/06 12:25 PM
745.00
3 inches
21.19
10.96
7/11/06 12:25 PM
7/12/06 12:00 AM
695.00
0 inches
0.00
0.00
10.96
7/12/06 12:00 AM
7/13/06 12:00 AM
1440.00
0 inches
0.00
0.00
0.00
7/13/06 12:00 AM
7/14/06 12:00 AM
1440.00
0 inches
0.00
0.00
7/14/06 12:00 AM
7/14/06 2:30 PM
870.00
0 inches
0.00
0.00
7/14/06 2:30 PM
7/15/06 12:00 AM
570.00
3 inches
21.19
8.39
8.39
7/15/06 12:00 AM
7/16/06 12:00 AM
1440.00
3 inches
21.19
21.19
21.19
7/16/06 12:00 AM
7/17/06 12:00 AM
1440.00
3 inches
21.19
21.19
21.19
7/17/06 12:00 AM
7/18/06 12:00 AM
1440.00
3 inches
21.19
21.19
21.19
7/18/06 12:00 AM
7/19/06 12:00 AM
1440.00
3 inches
21.19
21.19
21.19
7/19/06 12:00 AM
7/20/06 12:00 AM
1440.00
3 inches
21.19
21.19
21.19
7/20/06 12:00 AM
7/20/06 7:00 AM
420.00
3 inches
21.19
6.18
7/20/06 7:00 AM
7/21/06 12:00 AM
1020.00
0 inches
0.00
0.00
6.18
7/21/06 12:00 AM
7/21/06 9:05 AM
545.00
0 inches
0.00
0.00
7/21/06 9:05 AM
7/22/06 12:00 AM
895.00
6 inches
38.46
23.90
23.90
7/22/06 12:00 AM
7/23/06 12:00 AM
1440.00
6 inches
38.46
38.46
38.46
7/23/06 12:00 AM
7/24/06 12:00 AM
1440.00
6 inches
38.46
38.46
38.46
7/24/06 12:00 AM
7/25/06 12:00 AM
1440.00
6 inches
38.46
38.46
38.46
7/25/06 12:00 AM
7/25/06 9:00 AM
540.00
6 inches
38.46
14.42
7/25/06 9:00 AM
7/26/06 12:00 AM
900.00
3 inches
21.19
13.24
27.67
7/26/06 12:00 AM
7/26/06 12:25 AM
25.00
3 inches
21.19
0.37
7/26/06 12:25 AM
7/26/06 1:50 PM
805.00
0 inches
0.00
0.00
7/26/06 1:50 PM
7/27/06 12:00 AM
610.00
3 inches
21.19
8.98
9.34
7/27/06 12:00 AM
7/28/06 12:00 AM
1440.00
3 inches
21.19
21.19
21.19
7/28/06 12:00 AM
7/29/06 12:00 AM
1440.00
3 inches
21.19
21.19
21.19
7/29/06 12:00 AM
7/30/06 12:00 AM
1440.00
3 inches
21.19
21.19
21.19
7/30/06 12:00 AM
7/31/06 12:00 AM
1440.00
3 inches
21.19
21.19
21.19
7/31/06 12:00 AM
8/1/06 12:00 AM
1440.00
3 inches
21.19
21.19
21.19
8/1/06 12:00 AM
8/2/06 8:40 PM
2680.00
3 inches
21.19
39.44
8/2/06 8:40 PM
8/3/06 12:00 AM
200.00
0 inches
0.00
0.00
39.44
8/3/06 12:00 AM
8/4/06 12:00 AM
1440.00
0 inches
0.00
0.00
0.00
8/4/06 12:00 AM
8/4/06 1:20 PM
800.00
0 inches
0.00
0.00
8/4/06 1:20 PM
8/5/06 12:00 AM
640.00
6 inches
38.46
17.09
17.09
8/5/06 12:00 AM
8/6/06 12:00 AM
1440.00
6 inches
38.46
38.46
38.46
8/6/06 12:00 AM
8/7/06 12:00 AM
1440.00
6 inches
38.46
38.46
38.46
8/7/06 12:00 AM
8/8/06 12:00 AM
1440.00
6 inches
38.46
38.46
38.46
8/8/06 12:00 AM
8/8/06 8:00 AM
480.00
6 inches
38.46
12.82
8/8/06 8:00 AM
8/9/06 12:00 AM
960.00
3 inches
21.19
14.13
26.95
8/9/06 12:00 AM
8/10/06 12:00 AM
1440.00
3 inches
21.19
21.19
21.19
8/10/06 12:00 AM
8/10/06 9:45 AM
585.00
3 inches
21.19
8.61
8/10/06 9:45 AM
8/11/06 12:00 AM
855.00
0 inches
0.00
0.00
8.61
8/11/06 12:00 AM
8/11/06 9:35 AM
575.00
0 inches
0.00
0.00
8/11/06 9:35 AM
8/12/06 12:00 AM
865.00
3 inches
21.19
12.73
12.73
8/12/06 12:00 AM
8/13/06 12:00 AM
1440.00
3 inches
21.19
21.19
21.19
8/13/06 12:00 AM
8/14/06 12:00 AM
1440.00
3 inches
21.19
21.19
21.19
8/14/06 12:00 AM
8/15/06 12:00 AM
1440.00
3 inches
21.19
21.19
21.19
8/15/06 12:00 AM
8/16/06 12:00 AM
1440.00
3 inches
21.19
21.19
21.19
8/16/06 12:00 AM
8/17/06 12:00 AM
1440.00
3 inches
21.19
21.19
21.19
8/17/06 12:00 AM
8/18/06 12:00 AM
1440.00
3 inches
21.19
21.19
21.19
8/18/06 12:00 AM
8/19/06 12:00 AM
1440.00
3 inches
21.19
21.19
21.19
8/19/06 12:00 AM
8/20/06 12:00 AM
1440.00
3 inches
21.19
21.19
21.19
8/20/06 12:00 AM
8/21/06 12:00 AM
1440.00
3 inches
21.19
21.19
21.19
8/21/06 12:00 AM
8/22/06 12:00 AM
1440.00
3 inches
21.19
21.19
21.19
8/22/06 12:00 AM
8/23/06 12:00 AM
1440.00
3 inches
21.19
21.19
21.19
8/23/06 12:00 AM
8/24/06 12:00 AM
1440.00
3 inches
21.19
21.19
21.19
8/24/06 12:00 AM
8/24/06 7:35 AM
455.00
3 inches
21.19
6.70
8/24/06 7:35 AM
8/24/06 1:30 PM
355.00
0 inches
0.00
0.00
8/24/06 1:30 PM
8/25/06 12:00 AM
630.00
3 inches
21.19
9.27
15.97
8/25/06 12:00 AM
8/26/06 12:00 AM
1440.00
3 inches
21.19
21.19
21.19
8/26/06 12:00 AM
8/27/06 12:00 AM
1440.00
3 inches
21.19
21.19
21.19
8/27/06 12:00 AM
8/28/06 12:00 AM
1440.00
3 inches
21.19
21.19
21.19
8/28/06 12:00 AM
8/28/06 12:15 PM
735.00
3 inches
21.19
10.82
8/28/06 12:15 PM
8/29/06 12:00 AM
705.00
0 inches
0.00
0.00
10.82
8/29/06 12:00 AM
8/29/06 9:30 AM
570.00
0 inches
0.00
0.00
8/29/06 9:30 AM
8/30/06 12:00 AM
870.00
6 inches
38.46
23.24
23.24
8/30/06 12:00 AM
8/31/06 12:00 AM
1440.00
6 inches
38.46
38.46
38.46
8/31/06 12:00 AM
9/1/06 12:00 AM
1440.00
6 inches
38.46
38.46
38.46
9/1/06 12:00 AM
9/2/06 12:00 AM
1440.00
6 inches
38.46
38.46
38.46
9/2/06 12:00 AM
9/2/06 9:30 AM
570.00
6 inches
38.46
15.22
9/2/06 9:30 AM
9/3/06 12:00 AM
870.00
3 inches
21.19
12.80
28.03
9/3/06 12:00 AM
9/4/06 12:00 AM
1440.00
3 inches
21.19
21.19
21.19
9/4/06 12:00 AM
9/5/06 12:00 AM
1440.00
3 inches
21.19
21.19
21.19
9/5/06 12:00 AM
9/6/06 12:00 AM
1440.00
3 inches
21.19
21.19
21.19
9/6/06 12:00 AM
9/7/06 12:00 AM
1440.00
3 inches
21.19
21.19
21.19
9/7/06 12:00 AM
9/8/06 12:00 AM
1440.00
3 inches
21.19
21.19
21.19
9/8/06 12:00 AM
9/9/06 12:00 AM
1440.00
3 inches
21.19
21.19
21.19
9/9/06 12:00 AM
9/10/06 12:00 AM
1440.00
3 inches
21.19
21.19
21.19
9/10/06 12:00 AM
9/11/06 12:00 AM
1440.00
3 inches
21.19
21.19
21.19
9/11/06 12:00 AM
9/11/06 10:00 AM
600.00
3 inches
21.19
8.83
9/11/06 10:00 AM
9/12/06 7:25 PM
2005.00
6 inches
38.46
53.55
62.38
9/12/06 7:25 PM
9/13/06 12:00 AM
275.00
0 inches
0.00
0.00
0.00
9/13/06 12:00 AM
9/14/06 12:00 AM
1440.00
0 inches
0.00
0.00
0.00
9/14/06 12:00 AM
9/14/06 10:00 AM
600.00
0 inches
0.00
0.00
9/14/06 10:00 AM
9/15/06 12:00 AM
840.00
6 inches
38.46
22.44
22.44
9/15/06 12:00 AM
9/16/06 12:00 AM
1440.00
6 inches
38.46
38.46
38.46
9/16/06 12:00 AM
9/17/06 12:00 AM
1440.00
6 inches
38.46
38.46
38.46
9/17/06 12:00 AM
9/17/06 8:25 PM
1225.00
6 inches
38.46
32.72
9/17/06 8:25 PM
9/18/06 12:00 AM
215.00
0 inches
0.00
0:00
32.72
9/18/06 12:00 AM
9/18/06 7:30 AM
450.00
0 inches
0.00
0.00
9/18/06 7:30 AM
9/19/06 12:00 AM
990.00
6 inches
38.46
26.44
26.44
9/19/06 12:00 AM
9/20/06 12:00 AM
1440.00
6 inches
38.46
38.46
38.46
9/20/06 12:00 AM
9/21/06 12:00 AM
1440.00
6 inches
38.46
38.46
38.46
9/21/06 12:00 AM
9/21/06 7:30 AM
450.00
6 inches
38.46
12.02
9/21/06 7:30 AM
9/22/06 12:00 AM
990.00
3 inches
21.19
14.57
26.59
9/22/06 12:00 AM
9/23/06 12:00 AM
1440.00
3 inches
21.19
21.19
21.19
9/23/06 12:00 AM
9/23/06 5:25 PM
1045.00
3 inches
21.19
15.38
9/23/06 5:25 PM
9/24/06 12:00 AM
395.00
0 inches
0.00
0.00
15.38
9/24/06 12:00 AM
9/25/06 12:00 AM
1440.00
0 inches
0.00
0.00
0.00
9/25/06 12:00 AM
9/25/06 11:55 AM
715.00
0 inches
0.00
0.00
9/25/06 11:55 AM
9/26/06 12:00 AM
725.00
3 inches
21.19
10.67
10.67
9/26/06 12:00 AM
9/27/06 12:00 AM
1440.00
3 inches
21.19
21.19
21.19
9/27/06 12:00 AM
9/28/06 12:00 AM
1440.00
3 inches
21.19
21.19
21.19
9/28/06 12:00 AM
9/29/06 12:00 AM
1440.00
3 inches
21.19
21.19
21.19
9/29/06 12:00 AM
9/30/06 12:00 AM
1440.00
3 inches
21.19
21.19
21.19
9/30/06 12:00 AM
10/1/06 12:00 AM
1440.00
3 inches
21.19
21.19
21.19
10/1/06 12:00 AM
10/2/06 12:00 AM
1440.00
3 inches
21.19
21.19
21.19
10/2/06 12:00 AM
10/2/06 2:45 PM
885.00
3 inches
21.19
13.02
10/2/06 2:45 PM
10/3/06 12:00 AM
555.00
0 inches
0.00
0.00
13.02
"CLOSED FOR THE SEASON"
3,698.72