EXHIBIT
A
ENVIRONMENTAL ASSESSMENT
& EFFLUENT LIMIT DERIVATION REPORT
for THE AMMONIA DISCHARGE
from THE CITGO LEMONT REFINERY
for
CITGO Lemont Refinery
135
th Street and New Avenue
Lemont, Illinois
Prepared by:
James E. Huff, P.E.
Margaret A. Panatera, P.E.
February 2008
Electronic Filing - Received, Clerk's Office, March 18, 2008
* * * * * AS 2008-008 * * * * *
EXHIBIT 2
TABLE OF CONTENTS,
Page
1. INTRODUCTION
1
2. BACKGROUND INFORMATION
3
2.1 Site Description
3
2.2 Production Trends
3
2.3 Description of Wastewater Treatment Facility
6
2.4 Applicable Regulations
6
2.5 Mixing Zone
9
3. INFLUENT AND EFFLUENT WATER QUALITY
10
3.1 Introduction
10
3.2 Effluent Quality
10
3.3 Influent Ammonia Levels
13
3.4 Net Ammonia Loading
13
4. CHICAGO WATERWAY AND ILLINOIS RIVER SYSTEM WATER QUALITY
16
4.1 Introduction
16
4.2 USGS/IEPA Waterway Monitoring
17
4.3 Metropolitan Water Reclamation District of Greater Chicago Waterways Data
18
4.4 Midwest Generation Data
27
4.5 IEPA Waterway Classification/Assessment
30
5. DERIVATION OF EFFLUENT LIMITS
31
6.
SUMMARY
34
LIST OF FIGURES
FIGURE 2-1
FIGURE 2-2
FIGURE 2-3
FIGURE 3-1
FIGURE 3-2
FIGURE 3-3
FIGURE 3-4
Site Location Map
4
The Chicago Waterway and Upper Illinois River System
5
Process Flow Diagram of Existing Wastewater Treatment Facilities
7
Annual Average Effluent Ammonia Concentration, Lemont Refinery
11
Ammonia Effluent Loading, Lemont Refinery
12
Annual Average Influent Ammonia Concentrations, Sanitary & Ship Canal
14
Annual Average Ammonia Influent and Effluent Loading
15
LIST OF TABLES
TABLE 4-1
TABLE 4-2
TABLE 4-3
TABLE 4-4
Total Ammonia, NH3/N, mg/L
19
Un-Ionized Ammonia, mg/L
23
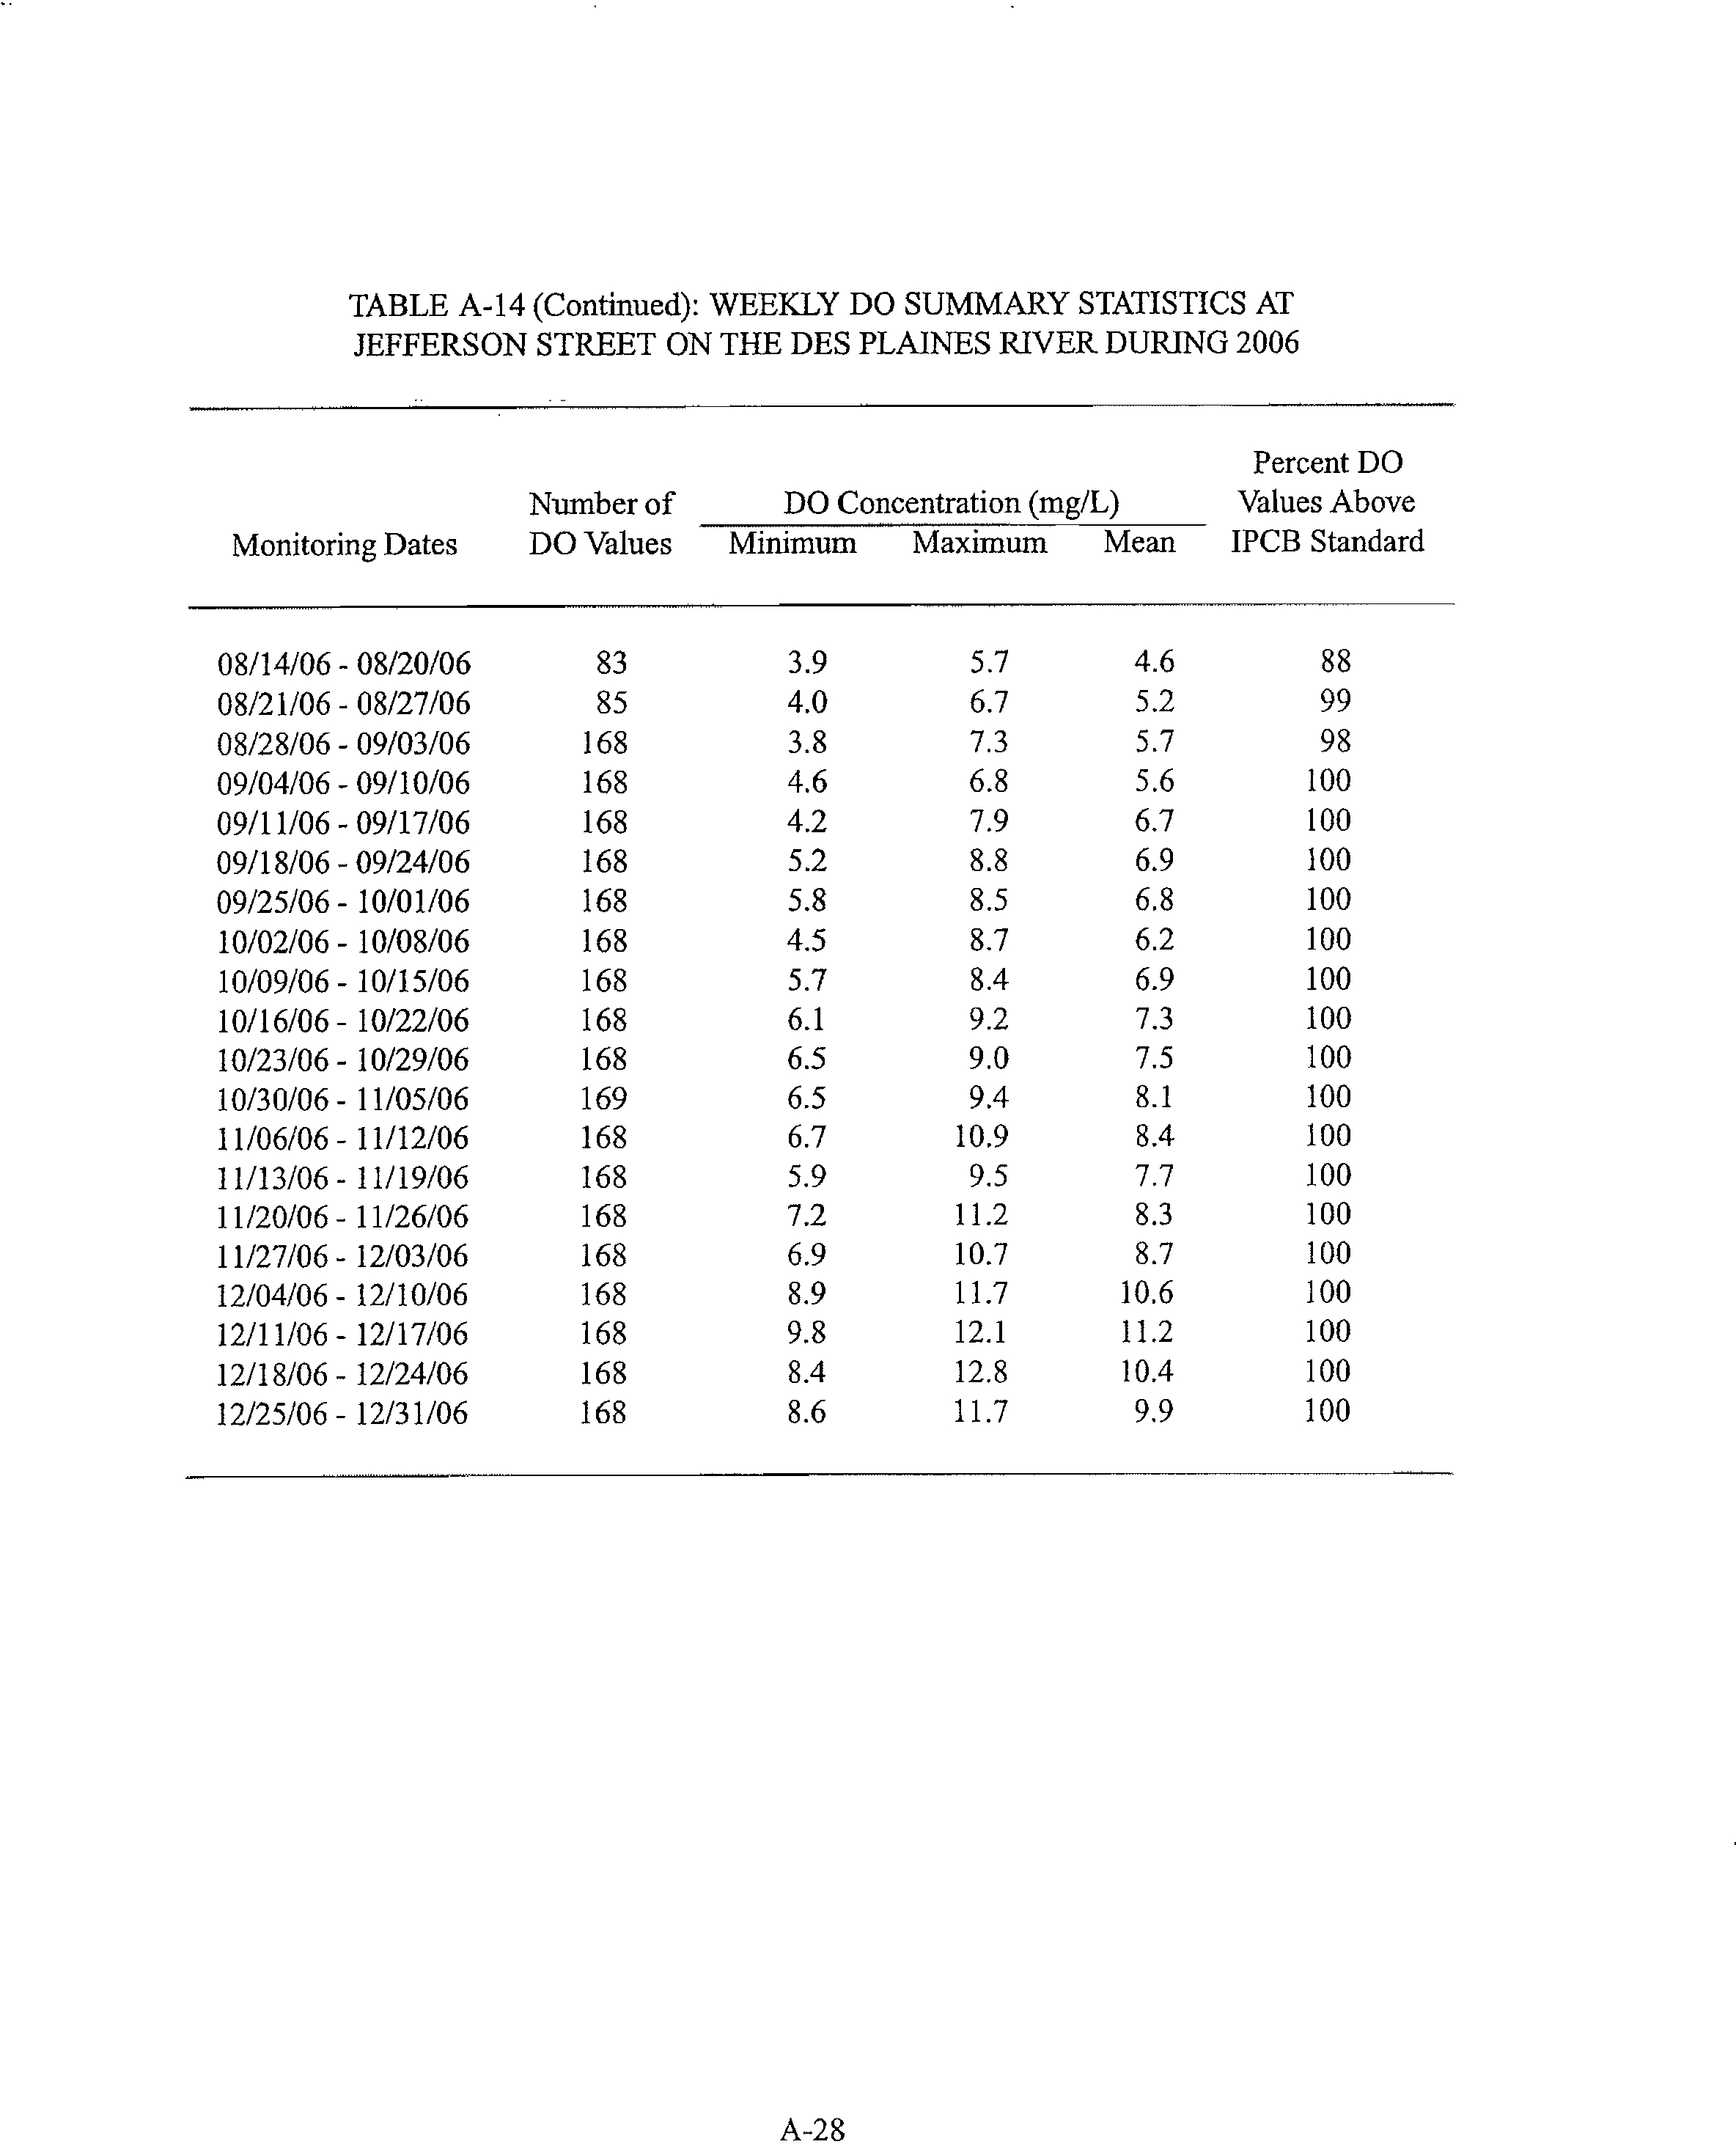
Metropolitan Water Reclamation District of Greater Chicago Des Plaines River Data
for 2000 from Lockport to 1-55
28
Midwest Generation EME, LLC Lower Des Plaines River at 1-55 Bridge Monthly
Minimum Dissolved Oxygen Concentration
29
Citgo, Lemont — Ammonia Report
February 2008
Electronic Filing - Received, Clerk's Office, March 18, 2008
* * * * * AS 2008-008 * * * * *
EXHIBIT 2
LIST OF APPENDICES
A?
NPDES General Permit No. 1L0001589
B?Lemont Refinery Data —1997 to 2007
C
?
USGS and MWRDGC Data — 1999 to 2006
D?
Statistical Analysis — Existing Effluent Data
Citgo, Lemont — Ammonia Report
February 2008
Electronic Filing - Received, Clerk's Office, March 18, 2008
* * * * * AS 2008-008 * * * * *
EXHIBIT 2
ABBREVIATIONS AND ACRONYMS
BAT
Best Available Technology Economically Achievable
BOD5 five-day biochemical oxygen demand
degrees F degrees Fahrenheit
D.O.
dissolved oxygen
EPA
Environmental Protection Agency
IAC
Illinois Administrative Code
IEPA
Illinois Environmental Protection Agency
IPCB
Illinois Pollution Control Board
ISWS
Illinois State Water Survey
lb/day pounds per day
MGD
million gallons per day
mg/L
milligrams per liter
MWRDGC
Metropolitan Water Reclamation District of Greater Chicago
NPDES
National Pollutant Discharge Elimination System
PCB
polychlorinated biphenyl
PTU purge treatment unit
TSS
total suspended solids
UAA Use Attainability Analysis
USGS
United States Geological Survey
Citgo, Lemont— Ammonia Report
Iii
February 2008
Electronic Filing - Received, Clerk's Office, March 18, 2008
* * * * * AS 2008-008 * * * * *
EXHIBIT 2
1. INTRODUCTION
CITGO Petroleum Corporation (Citgo) currently operates a petroleum refinery near Lemont, Illinois.
Lemont Refinery was formerly owned by UNO-VEN Company. On May 1, 1997, PDV Midwest
Refining, L.L.C. purchased Lemont Refinery from UNO-VEN and contracted with CITGO to operate
the refinery.
Wastewater treatment at Lemont Refinery includes physical/chemical and biological treatment processes.
The treatment plant includes primary, secondary, and tertiary treatment of the wastewater prior to
discharge into the Chicago Sanitary and Ship Canal (Ship Canal). The Ship Canal is part of the Chicago
Waterway classified as a Secondary Contact Water under Title 35: Subtitle C: Chapter I of the Illinois
Administrative Code. The Illinois Pollution Control Board (IPCB) adopted Title 35: Part 304.122 to
limit ammonia discharges to the Chicago River System. Rule 304.122(b) restricts larger industrial
discharges (greater than 100 lbs/day ammonia) to a 3.0 mg/L monthly average limit and 6.0 mg/L daily
maximum.
The IPCB has established water quality standards for state waters, including the Chicago Waterways to
further protect water quality. The Secondary Contact Water Quality Standard for ammonia is 0.1 mg/L
of un-ionized ammonia. There is no water quality limit on total ammonia levels in Secondary Contact
Waters. The Illinois EPA in October 2007 submitted a proposal to the IPCB to significantly change the
water quality standards on the
Secondary Contact
waterways, including ammonia nitrogen. The
proposed change in the ammonia water quality standard would basically bring the water quality
standards on the
Secondary Contact
waterways to the same levels as the
General Use
waterways. This
same proposal also proposes to delete the current total dissolved solids (TDS) water quality limit, and
add a sulfate water quality standard that is consistent with that proposed for
General Use
waterways.
The U.S. EPA has established effluent guidelines for wastewater discharges by industry category. The
petroleum refining industry is divided into five subcategories based upon the processes utilized and the
products produced. Lemont Refinery, under the federal regulation, is classified as a Subcategory-B,
Citgo, Lemont — Ammonia Report
February 2008
Electronic Filing - Received, Clerk's Office, March 18, 2008
* * * * * AS 2008-008 * * * * *
EXHIBIT 2
upon production, and are computed on a pounds per day basis. The refinery has historically achieved
compliance with the federal effluent guidelines; however, the 3.0 mg/L / 6.0 mg/L state effluent limit
has not been attainable on a continual basis.
In 1988 Lemont Refinery was granted a site-specific standard for effluent ammonia limits to gain
relief from the 3.0 mg/L state effluent limit, as set forth in 35 IAC 304.213. The initial rule change
required the refinery to meet the applicable BAT load limitations as follows:
Monthly Average Limit
749 lb/day
Daily Maximum Limit
1,648 lb/day
Two subsequent rule changes shifted the effluent limits to concentration-based standards. The
current rule limits the refinery to the following ammonia effluent limits:
Monthly Average Limit
9.4 mg/L
Daily Maximum Limit
26.0 mg/L
The concentration limits have been incorporated into the refinery's current NPDES permit
(IL0001989). A copy of the NPDES permit is provided in Appendix A. The provisions granting the
site-specific ammonia limits terminate December 31, 2008.
The purpose of this report is to assess the environmental impact of the ammonia in Lemont
Refinery's wastewater effluent. Effluent limits are derived based upon existing effluent quality,
BAT, and current water quality conditions on the Ship Canal. These limits are compared to the
existing concentration limits contained in the NPDES permit and new limits are proposed herein.
Citgo, Lemont - Ammonia Report
February 2008
Electronic Filing - Received, Clerk's Office, March 18, 2008
* * * * * AS 2008-008 * * * * *
EXHIBIT 2
2. BACKGROUND INFORMATION
2.1 Site Description
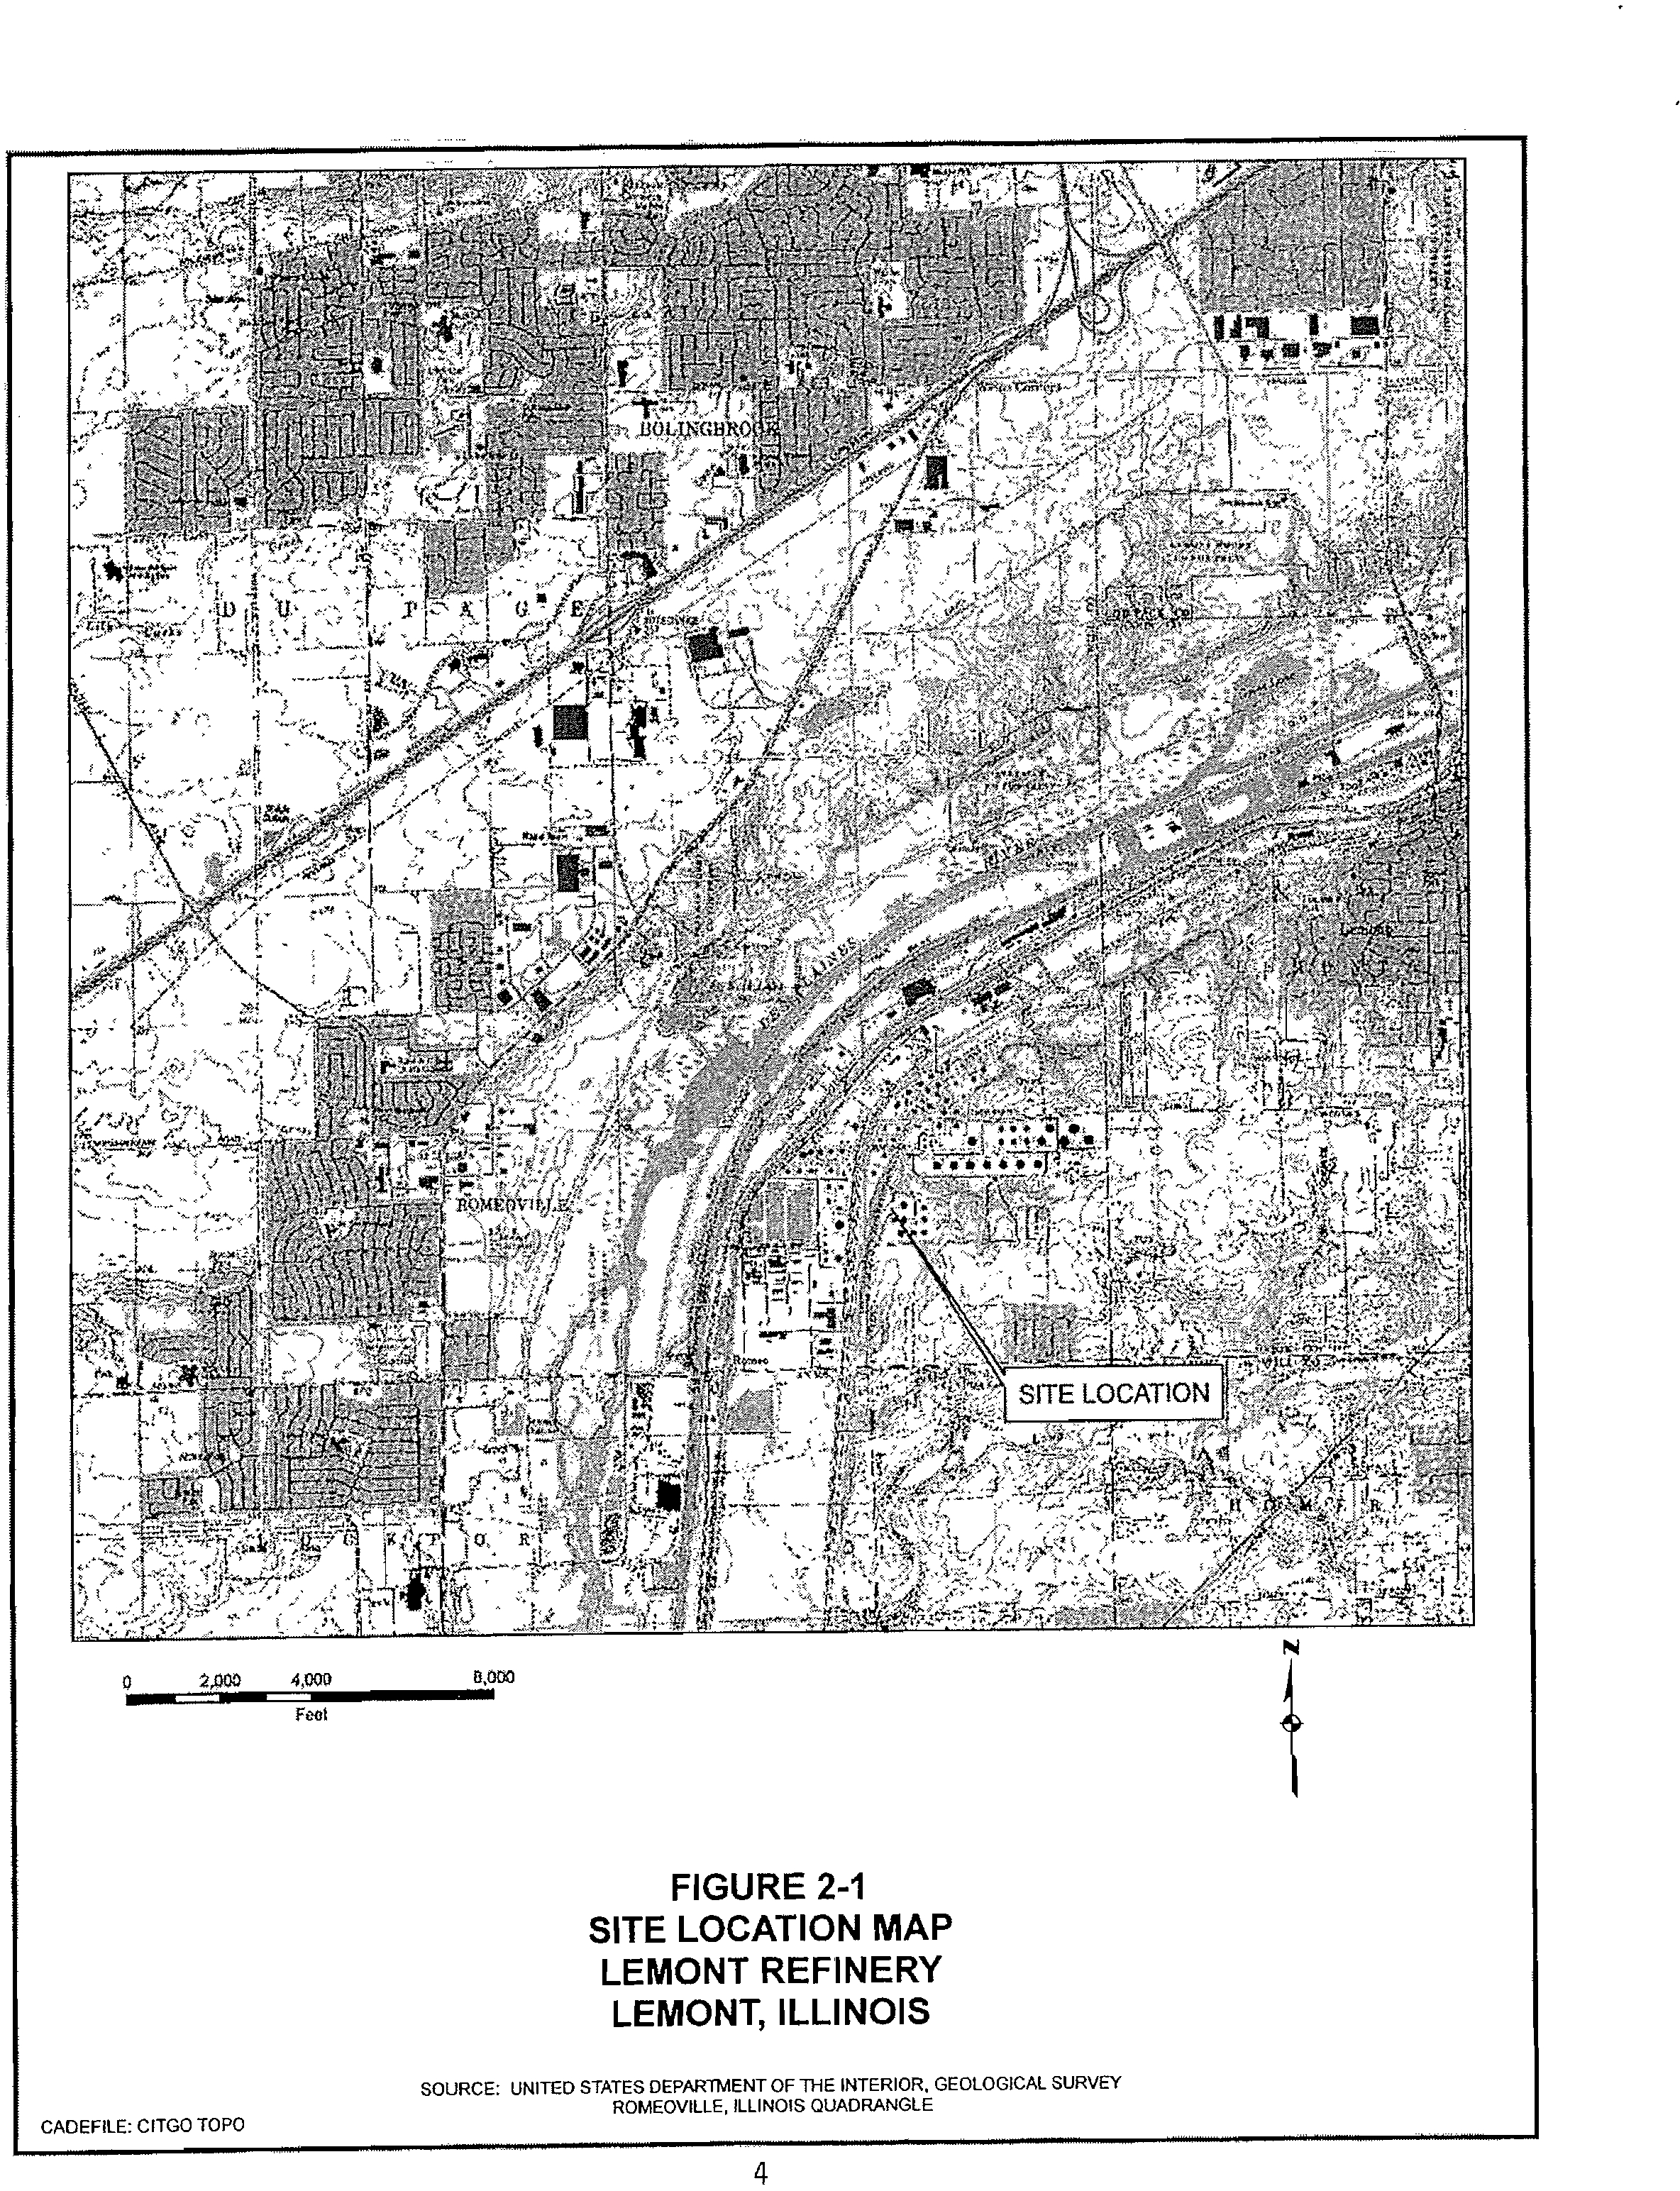
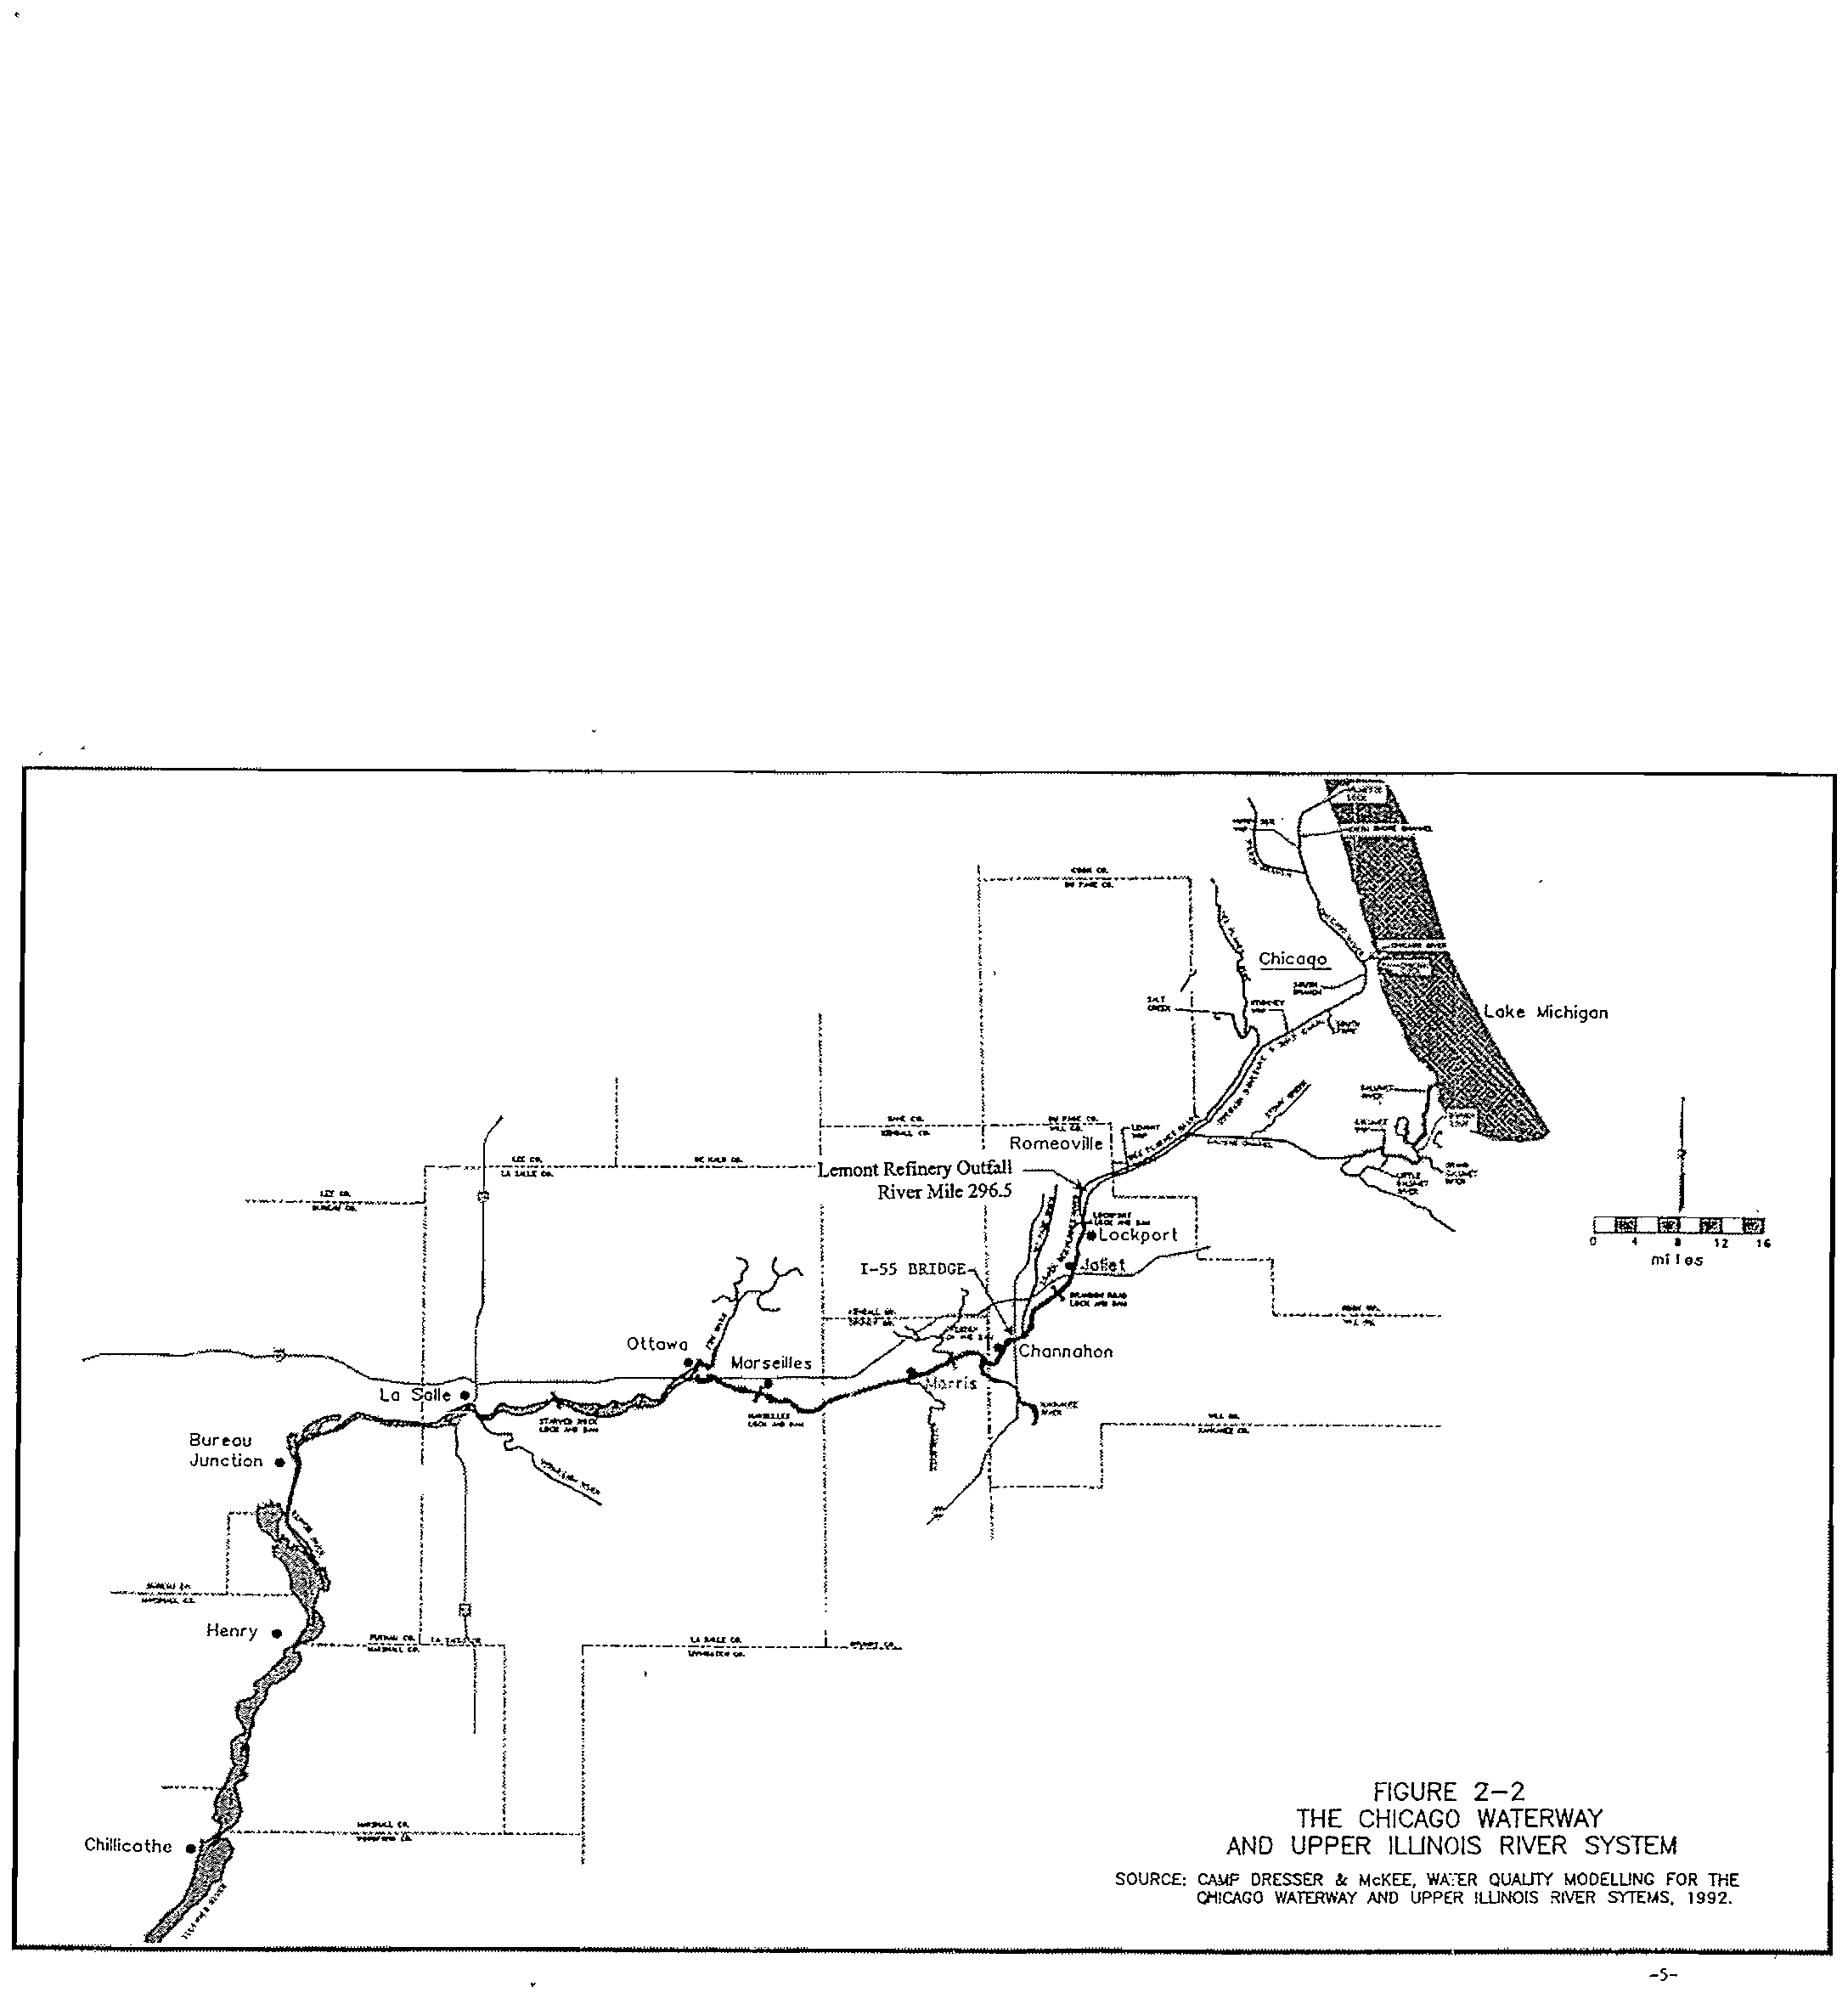
Lemont Refinery is located southwest of Lemont, Illinois and east of Romeoville, as depicted in Figure
2-1. The Chicago Sanitary and Ship Canal (Ship Canal) is situated to the north and west of the refinery.
The Ship Canal runs parallel to the Des Plaines River, generally flowing southwest at this location.
The Chicago Waterway is part of the Corps of Engineer river mile system. River mile point 0.0 is the
confluence of the Illinois River and the Mississippi River in Grafton, Illinois. Lemont Refinery's outfall
001 is located at river mile 296.5 on the Ship Canal, 5.5 miles upstream of the Lockport Lock and Dam.
The Chicago Waterway and Illinois River are shown on Figure 2-2.
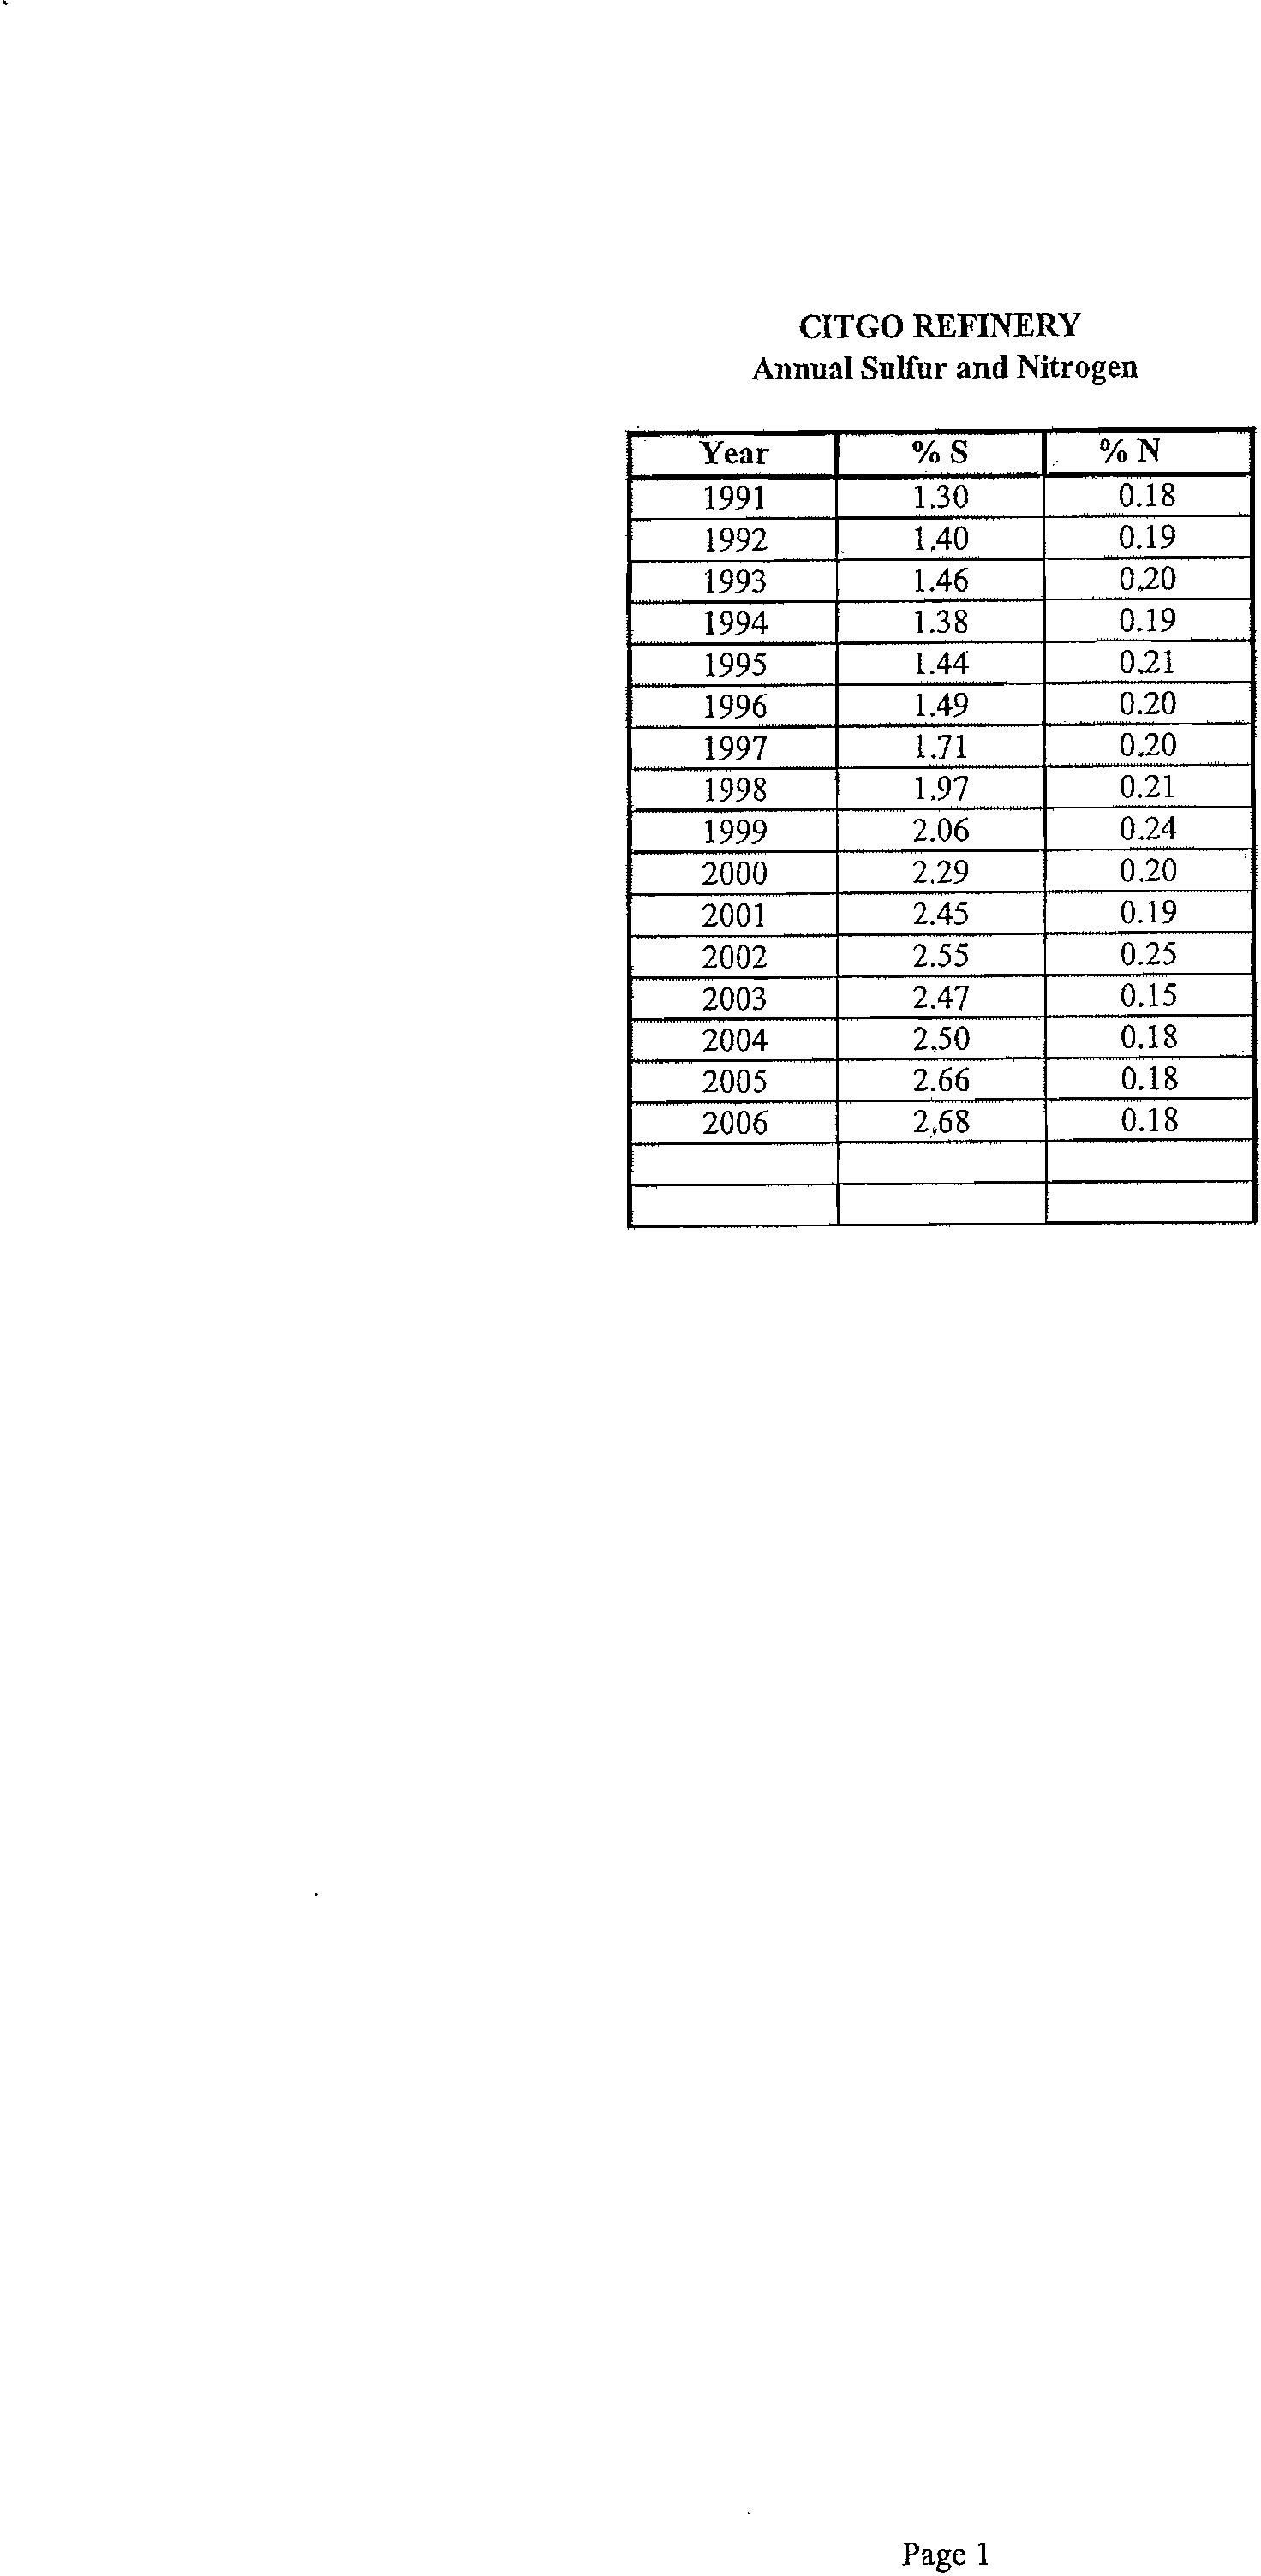
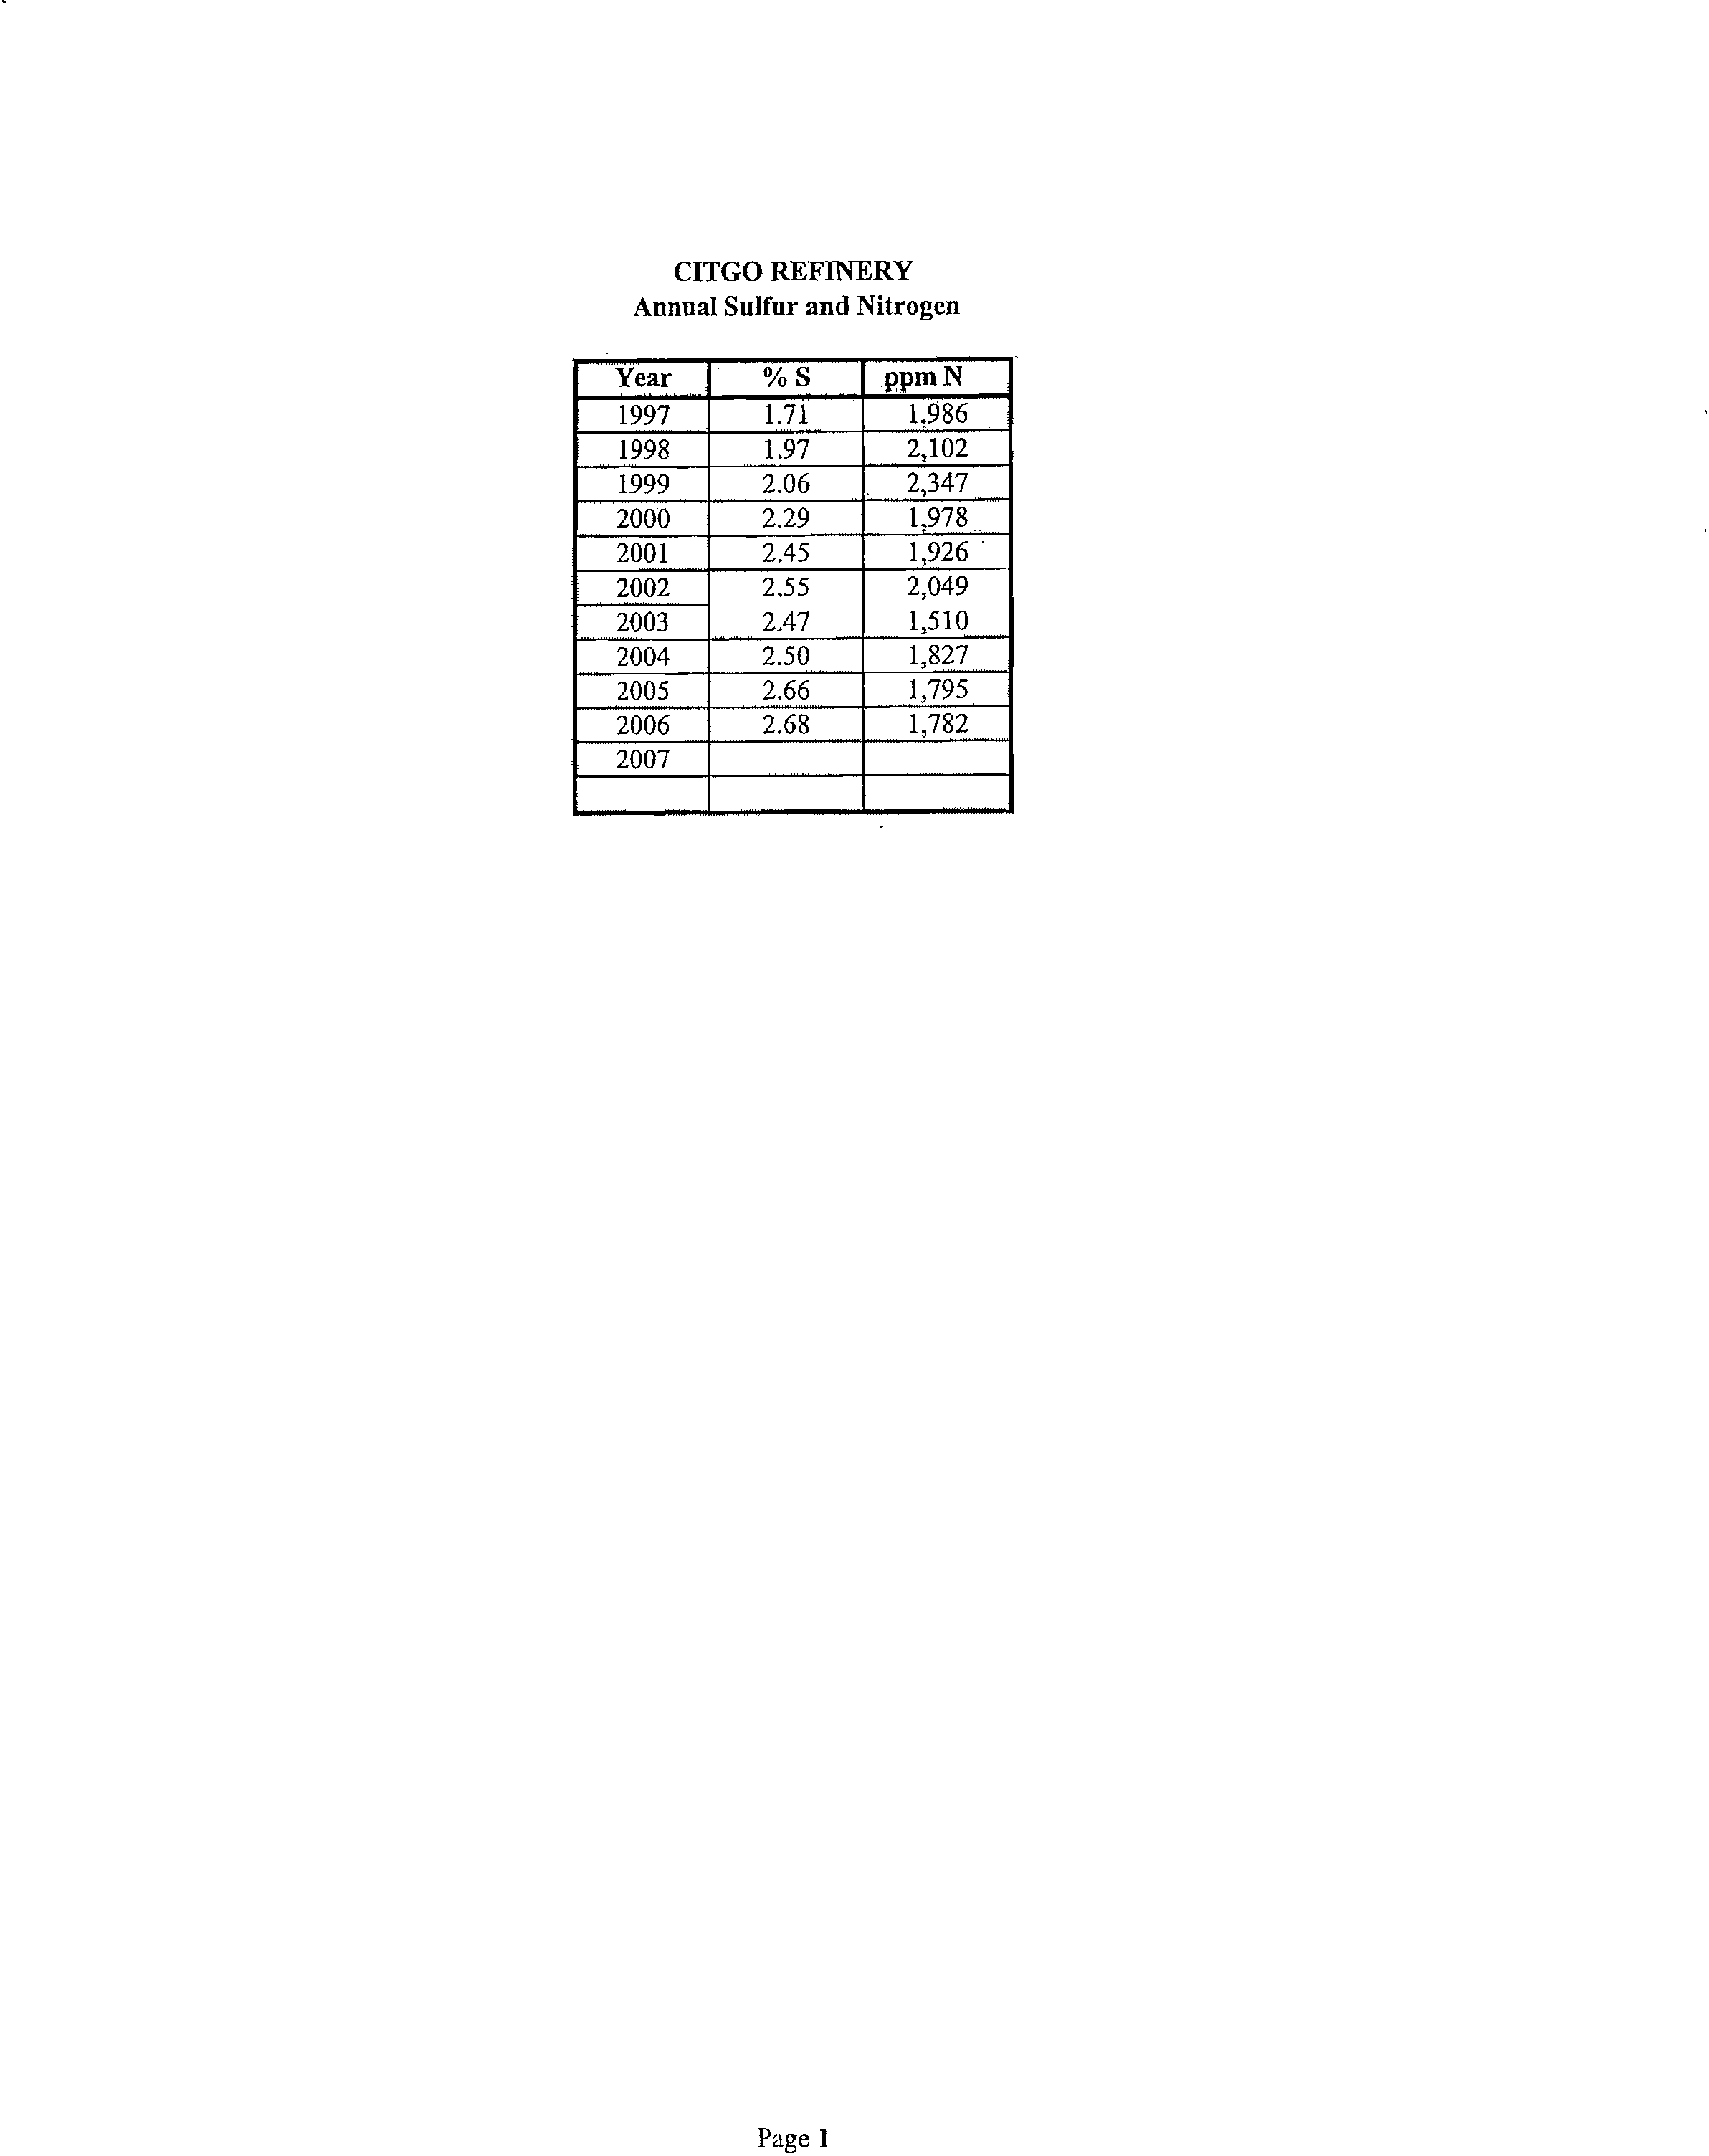
2.2 Production Trends
Lemont Refinery refines domestic and foreign crude oil to produce gasoline, kerosene, home heating oil,
aviation fuel, diesel oil, petrochemical solvents, and petroleum coke. Refining of crude oil includes the
removal of nitrogen and sulfur compounds through distillation, desalting, and fractionation processes.
The nitrogen that is removed during the refining process typically ends up in an aqueous waste stream,
along with sulfur compounds (sulfides). The various sulfur and nitrogen-bearing waste streams are
processed through four sour water strippers at the refinery to remove the sulfides and ammonia from the
wastewater prior to discharge to the process wastewater system.
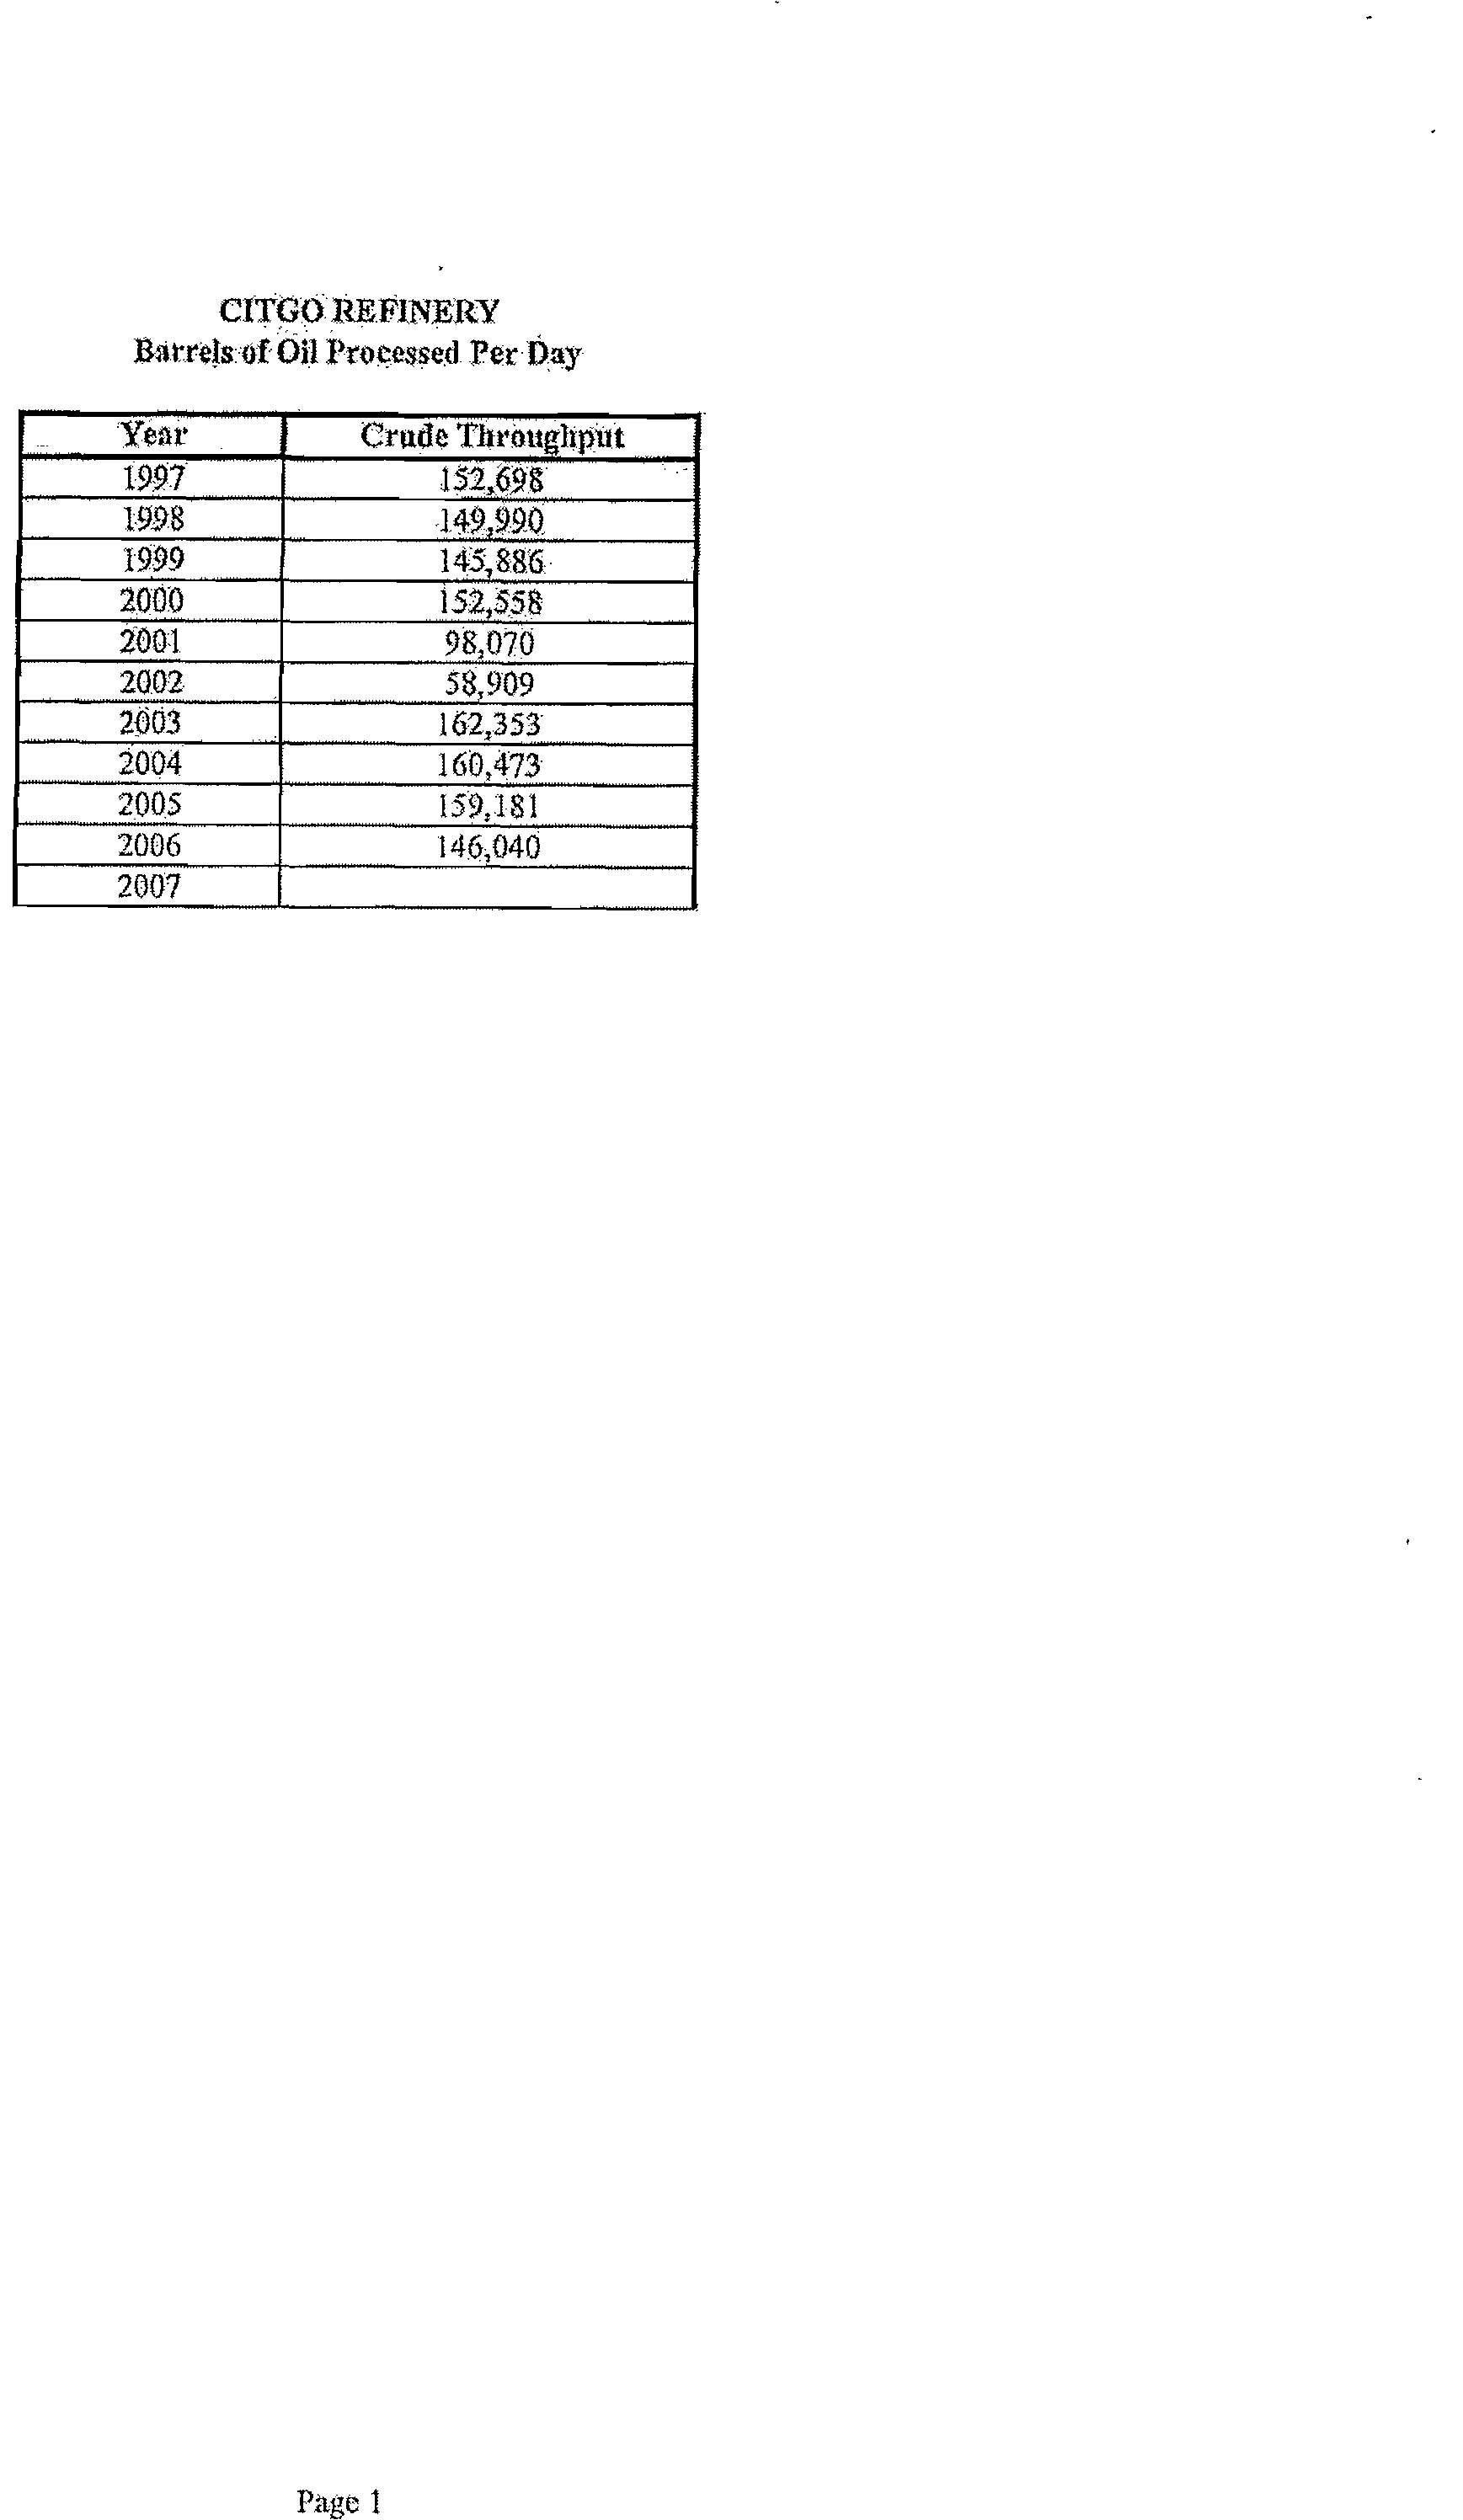
Crude throughput over the last ten years peaked in 2003 at an annual average of 162,353 bbls/day.
Nitrogen content of the crude oil has a bearing on ammonia loading in the wastewater. Nitrogen content
in the late 1990's and early 2000's remained fairly consistent near 0.20 percent. Between 2004 and
2006 nitrogen content
declined approximately
10 percent to 0.18
percent.
Citgo, Lemont — Ammonia Report
3
February 2008
Electronic Filing - Received, Clerk's Office, March 18, 2008
* * * * * AS 2008-008 * * * * *
EXHIBIT 2
SITE LOCATION
FIGURE 2-1
SITE LOCATION MAP
LEMONT REFINERY
LEMONT, ILLINOIS
SOURCE: UNITED STATES DEPARTMENT OF THE INTERIOR, GEOLOGICAL SURVEY
ROMEOVILLE, ILLINOIS QUADRANGLE
CADEFILE: CITGO TOPO
4
Electronic Filing - Received, Clerk's Office, March 18, 2008
* * * * * AS 2008-008 * * * * *
EXHIBIT 2
Chillicothe
_eke Michigan
0?I?
12?
14
mi es
Ottawa
'HS
Channohon
r4;
Henry •
r
?
=`,1
FIGURE 2-2
THE CHICAGO WATERWAY
AND UPPER ILLINOIS RIVER SYSTEM
SOURCE: CAMP DRESSER & McKEE, WAIIR DUALITY MODELLING FOR THE
CHICAGO WATERWAY AND UPPER ILLINOIS RIVER SYTEAS, 1992.
. Rorneoville
Lamont
Rcfmery Outfall
Bureau
Junction •
Electronic Filing - Received, Clerk's Office, March 18, 2008
* * * * * AS 2008-008 * * * * *
EXHIBIT 2
A challenge to ammonia treatment is the change in feedstock in recent years. The processing of heavier
crude oil has introduced significant increased solids and oil loadings on the wastewater treatment system,
causing difficulty in maintaining nitrification.
2.3 Description of Wastewater Treatment Facility
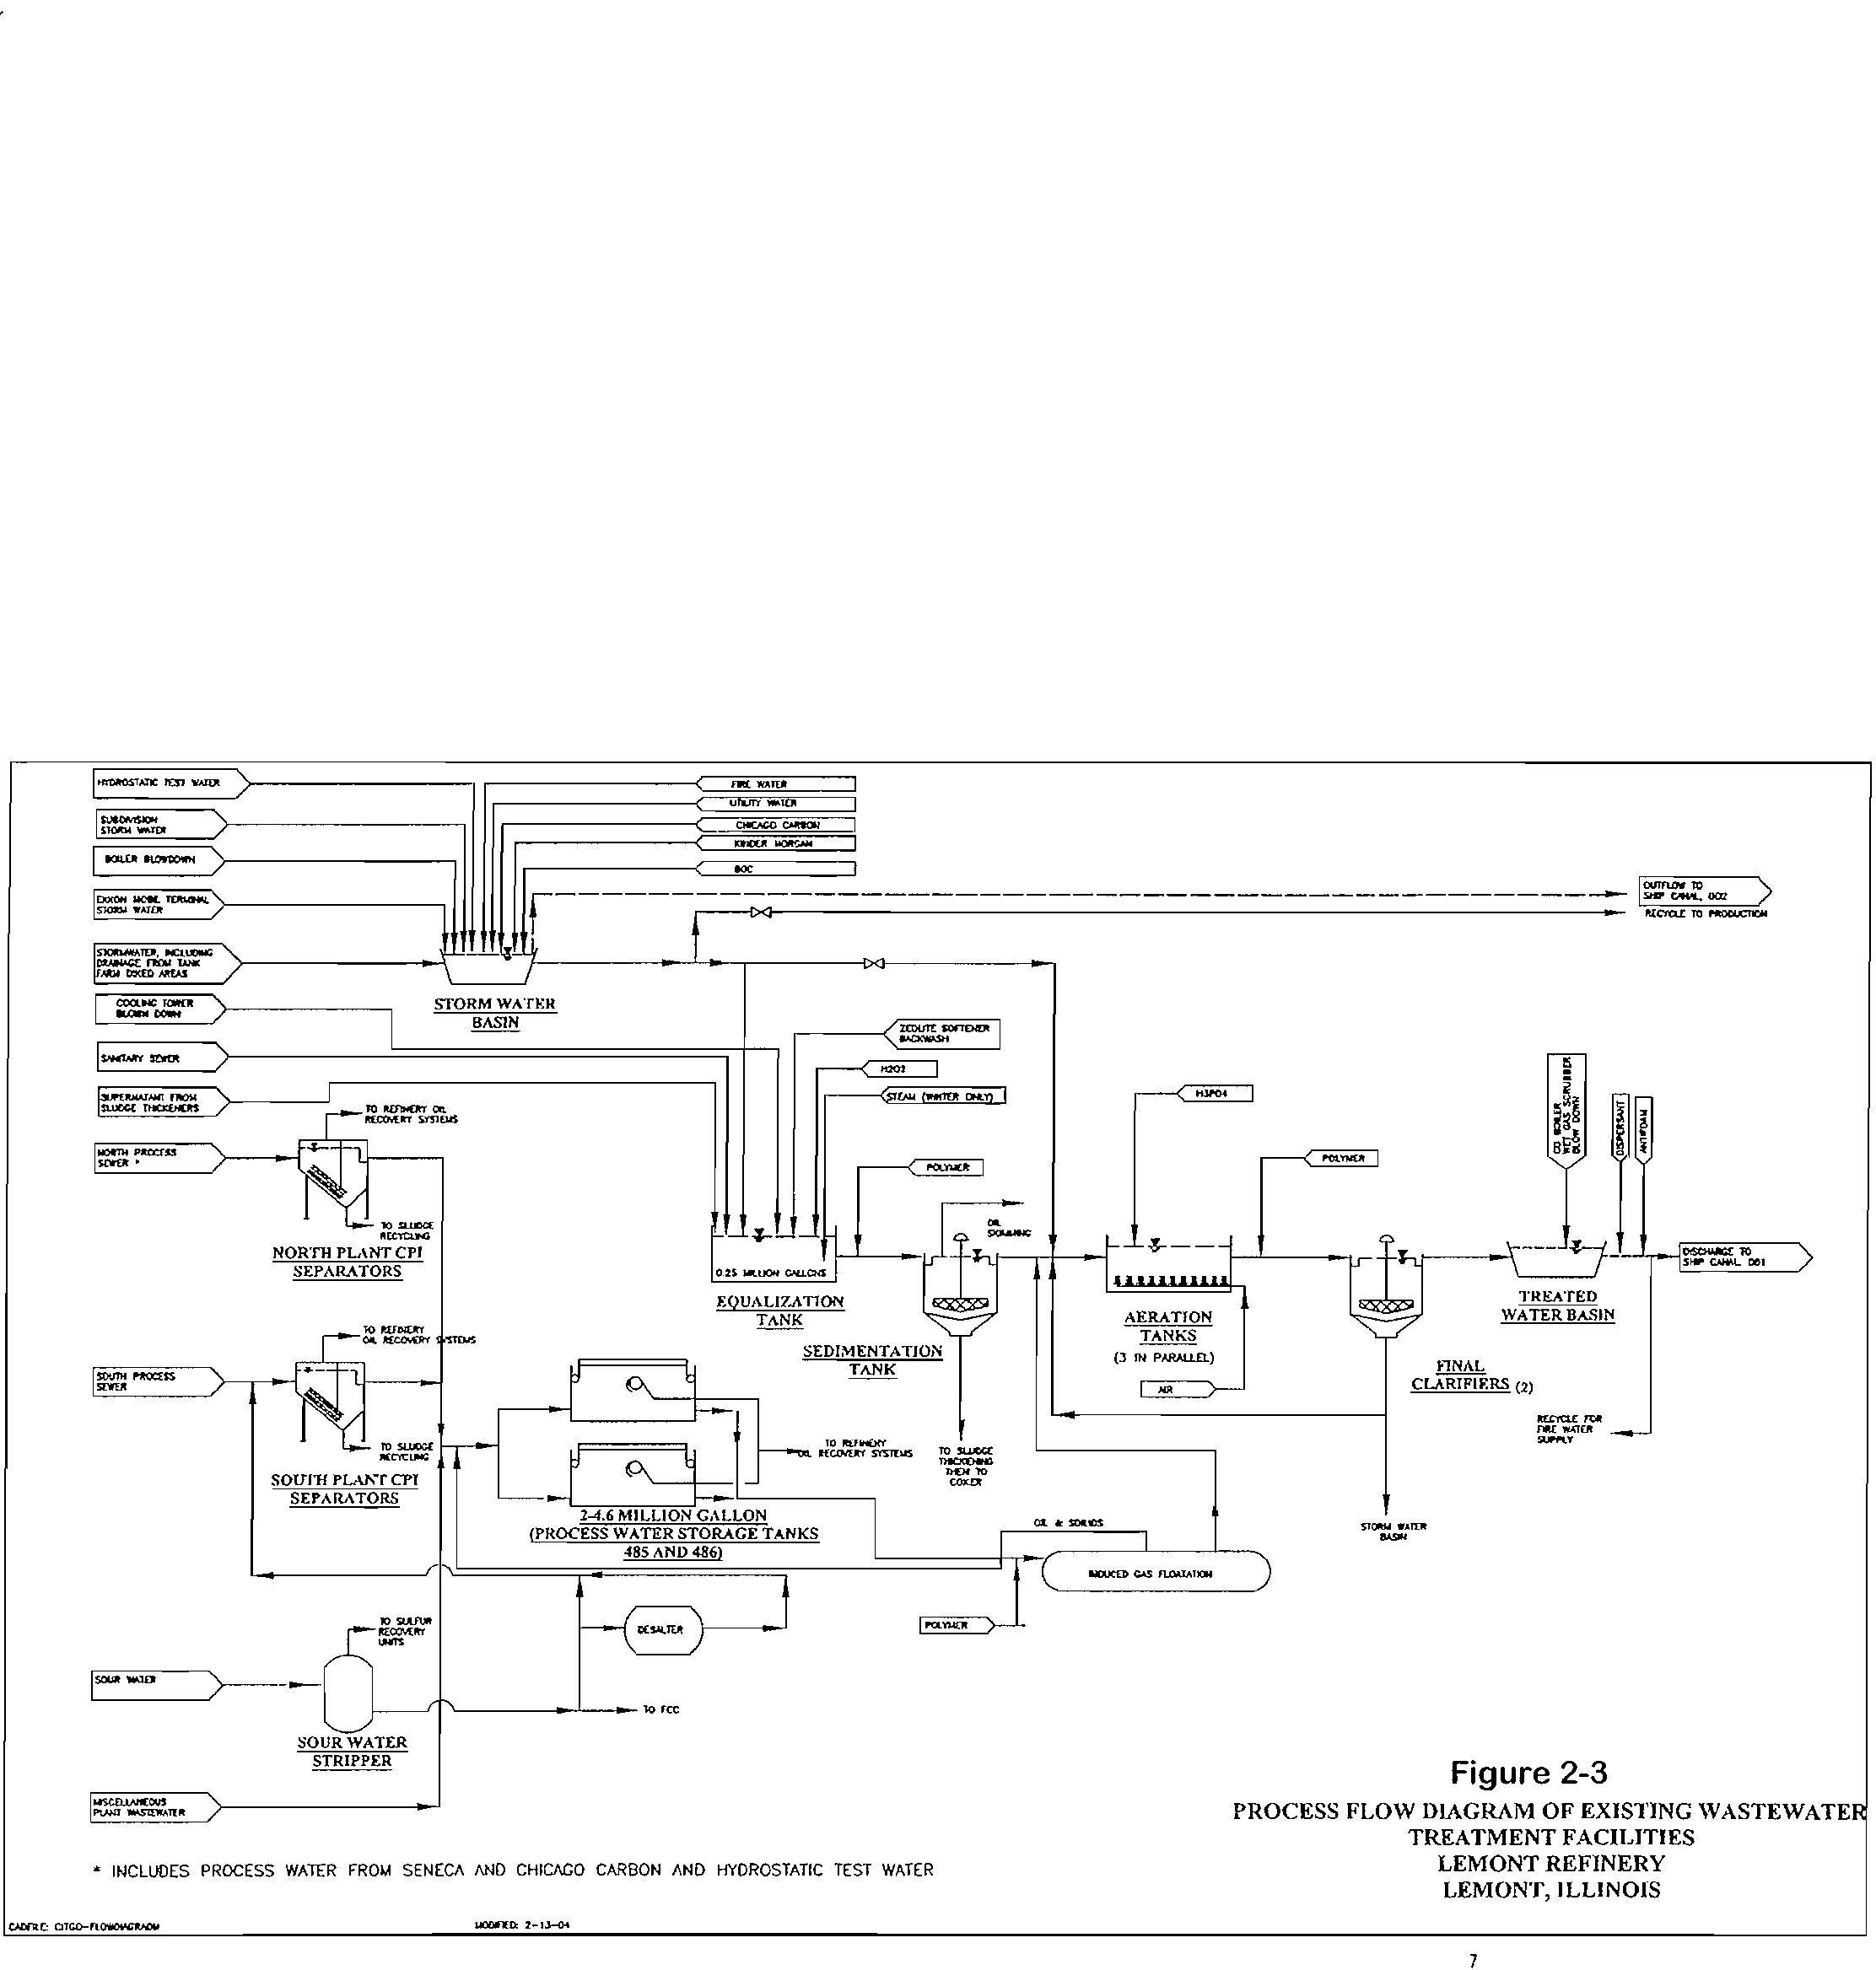
The wastewater treatment plant at the refinery began operation in 1969. The original design included
two oil-water separators, a flow equalization tank, a primary clarifier, activated sludge system, and a
polishing pond prior to discharge. Several wastewater treatment plant modifications have been made
since the original installation. Figure 2-3 depicts the process as it currently exists. Major changes to the
system prior to 1992 included new process water storage tanks, new oil/water separators, a new aeration
basin, a new clarifier, and fine bubble diffusers.
The stormwater basin was segregated from the process wastewater in 1992. The stormwater basin now
receives stormwater, hydrostatic test and fire water, utility, boiler blowdown and site tenant (Chicago
Carbon, Kinder Morgan, BOC) storm water. This segregation eliminated the bypass of pretreatment of
process wastewater during heavy flow. The segregation of the storm water basin cost $20,900,000. To
clean close the basins after the streams were segregated, the Refinery spent an additional $9,400,000.
Additional modifications/upgrades for the wastewater treatment system in the last ten years include:
induced gas flotation (with polymer addition) in 2000, additional strippers in the sour water system in
2003, upgrading diffused aerators in Cell B in 2003, upgrading the feed system for phosphoric acid in
2006, upgrading diffused aerators in Cell A in 2006, a purge treatment unit (PTU) for scrubber
discharge in 2007, and upgrading diffused aerators in Cell C in 2007. According to the current NPDES
permit (Appendix A), the design average flow for outfall 001 is 5.79 MGD.
2.4 Applicable Regulations
Lemont Refinery discharges effluent from its wastewater treatment plant into the Ship Canal. The
plant's discharge quality is limited under a NPDES permit (IL0001589) issued by the Illinois EPA.
Citgo, Lemont — Ammonia Report
6
February 2008
Electronic Filing - Received, Clerk's Office, March 18, 2008
* * * * * AS 2008-008 * * * * *
EXHIBIT 2
TO 141...(f
locoturf STY. IV
ntx
cwv
/0
np• •••,••
,pro.
;RI
411111:1AMIZ
57-CA4
)
I
—>
>
?
l
omax =Tom.>?
°SACO .11104
101ILOI 1•00R-Qd
1=1,
KC,.
7z.–
TO rsocccricA
>
TER, 1.0.1.110
TAW
Atla?
ATLAI
• •
STORM WA rEll
BASIN
20Lrlt WM".
•••:•,••",
Is...A
speck
>?
ktrOOT
6
SYTT
— 64
. 4. (won. Awn
1000-1.
110■714 .079
BCe
ILIDLE
NORTH PL NT CPI
SEPARATORS
0 25 WU. C.4104/
SNP Lel
EQUALIZATION
AERATION
TREA
rED
TANK
WATER BASIN
/1104:TX,
TANKS
r
—
AA nano,/ osron
SEDIMENTATION
(3
IN PARALLEL)
PACCES5
TANK
FINAL
CLARIFIERS (2)
11,2
SOVIIf PLAIA7 CPI
SEPARATORS
2-4.6 MILLION GALLON
(PROCESS WATER STORAGE TANKS
485 AND 486)
STORY
WATER
54574
I N
OSED C.■5 !LOOS,
PD SPADA
,E.E.04HRT
1
I
snot run
o rcc
SOUR WATER
STRIPPER
MSGELIAISOYS
INCLUDES PROCESS WATER FROM SENECA AND CHICAGO CARBON AND HYDROSTATIC TEST WATER
.171.0 0740-110
.
1101.01,10
1.1117F111 2-13-04
Figure 2-3
PROCESS FLOW DIAGRAM OF EXISTING WASTEWATER
TREATMENT FACILITIES
LEMONT REFINERY
LEMONT, ILLINOIS
Electronic Filing - Received, Clerk's Office, March 18, 2008
* * * * * AS 2008-008 * * * * *
EXHIBIT 2
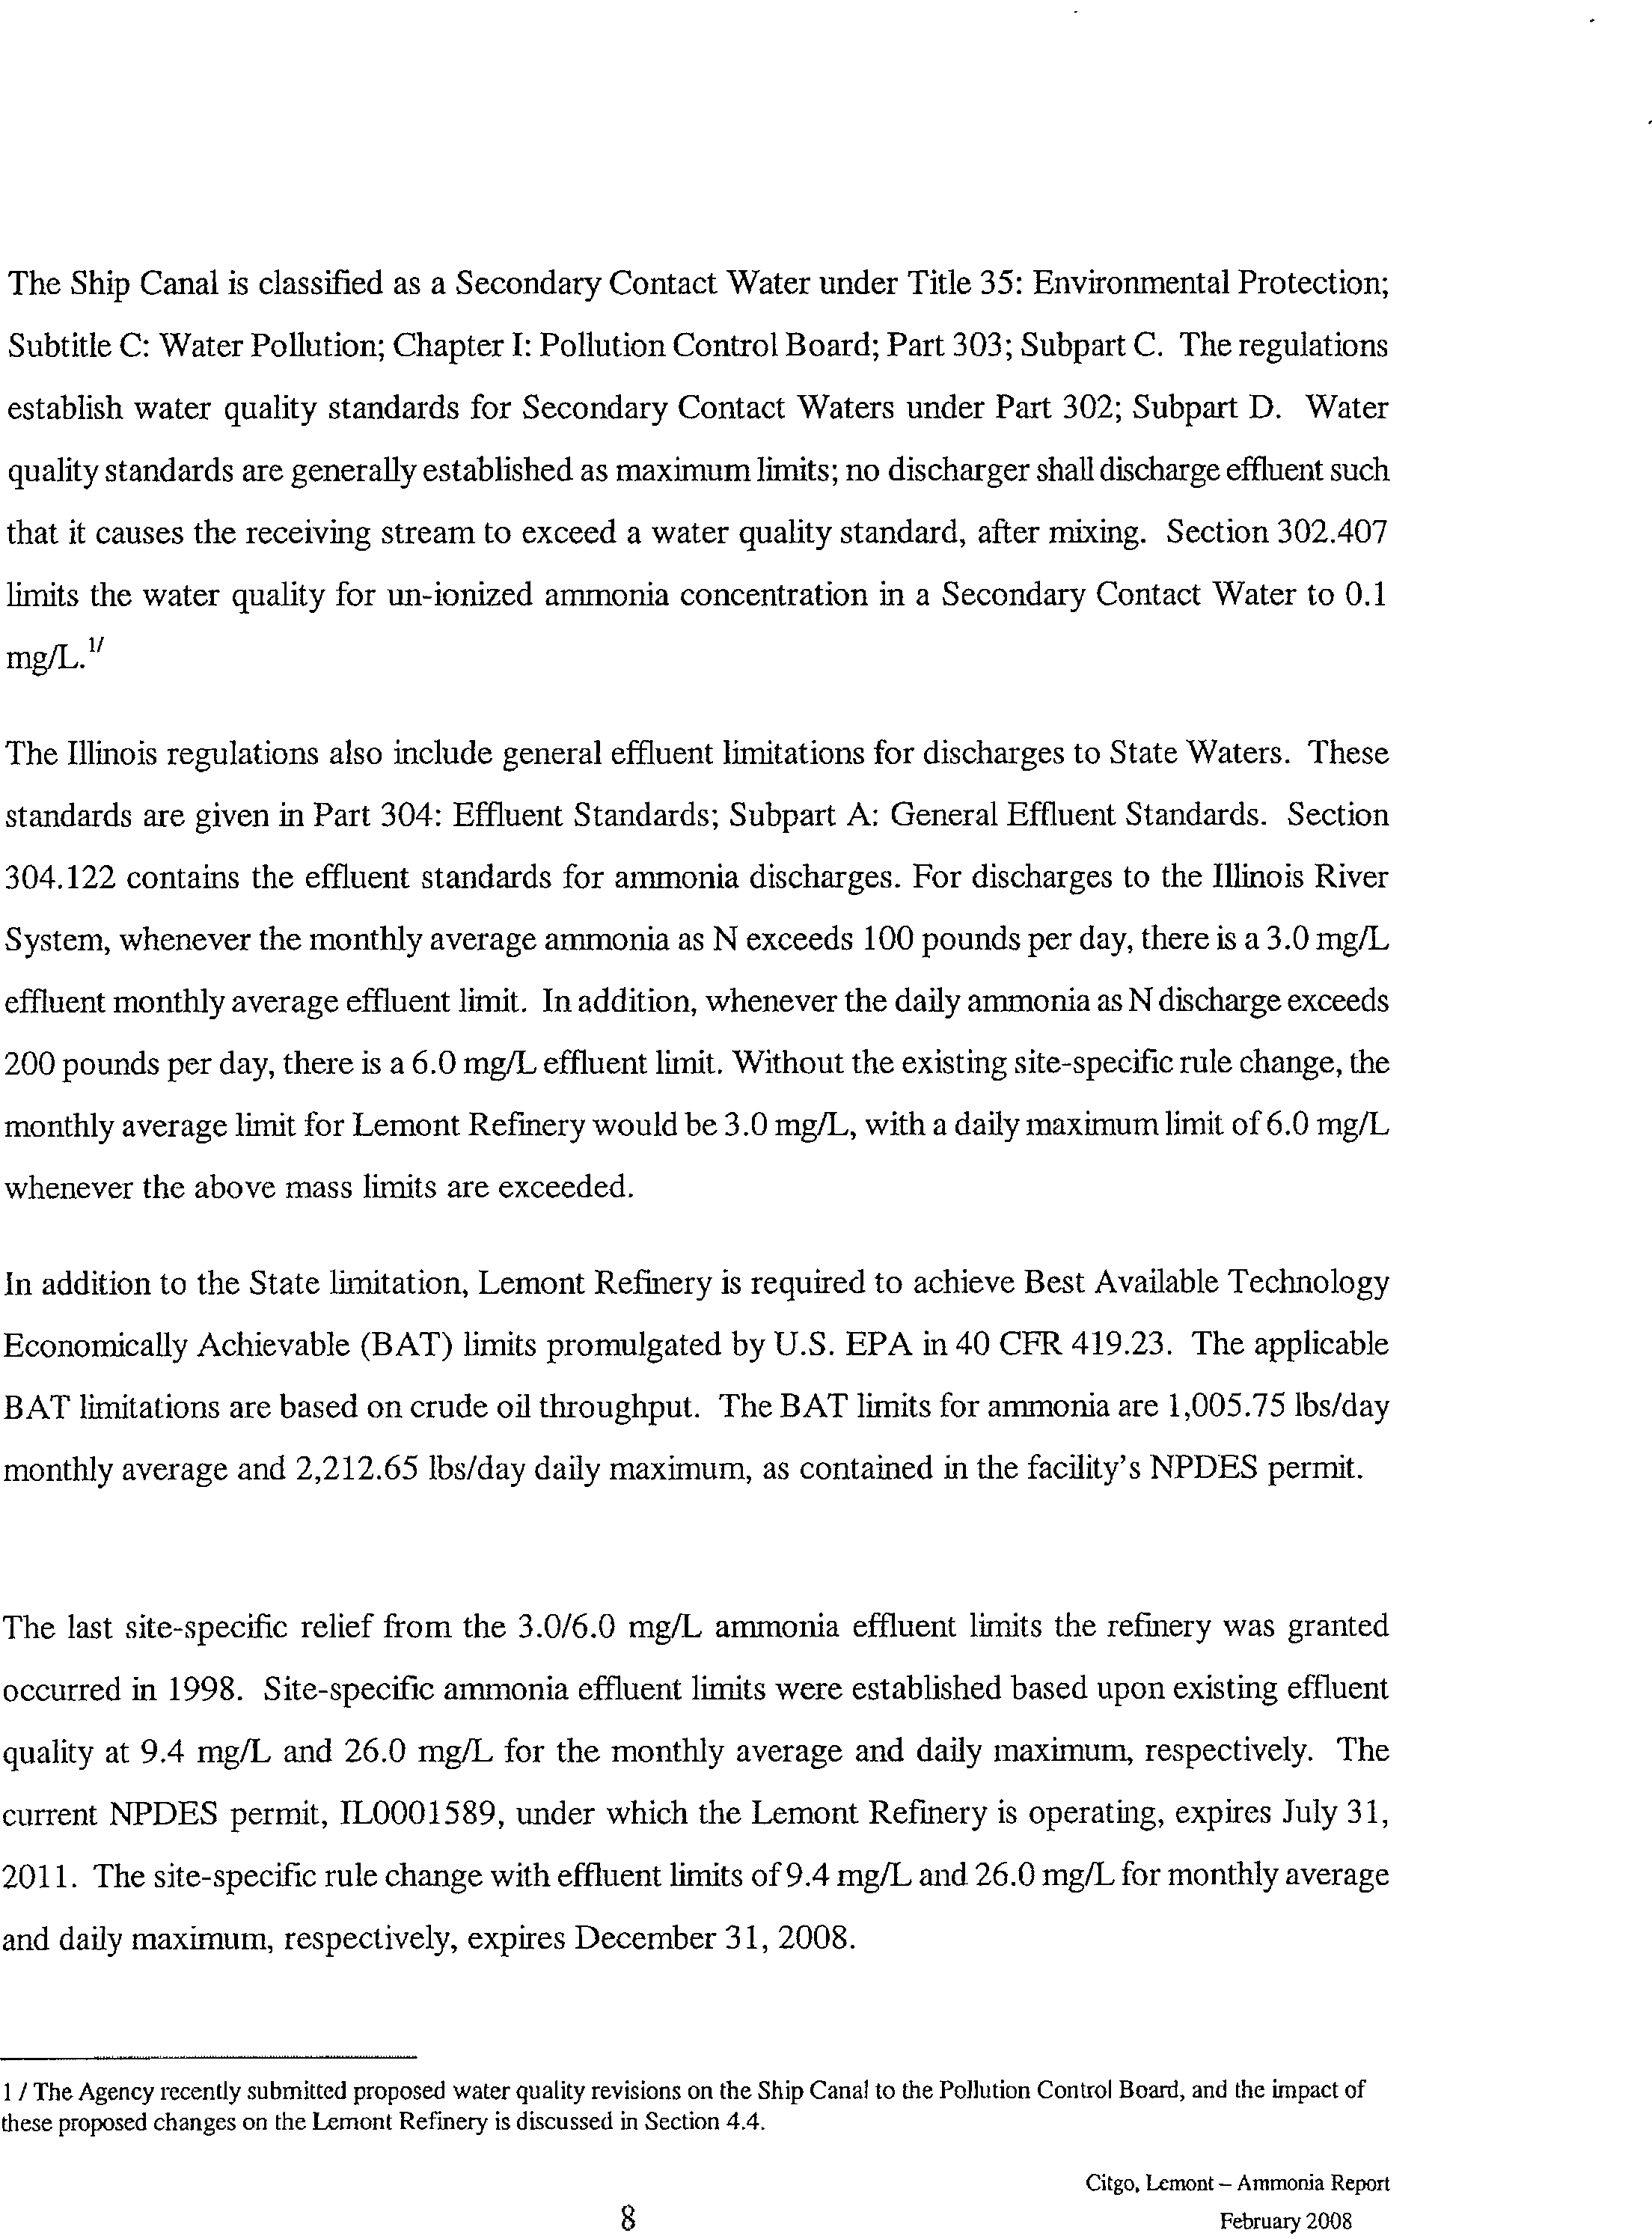
The Ship Canal is classified as a Secondary Contact Water under Title 35: Environmental Protection;
Subtitle C: Water Pollution; Chapter I: Pollution Control Board; Part 303; Subpart C. The regulations
establish water quality standards for Secondary Contact Waters under Part 302; Subpart D. Water
quality standards are generally established as maximum limits; no discharger shall discharge effluent such
that it causes the receiving stream to exceed a water quality standard, after mixing. Section 302.407
limits the water quality for un-ionized ammonia concentration in a Secondary Contact Water to 0.1
mg/L.
1/
The Illinois regulations also include general effluent limitations for discharges to State Waters. These
standards are given in Part 304: Effluent Standards; Subpart A: General Effluent Standards. Section
304.122 contains the effluent standards for ammonia discharges. For discharges to the Illinois River
System, whenever the monthly average ammonia as N exceeds 100 pounds per day, there is a 3.0 mg/L
effluent monthly average effluent limit. In addition, whenever the daily ammonia as N discharge exceeds
200 pounds per day, there is a 6.0 mg/L effluent limit. Without the existing site-specific rule change, the
monthly average limit for Lemont Refinery would be 3.0 mg/L, with a daily maximum limit of 6.0 mg/L
whenever the above mass limits are exceeded.
In addition to the State limitation, Lemont Refinery is required to achieve Best Available Technology
Economically Achievable (BAT) limits promulgated by U.S. EPA in 40 CPR 419.23. The applicable
BAT limitations are based on crude oil throughput. The BAT limits for ammonia are 1,005.75 lbs/day
monthly average and 2,212.65 lbs/day daily maximum, as contained in the facility's NPDES permit.
The last site-specific relief from the 3.0/6.0 mg/L ammonia effluent limits the refinery was granted
occurred in 1998. Site-specific ammonia effluent limits were established based upon existing effluent
quality at 9.4 mg/L and 26.0 mg/L for the monthly average and daily maximum, respectively. The
current NPDES permit, IL0001589, under which the Lemont Refinery is operating, expires July 31,
2011. The site-specific rule change with effluent limits of 9.4 mg/L and 26.0 mg/L for monthly average
and daily maximum, respectively, expires December 31, 2008.
1 / The Agency recently submitted proposed water quality revisions on the Ship Canal to the Pollution Control Board, and the impact of
these proposed changes on the Lemont Refinery is discussed in Section 4.4.
Citgo. Lemont — Ammonia Report
8?
February 2008
Electronic Filing - Received, Clerk's Office, March 18, 2008
* * * * * AS 2008-008 * * * * *
EXHIBIT 2
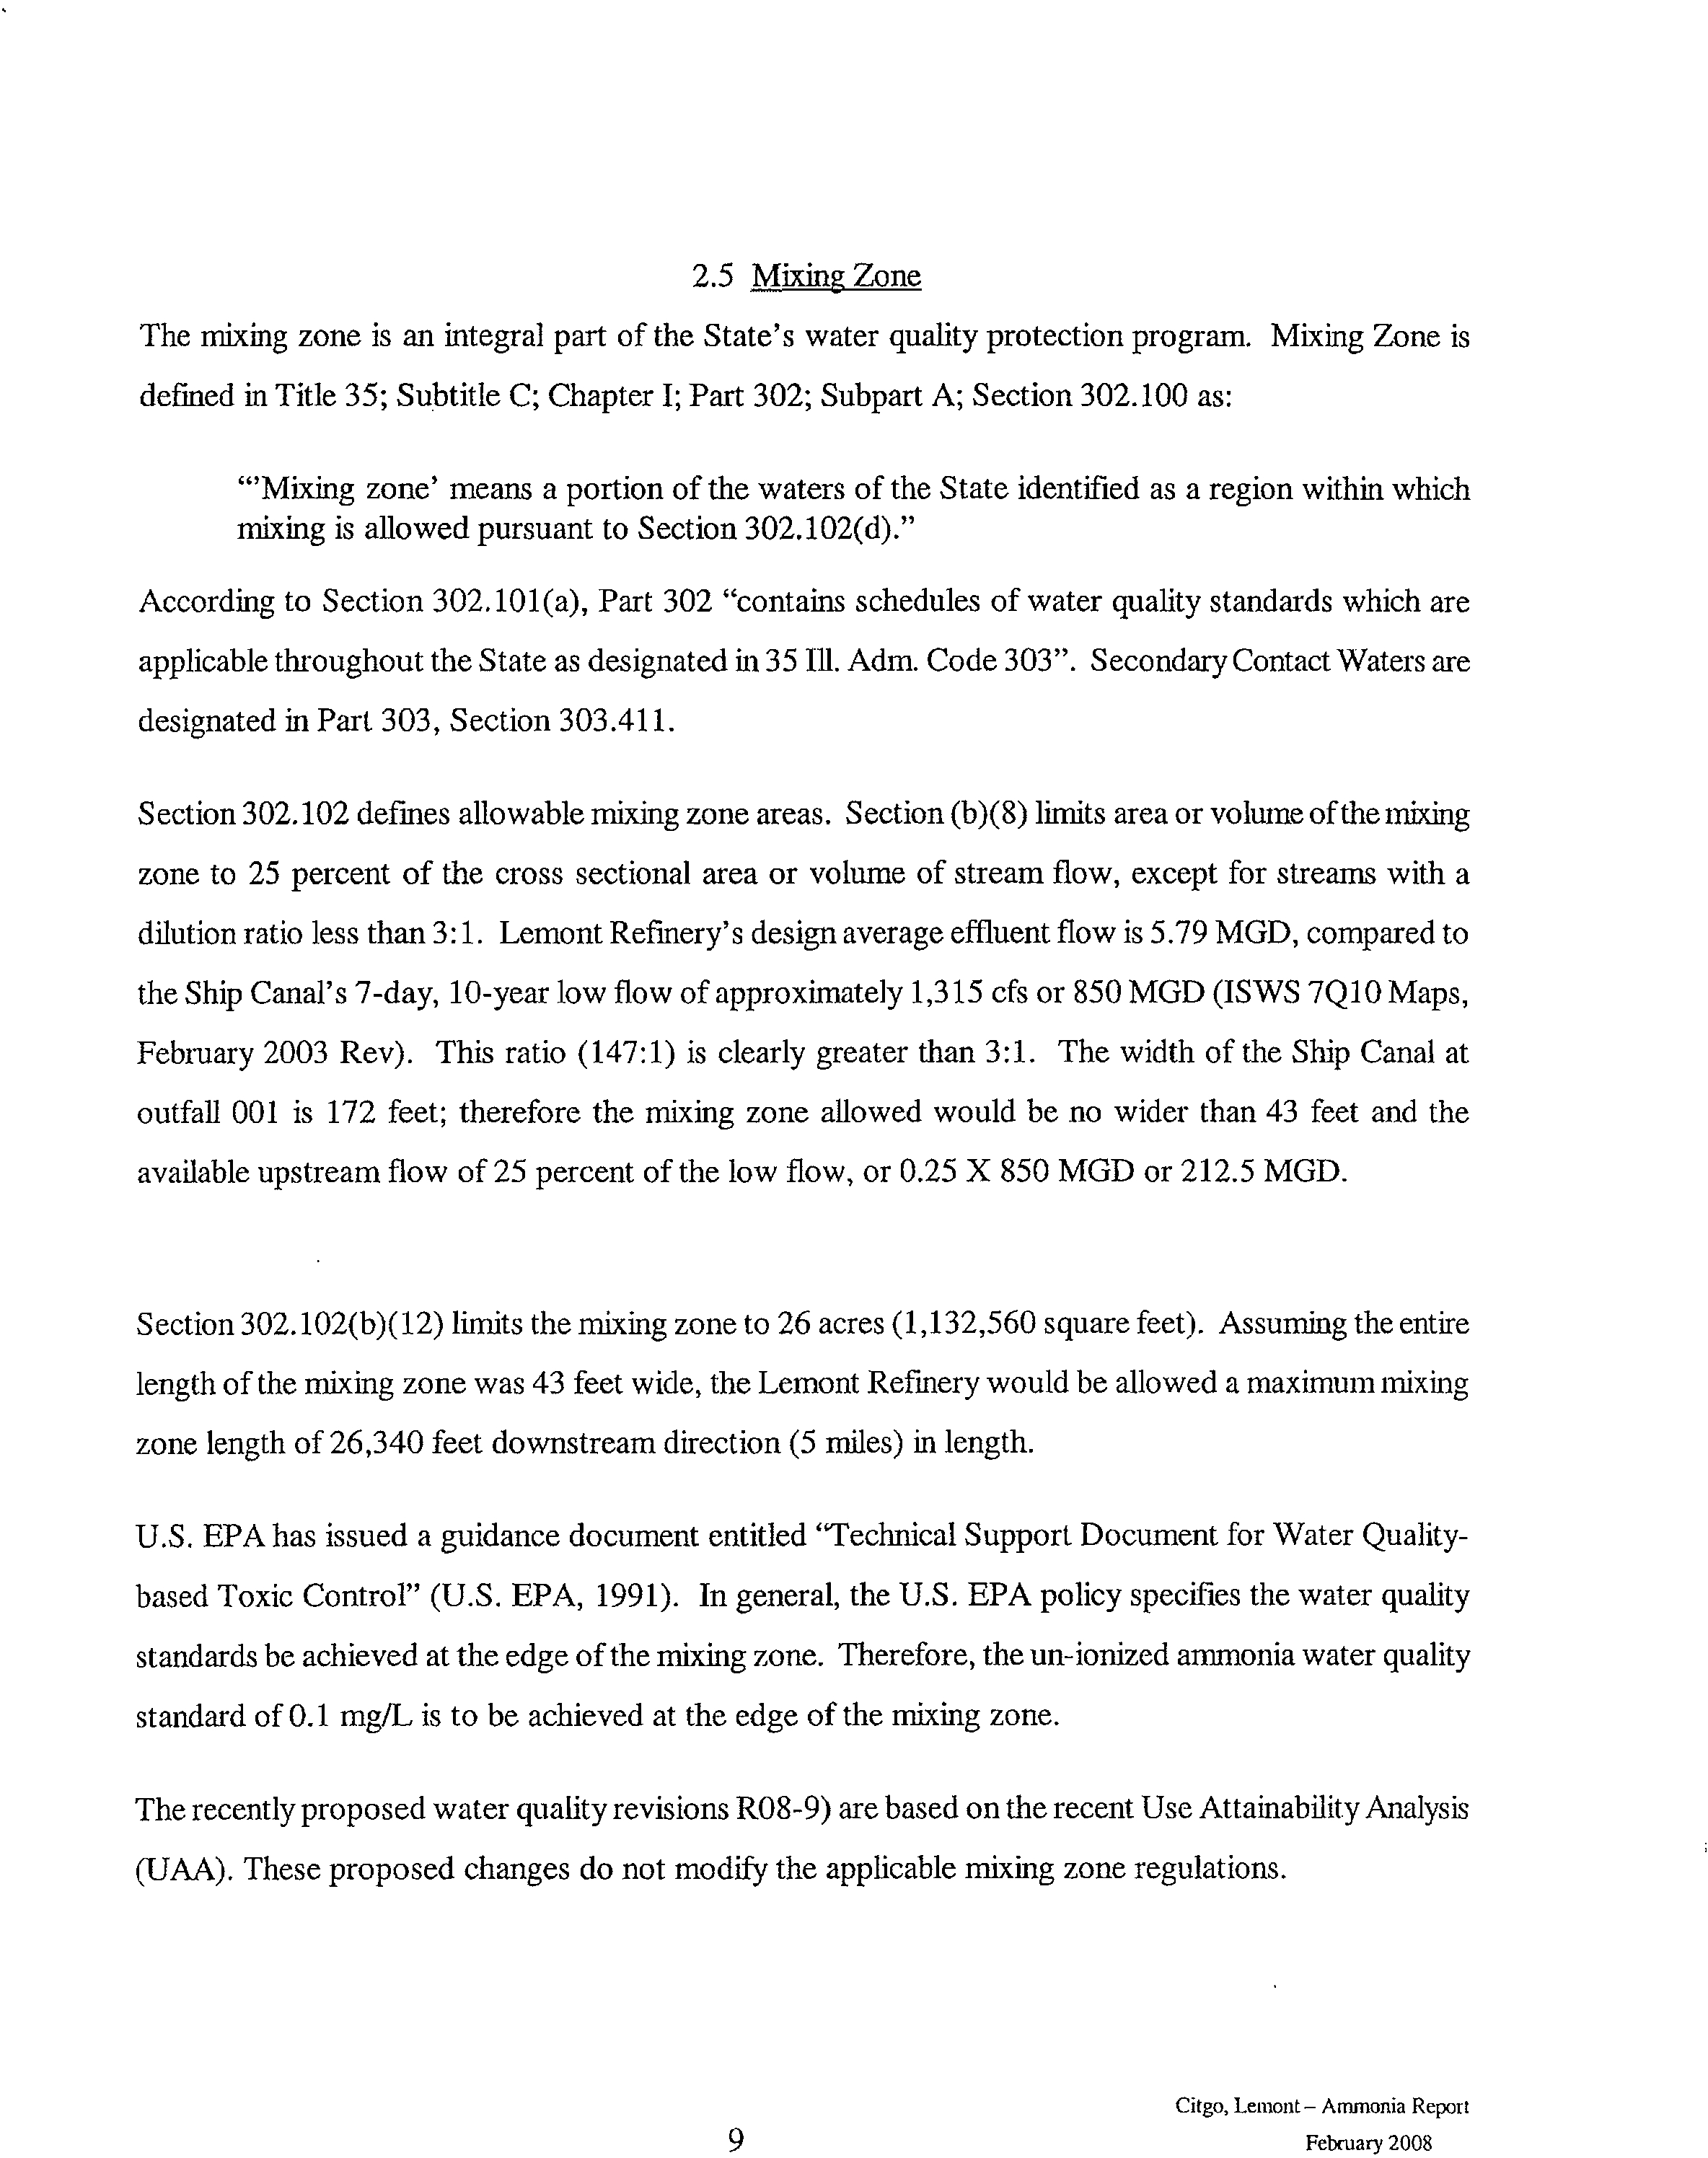
2.5 Mixing Zone
The mixing zone is an integral part of the State's water quality protection program. Mixing Zone is
defined in Title 35; Subtitle C; Chapter I; Part 302; Subpart A; Section 302.100 as:
'Mixing zone' means a portion of the waters of the State identified as a region within which
mixing is allowed pursuant to Section 302.102(d)."
According to Section 302.101(a), Part 302 "contains schedules of water quality standards which are
applicable throughout the State as designated in 35 Ill. Adm. Code 303". Secondary Contact Waters are
designated in Part 303, Section 303.411.
Section 302.102 defines allowable mixing zone areas. Section (b)(8) limits area or volume of the mixing
zone to 25 percent of the cross sectional area or volume of stream flow, except for streams with a
dilution ratio less than 3:1. Lemont Refinery's design average effluent flow is 5.79 MGD, compared to
the Ship Canal's 7-day, 10-year low flow of approximately 1,315 cfs or 850 MGD (ISWS 7Q10 Maps,
February 2003 Rev). This ratio (147:1) is clearly greater than 3:1. The width of the Ship Canal at
outfall 001 is 172 feet; therefore the mixing zone allowed would be no wider than 43 feet and the
available upstream flow of 25 percent of the low flow, or 0.25 X 850 MGD or 212.5 MGD.
Section 302.102(b)(12) limits the mixing zone to 26 acres (1,132,560 square feet). Assuming the entire
length of the mixing zone was 43 feet wide, the Lemont Refinery would be allowed a maximum mixing
zone length of 26,340 feet downstream direction (5 miles) in length.
U.S. EPA has issued a guidance document entitled "Technical Support Document for Water Quality-
based Toxic Control" (U.S. EPA, 1991). In general, the U.S. EPA policy specifies the water quality
standards be achieved at the edge of the mixing zone. Therefore, the un-ionized ammonia water quality
standard of 0.1 mg/L is to be achieved at the edge of the mixing zone.
The recently proposed water quality revisions R08-9) are based on the recent Use Attainability Analysis
(UAA). These proposed changes do not modify the applicable mixing zone regulations.
Citgo, Lemont— Ammonia Report
9
February 2008
Electronic Filing - Received, Clerk's Office, March 18, 2008
* * * * * AS 2008-008 * * * * *
EXHIBIT 2
3. INFLUENT and EFFLUENT WATER QUALITY
3.1 Introduction
Lemont Refinery produces a range of industrial products (coke, sulfur, etc.), solvents (aliphatic and
aromatic), and conventional and reformulated petroleum products, including gasoline, distillates, and jet
fuel. Since 1977, Lemont Refinery has implemented a variety of in-plant and end-of-pipe programs to
reduce effluent ammonia loadings. These efforts and resultant effluent quality are described below.
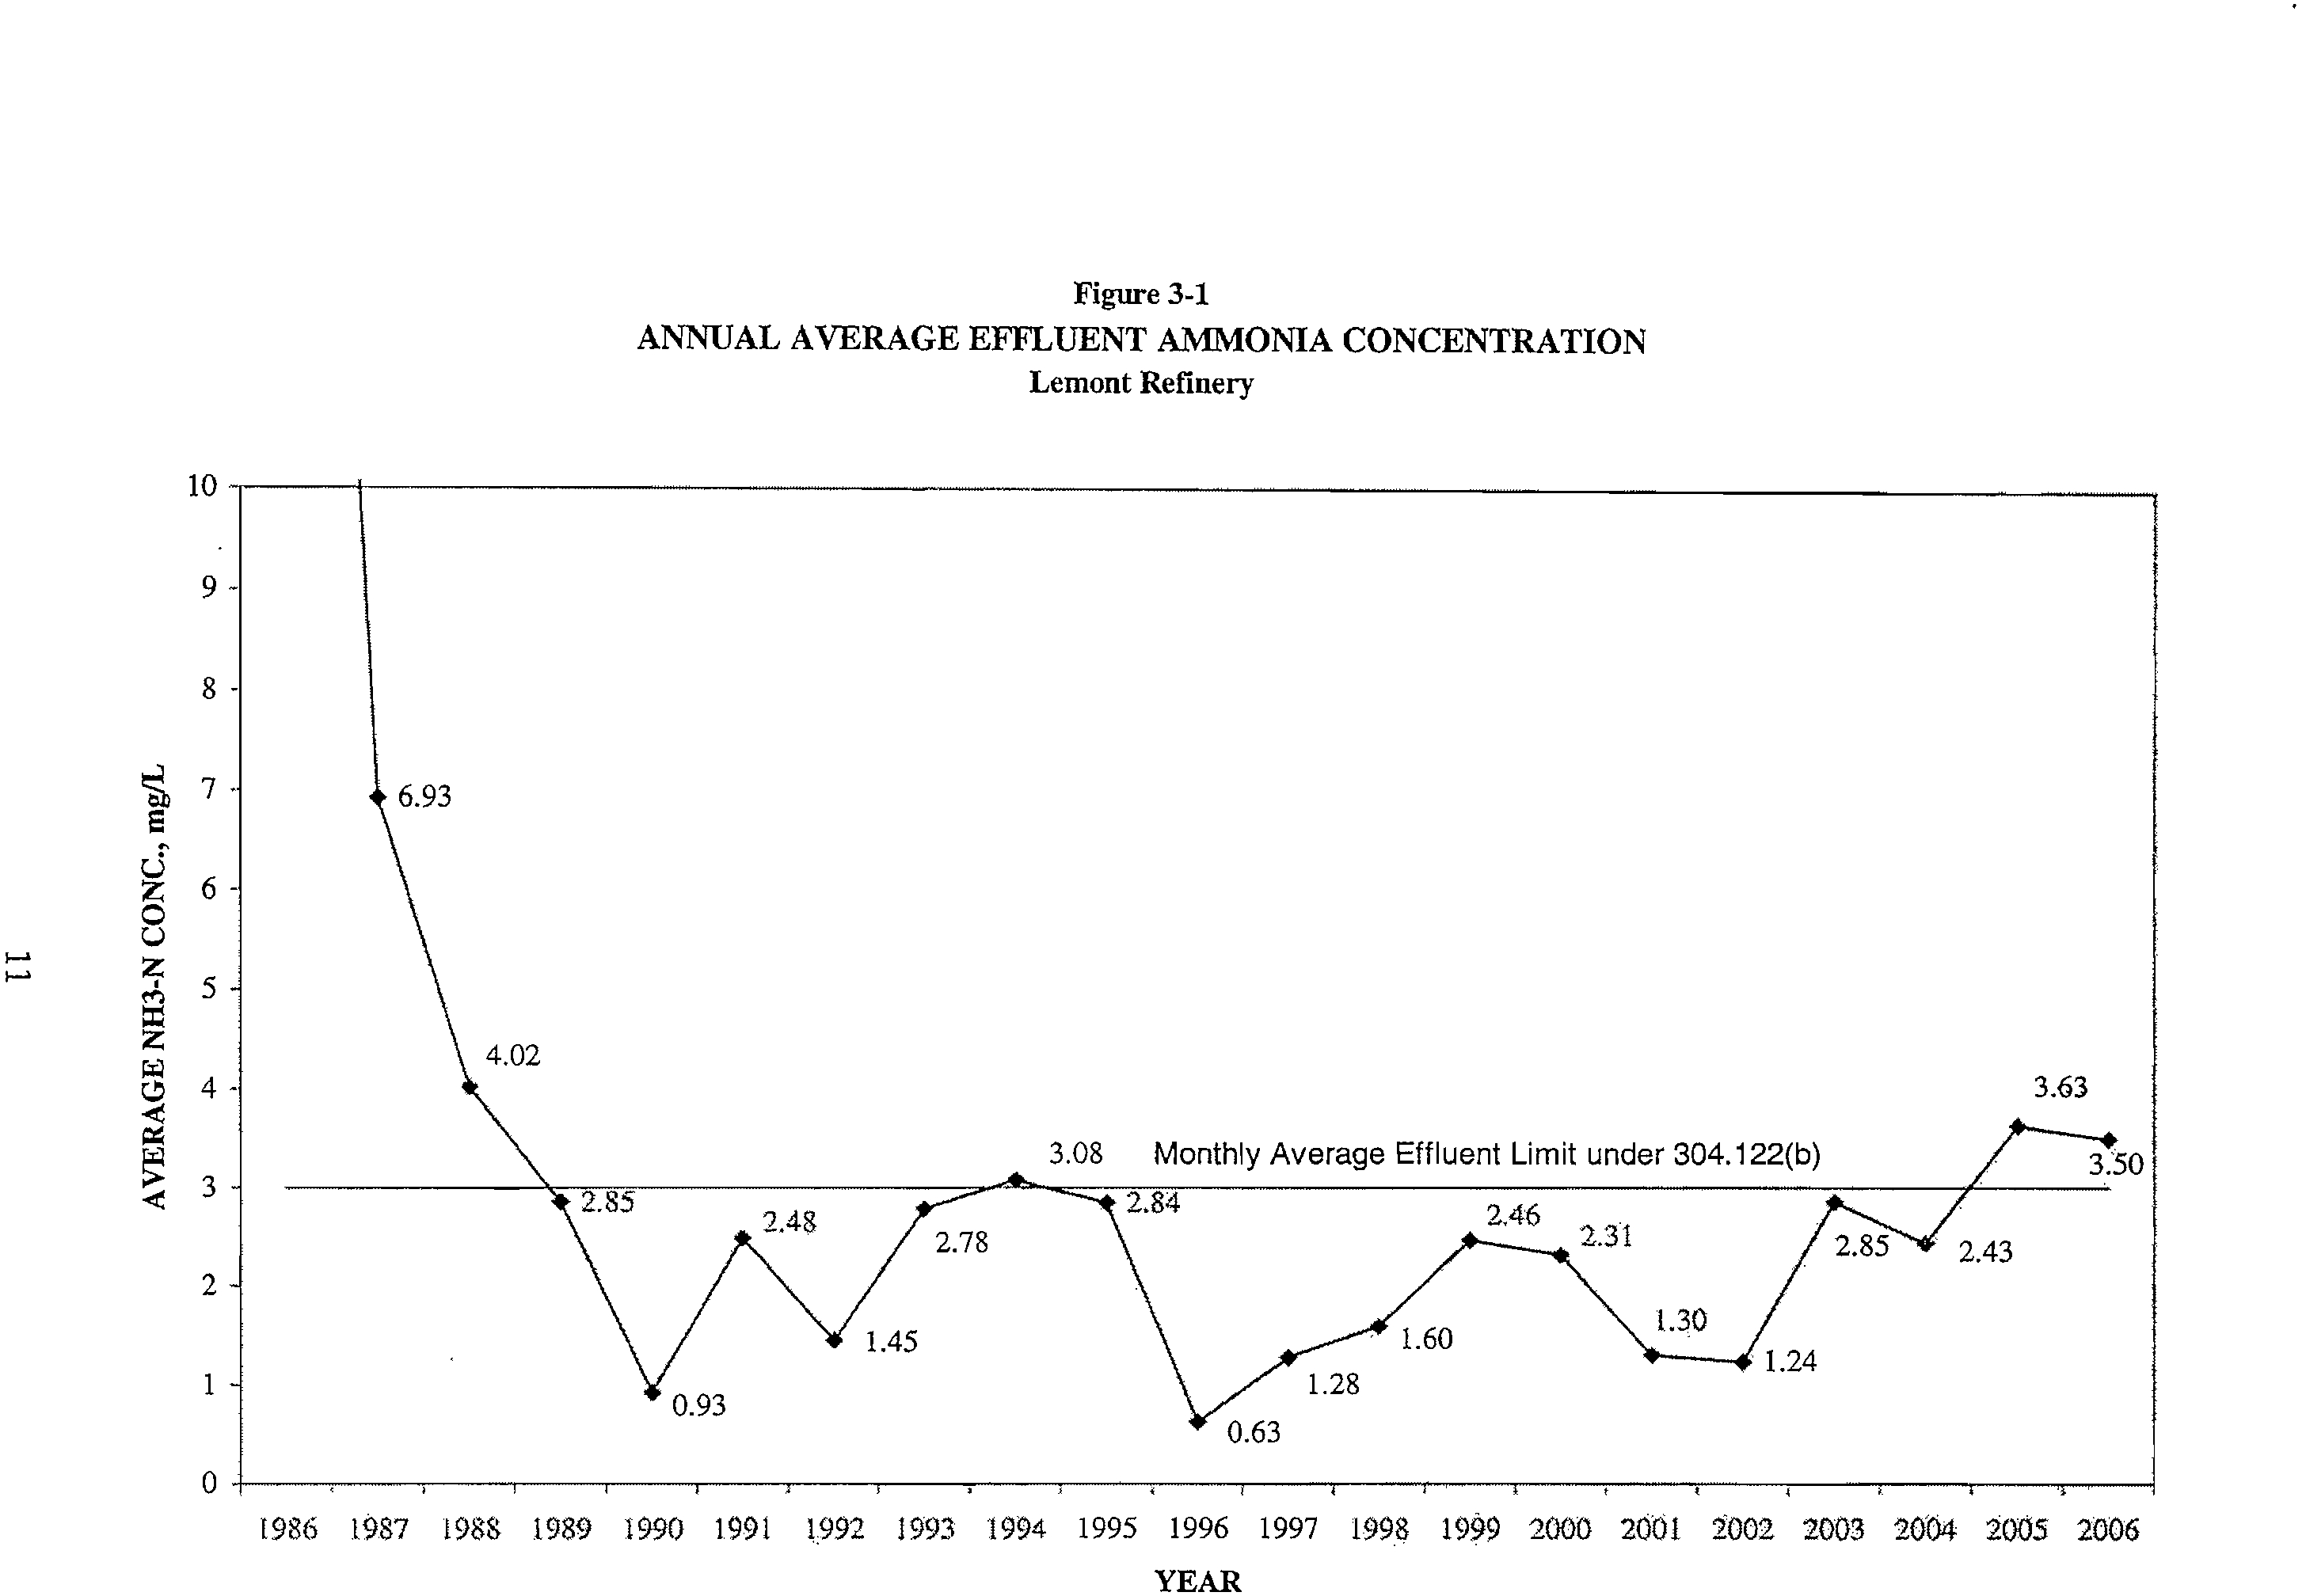
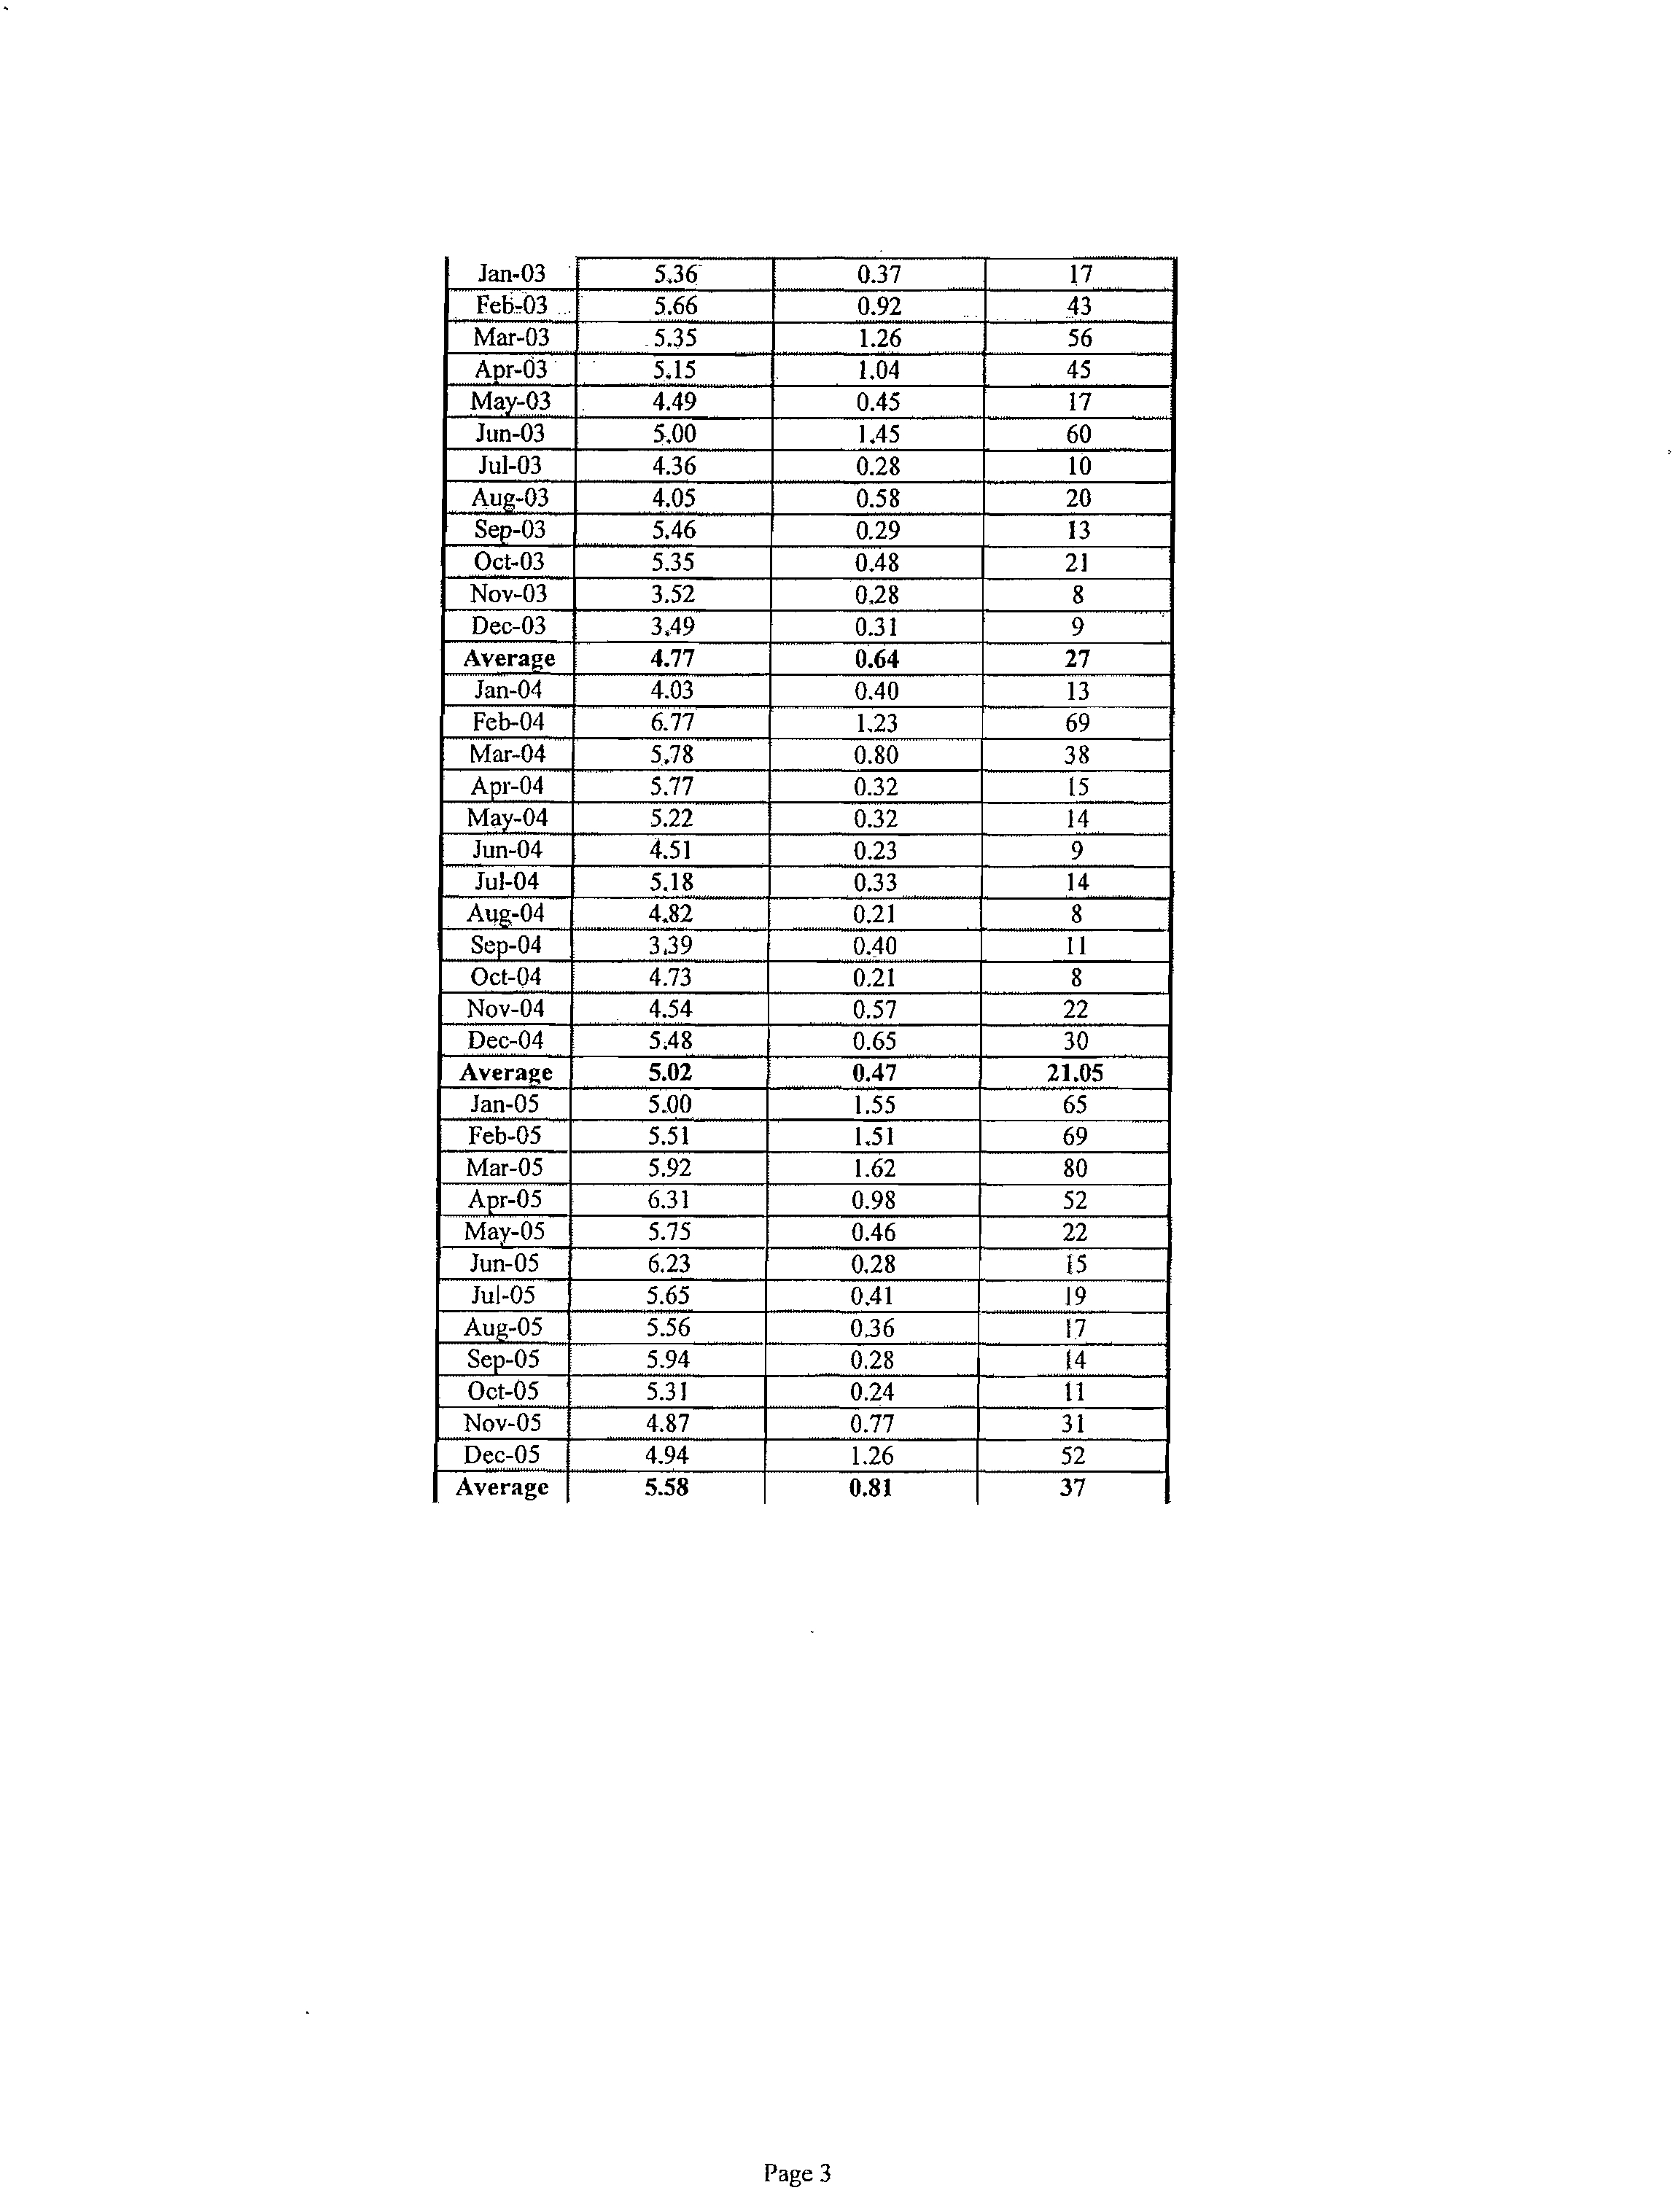
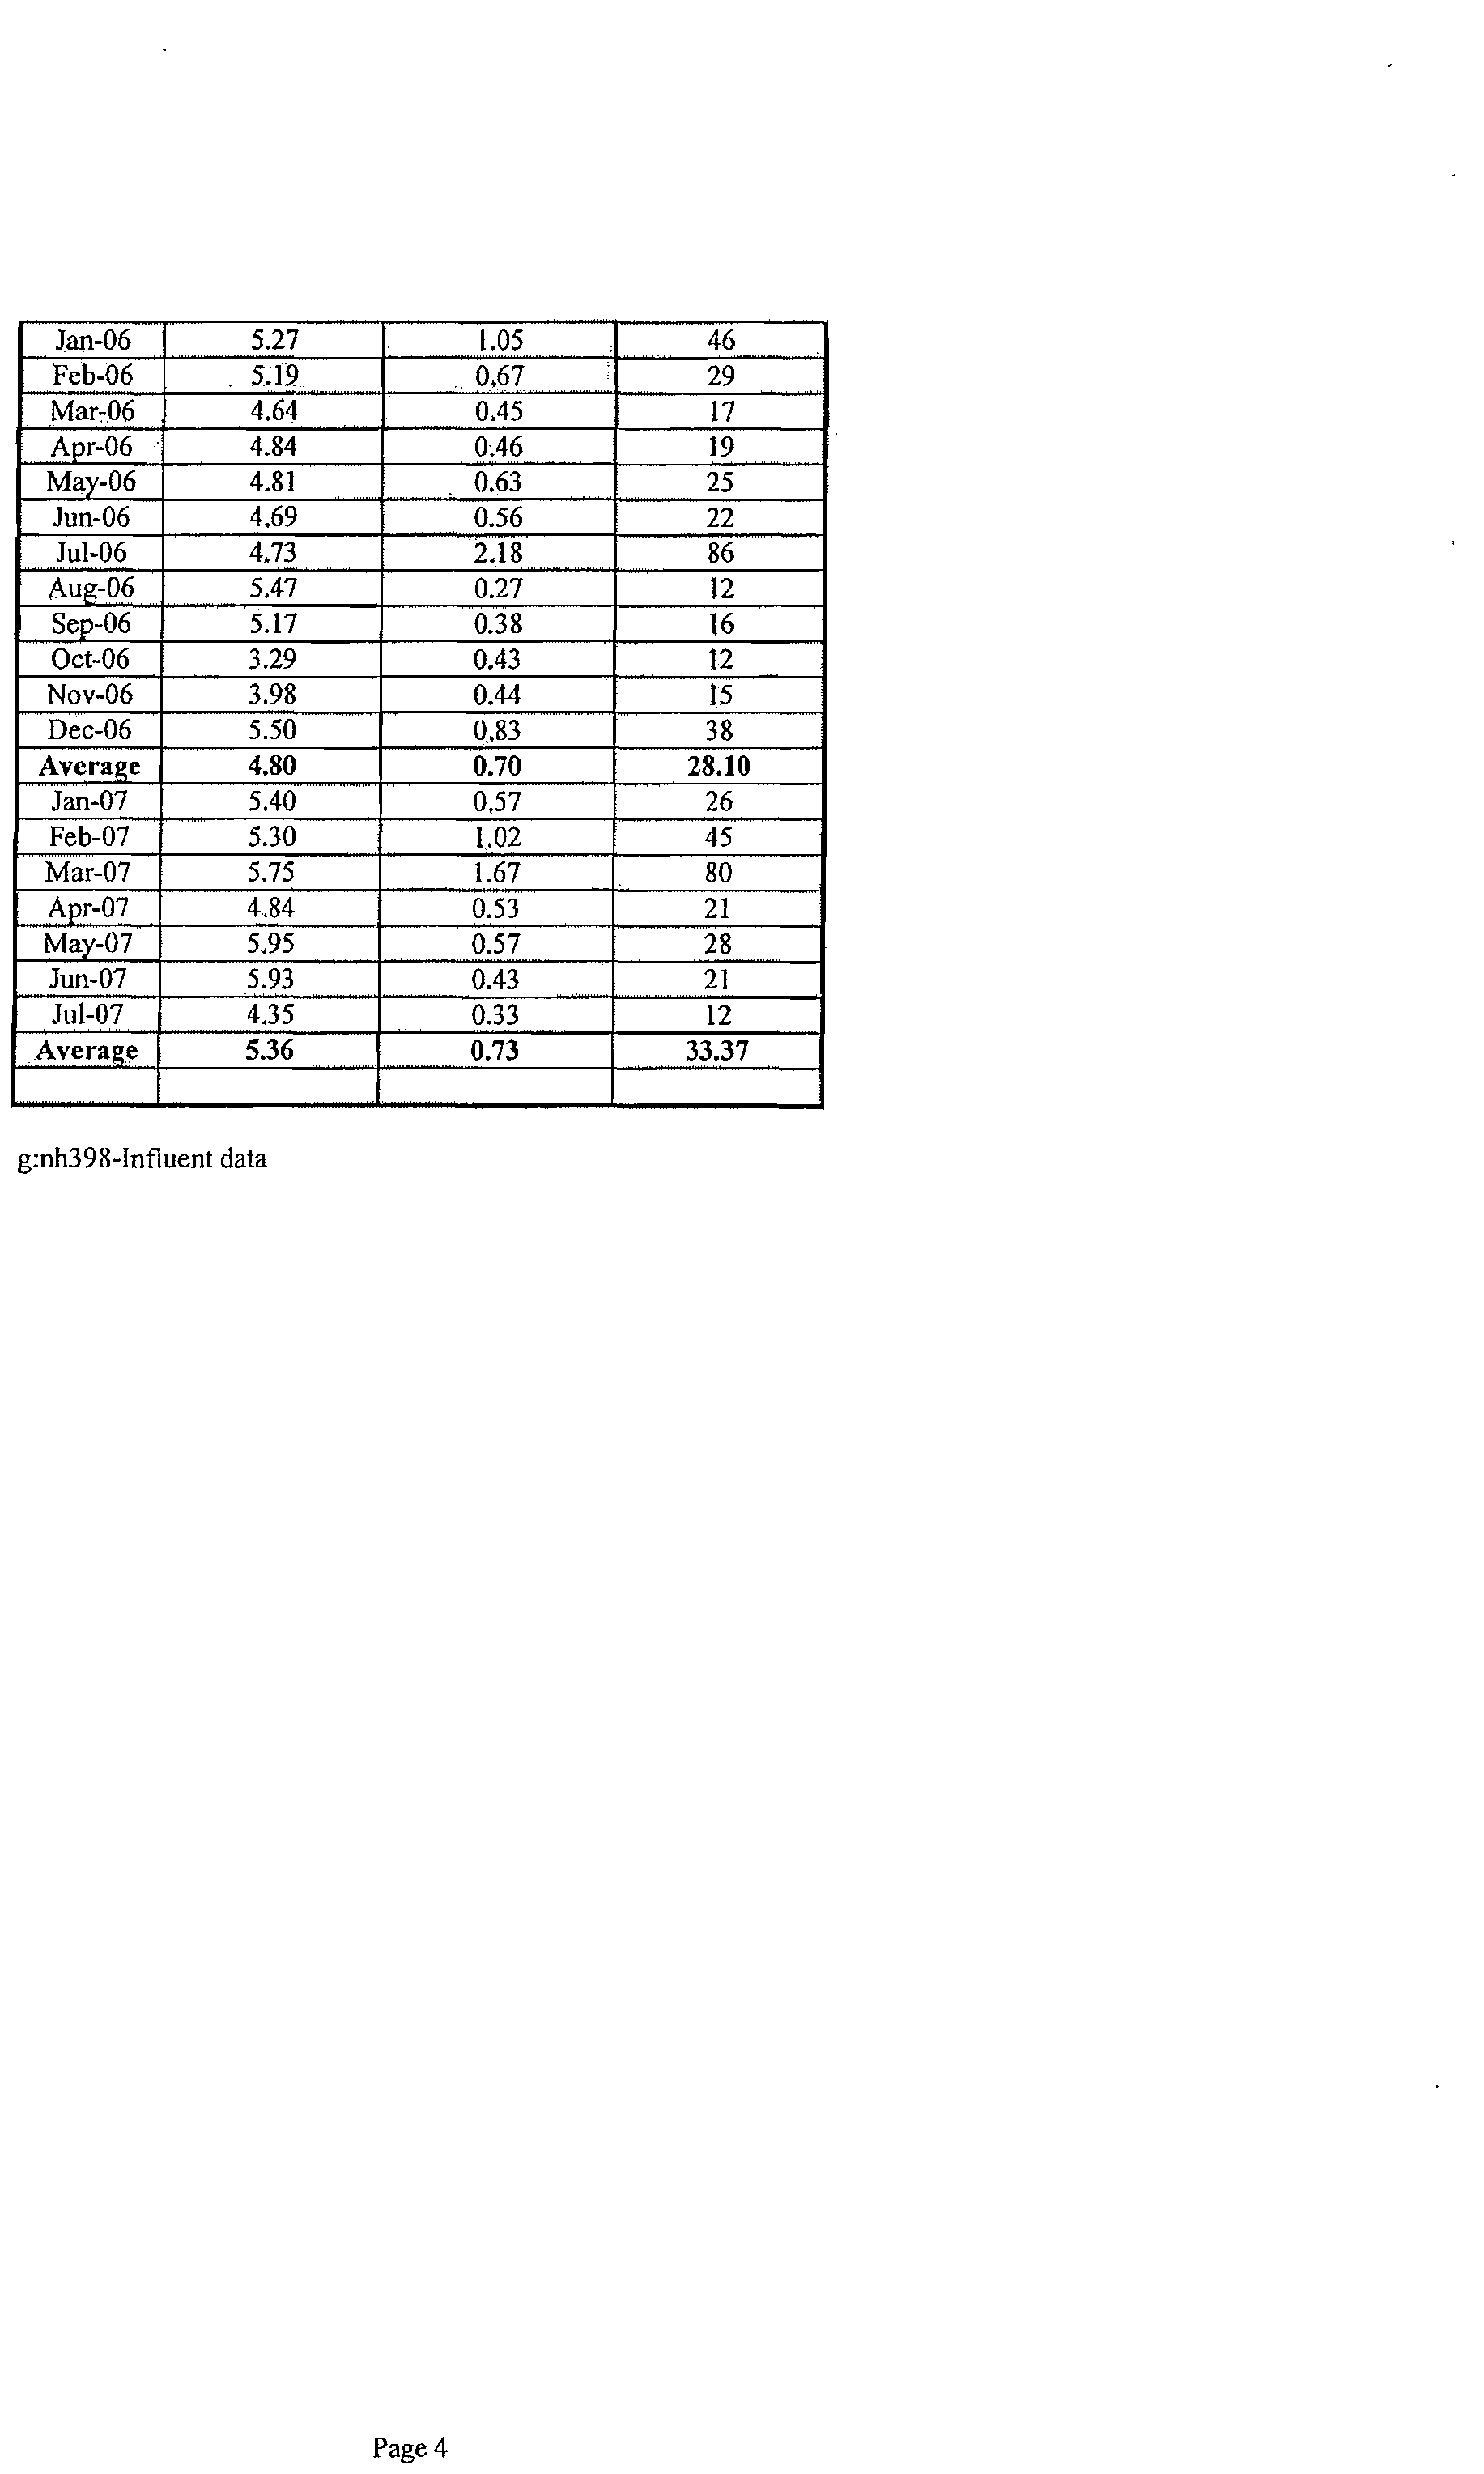
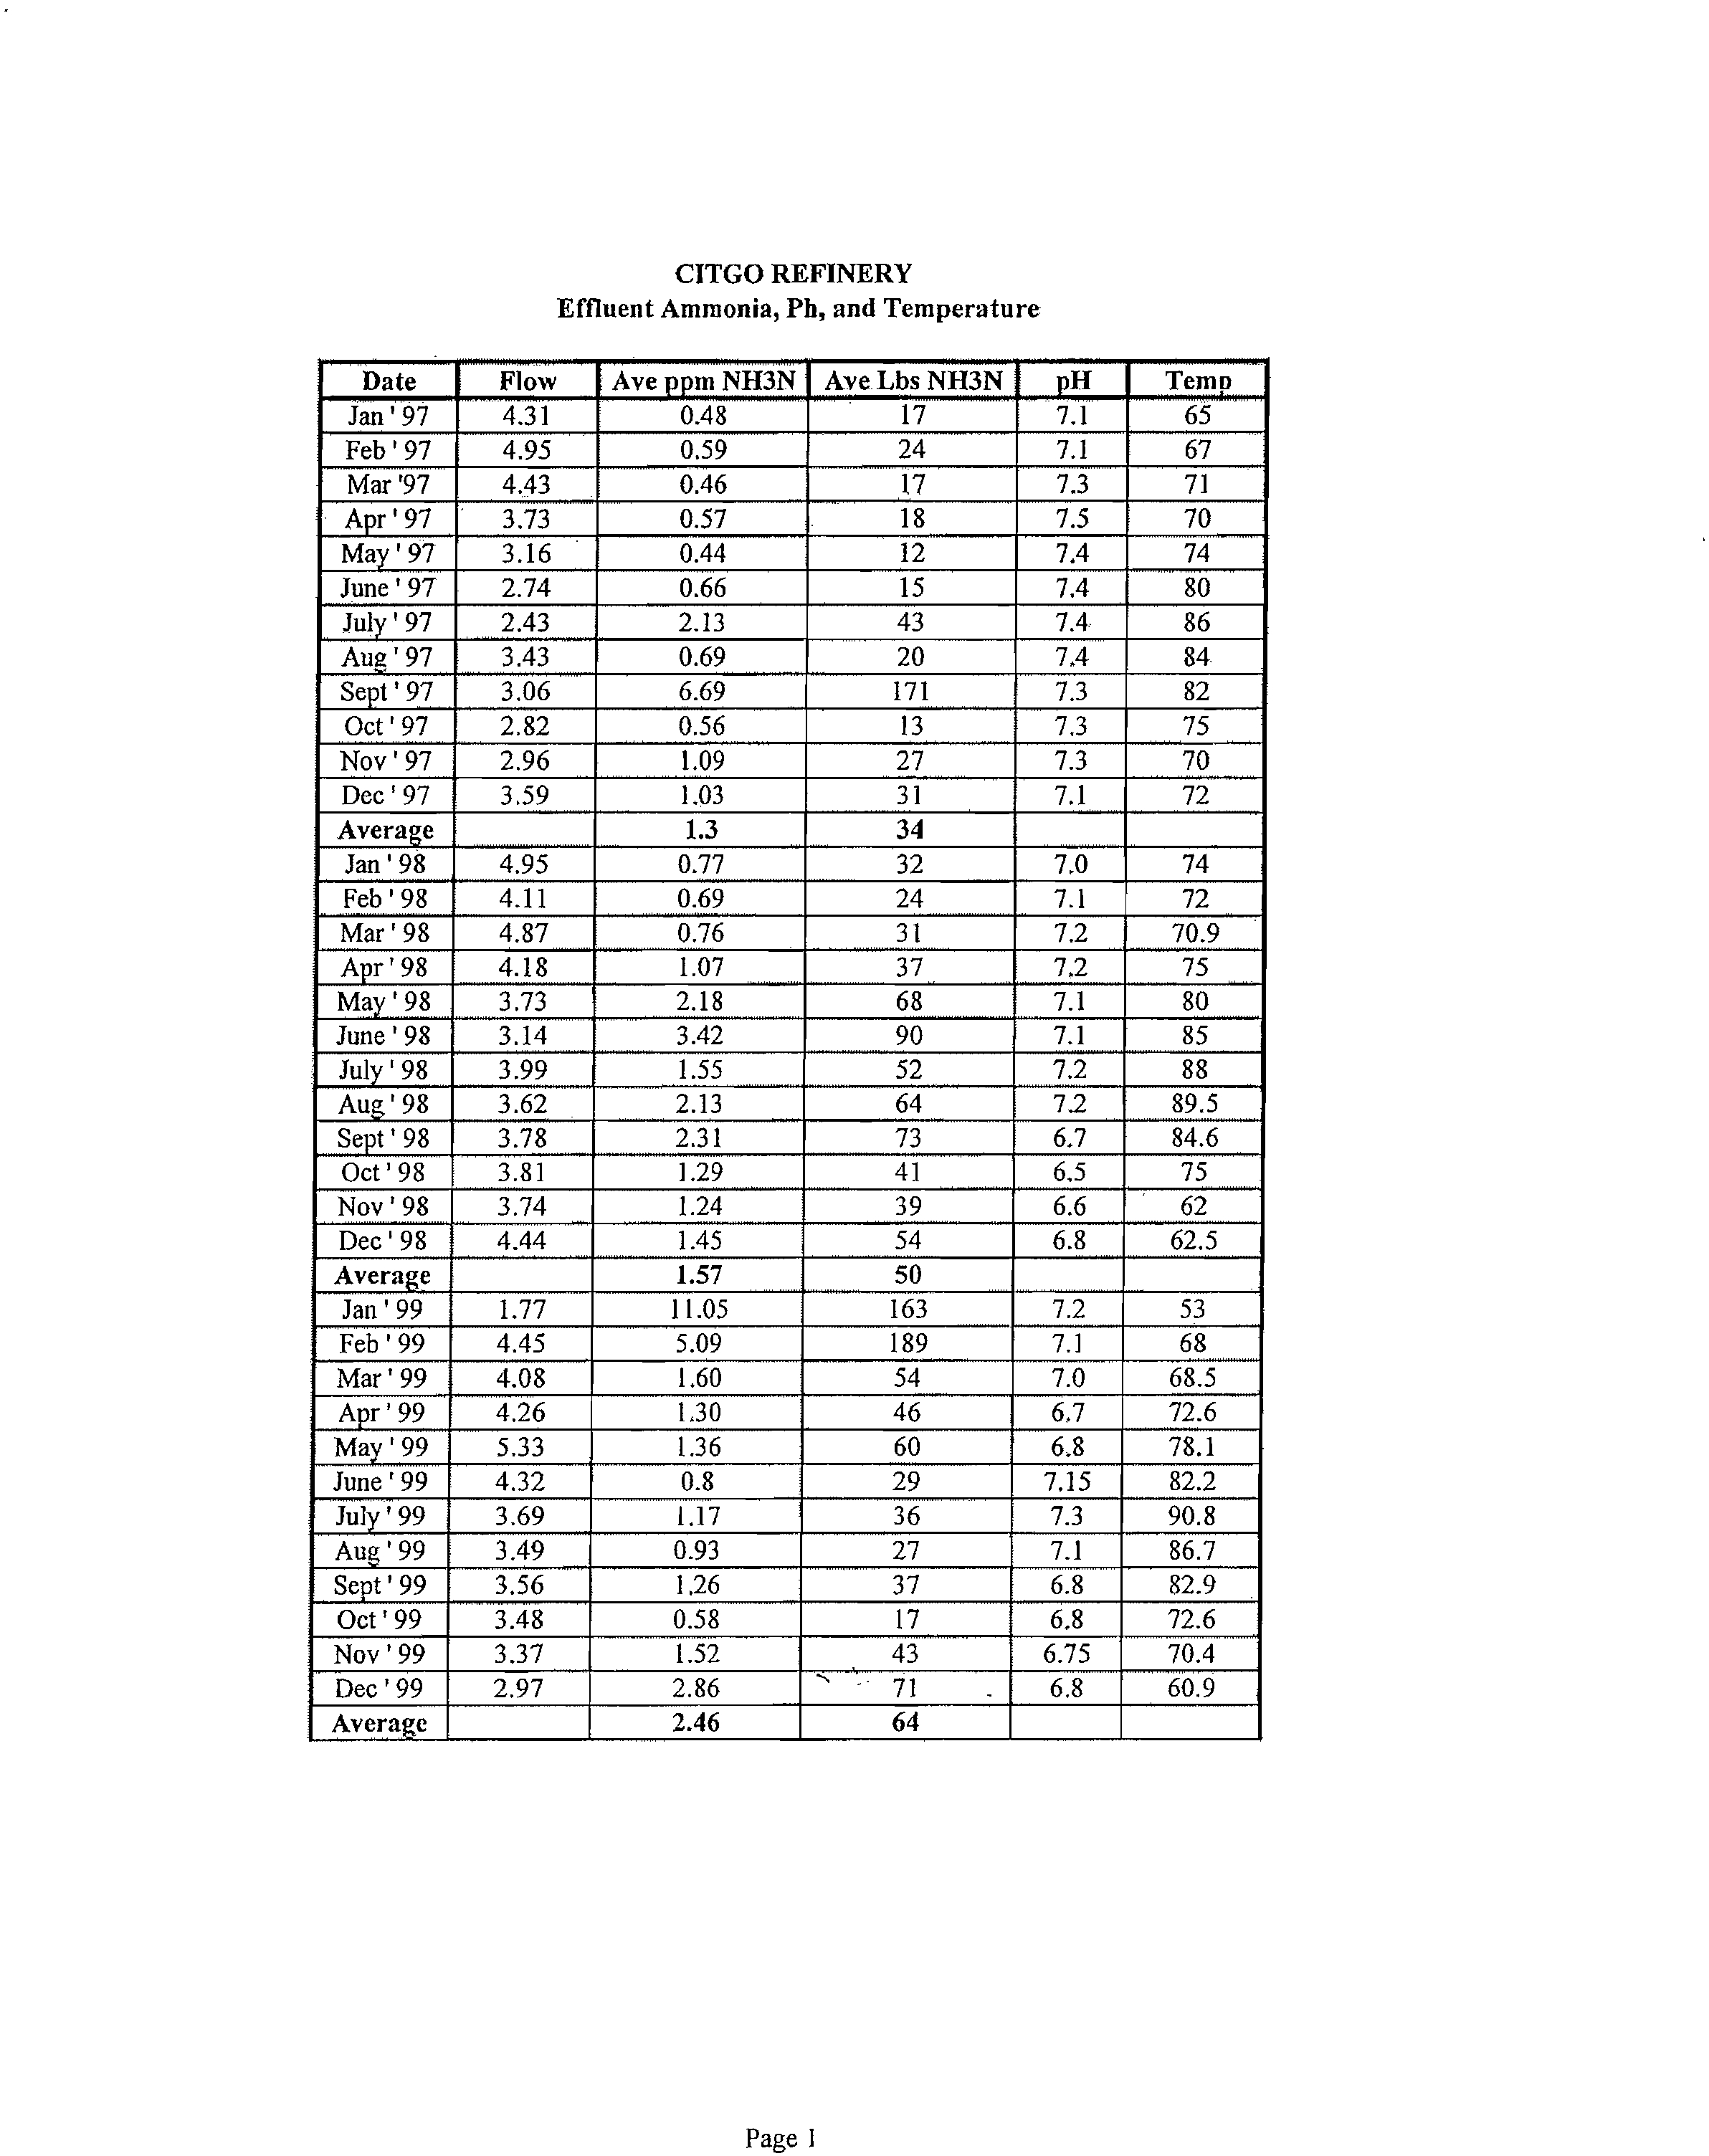
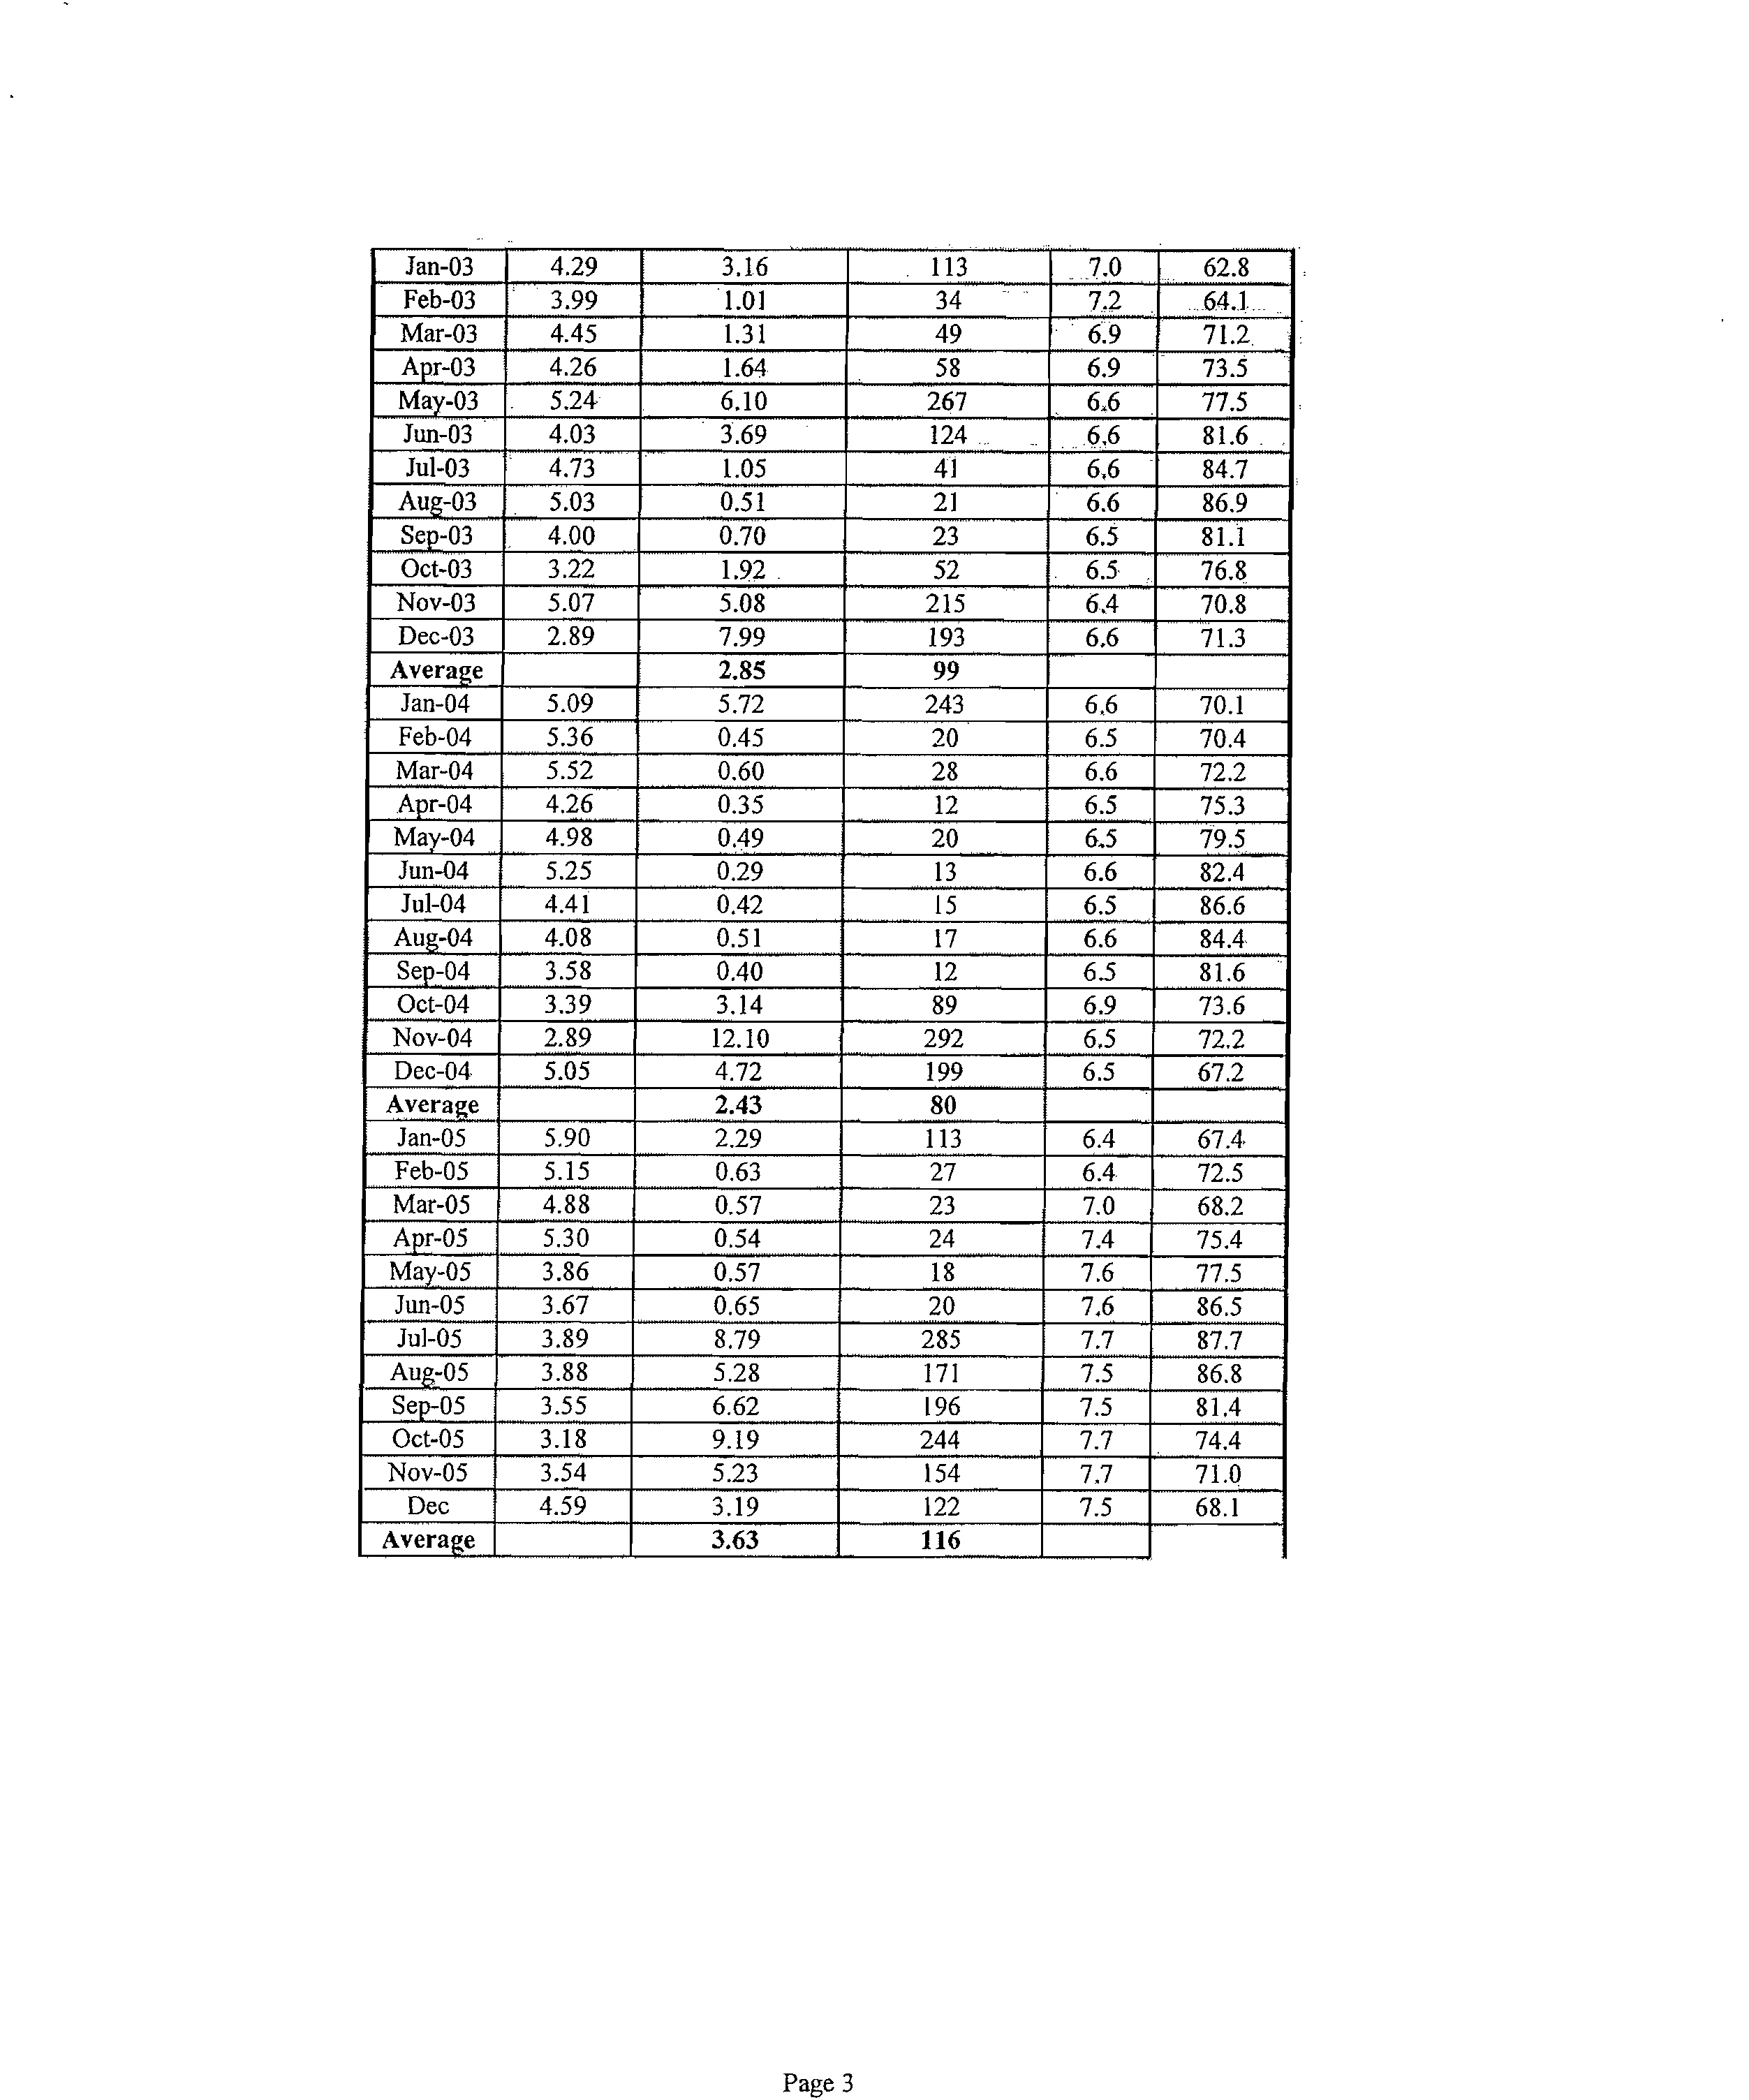
3.2 Effluent Quality
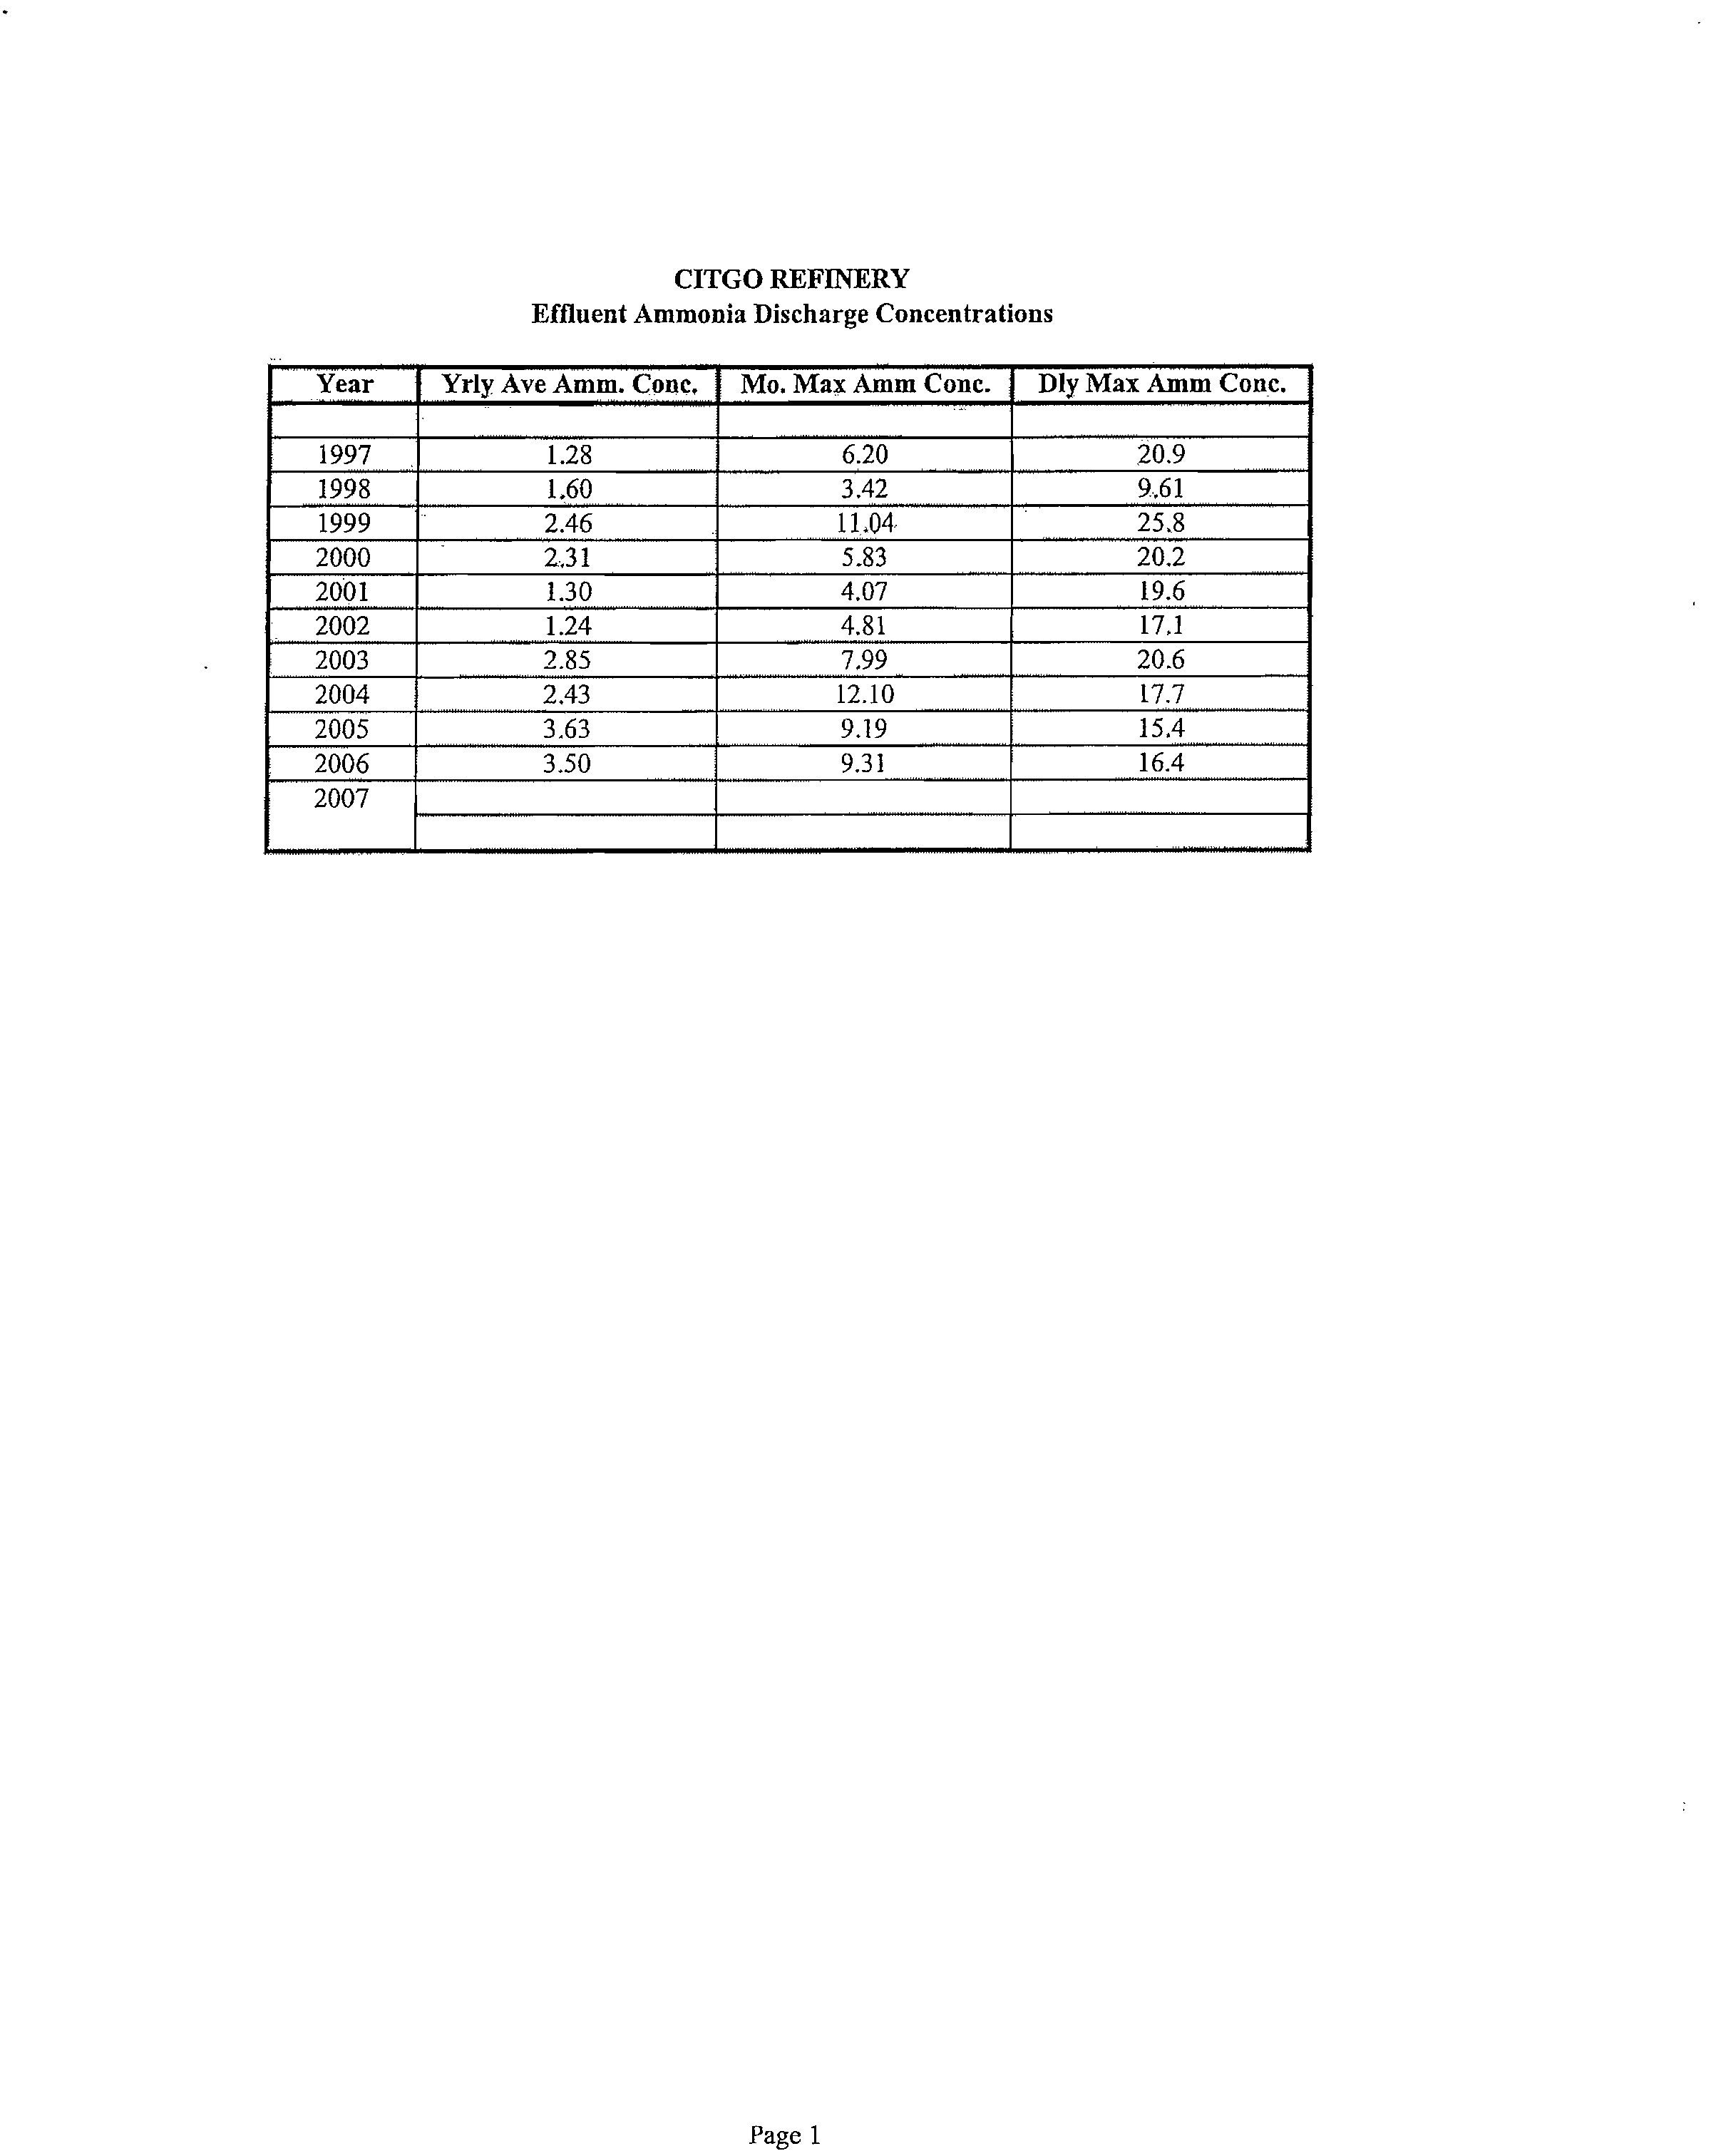
Several factors influence the ammonia nitrogen concentration in the effluent including nitrogen content
in the crude oil; crude oil throughput; influent BOD
5
, TSS, and oil loadings; and degree of nitrification
being achieved in the wastewater treatment plant. Figure 3-1 presents the annual average effluent
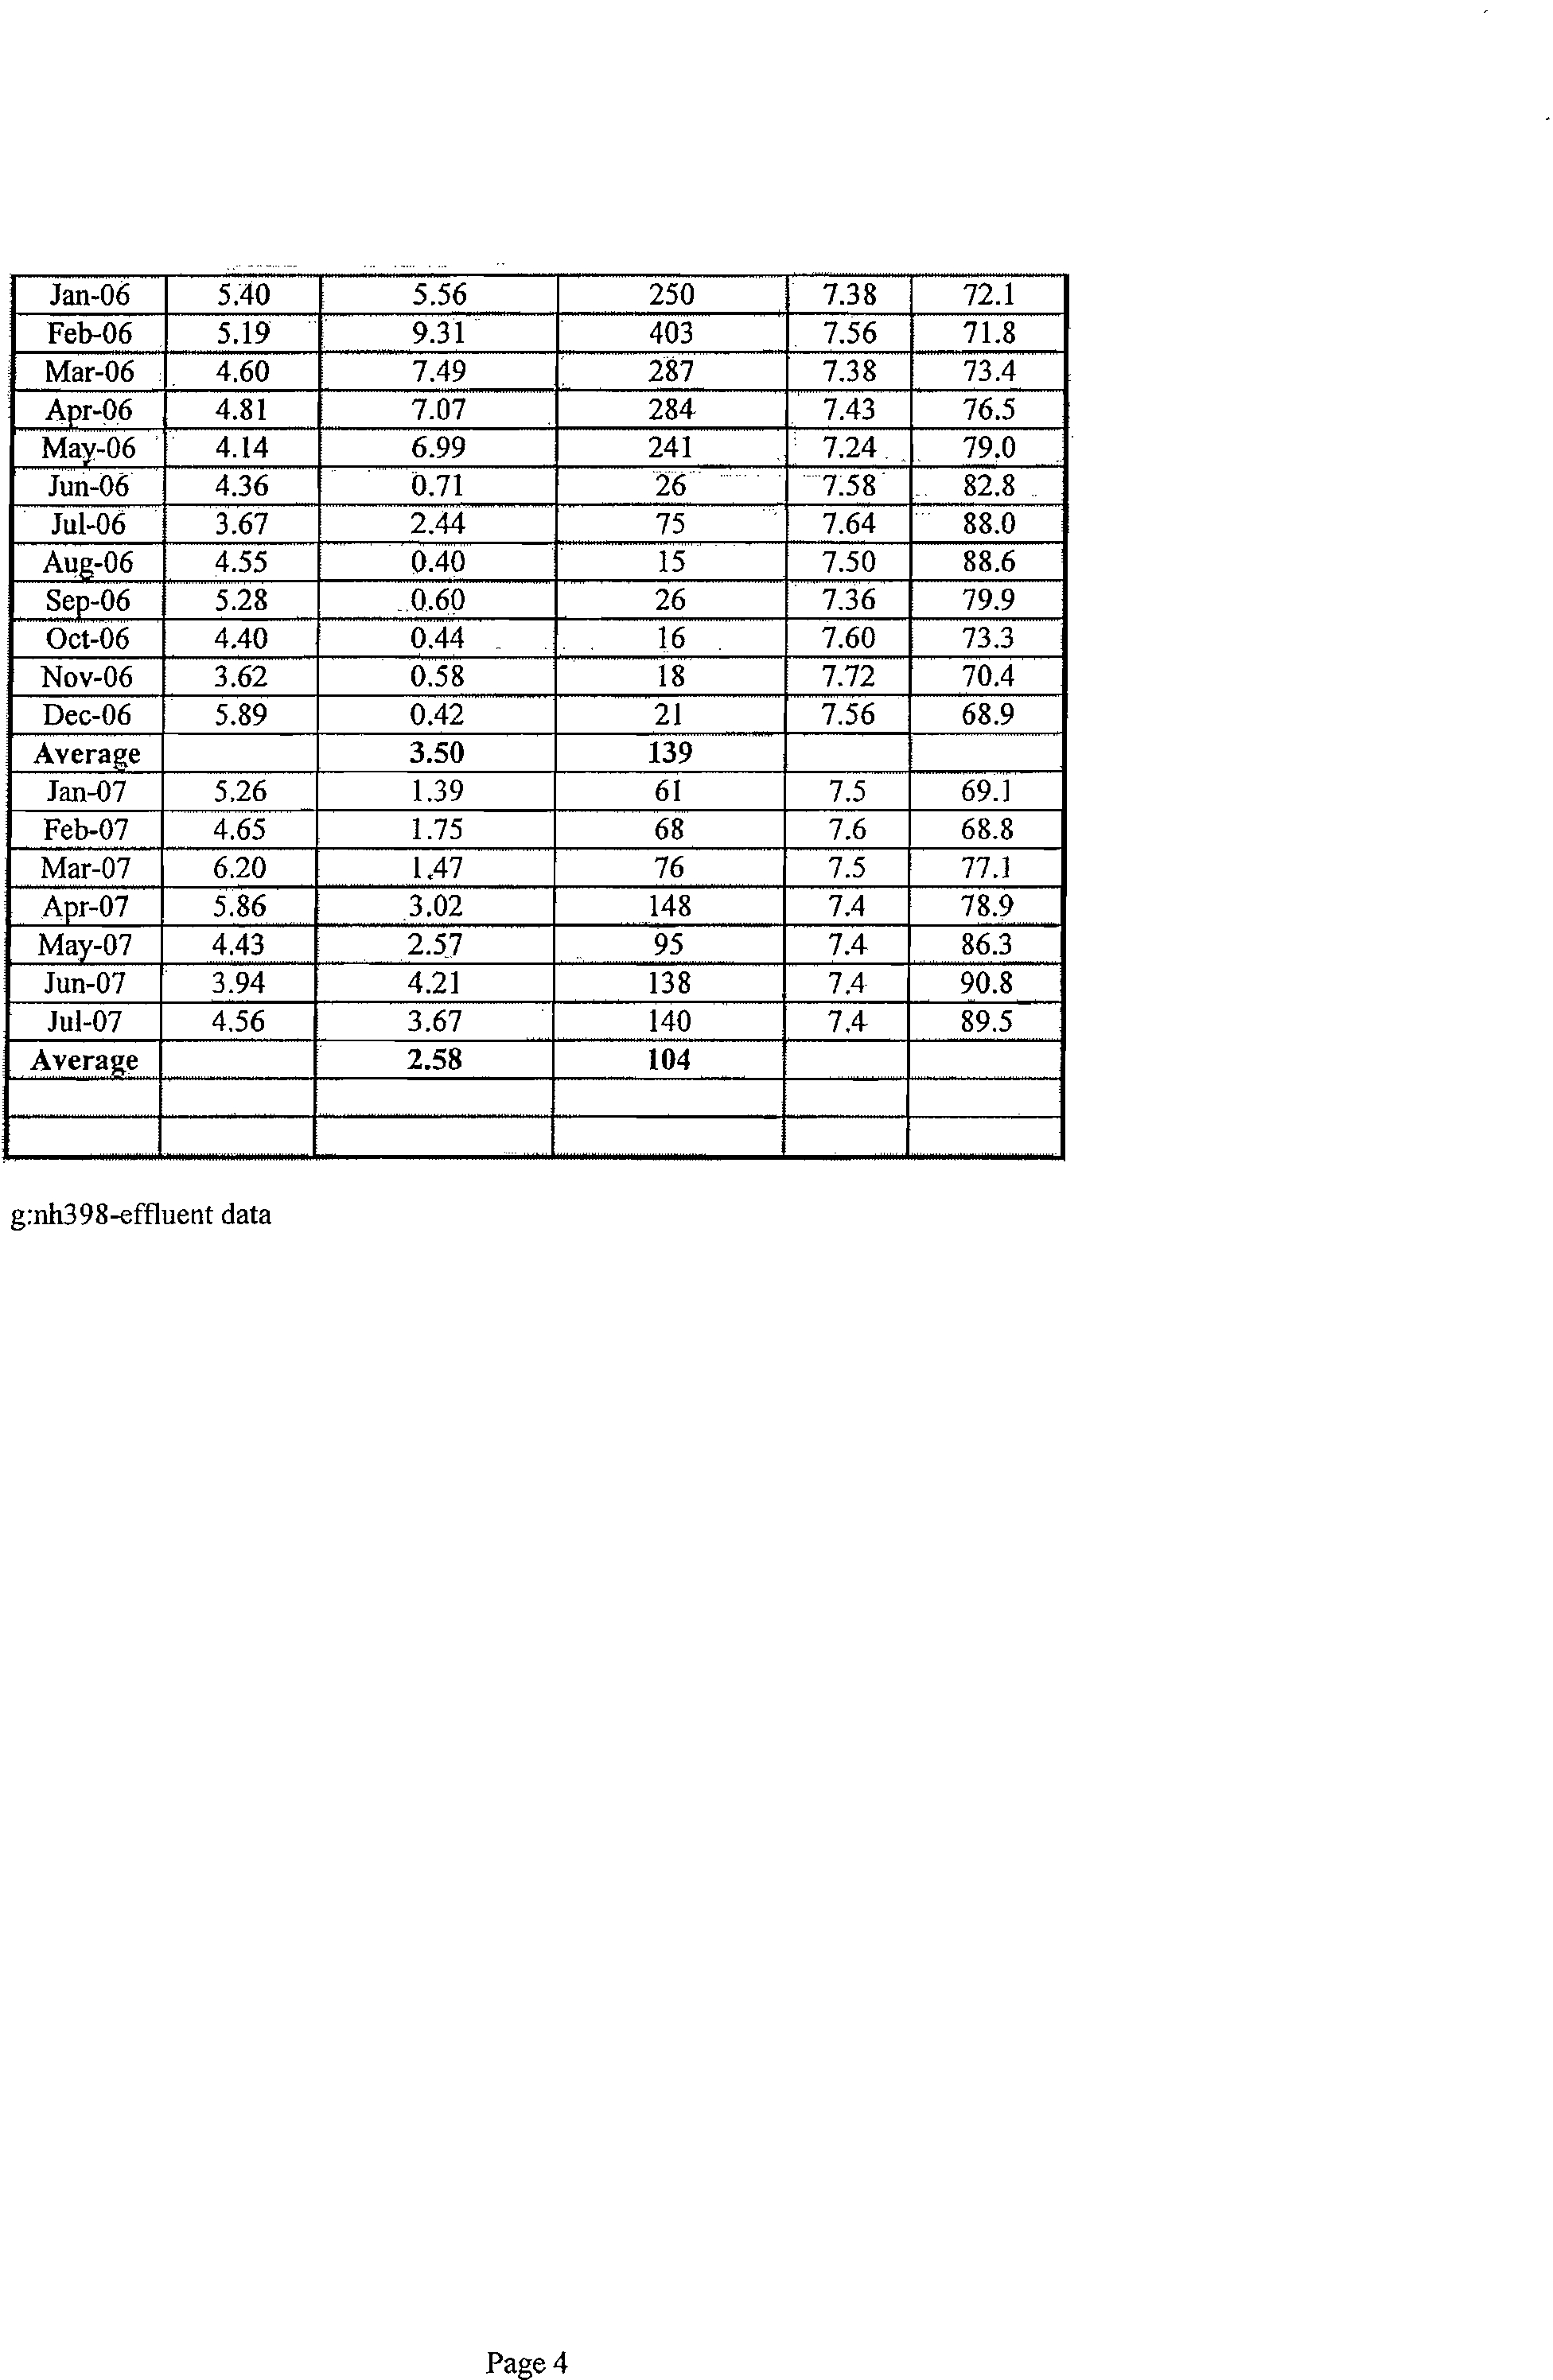
ammonia concentrations since 1997. (Appendix B presents tabulated effluent data for the last ten years.)
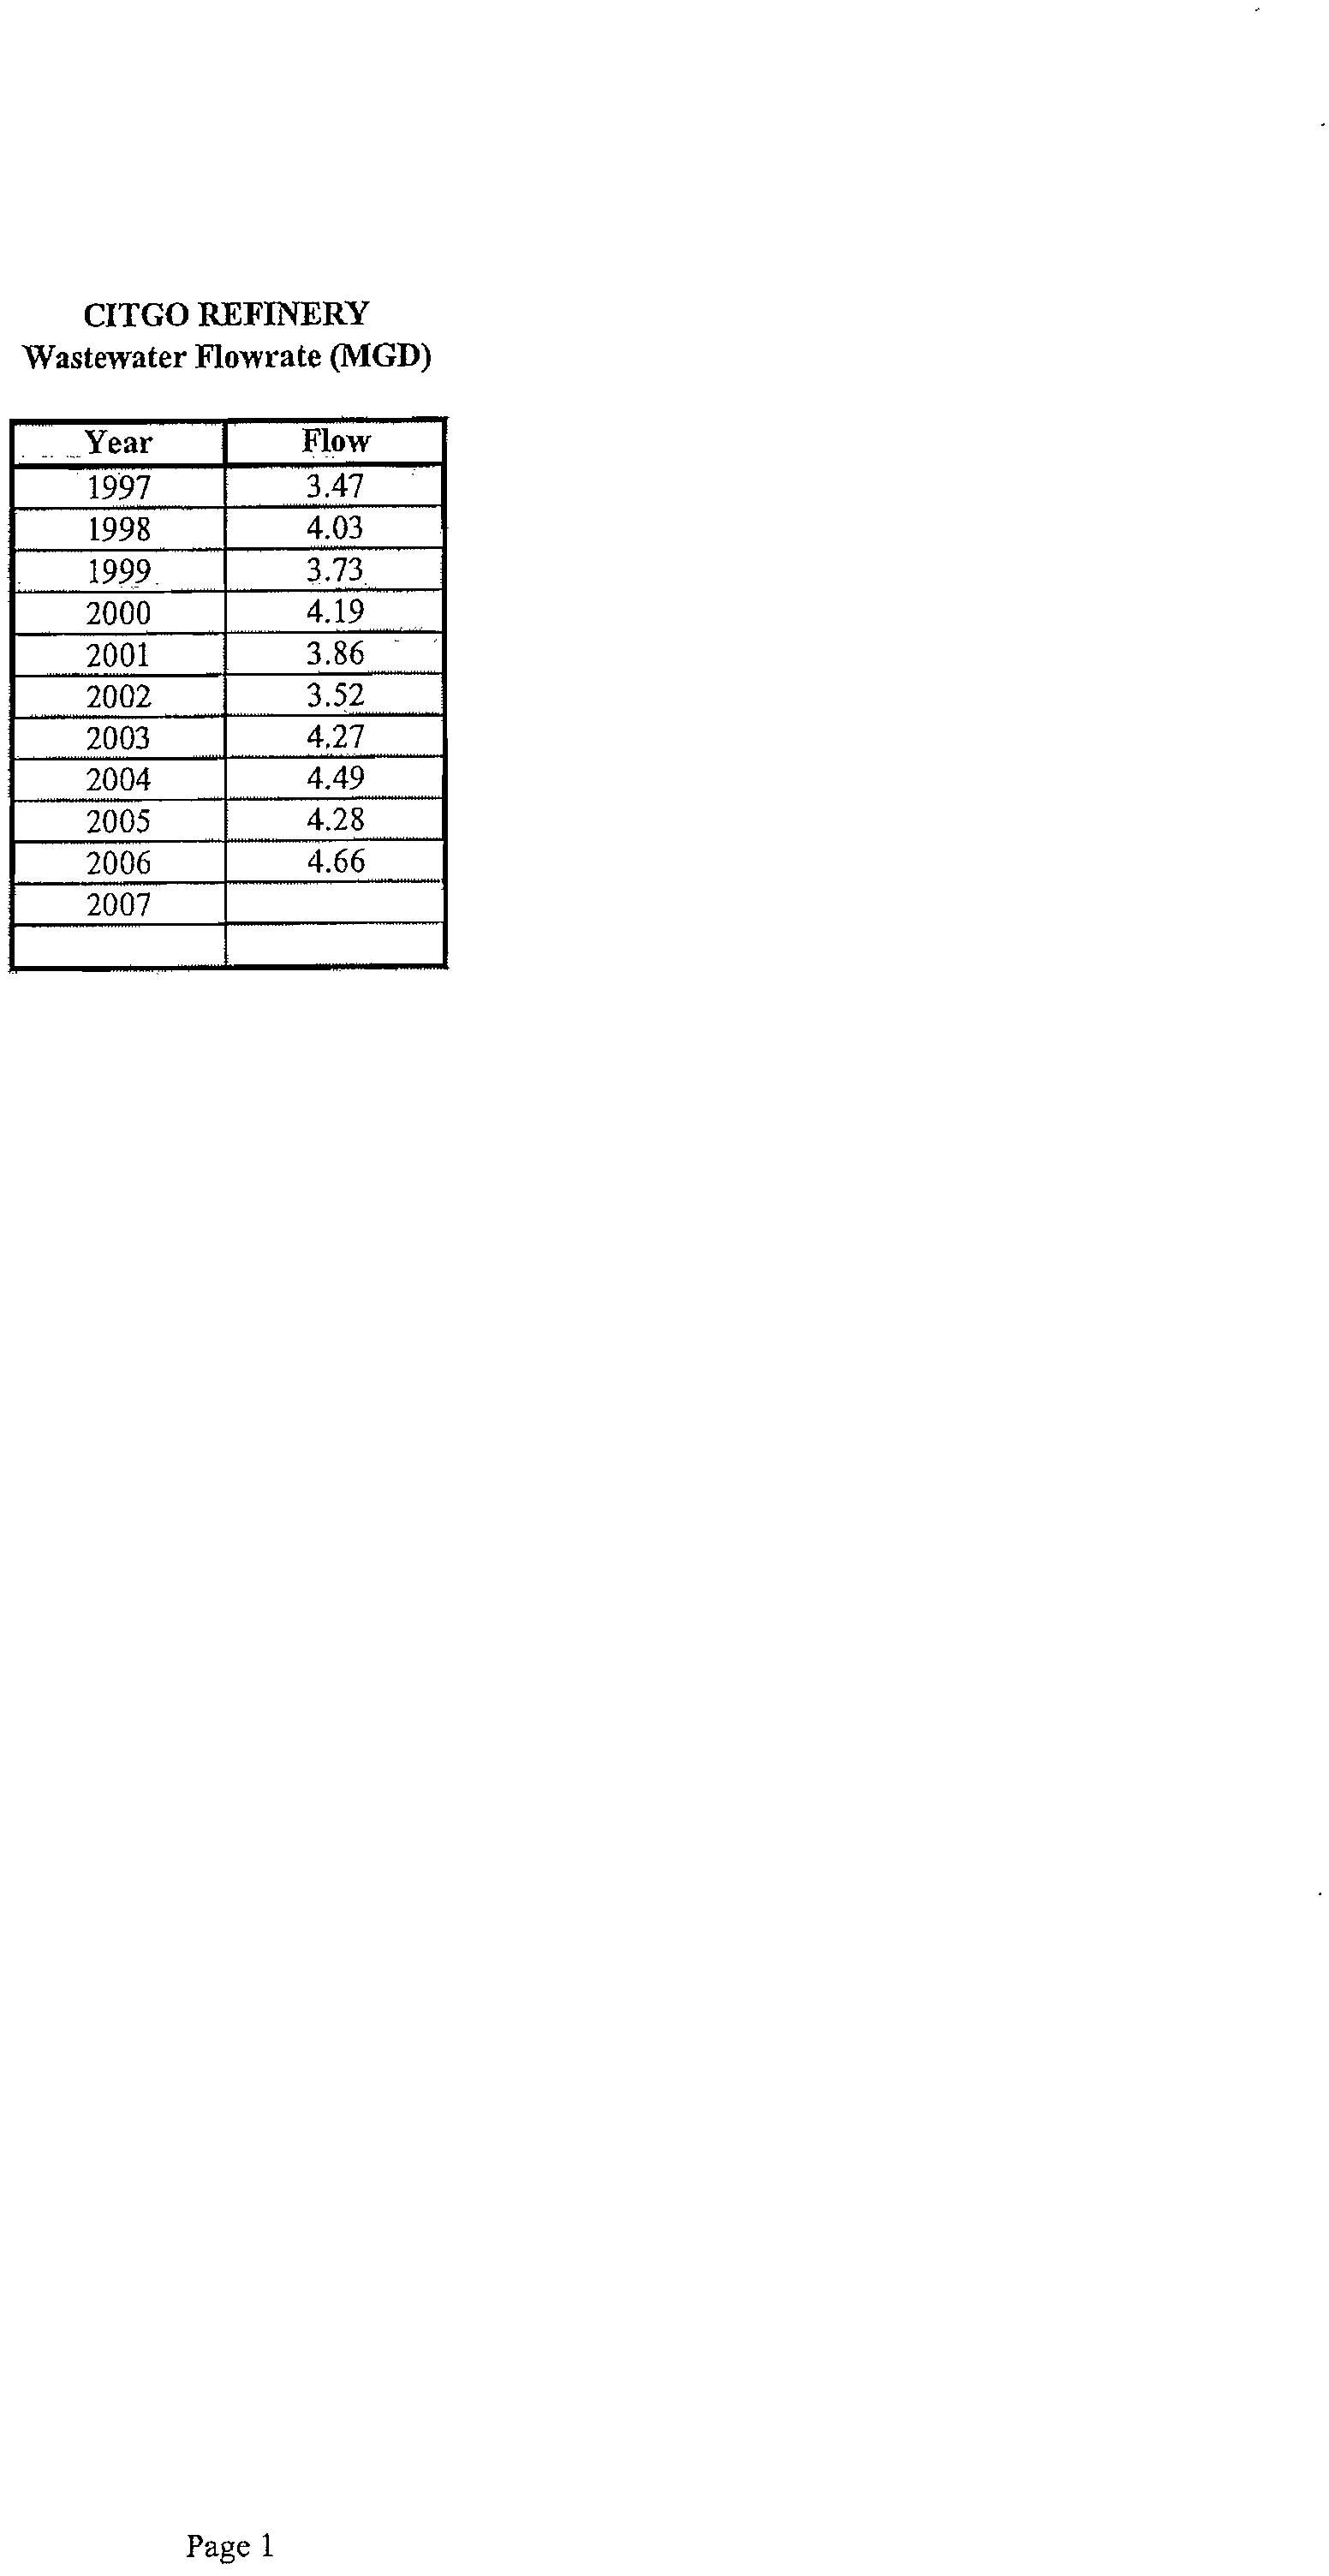
The annual average flow rate for the wastewater treatment system has remained fairly consistent,
between 3.5 MGD and 4.7 MGD from 1997 to 2006. From 2003 to 2006, the effluent flow has ranged
from an average of 4.3 MGD to 4.7 MGD.
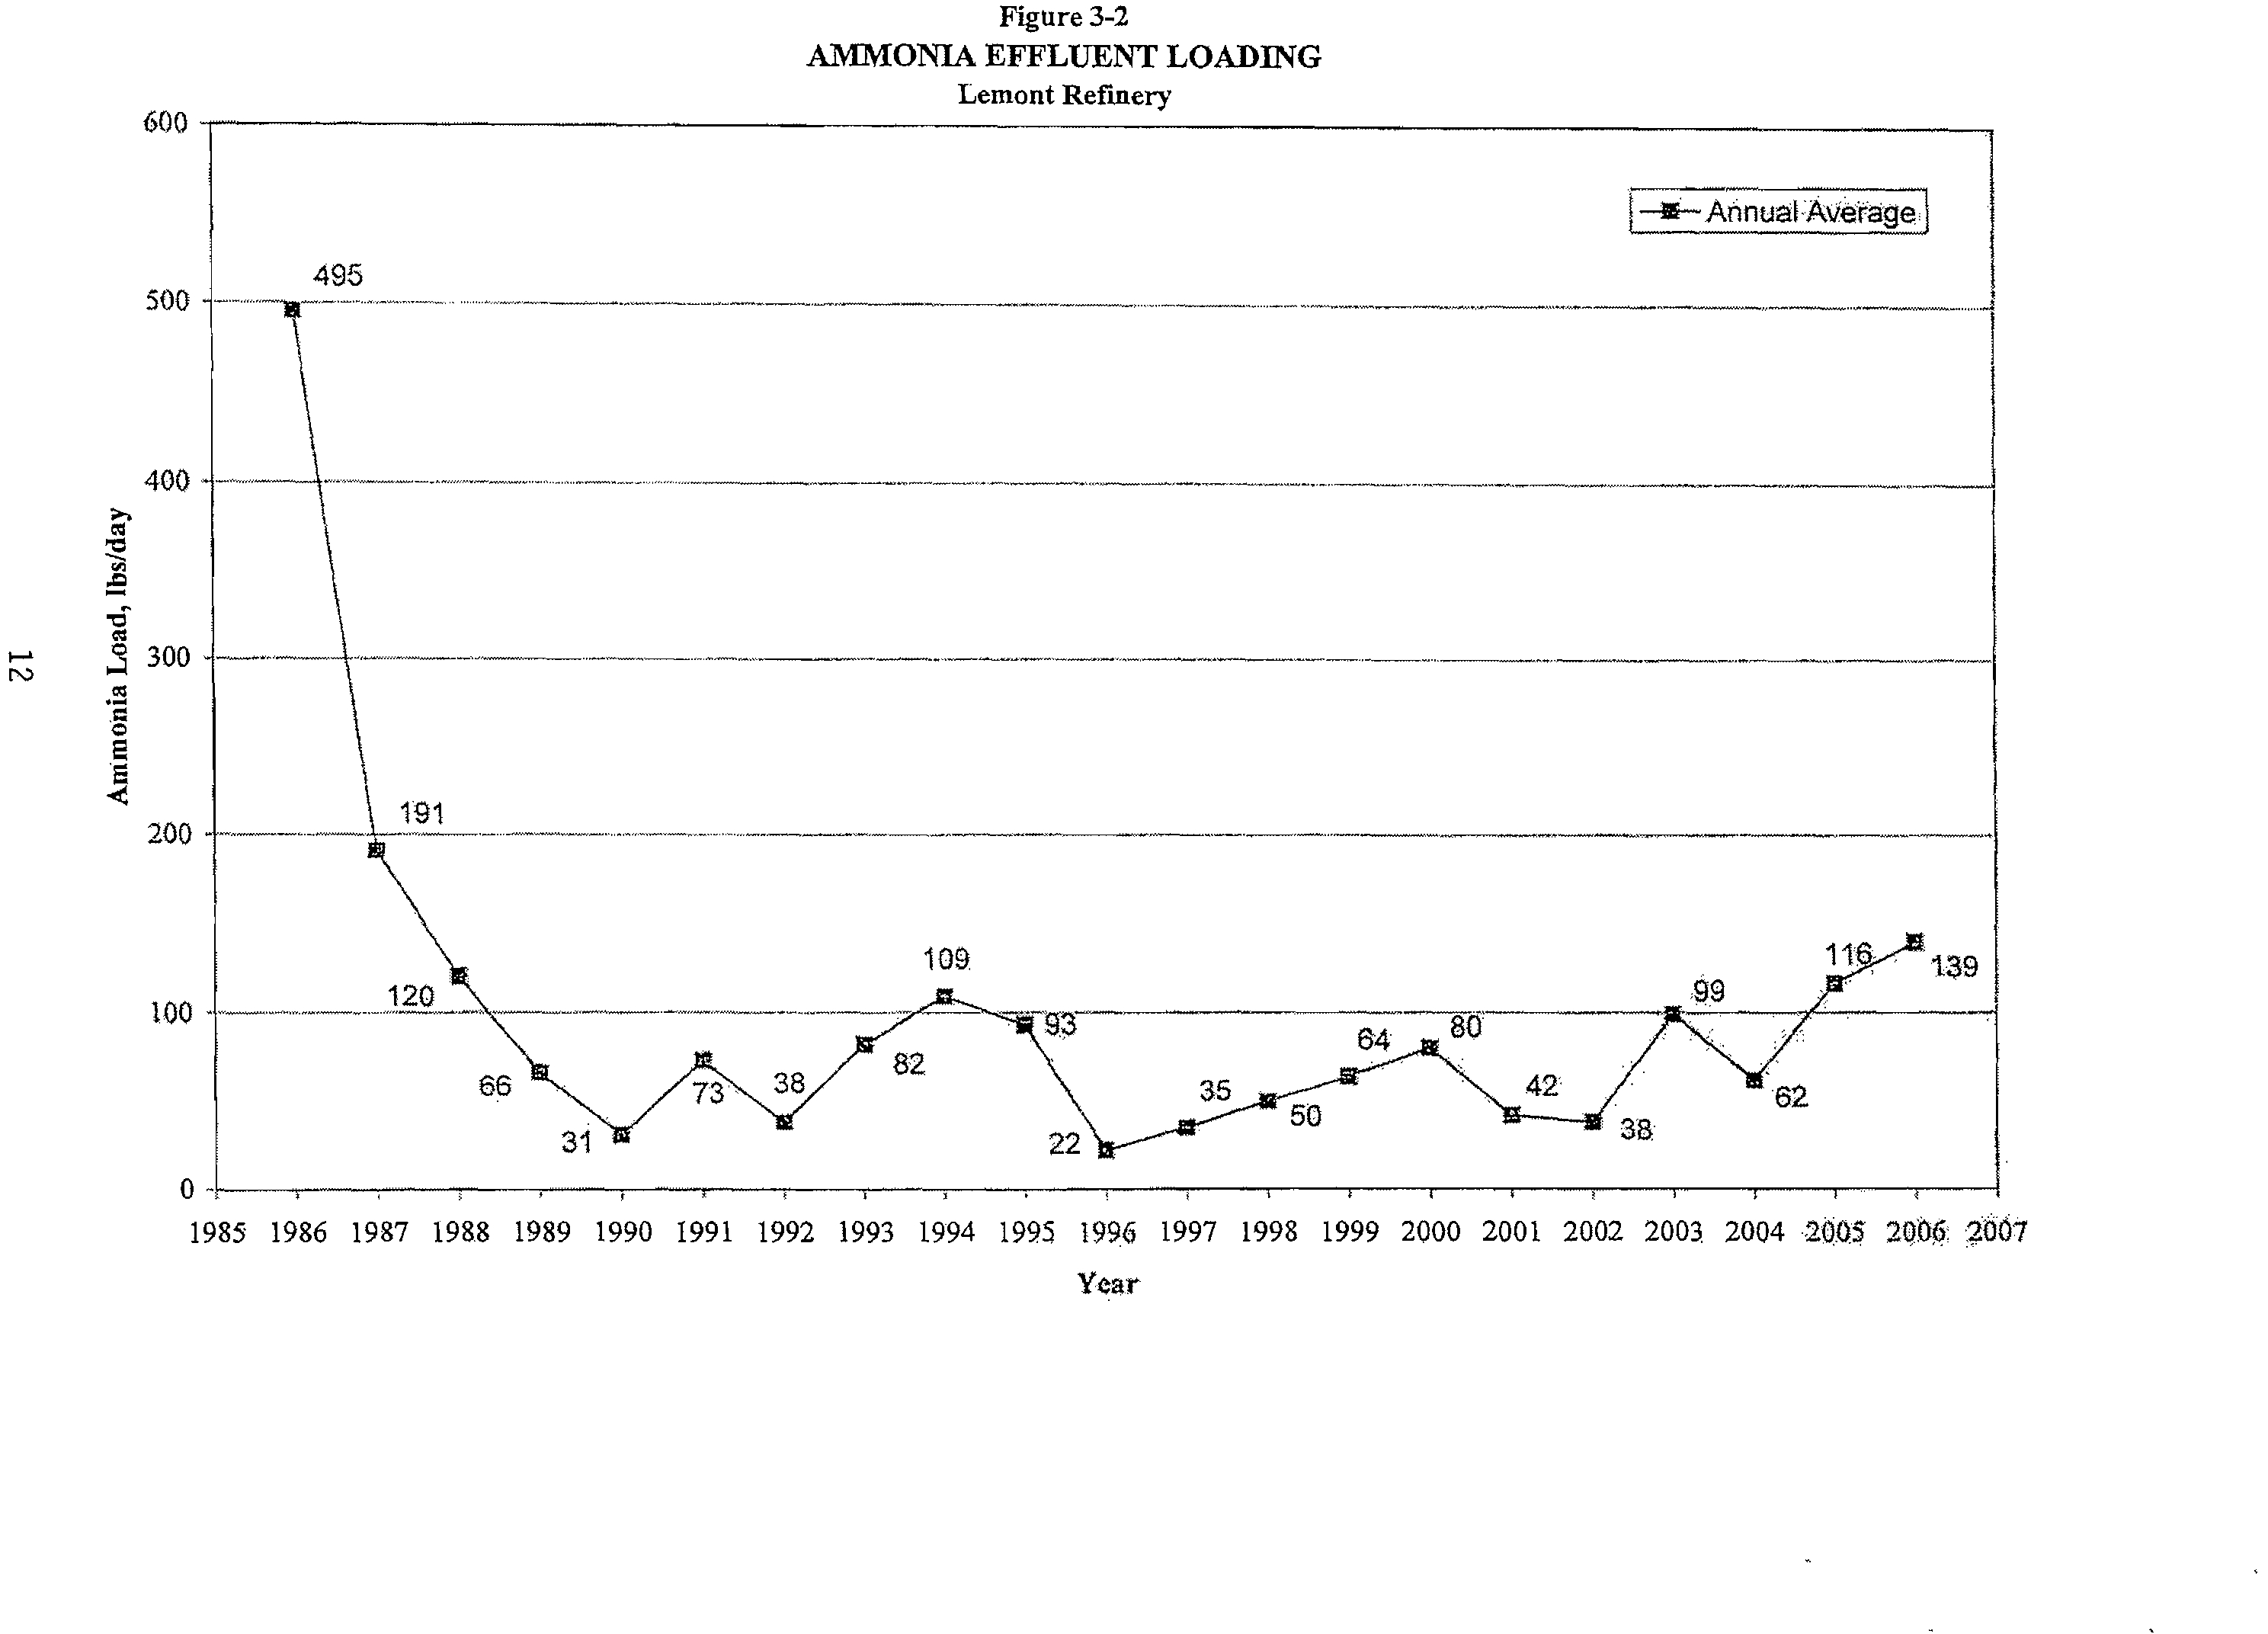
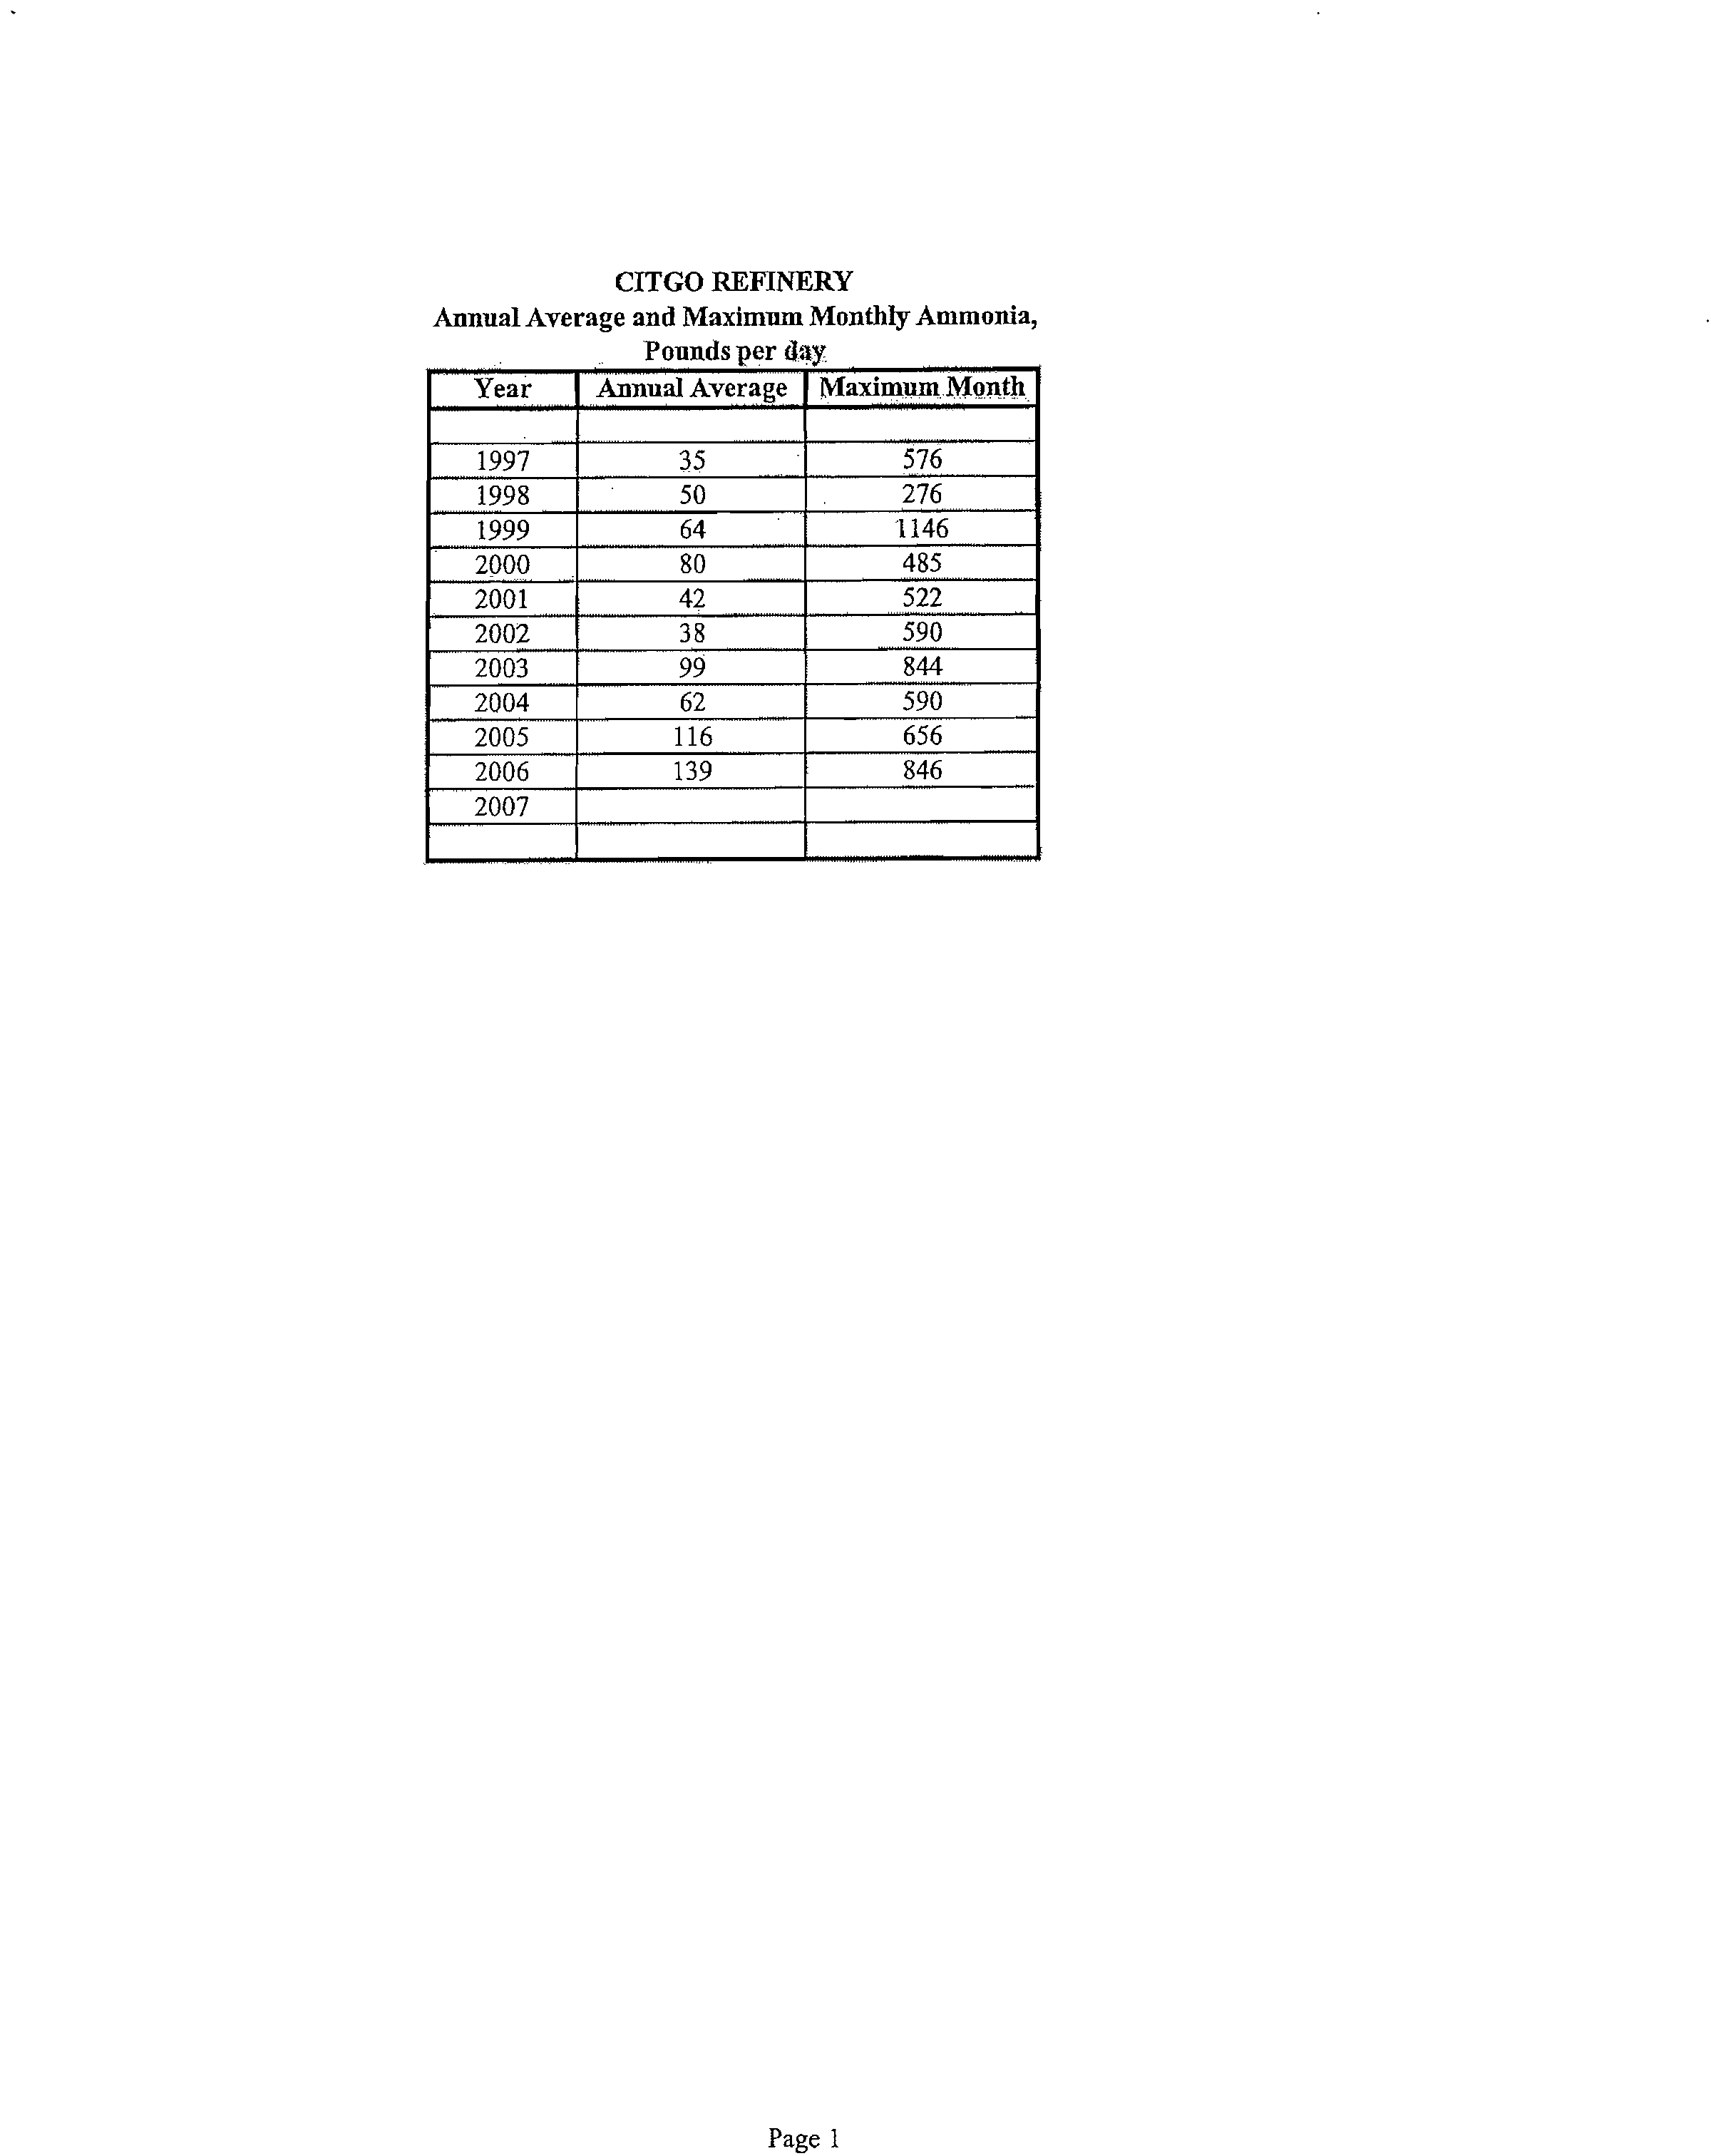
Ammonia loading from the Lemont Refinery's discharge to the Ship Canal is a function of both the
ammonia concentration and effluent flow rate. Figure 3-2 presents the annual average ammonia loadings
(in pounds per day) from 1997 to 2006. On an annual basis, the refinery has consistently discharged less
than 140 pounds per day. In fact, over 70 percent of the months the Lemont Refinery has discharged
less than 100 pounds per day of ammonia, so the 3 mg/L effluent limit would not apply during these
months, if the site specific standard were not in place.
Citgo, Lemont — Ammonia Report
10
February 2008
Electronic Filing - Received, Clerk's Office, March 18, 2008
* * * * * AS 2008-008 * * * * *
EXHIBIT 2
7`
E
4 6 -
O
z
5
z
4 -
d
3
6.93
4.02
3.63
3.08?
Monthly Average Effluent Limit under 304.122(b)
3.50
2.84
2.46
2.78
?
2.31
?
2.85
2.43
2-
1.45
?
1.60
1.30
1 -?
0.93
1.28
1.24
Figure 3-1
ANNUAL AVERAGE EFFLUENT AMMONIA CONCENTRATION
Lemont Refinery
10
9
8
0.63
1986 1987 1988 1989 1990 1991 1992 1993 1994 1995 1996 1997 1998 1999 200 2001 2002 2003 2004 2005 2006
YEAR
Electronic Filing - Received, Clerk's Office, March 18, 2008
* * * * * AS 2008-008 * * * * *
EXHIBIT 2
Q
600
Figure 3-2
AMMONIA EFFLUENT LOADING
Lemont Refinery
500
400
495
—Ave'rage
Annua
>,
c1
300
ets
0 ?
1985 1986 1987 1988 1989 1990 1991 1992 1993 1994 1995 1996 1997 1998 1999 2000 2001 2002 2003. 2004 2005 006 2007
Year
39
Electronic Filing - Received, Clerk's Office, March 18, 2008
* * * * * AS 2008-008 * * * * *
EXHIBIT 2
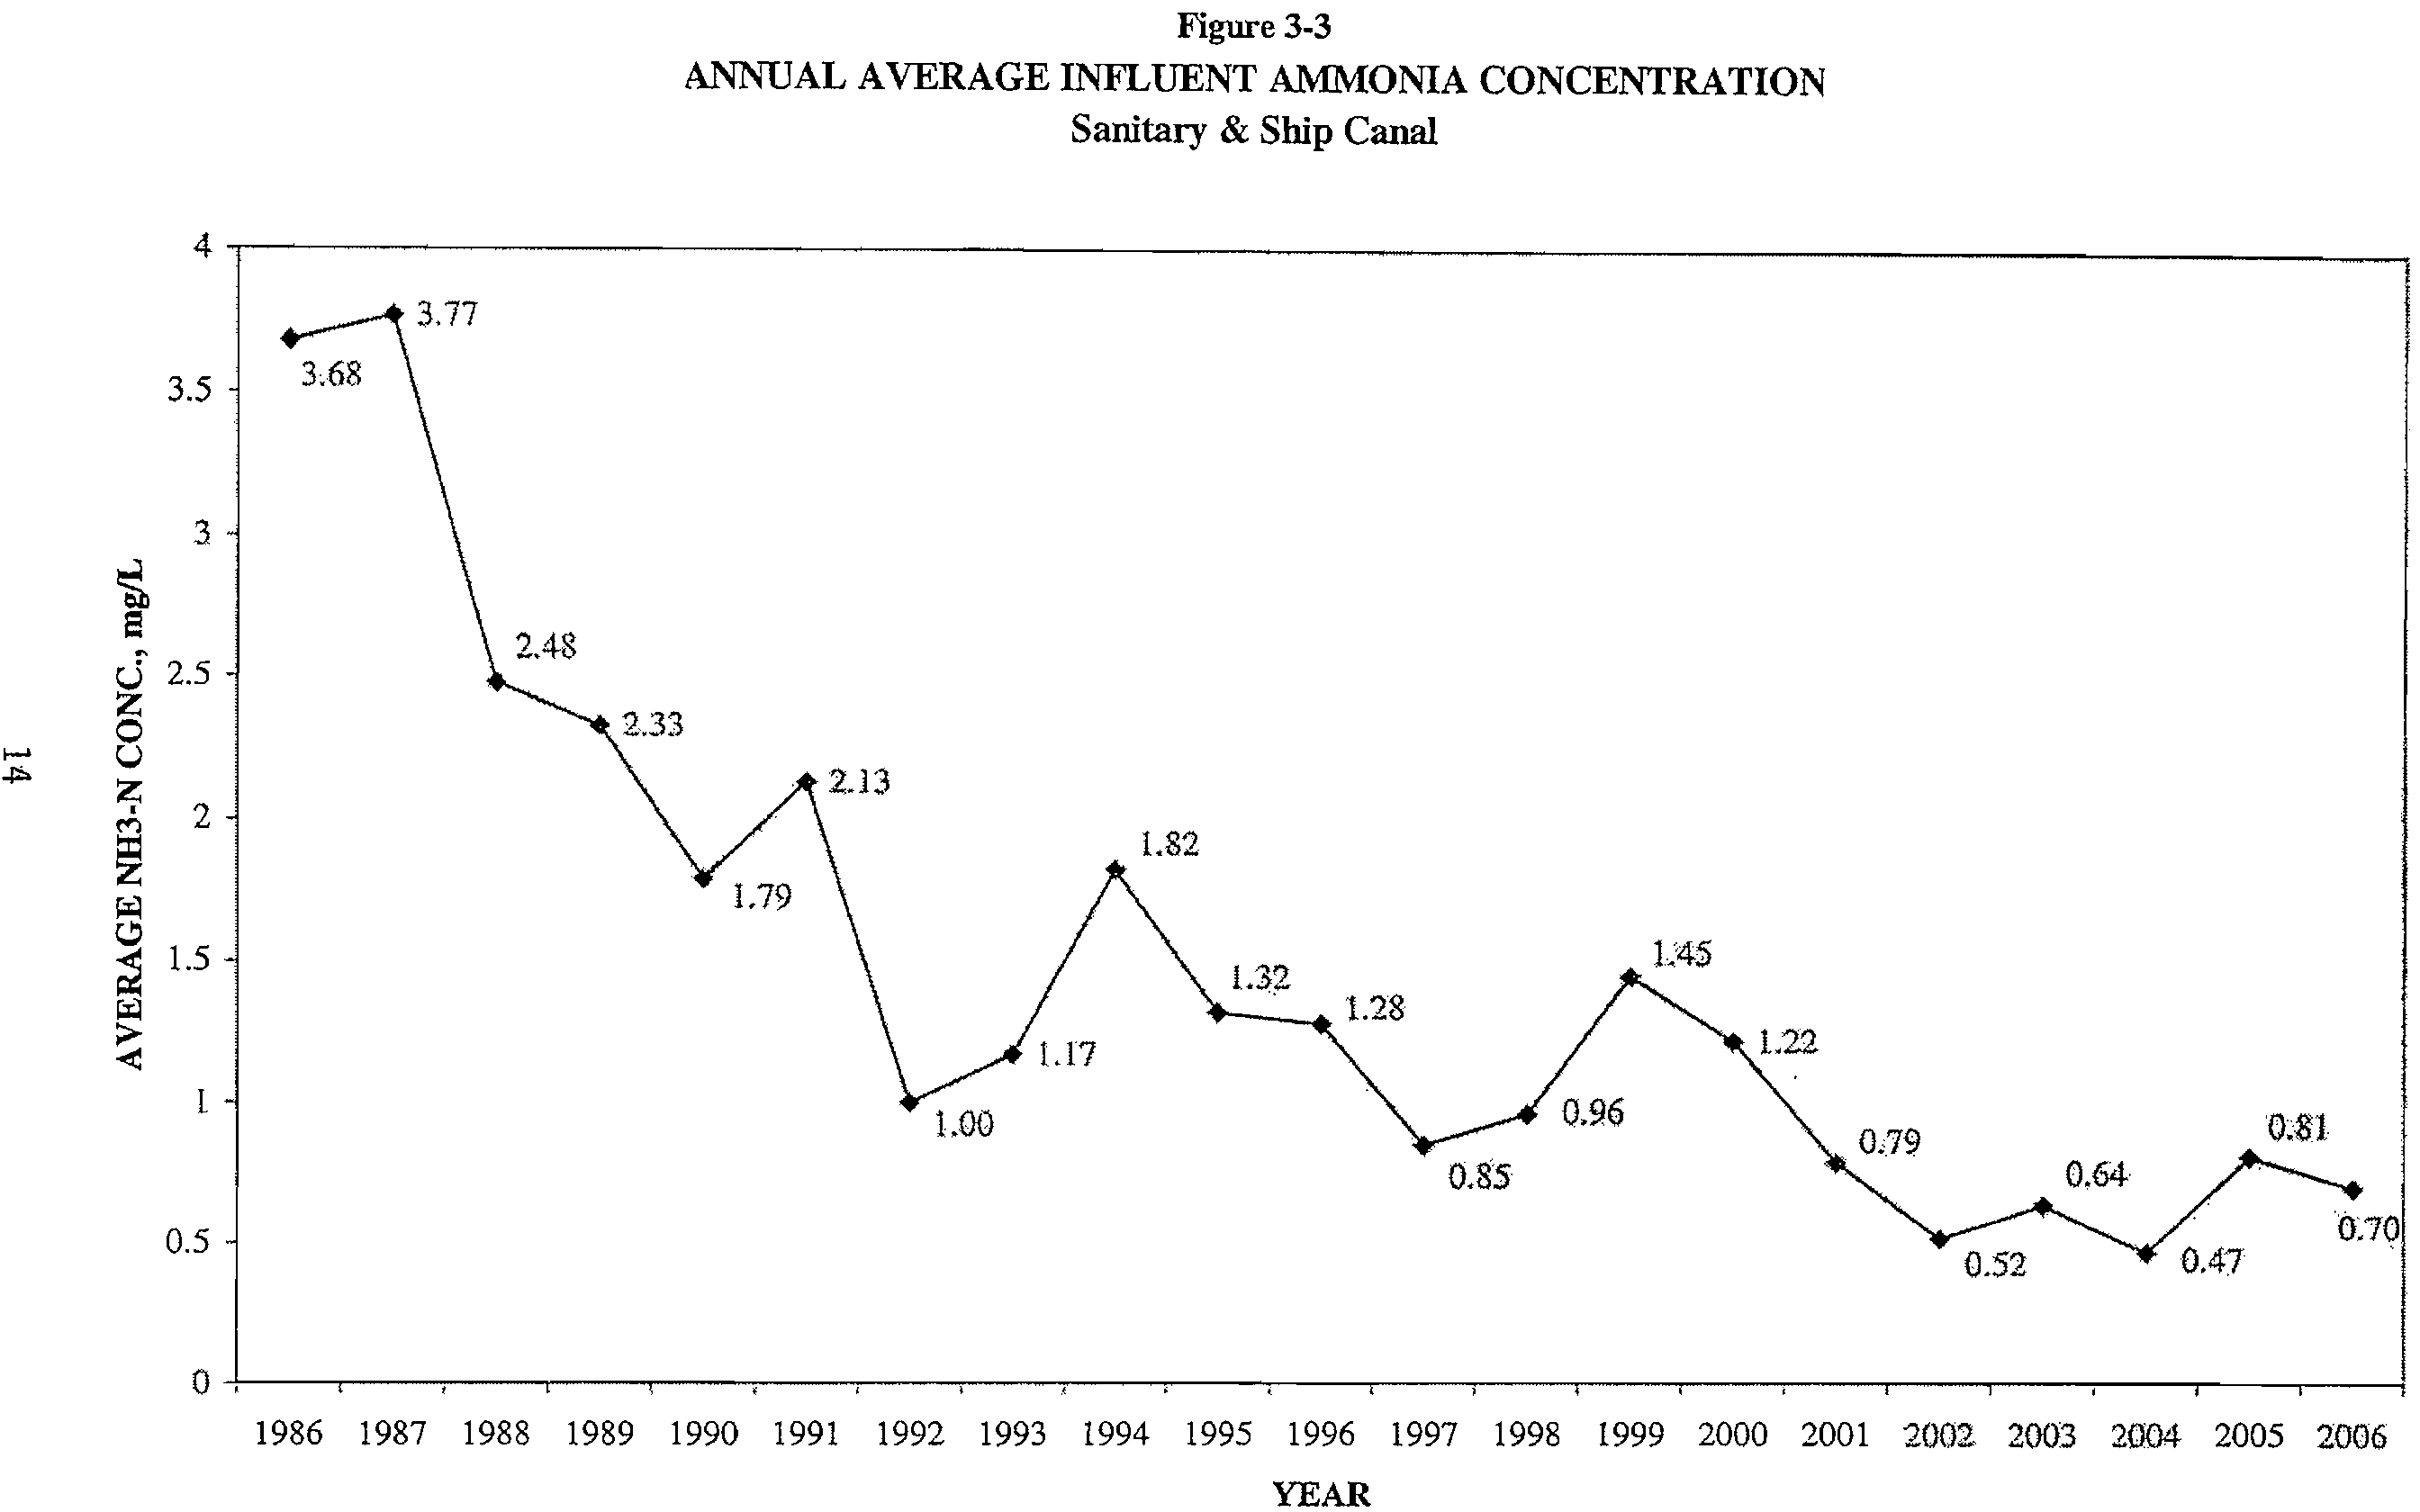
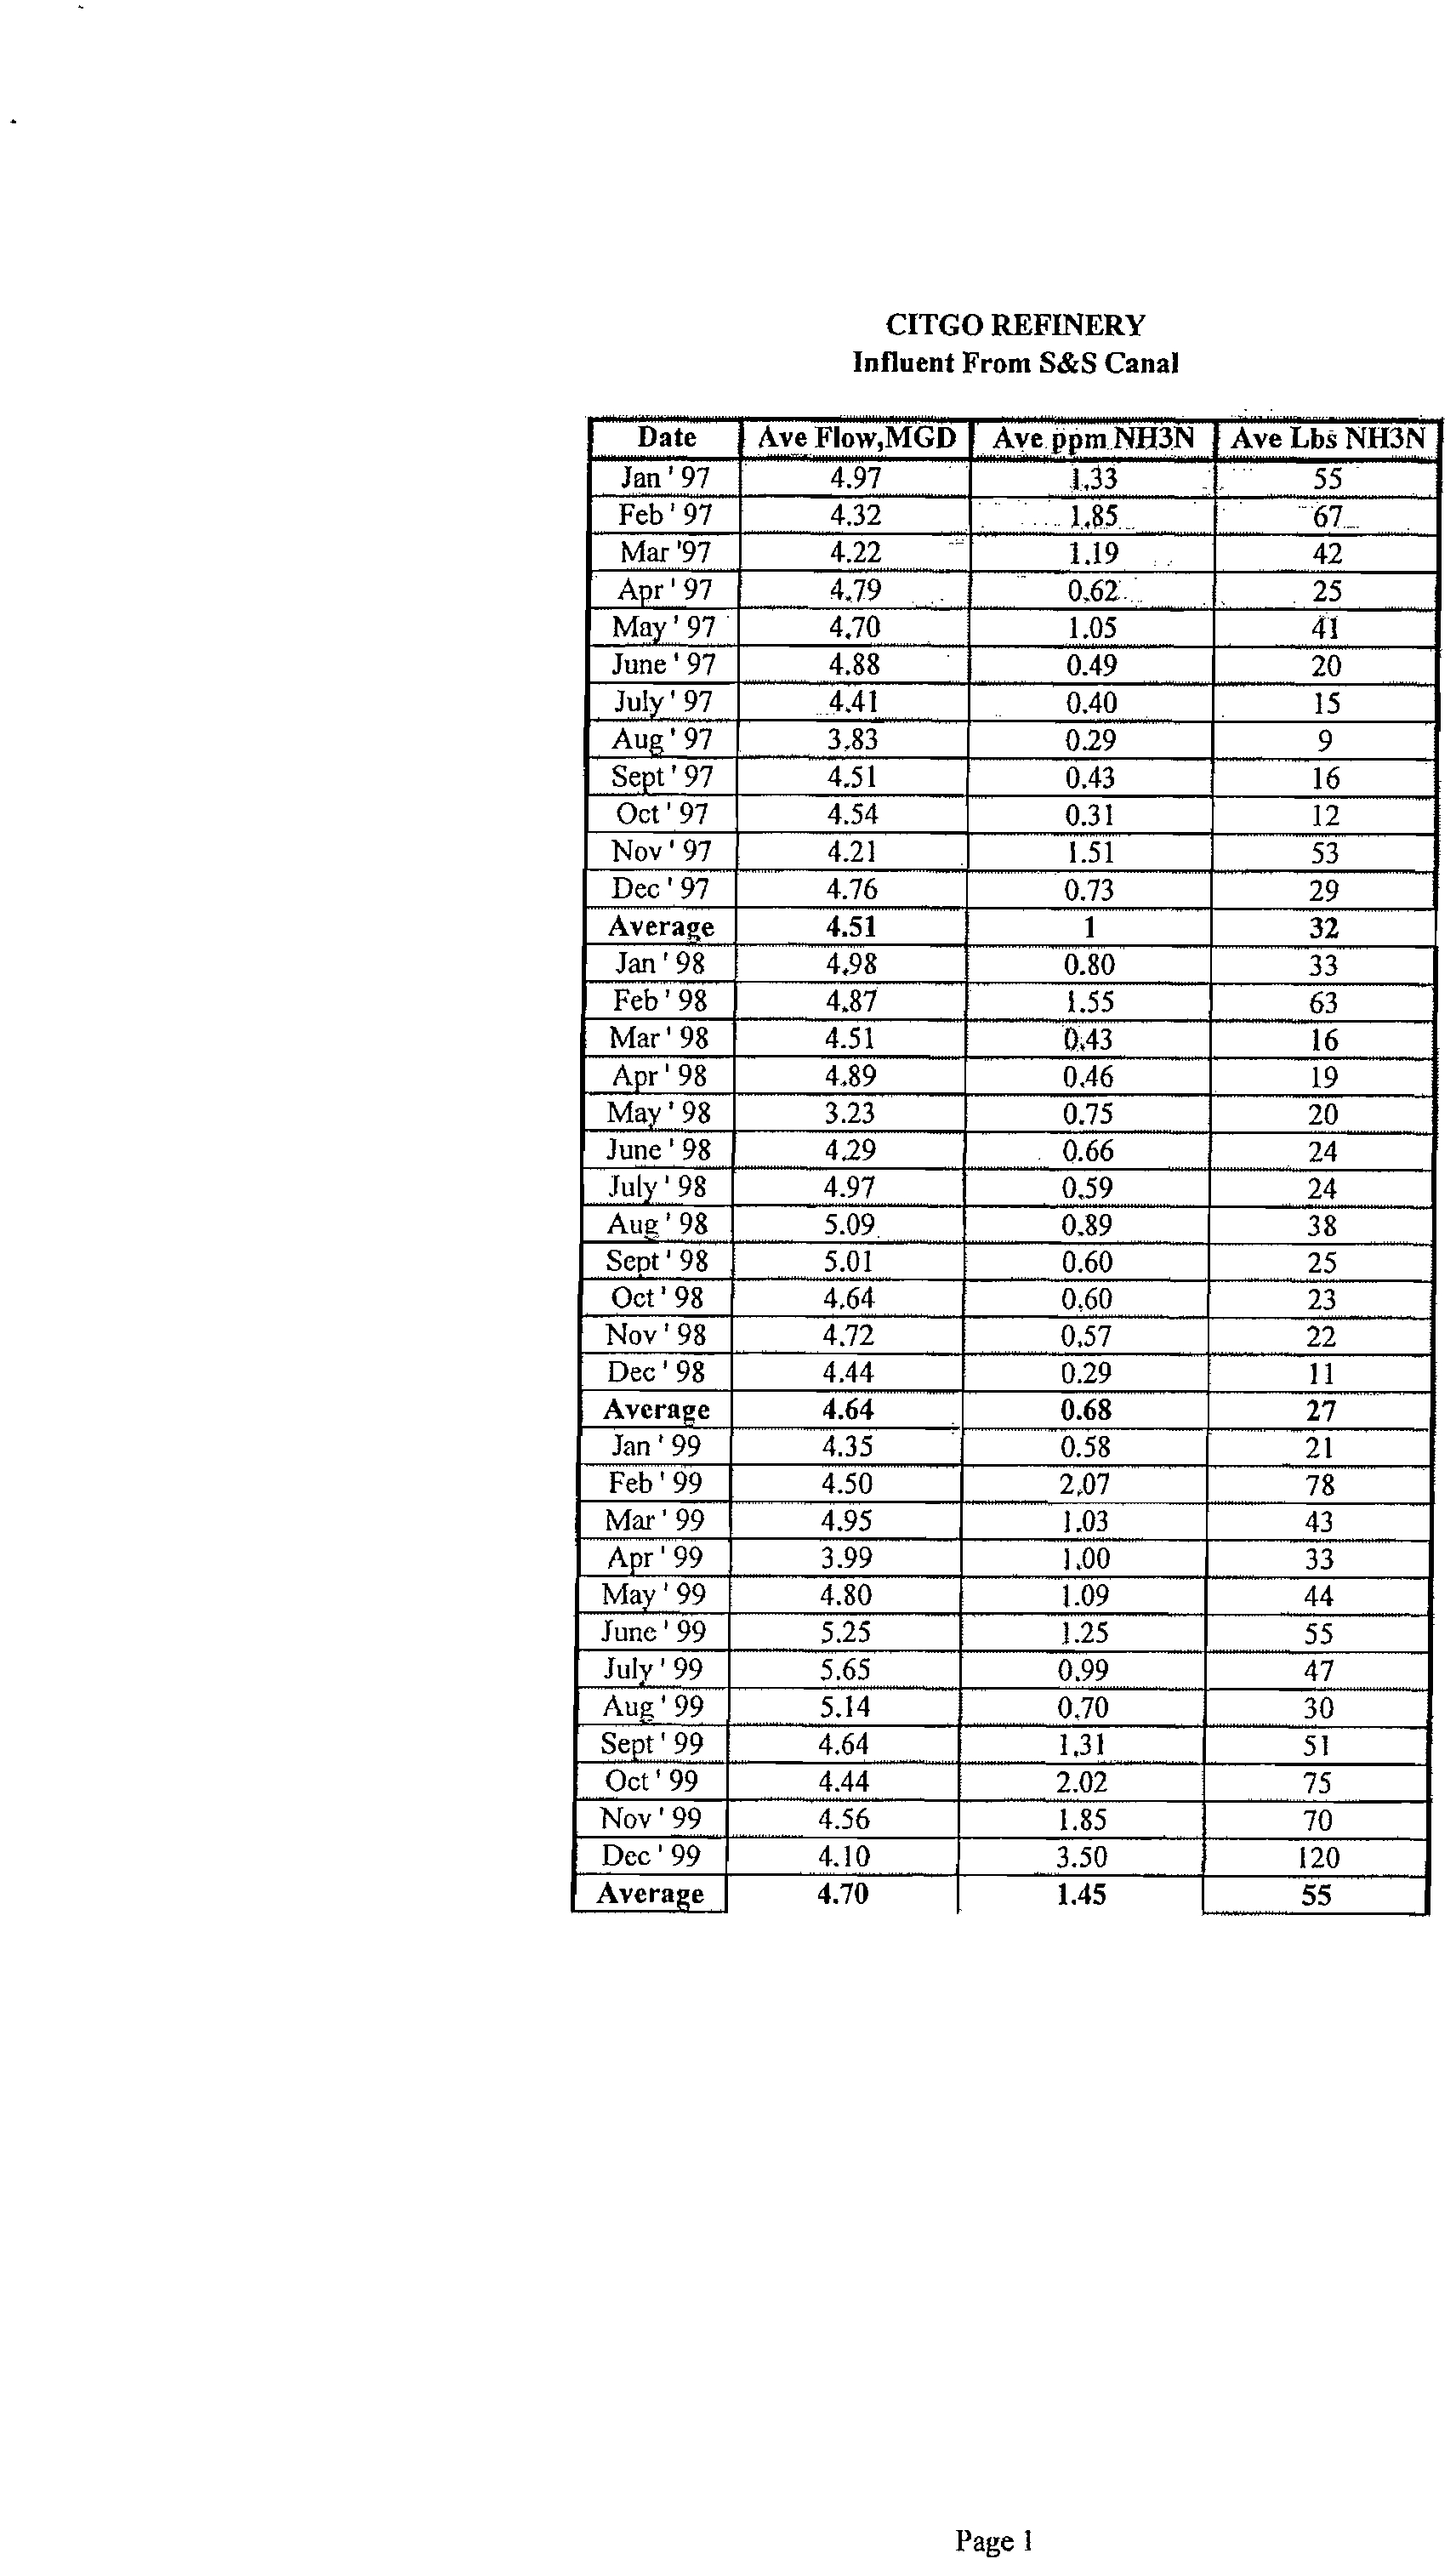
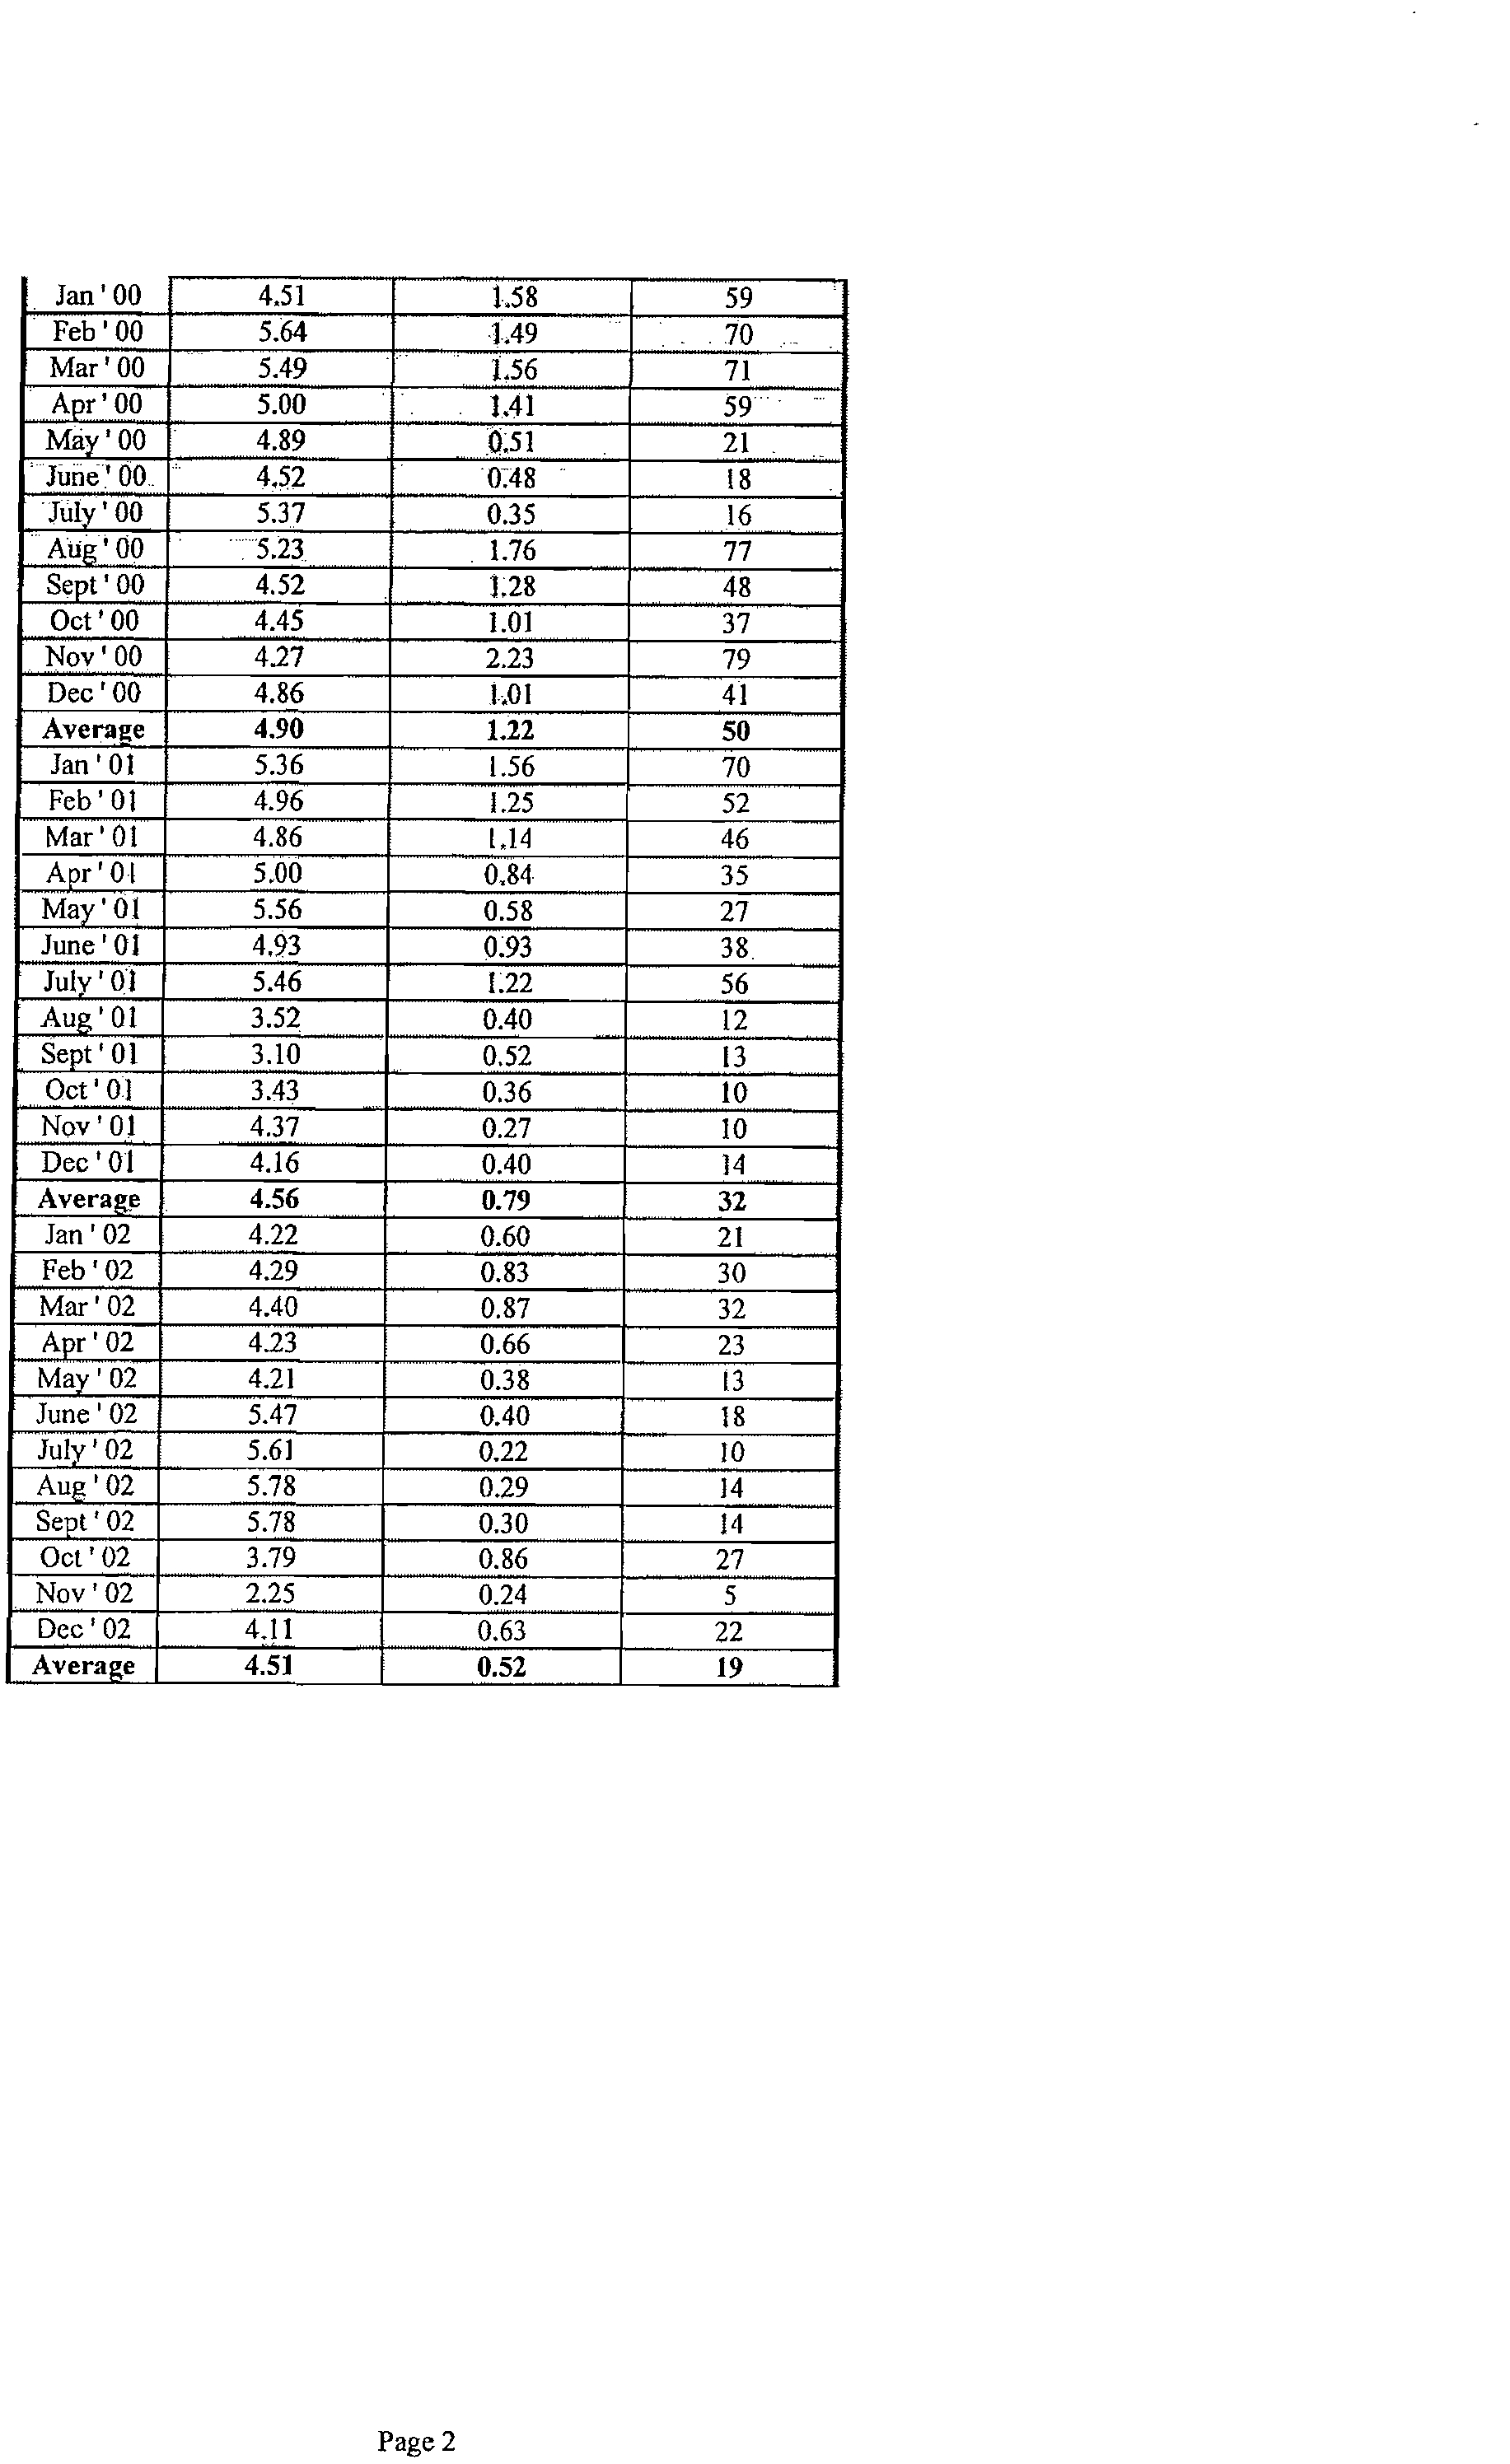
3.3 Influent Ammonia Levels
Lemont Refinery withdraws water from the Ship Canal as its primary water source. The intake is
upstream of the wastewater treatment plant outfall and is therefore not affected by effluent
concentrations. The flow rate of the influent is higher than that of the effluent. The annual average
intake has varied between 4.5 MGD and 5.6 MGD from 1997 to 2006. The reduction in flow rate
through the Refinery is due to evaporation losses from the cooling towers.
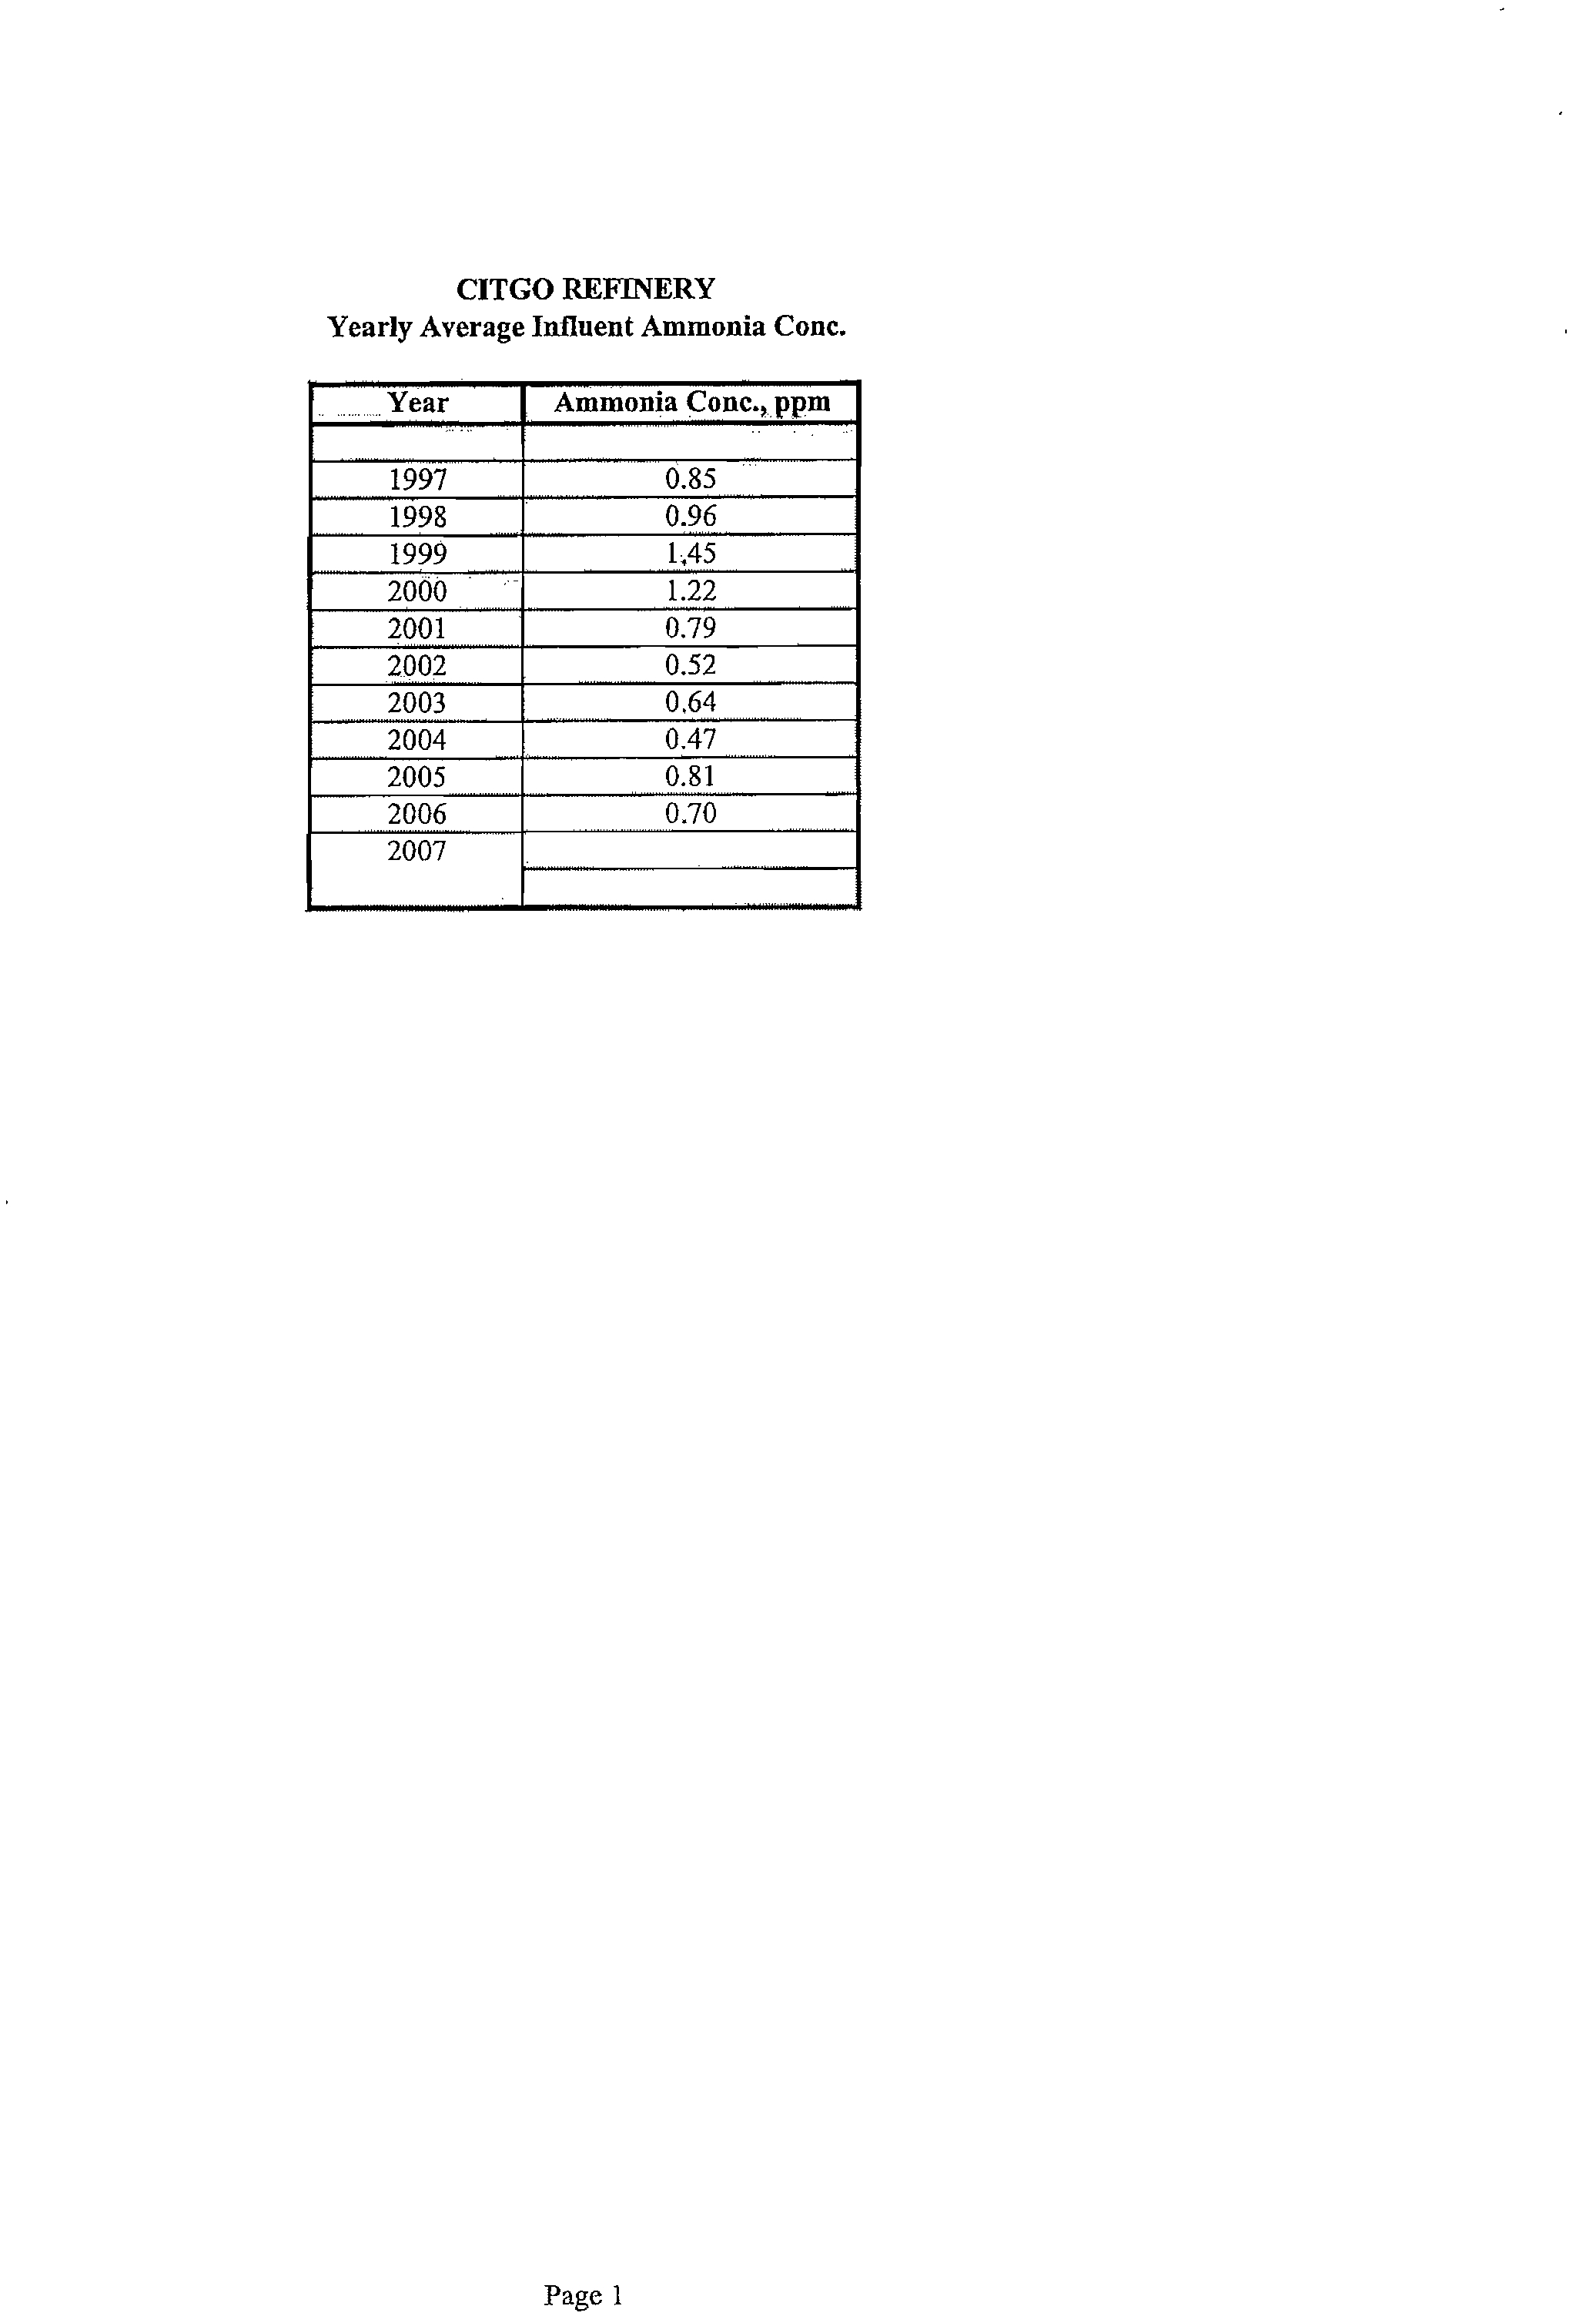
Figure 3-3 presents the average ammonia concentration in the intake water. A general declining trend is
apparent since 1999. The average Ship Canal concentration has declined to 0.7 mg/L in 2006.
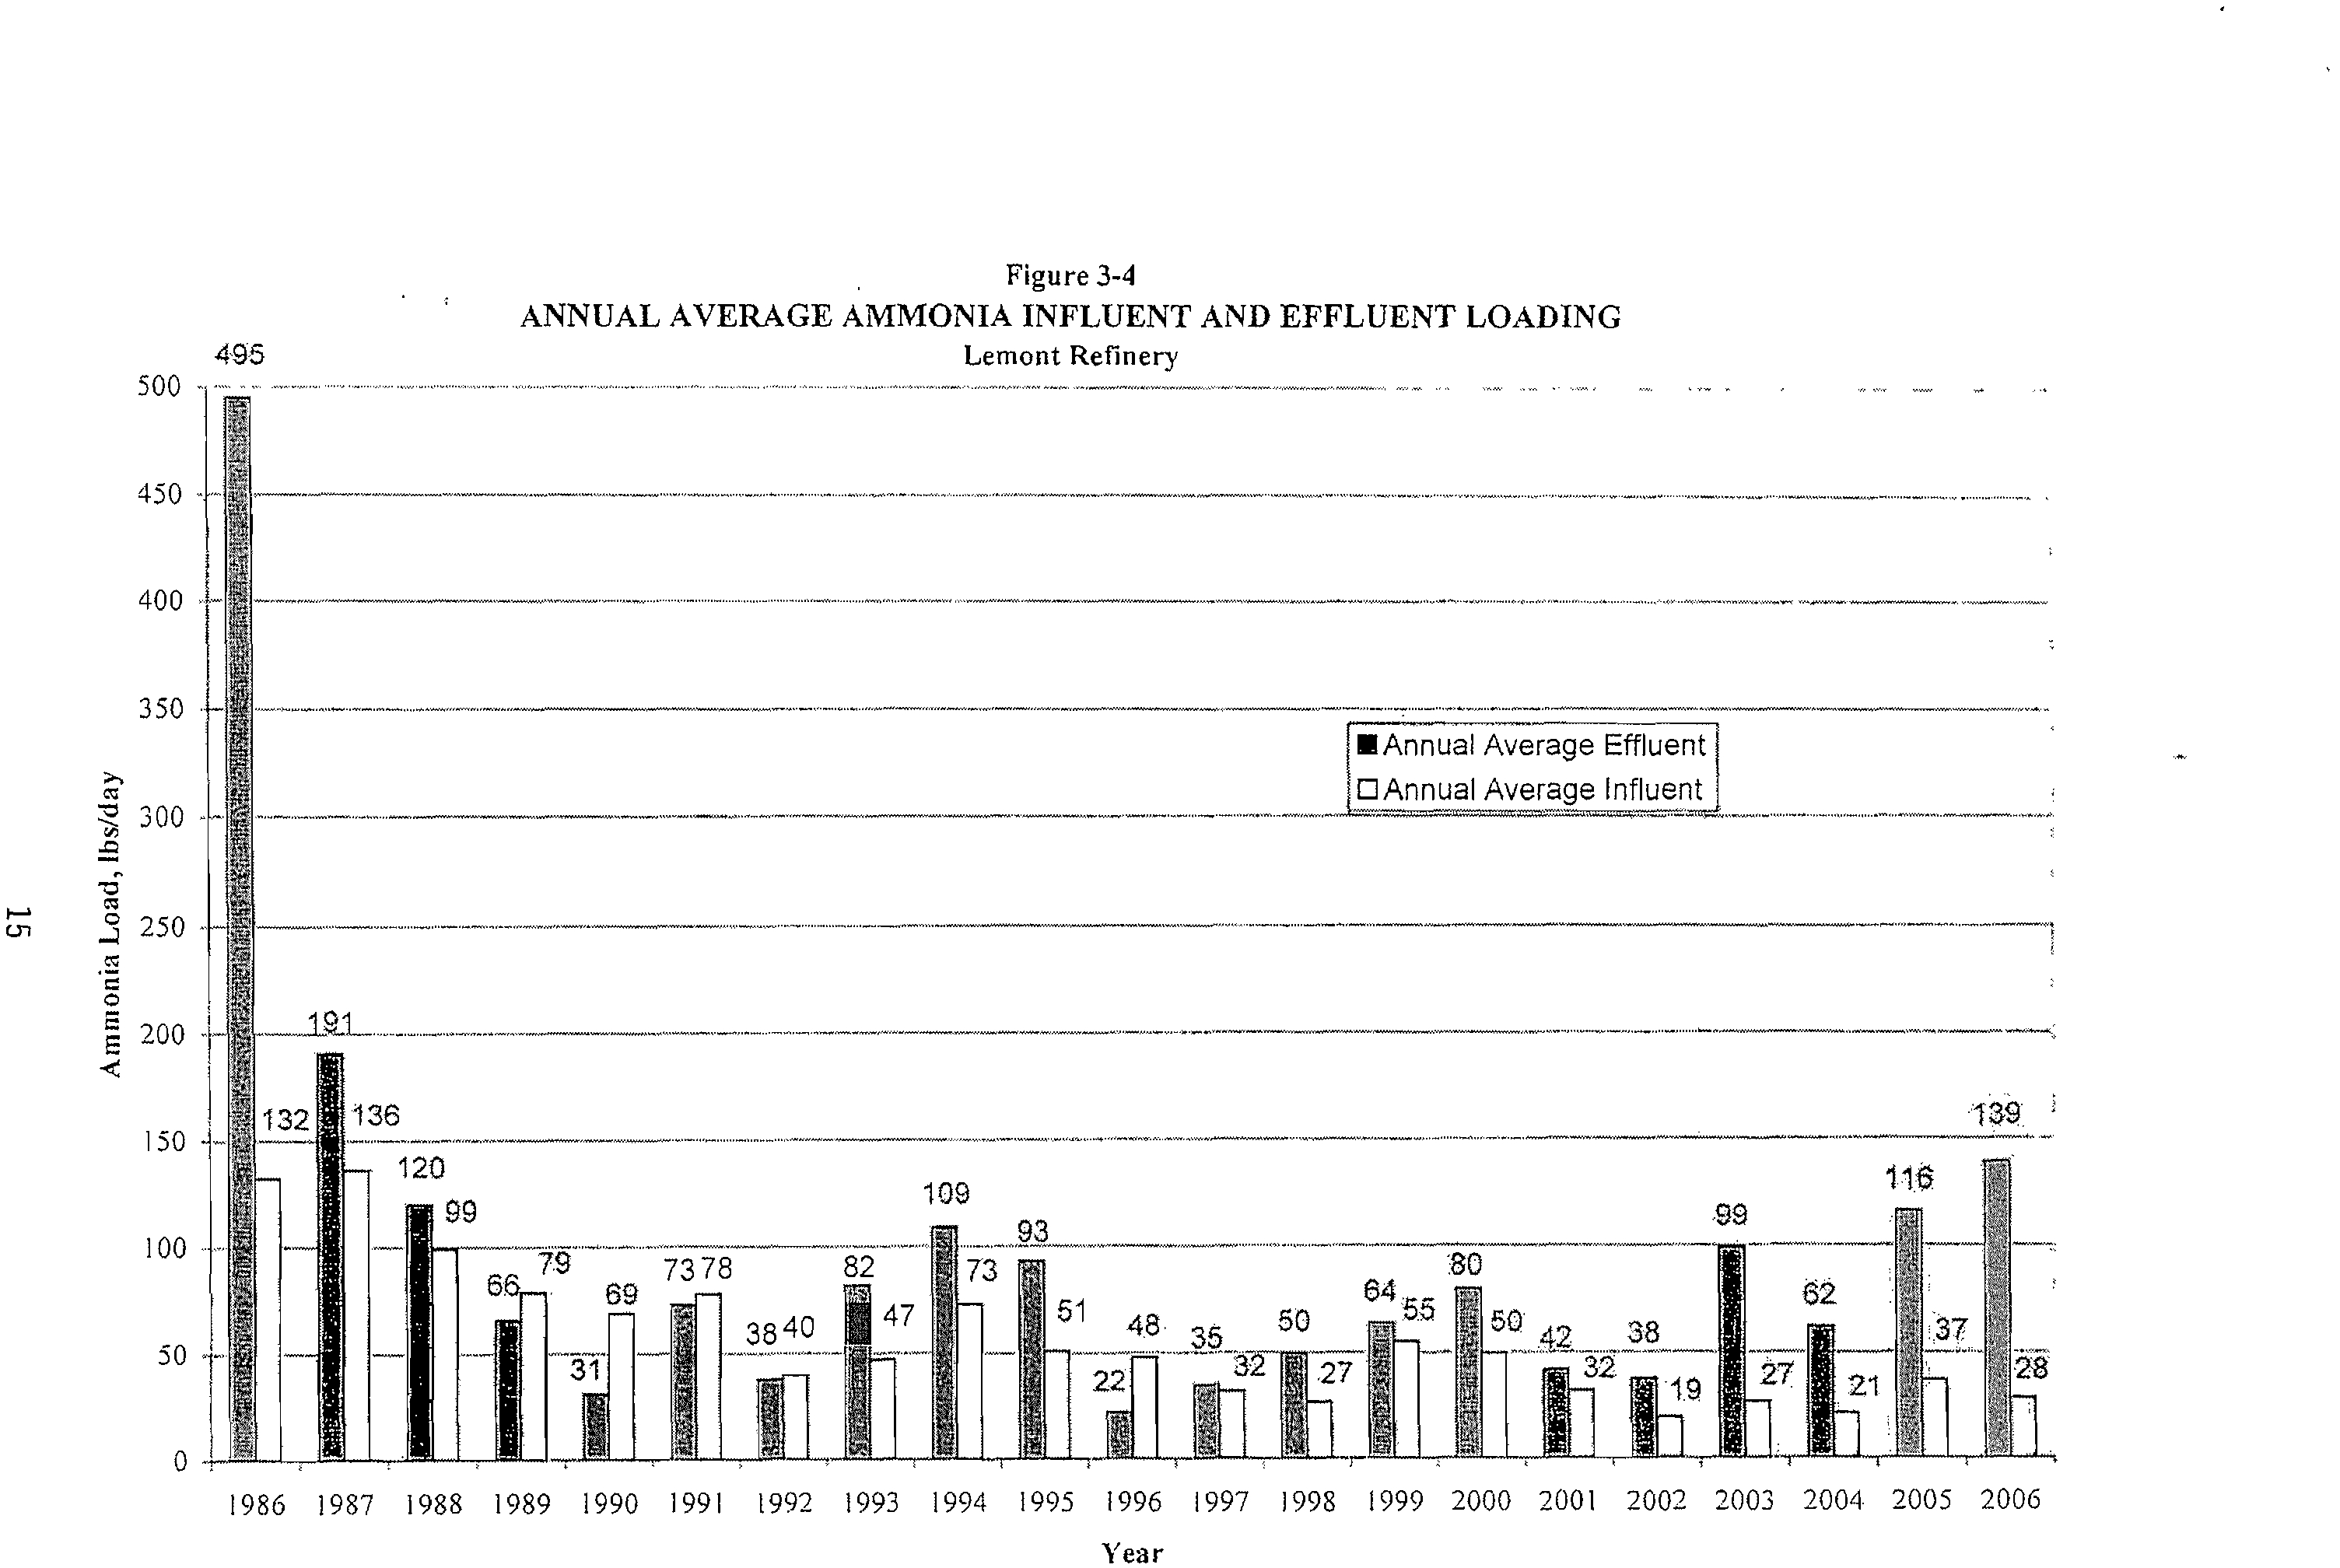
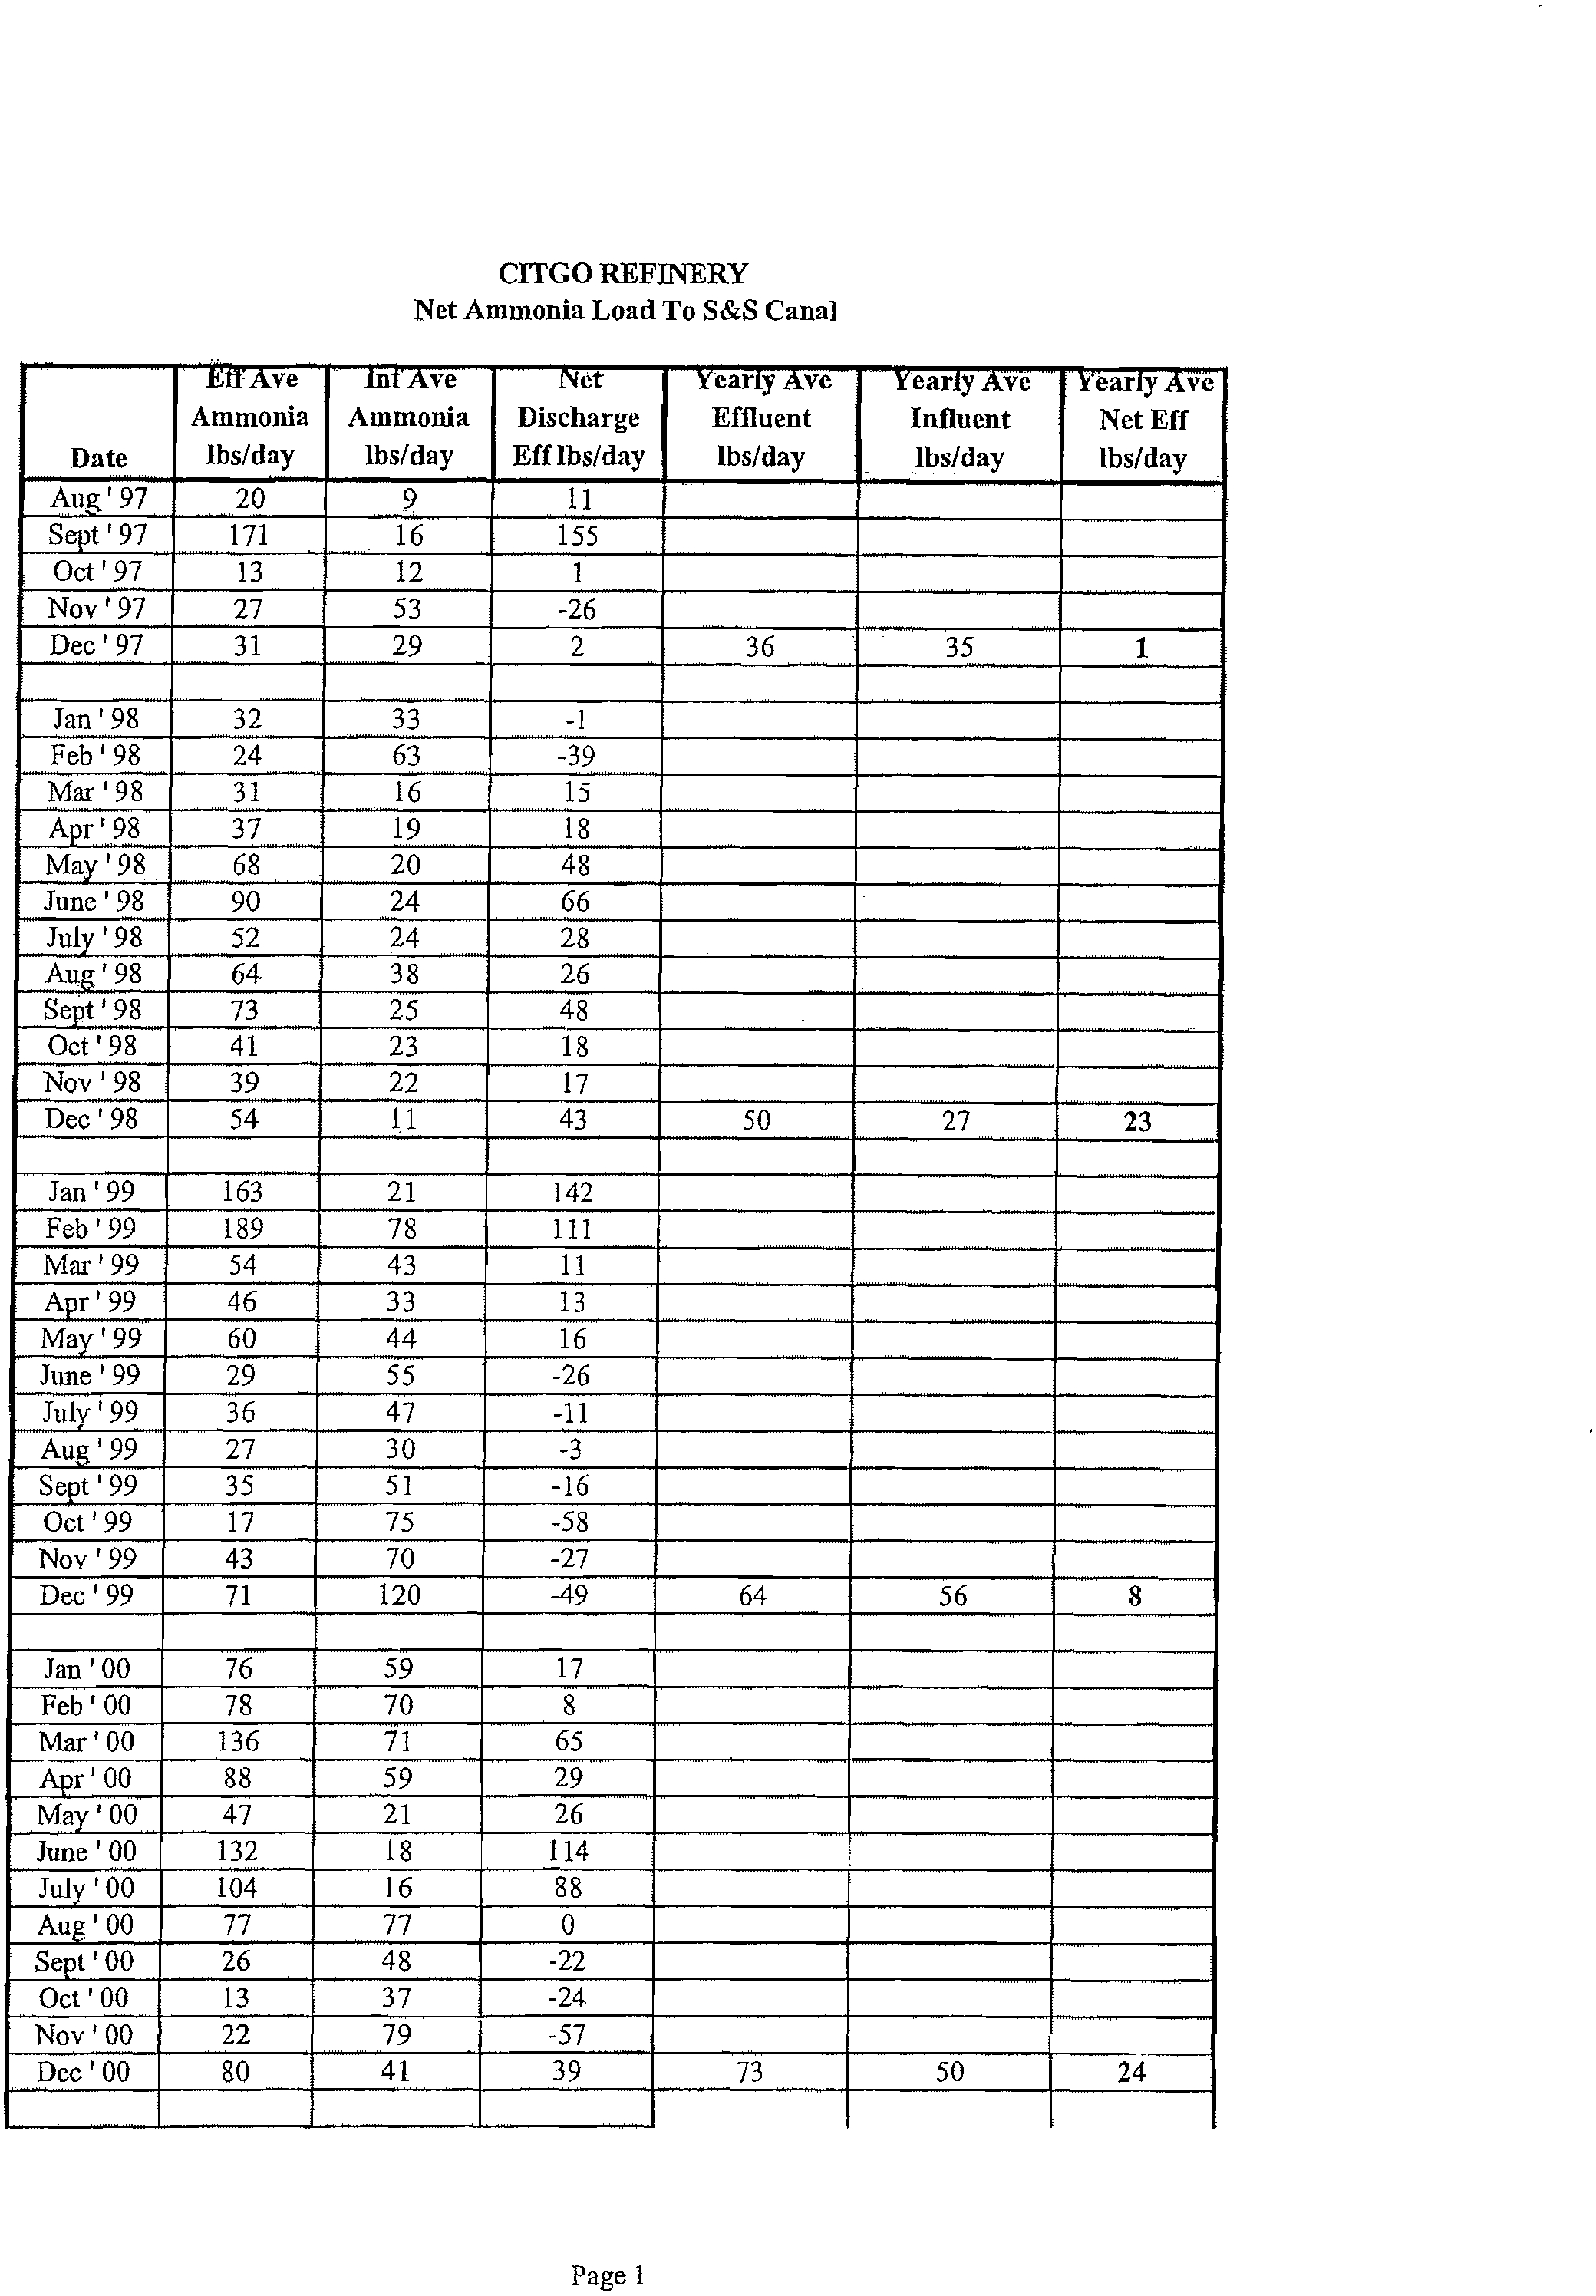
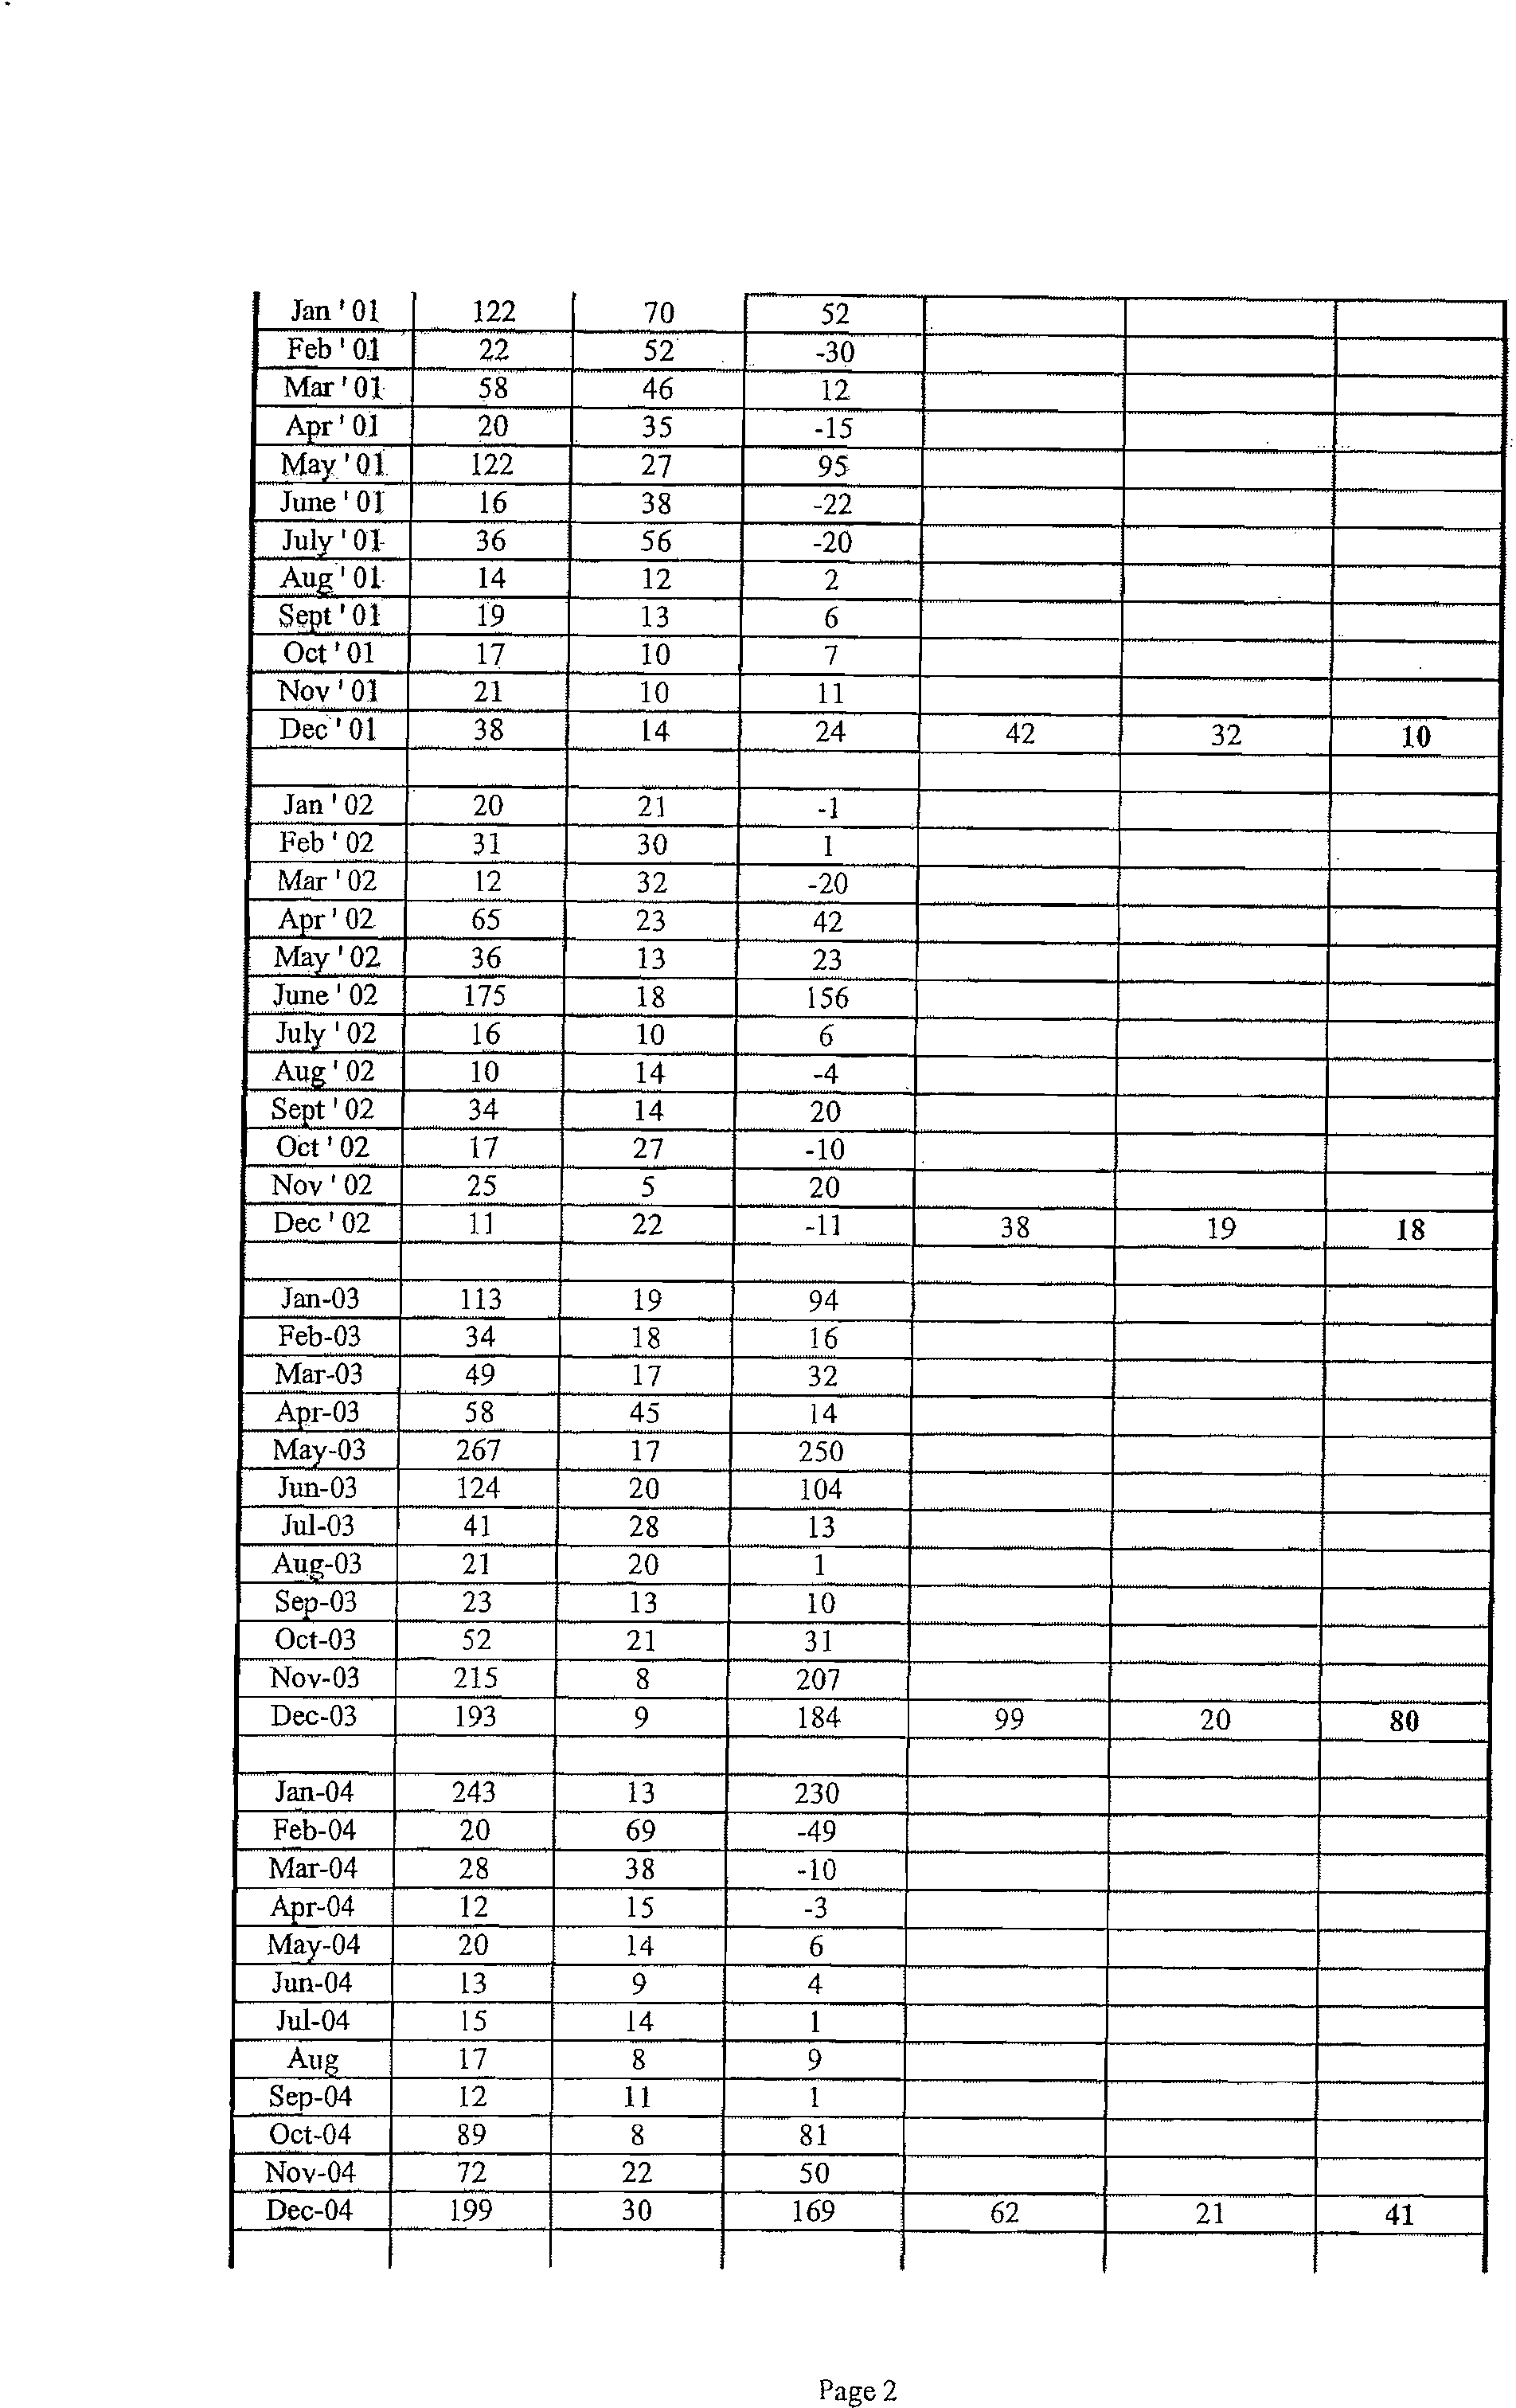
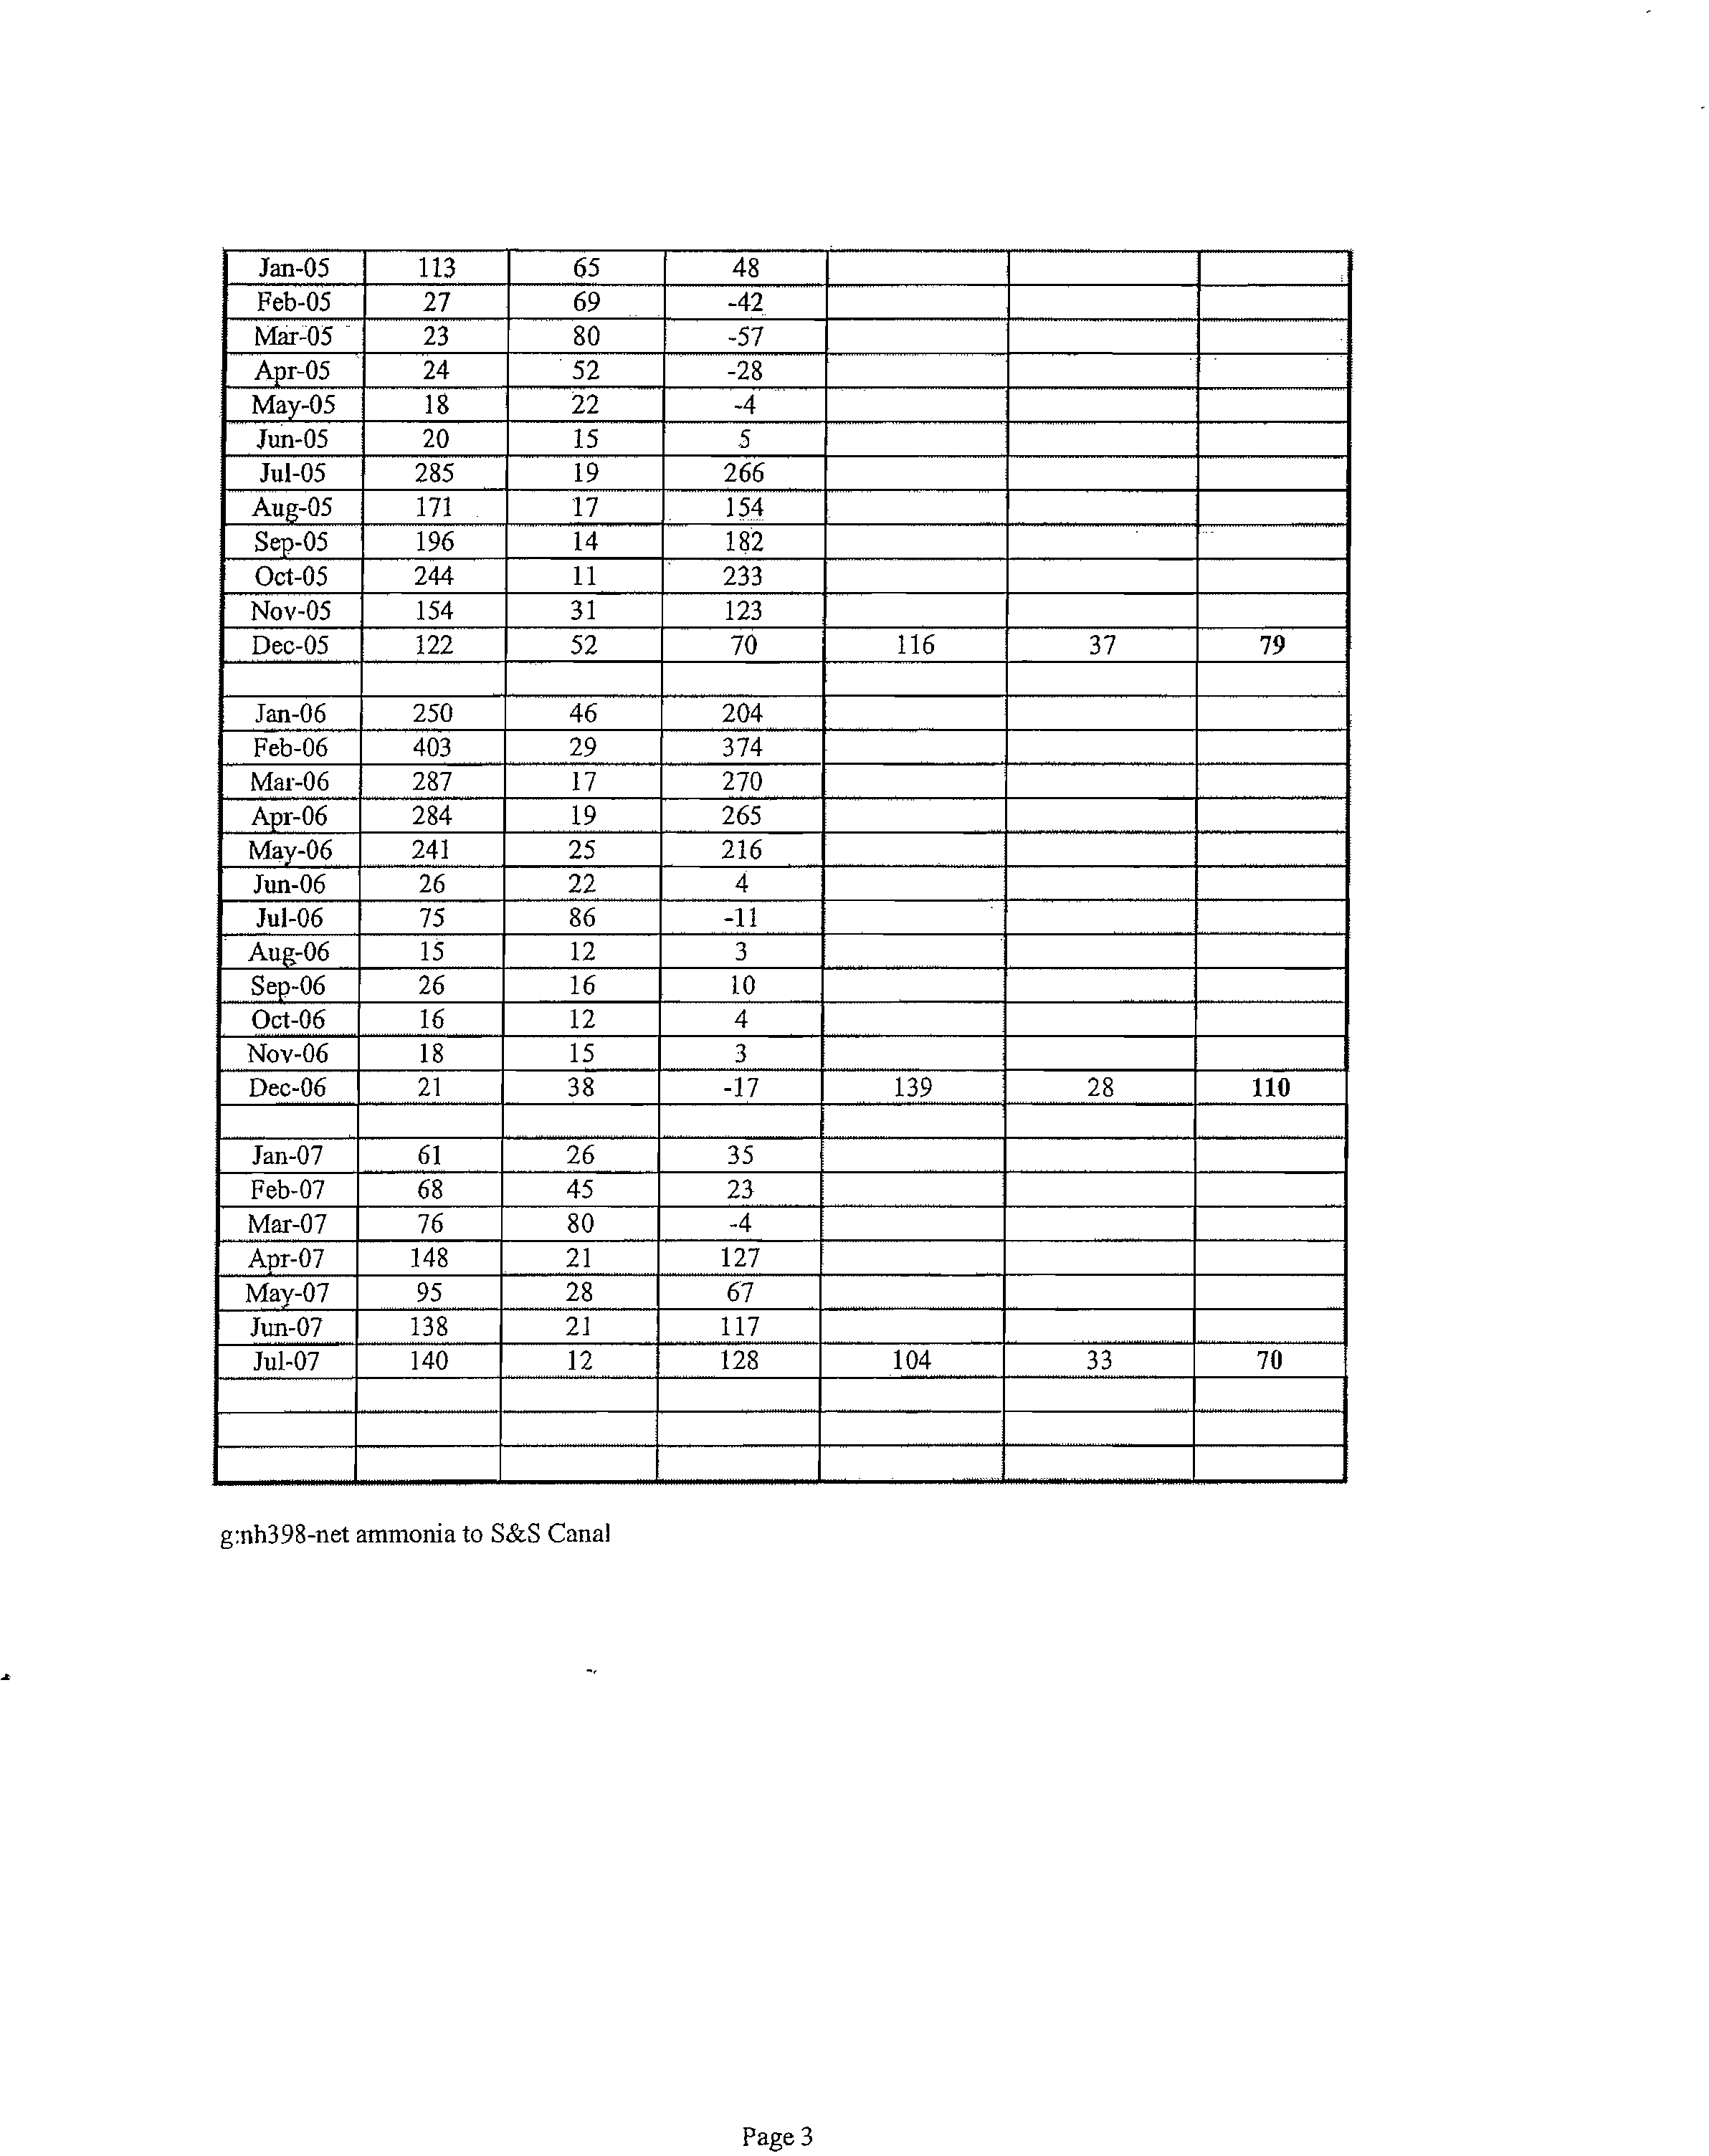
3.4 Net Ammonia Loading
Since 1997, Lemont Refinery has withdrawn an average of 32.8 lbs/day ammonia from the Ship Canal
compared to an average of 72.5 lbs/day discharged. The ammonia in the water drawn from the Ship
Canal represents 45 percent of the ammonia discharged over the past decade. Thus, the net ammonia
contributed by the refinery over the past decade has averaged 39.7 pounds per day. Figure 3-4 presents
the annual average effluent and influent loading for ammonia at the Lemont Refinery.
Citgo, Lemont— Ammonia Report
13
February 2008
Electronic Filing - Received, Clerk's Office, March 18, 2008
* * * * * AS 2008-008 * * * * *
EXHIBIT 2
3.5
0
.5 -
Figure 3-3
ANNUAL AVERAGE INFLUENT AMMONIA CONCENTRATION
Sanitary & Ship Canal
1986 1987 1988 1989 1990 1991 1992 1993 1994 1995 1996 1997 1998 1999 2000 2001 2002 2003 2004 2005 2006
YEAR
Electronic Filing - Received, Clerk's Office, March 18, 2008
* * * * * AS 2008-008 * * * * *
EXHIBIT 2
1986
1987 1988
1992 1993 1994 1995 1996 1997 1998 1999 2000
2001 2002 2003 2004 2005 2006
t
1989 1990 1991
495
500
450
•
Figure 3-4
ANNUAL AVERAGE AMMONIA INFLUENT AND EFFLUENT LOADING
Lemont
Refinery
'Annual Average Effluent
ElAnnual Average Influent
400
350
300
250
Year
Electronic Filing - Received, Clerk's Office, March 18, 2008
* * * * * AS 2008-008 * * * * *
EXHIBIT 2
4. CHICAGO WATERWAY and ILLINOIS RIVER SYSTEM WATER QUALITY
4.1 Introduction
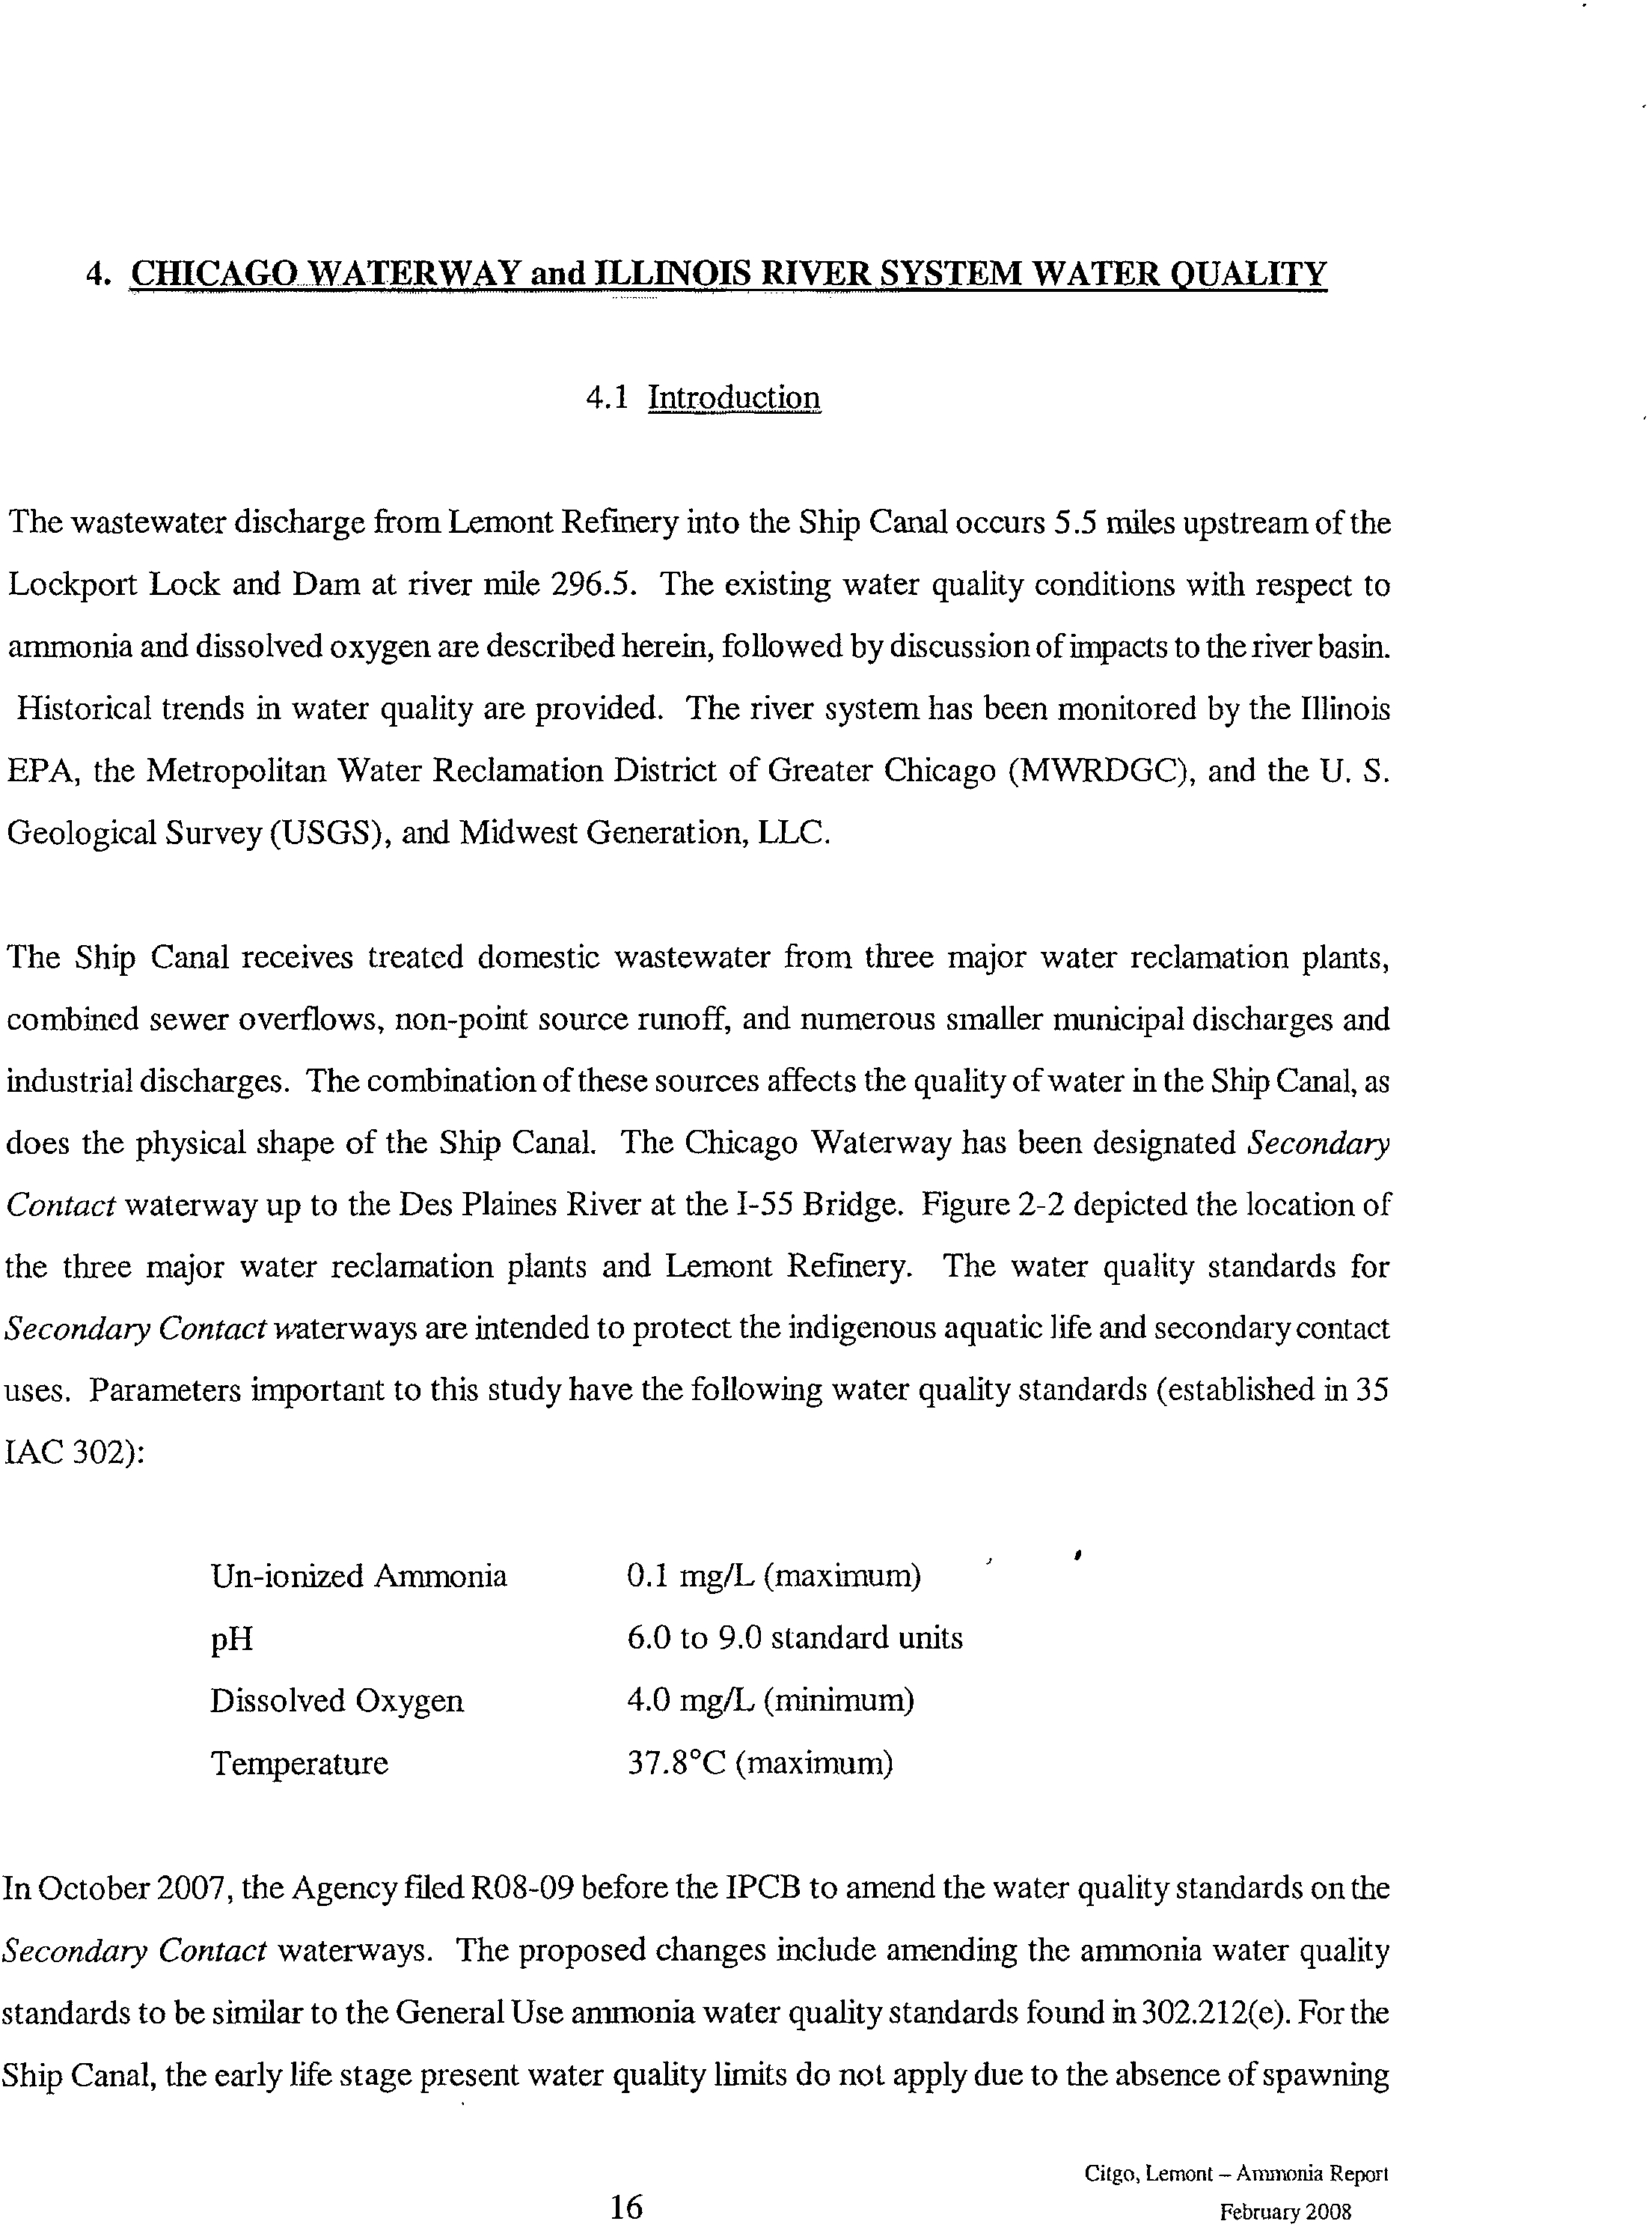
The wastewater discharge from Lemont Refinery into the Ship Canal occurs 5.5 miles upstream of the
Lockport Lock and Dam at river mile 296.5. The existing water quality conditions with respect to
ammonia and dissolved oxygen are described herein, followed by discussion of impacts to the river basin.
Historical trends in water quality are provided. The river system has been monitored by the Illinois
EPA, the Metropolitan Water Reclamation District of Greater Chicago (MWRDGC), and the U. S.
Geological Survey (USGS), and Midwest Generation, LLC.
The Ship Canal receives treated domestic wastewater from three major water reclamation plants,
combined sewer overflows, non-point source runoff, and numerous smaller municipal discharges and
industrial discharges. The combination of these sources affects the quality of water in the Ship Canal, as
does the physical shape of the Ship Canal. The Chicago Waterway has been designated
Secondary
Contact
waterway up to the Des Plaines River at the 1-55 Bridge. Figure 2-2 depicted the location of
the three major water reclamation plants and Lemont Refinery. The water quality standards for
Secondary Contact
waterways are intended to protect the indigenous aquatic life and secondary contact
uses. Parameters important to this study have the following water quality standards (established in 35
IAC 302):
Un-ionized Ammonia
0.1 mg/L (maximum)
pH
6.0 to 9.0 standard units
Dissolved Oxygen
4.0 mg/L (minimum)
Temperature
37.8°C (maximum)
In October 2007, the Agency filed R08-09 before the IPCB to amend the water quality standards on the
Secondary Contact
waterways. The proposed changes include amending the ammonia water quality
standards to be similar to the General Use ammonia water quality standards found in 302.212(e). For the
Ship Canal, the early life stage present water quality limits do not apply due to the absence of spawning
Citgo, Lemont — Ammonia Report
16
February 2008
Electronic Filing - Received, Clerk's Office, March 18, 2008
* * * * * AS 2008-008 * * * * *
EXHIBIT 2
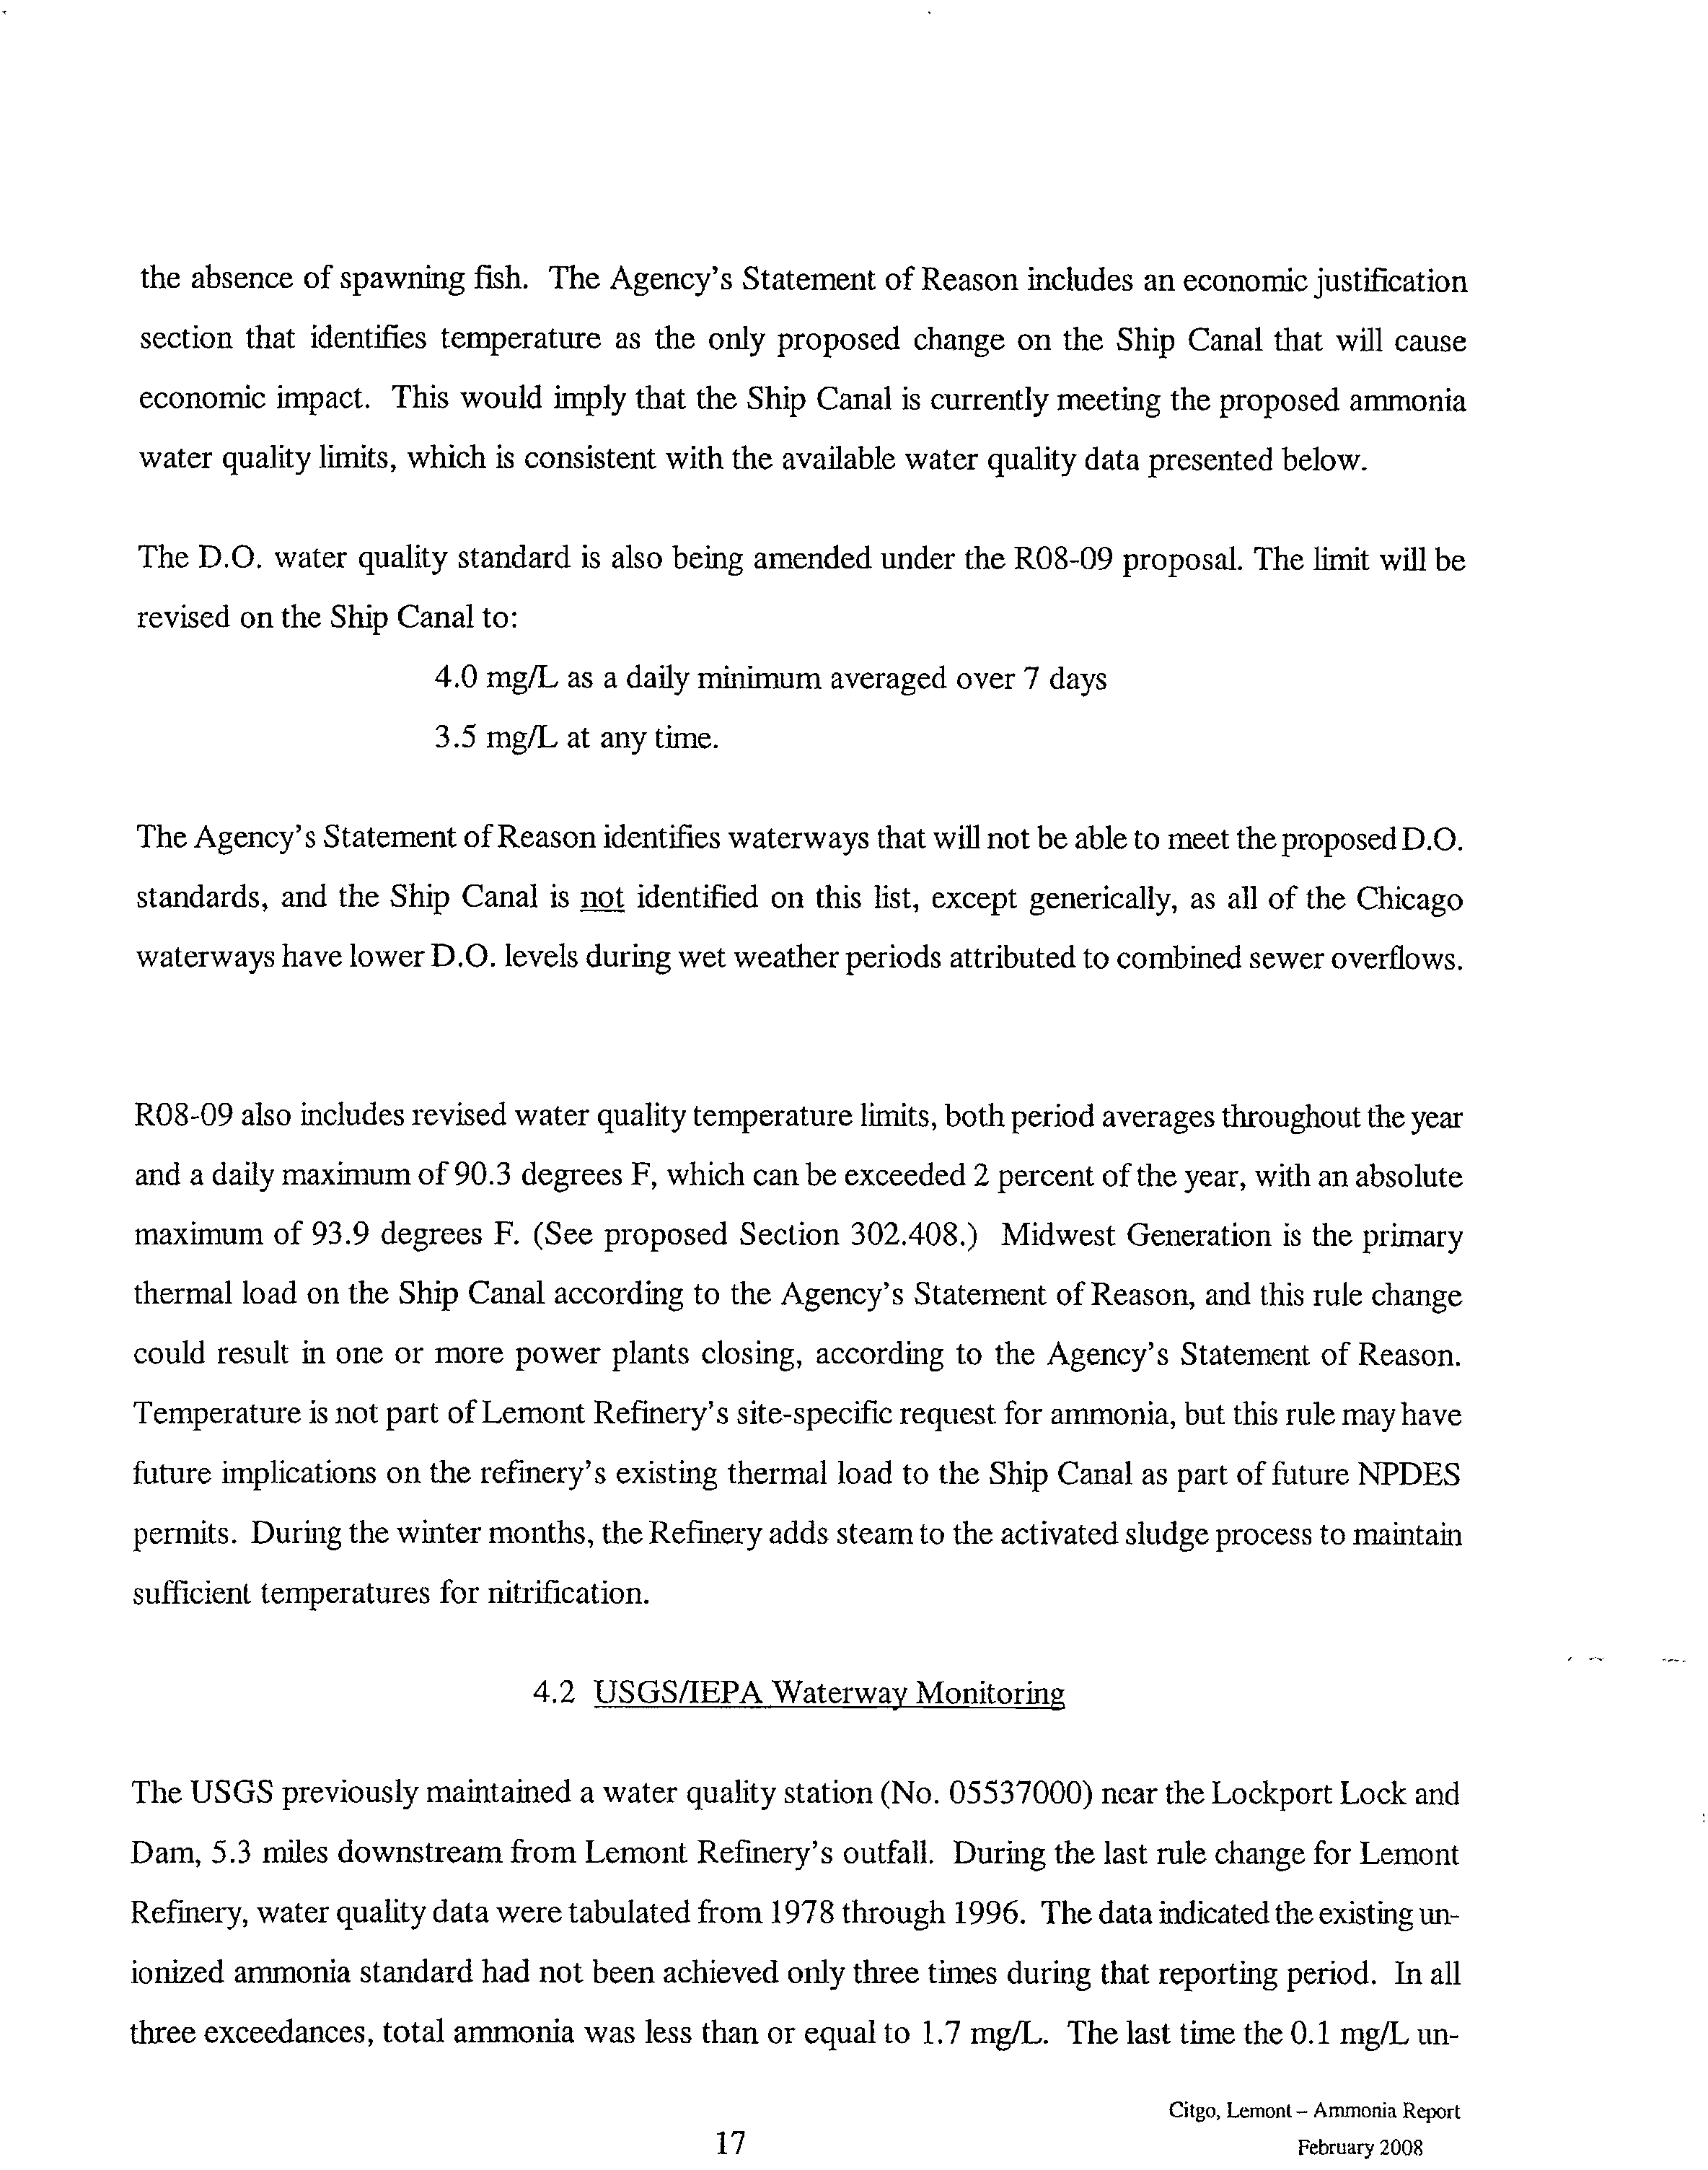
the absence of spawning fish. The Agency's Statement of Reason includes an economic justification
section that identifies temperature as the only proposed change on the Ship Canal that will cause
economic impact. This would imply that the Ship Canal is currently meeting the proposed ammonia
water quality limits, which is consistent with the available water quality data presented below.
The D.O. water quality standard is also being amended under the R08-09 proposal. The limit will be
revised on the Ship Canal to:
4.0 mg/L as a daily minimum averaged over 7 days
3.5 mg/L at any time.
The Agency's Statement of Reason identifies waterways that will not be able to meet the proposed D.O.
standards, and the Ship Canal is not identified on this list, except generically, as all of the Chicago
waterways have lower D.O. levels during wet weather periods attributed to combined sewer overflows.
R08-09 also includes revised water quality temperature limits, both period averages throughout the year
and a daily maximum of 90.3 degrees F, which can be exceeded 2 percent of the year, with an absolute
maximum of 93.9 degrees F. (See proposed Section 302.408.) Midwest Generation is the primary
thermal load on the Ship Canal according to the Agency's Statement of Reason, and this rule change
could result in one or more power plants closing, according to the Agency's Statement of Reason.
Temperature is not part of Lemont Refinery's site-specific request for ammonia, but this rule may have
future implications on the refinery's existing thermal load to the Ship Canal as part of future NPDES
permits. During the winter months, the Refinery adds steam to the activated sludge process to maintain
sufficient temperatures for nitrification.
4.2 USGS/IEPA Waterway Monitoring
The USGS previously maintained a water quality station (No. 05537000) near the Lockport Lock and
Dam, 5.3 miles downstream from Lemont Refinery's outfall. During the last rule change for Lemont
Refinery, water quality data were tabulated from 1978 through 1996. The data indicated the existing un-
ionized ammonia standard had not been achieved only three times during that reporting period. In all
three exceedances, total ammonia was less than or equal to 1.7 mg/L. The last time the 0.1 mg/L un-
Citgo, Lemont — Ammonia Report
17
February 2008
Electronic Filing - Received, Clerk's Office, March 18, 2008
* * * * * AS 2008-008 * * * * *
EXHIBIT 2
un-ionized standard was exceeded was May 4, 1994 with an un-ionized ammonia concentration of 0.177
mg/L. No water quality data are available for the time period since 1996 for station 05537000, as this
monitoring station was discontinued.
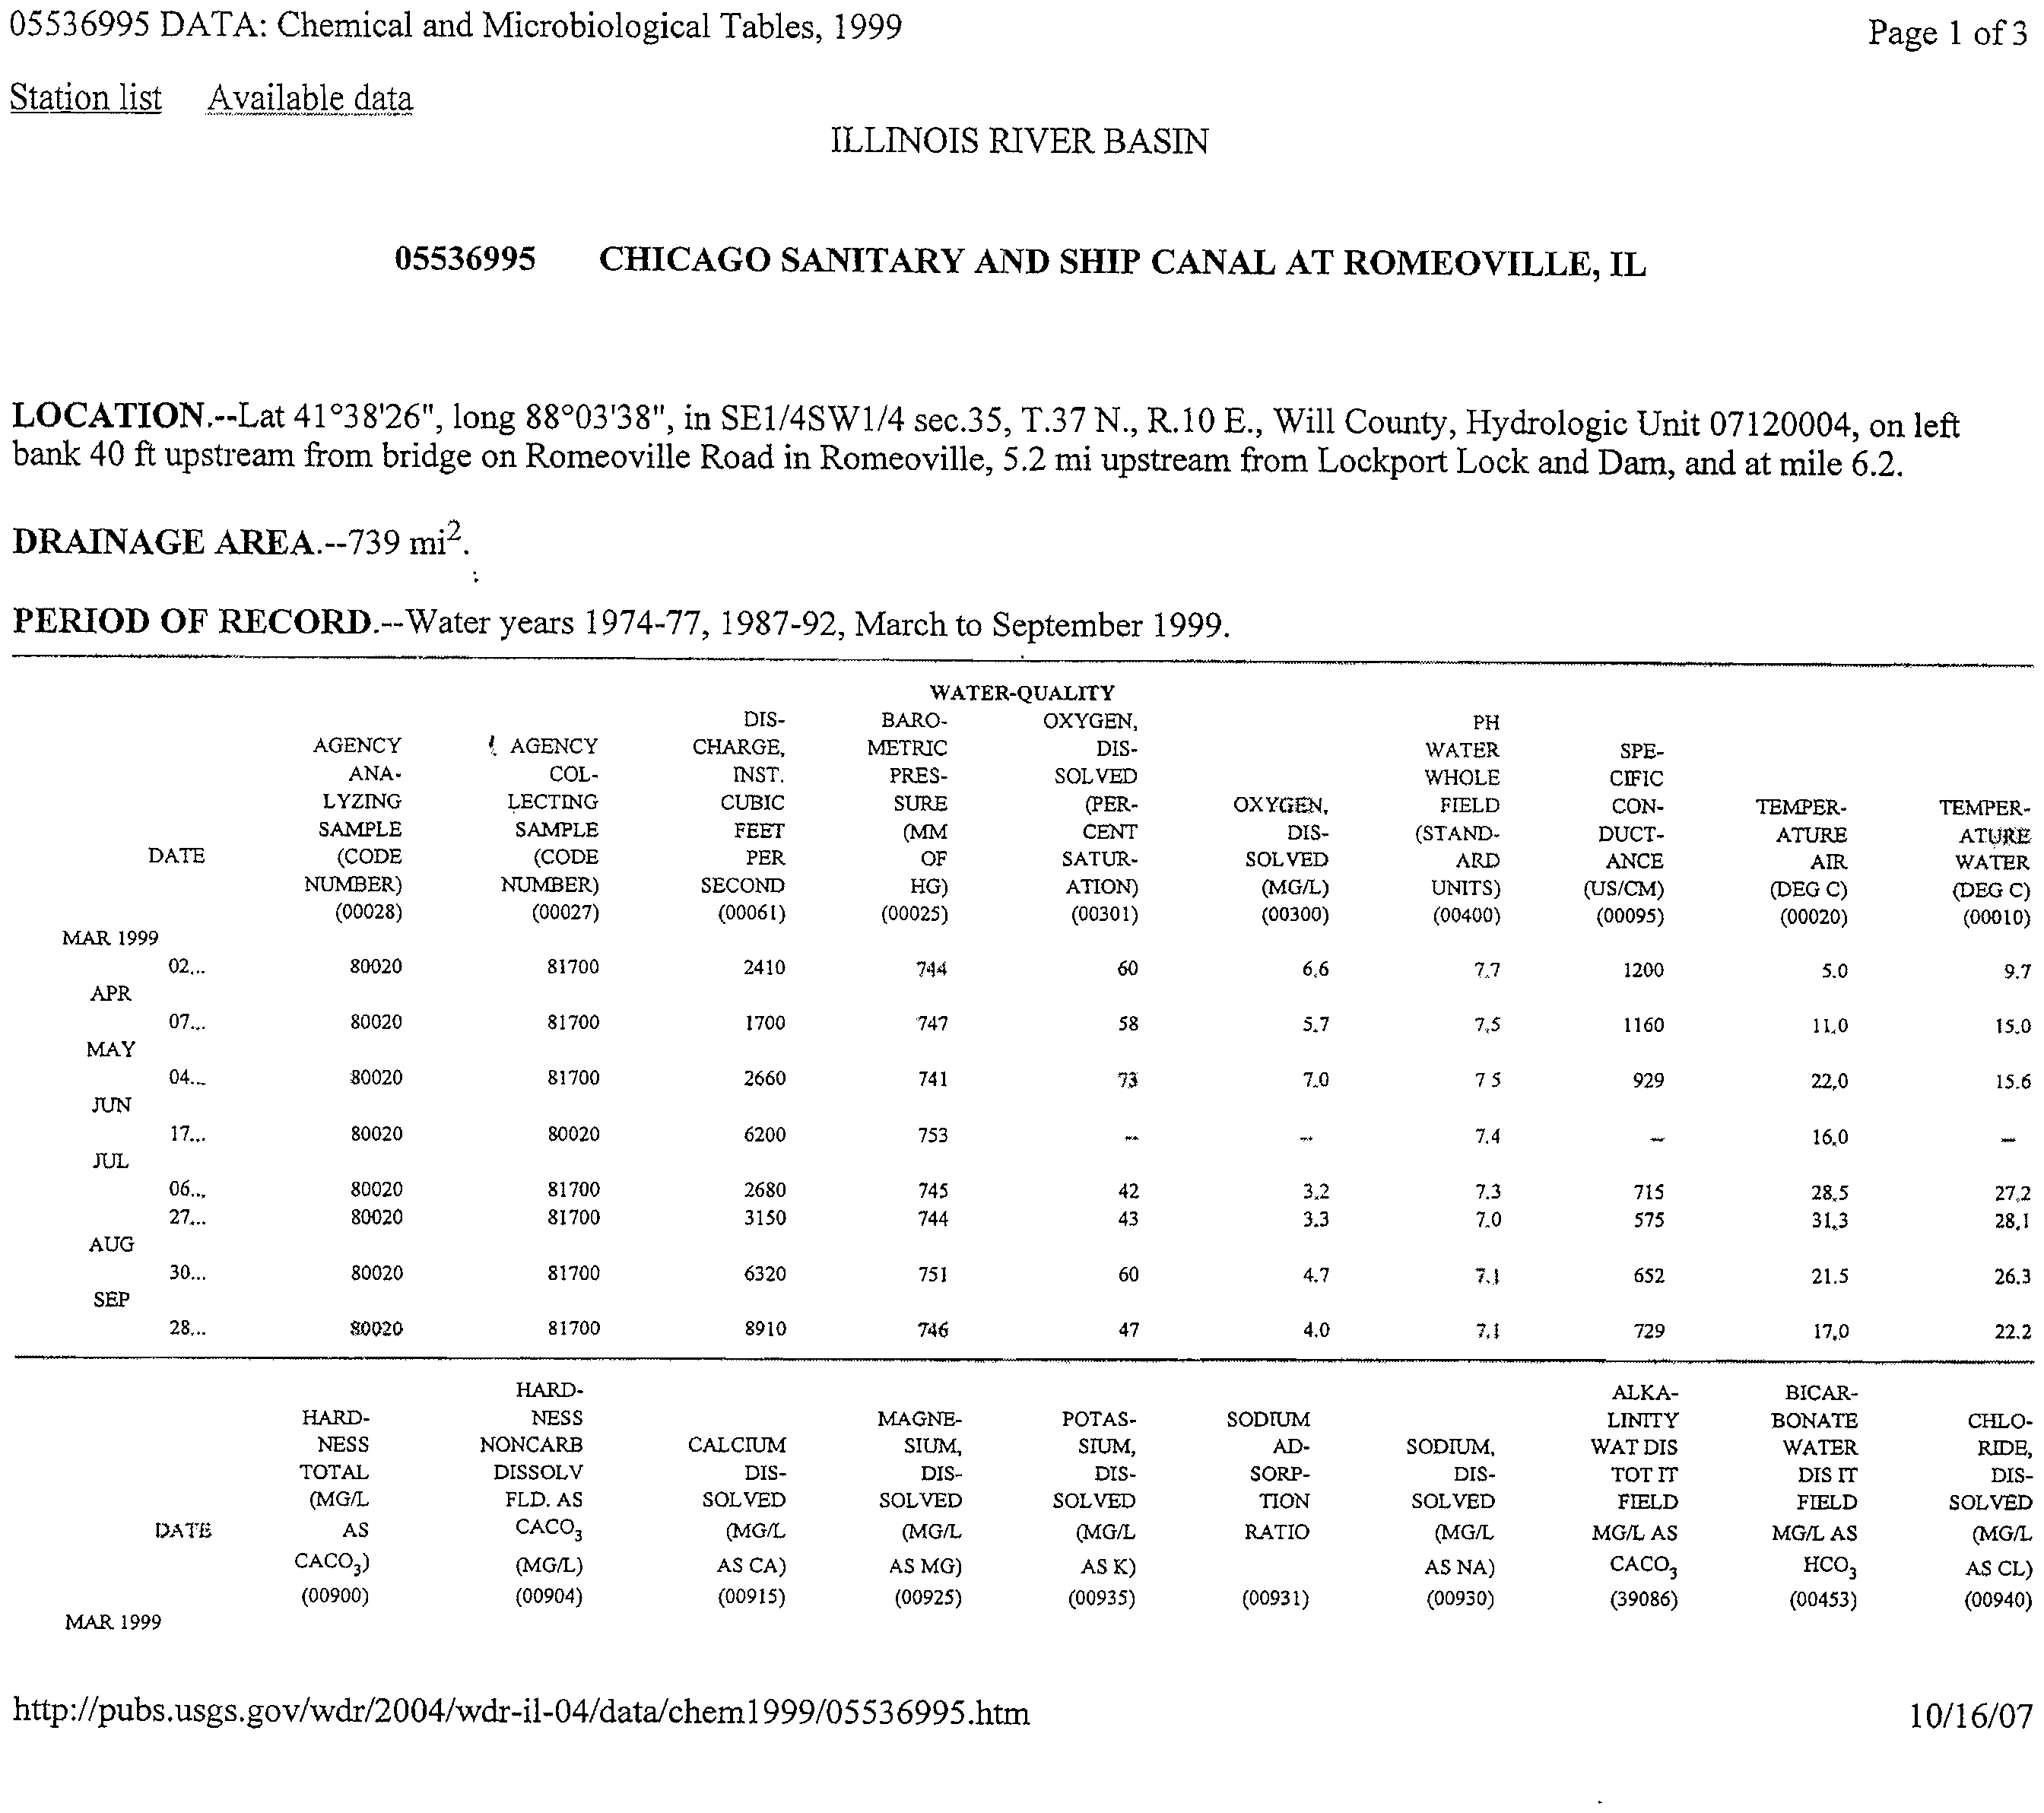
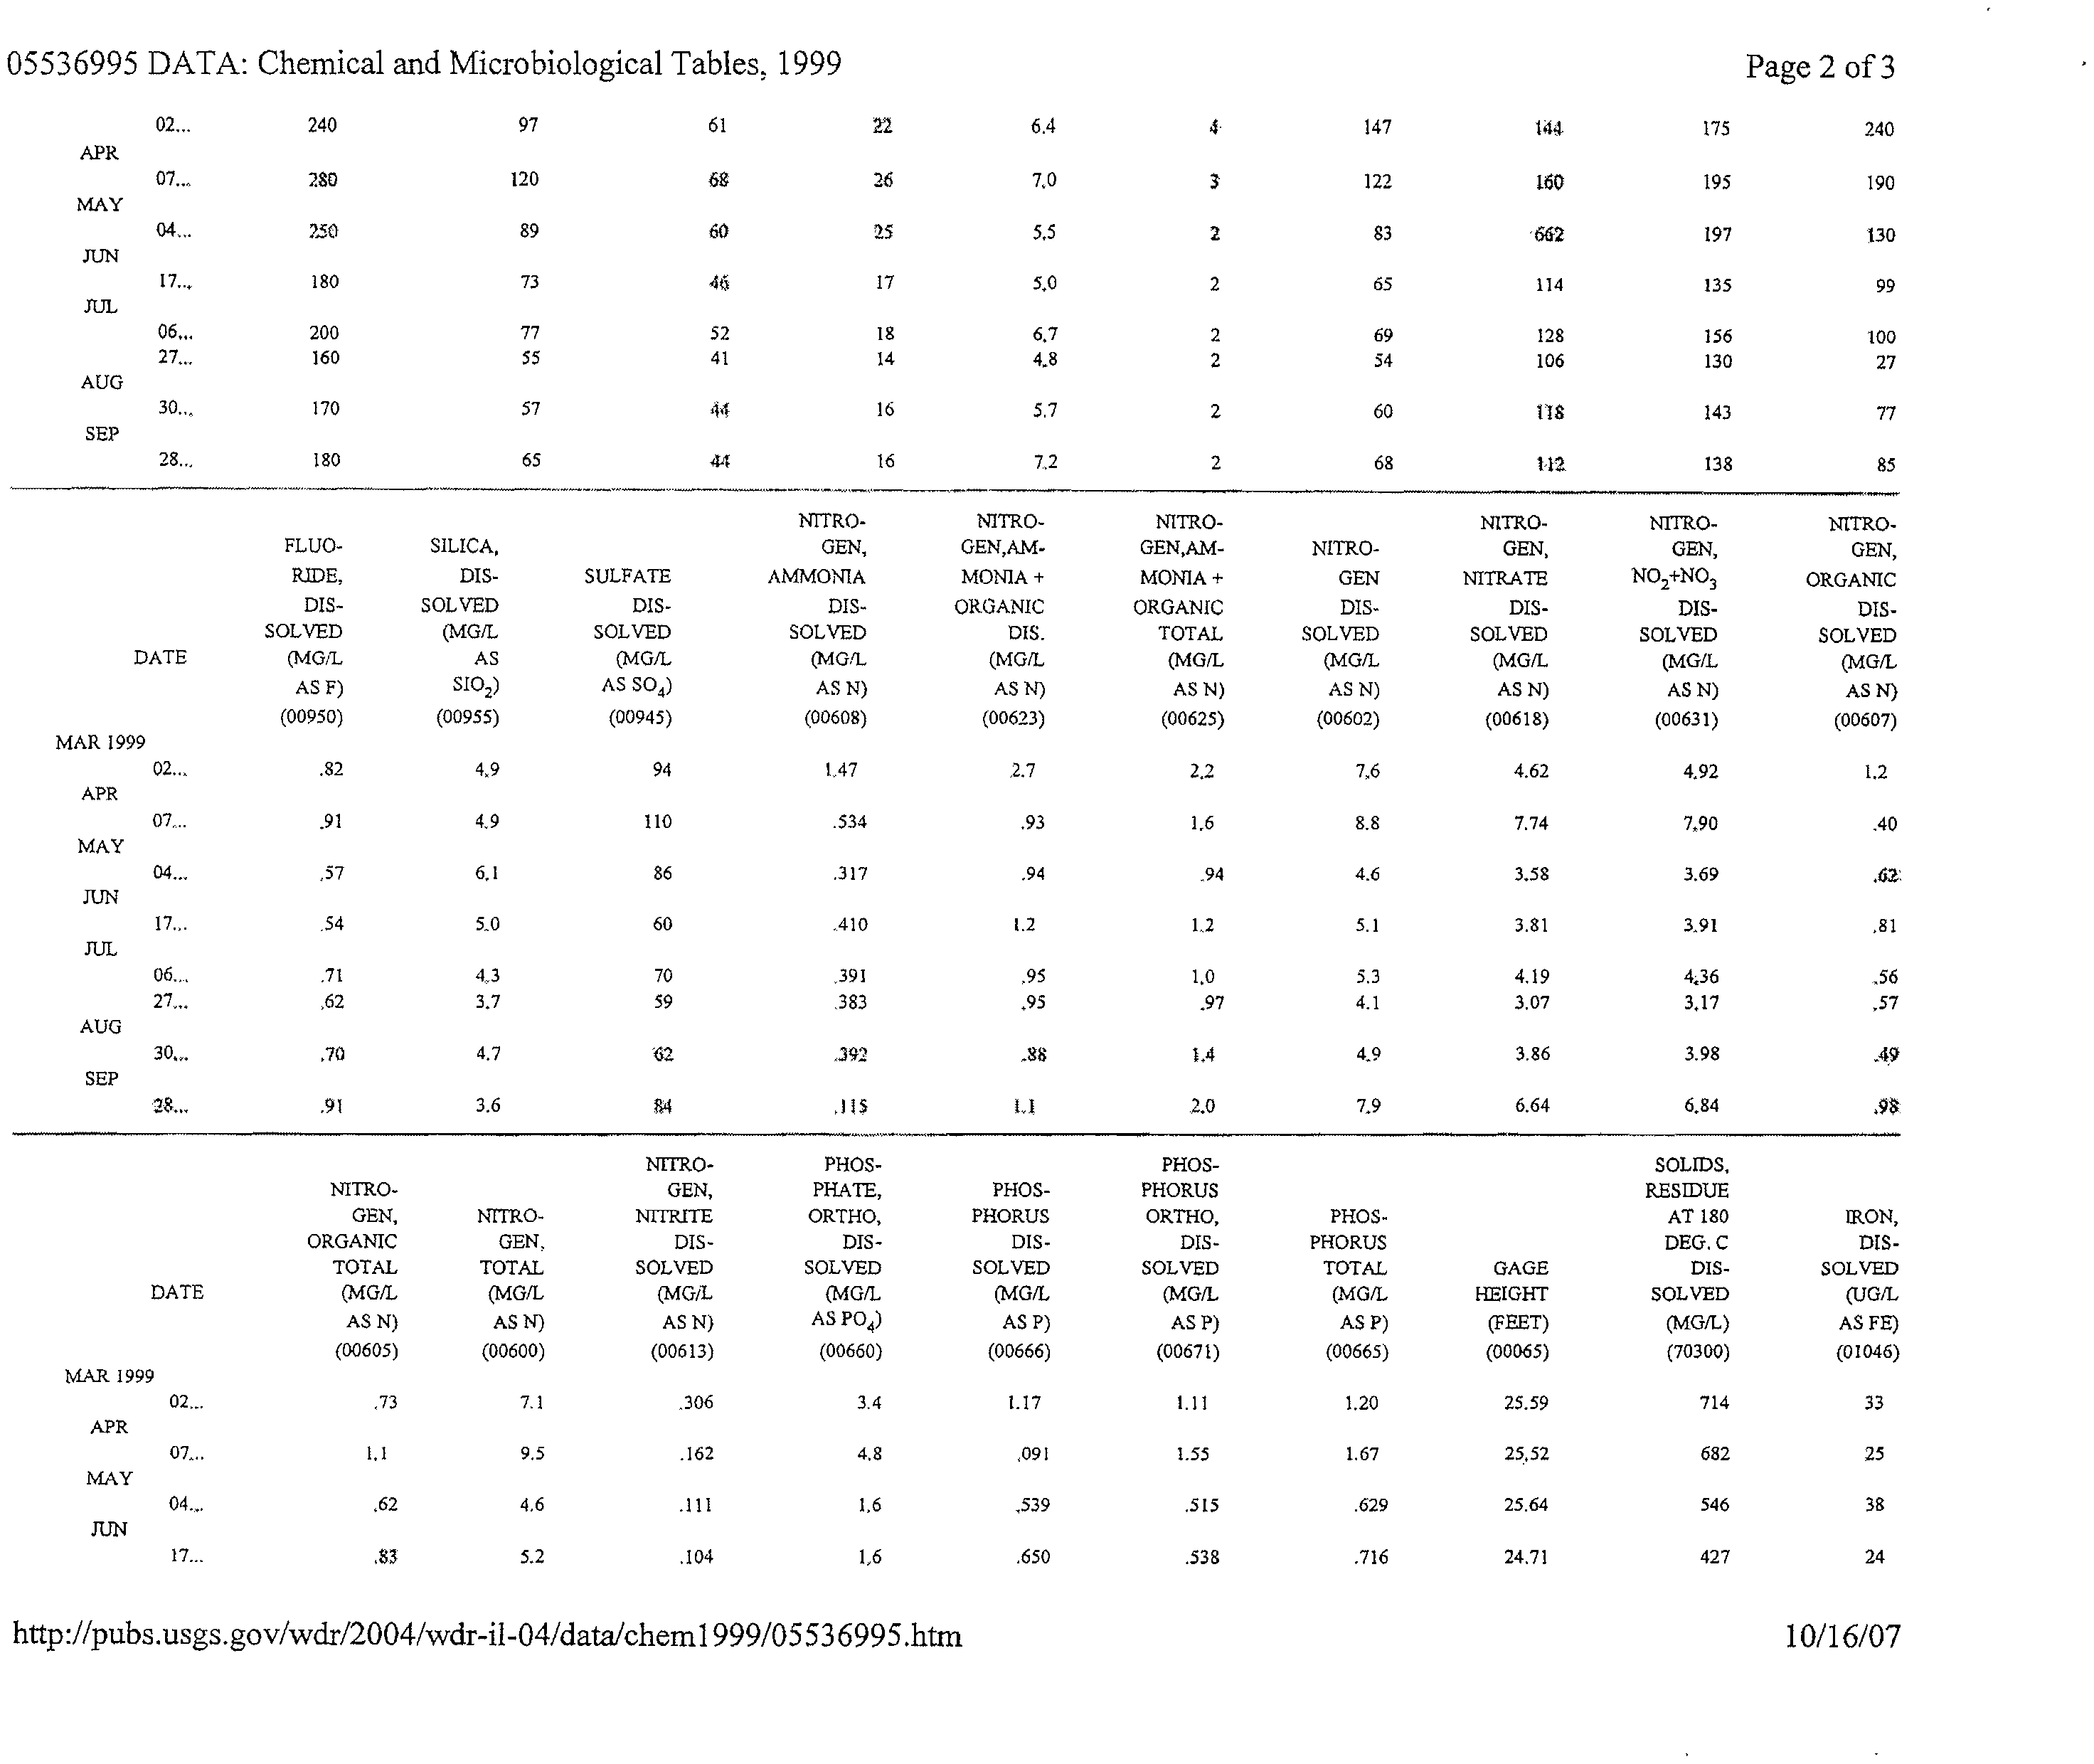
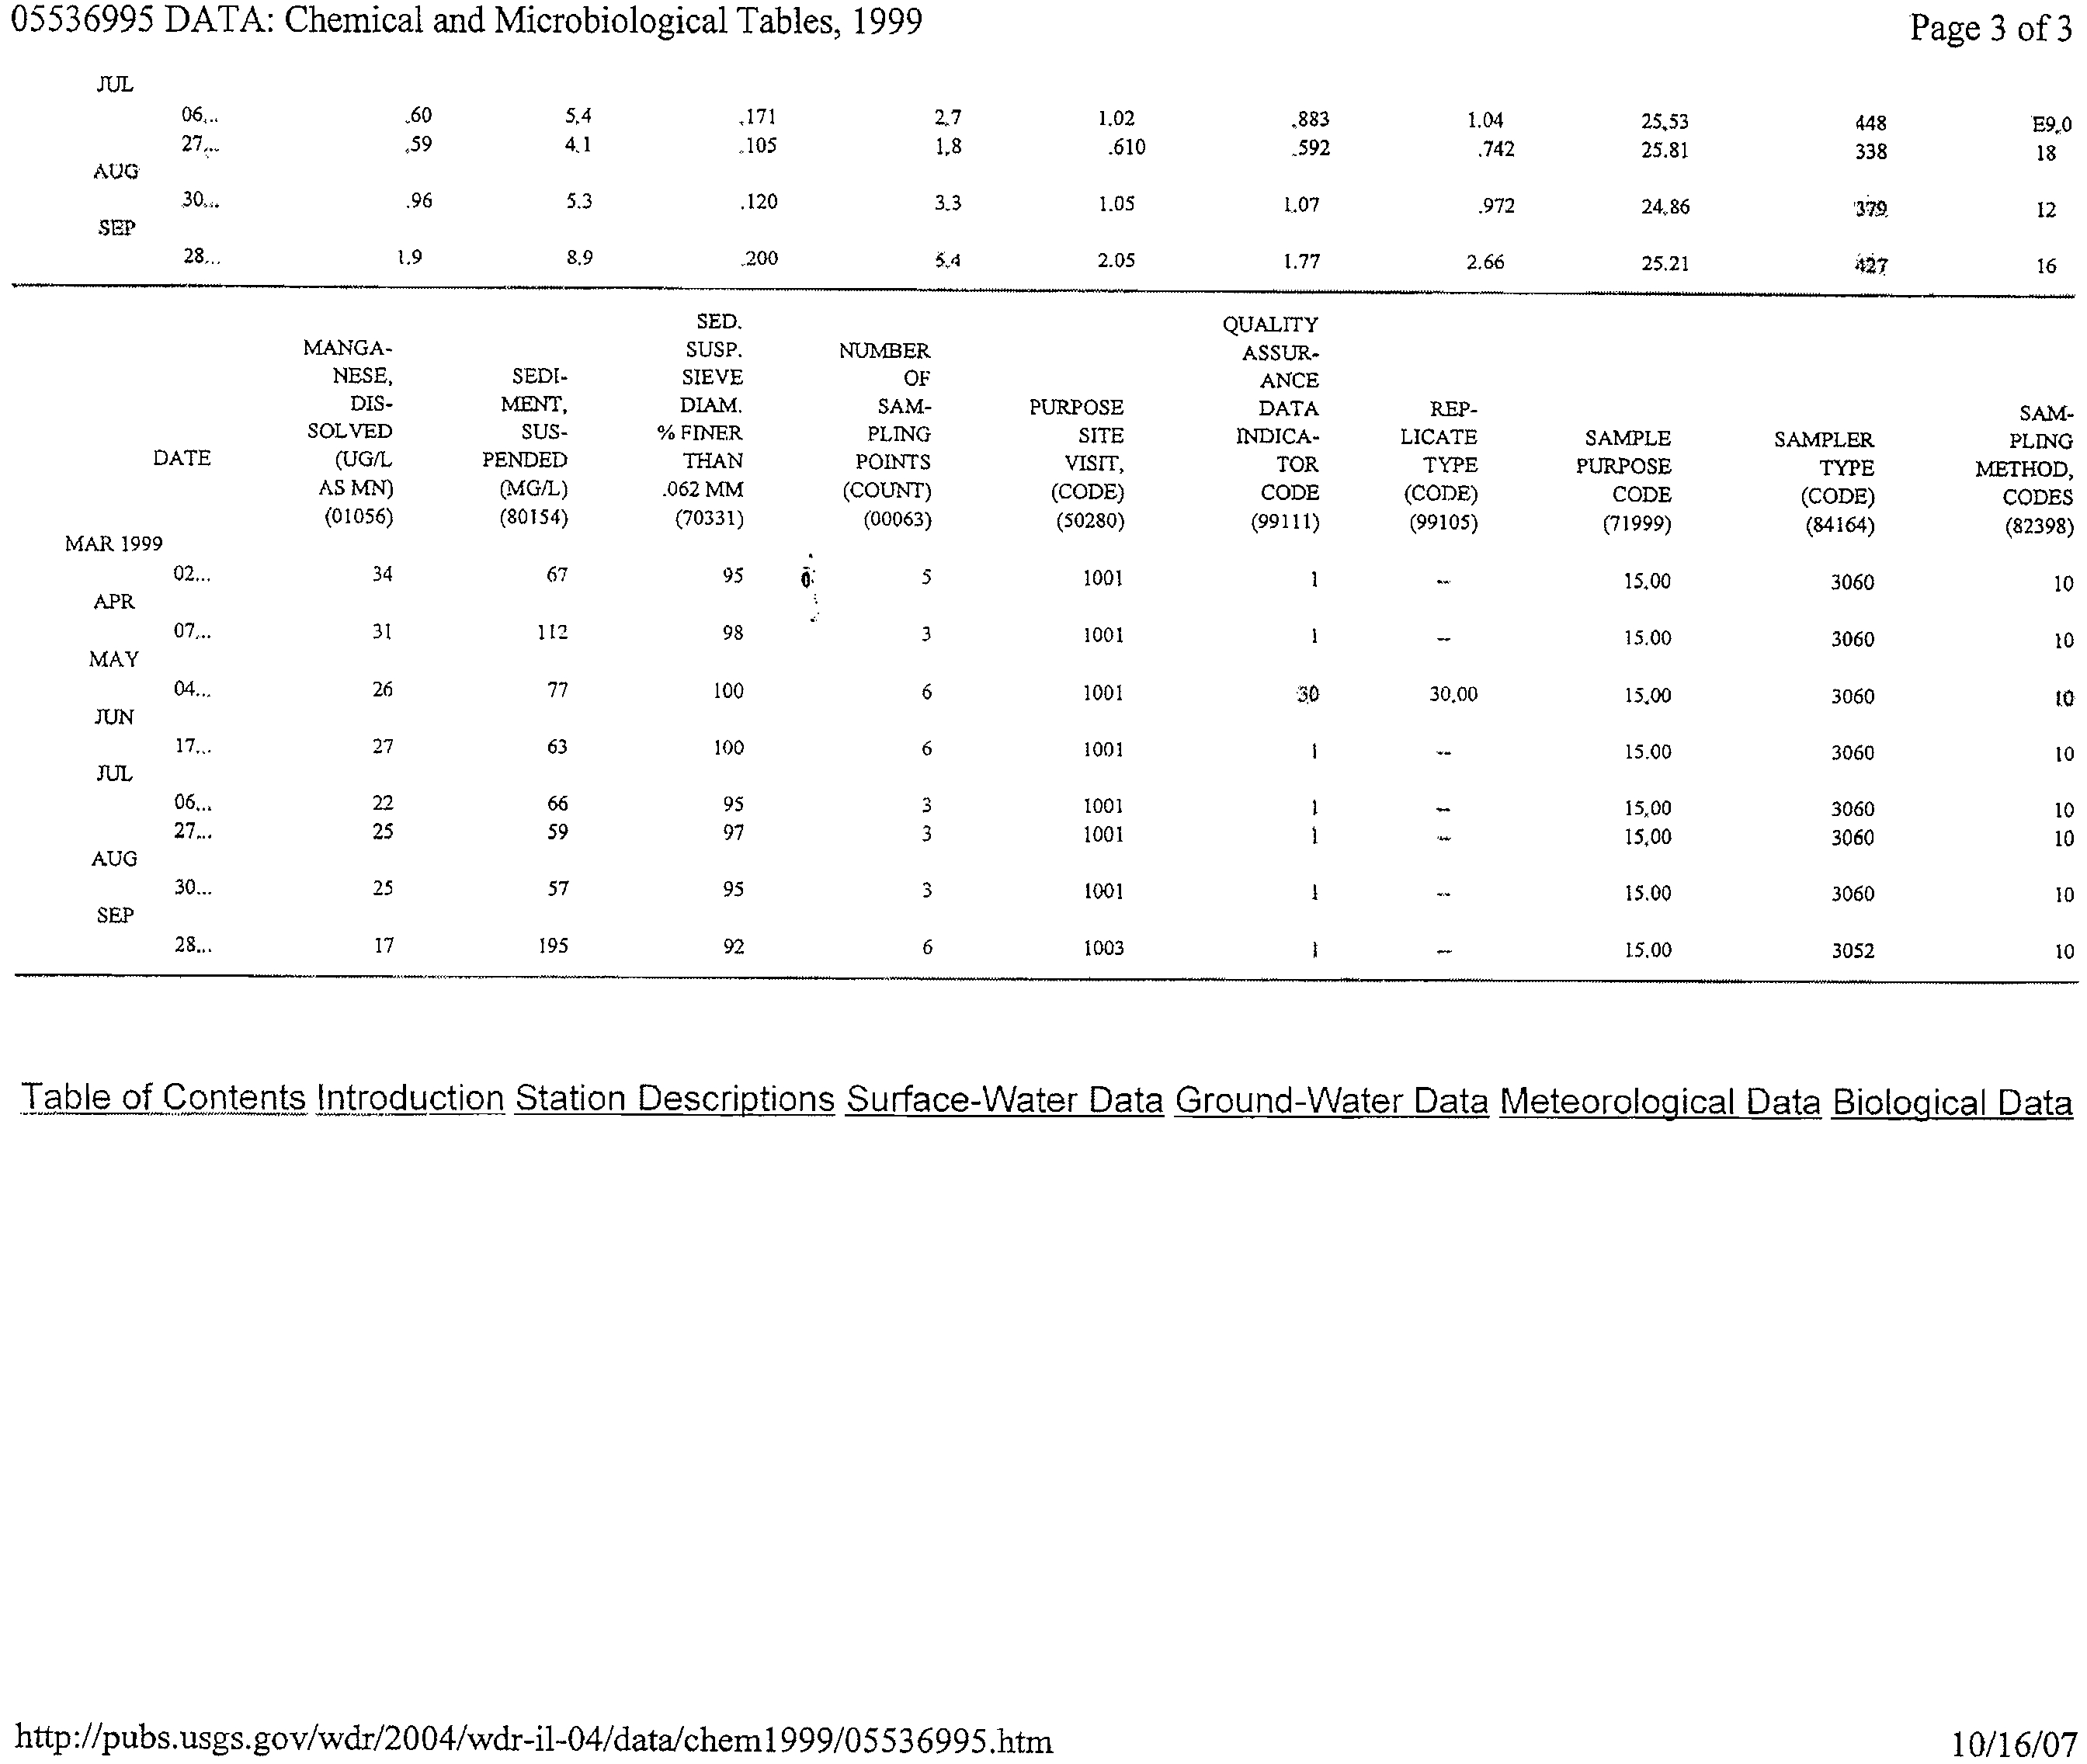
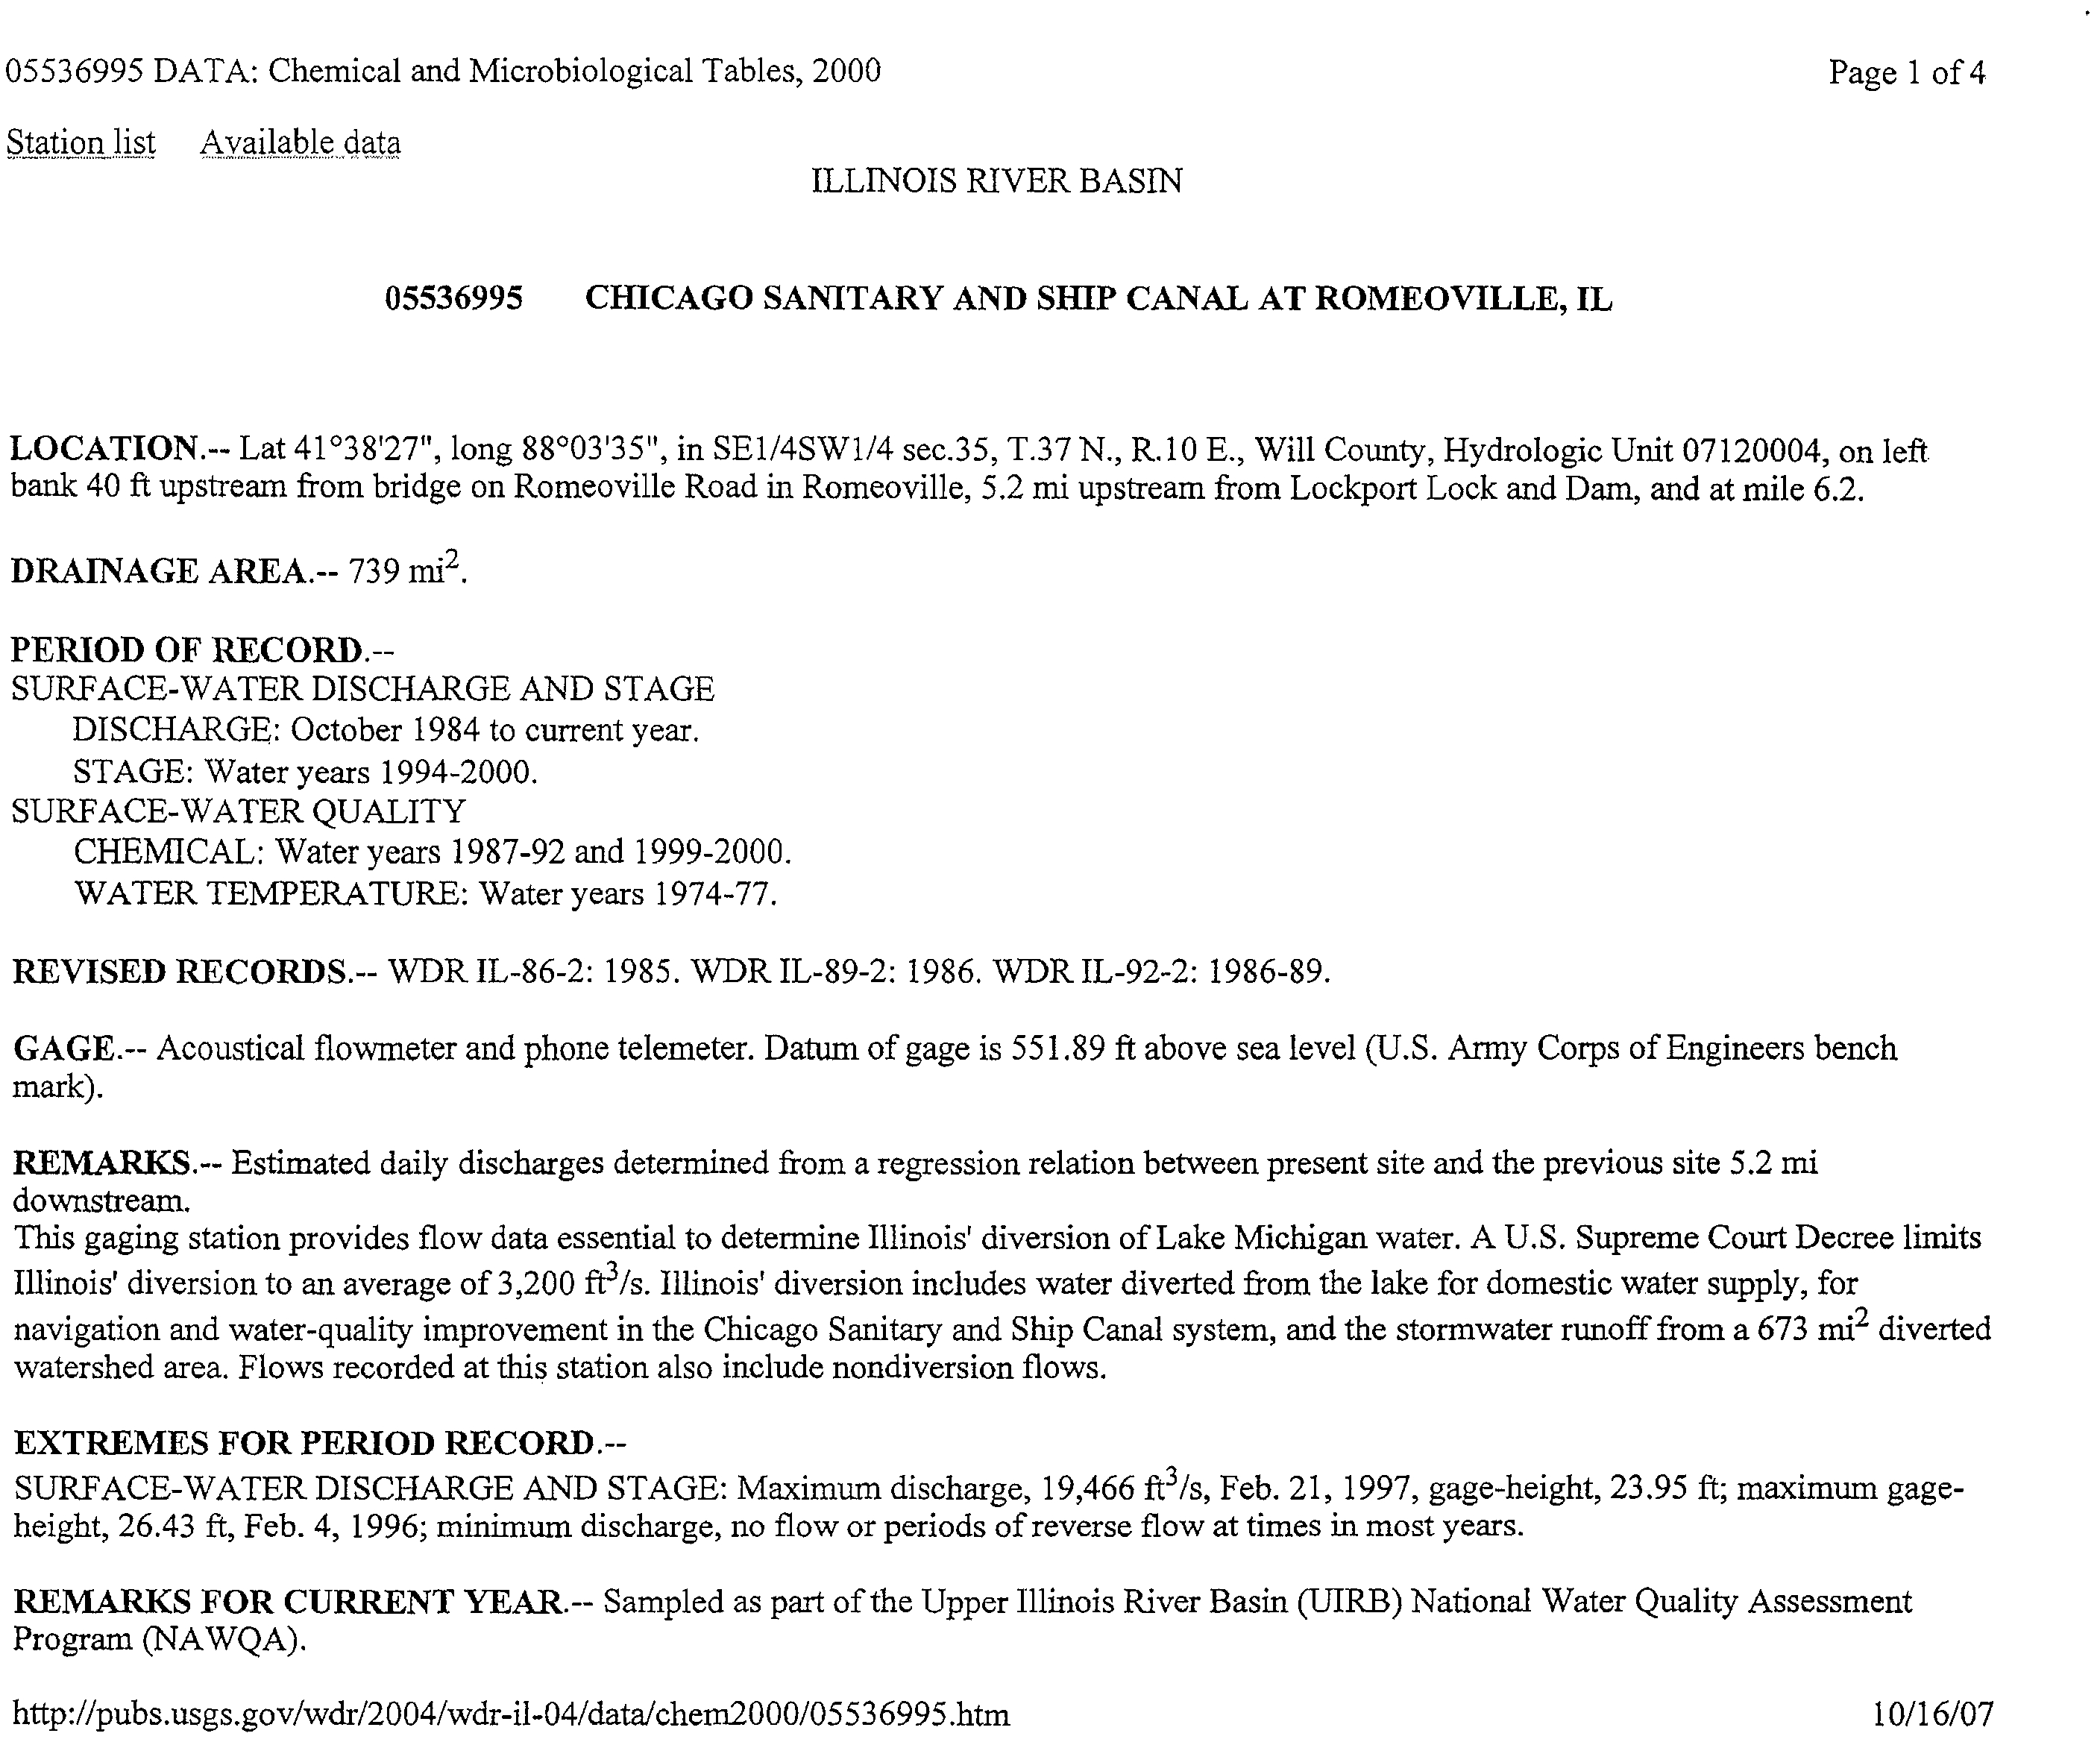
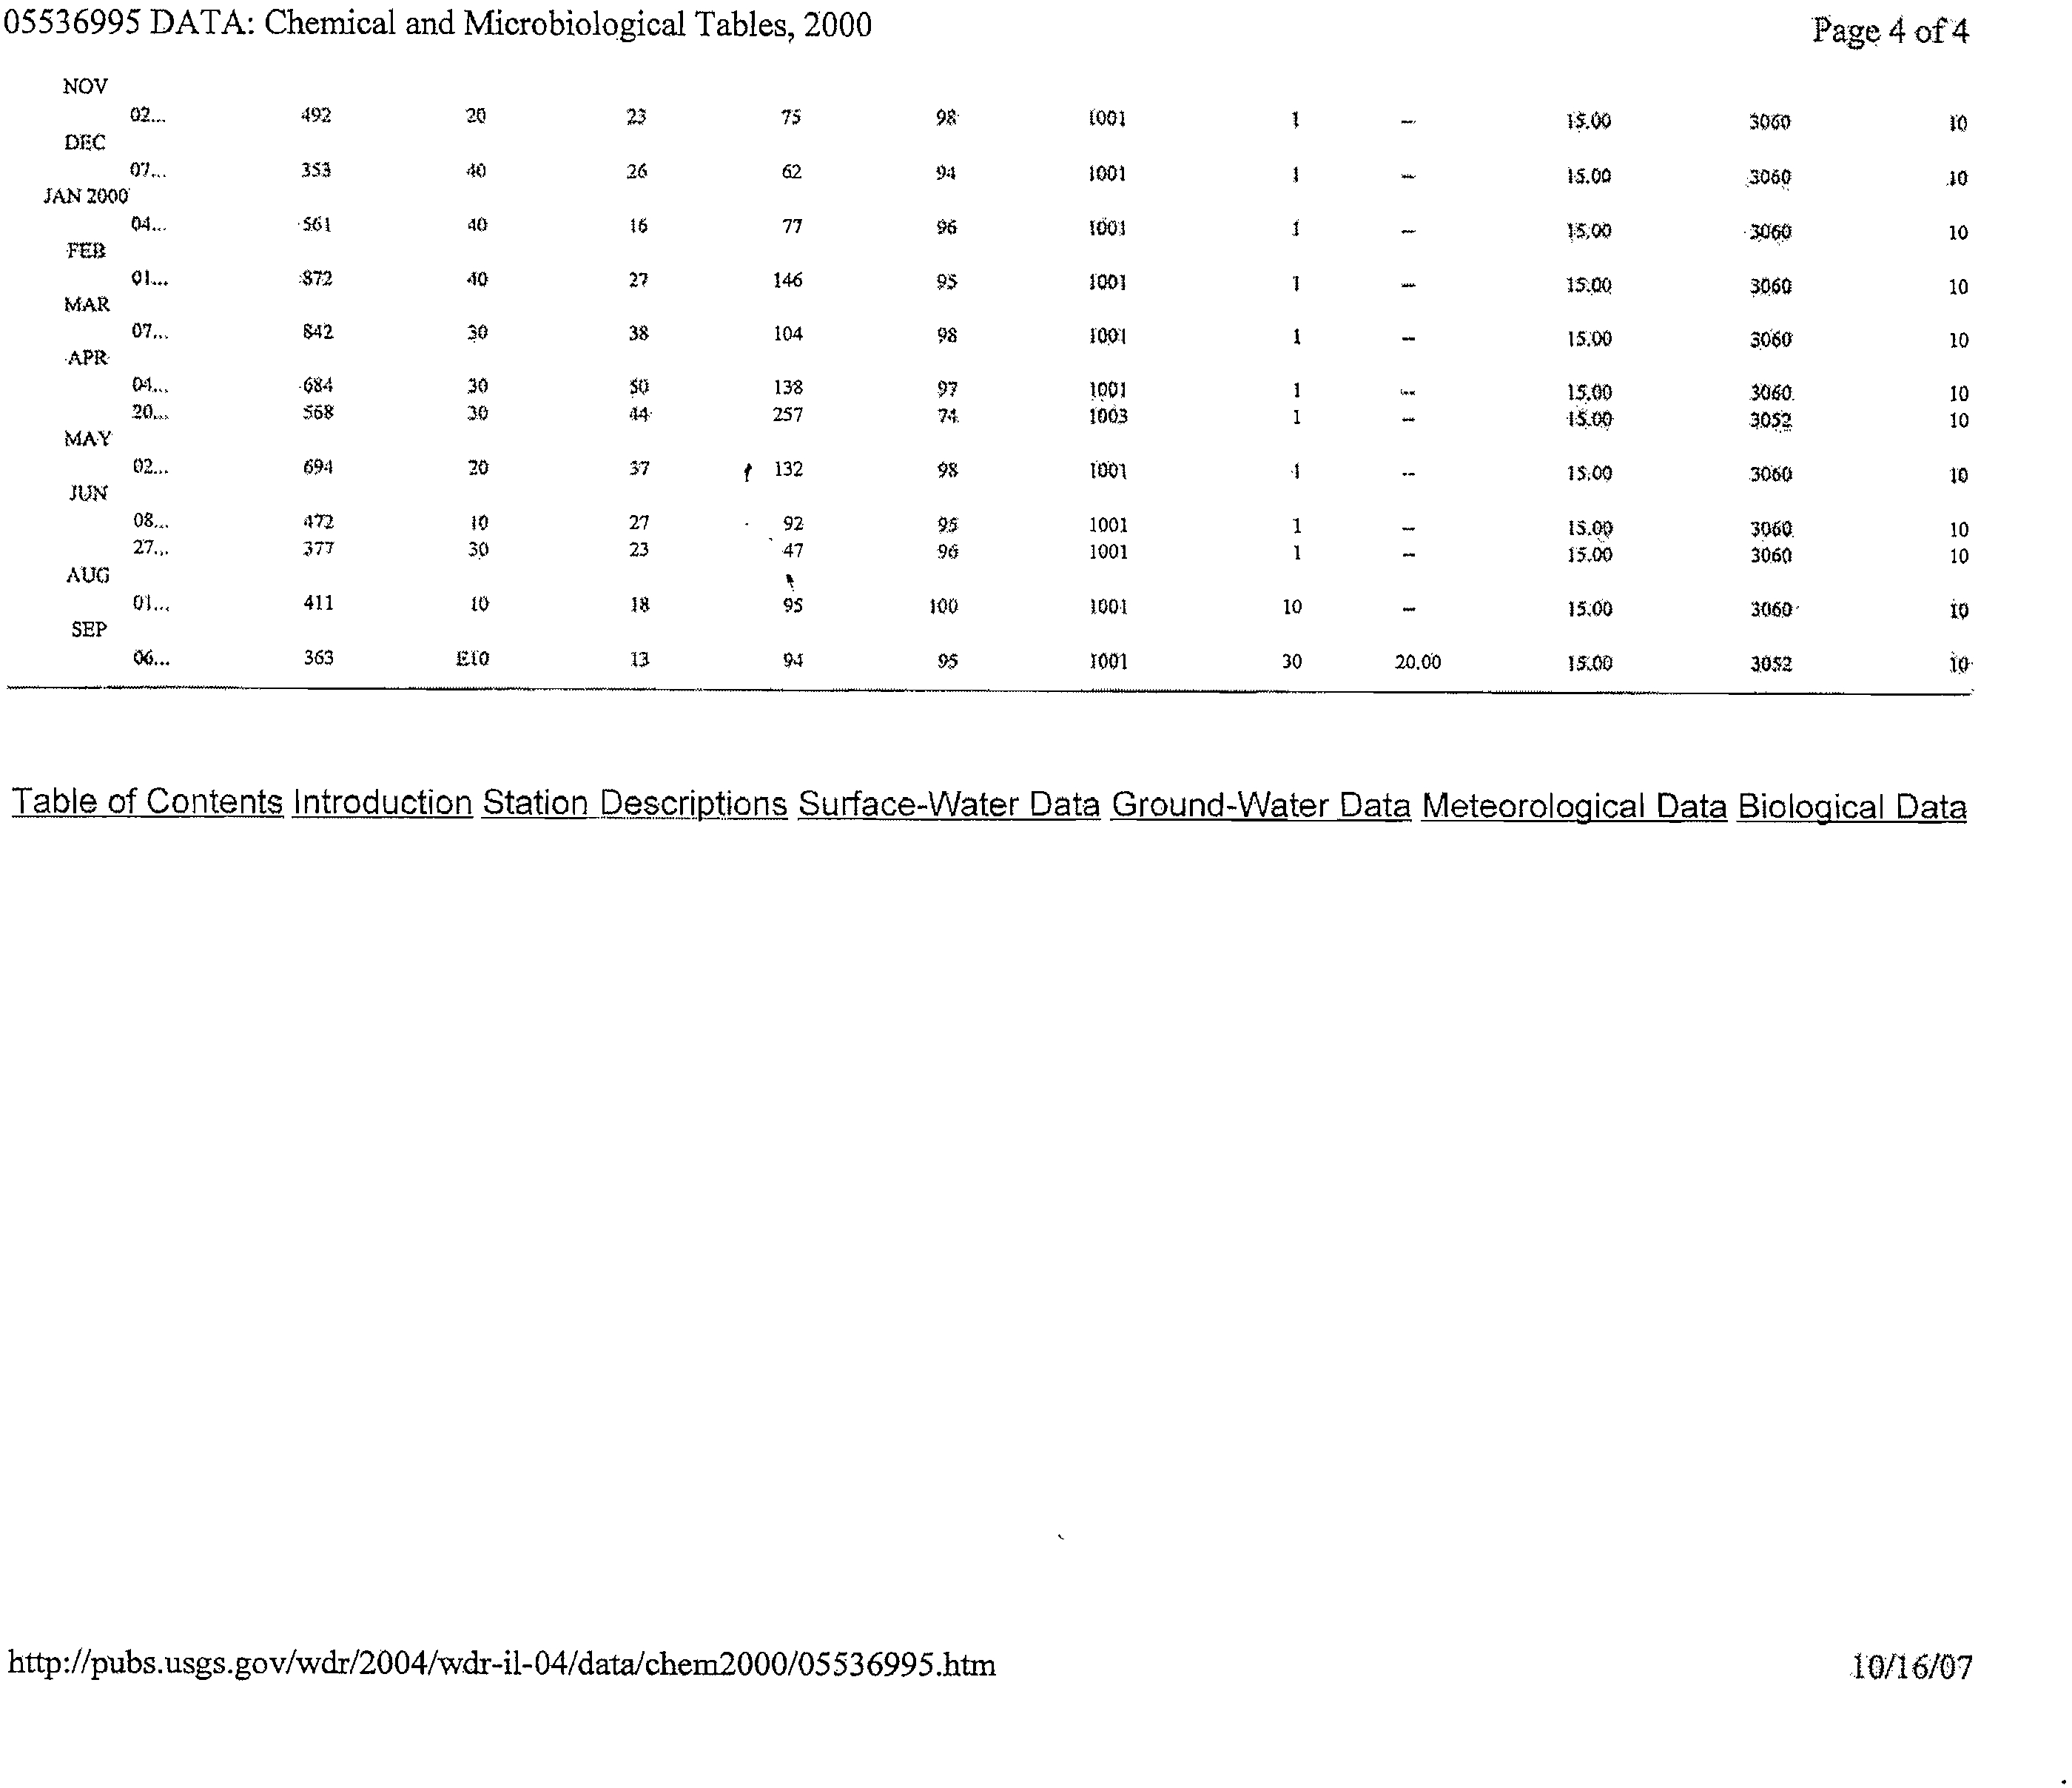
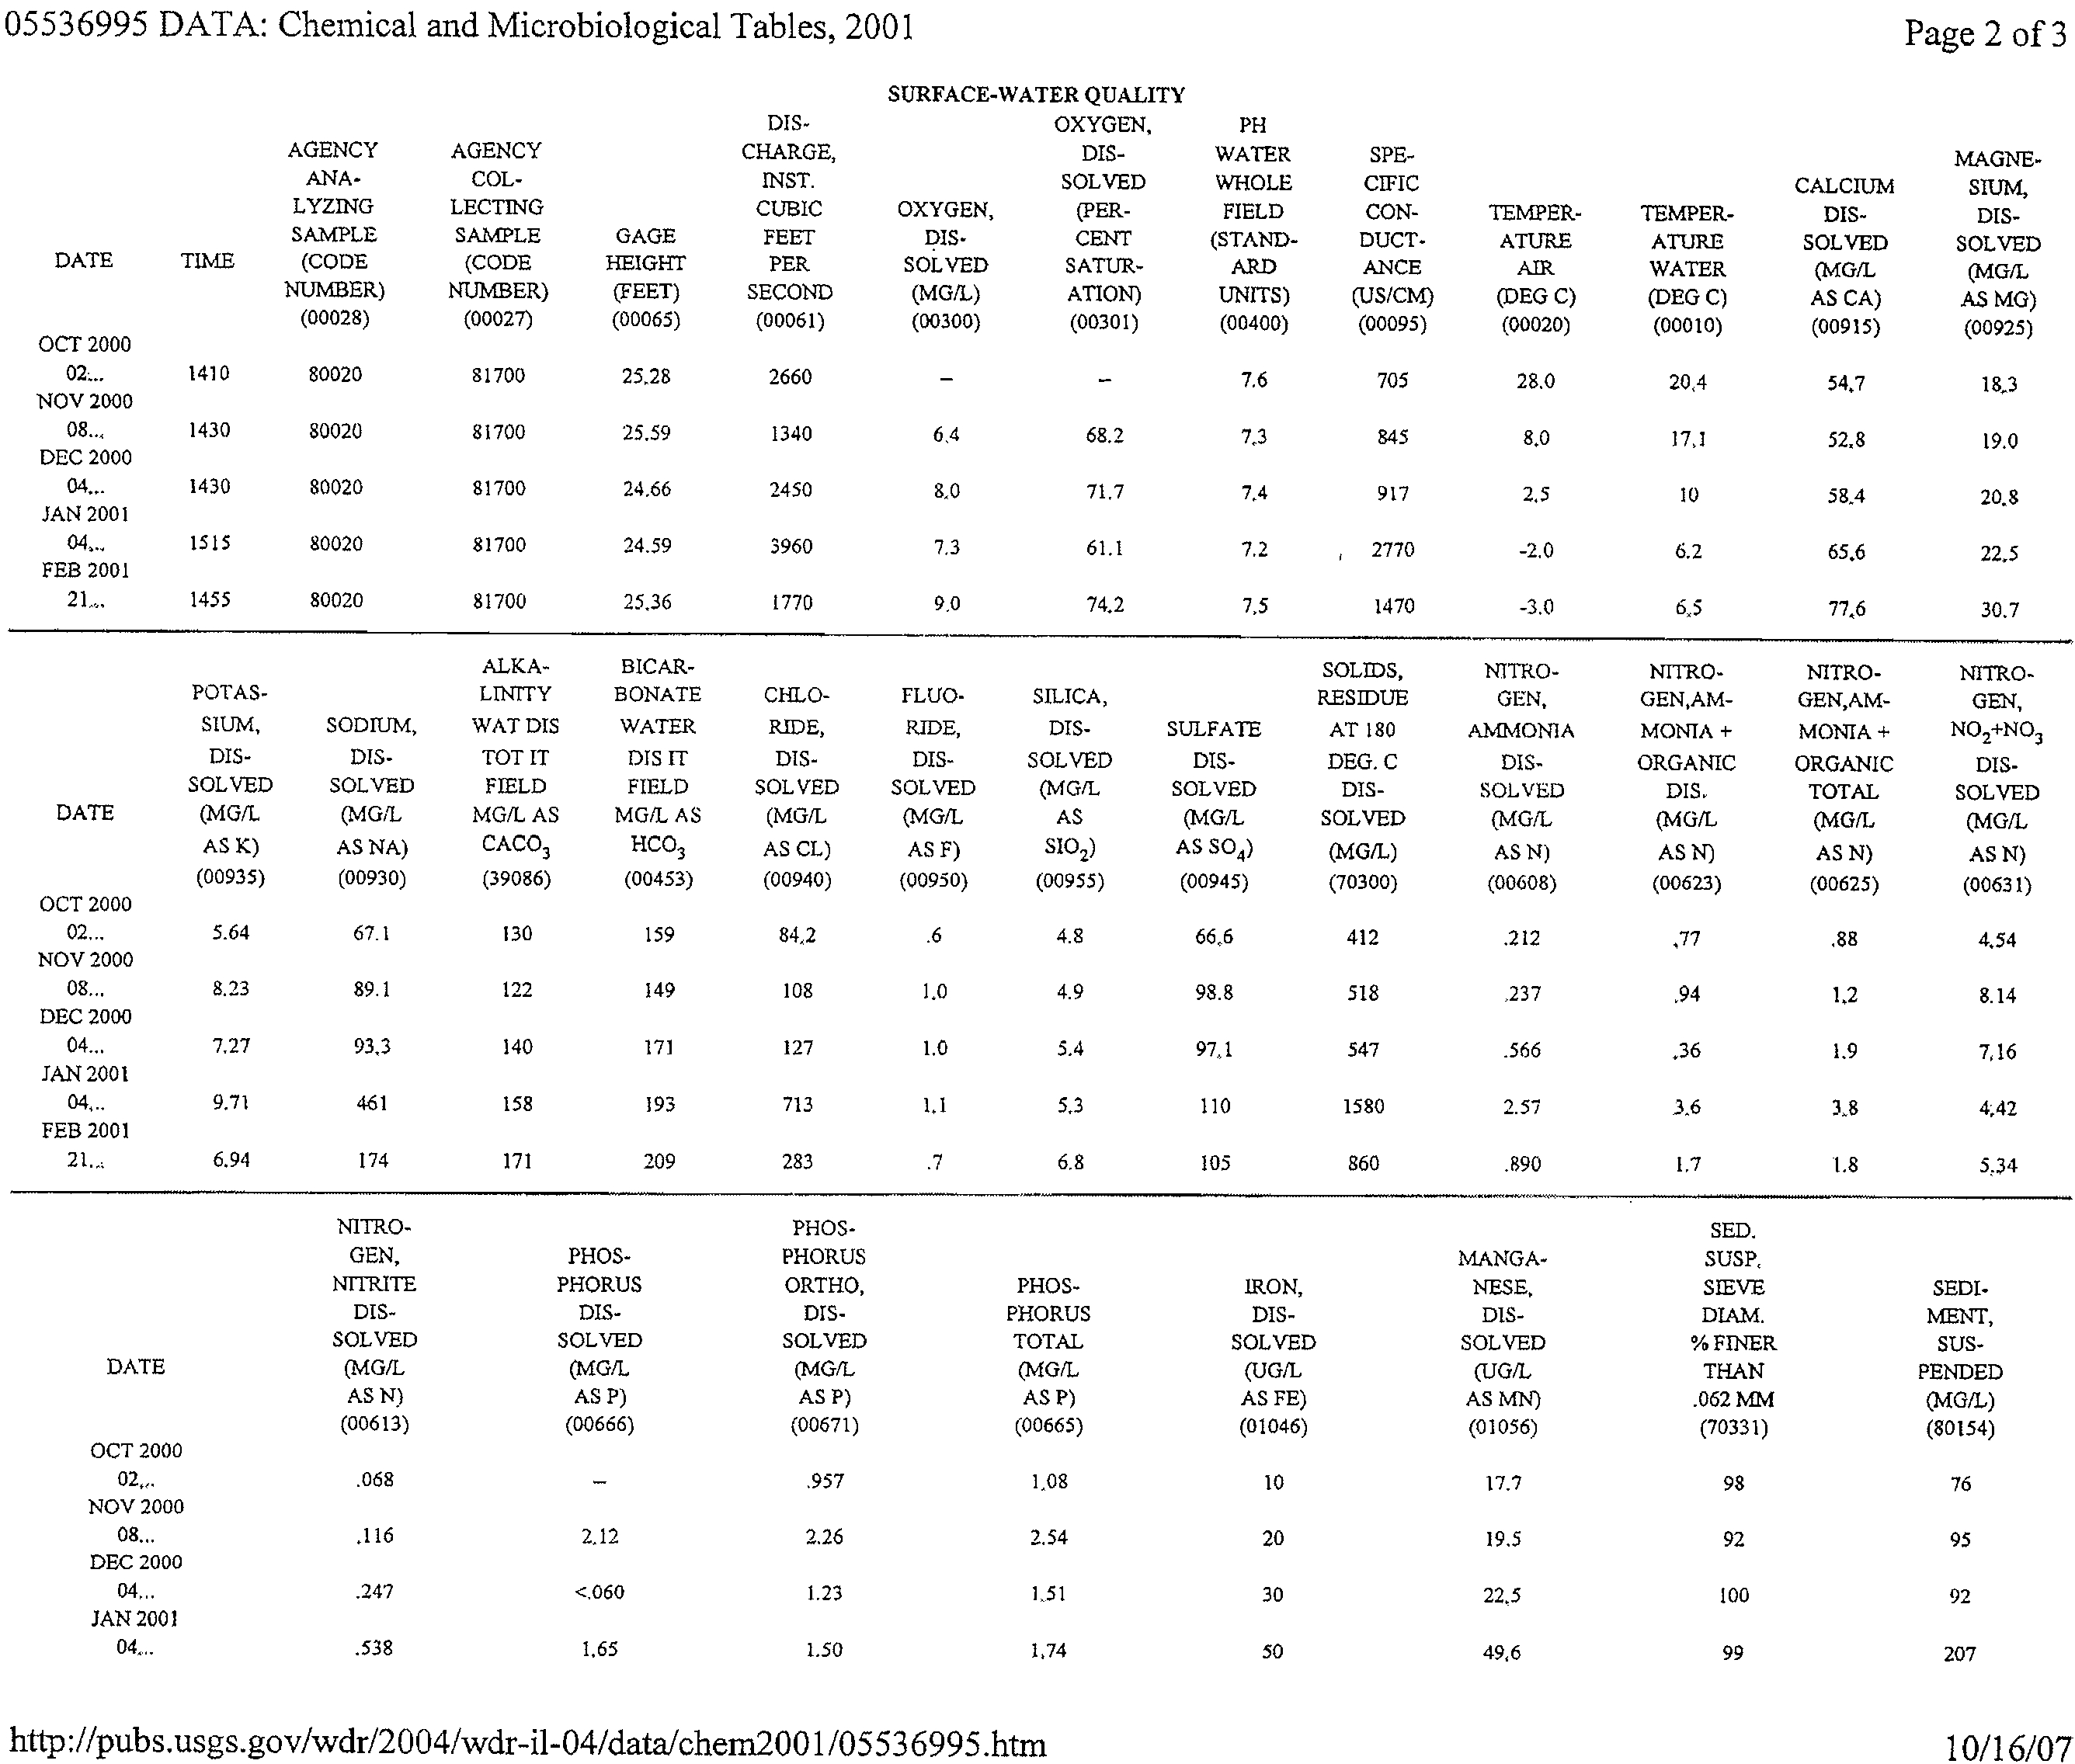
The USGS has also maintained a water quality station (No. 05536995) near Romeoville, 0.3 miles
downstream from Lemont Refinery's outfall. As this station is closer to Lemont Refinery, it would be
more responsive to changes in water quality associated with the effluent discharge. During the last rule
change for Lemont Refinery, water quality data were tabulated from 1987 through 1991. The data
indicated the un-ionized ammonia standard had not been achieved only one time (August 1987) during
that reporting period. The single exceedance was caused by a high pH (8.78) since the ammonia
concentration was only 1.1 mg/L. Un-ionized ammonia concentrations decreased through the end of the
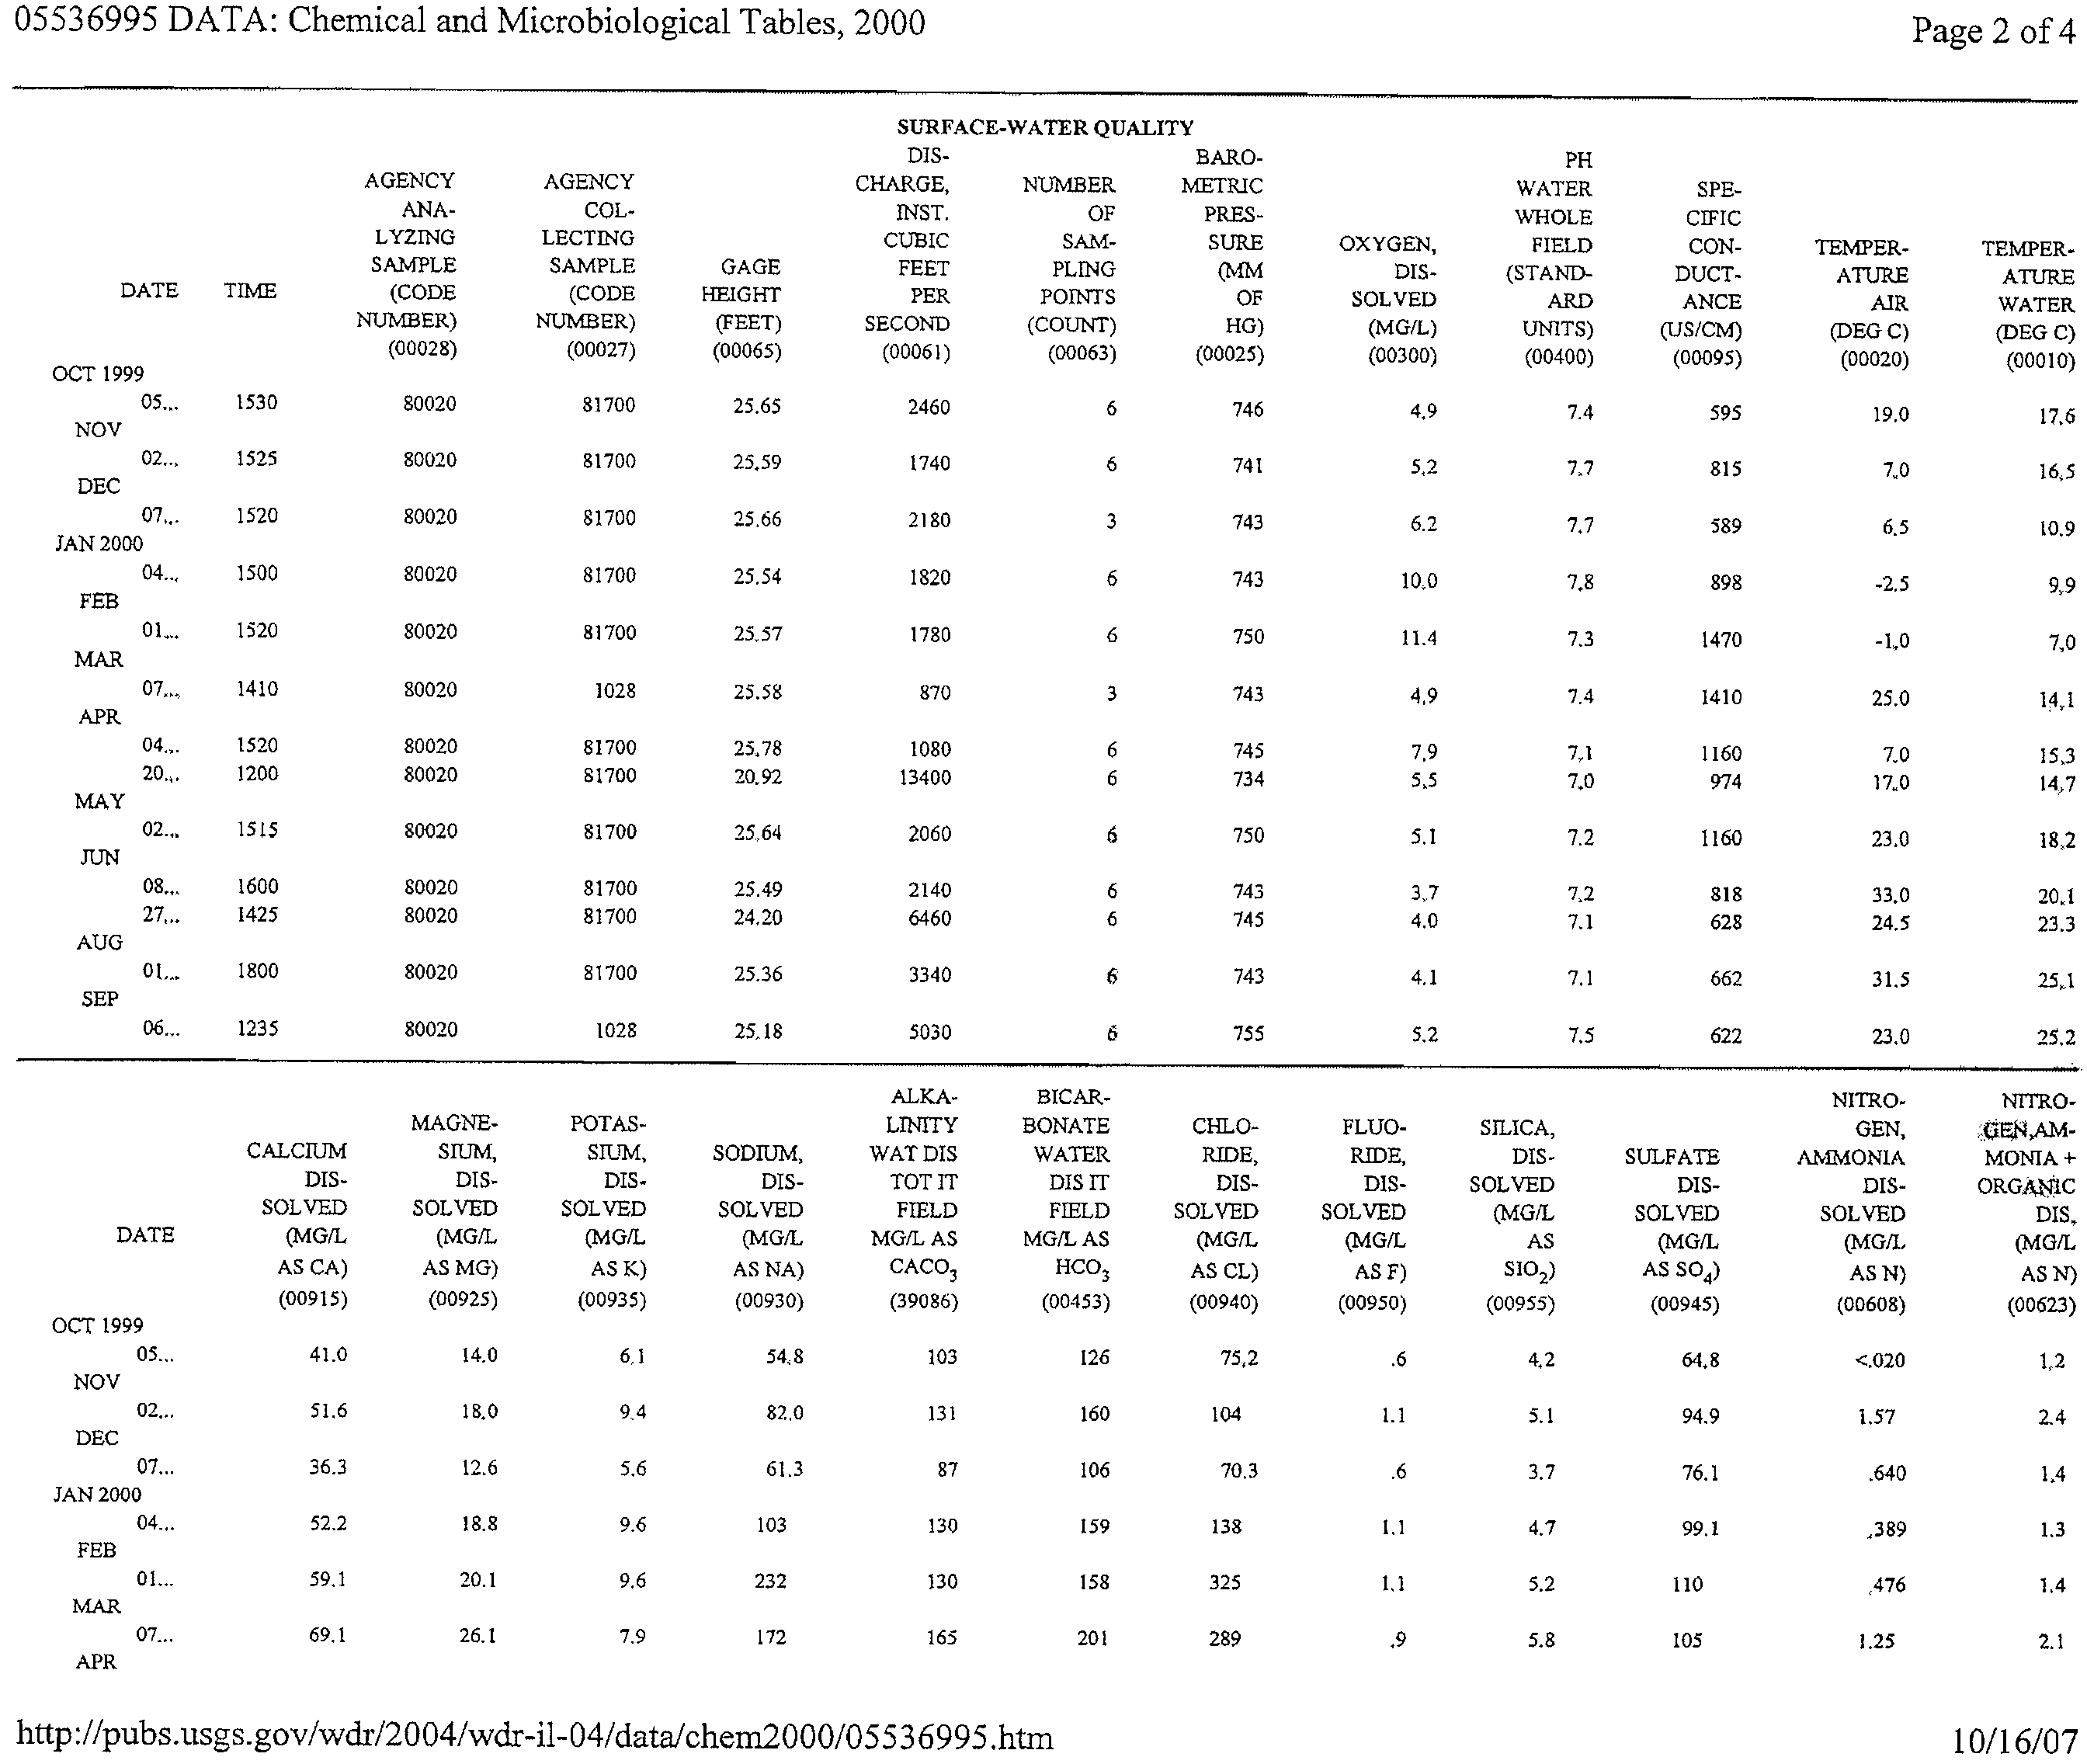
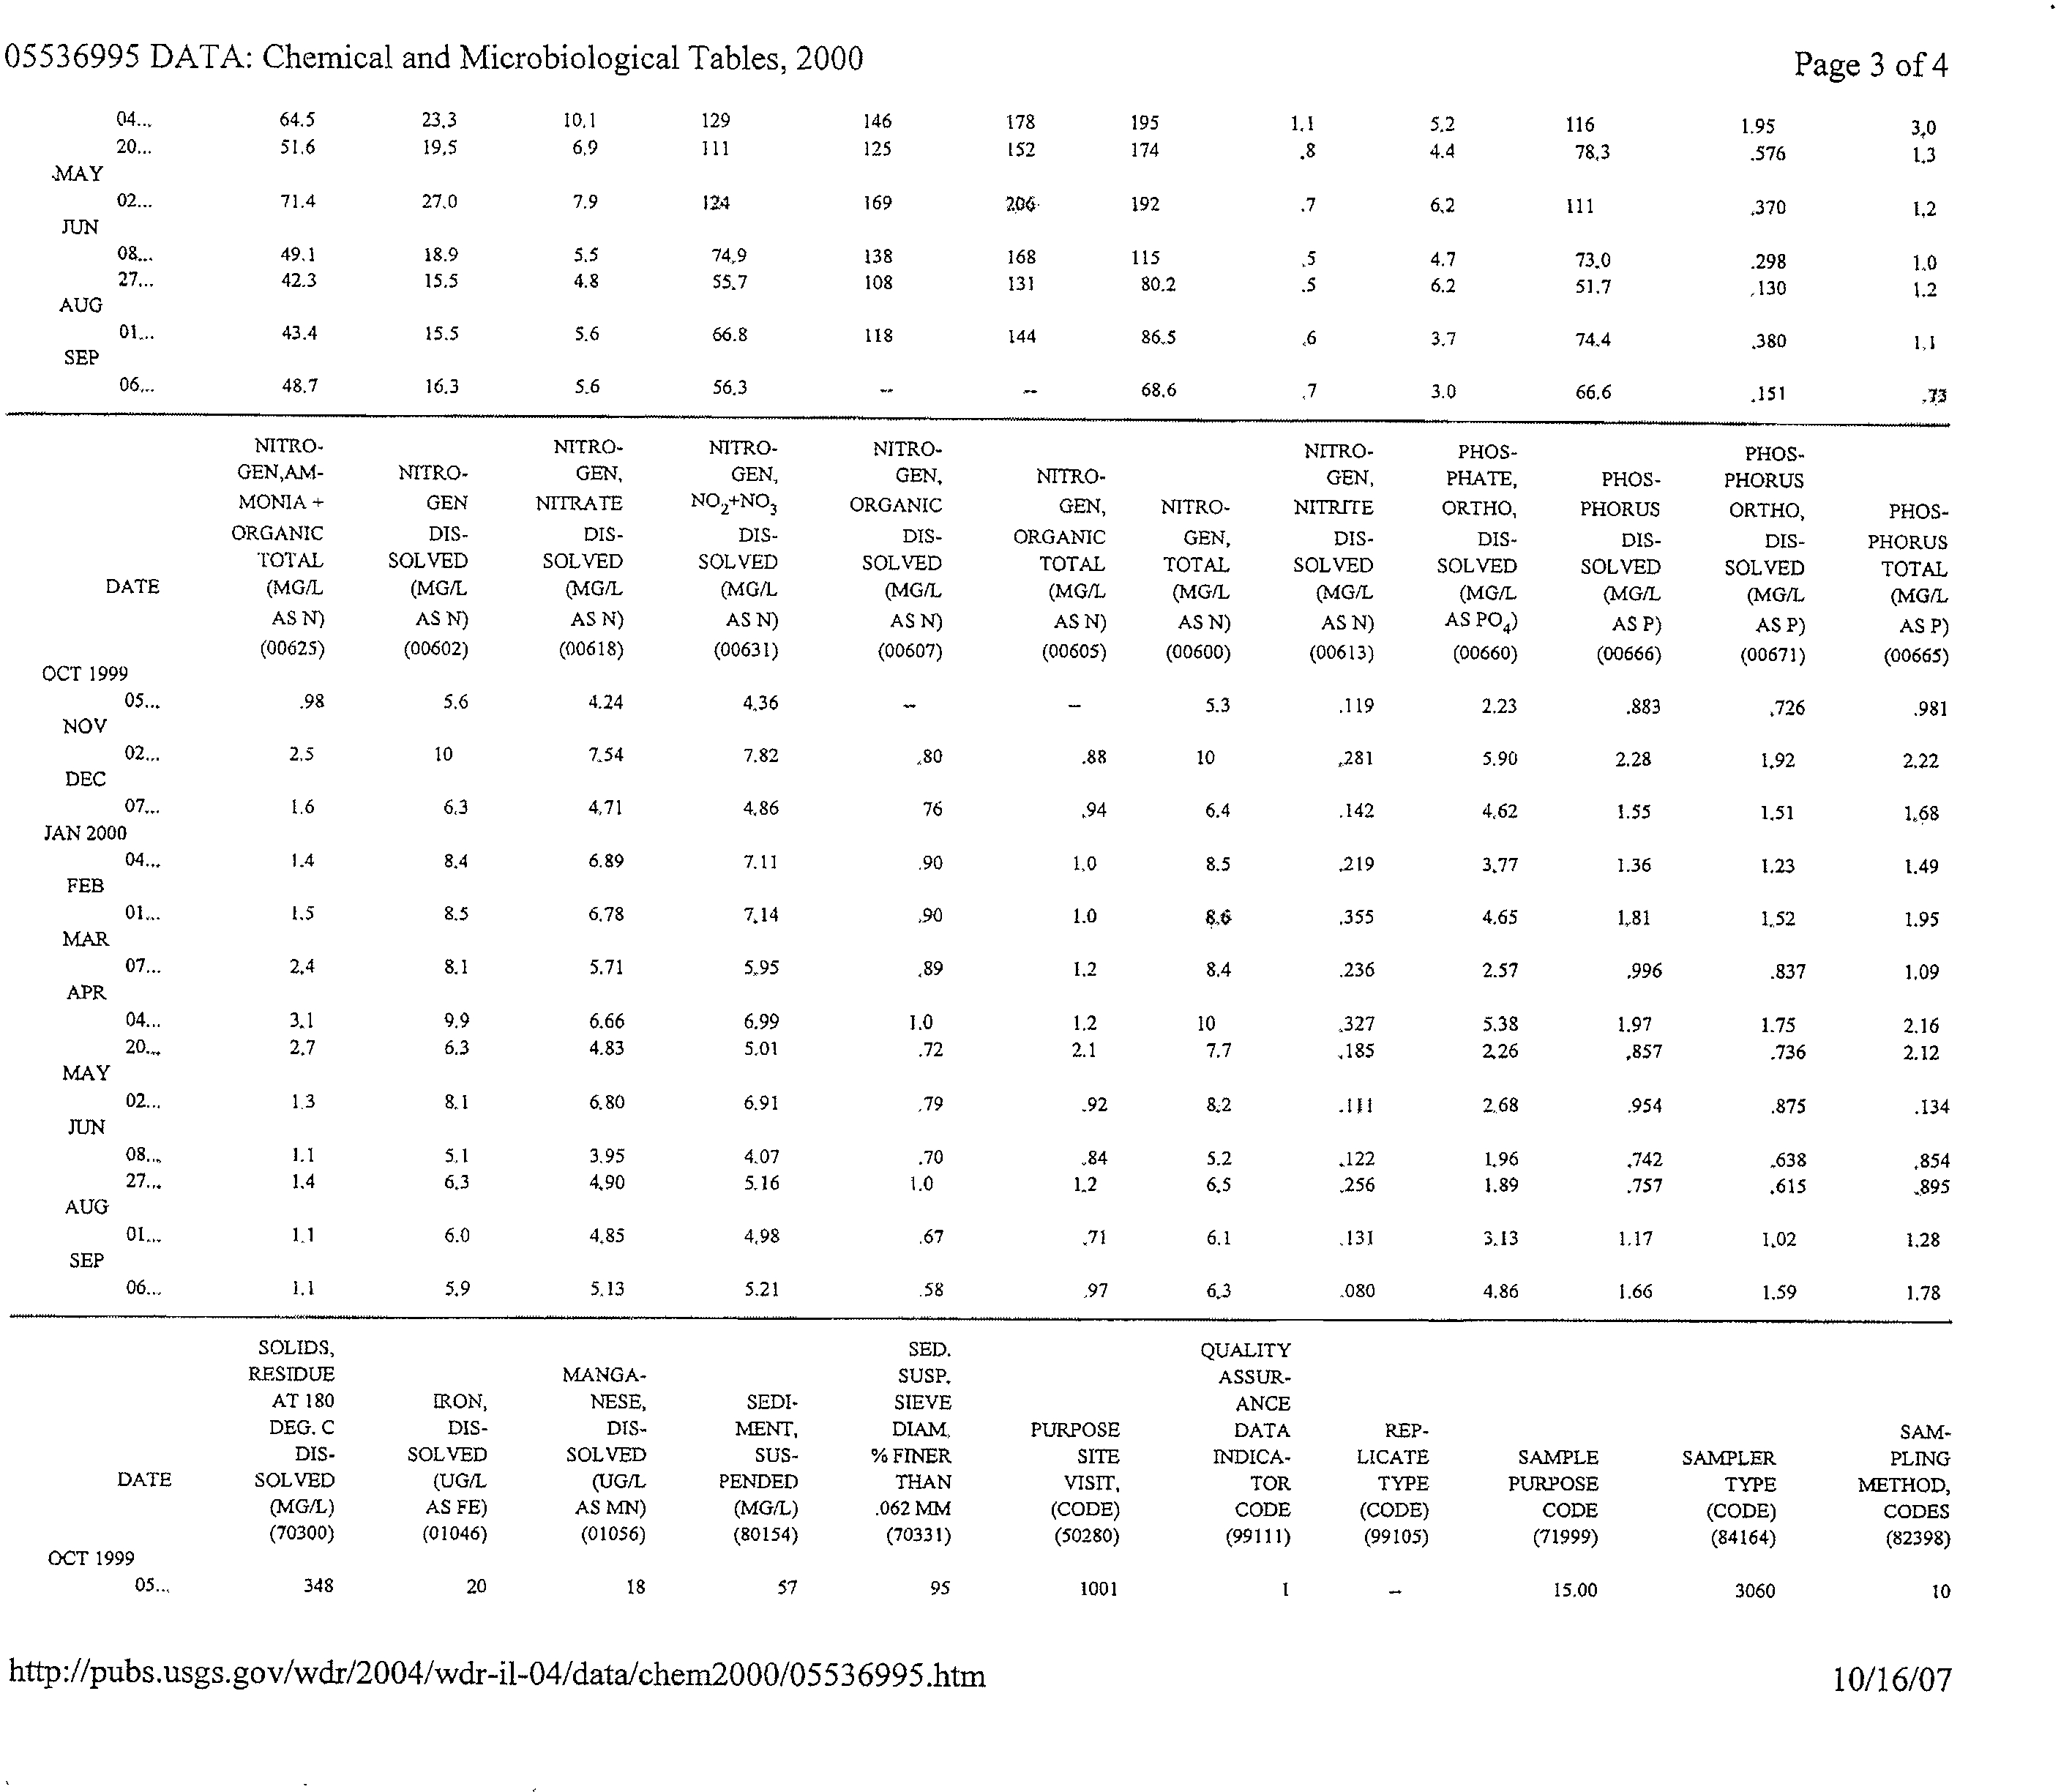
reporting period, consistently below 0.05 mg/L. More recent USGS ammonia water quality data at
Romeoville are included in Appendix C, for the 1999 to 2001 time period. Ammonia levels have
declined based upon a comparison of the 1994 to 1996 data to the 1999 to 2001 data.
D.O. data were available from March 1999 to February 2001 at station 05536995. (USGS data from
March 1999 to February 2001 are presented in Appendix C.) In 24 sampling events during this time
period, three events produced D.O. concentrations below 4.0 mg/L, with the minimum reported as 3.2
mg/L. These three samples were in July 1999 (two samples from this month) and June 2000. Other
summer D.O. concentrations were above the existing 4.0 mg/L D.O. minimum water quality standard.
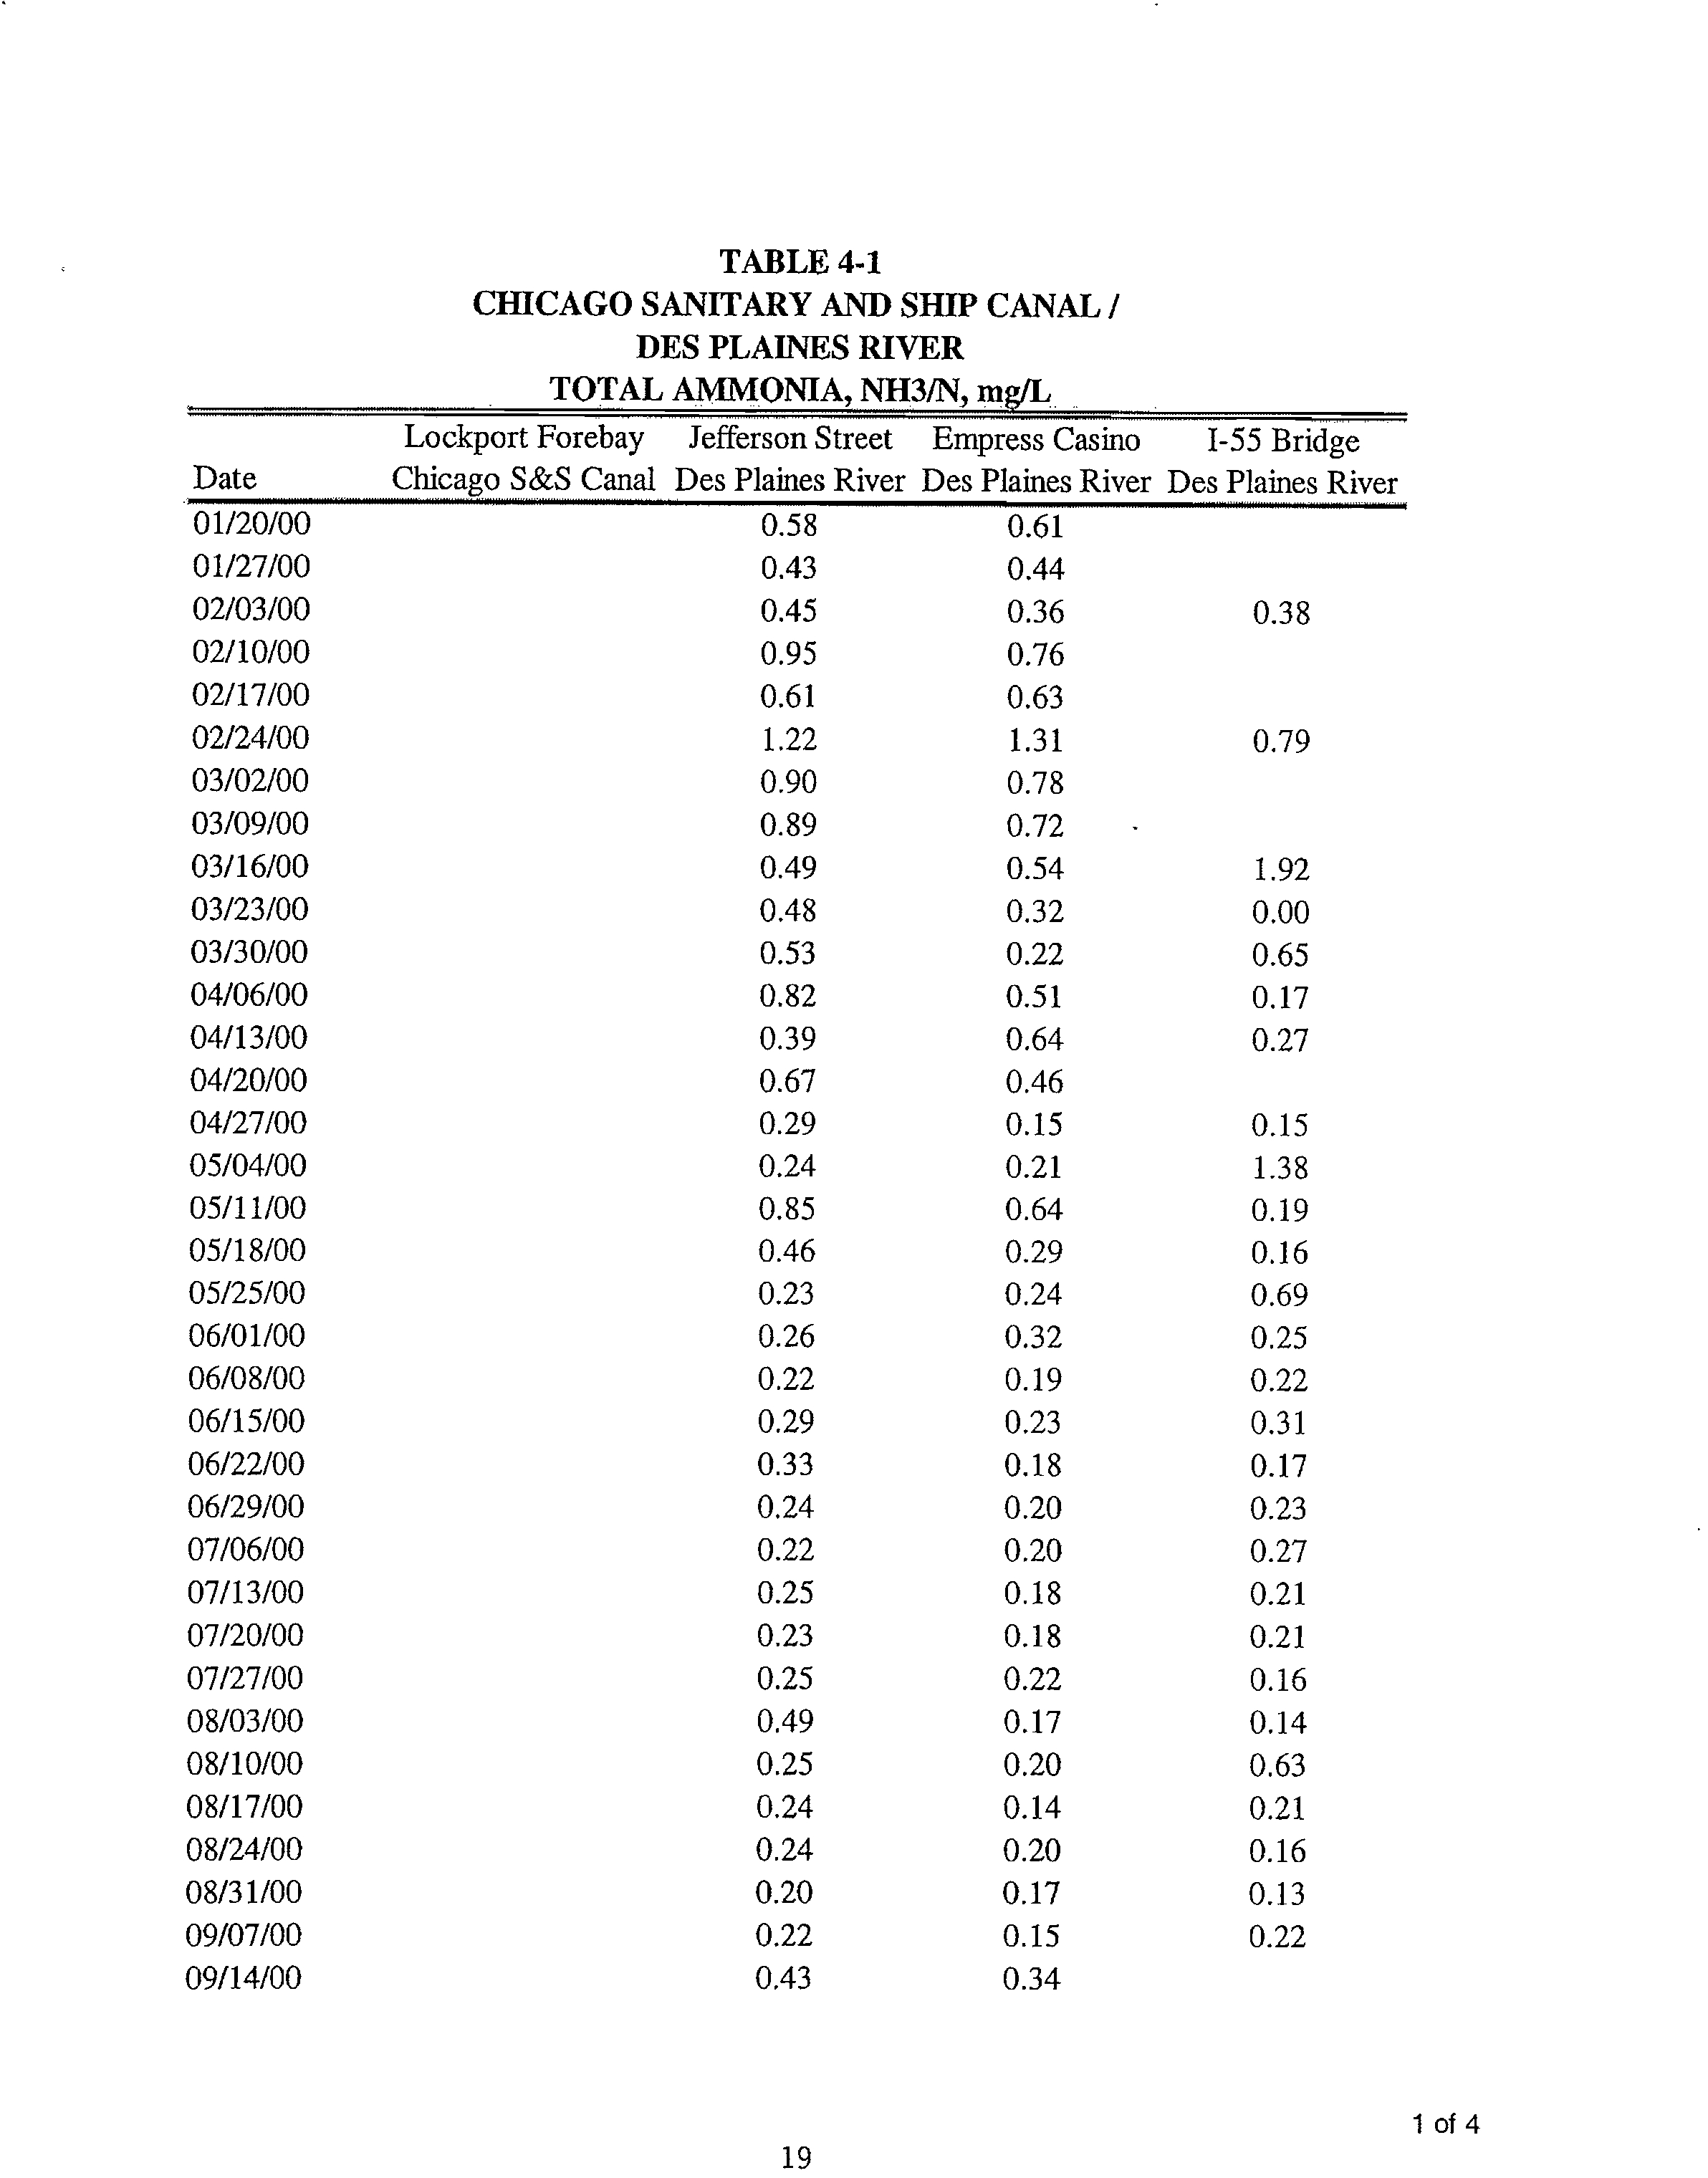
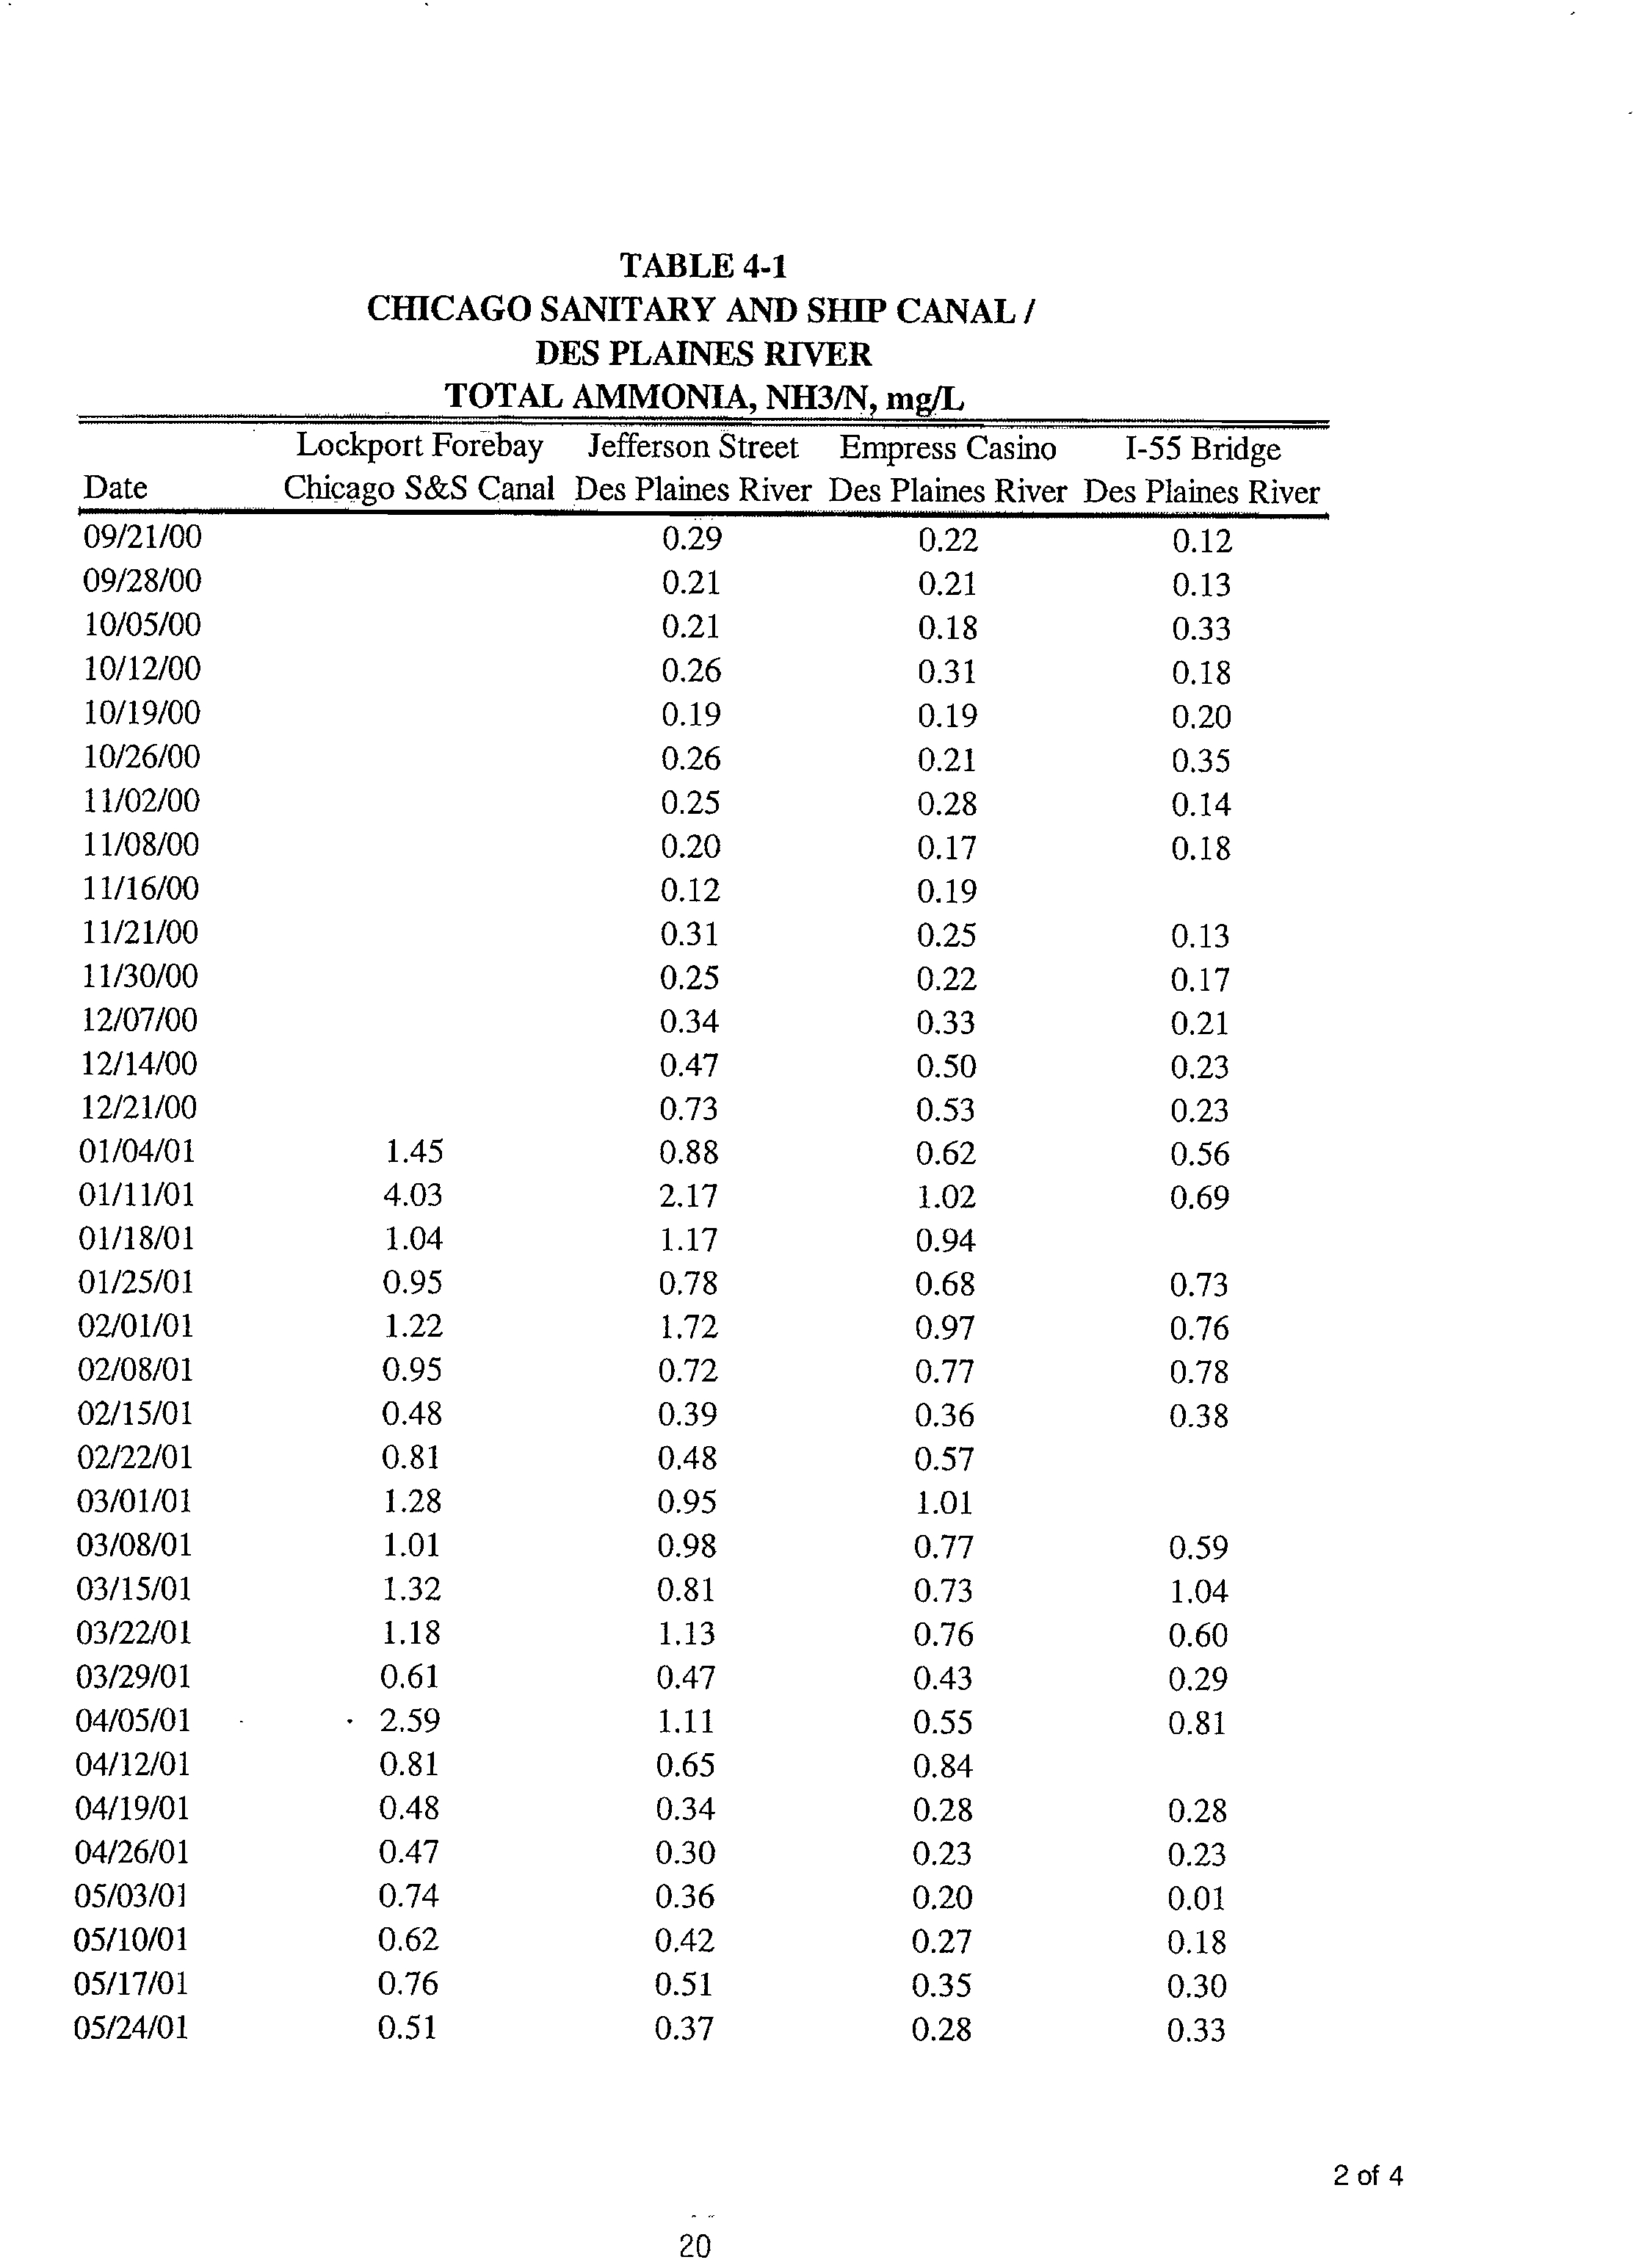
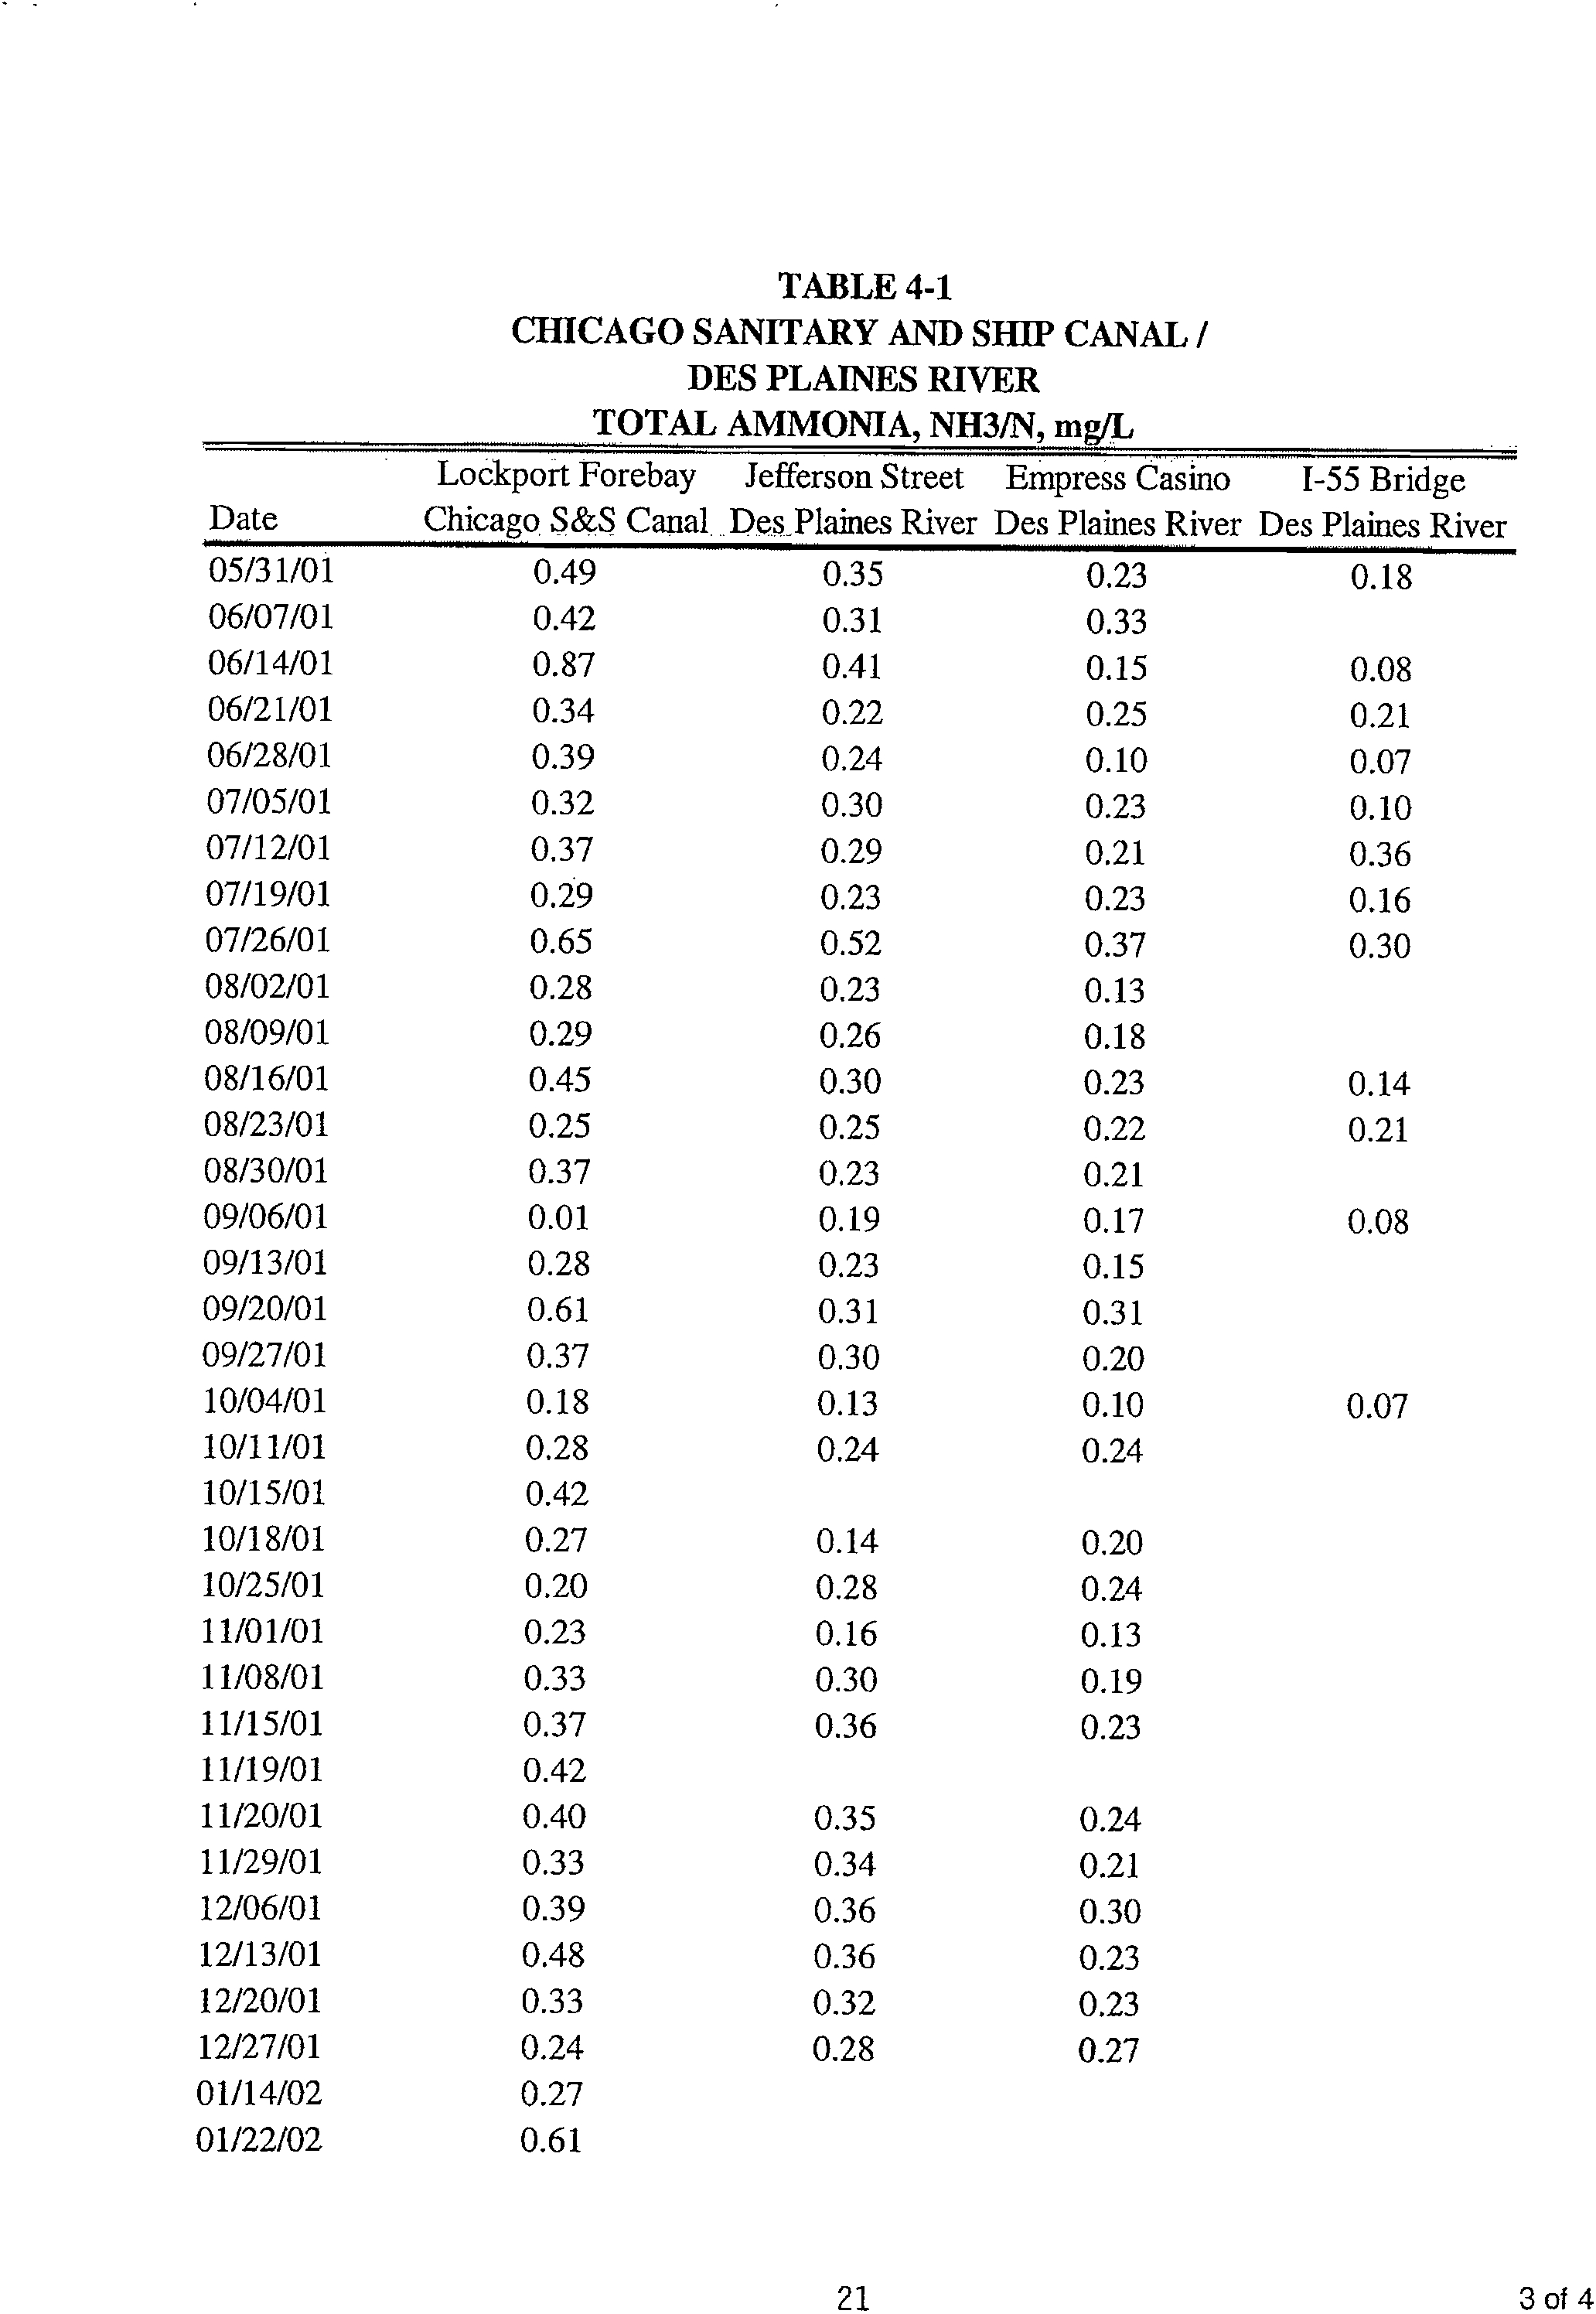
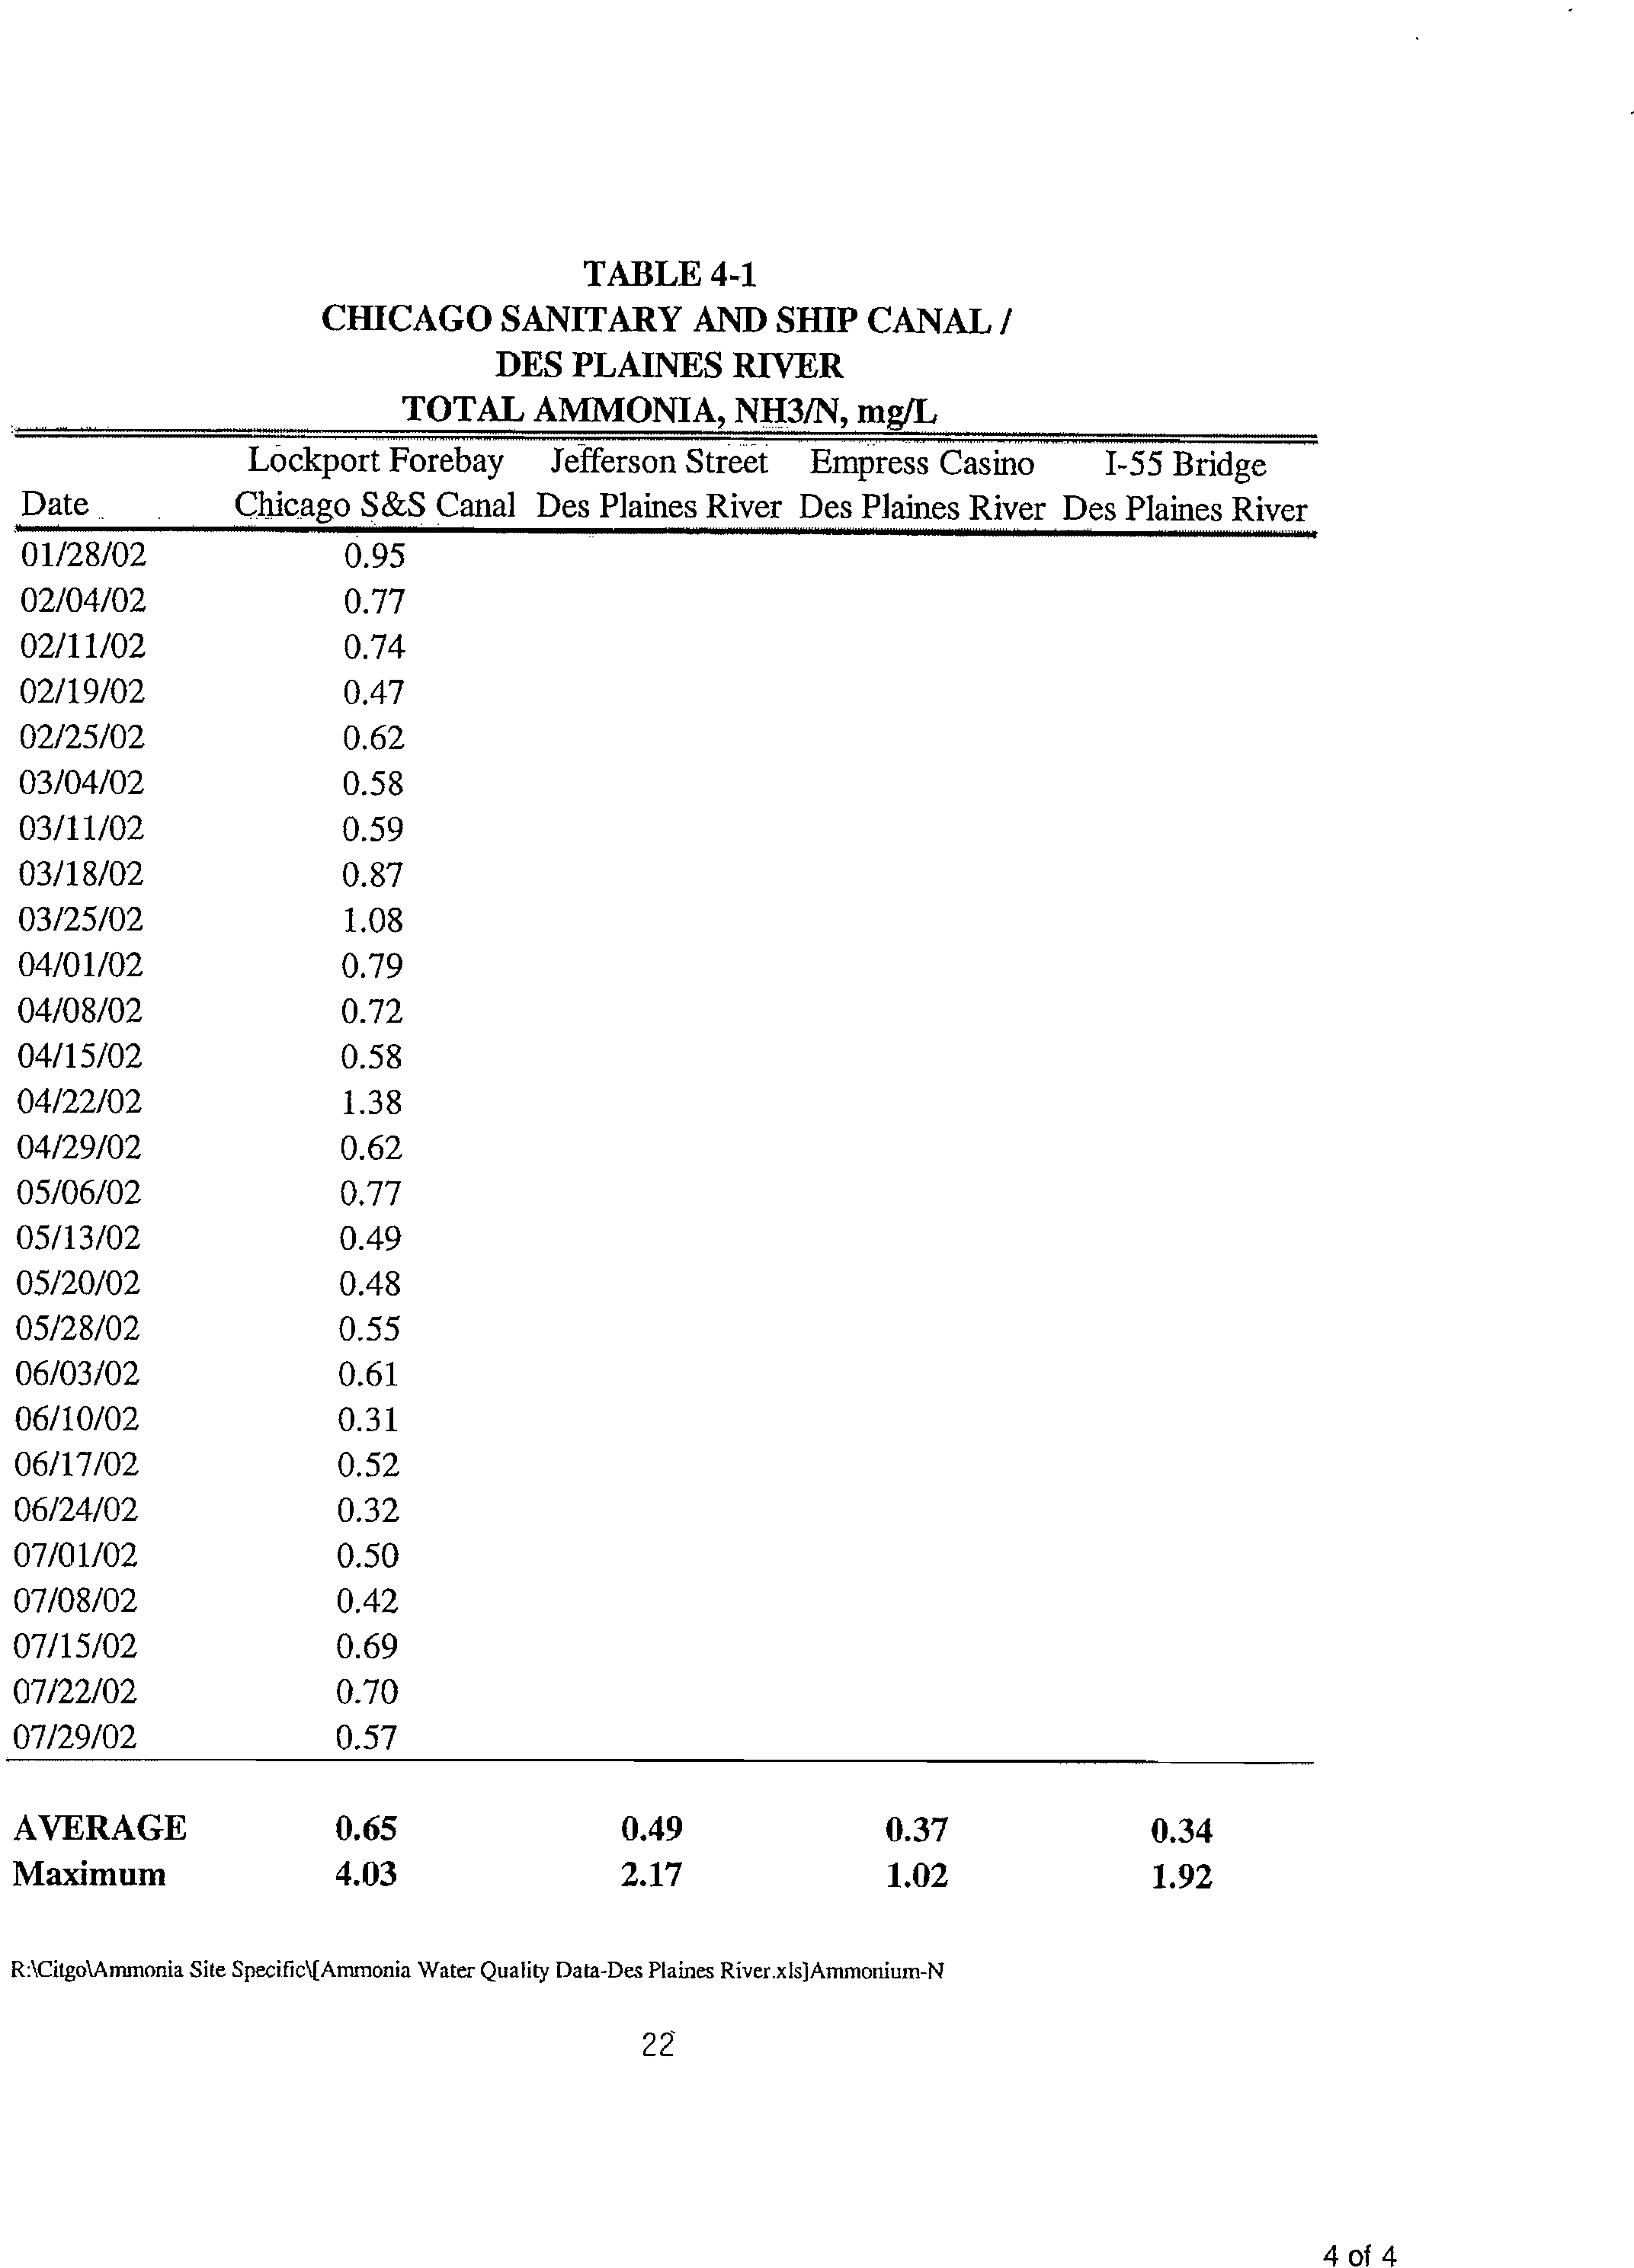
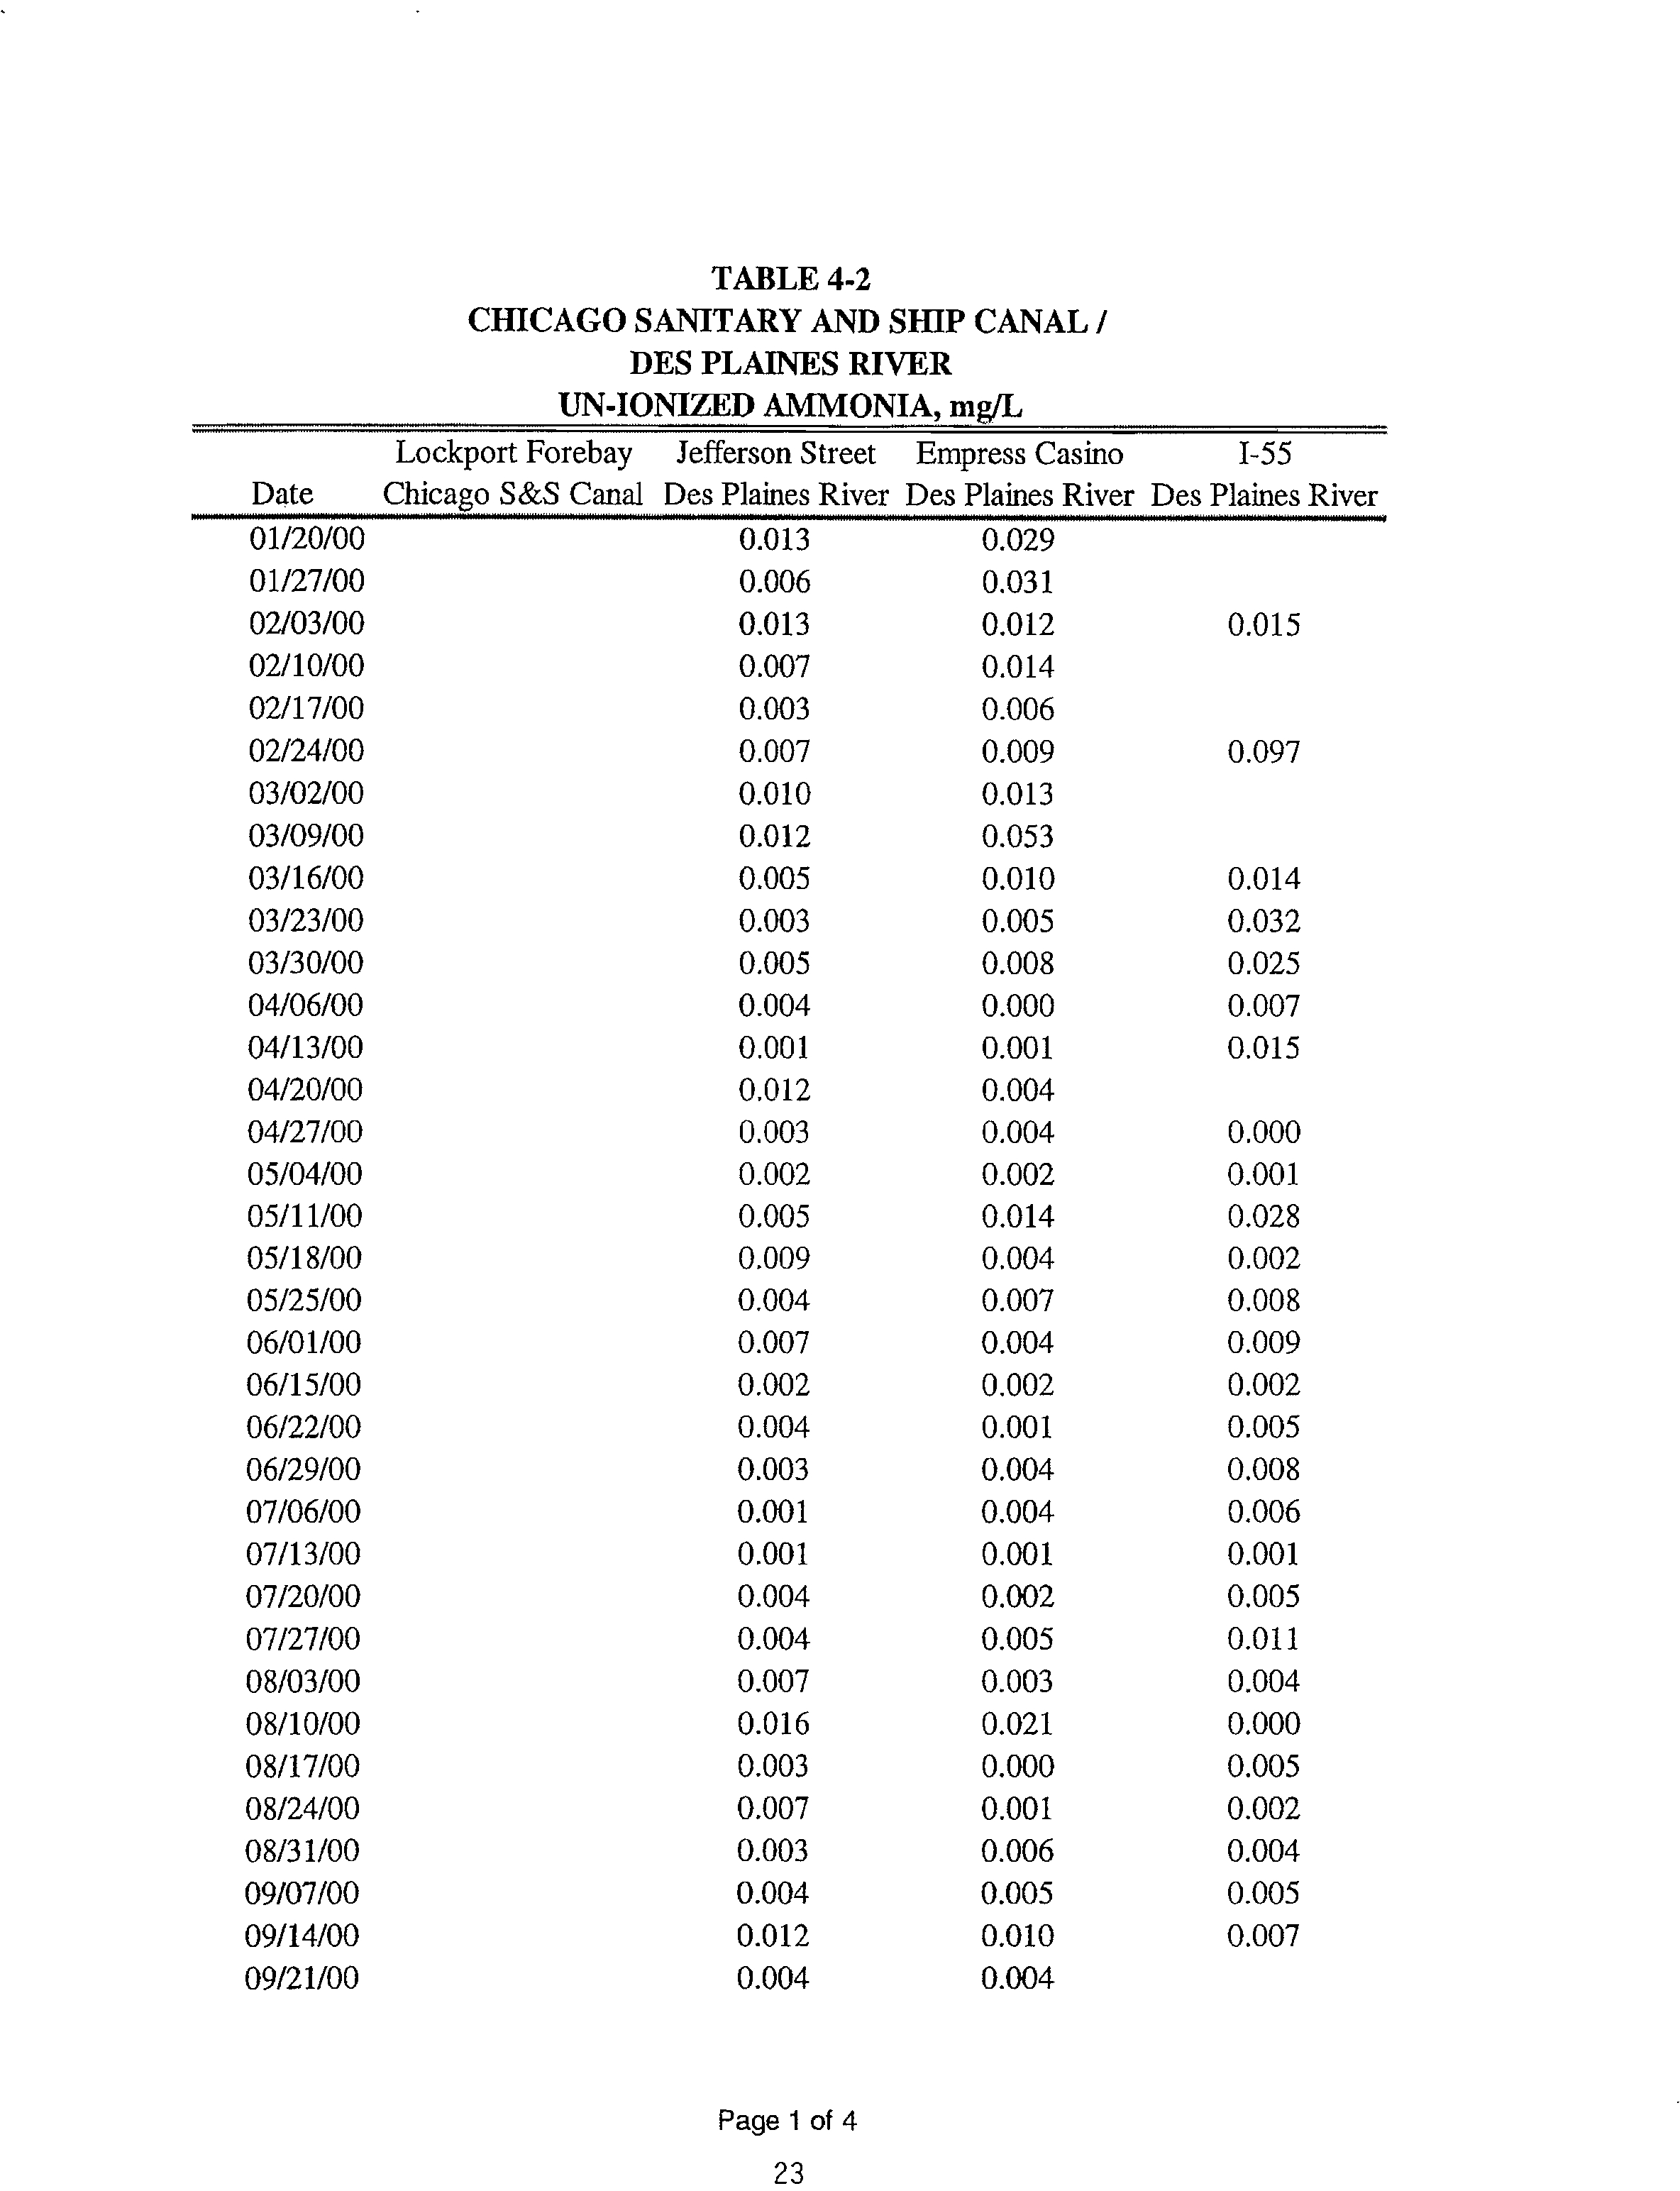
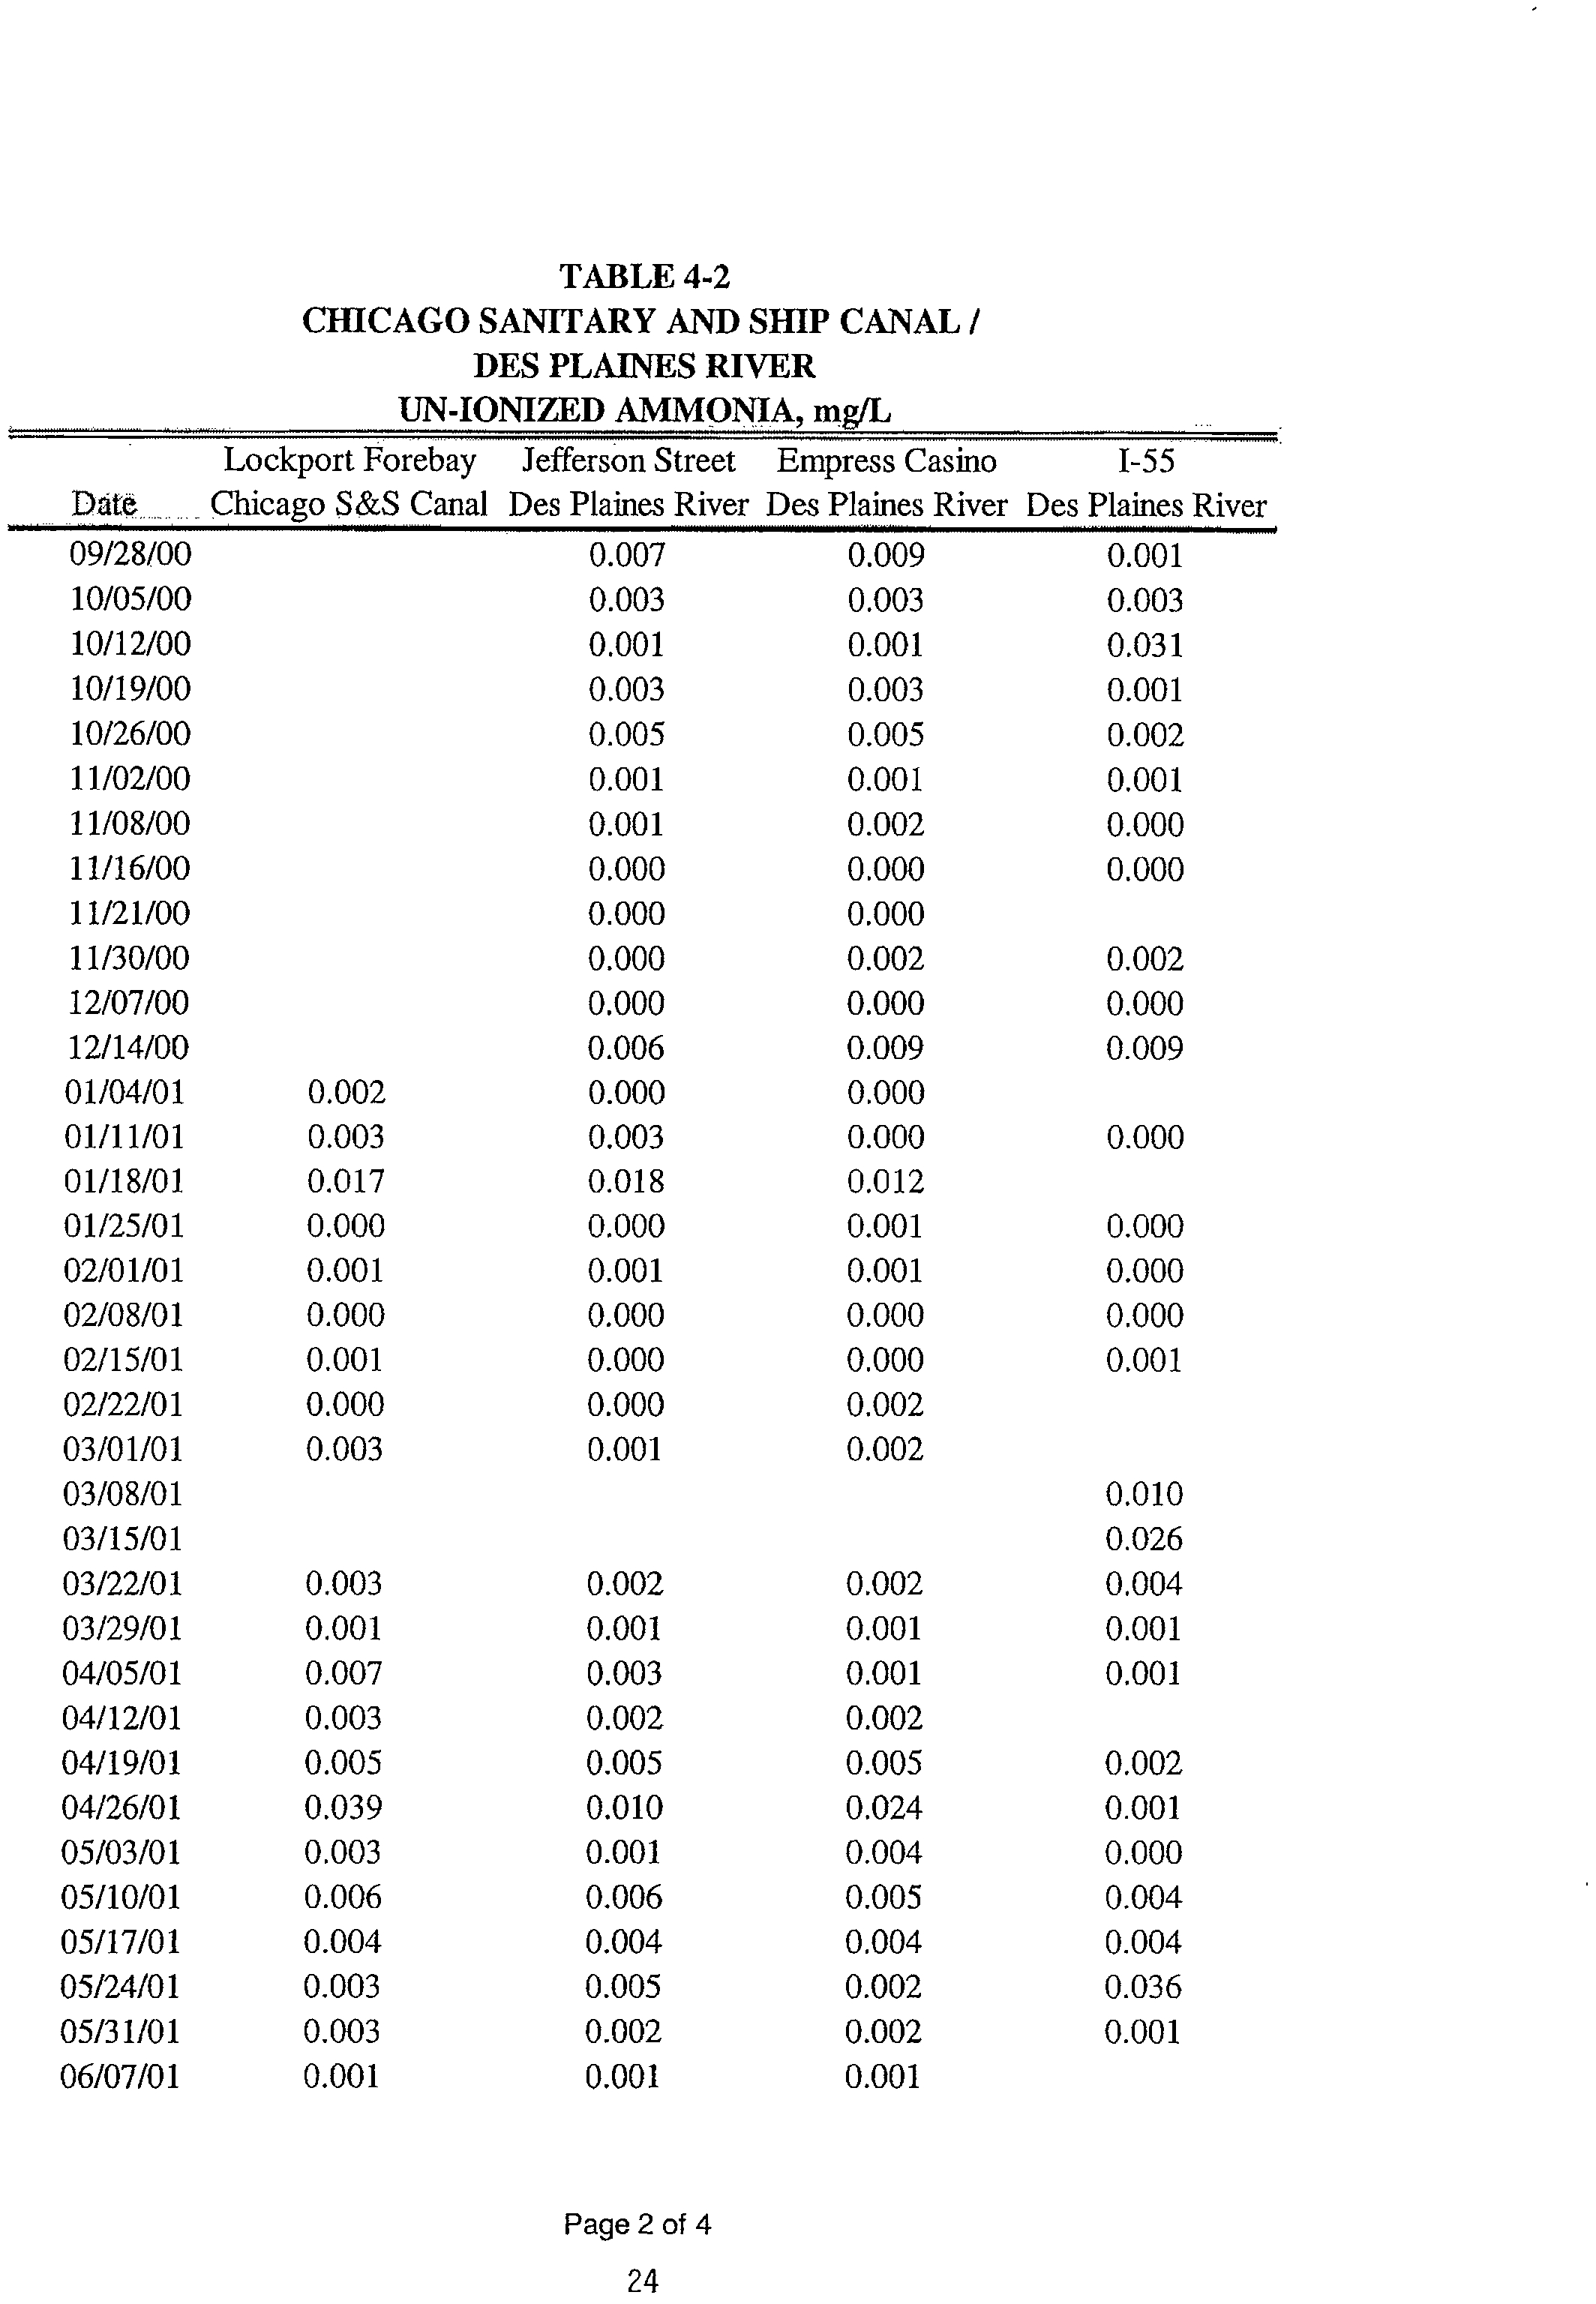
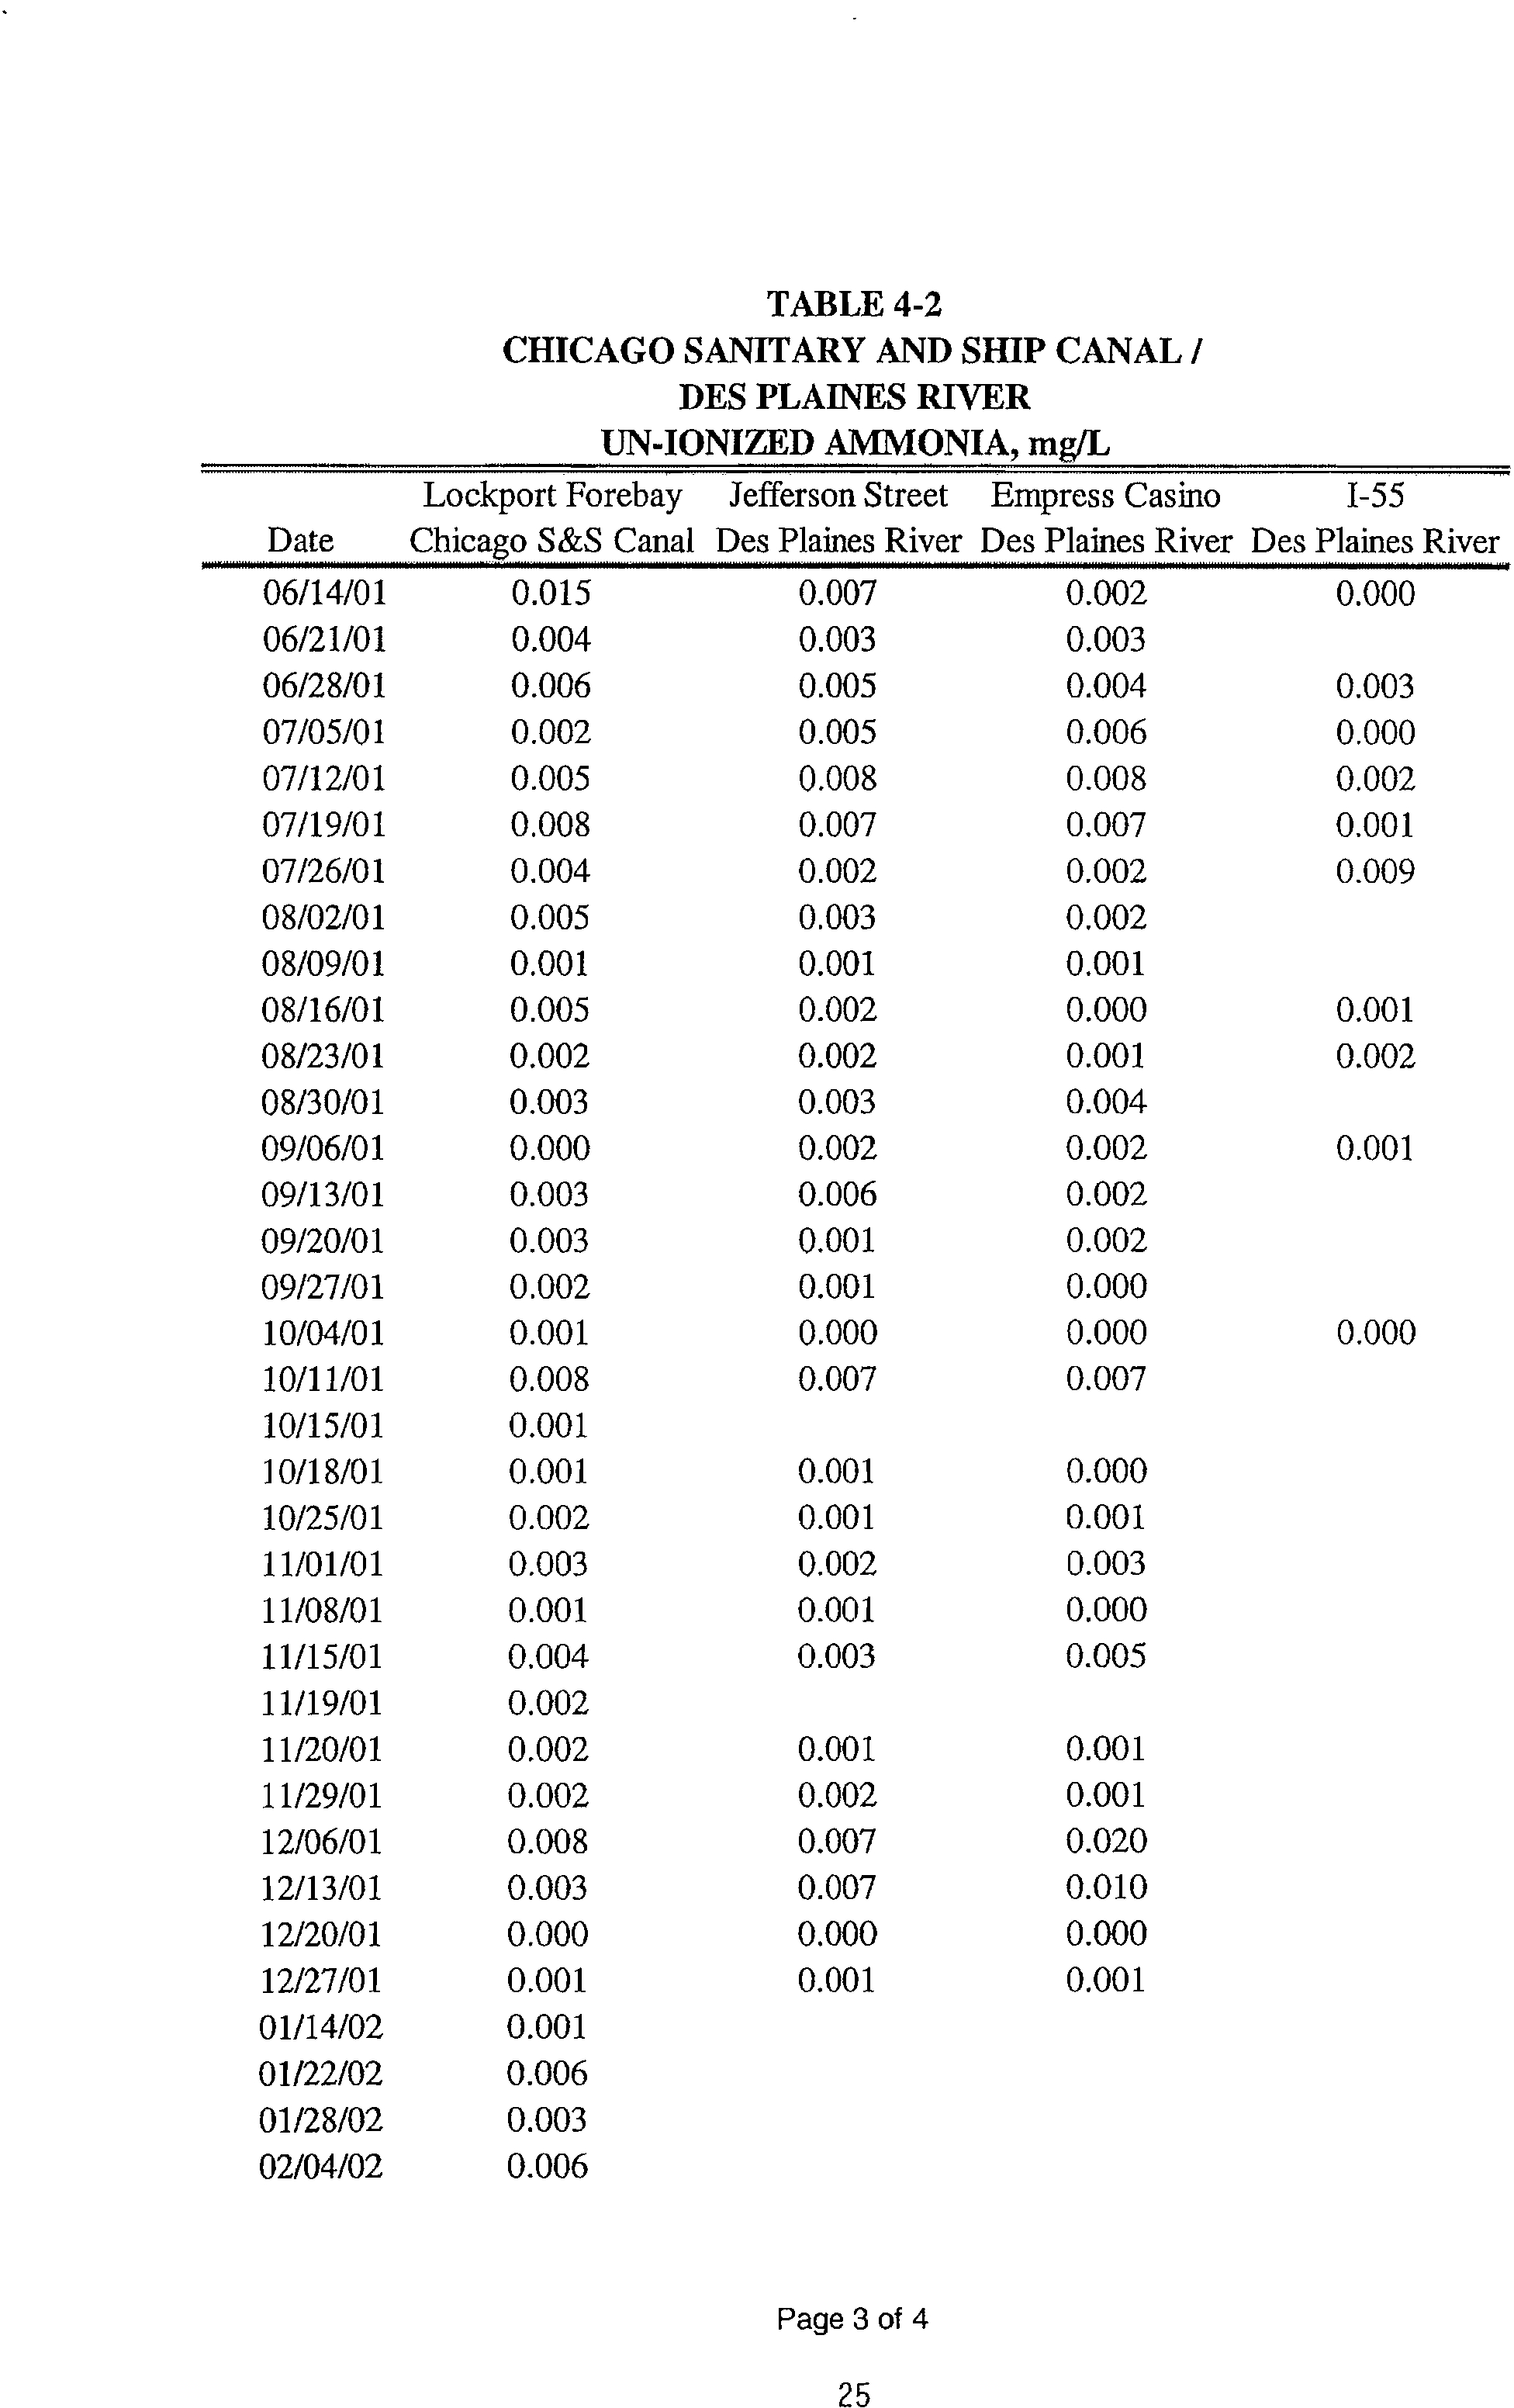
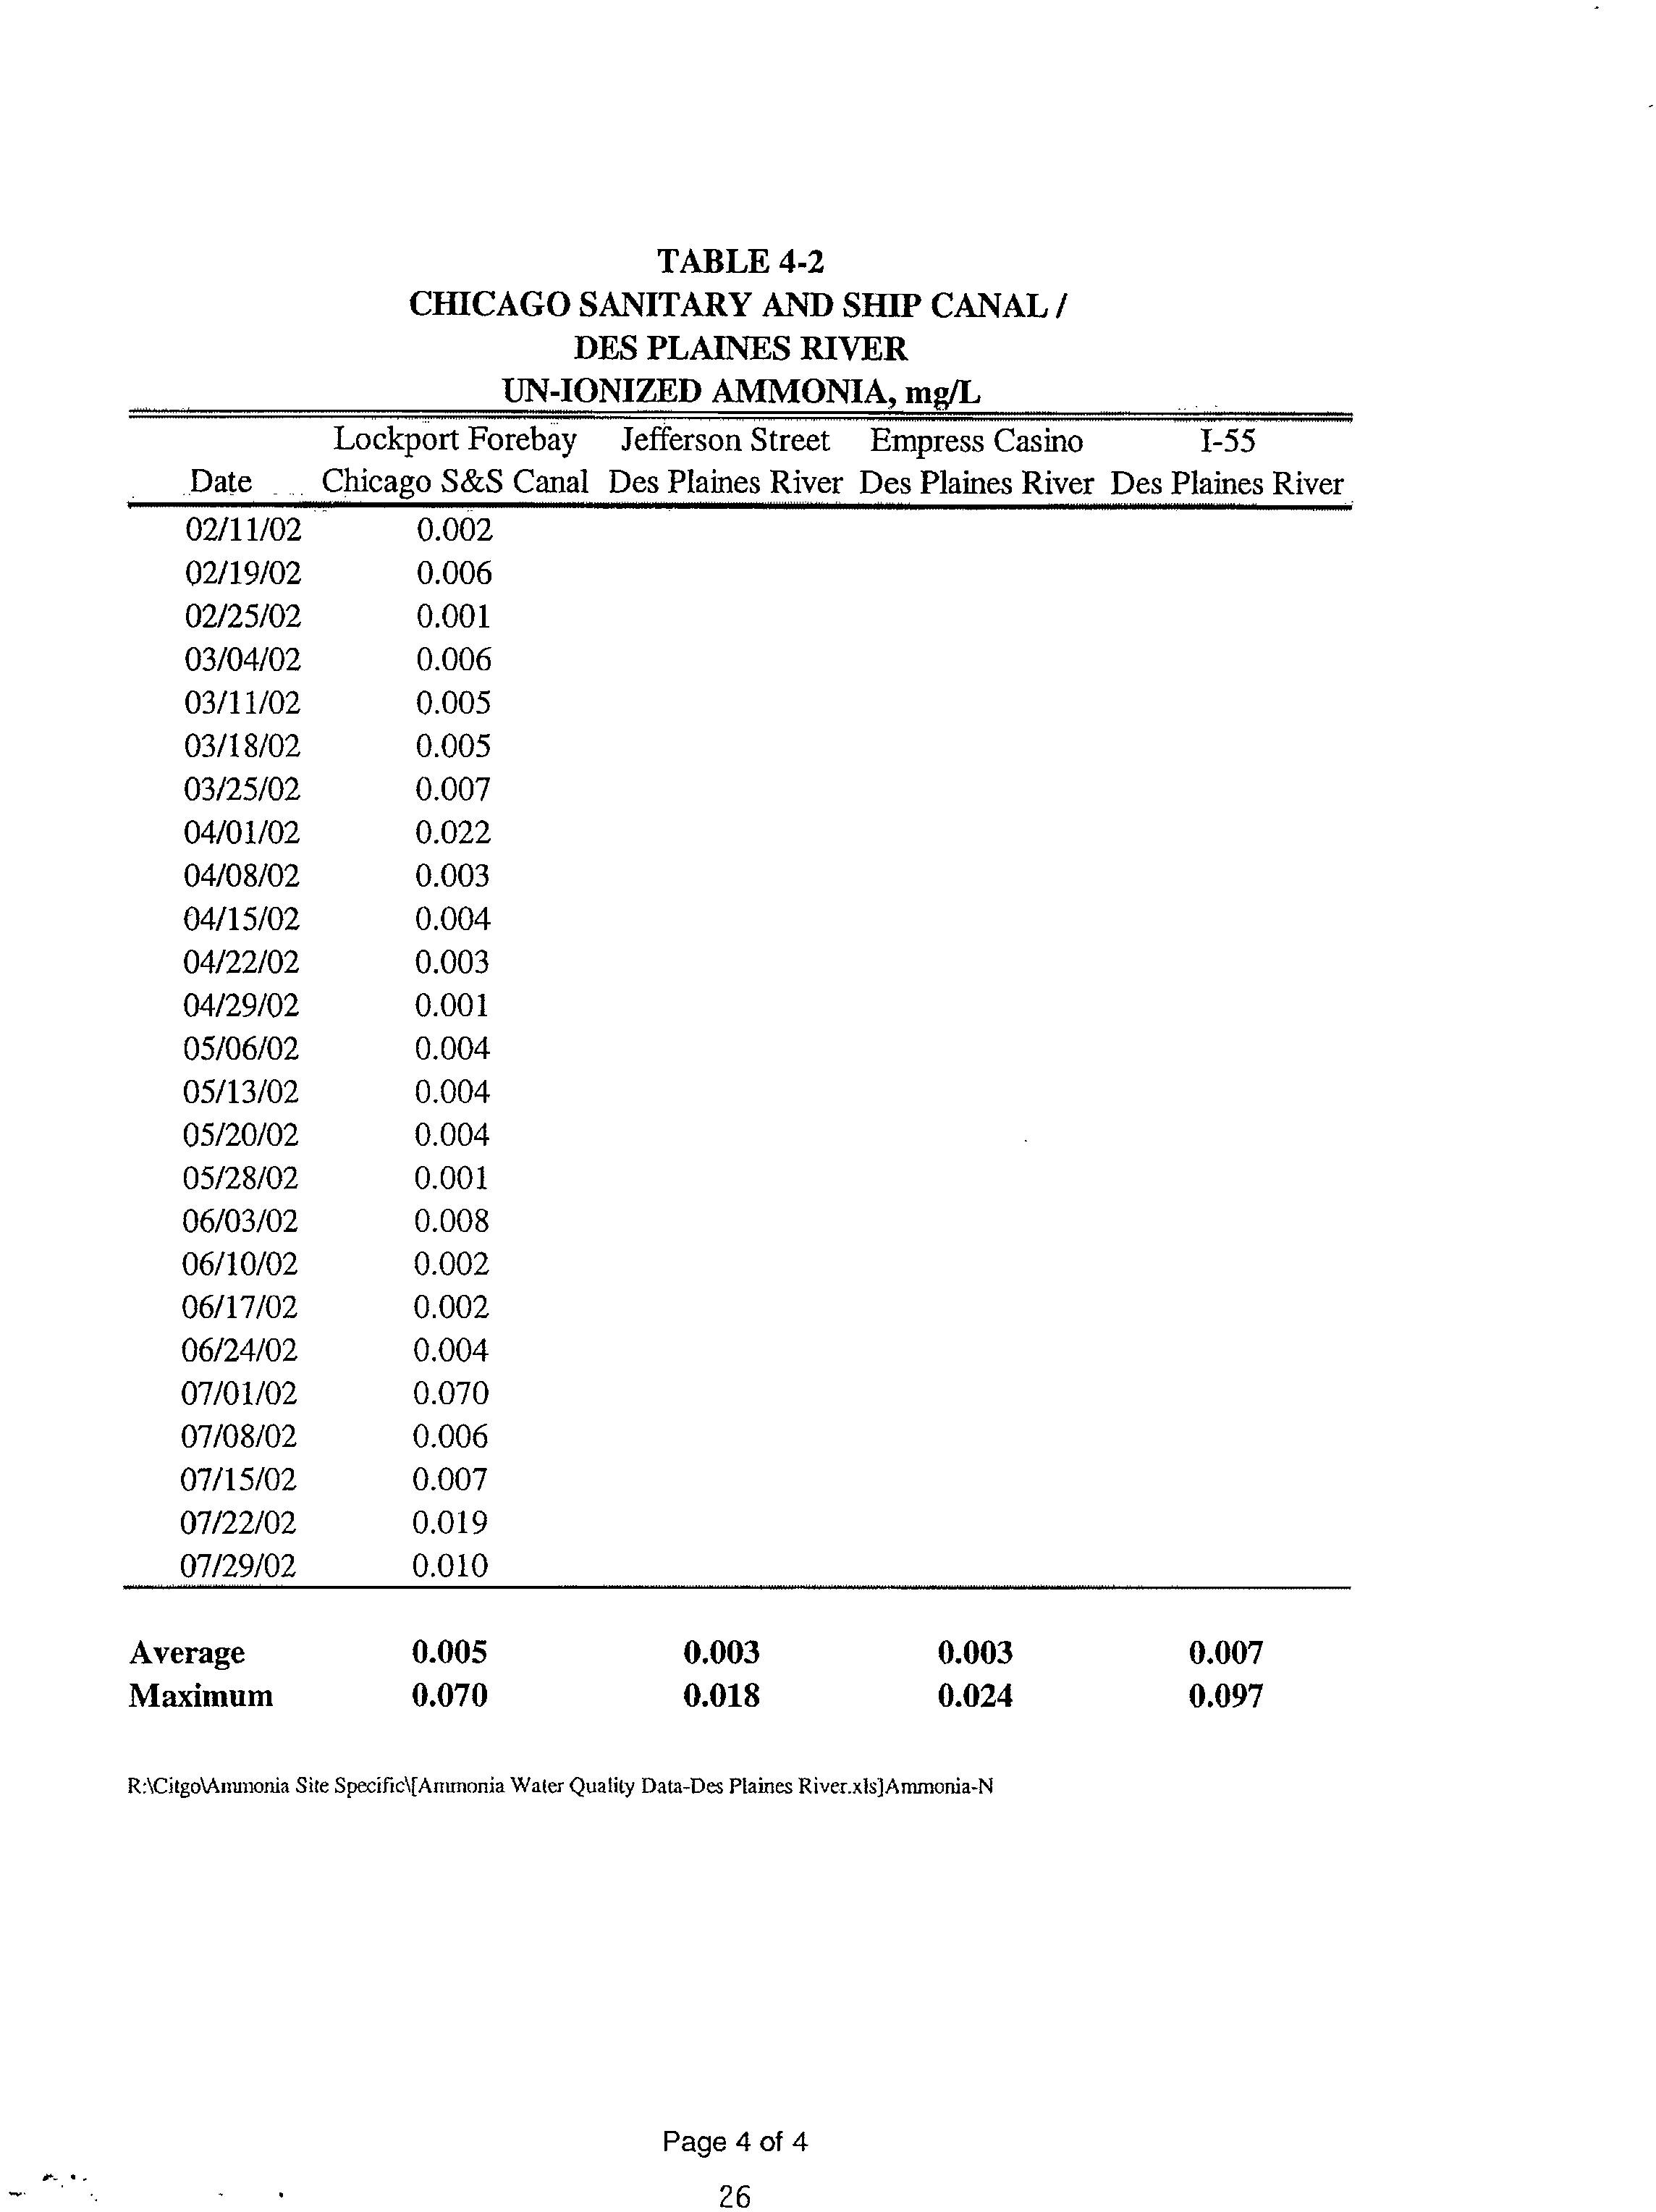
4.3 Metropolitan Water Reclamation District of Greater Chicago Waterways Data
Data for MWRDGC ammonia sampling (total and un-ionized) from January 2000 to July 2002 are
presented in Tables 4-1 and 4-2. The data are from four sampling locations: Lockport Forebay on the
Ship Canal, Jefferson Street on the Des Plaines River, Empress Casino on the Des Plaines River, and the
1-55 Bridge on the Des Plaines River. This is the most current data available. Average total ammonia
concentration declines from 0.65 mg/L on the Ship Canal to 0.34 mg/L at the 1-55 Bridge on the Des
Plaines River. Un-ionized ammonia concentration at all four locations consistently achieved the existing
0.1 mg/L standard throughout the data period. On the Ship Canal, the un-ionized ammonia averaged a
low 0.005 mg/L from 2000 to 2002, with a maximum reported as 0.070 mg/L.
Citgo, Lemont — Ammonia Report
18
February 2008
Electronic Filing - Received, Clerk's Office, March 18, 2008
* * * * * AS 2008-008 * * * * *
EXHIBIT 2
TABLE 4-1
CHICAGO SANITARY AND SHIP CANAL
/
DES PLAINES RIVER
TOTAL AMMONIA, NH3/N, mg/L
Date
Lockport Forebay
Jefferson Street
Empress Casino
1-55 Bridge
Chicago S&S Canal Des Plaines River Des Plaines River Des Plaines River
01/20/00
0.58
0.61
01/27/00
0.43
0.44
02/03/00
0.45
0.36
0.38
02/10/00
0.95
0.76
02/17/00
0.61
0.63
02/24/00
1.22
1.31
0.79
03/02/00
0.90
0.78
03/09/00
0.89
0.72
03/16/00
0.49
0.54
1.92
03/23/00
0.48
0.32
0.00
03/30/00
0.53
0.22
0.65
04/06/00
0.82
0.51
0.17
04/13/00
0.39
0.64
0.27
04/20/00
0.67
0.46
04/27/00
0.29
0.15
0.15
05/04/00
0.24
0.21
1.38
05/11/00
0.85
0.64
0.19
05/18/00
0.46
0.29
0.16
05/25/00
0.23
0.24
0.69
06/01/00
0.26
0.32
0.25
06/08/00
0.22
0.19
0.22
06/15/00
0.29
0.23
0.31
06/22/00
0.33
0.18
0.17
06/29/00
0.24
0.20
0.23
07/06/00
0.22
0.20
0.27
07/13/00
0.25
0.18
0.21
07/20/00
0.23
0.18
0.21
07/27/00
0.25
0.22
0.16
08/03/00
0.49
0.17
0.14
08/10/00
0.25
0.20
0.63
08/17/00
0.24
0.14
0.21
08/24/00
0.24
0.20
0.16
08/31/00
0.20
0.17
0.13
09/07/00
0.22
0.15
0.22
09/14/00
0.43
0.34
19
1 of 4
Electronic Filing - Received, Clerk's Office, March 18, 2008
* * * * * AS 2008-008 * * * * *
EXHIBIT 2
TABLE 4-1
CHICAGO SANITARY AND SHIP CANAL
/
DES PLAINES RIVER
TOTAL AMMONIA, NH3/N, mg/L
Lockport Forebay Jefferson Street Empress Casino
1-55 Bridge
Date
Chicago S&S Canal Des Plaines River Des Plaines River Des Plaines River
09/21/00
0.29
0.22
0.12
09/28/00
0.21
0.21
0.13
10/05/00
0.21
0.18
0.33
10/12/00
0.26
0.31
0.18
10/19/00
0.19
0.19
0.20
10/26/00
0.26
0.21
0.35
11/02/00
0.25
0.28
0.14
11/08/00
0.20
0.17
0.18
11/16/00
0.12
0.19
11/21/00
0.31
0.25
0.13
11/30/00
0.25
0.22
0.17
12/07/00
0.34
0.33
0.21
12/14/00
0.47
0.50
0.23
12/21/00
0.73
0.53
0.23
01/04/01
1.45
0.88
0.62
0.56
01/11/01
4.03
2.17
1.02
0.69
01/18/01
1.04
1.17
0.94
01/25/01
0.95
0.78
0.68
0.73
02/01/01
1.22
1.72
0.97
0.76
02/08/01
0.95
0.72
0.77
0.78
02/15/01
0.48
0.39
0.36
0.38
02/22/01
0.81
0.48
0.57
03/01/01
1.28
0.95
1.01
03/08/01
1.01
0.98
0.77
0.59
03/15/01
1.32
0.81
0.73
1.04
03/22/01
1.18
1.13
0.76
0.60
03/29/01
0.61
0.47
0.43
0.29
04/05/01
2,59
1.11
0.55
0.81
04/12/01
0.81
0.65
0.84
04/19/01
0.48
0.34
0.28
0.28
04/26/01
0.47
0.30
0.23
0.23
05/03/01
0.74
0.36
0.20
0.01
05/10/01
0.62
0.42
0.27
0.18
05/17/01
0.76
0.51
0.35
0.30
05/24/01
0.51
0.37
0.28
0.33
20
2 of 4
Electronic Filing - Received, Clerk's Office, March 18, 2008
* * * * * AS 2008-008 * * * * *
EXHIBIT 2
TABLE 4-1
CHICAGO SANITARY AND SHIP CANAL
/
DES PLAINES RIVER
TOTAL AMMONIA, NH3/N, mg/L
Lockport Forebay Jefferson Street Empress Casino
1-55 Bridge
Date
Chicago S&S Canal Des Plaines River Des Plaines River Des Plaines River
05/31/01
0.49
0.35
0.23
0.18
06/07/01
0.42
0.31
0.33
06/14/01
0.87
0.41
0.15
0.08
06/21/01
0.34
0.22
0.25
0.21
06/28/01
0.39
0.24
0.10
0.07
07/05/01
0.32
0.30
0.23
0.10
07/12/01
0.37
0.29
0.21
0.36
07/19/01
0.29
0.23
0.23
0.16
07/26/01
0.65
0.52
0.37
0.30
08/02/01
0.28
0.23
0.13
08/09/01
0.29
0.26
0.18
08/16/01
0.45
0.30
0.23
0.14
08/23/01
0.25
0.25
0.22
0.21
08/30/01
0.37
0.23
0.21
09/06/01
0.01
0.19
0.17
0.08
09/13/01
0.28
0.23
0.15
09/20/01
0.61
0.31
0.31
09/27/01
0.37
0.30
0.20
10/04/01
0.18
0.13
0.10
0.07
10/11/01
0.28
0.24
0.24
10/15/01
0.42
10/18/01
0.27
0.14
0.20
10/25/01
0.20
0.28
0.24
11/01/01
0.23
0.16
0.13
11/08/01
0.33
0.30
0.19
11/15/01
0.37
0.36
0.23
11/19/01
0.42
11/20/01
0.40
0.35
0.24
11/29/01
0.33
0.34
0.21
12/06/01
0.39
0.36
0.30
12/13/01
0.48
0.36
0.23
12/20/01
0.33
0.32
0.23
12/27/01
0.24
0.28
0.27
01/14/02
0.27
01/22/02
0.61
21
3
of 4
Electronic Filing - Received, Clerk's Office, March 18, 2008
* * * * * AS 2008-008 * * * * *
EXHIBIT 2
TABLE 4-1
CHICAGO SANITARY AND SHIP CANAL
/
DES PLAINES RIVER
TOTAL AMMONIA, NI13/N, mgfL
Lockport Forebay Jefferson Street Empress Casino
1-55 Bridge
Date
Chicago S&S Canal Des Plaines River Des Plaines River Des Plaines River
01/28/02
02/04/02
02/11/02
02/19/02
02/25/02
03/04/02
03/11/02
03/18/02
03/25/02
04/01/02
04/08/02
04/15/02
04/22/02
04/29/02
05/06/02
05/13/02
05/20/02
05/28/02
06/03/02
06/10/02
06/17/02
06/24/02
07/01/02
07/08/02
07/15/02
07/22/02
07/29/02
0.95
0.77
0.74
0.47
0.62
0.58
0.59
0.87
1.08
0.79
0.72
0.58
1.38
0.62
0.77
0.49
0.48
0.55
0.61
0.31
0.52
0.32
0.50
0.42
0.69
0.70
0.57
AVERAGE
Maximum
0.65
4.03
0.49
2.17
0.37
1.02
0.34
1.92
R:\Citgo\Ammonia Site Specific\(Atnmonia Water Quality Data-Des Plaines River.xls)Anunonium-N
22
4 of 4
Electronic Filing - Received, Clerk's Office, March 18, 2008
* * * * * AS 2008-008 * * * * *
EXHIBIT 2
TABLE 4-2
CHICAGO SANITARY AND SHIP CANAL
/
DES PLAINES RIVER
UN-IONIZED AMMONIA, mg/I.,
Date
Lockport Forebay
Jefferson Street
Empress Casino
1-55
Chicago S&S Canal Des Plaines River Des Plaines River Des Plaines River
01/20/00
0.013
0.029
01/27/00
0.006
0.031
02/03/00
0.013
0.012
0.015
02/10/00
0.007
0.014
02/17/00
0.003
0.006
02/24/00
0.007
0.009
0.097
03/02/00
0.010
0.013
03/09/00
0.012
0.053
03/16/00
0.005
0.010
0.014
03/23/00
0.003
0.005
0.032
03/30/00
0.005
0.008
0.025
04/06/00
0.004
0.000
0.007
04/13/00
0.001
0.001
0.015
04/20/00
0.012
0.004
04/27/00
0.003
0.004
0.000
05/04/00
0.002
0.002
0.001
05/11/00
0.005
0.014
0.028
05/18/00
0.009
0.004
0.002
05/25/00
0.004
0.007
0.008
06/01/00
0.007
0.004
0.009
06/15/00
0.002
0.002
0.002
06/22/00
0.004
0.001
0.005
06/29/00
0.003
0.004
0.008
07/06/00
0.001
0.004
0.006
07/13/00
0.001
0.001
0.001
07/20/00
0.004
0.002
0.005
07/27/00
0.004
0.005
0.011
08/03/00
0.007
0.003
0.004
08/10/00
0.016
0.021
0.000
08/17/00
0.003
0.000
0.005
08/24/00
0.007
0.001
0.002
08/31/00
0.003
0.006
0.004
09/07/00
0.004
0.005
0.005
09/14/00
0.012
0.010
0.007
09/21/00
0.004
0.004
Page 1 of 4
23
Electronic Filing - Received, Clerk's Office, March 18, 2008
* * * * * AS 2008-008 * * * * *
EXHIBIT 2
TABLE 4-2
CHICAGO SANITARY AND SHIP CANAL
/
DES PLAINES RIVER
UN-IONIZED AMMONIA, mg/L
Date
Lockport Forebay
?
Jefferson Street?
Empress Casino?
1-55
Chicago S&S Canal Des Plaines River Des Plaines River Des Plaines River
09/28/00
0.007
0.009
0.001
10/05/00
0.003
0.003
0.003
10/12/00
0.001
0.001
0.031
10/19/00
0.003
0.003
0.001
10/26/00
0.005
0.005
0.002
11/02/00
0.001
0.001
0.001
11/08/00
0.001
0.002
0.000
11/16/00
0.000
0.000
0.000
11/21/00
0.000
0.000
11/30/00
0.000
0.002
0.002
12/07/00
0.000
0.000
0.000
12/14/00
0.006
0.009
0.009
01/04/01
0.002
0.000
0.000
01/11/01
0.003
0.003
0.000
0.000
01/18/01
0.017
0.018
0.012
01/25/01
0.000
0.000
0.001
0.000
02/01/01
0.001
0.001
0.001
0.000
02/08/01
0.000
0.000
0.000
0.000
02/15/01
0.001
0.000
0.000
0.001
02/22/01
0.000
0.000
0.002
03/01/01
0.003
0.001
0.002
03/08/01
0.010
03/15/01
0.026
03/22/01
0.003
0.002
0.002
0.004
03/29/01
0.001
0.001
0.001
0.001
04/05/01
0.007
0.003
0.001
0.001
04/12/01
0.003
0.002
0.002
04/19/01
0.005
0.005
0.005
0.002
04/26/01
0.039
0.010
0.024
0.001
05/03/01
0.003
0.001
0.004
0.000
05/10/01
0.006
0.006
0.005
0.004
05/17/01
0.004
0.004
0.004
0.004
05/24/01
0.003
0.005
0.002
0.036
05/31/01
0.003
0.002
0.002
0.001
06/07/01
0.001
0.001
0.001
Page 2 of 4
24
Electronic Filing - Received, Clerk's Office, March 18, 2008
* * * * * AS 2008-008 * * * * *
EXHIBIT 2
TABLE 4-2
CHICAGO SANITARY AND SHIP CANAL
/
DES PLAINES RIVER
UN-IONIZED AMMONIA, mg/L
Lockport Forebay Jefferson Street Empress Casino
1-55
Date
Chicago S&S Canal Des Plaines River Des Plaines River Des Plaines River
06/14/01
0.015
0.007
0.002
0.000
06/21/01
0.004
0.003
0.003
06/28/01
0.006
0.005
0.004
0.003
07/05/01
0.002
0.005
0.006
0.000
07/12/01
0.005
0.008
0.008
0.002
07/19/01
0.008
0.007
0.007
0.001
07/26/01
0.004
0.002
0.002
0.009
08/02/01
0.005
0.003
0.002
08/09/01
0.001
0.001
0.001
08/16/01
0.005
0.002
0.000
0.001
08/23/01
0.002
0.002
0.001
0.002
08/30/01
0.003
0.003
0.004
09/06/01
0.000
0.002
0.002
0.001
09/13/01
0.003
0.006
0.002
09/20/01
0.003
0.001
0.002
09/27/01
0.002
0.001
0.000
10/04/01
0.001
0.000
0.000
0.000
10/11/01
0.008
0.007
0.007
10/15/01
0.001
10/18/01
0.001
0.001
0.000
10/25/01
0.002
0.001
0.001
11/01/01
0.003
0.002
0.003
11/08/01
0.001
0.001
0.000
11/15/01
0.004
0.003
0.005
11/19/01
0.002
11/20/01
0.002
0.001
0.001
11/29/01
0.002
0.002
0.001
12/06/01
0.008
0.007
0.020
12/13/01
0.003
0.007
0.010
12/20/01
0.000
0.000
0.000
12/27/01
0.001
0.001
0.001
01/14/02
0.001
01/22/02
0.006
01/28/02
0.003
02/04/02
0.006
Page 3 of 4
25
Electronic Filing - Received, Clerk's Office, March 18, 2008
* * * * * AS 2008-008 * * * * *
EXHIBIT 2
TABLE 4-2
CHICAGO SANITARY AND SHIP CANAL
/
DES PLAINES RIVER
UN-IONIZED AMMONIA, mWL
Lockport Forebay Jefferson Street Empress Casino
1-55
Date
Chicago
.
S&S Canal Des Plaines River Des Plaines River Des Plaines River
02/11/02
02/19/02
02/25/02
03/04/02
03/11/02
03/18/02
03/25/02
04/01/02
04/08/02
04/15/02
04/22/02
04/29/02
05/06/02
05/13/02
05/20/02
05/28/02
06/03/02
06/10/02
06/17/02
06/24/02
07/01/02
07/08/02
07/15/02
07/22/02
07/29/02
0.002
0.006
0.001
0.006
0.005
0.005
0.007
0.022
0.003
0.004
0.003
0.001
0.004
0.004
0.004
0.001
0.008
0.002
0.002
0.004
0.070
0.006
0.007
0.019
0.010
Average
Maximum
0.005
0.070
0.003
0.018
0.003
0.024
0.007
0.097
RACitgo\Ammonia Site Specifidl[Artirnonia Water Quality Data-Des Plaines River.xlsjAmmonia-N
Page 4 of 4
26
Electronic Filing - Received, Clerk's Office, March 18, 2008
* * * * * AS 2008-008 * * * * *
EXHIBIT 2
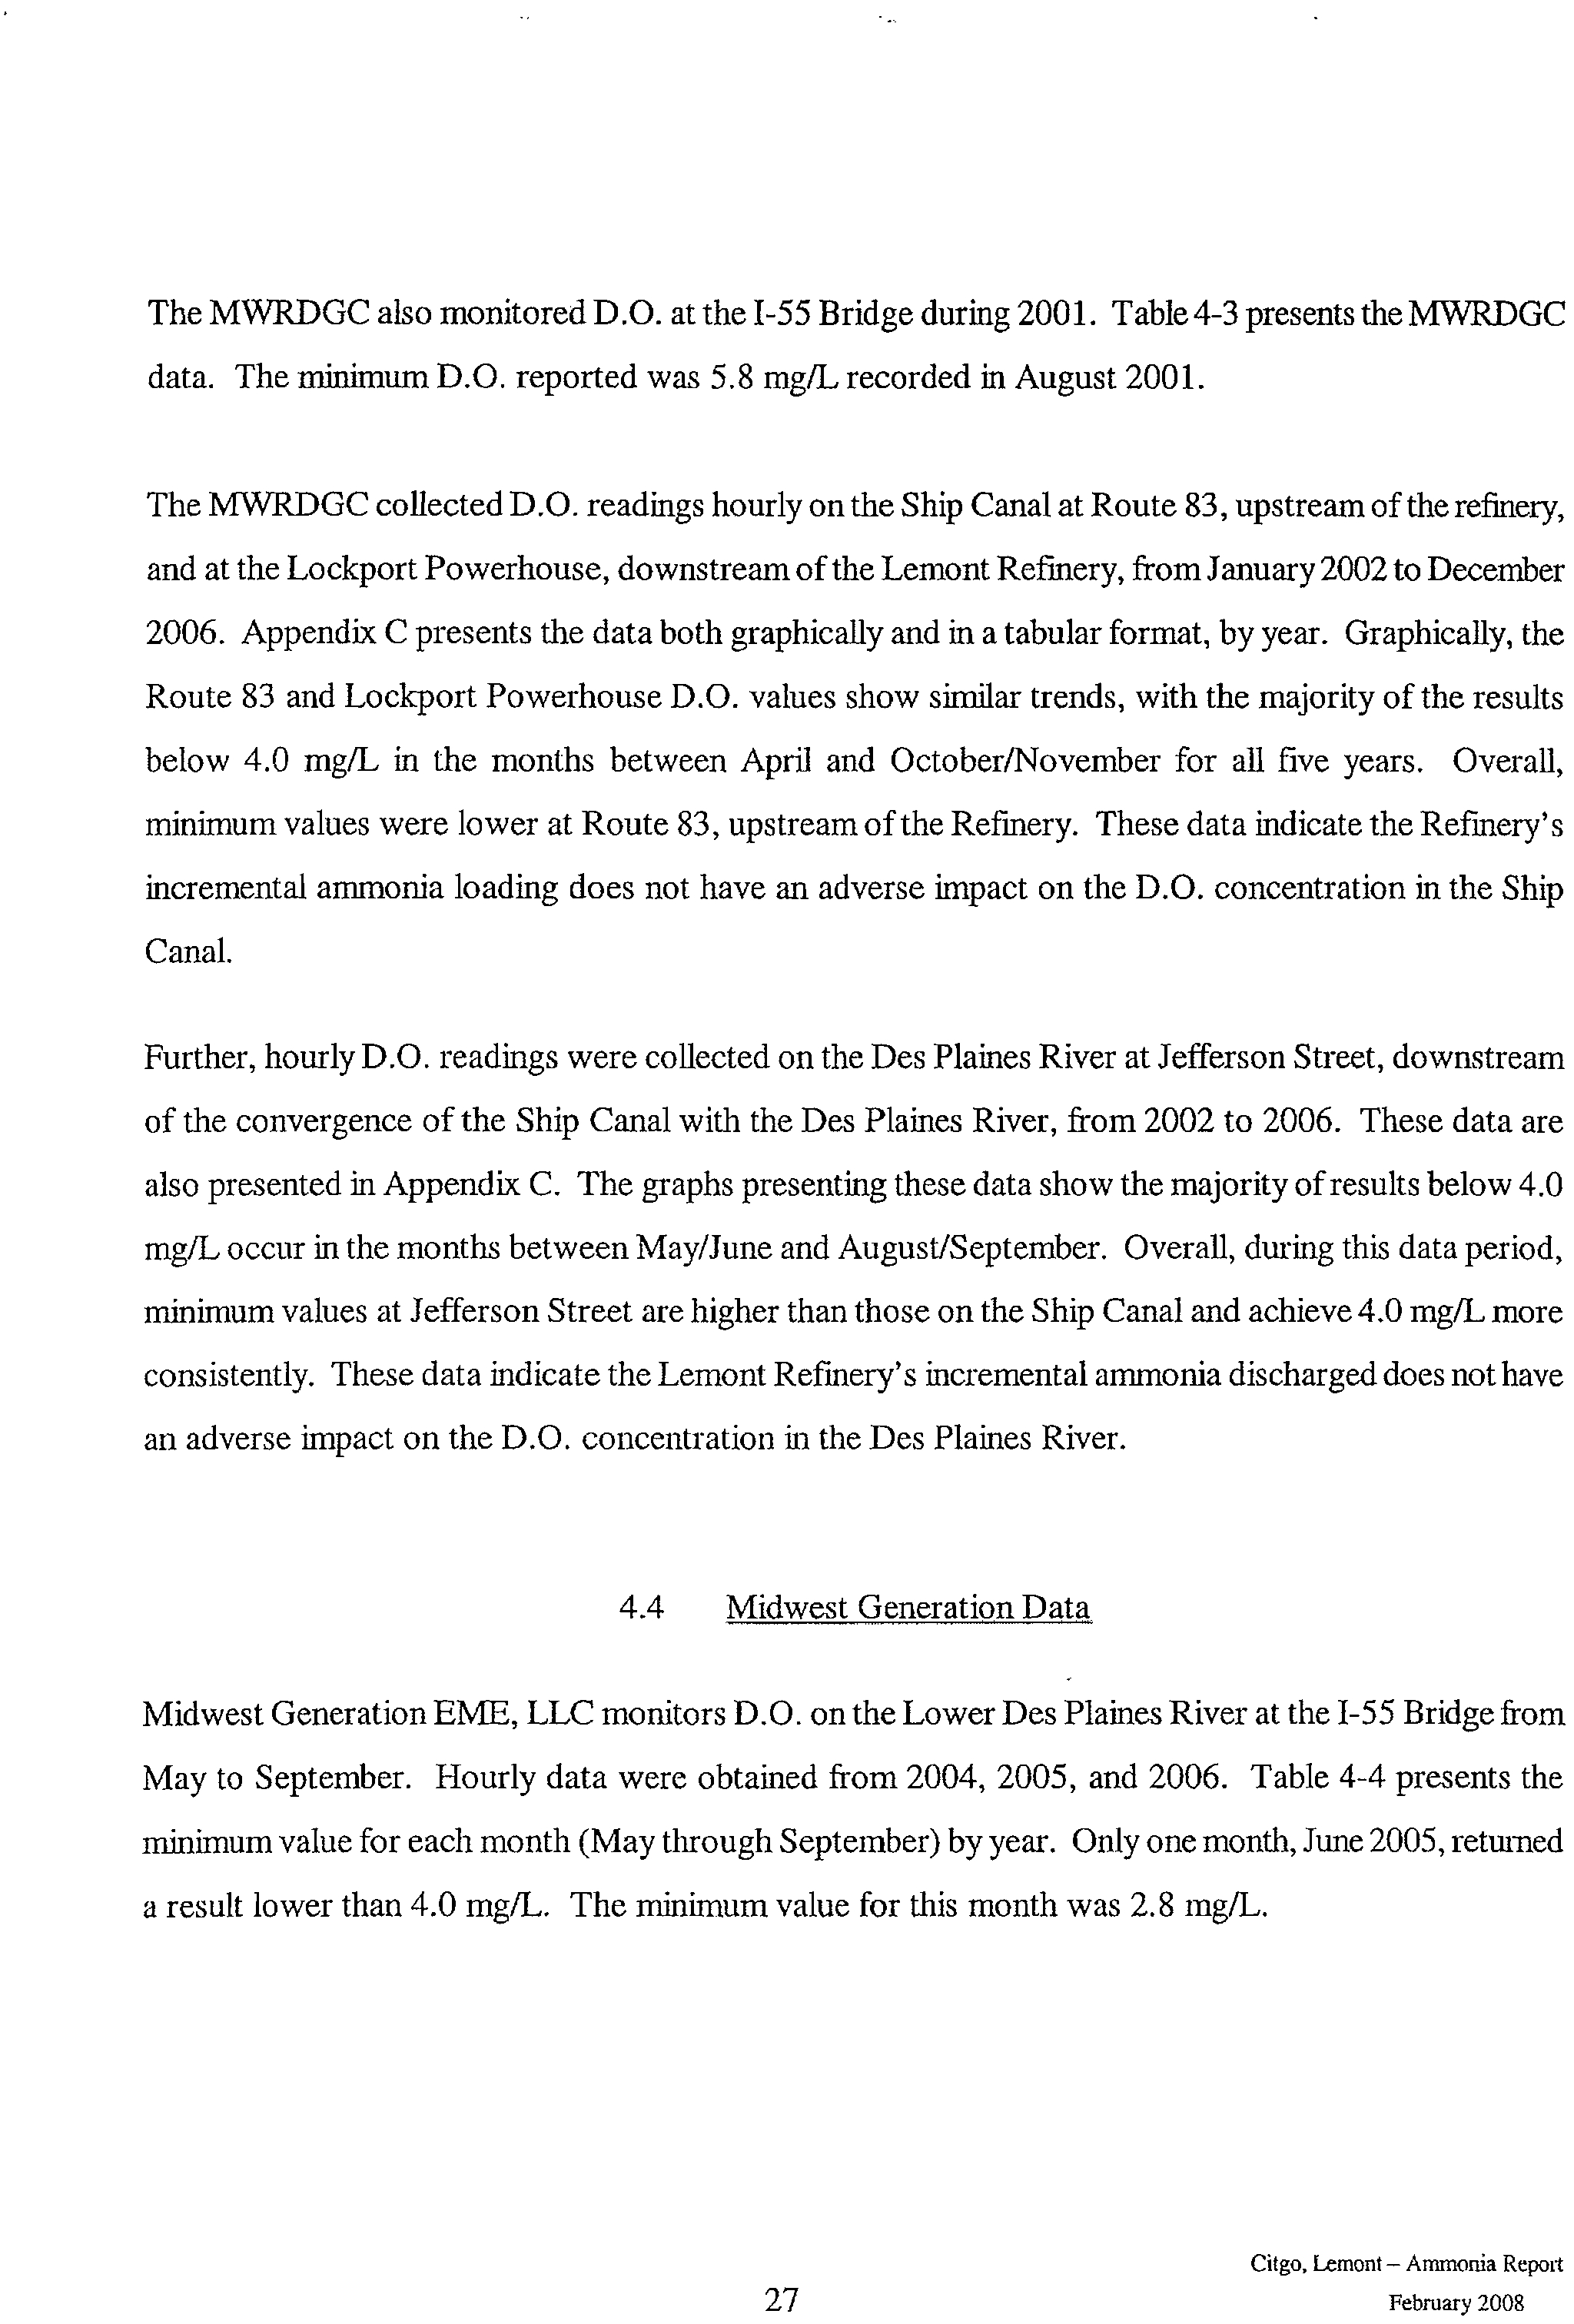
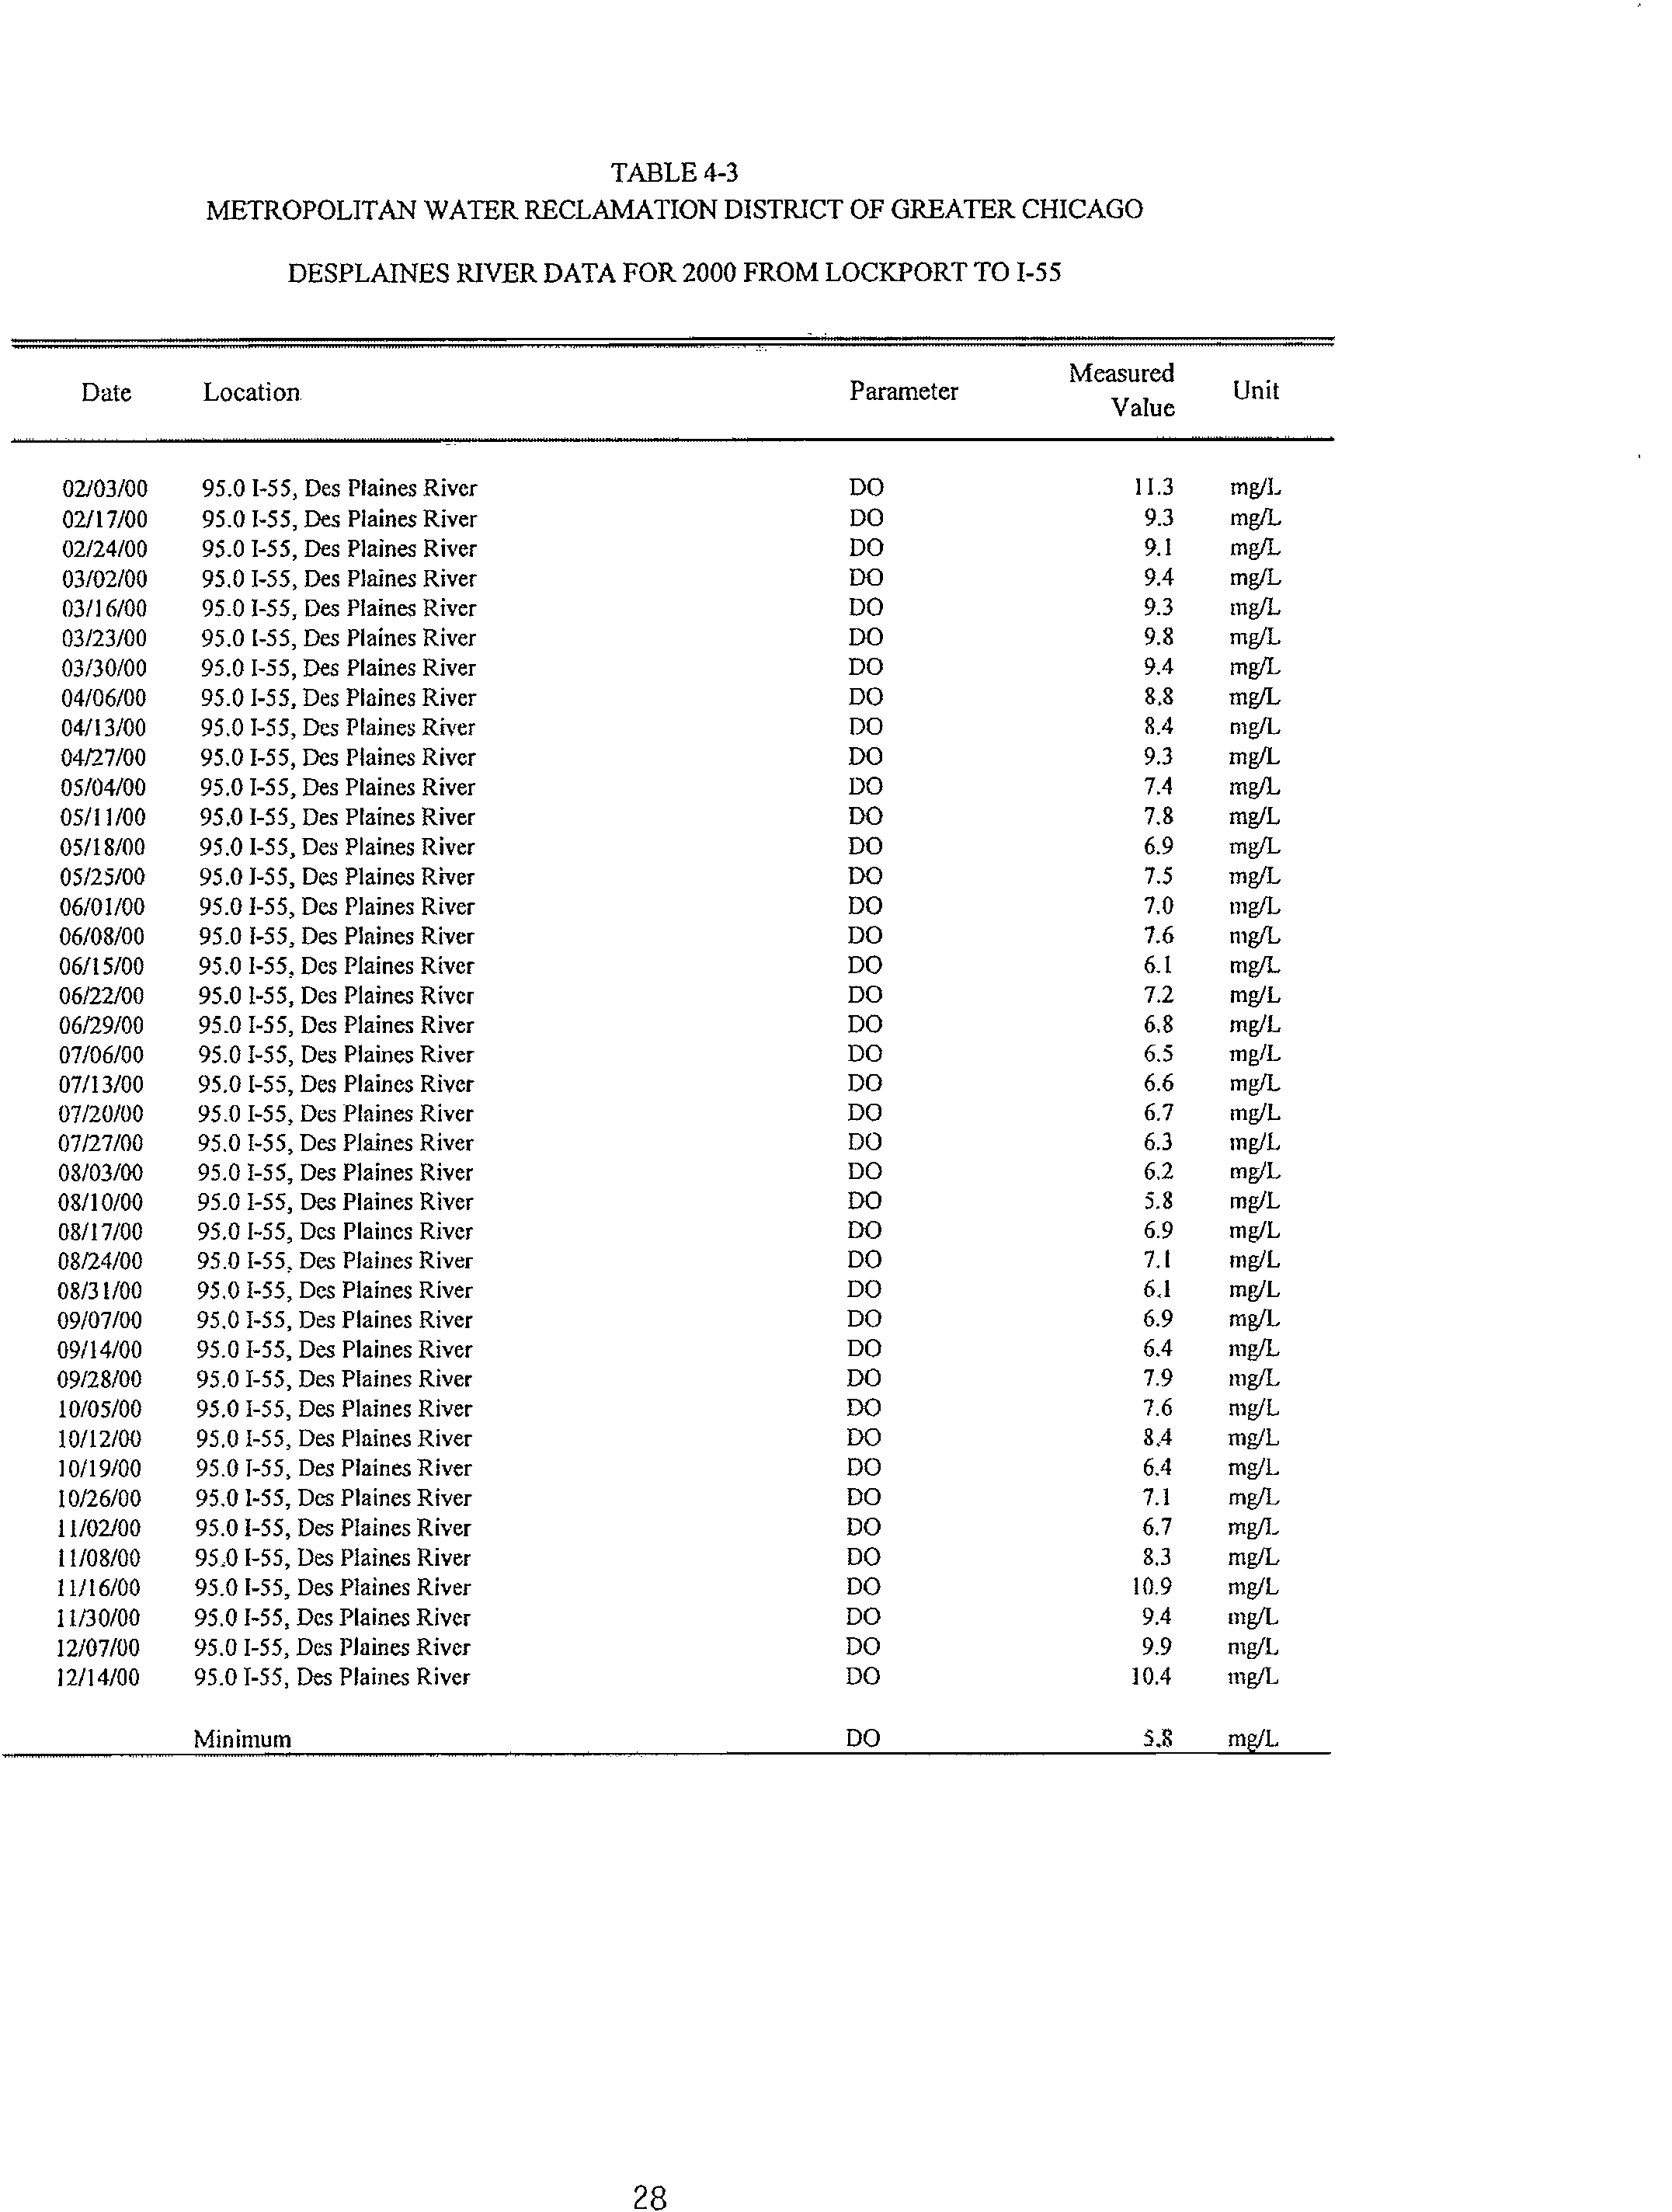
The MWRDGC also monitored D .0. at the 1-55 Bridge during 2001. Table 4-3 presents the MWRDGC
data. The minimum D.O. reported was 5.8 mg/L recorded in August 2001.
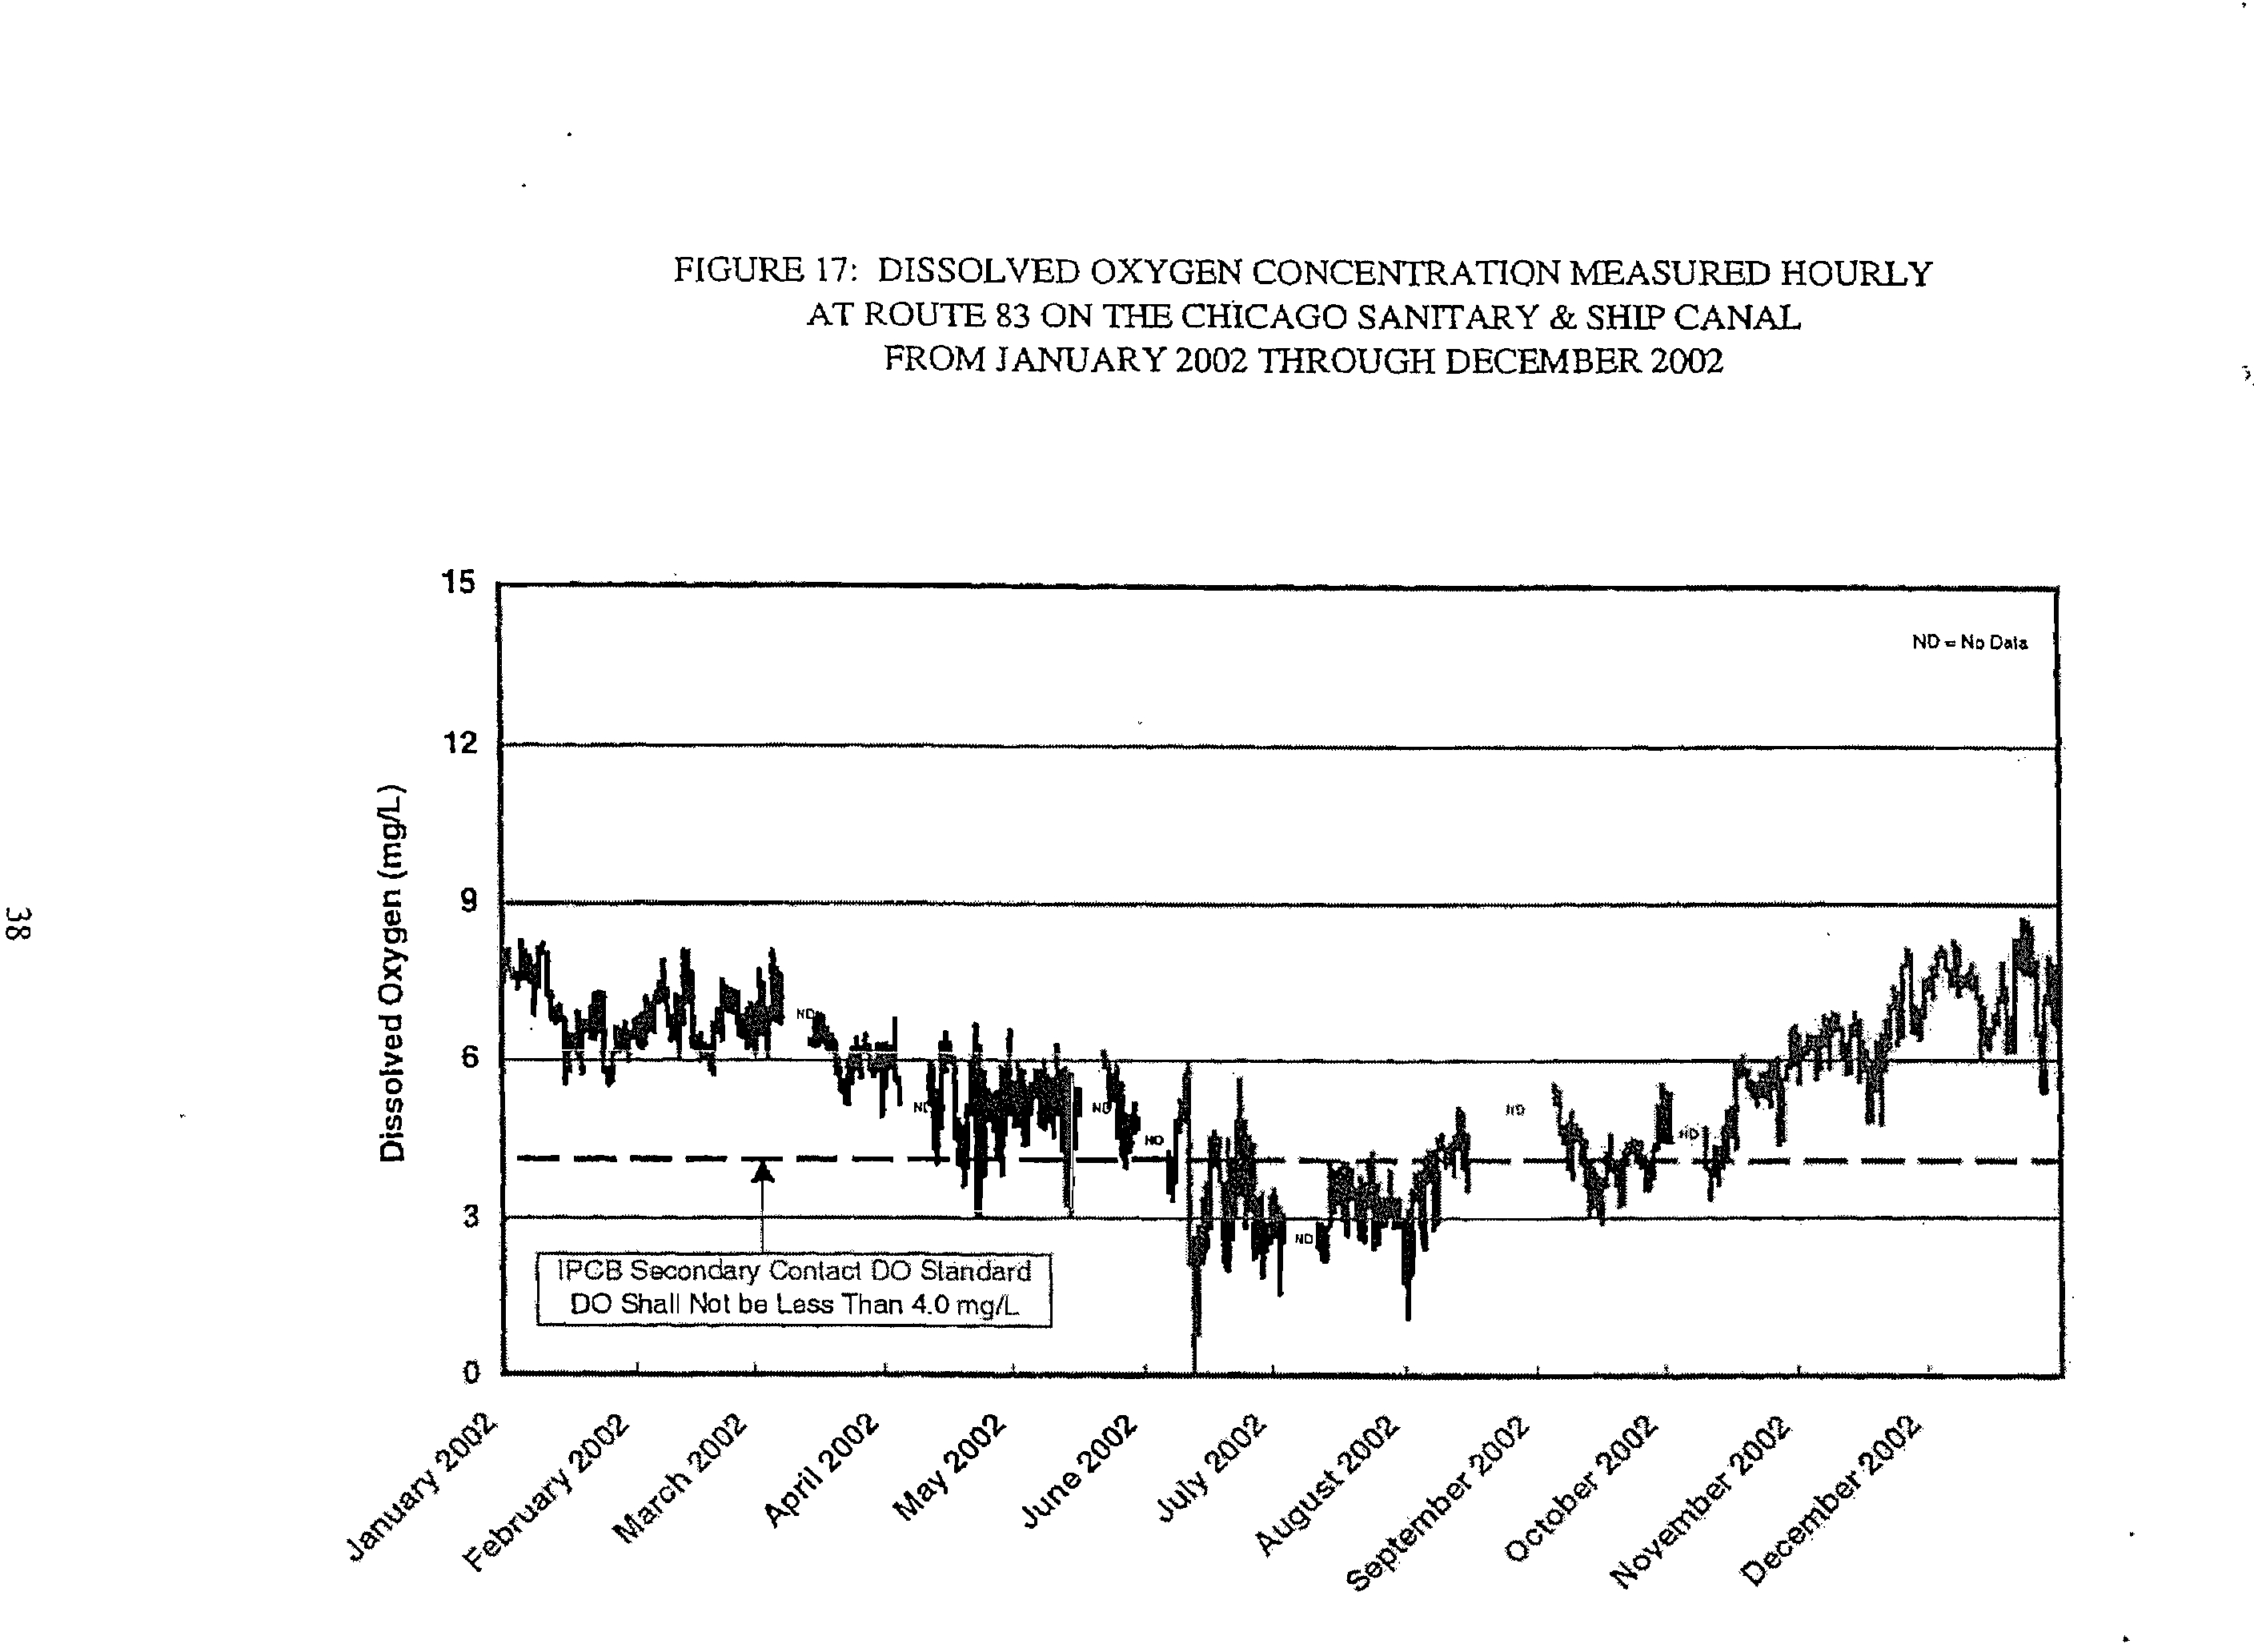
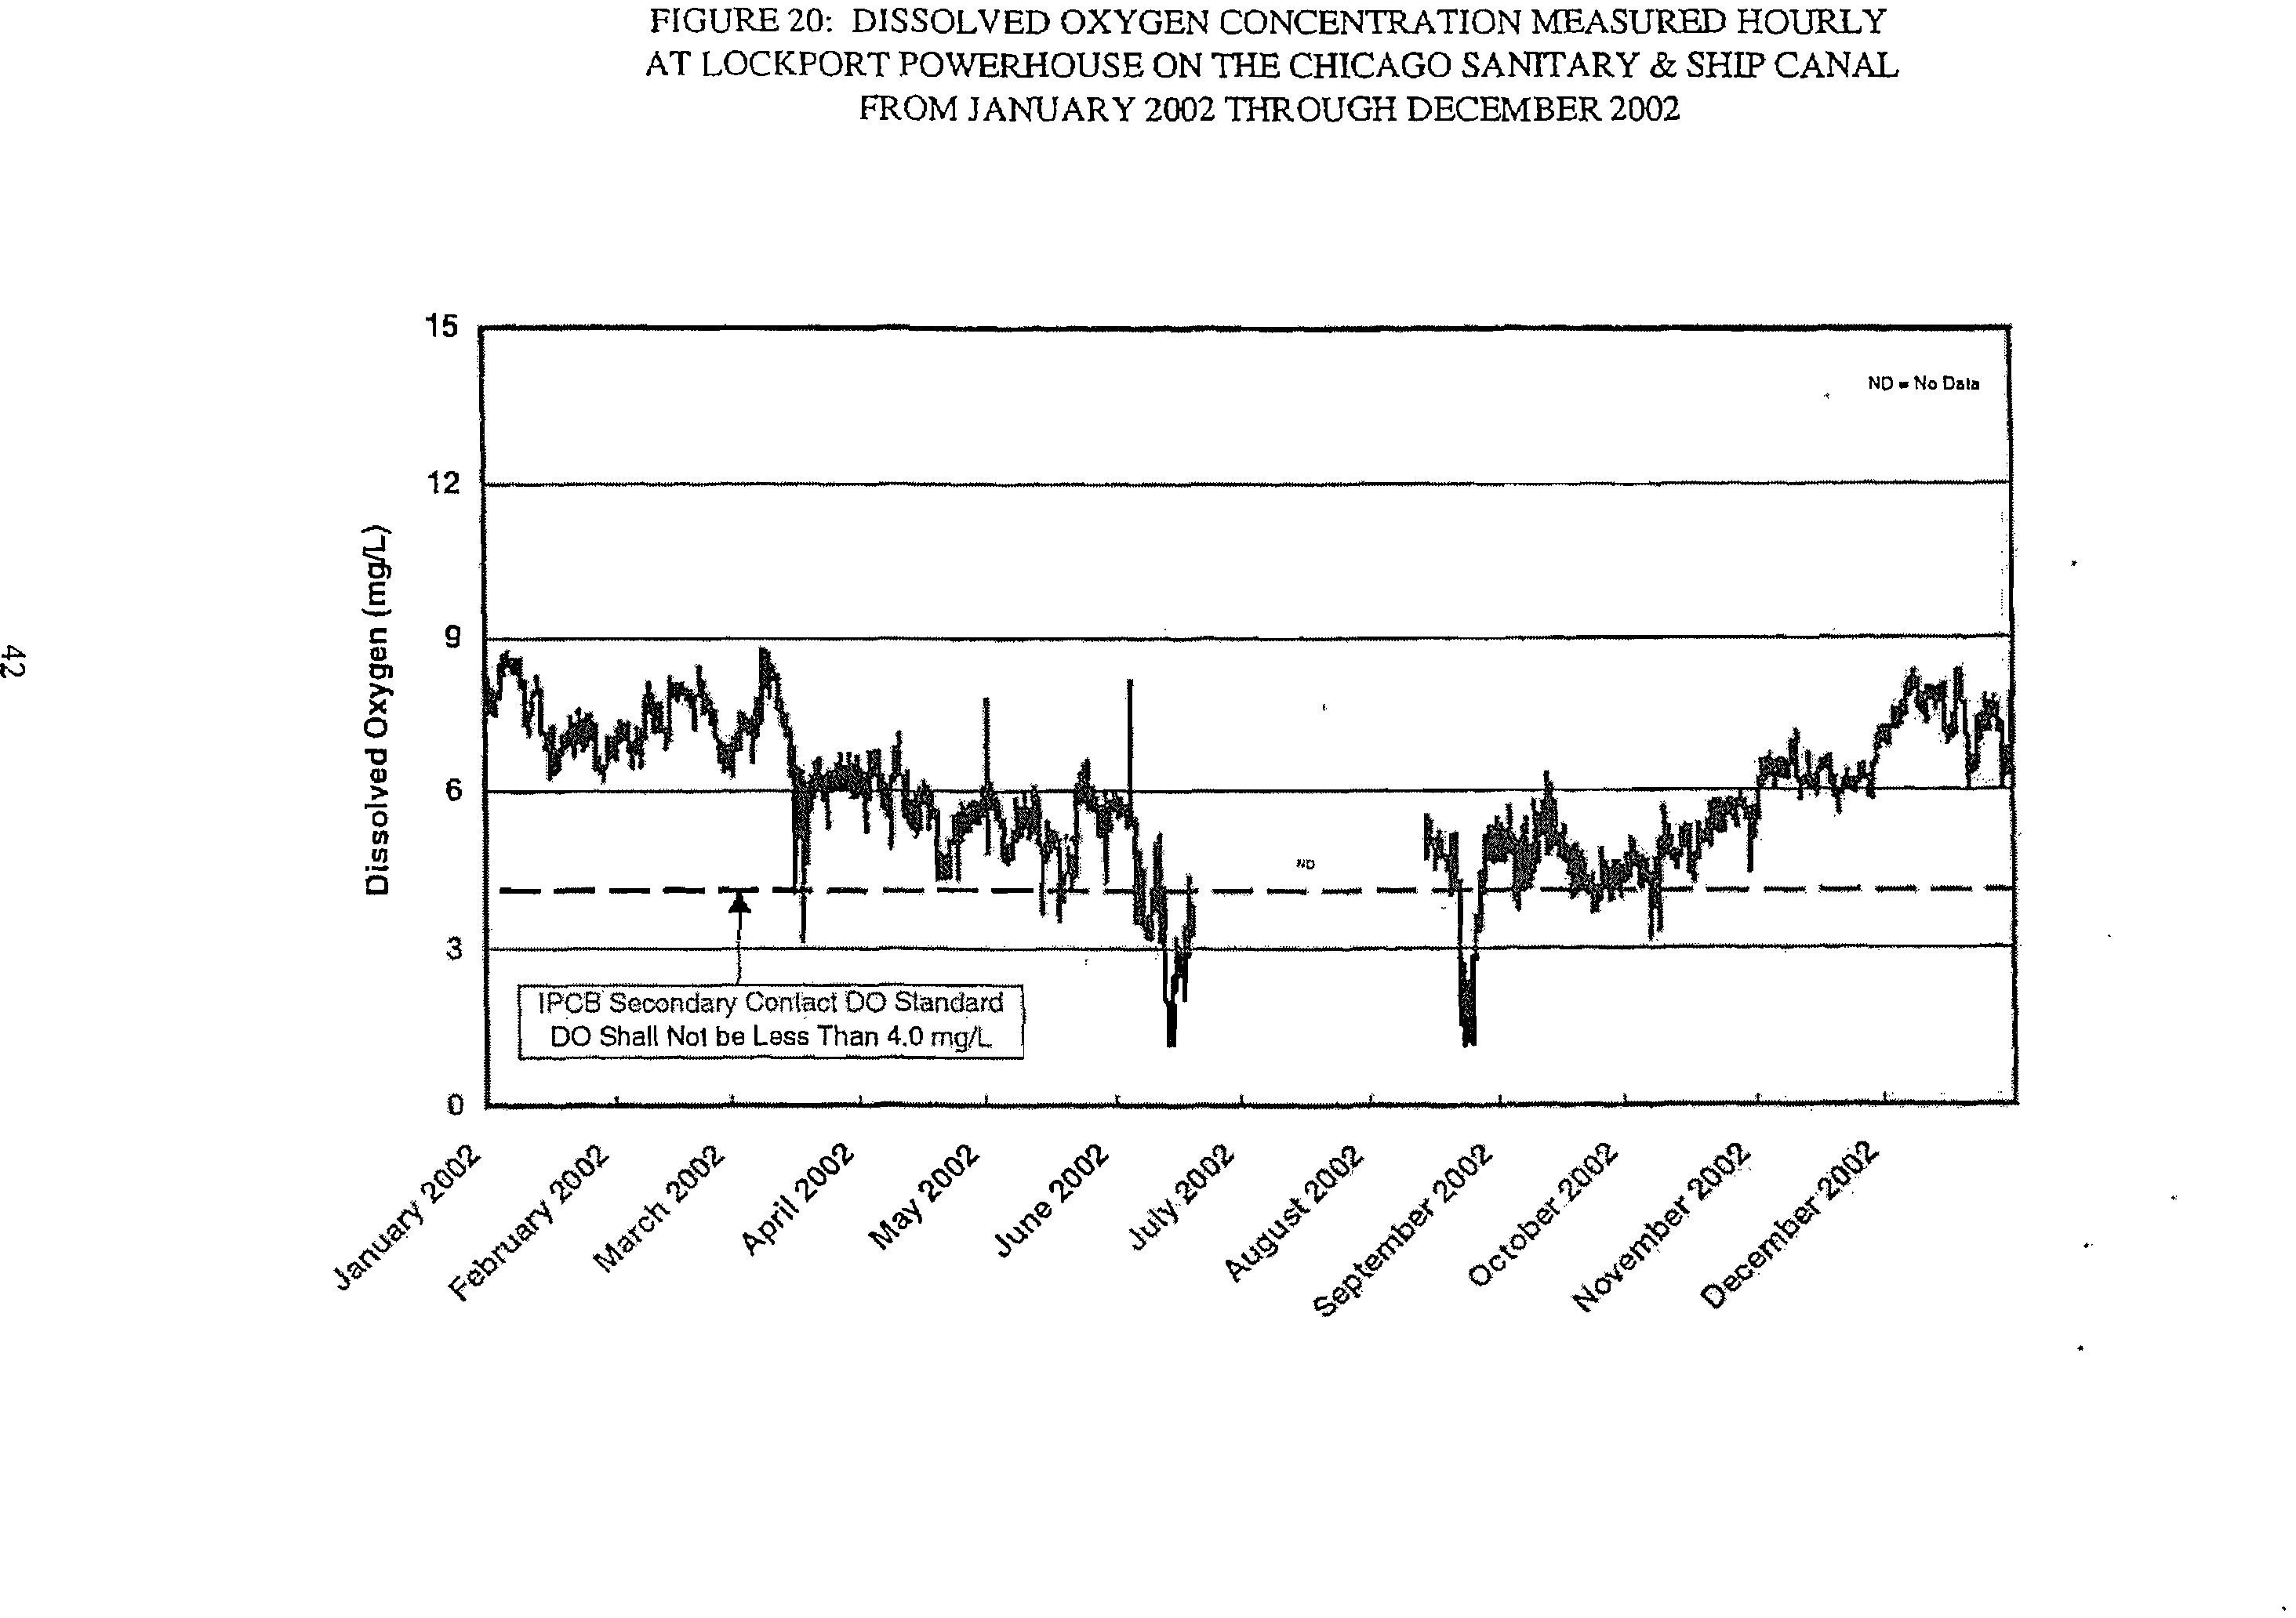
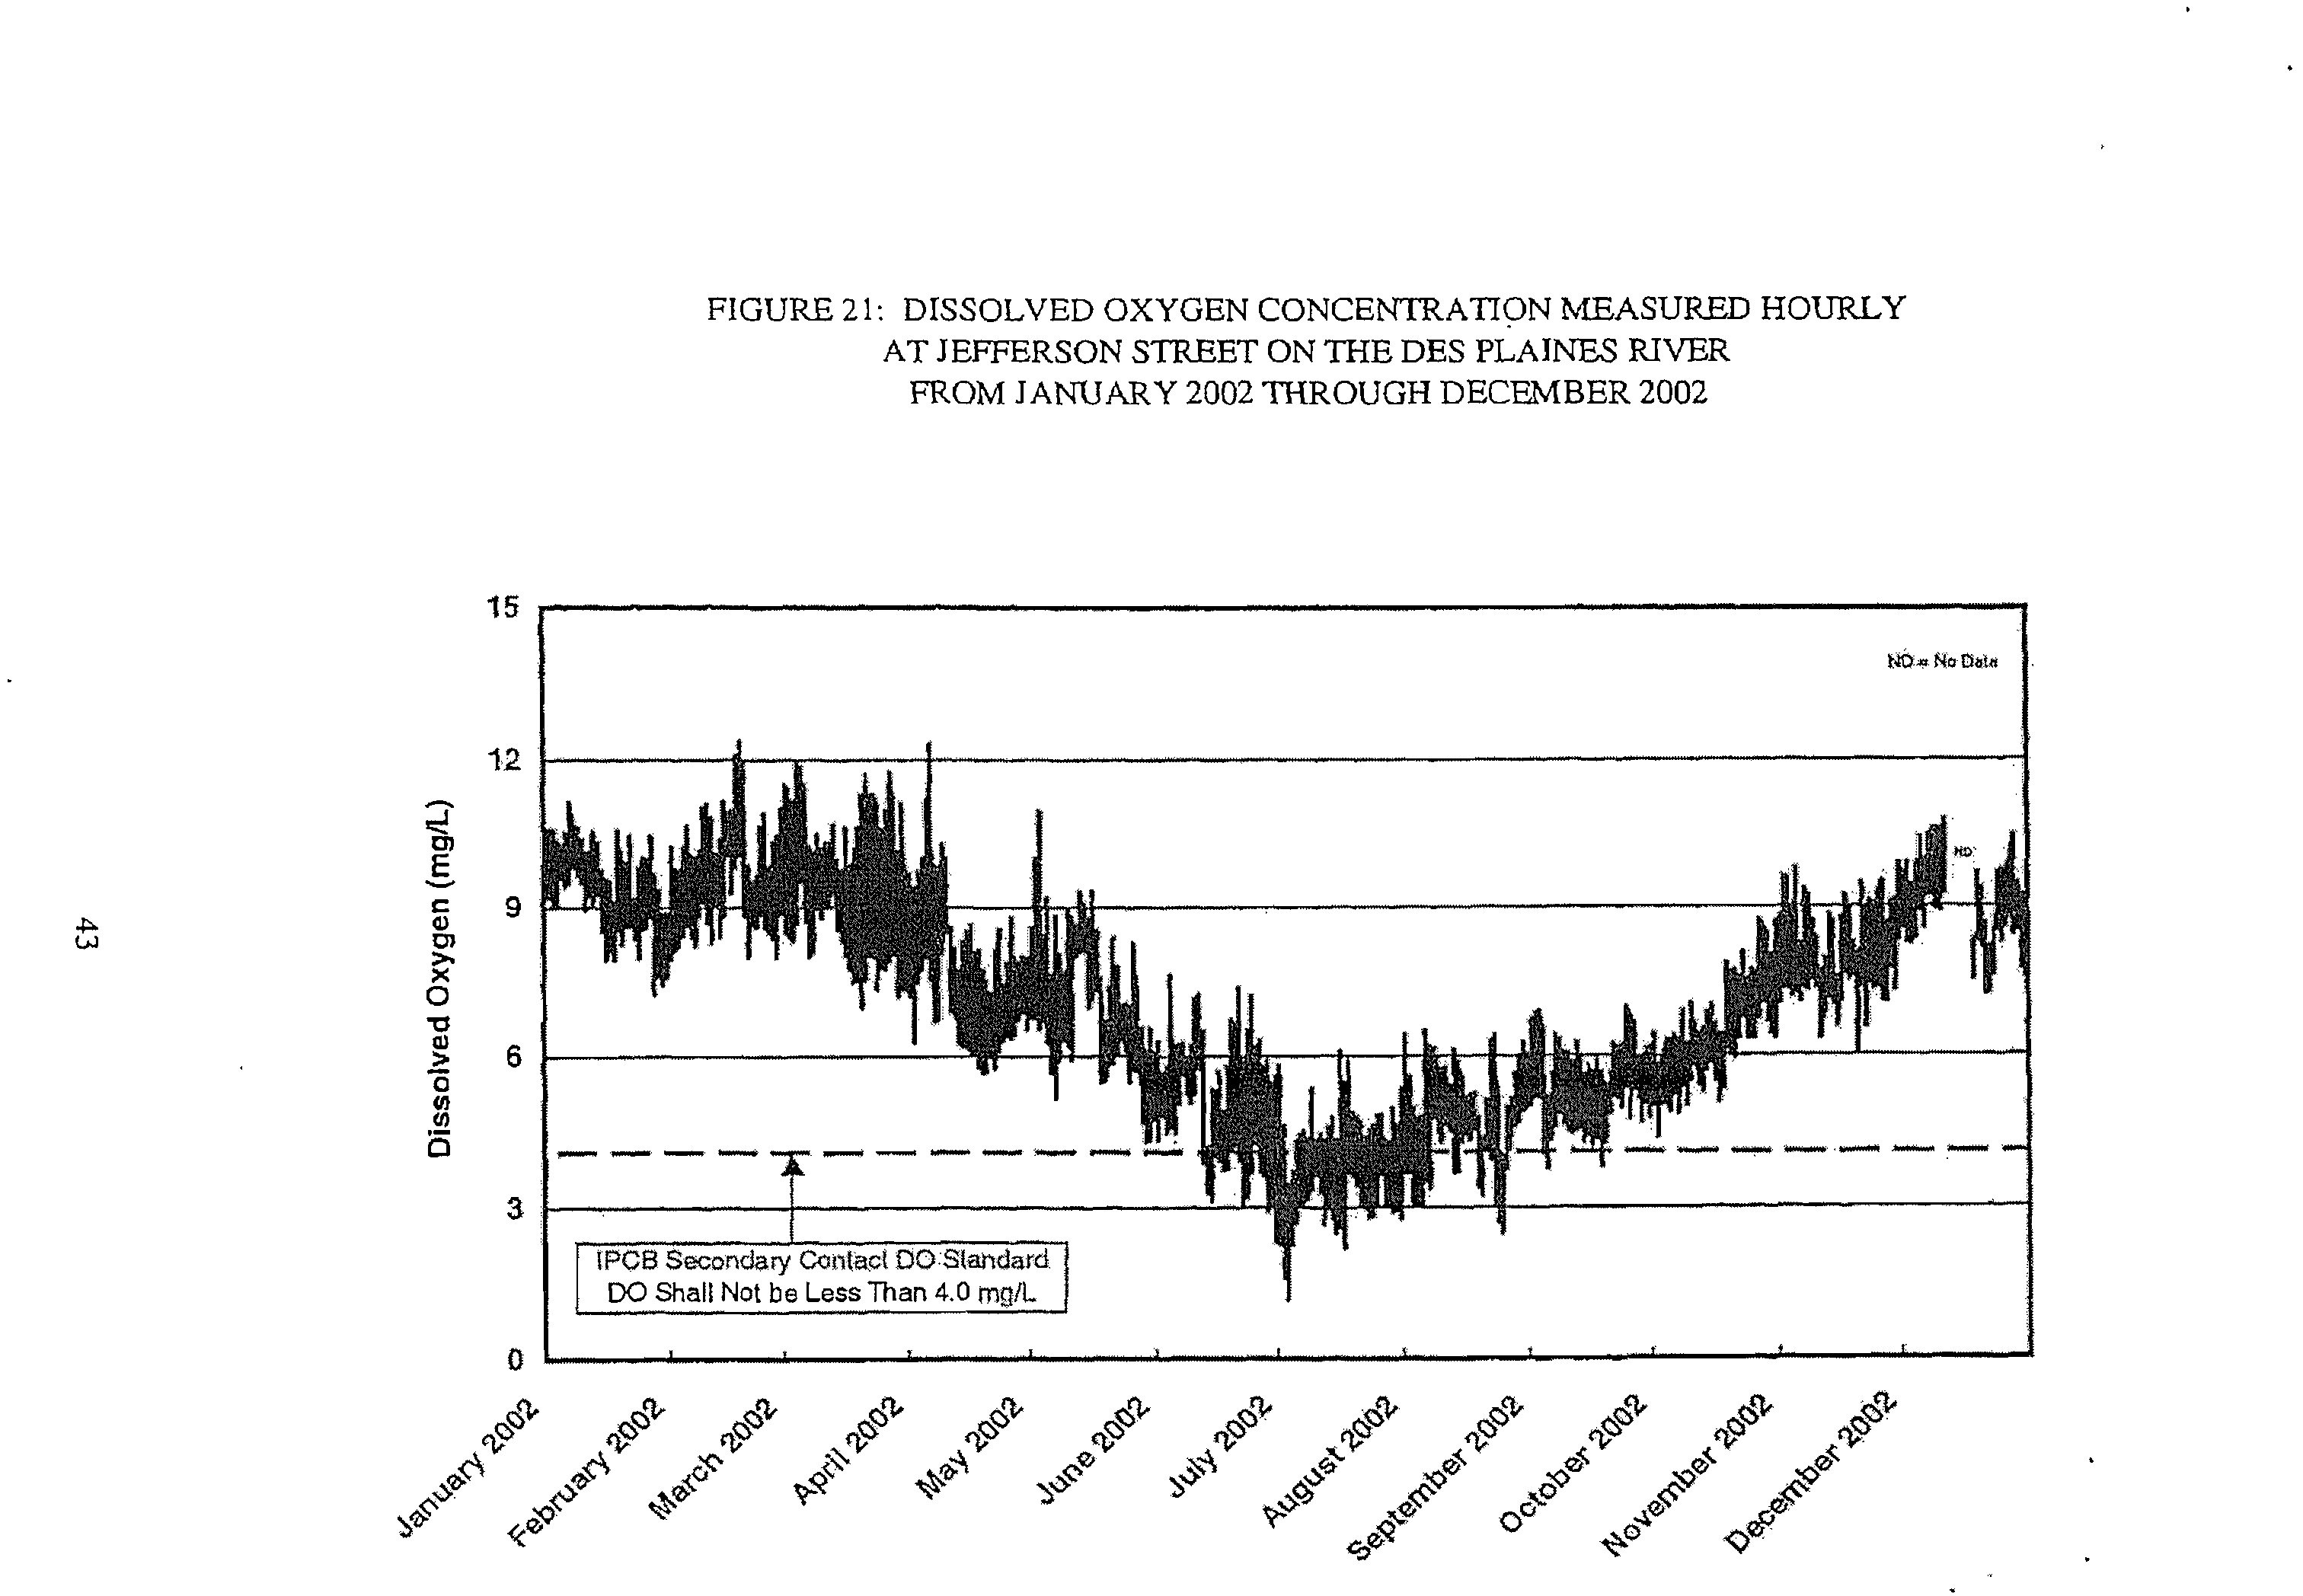
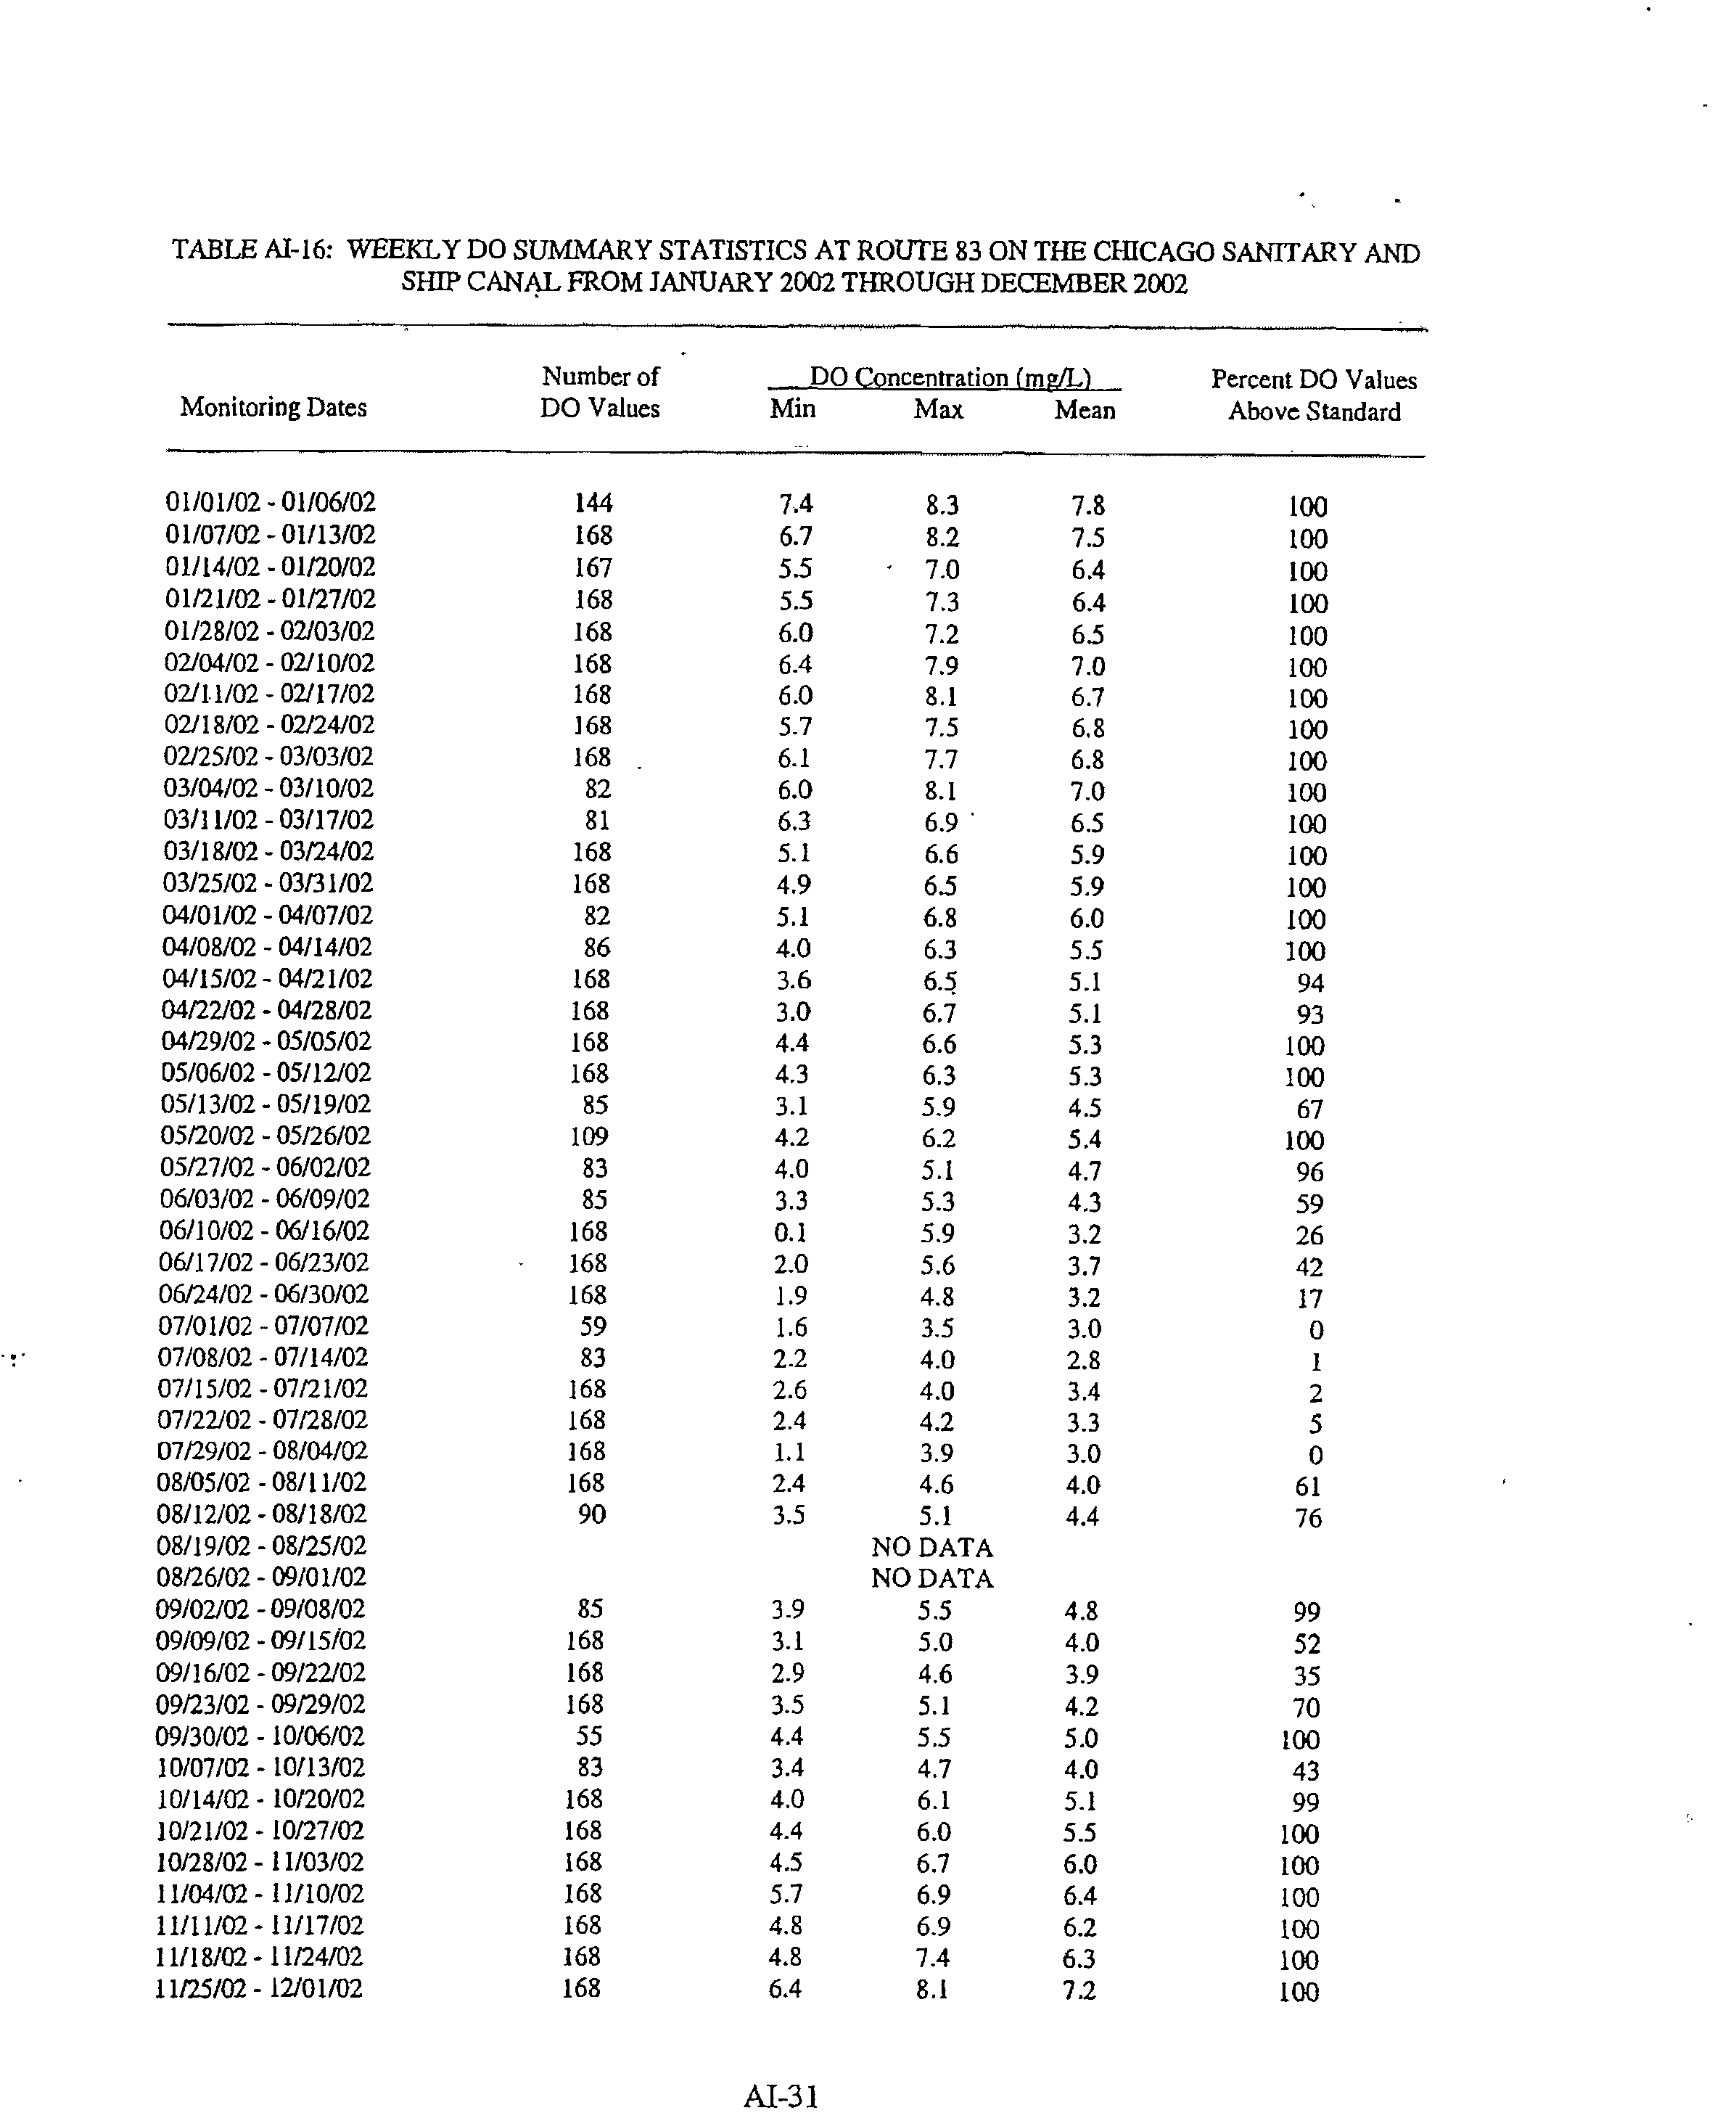
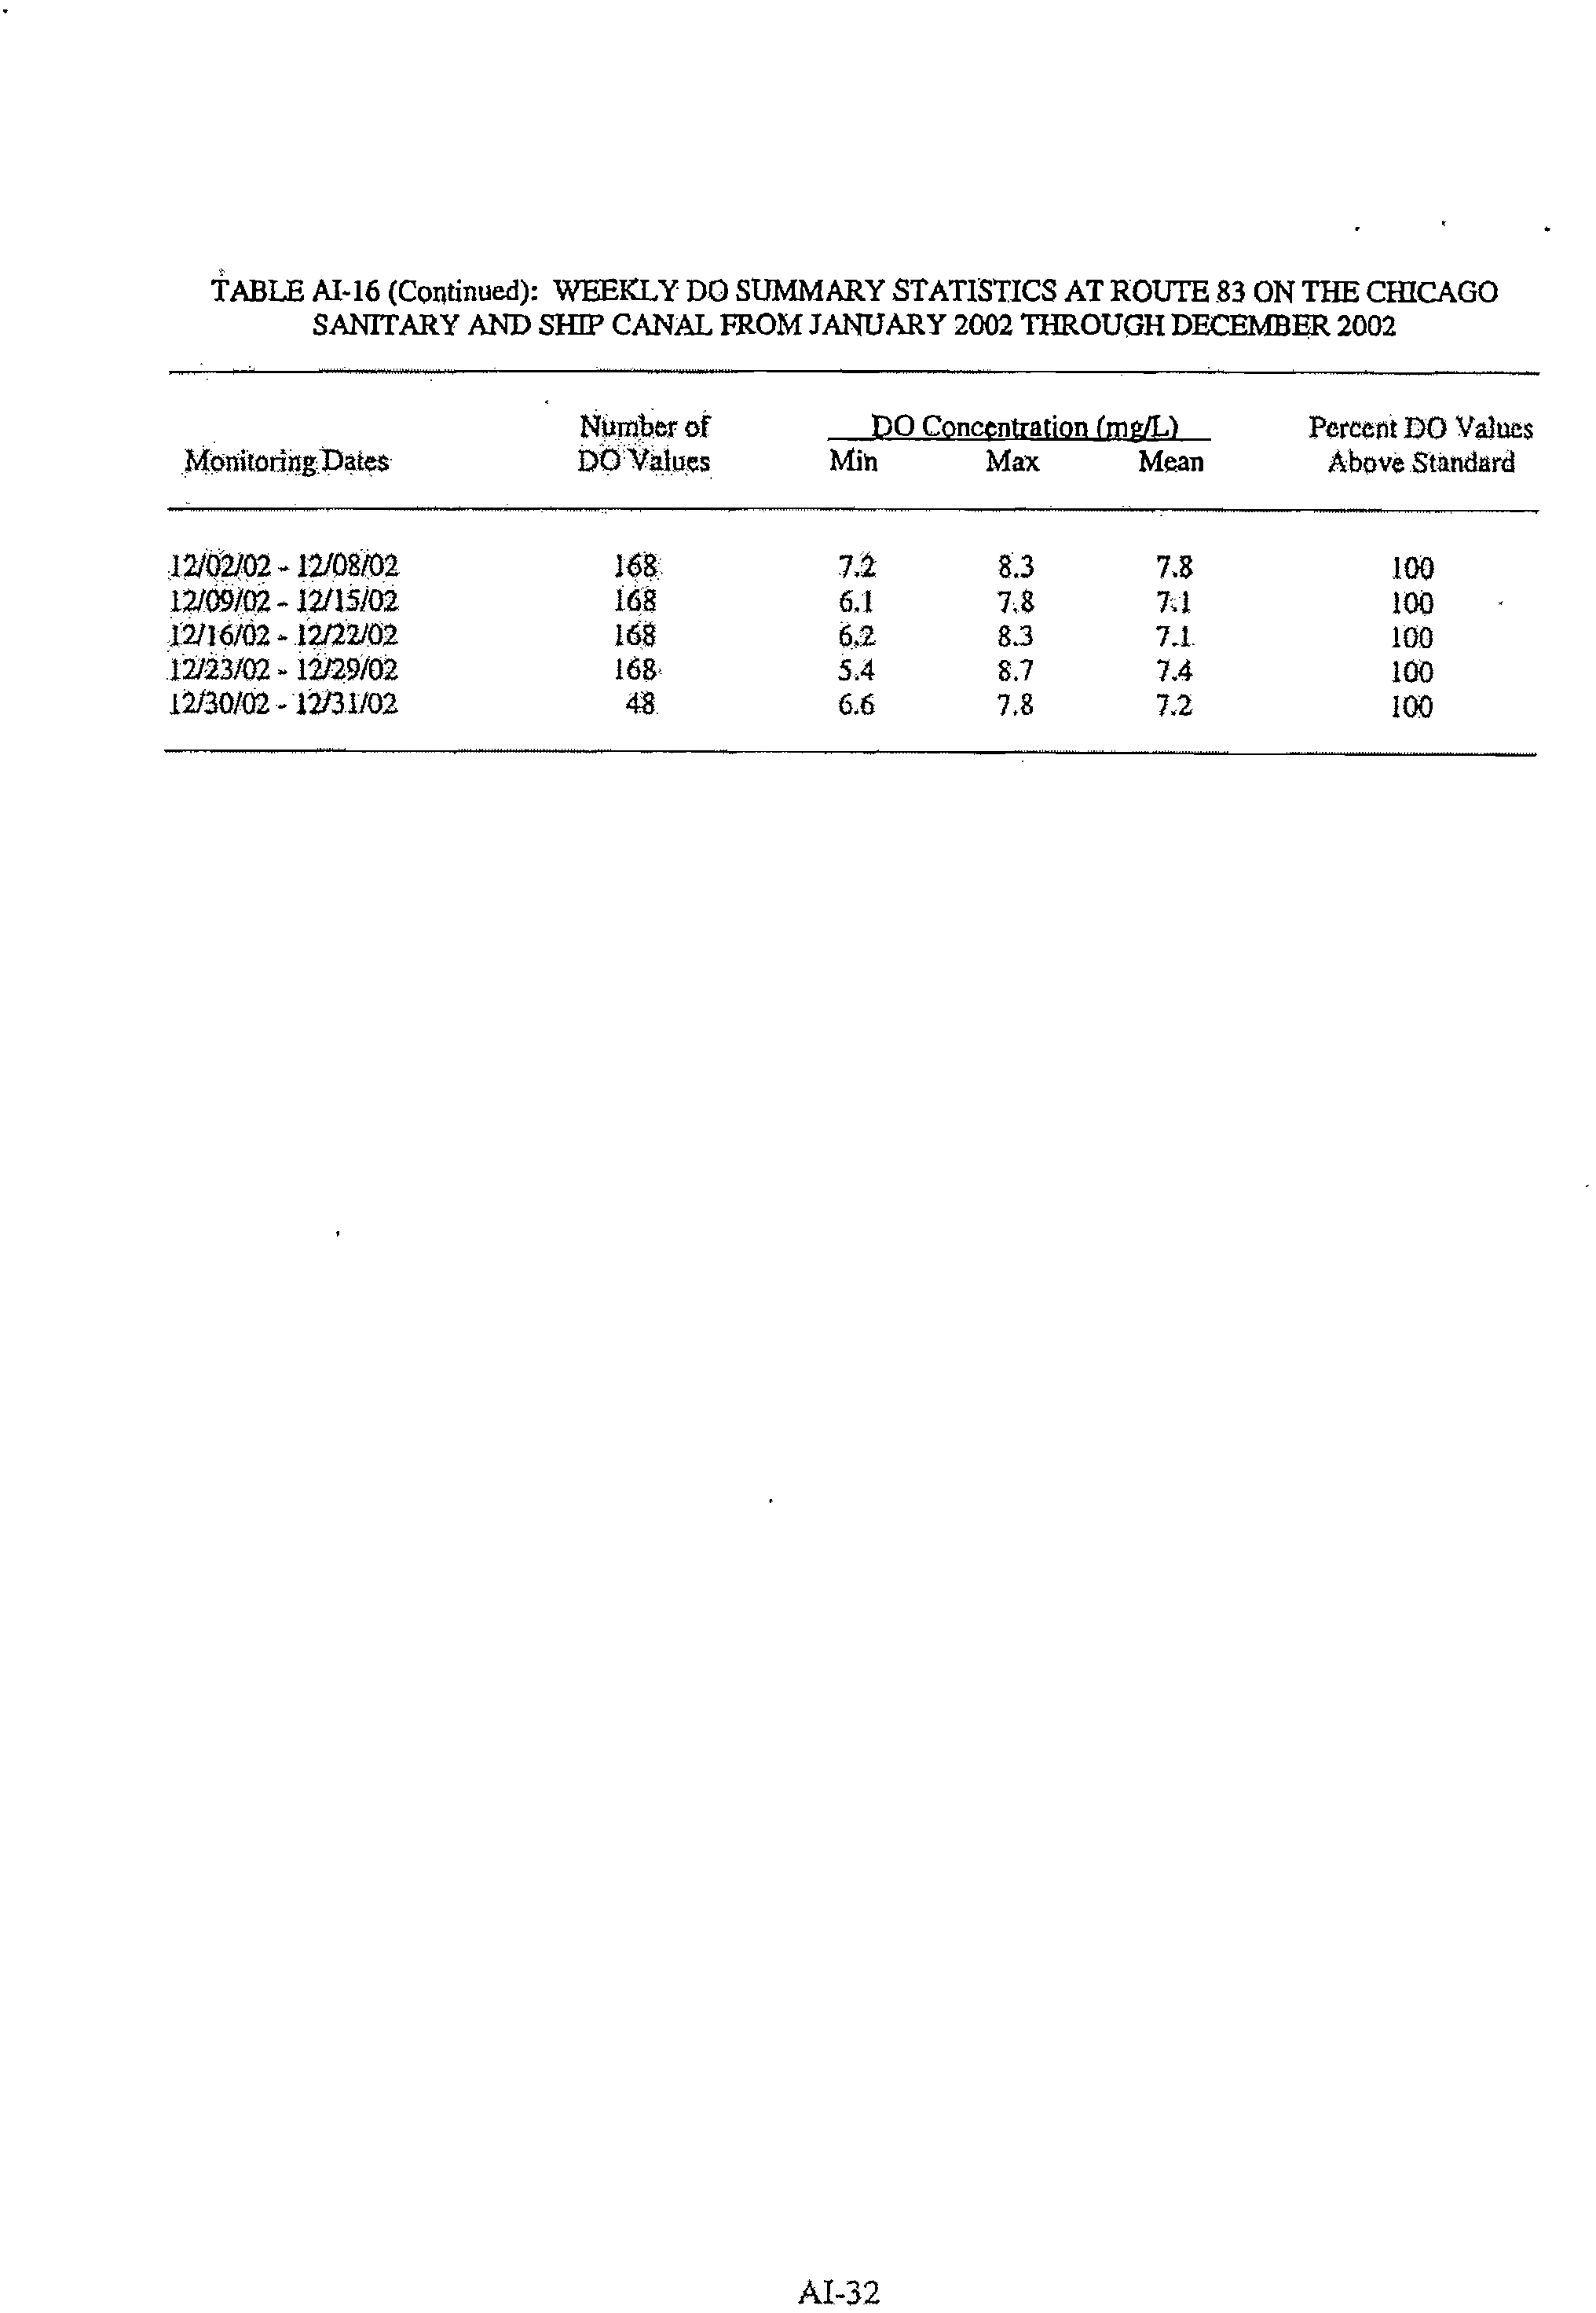
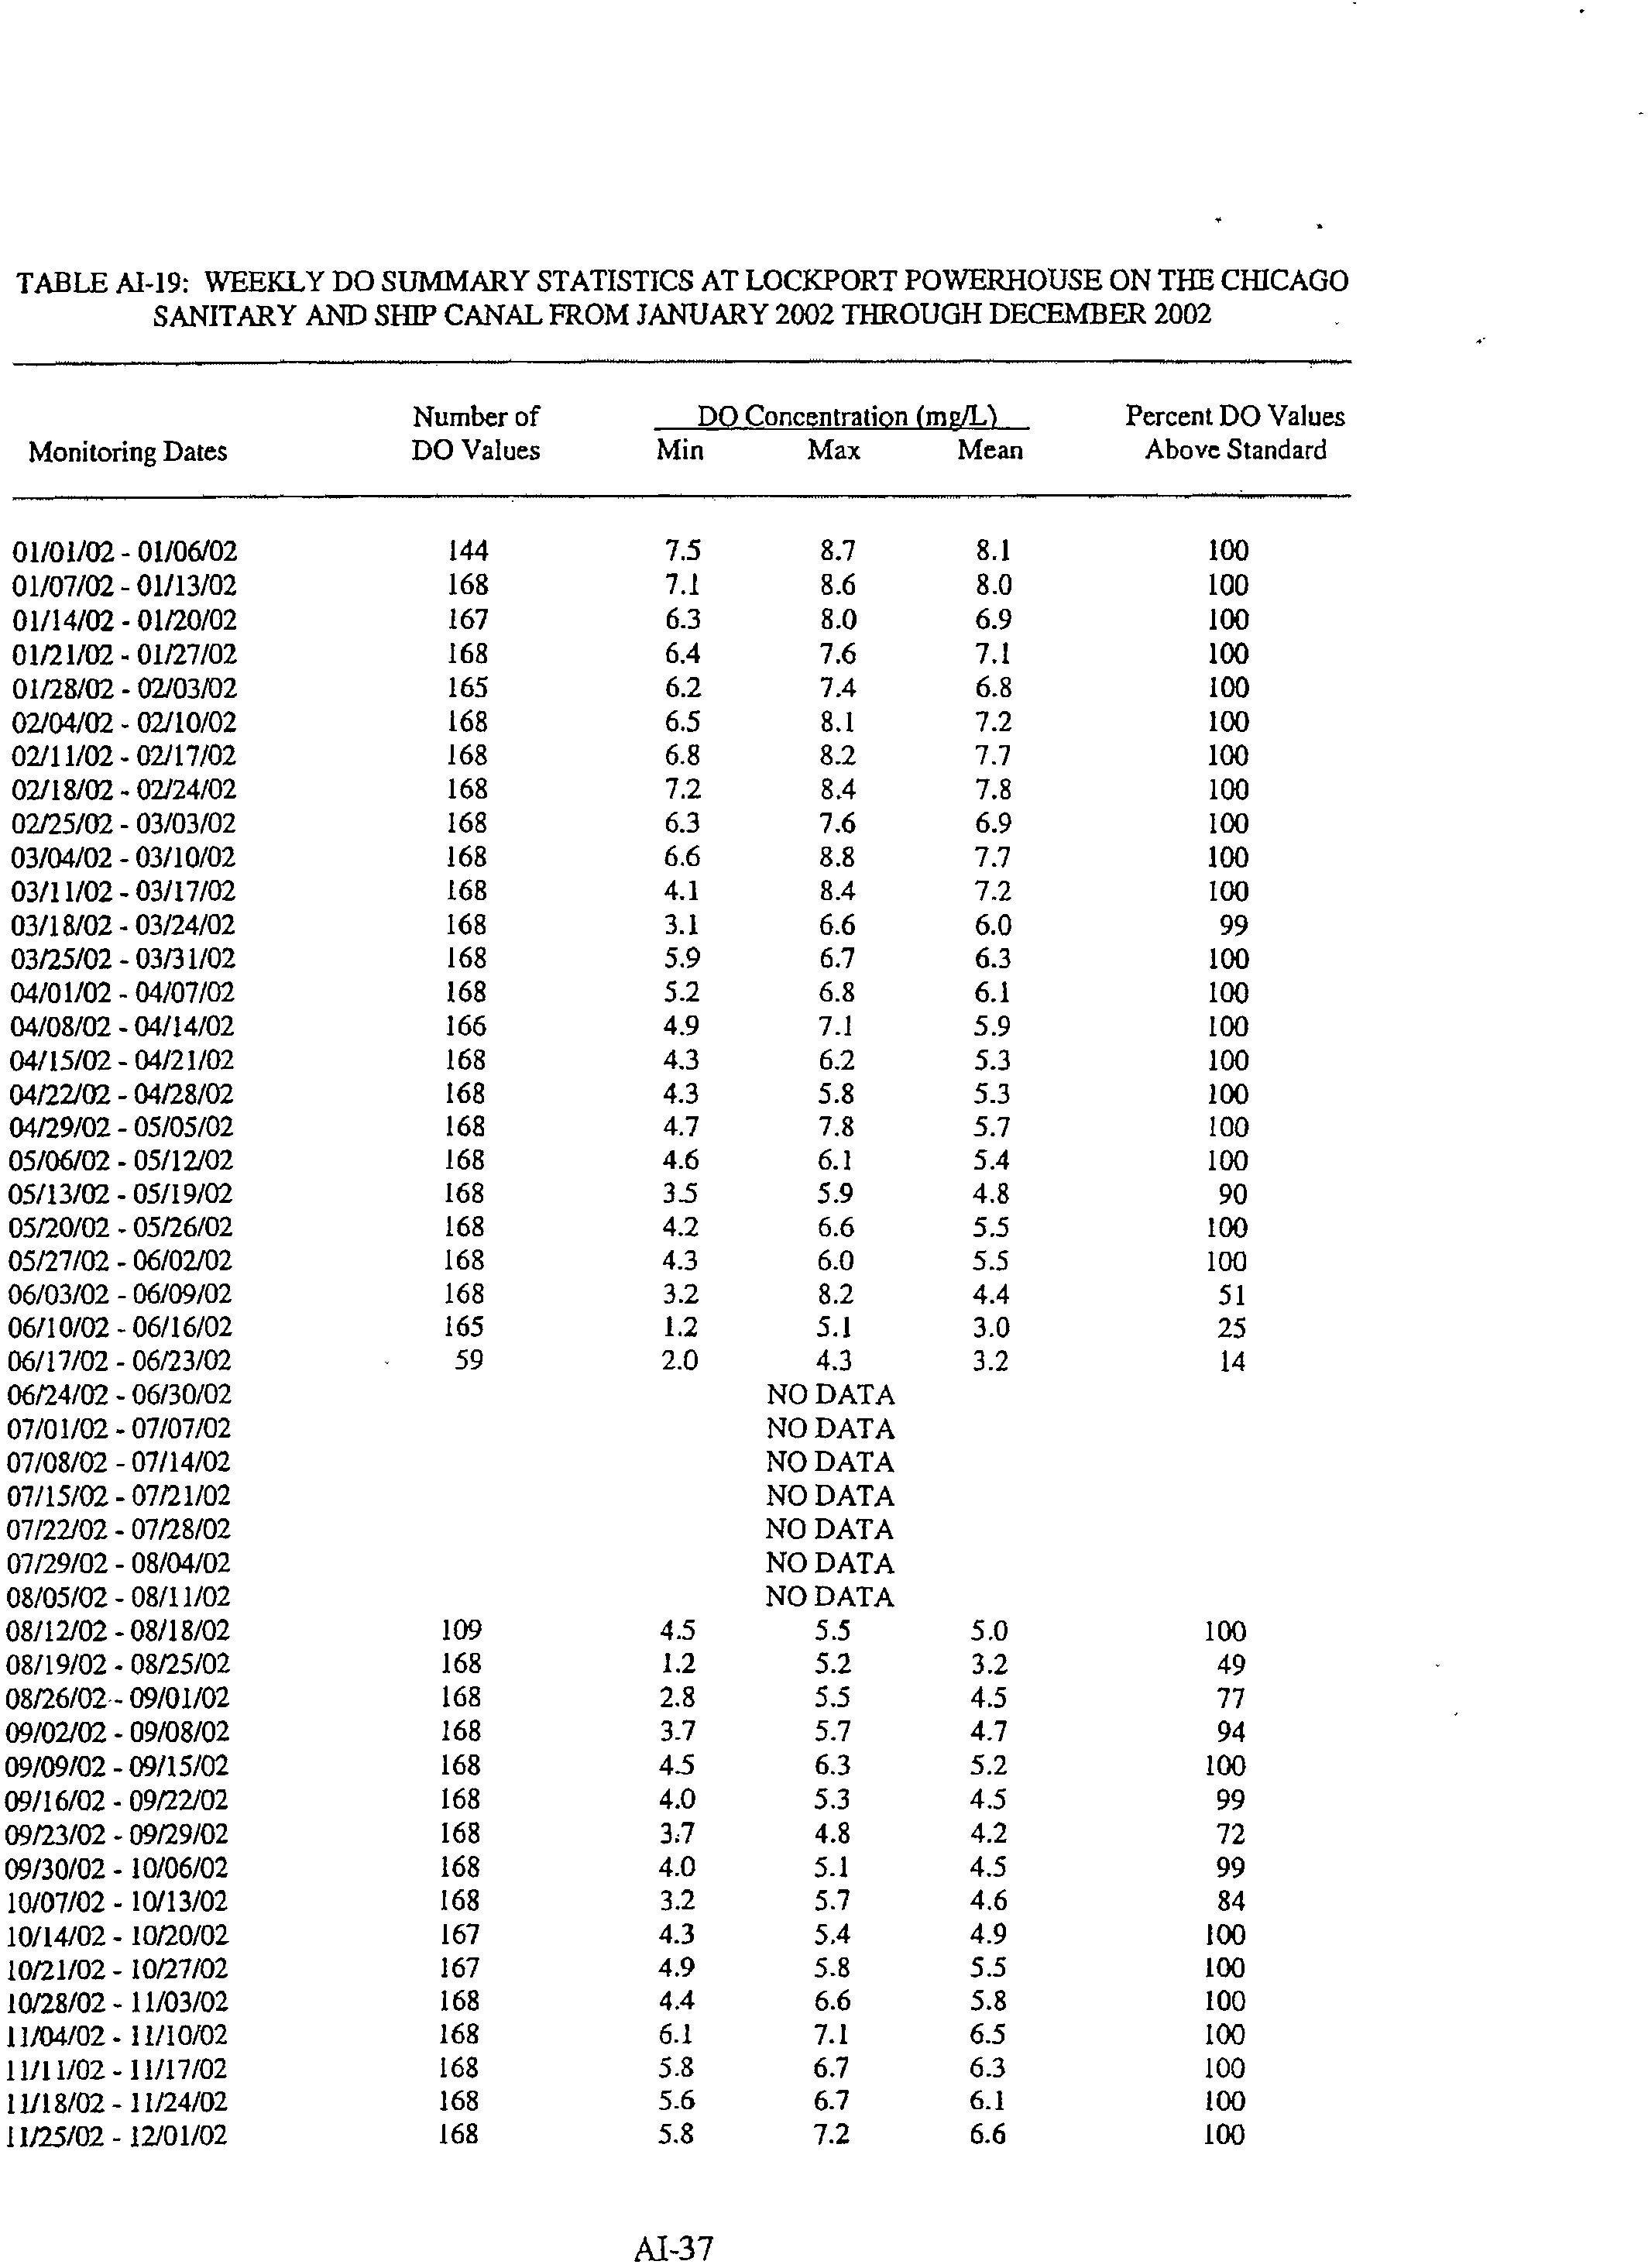
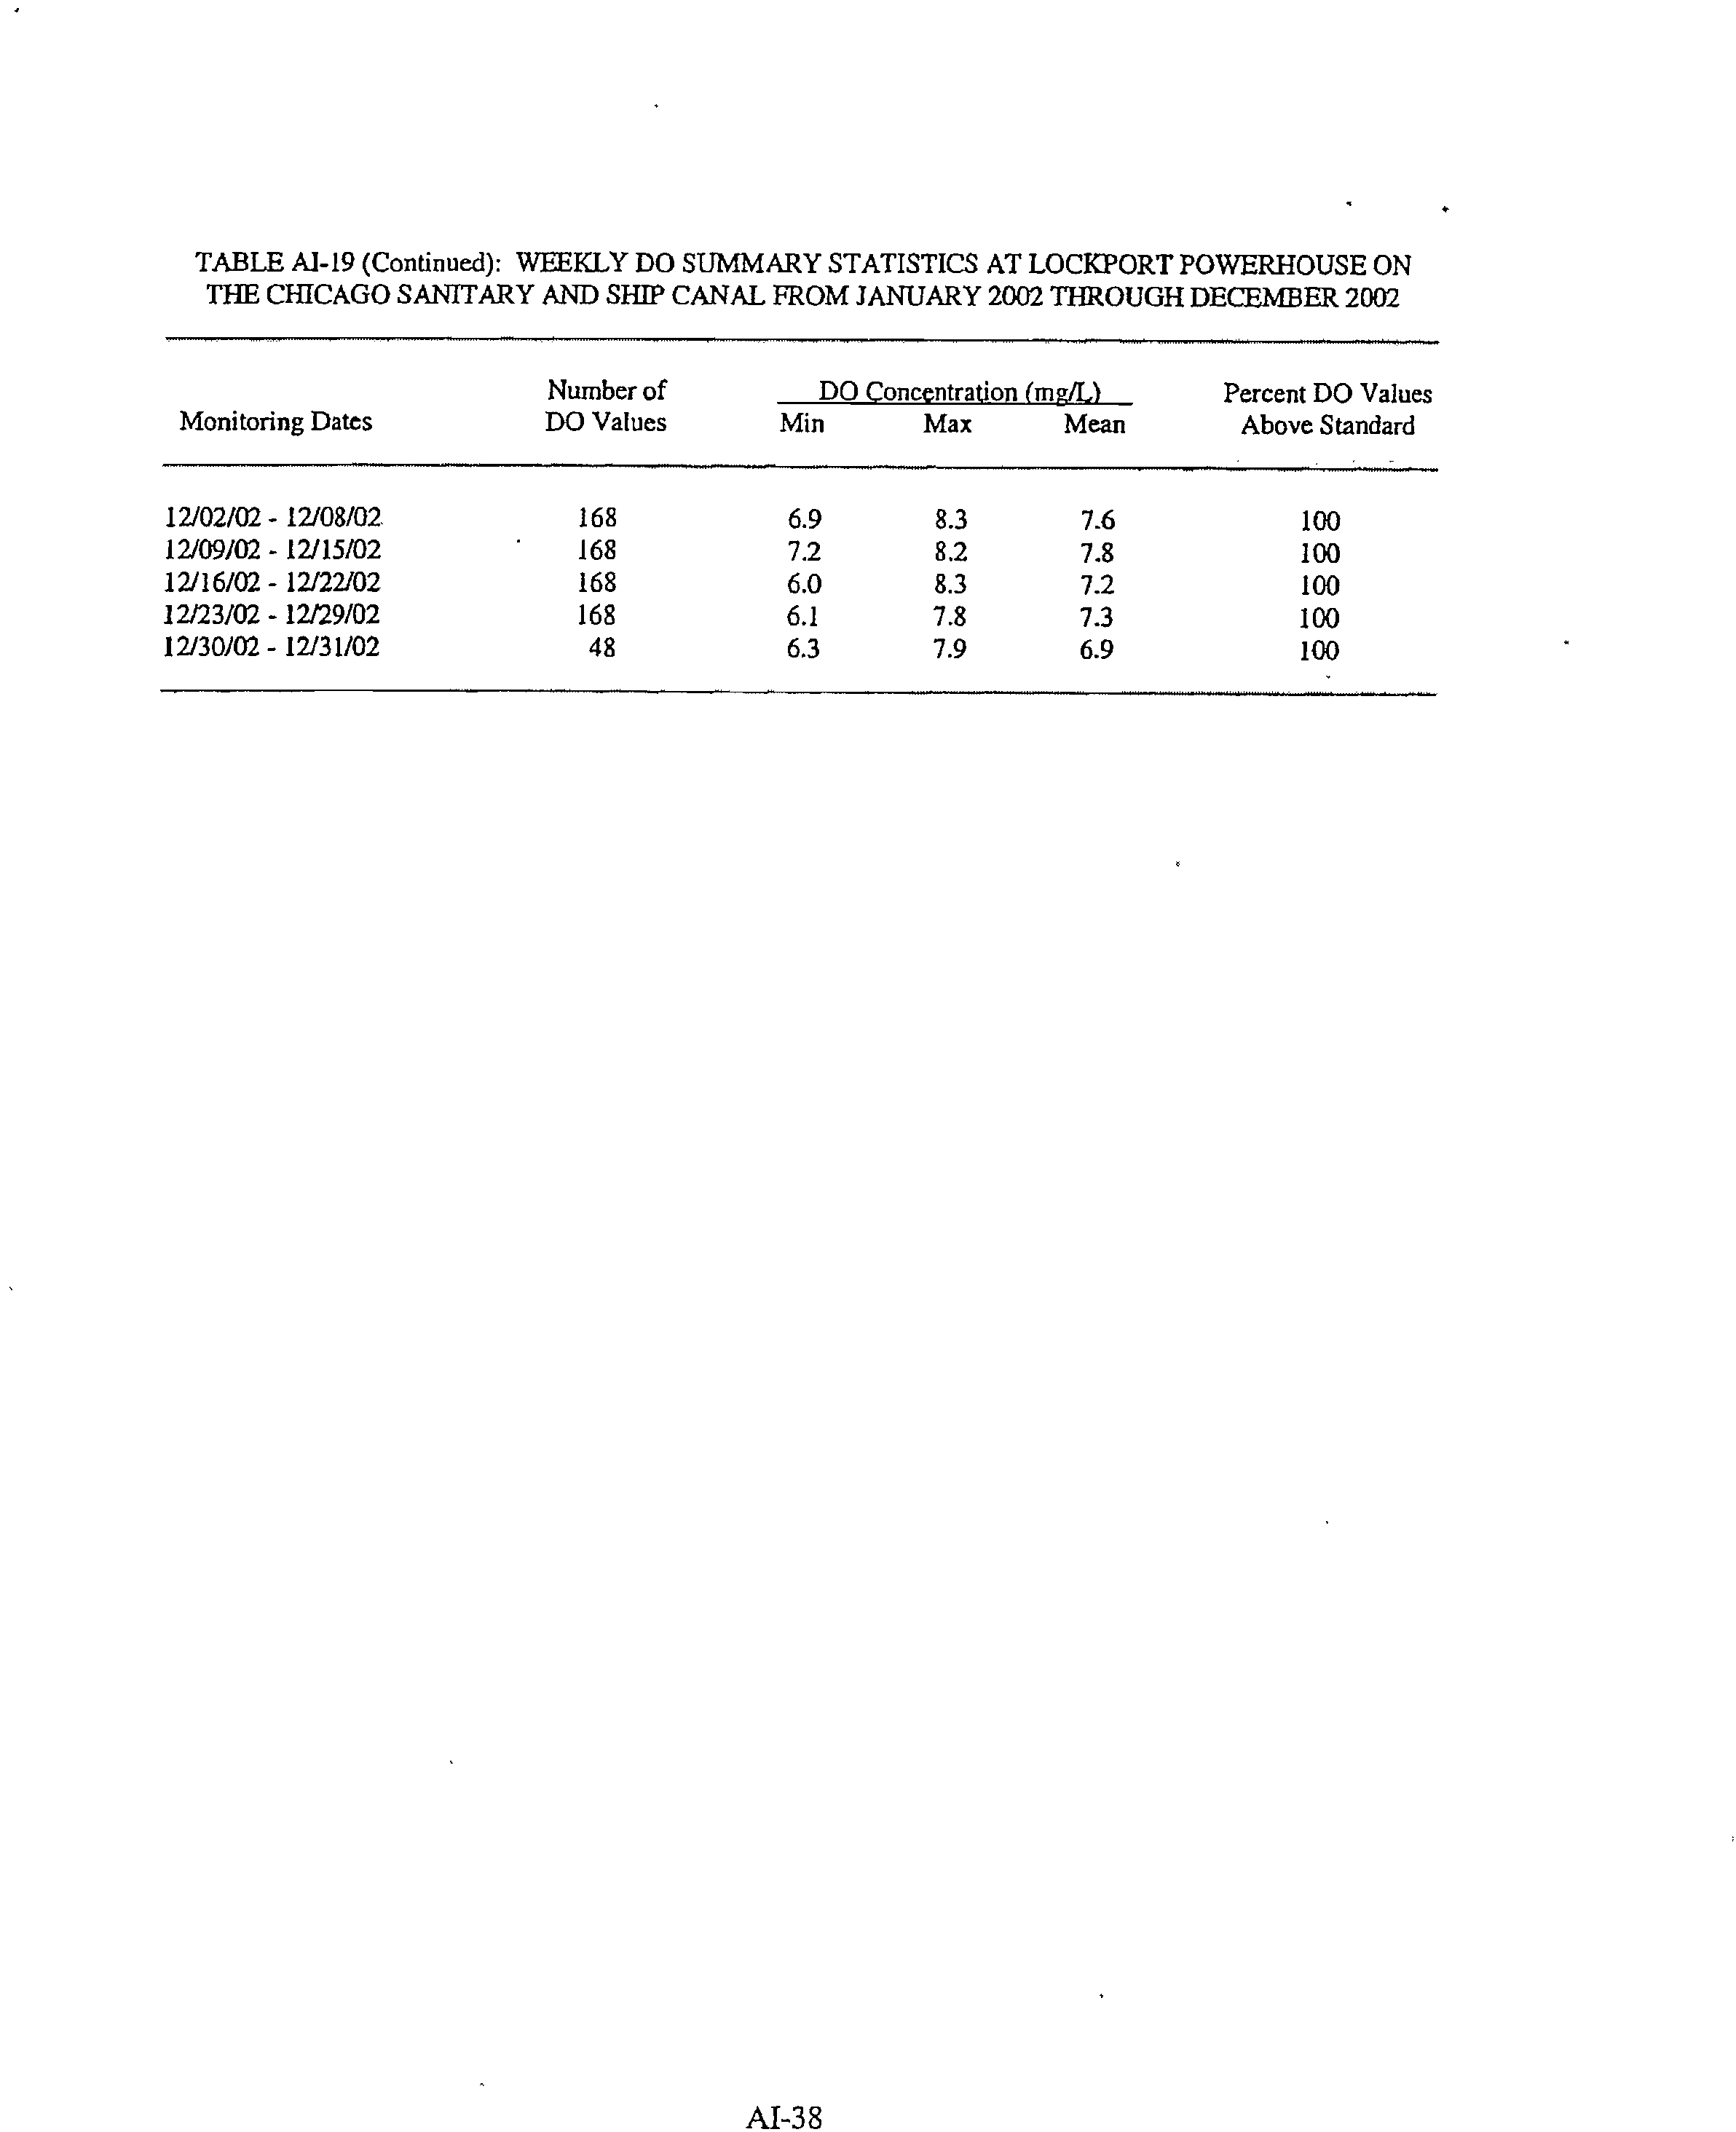
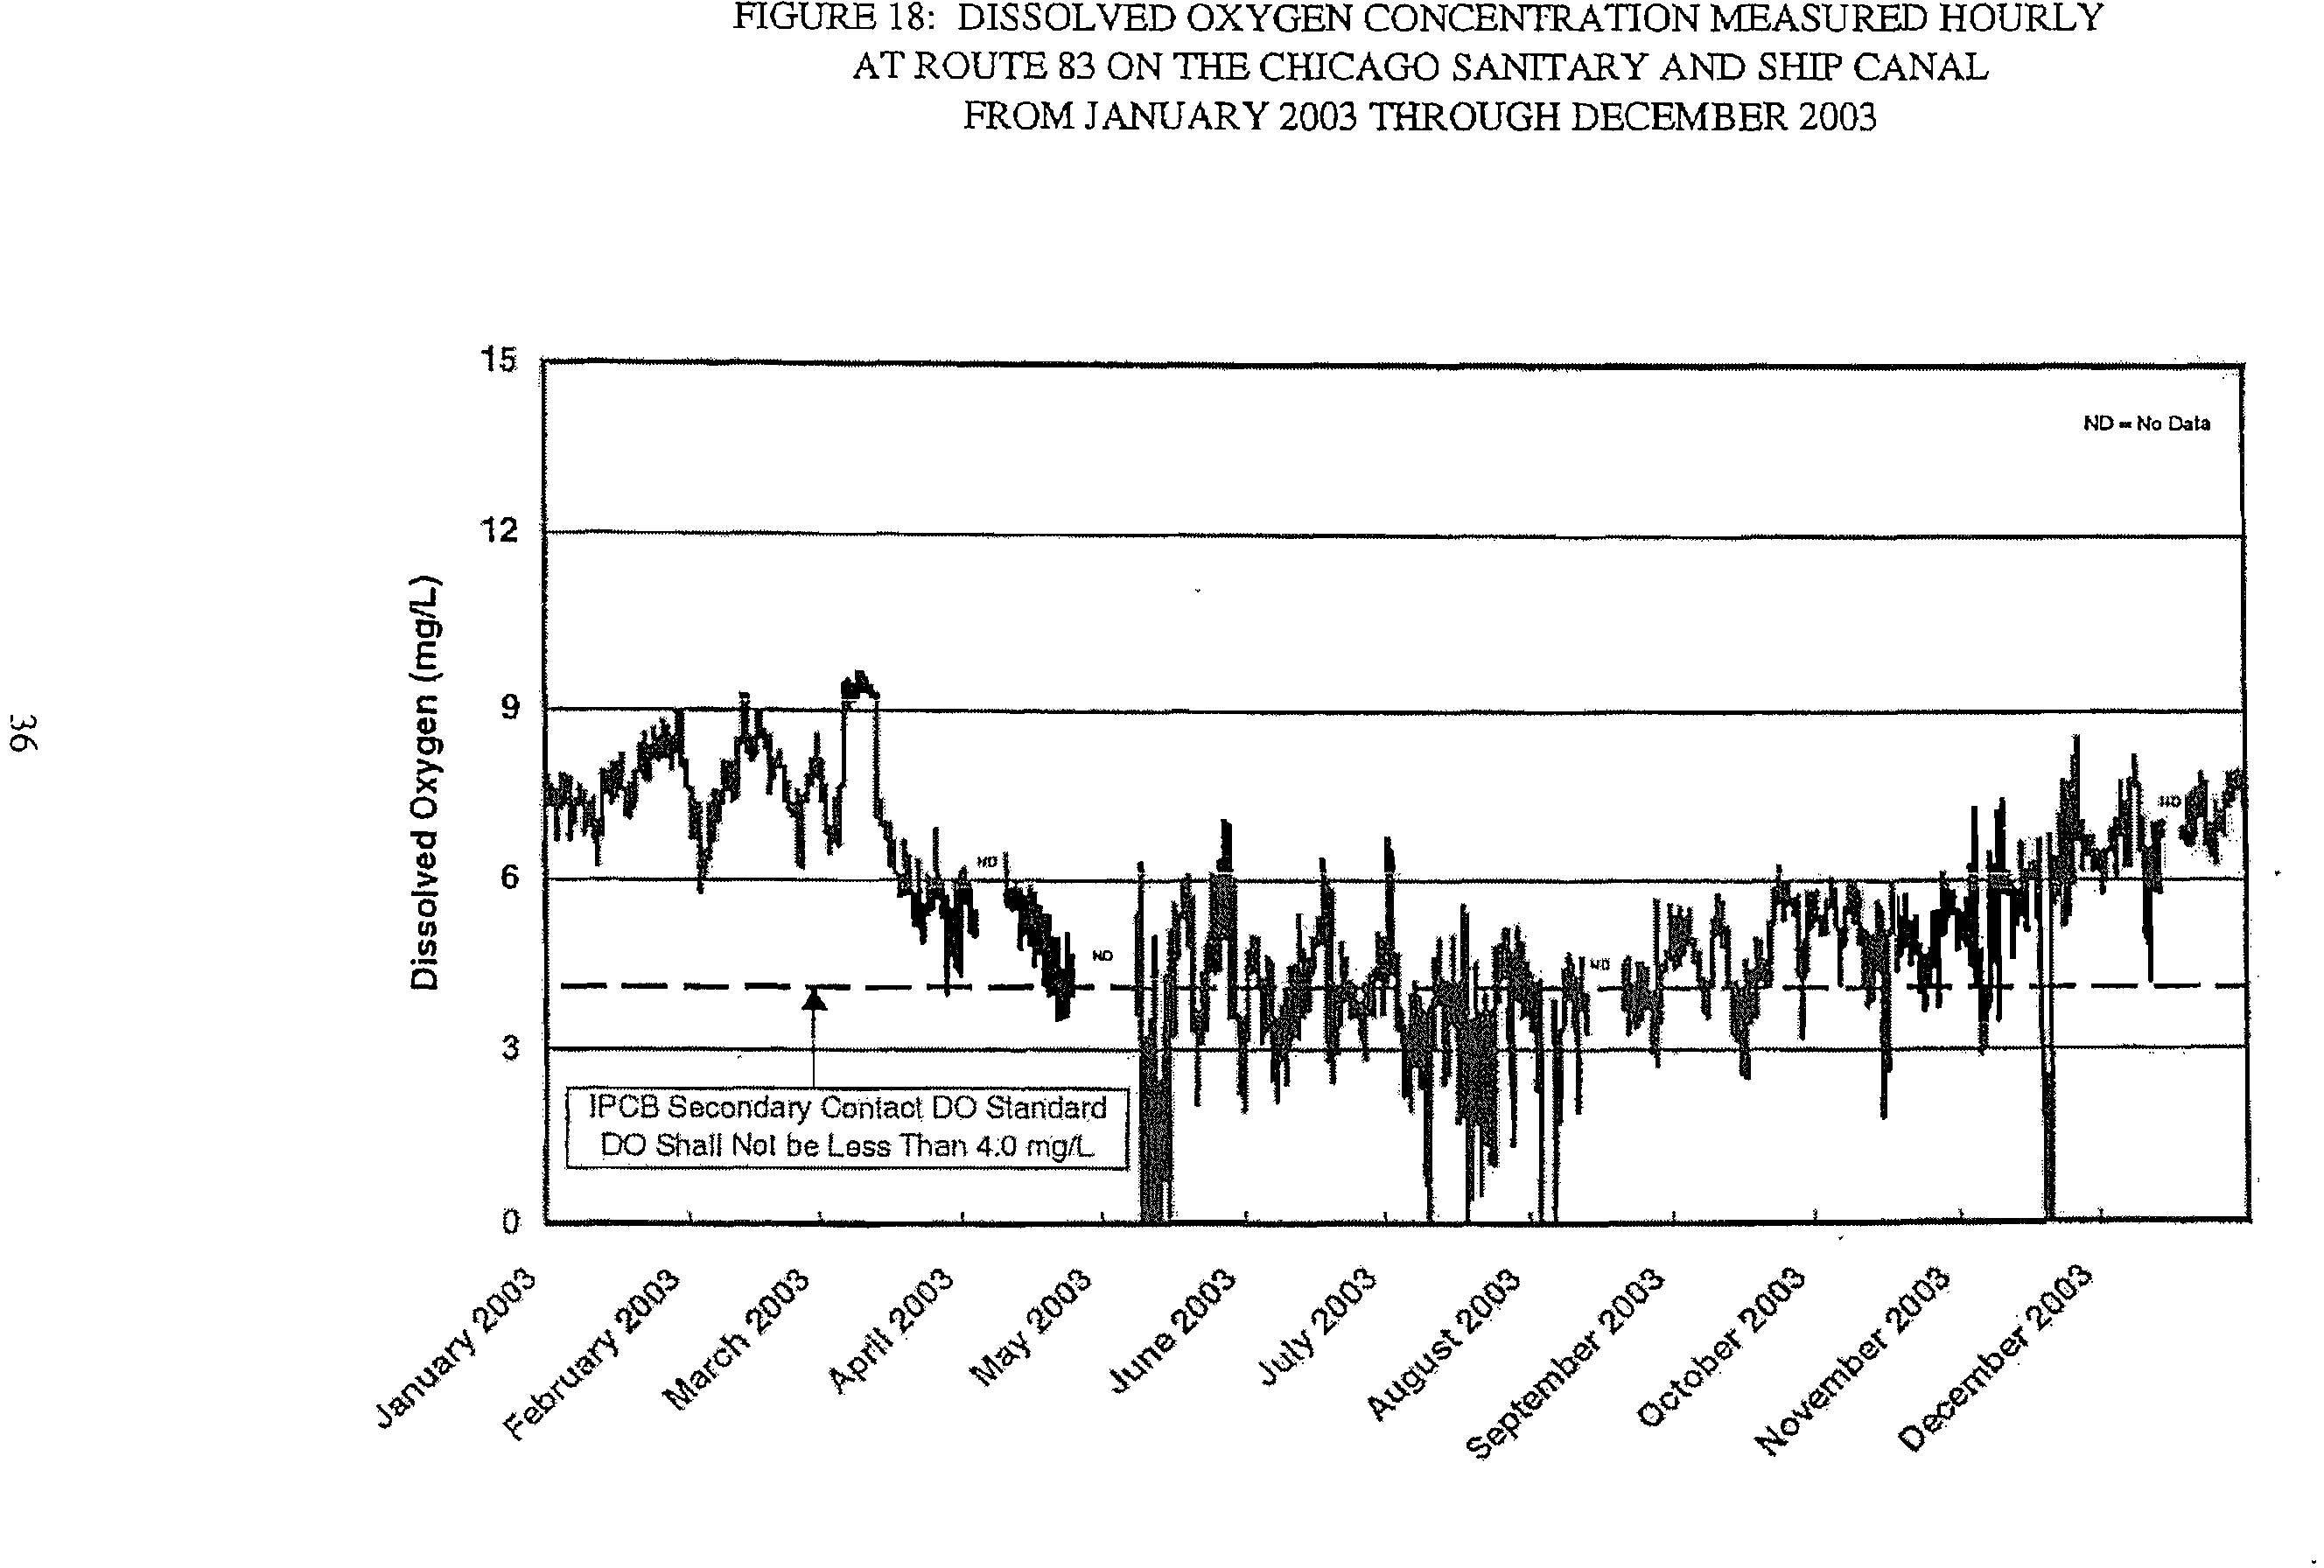
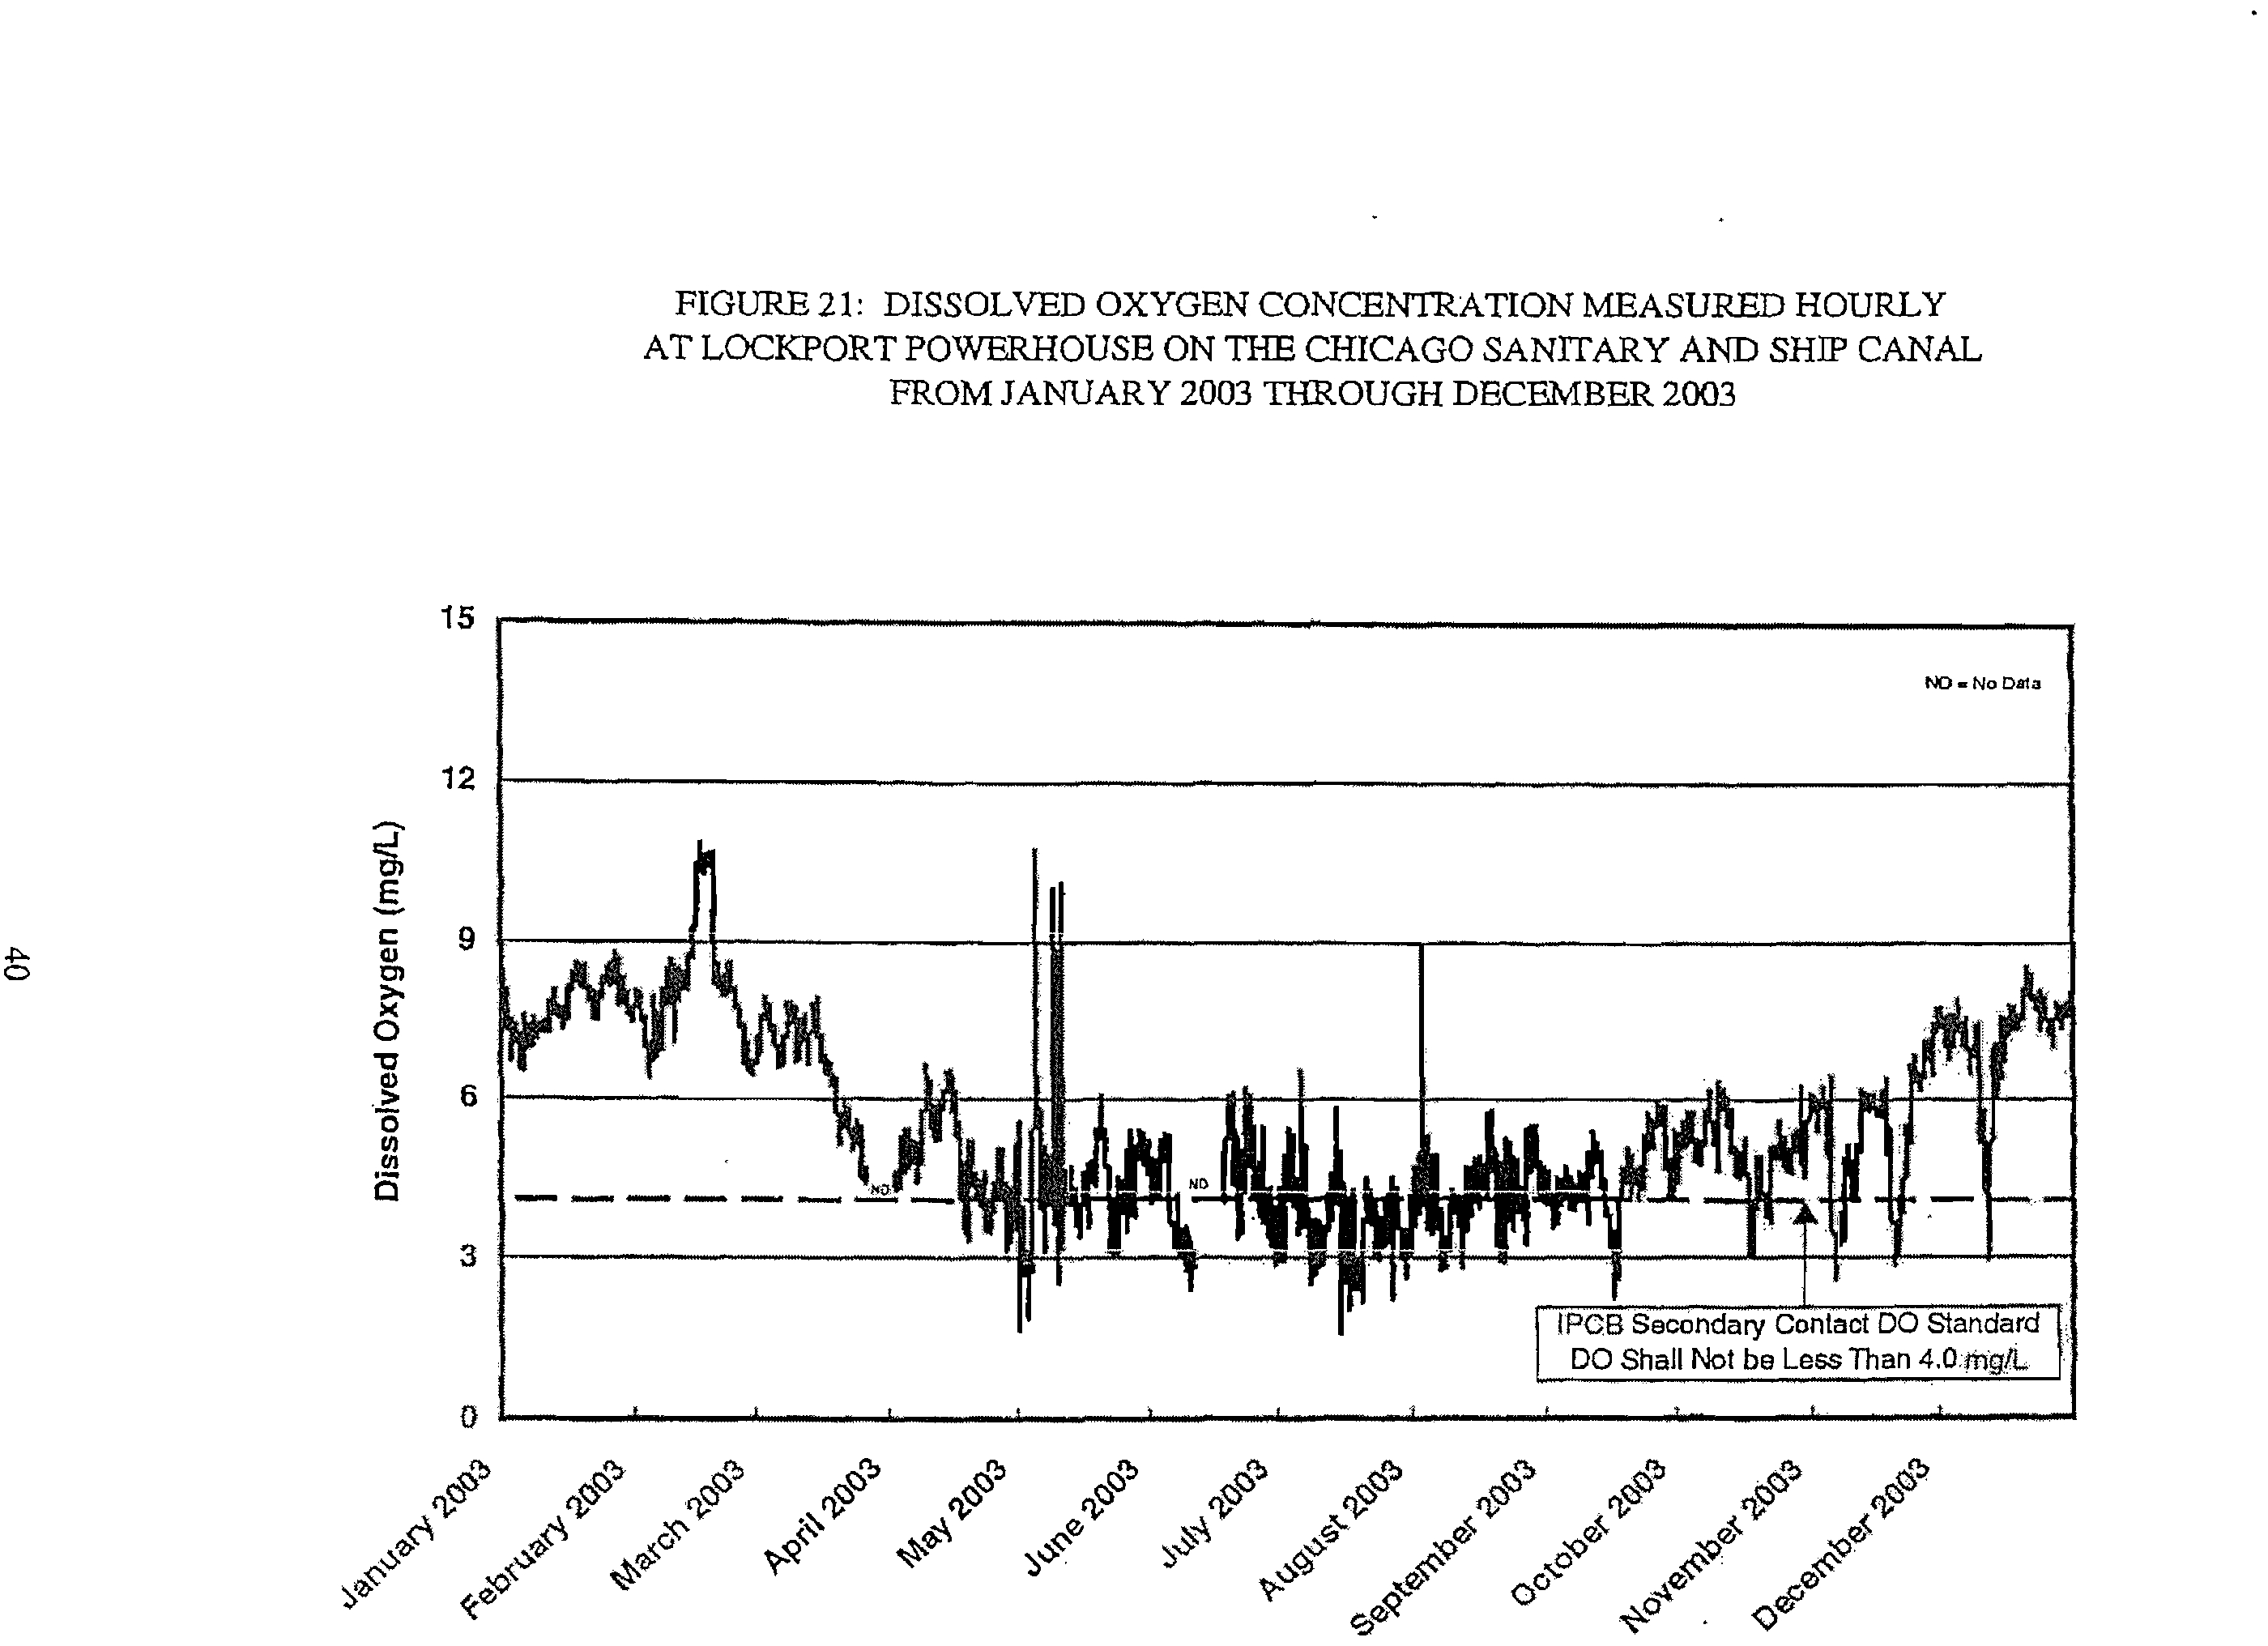
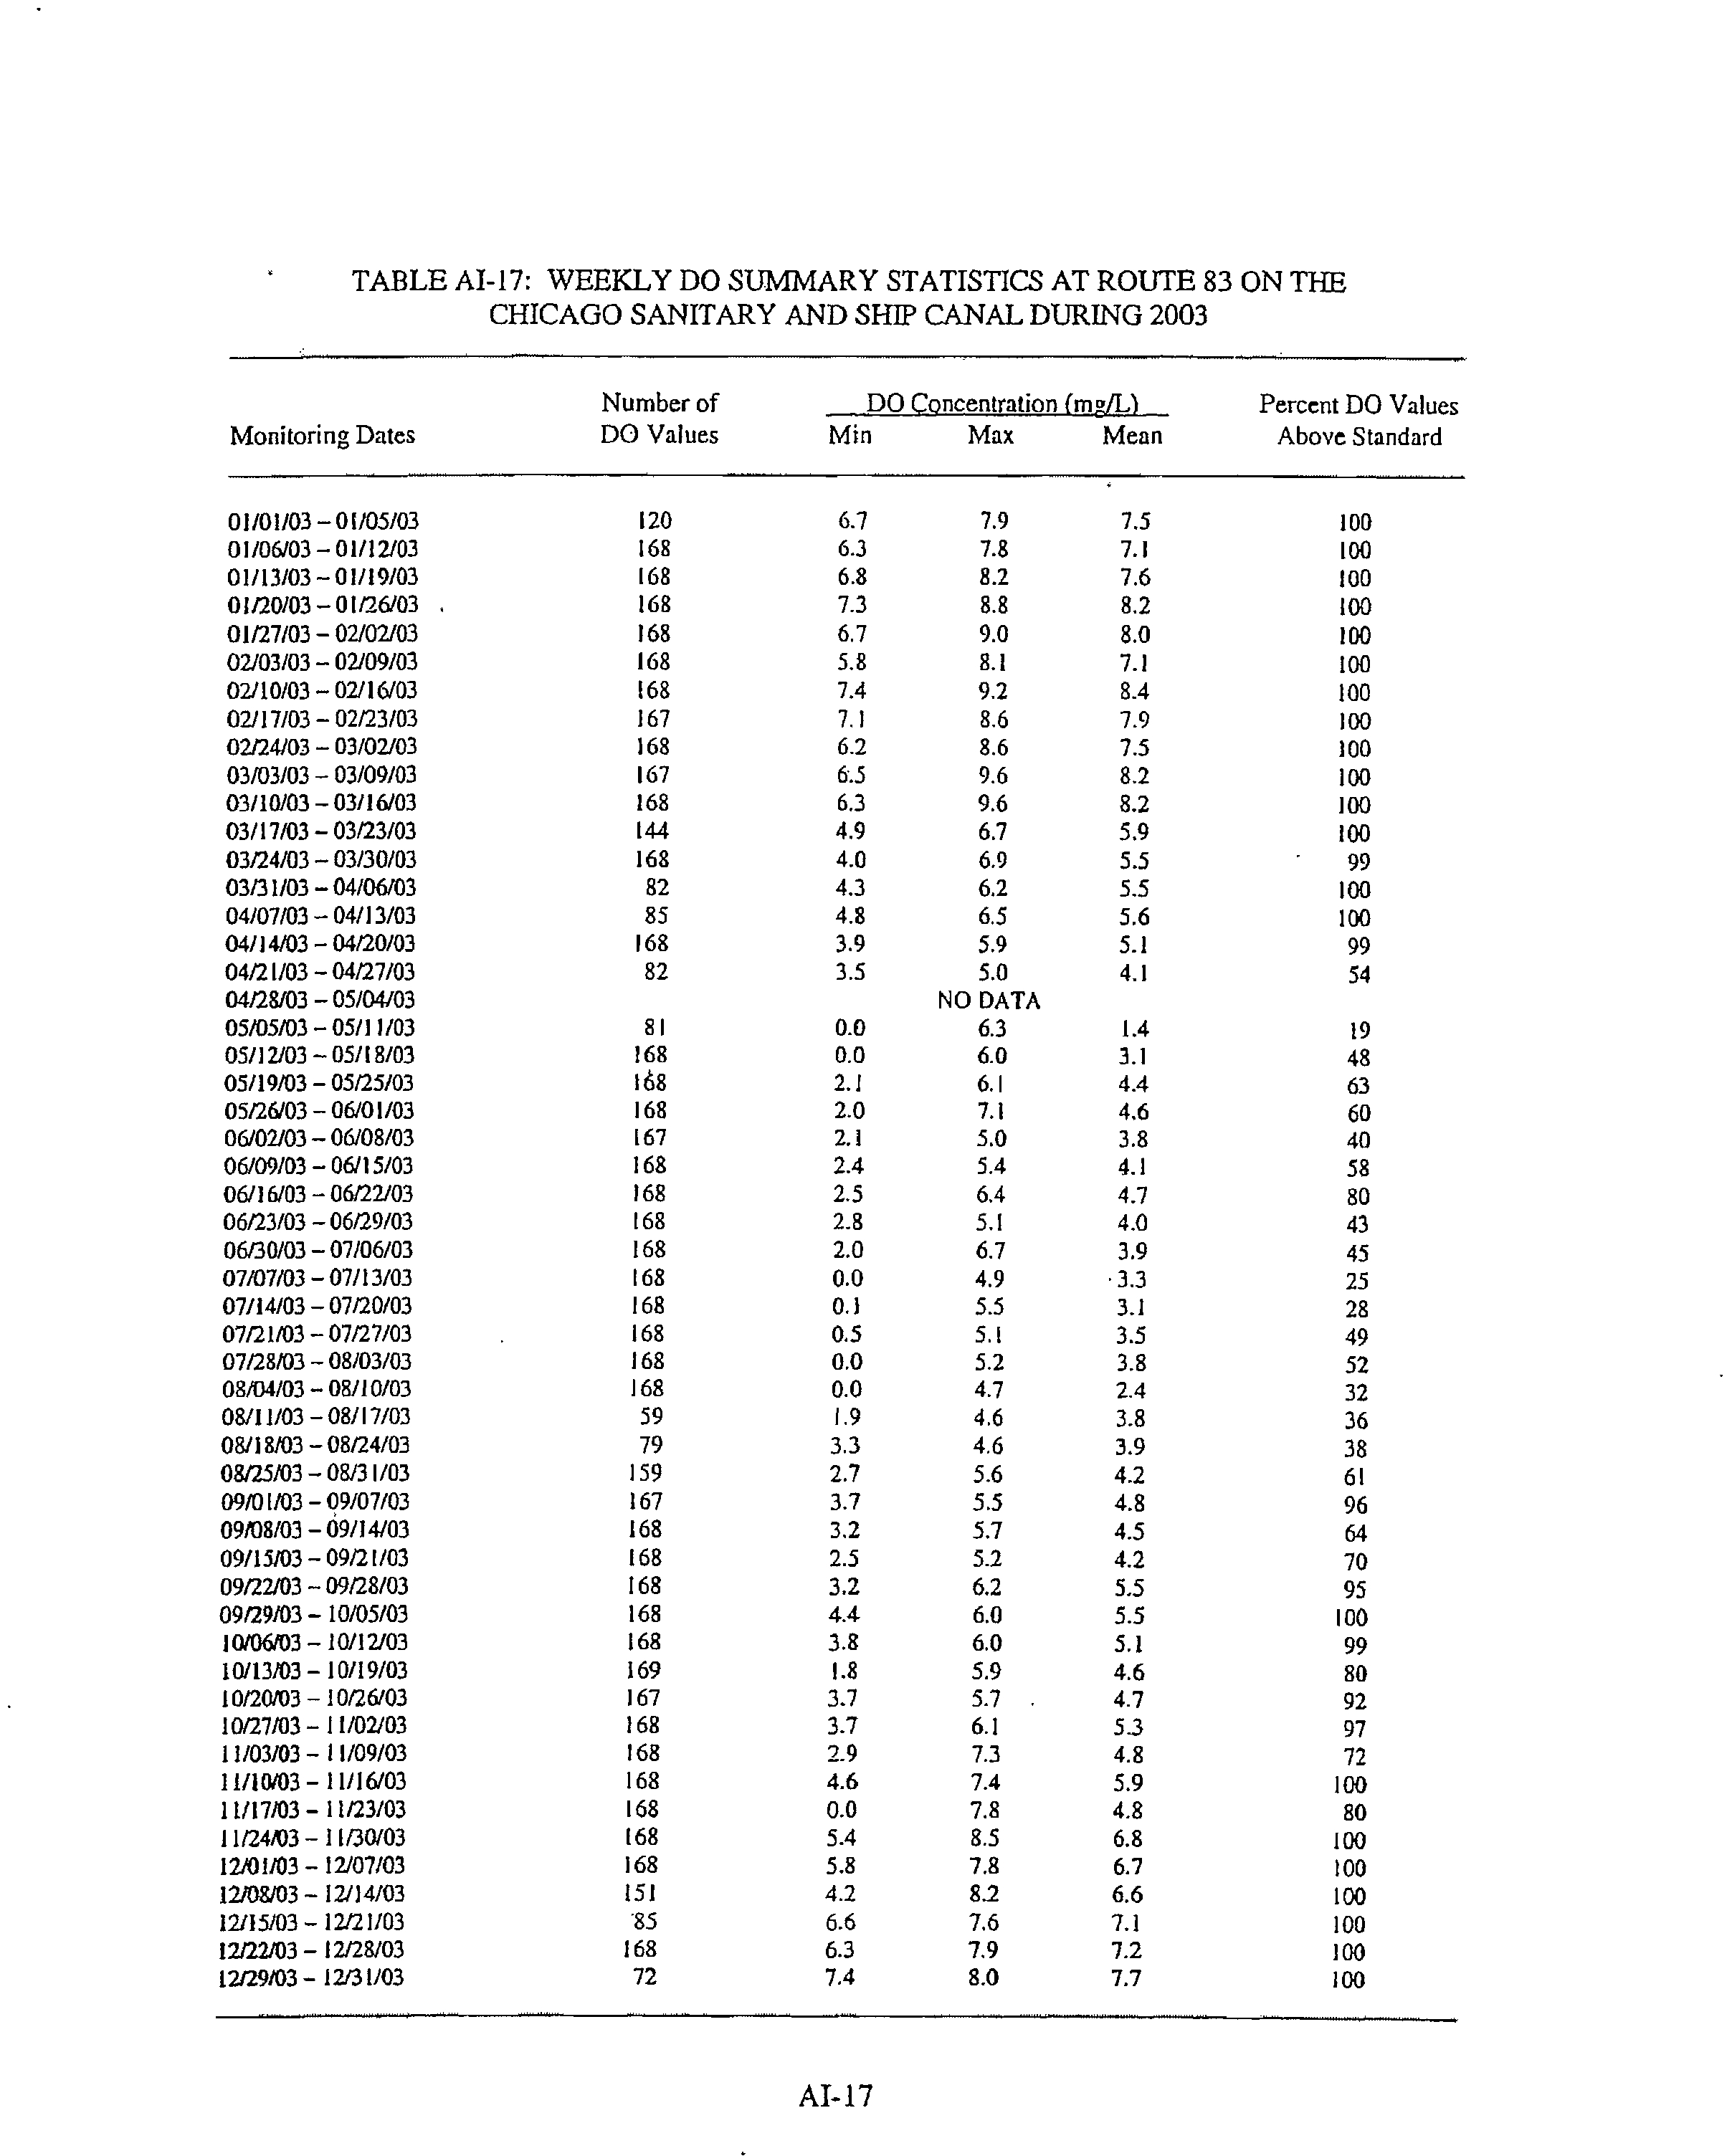
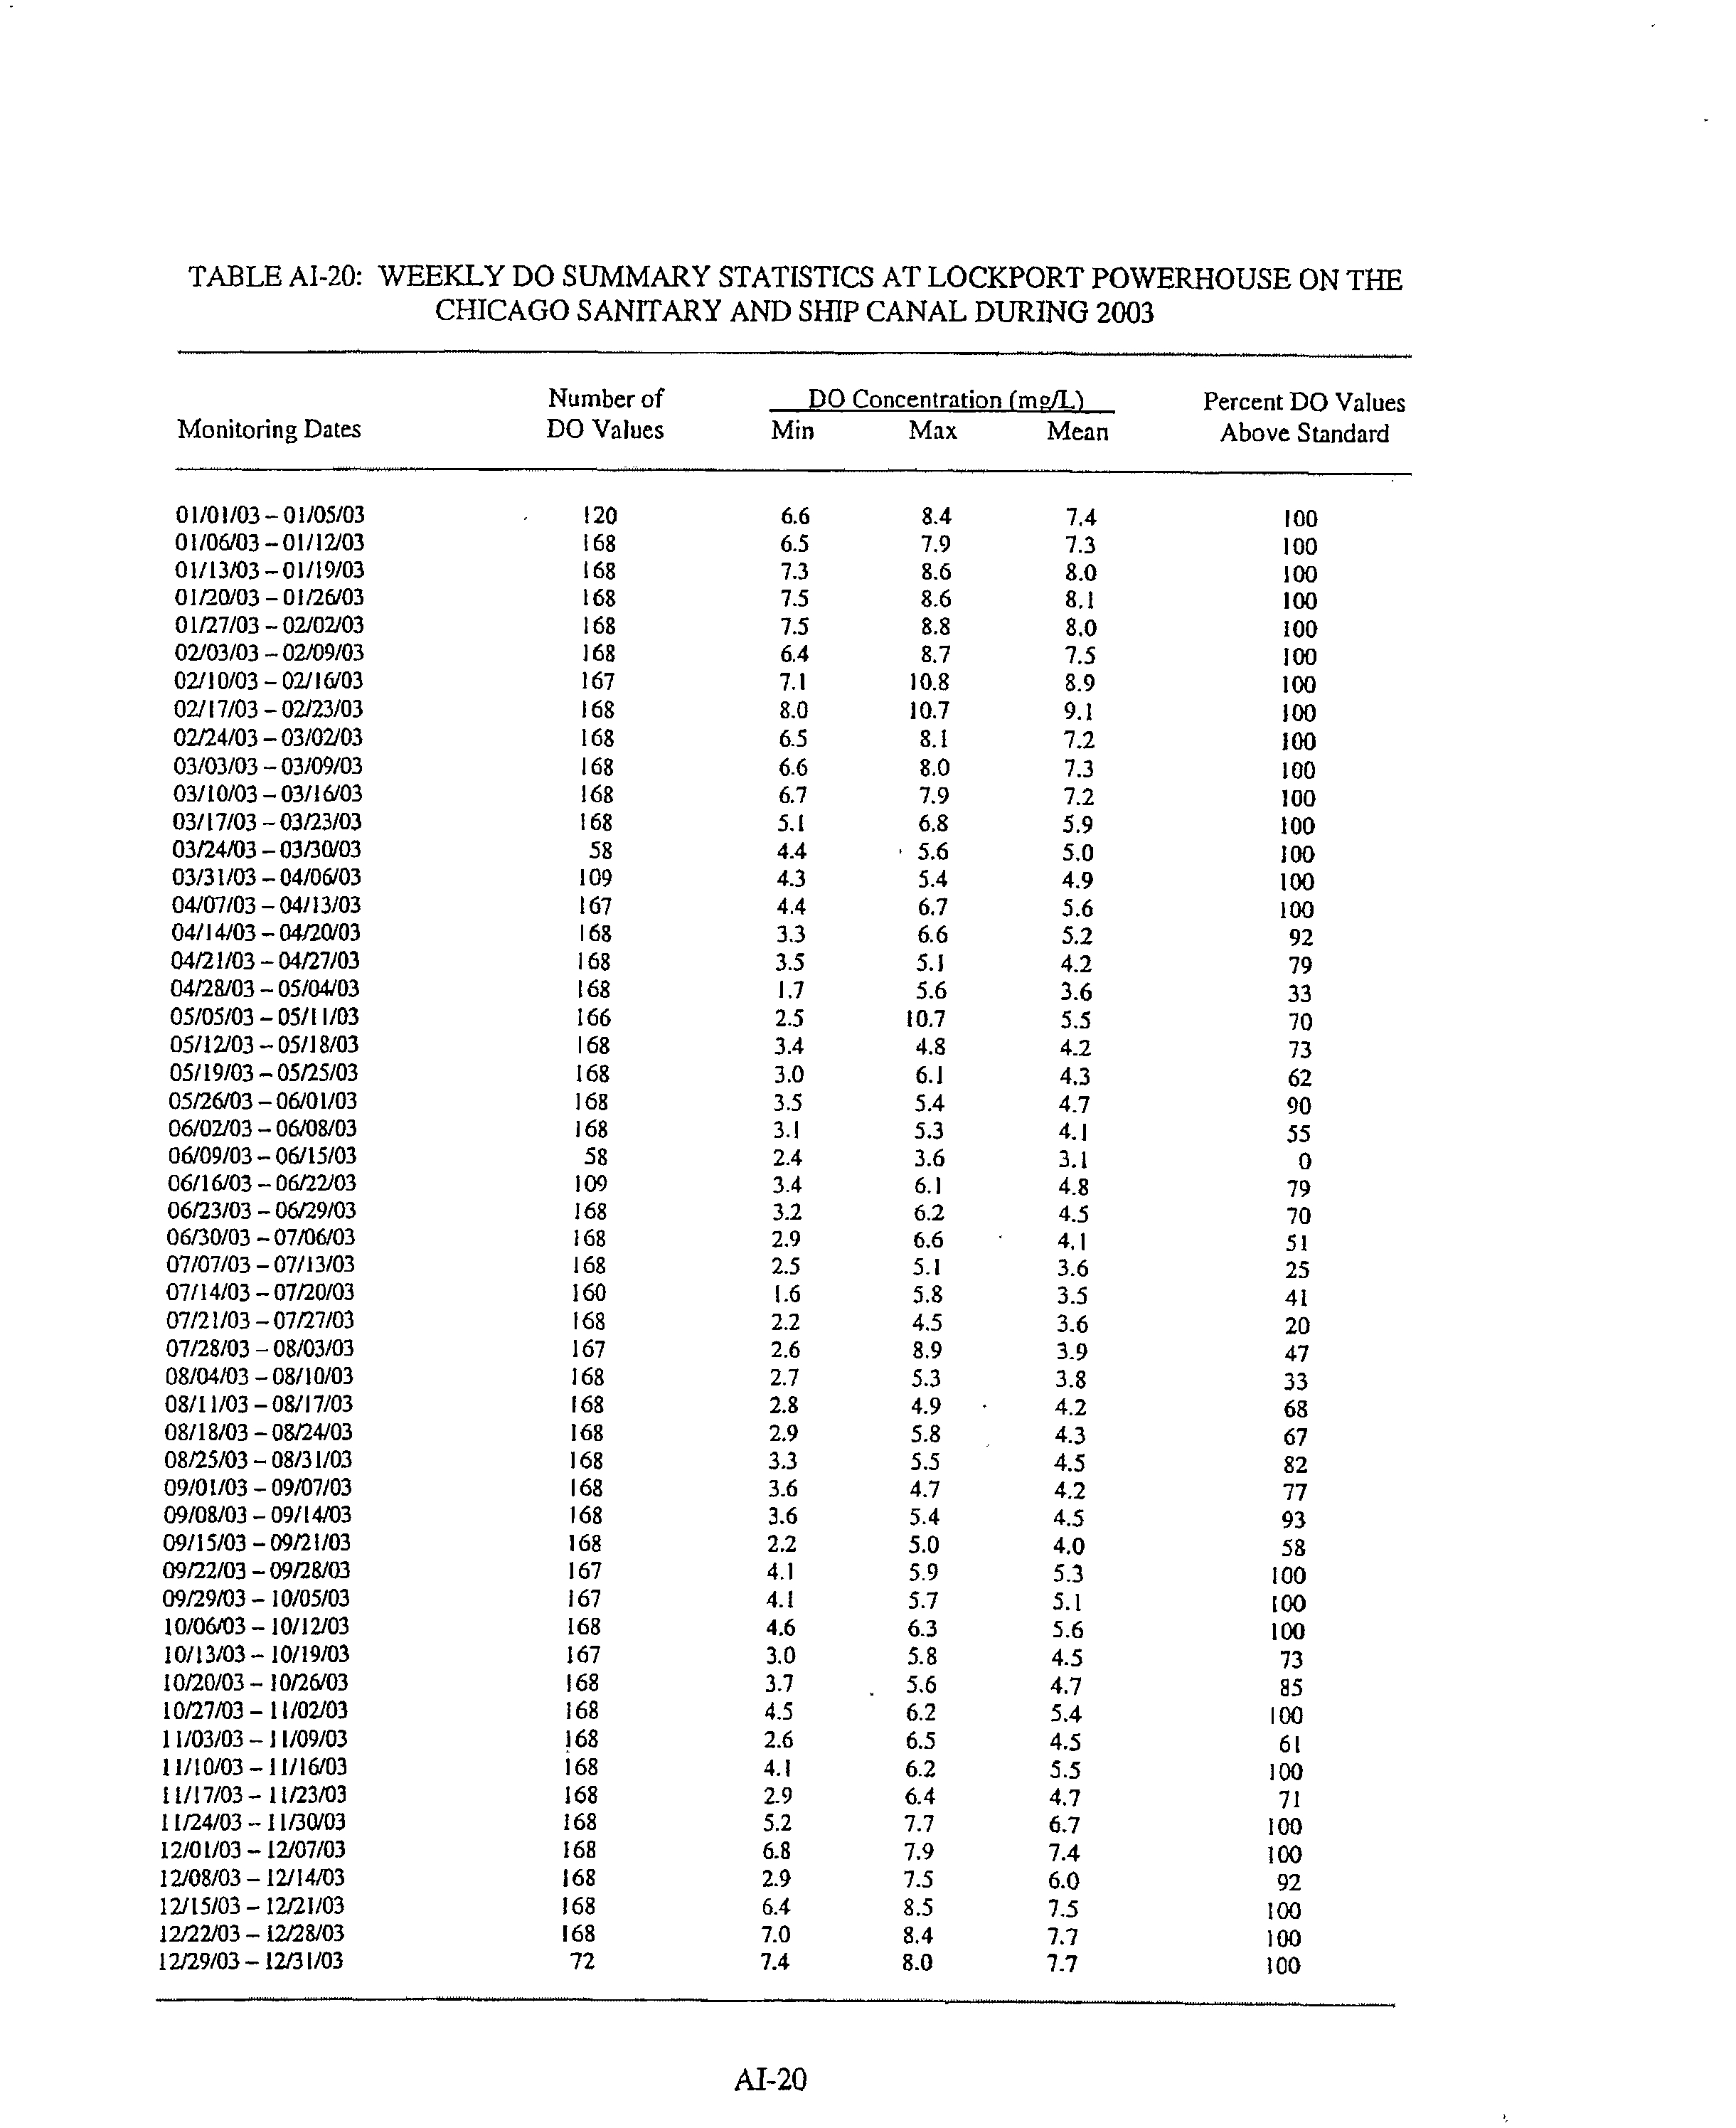
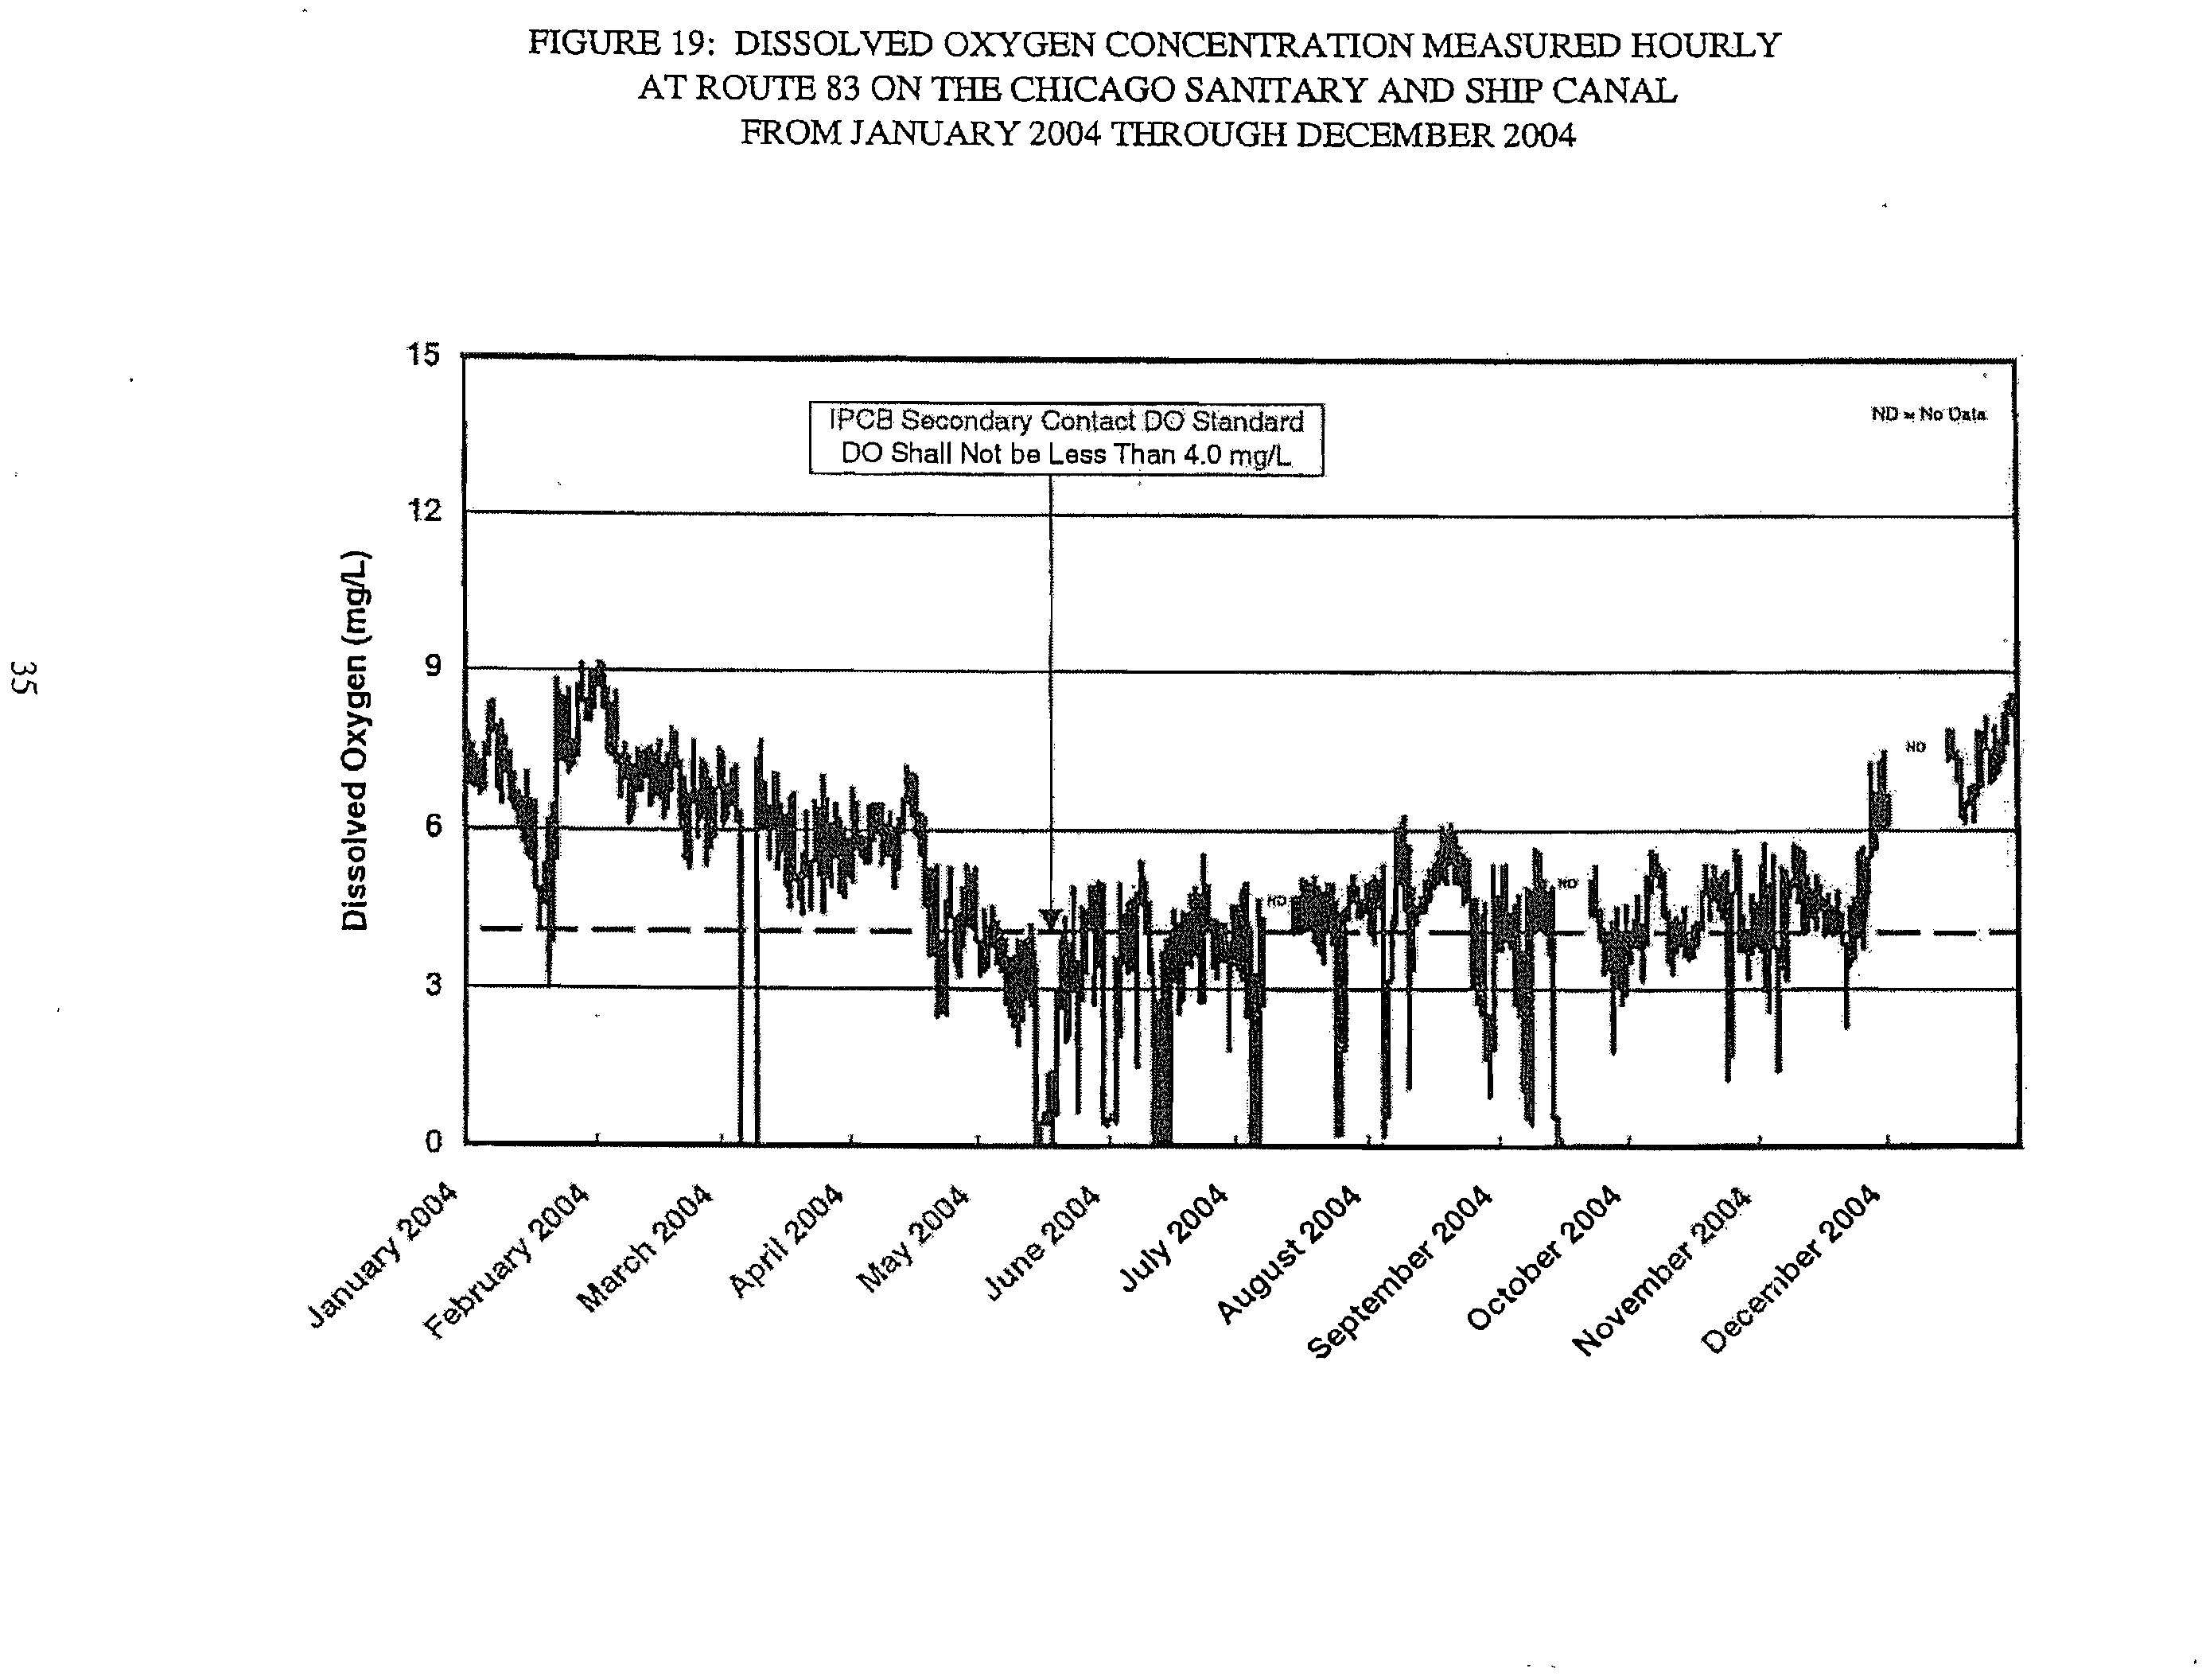
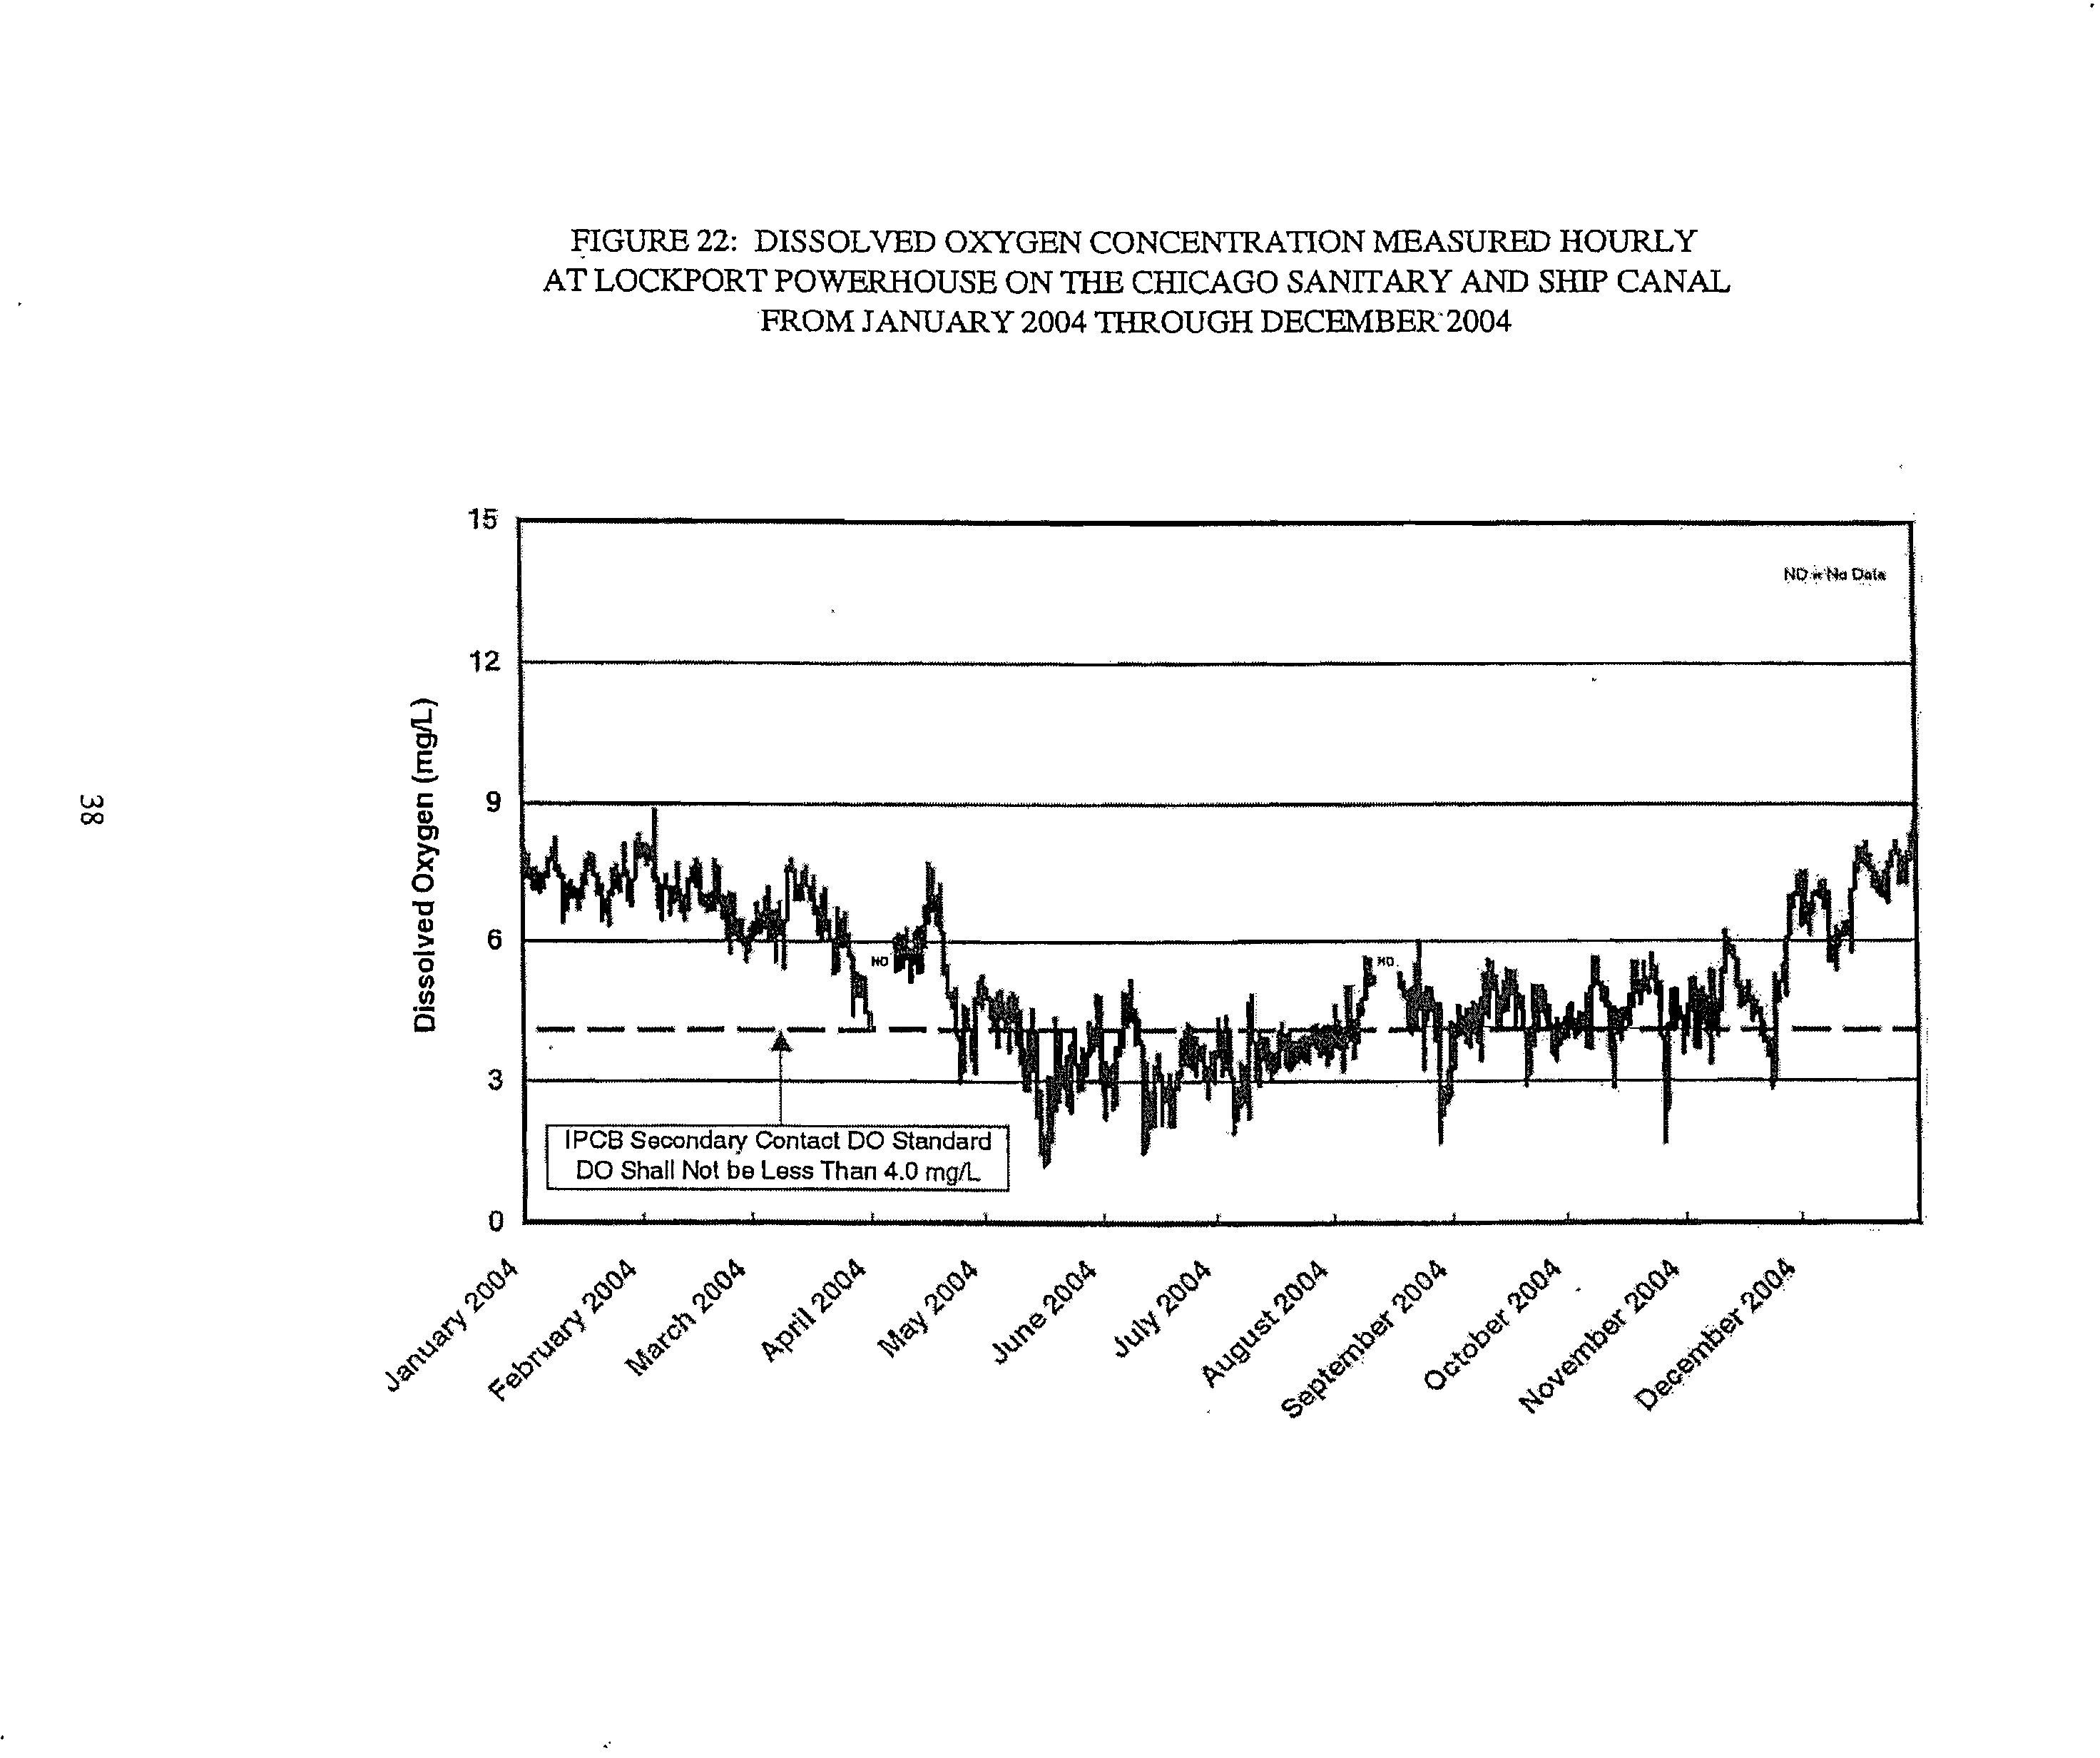
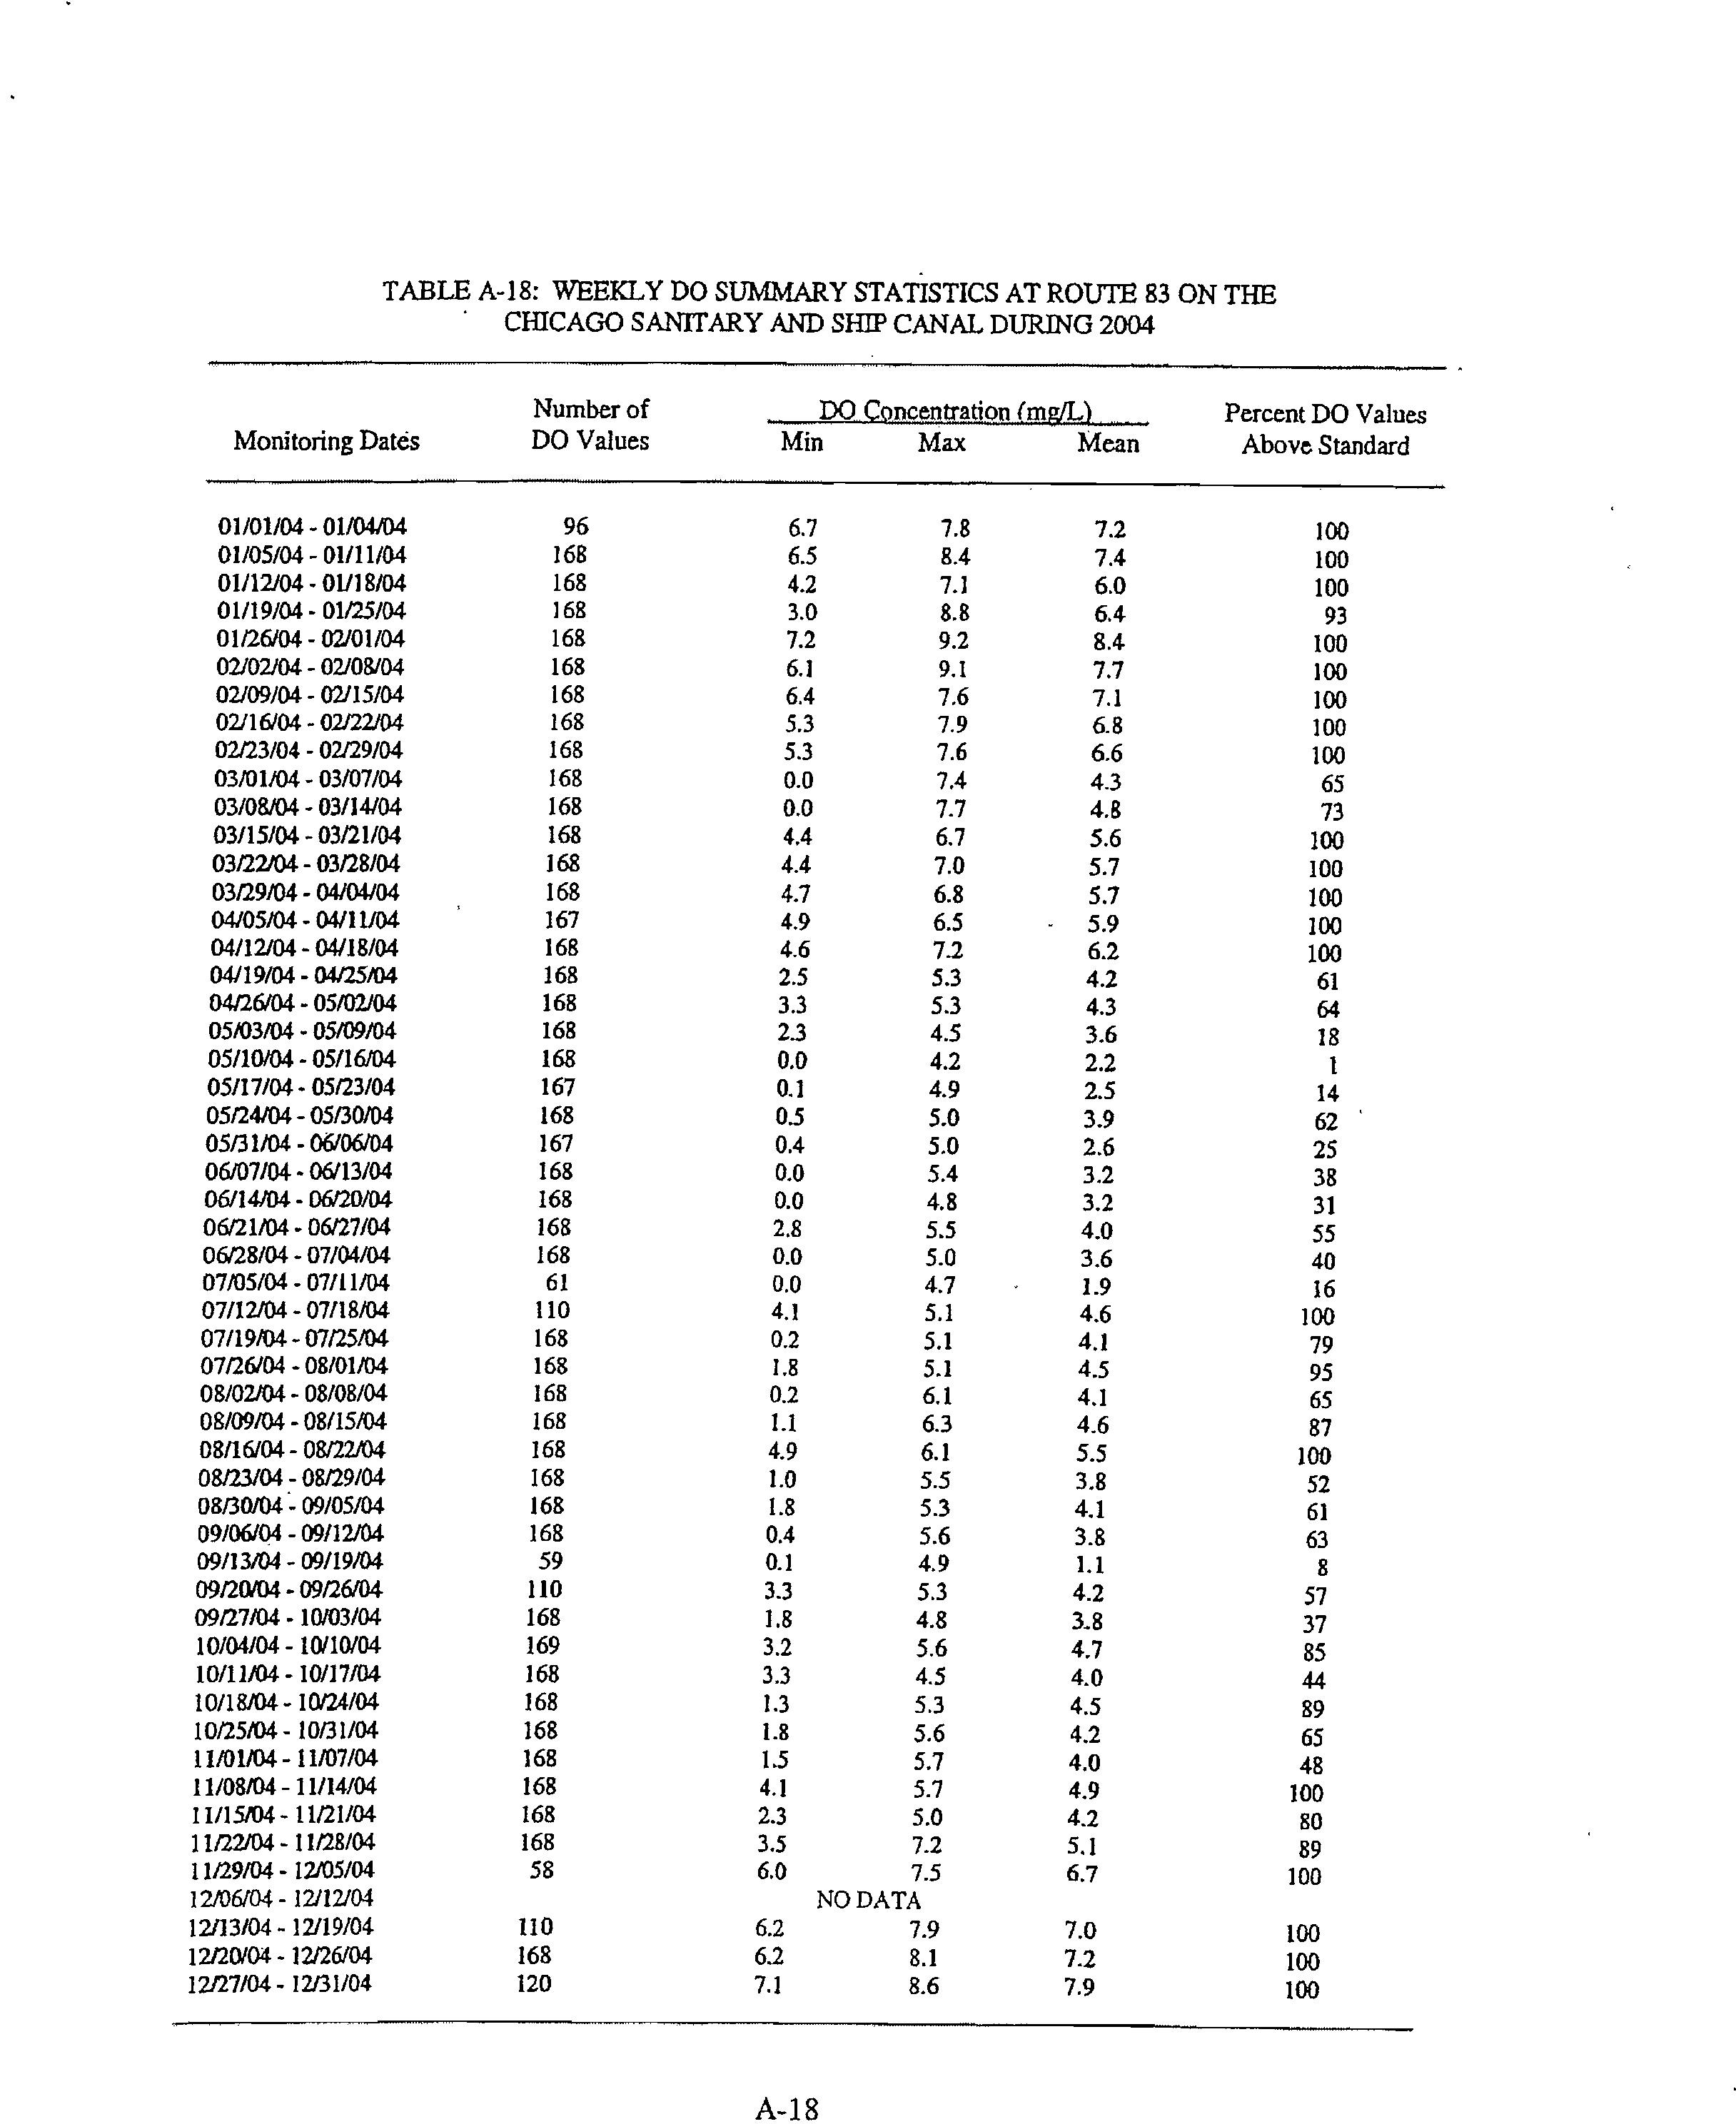
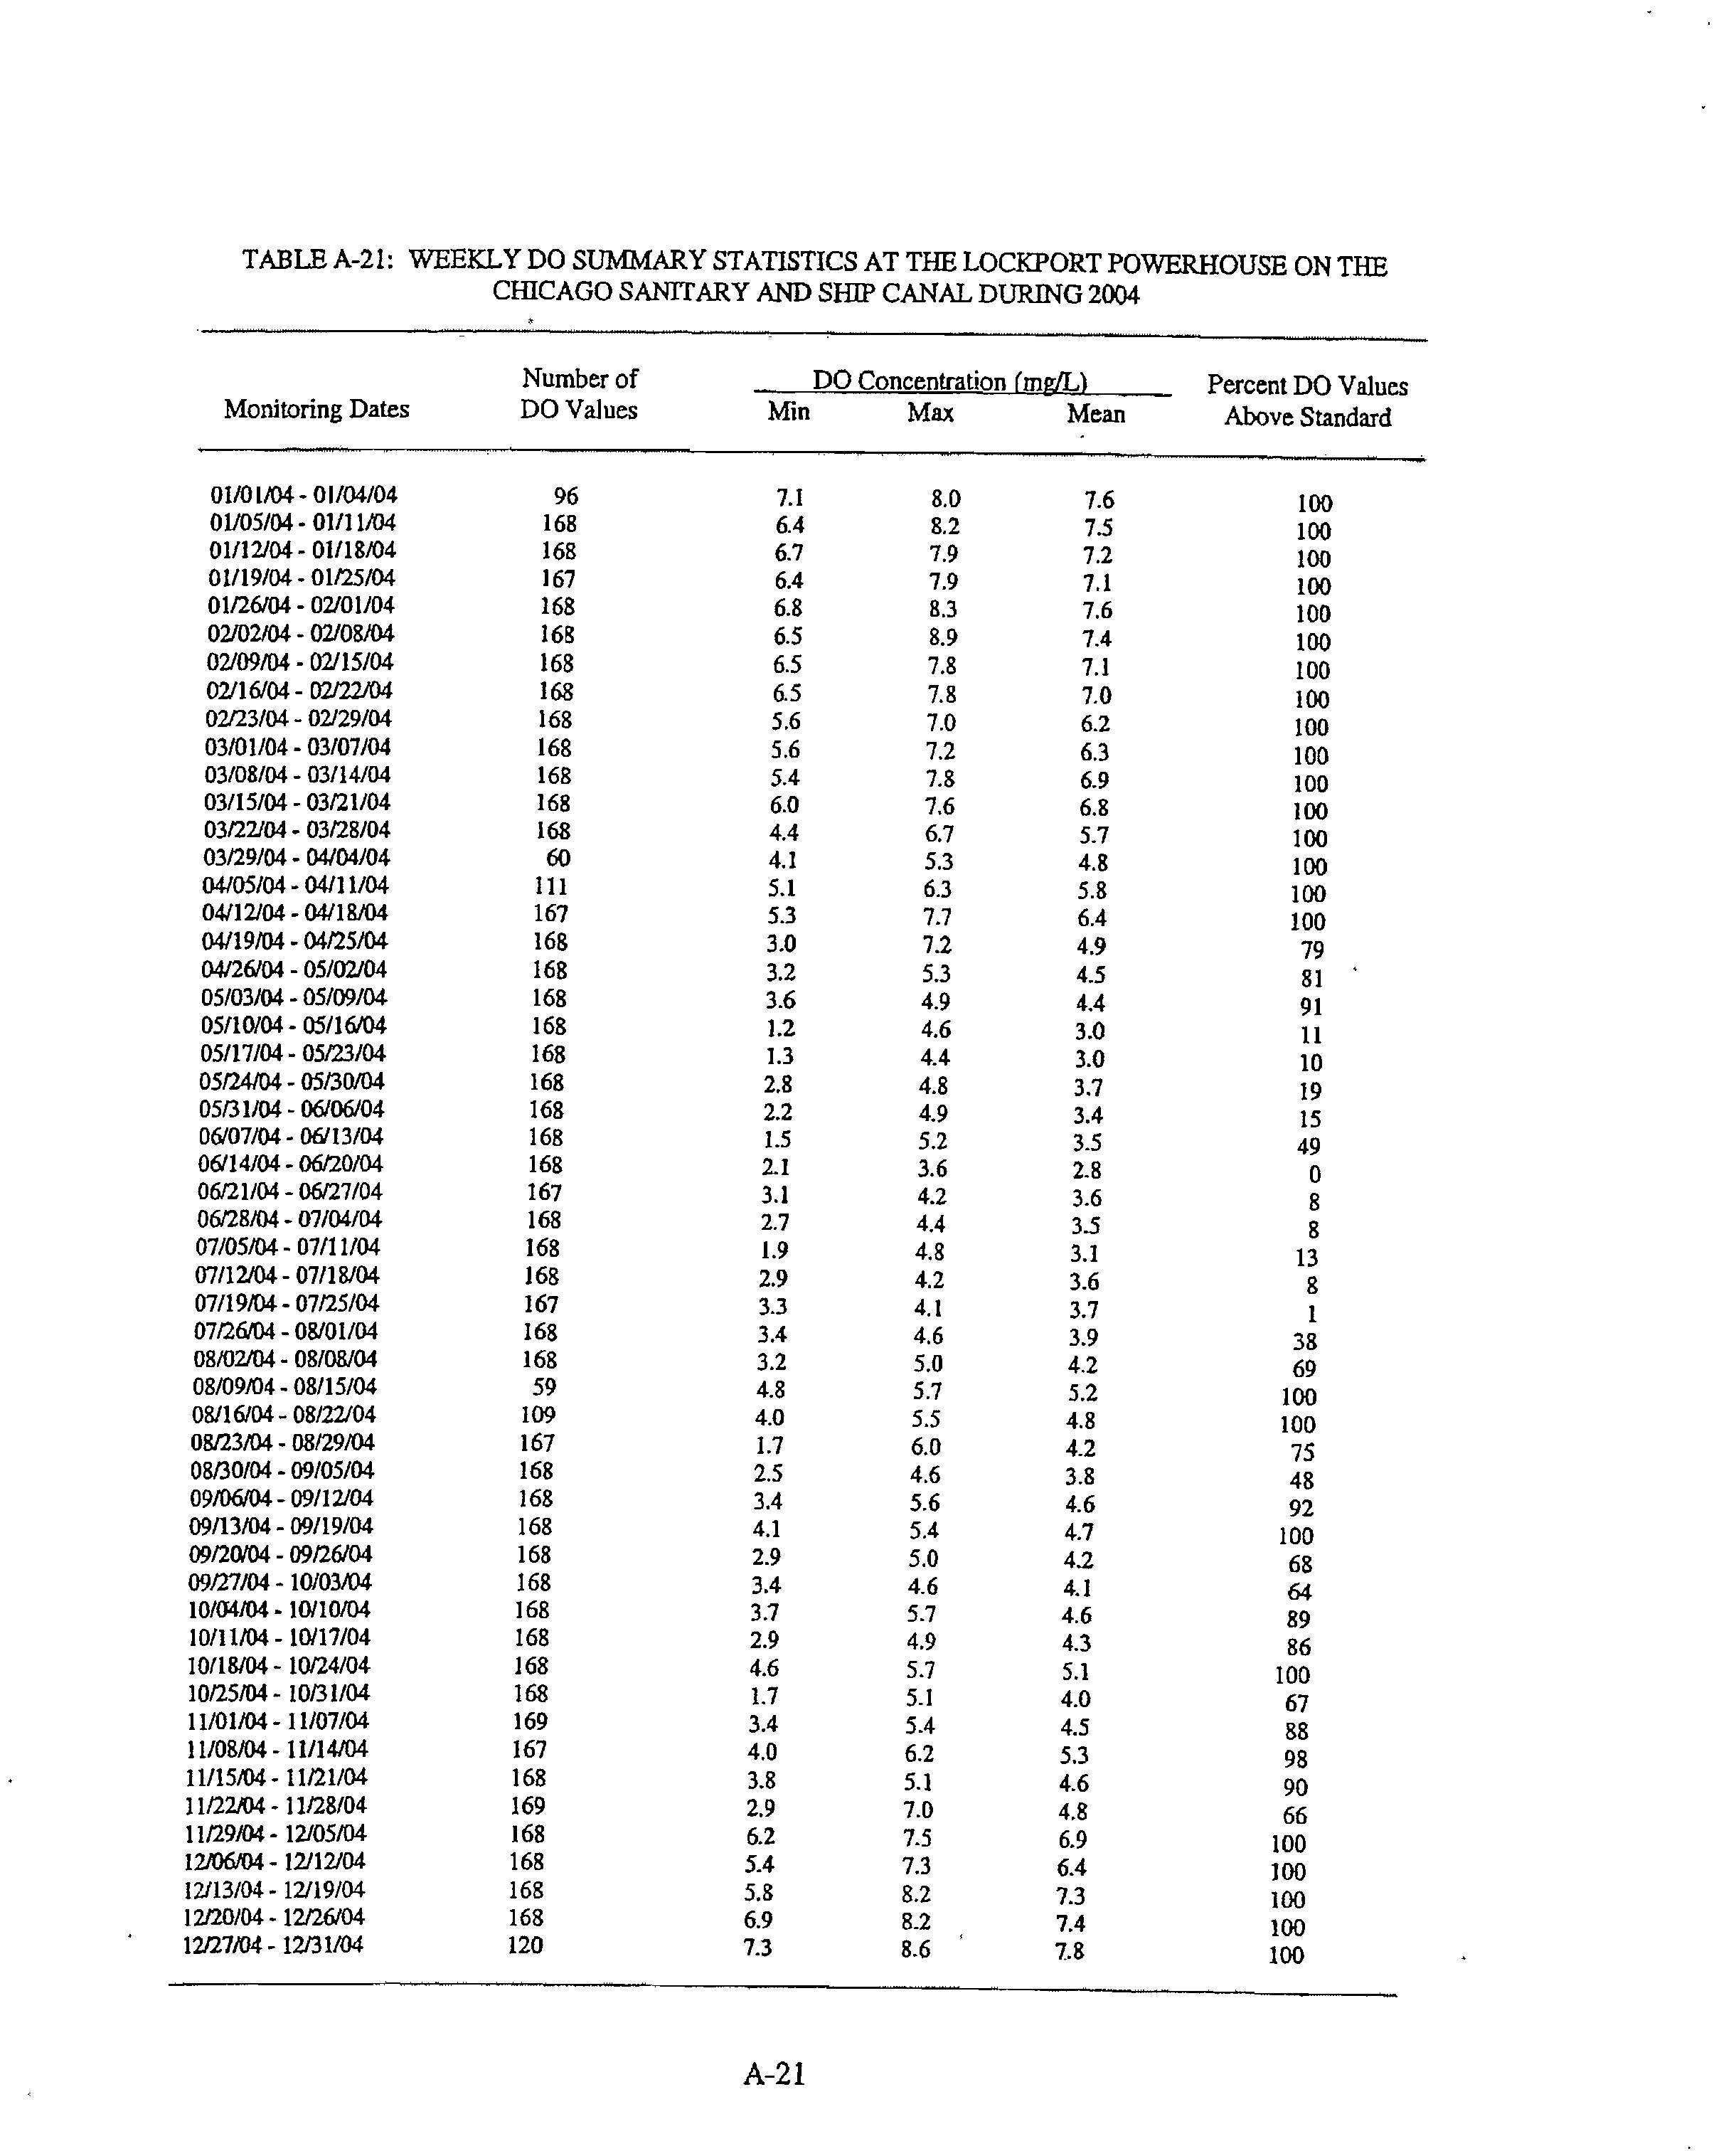
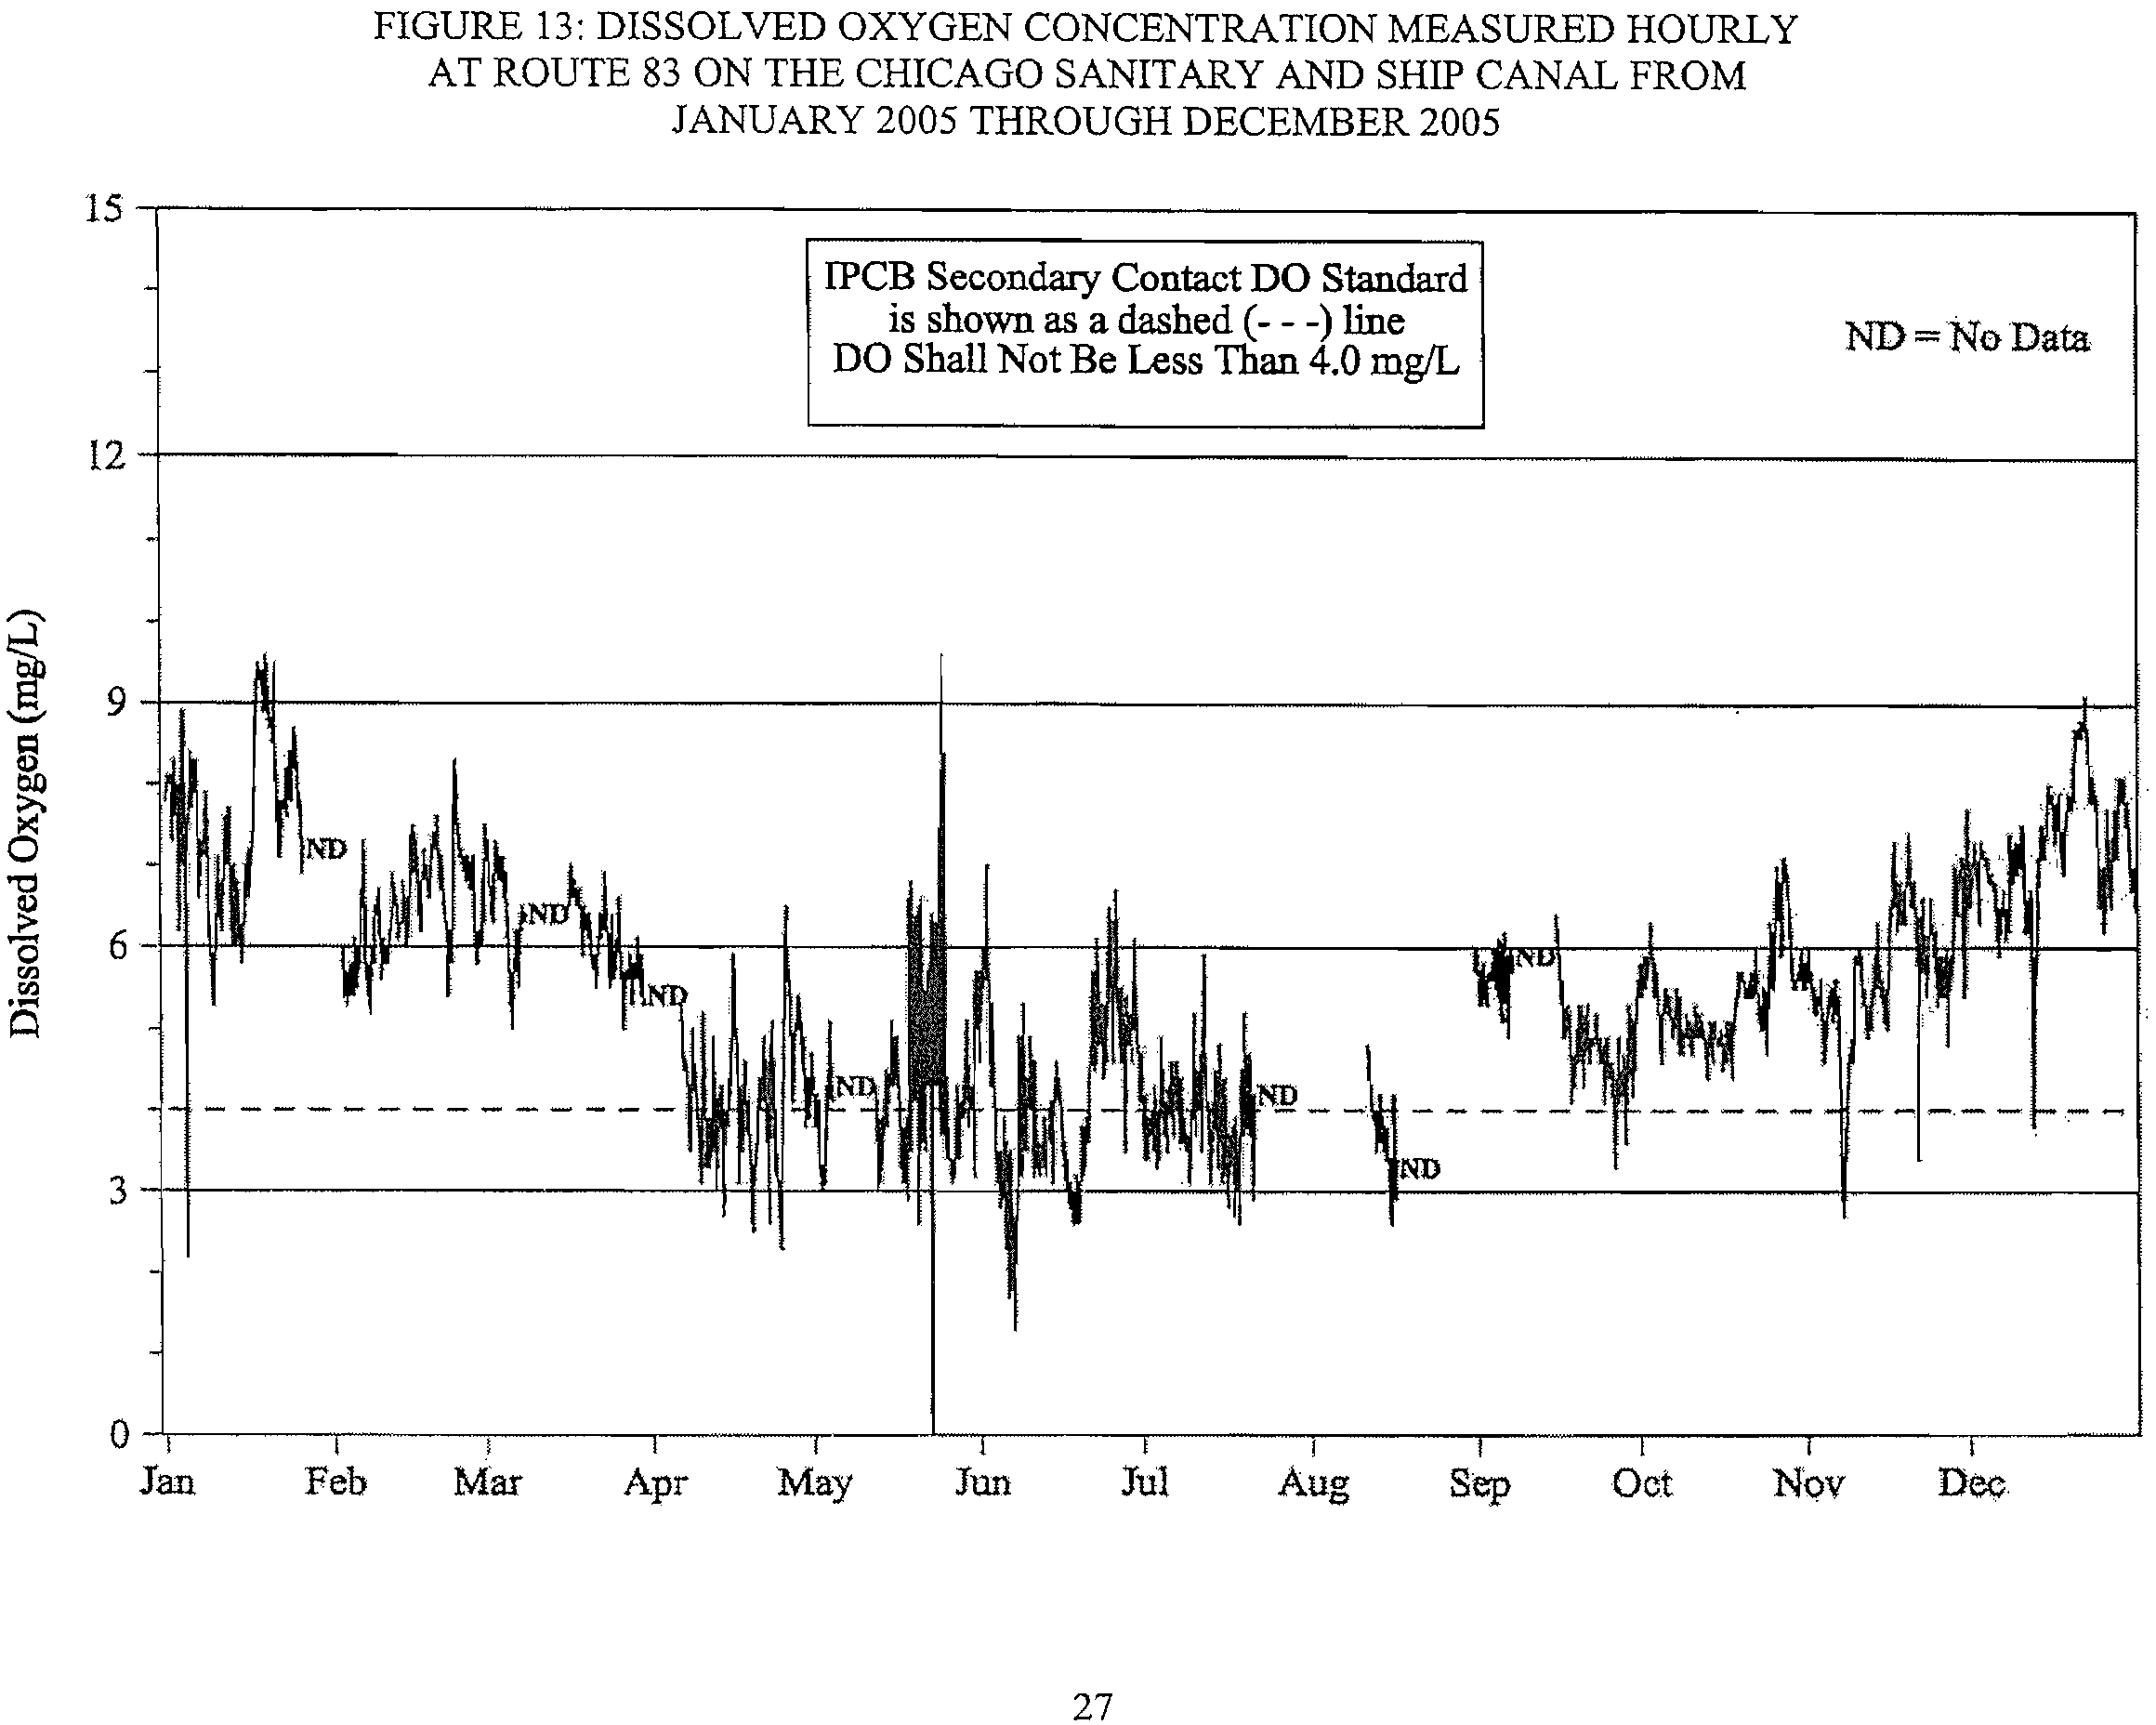
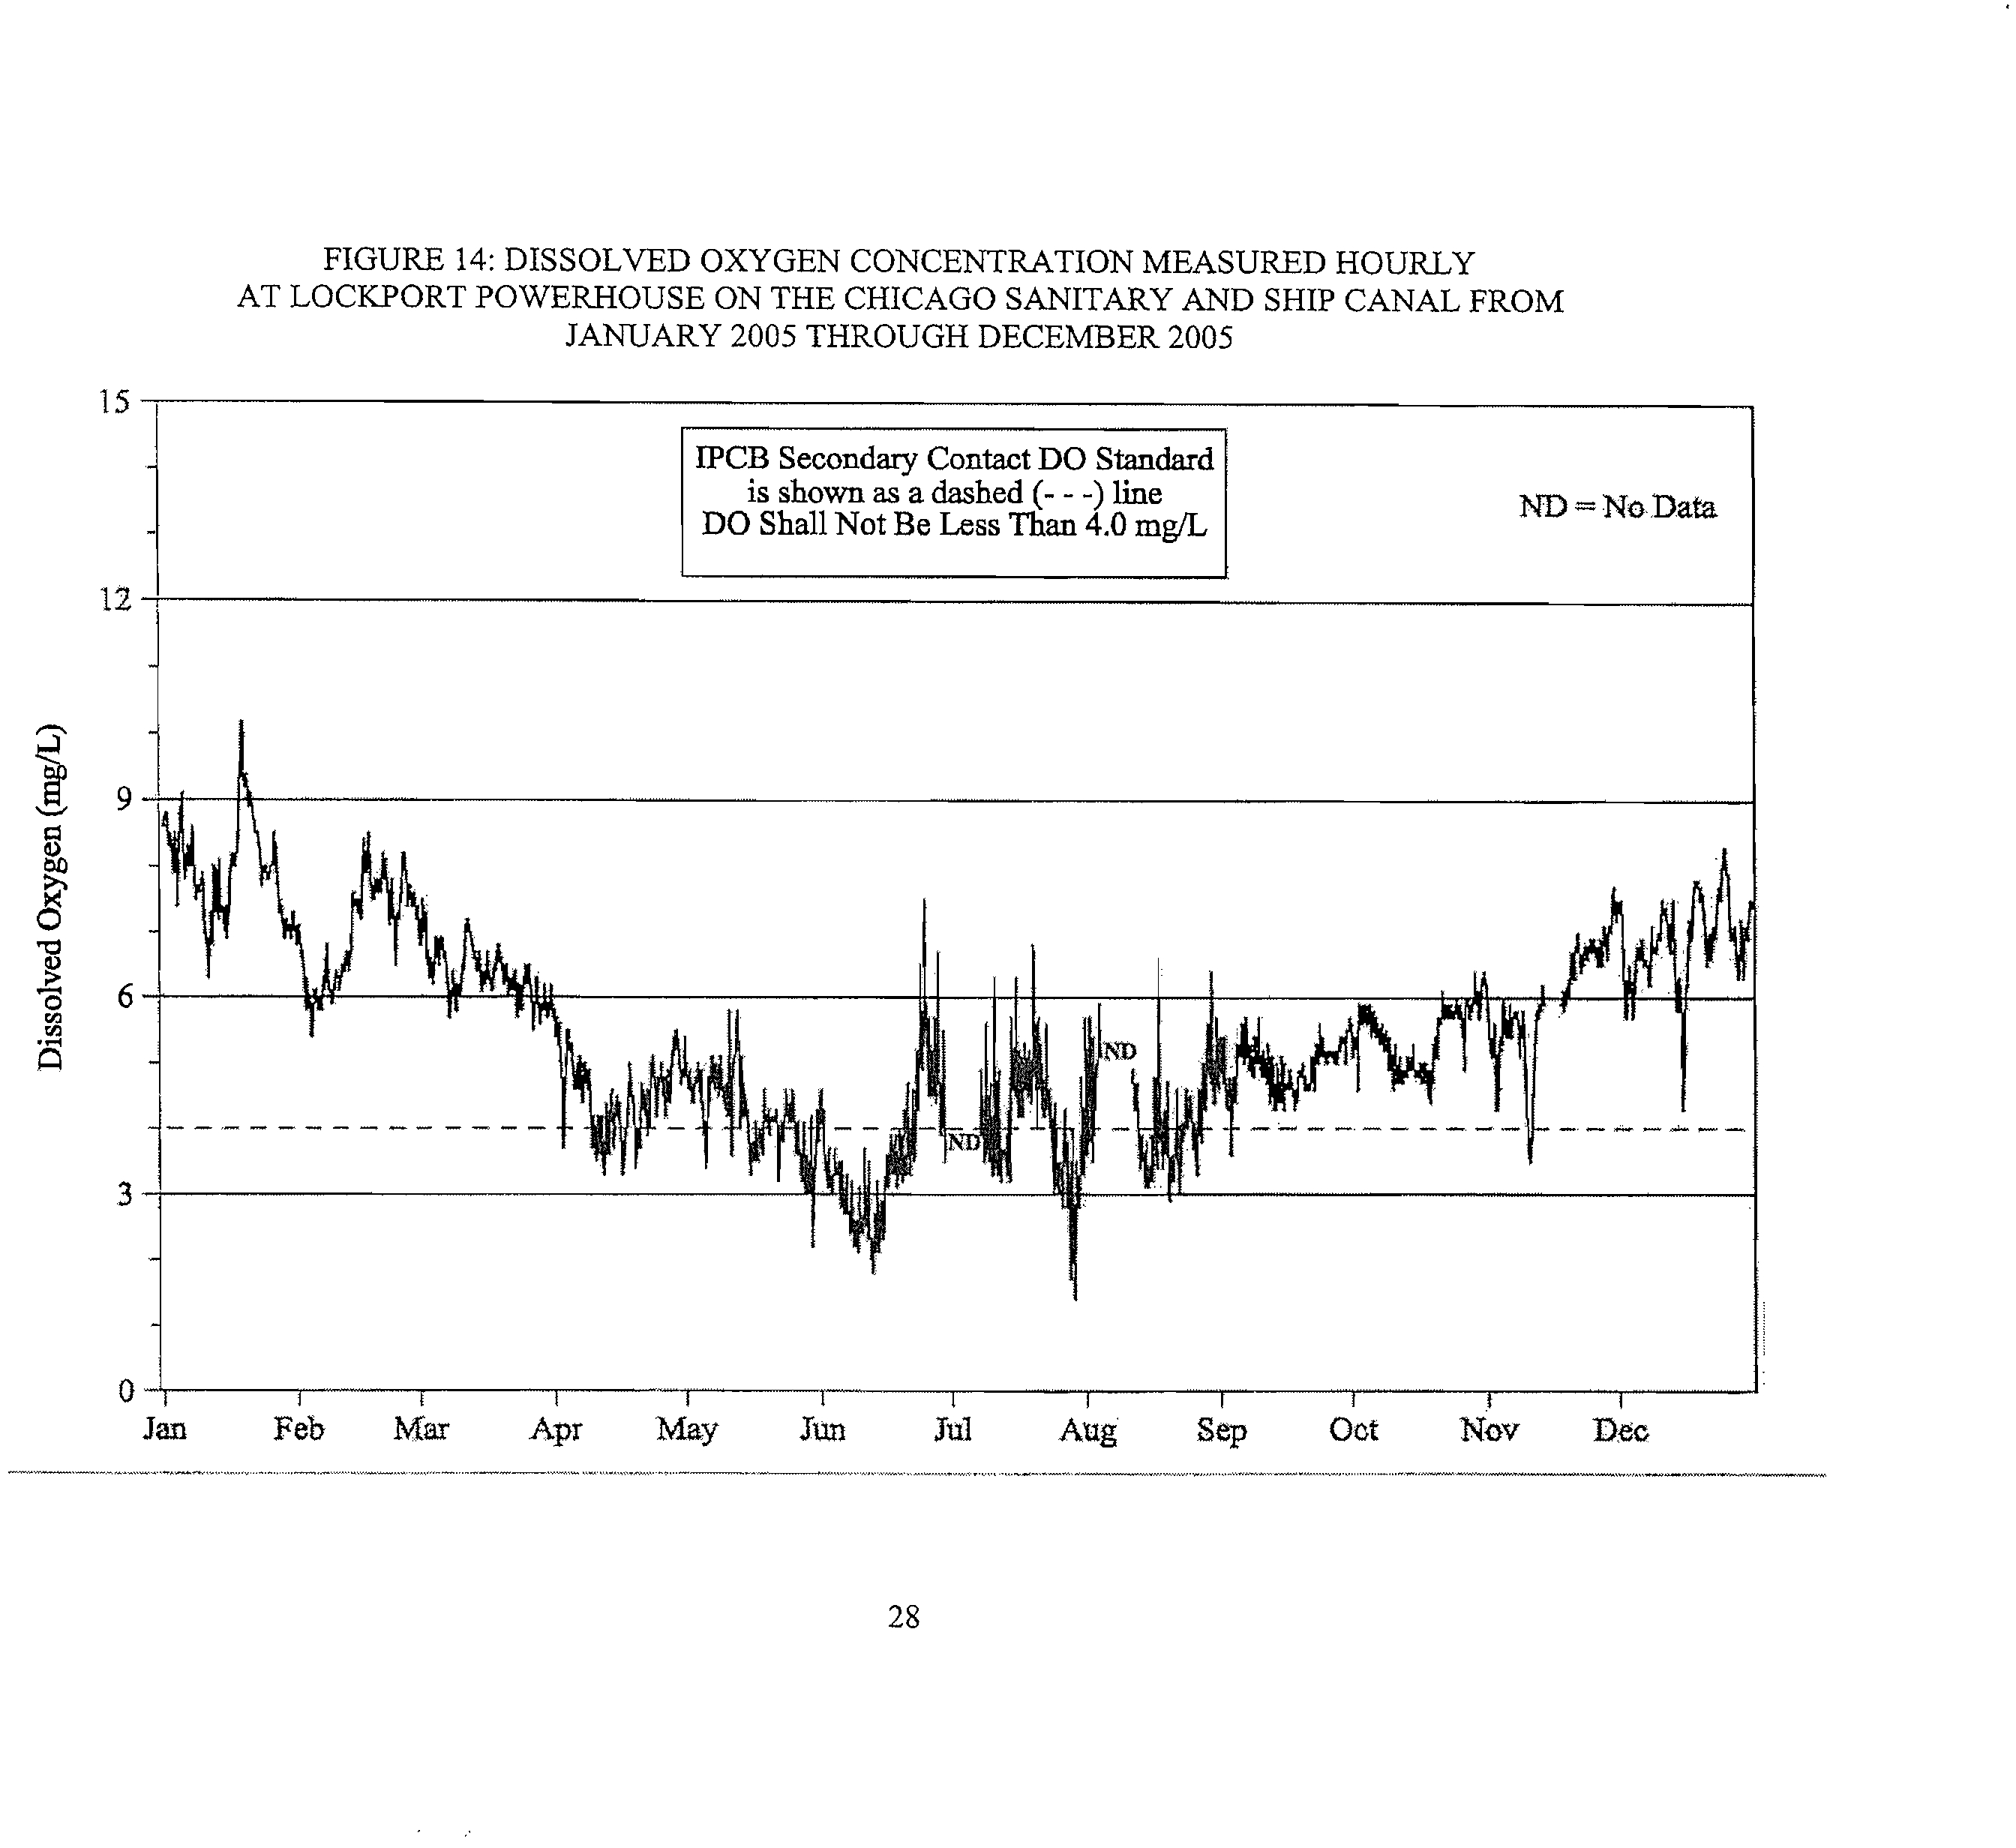
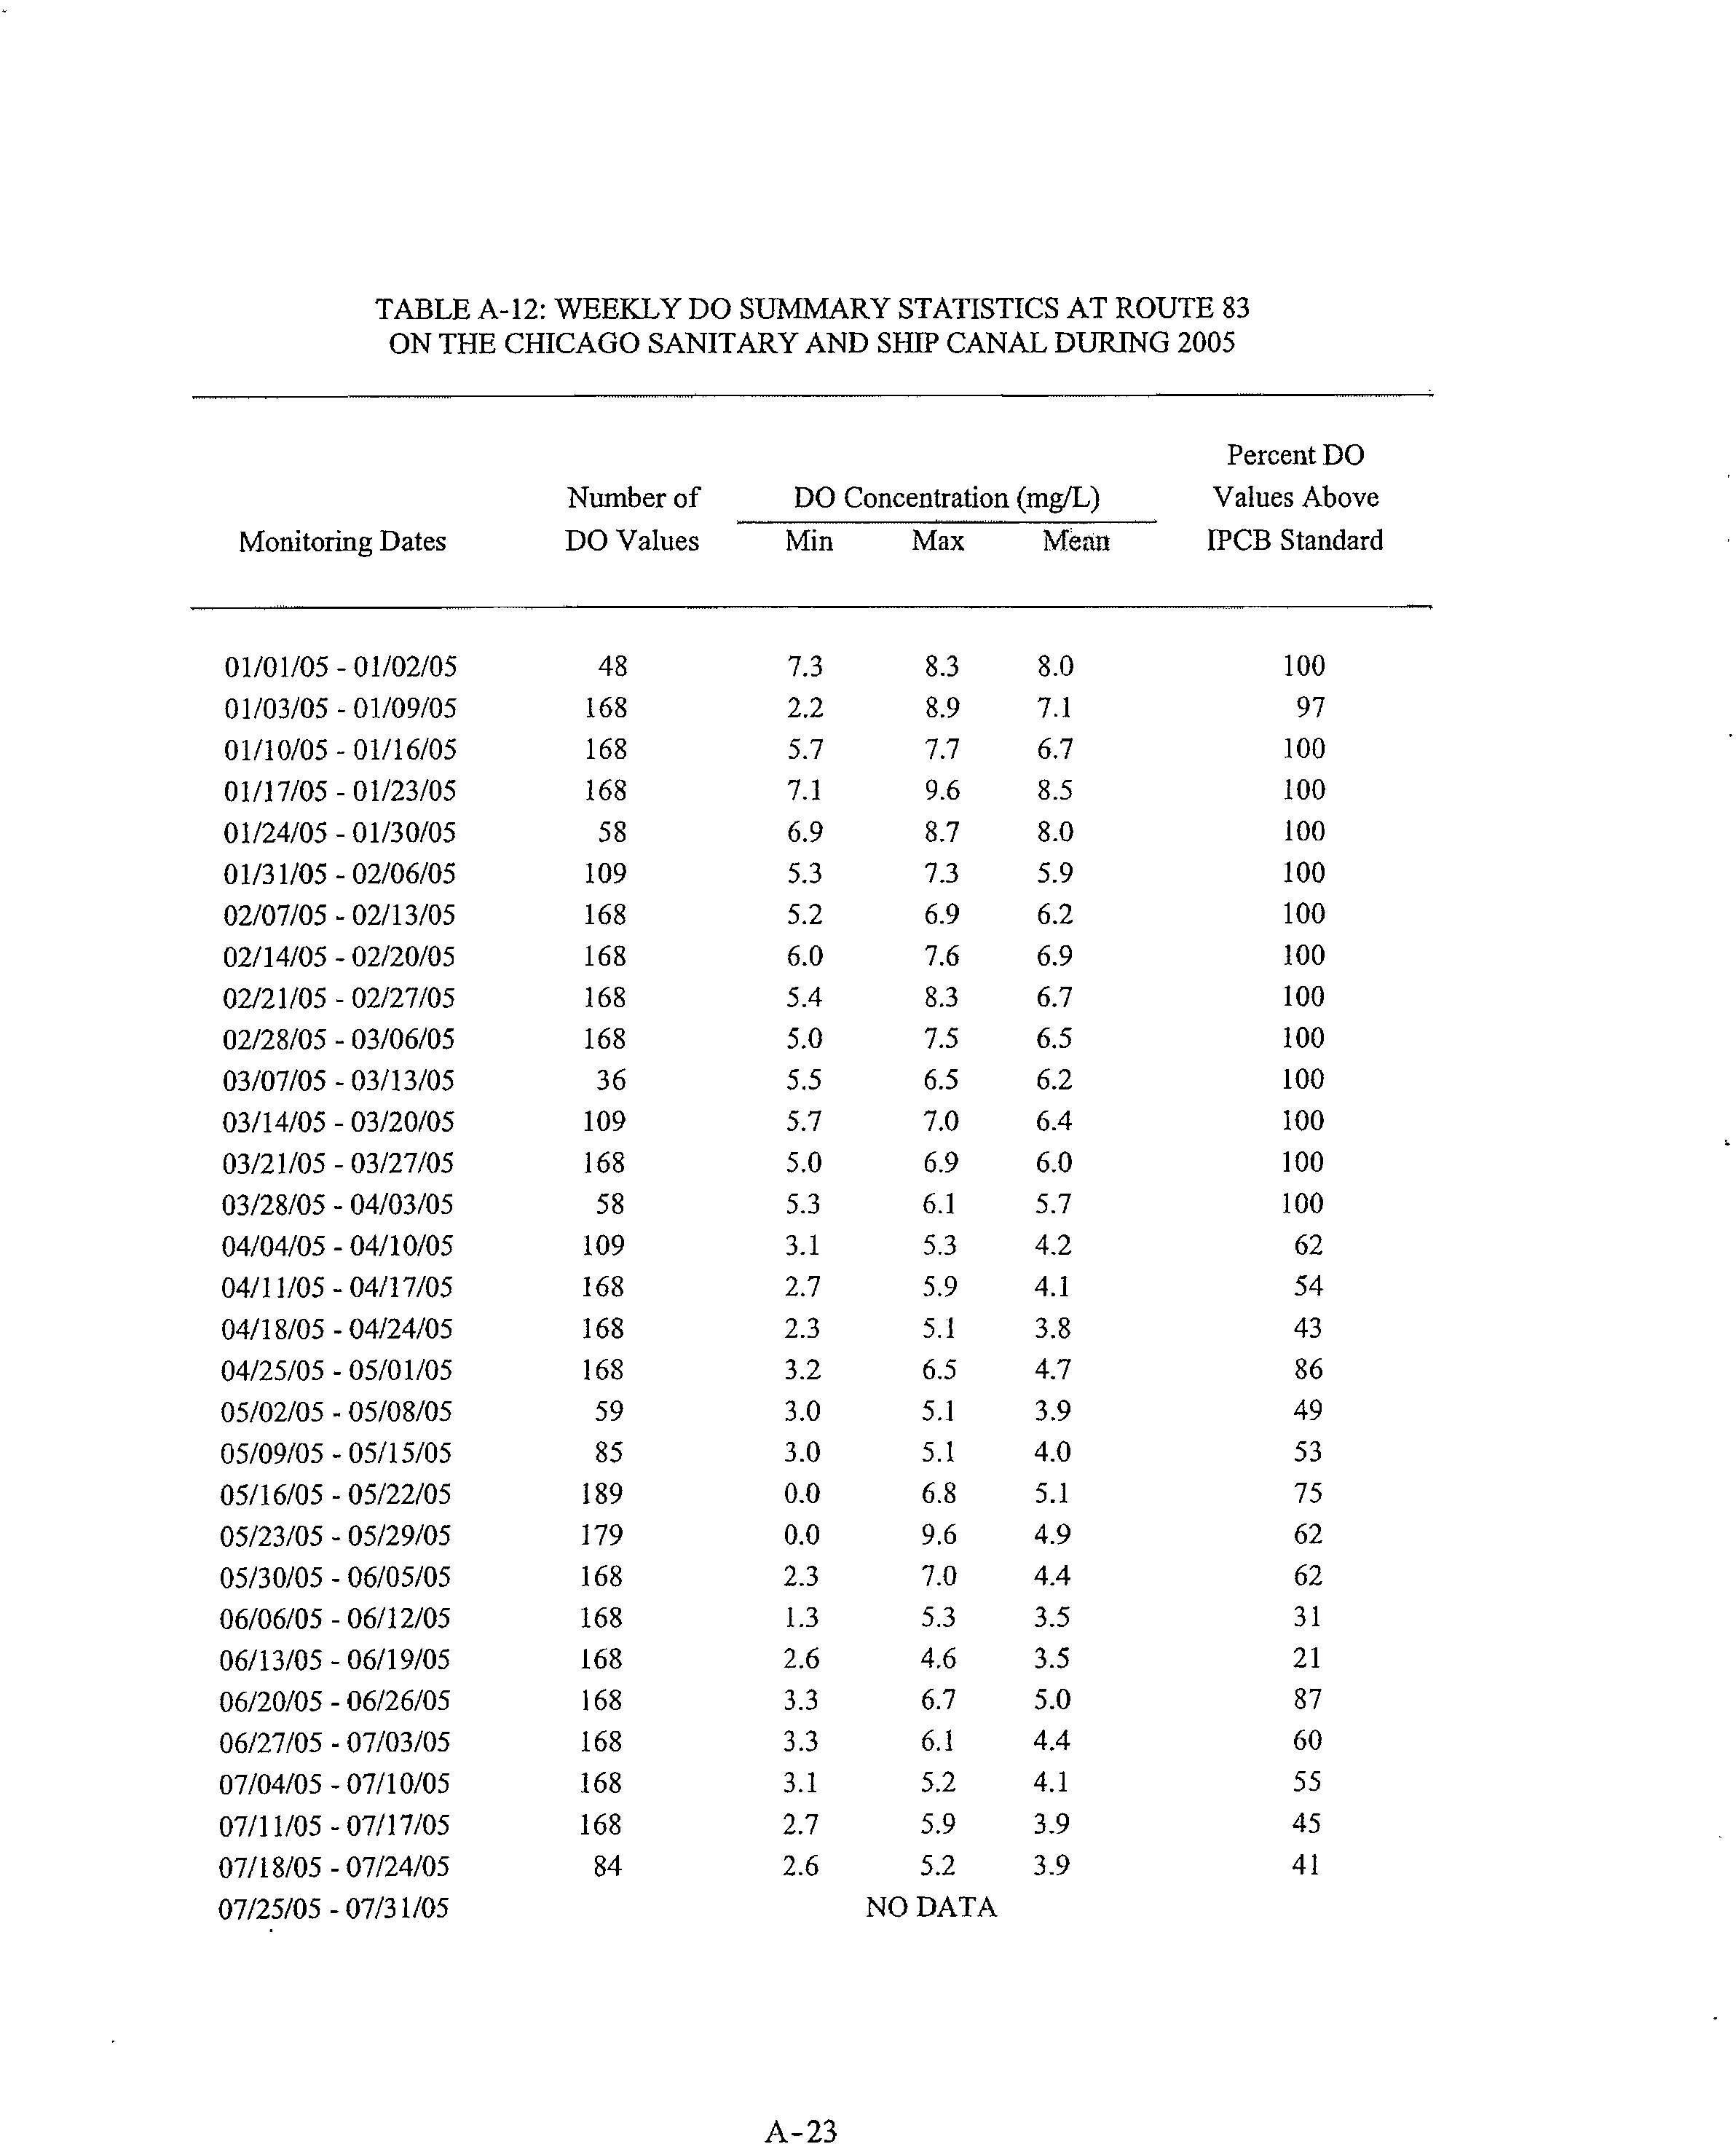
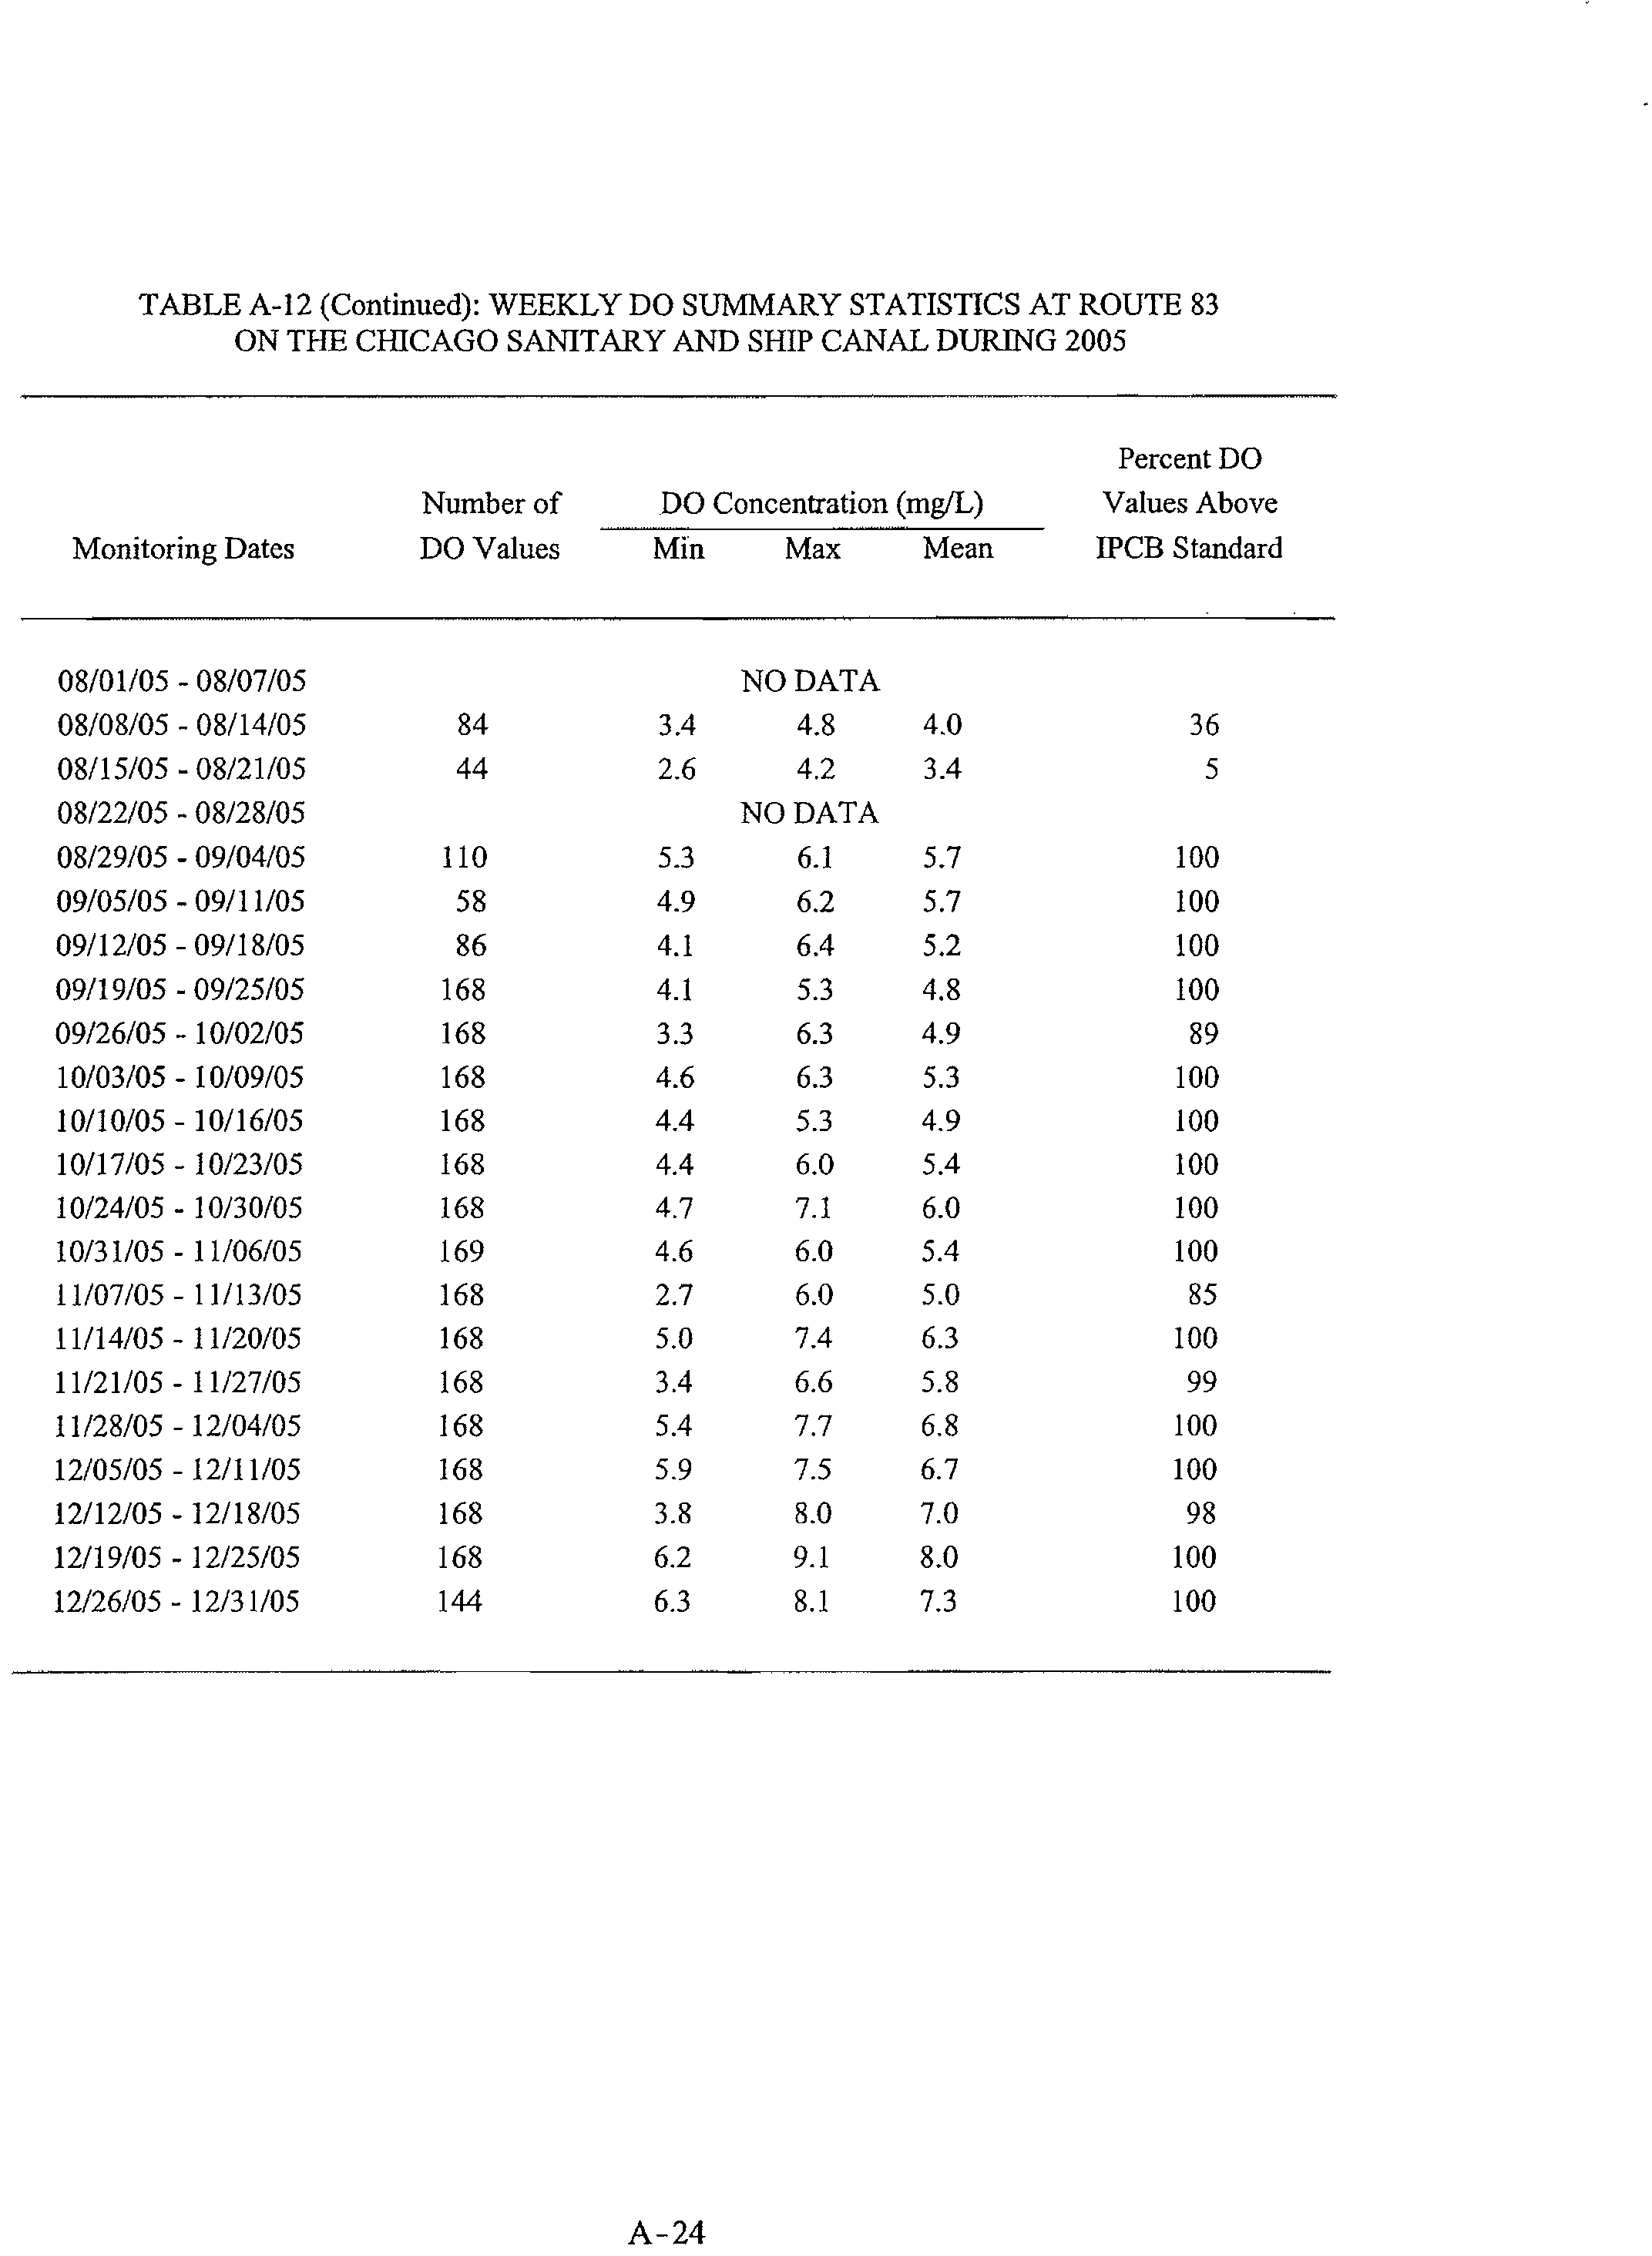
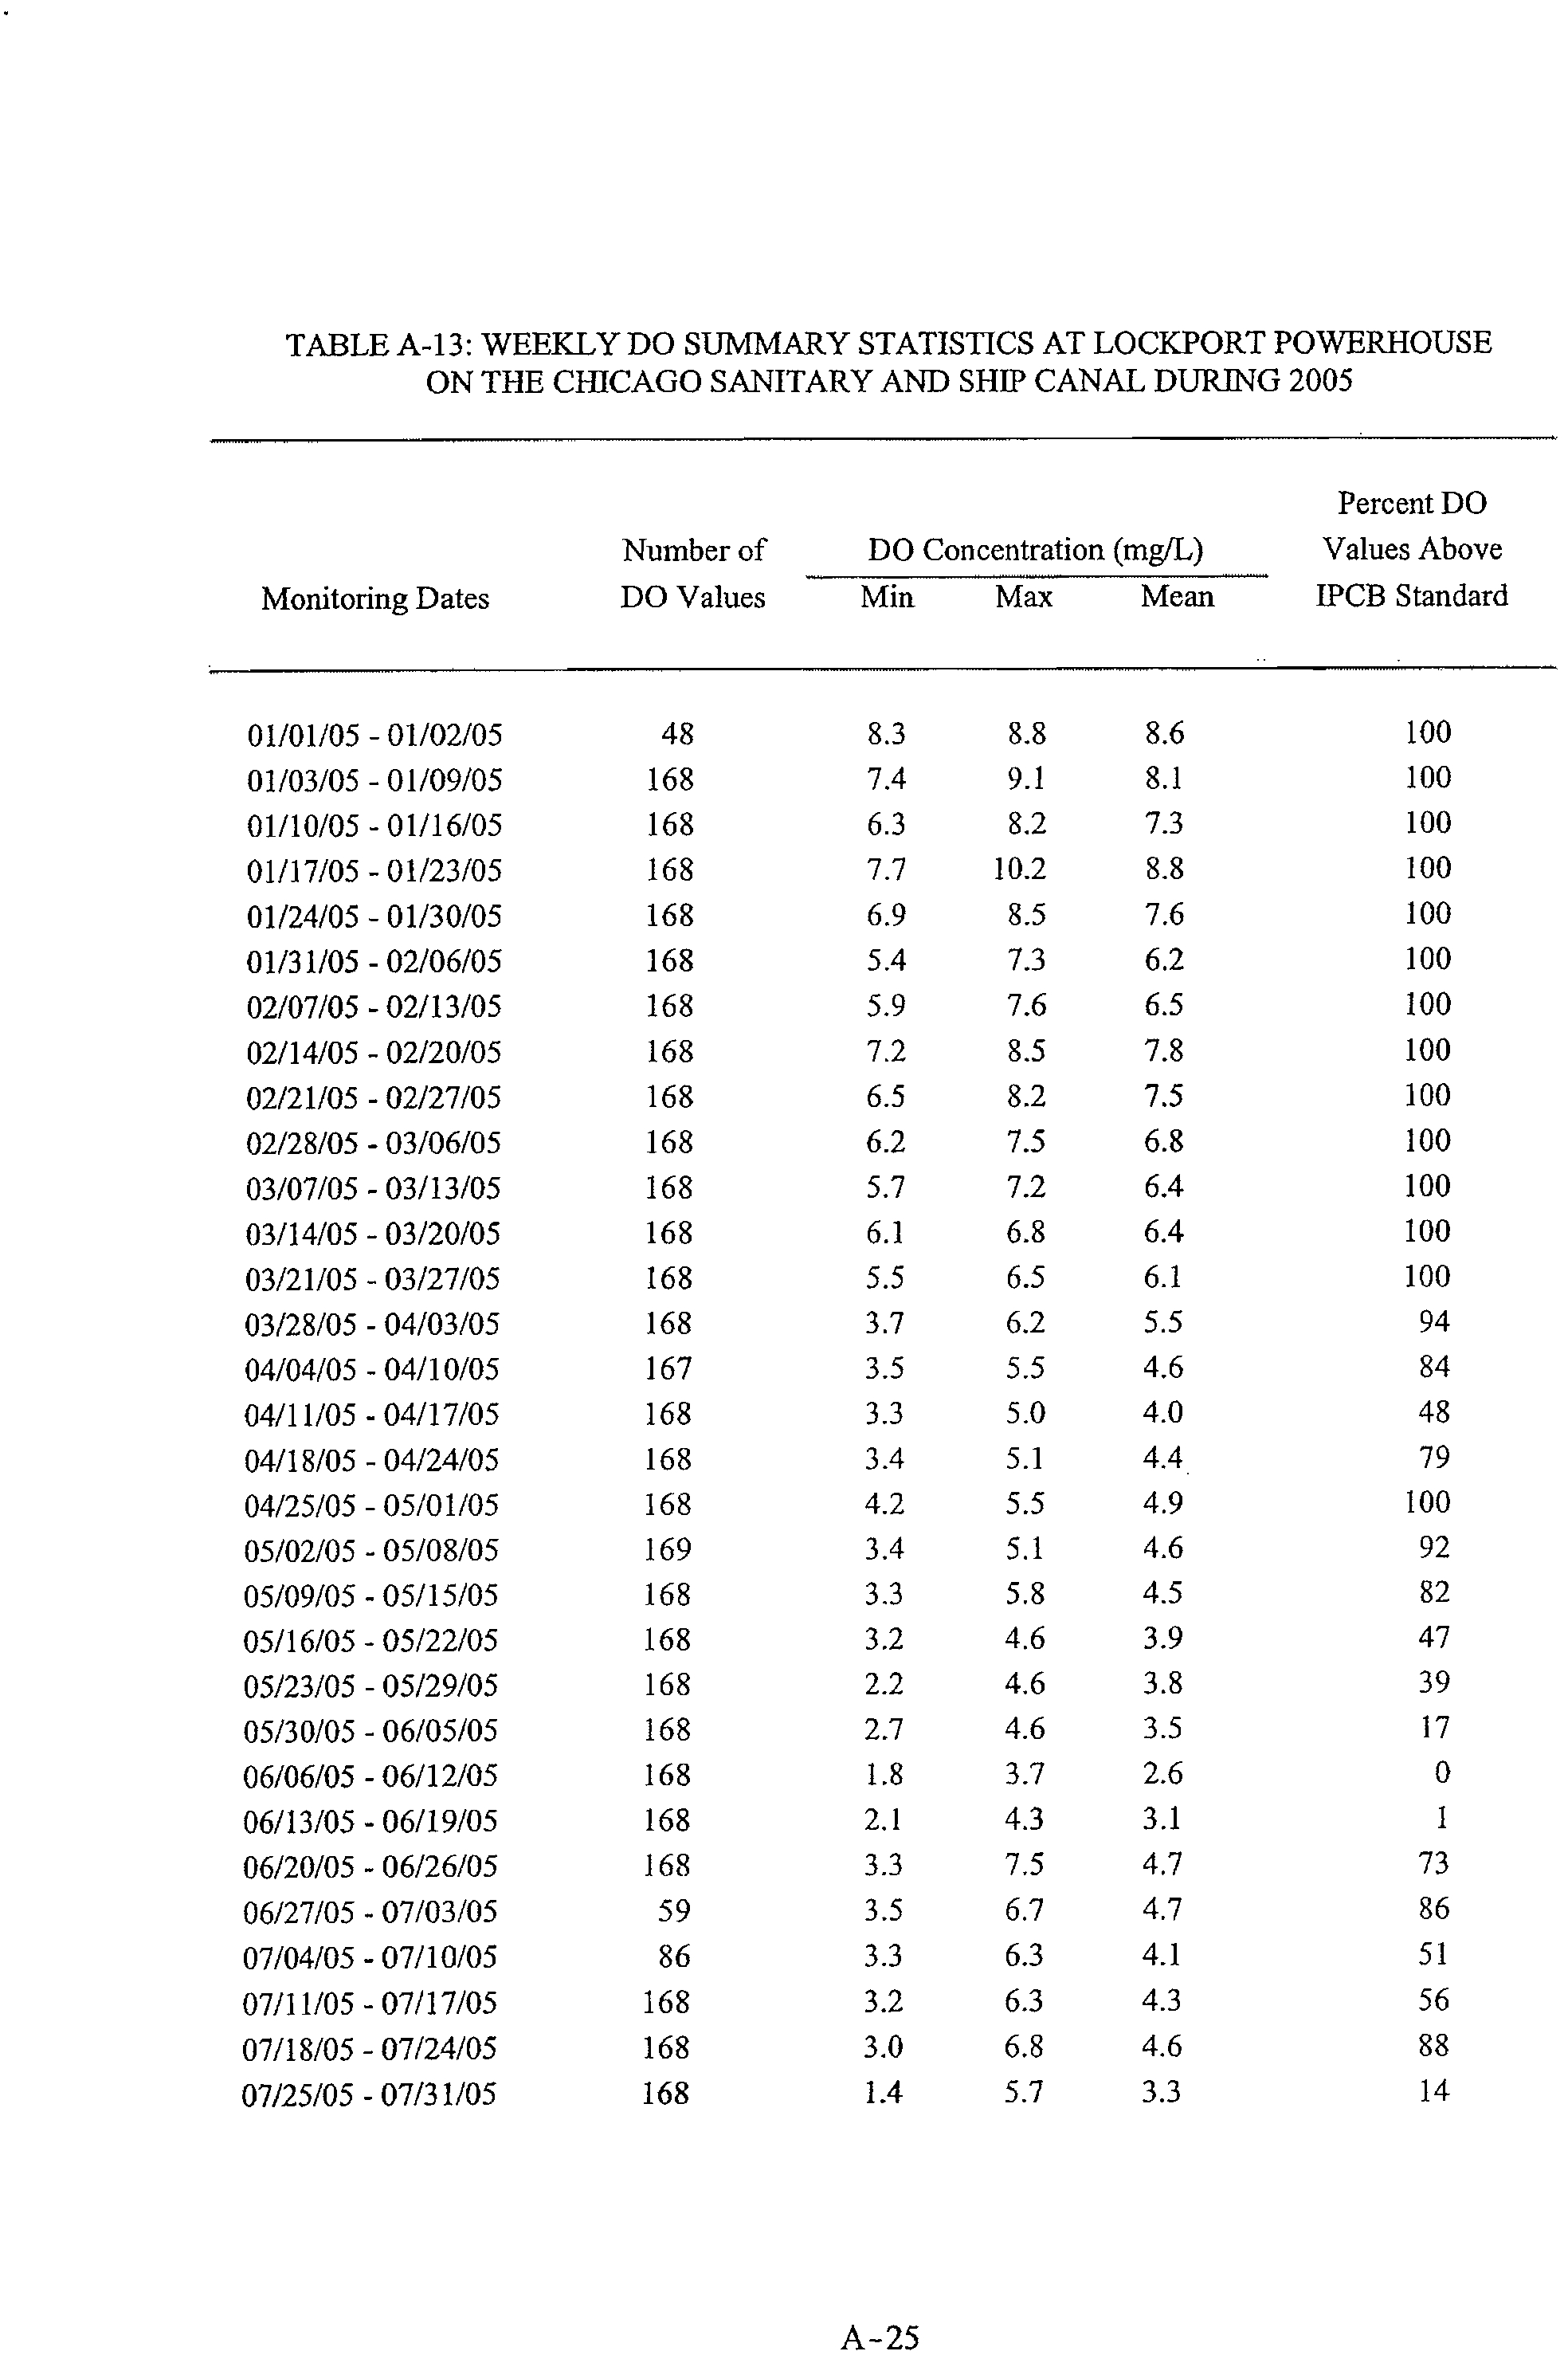
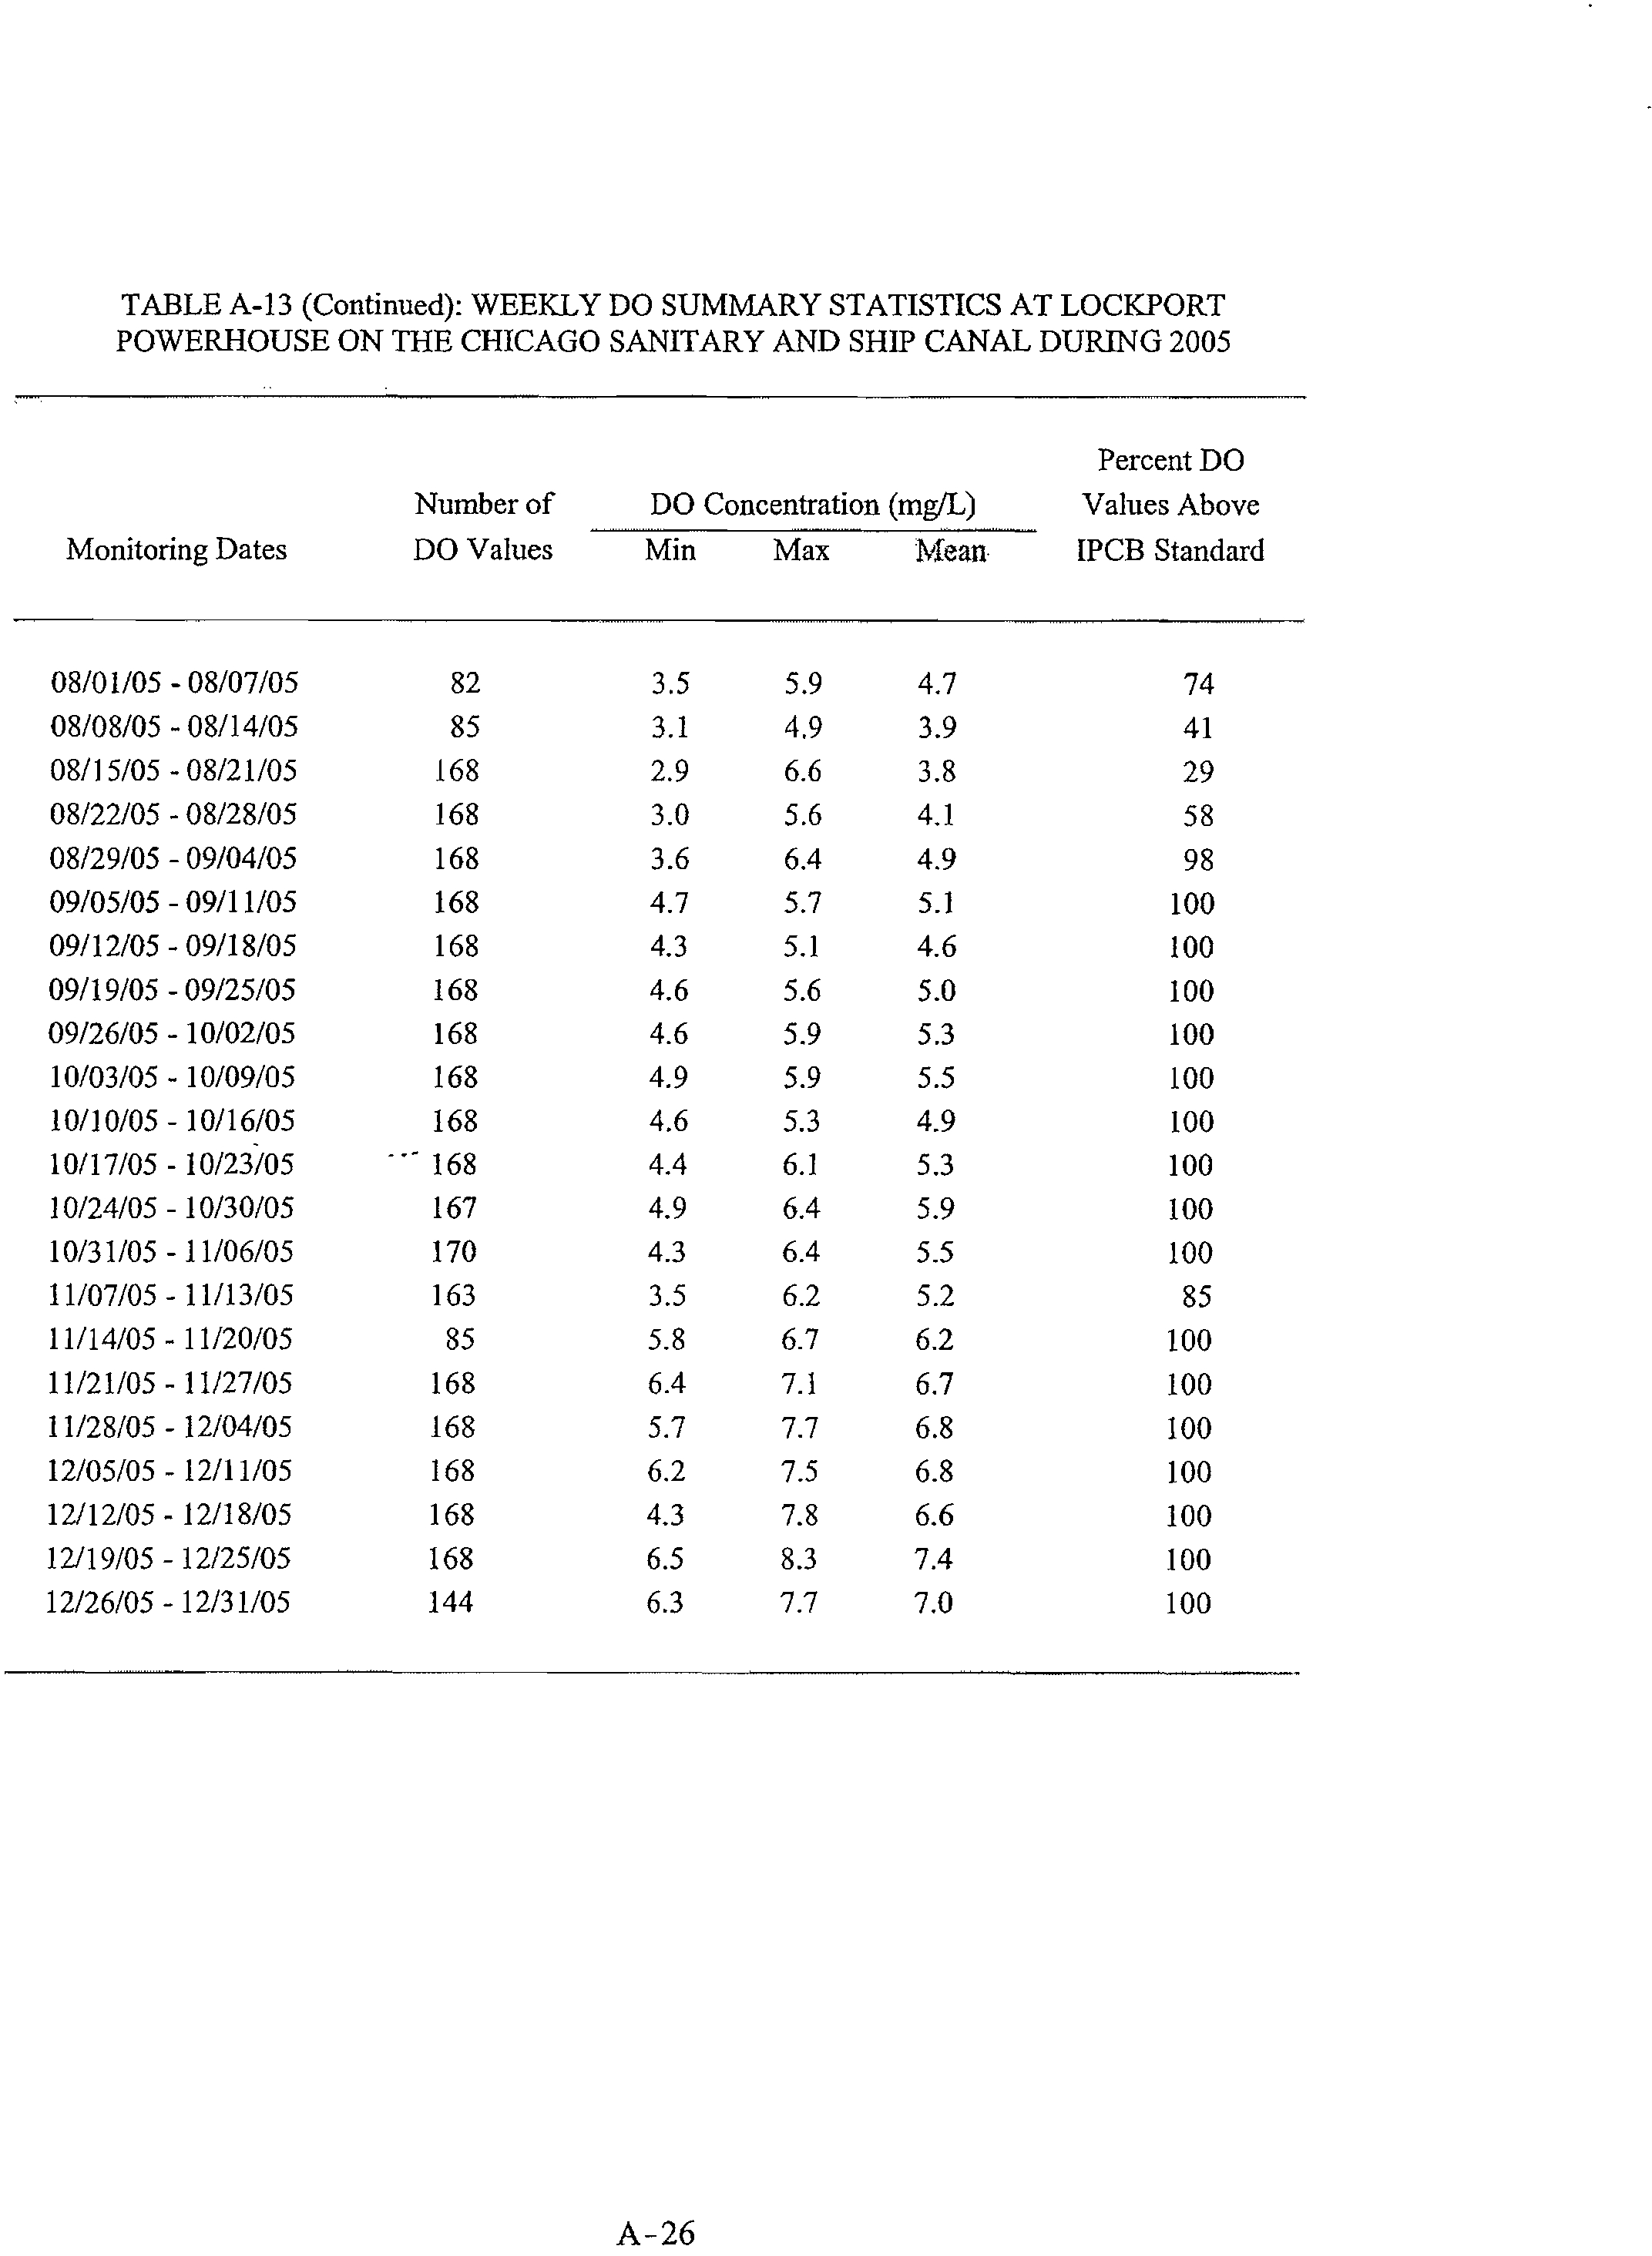
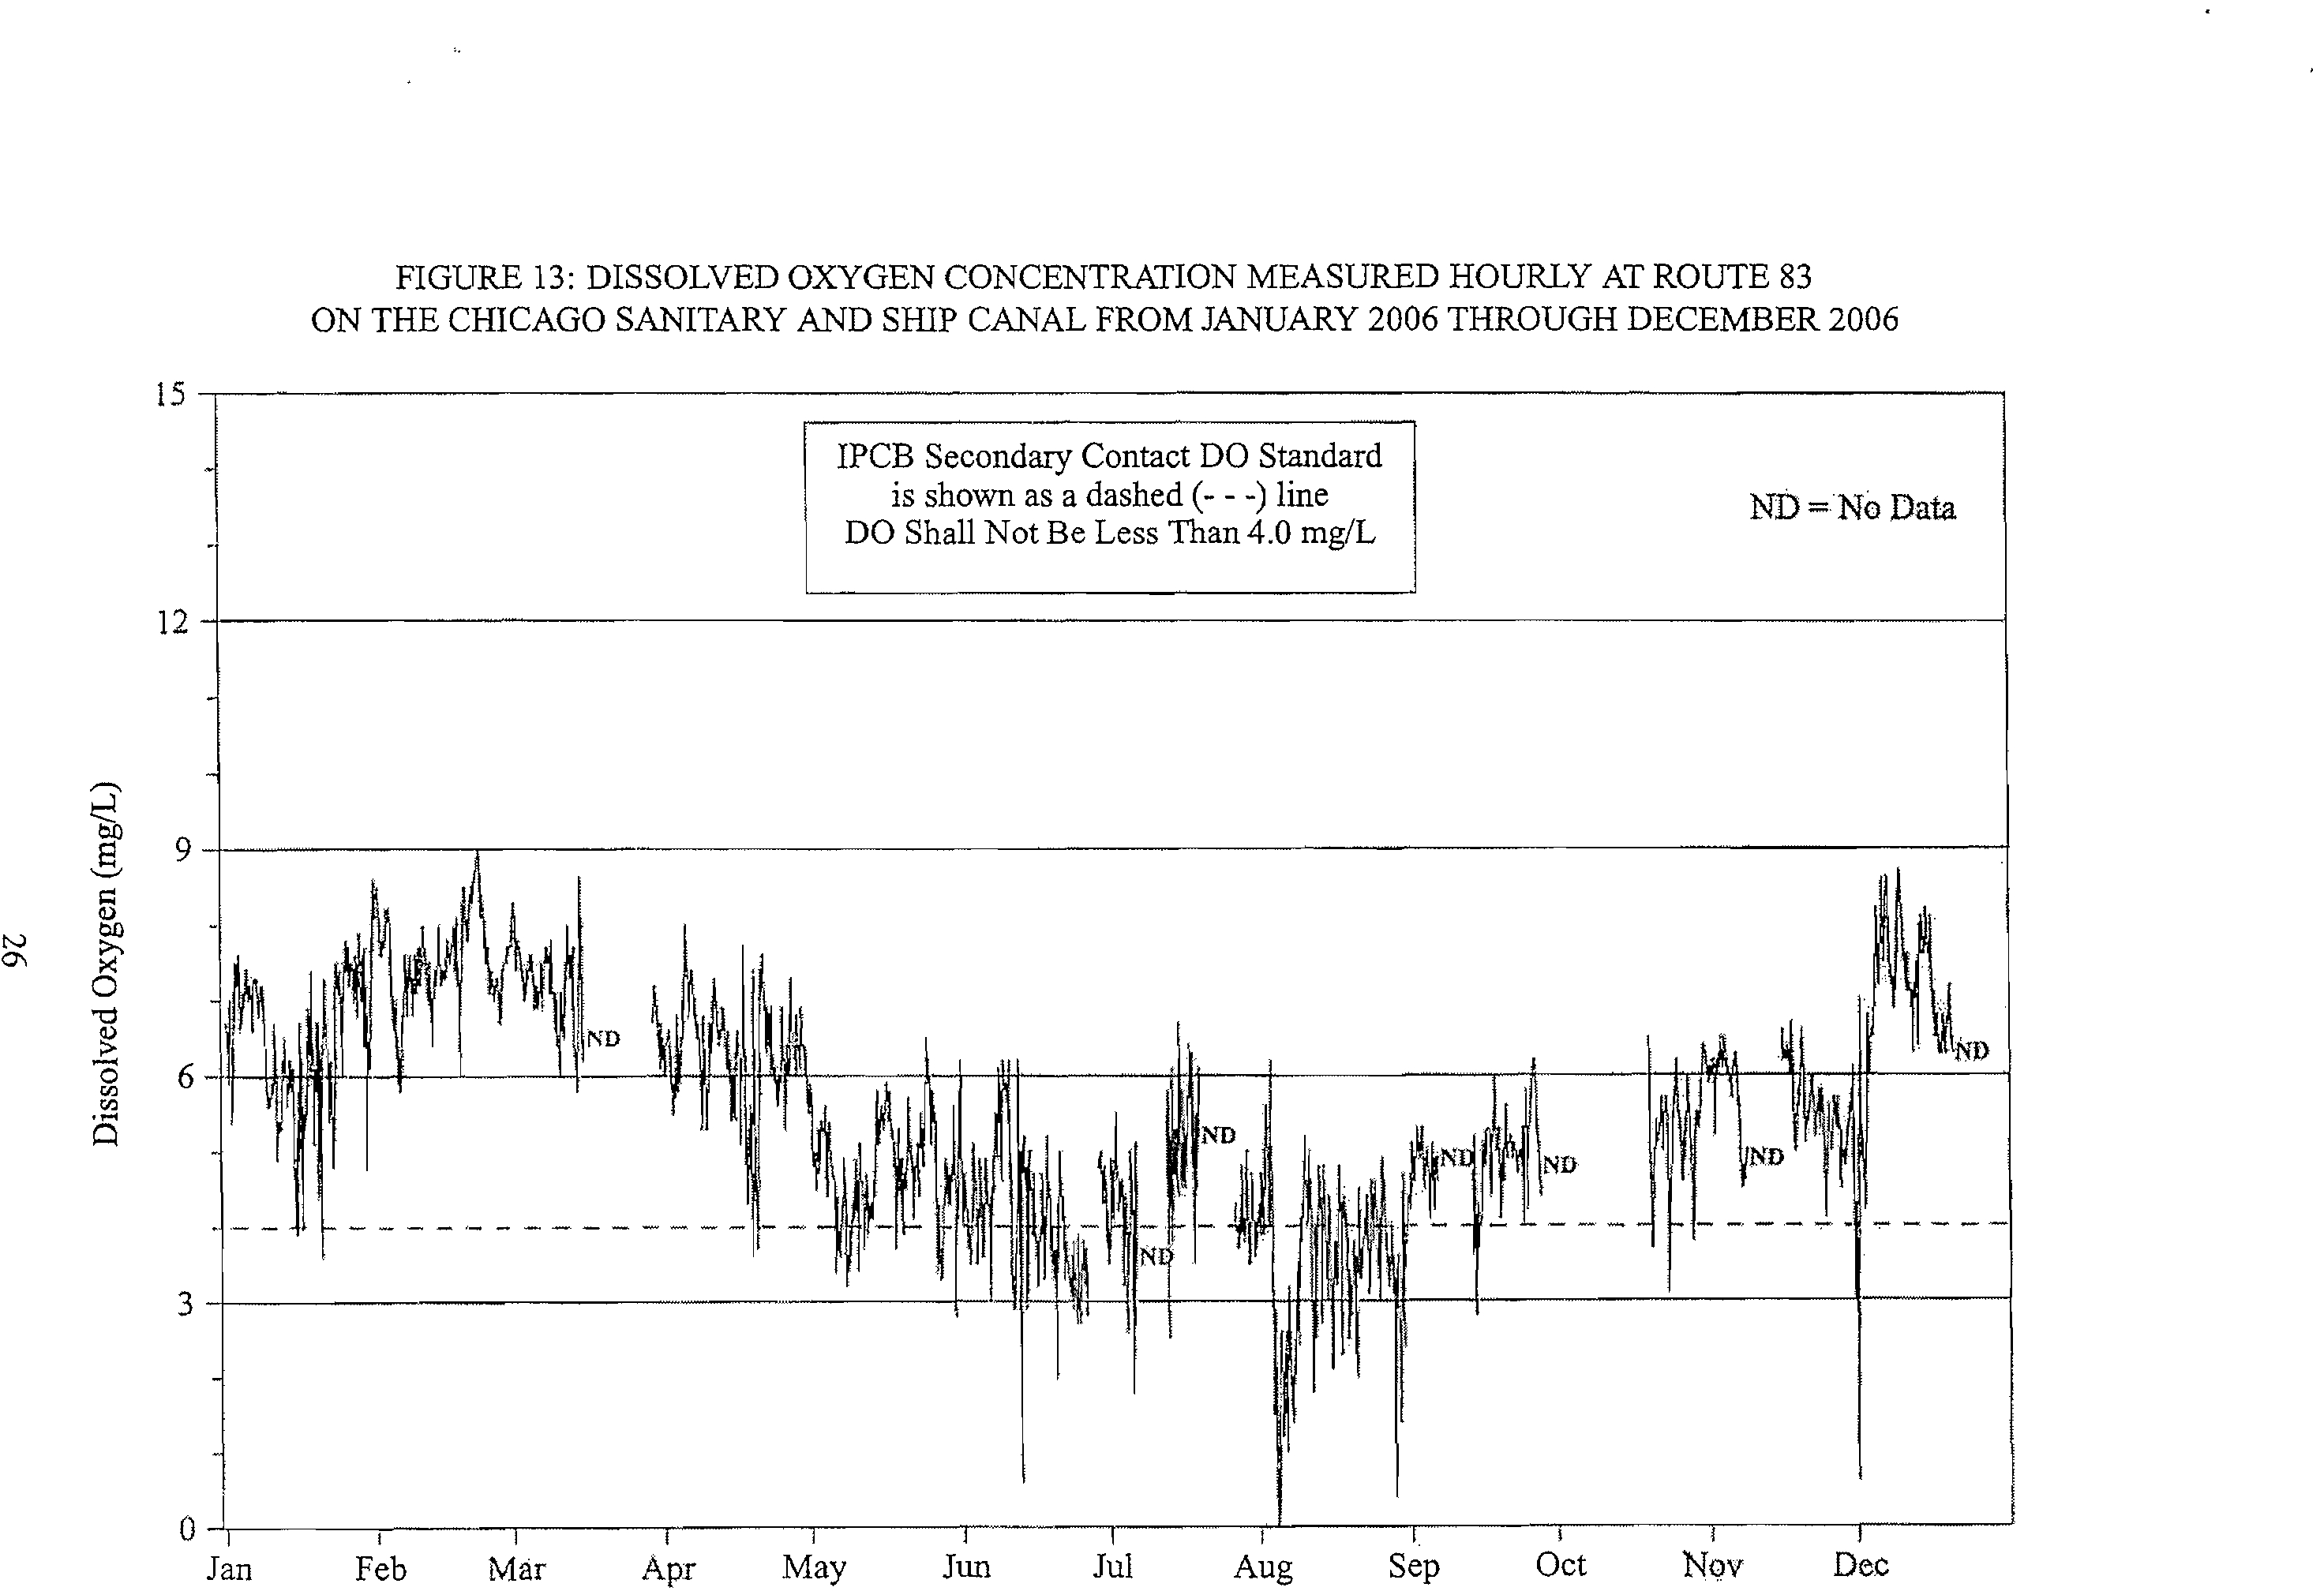
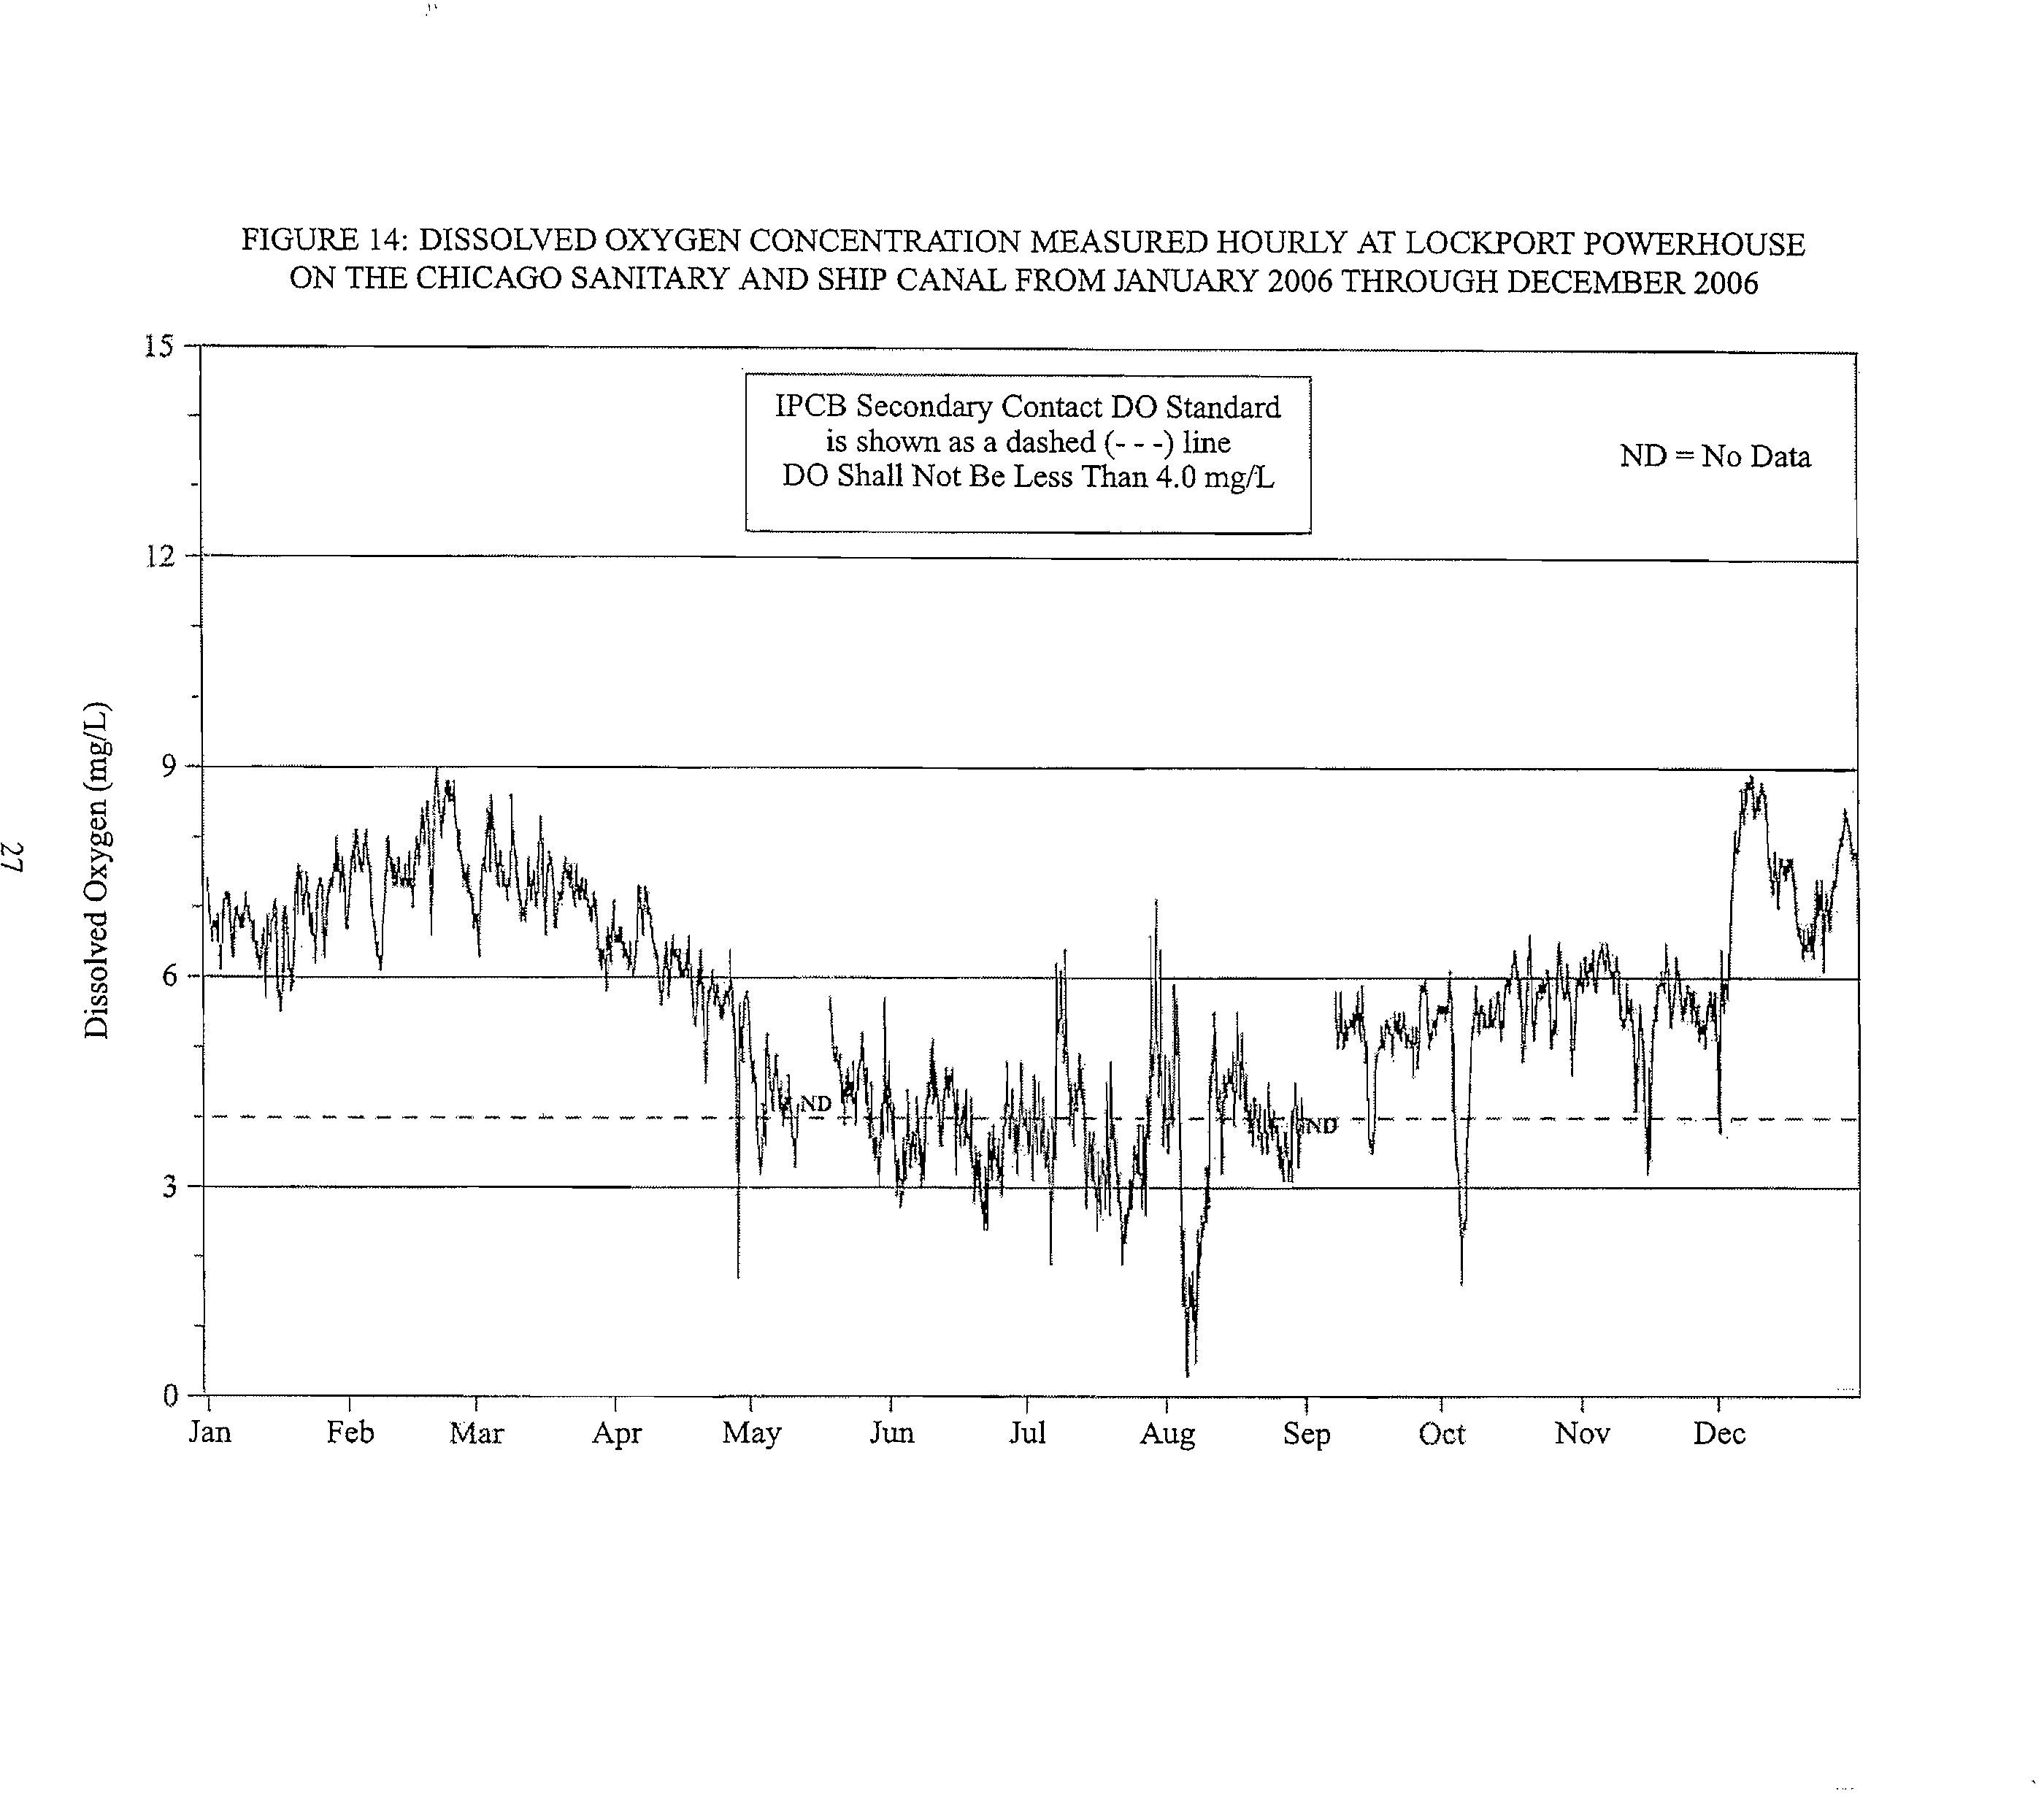
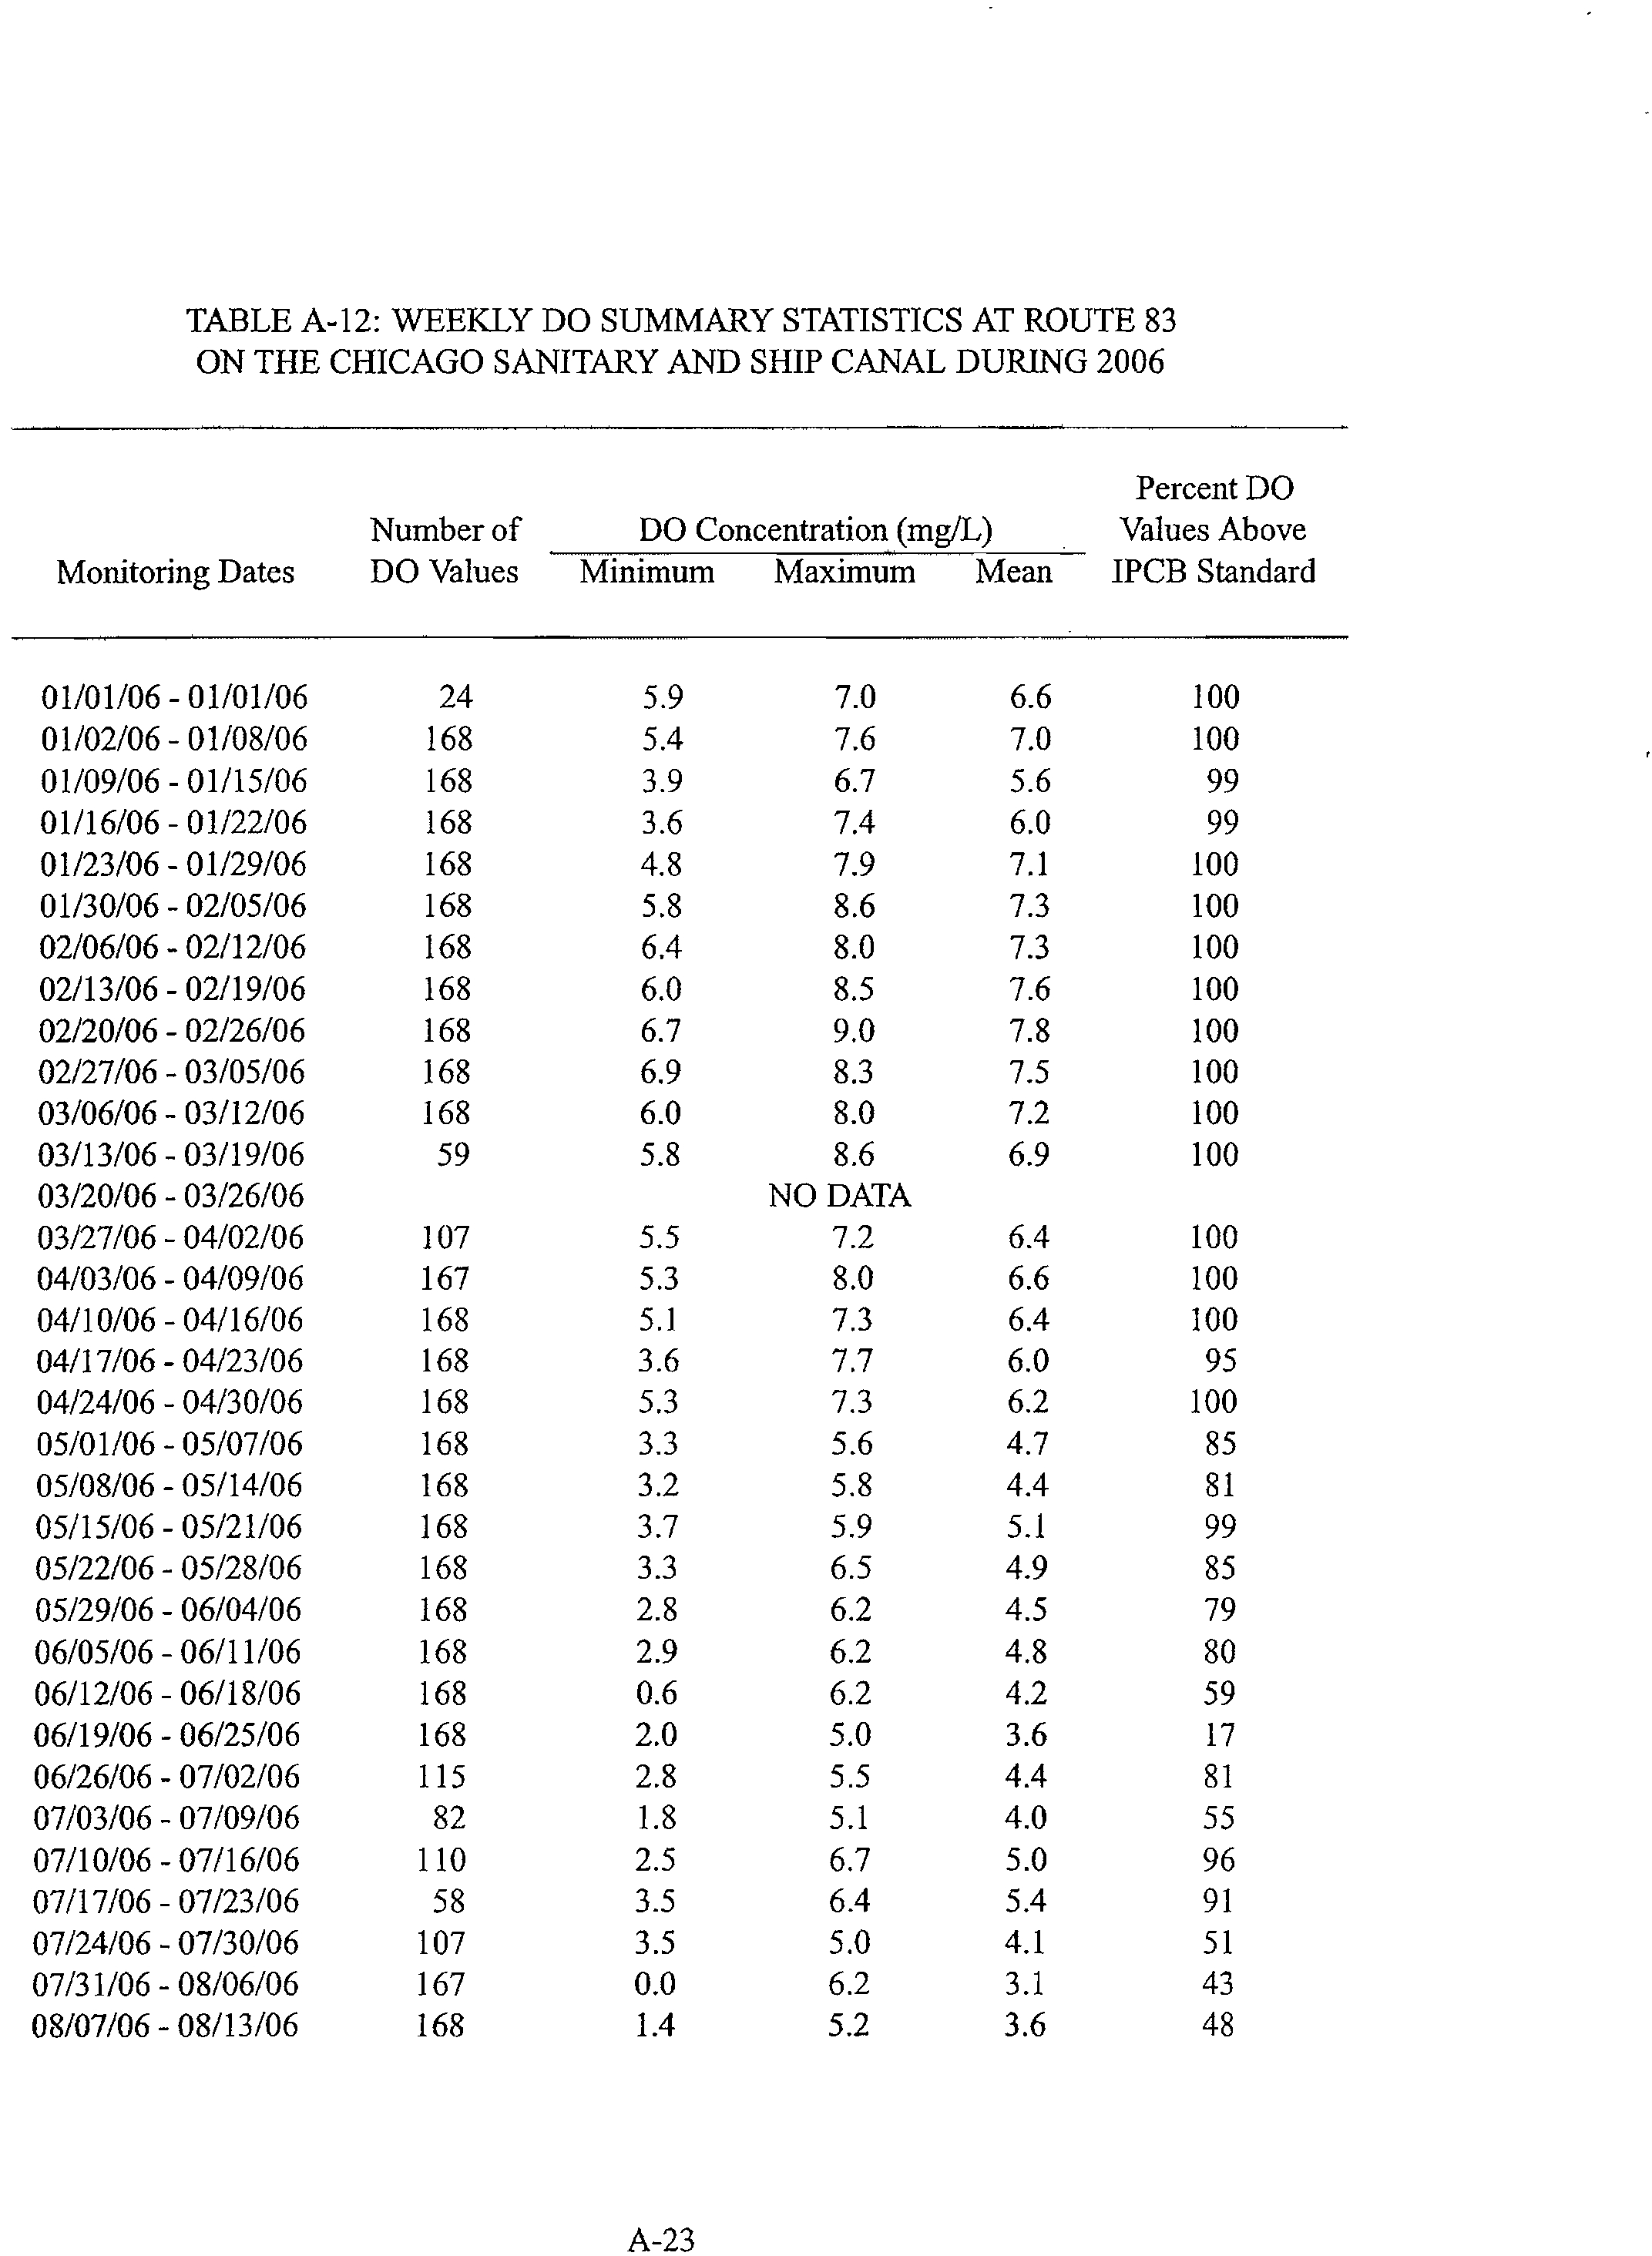
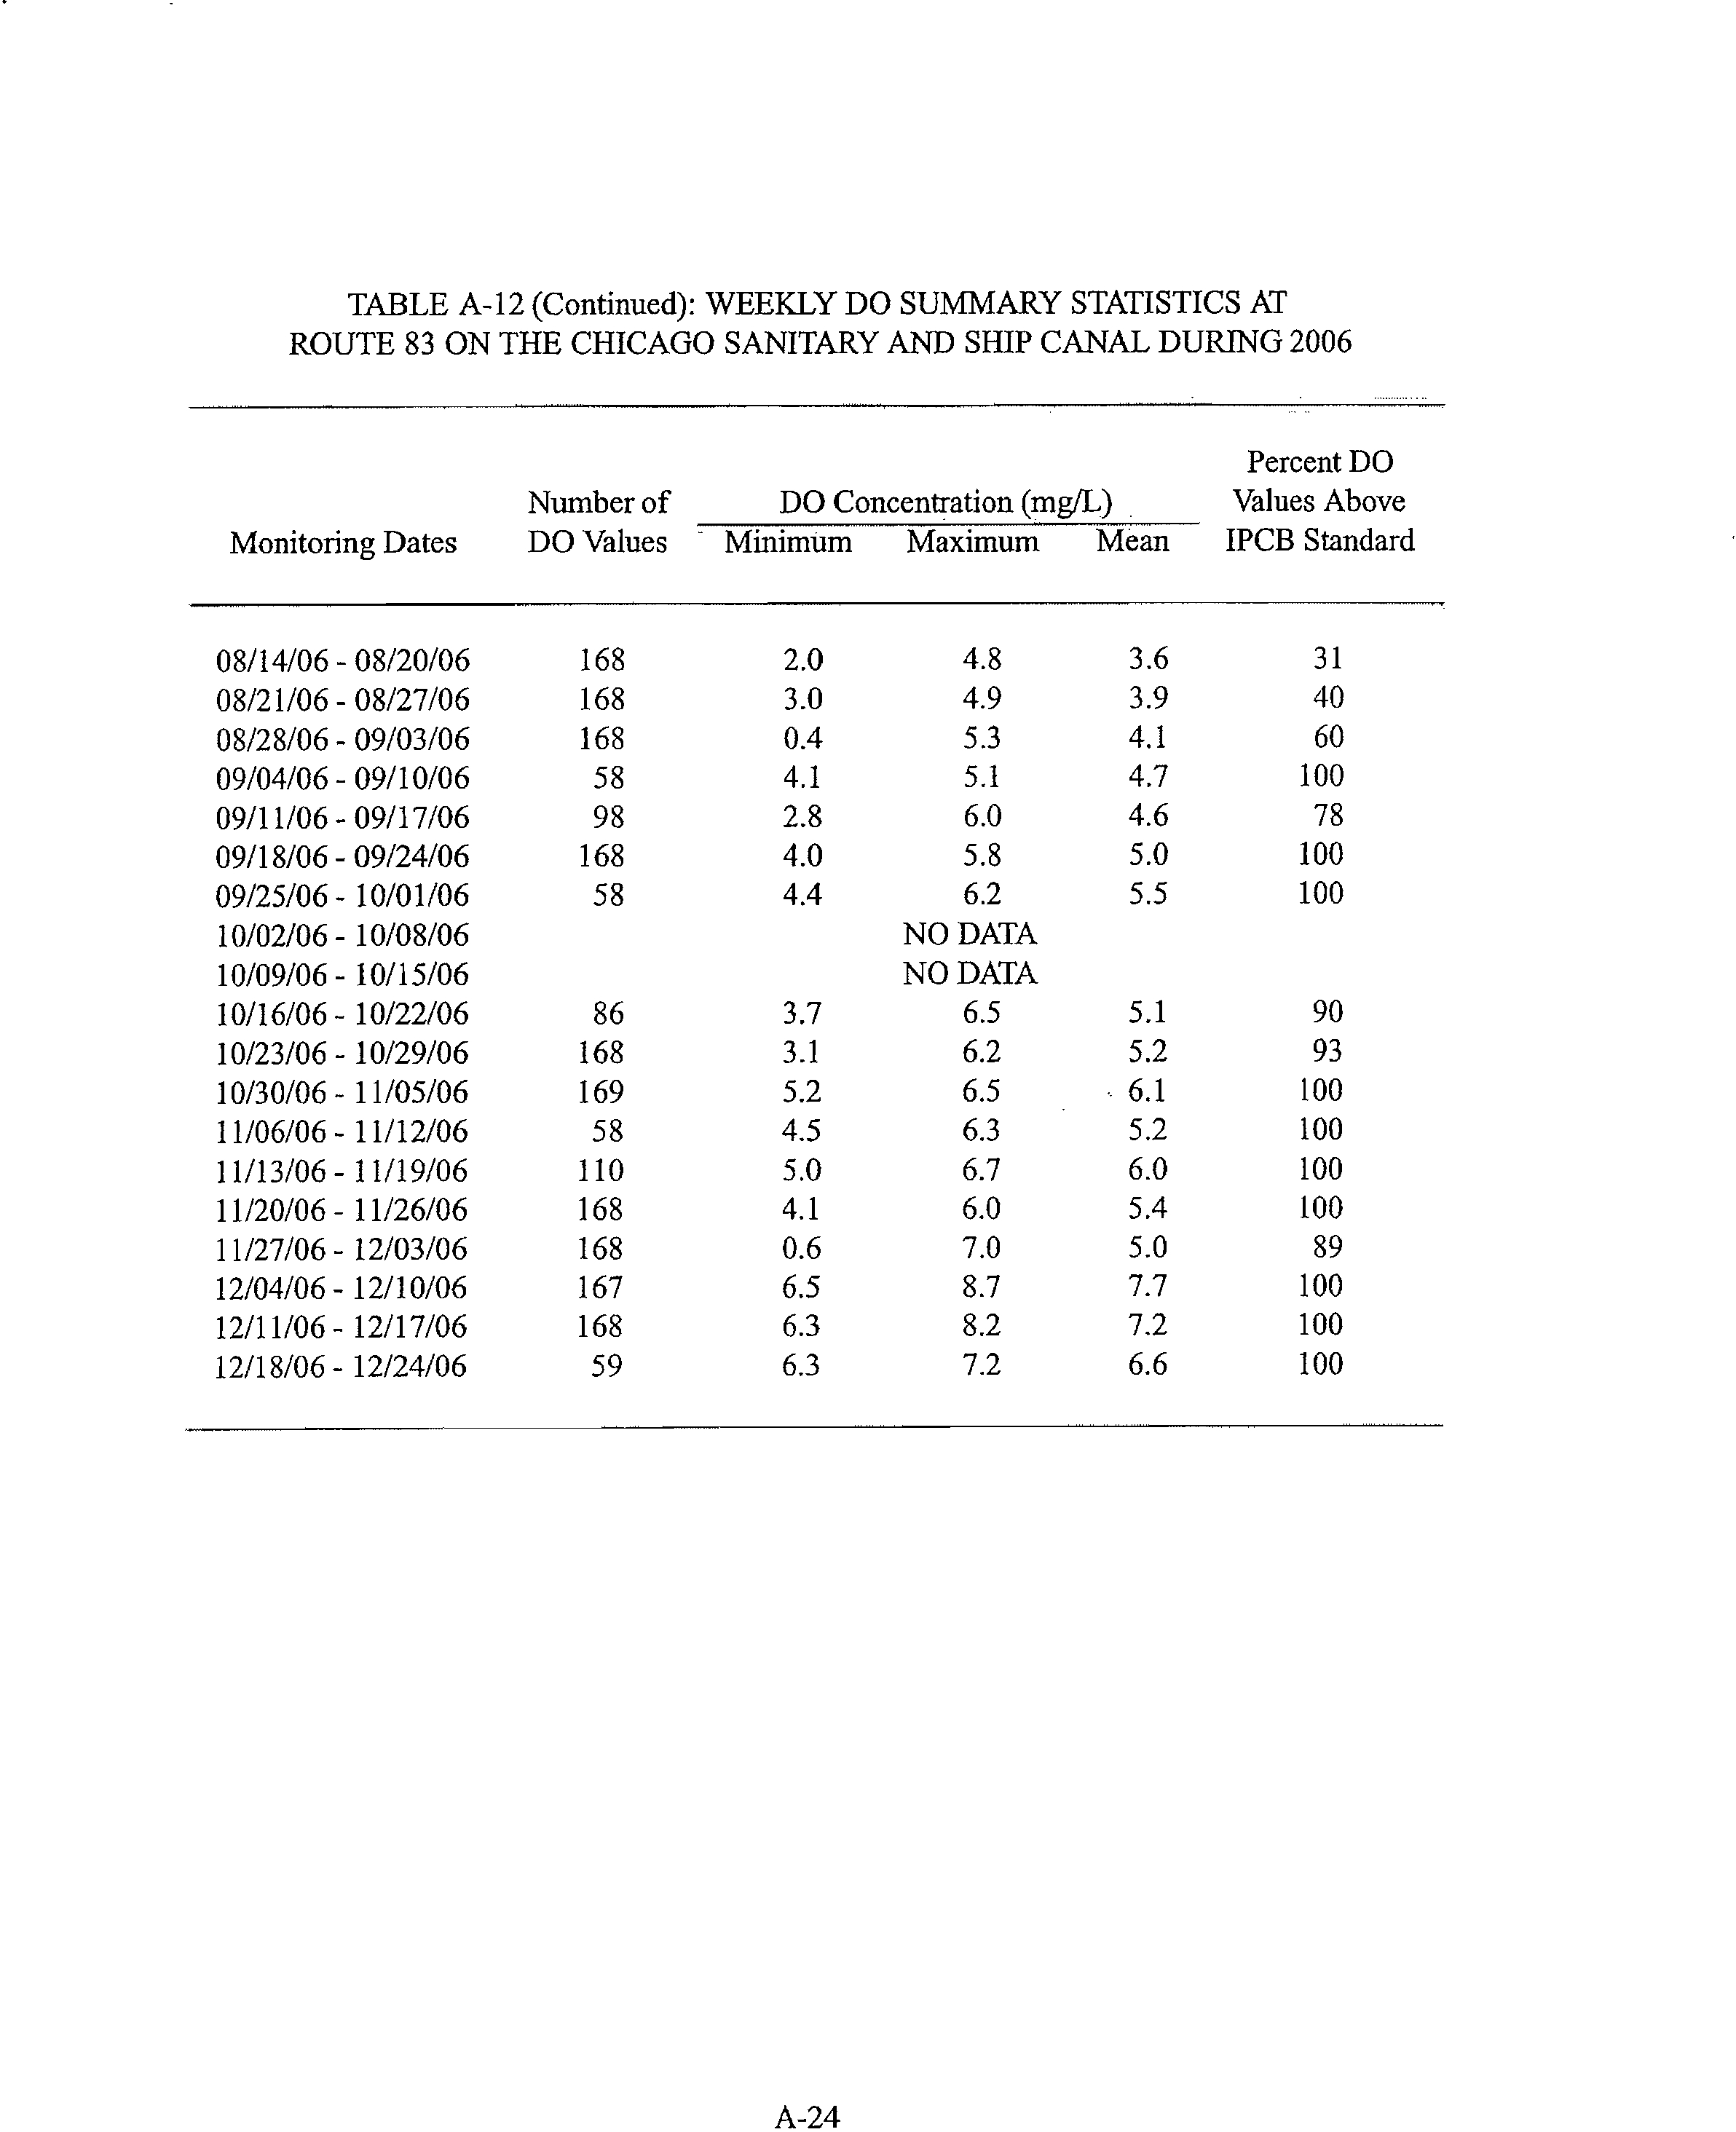
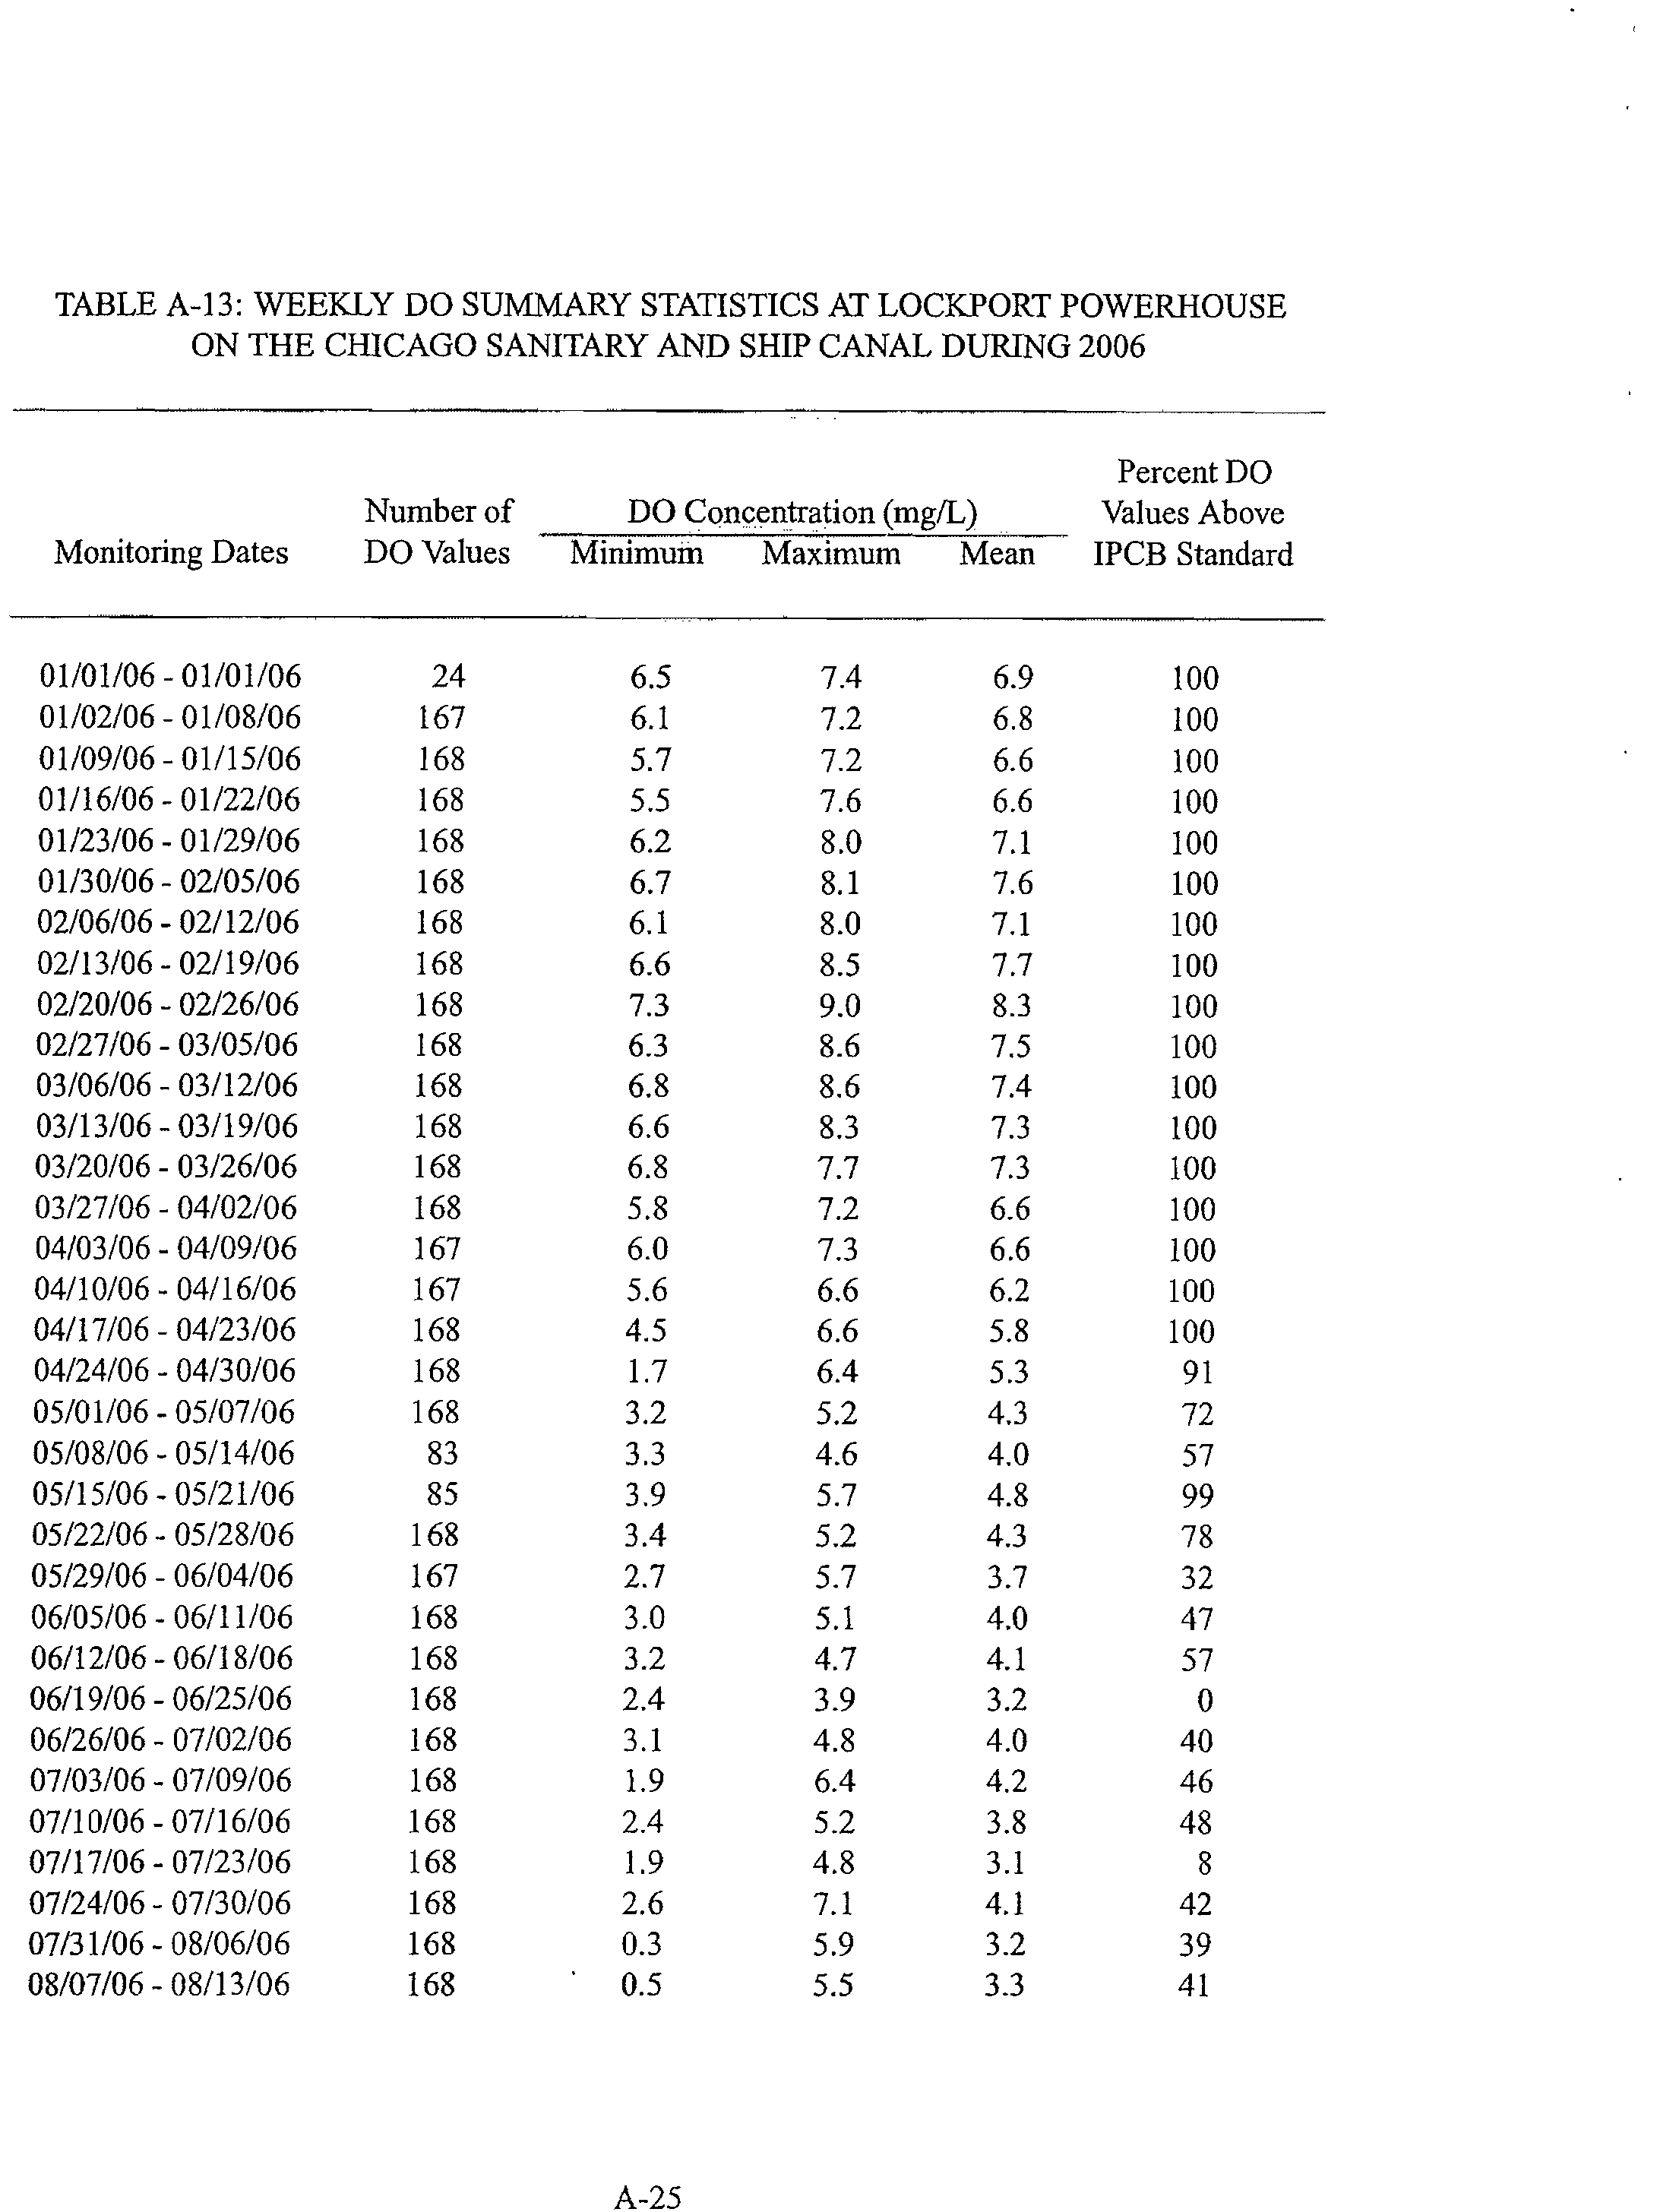
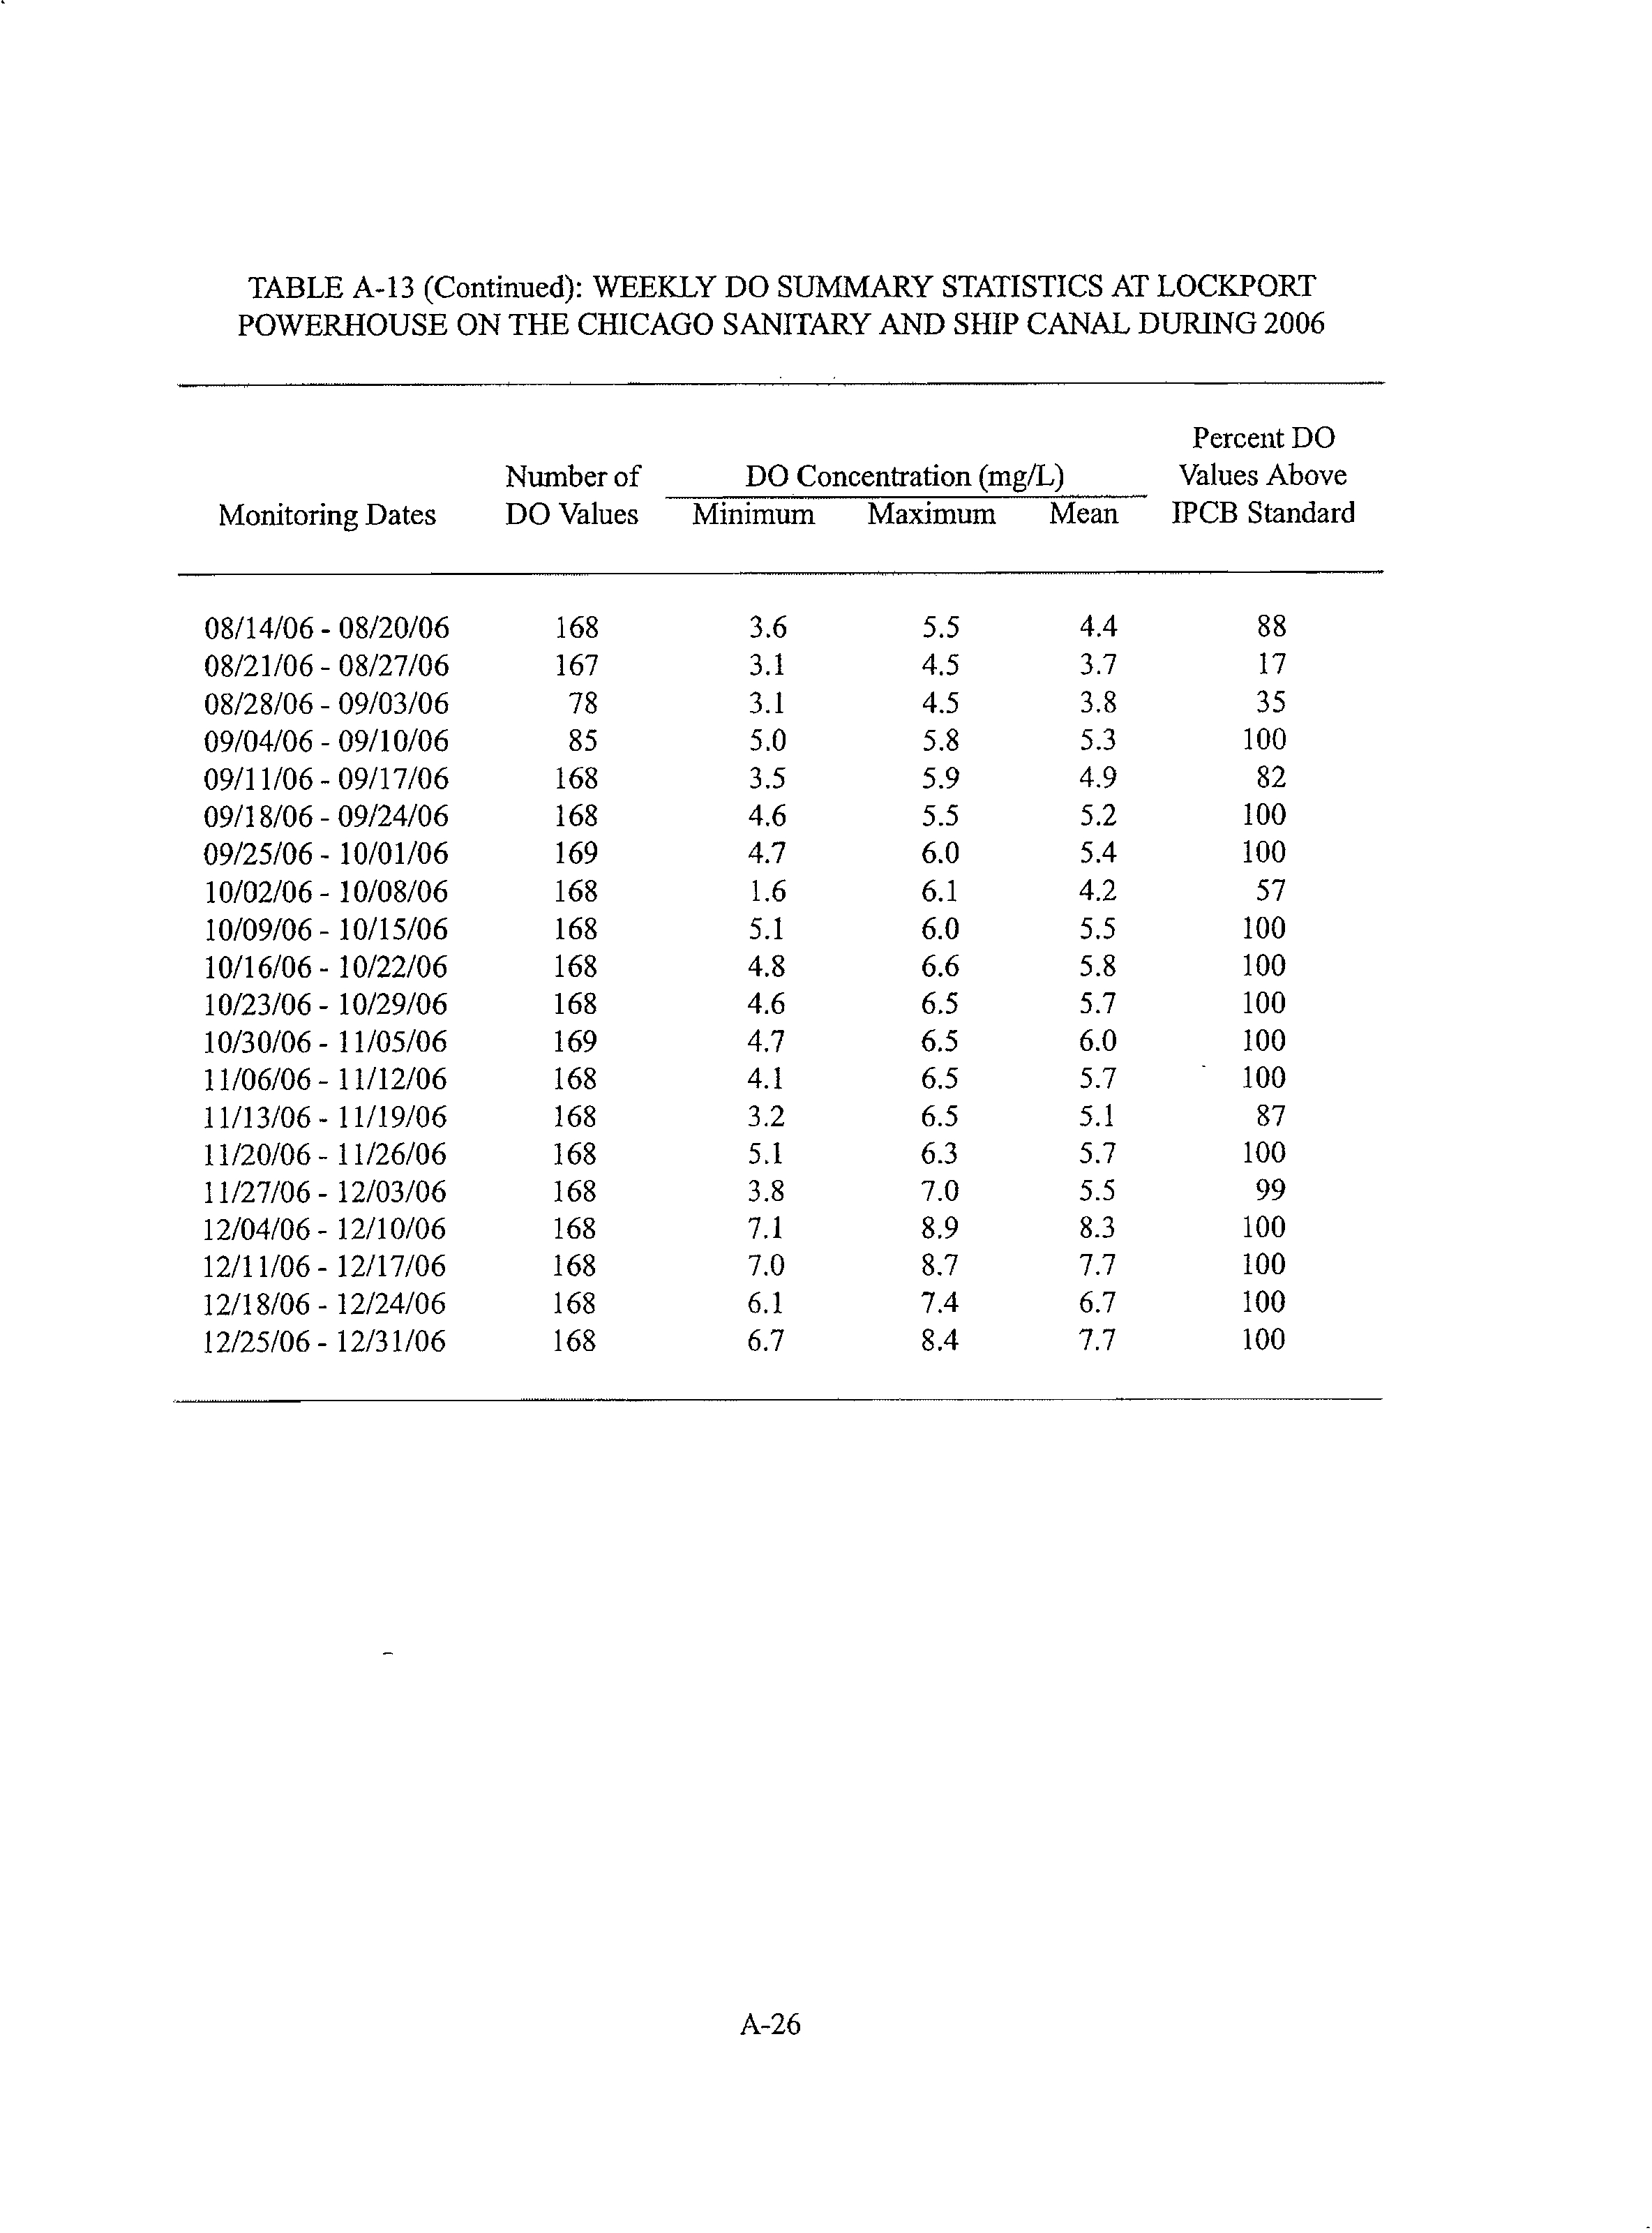
The MWRDGC collected D.O. readings hourly on the Ship Canal at Route 83, upstream of the refinery,
and at the Lockport Powerhouse, downstream of the Lemont Refinery, from January 2002 to December
2006. Appendix C presents the data both graphically and in a tabular format, by year. Graphically, the
Route 83 and Lockport Powerhouse D.O. values show similar trends, with the majority of the results
below 4.0 mg/L in the months between April and October/November for all five years. Overall,
minimum values were lower at Route 83, upstream of the Refinery. These data indicate the Refinery's
incremental ammonia loading does not have an adverse impact on the D.O. concentration in the Ship
Canal.
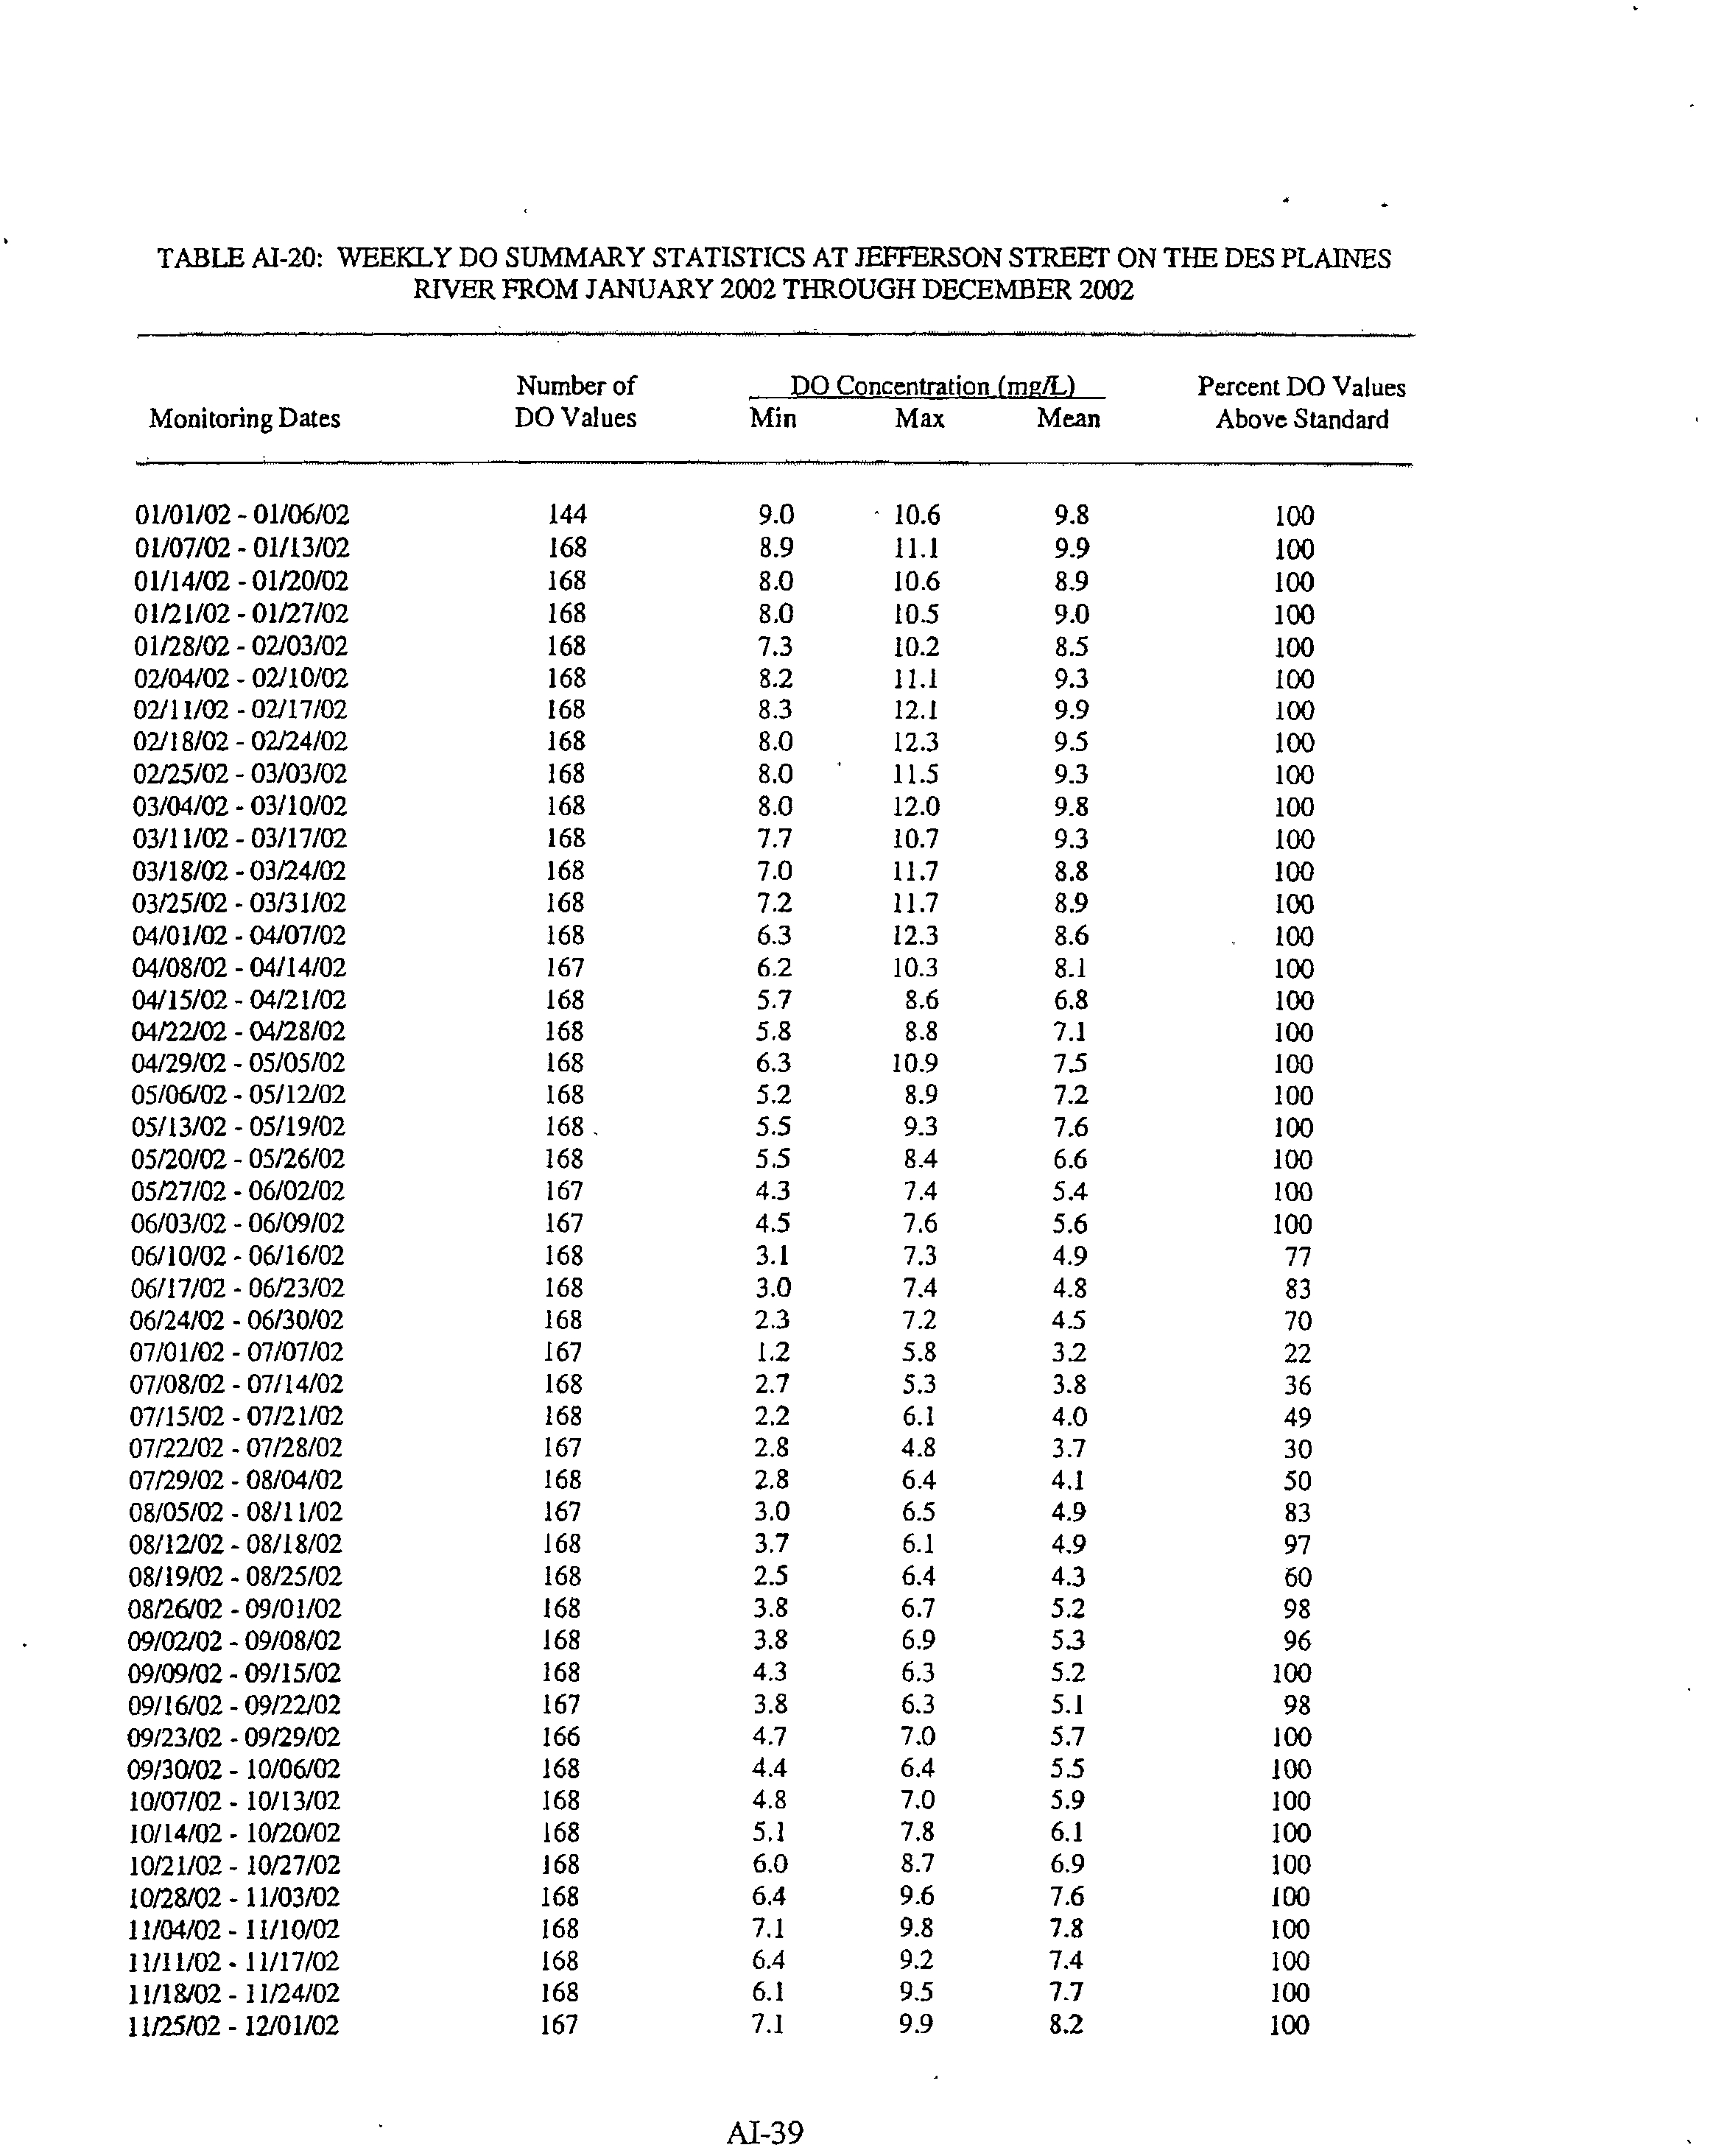
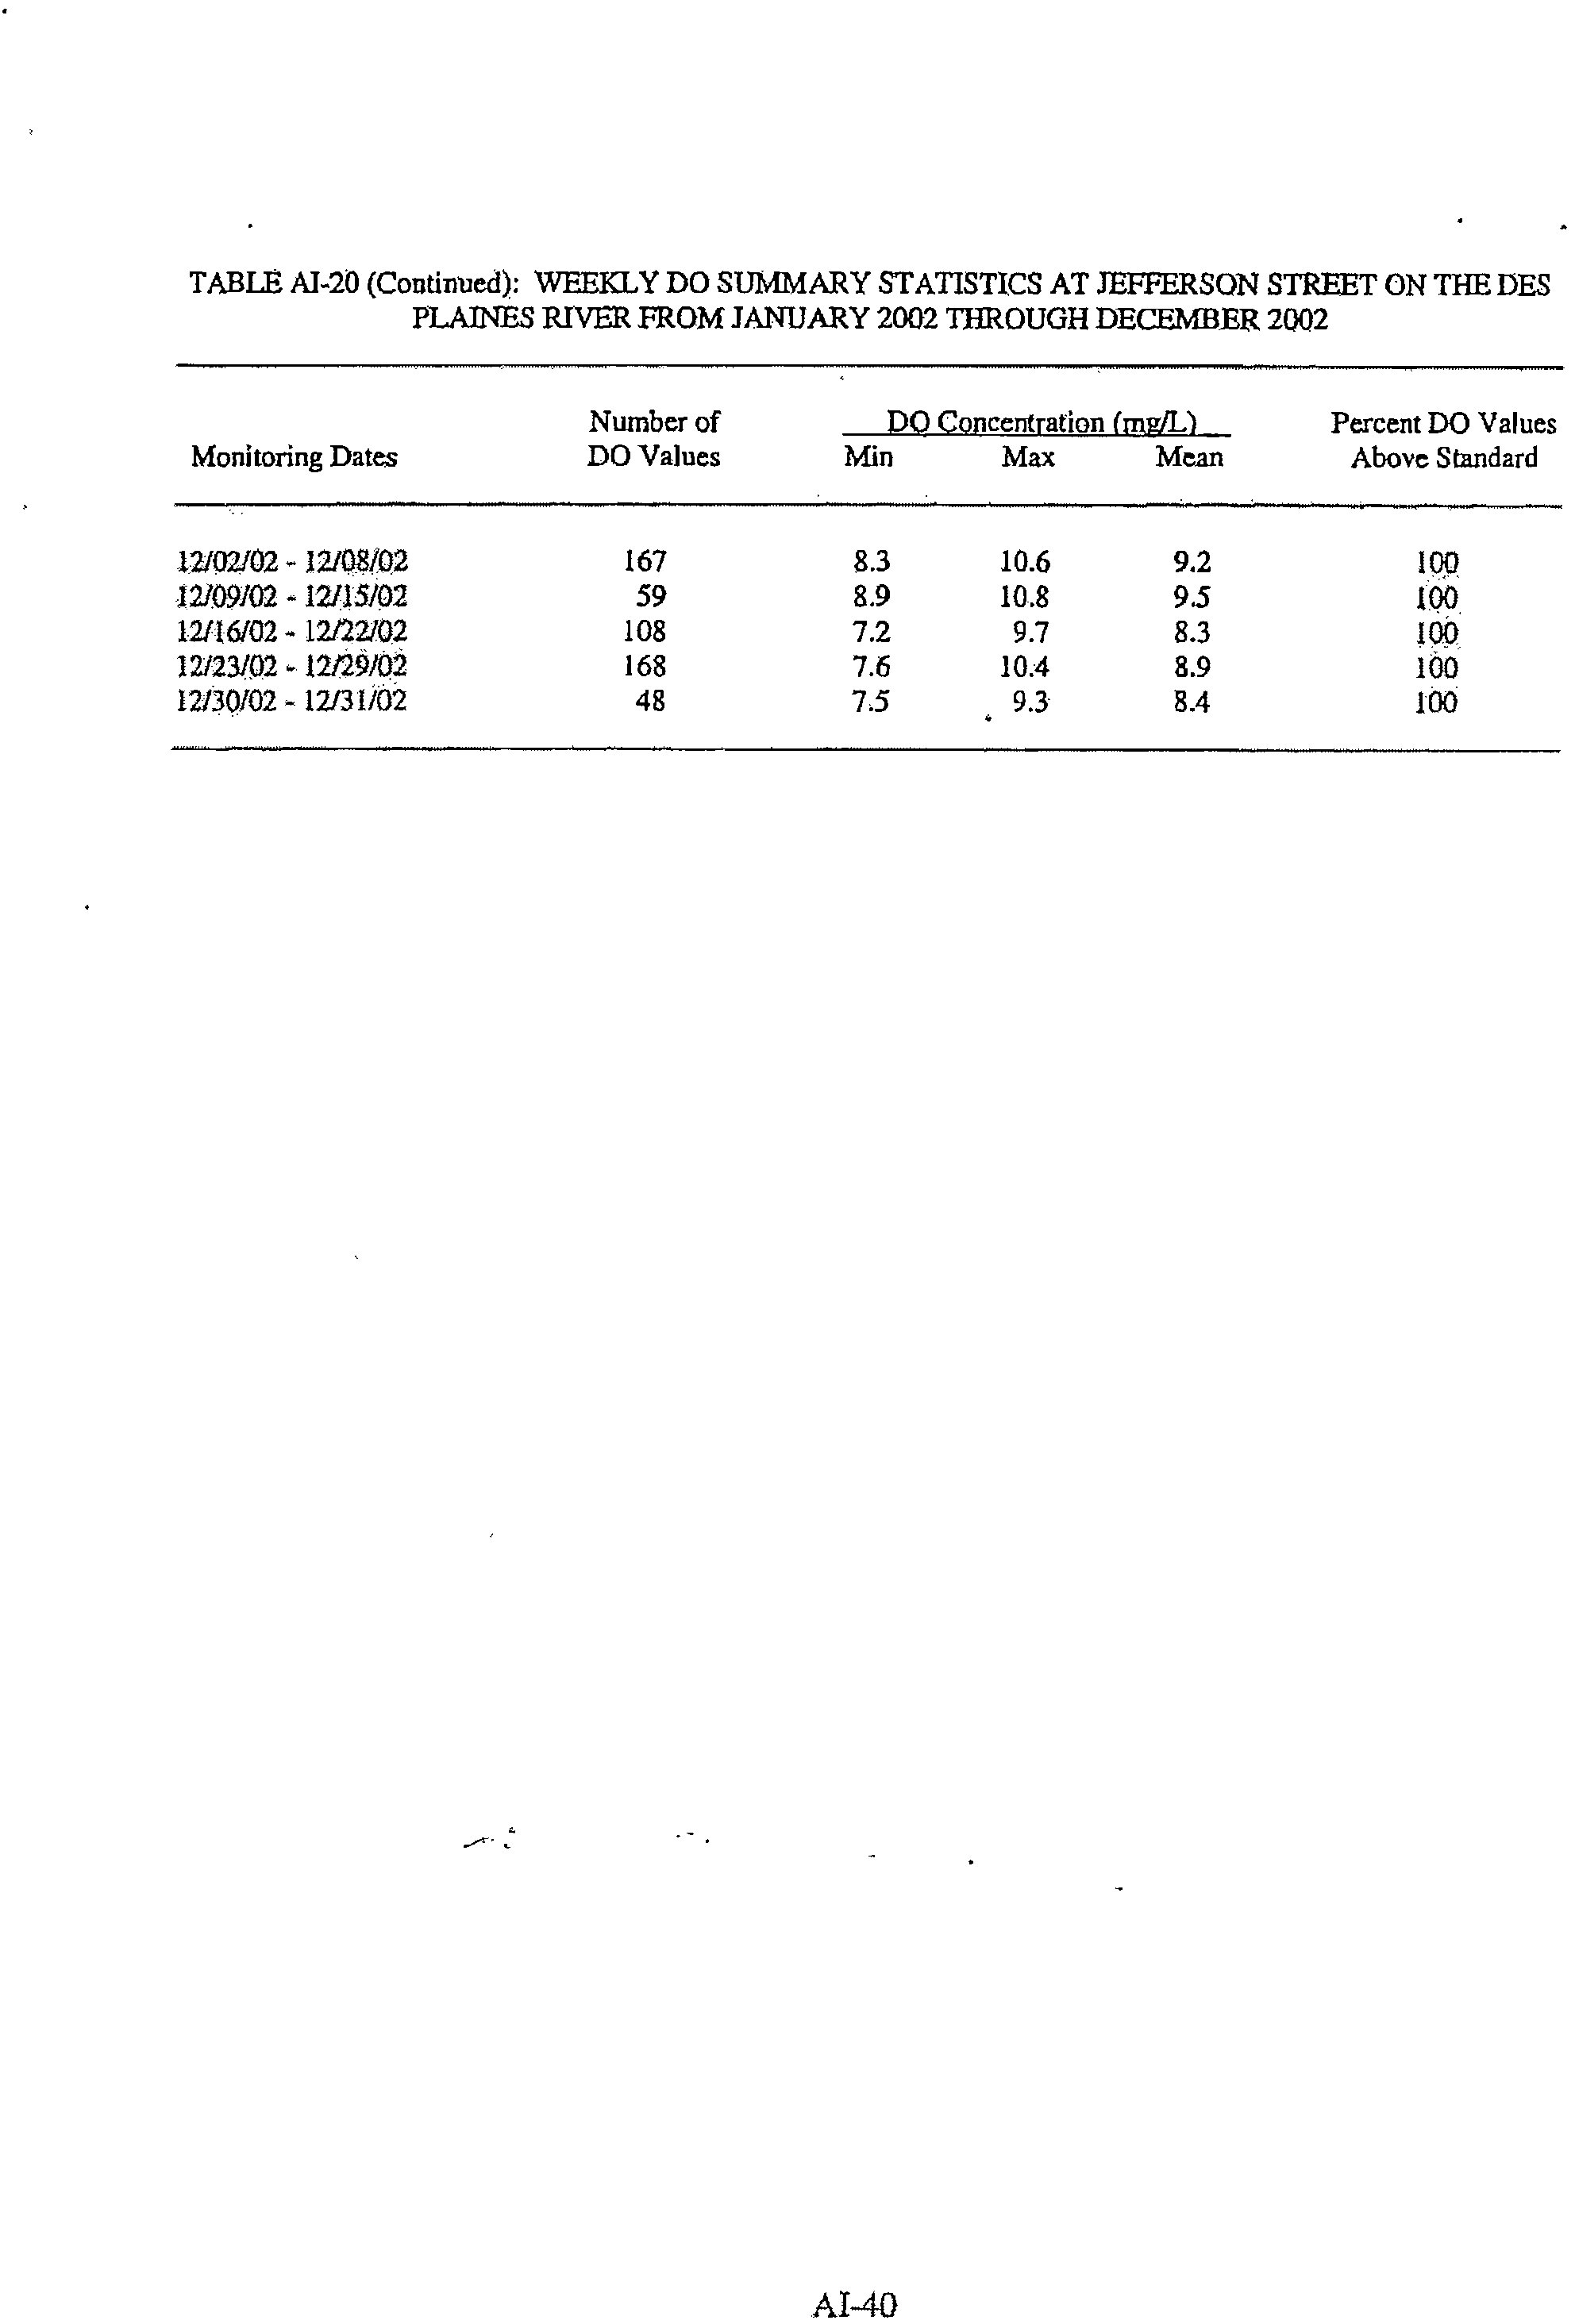
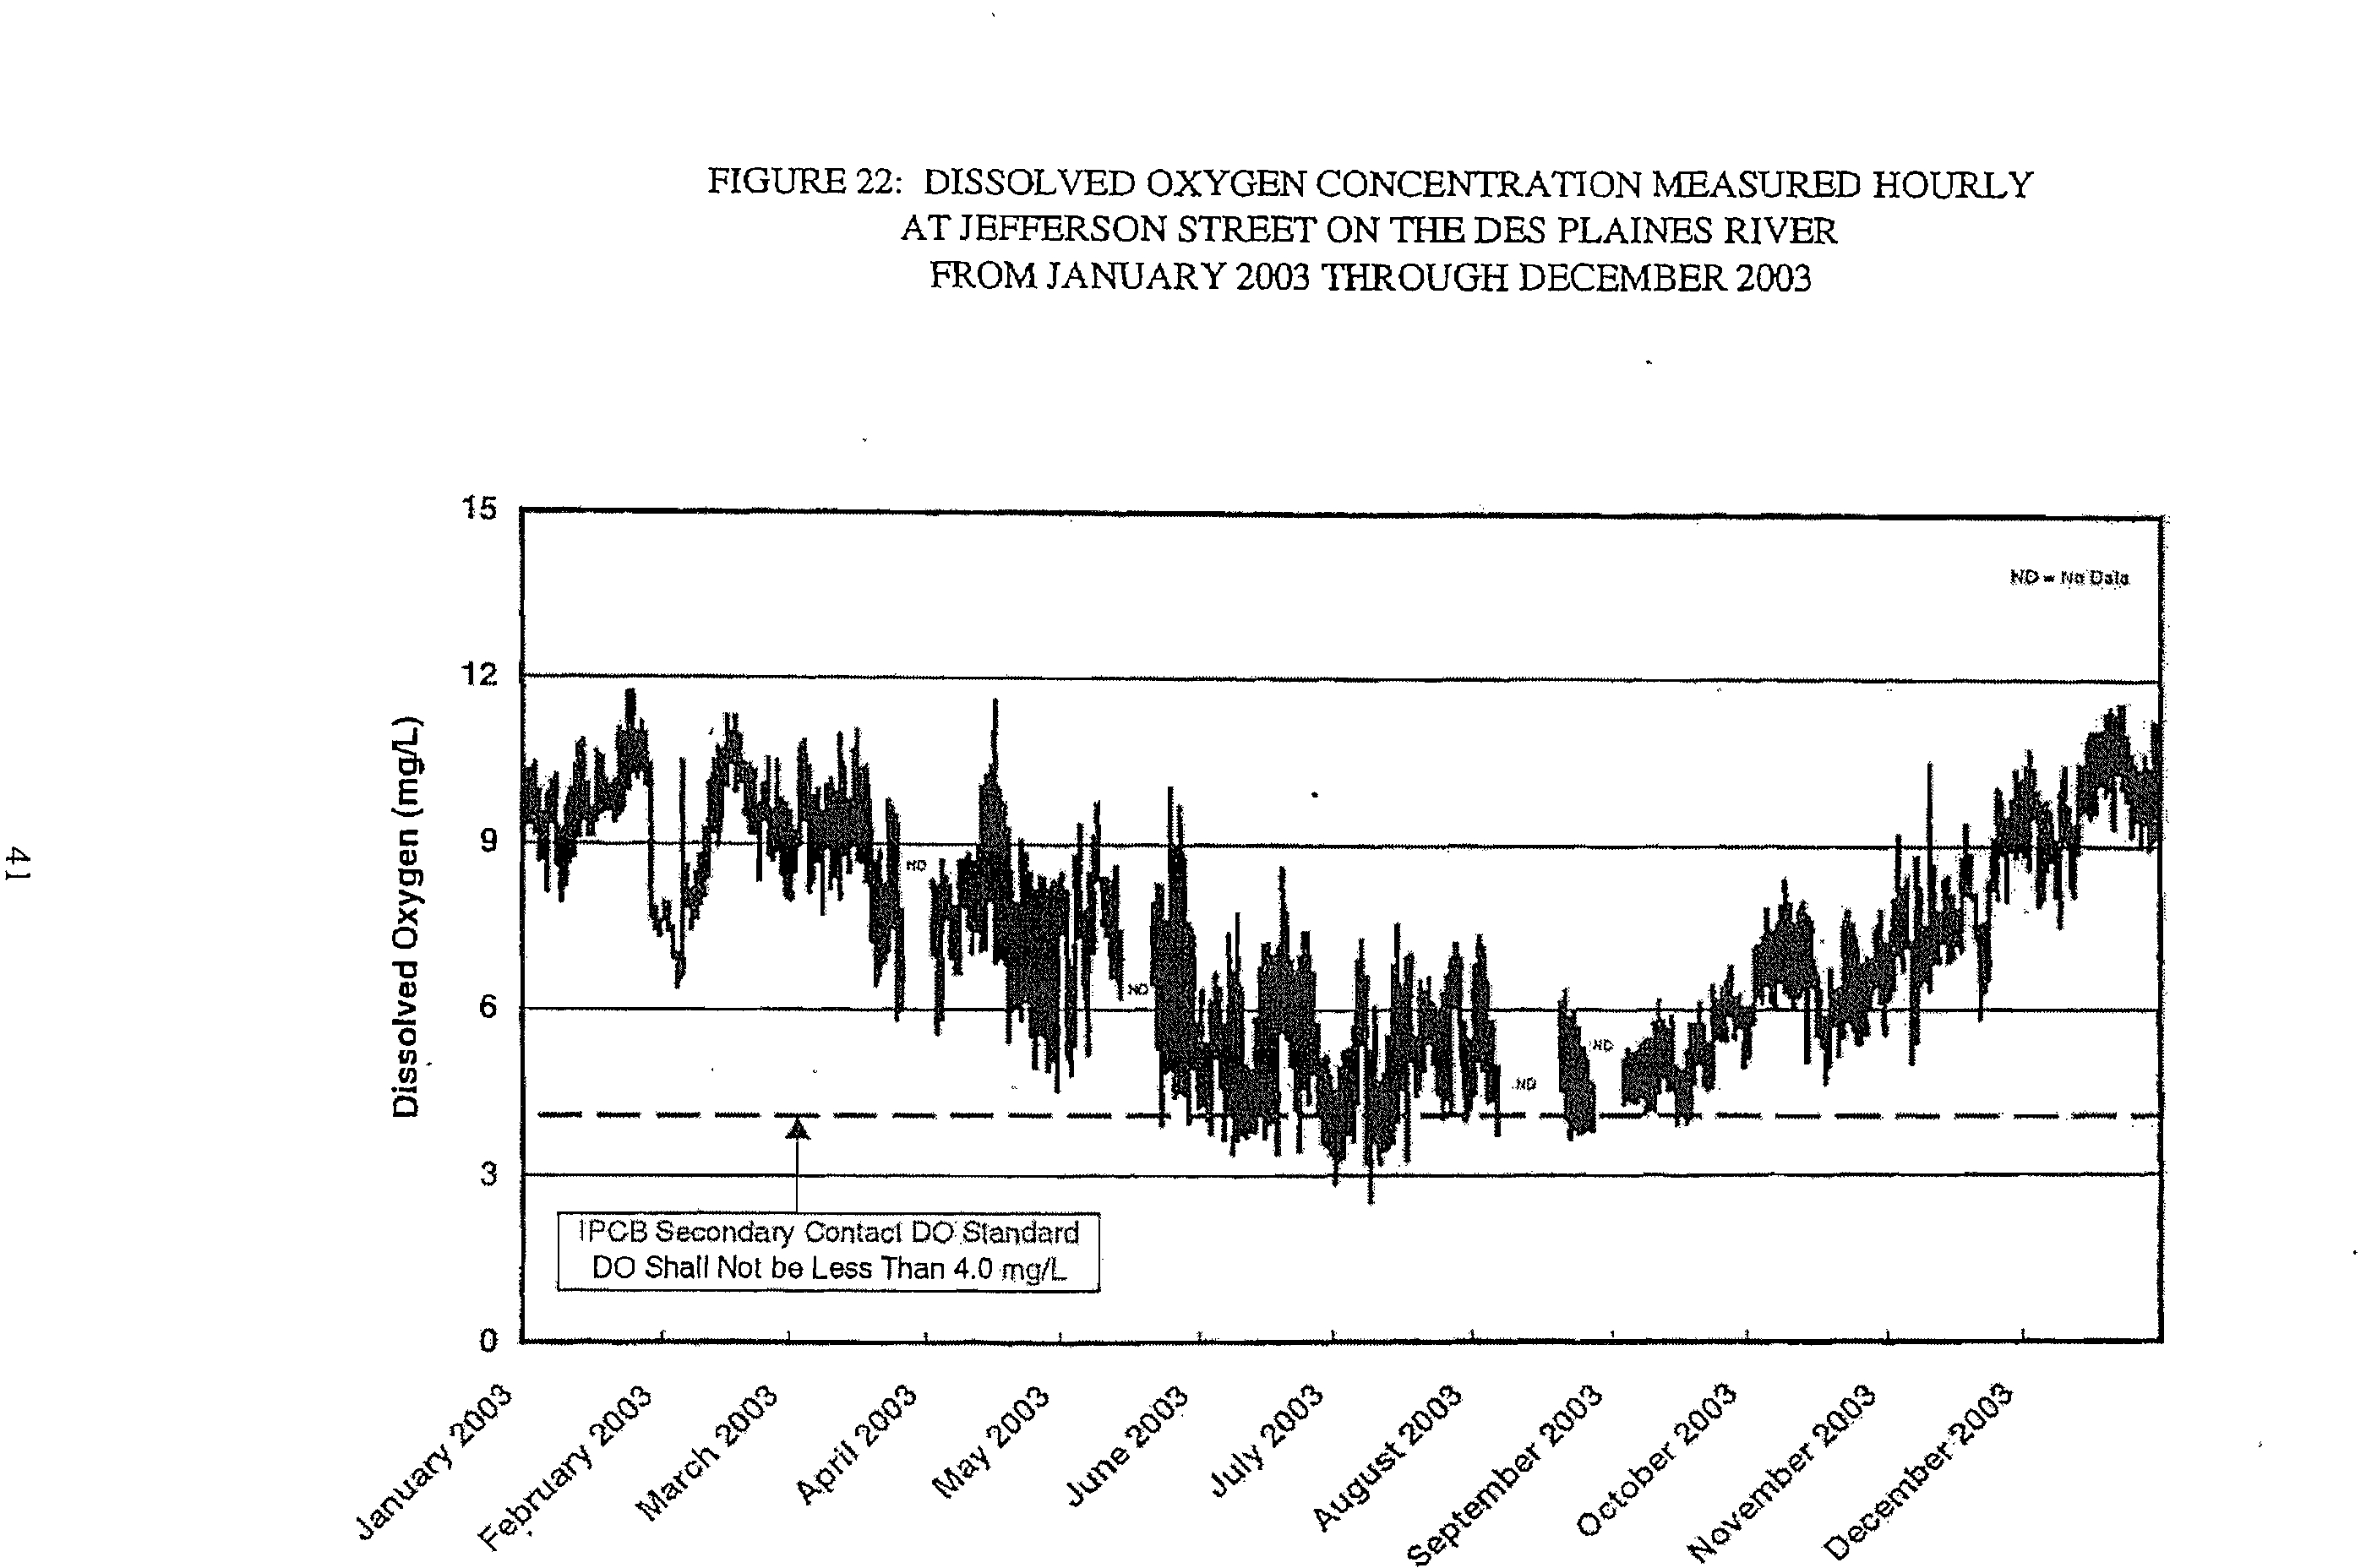
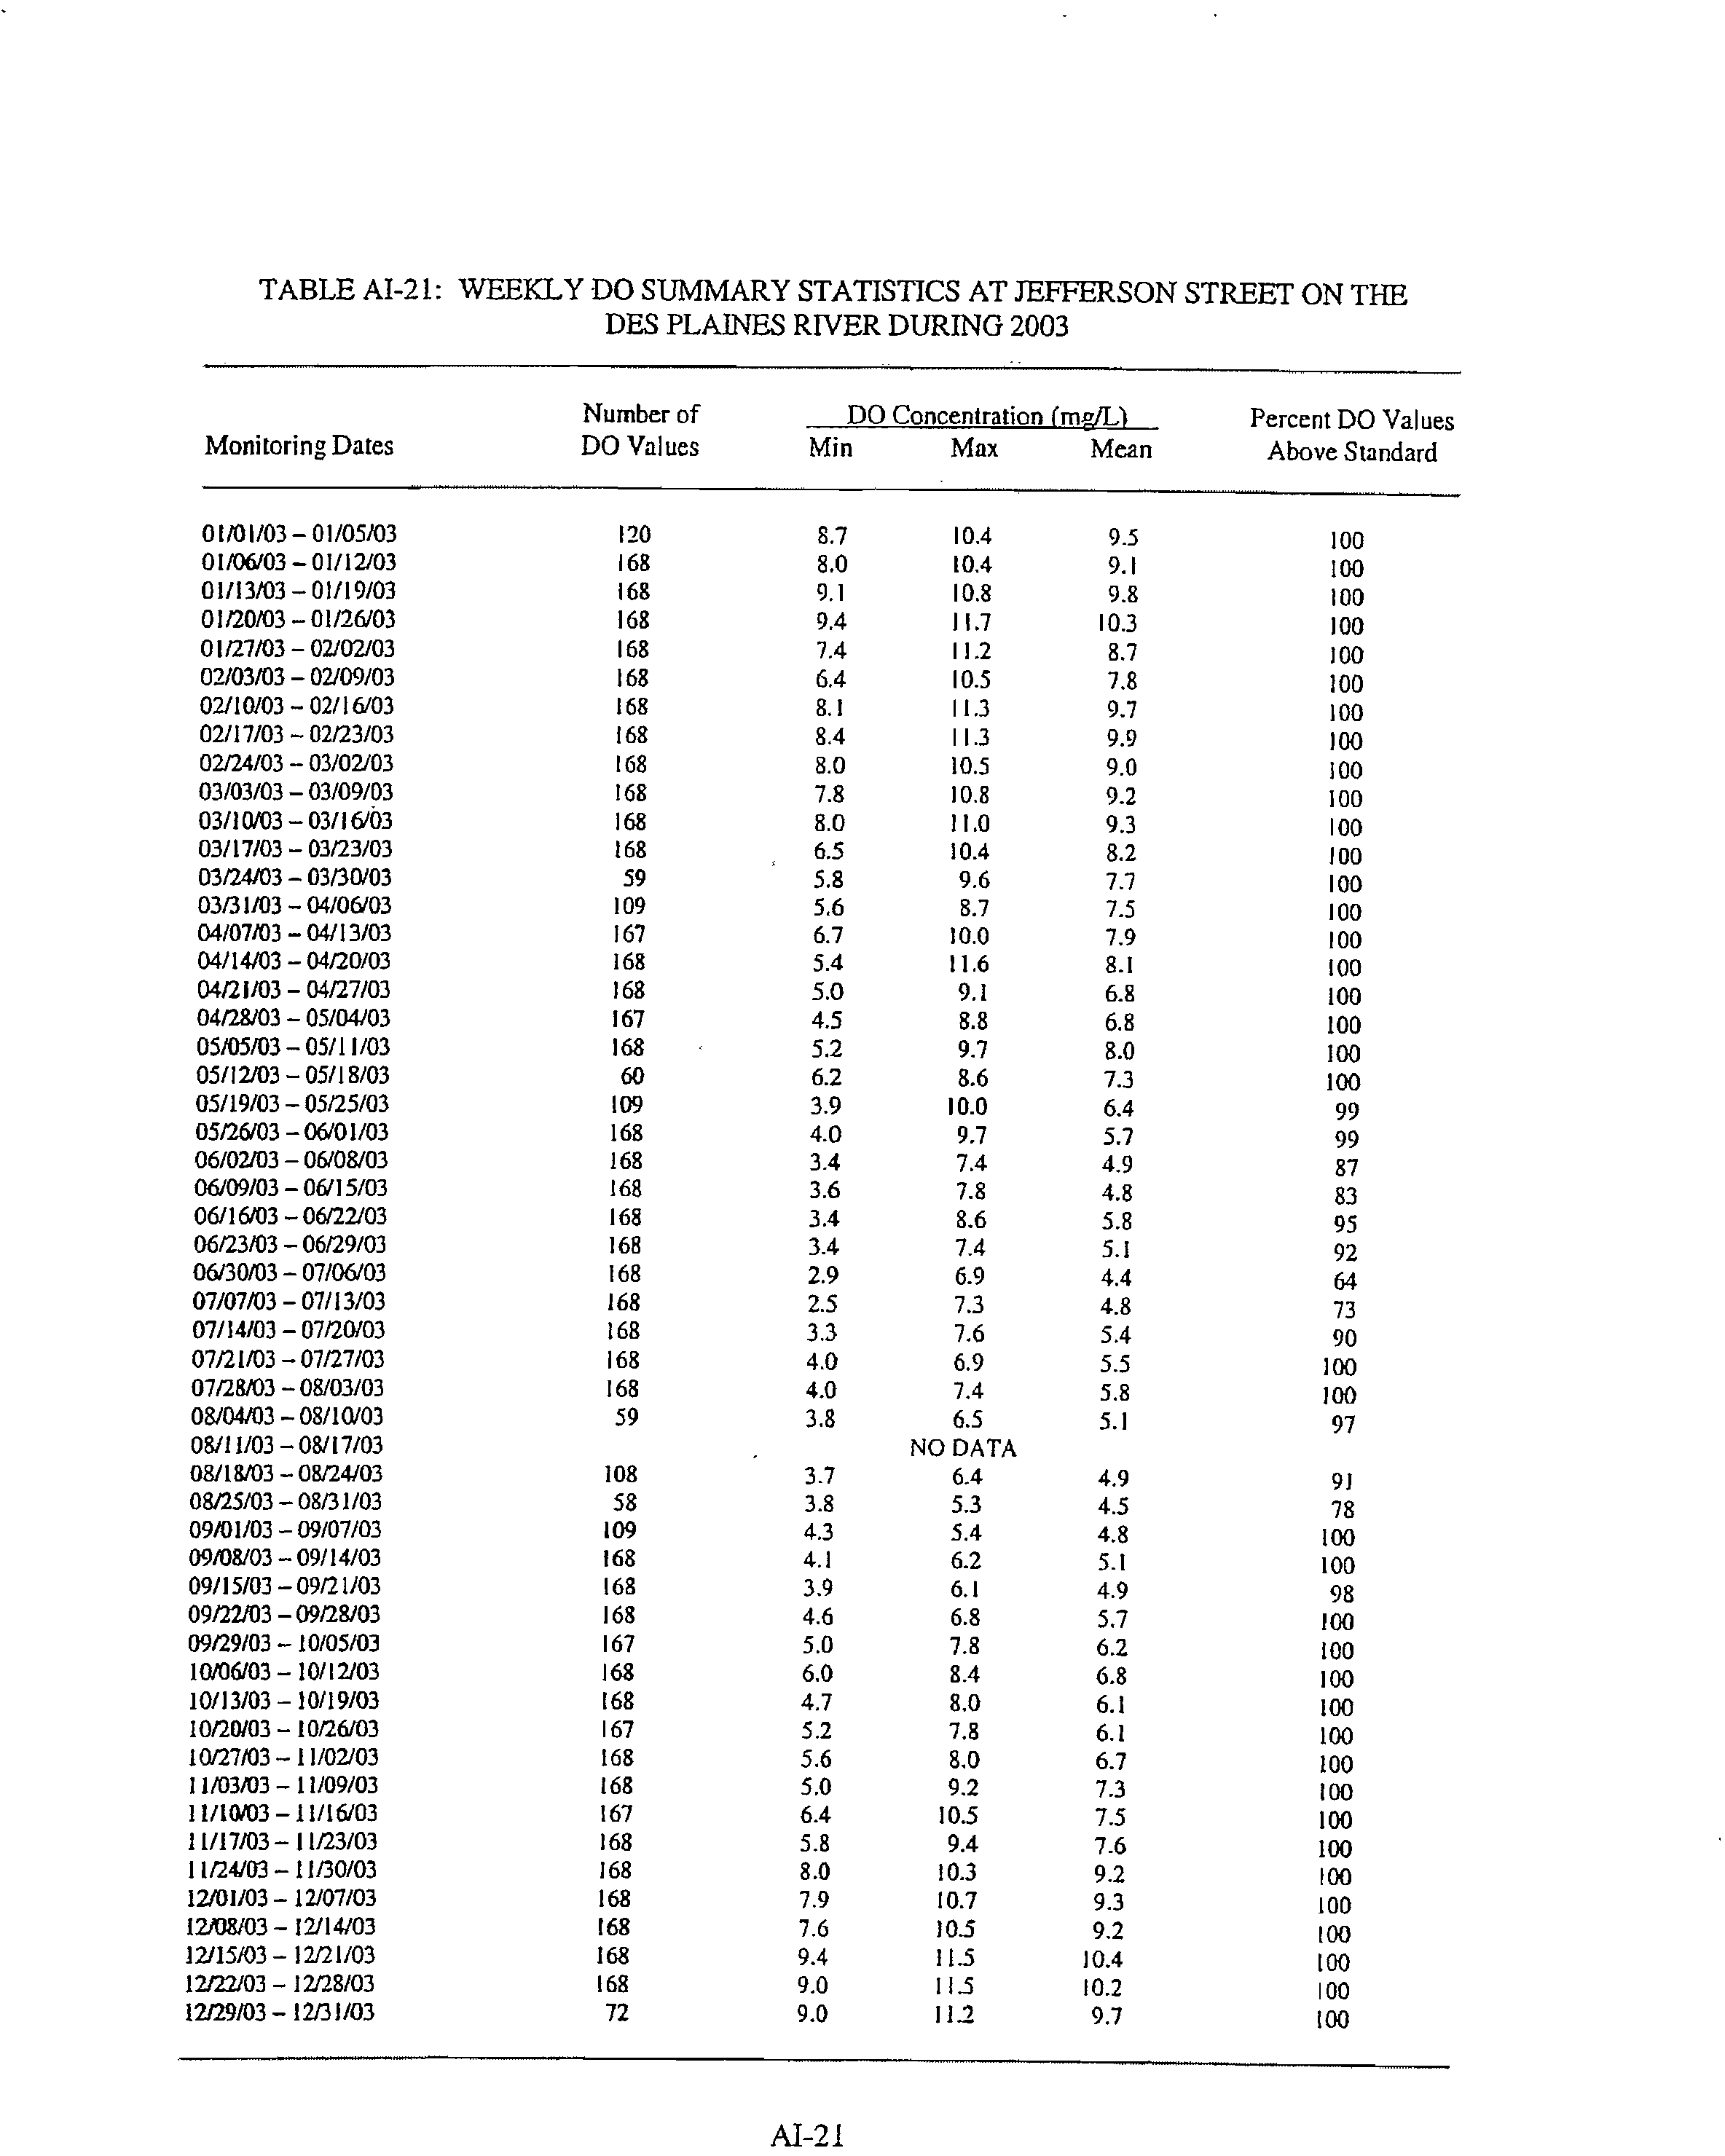
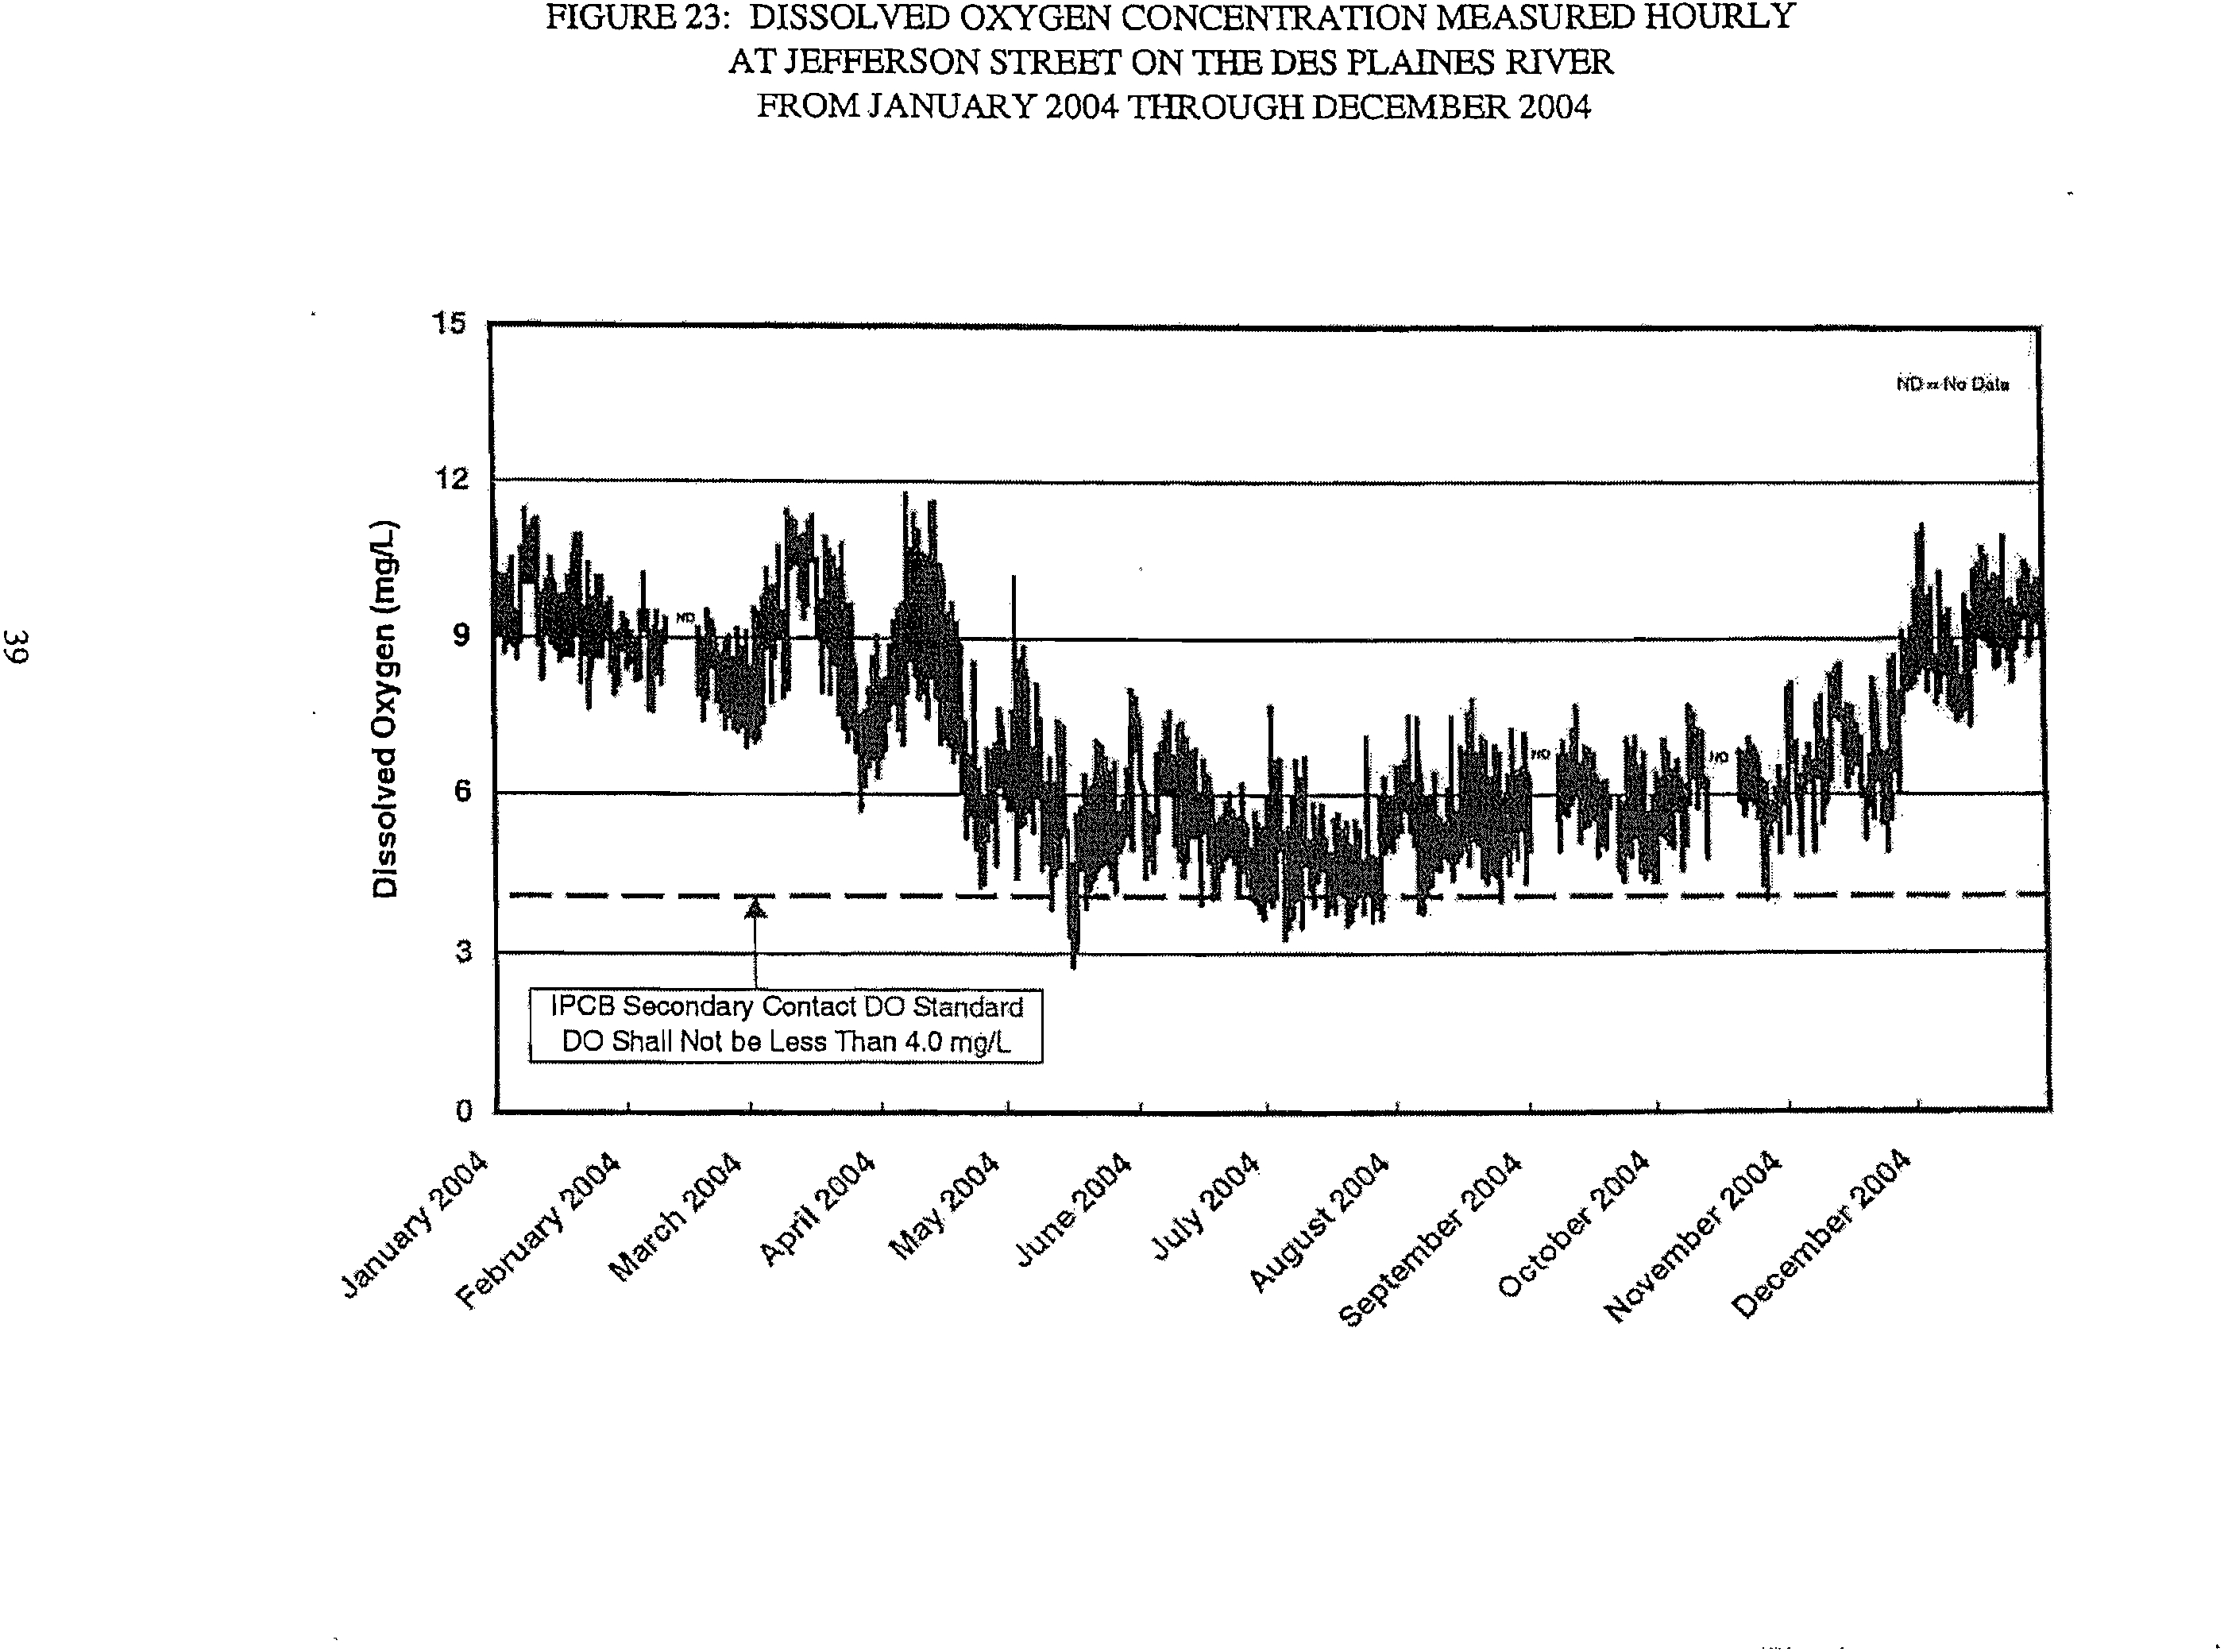
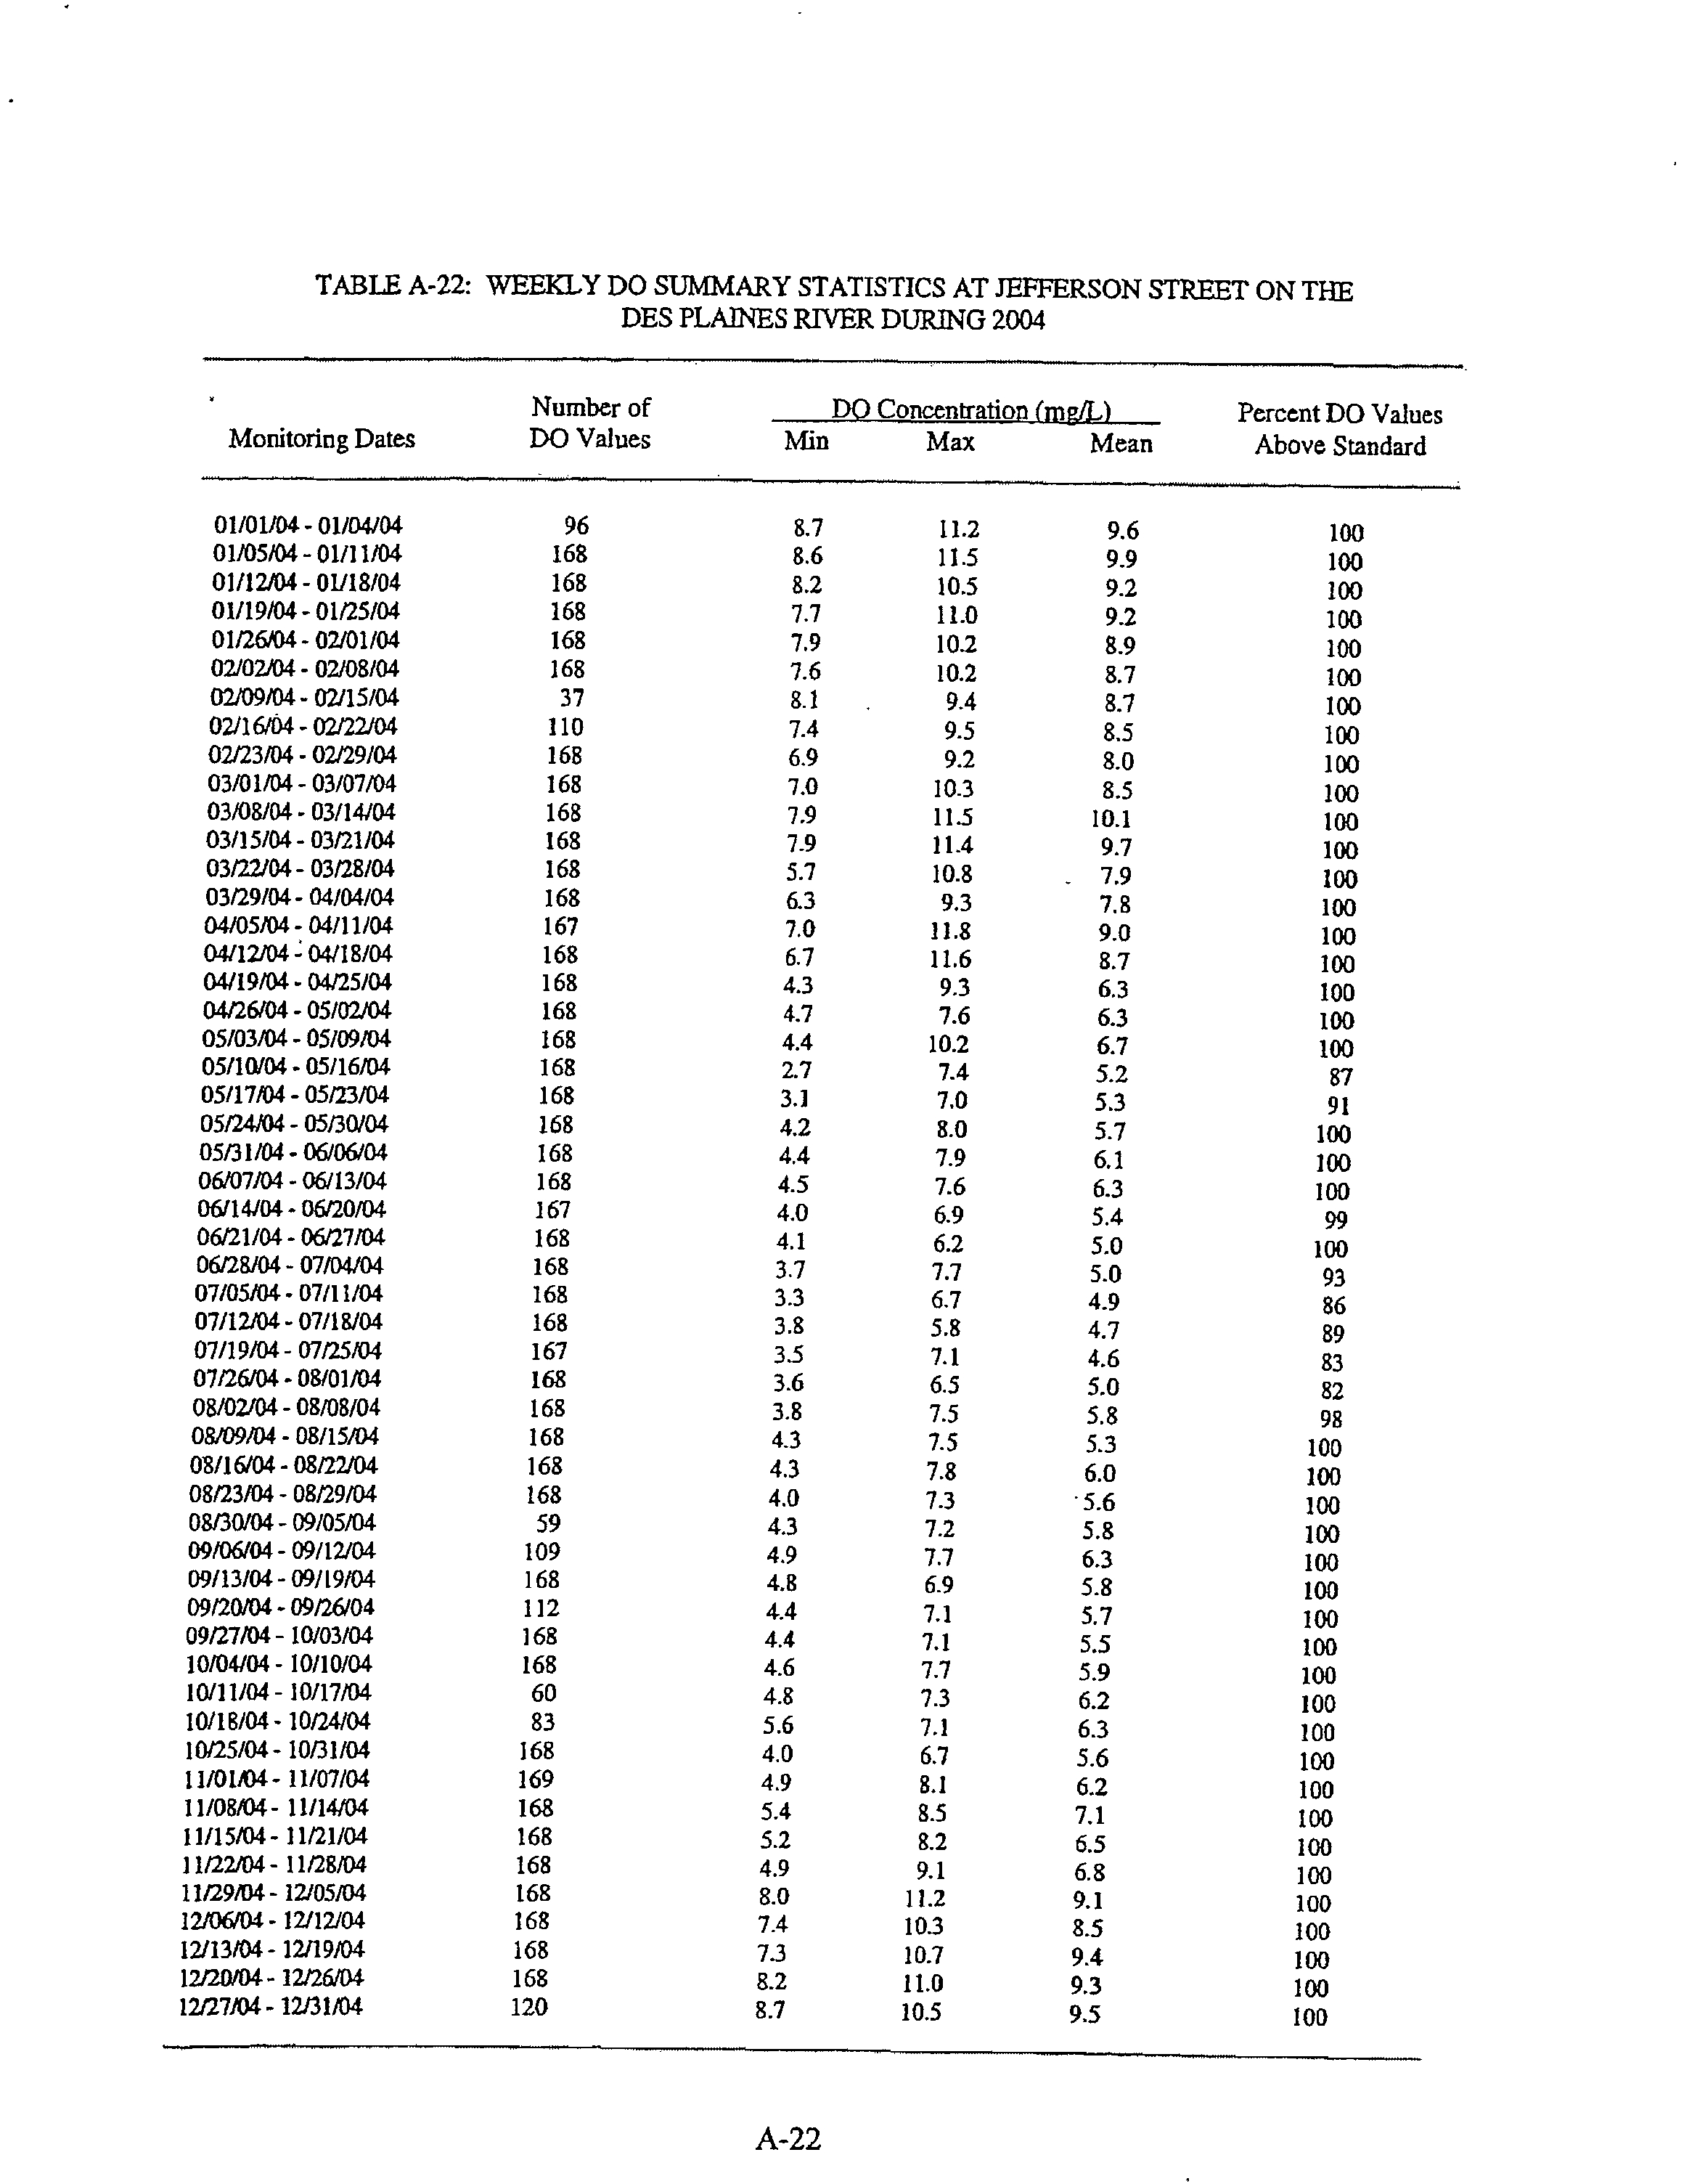
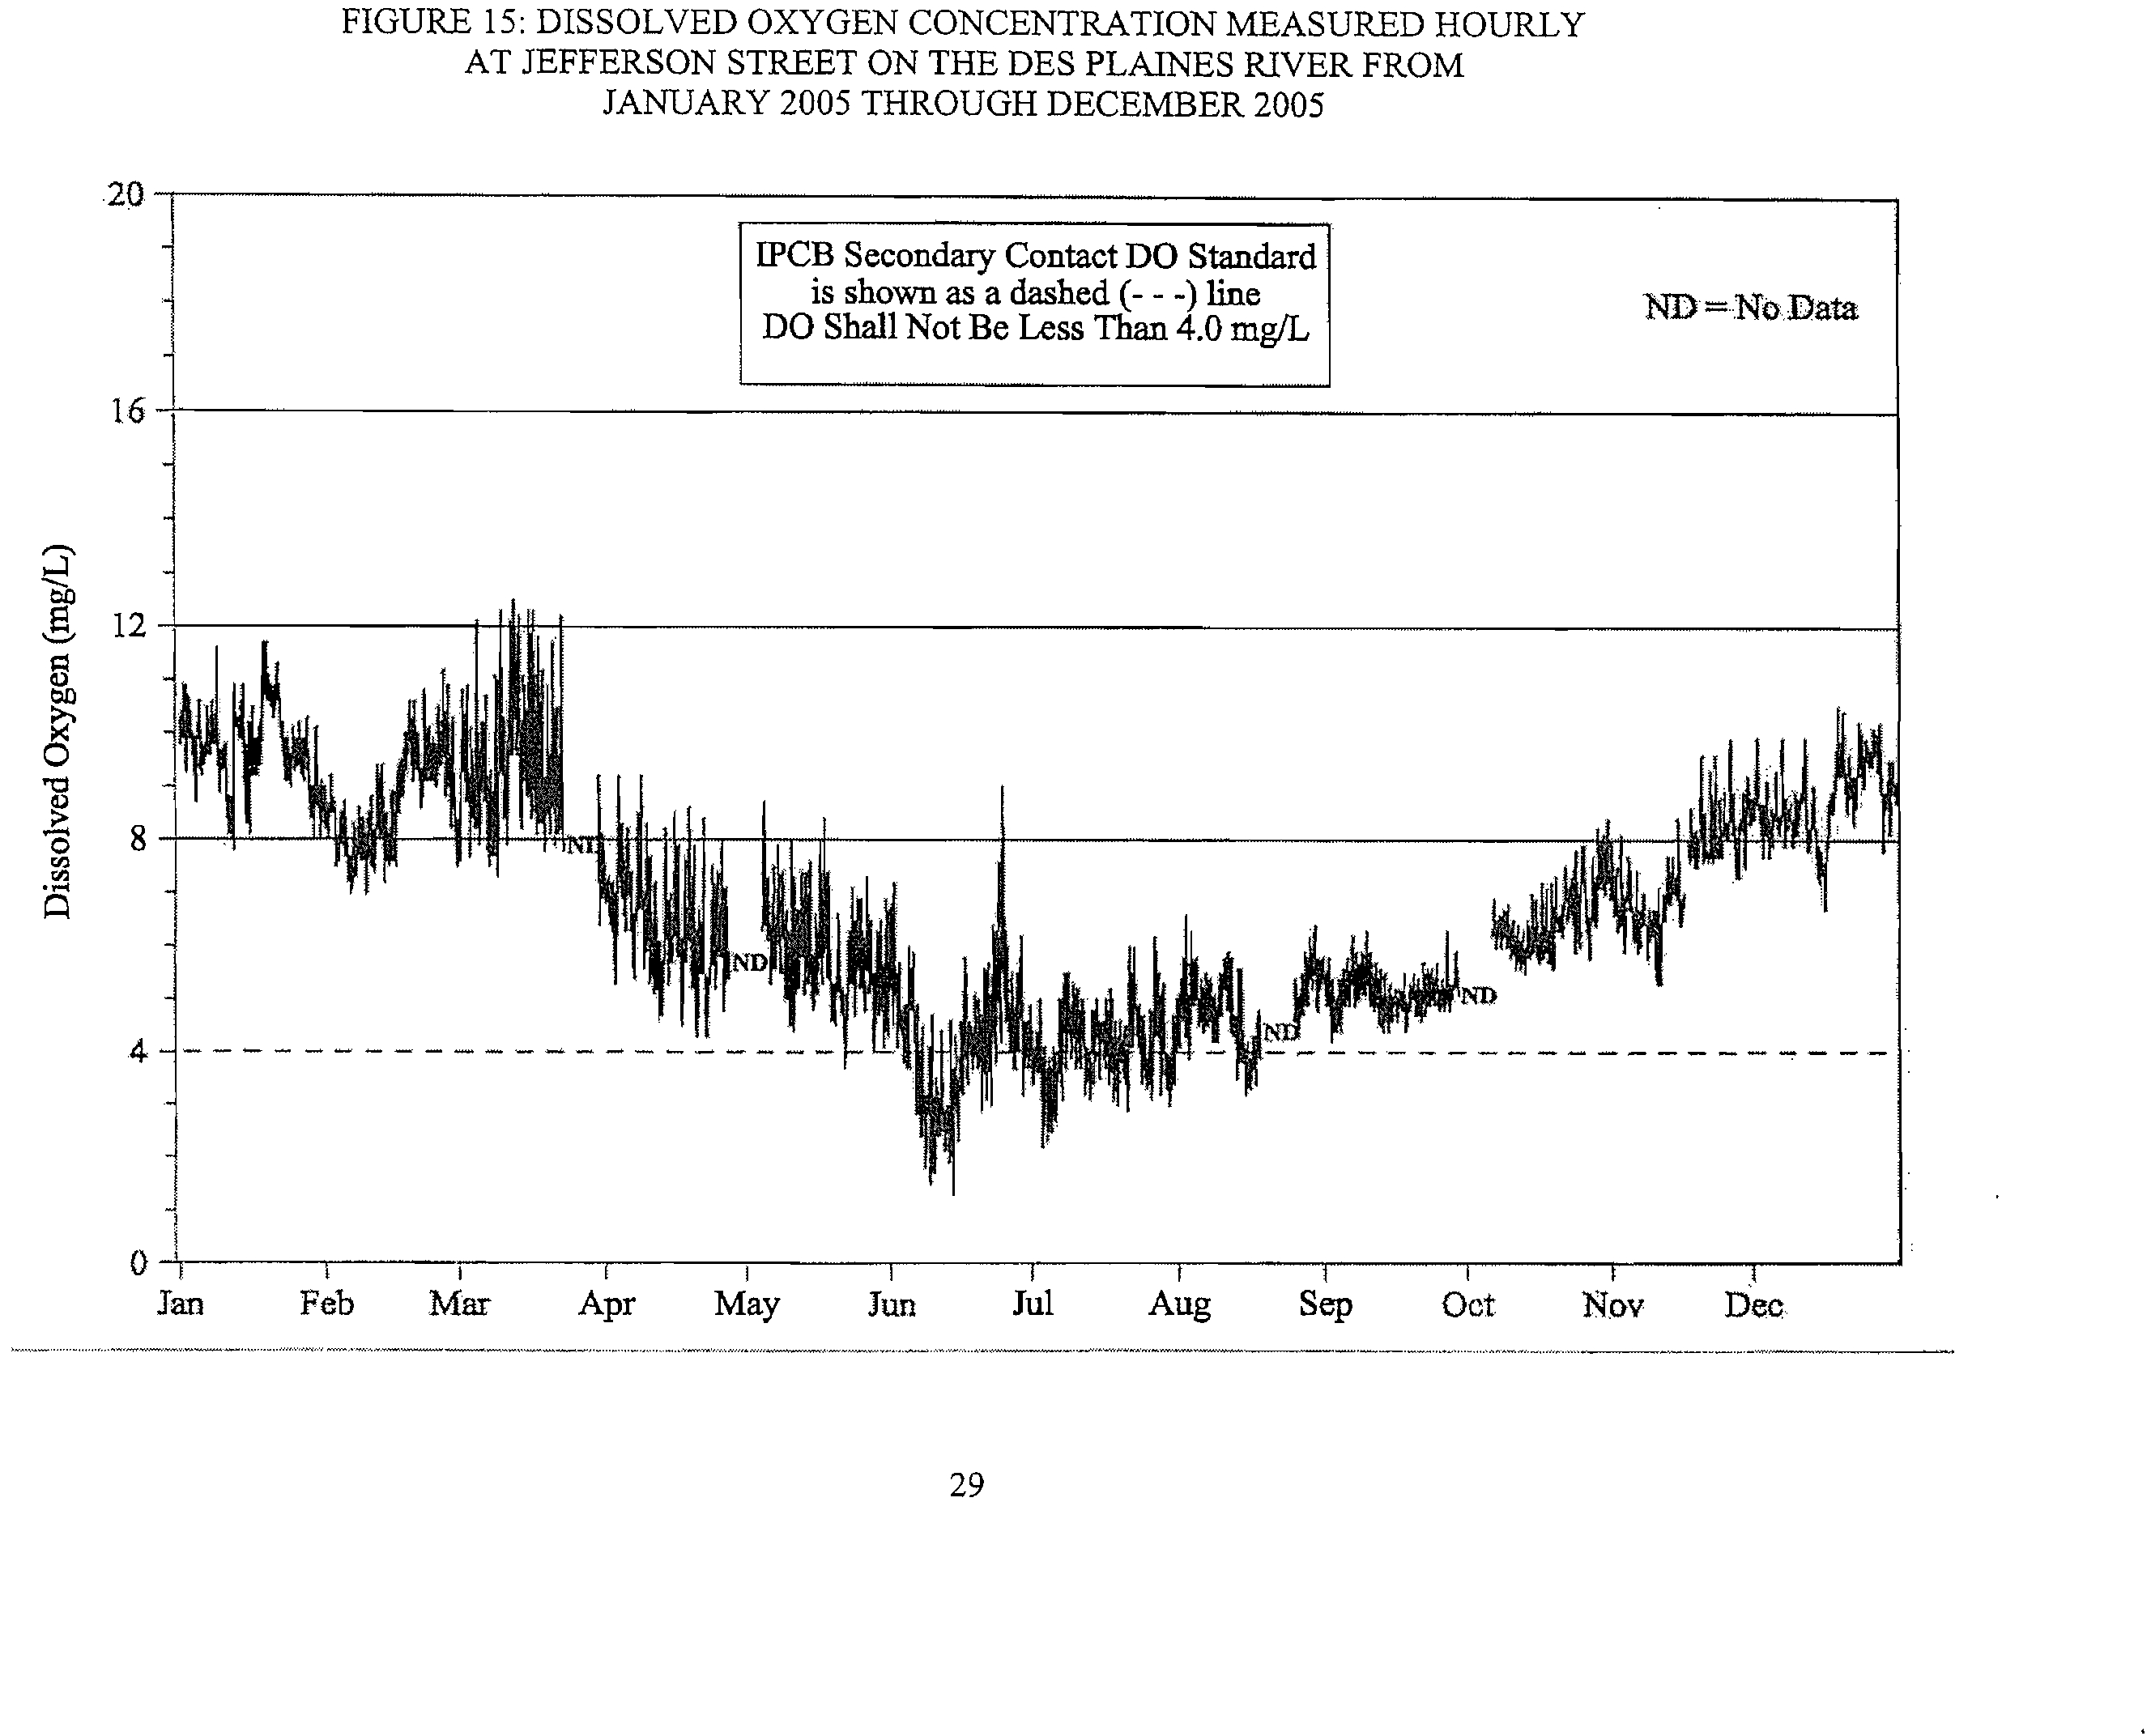
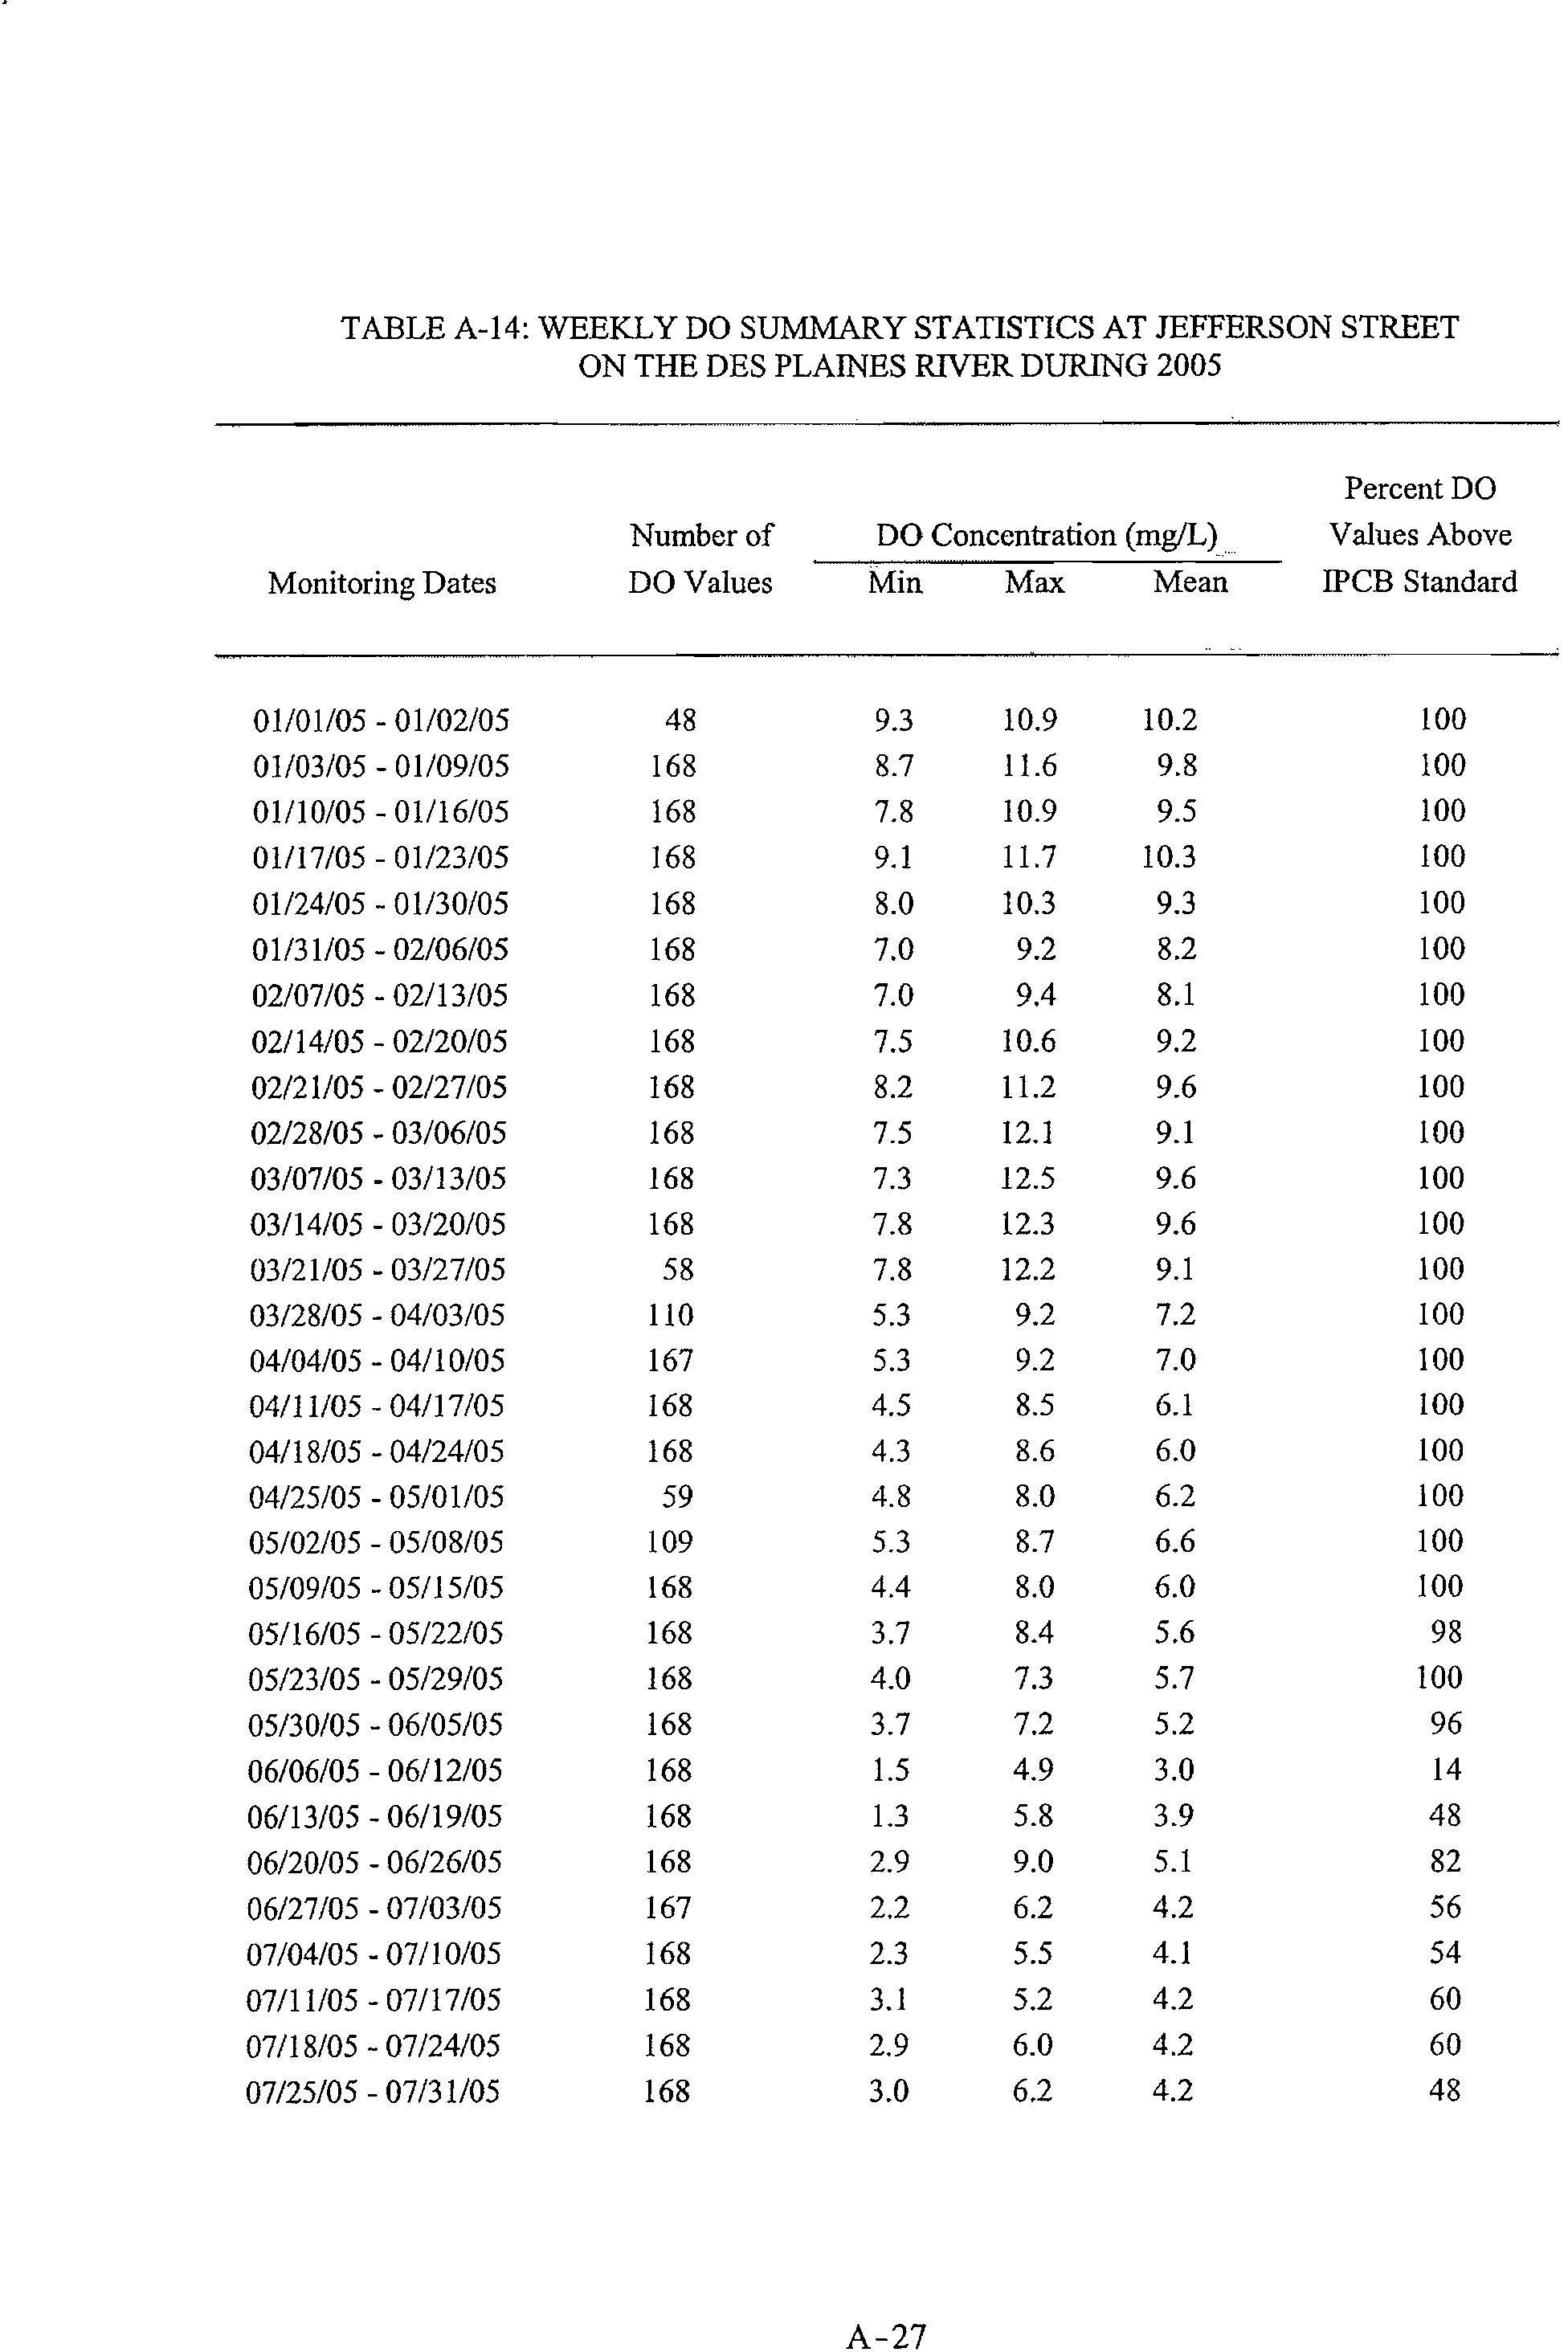
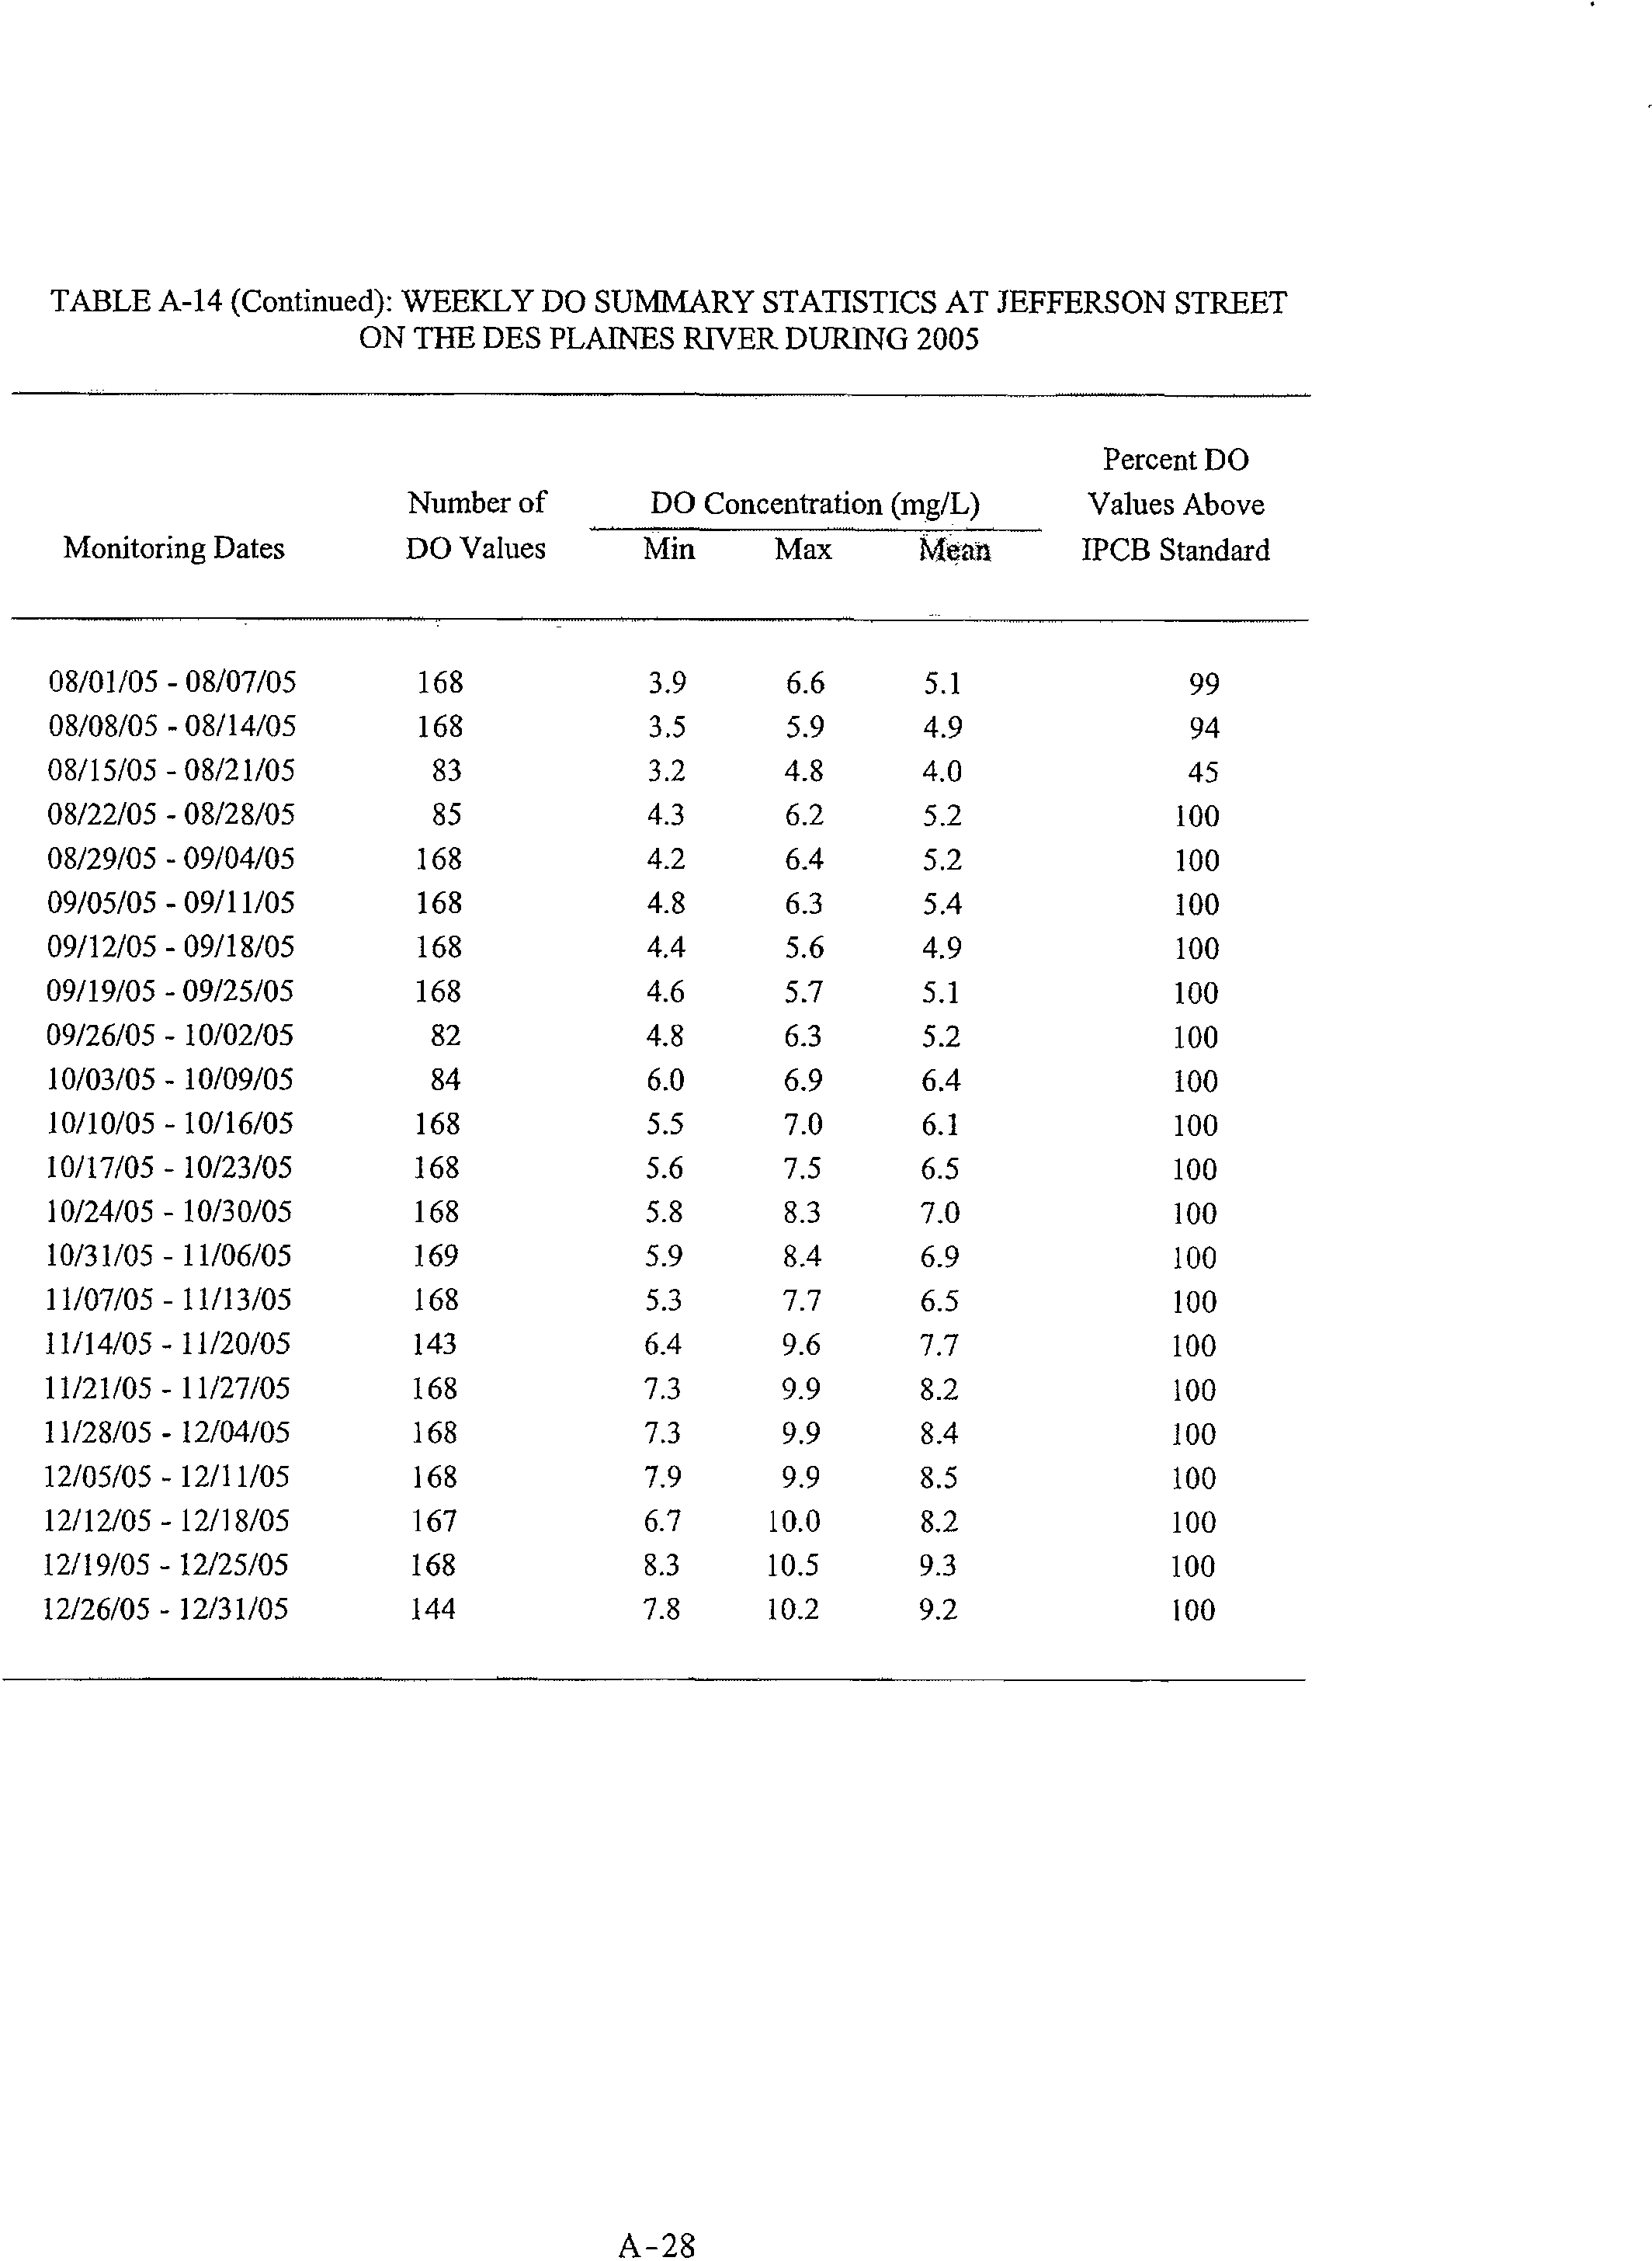
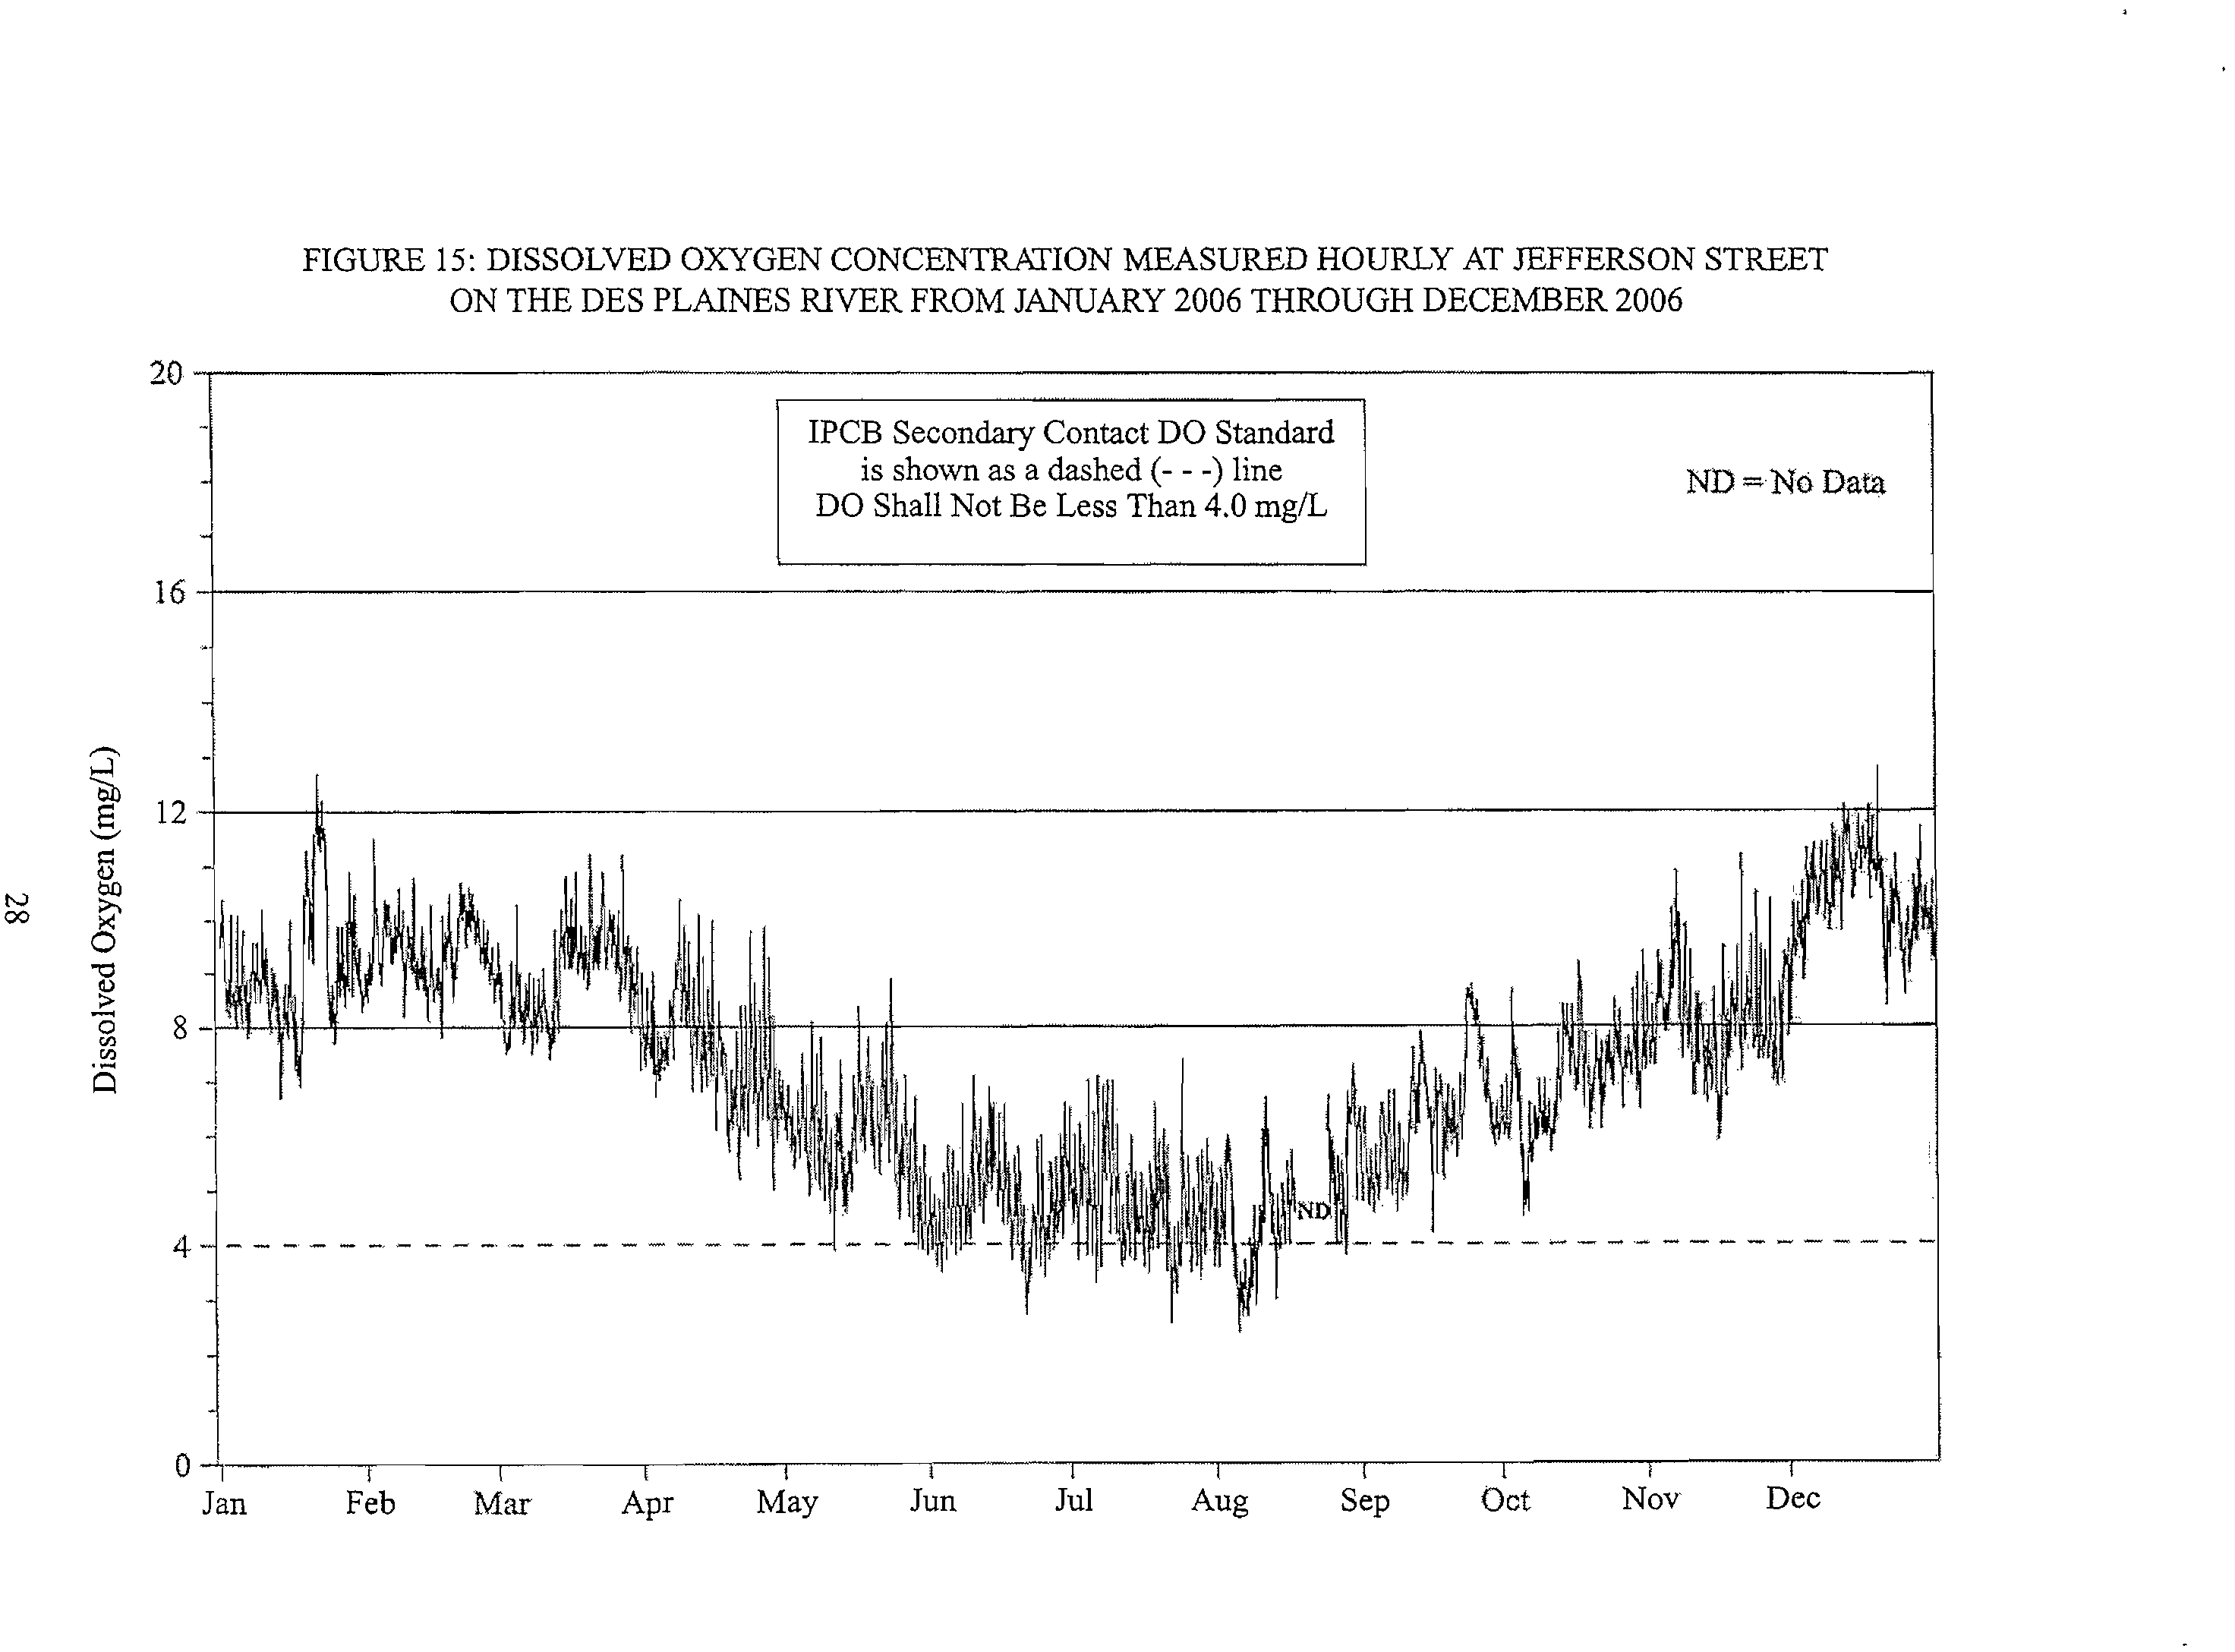
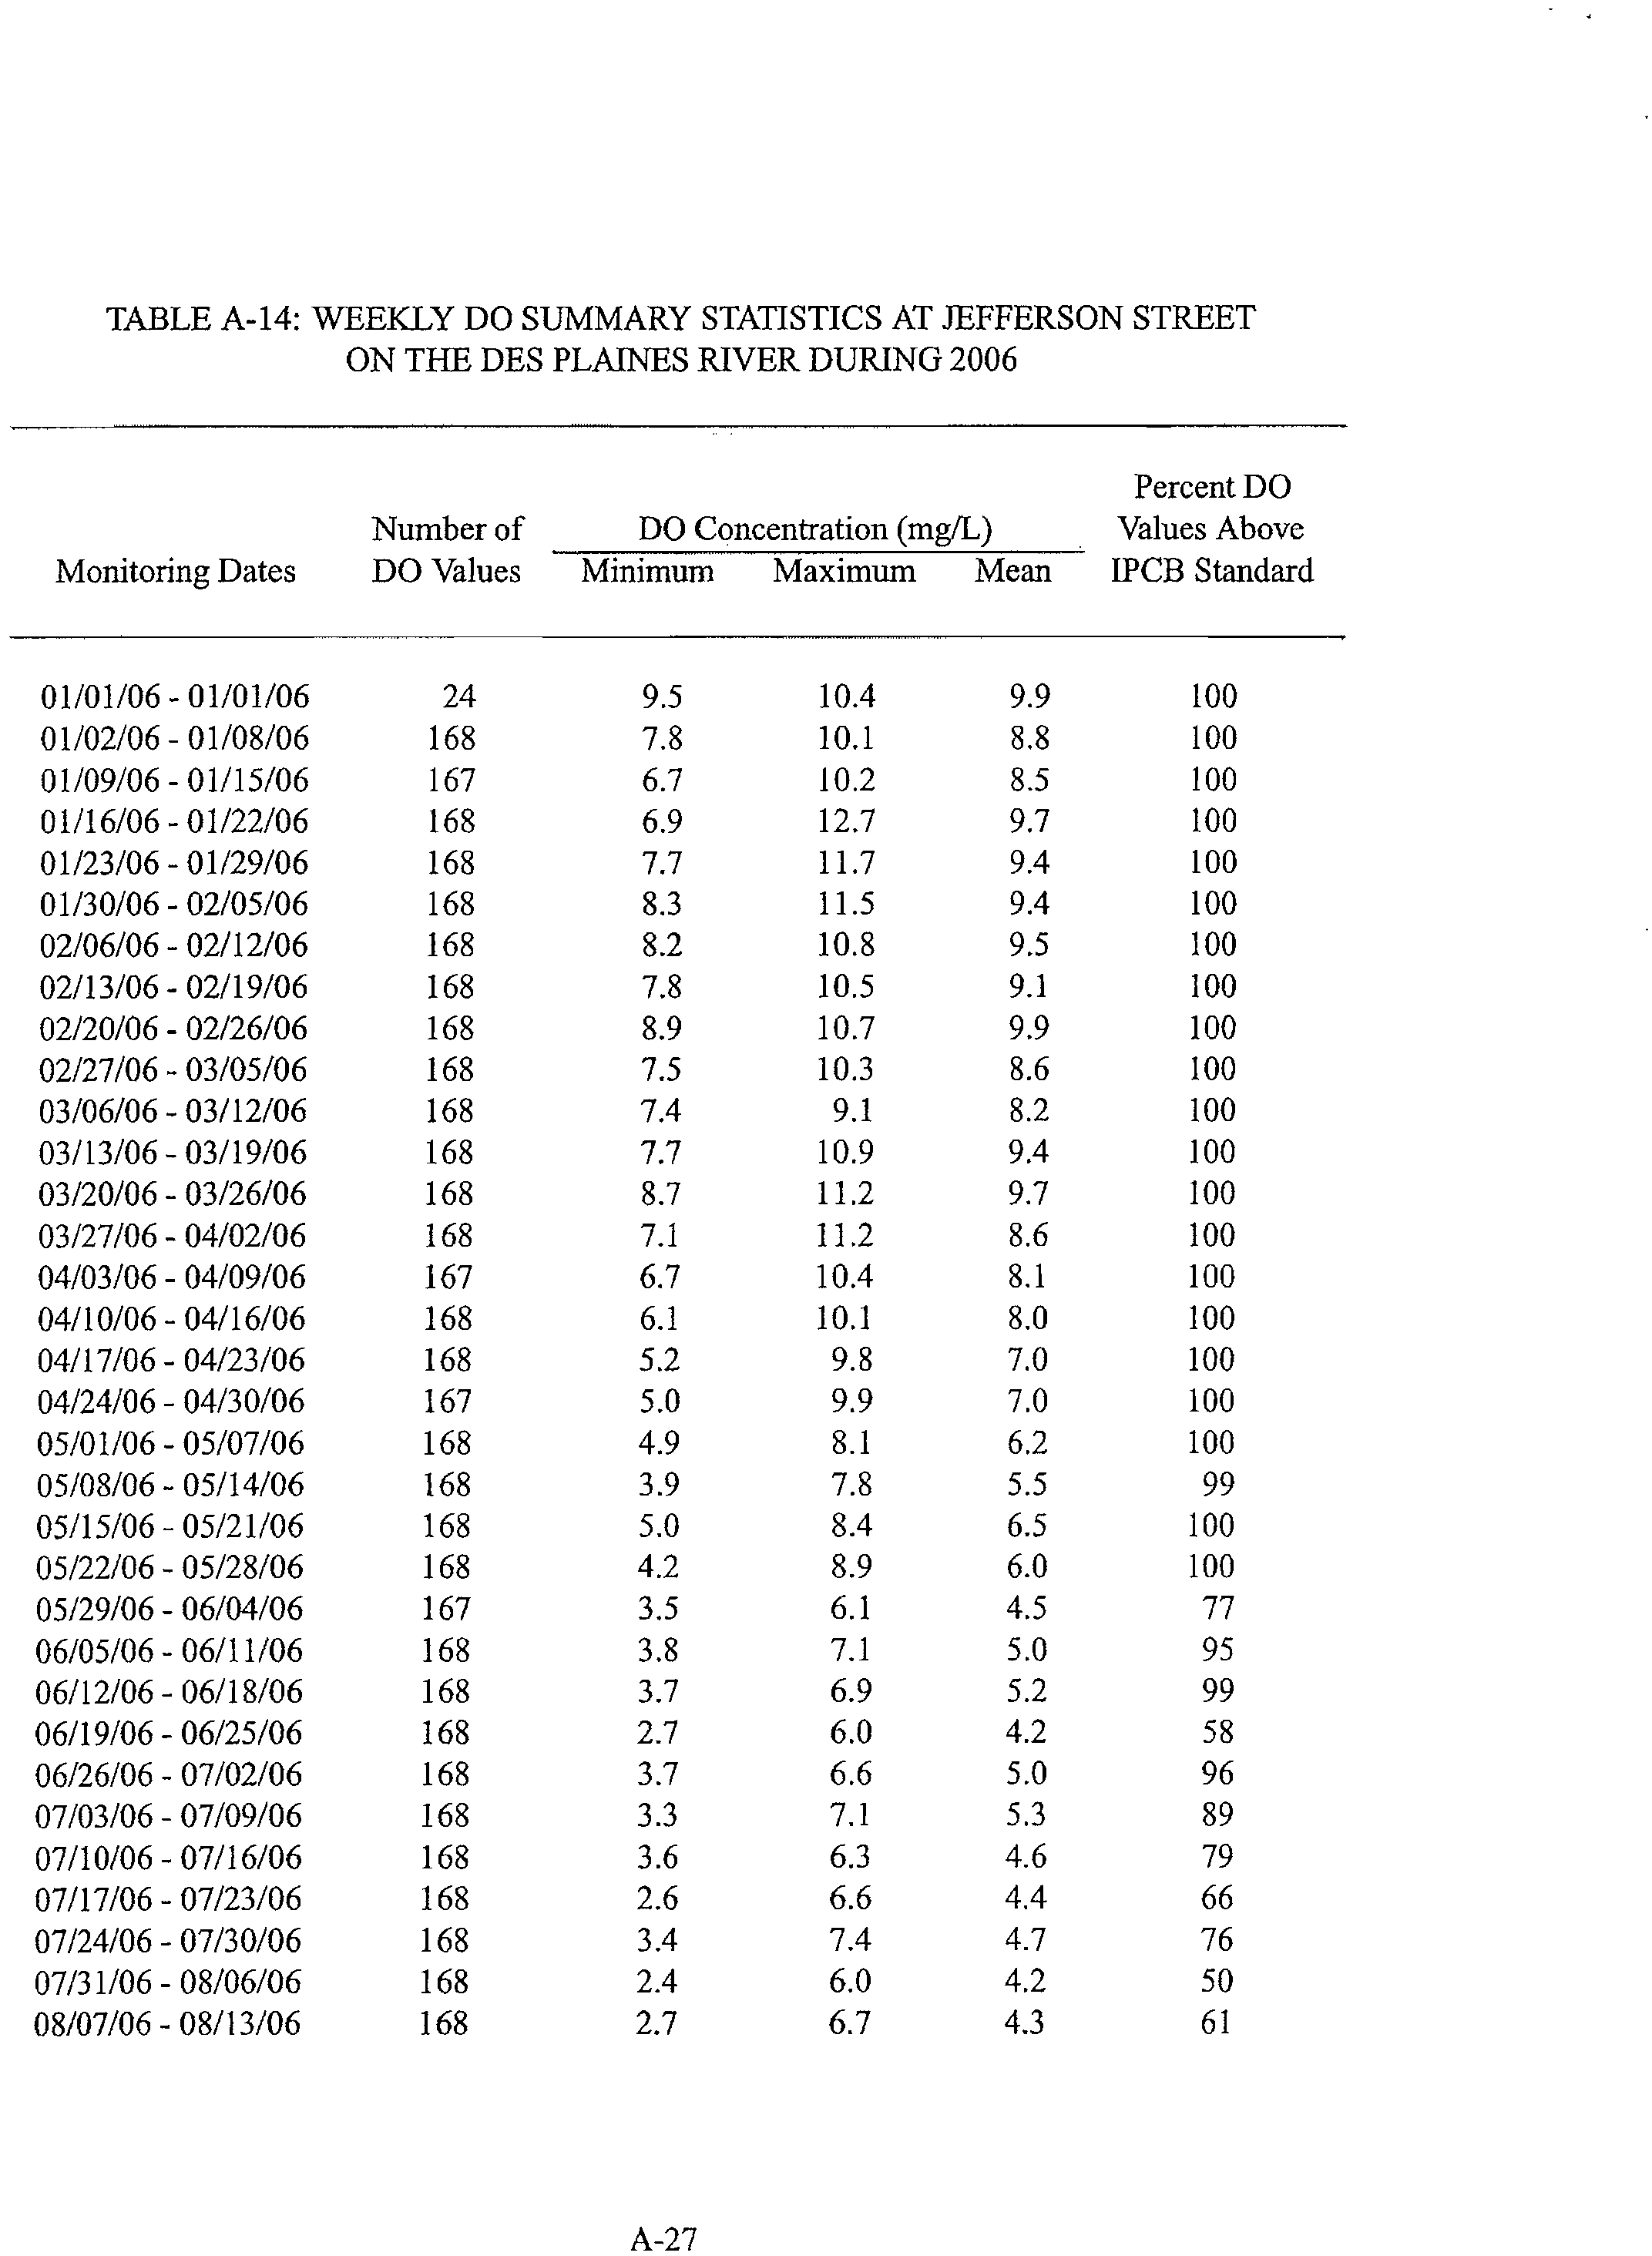
Further, hourly D.O. readings were collected on the Des Plaines River at Jefferson Street, downstream
of the convergence of the Ship Canal with the Des Plaines River, from 2002 to 2006. These data are
also presented in Appendix C. The graphs presenting these data show the majority of results below 4.0
mg/L occur in the months between May/June and August/September. Overall, during this data period,
minimum values at Jefferson Street are higher than those on the Ship Canal and achieve 4.0 mg/L more
consistently. These data indicate the Lemont Refinery's incremental ammonia discharged does not have
an adverse impact on the D.O. concentration in the Des Plaines River.
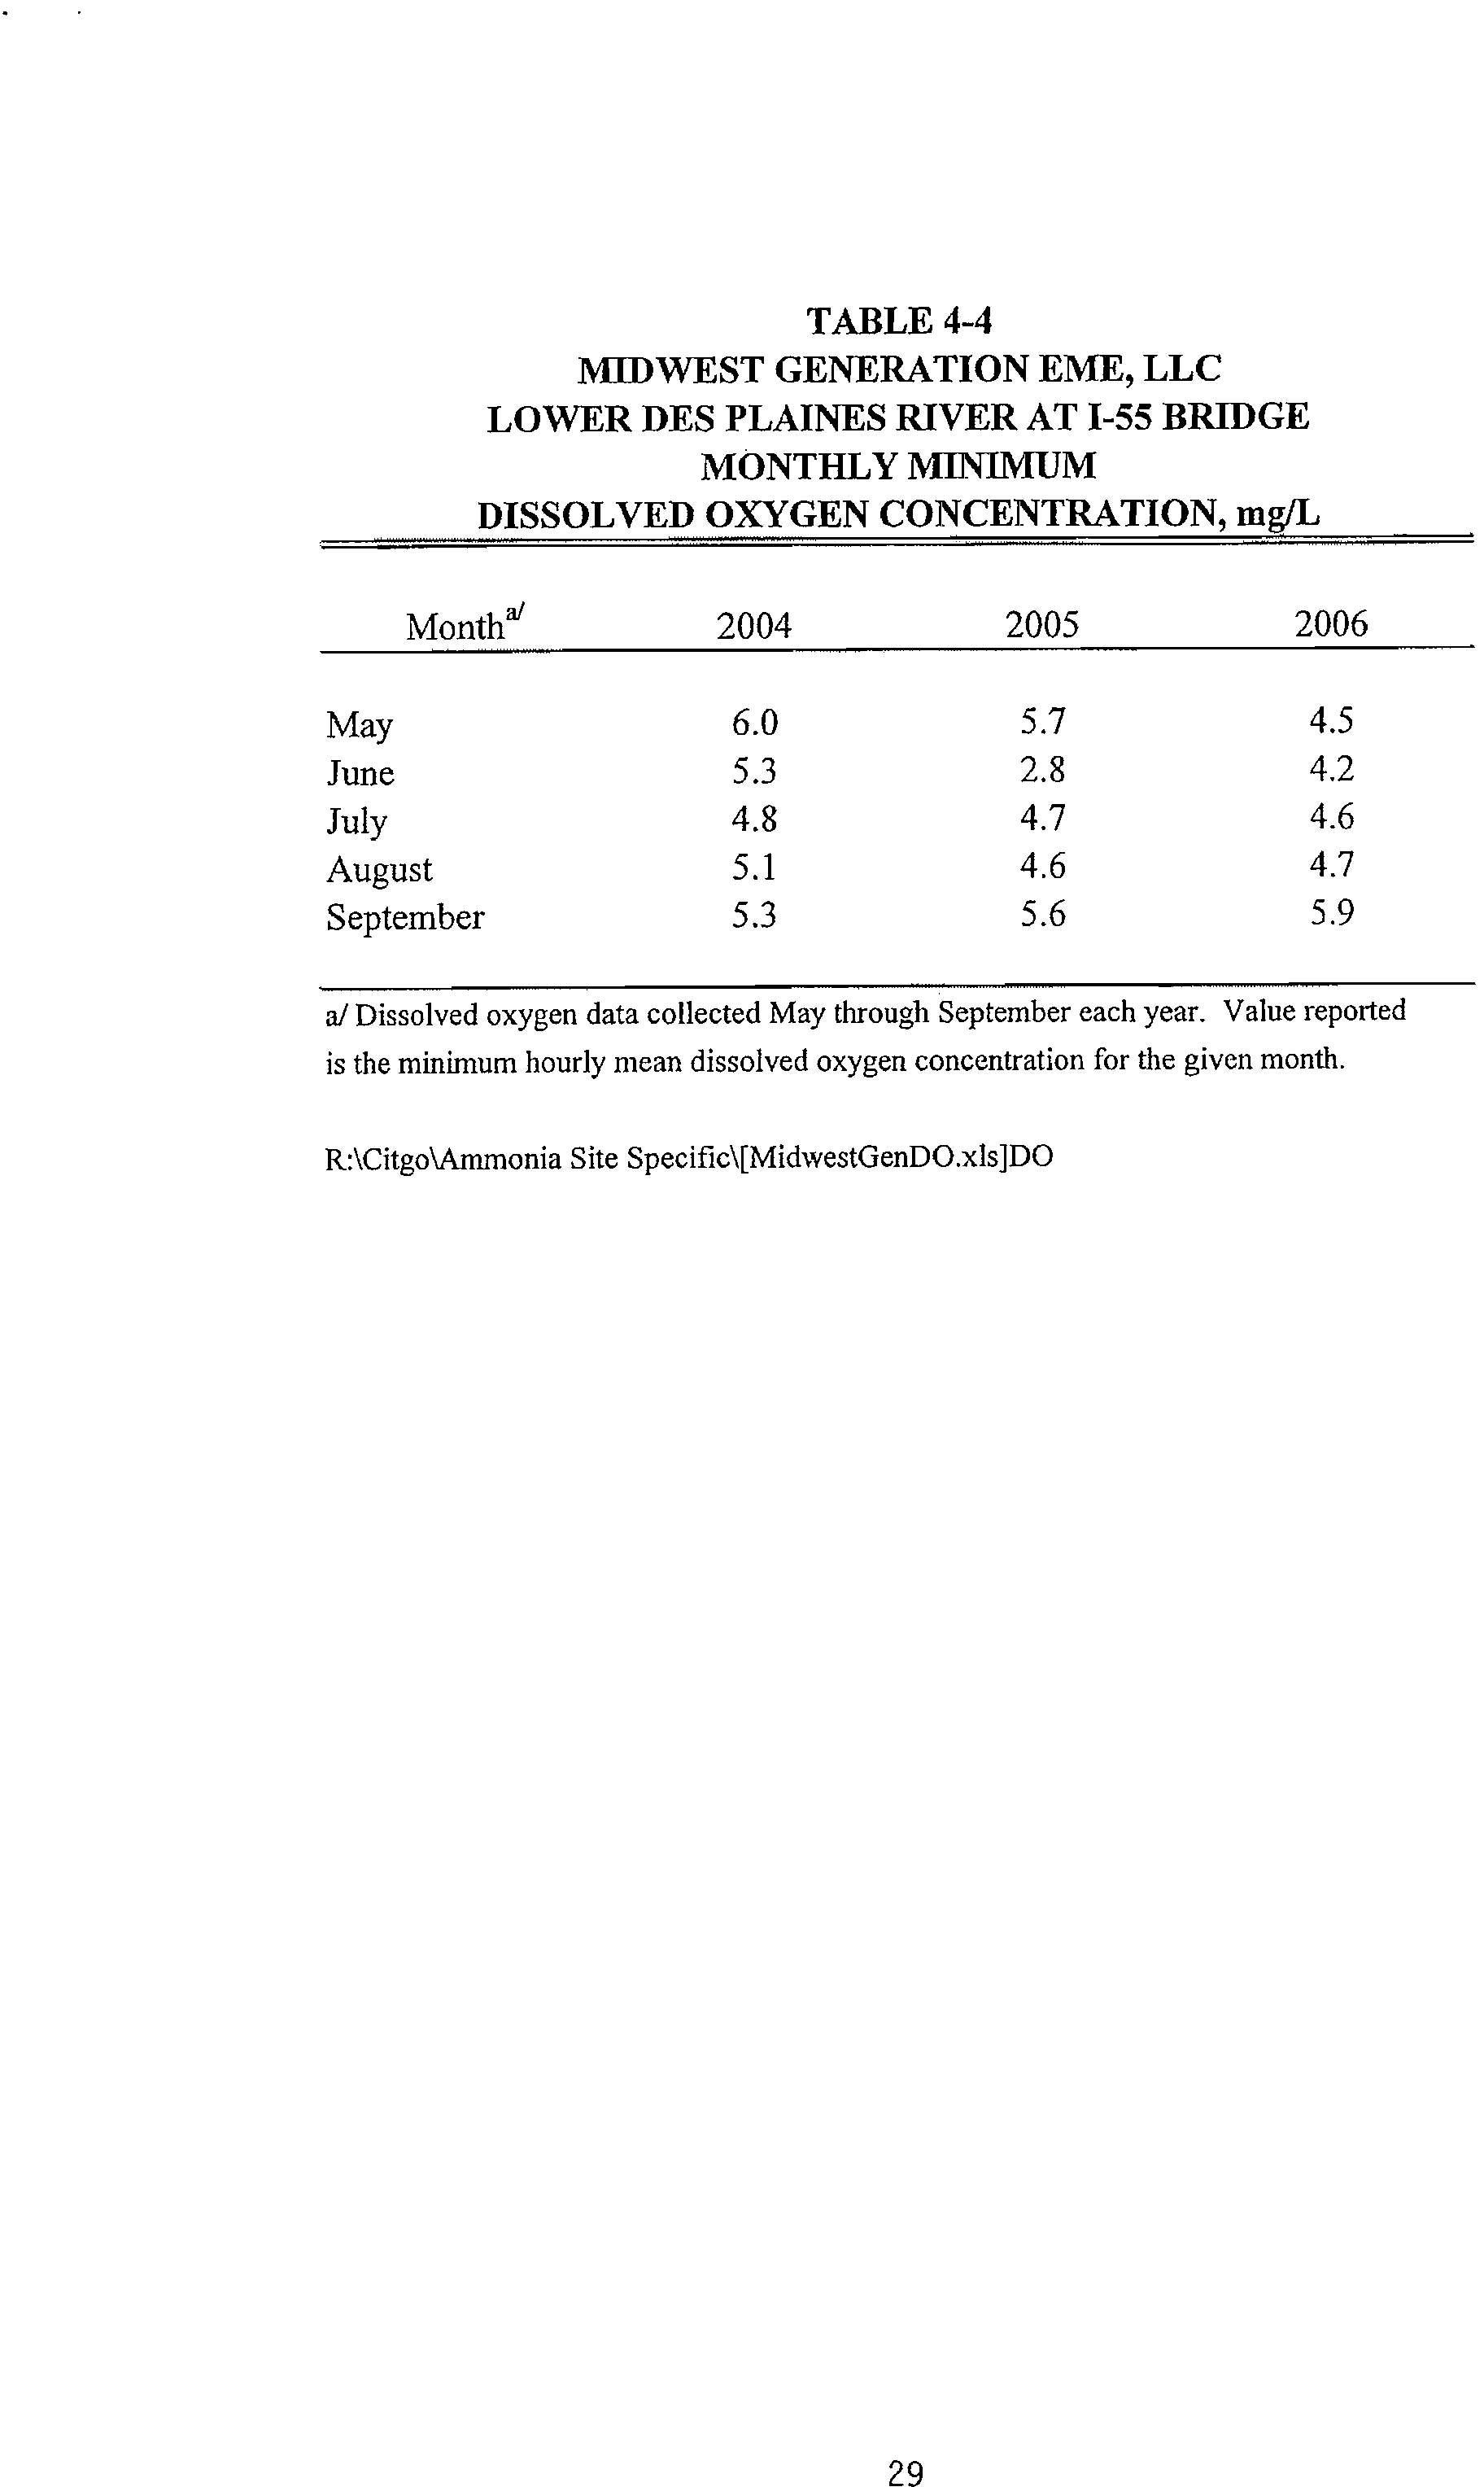
4.4
Midwest Generation Data
Midwest Generation EME, LLC monitors D.O. on the Lower Des Plaines River at the 1-55 Bridge from
May to September. Hourly data were obtained from 2004, 2005, and 2006. Table 4-4 presents the
minimum value for each month (May through September) by year. Only one month, June 2005, returned
a result lower than 4.0 mg/L. The minimum value for this month was 2.8 mg/L.
Citgo, Lemont — Ammonia Report
27
February 2008
Electronic Filing - Received, Clerk's Office, March 18, 2008
* * * * * AS 2008-008 * * * * *
EXHIBIT 2
TABLE 4-3
METROPOLITAN WATER RECLAMATION DISTRICT OF GREATER CHICAGO
DESPLAINES RIVER DATA FOR 2000 FROM LOCKPORT TO 1-55
Date
Location
Parameter
Measured
Value
Unit
02/03/00
95.0 1-55, Des Plaines River
DO
11.3
mg/L
02/17/00
95.0 1-55, Des Plaines River
DO
9.3
mg/L
02/24/00
95.0 1-55, Des Plaines River
DO
9.1
mg/L
03/02/00
95.0 1-55, Des Plaines River
DO
9.4
mg/L
03/16/00
95.0 1-55, Des Plaines River
DO
9.3
mg/L
03/23/00
95.0 1-55, Des Plaines River
DO
9.8
mg/L
03/30/00
95.0 1-55, Des Plaines River
DO
9.4
mg/L
04/06/00
95.0 1-55, Des Plaines River
DO
8,8
mg/L
04/13/00
95.0 1-55, Des Plaines River
DO
8.4
mg/L
04/27/00
95.0 1-55, Des Plaines River
DO
9.3
mg/L
05/04/00
95.0 1-55, Des Plaines River
DO
7.4
mg/L
05/11/00
95.0 1-55, Des Plaines River
DO
7.8
mg/L
05/18/00
95.0 1-55, Des Plaines River
DO
6.9
mg/L
05/25/00
95.0 1-55, Des Plaines River
DO
7.5
mg/L
06/01/00
95.0 1-55, Des Plaines River
DO
7.0
mg/L
06/08/00
95.0 1-55, Des Plaines River
DO
7.6
mg/L
06/15/00
95.0 1-55, Des Plaines River
DO
6.1
mg/L
06/22/00
95.0 1-55, Des Plaines River
DO
7.2
mg/L
06/29/00
95.0 1-55, Des Plaines River
DO
6.8
mg/L
07/06/00
95.0 1-55, Des Plaines River
DO
6.5
mg/L
07/13/00
95.0 1-55, Des Plaines River
DO
6.6
mg/L
07/20/00
95.0 1-55, Des Plaines River
DO
6.7
mg/L
07/27/00
95.0 1-55, Des Plaines River
DO
6.3
mg/L
08/03/00
95.0 1-55, Des Plaines River
DO
6.2
mg/L
08/10/00
95.0 1-55, Des Plaines River
DO
5.8
mg/L
08/17/00
95.0 1-55, Des Plaines River
DO
6.9
mg/L
08/24/00
95.0 1-55, Des Plaines River
DO
7.1
mg/L
08/31/00
95.0 1-55, Des Plaines River
DO
6.1
mg/L
09/07/00
95.0 1-55, Des Plaines River
DO
6.9
mg/L
09/14/00
95.0 1-55, Des Plaines River
DO
6.4
mg/L
09/28/00
95.0 1-55, Des Plaines River
DO
7.9
mg/L
10/05/00
95.0 1-55, Des Plaines River
DO
7.6
mg/L
10/12/00
95.0 1-55, Des Plaines River
DO
8.4
mg/L
10/19/00
95.0 1-55, Des Plaines River
DO
6.4
mg/L
10/26/00
95.0 1-55, Des Plaines River
DO
7.1
mg/L
11/02/00
95.0 1-55, Des Plaines River
DO
6.7
mg/L
11/08/00
95.0 1-55, Des Plaines River
DO
8.3
mg/L
11/16/00
95.0 1-55, Des Plaines River
DO
10.9
mg/L
11/30/00
95.0 1-55, Des Plaines River
DO
9.4
mg/L
12/07/00
95.0 1-55, Dm Plaines River
DO
9.9
mg/L
12/14/00
95.0 1-55, Des Plaines River
DO
10.4
mg/L
Minimum
DO
5.8
mg/L
28
Electronic Filing - Received, Clerk's Office, March 18, 2008
* * * * * AS 2008-008 * * * * *
EXHIBIT 2
TABLE 4-4
MIDWEST GENERATION EME, LLC
LOWER DES PLAINES RIVER AT 1-55 BRIDGE
MONTHLY MINIMUM
DISSOLVED OXYGEN CONCENTRATION,
mg/L
Month
2004
2005
2006
May
6.0
5.7
4.5
June
5.3
2.8
4.2
July
4.8
4.7
4.6
August
5.1
4.6
4.7
September
5.3
5.6
5.9
a/ Dissolved oxygen data collected May through September each year. Value reported
is the minimum hourly mean dissolved oxygen concentration for the given month.
R:\Citgo\Ammonia Site SpecificqMidwestGenDO.xlsiDO
29
Electronic Filing - Received, Clerk's Office, March 18, 2008
* * * * * AS 2008-008 * * * * *
EXHIBIT 2
4.5 IEPA Waterway Classification/Assessment
The Ship Canal is part of the Des Plaines/Lake Michigan River Basin. The Chicago River flows into the
Ship Canal. The Calumet River system flows into the Calumet-Sag Channel, which flows into the Ship
Canal near Lemont, Illinois. The Ship Canal, a tributary to the Des Plaines River, flows into the river
just north of the City of Joliet.
Stream quality is characterized by physical attributes and stream use. The IEPA assesses Illinois water
bodies for the degree of overall and individual use support (IEPA, 2006). These individual uses include
fish consumption and aquatic life, which apply to all water bodies within the State. Other uses include
swimming, secondary contact, drinking, and industrial water supplies whose uses apply to defined water
body segments. The degree of designated use support is described in relation to full support of the use:
full/threatened support, partial support, and non-support.
The aquatic habitat on the portion of the Ship Canal where the Lemont Refinery is located was rated as
"poor to very poor" (IEPA, 2006). Overall stream use is designated as non-support for fish
consumption and aquatic life. The identified causes of impairment were polychlorinated biphenyls
(PCBs), iron, oil and grease, D.O., total nitrogen, and total phosphorus. Sources included combined
sewer overflows, urban runoff/storm sewers, impacts from hydrostructure flow regulation/modification,
municipal point source discharges, and other unknown sources.
Two Use Attainability Analyses (UAA), one on the lower Des Plaines River and one on the Chicago
Area Waterways, have been completed, and these reports serve as part of the technical basis behind the
recent proposed rule change submitted by the Agency in R08-09. The UAA for the Chicago Area
Waterways focused on the potential uses of these waterways. The refinery's request for a site-specific
ammonia limit is not impacted by the UAA, nor will it have any impact on the Agency's proposal in R08-
09.21
The available water quality data on the Ship Canal indicate that the proposed more restrictive un-
ionized ammonia water quality standard is currently being achieved.
2/ CITGO also has a variance on TDS. If R08-09 is adopted as proposed, the TDS water quality standard will be
eliminated. A sulfate limit will be adopted under the Agency's proposal, that the Ship Canal will achieve downstream of the
Refinery outfall.
Citgo, Lemont— Ammonia Report
30
February 2008
Electronic Filing - Received, Clerk's Office, March 18, 2008
* * * * * AS 2008-008 * * * * *
EXHIBIT 2
Concentration Limits,
m:/L
Monthly Average
Daily Maximum
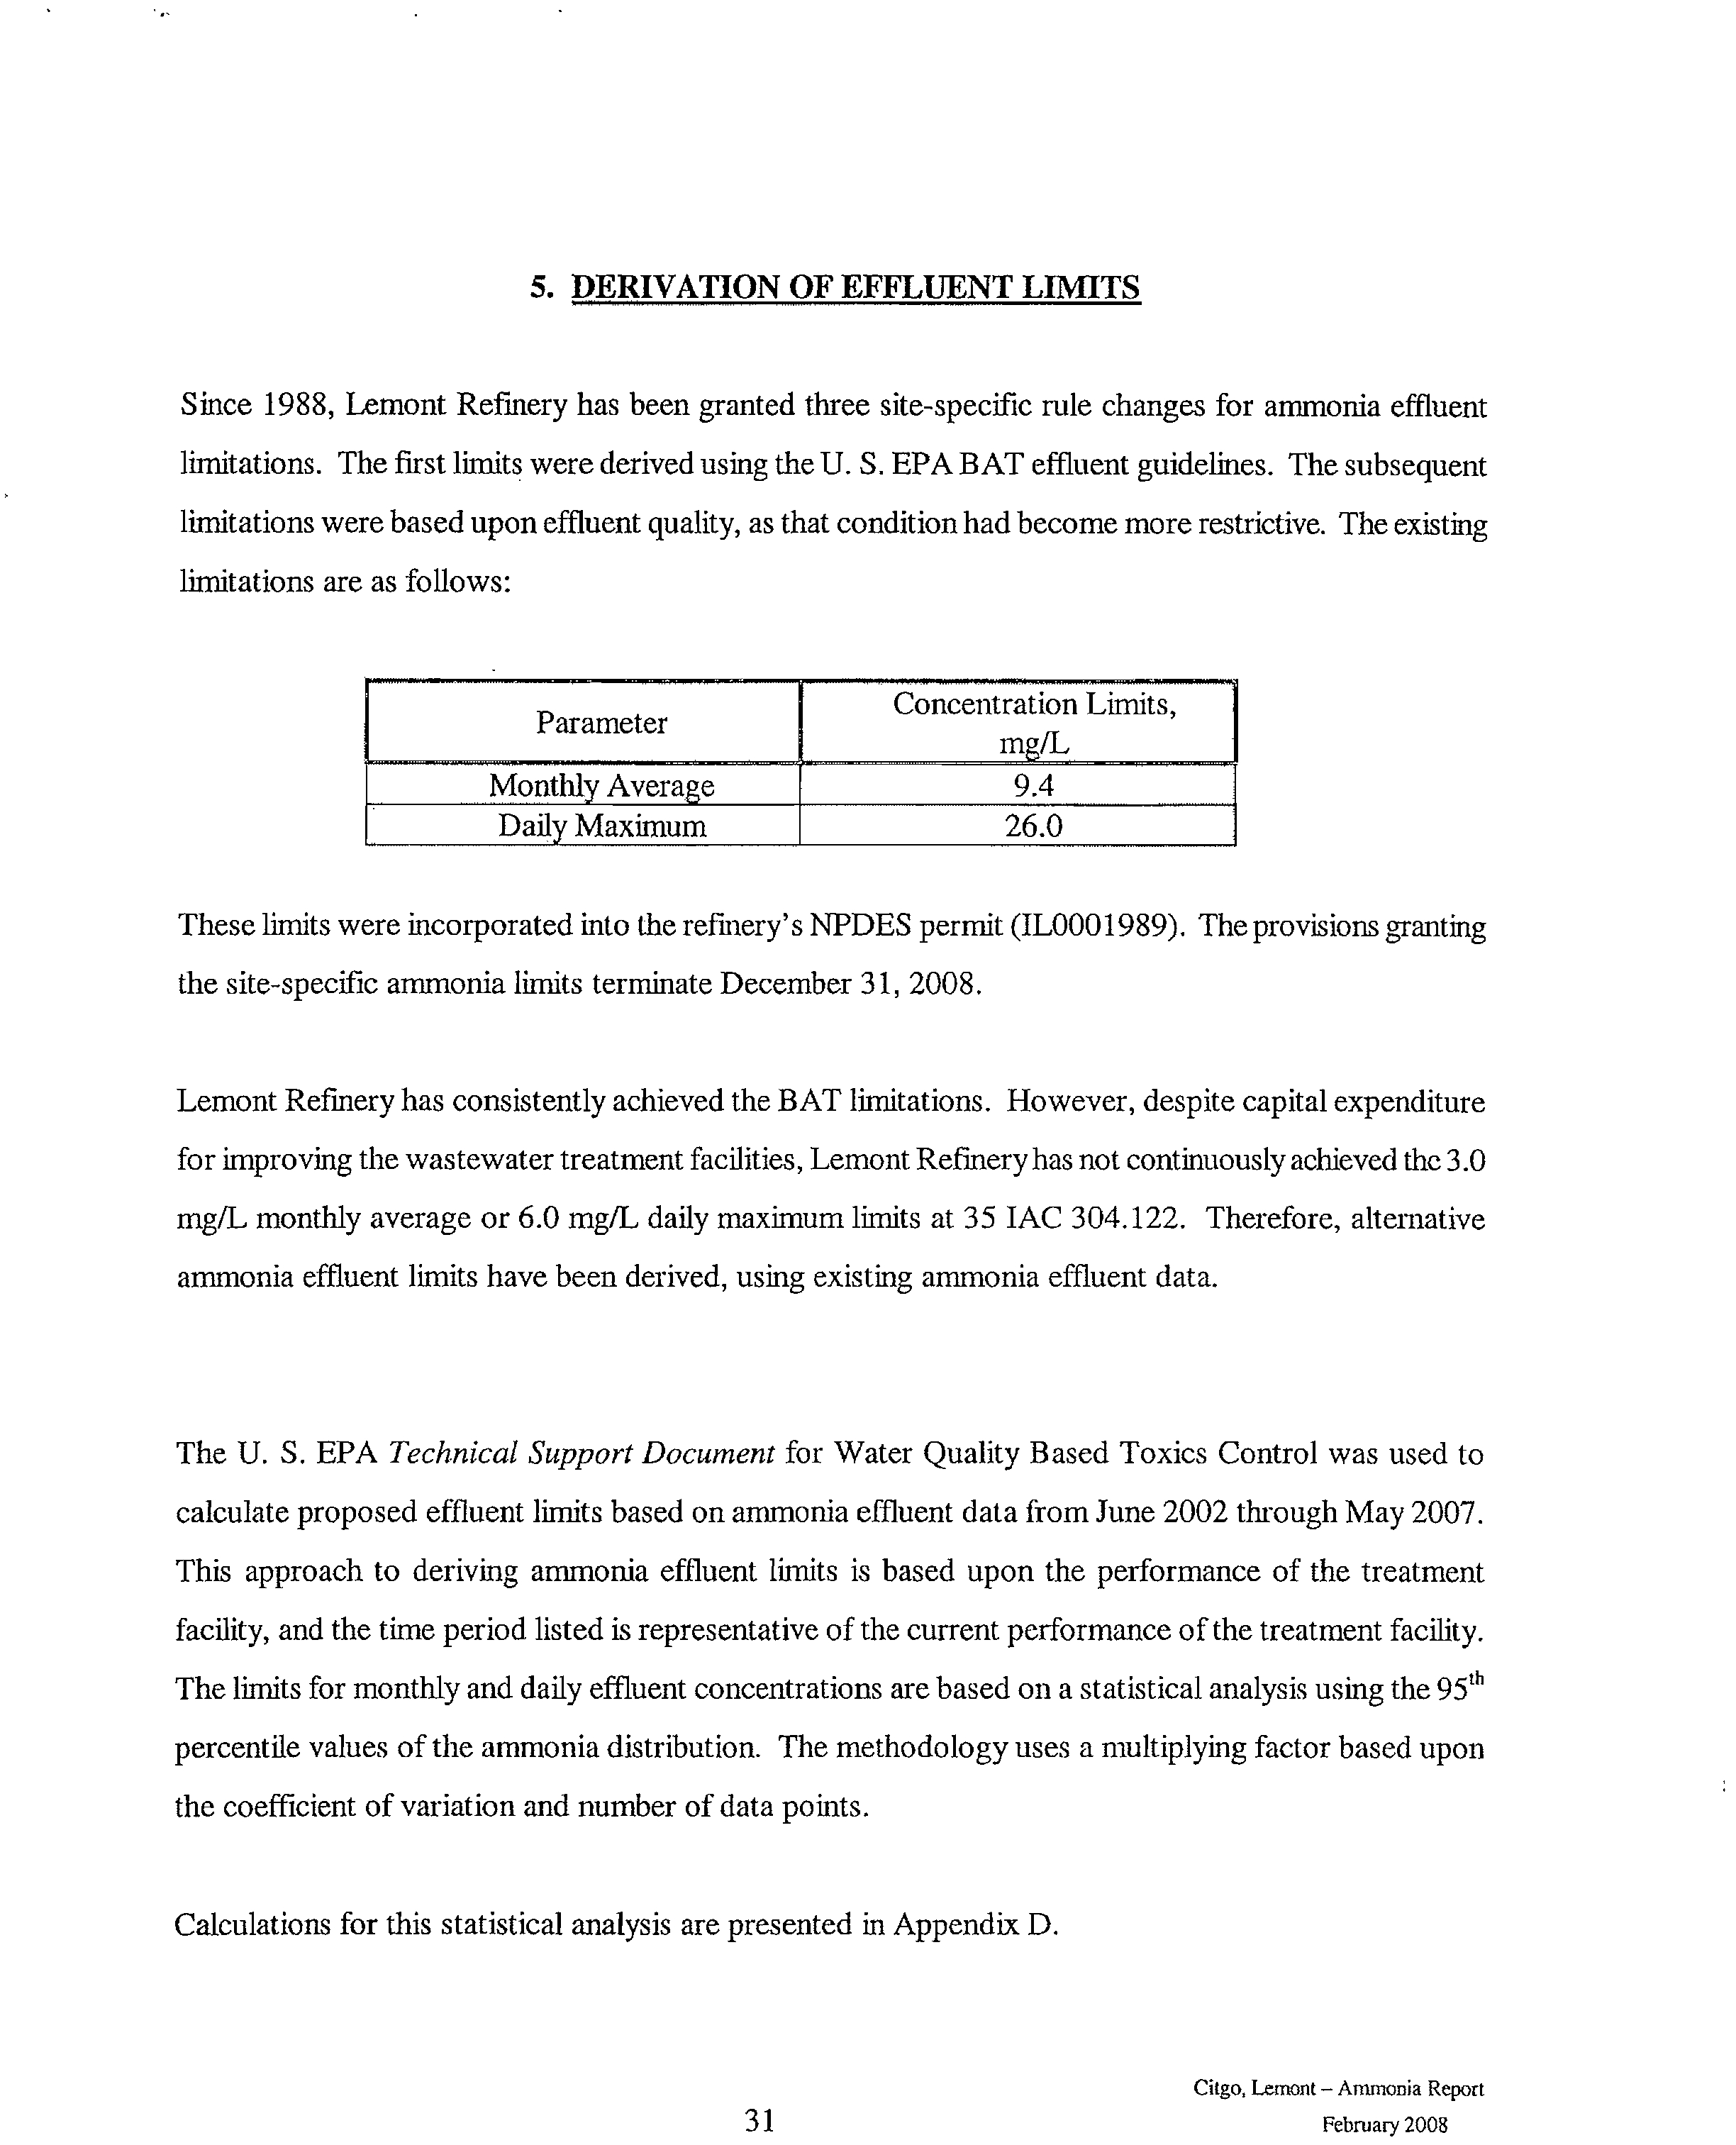
5. DERIVATION OF EFFLUENT LIMITS
Since 1988, Lemont Refinery has been granted three site-specific rule changes for ammonia effluent
limitations. The first limits were derived using the U. S. EPA BAT effluent guidel
nes.
i
The subsequent
limitations were based upon effluent quality, as that condition had become more restrictive. The existing
limitations are as follows:
These limits were incorporated into the refinery's NPDES permit (IL0001989). The provisions granting
the site-specific ammonia limits terminate December 31, 2008.
Lemont Refinery has consistently achieved the BAT limitations. However, despite capital expenditure
for improving the wastewater treatment facilities, Lemont Refinery has not continuously achieved the 3.0
mg/L monthly average or 6.0 mg/L daily maximum limits at 35 IAC 304.122. Therefore, alternative
ammonia effluent limits have been derived, using existing ammonia effluent data.
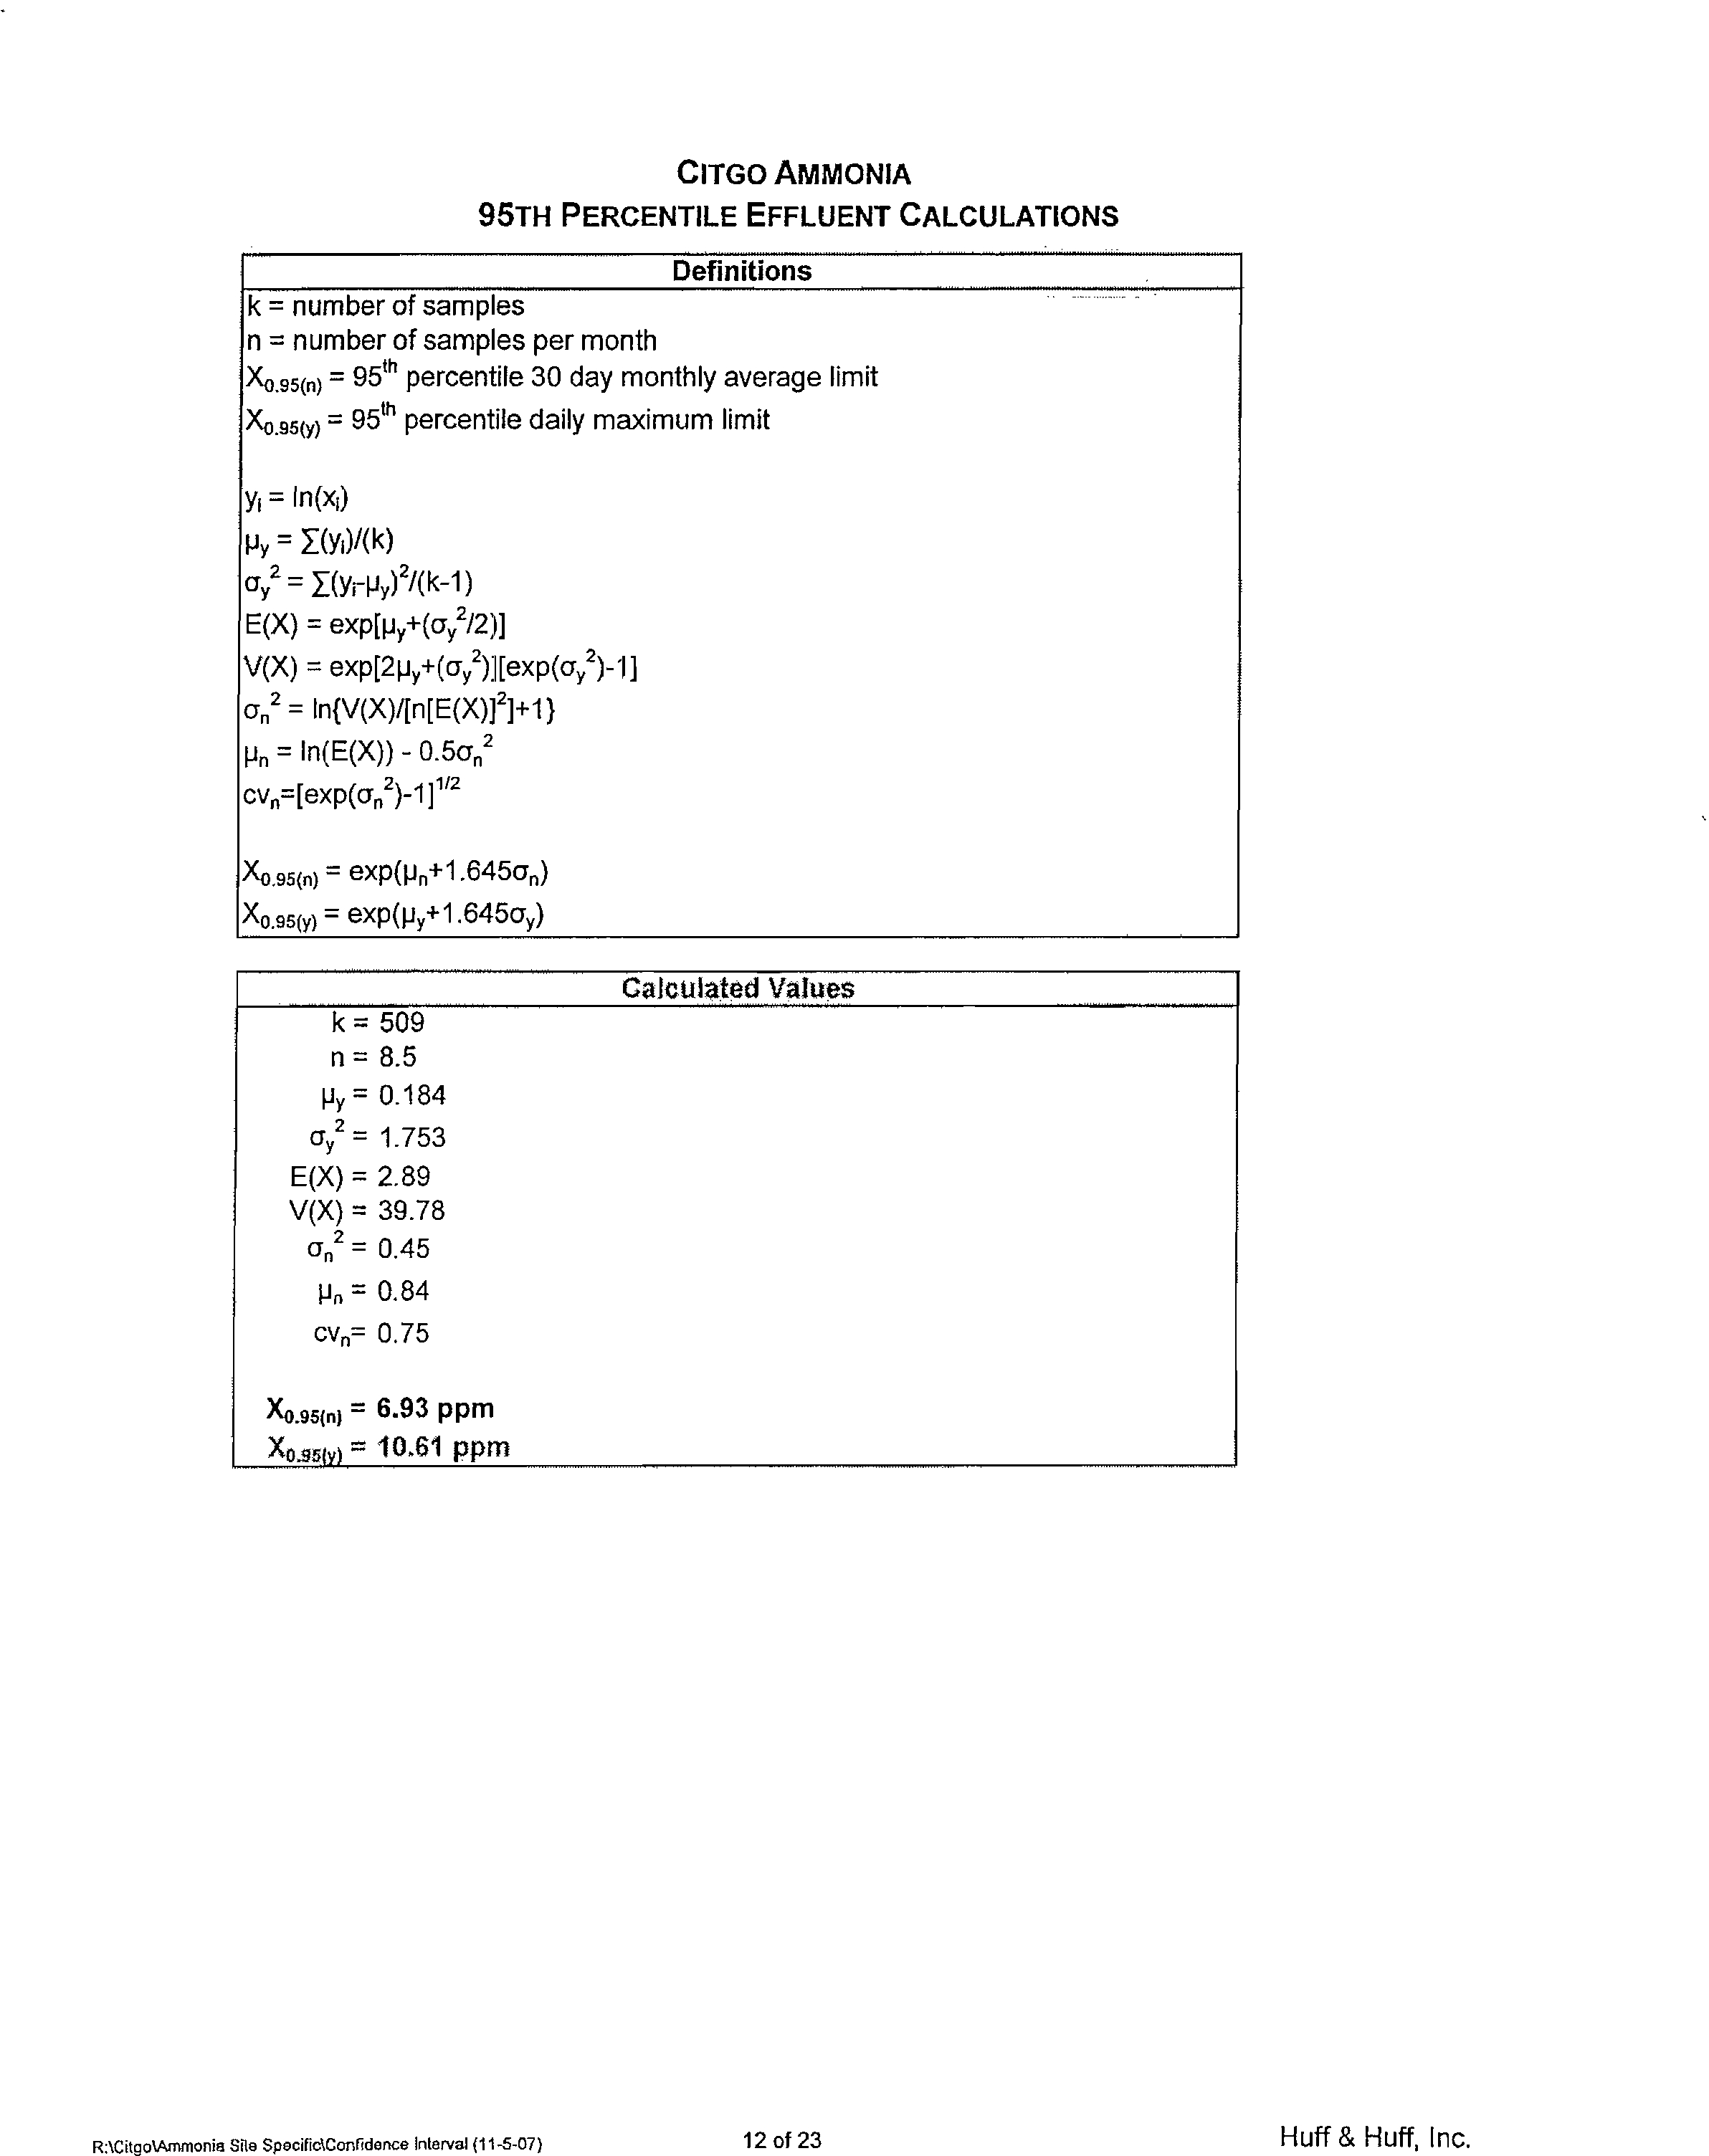
The U. S. EPA
Technical Support Document
for Water Quality Based Toxics Control was used to
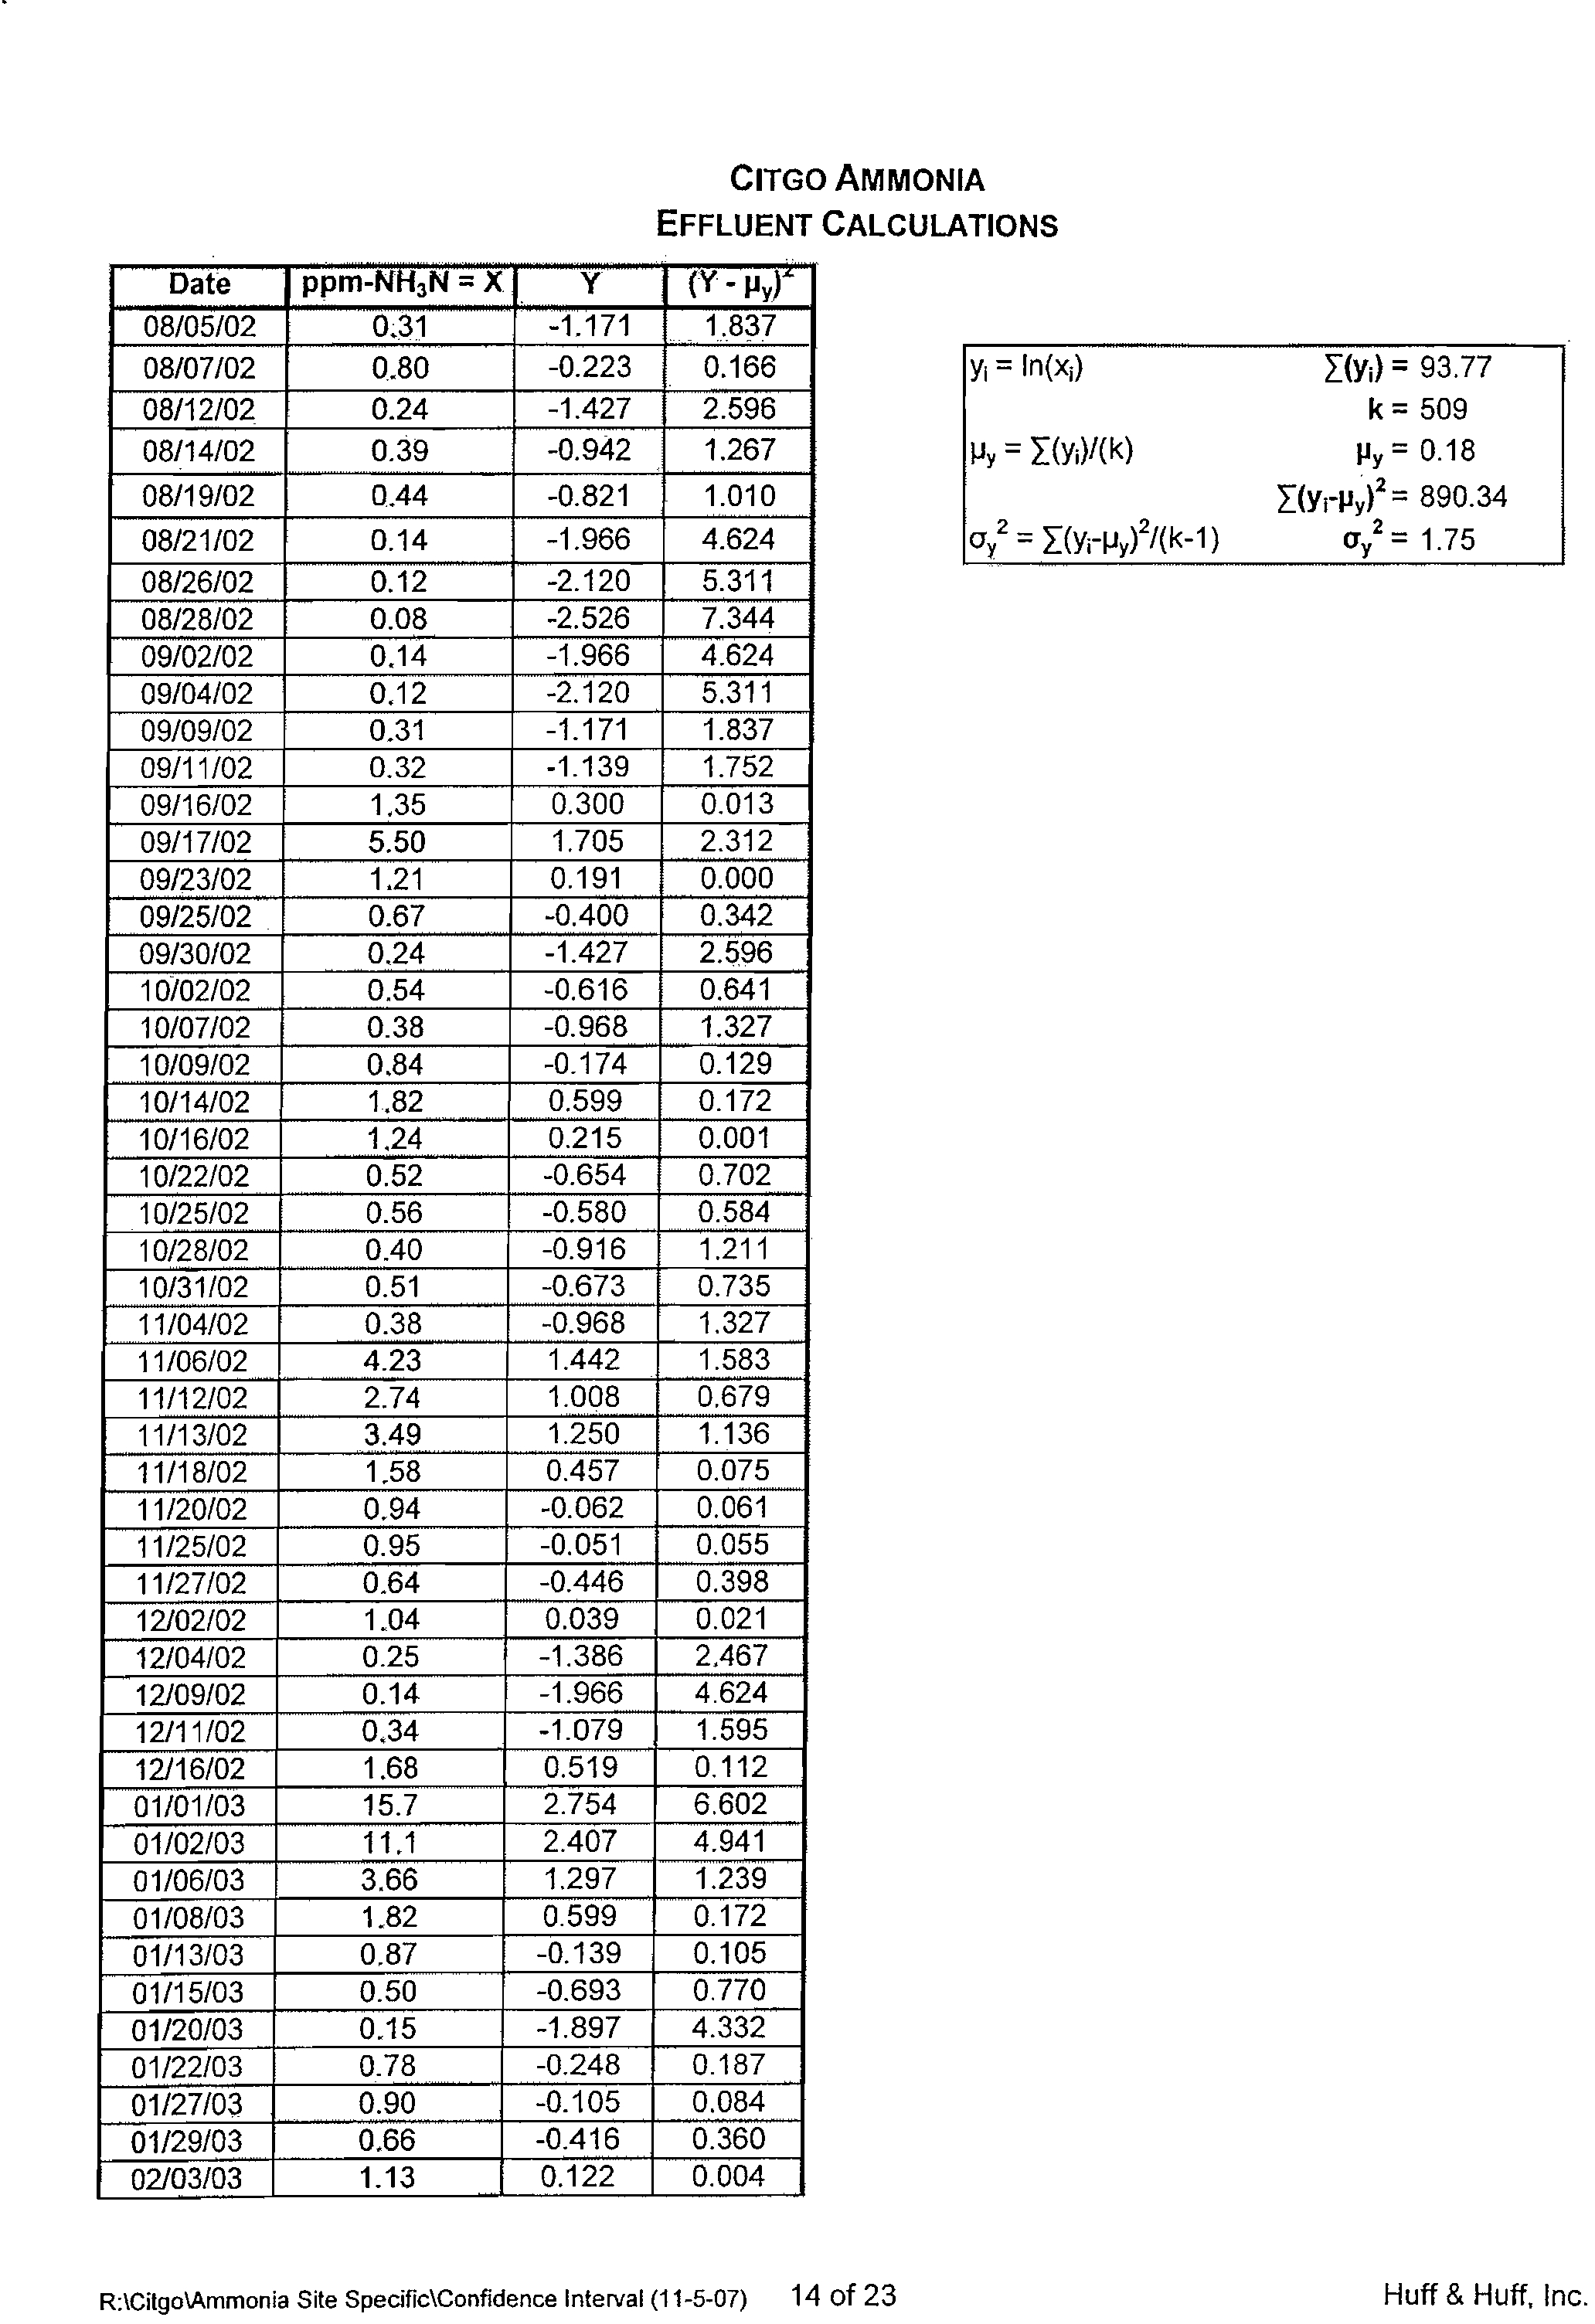
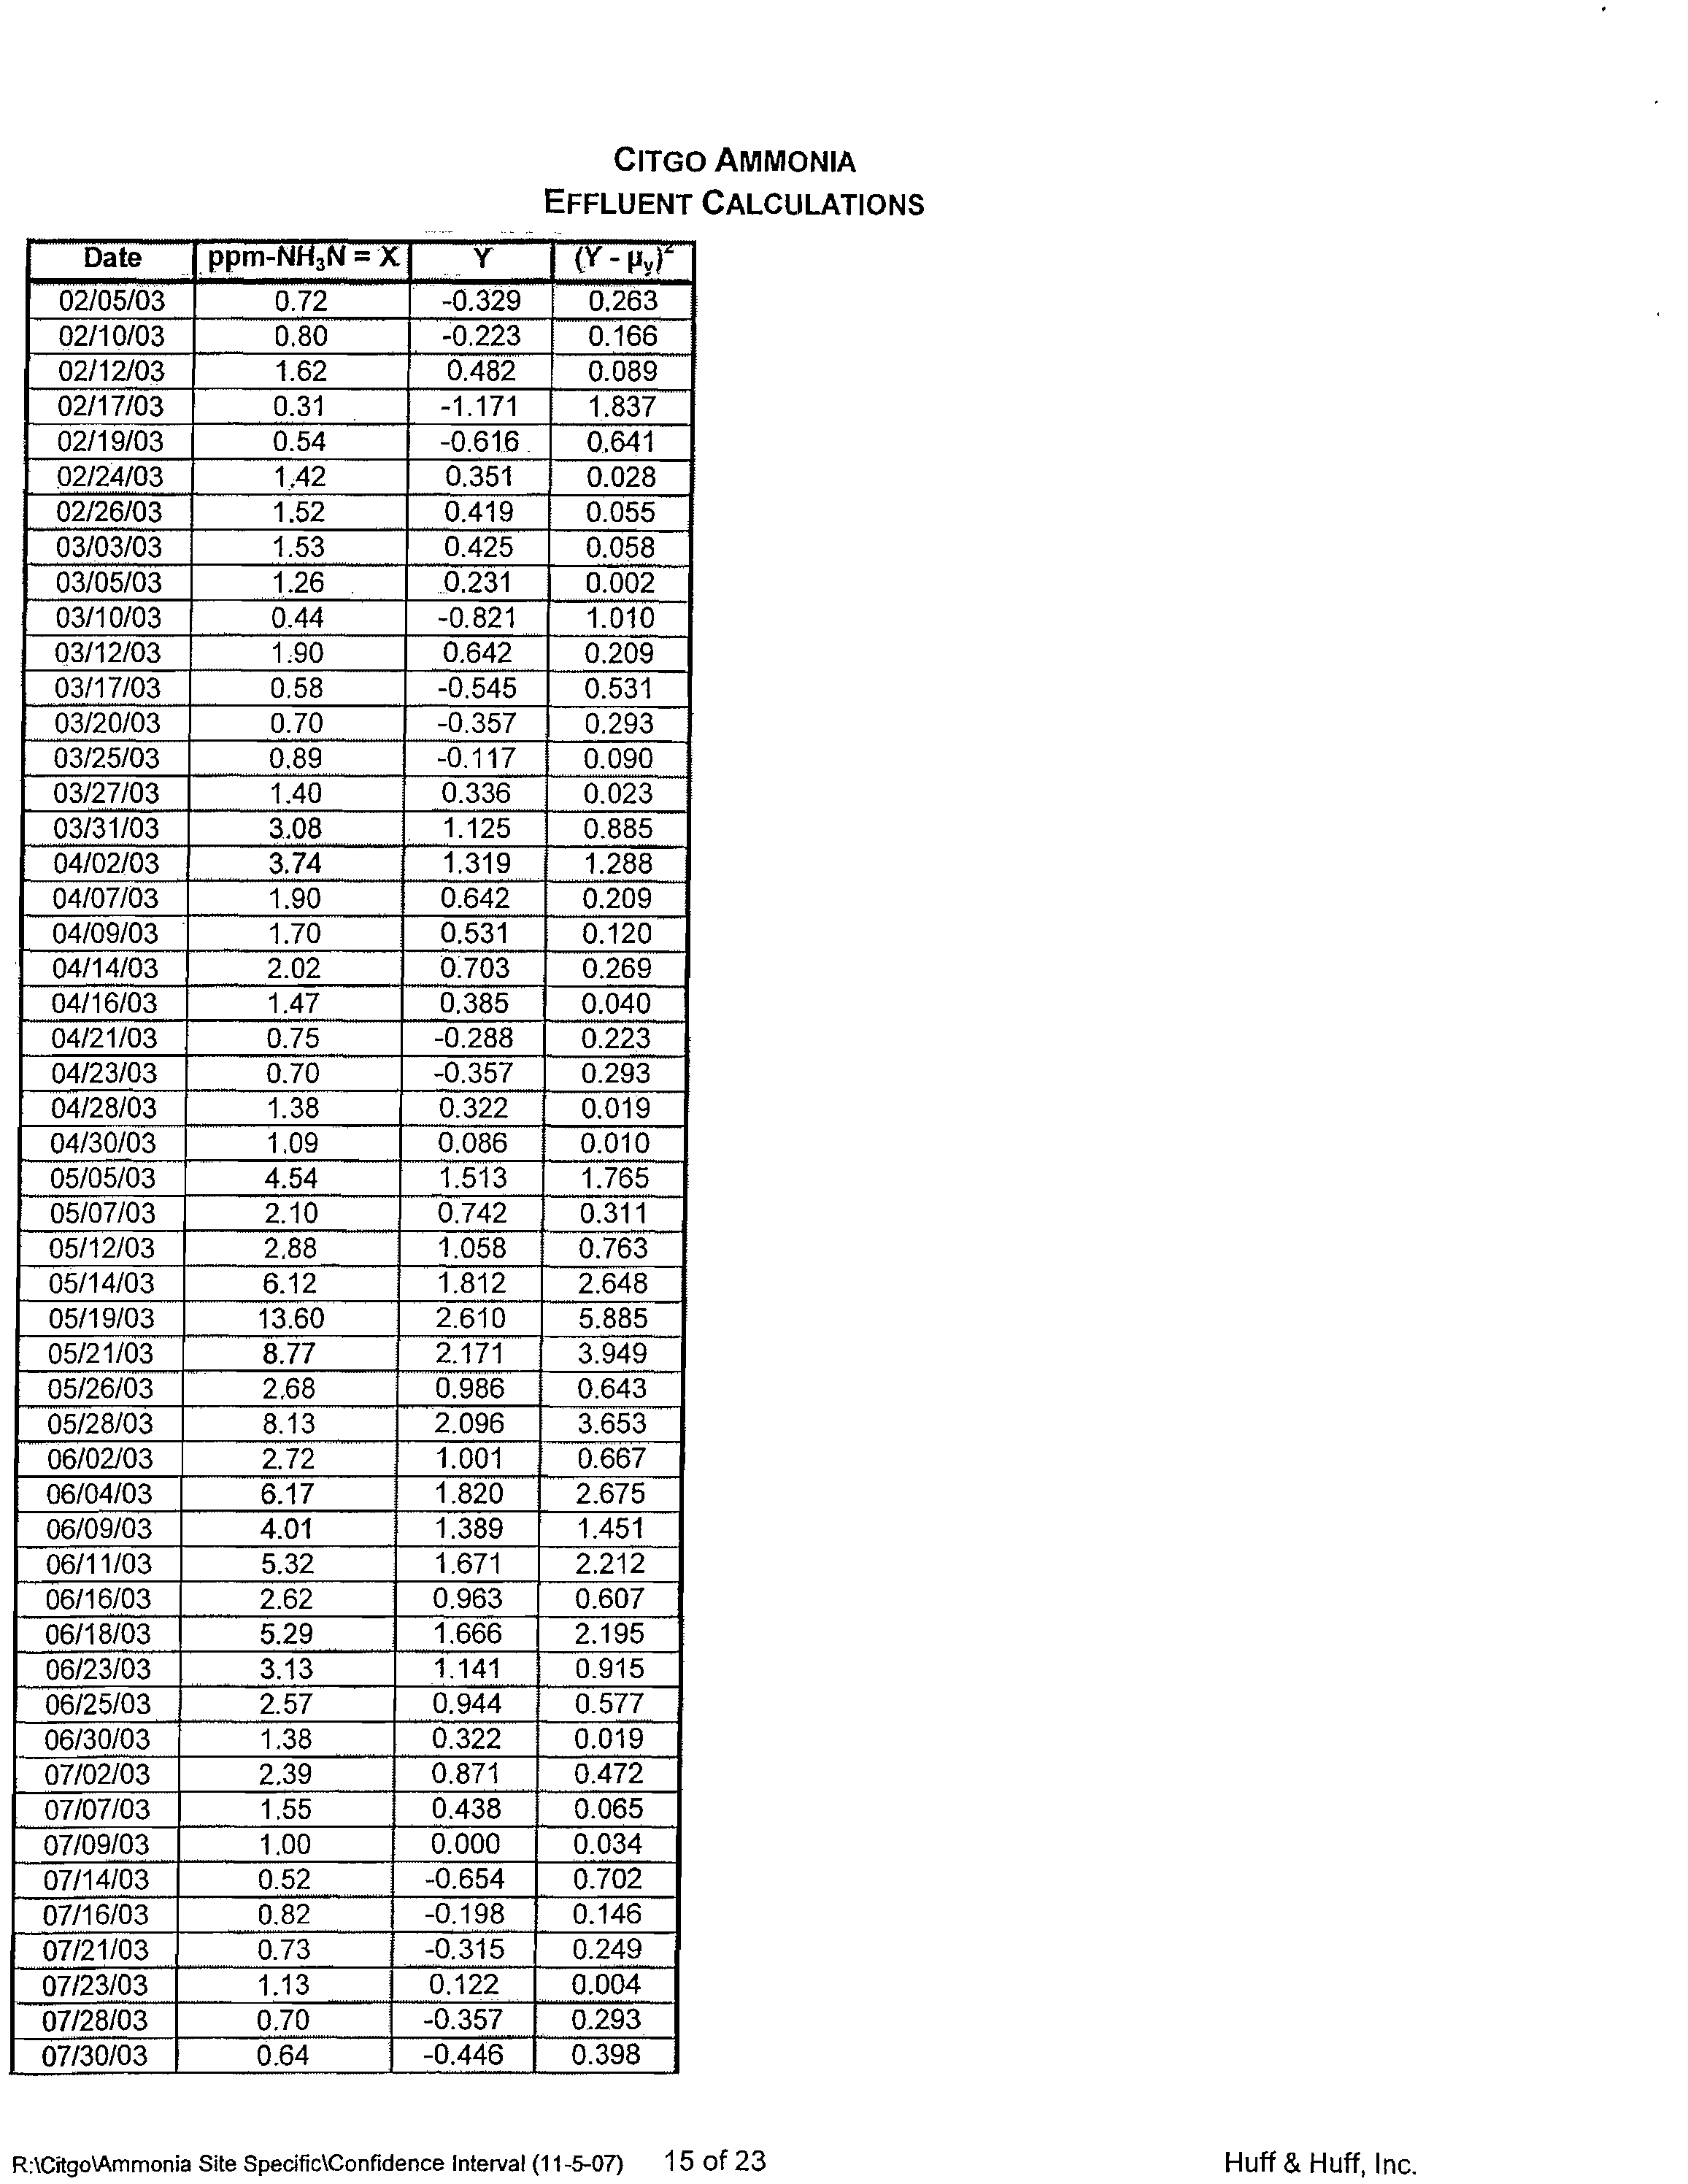
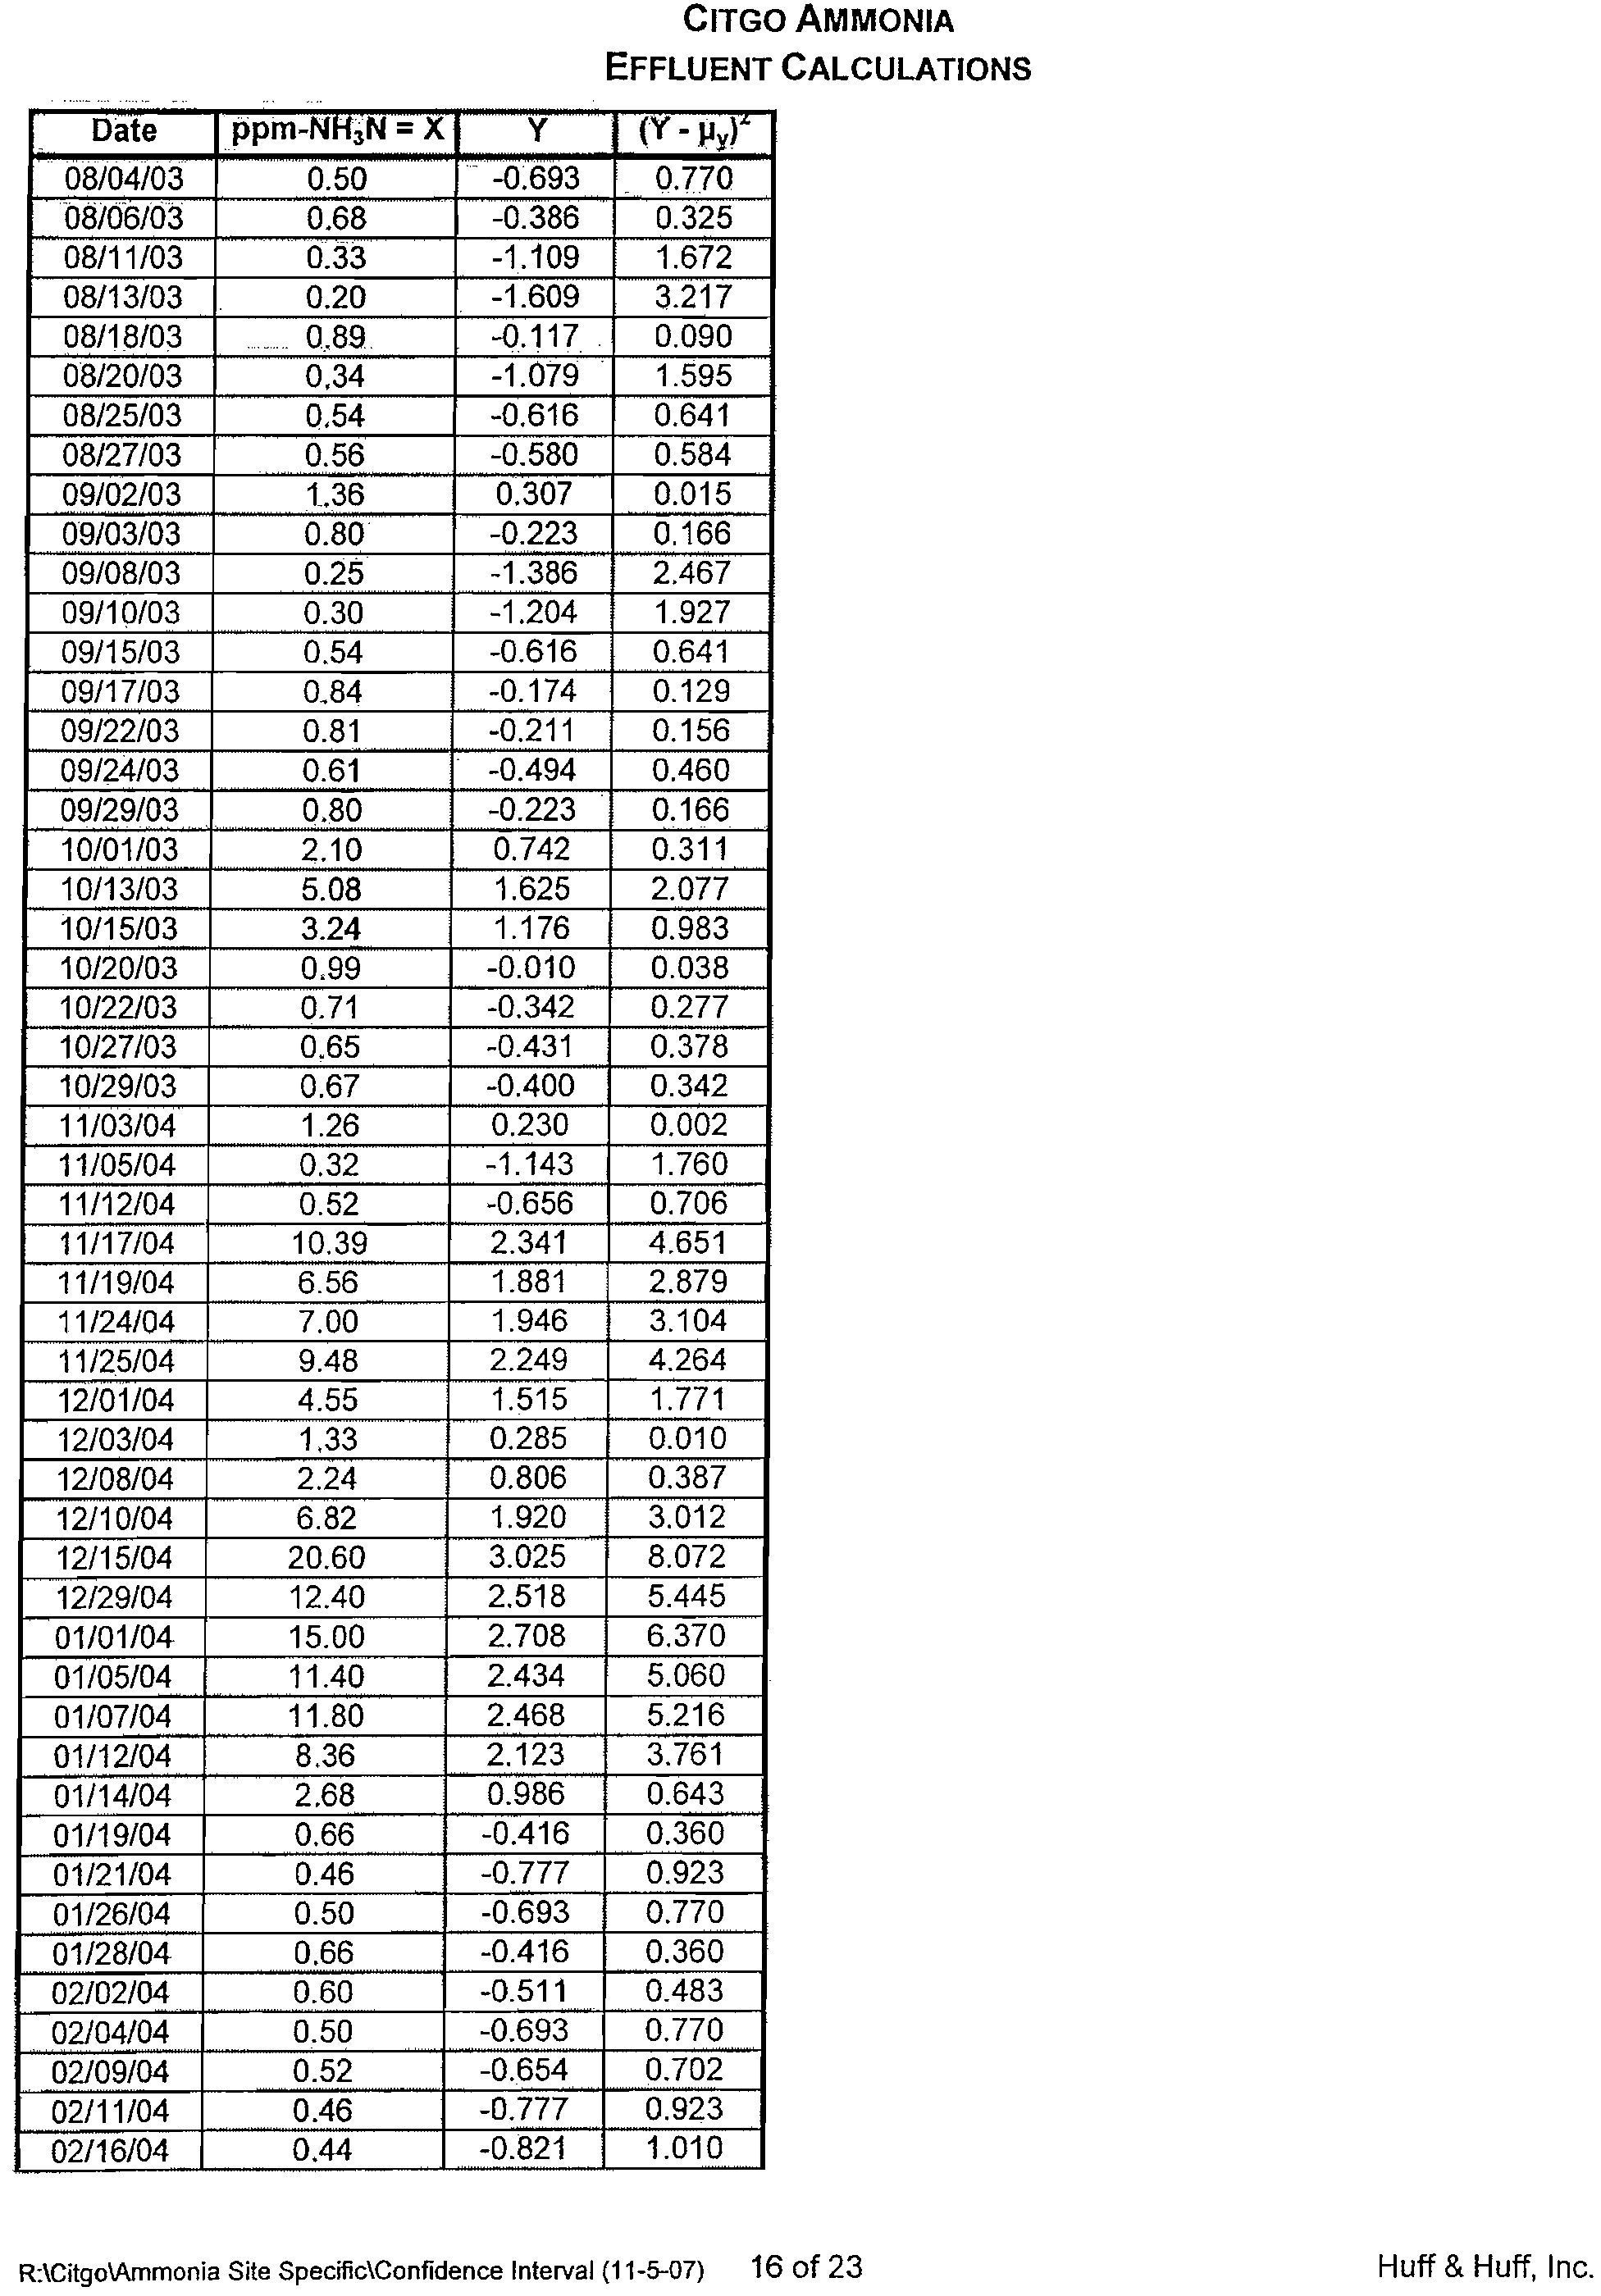
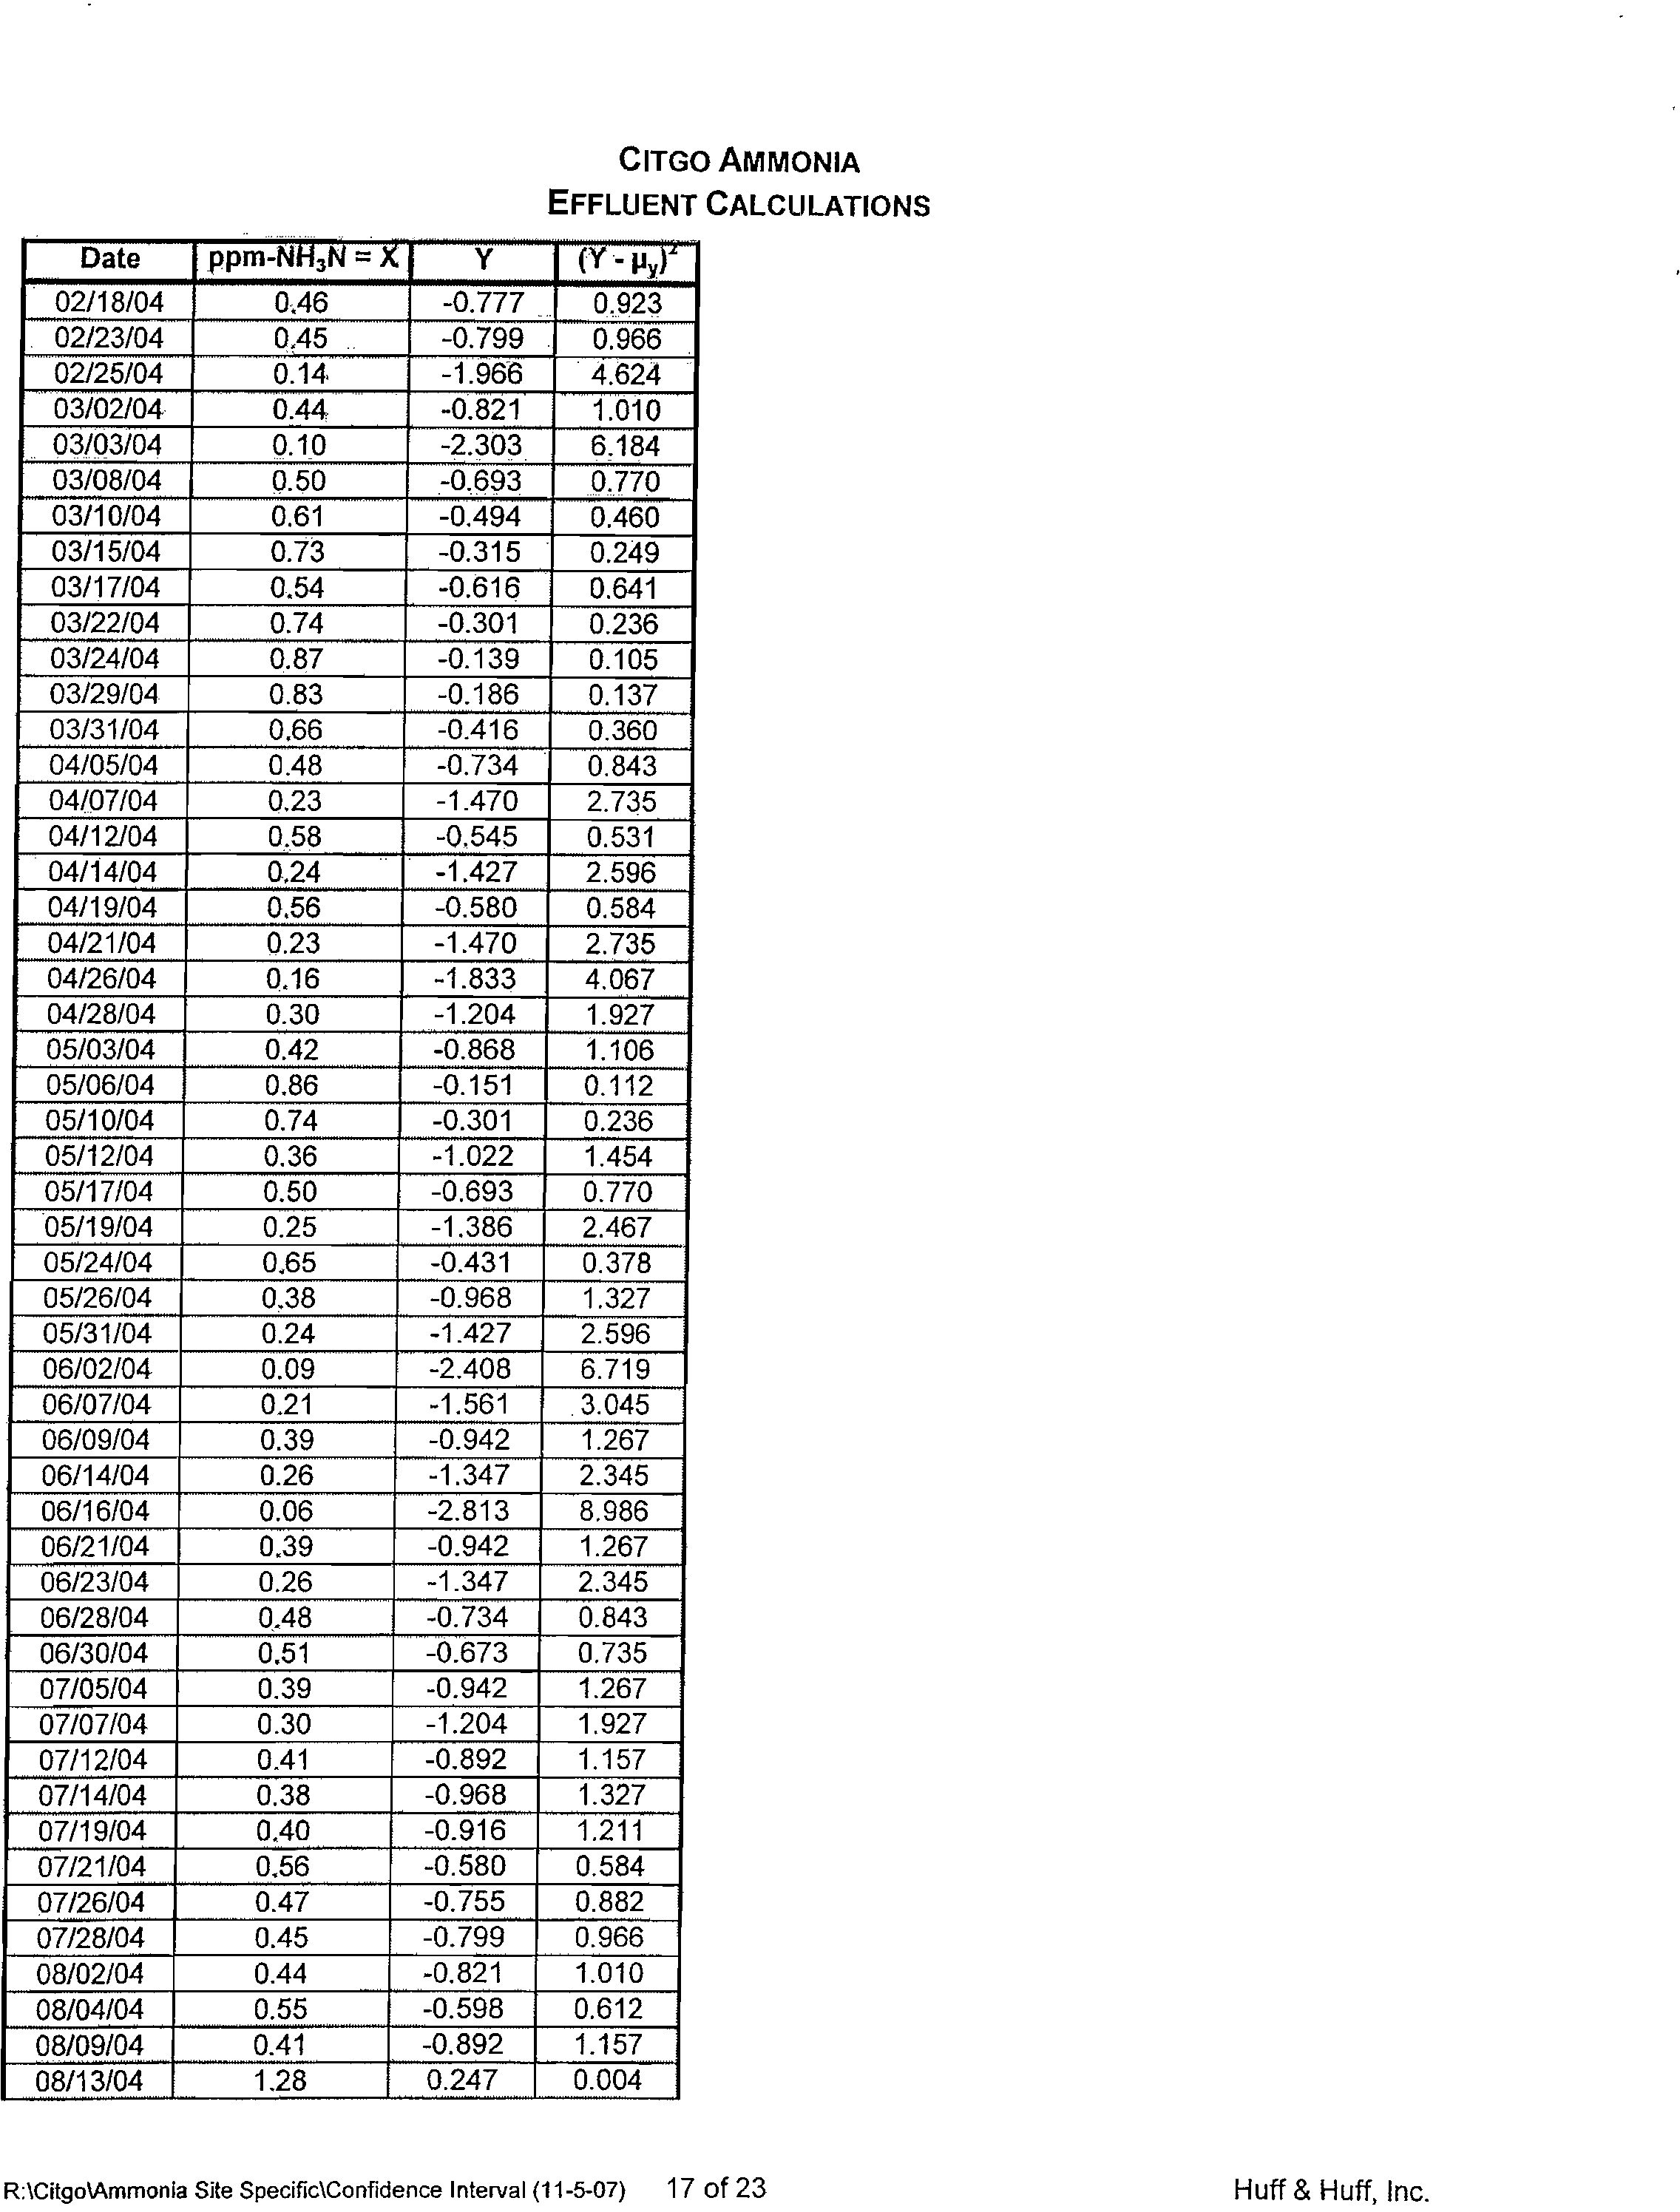
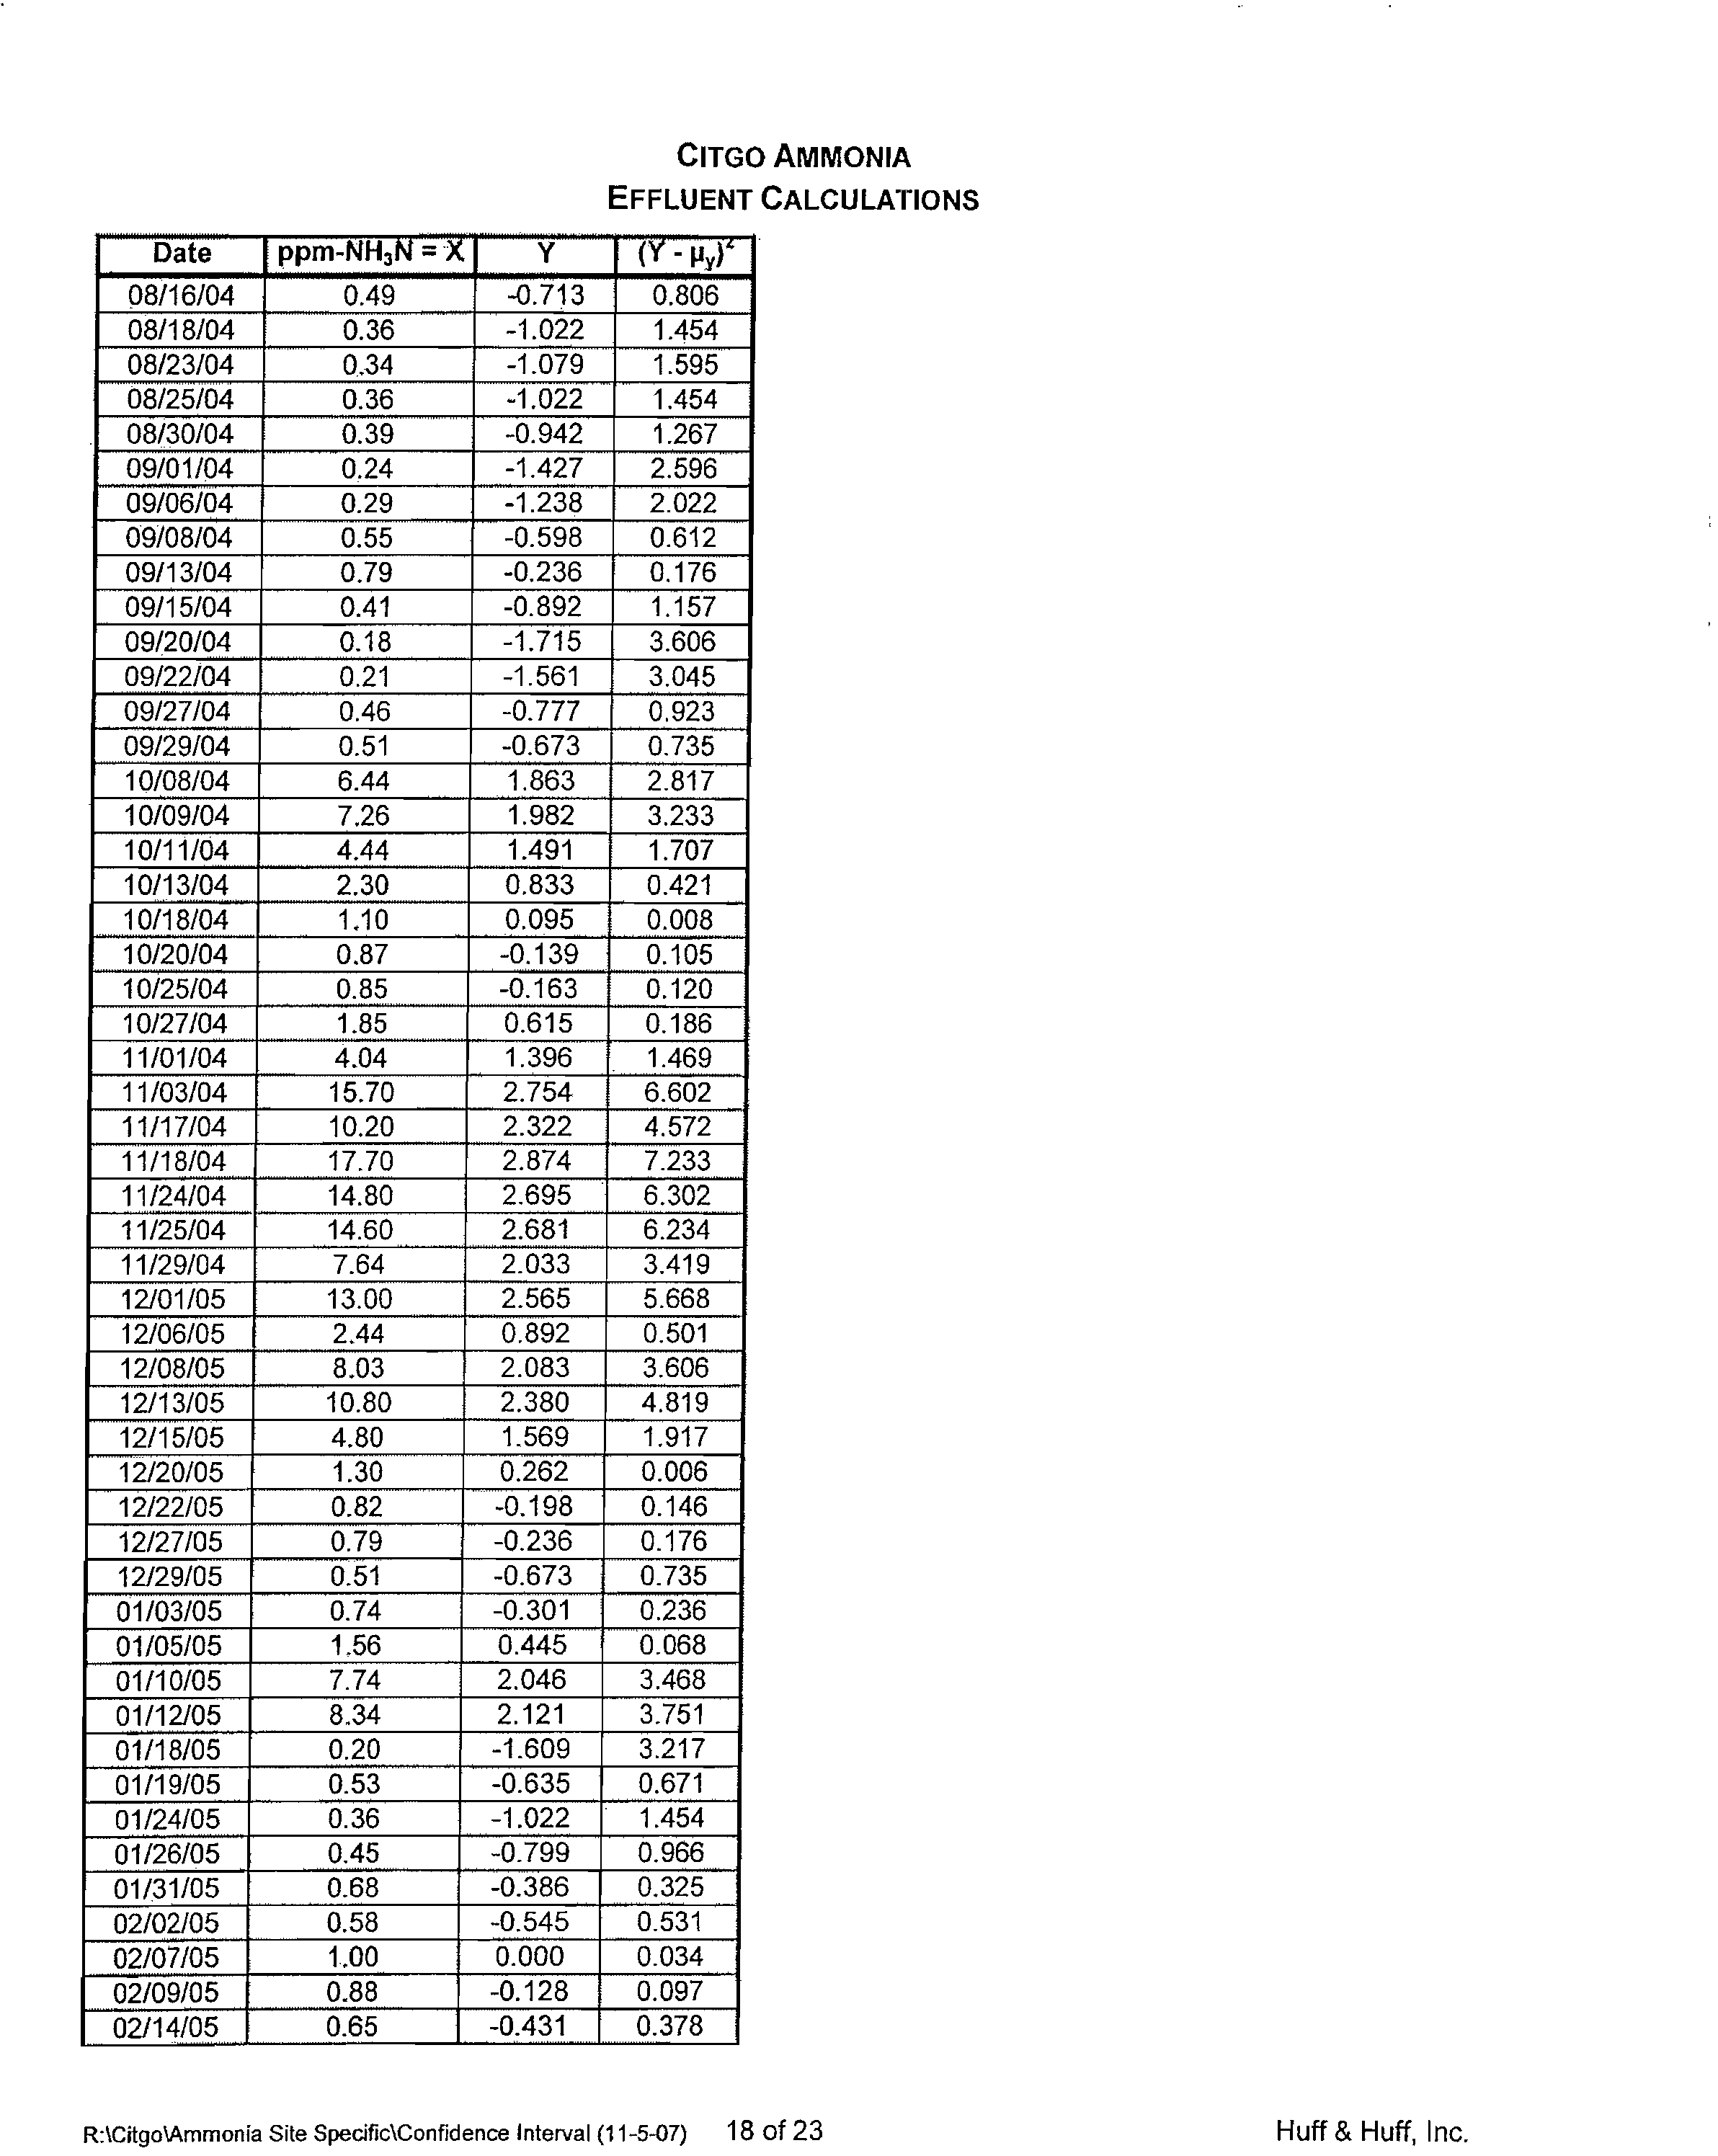
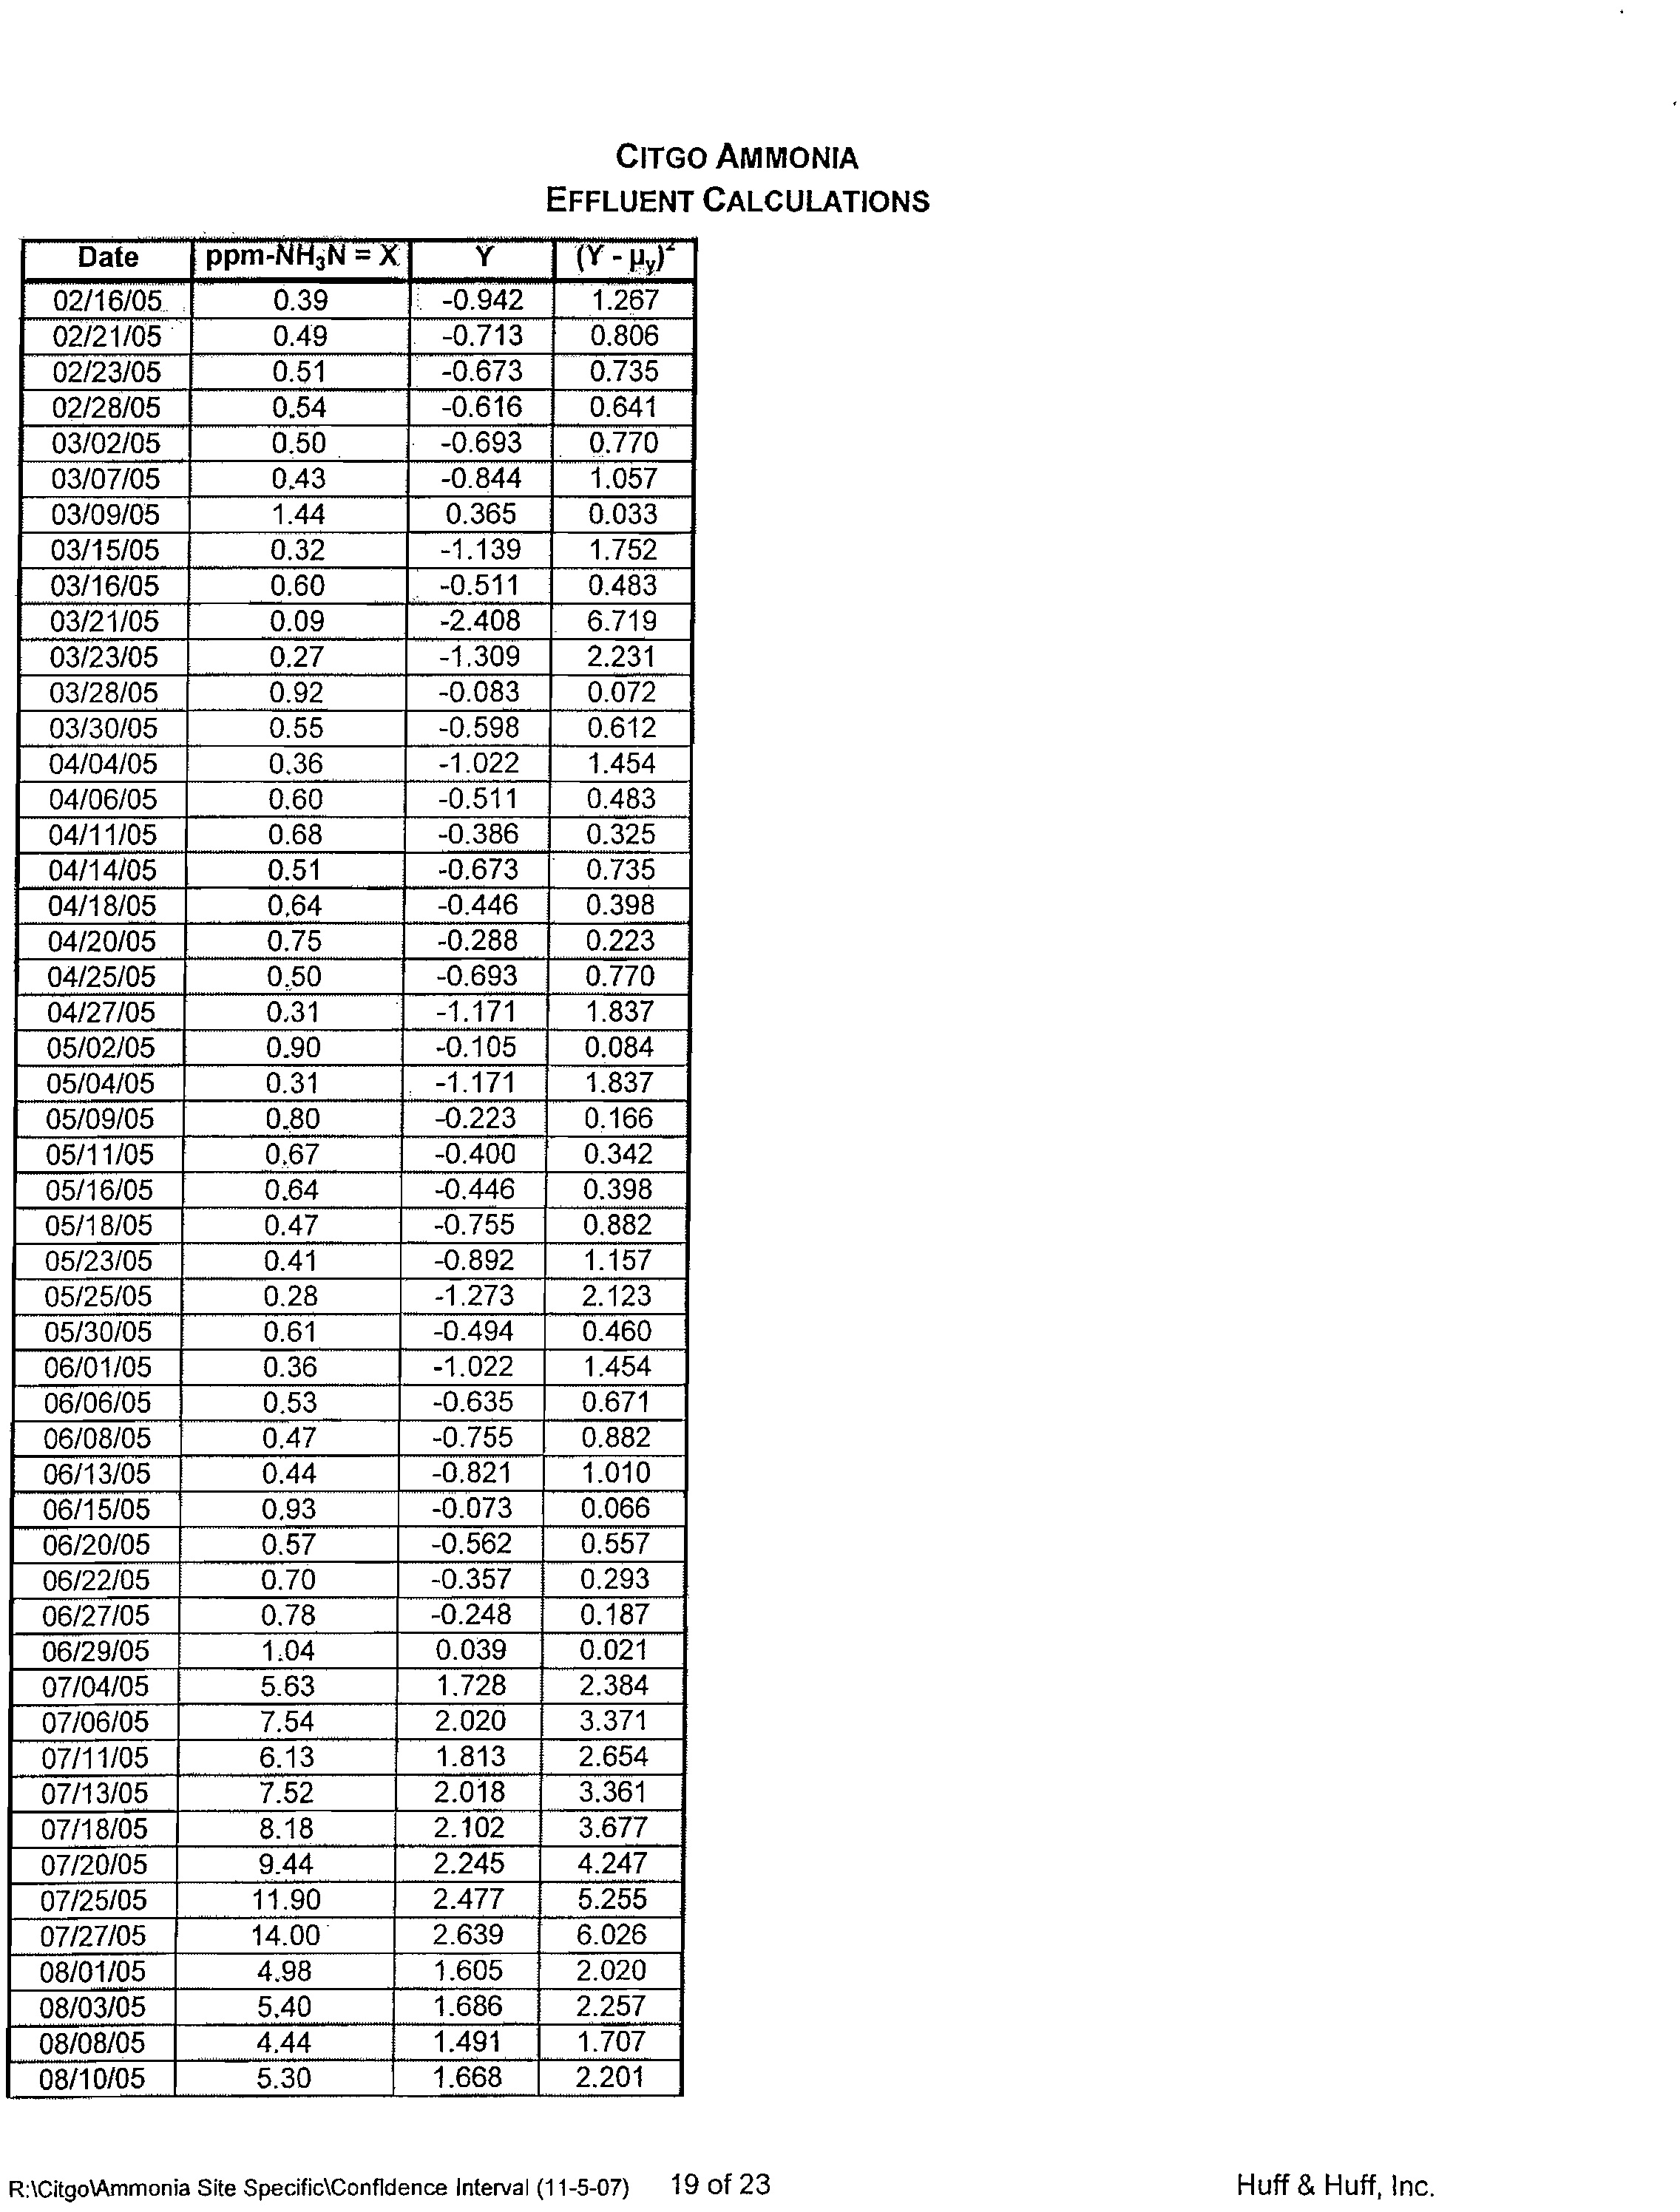
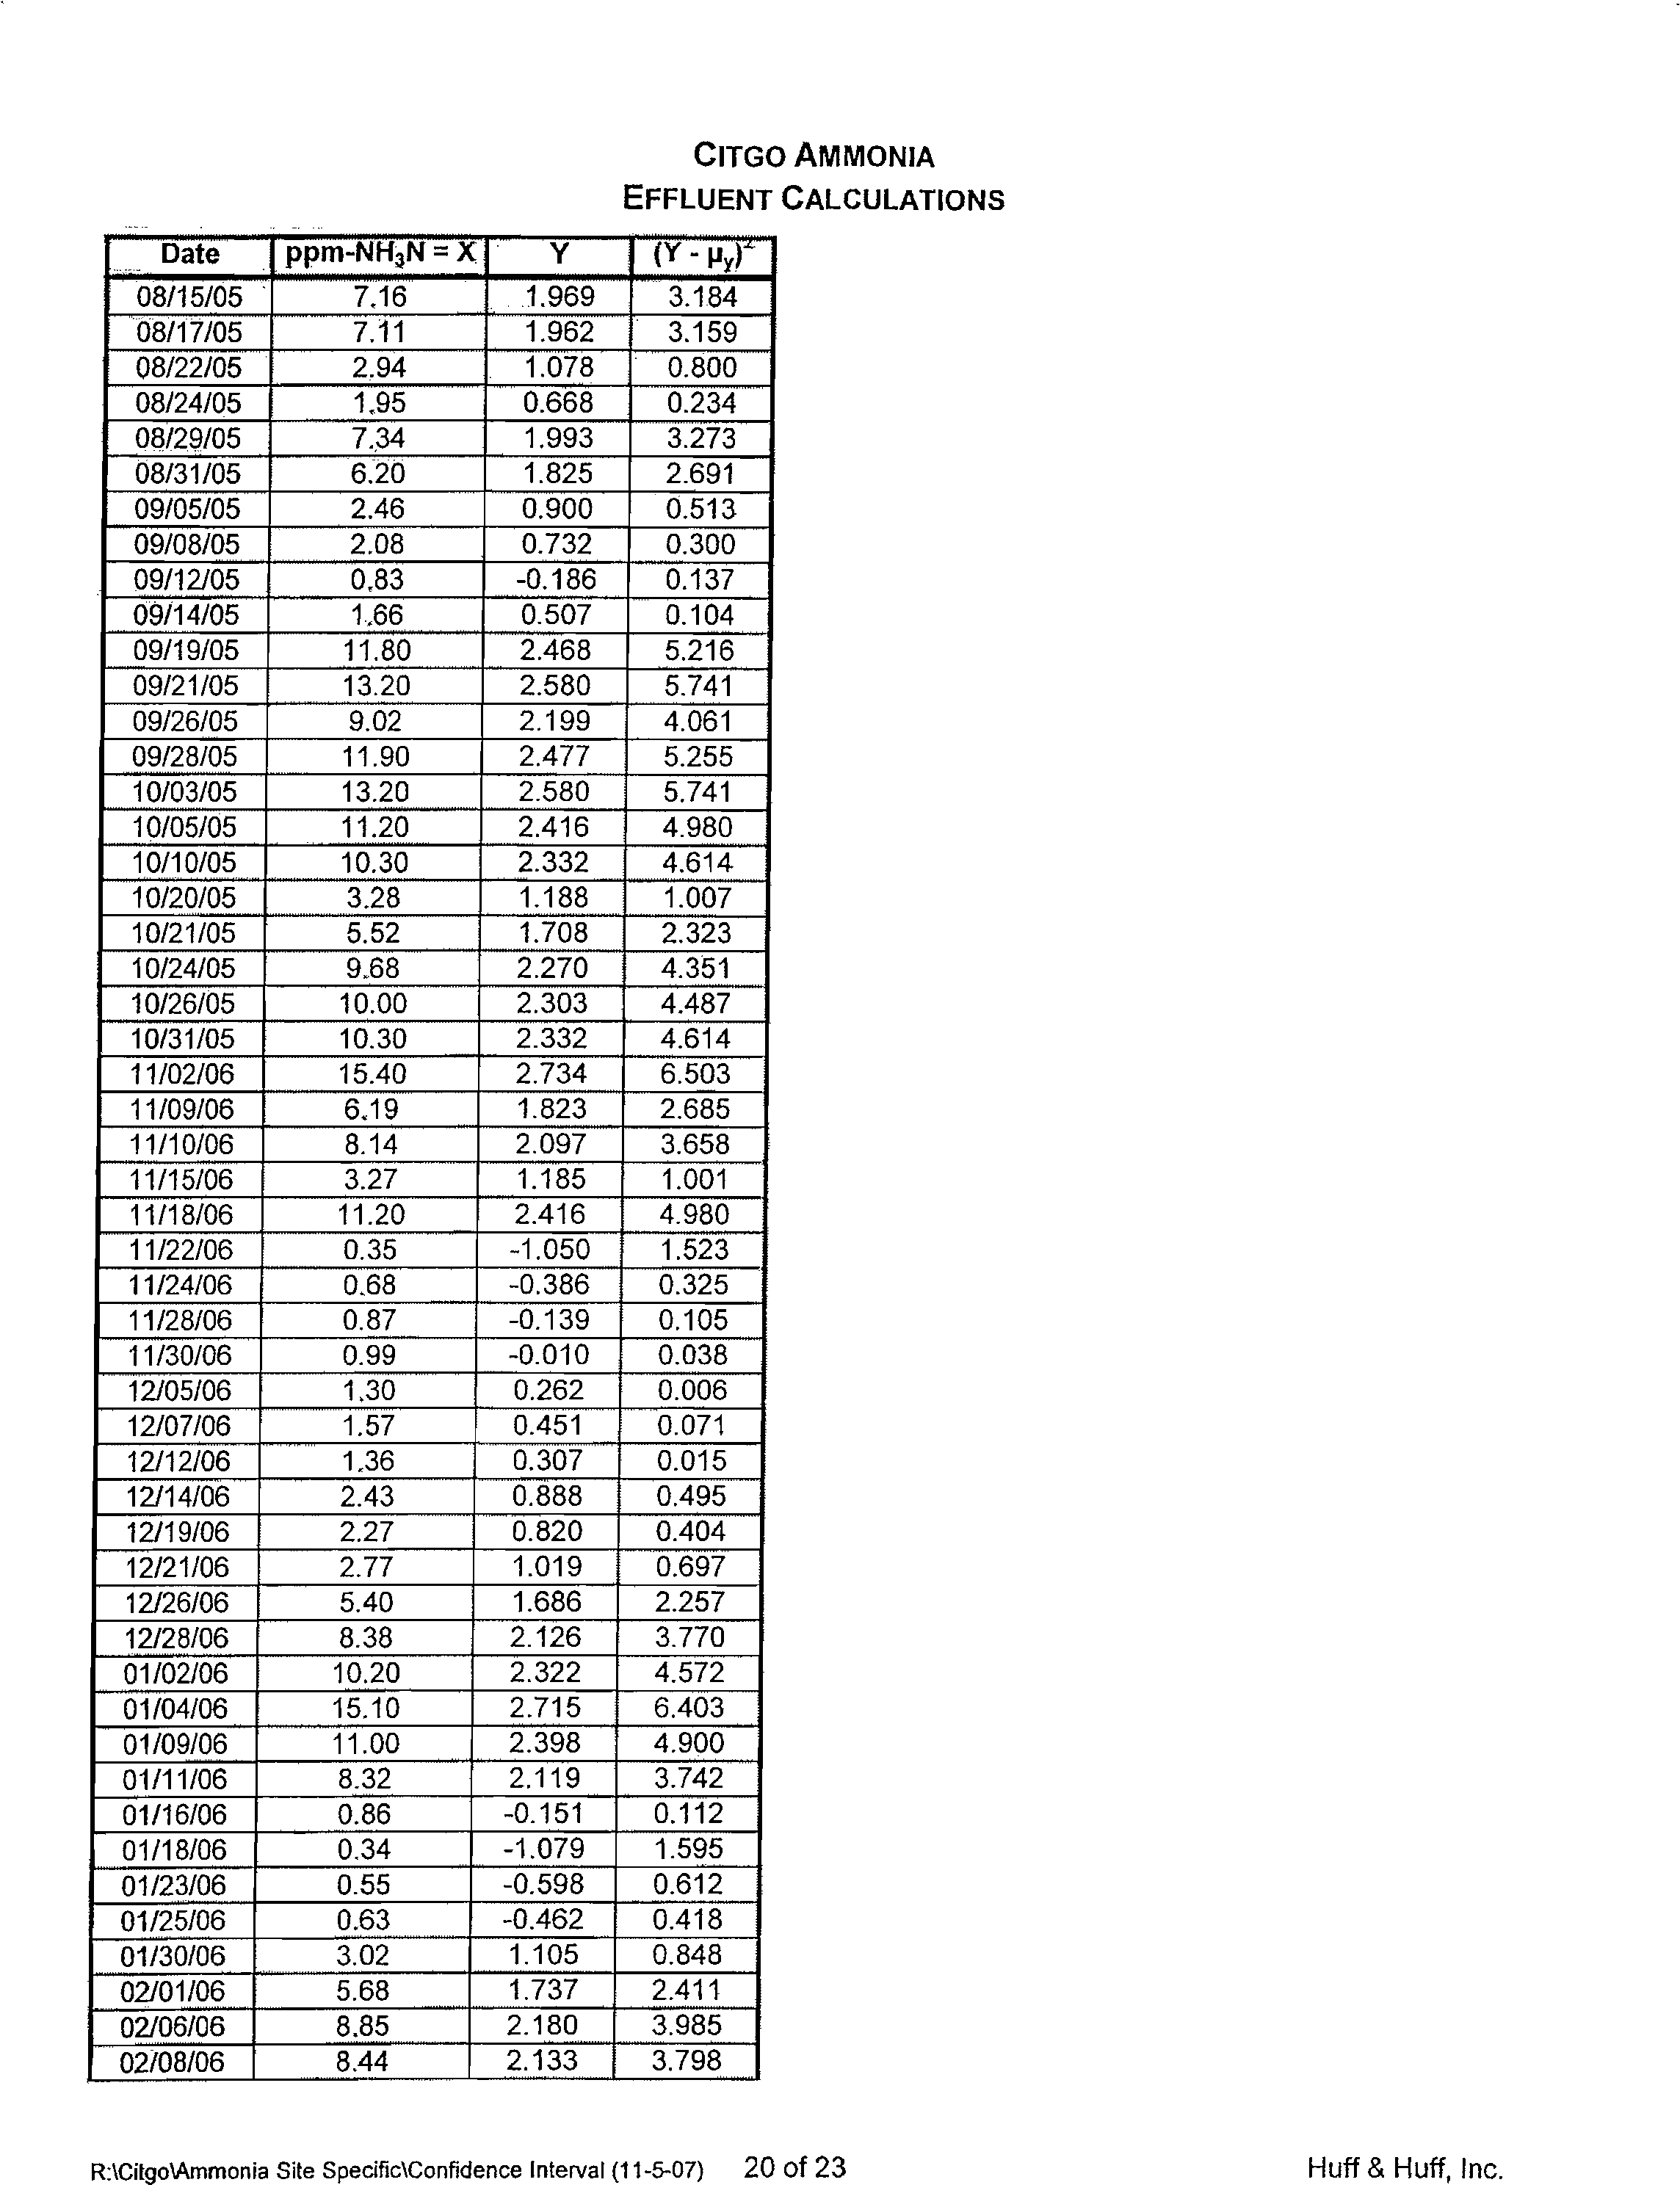
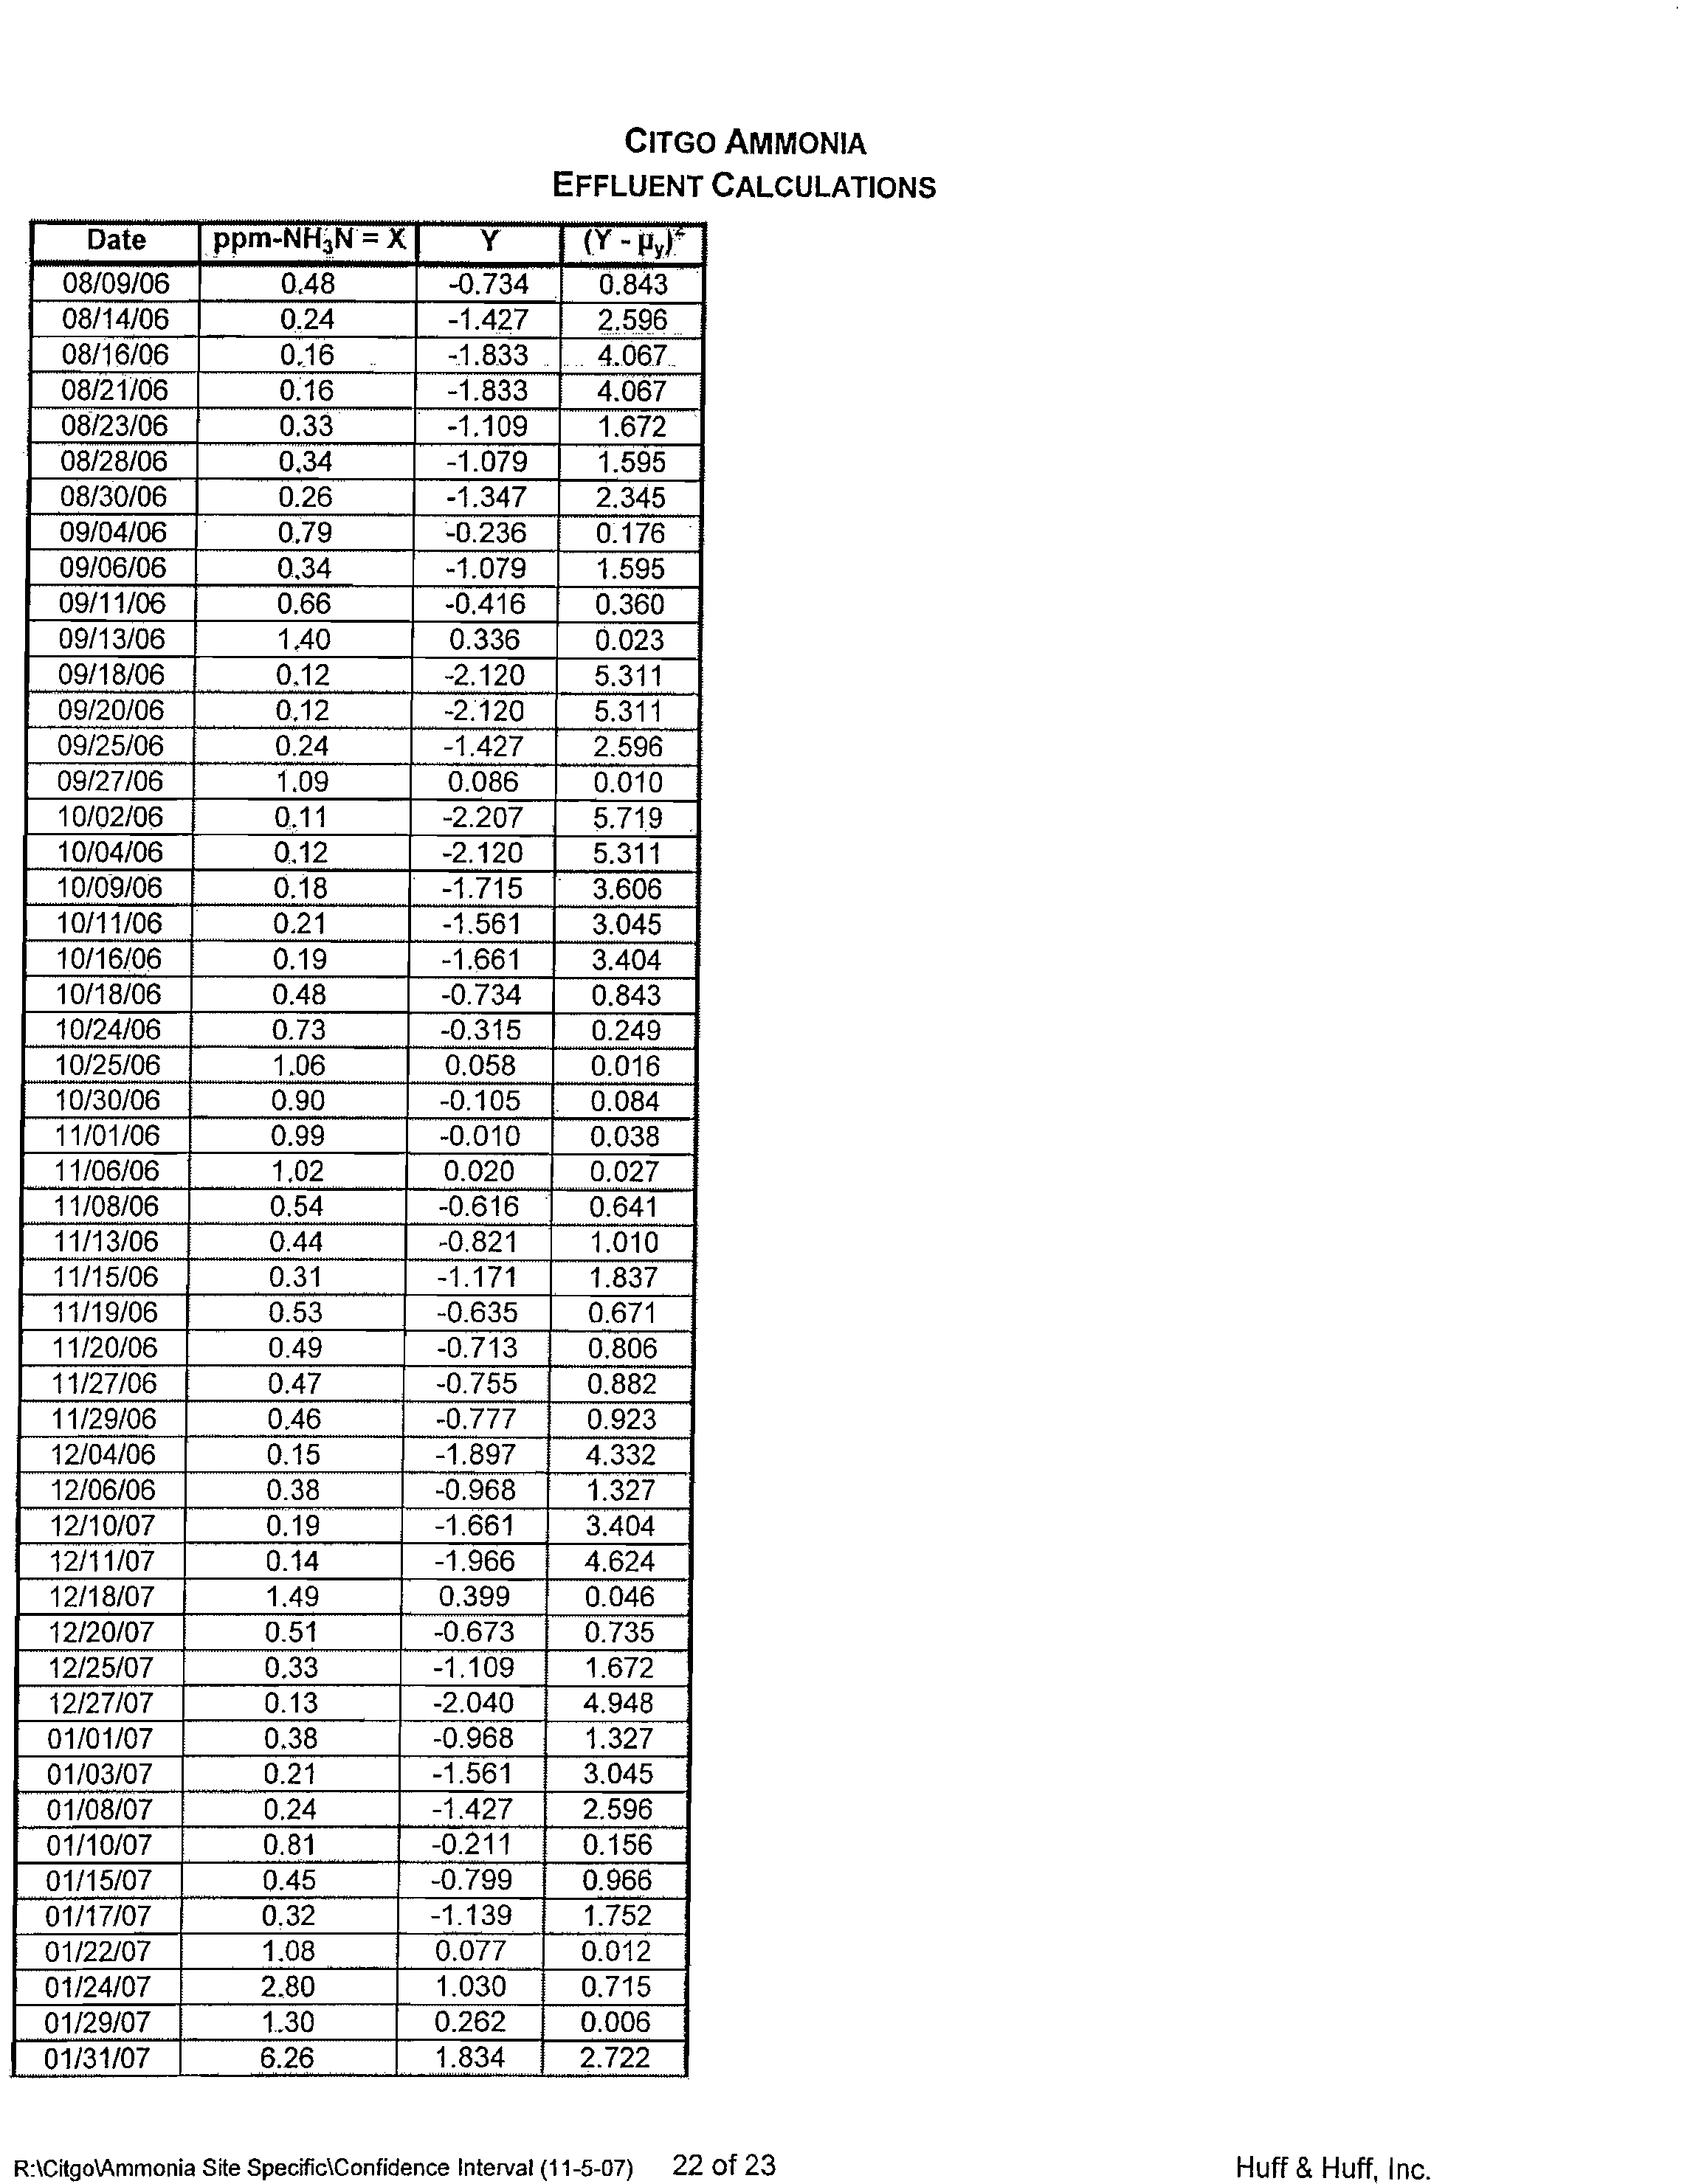
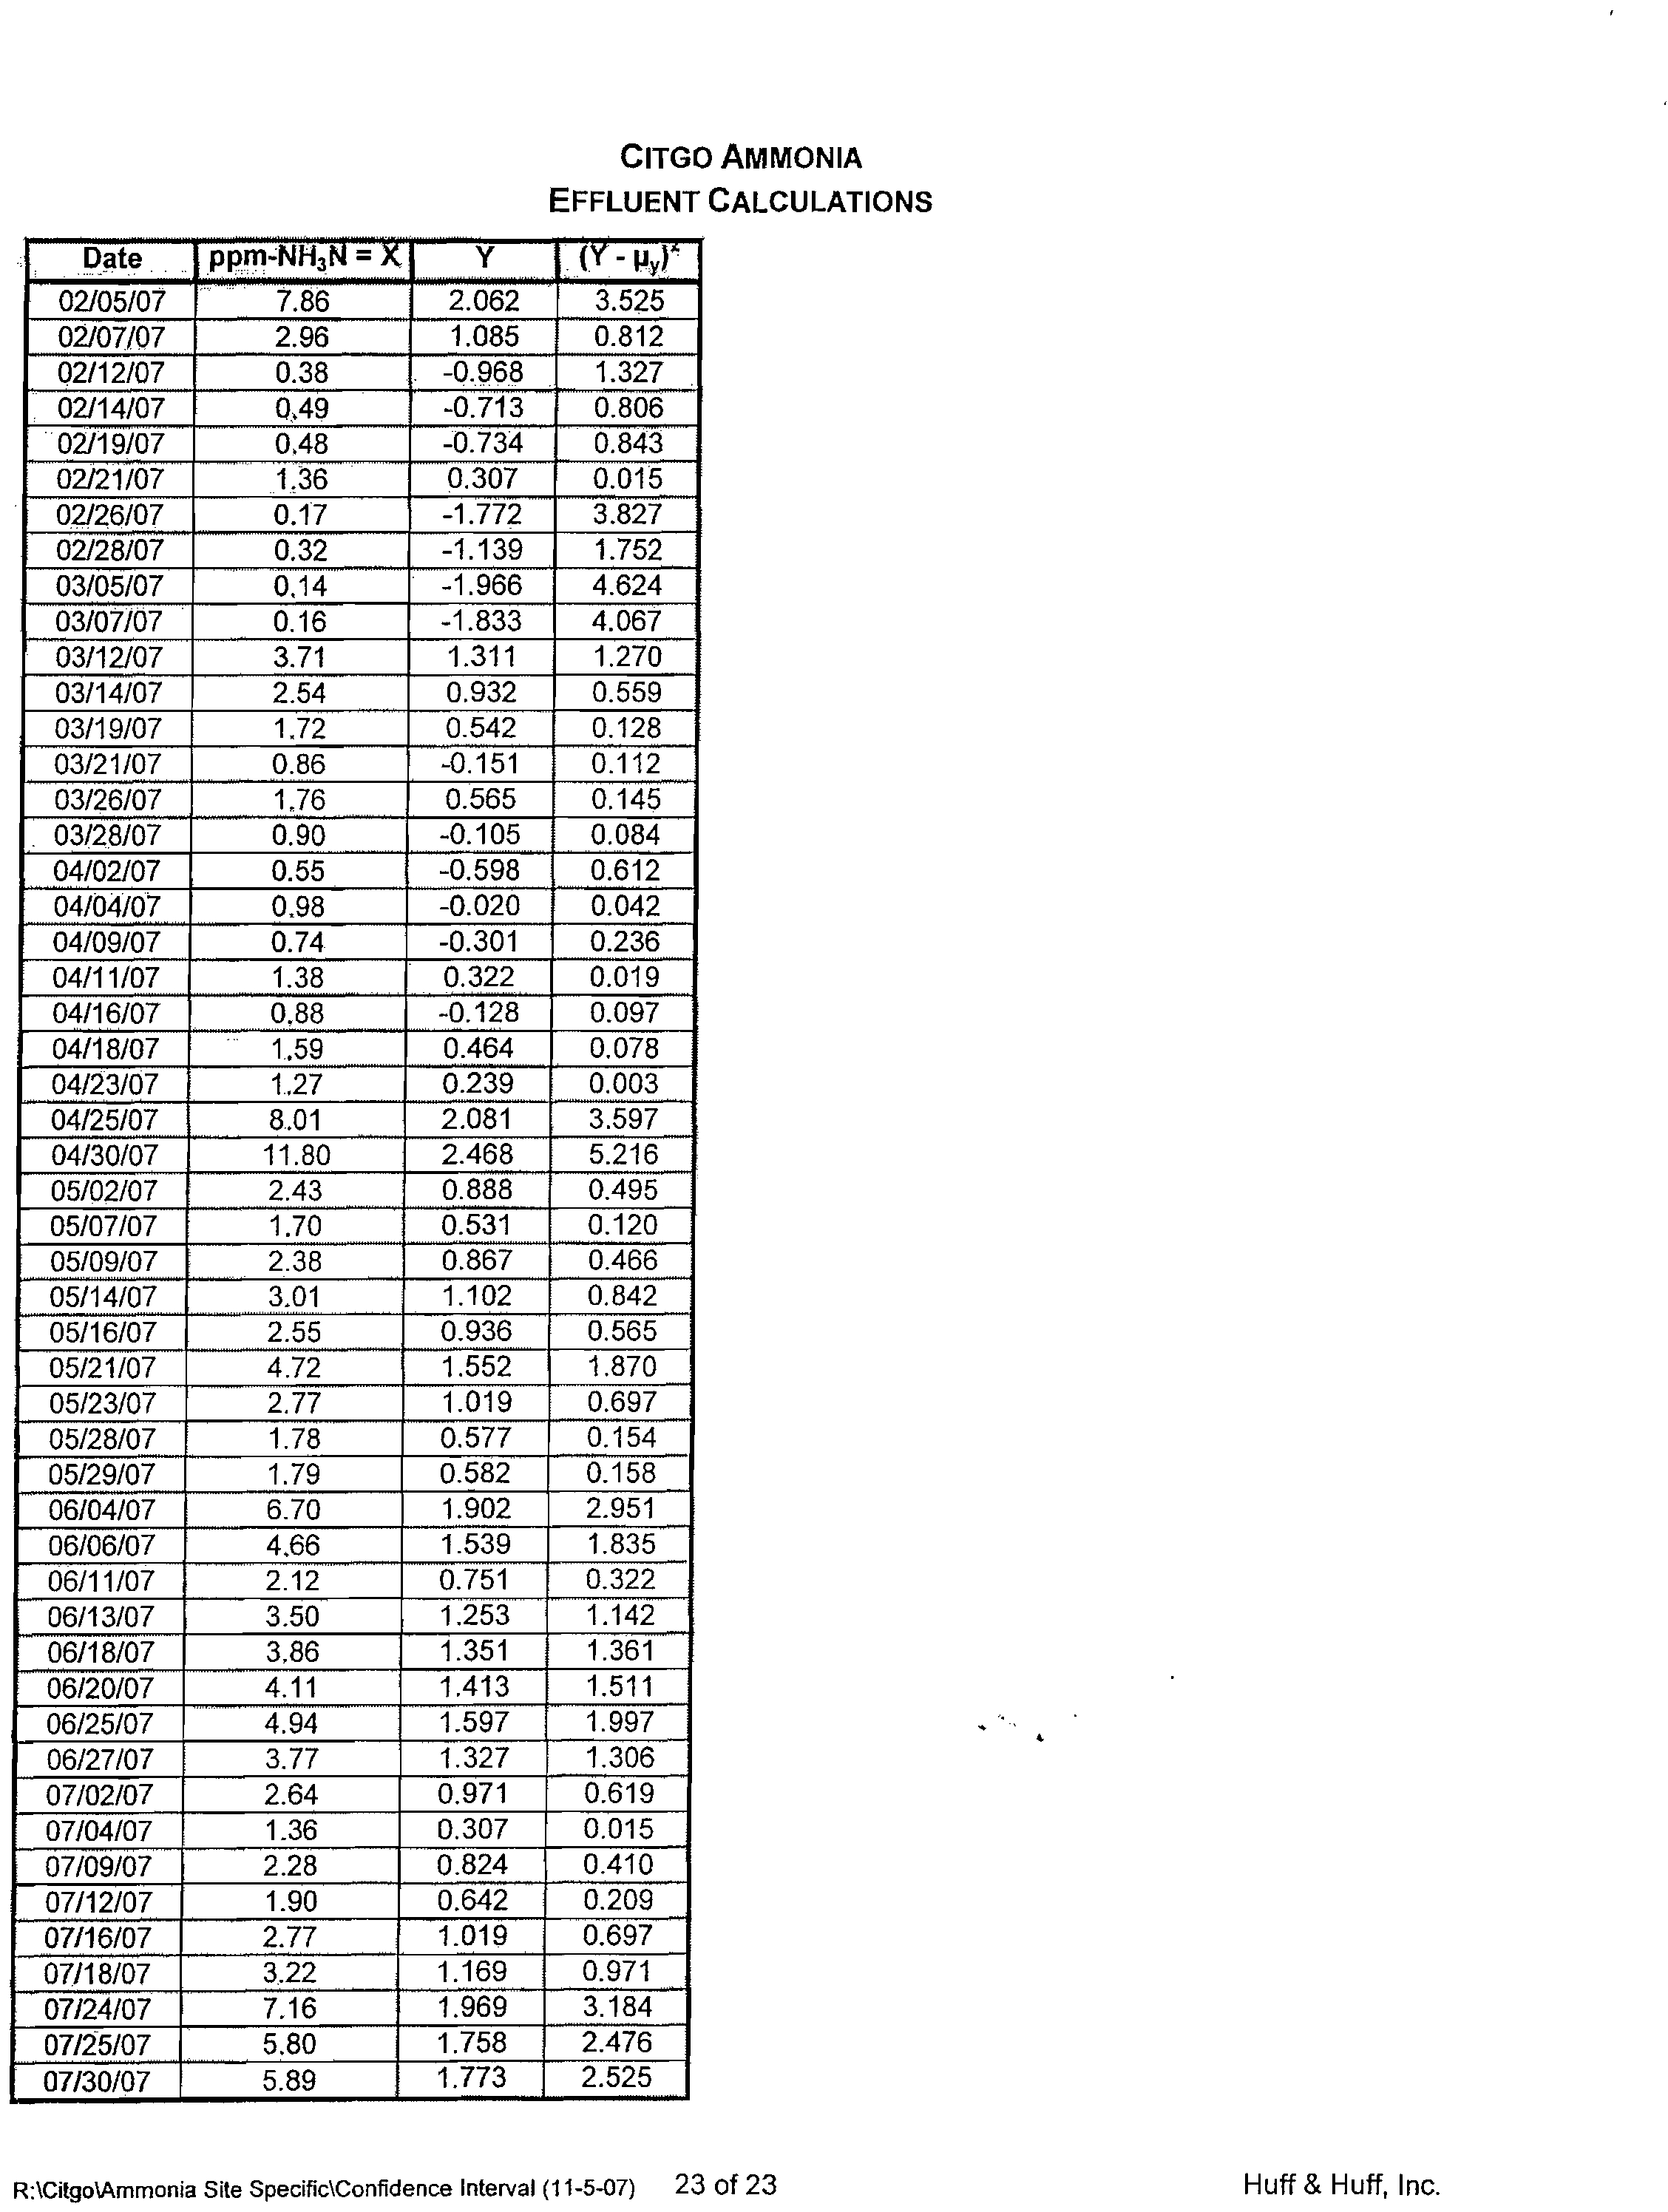
calculate proposed effluent limits based on ammonia effluent data from June 2002 through May 2007.
This approach to deriving ammonia effluent limits is based upon the performance of the treatment
facility, and the time period listed is representative of the current performance of the treatment facility.
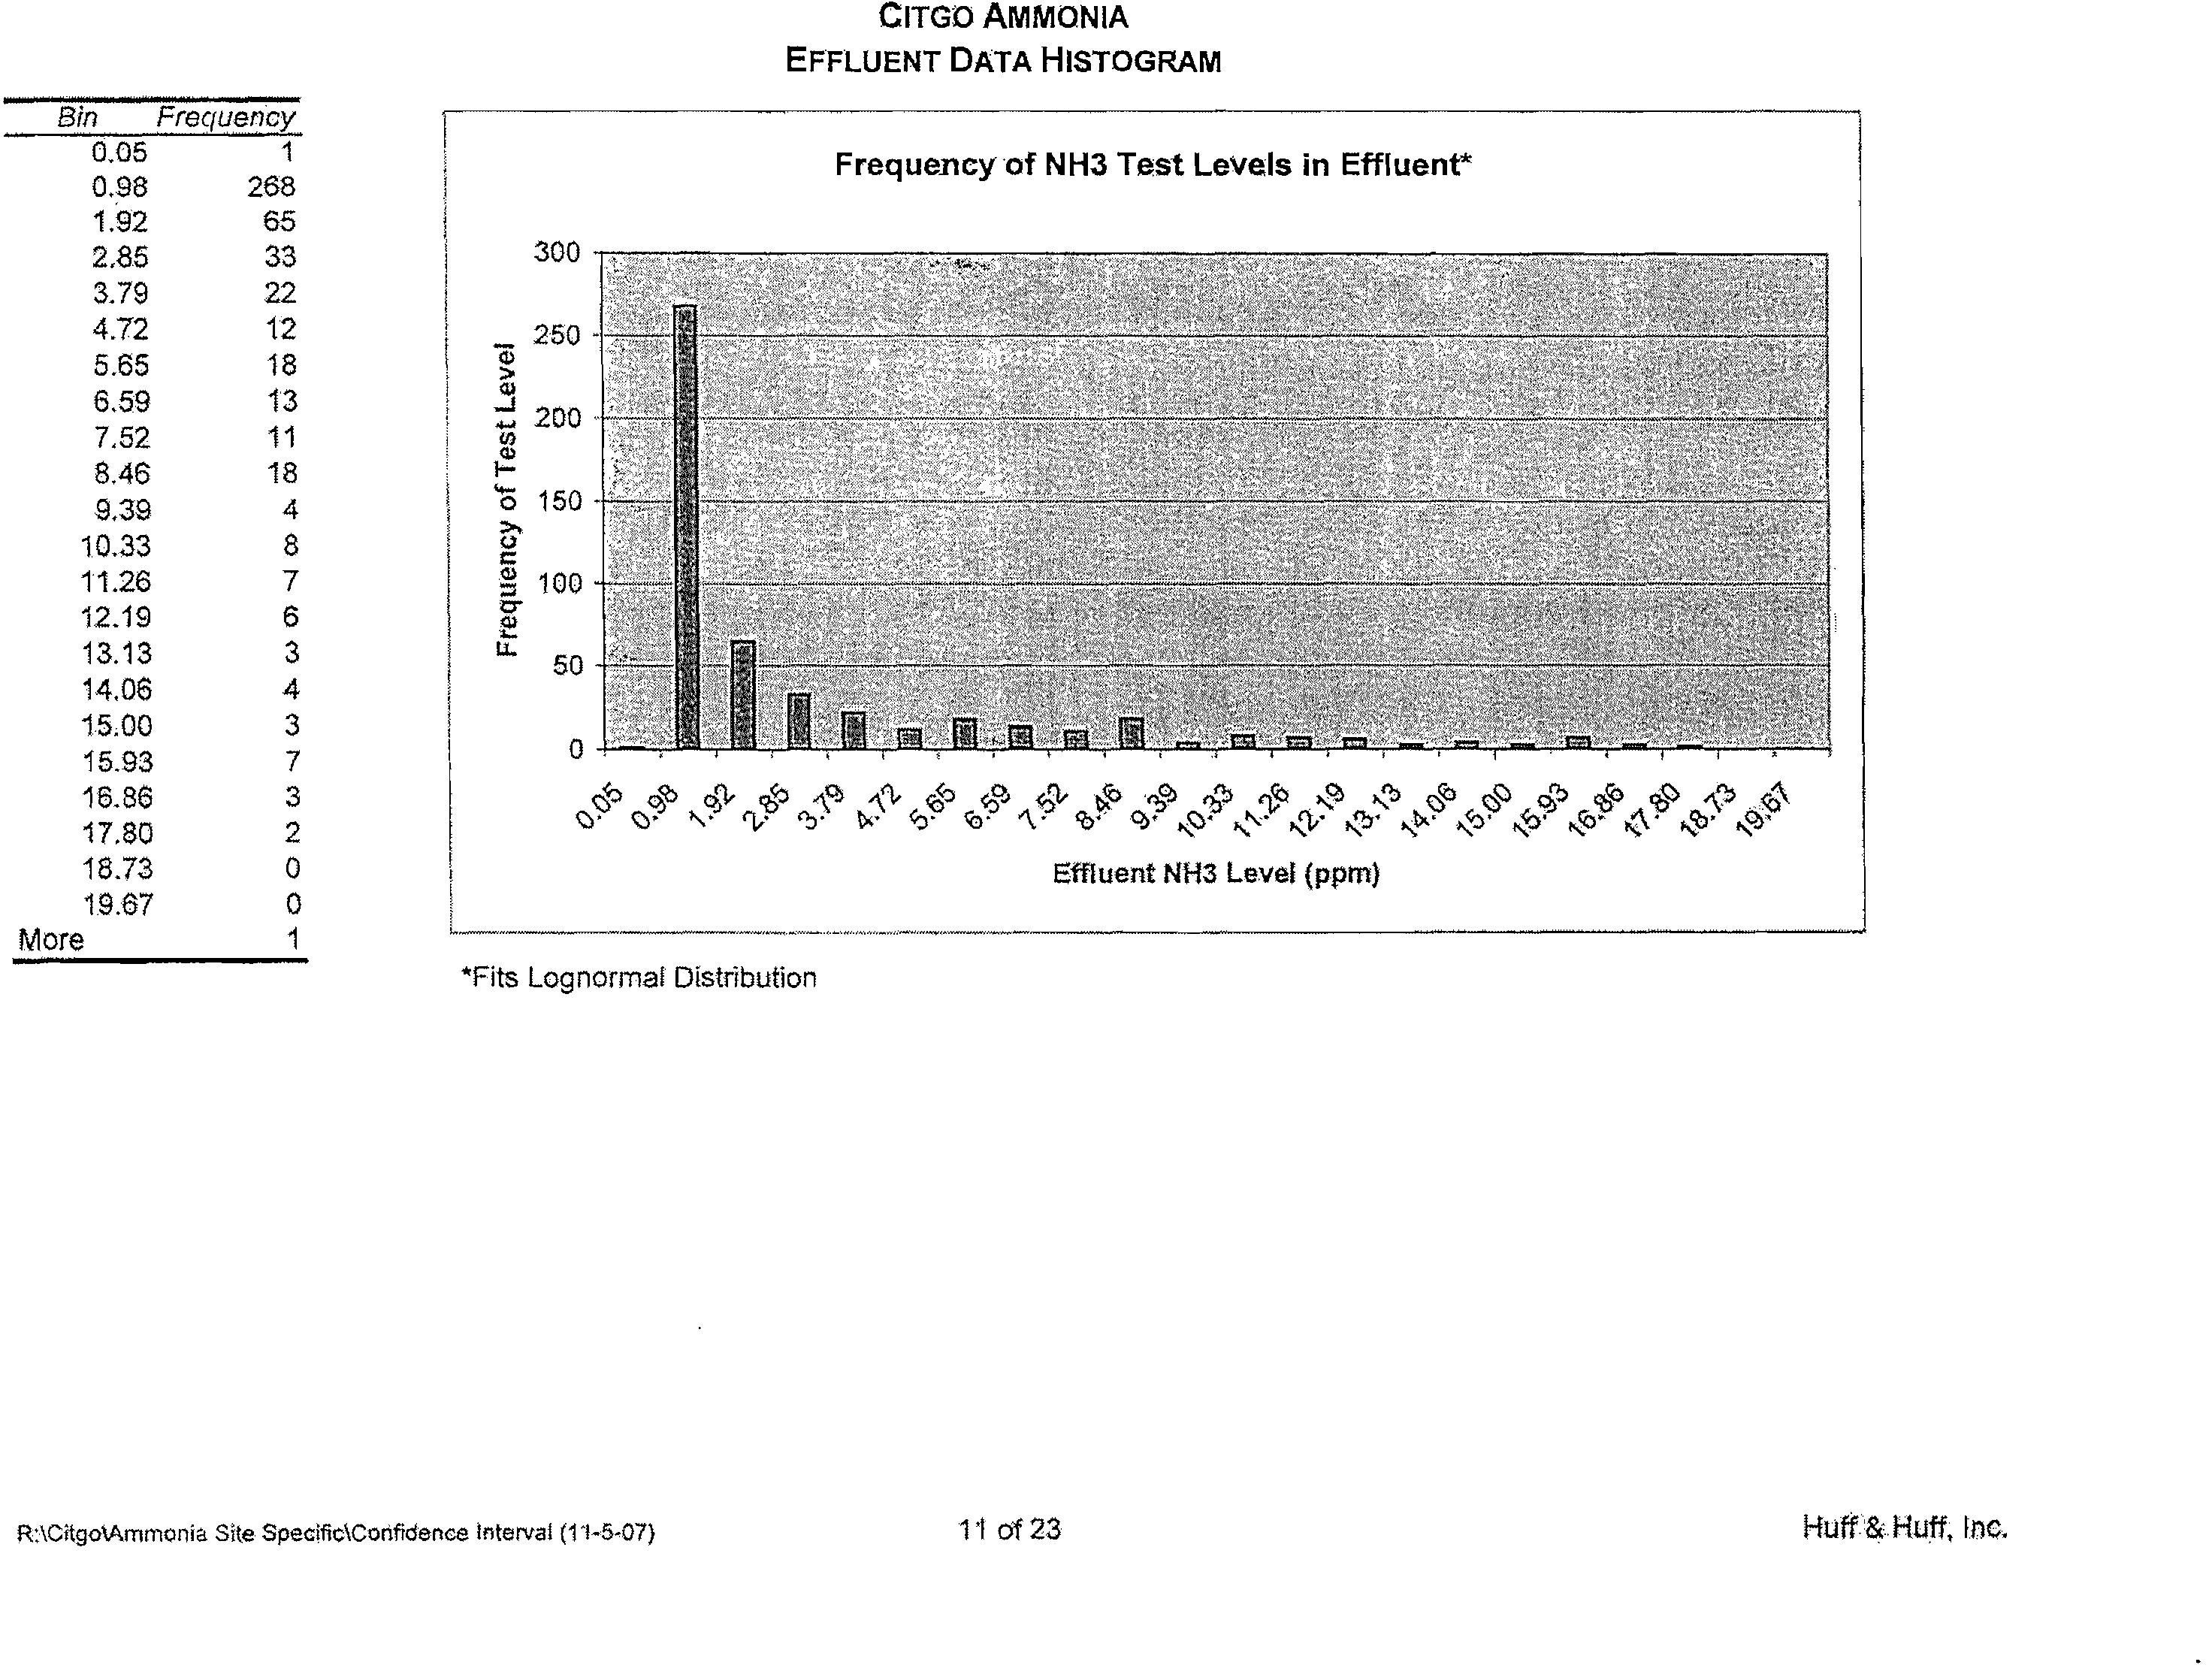
The limits for monthly and daily effluent concentrations are based on a statistical analysis using the 95th
percentile values of the ammonia distribution. The methodology uses a multiplying factor based upon
the coefficient of variation and number of data points.
Calculations for this statistical analysis are presented in Appendix D.
Citgo, Lemont — Ammonia Report
31
February 2008
Electronic Filing - Received, Clerk's Office, March 18, 2008
* * * * * AS 2008-008 * * * * *
EXHIBIT 2
Over the last several years, the Lemont Refinery has been processing heavier crudes and expects this
source to continue to expand. As the Lemont Refinery and the industry have learned over the past
several years, wastewater treatment, including the ability to consistently nitrify, has increased in difficulty
with the processing of the heavier crudes.
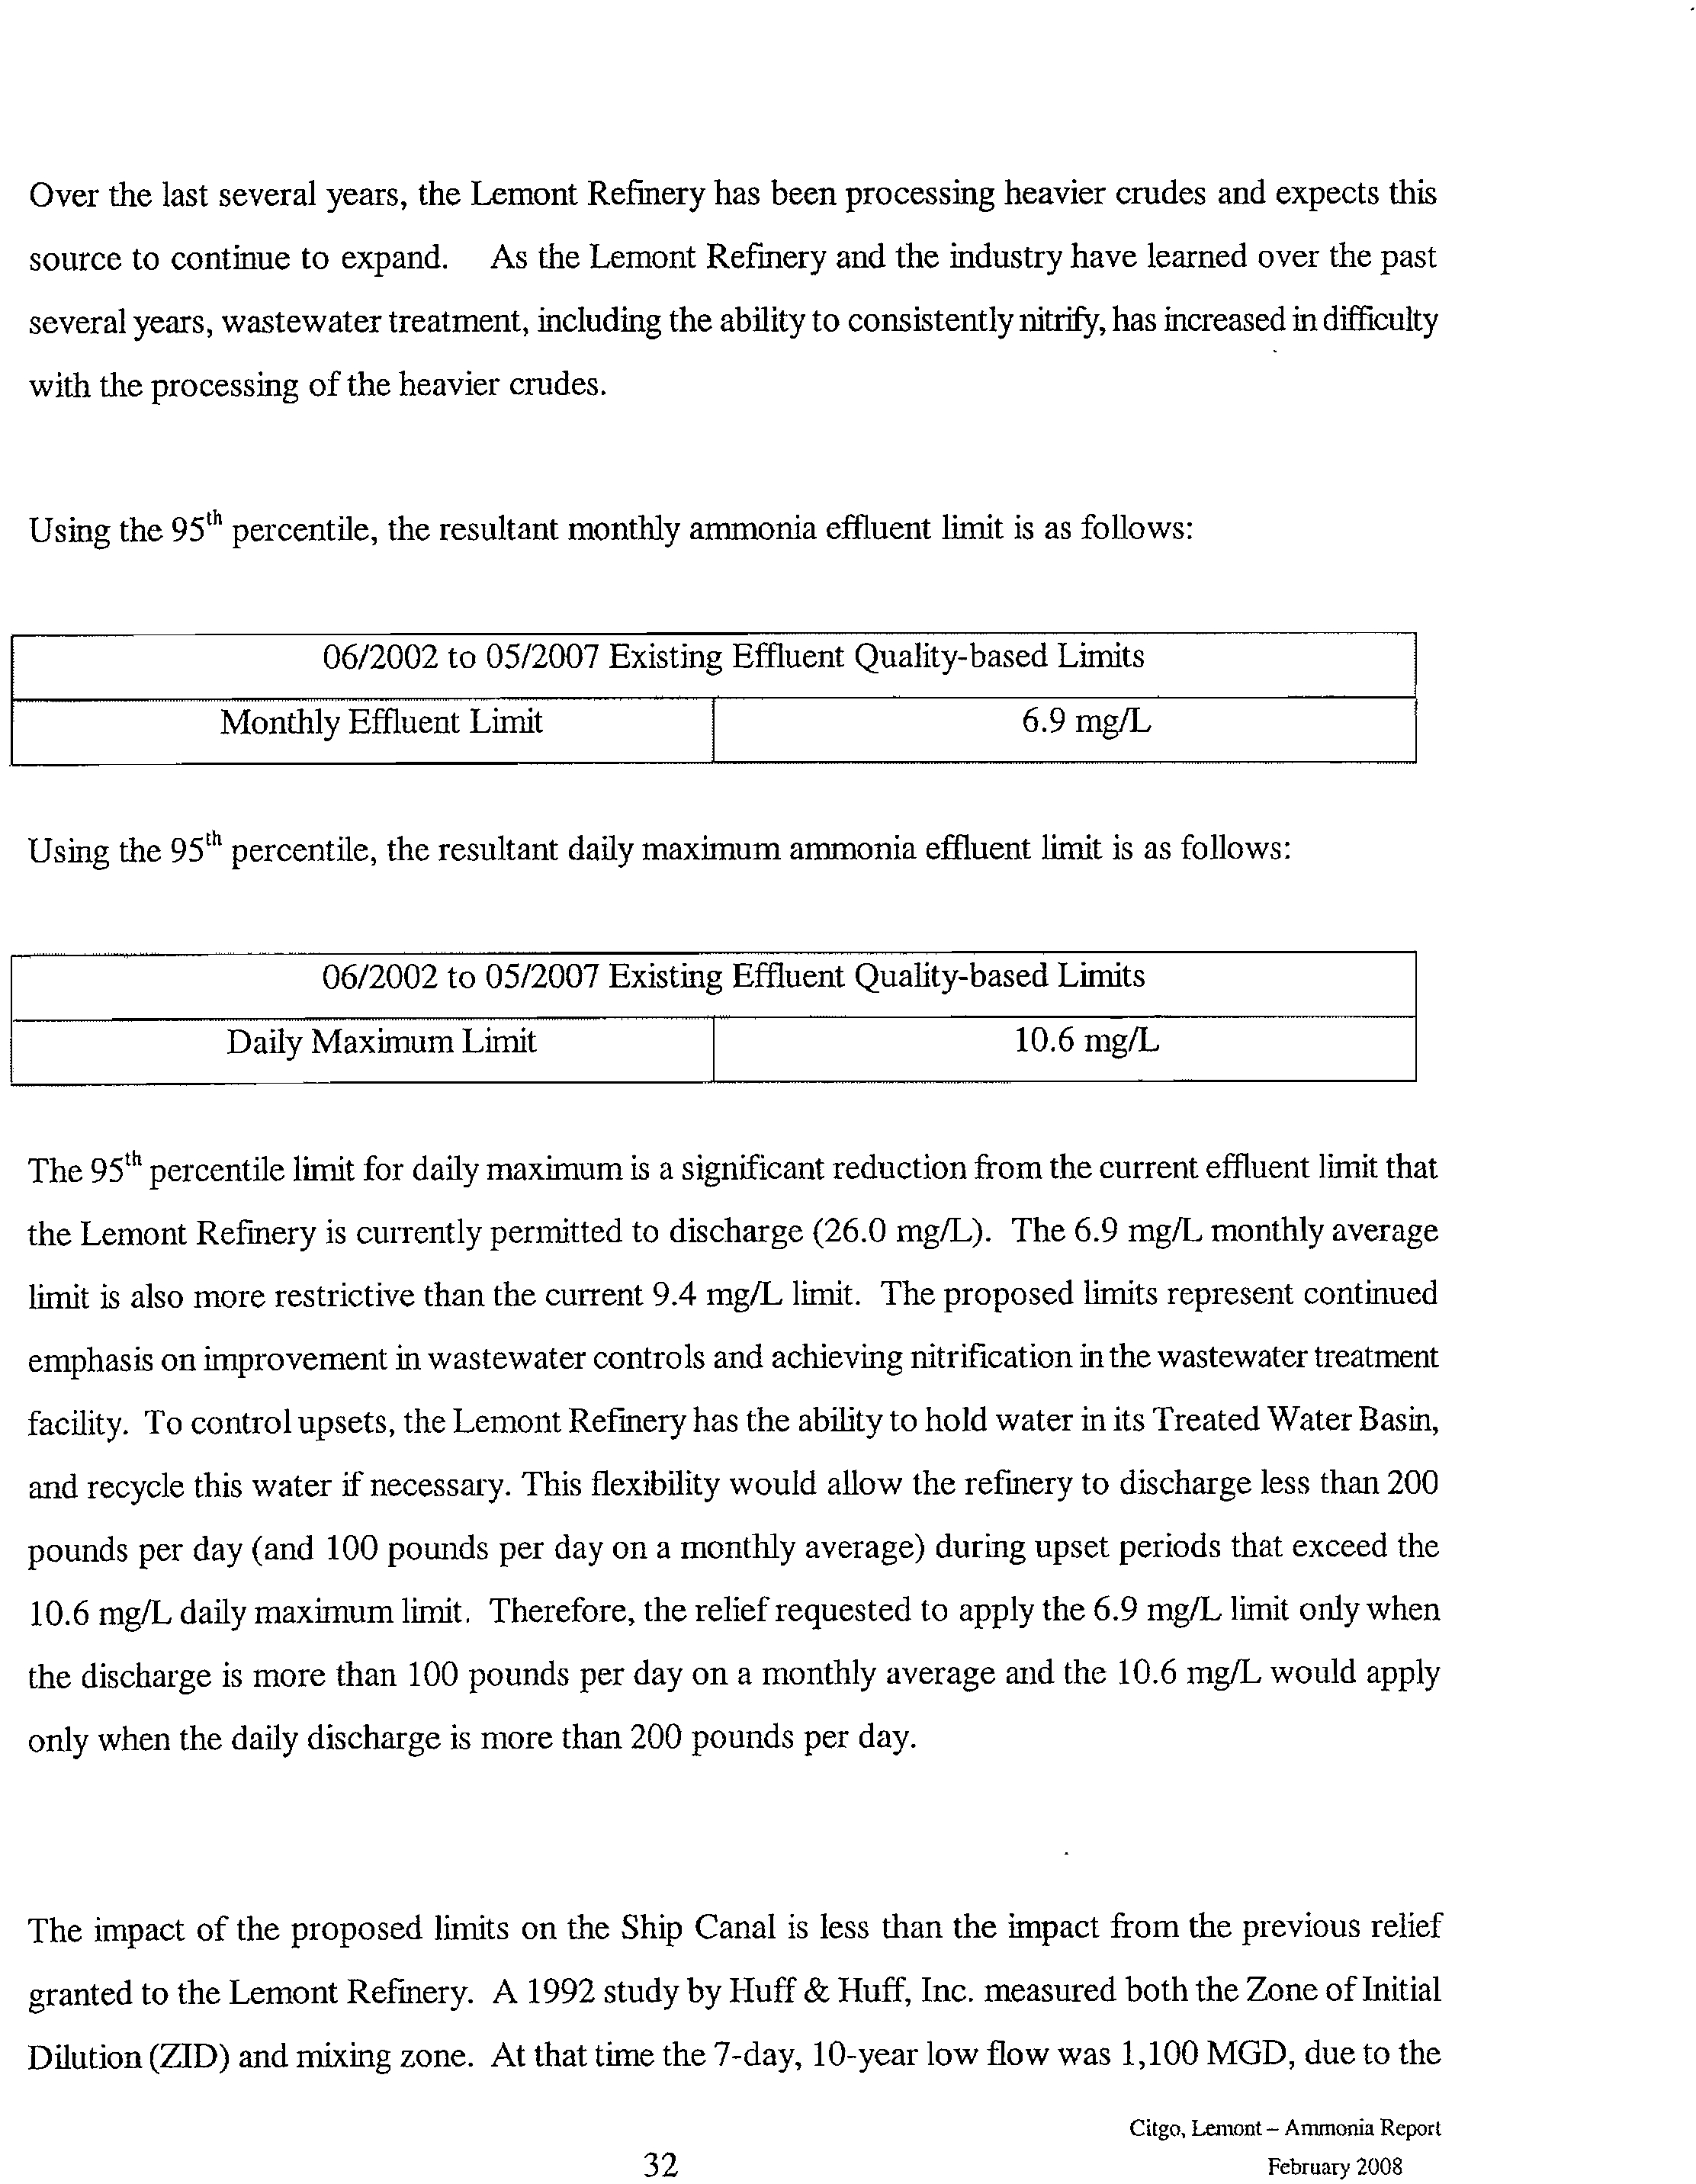
Using the 95
th
percentile, the resultant monthly ammonia effluent limit is as follows:
06/2002 to 05/2007 Existing Effluent Quality-based Limits
Monthly Effluent Limit
6.9 mg/L
Using the 95' percentile, the resultant daily maximum ammonia effluent limit is as follows:
06/2002 to 05/2007 Existing Effluent Quality-based Limits
Daily Maximum Limit
10.6 mg/L
The 95th
percentile limit for daily maximum is a significant reduction from the current effluent limit that
the Lemont Refinery is currently permitted to discharge (26.0 mg/L). The 6.9 mg/L monthly average
limit is also more restrictive than the current 9.4 mg/L limit. The proposed limits represent continued
emphasis on improvement in wastewater controls and achieving nitrification in the wastewater treatment
facility. To control upsets, the Lemont Refmery has the ability to hold water in its Treated Water Basin,
and recycle this water if necessary. This flexibility would allow the refinery to discharge less than 200
pounds per day (and 100 pounds per day on a monthly average) during upset periods that exceed the
10.6 mg/L daily maximum limit, Therefore, the relief requested to apply the 6.9 mg/L limit only when
the discharge is more than 100 pounds per day on a monthly average and the 10.6 mg/L would apply
only when the daily discharge is more than 200 pounds per day.
The impact of the proposed limits on the Ship Canal is less than the impact from the previous relief
granted to the Lemont Refmery. A 1992 study by Huff & Huff, Inc. measured both the Zone of Initial
Dilution (ZID) and mixing zone. At that time the 7-day, 10-year low flow was 1,100 MGD, due to the
Citgo, Lemont — Ammonia Report
32
February 2008
Electronic Filing - Received, Clerk's Office, March 18, 2008
* * * * * AS 2008-008 * * * * *
EXHIBIT 2
due to the discretionary diversion from Lake Michigan. The Lemont Refinery Outfall 001 is through a
submerged 15-inch diameter pipe, discharging in the downward direction 15 feet below the low flow
Ship Canal elevation. There is entrained air in the effluent due to a weir upstream. The plume is strongly
buoyant due to the air as well as temperature differences between the Outfall and the Ship Canal. Huff &
Huff found the mixing to be rapid, with a ZID occupying a very small 100 sq ft and providing a 10:1
dilution. In 1992, the mixing zone was measured as occupying on 0.05 acres and providing a 40:1
dilution at the point it extended 25 percent of the stream width at the surface. The design average flow
of the Lemont Refinery today has not changed since the mixing zone study, so that study remains valid
today. However, the reduction is discretion diversion from Lake Michigan has reduced the 7-day, 10-
year low flow from 1,100 MGD in 1992 to 850 MGD. This results in the maximum upstream flow
available of 25 percent of 850 MGD, or 212.5 MGD. Compared to the design average flow of 5.79
MGD, this yields an available mixing zone of 36.7:1. Therefore, for predicting the concentration at the
edge of the mixing zone, the 36.7:1 will be used going forward.
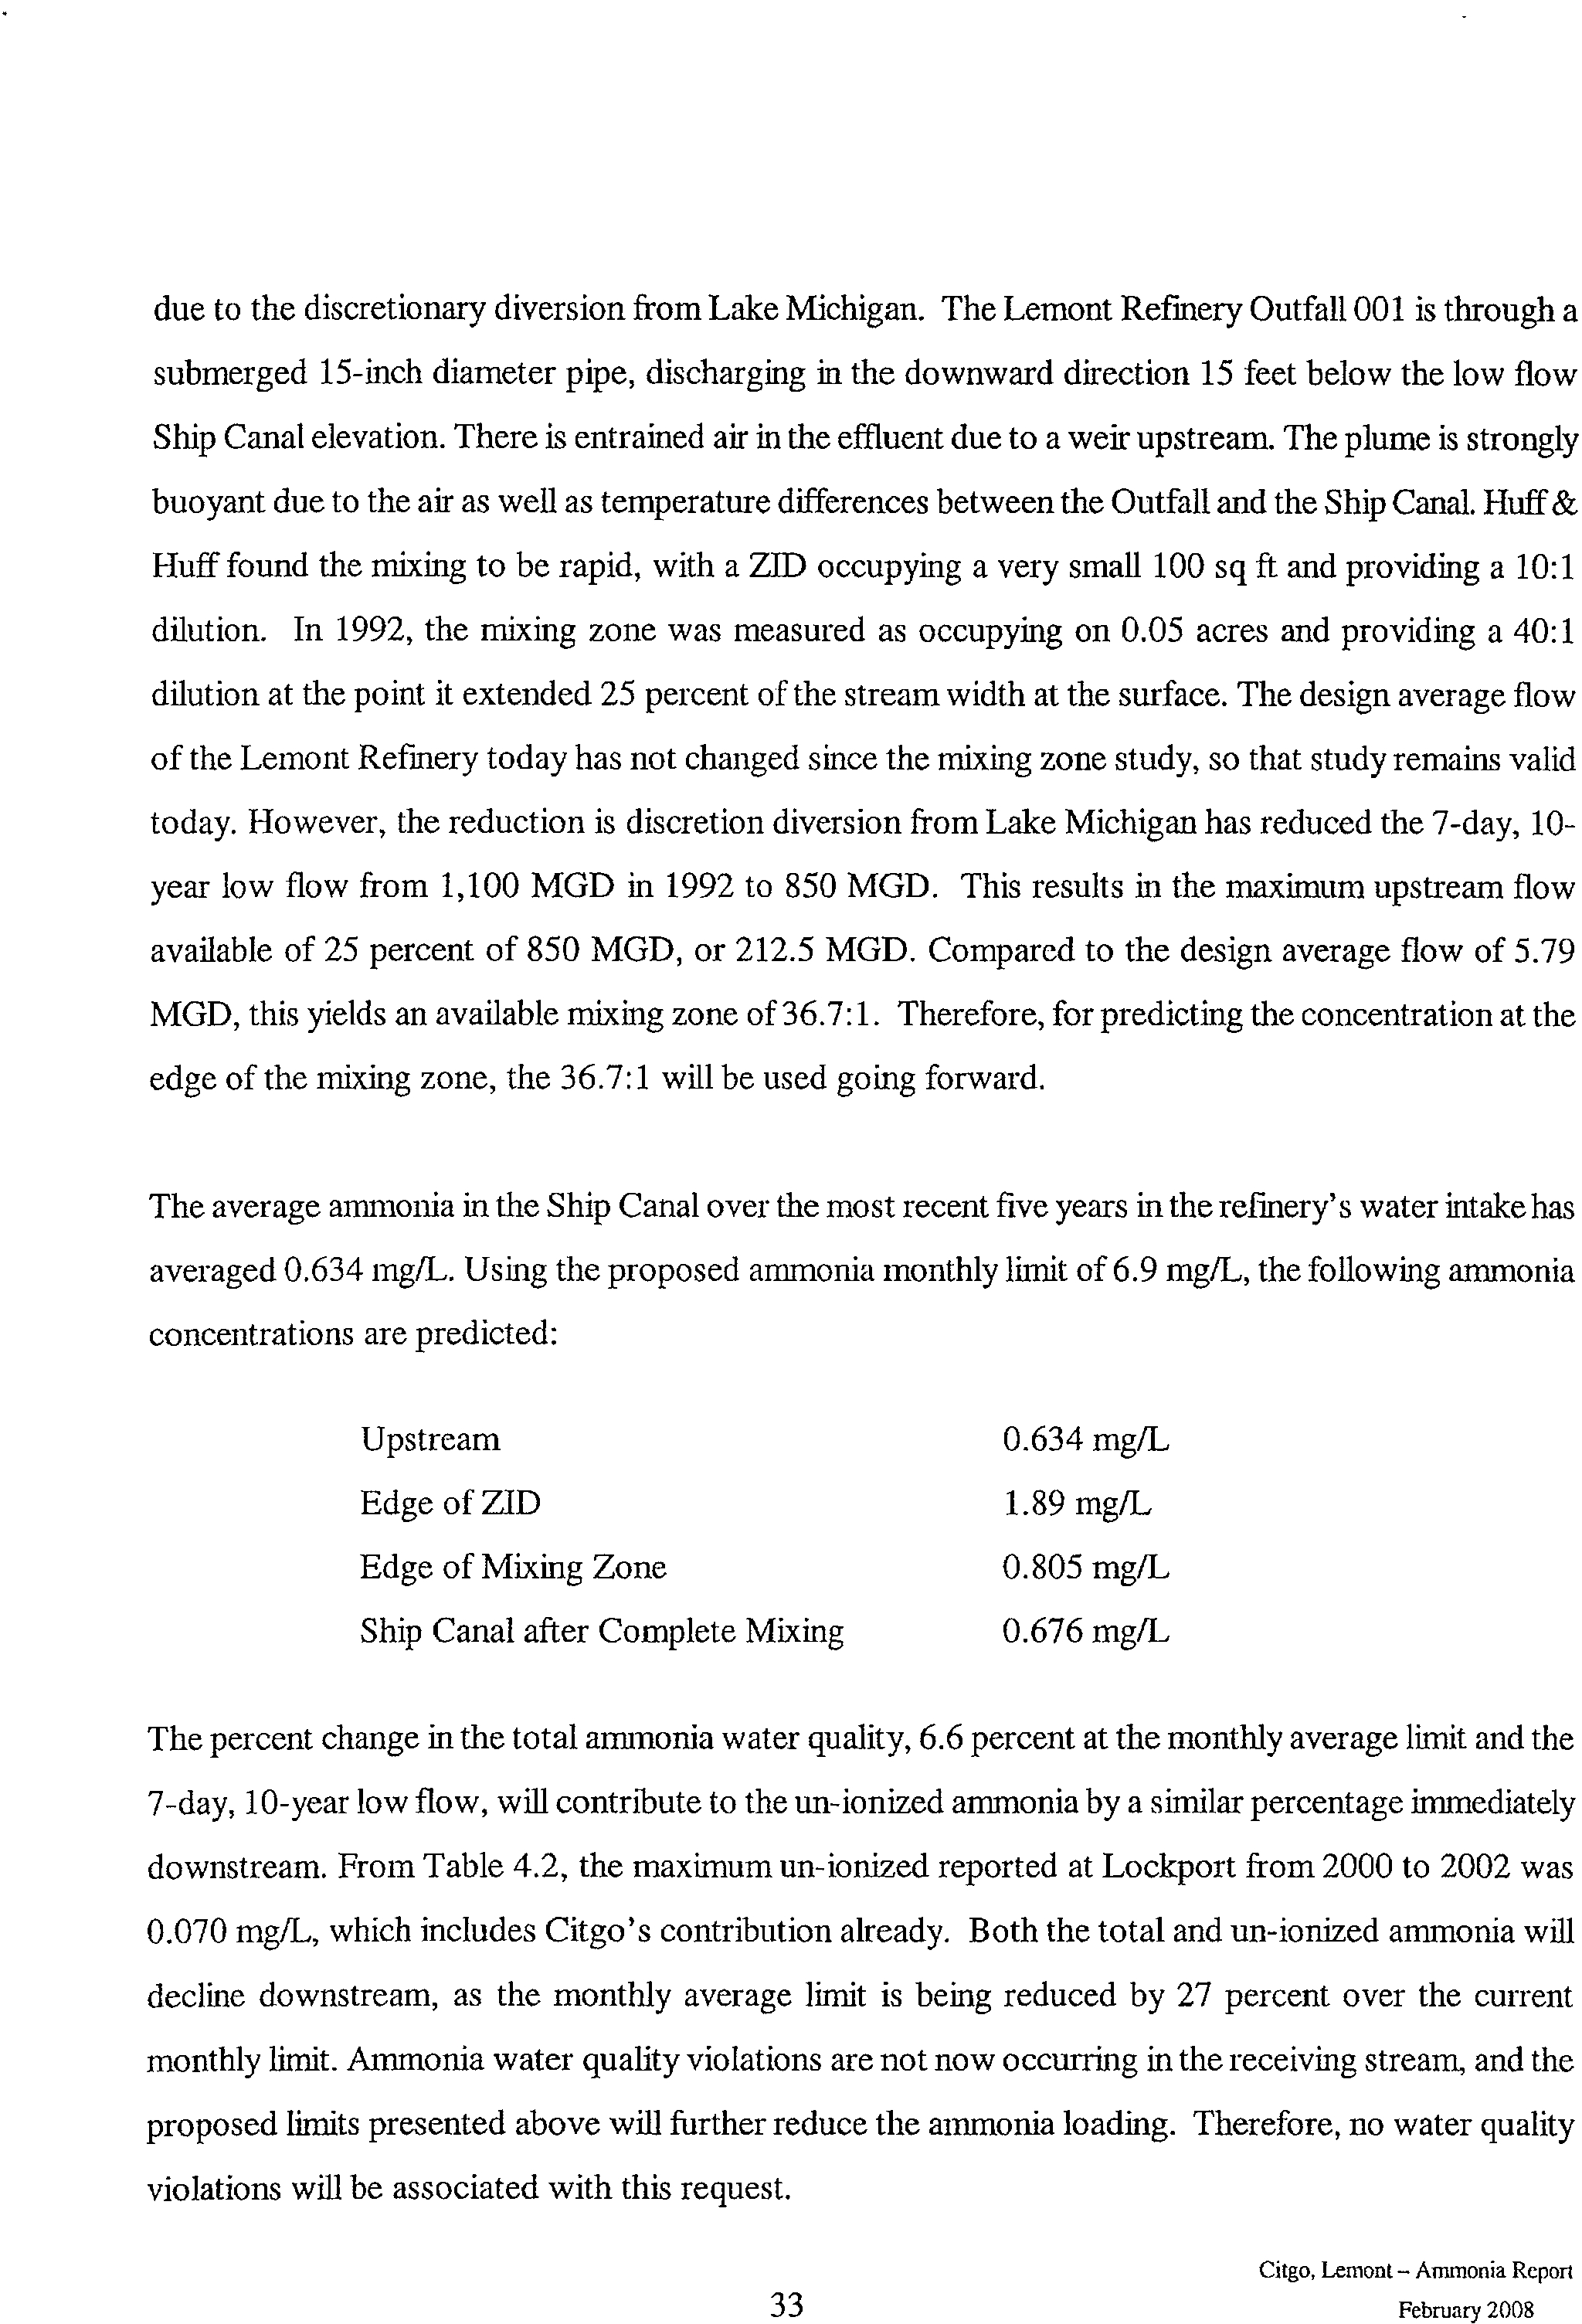
The average ammonia in the Ship Canal over the most recent five years in the refinery's water intake has
averaged 0.634 mg/L. Using the proposed ammonia monthly limit of 6.9 mg/L, the following ammonia
concentrations are predicted:
Upstream
0.634 mg/L
Edge of ZID
1.89 mg/L
Edge of Mixing Zone
0.805 mg/L
Ship Canal after Complete Mixing
0.676 mg/L
The percent change in the total ammonia water quality, 6.6 percent at the monthly average limit and the
7-day, 10-year low flow, will contribute to the un-ionized ammonia by a similar percentage immediately
downstream. From Table 4.2, the maximum un-ionized reported at Lockport from 2000 to 2002 was
0.070 mg/L, which includes Citgo's contribution already. Both the total and un-ionized ammonia will
decline downstream, as the monthly average limit is being reduced by 27 percent over the current
monthly limit. Ammonia water quality violations are not now occurring in the receiving stream, and the
proposed limits presented above will further reduce the ammonia loading. Therefore, no water quality
violations will be associated with this request.
Citgo, Lemont — Ammonia Report
33
February 2008
Electronic Filing - Received, Clerk's Office, March 18, 2008
* * * * * AS 2008-008 * * * * *
EXHIBIT 2
6. SUMMARY
The Lemont Refinery is seeking a renewal of its effluent ammonia site-specific limits for an
additional ten years. Over the past decade, progress has been made in the refinery's ability to nitrify;
however, recently this success has been challenged by the introduction of heavier crudes as
feedstock. This source of crude oil has placed additional loadings on the wastewater treatment
system that the refinery is learning to handle.
The Agency has proposed amending the ammonia (and TDS and sulfate) water quality standards that
apply to the Chicago Sanitary & Ship Canal, based upon an extensive Use Attainability Analysis.
The data presented herein indicate that the requested relief by the Lemont Refinery will not impede
the ability of the Ship Canal to achieve the proposed ammonia water quality limit (or the TDS/sulfate
changes).
Based upon U.S. EPA protocol, revised daily maximum and monthly average ammonia effluent
limits have been derived based upon the recent performance of the wastewater treatment plant
operation. The monthly limit calculated, based on the U.S. EPA
Technical Support Document
is 6.9
mg/L, a reduction of 27 percent in the current adjusted standard. This requested limit is based on the
95
111
percentile monthly limit and would apply whenever the monthly average discharge exceeds 100
pounds per day.
For the daily maximum, a limit of 10.6 mg/L is requested, based on the 95
th
percentile of the last five
years. This is a 59 percent reduction from the current adjusted standard, and would apply whenever
the daily discharge exceeds 200 pounds per day ammonia.
Citgo, Lemont— Ammonia Report
34
February 2008
Electronic Filing - Received, Clerk's Office, March 18, 2008
* * * * * AS 2008-008 * * * * *
EXHIBIT 2
APPENDIX A
NPDES GENERAL PERMIT NO. IL0001589
Electronic Filing - Received, Clerk's Office, March 18, 2008
* * * * * AS 2008-008 * * * * *
EXHIBIT 2
a
aga
alp/MO/OWN
;
Original Copy-filed
ILLINOIS ENVIRONMENTAL PROTECTION AGENCY
1021
NORTH GRAND AVENUE EAST, P.O. Box 19276,
SPRINGFIELD,
ILLINOIS 62794-9276 - ( 217) 782-3397
khif$ R. THOMPSON CENTER, 100 WEST RANDOLPH, SUITE
11-300,
CHICAGO, IL 60601 - (312) 814-6026
217/781-0610
ROD R.
BLAGOJEVIGH, GOVERNOR?
DOUGLAS P.
SCOTT, DIRECTOR
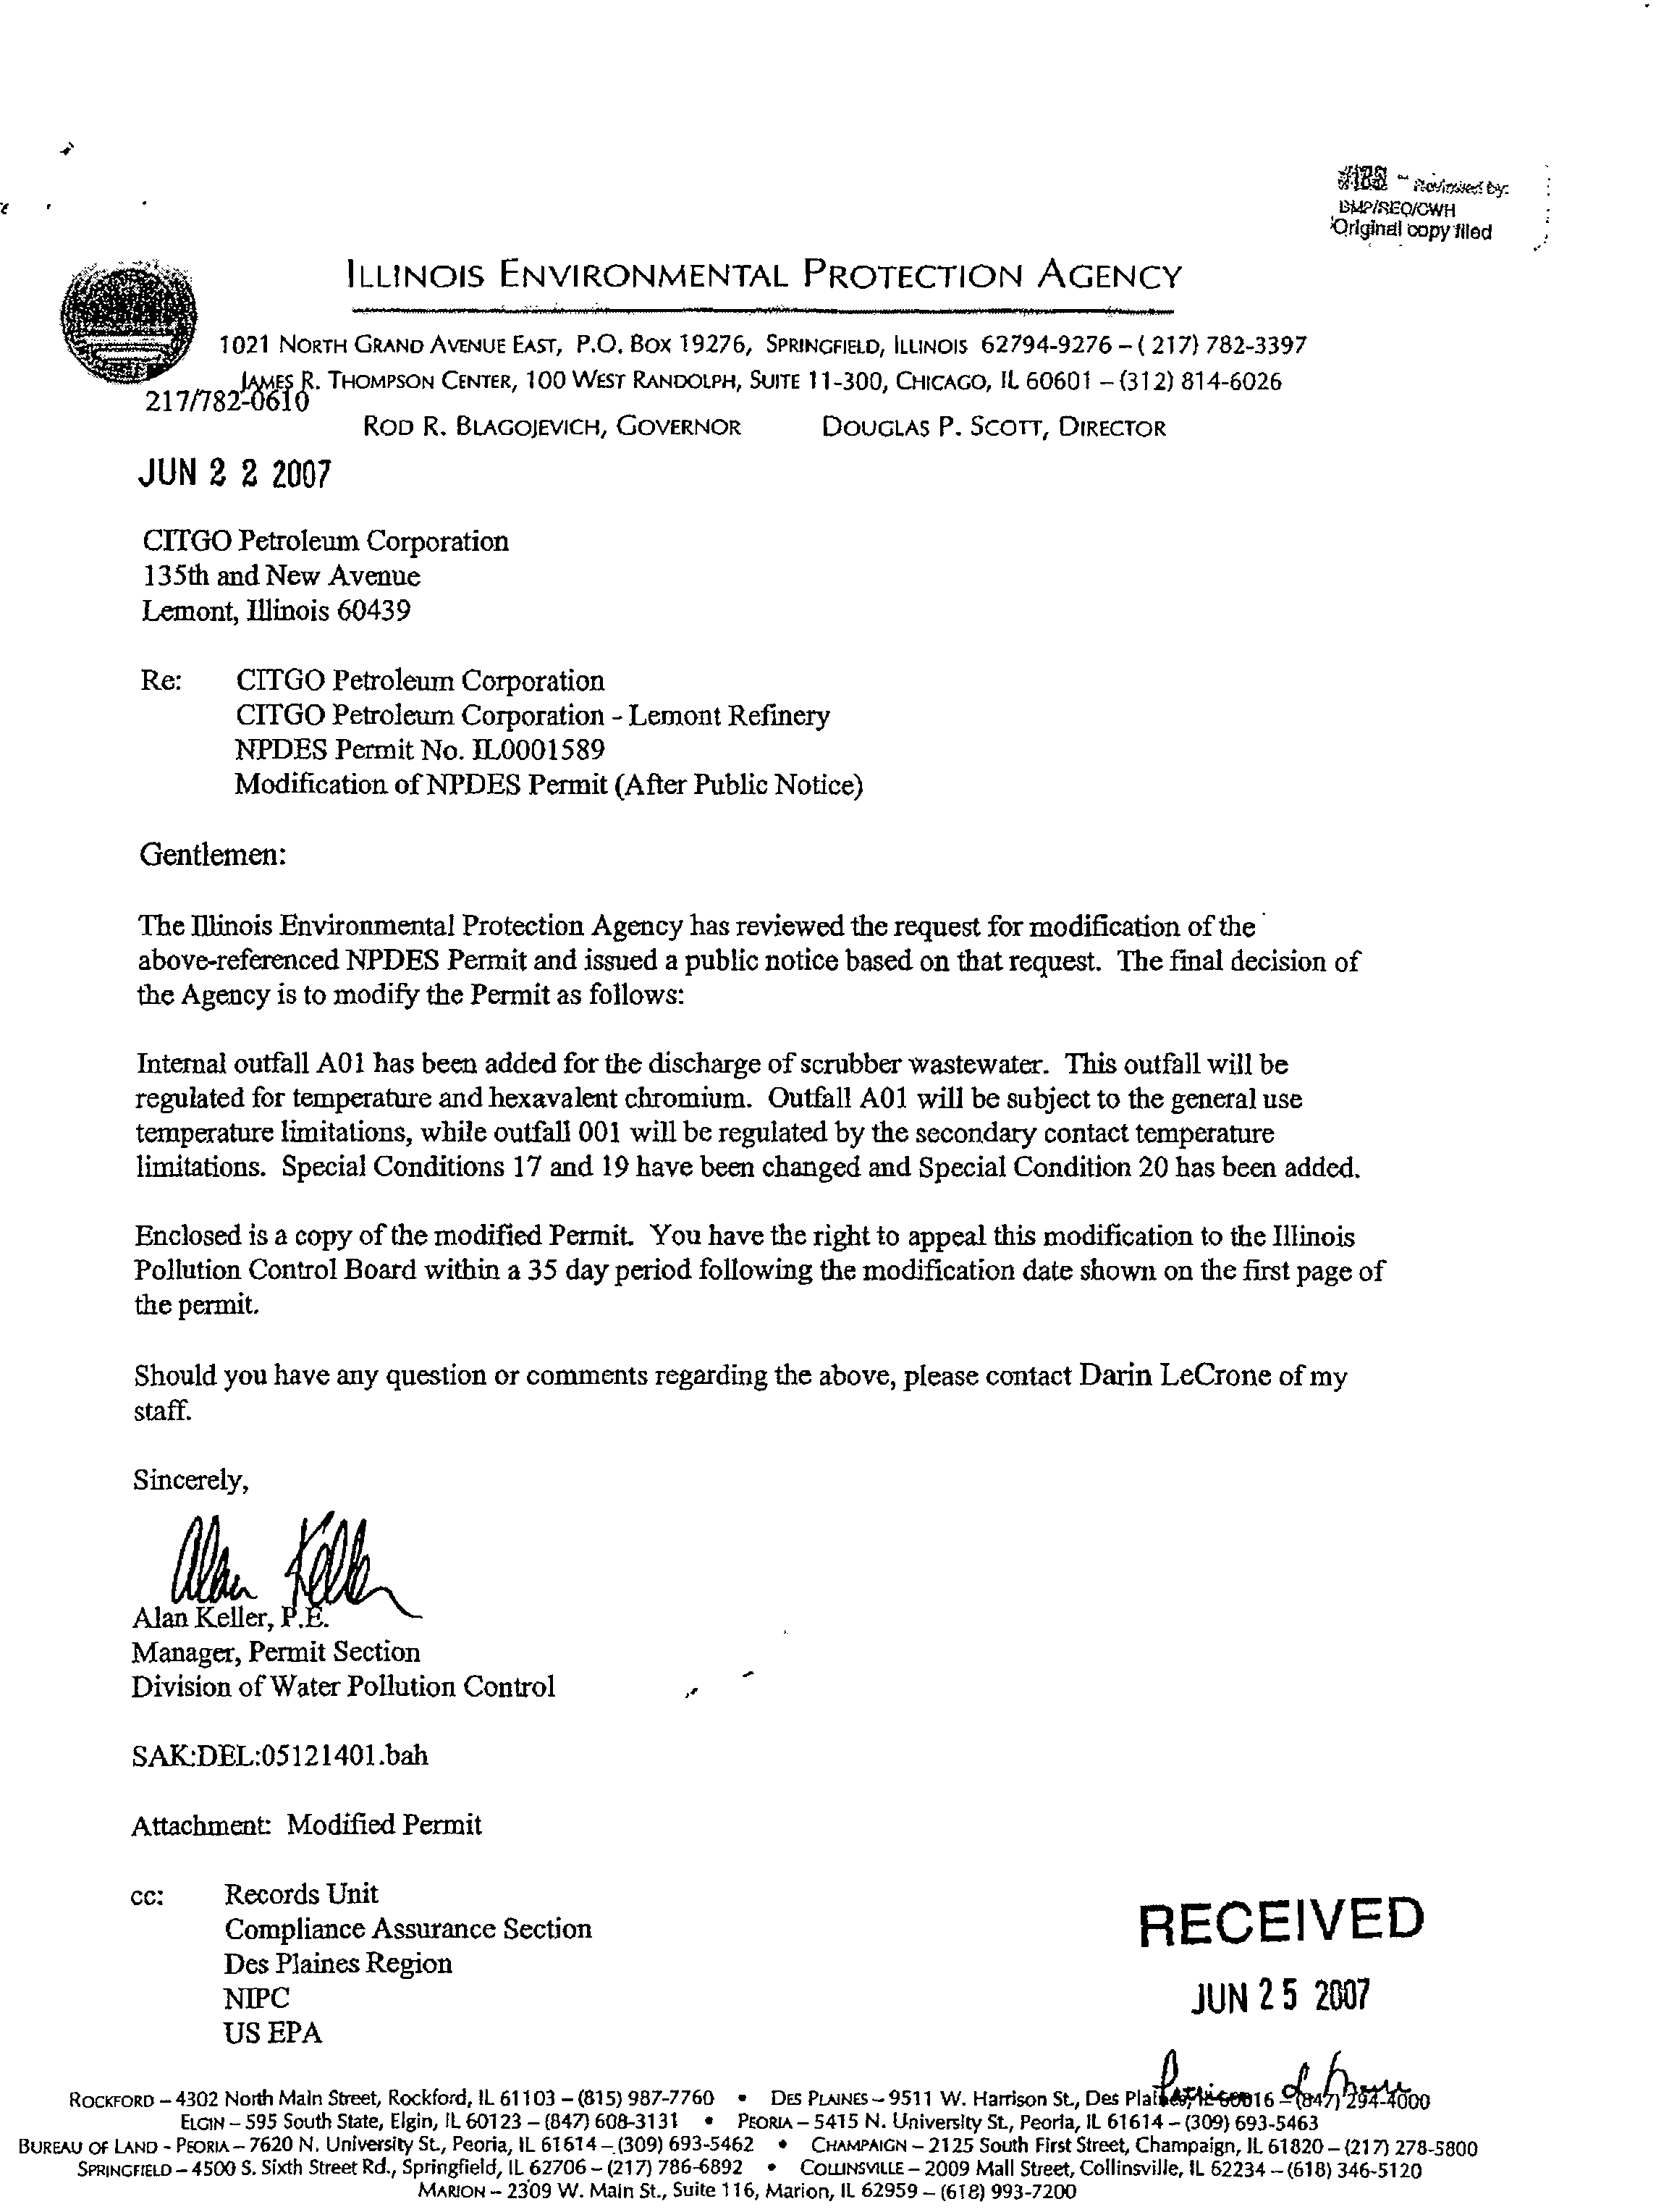
JUN 2 2 2007
CITGO Petroleum Corporation
135th and New Avenue
Lemont, Illinois 60439
Re:?
CITGO Petroleum Corporation
CITGO Petroleum Corporation - Lemont Refinery
NPDES Permit No. IL0001589
Modification of NPDES Permit (After Public Notice)
Gentlemen:
The Illinois Environmental Protection Agency has reviewed the request for modification of the
above-referenced NPDES Permit and issued a public notice based on that request. The final decision of
the Agency is to modify the Permit as follows:
Internal outfall A01 has been added for the discharge of scrubber Wastewater. This outfall will be
regulated for temperature and hexavalent chromium. Outfall A01 will be subject to the general use
temperature limitations, while outfall 001 will be regulated by the secondary contact temperature
limitations. Special Conditions 17 and 19 have been changed and Special Condition 20 has been added.
Enclosed is a copy of the modified Permit. You have the right to appeal this modification to the Illinois
Pollution Control Board within a 35 day period following the modification date shown on the first page of
the permit.
Should you have any question or comments regarding the above, please contact Darin LeCrone of my
staff.
Sincerely,
Alan Keller,
Manager, Permit Section
Division of Water Pollution Control
SAK:DEL:05121401.bah
Attachment Modified Permit
cc:?
Records Unit
Compliance Assurance Section
Des Plaines Region
NJPC
US EPA
RECEIVED
JUN 2 5 2007
ROCKFORD
–4302 North Main Street, Rockford, IL
61103 - (815) 987
-
7760 • DES PLAINES –
9511 W. Harrison St., Des Plat
?
16 484621.44600
ELGIN -
595 South State, Elgin, IL 60123 - (847) 608-3131 • PEORIA - 5415 N. University
?
Peoria, IL 61614 - (309) 693
-
5463
BUREAU OF LAND -
PEORIA- 7620 N. University St., Peoria, IL 61614 - (309) 693-5462 •
CHAMPAIGN –
2125 South First Street, Champaign, IL
61820 - (217) 278-5800
SPRINGFIELD-
4500
S. Sixth Street Rd., Springfield, IL
62706 - (217)
786-6892 •
COWNSVILLE –
2009 Mall Street, Collinsville, IL 62234 -(618) 346-5120
MARION -
2309 W. Main St., Suite 116, Marion, IL 62959 - (618) 993-7200
Electronic Filing - Received, Clerk's Office, March 18, 2008
* * * * * AS 2008-008 * * * * *
EXHIBIT 2
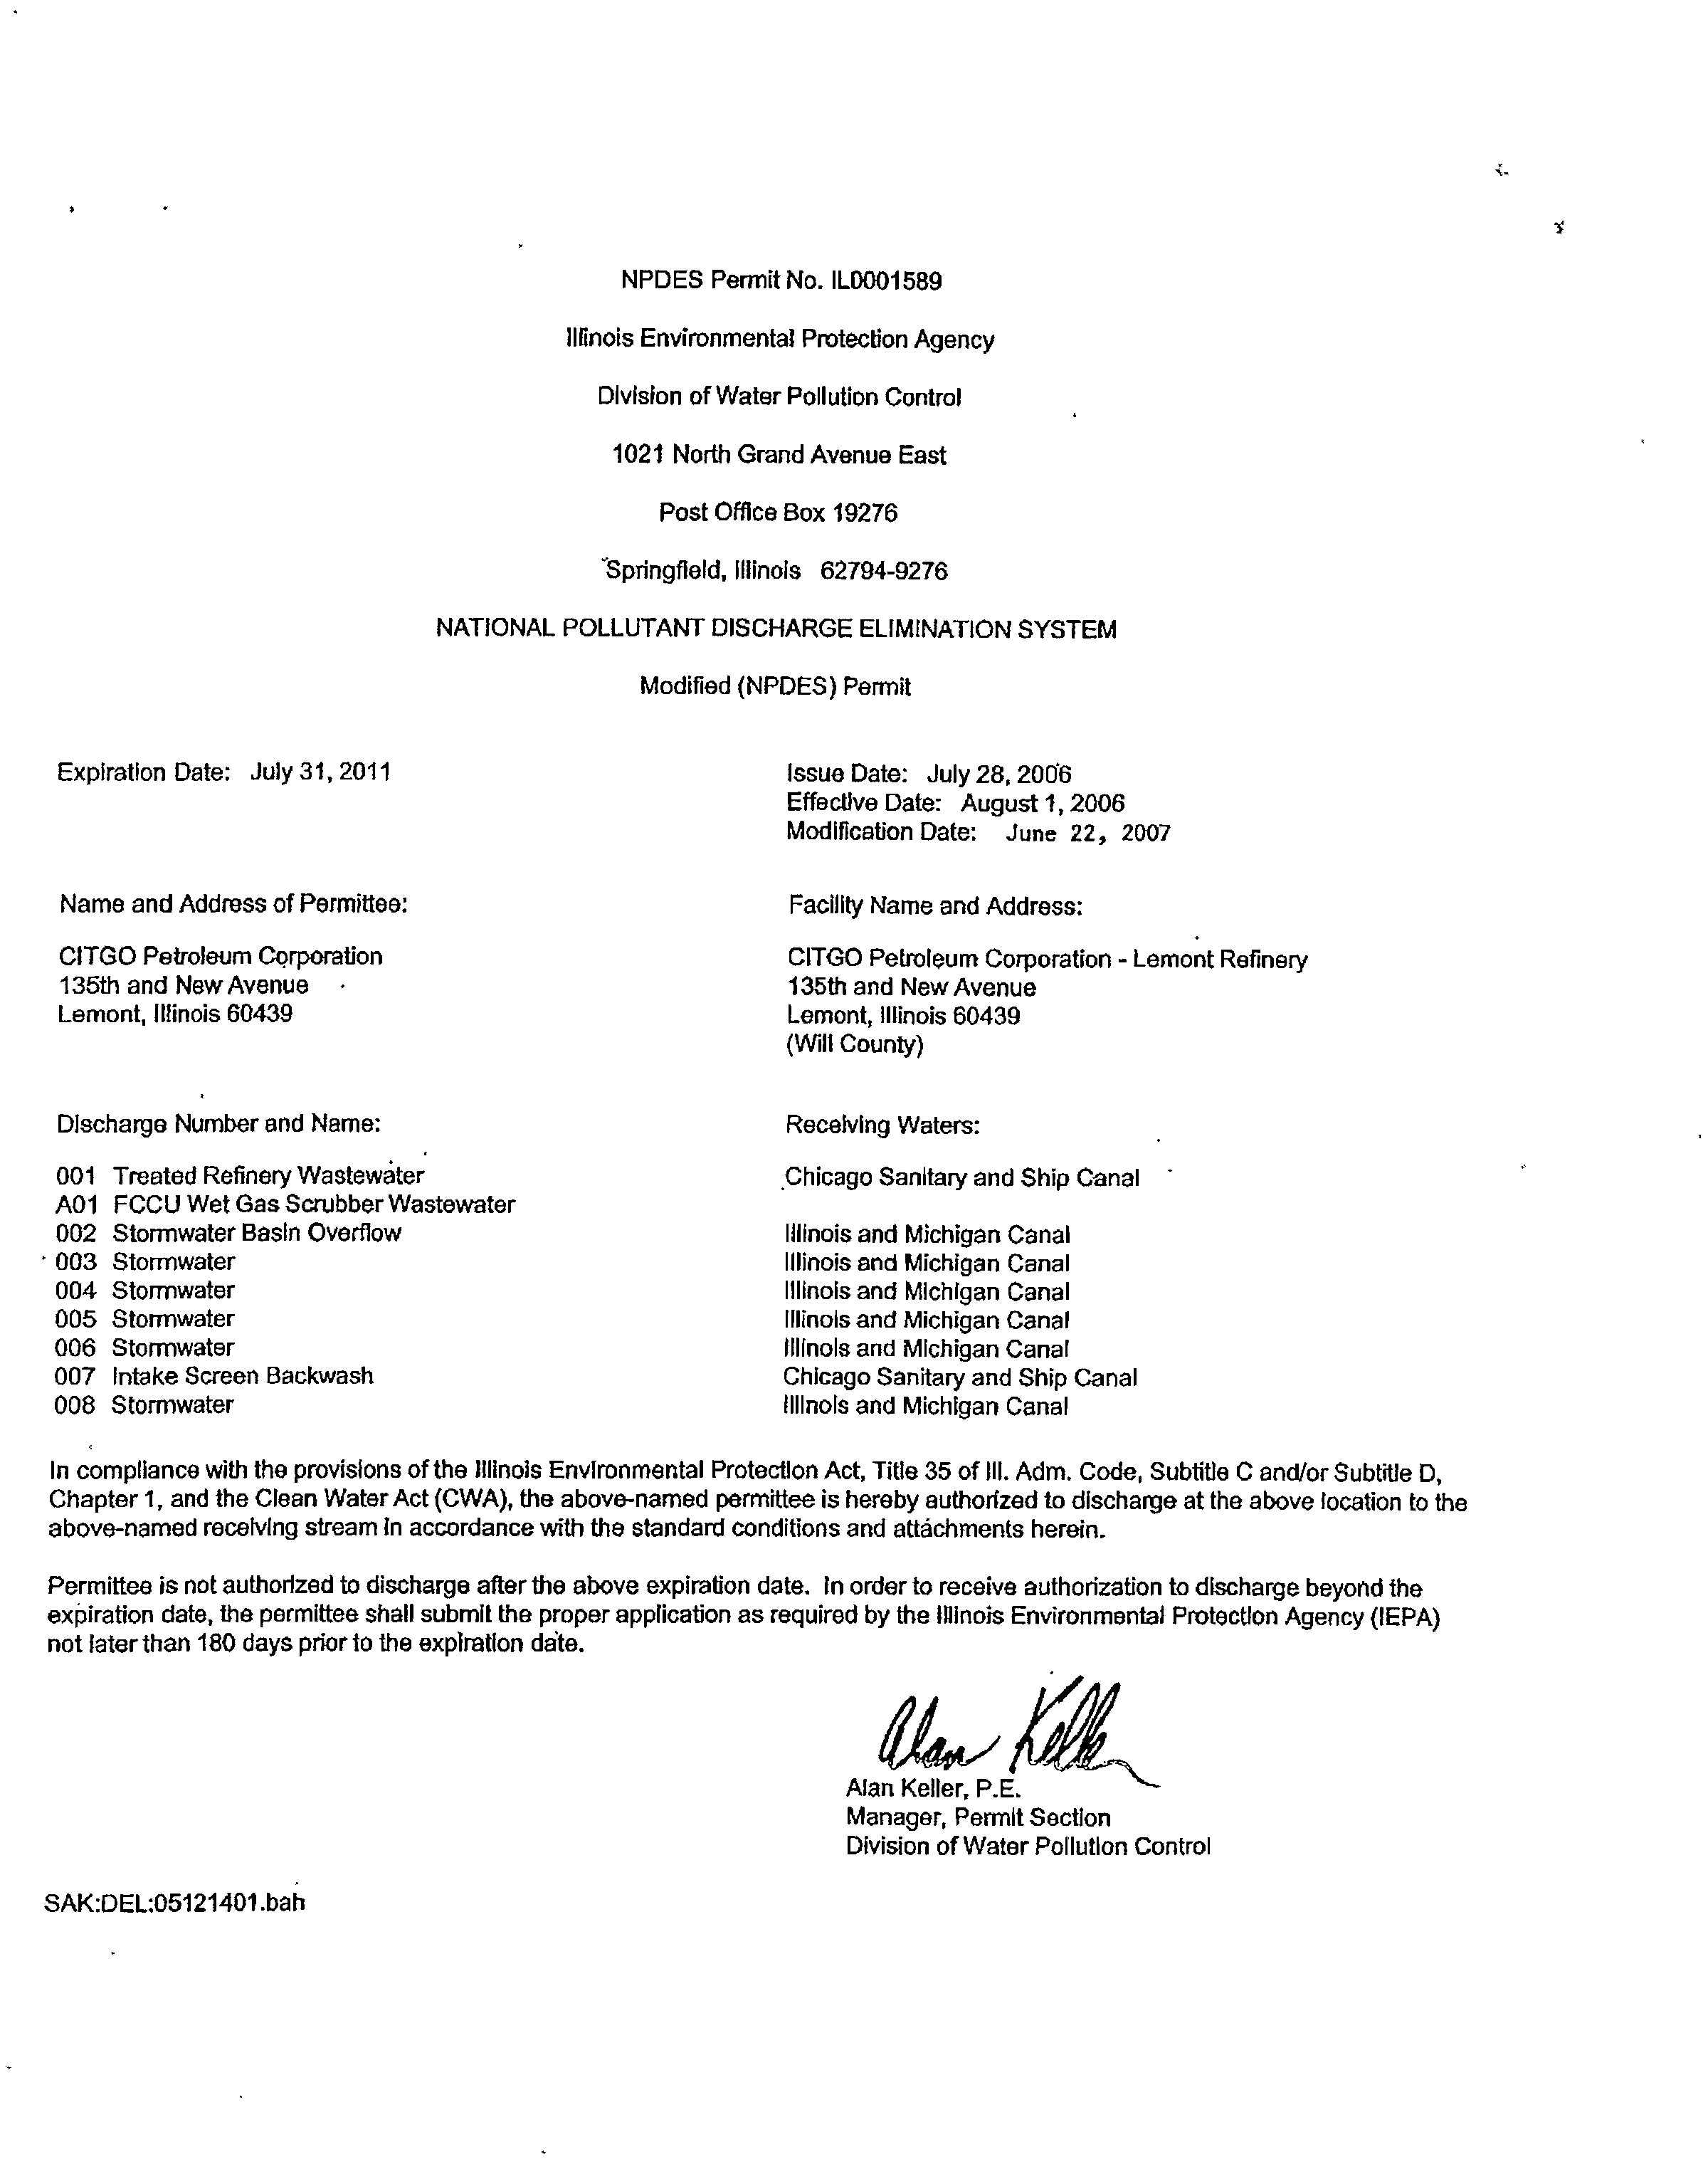
NPDES Permit No. IL0001589
Illinois Environmental Protection Agency
Division of Water Pollution Control
1021 North Grand Avenue East
Post Office Box 19276
Springfield, Illinois 62794-9276
NATIONAL POLLUTANT DISCHARGE ELIMINATION SYSTEM
Modified (NPDES) Permit
Expiration Date: July 31, 2011
?
Issue Date: July 28, 2006
Effective Date: August 1, 2006
Modification Date:
June 22, 2007
Name and Address of Permittea:?
Facility Name and Address:
CITGO Petroleum Corporation
?
CITGO Petroleum Corporation - Lemont Refinery
135th and New Avenue •
?
135th and New Avenue
Lemont, Illinois 60439
?
Lemont, Illinois 60439
(Will County)
Discharge Number and Name:
?
Receiving Waters:
001 Treated Refinery Wastewater
?
Chicago Sanitary and Ship Canal
A01 FCCU Wet Gas Scrubber Wastewater
002 Stormwater Basin Overflow
?
Illinois and Michigan Canal
003 Stormwater
?
Illinois and Michigan Canal
004 Stormwater
?
Illinois and Michigan Canal
005 Stormwater
?
Illinois and Michigan Canal
006 Stormwater
?
Illinois and Michigan Canal
007 Intake Screen Backwash
?
Chicago Sanitary and Ship Canal
008 Stormwater
?
Illinois and Michigan Canal
In compliance with the provisions of the Illinois Environmental Protection Act, Title 35 of III. Adm. Code, Subtitle C and/or Subtitle D,
Chapter 1, and the Clean Water Act (CWA), the above-named permittee is hereby authorized to discharge at the above location to the
above-named receiving stream in accordance with the standard conditions and attachments herein.
Permittee is not authorized to discharge after the above expiration date. In order to receive authorization to discharge beyond the
expiration
date, the permittee shall submit the proper application as required by the Illinois Environmental Protection Agency (IEPA)
not later than 180 days prior to the expiration date.
Alan Keller, P.E.
Manager, Permit Section
Division of Water Pollution Control
SAK:DEL:05121401.bah
Electronic Filing - Received, Clerk's Office, March 18, 2008
* * * * * AS 2008-008 * * * * *
EXHIBIT 2
Page 2 -^
?
Modification 138i:o: .tune 22, 220)7
NPDES Permit No. IL0001589
Effluent Limitations and Monitoring
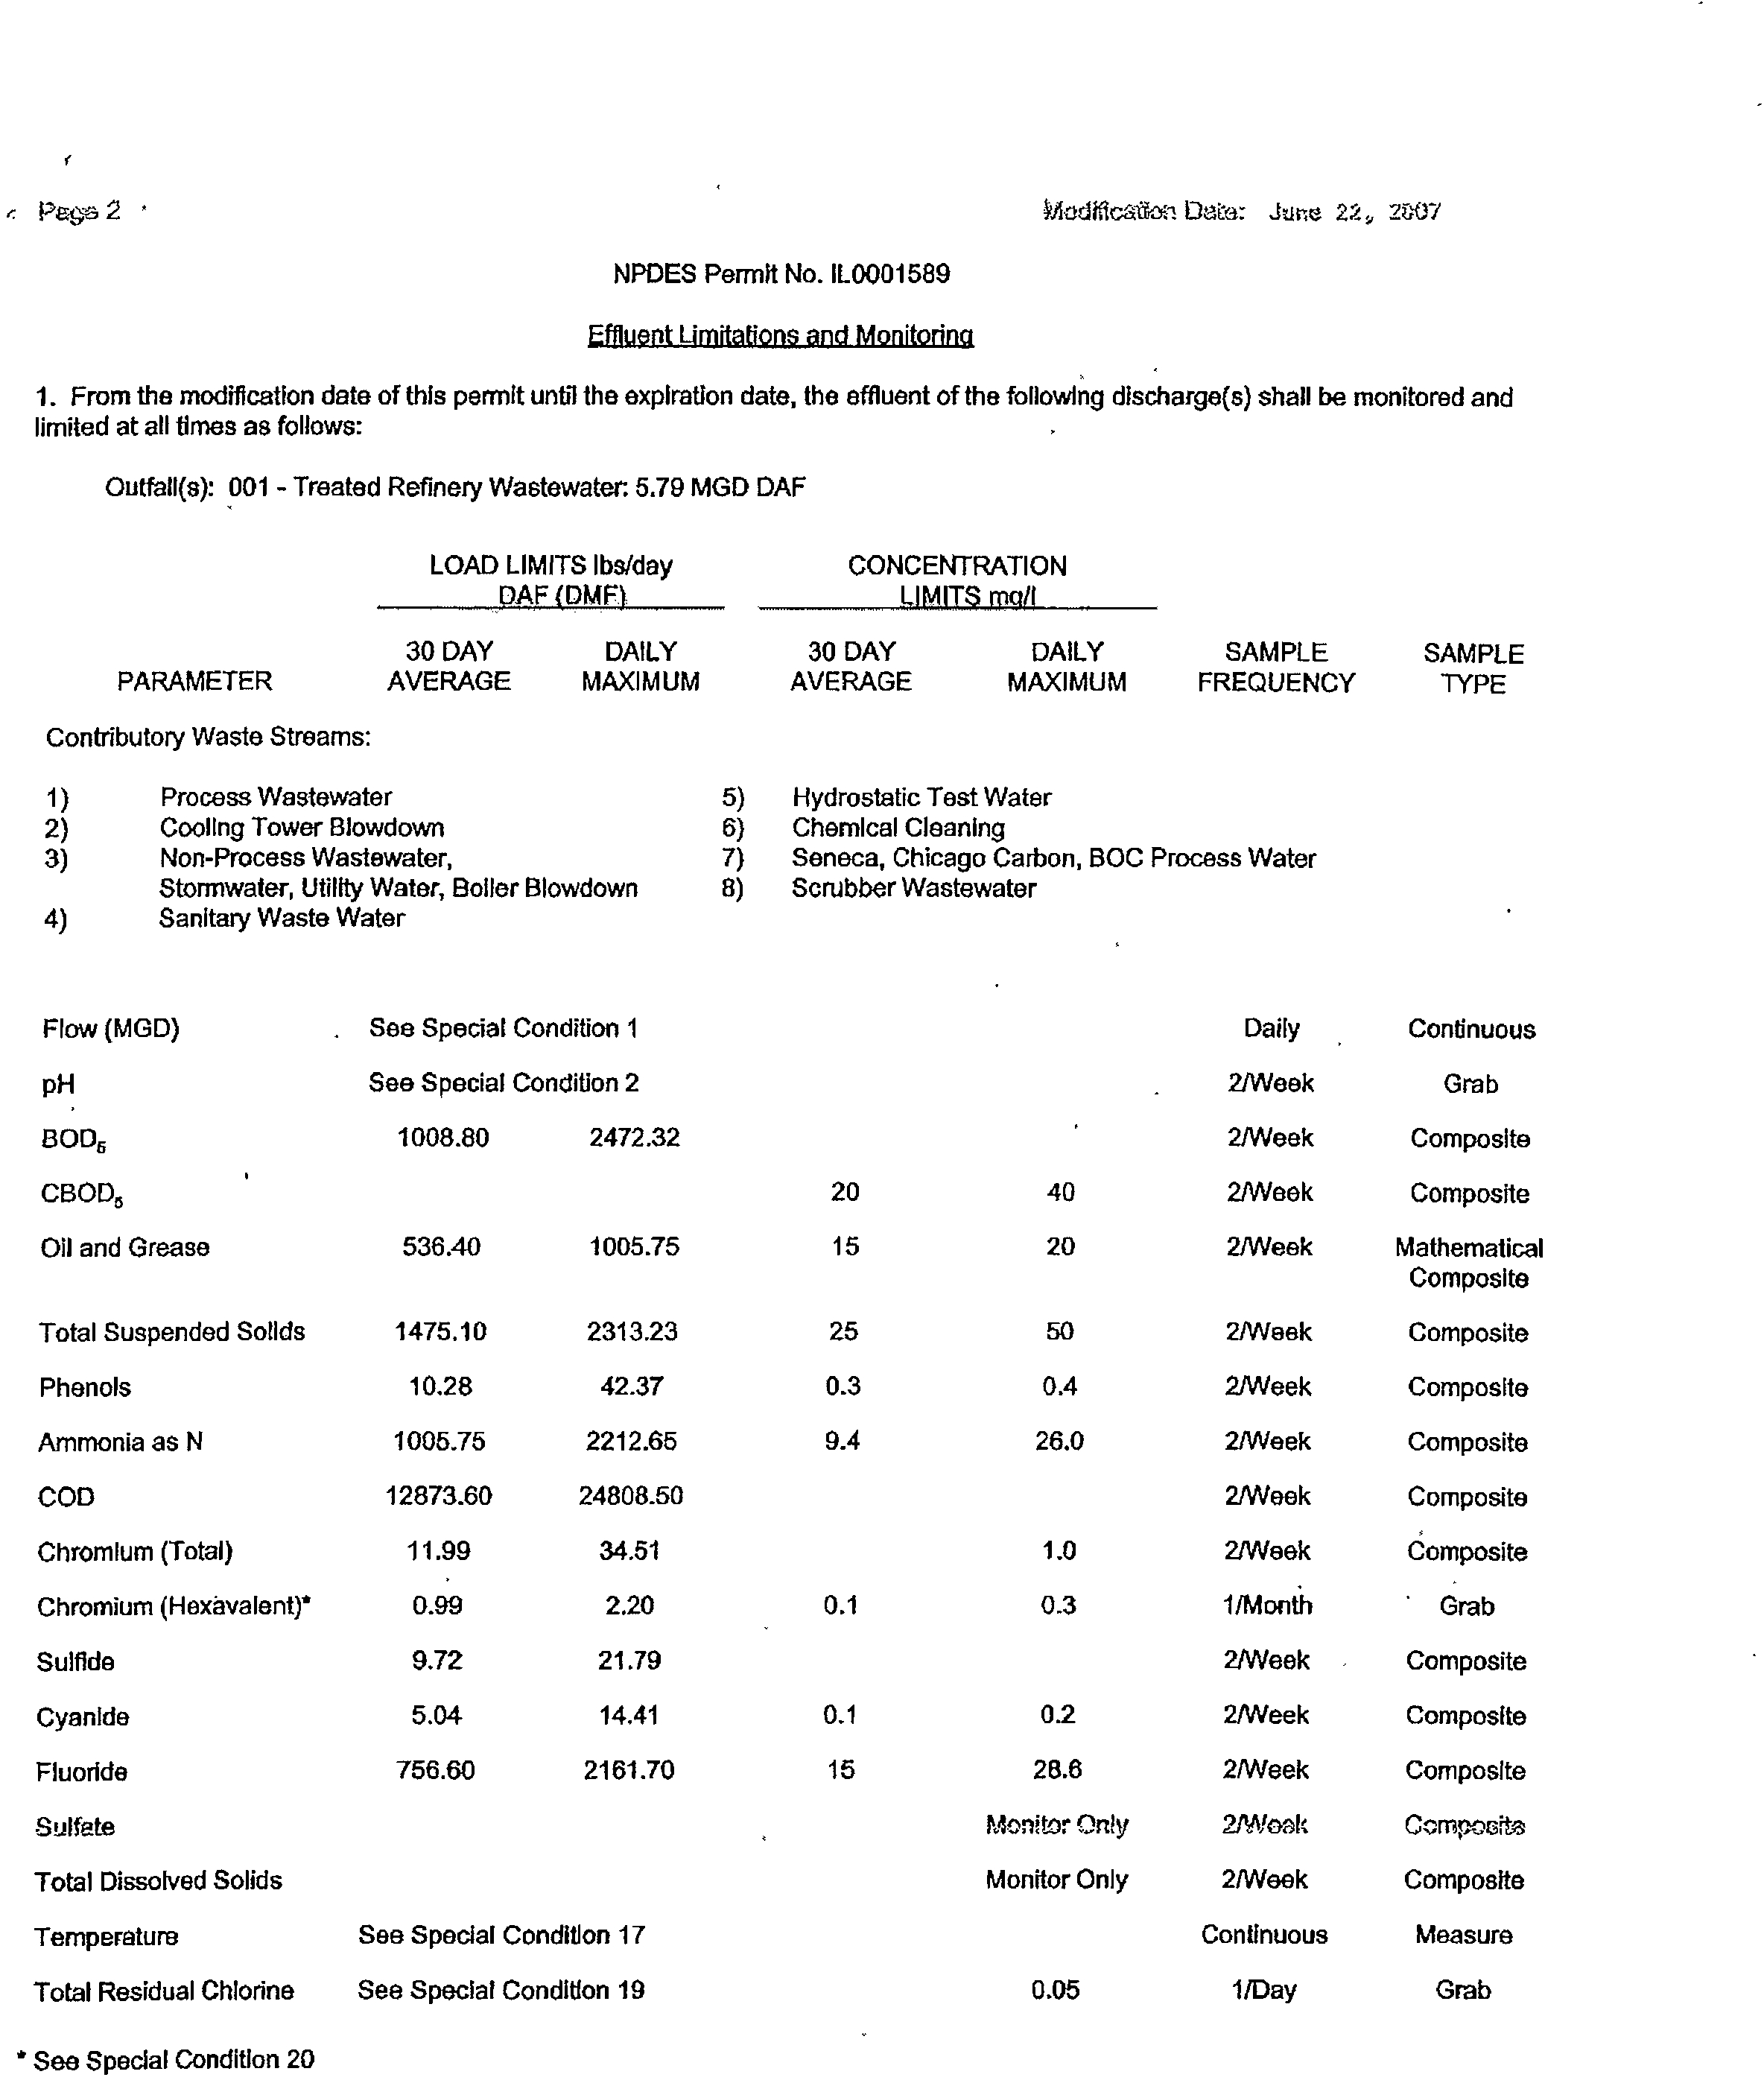
1. From the moditication date of this permit until the expiration date, the effluent of the following discharge(s) shall be monitored and
limited at all times as follows:
Outfall(s): 001 - Treated Refinery Wastewater 5.79 MGD DAF
LOAD LIMITS lbs/day
?CONCENTRATION
OAF (OMF).?
1,1MITS ffigit
30 DAY
?
DAILY
?
30 DAY
?
DAILY?
SAMPLE?
SAMPLE
PARAMETER?
AVERAGE?
MAXIMUM?
AVERAGE?
MAXIMUM?
FREQUENCY
?
TYPE
Contributory Waste Streams:
1)
Process Wastewater
5)
Hydrostatic Test Water
2)
Cooling Tower Biowdown
6)
Chemical Cleaning
3)
Non-Process Wastewater,
Stormwater, Utility Water, Boiler Blowdown
7)
8)
Seneca, Chicago Carbon, BOC Process Water
Scrubber Wastewater
4)
Sanitary Waste Water
Flow (MGD)
pH
See Special Condition 1
See Special Condition 2
Daily
2/Week
Continuous
Grab
8005
1008.80
?
2472.32
2/Week
Composite
CBOD,
Oil and Grease
536.40?
1005.75
20
15
40
20
2/Week
2/Week
Composite
Mathematical
Composite
Total Suspended Solids
1475.10
?
2313.23
25
50
2/Week
Composite
Phenols
10.28
?
42.37
0.3
0.4
2/Week
Composite
Ammonia as N
1005.75?
2212.65
9.4
26.0
2/Week
Composite
COD
12873.60
?
24808.50
2/Week
Composite
Chromium (Total)
11.99?
34.51
1.0
2/Week
Composite
Chromium (Hexavalent)*
0.99?2.20
0.1
0.3
1/Month
•?
Grab
Sulfide
9.72?
21.79
2NVeek
Composite
Cyanide
5.04?
14.41
0.1
02
2/Week
Composite
Fluoride
756.60?
2161.70
15
28.6
2NVeek
Composite
Sulfate
Monitor Only
2Nlionit
Composite
Total Dissolved Solids
Monitor Only
2/Week
Composite
Temperature
See Special Condition 17
Continuous
Measure
Total Residual Chlorine
See Special Condition 19
0.05
1/Day
Grab
See Special Condition 20
Electronic Filing - Received, Clerk's Office, March 18, 2008
* * * * * AS 2008-008 * * * * *
EXHIBIT 2
tPage 3
?
Modit c,Abrt Dark: June 22, 2067
NPDES Permit No. IL0001589
Effluent Limitations and Monitoring
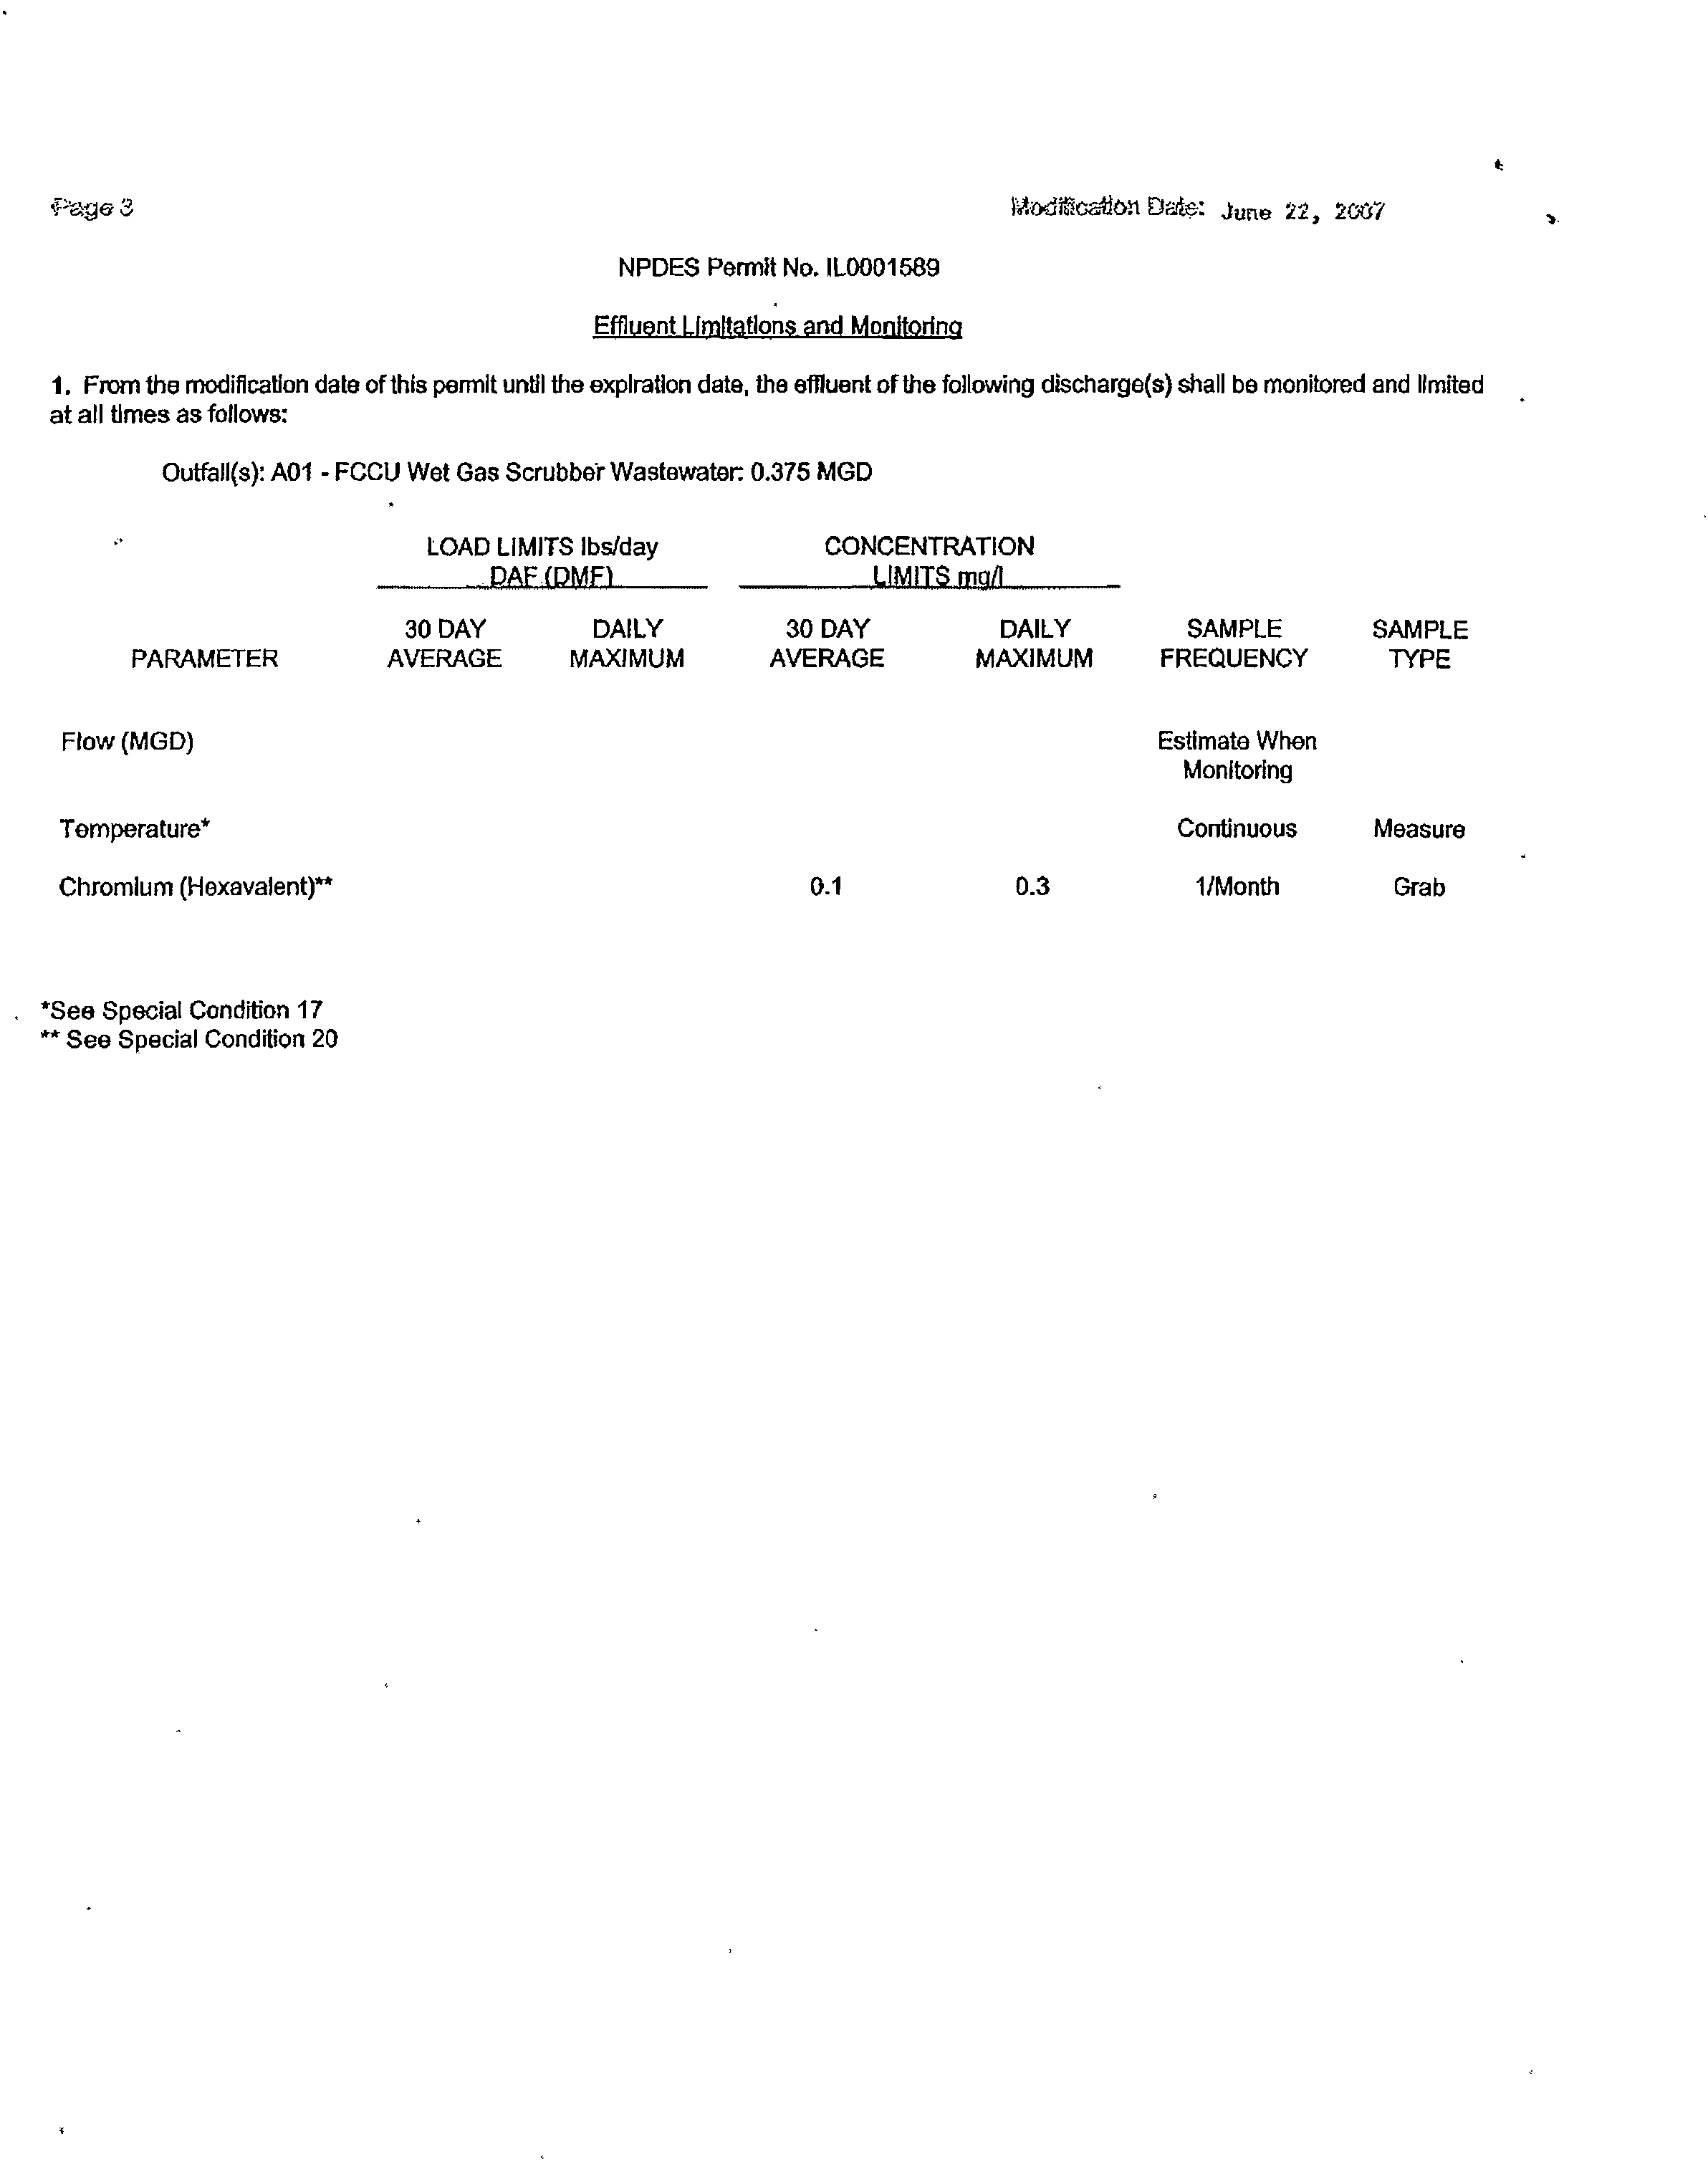
1. From the modification date of this permit until the expiration date, the effluent of the following discharge(s) shall be monitored and limited
at all times as follows:
Outfall(s):
A01 - FCCU Wet Gas Scrubber Wastewater: 0.375 MGD
LOAD
LIMITS lbs/day
?CONCENTRATION
DAF (DMF)?
LIMITS
mg/I
30 DAY?
DAILY?30 DAY?DAILY?SAMPLE?
SAMPLE
PARAMETER
?
AVERAGE
?
MAXIMUM?
AVERAGE
?
MAXIMUM
?
FREQUENCY?
TYPE
Flow (MGD)
?
Estimate When
Monitoring
Temperature*?
Continuous?
Measure
Chromium (1-lexavalent)**
?
0.1
?0.3?1/Month?
Grab
*See Special Condition
17
"
See
Special Condition 20
Electronic Filing - Received, Clerk's Office, March 18, 2008
* * * * * AS 2008-008 * * * * *
EXHIBIT 2
Page 4
?
c
a ?
Cistn: Jui14 22, :,c-o7
NPDES Permit No. IL0001589
Effluent Limitations and Monitoring
1. From the modification date of this permit until the expiration date, the effluent of the following discharge(s) shall be monitored and limited
at
all
times as follows:
Outfall(s): 002 - Stormwater Basin Overflow: Intermittent
LOAD LIMITS lbs/day
?
CONCENTRATION
DAF (DMF)
?
MRS mg/t
30 DAY
PARAMETER?
AVERAGE
Contributory Waste Streams:
DAILY
?
30 DAY
?
DAILY?SAMPLE
?
SAMPLE
MAXIMUM?
AVERAGE?
MAXIMUM
?
FREQUENCY?
TYPE
1)
Refinery Stormwater
7)
Biomass
2)
Treated Process Water (Fire Water)
8)
Off Site Stormwater Runoff
3)
Utility Water
9)
Exxon Mobil Terminal Stormwater
4)
Boller Blowdown
10)
Chicago Carbon Stormwater
5)
Tank Farm Stormwater
11)
Kinder Morgan Stormwater
6)
Hydrostatic Test Water
12)
BOC Stormwater
13) Seneca Stormwater
Flow (MGD)
See Special Condition 1
Estimate When
Monitoring
pH
See Special Condition 2
1/Day
Grab
BODE
20
40
1/Day
Grab
Total Suspended Solids
25
50
1/Day
Grab
Oil and Grease
15
30
1/Day
Grab
Phenols
0.3
0.6
1/Day
Grab
Chromium (Total)
1.0
1/Day
Grab
Chromium (Hexavalent)
0.1
0.3
1/Day
Grab
Cyanide
0.1
0.2
1/Day
Grab
Fluoride
15
28.6
1/Day
Grab
Ammonia as N
9.4
26.0
1/Day
Grab
COD
Monitor
1/Day
Grab
Sulfide
Monitor
1/Day
Grab
Electronic Filing - Received, Clerk's Office, March 18, 2008
* * * * * AS 2008-008 * * * * *
EXHIBIT 2
Page '5?
Maliti
c
?Date: Jane 22,
107
NPDES Permit No. 110001589
Effluent Limitations and Monitoring
1: From the modification date of this permit until the expiration date, the effluent of the following discharge(s) shall be monitored and
limited at all times as follows:
Outfall(s): 007 - Intake Screen Backwash: 0.027 MGD DAF
LOAD LIMITS lbs/day?
CONCENTRATION
OAF (DMF)
?
LIMITS mg/I
30 DAY?DAILY
?
30 DAY
?DAILY?SAMPLE?
SAMPLE
PARAME I ER?AVERAGE?
MAXIMUM?
AVERAGE
?
MAXIMUM?
FREQUENCY?
TYPE
Flow (MGD)?
See Special Condition 1
?
1/Week
?
Estimate
Total Residual Chlorine?
0.05?
1/Week*
?
Grab
*Sample frequency shall be 1/Week when chlorinating.
Outfalls: 003, 004, 005, 006, and 008 - Stormwater Runoff-. Intermittent
See Special Condition 10
Electronic Filing - Received, Clerk's Office, March 18, 2008
* * * * * AS 2008-008 * * * * *
EXHIBIT 2
Page 6
?
Modification Date: June 22, 2007
NPDES Permit No. IL0001589
Sp
ecial Conditions
SPECIAL CONDITION 1.
Flow (in Million Gallons per Day) shalt be reported as a monthly average and a daily maximum on the DMR form.
SPECIAL CONDITION
2.
The pH shall be in the range 6.0 to 9.0. The monthly minimum and monthly maximum values shall be reported
on the DMR form.
SPECIAL. CONDITION 3.
Samples taken in compliance with the effluent monitoring requirements shall be taken at a point representative
of the discharge, but prior to entry into the receiving stream.
SPECIAL CONDITION 4.
If an applicable effluent standard or limitation is promulgated under Sections 301(b)(2)(C) and (D), 304(b)(2),
and 307(a)(2) of the Clean Water Act and that effluent standard or limitation Is more stringent than any effluent limitation In the permit or
controls a pollutant not limited in the NPDES Permit, the Agency shall revise or modify the permit in accordance with the more stringent
standard or prohibition and shall so notify the permittee.
SPECIAL CONDITION 5.
This permit may be modified to include different final effluent limitations or requirements which are consistent
with applicable laws, regulations, or judicial orders. The Agency will public notice the permit modification.
SPECIAL CONDITION 6.
Mathematical composites for oil, fats and greases shall consist of a series of grab samples collected over any
24-hour consecutive period. Each sample shall be analyzed separately and the arithmetic mean of all grab samples collected during a
24-hour period shall constitute a mathematical composite. No single grab sample shall exceed a concentration of 75 mg/I.
SPECIAL CONDITION 7. For the purpose of this permit discharges from outfalls 003, 004, 005, 006, and 008 are limited to stormwater,
free from process and other wastewater discharges.
SPECIAL CONDITION 8. Stormwater discharges identified as outfalls 003, 004, 005, 006, and 008 may be rerouted to the facility's WWTP
and discharged via outfall 001, subject to the limitations of this permit. If these stormwater discharges are routed to the WWTP then they
shall no longer be subject to the requirements of Special Condition 10, but Instead shall meet the requirements of Special Condition 9.
SPECIAL CONDITION 9.
(Outfalls 001 and 002) The Agency has determined that the effluent limitations In this permit constitute BAT/BCT
for storm water which is treated In the existing treatment facilities for purposes of this permit reissuance, and no pollution prevention plan
will be required for such storm water. In addition to the chemical specific monitoring required elsewhere in this permit, the permittee shall
conduct an annual inspection of the facility site to Identify areas contributing to a storm water discharge associated with industrial activity,
and determine
whether
any facility modifications have occurred which result in previously-treated storm water discharges no longer
receiving treatment. If any such discharges are identified the permittee shall request a modification of this permit within 30 days after the
inspection. Records of the annual Inspection shall be retained by the permittee for the term of this permit and be made available to the
Agency on request.
SPECIAL CONDITION 10.
STORM.WATER POLLUTION PREVENTION PLAN (SWPPPI
A.
A stoma water pollution prevention plan shall be developed by the permlttee for the storm water associated with industrial activity at
this facility. The plan shall Identify potential sources of pollution which may be expected to affect the quality of storm water discharges
associated with the industrial activity at the facility. In addition, the plan shall describe and ensure the implementation of practices
which are to be used to reduce the pollutants in storm water discharges associated with Industrial activity at the facility and to assure
compliance with the terms and conditions of this permit.
B.
The plan shall be completed within 180 days of the effective date of this permit. Plans shall provide for compliance with the terms
of the plan within 365 days of the effective date of this permit. The owner or operator of the facility shall make a copy of the plan
available to the Agency at any reasonable time upon request. [Note: If the plan has already been developed and Implemented it shall
be maintained in accordance with all requirements of this special condition.]
C. The permittee may be notified by the Agency at any time that the plan does not meet the requirements of this condition. After such
notification, the permittee shall make changes to the plan and shall submit a written certification that the requested changes have
been made. Unless otherwise provided, the permittee shall have 30 days after such notification to make the changes.
Electronic Filing - Received, Clerk's Office, March 18, 2008
* * * * * AS 2008-008 * * * * *
EXHIBIT 2
Page 7
?
Modification Date:
June 22, 2007
NPDES Permit No. IL04001589
Special Conditions
D.
The discharger shall amend the plan whenever there is a change in construction, operation, or maintenance which may affect the
discharge of significant quantities of pollutants to the waters of the State or if a facility inspection required by paragraph G of this
condition indicates that an amendment is needed. The plan should also be amended lithe discharger is in violation of any conditions
of this permit, or has not achieved the general objective of controlling pollutants in storm water discharges. Amendments to the plan
shall be made within the shortest reasonable period of time, and shall be provided to the Agency for review upon request.
E.
The plan shall provide a description of potential sources which may be expected to add significant quantities of pollutants to storm
water discharges, or which may result In non-storm water discharges from storm water outfalis at the facility. The plan shall include,
at a minimum, the following items:
1. A topographic map extending one-quarter mile beyond the property boundaries of the facility, showing: the facility, surface water
bodies, wells (Including injection wells), seepage pits, infiltration ponds, and the discharge points where the facility's storm water
discharges to a municipal storm drain system or other water body. The requirements of this paragraph may be Included on the
site map if appropriate.
?
•
2. A site map showing:
I.
?
The storm water conveyance and discharge structures;
li.
?
An outline of the storm water drainage areas for each storm water discharge point;
Paved areas and buildings;
Iv.
?
Areas used for outdoor manufacturing, storage, or disposal of significant materials, including activities that generate
significant quantities of dust or particulates.
V.?
Location of existing storm water structural control measures (dikes, coverings, detention facilities, etc.);
vi.
Surface water locations and/or municipal storm drain locations
vii.
Areas of existing and potential soil erosion;
viii. Vehicle service areas;
ix.
Material loading, unloading, and access areas.
3. A narrative description of the following:
I.?
The nature of the industrial activities conducted at the site, Including a description of significant materials that are treated,
stored or disposed of in a manner to allow exposure to storm water;
Ii.?
Materials, equipment, and vehicle management practices employed to minimize contact of significant materials with storm
water discharges;
Ili.
?
Existing structural and non-structural control measures to reduce pollutants in storm water discharges;
Iv.?
Industrial storm water discharge treatment facilities;
V.?
Methods of onsite storage and disposal of significant materials;
4. A list of the types of pollutants that have a reasonable potential to be present In storm water discharges In significant quantities.
5. An estimate of the size of the facility In acres or square feet, and the percent of the facility that has impervious areas such as
pavement or buildings.
Electronic Filing - Received, Clerk's Office, March 18, 2008
* * * * * AS 2008-008 * * * * *
EXHIBIT 2
Page 8
?
Modification Date:
June 22, 2007
NPDES Permit No. 11-0001589
Sp
ecial Conditions
6. A summary of existing sampling data describing pollutants In storm water discharges_
F. The plan shall describe the storm water management controls which will be Implemented by the facility. The appropriate controls shall
reflect identified existing and potential sources of pollutants at the facility. The description of the storm water management controls
shall include:
1. Storm Water Pollution Prevention Personnel - identification by Job titles of the individuals who are responsible for developing,
implementing, and revising the plan.
2. Preventive Maintenance - Procedures for inspection and maintenance of storm water conveyance system devices such as
oiliWater separators, catch basins, etc., and inspection and testing of plant equipment and systems that could fail and result in
discharges of pollutants to storm water.
3. Good Housekeeping - Good housekeeping requires the maintenance of clean, orderly facility areas that discharge storm water.
Material handling areas shall be inspected and cleaned to reduce the potential for pollutants to enter the storm water conveyance
system.
4. Spill Prevention and Response - Identification of areas where significant materials can spill into or otherwise enter the storm
water conveyance systems and their accompanying drainage points. Specific material handling procedures, storage
requirements, spill clean up equipment and procedures should be Identified, as appropriate. internal notification procedures for
spills of significant materials should be established.
5. Storm Water Management Practices - Storm water management practices are practices other than those which control the
source of pollutants. They Include measures such as installing oil and grit separators, diverting storm water into retention basins,
etc.
Based on assessment of the potential of various sources to contribute pollutants, measures to remove pollutants from storm
water discharge shall be implemented. In developing the plan, the following management practices shall be considered:
•
I.?
Containment - Storage within berms or other secondary containment devices to prevent leaks and spills from entering
storm water runoff;
ii.
?
Oil & Grease Separation - Oil/water separators, booms, skimmers or other methods to minimize oil contaminated storm
water discharges;
Debris & Sediment Control - Screens, booms, sediment ponds or other methods to reduce debris and sediment In storm
water discharges;
Iv. Waste Chemical Disposal - Waste chemicals such as antifreeze, degreasers and used oils shall be recycled or disposed
of in an approved manner and In a way which prevents them from entering storm water discharges.
V.
Storm Water Diversion - Storm water diversion away from materials manufacturing, storage and other areas of potential
storm water contamination;
VI.
Covered Storage or Manufacturing Areas - Covered fueling operations, materials manufacturing and storage areas to
prevent contact with storm water.
6. Sediment and Erosion Prevention - The plan shall Identify areas which due to topography, activities, or other factors, have a high
potential for significant soil erosion and describe measures to limit erosion.
7.
Employee Training - Employee training programs shall inform personnel at all levels of responsibility of the components and
goals of the storm water pollution control plan. Training should address topics such as spill response, good housekeeping and
material management practices. The plan shall identify periodic dates for such training.
8.
Inspection Procedures - Qualified plant personnel shall be Identified to inspect designated equipment and plant areas. A tracking
or follow-up procedure shall be used to ensure appropriate response has been taken In response to an inspection. Inspections
and maintenance activities shall be documented and recorded.
Electronic Filing - Received, Clerk's Office, March 18, 2008
* * * * * AS 2008-008 * * * * *
EXHIBIT 2
Page 9?
Modification Date: June 22, 2007
NPDES Permit No. IL0001589
S
p
ecial Conditions
G.
The permittee shall conduct an annual facility Inspection to verify that all elements of the plan, including the site map, potential
pollutant sources, and structural and non-structural controls to reduce pollutants in industrial storm water discharges are accurate.
Observations that require a response and the appropriate response to the observation shall be retained as part of the plan. Records
documenting significant observations made during the site inspection shall be submitted to the Agency in accordance with the
reporting requirements of this permit.
H.
This plan should briefly describe the appropriate elements of other program requirements, including Spill Prevention Control and
Countermeasures (SPCC) plans required under Section 311
of
the CWA and the regulations promulgated thereunder, and Best
Management Programs under 40 CFR 125.100.
I.
The plan is considered a report that shall be available to the public under Section 308(b) of the CWA. The
.
perrnittee may claim
portions of the plan as confidential business information, including any portion describing facility security measures.
J.
The plan shall Include the signature and title of the person responsible for preparation of the plan and include the date of Initial
preparation and each amendment thereto.
Construction Authorization
K.
Authorization is hereby granted to construct treatment works and related equipment that may be required by the Storm Water Pollution
Prevention Plan developed pursuant to this permit.
This Authorization is issued subject to the following condition(s).
1.
If any statement or representation is found to be incorrect, this authorization may be revoked and the permittee there upon waives
all rights thereunder.
2.
The issuance of this authorization (a) does not release the permittee from any liability for damage to persons or property caused by
or resulting from the installation, maintenance or operation of the proposed facilities; (b) does not take into consideration the structural
stability of any units or part of this project; and (c) does not release the permittee from compliance with other applicable statutes of
the State of
Illinois, or other applicable focal law, regulations or ordinances.
3.
Plans and specifications of all treatment equipment being included as part
of
the stormwater management practice shall be Included
in the SWPPP.
4.
Construction activities which result from treatment equipment installation, including clearing, grading and excavation activities which
result in the disturbance of one acre or more of land area, are not covered by this authorization. The permittee shall contact the IEPA
regarding the required permit(s).
REPORTING
The facility shall submit an annual inspection report to the Illinois Environmental Protection Agency. The report shall include results
of the annual facility inspection which is required by Part G of the Storm Water Pollution Prevention Plan of this permit. The report
shall also include documentation of any
event
(spill, treatment unit malfunction, etc.) Which would require an inspection, results of
the inspection, and any subsequent corrective maintenance activity. The report shall be completed and signed by the authorized
facility employee(s) who conducted the inspection(s).
M. The first report shall contain information gathered during the one year time period beginning with the effective date of coverage under
this permit and shall be submitted no later than 60 days after this one year period has expired. Each subsequent report shall contain
the previous years information and shall be submitted no later than one year after the previous year's report was due.
Electronic Filing - Received, Clerk's Office, March 18, 2008
* * * * * AS 2008-008 * * * * *
EXHIBIT 2
Page 10
?
Modification Date: June 22, 2007
NPDES Permit No.11.0001589
Special Conditions
N. Annual inspection reports shall be mailed to the following address:
Illinois Environmental Protection Agency
Bureau of Water
Compliance Assurance Section
Annual Inspection Report
1021 North Grand Avenue East
Post Office Box 19276
Springfield, Illinois 62794-9276
0. If the facility performs inspections more frequently than required by this permit, the results shall be included as additional Information
in the annual report.
SPECIAL CONDITION 11. The Permittee
shall
record monitoring results on Discharge Monitoring Report (DMR) Forms using one such
form for each outfall each month.
In
the event that an outfall does not discharge during a monthly reporting period, the DMR Form shall be submitted with no discharge
Indicated.
The Permittee may choose to submit'electronic DMRs (eDMRs) instead of mailing paper DMRs to the IEPA. More information, including
registration information for the eDMR program, can be obtained on the IEPA website, http://www.epa.state.ii.us/wateriedmrAndex.html.
The completed Discharge Monitoring Report forms shall be submitted to EPA no later than the 15th day of the following month, unless
otherwise specified by the permitting authority.
Perrnittees not using eDMRs shall mall Discharge Monitoring Reports with an original signature to the IEPA at the following address:
Illinois Environmental Protection Agency
Division of Water Pollution Control
1021 North Grand Avenue East
Post Office Box 19276
Springfield, Illinois 62794-9276
Attention: Compliance Assurance Section, Mall Code # 19
SPECIAL CONDITION 1Z For the purpose of this permit, discharges from outfall 002 are limited to overflow from the stormwater retention
basin, free from additional process or other discharges.
SPECIAL CONDITION 13. The permittee shall monitor the nitrogen concentration of it's oil feed stocks and report the concentrations to
the Agency on an annual basis. Reports shall be submitted no later than 60 days after the end of the calendar year.
SPECIALCONDITION 14. The permittee may use the upset provision as an affirmative defense provided all the requirements of 40 CFR
122.41(n) are met.
SPECIAL CONDITION 15. Discharge from this facility shall be in accordance with 35
111.
Adm. Code Section 304.213 for ammonia nitrogen.
Tills section requires that the discharge meet EAT limitations pursuant to 40 CFR 419.23, as well as ammonia nitrogen concentration limits
of 9.4 mg/I as a monthly average and 26.0 mg/I as a daily maximum.
Electronic Filing - Received, Clerk's Office, March 18, 2008
* * * * * AS 2008-008 * * * * *
EXHIBIT 2
Page 11
?
Modification
Date: June 22, 2007
NPDES Permit No. IL0001589
Special Conditions
SPECIAL CONDITION 1Q. Storm Water Credit for Outran 001.,
An additional stormwater credit for the following parameters shall be calculated based on 100% of the stormwater flow as defined below.
Pounds per 1000 gallons of stormwater
Parameter
Average
Maximum
BOD
0.22
0.40
Total Suspended Solids
0.18
0.28
COD
1.5
3.0
Oil and Grease
0.067
0.13
Phenol
0.0014
0.0029
Cr (tot)
0,0018
0.0050
Cr (+6)
0.00023
0.00052
Dry Weather Flow — The average flow from the waste water treatment facility for the last three consecutive zero precipitation days.
Previously collected storm water shall not be included.
Storrnwater Flows — The stormwater runoff which Is treated in the waste water treatment facility shall be defined as that portion of the flow
greater than the dry weather flow.
In computing monthly average permit limits to include stormwater credit, the pound credit calculated above shall be averaged along with
process pound limits over the 30 day period. Explanatory calculations and flow data shall be submitted together with discharge monitoring
reports.
The stormwater credit does not authorize the permittee to exceed the concentration limits contained in effluent Limitations and Monitoring,
Page 2.
SPECIAL CONDITION 17.
a)
The discharge from outfall A01 shall be subject to the following limitations:
During the months of April through November, the discharge shall not exceed 90° F, except that one percent of the hours in any 12
month period may exceed 90° F but shall never exceed 93° F at any time.
The monthly average and monthly maximum value shall be reported on the DMR. The permittee shall also report the total number
hours the temperature exceeds 90° F.
b)
The waters receiving the discharge from outfall 001 are designated as Secondary Contact and Indigenous Aquatic Life Waters by
Section 302.408, Illinois Administrative Code, Title 35, Chapter 1, Subtitle C, as amended. These waters shall meet the following
standard:
Temperatures shall not exceed 93° F more than 5% of the time, or 100° F at any time at the edge of the mixing zone which is defined
by Rule 302.102 of the above regulations.
The monthly maximum value shall be reported on the DMR form. In lieu of monitoring at the edge of the mixing zone, the permittee
may demonstrate compliance with this paragraph by monitoring at outfall 001.
SPECIAL CONDITION 18. The permittee was granted a variance from the water quality standard for Total Dissolved Solids (TDS) for the
discharge at
outfall 001 in accordance with Illinois Pollution Control Board Order PCB 05-85. The permittee shall commence Its study of
downstream TDS concentrations in accordance with the schedule contained in this order. This permit may be modified to include any final
limitations or monitoring requirements which may be necessary based on the results of the study, or future Illinois Pollution Control Board
actions with result to Total Dissolved Solids water quality standards. This variance expires on December 15, 2009.
Electronic Filing - Received, Clerk's Office, March 18, 2008
* * * * * AS 2008-008 * * * * *
EXHIBIT 2
Page 12
?
Modification Date: June 22, 2007
NPDES Permit No.110001589
Sp
ecial
Conditions
SPECIAL CONDITION 19;
a.
From the effective date of this permit until such time that the FCCU Scrubber System becomes operational, monitoring for
Total Residual Chlorine (TRC) Is only required during those times when breakpoint or super chlorination is used for short term
ammonia treatment in the treated water basin. Prior to discharging from the treated water basin following chlorine treatment,
the permittee shall take a grab sample from the basin to determine compliance with the TRC limit of 0.05 mg/I. The discharge
from the basin shall then be sampled once per day using a grab sample, for a period of five days after resuming the
discharge. The permittee shall submit an attachment to the DMR explaining the reason for the temporary chlorine treatment,
the amount of chlorine used, and length of the temporary cessation of discharge. The maximum concentration recorded shall
be reported on the DMR.
b.
The permittee shall notify the Agency in writing 30 days (or as soon as practicable) prior to the start of operation of the FCCU
Scrubber Break Point Chlorination System. Upon start up of the break point chlorination system, the discharge from Outfall
001 shall be monitored on a continuous basis for Total Residual Chlorine and subject to a limit of 0.05 mg/I as an
instantaneous maximum. The maximum recorded' concentration shall be reported on the DMR.
c.
In the event that the continuous monitoring system is not functioning or need routine maintenance, the permittee may
substitute a once per day grab sample at Outfall 001 until such time that the continuous analyzer is operational. The
permittee shall include an attachment to the DMR explaining the reason and length of the outage.
SPECIAL CONDITION 20; For the purposes of compliance at Outfall 001, samples for hexavalent chromium shall be taken at a point
prior to entering the aeration basin. Upon commencement of operation of the FCCU Scrubber System, the discharge from internal
Outfali A01 shall also be sampled on a monthly basis for hexavalent chromium. Compliance with hexavalent chromium load limits at
outfall 001 shall be determined by multiplying the concentration times the flow for Outfall A01 plus the concentration times the flow
prior to entering the treated water basin.
Electronic Filing - Received, Clerk's Office, March 18, 2008
* * * * * AS 2008-008 * * * * *
EXHIBIT 2
Aliactstrourt.
Standard Conditions
Definitions
sat means the Olincils Environmental Protection Act, 415 ILLS 5 as Amended.
agency means the Illinois Environmental PrOler.lion Agency.
board means the Whole Pollution Control
Dori
Sean Water Act (formerly referred to as the Federal Water Pollution Control Act) means
L
92-500,
as amended. 33 U.S.C.
1251
et seq.
IP DES
(National Potertant Discharge Elimination System) meant), MIAOW program for
!suing, mortifying, revoldne andrelsru
l
ag, terminating monitoringand_enforcing
permits,
and
pposing and
enforcing pretreatment requiternents. under Sections 301.40Z
31S and 405
if the Chien Water Act
fSEPA means the United States Environmental Protection Agency.
/ally Mahe rg • Means
the
&charge
Or a
pollotant measured during II colander day or any
!4-hour period that reasonably iyJpt
gOtg.0‘0/
agIgga
V,
trot
milutants with limitations expressed In units of mass, the '
,
daily discharge'ts calculated at
he total mass of the pollutant discharged over the day, For pollutants with hmttations
srpressed in other units of measurements, the 'dolly discharge' Is calculated
as
the average
neesurement of the pollutant over the day.
daximum Daily Discharge Limitation Nally maximum) means the highest allowable daily
fiseharge.
leverage Monthly
Discharge limitation (30
day
average) means the highest allowable
average of daily discharges over I
calendar month. calculated a* the sum
or
ell daily
fischerges measured during a calendar month divided by
the number of (fatly discharges
treasured during that month.
►
verage Weekly Discharge
Limitation (1 day average) means the
highest allowable
lverage of day
discharges over a Calendar week, calculated as the sum of all
daily
lischarges
measured during a calendar week divided by the number of
deity discharges
Censured during that week.
lett Management Practices (IMPs) rows scheduleiof activities, prohlbeions of practice'.
naintmanth
procedut
tm
i, and other manageMent practices to prevent
or
reduce the pollution
webs:sof the Slate. Pi oho Staid() traitausettequirsmenbs. operating
Procedures, and
eacticetto control Omit site
melt
spillage or leAtillUdge or waste disposal, or drainage
tom raw material storage.
Itiquet means
a
Moyle of specified volume used to make up a total
composite sample.
d
rab Sample
means an Individual
sample of
el
least 100
milliblers collected at a randomly.
:elected time over a
period
not exceeding 15 narrates.
14
Hour Composite Sample means • combination
of at
least B sample aliquots of at least
milliliters, collected al periodic
intervals during the operating hours
of a featly over a 24.
sour period.
1 Hour Composite Semple means a combination of et least 3 sample aliquots of at feast 100
banters, collected at periodic intervals during the
operating hours of a facility over an 8-hour
teriod.
.low Proportional Composite Sample
means a combination of sample Aliquots of at least
i00 milliliters collected at periodic Intervals such that
either the time
Interval between each
iliquot or the volume of Beth aliquot is proportional loather the stream flow
at
the time of
iampling or the total
stream
stow since the collection of the previous aliquot.
(1)
Duty to comply.
The permittee must
comply with all conditions ot this permit. Any
perrnit noncompliance constitutes
a violation of the Act end is grounds for enforcement
action, permit termination,
revocation
end relssuince. niccialcallon,
or
for denial of
permit renewal application. The permittee shall comply with effluent standards or
prohibitions established under Section 307(a) of the Chan
Water Ad for toxic
pollutants within the time provided In the
regulations that establish these standards or
prohibitions, even V the permit has not yet been modified to Incorporate the
requirement
(2)
Duty to reapply. If the permittee wishes to continue en activity
regulated by this permit
after the expiration date of this permit, the pennin g° must apply for and obtain a new
permit. If the permtlee submits a proper
application as required by the Agency no later
than
180 days prior to the expiration date, this permit shall
conlihue In full force end
effect until the final Agency decision on the
application has
bean made.
(3)
Need to halt
or
reduce activity
not a defense. 11 shalt not be a defense
for a
petallike in an enforcement action that k would have bean necessary to halt or reduce
the permitted actively In
cater to
maintain compliance with the conditions of this permit.
(4)
Duty to mitigate. The permitter, shall take all reesonsbie steps to rnthinitte or prevent
arty
discharge
h
violation of this permit which has a reasonable tikelhood of adversely
affecting human health or
gle environment.
(5)
Proper operation and maintenance. The pemtittee
shall
at all times property operate
and
maintain all facilities and systems of treatment and control (end related
appurtenances)
which are Installed or used by the permittee to achieve compliance
with
conditions of this
paint. Proper operation end maintenance includes
effective
performance, adequate funding, adequate operatorsteffng and training, and adequate
laboratory and process controls, including appropriate quality assurance procedures.
This provision requires the operation of bark-up, or auxiliary Willies, or
simian
systems only when
necessary
to achieve compliance wit the Conditions of the perm*.
ttn Ri
t
q
rlit
?'11'1 P'ifier
?
5i
totwart
rS
.d. kr)).111.:(1
'kr?
ti:4n.a.0ancy pleurae): ic?
1:11.2;. +1'.o a her r 11 w
;arcade* fora pont* tnadifirartion, trevoteolion end rclaktialleb, or
teriniralltal,
noliScation of
planned changes or
Deticipated noncompliance, does not stay any
permit
condition.
(:) Property rights. This permit does not convey any property rights of any son, or
any
exclusive privilege.
0► Duty to provide Intonnahon. The permitted shell arartsti to the Agency Within
reasonable
tl
et
ior
OW) which the Agency may request tottetermine Whither
Cause (*isle for rivalltykrig, revoking end reissuing, or terminating Gila
perrnil,
or to
determine compliance with the puma. The permtltee shall also furnish to the Agency,
upon request copies
of records required to be kept by this permit.
Inspection and entry. The pomdttee shot allow m authorized representative of the
Agency, upon the presentation of oredentlats and other documents as may be required
by taw, to:
(11) Enter upon the pemoitteee premises
where
a regulated facility or activity Is
located or conducted, or
euliare records mat
be
kept
under 'hie
conditions of this
permit;
(b) Have access to
and copy, at reasonable times, any records that must be kept
under the conditions of this permit:
(e)
inspect at reasonable times any facilities, equipment (including monitoring and
control
equipment),
practices, or operations regulated or required
under
this
permit; and
(d) Sample or monitor at reasonable times, for
the
purpose of assuring permit
compliance, or es otherwise authorized by the Act any substances or
parameters
at any
location.
(10j
Monitoring and records.
Samples and measurements taken for the purpose of monitoring shall be
representative of the monitored activity.
(b) The perrnittee
Mal
retain
records of all monitoring information, including air
csillbration
and
mrantenance records. and alt original strip chart
recordings for
continuous monitoring
Insirementation,
copies of all reports required by this
permit,
and
records of ail data
used to
complete the application for NIS permit, for
a period of at
least
3 years from the date
or
figs permit, measurerneht,
report or
appliestIon. Tilts period may be extended by request of the Agency at any time
Records of monitoring information shall Include:
(I) The date,
exact place, and Unmet sampling or
measurements;
(2)
The individual(s) who performed
the sampling or measurements;
(3)
The date(s) analyses were performed;
(4)
The Individuals) who performed the analyses;
(5)
The anelyticat techniques or methods used; and
(8) The results of such analyses.
(d) Monitoring must be conducted
according tO lest
procedures approved under 40
CFR Part 136,
unless other test procedures have been
specified
in this permit.
Where
fro
test procedure under 4G CFR
Pad 138
has bean approved, the
pantiles mustsubrnit to the
Agency a test method for approve The penning*
shell
calibrate and perform maintenance procedures on all monitoring and
analytical instrumentation at interstate to ensure accuracy of measurements,
(ii)
Signatory requirement
Al
applications, reports or information submitted to the
Agency shall be signed
and
certified.
(a) Application. All puma
applications Mud be signed as follows:
(1)
For
a corporation: by a principal executive
officer of at least the level of
vice president or a
person
or position having overall responsibil
i
ty for
environmental matters
for the
corporation;
(2)
For e partnership or solo proprietorship: by s general partner or the
proprietor, respectively; or
(3)
Fora municipality, Stele, Federal, or other public agency:
by either a
principal
executive officer
or
ranking elected official.
(b) Reports. Ail reports required by permits, or other information requested
by
the
Agency shall
be signed by a person deathbed in paragraph (a) or
by a duly
authorized representative of (het person. A parson is a duly authorized
representative
only
if:
(1) The authorization is made
In
writing by ■ person described el paragraph (s);
and
(2) The authorization specifies
either en Individual or e position responsible for
the overall
operator of the bodily, tromwhich the discharge originates, such
as a plant manager, sup%
bdendent or person of equivalent responsibny:
and
(3)
The
written authorization is submitted to the Agency.
(a)
(c)
Electronic Filing - Received, Clerk's Office, March 18, 2008
* * * * * AS 2008-008 * * * * *
EXHIBIT 2
APPENDIX B
LEMONT REFINERY DATA - 1997 TO 2007
Electronic Filing - Received, Clerk's Office, March 18, 2008
* * * * * AS 2008-008 * * * * *
EXHIBIT 2
CITGO REFINERY
Annual Sulfur and Nitrogen
Year
%S
%N
111111111.
allaillin
1997
MEM
0.20
1998
1.97
0.21
1999
2.06
0.24
2000
2,29
0.20
2001
2.45
0.19
2002
2.55
0.25
2003
2.47
0.15
2004
2.50
0.18
2005
2.66
0.18
2006
2,68
0.18
Page
1
Electronic Filing - Received, Clerk's Office, March 18, 2008
* * * * * AS 2008-008 * * * * *
EXHIBIT 2
MG REFINERY
Barrels of Oil Processed Per Day
NIEDEMill?
Crude Throulliput
1111111111111
11111111
111111.1111111.111
2006?
146,040
2007
Page 1
Electronic Filing - Received, Clerk's Office, March 18, 2008
* * * * * AS 2008-008 * * * * *
EXHIBIT 2
CITGO REFINERY
Annual Sulfur and Nitrogen
MIEZa
1997
%
S
ppm N
IIMMI
1.986
1998
1.97
2,102
1999
2.06
2,347
2000
2.29
1 978
2001
2.45
1,926
2002
2.55
2,049
2003
2.47
1,510
2004
2.50
1,827
2005
2.66
1,795
2006
2.68
1,782
2007
111111111111111111111111
IIIIIIIIIIIIIIIIIIIIIIIIIIIIIIIII
Page 1
Electronic Filing - Received, Clerk's Office, March 18, 2008
* * * * * AS 2008-008 * * * * *
EXHIBIT 2
CITGO REFINERY
Wastewater Flovvrate (MGD)
Year
Flow
1997
3.47
1998
4.03
Mall
4.19
1999
2000
IIIIIIIIIIIII
2003
4,27
2006
11.11111
4.66
2007
Page 1
Electronic Filing - Received, Clerk's Office, March 18, 2008
* * * * * AS 2008-008 * * * * *
EXHIBIT 2
CITGO REFINERY
Annual Average and Maximum Monthly Ammonia,
MM.
Annual
Pounds
Average
per clay
Maximum Month
11111101111111111111111111111
IIIIIIIIIIIIIIIIIIIII
IIIIIIIIIIIIIIIIIIIIII
MI
2004?
62
ME
590
2005
116
656
2006
139
846
2007
Page 1
Electronic Filing - Received, Clerk's Office, March 18, 2008
* * * * * AS 2008-008 * * * * *
EXHIBIT 2
CITGO REFINERY
Yearly Average Influent Ammonia Conc.
Year
Ammonia Conc., ppm
IIIIIIIIIII
IIIIIIIIIII
2002
0.52
11111111111111111111
MEM
Page 1
Electronic Filing - Received, Clerk's Office, March 18, 2008
* * * * * AS 2008-008 * * * * *
EXHIBIT 2
CITGO REFINERY
Effluent Ammonia Discharge Concentrations
Year
Yrly Ave Amm. Conc.
Mo. Max Amm Conc.
Dly Max Amm Conc.
1111111111111
2005?
163?9.19
15.4
IIIIIIIIIMIIIIIIIIIIIIIII
Electronic Filing - Received, Clerk's Office, March 18, 2008
* * * * * AS 2008-008 * * * * *
EXHIBIT 2
Net Ammonia
CITG 0
Load
REFINERY
To S&S Canal
Date
ye
Ammonia
lbs/day
ye
Ammonia
lbs/day
et
Discharge
Eff lbs/day
ear
y?
ve
Effluent
lbs/day
ear y?
y
e
Influent
lbs/day
IIIIIMIIIMIIIIIIIIMMIIIIIIIIIIIIIIIII
IIIMIIIIIIIIMIIIIIIIIIIIIIIIIIIIIIII
ear y
?
ye
Net
Eff
lbs/day
Aug
,
' 97
20
9
S?
t ' 97
MEM
16
IIIIIIIIII1
111111111111111
11111111111111111111111111111111
Jan' 98
IIIIIIIIIIIMIIIIIIIIIIIIM
11111111111111111111111111111
Feb' 98
24
63
-39
MIMINIIIIII
Mar'
98
MEM
16
19
1111111111111111111111
18
MIIIIIIIIIIIIIMMII
A r ' 98
IIIIIIIII
Ma ' 98
68
20
48
111111111111MMIMM111111101.11111111
0111111.1111•11111111111111111111111111111
June ' 98
90
24
66
IIIIIIIIIIIIII
Jul?
' 98
MIN
24
28
Au
Se t'98
' 98
11111Mallalla
64-
38
48
26
IMEMINIMENEMMENIIIII
IIIIIIIIIIIIIIMMIIIIIIIMIIIMMIIIIIIN
Ma ' 99
60
IMMO
44
111111111111111
16
-26
MIIIIIIIIIIMIMIIIIIIIIIIIIMIIIIIIN
June' 99
29
111111111111111111111111.1111111111
1111
Se t'99
IMMISMIII
laall
1111111111111111111.11111
51
-16
-58
111111111111111111111111111111111111111111111
1111111111111111111111111111
MIIIIIIIIIIIIIIIIIIIIIIII
Oct ' 99
Nov
Dec'
'
99
99
Mall
43
120
70
111118111111
-49
64
56
8
111111111111111111111
76
59
8
IMMIIIIMMIIIIIIIII111111111111111111111111111
MIIIIIIIIIIIINMIIIIIIIIIIIIMIIIIIIIII
MIIIIIIIIIIIIM11111.11111111111
Jan ' 00
Feb ' 00
78
70
Mar' 00
Ma
Ap
r'
y'
1111111111111111111
Jul?
'00
104
16
88
111111111111111111111111111111111111111111
Nov'
Dec
Pg
'
00
00
allail
Nal
79
allaM
=III
1111111111
80
41
39
73
50
24
Page 1
Electronic Filing - Received, Clerk's Office, March 18, 2008
* * * * * AS 2008-008 * * * * *
EXHIBIT 2
Jan'
01
122
70
111111M11111111M1111
46
52
95
11111M1M1111111111
MEM
20
?
IIIEIIIIIIIIIIUIIIMIIIIIIMIIIIIIIIIIIIIIIIIIIIIIIIIIII
11111111111111.111111111111
1111111111111
IIIIIIIIIII
Mar'
Feb10101
58
M
A
a
r
'
' 01
01
122
1MM
1.1111111111111111111111111111111111111111
Au
Oct
P
`O1
'01
14?
1
IIIIIIIIIIIIIIIIIIIIIIIIOIIIIIIIIIIII
Dec '01
0
IIIIIaIIIIMIIIIIIIIIIIIIIIII
38
14?
24
42
32
10
NIIIIIIIIIIIIIIIIIIIIIIIIIIIIIII
0
1
' 02
MEM
18
156
1 111111111
111111111110111•11111111
'
June
111
Se?
02
34
20
IIIIIIIIIIIIIII
IIIIIIIIIII
-10110111111111
Nov
Oct
Oet t
'
02
02
1111=11111=1.11
IIIIIIIIII11131111
20
MI=
MUM
111111111111
Air-03
Mar-03
58
4
11111M1111111811111
45
14
MINIM
1111111•111111111111111111
all
MINIM
MINI
Ma
Jun-03
Jul-03
-03
267
124
1111111111
250
MIN
MEI
20
Aug
P
-03
11111111
MOE
20
28
1111111111111111111111111111111111111111111111111111111111
1°4
111111111111111111111111111
Feb-0
Jan-04
243
69
13
11.1111111111111111111111
230
111111111111111
111111.1
ISM
.11
15
IIII
al
AApr 04
1v1a -
0
.111111111111111111
Nov-04
Dec-04Oct-04
Sep-04
199
72
89
12
111111111111111111101111111111111111111101111111111111111111
30
22
8
169
50
81
62
21
al
41
Page 2
Electronic Filing - Received, Clerk's Office, March 18, 2008
* * * * * AS 2008-008 * * * * *
EXHIBIT 2
Jan-05
113
65
48
Feb-05
27
69
-42
Mar-05
23
80
-57
11111111111111111111111111111.1
IIIIIIIIIIIIIIIIIIIIIIIIIIIIIIIIII
Air-OS
24
52
-28
Ma -05
18
1
al
Au -05
171
1111311111
154
IIIIIIIIIIIIIIIIIIIIIII
IIIIIIIIIIIMIIIIIIIIIIIIIIIIIIIIIIII
S
-05
196
14
182
1111111.11111111111111111
IIIIIIII
11111
11
Y
III
BEI
11111111111111111
Mill
Oct-06
1.111111111111111111
16
12
4
1111111111111.1
MIMI
IIIIIIIIIIIII
11111111111111111
111
imillE
OM
11111111111
11111111111111111
111111111111
1.11M.11111111111
IIIIIIIIIIMIIIIIIIIIIIIIIIIIIIIIIIII
g:nh398-net ammonia to S&S Canal
Page 3
Electronic Filing - Received, Clerk's Office, March 18, 2008
* * * * * AS 2008-008 * * * * *
EXHIBIT 2
CITGO REFINERY
Influent From S&S Canal
Date
Ave Flow,MGD
Ave ppm NH3N
Ave
Lbs NH3N
67_
Jan' 97
4.97
1111111MINIENIMININ
Feb' 97
4.32
1.85
Mar '97
4.22
1.19
42
Ma
Apr19
'97
June ' 97
4.88
0.49
20
Jul
' 97
4.41
0.40
15
Au:' 97
Se t ' 97
3.83
029
9
4.51
0.43
16
111111MION
20
Oct' 97
4.54
4.21
11111Mili
5.0
4.6
0.31
Nov' 97
IIIIIIDBIIIIIIMIIMEIIIII
Ma '
9
8
IMIIIIIIIIINIIIIIIIIIIM
11111111.111111
Aug
' 98
MIIIIIIIIIIIIIIIIMIIIII
0.75
ONE
11111111111111111111111
Se
nt' 98
Oct' 98
Nov' 98
4.7
Dec' 98
4.4
Averag
Feb' 9
P
.),
IIIIIIIIII
June' 99
Aug' 99
4.64
11111111111111.1111111
Se t ' 99
51
Dec' 99
4.10
3.50
120
1103=1
4.70
1.45
55
Page I
Electronic Filing - Received, Clerk's Office, March 18, 2008
* * * * * AS 2008-008 * * * * *
EXHIBIT 2
Jan '00
00
4.51
1.58
59
Feb ' 00
5.64
1.49
70
Mar' 00
5.49
L56
71
Air' 00
5.00
1.41
59
111111111.11111111111
111=/Mall
IIII
Jan' 01
5.36
Ell
IIIIIIIIIIIII
70
IIIIIIMIIIIIIMIMIIII
11111111111111111
1.56
Mar O1
Apr' O1
Au
• ' 01
3.52
0.40
11.11119111111
111111
Se t' 01
3.10
0.52
Oct' 01
3.43
0.36
10
Nov'
01
4.37
aIIIIIIMIMII
0.27
10
Dec'01
Avera
g
Ell
MI
IIIII
Jul
y
' 02
IIIIIIIMIIIIII
5.61
N
0.22
10
Au ' 02
5.78
0.29
14
Sept
Oct' 02
111111EMIN
111111111111111111111111
0.24
IIIIIBMIIIIO
22
Nov' 02
Dec' 02?
4.11
0.63
ISCE111
?
4.51
0.52
19
Page 2
Electronic Filing - Received, Clerk's Office, March 18, 2008
* * * * * AS 2008-008 * * * * *
EXHIBIT 2
Jan-03
536
0.37
17
Feb-03
5.66
0.92
43
Mar-03
1.26
56
A r-03
1.04
45
Ma -03
4.49
0.45
INNIMMON
MINIMaill
Se -03
5.46
0.29
13
Oct-03
5.35
0.48
21
Nov-03
3.52
0,28
8
Dec-03
Averag
3 A9
0.31
9
Jan-0
.111111111111111
Feb 04
Mar-04
5,78
0.80
38
A 1.-04
1111111M1111
0.32
15
May
-04alliaIIIIIIII
Au -04
4.82
0.21
8
Se -04
339
0.40
11
Oct-04
Nov-0
4.73
0,21
8
Dec-0
Averag
Jan-0
Feb-05
Mar-0
P
May-O
111111111
Jun O
Jul
-O
Au -O
Se -05
IIIIIIEEUIIIII
0.28
0.24
14
Oct-OS
11
Nov-05
4.87
0.77
31
1111.31.111
37
Dec-05
4.94
1.26
Average
5.58
0.81
Page 3
Electronic Filing - Received, Clerk's Office, March 18, 2008
* * * * * AS 2008-008 * * * * *
EXHIBIT 2
Jan-06?
IIIIIEMIIMI?
1.05
46
Feb-06?
5.19?
0.67
29
11111111M111
19
Mar-06
4.64
0A5
A r-06
4.84
0.46
Ma -06
4.81
0.63
25
Jun-06
4.69
0.56
Jul-06
4.73
2,18
86
Au -06
5.47
0.27
12
Se -06
5.17
0.38
16
IIIIIEIIIII
11111111.1111
38
Oct-06
3.29
0.43
Nov-06
3.98
0.44
Dec-06
1110n=
Jan-07
5.50
0,83
4.80
0.70
28.10
5.40
0,57
26
Feb-07
5.30
1.02
45
Mar-07
5.75
1.67
80
A r-07
4,84
0.53
21
Ma -07
5,95
0.57
28
11111111,0111111
111111=1.11
IIIIIMEMI
Jun-07
5 .93
0.43
Jul-07
11=31
4.35
0.33
IIIIIIIIIMIIIMIIIIIIIIIIMIMNIIIIIIIIIIII
5.36
0.73
g:nh398-Influent data
Page 4
Electronic Filing - Received, Clerk's Office, March 18, 2008
* * * * * AS 2008-008 * * * * *
EXHIBIT 2
CITGO REFINERY
Effluent Ammonia, Ph, and Temperature
Date
Flow
Efraimm
Ave Lbs NH3N
0.48?
IIIIIIIEIIIIIIIIIIIM
WEE
T
-
CM D
Jan' 97
4.31
65
Feb' 97 4.95
0.59?24
11 1111111111111
2.13?43
7.1
?
67
7.4
?
86
'97
May
Mar
June' 97
Jul
?
' 97
2.43
AU2 '
97
3.43
0.69
11111=1111111111111111111
20
34
IME11111111111EMIlailll
IIIIIIIIIIIIIIII
7.4
111111111111111111
84
Se
t '
97
3.06
6.69
82
Oct' 97
2.82
0.56
IIIII
1.3
111111111.1111111
Ell
A r ' 98
4.18
1.07
Ma ' 98
OEM
2.18
111111111131111111111111/9M1
68
I
Mil
sis
80
111111111111111111111111111111
IIIIIMIMIIIIIIIIIIIIIIIIIIIIIIIII
Averag
Jan' 99
Mar'
9
P
III
June ' 99
4.32
0.8
29
7.15
82.2
1111111.111111111111111111
Oct ' 99
3.48
0.58
ININE11111111
6.8
72.6
Nov ' 99
3.37
11.111M1.11
43
6.75
70.4
Dec ' 99
2.97
2.86
71
6.8
60.9
Average
2.46
64
Page 1
Electronic Filing - Received, Clerk's Office, March 18, 2008
* * * * * AS 2008-008 * * * * *
EXHIBIT 2
Jan' 00
3.45
2.64
76
6.8
66.1
Feb ' 00
4.31
2.16
78
6.7
69.6
Mar' 00
3.98
4.10
136
6.8
72.4
Apr' 00
4.82
2.18
88
6.7
71.4
May' 00
5.42
1.03
47
7.1
78.0
June' 00
5.68
2.79
132
7,1
77.9
fillallaillEMIIIII
Oct' 00
3.14
0.48
IIIIIIIII
75.9
Nov' 00
0.71
IIIIIIIEIIIIIII
7.0
68.9
111
P
1111111111
16
11111111111111111
6.7
85.0
Ma?
Ol.
M
June' 01
2.88
0.68
Jul?
' 01
3.08
1.39
36
6.8
88.6
Au• ' 01
3.33
0.52.
14
6.8
84.6
Se t ' 01
3.01
0.75
19?6.7
76.4
IIIIIIIIIIIIIIIIIIIIIIIIIIIIIIIIII
111111111111111111111111111
111111
•
1111111111111111111111111111
A r ' 02
4.64
1.67
65
7.4
mem
7.2
111111111111M111
MEM
87.7
83.2
Ma ' 02
4.53
0.95
IIIIIIIIIIIIIIIIIIIIIIIII
0.32
36
Au?
' 02
3.87
10
Seat' 0
1.10
34
11111.1111.11
Page 2
Electronic Filing - Received, Clerk's Office, March 18, 2008
* * * * * AS 2008-008 * * * * *
EXHIBIT 2
Jan-03
4.29
3.16
113
7.0
62.8
a
Ma
Ap
-0
111.11
MI
Au -03
5.03
5.07
111111.111111111111111111111111
11111111111111111111111
0.51
21
5.08
111111MIN
6.6
6.4
86.9
70.8
MEM
Sep 0
Nov-03
lial=
Dec-03
2.89
7.99
193
2.85
99
6.6
MINEI
11111111111111
Ma -04
4.98
0.49
20
6.5
79.5
Jun-04
EMI
0.29
111.11111MIN
6.6
82.4
MEM
al
Oct-04
3.39
3.14
89
6.9
73.6
Nov-04
2.89
12.10
292
6.5
72.2
Dec-04
5.05
4.72
199
6.5
67.2
2.29
11111133111111
111111111111111
80
.111111
6A
IIIIIIIIIM
Jan-05
5.90
67.4.
EIIEIEIMIIIIIIIIIMI
Ma -05
3.86
0.57
18
7.6
Jun-05
3.67
0.65
20
7.6
86.5
Jul-05
3.89
8.79
285
IIIIIIIIIIIIIIIIIIM
87.7
Mill
74.4
71.0
1111111.111111111111
68.1
Page 3
Electronic Filing - Received, Clerk's Office, March 18, 2008
* * * * * AS 2008-008 * * * * *
EXHIBIT 2
Jan-06
5A0
5.56
250
7.38
72.1
Feb-06
5.19
9.31
403
7.56
71.8
Mar-06
4.60
7.49
287
7.38
73.4
A ,r-06
4.81
7.07
284
7.43
76.5
Ma -06
4.14
6.99
241
7.24
79.0
Jun-06
4.36
0.71
26
7.58
82.8
Jul-06
3.67
2.44
IIIIIIEIIIIII
7.64
88.0
Au -06
4.55
o.4o
1111111011111111111
7.5o
88.6
Se -06
5.28
0.60
26
7.36
79.9
MBE
70.4
Oct-06
4.40
0.44
16
7.60
Nov-06
3.62
Mil
0.58
18
Dec-06
5.89
0.42?
Illiffaill
7.56
68.9
lial=11
3.50?139
Ma -07
111111111111111
4.43?
111111EMIll?
95
7.4
86.3
IIIIIIIIIIIIIIIIIIIIIIIIIIIIIIIIIIIIIIIIIIIIIIIMIIIIIII
MIIIIIIIIIIIIIIIIIIII.
IIIIIIIMINIMNMNIIIIIIIIIIIIUIMIIIIIIIIIIIIIIIIIIIIIIII
g:nh398-effluent data
Page 4
Electronic Filing - Received, Clerk's Office, March 18, 2008
* * * * * AS 2008-008 * * * * *
EXHIBIT 2
APPENDIX C
USGS AND MWRDGC DATA - 1999 TO 2006
Electronic Filing - Received, Clerk's Office, March 18, 2008
* * * * * AS 2008-008 * * * * *
EXHIBIT 2
05536995 DATA: Chemical and Microbiological Tables, 1999
Page 1 of 3
Station list Available data
ILLINOIS RIVER BASIN
05536995 CHICAGO SANITARY AND SHIP CANAL AT ROMEOVILLE, IL
LOCATION.--Lat
41°38'26", long 88°03'38", in SE1/4SW1/4 sec.35, T.37 N., R.10 E., Will County, Hydrologic Unit 07120004, on left
bank 40 ft upstream from bridge on Romeoville Road in Romeoville, 5.2 mi upstream from Lockport Lock and Dam, and at mile 6.2.
DRAINAGE AREA.--739
mil.
PERIOD OF RECORD.--Water
years 1974-77, 1987-92, March to September 1999.
WATER-QUALITY
AGENCY?
‘f. AGENCY
ANA.
?COL-
LYZING?LECT1NG
SAMPLE?
SAMPLE
DATE?
(CODE
?
(CODE
NUMBER)
?NUMBER)
DIS-
CHARGE,
INST.
CUBIC
FEET
PER
SECOND
BARO-
METRIC
PRES-
SURE
(MM
OF
HG)
OXYGEN,?
PH
DIS-?
WATER?
SPE-
SOLVED?
WHOLE
?
CIFIC
(PER-
?
OXYGEN,?FIELD
?
CON-?
TEMPER-
?TEMPER-
CENT?
DIS-?
(STAND-?
DUCT-?
ATURE?
ATURE
SATUR-?
SOLVED?
ARD?
ANCE
?
AIR?
WATER
ATION)?(MG/L)?
UNITS)?
(US/CM)?
(DEG C)?
(DEG C)
(00028)
(00027)
(00061)
(00025)
(00301)
(00300)
(00400)
(00095)
(00020)
(00010)
MAR 1999
02,..
80020
81700
2410
744
60
6,6
7.7
1200
5.0
9.7
APR
07...
80020
81700
1700
747
58
5,7
7,5
1160
11,0
15.0
MAY
04...
80020
81700
2660
741
73
7,0
75
929
22,0
15.6
.TUN
17.,.
80020
80020
6200
753
7.4
16,0
JUL
06..,
80020
81700
2680
745
42
3,2
7.3
715
28.5
27,2
27...
80020
81700
3150
744
43
3.3
7.0
575
313
28,1
AUG
30...
80020
81700
6320
751
60
4.7
7.1
652
21.5
26.3
SEP
28,..
80020
81700
8910
746
47
4.0
7,1
729
17,0
22.2
HARD-
ALKA-
BICAR-
HARD-
NESS
MAGNE-
POTAS-
SODIUM
UNITY
BONATE
CHLO-
NESS
TOTAL
NONCARB
DISSOLV
CALCIUM
DIS-
SIUM,
DIS-
SIUM,
DIS-
AD-
SORP-
SODIUM,
DIS-
WAT DIS
TOT IT
WATER
DIS IT
RIDE,
DIS-
(MG/L
FLD. AS
SOLVED
SOLVED
SOLVED
TION
SOLVED
FIELD
FIELD
SOLVED
DATE
AS
CACO3 )
CACO3
(MG/L)
(MG/I.,
AS CA)
(MG/L
AS MG)
(MG/L
AS K)
RATIO
(MG/L
AS NA)
MG/L AS
CACO3
MG/L AS
HCO3
(MG/L
AS CL)
(00900)
?
(00904)?(00915)
?
(00925)?
(00935)?(00931)?(00930)?
(39086)?
(00453)?
(00940)
MAR 1999
http://pubs.usgs.gov/wdr/2004/wdr-i1-04/data/chem1999/05536995.htm
10/16/07
Electronic Filing - Received, Clerk's Office, March 18, 2008
* * * * * AS 2008-008 * * * * *
EXHIBIT 2
05536995 DATA: Chemical and Microbiological Tables, 1999
Page 2 of 3
02...
240
97
61
22
6.4
4
147
44
175
240
APR
07...
280
120
68
26
7,0
3
122
195
190
MAY
04...
230
89
60
25
5,5
2
83
662
197
130
JUN
17..,
180
73
44
17
5,0
2
65
114
135
99
JUL
06,,.
200
77
52
18
6,7
2
69
128
156
100
27...
160
55
41
14
4.8
2
54
106
130
27
AUG
30..,
170
57
44
16
5.7
2
60
118
143
77
SEP
28...
180
65
44
16
7,2
2
68
112
138
85
NITRO-
NITRO-
NITRO-
NITRO-
NITRO-
NITRO-
FLUO-
RIDE,
DIS-
SILICA,
DIS.
SOLVED
SULFATE
DIS-
GEN,
AMMONIA
DIS-
GEN,AM-
MONIA
+
ORGANIC
GEN,AM-
MONIA
+
ORGANIC
NITRO-
GEN
DIS-
GEN,
NITRATE
DIS-
GEN,
NO2+NO3
DIS-
GEN,
ORGANIC
DIS-
SOLVED
(MG/L
SOLVED
SOLVED
DIS.
TOTAL
SOLVED
SOLVED
SOLVED
SOLVED
DATE
(MG/I,
AS F)
AS
5102)
(MG/L
AS SO
4
)
(MGT.
AS N)
(MG/L
AS N)
(MG/L
AS N)
(MG/L
AS N)
(MG/L
AS N)
(MG/L
AS N)
(MG/L
AS N)
(00950)
(00955)
(00945)
(00608)
(00623)
(00625)
(00602)
(00618)
(00631)
(00607)
MAR 1999
02...
.82
4,9
94
1,47
2.7
2,2
7,6
4.62
4.92
1.2
APR
07,..
.91
4,9
110
.534
.93
1,6
8.8
7.74
7,90
.40
MAY
04...
,57
6.1
86
.317
.94
.94
4.6
3.58
3.69
.62
JUN
17...
.54
5.0
60
410
1.2
1,2
5.1
3.81
3,91
.81
JUL
06_,
.71
4.3
70
.391
.95
1,0
5.3
4.19
4.36
.56
27„.
,62
3.7
59
.383
.95
.97
4.1
3.07
3,17
,57
AUG
30„.
,70
4.7
62
.342
.88
1.4
4,9
3.86
3.98
SEP
28...
.91
3.6
M
,1 I 5
1.1
2.0
7.9
6.64
6,84
NITRO-
GEN,
ORGANIC
TOTAL
NITRO-
GEN,
TOTAL
NITRO-
GEN,
NITRITE
DIS-
SOLVED
PHOS-
PHATE,
ORTHO,
DIS-
SOLVED
PHOS-
PHORUS
DIS-
SOLVED
PHOS-
PHORUS
ORTHO,
DIS-
SOLVED
PHOS-
PHORUS
TOTAL
GAGE
SOLIDS,
RESIDUE
AT 180
DEG. C
IRON,
DIS-
SOLVED
DATE
(MG/L
(MG/L
(MG/L
(MG/L
(MG/L
(MG/L
(MG/L
HEIGHT
SOLVED
(UG/L
AS N)
AS N)
AS N)
AS PO
4
)
AS P)
ASP)
AS P)
(FEET)
(MG/L)
AS FE)
(00605)
(00600)
(00613)
(00660)
(00666)
(00671)
(00665)
(00065)
(70300)
(01046)
MAR 1999
02...
,73
7.1
.306
3.4
1.17
1.11
1.20
25.59
714
33
APR
07...
1,1
9.5
.162
4.8
,091
1.55
1.67
25,52
682
25
MAY
04.,.
.62
4,6
.111
1.6
,539
.515
.629
25.64
546
38
JUN
17...
.83
5.2
.104
1,6
.650
.538
.716
24.71
427
24
http://pubs.usgs.gov/wdr/2004/wdr-i1-04/data/chem1999/05536995.htm
10/16/07
Electronic Filing - Received, Clerk's Office, March 18, 2008
* * * * * AS 2008-008 * * * * *
EXHIBIT 2
05536995 DATA: Chemical and Microbiological Tables, 1999
?
Page 3 of 3
JUL
06,..
.60
5,4
.171
2,7
1,02
.883
1.04
25,53
448
E9,0
27,..
,59
4.1
.105
1,8
.610
.592
.742
25.81
338
18
AUG
30,,.
.96
5.3
.120
3.3
1.05
LO7
.972
24,86
37
12
SEP
28,
1.9
8.9
200
5,4
2.05
1.77
2.66
25.21
427
16
SED.
QUALITY
MANGA-
SUSP.
NUMBER
ASSUR-
NESE,
DIS-
SOLVED
SEDI-
MENT,
SUS-
SIEVE
DIAM.
%
FINER
OF
SAM-
FLING
PURPOSE
SITE
ANCE
DATA
INDICA-
REP-
LICATE
SAMPLE
SAMPLER
SAM-
FLING
DATE
(UG/L
AS MN)
FENDED
(MG/L)
THAN
.062 MM
POINTS
(COUNT)
VISIT,
(CODE)
TOR
CODE
TYPE
(CODE)
PURPOSE
CODE
TYPE
(CODE)
METHOD,
CODES
(01056)
(80154)
(70331)
(00063)
(50280)
(99111)
(99105)
(71999)
(84164)
(82398)
MAR 1999
02...
34
67
95
5
1001
1
15,00
3060
10
APR
07,..
31
112
98
3
1001
1
-
15.00
3060
10
MAY
04...
26
77
100
6
1001
30
30,00
15,00
3060
10
JUN
17...
27
63
100
6
1001
1
15.00
3060
10
JUL
06,.,
27...
22
25
66
59
95
97
3
3
1001
1001
1
15,00
15,00
3060
3060
10
10
AUG
30...
25
57
95
3
1001
15.00
3060
10
SEP
28...
17
195
92
6
1003
1
15.00
3052
10
Table of Contents Introduction Station Descriptions Surface-Water Data Ground-Water Data Meteorological Data Biological Data
http://pubs.usgs.gov/wdr/2004/wdr-11-04/data/chem1999/05536995.htm
10/16/07
Electronic Filing - Received, Clerk's Office, March 18, 2008
* * * * * AS 2008-008 * * * * *
EXHIBIT 2
05536995 DATA: Chemical and Microbiological Tables, 2000
Page 1 of 4
Station list Available data
ILLINOIS RIVER BASIN
05536995 CHICAGO SANITARY AND SHIP CANAL AT ROMEOVILLE, IL
LOCATION.--
Lat 41°38'27", long 88°03'35", in SE1/4SW1/4 sec.35, T.37 N., R.10 E., Will County, Hydrologic Unit 07120004, on left
bank 40 ft upstream from bridge on Romeoville Road in Romeoville, 5.2 mi upstream from Lockport Lock and Dam, and at mile 6.2.
DRAINAGE AREA.--
739 mi2.
PERIOD OF RECORD.-
-
SURFACE-WATER DISCHARGE AND STAGE
DISCHARGE: October 1984 to current year.
STAGE: Water years 1994-2000.
SURFACE-WATER QUALITY
CHEMICAL: Water years 1987-92 and 1999-2000.
WATER TEMPERATURE: Water years 1974-77.
REVISED RECORDS.--
WDR IL-86-2: 1985. WDR IL-89-2: 1986. WDR IL-92-2: 1986-89.
GAGE.-- Acoustical flowmeter and phone telemeter. Datum of gage is 551.89 ft above sea level (U.S. Army Corps of Engineers bench
mark).
REMARKS.--
Estimated daily discharges determined from a regression relation between present site and the previous site 5.2 mi
downstream.
This gaging station provides flow data essential to determine Illinois' diversion of Lake Michigan water. A U.S. Supreme Court Decree limits
Illinois' diversion to an average of 3,200 ft
3/s. Illinois' diversion includes water diverted from the lake for domestic water supply, for
navigation and water-quality improvement in the Chicago Sanitary and Ship Canal system, and the stormwater runoff from a 673 mi
2
diverted
watershed area. Flows recorded at this station also include nondiversion flows.
EXTREMES FOR PERIOD RECORD.-
-
SURFACE-WATER DISCHARGE AND STAGE: Maximum discharge, 19,466 ft 3
/s, Feb. 21, 1997, gage-height, 23.95 ft; maximum gage-
height, 26.43 ft, Feb. 4, 1996; minimum discharge, no flow or periods of reverse flow at times in most years.
REMARKS FOR CURRENT YEAR.--
Sampled as part of the Upper Illinois River Basin (UIRB) National Water Quality Assessment
Program (NAWQA).
http://pubs.usgs.gov/wdr/2004/wdr-i1-04/data/chem2000/05536995.htm
10/16/07
Electronic Filing - Received, Clerk's Office, March 18, 2008
* * * * * AS 2008-008 * * * * *
EXHIBIT 2
05536995 DATA: Chemical and Microbiological Tables, 2000
Page 2 of 4
SURFACE-WATER QUALITY
DIS-
BARD-
PH
AGENCY
ANA-
AGENCY
COL-
CHARGE,
INST.
NUMBER
OF
METRIC
PRES-
WATER
WHOLE
SPE-
CIFIC
LYZING
SAMPLE
LECTING
SAMPLE
GAGE
CUBIC
FEET
SAM-
FLING
SURE
(MM
OXYGEN,
DIS-
FIELD
(STAND-
CON-
DUCT-
TEMPER-
ATURE
TEMPER-
ATURE
DATE
TIME
(CODE
(CODE
HEIGHT
PER
POINTS
OF
SOLVED
ARD
ANCE
AIR
WATER
NUMBER)
NUMBER)
(FEET)
SECOND
(COUNT)
HG)
(MG/L)
UNITS)
(US/CM)
(DEG C)
(DEG C)
(00028)
(00027)
(00065)
(00061)
(00063)
(00025)
(00300)
(00400)
(00095)
(00020)
(00010)
OCT 1999
05...
NOV
1530
80020
81700
25.65
2460
6
746
4,9
7.4
595
19.0
17,6
02...
1525
80020
81700
25,59
1740
6
741
5,2
7,7
815
7,0
16,5
DEC
07,..
1520
80020
81700
25.66
2180
3
743
6.2
7,7
589
6,5
10.9
JAN 2000
04..,
1500
80020
81700
25.54
1820
6
743
10.0
7,8
898
-2.5
9,9
FEB
01._
1520
80020
81700
25,57
1780
6
750
11.4
7.3
1470
-1,0
7,0
MAR
07,
1410 80020
1028
25.58
870
3
743
4,9
7.4
1410
25.0
14,1
APR
04.,.
1520
80020
81700
25,78
1080
6
745
7,9
7,1
1160
7.0
15,3
20.,,
1200
80020
81700
20,92
13400
6
734
5,5
7,0
974
17.0
14,7
MAY
02...
1515
80020
81700
25,64
2060
6
750
5.1
7.2
1160
23.0
18,2
JUN
1600
80020
81700
25.49
2140
6
743
3,7
7,2
818
33.0
20,1
27,.
1425
80020
81700
24,20
6460
6
745
4.0
7.1
628
24.5
23.3
AUG
1800
80020
81700
25.36
3340
743
4.1
7.1
662
31.5
25,1
SEP
1235
80020
1028
25,18
5030
6
755
5.2
7.5
622
23.0
25,2
ALKA-
BICAR-
NITRO-
NITRO-
MAGNE-
CALCIUM
SLUM,
DIS-
DIS-
POTAS-
SLUM,
DIS-
SODIUM,
DIS-
UNITY
WAT DIS
TOT IT
BONATE
WATER
DIS IT
CHLO-
RIDE,
DIS-
FLUO-
RIDE,
DIS-
SILICA,
DIS-
SOLVED
SULFATE
DIS-
GEN,
AMMONIA
DIS-
CigN,Am-
MONIA
+
ORGANIC
DATE
SOLVED
SOLVED
(MG/L
(MG/L
SOLVED
(MG/L
SOLVED
(MG/L
FIELD
MG/L AS
FIELD
MG/L AS
SOLVED
(MG/L
SOLVED
(MG/L
(MG/L
AS
SOLVED
(MG/L
SOLVED
(MG/L
DIS,
(MG/L
AS CA)
AS MG)
AS K)
AS NA)
CACO3
HCO3
AS CL)
AS F)
5102)
AS SO
4
)
AS N)
AS N)
(00915)
(00925)
(00935)
(00930)
(39086)
(00453)
(00940)
(00950)
(00955)
(00945)
(00608)
(00623)
OCT 1999
05...
41.0
14.0
6,1
54,8
103
126
75,2
.6
4,2
64,8
<.020
1,2
NOV
02,..
51.6
18.0
9.4
82,0
131
160
104
1.1
5.1
94.9
1.57
2.4
DEC
07...
36.3
12.6
5.6
61.3
87
106
70.3
.6
3.7
76.1
.640
1,4
JAN 2000
04.,.
52.2
18.8
9.6
103
130
159
138
1.1
4.7
99.1
,389
1.3
FEB
01...
59.1
20.1
9.6
232
130
158
325
1,1
5.2
110
476
1,4
MAR
07...
69.1
26.1
7.9
172
165
201
289
.9
5.8
105
1.25
2.1
APR
http://pubs.usgs.gov/wdr/2004/wdr-i1-04/data/chem2000/05536995.htm
10/16/07
Electronic Filing - Received, Clerk's Office, March 18, 2008
* * * * * AS 2008-008 * * * * *
EXHIBIT 2
05536995 DATA: Chemical and Microbiological Tables, 2000
Page 3 of 4
04..,
64.5
23,3 10,1 129
146
178
195
1.1
5,2
116
1.95
3,0
20...
51.6
19,5 6,9
111
125
152
174
.8
4.4
78,3
.576
1.3
,MAY
02... 71.4
27,0
7.9
124
169
206
192
.7
6,2
111
.370
1,2
JUN
08_
49.1
18.9
5.5
74,9
138 168
115
,5 4.7
73.0
.298
1.0
AUG 27...
42.3
15.5 4.8
55,7
108
131
80.2
.5 6.2
51.7
,130
1.2
SEP 01,..
43.4
15.5 5.6
66.8
118
144
86.5
,6
3.7
74,4
.380
1,1
06,..
?
48.7
16.3
5.6
56.3
68.6
,7
3.0
66.6
.151
NITRO-
NITRO-
NITRO-
NITRO-
NITRO-
PHOS-
PHOS-
GEN,A1M-
NITRO-
GEN,
GEN,
GEN,
NITRO-
GEN,
PHATE,
PHOS-
PHORUS
MONIA +
GEN
NITRATE
NO2+NO3
ORGANIC
GEN,
NITRO-
NITRITE
ORTHO,
PHORUS
ORTHO,
PHOS-
ORGANIC
DIS- DIS-
DIS-
DIS-
ORGANIC
GEN,
DIS-
DIS-
DIS-
DIS-
PHORUS
TOTAL
SOLVED
SOLVED
SOLVED
SOLVED
TOTAL
TOTAL
SOLVED
SOLVED
SOLVED
SOLVED
TOTAL
DATE
(MG/L
(MG/L (MG/L
(MG/L
(MG/L
(MG/L
(MG/L
(MG/L
(MG/L
(MG/L
(MG/L
(MG/L
AS N)
AS N)
AS N)
AS N)
AS N) AS N)
AS N)
AS N)
AS PO
4
)
ASP)
ASP)
AS P)
OCT 1999
(00625)
(00602)
(00618)
(00631)
(00607)
(00605)
(00600)
(00613)
(00660)
(00666)
(00671)
(00665)
05...
.98
5.6
4.24
4,36
-
-
5.3
.119
2,23
.883
,726
.981
NOV
02...
2,5
10
7,54
7.82
.80
.88
10
.281
5.90
2.28
1,92
2,22
DEC
07„.
1.6
6,3
4,71
4,86
76
.94
6.4
.142
4,62
1.55
1,51
1,68
JAN 2000
1.4
8,4
6.89
7.11
.90
1,0
8.5
.219
3,77
1.36
1.23
1.49
FEB
01...
1,5
8.5
6.78
7,14
,90
1.0
94
,355
4.65
1,81
1,52
1.95
MAR
07...
2.4
8.1
5.71
5,95
,89
1.2
8.4
.236
2.57
.996
.837
1.09
APR
04...
3.1
9.9
6.66
6.99
1.0
1.2
10
,327
5.38
1.97
1.75
2.16
20_
2.7
6.3
4.83
5,01
.72
2.1
7.7
.185
2,26
,857
.736
2.12
MAY
02...
1.3
8,1
6.80
6.91
79
.92
8.2
.111
2 68
.954
.875
.134
JUN
08.„
1.1
5,1
3,95
4,07
.70
.84
5.2
.122
1.96
,742
.638
,854
1,4
6,3
4,90
5.16
1.0
1.2
6,5
.256
1.89
.757
.615
.895
AUG
01.,.
1.1
6.0
4,85
4,98
.67
,71
6.1
,131
3.13
1.17
1,02
1.28
SEP
06..,
1.1
5,9
5,13
5.21
58
97
6,3
.080
4.86
1.66
1.59
1.78
SOLIDS,
SED.
QUALITY
RESIDUE
MANGA-
SUSP,
ASSUR-
AT 180
IRON, NESE,
SEDI-
SIEVE
ANCE
DEG. C
DIS-
DIS-
MENT,
DIAM,
PURPOSE
DATA
REP-
SAM-
DM-
SOLVED
SOLVED SUS-
% FINER SITE
INDICA-
LICATE
SAMPLE
SAMPLER
PLING
DATE
SOLVED (UG/L
(UG/L
FENDED
THAN
VISIT,
TOR
TYPE
PURPOSE
TYPE
METHOD,
(MG/L)
AS FE)
AS MN)
(MG/L)
.062 MM
(CODE)
CODE
(CODE) CODE
(CODE)
CODES
(70300)
(01046)
(01056)
(80154)
(70331)
(50280)
(99111)
(99105) (71999)
(84164) (82398)
OCT 1999
05..
348
20 18 57
95
1001
1
-
15,00
3060
10
hap://pubs.usgs.gov/wdr/2004/wdr-i1-04/data/chem2000/05536995.htm
10/16/07
Electronic Filing - Received, Clerk's Office, March 18, 2008
* * * * * AS 2008-008 * * * * *
EXHIBIT 2
05536995 DATA: Chemical and Microbiological Tables, 2000
Pa
g
e 4 of 4
NOV
02...
DEC
07.
JAN 2000
04..
FM
01...
MAR.
07„,
APR.
04.„
20,-
MAY
02...
JUN
08._
27.,.
AUG
01...
SEP
06...
492
353
561
572
842
684
568
694
472
377
411
363
20
40
40
40
30
30
30
20
10
30
10
Et 0
23
26
16
27
59
14
37
27
23
18
13
75
62
77
146
104
138
257
f
132
92
' 47
k
95
94
98
94
95
92
97
74.
98
95
96
100
95
t001
1001
1001
1001
1001
1001
1003
1001
1001
1001
1001
1001
1
1
1
1
1
1
10
30
20.00
15.00
15.90
15.00
15.00
Mt*
15.00
ts.00
15.00
15.00
3060
3060
3060
3060.
3.053
3060
3060
3060
3060
3052
10
10
10
10
10
10
10
'10
10
10
Table of Contents Introduction Station Descriptions Surface-Water Data Ground-Water Data Meteorological Data Biological Data
h
p://pubs.usgs.gov/wdr/2004/wdr-i1-04/data/chern7000/05536995.htm
10/16/07
Electronic Filing - Received, Clerk's Office, March 18, 2008
* * * * * AS 2008-008 * * * * *
EXHIBIT 2
05536995 DATA: Chemical and Microbiological Tables, 2001
Page 1 of 3
Station list Available data
ILLINOIS RIVER BASIN
05536995 CHICAGO SANITARY AND SHIP CANAL AT ROMEOVILLE, IL
LOCATION.-- Lat 41°38'27", long 88°03'35", in SE1/4SW1/4 sec.35, T.37 N., R.10 E., Will County, Hydrologic Unit 07120004, on left
bank 40 ft upstream from bridge on Romeoville Road in Romeoville, 5.2 mi upstream from Lockport Lock and Dam, and at mile 6.2.
DRAINAGE AREA.--
739 mi2.
PERIOD OF RECORD.-
-
SURFACE-WATER DISCHARGE AND STAGE
DISCHARGE: October 1984 to current year.
STAGE: Water years 1994-2001.
SURFACE-WATER QUALITY
CHEMICAL: Water years 1987-92 and 1999 to current.
WATER TEMPERATURE: Water years 1974-77.
REVISED RECORDS.--
WDR IL-86-2: 1985. WDR IL-89-2: 1986. WDR IL-92-2: 1986-89.
GAGE.-- Acoustical flowmeter and phone telemeter. Datum of gage is 551.89 ft above sea level (U.S. Army Corps of Engineers bench
mark).
REMARKS.--
Estimated daily discharges determined from a regression relation between present site and the previous site 5.2 mi
downstream. This gaging station provides flow data essential to determine Illinois' diversion of Lake Michigan water. A U.S. Supreme Court
Decree limits Illinois' diversion to an average of 3,200 ft
3 /s. Illinois' diversion includes water diverted from the lake for domestic water
supply, for navigation and water-quality improvement in the Chicago Sanitary and Ship Canal system, and the stormwater runoff from a 673
mi2 diverted watershed area. Flows recorded at this station also include nondiversion flows.
EXTREMES FOR PERIOD RECORD.-
-
SURFACE-WATER DISCHARGE AND STAGE: Maximum discharge, 19,466 ft
3 /s, Feb. 21, 1997, gage-height, 23.95 ft; maximum gage-
height, 26.43 ft, Feb. 4, 1996, discharge, 2,876 ft
3
/s; minimum discharge, no flow or periods of reverse flow at times in most years.
REMARKS FOR CURRENT YEAR.--
Sampled as part of the Upper Illinois River Basin (UIRB) National Water Quality Assessment
Program (NAWQA).
http://pubs.usgs.gov/wdr/2004/wdr-i1-04/data/chem2001/05536995.htm
10/16/07
Electronic Filing - Received, Clerk's Office, March 18, 2008
* * * * * AS 2008-008 * * * * *
EXHIBIT 2
05536995 DATA: Chemical and Microbiological Tables, 2001
Page 2 of 3
SURFACE-WATER QUALITY
DIS-
OXYGEN,
PH
AGENCY
AGENCY
CHARGE,
DIS-
WATER
SPE-
MAGNE-
ANA-
COL-
INST.
SOLVED
WHOLE
CIFIC
CALCIUM
S1UM,
LYZING
LECTING
CUBIC
OXYGEN,
(PER-
FIELD
CON-
TEMPER-
TEMPER-
DIS-
DIS-
SAMPLE
SAMPLE
GAGE
FEET
DIS-
CENT
(STAND-
DUCT-
ATURE
ATURE
SOLVED
SOLVED
DATE
TIME
(CODE
(CODE
HEIGHT
PER
SOLVED
SATUR-
ARD
ANCE
AIR
WATER
(MG/L
(MG/L
NUMBER)
NUMBER)
(FEET)
SECOND
(MG/L)
ATION)
UNITS)
(US/CM)
(DEG C)
(DEG C)
AS CA)
AS MG)
(00028)
(00027)
(00065)
(00061)
(00300)
(00301)
(00400)
(00095)
(00020)
(00010)
(00915)
(00925)
OCT 2000
02...
1410
80020
81700
25,28
2660
-
-
7.6 705
28.0
20,4
54,7
18,3
NOV 2000
08_
1430
80020
81700
25.59
1340 6,4
68.2
7,3
845
8,0
17,1
52,8
19.0
DEC 2000
04._
1430
80020
81700
24.66
2450
8,0
71,7
7,4
917
2,5
10
58.4
20,8
JAN 2001
04-
1515
80020
81700
24.59
3960
7.3
61.1
7.2
2770
-2.0
6.2
65.6
22,5
FEB 2001
21-
1455
80020
81700
25,36
1770 9,0
74,2
7,5
1470
-3.0 6,5
77,6
30.7
ALKA-
BICAR-
SOLIDS,
NITRO-
NITRO-
NITRO-
NITRO-
POTAS-
UNITY
BONATE
CHLO-
FLUO-
SILICA,
RESIDUE
GEN,
GEN,AM-
GEN,AM-
GEN,
SLUM,
SODIUM,
WAT DIS
WATER
RIDE,
RIDE,
DIS-
SULFATE
AT 180
AMMONIA
MONIA +
MONIA +
NO2+NO3
DIS-
DIS-
TOT IT
DIS IT
DIS-
DIS-
SOLVED
DIS-
DEG. C
DIS-
ORGANIC
ORGANIC
DIS-
SOLVED
SOLVED
FIELD
FIELD
SOLVED
SOLVED
(MG/L
SOLVED
DIS-
SOLVED DIS.
TOTAL
SOLVED
DATE
WWI.
(MG/L
MG/L AS
MG/L AS
(MG/L
(MG/L
AS
(MG/L
SOLVED
(MG/L (MG/L
(MG/L
(MG/L
ASK)
AS NA)
CACO3
HCO3
AS CL)
AS F)
S103)
AS SO4 )
(MG/L)
AS N) AS N)
AS N)
AS N)
(00935)
(00930)
(39086)
(00453)
(00940)
(00950)
(00955)
(00945)
(70300)
(00608)
(00623)
(00625)
(00631)
OCT 2000
02...
5.64
67.1
130
159
84,2
4.8
66,6
412
.212
,77 ,88
4,54
NOV 2000
08..,
8.23
89.1
122
149 108
1,0
4.9
98.8
518
,237
.94
1,2
8.14
DEC 2000
04... 7.27
93,3
140 171
127 1.0
5.4
97,1 547
.566 ,36
1.9
7,16
IAN 2001
04,..
9.71
461
158
193
713
1,1
5,3 110 1580
2.57 3,6
3,8
4,42
FEB 2001
21.„
6.94
174
171
209 283 6.8
105 860
.890
1,7
1.8
5.34
NITRO-
PHOS-
SED.
GEN,
PHOS-
PHORUS
MANGA- SUSP,
NITRITE
PHORUS
ORTHO,
PHOS-
IRON,
NESE, SIEVE
SEDI-
DIS-
DIS-
DIS-
PHORUS
DIS- D1S-
DIAM.
MENT,
SOLVED
SOLVED
SOLVED
TOTAL
SOLVED SOLVED
% FINER
SUS-
DATE
(MG/L
(MG/L
(MG/L
(MG/L
(UG/L
(UG/L THAN
PENDED
AS N)
AS P) ASP)
ASP) AS FE)
AS MN)
.062 MM
(MG/L)
(00613) (00666)
(00671)
(00665)
(01046)
(01056)
(70331)
(80154)
OCT 2000
02,,.
.068
- .957
1,08
10
17.7
98
76
NOV 2000
08...
.116
2,12
2.26
2.54
20 19.5
92
95
DEC 2000
N...
.247
<.060
1.23
1,51
30
22,5 100
92
JAN 2001
04,..
.538
1,65
1.50
1,74
50
49,6
99
207
hap://pubs.usgs.gov/wdr/2004/wdr-i1-04/data/chem2001/05536995.htm
10/16/07
Electronic Filing - Received, Clerk's Office, March 18, 2008
* * * * * AS 2008-008 * * * * *
EXHIBIT 2
15
ND. No Daia
12
Lp
•111111111= 11•••••■•
1PCB Secondary Contact DO Standard
DO Shall Not be Less Than 40 mg/L
a
cc,
?
cc,
,
e
(to'.?
04
,
)
,6
?
z9?
'?
f
43›
.0.4c
to,-?
cc,
•
_
4t>
ke,
FIGURE 17: DISSOLVED OXYGEN CONCENTRATION MEASURED HOURLY
AT ROUTE 83 ON THE CHICAGO SANITARY & SHIP CANAL
FROM JANUARY 2002 THROUGH DECEMBER 2002
E
a)
E
1
0
0
U)
i5
Electronic Filing - Received, Clerk's Office, March 18, 2008
* * * * * AS 2008-008 * * * * *
EXHIBIT 2
12
IPCB Secondary Contact DO Standard
DO Shall Not be Less Than 4.0 mg/L
FIGURE 20: DISSOLVED OXYGEN CONCENTRATION MEASURED HOURLY
AT LOCKPORT POWERHOUSE ON THE CHICAGO SANITARY & SHIP CANAL
FROM JANUARY 2002 THROUGH DECEMBER 2002
15
(4,
0
q5s
"c,<`•
s
ez;
(
"‘?
‹6"`
.
;
" 4‘1)-
tz.%?
o9-?
o%?
cP?
`1'
?
tzi?
'?
O '?
fie
_
4(1,
o?
rt,
o?
oc)
?
o?
O''''
:\
'`'?
4„,..cri
m iry
t),?
,?
ai
r
1
miry
„A
e?
-..,
?
4
.).
?
?
6
.,
.0
?
.e.
?e
,,,40
6%.?
4'
.
Electronic Filing - Received, Clerk's Office, March 18, 2008
* * * * * AS 2008-008 * * * * *
EXHIBIT 2
0
%.?
0?
01'?
4:C
tf
t,q-
*
c
c.
?
4S'?
el,tr?
1-0
0?
?
rip
rv'''
,,..
ca
?
4§
?
c?,q:
,? Pl?
c,.
'<>°?
X>
?‘19?‘0
42PN'
A9
?
.4Q,CC?
$'''
,
s-?
4,..?
00
FIGURE 21: DISSOLVED OXYGEN CONCENTRATION MEASURED HOURLY
AT JEFFbRSON STREET ON THE DES PLAINES RIVER
FROM JANUARY 2002 THROUGH DECEMBER 2002
Electronic Filing - Received, Clerk's Office, March 18, 2008
* * * * * AS 2008-008 * * * * *
EXHIBIT 2
TABLE AI-16: WEEKLY DO SUMMARY STATISTICS AT ROUTE 83 ON THE CHICAGO SANITARY AND
SHIP CANAL FROM JANUARY 2002 THROUGH DECEMBER 2002
Monitoring Dates
Number of
DO Values
DO Concentration (mg/L)
Percent DO Values
Min
Max
Mean
Above Standard
01/01/02 - 01/06/02
144
7.4
8.3
7.8
100
01/07/02 - 01/13/02
168
6.7
8.2
7.5
100
01/14/02 - 01/20/02
167
5.5
7.0
6.4
100
01/21/02 - 01/27/02
168
5.5
7.3
6.4
100
01/28/02 - 02/03/02
168
6.0
7.2
6.5
100
02/04/02 - 02/10/02
168
6.4
7.9
7.0
100
02/11/02 - 02/17/02
168
6.0
8.1
6.7
100
02/18/02 - 02/24102
168
5.7
7.5
6.8
100
02/25/02 - 03/03/02
168
6.1
7.7
6.8
100
03/04/02 - 03/10/02
82
6.0
8.1
7.0
100
03/11/02 - 03/17/02
81
6.3
6.9
6.5
100
03/18/02 - 03/24/02
168
5.1
6.6
5.9
100
03/25/02 - 03/31/02
168
4.9
6.5
5.9
100
04/01/02 - 04/07/02
82
5.1
6.8
6.0
100
04/08/02 - 04/14/02
86
4.0
6.3
5.5
100
04/15/02 - 04/21/02
168
3.6
6.5
5.1
94
04/22/02 - 04/28/02
168
3.0
6.7
5.1
93
04/29/02 - 05/05/02
168
4.4
6.6
5.3
100
05/06/02 - 05/12/02
168
4.3
6.3
5.3
100
05/13/02 - 05/19/02
85
3.1
5.9
4.5
67
05/20/02 - 05/26/02
109
4.2
6.2
5.4
100
05/27/02 - 06/02/02
83
4.0
5.1
4.7
96
06/03/02 - 06/09/02
85
3.3
5.3
4.3
59
06/10/02 - 06/16/02
168
0.1
5.9
3.2
26
06/17/02 - 06/23/02
168
2.0
5.6
3.7
42
06/24/02 - 06/30/02
168
1.9
4.8
3.2
17
07/01/02 - 07/07/02
59
1.6
3.5
3.0
0
07/08/02 - 07/14/02
83
2.2
4.0
2.8
1
07/15/02 - 07/21/02
168
2.6
4.0
3.4
2
07/22/02 - 07/28/02
168
2.4
4.2
3.3
5
07/29/02 - 08/04/02
168
1.1
3.9
3.0
0
08/05/02 - 08/11/02
168
2.4
4.6
4.0
61
08/12/02 - 08/18/02
90
3.5
5.1
4.4
76
08/19/02 - 08/25/02
NO DATA
08/26/02 - 09/01/02
NO DATA
09/02/02 - 09/08/02
85
3.9
5.5
4.8
99
09/09/02 - 09/15/02
168
3.1
5.0
4.0
52
09/16/02 - 09/22/02
168
2.9
4.6
3.9
35
09/23/02 - 09/29/02
168
3.5
5.1
4.2
70
09/30/02 - 10/06/02
55
4.4
5.5
5.0
100
10/07/02 - 10/13/02
83
3.4
4.7
4.0
43
10/14/02 - 10/20/02
168
4.0
6.1
5.1
99
10/21/02 - 10/27/02
168
4.4
6.0
5.5
100
10/28/02 - 11/03/02
168
4.5
6.7
6.0
100
11/04/02 - 11/10/02
168
5.7
6.9
6.4
100
11/11/02 - 11/17/02
168
4.8
6.9
6.2
100
11/18/02 - 11/24/02
168
4.8
7.4
6.3
100
11/25/02 - 12/01/02
168
6.4
8.1
7.2
100
AI-31
Electronic Filing - Received, Clerk's Office, March 18, 2008
* * * * * AS 2008-008 * * * * *
EXHIBIT 2
TABLE AI-16 (Continued): WEEKLY DO SUMMARY STATISTICS AT ROUTE 83 ON THE CHICAGO
SANITARY AND SHIP CANAL FROM JANUARY 2002 THROUGH DECEMBER 2002
Number of
?DO Concentration fmg/L)
?
Percent DO Values
MonitodngDates
?
DO Values
?
Ivtih
?
Max?
Mean
?
Above Standard
12/02/02 -
12/08/02
168
7,2
8.3
7,8
100
12/09/02 - 12/15/02
168
6.1
7.8
7,1
100
12/16/02 - .12/22/02
168
6.2
83
7.1.
100
12/23/02 - 12/29/02
168
5.4
8.7
7.4
100
12/30/02 - 12/31/02
48
6.6
7.8
7,2
100
AI-32
Electronic Filing - Received, Clerk's Office, March 18, 2008
* * * * * AS 2008-008 * * * * *
EXHIBIT 2
TABLE A1-19: WEEKLY DO SUMMARY STATISTICS AT LOCKPORT POWERHOUSE ON THE CHICAGO
SANITARY AND SHIP CANAL FROM JANUARY 2002 THROUGH DECEMBER 2002
Monitoring Dates
Number of
DO Values
DQ Concentration (mg/L)
Percent DO Values
Min?
Max?
Mean
Above Standard
01/01/02 - 01/06/02
144
7.5
8.7
8.1
100
01/07/02 - 01/13/02
168
7.1
8.6
8.0
100
01/14/02 - 01/20/02
167
6.3
8.0
6.9
100
01/21/02 - 01/27/02
168
6.4
7.6
7.1
100
01/28/02 - 02/03/02
165
6.2
7.4
6.8
100
02/04/02 - 02/10/02
168
6.5
8.1
7.2
100
02/11/02 - 02/17/02
168
6.8
8.2
7.7
100
02/18/02 - 02/24/02
168
7.2
8.4
7.8
100
02/25/02 - 03/03/02
168
6.3
7.6
6.9
100
03/04/02 - 03/10/02
168
6.6
8.8
7.7
100
03/11/02 - 03/17/02
168
4.1
8.4
7.2
100
03/18/02 - 03/24/02
168
3.1
6.6
6.0
99
03/25/02 - 03/31/02
168
5.9
6.7
6.3
100
04/01/02 - 04/07/02
168
5.2
6.8
6.1
100
04/08/02 - 04/14/02
166
4.9
7.1
5.9
100
04/15/02 - 04/21/02
168
4.3
6.2
5.3
100
04/22/02 - 04/28/02
168
4.3
5.8
5.3
100
04/29/02 - 05/05/02
168
4.7
7.8
5.7
100
05/06/02 - 05/12/02
168
4.6
6.1
5.4
100
05/13/02 - 05/19/02
168
3.5
5.9
4.8
90
05/20/02 - 05/26/02
168
4.2
6.6
5.5
100
05/27/02 - 06/02/02
168
4.3
6.0
5.5
100
06/03/02 - 06/09/02
168
3.2
8.2
4.4
51
06/10/02 - 06/16/02
165
1.2
5.1
3.0
25
06/17/02 - 06/23/02
59
2.0
4.3
3.2
14
06/24/02 - 06/30/02
NO DATA
07/01/02 - 07/07/02
NO DATA
07/08/02 - 07/14/02
NO DATA
07/15/02 - 07/21/02
NO DATA
07/22/02 - 07/28/02
NO DATA
07/29/02 - 08/04/02
NO DATA
08/05/02 - 08/11/02
NO DATA
08/12/02 - 08/18/02
109
4.5
5.5
5.0
100
08/19/02 - 08/25/02
168
1.2
5.2
3.2
49
08/26/02 - 09/01/02
168
2.8
5.5
4.5
77
09/02/02 - 09/08/02
168
3_7
5.7
4.7
94
09/09/02 - 09/15/02
168
4.5
6.3
5.2
100
09/16/02 - 0922/02
168
4.0
5.3
4.5
99
09/23/02 - 09/29/02
168
17
4.8
4.2
72
09/30/02 - 10/06/02
168
4.0
5.1
4.5
99
10/07/02 - 10/13/02
168
3.2
5.7
4.6
84
10/14/02 - 10/20/02
167
4.3
5.4
4.9
100
10/21/02 - 10/27/02
167
4.9
5.8
5.5
100
1028/02 - 11/03/02
168
4.4
6.6
5.8
100
11/04/02 - 11/10/02
168
6.1
7.1
6.5
100
11/11/02 - 11/17/02
168
5.8
6.7
6.3
100
11/18/02 - 11/24/02
168
5.6
6.7
6.1
100
11/25/02 - 12/01/02
168
5.8
7.2
6.6
100
AI-37
Electronic Filing - Received, Clerk's Office, March 18, 2008
* * * * * AS 2008-008 * * * * *
EXHIBIT 2
TABLE Al-19 (Continued):
WEEKLY DO
SUMMARY STATISTICS AT LOCKPORT POWERHOUSE
ON
THE CHICAGO
SANITARY
AND SHIP
CANAL
FROM
JANUARY 2002 THROUGH
DECEMBER 2002
Number of
DO Concentration (mg/L?
?
Percent DO Values
Monitoring Dates
DO Values
Min
Max
Mean
Above Standard
12/02/02 - 12/08/02.
168
6.9
8.3
7.6
100
12/09/02 - 12/15/02
168
7.2
8.2
7.8
100
12/16/02 - 12/22/02
168
6.0
8.3
7.2
100
12/23/02 - 12/29/02
168
6.1
7.8
7.3
100
12/30/02 - 12/31/02
48
6.3
7.9
6.9
100
Electronic Filing - Received, Clerk's Office, March 18, 2008
* * * * * AS 2008-008 * * * * *
EXHIBIT 2
TABLE AI-20: WEEKLY DO SUMMARY STATISTICS AT JEFFERSON STREET ON THE DES PLAINES
RIVER FROM JANUARY 2002 THROUGH DECEMBER 2002
Monitoring Dates
Number of
DO Values
DO Concentration (mg/L)
Percent DO Values
Min
Max
Mean
Above Standard
01/01/02 - 01/06/02
144
9.0
10.6
9.8
100
01/07/02 - 01/13/02
168
8.9
11.1
9.9
100
01/14/02 - 01/20/02
168
8.0
10.6
8.9
100
01/21/02 - 01/27/02
168
8.0
10.5
9.0
100
01/28/02 - 02/03/02
168
7.3
10.2
8.5
100
02/04/02 - 02/10/02
168
8.2
11.1
9.3
100
02/11/02 - 02/17/02
168
8.3
12.1
9.9
100
02/18/02 - 02/24/02
168
8.0
12.3
9.5
100
02/2.5/02 - 03/03/02
168
8.0
11.5
9.3
100
03/04/02 - 03/10/02
168
8.0
12.0
9.8
100
03/11/02 - 03/17/02
168
7.7
10.7
9.3
100
03/18/02 - 03/24/02
168
7.0
11.7
8.8
100
03/25/02 - 03/31/02
168
7.2
11.7
8.9
100
04/01/02 - 04/07/02
168
6.3
12.3
8.6
100
04/08/02 - 04/14/02
167
6.2
10.3
8.1
100
04/15/02 - 04/21/02
168
5.7
8.6
6.8
100
04/22/02 - 04/28/02
168
5.8
8.8
7.1
100
04/29/02 - 05/05/02
168
6.3
10.9
7.5
100
05/06/02 - 05/12/02
168
5.2
8.9
7.2
100
05/13/02 - 05/19/02
168.
5.5
9.3
7.6
100
05/20/02 - 05/26/02
168
5.5
8.4
6.6
100
05/27/02 - 06/02/02
167
4.3
7.4
5.4
100
06/03/02 - 06/09/02
167
4.5
7.6
5.6
100
06/10/02 - 06/16/02
168
3.1
7.3
4.9
77
06/17/02 - 06/23/02
168
3.0
7.4
4.8
83
06/24/02 - 06/30/02
168
2.3
7.2
4.5
70
07/01/02 - 07/07/02
167
1.2
5.8
3.2
22
07/08/02 - 07/14/02
168
2.7
5.3
3.8
36
07/15/02 - 07/21/02
168
2.2
6.1
4.0
49
07/22/02 - 07/28/02
167
2.8
4.8
3.7
30
07/29/02 - 08/04/02
168
2.8
6.4
4.1
50
08/05/02 - 08/11/02
167
3.0
6.5
4.9
83
08/12/02 - 08/18/02
168
3.7
6.1
4.9
97
08/19/02 - 08/25/02
168
2.5
6.4
4.3
60
08/26/02 - 09/01/02
168
3.8
6.7
5.2
98
09/02/02 - 09/08/02
168
3.8
6.9
53
96
09/09/02 - 09/15/02
168
4.3
6.3
5.2
100
09/16/02 - 09/22/02
167
3.8
6.3
5.1
98
09/23/02 - 09/29/02
166
4.7
7.0
5.7
100
09/3W02 - 10/06/02
168
4.4
6.4
5.5
100
10/07/02 - 10/13/02
168
4.8
7.0
5.9
100
10/14/02 - 10/20/02
168
5.1
7.8
6.1
100
10/21/02 - 10/27/02
168
6.0
8.7
6.9
100
10/28/02 - 11/03/02
168
6.4
9.6
7.6
100
11/04/02 - 11/10/02
168
7.1
9.8
7.8
100
11/11/02 - 11/17/02
168
6.4
9.2
7.4
100
11/18/02 - 11/24/02
168
6.1
9.5
7.7
100
11/25/02 - 12/01/02
167
7.1
9.9
8.2
100
AI-39
Electronic Filing - Received, Clerk's Office, March 18, 2008
* * * * * AS 2008-008 * * * * *
EXHIBIT 2
TABLE AI-20 (Continued): WEEKLY DO SUMMARY STATISTICS AT JEFFERSON STREET ON THE DES
PLAINES RIVER FROM JANUARY 2002 THROUGH DECEMBER 2002
Number of
DO Concentration (mg/L1
Percent DO Values
Monitoring Dates
DO Values
Min
Max
Mean
Above Standard
12/02/02 - 12/08/02
167
8.3
10.6
9.2
100
12109/02 - 12/15/02
59
8.9
10.8
9.5
100
12/16/02 - 12/22/02
108
7.2
9.7
8.3
100
12/23/02 - 12/29/02
168
7.6
10.4
8.9
100
12/30/02 - 12/31/02
48
7.5
9.3
8.4
100
AI-40
Electronic Filing - Received, Clerk's Office, March 18, 2008
* * * * * AS 2008-008 * * * * *
EXHIBIT 2
r
Q
,
0
or
b
c
l
0
,
'
?
‘
0
iv
0
s
-,,A
V "?
AcP
e
?
t
4:',FI
sC'
et
?
t
?
e
,ti,
+°
' • .
c
2
eN?
Q
FIGURE 18: DISSOLVED OXYGEN CONCENTRATION MEASURED HOURLY
AT ROUTE 83 ON THE CHICAGO SANITARY AND SHIP CANAL
FROM JANUARY 2003 THROUGH DECEMBER 2003
Electronic Filing - Received, Clerk's Office, March 18, 2008
* * * * * AS 2008-008 * * * * *
EXHIBIT 2
IPOB Secondary Contact DO Standard
DO Shall Not be Less Than 4.0
FIGURE
21:
DISSOLVED OXYGEN CONCENTRATION MEASURED HOURLY
AT LOCKPORT POWERHOUSE ON THE CHICAGO SANITARY AND SHIP CANAL
i-ROM JANUARY 2003 THROUGH DECEMBER 2003
f).
(1,
co
41,
r b
Orb
ez,
,„0
06s-
ses=
?
e
Electronic Filing - Received, Clerk's Office, March 18, 2008
* * * * * AS 2008-008 * * * * *
EXHIBIT 2
E
0
x
co
CD
IPCB Secondary Contact DO
Standard
DO Shall Not be Less Than 4.0 mg/L
FIGURE 22: DISSOLVED OXYGEN CONCENTRATION MEASURED HOURLY
AT JEH±RSON STREET ON 'THE DES PLAINES RIVER
FROM JANUARY 2003 THROUGH DECEMBER 2003
Electronic Filing - Received, Clerk's Office, March 18, 2008
* * * * * AS 2008-008 * * * * *
EXHIBIT 2
TABLE AI-17: WEEKLY DO SUMMARY STATISTICS AT ROUTE 83 ON THE
CHICAGO SANITARY AND SHIP CANAL DURING 2003
Monitoring Dates
Number of
DO Values
DO Concentration (mg/1.,)
Percent DO Values
Min?
Max?
Mean
Above Standard
01/01/03 - 01/05/03
120
6.7
7.9
7.5
100
01/06/03 - 01/12/03
168
6.3
7.8
7.1
100
01/13/03 - 01/19/03
168
6.8
8.2
7.6
100
01/20/03 - 01/26/03
168
7.3
8.8
8.2
100
01/27/03 - 02/02/03
168
6.7
9.0
8.0
100
02/03/03 - 02/09/03
168
5.8
8.1
7.1
100
02/10/03 - 02/16/03
168
7.4
9.2
8.4
100
02/17/03 - 02/23/03
167
7.1
8.6
7.9
100
02/24/03 - 03/02/03
168
6.2
8.6
7.5
100
03/03/03 - 03/09/03
167
6.5
9.6
8.2
100
03/10103 - 03/16/03
168
6.3
9.6
8.2
100
03/17/03 - 03/23/03
144
4.9
6.7
5.9
100
03/24/03 - 03/30/03
168
4.0
6.9
5.5
99
03/31/03 - 04/06/03
82
4.3
6.2
5.5
100
04/07/03 - 04/13/03
85
4.8
6.5
5.6
100
04/14/03 - 04/20/03
168
3.9
5.9
5.1
99
04/21/03 - 04/27/03
82
3.5
5.0
4.1
54
04/28/03 - 05/04/03
NO DATA
05/05/03 - 05/11/03
81
0.0
6.3
1.4
19
05/12/03 - 05/18/03
168
0.0
6.0
3.1
48
05/19/03 - 05/25/03
168
2.1
6.1
4.4
63
05/26/03 - 06/01/03
168
2.0
7.1
4.6
60
06/02/03 - 06/08/03
167
2.1
5.0
3.8
40
06/09/03 - 06/15/03
168
2.4
5.4
4.1
58
06/16/03 - 06/22/03
168
2.5
6.4
4.7
80
06/23/03 - 06/29/03
168
2.8
5.1
4.0
43
06/30/03 - 07/06/03
168
2.0
6.7
3.9
45
0'1107/03 - 07/13/03
168
0.0
4.9
• 3.3
25
07/14/03 - 07/20/03
168
0.1
5.5
3.1
28
07/21/03 - 07/27/03
168
0.5
5.1
3.5
49
07/28103 - 08/03/03
168
0.0
5.2
3.8
52
08A34/03 - 08/10/03
168
0.0
4.7
2.4
32
08/11/03 - 08/17/03
59
1.9
4.6
3.8
36
08/18/03 - 08/24/03
79
3.3
4.6
3.9
38
08/25/03 - 08/31/03
159
2.7
5.6
4.2
61
09/01/03 - 09/07/03
167
3.7
5.5
4.8
96
09/08/03 - 09/14103
168
3.2
5.7
4.5
64
09/15/03 - 09/21/03
168
2.5
5.2
4.2
70
09/22/03 - 09/28/03
168
3.2
6.2
5.5
95
09129/03 - 10/05/03
168
4.4
6.0
5.5
100
10/06/03 - 10/12/03
168
3.8
6.0
5.1
99
10/13/03 - 10/19/03
169
1.8
5.9
4.6
80
10/20/03 - 10/26/03
167
3.7
5.7
4.7
92
10/27/03 - 11/02/03
168
3.7
6.1
53
97
11/03/03 - 11/09/03
168
2.9
7.3
4.8
72
11/10/03 - 11/16/03
168
4.6
7.4
5.9
100
11/17/03 - 11/23/03
168
0.0
7.8
4.8
80
11/24/03 - 11/30/03
168
5.4
8.5
6.8
100
12/01/03 - 12/07/03
168
5.8
7.8
6.7
100
12/08/03 - 12/14/03
151
4.2
8.2
6.6
100
12/15/03 - 12/21/03
"85
6.6
7.6
7.1
100
12/22/03 - 12/28/03
168
6.3
7.9
7.2
100
12/29/03 - 12/31/03
72
7.4
8.0
7.7
100
AI-17
Electronic Filing - Received, Clerk's Office, March 18, 2008
* * * * * AS 2008-008 * * * * *
EXHIBIT 2
TABLE AI-20: WEEKLY DO SUMMARY STATISTICS AT LOCKPORT POWERHOUSE ON THE
CHICAGO SANITARY AND SHIP CANAL DURING 2003
Monitoring Dates
Number of
DO Values
DO Concentration
(mR/U
Percent DO Values
Min
Max
Mean
Above Standard
01/01/03 - 01/05/03
120
6.6
8.4
7.4
100
01/06/03 - 01/12/03
168
6.5
7.9
7.3
100
01/13/03 - 01/19/03
168
7.3
8.6
8.0
100
01/20/03 - 01/26/03
168
7.5
8.6
8.1
100
01/27/03 - 02/02/03
168
7.5
8.8
8.0
100
02/03/03 - 02/09/03
168
6.4
8.7
7.5
100
02/10/03 - 02/16/03
167
7.1
10.8
8.9
100
02/17/03 - 02/23/03
168
8.0
10.7
9.1
100
02/24/03 - 03/02/03
168
6.5
8.1
7.2
100
03/03/03 - 03/09/03
168
6.6
8.0
7.3
100
03/10/03 - 03/16/03
168
6.7
7.9
7.2
100
03/17/03 - 03/23/03
168
5.1
6.8
5.9
100
03/24/03 - 03/30/03
58
4.4
•?
5.6
5.0
100
03/31/03 - 04/06/03
109
4.3
5.4
4.9
100
04/07/03 - 04/13/03
167
4.4
6.7
5.6
100
04/14/03 - 04/20/03
168
3.3
6.6
5.2
92
04/21/03 - 04/27/03
168
3.5
5.1
4.2
79
04/28/03 - 05/04/03
168
1.7
5.6
3.6
33
05/05/03 - 05/11/03
166
2.5
10.7
5.5
70
05/12/03 - 05/18/03
168
3.4
4.8
4.2
73
05/19/03 - 05/25/03
168
3.0
6.1
4.3
62
05/26/03 - 06/01/03
168
3.5
5.4
4.7
90
06/02/03 - 06/08/03
168
3.1
5.3
4.1
55
06/09/03 - 06/15/03
58
2.4
3.6
3.1
0
06/16/03 - 06/22/03
109
3.4
6.1
4.8
79
06/23/03 - 06/29/03
168
3.2
6.2
4.5
70
06/30/03 - 07/06/03
168
2.9
6.6
4,1
51
07/07/03 - 07/13/03
168
2.5
5.1
3.6
25
07/14/03 - 07/20/03
160
1.6
5.8
3.5
41
07/21/03 - 0727/03
168
2.2
4.5
3.6
20
07/28/03 - 08/03/03
167
2.6
8.9
3.9
47
08/04/03 - 08/10/03
168
2.7
5.3
3.8
33
08/11/03 - 08/17/03
168
2.8
4.9
4.2
68
08/18/03 - 08/24/03
168
2.9
5.8
4.3
67
08/25/03 - 08/31/03
168
3.3
5.5
4.5
82
09/01/03 - 09/07/03
168
3.6
4.7
4.2
77
09/08/03 - 09/14/03
168
3.6
5.4
4.5
93
09/15/03 - 09/21/03
168
2.2
5.0
4.0
58
0922/03 - 09/28/03
167
4.1
5.9
5.3
100
0929/03 - 10/05/03
167
4.1
5.7
5.1
100
10/06/03 - 10/12/03
168
4.6
6.3
5.6
100
10/13/03 - 10/19/03
167
3.0
5.8
4.5
73
1020/03 - 10/26/03
168
3.7
5.6
4.7
85
1027/03 - 11/02/03
168
4.5
6.2
5.4
100
11/03/03 - 1 1/09/03
168
2.6
6.5
4.5
61
11/10/03 - 11/16/03
168
4.1
6.2
5.5
100
11/17/03 - 11/23/03
168
2.9
6.4
4.7
71
1124/03 - 11/30/03
168
5.2
7.7
6.7
100
12/01/03 - 12/07/03
168
6.8
7.9
7.4
100
12/08/03 - 12/14/03
168
2.9
7.5
6.0
92
12/15/03 - 12/21/03
168
6.4
8.5
7.5
100
12/22/03 - 12/28/03
168
7.0
8.4
7.7
100
12/29/03 - 12/31/03
72
7.4
8.0
7.7
100
AI-20
Electronic Filing - Received, Clerk's Office, March 18, 2008
* * * * * AS 2008-008 * * * * *
EXHIBIT 2
TABLE AI-21: WEEKLY DO SUMMARY STATISTICS AT JE1-1-ERSON STREET ON THE
DES PLAINES RIVER DURING 2003
Monitoring Dates
Number of
DO Values
DO Concentration (mg/1.3
Percent DO Values
Min?
Max?
Mean
Above Standard
01/01/03 - 01/05103
120
8.7
10.4
9.5
100
01/06/03 - 01/12/03
168
8.0
10.4
9.1
100
01/13/03 - 01/19/03
168
9.1
10.8
9.8
100
01/20/03 - 01/26/03
168
9.4
11.7
10.3
100
01/27/03 - 02/02/03
168
7.4
11.2
8.7
100
02/03/03 - 02/09/03
168
6.4
10.5
7.8
100
02/10/03 - 02/16/03
168
8.1
11.3
9.7
100
02/17/03 - 02/23/03
168
8.4
11.3
9.9
100
02/24/03 - 03/02/03
168
8.0
10.5
9.0
100
03/03/03 - 03/09/03
168
7.8
10.8
9.2
100
03/10/03 - 03/16/03
168
8.0
11.0
9.3
100
03/17/03 - 03/23/03
168
6.5
10.4
8.2
100
03/24/03 - 03/30/03
59
5.8
9.6
7.7
100
03/31/03 - 04/06/03
109
5.6
8.7
7.5
100
04/07/03 - 04/13/03
167
6.7
10.0
7.9
100
04/14/03 - 04/20/03
168
5.4
11.6
8.1
100
04/21/03 - 04/27/03
168
5.0
9.1
6.8
100
04/28/03 - 05/04103
167
4.5
8.8
6.8
100
05/05/03 - 05/11/03
168
5.2
9.7
8.0
100
05/12/03 - 05/18/03
60
6.2
8.6
7.3
100
05/19/03 - 05/25/03
109
3.9
10.0
6.4
99
05/26/03 - 06/01/03
168
4.0
9.7
5.7
99
06/02/03 - 06/08/03
168
3.4
7.4
4.9
87
06/09/03 - 06/15/03
168
3.6
7.8
4.8
83
06/16/03 - 06/22/03
168
3.4
8.6
5.8
95
06/23/03 - 06/29/03
168
3.4
7.4
5.1
92
06/30/03 - 07/06/03
168
2.9
6.9
4.4
64
07/07/03 - 07/13/03
168
2.5
7.3
4.8
73
07/14/03 - 07/20/03
168
3.3
7.6
5.4
90
07121/03 - 07/27/03
168
4.0
6.9
5.5
100
07/28/03 - 08/03/03
168
4.0
7.4
5.8
100
08/04/03 - 08/10/03
59
3.8
6.5
5.1
97
08/11/03 - 08/17/03
NO DATA
08/18/03 - 0824/03
108
3.7
6.4
4.9
91
08/25/03 - 08/31/03
58
3.8
5.3
4.5
78
09/01/03 - 09/07/03
109
4.3
5.4
4.8
100
09/08/03 - 09/14/03
168
4.1
6.2
5.1
100
09/15/03 - 09/21/03
168
3.9
6.1
4.9
98
09/22/03 - 0928/03
168
4.6
6.8
5.7
100
09/29/03 - 10/05/03
167
5.0
7.8
6.2
100
10/06/03 - 10/12/03
168
6.0
8.4
6.8
100
10/13/03 - / 0/19/03
168
4.7
8.0
6.1
100
10/20/03 -1026/03
167
5.2
7.8
6.1
100
10/27/03 - 11/02/03
168
5.6
8.0
6.7
100
11/03/133 - 11/09/03
168
5.0
9.2
7.3
100
11/10/03 - 11/16/03
167
6.4
10.5
7.5
100
11/17/03 - 11/23/03
168
5.8
9.4
7.6
100
11/24/03 - 11/30/03
168
8.0
10.3
9.2
100
12/01/03 - 12/07/03
168
7.9
10.7
9.3
100
12/0103 - 12/14/03
168
7.6
103
9.2
100
12115/03 - 12/21/03
168
9.4
11.5
10.4
100
12/22/03 - 12/28/03
168
9.0
11.5
10.2
100
12/29/03 - 12/31/03
72
9.0
11.2
9.7
100
AI-21
Electronic Filing - Received, Clerk's Office, March 18, 2008
* * * * * AS 2008-008 * * * * *
EXHIBIT 2
FIGURE 19: DISSOLVED OXYGEN CONCENTRATION MEASURED HOURLY
AT ROUTE 83 ON THE CHICAGO SANITARY AND SHIP CANAL
FROM JANUARY 2004 THROUGH DECEMBER 2004
if)C8 Secondary Contact DO Standard
DO Shall Not be Less Than 4.0 mg/t.
15
2
0
4
ot)'?
o
?
o?
o?
o?
o?
o?
o
t.?
t.?
Ix
?
t.,?
).?
b.
46
(1,
0
,,
?
1
le
'0.
.0
‘1,
,..
'Q6
0
nO
41,
0
ft,
0
q•
0
I?'
NO
?
•c.0
tC%?
v
•‘.
OC.
4
"
4`
e
?
'
?
g
0
,o
e,
G
P
?
0c6
0
Electronic Filing - Received, Clerk's Office, March 18, 2008
* * * * * AS 2008-008 * * * * *
EXHIBIT 2
FIGURE 22: DISSOLVED OXYGEN CONCENTRATION MEASURED HOURLY
AT LOCKPORT POWERHOUSE ON THE CHICAGO SANITARY AND SHIP CANAL
FROM JANUARY 2004 THROUGH DECEMBER 2004
Electronic Filing - Received, Clerk's Office, March 18, 2008
* * * * * AS 2008-008 * * * * *
EXHIBIT 2
IPCB Secondary Contact DO Standard
DO Shall Not be Less Than 4.0 mg/L
15
12
E
\r)
rn
9
0
6
0)
3
6
?
c§sb`
cb,
4Z4"
FIGURE 23: DISSOLVED OXYGEN CONCENTRATION MEASURED HOURLY
AT JEFFERSON STREET ON THE DBS PLAINES RIVER
FROM JANUARY 2004 THROUGH DECEMBER 2004
tpiN?
ot.
?
c),;?,
(".
?
v
„v.
i„.
0`064.
rz,/
fr,
sC)
co°41/4'?
"e'9.
Electronic Filing - Received, Clerk's Office, March 18, 2008
* * * * * AS 2008-008 * * * * *
EXHIBIT 2
TABLE A-18: WEEKLY DO SUMMARY STATISTICS AT ROUTE 83 ON THE
CHICAGO SANITARY AND SHIP CANAL DURING 2004
Monitoring Dates
Number of
DO Values
DO Concentration (me-)
Percent DO Values
Min
Max
Mean
Above Standard
01/01/04 - 01/04104
96
6.7
7.8
7.2
100
01/05/04 - 01/11/04
168
6.5 8.4
7.4
100
01/12/04 - 01/18/04
168
4.2
7.1
6.0
100
01/19/04 - 01/25/04
168
3.0
8.8
6.4
93
01/26/94 - 02/01/04
168
7.2
9.2
8.4
100
02/02/04 - 02/08/04
168
6.1
9.1
7.7
100
02/09/04 - 02/15/04
168
6.4
7.6
7.1
100
02/16/04 - 02/22/04
168
5.3
7.9
6.8
100
02/23/04 - 02/29/04
168
5.3
7.6
6.6
100
03/01/04 - 03/07/04
168
0.0
7.4
4.3
65
03/08/04 - 03/14/04
168
0.0
7.7
4.8
73
03/15/04 - 03/21/04
168
4.4
6.7
5.6
100
03/22/04 - 03/28/04
168
4.4
7.0
5.7
100
03/29/04 - 04/04/04
168
4.7
6.8
5.7
100
04/05/04 - 04/11/04
167
4.9
6.5
5.9
100
04/12/04 - 04/18/04
168
4.6
7.2
6.2
100
04/19/04 -
04/25/04
168
2.5
5.3
4.2
61
04/26/04 - 05/02/04
168
3.3
5.3
4.3
64
05/03/04 - 05/09/04
168
2.3
4.5
3.6
18
05/10/04 - 05/16/04
168
0.0
4.2
2.2
1
05/17/04 - 05/23/04
167
0.1
4.9
2.5
14
05/24/04 - 05/30/04
168
0.5
5.0
3.9
62
05/31/04 - 06/06/04
167
0.4
5.0
2.6
25
06/07/04 - 06/13/04
168
0.0
5.4
3.2
38
06/14/04 - 06/20/04
168
0.0
4.8
3.2
31
06/21/04 - 06/27/04
168
2.8
5.5
4.0
55
06/28/04 - 07/04/04
168
0.0
5.0
3.6
40
07/05/04 - 07/11/04
61
0.0
4.7
1.9
16
07/12/04 - 07/18/04
110
4.1
5.1
4.6
100
07/19/04 - 07/25/04
168
0.2
5.1
4.1
79
07/26/04 - 08/01/04
168
1.8
5.1
4.5
95
08/02/04 - 08/08/04
168
0.2
6.1
4.1
65
08/09/04 - 08/15/04
168
1.1
6.3
4.6
87
08/16/04 - 08/22/04
168
4.9
6.1
5.5
100
08/23/04 - 08/29/04
I68
1.0
5.5
3.8
52
08/30/04 - 09/05/04
168
1.8
5.3
4.1
61
09/06/04 - 09/12/04
168
0.4
5.6
3.8
63
09/13/04 - 09/19/04
59
0.1
4.9
1.1
8
09/2CVO4 - 09/26/04
110
3.3
5.3
4.2
57
09/27/04 - 10/03/04
168
1.8
4.8
3.8
37
10/04/04 - 10/10/04
169
3.2
5.6
4.7
85
10/11/04 - 10/17/04
168
3.3
4.5
4.0
44
10/18/04 - 10/24/04
168
1.3
5.3
4.5
89
1025/04 - 10/31/04
168
1.8
5.6
4.2
65
11/01/04 - 11/07/04
168
1.5
5.7
4.0
48
11/08/04 - 11/14/04
168
4.1
5.7
4.9
100
11/15/04 - 11/21/04
168
2.3
5.0
4.2
80
1122/04 - 11/28/04
168
3.5
7.2
5.1
89
11/29/04 - 12/05/04
58
6.0
7.5
6.7
100
12/06/04 - 12/12/04
NO DATA
12/13/04 - 12/19/04
110
6.2
7.9
7.0
100
12/20/04 - 12/26/04
168
6.2
8.1
7.2
100
12/27/04 - 12/31/04
120
7.1
8.6
7.9
100
A-18
Electronic Filing - Received, Clerk's Office, March 18, 2008
* * * * * AS 2008-008 * * * * *
EXHIBIT 2
TABLE A-21: WEEKLY DO
SUMMARY
STATISTICS AT THE LOCKPORT POWERHOUSE ON THE
CHICAGO SANITARY AND SHIP CANAL DURING 2004
Monitoring Dates
Number of
DO Values
DO Concentration (mg/L)
Percent DO Values
Min
Max
Mean
Above Standard
01/01/04 - 01/04/04
96
7.1
8.0
7.6
100
01/05/04 - 01/11/04
168
6.4
8.2
7.5
100
01/12/04- 01/18/04
168
6.7
7.9
7.2
100
01/19/04 - 01/25/04
167
6.4
7.9
7.1
100
01/26/04 - 02/01/04
168
6.8
8.3
7.6
100
02/02/04 - 02/08/04
168
6.5
8.9
7.4
100
02/09/04 - 02/15/04
168
6.5
7.8
7.1
100
02/16/04 - 02/22/04
168
6.5
7.8
7.0
100
0223/04 - 02/29/04
168
5.6
7.0
6.2
100
03/01/04 - 03/07/04
168
5.6
7.2
6.3
100
03/08/04 - 03/14/04
168
5.4
7.8
6.9
100
03/15/04 - 03/21/04
168
6.0
7,6
6.8
100
0322/04 - 03/28/04
168
4.4
6.7
5.7
100
03/29/04 - 04/04/04
60
4.1
5.3
4.8
100
0405/04 - 04/11/04
111
5.1
6.3
5.8
100
04/12/04 - 04/18/04
167
5.3
7.7
6.4
100
04/19/04 - 0425/04
168
3.0
7.2
4.9
79
04/26/04 - 05/02/04
168
3.2
5.3
4.5
81
05/03/04 - 05/09/04
168
3.6
4.9
4.4
91
05110/04 -
05/16/04
168
1.2
4.6
3.0
11
05/17/04 - 0523/04
168
1.3
4.4
3.0
10
0524/04 - 05/30/04
168
2.8
4.8
3.7
/9
05/31/04 - 06/06/04
168
2.2
4.9
3.4
15
06/07/04 - 06/13/04
168
1.5
5.2
3.5
49
06/14/04 - 0620/04
168
2.1
3.6
2.8
0
06/21/04 - 06/27/04
167
3.1
4.2
3.6
8
0628/04 - 07/04/04
168
2.7
4.4
3.5
8
07/05/04 - 07/11/04
168
1.9
4.8
3.1
13
07/12/04- 07/18/04
168
2.9
4.2
3.6
8
07/19/04 - 07/25/04
167
3.3
4.1
3.7
1
0726/04 - 08/01/04
168
3.4
4.6
3.9
38
08/02/04 - 08/08/04
168
3.2
5.0
4.2
69
08/09/04- 08/15/04
59
4.8
5.7
5.2
100
08/16/04- 08/22/04
109
4.0
5.5
4.8
100
0823/04 - 08/29/04
167
1.7
6.0
4.2
75
08/30/04 - 09/05/04
168
2.5
4.6
3.8
48
09/06/04 - 09/12/04
168
3.4
5.6
4.6
92
09/13/04 - 09/19/04
168
4.1
5.4
4.7
100
09/20/04 - 09/26104
168
2.9
5.0
4.2
68
09/27/04 - 10/03/04
168
3.4
4.6
4.1
64
10/04/04 - 10/10/04
168
3.7
5.7
4.6
89
10/11/04 - 10/17/04
168
2.9
4.9
4.3
86
10/18/04 - 10/24/04
168
4.6
5.7
5.1
I00
10/25/04 - 10/31/04
168
1.7
5.1
4.0
67
11/01/04 - 11/07/04
169
3.4
5.4
4.5
88
11/08/04 - 11/14/04
167
4.0
6.2
5.3
98
11/15/04 - 11/21/04
168
3.8
5.1
4.6
90
11/22/04 - 1128/04
169
2.9
7.0
4.8
66
11/29/04 - 12/05/04
168
6.2
7.5
6.9
100
12/06/04 - 12/12/04
168
5.4
7.3
6.4
100
12113/04- 12/19/04
168
5.8
8.2
7.3
IGO
12/20/04 - 12/26/04
168
6.9
8.2
7.4
100
12/27/04 - 12/31/04
120
7.3
8.6
7.8
100
A-21
Electronic Filing - Received, Clerk's Office, March 18, 2008
* * * * * AS 2008-008 * * * * *
EXHIBIT 2
TABLE A-22: WEEKLY DO SUMMARY STATISTICS AT JE1-1
,
ERSON STREET ON THE
DES PLAINES RIVER DURING 2004
Monitoring Dates
Number of
DO Values
DO Concentration (mg/LA
Percent DO Values
Min
Max
Mean
Above Standard
01/01/04 -
01/04/04
96
8.7
11.2
9.6
100
01/05/04 - 01/11/04
168
8.6
11.5
9.9
100
01/12/04 - 01/18/04
168
8.2
10.5
9.2
100
01/19/04 - 01/25/04
168
7.7
11.0
9.2
100
01/26/04 - 02/01/04
168
7.9
10.2
8.9
100
02/02/04 - 02/08/04
168
7.6
10.2
8.7
100
02/09/04 - 02/15/04
37
8.1
9.4
8.7
100
02/16/D4 - 02/22/04
110
7.4
9.5
8.5
100
02/23/04 - 02/29/04
168
6.9
9.2
8.0
100
03/01/04 - 03/07/04
168
7.0
10.3
8.5
100
03/08/04 - 03/14/04
168
7.9
11.5
10.1
100
03/15/04 - 03/21/04
168
7_9
11.4
9.7
100
03/22104- 03/28/04
168
5.7
10.8
.?
7.9
100
03/29/04 - 04/04/04
168
6.3
9.3
7.8
100
04/05/04 - 04/11/04
167
7.0
11.8
9.0
100
04/12/04 -: 04/18/04
168
6.7
11.6
8.7
100
04/19/04 - 04/25/04
168
4.3
9.3
6.3
100
04/26/04 - 05/02/04
168
4.7
7.6
6.3
100
05/10/04
05/03/04 -
-
05/09/0405/16/04
168
168
2.7
4.4
10.2
7.4
5.2
6.7
10087
05/17/04 - 05/23/04
168
3.1
7.0
5.3
91
05/24104 - 05/30/04
168
4.2
8.0
5.7
100
05/31/04 - 06/06/04
168
4.4
7.9
6.1
100
06/07/04 - 06/13/04
168
4.5
7.6
6.3
10D
05/14/04 - 06/20/04
167
4.0
6.9
5.4
99
06/21/04 - 06/27/04
168
4.1
6.2
5.0
100
07/2604
07/19/04
07/12/04
07/05104
06/28/04
-
-
-
-
-
08/01/04
07/18/0407/04/04
07/11/04
07/2904
168
167
168168168
35
3.6
3.83.3
3.7
6.5
7.1
5.86.77.7
4.64.75.0
4.95.0
83
828993
86
08/02/04 - 08/08/04
168
3.8
7.5
5.8
98
08/09/04 - 08/15/04
168
4.3
7.5
5.3
100
08/16/04 - 08/22/04
168
4.3
7.8
6.0
100
08/23/04 - 08/29/04
168
4.0
7.3
• 5.6
100
08/30/04 - 09/05/04
59
4.3
7.2
5.8
100
09/06/04 - 09/12/04
109
4.9
7.7
6.3
100
09/13/04 - 09/19/04
168
4.8
6.9
5.8
100
09/20/04 - 09/26/04
112
4.4
7.1
5.7
100
09/27/04 - 10/03/04
168
4.4
7.1
5.5
100
10/04/04 - 10/10/04
168
4.6
7.7
5,9
100
10/11/04 - 10/17/04
60
4.8
7.3
6.2
100
10/113/04 - 10/24/04
83
5.6
7.1
6.3
100
1025/04- 10/31/04
168
4.0
6.7
5.6
100
1 I/01A)4 - 11/07/04
169
4.9
8.1
6.2
100
11/08/04- 11/14/04
168
5.4
8.5
7.1
100
11/15/04- 11/21/04
168
5.2
8.2
6.5
100
1122/04 - 11/28/04
168
4.9
9.1
6.8
100
11/29/04 - 12/05/04
168
8.0
11.2
9.1
100
12/06/04 - 12/12/04
168
74
103
8.5
100
12/13/04 - 12/19/04
168
7.3
10.7
9.4
100
12/20/04 - 12/26/04
168
8.2
11.0
9.3
100
1227/04 - 12/31/04
120
8.7
10.5
9.5
100
A-22
Electronic Filing - Received, Clerk's Office, March 18, 2008
* * * * * AS 2008-008 * * * * *
EXHIBIT 2
FIGURE 13: DISSOLVED OXYGEN CONCENTRATION MEASURED HOURLY
AT ROUTE 83 ON THE CHICAGO SANITARY AND SHIP CANAL FROM
JANUARY 2005 THROUGH DECEMBER 2005
15
IPCB Secondary Contact DO Standard
is shown as a dashed (- - -) line
DO Shall Not Be Less Than 4.0 mg/L
ND = No Data
12
0
Tan
Feb
Apr May
fun
ful
Aug
Sep
Oct
?
NOT?
MO
27
Electronic Filing - Received, Clerk's Office, March 18, 2008
* * * * * AS 2008-008 * * * * *
EXHIBIT 2
FIGURE 14: DISSOLVED OXYGEN CONCENTRATION MEASURED HOURLY
AT LOCKPORT POWERHOUSE ON THE CHICAGO SANITARY AND SHIP CANAL FROM
JANUARY 2005 THROUGH DECEMBER 2005
15
IPCB Secondary Contact DO Standard
is shown as a dashed (- - -) line
DO Shall Not Be Less Than 4.0 mg/L
ND =No Data
12
0
1
1
J
an.
Feb
Mar
Apr
May
Jul?
Aug
Sep?
Oct
Nov
?
Dee
28
Electronic Filing - Received, Clerk's Office, March 18, 2008
* * * * * AS 2008-008 * * * * *
EXHIBIT 2
ND .= No Data
[PCB Secondary Contact DO Standard
is shown as a dashed (- - -) line
DO Shall Not Be Less Than 4.0 mg/L
20
6
12
0 ?
NI
FIGURE 15: DISSOLVED OXYGEN CONCENTRATION MEASURED HOURLY
AT JEFFERSON STREET ON THE DES PLAINES RIVER FROM
JANUARY 2005 THROUGH DECEMBER 2005
Feb?
Mar?
Apr?
May?
Jun?
Jul
?
Aug?
Sep?
Oct.
?
Nov?
Dec
29
Electronic Filing - Received, Clerk's Office, March 18, 2008
* * * * * AS 2008-008 * * * * *
EXHIBIT 2
TABLE A-12: WEEKLY DO SUMMARY STATISTICS AT ROUTE 83
ON THE CHICAGO SANITARY AND SHIP CANAL DURING 2005
Monitoring Dates
Number of
DO Values
DO Concentration (mg/L)
Percent DO
Values Above
Min
IPCB Standard
Max
Mean
01/01/05 - 01/02/05
48
7.3
8.3
8.0
100
01/03/05 - 01/09/05
168
2.2
8.9
7.1
97
01/10/05 - 01/16/05
168
5.7
7.7
6.7
100
01/17/05 - 01/23/05
168
7.1
9.6
8.5
100
01/24/05 - 01/30/05
58
6.9
8.7
8.0
100
01/31/05 - 02/06/05
109
5.3
7.3
5.9
100
02/07/05 - 02/13/05
168
5.2
6.9
6.2
100
02/14/05 - 02/20/05
168
6.0
7.6
6.9
100
02/21/05 - 02/27/05
168
5.4
8.3
6.7
100
02/28/05 - 03/06/05
168
5.0
7.5
6.5
100
03/07/05 - 03/13/05
36
5.5
6.5
6.2
100
03/14/05 - 03/20/05
109
5.7
7.0
6.4
100
03/21/05 - 03/27/05
168
5.0
6.9
6.0
100
03/28/05 - 04/03/05
58
5.3
6.1
5.7
100
04/04/05 - 04/10/05
109
3.1
5.3
4.2
62
04/11/05 - 04/17/05
168
2.7
5.9
4.1
54
04/18/05 - 04/24/05
168
2.3
5.1
3.8
43
04/25/05 - 05/01/05
168
3.2
6.5
4.7
86
05/02/05 - 05/08/05
59
3.0
5.1
3.9
49
05/09/05 - 05/15/05
85
3.0
5.1
4.0
53
05/16/05 - 05/22/05
189
0.0
6.8
5.1
75
05/23/05 - 05/29/05
179
0.0
9.6
4.9
62
05/30/05 - 06/05/05
168
2.3
7.0
4.4
62
06/06/05 - 06/12/05
168
1.3
5.3
3.5
31
06/13/05 - 06/19/05
168
2.6
4.6
3.5
21
06/20/05 - 06/26/05
168
3.3
6.7
5.0
87
06/27/05 - 07/03/05
168
3.3
6.1
4.4
60
07/04/05 - 07/10/05
168
3.1
5.2
4.1
55
07/11/05 - 07/17/05
168
2.7
5.9
3.9
45
07/18/05 - 07/24/05
84
2.6
5.2
3.9
41
07/25/05 - 07/31/05
NO DATA
A-23
Electronic Filing - Received, Clerk's Office, March 18, 2008
* * * * * AS 2008-008 * * * * *
EXHIBIT 2
TABLE A-12 (Continued): WEEKLY DO SUMMARY STATISTICS AT ROUTE 83
ON THE CHICAGO SANITARY AND SHIP CANAL DURING 2005
Monitoring Dates
Number of
DO Concentration (mg/L)
Percent DO
Values Above
DO Values
Min
Max
IPCB Standard
Mean
08/01/05 - 08/07/05
NO DATA
08/08/05 - 08/14/05
84
3.4
4.8
4.0
36
08/15/05 - 08/21/05
44
2.6
4.2
3.4
5
08/22/05 - 08/28/05
NO DATA
08/29/05 - 09/04/05
110
5.3
6.1
5.7
100
09/05/05 - 09/11/05
58
4.9
6.2
5.7
100
09/12/05 - 09/18/05
86
4.1
6.4
5.2
100
09/19/05 - 09/25/05
168
4.1
5.3
4.8
100
09/26/05 - 10/02/05
168
3.3
6.3
4.9
89
10/03/05 - 10/09/05
168
4.6
6.3
5.3
100
10/10/05 - 10/16/05
168
4.4
5.3
4.9
100
10/17/05 - 10/23/05
168
4.4
6.0
5.4
100
10/24/05 - 10/30/05
168
4.7
7.1
6.0
100
10/31/05 - 11/06/05
169
4.6
6.0
5.4
100
11/07/05 - 11/13/05
168
2.7
6.0
5.0
85
11/14/05 - 11/20/05
168
5.0
7.4
6.3
100
11/21/05 - 11/27/05
168
3.4
6.6
5.8
99
11/28/05 - 12/04/05
168
5.4
7.7
6.8
100
12/05/05 - 12/11/05
168
5.9
7.5
6.7
100
12/12/05 - 12/18/05
168
3.8
8.0
7.0
98
12/19/05 - 12/25/05
168
6.2
9.1
8.0
100
12/26/05 - 12/31/05
144
6.3
8.1
7.3
100
Electronic Filing - Received, Clerk's Office, March 18, 2008
* * * * * AS 2008-008 * * * * *
EXHIBIT 2
TABLE A-13: WEEKLY DO SUMMARY STATISTICS AT LOCKPORT POWERHOUSE
ON THE CHICAGO SANITARY AND SHIP CANAL DURING 2005
Monitoring Dates
Number of
DO Concentration (mg/L)
Percent DO
Values Above
DO Values
MM
Max
Mean
IPCB Standard
01/01/05 - 01/02/05
48
8.3
8.8
8.6
100
01/03/05 - 01/09/05
168
7.4
9.1
8.1
100
01/10/05 - 01/16/05
168
6.3
8.2
7.3
100
01/17/05 - 01/23/05
168
7.7
10.2
8.8
100
01/24/05 - 01/30/05
168
6.9
8.5
7.6
100
01/31/05 - 02/06/05
168
5.4
7.3
6.2
100
02/07/05 - 02/13/05
168
5.9
7.6
6.5
100
02/14/05 - 02/20/05
168
7.2
8.5
7.8
100
02/21/05 - 02/27/05
168
6.5
8.2
7.5
100
02/28/05 - 03/06/05
168
6.2
7.5
6.8
100
03/07/05 - 03/13/05
168
5.7
7.2
6.4
100
03/14/05 - 03/20/05
168
6.1
6.8
6.4
100
03/21/05 - 03/27/05
168
5.5
6.5
6.1
100
03/28/05 - 04/03/05
168
3.7
6.2
5.5
94
04/04/05 - 04/10/05
167
3.5
5.5
4.6
84
04/11/05 - 04/17/05
168
3.3
5.0
4.0
48
04/18/05 - 04/24/05
168
3.4
5.1
4.4
79
04/25/05 - 05/01/05
168
4.2
5.5
4.9
100
05/02/05 - 05/08/05
169
3.4
5.1
4.6
92
05/09/05 - 05/15/05
168
3.3
5.8
4.5
82
05/16/05 - 05/22/05
168
3.2
4.6
3.9
47
05/23/05 - 05/29/05
168
2.2
4.6
3.8
39
05/30/05 - 06/05/05
168
2.7
4.6
3.5
17
06/06/05 - 06/12/05
168
1.8
3.7
2.6
0
06/13/05 - 06/19/05
168
2.1
4.3
3.1
I
06/20/05 - 06/26/05
168
3.3
7.5
4.7
73
06/27/05 - 07/03/05
59
3.5
6.7
4.7
86
07/04/05 - 07/10/05
86
3.3
6.3
4.1
51
07/11/05 - 07/17/05
168
3.2
6.3
4.3
56
07/18/05 - 07/24/05
168
3.0
6.8
4.6
88
07/25/05 - 07/31/05
168
1.4
5.7
3.3
14
A-25
Electronic Filing - Received, Clerk's Office, March 18, 2008
* * * * * AS 2008-008 * * * * *
EXHIBIT 2
TABLE A-13 (Continued): WEEKLY DO SUMMARY STATISTICS AT LOCKPORT
POWERHOUSE ON THE CHICAGO SANITARY AND SHIP CANAL DURING 2005
Monitoring Dates
Number of
DO Concentration (mg/L)
Percent DO
Values Above
DO Values
Min
Max
Mean
IPCB Standard
08/01/05 - 08/07/05
82
3.5
5.9
4.7
74
08/08/05 - 08/14/05
85
3.1
4.9
3.9
41
08/15/05 - 08/21/05
168
2.9
6.6
3.8
29
08/22/05 - 08/28/05
168
3.0
5.6
4.1
58
08/29/05 - 09/04/05
168
3.6
6.4
4.9
98
09/05/05 - 09/11/05
168
4.7
5.7
5.1
100
09/12/05 - 09/18/05
168
4.3
5.1
4.6
100
09/19/05 - 09/25/05
168
4.6
5.6
5.0
100
09/26/05 - 10/02/05
168
4.6
5.9
5.3
100
10/03/05 - 10/09/05
168
4.9
5.9
5.5
100
10/10/05 - 10/16/05
168
4.6
5.3
4.9
100
10/17/05 - 10/23/05
168
4.4
6.1
5.3
100
10/24/05 - 10/30/05
167
4.9
6.4
5.9
100
10/31/05 - 11/06/05
170
4.3
6.4
5.5
100
11/07/05 - 11/13/05
163
3.5
6.2
5.2
85
11/14/05 - 11/20/05
85
5.8
6.7
6.2
100
11/21/05 - 11/27/05
168
6.4
7.1
6.7
100
11/28/05 - 12/04/05
168
5.7
7.7
6.8
100
12/05/05 - 12/11/05
168
6.2
7.5
6.8
100
12/12/05 - 12/18/05
168
4.3
7.8
6.6
100
12/19/05 - 12/25/05
168
6.5
8.3
7.4
100
12/26/05 - 12/31/05
144
6.3
7.7
7.0
100
Electronic Filing - Received, Clerk's Office, March 18, 2008
* * * * * AS 2008-008 * * * * *
EXHIBIT 2
TABLE A-14: WEEKLY DO SUMMARY STATISTICS AT JEFFERSON STREET
ON THE DES PLAINES RIVER DURING 2005
Monitoring Dates
Number of
DO Values
DO Concentration (mg/L)
Percent DO
Values Above
MM
Max
Mean
IPCB Standard
01/01/05 - 01/02/05
48
9.3
10.9
10.2
100
01/03/05 - 01/09/05
168
8.7
11.6
9.8
100
01/10/05 - 01/16/05
168
7.8
10.9
9.5
100
01/17/05 - 01/23/05
168
9.1
11.7
10.3
100
01/24/05 - 01/30/05
168
8.0
10.3
9.3
100
01/31/05 - 02/06/05
168
7.0
9.2
8.2
100
02/07/05 - 02/13/05
168
7.0
9.4
8.1
100
02/14/05 - 02/20/05
168
7.5
10.6
9.2
100
02/21/05 - 02/27/05
168
8.2
11.2
9.6
100
02/28/05 - 03/06/05
168
7.5
12.1
9.1
100
03/07/05 - 03/13/05
168
7.3
12.5
9.6
100
03/14/05 - 03/20/05
168
7.8
12.3
9.6
100
03/21/05 - 03/27/05
58
7.8
12.2
9.1
100
03/28/05 - 04/03/05
110
5.3
9.2
7.2
100
04/04/05 - 04/10/05
167
5.3
9.2
7.0
100
04/11/05 - 04/17/05
168
4.5
8.5
6.1
100
04/18/05 - 04/24/05
168
4.3
8.6
6.0
100
04/25/05 - 05/01/05
59
4.8
8.0
6.2
100
05/02/05 - 05/08/05
109
5.3
8.7
6.6
100
05/09/05 - 05/15/05
168
4.4
8.0
6.0
100
05/16/05 - 05/22/05
168
3.7
8.4
5.6
98
05/23/05 - 05/29/05
168
4.0
7.3
5.7
100
05/30/05 - 06/05/05
168
3.7
7.2
5.2
96
06/06/05 - 06/12/05
168
1.5
4.9
3.0
14
06/13/05 - 06/19/05
168
1.3
5.8
3.9
48
06/20/05 - 06/26/05
168
2.9
9.0
5.1
82
06/27/05 - 07/03/05
167
2.2
6.2
4.2
56
07/04/05 - 07/10/05
168
2.3
5.5
4.1
54
07/11/05 - 07/17/05
168
3.1
5.2
4.2
60
07/18/05 - 07/24/05
168
2.9
6.0
4.2
60
07/25/05 - 07/31/05
168
3.0
6.2
4.2
48
A-27
Electronic Filing - Received, Clerk's Office, March 18, 2008
* * * * * AS 2008-008 * * * * *
EXHIBIT 2
TABLE A-14 (Continued): WEEKLY DO SUMMARY STATISTICS AT JEFFERSON STREET
ON THE DES PLAINES RIVER DURING 2005
Monitoring Dates
Number of
DO Concentration (mg/L)
Percent DO
Values Above
DO Values
Min
Max
Mean
IPCB Standard
08/01/05 - 08/07/05
168
3.9
6.6
5.1
99
08/08/05 - 08/14/05
168
3.5
5.9
4.9
94
08/15/05 - 08/21/05
83
3.2
4.8
4.0
45
08/22/05 - 08/28/05
85
4.3
6.2
5.2
100
08/29/05 - 09/04/05
168
4.2
6.4
5.2
100
09/05/05 - 09/11/05
168
4.8
6.3
5.4
100
09/12/05 - 09/18/05
168
4.4
5.6
4.9
100
09/19/05 - 09/25/05
168
4.6
5.7
5.1
100
09/26/05 - 10/02/05
82
4.8
6.3
5.2
100
10/03/05 - 10/09/05
84
6.0
6.9
6.4
100
10/10/05 - 10/16/05
168
5.5
7.0
6.1
100
10/17/05 - 10/23/05
168
5.6
7.5
6.5
100
10/24/05 - 10/30/05
168
5.8
8.3
7.0
100
10/31/05 - 11/06/05
169
5.9
8.4
6.9
100
11/07/05 - 11/13/05
168
5.3
7.7
6.5
100
11/14/05 - 11/20/05
143
6.4
9.6
7.7
100
11/21/05 - 11/27/05
168
7.3
9.9
8.2
100
11/28/05 - 12/04/05
168
7.3
9.9
8.4
100
12/05/05 - 12/11/05
168
7.9
9.9
8.5
100
12/12/05 - 12/18/05
167
6.7
10.0
8.2
100
12/19/05 - 12/25/05
168
8.3
10.5
9.3
100
12/26/05 - 12/31/05
144
7.8
10.2
9.2
100
Electronic Filing - Received, Clerk's Office, March 18, 2008
* * * * * AS 2008-008 * * * * *
EXHIBIT 2
15
12
FIGURE 13: DISSOLVED OXYGEN CONCENTRATION MEASURED HOURLY AT ROUTE 83
ON THE CHICAGO SANITARY AND SHIP CANAL FROM JANUARY 2006 THROUGH DECEMBER 2006
ND
=
NoDa
ta:
IPCB Secondary Contact DO Standard
is shown as a dashed (- - -) line
DO Shall Not Be Less Than 4.0 mg/L
ND
1
N
Feb?
Mar
Apr
May
Jun
Jul
Aug
Sep
?
Oct
Nov
?
Dec
9
6
0
Jan
Electronic Filing - Received, Clerk's Office, March 18, 2008
* * * * * AS 2008-008 * * * * *
EXHIBIT 2
15
12
FIGURE 14: DISSOLVED OXYGEN CONCENTRATION MEASURED HOURLY AT LOCKPORT POWERHOUSE
ON THE CHICAGO SANITARY AND SHIP CANAL FROM JANUARY 2006 THROUGH DECEMBER 2006
ND
=
No Data
IPCB Secondary Contact DO Standard
is shown as a dashed (- - -) line
DO Shall Not Be Less Than 4.0 mg/L
.
ND
,
1
11.
Feb
Mar
Apr
May
Jun
Jul
Aug
Sep
Oct
Nov
Dec
9
6
0
Jan
Electronic Filing - Received, Clerk's Office, March 18, 2008
* * * * * AS 2008-008 * * * * *
EXHIBIT 2
20
16
4
FIGURE 15: DISSOLVED OXYGEN CONCENTRATION MEASURED HOURLY AT JEFFERSON STREET
ON THE DES PLAINES RIVER FROM JANUARY 2006 THROUGH DECEMBER 2006
N
-.,-.
-:INTO Data
IPCB Secondary Contact DO Standard
is shown as a dashed (- - -) line
DO Shall Not Be Less Than 4.0 mg/L
1
.
1/
1
11
ir
V
1
1
1
1,
1
3
1
ll'
i
ill
3
11
i
1
12
8
0
Jan
Feb
Mar
Apr
May
Jun
Jul
Aug
Sep
Oct
Nov
Dec
Electronic Filing - Received, Clerk's Office, March 18, 2008
* * * * * AS 2008-008 * * * * *
EXHIBIT 2
TABLE A-12: WEEKLY DO SUMMARY STATISTICS AT ROUTE 83
ON THE CHICAGO SANITARY AND SHIP CANAL DURING 2006
Monitoring Dates
Number of
DO Values
DO Concentration (mg/L)
Percent DO
Values Above
Minimum
Maximum
Mean
IPCB Standard
01/01/06 - 01/01/06
24
5.9
7.0
6.6
100
01/02/06 - 01/08/06
168
5.4
7.6
7.0
100
01/09/06 - 01/15/06
168
3.9
6.7
5.6
99
01/16/06 - 01/22/06
168
3.6
7.4
6.0
99
01/23/06 - 01/29/06
168
4.8
7.9
7.1
100
01/30/06 - 02/05/06
168
5.8
8.6
7.3
100
02/06/06 - 02/12/06
168
6.4
8.0
7.3
100
02/13/06 - 02/19/06
168
6.0
8.5
7.6
100
02/20/06 - 02/26/06
168
6.7
9.0
7.8
100
02/27/06 - 03/05/06
168
6.9
8.3
7.5
100
03/06/06 - 03/12/06
168
6.0
8.0
7.2
100
03/13/06 - 03/19/06
59
5.8
8.6
6.9
100
03/20/06 - 03/26/06
NO DATA
03/27/06 - 04/02/06
107
5.5
7.2
6.4
100
04/03/06 - 04/09/06
167
5.3
8.0
6.6
100
04/10/06 - 04/16/06
168
5.1
7.3
6.4
100
04/17/06 - 04/23/06
168
3.6
7.7
6.0
95
04/24/06 - 04/30/06
168
5.3
7.3
6.2
100
05/01/06 - 05/07/06
168
3.3
5.6
4.7
85
05/08/06 - 05/14/06
168
3.2
5.8
4.4
81
05/15/06 - 05/21/06
168
3.7
5.9
5.1
99
05/22/06 - 05/28/06
168
3.3
6.5
4.9
85
05/29/06 - 06/04/06
168
2.8
6.2
4.5
79
06/05/06 - 06/11/06
168
2.9
6.2
4.8
80
06/12/06 - 06/18/06
168
0.6
6.2
4.2
59
06/19/06 - 06/25/06
168
2.0
5.0
3.6
17
06/26/06 - 07/02/06
115
2.8
5.5
4.4
81
07/03/06 - 07/09/06
82
1.8
5.1
4.0
55
07/10/06 - 07/16/06
110
2.5
6.7
5.0
96
07/17/06 - 07/23/06
58
3.5
6.4
5.4
91
07/24/06 - 07/30/06
107
3.5
5.0
4.1
51
07/31/06 - 08/06/06
167
0.0
6.2
3.1
43
08/07/06 - 08/13/06
168
1.4
5.2
3.6
48
A-23
Electronic Filing - Received, Clerk's Office, March 18, 2008
* * * * * AS 2008-008 * * * * *
EXHIBIT 2
TABLE A-12 (Continued): WEEKLY DO SUMMARY STATISTICS AT
ROUTE 83 ON THE CHICAGO SANITARY AND SHIP CANAL DURING 2006
Monitoring Dates
Number of
DO Concentration (mg/L)
Percent DO
Values Above
DO Values
Minimum
Maximum
Mean
IPCB Standard
08/14/06 - 08/20/06
168
2.0
4.8
3.6
31
08/21/06 - 08/27/06
168
3.0
4.9
3.9
40
08/28/06 - 09/03/06
168
0.4
5.3
4.1
60
09/04/06 - 09/10/06
58
4.1
5.1
4.7
100
09/11/06 - 09/17/06
98
2.8
6.0
4.6
78
09/18/06 - 09/24/06
168
4.0
5.8
5.0
100
09/25/06 - 10/01/06
58
4.4
6.2
5.5
100
10/02/06 - 10/08/06
NO DATA
10/09/06 - 10/15/06
NO DATA
10/16/06 - 10/22/06
86
3.7
6.5
5.1
90
10/23/06 - 10/29/06
168
3.1
6.2
5.2
93
10/30/06 - 11/05/06
169
5.2
6.5
6.1
100
11/06/06 - 11/12/06
58
4.5
6.3
5.2
100
11/13/06 - 11/19/06
110
5.0
6.7
6.0
100
11/20/06 - 11/26/06
168
4.1
6.0
5.4
100
11/27/06 - 12/03/06
168
0.6
7.0
5.0
89
12/04/06 - 12/10/06
167
6.5
8.7
7.7
100
12/11/06 - 12/17/06
168
6.3
8.2
7.2
100
12/18/06 - 12/24/06
59
6.3
7.2
6.6
100
Electronic Filing - Received, Clerk's Office, March 18, 2008
* * * * * AS 2008-008 * * * * *
EXHIBIT 2
TABLE A-13: WEEKLY DO SUMMARY STATISTICS AT LOCKPORT POWERHOUSE
ON THE CHICAGO SANITARY AND SHIP CANAL DURING 2006
Monitoring Dates
Number of
DO
Concentration (mg/L)
Percent DO
Values Above
DO Values
Minimum
Maximum
Mean
IPCB Standard
01/01/06 - 01/01/06
24
6.5
7.4
6.9
100
01/02/06 - 01/08/06
167
6.1
7.2
6.8
100
01/09/06 - 01/15/06
168
5.7
7.2
6.6
100
01/16/06 - 01/22/06
168
5.5
7.6
6.6
100
01/23/06 - 01/29/06
168
6.2
8.0
7.1
100
01/30/06 - 02/05/06
168
6.7
8.1
7.6
100
02/06/06 - 02/12/06
168
6.1
8.0
7.1
100
02/13/06 - 02/19/06
168
6.6
8.5
7.7
100
02/20/06 - 02/26/06
168
7.3
9.0
8.3
100
02/27/06 - 03/05/06
168
6.3
8.6
7.5
100
03/06/06 - 03/12/06
168
6.8
8.6
7.4
100
03/13/06 - 03/19/06
168
6.6
8.3
7.3
100
03/20/06 - 03/26/06
168
6.8
7.7
7.3
100
03/27/06 - 04/02/06
168
5.8
7.2
6.6
100
04/03/06 - 04/09/06
167
6.0
7.3
6.6
100
04/10/06 - 04/16/06
167
5.6
6.6
6.2
100
04/17/06 - 04/23/06
168
4.5
6.6
5.8
100
04/24/06 - 04/30/06
168
1.7
6.4
5.3
91
05/01/06 - 05/07/06
168
3.2
5.2
4.3
72
05/08/06 - 05/14/06
83
3.3
4.6
4.0
57
05/15/06 - 05/21/06
85
3.9
5.7
4.8
99
05/22/06 - 05/28/06
168
3.4
5.2
4.3
78
05/29/06 - 06/04/06
167
2.7
5.7
3.7
32
06/05/06 - 06/11/06
168
3.0
5.1
4.0
47
06/12/06 - 06/18/06
168
3.2
4.7
4.1
57
06/19/06 - 06/25/06
168
2.4
3.9
3.2
0
06/26/06 - 07/02/06
168
3.1
4.8
4.0
40
07/03/06 - 07/09/06
168
1.9
6.4
4.2
46
07/10/06 - 07/16/06
168
2.4
5.2
3.8
48
07/17/06 - 07/23/06
168
1.9
4.8
3.1
8
07/24/06 - 07/30/06
168
2.6
7.1
4.1
42
07/31/06 - 08/06/06
168
0.3
5.9
3.2
39
08/07/06 - 08/13/06
168
0.5
5.5
33
41
A-25
Electronic Filing - Received, Clerk's Office, March 18, 2008
* * * * * AS 2008-008 * * * * *
EXHIBIT 2
TABLE A-13 (Continued): WEEKLY DO SUMMARY STATISTICS AT LOCKPORT
POWERHOUSE ON THE CHICAGO SANITARY AND SHIP CANAL DURING 2006
Monitoring Dates
Number of
DO Concentration (mg/L)
Percent DO
Values Above
DO Values
Minimum Maximum
Mean
IPCB
Standard
08/14/06 - 08/20/06
168
3.6
5.5
4.4
88
08/21/06 - 08/27/06
167
3.1
4.5
3.7
17
08/28/06 - 09/03/06
78
3.1
4.5
3.8
35
09/04/06 - 09/10/06
85
5.0
5.8
5.3
100
09/11/06 - 09/17/06
168
3.5
5.9
4.9
82
09/18/06 - 09/24/06
168
4.6
5.5
5.2
100
09/25/06 - 10/01/06
169
4.7
6.0
5.4
100
10/02/06 - 10/08/06
168
1.6
6.1
4.2
57
10/09/06 - 10/15/06
168
5.1
6.0
5.5
100
10/16/06 - 10/22/06
168
4.8
6.6
5.8
100
10/23/06 - 10/29/06
168
4.6
6.5
5.7
100
10/30/06 - 11/05/06
169
4.7
6.5
6.0
100
11/06/06 - 11/12/06
168
4.1
6.5
5.7
100
11/13/06 - 11/19/06
168
3.2
6.5
5.1
87
11/20/06 - 11/26/06
168
5.1
6.3
5.7
100
11/27/06 - 12/03/06
168
3.8
7.0
5.5
99
12/04/06 - 12/10/06
168
7.1
8.9
8.3
100
12/11/06 - 12/17/06
168
7.0
8.7
7.7
100
12/18/06 - 12/24/06
168
6.1
7.4
6.7
100
12/25/06 - 12/31/06
168
6.7
8.4
7.7
100
Electronic Filing - Received, Clerk's Office, March 18, 2008
* * * * * AS 2008-008 * * * * *
EXHIBIT 2
TABLE A-14: WEEKLY DO SUMMARY STATISTICS AT JEFFERSON STREET
ON THE DES PLAINES RIVER DURING 2006
Monitoring Dates
Number of
DO Values
DO Concentration (mg/L)
Percent DO
Values Above
Minimum Maximum?
Mean IPCB Standard
01/01/06 - 01/01/06
24
9.5
10.4
9.9
100
01/02/06 - 01/08/06
168
7.8
10.1
8.8
100
01/09/06 - 01/15/06
167
6.7
10.2
8.5
100
01/16/06 - 01/22/06
168
6.9
12.7
9.7
100
01/23/06 - 01/29/06
168
7.7
11.7
9.4
100
01/30/06 - 02/05/06
168
8.3
11.5
9.4
100
02/06/06 - 02/12/06
168
8.2
10.8
9.5
100
02/13/06 - 02/19/06
168
7.8
10.5
9.1
100
02/20/06 - 02/26/06
168
8.9
10.7
9.9
100
02/27/06 - 03/05/06
168
7.5
10.3
8.6
100
03/06/06 - 03/12/06
168
7.4
9.1
8.2
100
03/13/06 - 03/19/06
168
7.7
10.9
9.4
100
03/20/06 - 03/26/06
168
8.7
11.2
9.7
100
03/27/06 - 04/02/06
168
7.1
11.2
8.6
100
04/03/06 - 04/09/06
167
6.7
10.4
8.1
100
04/10/06 - 04/16/06
168
6.1
10.1
8.0
100
04/17/06 - 04/23/06
168
5.2
9.8
7.0
100
04/24/06 - 04/30/06
167
5.0
9.9
7.0
100
05/01/06 - 05/07/06
168
4.9
8.1
6.2
100
05/08/06 - 05/14/06
168
3.9
7.8
5.5
99
05/15/06 - 05/21/06
168
5.0
8.4
6.5
100
05/22/06 - 05/28/06
168
4.2
8.9
6.0
100
05/29/06 - 06/04/06
167
3.5
6.1
4.5
77
06/05/06 - 06/11/06
168
3.8
7.1
5.0
95
06/12/06 - 06/18/06
168
3.7
6.9
5.2
99
06/19/06 - 06/25/06
168
2.7
6.0
4.2
58
06/26/06 - 07/02/06
168
3.7
6.6
5.0
96
07/03/06 - 07/09/06
168
3.3
7.1
5.3
89
07/10/06 - 07/16/06
168
3.6
6.3
4.6
79
07/17/06 - 07/23/06
168
2.6
6.6
4.4
66
07/24/06 - 07/30/06
168
3.4
7.4
4.7
76
07/31/06 - 08/06/06
168
2.4
6.0
4.2
50
08/07/06 - 08/13/06
168
2.7
6.7
4.3
61
A-27
Electronic Filing - Received, Clerk's Office, March 18, 2008
* * * * * AS 2008-008 * * * * *
EXHIBIT 2
TABLE A-14 (Continued): WEEKLY DO SUMMARY STATISTICS AT
JEFFERSON STREET ON THE DES PLAINES RIVER DURING 2006
Monitoring Dates
Number of
DO Concentration (mg/L)
Percent DO
Values Above
DO Values
Minimum
Maximum
Mean
IPCB Standard
08/14/06 - 08/20/06
83
3.9
5.7
4.6
88
08/21/06 - 08/27/06
85
4.0
6.7
5.2
99
08/28/06 - 09/03/06
168
3.8
7.3
5.7
98
09/04/06 - 09/10/06
168
4.6
6.8
5.6
100
09/11/06 - 09/17/06
168
4.2
7.9
6.7
100
09/18/06 - 09/24/06
168
5.2
8.8
6.9
100
09/25/06 - 10/01/06
168
5.8
8.5
6.8
100
10/02/06 - 10/08/06
168
4.5
8.7
6.2
100
10/09/06 - 10/15/06
168
5.7
8.4
6.9
100
10/16/06 - 10/22/06
168
6.1
9.2
7.3
100
10/23/06 - 10/29/06
168
6.5
9.0
7.5
100
10/30/06 - 11/05/06
169
6.5
9.4
8.1
100
11/06/06 - 11/12/06
168
6.7
10.9
8.4
100
11/13/06 - 11/19/06
168
5.9
9.5
7.7
100
11/20/06 - 11/26/06
168
7.2
11.2
8.3
100
11/27/06 - 12/03/06
168
6.9
10.7
8.7
100
12/04/06 - 12/10/06
168
8.9
11.7
10.6
100
12/11/06 - 12/17/06
168
9.8
12.1
11.2
100
12/18/06 - 12/24/06
168
8.4
12.8
10.4
100
12/25/06 - 12/31/06
168
8.6
11.7
9.9
100
Electronic Filing - Received, Clerk's Office, March 18, 2008
* * * * * AS 2008-008 * * * * *
EXHIBIT 2
APPENDIX D
STATISTICAL ANALYSIS - EXISTING EFFLUENT DATA
Electronic Filing - Received, Clerk's Office, March 18, 2008
* * * * * AS 2008-008 * * * * *
EXHIBIT 2
CITGO AMMONIA
95TH PERCENTILE EFFLUENT CALCULATIONS
Definitions
k
= number of samples
n = number of samples per month
4
195(
n
) = 95th percentile 30 day monthly average limit
X0.95(y)= 95
th
percentile daily maximum limit
YI
= In(xl)
la
y = EY1)/(k)
aye = 1(yrpy)2/(k-1)
E(X) = exp[py+(cry2/2)]
V(X) = exp[2py+(ay2)][exp(ay2)-1]
a n t = In{V(X)/[n[E(X)]2]+1)
Pn =
In(E(X)) - 0-50.o2
cv,=[exp(an2)-1]1/2
X
o 95(0 = exP(Po+1.6450)
Xo.95(y
) =
exp(py+1.645ay)
Cato lated Values
k = 509
n = 8.5
py = 0.184
aye = 1.753
E(X) = 2.89
V(X) = 39.78
an
t
= 0.45
Ia
n = 0.84
cv
n
= 0.75
X
0.95(n) =
6.93 ppm
X0,
95(y) = 10.61
ppm
RACitgolAmmonia Site SpecifidCanfidence Interval
(11-5-07)
?
12 of 23
?
Huff & Huff, Inc.
Electronic Filing - Received, Clerk's Office, March 18, 2008
* * * * * AS 2008-008 * * * * *
EXHIBIT 2
IFIrC MR
?
r T.-$
cS
1'
r
cs
i;
c.")?
rb-'
?
"<st'
<0-
3,(°?
co- A-
�
L1'?
qy
'?
oP
„sc).
o
gi
?
?
0.?
40?
t6='?
4-0
pcA.
c
6
?
(
'
?
Nr-b'
-<./‘
Effluent NH3 Level (ppm)
Frequency of NH3 Test Levels in Effluent*
CITGO AMMONIA
EFFLUENT DATA HISTOGRAM
Bin
?
Frequency
?0.05
?
1
0.98
?
268
1.92
?
65
2,85
?
33
3.79
?
22
4.72
?
12
5.65
?
18
6.59
?
13
7,52
?
11
8.46
?
18
9,39
10.33
11.26
12.19
13.13
14.06
15.00
15.93
16,86
17.80
18.73
19.67
More
*Fits Lognormal Distribution
RACitgotAmmonia Site Specific\Confidence interval (11-5-07)
11 of 23?
Huff & Huff, Inc.
Electronic Filing - Received, Clerk's Office, March 18, 2008
* * * * * AS 2008-008 * * * * *
EXHIBIT 2
CITGO AMMONIA
EFFLUENT CALCULATIONS
Date
ppm-NI-13N
=
X
(Y - Py)`
08/05/02
0.31
-1,171
1.837
08/07/02
0.80
-0.223
0.166
08/12/02
0.24
-1.427
2.596
08/14/02
0.39
-0.942
1.267
08/19/02
0.44
-0.821
1.010
08/21/02
0.14
-1.966
4.624
08/26/02
0.12
-2.120
5.311
08/28/02
0.08
-2.526
7.344
09/02/02
0.14
-1.966
'4.624
09/04/02
0.12
5.311
09/09/02
0.31
1.837
09/11/02
0.32
1.752
09/16/02
1,35
0.013
09/17/02
5.50
2.312
09/23/02
1.21
0.000
09/25/02
0.67
0.342
09/30/02
0.24
2.596
10/02/02
0.54
0.641
10/07/02
0.38
1.327
10/09/02
0.84
0.129
10/14/02
1.82
0.172
10/16/02
1,24
0.001
10/22/02
0.52
0.702
10/25/02
0.56
0.584
10/28/02
0.40
1.211
10/31/02
0.51
0.735
11/04/02
0.38
1.327
11/06/02
4.23
1.583
11/12/02
2.74
1.008
0.679
11/13/02
3.49
1.250
1.136
11/18/02
1.58
0.075
11/20/02
0.94
0.061
11/25/02
0.95
0.055
11/27/02
0.64
0.398
12/02/02
1.04
0.021
12/04/02
0.25
2,467
12/09/02
0.14
4.624
12/11/02
0,34
1.595
12/16/02
1.68
0.112
01/01/03
15.7
6.602
01/02/03
11,1
4.941
01/06/03
3.66
1.297
1.239
01/08/03
1.82
0.599
0.172
01/13/03
0,87
0.105
01/15/03
0.50
0.770
01/20/03
0.15
4.332
01/22/03
0.78
0.187
01/27/03
0.90
0.084 J
01/29/03
0.66
-0.416
0.360
02/03/03
1.13
0.122
0.004
= In(x
i
)
?
I(yi) = 93.77
k = 509
Ny
= Z(Yi)/( k)?
Py =
0.18
E(Yr1-
1 02
= 890.34
cry2 ZN-1-02/( k- 1 )?
ay2 =
1.75
R:\CitgolAmmonia Site Specific\Confidence Interval (11-5-07) ?
14 of 23
?
Huff & Huff, Inc.
Electronic Filing - Received, Clerk's Office, March 18, 2008
* * * * * AS 2008-008 * * * * *
EXHIBIT 2
CITGO AMMONIA
EFFLUENT CALCULATIONS
Date
ppm-N
3
?
=
IlitiII
02/05/03
0.72
-0.329
0.263
02/10/03
0.80
-0.223
0.166
02/12/03
1.62
0.482
0.089
02/17/03
0.31
-1.171
1.837
02/19/03
0.54
-0.616
0.641
02/24/03
1,42
0.351
0.028
02/26/03
IIIIInnl.
0.419
0.055
03/03/03
IMEEDIIIIII
0.425
0.058
03/05/03
1.26
0.231
0.002
03/10/03
0.44
-0.821
1.010
03/12/03
1.90
0.642
0.209
03/17/03
0.58
-0.545
0.531
03/20/03
0.70
-0.357
0.293
03/25/03
0.89
-0.117
0.090
03/27/03
1.40
0.336
0.023
03/31/03
3.08
MEM
0.885
04/02/03
3.74
1.319
1.288
04/07/03
1.90
0.642
0.209
04/09/03
1.70
0.531
0.120
04/14/03
2.02
0.703
0.269
04/16/03
1.47
0.385
0.040
04/21/03
0.75
-0.288
0.223
04/23/03
0.70
-0.357
0.293
04/28/03
1.38
0.322
0.019
04/30/03
1,09
0.086
0.010
05/05/03
4.54
EMI
1.765
05/07/03
2.10
0.742
0.311
05/12/03
2,88
1.058
0.763
05/14/03
6.12
1.812
2.648
05/19/03
13.60
2.610
5.885
05/21/03
8.77
j
3.949
05/26/03
2,68
0.986
0.643
05/28/03
8.13
2.096
3.653
06/02/03
IIIIIIEMIIIII
1.001
0.667
06/04/03
6.17
1.820
2.675
06/09/03
4.01
1.389
1.451
06/11/03
5.32
1.671
2.212
06/16/03
2.62
0.963
0.607
06/18/03
5.29
1.666
2.195
06/23/03
1.141
0.915
06/25/03
0.944
0.577
06/30/03
1,38
0.322
0.019
07/02/03
2.39
0.871
0.472
07/07/03
0.438
0.065
07/09/03
1.00
0.000
0.034
07/14/03
0.52
-0.654
0.702
07/16/03
0.82
-0.198
0.146
07/21/03
0.73
-0.315
0.249
07/23/03
?
11111111B11111
0.122
0.004
07/28/03
0.70
-0.357
0.293
07/30/03
0.64
-0.446
0.398
RACitgolAmmonia Site Specific\Confidence Interval (11-5-07)?
15 of 23?
Huff & Huff, Inc.
Electronic Filing - Received, Clerk's Office, March 18, 2008
* * * * * AS 2008-008 * * * * *
EXHIBIT 2
CITGO AMMONIA
EFFLUENT CALCULATIONS
Date
ppm-N
3 61
X
NM=
08/04/03
0.50
-0.693
0.770
08/06/03
0.68
-0.386
0.325
08/11/03
0.33
-1.109
1.672
08/13/03
0.20
-1.609
08/18/03
0,89
-0.117
0.090
08/20/03
0,34
-1.079
1.595
08/25/03
0,54
-0.616
0.641
08/27/03
0.56
-0.580
0.584
09/02/03
1_.36
.
0.307
0.015
09/03/03
0.80
-0.223
0.166
09/08/03
0.25
-1.386
2.467
09/10/03
0.30
-1.204
1.927
09/15/03
0.54
-0.616
0.641
09/17/03
0,84
-0.174
0.129
09/22/03
0.81
-0.211
0.156
09/24/03
0.61
-0.494
0.460
09/29/03
0.80
-0.223
0.166
10/01/03
2.10
0.742
0.311
10/13/03
5.08
1.625
2.077
10/15/03
3.24
1.176
0.983
10/20/03
0,99
-0.010
0.038
10/22/03
0.71
-0.342
0.277
10/27/03
0,65
-0.431
0.378
10/29/03
0.67
-0.400
0.342
11/03/04
1.26
0.230
0.002
11/05/04
0.32
-1.143
1.760
11/12/04
0.52
-0.656
0.706
11/17/04
10.39
2.341
4.651
11/19/04
6.56
1.881
2.879
11/24/04
7.00
1.946
3.104
11/25/04
9.48
2.249
4.264
12/01/04
4.55
Man
1.771
12/03/04
1111.1111M11II
0.285
0.010
12/08/04
2.24
0.806
0.387
12/10/04
6.82
1.920
3.012
12/15/04
20.60
3.025
8.072
12/29/04
12.40
2.518
5.445
01/01/04
15.00
2.708
6.370
01/05/04
11.40
2.434
5.060
01/07/04
11.80
2.468
5.216
01/12/04
8.36
MEM
3.761
01/14/04
2.68
0.986
0.643
01/19/04
0.66
-0.416
0.360
01/21/04
0.46
-0.777
0.923
01/26/04
0.50
-0.693
0.770
01/28/04
0.66
-0.416
0.360
02/02/04
0.60
-0.511
0.483
02/04/04
0.50
-0.693
0.770
02/09/04
0.52
-0.654
0.702
02/11/04
0.46
-0.777
0.923
02/16/04
0.44
-0.821
1.010
RACitgoNAmmonia Site Specific\Confidence Interval (11-5-07)
?
16 of 23
Huff & Huff, Inc.
Electronic Filing - Received, Clerk's Office, March 18, 2008
* * * * * AS 2008-008 * * * * *
EXHIBIT 2
CITGO AMMONIA
EFFLUENT CALCULATIONS
Date
ppm-W.3
?
=
?
1P'
(
?
.
py
02/18/04
0,46?
Miliall
0.923
02/23/04
0.45
-0.799
0.966
02/25/04
0.14
-1.966
4.624
03/02/04
OM
-0.821
1.010
03/03/04
0.10
-2 303
6 184
03/08/04
0.50
-0.693
0.770
03/10/04
I.
-0.494
0.460
03/15/04
0.73
-0.315
0.249
03/17/04
0.54
-0.616
0.641
03/22/04
0.74
-0.301
0.236
03/24/04
0.87
-0.139
0.105
03/2904
0.83
-0.186
0.137
03/31/04
0.66
-0.416
0.360
04/05/04
0.48
-0.734
0.843
04/07/04
0.23
-1.470
2.735
04/12/04
0.58
-0.545
0.531
04/14/04
G 24
-1.427
2.596
04/19/04
0 56
-0.580
0.584
04/21/04
0.23
-1.470
2.735
04/26/04
0
.
16
-1.833
4.067
04/2804
0.30
-1.204
1.927
05/03/04
0.42
-0.868
I.
05/06/04
0.86
-0.151
0.112
05/10/04
0.74
-0.301
0.236
05/12/04
0.36
-1.022
1.454
05/17/04
0.50
-0.693
0.770
05/19/04
0.25
-1.386
2.467
05/24/04
065
-0.431
0.378
05/26/04
I
-0.968
1.327
05/31/04
I
-1.427
2.596
06/02/04
0.09
-2.408
6.719
06/07/04
0.21
-1.561
3.045
06/09/04
0.39
-0.942
1.267
8.986
Wil
1.267
06/14/04
0.26
-1.347
06/16/04
0.06
-2.813
06/21/04
0.39
-0.942
06/23/04
0.26
-1.347
2.345
06/28/04
0.48
-0.734
0.843
06/30/04
I
-0.673
0.735
07/05/04
0.39
-0.942
1.267
07/07/04
0.30
-1.204
1.927
07/12/04
0.41
-0.892
1.157
07/1404
0.38
-0.968
1.327
07/1904
0 40
-0.916
1.211
07/21/04
0 56
-0.580
0.584
07/26/04
I
-0.755
0.882
07/28/04
0.45
-0.799
0.966
08/02/04
0.44
-0.821
1.010
08/04/04
0.55
-0.598
0.612
MEM
0.004
08/09/04
0.41
-0.892
08/13/04
1.28
0.247
RACitgokAmmonla Site Specific\Confidence Interval (11-5-07)
?
17
of 23?
Huff & Huff, Inc.
Electronic Filing - Received, Clerk's Office, March 18, 2008
* * * * * AS 2008-008 * * * * *
EXHIBIT 2
CITGO AMMONIA
EFFLUENT CALCULATIONS
Date
ppm-NH3
MEI
08/16/04
0.49
-0.713
0.806
08/18104
0.36
-1.022
1.454
08/23/04
0.34
1.079
1.595
08/25/04
0.36
-1.022
1.454
08/30/04
0.39
-0.942
1.267
09/01/04
0.24
-1.427
2.596
09/06/04
0.29
-1.238
2.022
09/08/04
0.55
-0.598
0.612
09/13/04
0.79
-0.236
0.176
09/15/04
0.41
-0.892
1.157
09/20/04
0.18
-1.715
3.606
09/22/04
0.21
-1.561
3.045
09/27/04
0.46
-0.777
0,923
09/29/04
0.51
-0.673
0.735
10/08/04
6.44
1.863
2.817
10/09/04
7.26
1.982
3.233
10/11/04
4.44
1.491
1.707
10/13/04
2.30
0.833
0.421
10/18/04
110
0.095
0.008
10/20104
0.87
-0.139
0.105
10/25/04
0.85
-0.163
0.120
1.469
Mill
6.602
10/27/04
1.85
0.615
11/01/04
4.04
1.396
11/03/04
15.70
2.754
11/17/04
10.20
2.322
4.572
11/18/04
17.70
2.874
7.233
11/24/04
14.80
2.695
6.302
11/25/04
14.60
2.681
6.234
11/2904
7.64
2.033
3.419
12/01/05
13.00
2.565
5.668
12/06/05
2A4
0.892
0.501
12/08/05
8.03
2.083
3.606
12J13/05
10.80
2.380
4.819
12/15/05
4.80
1.569
1.917
12J20/05
1.30
0.262
0.006
0.146
12/27/05
MIIMIIIMI
0.79
-0.26
0.16
0 735
01/03/05
MIMI
01/05/05
-0.673
0.74
1.56
-0.301
0.445
0.236
0.068
01/10/05
7.74
2.046
3.468
01/12/05
8.34
2.121
3
751
01/18/05
0.20
-1.609
3.217
01/19/05
0.53
-0.635
0.671
01/24/05
0.36
-1.022
1.454
01/26/05
0.45
-0.799
0.966
oini/o5
0.68
-0.386
0.325
02/02/05
0.58
-0.545
0.531
02/07/05
?
1.00
0.000
0.034
02/14/05
MIIMIIIIMIMII
0.65
-0.431
?
0.378
11:1Citgo‘Ammonia Site Specific\Confidence Interval (11-5-07)
?
18 of 23
?
Huff & Huff, Inc.
Electronic Filing - Received, Clerk's Office, March 18, 2008
* * * * * AS 2008-008 * * * * *
EXHIBIT 2
CITGO AMMONIA
EFFLUENT CALCULATIONS
Date
ppm-NH3N =
X
Y
(Y - pr)`
02/16/05
0.39
-0.942
1.267
02/21/05
0.49
-0.713
0.806
02/23/05
0.51
-0.673
0.735
02/28/05
0.54
-0.616
0.641
03/02/05
0.50
-0.693
0.770
03/07/05
0.43
-0.844
1.057
03/09/05
1.44
0.365
0.033
03/15/05
0.32
-1.139
1.752
03/16/05
0.60
-0.511
0.483
03/21/05
0.09
-2.408
6.719
03/23/05
0.27
-1.309
2.231
03/28/05
0.92
-0.083
0.072
03/30/05
0.55
-0.598
0.612
04/04/05
0.36
-1.022
1.454
04/06/05
0.60
-0.511
0.483
04/11/05
0.68
-0.386
0.325
04/14/05
0.51
-0.673
0.735
04/18/05
0,64
-0.446
0.398
04/20/05
0.75
-0.288
0.223
04/25/05
0.50
-0.693
0.770
04/27/05
0,31
-1.171
1.837
05/02/05
0.90
-0.105
0.084
05/04/05
0.31
-1.171
1.837
05/09/05
0.80
-0.223
0.166
05/11/05
0.67
-0.400
0.342
05/16/05
0.64
-0.446
0.398
05/18/05
0.47
-0.755
0.882
05/23/05
0.41
-0.892
1.157
05/25/05
0.28
-1.273
2.123
05/30/05
0.61
-0.494
0.460
06/01/05
0.36
-1.022
1.454
06/06/05
0.53
-0.635
0.671
06/08/05
0.47
-0.755
0.882
06/13/05
0.44
-0.821
1.010
06/15/05
0,93
-0.073
0.066
06/20/05
0.57
-0.562
0.557
06/22/05
0.70
-0.357
0.293
06/27/05
0.78
-0.248
0.187
06/29/05
1.04
0.039
0.021
07/04/05
5.63
1.728
2.384
07/06/05
7.54
2.020
3.371
07/11/05
6.13
1.813
2.654
07/13/05
7.52
2.018
3.361
07/18/05
8.18
2.102
3.677
07/20/05
9.44
2.245
4.247
07/25/05
11.90
2.477
5.255
07/27/05
14.00
2.639
6.026
08/01/05
4.98
1.605
2.020
08/03/05
5.40
1.686
2.257
08/08/05
4.44
1.491
1.707
08/10/05
5.30
1.668
2.201
R:\Citgo\Ammonia Site Specific\Confidence Interval (11-5-07)
?
19 of 23?
Huff & Huff, inc.
Electronic Filing - Received, Clerk's Office, March 18, 2008
* * * * * AS 2008-008 * * * * *
EXHIBIT 2
CITGO AMMONIA
EFFLUENT CALCULATIONS
Date
Plmn-NFI3N
=
X
IIIMMIgnill
1111111111111111111111111111
08/22/05
2.94
1.078
0.800
Mall
09/14/05
09/19/05
11.80
1,66
2.468
0.507
5.2160.104
IIIIIIIIIIIII
10/20/0510/21
10/10/0510/05/05/05
11.20
10.30
3.28
MEM
2.416
1.188
4.980
4.614
1.007
10/24/0
10/26/0
10/31/0
11
11/02/0
11/09/0
11/10/0
111i
12/12/06
1,36
11111111111111111111111
0.307
0.015
IIIII
IIIIIIIII
11111
01/25/06
0.63
-0.462
I
0.418
01/30/06
3.02
MUM
2.180
1.105
02/01/0602/08/0602/06/06
8.44
8.855.68
2.133
3.985
3.798
2.411
0.848
RACitgolArnmonia Site Specific\Confidence Interval (11-5-07) ?
20 of 23
?
Huff & Huff, Inc.
Electronic Filing - Received, Clerk's Office, March 18, 2008
* * * * * AS 2008-008 * * * * *
EXHIBIT 2
CITGO AMMONIA
EFFLUENT CALCULATIONS
02/13/06
Date
ppm-NI-i3N
4,87
=
k -?
1.583
Y
'(?
1.957
- iv
02/15/06
15.60
2.747
6.569
02/20/06
7.86
2.062
3.525
02/22/06
7,20
1.974
3.204
02/27/06
16.00
2.773
6.700
03/01/06
15.30
2.728
6.470
03/06/06
3.42
1.230
1.093
03/08/06
8.19
2.103
3.681
03/13/06
8.30
2.116
3.733
03/15/06
1.526
1.801
03/21/06
1.775
2.530
03/22/06
2.542
5.557
03/27/06
1.668
2.201
03/29/06
1.314
1.276
04/03/06
0.631
0.200
04/05/06
1.802
2.616
04/10/06
1.044
0.739
04/12/06
1.719
2.356
04/17/06
1.985
3.243
04/19/06
1.708
2.323
04/24/06
2.342
4.655
04/27/06
2.833
7.017
05/01/06
2.681
6.234
05/03/06
2.785
6.764
05/08/06
2.045
3.463
05/10/06
2.797
6.828
05/19/06
0.663
0.229
05/20/06
1.112
0.861
05/22/06
1.212
1.056
05/24/06
1.641
2.122
05/29/06
-0.041
0.051
05/31/06
-0.713
0.806
06/05/06
-2.996
10.112
06/07/06
-0.616
0.641
06/12/06
2,29
0.829
0.415
06/14/06
-1.386
2.467
06/19/06
-1.427
2.596
06/21/06
0.519
0.112
06/26/06
-0.968
1.327
06/28/06
-1.470
2.735
07/02/06
-1.109
1.672
07/05/06
-2.526
7.344
07/10/06
0.57
-0.562
0.557
07/12/06
2.44
0.892
0.501
07/17/06
8.68
2.161
3.908
07/19/06
4.76
1.560
1.893
07/24/06
2.89
1.061
0.769
07/26/06
1.48
0.392
0.043
07/31/06
0,76
-0.274
0.210
08/02/06
1.21
0.191
0.000
08/07/06
0.45
-0.799
0.966
RACitgo\Arnmonia Site Specific\Confidence Interval (11-5-07)
?
21 of 23
?
Huff & Huff, Inc.
Electronic Filing - Received, Clerk's Office, March 18, 2008
* * * * * AS 2008-008 * * * * *
EXHIBIT 2
CITGO AMMONIA
EFFLUENT CALCULATIONS
Date
ppm-Nti3N
= X
Y
(Y -
Pyr
08/09/06
0.48
-0.734
0.843
08/14/06
0.24
-1.427
2.596
08/16/06
0.16
-1.833
4.067
08/21/06
0.16
-1.833
4.067
08/23/06
0.33
-1.109
1.672
08/28/06
0.34
-1.079
1.595
08/30/06
0.26
-1.347
2.345
09/04/06
0.79
-0.236
0.176
09/06/06
0.34
-1.079
1.595
09/11/06
0.66
-0.416
0.360
09/13/06
1.40
0.336
0.023
09/18/06
0,12
-2.120
5.311
09/20/06
0.12
-2.120
5.311
09/25/06
0.24
-1.427
2.596
09/27/06
1.09
0.086
0.010
10/02/06
0.11
-2.207
5.719
10/04/06
0,12
-2.120
5.311
10/09/06
0.18
-1.715
3.606
10/11/06
0.21
-1.561
3.045
10/16/06
0.19
-1.661
3.404
10/18/06
0.48
-0.734
0.843
10/24/06
0.73
-0.315
0.249
10/25/06
1.06
0.058
0.016
10/30/06
0.90
-0.105
0.084
11/01/06
0.99
-0.010
0.038
11/06/06
1,02
0.020
0.027
11/08/06
0.54
-0.616
0.641
11/13/06
0.44
-0.821
1.010
11/15/06
0.31
-1.171
1.837
11/19/06
0.53
-0.635
0.671
11/20/06
0.49
-0.713
0.806
11/27/06
0.47
-0.755
0.882
11/29/06
0.46
-0.777
0.923
12/04/06
0.15
-1.897
4.332
12/06/06
0.38
-0.968
1.327
12/10/07
0.19
-1.661
3.404
12/11/07
0.14
-1.966
4.624
12/18/07
1.49
0.399
0.046
12/20/07
0.51
-0.673
0.735
12/25/07
0.33
-1.109
1.672
12/27/07
0.13
-2.040
4.948
01/01/07
0.38
-0.968
1.327
01/03/07
0.21
-1.561
3.045
01/08/07
0.24
-1.427
2.596
01/10/07
0.81
-0.211
0.156
01/15/07
0.45
-0.799
0.966
01/17/07
0.32
-1.139
1.752
01/22/07
1.08
0.077
0.012
01/24/07
2.80
1.030
0.715
01/29/07
1.30
0.262
0.006
01/31/07
6.26
1.834
2.722
RACitgo\Ammonia Site SpecificlConfidence Interval (11-5-07)
22 of 23
?
Huff & Huff, Inc.
Electronic Filing - Received, Clerk's Office, March 18, 2008
* * * * * AS 2008-008 * * * * *
EXHIBIT 2
CITGO AMMONIA
EFFLUENT CALCULATIONS
Date
ppm-NH3
?
=
ME'
IIIIIIIIIIIIII
02/14/07
0,49
?
-0.713
0.806
02/19/07
0,48
-0.734
0.843
02/21/07
1.36
0.307
0.015
02/26/07
0.17
IISMI
3.827
02/28/07
0.32
-1.139
NMI
IIIIIII
11111
111111
IIIIIIIIIIIIIIIIII
04/16/07
0.88
-0.128 0.097
04/18/07
1.59
0.464
0.078
04/23/07
1,27
0.239
0.003
04/25/07
8.01
IIIIIIMMIIIIIII
1.70
2.081
0.531
3.597
05/07/07
0.120
05/09/07
2.38
0.867
0.466
05/14/07
3.01
1.102
0.842
05/21/07
1.552
S
05/28/07
0.577
a
06/11/07
0.751
06/13/07
3.50
MEM
111.111111
1.142
IIIIIIIIIIII
IIIIIIIIIIIIIIMI
07/16/07
11111111MMI
1.019
0.697
07/18/07
3.22
1.169
0.971
07/24/07
7.16
1.969
3.184
07/25/07
5.80
1.758
2.476
07/30/07
5.89
1.773
2.525
R:\Citgo\Ammonia Site Specific\Confidence Interval (11-5-07)
?
23 of
23
?
Huff & Huff, Inc.
Electronic Filing - Received, Clerk's Office, March 18, 2008
* * * * * AS 2008-008 * * * * *
EXHIBIT 2