Revision 1
Certain figures in this Report contain sensitive, security-
related information protected from public disclosure by
Federal and State law. This Report is suitable for
public disclosure only after these figures are removed.
HYDROGEOLOGIC INVESTIGATION REPORT
FLEETWIDE ASSESSMENT
BRAIDWOOD GENERATING STATION
BRACEVILLE, ILLINOIS
Prepared For:
Exelon Generation Company, LLC
DISCLAIMER:
SOME FORMATTING CHANGES MAY HAVE OCCURRED WHEN
THE ORIGINAL DOCUMENT WAS PRINTED TO PDF; HOWEVER,
THE ORIGINAL CONTENT REMAINS UNCHANGED.
SEPTEMBER 2006
R
EF. NO. 045136 (12)
Prepared by:
Conestoga-Rovers
& Associates
651 Colby Drive
Waterloo, Ontario
Canada N2V 1C2
Office: (519) 884-0510
Fax:
(519) 884-0525
web: http:\\www.CRAworld.com
Worldwide Engineering , Environmental , Construction , and IT Services
Revision 1
TABLE OF CONTENTS
Page
EXECUTIVE SUMMARY.................................................................................................................... i
1.0
INTRODUCTION ...................................................................................................................1
2.0
STATION DESCRIPTION .....................................................................................................2
2.1
STATION LOCATION .......................................................................................2
2.2
OVERVIEW OF COOLING WATER OPERATIONS.....................................2
2.3
SURROUNDING LAND USE ...........................................................................3
2.4
STATION SETTING............................................................................................4
2.4.1
TOPOGRAPHY AND SURFACE WATER FEATURES.................................4
2.4.2
GEOLOGY............................................................................................................5
2.4.3
HYDROGEOLOGY .............................................................................................7
2.5
AREA GROUNDWATER USE..........................................................................9
2.6
BRAIDWOOD STATION BLOWDOWN LINE INVESTIGATIONS.........10
3.0
AREAS FOR FURTHER
EVALUATION...........................................................................11
3.1
SYSTEMS EVALUATIONS..............................................................................11
3.2
HISTORICAL RELEASES ................................................................................14
3.3
STATION INVESTIGATIONS.........................................................................14
3.3.1
PRE-OPERATIONAL RADIOLOGICAL ENVIRONMENTAL
MONITORING PROGRAM.............................................................................14
3.3.2
RADIOLOGICAL ENVIRONMENTAL MONITORING PROGRAM ......15
3.3.3
HISTORIC SITE INVESTIGATIONS ..............................................................16
3.3.3.1
POWER PLANT DOCUMENTS-UFSAR REPORT ......................................16
3.3.3.2
BLOWDOWN LINE INVESTIGATION.........................................................16
3.4
IDENTIFIED AREAS FOR FURTHER EVALUATION ...............................16
4.0
FIELD METHODS.................................................................................................................19
4.1
STAFF GAUGES INSTALLATION ................................................................19
4.2
GROUNDWATER MONITORING WELL INSTALLATION.....................19
4.3
GROUNDWATER MONITORING WELL DEVELOPMENT ....................21
4.4
WELL INVENTORY .........................................................................................21
4.5
SURVEY ..............................................................................................................22
4.6
GROUNDWATER AND SURFACE WATER ELEVATION
MEASUREMENTS
............................................................................................22
4.7
GROUNDWATER AND SURFACE WATER
SAMPLE COLLECTION
..................................................................................24
4.8
DATA QUALITY OBJECTIVES.......................................................................26
4.9
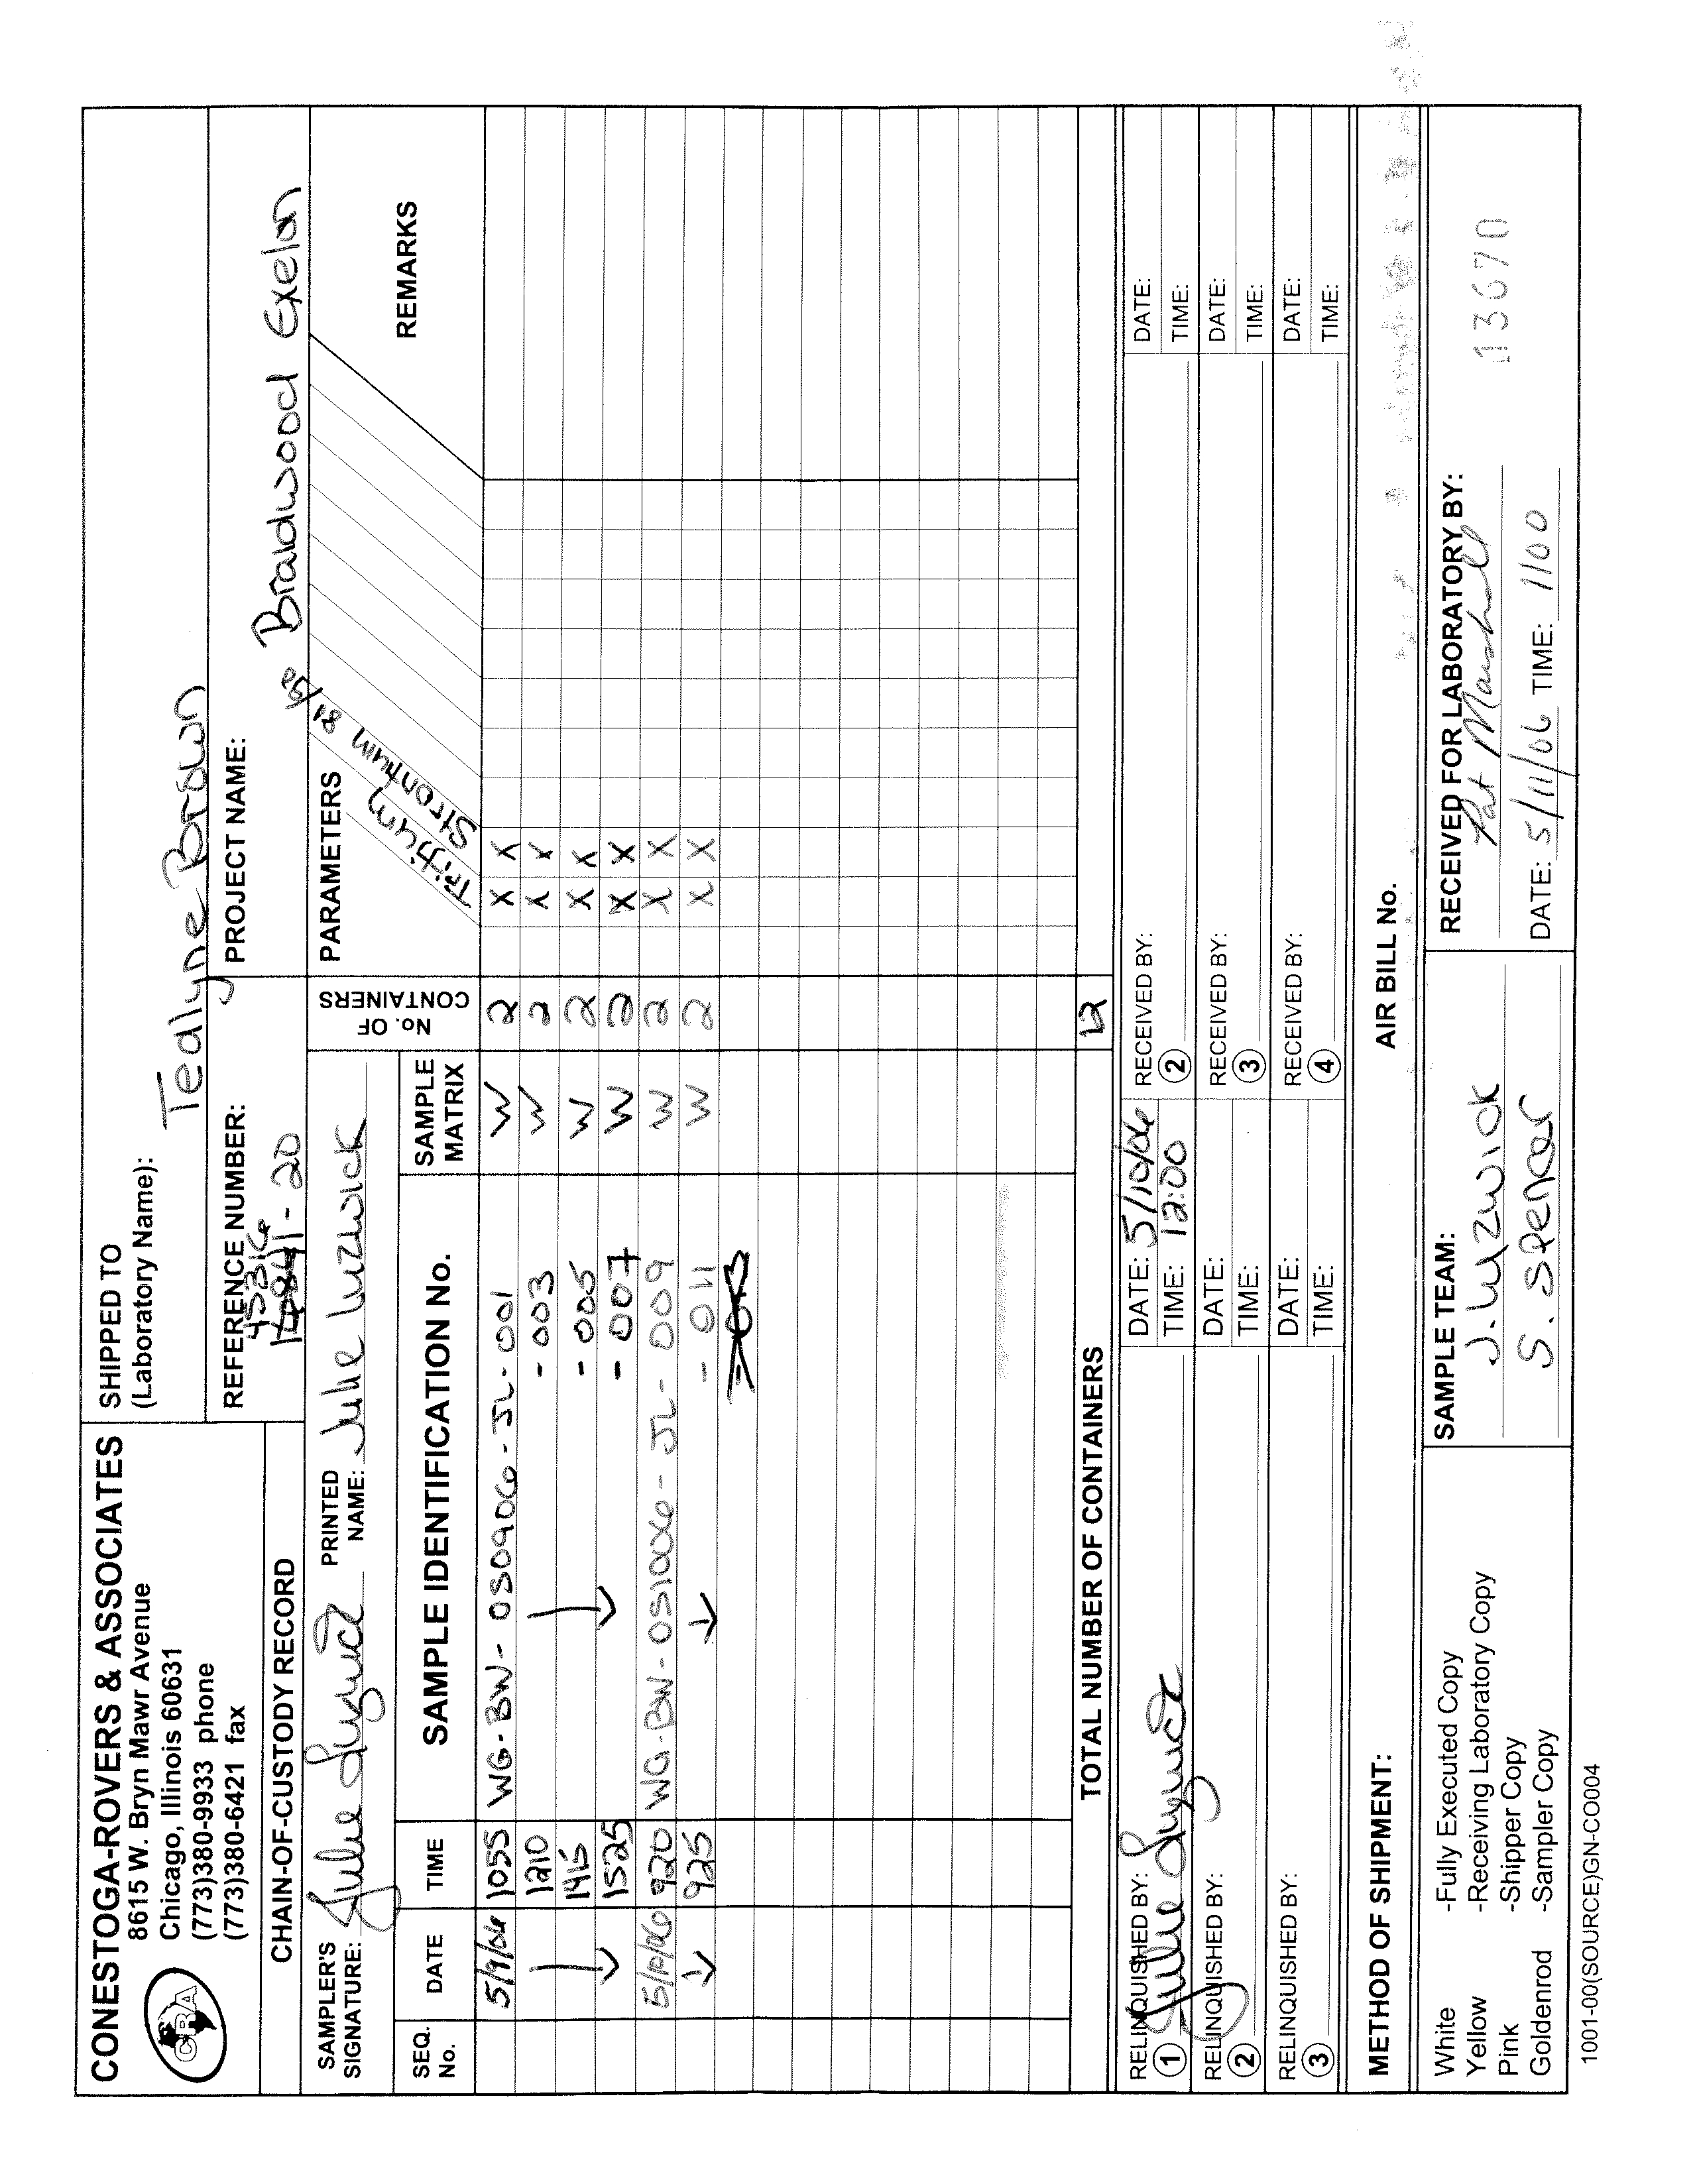
SAMPLE IDENTIFICATION...........................................................................26
4.10
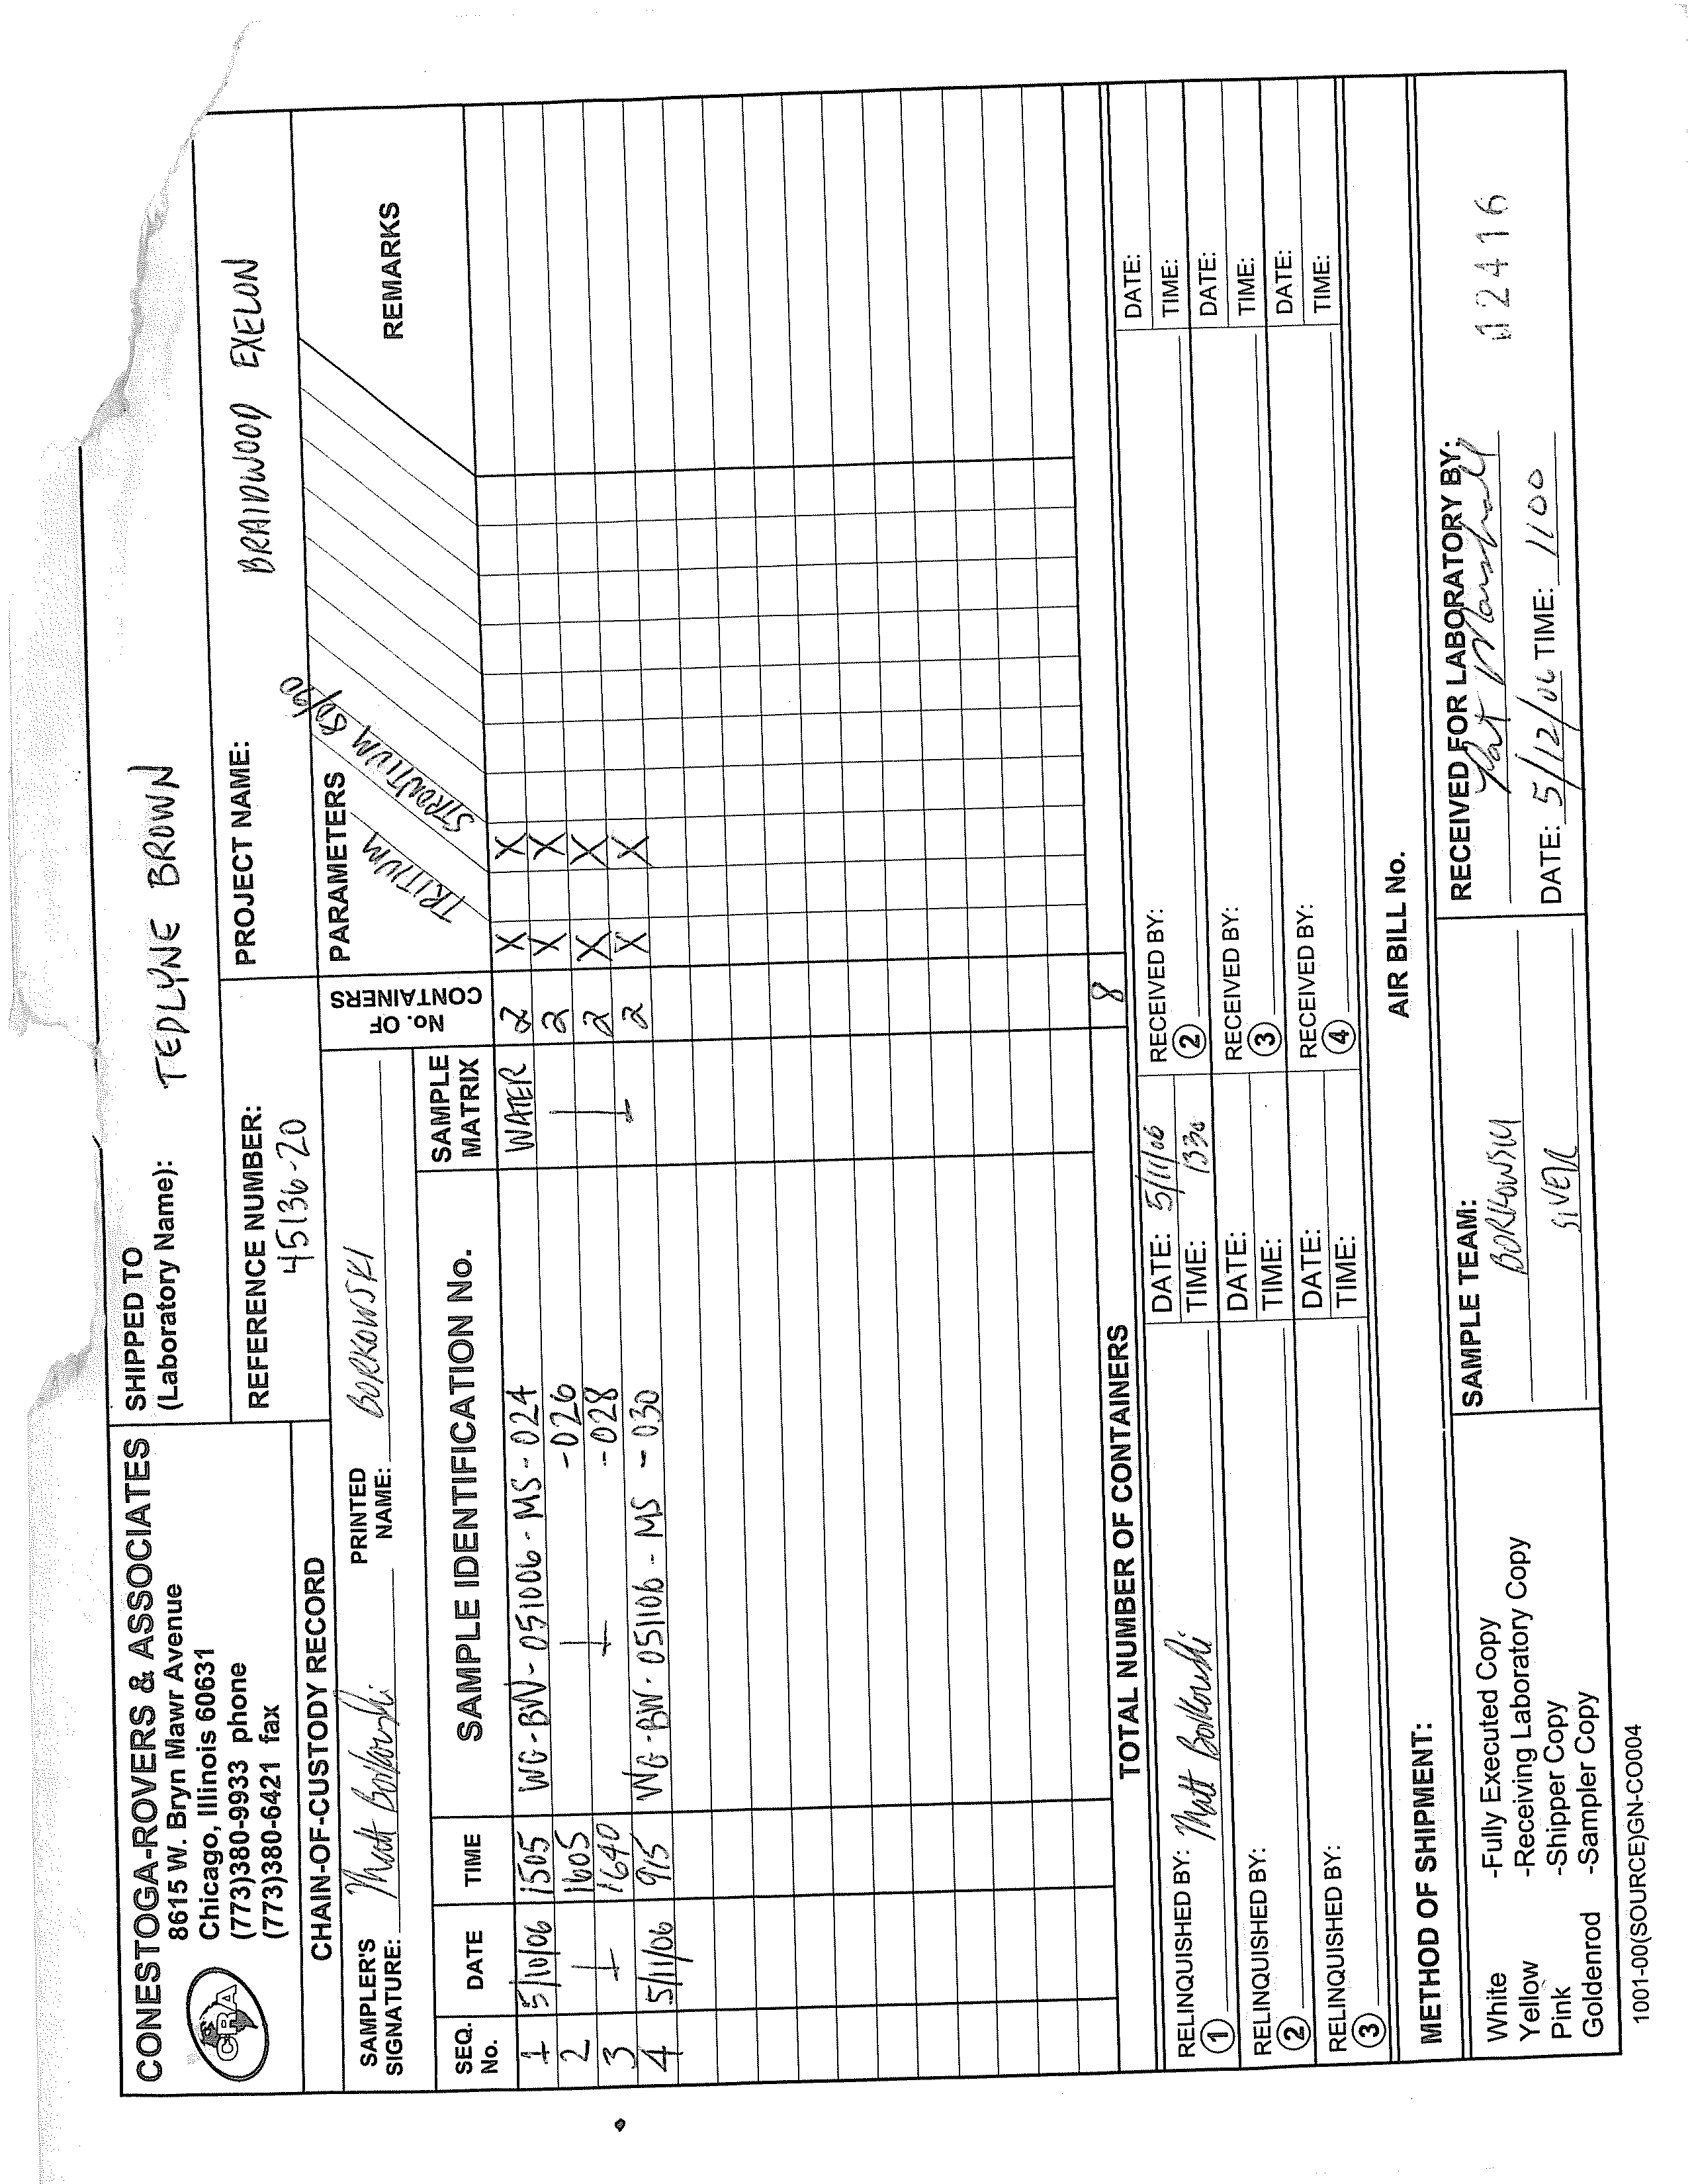
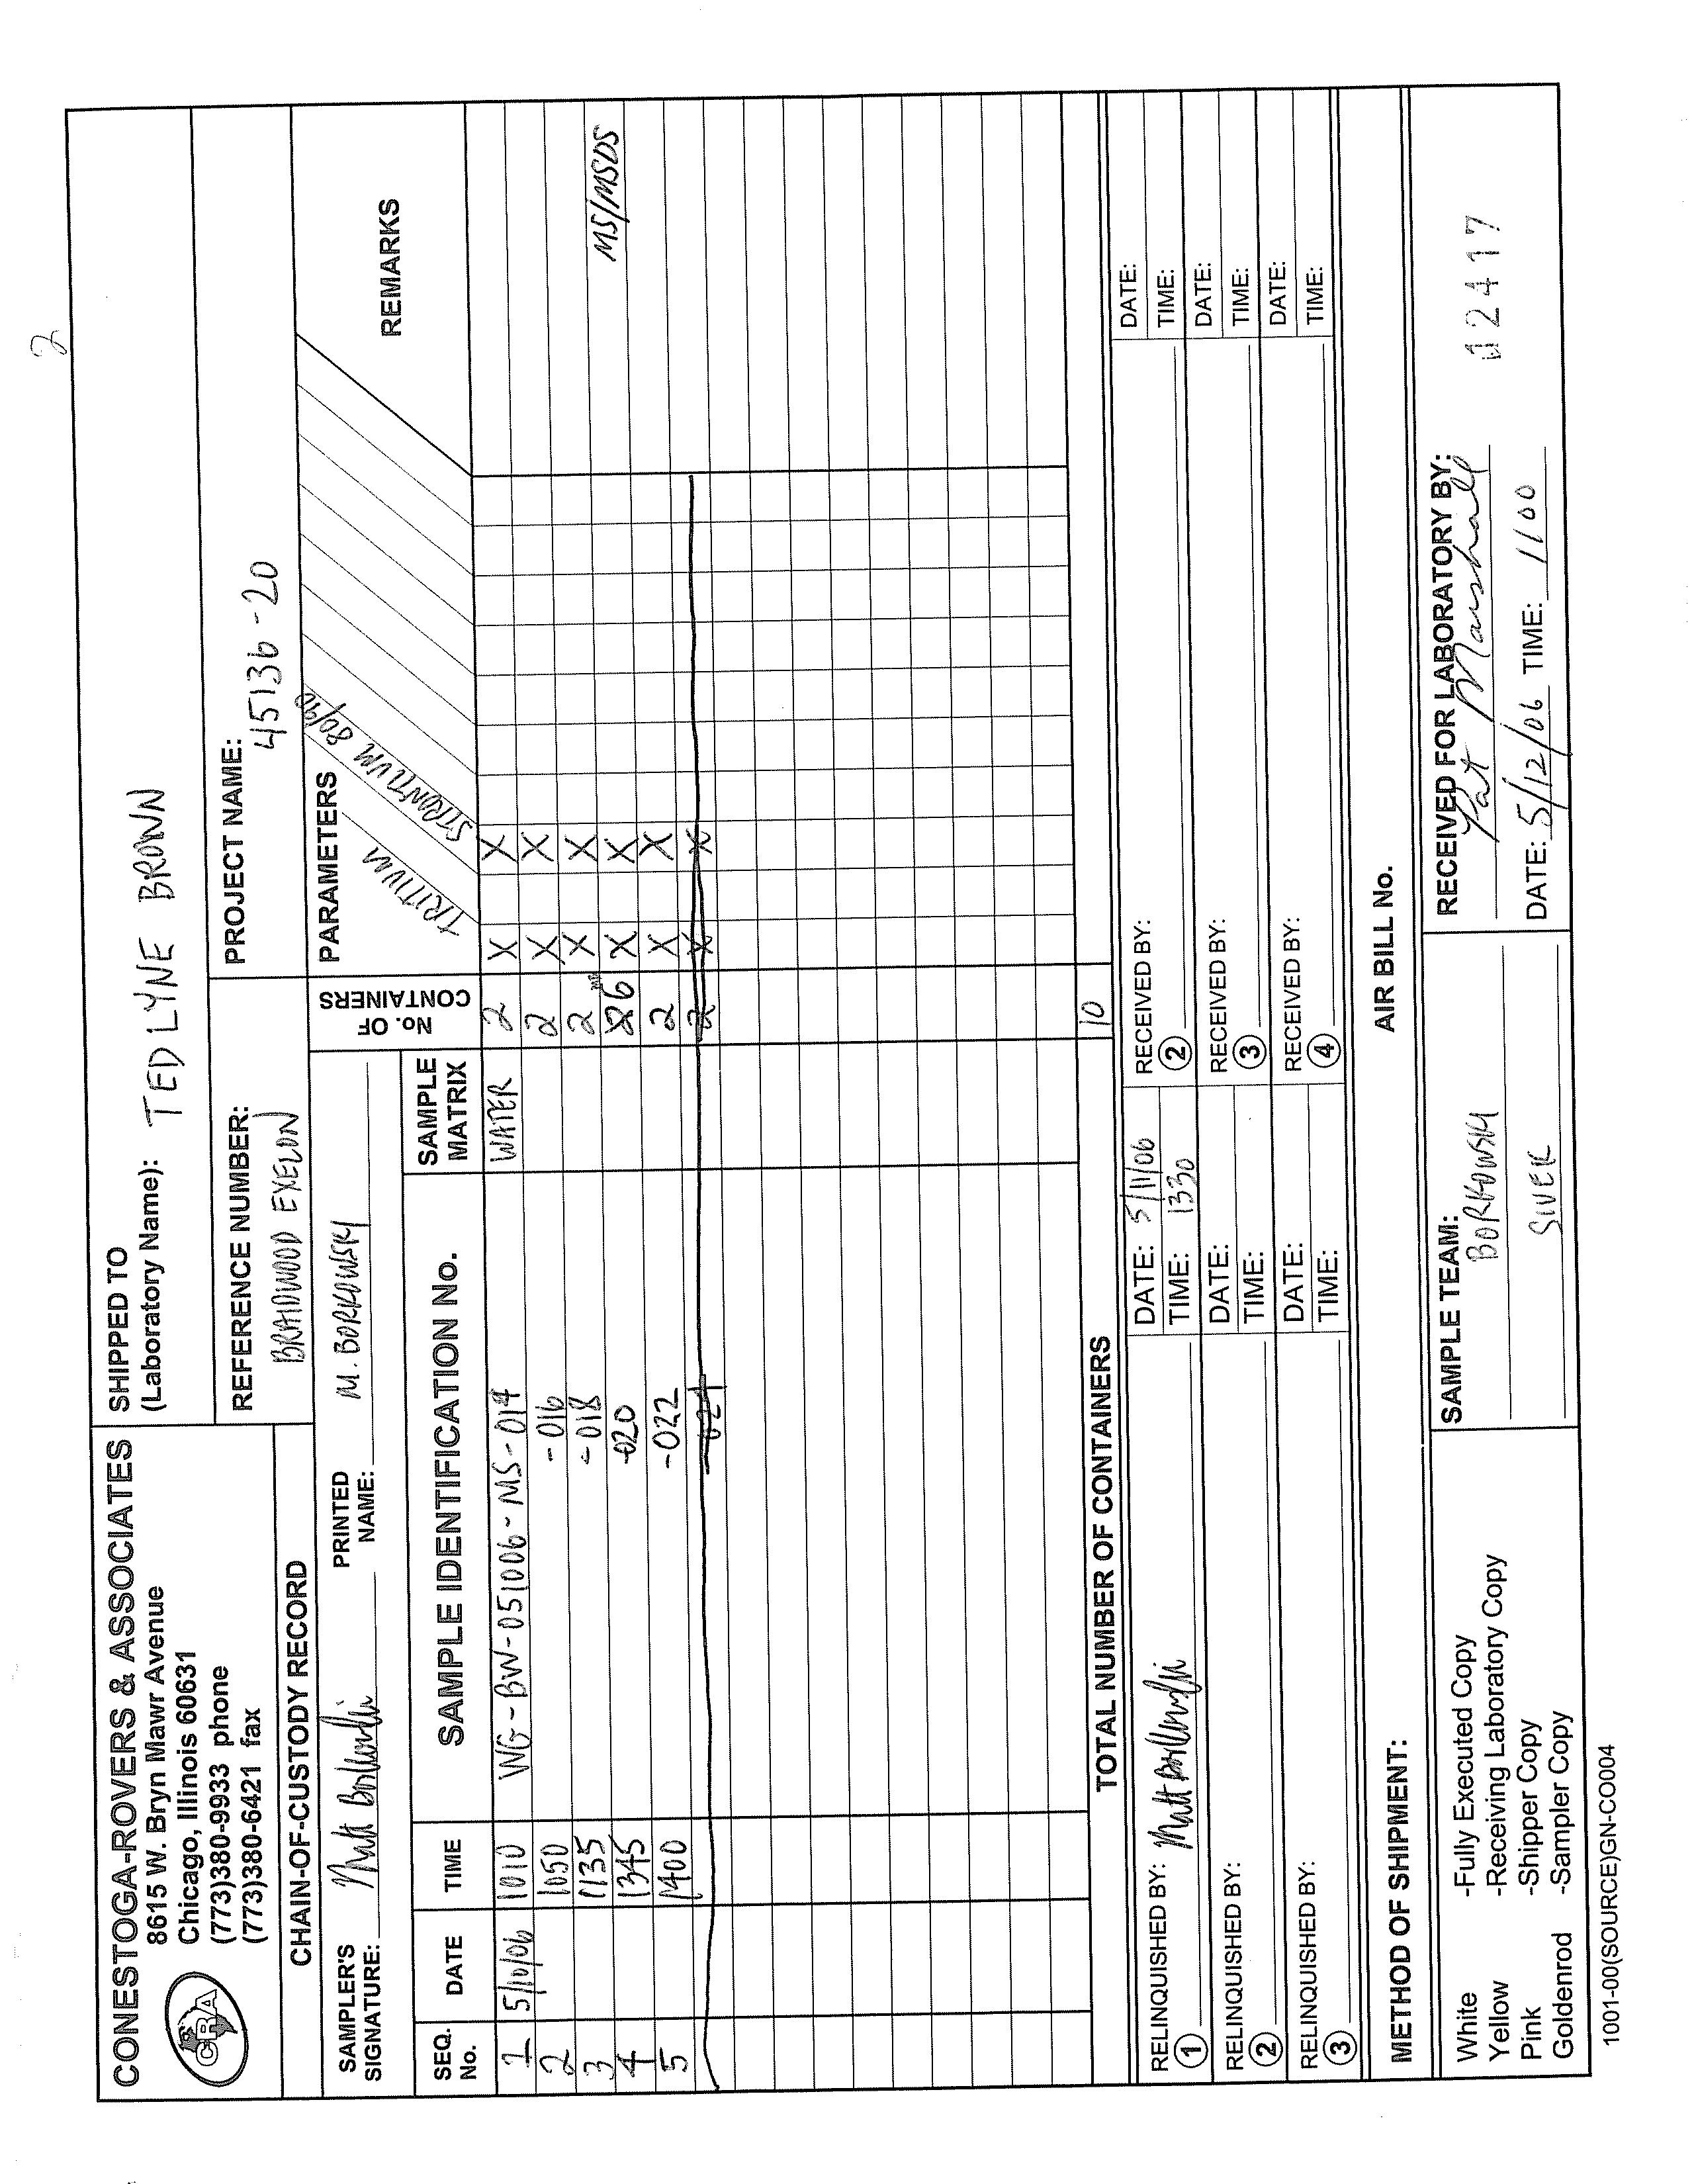
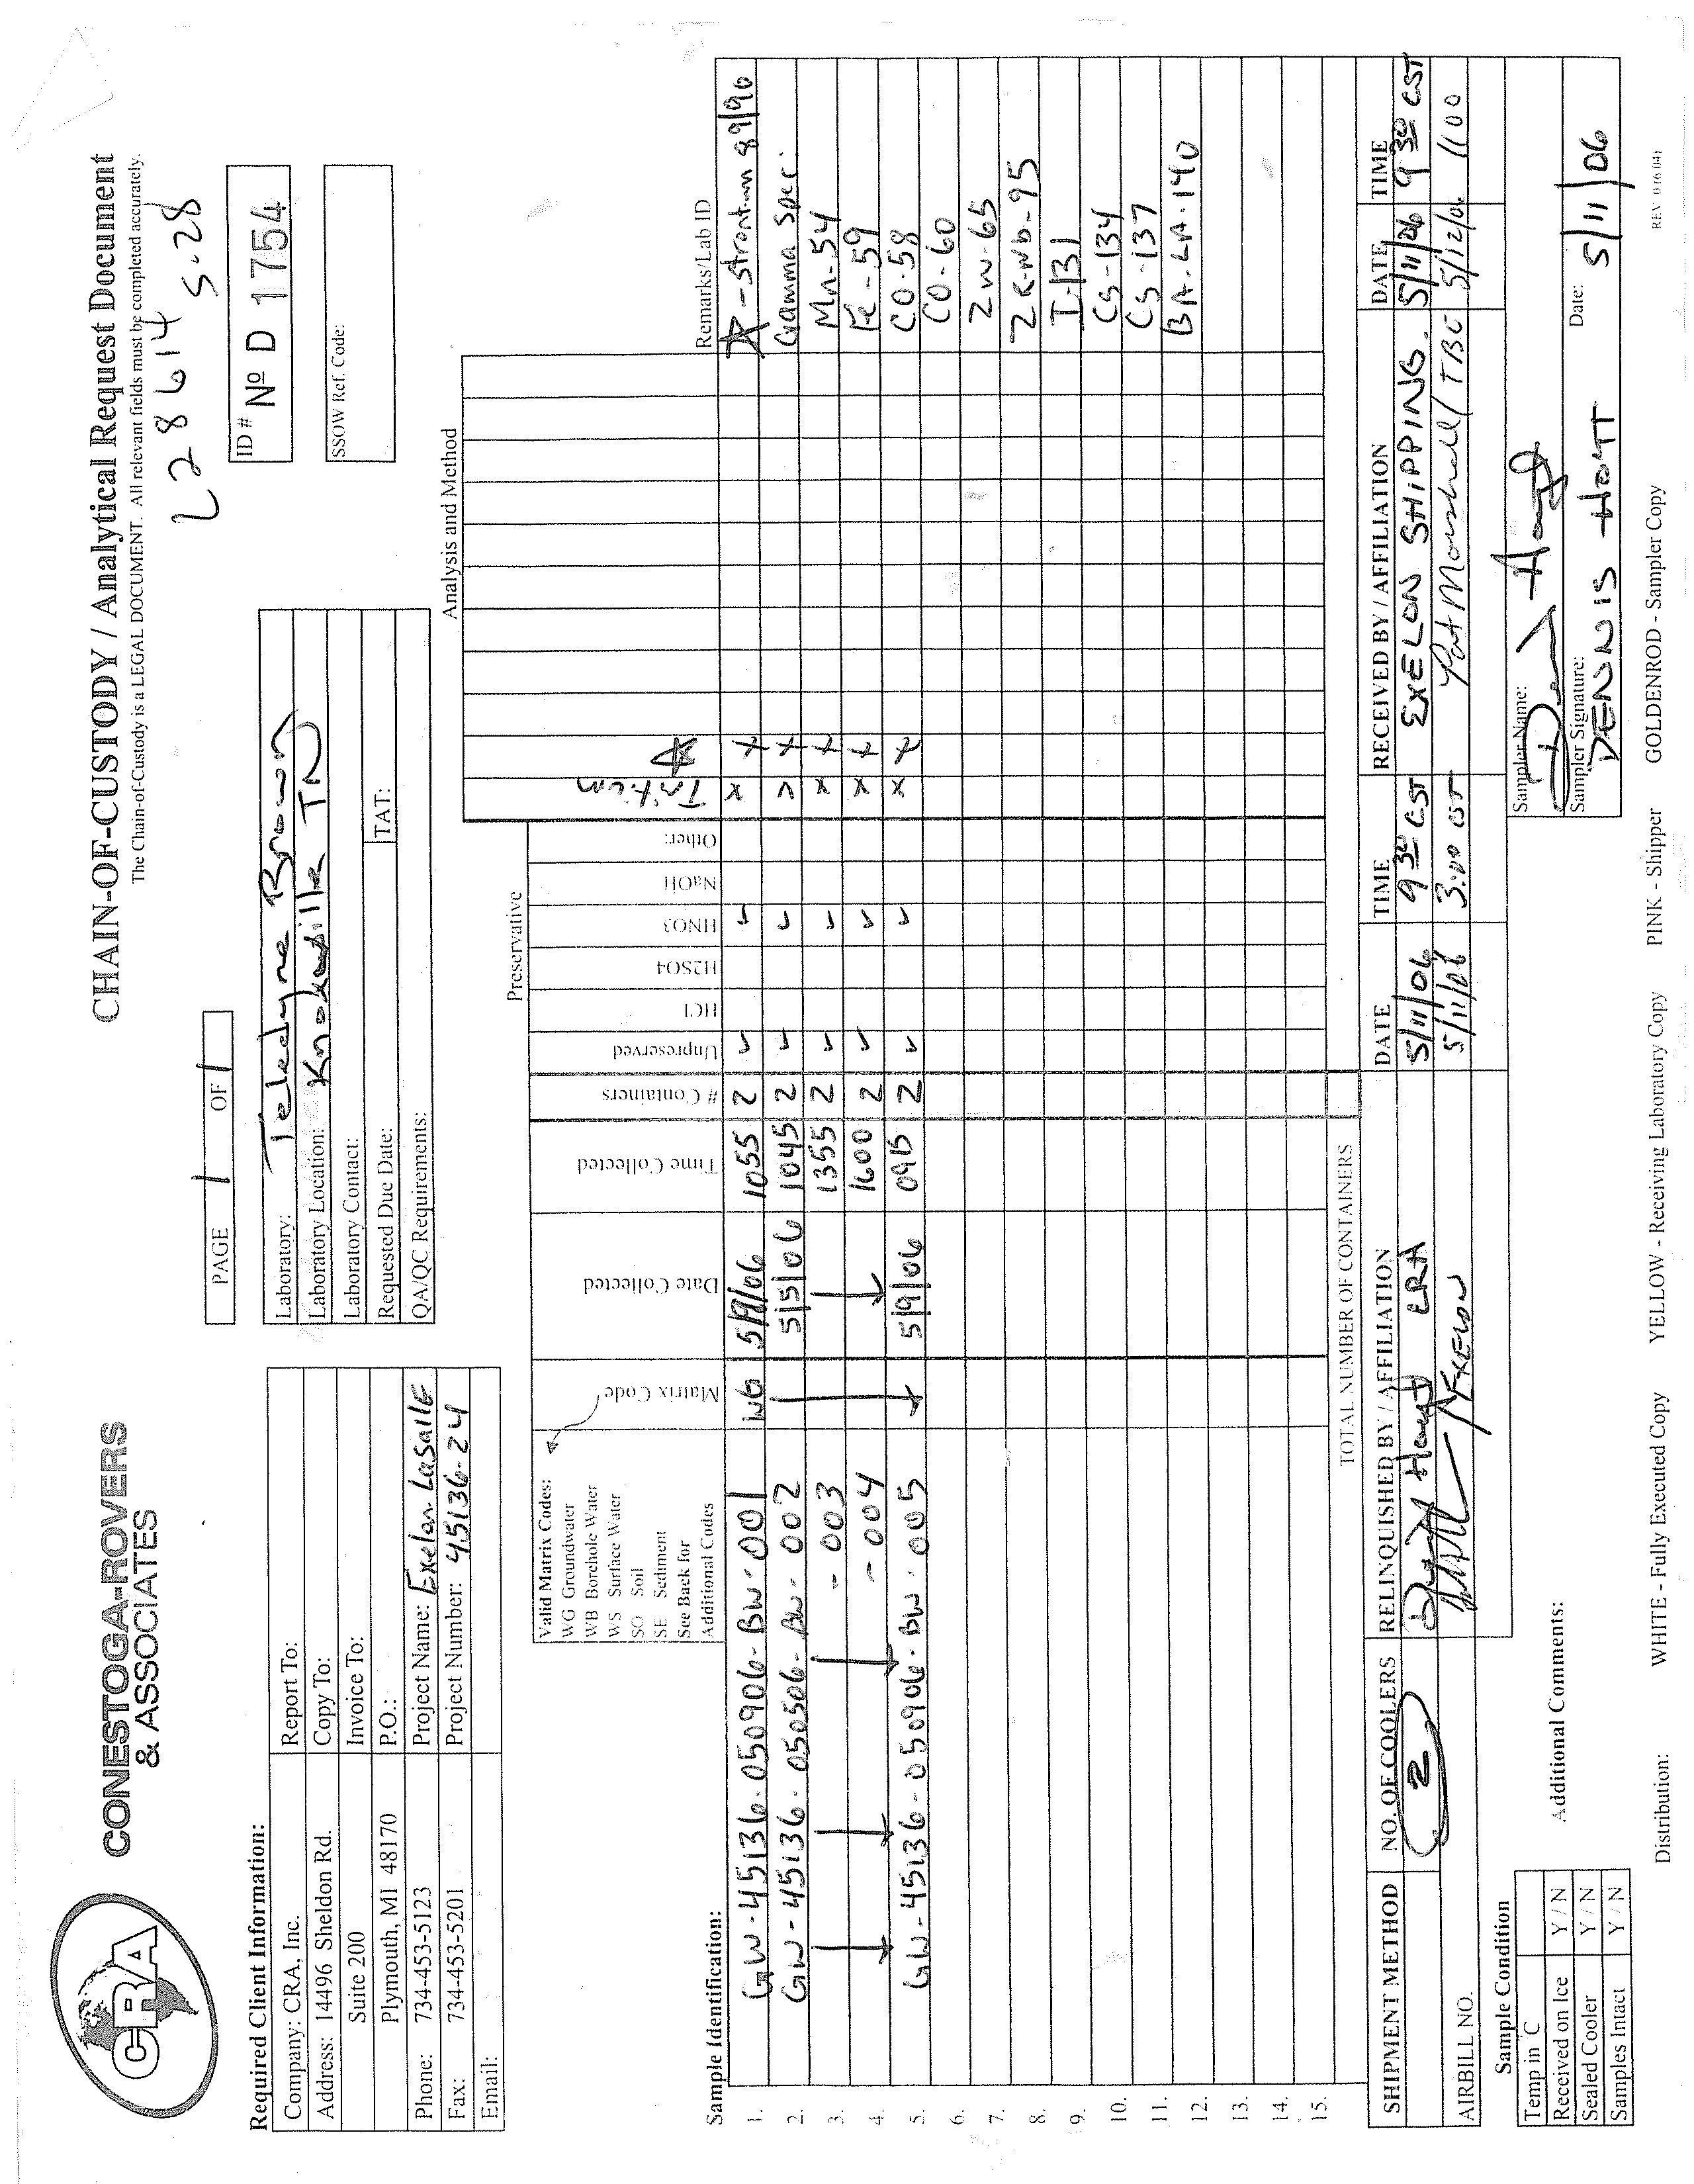
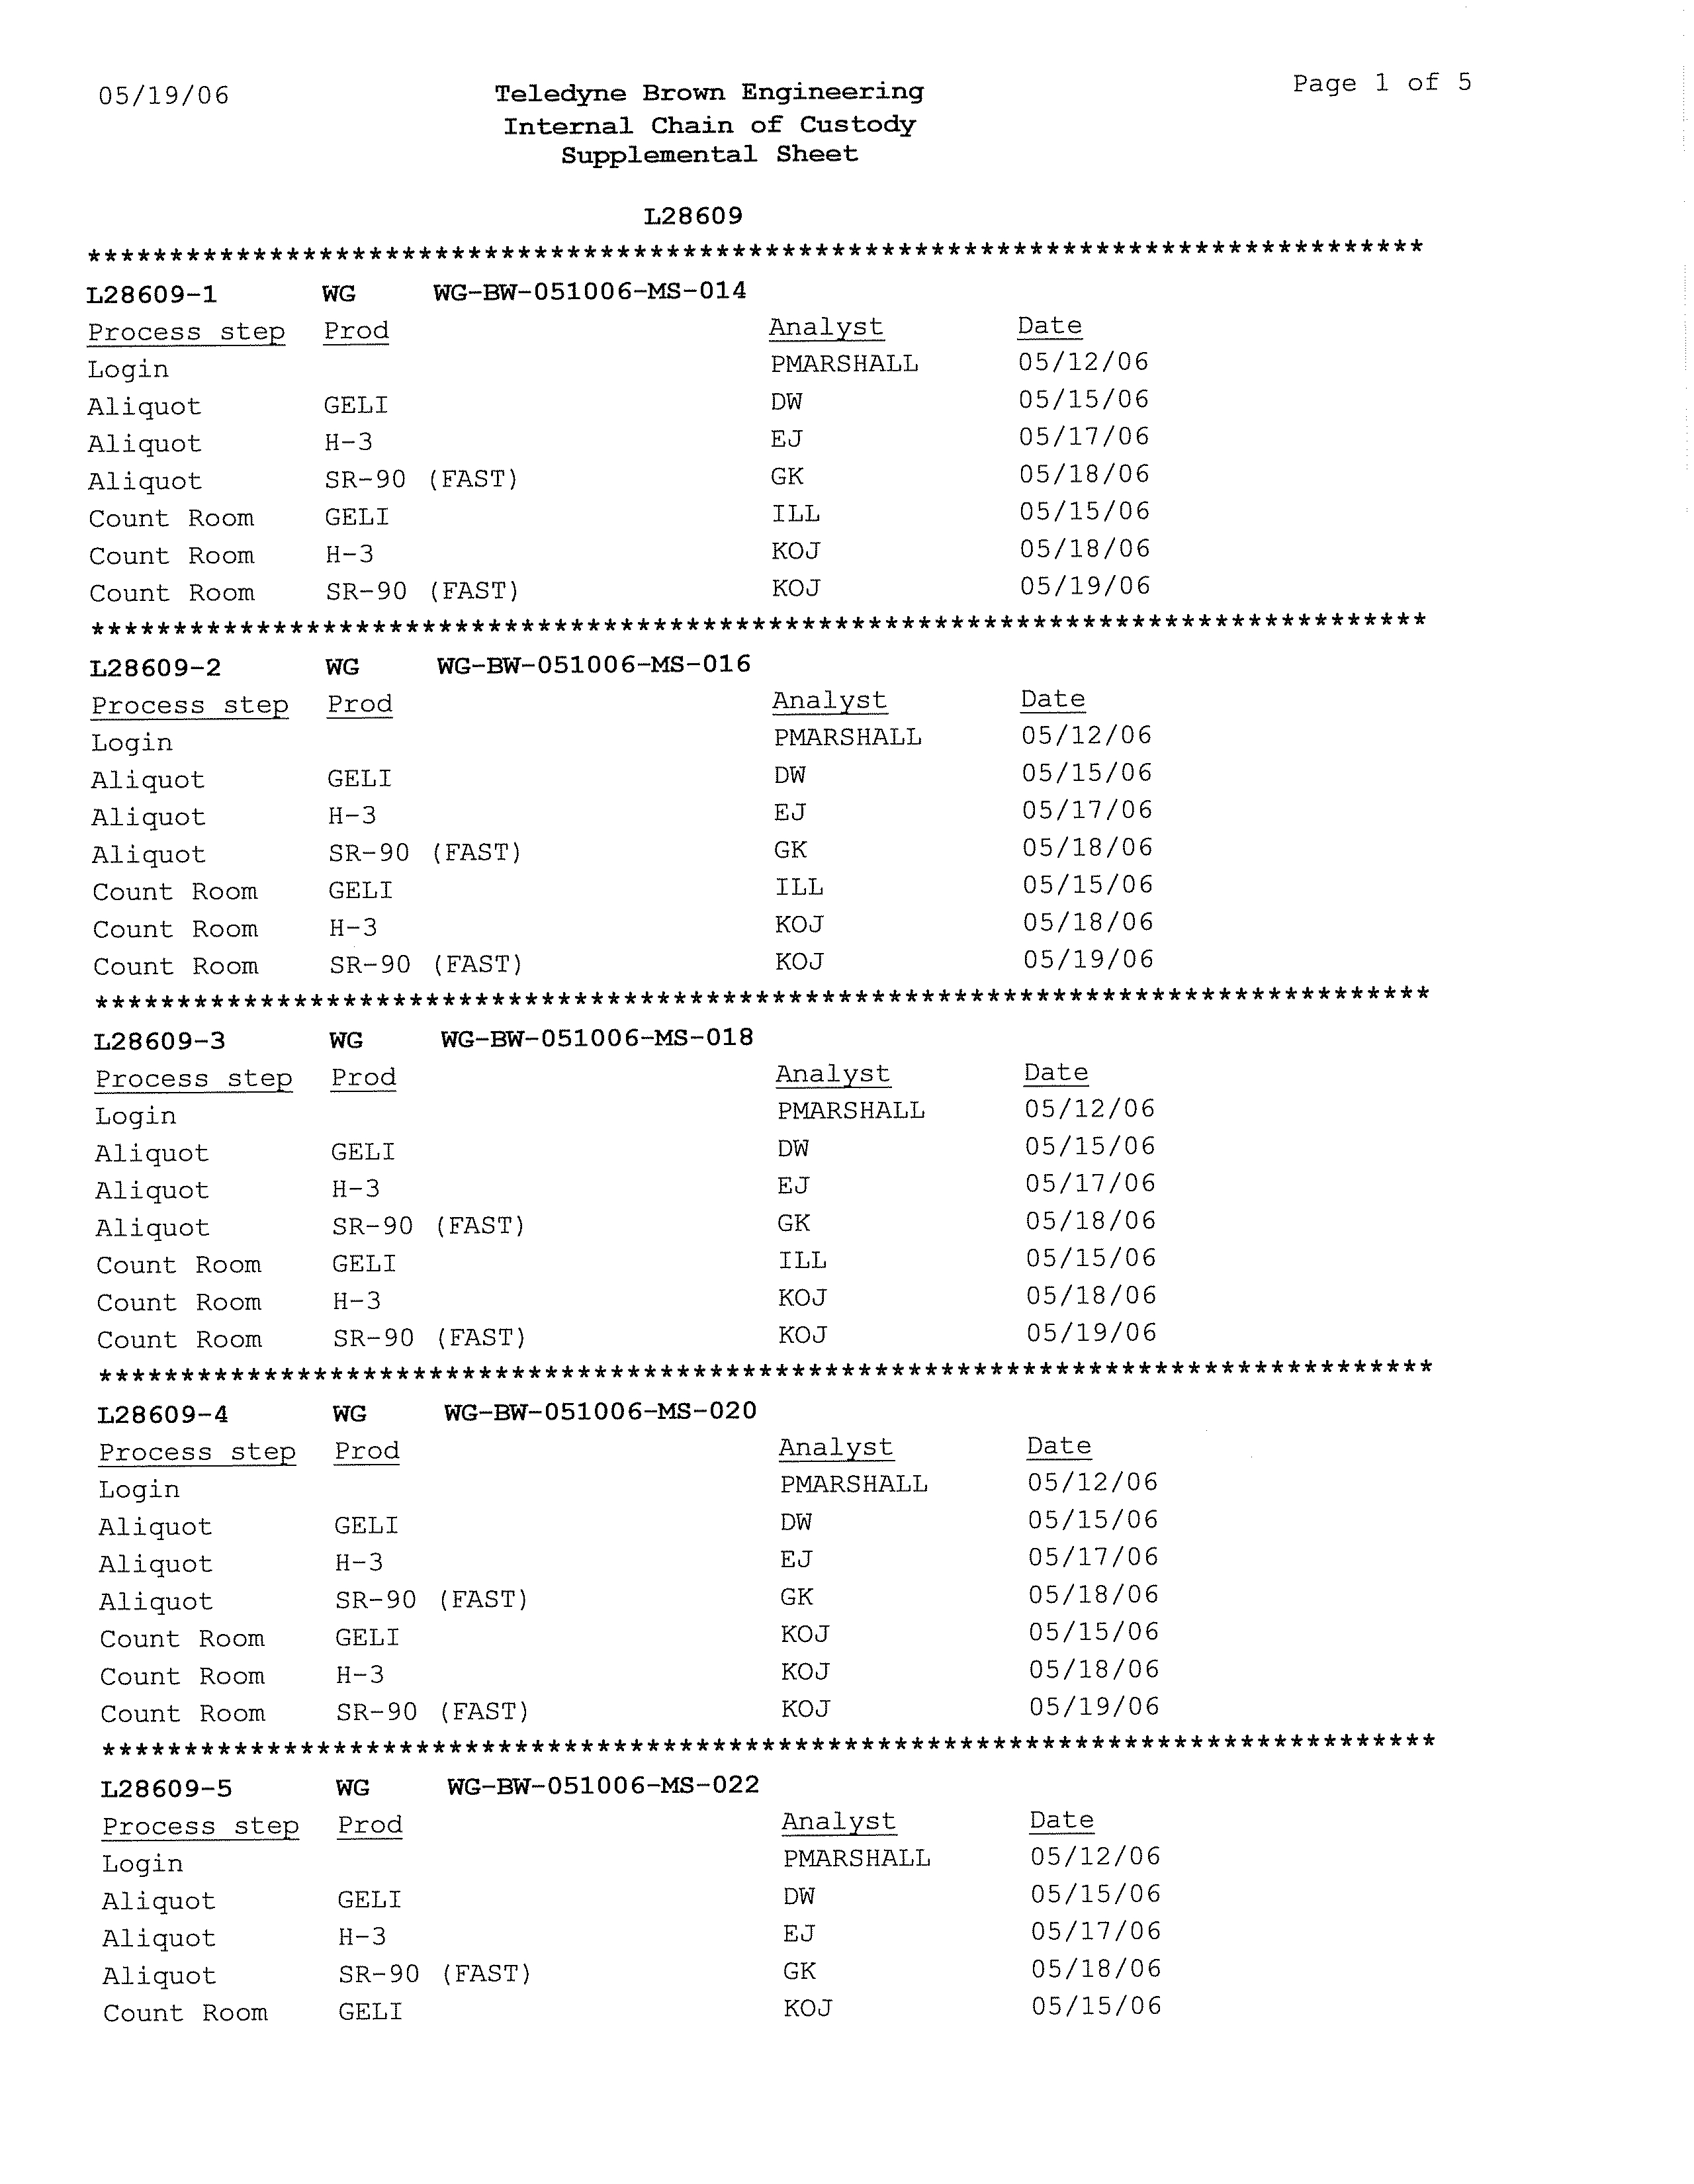
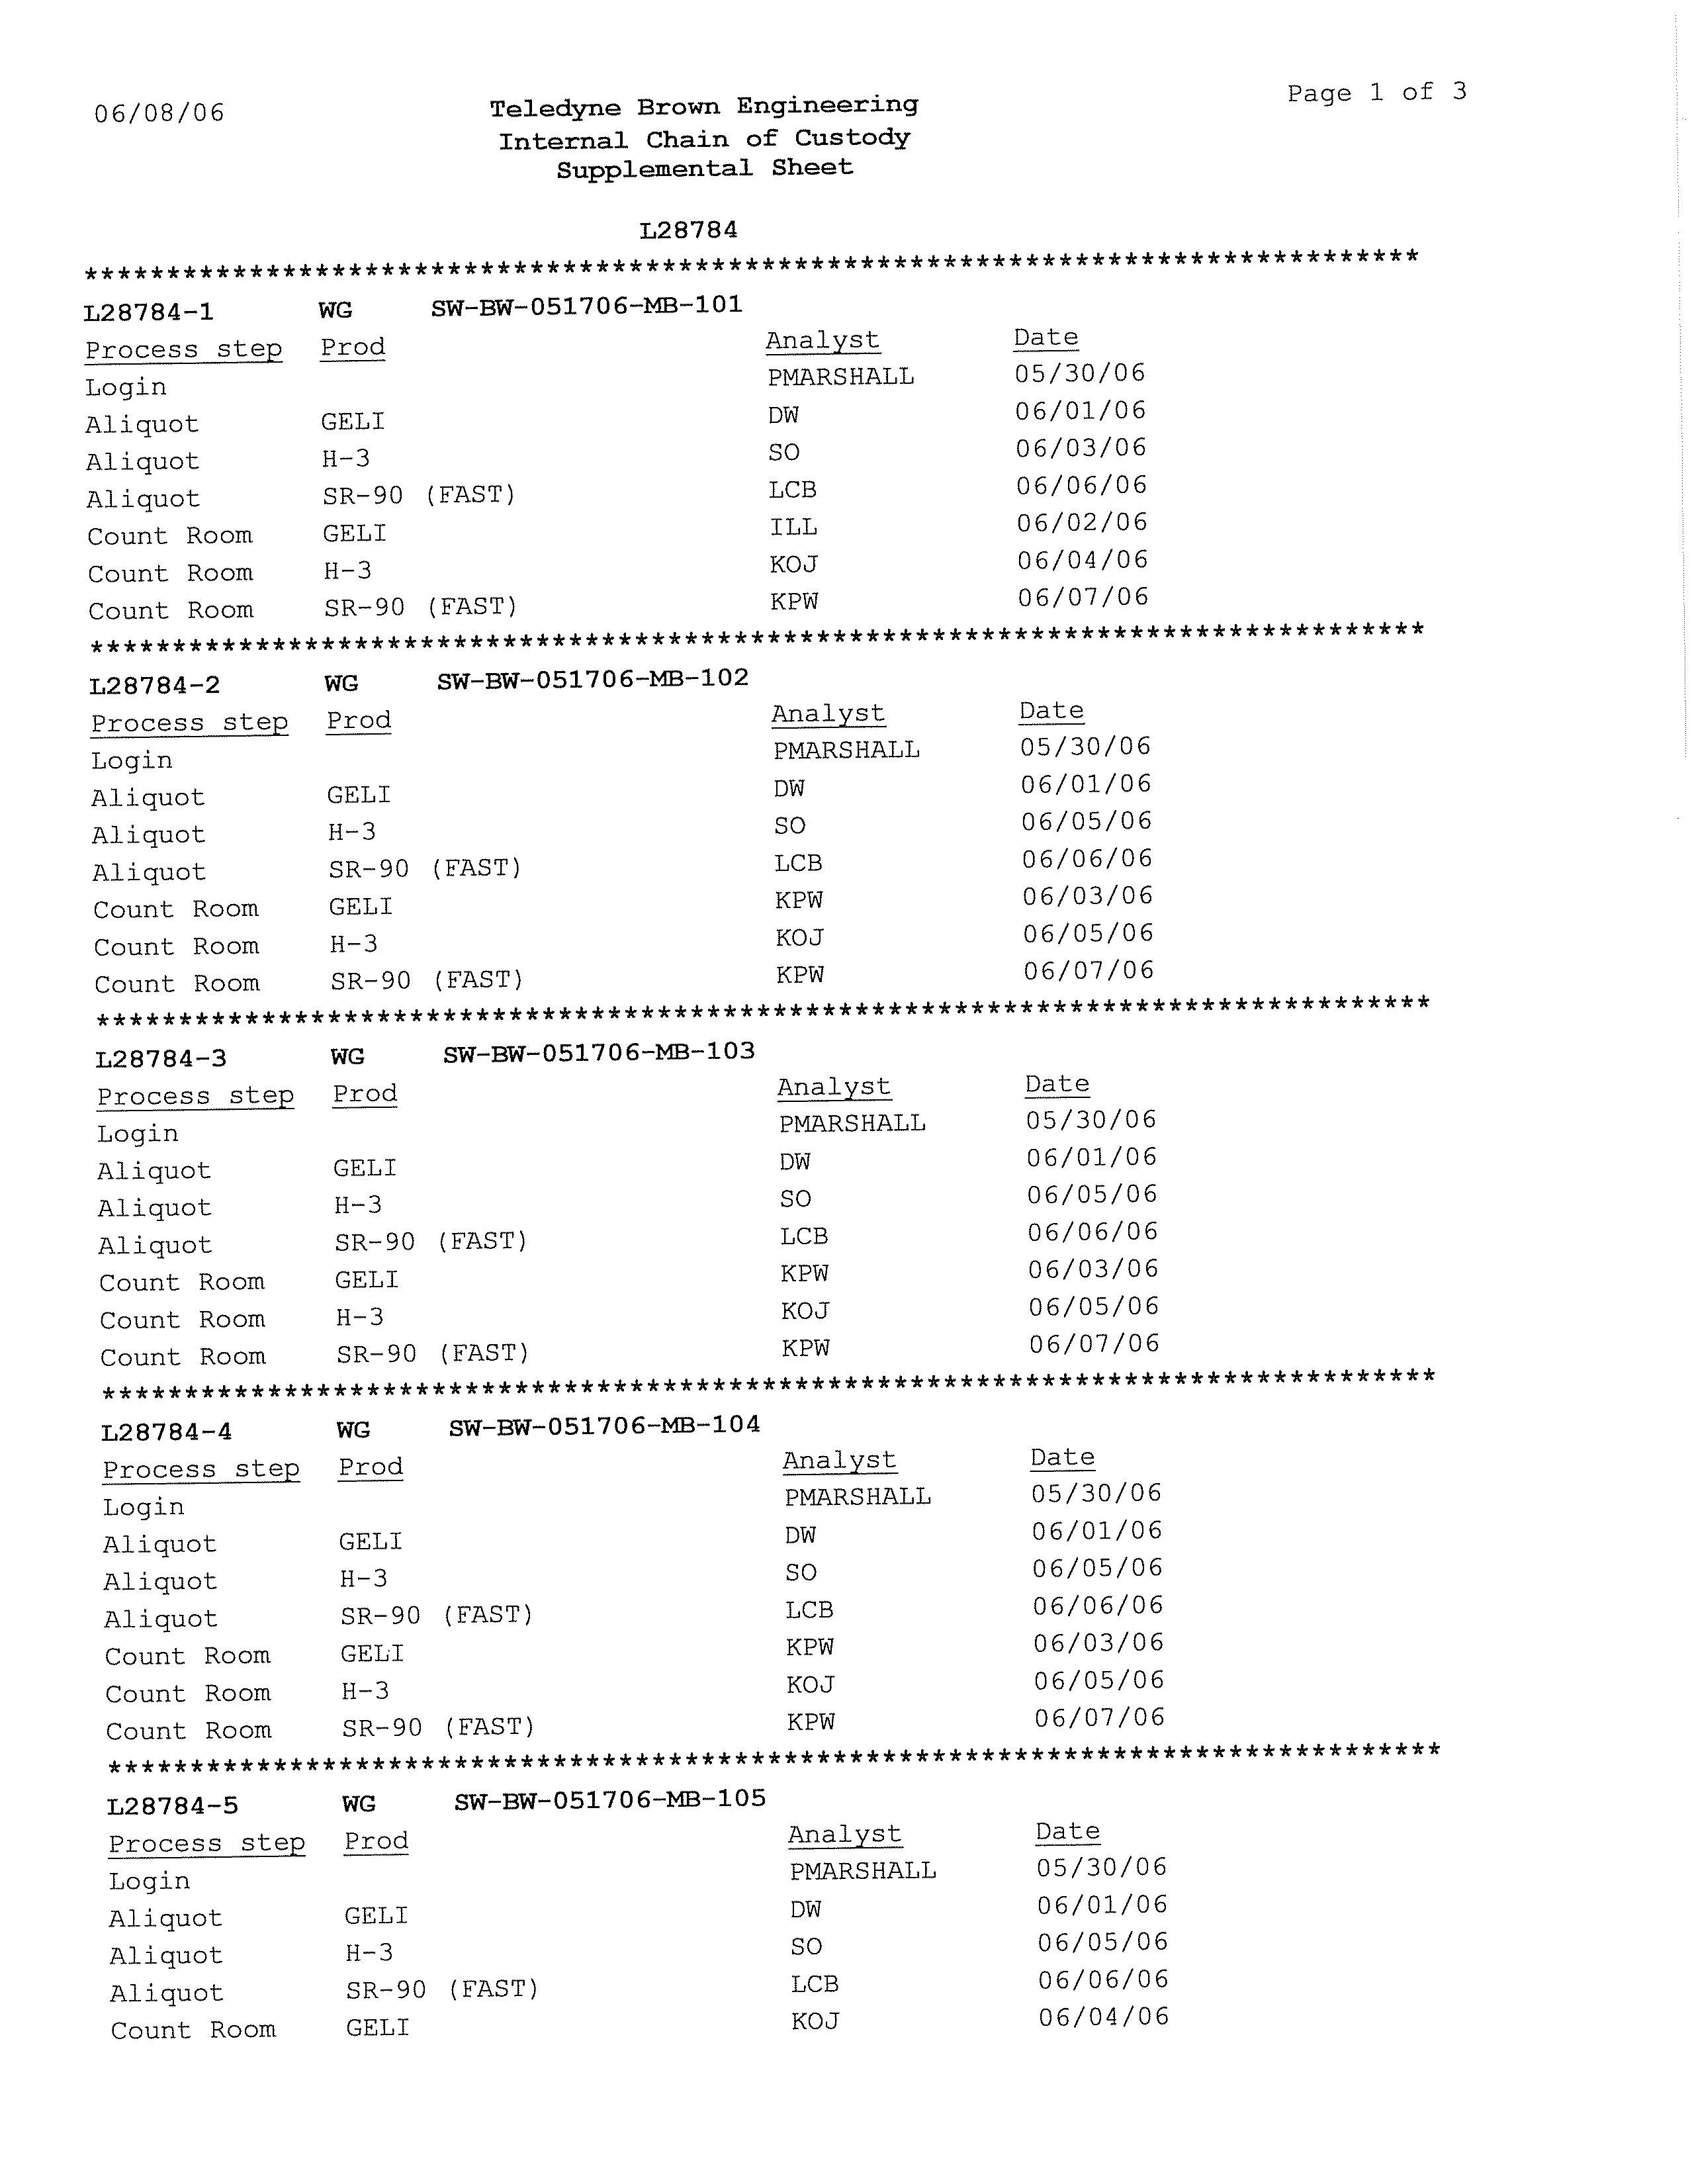
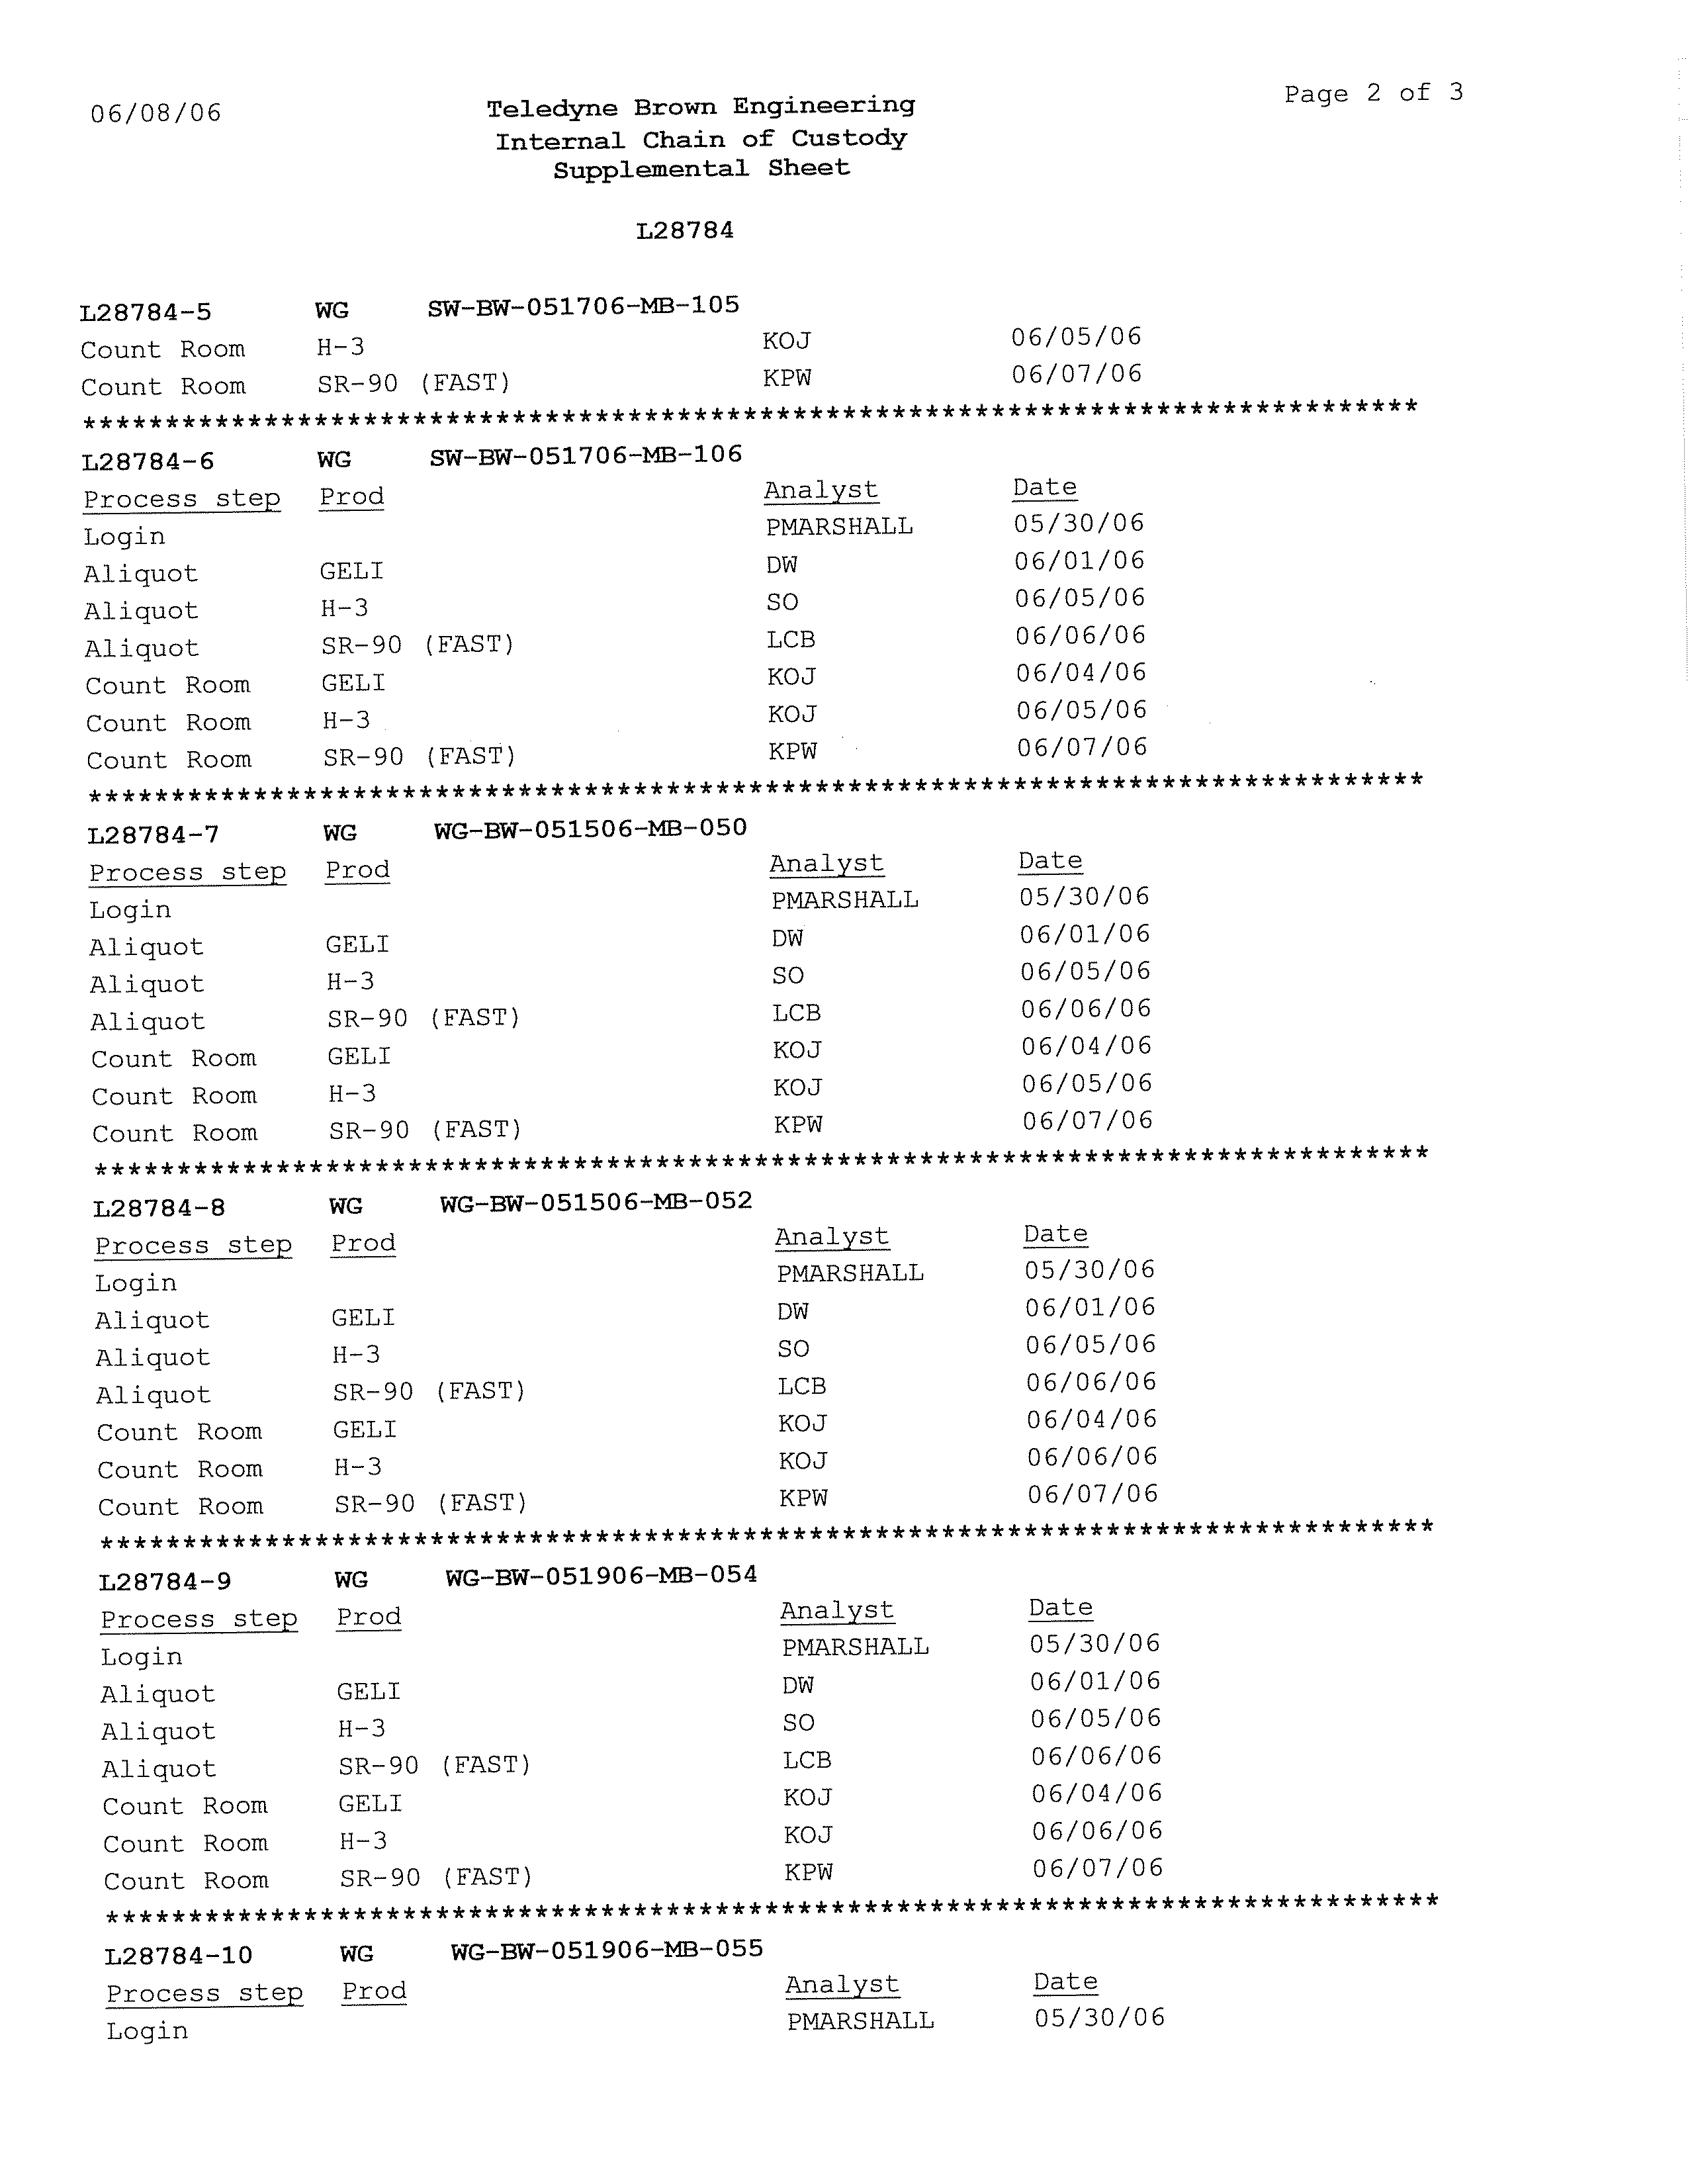
CHAIN-OF-CUSTODY RECORD...................................................................27
4.11
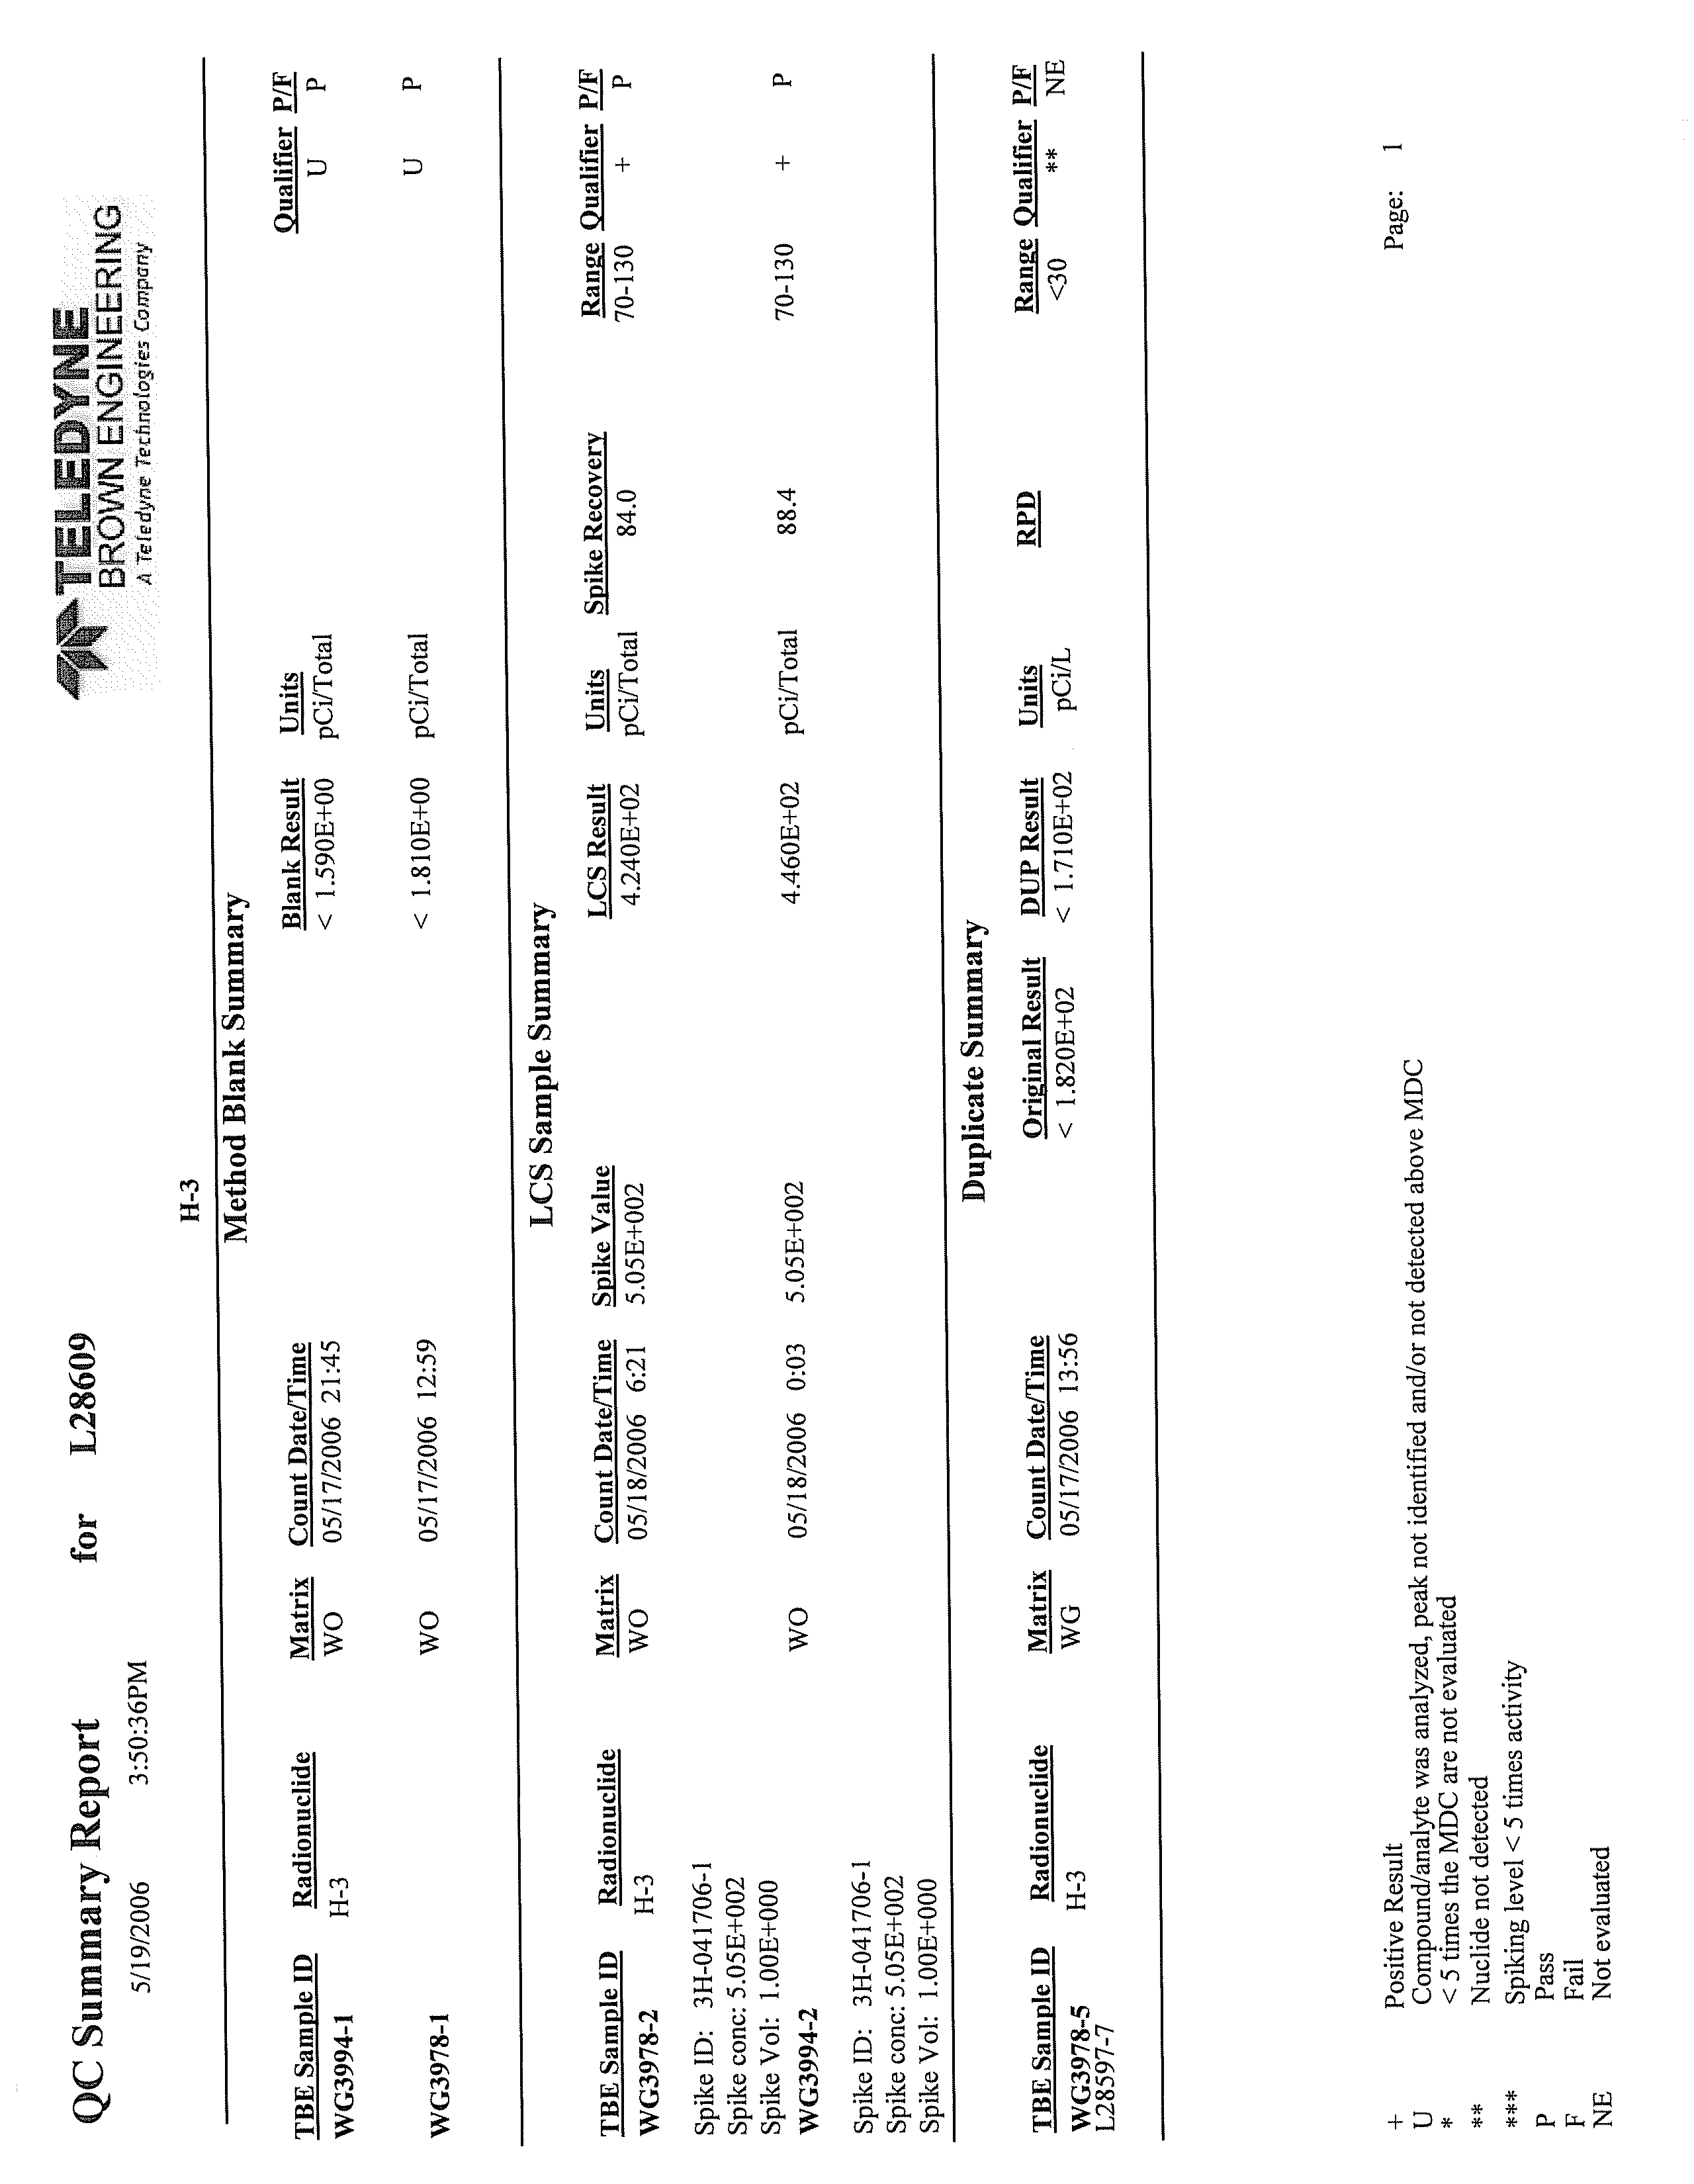
QUALITY CONTROL SAMPLES ...................................................................27
4.12
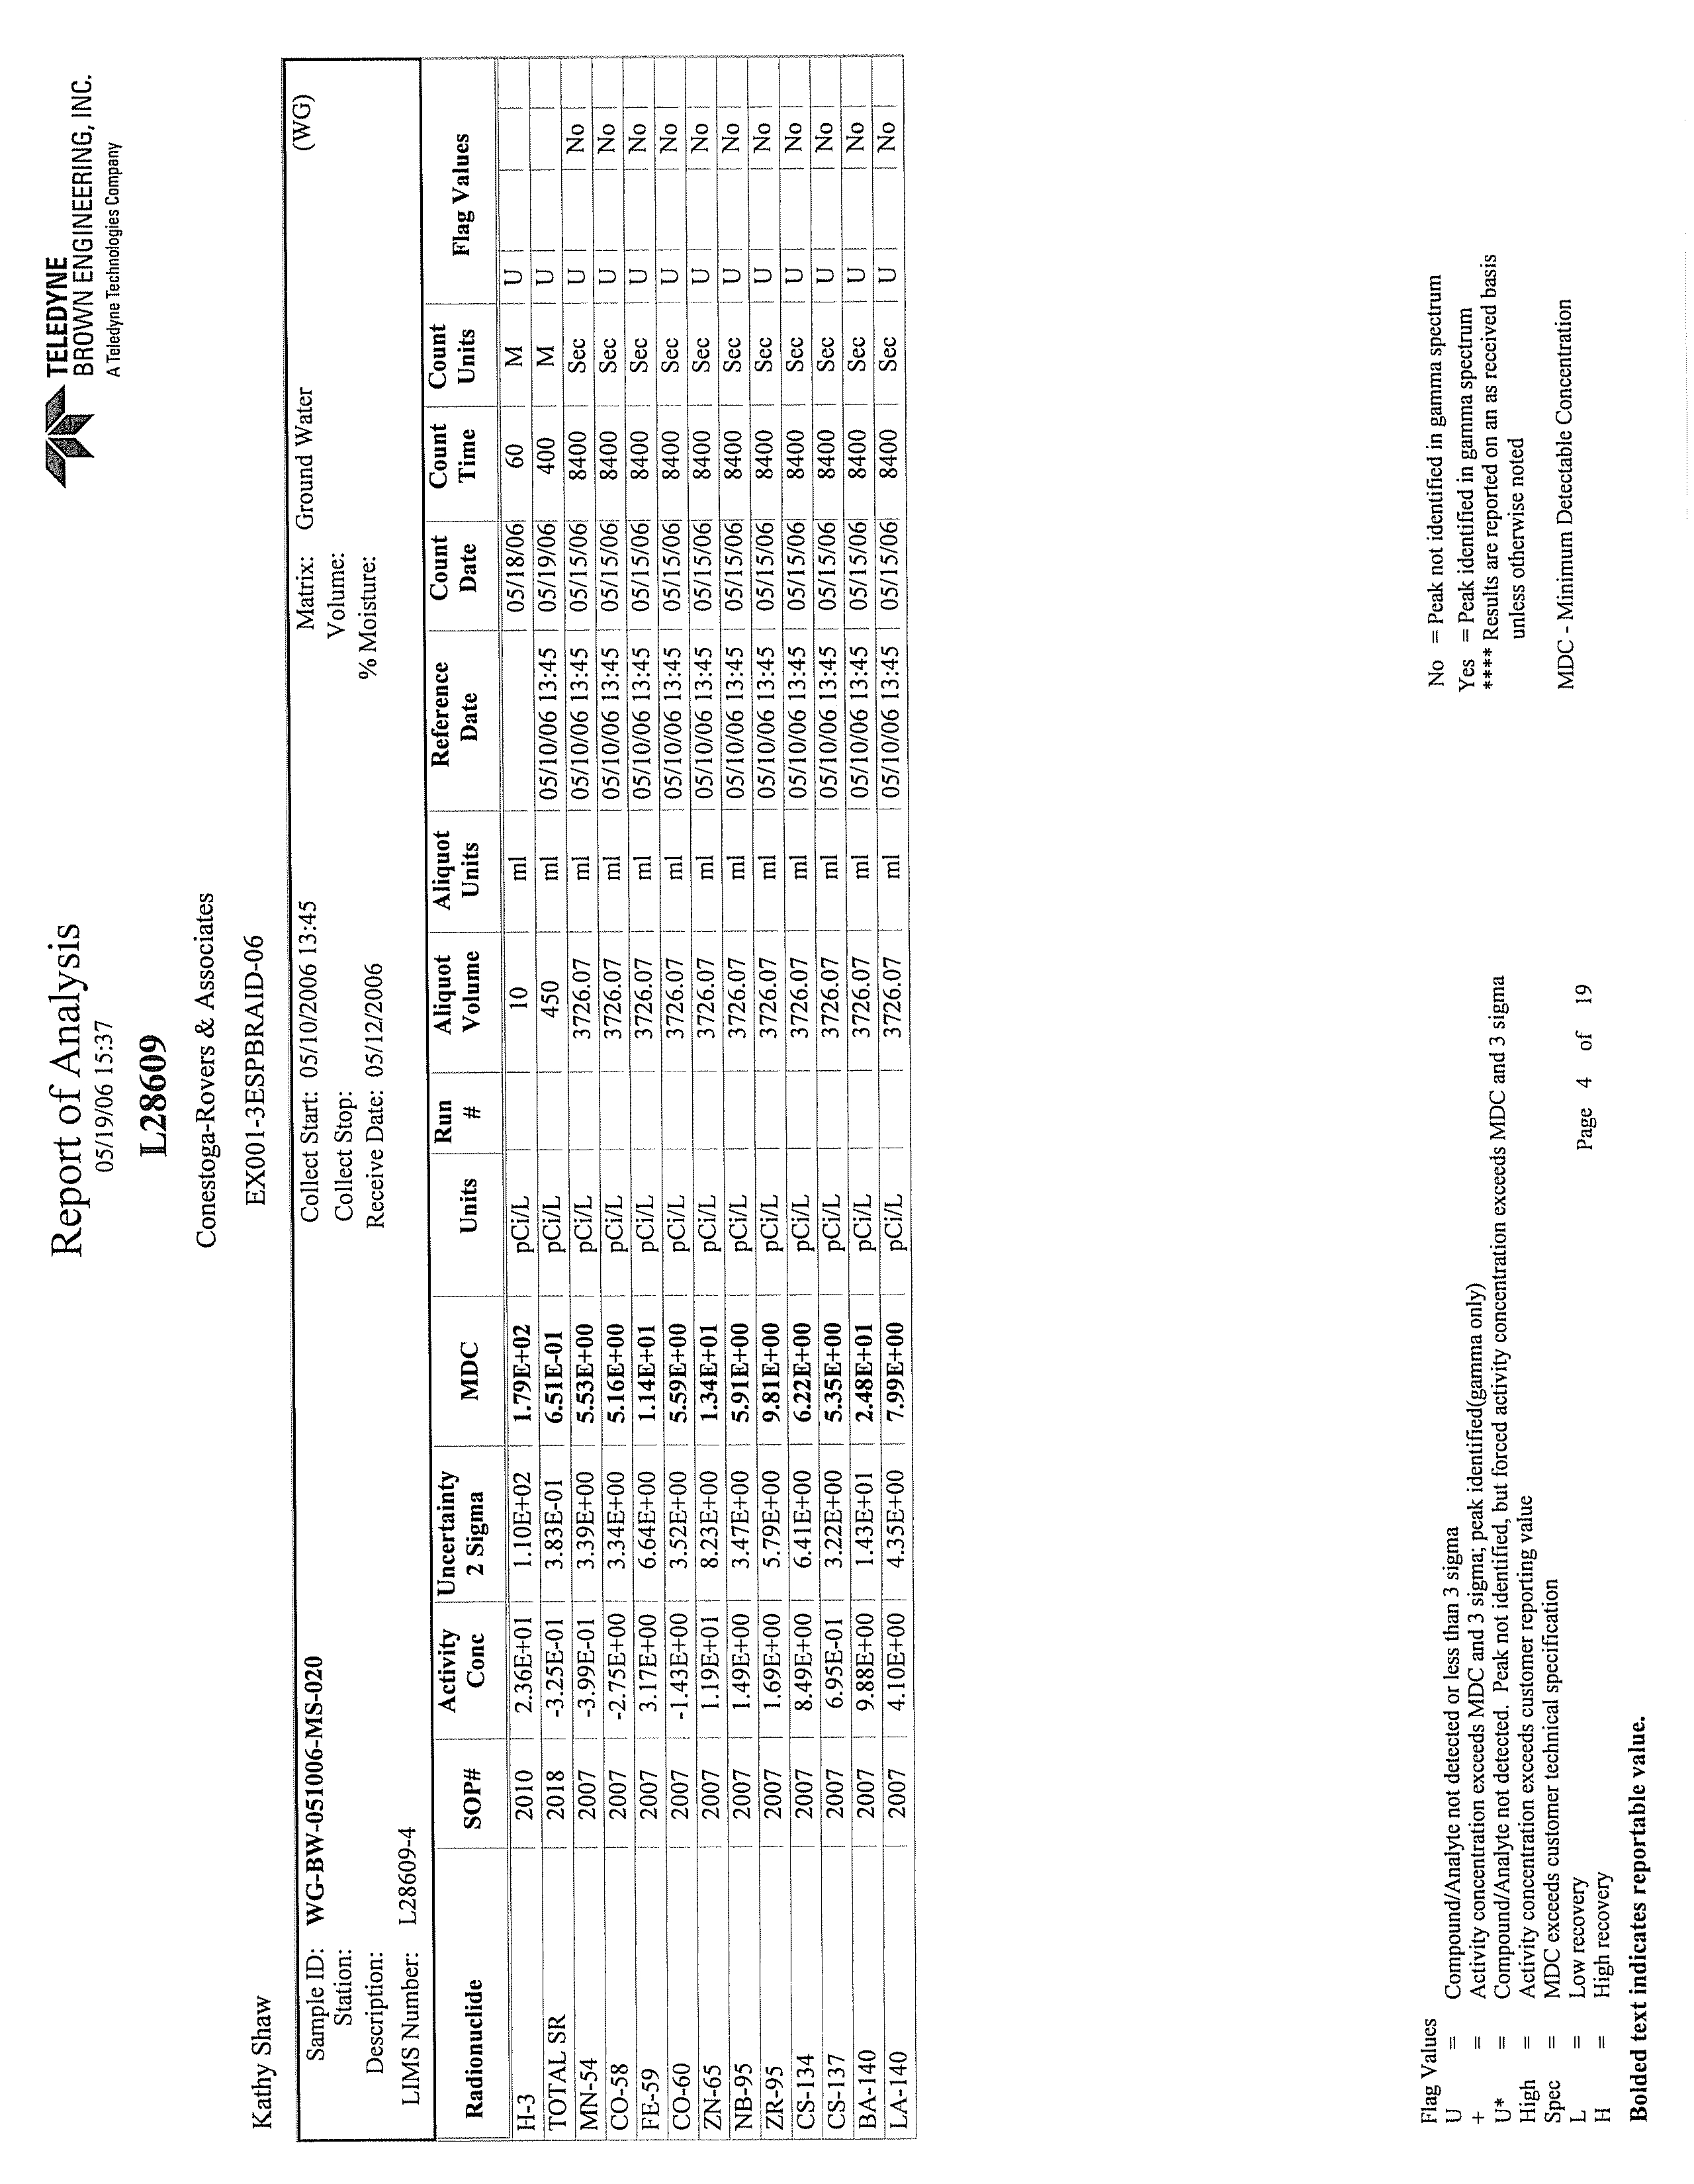
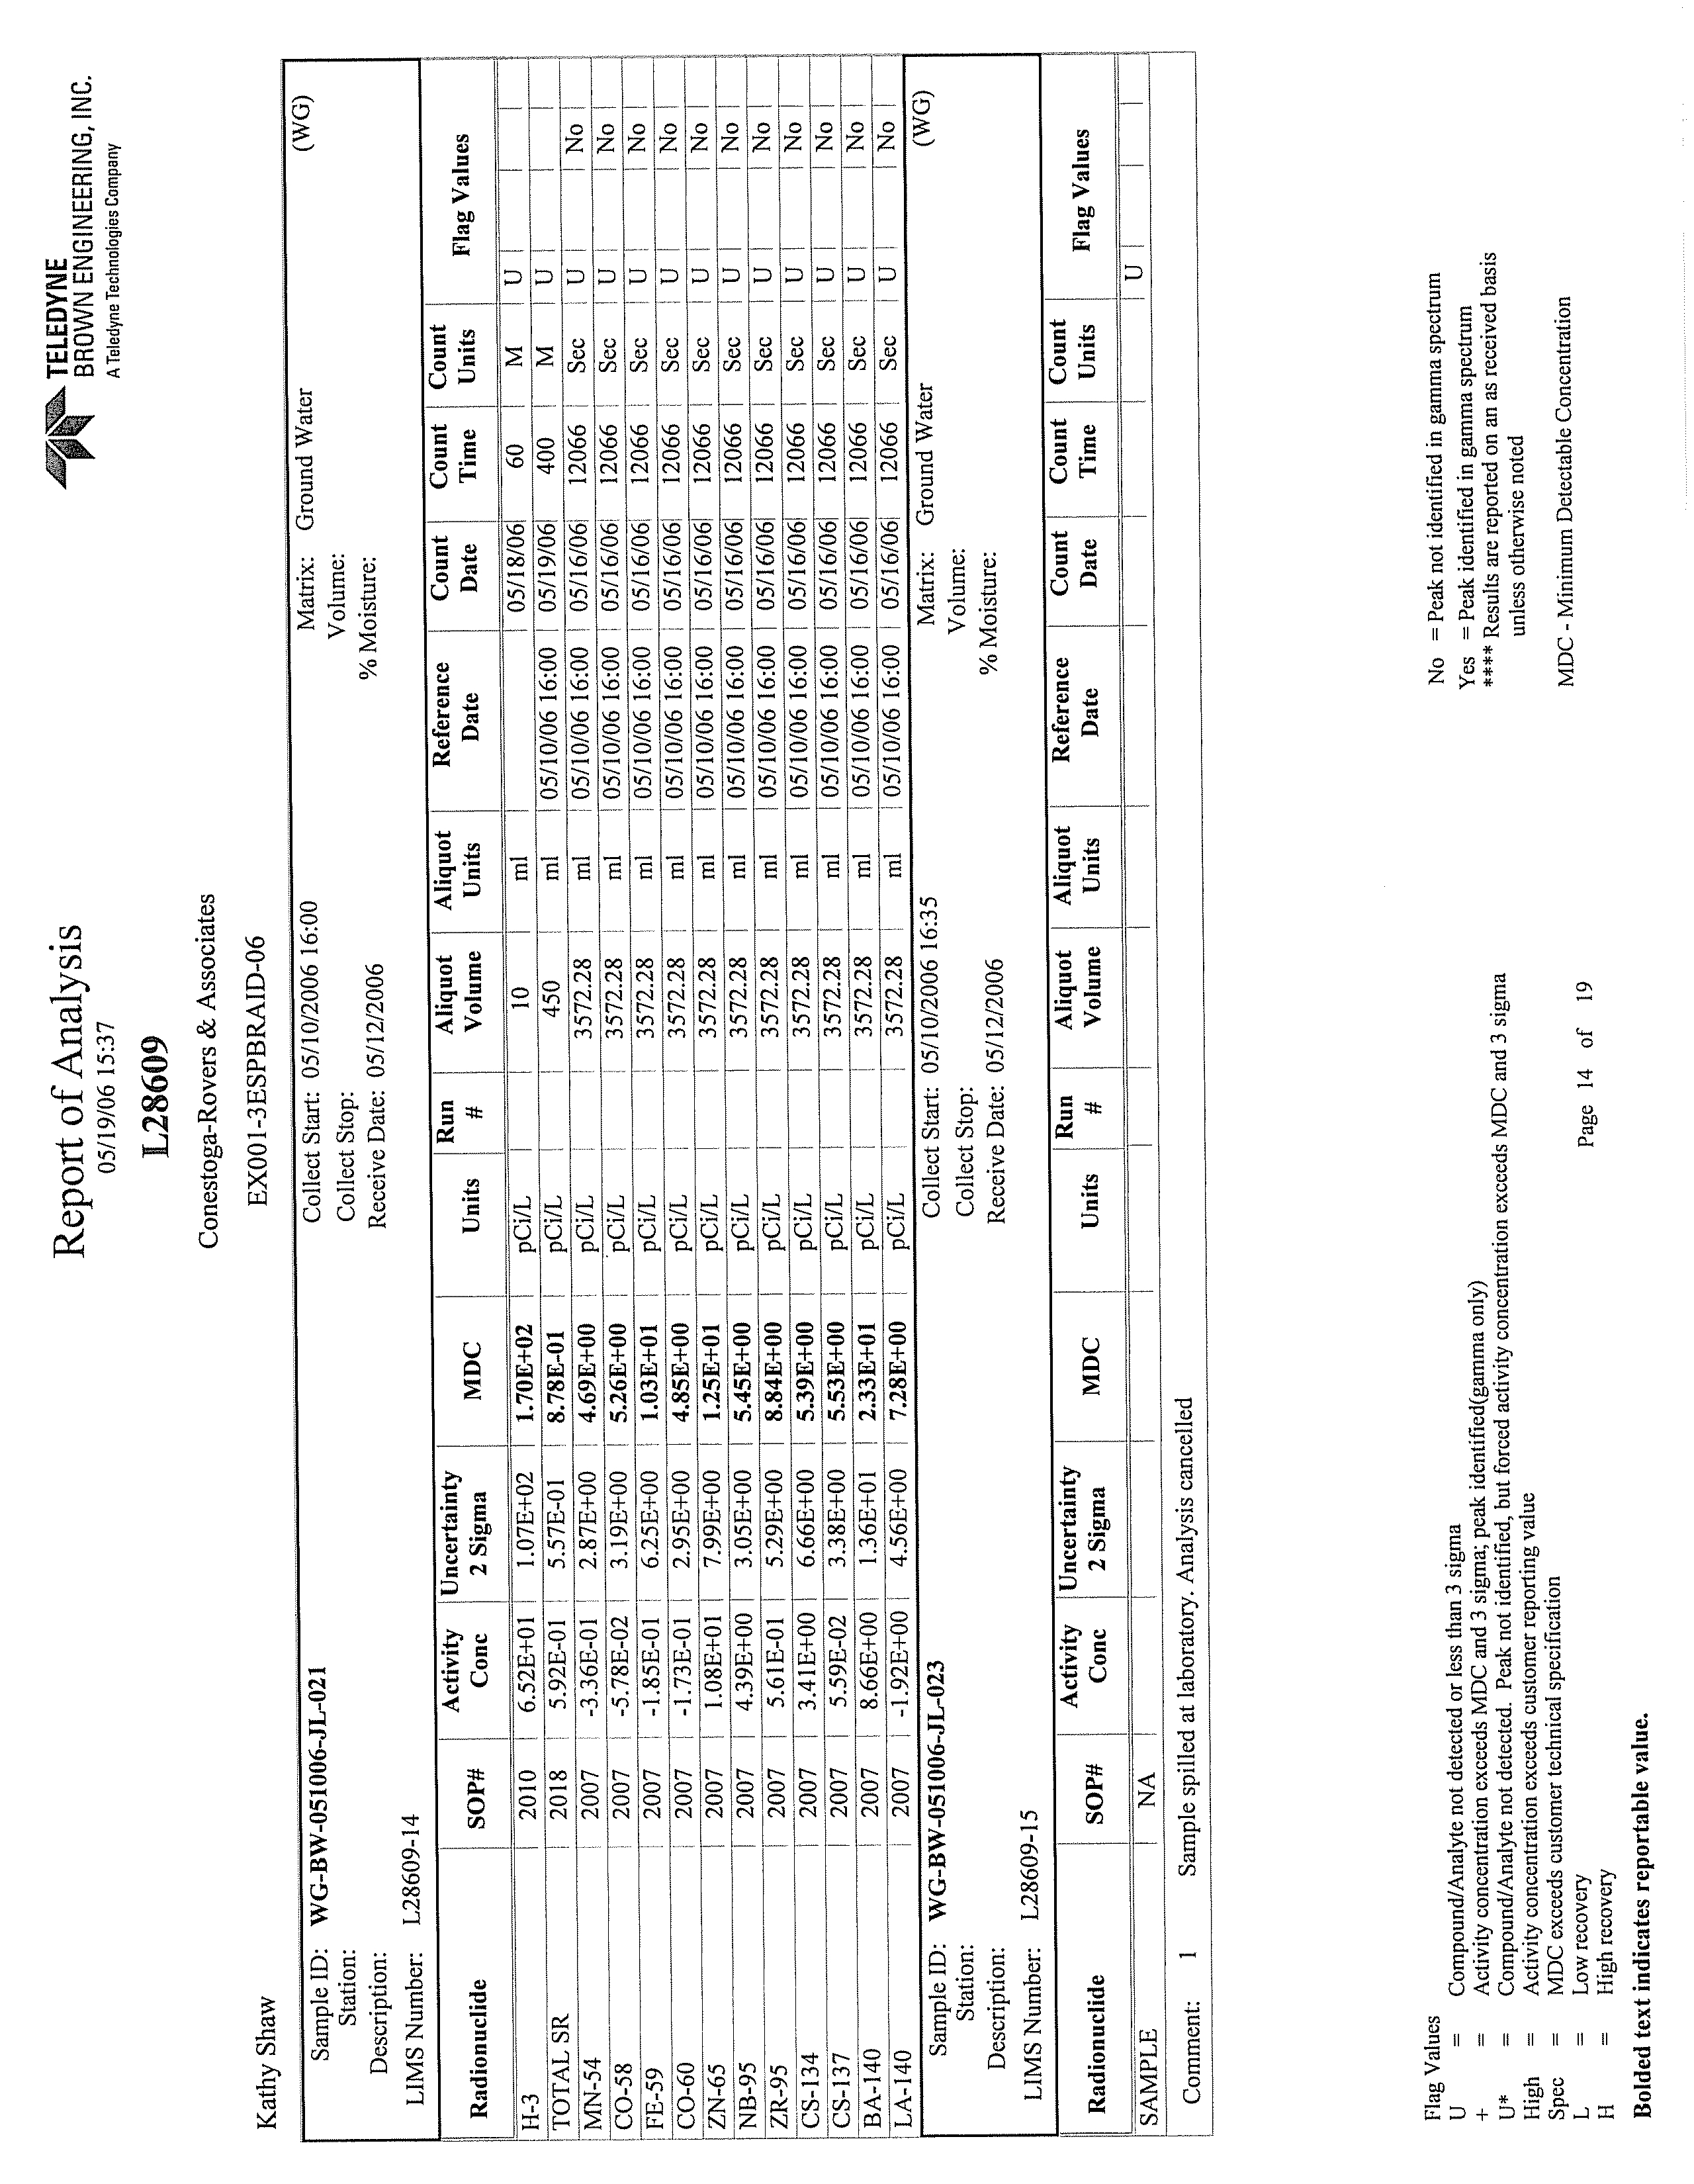
ANALYSES.........................................................................................................27
045136 (12) Braidwood Generation Station
CONESTOGA-ROVERS & ASSOCIATES
Revision 1
TABLE OF CONTENTS
Page
5.0
RESULTS SUMMARY..........................................................................................................28
5.1
STATION GEOLOGY .......................................................................................28
5.2
SITE HYDROGEOLOGY..................................................................................30
5.2.1
GROUNDWATER FLOW DIRECTIONS ......................................................30
5.2.2
MAN-MADE INFLUENCES ON GROUNDWATER FLOW .....................31
5.2.3
VERTICAL HYDRAULIC GRADIENTS........................................................32
5.2.4
LATERAL GROUNDWATER FLOW AND VELOCITY.............................33
5.3
GROUNDWATER QUALITY..........................................................................35
5.3.1
SUMMARY OF BETA-EMITTING RADIONUCLIDES
ANALYTICAL RESULTS.................................................................................35
5.3.2
SUMMARY OF GAMMA-EMITTING RADIONUCLIDES
ANALYTICAL
RESULTS.................................................................................36
5.3.3
SUMMARY OF FIELD MEASUREMENTS ...................................................36
5.4
SURFACE WATER QUALITY.........................................................................37
5.4.1
SUMMARY OF BETA-EMITTING RADIONUCLIDES
ANALYTICAL
RESULTS.................................................................................37
5.4.2
SUMMARY OF GAMMA-EMITTING RADIONUCLIDES
ANALYTICAL
RESULTS.................................................................................38
6.0
RADIONUCLIDES OF CONCERN AND SOURCE AREAS .........................................39
6.1
GAMMA-EMITTING RADIONUCLIDES.....................................................39
6.2
BETA-EMITTING RADIONUCLIDES ...........................................................39
6.3
TRITIUM.............................................................................................................39
6.3.1
GENERAL CHARACTERISTICS....................................................................39
6.3.2
DISTRIBUTION IN STATION GROUNDWATER.......................................40
6.3.2.1
UPPER SAND AQUIFER .................................................................................41
6.3.2.2
DEEPER BEDROCK GROUNDWATER........................................................42
6.3.3
DISTRIBUTION IN STATION SURFACE WATER......................................43
6.3.4
CONCEPTUAL MODEL OF TRITIUM RELEASE AND MIGRATION ...43
6.3.5
ATTENUATION OF TRITIUM WITHIN
THE SHALLOW
GROUNDWATER SYSTEM..............................................47
7.0
EXPOSURE PATHWAY ASSESSMENT............................................................................49
7.1
HEALTH EFFECTS OF TRITIUM...................................................................49
7.2
BACKGROUND CONCENTRATIONS
OF TRITIUM ................................50
7.2.1
GROUNDWATER.............................................................................................50
7.2.2
PRECIPITATION DATA..................................................................................50
7.2.3
SURFACE WATER DATA ...............................................................................51
7.2.4
DRINKING WATER DATA ............................................................................52
7.2.5
EXPECTED TRITIUM BACKGROUND FOR THE STATION ...................52
045136 (12) Braidwood Generation Station
CONESTOGA-ROVERS & ASSOCIATES
Revision 1
TABLE OF CONTENTS
Page
7.3
IDENTIFICATION OF POTENTIAL EXPOSURE
PATHWAYS AND POTENTIAL RECEPTORS
............................................53
7.3.1
POTENTIAL GROUNDWATER MIGRATION TO
DRINKING WATER
USERS OFF THE STATION PROPERTY .................53
7.3.2
POTENTIAL GROUNDWATER MIGRATION TO
SURFACE
WATER USERS OFF THE STATION PROPERTY....................54
7.3.3
POTENTIAL EXPOSURE TO SURFACE WATER
IN THE PERIMETER DITCH
AT THE STATION........................................54
7.4
SUMMARY OF POTENTIAL TRITIUM
EXPOSURE PATHWAYS ..........55
7.5
OTHER RADIONUCLIDES.............................................................................55
8.0
CONCLUSIONS....................................................................................................................56
9.0
RECOMMENDATIONS.......................................................................................................61
9.1
DATA GAPS ......................................................................................................61
9.2
GROUNDWATER MONITORING ................................................................61
10.0
REFERENCES CITED...........................................................................................................
62
045136 (12) Braidwood Generation Station
CONESTOGA-ROVERS & ASSOCIATES
Revision 1
LIST OF FIGURES
(Following Text)
FIGURE 1.1
STATION LOCATION MAP
FIGURE 1.2
STATION BOUNDARIES AND FEATURES
FIGURE 1.3
STATION BOUNDARIES INCLUDING BLOWDOWN LINE
FIGURE 2.1
STATION BASE MAP
FIGURE 2.2
STATION FEATURES AND WELL LOCATIONS
FIGURE 2.3
STATION SURFACE WATER FEATURES
FIGURE 2.4
STORM WATER DRAINAGE CROSS-SECTION AA-AA'
FIGURE 2.5
OIL-WATER SEPARATOR CROSS-SECTION BB-BB'
FIGURE 2.6
PERIMETER DITCH CROSS-SECTION CC-CC'
FIGURE 2.7
PERIMETER DITCH CROSS-SECTION DD-DD'
FIGURE 2.8
LOCAL GEOLOGIC CROSS-SECTION
FIGURE 2.9
CONTOUR MAP OF THE WEDRON FORMATION
FIGURE 2.10
PRIVATE WELL LOCATIONS AND WELL DEPTHS
FIGURE 2.11
GROUNDWATER MONITORING LOCATIONS
FIGURE 2.12
REGIONAL HYDROGEOLOGIC CROSS-SECTION LOCATIONS
FIGURE 2.13
REGIONAL HYDROGEOLOGIC CROSS-SECTION E-E'
FIGURE 2.14
REGIONAL HYDROGEOLOGIC CROSS-SECTION F-F'
FIGURE 2.15
PRIVATE WELL AND MONITORING WELL SAMPLE RESULTS
FIGURE 3.1
AREAS FOR FURTHER EVALUATION (STATION)
045136 (12) Braidwood Generation Station
CONESTOGA-ROVERS & ASSOCIATES
Revision 1
LIST OF FIGURES
(Following Text)
FIGURE 3.2
AREAS FOR FURTHER EVALUATION (WEST SIDE OF TURBINE
BUILDING)
FIGURE 4.1
SURFACE WATER/STAFF GAUGE MONITORING LOCATIONS
FIGURE 4.2
GROUNDWATER MONITORING LOCATIONS (STATION)
FIGURE 4.3
PRESSURE TRANSDUCER AND PRECIPITATION DATA –
JUNE/JULY 2006
FIGURE 5.1
HYDROGEOLOGIC CROSS-SECTION LOCATIONS
FIGURE 5.2
HYDROGEOLOGIC CROSS-SECTION A-A'
FIGURE 5.3
HYDROGEOLOGIC CROSS-SECTION B-B'
FIGURE 5.4
HYDROGEOLOGIC CROSS-SECTION C-C'
FIGURE 5.5
HYDROGEOLOGIC CROSS-SECTION D-D'
FIGURE 5.6
POTENTIOMETRIC SURFACE CONTOURS – SHALLOW ZONE -
MAY 2006
FIGURE 5.7
POTENTIOMETRIC SURFACE CONTOURS – SHALLOW ZONE -
JULY 2006
FIGURE 5.8
POTENTIOMETRIC SURFACE CONTOURS – DEEP ZONE - MAY 2006
FIGURE 5.9
POTENTIOMETRIC SURFACE CONTOURS – DEEP ZONE - JULY 2006
FIGURE 5.10
TRITIUM CONCENTRATIONS - GROUNDWATER AND SURFACE
WATER
FIGURE 5.11
RADIONUCLIDE CONCENTRATIONS – GROUNDWATER AND
SURFACE WATER
FIGURE 6.1
HYDROGEOLOGIC PROFILE-TRITIUM CONCENTRATIONS –
GROUNDWATER
FIGURE 6.2
MONITORING WELL TRITIUM SAMPLE RESULTS
045136 (12) Braidwood Generation Station
CONESTOGA-ROVERS & ASSOCIATES
Revision 1
LIST OF TABLES
(Following Text)
TABLE 4.1
SUMMARY OF MONITORING WELL INSTALLATION DETAILS
TABLE 4.2
SUMMARY OF MONITORING WELL DEVELOPMENT PARAMETERS
TABLE 4.3
SUMMARY OF GROUNDWATER ELEVATIONS
TABLE 4.4
SUMMARY OF SURFACE WATER ELEVATIONS
TABLE 4.5
SAMPLE KEY
TABLE 4.6
SUMMARY OF MONITORING WELL PURGING PARAMETERS
TABLE 5.1
SUMMARY OF CALCULATED VERTICAL HYDRAULIC GRADIENTS
TABLE 5.2
ANALYTICAL RESULTS SUMMARY - TRITIUM IN GROUNDWATER
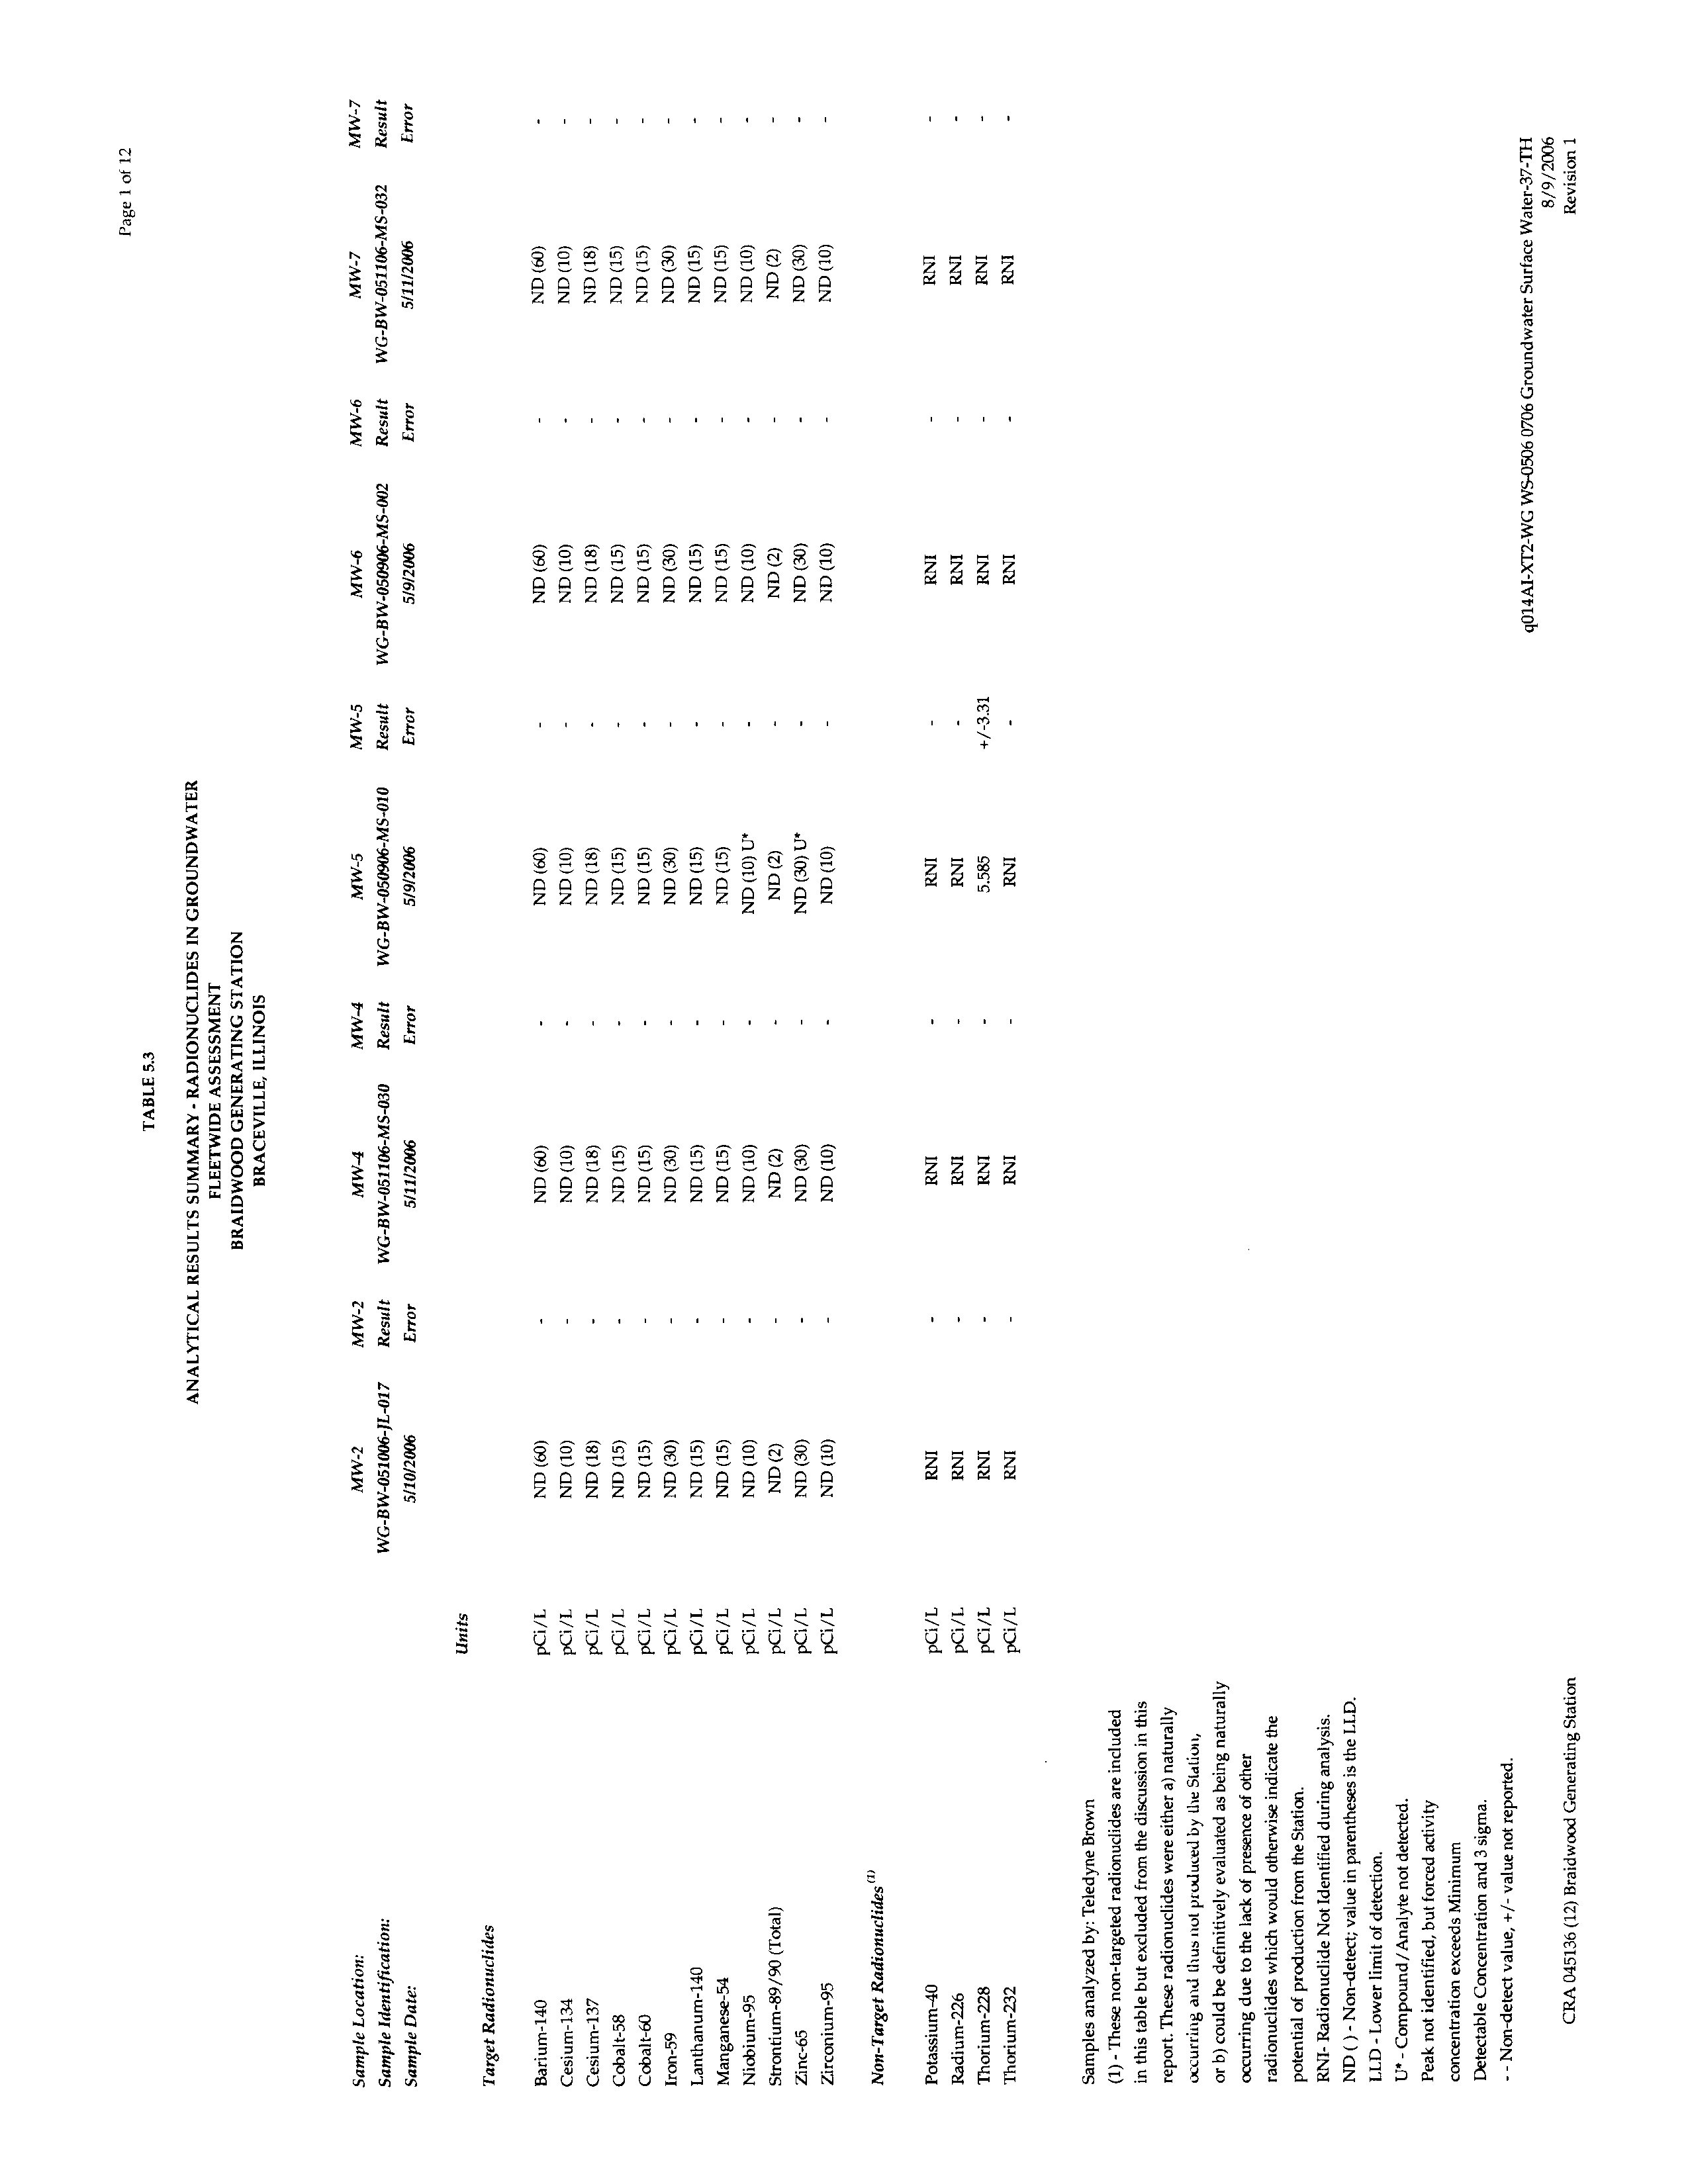
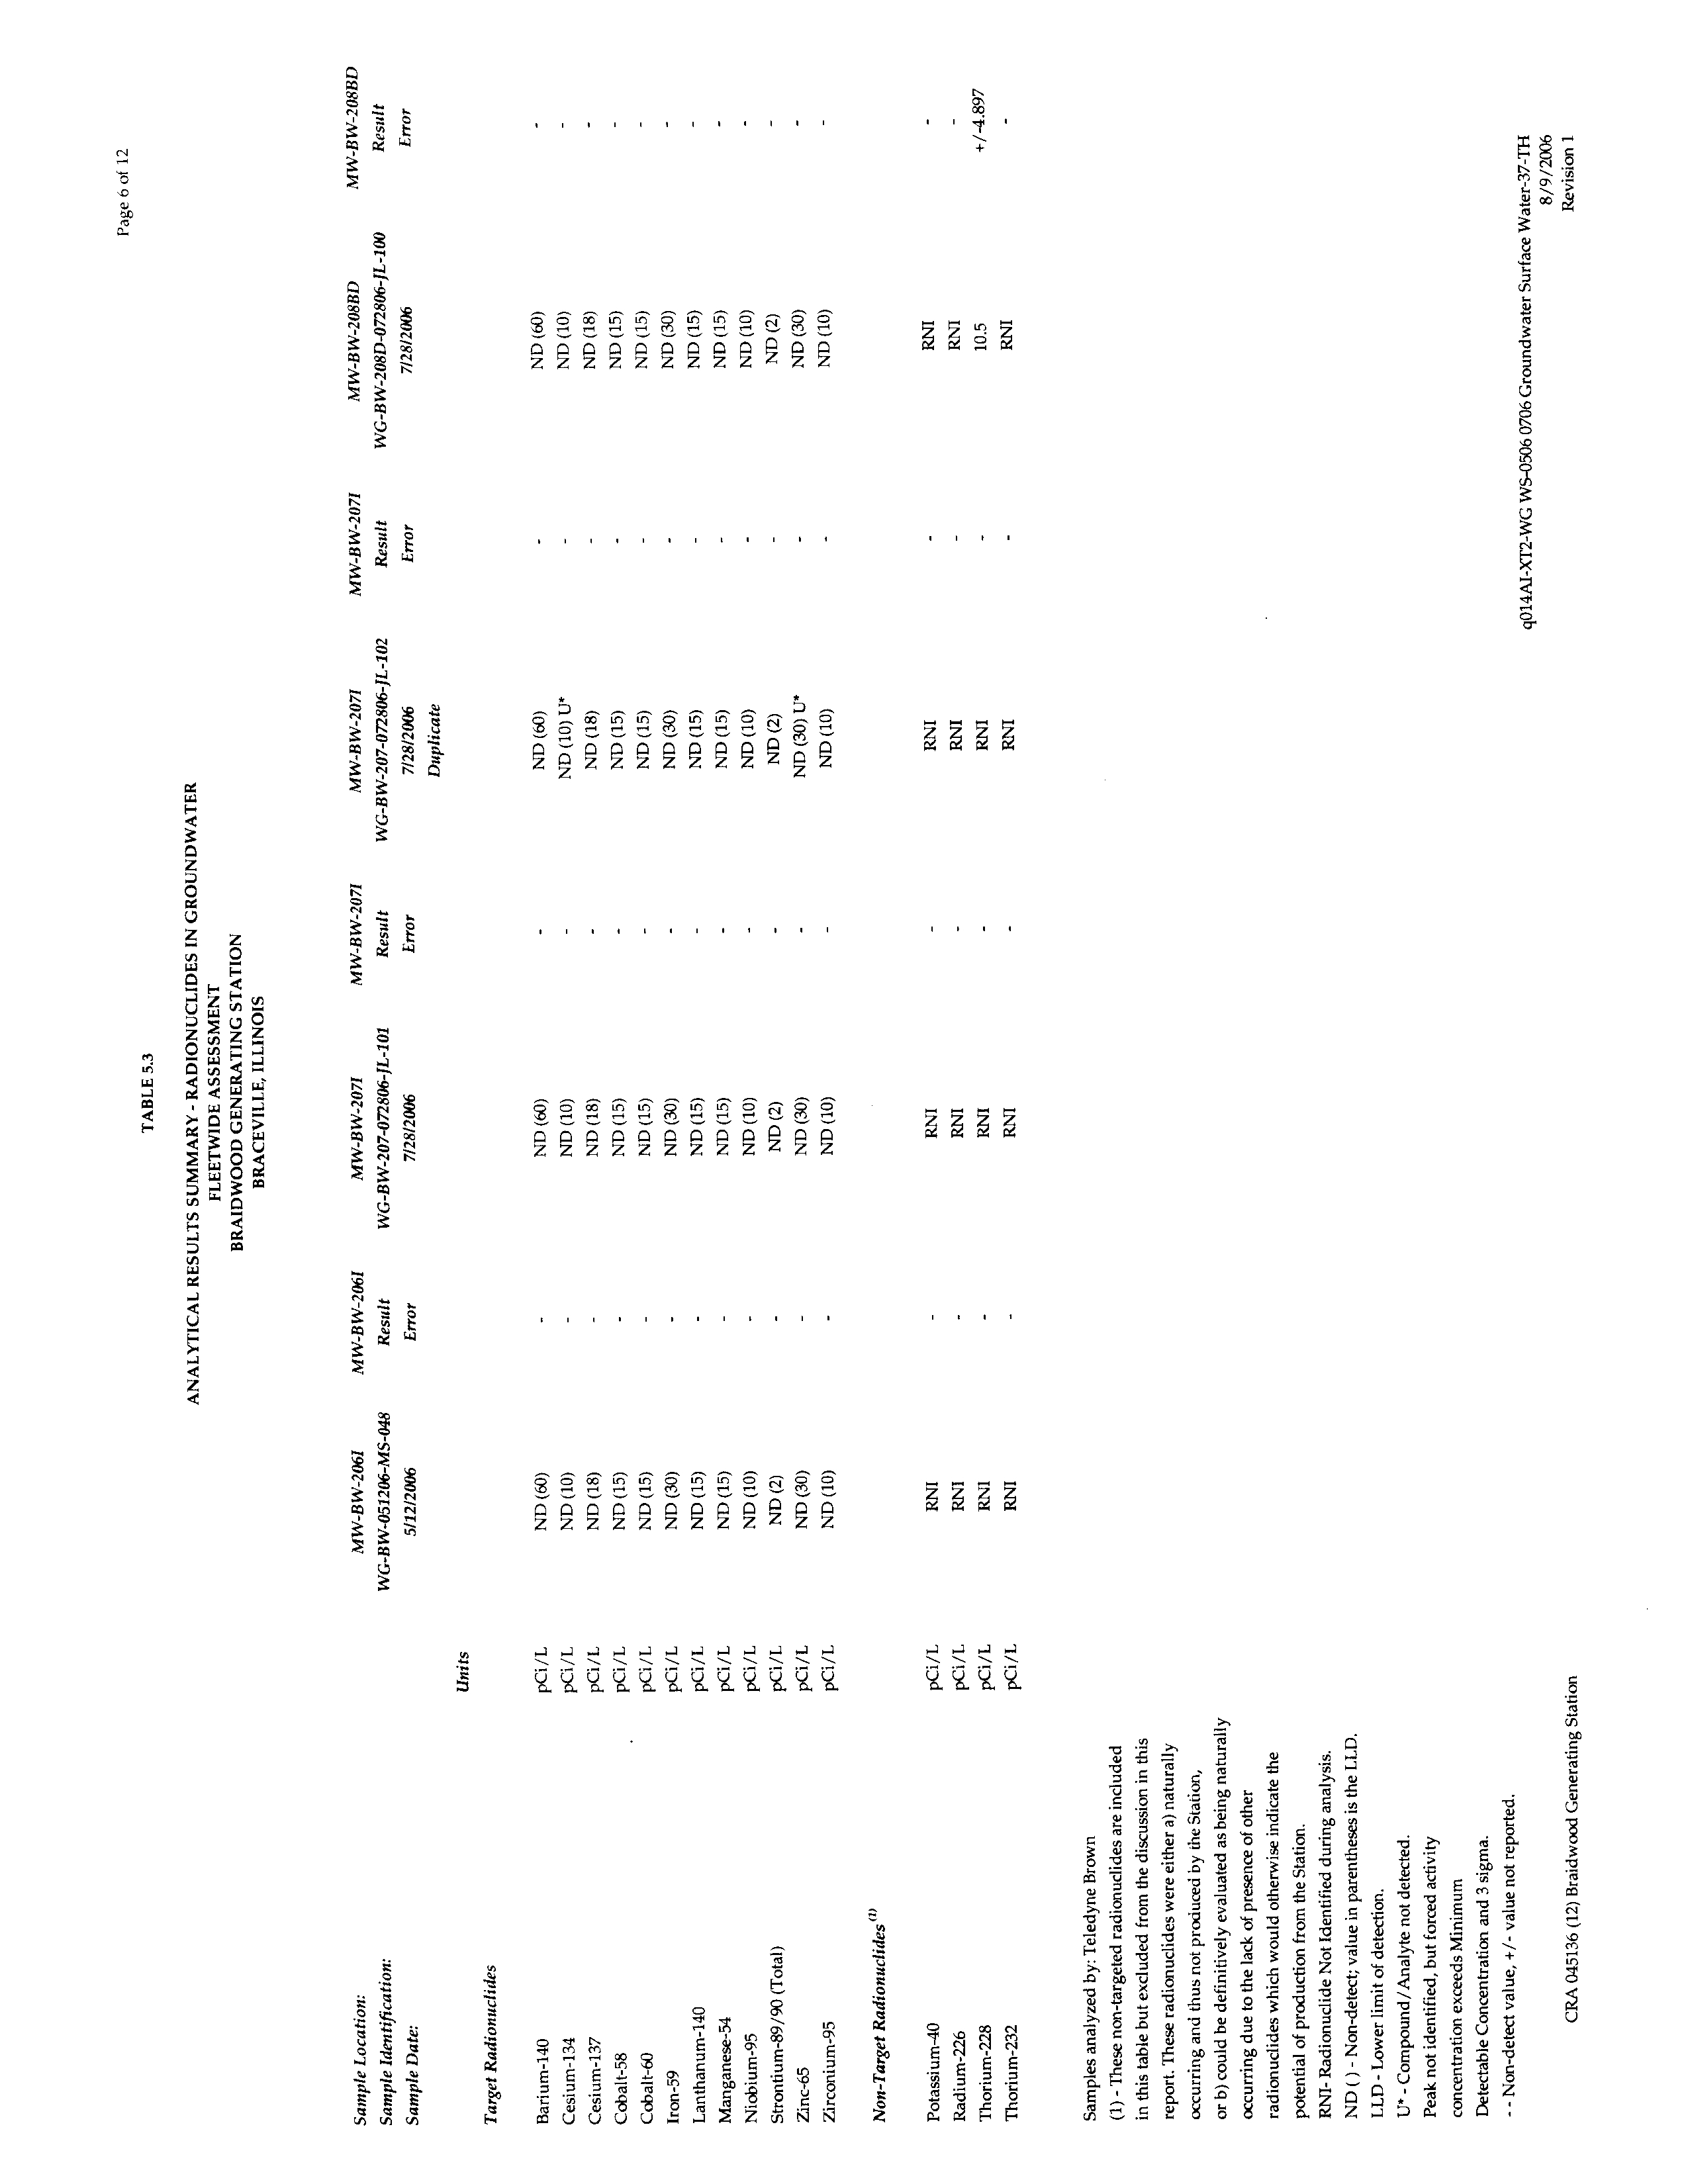
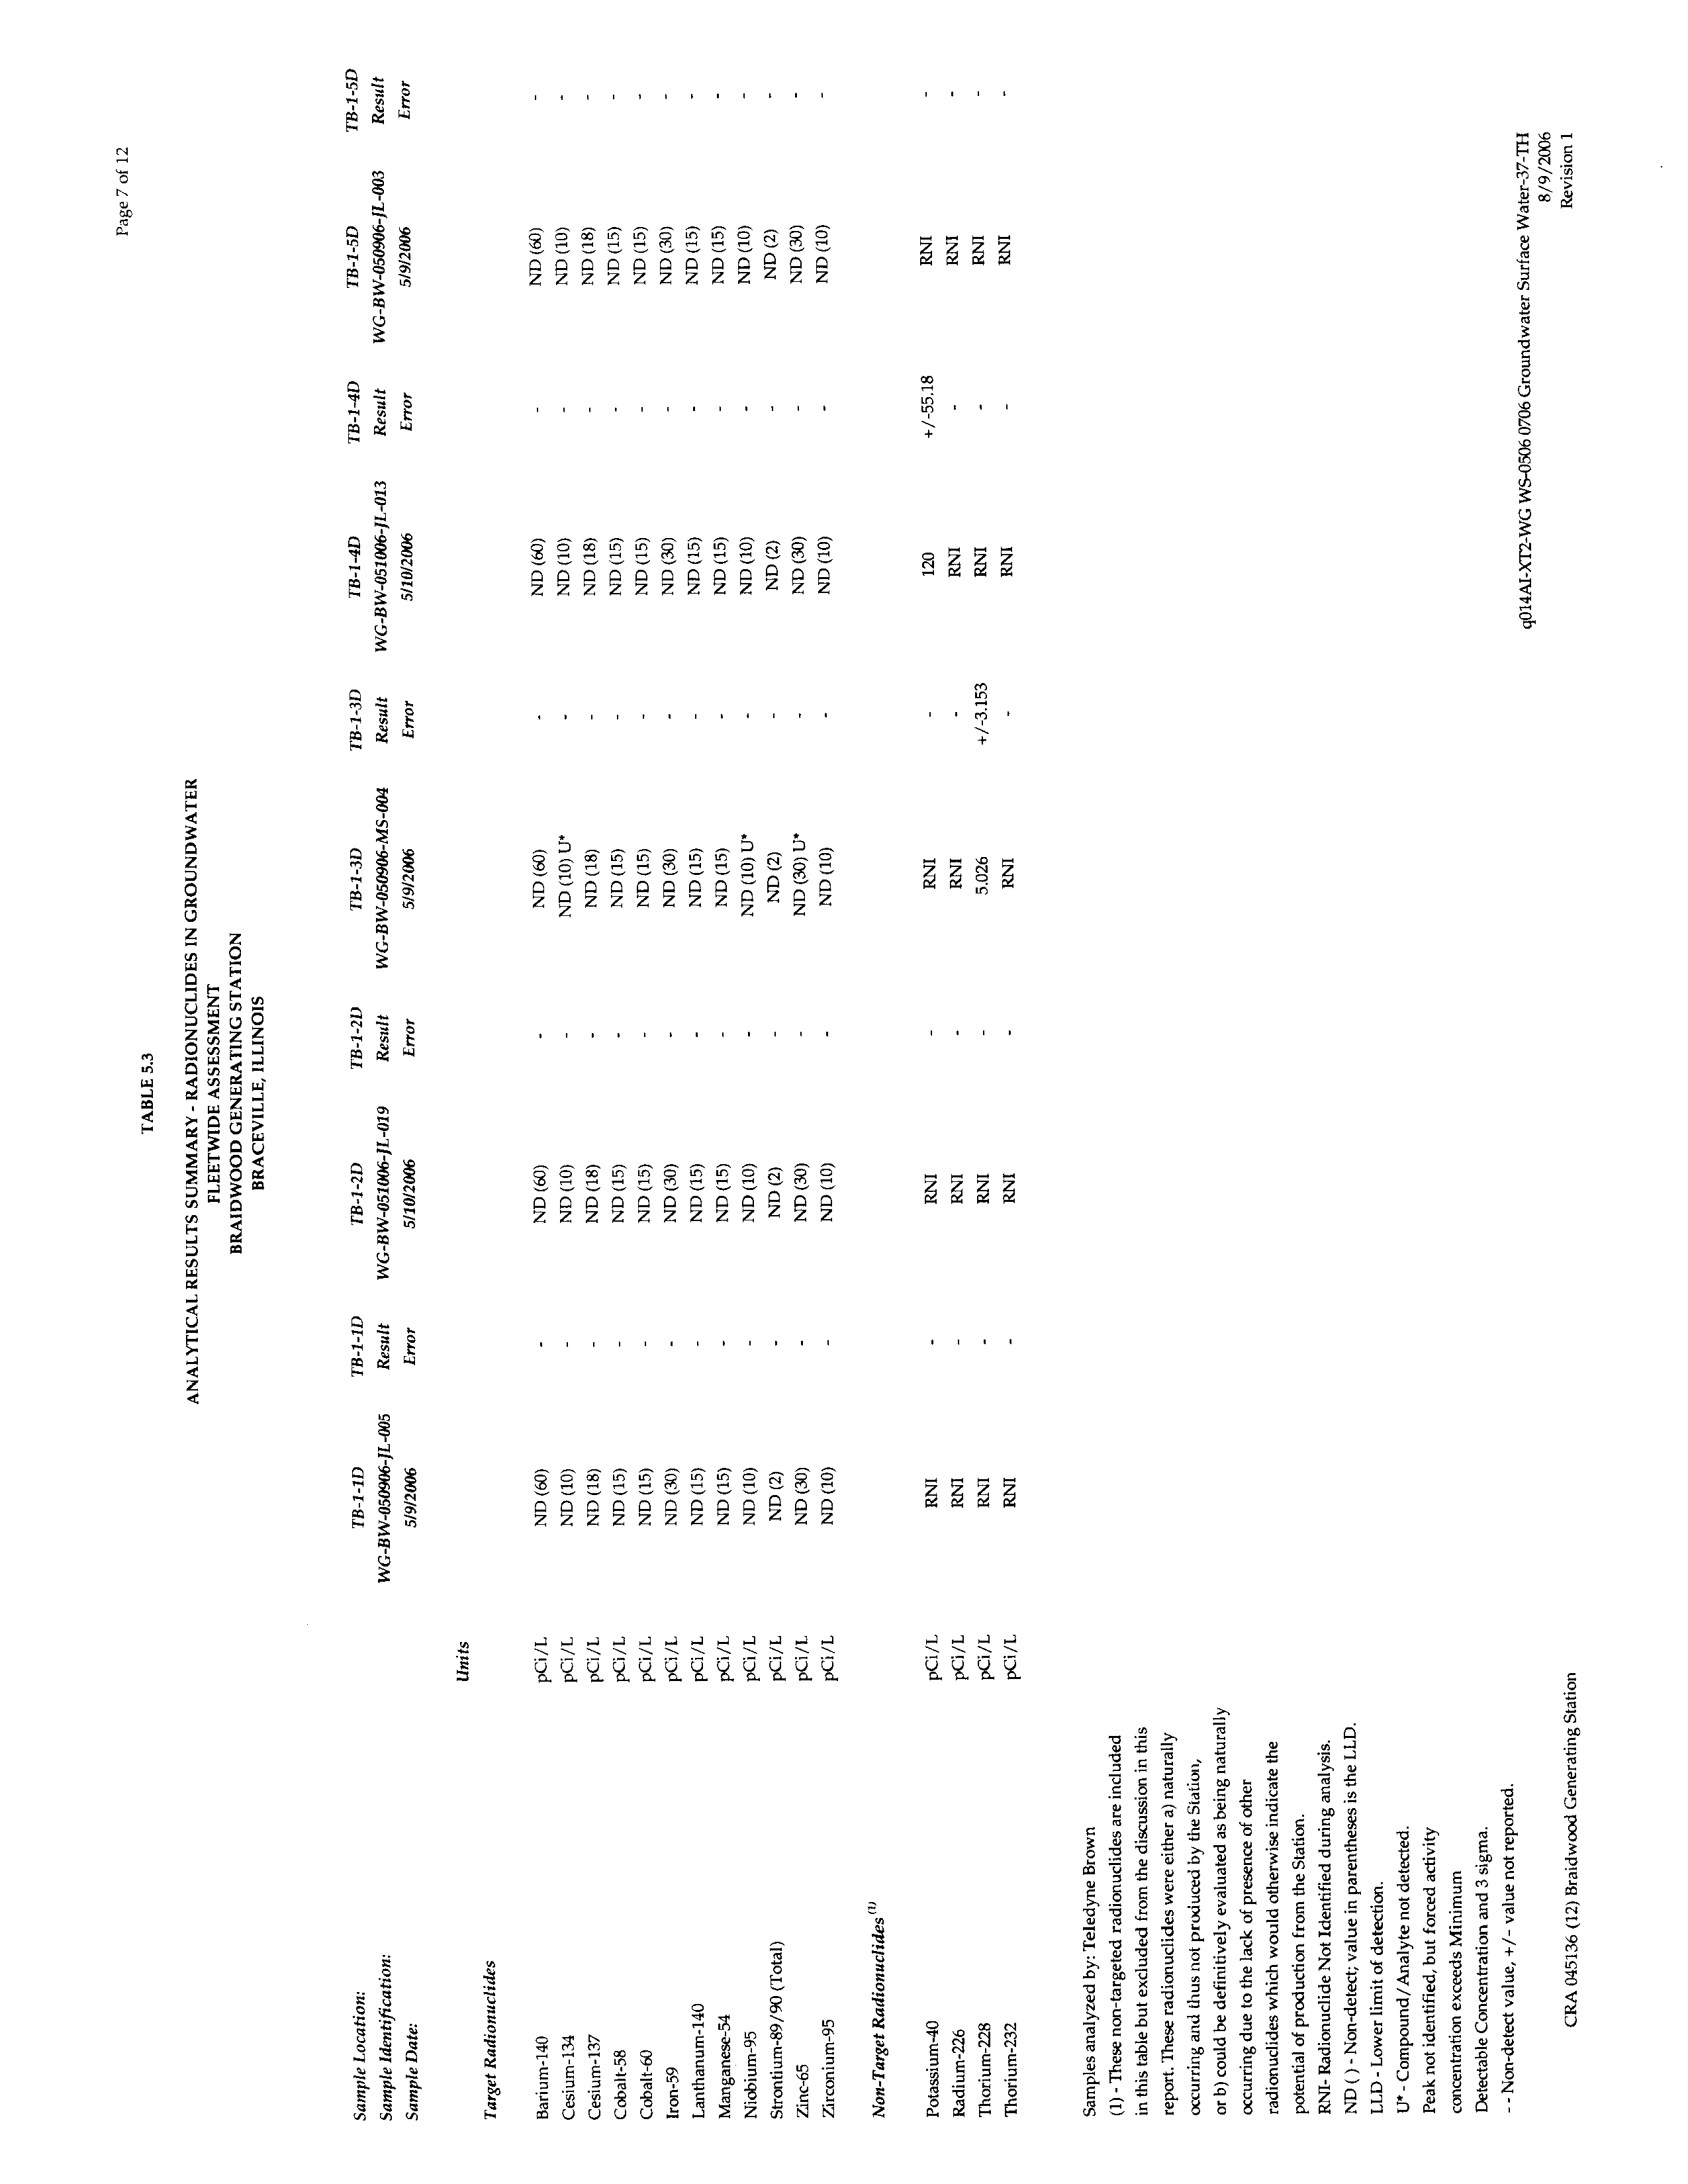
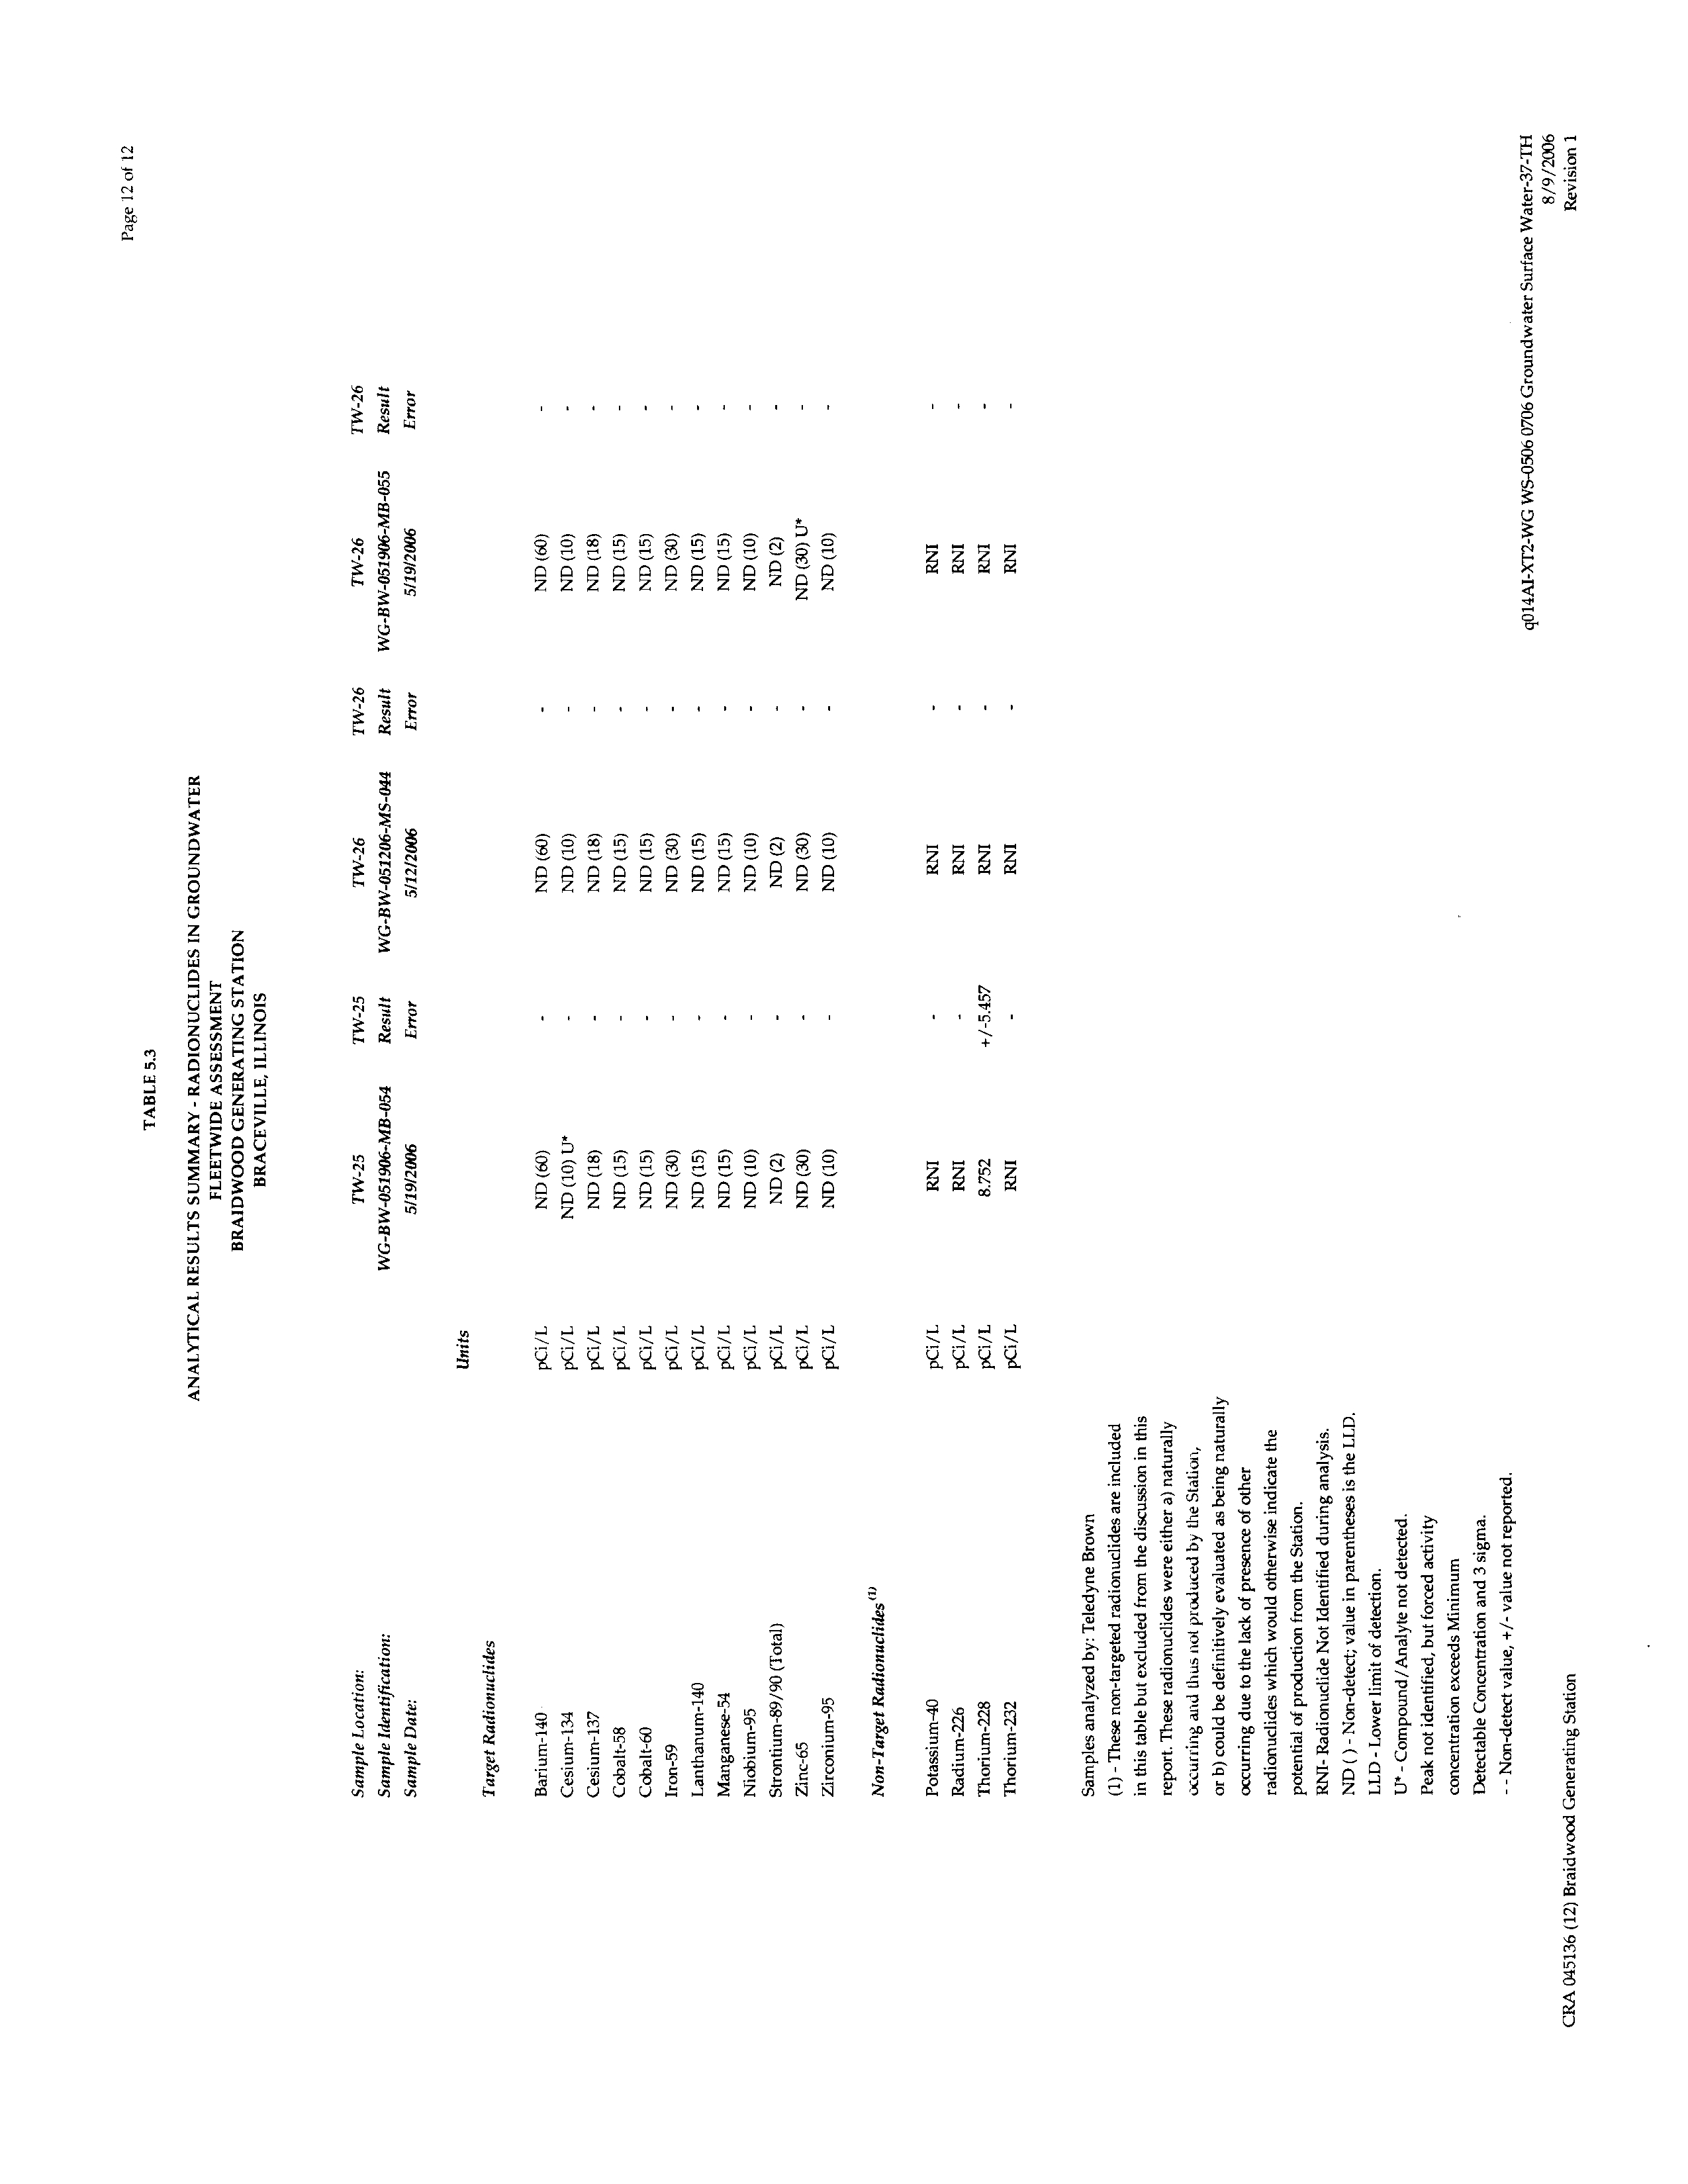
TABLE 5.3
ANALYTICAL RESULTS SUMMARY - RADIONUCLIDES IN
GROUNDWATER
TABLE 5.4
ANALYTICAL RESULTS SUMMARY - TRITIUM IN SURFACE WATER
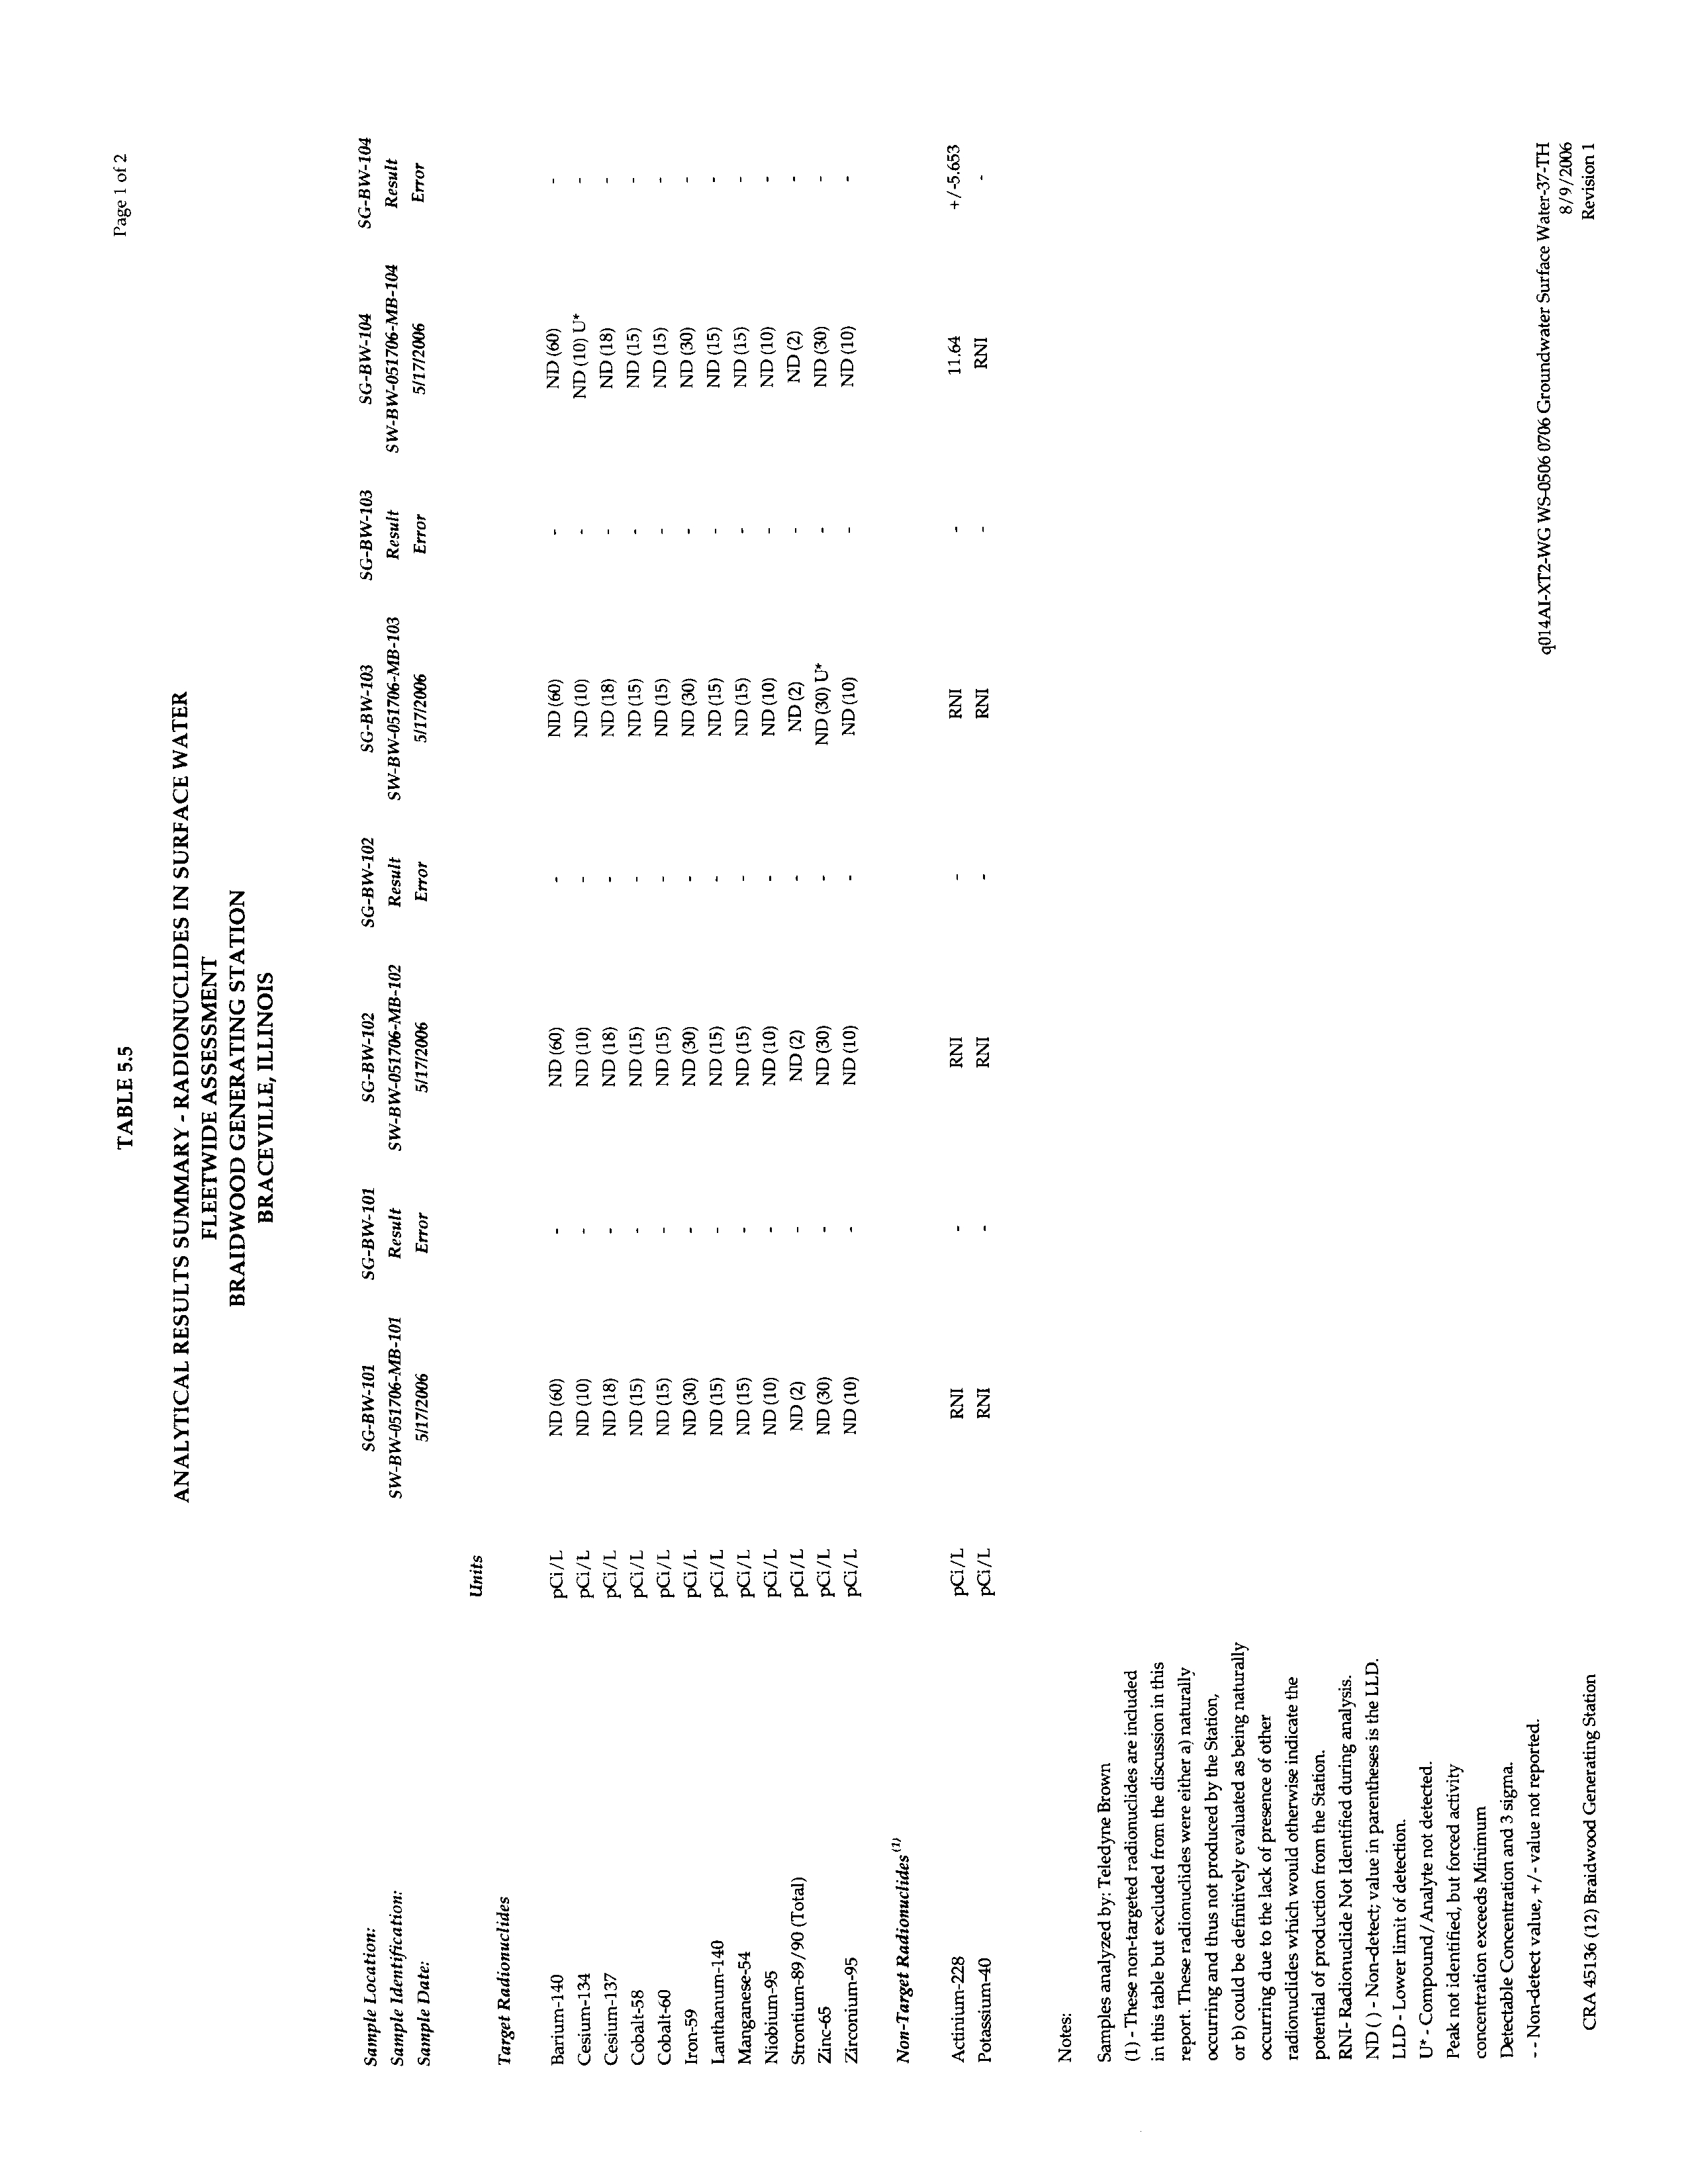
TABLE 5.5
ANALYTICAL RESULTS SUMMARY - RADIONUCLIDES IN SURFACE
WATER
TABLE 5.6
EXISTING ANALYTICAL RESULTS SUMMARY - TRITIUM IN
GROUNDWATER
TABLE 5.7
EXISTING ANALYTICAL RESULTS SUMMARY - TRITIUM IN
SURFACE WATER
045136 (12) Braidwood Generation Station
CONESTOGA-ROVERS & ASSOCIATES
Revision 1
LIST OF APPENDICES
APPENDIX A
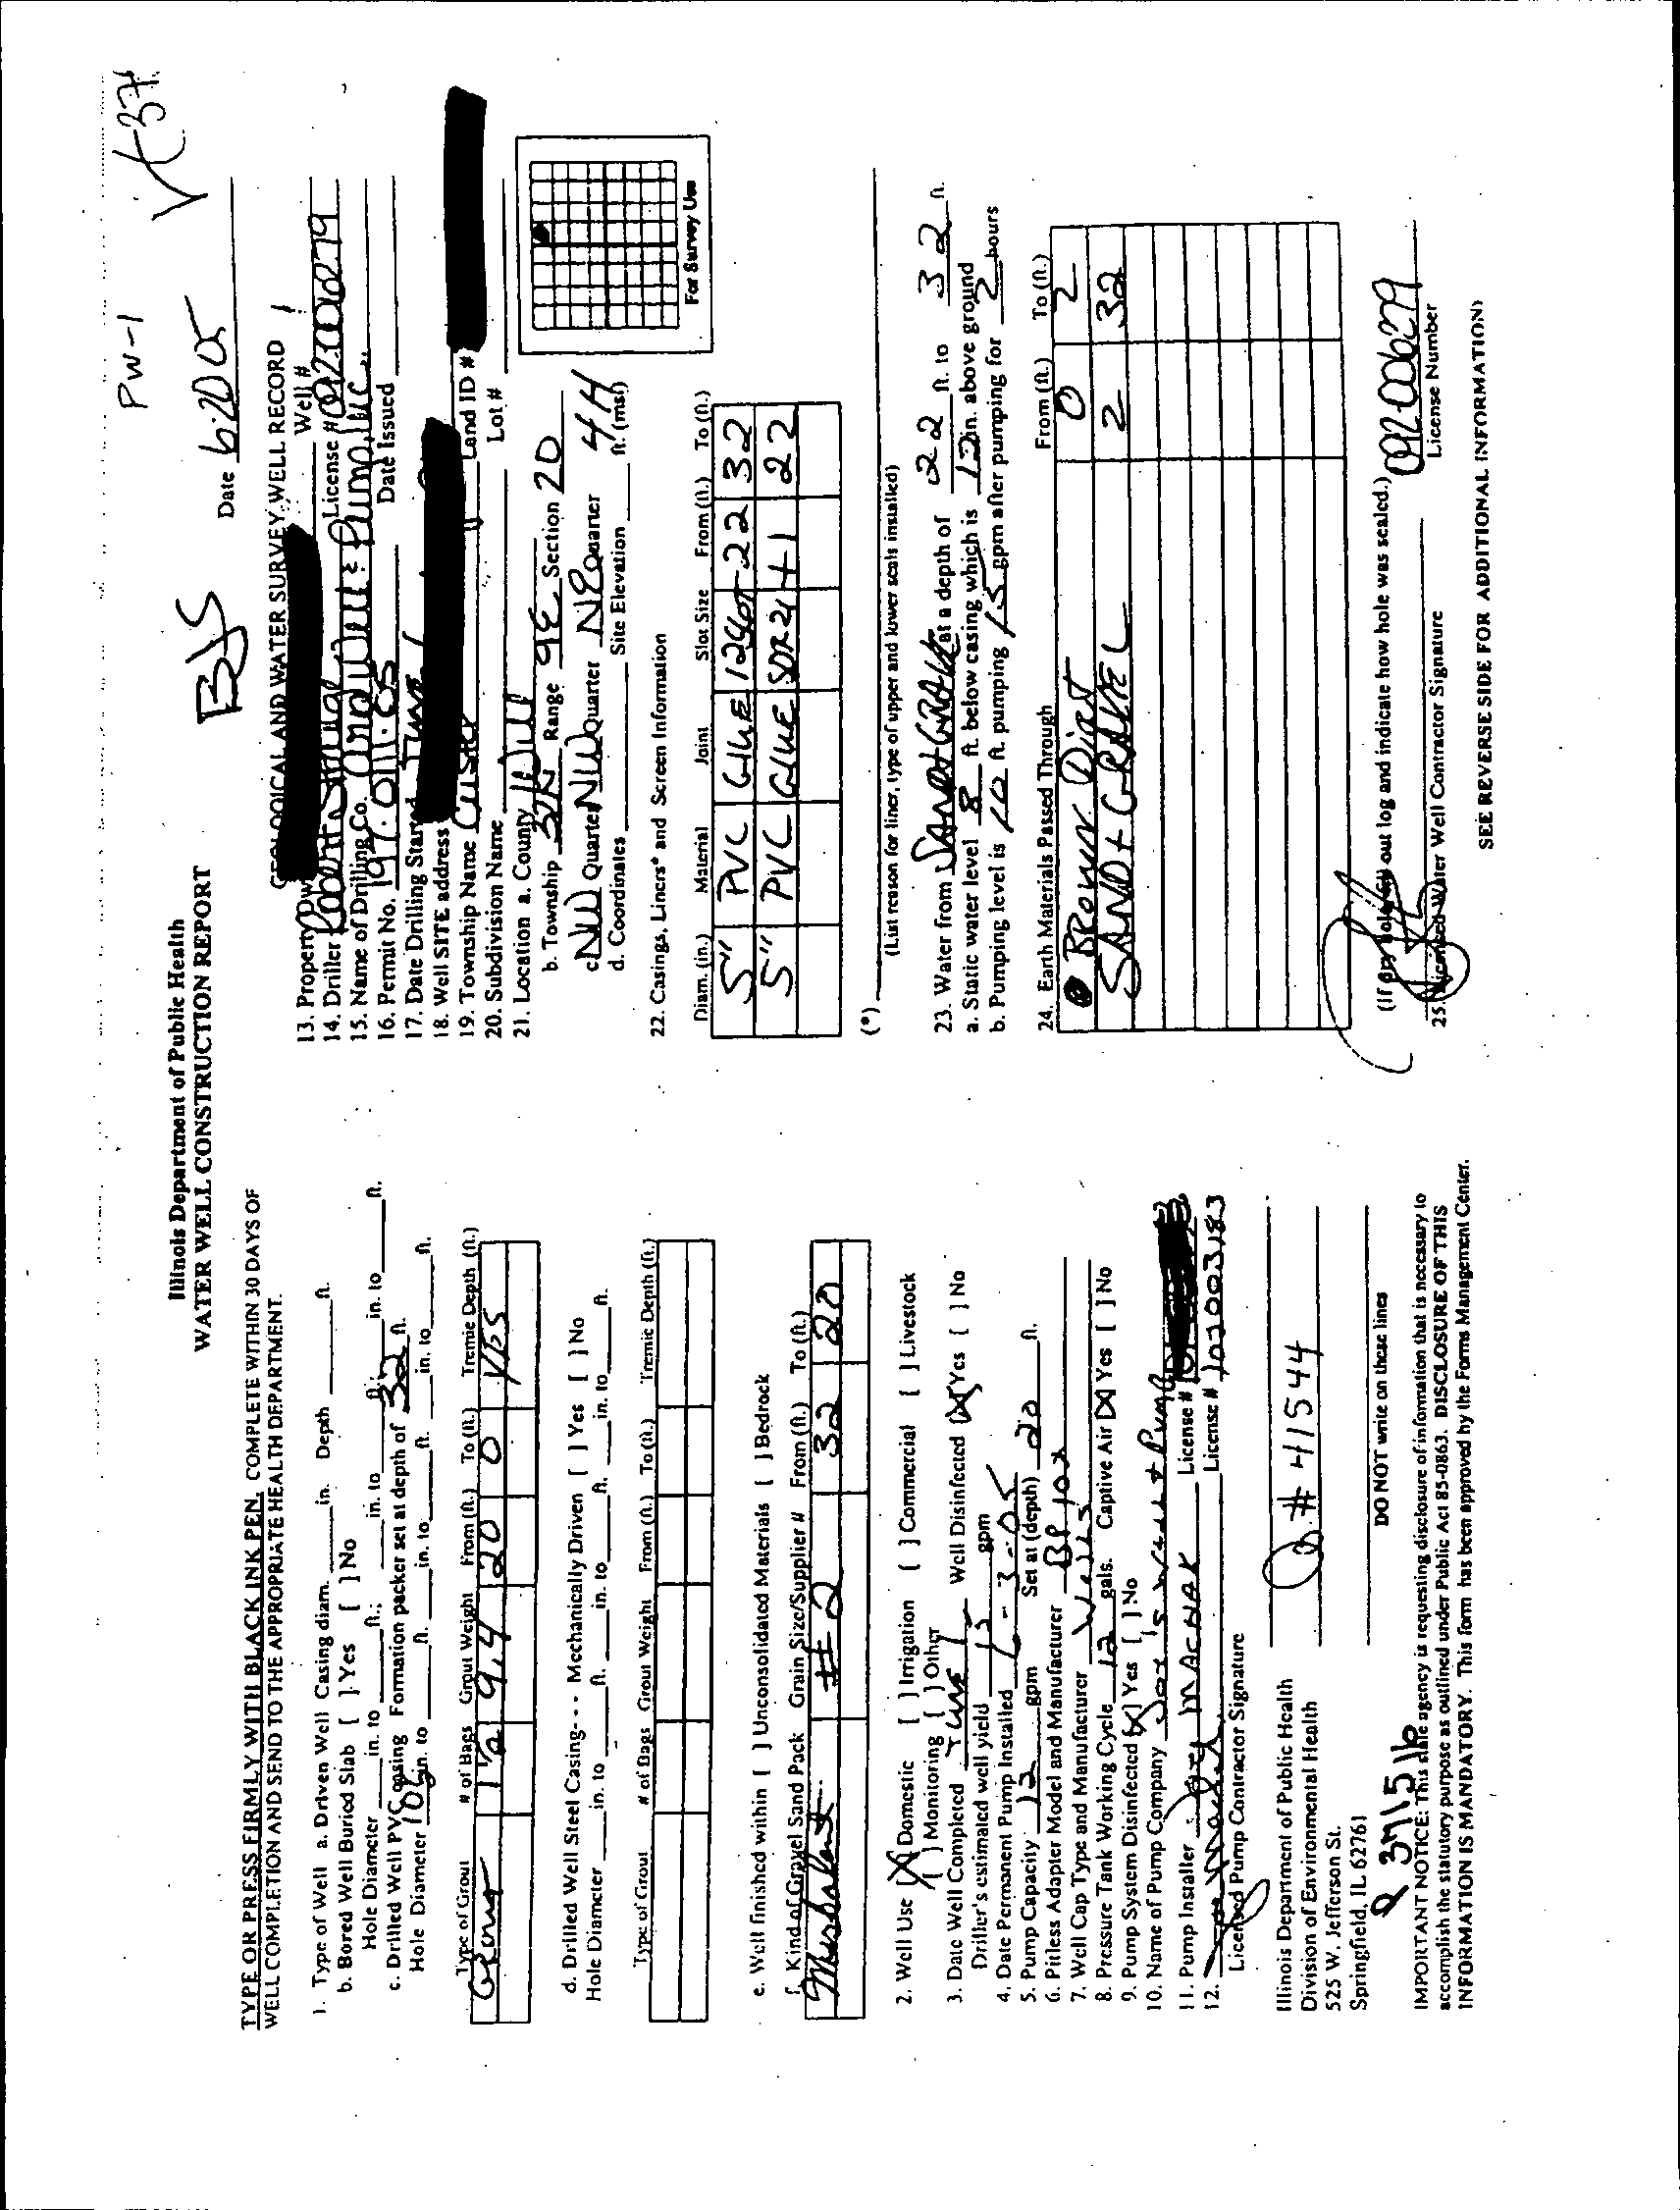
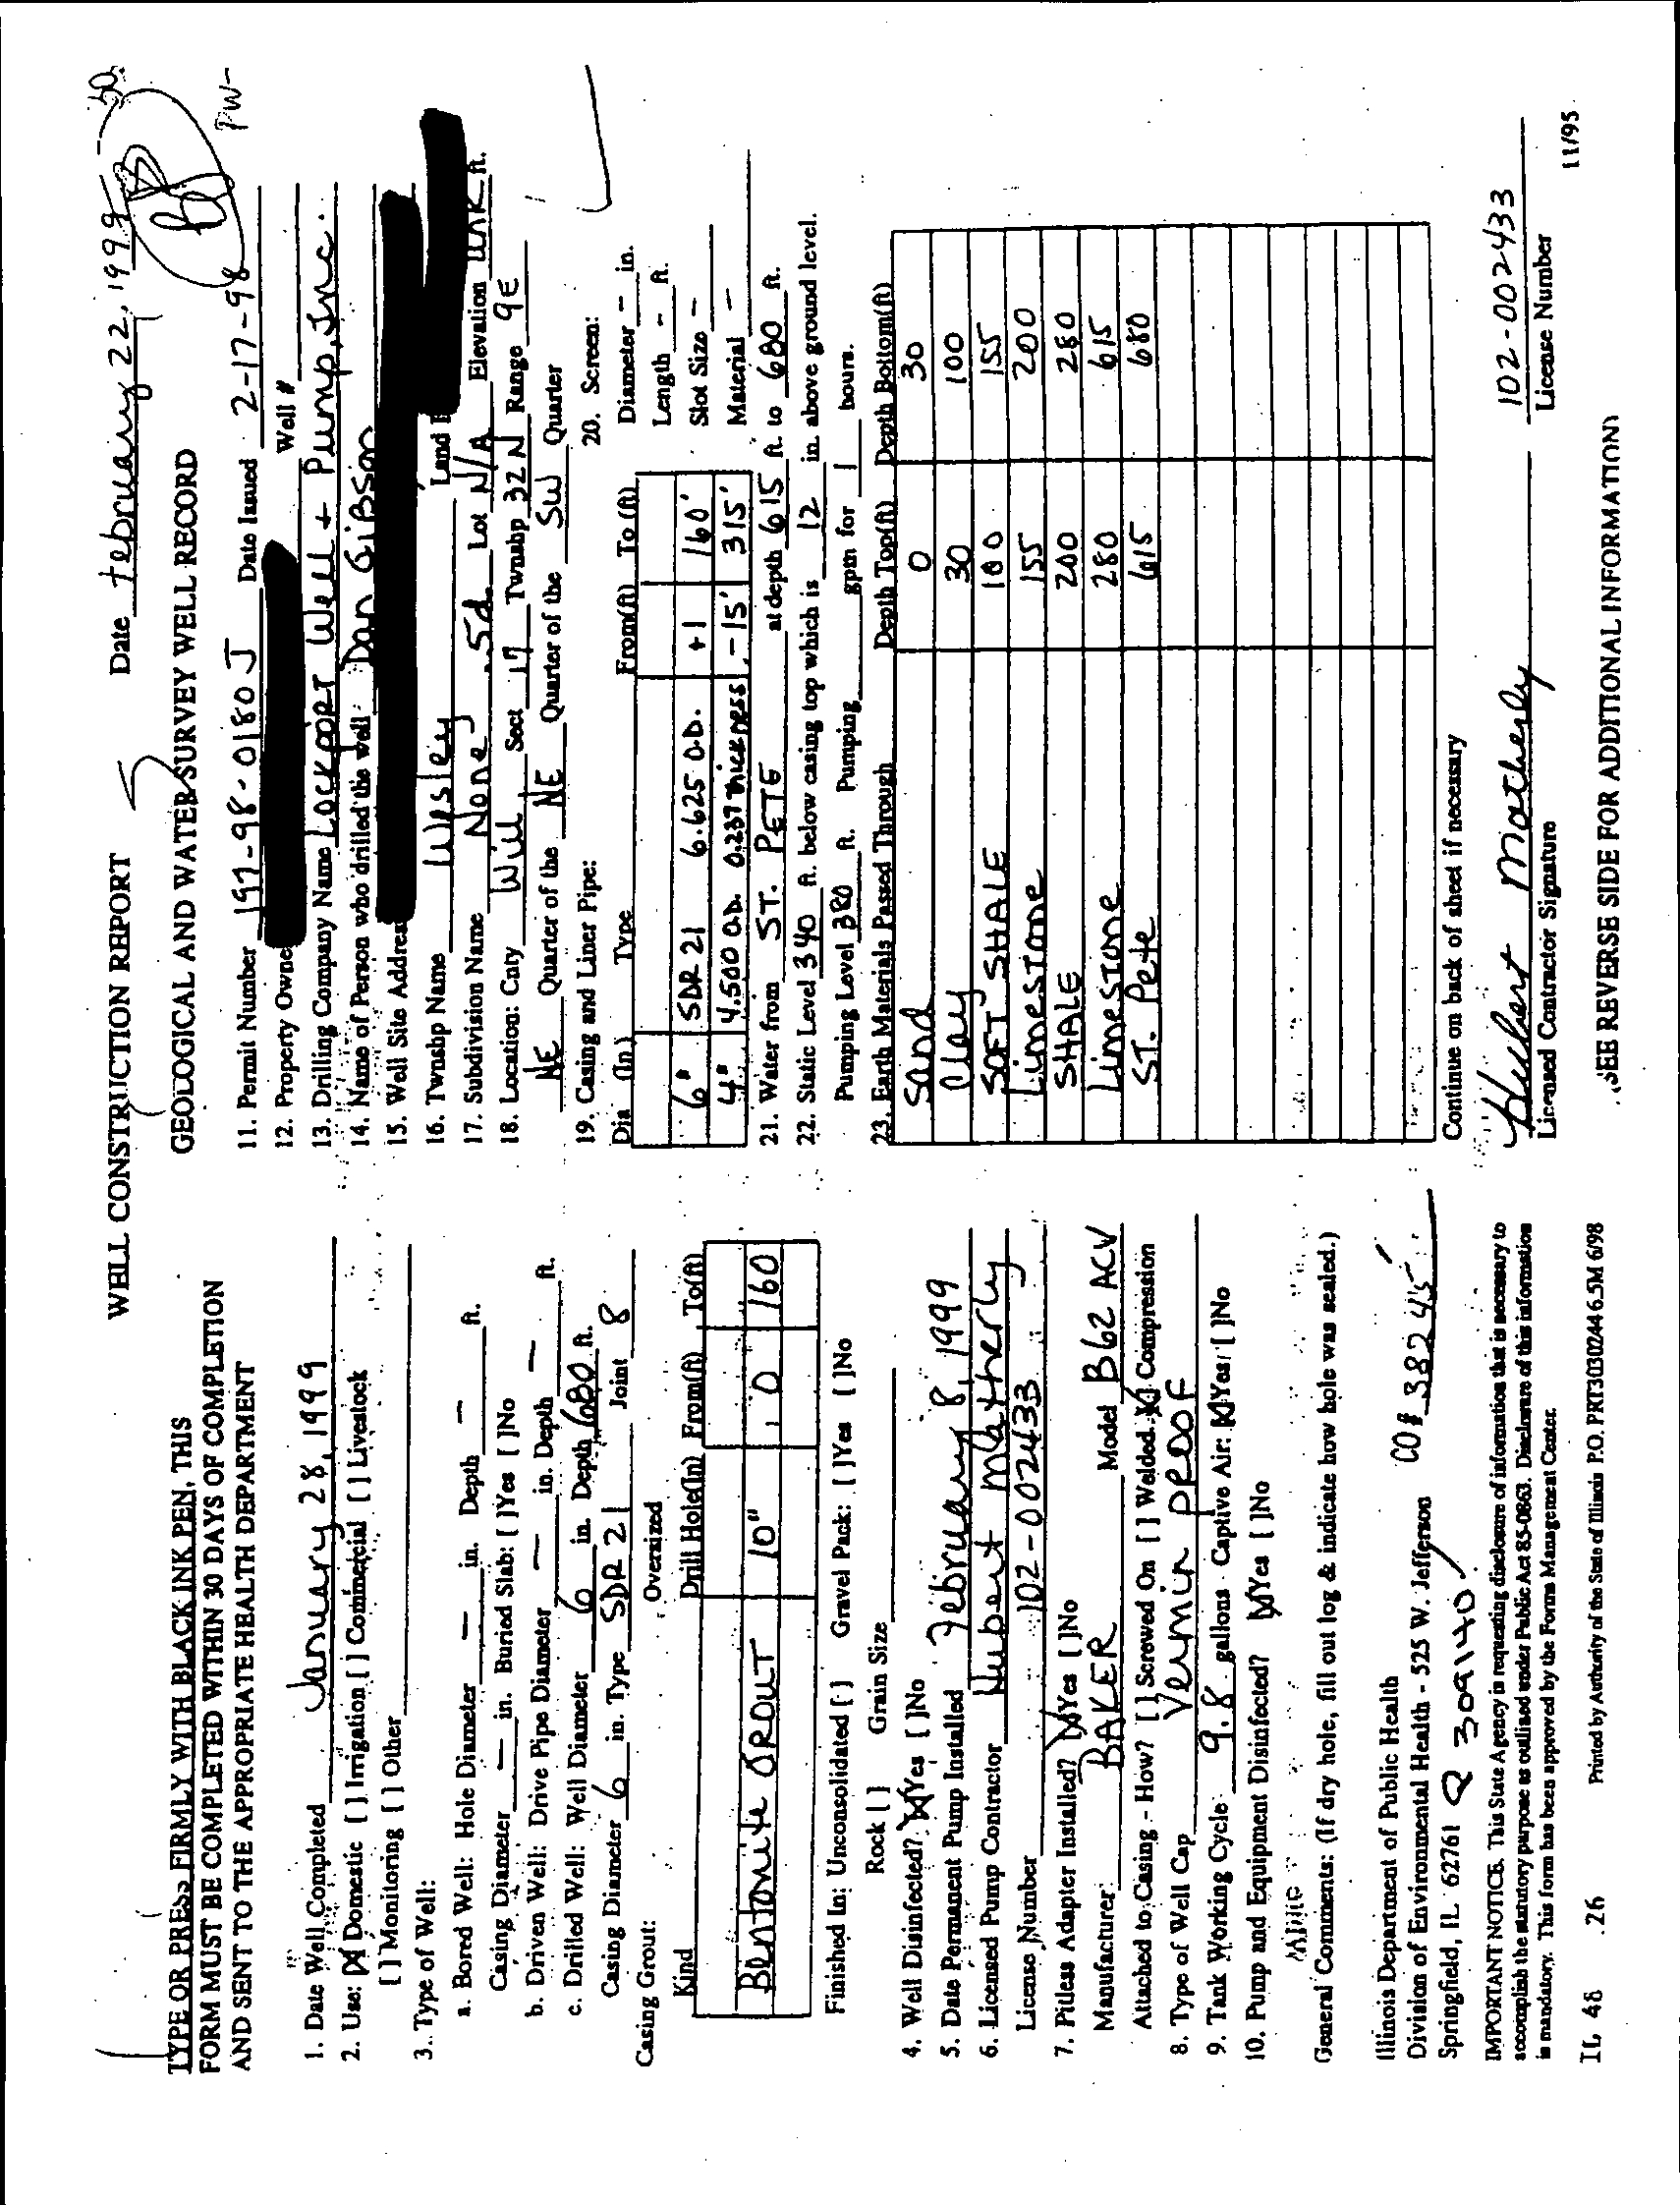
MONITORING WELL LOGS
APPENDIX B
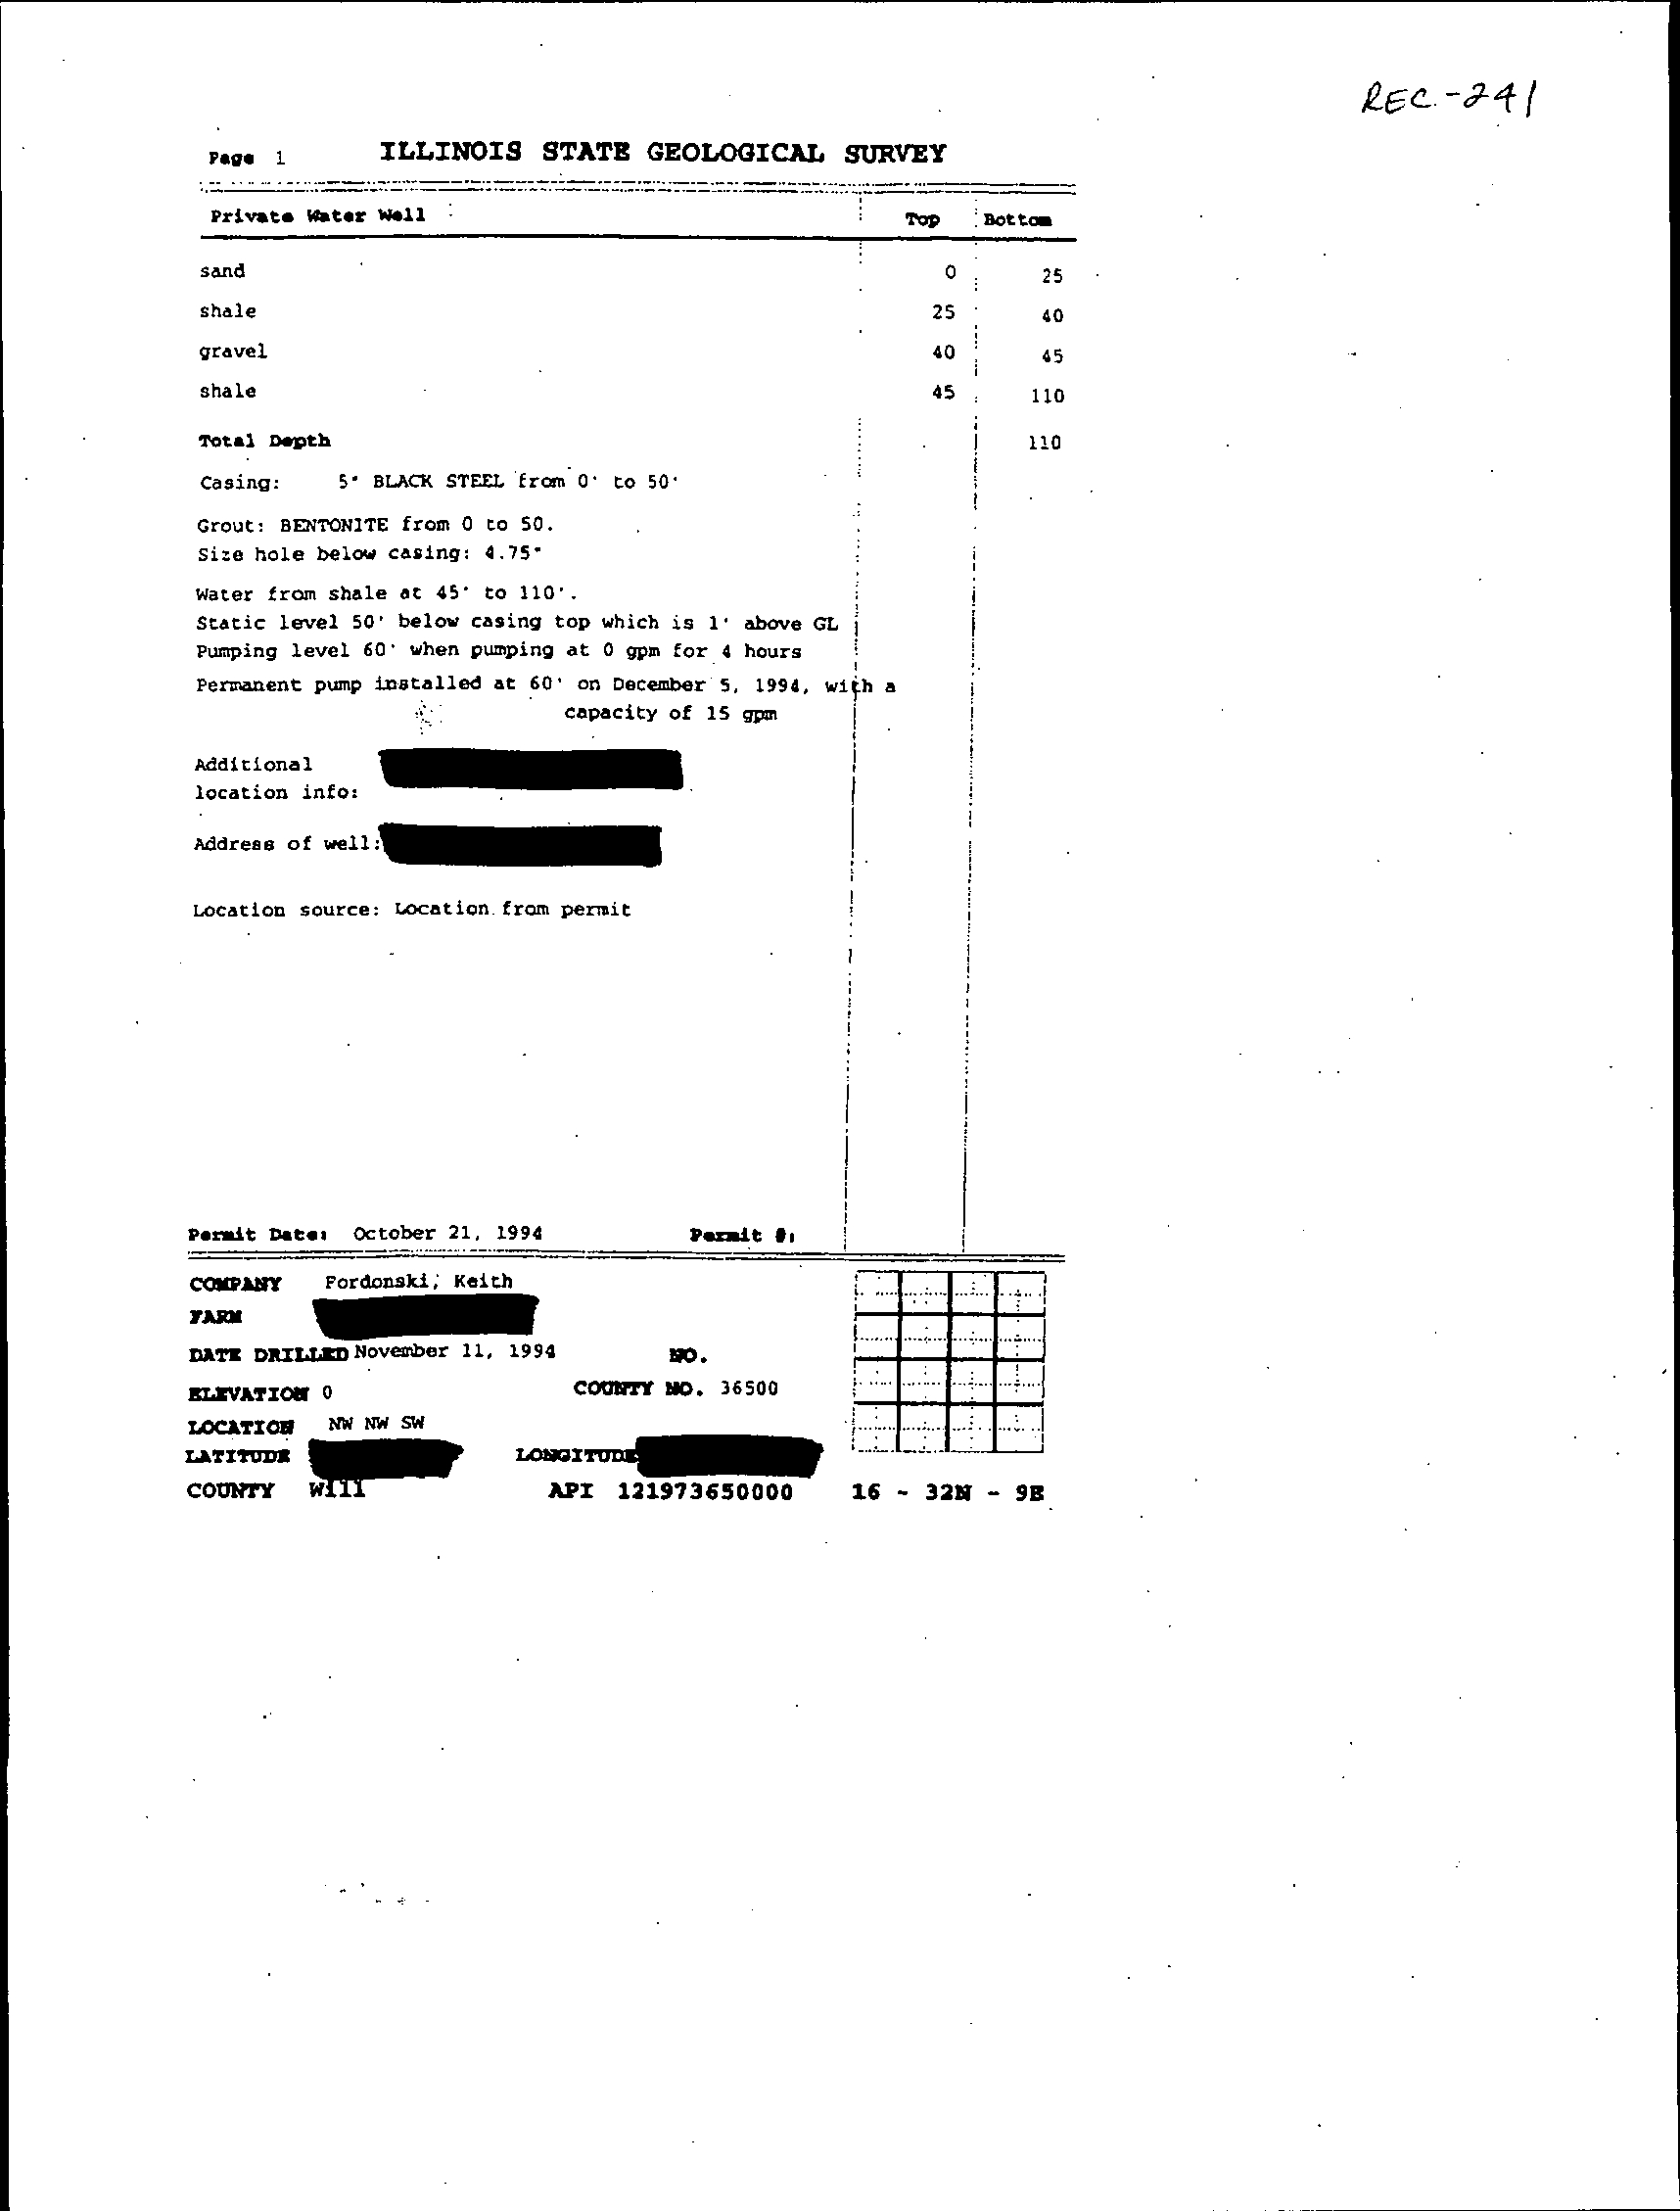
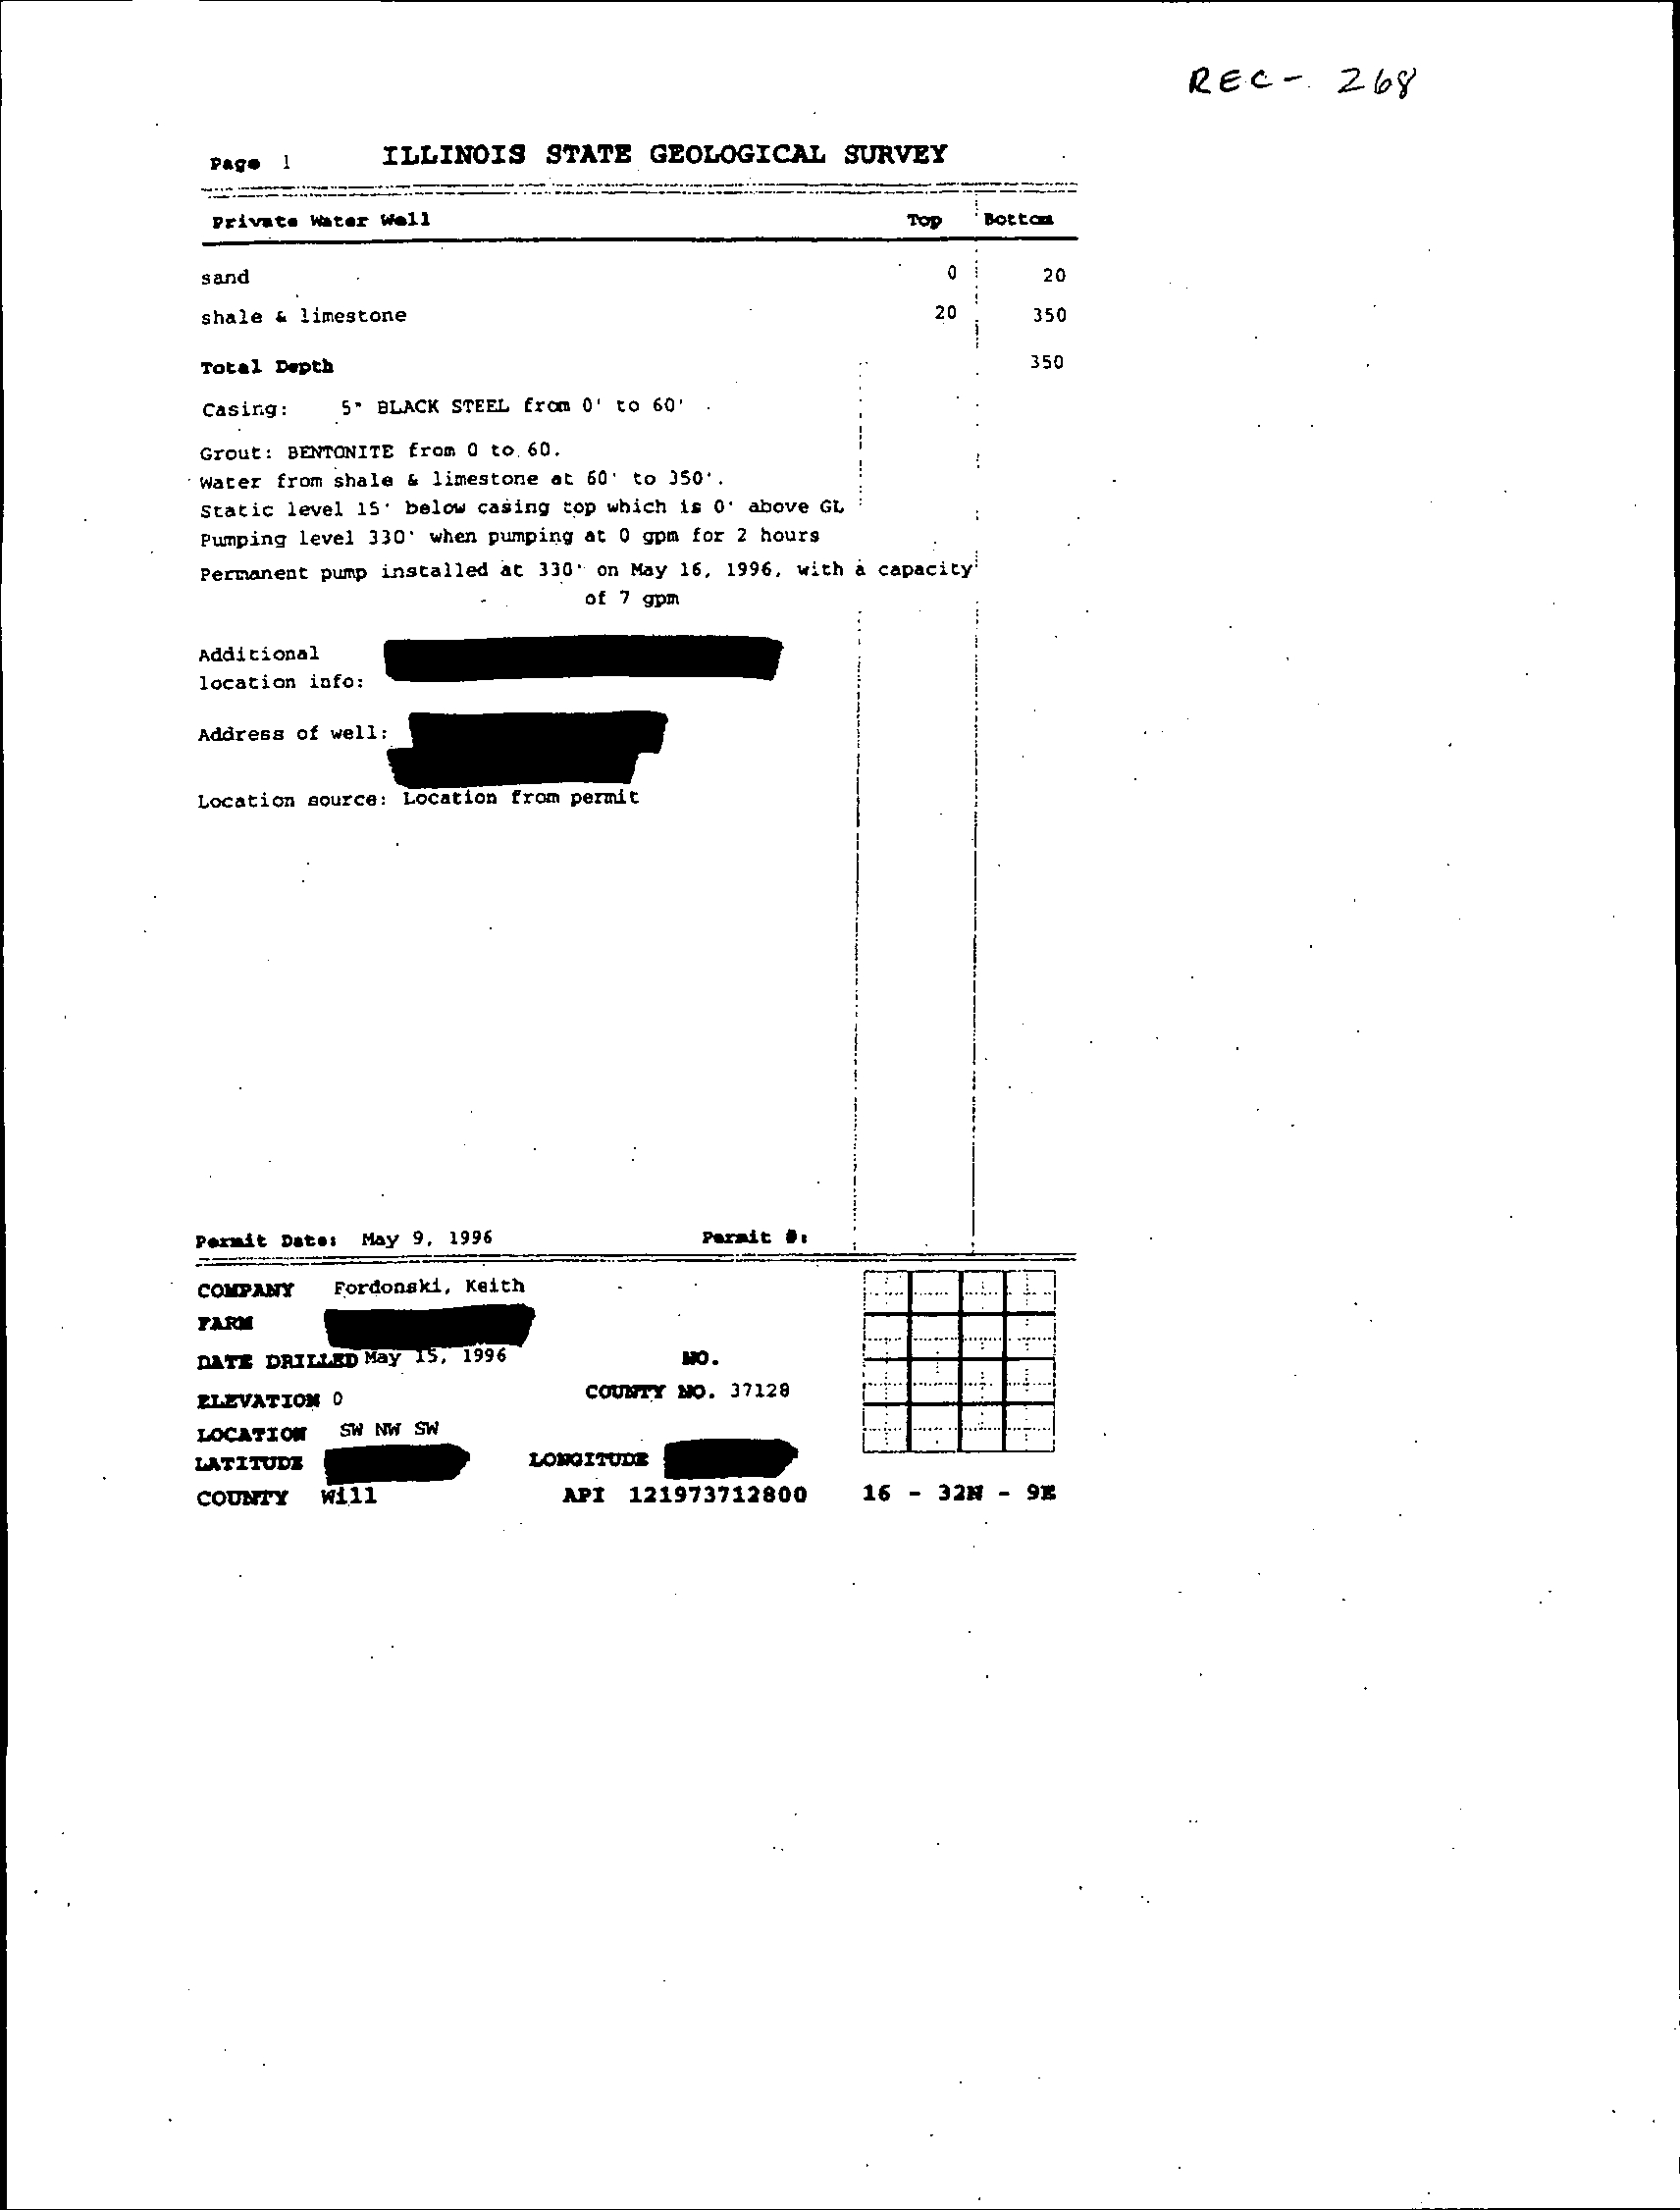
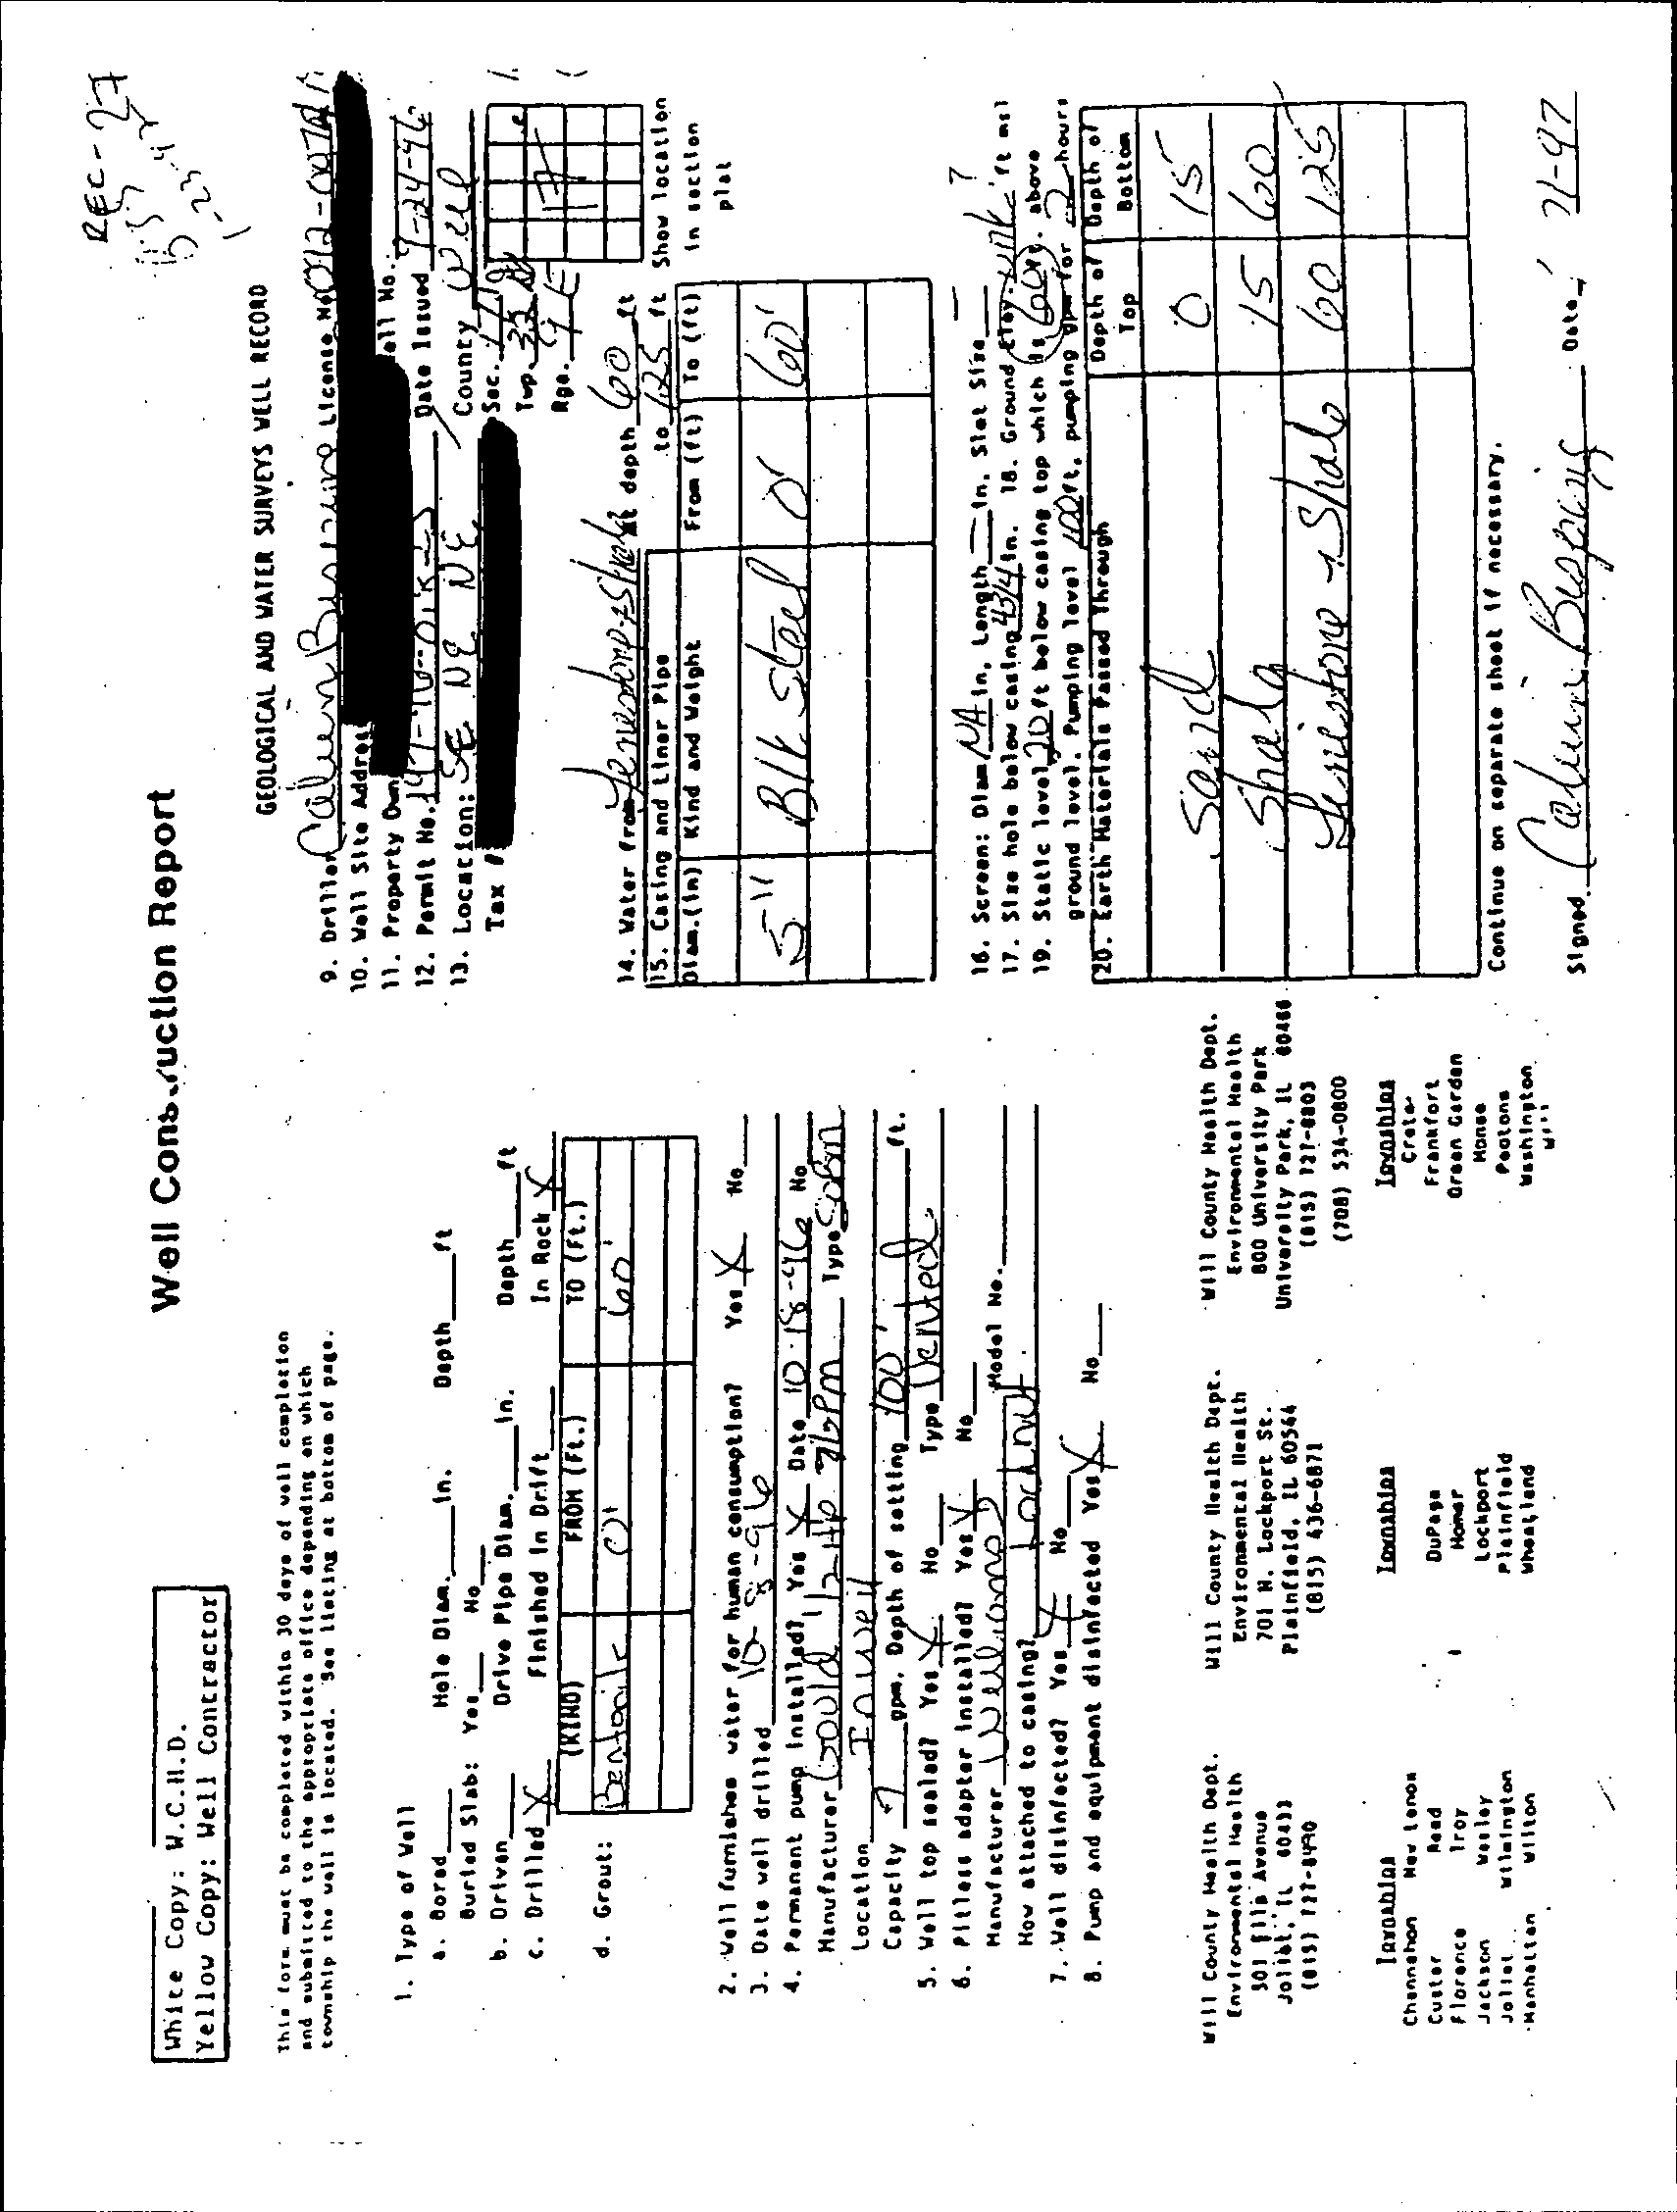
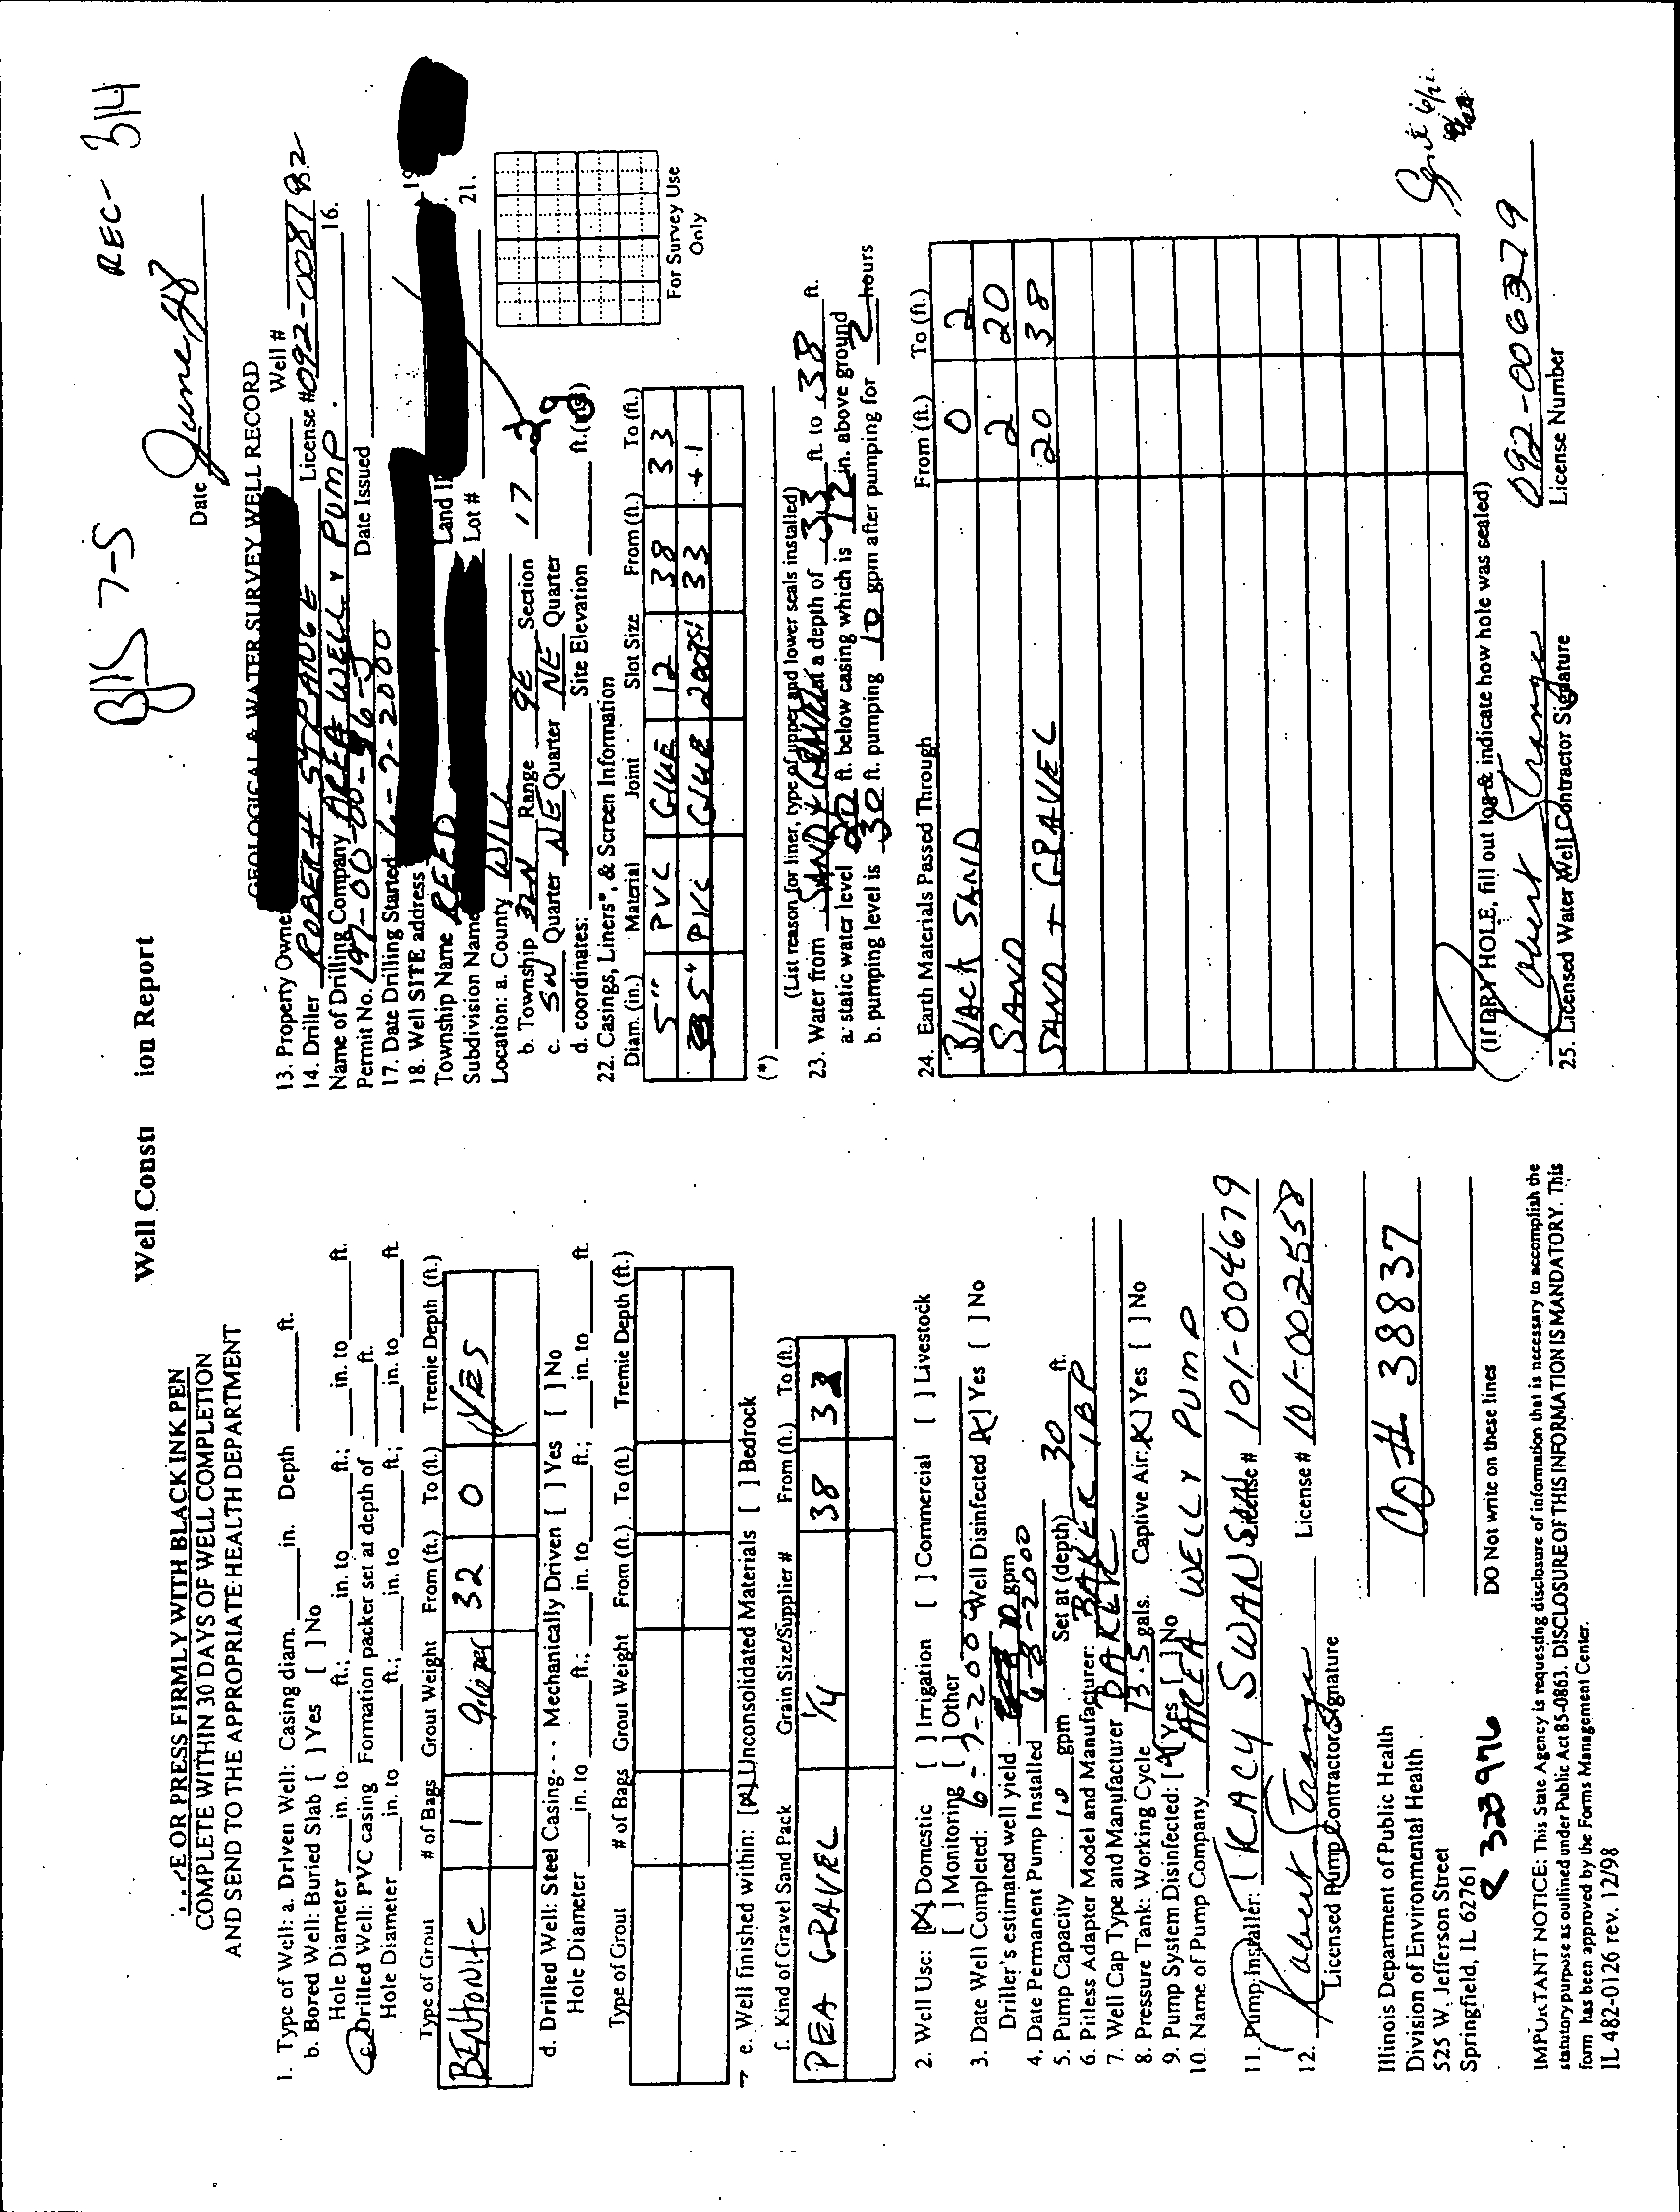
PRIVATE WATER WELL INVENTORY RECORDS (CRA, MARCH 2006)
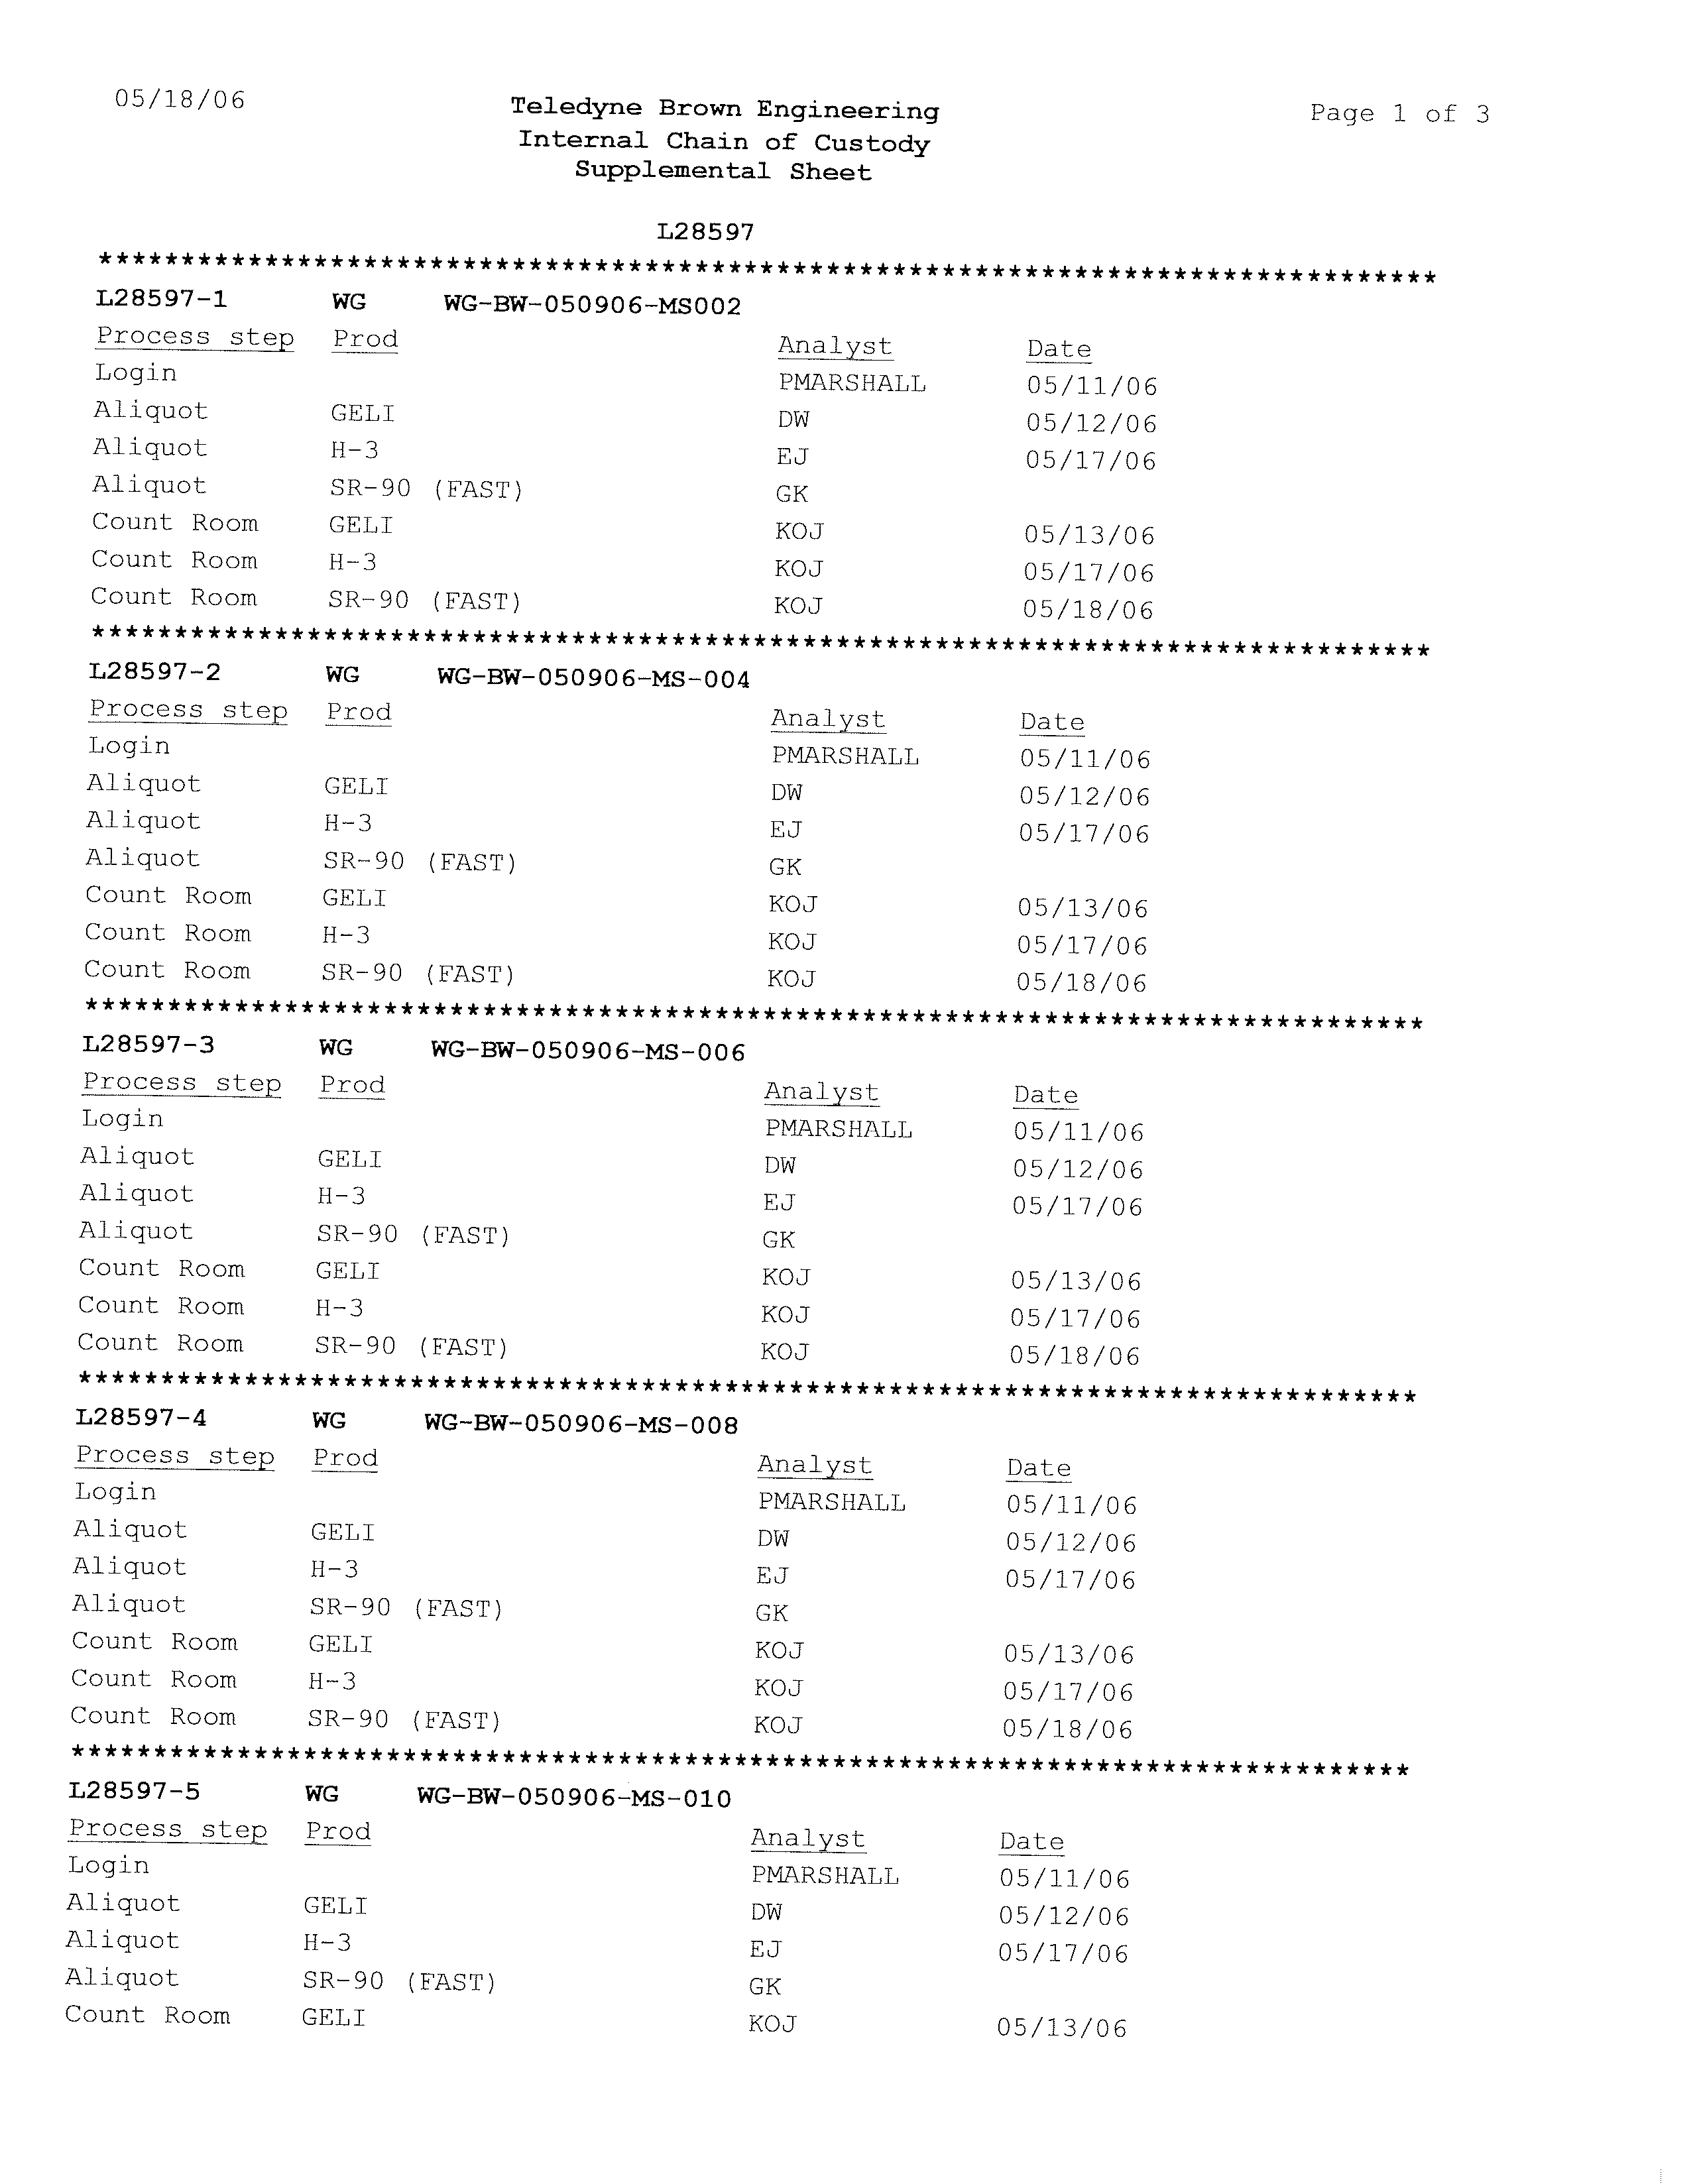
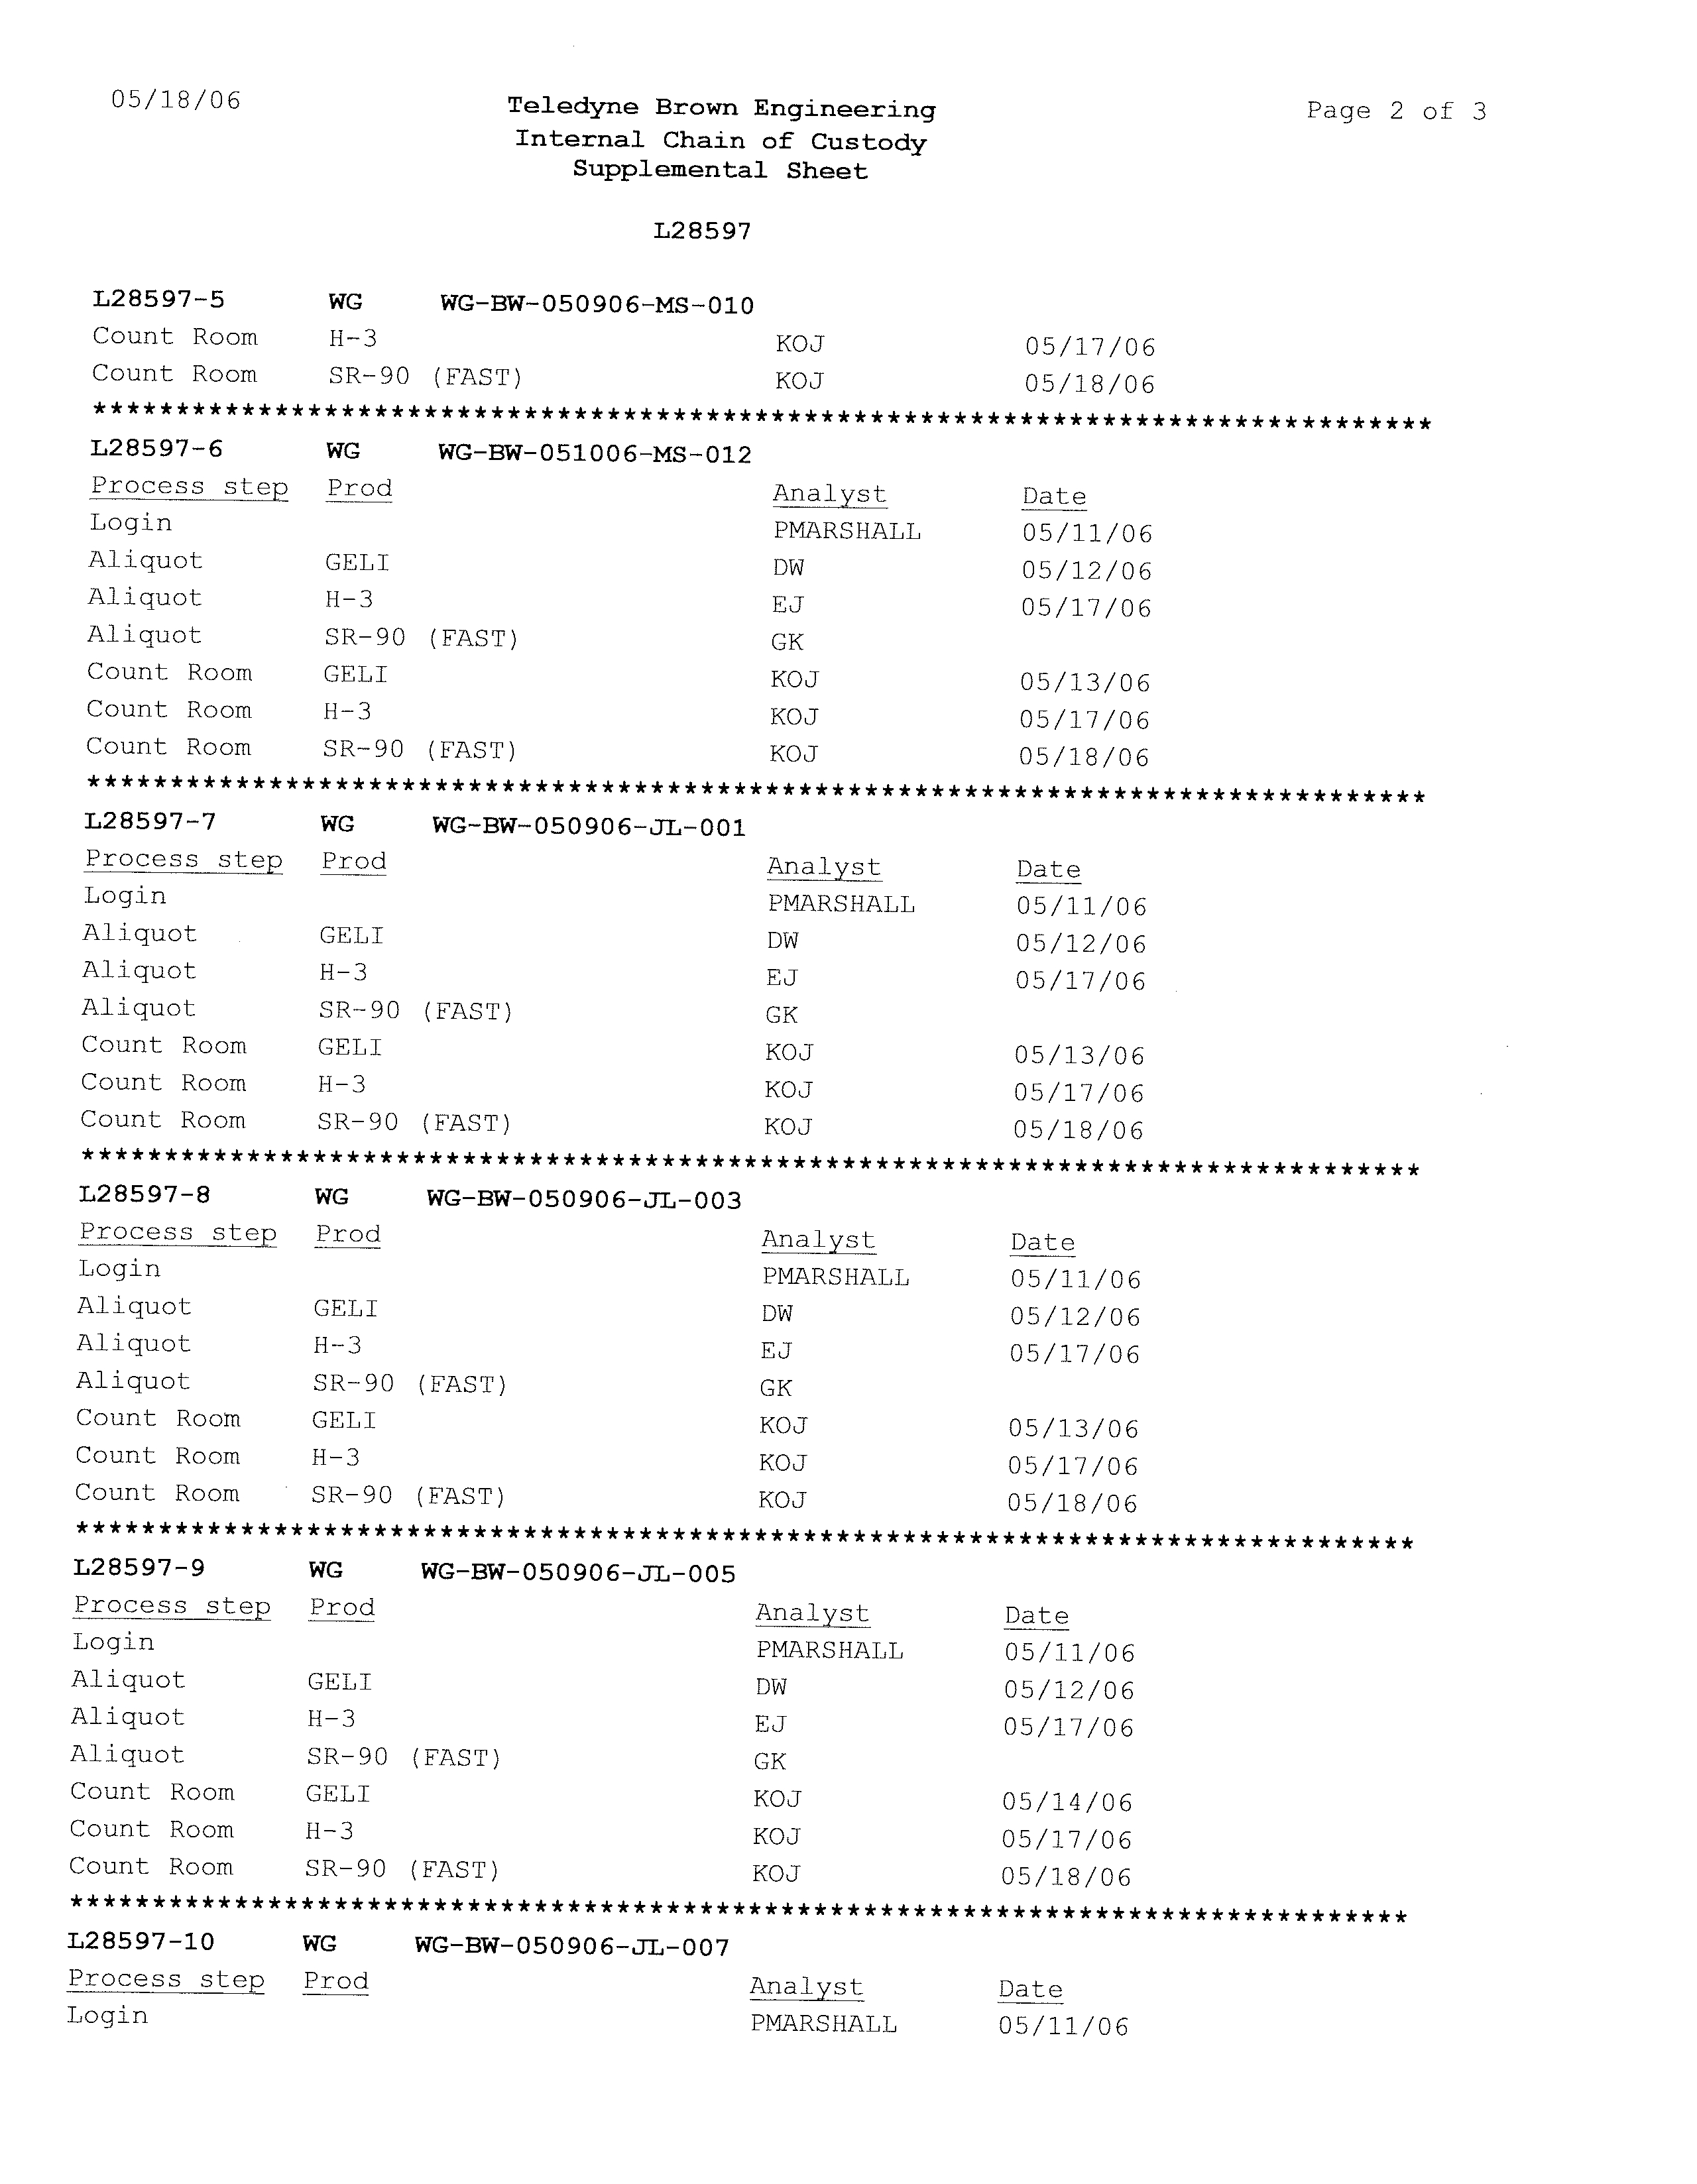
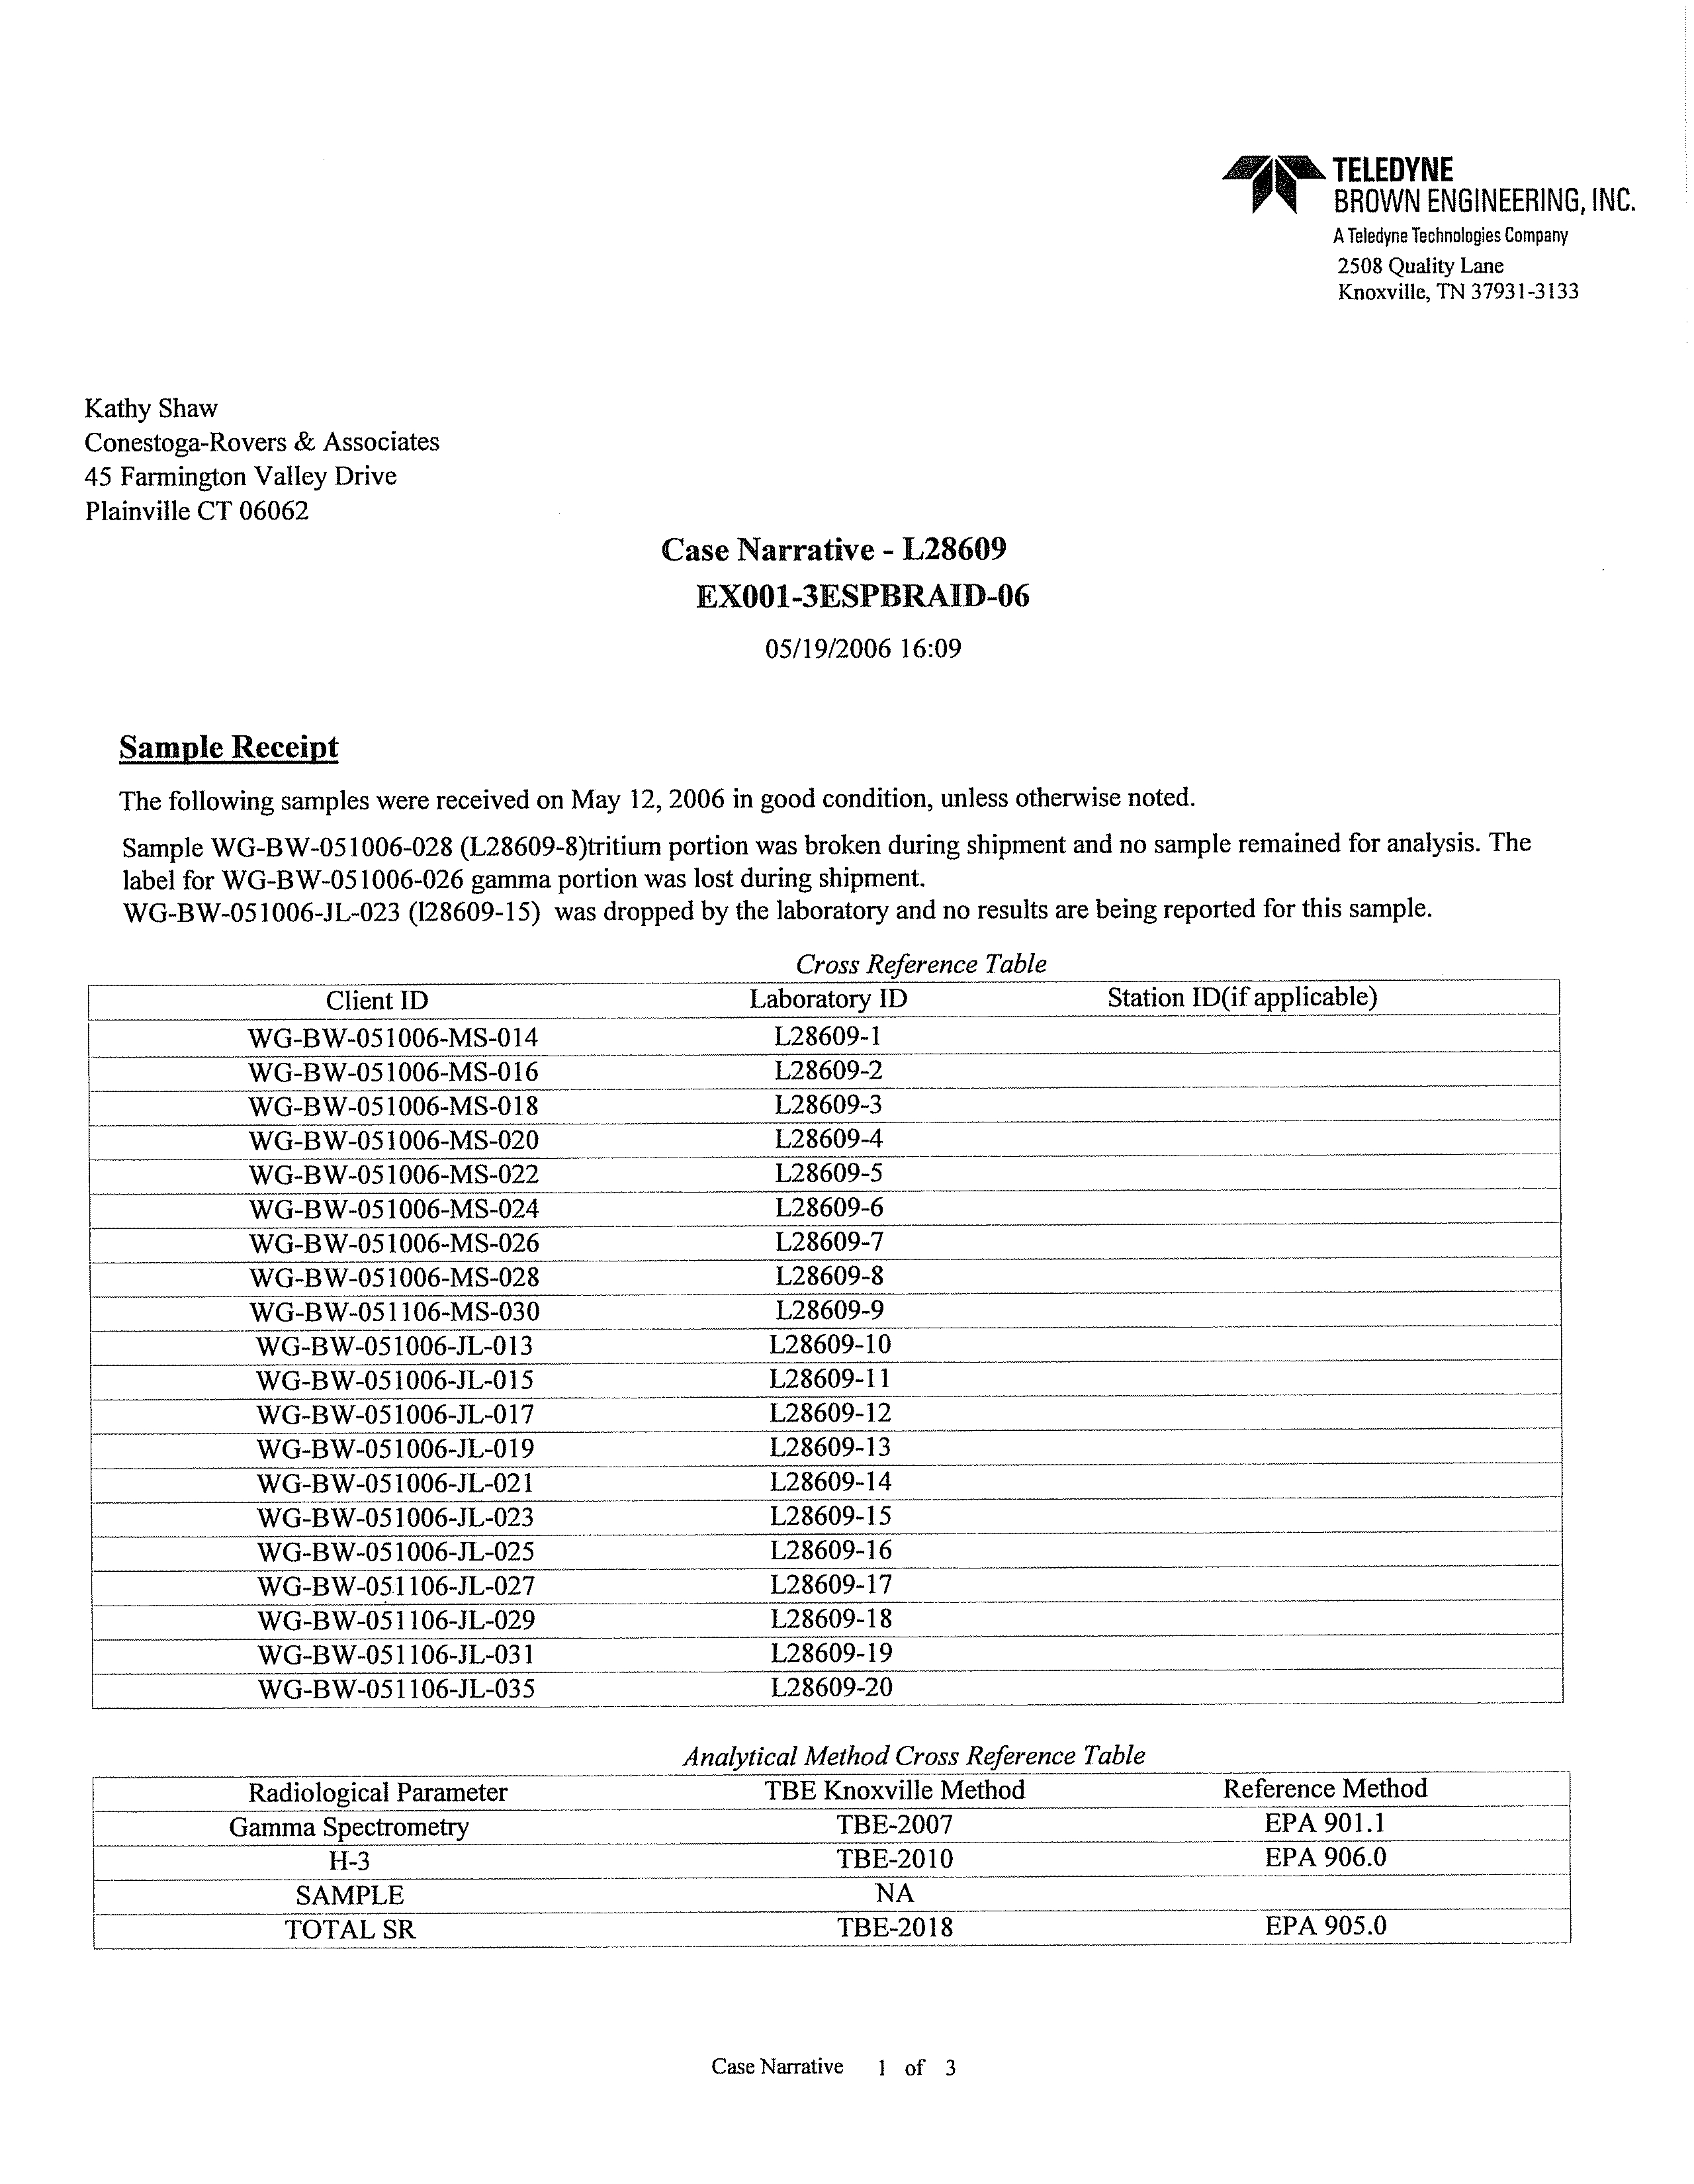
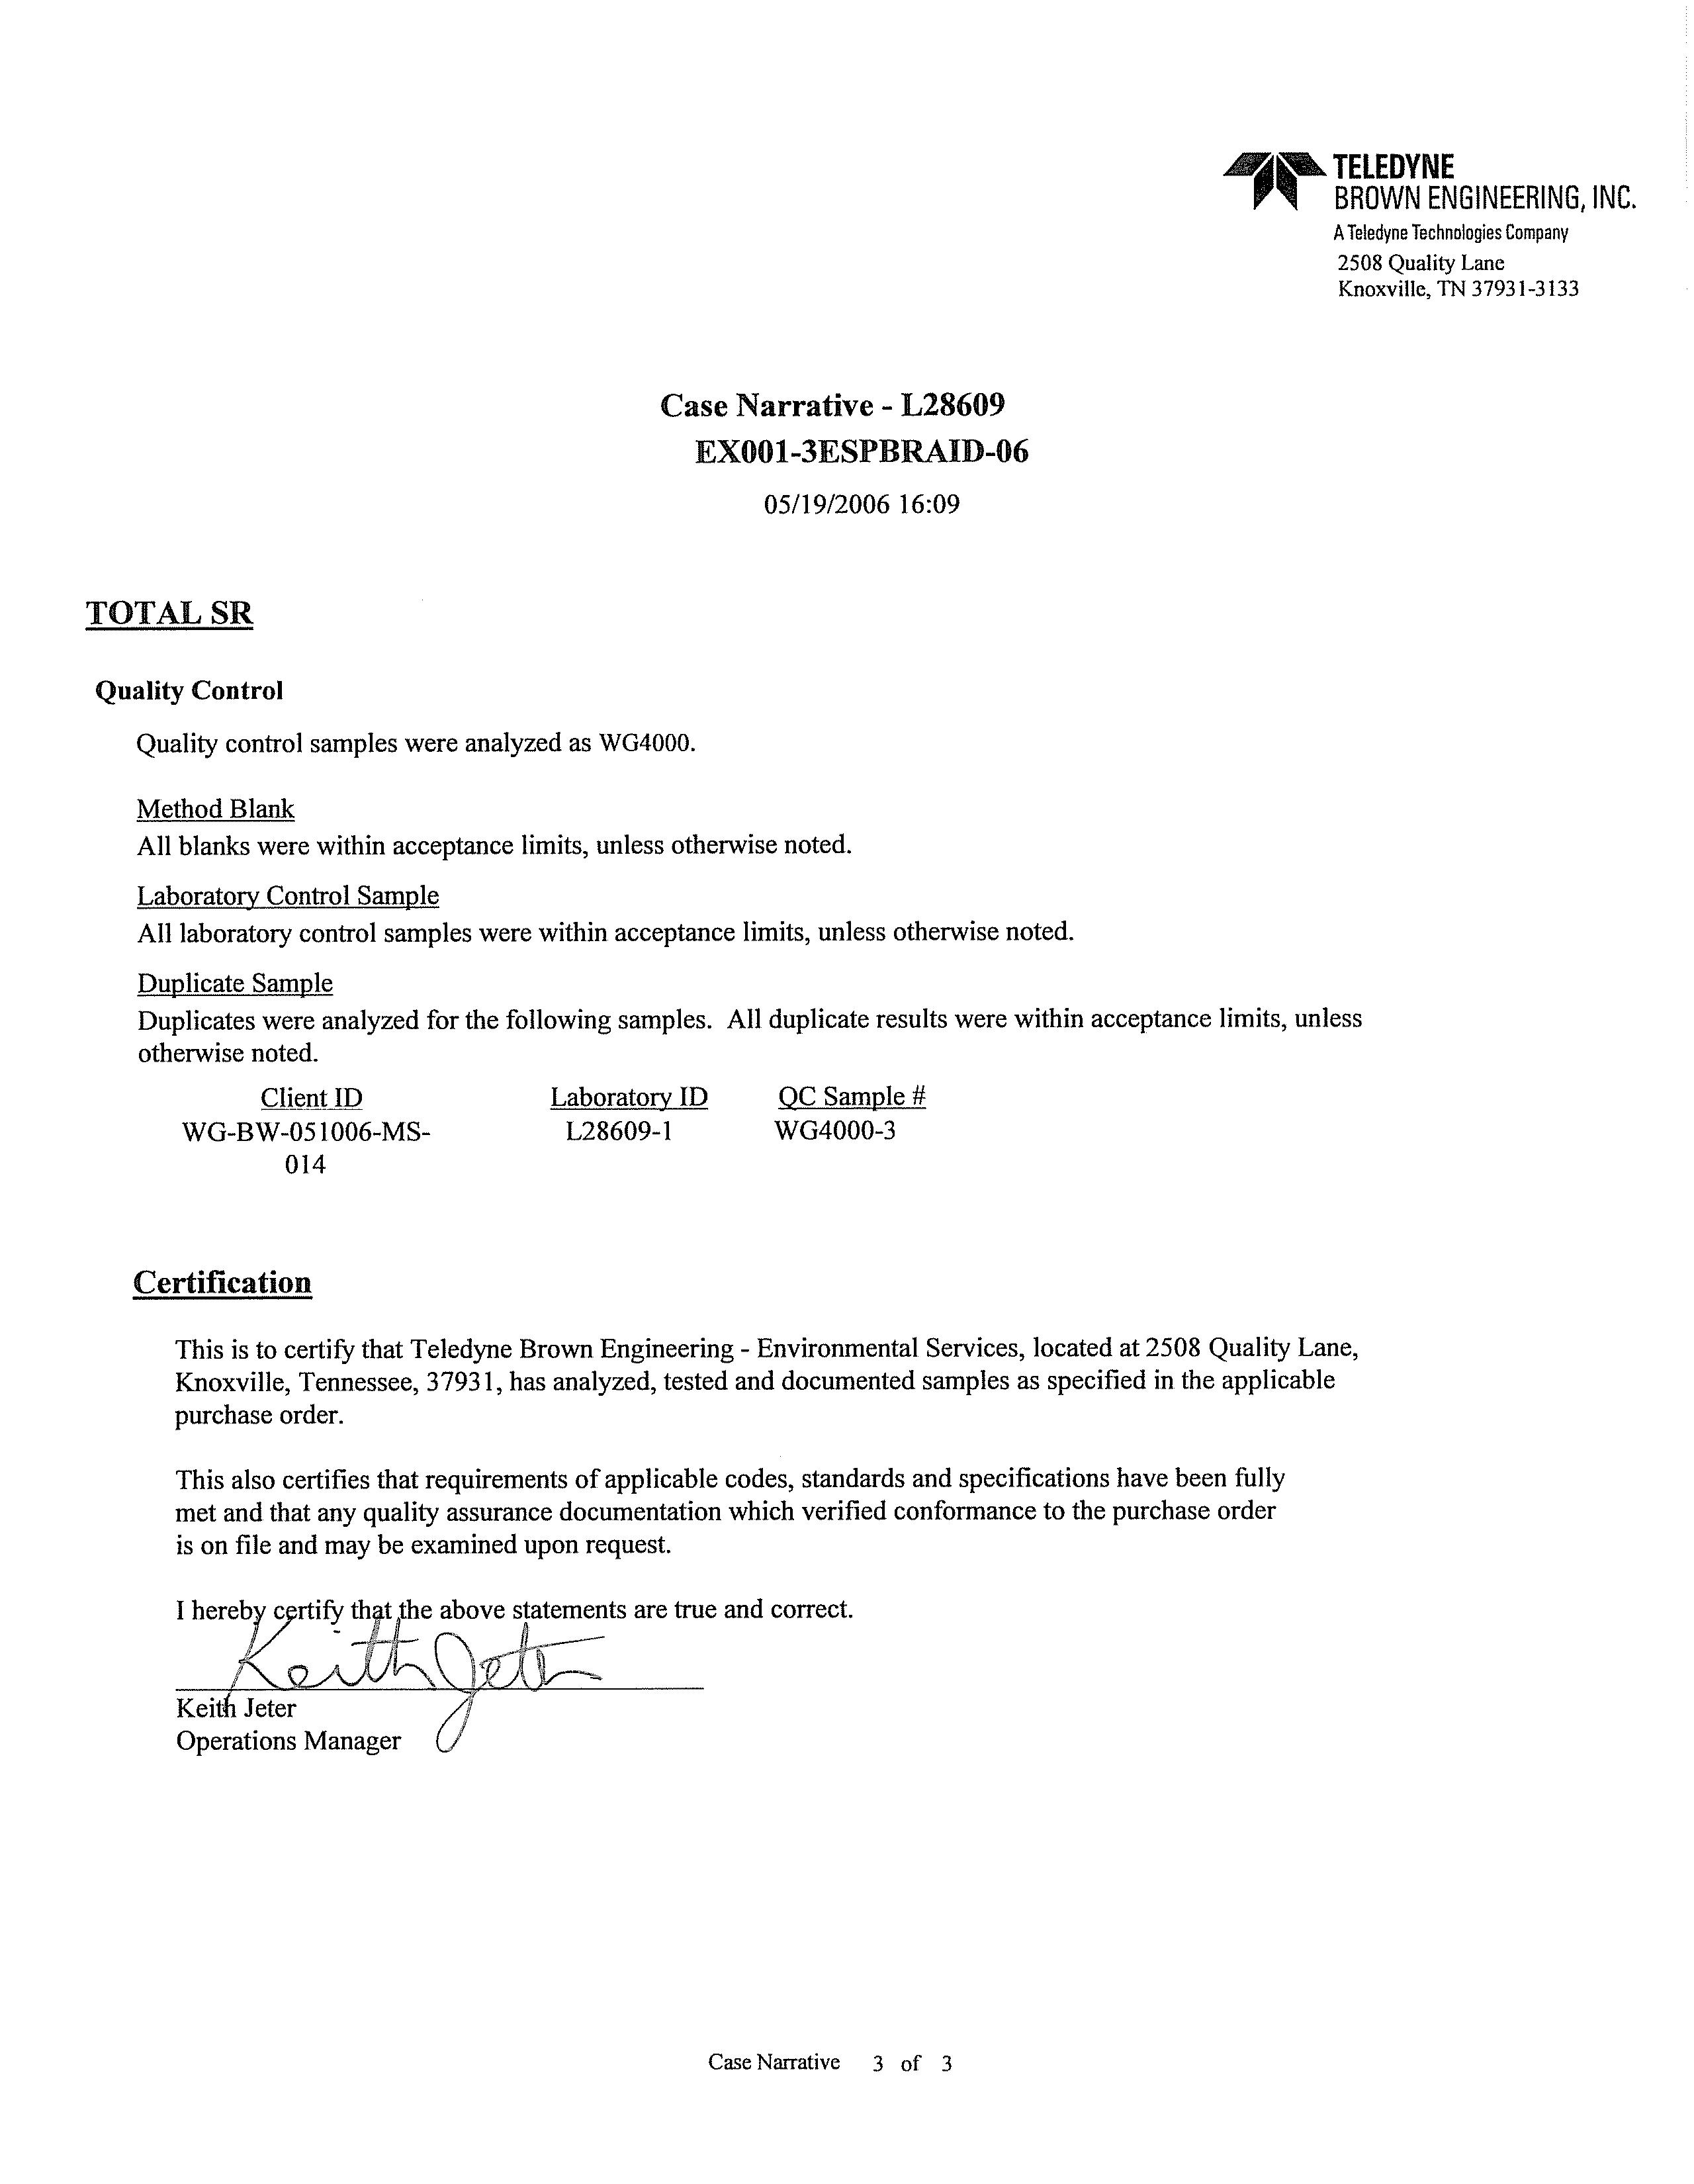
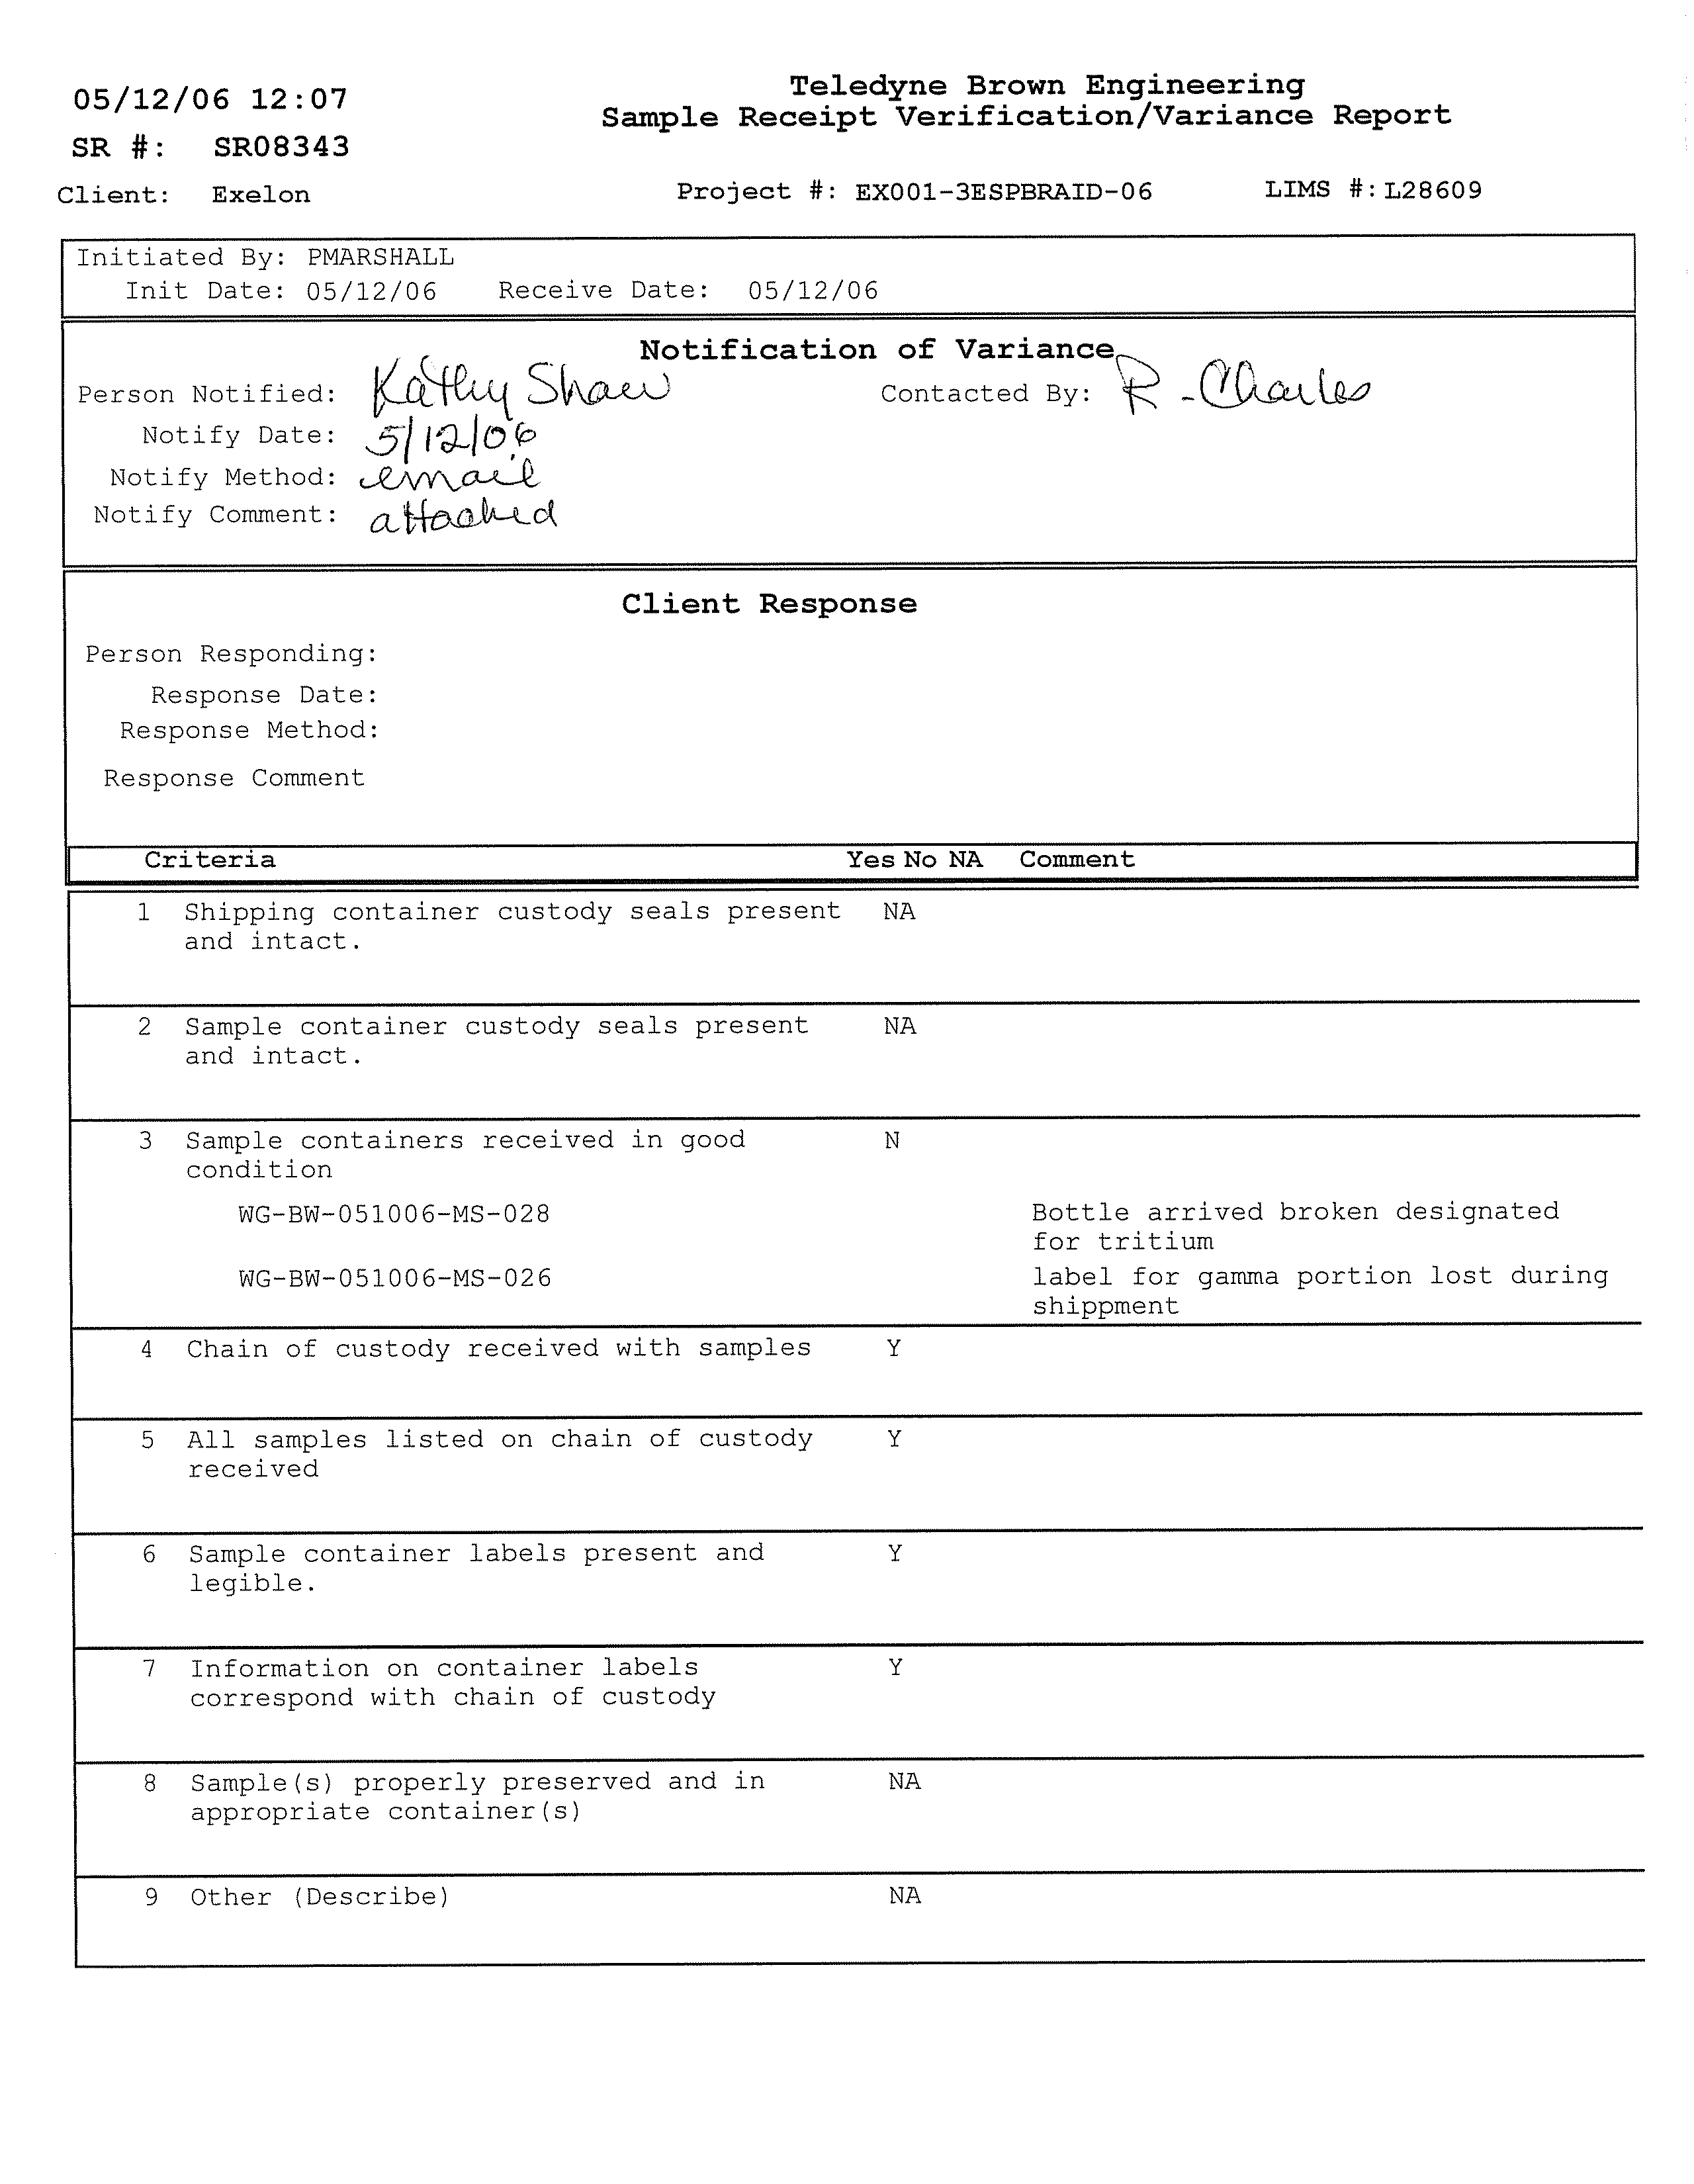
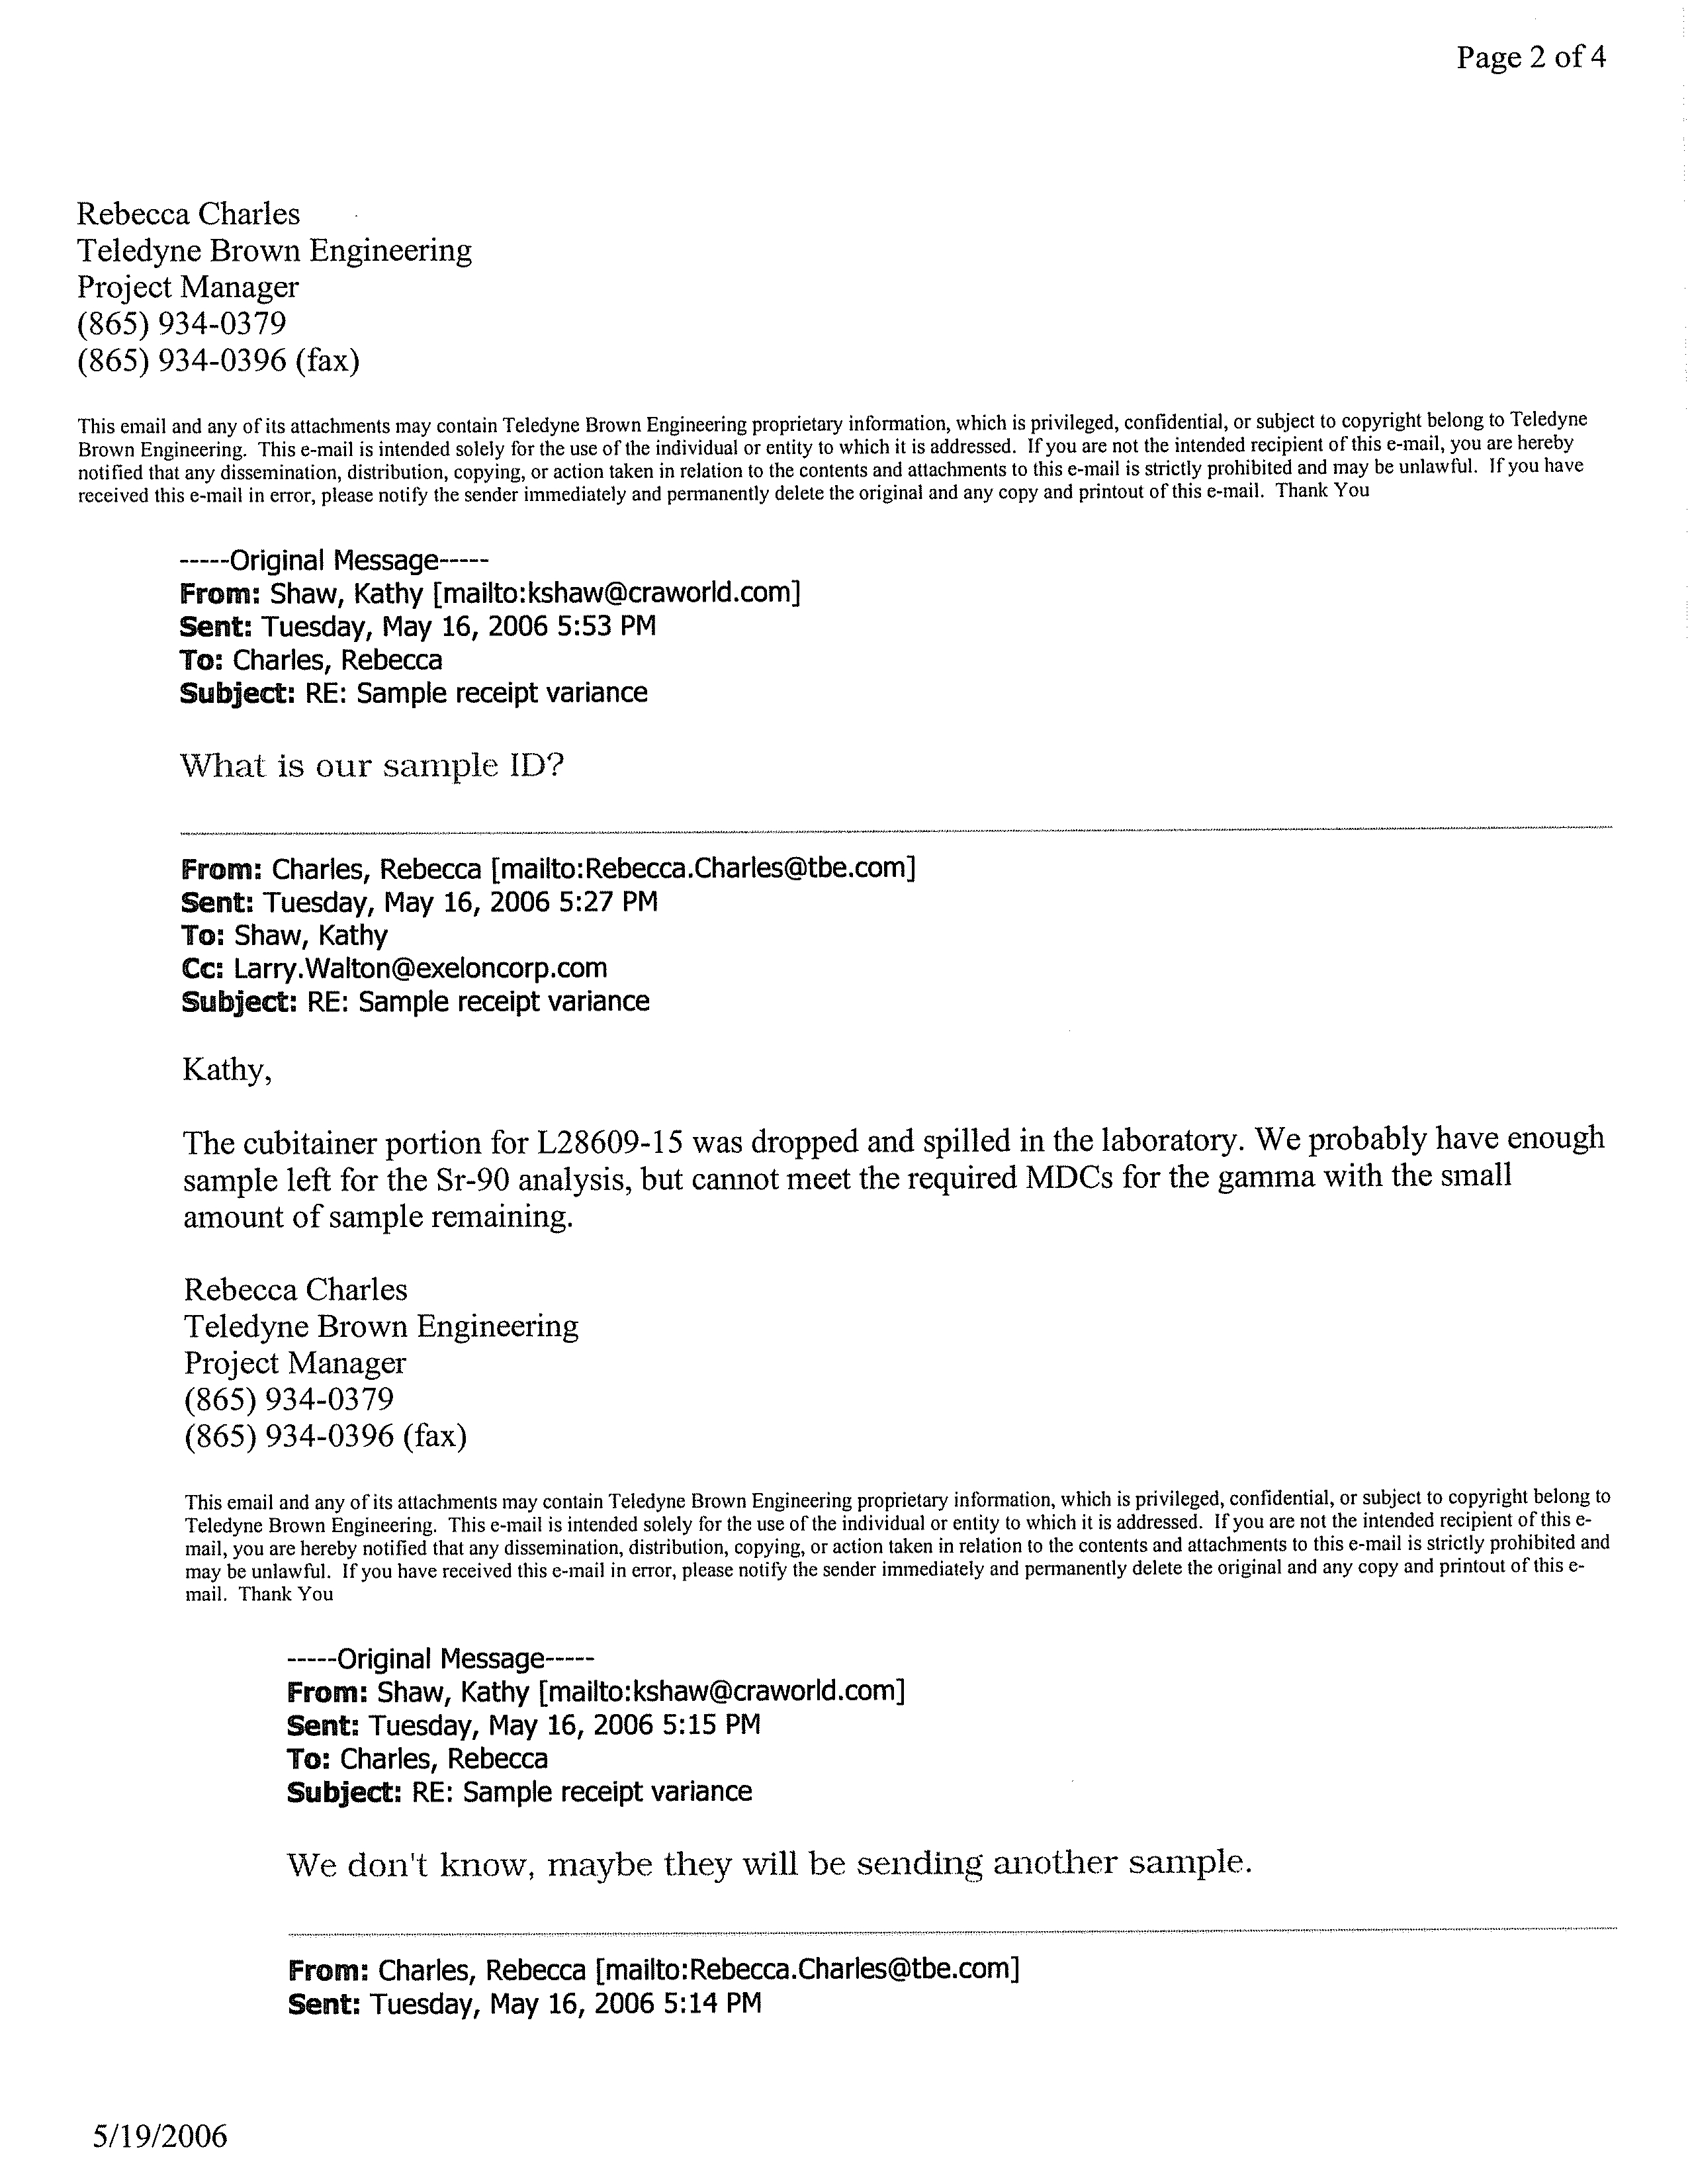
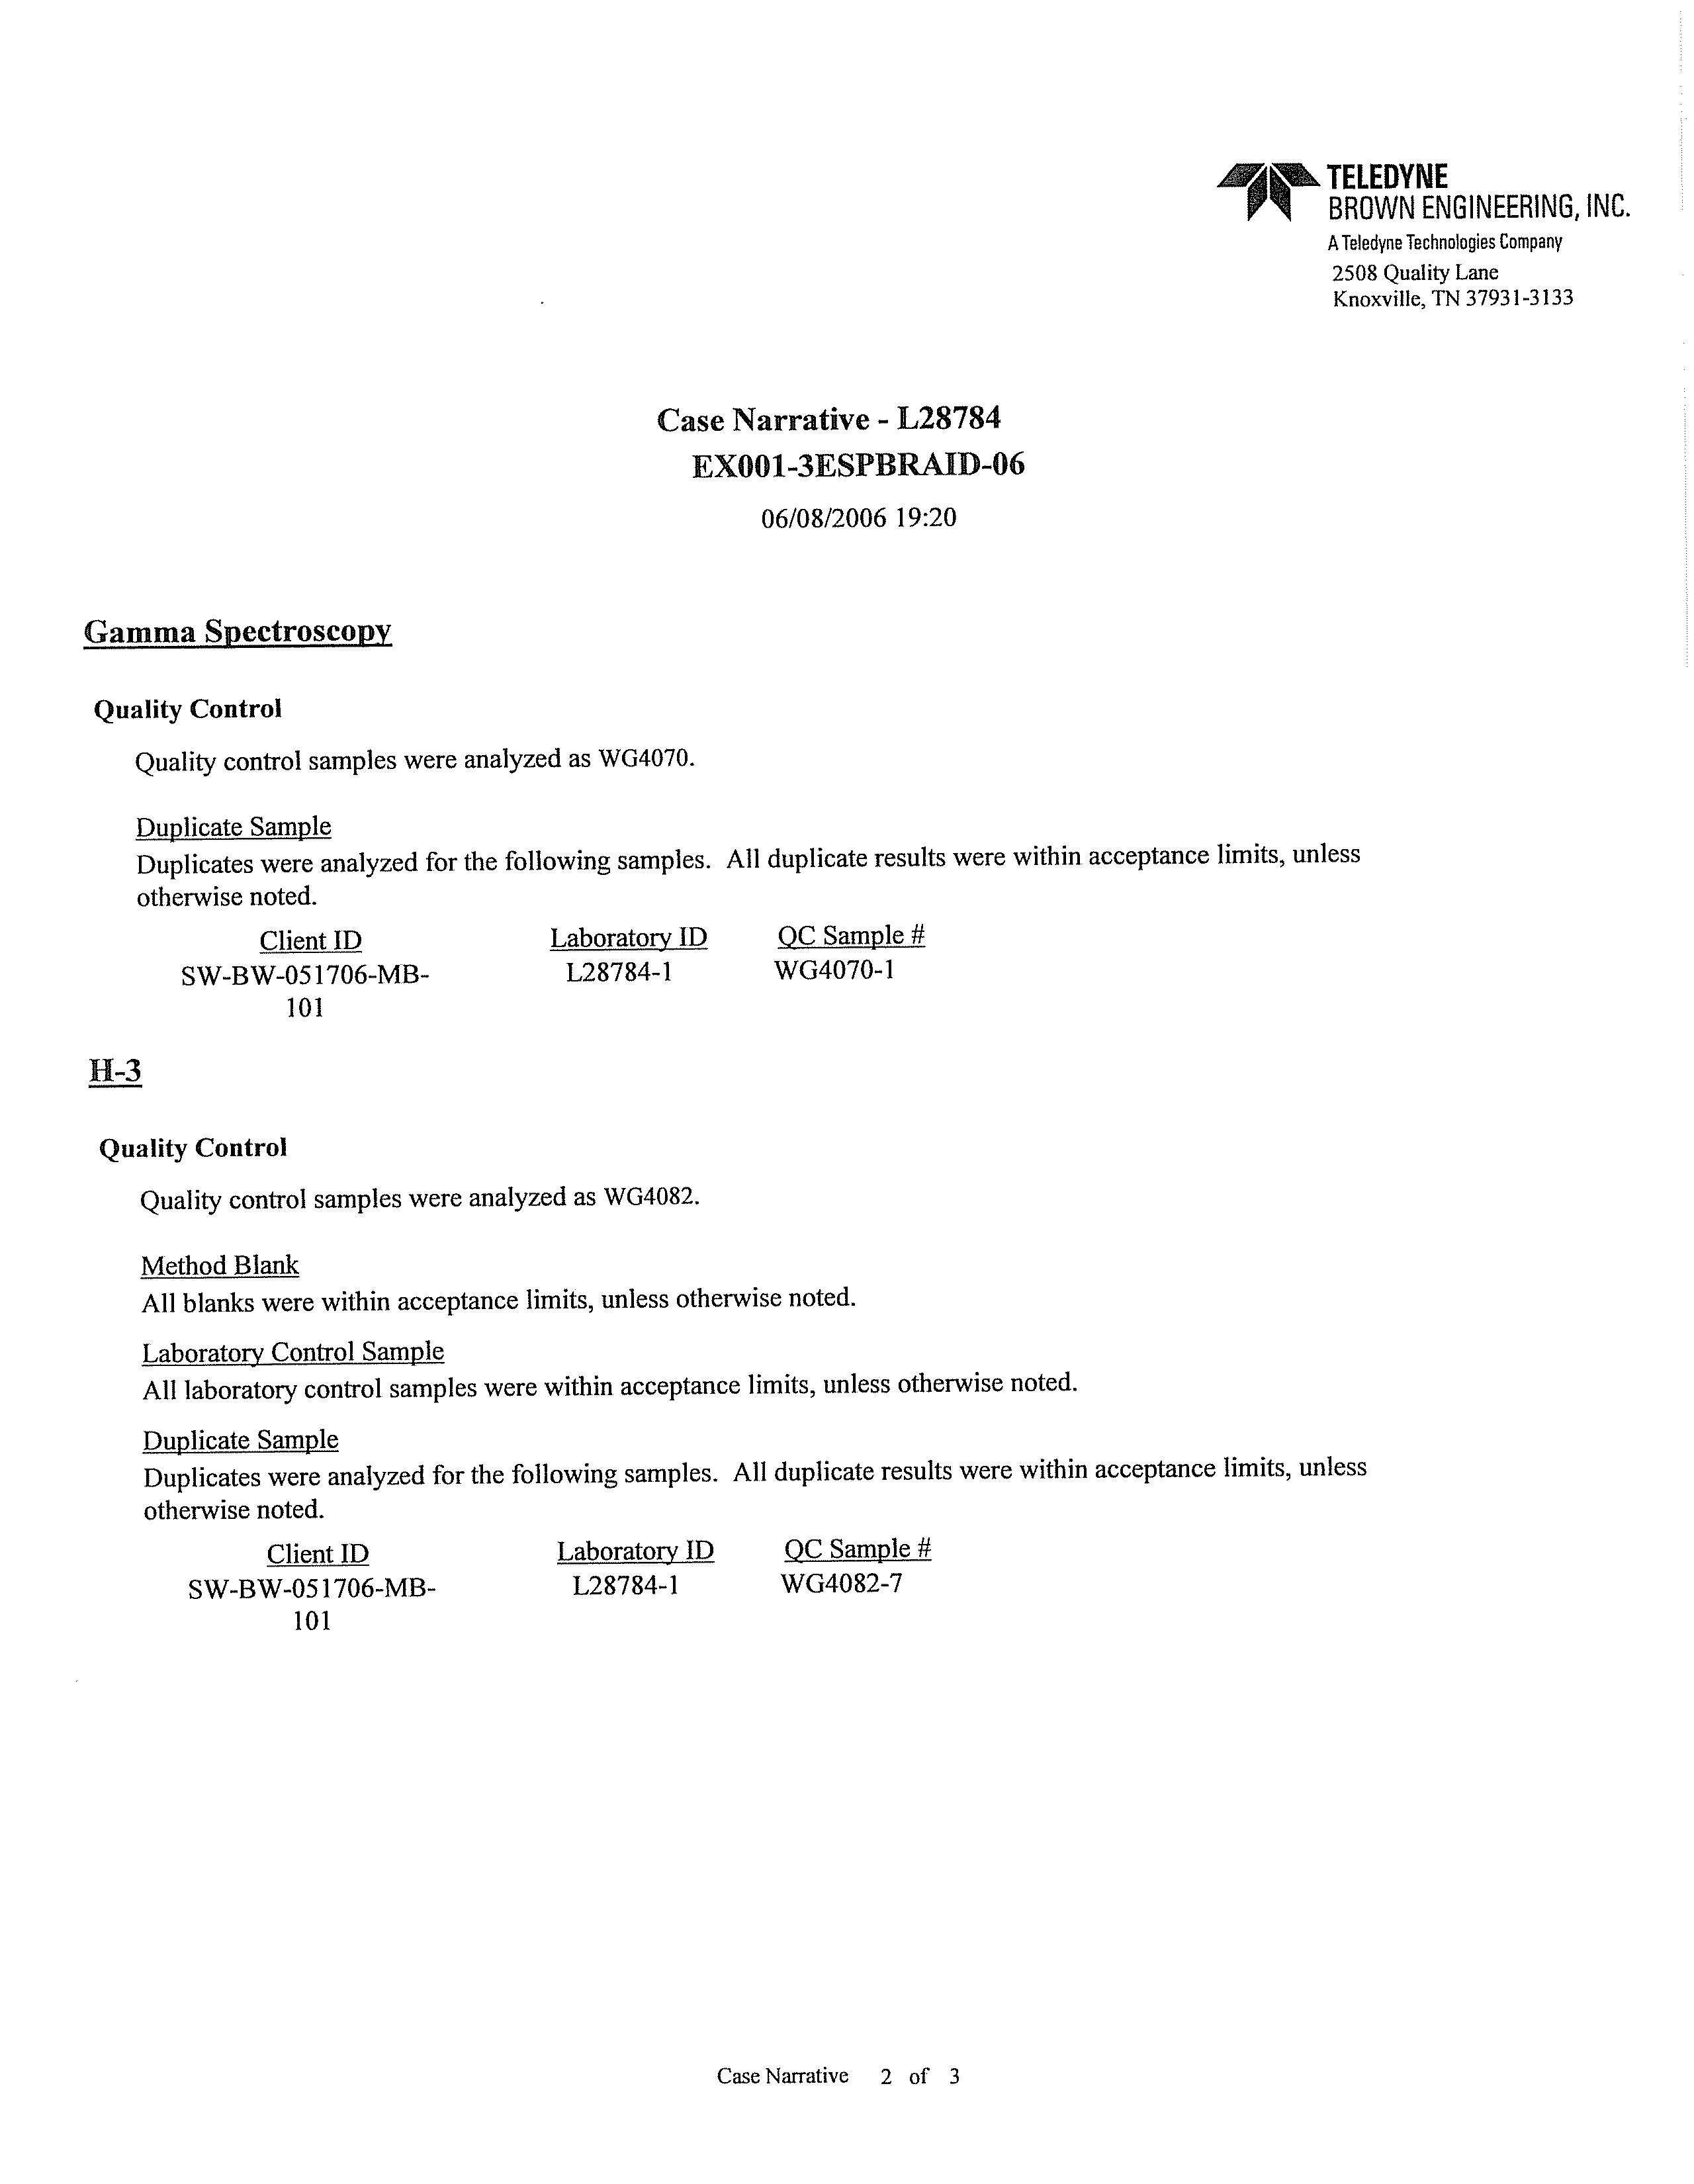
APPENDIX C
QUALITY ASSURANCE PROGRAM – TELEDYNE BROWN
ENGINEERING, INC.
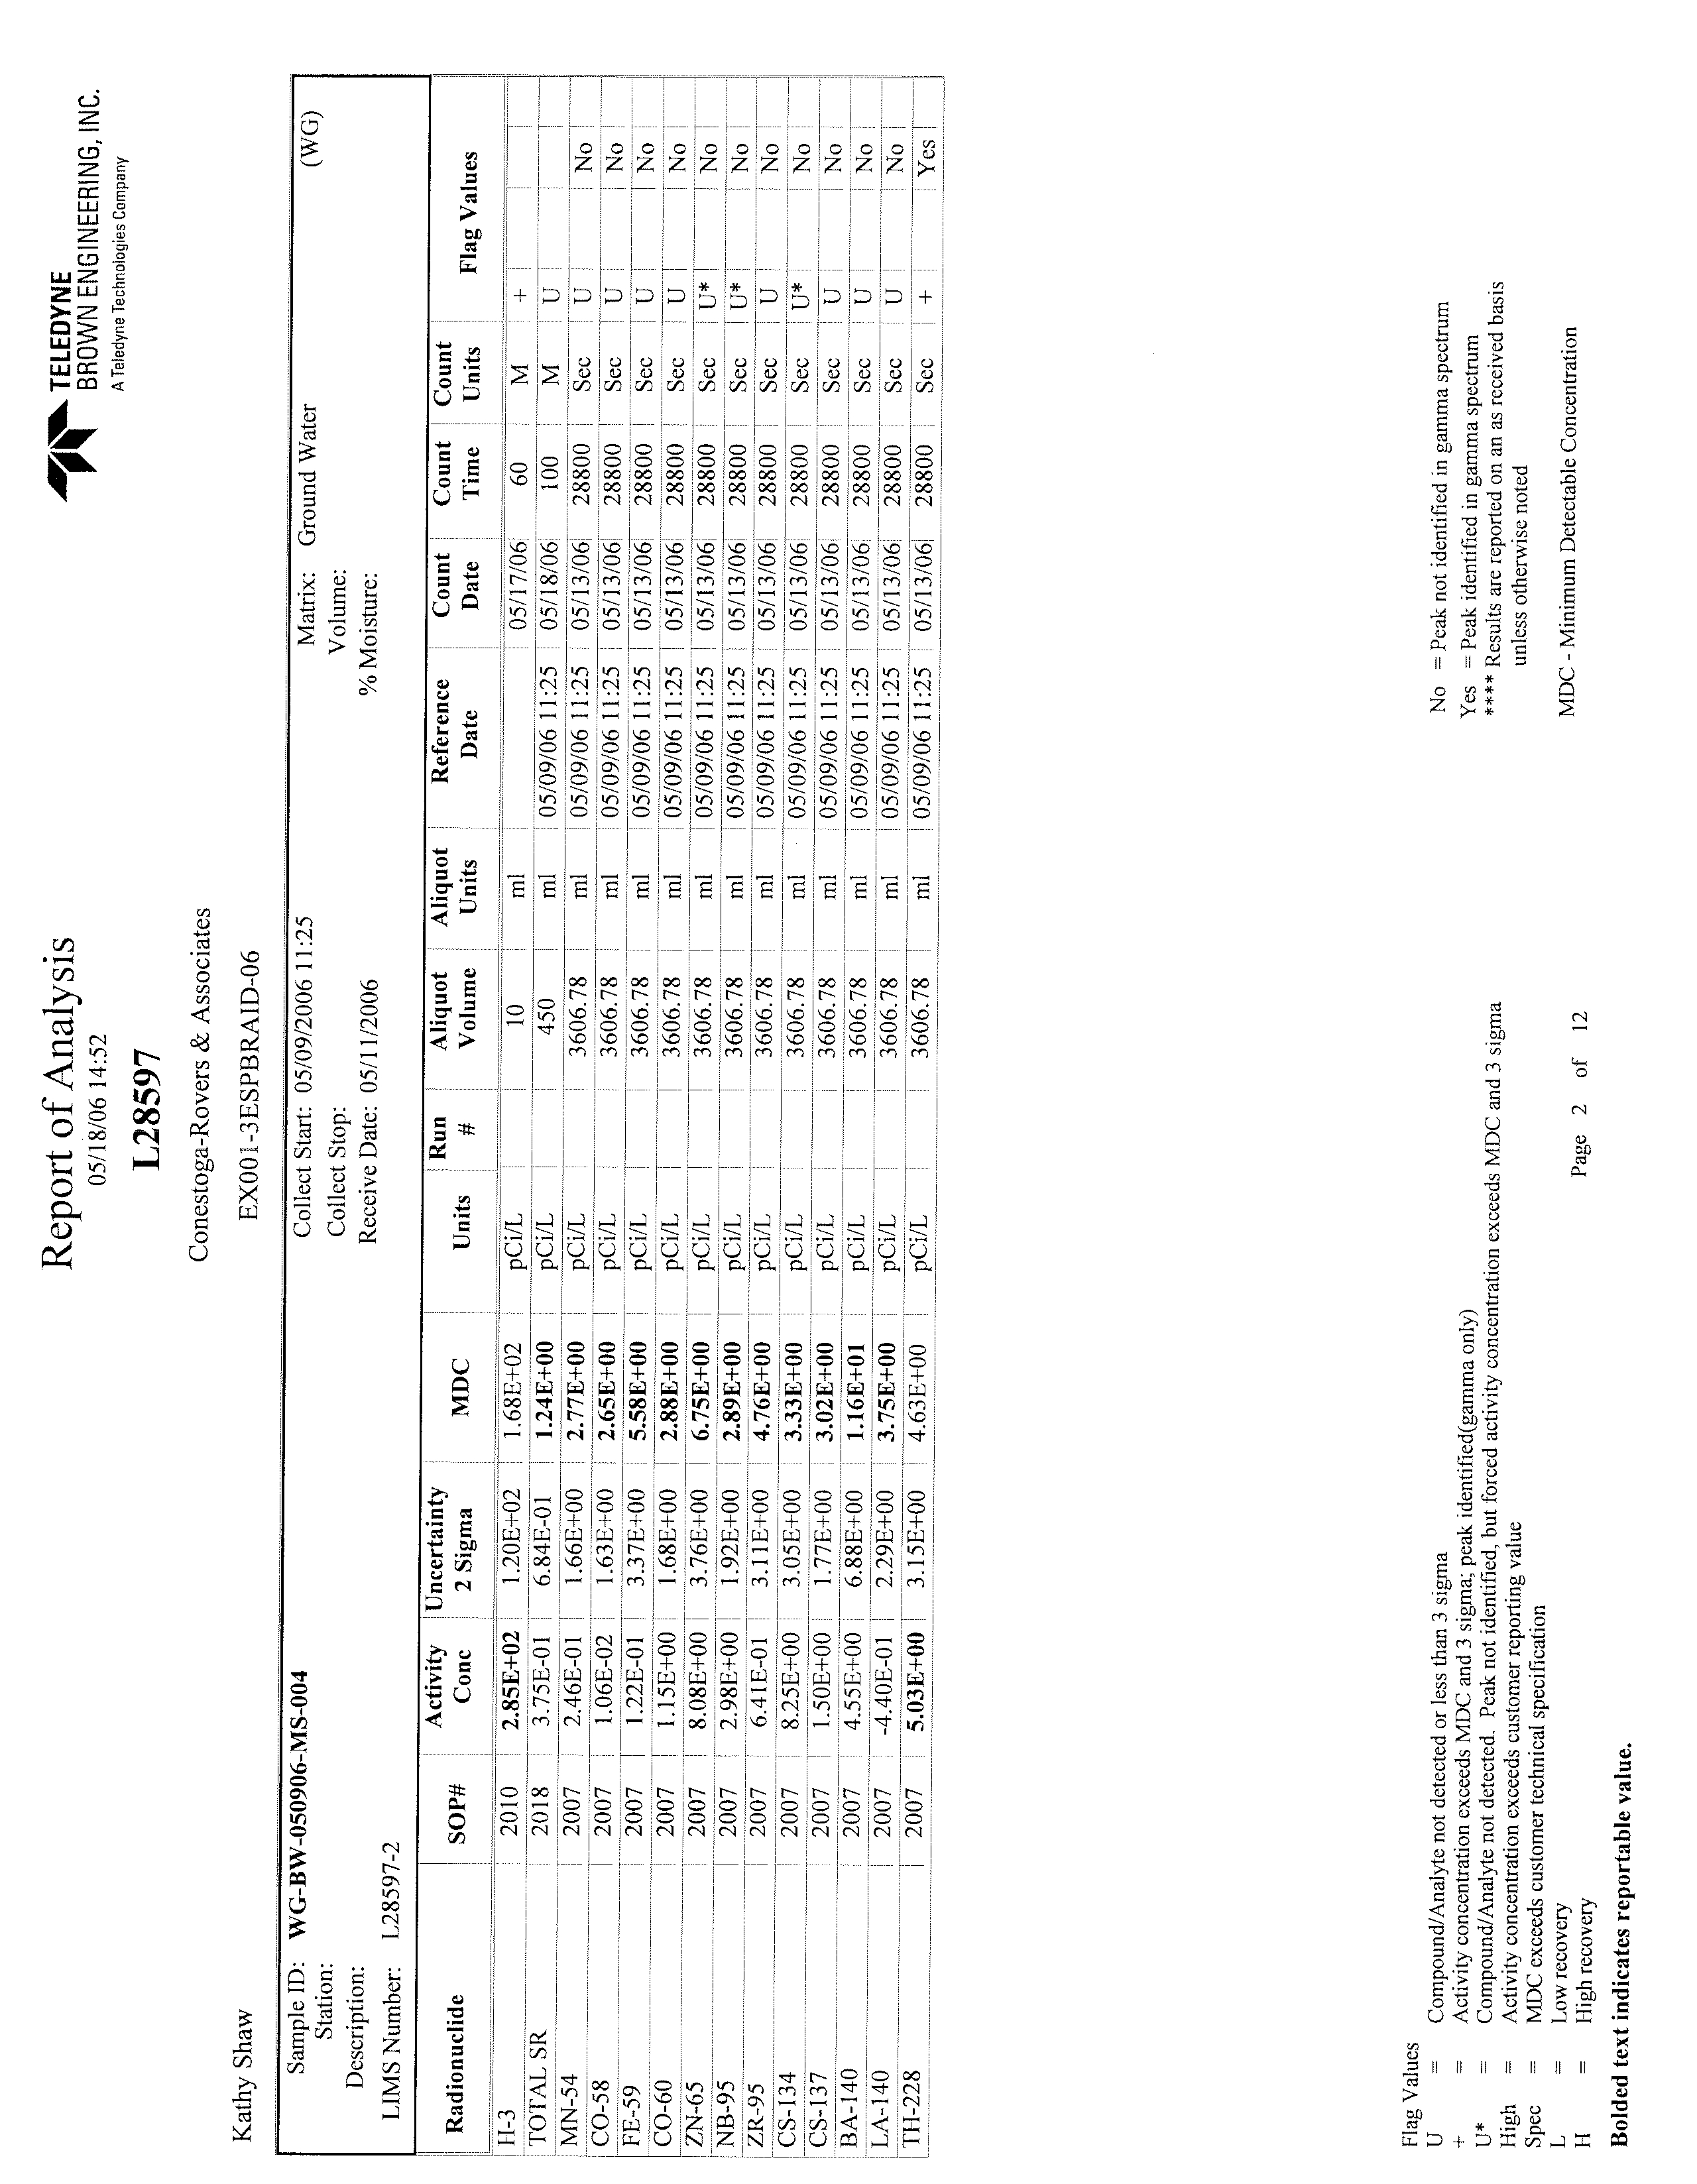
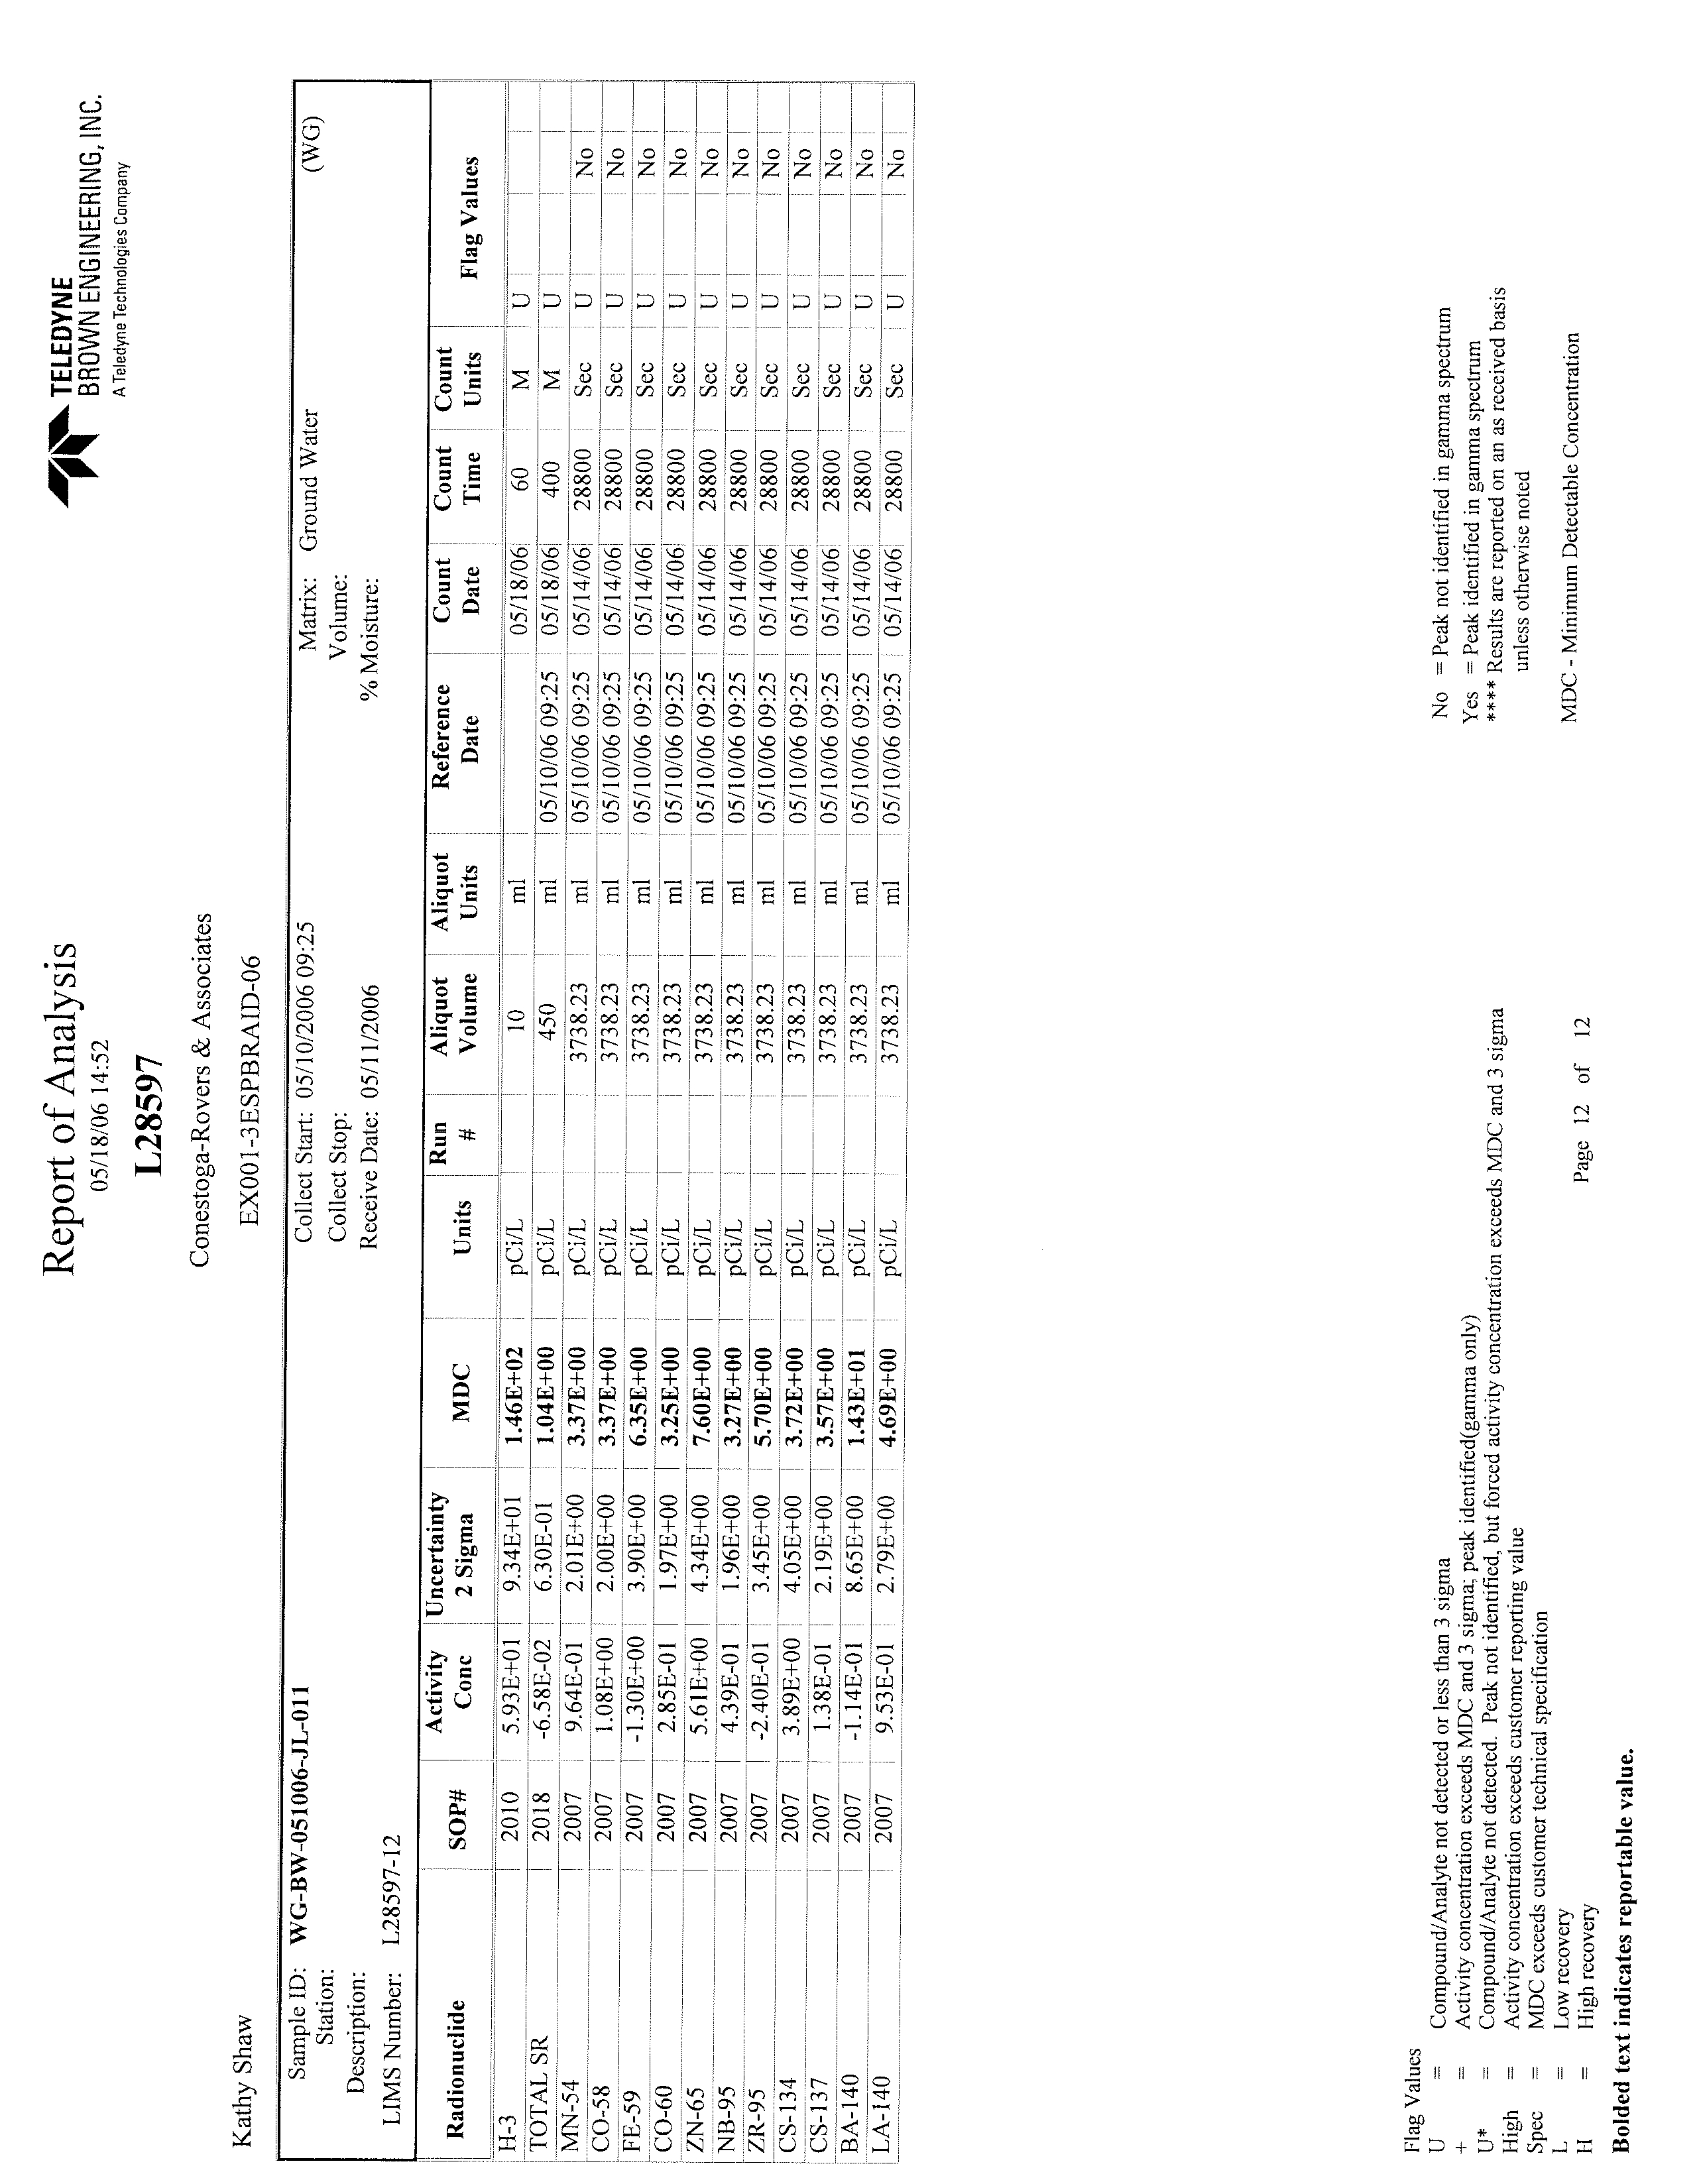
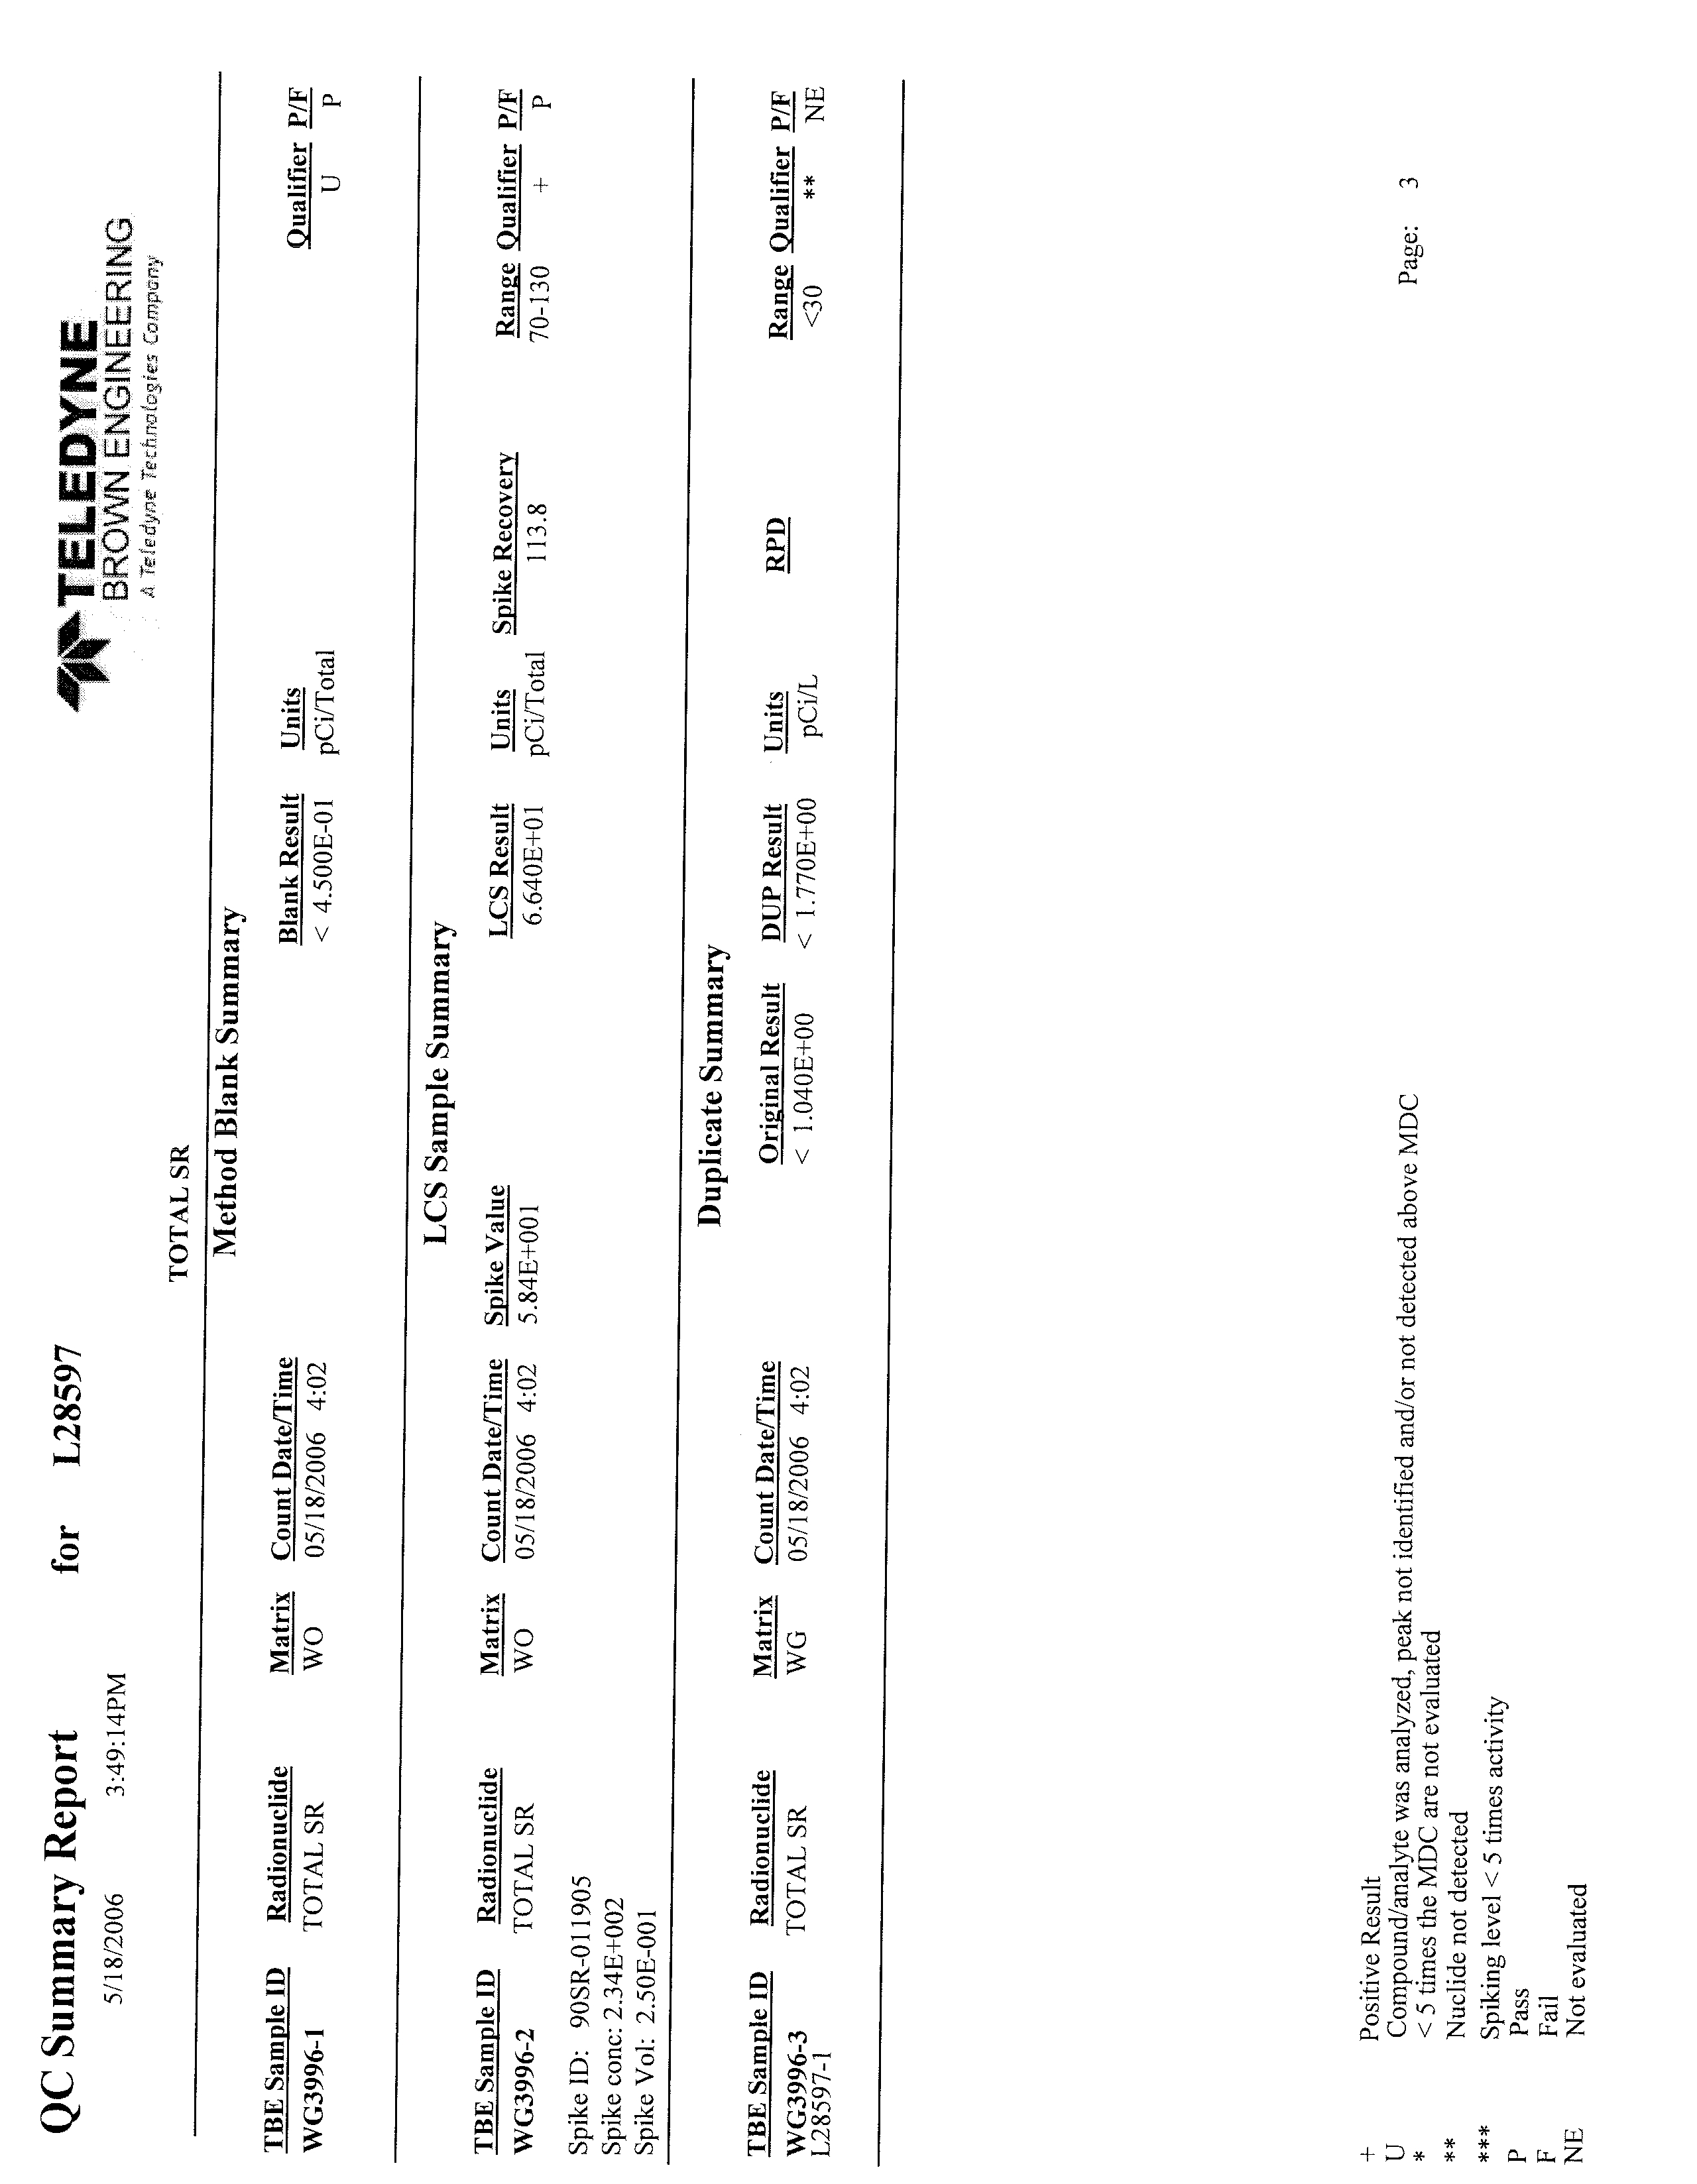
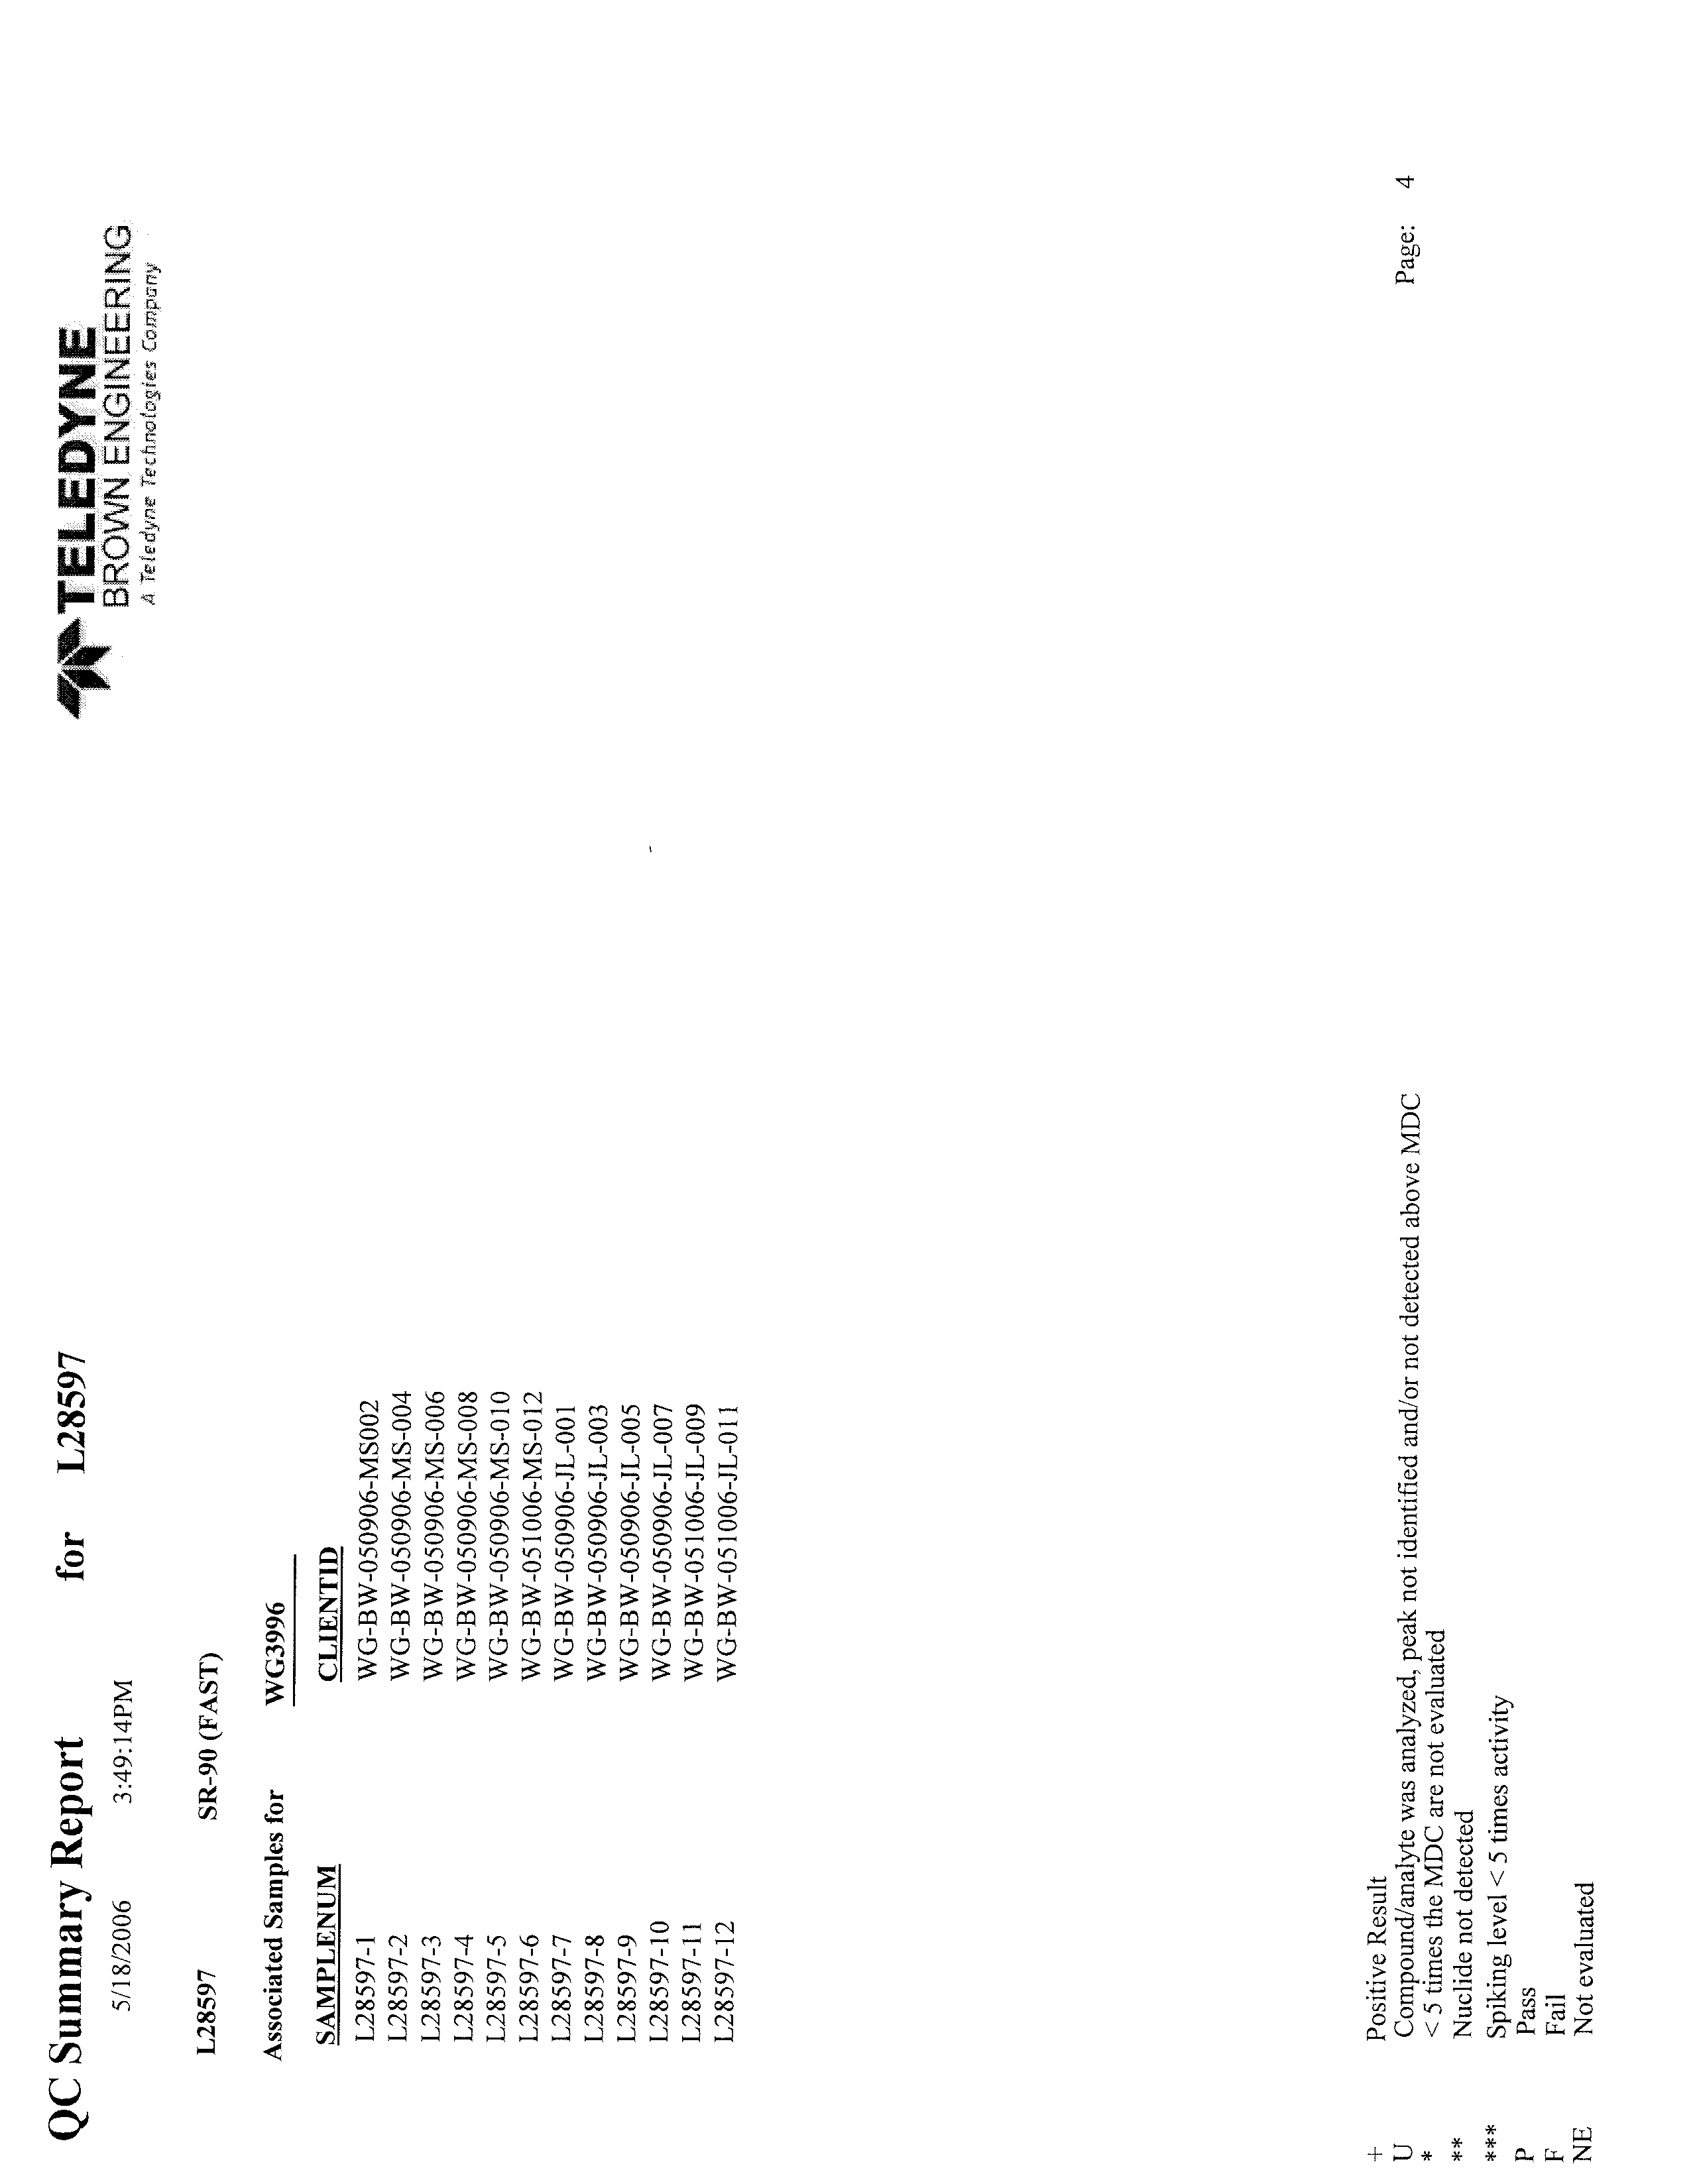
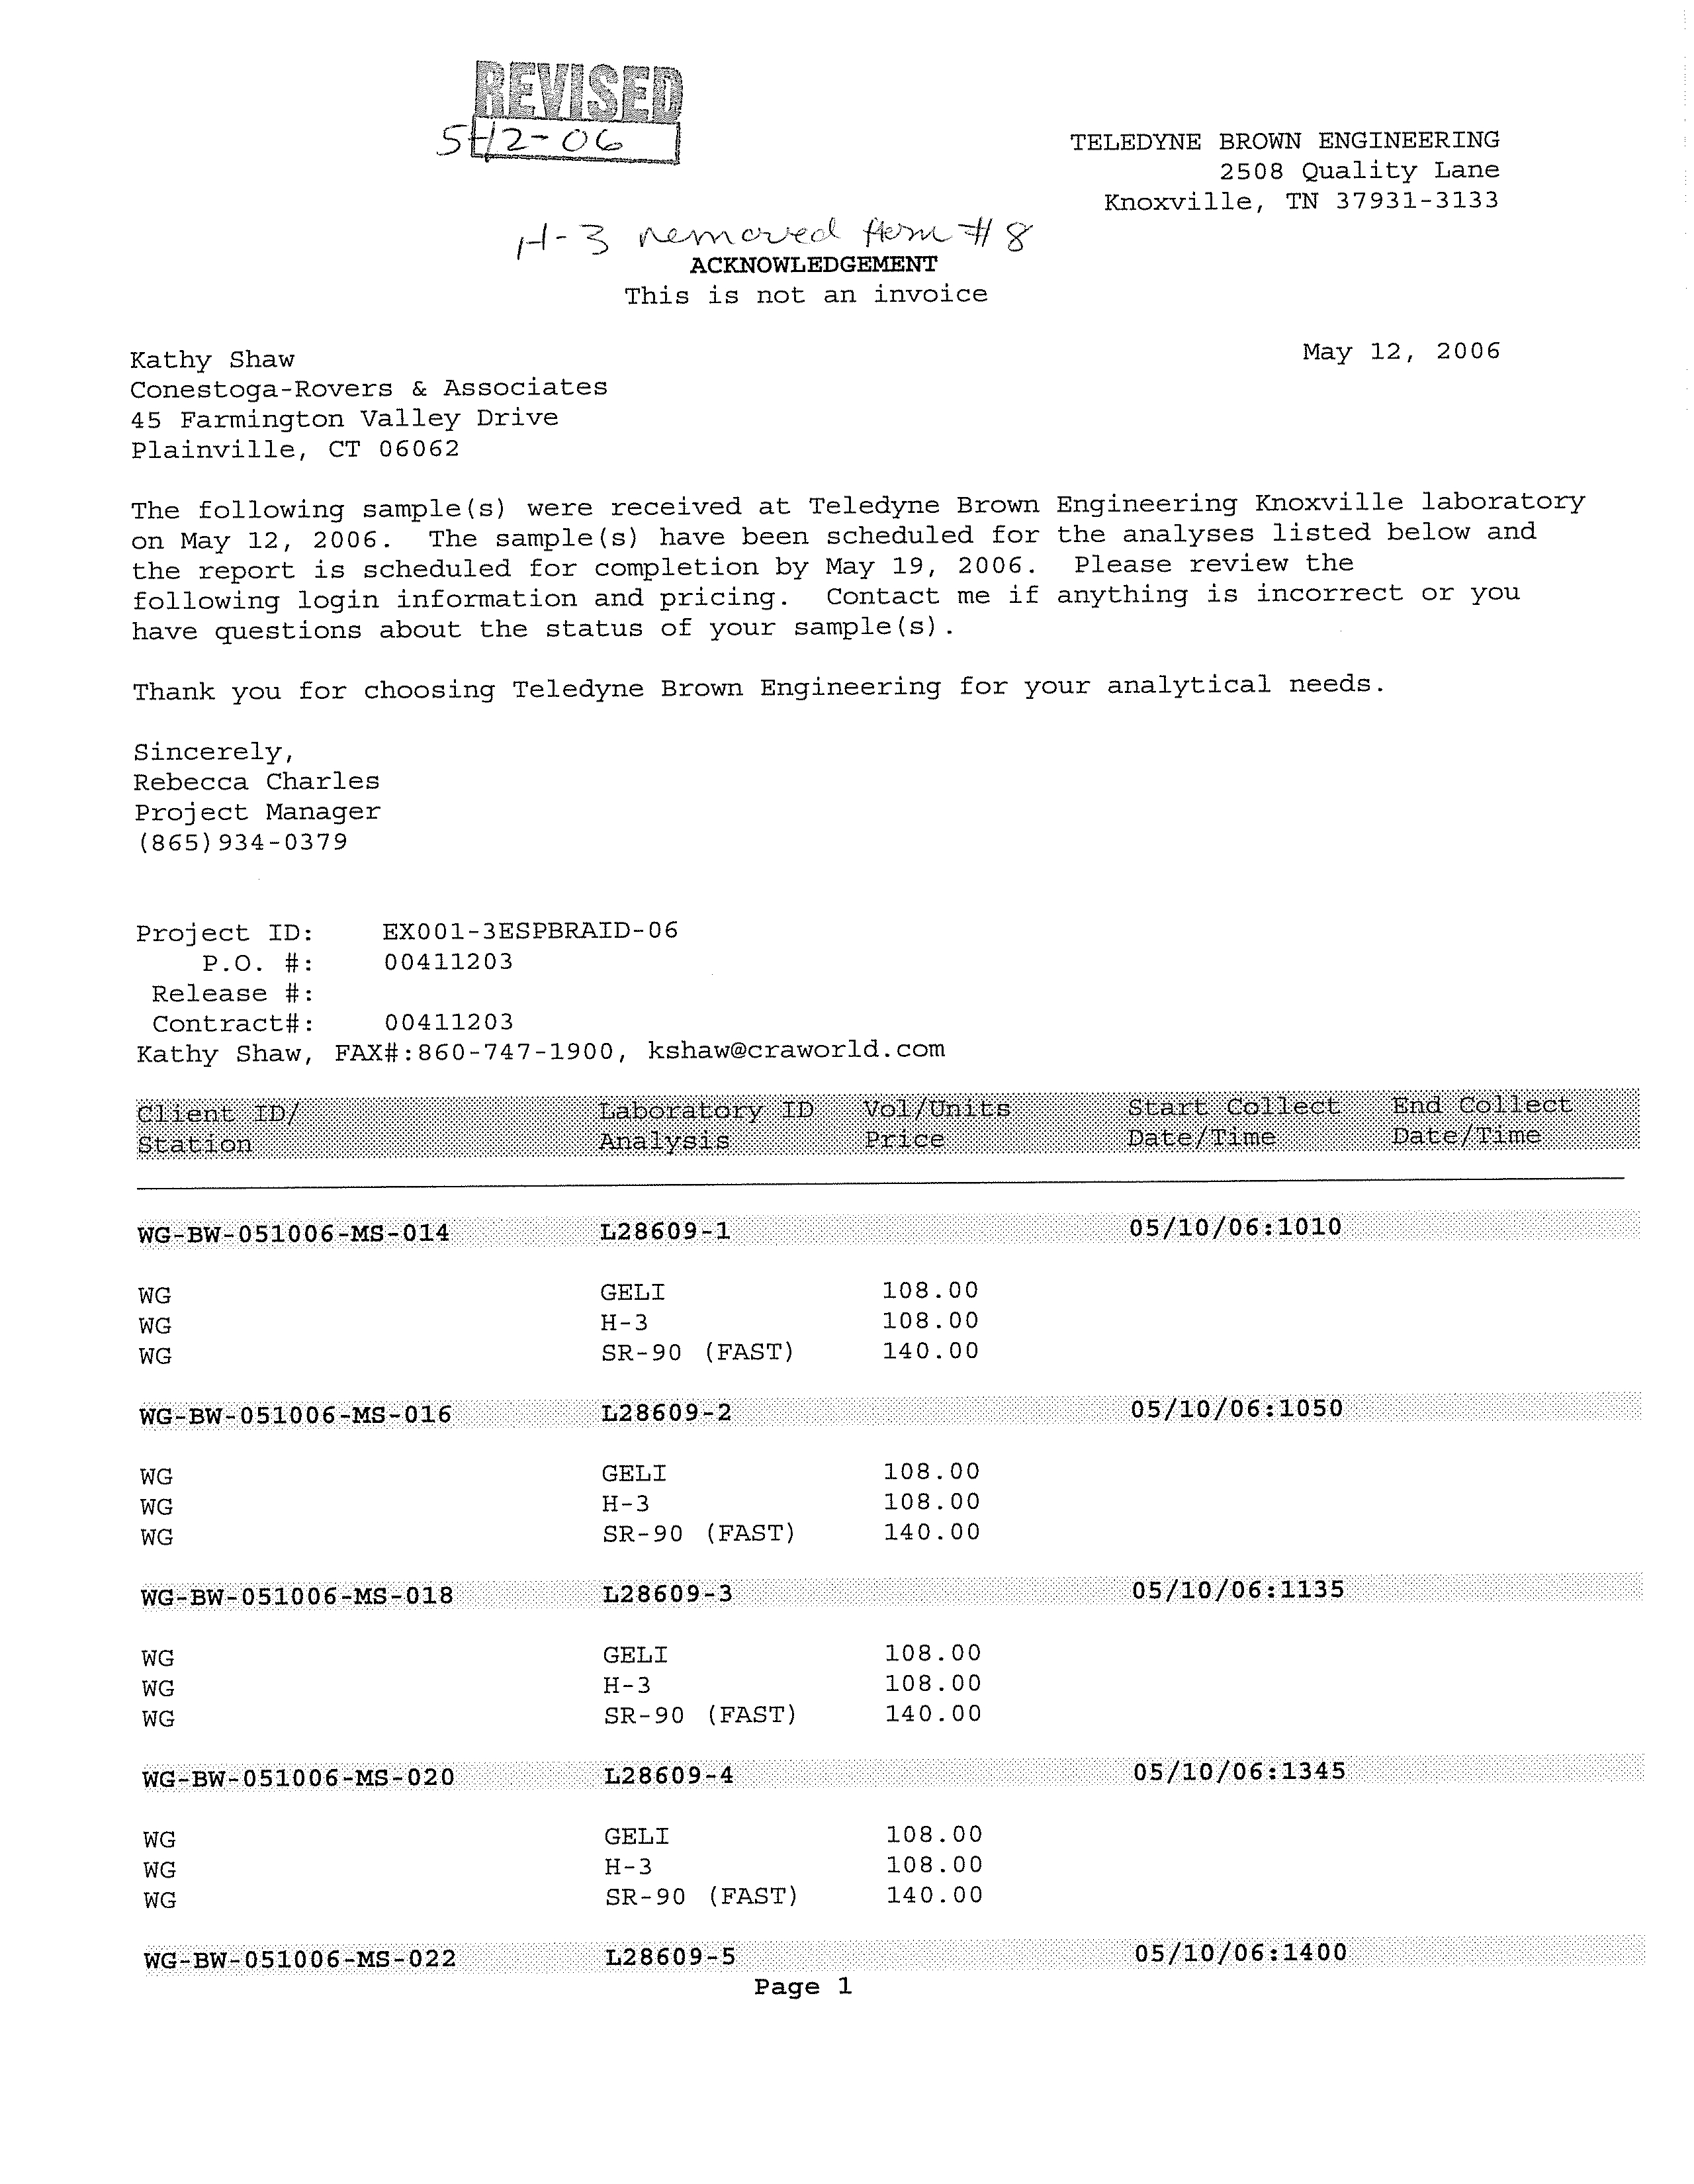
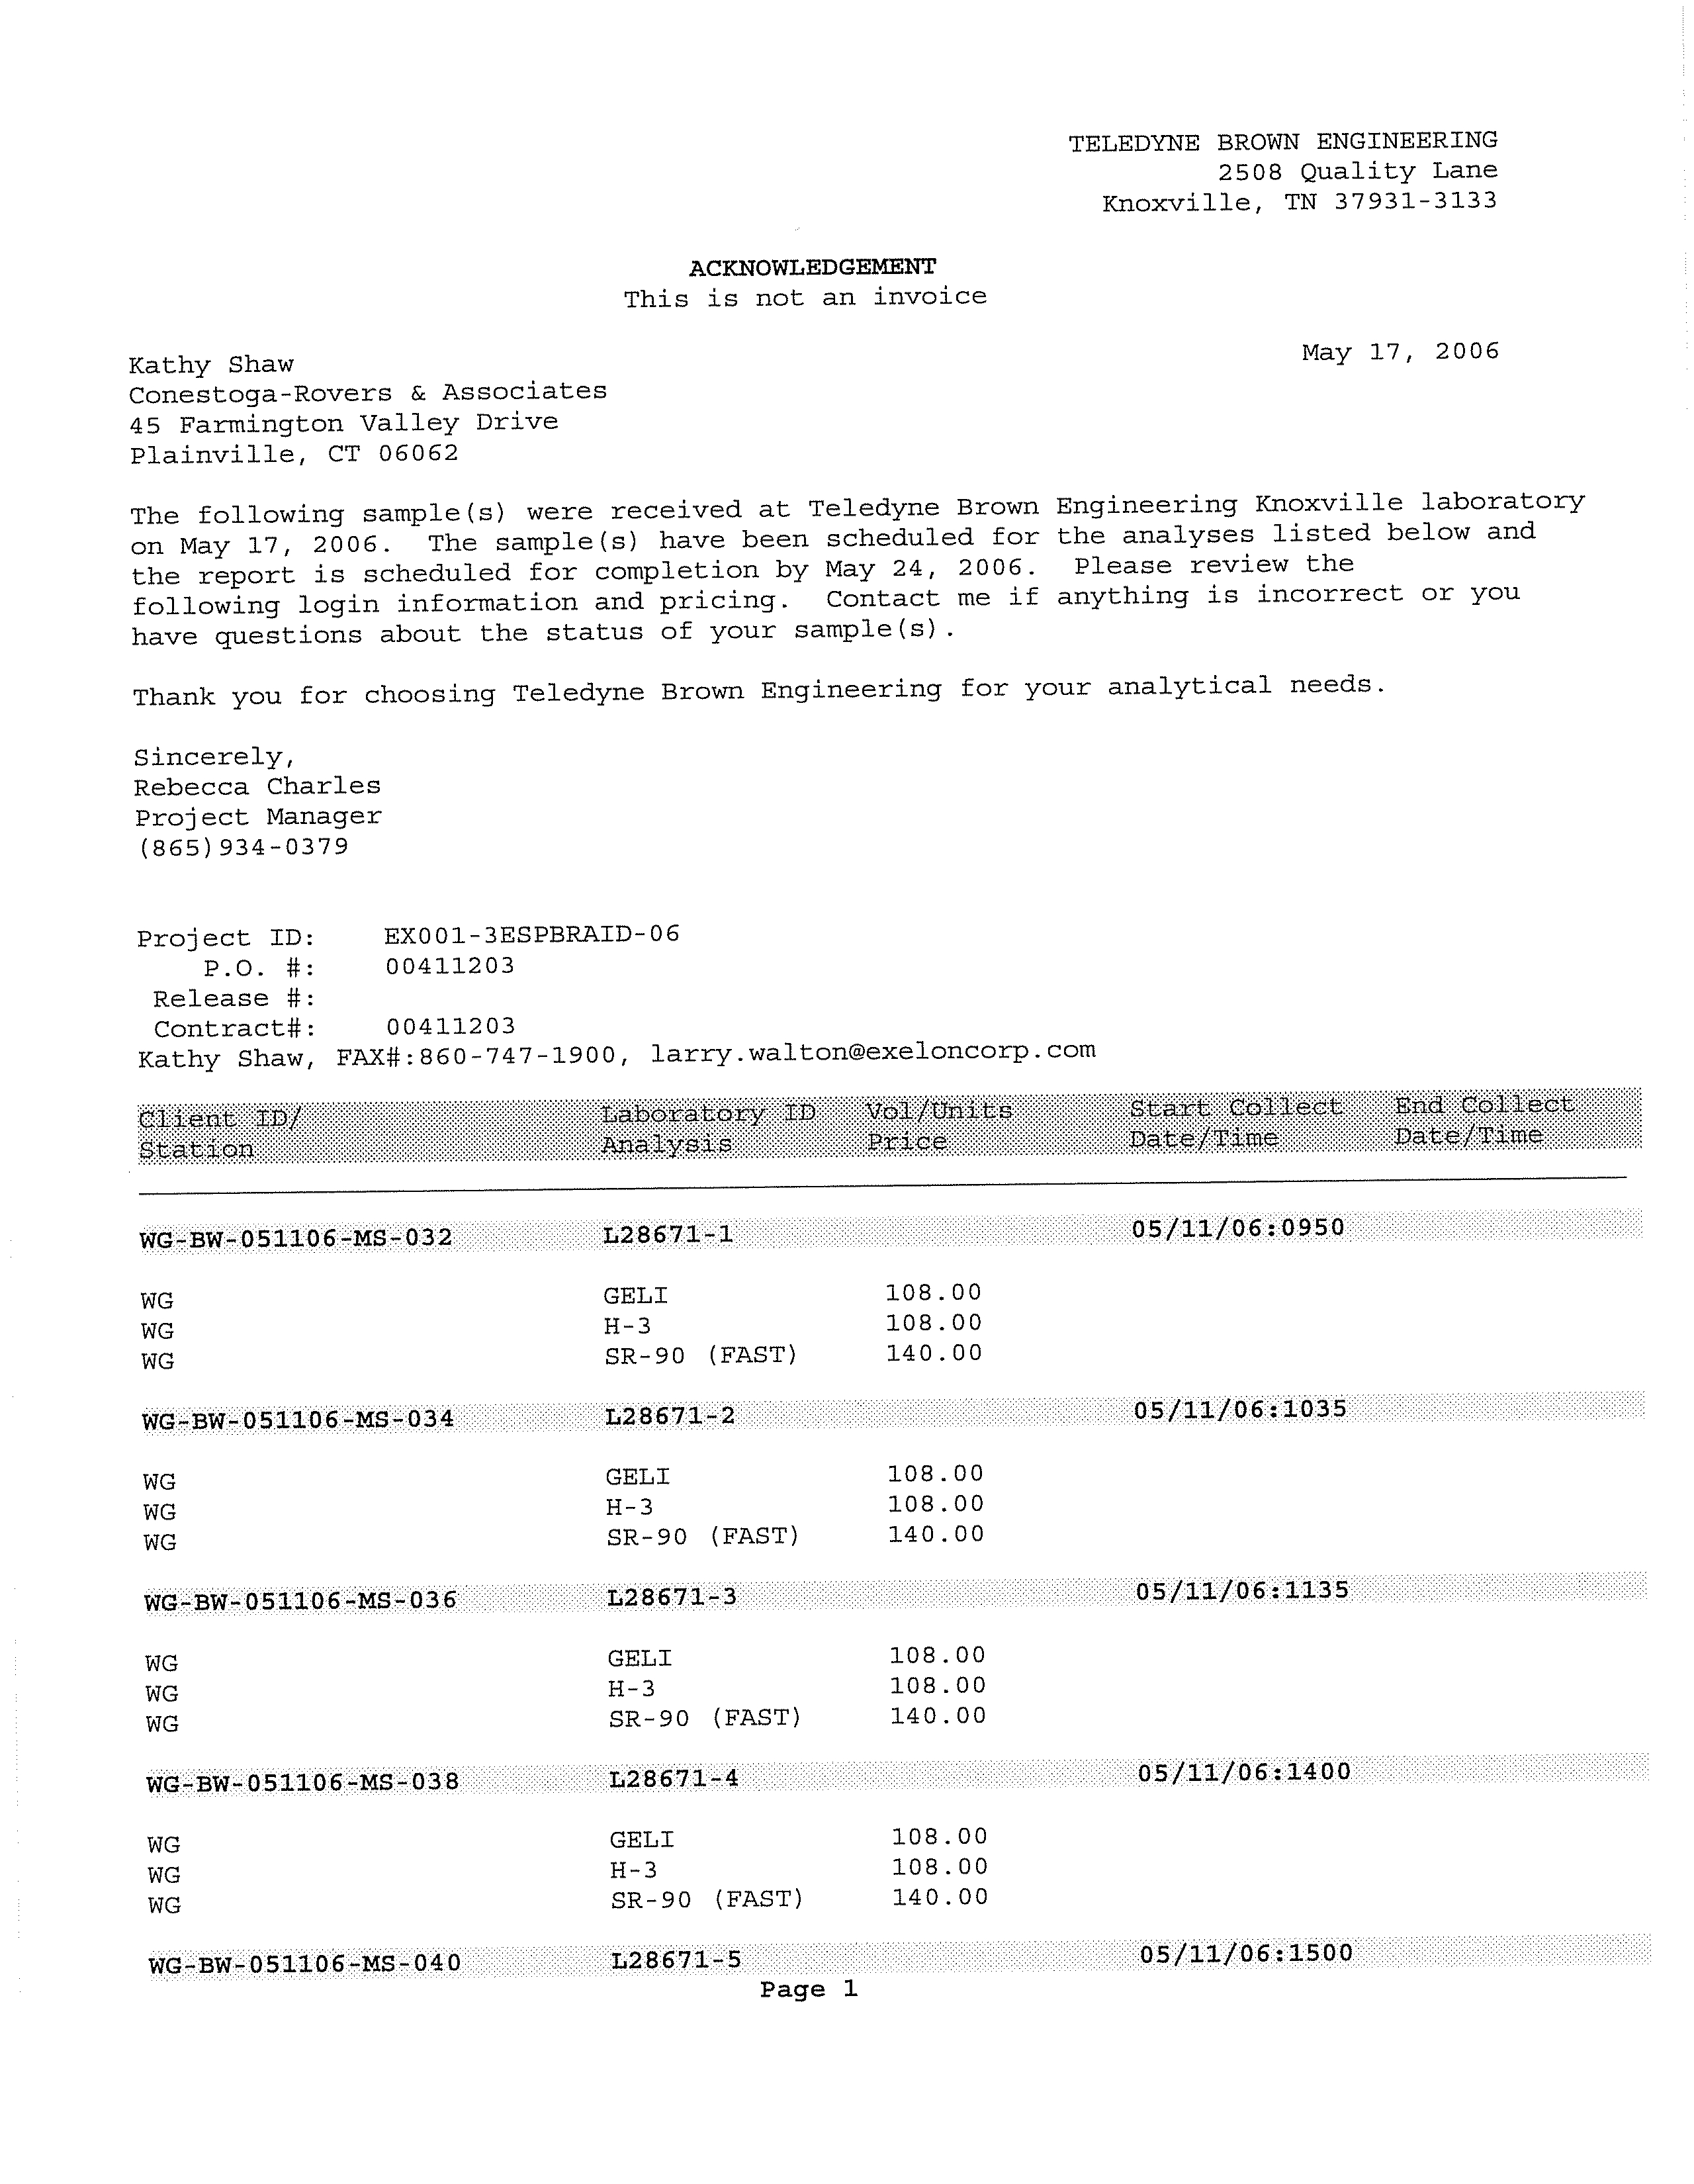
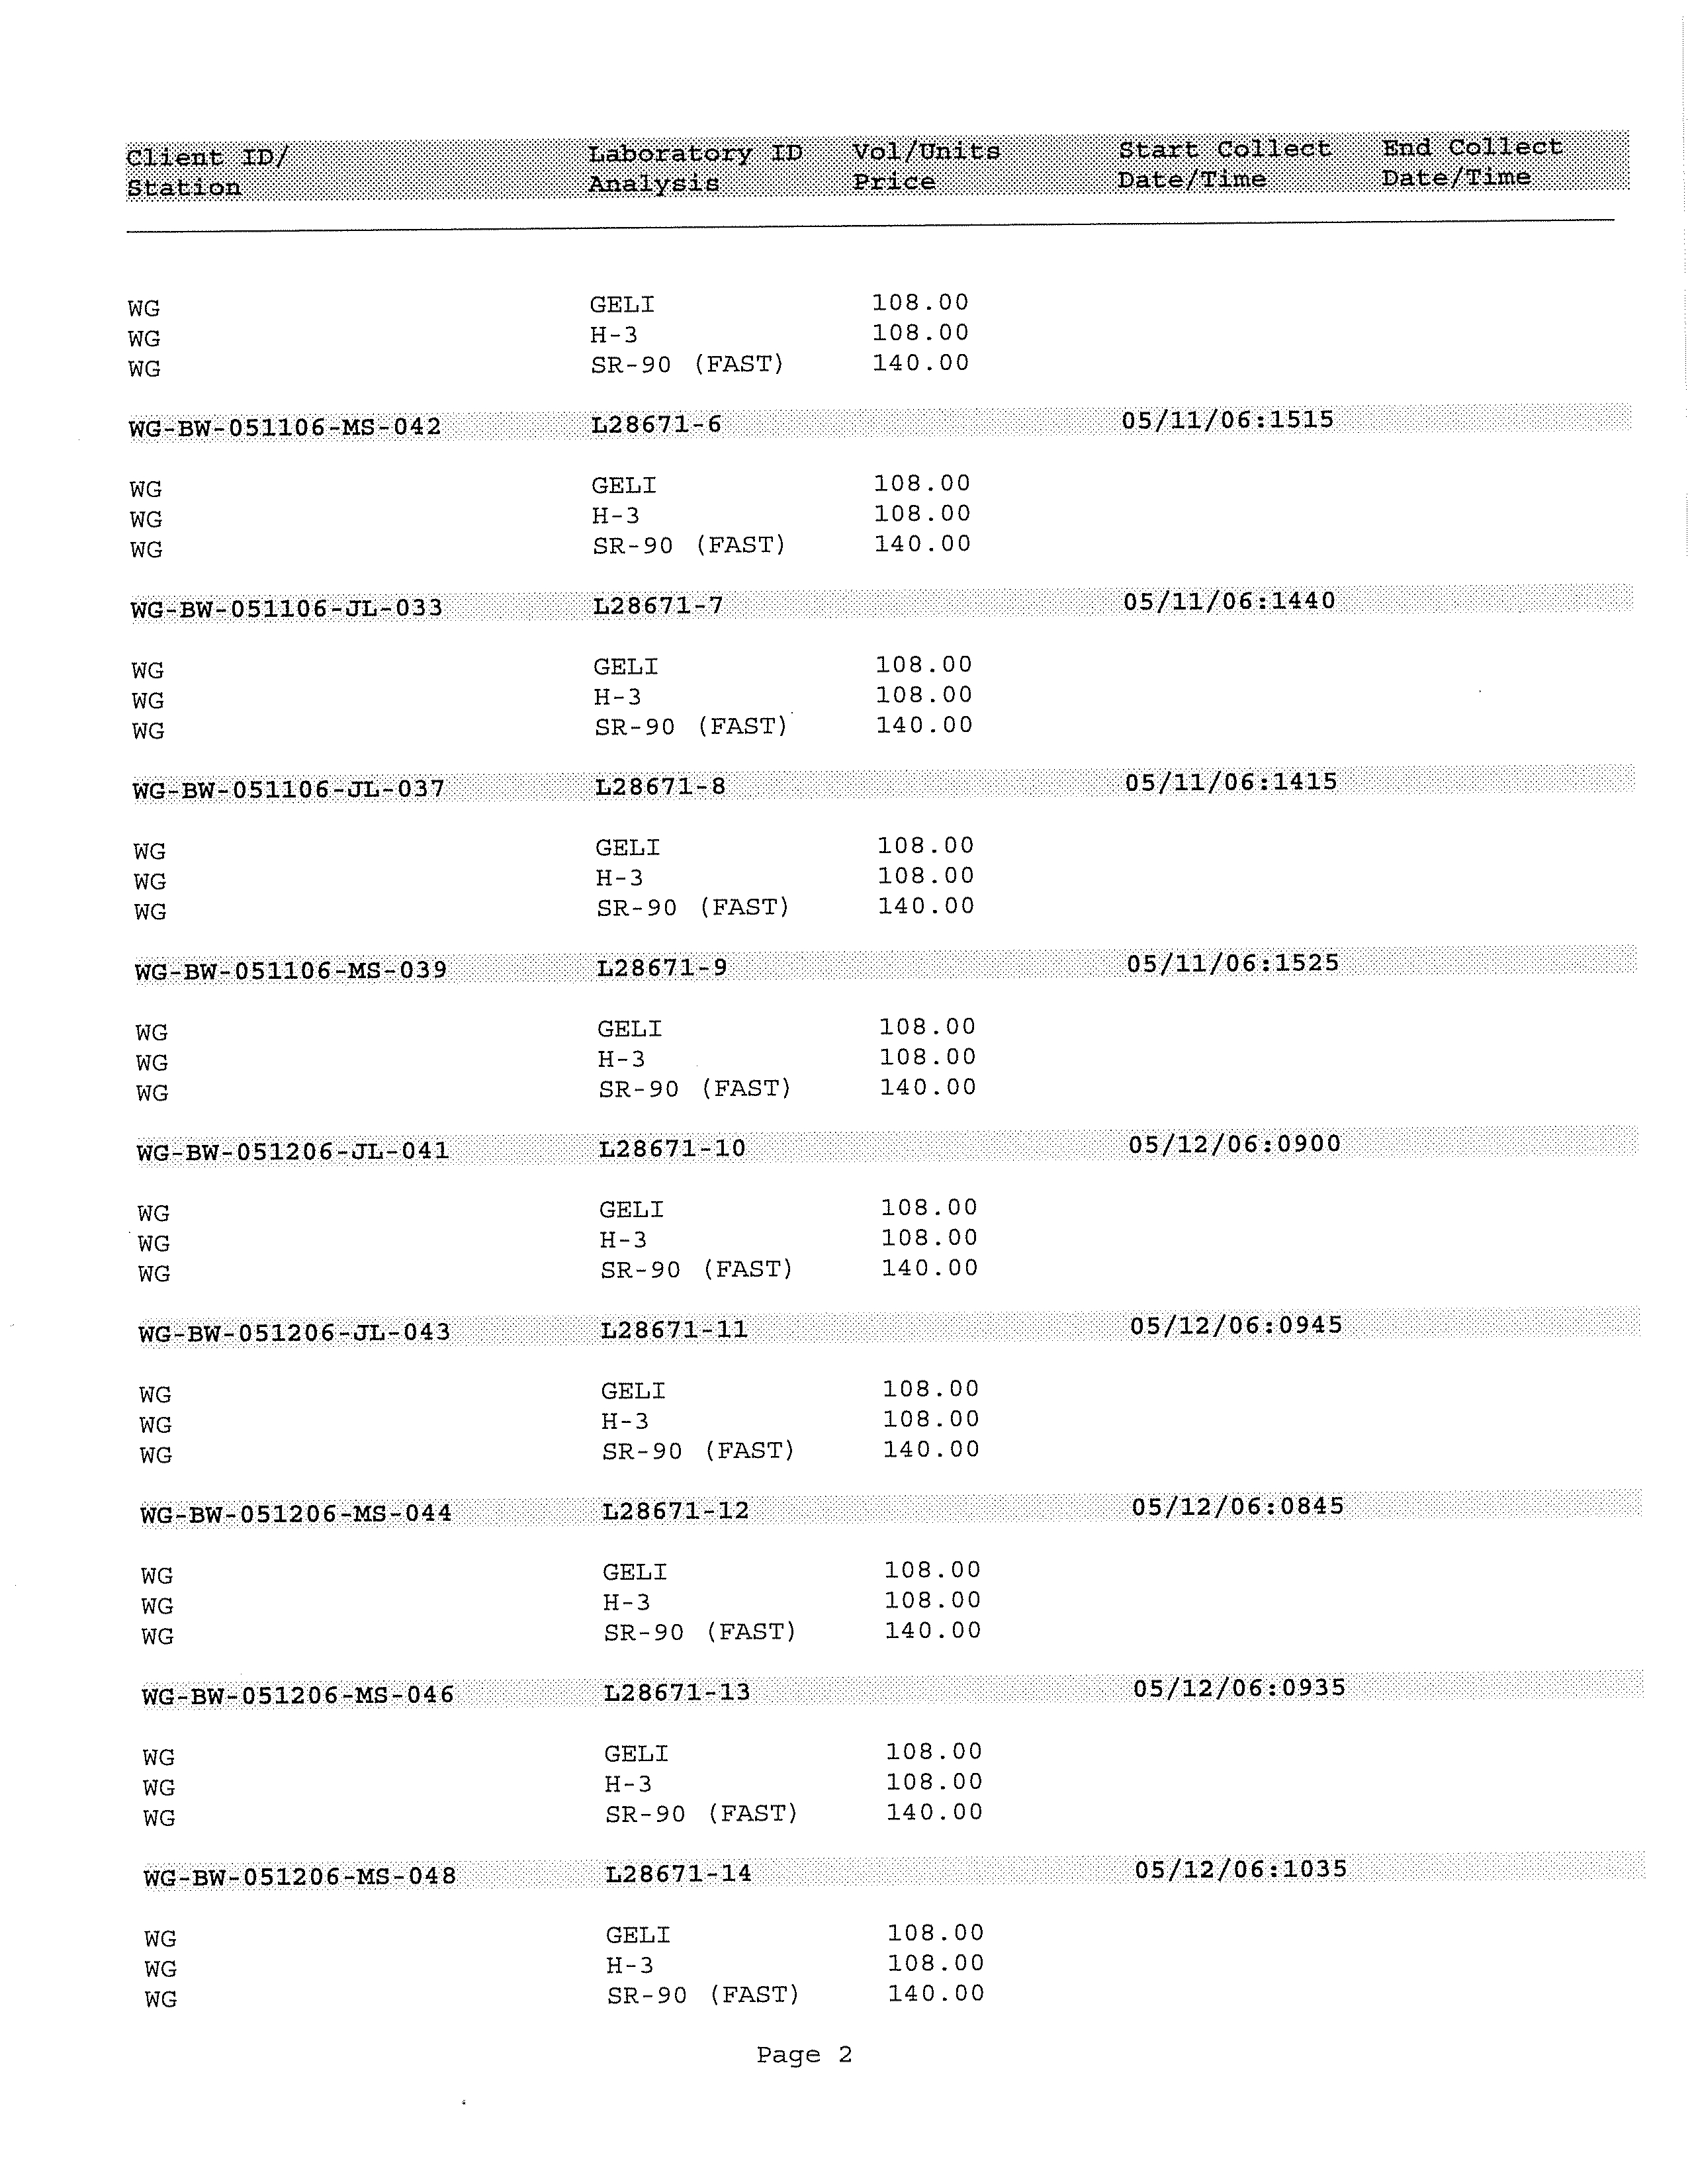
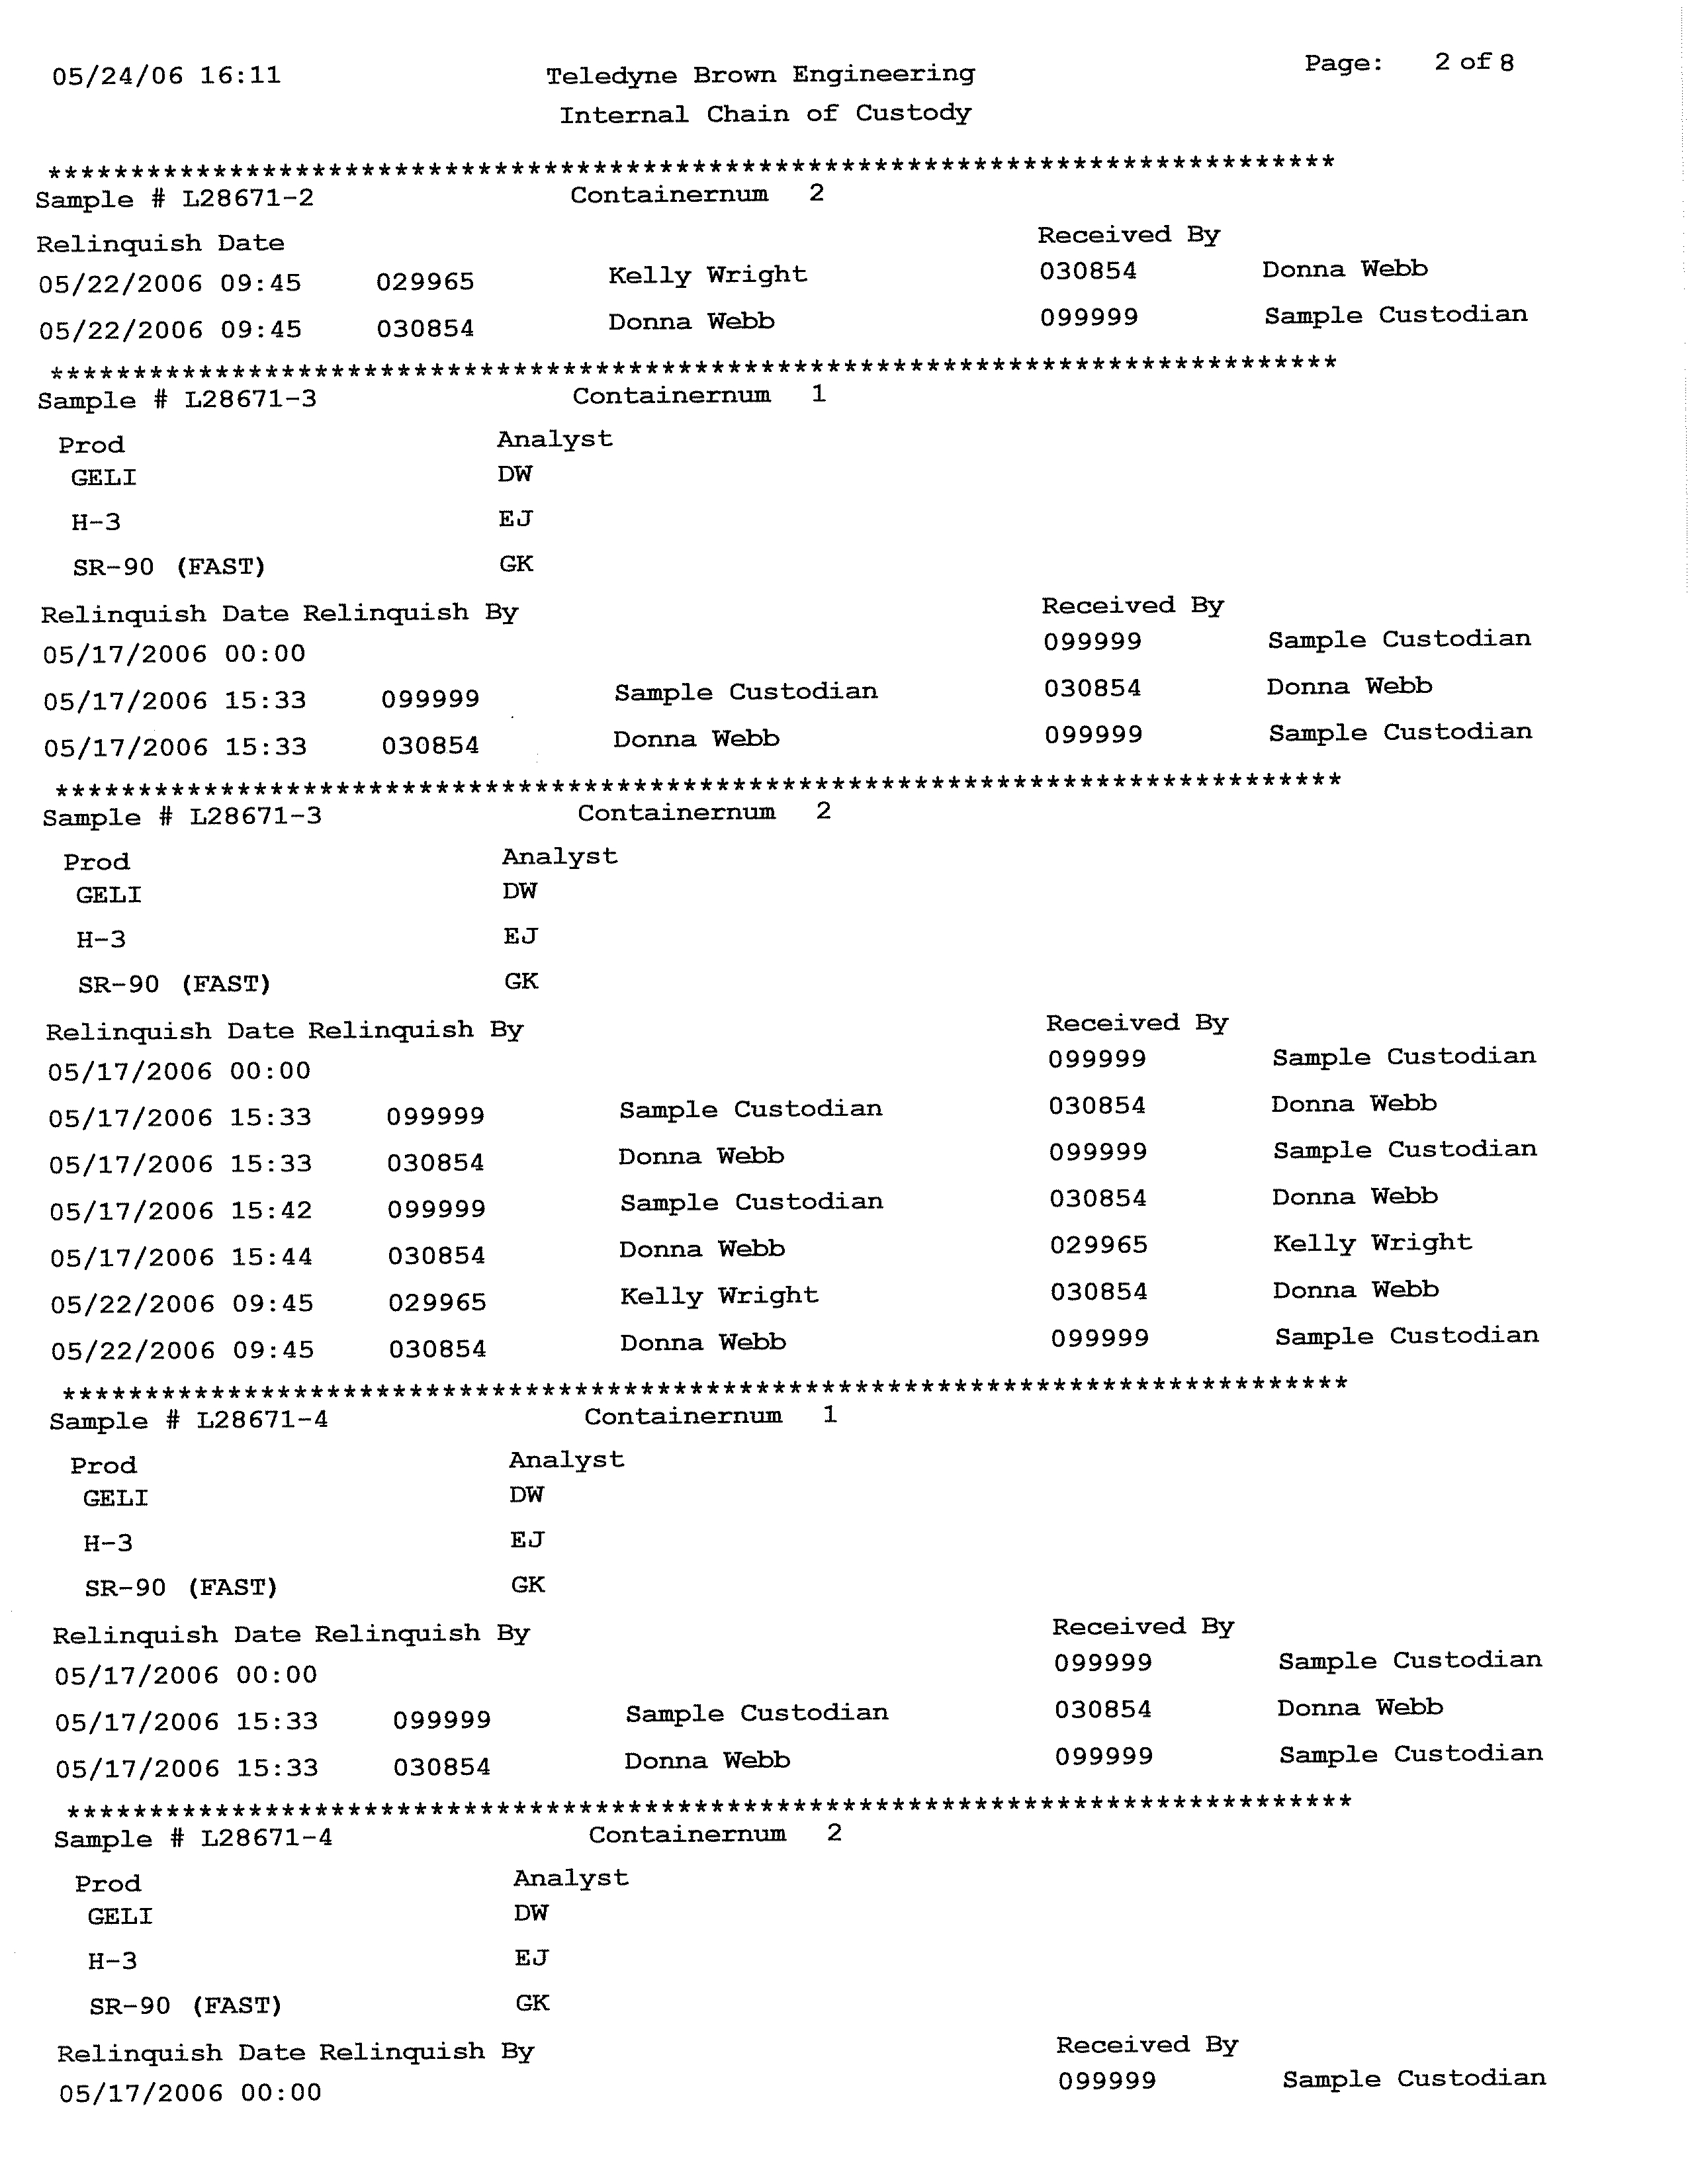
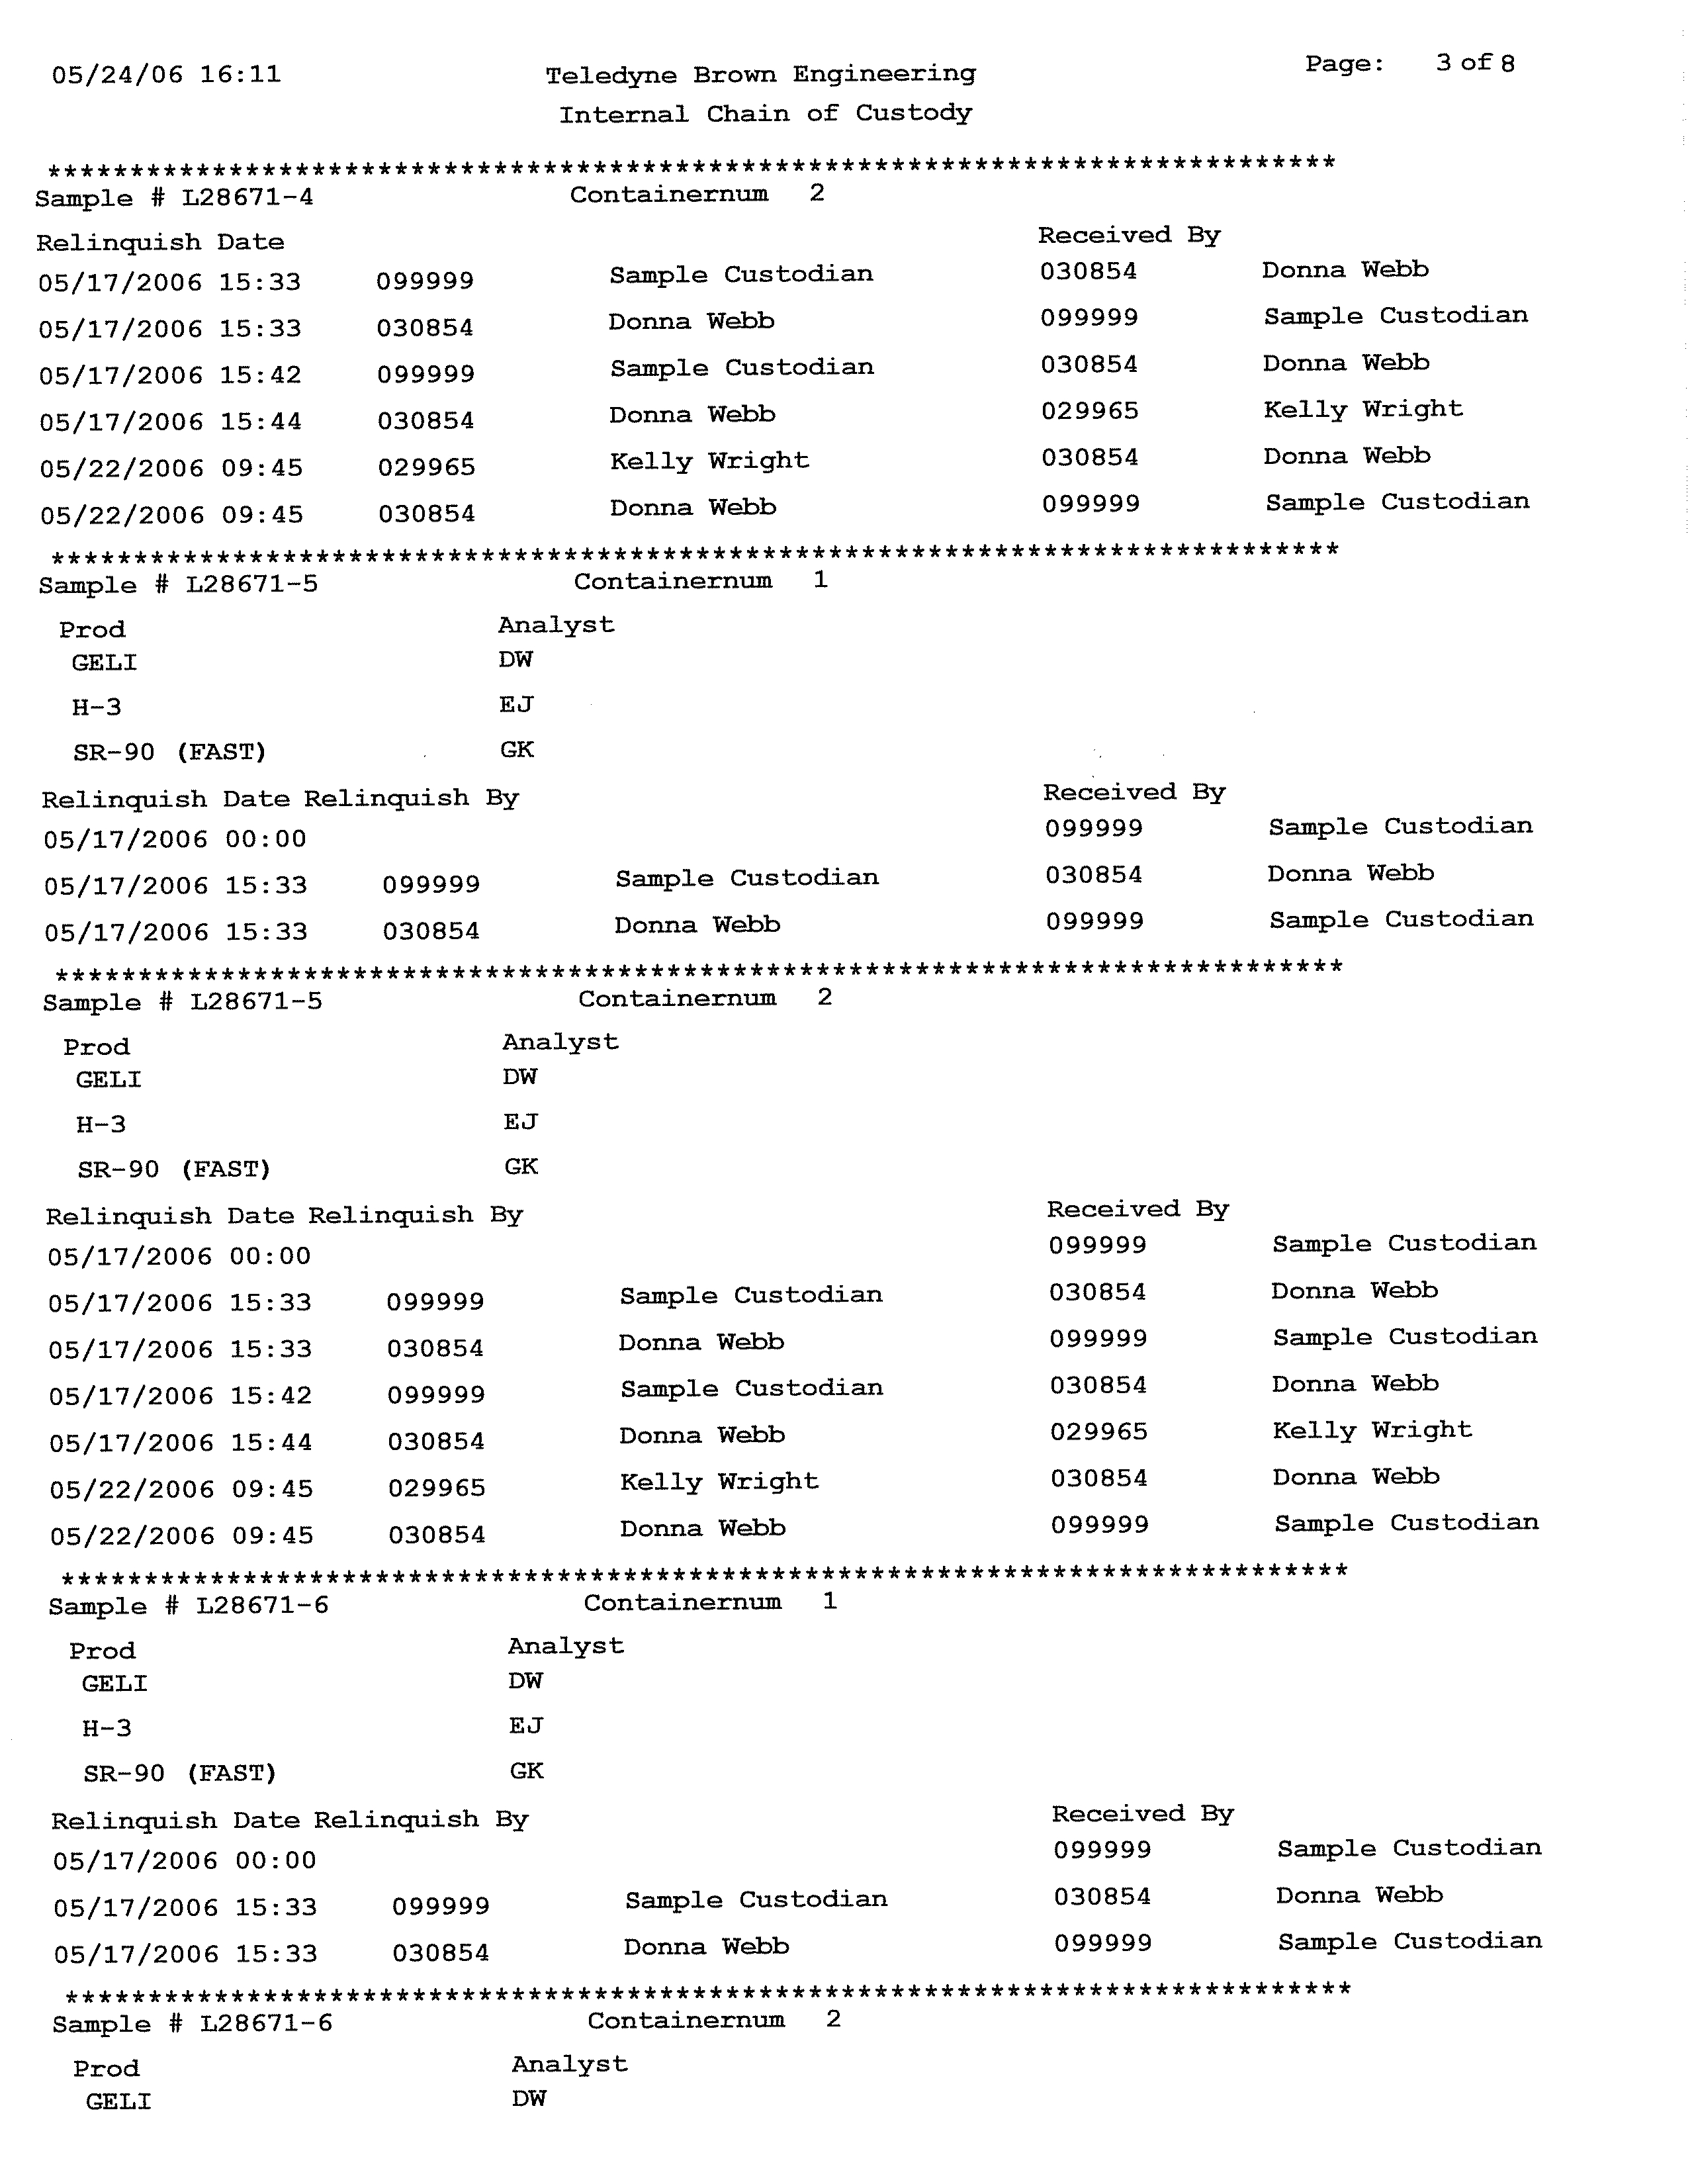
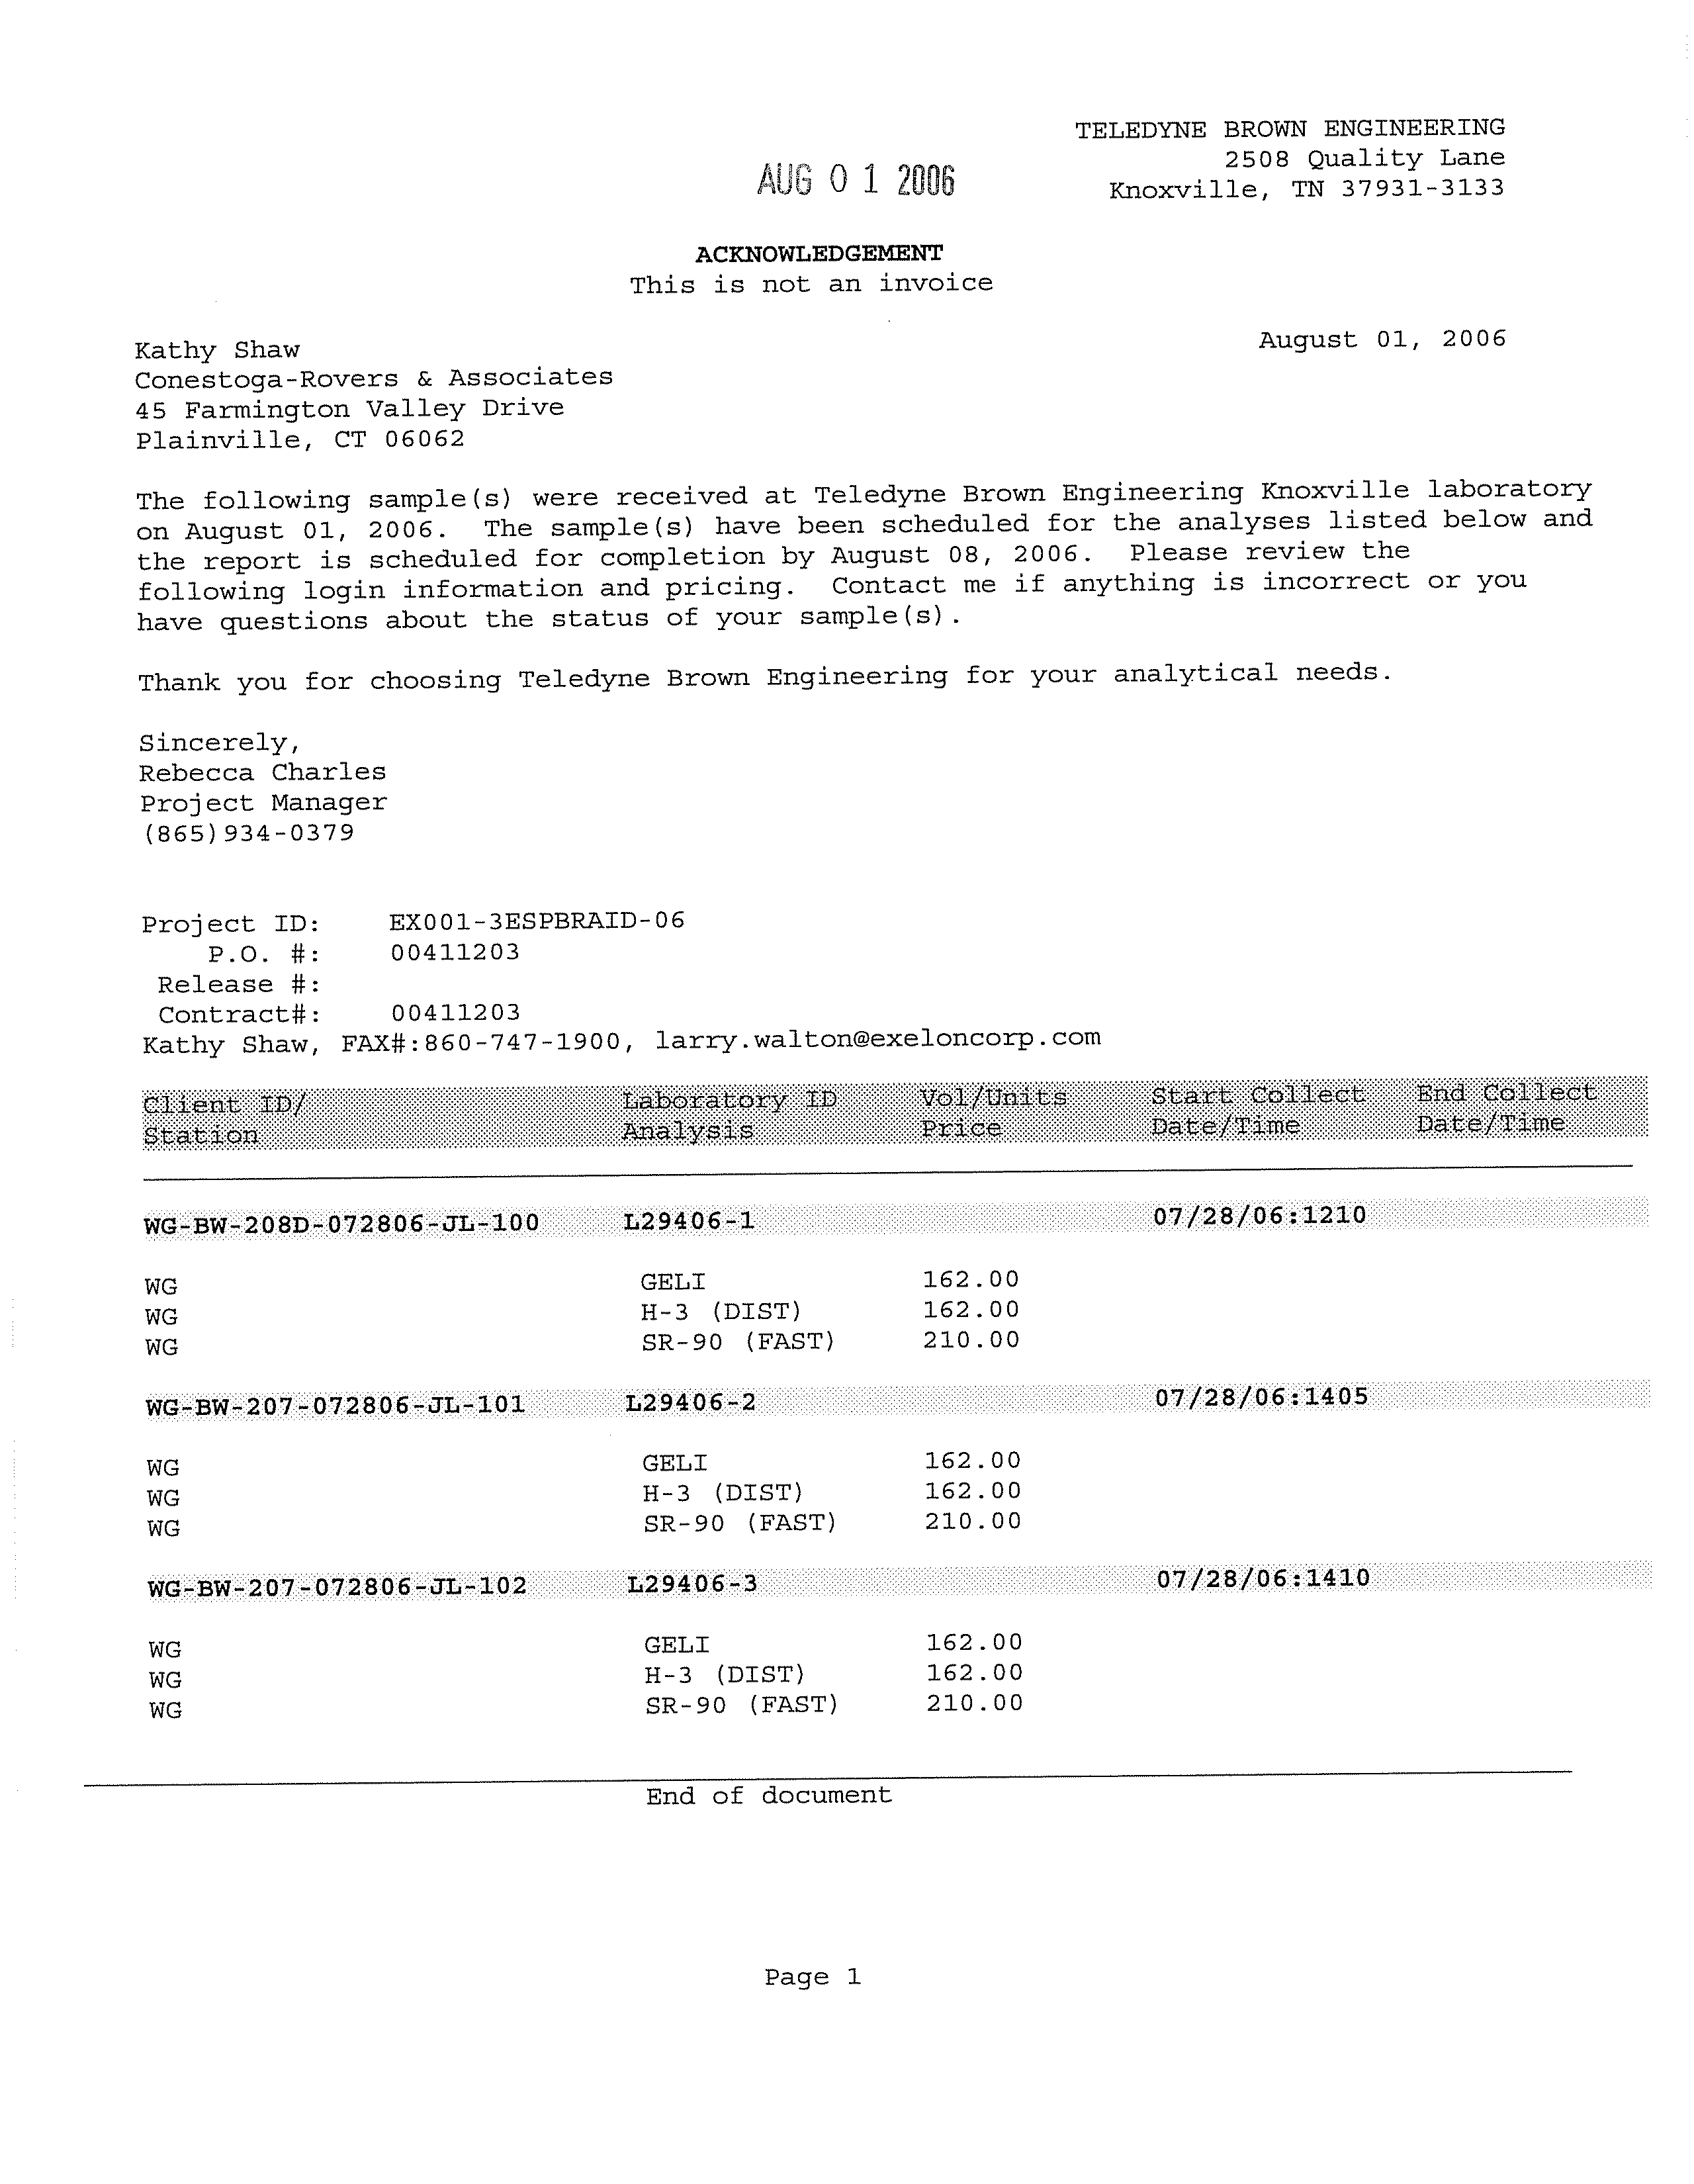
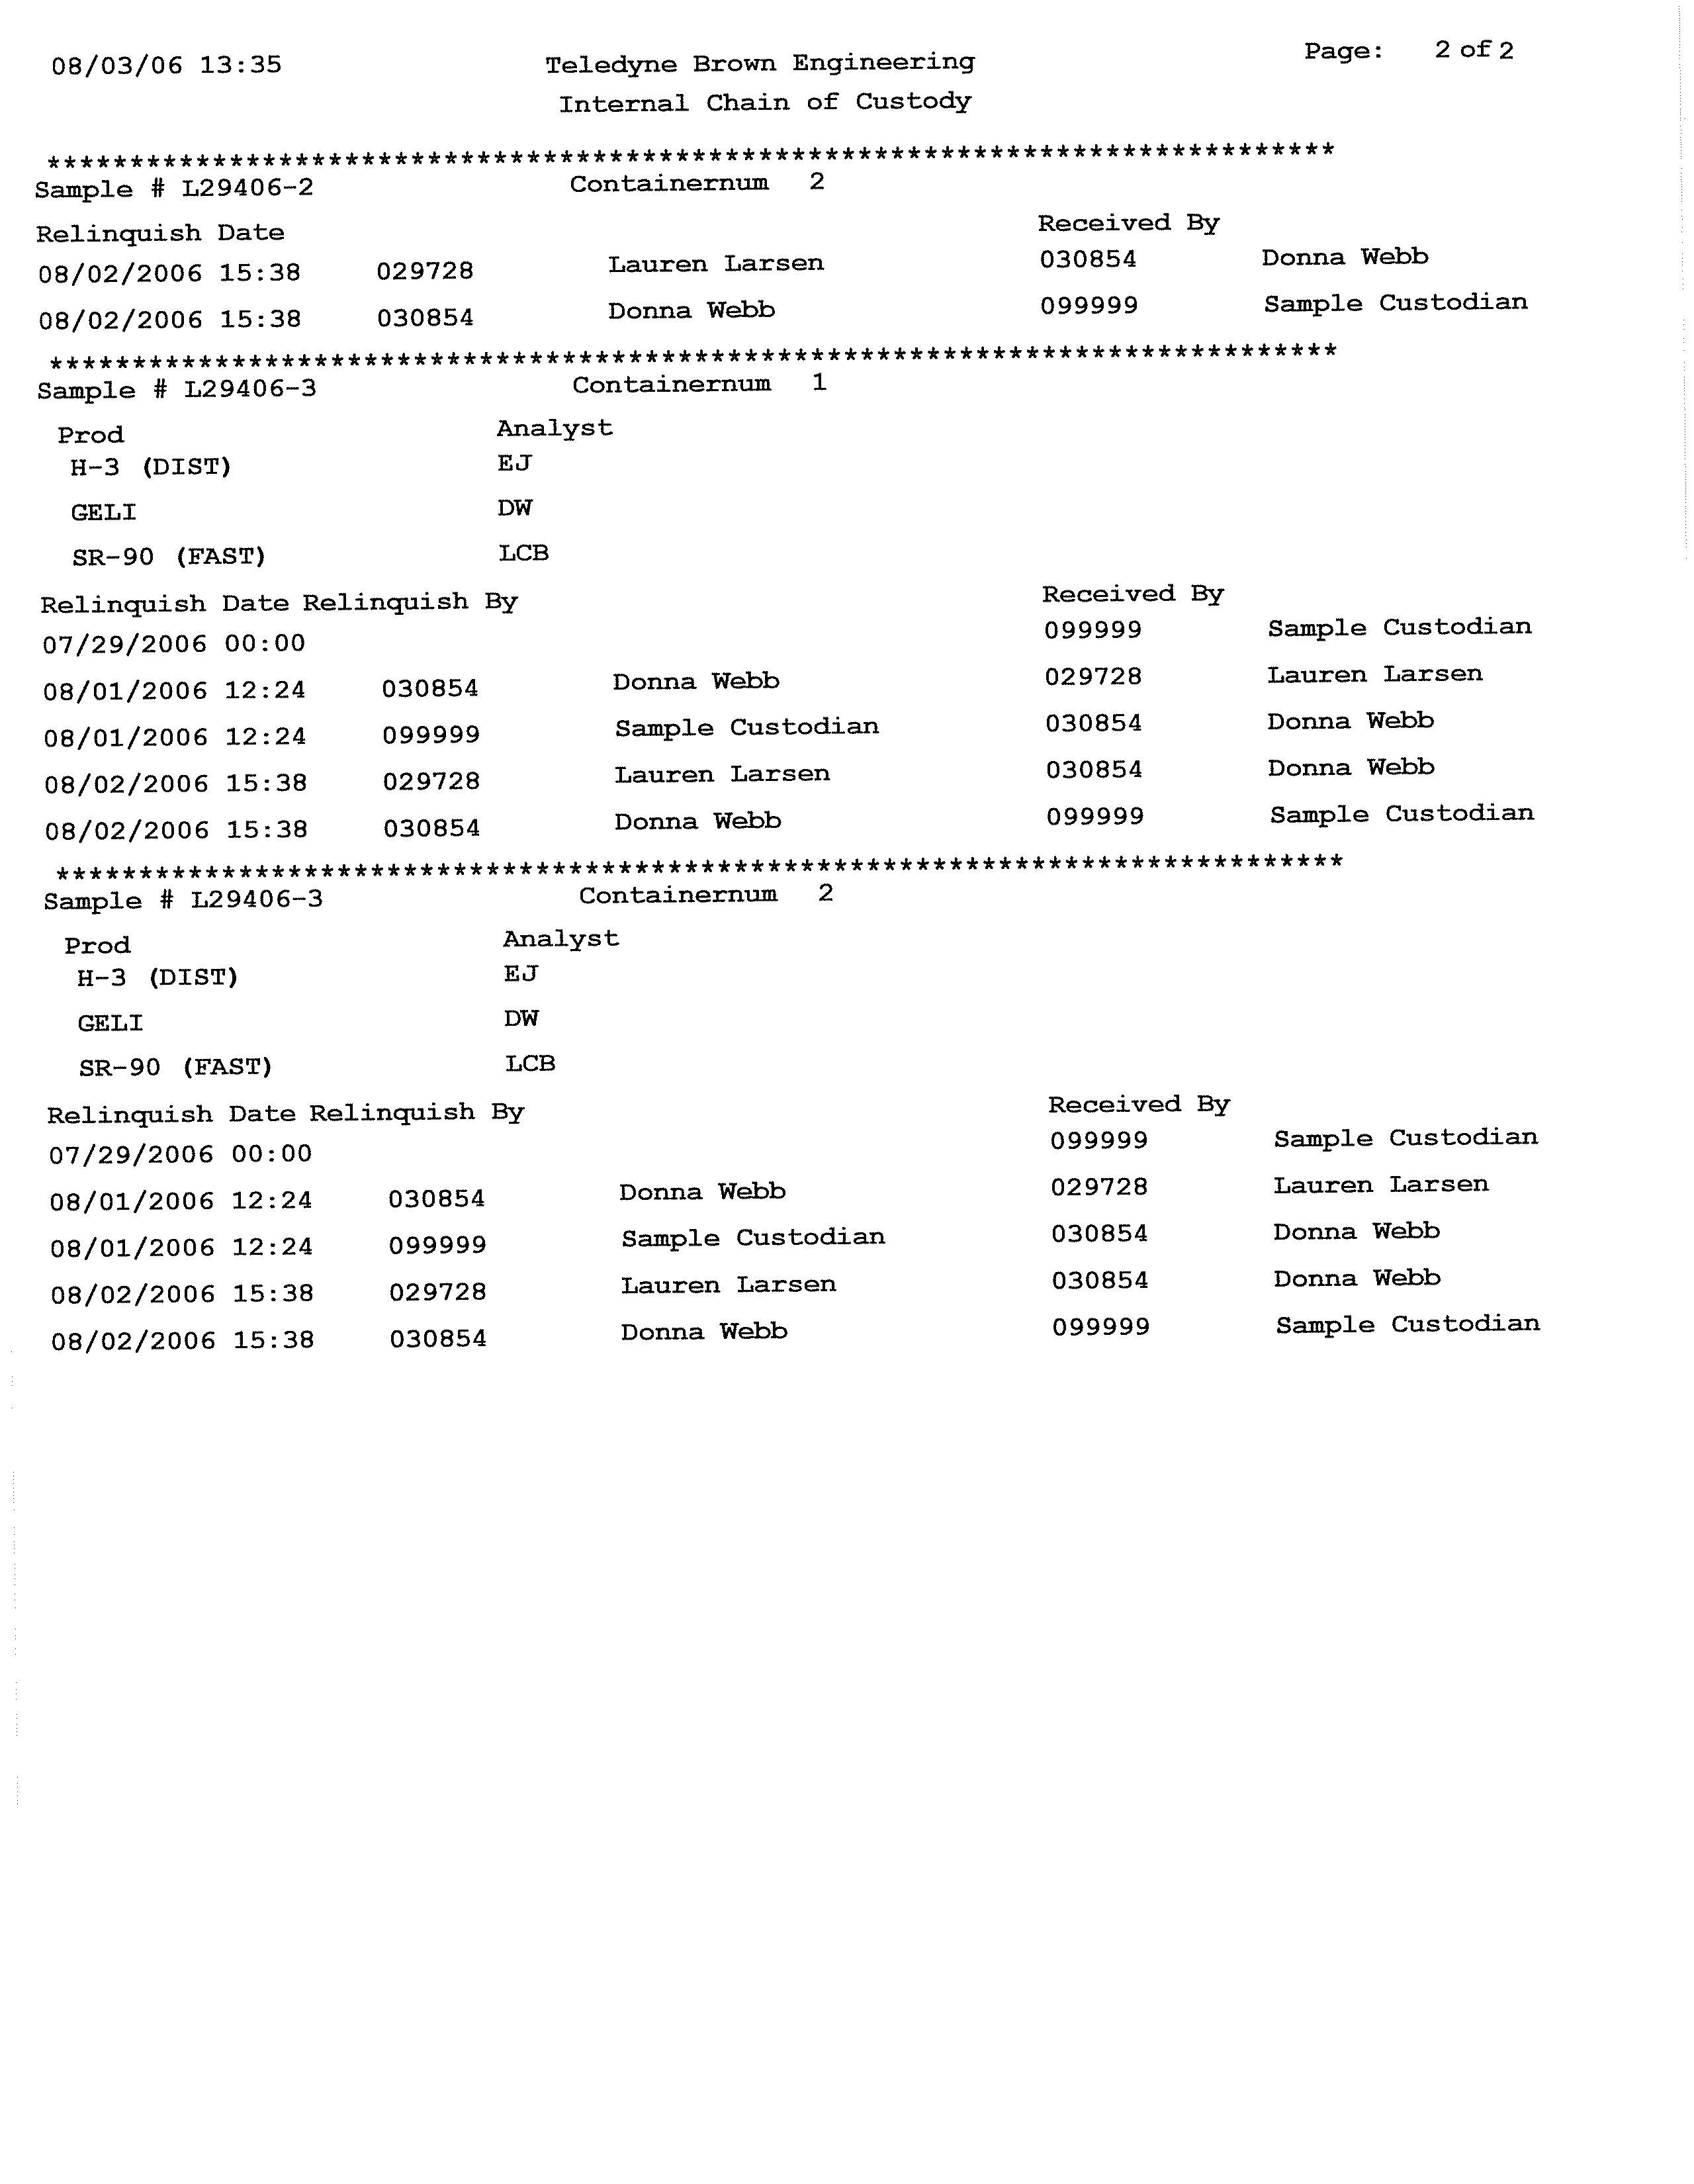
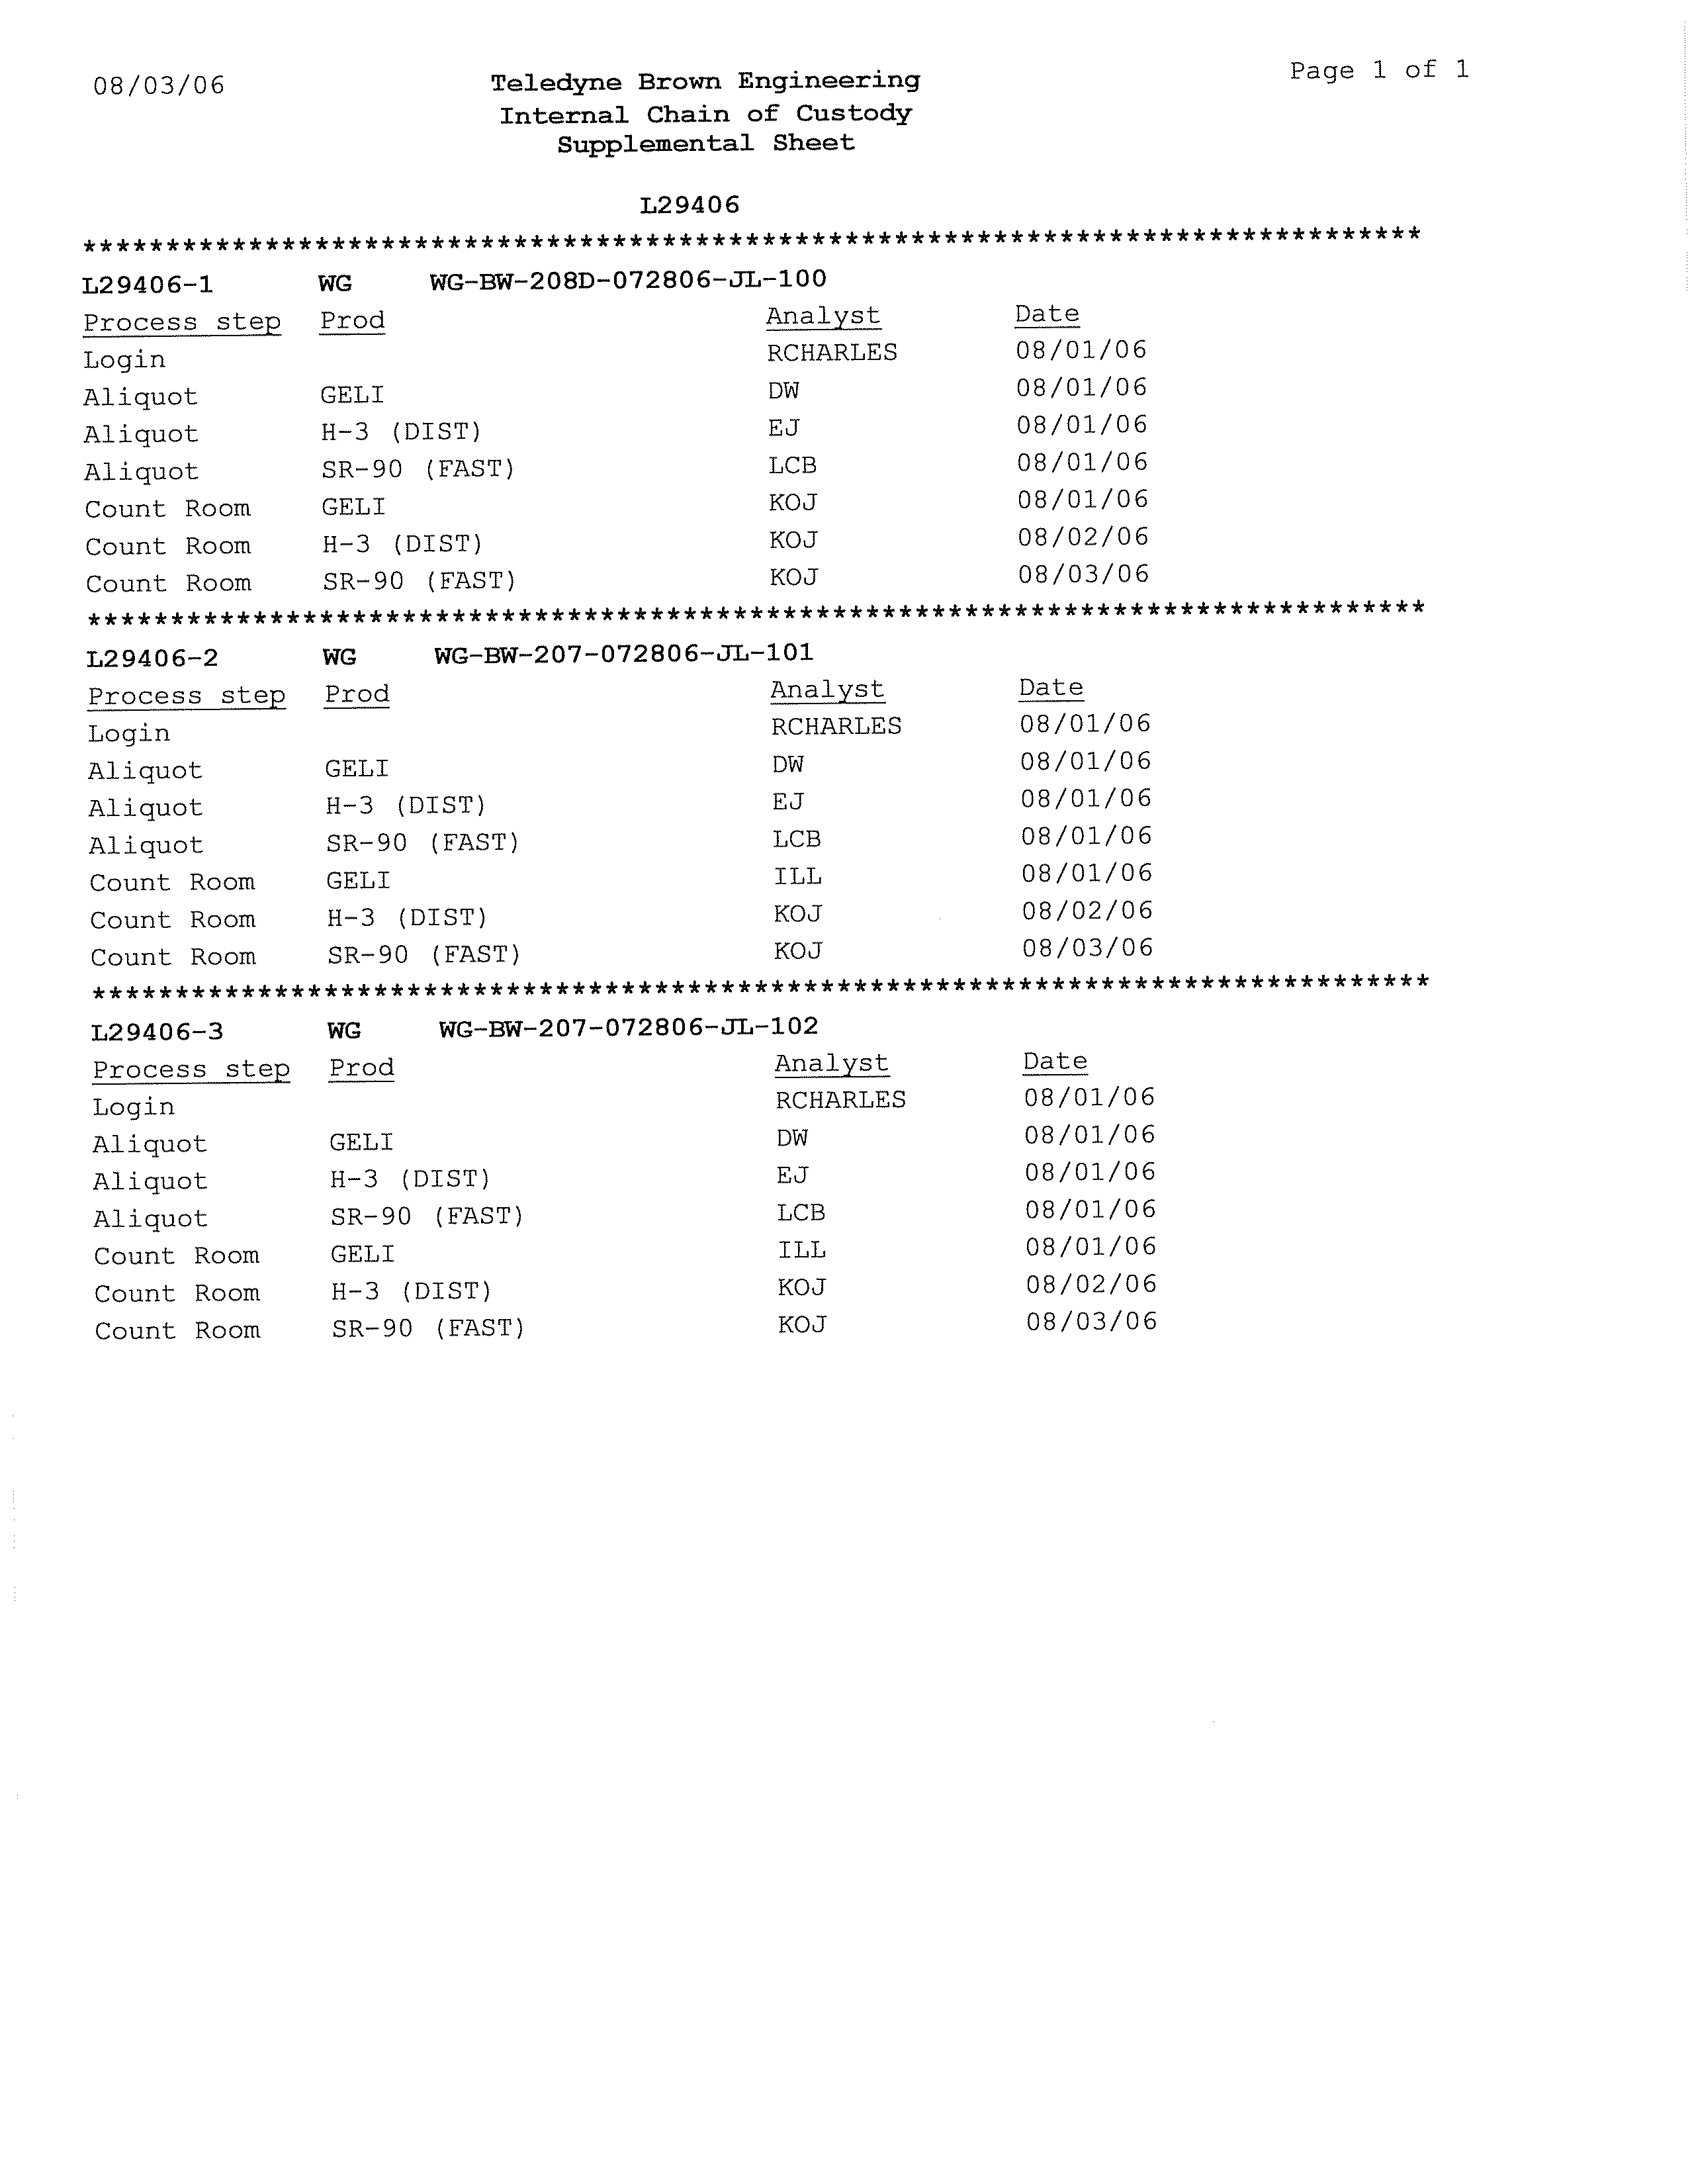
APPENDIX D
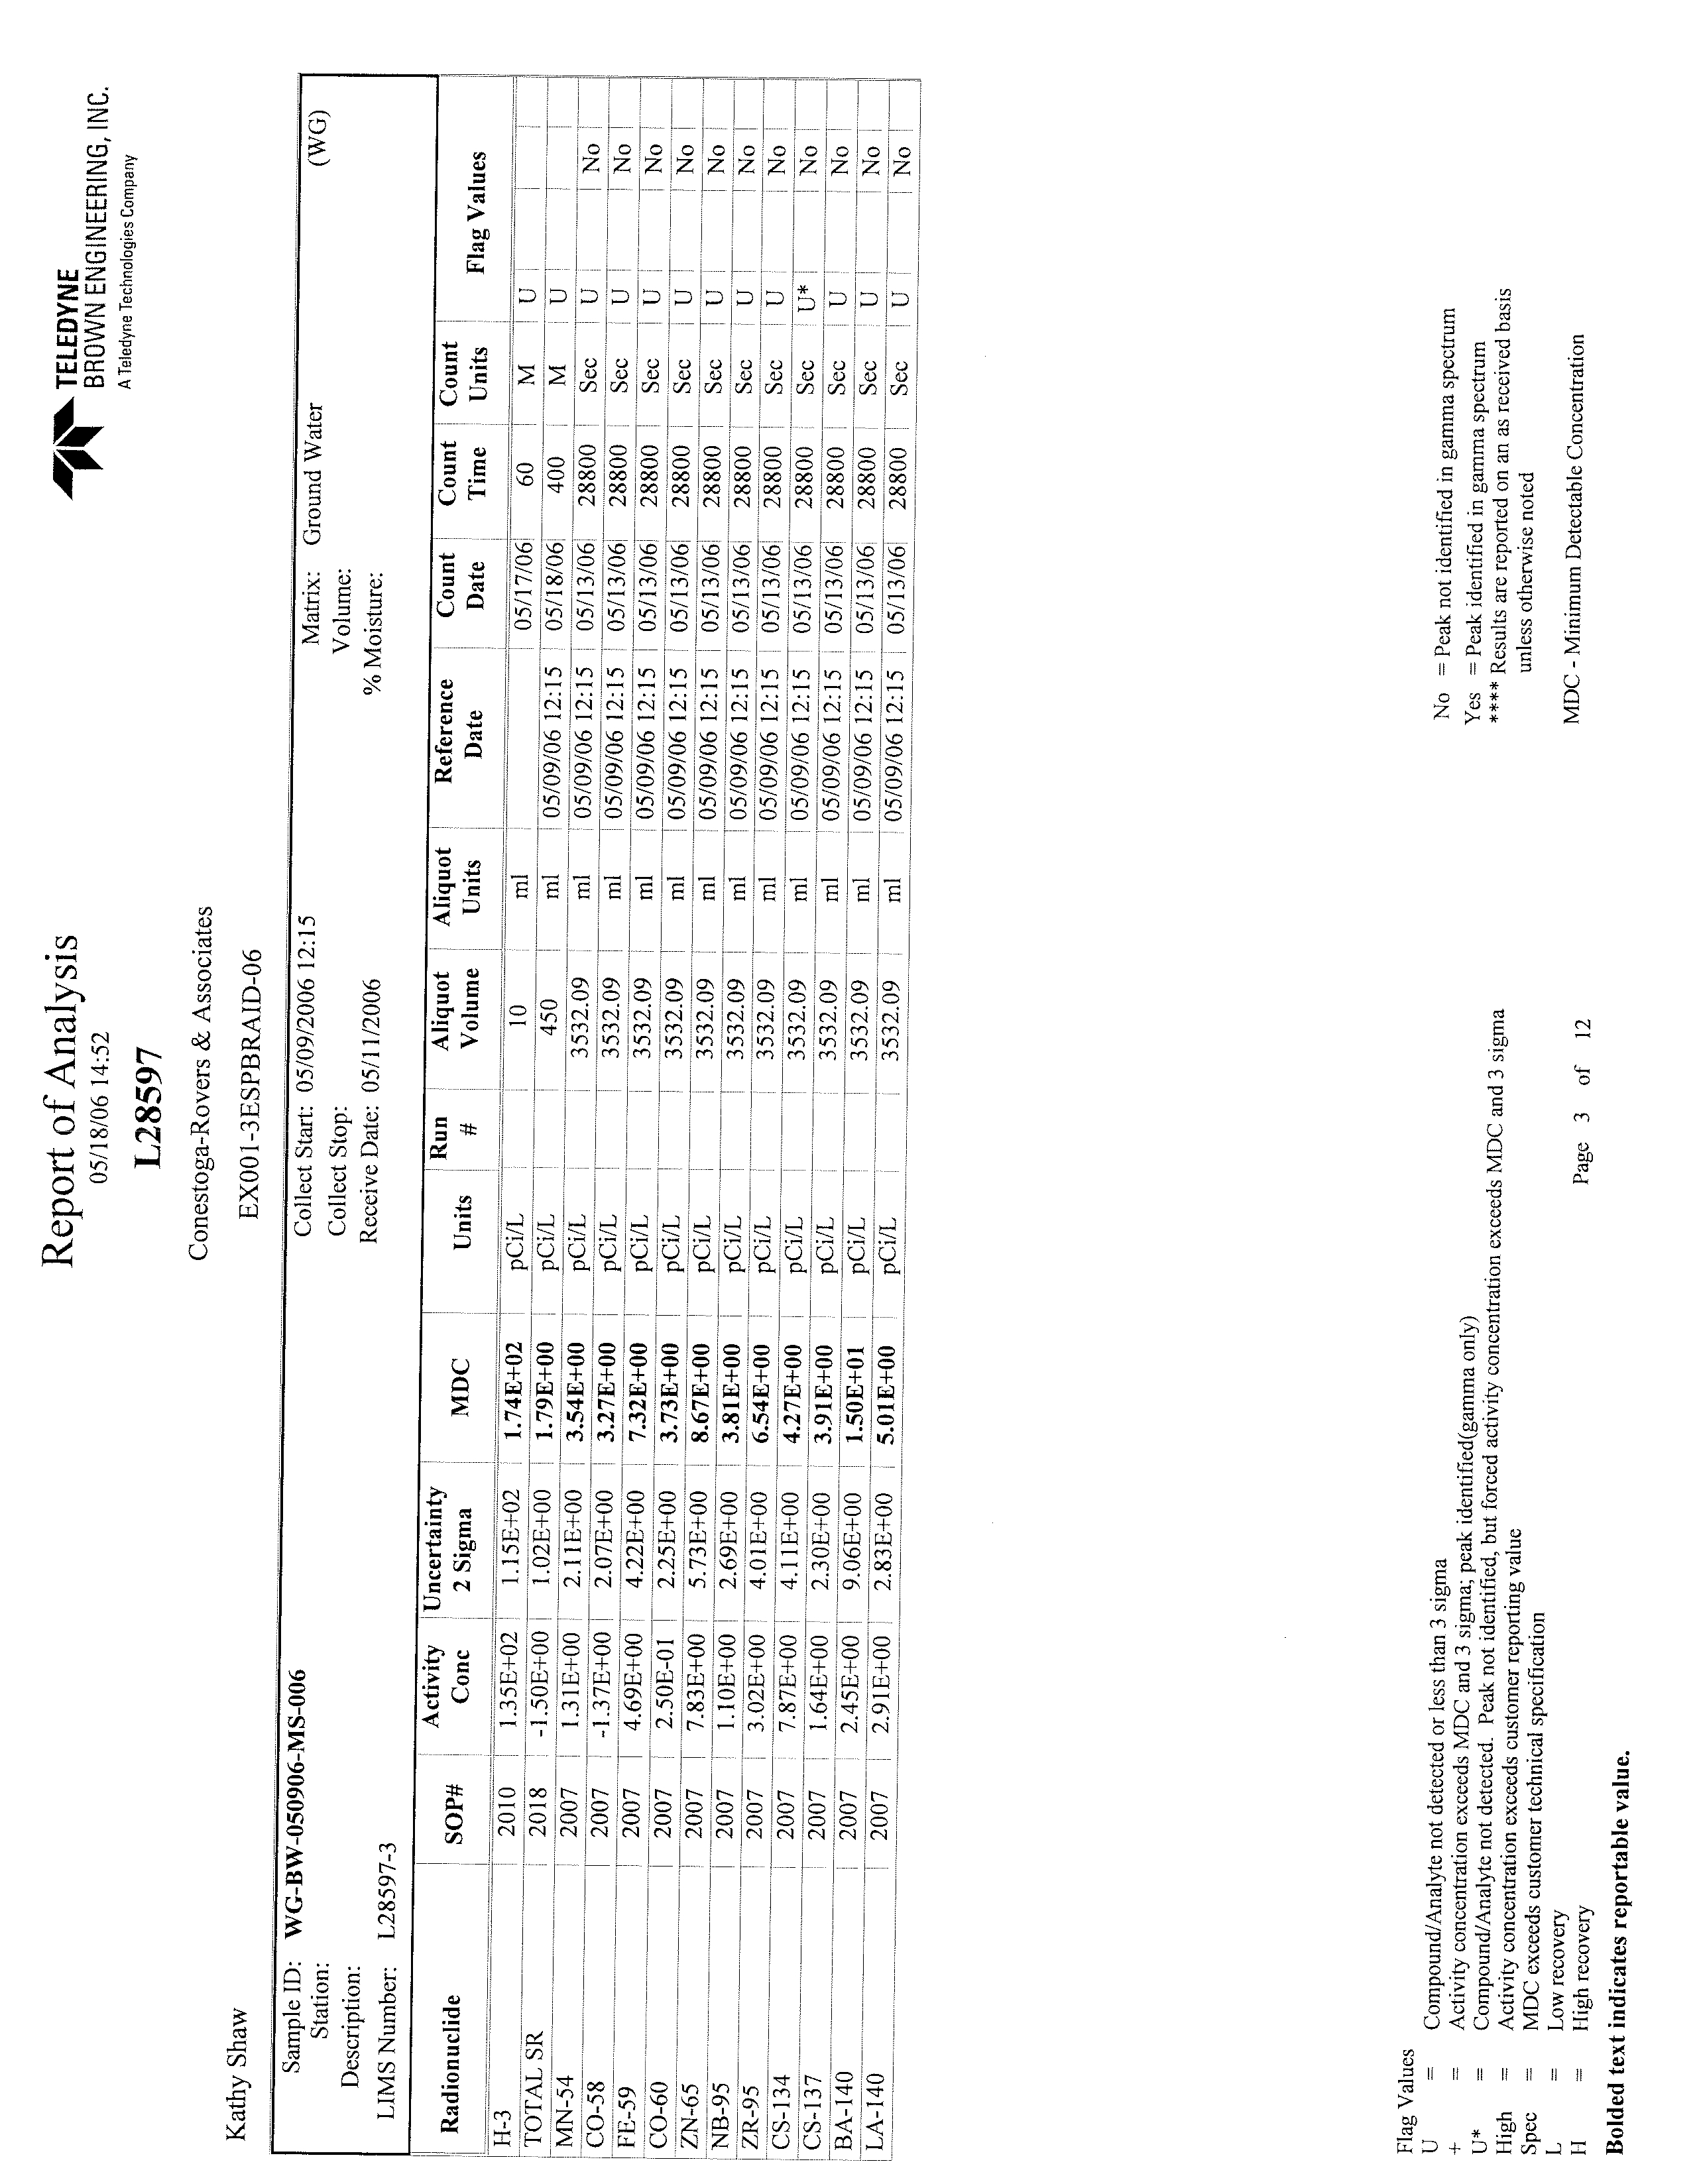
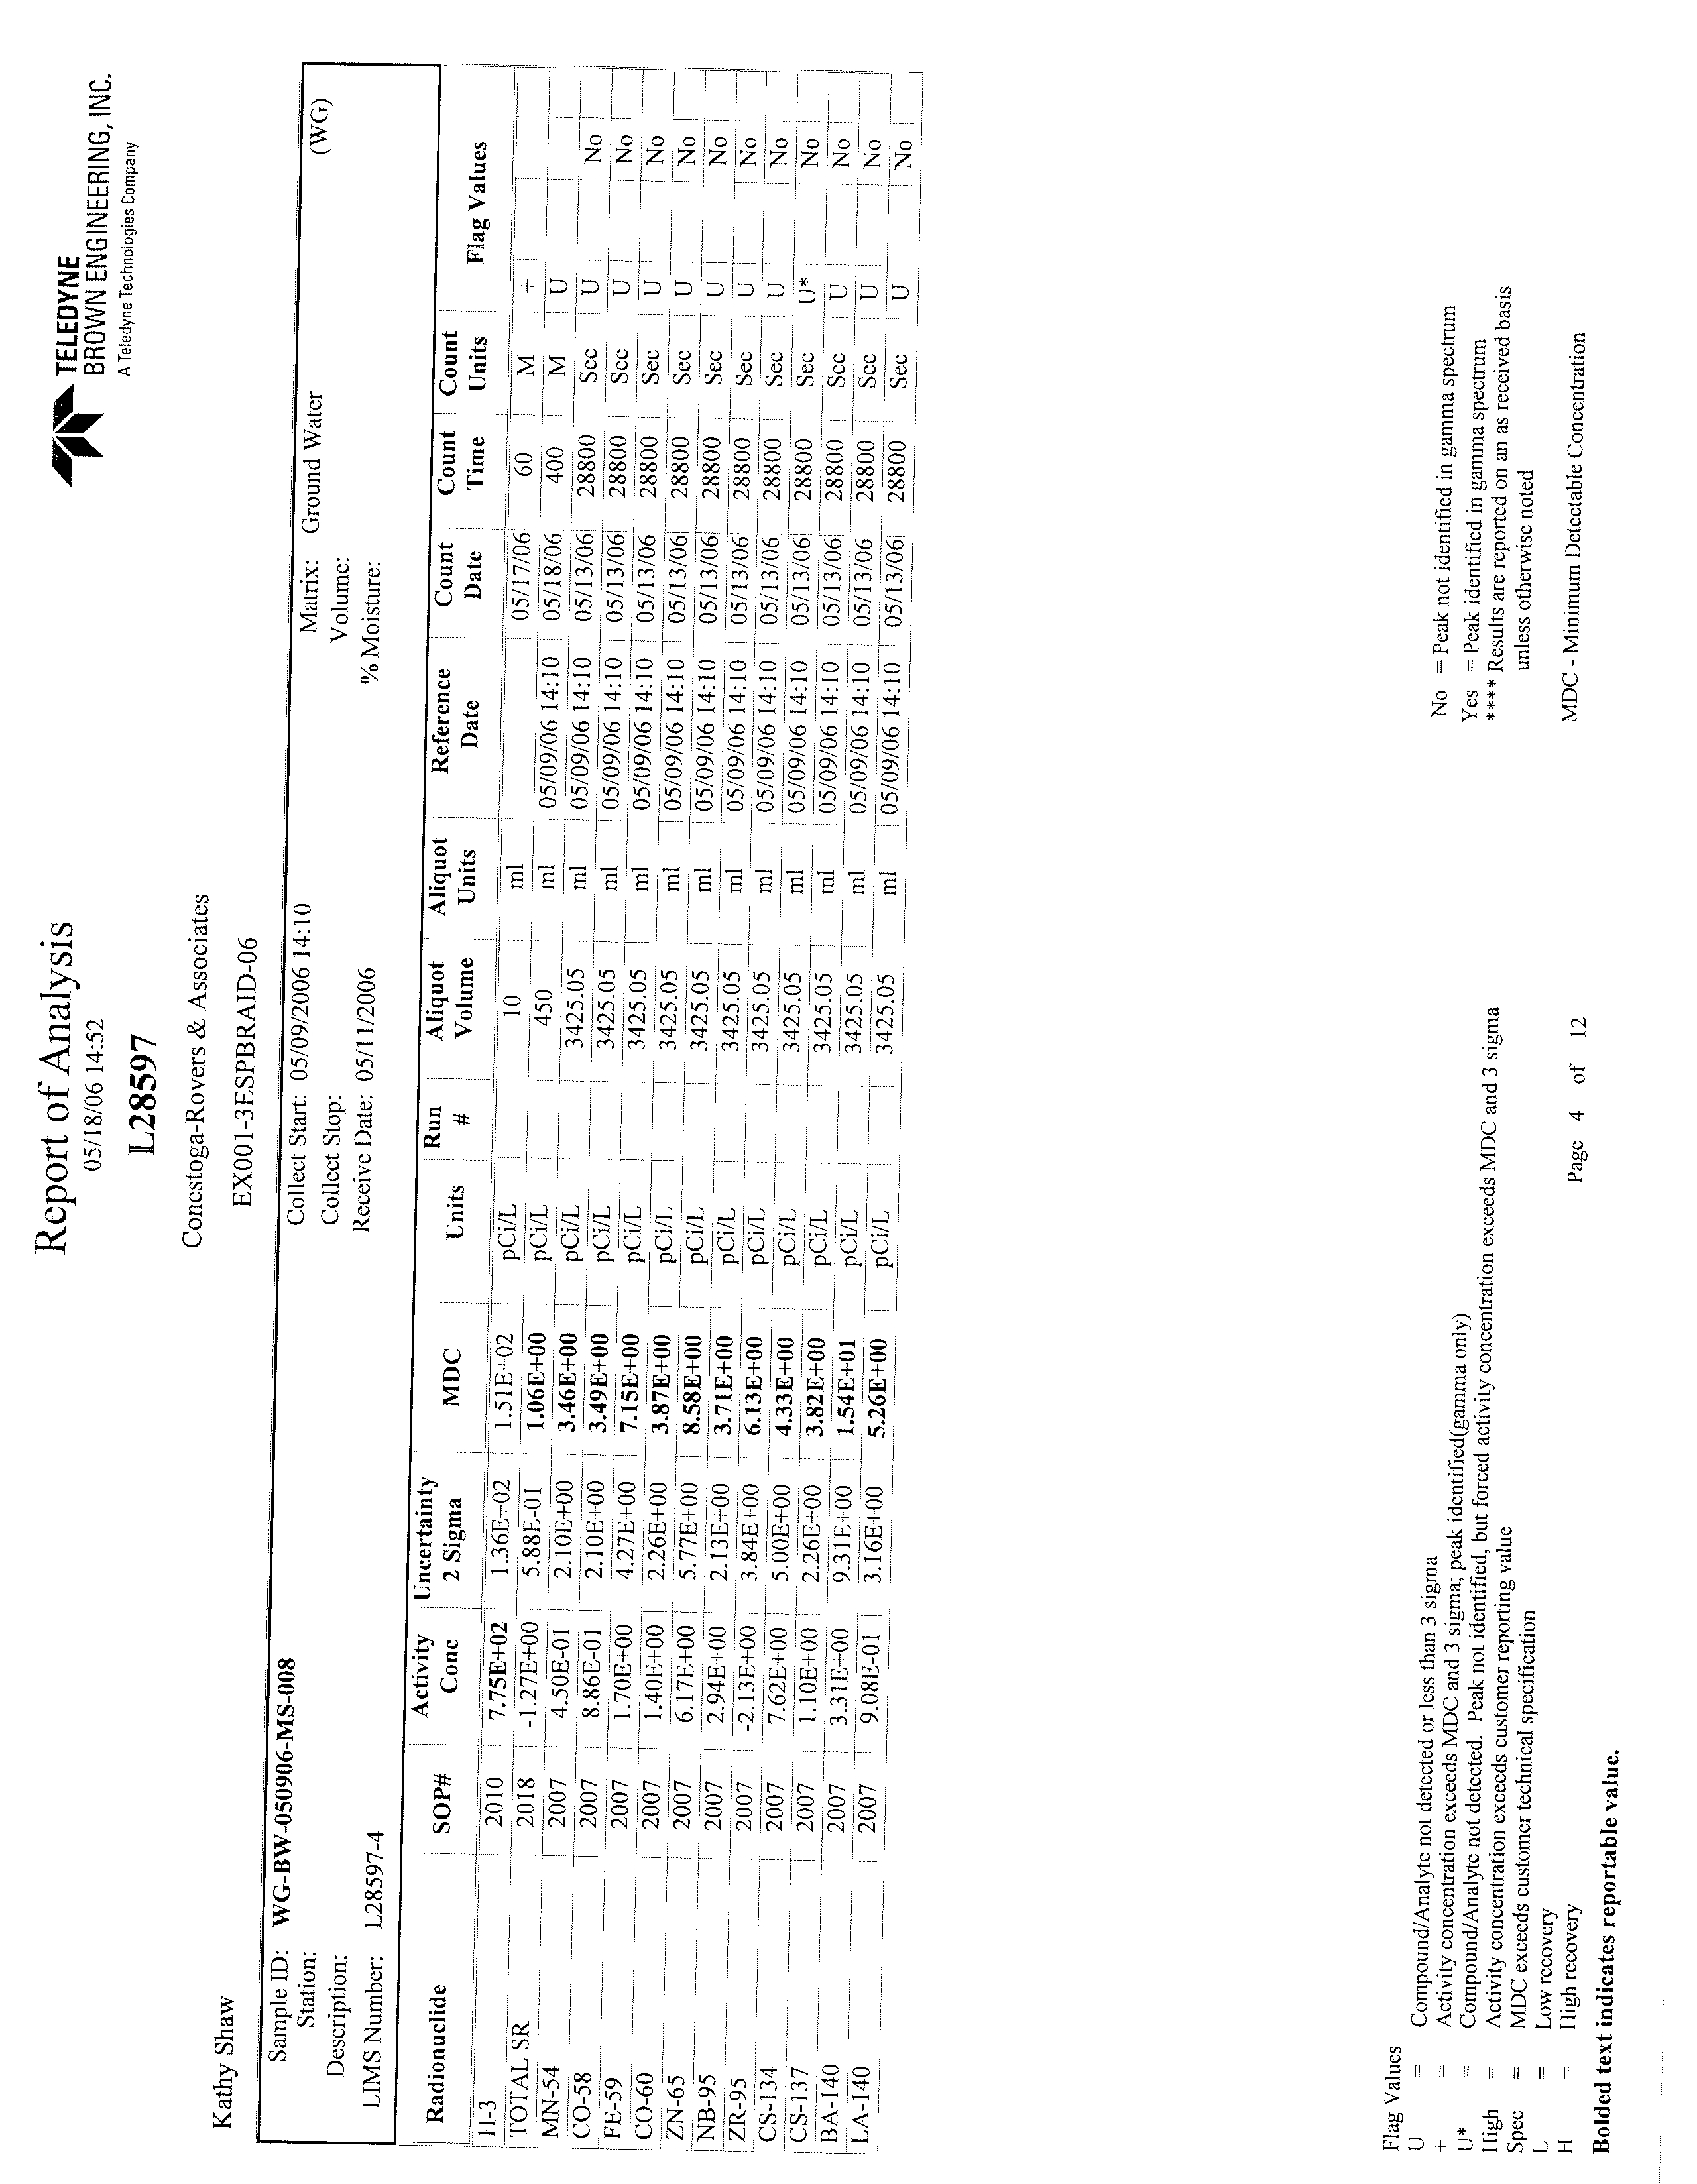
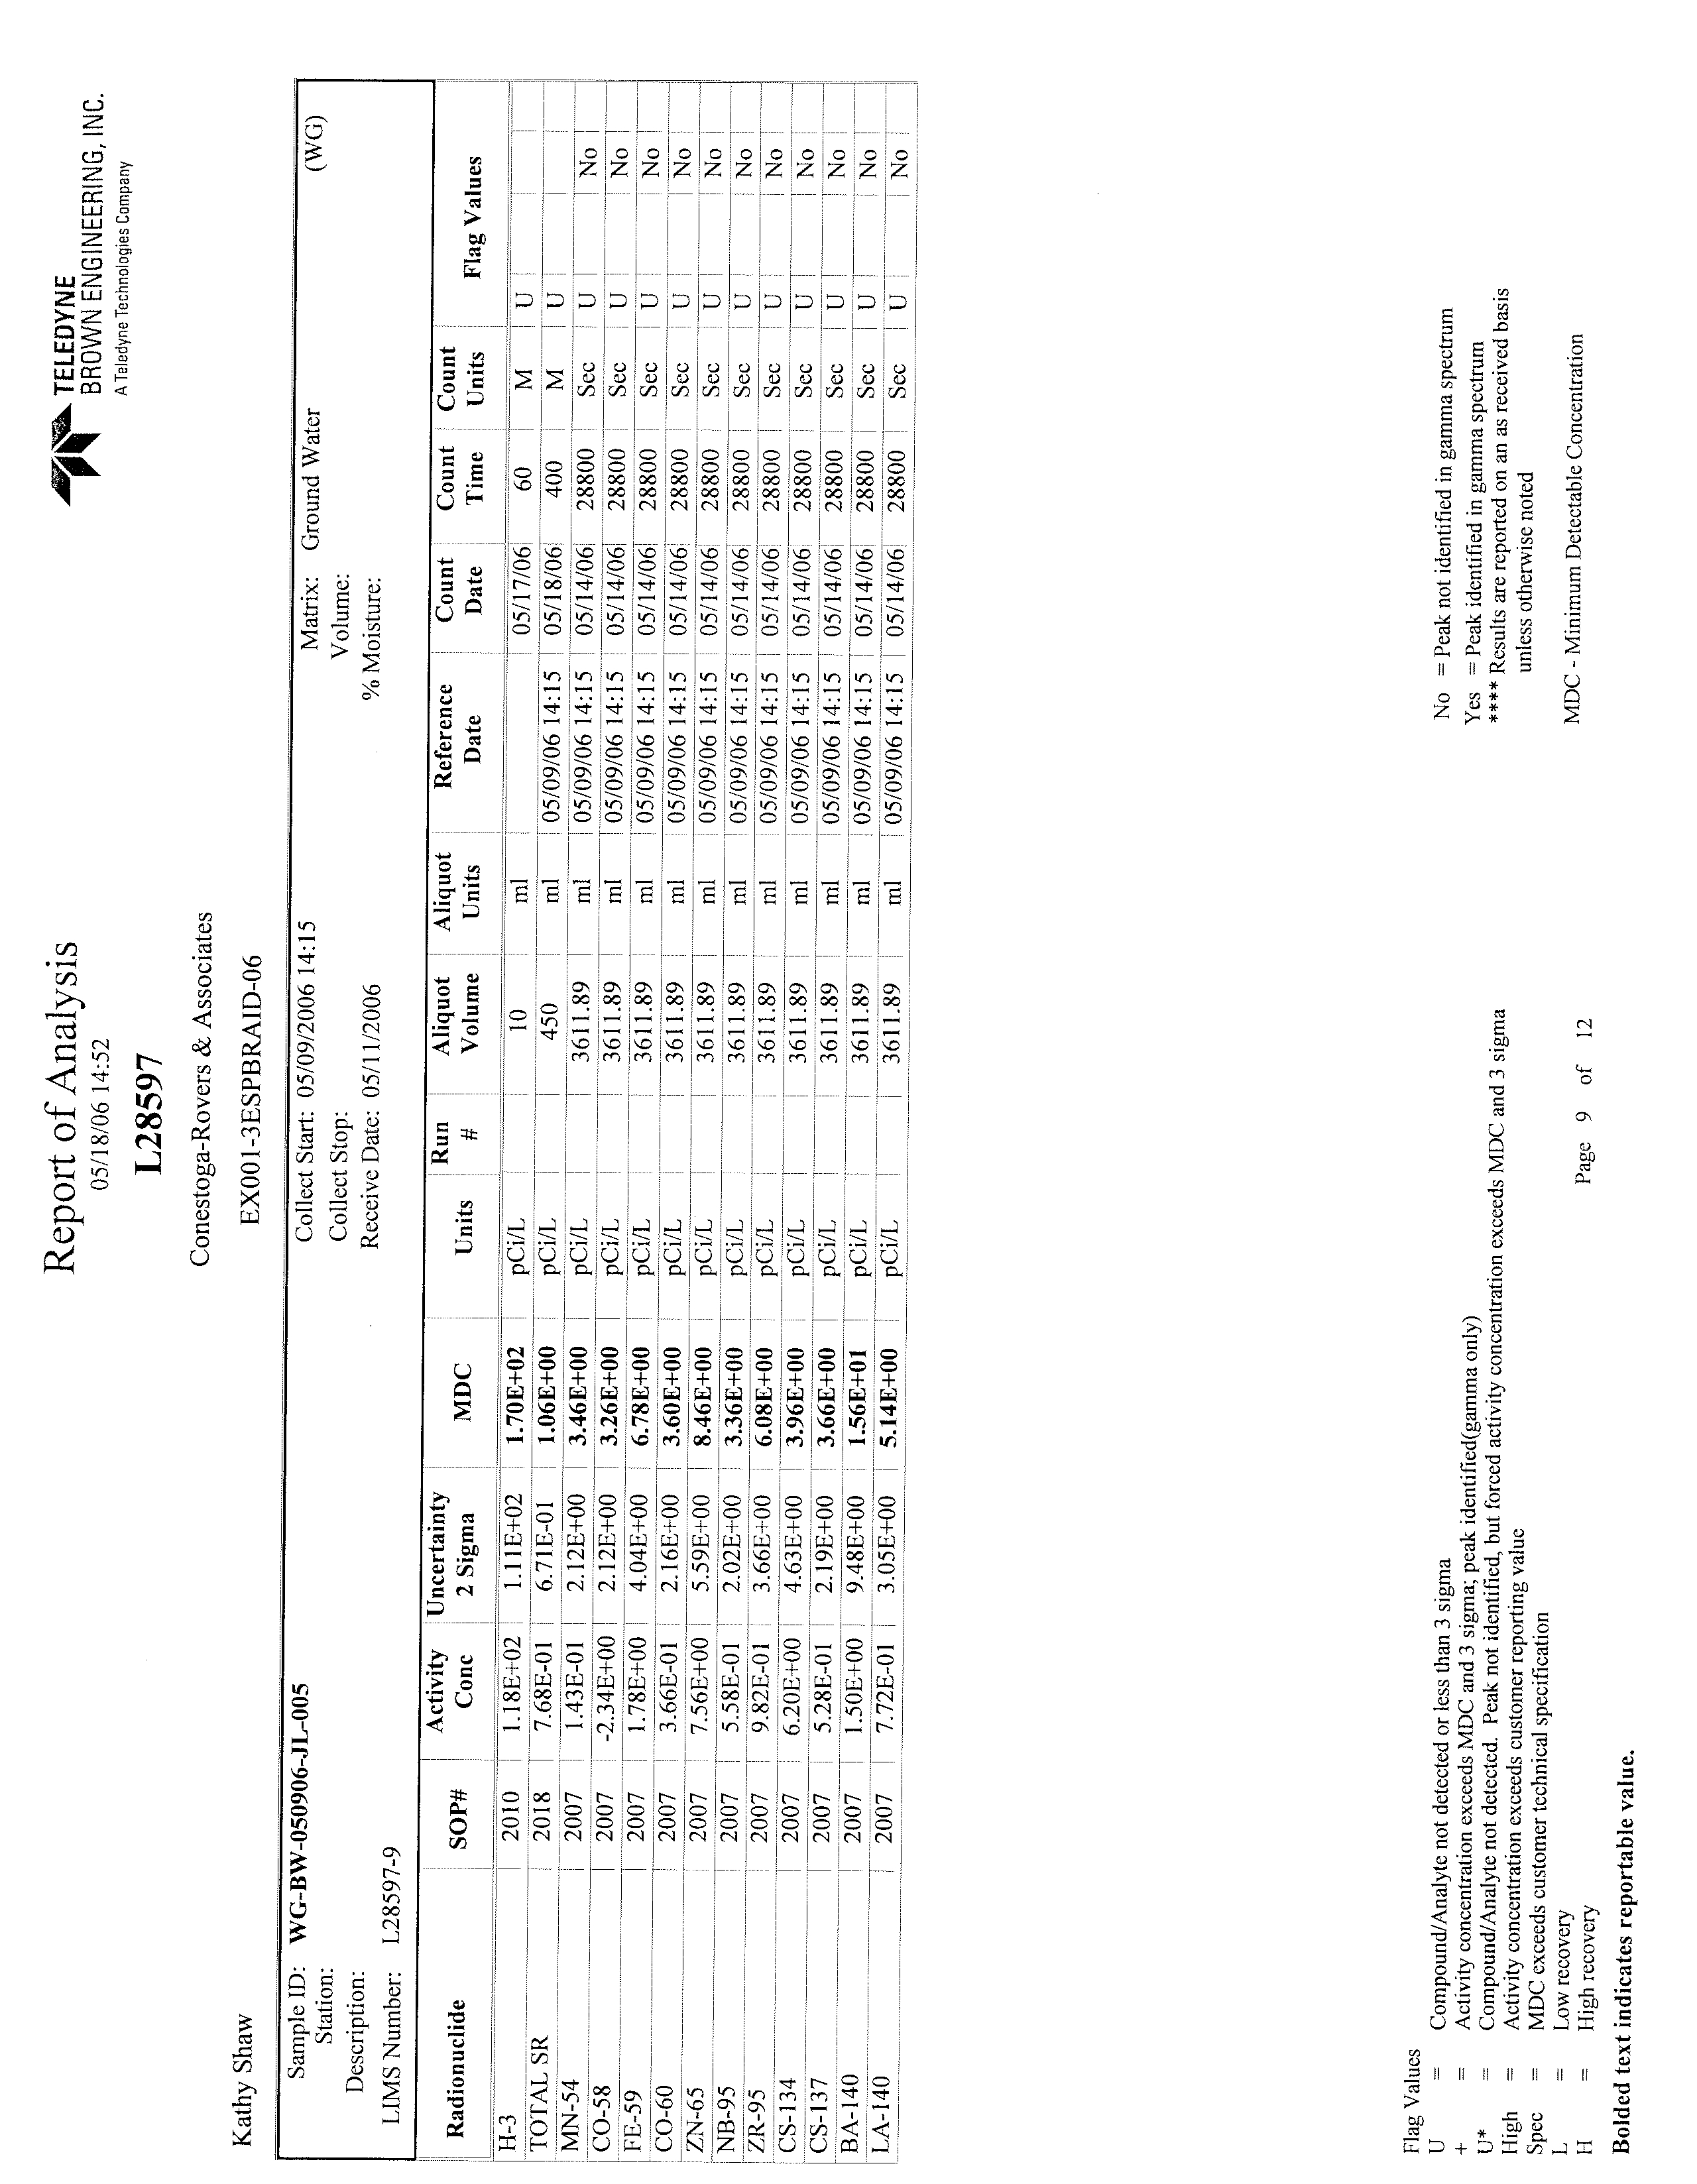
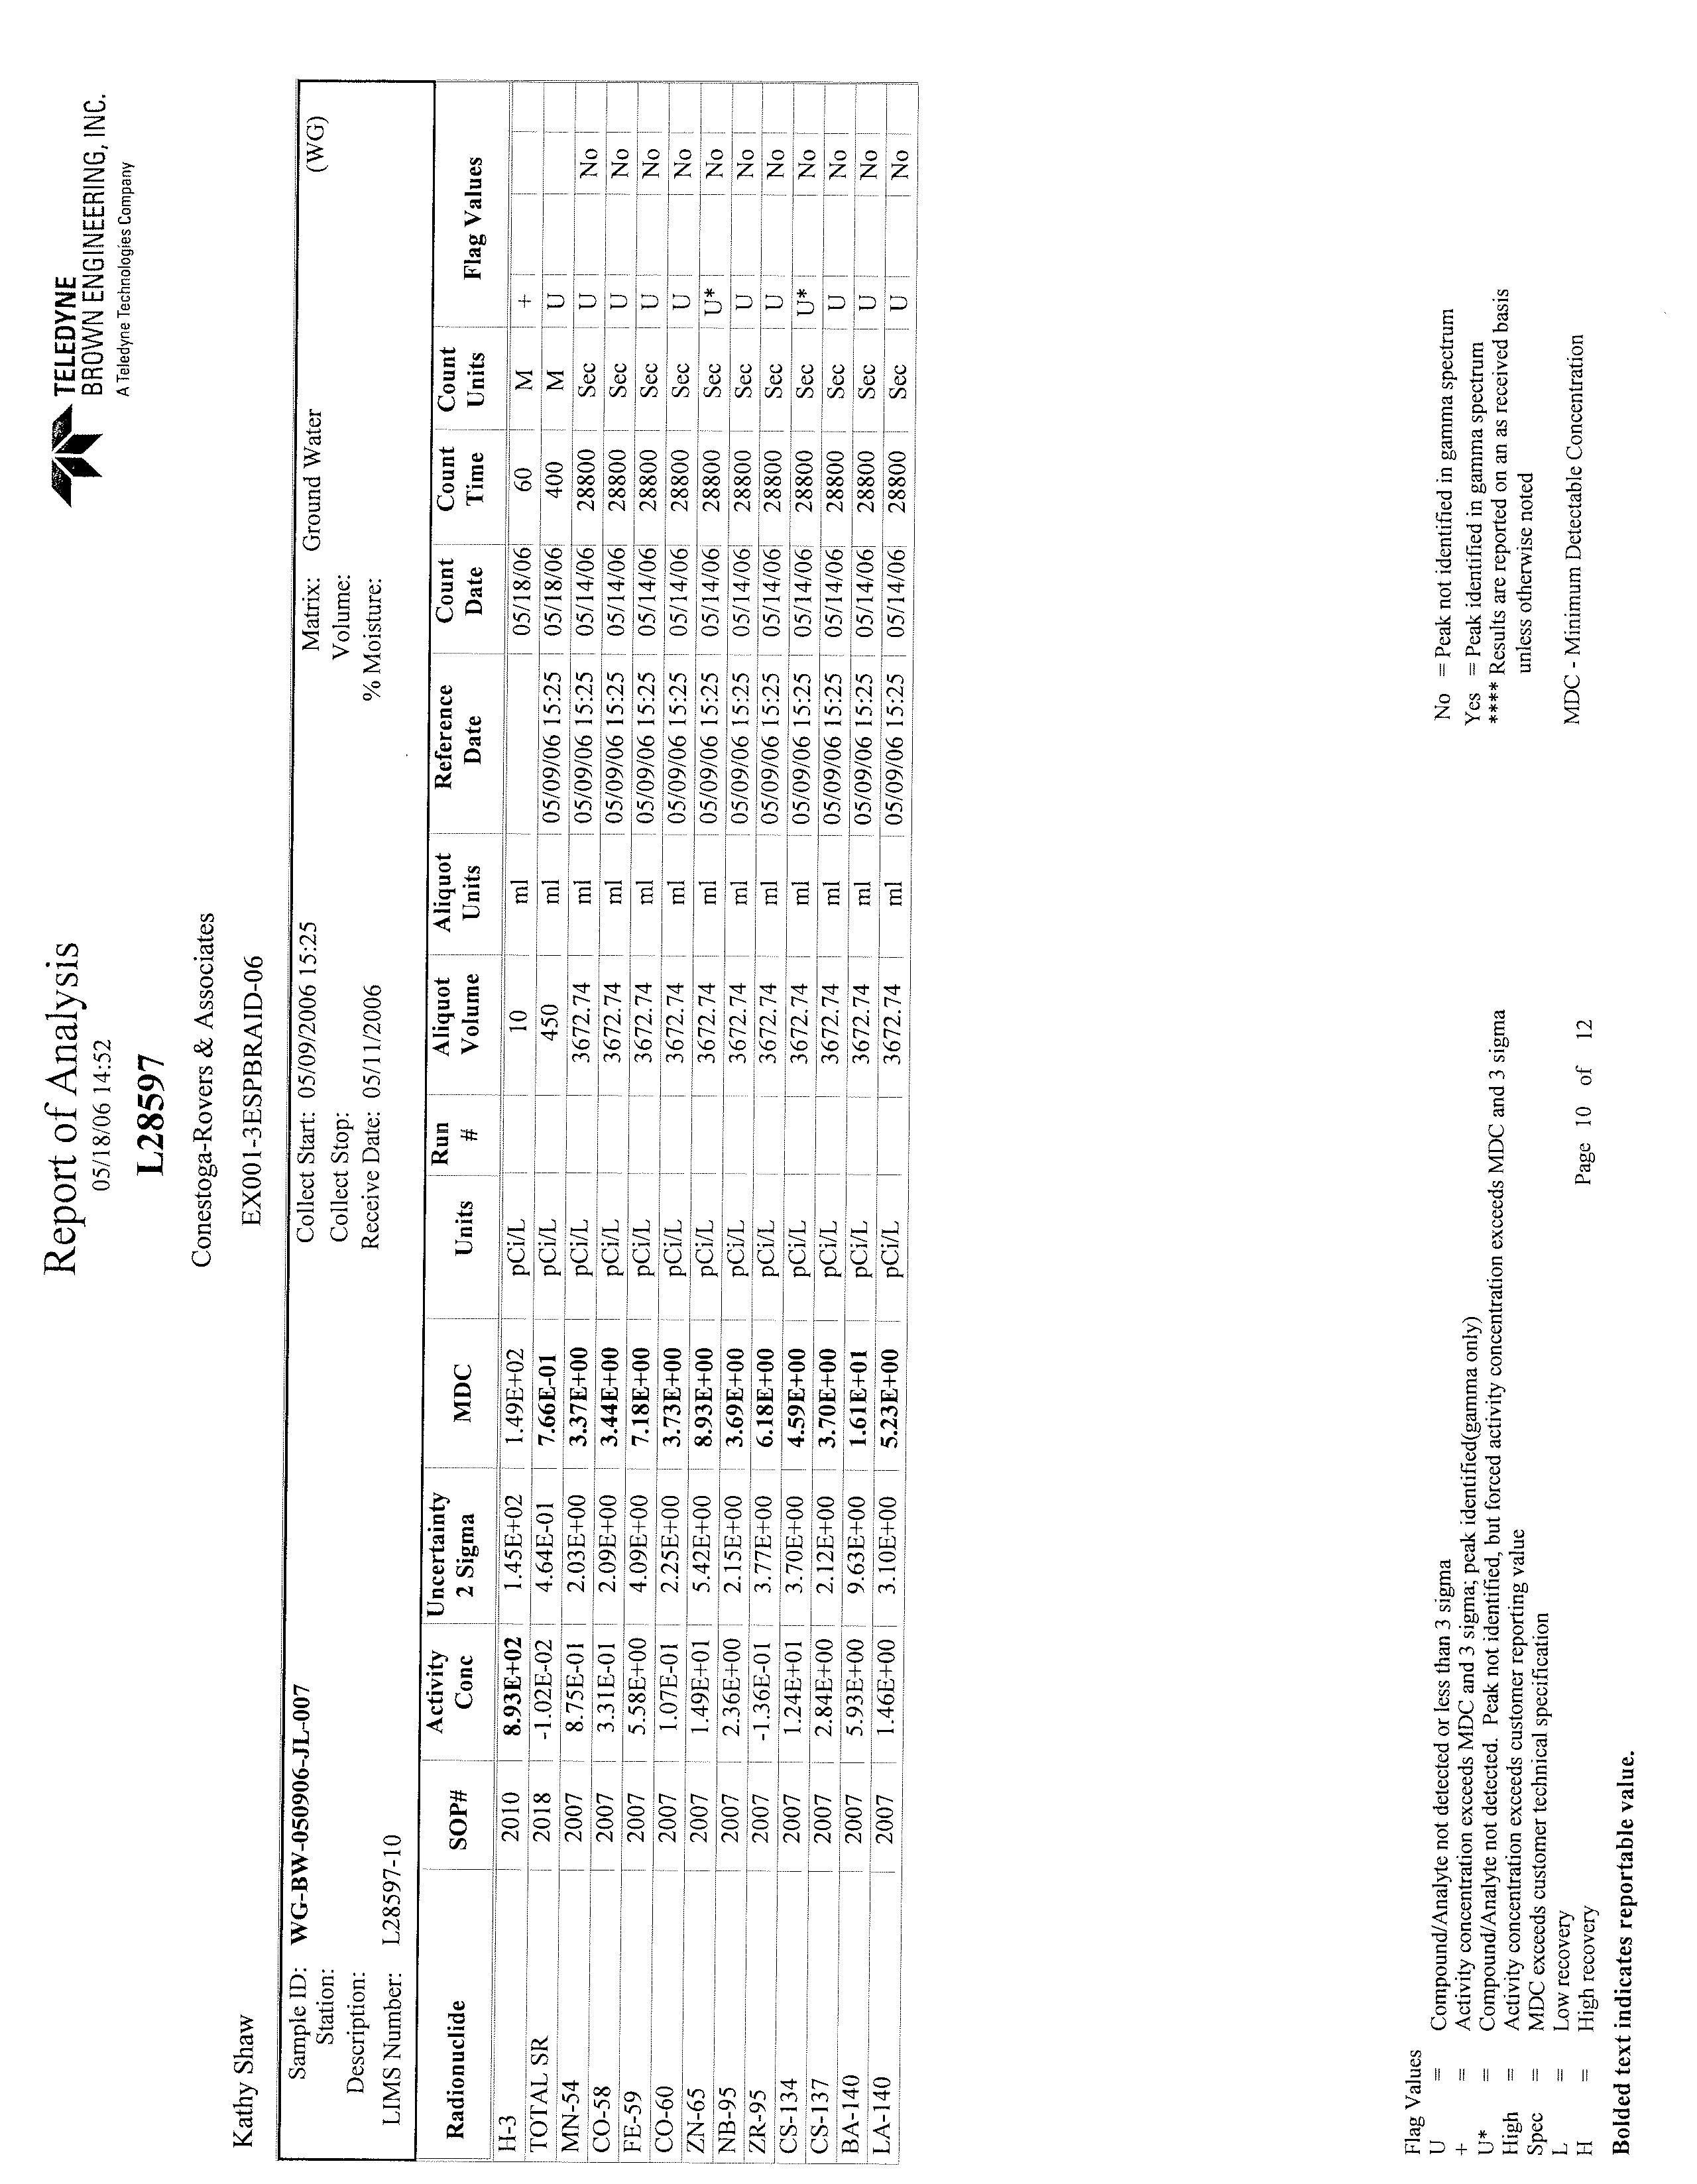
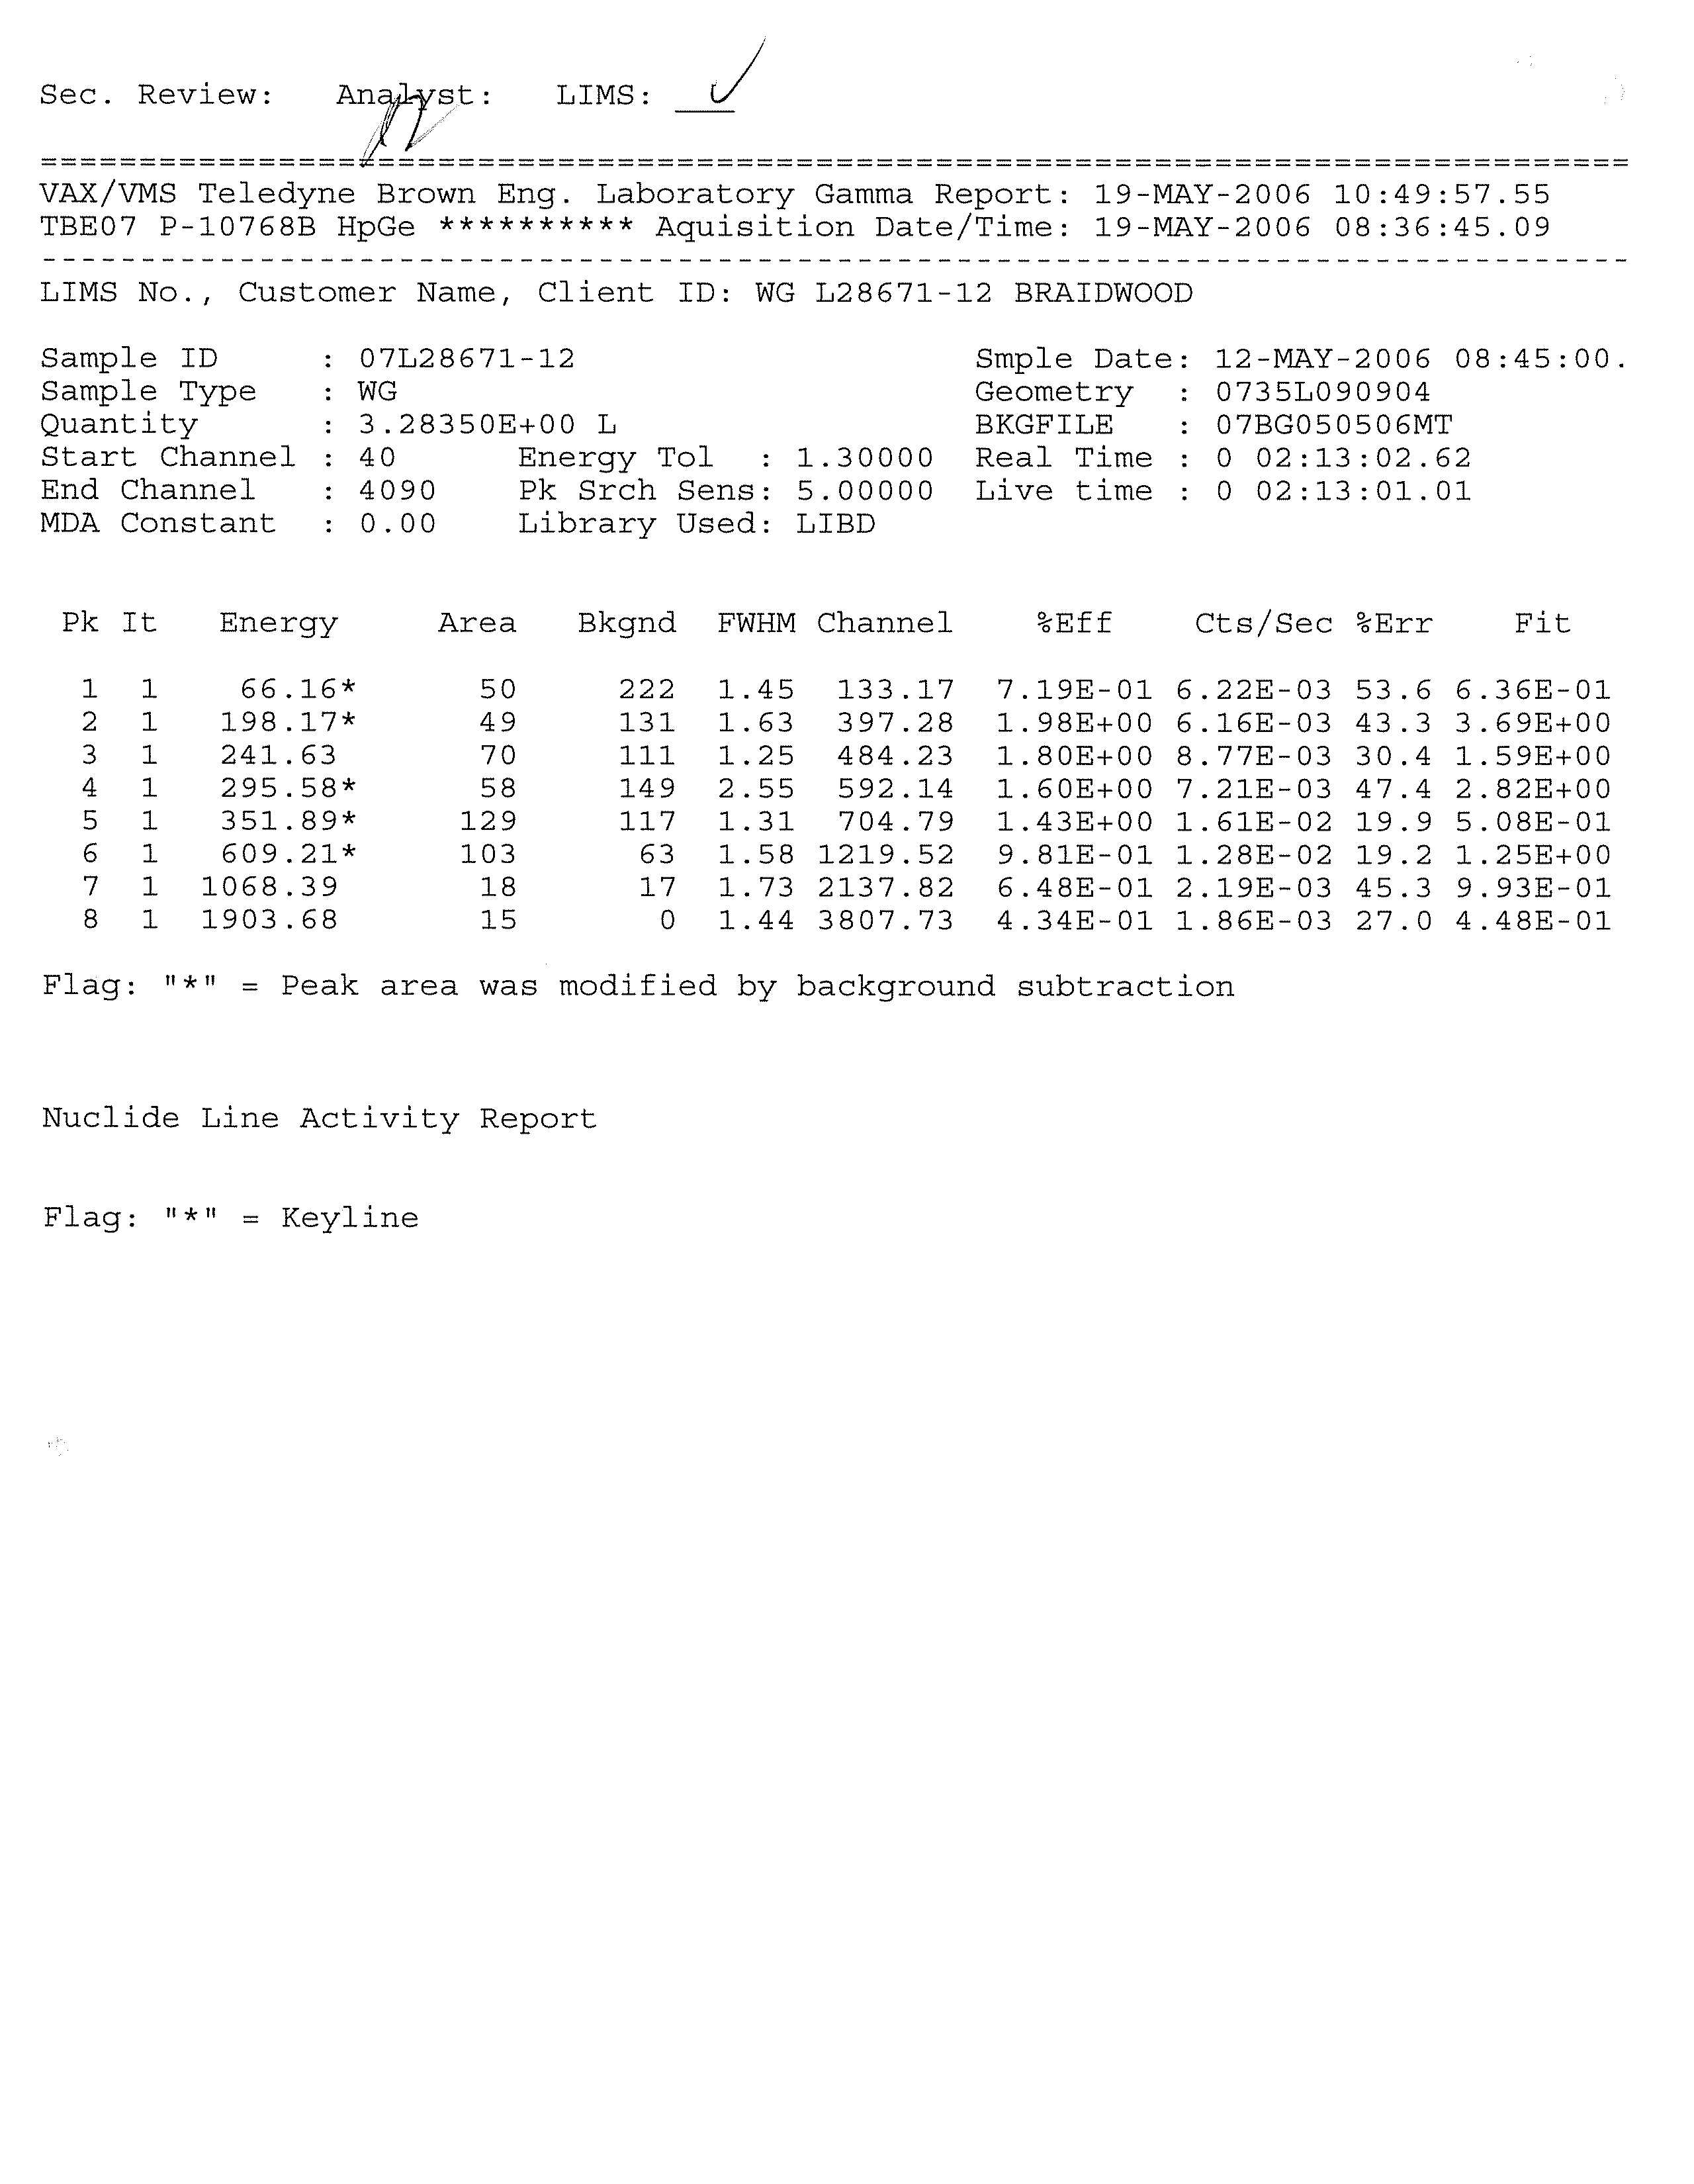
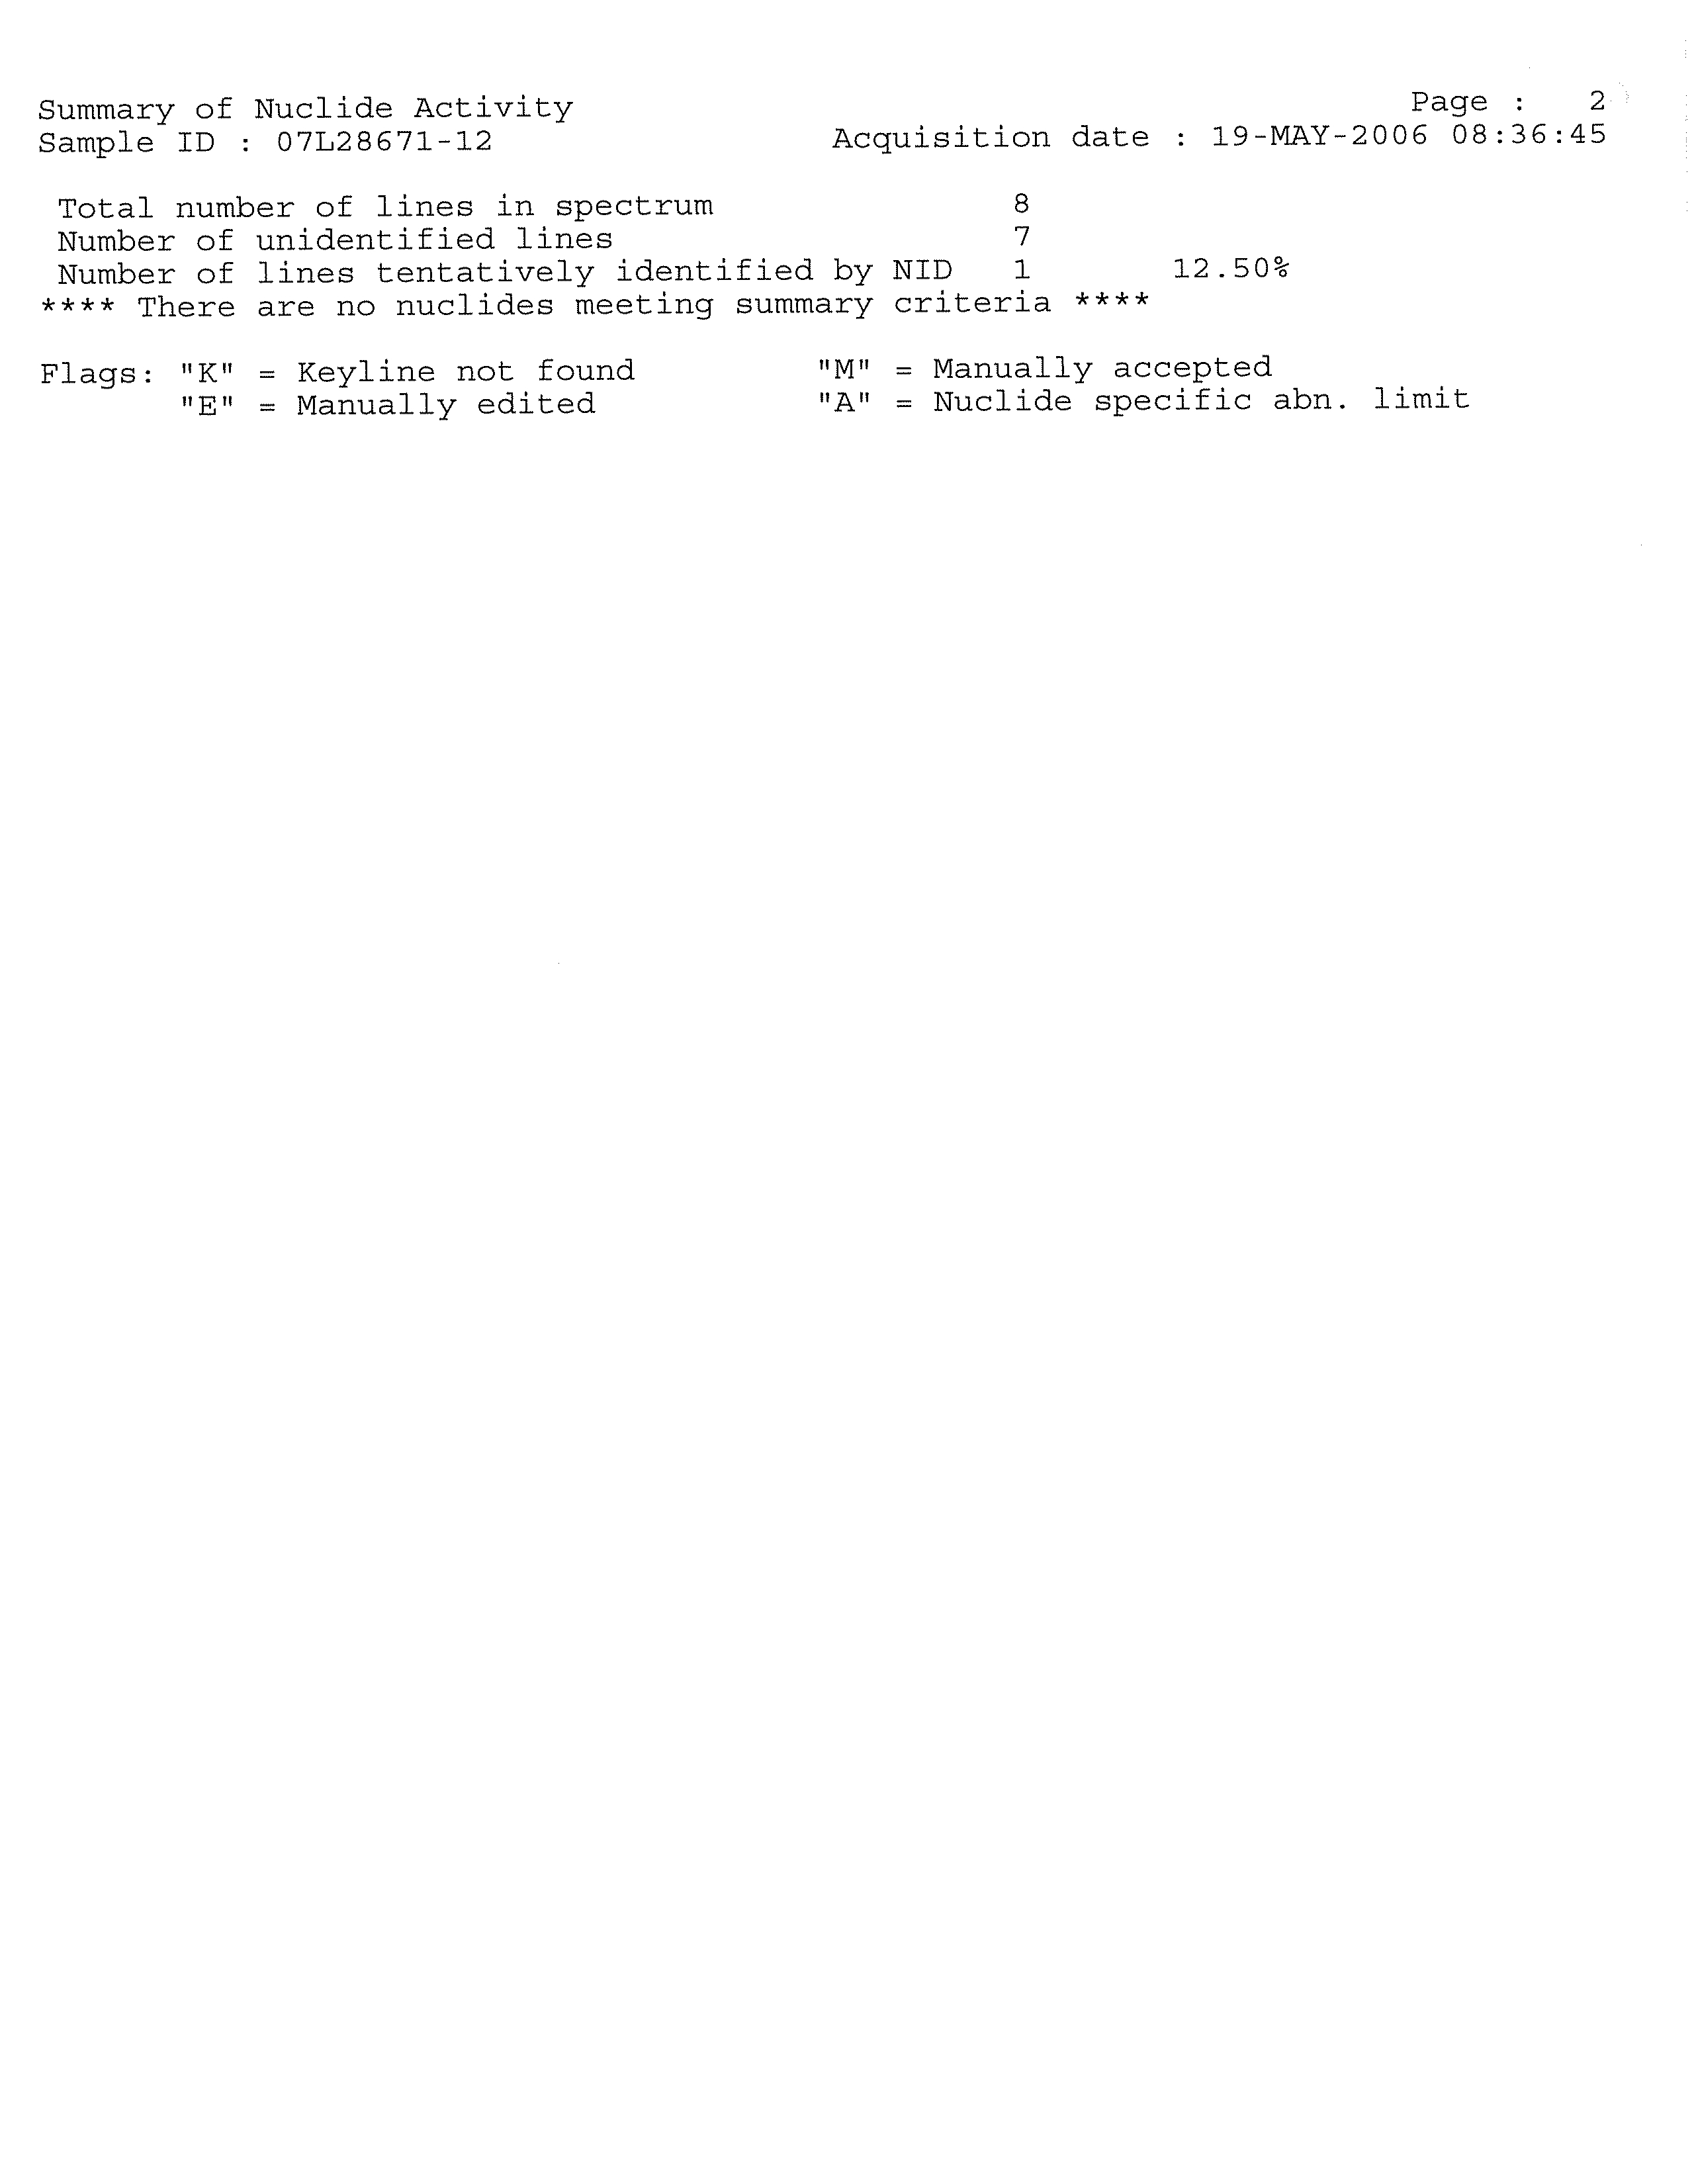
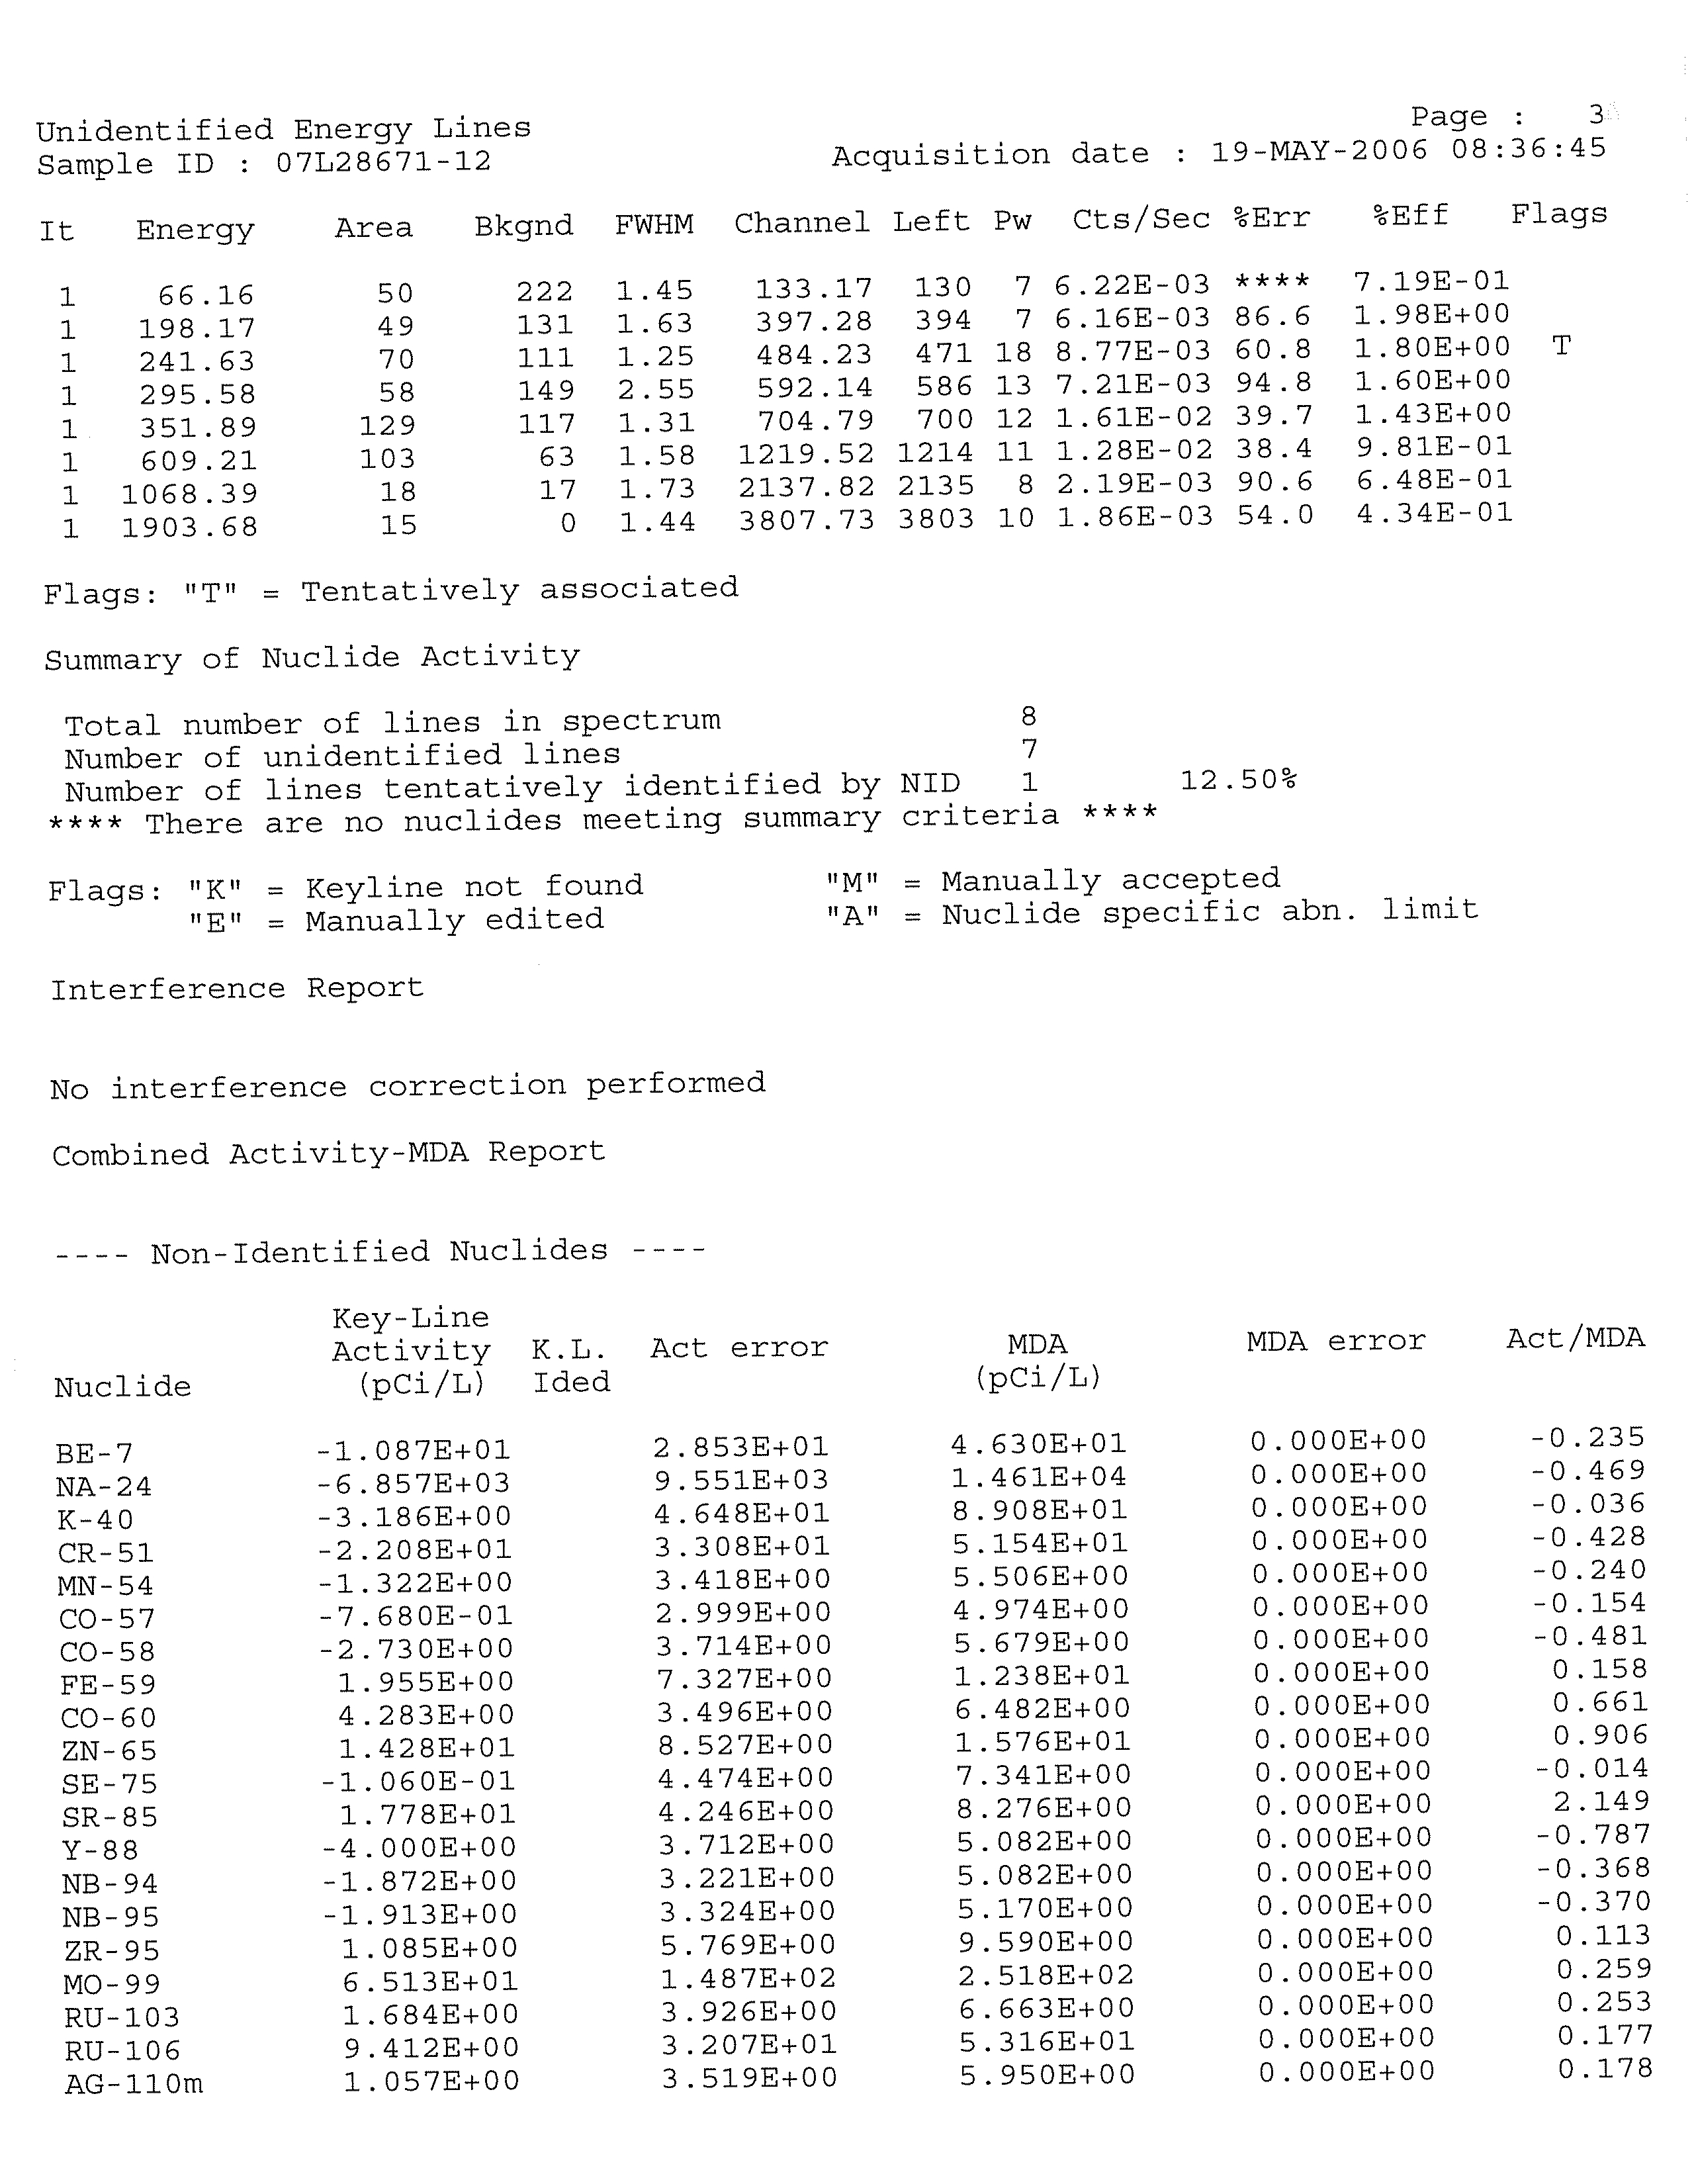
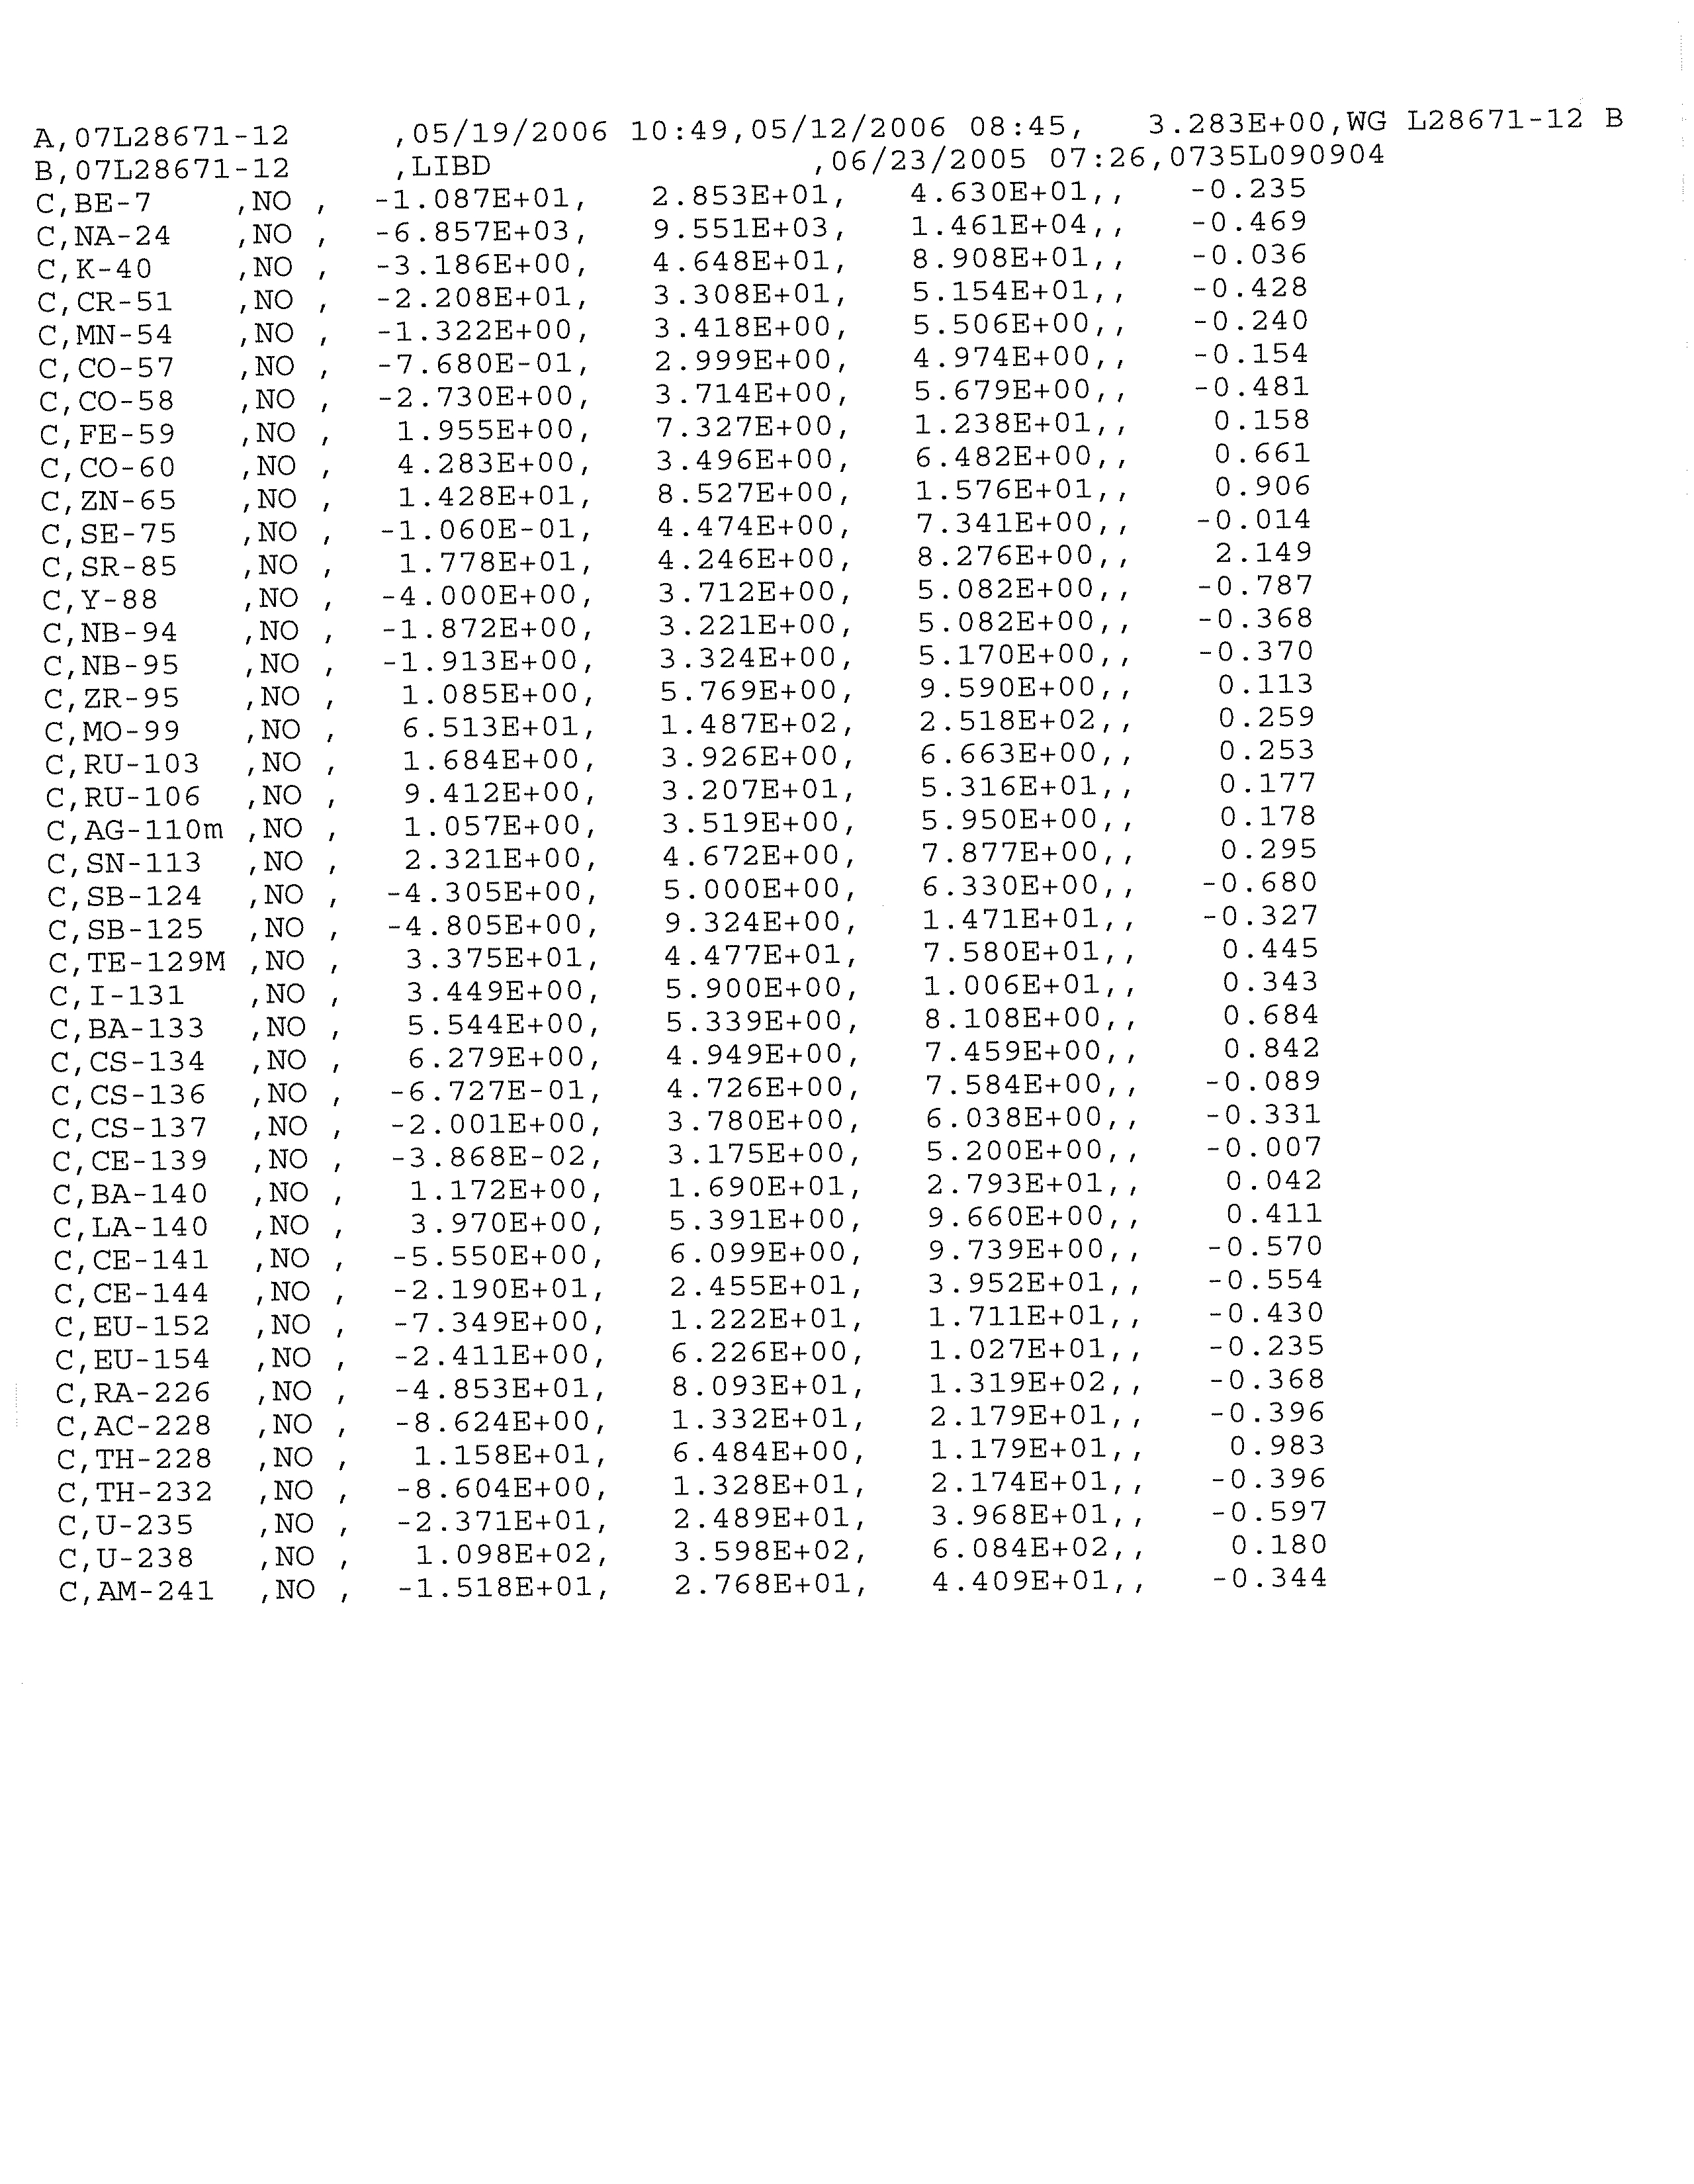
LABORATORY ANALYTICAL REPORTS
APPENDIX E
DATA VALIDATION MEMORANDUM
045136 (12) Braidwood Generation Station
CONESTOGA-ROVERS & ASSOCIATES
Revision 1
EXECUTIVE SUMMARY
This Hydrogeologic Investigation Report (HIR) documents the results of
Conestoga-Rovers & Associates' (CRA's) May
2006 Hydrogeologic Investigation Work
Plan (Work Plan) and associated correspondence pertaining to the Braidwood
Generating Station in Braceville, Illinois. CRA prepared this HIR for Exelon as part of its
Fleetwide Program to determine whether groundwater at and in the vicinity of its
nuclear power generating facilities has been adversely impacted by any releases of
radionuclides.
CRA collected and analyzed information on any historical releases, the structures,
components,
and areas of the Station that have the potential to release tritium or other
radioactive liquids to the environment and past hydrogeologic investigations at the
Station. CRA used this information, combined with its understanding of groundwater
flow and sample locations at the Station to identify the Areas for Further Evaluation
(AFEs) for the Station.
CRA collected 45 groundwater samples and six surface water samples at the Station.
CRA also collected a full round of water levels on two occasions from the newly
installed and existing
wells and measured surface water levels. All groundwater and
surface water samples were analyzed for tritium, strontium-89/90, and gamma-emitting
radionuclides.
This HIR does not discuss the investigations of tritium in groundwater along the
Braidwood Station Blowdown Line. This report
focuses on the groundwater conditions
in and near the Protected Area (PA). The results of this hydrogeologic investigation are:
•
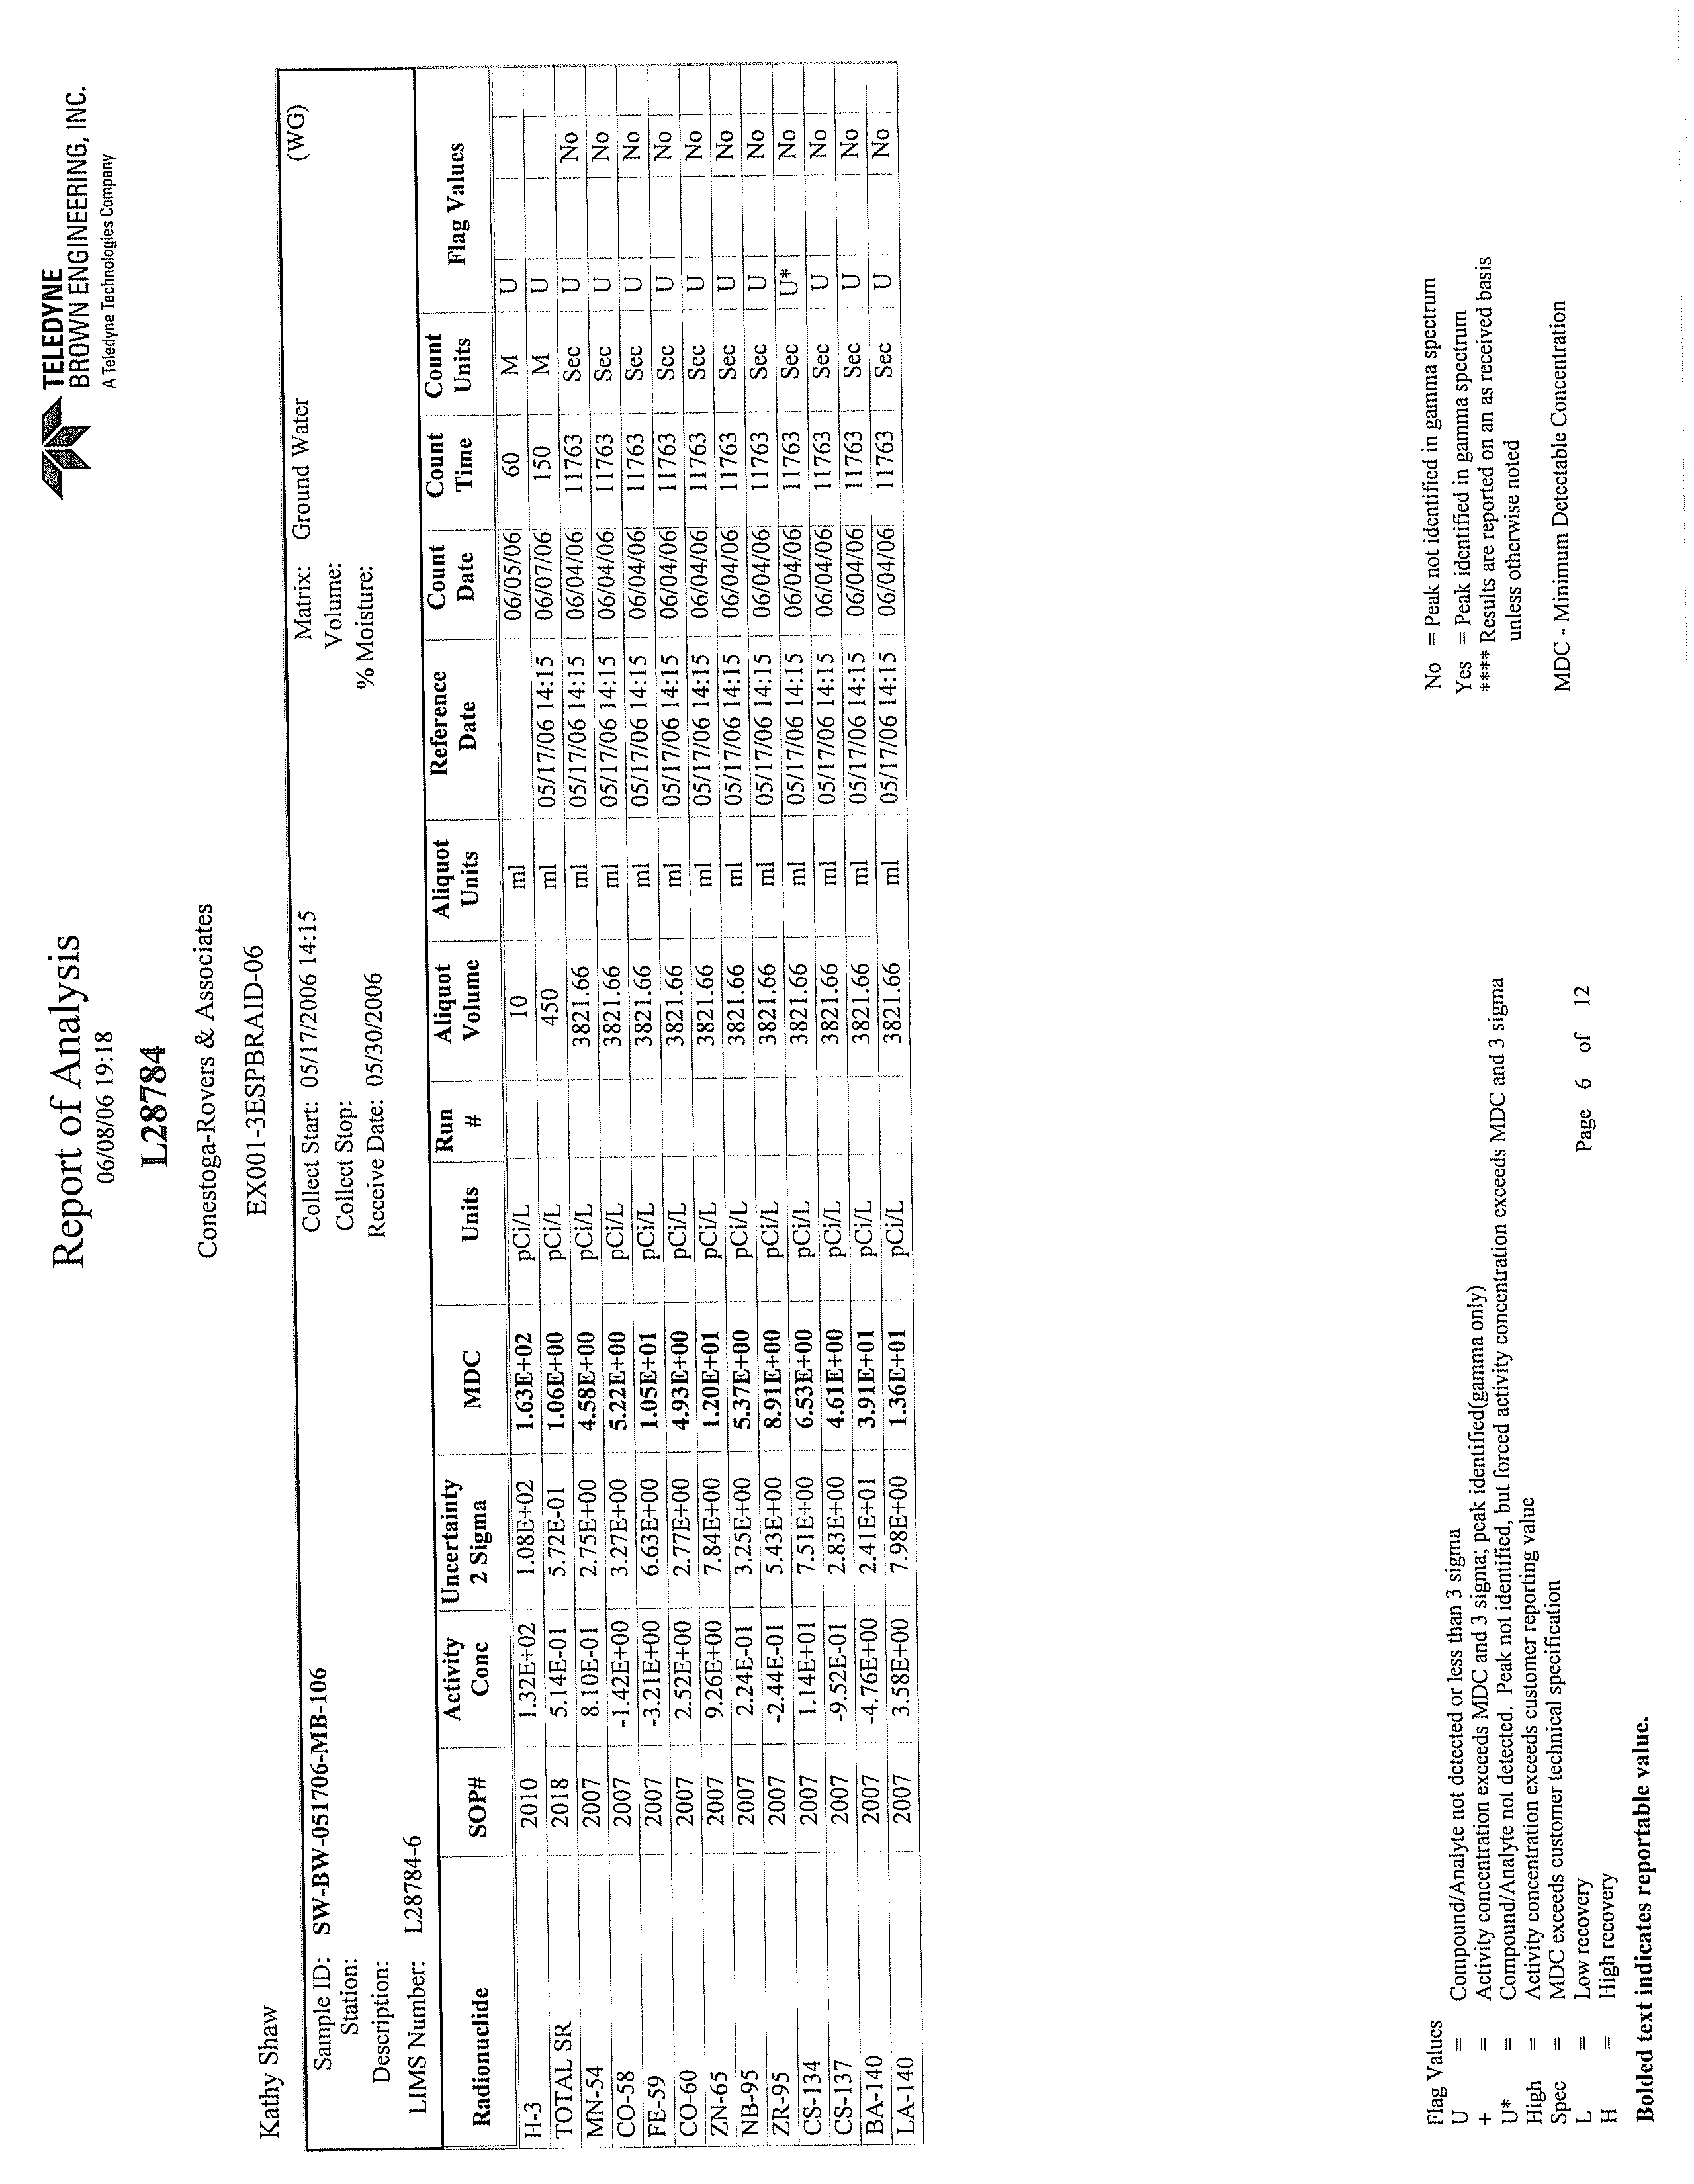
Gamma-emitting radionuclides associated with licensed plant operations were not
detected at concentrations greater than their respective Lower Limits of Detection
(LLDs) in any of the groundwater or surface water samples obtained and analyzed
during the course of this investigation;
•
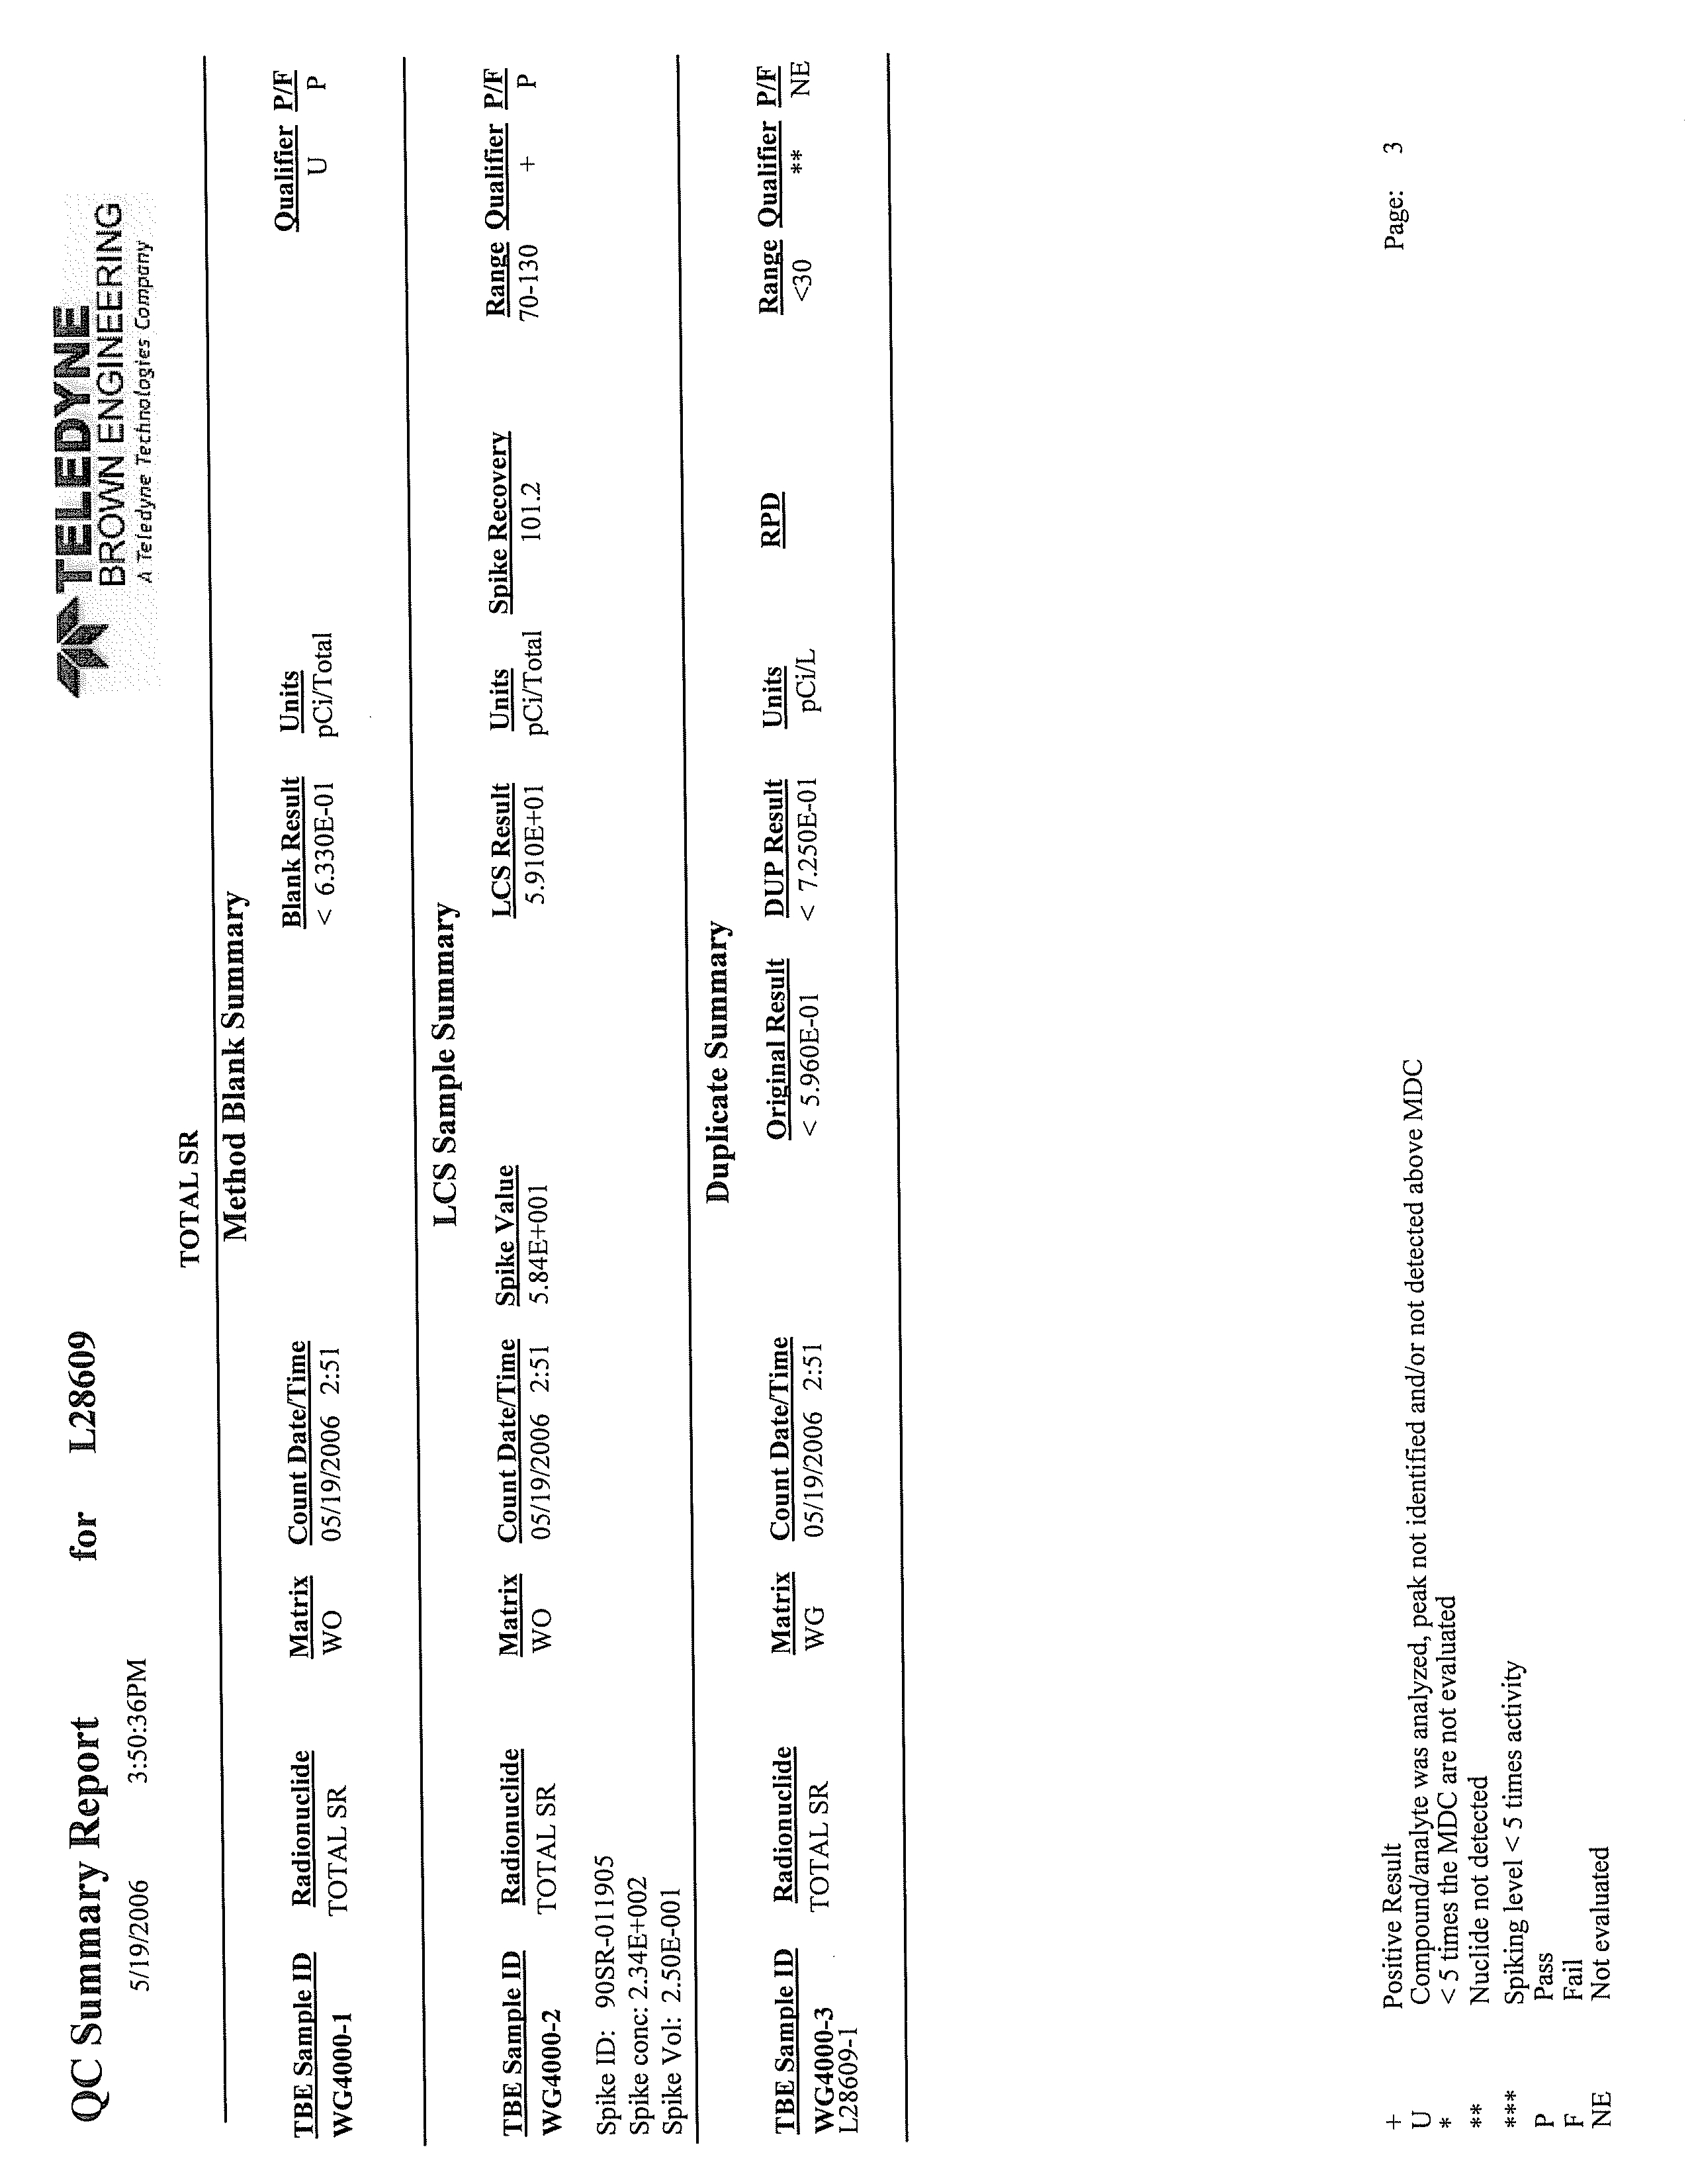
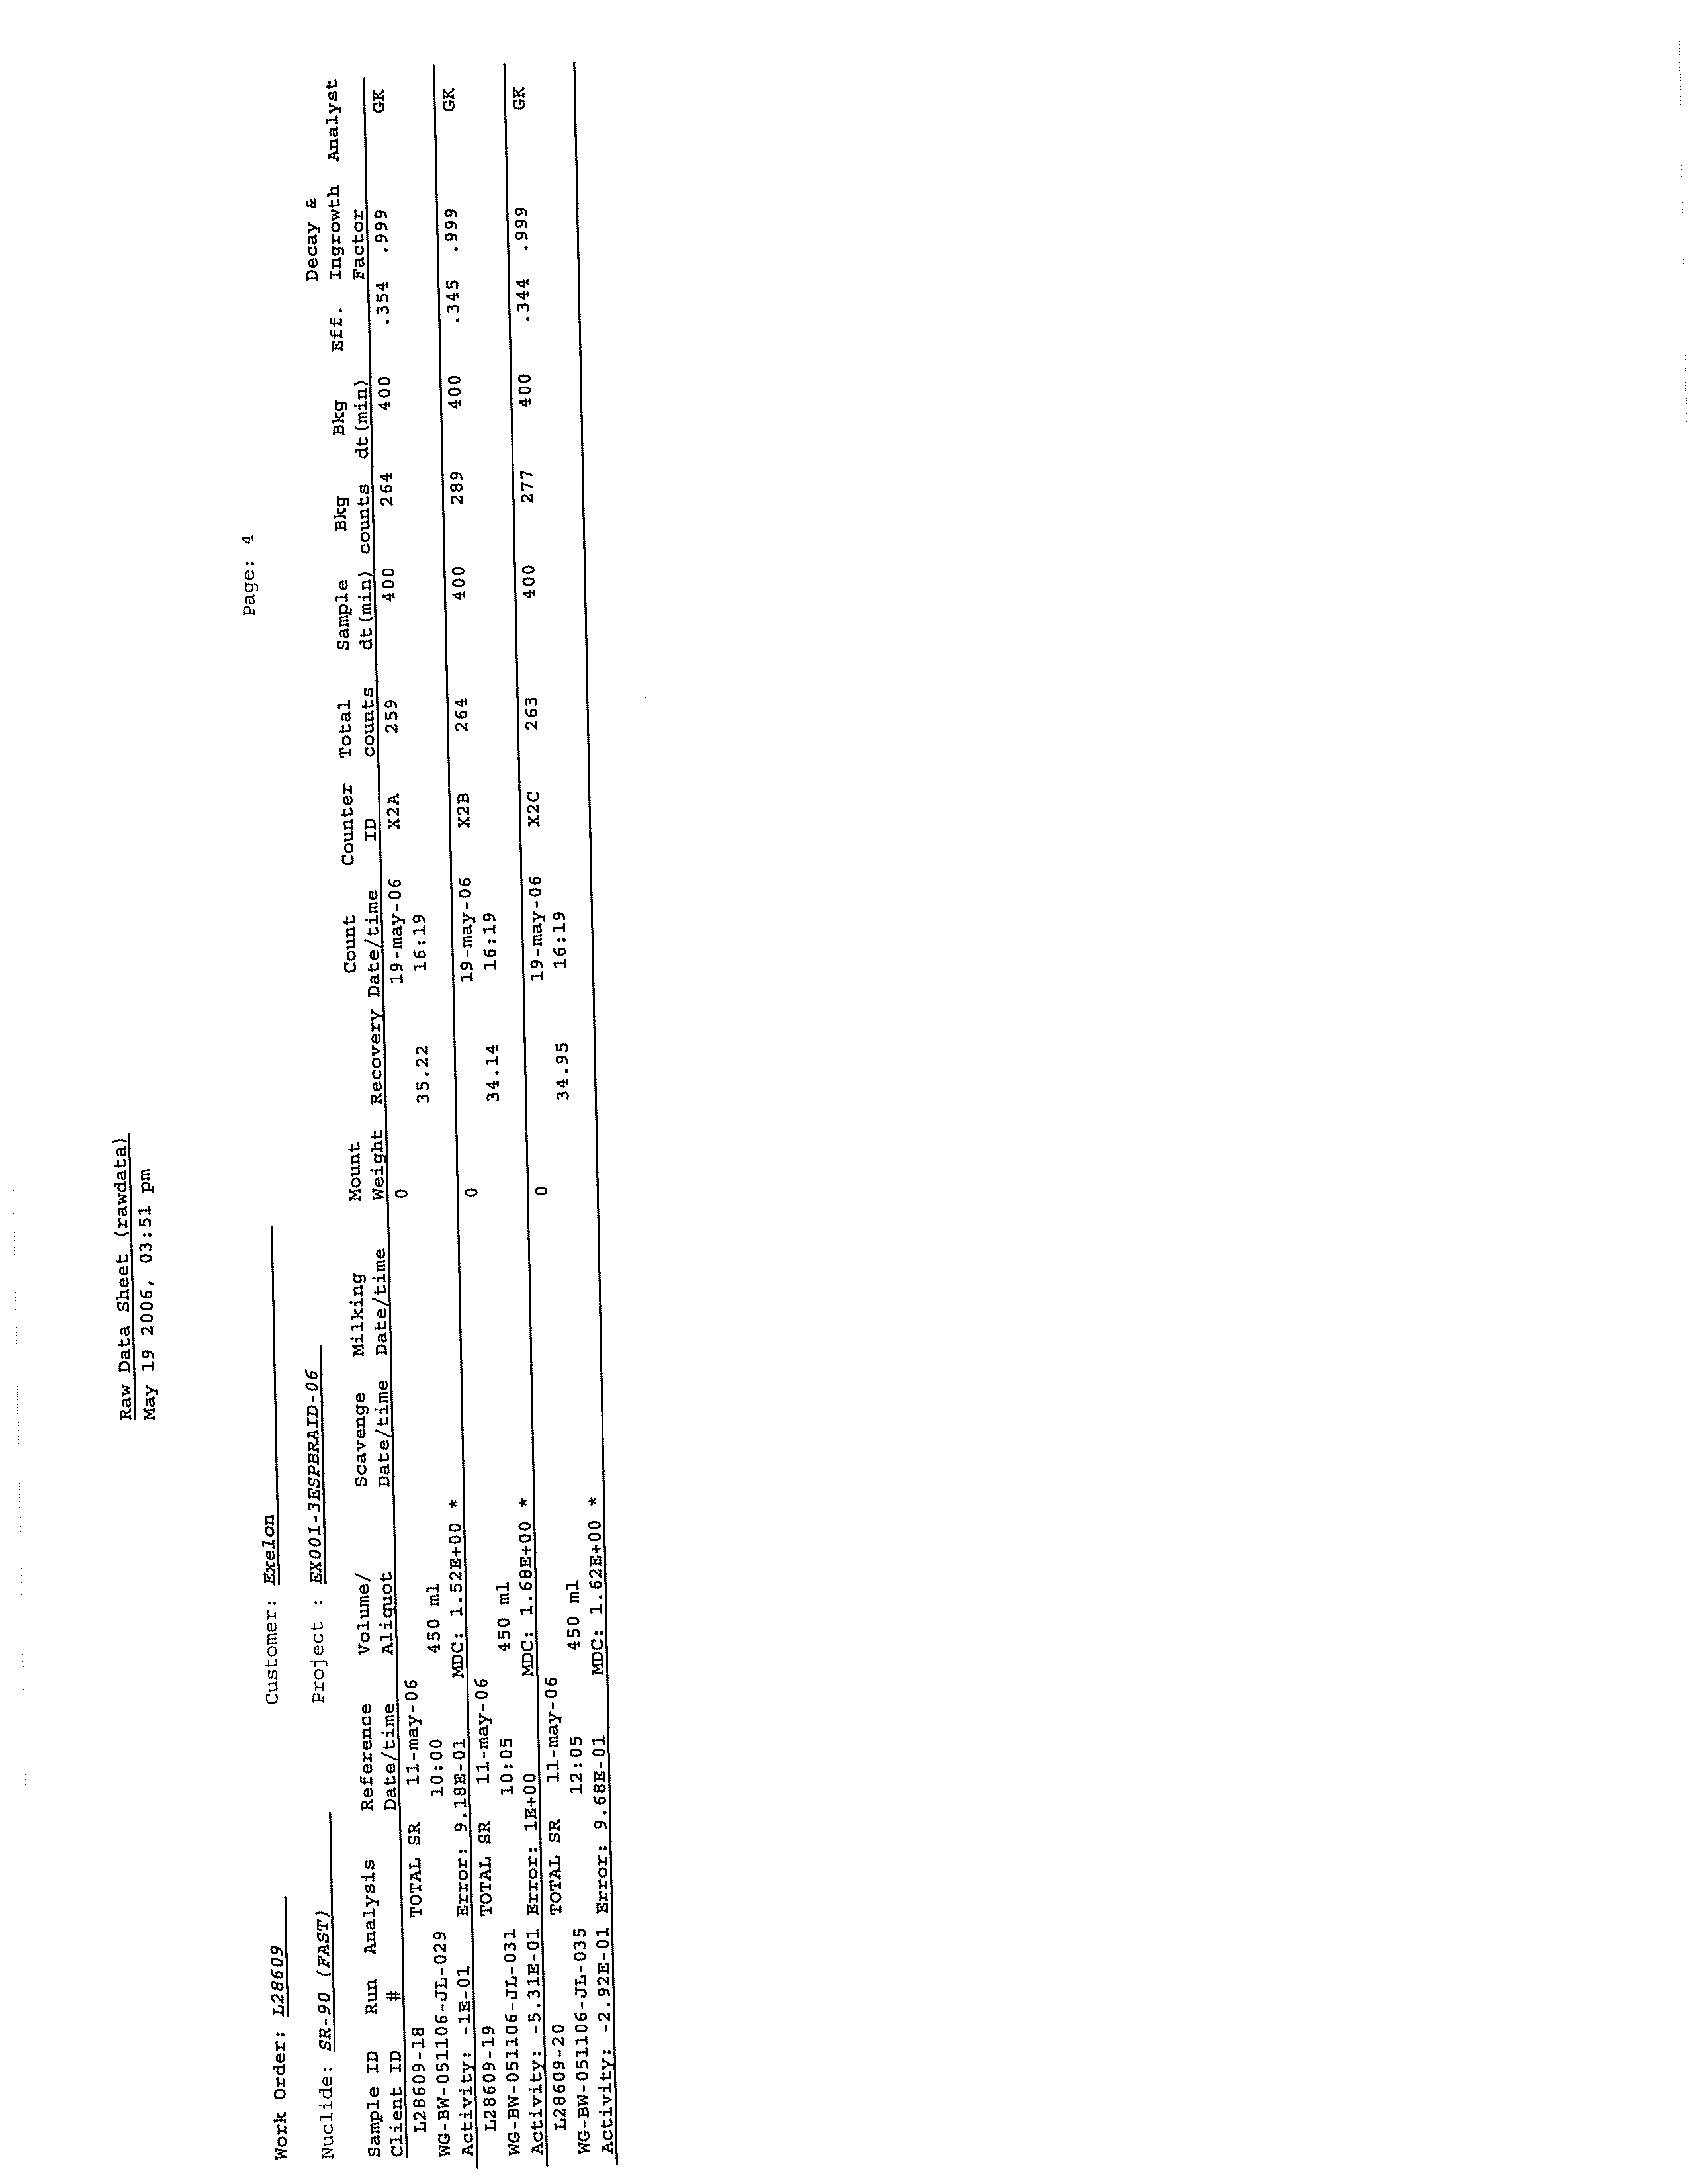
Strontium-89/90 was not detected at a concentration greater than the LLD of
2.0 picoCuries per liter (pCi/L) in any of the groundwater or surface water samples
obtained and analyzed during the course of this investigation;
•
Tritium was not detected in any of the groundwater or surface water samples
obtained during the course of this investigation at concentrations greater than the
United States Environmental Protection Agency drinking water standard of
20,000 pCi/L;
045136 (12) Braidwood Generation Station
i
CONESTOGA-ROVERS & ASSOCIATES
Revision 1
•
Low levels of tritium were detected at concentrations greater than the LLD of
200 pCi/L in 15 of 45 groundwater monitoring locations.
These tritium
concentrations ranged from 204 (± 112 pCi/L) to 1,040 (± 172 pCi/L);
•
Most of the tritium that was detected in groundwater at the Station is on the west
side of the Turbine building and is believed to be the result of isolated historical
releases;
•
Based on the results of this investigation, tritium is not migrating off the Station
property at detectable concentrations;
•
Based on the results of this investigation, there is no current risk from exposure to
radionuclides associated with licensed plant operations through any of the identified
potential exposure pathways; and
•
Based on the results of this investigation, there are no known active releases into the
groundwater at the Station.
Based upon the information collected to date, CRA recommends that Exelon conduct
periodic monitoring of selected locations.
045136 (12) Braidwood Generation Station
ii
CONESTOGA-ROVERS & ASSOCIATES
Revision 1
1.0
INTRODUCTION
Conestoga-Rovers & Associates (CRA) has prepared this Hydrogeologic Investigation
Report (HIR) for Exelon Generating Company, LLC (Exelon) as part of its fleetwide
program to determine whether groundwater at and near its nuclear power generating
facilities has been adversely impacted by any releases of radionuclides. This report
documents the results of CRA's May 2006 Hydrogeologic Investigation Work Plan
(Work Plan), as well as, several other investigative tasks recommended by CRA during
the course of the investigation. These investigations pertain to Exelon's Braidwood
Nuclear Power Station in Braceville, Illinois (Station) (see Figure 1.1).
The Station is defined as all property, structures, systems, and components owned and
operated by Exelon LLC located at 35100 South Route
53, Braceville, Illinois. The Station
boundaries for all areas of the Station are depicted on Figure 1.2 and Figure 1.3.
Pursuant to the Work Plan, CRA assessed groundwater quality at the Station in
locations
designated as areas for further evaluation (AFEs). The process by which CRA
identified AFEs is discussed in Section 3.0 of this report.
Since the spring of 2005, Exelon has performed investigations into the occurrence of
tritium along the blowdown line, as discussed in the following Section
2.0. This report
does not include discussions of hydrogeologic investigations related to the Braidwood
Station's Cooling Lake blowdown line.
The objectives of the Work Plan were to:
•
characterize the geologic and hydrogeologic conditions at the Station including
subsurface soil types, the presence or absence of confining layers, and the direction
and rate of groundwater flow;
•
characterize the groundwater/surface water interaction at the Station, including a
determination of the surface water flow regime;
•
evaluate groundwater quality at the Station including the vertical and horizontal
extent, quantity, concentrations, and potential sources of tritium and other
radionuclides in the groundwater, if any;
•
define the probable sources of any radionuclides released at the Station;
•
evaluate potential human, ecological, or environmental receptors of any
radionuclides that might have been released to the groundwater; and
•
evaluate whether interim response activities are warranted.
045136 (12) Braidwood Generating Station
1
CONESTOGA-ROVERS & ASSOCIATES
Revision 1
2.0
STATION DESCRIPTION
The following section presents a general summary of the Station location and definition,
overview of Station operations, surrounding land
use, and an overview of both regional
and Station-specific topography, surface water features, geology, hydrogeology, and
groundwater flow conditions. This section also presents an overview of groundwater
use in the area.
2.1
STATION LOCATION
The Station property consists of approximately 4,450
acres, of which approximately
52 acres are used for the generating facilities. The other approximately 4,400 acres of
property encompasses an approximately 2,500-acre Cooling Lake and the land
associated with the blowdown line. The Station address is 35100 South Route 53,
Braceville, Illinois. The Station is owned and operated by Exelon. Figure 2.1 presents
the Station Base Map, which includes the key features.
This HIR excludes land associated with the Cooling
Lake and as discussed in Section 1.0,
excludes the land associated with the blowdown line and the blowdown line's vacuum
breakers. As such, this HIR does not discuss the groundwater investigations performed
recently along the Station's blowdown line. These are discussed further in Section 2.5.
2.2
OVERVIEW OF COOLING WATER OPERATIONS
The Station contains a two-unit nuclear generating facility capable of generating
1,120 net megawatts of electricity per unit. Units 1 and 2 are pressurized water reactors
(PWRs) designed by Westinghouse and began commercial operation in July and
October 1988, respectively. A PWR plant consists of three separate loops of fluids. Each
loop is designed to avoid mixing the fluids of one loop with the fluids of another. The
three loops are called the primary loop, the secondary loop, and the tertiary loop.
The main purpose of the primary loop is to transfer the energy generated from fission in
the fuel to the secondary
loop steam generators. It is a closed loop system. Nuclear
fission creates heat in the fuel. This heat is removed by the flow of reactor coolant water
through the reactor vessel and into the steam generators. The heat is transferred to the
secondary side where steam is generated. The water is then pumped back to the reactor
vessel to cool the fuel again.
045136 (12) Braidwood Generating Station
2
CONESTOGA-ROVERS & ASSOCIATES
Revision 1
The main purpose of the secondary loop is to use the steam generated in the steam
generators to turn the turbine generator, which makes electricity. It is also a closed
system.
The main purpose of the tertiary loop is to use cooler lake water to condense the steam
in the condenser and transfer the heat to the atmosphere.
The lake loop needs makeup
water to operate properly. Makeup water comes from the Kankakee River.
As the steam is condensed in the condenser, the circulating water becomes hotter.
The
circulating water is discharged to the Cooling Lake where it loses some of its heat
through evaporation. The now cooler water is then pumped back to the condenser to
start the loop over again.
The Braidwood Station employs a blowdown line
to return water from the Cooling Lake
back to the Kankakee River for the purposes of reducing the dissolved mineral
concentration in the lake water. This blowdown line also serves as a permitted
discharge point for the site's sewage treatment plant and the liquid Radwaste system.
The discharge is approved under the Station's National Pollutant Discharge Elimination
System (NPDES) Permit IL 0048321 and Nuclear Regulatory Commission (NRC)
Operating Licenses NPF-72 and NPF-77 for Units 1 and 2, respectively.
2.3
SURROUNDING LAND USE
To the north, south, east, and west, land surrounding the Station is primarily for
agricultural, residential, and recreational use. Residential lots surround the Station to
the
north and to the east along Smiley Road and Center Street. Further to the north,
there are several ponds or small lakes. The center of the Village of Braidwood is
approximately 1.5 miles north of Braidwood Station measured from Smiley Road. To
the northwest of the site, there are two main highways (Illinois State Highway 53 and
Illinois Route 129) running parallel to each other with a railroad (Southern Pacific
Railroad) between them. Within the southern portion of the Station is the Cooling Lake
that is designated as a recreational area in the summer for boating and fishing under the
auspices of the Illinois Department of Natural Resources (IDNR) (Refer to Figures 1.2
and 1.3). The town of Godley is located west and southwest of the PA.
045136 (12) Braidwood Generating Station
3
CONESTOGA-ROVERS & ASSOCIATES
Revision 1
2.4
STATION SETTING
The following sections present a summary of the topography, surface
water features,
geology, hydrogeology, and groundwater flow conditions in the region surrounding the
Station. The information was primarily gathered from Sections 2.1 and 2.5 of the
Braidwood Station Updated Final Safety Analysis Report (UFSAR) Revision 10, dated
December 2004. The main references the UFSAR relies upon are listed in Section 10.0 of
this HIR. CRA checked and verified all UFSAR references that apply to this HIR.
2.4.1
TOPOGRAPHY AND SURFACE WATER FEATURES
In general, the topography of the area slopes gently downward to the north toward the
Illinois River and is relatively flat (see Figure 1.1 and United States Geological
Topographic Quadrangle Map—Essex—1973, Photo revised 1980).
The Cooling Lake was formed from former coal
strip mining operations discussed
further in Section 2.4.2.
The average depth of the Cooling Lake is about 8 feet
(UFSAR, 1994). It is isolated from the adjacent upper water bearing aquifer by a slurry
wall constructed during building construction at the PA. The lake bottom consists of
mine spoils left behind after strip-mining operations.
There are also remnants of former coal strip mining operations to the north of
the PA
(ISGS March 2005 and October 2003). There are also a number of ponds located
northeast of the PA that were dug originally as sand borrow pits (for highway
construction materials) that have subsequently filled with groundwater. These include
the ponds located near Center Street and Smiley Road (Figures 1.1 and 2.2). The ponds
are evident on the aerial photo presented on Figure 2.2.
Figure 2.3 presents portions of some of the relevant
surface water features at the Station
such as the Cooling Lake, pond, and perimeter ditch. Surface water drains via the storm
water drainage system and man-made ditches (e.g., the perimeter ditch) and flows
generally to the north within the PA. Surface water is conveyed away from the Cooling
Lake via the perimeter ditch (Figure 2.3). This ditch eventually flows west and south
past the PA and past the Village of Godley.
This ditch intercepts the shallow
groundwater table (CRA, September 2003).
The PA and surrounding land is generally flat and covered by paved areas, roadways,
and parking lots. These areas are drained by a storm water drainage system that drains
to the northwest corner of the PA (Figure
2.3). The storm water drainage system drains
045136 (12) Braidwood Generating Station
4
CONESTOGA-ROVERS & ASSOCIATES
Revision 1
to an Oil/Water Separator at the north end of the PA. The outfall from the Oil/Water
Separator discharges to a small east-west ditch and flows west to the perimeter ditch.
Previous studies have documented that the storm water drainage system intercepts
groundwater on the west side
of the Turbine Building. These same studies have
indicated that the perimeter ditch (Figure 2.3), which flows from the north to the south
along the western Station property line, also intercepts the groundwater (CRA,
September 2003).
Hydrogeologic profiles of the storm water drainage system,
Oil/Water Separator, and the perimeter ditch are provided on Figures 2.4 to 2.7. These
figures are from the CRA September 2003 report.
2.4.2
GEOLOGY
The Natural Resource Conservation Service (NRCS) classifies the shallow soils
surrounding
the site as primarily fine sands and silt loams; typical soils of an outwash
plain. The NRCS classified the soils around the Station in groups that primarily include
the following soils: Oakville fine sand, Wateska loamy fine sand, Markham silt loam,
and Orthents loamy soil. These soil groups all have similar characteristics and vary by
the amount of silt in the material. These soils are moderately to well drained, have
moderate to rapid permeability from 0 to 60 inches below ground surface (bgs), and
contain 0.5 to 2 percent organic matter.
The local geology is composed of a relatively thin overburden layer overlying the
bedrock. Figure 2.8 presents a stratigraphic cross-section of the local geology.
The overburden consists of the Equality Formation (silty sand) and the Wedron Clay Till
Formation
(glacial outwash and till) (UFSAR, 1994).
The Equality Formation is
Quaternary age and primarily consists of eolian and lacustrine sands and at the Station it
is described as a homogenous, loose, gray to brown sand.
This formation is
approximately 20 feet thick at the site (Arnold et al., 1999). The Wedron Clay Till
consists of glacial till and interbedded discontinuous glacial outwash deposits. At the
site, the Wedron Clay Till is predominantly a silty clay. The Wedron Clay Till ranges
from 15 to 20 feet thick at the site (Willman et al., 1975). A contour map of the top of the
Wedron Clay Till around the Turbine Building and Reactors from the UFSAR is
included on Figure 2.9 (UFSAR, 1994).
045136 (12) Braidwood Generating Station
5
CONESTOGA-ROVERS & ASSOCIATES
Revision 1
The important bedrock units in the site area can be divided into these three general
sections (Willman and Frye, 1970):
•
Pennsylvanian age siltstone, shale, and coal;
•
Ordovician shale; and
•
Cambrian- Ordovician sandstone and limestone/dolostone.
The Pennsylvanian age units are generally horizontal strata that act as an aquitard
and
barriers to vertical flow. The coal-bearing Carbondale Formation (Colchester Member)
within this group was previously strip-mined in the area of the Station (Figure 2.8). The
strip mining removed the overlying units to the bottom of this coal seam
(Chapter 2.5.1.2.7, UFSAR, 1994; and ISGS, October 2003). The Carbondale Formation
includes the Francis Creek Shale Member and the Colchester Coal Member. It is
underlain by the Spoon Formation (Figure 2.8).
Coal was discovered in Braidwood in 1854. Underground mining began in the
1870s.
Strip-mining began in the 1920s. Total production of coal is estimated at over 26 million
tons. Approximately 6.2 million tons was produced from underground mines, and
about 20.5 million tons from strip mines. Coal was produced mainly from the No. 2
Coal Seam (Figure 2.8). The coal seam is approximately 100 feet bgs. Overlaying the
coal is 30 or more feet of the Francis Creek Shale Member of the Pennsylvanian
Carbondale Formation. This seam is also known as the Colchester Coal No. 2, which has
an average thickness of 3 feet. In the southwestern part of the area thin seams of coal lie
closely above and below the Colchester No. 2 seam.
As a result of coal mining, there are several small lakes near the site,
which formed
when abandoned open-pit mines subsequently filled with groundwater and
precipitation. The Cooling Lake south of the facility is one of these lakes (Figure 1.2).
The Cooling Lake is filled with mine spoils consisting of fractured, fragmented deposits
of clay shale and other excavated material.
The Ordovician shale is the Maquoketa Shale Group of varying thickness but generally
at least 70
feet thick.
The Maquoketa Shale separates upper shallower bedrock
formations (limestone and dolomite) from the deep sandstone bedrock of
Cambrian-Ordovician-Glenwood-St. Peter Formations and the Ironton-Galesville
Formations (Figure 2.8).
045136 (12) Braidwood Generating Station
6
CONESTOGA-ROVERS & ASSOCIATES
Revision 1
2.4.3
HYDROGEOLOGY
Groundwater in the site area is mainly extracted from two primary aquifers:
•
the upper sand aquifer; and
•
the deep Cambrian and Ordovician age sandstone formations.
There is some indication, however, based upon well logs from private
residences that
water supply wells are sometimes completed in the sandstone and limestone of the
Carbondale Formation and the Spoon Formation (Figures 2.2 and 2.10). The Carbondale
Formation includes the Francis Creek Shale Member, an aquitard, siltstones,
conglomerates, shale, and the Colchester No. 2 coal. Beneath the Carbondale Formation
is the limestone of the Spoon Formation. Apparently some private wells are installed
into the Carbondale Formation above the coal or into the underlying Spoon Formation
based upon well depth. Figure 2.10 presents wells completed in the 80- to 120-foot
depth that may represent the Spoon Formation.
The upper sand aquifer comprises Quaternary age eolian and
lacustrine sands (20 to
30 feet deep) (UFSAR, 1994). There are numerous private wells screened within the
surficial sand unit where well yields are highly variable. In general, on a regional scale,
well yields range from 20 gallons per minute (gpm) to 100 gpm; the higher yields are in
areas where the sand and gravel deposits are thickest. The shallow groundwater flow
direction is typically north-northeast but is influenced by surface water bodies.
The deeper bedrock formations used regionally
for municipal and private water
supplies (depths of 600 to 1,600 feet) are separated from the shallow system by a number
of regional aquitards (Visocky, 1985). These barriers include the Wedron Clay Till
(located just beneath the shallow sands) and various shale formations including the
Scales Shale, which is over 70 feet thick at the Station and found at depths of 400 feet.
Groundwater flow in these deep bedrock formations is expected to be toward the
northeast in response to regional pumping centers near Joliet, Illinois (Visocky, 1985).
The groundwater system of most interest at the Station is the upper sand aquifer. This is
the zone where previous studies of tritium
occurrence have indicated its migration on
and off the Braidwood Station property (CRA, March 2006).
The groundwater in the upper sand aquifer occurs under unconfined (water table)
conditions and the saturated thickness ranges
from 20 to 22 feet. The groundwater in
this aquifer is recharged by local precipitation and discharges to local ponds and
streams, and to the bedrock near the Kankakee River.
045136 (12) Braidwood Generating Station
7
CONESTOGA-ROVERS & ASSOCIATES
Revision 1
Recently, over 300 permanent and temporary monitoring wells have been installed into
the deep and shallow zones (as described in Section 4.0) of the upper sand aquifer at
Braidwood Station along the blowdown line (refer to Figure 2.11). Several well nests
have been installed in the upper sand aquifer to determine the vertical distribution of
impacted groundwater, and also the vertical hydraulic gradient within the aquifer.
Previous investigations along the blowdown line did not indicate a systematic pattern of
vertical hydraulic gradients within the upper sand aquifer.
The data recently collected
as part of the fleetwide investigation has indicated similar vertical hydraulic gradients
with one area of exception. Monitoring well clusters located just west of the Turbine
Building indicate a downward vertical hydraulic gradient.
Data collected from CRA's previous investigations
(CRA, September 2003 and
March 2006) indicate there is a significant interaction between the groundwater in the
overburden and the surface water bodies such as the perimeter ditch and the ponds to
the northeast of the Station (refer to Figures 2.6 and 2.7).
The results from single-well response tests performed as part of the blowdown line
investigation indicate that the
hydraulic conductivity of the overburden aquifer is in the
range of 2.5 x 10
-2
centimeters/second (cm/sec) to 3.7 x 10
-2
cm/sec (CRA, March 2006).
Average groundwater velocity in the overburden aquifer is 80 feet/year (ft/yr) to
170 ft/yr in the area of the blowdown line.
The Cooling Lake, which is on the upgradient side
of the Station, is not in direct contact
with the upper sand aquifer, but rather is separated by a slurry wall (a low permeability
barrier) that was installed at the time the Station was built. The slurry wall was installed
or keyed into the Wedron Clay Till. The Cooling Lake is surrounded by this slurry wall
and is, therefore, isolated from the upper sand aquifer at the site.
The Cooling Lake, although on the average is only 8
feet deep, is underlain by mine
spoils left over from the coal-strip mining activities discussed previously. These mine
spoils typically contain shales, clays, and siltstones that have been excavated and
re-deposited. The mine spoil permeability is expected to be extremely low based upon
CRA experience with mine spoils in the region. Consequently, the vertical seepage out
of the Cooling Lake should not be significant when compared to evaporation losses or
the amount of water blown down to the Kankakee River. Finally, although the
Colchester Coal No. 2 was mined in this area, the Maquoketa Shale was not disturbed
and remains a barrier to vertical flow beneath the Cooling Lake.
045136 (12) Braidwood Generating Station
8
CONESTOGA-ROVERS & ASSOCIATES
Revision 1
Approximately 140 feet of relatively impermeable shale separate the overburden aquifer
from the deep bedrock aquifer. The shale units act as aquitards, limiting the hydraulic
communication between the groundwater in the overburden and the bedrock aquifer
(Visocky, 1985).
Most domestic wells in the area are completed within the
Glenwood-St. Peter Formation, which is approximately 600 feet bgs.
The Station does not rely on groundwater for any of its water supplies; consequently,
there is little information on the deeper groundwater bearing zones at the Station
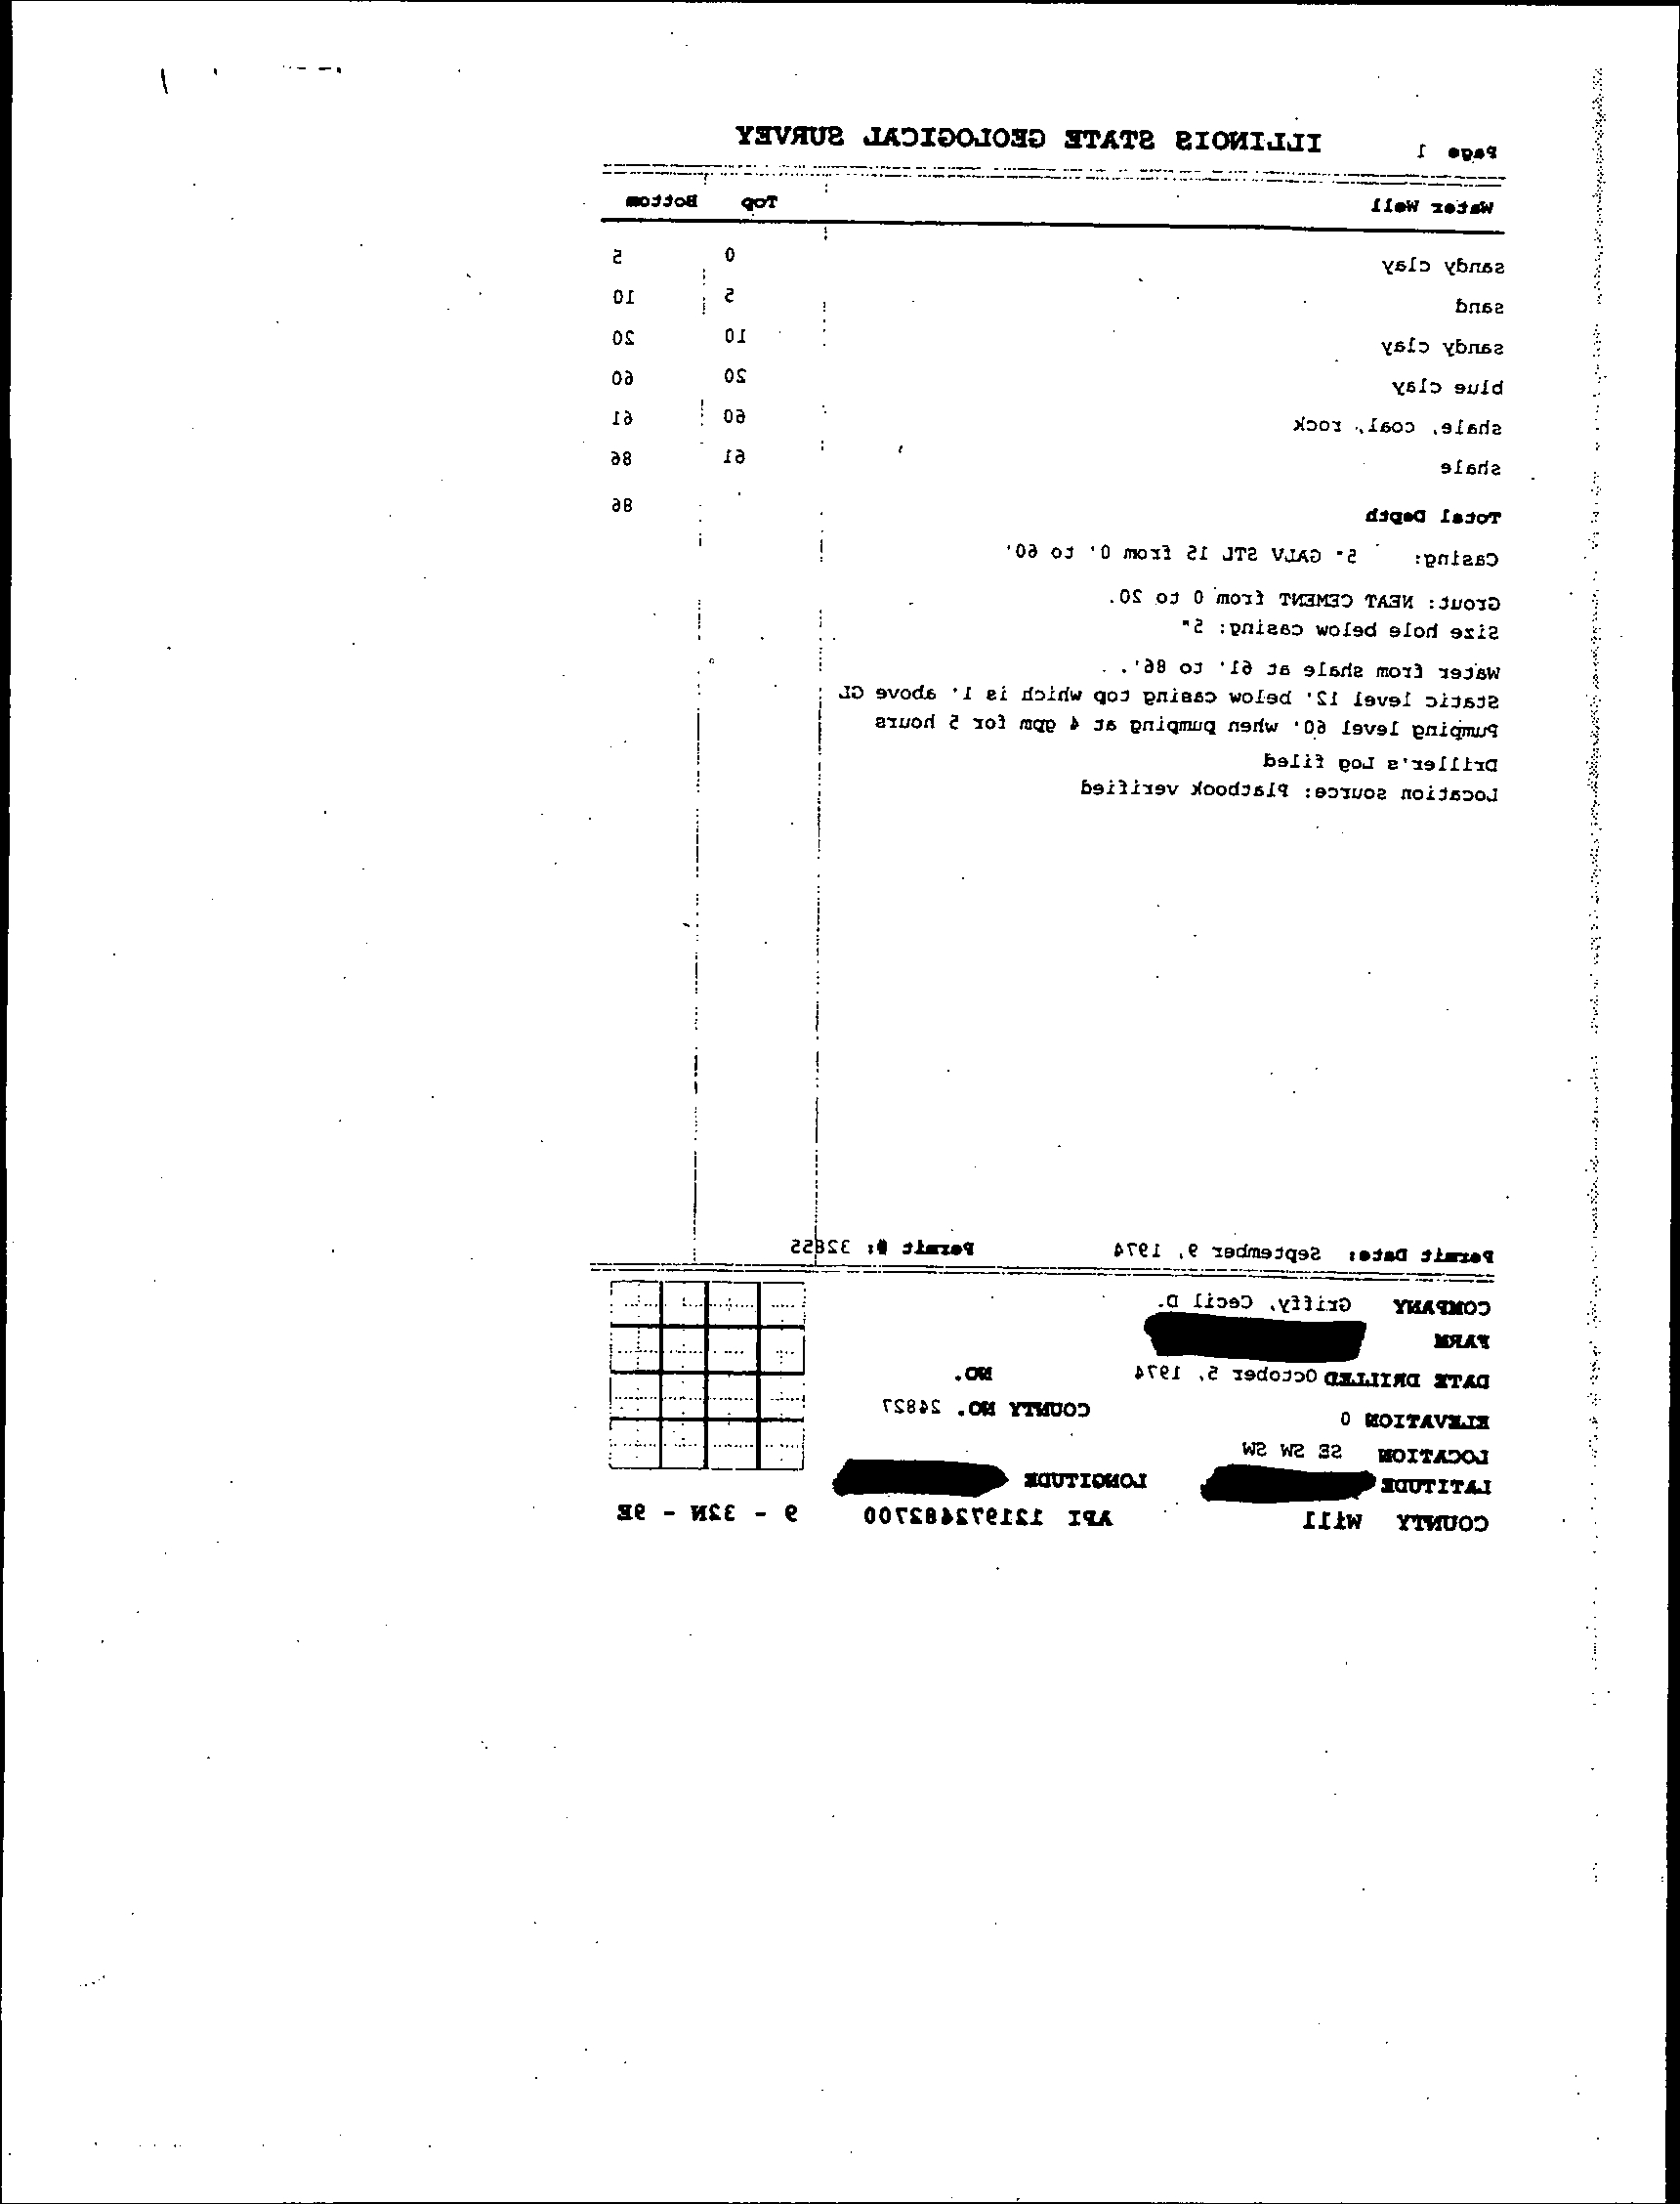
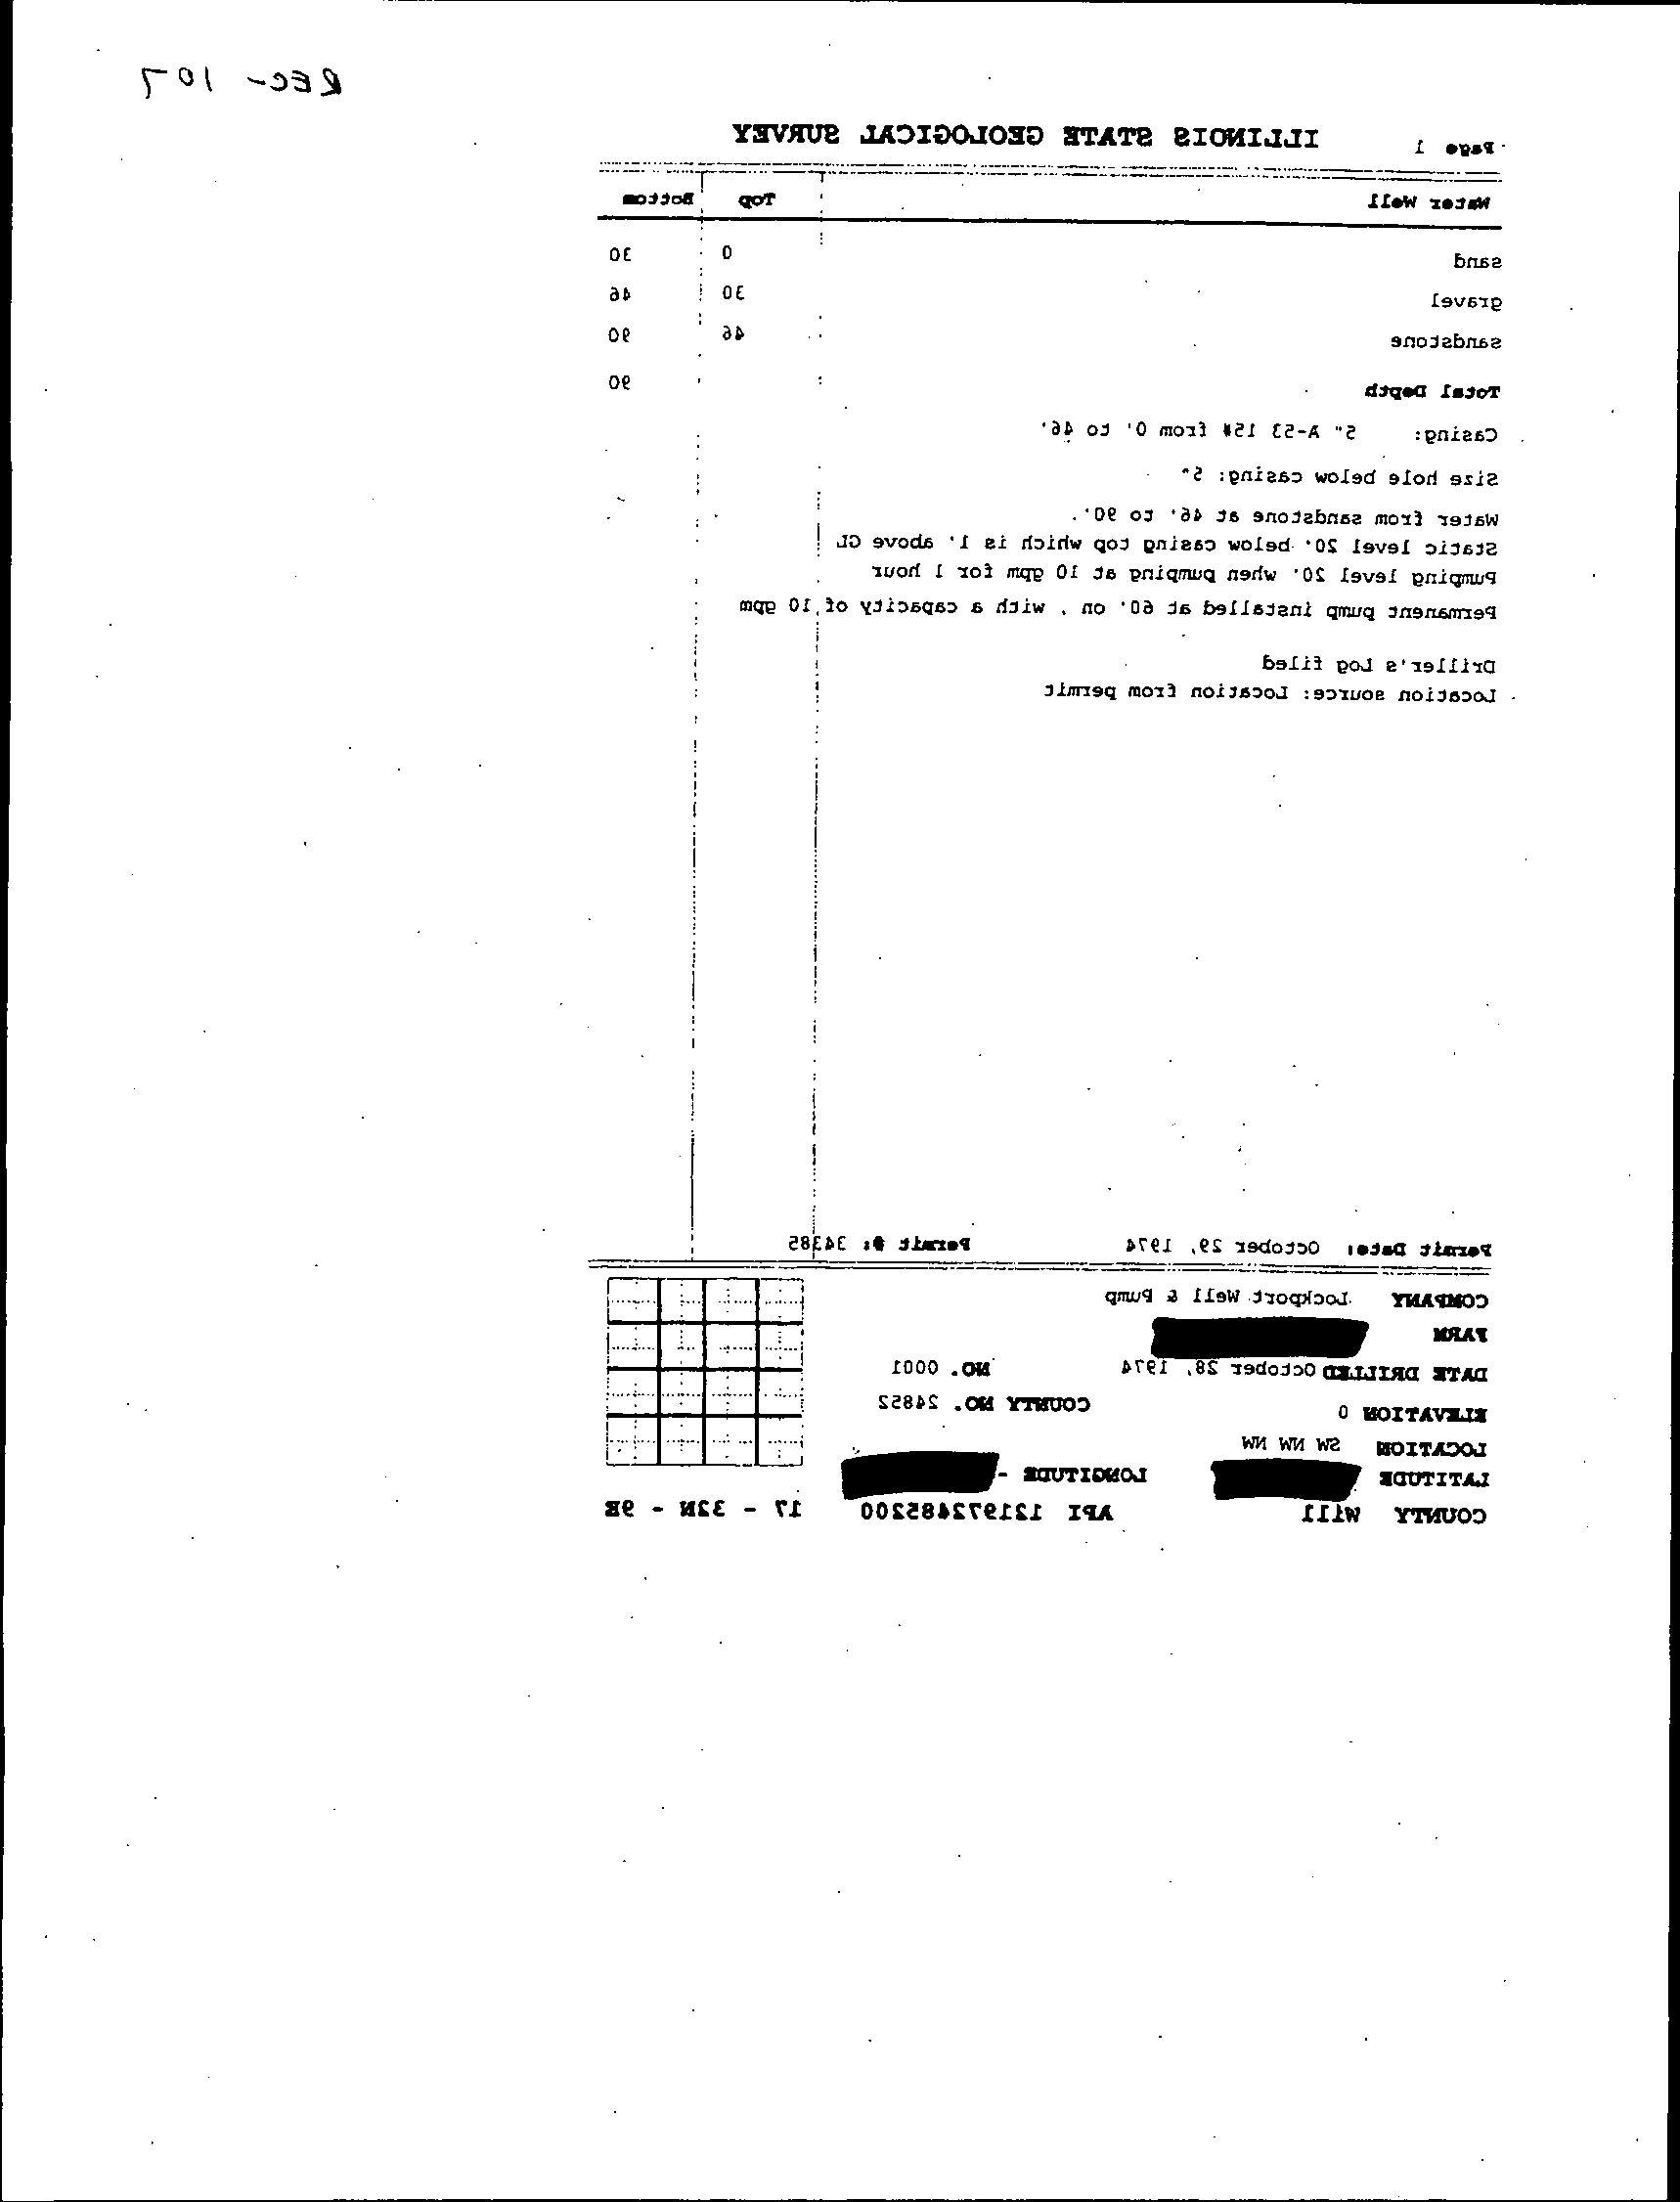
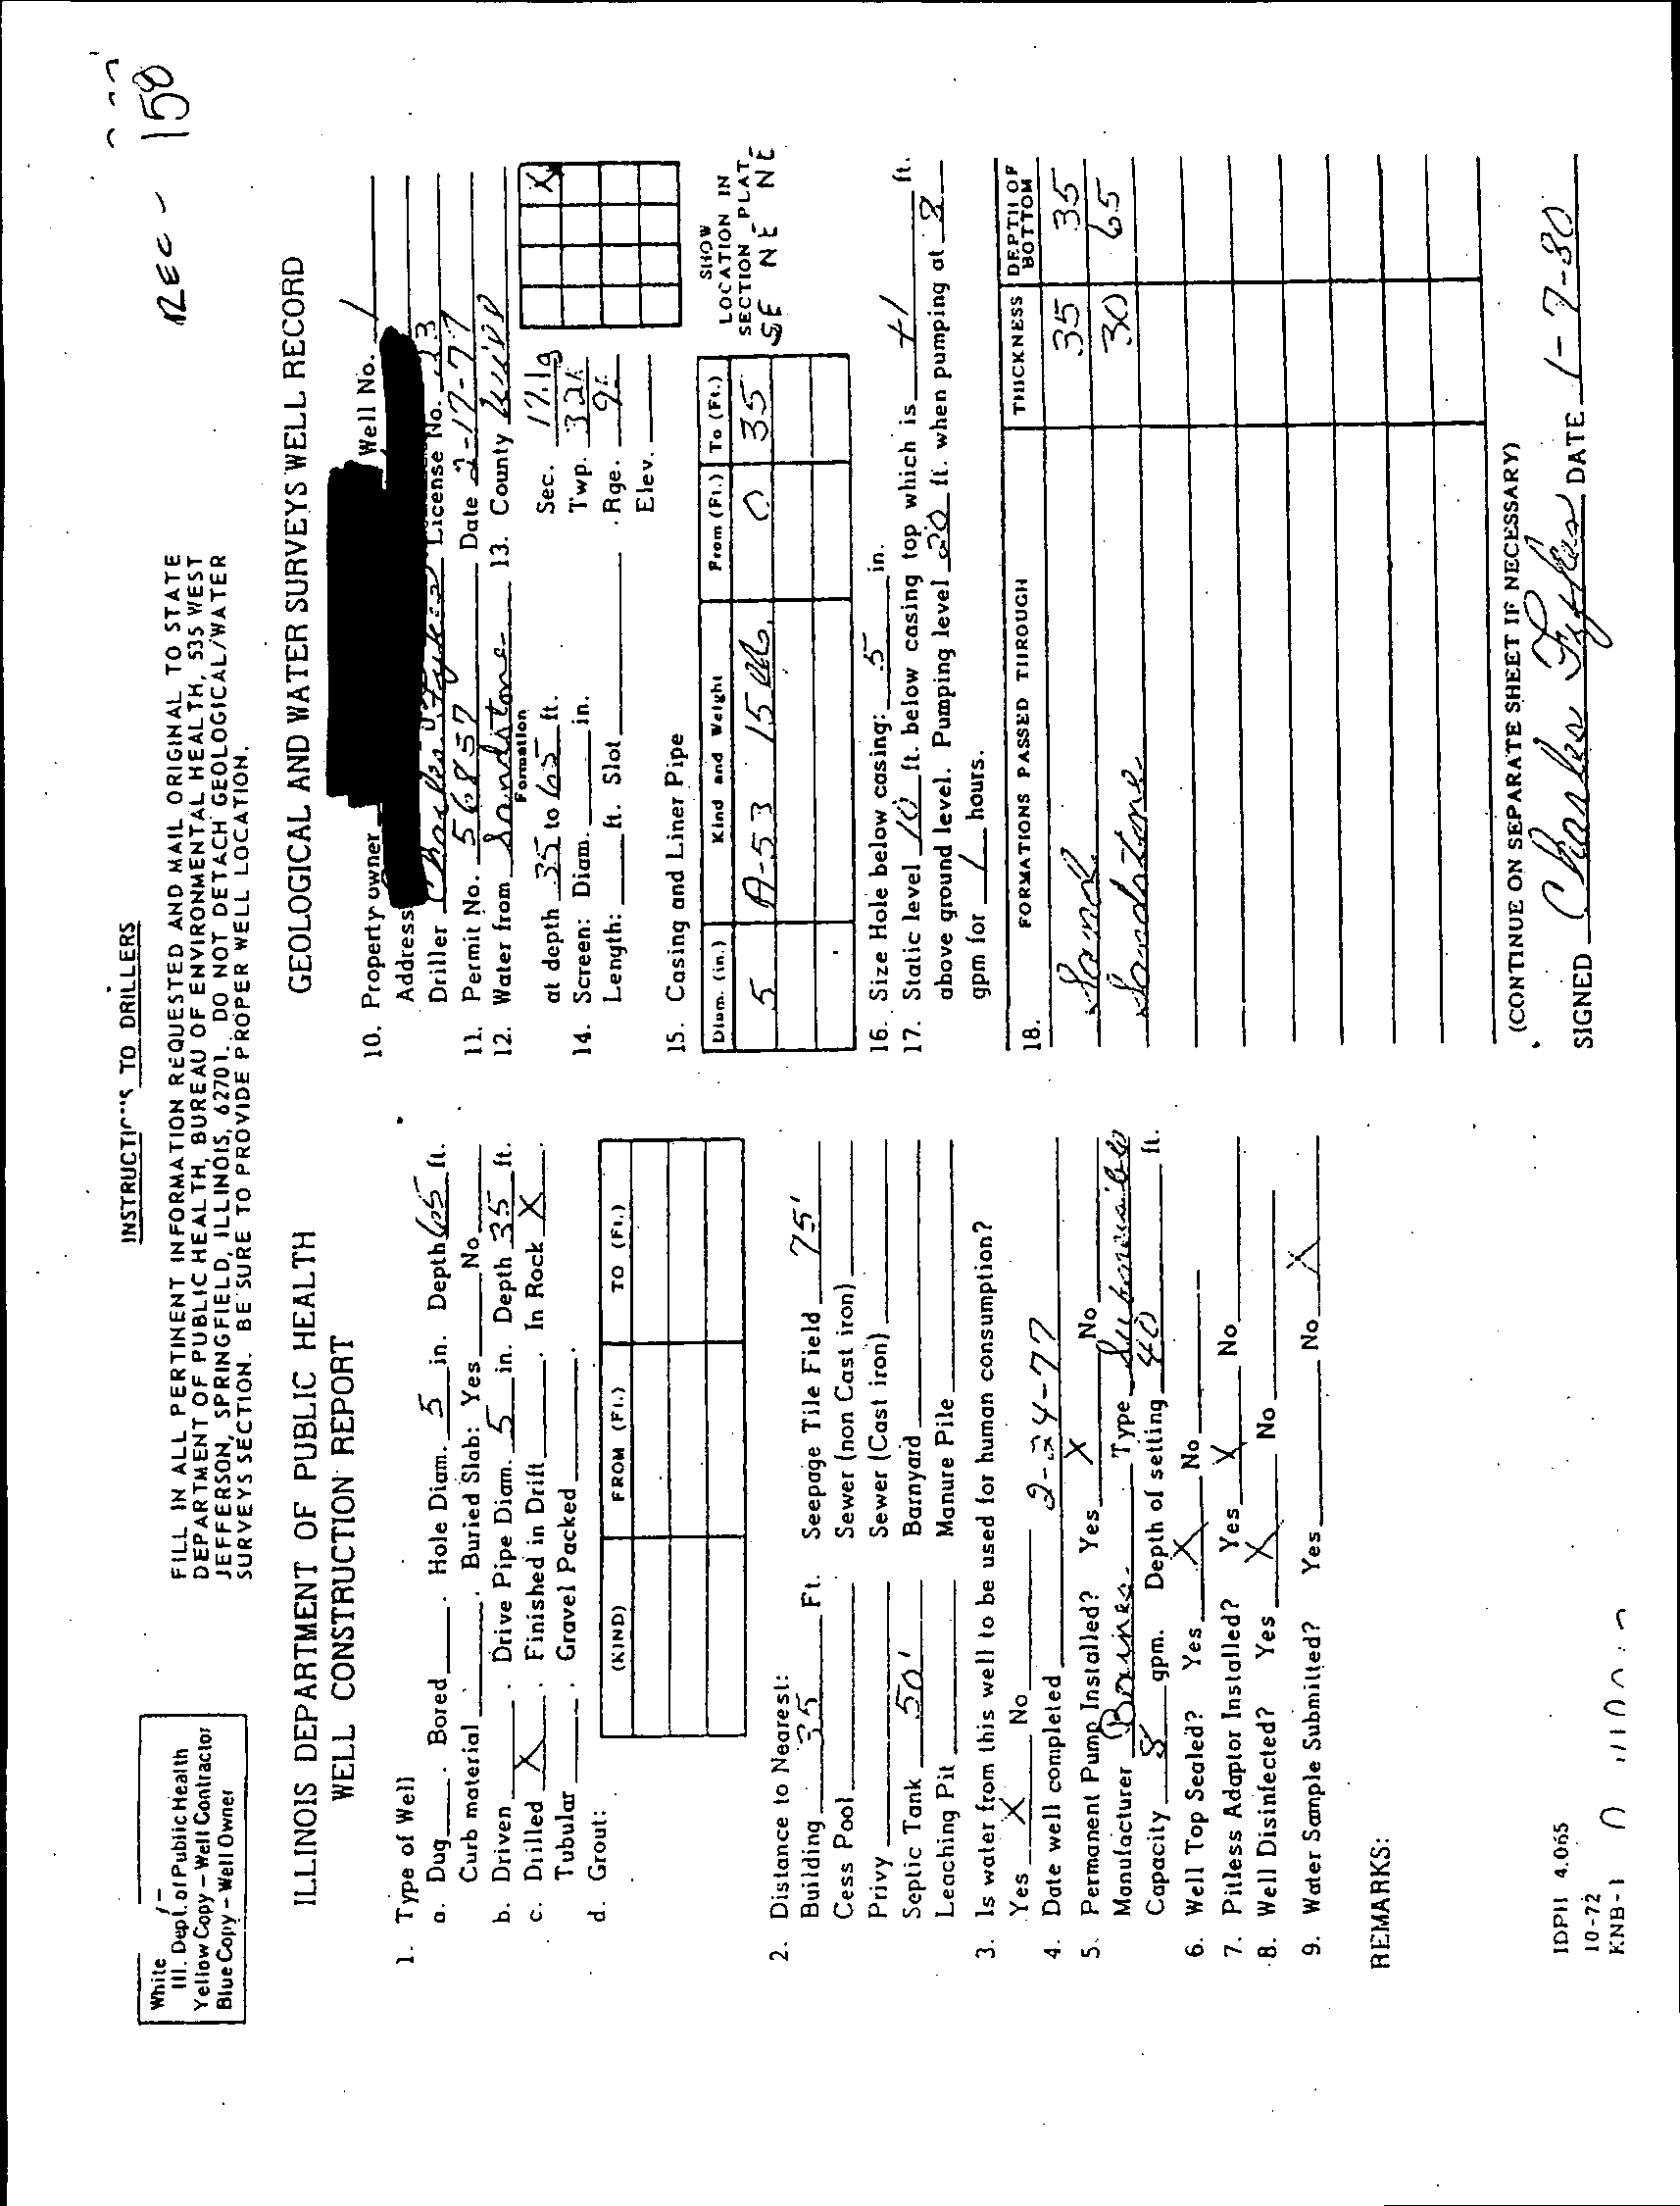
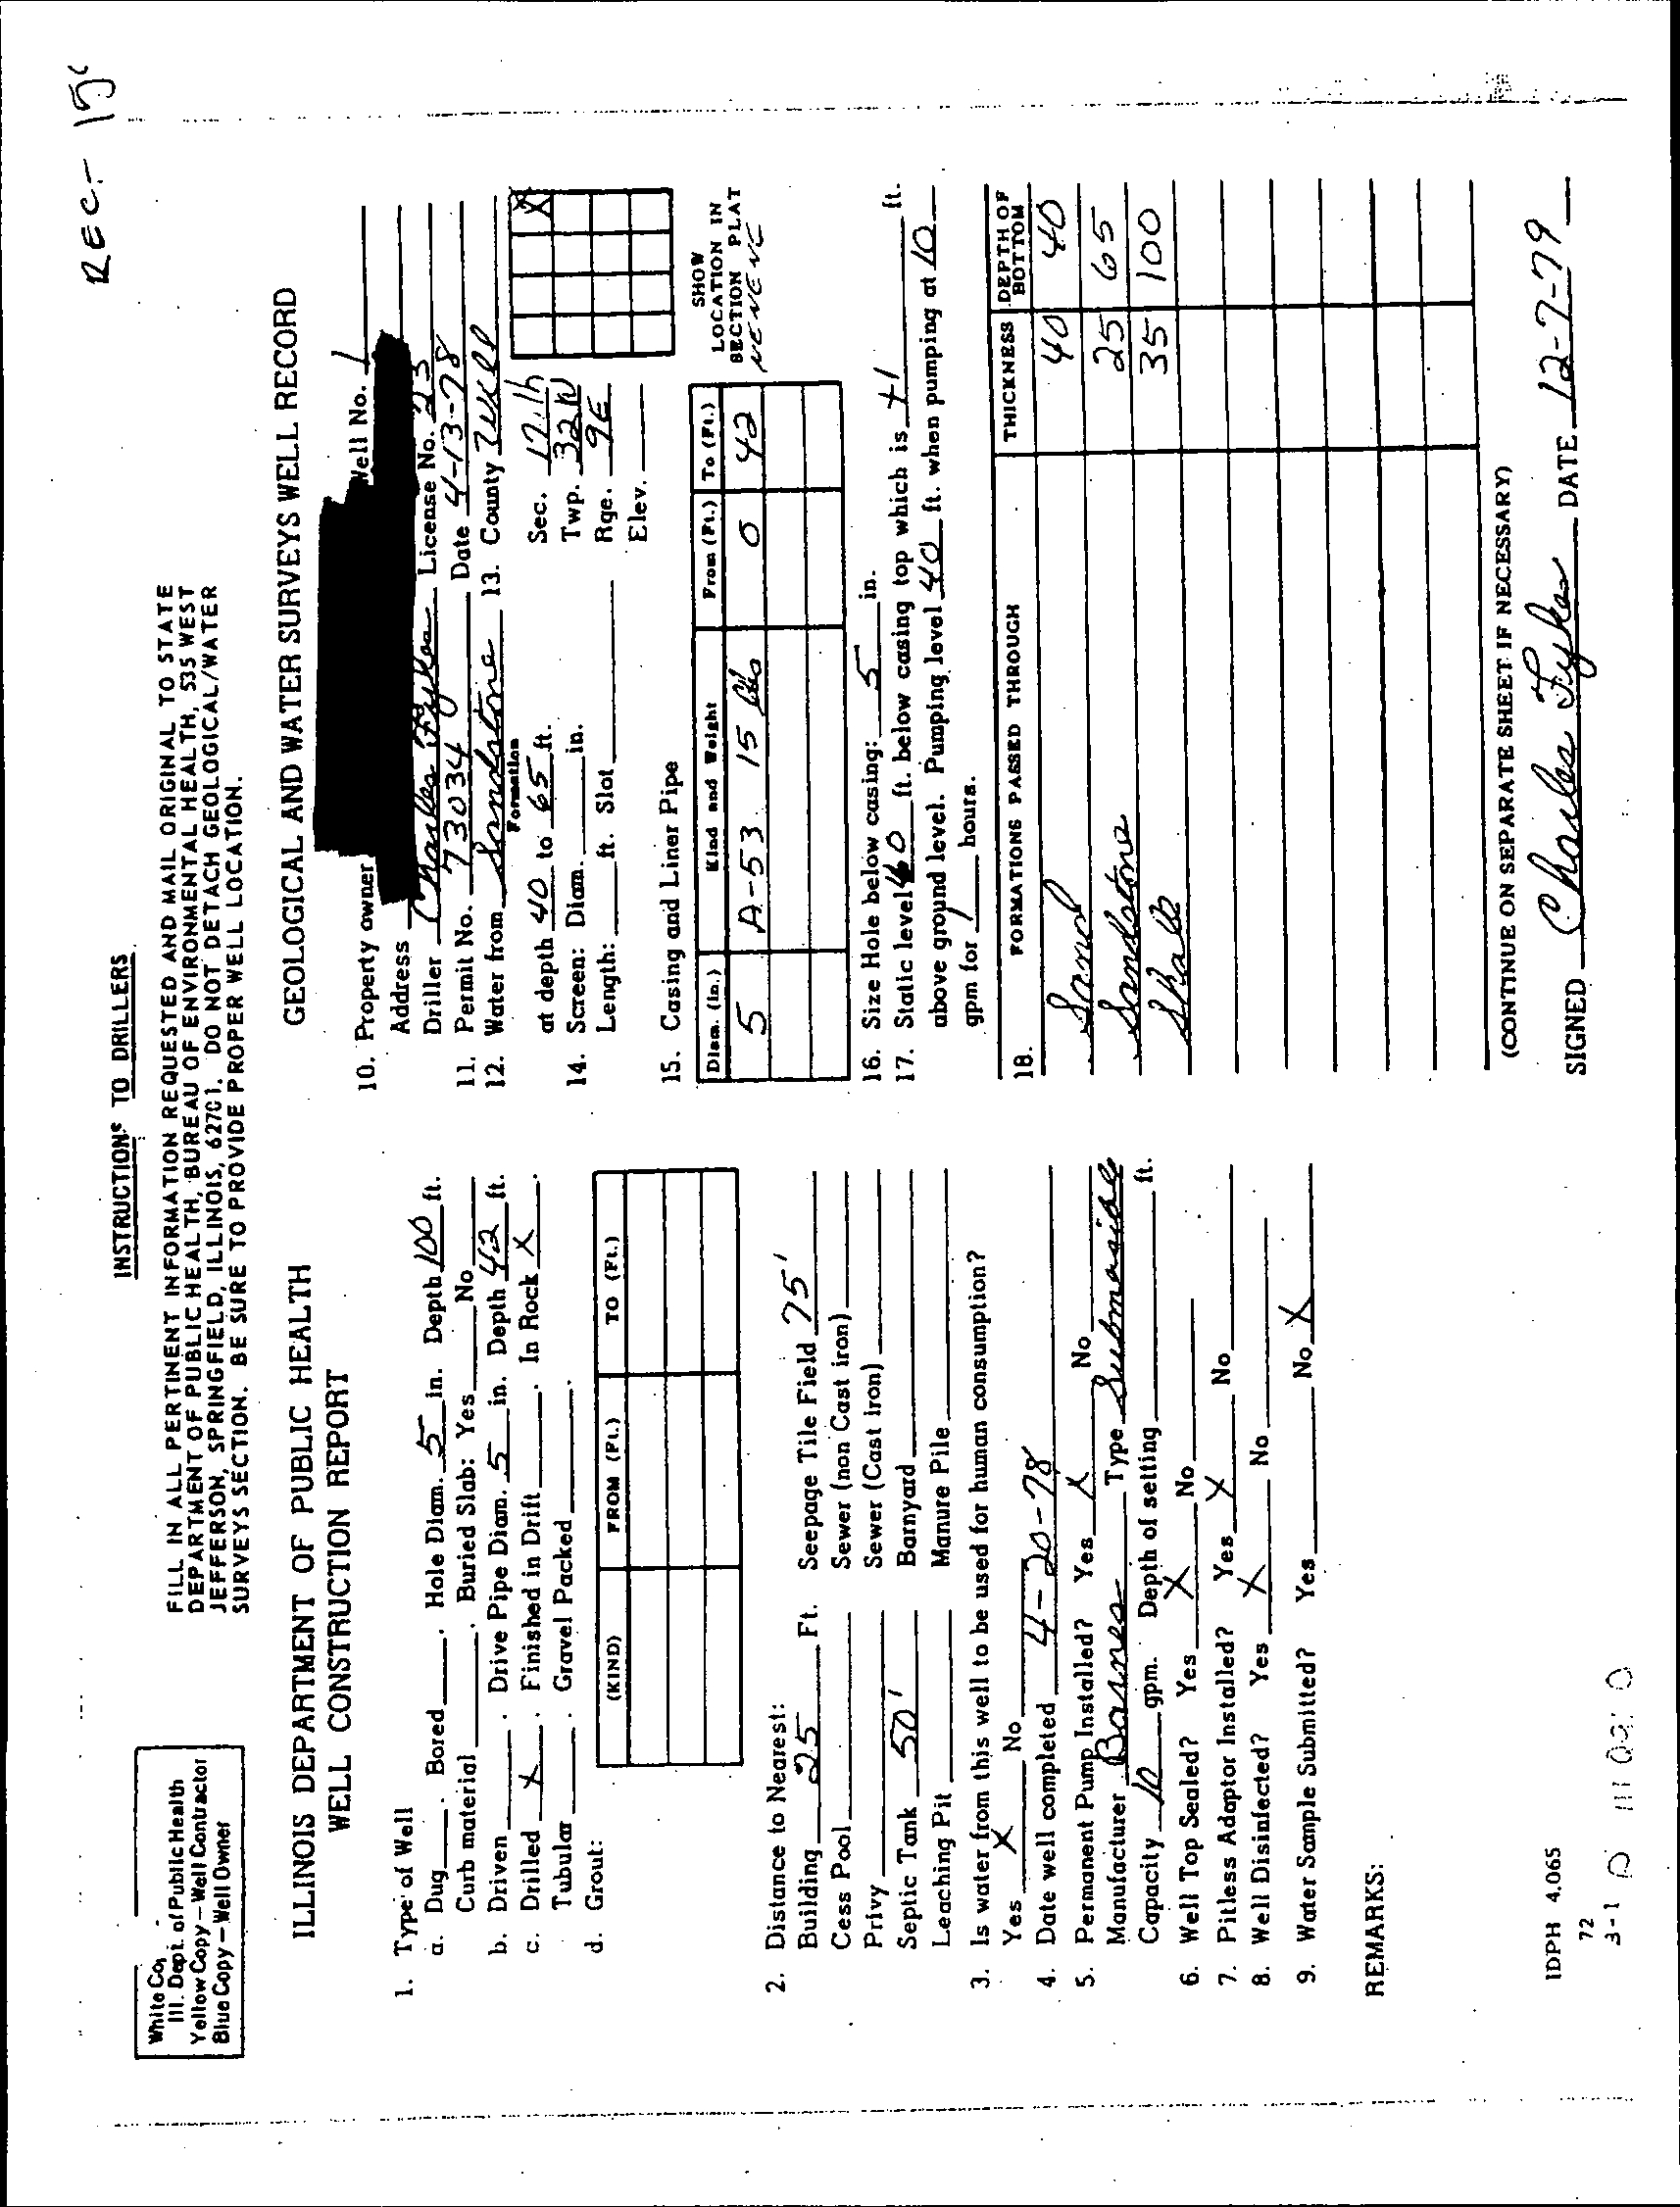
property. However, a review of the water well logs (Appendix A) for private and public
supply wells in the area indicate similar groundwater conditions as discussed
previously in Section 2.0. Water supply wells in the Station area are completed to
depths of approximately 100 feet, 600 feet, and 1,600 feet in order to tap bedrock water
bearing formations (refer to Figure 2.10).
Figure 2.12 presents the locations of a local regional cross-section presenting the regional
geology,
the location of the PA and deeper private and public water supply wells.
Figure 2.13 is a regional cross-section in a southwest to northeast direction. Figure 2.14
is a regional cross-section in a more northerly direction. Both Figures 2.13 and 2.14
indicate the relative depths of PA features, the bedrock aquifers, aquitards and private
and public water supply wells.
A former construction water supply well is located in the northeast area of the PA, just
east
of the Condensate Storage Tanks (Figure 2.1). This well was drilled to a depth of
approximately 1,750 feet and is cased to approximately 260 feet bgs. The Braidwood
Station does not use this former supply well and there are plans to plug and abandon
the well in the near future. The pump inside the well casing restricts access to this well.
2.5
AREA GROUNDWATER USE
The groundwater beneath the Station is not used as a potable resource for its operations.
The Station obtains its water from the Kankakee River. There are a number of domestic
wells near the Station (see Figures 2.2 and 2.10 for private well locations) that obtain
their water from the upper sand aquifer. The groundwater within this upper sand
aquifer is under water table conditions with the depth to water ranging from
5 to 15 feet bgs. The shallow aquifer is recharged by precipitation and the shallow
aquifer discharges to nearby surface streams and strip mines.
045136 (12) Braidwood Generating Station
9
CONESTOGA-ROVERS & ASSOCIATES
Revision 1
The upper sand aquifer is underlain by Pennsylvanian bedrock composed of siltstone,
shale, sandstone, clay, limestone, and coal (Carbondale and Spoon Formations). The
Pennsylvanian strata may locally yield up to 20 gpm from the interbedded sandstones.
The Cambrian and Ordovician aquifers in the Station area comprise the
Mt. Simon, the
Ironton Galesville and the Glenwood-St. Peter Sandstones. These deeper Cambrian and
Ordovician aquifers consist of sandstones in contrast to the shallow Pennsylvanian
formations, which consist mainly of shale and limestone (Visocky et al, 1985). Water
supply wells completed in this aquifer are at depths of over 600 feet (Figures 2.10, 2.13,
and 2.14). Most of the groundwater supply wells within the surrounding area of the
Braidwood Station are finished within these deeper aquifers (depths of 100 feet, and
600 to 1,600 feet) (Figure 2.10).
The Village of Braidwood, which is approximately 1.5
miles north of the site, provides
municipal water via at least one deep bedrock water supply well that has a depth of
over 1,600 feet (Figure 2.14). The homeowners and businesses in the Village of Godley
generally rely upon shallow sand-point type wells that are constructed into the upper
sand aquifer. The Godley Park District uses a deeper bedrock well for its purposes.
2.6
BRAIDWOOD STATION BLOWDOWN LINE INVESTIGATIONS
Since the spring of 2005, Exelon has undertaken extensive efforts to investigate tritium
impact in areas outside and east of the PA and along the Station's blowdown lines,
including extensive sampling of groundwater, surface water, and private wells. The
results are presented as follows:
•
Tritium Investigation Report (CRA, March 2006);
•
Investigation of Tritium in the Groundwater in the Vicinity of VB-4 (CRA,
April 2006);
•
Investigation of Tritium in the Groundwater in the Vicinity of VB-6 (CRA,
April 2006);
•
Investigation of Tritium in the Groundwater in the Vicinity of VB-7 (CRA,
April 2006);
•
Technical memorandum, "Evaluation of the Source of Tritium in Two Private Wells
located Along the Kankakee River and Illinois Route 113" (CRA, June 2006); and
•
Hydrogeologic investigation Turbine Building/Protected Area (CRA, June 2006).
The above documents have been submitted to the Illinois EPA.
045136 (12) Braidwood Generating Station
10
CONESTOGA-ROVERS & ASSOCIATES
Revision 1
3.0
AREAS FOR FURTHER EVALUATION
CRA considered all Station operations in assessing groundwater quality at the Station.
During this process, CRA identified areas at the Station that warranted further
evaluation or "AFEs". This section discusses the process by which AFEs were selected.
CRA's identification of AFEs involved the following components:
•
Station inspection on March 24, 2006;
•
interviews with Station personnel;
•
evaluation of Station systems;
•
investigation of confirmed and unconfirmed releases of radionuclides; and
•
review of previous Station investigations.
CRA analyzed the information collected from these components combined with
information obtained from CRA's study of hydrogeologic conditions at the
Station to
identify those areas where groundwater potentially could be impacted from operations
at the Station.
CRA then designed an investigation to determine whether any confirmed or potential
releases
or any other release of radionuclides adversely affected groundwater. This
entailed evaluating whether existing Station groundwater monitoring systems were
sufficient to assess the groundwater quality at the AFEs. If the systems were not
sufficient to adequately investigate groundwater quality associated with any AFE,
additional monitoring wells were installed by CRA.
The following sections describe the above considerations and the identification of AFEs.
The results of CRA's investigation are discussed in Section 5.0.
3.1
SYSTEMS EVALUATIONS
Exelon launched an initiative to systematically assess the structures, systems and
components that store, use, or convey potentially radioactively contaminated liquids.
Maps depicting each of these systems were developed and provided to CRA for review.
The locations of these systems are presented on Figures 3.1 and 3.2. The Station
identified a total of 21 systems that contain or could contain potentially radioactively
contaminated liquids. The following presents a list of these systems.
045136 (12) Braidwood Generating Station
11
CONESTOGA-ROVERS & ASSOCIATES
Revision 1
System Identification
Description
AB
Boric Acid Process
AS
Auxiliary System Steam
CD
Condensate
CP
Condensate Cleanup
CW
Circulation Water Blowdown and Treated Runoff Return Portions
FC
Fuel Pool Cooling
HD
Feedwater Drains
OG
Off Gas
OD
Equipment/Floor Oil Drain
PW
Primary Water
RF
Reactor Building Floor Drains
SH
Station Heating
ST
Sewage Treatment
SX
Essential Service Water
TE
Turbine Building Floor Drains
TF
Turbine Building Floor Drains
TR
Treated Runoff
VF
Filtered Vents
WE
Auxiliary Building Equipment Drain
WF
Auxiliary Building Floor Drain
WX
Radwaste Disposal
After these systems were identified, Exelon developed a list of the various structures,
components and areas of the systems (e.g., piping, tanks, process equipment) that
handle or could potentially handle any radioactively contaminated liquids.
The
structures, components, and areas may include:
•
aboveground storage tanks;
•
condensate vents;
•
areas where confirmed or potential historical releases, spills, or accidental discharges
may have occurred;
•
pipes;
•
pools;
•
sumps;
•
surface water bodies (i.e., basins, pits, ponds, or lagoons);
•
trenches;
•
underground storage tanks; and
•
vaults.
045136 (12) Braidwood Generating Station
12
CONESTOGA-ROVERS & ASSOCIATES
Revision 1
The Station then individually evaluated the various system components
to determine
the potential for any release of radioactively contaminated liquid to enter the
environment.
Each structure or identified component was evaluated against the
following seven primary criteria:
•
location of the component (i.e., basement or second floor of building);
•
component construction material (i.e., stainless steel or steel tanks);
•
construction methodologies (i.e., welded or mechanical pipe joints);
•
concentration of radioactively contaminated liquid stored or conveyed;
•
amount of radioactively contaminated liquid stored or conveyed;
•
existing controls (i.e., containment and detection); and
•
maintenance history.
System components, which were located inside a building or that otherwise had some
form
of secondary containment, such that a release of radioactively contaminated liquid
would not be discharged directly to the environment, were eliminated from further
evaluation. System components that are not located within buildings or did not have
some other form of secondary containment were retained for further qualitative
evaluation of the risk of a release of radioactively contaminated liquid to the
environment and the potential magnitude of any release.
Exelon's risk evaluation took into consideration factors such as:
•
the potential concentration of radionuclides;
•
the volume of liquid
stored or managed;
•
the
probabilities of the systems actually containing radioactively contaminated
liquid; and
•
the potential for a release of radioactively contaminated liquid from the system
component.
These factors were then used to rank the systems and system components according to
the
risk for a potential release of a radioactively contaminated liquid to the environment.
The evaluation process resulted in the identification of structures, components, and
areas to be considered for further evaluation.
045136 (12) Braidwood Generating Station
13
CONESTOGA-ROVERS & ASSOCIATES
Revision 1
3.2
HISTORICAL RELEASES
CRA also reviewed information concerning confirmed or potential historical releases of
radionuclides at the Station, including reports and documents previously prepared by
Exelon and compiled for CRA's review. CRA evaluated this information in identifying
the AFEs. Any historical releases identified during the course of this assessment that
may have a current impact on Station conditions are further discussed in Section 3.4.
3.3
STATION INVESTIGATIONS
CRA also considered previous Station investigations
in the process of selecting the AFEs
for the Station. This section presents a summary of the pre-operational radiological
environmental monitoring program, past station investigations, and the radiological
environmental monitoring program.
3.3.1
PRE-OPERATIONAL RADIOLOGICAL ENVIRONMENTAL
MONITORING PROGRAM
A pre-operational radiological environmental monitoring program (pre-operational
REMP) was conducted to establish background radioactivity levels prior to operation of
the Station. The environmental media sampled and analyzed during the pre-operational
REMP were atmospheric radiation, fall-out, domestic water, surface water, marine life,
and foodstuffs. The results of the monitoring were detailed in the report entitled,
Environmental Radiological Monitoring for Braidwood Nuclear Power Station,
Commonwealth Edison Company, Annual Report 1986, May 1987.
The pre-operational REMP at Braidwood commenced in July 1983. The fourth annual
report
in 1986 presented data acquired during the period from January through
December 1985. Atmospheric radiation monitoring consisted of gas and air particulate
radioactivity
measurements;
fall-out
monitoring
consisted
of
radioactivity
measurements of soil, vegetation, and rain water; domestic water monitoring consisted
of well water sample analysis; surface water samples were collected from the two
Kankakee River locations and two cooling water locations. Foodstuffs were monitored
by analyzing samples of cow's milk and vegetables from nearby farms.
The pre-operational REMP contained analytical results from samples collected from the
surface
water and groundwater. The samples were analyzed for gross beta content and
were averaged for each quarter.
045136 (12) Braidwood Generating Station
14
CONESTOGA-ROVERS & ASSOCIATES
Revision 1
Surface water at the Kankakee River downstream collection point, BD-10, had gross beta
concentrations that ranged from 2.8
±
0.9 picoCuries per liter (pCi/L) to 3.2
±
1.4 pCi/L.
At the upstream Kankakee River collection point, BD-7, the average gross beta
concentrations for the second and fourth quarters was 3.6 pCi/L and the average gross
beta concentration during the third quarter was 18.8 pCi/L. Gross beta concentrations
from the cooling water sample points ranged from unspecified LLDs to a maximum
detection of 4.9
±
1.0 pCi/L.
Monthly composites of weekly sample collections from all surface water locations
indicated tritium concentrations were non detect at the LLD (200
pCi/L). Monthly
composites of weekly sample collections from all surface water locations indicate
(strontium-89, strontium-90, cesium-134, and cesium-137) concentrations less than their
specified LLDs.
Groundwater was collected from one off-site well on a quarterly basis.
Gross beta,
gamma isotopic, radiostrontium, and tritium analyses were performed on all samples.
Strontium-89, strontium-90, tritium and gamma emitters were below their respective
LLDs.
Gross beta activity was within the expected levels and ranged from
3.7
±
1.7 pCi/L to 37.9
±
3.2 pCi/L.
3.3.2
RADIOLOGICAL ENVIRONMENTAL MONITORING PROGRAM
As part of its NRC operating license, Braidwood Station conducts a REMP. The REMP
includes the collection of multi-media samples including air, surface water,
groundwater, fish, sediment, and vegetation. The samples are analyzed for beta and
gamma emitting radionuclides, tritium, iodine-131, and/or strontium as established in
the procedures developed for the REMP. The samples are collected at established
locations, identified as stations, so that trends in the data can be monitored.
An annual report is prepared providing a description of the activities performed and the
results of the analysis of the samples collected from
the various media. The latest report
generated was prepared by Station personnel and is entitled Annual Radiological
Environmental Operating Report for the Braidwood Station (period from January 1 to
December 31, 2005), May 2006.
This report concluded that the operation of the
Braidwood Station had no adverse radiological impact on the environment.
As part of REMP, surface water samples are collected at two locations and groundwater
samples are collected at six locations.
045136 (12) Braidwood Generating Station
15
CONESTOGA-ROVERS & ASSOCIATES
Revision 1
3.3.3
HISTORIC SITE INVESTIGATIONS
This section summarizes historic site investigations completed at the Station in regard to
releases of radioactively contaminated liquid to the subsurface.
3.3.3.1
POWER PLANT DOCUMENTS-UFSAR REPORT
During the construction of the Station, a series of comprehensive investigations of
regional and local geology, surface water, and groundwater conditions were conducted.
These studies are documented in the UFSAR Rev. 10, December 2004.
3.3.3.2
BLOWDOWN LINE INVESTIGATION
The blowdown line, which runs from the PA and east to the Kankakee River, was
previously evaluated by CRA. The results are presented in a series of reports listed in
Section 2.6 and Section 10.0. Figure 2.11 presents locations of monitoring wells installed
as of May 2006 along the blowdown line and in the PA as part of these previous studies.
3.4
IDENTIFIED AREAS FOR FURTHER EVALUATION
CRA used the information presented in the above sections along with its understanding
of the hydrogeology at the Station to identify AFEs, which were a primary consideration
in the development of the scope of work in the Work Plan. The establishment of AFEs is
a standard planning practice in hydrogeologic investigations to focus the investigation
activities at areas where there is the greatest potential for impact to groundwater.
Specifically, AFEs were identified based on these six considerations:
•
systems evaluations;
•
risk evaluations;
•
review of confirmed and/or potential releases;
•
review of documents;
•
review of the hydrogeologic conditions; and
•
Station inspection completed on March 24, 2006.
045136 (12) Braidwood Generating Station
16
CONESTOGA-ROVERS & ASSOCIATES
Revision 1
Prior to CRA completing its analysis and determination of AFEs, Station personnel
completed an exhaustive review of all historic and current management of systems that
may contain potentially radioactively contaminated liquids.
CRA reviewed the systems identified by the Station, which have the potential for the
release of radioactively contaminated liquids
to the environment, and groundwater flow
at the Station. This evaluation allowed CRA to become familiar with Station operations
and potential systems that may impact groundwater. CRA then evaluated information
concerning historic releases as provided by the Station. This information, along with a
review of the results from historic investigations, was used to refine CRA's
understanding of areas likely to have the highest possibility of impacting groundwater.
Where at risk systems or identified historical releases were located in close proximity or
were located in areas which could not be evaluated separately, the systems and
historical releases were combined into a single AFE. At times, during the Station
investigation, separate AFEs were combined into one or were otherwise altered based on
additional information and consideration.
Finally, CRA used its understanding of known hydrogeologic conditions (prior to this
investigation)
to identify AFEs. Groundwater flow was an important factor in deciding
whether to combine systems or historical releases into a single AFE or create separate
AFEs. For example, groundwater beneath several systems that contain radioactively
contaminated liquids that flows toward a common discharge point were likely
combined into a single AFE. The AFEs were created based on known groundwater flow
conditions prior to the work completed during this investigation.
Based upon its review of information concerning
confirmed or potential historical
releases, historic investigations, and the systems at the Station that have the potential for
release of radioactively contaminated liquids to the environment combined with its
understanding of groundwater flow at the Station, CRA identified four AFEs (see
Figures 3.1 and 3.2).
AFE-Braidwood-1- North of the Slurry Wall
This area was identified as an AFE to investigate the possibility that the slurry
wall
(slurry trench) is not providing sufficient hydraulic control to prevent tritium (if present)
from migrating off the site property. Tritium has been detected in the groundwater
within the slurry wall on the west side of the Turbine Building. It was necessary to
assess if this tritium or other groundwater impacts had the potential to migrate north of
the slurry wall and outside the PA.
045136 (12) Braidwood Generating Station
17
CONESTOGA-ROVERS & ASSOCIATES
Revision 1
On March 13, 2006, rain accumulated and mixed with tritiated water within the bermed
area surrounding the Frac Tank storage area located on a concrete pad (Refer to
Figure 3.2). The berm surrounding the tanks was breached and allowed water to spill
over the berm and seep into soils near the pad. Most of the water was recovered.
AFE-Braidwood-2 - North/Northeast of Units 1 and 2
This area was identified as an AFE due to its proximity to Units
1 and 2 and the systems
near these two units. More specifically, this area was identified as an AFE to monitor
groundwater quality on the northeast of the reactors, the fuel handling building, and
other systems.
AFE-Braidwood-3 - Auxiliary Construction Storage Tank
This area comprises the Auxiliary Construction Storage Tank, the blowdown
line as it
exits the PA, and the sewage treatment plant. This area was selected for groundwater
monitoring to evaluate the quality of groundwater in this area of the PA and the
potential impacts of historical releases documented by Exelon.
AFE-Braidwood-4 - West Side of Turbine Building
This area comprises the west side of the Turbine Building. The following five pieces of
information provide support to this area being identified as an AFE:
•
existing
monitoring well data from the Winter of 2006 had indicated tritium impacts
in wells located adjacent to the west side of the Turbine Building foundation;
•
a seep, occurring intermittently,
into the basement of the Turbine Building had
indicated concentrations of tritium over the LLD of 200 pCi/L;
•
prior to 1992, effluent from
Turbine Building Fire and Oil Sump was released to the
storm water drainage system;
•
in December
1990, some tritiated water may have been periodically discharging to
the storm sewer system through a heating system relief valve. The valves discharge
to the Oil/Water Separator on the north end of the property. The separator then
discharges into the drainage ditch; and
•
on April
6, 2006, a release of steam (location is presented on Figure 3.2) from the
west side of the Turbine Building discharged onto the ground surface near the waste
treatment lagoons and north of the waste treatment plant. The release was partially
remediated by collecting all available standing water, pumping water from the
storm water drainage system, and blocking drainage paths for some site drainage
ditches.
045136 (12) Braidwood Generating Station
18
CONESTOGA-ROVERS & ASSOCIATES
Revision 1
4.0
FIELD METHODS
The field investigations completed for this HIR were completed in April, May, and
July
2006. CRA supervised the installation of monitoring wells and staff gauges,
collected samples from the newly-installed and existing monitoring wells and from
surface water locations, and collected a round of groundwater and surface water
measurements.
The field investigations were completed in accordance with the
methodologies presented in the Work Plan (CRA, 2006).
4.1
STAFF GAUGES INSTALLATION
Figure 4.1 presents the location of the four new staff gauges and two surface water
monitoring points installed as part of this investigation. CRA installed staff gauges at
four locations (SG-BW-101 to 104) within the perimeter ditch and established two
monitoring points (SG-105 and 106) on the Cooling Lake.
4.2
GROUNDWATER MONITORING WELL INSTALLATION
Twelve new monitoring wells were installed for the fleetwide hydrogeologic
investigation. Monitoring well construction logs are provided in Appendix A. This
included ten wells completed within the upper sand aquifer and two completed within
the shallow bedrock. Figure 4.2 presents the location of the new monitoring wells.
These locations were selected based on a review of all data provided, the hydrogeology
at the Station, and current understanding of identified AFEs. Table 4.1 summarizes the
well completion details.
Prior to completing any ground penetration activities, CRA completed subsurface utility
clearance procedures to minimize the potential of injury to
workers and/or damage to
subsurface utility structures.
The subsurface clearance procedures consisted of
completing an electronic survey within a minimum of 10-foot radius of the proposed
location utilizing electromagnetic and ground penetrating radar technology.
Additionally, an air knife was utilized to verify utilities were not present at the proposed
location to a depth to 10 feet bgs.
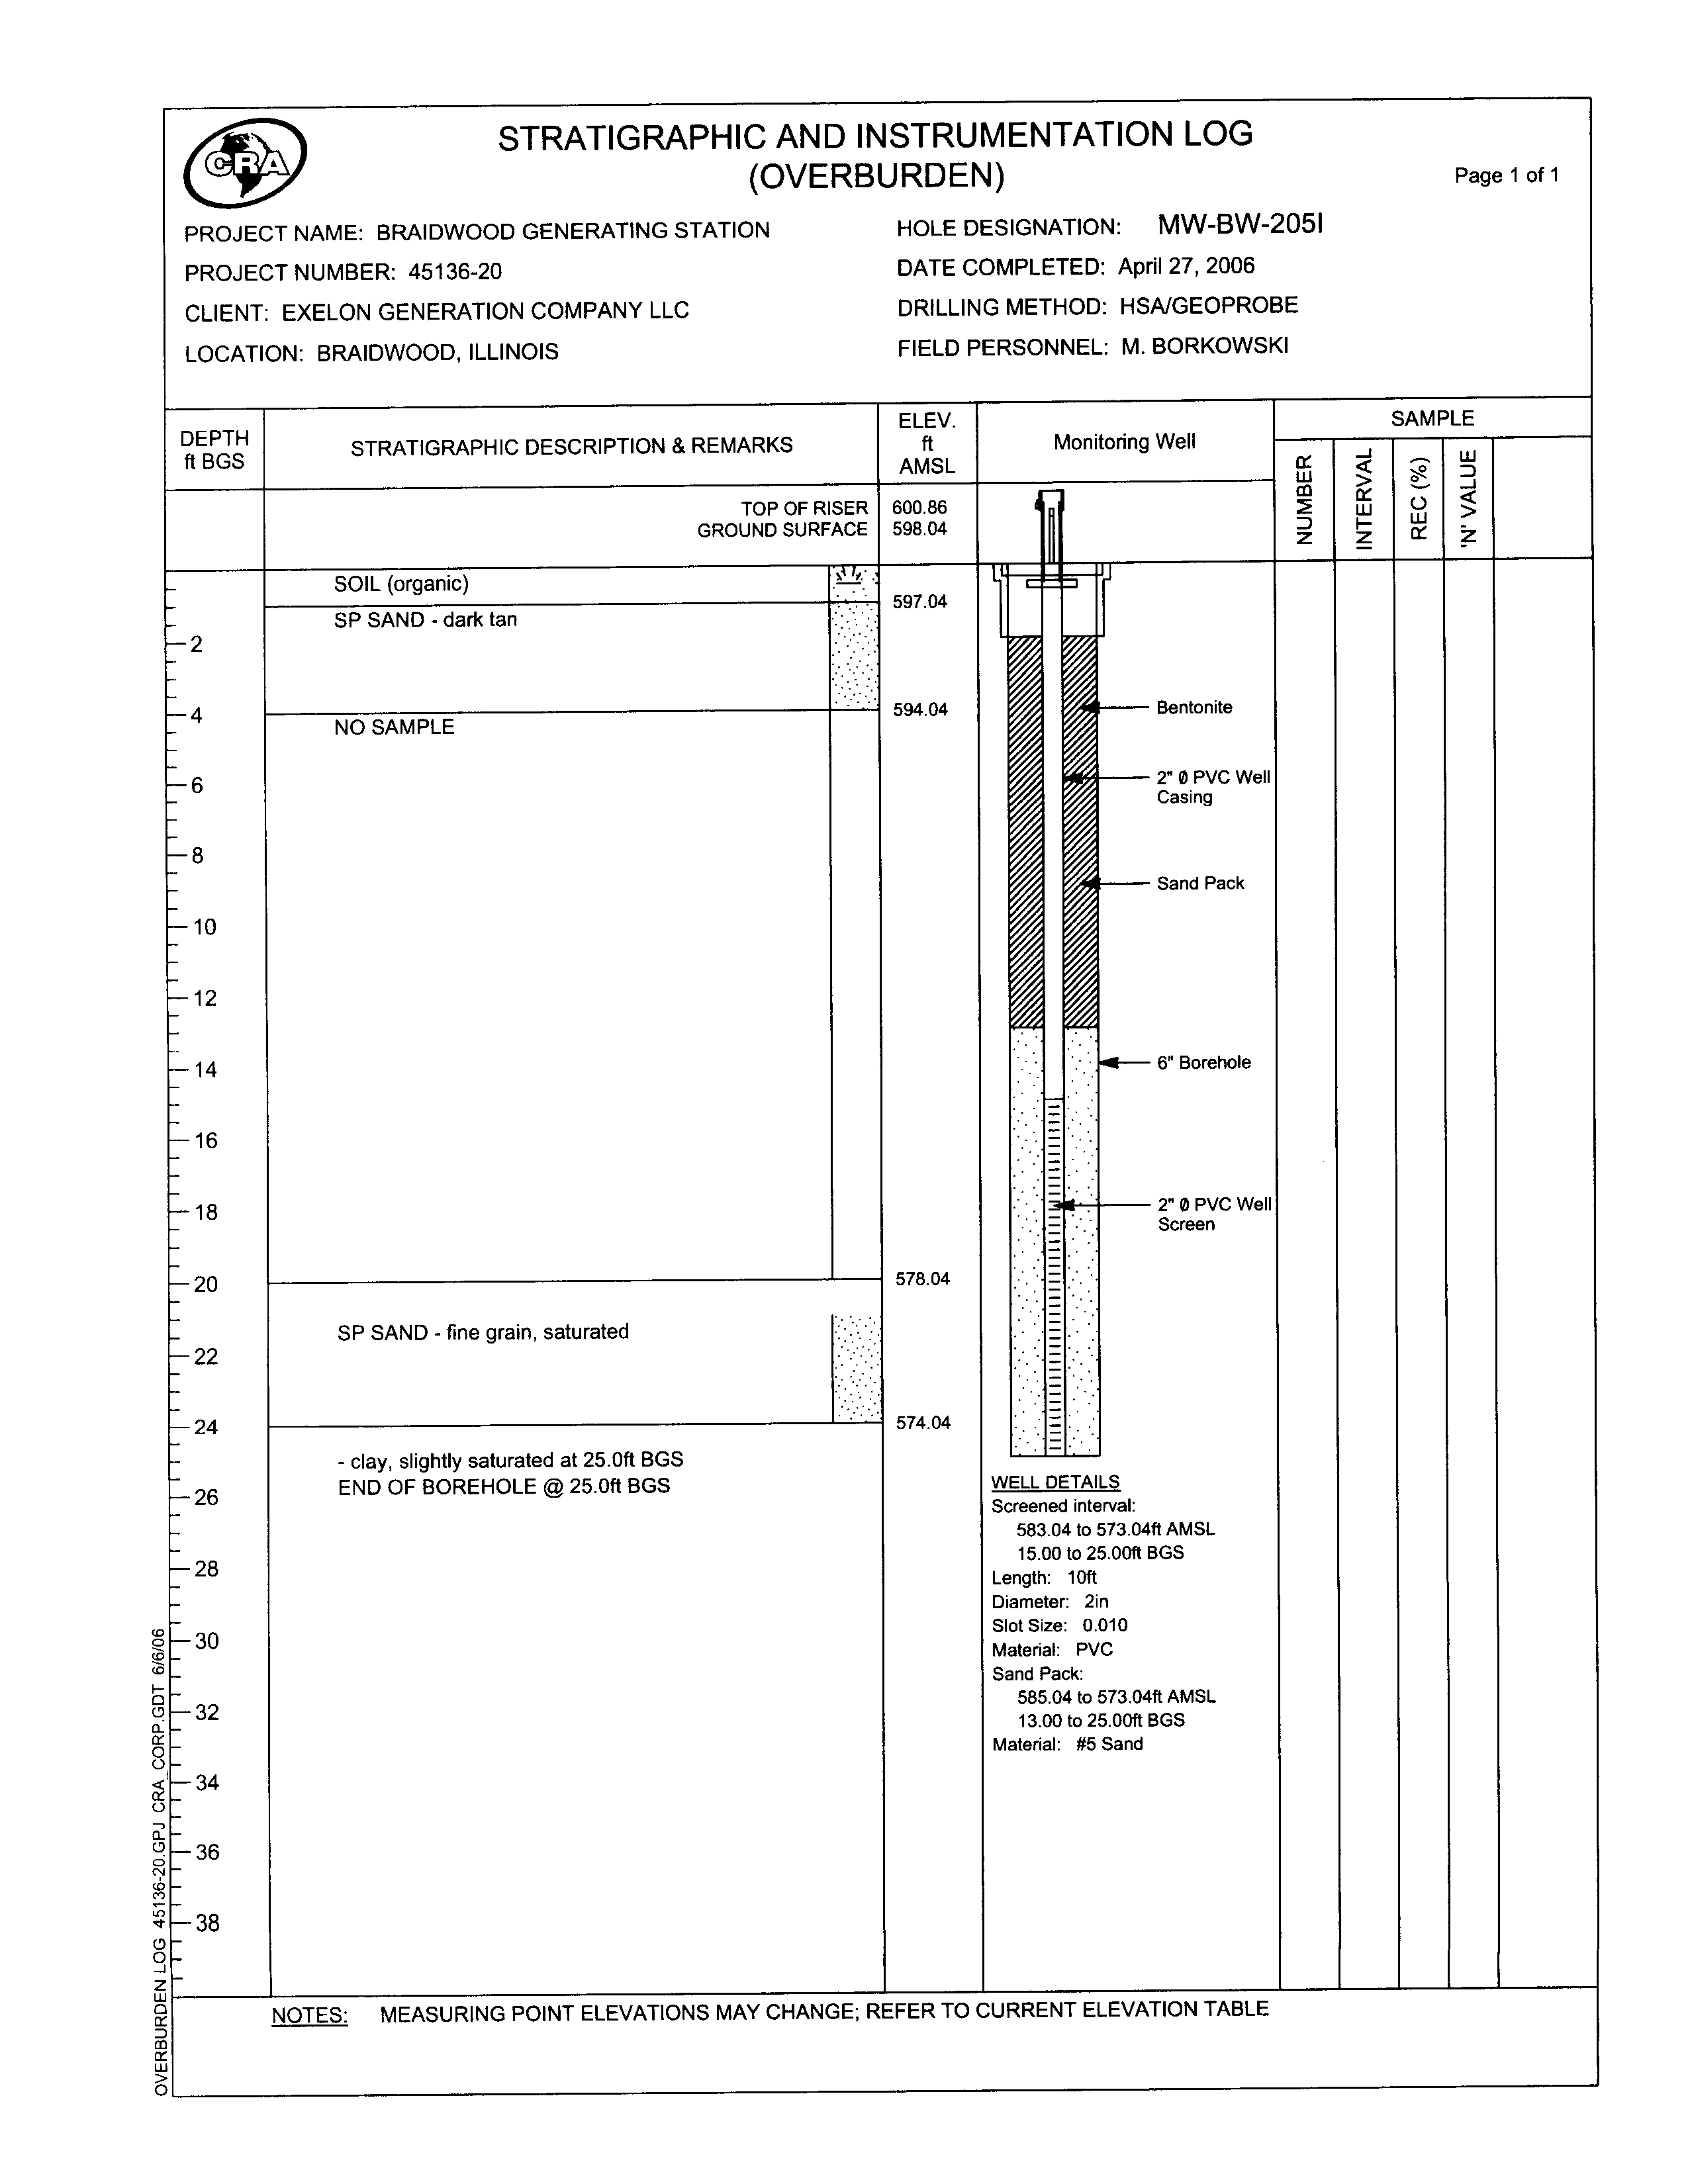
Specific installation protocols for the ten shallow monitoring wells are described below:
•
the
borehole was advanced to the target depth using 4.25-inch inside diameter
hollow-stem augers (HSA) or Rotosonic techniques;
045136 (12) Braidwood Generating Station
19
CONESTOGA-ROVERS & ASSOCIATES
Revision 1
•
a nominal 2-inch diameter (No. 10 slot) PVC screen, 10 feet in length, attached to a
sufficient length of 2-inch diameter schedule 40 PVC riser pipe to extend to the
surface, was placed into the borehole through the augers;
•
a
filter sand pack consisting of silica sand was installed to a minimum height of
2 feet above the top of the screen as the augers are removed;
•
a minimum 2-foot thick seal consisting of
3/8-inch diameter bentonite pellets or
chips was placed on top of the sand pack and hydrated using potable water;
•
the remaining borehole annulus
was sealed to within 3 feet of the surface using pure
bentonite chips;
•
the remaining portion of the annulus was filled
with concrete and a 6-inch diameter
protective above-grade casing. The well head will be fitted with a water-tight,
lockable cap; and
•
cement-filled bollard posts were installed around selected monitoring well locations.
Shallow monitoring wells included two types of
wells completed within the upper sand
aquifer. A shallow zone well was completed at depths of approximately 15 feet bgs into
the upper sand zone and at the water table. The deep zone wells were completed at
depths of approximately 25 to 30 feet bgs and into the lower portions of sand found on
top of the Wedron Clay Till.
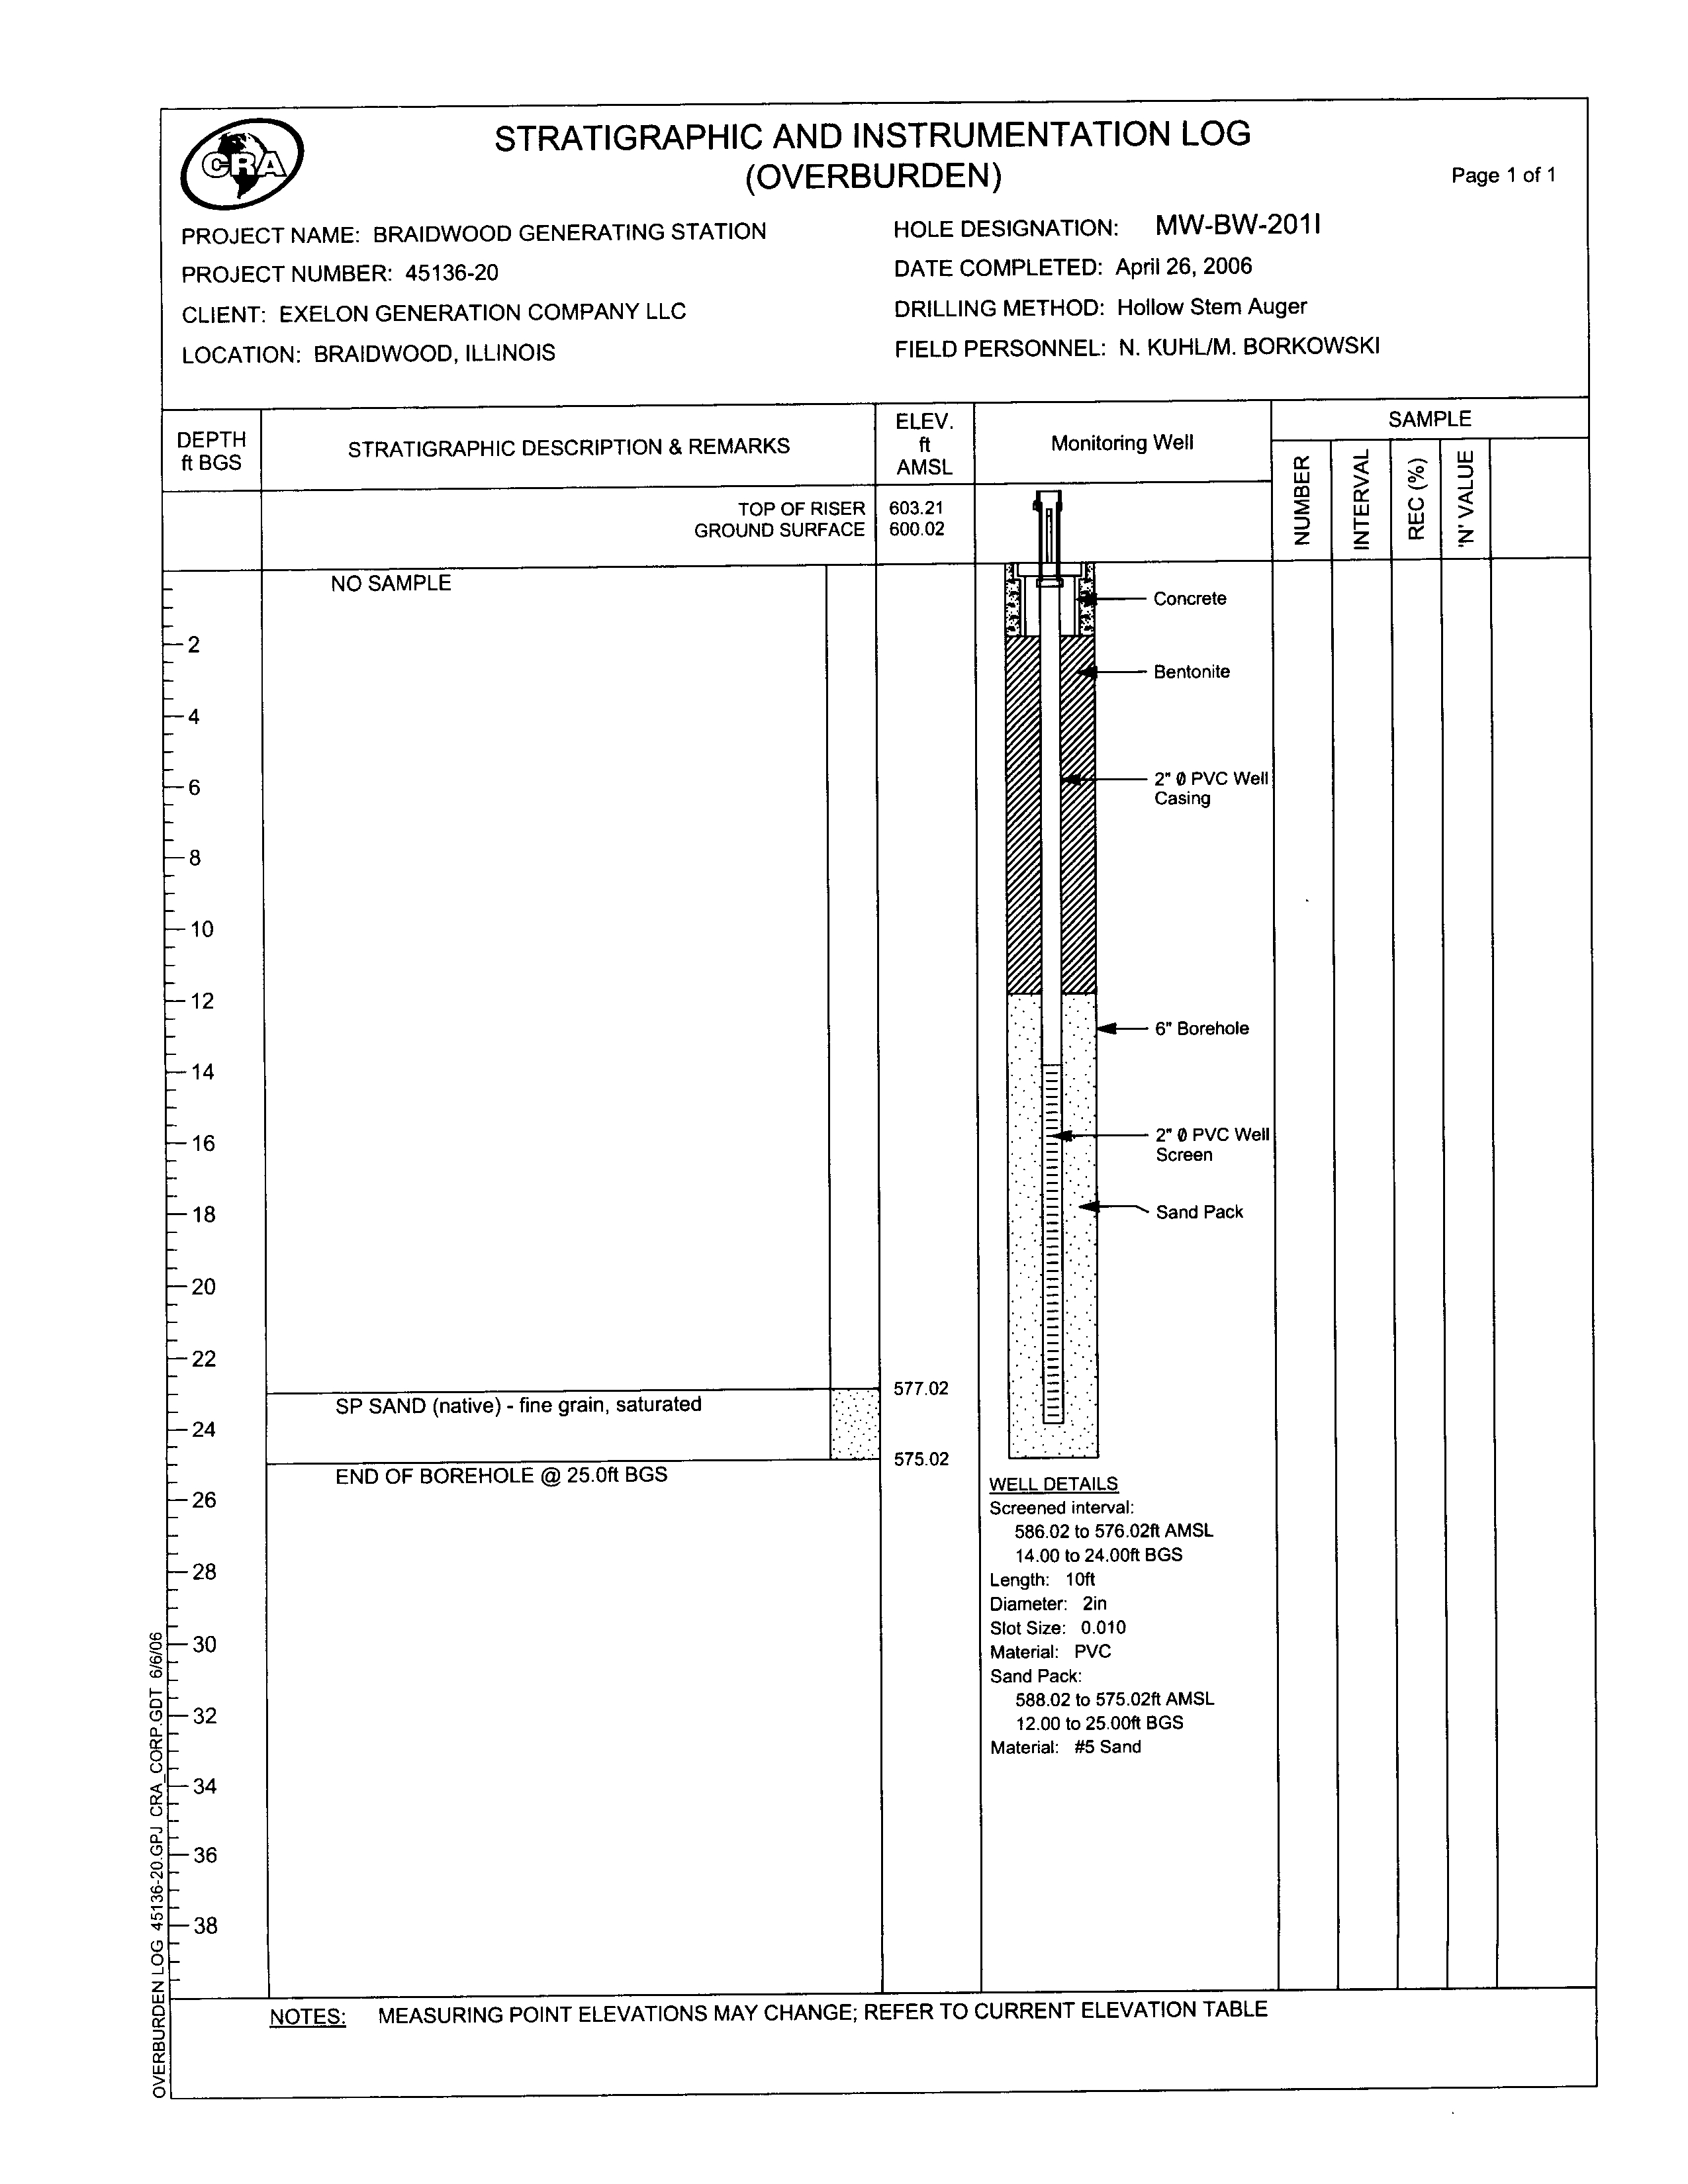
Specific installation protocols for the two bedrock monitoring wells are described below.
Each shallow bedrock well was drilled to and completed within the first water bearing
zone encountered beneath the Francis Creek Shale Member.
A
sandstone was
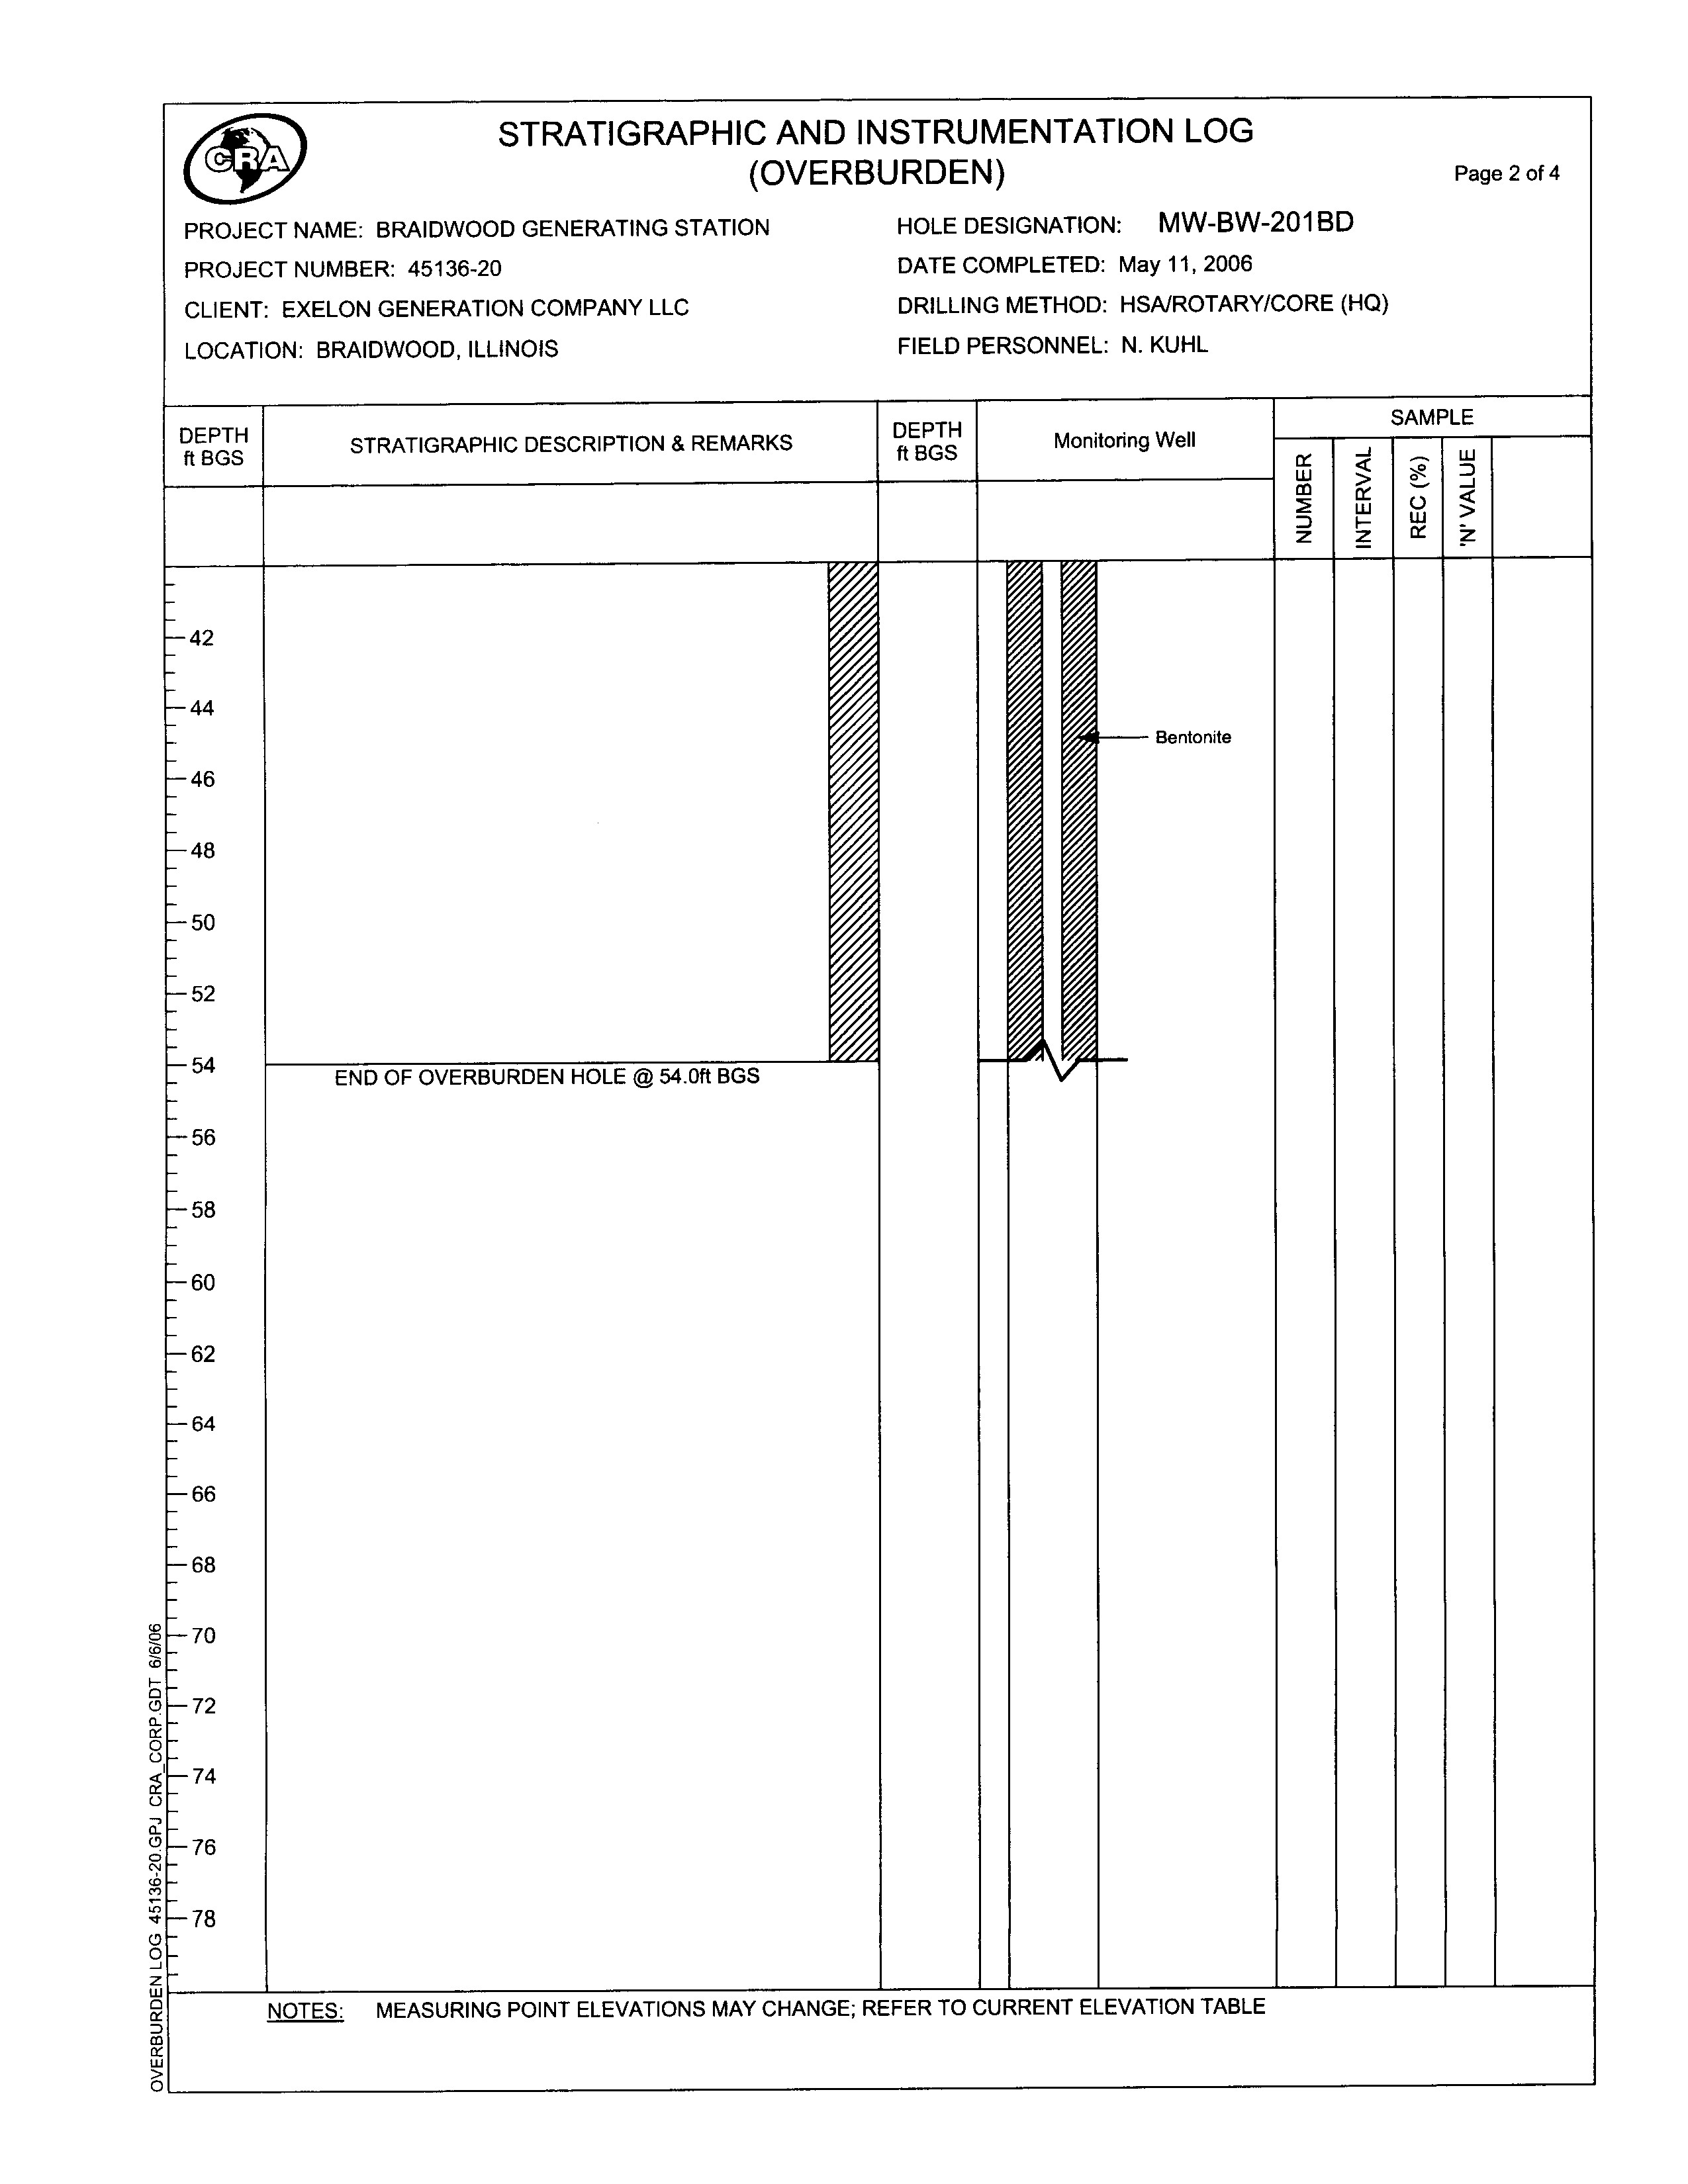
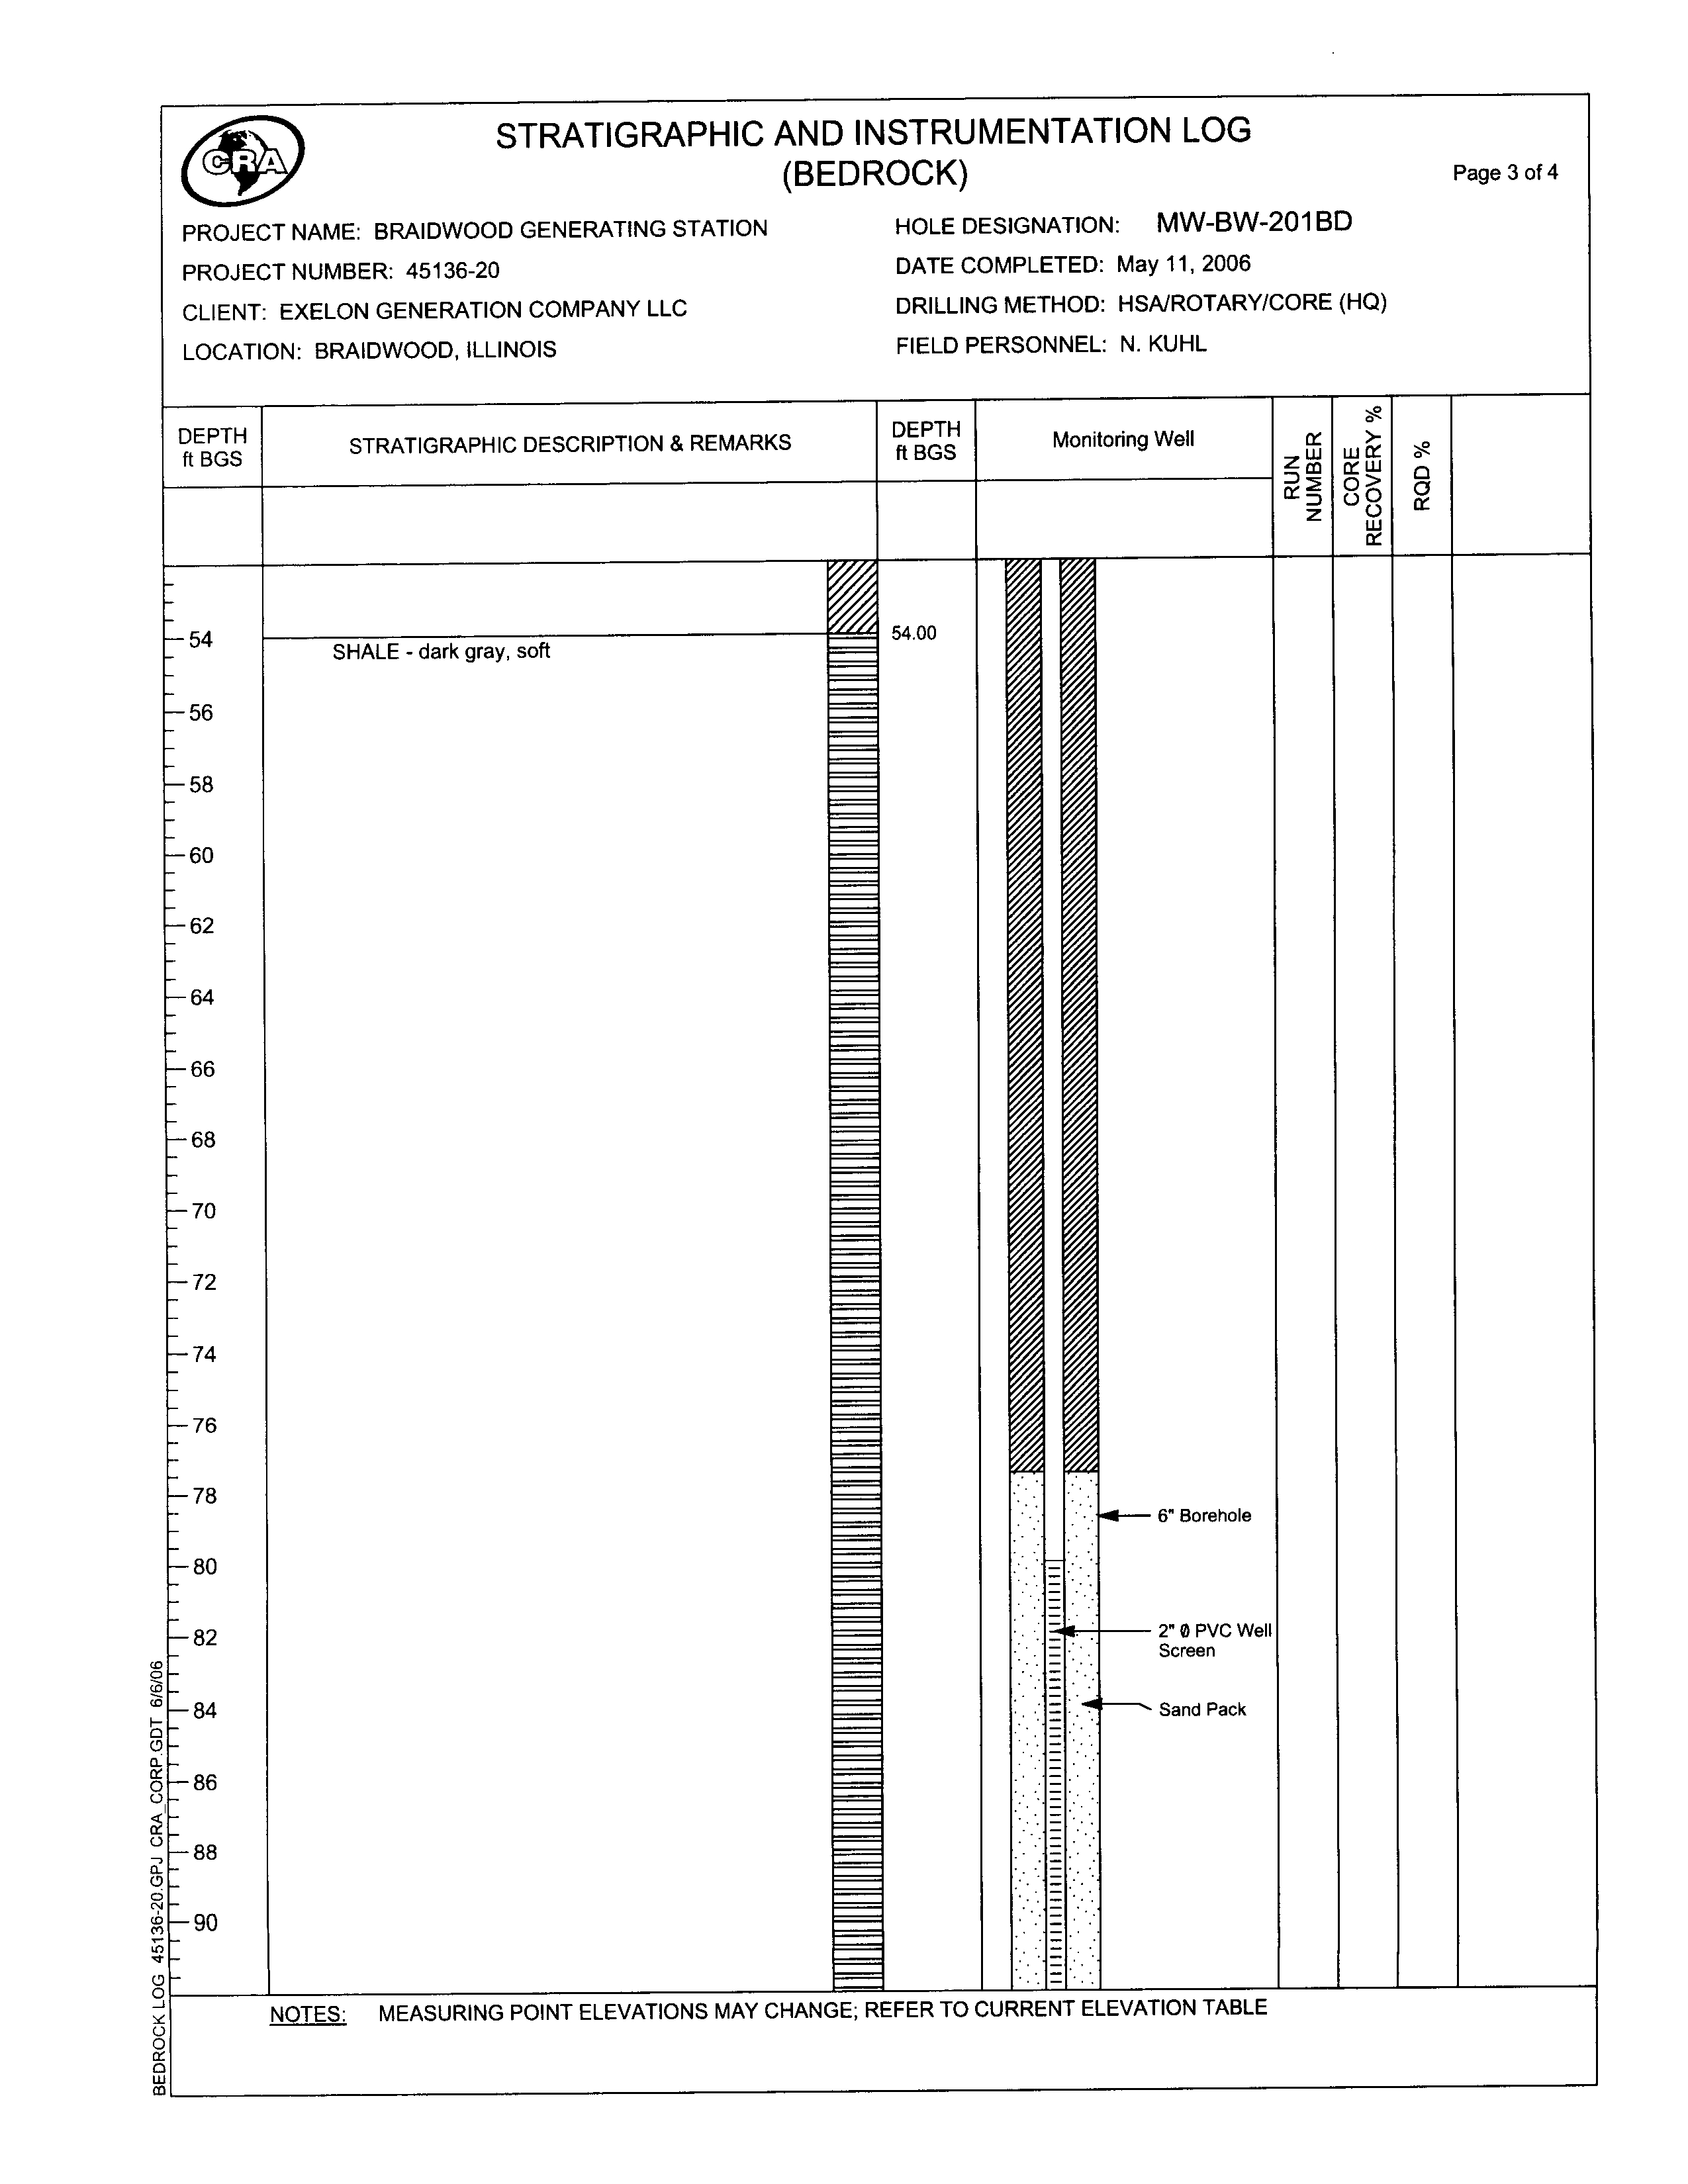
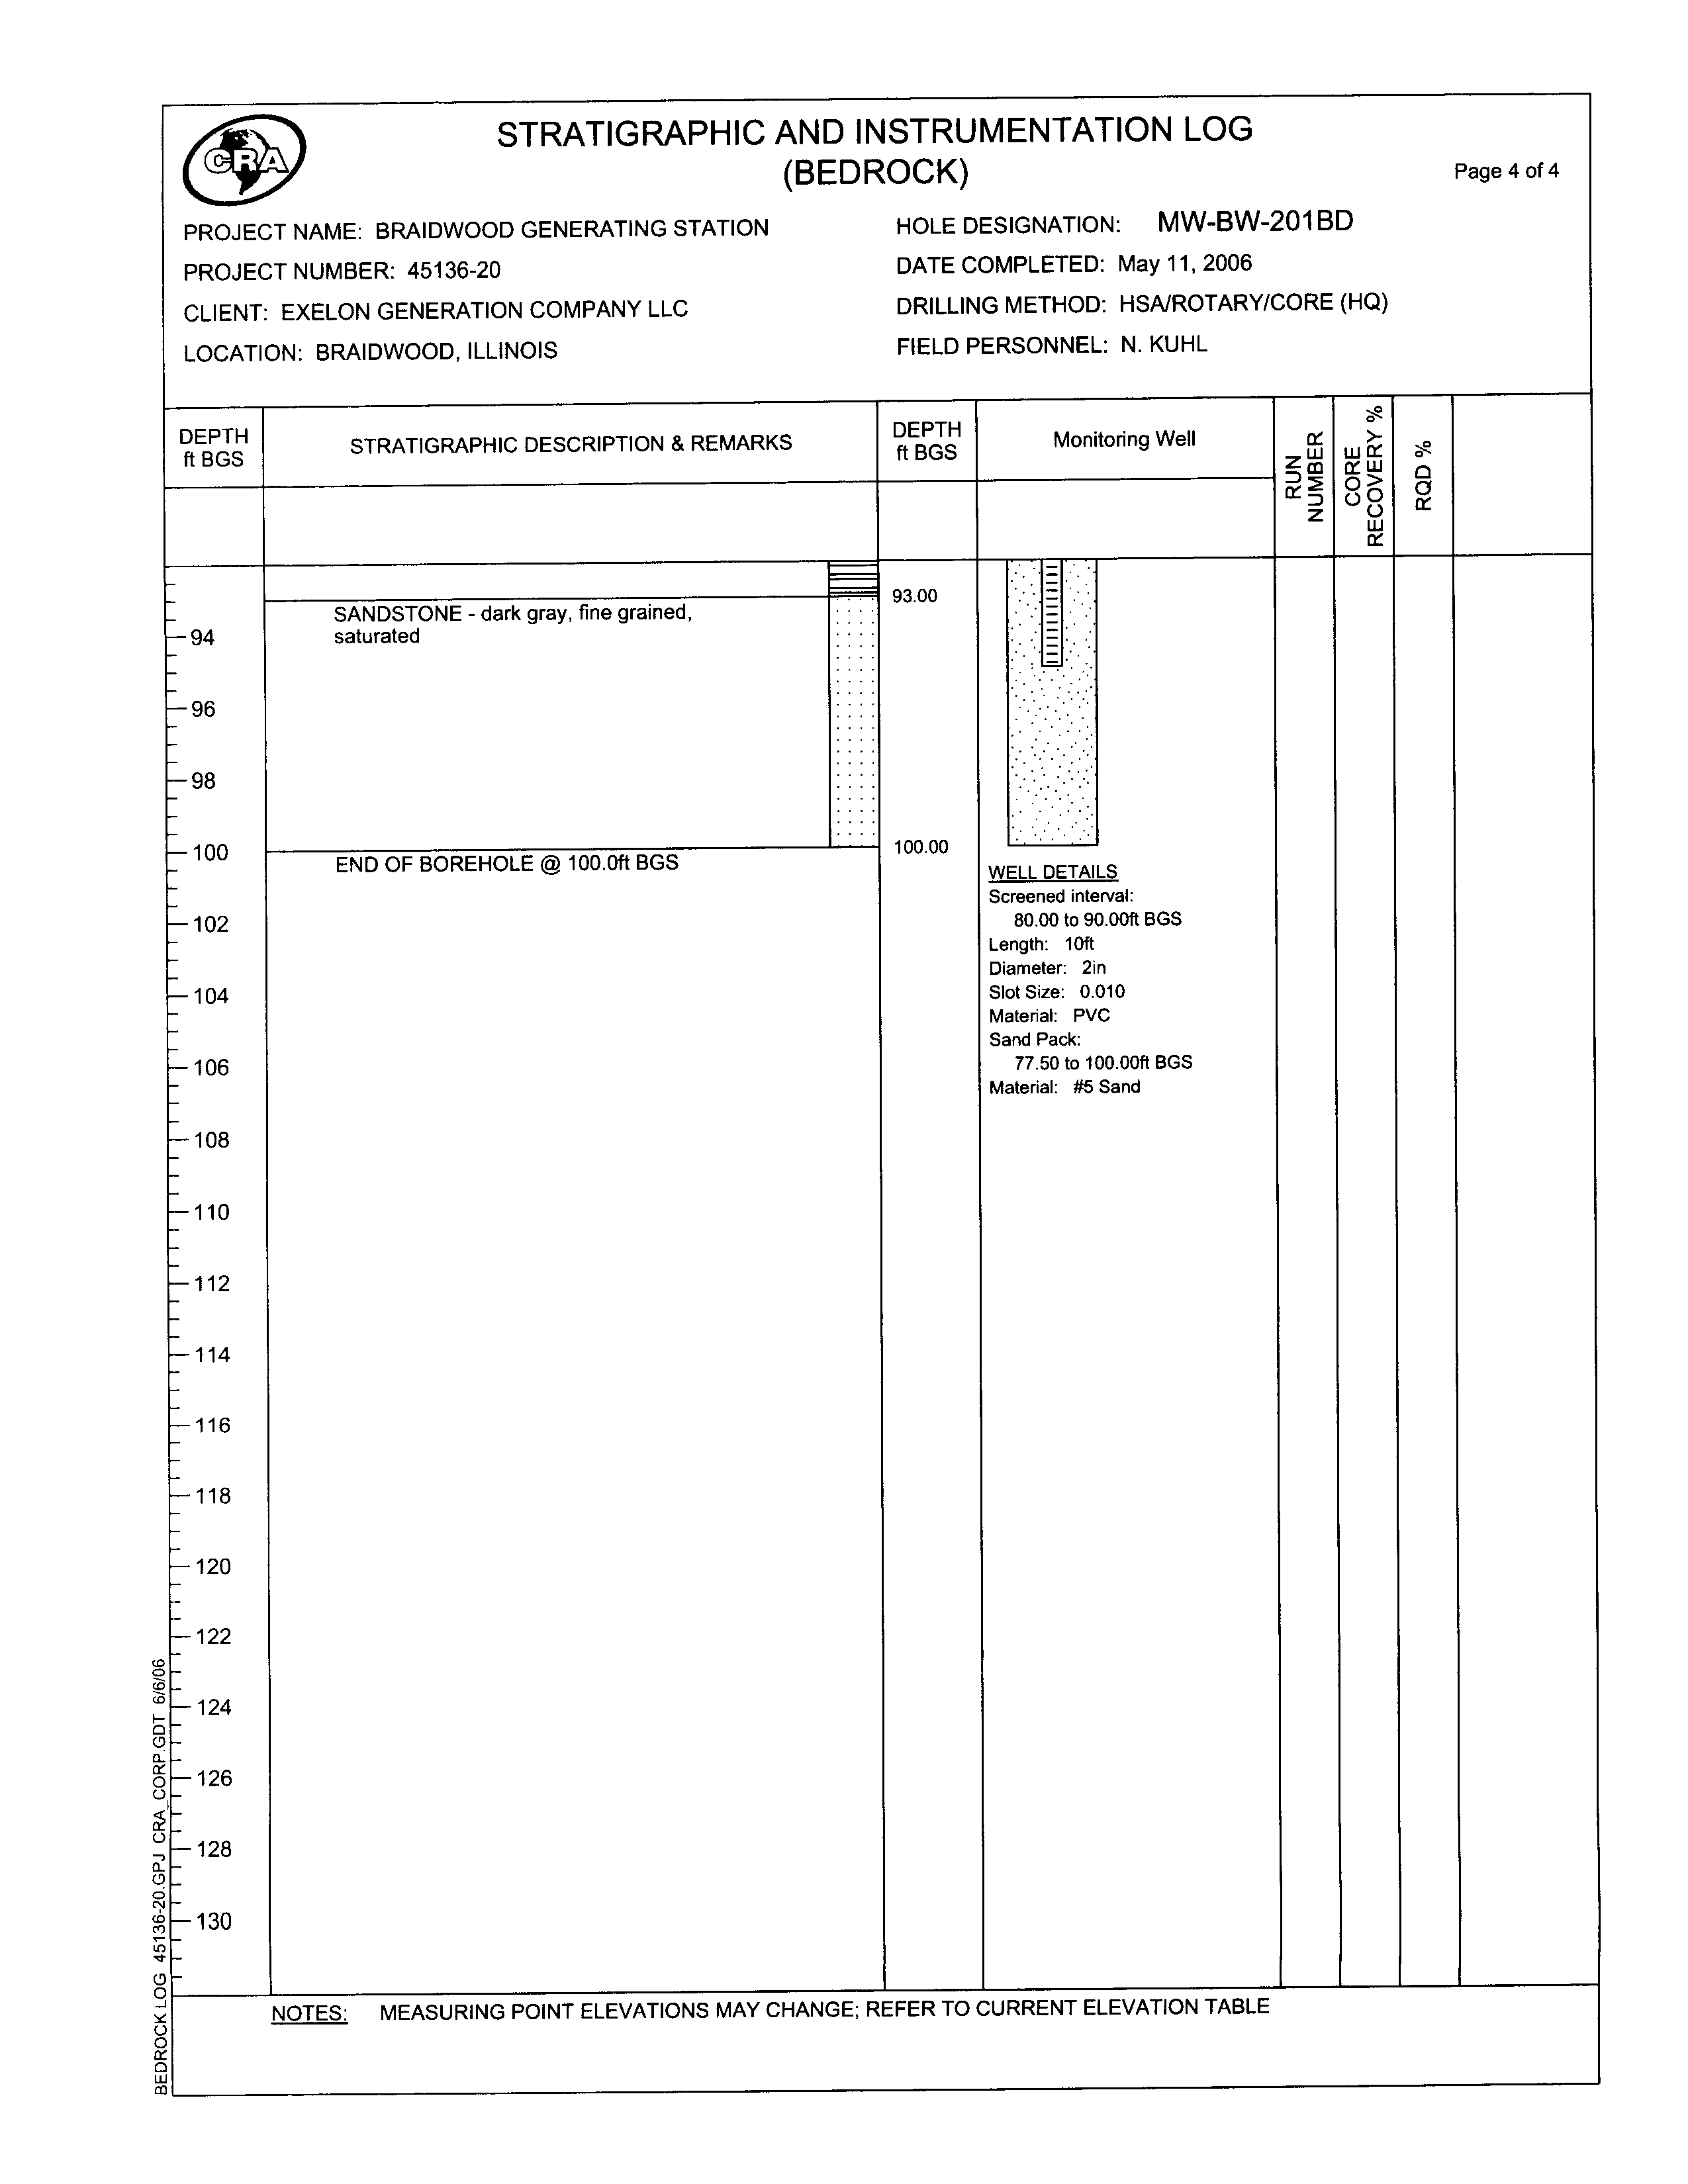
encountered below these shales and the screened interval for both MW-BW-201BD and
MW-BW-208BD was set into this sandstone layer at a depth of approximately
80 to 95 feet bgs at MW-BW-201BD and from 85 to 100 feet bgs at MW-BW-208BD. This
sandstone is expected to be part of the underlying Spoon Formation.
MW-BW-201D was installed using 8-inch HSA drilled to a depth of 39
feet bgs. A 6-inch
protective casing was then installed through the augers and pushed to a depth of
40 feet bgs to ensure a proper seal into the till. A HQ coring bit was used to drill
through the shale and siltstone formations to a depth of 100 feet bgs. Ten-foot core
samples were recovered between 70 and 100 feet bgs. The core sample recovered in
MW-BW-201BD between 84 and 91 feet bgs appeared to contain highly fractured and
weathered sandstone, therefore the monitoring well screen was installed to straddle that
zone (i.e., from 80 to 95 feet bgs) as shown on the well construction log.
Similar
conditions were encountered at MW-BW-208BD. At this location the well screen was
045136 (12) Braidwood Generating Station
20
CONESTOGA-ROVERS & ASSOCIATES
Revision 1
installed between 80 to 100 feet bgs. The monitoring well MW-BW-208BD was installed
in July 2006 using Rotosonic drilling techniques.
Sand was installed in the borehole from the bottom of the hole to the bottom of the well
screen to provide a base for the 2-inch monitoring
well. A sand pack was then installed
up to a depth of 2 feet above the top of the screen. Bentonite chips were installed to
ensure a hydraulic seal above the sand pack. The protective casing and either the 8-inch
augers (in the case of the HSA) or the drill steel (in the case of the Rotosonic) were then
removed from the borehole. A bentonite gel and Portland cement slurry was then
mixed and added to the borehole to 2 feet bgs. The monitoring wells were then finished
with a Pro-cover protective casing.
4.3
GROUNDWATER MONITORING WELL DEVELOPMENT
In order to establish good hydraulic communication with the aquifer and reduce the
volume of sediment in the monitoring well, monitoring well development was
performed in accordance with the procedure outlined below:
•
Monitoring
wells were surged using a pre-cleaned surge block for a period of at least
20 minutes.
•
Water was purged from the monitoring
well using a pneumatic submersible pump.
•
Groundwater was collected at
regular intervals with the pH, temperature, and
conductivity measured using field instruments. These instruments were calibrated
daily according to the manufacturer's specifications. Additional observations such
as color, odor, and turbidity of the purged water were recorded in the field book.
•
Development
continued until the turbidity and silt content of the monitoring wells
was significantly reduced and three consistent readings of pH, temperature, and
conductivity were recorded, or a minimum of ten well volumes were purged.
A summary of the well development parameters is provided in Table 4.2.
4.4
WELL INVENTORY
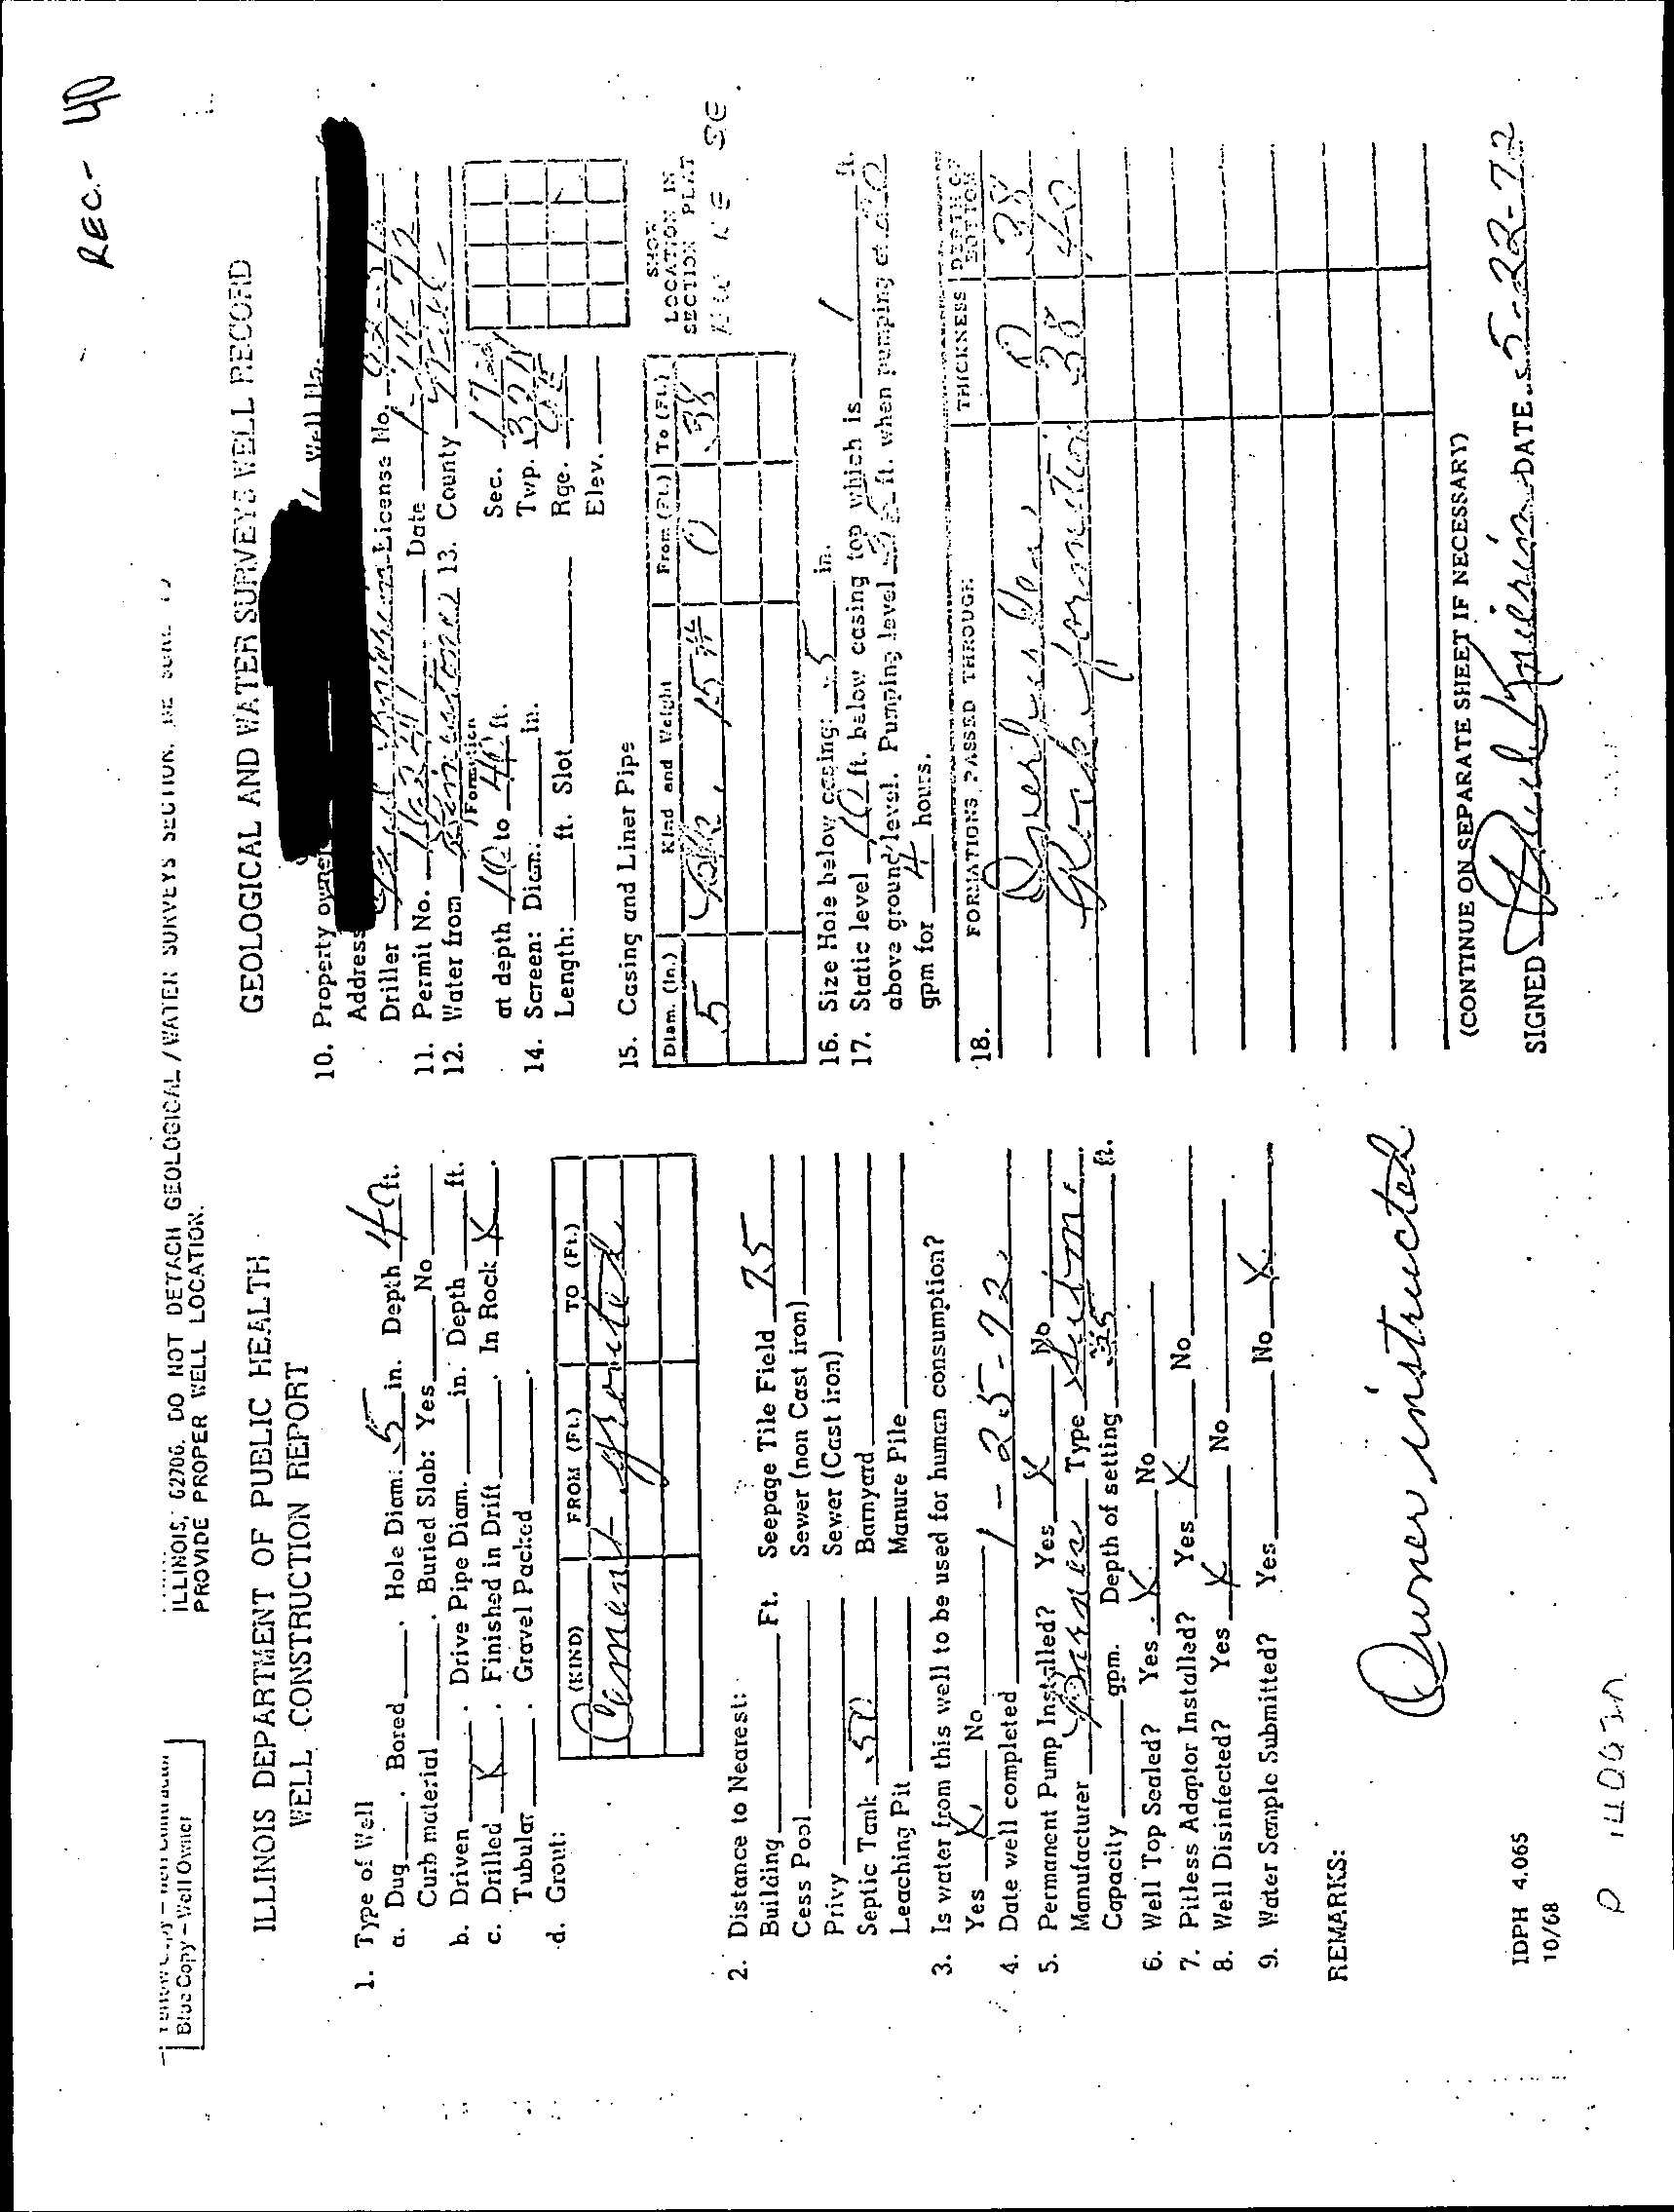
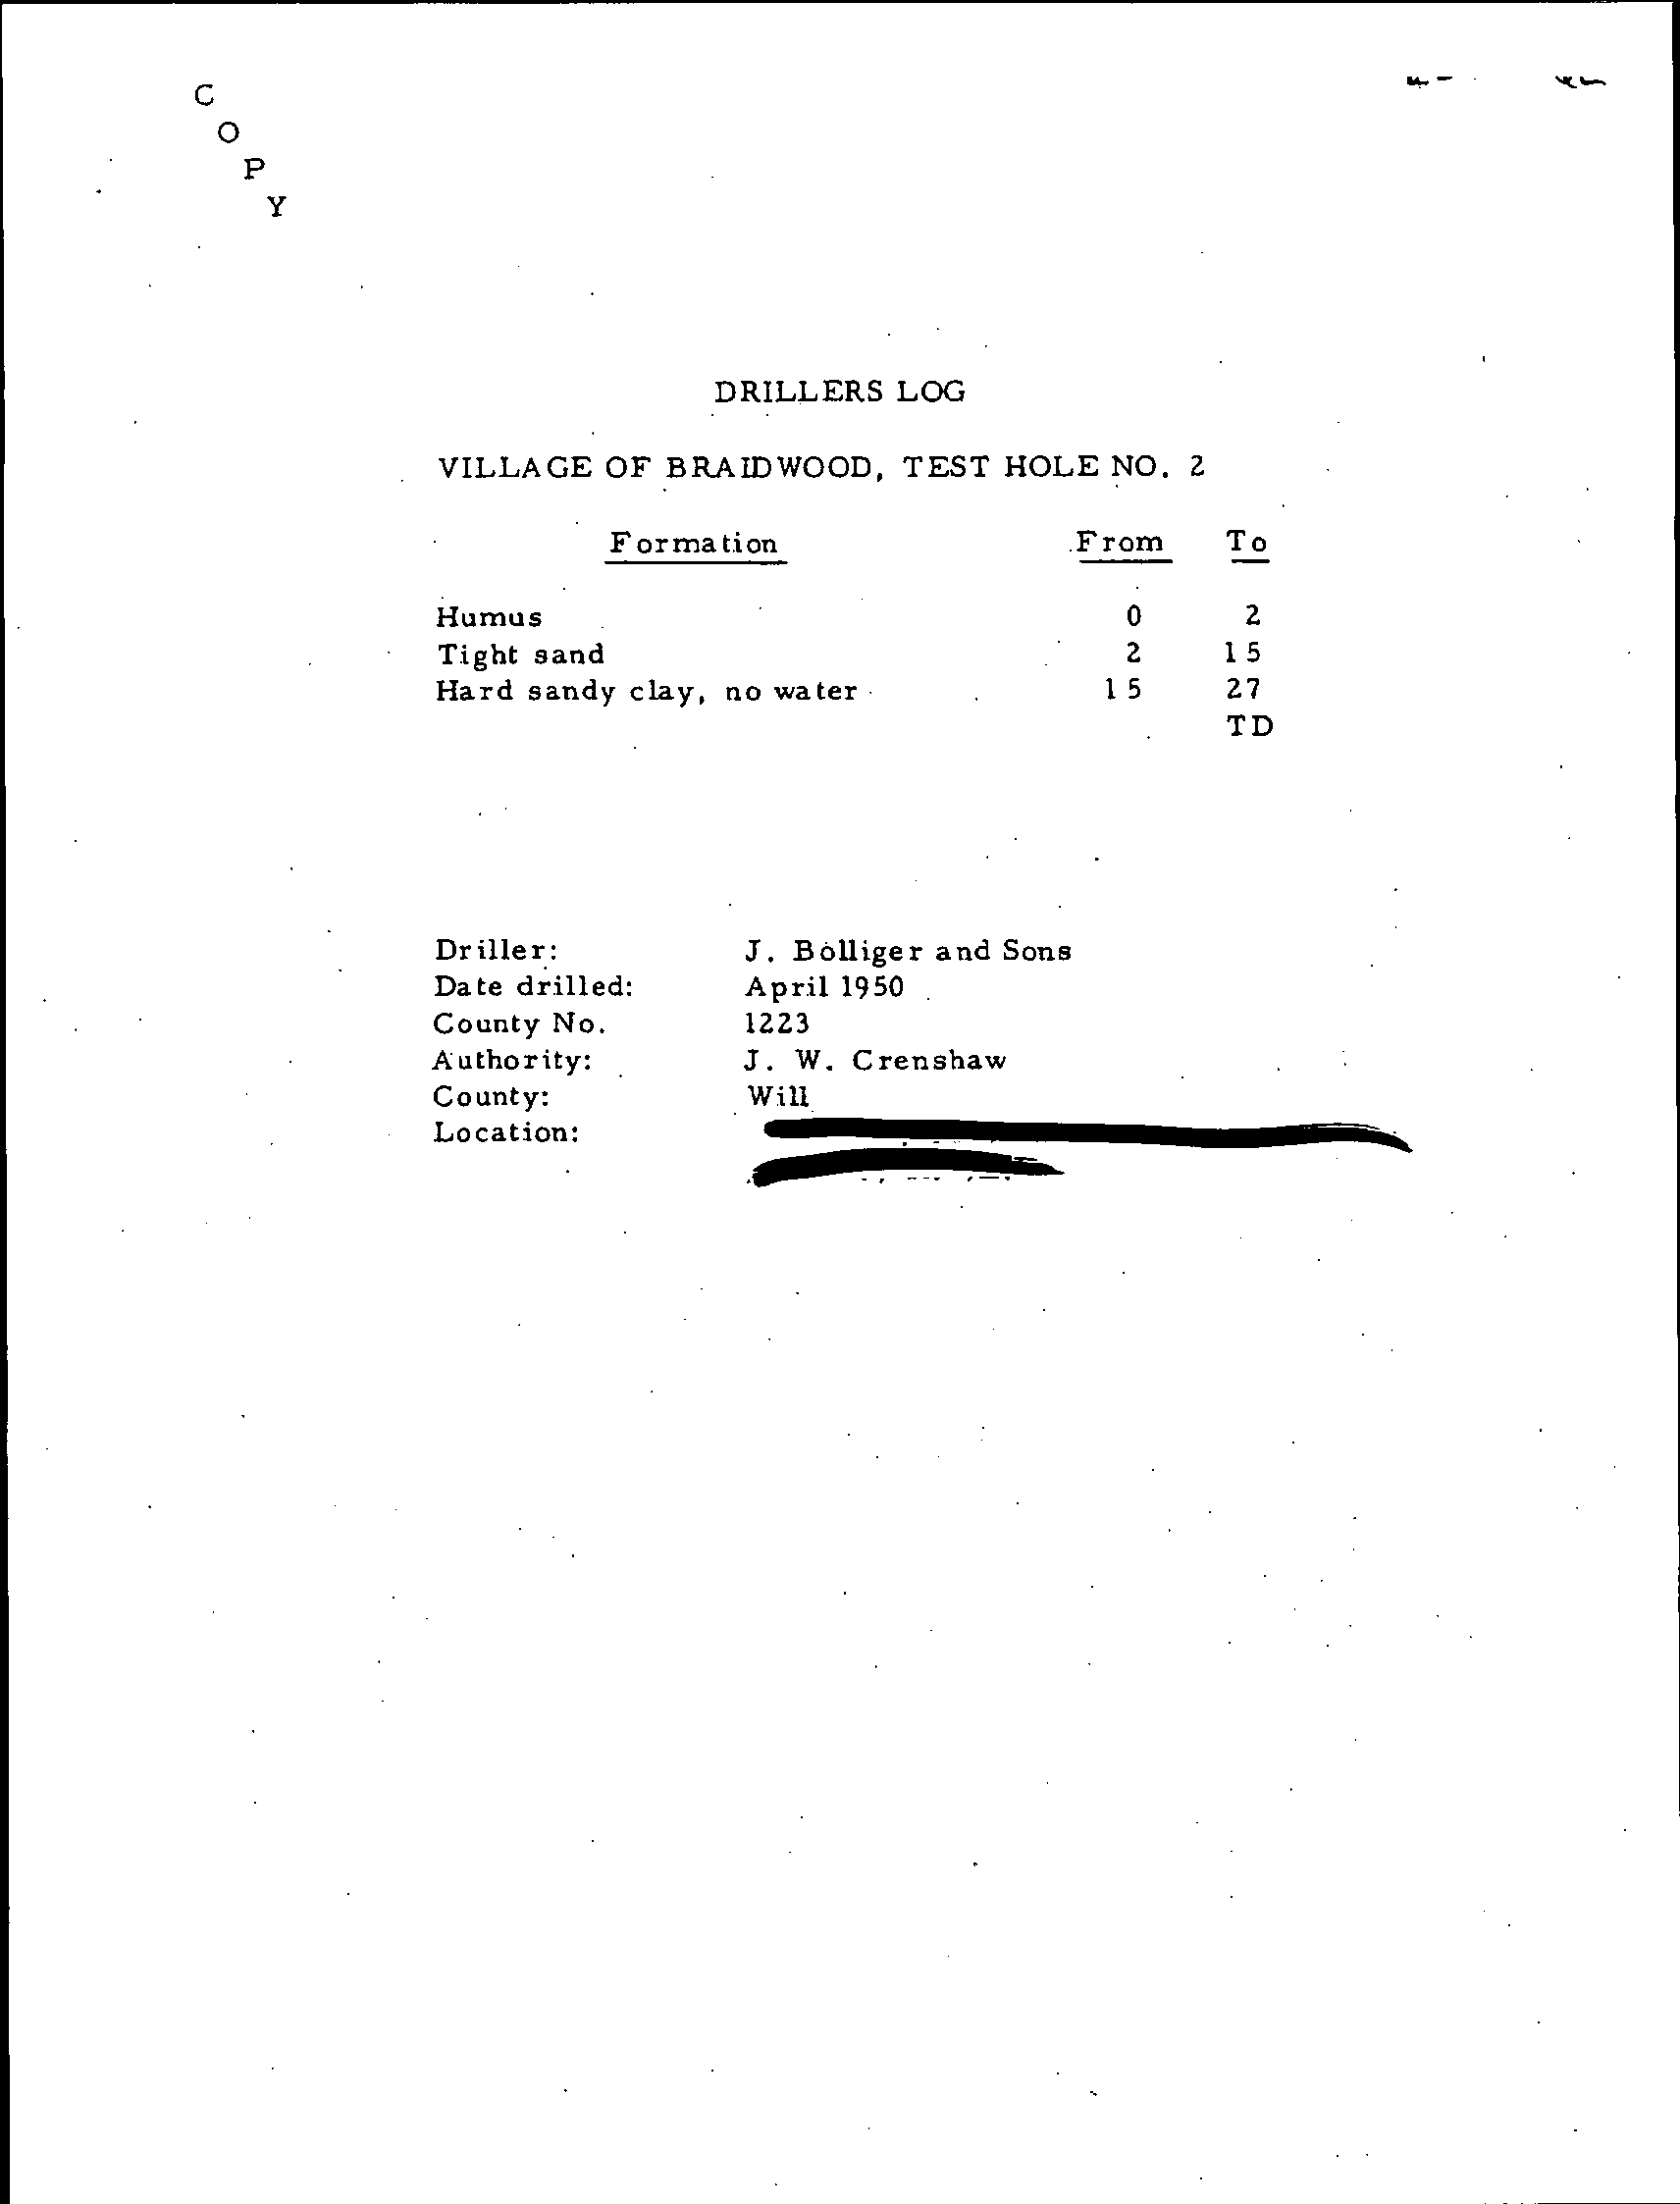
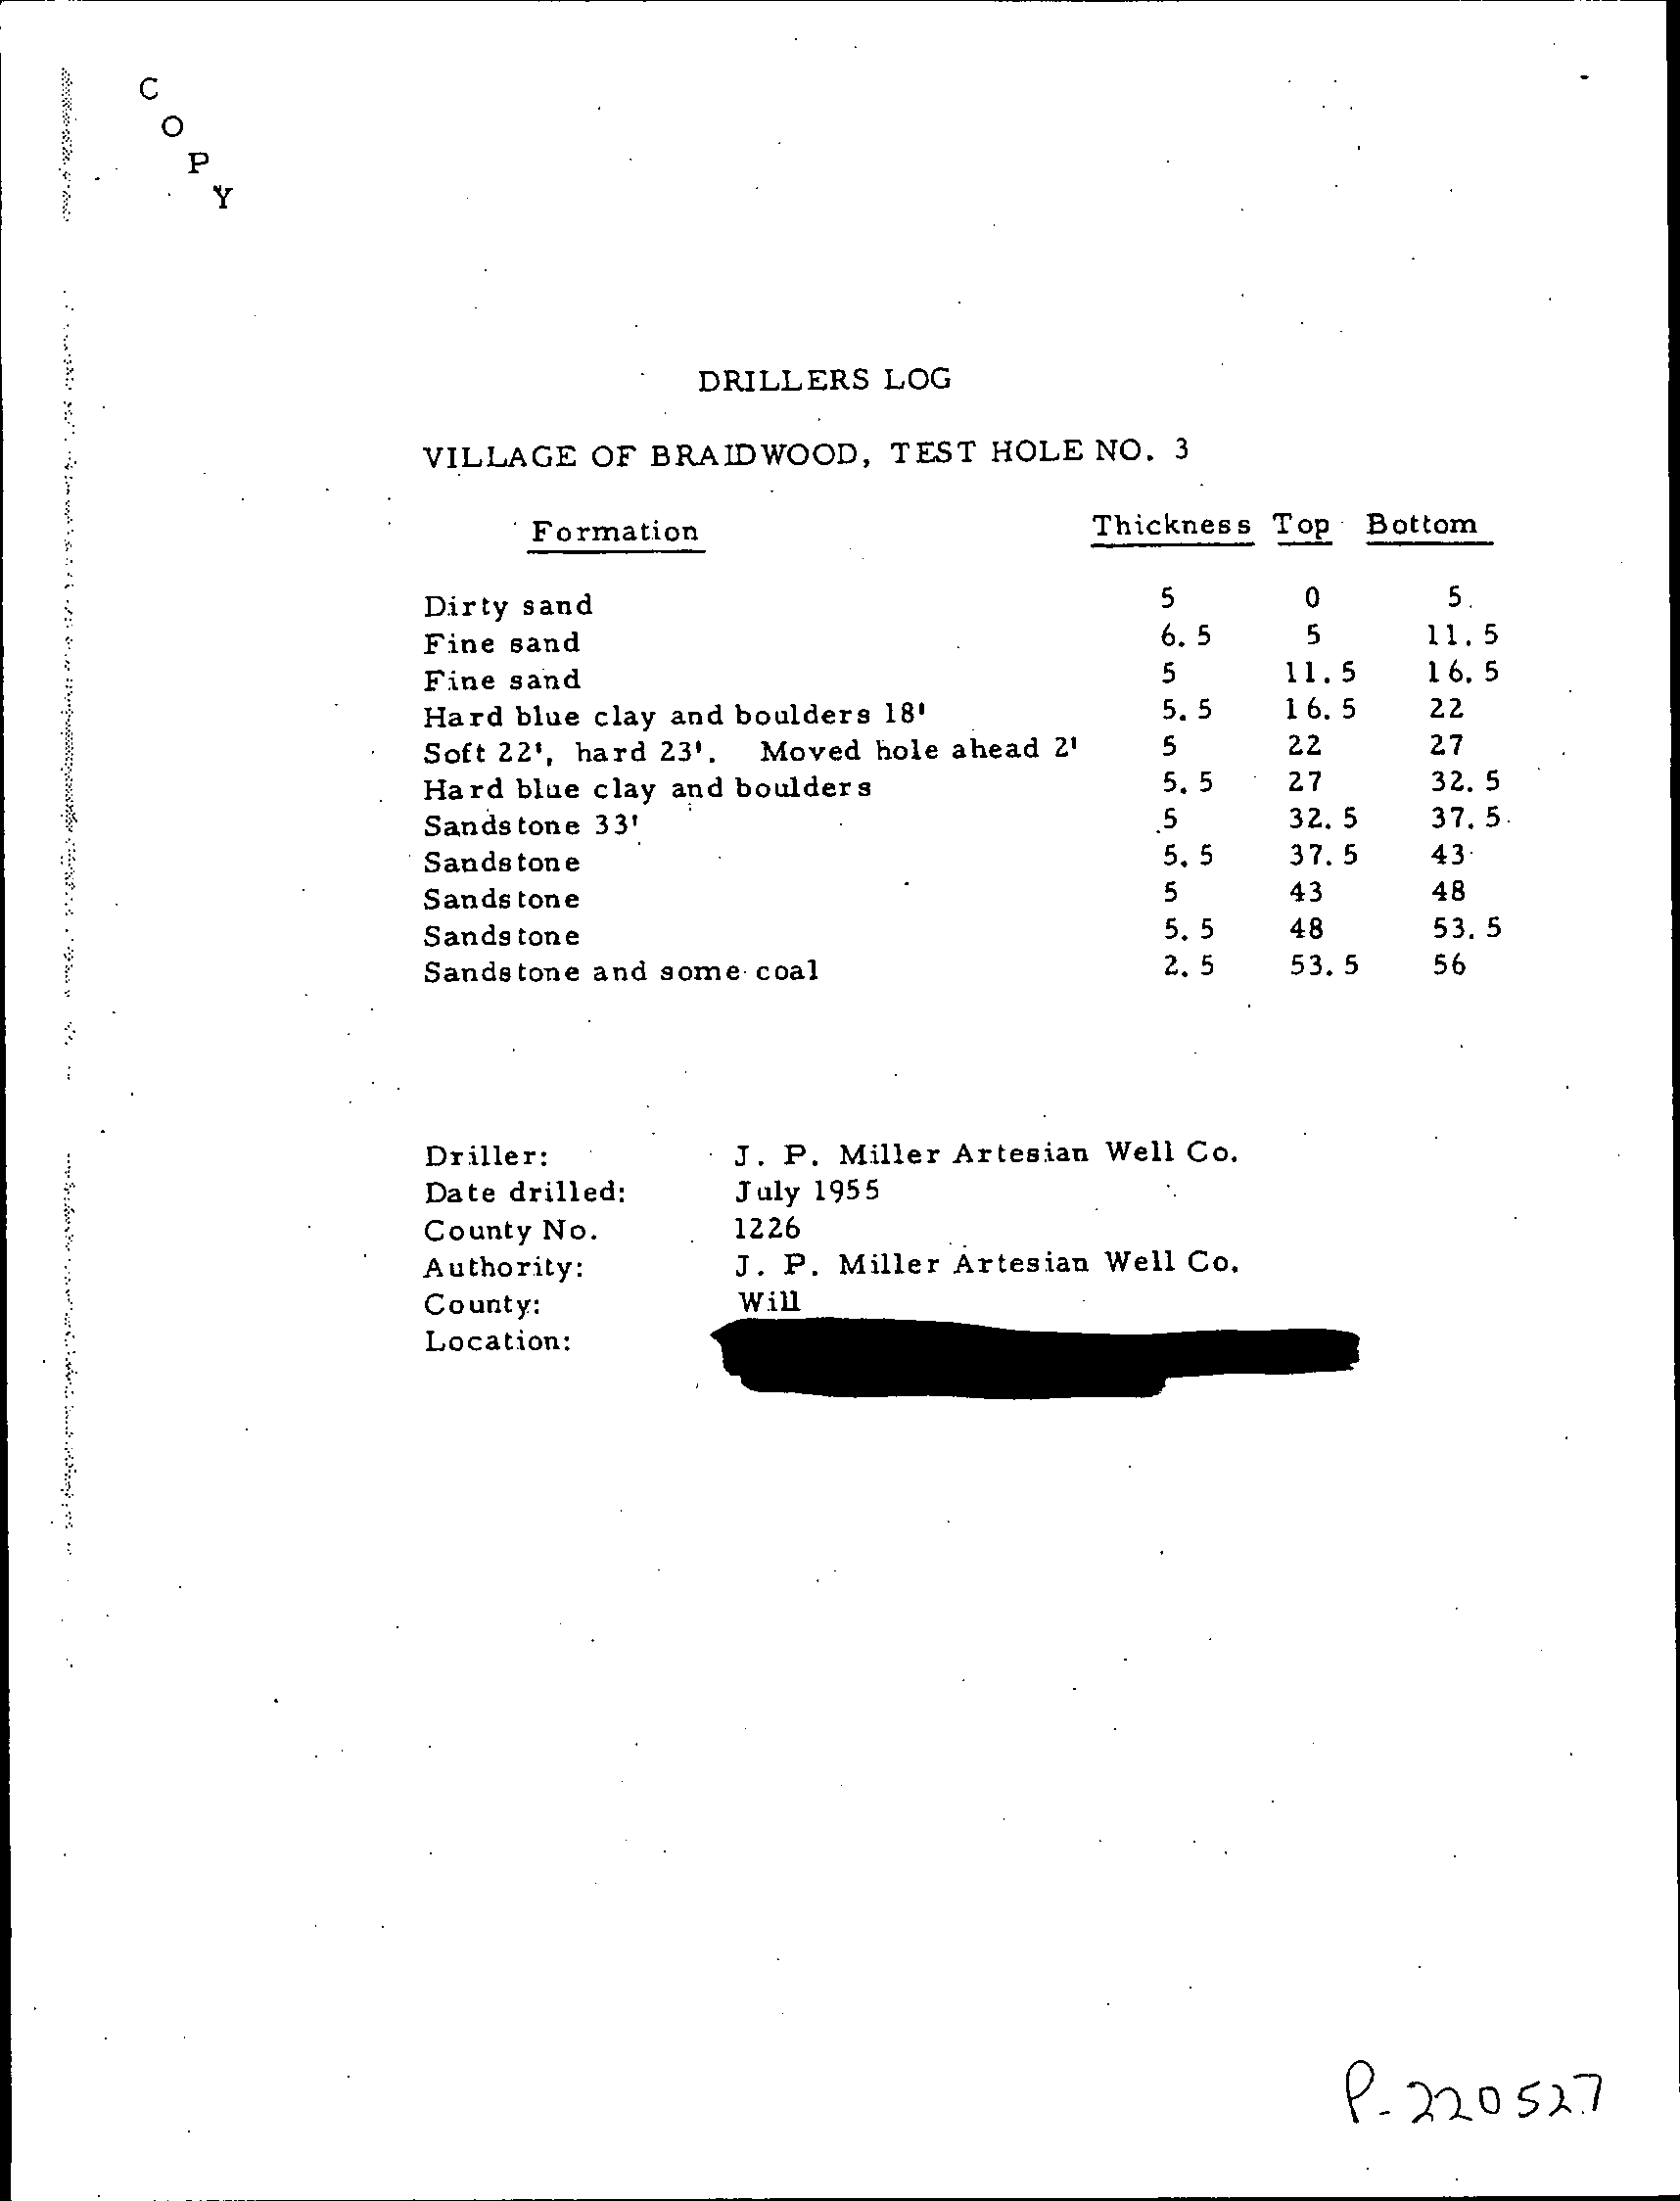
CRA performed a comprehensive private well survey/inventory along the length of the
blowdown line and in areas north and west of the site. This well inventory was
presented in the reports discussed in Section 2.6. The private well logs for wells near
and surrounding the Site are provided in Appendix B. These wells are a subset of the
045136 (12) Braidwood Generating Station
21
CONESTOGA-ROVERS & ASSOCIATES
Revision 1
water supply wells sampled by Exelon. Figure 2.15 presents the locations and results for
private wells, public wells, and monitoring wells.
4.5
SURVEY
The new monitoring wells and staff gauges were surveyed to establish reference
elevations relative to mean sea level. The top of each well casing was surveyed to the
nearest 0.01 feet relative to the National Geodetic Vertical Datum (NGVD), and the
survey point was marked on the well casing. The survey included the ground elevation
at each well to the nearest 0.10 feet relative to the NGVD, and the well location to the
nearest 1.0 foot. A reference point was also marked on each staff gauge.
4.6
GROUNDWATER AND SURFACE WATER ELEVATION
MEASUREMENTS
From May 9 to 11, 2006, CRA collected water level
measurements from both existing
monitoring wells, new monitoring wells, and from surface water locations in accordance
with the Work Plan. CRA collected a second round of water levels from both existing
and new monitoring wells on July 31, 2006. Based on the measured depth to water from
the reference point and the surveyed elevation of the reference point, the groundwater
or surface water elevation was calculated. A summary of groundwater elevations for
the events is provided in Table 4.3.
Prior to the water level measurements, the wells
were correctly identified and located.
Once the well was identified, a thorough inspection of each well was conducted, and
any deficiencies were noted. Water level measurements were collected using an
electronic depth-to-water probe accurate to +/- 0.01 feet. The measurements were made
from the designated location on each of the monitoring wells inner riser or steel casing.
The water level measurements were obtained using the following procedures:
•
The proper elevation of the meter was checked
by inserting the tip into water and
noting if the contact was registering correctly.
•
The
tip was dried, and then slowly lowered into the well until contact with the water
was indicated.
•
The tip was slowly raised until the light and/or buzzer just began to activate. This
indicated the static water level.
•
The reading at the reference point was noted to the nearest hundredth of a foot.
045136 (12) Braidwood Generating Station
22
CONESTOGA-ROVERS & ASSOCIATES
Revision 1
•
The reading was then re-checked.
•
The water level was then recorded, and the
water level meter decontaminated prior
to use at the next well location.
In early May 2006, as part of the fleetwide investigation, CRA collected a round of water
level measurements from 43
of the Station monitoring wells and six surface water
locations on the Station. On July 31, 2006, CRA collected a second round of water level
measurements from 45 of the Station monitoring wells (including the two newly
installed monitoring wells, MW-BW-207I and MW-BW-208BD).
A summary of
groundwater elevations for the two events is provided in Table 4.3.
During the May 2006 groundwater sampling program, the following
monitoring wells
(MW-4, MW-5, TB-1-3D, TW-6, and TW-8) were not measured for depth to water due to
problems with the water level indicator meter. CRA subsequently has gone back at a
later date to get these water levels. Also, water levels were not measured at TW-8
because TW-8 had broken riser.
Surface water elevations were measured at the four staff gages installed within the
perimeter ditch (Figure
4.1) and at two locations on the north side of the Cooling Lake
(Figure 4.1). The data from these measurements are provided in Table 4.4.
A pressure transducer was installed by CRA at TB-1-4D for approximately
6 weeks to
evaluate water level changes near the Turbine Building close to where leaks have
occurred within the basement. The purpose of the continuous monitoring was to
determine if the system (pipe) water leaks were creating this basement seep, or, if
precipitation/storm water system leaks were affecting flow into the basement.
Water level data were recorded for the period from June
6 to July 21, 2006. Precipitation
data were also reviewed for this same period for the Village of Braidwood. Figure 4.3
presents a graphical presentation of the relative head (feet above the transducer)
measurements from the transducer. Figure 4.3 also presents the precipitation (inches)
for the monitored period. The pressure transducer was set at 10 feet below the top of the
well casing. At the time of installation, the water table was 6.9 feet below the top of the
well casing.
045136 (12) Braidwood Generating Station
23
CONESTOGA-ROVERS & ASSOCIATES
Revision 1
4.7
GROUNDWATER AND SURFACE WATER
SAMPLE COLLECTION
CRA conducted two rounds of groundwater sampling during the completion of the
Work
Plan for these hydrogeologic investigations. A total of 43 monitoring wells were
sampled between May 9 and May 22, 2006 and two monitoring wells were sampled on
July 28, 2006. Of the 45 monitoring wells sampled, 12 were newly installed. The
sampling was scheduled to allow for two weeks to elapse between well development
and groundwater sample collection. The existing wells were selected for inclusion in
this monitoring program based on their proximity to the AFEs. The new wells were
installed to complete the monitoring network near the AFEs.
At the monitoring locations, CRA conducted the sampling using dedicated tubing and
peristaltic
pumps and employed low-flow purging techniques as described in Puls and
Barcelona (1996).
The groundwater in the monitoring wells was sampled by the following
low-flow
procedures:
•
The wells were located and the well identification numbers were verified.
•
A water level measurement was taken.
•
The well was sounded by carefully lowering the water level tape to the bottom of
the
well (so as to minimize penetration and disturbance of the well bottom sediment),
and comparing the sounded depth to the installed depth to assess the presence of
any excess sediment or drill cuttings.
•
The pump or tubing was lowered slowly into
the well and fixed into place such that
the intake was located at the mid-point of the well screen, or a minimum of 2 feet
above the well bottom/sediment level.
•
The
purging was conducted using a pumping rate between 100 to 500 milliliters per
minute (mL/min). Initial purging began using the lower end of this range. The
groundwater level was monitored to ensure that a drawdown of less than 0.3 feet
occurred. If this criterion was met, the pumping rate was increased dependent on
the behavior of the well. During purging, the pumping rate and groundwater level
were measured and recorded every 10 minutes.
•
The field parameters (pH, temperature, conductivity, oxidation-reduction
potential
(ORP), dissolved oxygen (DO), and turbidity) were monitored during the purging to
evaluate the stabilization of the purged groundwater. Stabilization was considered
to be achieved when three consecutive readings for each parameter, taken at
5-minute intervals, were within the following limits:
045136 (12) Braidwood Generating Station
24
CONESTOGA-ROVERS & ASSOCIATES
Revision 1
pH
± 0.1 pH units of the average value of the three readings;
Temperature
± 3 percent of the average value of the three readings;
Conductivity
± 0.005 milliSiemen per centimeter (mS/cm) of the average value
of the three readings for
conductivity <1 mS/cm and
± 0.01 mS/cm of the average value of the three readings for
conductivity >1 mS/cm;
ORP
± 10 millivolts (mV) of the average value of the three readings;
DO
± 10 percent of the average value of the three readings; and
Turbidity
± 10 percent of the average value of the three readings, or a final
value of less than 5 nephelometric turbidity units (NTU).
•
Once purging was complete, the groundwater
samples were collected directly from
the pump/tubing directly into the sample containers.
All groundwater samples were labeled with a unique
sample number, the date and time,
the parameters to be analyzed, the job number, and the sampler's initials. The samples
were then screened by the Station for shipment to Teledyne Brown Engineering, Inc.
(Teledyne Brown).
A sample key is presented in Table 4.5; purging parameters for the fleetwide event are
presented in Table 4.6.
CRA containerized the water purged from the monitoring wells during the sampling, as
well as the water purged from
all of the wells during the hydrogeologic investigation.
The water was placed into 55-gallon drums, which will be processed by the Station in
accordance with its NPDES permit.
Surface water samples were collected on May 17, 2006 a few days after a storm event.
The surface water samples were collected under dry conditions in order to avoid
dilution by rainwater. Six surface water
samples were collected, four at staff gauges
located on the perimeter ditch and locations on the north end of the Cooling Lake. The
surface water sampling locations are presented on Figure 4.1.
The surface water samples were collected by submerging the sample container at the
determined sample locations until completely filled. All samples were shipped
to
Teledyne Brown for analysis.
045136 (12) Braidwood Generating Station
25
CONESTOGA-ROVERS & ASSOCIATES
Revision 1
4.8
DATA QUALITY OBJECTIVES
CRA has validated the analytical data to establish the accuracy and completeness of the
data reported. Teledyne Brown
provided the analytical services. The Quality Assurance
Programs for the laboratory is described in Appendix E.
Analytical data for
groundwater and surface water samples collected in accordance with the Work Plan are
presented in Appendix F. Data validation reports are presented in Appendix G. The
data validation included the following information and evaluations:
•
sample preservation;
•
sample holding times;
•
laboratory method blanks;
•
laboratory control samples;
•
laboratory duplicates;
•
verification of laboratory qualifiers; and
•
field quality control (field blanks and duplicates).
Following the completion of field activities, CRA compiled and reviewed the geologic,
hydrogeologic, and analytical data.
The data were reviewed using the following techniques:
•
data tables and databox figures;
•
hydrogeologic cross-sections; and
•
hydraulic analyses.
4.9
SAMPLE IDENTIFICATION
Systematic sample identification codes were used to uniquely identify all samples. The
identification code format used in the field was: WG - BW – 050806 - MB - 001. A
summary of sample identification numbers is presented in Table 4.5.
WG
- Sample matrix -groundwater
SW
- Sample matrix - surface water
BW
- Station code
050806 - Date
MB
- Sampler initial
001
- Sample number
045136 (12) Braidwood Generating Station
26
CONESTOGA-ROVERS & ASSOCIATES
Revision 1
4.10
CHAIN-OF-CUSTODY RECORD
The samples were delivered to Station personnel under chain-of-custody protocol.
Subsequently, the Station shipped the samples under chain-of-custody protocol to
Teledyne Brown for analyses.
4.11
QUALITY CONTROL SAMPLES
Quality control samples were collected to evaluate the sampling and analysis process.
Field Duplicates
Field duplicates were collected to verify the accuracy of the analytical laboratory by
providing two samples collected at the same location and then
comparing the analytical
results for consistency. Field duplicate samples were collected at a frequency of one
duplicate for every ten samples collected. A total of seven duplicate samples were
collected. The locations of duplicate samples were selected in the field during the
performance of sample collection activities. The duplicate samples were collected
simultaneously with the actual sample and were analyzed for the same parameters as
the actual samples.
Split Samples
Split samples were collected for the NRC for tritium simultaneously with the actual
sample at every sample location. Split samples were delivered to the Station personnel
and made available to the NRC.
4.12
ANALYSES
Groundwater and surface water samples were
analyzed for tritium and gamma-emitting
radionuclides as listed in NUREG-1301 and strontium-89/90 as listed in 40 CFR 141.25.
045136 (12) Braidwood Generating Station
27
CONESTOGA-ROVERS & ASSOCIATES
Revision 1
5.0
RESULTS SUMMARY
This section provides a summary of Station-specific geology and hydrogeology, along
with a discussion of hydraulic gradients, groundwater elevations, and flow directions in
the vicinity of the Station. This section also presents and evaluates the analytical results
obtained from activities performed in accordance with the Work Plan.
5.1
STATION GEOLOGY
The geology encountered during monitoring well installation is consistent with the
geology
described in Section 2.4.2 and the geology within areas to the east and along the
blowdown line as described in the CRA reports previously listed (refer to Section 2.5).
The geology beneath the site consists of overburden deposits of sand (Equality
Formation) and clay (Wedron Clay Till) that overlies alternating layers of shale/siltstone
and dolostone (Carbondale Formation) (refer to the site specific stratigraphic column on
Figure 2.8). South-north and east-west hydrogeologic profiles (profiles) are presented
on Figures 5.1 to 5.5. These profile locations were chosen because of their close
proximity to structures potentially influencing groundwater flow patterns.
The three new shallow and seven intermediate depth wells (MW-BW-201S,
MW-BW-201I,
MW-BW-202S,
MW-BW-202I,
MW-BW-203S,
MW-BW-203I,
MW-BW-204I, MW-BW-205I, MW-BW-206I, and MW-BW-207I) were installed within
the Equality Formation. The Equality Formation is primarily uniform fine-grained sand.
The monitoring well logs for the new monitoring wells are presented in Appendix A.
The two bedrock wells, MW-BW-201BD and MW-BW-208BD, were installed through the
Equality Formation, the Wedron
Clay Till, the Francis Creek Shale Member of the
Carbondale Formation and into the lower portion of the Francis Creek Shale Member.
Refer to Figure 2.8 for the sequence of formations beneath the site. The top of the
Wedron Clay Till was encountered at approximately 24 feet bgs, which is consistent
with previous geological investigations. The bottom of the clay was approximately
54 feet bgs where shale bedrock was encountered and is considered to be the Francis
Creek Shale Member. At a depth of approximately 85 feet bgs, a sandstone was
encountered that was weathered.
From 90 to 100 feet, the material included a
conglomerate, sandstone, and shale. MW-BW-201BD and MW-BW-208BD were both
completed in this lower zone from 80 to 95 feet bgs and 85 to 100 feet bgs, respectively.
This is expected to be the bottom of the Francis Creek Shale Member of the Carbondale
Formation and it is located just above the Colchester Coal (Figure 2.8).
045136 (12) Braidwood Generating Station
28
CONESTOGA-ROVERS & ASSOCIATES
Revision 1
Profile A-A' (Figure 5.2) is a west-east profile through the middle of the Station. It
begins at the western fence line bordering the Station and terminates near the eastern
perimeter ditch approximately 1,200 feet east of the eastern fence line of the site. The
profile A-A' presents the relative elevations of the perimeter ditch water levels with
groundwater levels on both sides of the PA. Higher water levels are measured in the
eastern stretch of the perimeter ditch. The profile also indicates that the buildings
extend to the top of the Francis Creek Shale Member (through the Wedron Clay Till) and
will act as barriers to lateral flow. The backfilled area around the building is also
indicated on this profile. Finally, the slurry wall is projected on this figure based upon
information gathered from Station documents. The top of the slurry wall appears to be
close to the current water table elevation.
Profile B-B' (Figure 5.3) is a north-south profile and parallels the storm sewer line that
runs
south-north. The profile B-B' indicates the relative elevation of the groundwater
table and the approximate depth of the storm water drainage system. This figure clearly
indicates that the storm water drainage system intercepts the water table as reported
previously (CRA, August 2002 and September 2003). The limits of the construction
excavation are also depicted on this profile along with the expected condition of the
slurry wall. During drilling of the intermediate monitoring well MW-BW-207I on
July 13, 2006, the Wedron Clay Till was not encountered. The material encountered
included sands and other fill type material such as gravels and concrete. These
observations indicate that the Station construction excavation went to a depth of
approximately 44 to 45 feet bgs at this location. This depth of the excavation is indicated
on Figure 5.3. Although the clay was missing in the location of MW-BW-207I, the top of
the Francis Creek Shale Member was encountered where expected (45 feet bgs).
Profile C-C (Figure 5.4) is a north-south profile down the center of the PA area to the
Cooling Lake. The bedrock well (MW-BW-201BD) is displayed on this figure,
as well as
the building foundation.
The profile C-C' presents a more regional depiction of
subsurface conditions from the Cooling Lake in the south to the north end of the PA.
The slurry wall associated with the Cooling Lake and the slurry wall associated with the
building construction are depicted on this profile. The depths of the various facility
buildings are shown to extend down through the Wedron Clay Till and to the top of the
Francis Creek Shale Member.
As such, these buildings are barriers to lateral
groundwater flow. The shallow bedrock monitoring well (MW-BW-201BD) is presented
on this figure and indicates the bottom of the Francis Creek Shale Member.
Profile D-D' (Figure 5.5) is a west-east profile in the northern portion of the PA that
transects the CST area.
Hydrogeologic profile D-D' presents the locations and relative
elevations of the groundwater, storm water drainage system, slurry wall, and
045136 (12) Braidwood Generating Station
29
CONESTOGA-ROVERS & ASSOCIATES
Revision 1
excavation/fill material. This profile is north of the Turbine Building and as such does
not present subsurface building structures. The water levels on each side of the slurry
wall on the west do indicate a slight difference in elevation. However, this is not as
apparent in other areas in the PA.
5.2
SITE HYDROGEOLOGY
This section describes groundwater flow in the various hydrogeologic units identified at
the site.
Figure
5.1 presents the monitoring well network in relationship to the
hydrogeologic profile locations. Hydrogeologic profiles are presented on Figures 5.2
to 5.5.
5.2.1
GROUNDWATER FLOW DIRECTIONS
Groundwater flow directions in the upper sand aquifer
are presented on Figures 5.6
and 5.7 (the shallow zone) and on Figures 5.8 and 5.9 (the deep zone). Figures 5.6
and 5.8 represent water levels measured in May 2006. Figures 5.7 and 5.9 represent
water levels measured in July 2006. CRA has identified four areas of differing flow
within and around the PA based upon the May and July water levels. These four areas
are a result of the man-made features presented in the previous section.
One flow system encompasses the east side of the PA. The second system is found along
the west side of the Turbine Building within the perimeter of the slurry wall and within
the limits of the former excavation.
The third system is to the northwest of the slurry
wall near the perimeter ditch. The fourth system includes the area west-southwest of
the PA where groundwater flows to the southwest and discharges to the perimeter
ditch. The groundwater flow is restricted by the basement walls and, to some degree,
the slurry trench. Groundwater flow directions are provided on Figures 5.6 and 5.7 for
the shallow zone of the upper sand aquifer and on Figures 5.8 and 5.9 for the deep zone
of the upper sand aquifer.
Groundwater in the near west side of the Turbine Building predominantly flows to the
north
toward a storm water drainage system ditch north of the Oil/Water Separator.
The storm water drainage system ditch is a tributary to the perimeter ditch (Figure 2.3).
To the west and southwest of the PA, the perimeter ditch acts as a discharge point for
the shallow groundwater system (CRA, August
2002). Groundwater generally flows to
the ditch from east to west. The water elevation within the ditch is measured to be
045136 (12) Braidwood Generating Station
30
CONESTOGA-ROVERS & ASSOCIATES
Revision 1
approximately 586 feet above mean sea level (AMSL) at a location northwest of the PA.
Groundwater elevations are higher than ditch elevations along the length of the
perimeter ditch as it flows to the south. There is no shallow groundwater flow to the
west of the perimeter ditch under normal flow conditions (CRA, September 2003).
5.2.2
MAN-MADE INFLUENCES ON GROUNDWATER FLOW
There are a number of man-made features that
influence the flow direction and velocity
of groundwater as it moves through the site area. These features include:
•
The perimeter ditch (Figures
2.3, 2.6, and 2.7), which was dug at the time of the
Station Construction to drain surface water away from the Cooling Lake;
•
The
storm water drainage system (Figures 2.3, 2.4, and 2.5) located on the west side
of the Turbine Building and its associated Oil/Water Separator;
•
The
slurry wall constructed around the footprint of the buildings in the PA
(Figure 2.1;
•
The former excavation now
backfilled with material located around the current
buildings (Figure 2.1);
•
The various basements and foundations of the
turbine, auxiliary, reactor, fuel
handling, and other buildings, many of these extend through the water table
(Figures 5.2 to 5.5); and
•
The
Cooling Lake and the slurry wall, which are located south of the PA
(Figures 2.13, 2.14, and 5.4).
The figures listed above and the discussion presented below provide basic observations
on
the impact of these features on groundwater flow which was discussed previously in
Section 5.2.2.
The PA (Figure 1.2) is located at the northwest area of the Station property and is
surrounded by the perimeter
ditch, which flows from the east, to the north of the PA,
and then to the south. The perimeter ditch flows along the western boundary of the
Station property (Figure 2.3). The elevation of the water in the ditch drops from about
593 feet AMSL on the east side to 586 feet AMSL on the west side. The water levels
continue to drop as the ditch flows to the south and west. As the ditch exits the
Braidwood Station Property, its surface water elevation is about 579 feet AMSL.
To the south of the PA is the Cooling Lake, which comprises over 2,500
acres of
impounded water. A slurry wall constructed to keep surface water from seeping into
045136 (12) Braidwood Generating Station
31
CONESTOGA-ROVERS & ASSOCIATES
Revision 1
the upper sand aquifer surrounds the Cooling Lake.
This is confirmed by the
groundwater data monitored by the Station at various locations around the Lake.
During construction of the buildings within the PA, a slurry
wall was constructed to
minimize groundwater infiltration into the excavation. This excavation was within the
confines of the slurry wall and in some areas the depth was greater than 40 feet and into
the underlying bedrock shale formation (UFSAR, 1994).
The foundations or basements associated with the Reactors/Auxiliary Building and the
Turbine Building extend to depths below the water table. In fact, the foundations were
completed through the Wedron Clay Till at
this Station, as is shown on the
hydrogeologic profiles presented on Figures 5.2 to 5.5 (i.e., the Wedron Clay Till was
removed during building excavation). These basements are barriers to groundwater
flow in the upper sand aquifer. There are no dewatering systems such as sump pumps
used to manage groundwater inflow. As such, the basement walls are assumed to be
impermeable to groundwater flow. Consequently, groundwater pressure on these
foundations will create an inward gradient into the basement. The Francis Creek Shale
Member was not disturbed during building construction and remains in place as an
aquitard.
The PA and surrounding land is generally flat and paved areas, roadways, and parking
lots now cover it. These areas are drained by
a storm water drainage system that drains
to the northwest corner of the PA. The storm water drainage system drains to an
Oil/Water Separator at the north end of the PA (Figures 2.3 and 2.5). The outfall from
the Oil/Water Separator discharges to a small east-west ditch and then flows west to the
perimeter ditch.
Previous studies have documented that the storm water drainage system intercepts
groundwater on the west side
of the Turbine Building. These same studies have
indicated that the perimeter ditch, which flows from the north to the south along the
western Station property line, also intercepts the groundwater (CRA, August 2002 and
September 2003). As such, groundwater flowing near the perimeter ditch will be
intercepted by the ditch (Figures 2.6 and 2.7).
5.2.3
VERTICAL HYDRAULIC GRADIENTS
Several monitoring well nests have been installed in the upper sand aquifer
not only to
determine the vertical distribution of impacted groundwater, but also the vertical
hydraulic gradient within the aquifer. The calculated hydraulic gradients for the site are
045136 (12) Braidwood Generating Station
32
CONESTOGA-ROVERS & ASSOCIATES
Revision 1
provided in Table 5.1 and the well locations used to calculate hydraulic gradients are
shown on Figure 5.1.
Table 5.1 indicates that vertical hydraulic gradients
are minor or slightly upward in
areas away from the buildings and away from the former construction excavation.
However, a few monitoring well clusters located on the west side of the Turbine
Building indicate a downward vertical hydraulic gradient. This gradient varies from
0.005 feet/foot (ft/ft) at TB-1-4D/TW-3 location to 0.167 ft/ft at the TB-1-2D/MW-2
location. The locations with downward vertical hydraulic gradients are also near the
storm water drainage system. The cause of the downward vertical hydraulic gradients
is likely related to the additional recharge from the nearby storm water drainage system.
Vertical groundwater flow is restricted by the regional aquitards. However, due to the
removal of the Wedron Clay Till beneath the
buildings, one of the two regional
aquitards was locally removed within the PA. Nevertheless, groundwater data indicate
that the remaining aquitard (the Francis Creek Shale Member) is preventing vertical
migration of tritium downward within the PA.
The downward vertical hydraulic gradients measured along the west side of the Turbine
Building are likely caused by increased recharge into the fill
material by precipitation
that leaks from the storm water drainage system. A review of the precipitation and
transducer data on Figure 4.3 suggests that there are small groundwater fluctuations
that may be due to precipitation/storm water infiltration. The data presented on
Figure 4.3 do not suggest that there are any types of systematic or routine events
(i.e., operations) that are causing fluctuations in the water table elevations.
5.2.4
LATERAL GROUNDWATER FLOW AND VELOCITY
The groundwater flow directions depicted on Figures
5.6, 5.7, 5.8, and 5.9 for the upper
sand aquifer indicate, to some degree, a radial pattern of flow from the center of the PA.
Groundwater flow directions are similar to conditions measured in May and July 2006.
This pattern is better explained by understanding the role of man-made features on the
regional flow direction in this upper sand aquifer. Groundwater on a local or regional
basis in the upper sand aquifer is to the north and northeast towards the surface waters
that drain to the Kankakee and Illinois Rivers (CRA March 2006). This flow direction
was confirmed in the blowdown studies discussed in Section 2.6.
Within and nearby the PA the man-made features
have modified the local flow system
to the north. First, the former construction excavation and the building basements force
045136 (12) Braidwood Generating Station
33
CONESTOGA-ROVERS & ASSOCIATES
Revision 1
a split or divide in flow as groundwater moves from south to north. Second, the
perimeter ditch flows from east, to north to south and ultimately to the west around the
PA and becomes a discharge point for groundwater.
This ditch intercepts the
groundwater table and groundwater discharges into this ditch along its whole length.
The surface water elevation of the perimeter ditch as it exits the Braidwood Station
property (south of Godley) is approximately 579 feet AMSL (CRA, September 2000).
This is 11 to 16 feet lower than the groundwater elevation in the PA.
Consequently, the combination of structures in the PA and the
presence of the perimeter
ditch create the appearance of radial flow, but these influences are just a modification to
the regional flow direction of south to north.
The average calculated horizontal hydraulic gradient in the upper sand aquifer
along
the east side of the PA is 0.004 ft/ft. The groundwater flow direction in this area is from
the south to north. Figures 5.6 and 5.7 display the groundwater elevation contours in
the shallow groundwater zone.
The average calculated horizontal hydraulic gradient in the upper sand aquifer
along
the west side of the Turbine Building is 0.007 ft/ft. The general groundwater flow
direction in this area is from south to north (Figures 5.6, 5.7, 5.8, and 5.9).
The average calculated horizontal hydraulic gradient in the upper sand aquifer
west of
the slurry wall is 0.005 ft/ft. The general groundwater flow direction in this area is from
the southeast to the northwest (Figures 5.6, 5.7, 5.8, and 5.9).
The overall, site-wide, average calculated horizontal hydraulic gradient is
approximately
0.007 ft/ft within the upper sand aquifer.
Results from previous
single-well response tests performed east of the PA and along the blowdown line
(previous investigations referred to in Section 1.0) indicate that the hydraulic
conductivity of the overburden aquifer is 2.5 x 10
-2
cm/s. Assuming an average effective
porosity of 0.3, the average groundwater velocity in the upper sand aquifer is
approximately 604 ft/yr.
The calculated hydraulic gradients and average
groundwater velocity are greater than
that observed east of the PA and along the blowdown line. It is likely that the
groundwater velocity is influenced by steep hydraulic gradients toward the perimeter
ditch flowing to the north and to the west of the PA.
045136 (12) Braidwood Generating Station
34
CONESTOGA-ROVERS & ASSOCIATES
Revision 1
5.3
GROUNDWATER QUALITY
CRA personnel collected groundwater samples from 45
of the monitoring wells located
on the Station property, including 12 newly installed monitoring wells. This subset
included all available existing monitoring wells in the PA but did not include those
located along the blowdown line to the east. The groundwater samples were analyzed
for tritium and additional radionuclides. Teledyne Brown provided the analytical
services. The Quality Assurance Program for the laboratory is described in Appendix E.
The analytical data reports are provided in Appendix F.
Table 5.2 presents a summary of tritium analyses for groundwater
samples collected
recently in May and July 2006. Table 5.3 presents a summary of radionuclides analyzed
in groundwater samples collected in May and July 2006. Tables 5.4 and 5.5 present the
tritium and radionuclide analyses for surface water samples, respectively. Table 5.6
presents a summary of groundwater analyses for tritium in samples collected previously
at existing monitoring wells. Table 5.7 presents a summary of surface water analyses for
tritium in samples collected previously at existing surface water locations.
The analytical data presented herein has been subjected to CRA's data validation
process. CRA has used the data with appropriate qualifiers where necessary.
The data reported in the figures and tables does not include the results of recounts that
the laboratory completed, except if those results ultimately replaced an initial report.
The tables and figures, therefore, include only the first analysis reported by the
laboratory. Where multiple samples were collected over time, then the most recent
result has been used in the discussion, below.
5.3.1
SUMMARY OF BETA-EMITTING RADIONUCLIDES
ANALYTICAL RESULTS
A summary of the tritium results for the groundwater samples collected during this
investigation is provided in Table
5.2 and shown on Figure 5.10. Table 5.6 summarizes
analytical results for previous sampling events performed at the site.
All tritium concentrations were below the USEPA drinking water standard of
20,000
pCi/L. Tritium was not detected at concentrations greater than at the LLD of
200 pCi/L in 34 of the 45 groundwater samples collected.
045136 (12) Braidwood Generating Station
35
CONESTOGA-ROVERS & ASSOCIATES
Revision 1
The highest concentrations of tritium (between 200 pCi/L and 1,040 ± 172 pCi/L) in test
wells were predominantly from groundwater samples collected on the west side of the
Turbine Building. The highest concentration of tritium at 1,040 ± 172 pCi/L was found
at TW-3, which was installed in the deep upper sand aquifer. At five of these locations,
the groundwater analyses indicated tritium concentrations just over 200 pCi/L and less
than 250 pCi/L.
The groundwater samples collected from the bedrock monitoring wells MW-BW-201BD
and MW-BW-208BD, which were completed to a depth of 95
feet bgs and 100 feet bgs,
respectively, did not contain tritium at a concentration exceeding the LLD of 200 pCi/L.
These wells were completed beneath the confining layers of the Wedron Clay Till and
the Francis Creek Shale Member.
Strontium-89/90 was not detected in concentrations greater than the LLD of 2.0 pCi/L.
A summary of the strontium-89/90 results for the groundwater samples collected as
part of the investigation that is the subject of this HIR is provided in Table
5.3 and
shown on Figure 5.11.
5.3.2
SUMMARY OF GAMMA-EMITTING RADIONUCLIDES
ANALYTICAL RESULTS
Gamma-emitting target radionuclides were not detected in concentrations greater than
their
respective LLD. A summary of the gamma-emitting radionuclides results for the
groundwater samples collected as part of the investigation that is the subject of this HIR
is provided in Table 5.3 and shown on Figure 5.11.
Other non-targeted radionuclides were also included in the tables but excluded from
discussion in this report.
These radionuclides were either a) naturally occurring and
thus not produced by the Station, or b) could be definitively evaluated as being naturally
occurring due to the lack of presence of other radionuclides which would otherwise
indicate the potential of production from the Station.
5.3.3
SUMMARY OF FIELD MEASUREMENTS
Table 4.6 presents of a summary of field measurements collected during the well
purging and sampling activities.
These field measurements included pH, dissolved
oxygen, conductivity, turbidity and temperature. The field parameters were typical of a
shallow sand aquifer with carbonate source rock (i.e., the underlying limestones and
045136 (12) Braidwood Generating Station
36
CONESTOGA-ROVERS & ASSOCIATES
Revision 1
shales). As such the pH values were found to be above 7.0 and the conductivity was
indicative of a shallow water table system subject to surface water recharge.
Of note were the slightly elevated temperature readings (above 20
degrees Celsius) at
TB-1-9D, which is located south of the wastewater treatment building and the treatment
lagoon (Figure 3.1), TB-10-D, which is located adjacent to the Turbine Building, and just
east of TB-1-9D, and MW-BW-207I, which is located adjacent to the Turbine Building,
and north of TB-1-10D. It should also be noted that the conductivity of the water purged
from MW-6, TB-1-3D, and TB-1-8D was an order-of-magnitude higher than the readings
from other sampling locations.
5.4
SURFACE WATER QUALITY
Six surface water samples were collected from the four staff gauge locations on the
perimeter ditch and from two locations along the north end of the Cooling Lake. The
locations of the samples are shown on Figure
4.1. The samples were analyzed for
tritium, gamma-emitting radionuclides, and strontium-89/90.
Teledyne Brown
provided the analytical services. The Quality Assurance Program for the laboratory is
described in Appendix E. The analytical data reports are provided in Appendix F.
Analytical data for these surface water samples are presented in Tables 5.4 and 5.5.
5.4.1
SUMMARY OF BETA-EMITTING RADIONUCLIDES
ANALYTICAL RESULTS
A summary of the tritium results for the surface water samples collected in this
investigation is provided in Table 5.4 and shown on Figure 5.10.
Surface water samples SW-101, SW-102, SW-103 had concentrations of tritium of
398 ±
129, 365 ± 120, and 230 ± 114 pCi/L, respectively. These concentrations are greater
than the LLD of 200 pCi/L. Surface water samples SW-101 and SW-102 were collected
from the perimeter ditch located just northwest of the PA. Surface water sample SW-103
was collected along the perimeter ditch near the northeast corner of the Cooling Lake. A
summary of the tritium analytical results from six surface water samples is presented in
Table 5.4. Surface water samples collected as part of the blowdown line investigations
and as part of the interim routine monitoring program in the PA are provided in
Table 5.7.
045136 (12) Braidwood Generating Station
37
CONESTOGA-ROVERS & ASSOCIATES
Revision 1
The results of analyses of numerous surface water samples, which were collected during
the spring and summer of 2006, along the perimeter ditch, have shown that no tritium
greater than detectable limits have left the Station.
Strontium-89/90 was not detected in concentrations greater than the LLD of 2.0 pCi/L.
A
summary of the strontium-89/90 results for the surface water samples collected in this
investigation is provided in Table 5.5 and shown on Figure 5.11.
Surface water samples were collected within the perimeter ditch and analyzed for
tritium at four monitoring points
found north, west, and south of the PA. In addition,
surface water was collected at the north end of the Cooling Lake at two locations just off
the shoreline. Figure 4.1 presents these locations.
5.4.2
SUMMARY OF GAMMA-EMITTING RADIONUCLIDES
ANALYTICAL RESULTS
Gamma-emitting target radionuclides were not detected in concentrations greater than
their
respective LLD. A summary of the gamma-emitting radionuclides results for the
surface water samples collected in this investigation is provided in Table 5.5 and shown
on Figure 5.11.
Other non-targeted radionuclides were also included in the tables but excluded from
discussion in this report.
These radionuclides were either a) naturally occurring and
thus not produced by the Station, or b) could be definitively evaluated as being naturally
occurring due to the lack of presence of other radionuclides which would otherwise
indicate the potential of production from the Station.
045136 (12) Braidwood Generating Station
38
CONESTOGA-ROVERS & ASSOCIATES
Revision 1
6.0
RADIONUCLIDES OF CONCERN AND SOURCE AREAS
This section discusses radionuclides evaluated in
this investigation, potential sources of
the radionuclides detected, and their distribution.
6.1
GAMMA-EMITTING RADIONUCLIDES
Gamma-emitting target radionuclides were not detected at concentrations greater than
their respective LLD. Other non-targeted
radionuclides were also included in the tables
but excluded from discussion in this report.
These radionuclides were either
a) naturally occurring and thus not produced by the Station, or b) could be definitively
evaluated as being naturally occurring due to the lack of presence of other radionuclides
which would otherwise indicate the potential of production from the Station.
6.2
BETA-EMITTING RADIONUCLIDES
Strontium-89/90 was not detected in any of the samples collected at concentrations that
were greater than the LLD of 2.0
pCi/L. Concentrations of tritium ranged between
200 pCi/L and 1,040 ± 172 pCi/L.
Since only tritium was detected at concentrations greater than the LLDs, the following
sections focus on tritium; specifically,
providing general characteristics of tritium,
potential sources, distribution in groundwater, and a conceptual model for migration.
6.3
TRITIUM
This section discusses the general characteristics of tritium, the distribution of tritium in
groundwater and surface water, and the conceptual model of tritium
release and
migration.
6.3.1
GENERAL CHARACTERISTICS
Tritium (chemical symbol H-3) is a radioactive isotope of hydrogen. The most common
forms of tritium are tritium gas
and tritium oxide, which is also called "tritiated water."
The chemical properties of tritium are essentially those of ordinary hydrogen. Tritiated
water behaves the same as ordinary water in both the environment and the body.
045136 (12) Braidwood Generating Station
39
CONESTOGA-ROVERS & ASSOCIATES
Revision 1
Tritium can be taken into the body by drinking water, breathing air, eating food, or
absorption through skin. Once tritium enters the body, it disperses quickly and is
uniformly distributed throughout the body. Tritium is excreted primarily through urine
within a month or so after ingestion. Organically bound tritium (tritium that is
incorporated in organic compounds) can remain in the body for a longer period.
Tritium is produced naturally in the upper atmosphere when cosmic rays strike air
molecules.
Tritium is also produced during nuclear weapons explosions,
as a
by-product in reactors producing electricity, and in special production reactors, where
the isotopes lithium-7 and/or boron-10 are bombarded to produce tritium.
Although tritium can be a gas, its most
common form is in water because, like
non-radioactive hydrogen, radioactive tritium reacts with oxygen to form water.
Tritium replaces one of the stable hydrogen atoms in the water molecule and is called
tritiated water. Like normal water, tritiated water is colorless and odorless. Tritiated
water behaves chemically and physically like non-tritiated water in the subsurface, and
therefore tritiated water will travel at the same velocity as the average groundwater
velocity.
Tritium has a half-life of approximately 12.3 years. It decays spontaneously to helium-3
(
3
He). This radioactive decay releases a beta particle (low-energy electron). The
radioactivity of tritium is the source of the risk of exposure.
Tritium is one of the least dangerous radionuclides because it emits
very weak radiation
and leaves the body relatively quickly. Since tritium is almost always found as water, it
goes directly into soft tissues and organs. The associated dose to these tissues is
generally uniform and is dependent on the water content of the specific tissue.
6.3.2
DISTRIBUTION IN STATION GROUNDWATER
This section provides an overview of the lateral and vertical distribution of
tritium
detected in groundwater within and adjacent to the PA. Tritium has been the only
parameter detected in the upper sand aquifer at concentrations exceeding background
concentrations. This observation is based upon the studies recently completed within
and adjacent to the PA and based upon the extensive studies performed along the
blowdown line and reported previously to the Illinois EPA. A hydrogeologic profile of
the tritium concentrations in groundwater is presented on Figure 6.1. In addition, a plan
view of the tritium concentrations detected in the groundwater samples collected as part
of this investigation is presented on Figure 6.2. As discussed later in this section, tritium
045136 (12) Braidwood Generating Station
40
CONESTOGA-ROVERS & ASSOCIATES
Revision 1
has not been detected in the deeper, bedrock groundwater at concentrations greater than
the LLD of 200 pCi/L.
The detections of tritium in the shallow or deeper parts of the upper sand aquifer in the
Station area, which were greater than the LLD of 200
pCi/L, occur within the confines of
the slurry wall.
6.3.2.1
UPPER SAND AQUIFER
West Side of the Turbine Building
Generally, tritium concentrations that were greater than the LLD of 200 pCi/L are
limited to an area along the west side of
the Turbine Building, as summarized in
Table 5.2 and illustrated on Figures 5.10 and 6.2.
The tritium detected in the
groundwater samples from monitoring wells located along the west side of the Turbine
Building (TB-1-3D, TB-1-4D, TW-3, TW-6, MW-9, TW-21, and TB-1-5D) indicate
consistent concentrations of tritium greater than the LLD. Tritium analytical data for
groundwater samples collected from these monitoring wells are available back to
January 2006 and have been included in Table 5.6.
Groundwater flow within the west side of the Turbine Building
has been observed
recently and historically to flow from south to north. The monitoring wells on the west
side of the Turbine Building are located within the limits of the former excavated area
(for Station construction) and are located within 150 feet of the main foundation of the
Turbine Building. These wells are also located within 150 feet of the main storm water
drainage system, which runs from the south to the north parallel to the Turbine Building
(Figure 2.3). This storm water drainage system discharges to the Oil/Water Separator
located at the north end of the PA as is shown on Figure 2.3.
The storm water drainage system intercepts groundwater and has been shown to be a
preferential pathway for groundwater to migrate to the north (Figures
2.4 and 2.5). The
sewer's ability to transmit groundwater and its contaminants was documented in
various reports submitted to the Illinois EPA in the past (CRA, September 2003).
The more recent detections of tritium in groundwater samples from monitoring wells
installed in the area along the west side of
the Turbine Building are found both in the
upper portions or shallow zone of the sand aquifer (e.g., TW-3 and TW-6) in the deeper
portions (deeper zone) of the upper sand aquifer (e.g., TB-1-4D and TB-1-5D); and
within the fill material (MW-BW-207I).
045136 (12) Braidwood Generating Station
41
CONESTOGA-ROVERS & ASSOCIATES
Revision 1
Other Areas
There are four monitoring wells where tritium
has been detected in groundwater
samples at concentrations greater than the LLD of 200 pCi/L in areas not associated
with the Turbine Building. These wells are MW-BW-201S/I, MW-BW-205I and TW-24,
and at TW-16. The tritium concentrations detected in groundwater samples from
MW-BW-201S/I, MW-BW-205I and TW-24 were only slightly greater than the LLD of
200 pCi/L and below 250 pCi/L (refer to Figures 5.10 and 6.2).
The tritium concentration detected in a groundwater sample from TW-16, which is
located approximately
300 feet due west of TW-3 (Figures 4.2, 5.10, and 6.2), is situated
where water ponded from the April 6, 2006 steam release (Figure 4.2), was
893 ± 145 pCi/L. In this case, the tritium in the groundwater sample from TW-16 can be
explained by the more recent release of tritiated water in the west area of the PA, as is
discussed further below. Both TW-3 and TW-16 are located in an area near the point at
which the relief valve vents outside of the Turbine Building. As shown on Figure 5.7,
the groundwater beneath the western side of the PA generally flows from the south to
north-northwest.
6.3.2.2
DEEPER BEDROCK GROUNDWATER
The first water bearing zone in the deeper bedrock, the zone below the Wedron Clay Till
and the Francis Creek Shale Member of
the Carbondale Formation was monitored by
MW-BW-201BD and MW-BW-208BD. The screened intervals of these two monitoring
wells are completed in the zone of conglomerates and sandstones found at the base of
the Francis Creek Shale Member and just above the Colchester Coal No. 2. Some of the
private wells located north and east of the PA are also completed in this zone
(Figure 2.10). The two deeper bedrock monitoring wells were installed at locations
expected to be downgradient of the reactor buildings and fuel handling building. The
location of these wells is shown on Figure 4.2. Groundwater samples collected from the
two bedrock monitoring wells (including samples and duplicates) indicated tritium
concentrations less than the LLD of 200 pCi/L.
Additionally, there are a number of private and public wells located to the north of the
PA, which have been sampled as
part of the blowdown line investigations. The sample
results for tritium from these wells indicated no concentrations greater than the LLD of
200 pCi/L.
045136 (12) Braidwood Generating Station
42
CONESTOGA-ROVERS & ASSOCIATES
Revision 1
Based upon the findings from the recent studies around the PA and those performed in
the past along the blowdown line, the groundwater zones found below the Wedron Clay
Till and the Francis Creek Shale Member do not indicate tritium impacts from releases
within or adjacent to the PA.
6.3.3
DISTRIBUTION IN STATION SURFACE WATER
Surface water was collected within the perimeter ditch and analyzed for tritium at four
monitoring points found north, west, and south of the PA. In addition, surface
water
was collected at the north end of the Cooling Lake at two locations just off the shoreline.
Figure 4.1 presents these locations.
Surface water samples SW-101, SW-102, and SW-103 had concentrations of
tritium of
398 ± 129, 365 ± 120, and 230 ± 114 pCi/L, respectively. These concentrations exceeded
the LLD of 200 pCi/L. Surface water samples SW-101 and SW-102 were collected from
the perimeter ditch located just northwest of the PA. Surface water sample SW-103 was
collected along the perimeter ditch near the northeast corner of the Cooling Lake. A
summary of the tritium analytical results from samples collected from surface water is
presented in Table 5.4. Surface water samples collected as part of the blowdown line
investigations and as part of the interim routine monitoring program in the PA are
provided in Table 5.7.
6.3.4
CONCEPTUAL MODEL OF TRITIUM RELEASE AND MIGRATION
This section presents CRA's conceptual model of groundwater and tritium migration at
the Station. This model is then used to discuss the historic detections of tritium within
the PA and the more
recent detections found during the hydrogeologic investigations
presented in this report.
Hydrogeologic Framework
Groundwater flows within the upper sand aquifer (Equality Formation) at the site in
response to regional discharge points located to the north and in response to the
perimeter ditch located west and south of the site. Groundwater moving within the
upper sand aquifer is separated from the regional
bedrock aquifer zones by the Wedron
Clay Till, the Francis Creek Shale Member and the Maquoketa Shale. The only exception
is where the building basements were constructed through the Wedron Clay Till.
045136 (12) Braidwood Generating Station
43
CONESTOGA-ROVERS & ASSOCIATES
Revision 1
However, these building structures are considered impermeable barriers to flow in or
out of their foundations.
As of the date of this report, no tritium has been detected at concentrations greater than
the LLD of 200
pCi/L in samples from bedrock monitoring wells, bedrock private wells,
or bedrock public wells located downgradient of the PA. These groundwater quality
data further support the role of the Wedron Clay Till and the Francis Creek Shale
Member as aquitards. As such, the focus of the conceptual hydrogeologic model
presented herein is the migration of groundwater and tritium within the upper sand
aquifer.
Groundwater flowing in the upper sand aquifer within the PA is restricted by the
building foundations which, in
some cases, extend through the Wedron Clay Till. As a
result, groundwater flowing with the regional gradient from south to north is diverted
to the east or west of the building structures (a divide). In addition, groundwater
flowing on the west side of the Turbine Building discharges into and out of the storm
water drainage system located in this area of the PA. Additional recharge of water from
the sewer into groundwater is expected in this area.
The slurry wall, which surrounds the main Station buildings, appears to provide some
limited hydraulic control on the west side of
the PA. There is a noticeable drop in
groundwater levels across the wall on the west side and groundwater flow changes
direction from north to northwest in this area (Figures 5.6 and 5.7). However, the slurry
wall's impact on groundwater flowing north toward the regional surface water
discharge points is still unknown. The lateral hydraulic gradients to the north are
consistent across the slurry wall.
To the west and south of the PA, the upper sand aquifer is influenced by the perimeter
ditch which flows from north to south on the west side of the Station property.
This
man-made ditch intercepts the shallow aquifer and under normal flow conditions is a
discharge point for groundwater. The water level in the ditch as it exits the Braidwood
Station property is 11 to 16 feet lower than groundwater in the PA. As such, the
perimeter ditch is acting similar to a gravity drain or "French Drain" within the upper
sand aquifer. This is evident in the southwest and west flow of groundwater outside the
slurry wall (Figures 5.6 and 5.7).
045136 (12) Braidwood Generating Station
44
CONESTOGA-ROVERS & ASSOCIATES
Revision 1
Sources and Migration of Tritium
Tritium has recently been detected at concentrations greater than background in
groundwater samples from two areas within the PA and within the confines of the
slurry wall:
•
Along the west side of the Turbine Building; and
•
300 feet west of the Turbine Building.
Prior to the more recent release of tritium to the surface in the west area of the PA, the
tritium
detections were limited to the area near the west wall of the Turbine Building.
The current distribution of tritium (both within the shallow water table zone and within
the deeper portions of the upper sand aquifer) is likely related to the following tritiated
water release history:
•
previous releases of tritium to the surface or subsurface; and
•
the April 6, 2006 release of steam containing tritiated water.
After April 2006 a number of groundwater samples from the same
monitoring wells
sampled in early 2006 indicated higher concentrations of tritium. The more recent
groundwater sampling data that were collected in May and July 2006 show very good
correlation with the release of steam which occurred on April 6, 2006 on the west side of
the Turbine Building. The distribution of tritium in May 2006 groundwater samples
matches with the location of ponded areas of the April 6 steam release and with
groundwater and surface water (e.g., storm water) flow directions in this area of the PA.
Refer to Figures 6.1 and 6.2 for a presentation of the vertical and lateral distribution of
tritium in groundwater, respectively.
In the case of both the pre-April 2006 groundwater data and the post-April
2006
groundwater data the role of surface water infiltration and transport within the storm
water drainage system is well documented. The previous discussions suggest that the
tritium detected in the groundwater on the west side of the Turbine Building is a result
of multiple isolated spills or releases to the surface that have occurred over time.
Groundwater samples were collected from the existing monitoring wells within the PA
and
the new monitoring wells in the first week of May 2006; a month after the April 6
steam release. This was a surface release that allowed tritiated water to both pond on
the land surface and also to seep into the storm water drainage system.
045136 (12) Braidwood Generating Station
45
CONESTOGA-ROVERS & ASSOCIATES
Revision 1
The May 2006 groundwater sampling event very clearly shows the impact of the steam
release waters as they ponded on the ground and drained into the storm water drainage
system (Figure 3.1). Figure 5.10 and Table 5.2 present the May and July 2006 tritium
data in groundwater.
The highest concentration of tritium detected was in the
groundwater sample from the shallow monitoring well TW-3 (1,040 ± 172 pCi/L), which
is near the valve which released the steam with the tritiated water. The concentration of
tritium in the groundwater sample from this well in March 2006 was approximately
300 pCi/L. CRA considers the increase in tritium concentrations in TW-3 to be a result
of steam/water entering the groundwater through the storm water drainage system,
which is located near this well. Similarly, the tritium concentration in the groundwater
sample from TW-16, which is directly west of the steam vent and where the tritiated
water pooled on the ground, increased from 368 ± 94 pCi/L to 893 ± 145 pCi/L. This
information indicates that within 30 days the steam release waters had impacted the
shallow groundwater zone. The steam release event is also suspected to have affected
the groundwater near TW-6, MW-9, and TB-1-5D, which are along or near the storm
water drainage system.
Groundwater infiltrating the storm water drainage system will flow to the Oil/Water
Separator to the north. This separator discharges
water to small ditch which then flows
to the west and discharges to the perimeter ditch (Figure 2.3). Surface water samples
collected in the perimeter ditch as part of this investigation of the PA (Figure 4.1) and
surface water samples collected in the perimeter ditch have indicated concentrations of
tritium greater than background at locations north and west of the PA. The main source
of the tritium in this area of the perimeter ditch is the plume of tritium migrating from
historical releases at vacuum breaker VB-1 into the ditch at that location (CRA,
March 2006).
In addition, as a result of the recent steam release, it is expected that
some tritiated water
has entered the Oil/Water Separator and migrated in the small ditch toward the larger
perimeter ditch. Recent sampling of the Oil/Water Separator supports this pathway of
tritiated water migration.
Table 5.7 presents the results of previous sampling
of surface water in the perimeter
ditch and samples from the Oil/Water Separator discharge after the April 6, 2006 steam
release.
The following section provides further details supporting the conceptual model of
groundwater flow and tritium transport discussed above.
045136 (12) Braidwood Generating Station
46
CONESTOGA-ROVERS & ASSOCIATES
Revision 1
6.3.5
ATTENUATION OF TRITIUM WITHIN
THE SHALLOW GROUNDWATER SYSTEM
Within the PA consideration must be given to how long ago a release occurred and the
effect of precipitation water infiltration on
groundwater quality. During the previous
hydrogeologic investigations the releases from vacuum breakers along the blowdown
line where it became apparent that the distribution of a historical or older release of
tritium into the groundwater system would be impacted by the infiltration from "clean"
precipitation recharge (CRA, March 2006). This resulted in the upper, water table zone
of the sand aquifer appearing to have lower concentrations of tritium from the deeper
portions (these zones are only separated by 5 to 15 feet). This "cleaning up" of the
shallow zone of the sand aquifer needs to be considered when evaluating the data
collected within the PA. Specifically, the location of the storm water drainage system
near the Turbine Building and the affected monitoring wells (TB-1-3D, TB-1-4D, TW-3,
TW-6, MW-9, TB-1-5D, and MW-BW-207I) likely allows for both the flow in and out of
the sewer line of tritiated water and clean precipitation waters.
Table 5.6 presents the history of sampling results
in 2006 for the area west of the Turbine
Building. Figure 6.2 presents a summary of these data on a plan view map. The highest
concentrations detected prior to the April 6, 2006 steam release event are found in
monitoring wells TW-6 and TB-1-4D.
The detections in TB-1-4D in March 2006
(582 pCi/L) were greater than in the adjacent shallow well TW-3 (330 pCi/L) for the
same sampling event. This suggests that the source for this deeper tritium is not recent
but historical in nature. The tritium concentrations in March 2006 for groundwater
samples collected at TW-6 were in the 600 to 800 pCi/L range and may indicate a more
recent release, although of limited in extent. In both cases (TW-6 and TB-1-4D) the
extent of tritium impacts in the upper sand aquifer appears to be limited to near these
two wells along the west side of the Turbine Building. It has been determined that the
vertical limits in the excavated area are restricted by the underlying shale formation
(Figure 6.1).
The relatively high groundwater velocities measured in the site area of 600
ft/yr and the
permeable nature of the upper sand aquifer also support attenuation of the tritium
through lateral groundwater movement. The dispersion of the tritium as it flows
through the sand along with its natural decay rate will allow for reduction in
concentrations over time and with distance from a release into the groundwater. Simple
fate and transport modeling performed for the blowdown line investigations using the
USEPA BIOSCREEN Model (CRA, March 2006 and April 2006) provides evidence of the
attenuation of tritium through dispersion and decay. Consequently, tritium released
045136 (12) Braidwood Generating Station
47
CONESTOGA-ROVERS & ASSOCIATES
Revision 1
within the west side of the PA and near the Turbine Building would also be expected to
attenuate rapidly to lower concentrations as it flowed in the upper sand aquifer.
The natural decay rate of the tritium itself lends to further attenuation of its
concentration in the groundwater. Tritium has a half-life of 12.3
years and as such its
concentration would be reduced over the time period that it travels in the groundwater
system. Consequently, as the tritium migrates with the groundwater, its concentration
would be decreased by 50 percent in a 12.3-year time frame.
045136 (12) Braidwood Generating Station
48
CONESTOGA-ROVERS & ASSOCIATES
Revision 1
7.0
EXPOSURE PATHWAY ASSESSMENT
This section addresses the groundwater impacts from tritium and other radionuclides
at
the Station and potential risks to human health and the environment.
Based upon historical knowledge and data related to the Station operations, and based
upon radionuclide analyses of groundwater samples, the primary constituent of concern
(COC) is tritium. The
discussions that follow are restricted to the exposure pathways
related to tritium.
Teledyne Brown reports all samples to their statistically derived Minimum Detectable
Concentration (MDC) of approximately
150 to 170 pCi/L, which is associated with
95 percent confidence interval on their hardcopy reports. However, the laboratory uses
a 99 percent confidence range (
±
3 sigma) for determining whether to report the sample
activity concentration as detected or not. This 3-sigma confidence range typically
equates to 150 (± 135.75) pCi/L.
Exelon has specified a LLD of 200 pCi/L for the
Fleetwide assessment. Exelon has also
required the laboratory to report related peaks identified at the 95 percent confidence
level (2-sigma).
This HIR, therefore, screens and assesses data using Exelon's
LLD of 200 pCi/L. As is
outlined below, this concentration is also a reasonable approximation of the background
concentration of tritium in groundwater at the Station.
7.1
HEALTH EFFECTS OF TRITIUM
Tritium is a radionuclide that decays by emitting a low-energy beta particle that cannot
penetrate deeply into tissue or travel far in air. A person's exposure to
tritium is
primarily through the ingestion of water (drinking water) or through ingestion of water
bearing food products. Inhalation of tritium requires the water to be in a vapor form
(i.e., through evaporation or vaporization due to heating). Inhalation is a minor
exposure route when compared to direct ingestion or drinking of tritiated water.
Absorption of tritium through skin is possible, but tritium exposure is more limited here
versus direct ingestion or drinking of tritiated water.
045136 (12) Braidwood Generating Station
49
CONESTOGA-ROVERS & ASSOCIATES
Revision 1
7.2
BACKGROUND CONCENTRATIONS OF TRITIUM
The purpose of the following paragraphs is
to establish a background concentration
through review of various media.
7.2.1
GROUNDWATER
Tritium is created in the environment from naturally occurring processes both cosmic
and
subterranean, as well as from anthropogenic (i.e., man-made) sources. In the upper
atmosphere, "cosmogenic" tritium is produced from the bombardment of stable nuclides
and combines with oxygen to form tritiated water, which will then enter the hydrologic
cycle. Below ground, "lithogenic" tritium is produced by the bombardment of natural
lithium isotopes
6
Li
(92.5 percent abundance) and
7
Li
(7.5 percent abundance) present in
crystalline rocks by neutrons produced by the radioactive decay of uranium and
thorium. Lithogenic production of tritium is usually negligible compared to other
sources due to the limited abundance of lithium in rock. The lithogenic tritium is
introduced directly to groundwater.
A major anthropogenic source of tritium comes from the former atmospheric testing of
thermonuclear weapons. Levels of tritium in precipitation increased during the 1950s
and early 1960s, coinciding with the release of significant amounts of tritium to
the
atmosphere during nuclear weapons testing prior to the signing of the Limited Test Ban
Treaty in 1963, which prohibited atmospheric nuclear tests.
7.2.2
PRECIPITATION DATA
Precipitation samples are routinely collected at stations around the world for the
analysis of tritium and other radionuclides.
Two publicly available databases that
provided tritium concentrations in precipitation are Global Network of Isotopes in
Precipitation (GNIP) and USEPA's RadNet database.
GNIP provides tritium
precipitation concentration data for samples collected world wide from 1960 to 2006.
RadNet provides tritium precipitation concentration data for samples collected at
Stations through the U.S. from 1960 up to and including 2006.
Based on GNIP data for sample stations located in the U.S.
Midwest including Chicago,
St. Louis and Madison, Wisconsin, as well as Ottawa Ontario, and data from the
University of Chicago, tritium concentrations peaked around 1963. This peak, which
approached 10,000 pCi/L for some stations, coincided with the atmospheric testing of
045136 (12) Braidwood Generating Station
50
CONESTOGA-ROVERS & ASSOCIATES
Revision 1
thermonuclear weapons. Tritium concentrations showed a sharp decline up until 1975
followed by a gradual decline since that time. Tritium concentrations in Midwest
precipitation have typically been below 100 pCi/L since around 1980.
The RadNet database for several stations in
the U.S. Midwest (Chicago, Columbus,
Indianapolis, Lansing, Madison, Minneapolis, Painesville, Toledo, and Welsch, MN) did
not show the same trend, which can attributed to pre-1995 data handling procedures.
The pre-1995 data were rounded to the nearest 100 pCi/L, which damped out variances
in the data. The post-1995 RadNet data, where rounding was not applied, exhibit much
more scatter, and similar to the GNIP data, the vast majority of the data were less than
100 pCi/L.
CRA constructed a non-parametric upper tolerance
limit with a confidence of 95 percent
and a coverage of 95 percent based on RadNet data for USEPA Region 5 from 2004 to
2005. The resulting upper tolerance limit is 133 pCi/L, which indicates that CRA is
95 percent confident that 95 percent of the ambient precipitation concentration results
are below 133 pCi/L. The statistical confidence, however, must be compared with the
limitations of the underlying RadNet data, which does not include the minimum
detectable concentration for a majority of the measurements. Some of the RadNet values
below 200 pCi/L may be approximated. Nevertheless, these results show a background
contribution for precipitation of up to 133 pCi/L.
7.2.3
SURFACE WATER DATA
Tritium concentrations are routinely measured in large surface water bodies, including
Lake Michigan and the Mississippi River. Surface
water data from the RadNet database
for Illinois sampling stations include East Moline (Mississippi River), Moline
(Mississippi River), Marseilles (Illinois River), Morris (Illinois River), Oregon (Rock
River), and Zion (Lake Michigan). As is the case for the RadNet precipitation data, the
pre-September 1995 Illinois surface water data was rounded to the nearest 100 pCi/L,
creating a dampening of variances in the data. The post-1995 Illinois surface water data,
similar to the post-1995 Midwest precipitation data, were less than 100 pCi/L with the
exception of the Moline (Mississippi River) station.
Tritium surface water
concentrations at this location varied between 100 and 800 pCi/L, which may reflect
local natural or anthropogenic inputs.
For the Lake Michigan station, the surface water concentrations were less than
100
pCi/L, with the exception of a couple of occasions occurring around 1996 to 1997.
Tritium concentrations in Lake Michigan would be expected to be lower than
045136 (12) Braidwood Generating Station
51
CONESTOGA-ROVERS & ASSOCIATES
Revision 1
precipitation concentrations given the 99-year surface water residence time within Lake
Michigan, which corresponds to 8 half-lives of tritium and the dilution provided the
large volume of the Lake (1,180 cubic miles) as well as seasonal mixing effects
(WDNR, 1999).
The USEPA RadNet surface water data typically has a reported 'Combined Standard
Uncertainty'
of 35 to 50 pCi/L.
According to USEPA, this corresponds to a
±
70 to 100 pCi/L 95 percent confidence bound on each given measurement. Therefore,
the typical background data provided may be subject to measurement uncertainty of
approximately
±
70 to 100 pCi/L.
7.2.4
DRINKING WATER DATA
Tritium concentrations in drinking water from the RadNet database for three Illinois
sampling stations (Chicago, Morris, and East Chicago) exhibit
similar trends as the
precipitation and surface water data. As with the precipitation and surface water data,
the pre-1995 data has dampened out variances due to rounding the data to the nearest
100 pCi/L. The post-1995 results show tritium concentrations in drinking water well
below 100 pCi/L and less than the tritium concentrations found in precipitation and
surface water.
7.2.5
EXPECTED TRITIUM BACKGROUND FOR THE STATION
As reported in the GNIP and RadNet databases,
tritium concentrations in U.S. Midwest
precipitation has typically been less than 100 pCi/L since 1980. Tritium concentrations
reported in the RadNet database for Illinois surface water and groundwater, at least
since 1995, has typically been less than 100 pCi/L. Based on the USEPA Region 5's 2004
to 2005 RadNet precipitation data, 95 percent of the ambient concentrations of tritiated
water in Illinois are expected to be less than 133 pCi/L, based on a 95 percent confidence
limit. Tritium concentrations in surface water and drinking water are expected to be
comparable or less based on historical data and trends.
Concentrations in groundwater similar to surface water and drinking are expected
to be
less as compared to precipitation values. The lower groundwater concentrations are
related to the age of the groundwater as compared to the half-life of tritium. Deep
aquifers in proximity to crystalline basement rock, however, can potentially show
elevated concentrations of tritium due to lithogenic sources.
045136 (12) Braidwood Generating Station
52
CONESTOGA-ROVERS & ASSOCIATES
Revision 1
As was noted in Section 7.0, the analytical laboratory is reporting tritium results to a
LLD of 200 pCi/L. This concentration also represents a reasonable representation of
background groundwater quality, given the data for precipitation, surface water, and
drinking water.
Based on the evaluation presented above, the background concentration for
tritium at
the Station is reasonably represented by the LLD of 200 pCi/L.
7.3
IDENTIFICATION OF POTENTIAL EXPOSURE
PATHWAYS AND POTENTIAL RECEPTORS
Three potential exposure pathways were considered during the evaluation
of tritium in
groundwater:
•
groundwater migration off the Station Property
to private and public groundwater
users;
•
groundwater migration off the Station Property
to a surface water body; and
•
potential exposure to surface water in the perimeter ditch at the Station.
The following section provides an overview of each of these three potential exposure
pathways for tritium in groundwater.
7.3.1
POTENTIAL GROUNDWATER MIGRATION TO
DRINKING WATER USERS OFF THE STATION PROPERTY
In this pathway groundwater flows to the north
off Exelon's property and onto adjacent
private property. There are a number of private landowners to the north that use
private wells completed in the upper sand aquifer. These shallow water supply wells
are considered potential pathways.
The concentrations of tritium in groundwater (within the upper sand aquifer
and the
deeper bedrock aquifer) are below the LLD of 200 pCi/L off the Station property.
Consequently, there is no tritium in the groundwater currently migrating off the Station
property.
With the exception of the blowdown line investigation
there have been no samples
collected from private or public water supply wells, to the north or west of the PA, that
contained tritium at concentrations that exceed the LLD of 200 pCi/L. Therefore,
045136 (12) Braidwood Generating Station
53
CONESTOGA-ROVERS & ASSOCIATES
Revision 1
although there is a potentially complete exposure pathway, there is no current risk of
exposure associated with groundwater ingestion from private wells in the upper sand
aquifer.
Groundwater samples collected from private wells in the deep bedrock investigated did
not contain tritium that exceeded
the LLD of 200 pCi/L. This is to be expected because
the vertical movement of tritiated water into deeper formations is restricted by the
following three regional aquitards (see Figure 2.8):
•
the Wedron Clay Till, which directly
underlies the upper sand aquifer;
•
the shales of the Carbondale Formation
(Francis Creek Shale Member); and
•
the Scales Shale of the Maquoketa Group.
The effectiveness of these aquitards is further supported by the recent data collected
from the approximately
100 feet deep bedrock monitoring wells MW-BW-201BD and
MW-BW-208BD on the Station property. Samples from these wells were from a water
bearing zone just beneath the Francis Creek Shale Member and contained tritium at
concentrations less than the LLD of 200 pCi/L. Therefore, the exposure pathway is
incomplete and there is no current risk of exposure associated with groundwater
ingestion from private wells in the deep bedrock aquifer.
7.3.2
POTENTIAL GROUNDWATER MIGRATION TO
SURFACE WATER USERS OFF THE STATION PROPERTY
There is a potential exposure pathway in the upper sand aquifer
to ponds, ditches, and
other surface water bodies. Based on the results of this investigation tritium has not
been detected at concentrations greater than the LLD 200 pCi/L in groundwater, which
might discharge to these surface water bodies.
Although this is a potentially complete exposure pathway, there is no current risk of
exposure
associated with ingestion and recreational use off the Station property.
7.3.3
POTENTIAL EXPOSURE TO SURFACE WATER
IN THE PERIMETER DITCH AT THE STATION
The perimeter ditch flows to the south on the west
side of the Station Property and does
not flow off the property until a point located approximately 2 miles southwest of the
PA.
045136 (12) Braidwood Generating Station
54
CONESTOGA-ROVERS & ASSOCIATES
Revision 1
Under this potential exposure pathway, groundwater must migrate to the surface and
into the perimeter ditch. Potential exposures could occur if the groundwater discharge
to the surface water contains tritium. Although water in the perimeter ditch has
contained trace amounts of tritium in the past, Station personnel are protected and
monitored by the Radiation Protection Program, which is controlled by Federal
guidelines. This is a potentially complete exposure pathway, but there is no current risk
of exposure associated with ingestion, inhalation, or absorption on Station property.
7.4
SUMMARY OF POTENTIAL TRITIUM EXPOSURE PATHWAYS
There are three potential exposure pathways for tritium originating in or adjacent to the
PA:
•
groundwater migration off the Station Property
to private and public groundwater
users (drinking water exposure);
•
groundwater migration off the Station Property to a surface water body
(recreational
exposure); and
•
potential exposure to surface water in the perimeter ditch at the Station.
In summary, based upon the groundwater and surface water data provided and
referenced in this investigation, none of the potential
receptors are at risk of exposure to
concentrations of tritium in excess of USEPA drinking water standards (20,000 pCi/L).
7.5
OTHER RADIONUCLIDES
Target radionuclides were not detected at concentrations greater than their respective
LLD
in the groundwater samples collected. Other non-targeted radionuclides were also
included in the tables but excluded from discussion in this report. These radionuclides
were either a) naturally occurring and thus not produced by the Station, or b) could be
definitively evaluated as being naturally occurring due to the lack of presence of other
radionuclides which would otherwise indicate the potential of production from the
Station.
045136 (12) Braidwood Generating Station
55
CONESTOGA-ROVERS & ASSOCIATES
Revision 1
8.0
CONCLUSIONS
Based on all of the studies completed to date at this site, CRA concludes:
Groundwater Flow
•
The deeper bedrock water supply aquifers are separated from the upper sand
aquifer system by a number of aquitards,
including the Wedron Clay Till and the
regionally-identified Francis Creek Shale Member, and the Maquoketa Shale. These
aquitards are present beneath the PA and continue to restrict downward vertical
movement of groundwater.
•
Groundwater at near-by properties is extracted
from both the 20- to 30-foot thick
upper sand aquifer and deeper bedrock formations at depths of 600 to 1,600 feet.
•
Depth to groundwater in the upper sand aquifer
ranges from 4 to 12 feet and it flows
beneath the PA in a generally south to north manner, flowing from the Cooling Lake
toward ponds and streams located north of the Station property.
•
Groundwater in the upper sand aquifer
flows to the west and southwest at locations
west and south of the PA.
•
Lateral groundwater flow within the
PA is affected by the construction
(basements/foundations) of the Reactor, Turbine, and Auxiliary Buildings, which
were constructed through the Wedron Clay Till onto the top of the Francis Creek
Shale Member. These buildings are barriers to lateral flow.
•
Lateral groundwater flow within the PA
is controlled by the slurry trench to some
degree as is evident by the change in hydraulic gradients on the west side of the PA.
However, the degree of its influence on flow to the north is not known at this time.
•
Vertical groundwater flow is restricted by the regional aquitards,
however, due to
the removal of the Wedron Clay Till beneath the buildings, one of the two regional
aquitards has been removed within the PA. Nevertheless, groundwater data
indicate that the remaining aquitard (Francis Creek Shale Member) is preventing
vertical migration of tritium downward within the PA.
Groundwater Quality
•
Tritium
concentrations in groundwater were not detected at concentrations greater
than the USEPA drinking water standard of 20,000 pCi/L.
•
Tritium
was not detected at concentrations greater than the LLD (200 pCi/L) in 34 of
the 45 samples collected as part of this investigation.
045136 (12) Braidwood Generating Station
56
CONESTOGA-ROVERS & ASSOCIATES
Revision 1
•
Gamma-emitting radionuclides associated with licensed plant operations were not
detected at concentrations greater than their respective LLDs in 45 of the 45 samples
collected as part of this investigation.
•
Strontium-89/90 was not detected at a concentration greater than the LLD
of
2.0 pCi/L in 45 of the 45 samples collected as part of this investigation.
•
In the site area, tritium is not migrating off the Exelon property in the upper sand
aquifer
at concentrations greater than the LLD of 200 pCi/L.
•
Deeper
private water supply wells that are located downgradient of the PA contain
concentrations of tritium less than the LLD of 200 pCi/L. The regional aquitards act
as vertical barriers to migration of tritium from surficial aquifers to deeper bedrock
aquifers.
•
The depth of the tritium detected within the
PA is defined by the top of the Wedron
Clay Till with one exception. Along the west side of the Turbine Building and
within the formerly excavated area, where the clay was excavated and backfilled, the
vertical extent of the tritium is limited by the top of the Francis Creek Shale Member.
•
Tritium has not been detected at
concentrations greater than the LLD of 200 pCi/L in
groundwater located beneath the Francis Creek Shale Member in the vicinity of the
PA, downgradient of the buildings, and near the former building excavation.
Surface Water Quality
•
Tritium concentrations in surface water were
not detected at concentrations greater
than the USEPA drinking water standard of 20,000 pCi/L.
•
Tritium
was not detected at concentrations greater than the LLD (200 pCi/L) in three
of the six samples collected as part of this investigation.
•
Gamma-emitting radionuclides associated
with licensed plant operations were not
detected at concentrations greater than their respective LLDs in six of the six samples
collected as part of this investigation.
•
Strontium-89/90 was not detected at a concentration greater than the LLD
of
2.0 pCi/L in six of the six samples collected as part of this investigation.
•
In
the site area, tritium is not migrating off the Exelon property in surface water at
concentrations exceeding the LLD of 200 pCi/L.
•
Detections of tritium in the north and east stretches of the perimeter
ditch can be
attributed to the releases at vacuum breaker VB-1 located to the east along the
blowdown line.
045136 (12) Braidwood Generating Station
57
CONESTOGA-ROVERS & ASSOCIATES
Revision 1
AFE-Braidwood-1 – North of the Slurry Wall
•
Gamma-emitting radionuclides associated
with licensed plant operations were not
detected at concentrations greater than their respective LLDs in any of the
groundwater samples collected from the monitoring wells in the vicinity of AFE-
Braidwood-1.
•
Strontium-89/90 was not detected at a concentration greater than the LLD
of
2.0 pCi/L in any of the groundwater samples collected from the monitoring wells in
the vicinity of AFE-Braidwood-1.
•
In the area north of the
slurry wall, tritium was detected in groundwater samples
from the shallow and deeper zones of the upper sand aquifer at concentrations less
than 250 pCi/L.
•
The concentrations of tritium detected in groundwater samples from north of the
slurry wall in the upper
sand aquifer are less than or just slightly greater than the
LLD of 200 pCi/L.
•
The concentrations of tritium detected in groundwater samples from the deeper
bedrock monitoring well completed just below
the Francis Creek Shale Member was
less than the LLD of 200 pCi/L.
•
Private well samples collected
downgradient of this area provide additional
evidence that the deeper bedrock is not impacted by tritium greater than the LLD of
200pCi/L.
•
There
are currently three monitoring wells (and numerous private wells) located
downgradient of this AFE. No additional data are needed in this area of the site.
There have been no impacts to groundwater from AFE-Braidwood-1.
AFE-Braidwood-2 – North/Northeast of Units 1 and 2
•
Gamma-emitting radionuclides associated
with licensed plant operations were not
detected at concentrations greater than their respective LLDs in any of the
groundwater samples collected from the monitoring wells in the vicinity of AFE-
Braidwood-2.
•
Strontium-89/90 was not detected at a concentration greater than the LLD
of
2.0 pCi/L in any of the groundwater samples collected from the monitoring wells in
the vicinity of AFE-Braidwood-2.
•
Groundwater samples collected downgradient of the fuel
handling building, Units 1
and 2, and other systems on the east side of the PA did not contain tritium at
concentrations greater than the LLD of 200 pCi/L.
045136 (12) Braidwood Generating Station
58
CONESTOGA-ROVERS & ASSOCIATES
Revision 1
•
There are currently five monitoring wells (and numerous private wells) located
downgradient of this AFE. There is no current impact to groundwater from AFE-
Braidwood-2.
AFE-Braidwood-3 – Auxiliary Condensate Construction Storage Tank
•
Gamma-emitting radionuclides associated
with licensed plant operations were not
detected at concentrations greater than their respective LLDs in any of the
groundwater samples collected from the monitoring wells in the vicinity of AFE-
Braidwood-3.
•
Strontium-89/90 was not detected at a concentration greater than the LLD
of
2.0 pCi/L in any of the groundwater samples collected from the monitoring wells in
the vicinity of AFE-Braidwood-3.
•
Groundwater samples collected from new monitoring wells
located near and
downgradient of this AFE area did not contain tritium at concentrations greater than
the LLD of 200 pCi/L.
•
There are two monitoring wells (and numerous private wells) located downgradient
of this AFE. There is no current impact to groundwater from AFE-Braidwood-3.
AFE-Braidwood-4 – West Side of Turbine Building
•
Gamma-emitting radionuclides associated
with licensed plant operations were not
detected at concentrations greater than their respective LLDs in any of the
groundwater samples collected from the monitoring wells in the vicinity of AFE-
Braidwood-4.
•
Strontium-89/90 was not detected at a concentration greater than the LLD
of
2.0 pCi/L in any of the groundwater samples collected from the monitoring wells in
the vicinity of AFE-Braidwood-4.
•
Tritium has been detected at concentrations greater than the LLD of 200
pCi/L in a
localized area found along the west side of the Turbine Building. These detections
are within the former excavation used during construction, adjacent to the deep
basement of the Turbine Building and next to the storm water sewer.
•
The lateral extent of tritium within this area of the Station has been defined by
groundwater
monitoring data to the north, west, and south, by the building
basements to the east. The vertical extent of the tritium is limited by the Wedron
Clay Till.
045136 (12) Braidwood Generating Station
59
CONESTOGA-ROVERS & ASSOCIATES
Revision 1
•
The vertical extent of tritium within this area of the Station has been defined by
groundwater monitoring data where the Wedron Clay Till has not been excavated
and has been defined within the formerly excavated area.
•
There
are over 37 monitoring wells on the west side of the Turbine building that
delineate the lateral and vertical extent of tritium in the upper sand unit and within
the fill material.
•
The source of the tritium detected on the west side of the Turbine Building is
likely a
result of multiple intermittent surface spills or releases of tritiated water.
Potential Receptors
•
Based on the results of this investigation
1
, there is no current risk from exposure to
radionuclides associated with licensed plant operations through any of the identified
potential exposure pathways.
General Conclusions
•
Based on the results of this investigation, tritium is not migrating off the Station
property at detectable concentrations.
•
Based on the results of this investigation, there
are no known active releases into the
groundwater at the Station.
1
Using the LLD specified in this HIR.
045136 (12) Braidwood Generating Station
60
CONESTOGA-ROVERS & ASSOCIATES
Revision 1
9.0
RECOMMENDATIONS
The following presents CRA's recommendations for proposed activities to be completed
at the Braidwood Station
9.1
DATA GAPS
Based on the results of this hydrogeologic investigation, there are no data gaps
remaining to support CRA’s conclusions regarding
the characterization of the
groundwater regime and potential impacts from radionuclides at the Station.
9.2
GROUNDWATER MONITORING
Based upon the information collected to date, CRA recommends that Exelon conduct
periodic monitoring of selected sample locations.
045136 (12) Braidwood Generating Station
61
CONESTOGA-ROVERS & ASSOCIATES
Revision 1
10.0
REFERENCES CITED
Arnold, T.L., Sullivan, D.J., Harris, M.A., Fitzpatrick F.A.,
Scudder, B.C., Ruhl, P.M.,
Hanchar, D.W., and Stewart, J.S., 1999. Environmental Setting of the Upper
Illinois River Basin and Implications for Water Quality; Water Resources
Report 98-4288.
Bouwer, H. and R.C. Rice, 1976. A slug test method for determining hydraulic
conductivity of unconfined aquifers
with completely or partially penetrating
wells, Water Resources Research, vol. 12, no. 3, pp. 423-428.
CRA, June 2006. Memorandum entitled "Evaluation of the Source of Tritium in Two
Private Water Supply Wells located along the Kankakee River and IL-Route
113
Braidwood Nuclear Station".
CRA, April 2006. Investigation of Tritium in the Groundwater in the Vicinity of VB-4.
CRA, April 2006. Investigation of Tritium in the Groundwater in the Vicinity of VB-6.
CRA, April 2006. Investigation of Tritium in the Groundwater in the Vicinity of VB-7.
CRA, August 2002. Results of Stage 2 Investigations, Illinois Site Remediation Program,
Exelon Generation - Braidwood Facility.
CRA, March 2006. Tritium Investigation Report.
CRA, May 2006. Hydrogeologic Investigation Work Plan.
CRA, September 2000. Results of Sampling of the Perimeter Ditch, Commonwealth
Edison Braidwood Facility, Braceville, Illinois.
CRA, September 2003. Results of Stage 1 Activities,
Illinois Site Remediation Program,
Exelon Generation Braidwood Facility.
Eisenbud, Merril and Gesell, Thomas, 1997. Environmental Radioactivity From Natural,
Industrial, and Military Sources, Fourth Edition.
Exelon, 2004. Updated
Final
Safety
Analysis
Report
(UFSAR)
Revision 10,
December 2004.
Exelon, 2005. Braidwood
Station
Units 1 and 2,
2004
Annual
Radiological
Environmental Operating Report, Exelon, (January 1 to December 31, 2005),
Braceville, Illinois May 2006.
Illinois Administrative Code Title 35 Part 742,
Tiered Approach to Corrective Action
Objectives, Illinois Pollution Control Board, effective February 5, 2002.
Illinois Geological Survey, March 2006 and October 2003, Coal Section, Map of Coal
Mines –
Will County.
045136 (12) Braidwood Generating Station
62
CONESTOGA-ROVERS & ASSOCIATES
Revision 1
Puls, R.W.,
and
M.J. Barcelona, April 1996. Low-Flow
(Minimal
Drawdown)
Ground-Water
Sampling
Procedures,
EPA
Ground
Water
Issue
,
EPA/540/S-92/005, R. S. Kerr Environmental Research Center, United States
Environmental Protection Agency, Ada, Oklahoma.
Schicht, Richard J.,
J. Rodger Adams,
and
John B. Stall, 1976. Water
Resources
Availability, Quality, and Cost in
Northeastern Illinois, Illinois State Water
Survey Report of Investigation 83.
Teledyne
Isotopes
Midwest Laboratory, May 1987. Environmental
Radiological
Monitoring for Braidwood Nuclear Power Station, Commonwealth Edison
Company, Annual Report 1986.
Visocky, Adrian P., 1997. Water-Level Trends and Pumpage in the Deep
Bedrock
Aquifers in the Chicago Region, 1991-1995, Illinois State Water Survey Circular
182.
Visocky, Adrian P.,
Marvin G. Sherrill,
and
Keros
Cartwright, 1985. Geology,
Hydrogeology,
and Water Quality of the Cambrian and Ordovician Systems in
Northern Illinois, Illinois State Geological Survey, Illinois State Water Survey,
Cooperative Groundwater Report 10.
Willman, H.B. and Frye, J.C., 1970. Pleistocene Stratigraphy of Illinois, Bulletin
94,
Illinois State Geological Survey.
Willman, H.B., Atherton E., Buschbach, T.C., Collinson, C., Frye, J.C., Hopkins, M.E.,
Lineback, J.A.,
Simon, J.A., 1975. Handbook of Illinois Stratigraphy, ISGS
Bulletin 95.
045136 (12) Braidwood Generating Station
63
CONESTOGA-ROVERS & ASSOCIATES
STATION
SOURCE: USGS QUADRANGLE MAP;
0
2000
4000ft
BRAIDWOOD MOSAIC, ILLINOIS - 1973 (PHOTO REVISED 1980)
figure 1.1
STATION LOCATION MAP
BRAIDWOOD GENERATING STATION
EXELON GENERATION COMPANY, LLC
45136-20(012)GN-WA037 AUG 23/2006
PROPERTY BOUNDARY
REVISION 1
FIGURE 1.2 STATION BOUNDARIES
AND FEATURES
(Withheld)
BRAIDWOOD
KANKAKEE RIVER
EXELON NUCLEAR STATION
VB1
VB2
VB3
VB4
VB5
VB6
VB7
VB8
VB9
VB10
VB11
ROUTE 129
ROUTE 53
BRAIDWOOD
COOLING
LAKE
figure 1.3
STATION BOUNDARIES INCLUDING BLOWDOWN LINE
AERIAL PHOTO WITH UBS
EXELON GENERATION COMPANY, LLC
45136-20(012)GN-WA038 AUG 23/2006
0
1000
3000ft
LEGEND
BLOW DOWN LINE
REVISION 1
FIGURE 2.1 STATION BASE MAP
(Withheld)
FIGURE 2.2 STATION FEATURES
AND WELL LOCATIONS
(Withheld)
FIGURE 2.3 STATION SURFACE
WATER FEATURES
(Withheld)
FIGURE 2.3 STATION SURFACE
WATER FEATURES
(Withheld)
598
594
590
586
582
GROUND SURFACE (APPROXIMATE)
WELL CASING
GROUNDWATER ELEVATION (FT. AMSL)
WELL SCREEN
TEMPORARY MONITORING WELL IDENTIFIER
LEGEND
602
TW-7
MP-3
OCTOBER 9, 2001
SOUTHWEST
NORTHEAST
AA
AA'
APPROXIMATE FUEL LINE
APPROXIMATE STORM SEWER LINE
RESULTS OF STAGE 1 ACTIVITIES
CRA, SEPTEMBER 2003
SOURCE:
TANK
MP-3
SB-17
SB-16
TW-6
TW-7
0
40
N
20
AA
AA'
SOUTHWEST
NORTHEAST
figure 2.4
STORM WATER DRAINAGE CROSS-SECTION AA-AA'
MAIN SITE AREA
EXELON GENERATION COMPANY, LLC
45136-20(012)GN-WA041 AUG 23/2006
REVISION 1
GROUND SURFACE (APPROXIMATE)
WELL CASING
GROUNDWATER ELEVATION (FT. AMSL)
WELL SCREEN
TEMPORARY MONITORING WELL IDENTIFIER
LEGEND
OCTOBER 9, 2001
BB
602
598
594
590
586
582
BB'
BASE
WATER
OIL
OIL WATER SEPARATOR
WEST
EAST
RESULTS OF STAGE 1 ACTIVITIES
CRA, SEPTEMBER 2003
SOURCE:
OIL/WATER
SEPARATOR
SB-22
TW-13
SB-21
SB-20
MP-2
0
30
N
15
BB
BB'
WEST
EAST
figure 2.5
OIL-WATER SEPARATOR CROSS-SECTION BB-BB'
MAIN SITE AREA
EXELON GENERATION COMPANY, LLC
45136-20(012)GN-WA042 AUG 23/2006
REVISION 1
598
594
590
586
582
GROUND SURFACE (APPROIXMATE)
WELL CASING
GROUNDWATER ELEVATION (FT. AMSL)
WELL SCREEN
TEMPORARY MONITORING WELL IDENTIFIER
LEGEND
MP-1
TW-17
PERIMETER
DITCH
OCTOBER 9, 2001
CC
CC'
NORTHWEST
SOUTHEAST
RESULTS OF STAGE 1 ACTIVITIES
CRA, SEPTEMBER 2003
SOURCE:
TW-17
MP-1
CC
CC'
N
0
40
80
NORTHWEST
SOUTHEAST
figure 2.6
PERIMETER DITCH CROSS-SECTION CC-CC'
MAIN SITE AREA
EXELON GENERATION COMPANY, LLC
45136-20(012)GN-WA043 AUG 23/2006
REVISION 1
598
594
590
586
582
578
574
GROUND SURFACE (APPROXIMATE)
WELL CASING
GROUNDWATER ELEVATION (FT. AMSL)
WELL SCREEN OCTOBER 9, 2001
TEMPORARY MONITORING WELL IDENTIFIER
LEGEND
TW-20
SG-1
TW-19
WEST
EAST
PERIMETER
DITCH
DD
DD'
OCTOBER 9, 2001
RESULTS OF STAGE 1 ACTIVITIES
CRA, SEPTEMBER 2003
SOURCE:
TW-19
SG-1
TW-20
DD
DD'
N
0
40
80
WEST
EAST
figure 2.7
PERIMETER DITCH CROSS-SECTION DD-DD'
MAIN SITE AREA
EXELON GENERATION COMPANY, LLC
45136-20(012)GN-WA044 AUG 23/2006
REVISION 1
EXISTING GROUND SURFACE
WEDRON FORMATION
FRANCIS CREEK SHALE MEMBER
SPOON FORMATION
CHANNEL SANDSTONE DEPOSITS
SILTSTONE
600
580
560
540
520
500
480
460
440
420
400
380
360
600
580
560
540
520
500
480
460
440
420
400
380
360
SOUTHWEST
NORTHEAST
ELEVATION IN FEET (MSL)
340
320
300
340
320
300
620
620
280
280
MAQUOKETA SHALE GROUP
CONGLOMERATE
EQUALITY FORMATION
BLOWDOWN LINE
GALENA AND PLATTEVILLE GROUPS (DEEP BEDROCK AQUIFER) FROM 250 TO 0 ftAMSL
GLENWOOD - ST. PETER FORMATION (DEEP BEDROCK AQUIFER) FROM 0 TO -280 ftBMSL
ORDOVICIAN
CAMBRIAN
ORDOVICIAN SHALES
PENNSYLVANIA SHALES
CARBONDALE
FORMATION
REGIONAL USE
BEDROCK
AQUIFER
OVERBURDEN
AQUIFER
LOCAL
USE
AQUIFER
MEMBER
COAL
COLCHESTER
MEMBER
AQUITARD
figure 2.8
LOCAL GEOLOGIC CROSS-SECTION
EXELON GENERATION COMPANY, LLC
45136-20(012)GN-WA046 AUG 23/2006
SCALE: HORIZONTAL 1"=400'
VERTICAL 1"=40'
REVISION 1
FIGURE 2.9 CONTOUR MAP OF THE
WEDRON FORMATION
(Withheld)
FIGURE 2.10 PRIVATE WELL
LOCATIONS AND WELL DEPTHS
(Withheld)
FIGURE 2.11 GROUNDWATER
MONITORING LOCATIONS
(Withheld)
FIGURE 2.12 REGIONAL
HYDROGEOLOGIC CROSS-SECTION
LOCATIONS
(Withheld)
ELEVATION (ft. AMSL)
DISTANCE (ft.)
0
500
1000
2000
3000
5000
6000
7000
8000
600
TRAINING FACILITY
GATE HOUSE
LIMIT OF EXCAVATION
PERIMETER DITCH
PW-14
PW-10
PW-11
G-2/D
500
1500
2500
3500
4000
4500
5500
6500
7500
400
300
200
100
0
-100
ELEVATION (ft. AMSL)
500
600
400
300
200
100
0
-100
COOLING
LAKE
SLURRY WALL
SLURRY WALL
CONTAINMENT BUILDING No. 2
SLURRY WALL
RADWASTE/SERVICE
BUILDING COMPLEX
LIMIT OF EXCAVATION
E
SOUTH
E
NORTH
Scale:
Source Reference:
Project Manager:
Reviewed By:
Project N
o
:
Date:
Report N
o
:
Drawing N
o
:
THIS BAR MEASURES 1" ON ORIGINAL. ADJUST SCALE ACCORDINGLY.
SCALE VERIFICATION
EXELON GENERATION COMPANY, LLC
BRACEVILLE, ILLINOIS
REGIONAL HYDROGEOLOGIC CROSS-SECTION E-E'
BRAIDWOOD GENERATING STATION
FLEETWIDE ASSESSMENT
S. QUIGLEY
M. KELLY
AUGUST 2006
45136-20
012
figure 2.13
45136-20(012)GN-WA028 AUG 23/2006
AS SHOWN
W-2
REVISION 1
F'
SOUTH
MW-BW-201I
MW-BW-201S
MW-BW-204I
500
1000
1500
2000
2500
3000
3500
LIMIT OF EXCAVATION
REACTOR CONTAINMENT UNIT I
REACTOR CONTAINMENT UNIT II
LIMIT OF EXCAVATION
AUXILIARY BUILDING
F
ELEVATION (ft. AMSL)
NORTH
DISTANCE (ft.)
0
600
MW-BW-201BD
COOLING
LAKE
~594.8
SLURRY WALL
SLURRY WALL - BOTTOM ELEVATION 575
SLURRY WALL - BOTTOM ELEVATION 575
500
400
300
200
100
0
-100
-200
ELEVATION (ft. AMSL)
600
500
400
300
200
100
0
-100
-200
4000
4500
5000
5500
6000
6500
7000
7500
8000
8500
9000
9500
10000
BRAIDWOOD MUNICIPAL WELL
- BOTTOM OF WELL 1647' BGS
BOTTOM AT 1647' BGS
Scale:
Source Reference:
Project Manager:
Reviewed By:
Project N
o
:
Date:
Report N
o
:
Drawing N
o
:
THIS BAR MEASURES 1" ON ORIGINAL. ADJUST SCALE ACCORDINGLY.
SCALE VERIFICATION
EXELON GENERATION COMPANY, LLC
BRACEVILLE, ILLINOIS
REGIONAL HYDROGEOLOGIC CROSS-SECTION F-F'
BRAIDWOOD GENERATING STATION
FLEETWIDE ASSESSMENT
S. QUIGLEY
M. KELLY
AUGUST 2006
45136-20
012
figure 2.14
45136-20(012)GN-WA028 AUG 23/2006
AS SHOWN
W-2
REVISION 1
FIGURE 2.15 PRIVATE WELL AND
MONITORING WELL SAMPLE
RESULTS
(Withheld)
FIGURE 3.1 AREAS FOR FURTHER
EVALUATION (STATION)
(Withheld)
FIGURE 3.2 AREAS FOR FURTHER
EVALUATION (WEST SIDE OF
TURBINE BUILDING)
(Withheld)
FIGURE 4.1 SURFACE WATER/STAFF
GAUGE MONITORING LOCATIONS
(Withheld)
FIGURE 4.2 GROUNDWATER
MONITORING LOCATIONS (STATION)
(Withheld)
0
0.1
0.2
0.3
0.4
0.5
0.6
0.7
6/6/06
6/7/06
6/8/06
6/9/06
6/10/06
6/11/06
6/12/06
6/13/06
6/14/06
6/15/06
6/16/06
6/17/06
6/18/06
6/19/06
6/20/06
6/21/06
6/22/06
6/23/06
6/24/06
6/25/06
6/26/06
6/27/06
6/28/06
6/29/06
6/30/06
7/1/06
7/2/06
7/3/06
7/4/06
7/5/06
7/6/06
7/7/06
7/8/06
7/9/06
7/10/06
7/11/06
7/12/06
7/13/06
7/14/06
7/15/06
7/16/06
7/17/06
7/18/06
7/19/06
7/20/06
7/21/06
Date
Transducer (feet of head)
0.00
0.20
0.40
0.60
0.80
1.00
1.20
1.40
1.60
1.80
Precipitation (inches)
Transducer Data from TB-1-4D
Precipitation - Braidwood
figure 4.3
PRESSURE TRANSDUCER AND PRECIPITATION DATA-JUNE/JULY 2006
BRAIDWOOD GENERATING STATION
EXELON GENERATION COMPANY, LLC
45136-20(012)GN-WA036 AUG 23/2006
REVISION 1
FIGURE 5.1 HYDROGEOLOGIC
CROSS-SECTION LOCATIONS
(Withheld)
A
ELEVATION (ft. AMSL)
WEST
DISTANCE (ft.)
0
TB-1-3D
MW-BW-203I
MW-BW-203S (O/S 14' NORTH)
D-1D (O/S 16' NORTH)
D-1 (O/S 14' NORTH)
MW-107
TW-20
560
570
580
590
600
610
A'
ELEVATION (ft. AMSL)
EAST
560
570
580
590
600
610
500
1000
1500
2000
2500
3000
3500
4000
FENCE
RAILROAD
RAILROAD
ROAD
FENCE
FENCE
ROAD
SLURRY WALL
LIMIT OF EXCAVATION (BOTTOM ~539.0')
REACTOR CONTAINMENT UNIT II
LIMIT OF EXCAVATION (BOTTOM ~539.0')
FENCE
SLURRY WALL
ROAD
FENCE
FENCE
FENCE
ROAD
DITCH
BURIED PIPES (APPROXIMATE)
MW-6
DITCH
594.79
594.79
592.25
593
586
585.06
TURBINE/AUXILIARY/
REACTOR BUILDING
(BASE OF BUILDING AT 539.0')
550
540
530
520
550
540
530
520
Scale:
Source Reference:
Project Manager:
Reviewed By:
Project N
o
:
Date:
Report N
o
:
Drawing N
o
:
THIS BAR MEASURES 1" ON ORIGINAL. ADJUST SCALE ACCORDINGLY.
SCALE VERIFICATION
EXELON GENERATION COMPANY, LLC
BRACEVILLE, ILLINOIS
HYDROGEOLOGIC CROSS-SECTION A-A'
BRAIDWOOD GENERATING STATION
FLEETWIDE ASSESSMENT
S. QUIGLEY
M. KELLY
AUGUST 2006
45136-20
012
figure 5.2
45136-20(012)GN-WA026 AUG 23/2006
AS SHOWN
W-2
593.72
SAND
WEDRON CLAY TILL
FILL
FRANCIS CREEK SHALE
FRANCIS CREEK SILTSTONE/CONGLOMERATE
COLCHESTER COAL NO. 2
SPOON FORMATION
REVISION 1
B
ELEVATION (ft. AMSL)
NORTH
DISTANCE (ft.)
0
500
FENCE
610
MW-13
MW-9
MW-7 (O/S 12' WEST)
MW-4 (O/S 11' WEST)
TB-1-3D (O/S 1' EAST)
MW-6
TB-1-10D (O/S 9' EAST)
TB-1-8D
600
590
580
570
560
1000
1500
B'
ELEVATION (ft. AMSL)
SOUTH
610
600
590
580
570
560
SLURRY WALL
SERVICE BUILDING
FENCE
FENCE
ROAD
FENCE
FENCE
SLURRY WALL
TW-3 (O/S 46' EAST)
TB-1-4D (O/S 45' EAST)
TB-1-5D (O/S 56' EAST)
TB-1-14D (O/S 58' EAST)
LIMIT OF EXCAVATION
(BOTTOM ELEVATION ~ 539')
LIMIT OF EXCAVATION (BOTTOM
ELEVATION ~ 539')
595.55
595.55
594.5
594.31
593.8
591.48
590.56
590.99
APPROXIMATE STORMWATER DRAINAGE SYSTEM
550
540
550
540
MW-207I (O/S 51' EAST) (BOTTOM ELEVATION 549.59)
Scale:
Source Reference:
Project Manager:
Reviewed By:
Project N
o
:
Date:
Report N
o
:
Drawing N
o
:
THIS BAR MEASURES 1" ON ORIGINAL. ADJUST SCALE ACCORDINGLY.
SCALE VERIFICATION
EXELON GENERATION COMPANY, LLC
BRACEVILLE, ILLINOIS
HYDROGEOLOGIC CROSS-SECTION B-B'
BRAIDWOOD GENERATING STATION
FLEETWIDE ASSESSMENT
S. QUIGLEY
M. KELLY
AUGUST 2006
45136-20
012
figure 5.3
45136-20(012)GN-WA026 AUG 23/2006
AS SHOWN
W-2
593.72
SAND
WEDRON CLAY TILL
FILL
FRANCIS CREEK SHALE
FRANCIS CREEK SILTSTONE/CONGLOMERATE
COLCHESTER COAL NO. 2
SPOON FORMATION
REVISION 1
C'
SOUTH
FENCE
MW-BW-201I
MW-BW-201S
MW-BW-204I
500
1000
1500
2000
2500
3000
3500
ELEVATION (ft. AMSL)
490
500
510
520
530
540
550
560
570
580
590
600
610
FENCE
FENCE
RAILROAD
RAILROAD
LIMIT OF EXCAVATION
REACTOR CONTAINMENT UNIT I
REACTOR CONTAINMENT UNIT II
LIMIT OF EXCAVATION
FENCE
FENCE
ROAD
C
ELEVATION (ft. AMSL)
NORTH
DISTANCE (ft.)
490
0
500
510
520
530
540
550
560
570
580
590
600
610
MW-BW-201BD
592.42
592.40
COOLING LAKE
~594.8
592.40
SLURRY WALL
430
SLURRY WALL -
BOTTOM ELEVATION 571
SLURRY WALL -
BOTTOM ELEVATION 571
480
470
460
450
440
480
470
460
450
440
430
592.27
MINE SPOIL
AUXILIARY BUILDING
/ FUEL HANDLING BUILDING
Scale:
Source Reference:
Project Manager:
Reviewed By:
Project N
o
:
Date:
Report N
o
:
Drawing N
o
:
THIS BAR MEASURES 1" ON ORIGINAL. ADJUST SCALE ACCORDINGLY.
SCALE VERIFICATION
EXELON GENERATION COMPANY, LLC
BRACEVILLE, ILLINOIS
HYDROGEOLOGIC CROSS-SECTION C-C'
BRAIDWOOD GENERATING STATION
FLEETWIDE ASSESSMENT
S. QUIGLEY
M. KELLY
AUGUST 2006
45136-20
012
figure 5.4
45136-20(012)GN-WA026 AUG 23/2006
AS SHOWN
W-2
593.72
SAND
WEDRON CLAY TILL
FILL
FRANCIS CREEK SHALE
FRANCIS CREEK SILTSTONE/CONGLOMERATE
COLCHESTER COAL NO. 2
SPOON FORMATION
MINE SPOIL
REVISION 1
D
ELEVATION (ft. AMSL)
WEST
DISTANCE (ft.)
0
200
590
600
TW-24
TW-12
MW-9
TW-8 (O/S 12' NORTH)
MW-BW-202I
MW-BW-202S (O/S 10' SOUTH)
100
300
400
500
600
700
800
900
1000
1100
1200
1300
1400
580
570
575
585
595
605
D'
ELEVATION (ft. AMSL)
EAST
590
600
580
575
585
595
605
FENCE
RAILROAD
ROAD
FENCE
FENCE
ROAD
SLURRY WALL
LIMIT OF EXCAVATION
LIMIT OF EXCAVATION
RAILROAD
FENCE
ROAD
570
SLURRY WALL
593.74
593.72
593.45
593.90
592.95
593.64
STORM SEWER DRAIN NOT TO
SCALE AND APPROXIMATE
WEST WALL OF
WAREHOUSE NO.1
565
560
555
550
565
560
555
550
Scale:
Source Reference:
Project Manager:
Reviewed By:
Project N
o
:
Date:
Report N
o
:
Drawing N
o
:
THIS BAR MEASURES 1" ON ORIGINAL. ADJUST SCALE ACCORDINGLY.
SCALE VERIFICATION
EXELON GENERATION COMPANY, LLC
BRACEVILLE, ILLINOIS
HYDROGEOLOGIC CROSS-SECTION D-D'
BRAIDWOOD GENERATING STATION
FLEETWIDE ASSESSMENT
S. QUIGLEY
M. KELLY
AUGUST 2006
45136-20
012
figure 5.5
45136-20(012)GN-WA026 AUG 23/2006
AS SHOWN
W-2
593.72
STORM SEWER
SAND
WEDRON CLAY TILL
FILL
FRANCIS CREEK SHALE
FRANCIS CREEK SILTSTONE/CONGLOMERATE
COLCHESTER COAL NO. 2
SPOON FORMATION
REVISION 1
FIGURE 5.6 POTENTIOMETRIC
SURFACE CONTOURS – SHALLOW
ZONE - MAY 2006
(Withheld)
FIGURE 5.7 POTENTIOMETRIC
SURFACE CONTOURS – SHALLOW
ZONE - JULY 2006
(Withheld)
FIGURE 5.8 POTENTIOMETRIC
SURFACE CONTOURS – DEEP ZONE
- MAY 2006
(Withheld)
FIGURE 5.9 POTENTIOMETRIC
SURFACE CONTOURS – DEEP ZONE
- JULY 2006
(Withheld)
FIGURE 5.10 TRITIUM
CONCENTRATIONS -
GROUNDWATER AND SURFACE
WATER
(Withheld)
FIGURE 5.11 RADIONUCLIDE
CONCENTRATIONS –
GROUNDWATER AND SURFACE
WATER
(Withheld)
B
ELEVATION (ft. AMSL)
NORTH
FENCE
610
MW-13
MW-9
MW-7 (O/S 12' WEST)
MW-4 (O/S 11' WEST)
TB-1-3D (O/S 1' EAST)
MW-6
TB-1-10D (O/S 9' EAST)
TB-1-8D
600
590
580
570
560
B'
ELEVATION (ft. AMSL)
SOUTH
610
600
590
580
570
560
SLURRY TRENCH
LIMIT OF EXCAVATION (BOTTOM ELEVATION ~ 539')
BUILDING
FENCE
LIMIT OF EXCAVATION (BOTTOM ELEVATION ~ 539')
FENCE
ROAD
FENCE
FENCE
SLURRY TRENCH
TW-3 (O/S 46' EAST)
TB-1-4D (O/S 45' EAST)
594.5
595.55
MW-13
ND
MW-7
214
MW-4
196
TW-3
1040
TB-1-3D
285
TB-1-4D
719
MW-6
288
TB-1-10D
ND
TB-1-8D
ND
590.99
MW-9
311
593.8
594.31
200
500
TB-1-5D (O/S 56' EAST)
TB-1-14D (O/S 58' EAST)
590.56
591.48
TB-1-5D
172
3/8/06
TB-1-14D
ND
0
500
DISTANCE (ft.)
560
1000
1500
560
555
430
515
508
504
555
430
515
508
504
595.55
200
APPROXIMATE STORM DRAIN
MW-207I (O/S 51' EAST) (BOTTOM ELEVATION 549.59)
MW-BW-207I
471
Scale:
Source Reference:
Project Manager:
Reviewed By:
Project N
o
:
Date:
Report N
o
:
Drawing N
o
:
THIS BAR MEASURES 1" ON ORIGINAL. ADJUST SCALE ACCORDINGLY.
SCALE VERIFICATION
EXELON GENERATION COMPANY, LLC
BRACEVILLE, ILLINOIS
HYDROGEOLOGIC PROFILE
TRITIUM CONCENTRATIONS - GROUNDWATER
FLEETWIDE ASSESSMENT
S. QUIGLEY
M. KELLY
AUGUST 2006
45136-20
012
figure 6.1
45136-20(012)GN-WA027 AUG 23/2006
AS SHOWN
W-2
593.72
MW-13
ND
WELL SCREEN
TRITIUM CONCENTRATION
TRITIUM RESULTS GREATER THAN 1,000 (pCi/L)
TRITIUM RESULTS 500 TO 1,000 (pCi/L)
TRITIUM RESULTS 200 TO 500 (pCi/L)
TRITIUM RESULTS 0 TO 200 (pCi/L)
BRAIDWOOD GENERATING STATION
REVISION 1
FIGURE 6.2 MONITORING WELL
TRITIUM SAMPLE RESULTS
(Withheld)
Page 1 of 2
TABLE 4.1
SUMMARY OF MONITORING WELL INSTALLATION DETAILS
FLEETWIDE ASSESSMENT
BRAIDWOOD GENERATING STATION
BRACEVILLE, ILLINOIS
Surface
Reference
Hydrogeologic
Sample
X coor.
Y coor.
Elevation
Elevation
Top
Bottom
Top
Bottom
Well
Unit
Location
(ft
AMSL)
1
(ft AMSL)
Construction
Screened
3
Existing Monitoring Wells
MW-11
65288.1939
84097.4503
600.60
603.83
2.0
12.0
596.00
586.00
2-inch PVC Screen
S
MW-13
65367.1182
84267.4234
597.50
600.85
2.5
12.5
595.00
585.00
2-inch PVC Screen
S
MW-14
65103.9949
84342.5513
599.50
602.46
2.0
12.0
597.50
587.50
2-inch PVC Screen
S
MW-2
65271.3906
83474.2371
599.80
603.00
2.0
12.0
597.80
587.80
2-inch PVC Screen
S
MW-22
65319.3555
83911.9591
597.70
601.65
7.0
17.0
591.70
581.70
2-inch PVC Screen
S
MW-4
65409.1225
83750.0194
599.60
599.35
2.0
12.0
597.60
587.60
2-inch PVC Screen
S
MW-5
65250.5952
83778.1842
599.90
598.64
2.0
12.0
597.90
587.90
2-inch PVC Screen
S
MW-6
65425.2927
83575.8848
599.10
599.56
5.0
15.0
594.10
584.10
2-inch PVC Screen
S
MW-9
65412.2272
84020.0972
600.40
603.83
2.0
12.0
598.40
588.40
2-inch PVC Screen
S
Exelon-Owned Wells
MW-BW-201I
65818.6280
84208.5570
600.02
603.21
14
24
586.02
576.02
2-inch PVC Screen
I
MW-BW-202I
66014.4060
84018.4590
600.72
604.09
15
25
585.72
575.72
2-inch PVC Screen
I
MW-BW-203I
66327.2810
83422.6210
598.95
602.19
15
25
583.95
573.95
2-inch PVC Screen
I
MW-BW-204I
66042.0060
82081.7290
600.37
603.17
5
25
595.37
575.37
2-inch PVC Screen
I
MW-BW-205I
64768.7390
82860.2200
598.04
600.86
15
25
583.04
573.04
2-inch PVC Screen
I
MW-BW-206I
64330.7570
81803.4620
595.10
598.35
14
24
581.10
571.10
2-inch PVC Screen
I
MW-BW-207I
66063.7670
83836.3590
599.59
601.59
35
45
564.59
554.59
2-inch PVC Screen
I
MW-BW-201S
65819.1100
84203.0330
599.97
603.11
5
15
594.97
584.97
2-inch PVC Screen
S
MW-BW-202S
66013.7490
84009.2920
600.87
604.30
5
15
595.87
585.87
2-inch PVC Screen
S
MW-BW-203S
66327.6550
83436.7650
599.14
602.33
5
15
594.14
584.14
2-inch PVC Screen
S
MW-BW-201BD
65825.1430
84203.7530
599.94
603.23
80
95
519.94
504.94
2-inch PVC Screen
BD
MW-BW-208BD
66063.7670
83836.3590
599.98
601.98
85
100
514.59
499.59
2-inch PVC Screen
BD
Existing Temporary Wells
TB-1-1D
65393.4430
83562.0330
598.50
601.00
15
20
583.50
578.50
1-inch PVC Screen
I
TB-1-2D
65273.1690
83473.5080
599.41
600.62
19
24
580.41
575.41
1-inch PVC Screen
I
TB-1-3D
65425.9530
83576.8750
599.70
602.77
10
15
589.70
584.70
1-inch PVC Screen
I
TB-1-4D
65468.1300
83642.7460
599.45
600.86
17
22
582.45
577.45
1-inch PVC Screen
I
TB-1-5D
65467.1650
84030.2150
600.71
602.37
23
28
577.71
572.71
1-inch PVC Screen
I
TB-1-6D
65289.3290
84093.8570
600.34
602.69
22.5
27.5
577.84
572.84
1-inch PVC Screen
I
TB-1-7D
65143.3310
84097.4860
600.45
601.46
18
23
582.45
577.45
1-inch PVC Screen
I
Screened Interval
(Site-Specific Coordinates)
(ft bgs)
2
(ft AMSL)
CRA 045136 (12) Braidwood Generating Station
Revision 1
Page 2 of 2
TABLE 4.1
SUMMARY OF MONITORING WELL INSTALLATION DETAILS
FLEETWIDE ASSESSMENT
BRAIDWOOD GENERATING STATION
BRACEVILLE, ILLINOIS
Surface
Reference
Hydrogeologic
Sample
X coor.
Y coor.
Elevation
Elevation
Top
Bottom
Top
Bottom
Well
Unit
Location
(ft
AMSL)
1
(ft AMSL)
Construction
Screened
3
Screened Interval
(Site-Specific Coordinates)
(ft bgs)
2
(ft AMSL)
TB-1-8D
65618.2450
83005.0640
600.43
602.43
23
28
577.43
572.43
1-inch PVC Screen
I
TB-1-9D
65293.9090
83362.6330
600.68
603.41
22
27
578.68
573.68
1-inch PVC Screen
I
TB-1-10D
65490.5850
83409.8970
600.05
604.68
23
28
577.05
572.05
1-inch PVC Screen
I
TB-1-11D
65532.5070
84328.0420
600.41
604.29
10
25
590.41
575.41
1-inch PVC Screen
I
TB-1-12D
65621.9120
84412.5880
599.40
603.15
10
25
589.40
574.40
1-inch PVC Screen
I
TB-1-13D
65517.5830
84403.9470
599.40
602.59
10
25
589.40
574.40
1-inch PVC Screen
I
TB-1-14D
65425.3930
84345.7930
599.16
602.32
10
25
589.16
574.16
1-inch PVC Screen
I
TBRW-1
65534.1810
84232.9450
600.58
603.74
4
14
596.58
586.58
2-inch PVC Screen
I
TBRW-2
65600.3030
84274.6220
600.44
603.72
4
14
596.44
586.44
2-inch PVC Screen
I
TBRW-3
65571.3530
84346.9090
600.53
603.44
4
14
596.53
586.53
2-inch PVC Screen
I
TW-8
65465.9498
84031.8836
600.70
600.52
2
12
598.70
588.70
1-inch PVC Screen
S
TW-16
65187.5681
83650.3472
599.00
601.93
2
12
597.20
587.20
1-inch PVC Screen
S
TW-6
65459.9085
83827.6580
599.60
599.56
2
12
597.60
587.60
1-inch PVC Screen
S
TW-23
65288.6581
84140.0696
600.10
603.10
6
16
594.10
584.10
1-inch PVC Screen
S
TW-3
65469.3170
83648.7042
599.60
599.37
2
12
597.60
587.60
1-inch PVC Screen
S
TW-10
65403.4913
84146.6207
600.60
602.54
2
12
598.60
588.60
1-inch PVC Screen
S
TW-15
65099.6209
84260.1475
599.20
601.17
3
13
596.20
586.20
1-inch PVC Screen
S
TW-12
65134.2956
84008.2068
599.30
601.51
2
12
597.30
587.30
1-inch PVC Screen
S
TW-21
65466.2133
84104.6516
600.70
600.54
2
12
598.70
588.70
1-inch PVC Screen
S
TW-18
64856.1143
83653.2073
597.70
599.09
3
13
594.70
584.70
1-inch PVC Screen
S
TW-24
65099.2125
84010.5879
598.90
601.87
5
15
593.90
583.90
1-inch PVC Screen
S
TW-25
65142.5107
84100.4868
597.10
600.07
6
16
591.10
581.10
1-inch PVC Screen
S
TW-26
64958.0854
84223.0321
599.70
602.68
7
17
592.70
582.70
1-inch PVC Screen
S
Notes:
1
ft AMSL - feet Above Mean Sea Level
S, well open to the water table in the shallow aquifer
2
ft bgs - feet below ground surface
I, well open to the water table in the intermediate aquifer
3
Hydrogeologic unit screened:
BD, well open to the top of the bedrock
CRA 045136 (12) Braidwood Generating Station
Revision 1
Page 1 of 2
TABLE 4.2
SUMMARY OF MONITORING WELL DEVELOPMENT PARAMETERS
FLEETWIDE ASSESSMENT
BRAIDWOOD GENERATING STATION
BRACEVILLE, ILLINOIS
Sample
Well
Volume
Location
Date
Volume
Purged
pH
Conductivity
Temperature
Turbidity
Observations
(gallons)
(gallons)
(Std. Units)
(1)
(μS/cm )
(2)
(° C)
(3)
(NTU)
(4)
MW-BW-201I
5/1/2006
2.6
6
7.17
891
11.7
452
NM
(5)
12
7.04
1,014
11.7
175
NM
18
7.00
1,052
11.7
77
NM
MW-BW-201S
5/1/2006
1.2
3
7.33
1,006
11.0
180
NM
6
7.11
1,132
11.0
22.0
NM
9
7.07
1,145
11.0
18.6
NM
MW-BW-202I
5/1/2006
2.7
6
7.68
167
12.2
555
NM
12
7.34
178
12.3
704
NM
18
7.26
175
12.3
305
NM
MW-BW-202S
5/1/2006
1.2
4
6.97
248
12.3
310
NM
8
6.93
221
12.3
85.1
NM
12
6.89
217
12.3
67.5
NM
MW-BW-203I
5/1/2006
3.2
7
7.23
1,192
11.7
678
NM
14
7.16
1,201
11.7
177
NM
21
7.14
1,195
11.7
64
NM
MW-BW-203S
5/1/2006
1.6
4
9.04
930
10.8
1,248
NM
8
8.30
1,004
10.8
150
NM
12
8.01
1,040
10.8
73.5
NM
16
7.91
1,062
10.8
61.1
NM
MW-BW-204I
4/28/2006
2.9
6
8.11
638
13.3
417
Cloudy
12
7.96
612
13.5
337
Slightly cloudy
18
7.85
611
13.3
222
Slightly cloudy
24
7.77
613
13.3
84.2
Slightly cloudy
CRA 045136 (12) Braidwood Generating Station
Revision 1
Page 2 of 2
TABLE 4.2
SUMMARY OF MONITORING WELL DEVELOPMENT PARAMETERS
FLEETWIDE ASSESSMENT
BRAIDWOOD GENERATING STATION
BRACEVILLE, ILLINOIS
Sample
Well
Volume
Location
Date
Volume
Purged
pH
Conductivity
Temperature
Turbidity
Observations
(gallons)
(gallons)
(Std. Units)
(1)
(μS/cm )
(2)
(° C)
(3)
(NTU)
(4)
MW-BW-201I
5/1/2006
2.6
6
7.17
891
11.7
452
NM
(5)
12
7.04
1,014
11.7
175
NM
18
7.00
1,052
11.7
77
NM
MW-BW-201S
5/1/2006
1.2
3
7.33
1,006
11.0
180
NM
6
7.11
1,132
11.0
22.0
NM
9
7.07
1,145
11.0
18.6
NM
MW-BW-205I
4/28/2006
3.1
6
7.78
859
23.5
264
Cloudy
12
7.74
825
23.4
48.5
Slightly cloudy
18
7.72
819
23.3
27.4
Clear
MW-BW-206I
4/28/2006
2.7
5
6.89
1,494
20.7
204
Cloudy
10
6.92
1,418
20.5
33.0
Slightly cloudy
15
7.01
1,354
20.6
12.2
Clear
MW-BW-207I
7/14/2006
6.5
6
7.19
491
11.7
NM
Slightly
cloudy
12
7.24
475
12.0
NM
Slightly cloudy
18
7.27
469
12.0
NM
Slightly cloudy
24
7.31
431
12.1
NM
Clear
30
7.35
421
12.0
NM
Clear
MW-BW-208BD
7/18/2006
14
28
7.91
359
13.1
NM
Slightly
cloudy
42
7.53
371
12.9
NM
Slightly cloudy
56
7.29
385
12.5
NM
Slightly cloudy
70
7.13
391
12.3
NM
Slightly cloudy
Notes:
(1)
Std. Units - standard units
(2)
μS/cm - microsiemens per centimeter
(3)
° C - degrees Celsius
(4)
NTU - nephelometric turbidity
units
(5)
NM - not measured
CRA 045136 (12) Braidwood Generating Station
Revision 1
Page 1 of 1
TABLE 4.3
SUMMARY OF GROUNDWATER ELEVATIONS
FLEETWIDE ASSESSMENT
BRAIDWOOD GENERATING STATION
BRACEVILLE, ILLINOIS
Sample
Reference
Depth to Water
Groundwater
Depth to Water
Groundwater
Location
Elevation
(ft Below
Elevation
(ft Below
Elevation
(ft AMSL)
(1)
Reference)
(ft AMSL)
Reference)
(ft AMSL)
May 9-11, 06
May 9-11, 06
July 31, 06
July 31, 06
MW-11
603.83
10.49
593.34
10.79
593.04
MW-13
600.85
9.86
590.99
9.95
590.90
MW-14
602.46
12.69
589.77
12.78
589.68
MW-2
603
NM
NM
6.93
596.07
MW-22
601.65
8.60
593.05
8.15
593.50
MW-4
599.35
4.89
594.46
4.73
594.62
MW-5
599.9
5.40
594.50
4.23
595.67
MW-6
599.1
5.42
593.68
3.41
595.69
MW-9
603.83
10.03
593.80
10.40
593.43
MW-BW-201BD
603.23
10.96
592.27
11.45
591.78
MW-BW-201I
603.21
10.79
592.42
11.89
591.32
MW-BW-201S
603.11
10.71
592.40
10.75
592.36
MW-BW-202I
604.09
10.37
593.72
10.38
593.71
MW-BW-202S
604.3
10.56
593.74
10.55
593.75
MW-BW-203I
602.19
7.39
594.80
7.49
594.70
MW-BW-203S
602.33
7.55
594.78
7.65
594.68
MW-BW-204I
603.173
8.51
594.66
8.94
594.23
MW-BW-205I
600.859
8.13
592.73
8.30
592.56
MW-BW-206I
598.349
10.74
587.61
11.11
587.24
MW-BW-207I
599.59
NM
NM
7.35
592.24
MW-BW-208BD
601.98
NM
NM
13.05
588.93*
TB-1-10D
604.68
9.35
595.33
9.03
595.65
TB-1-1D
601
6.61
594.39
5.91
595.09
TB-1-2D
600.62
6.22
594.40
7.04
593.58
TB-1-3D
602.77
8.64
594.13
6.94
595.83
TB-1-4D
600.86
6.60
594.26
5.38
595.48
TB-1-5D
602.37
10.89
591.48
11.40
590.97
TB-1-6D
602.69
11.14
591.55
11.28
591.41
TB-1-7D
601.46
9.65
591.81
9.55
591.91
TB-1-8D
602.43
6.88
595.55
7.00
595.43
TB-1-9D
603.41
8.03
595.38
7.40
596.01
TW-10
602.54
10.42
592.12
10.76
591.78
TW-12
601.51
9.16
592.35
9.06
592.45
TW-15
601.17
10.92
590.25
11.00
590.17
TW-16
601.93
7.14
594.79
6.56
595.37
TW-18
599.09
7.65
591.44
8.61
590.48
TW-21
600.54
4.79
595.75
7.25
593.29
TW-23
603.1
11.80
591.30
11.90
591.20
TW-24
601.87
10.51
591.36
10.48
591.39
TW-25
600.07
8.14
591.93
8.06
592.01
TW-26
602.68
12.53
590.15
12.77
589.91
TW-3
599.37
4.51
594.86
3.82
595.55
TW-6
599.56
6.73
592.83
5.00
594.56
TW-84
600.52
6.13
594.39
7.10
593.42
Notes:
(1)
- ft AMSL - feet above mean sea level.
NM
- Not Measured.
*
- A water elevation of 592.74 ft AMSL was measured at MW-BW-208BD on August 15, 2006.
CRA 045136 (12) Braidwood Generating Station
Revision 1
Page 1 of 1
TABLE 4.4
SUMMARY OF SURFACE WATER ELEVATIONS
FLEETWIDE ASSESSMENT
BRAIDWOOD GENERATING STATION
BRACEVILLE, ILLINOIS
Sample
Reference
Depth to Water
Groundwater
Location
Elevation
(ft Below
Elevation
(ft
AMSL)
Reference)
(ft AMSL)
SG-BW-101
588.36
1.00
587.36
SG-BW-102
587.61
1.00
586.61
SG-BW-103
580.03
1.00
579.03
SG-BW-104
567.38
1.00
566.38
SG-BW-105
595.92
1.42
594.50
SG-BW-106
596.44
2.03
594.41
Notes:
All elevations were measured May 17, 2006.
ft AMSL - feet above mean sea level.
CRA 045136 (12) Braidwood Generating Station
Page 1 of 1
TABLE 4.5
SAMPLE KEY
FLEETWIDE ASSESSMENT
BRAIDWOOD GENERATING STATION
BRACEVILLE, ILLINOIS
Sample
Date
Location
Sample Identification
QC Sample
Collected
Matrix
Analyses
TB-1-9D
WG-BW-050906-JL-001
5/9/2006
Groundwater
Tritium/Strontium/Gamma Spectrum
MW-6
WG-BW-050906-MS-002
5/9/2006
Groundwater
Tritium/Strontium/Gamma Spectrum
TB-1-5D
WG-BW-050906-JL-003
5/9/2006
Groundwater
Tritium/Strontium/Gamma Spectrum
TB-1-3D
WG-BW-050906-MS-004
5/9/2006
Groundwater
Tritium/Strontium/Gamma Spectrum
TB-1-1D
WG-BW-050906-JL-005
5/9/2006
Groundwater
Tritium/Strontium/Gamma Spectrum
TW-8
WG-BW-050906-MS-006
5/9/2006
Groundwater
Tritium/Strontium/Gamma Spectrum
TW-16
WG-BW-050906-JL-007
5/9/2006
Groundwater
Tritium/Strontium/Gamma Spectrum
TW-6
WG-BW-050906-MS-008
5/9/2006
Groundwater
Tritium/Strontium/Gamma Spectrum
TB-1-10D
WG-BW-051006-JL-009
5/10/2006
Groundwater
Tritium/Strontium/Gamma Spectrum
MW-5
WG-BW-050906-MS-010
5/9/2006
Groundwater
Tritium/Strontium/Gamma Spectrum
TB-1-10D
WG-BW-051006-JL-011
Duplicate (009)
5/10/2006
Groundwater
Tritium/Strontium/Gamma Spectrum
MW-11
WG-BW-051006-MS-012
5/10/2006
Groundwater
Tritium/Strontium/Gamma Spectrum
TB-1-4D
WG-BW-051006-JL-013
5/10/2006
Groundwater
Tritium/Strontium/Gamma Spectrum
TW-23
WG-BW-051006-MS-014
5/10/2006
Groundwater
Tritium/Strontium/Gamma Spectrum
TW-3
WG-BW-051006-JL-015
5/10/2006
Groundwater
Tritium/Strontium/Gamma Spectrum
TW-10
WG-BW-051006-MS-016
5/10/2006
Groundwater
Tritium/Strontium/Gamma Spectrum
MW-2
WG-BW-051006-JL-017
5/10/2006
Groundwater
Tritium/Strontium/Gamma Spectrum
MW-13
WG-BW-051006-MS-018
5/10/2006
Groundwater
Tritium/Strontium/Gamma Spectrum
TB-1-2D
WG-BW-051006-JL-019
5/10/2006
Groundwater
Tritium/Strontium/Gamma Spectrum
TW-15
WG-BW-051006-MS-020
5/10/2006
Groundwater
Tritium/Strontium/Gamma Spectrum
TB-1-7D
WG-BW-051006-JL-021
5/10/2006
Groundwater
Tritium/Strontium/Gamma Spectrum
TW-15
WG-BW-051006-MS-022
Duplicate (020)
5/10/2006
Groundwater
Tritium/Strontium/Gamma Spectrum
MW-14
WG-BW-051006-MS-024
5/10/2006
Groundwater
Tritium/Strontium/Gamma Spectrum
TB-1-8D
WG-BW-051006-JL-025
5/10/2006
Groundwater
Tritium/Strontium/Gamma Spectrum
TW-12
WG-BW-051006-MS-026
5/10/2006
Groundwater
Tritium/Strontium/Gamma Spectrum
MW-22
WG-BW-051106-JL-027
5/11/2006
Groundwater
Tritium/Strontium/Gamma Spectrum
TW-24
WG-BW-051006-MS-028
5/10/2006
Groundwater
Tritium/Strontium/Gamma Spectrum
MW-9
WG-BW-051106-JL-029
5/11/2006
Groundwater
Tritium/Strontium/Gamma Spectrum
MW-4
WG-BW-051106-MS-030
5/11/2006
Groundwater
Tritium/Strontium/Gamma Spectrum
MW-9
WG-BW-051106-JL-031
Duplicate (029)
5/11/2006
Groundwater
Tritium/Strontium/Gamma Spectrum
MW-7
WG-BW-051106-MS-032
5/11/2006
Groundwater
Tritium/Strontium/Gamma Spectrum
TB-1-6D
WG-BW-051106-JL-033
5/11/2006
Groundwater
Tritium/Strontium/Gamma Spectrum
TW-21
WG-BW-051106-MS-034
5/11/2006
Groundwater
Tritium/Strontium/Gamma Spectrum
MW-BW-202I
WG-BW-051106-JL-035
5/11/2006
Groundwater
Tritium/Strontium/Gamma Spectrum
MW-BW-203S
WG-BW-051106-MS-036
5/11/2006
Groundwater
Tritium/Strontium/Gamma Spectrum
MW-BW-202S
WG-BW-051106-JL-037
5/11/2006
Groundwater
Tritium/Strontium/Gamma Spectrum
MW-BW-203I
WG-BW-051106-MS-038
5/11/2006
Groundwater
Tritium/Strontium/Gamma Spectrum
MW-BW-201S
WG-BW-051106-JL-039
5/11/2006
Groundwater
Tritium/Strontium/Gamma Spectrum
MW-BW-201I
WG-BW-051106-MS-040
5/11/2006
Groundwater
Tritium/Strontium/Gamma Spectrum
MW-BW-204I
WG-BW-051206-JL-041
5/12/2006
Groundwater
Tritium/Strontium/Gamma Spectrum
MW-BW-201I
WG-BW-051106-MS-042
Duplicate (040)
5/11/2006
Groundwater
Tritium/Strontium/Gamma Spectrum
MW-BW-205I
WG-BW-051206-JL-043
5/12/2006
Groundwater
Tritium/Strontium/Gamma Spectrum
TW-26
WG-BW-051206-MS-044
5/12/2006
Groundwater
Tritium/Strontium/Gamma Spectrum
TW-18
WG-BW-051206-MS-046
5/12/2006
Groundwater
Tritium/Strontium/Gamma Spectrum
MW-BW-206I
WG-BW-051206-MS-048
5/12/2006
Groundwater
Tritium/Strontium/Gamma Spectrum
TW-24
WG-BW-051506-MB-050
5/15/2006
Groundwater
Tritium/Strontium/Gamma Spectrum
TW-24
WG-BW-051506-MB-052
Duplicate (050)
5/15/2006
Groundwater
Tritium/Strontium/Gamma Spectrum
SG-BW-101
SW-BW-051706-MB-101
5/17/2006
Surface Water
Tritium/Strontium/Gamma Spectrum
SG-BW-102
SW-BW-051706-MB-102
5/17/2006
Surface Water
Tritium/Strontium/Gamma Spectrum
SG-BW-103
SW-BW-051706-MB-103
5/17/2006
Surface Water
Tritium/Strontium/Gamma Spectrum
SG-BW-104
SW-BW-051706-MB-104
5/17/2006
Surface Water
Tritium/Strontium/Gamma Spectrum
SG-BW-105
SW-BW-051706-MB-105
5/17/2006
Surface Water
Tritium/Strontium/Gamma Spectrum
SG-BW-106
SW-BW-051706-MB-106
5/17/2006
Surface Water
Tritium/Strontium/Gamma Spectrum
TW-25
WG-BW-051906-MB-054
5/19/2006
Groundwater
Tritium/Strontium/Gamma Spectrum
TW-26
WG-BW-051906-MB-055
5/19/2006
Groundwater
Tritium/Strontium/Gamma Spectrum
MW-BW-201BD
WG-BW-052206-MB-056
5/22/2006
Groundwater
Tritium/Strontium/Gamma Spectrum
MW-BW-201BD
WG-BW-052206-MB-057
Duplicate (056)
5/22/2006
Groundwater
Tritium/Strontium/Gamma Spectrum
MW-BW-208BD
WG-BW-MW-208BD-072806-JL-100
7/28/2006
Groundwater
Tritium/Strontium/Gamma Spectrum
MW-BW-207I
WG-BW-MW-207I-072806-JL-101
7/28/2006
Groundwater
Tritium/Strontium/Gamma Spectrum
MW-BW-207I
WG-BW-MW-207I-072806-JL-102
Duplicate (101)
7/28/2006
Groundwater
Tritium/Strontium/Gamma Spectrum
Notes:
QC - Quality
Control
Gamma Spectrum
- Barium-140, Cesium-134, Cesium-137, Cobalt-58, Cobalt-60, Iron-59, Lanthanum-140,
Manganese-54,
Niobium-95, Zinc-65, Zirconium-95
CRA 045136 (12) Braidwood Generating Station
Revision 1
Page 1 of 9
TABLE 4.6
SUMMARY OF MONITORING WELL PURGING PARAMETERS
FLEETWIDE ASSESSMENT
BRAIDWOOD GENERATING STATION
BRACEVILLE, ILLINOIS
Sample
Minutes
Pumping
Volume
Location
Date
Purged
Rate
pH
Temperature
Conductivity
ORP
(5)
DO
(7)
Turbidity
Purged
(mL/min)
(1)
(Std. Units)
(2)
(°C)
(3)
(μS/cm)
(4)
(mV)
(6)
(mg/L)
(8)
(NTU)
(9)
(gallons)
TB-1-9D
5/9/2006
5
200
7.18
22.01
1600
NA
0.80
95
10
200
7.19
22.35
1590
NA
0.24
40
15
200
7.20
22.47
1580
NA
0.16
37
20
200
7.21
22.55
1560
NA
0.13
35
25
200
7.22
22.62
1560
NA
0.12
20
30
200
7.24
22.62
1550
NA
0.09
20
35
200
7.25
22.64
1540
NA
0.10
17
2 gallons
MW-6
5/9/2006
5
250
7.51
16.25
19990
281
0.73
141
10
250
7.31
16.14
20020
277
0.55
62.5
15
250
7.22
15.98
21000
275
0.58
16.4
20
250
7.16
16.01
22200
275
0.55
34.9
25
250
7.11
15.91
24300
275
0.51
32.8
2 gallons
TB-1-5D
5/9/2006
5
200
7.76
13.74
763
NA
1.55
100
10
200
7.56
14.19
828
NA
2.05
55
15
200
7.54
14.77
898
NA
4.68
45
20
200
7.52
14.93
907
NA
7.47
29
25
200
7.42
14.97
929
NA
7.41
9.2
30
200
7.34
15.09
939
NA
7.31
7.6
35
200
7.29
15.13
942
NA
7.30
5.7
40
200
7.30
15.10
941
NA
7.34
6
2 gallons
TB-3D
5/9/2006
5
200
7.06
16.19
23500
142
0.46
76.7
10
200
7.08
15.99
24000
90
0.37
14.1
15
200
7.05
16.04
24000
66
0.33
5.98
20
200
7.04
15.93
23800
45
0.32
5.11
25
200
7.02
15.92
23700
29
0.31
2.96
1 gallon
TB-1D
5/9/2006
5
200
7.48
14.22
889
NA
1.67
190
10
200
7.44
14.33
894
NA
1.03
60
15
200
7.46
14.30
892
NA
0.12
27
20
200
7.47
14.33
889
NA
0.10
28
25
200
7.44
14.37
891
NA
0.09
18
30
200
7.45
14.33
891
NA
0.08
23
1.5 gallons
CRA 045136 (12) Braidwood Generating Station
Revision 1
Page 2 of 9
TABLE 4.6
SUMMARY OF MONITORING WELL PURGING PARAMETERS
FLEETWIDE ASSESSMENT
BRAIDWOOD GENERATING STATION
BRACEVILLE, ILLINOIS
Sample
Minutes
Pumping
Volume
Location
Date
Purged
Rate
pH
Temperature
Conductivity
ORP
(5)
DO
(7)
Turbidity
Purged
(mL/min)
(1)
(Std. Units)
(2)
(°C)
(3)
(μS/cm)
(4)
(mV)
(6)
(mg/L)
(8)
(NTU)
(9)
(gallons)
TW-8
5/9/2006
5
200
7.98
13.32
8040
217
0.86
13.7
10
200
7.17
13.19
7840
222.0
0.62
8.09
15
200
6.88
13.18
7650
226
0.52
4.94
20
200
6.81
13.16
7540
229
0.48
4.84
25
200
6.78
13.01
7330
231
0.48
3.25
1 gallon
TW-16
5/9/2006
5
200
7.14
13.75
437
NA
1.24
5.3
10
200
6.98
13.66
435
NA
1.12
3.4
15
200
6.90
13.64
432
NA
0.90
2.8
20
200
6.83
13.62
438
NA
0.73
1.7
25
200
6.83
13.61
439
NA
0.65
2
30
200
6.81
13.59
443
NA
0.63
1.4
1.5 gallons
TW-6
5/9/2006
5
200
8.16
16.88
925
123
0.77
16
10
200
7.66
17.26
872
112
0.62
16.1
15
200
7.39
17.38
781
107
0.70
7.67
20
200
7.31
16.70
694
94
0.55
4.44
25
200
7.22
16.65
695
89
0.52
2.45
1 gallon
TB-1-10D
5/10/2006
5
200
7.09
19.37
2690
NA
1.01
15
10
200
7.15
19.81
2280
NA
6.12
18
15
200
7.18
20.11
2060
NA
6.72
4.8
20
200
7.10
20.09
1970
NA
5.26
2.2
25
200
7.11
20.08
1960
NA
5.84
1.6
30
200
7.17
20.10
1940
NA
5.87
1.4
1.5 gallons
MW-5
5/9/2006
5
200
8.68
12.48
553
168
7.76
19.1
10
200
8.10
12.52
551
198
7.87
13
15
200
7.90
12.64
550
220
7.84
6.43
20
200
7.82
12.51
550
231
7.94
5.49
25
200
7.77
12.51
556
242
8.06
4.3
1 gallon
CRA 045136 (12) Braidwood Generating Station
Revision 1
Page 3 of 9
TABLE 4.6
SUMMARY OF MONITORING WELL PURGING PARAMETERS
FLEETWIDE ASSESSMENT
BRAIDWOOD GENERATING STATION
BRACEVILLE, ILLINOIS
Sample
Minutes
Pumping
Volume
Location
Date
Purged
Rate
pH
Temperature
Conductivity
ORP
(5)
DO
(7)
Turbidity
Purged
(mL/min)
(1)
(Std. Units)
(2)
(°C)
(3)
(μS/cm)
(4)
(mV)
(6)
(mg/L)
(8)
(NTU)
(9)
(gallons)
TB-1-4D
5/10/2006
5
200
7.54
16.14
7730
NA
0.19
310
10
200
7.56
16.11
7140
NA
0.14
110
15
200
7.58
16.03
6990
NA
0.11
60
20
200
7.60
16.04
6770
NA
0.11
31
25
200
7.58
16.10
6680
NA
0.11
36
30
200
7.60
16.08
6650
NA
0.15
33
1.5 gallons
MW-11
5/10/2006
5
200
8.83
13.26
6600
380.0
6.51
6.18
10
200
7.89
13.21
6560
382.0
6.53
5.6
15
200
7.38
13.18
6470
384.0
6.42
3.83
20
200
7.15
13.21
6330
385.0
6.37
2.16
25
200
7.05
13.16
6230
386.0
6.41
1.41
1 gallon
TW-3
5/10/2006
5
200
8.58
16.28
2210
NA
0.58
95
10
200
9.31
16.16
2730
NA
0.48
100
15
200
9.58
16.14
3070
NA
0.28
390
20
200
9.76
16.01
3340
NA
0.25
400
25
200
10.06
16.01
3690
NA
0.29
350
1 gallon
TW-23
5/10/2006
5
200
8.31
13.42
2160
303.0
1.57
8.78
10
200
7.54
13.02
1710
315.0
3.42
8.75
15
200
7.32
12.88
1670
321
3.69
4.65
20
200
7.19
12.89
1680
325
3.51
2.77
25
200
7.14
12.87
1650
328
3.50
1.72
1 gallon
MW-2
5/10/2006
5
200
7.32
13.40
401
NA
2.43
16
10
200
7.26
13.51
400
NA
1.34
8.9
15
200
7.23
13.55
398
NA
0.67
4.9
20
200
7.21
13.49
397
NA
0.46
3.8
25
200
7.19
13.44
397
NA
0.37
2.9
1 gallon
TW-10
5/10/2006
5
200
8.78
14.10
772
282
7.18
47.2
10
200
8.63
13.93
772
290
7.31
45.1
15
200
8.56
13.92
774
296
7.35
42.3
20
200
8.53
13.92
776
301
7.40
39.5
1 gallon
CRA 045136 (12) Braidwood Generating Station
Revision 1
Page 4 of 9
TABLE 4.6
SUMMARY OF MONITORING WELL PURGING PARAMETERS
FLEETWIDE ASSESSMENT
BRAIDWOOD GENERATING STATION
BRACEVILLE, ILLINOIS
Sample
Minutes
Pumping
Volume
Location
Date
Purged
Rate
pH
Temperature
Conductivity
ORP
(5)
DO
(7)
Turbidity
Purged
(mL/min)
(1)
(Std. Units)
(2)
(°C)
(3)
(μS/cm)
(4)
(mV)
(6)
(mg/L)
(8)
(NTU)
(9)
(gallons)
TB-1-2D
5/10/2006
5
200
7.68
14.49
493
NA
2.49
75
10
200
7.66
14.87
488
NA
2.53
32
15
200
7.57
14.99
486
NA
1.82
26
20
200
7.54
14.96
482
NA
2.08
15
25
200
7.52
14.96
482
NA
2.20
16
1 gallon
MW-13
5/10/2006
5
200
7.92
14.57
2190
284
2.13
295
10
200
7.47
14.49
2780
295
1.86
169
15
200
7.18
14.46
3820
304
1.35
89.7
20
200
7.06
14.31
4620
309
1.07
62.3
25
200
6.95
14.19
5040
302
0.96
43
1 gallon
TB-1-7D
5/10/2006
5
200
7.60
13.30
1660
NA
1.81
55
10
200
7.56
13.24
1650
NA
1.50
100
15
200
7.53
13.32
1640
NA
1.24
120
20
200
7.55
13.21
1630
NA
1.79
23
25
200
7.53
13.55
1640
NA
1.74
12
30
200
7.55
13.28
1630
NA
1.51
24
1.5 gallons
TW-15
5/10/2006
5
200
8.69
12.57
662
283
6.89
3.75
10
200
7.68
12.40
645
293
7.01
1.67
15
200
7.28
12.40
650
303
7.01
1.46
1 gallon
TW-25
5/10/2006
5
200
7.19
12.91
7200
NA
4.97
6.1
10
200
7.18
12.97
6550
NA
4.39
3.2
15
200
7.20
12.92
6100
NA
4.01
2.7
20
200
7.21
12.94
5940
NA
3.94
2.4
25
200
7.21
12.98
5860
NA
3.83
2.5
1 gallon
MW-14
5/10/2006
5
200
9.21
11.88
563
288
8.92
2.39
10
200
7.97
11.66
524
305
8.90
1.97
15
200
7.83
11.59
522
309
8.90
1.46
20
200
7.61
11.55
517
314
9.10
1.33
1 gallon
CRA 045136 (12) Braidwood Generating Station
Revision 1
Page 5 of 9
TABLE 4.6
SUMMARY OF MONITORING WELL PURGING PARAMETERS
FLEETWIDE ASSESSMENT
BRAIDWOOD GENERATING STATION
BRACEVILLE, ILLINOIS
Sample
Minutes
Pumping
Volume
Location
Date
Purged
Rate
pH
Temperature
Conductivity
ORP
(5)
DO
(7)
Turbidity
Purged
(mL/min)
(1)
(Std. Units)
(2)
(°C)
(3)
(μS/cm)
(4)
(mV)
(6)
(mg/L)
(8)
(NTU)
(9)
(gallons)
TB-1-8D
5/10/2006
5
250
7.22
14.51
11580
NA
2.11
160
10
200
7.21
14.49
11560
NA
1.38
40
15
200
7.20
14.54
11460
NA
0.74
16
20
200
7.20
14.51
11470
NA
0.41
13
25
200
7.19
14.52
11520
NA
0.37
7.3
1.5 gallons
TW-12
5/10/2006
5
200
7.90
14.89
2440
317
7.17
3.01
10
200
7.34
14.68
2440
322
7.35
4.95
15
200
7.13
14.63
2520
328
7.42
5.93
20
200
7.01
14.58
2840
332
7.60
4.02
25
200
6.95
14.54
3090
335
7.13
2.01
1 gallon
MW-22
5/10/2006
5
250
7.79
14.44
717
NA
3.57
7.2
10
200
7.78
14.44
732
NA
2.72
4.5
15
200
7.76
14.89
740
NA
2.66
4.7
20
200
7.74
14.50
738
NA
2.76
2.4
1 gallon
TW-24
5/12/2006
5
250
7.25
16.59
2
301
8.55
2.91
10
200
7.21
16.32
2
311
8.60
2.81
15
200
7.20
16.30
1
319
8.63
1.79
1 gallon
MW-9
5/10/2006
5
200
7.53
12.00
2520
NA
1.21
2.6
10
200
7.53
11.99
2550
NA
1.05
2
15
200
7.52
11.95
2570
NA
1.01
1.9
1 gallon
MW-4
5/11/2006
5
200
7.68
13.00
2610
334
0.94
11.1
10
200
7.08
13.02
2610
306
0.78
10
15
200
6.88
13.14
2630
271
0.74
6.94
20
200
6.82
13.01
2620
251
0.69
4.42
1 gallon
TB-1-6D
5/11/2006
5
200
8.10
12.72
807
NA
3.05
19
10
200
8.05
12.65
851
NA
3.85
25
15
150
7.97
12.72
927
NA
3.33
19
20
150
7.90
12.73
928
NA
3.16
11
25
150
8.11
12.68
930
NA
3.85
5.4
1 gallon
CRA 045136 (12) Braidwood Generating Station
Revision 1
Page 6 of 9
TABLE 4.6
SUMMARY OF MONITORING WELL PURGING PARAMETERS
FLEETWIDE ASSESSMENT
BRAIDWOOD GENERATING STATION
BRACEVILLE, ILLINOIS
Sample
Minutes
Pumping
Volume
Location
Date
Purged
Rate
pH
Temperature
Conductivity
ORP
(5)
DO
(7)
Turbidity
Purged
(mL/min)
(1)
(Std. Units)
(2)
(°C)
(3)
(μS/cm)
(4)
(mV)
(6)
(mg/L)
(8)
(NTU)
(9)
(gallons)
MW-7
5/11/2006
5
200
7.08
14.56
4320
265
1.83
98.7
10
200
7.09
14.79
4050
267
1.57
94.2
15
200
7.20
14.83
3290
271
2.87
86.2
20
200
7.16
14.82
3110
276
2.92
48.3
1 gallon
MW-BW-202
5/11/2006
5
250
7.55
12.01
1480
NA
1.47
85
10
250
7.54
12.02
1510
NA
1.46
27
15
250
7.55
12.00
1520
NA
0.68
13
20
250
7.54
12.02
1540
NA
0.51
6.9
25
250
7.54
12.01
1540
NA
0.88
4.6
1.5 gallons
TW-21
5/11/2006
5
250
7.19
13.32
3040
303
3.10
64.1
10
200
7.16
13.19
3080
305
3.11
31.5
15
200
7.08
13.06
3090
307
3.38
13
20
200
7.03
12.02
2820
309
3.43
11
1 gallon
MW-BW-202S
5/11/2006
5
250
7.48
12.42
3480
NA
1.56
24
10
250
7.35
12.38
3400
NA
0.81
13
15
250
7.34
12.39
3130
NA
0.55
7.9
20
250
7.35
12.39
2850
NA
0.39
6.7
25
250
7.35
12.36
2620
NA
0.38
4.7
30
250
7.35
12.31
2590
NA
0.36
3.7
MW-BW-203S
5/11/2006
5
200
7.54
11.02
962
317
4.64
129
10
200
7.54
11.08
997
318
4.27
60.2
15
200
7.53
11.12
1005
318
4.20
32.8
20
200
7.51
11.15
1025
320
3.99
13.11
25
200
7.51
11.16
1032
321
3.90
7.89
1 gallon
MW-BW-201S
5/11/2006
5
250
7.62
11.07
893
NA
4.94
5.1
10
250
7.59
11.10
904
NA
4.73
3.6
15
250
7.58
11.09
915
NA
4.67
3.4
20
250
7.58
11.09
914
NA
4.68
1.7
1 gallon
CRA 045136 (12) Braidwood Generating Station
Revision 1
Page 7 of 9
TABLE 4.6
SUMMARY OF MONITORING WELL PURGING PARAMETERS
FLEETWIDE ASSESSMENT
BRAIDWOOD GENERATING STATION
BRACEVILLE, ILLINOIS
Sample
Minutes
Pumping
Volume
Location
Date
Purged
Rate
pH
Temperature
Conductivity
ORP
(5)
DO
(7)
Turbidity
Purged
(mL/min)
(1)
(Std. Units)
(2)
(°C)
(3)
(μS/cm)
(4)
(mV)
(6)
(mg/L)
(8)
(NTU)
(9)
(gallons)
MW-BW-203I
5/11/2006
5
200
8.24
11.68
1332
217
1.02
764
10
200
7.61
11.53
1324
216
0.77
113
15
200
7.30
11.50
1326
209
0.71
37.5
20
200
7.14
11.50
1332
207
0.65
26.2
25
200
7.07
11.48
1329
203
0.63
12.4
1 gallon
MW-BW-201I
5/11/2006
5
200
7.20
12.42
1
267
9.31
na
10
200
7.19
11.54
1630
267
1.32
534
15
200
7.20
11.50
1680
271
0.85
57.5
20
200
7.17
11.47
1700
272
0.70
27.1
25
200
7.13
11.46
1710
274
0.62
11.2
1 gallon
MW-BW-204I
5/12/2006
5
250
7.36
10.44
512
NA
2.27
900
10
250
7.34
10.35
510
NA
1.43
130
15
250
7.33
10.30
514
NA
0.96
60
20
250
7.33
10.33
520
NA
0.62
55
25
250
7.32
10.36
522
NA
0.45
31
30
250
7.31
10.35
523
NA
0.32
24
35
250
7.31
10.34
525
NA
0.34
18
2 gallons
TW-26
5/12/2006
5
200
7.81
11.28
949
305
5.66
29.5
10
200
7.36
11.29
1043
314
5.51
21.5
15
200
7.17
11.34
1092
321
5.52
16.2
20
200
7.05
11.32
1113
325
5.51
11.6
1 gallon
TW-18
5/12/2006
5
200
7.17
10.57
1780
341
1.06
10.73
10
200
7.16
10.64
1770
340
0.93
8.13
15
200
7.13
10.68
1760
326
0.77
4.47
1 gallon
MW-BW-205I
5/12/2006
5
250
7.87
20.43
944
NA
0.19
16
10
250
7.88
20.37
944
NA
0.12
8.8
15
250
7.86
20.63
943
NA
0.10
5.4
20
250
7.87
20.74
941
NA
0.09
6.2
1 gallon
CRA 045136 (12) Braidwood Generating Station
Revision 1
Page 8 of 9
TABLE 4.6
SUMMARY OF MONITORING WELL PURGING PARAMETERS
FLEETWIDE ASSESSMENT
BRAIDWOOD GENERATING STATION
BRACEVILLE, ILLINOIS
Sample
Minutes
Pumping
Volume
Location
Date
Purged
Rate
pH
Temperature
Conductivity
ORP
(5)
DO
(7)
Turbidity
Purged
(mL/min)
(1)
(Std. Units)
(2)
(°C)
(3)
(μS/cm)
(4)
(mV)
(6)
(mg/L)
(8)
(NTU)
(9)
(gallons)
MW-BW-206I
5/12/2006
5
200
6.78
16.55
3580
233
1.11
na
10
200
6.61
16.06
3570
213
0.94
na
15
200
6.60
16.34
3580
208
0.88
799
20
200
6.54
16.21
3590
197
0.77
287
25
200
6.54
16.30
3600
189
0.72
147
1 gallon
TW-24
5/15/2006
5
200
7.25
16.59
2000
303
8.55
2.91
10
200
7.21
16.32
2000
310
8.60
2.81
15
200
7.20
16.30
100
313
8.63
1.79
1 gallon
TW-25
5/19/2006
5
200
6.89
12.90
457
310
6.21
45.7
10
200
6.87
12.80
463
316
6.15
32.1
15
200
6.85
12.90
471
318
6.13
19.6
1 gallon
TW-26
5/19/2006
5
200
7.71
11.32
949
307
5.65
30.2
10
200
7.32
11.32
1010
310
5.62
24.1
15
200
7.05
11.33
1015
313
5.61
20.9
20
200
7.01
11.35
1023
315
5.61
14.6
1 gallon
MW-BW-201BD
5/22/2006
5
200
7.59
12.00
432
732
1.56
1000
10
200
7.54
12.30
452
315
2.15
1000
15
200
7.55
12.20
455
217
3.19
929
20
200
7.37
12.50
432
214
3.27
572
25
200
7.28
12.70
415
210
3.33
453
30
200
7.27
12.90
417
208
3.34
193
1.5 gallons
MW-BW-208BD
7/28/2006
10
250
7.15
19.53
419
333
2.17
cloudy
15
250
7.39
17.75
429
319
2.71
cloudy
20
250
7.41
17.06
422
311
2.53
cloudy
25
250
7.50
17.70
411
305
3.18
cloudy
30
250
7.46
17.09
408
307
2.76
cloudy
35
250
7.58
17.10
400
302
2.70
cloudy
40
250
7.57
17.05
400
302
2.40
cloudy
45
250
7.60
17.66
402
301
2.65
cloudy
50
250
7.64
17.09
401
299
2.72
cloudy
55
250
7.63
17.13
403
302
2.61
slightly cloudy
3 gallons
MW-BW-207I
7/28/2006
10
250
8.20
24.73
1290
245
0.18
cloudy
CRA 045136 (12) Braidwood Generating Station
Revision 1
Page 9 of 9
TABLE 4.6
SUMMARY OF MONITORING WELL PURGING PARAMETERS
FLEETWIDE ASSESSMENT
BRAIDWOOD GENERATING STATION
BRACEVILLE, ILLINOIS
Sample
Minutes
Pumping
Volume
Location
Date
Purged
Rate
pH
Temperature
Conductivity
ORP
(5)
DO
(7)
Turbidity
Purged
(mL/min)
(1)
(Std. Units)
(2)
(°C)
(3)
(μS/cm)
(4)
(mV)
(6)
(mg/L)
(8)
(NTU)
(9)
(gallons)
15
250
8.25
24.83
1292
230
0.16
slightly cloudy
20
250
8.31
24.98
1295
216
0.15
slightly cloudy
25
250
8.32
24.93
1293
190
0.15
clear
30
250
8.30
24.93
1289
185
0.14
clear
1.5 gallons
Notes:
(1)
mL/min - milliliters per minute
(6)
mV - millivolts
(2)
Std. Units - standard units
(7)
DO - dissolved oxygen
(3)
°C - degrees Celsius
(8)
mg/L - milligrams per liter
(4)
μS/cm - microsiemens per centimet
(9)
NTU - nephelometric turbidity units
(5)
ORP - oxidation-reduction potential
The last three readings are provided in the table
CRA 045136 (12) Braidwood Generating Station
Revision 1
Page 1 of 1
TABLE 5.1
SUMMARY OF CALCULATED VERTICAL GRADIENTS
FLEETWIDE ASSESSMENT
BRAIDWOOD GENERATING STATION
BRACEVILLE, ILLINOIS
Top of
Bottom of
Mid-Point
Sample
Screen
Screen
of Screen
Water
Vertical
Location
Elevation
Elevation
Elevation
Level
Gradient
(ft AMSL)
(ft AMSL)
(ft AMSL)
(ft AMSL)
(ft/ft)
(1)
MW-BW-201S
594.97
584.97
589.97
592.36
0.116
MW-BW-201I
586.02
576.02
581.02
591.32
MW-BW-202S
595.87
585.87
590.87
593.75
0.004
MW-BW-202I
585.72
575.72
580.72
593.71
MW-BW-203S
594.14
584.14
589.14
594.68
-0.002
MW-BW-203I
583.95
573.95
578.95
594.70
TB-1-4D
582.45
577.45
579.45
595.48
0.005
TW-3
597.60
587.60
592.6
595.55
TB-1-2D
580.41
575.41
577.91
593.58
0.167
MW-2
597.80
587.80
592.8
596.07
MW-11
594.10
584.10
589.1
593.04
0.118
TB-1-6D
577.84
572.84
575.34
591.41
MW-6
594.10
584.10
589.1
595.69
-0.074
TB-1-3D
589.70
584.70
587.2
595.83
MW-BW-207I
564.59
554.59
559.59
592.24
0.100
TW-3
597.60
587.60
592.6
595.55
Notes:
ft AMSL
feet above mean sea level.
(1)
Positive value denotes downward vertical
gradient; negative value denotes upward vertical gradient.
31-Jul-06
CRA 045136 (12) Braidwood Generating Station
Revision 1
Page 1 of 1
TABLE 5.2
ANALYTICAL RESULTS SUMMARY - TRITIUM IN GROUNDWATER
FLEETWIDE ASSESSMENT
BRAIDWOOD GENERATING STATION
BRACEVILLE, ILLINOIS
Sample Location
Sample Identification
QC Sample
Sample Date Tritium (pCi/L) Result Error
MW-2
WG-BW-051006-JL-017
5/10/2006
ND (200)
-
MW-4
WG-BW-051106-MS-030
5/11/2006
ND (200)
-
MW-5
WG-BW-050906-MS-010
5/9/2006
ND (200)
-
MW-6
WG-BW-050906-MS-002
5/9/2006
288
+/-121
MW-7
WG-BW-051106-MS-032
5/11/2006
214
+/-101
MW-9
WG-BW-051106-JL-029
5/11/2006
311
+/-118
MW-9
WG-BW-051106-JL-031
Duplicate (029)
5/11/2006
441
+/-131
MW-11
WG-BW-051006-MS-012
5/10/2006
ND (200)
-
MW-13
WG-BW-051006-MS-018
5/10/2006
ND (200)
-
MW-14
WG-BW-051006-MS-024
5/10/2006
ND (200)
-
MW-22
WG-BW-051106-JL-027
5/11/2006
ND (200)
-
MW-BW-201BD
WG-BW-052206-MB-056
5/22/2006
ND (200)
-
MW-BW-201BD
WG-BW-052206-MB-057
Duplicate (056)
5/22/2006
ND (200)
-
MW-BW-201I
WG-BW-051106-MS-040
5/11/2006
261
+/-104
MW-BW-201I
WG-BW-051106-MS-042
Duplicate (040)
5/11/2006
ND (200)
-
MW-BW-201S
WG-BW-051106-JL-039
5/11/2006
244
+/-100
MW-BW-202I
WG-BW-051106-JL-035
5/11/2006
ND (200)
-
MW-BW-202S
WG-BW-051106-JL-037
5/11/2006
ND (200)
-
MW-BW-203I
WG-BW-051106-MS-038
5/11/2006
ND (200)
-
MW-BW-203S
WG-BW-051106-MS-036
5/11/2006
ND (200)
-
MW-BW-204I
WG-BW-051206-JL-041
5/12/2006
ND (200)
-
MW-BW-205I
WG-BW-051206-JL-043
5/12/2006
221
+/-102
MW-BW-206I
WG-BW-051206-MS-048
5/12/2006
ND (200)
-
MW-BW-207I
WG-BW-207-072806-JL-101
7/28/2006
438
+/-133
MW-BW-207I
WG-BW-207-072806-JL-102
Duplicate (101)
7/28/2006
471
+/-137
MW-BW-208BD
WG-BW-208D-072806-JL-100
7/28/2006
ND (200)
-
TB-1-1D
WG-BW-050906-JL-005
5/9/2006
ND (200)
-
TB-1-2D
WG-BW-051006-JL-019
5/10/2006
ND (200)
-
TB-1-3D
WG-BW-050906-MS-004
5/9/2006
285
+/-120
TB-1-4D
WG-BW-051006-JL-013
5/10/2006
719
+/-150
TB-1-5D
WG-BW-050906-JL-003
5/9/2006
443
+/-122
TB-1-6D
WG-BW-051106-JL-033
5/11/2006
ND (200)
-
TB-1-7D
WG-BW-051006-JL-021
5/10/2006
ND (200)
-
TB-1-8D
WG-BW-051006-JL-025
5/10/2006
ND (200)
-
TB-1-9D
WG-BW-050906-JL-001
5/9/2006
ND (200)
-
TB-1-10D
WG-BW-051006-JL-011
Duplicate (009)
(1)
5/10/2006
ND (200)
-
TW-3
WG-BW-051006-JL-015
5/10/2006
1040
+/-172
TW-6
WG-BW-050906-MS-008
5/9/2006
775
+/-136
TW-8
WG-BW-050906-MS-006
5/9/2006
ND (200)
-
TW-10
WG-BW-051006-MS-016
5/10/2006
ND (200)
-
TW-12
WG-BW-051006-MS-026
5/10/2006
ND (200)
-
TW-15
WG-BW-051006-MS-020
5/10/2006
ND (200)
-
TW-15
WG-BW-051006-MS-022
Duplicate (020)
5/10/2006
ND (200)
-
TW-16
WG-BW-050906-JL-007
5/9/2006
893
+/-145
TW-18
WG-BW-051206-MS-046
5/12/2006
ND (200)
-
TW-21
WG-BW-051106-MS-034
5/11/2006
211
+/-95.6
TW-23
WG-BW-051006-MS-014
5/10/2006
ND (200)
-
TW-24
WG-BW-051506-MB-050
5/15/2006
204
+/-112
TW-24
WG-BW-051506-MB-052
Duplicate (050)
5/15/2006
200
+/-111
TW-25
WG-BW-051906-MB-054
5/19/2006
ND (200)
-
TW-26
WG-BW-051206-MS-044
5/12/2006
ND (200)
-
TW-26
WG-BW-051906-MB-055
5/19/2006
ND (200)
-
Notes:
Samples analyzed
by: Teledyne Brown Engineering, Inc.
QC - Quality
Control
(1) - Sample container for original
tritium analysis lost in transit.
ND ( ) - Non-detect; value in parentheses is the LLD.
LLD - Lower limit of detection.
- -
Non-detect value, +/- value not reported.
CRA 045136 (12) Braidwood Generating Station
q014AI-XT2-WG WS-0506 0706 Groundwater Surface Water-37-TH
8/9/2006
Revision 1
Page 1 of 1
TABLE 5.4
ANALYTICAL RESULTS SUMMARY - TRITIUM IN SURFACE WATER
FLEETWIDE ASSESSMENT
BRAIDWOOD GENERATING STATION
BRACEVILLE, ILLINOIS
Sample
Location
Sample Identification
Sample Date
Tritium (pCi/L)
Result Error
SG-BW-101
SW-BW-051706-MB-101
5/17/2006
398
+/-129
SG-BW-102
SW-BW-051706-MB-102
5/17/2006
365
+/-120
SG-BW-103
SW-BW-051706-MB-103
5/17/2006
230
+/-114
SG-BW-104
SW-BW-051706-MB-104
5/17/2006
ND (200)
-
SG-BW-105
SW-BW-051706-MB-105
5/17/2006
ND (200)
-
SG-BW-106
SW-BW-051706-MB-106
5/17/2006
ND (200)
-
Notes:
Samples analyzed by: Teledyne Brown Engineering, Inc.
ND ( ) - Non-detect; value in parentheses is the LLD.
LLD - Lower limit of detection.
- -
Non-detect value, +/- value not reported.
CRA 045136 (12) Braidwood Generating Station
q014AI-XT2-WG WS-0506 0706 Groundwater Surface Water-37-TH
8/9/2006
Revision 1
Page 1 of 2
TABLE 5.6
EXISTING ANALYTICAL RESULTS SUMMARY - TRITIUM IN GROUNDWATER
FLEETWIDE ASSESSMENT
BRAIDWOOD GENERATING STATION
BRACEVILLE, ILLINOIS
Sample Location
Sample Identification
QC Sample
Laboratory Analysis Laboratory Sample Date Tritium (pCi/L) Result Error
MW-2
GW-030806-MB-MW-2
EI
3/8/2006
ND (200)
-
MW-2
WG-BW-051006-JL-017
TBE
5/10/2006
ND (200)
-
MW-4
GW-030806-MB-MW-4
EI
3/8/2006
ND (200)
-
MW-4
GW-050206-MB-MW-4
EI
5/2/2006
390
+/-95
MW-4
WG-BW-051106-MS-030
TBE
5/11/2006
ND (200)
-
MW-5
GW-050206-MB-MW-5
EI
5/2/2006
206
+/-87
MW-5
WG-BW-050906-MS-010
TBE
5/9/2006
ND (200)
-
MW-6
GW-030806-MB-MW-6
EI
3/8/2006
348
+/-107
MW-6
WG-BW-050906-MS-002
TBE
5/9/2006
288
+/-121
MW-7
WG-BW-051106-MS-032
TBE
5/11/2006
214
+/-101
MW-9
WG-BW-051106-JL-029
TBE
5/11/2006
311
+/-118
MW-9
WG-BW-051106-JL-031
Duplicate (029)
TBE
5/11/2006
441
+/-131
MW-11
WG-BW-051006-MS-012
TBE
5/10/2006
ND (200)
-
MW-13
WG-BW-051006-MS-018
TBE
5/10/2006
ND (200)
-
MW-14
WG-BW-051006-MS-024
TBE
5/10/2006
ND (200)
-
MW-22
WG-BW-051106-JL-027
TBE
5/11/2006
ND (200)
-
MW-BW-201BD
WG-BW-052206-MB-056
TBE
5/22/2006
ND (200)
-
MW-BW-201BD
WG-BW-052206-MB-057
Duplicate (056)
TBE
5/22/2006
ND (200)
-
MW-BW-201I
WG-BW-051106-MS-040
TBE
5/11/2006
261
+/-104
MW-BW-201I
WG-BW-051106-MS-042
Duplicate (040)
TBE
5/11/2006
ND (200)
-
MW-BW-201S
WG-BW-051106-JL-039
TBE
5/11/2006
244
+/-100
MW-BW-202I
WG-BW-051106-JL-035
TBE
5/11/2006
ND (200)
-
MW-BW-202S
WG-BW-051106-JL-037
TBE
5/11/2006
ND (200)
-
MW-BW-203I
WG-BW-051106-MS-038
TBE
5/11/2006
ND (200)
-
MW-BW-203S
WG-BW-051106-MS-036
TBE
5/11/2006
ND (200)
-
MW-BW-204I
WG-BW-051206-JL-041
TBE
5/12/2006
ND (200)
-
MW-BW-205I
WG-BW-051206-JL-043
TBE
5/12/2006
221
+/-102
MW-BW-206I
WG-BW-051206-MS-048
TBE
5/12/2006
ND (200)
-
TB-1-1D
GW-011106-MB-TB-1D
EI
1/11/2006
ND (200)
-
TB-1-1D
GW-030806-MB-TB-1D
EI
3/8/2006
ND (200)
-
TB-1-1D
WG-BW-050906-JL-005
TBE
5/9/2006
ND (200)
-
TB-1-2D
GW-011106-MB-TB-2D
EI
1/11/2006
ND (200)
-
TB-1-2D
GW-030806-MB-TB-2D
EI
3/8/2006
ND (200)
-
TB-1-2D
WG-BW-051006-JL-019
TBE
5/10/2006
ND (200)
-
TB-1-3D
GW-011106-MB-TB-3D
EI
1/11/2006
265
+/-117
TB-1-3D
GW-030806-MB-TB-3D
EI
3/8/2006
301
+/-90
TB-1-3D
WG-BW-050906-MS-004
TBE
5/9/2006
285
+/-120
TB-1-4D
GW-011106-MB-TB-4D
EI
1/11/2006
622
+/-128
TB-1-4D
GW-030806-EV-TB-4D
EI
3/8/2006
582
+/-111
TB-1-4D
WG-BW-051006-JL-013
TBE
5/10/2006
719
+/-150
TB-1-5D
GW-011106-MB-TB-5D
EI
1/11/2006
ND (200)
-
TB-1-5D
GW-030806-MB-TB-5D
EI
3/8/2006
ND (200)
-
TB-1-5D
WG-BW-050906-JL-003
TBE
5/9/2006
443
+/-122
TB-1-6D
GW-011106-MB-TB-6D
EI
1/11/2006
ND (200)
-
TB-1-6D
GW-030806-MB-TB-6D
EI
3/8/2006
ND (200)
-
TB-1-6D
WG-BW-051106-JL-033
TBE
5/11/2006
ND (200)
-
TB-1-7D
GW-011106-MB-TB-7D
EI
1/11/2006
ND (200)
-
TB-1-7D
GW-030806-EV-TB-7D
EI
3/8/2006
ND (200)
-
TB-1-7D
WG-BW-051006-JL-021
TBE
5/10/2006
ND (200)
-
TB-1-8D
GW-022406-MB-TB1-8D
EI
2/24/2006
ND (200)
-
TB-1-8D
GW-030806-MB-TB-8D
EI
3/8/2006
ND (200)
-
TB-1-8D
WG-BW-051006-JL-025
TBE
5/10/2006
ND (200)
-
TB-1-9D
GW-022406-MB-TB1-9D
EI
2/24/2006
ND (200)
-
TB-1-9D
GW-030806-EV-TB1-9D
EI
3/8/2006
ND (200)
-
TB-1-9D
WG-BW-050906-JL-001
TBE
5/9/2006
ND (200)
-
TB-1-10D
GW-022406-MB-TB1-10D
EI
2/24/2006
ND (200)
-
CRA 045136 (12) Braidwood Generating Station
Page 2 of 2
TABLE 5.6
EXISTING ANALYTICAL RESULTS SUMMARY - TRITIUM IN GROUNDWATER
FLEETWIDE ASSESSMENT
BRAIDWOOD GENERATING STATION
BRACEVILLE, ILLINOIS
Sample Location
Sample Identification
QC Sample
Laboratory Analysis Laboratory Sample Date Tritium (pCi/L) Result Error
TB-1-10D
GW-030806-EV-TB-1-10D
EI
3/8/2006
ND (200)
-
TB-1-10D
WG-BW-051006-JL-011
Duplicate (009)
(1)
TBE
5/10/2006
ND (200)
-
TB-1-11D
GW-031706-MB-TB1-11D
EI
3/17/2006
ND (200)
-
TB-1-12D
GW-031606-MB-TB1-12D
EI
3/16/2006
ND (200)
-
TB-1-13D
GW-031606-MB-TB1-13D
EI
3/16/2006
ND (200)
-
TB-1-14D
GW-031706-MB-TB1-14D
EI
3/17/2006
ND (200)
-
TBRW-1
GW-031706-MB-TBRW-1
EI
3/17/2006
ND (200)
-
TBRW-1
GW-050206-MB-TBRW-1
EI
5/2/2006
ND (200)
-
TBRW-2
GW-031706-MB-TBRW-2
EI
3/17/2006
ND (200)
-
TBRW-2
GW-050206-MB-TBRW-2
EI
5/2/2006
ND (200)
-
TBRW-3
GW-031706-MB-TBRW-3
EI
3/17/2006
ND (200)
-
TBRW-3
GW-050206-MB-TBRW-3
EI
5/2/2006
ND (200)
-
TW-3
GW-030806-EV-TW-3
EI
3/8/2006
302
+/-101
TW-3
GW-030806-EV-TW-3-recount
Recount
EI
3/8/2006
330
+/-103
TW-3
WG-BW-051006-JL-015
TBE
5/10/2006
1040
+/-172
TW-6
GW-030806-EV-TW-6
EI
3/8/2006
880
+/-110
TW-6
GW-030806-EV-TW-6-recount
Recount
EI
3/8/2006
676
+/-117
TW-6
WG-BW-050906-MS-008
TBE
5/9/2006
775
+/-136
TW-8
GW-030806-EV-TW-8
EI
3/8/2006
ND (200)
-
TW-8
WG-BW-050906-MS-006
TBE
5/9/2006
ND (200)
-
TW-10
WG-BW-051006-MS-016
TBE
5/10/2006
ND (200)
-
TW-12
WG-BW-051006-MS-026
TBE
5/10/2006
ND (200)
-
TW-15
WG-BW-051006-MS-020
TBE
5/10/2006
ND (200)
-
TW-15
WG-BW-051006-MS-022
Duplicate (020)
TBE
5/10/2006
ND (200)
-
TW-16
GW-050206-MB-TW-16
EI
5/2/2006
368
+/-94
TW-16
WG-BW-050906-JL-007
TBE
5/9/2006
893
+/-145
TW-18
WG-BW-051206-MS-046
TBE
5/12/2006
ND (200)
-
TW-21
WG-BW-051106-MS-034
TBE
5/11/2006
211
+/-95.6
TW-23
WG-BW-051006-MS-014
TBE
5/10/2006
ND (200)
-
TW-24
WG-BW-051506-MB-050
TBE
5/15/2006
204
+/-112
TW-24
WG-BW-051506-MB-052
Duplicate (050)
TBE
5/15/2006
200
+/-111
TW-25
GW-030806-EV-TW-25
EI
3/8/2006
ND (200)
-
TW-25
WG-BW-051906-MB-054
TBE
5/19/2006
ND (200)
-
TW-26
WG-BW-051206-MS-044
TBE
5/12/2006
ND (200)
-
TW-26
WG-BW-051906-MB-055
TBE
5/19/2006
ND (200)
-
Seep*
Turbine Building Basement
EI
12/13/2005
2,825
+/-181
Notes:
EI - Environmental, Inc.
TBE - Teledyne Brown Engineering, Inc.
QC - Quality Control
(1) - Sample container for original tritium analysis lost in transit.
ND - Non-detect at associated value.
- Non-detect value, +/- value not reported.
* This seep sample was collected from the west side of the Turbine Building within the basement. The
water seeps into the basement on an intermittent basis. This water sample may not represent
groundwater.
CRA 045136 (12) Braidwood Generating Station
Page 1 of 1
TABLE 5.7
EXISTING ANALYTICAL RESULTS SUMMARY - TRITIUM IN SURFACE WATER
FLEETWIDE ASSESSMENT
BRAIDWOOD GENERATING STATION
BRACEVILLE, ILLINOIS
Sample Location
Sample Date
Sample Identification
Tritium (pCi/L) Result Error
Ditch at Culvert
12/22/2005
Ditch at Culvert~12/22/05
1007
+/-128
Ditch at Culvert
2/15/2006
GW-021506-MB-Ditch at Culvert
468
+/-99
Ditch at Culvert
2/22/2006
GW-022206-MB-Ditch at Culvert
306
+/-95
Ditch at Culvert
3/1/2006
GW-030106-MB-Ditch at Culvert
670
+/-119
Ditch at Culvert
3/7/2006
GW-030706-MB-Ditch at Culvert
311
+/-91
Ditch at Culvert
3/15/2006
GW-031506-MB-Ditch at Culvert
458
+/-96
Ditch at Culvert
3/22/2006
GW-032206-MB-Ditch at Culvert
889
+/-119
Ditch at Culvert
3/29/2006
GW-032906-MB-Ditch at Culvert
598
+/-109
Ditch at Culvert
4/5/2006
GW-040506-MB-Ditch at Culvert
704
+/-110
Ditch at Culvert
4/12/2006
GW-041206-MB-Ditch at Culvert
664
+/-102
Ditch at Culvert
4/19/2006
GW-041906-MB-Ditch at Culvert
423
+/-90
Ditch at Culvert
4/26/2006
GW-042606-JL-Ditch at Culvert
633
+/-104
Ditch at Culvert
5/17/2006
GW-051706-MB-Ditch at Culvert
368
+/-101
Ditch by Alpha Gate
12/15/2005
Ditch by Alpha Gate~12/15/05
1
+/-82
Ditch by Alpha Gate
12/22/2005
Ditch by Alpha Gate~12/22/05
13
+/-82
Ditch by Alpha Gate
12/29/2005
Ditch by Alpha Gate~12/29/05
11
+/-93
Ditch by Alpha Gate
1/5/2006
Ditch by Alpha Gate~1/5/06
7
+/-93
Ditch by Alpha Gate
1/12/2006
Ditch by Alpha Gate~1/12/06
-30
+/-95
Ditch by Alpha Gate
1/19/2006
Ditch by Alpha Gate~1/19/06
107
+/-100
Ditch by Alpha Gate
1/26/2006
Ditch by Alpha Gate~1/26/06
77
+/-98
Ditch by Alpha Gate
2/2/2006
Ditch by Alpha Gate~2/2/06
23
+/-96
Ditch by Alpha Gate
2/9/2006
Ditch by Alpha Gate~2/9/06
201
+/-86
Ditch by Alpha Gate
2/16/2006
Ditch by Alpha Gate~2/16/06
123
+/-100
Ditch by Alpha Gate
2/23/2006
Ditch by Alpha Gate~2/23/06
166
+/-84
Ditch by GW-1
2/15/2006
GW-021506-MB-Ditch by GW-1
36
+/-82
Ditch by GW-1
2/22/2006
GW-022206-MB-Ditch by GW-1
100
+/-91
Ditch by GW-1
3/1/2006
GW-030106-MB-Ditch by GW-1
-10
+/-80
Ditch by GW-1
3/7/2006
GW-030706-MB-Ditch by GW-1
56
+/-80
Ditch by GW-1
3/15/2006
GW-031506-MB-Ditch by GW-1
96
+/-81
Ditch by GW-1
3/22/2006
GW-032206-MB-Ditch by GW-1
70
+/-82
Ditch by GW-1
3/29/2006
GW-032906-MB-Ditch by GW-1
-166
+/-79
Ditch by GW-1
4/5/2006
GW-040506-MB-Ditch by GW-1
122
+/-89
Ditch by GW-1
4/12/2006
GW-041206-MB-Ditch by GW-1
89
+/-79
Ditch by GW-1
4/19/2006
GW-041906-MB-Ditch by GW-1
-30
+/-97
Ditch by GW-1
4/26/2006
GW-042606-JL-Ditch at GW-1
152
+/-85
Ditch by GW-1
5/17/2006
GW-051706-MB-DITCHBYGW-1
105
+/-108
Oil Water Sep
4/19/2006
GW-041906-MB-Oil Water Sep
86
+/-75
Oil Water Sep
5/2/2006
GW-050206-MB-OILWATERSEP
368
+/-94
Oil Water Sep
5/18/2006
Oil Separator~051806
394
+/-99
Oil Water Sep
6/2/2006
Oil Separator~060206
199
+/-85
Note:
Samples analyzed by Environmental, Inc.
CRA 045136 (12) Braidwood Generating Station
Revision 1
045136 (12) Braidwood Generating Station
APPENDIX A
MONITORING WELL LOGS
Asphalt
SP - Sand, brown
- saturated at 5.0ft BGS
Fill, gray, poorly graded, medium grained
sand, saturated
- brown at 25.0ft BGS
Grout
Bentonite
Chips
599.09
589.59
INTERVAL
SAMPLE
REC (%)
NUMBER
'N' VALUE
(OVERBURDEN)
Page 1 of 2
MW-BW-207I
STRATIGRAPHIC AND INSTRUMENTATION LOG
2
4
6
8
10
12
14
16
18
20
22
24
26
28
DEPTH
ft BGS
PROJECT NAME: BRAIDWOOD GENERATING STATION
PROJECT NUMBER: 45136-20
CLIENT: EXELON GENERATION COMPANY LLC
LOCATION: BRAIDWOOD, ILLINOIS
HOLE DESIGNATION:
STRATIGRAPHIC DESCRIPTION & REMARKS
NOTES:
MEASURING POINT ELEVATIONS MAY CHANGE; REFER TO CURRENT ELEVATION TABLE
DATE COMPLETED: July 13, 2006
DRILLING METHOD: Sonic
FIELD PERSONNEL: N. KUHL
OVERBURDEN LOG 45136-20.GPJ CRA_CORP.GDT 8/9/06
Monitoring Well
GROUND SURFACE
ELEV.
ft
AMSL
599.59
- cobble seam at 30.0ft BGS
Sand/gravel fill, dry concrete
CL - Clay, silty
Shale, hard
END OF BOREHOLE @ 50.0ft BGS
Sand
2" 0 / PVC Well
Screen
WELL DETAILS
Screened interval:
564.59 to 554.59ft AMSL
35.00 to 45.00ft BGS
Length: 10ft
Diameter: 2in
Slot Size: 10
Material: PVC
Sand Pack:
567.59 to 549.59ft AMSL
32.00 to 50.00ft BGS
Material: Sand
559.59
555.59
554.09
549.59
INTERVAL
SAMPLE
REC (%)
NUMBER
'N' VALUE
(OVERBURDEN)
Page 2 of 2
MW-BW-207I
STRATIGRAPHIC AND INSTRUMENTATION LOG
32
34
36
38
40
42
44
46
48
50
52
54
56
58
DEPTH
ft BGS
PROJECT NAME: BRAIDWOOD GENERATING STATION
PROJECT NUMBER: 45136-20
CLIENT: EXELON GENERATION COMPANY LLC
LOCATION: BRAIDWOOD, ILLINOIS
HOLE DESIGNATION:
STRATIGRAPHIC DESCRIPTION & REMARKS
NOTES:
MEASURING POINT ELEVATIONS MAY CHANGE; REFER TO CURRENT ELEVATION TABLE
DATE COMPLETED: July 13, 2006
DRILLING METHOD: Sonic
FIELD PERSONNEL: N. KUHL
OVERBURDEN LOG 45136-20.GPJ CRA_CORP.GDT 8/9/06
Monitoring Well
ELEV.
ft
AMSL
SP - Sand, brown
Grout
INTERVAL
SAMPLE
REC (%)
NUMBER
'N' VALUE
(OVERBURDEN)
Page 1 of 5
MW-BW-208BD
STRATIGRAPHIC AND INSTRUMENTATION LOG
2
4
6
8
10
12
14
16
18
20
22
24
26
28
DEPTH
ft BGS
PROJECT NAME: BRAIDWOOD GENERATING STATION
PROJECT NUMBER: 45136-20
CLIENT: EXELON GENERATION COMPANY LLC
LOCATION: BRAIDWOOD, ILLINOIS
HOLE DESIGNATION:
STRATIGRAPHIC DESCRIPTION & REMARKS
NOTES:
MEASURING POINT ELEVATIONS MAY CHANGE; REFER TO CURRENT ELEVATION TABLE
DATE COMPLETED: July 13, 2006
DRILLING METHOD: Sonic
FIELD PERSONNEL: N. KUHL
OVERBURDEN LOG 45136-20.GPJ CRA_CORP.GDT 8/9/06
Monitoring Well
TOP OF CASING
DEPTH
ft BGS
601.98
CL - clay, silty, gray
END OF OVERBURDEN HOLE @ 40.0ft BGS
30.00
INTERVAL
SAMPLE
REC (%)
NUMBER
'N' VALUE
(OVERBURDEN)
Page 2 of 5
MW-BW-208BD
STRATIGRAPHIC AND INSTRUMENTATION LOG
32
34
36
38
40
42
44
46
48
50
52
54
56
58
DEPTH
ft BGS
PROJECT NAME: BRAIDWOOD GENERATING STATION
PROJECT NUMBER: 45136-20
CLIENT: EXELON GENERATION COMPANY LLC
LOCATION: BRAIDWOOD, ILLINOIS
HOLE DESIGNATION:
STRATIGRAPHIC DESCRIPTION & REMARKS
NOTES:
MEASURING POINT ELEVATIONS MAY CHANGE; REFER TO CURRENT ELEVATION TABLE
DATE COMPLETED: July 13, 2006
DRILLING METHOD: Sonic
FIELD PERSONNEL: N. KUHL
OVERBURDEN LOG 45136-20.GPJ CRA_CORP.GDT 8/9/06
DEPTH
Monitoring Well
ft BGS
Shale, gray
Grout
40.00
(BEDROCK)
Page 3 of 5
RUN
NUMBER
CORE
RECOVERY %
RQD %
MW-BW-208BD
STRATIGRAPHIC AND INSTRUMENTATION LOG
40
42
44
46
48
50
52
54
56
58
60
62
64
66
DEPTH
ft BGS
PROJECT NAME: BRAIDWOOD GENERATING STATION
PROJECT NUMBER: 45136-20
CLIENT: EXELON GENERATION COMPANY LLC
LOCATION: BRAIDWOOD, ILLINOIS
HOLE DESIGNATION:
STRATIGRAPHIC DESCRIPTION & REMARKS
NOTES:
MEASURING POINT ELEVATIONS MAY CHANGE; REFER TO CURRENT ELEVATION TABLE
DATE COMPLETED: July 13, 2006
DRILLING METHOD: Sonic
FIELD PERSONNEL: N. KUHL
BEDROCK LOG 45136-20.GPJ CRA_CORP.GDT 8/9/06
DEPTH
Monitoring Well
ft BGS
Bentonite
Chips
Sand
2" 0 / PVC Well
Screen
(BEDROCK)
Page 4 of 5
RUN
NUMBER
CORE
RECOVERY %
RQD %
MW-BW-208BD
STRATIGRAPHIC AND INSTRUMENTATION LOG
70
72
74
76
78
80
82
84
86
88
90
92
94
96
DEPTH
ft BGS
PROJECT NAME: BRAIDWOOD GENERATING STATION
PROJECT NUMBER: 45136-20
CLIENT: EXELON GENERATION COMPANY LLC
LOCATION: BRAIDWOOD, ILLINOIS
HOLE DESIGNATION:
STRATIGRAPHIC DESCRIPTION & REMARKS
NOTES:
MEASURING POINT ELEVATIONS MAY CHANGE; REFER TO CURRENT ELEVATION TABLE
DATE COMPLETED: July 13, 2006
DRILLING METHOD: Sonic
FIELD PERSONNEL: N. KUHL
BEDROCK LOG 45136-20.GPJ CRA_CORP.GDT 8/9/06
DEPTH
Monitoring Well
ft BGS
- trace sandstone at 98.0ft BGS
END OF BOREHOLE @ 102.0ft BGS
WELL DETAILS
Screened interval:
85.00 to 100.00ft BGS
Length: 15ft
Diameter: 2in
Slot Size: 10
Material: PVC
Sand Pack:
82.00 to 102.00ft BGS
Material: Sand
102.00
(BEDROCK)
Page 5 of 5
RUN
NUMBER
CORE
RECOVERY %
RQD %
MW-BW-208BD
STRATIGRAPHIC AND INSTRUMENTATION LOG
100
102
104
106
108
110
112
114
116
118
120
122
124
126
DEPTH
ft BGS
PROJECT NAME: BRAIDWOOD GENERATING STATION
PROJECT NUMBER: 45136-20
CLIENT: EXELON GENERATION COMPANY LLC
LOCATION: BRAIDWOOD, ILLINOIS
HOLE DESIGNATION:
STRATIGRAPHIC DESCRIPTION & REMARKS
NOTES:
MEASURING POINT ELEVATIONS MAY CHANGE; REFER TO CURRENT ELEVATION TABLE
DATE COMPLETED: July 13, 2006
DRILLING METHOD: Sonic
FIELD PERSONNEL: N. KUHL
BEDROCK LOG 45136-20.GPJ CRA_CORP.GDT 8/9/06
DEPTH
Monitoring Well
ft BGS
Revision 0
045136 (12) Braidwood Generating Station
APPENDIX B
PRIVATE WATER WELL INVENTORY RECORDS (CRA, MARCH 2006)
TABLE B.1
SUMMARY OF PRIVATE WELL LOCATIONS
FLEETWIDE TRITIUM ASSESSMENT
BRAIDWOOD GENERATING STATION
BRACEVILLE, ILLINOIS
Page 1 of 5
Location
X-coord
Y-coord
PW-8
69990.437
86292.616
PWS-105
72609.760
84740.620
PWS-201B
72599.192
84017.487
PWS-104
72321.130
84616.820
PWN-103
72237.120
85936.930
PWS-101
72171.640
85070.240
PW-409
72106.054
85345.562
PWN-102
72073.780
85953.130
PW-411
72044.983
84695.237
PW-410
72029.555
85013.795
PWS-102
71952.970
84886.930
PWS-103
71940.060
84650.450
PWN-202
71931.210
86935.330
PWN-101
71858.950
85920.420
PW-403
71852.715
87016.198
PW-406
71852.715
86649.659
PW-407
71848.974
86567.375
PW-416
71845.234
86862.850
PW-900
71802.536
86662.790
PW-600
71801.847
88801.973
PWN-201
71701.864
85717.075
PW-408
71643.264
86500.052
PW-418
71643.264
86088.631
PW-419
71639.524
85763.235
PW-405
71624.563
86806.747
PW-6
71605.796
85391.696
PW-420
71602.122
85254.570
PW-12
71587.852
86707.365
PW-404
71583.421
87132.143
PW-13
71546.472
86841.803
PW-6P
71388.441
85039.761
PW-401
71385.191
88665.620
PW-402
71329.088
88014.827
PW-530
71289.638
88990.609
PW-5
71067.841
85419.750
PW-414
71011.173
88710.502
PW-415
70996.212
88863.850
PW-7
70885.511
86008.244
PW-422-Pond
70708.217
87846.519
SW-7
70580.707
88711.098
PW-422
70405.262
88033.528
PW-400
70337.939
88673.100
PW-3
69587.058
84332.752
PW-2
69372.937
84385.856
PW-11
69334.651
86909.209
PW-1
69272.431
84296.473
PW-9
69244.481
86394.565
CRA 45136 (12) Braidwood Generating Station
TABLE B.1
SUMMARY OF PRIVATE WELL LOCATIONS
FLEETWIDE TRITIUM ASSESSMENT
BRAIDWOOD GENERATING STATION
BRACEVILLE, ILLINOIS
Page 2 of 5
Location
X-coord
Y-coord
PW-413
69163.521
88609.517
PW-604-Pond
69024.152
93493.943
PW-603
69024.152
93493.943
PW-602
69024.152
93512.320
PW-431
68697.487
84158.754
PW-423-Trailer
68580.051
86803.007
PW-10
68549.643
86613.142
PW-423
68381.822
88669.360
PW-15
68374.868
85430.394
PW-4
68105.605
85295.707
PW-14
68000.667
85361.724
PWG-005
67790.817
90404.436
PW-614
66594.462
87475.150
PW-540
66064.576
87131.387
PWG-184
63950.203
81324.681
PWG-080
63943.422
81783.803
PWG-143
63914.529
81998.729
PWG-142
63892.440
82101.811
PWG-096
63882.426
81783.803
PWG-182
63871.101
81333.470
PWG-181
63859.382
81506.324
PWG-105
63848.878
82351.066
PWG-104
63845.829
82457.809
PWG-041
63832.868
83173.340
PWG-095
63824.480
81780.753
PWG-141
63821.264
81992.593
PWG-031
63808.704
82699.370
PWG-600
63781.890
82113.025
PWG-180
63780.279
81330.540
PWG-102
63772.633
82451.710
PWG-094
63754.335
81777.703
PWG-179
63753.912
81491.675
PWG-038
63748.755
83174.927
PWG-027
63682.535
82703.958
PWG-026
63680.241
82839.302
PWG-139
63677.686
81982.776
PWG-099
63668.940
82360.216
PWG-093
63665.890
81768.554
PWG-176
63663.090
81491.675
PWG-177
63660.161
81318.822
PWG-138
63650.688
82095.675
PWG-025
63643.538
82706.252
PWG-022
63636.656
82850.772
PWG-091
63598.795
81762.454
PWG-136
63595.466
81972.959
PWG-234
63595.438
81888.498
PWG-032
63595.364
83169.634
CRA 45136 (12) Braidwood Generating Station
TABLE B.1
SUMMARY OF PRIVATE WELL LOCATIONS
FLEETWIDE TRITIUM ASSESSMENT
BRAIDWOOD GENERATING STATION
BRACEVILLE, ILLINOIS
Page 3 of 5
Location
X-coord
Y-coord
PWG-135
63593.012
82096.903
PWG-227
63588.720
82096.765
PWG-229
63588.720
82161.708
PWG-228
63588.720
82159.469
PWG-097
63586.595
82348.016
PWG-024
63581.601
82701.664
PWG-023
63572.425
82832.420
PWG-232
63564.086
83292.621
PWG-233
63555.128
83568.071
PWG-174
63551.761
81491.675
PWG-175
63551.761
81310.032
PWG-090
63525.599
81759.404
PWG-230
63494.664
82237.849
PWG-187
63490.780
84164.240
PWG-172
63481.448
81491.675
PWG-173
63481.448
81310.032
PWG-089
63452.404
81750.255
PWG-171
63440.432
81307.103
PWG-170
63414.064
81488.745
PWG-087
63363.960
81768.554
PWG-185
63361.329
81280.735
PWG-156
63361.329
81280.735
PWG-186
63358.399
81482.886
PWG-088
63342.611
81930.193
PWG-199
63324.066
82912.177
PWG-198-1
63324.002
82912.876
PWG-122
63309.063
82421.212
PWG-169
63273.437
81479.956
PWG-189
63269.049
83305.923
PWG-086
63266.366
81771.603
PWG-237
63265.453
83313.127
PWG-168
63255.859
81307.103
PWG-120
63226.718
82280.921
PWG-085
63180.971
81762.454
PWG-198-2
63177.091
83054.698
PWG-200
63172.637
82907.723
PWG-166
63170.897
81304.173
PWG-167
63170.897
81465.308
PWG-121
63162.673
82430.361
PWG-126
63150.473
82283.970
PWG-084
63110.826
81759.404
PWG-164
63083.005
81304.173
PWG-163
63071.287
81465.308
PWG-007
63047.106
82281.973
PWG-119
63043.730
82277.871
PWG-009
63026.460
82121.289
PWG-083
63022.382
81756.354
CRA 45136 (12) Braidwood Generating Station
TABLE B.1
SUMMARY OF PRIVATE WELL LOCATIONS
FLEETWIDE TRITIUM ASSESSMENT
BRAIDWOOD GENERATING STATION
BRACEVILLE, ILLINOIS
Page 4 of 5
Location
X-coord
Y-coord
PWG-162
62995.114
81304.173
PWG-161
62980.465
81453.589
PWG-008
62953.053
82167.169
PWG-082
62936.987
81756.354
PWG-006
62934.701
82295.684
PWG-129
62912.589
82433.411
PWG-131
62909.539
82433.411
PWG-160
62872.065
81274.876
PWG-116
62863.792
82283.970
PWG-081
62857.692
81753.305
PWG-159
62848.628
81441.870
PWG-130
62833.294
82430.361
PWG-133
62833.294
82430.361
PWG-157
62792.963
81269.016
PWG-115
62790.596
82265.672
PWG-114
62787.547
82268.721
PWG-158
62769.525
81447.729
PWG-079
62766.198
81744.155
PWG-145
62758.451
82130.765
PWG-188
62754.058
82740.864
PWG-113
62753.999
82393.763
PWG-112
62753.999
82396.813
PWG-109
62753.999
82396.813
PWG-110
62753.999
82396.813
PWG-144
62752.826
82220.766
PWG-124
62750.949
82393.763
PWG-125
62750.949
82393.763
PWG-132
62747.899
82396.813
PWG-192
62746.906
82748.017
PWG-147
62653.450
81842.011
PWG-146
62649.700
82142.015
PWG-034
62629.564
81644.013
PWG-149
62627.199
81643.259
PWG-014
62407.088
81082.121
PWG-015
62404.794
81004.126
PWG-021
62400.206
80669.206
PWG-020
62395.618
80747.201
PWG-017
62395.618
80889.427
PWG-018
62393.324
80838.960
PWG-019
62322.211
80721.967
PWG-013
62319.917
81194.525
PW-535
62316.016
81977.041
PWG-012
62310.741
81267.932
PWG-064
62244.682
80856.662
PWG-213
62197.256
80297.800
PWG-108
62192.835
82073.534
PWG-107
62189.785
81902.745
CRA 45136 (12) Braidwood Generating Station
TABLE B.1
SUMMARY OF PRIVATE WELL LOCATIONS
FLEETWIDE TRITIUM ASSESSMENT
BRAIDWOOD GENERATING STATION
BRACEVILLE, ILLINOIS
Page 5 of 5
Location
X-coord
Y-coord
PWG-062
62162.337
80856.662
PWG-210
62117.088
80627.381
PWG-206
62108.180
81090.575
PWG-203
62108.180
81331.080
PWG-202
62103.727
81429.064
PWG-208
62014.651
80979.230
PWG-071
61939.701
80444.939
PWG-061
61918.352
80756.019
PWG-205
61912.214
81126.206
PWG-003
61872.603
81240.813
PWG-070
61848.207
80444.939
PWG-069
61848.207
80344.295
PWG-002
61829.919
81115.274
PWG-068
61784.161
80341.245
PWG-224
61778.600
80685.280
PWG-001
61759.617
81110.252
PWG-221
61756.331
81420.156
PWG-223
61756.331
80930.239
PWG-222
61756.331
81001.499
PWG-225
61640.532
80645.196
PWG-004
61631.567
81243.324
PWG-067
61616.422
80826.164
PWG-072
61573.725
80447.988
PWG-066
61534.077
80734.670
PWG-190
61516.651
81467.694
PWG-190-Pond
61516.376
81471.908
PWG-193
61509.499
81467.694
PWG-065
61476.131
80829.214
PWG-052-Pond
61425.969
79697.474
PWG-591
61425.953
81080.151
PWG-049
61417.429
80490.904
PWG-042
61414.176
81226.180
PWG-048
61404.415
80617.788
PWG-047
61404.415
80708.884
PWG-045
61340.567
83003.772
PWG-054
61328.366
79636.472
PWG-053
61328.366
79689.341
PWG-046
61313.319
80725.151
PWG-051
61312.099
79827.611
PWG-050
61303.966
79913.014
PWG-059
61280.545
80190.231
PWG-056
61280.545
86566.046
PWG-542
61204.623
82476.990
PWG-043
61181.962
83007.839
CRA 45136 (12) Braidwood Generating Station
Revision 0
045136 (12) Braidwood Generating Station
APPENDIX C
QUALITY ASSURANCE PROGRAM – TELEDYNE BROWN ENGINEERING, INC.
Page 2 of 32
TABLE OF CONTENTS
Section
Title
Page
1.0
KNOXVILLE QAM SECTION INTRODUCTION
7
2.0
QUALITY SYSTEM
10
2.1
Policy
10
2.2
Quality System Structure
10
2.3
Quality System Objectives
10
2.4
Personnel Orientation, Training, and Qualification
11
3.0
ORGANIZATION, AUTHORITY, AND RESPONSIBILITY
12
4.0
PERSONNEL ORIENTATION, DATA INTEGRITY, TRAINING,
AND QUALIFICATION
13
4.1
Orientation
13
4.2
Data Integrity
13
4.3
Training
13
4.4
Qualification
13
4.5
Records
13
5.0
CUSTOMER INTERFACES
14
5.1
Interface Personnel
14
5.2
Bid Requests and Tenders
14
5.3
Contracts
14
5.4
TBE’s Expectation of Customers
14
5.5
Customer Satisfaction
15
5.5.1
Customer Complaints
15
5.5.2
Customer Confidentiality
15
6.0
DOCUMENTATION GENERATION AND CONTROL
16
6.1
General
16
6.2
New Documentation
16
6.3
Documentation Changes
16
Page 3 of 32
TABLE OF CONTENTS - Continued
6.4
Documentation Lists and Distributions
16
6.5
Other Documentation
16
6.6
Documentation Reviews
16
7.0
DESIGN OF LABORATORY CONTROLS
17
7.1
General
17
7.2
Facility
17
7.3
Technical Processes and Methods
17
7.3.1
Operational Flow
17
7.3.2
Methods
18
7.3.3
Data Reduction and Analysis
18
7.4
Verification of Technical Processes, Methods, and Software
18
7.4.1
Operational Flow Verification
18
7.4.2
Method Verifications
18
7.4.3
Data Reduction and Analysis Verification
18
7.5
Design of Quality Controls
18
7.5.1
General
19
7.5.2
Demonstration of Capability (D of C)
19
7.5.3
Process Control Checks
19
7.6
Counting Instrument Controls
20
8.0
PURCHASING AND SUBCONTRACT CONTROLS
21
8.1
General
21
8.2
Source Selection
21
8.3
Procurement of Supplies and Support Services
21
8.3.1
Catalog Supplies
21
8.3.2
Support Services
21
8.3.3
Equipment and Software
22
8.4
Subcontracting of Analytical Services
22
8.5
Acceptance of Items or Services
22
Page 4 of 32
TABLE OF CONTENTS - Continued
9.0
TEST SAMPLE IDENTIFICATION AND CONTROL
23
9.1
Sample Identification
23
9.2
LIMS
23
9.3
Sample Control
23
10.0
SPECIAL PROCESSES, INSPECTION, AND TEST
24
10.1
Special Processes
24
10.2
Inspections and Tests
24
10.2.1 Intra Laboratory Checks (QC Checks)
24
10.2.2 Inter Laboratory Checks
24
10.2.3 Data Reviews
24
10.3
Control of Sampling of Samples
24
10.4
Reference Standards / Material
24
10.4.1 Weights and Temperatures
25
10.4.2 Radioactive Materials
25
11.0
EQUIPMENT MAINTENANCE AND CALIBRATION
26
11.1
General
26
11.2
Support Equipment
26
11.3
Instruments
26
11.4
Nonconformances and Corrective Actions
26
11.5
Records
27
12.0
NONCONFORMANCE CONTROLS
28
12.1
General
28
12.2
Responsibility and Authority
28
12.3
10CFR21 Reporting
28
Page 5 of 32
TABLE OF CONTENTS - Continued
13.0
CORRECTIVE AND PREVENTIVE ACTIONS
29
13.1
General
29
13.2
Corrective Actions
29
13.3
Preventive Actions
29
14.0
RESULTS ANALYSIS AND REPORTING
30
14.1
General
30
14.2
Results Review
30
14.3
Reports
30
15.0
RECORDS
31
15.1
General
31
15.2
Type of Records
31
15.3
Storage and Retention
31
15.4
Destruction or Disposal
31
16.0
ASSESSMENTS
32
16.1
General
32
16.2
Audits
32
16.3
Management Reviews
32
Page 6 of 32
REVISION HISTORY
Revision 7
Complete re-write
January 1, 2005
Bill Meyer
Revision 8
Updated organization
chart, minor change to
1.0, 4.4, 7.5.3.2,
10.2.3, and 12.3
Page 7 of 32
1.0
Knoxville QAM Section Introduction
This Quality Assurance Manual (QAM) and related Procedures describes the
Knoxville Environmental Services Laboratory’s QA system. This system is designed
to meet multiple quality standards imposed by Customers and regulatory agencies
including:
NRC’s 10 CFR 50 Appendix B
NRC’s Regulatory Guide 4.15
DOE’s Order 414.1
DOE’s QSAS
ANSI N 42.23
ANSI N 13.30
NELAC Standard, Chapter 5
The Environmental Services (ES) Laboratory does low level radioactivity
analyses for Power Plants and other customers. It primarily analyzes environmental
samples (natural products from around plants such as milk), in-plant samples (air
filters, waters), bioassay samples from customer’s employees, and waste disposal
samples (liquids and solids).
Potable and non-potable water samples are tested using methods based on
EPA standards as cited in State licenses (see Procedure 4010). The listing [current
as of initial printing of this Manual – see current index for revision status and
additions / deletions] of implementing Procedures (SOPs) covering Administration,
Methods, Counting Instruments, Technical, Miscellaneous, and LIMS is shown in
Table 1-1. Reference to these Procedures by number is made throughout this QAM.
Table 1-1
Number
Title
Part 1
Administrative Procedures
1001
Validation and Verification of Computer Programs for Radiochemistry Data
Reduction
1002
Organization and Responsibility
1003
Control, Retention, and Disposal of Quality Assurance Records
1004
Definitions
1005
Data Integrity
1006
Job Descriptions
1007
Training and Certifications
1008
Procedure and Document Control
1009
Calibration System
1010
Nonconformance Controls
1011
10CFR21 Reporting
1012
Corrective Action and Preventive Action
Page 8 of 32
Number
Title
1013
Internal Audits and Management Reviews
1014
RFP, Contract Review, and Order Entry (formerly 4001)
1015
Procurement Controls
Part 2
Method Procedures
2001
Alpha Isotopic and Plutonium-241
2002
Carbon-14 Activity in Various Matrices
2003
Carbon-14 and Tritium in Soils, Solids, and Biological Samples; Harvey
Oxidizer Method
2004
Cerium-141 and Cerium-144 by Radiochemical Separation
2005
Cesium-137 by Radiochemical Separation
2006
Iron-55 Activity in Various Matrices
2007
Gamma Emitting Radioisotope Analysis
2008
Gross Alpha and/or Gross Beta Activity in Various Matrices
2009
Gross Beta Minus Potassium-40 Activity in Urine and Fecal Samples
2010
Tritium and Carbon-14 Analysis by Liquid Scintillation
2011
Tritium Analysis in Drinking Water by Liquid Scintillation
2012
Radioiodine in Various Matrices
2013
Radionickel Activity in Various Matrices
2014
Phosphorus-32 Activity in Various Matrices
2015
Lead-210 Activity in Various Matrices
2016
Radium-226 Analysis in Various Matrices
2017
Total Radium in Water Samples
2018
Radiostrontium Analysis by Chemical Separation
2019
Radiostrontium Analysis by Ion Exchange
2020
Sulfur-35 Analysis
2021
Technetium-99 Analysis by Eichrom Resin Separation
2022
Total Uranium Analysis by KPA
2023
Compositing of Samples
2024
Dry Ashing of Environmental Samples
2025
Preparation and Standardization of Carrier Solutions
2026
Radioactive Reference Standard Solutions and Records
2027
Glassware Washing and Storage
2028
Moisture Content of Various Matrices
2029
Polonium-210 Activity in Various Matrices
2030
Promethium-147 Analysis
Page 9 of 32
Number
Title
Part 3
Instrument Procedures
3001
Calibration and Control of Gamma-Ray Spectrometers
3002
Calibration of Alpha Spectrometers
3003
Calibration and Control of Alpha and Beta Counting Instruments
3004
Calibration and Control of Liquid Scintillation Counters
3005
Calibration and Operation of pH Meters
3006
Balance Calibration and Check
3008
Negative Results Evaluation Policy
3009
Use and Maintenance of Mechanical Pipettors
3010
Microwave Digestion System Use and Maintenance
Part 4
Technical Procedures
4001
Not Used
4002
QC Checks on Data
4003
Sample Regent and Control
4004
Data Package Preparation and Reporting
4005
Blank, Spike, and Duplicate Controls
4006
Inter-Laboratory Comparison Study Process
4007
Method Basis and Initial Validation Process
4008
Not Used
4009
MDL Controls
4010
State Certification Process
4011
Accuracy, Precision, Efficiency, and Bias Controls and Data Quality Objectives
4012
Not Used
4013
Not Used
4014
Facility Operation and Control
4015
Documentation of Analytical Laboratory Logbooks (formerly 1002)
4016
Total Propagated Uncertainty (formerly 1004)
4017
LIMS Operation
4018
Instrument Calibration System
4019
Radioactive Reference Material Standards
Part 5
Miscellaneous Procedures
5001
Laboratory Hood Operations
5002
Operation and Maintenance of Deionized Water System
5003
Waste Management
5004
Acid Neutralization and Purification System Operation Procedure
Page 10 of 32
Part 6
LIMS
6001
LIMS Raw Data Processing and Reporting
6002
Software Development and/or Pilots of COTS Packages
6003
Software Change and Version Control
6004
Backup of Data and System Files
6005
Disaster Recovery Plan
6006
LIMS Hardware
6007
LIMS User Access
6008
LIMS Training
6009
LIMS Security
2.0
QUALITY SYSTEM
The TBE-ES QA system is designed to comply with multiple customer- and
regulatory agency-imposed specifications related to quality. This quality system
applies to all activities of TBE-ES that affect the quality of analyses performed by the
laboratory.
2.1
Policy
The TBE quality policy, given in Company Policy P-501, is “TBE will
continually improve our processes and effectiveness in providing products and
services that exceed our customer’s expectations.”
This policy is amplified by this Laboratory’s commitment, as attested to by the
title page signatures, to perform all work to good professional practices and to
deliver high quality services to our customers with full data integrity. (See Section
4.0 and Procedure 1005).
2.2
Quality System Structure
The Quality System is operated by the organizations described in Section 3.0
of this Manual. The Quality System is described in this Manual and in the
Procedures Manual, both of which are maintained by the QA Manager. Procedures
are divided into 6 sections – Administrative, Methods, Equipments, Technical,
Miscellaneous, and LIMS. This Manual is structured as shown in the Table of
Contents and refers to Procedures when applicable.
Cross references to the
various imposed quality specifications are contained in Appendices to this Manual.
2.3
Quality System Objectives
The Quality System is established to meet the objective of assuring all
operations are planned and executed in accordance with system requirements. The
Quality System also assures that performance evaluations are performed (see
Procedure 4006), and that appropriate verifications are performed (see Procedures
in the 1000 and 4000 series) to further assure compliance. Verification includes
Page 11 of 32
examination of final reports (prior to submittal to customers) to determine their
quality (see Procedure 4004).
To further these objectives, various in-process assessments of data, as well
as assessments of the system, via internal audits and management reviews, are
performed. Both internal experts and customer / regulatory agencies perform further
assessments of the system and compliance to requirements.
2.4
Personnel Orientation, Training, and Qualification
TBE provides indoctrination and training to employees and performs
proficiency evaluation of technical personnel. This effort is described in Section 4.0.
Page 12 of 32
3.0
ORGANIZATION, AUTHORITY, AND RESPONSIBILITY
TBE has established an effective organization for conducting laboratory
analyses at the Knoxville Environmental Services Laboratory.
The basic
organization is shown in Figure 3-1. Detail organization charts with names,
authorities, and responsibilities are given in Procedure 1002. Job descriptions are
given in Procedure 1006.
This organization provides clearly established Quality Assurance authorities,
duties, and functions. QA has the organizational freedom needed to:
(1)
Identify problems
(2)
Stop nonconforming work
(3)
Initiate investigations
(4)
Recommend corrective and preventive actions
(5)
Provide solutions or recommend solutions
(6)
Verify implementation of actions
All Laboratory personnel have the authority and resources to do their
assigned duties and have the freedom to act on problems. The QA personnel have
direct, independent access to Company management as shown in Figure 3-1.
Figure 3.1. Laboratory Organization
President
VP
Administration & QA
VP
Environmental
Product Assurance
Director
Lab QA Manager
Lab Operations
Manager
Program
Managers
Lab
Supervisor
Administration
Staff
Page 13 of 32
4.0 PERSONNEL ORIENTATION, DATA INTEGRITY, TRAINING, AND
QUALIFICATION
4.1
Orientation
All laboratory personnel must receive orientation to the quality program if their
work can affect quality. Orientation includes a brief review of customer- and
regulatory agency-imposed quality requirements, the structure of the QAM, and the
implementing procedures. The goal of orientation is to cover the nature and goals of
the QA program.
4.2
Data Integrity
The primary output of the Laboratory is data. Special emphasis and training
in data integrity is given to all personnel whose work provides or supports data
delivery. The Laboratory Data Integrity Procedure (Procedure 1005) describes
training, personnel attestations, and monitoring operations. Annual reviews are
required.
4.3
Training
The Quality Assurance Manager (QAM) maintains a training matrix indicating
which laboratory personnel need training in which specific Procedures. This matrix
is updated when personnel change or change assignments. All personnel are
trained per these requirements and procedures. This training program is described
in Procedure 1007. The assigned responsibilities for employees are described in
Procedure 1002 (See Section 3.0) on Organization and in Procedure 1006, Job
Descriptions. Refresher training or re-training is given annually as appropriate.
4.4
Qualification
Personnel are qualified as required by their job description. Management and
non-analysts are evaluated based on past experience, education, and
management’s assessment of their capabilities. Formal qualification is required of
analysts and related technical personnel who perform laboratory functions. Each
applicable person is given training and then formally evaluated by the Operations
Manager (or his designees) and by QA. Each analyst must initially demonstrate
capability to perform each assigned analytical effort. Each year, thereafter, he or
she must perform similar analyses on Interlab Comparison Samples (see Procedure
4006) or on equivalent blanks and spikes samples. Acceptable results extend
qualifications (certification). Unacceptable results require retraining in the subject
method / Procedures. (See Procedure 1007 for added information, records, forms,
etc. used.)
4.5
Records
Records of training subjects, contents, attendees, instructors, and
certifications are maintained by QA.
Page 14 of 32
5.0
CUSTOMER INTERFACES
5.1
Interface Personnel
The Laboratory has designated Program Managers as the primary interface
with all customers. Other interfaces may be the QA Manager or the Lab Operations
Manager.
5.2
Bid Requests and Tenders
The Program Managers respond to customer requests for bids and proposals
per Procedure 1014 for bids, proposals, and contract reviews. They clarify customer
requests so both the customer and the lab staff understand requests. As responses
are developed, internal reviews are conducted to ensure that requirements are
adequately defined and documented and to verify that the Laboratory has adequate
resources in physical capabilities, personal skills, and technical information to
perform the work. Accreditation needs are reviewed. If subcontracts are required to
perform any analysis, the subcontractor is similarly evaluated and the client notified
in writing of the effort. Most qualifications are routine with standard pricing and the
review of these quotes is performed by the Program Manager. Larger or more
complex quotes are reviewed by the Operations Manager and the QA Manager (or
designees). Evidence of review is by initialing and dating applicable papers,
signatures on quotations, or by memo.
5.3
Contracts
The Program Manager’s receive contract awards (oral or written) and
generate the work planning for initiation preparation (charge numbers, data structure
or contents in LIMS, etc.). They review contracts for possible differences from
quotations and, if acceptable, contracts are processed. Documentation of the review
is by initials and date as a minimum. Contract changes receive similar reviews and
planning.
5.4
TBE’s Expectation of Customers
TBE expects customers to provide samples suitable for lab analysis. These
expectations include:
Accurate and unambiguous identification of samples
Proper collection and preservation of samples
Use of appropriate containers free from external and internal
contamination
Integrity preservation during shipment and timely delivery of samples that
are age sensitive
Adequate sized samples that allow for retest, if needed
Specification of unique MOA/MDC requirements
Alerting the lab about abnormal samples (high activity, different chemical
contents, etc.)
Chain of custody initiation, when required.
Page 15 of 32
5.5
Customer Satisfaction
TBE’s quality policy centers on customer satisfaction (See 2.0). TBE will
work to satisfy customers through full compliance with contract requirements,
providing accurate data and properly responding to any questions or complaints.
Customers are provided full cooperation in their monitoring of Laboratory
performance. Customers are notified if any applicable State Accreditation is
withdrawn, revoked, or suspended.
5.5.1 Customer Complaints
Any customer complaints are documented and tracked to closure. Most
complaints concern analysis data and are received by Program Managers. They
log each such complaint, order retests for verification, and provide documented
results to customers. Complaints may also be received by QA or Operations.
If complaints are other than re-test type, the nonconformance and corrective
action systems (Sections 12 and 13) are used to resolve them and record all actions
taken.
5.5.2 Customer Confidentiality
All laboratory personnel maintain confidentiality of customer-unique
information.
Page 16 of 32
6.0
DOCUMENTATION GENERATION & CONTROL
6.1
General
The documentation generation and control system is detailed in Procedure
1008. An overview is given below. The basic quality system documents are
described in Section 2.0.
6.2
New Documentation
Each Procedure and this QAM is written by appropriate personnel, validated if
applicable (see Section 7.0), reviewed for adequacy, completeness, and
correctness, and, if acceptable, accepted by the authorized approver [QA Manager,
Operations Manager (or their designee)]. Both approvals are required if a Procedure
affects both QA and Operations. (See Responsibilities in Section 3.0).
These
procedures control the quality measurements and their accuracy.
Each document carries a unique identification number, a revision level, dates,
page numbers and total page count, and approver identification and sign off. If TBE
writes code for software, the software is version identified and issued after
Verification and Validation per Section 7.0.
6.3
Documentation Changes
Each change is reviewed in the same manner and by the same people as
new documentation. Revision identifications are updated and changes indicated by
side bars, italicized words, or by revision description when practical. Obsolete
revisions are maintained by QA after being identified as obsolete.
6.4
Documentation Lists and Distributions
Computer indexes of documents are maintained by Quality showing the
current authorized revision level of each document. These revisions are placed on
the Laboratory server and obsolete ones are removed so that all personnel have
only the current documents. If hard copies are produced and distributed, separate
distribution lists are maintained indicating who has them and their revision level(s).
Copies downloaded off the server are uncontrolled unless verified by the user (on
the computer) to be the latest revision.
6.5
Other Documentation
In addition to TBE-generated documentation, QA maintains copies of
applicable specifications, regulations, and standard methods.
6.6
Documentation Reviews
Each issued document is reviewed at least every third year by the approving
personnel. This review determines continued suitability for use and compliance with
requirements.
Page 17 of 32
7.0
DESIGN OF LABORATORY CONTROLS
7.1
General
The Laboratory and its operating procedures are designed specifically for low
level (environmental and in-plant) radioactive sample analysis. The various aspects
of the laboratory design include the following which are discussed in subsequent
paragraphs of this Section:
(a) Facility
(b) Technical Processes and Methods
(c) Verification of Design of Processes, Methods, and Software.
(d) Design of Quality Controls
(e) Counting Instrument Controls
7.2
Facility
The facility was designed and built in 2000 to facilitate correct performance of
operations in accordance with good laboratory practices and regulatory
requirements. It provides security for operations and samples. It separates sample
storage areas based on activity levels, separates wet chemistry from counting
instrumentation for contamination control, and provides space and electronic
systems for documentation, analysis, and record storage. Procedure 4014 describes
the facility, room uses, layouts, etc.
7.3
Technical Processes and Methods
7.3.1 Operational Flow
The laboratory design provides for sample receipt and storage (including
special environmental provisions for perishable items) where samples are received
from clients and other labs (see Section 9.0). The samples are logged into the
computer based Laboratory Information Management System (LIMS) and receive
unique identification numbers and bar code labels. (See Procedure 4017 for LIMS
description and user procedures). The Program Managers then plan the work and
assure LIMS contains any special instructions to analysts. Samples then go to
sample preparation, wet chemistry (for chemical separation), and counting based on
the radionuclides. See Procedures in the 2000 and 3000 series. Analysts perform
the required tasks with data being entered into logbooks, LIMS, and counting
equipment data systems as appropriate. Results are collected and reviewed by the
Operations Manager and Program Managers and reports to clients are generated
(See Section 14.0). All records (electronic or hard copy) are maintained in files or in
back-up electronic copies (see Section 15.0). After the required hold periods and
client notification and approval, samples are disposed of in compliance with
regulatory requirements (see Procedures 5003 and 5004).
Page 18 of 32
7.3.2 Methods
The laboratory methods documented in the 2000 and 3000 series of
Procedures were primarily developed by senior TBE laboratory personnel based on
years of experience at our prior facility in New Jersey. They have been improved,
supplemented and implemented here. Where EPA or other accepted national
methods exist (primarily for water analyses under State certification programs - see
Procedure 4010), the TBE methods conform to the imposed requirements or State
accepted alternate requirements. Any method modifications are documented and
described in the Procedure. There are no nationally recognized methods for most
other analysis methods but references to other method documents are noted where
applicable.
7.3.3 Data Reduction and Analysis
Whenever possible automatic data capture and computerized data reduction
programs are used. Calculations are either performed using commercial software
(counting system operating systems) or TBE developed and validated software is
used (see 7.4 below). Analysis of reduced data is performed as described in Section
14.0 and Procedure 4004.
7.4
Verification of Technical Processes, Methods, and Software
7.4.1 Operational Flow Verification
The entire QA Manual and related procedures describe the verification of
elements of the technical process flow and the establishment of quality check points,
reviews, and controls.
7.4.2 Method Verifications
Methods are verified and validated per Procedure 4007 prior to use unless
otherwise agreed to by the client. For most TBE methods initial validation occurred
well in the past. New or significantly revised Methods receive initial validation by
demonstration of their performance using known analytes (NIST traceable) in
appropriate matrices. Sufficient samples are run to obtain statistical data that
provides evidence of process capability and control, establishes detection levels
(see procedure 4009), bias and precision data (see Procedure 4011). All method
procedures and validation data are available to respective clients. Also see Section
7.5 below for the Demonstration of Capability program.
7.4.3 Data Reduction and Analysis Verification
Data reduction and analysis verification is performed by personnel who did
not generate the data. (See Section 14.0).
7.5
Design of Quality Controls
Page 19 of 32
7.5.1 General
There are multiple quality controls designed into the laboratory operations.
Many of these are described elsewhere in this manual and include personnel
qualification (Section 4.0), Document control (6.0), Sample identification and control
(9.0), Use of reference standards (10.0), intra- and inter- laboratory tests (10.0), etc.
This Section describes the basic quality control systems used to verify Method
capability and performance.
7.5.2 Demonstration of Capability (D of C)
The demonstration of capability system verifies and documents that the
method, analyst, and the equipment can perform within acceptable limits. The D of C
is certified for each combination of analyte, method, and instrument type. D of C's
are certified based on objective evidence at least annually. This program is
combined with the analyst D of C program (See Section 4.0). Initial D of C's use the
method validation effort as covered above. Subsequent D of C's use Inter-
Laboratory samples (Procedure 4006) or, if necessary, laboratory generated
samples using NIST traceable standards. If results are outside of control limits, re-
demonstration is required after investigation and corrective action is accomplished
(See Sections 12.0 and 13.0)
7.5.3 Process Control Checks
Process control checks are designed to include Inter-Lab samples, Intra-lab
QC check samples, and customer provided check samples. 10% of laboratory
analysis samples are for process control purposes.
7.5.3.1 Inter- Lab Samples.
Inter-lab samples are procured or
obtained from sources providing analytes of interest in matrices similar to normal
client samples. These samples may be used for Demonstration of Capability of
analyst's, equipment and methods. They also provide for independent insight into
the lab's process capabilities. Any value reported as being in the warning zone (over
2 sigma) is reviewed and improvements taken. Any value failing (over 3 sigma) is
documented on an NCR and formal investigation per Section 12.0 and 13.0 is
performed. If root causes are not clearly understood and fixed, re-tests are required
using lab prepared samples (See Procedure 4006).
7.5.3.2 QC Samples.
QC samples, along with Inter-lab samples and
customer check samples, are 10% of the annual lab workload for the applicable
analyte and method. If batch processing is used, some specifications require specific
checks with each batch or each day rather than as continuous process controls.
(See Procedure 4005)
QC samples consist of multiple types of samples including:
(a) Method blanks
(b) Blank spikes
(c) Matrix spikes
Page 20 of 32
(d) Duplicates
(e) Tracers and carriers
Acceptance limits for these samples are given in Procedures or in lab
standards. The number, frequency, and use of these sample types varies with the
method, matrix, and supplemental requirements. The patterns of use versus method
and the use of the resulting test data is described in Procedure 4005.
7.5.3.3 Customer Provided Check Samples.
Customers may
provide blind check samples and duplicates to aid in their evaluation of the
Laboratory. When the lab is notified that samples are check samples their results are
included in the QC sample percentage counts. Any reported problems are treated as
formal complaints and investigated per Section 5.
7.6
Counting Instrument Controls
The calibration of instruments is their primary control and is described in
Section 11.0. In addition, counting procedures (3000 series) also specify use of
background checks (method blank data is not used for this) to evaluate possible
counting equipment contamination. Instrument calibration checks using a lab
standard from a different source than the one used for calibration are also used.
Background data can be used to adjust client and test data. Checks with lab
standards indicate potential calibration changes.
Page 21 of 32
8.0
PURCHASING AND SUBCONTRACT CONTROLS
8.1
General
Procurement and Subcontracts efforts use the Huntsville-based Cost Point
computer system to process orders.
The Laboratory-generated Purchase
Requisitions are electronically copied into Purchase Orders in Huntsville. The
Laboratory also specifies sources to be used. Procured items and services are
received at the Laboratory where receiving checks and inspections are made.
Laboratory Procedure 1015 provides details on the procurement control system at
the Laboratory and references the Huntsville procedures as applicable.
8.2
Source Selection
Sources for procurements of items and services are evaluated and approved
by QA as described in Procedure 1015. Nationally recognized catalog item sources
are approved by the QA Manager based on reputation. Maintenance services by an
approved distributor or the equipment manufacturing company are pre-approved.
Sources for other services are evaluated by QA, based on service criticality to the
quality system, by phone, mail out, or site visit.
Subcontract sources for laboratory analysis services are only placed with
accredited laboratories (by NELAP, NUPIC, State, Client, etc.) as applicable for the
type of analysis to be performed. QA maintains lists of approved vendors and
records of evaluations performed.
8.3
Procurement of Supplies and Support Services
8.3.1 Catalog Supplies
The Laboratory procures reagents, processing chemicals, laboratory
“glassware,” consumables, and other catalog items from nationally known vendors
and to applicable laboratory grades, purities, concentrations, accuracy levels, etc.
Purchase Requisitions for these items specify catalog numbers or similar call-outs
for these off-the-shelf items. Requisitions are generated by the personnel in the lab
needing the item and are approved by the Operations or Production Manager.
Reagents are analytical reagent grade only.
8.3.2 Support Services
Purchase Requisitions for support services (such as balance
calibration, equipment maintenance, etc.) are processed as in 8.3.1 but technical
requirements are specified and reviewed before approvals are given.
Page 22 of 32
8.3.3 Equipment and Software
Purchase Requisitions for new equipment, software programs, and
major facility modifications affecting the quality system are reviewed and approved
by the Operations Manager and the QA Manager.
8.4
Subcontracting of Analytical Services
When necessary, the Laboratory may subcontract analytical services required
by a client. This may be because of special needs, infrequency of analysis, etc.
Applicable quality and regulatory requirements are imposed in the Purchase
Requisition and undergo a technical review by QA. TBE reserves the right of access
by TBE and our client for verification purposes.
8.5
Acceptance of Items or Services
Items and services affecting the quality system are verified at receipt based
on objective evidence supplied by the vendor. Supply items are reviewed by the
requisitioner and, if acceptable, are accepted via annotation on the vendor packing
list or similar document. Similarly, equipment services are accepted by the
requisitioning lab person. Calibration services are accepted by QA based on
certification reviews. (See Section 11.0.)
Data reports from analytical subcontractors are evaluated by Program
Managers and subsequently by the Operations Manager (or designee) as part of
client report reviews.
Items are not used until accepted and if items or services are rejected, QA is
notified and nonconformance controls per Section 12.0 are followed. Vendors may
be removed from the approved vendor’s list if their performance is unacceptable.
Page 23 of 32
9.0
TEST SAMPLE IDENTIFICATION AND CONTROL
9.1
Sample Identification
Incoming samples are inspected for customer identification, container
condition, chain of custody forms, and radioactivity levels. If acceptable, the sample
information is entered into LIMS which generates bar coded labels for attachment to
the sample(s). The labels are attached and samples stored in the assigned location.
If environmental controls are needed (refrigeration, freezing, etc.), the samples are
placed in these storage locations. If not acceptable, the Program Manager is
notified, the customer contacted, and the problem resolved (return of sample, added
data receipts, etc.). See Procedure 4003 for more information on sample receipt.
9.2
LIMS
The LIMS is used to schedule work, provide special information to analysts,
and record all actions taken on samples. See Procedure 4017 and the 6000 series
of procedures for more information on LIMS operations.
9.3
Sample Control
The sample, with its bar coded label, is logged out to the applicable lab
operation where the sample is processed per the applicable methods (Procedures
2000 and 3000). The LIMS-assigned numbers are used for identification through all
operations to record data. Data is entered into LIMS, log books (kept by the
analysts) or equipment data systems to record data. The combination of LIMS,
logbooks, and equipment data systems provide the Chain of Custody data and
document all actions taken on samples. Unused sample portions are returned to its
storage area for possible verification use. Samples are discarded after required time
limits are passed and after client notification and approval, if required.
Page 24 of 32
10.0 SPECIAL PROCESSES, INSPECTION, AND TEST
10.1 Special Processes
The Laboratory’s special processes are the methods used to analyze a
sample and control equipment. These methods are defined in Procedures in the
2000 and 3000 series. These processes are performed to the qualified methods
(see Section 7.0) by qualified people (see 4.0).
10.2 Inspections and Tests
The quality of the process is monitored by indirect means. This program
involves calibration checks on counting equipments (see Section 11.0), intra-
laboratory checks, and inter-laboratory checks. In addition, some customers submit
quality control check samples (blinds, duplicates, external reference standards). All
generated data gets independent reviews.
10.2.1 Intra Laboratory Checks (QC Checks)
The quantity and types of checks varies with the method, but basic checks
which may include blanks, spiked blanks, matrix spikes, matrix spike duplicates, and
duplicates are used as appropriate for customer samples. This process is described
in Procedure 4005 and in Section 7.0.
10.2.2 Inter Laboratory Checks
TBE participates in Inter-lab performance evaluation (check) programs with
multiple higher level labs. These programs provide blind matrices for the types of
matrix/analyte combinations routinely processed by the Lab, if available. This
program is described in Procedure 4006.
10.2.3 Data Reviews
Raw data and reports are reviewed by the Operations Manager, or
designees.
This review checks for data logic, expected results, procedure
compliance, etc. (See Section 14.0).
10.3 Control of Sampling of Samples
Samples for analysis are supplied by customers preferably in quantities
sufficient to allow re-verification analyses if needed. The samples are prepared for
analysis by analysts and then an aliquot (partial sample extraction) is taken from the
homogeneous customer sample for the initial analysis. Methods specify standard
volumes of sample material required. Sampling data is recorded in LIMS and/or
logbooks.
10.4 Reference Standards / Material
Page 25 of 32
10.4.1 Weights and Temperatures
Reference standards are used by the Laboratory’s calibration vendor to
calibrate the Labs working instruments measuring weights and thermometers.
10.4.2 Radioactive Materials
Reference radioactive standards, traceable to NIST, are procured from higher
level laboratories. These reference materials are maintained in the standards area
and are diluted down for use by laboratory analysts. All original and diluted volumes
are fully traceable to source, procedure, analyst, dilution, and acquisition dates. See
Section 11.0 and Procedure 1009.
Page 26 of 32
11.0 EQUIPMENT MAINTENANCE AND CALIBRATION
11.1 General
There are two types of equipment used by the Laboratory:
support
equipment (scales, glassware, weights, thermometers, etc.) and instruments for
counting. Standards traceable to NIST are used for calibration and are of the
needed accuracy for laboratory operations. Procedures 1009, 4018, and 4019
describe the calibration and maintenance programs.
11.2 Support Equipment
Analytical support equipment is purchased with the necessary accuracies and
appropriate calibration data. If needed, initial calibration by the Laboratory or its
calibration vendor is performed. Recalibration schedules are established and
equipment recalibrated by the scheduled date by a calibration vendor or by
Laboratory personnel. Maintenance is performed, as needed, per manufacturer’s
manuals or lab procedures.
In addition to calibrations and recalibrations, checks are made on the
continued accuracy of items as described in Procedure 1009. Records are
maintained of calibration and specified checks.
11.3 Instruments
Instruments receive initial calibration using radioactive sources traceable to
NIST. The initial calibration establishes statistical limits of variation that are used to
set control limits for future checks and recalibration. This process is described in
Procedure 4018. Instruments are maintained per Instrument Manual requirements.
Recalibrations are performed per the Procedure.
Between calibrations, check sources are used to assure no significant
changes have occurred in the calibration of items. Background checks are
performed to check for possible radioactive contamination. Background values are
used to adjust sample results. Hardware and software are safeguarded from
adjustments that could invalidate calibrations or results.
11.4 Nonconformances and Corrective Actions
If calibrations or checks indicate a problem, the nonconformance system
(Section 12.0) and corrective action system (Section 13.0) are initiated to document
the problem and its resolution. Equipment is promptly removed from service if
questionable.
Page 27 of 32
11.5 Records
Records of calibrations are maintained.
Calibration certificates from
calibration vendors are maintained by QA. Other calibration data and check data is
maintained in log books, LIMS, or instrument software as appropriate and as
described in Procedures 1009, 4018, and 4019.
Page 28 of 32
12.0 NONCONFORMANCE CONTROLS
12.1 General
The nonconformance control system is implemented whenever a
nonconforming condition on any aspect of Laboratory analysis, testing, or results
exist. The system takes graded actions based on the nature and severity of the
nonconformance. Nonconforming items or processes are controlled to prevent
inadvertent use. Nonconformances are documented and dispositioned. Notification
is made to affected organizations, including clients. Procedure 1010 describes the
procedures followed. Sample results are only reported after resolution.
12.2 Responsibility and Authority
Each Laboratory employee has the responsibility to report nonconformances
and the authority to stop performing nonconforming work or using nonconforming
equipment. Laboratory supervision can disposition and take corrective actions on
minor problems.
Any significant problem is documented by QA using the
Laboratory’s NCR system per Procedure 1010. QA conducts or assures the conduct
of cause analyses, disposition of items or data, and initiation of corrective action if
the nonconformance could recur.
12.3 10CFR21 Reporting
The QA Manager reviews NCRs for possible need of customer and/or NRC
notification per the requirements of 10CFR21. Procedure 1011 is followed in this
review and for any required reporting.
Page 29 of 32
13.0 CORRECTIVE AND PREVENTIVE ACTIONS
13.1 General
The Laboratory takes corrective actions on significant nonconformances (see
Section 12.0). It also initiates preventive and improvement actions per the Company
Quality Policy (see Section 2.0). The procedures for Corrective Action/Preventive
Action systems are contained in Procedure 1012.
13.2 Corrective Actions
Corrective actions are taken by Operations and Quality to promptly correct
significant conditions adverse to quality. The condition is identified and cause
analysis is performed to identify root causes. Solutions are evaluated and the
optimum one selected that will prevent recurrence, can be implemented by the
Laboratory, allows the Laboratory to meet its other goals, and is commensurate with
the significance of the problem. All steps are documented, action plans developed
for major efforts, and reports made to Management. QA verifies the implementation
effectiveness. Procedure 1012 provides instructions and designates authorities and
responsibilities.
13.3 Preventive Actions
Preventive actions are improvements intended to reduce the potential for
nonconformances. Possible preventive actions are developed from suggestions
from employees and from analysis of Laboratory technical and quality systems by
management. If preventive actions or improvements are selected for investigation,
the issues, investigation, recommendations, and implementation actions are
documented. Follow up verifies effectiveness.
Page 30 of 32
14.0 RESULTS ANALYSIS AND REPORTING
14.1 General
The Laboratory’s role is to provide measurement-based information to clients
that is technically valid, legally defensible, and of known quality.
14.2 Results Review
The results obtained from analytical efforts are collected and reviewed by the
Operations Manager and the Program Manager.
This review verifies the
reasonableness and consistency of the results. It includes review of sample and the
related QC activity data. Procedure 4002 describes the process. Any deficiencies
are corrected by re-analyses, recalculations, or corrective actions per Sections 12.0
and 13.0. Use of the LIMS with its automatic data loading features (see Procedure
4017) minimizes the possibility of transcription or calculation errors.
14.3 Reports
Reports range from simple results reporting to elaborate analytical reports
based on the client requirements and imposed specifications and standards. (See
Procedure 4004.) Reports present results accurately, clearly, unambiguously,
objectively, and as required by the applicable Method(s).
Reports include
reproduction restrictions, information on any deviations from methods, and any
needed data qualifiers based on QC data. If any data is supplied by analytical
subcontractors (see Section 8.0), it is clearly identified and attributed to that
Laboratory by either name or accreditation number.
If results are faxed or transmitted electronically, confidentiality statements are
included in case of receipt by other than the intended client.
Reports are approved by the Program Manager and Operations Manager and
record copies kept in file (See Section 15.0).
Page 31 of 32
15.0 RECORDS
15.1 General
The Laboratory collects generated data and information related to quality or
technical data and maintains them as records. Records are identified, prepared,
reviewed, placed in storage, and maintained as set forth in Procedure 1003.
15.2 Type of Records
All original observations, calculations, derived data, calibration data, and test
reports are included. In addition QA data such as audits, management reviews,
corrective and preventive actions, manuals, and procedures are included.
15.3 Storage and Retention
Records are stored in files after completion in the lab. Files are in specified
locations and under the control of custodians. Filing systems provide for retrieval.
Electronic files are kept on Company servers (with regular back up) or on media
stored in fireproof file cabinets. Records are kept in Laboratory files for at least 2
years after the last entry and then in Company files for another year as a minimum.
Some customers specify larger periods – up to 7 years – which is also met. Generic
records supporting multiple customers are kept for the longest applicable period.
15.4 Destruction or Disposal
Records may be destroyed after the retention period and after client
notification and acceptance, if required. If the Laboratory closes, records will go in to
company storage in Huntsville unless otherwise directed by customers. If the
Laboratory is sold, either the new owner will accept record ownership or the records
will go into Company storage as stated above.
Page 32 of 32
16.0 ASSESSMENTS
16.1 General
Assessments consist of internal audits and management reviews as set forth
in Procedure 1013.
16.2 Audits
Internal audits are planned, performed at least annually on all areas of the
quality system, and are performed by qualified people who are as independent as
possible from the activity audited.
(The Laboratory’s small size inhibits full
independence in some technical areas.) Audits are coordinated by the Quality
Manager who assures audit plans and checklists are generated and the results
documented. Reports include descriptions of any findings and provide the auditor’s
assessment of the effectiveness of the audited activity. Report data includes
personnel contacted.
Audit findings are reviewed with management and corrective actions agreed
to and scheduled. Follow up is performed by QA to verify accomplishment and
effectiveness of the corrective action.
16.3 Management Reviews
The Annual Quality Assurance Report, prepared for some clients, is the
Management Review vehicle. These reports cover audit results, corrective and
preventive actions, external assessments, and QC and inter-laboratory performance
checks. The report is reviewed with Management by the QA Manager for the
continued suitability of the Quality Program and its effectiveness. Any needed
improvements are defined, documented, and implemented. Follow ups are made to
verify implementation and effectiveness.
Revision 1
045136 (12) Braidwood Generating Station
APPENDIX D
LABORATORY ANALYTICAL REPORTS
L28597 1 of 111
L28597 2 of 111
L28597 3 of 111
L28597 4 of 111
L28597 5 of 111
L28597 6 of 111
L28597 7 of 111
L28597 8 of 111
L28597 9 of 111
L28597 10 of 111
L28597 11 of 111
L28597 12 of 111
L28597 13 of 111
L28597 14 of 111
L28597 15 of 111
L28597 16 of 111
L28597 17 of 111
L28597 18 of 111
L28597 19 of 111
L28597 20 of 111
L28597 21 of 111
L28597 22 of 111
L28597 23 of 111
L28597 24 of 111
L28597 25 of 111
L28597 26 of 111
L28597 27 of 111
L28597 28 of 111
L28597 29 of 111
L28597 30 of 111
L28597 31 of 111
L28597 32 of 111
L28597 33 of 111
L28597 34 of 111
L28597 35 of 111
L28597 36 of 111
L28597 37 of 111
L28597 38 of 111
L28597 39 of 111
L28597 40 of 111
L28597 41 of 111
L28597 42 of 111
L28597 43 of 111
L28597 44 of 111
L28597 45 of 111
L28597 46 of 111
L28597 47 of 111
L28597 48 of 111
L28597 49 of 111
L28597 50 of 111
L28597 51 of 111
L28597 52 of 111
L28597 53 of 111
L28597 54 of 111
L28597 55 of 111
L28597 56 of 111
L28597 57 of 111
L28597 58 of 111
L28597 59 of 111
L28597 60 of 111
L28597 61 of 111
L28597 62 of 111
L28597 63 of 111
L28597 64 of 111
L28597 65 of 111
L28597 66 of 111
L28597 67 of 111
L28597 68 of 111
L28597 69 of 111
L28597 70 of 111
L28597 71 of 111
L28597 72 of 111
L28597 73 of 111
L28597 74 of 111
L28597 75 of 111
L28597 76 of 111
L28597 77 of 111
L28597 78 of 111
L28597 79 of 111
L28597 80 of 111
L28597 81 of 111
L28597 82 of 111
L28597 83 of 111
L28597 84 of 111
L28597 85 of 111
L28597 86 of 111
L28597 87 of 111
L28597 88 of 111
L28597 89 of 111
L28597 90 of 111
L28597 91 of 111
L28597 92 of 111
L28597 93 of 111
L28597 94 of 111
L28597 95 of 111
L28597 96 of 111
L28597 97 of 111
L28597 98 of 111
L28597 99 of 111
L28597 100 of 111
L28597 101 of 111
L28597 102 of 111
L28597 103 of 111
L28597 104 of 111
L28597 105 of 111
L28597 106 of 111
L28597 107 of 111
L28597 108 of 111
L28597 109 of 111
L28597 110 of 111
L28597 111 of 111
L28609 1 of 158
L28609 2 of 158
L28609 3 of 158
L28609 4 of 158
L28609 5 of 158
L28609 6 of 158
L28609 7 of 158
L28609 8 of 158
L28609 9 of 158
L28609 10 of 158
L28609 11 of 158
L28609 12 of 158
L28609 13 of 158
L28609 14 of 158
L28609 15 of 158
L28609 16 of 158
L28609 17 of 158
L28609 18 of 158
L28609 19 of 158
L28609 20 of 158
L28609 21 of 158
L28609 22 of 158
L28609 23 of 158
L28609 24 of 158
L28609 25 of 158
L28609 26 of 158
L28609 27 of 158
L28609 28 of 158
L28609 29 of 158
L28609 30 of 158
L28609 31 of 158
L28609 32 of 158
L28609 33 of 158
L28609 34 of 158
L28609 35 of 158
L28609 36 of 158
L28609 37 of 158
L28609 38 of 158
L28609 39 of 158
L28609 40 of 158
L28609 41 of 158
L28609 42 of 158
L28609 43 of 158
L28609 44 of 158
L28609 45 of 158
L28609 46 of 158
L28609 47 of 158
L28609 48 of 158
L28609 49 of 158
L28609 50 of 158
L28609 51 of 158
L28609 52 of 158
L28609 53 of 158
L28609 54 of 158
L28609 55 of 158
L28609 56 of 158
L28609 57 of 158
L28609 58 of 158
L28609 59 of 158
L28609 60 of 158
L28609 61 of 158
L28609 62 of 158
L28609 63 of 158
L28609 64 of 158
L28609 65 of 158
L28609 66 of 158
L28609 67 of 158
L28609 68 of 158
L28609 69 of 158
L28609 70 of 158
L28609 71 of 158
L28609 72 of 158
L28609 73 of 158
L28609 74 of 158
L28609 75 of 158
L28609 76 of 158
L28609 77 of 158
L28609 78 of 158
L28609 79 of 158
L28609 80 of 158
L28609 81 of 158
L28609 82 of 158
L28609 83 of 158
L28609 84 of 158
L28609 85 of 158
L28609 86 of 158
L28609 87 of 158
L28609 88 of 158
L28609 89 of 158
L28609 90 of 158
L28609 91 of 158
L28609 92 of 158
L28609 93 of 158
L28609 94 of 158
L28609 95 of 158
L28609 96 of 158
L28609 97 of 158
L28609 98 of 158
L28609 99 of 158
L28609 100 of 158
L28609 101 of 158
L28609 102 of 158
L28609 103 of 158
L28609 104 of 158
L28609 105 of 158
L28609 106 of 158
L28609 107 of 158
L28609 108 of 158
L28609 109 of 158
L28609 110 of 158
L28609 111 of 158
L28609 112 of 158
L28609 113 of 158
L28609 114 of 158
L28609 115 of 158
L28609 116 of 158
L28609 117 of 158
L28609 118 of 158
L28609 119 of 158
L28609 120 of 158
L28609 121 of 158
L28609 122 of 158
L28609 123 of 158
L28609 124 of 158
L28609 125 of 158
L28609 126 of 158
L28609 127 of 158
L28609 128 of 158
L28609 129 of 158
L28609 130 of 158
L28609 131 of 158
L28609 132 of 158
L28609 133 of 158
L28609 134 of 158
L28609 135 of 158
L28609 136 of 158
L28609 137 of 158
L28609 138 of 158
L28609 139 of 158
L28609 140 of 158
L28609 141 of 158
L28609 142 of 158
L28609 143 of 158
L28609 144 of 158
L28609 145 of 158
L28609 146 of 158
L28609 147 of 158
L28609 148 of 158
L28609 149 of 158
L28609 150 of 158
L28609 151 of 158
L28609 152 of 158
L28609 153 of 158
L28609 154 of 158
L28609 155 of 158
L28609 156 of 158
L28609 157 of 158
L28609 158 of 158
L28671 1 of 123
L28671 2 of 123
L28671 3 of 123
L28671 4 of 123
L28671 5 of 123
L28671 6 of 123
L28671 7 of 123
L28671 8 of 123
L28671 9 of 123
L28671 10 of 123
L28671 11 of 123
L28671 12 of 123
L28671 13 of 123
L28671 14 of 123
L28671 15 of 123
L28671 16 of 123
L28671 17 of 123
L28671 18 of 123
L28671 19 of 123
L28671 20 of 123
L28671 21 of 123
L28671 22 of 123
L28671 23 of 123
L28671 24 of 123
L28671 25 of 123
L28671 26 of 123
L28671 27 of 123
L28671 28 of 123
L28671 29 of 123
L28671 30 of 123
L28671 31 of 123
L28671 32 of 123
L28671 33 of 123
L28671 34 of 123
L28671 35 of 123
L28671 36 of 123
L28671 37 of 123
L28671 38 of 123
L28671 39 of 123
L28671 40 of 123
L28671 41 of 123
L28671 42 of 123
L28671 43 of 123
L28671 44 of 123
L28671 45 of 123
L28671 46 of 123
L28671 47 of 123
L28671 48 of 123
L28671 49 of 123
L28671 50 of 123
L28671 51 of 123
L28671 52 of 123
L28671 53 of 123
L28671 54 of 123
L28671 55 of 123
L28671 56 of 123
L28671 57 of 123
L28671 58 of 123
L28671 59 of 123
L28671 60 of 123
L28671 61 of 123
L28671 62 of 123
L28671 63 of 123
L28671 64 of 123
L28671 65 of 123
L28671 66 of 123
L28671 67 of 123
L28671 68 of 123
L28671 69 of 123
L28671 70 of 123
L28671 71 of 123
L28671 72 of 123
L28671 73 of 123
L28671 74 of 123
L28671 75 of 123
L28671 76 of 123
L28671 77 of 123
L28671 78 of 123
L28671 79 of 123
L28671 80 of 123
L28671 81 of 123
L28671 82 of 123
L28671 83 of 123
L28671 84 of 123
L28671 85 of 123
L28671 86 of 123
L28671 87 of 123
L28671 88 of 123
L28671 89 of 123
L28671 90 of 123
L28671 91 of 123
L28671 92 of 123
L28671 93 of 123
L28671 94 of 123
L28671 95 of 123
L28671 96 of 123
L28671 97 of 123
L28671 98 of 123
L28671 99 of 123
L28671 100 of 123
L28671 101 of 123
L28671 102 of 123
L28671 103 of 123
L28671 104 of 123
L28671 105 of 123
L28671 106 of 123
L28671 107 of 123
L28671 108 of 123
L28671 109 of 123
L28671 110 of 123
L28671 111 of 123
L28671 112 of 123
L28671 113 of 123
L28671 114 of 123
L28671 115 of 123
L28671 116 of 123
L28671 117 of 123
L28671 118 of 123
L28671 119 of 123
L28671 120 of 123
L28671 121 of 123
L28671 122 of 123
L28671 123 of 123
L28784 1 of 141
L28784 2 of 141
L28784 3 of 141
L28784 4 of 141
L28784 5 of 141
L28784 6 of 141
L28784 7 of 141
L28784 8 of 141
L28784 9 of 141
L28784 10 of 141
L28784 11 of 141
L28784 12 of 141
L28784 13 of 141
L28784 14 of 141
L28784 15 of 141
L28784 16 of 141
L28784 17 of 141
L28784 18 of 141
L28784 19 of 141
L28784 20 of 141
L28784 21 of 141
L28784 22 of 141
L28784 23 of 141
L28784 24 of 141
L28784 25 of 141
L28784 26 of 141
L28784 27 of 141
L28784 28 of 141
L28784 29 of 141
L28784 30 of 141
L28784 31 of 141
L28784 32 of 141
L28784 33 of 141
L28784 34 of 141
L28784 35 of 141
L28784 36 of 141
L28784 37 of 141
L28784 38 of 141
L28784 39 of 141
L28784 40 of 141
L28784 41 of 141
L28784 42 of 141
L28784 43 of 141
L28784 44 of 141
L28784 45 of 141
L28784 46 of 141
L28784 47 of 141
L28784 48 of 141
L28784 49 of 141
L28784 50 of 141
L28784 51 of 141
L28784 52 of 141
L28784 53 of 141
L28784 54 of 141
L28784 55 of 141
L28784 56 of 141
L28784 57 of 141
L28784 58 of 141
L28784 59 of 141
L28784 60 of 141
L28784 61 of 141
L28784 62 of 141
L28784 63 of 141
L28784 64 of 141
L28784 65 of 141
L28784 66 of 141
L28784 67 of 141
L28784 68 of 141
L28784 69 of 141
L28784 70 of 141
L28784 71 of 141
L28784 72 of 141
L28784 73 of 141
L28784 74 of 141
L28784 75 of 141
L28784 76 of 141
L28784 77 of 141
L28784 78 of 141
L28784 79 of 141
L28784 80 of 141
L28784 81 of 141
L28784 82 of 141
L28784 83 of 141
L28784 84 of 141
L28784 85 of 141
L28784 86 of 141
L28784 87 of 141
L28784 88 of 141
L28784 89 of 141
L28784 90 of 141
L28784 91 of 141
L28784 92 of 141
L28784 93 of 141
L28784 94 of 141
L28784 95 of 141
L28784 96 of 141
L28784 97 of 141
L28784 98 of 141
L28784 99 of 141
L28784 100 of 141
L28784 101 of 141
L28784 102 of 141
L28784 103 of 141
L28784 104 of 141
L28784 105 of 141
L28784 106 of 141
L28784 107 of 141
L28784 108 of 141
L28784 109 of 141
L28784 110 of 141
L28784 111 of 141
L28784 112 of 141
L28784 113 of 141
L28784 114 of 141
L28784 115 of 141
L28784 116 of 141
L28784 117 of 141
L28784 118 of 141
L28784 119 of 141
L28784 120 of 141
L28784 121 of 141
L28784 122 of 141
L28784 123 of 141
L28784 124 of 141
L28784 125 of 141
L28784 126 of 141
L28784 127 of 141
L28784 128 of 141
L28784 129 of 141
L28784 130 of 141
L28784 131 of 141
L28784 132 of 141
L28784 133 of 141
L28784 134 of 141
L28784 135 of 141
L28784 136 of 141
L28784 137 of 141
L28784 138 of 141
L28784 139 of 141
L28784 140 of 141
L28784 141 of 141
L29406 1 of 37
L29406 2 of 37
L29406 3 of 37
L29406 4 of 37
L29406 5 of 37
L29406 6 of 37
L29406 7 of 37
L29406 8 of 37
L29406 9 of 37
L29406 10 of 37
L29406 11 of 37
L29406 12 of 37
L29406 13 of 37
L29406 14 of 37
L29406 15 of 37
L29406 16 of 37
L29406 17 of 37
L29406 18 of 37
L29406 19 of 37
L29406 20 of 37
L29406 21 of 37
L29406 22 of 37
L29406 23 of 37
L29406 24 of 37
L29406 25 of 37
L29406 26 of 37
L29406 27 of 37
L29406 28 of 37
L29406 29 of 37
L29406 30 of 37
L29406 31 of 37
L29406 32 of 37
L29406 33 of 37
L29406 34 of 37
L29406 35 of 37
L29406 36 of 37
L29406 37 of 37
Revision 1
045136 (12) Braidwood Generating Station
APPENDIX E
DATA VALIDATION MEMORANDUM