Worldwide Engineering , Environmental , Construction , and IT Services
Revision 1
Certain figures in this Report contain sensitive, security-
related information protected from public disclosure by
Federal and State law. This Report is suitable for
public disclosure only after these figures are removed.
HYDROGEOLOGIC INVESTIGATION REPORT
FLEETWIDE ASSESSMENT
ZION STATION
ZION, ILLINOIS
Prepared For:
Exelon Generation Company, LLC
DISCLAIMER:
SOME FORMATTING CHANGES MAY HAVE OCCURRED WHEN
THE ORIGINAL DOCUMENT WAS PRINTED TO PDF; HOWEVER,
THE ORIGINAL CONTENT REMAINS UNCHANGED.
SEPTEMBER 2006
R
EF. NO. 045136 (22)
Prepared by:
Conestoga-Rovers
& Associates
651 Colby Drive
Waterloo, Ontario
Canada N2V 1C2
Office: (519) 884-0510
Fax:
(519) 884-0525
web: http:\\www.CRAworld.com
Revision 1
TABLE OF CONTENTS
Page
EXECUTIVE SUMMARY.................................................................................................................... i
1.0
INTRODUCTION ...................................................................................................................1
2.0
STATION DESCRIPTION .....................................................................................................2
2.1
STATION LOCATION .......................................................................................2
2.2
OVERVIEW OF COOLING WATER OPERATIONS.....................................2
2.3
SURROUNDING LAND USE ...........................................................................4
2.4
STATION SETTING............................................................................................5
2.4.1
TOPOGRAPHY AND SURFACE WATER FEATURES.................................5
2.4.2
GEOLOGY............................................................................................................6
2.4.3
HYDROGEOLOGY .............................................................................................7
2.5
AREA GROUNDWATER USE..........................................................................8
3.0
AREAS FOR FURTHER EVALUATION.............................................................................9
3.1
SYSTEMS EVALUATIONS................................................................................9
3.2
HISTORICAL RELEASES ................................................................................12
3.3
STATION INVESTIGATIONS.........................................................................12
3.3.1
PRE-OPERATIONAL RADIOLOGICAL
ENVIRONMENTAL MONITORING PROGRAM .......................................12
3.3.2
RADIOLOGICAL ENVIRONMENTAL MONITORING PROGRAM ......13
3.3.3
DEFUELED SAFETY ANALYSIS REPORT...................................................14
3.3.4
WISCONSIN DEPARTMENT OF HEALTH AND
FAMILY SERVICES MONITORING ..............................................................15
3.4
IDENTIFIED AREAS FOR FURTHER EVALUATION ...............................15
4.0
FIELD METHODS.................................................................................................................18
4.1
STAFF GAUGE INSTALLATION...................................................................18
4.2
GROUNDWATER MONITORING WELL INSTALLATION.....................18
4.3
GROUNDWATER MONITORING WELL DEVELOPMENT ....................20
4.4
SURVEY ..............................................................................................................21
4.5
GROUNDWATER AND SURFACE WATER
ELEVATION MEASUREMENTS....................................................................21
4.6
GROUNDWATER AND SURFACE WATER SAMPLE COLLECTION...22
4.7
DATA QUALITY OBJECTIVES.......................................................................24
4.8
SAMPLE IDENTIFICATION...........................................................................25
4.9
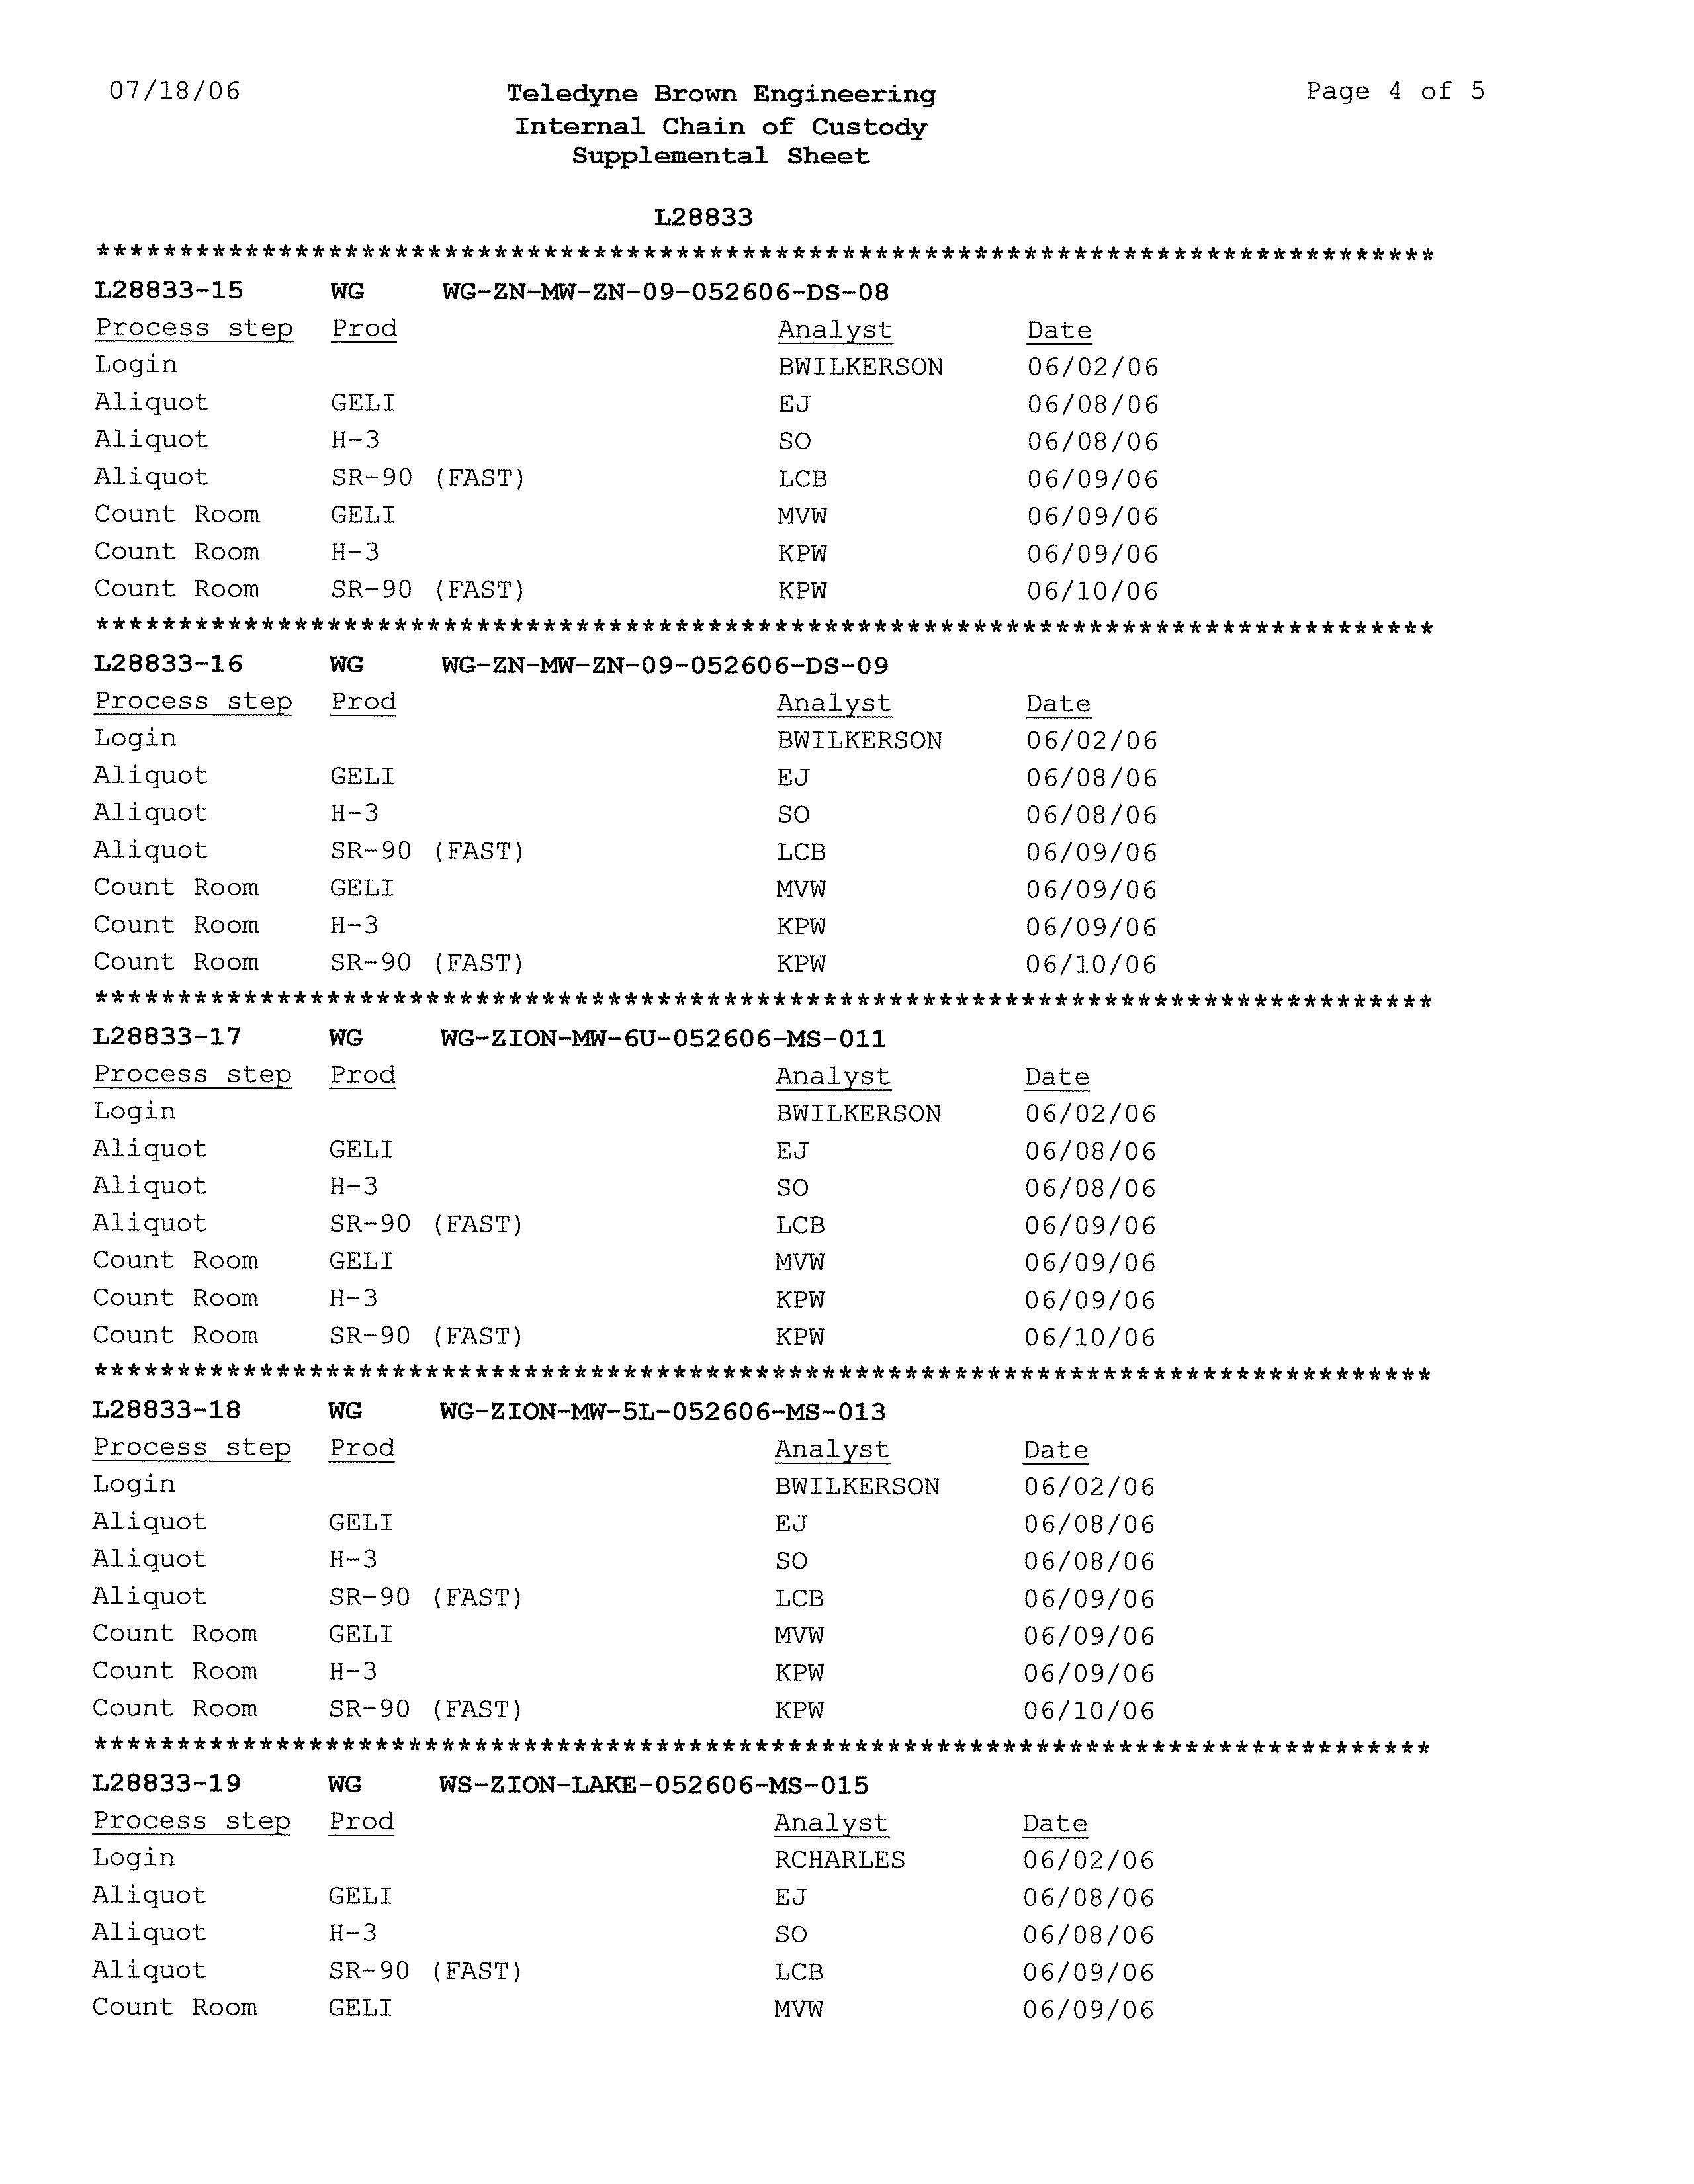
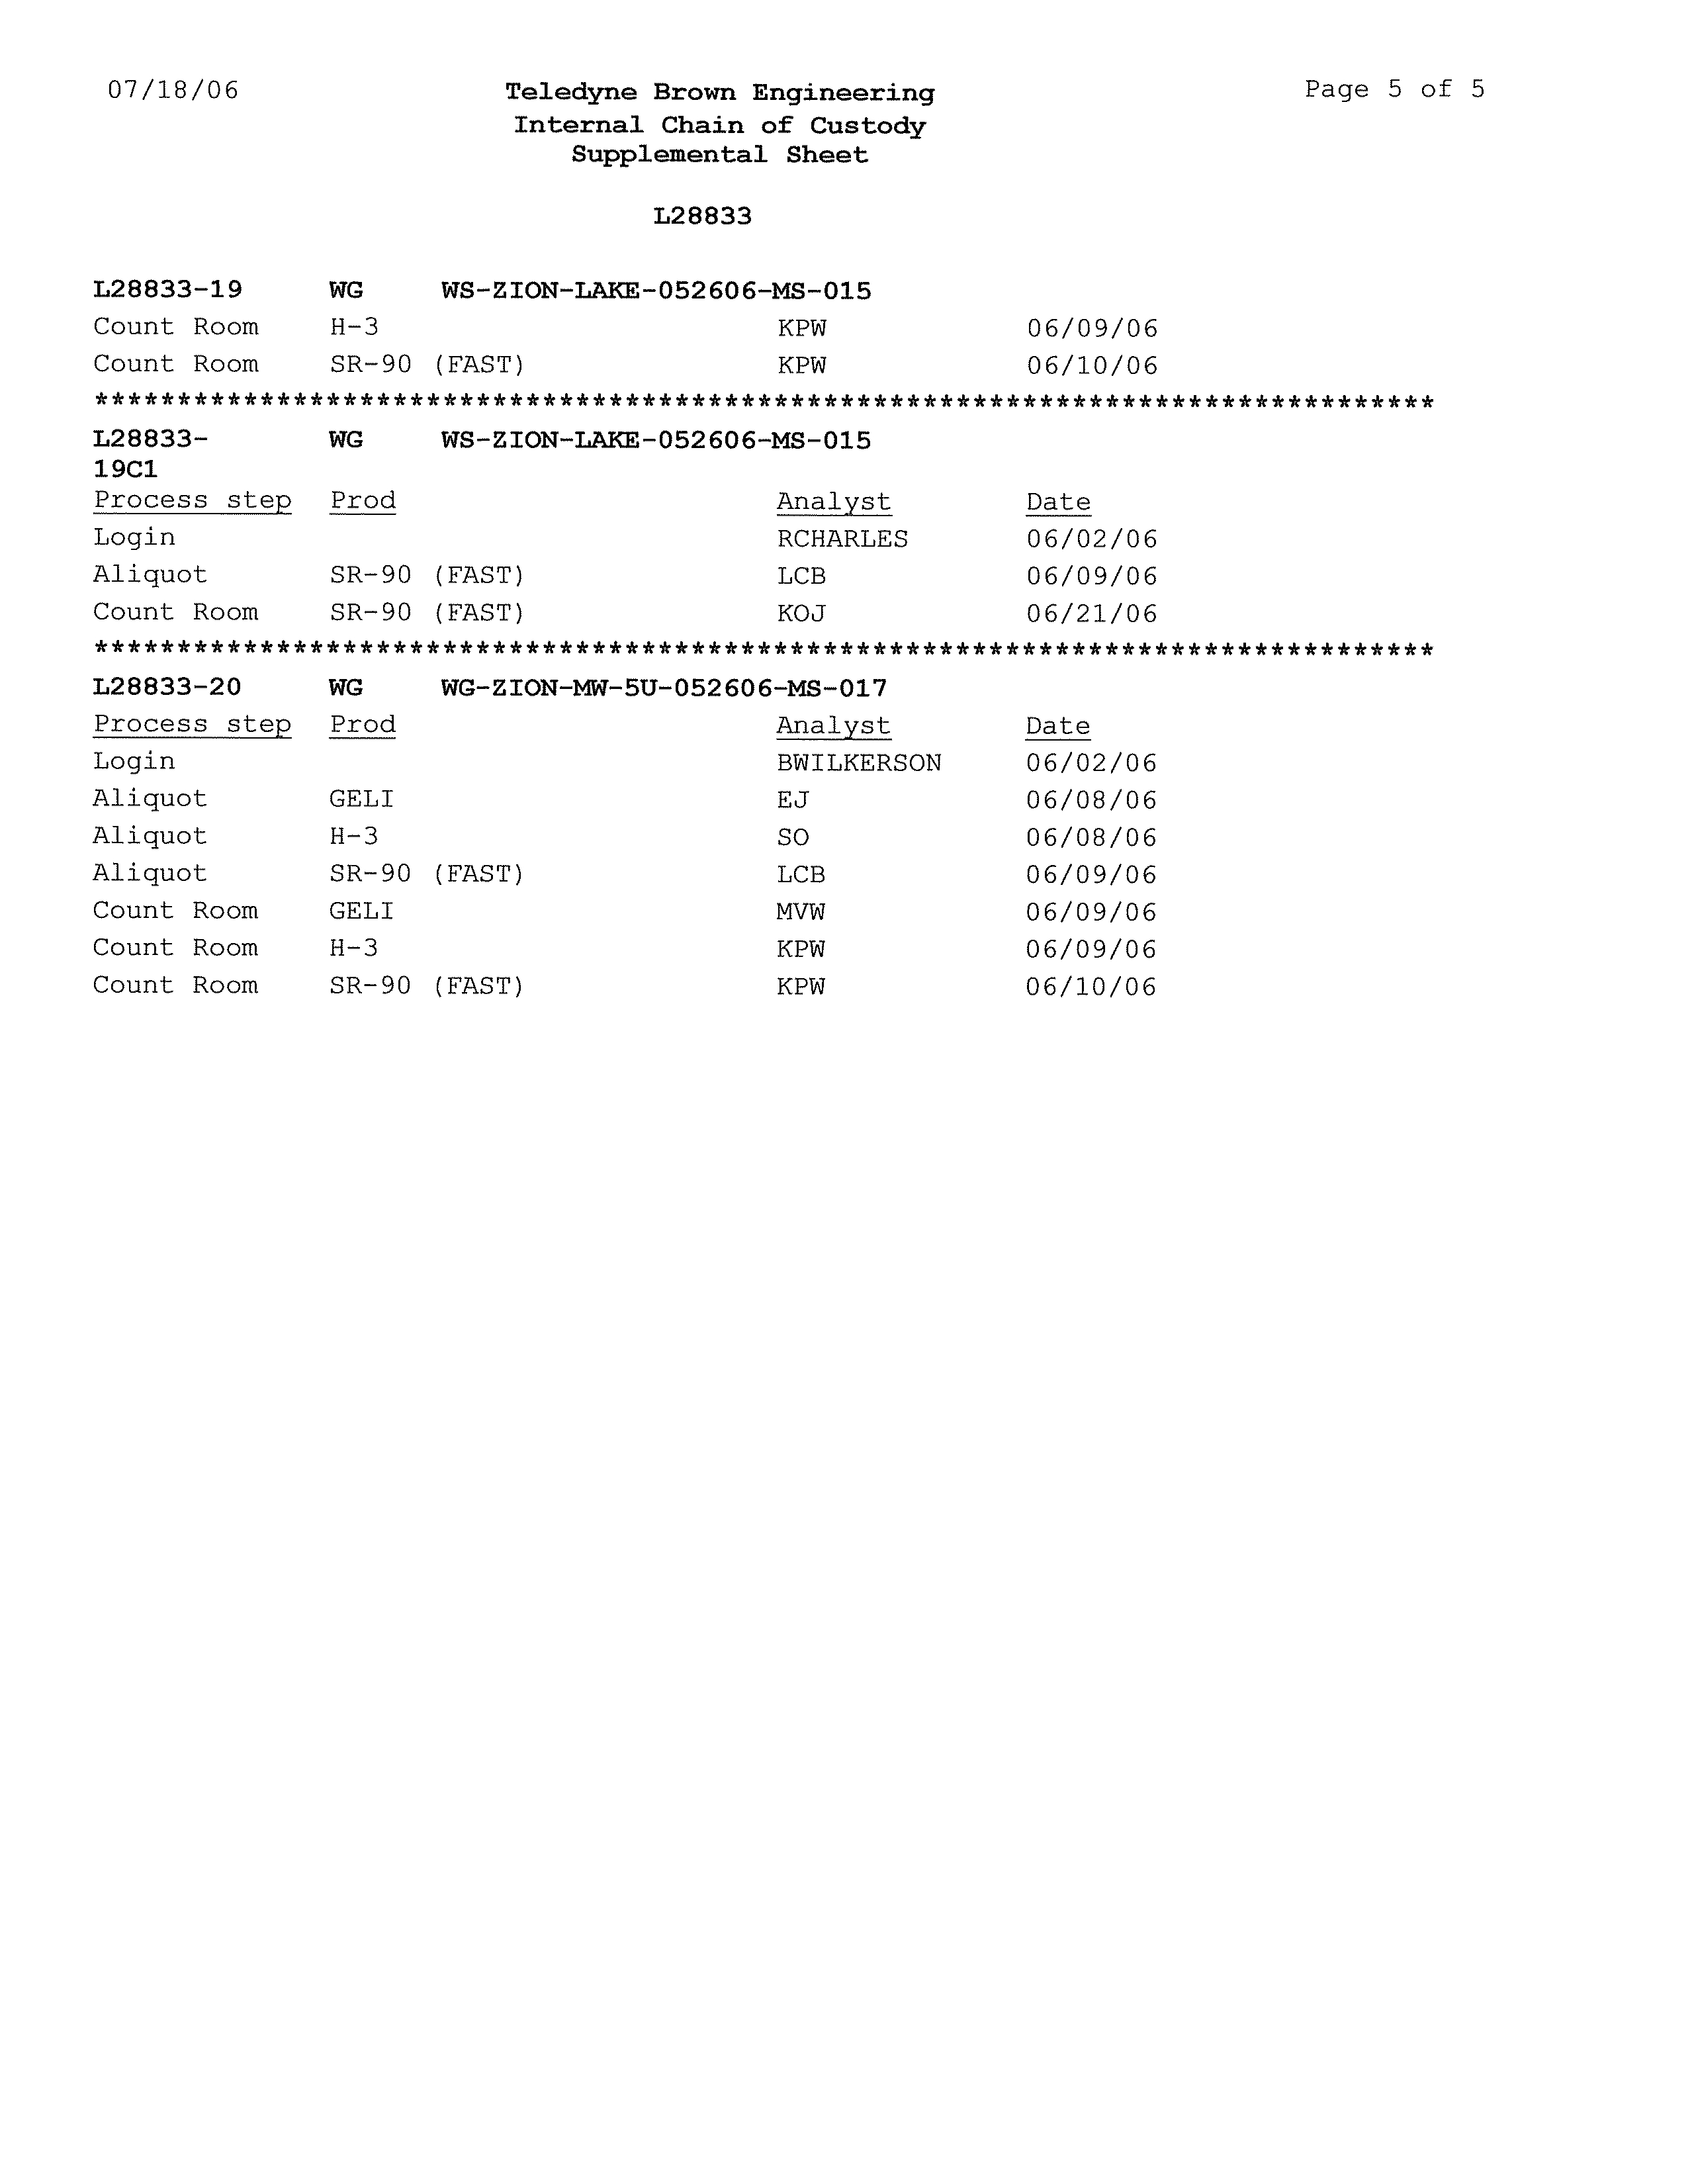
CHAIN-OF-CUSTODY RECORD...................................................................25
4.10
QUALITY CONTROL SAMPLES ...................................................................26
4.11
ANALYSES.........................................................................................................26
045136 (22) Zion Station
CONESTOGA-ROVERS & ASSOCIATES
Revision 1
TABLE OF CONTENTS
Page
5.0
RESULTS SUMMARY..........................................................................................................27
5.1
STATION GEOLOGY .......................................................................................27
5.2
STATION HYDROGEOLOGY ........................................................................29
5.2.1
GROUNDWATER FLOW DIRECTIONS ......................................................29
5.2.2
MAN-MADE INFLUENCES ON GROUNDWATER FLOW .....................29
5.2.3
VERTICAL HYDRAULIC GRADIENTS........................................................30
5.2.4
LATERAL GROUNDWATER FLOW AND VELOCITY.............................30
5.3
GROUNDWATER QUALITY..........................................................................31
5.3.1
SUMMARY OF BETA-EMITTING RADIONUCLIDES
ANALYTICAL RESULTS.................................................................................31
5.3.2
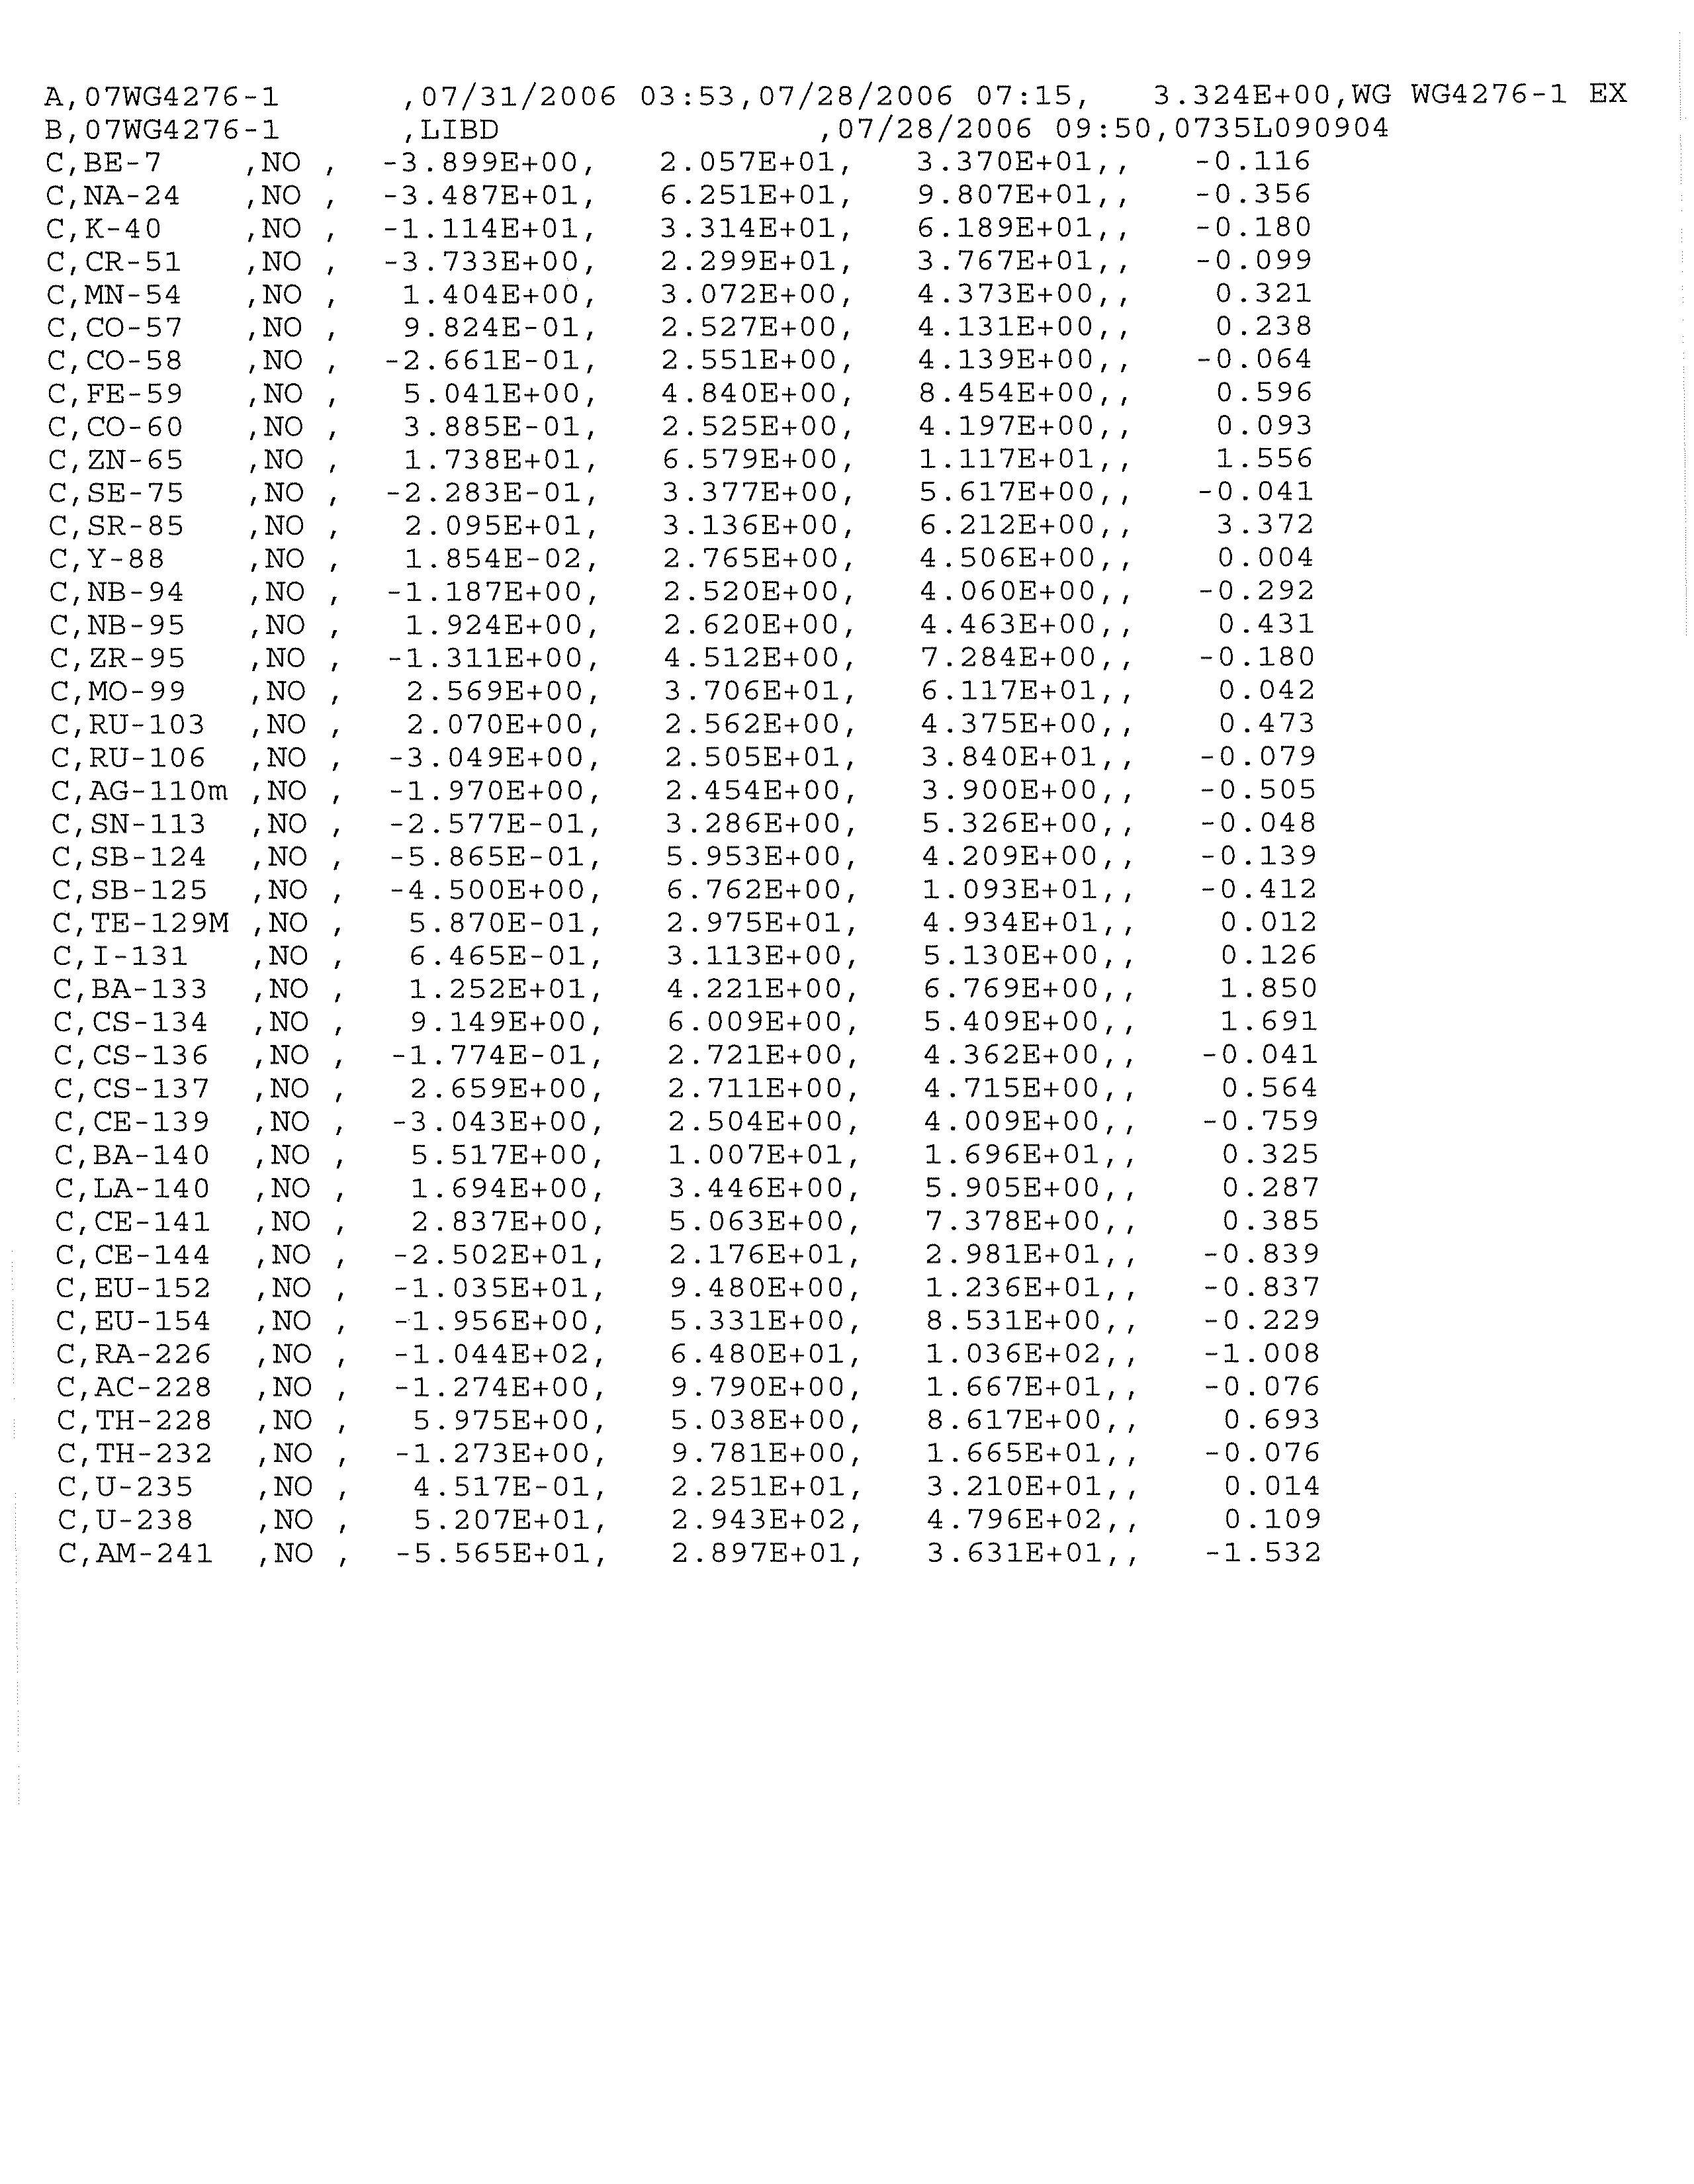
SUMMARY OF GAMMA-EMITTING RADIONUCLIDES
ANALYTICAL RESULTS.................................................................................32
5.3.3
SUMMARY OF FIELD MEASUREMENTS ...................................................32
5.4
SURFACE WATER QUALITY.........................................................................33
5.4.1
SUMMARY OF BETA-EMITTING RADIONUCLIDE
ANALYTICAL RESULTS.................................................................................33
5.4.2
SUMMARY OF GAMMA-EMITTING RADIONUCLIDES
ANALYTICAL RESULTS.................................................................................33
6.0
RADIONUCLIDES OF CONCERN AND SOURCE AREAS .........................................35
6.1
GAMMA-EMITTING RADIONUCLIDES.....................................................35
6.2
BETA-EMITTING RADIONUCLIDES ...........................................................35
6.3
TRITIUM.............................................................................................................35
6.3.1
GENERAL CHARACTERISTICS....................................................................35
6.3.2
DISTRIBUTION IN STATION GROUNDWATER.......................................36
6.3.3
CONCEPTUAL MODEL OF TRITIUM
RELEASE AND MIGRATION.........................................................................37
6.3.4
ATTENUATION OF TRITIUM WITHIN THE SHALLOW
GROUNDWATER SYSTEM ............................................................................37
7.0
EXPOSURE PATHWAY ASSESSMENT............................................................................39
7.1
HEALTH EFFECTS OF TRITIUM...................................................................39
7.2
BACKGROUND CONCENTRATIONS OF TRITIUM ................................40
7.2.1
GROUNDWATER.............................................................................................40
7.2.2
PRECIPITATION DATA..................................................................................40
7.2.3
SURFACE WATER DATA ...............................................................................41
7.2.4
DRINKING WATER DATA ............................................................................42
7.2.5
EXPECTED TRITIUM BACKGROUND FOR THE STATION ...................42
7.3
IDENTIFICATION OF POTENTIAL EXPOSURE
PATHWAYS AND POTENTIAL RECEPTORS ............................................43
7.3.1
POTENTIAL GROUNDWATER MIGRATION TO DRINKING
WATER USERS OFF THE STATION PROPERTY .......................................43
045136 (22) Zion Station
CONESTOGA-ROVERS & ASSOCIATES
Revision 1
TABLE OF CONTENTS
Page
7.3.2
POTENTIAL GROUNDWATER MIGRATION TO
SURFACE WATER USERS ..............................................................................44
7.4
SUMMARY OF POTENTIAL TRITIUM EXPOSURE PATHWAYS ..........44
7.5
OTHER RADIONUCLIDES.............................................................................45
8.0
CONCLUSIONS....................................................................................................................46
9.0
RECOMMENDATIONS.......................................................................................................49
9.1
DATA GAPS ......................................................................................................49
9.2
GROUNDWATER MONITORING ................................................................49
10.0
REFERENCES........................................................................................................................50
045136 (22) Zion Station
CONESTOGA-ROVERS & ASSOCIATES
Revision 1
LIST OF FIGURES
(Following Text)
FIGURE 1.1
STATION LOCATION MAP
FIGURE 1.2
STATION BOUNDARIES AND FEATURES
FIGURE 2.1
STATION SURFACE WATER FEATURES
FIGURE 2.2
REGIONAL STRATIGRAPHIC CROSS-SECTION
FIGURE 2.3
CROSS-SECTION OF THE ZION BEACH-RIDGE PLAIN
FIGURE 2.4
PRIVATE/PUBLIC WATER SUPPLY WELL LOCATIONS
FIGURE 3.1
AREAS FOR FURTHER EVALUATION
FIGURE 4.1
GROUNDWATER AND SURFACE WATER MONITORING LOCATIONS
FIGURE 5.1
STATION GEOLOGIC CROSS–SECTION LOCATION MAP
FIGURE 5.2
GEOLOGIC CROSS–SECTION A-A'
FIGURE 5.3
GEOLOGIC CROSS–SECTION B-B'
FIGURE 5.4
POTENTIOMETRIC SURFACE CONTOURS - MAY 2006 -
SHALLOW GROUNDWATER ZONE
FIGURE 5.5
POTENTIOMETRIC SURFACE CONTOURS - JULY 2006 -
SHALLOW GROUNDWATER ZONE
FIGURE 5.6
TRITIUM CONCENTRATIONS - GROUNDWATER AND
SURFACE WATER
FIGURE 5.7
RADIONUCLIDE CONCENTRATIONS - GROUNDWATER
AND SURFACE WATER
045136 (22) Zion Station
CONESTOGA-ROVERS & ASSOCIATES
Revision 1
LIST OF TABLES
(Following Text)
TABLE 4.1
SUMMARY OF MONITORING WELL INSTALLATION DETAILS
TABLE 4.2
SUMMARY OF MONITORING WELL DEVELOPMENT PARAMETERS
TABLE 4.3
SUMMARY OF GROUNDWATER AND SURFACE WATER ELEVATIONS
TABLE 4.4
SAMPLE KEY
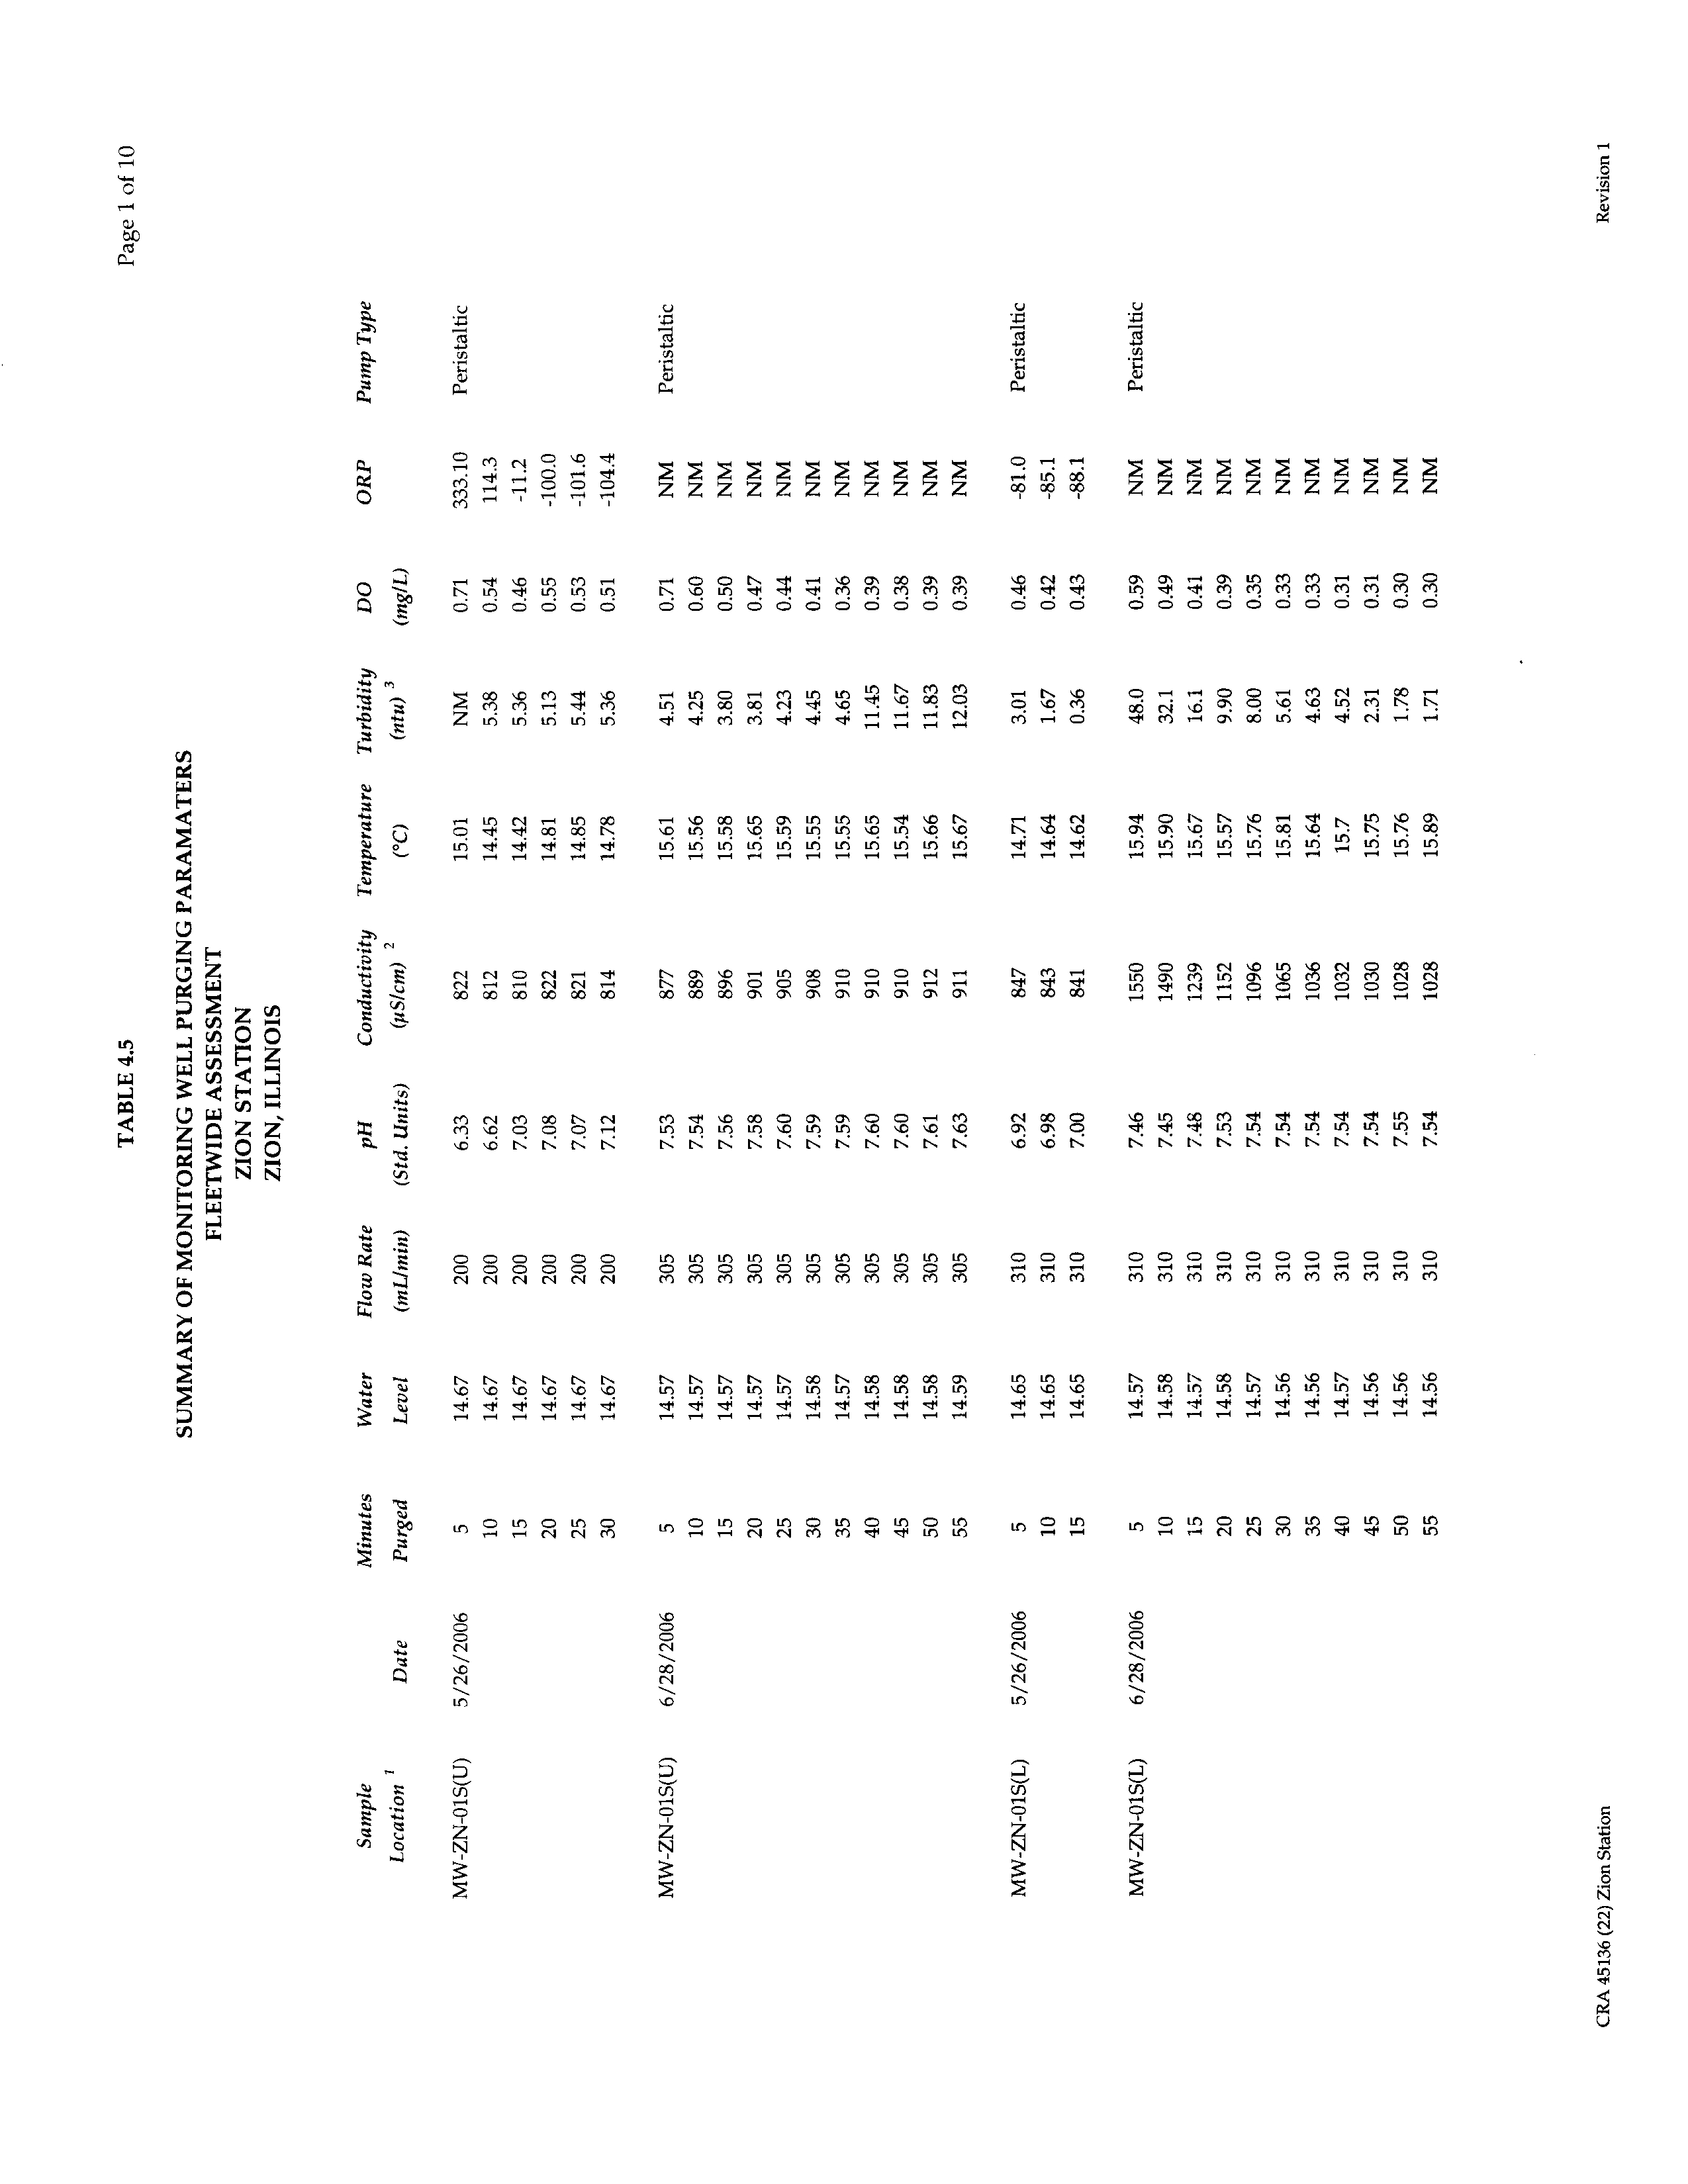
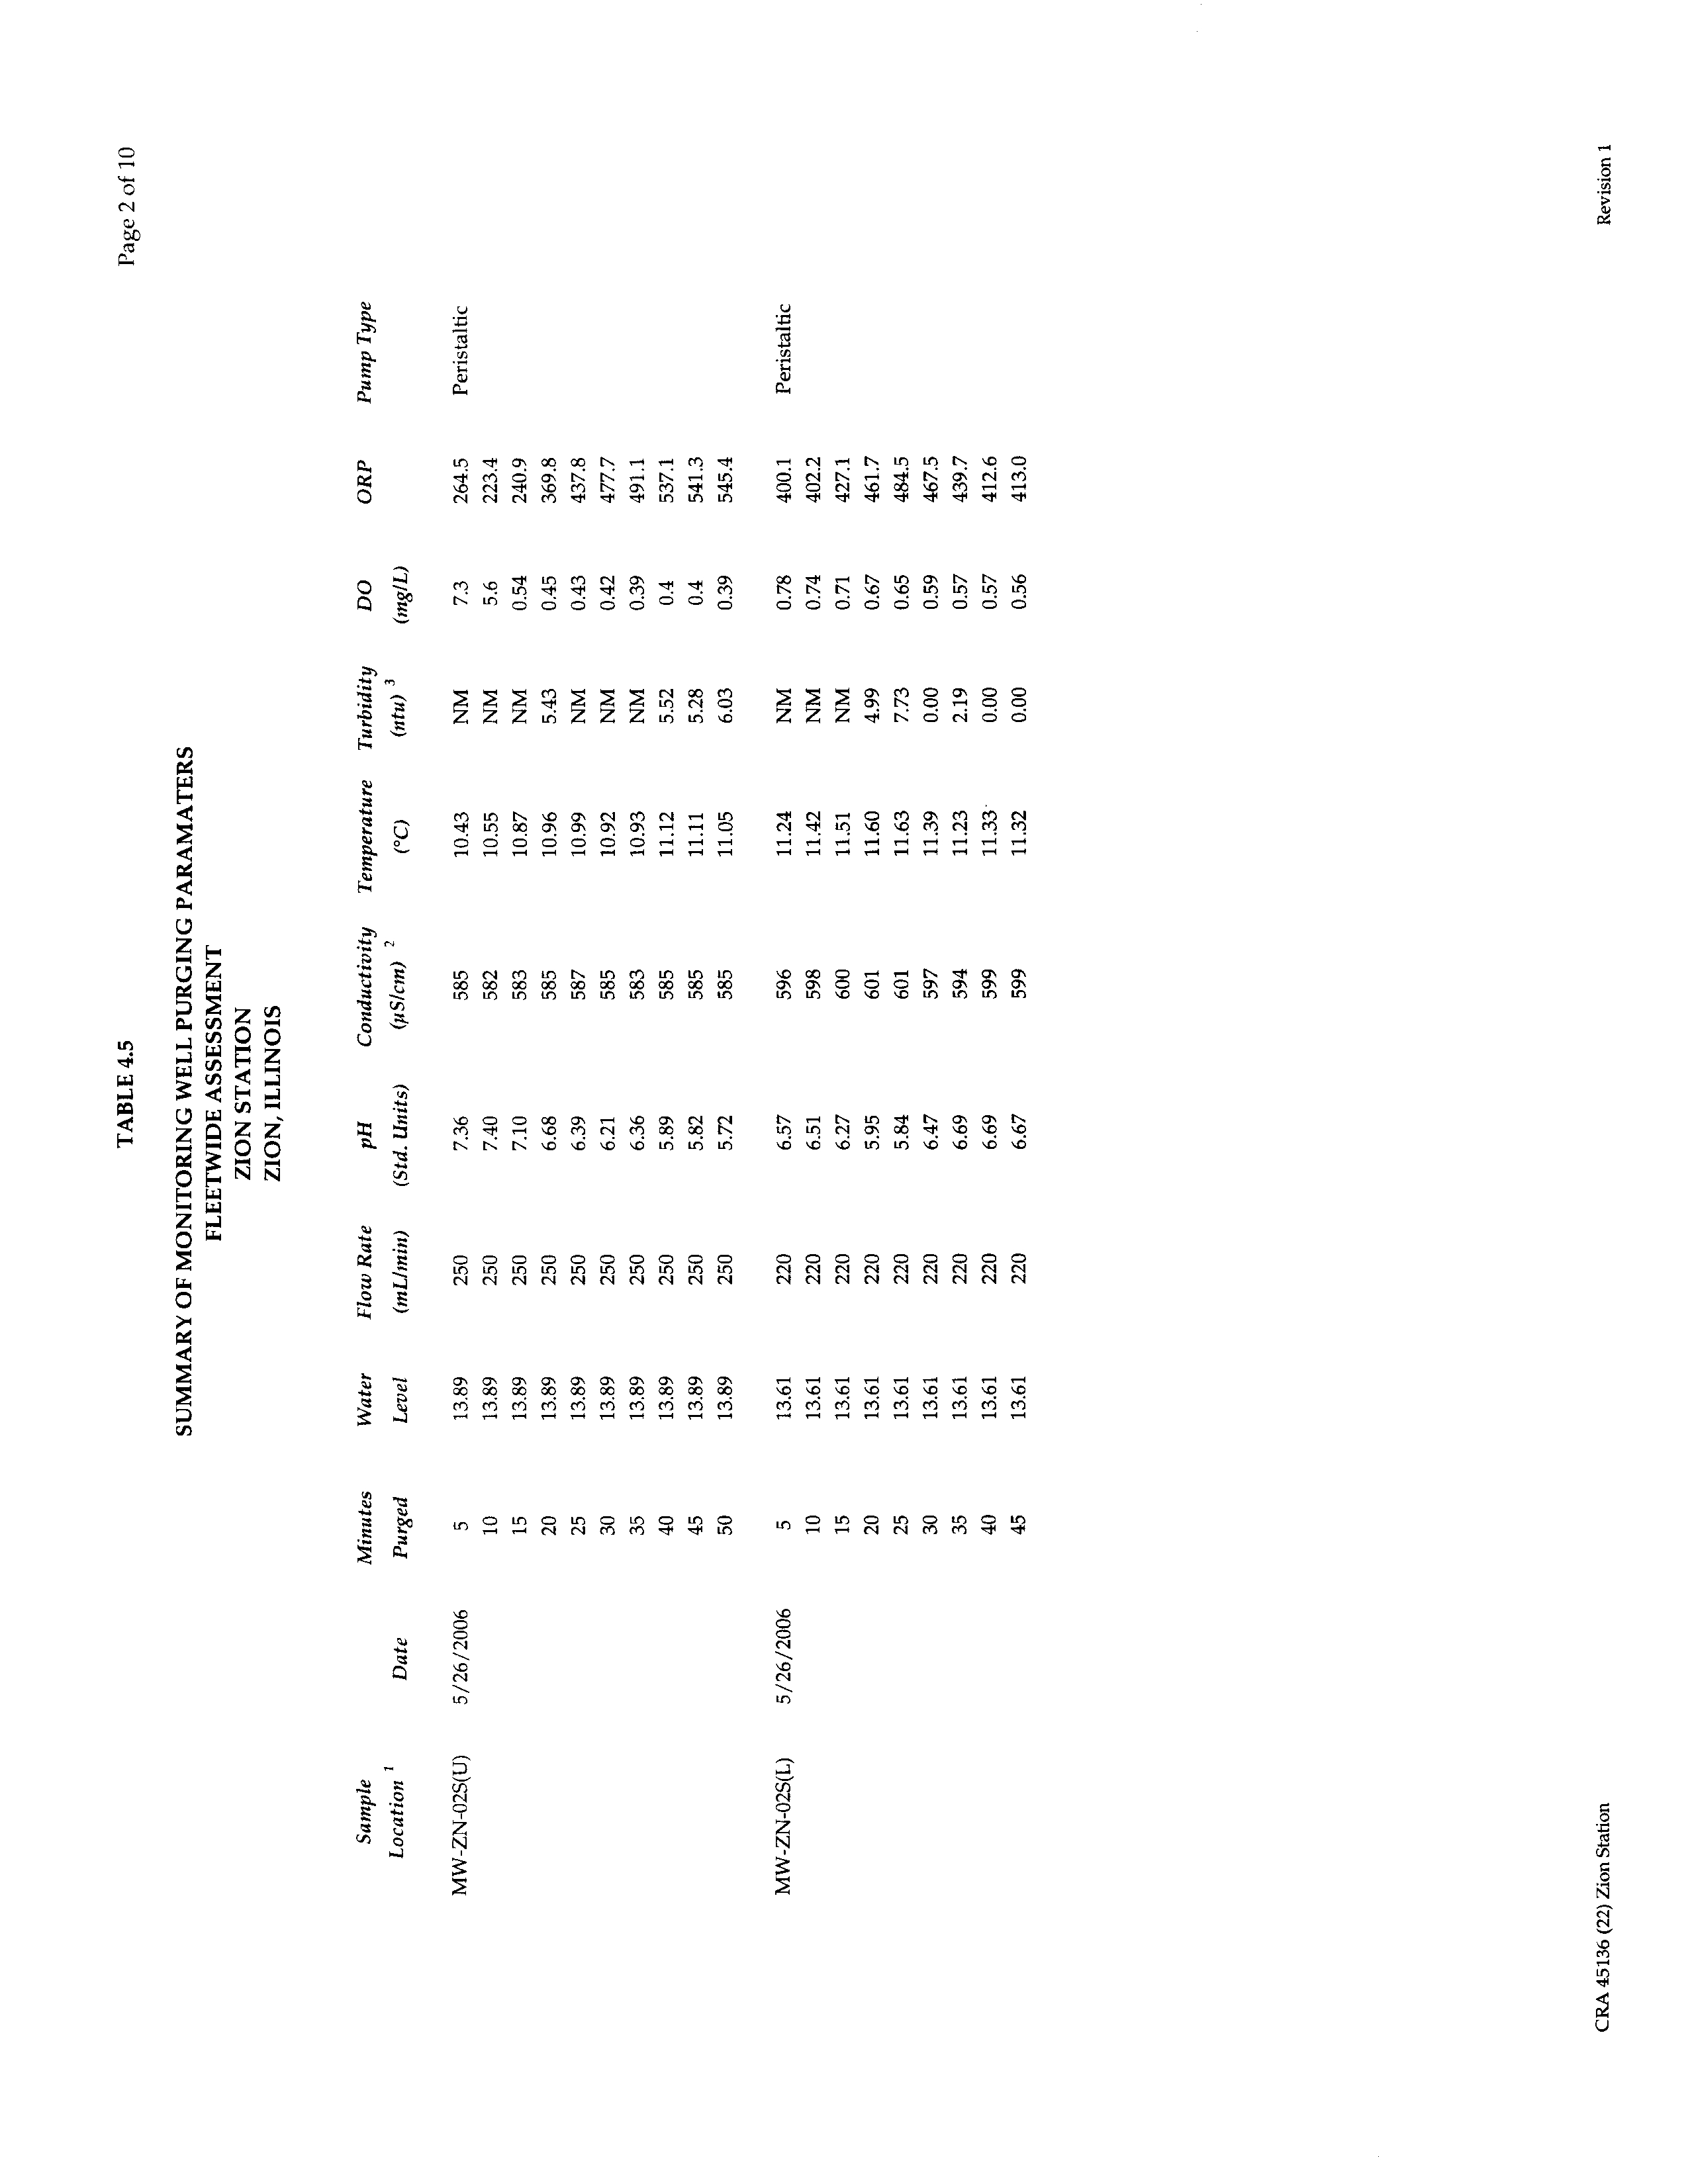
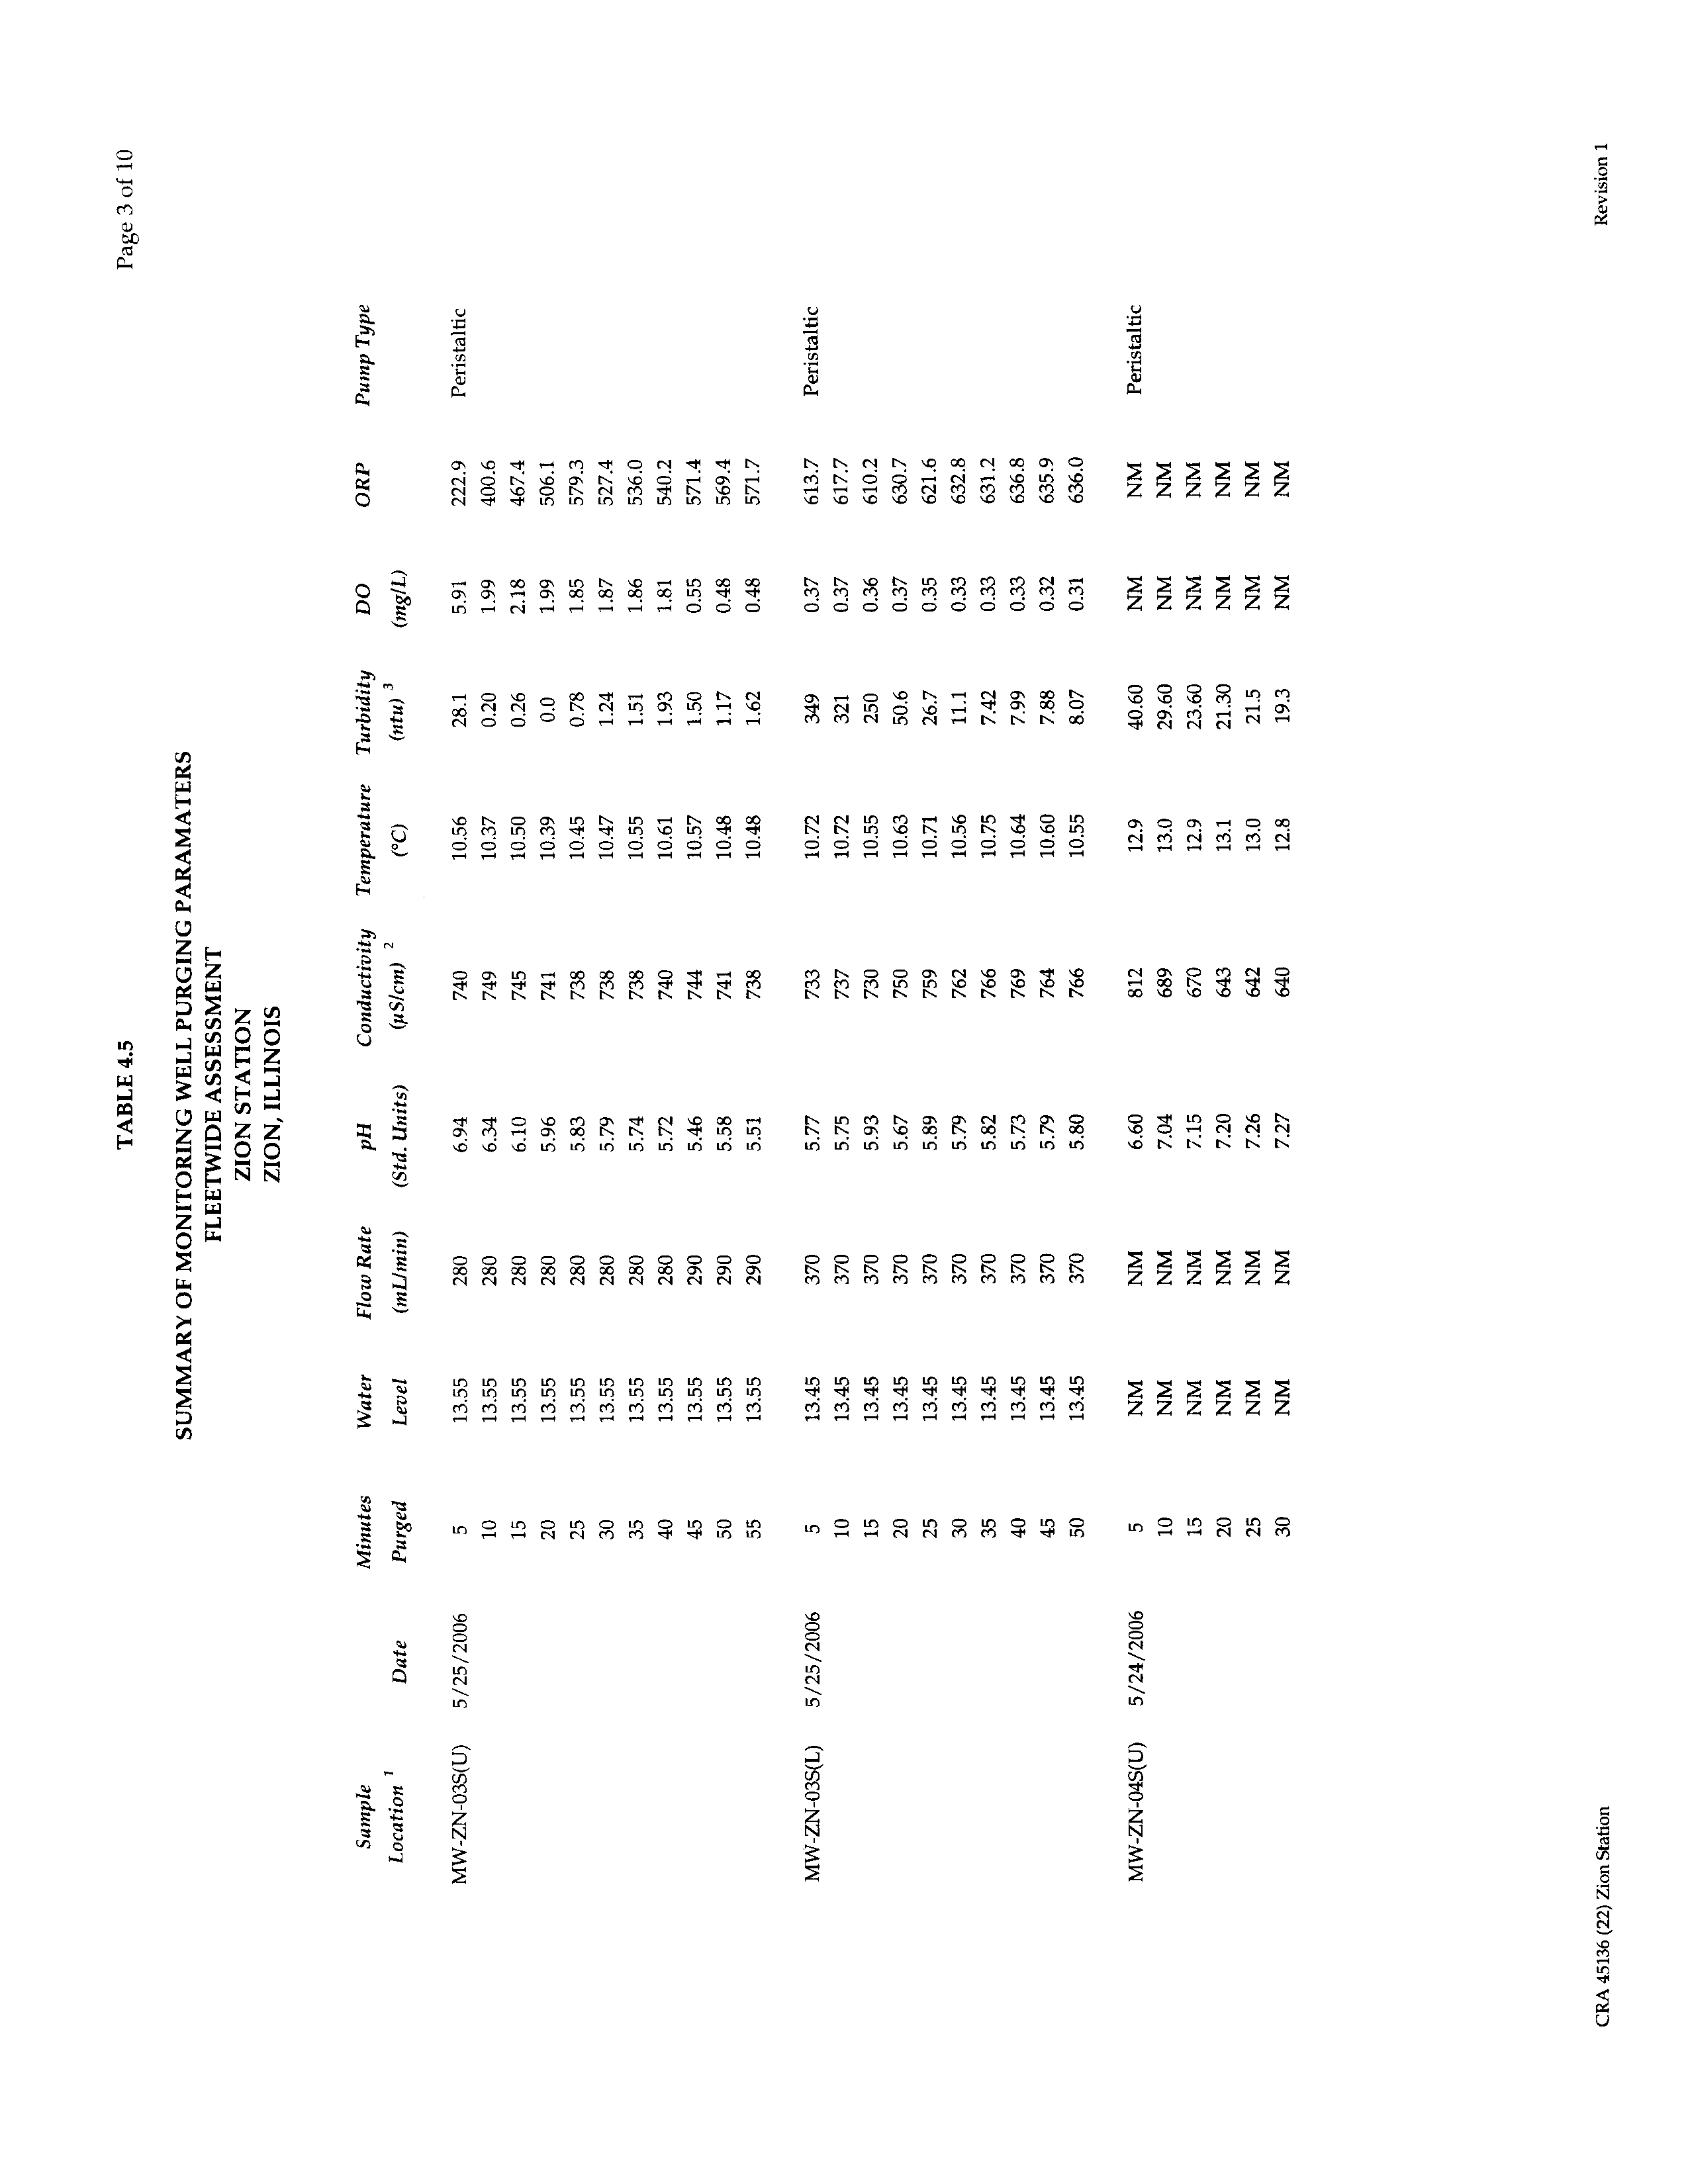
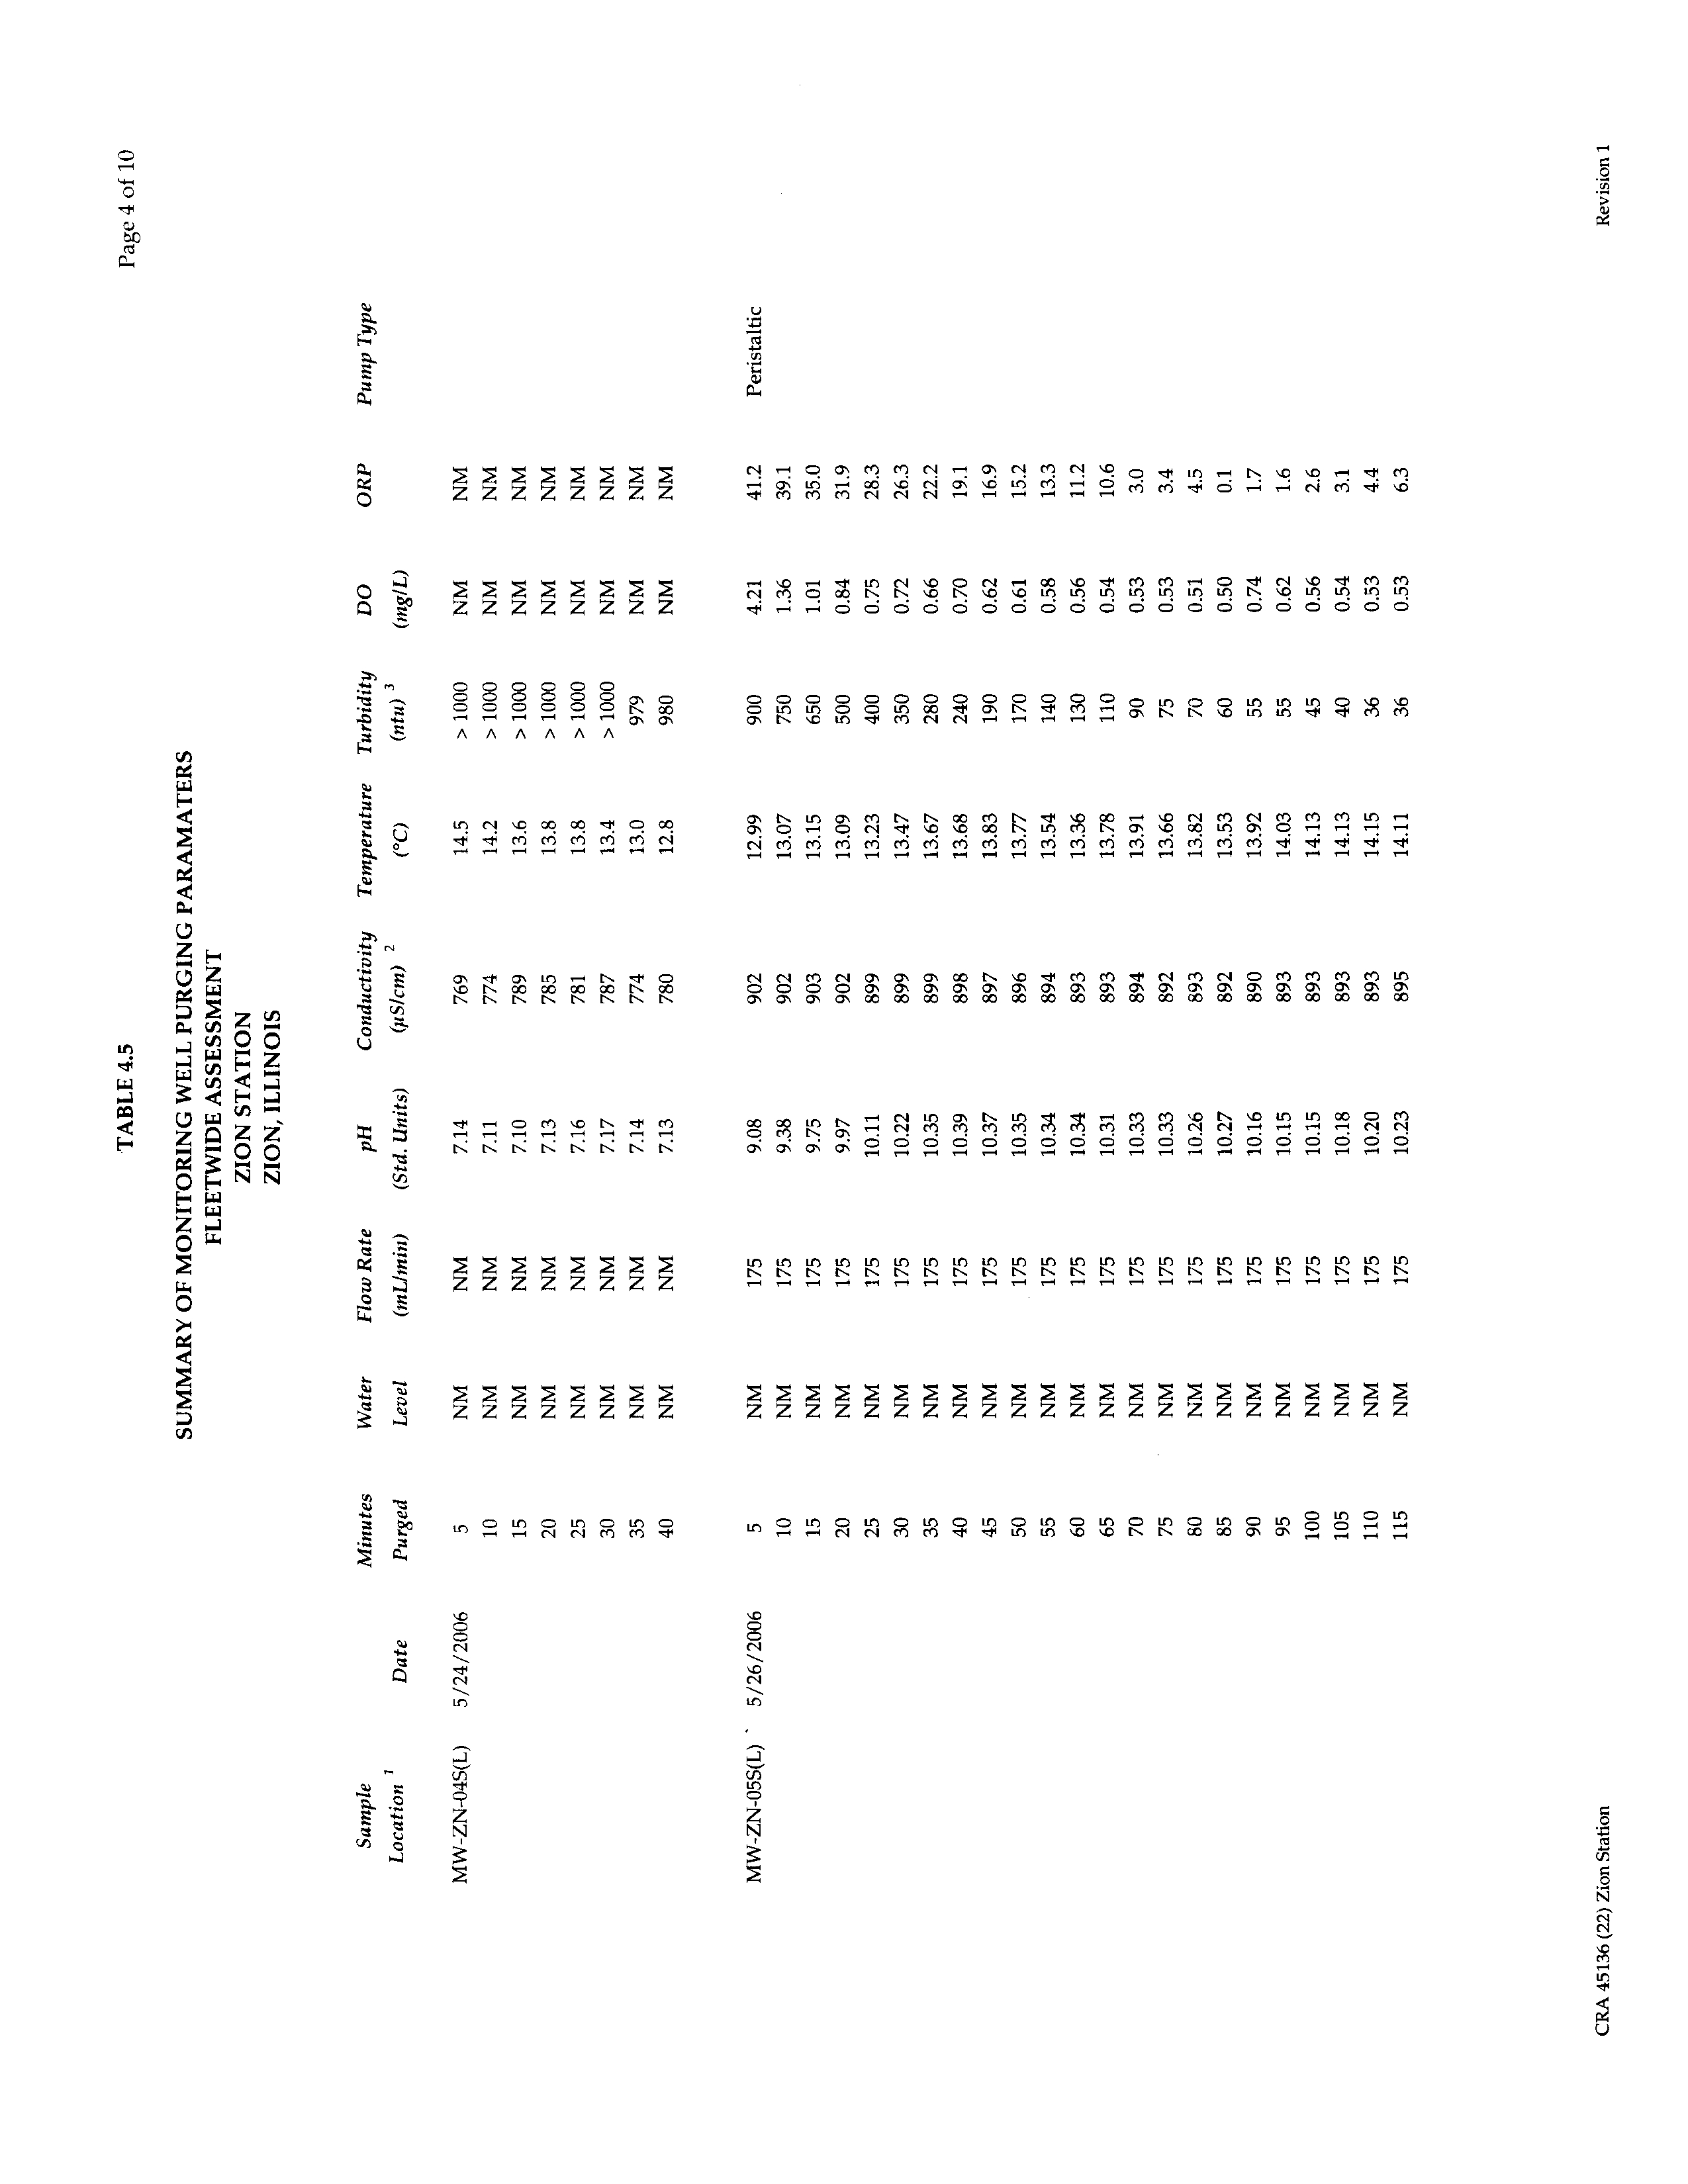
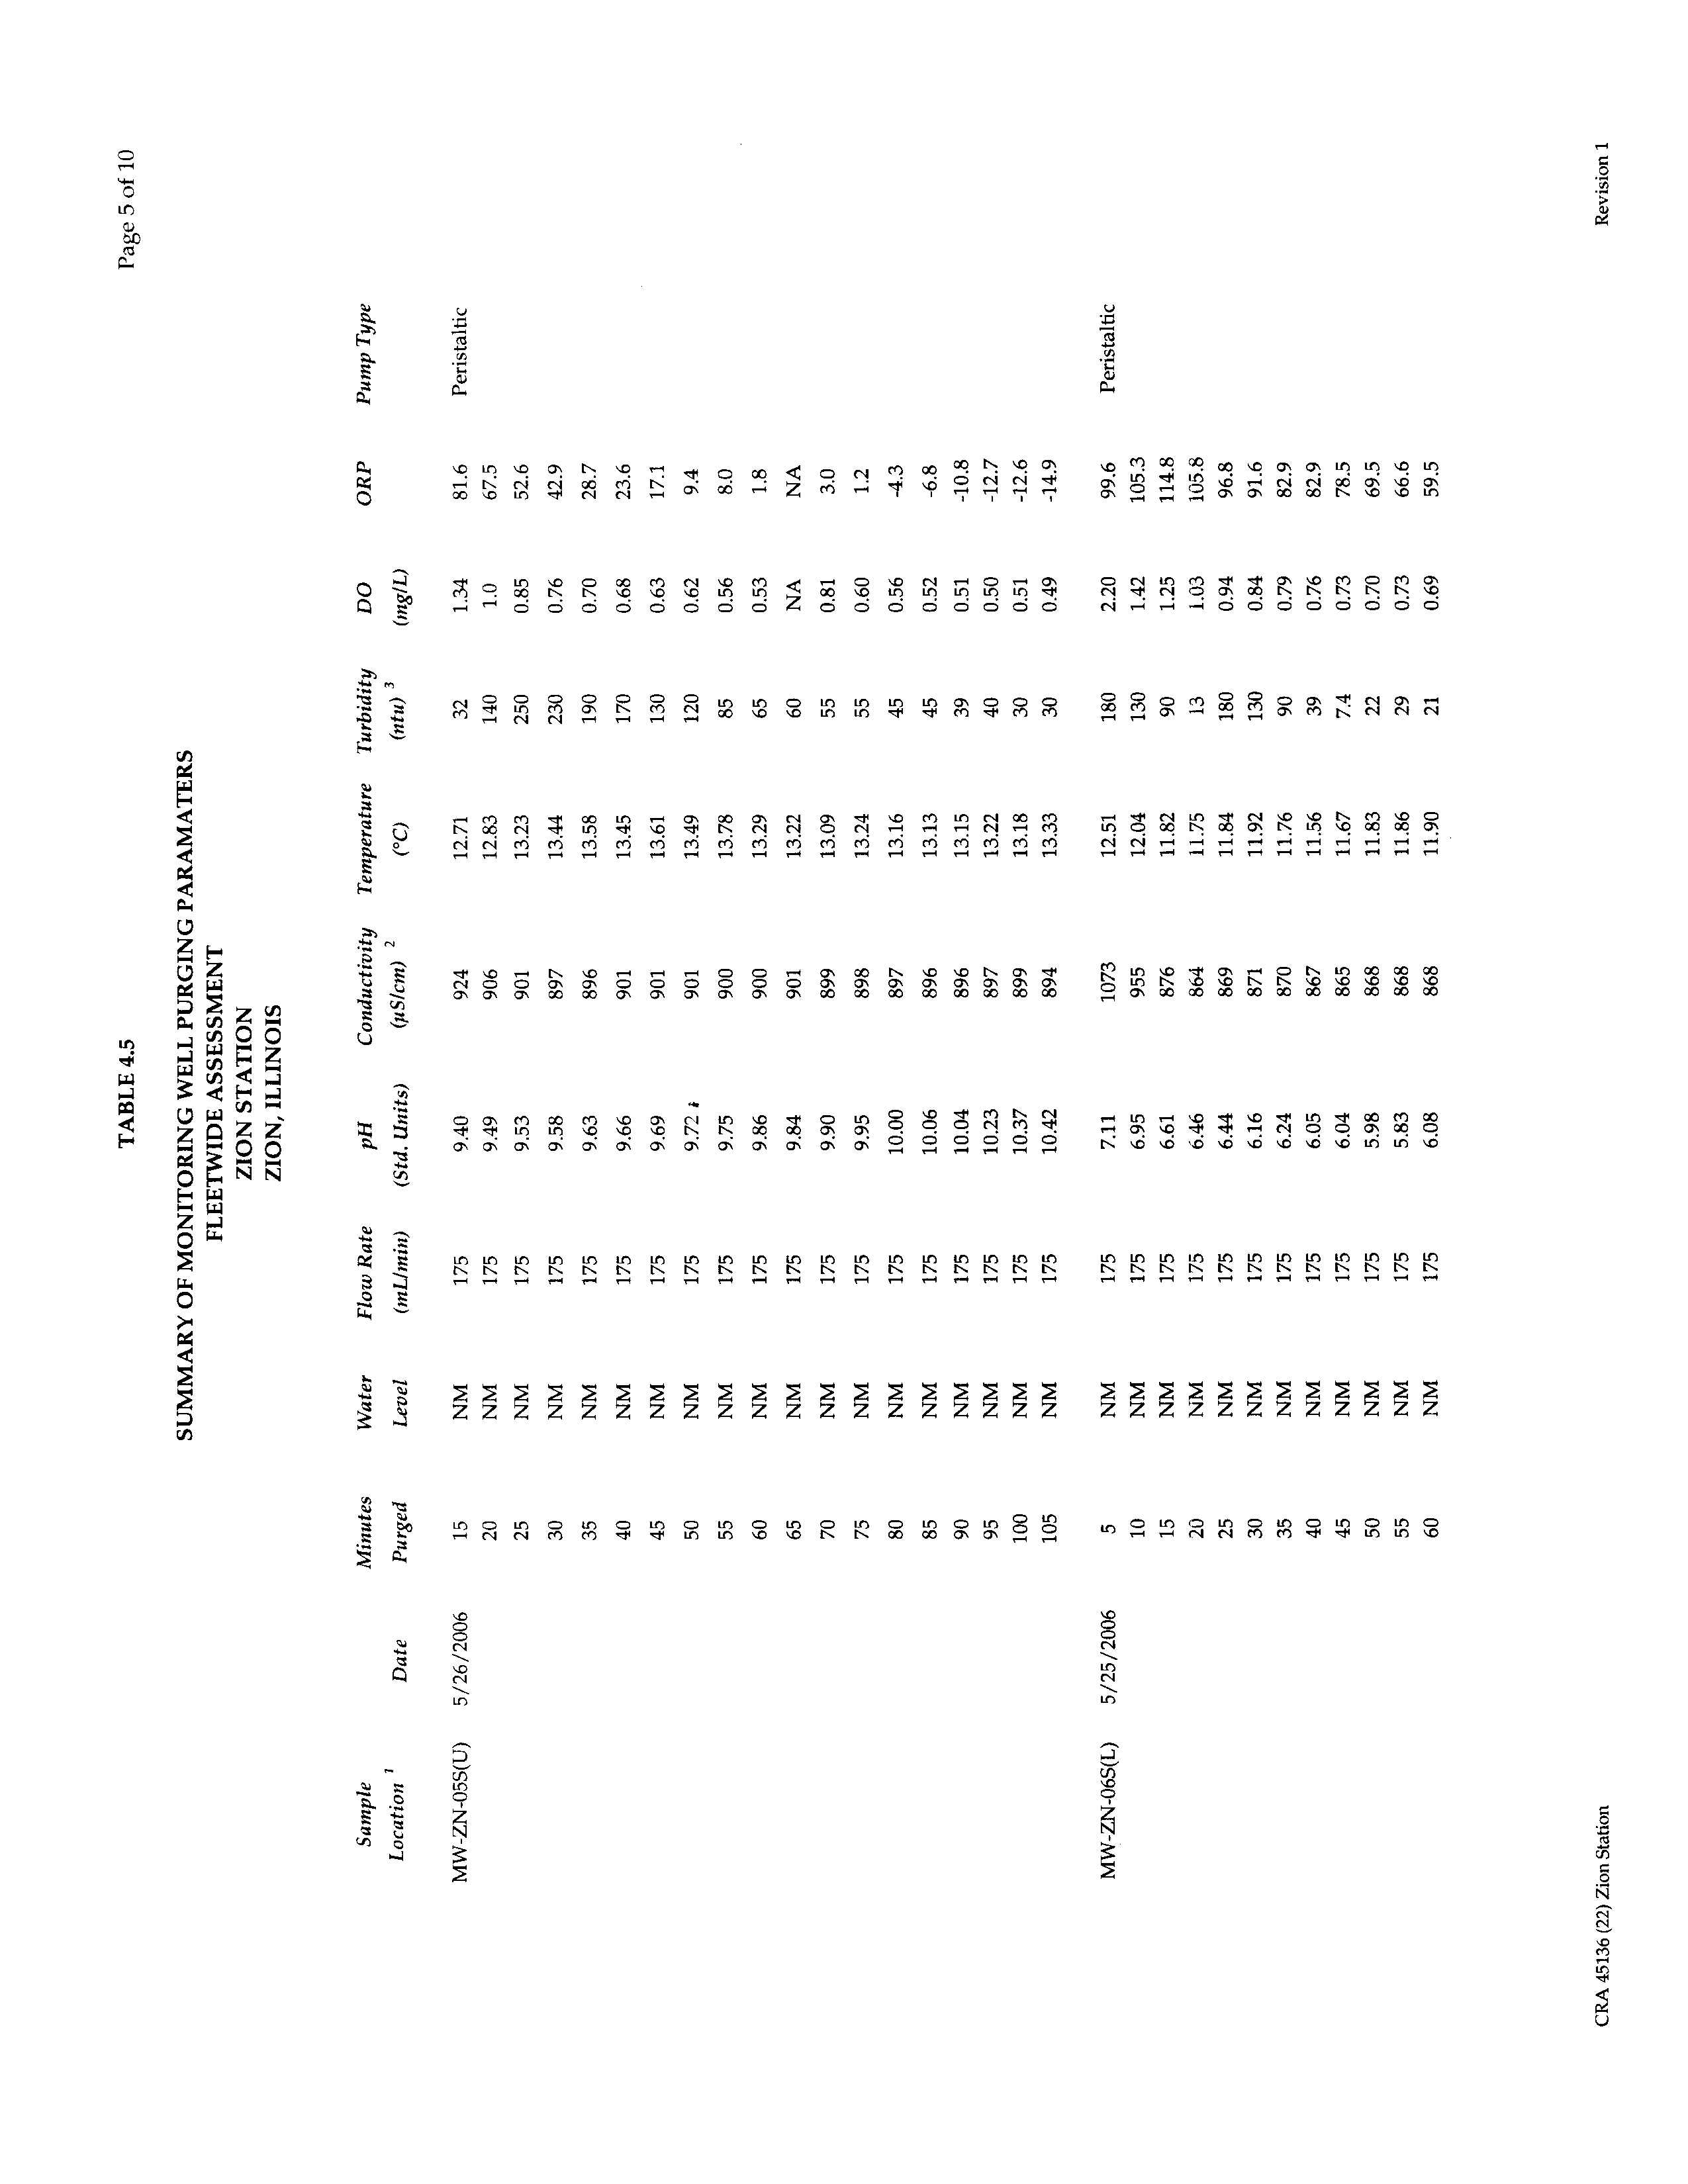
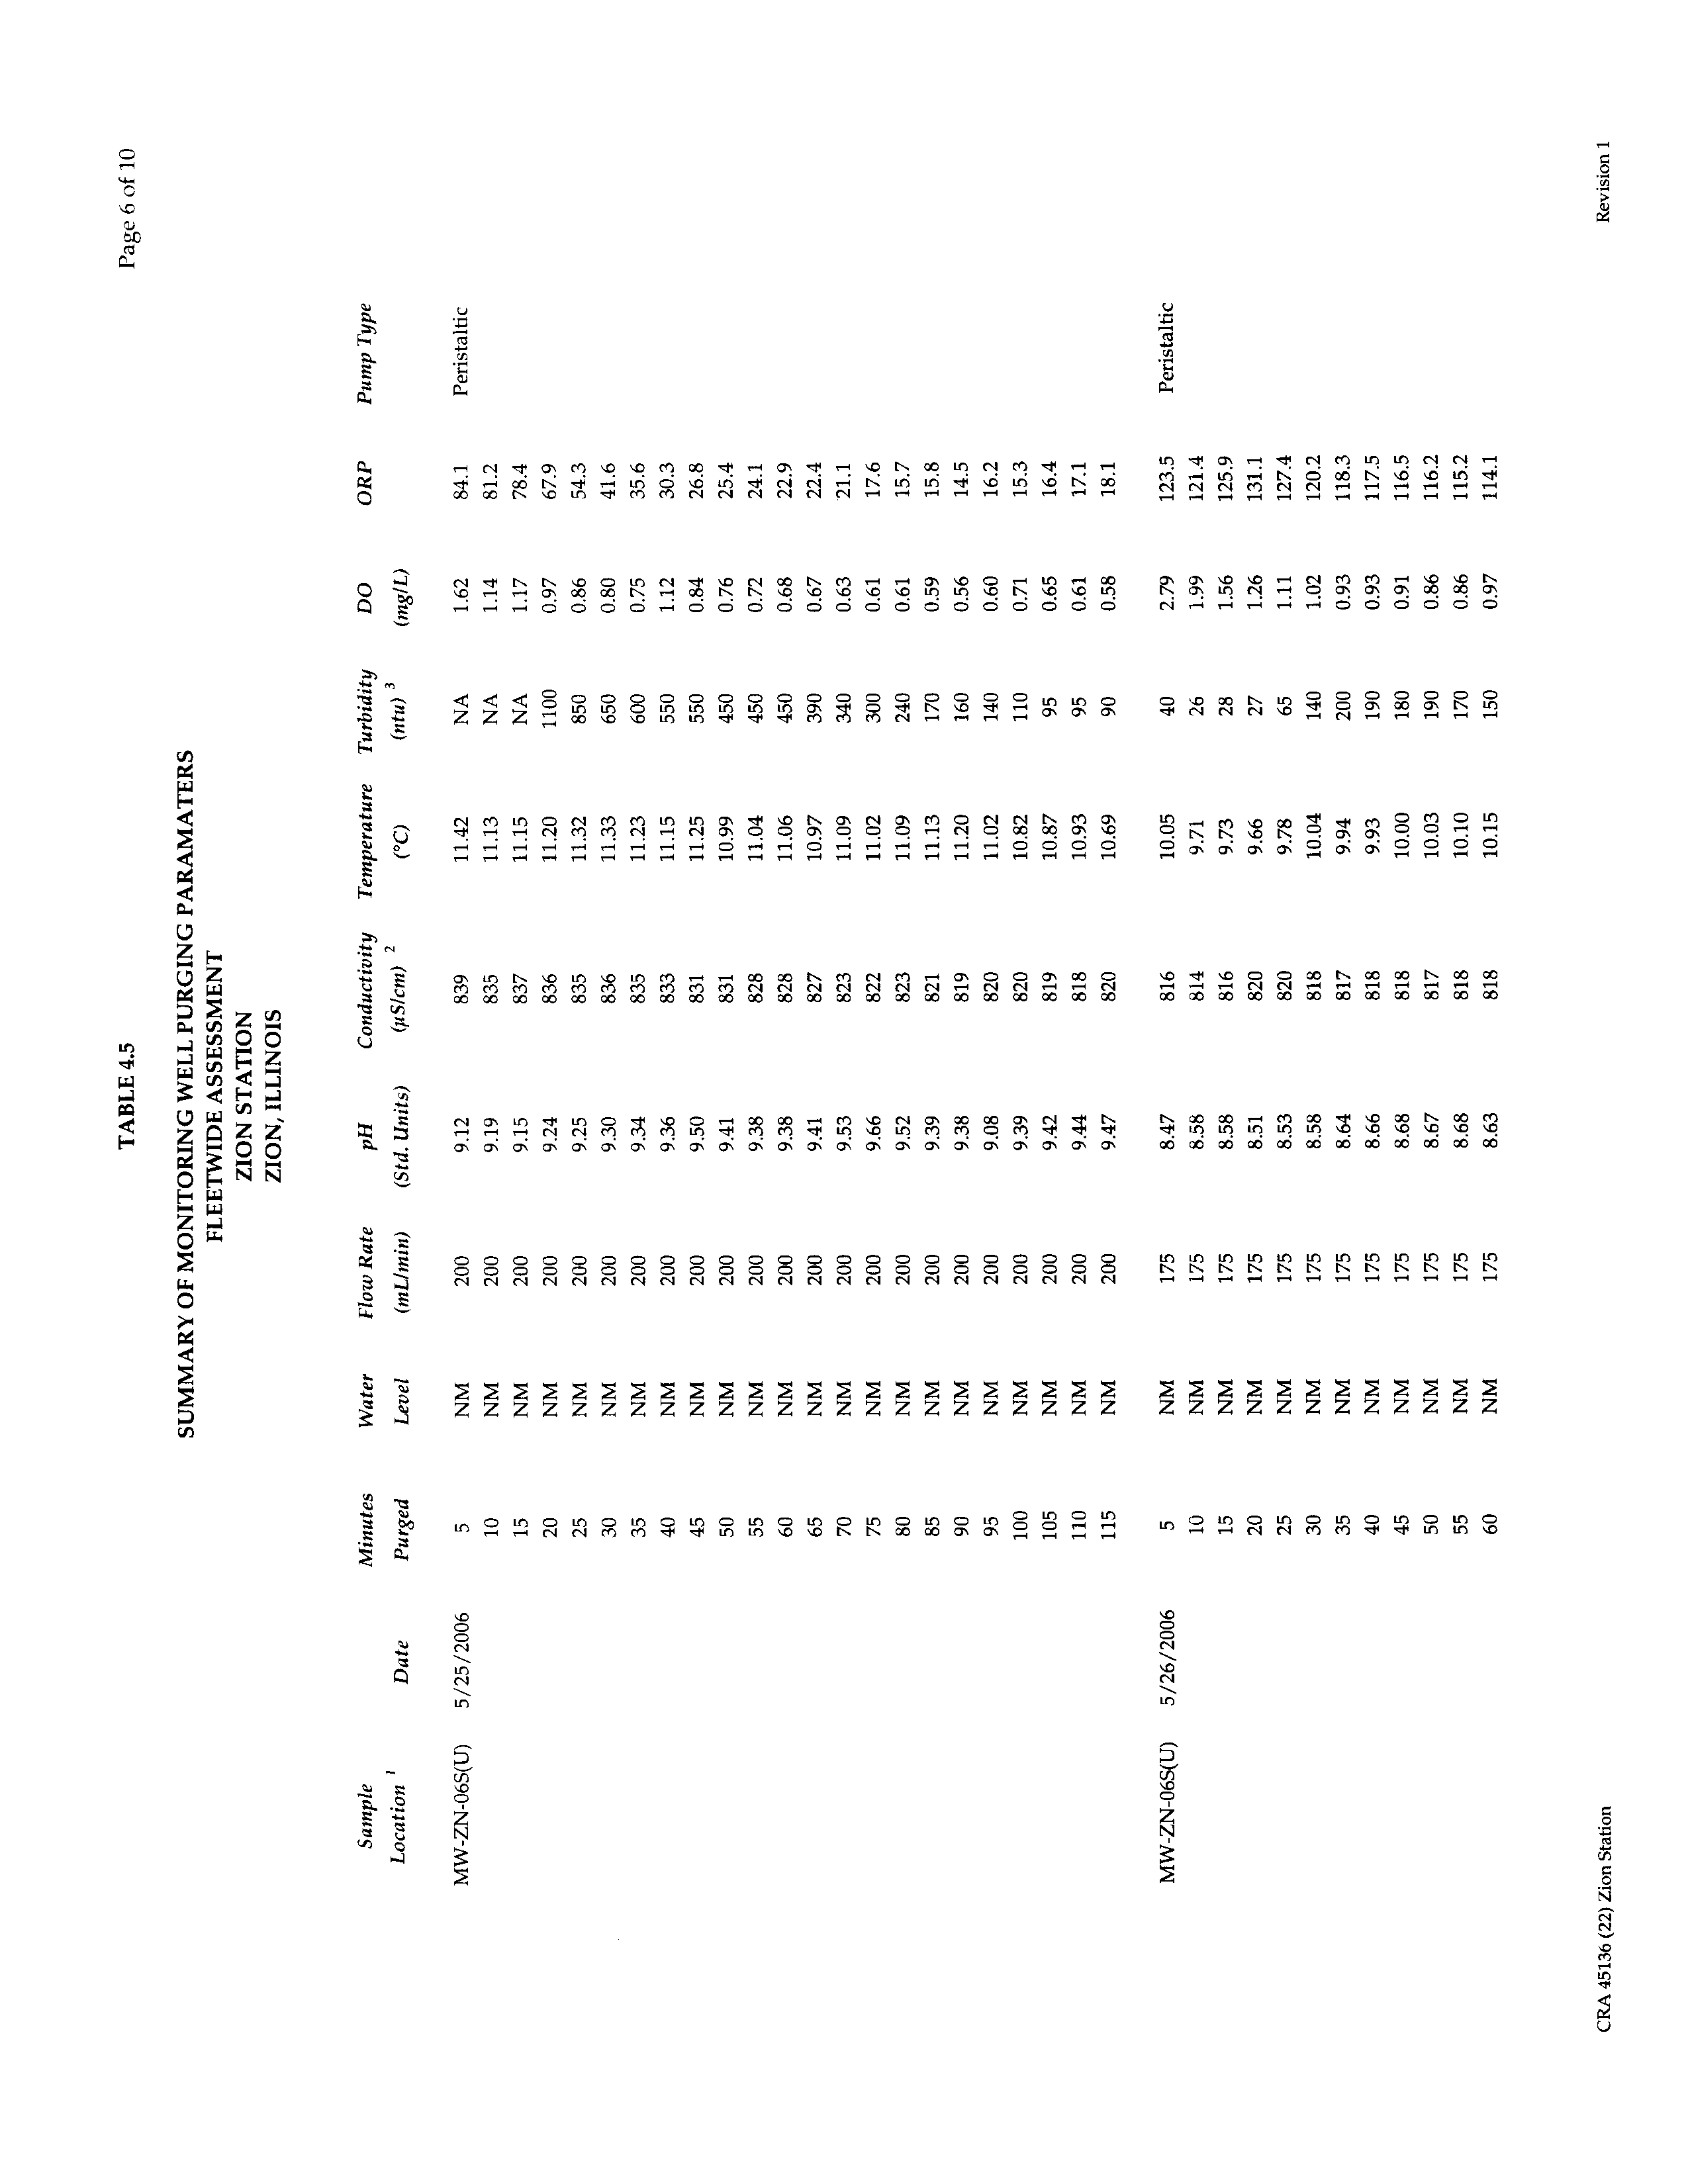
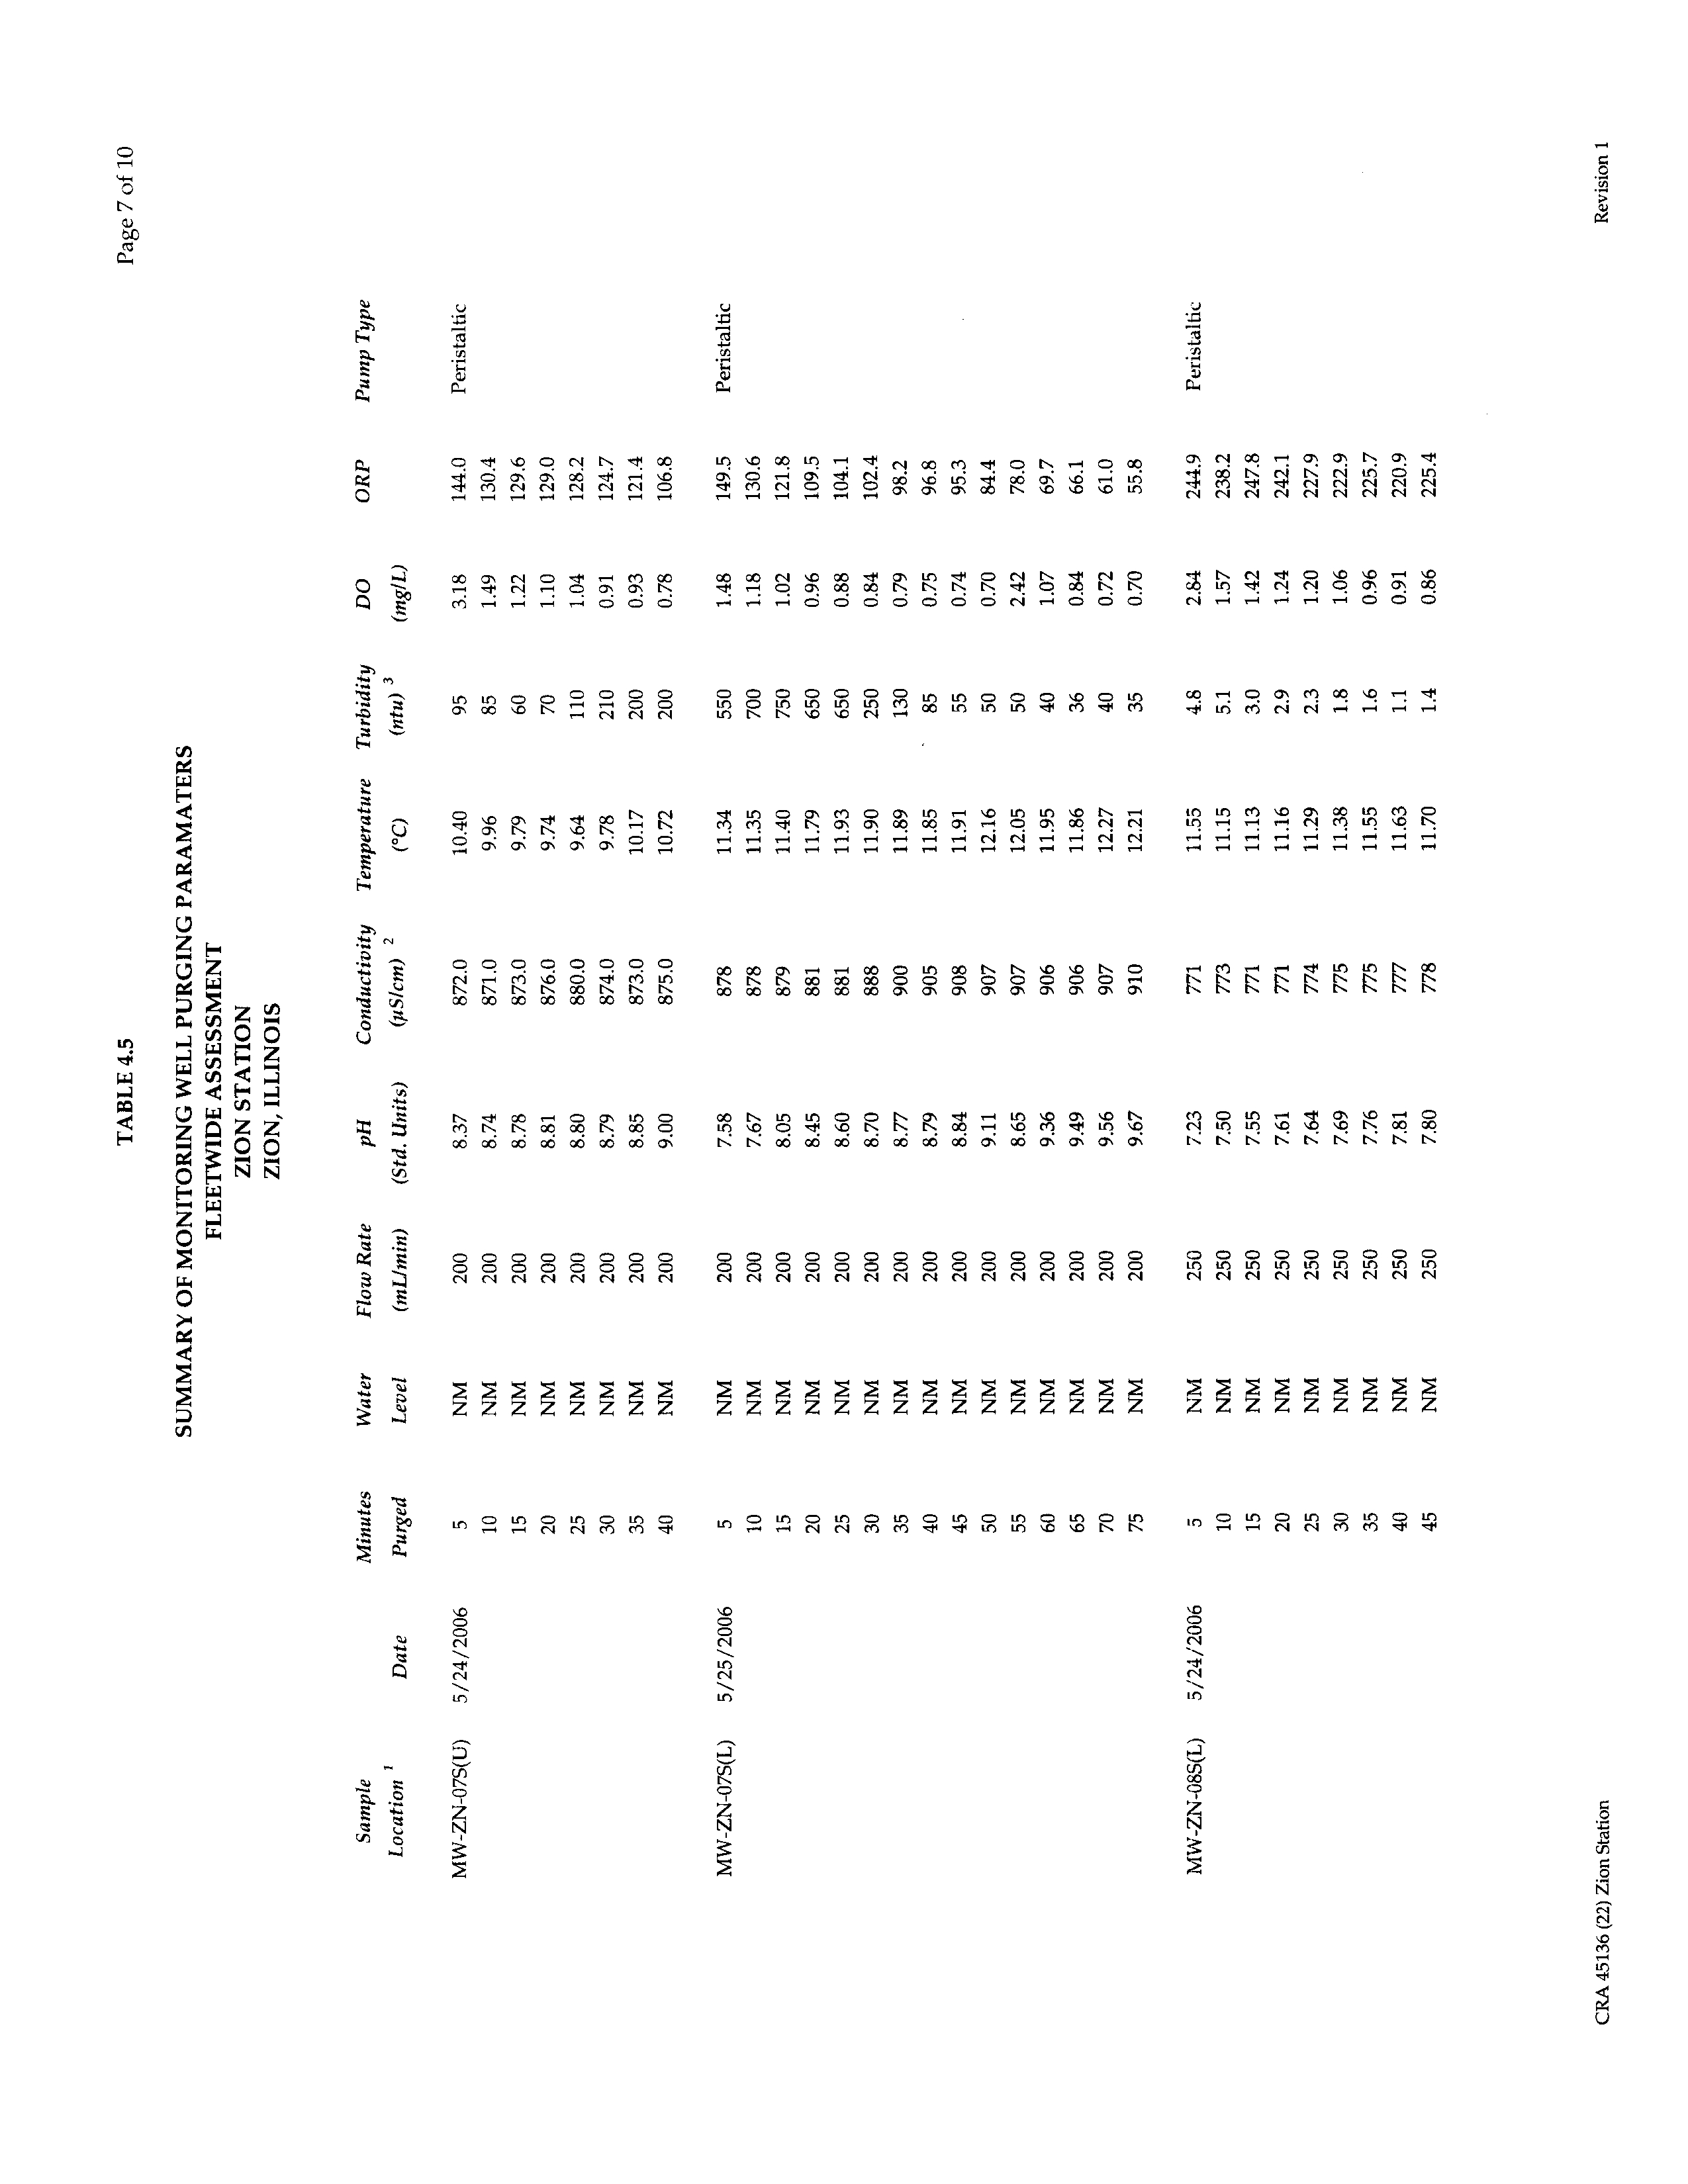
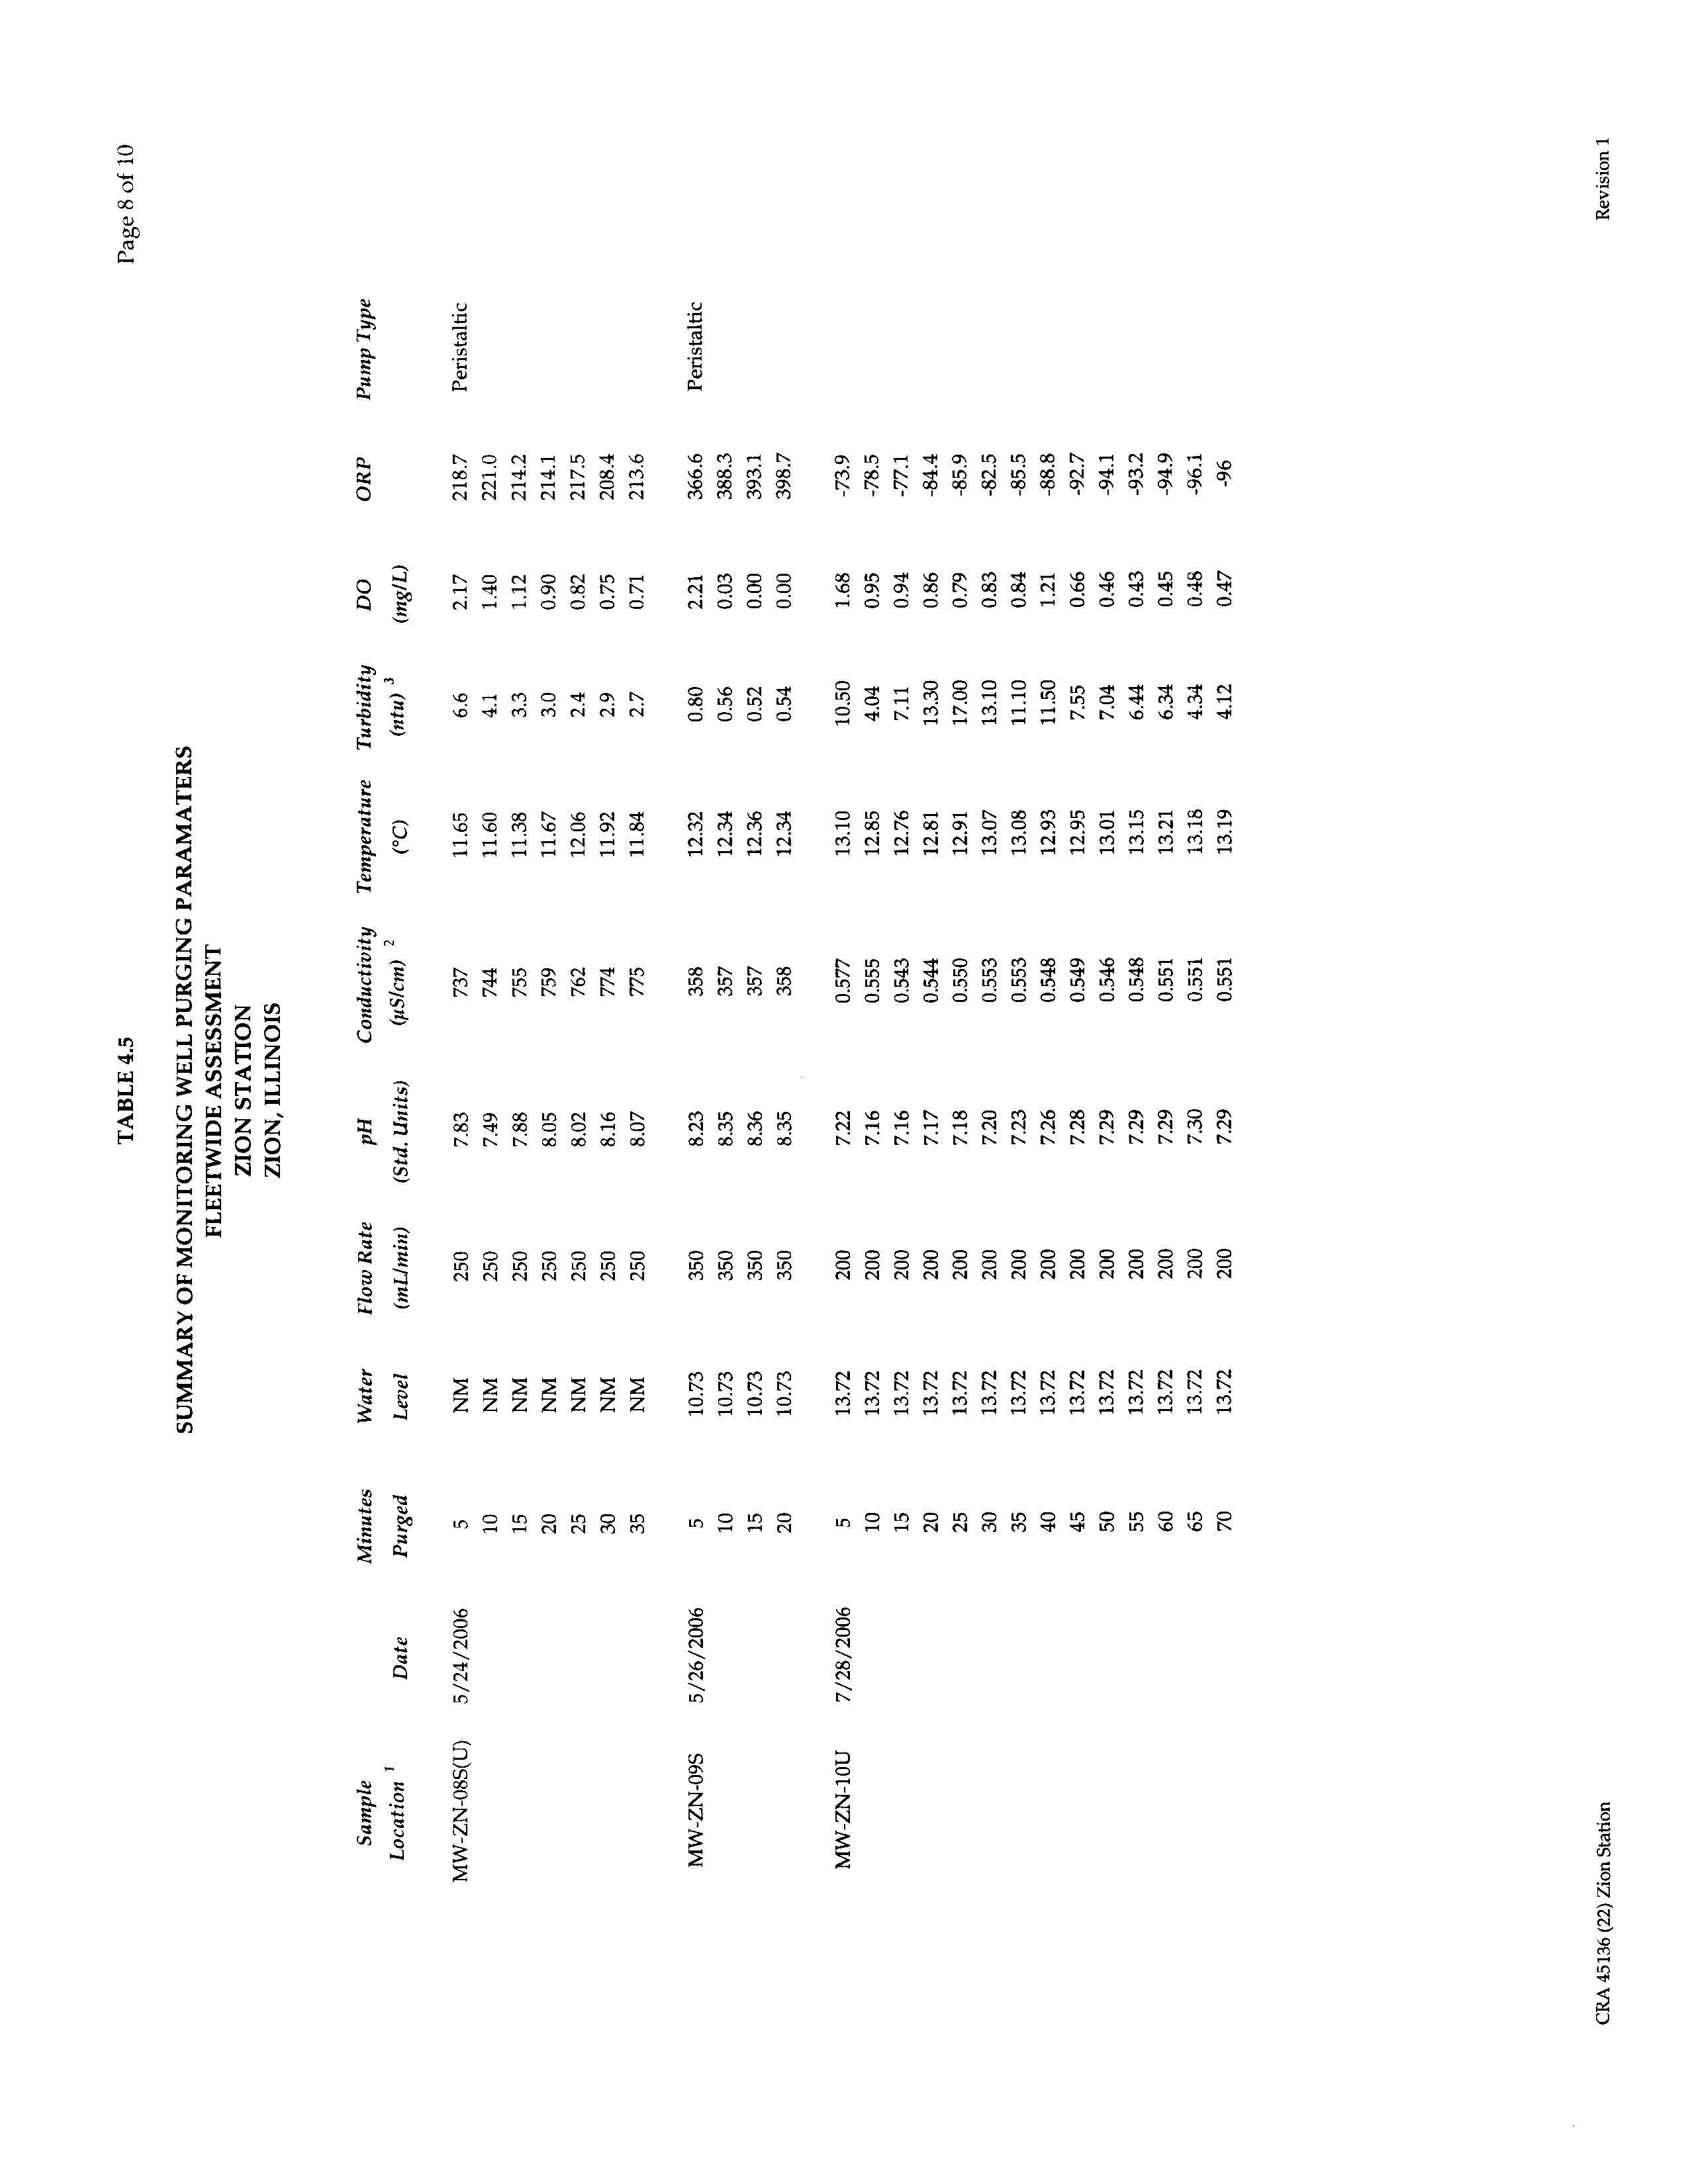
TABLE 4.5
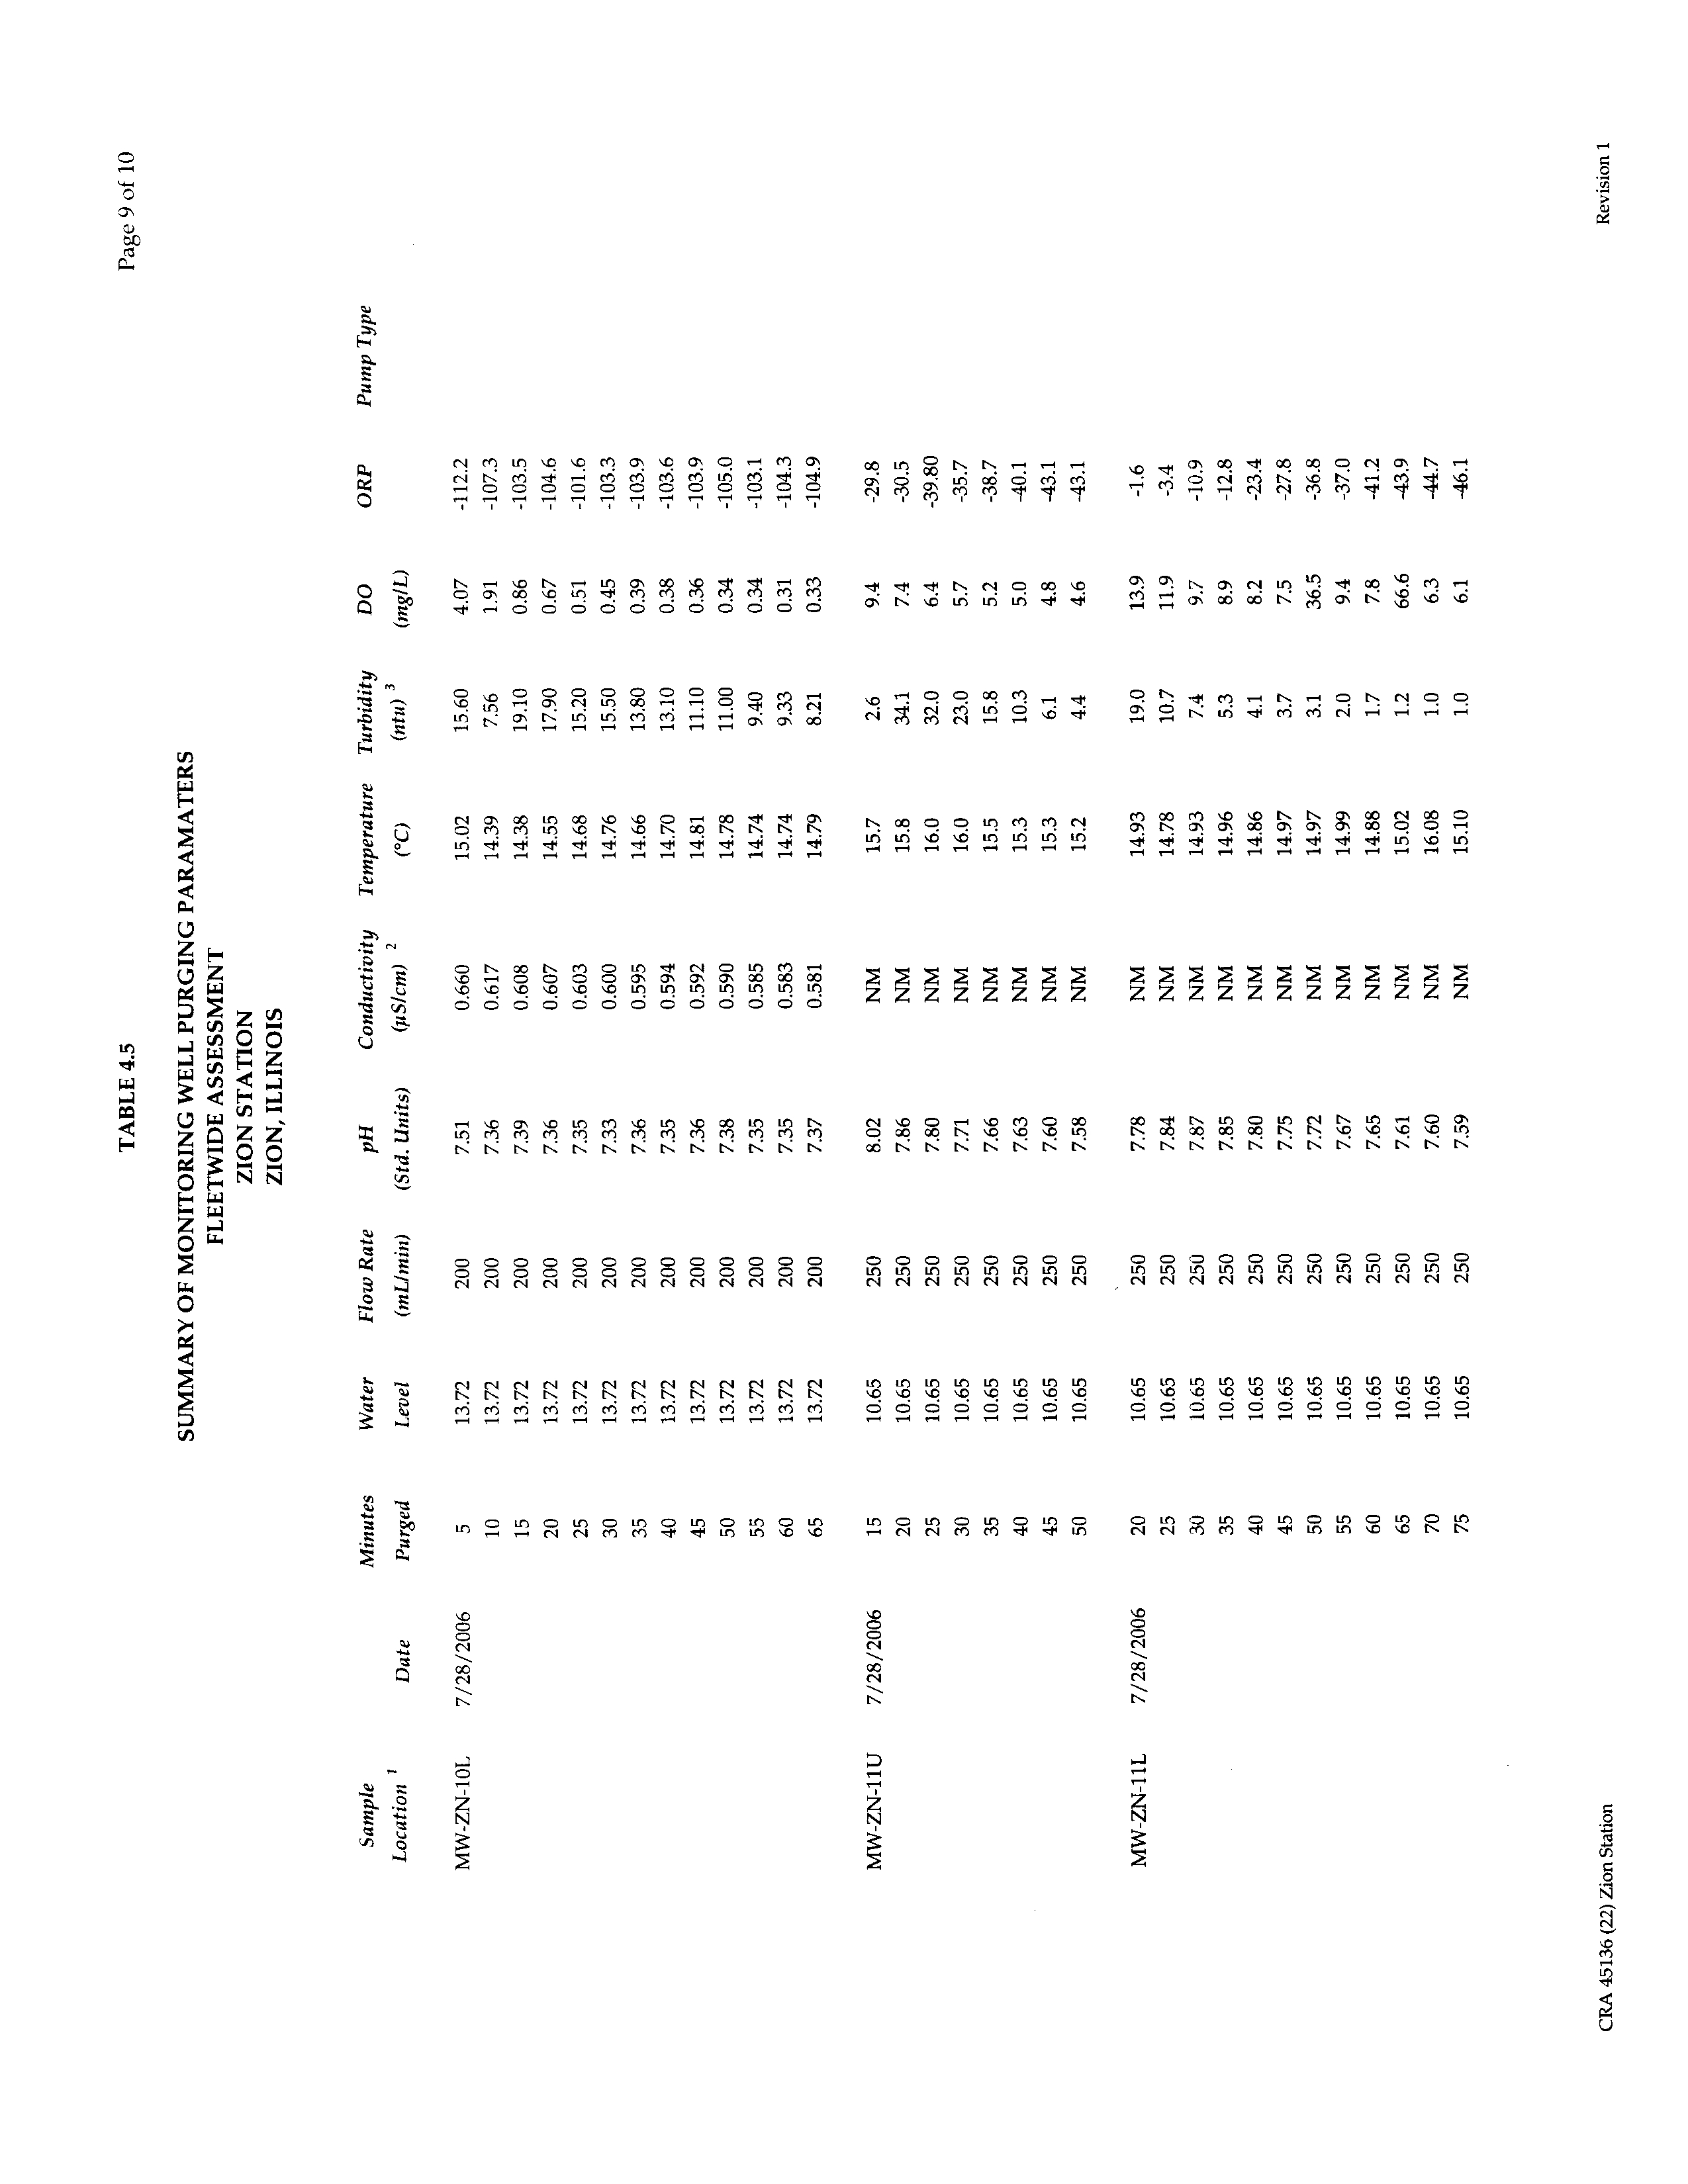
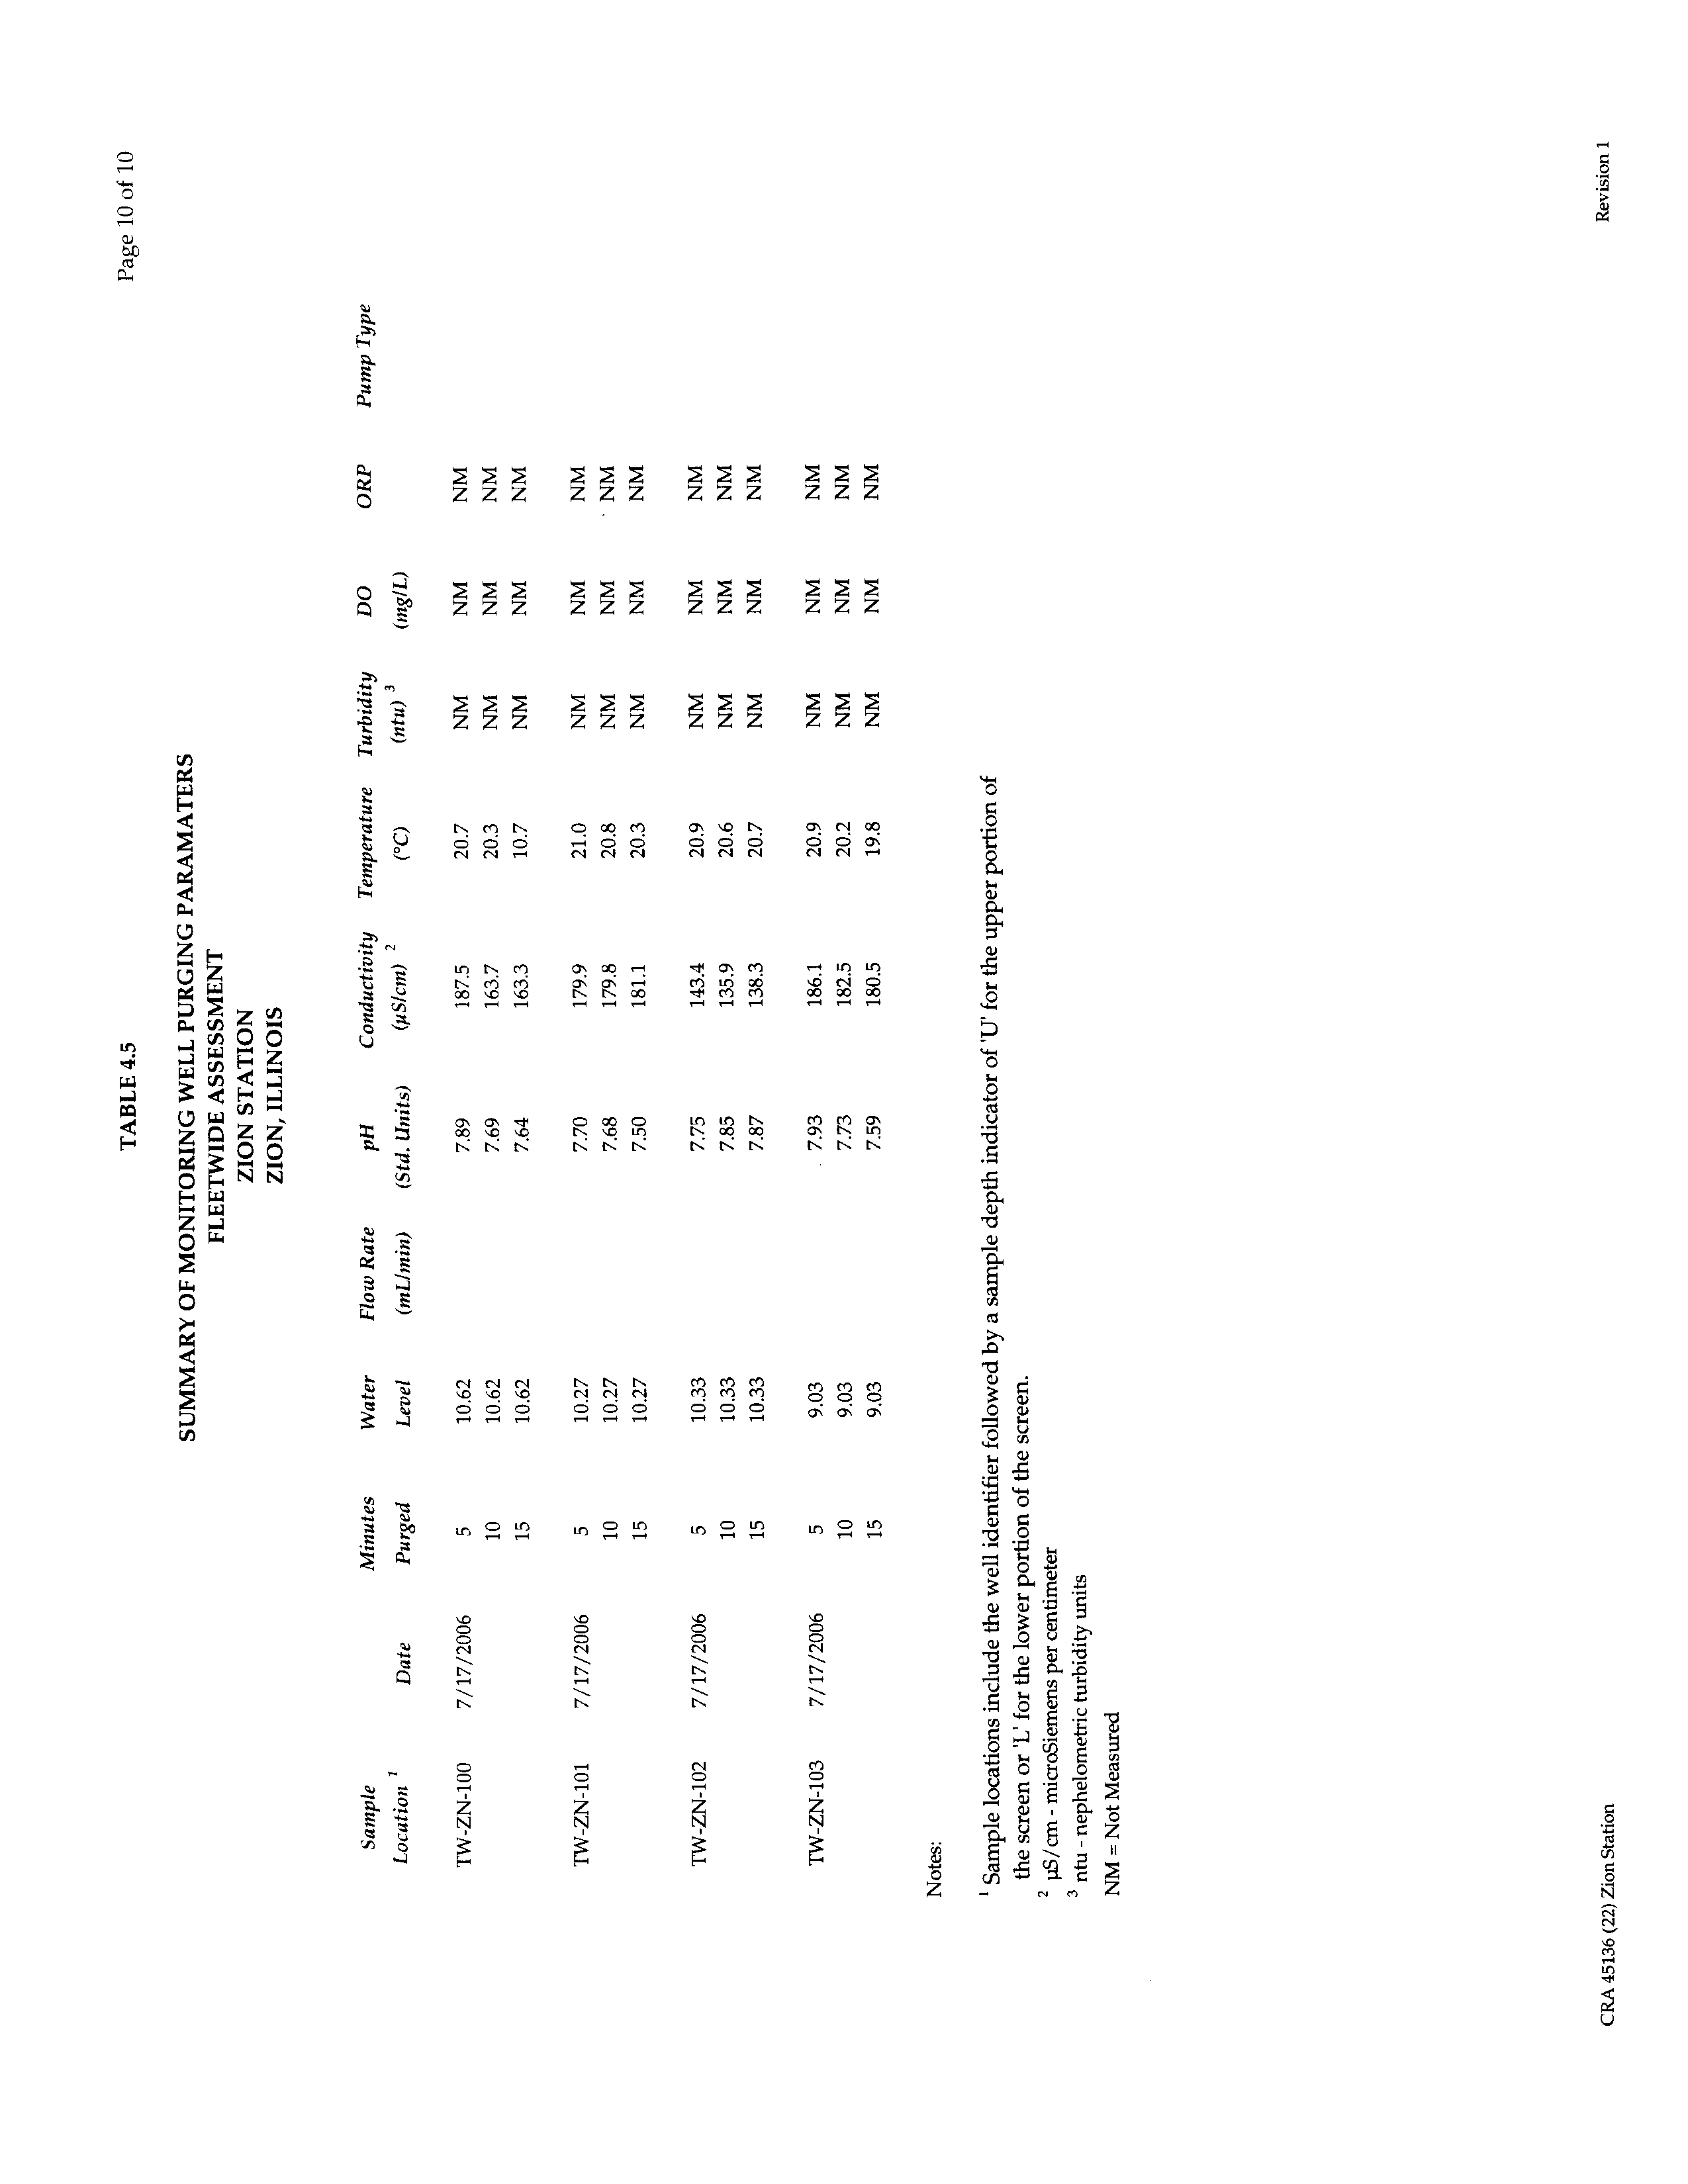
SUMMARY OF MONITORING WELL PURGING PARAMETERS
TABLE 5.1
ANALYTICAL RESULTS SUMMARY – TRITIUM IN GROUNDWATER
AND SURFACE WATER
TABLE 5.2
ANALYTICAL RESULTS SUMMARY – RADIONUCLIDES IN
GROUNDWATER AND SURFACE WATER
045136 (22) Zion Station
CONESTOGA-ROVERS & ASSOCIATES
Revision 1
LIST OF APPENDICES
APPENDIX A
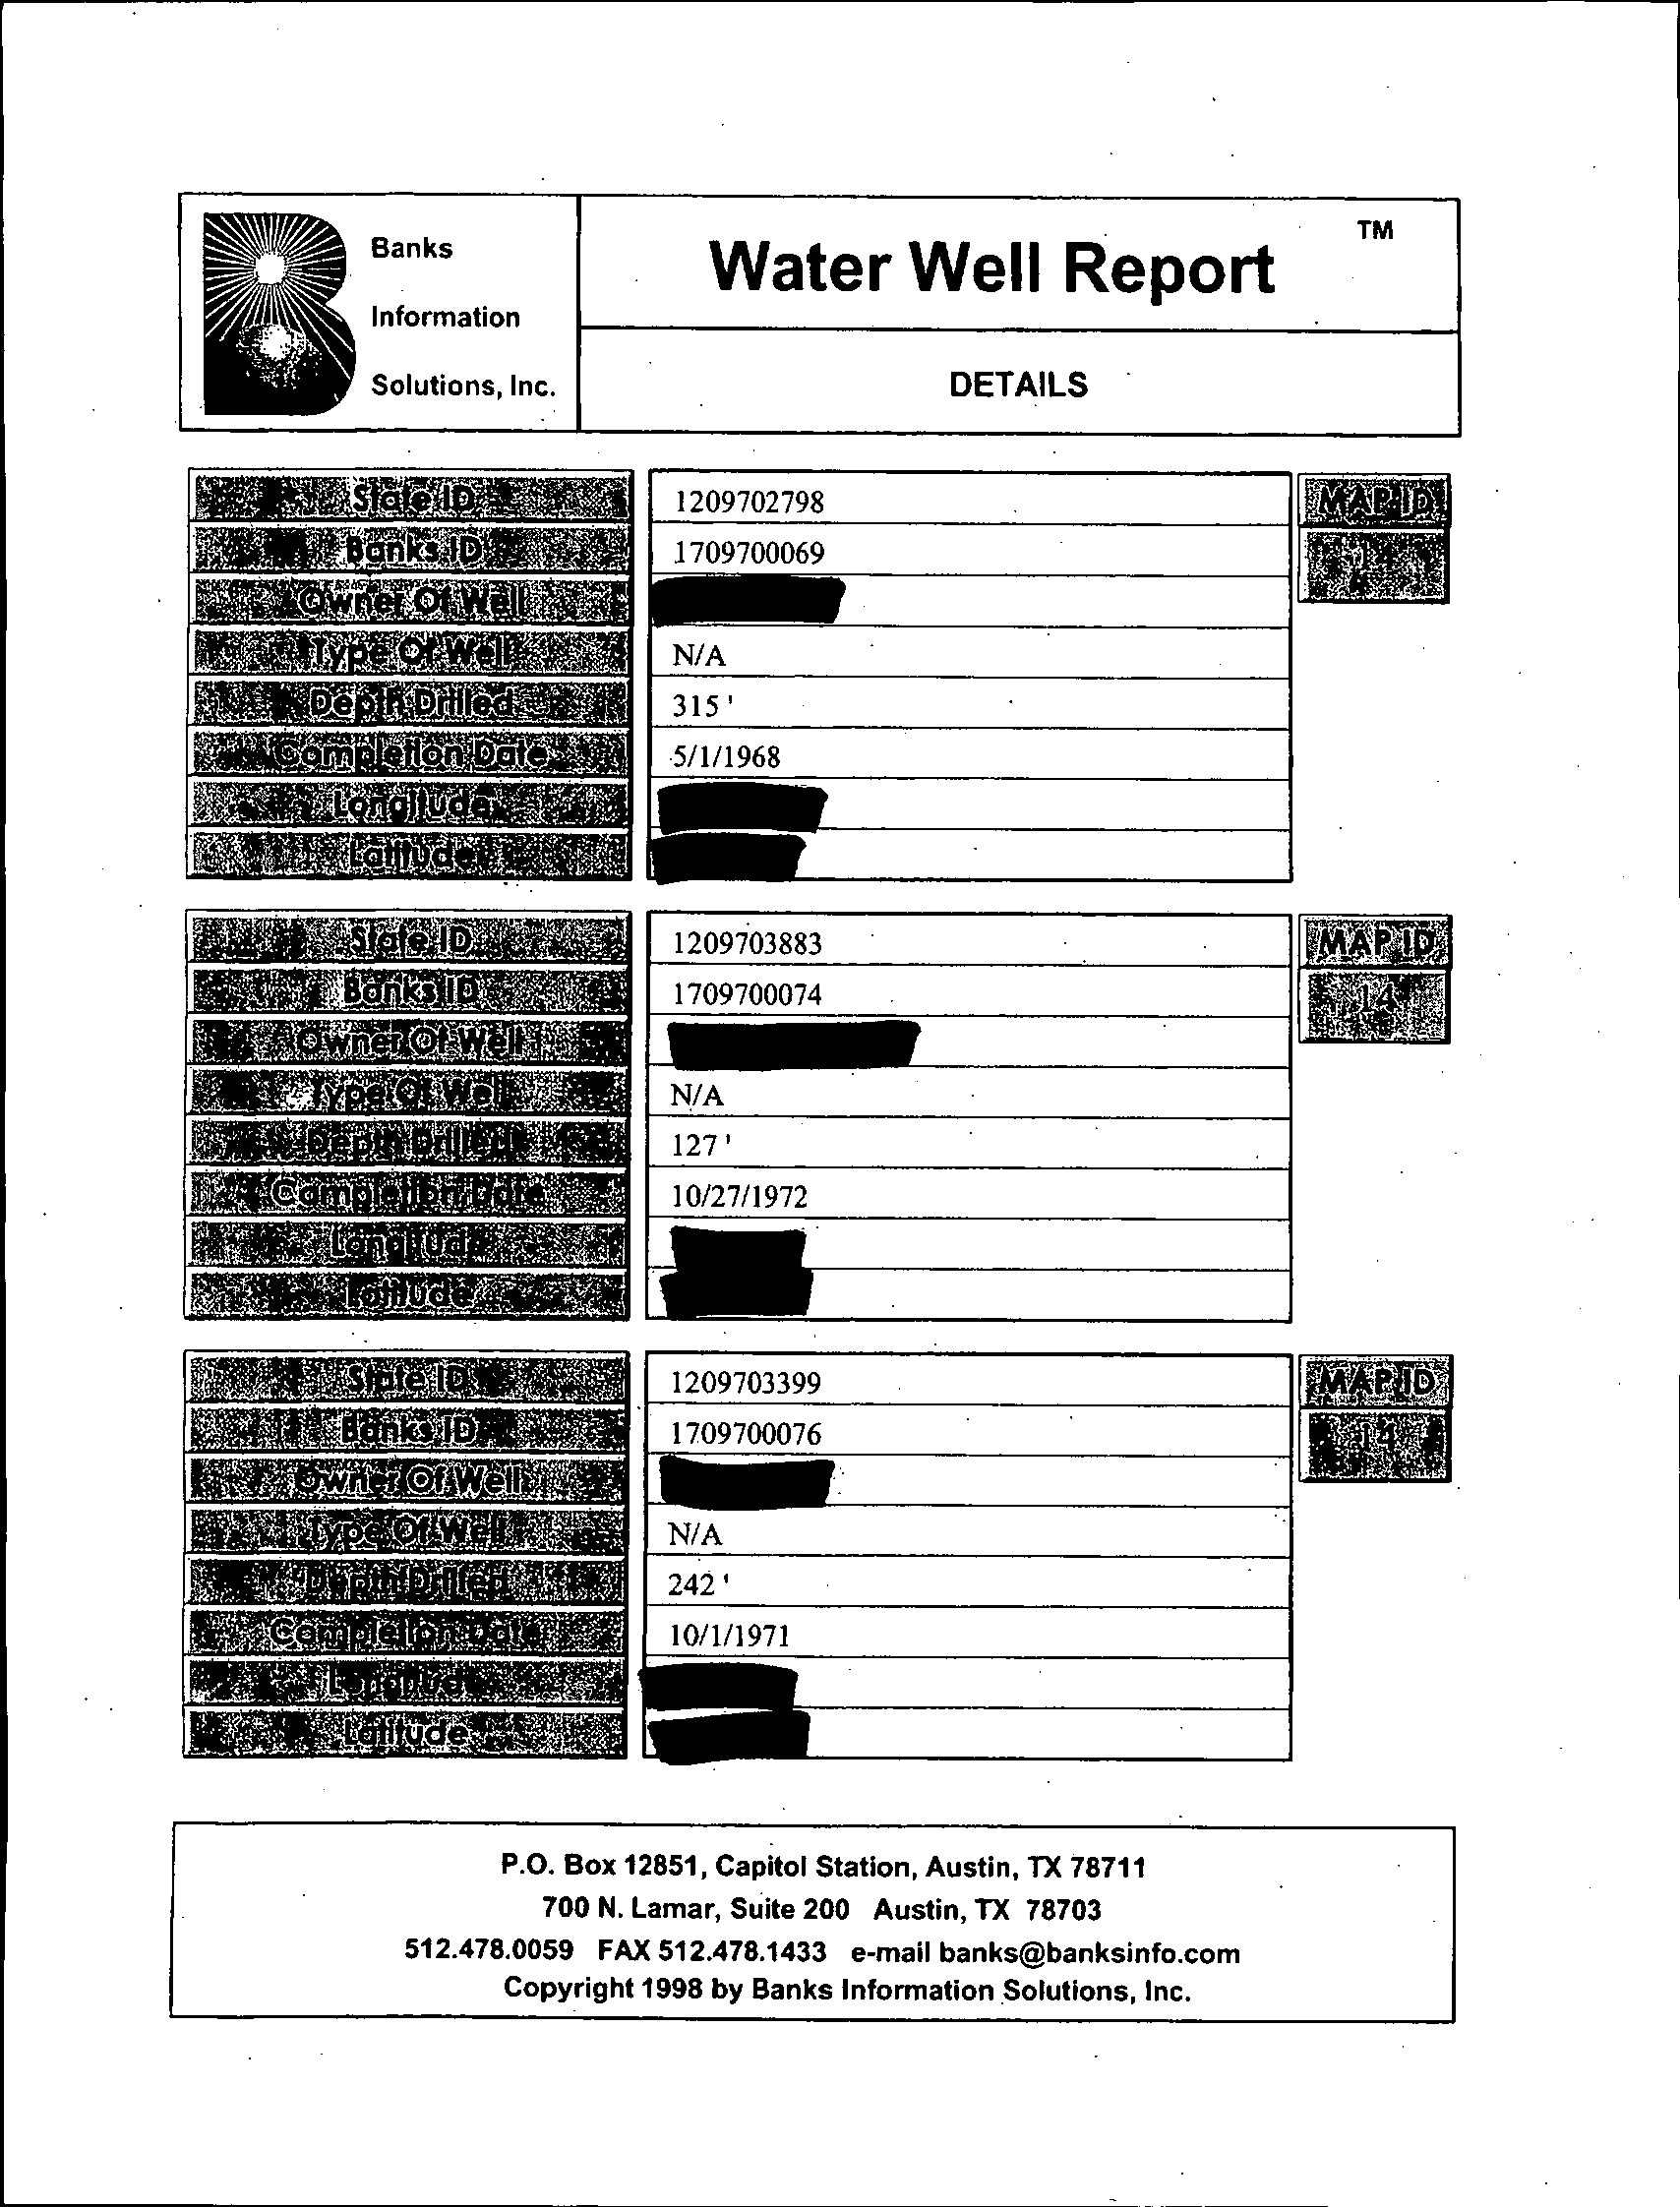
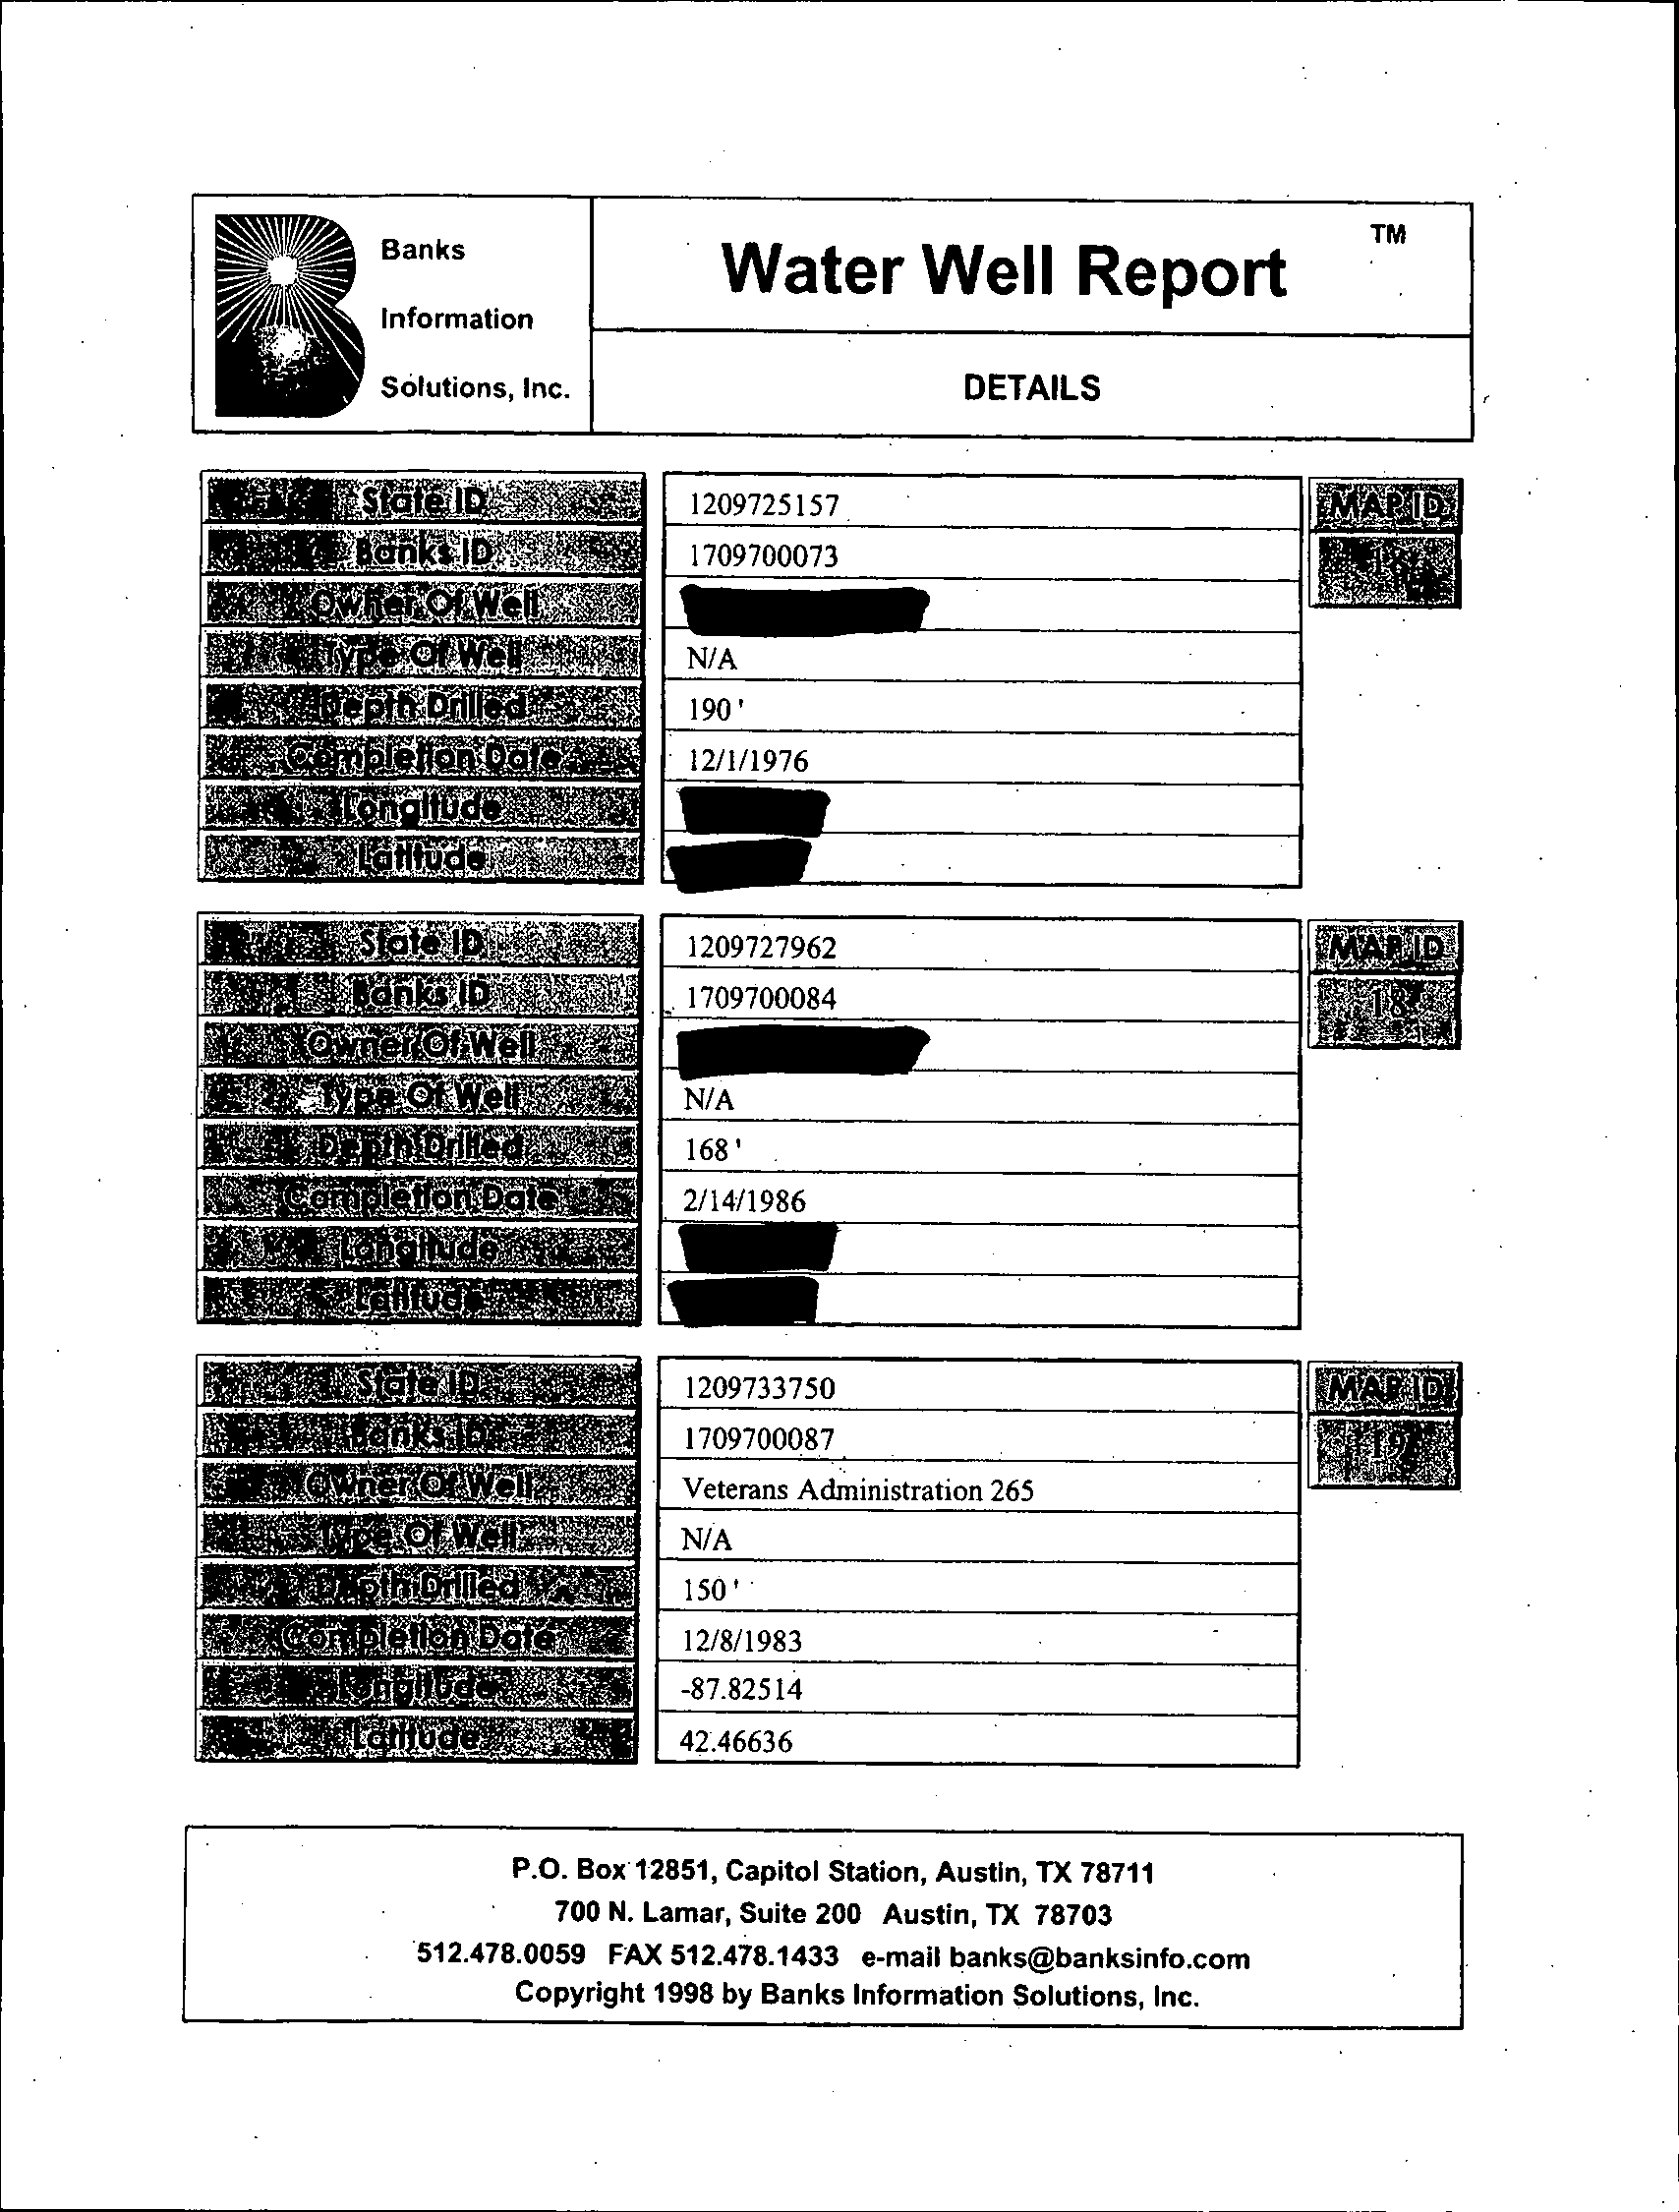
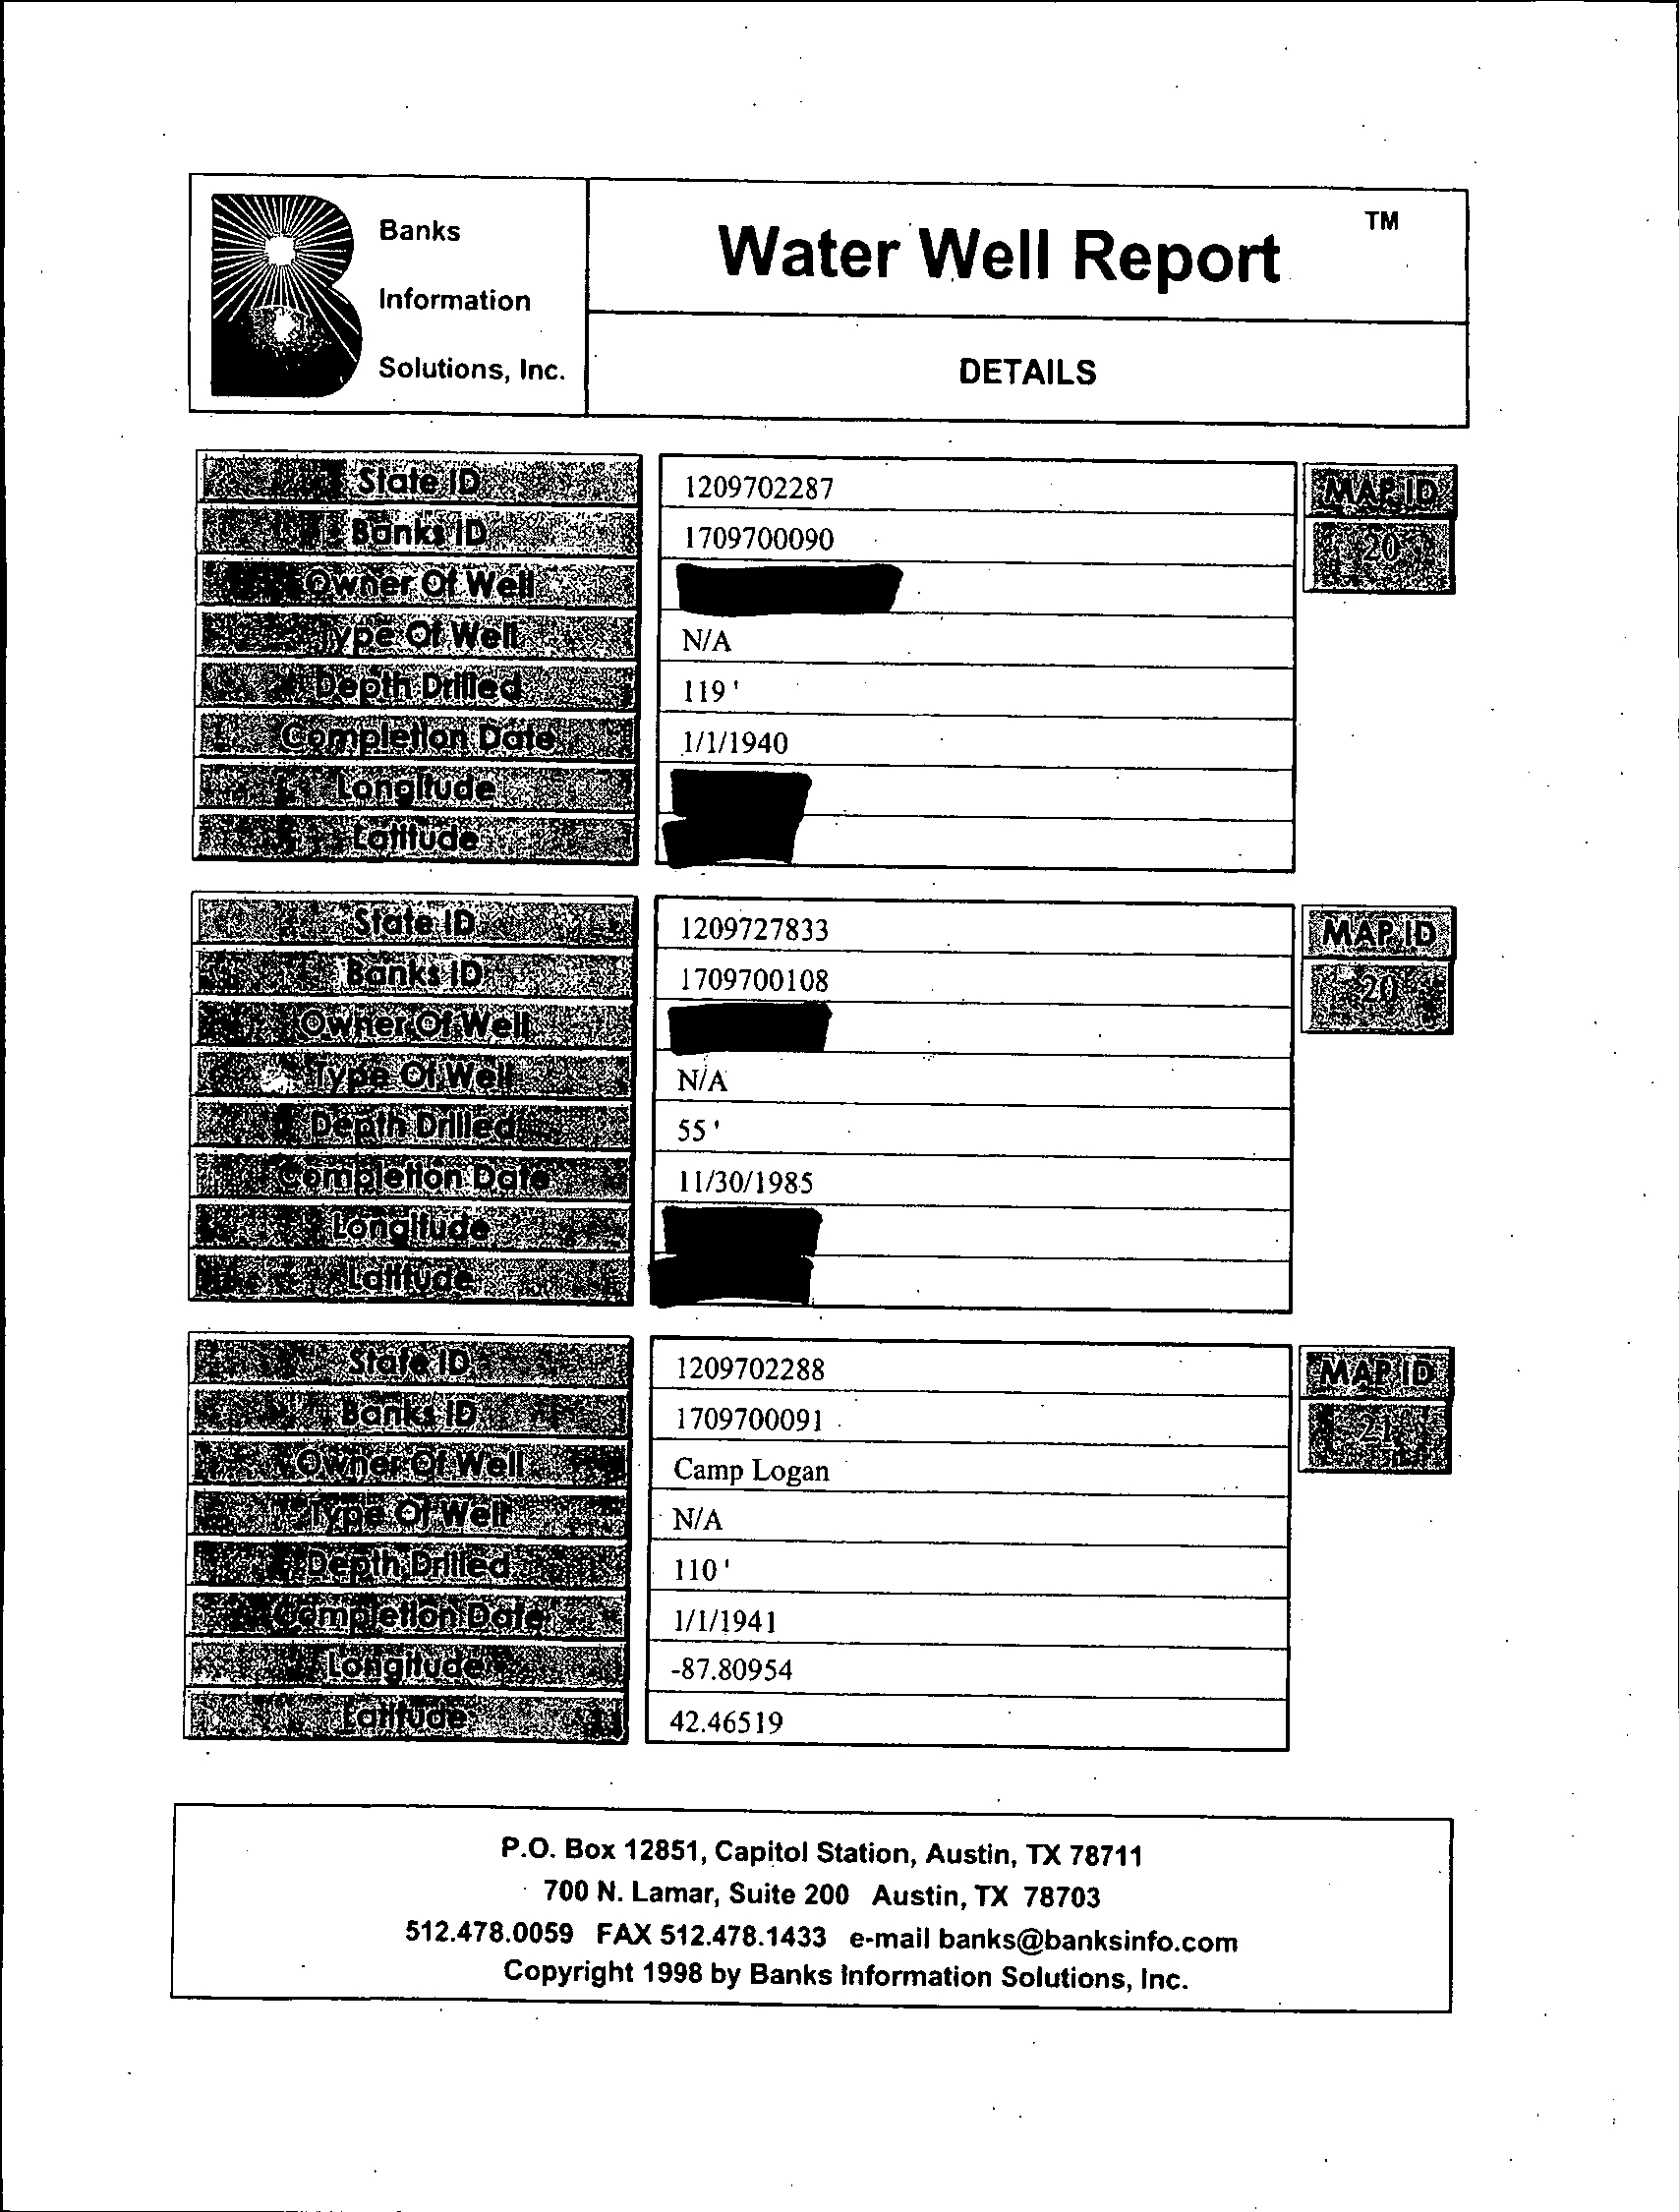
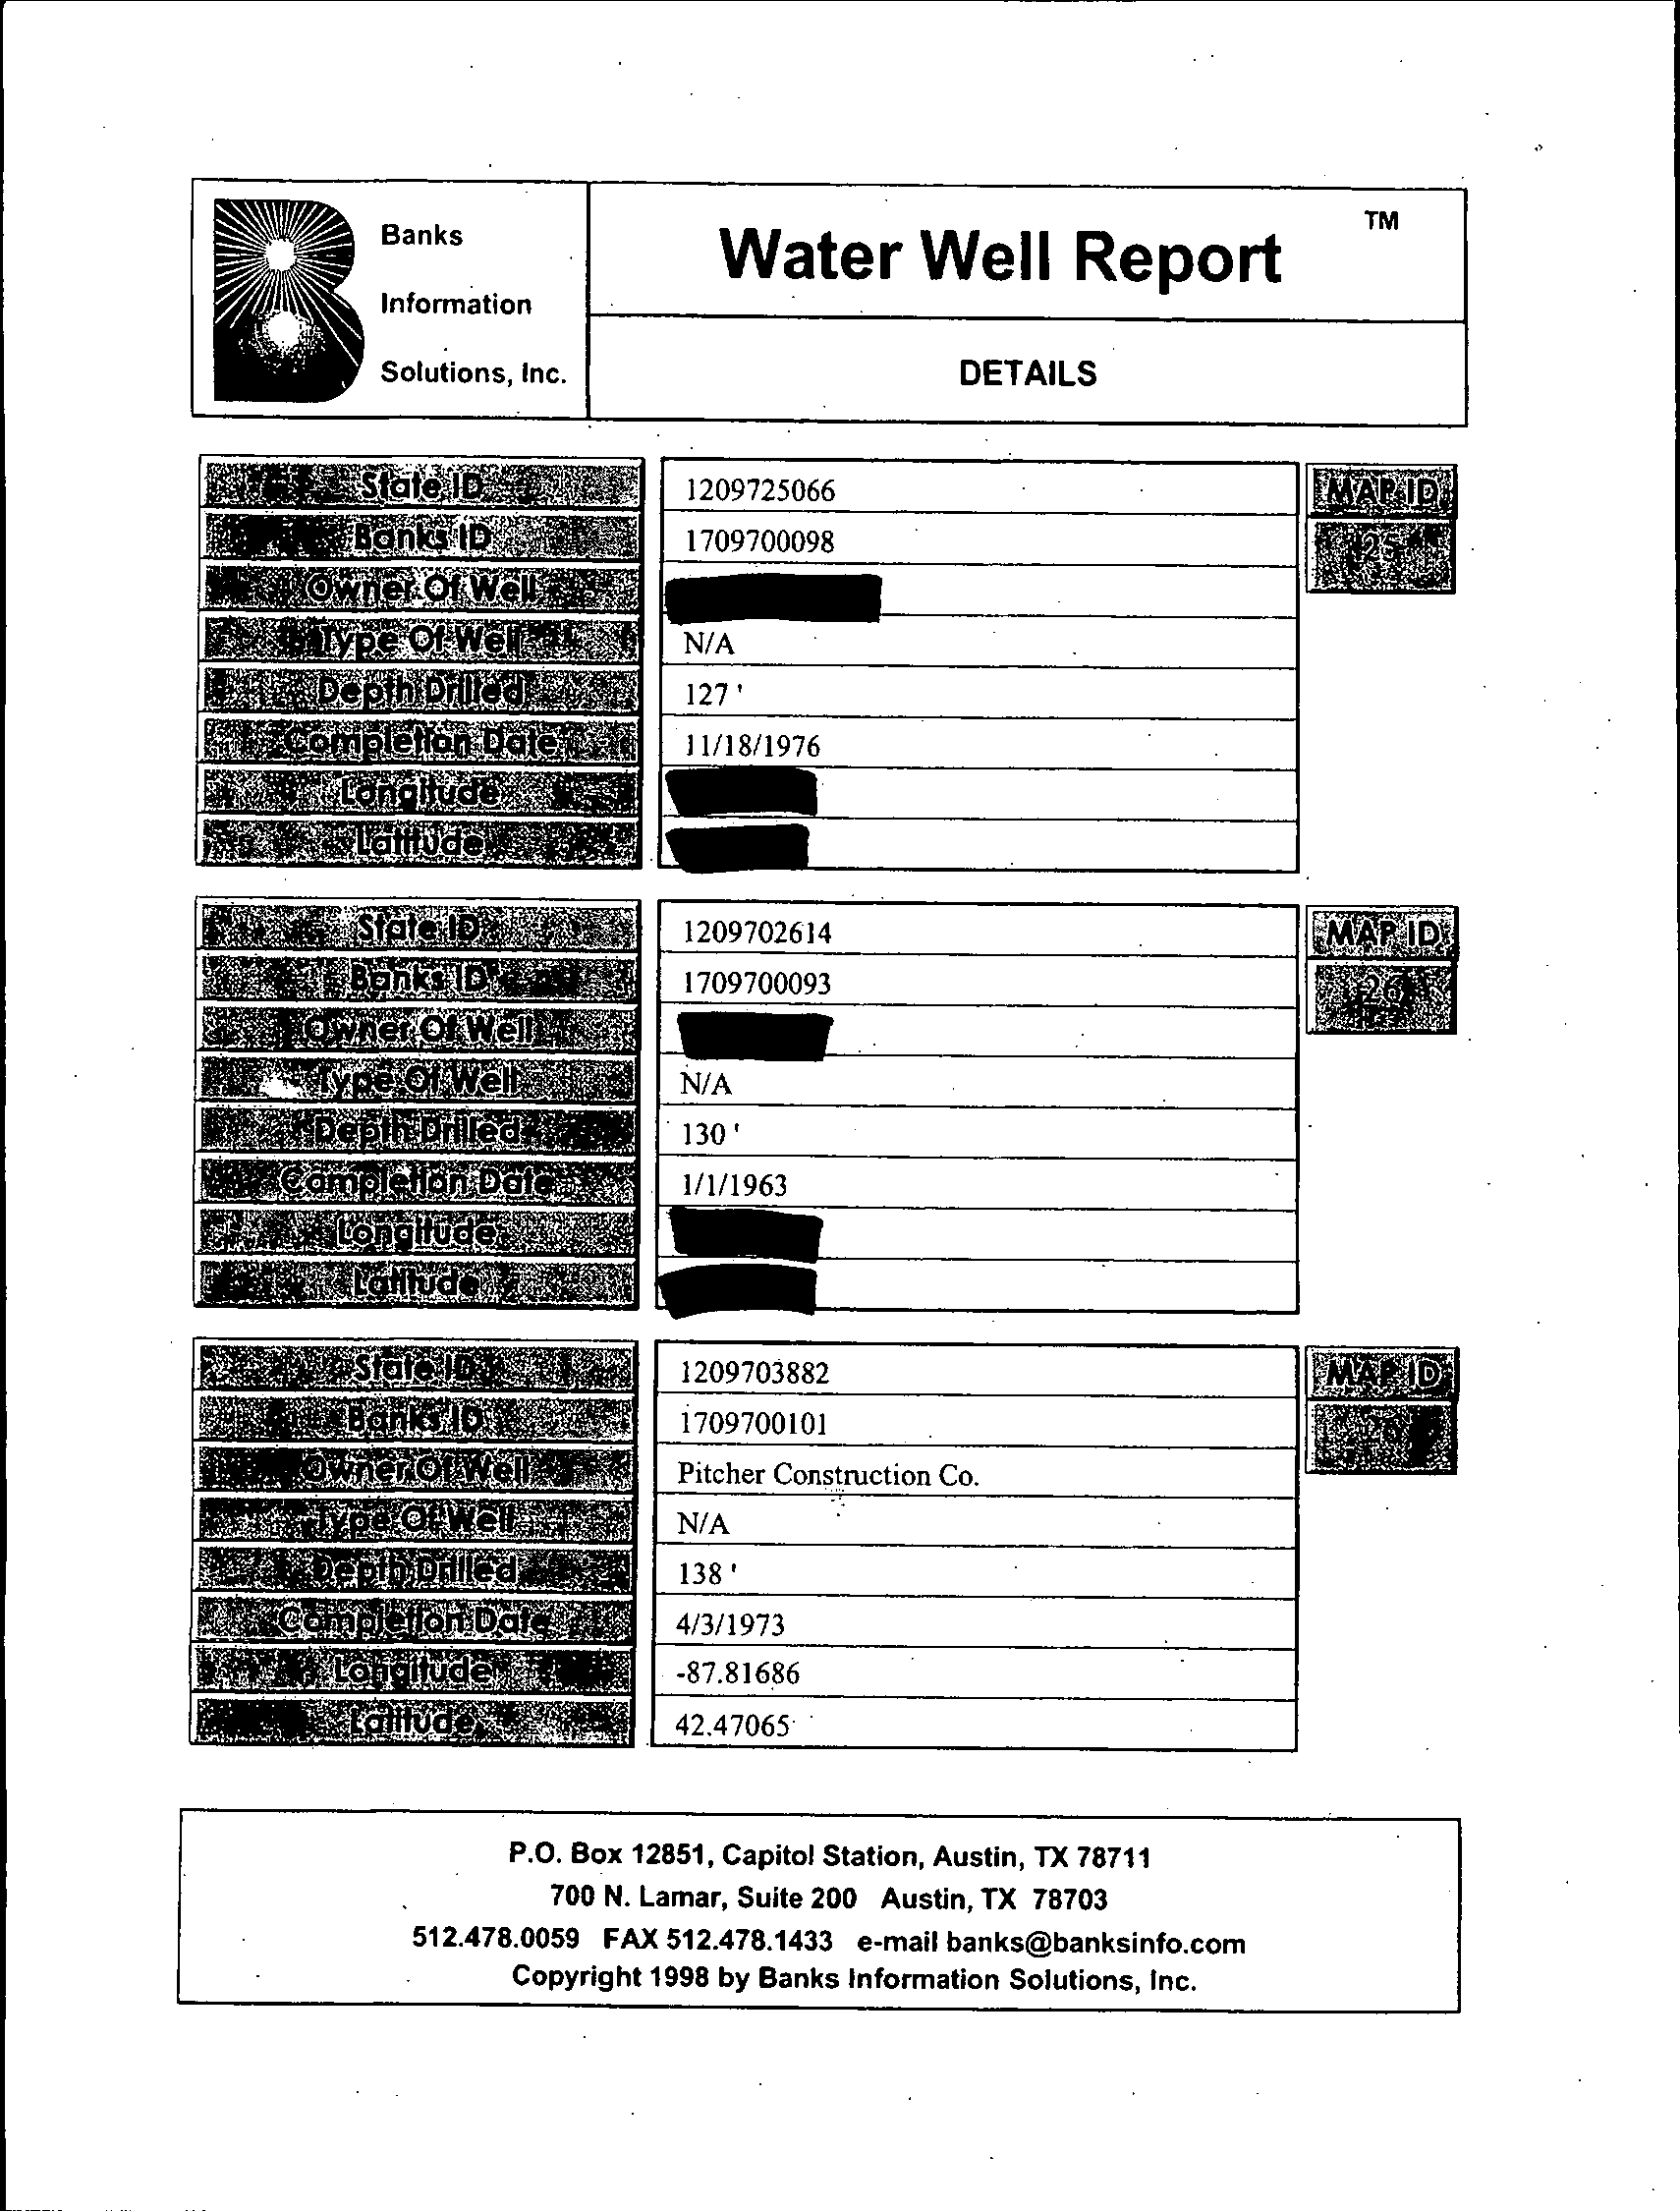
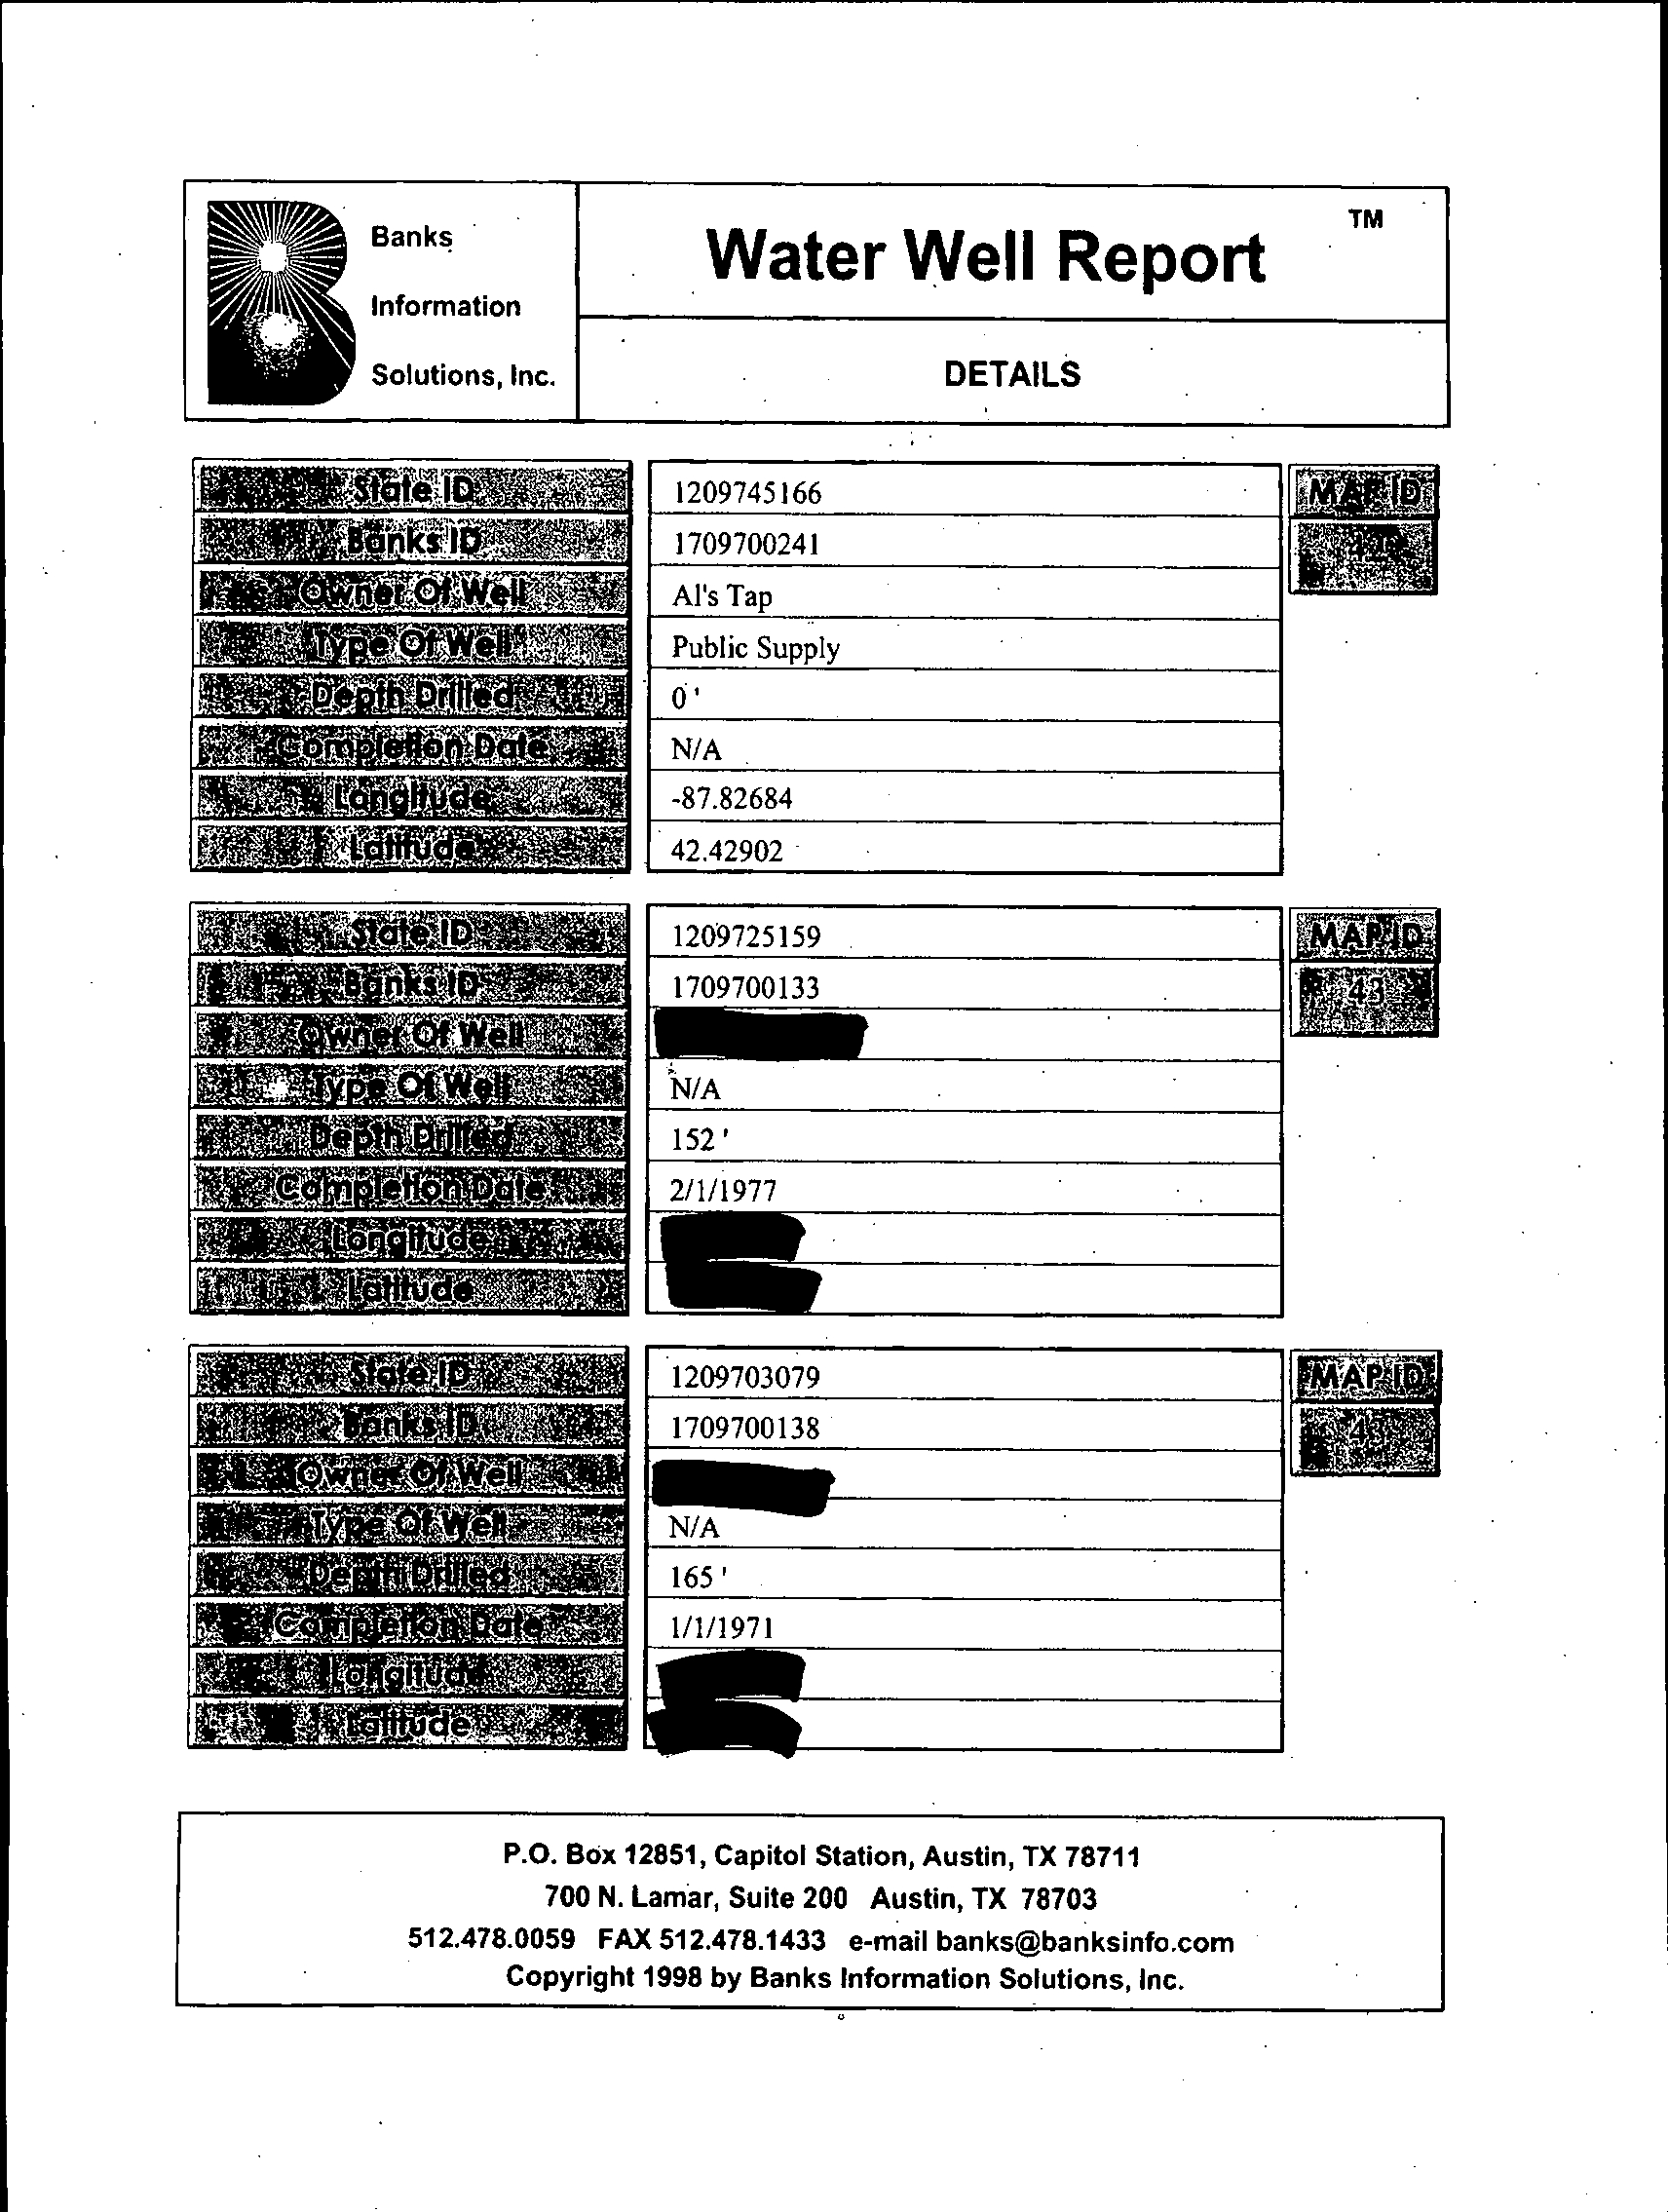
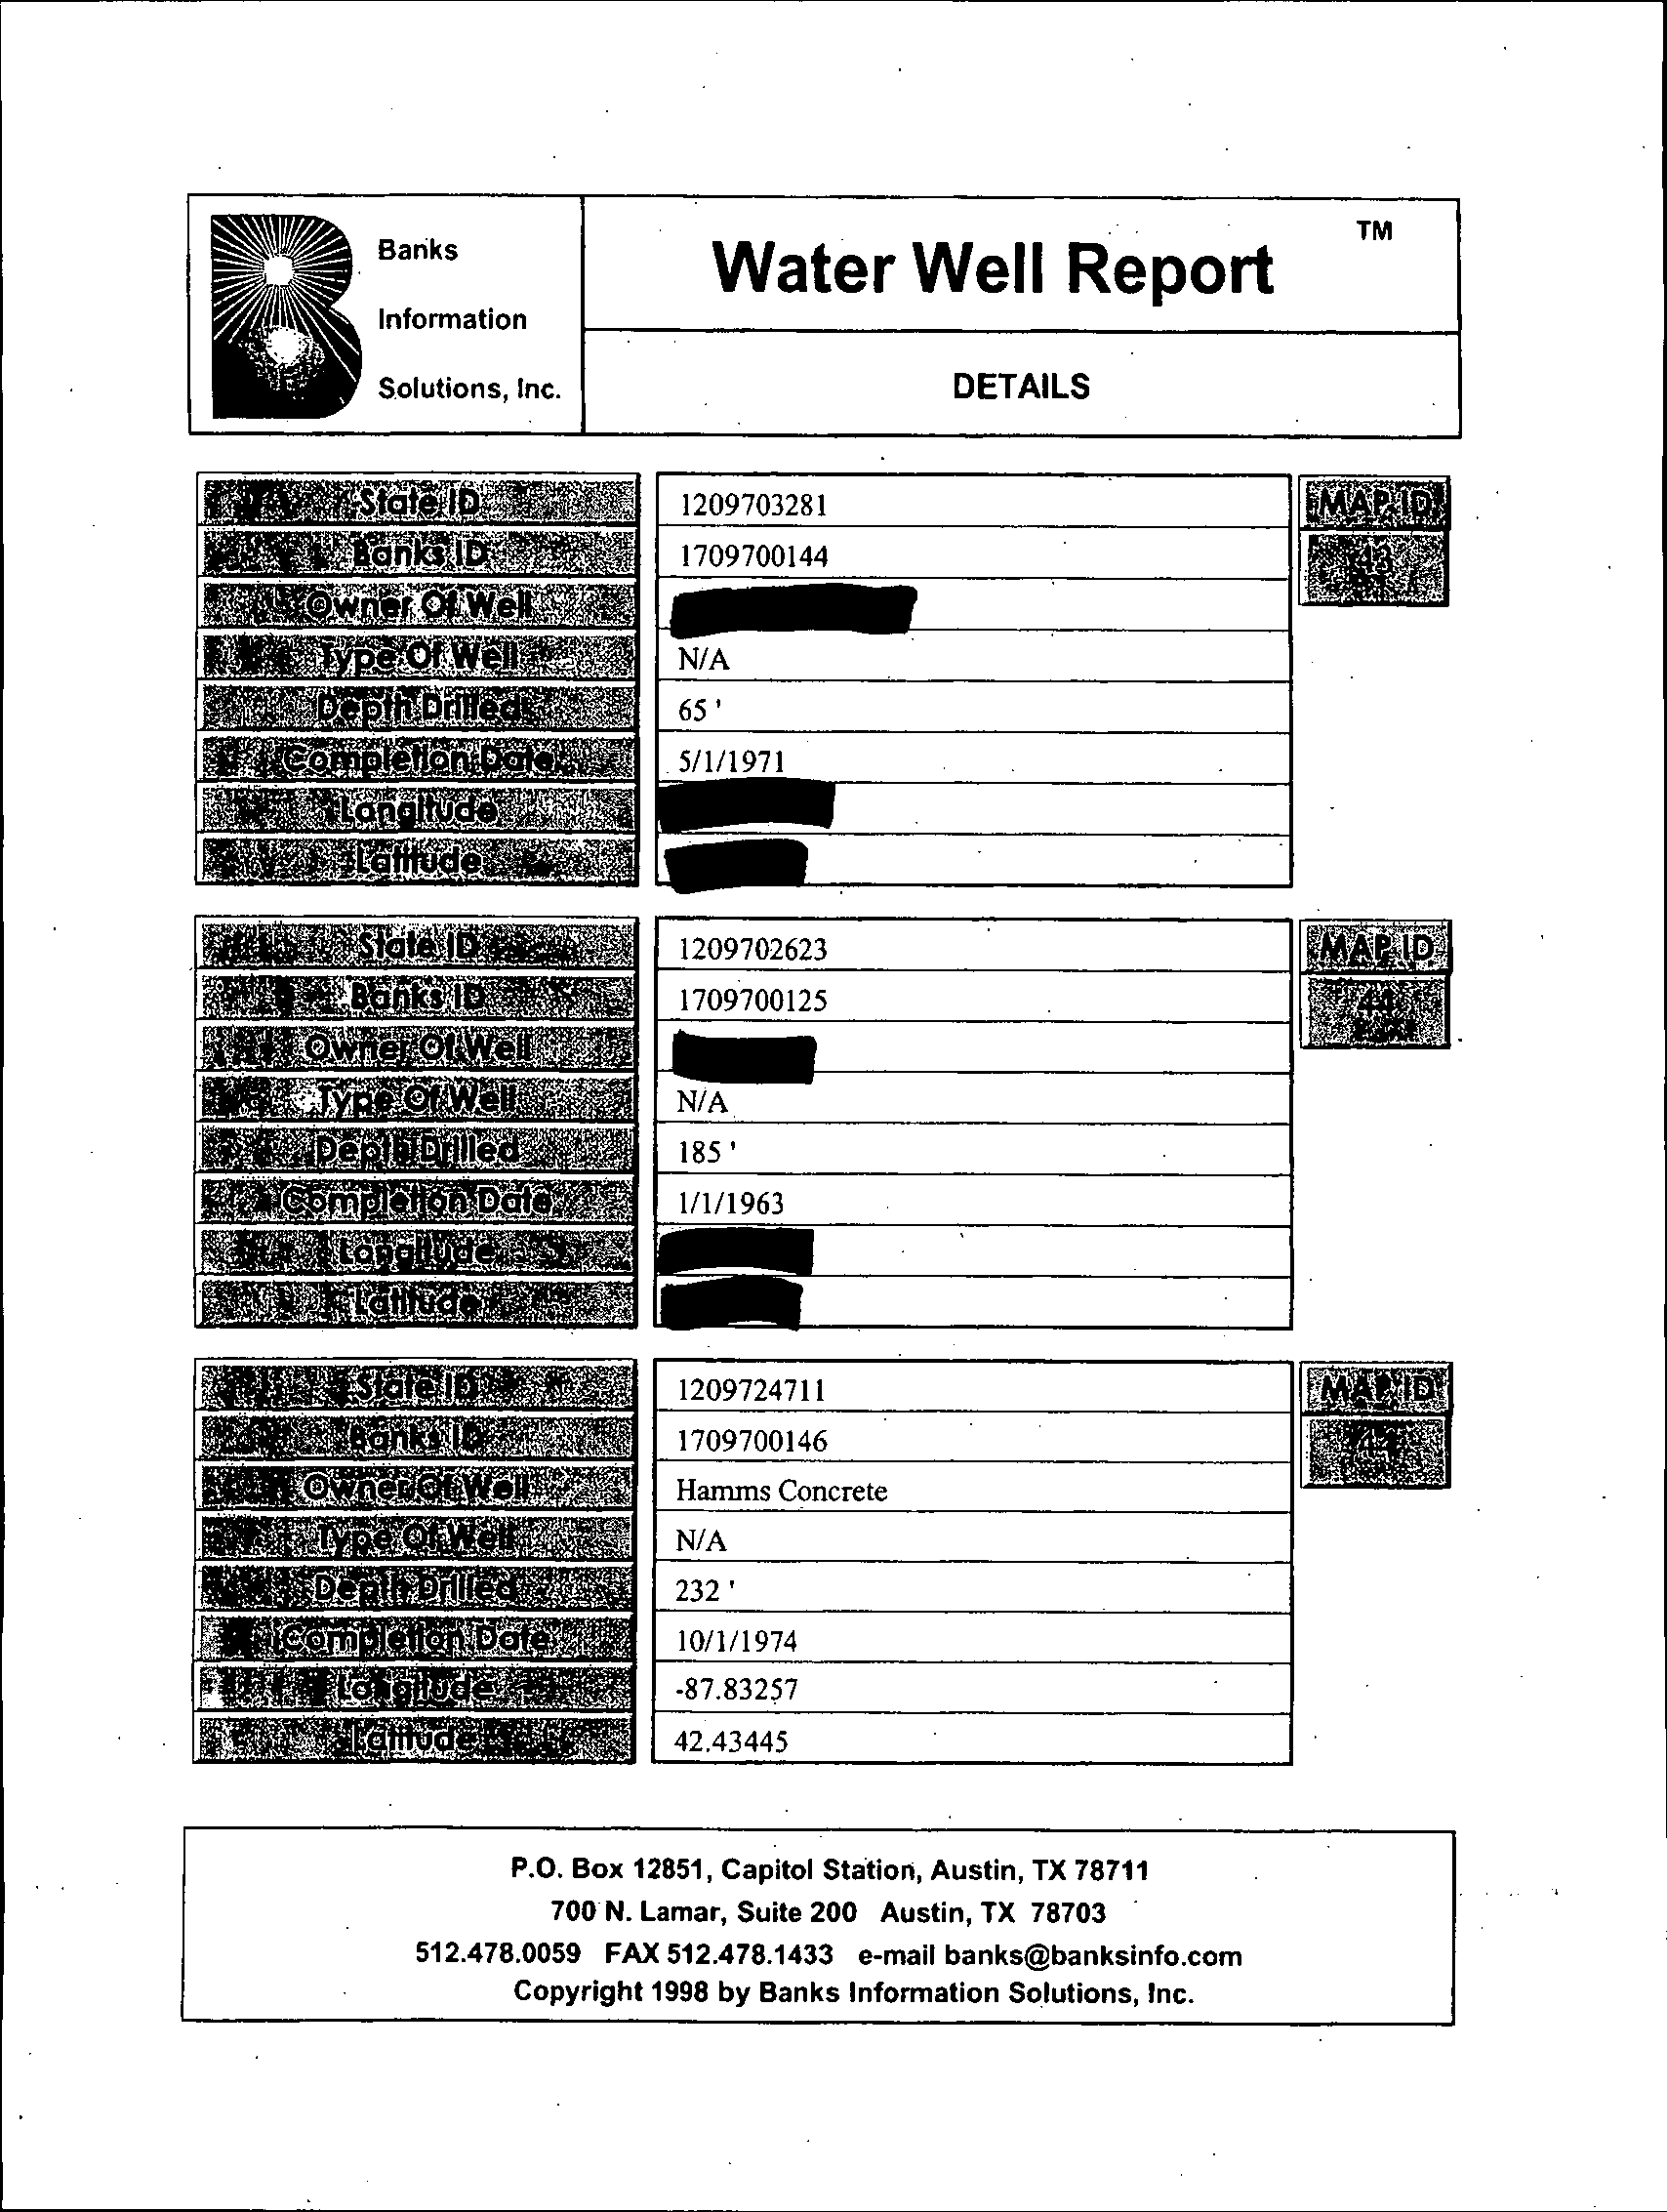
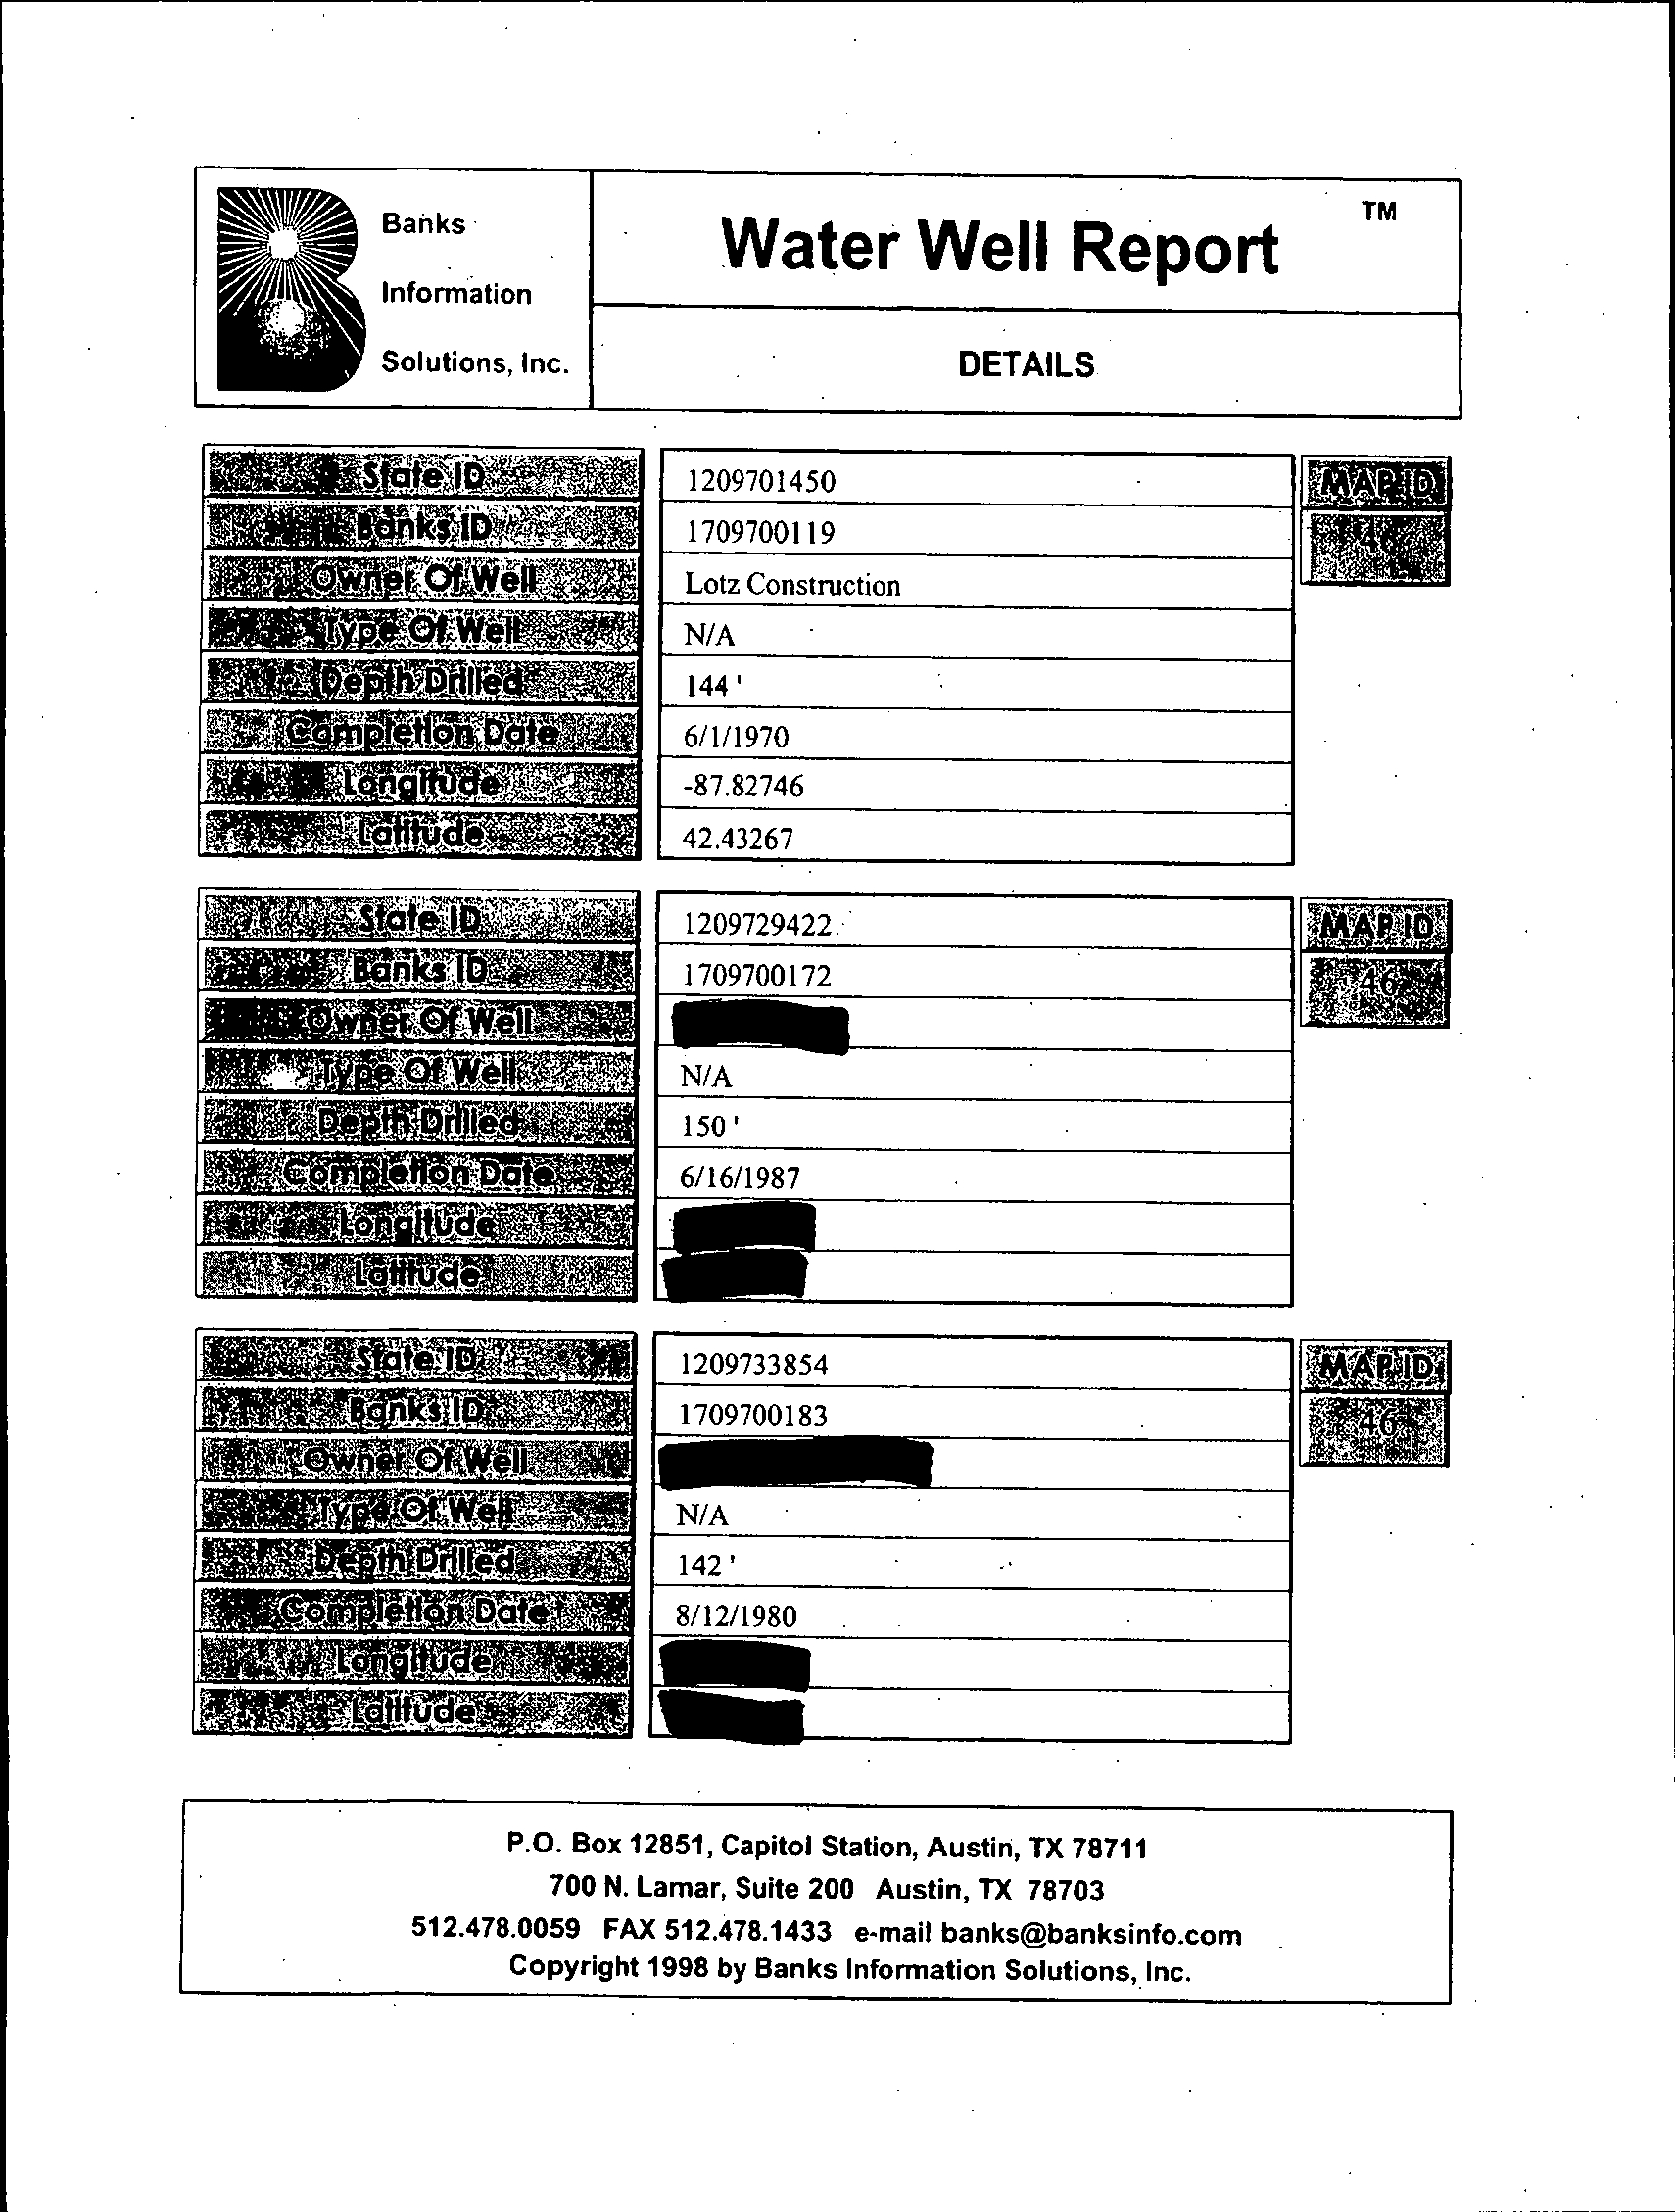
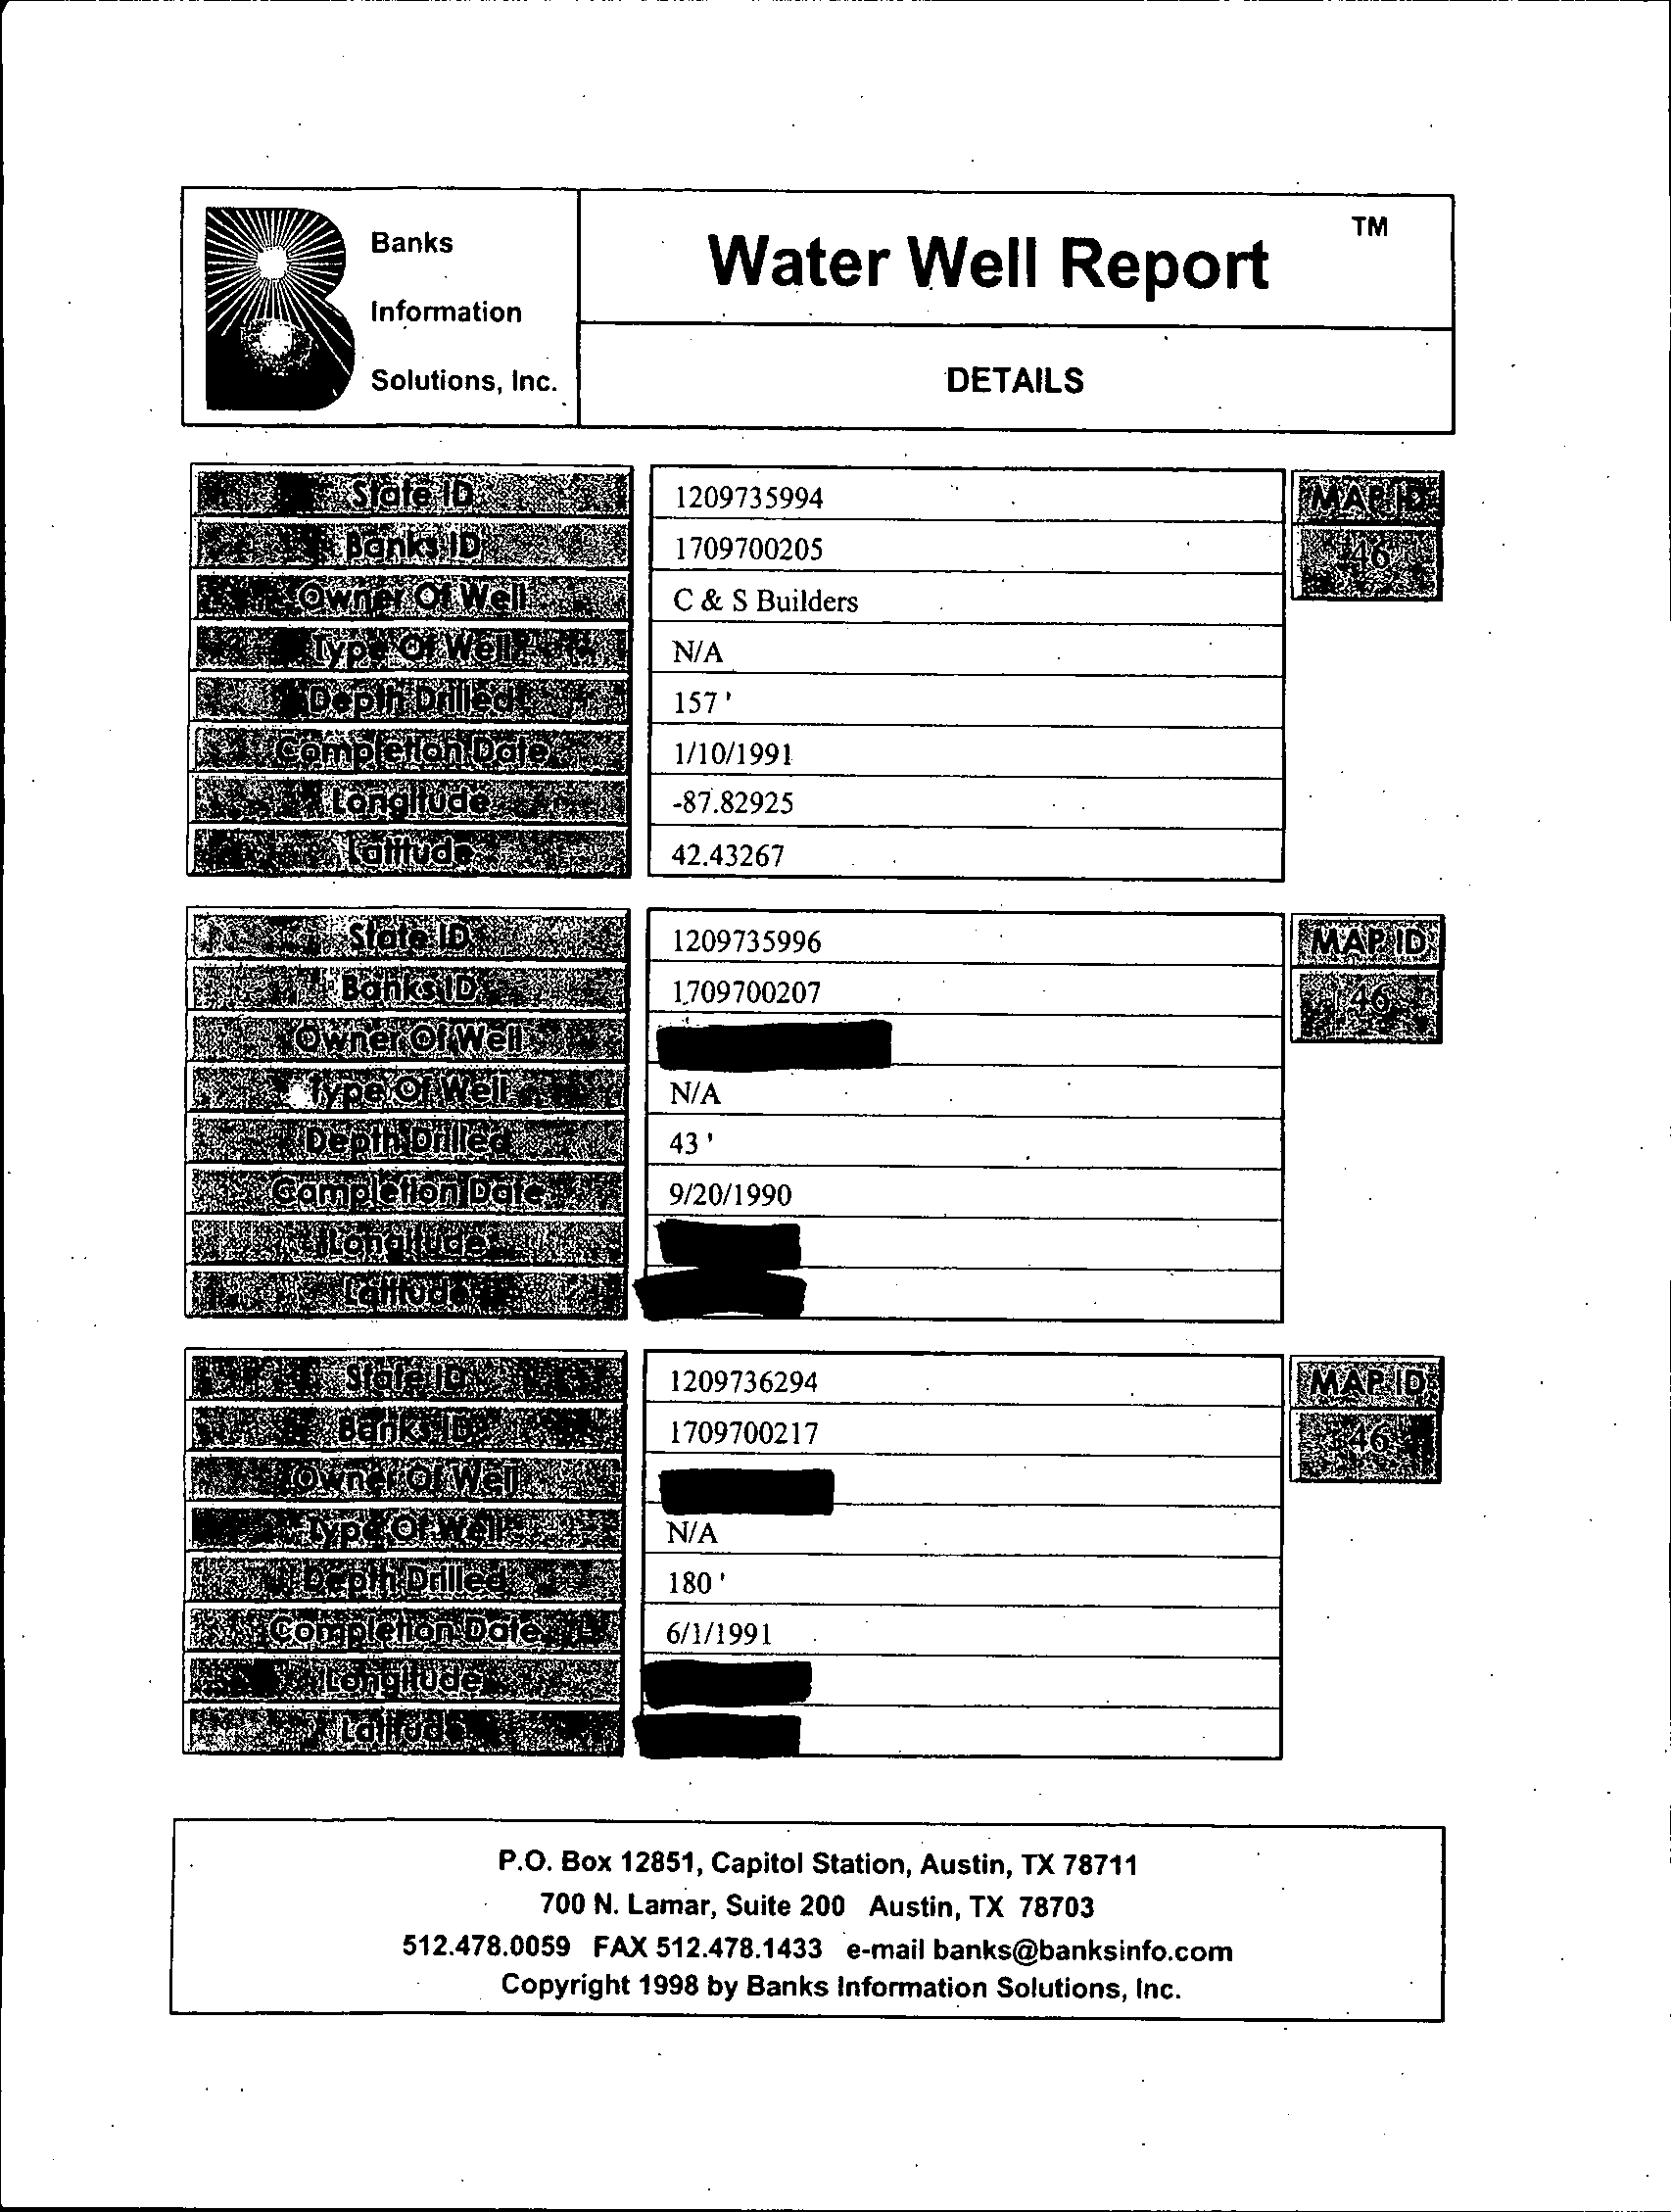
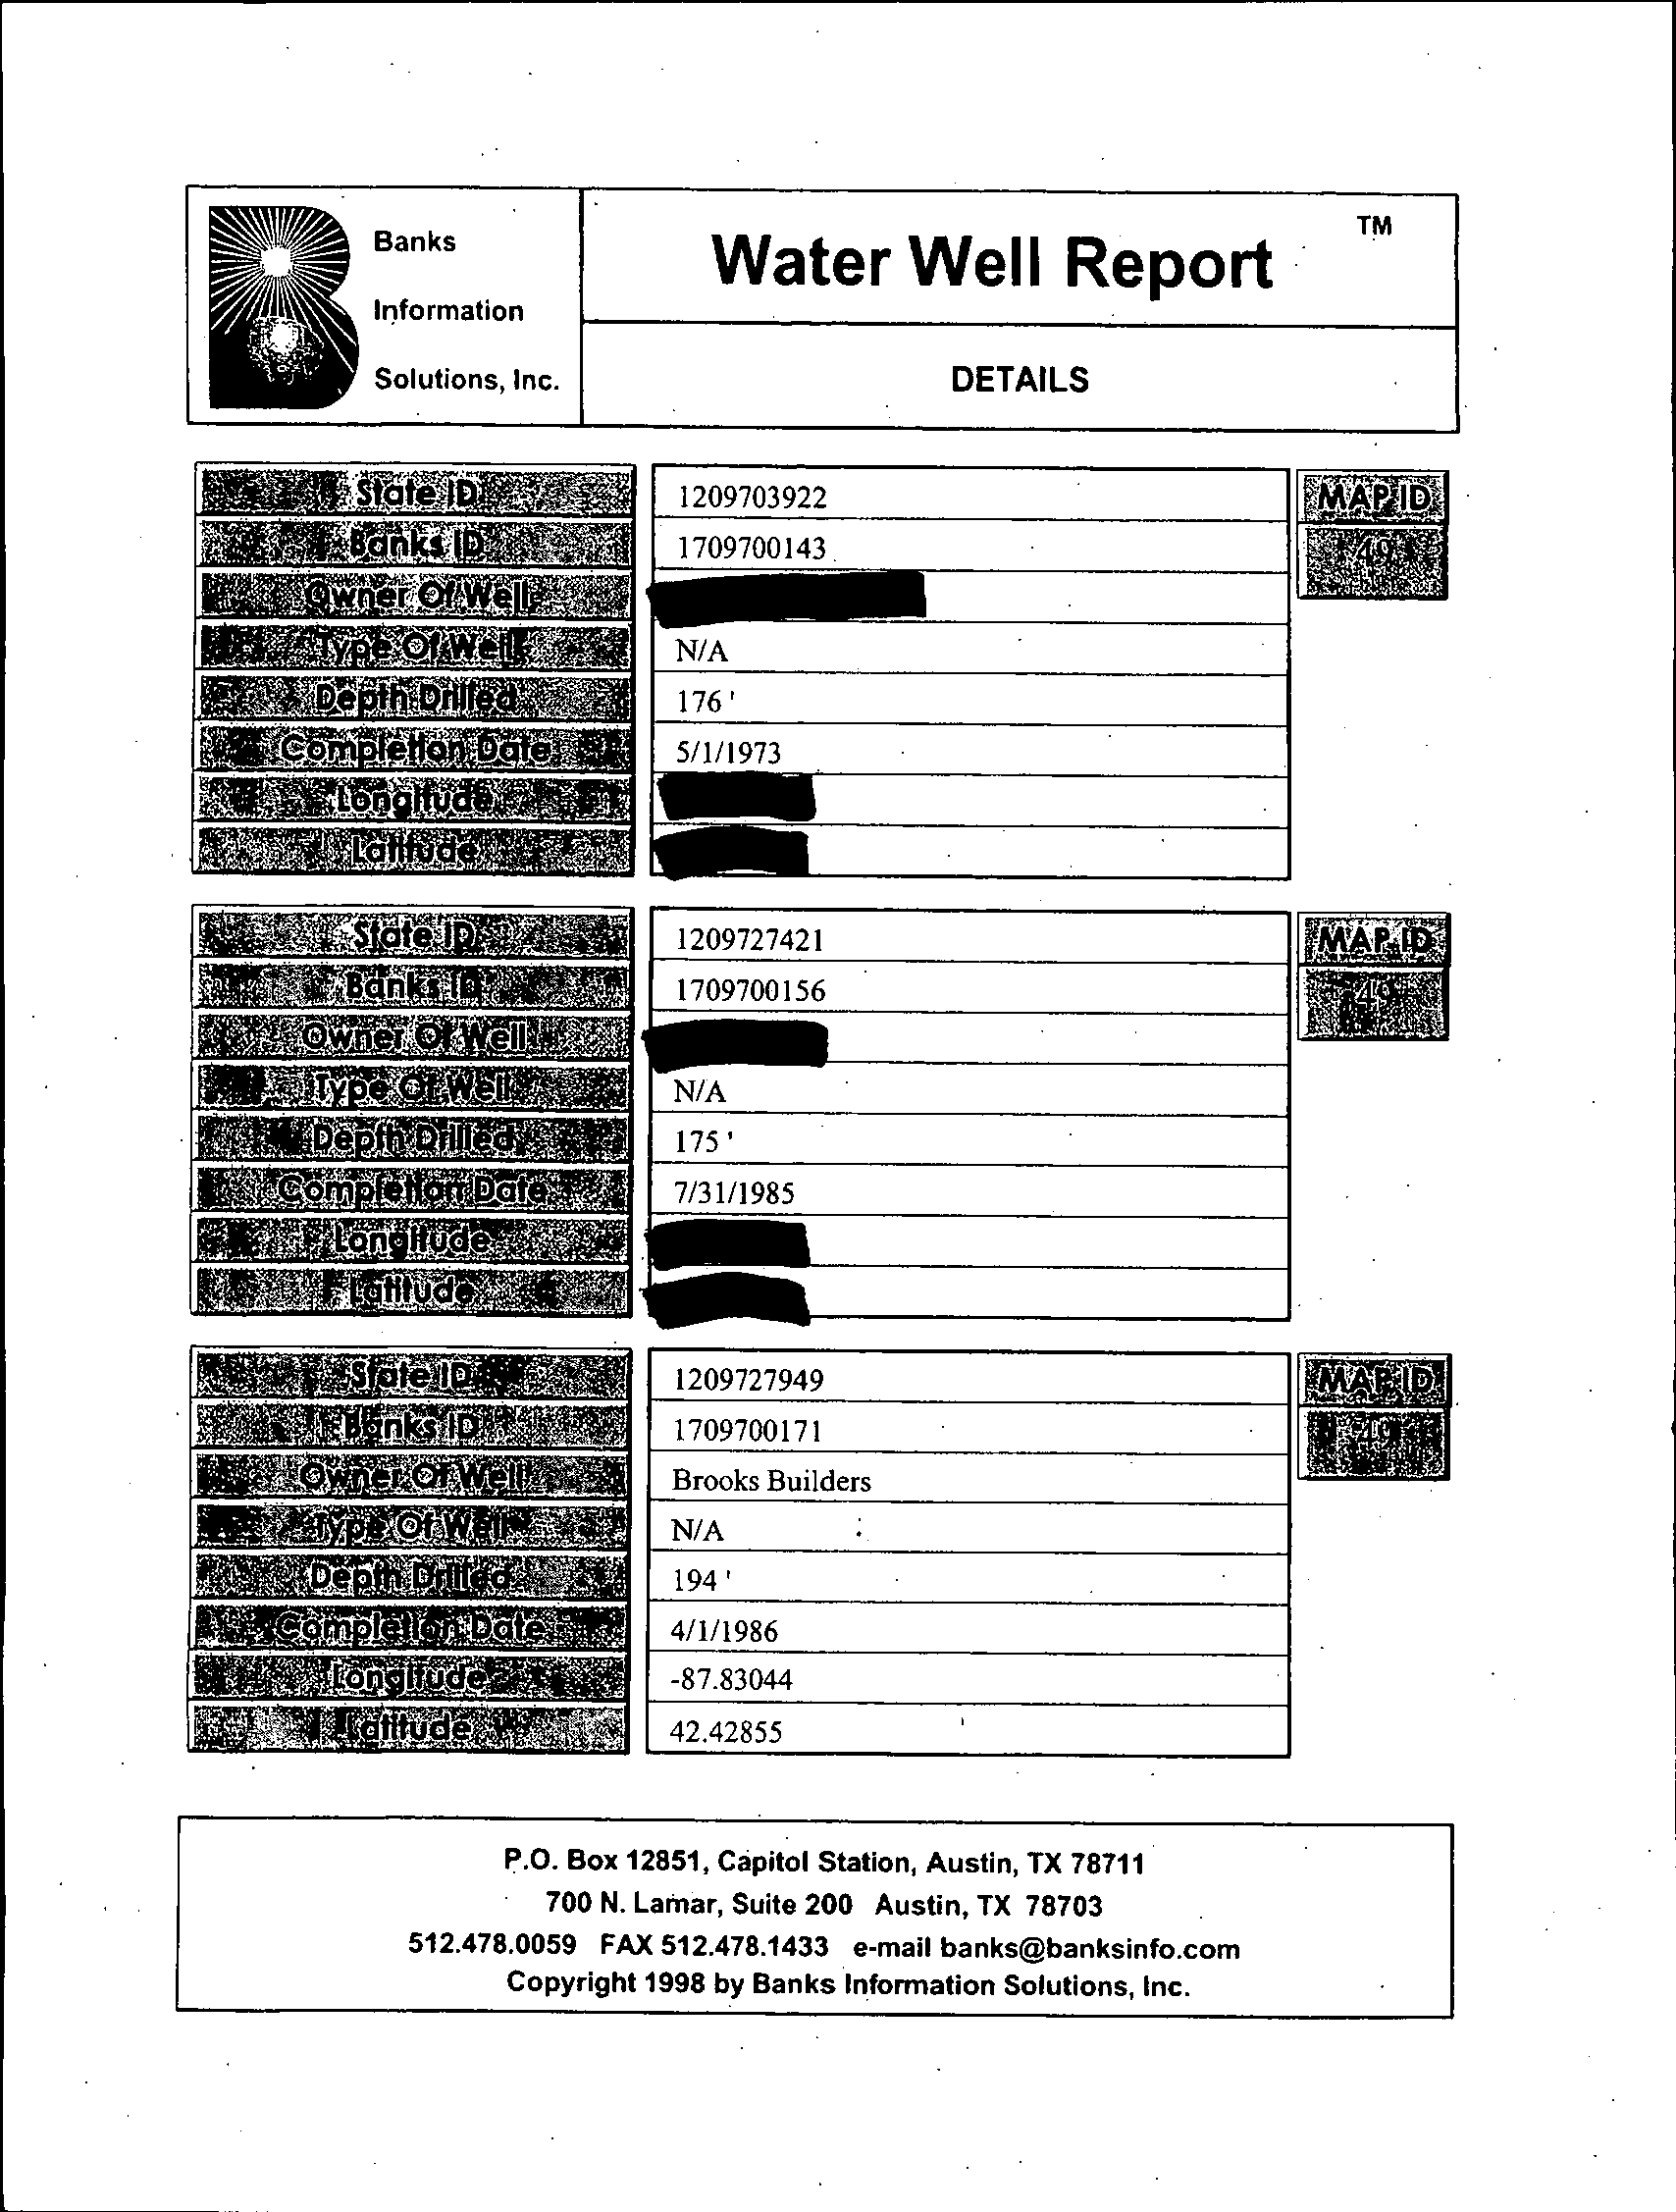
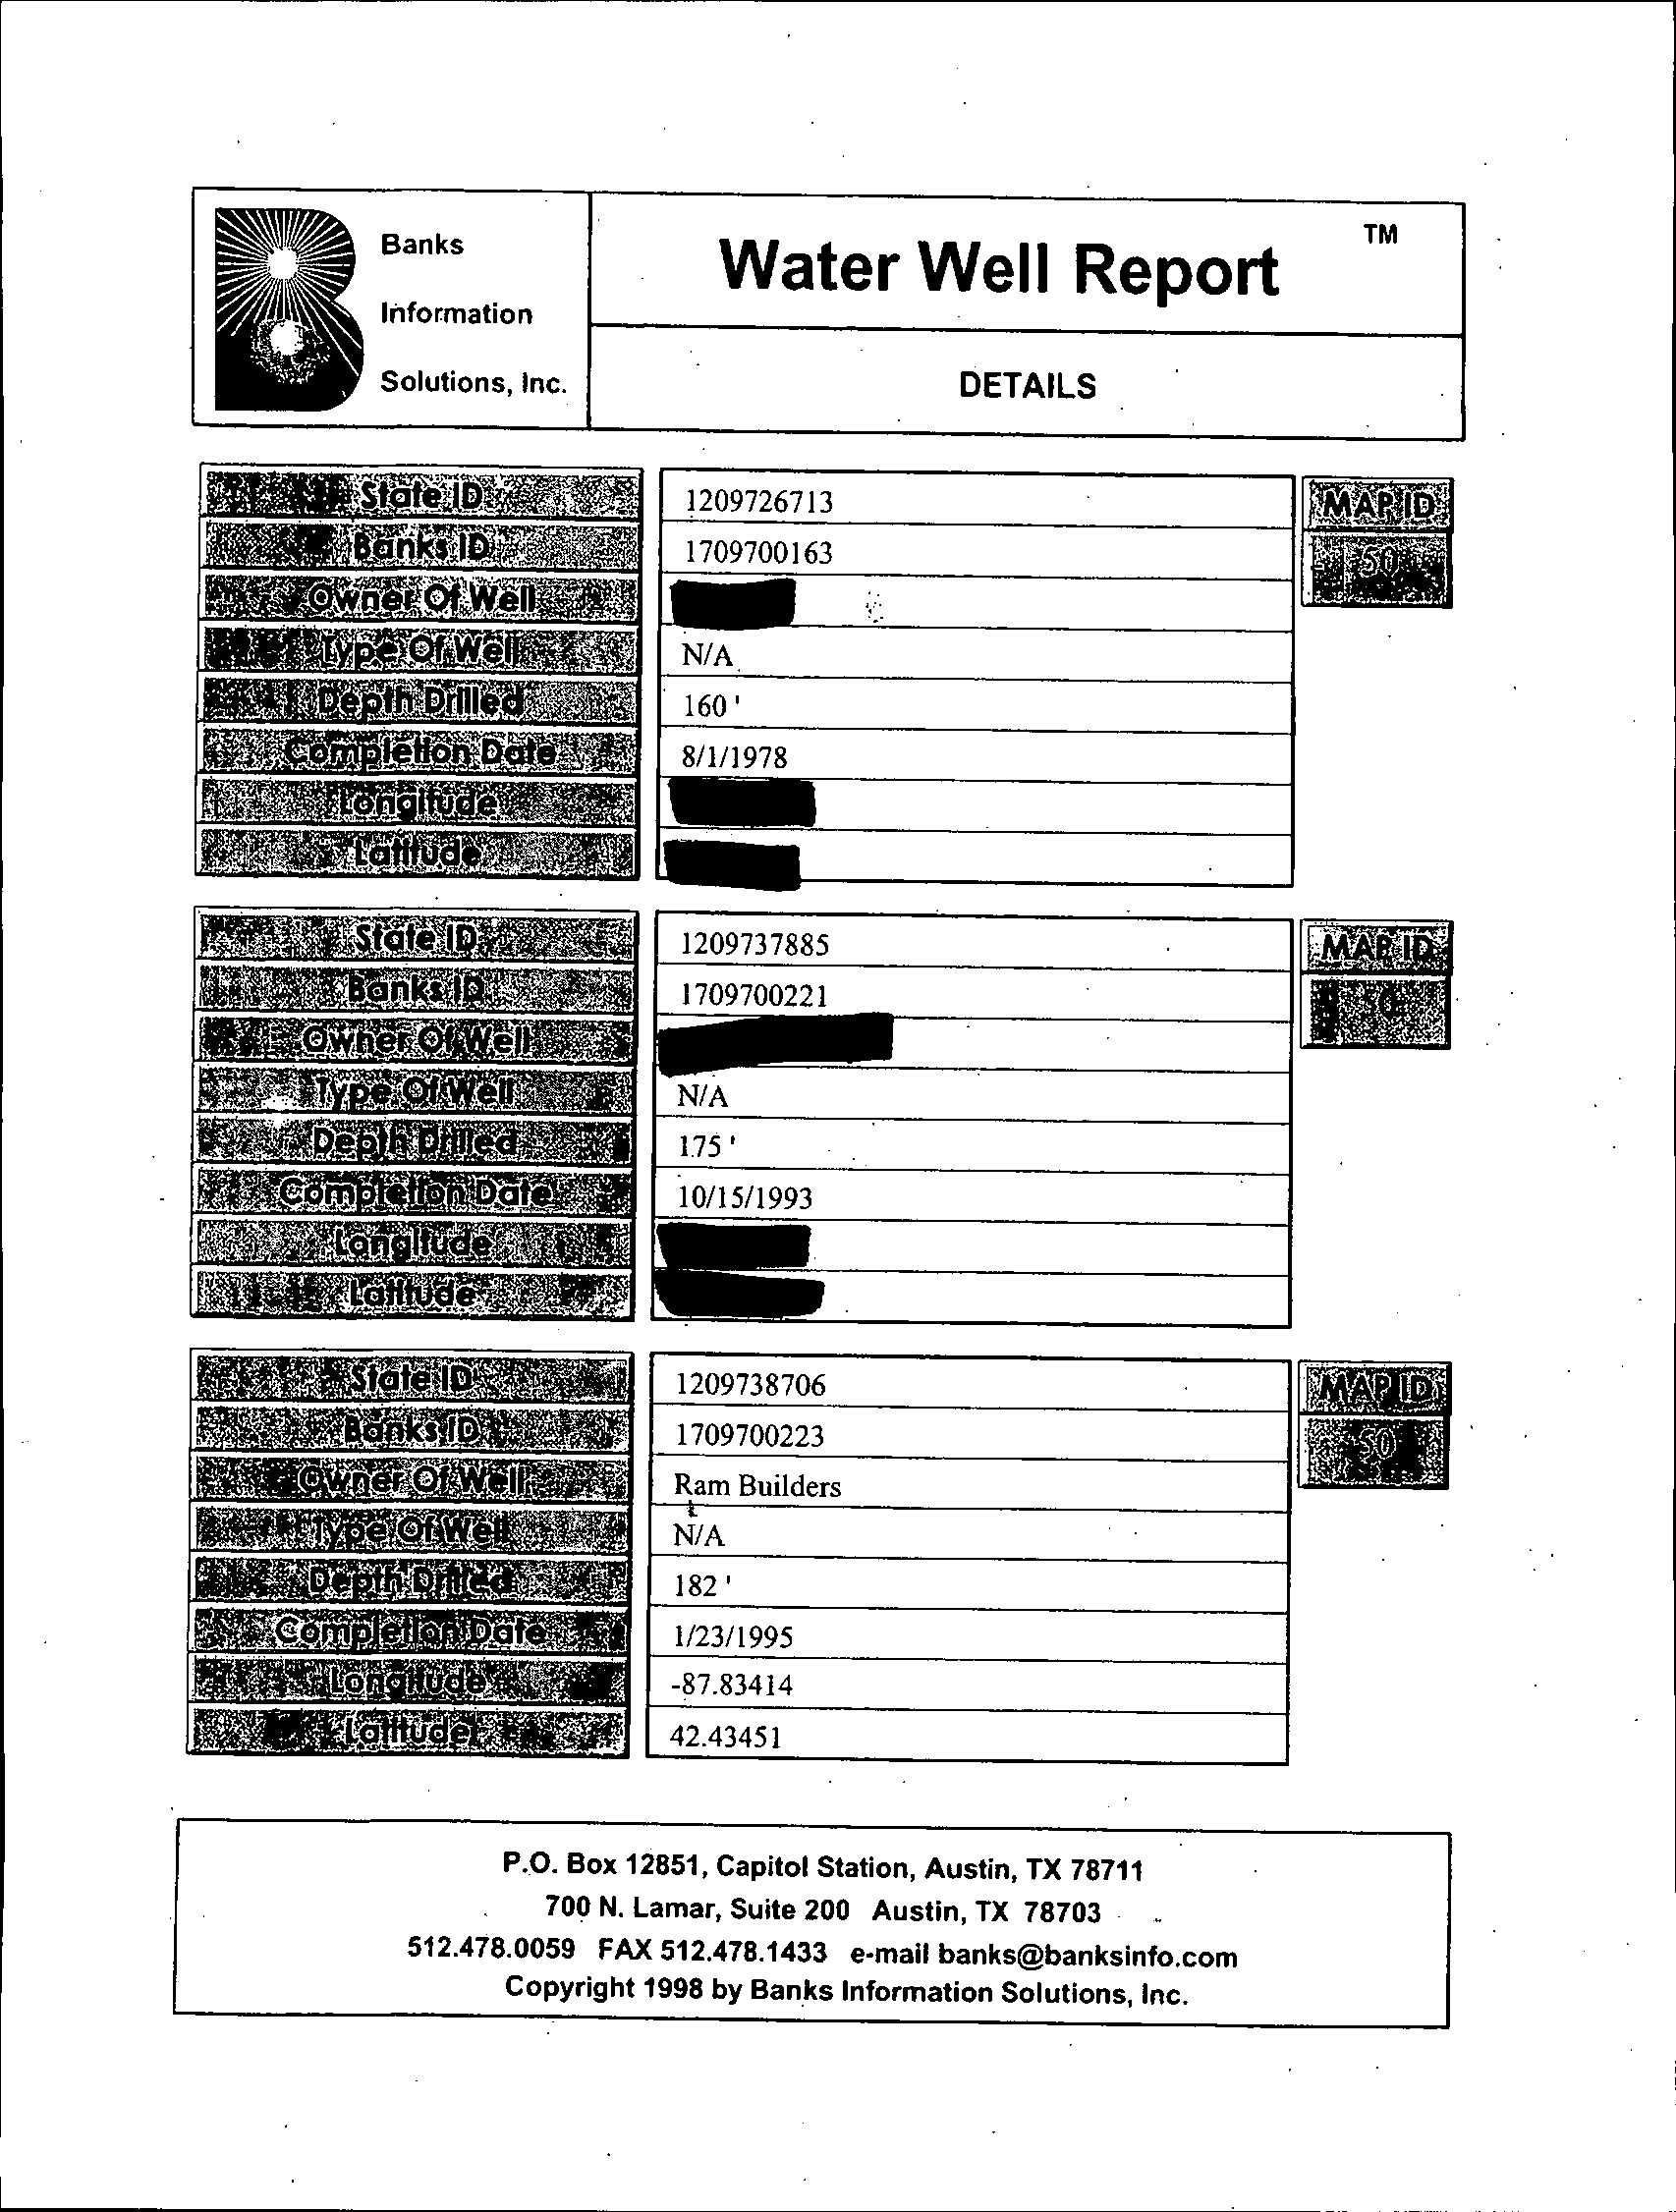
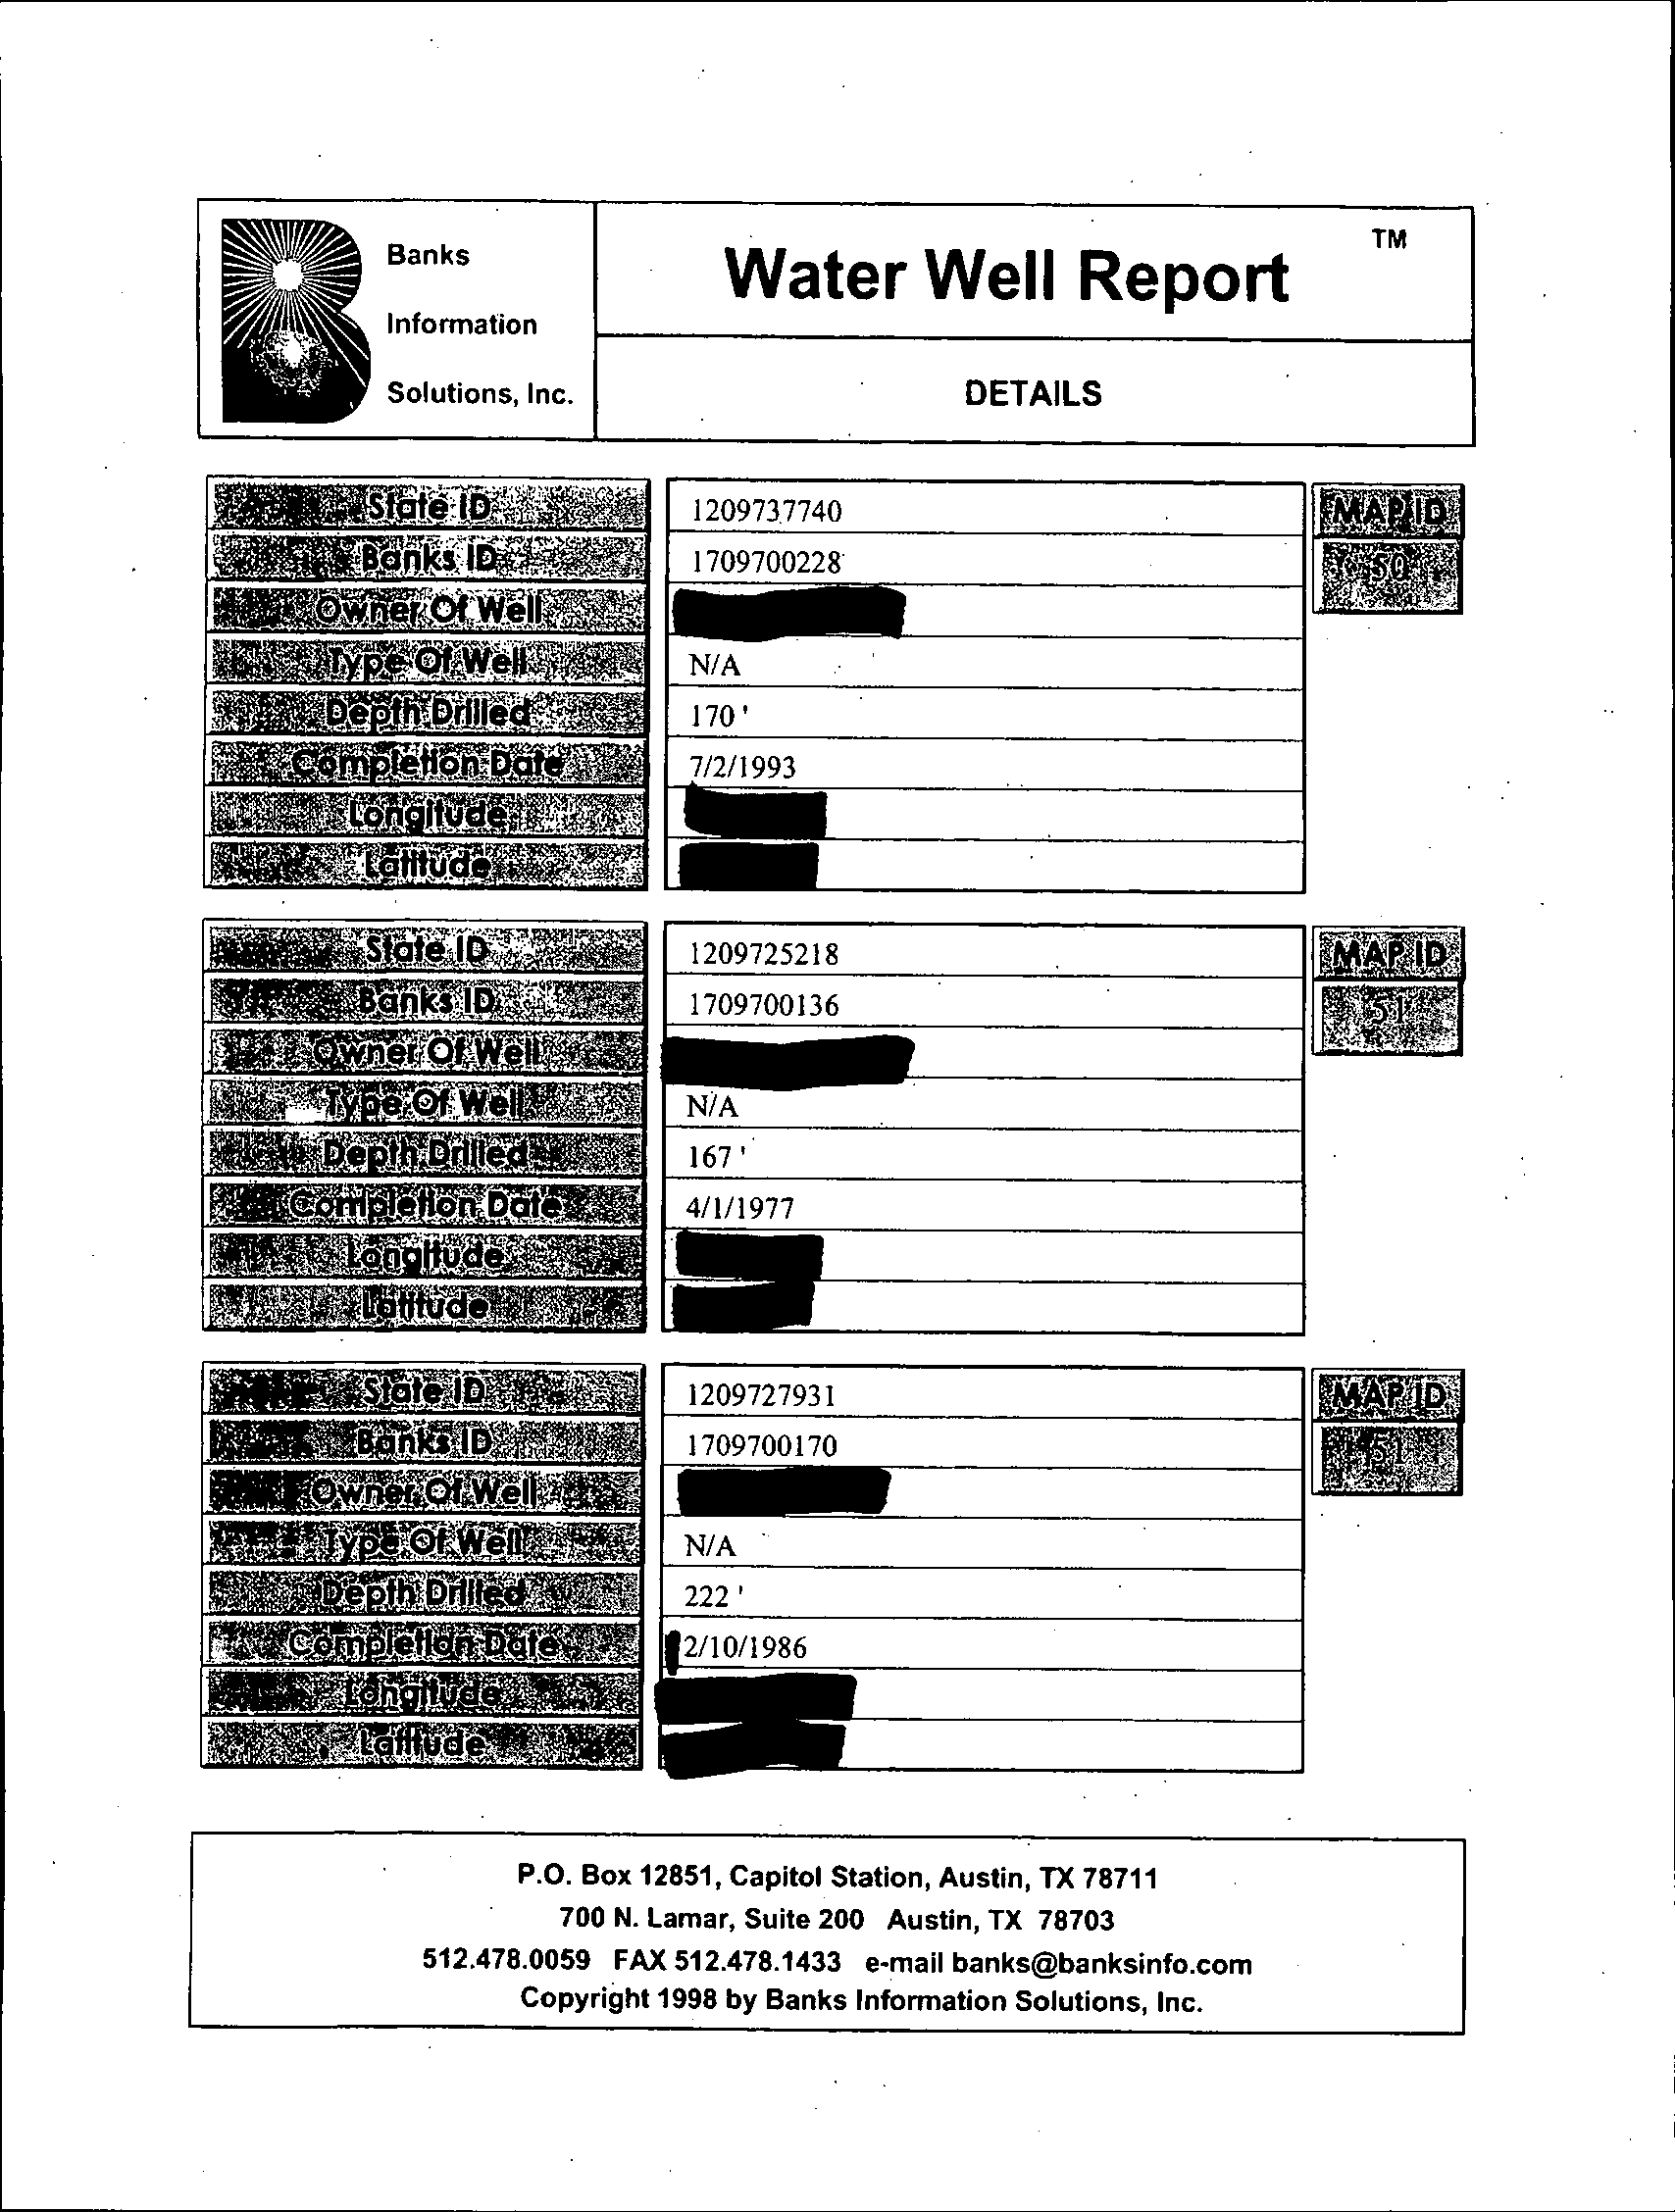
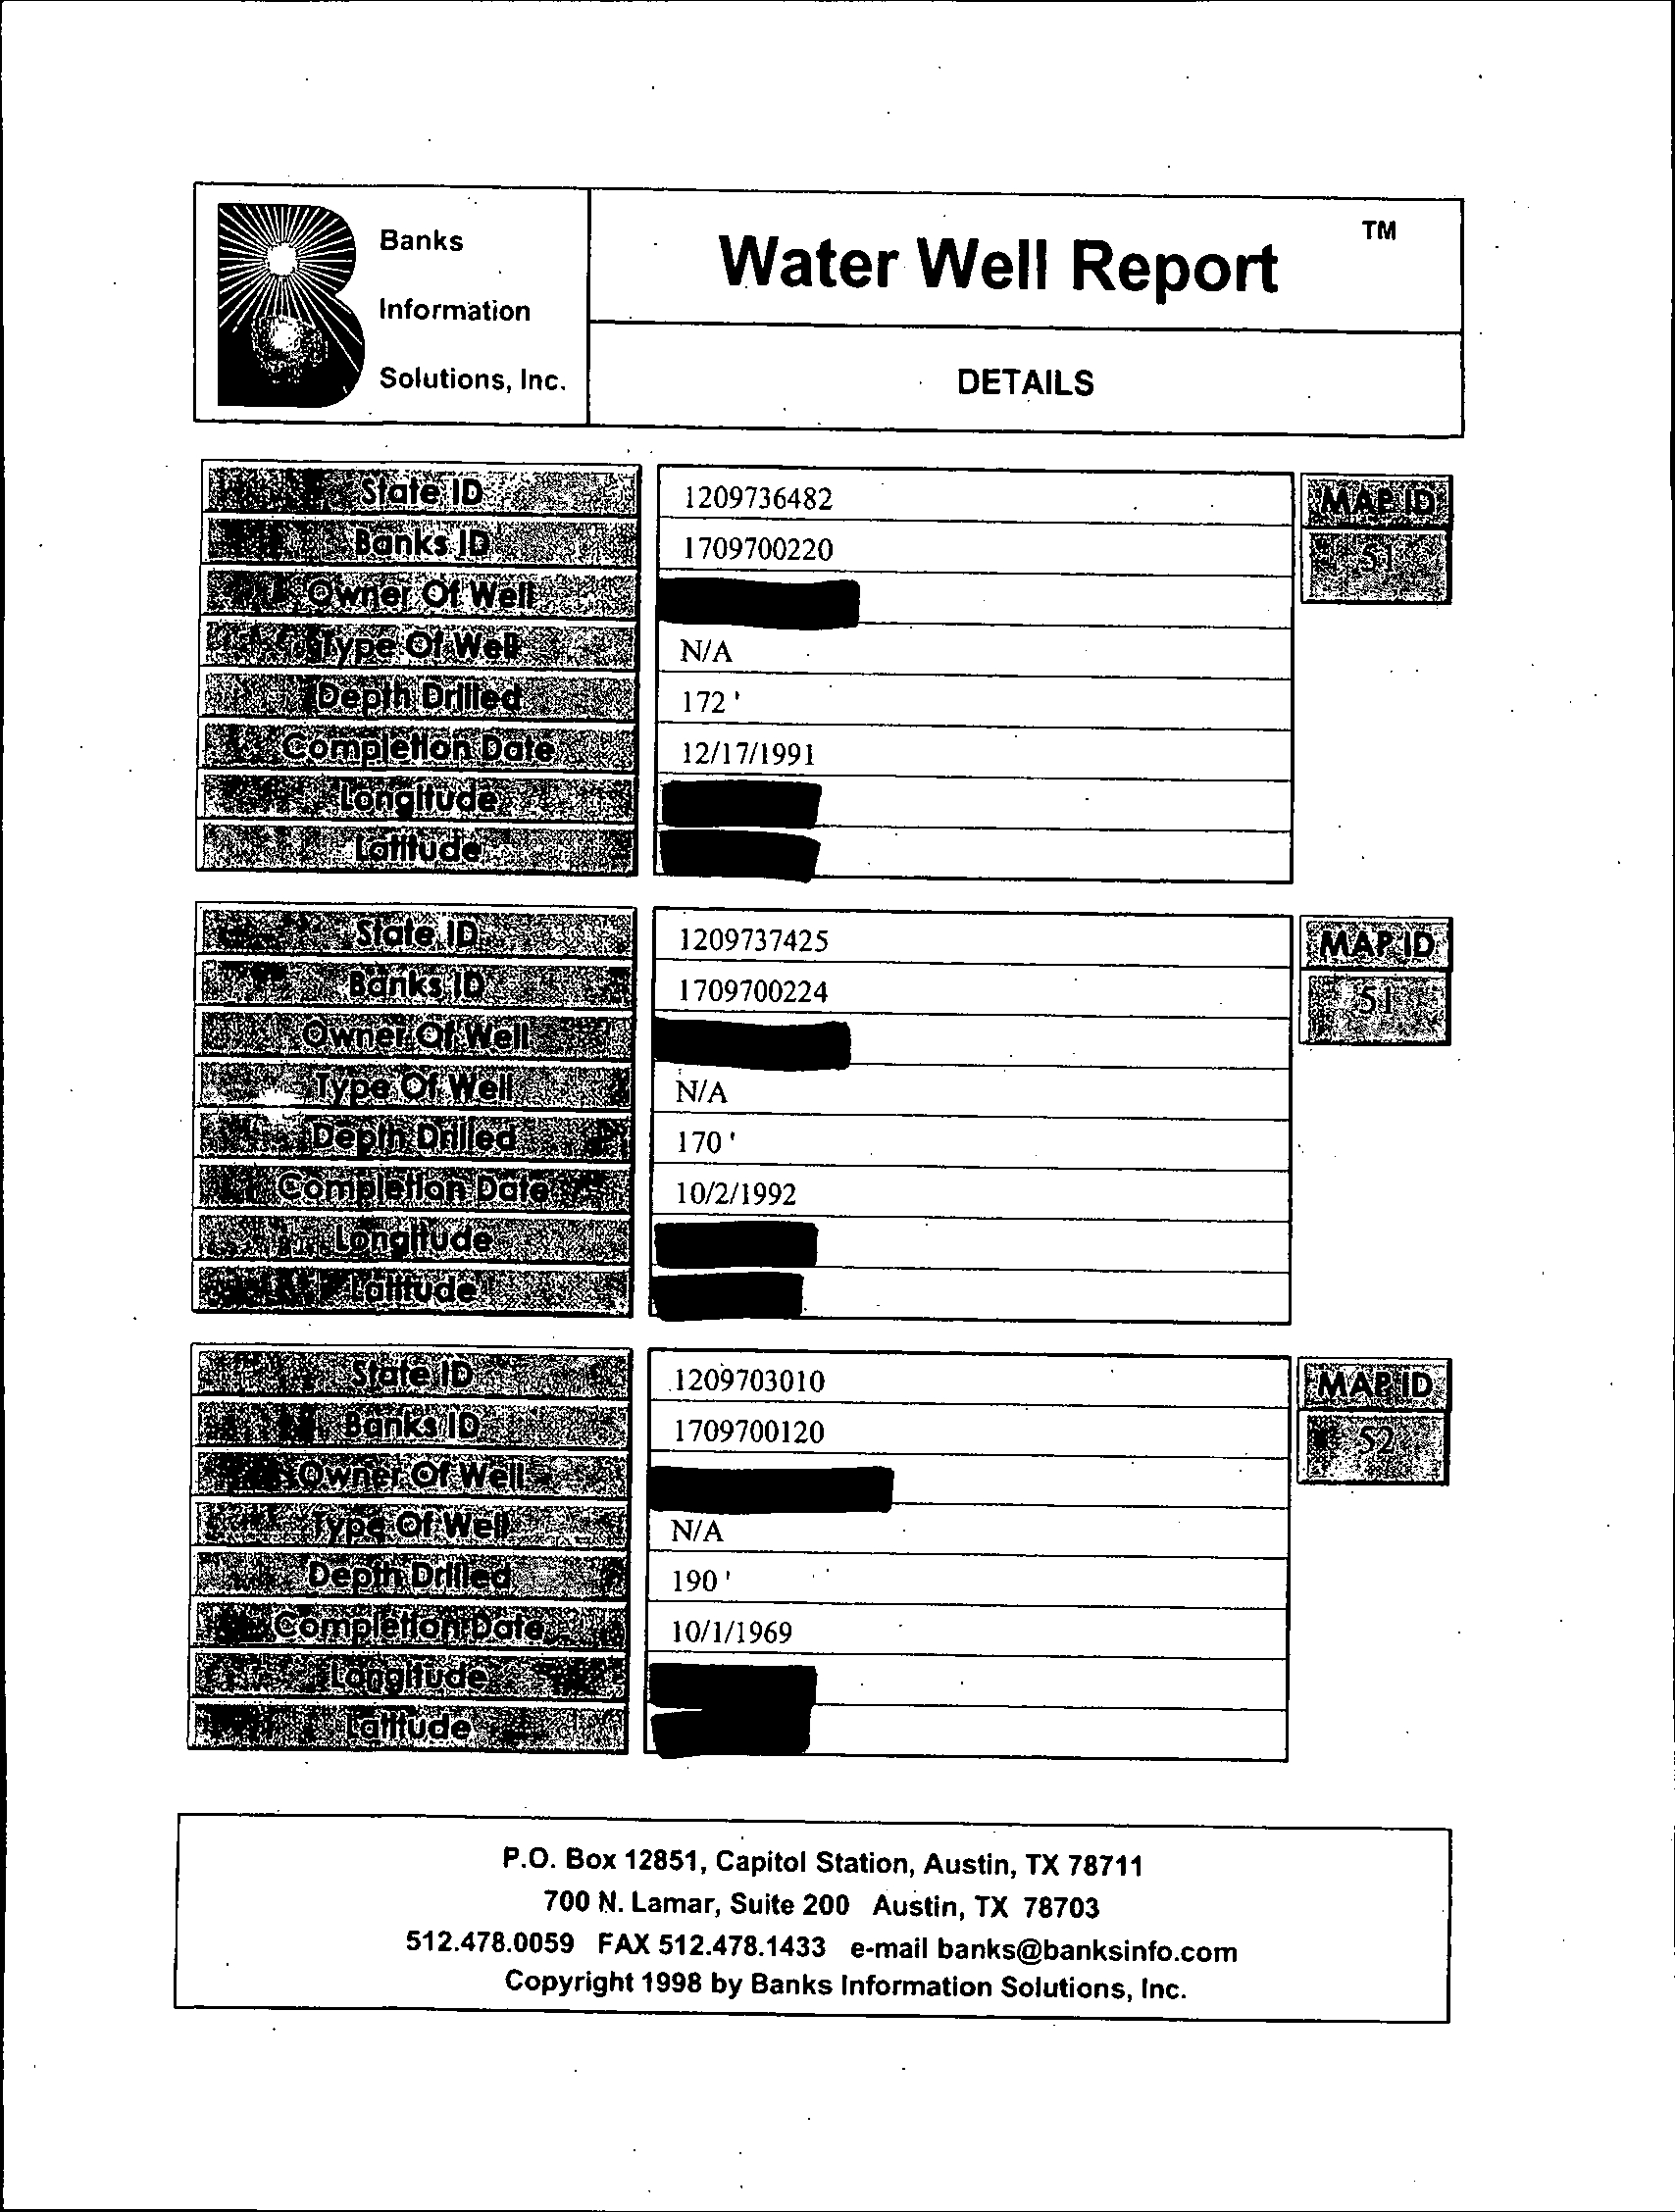
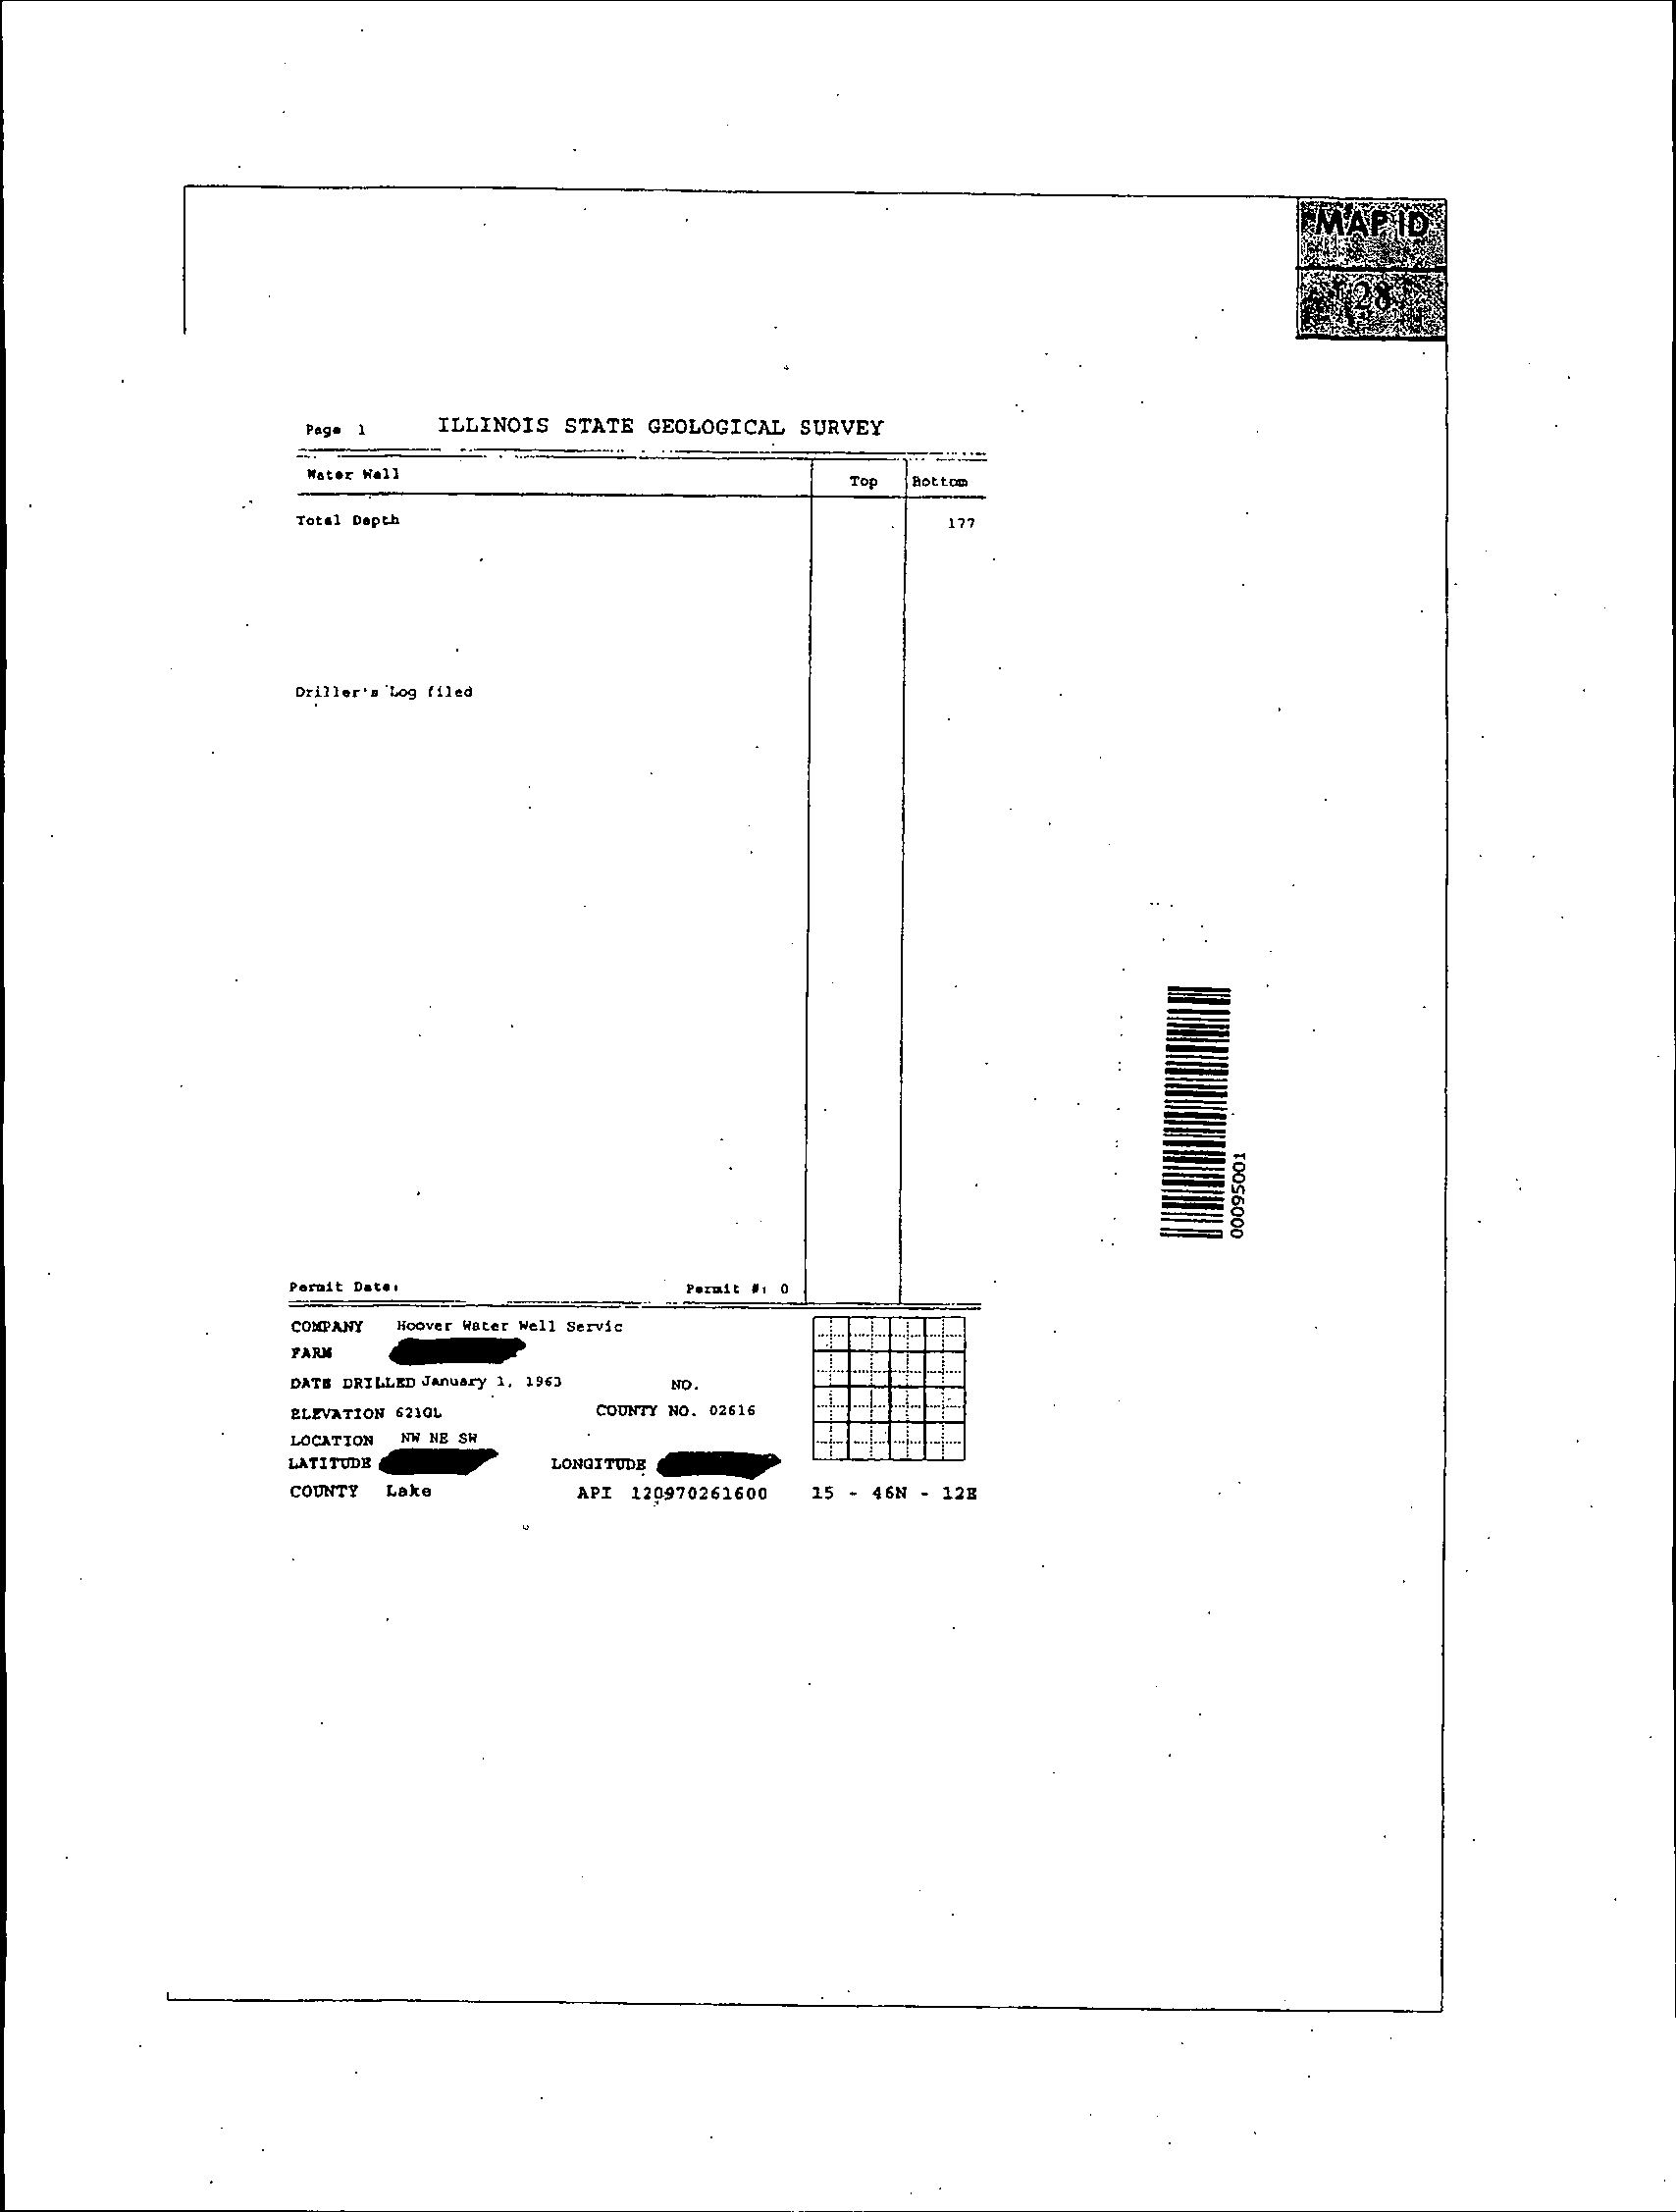
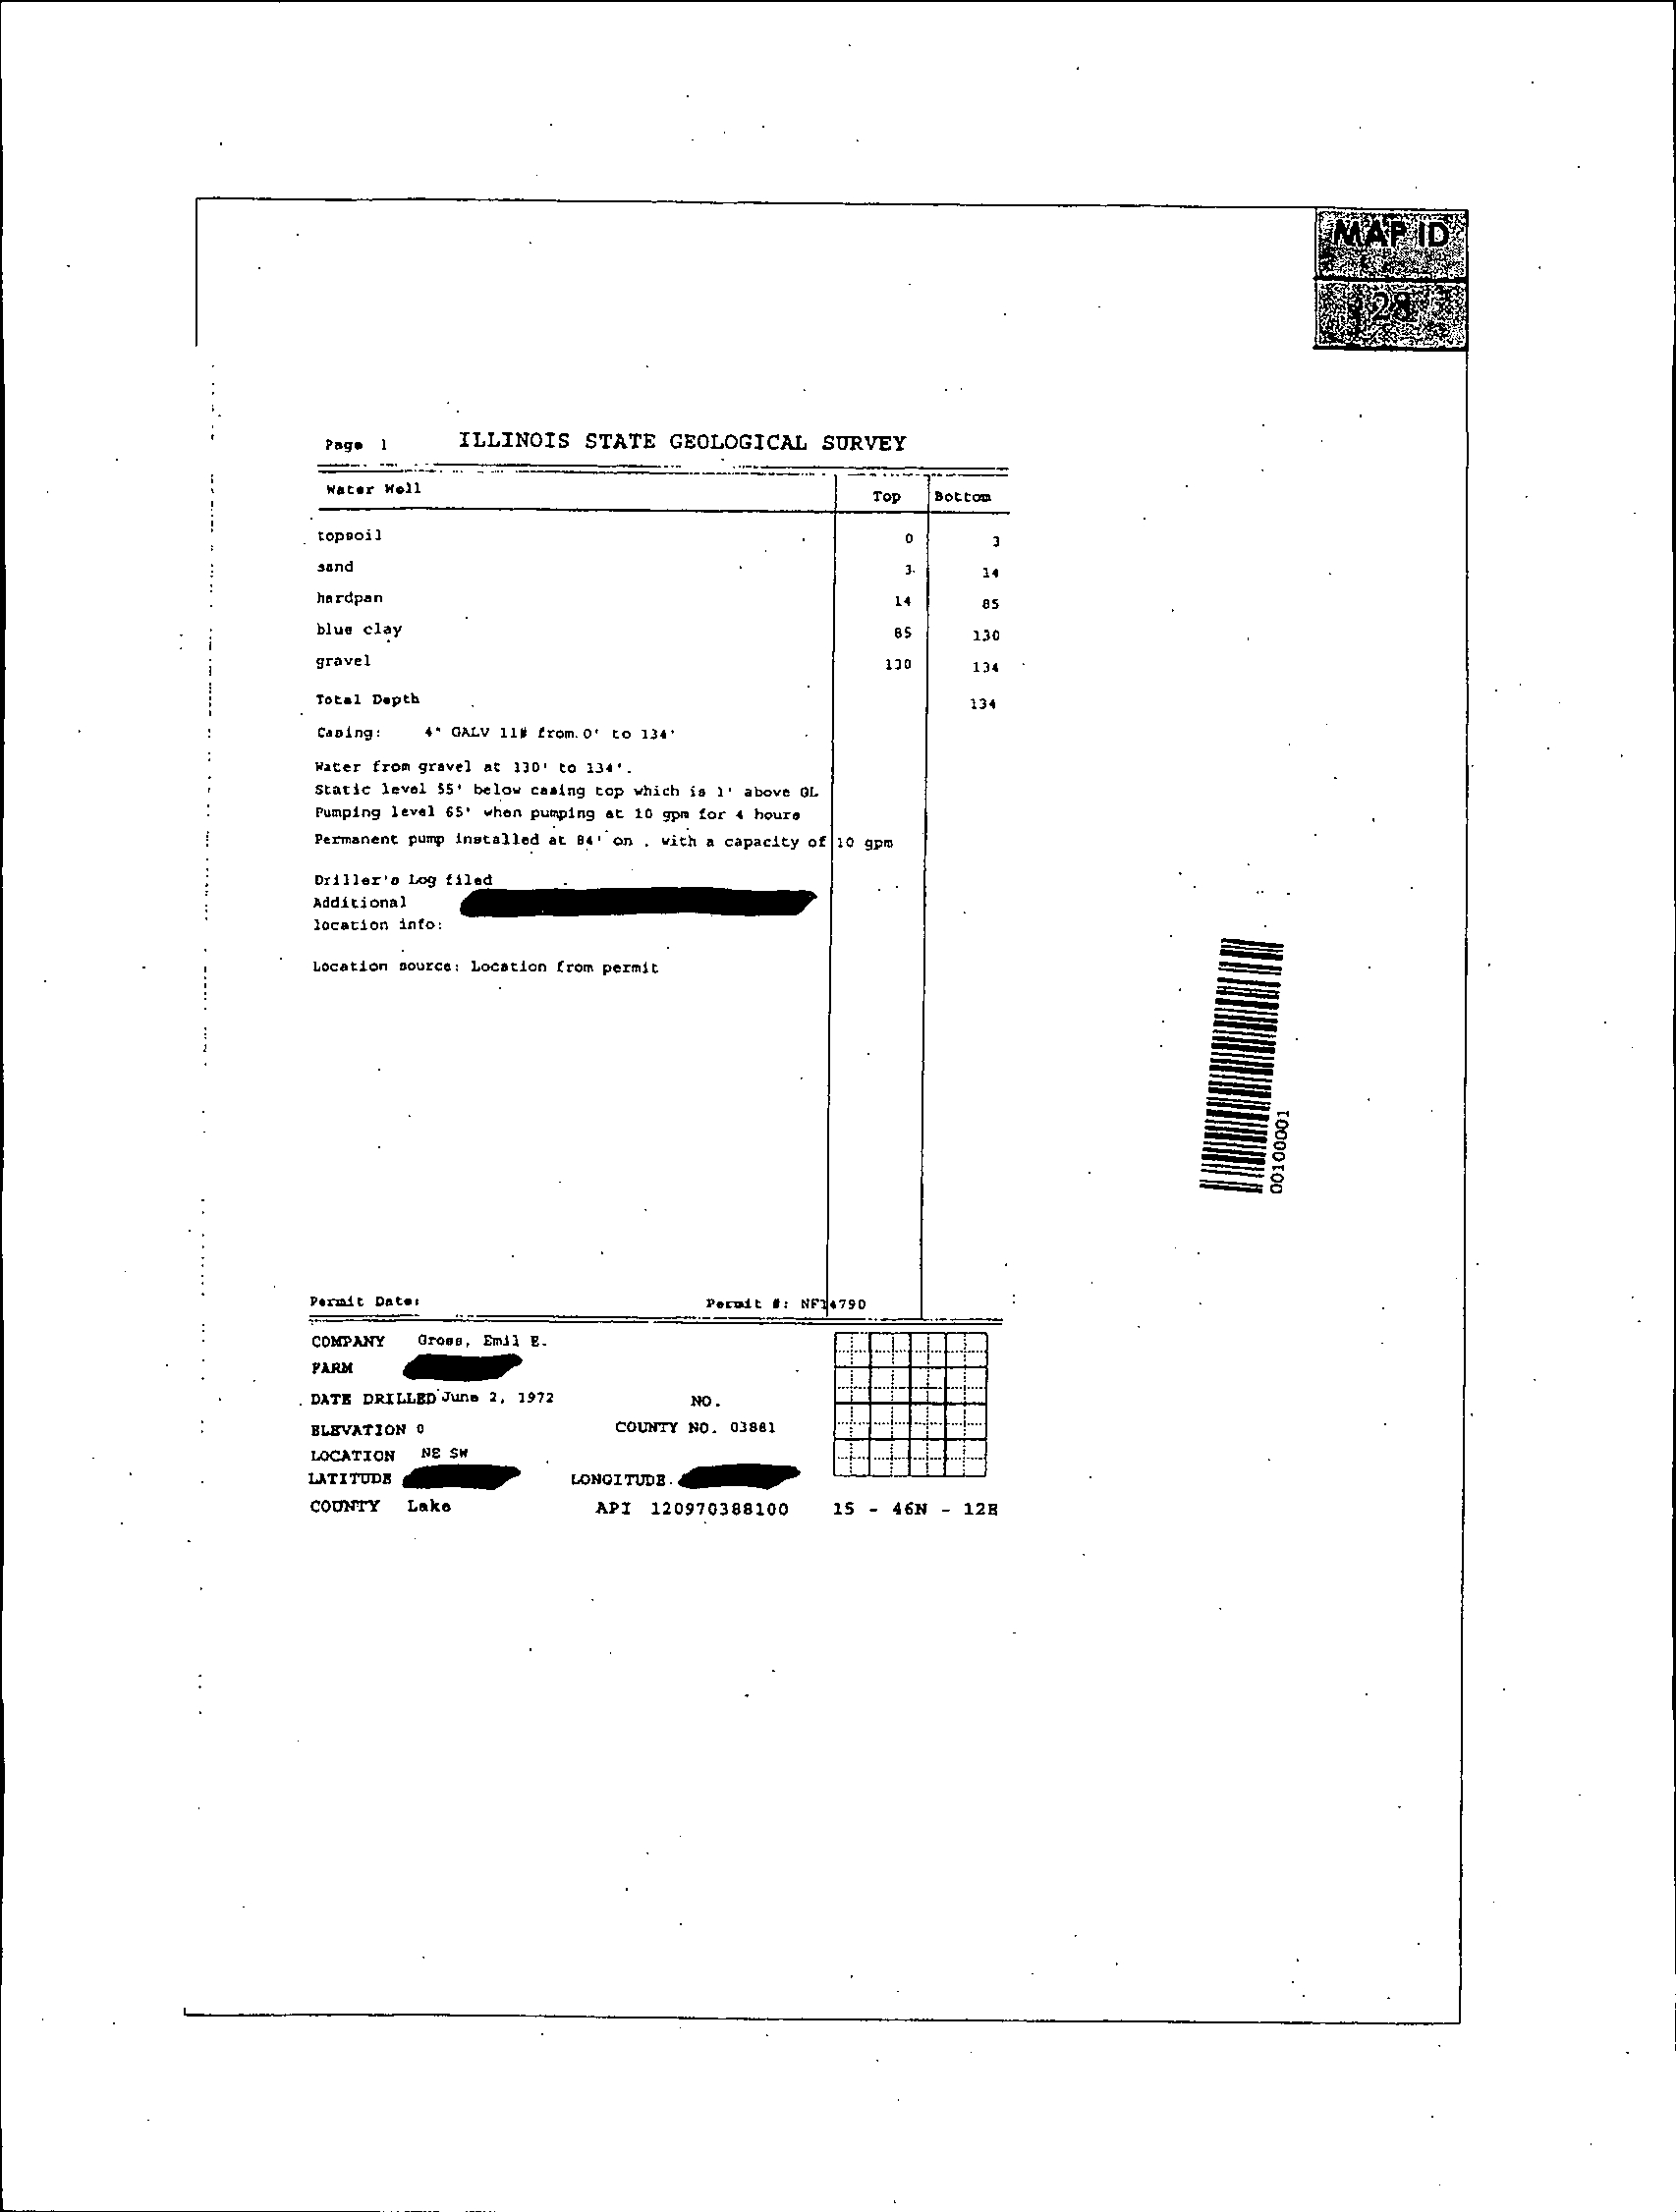
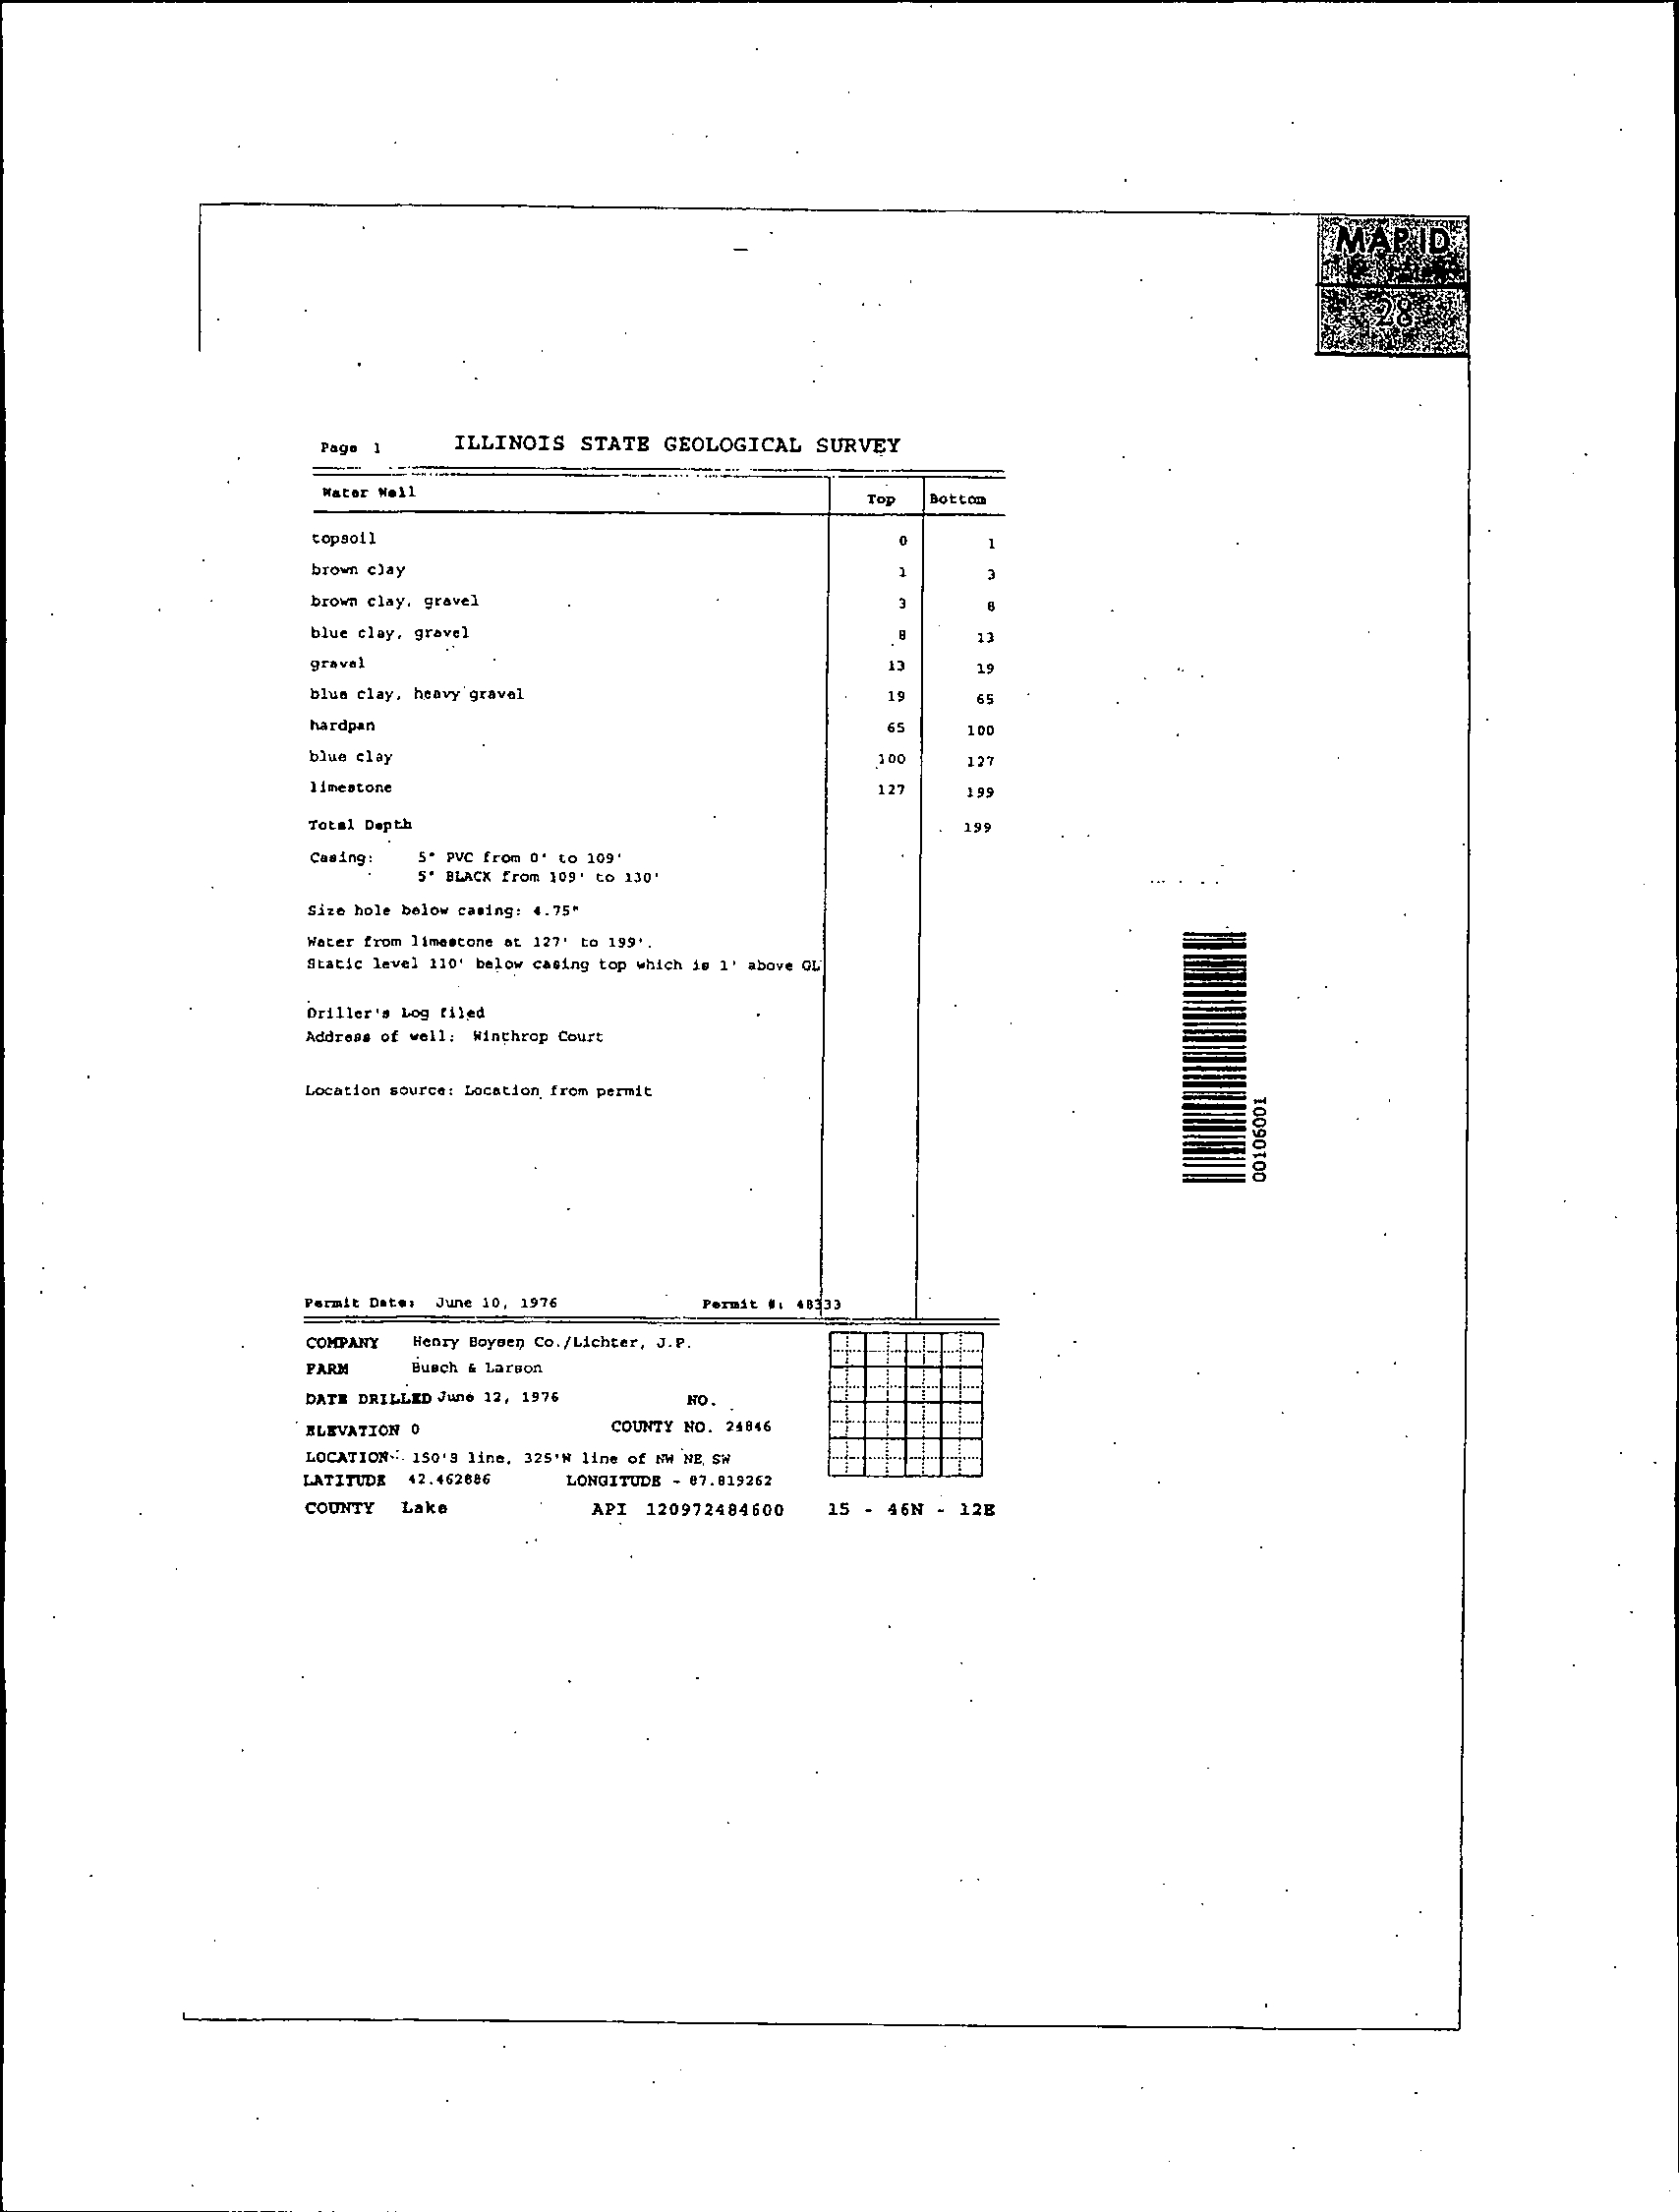
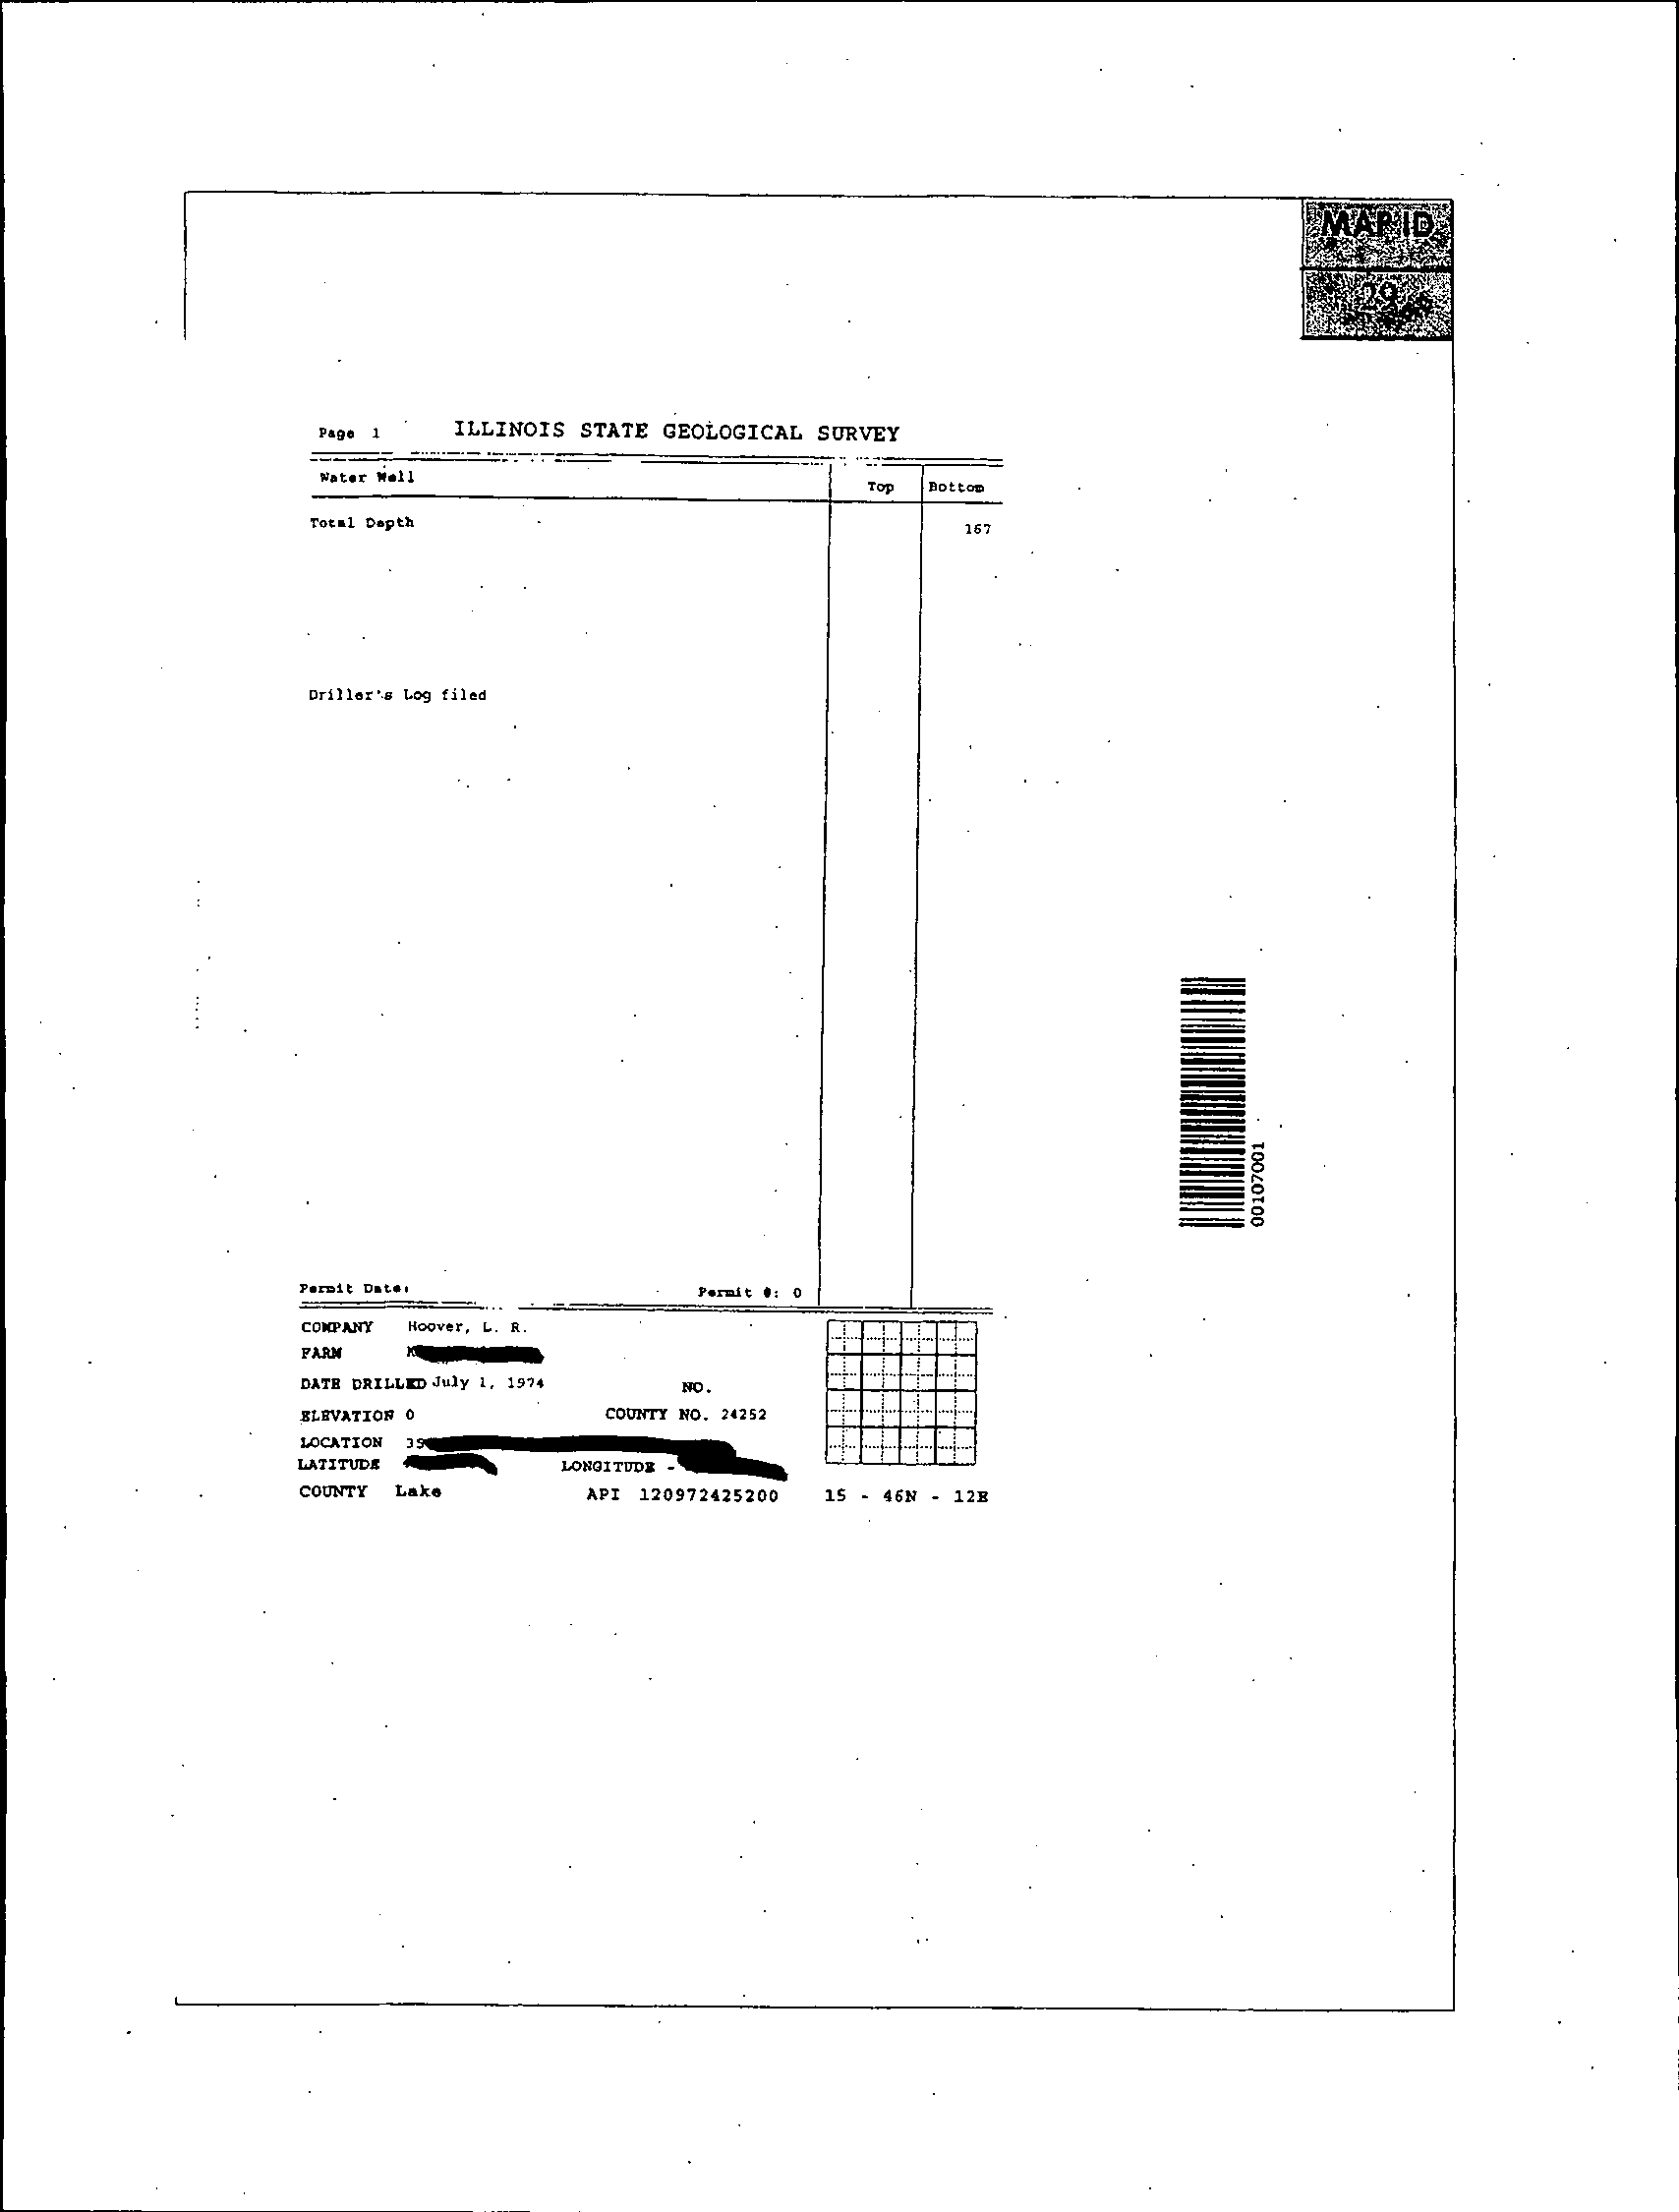
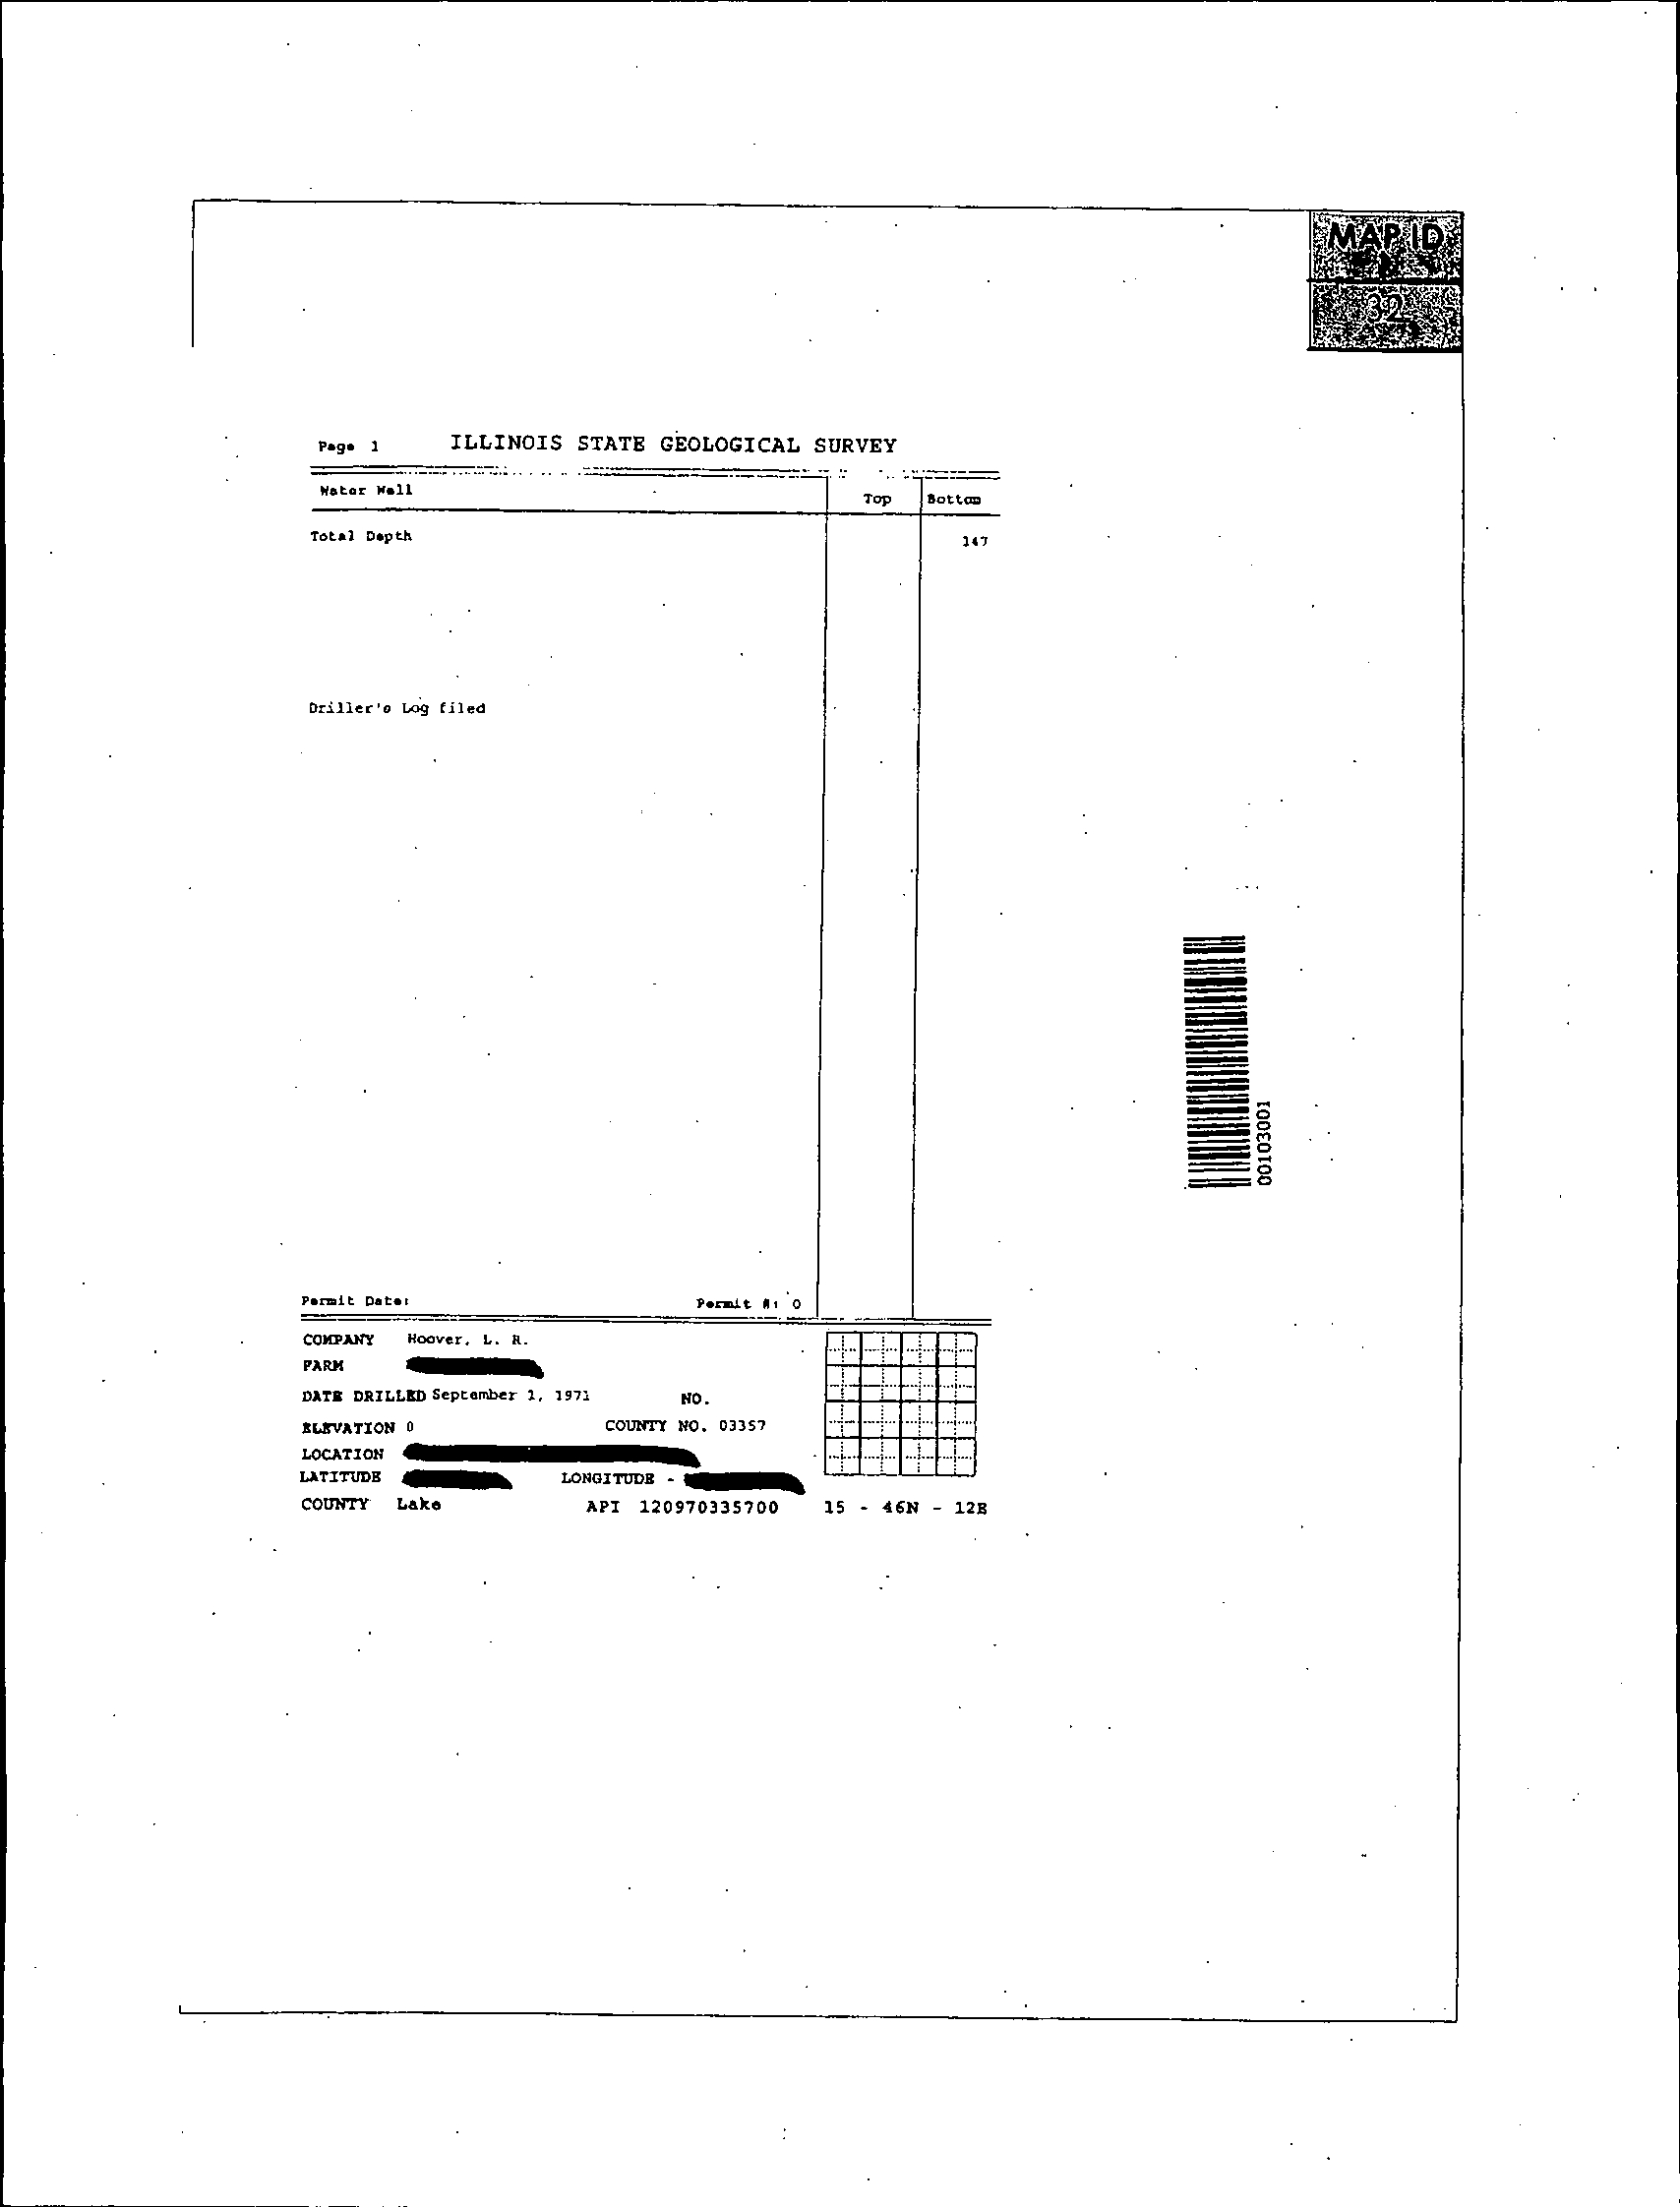
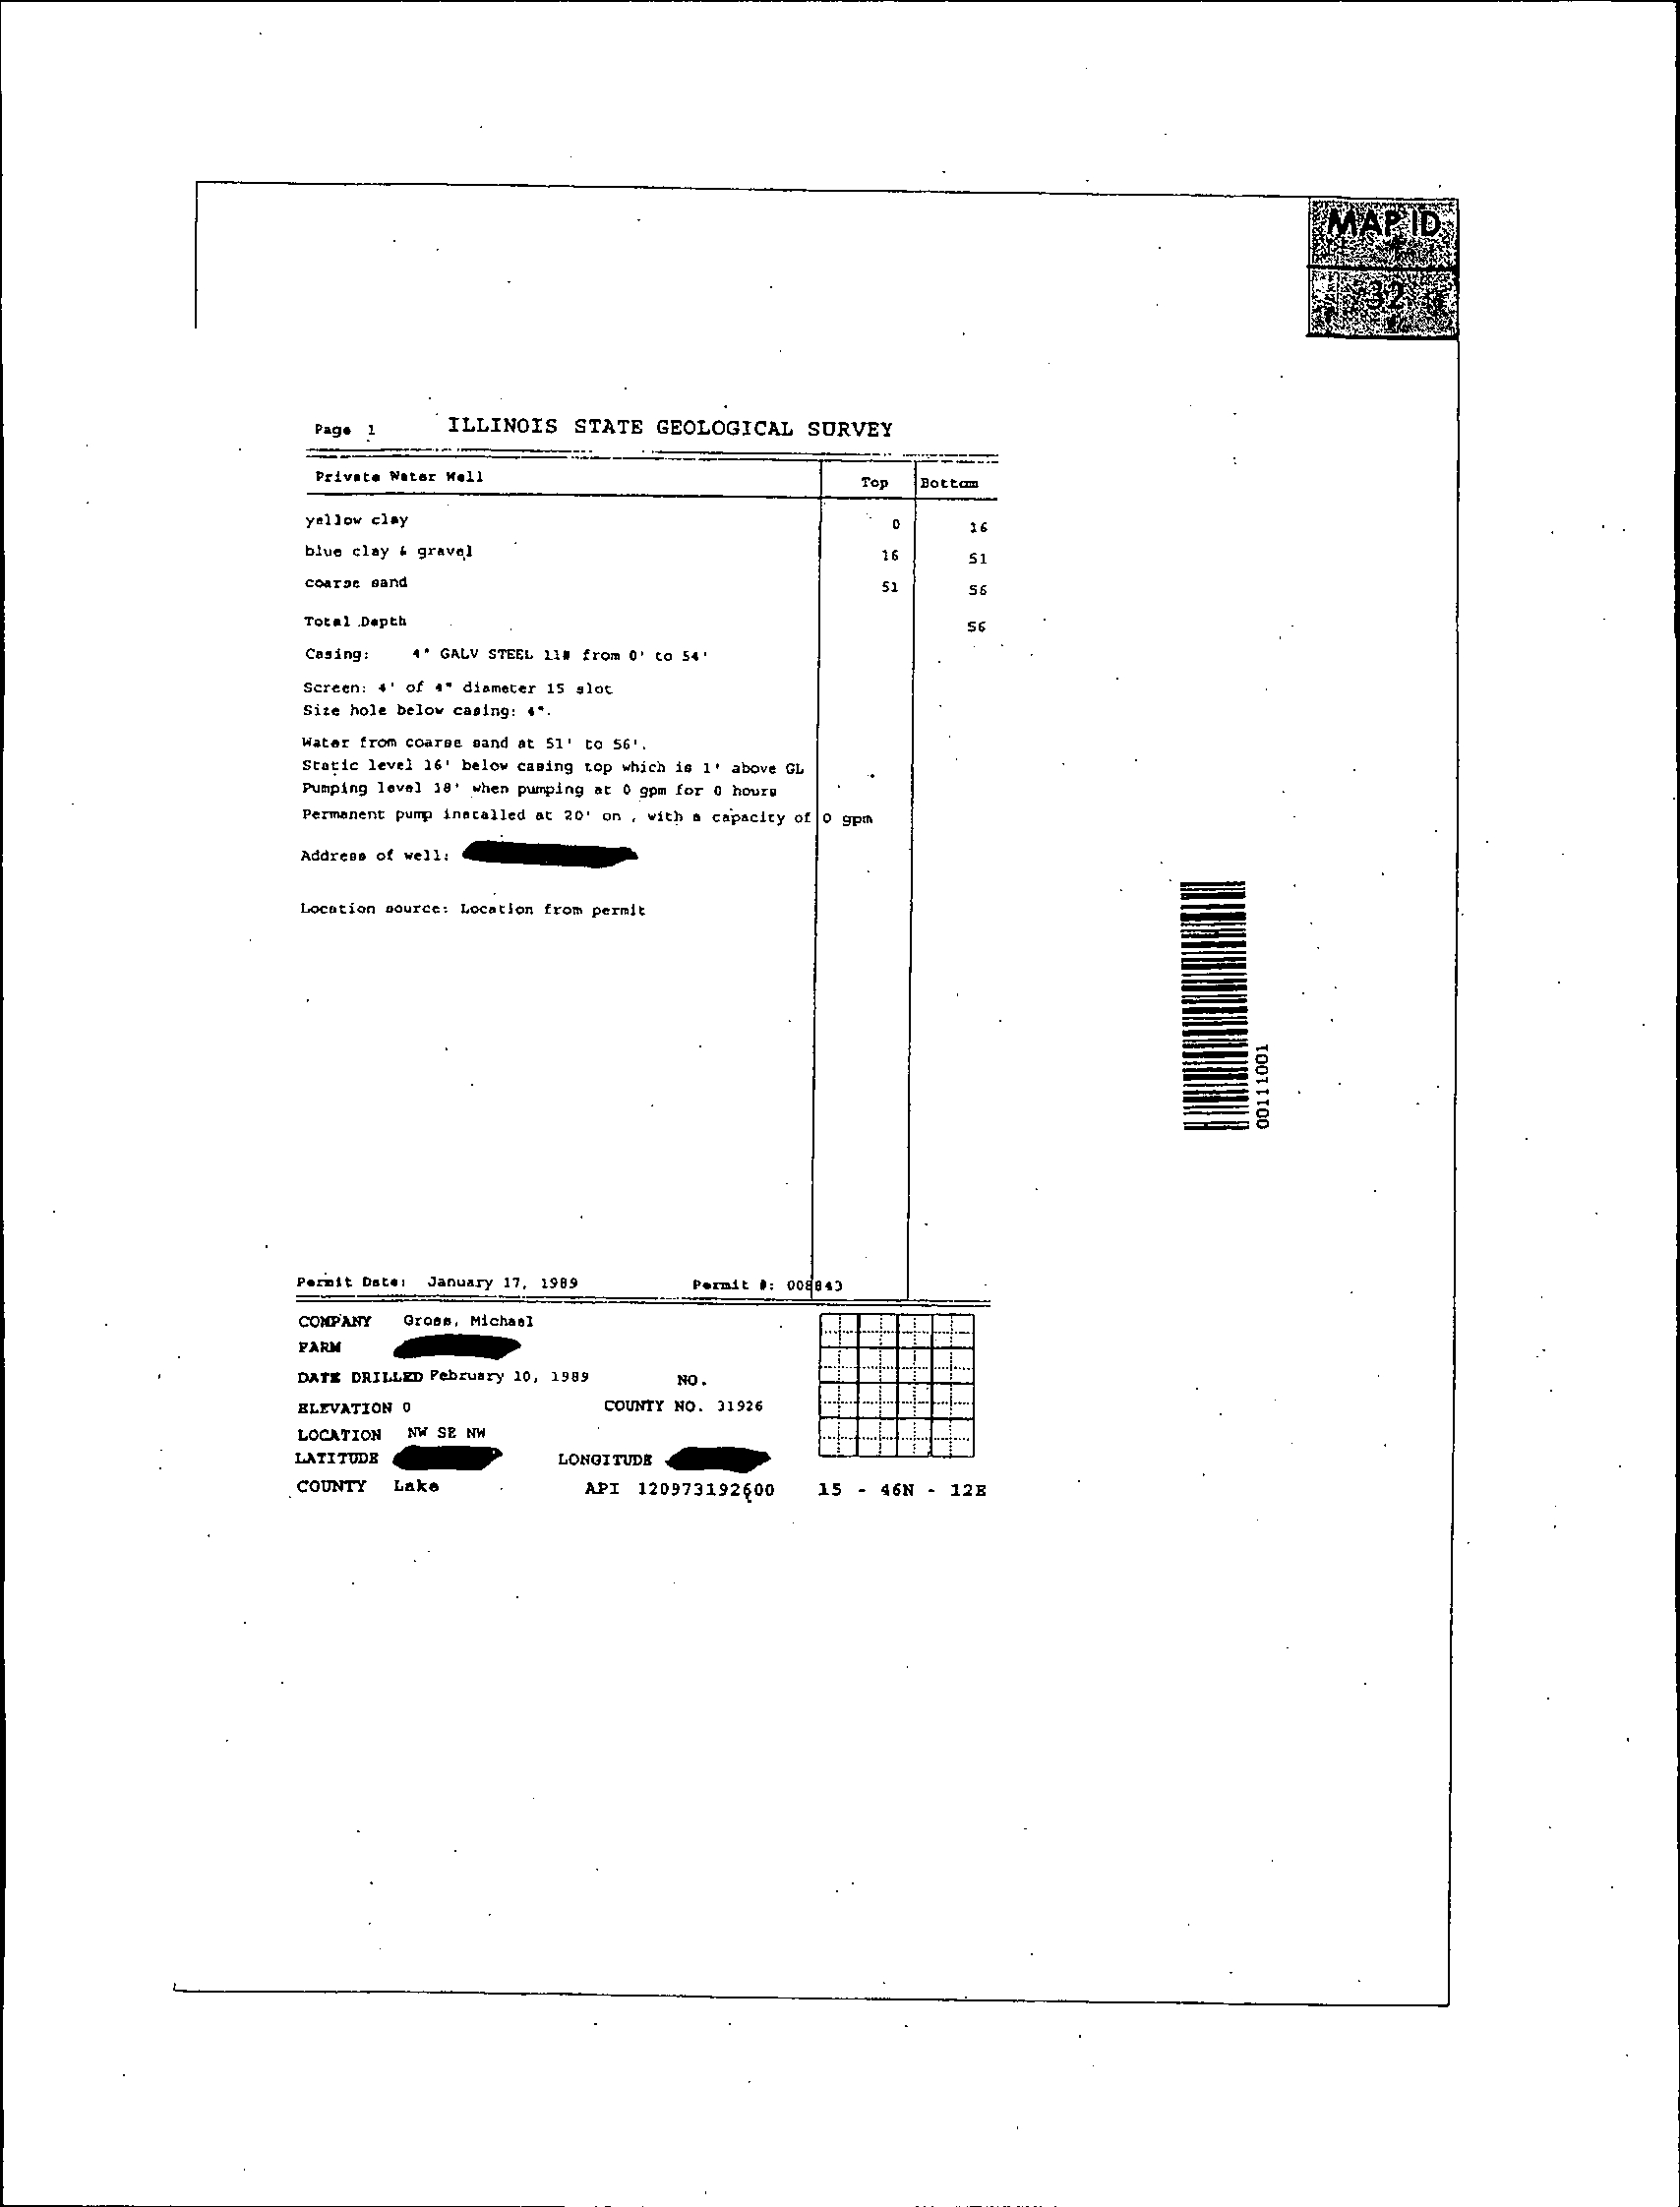
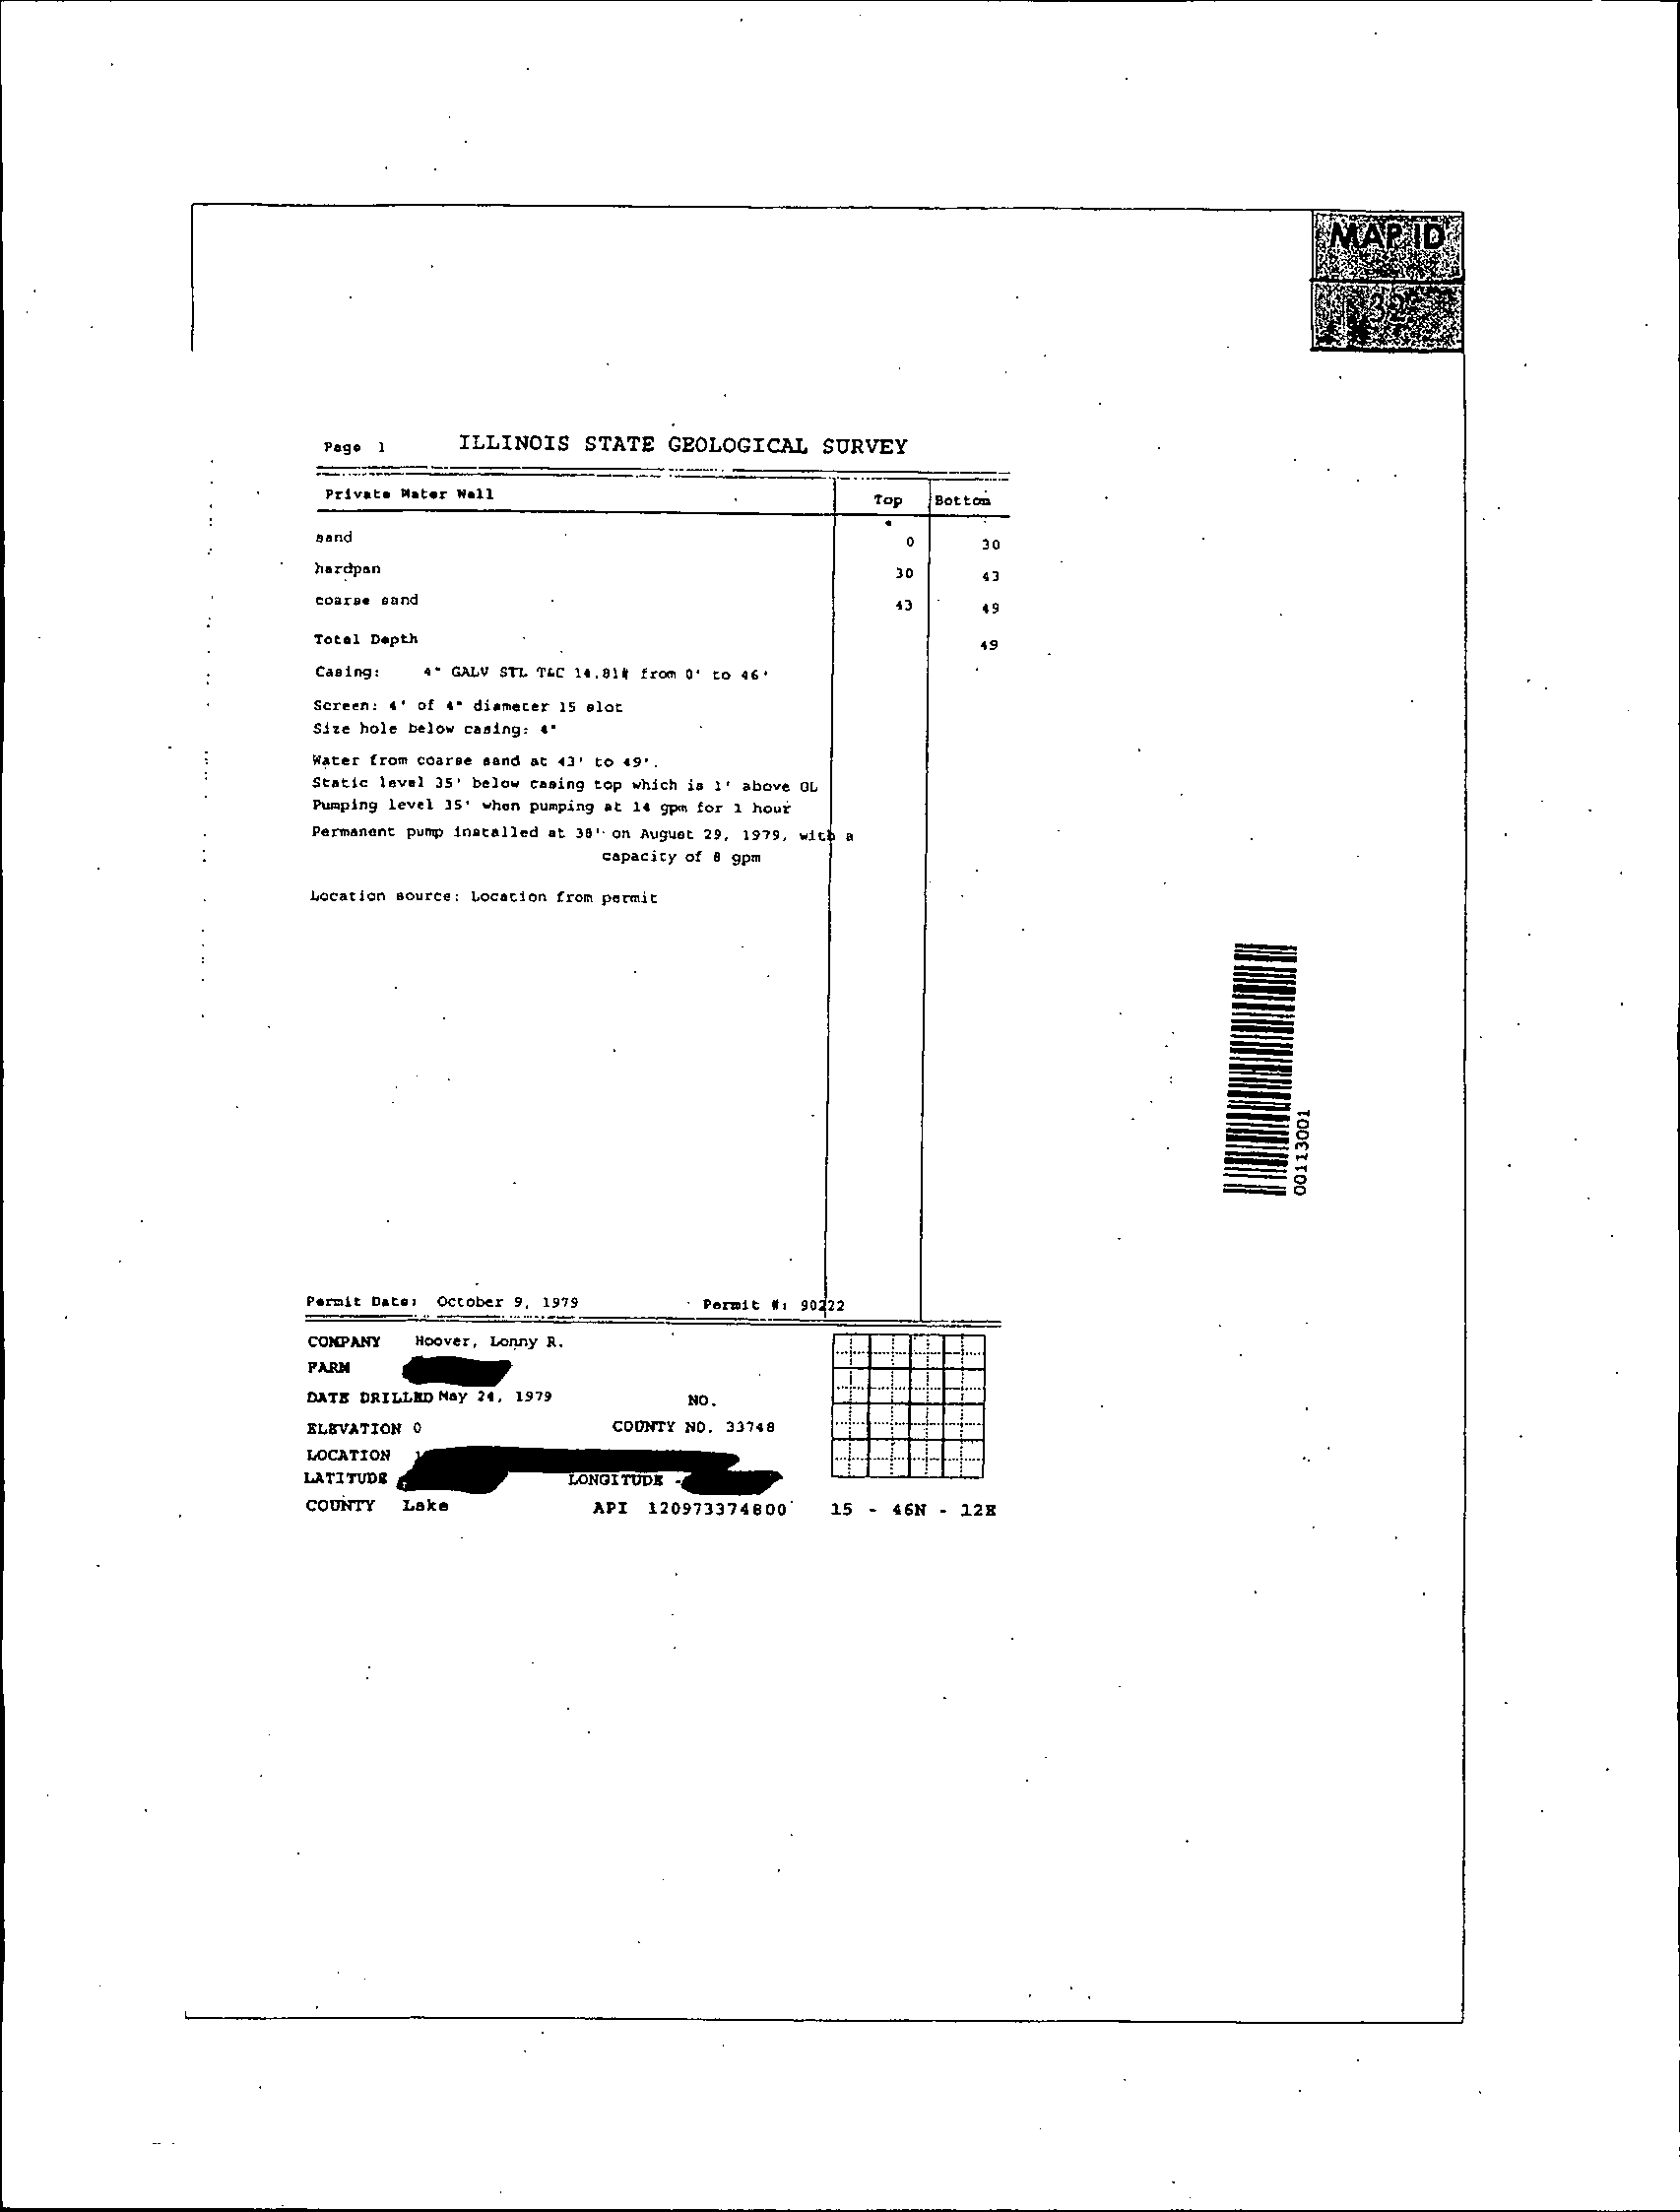
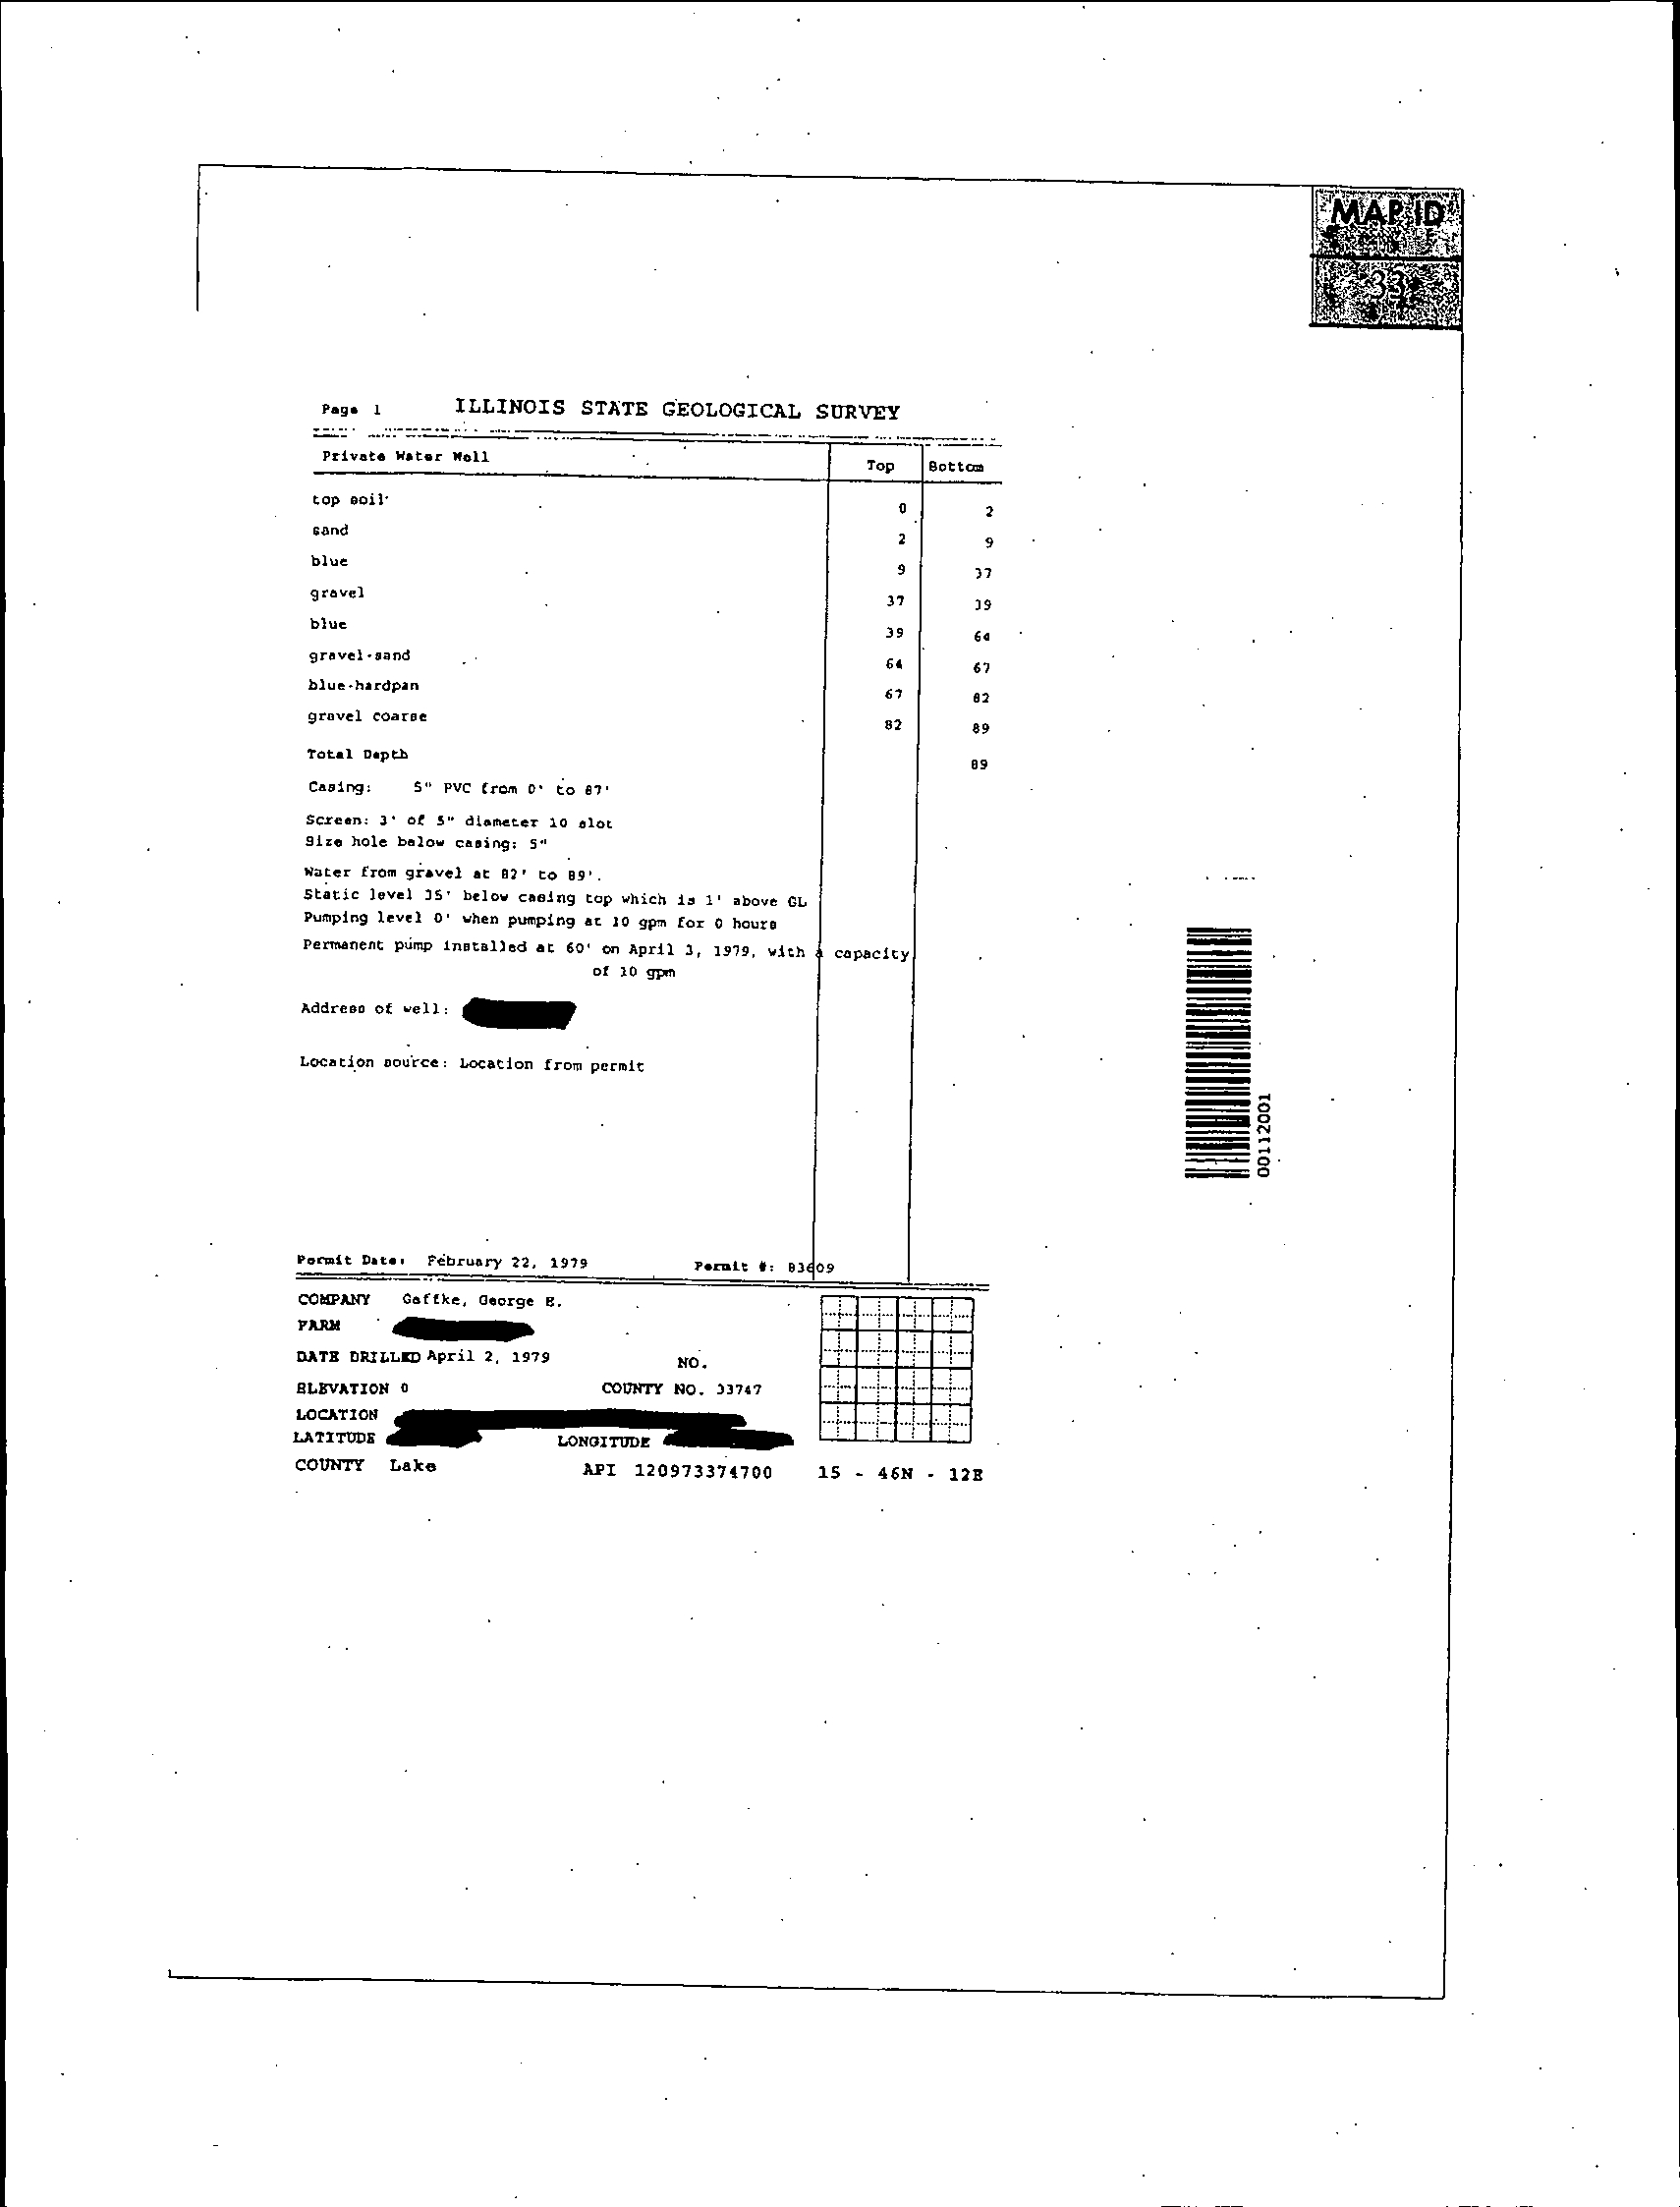
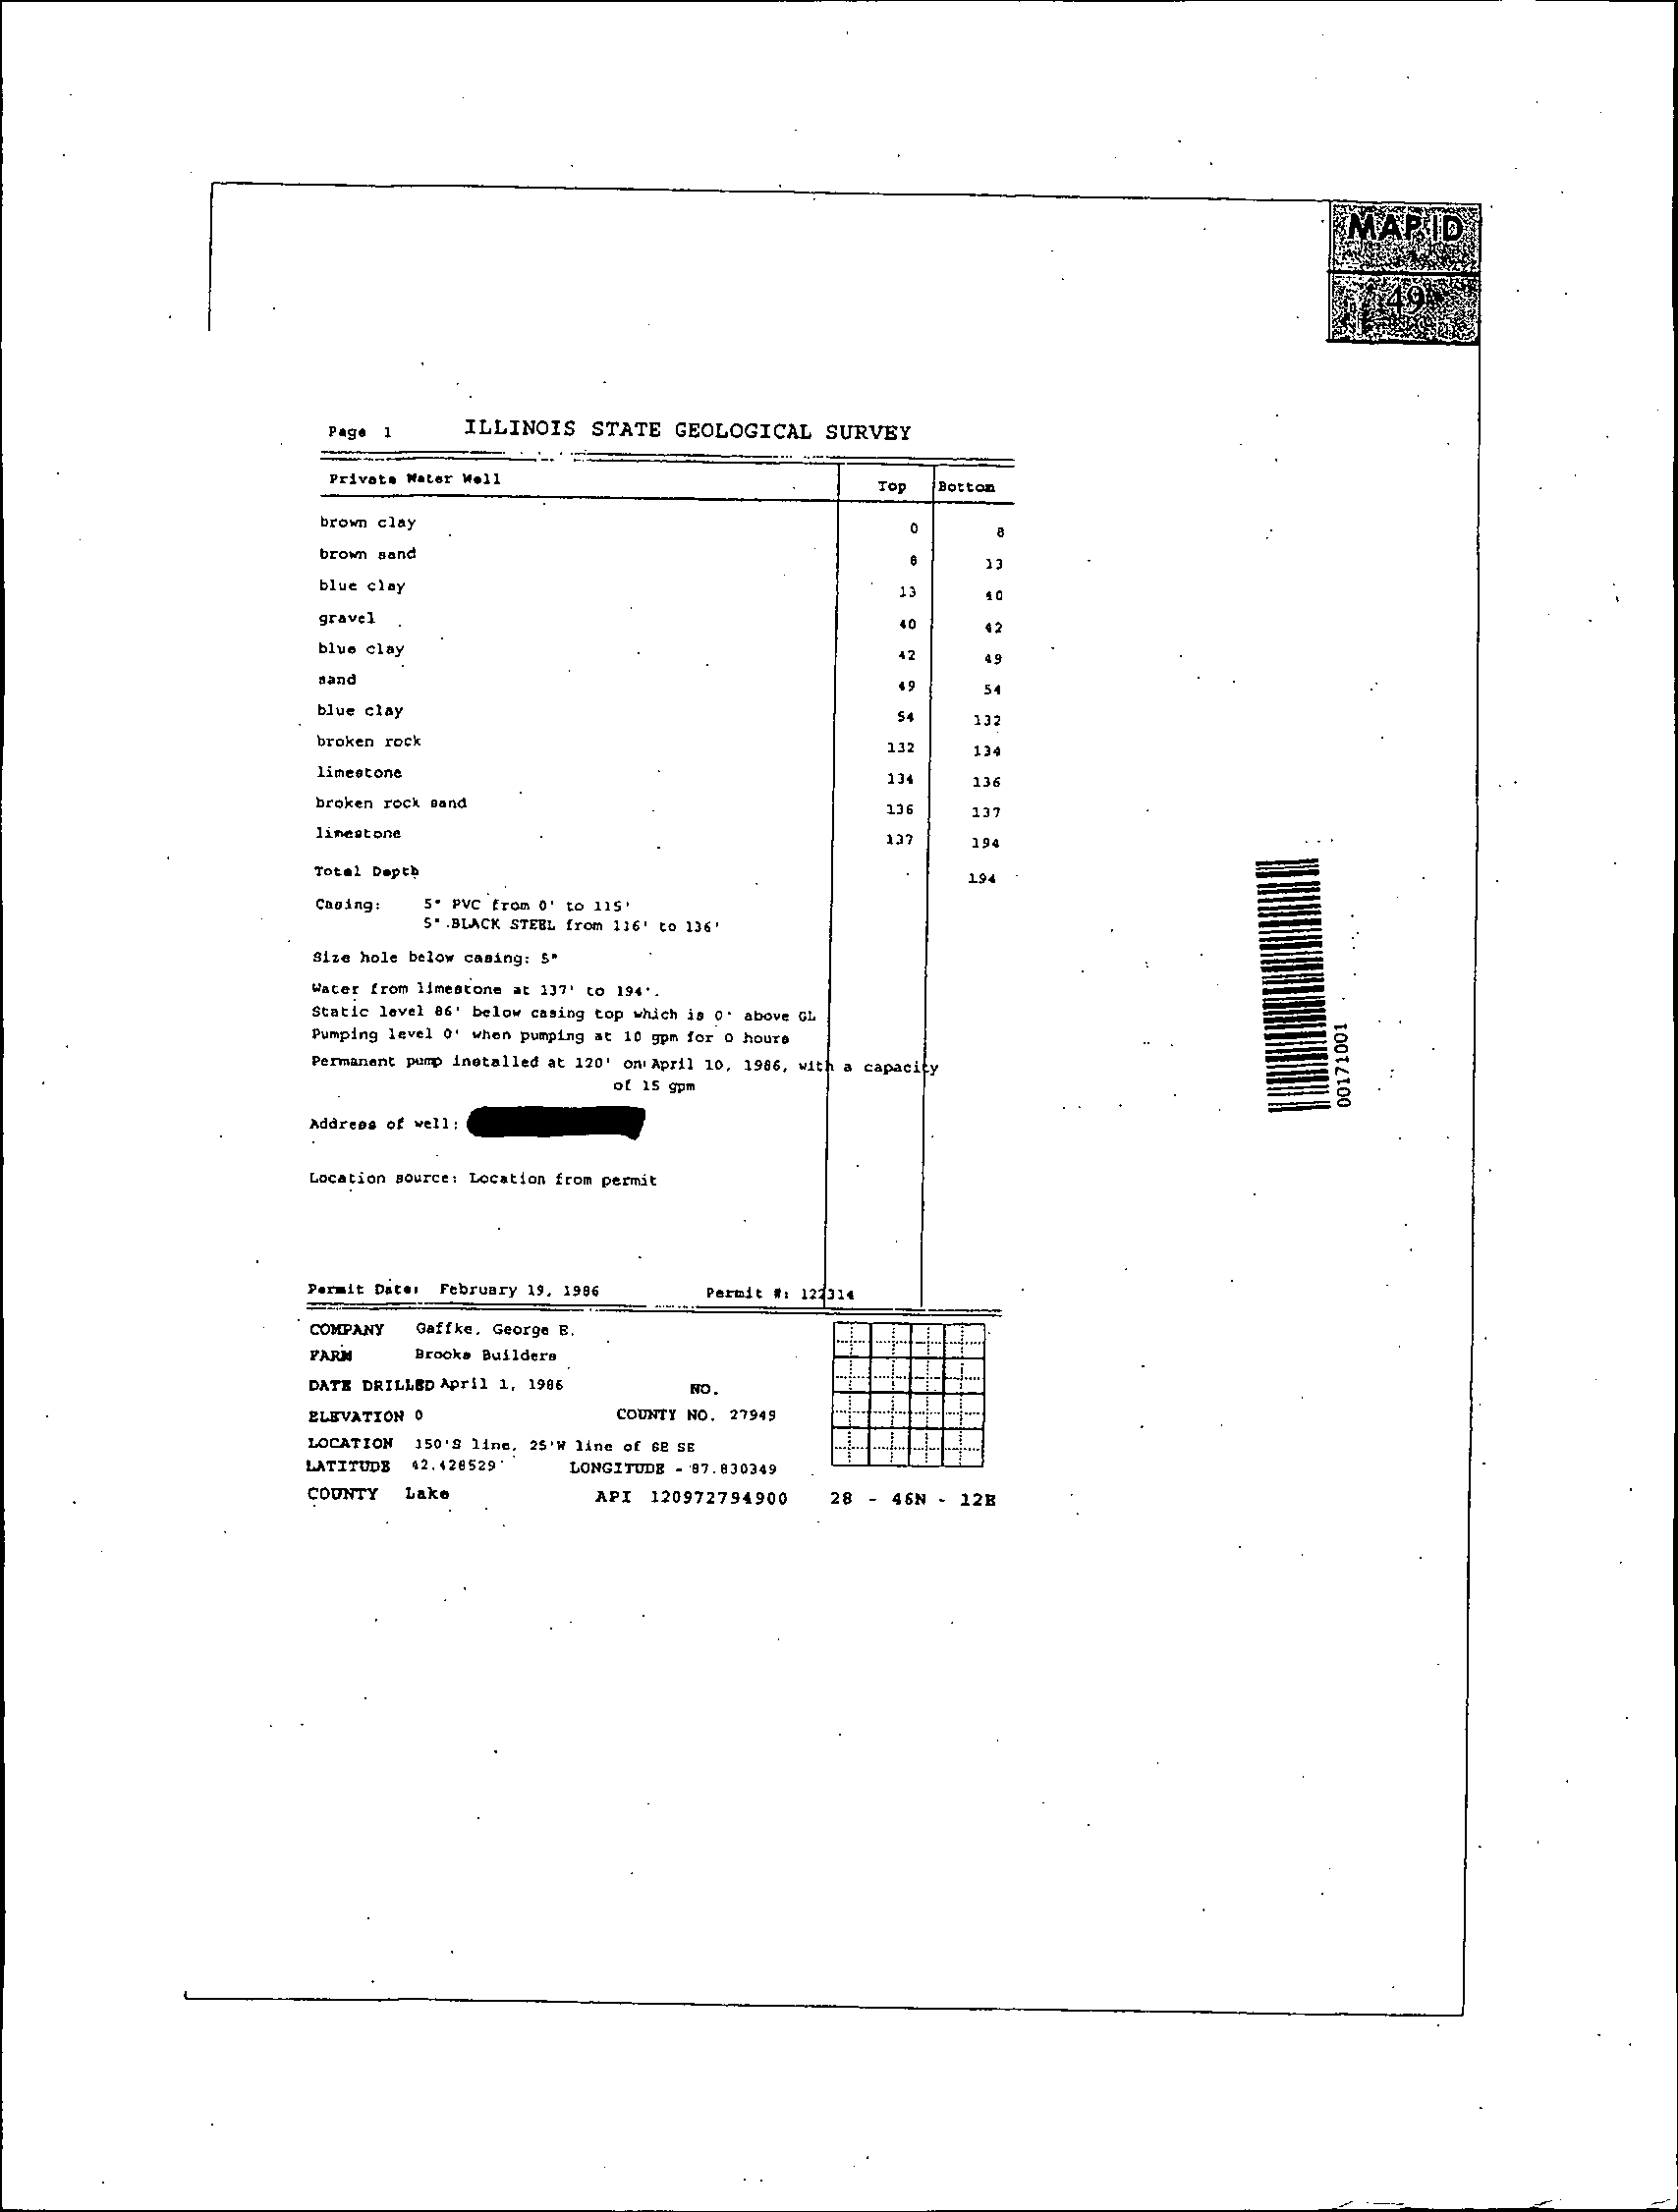
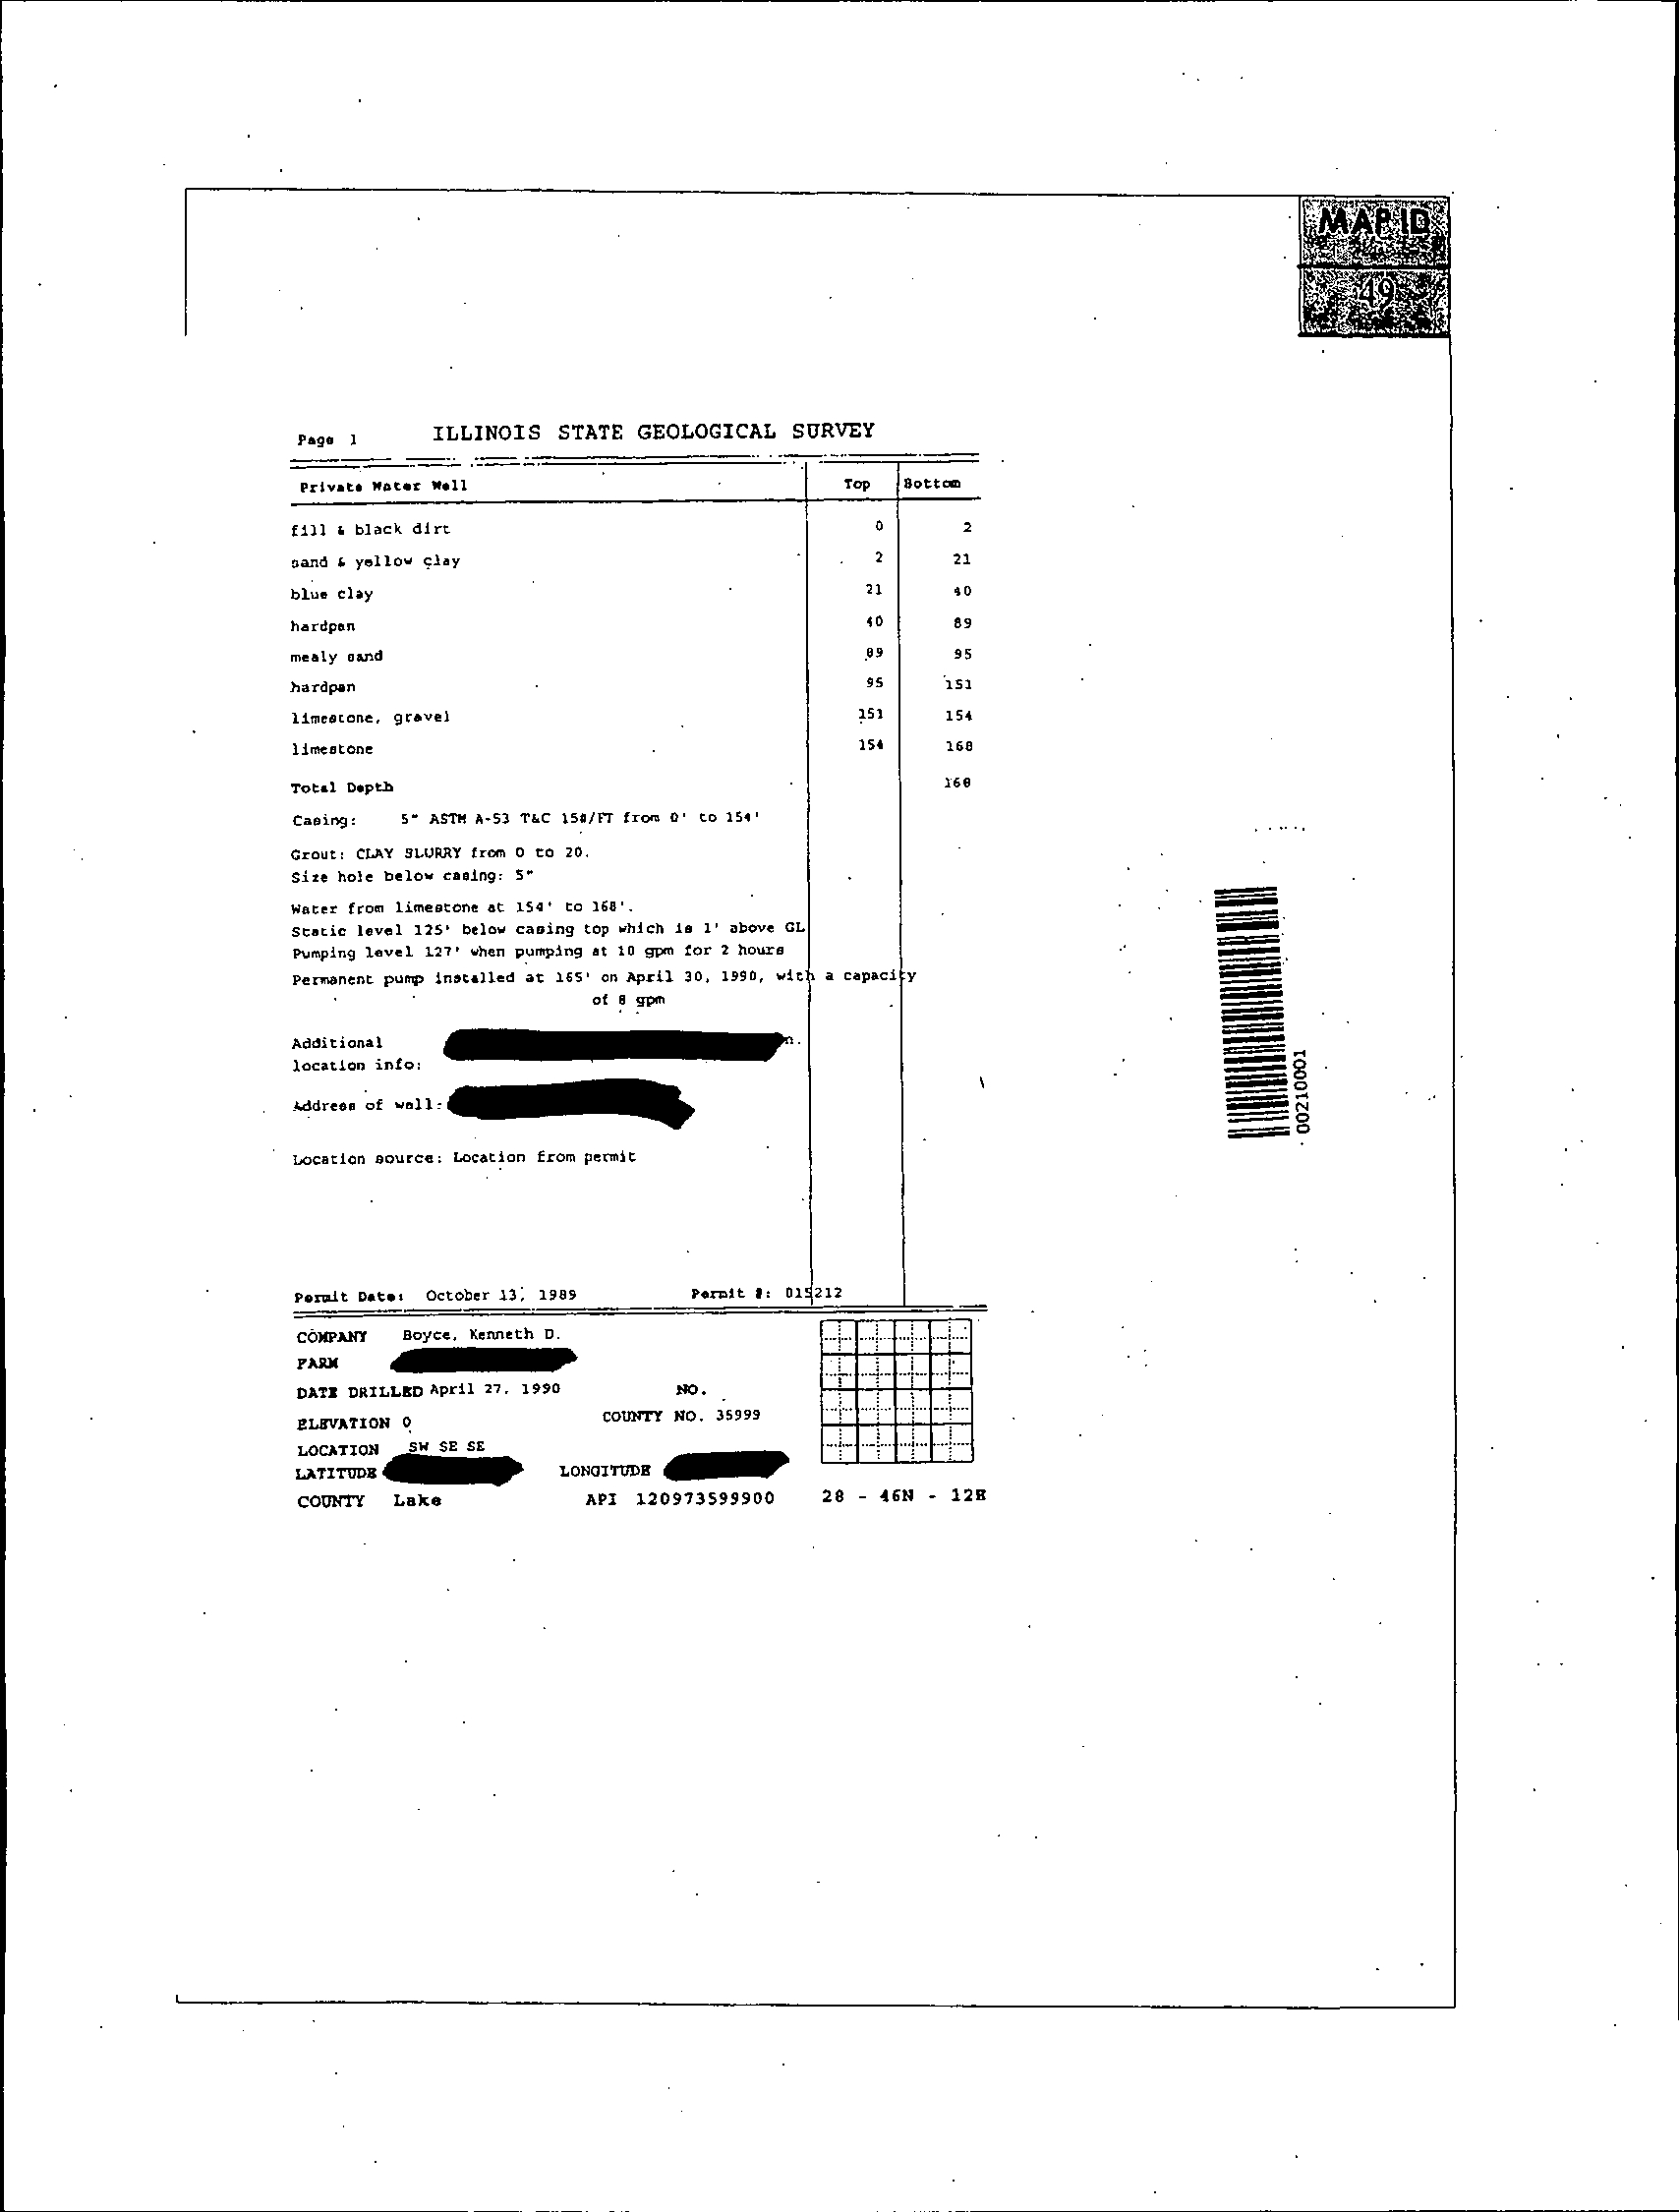
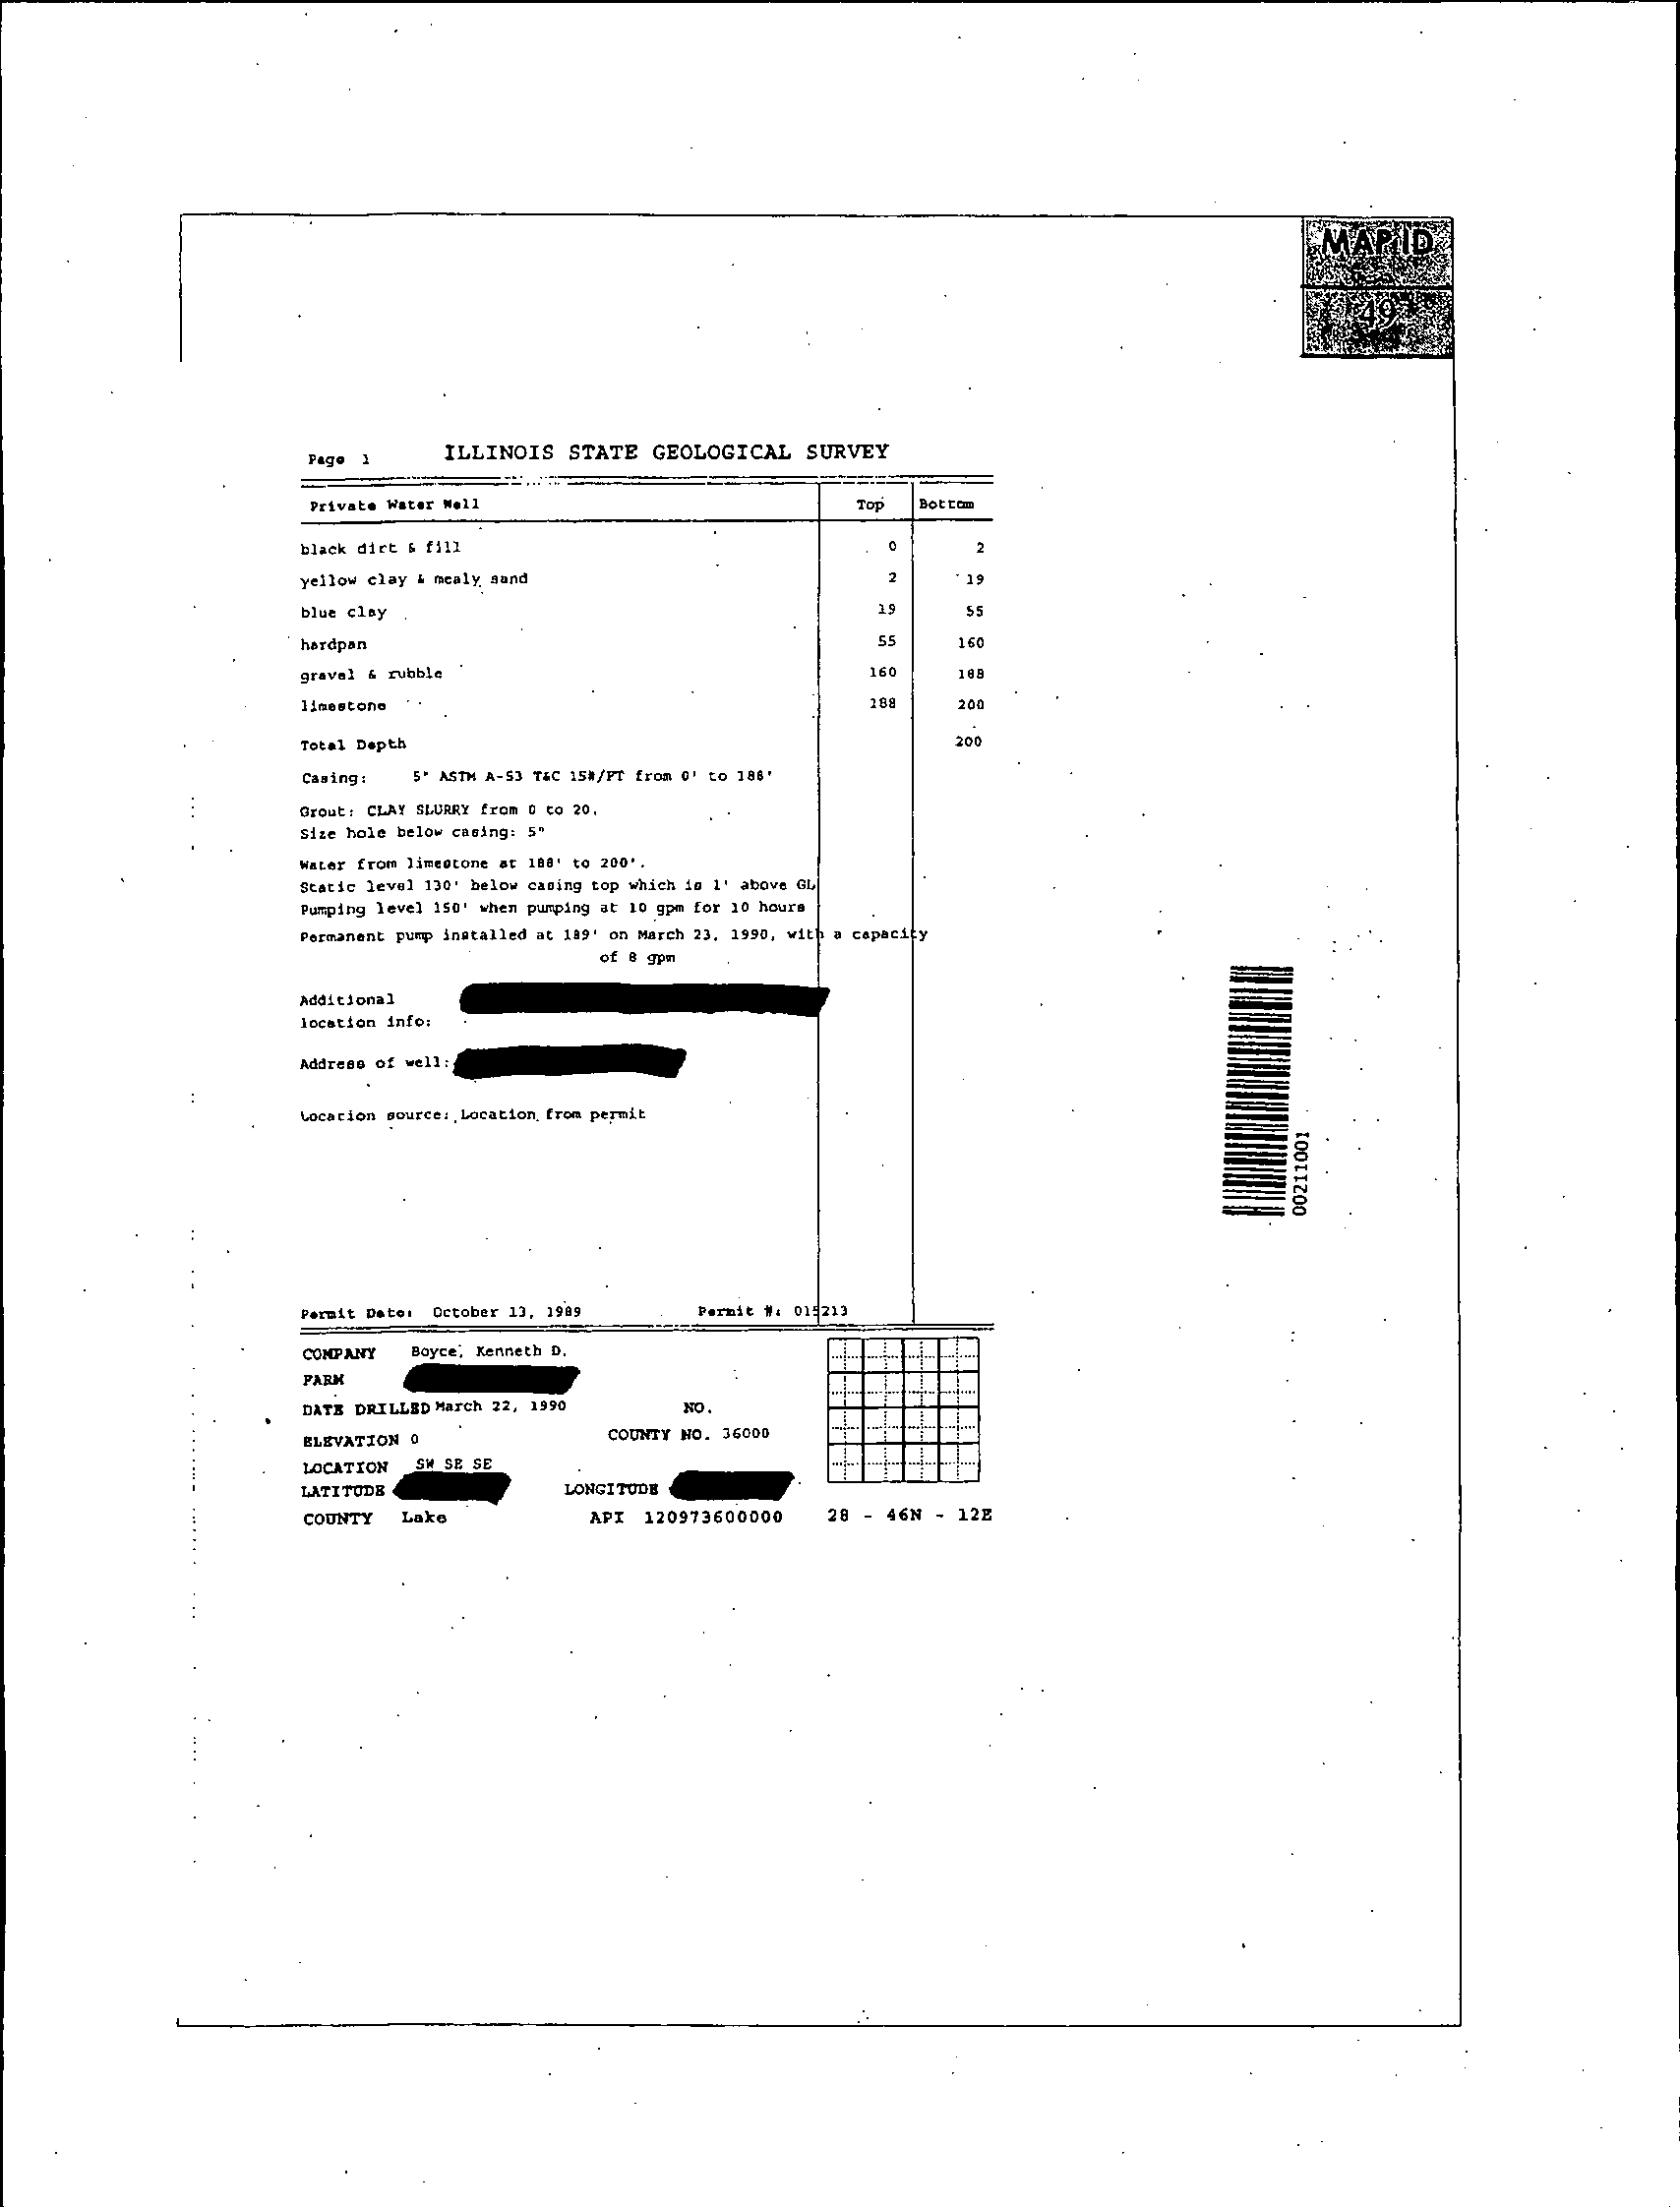
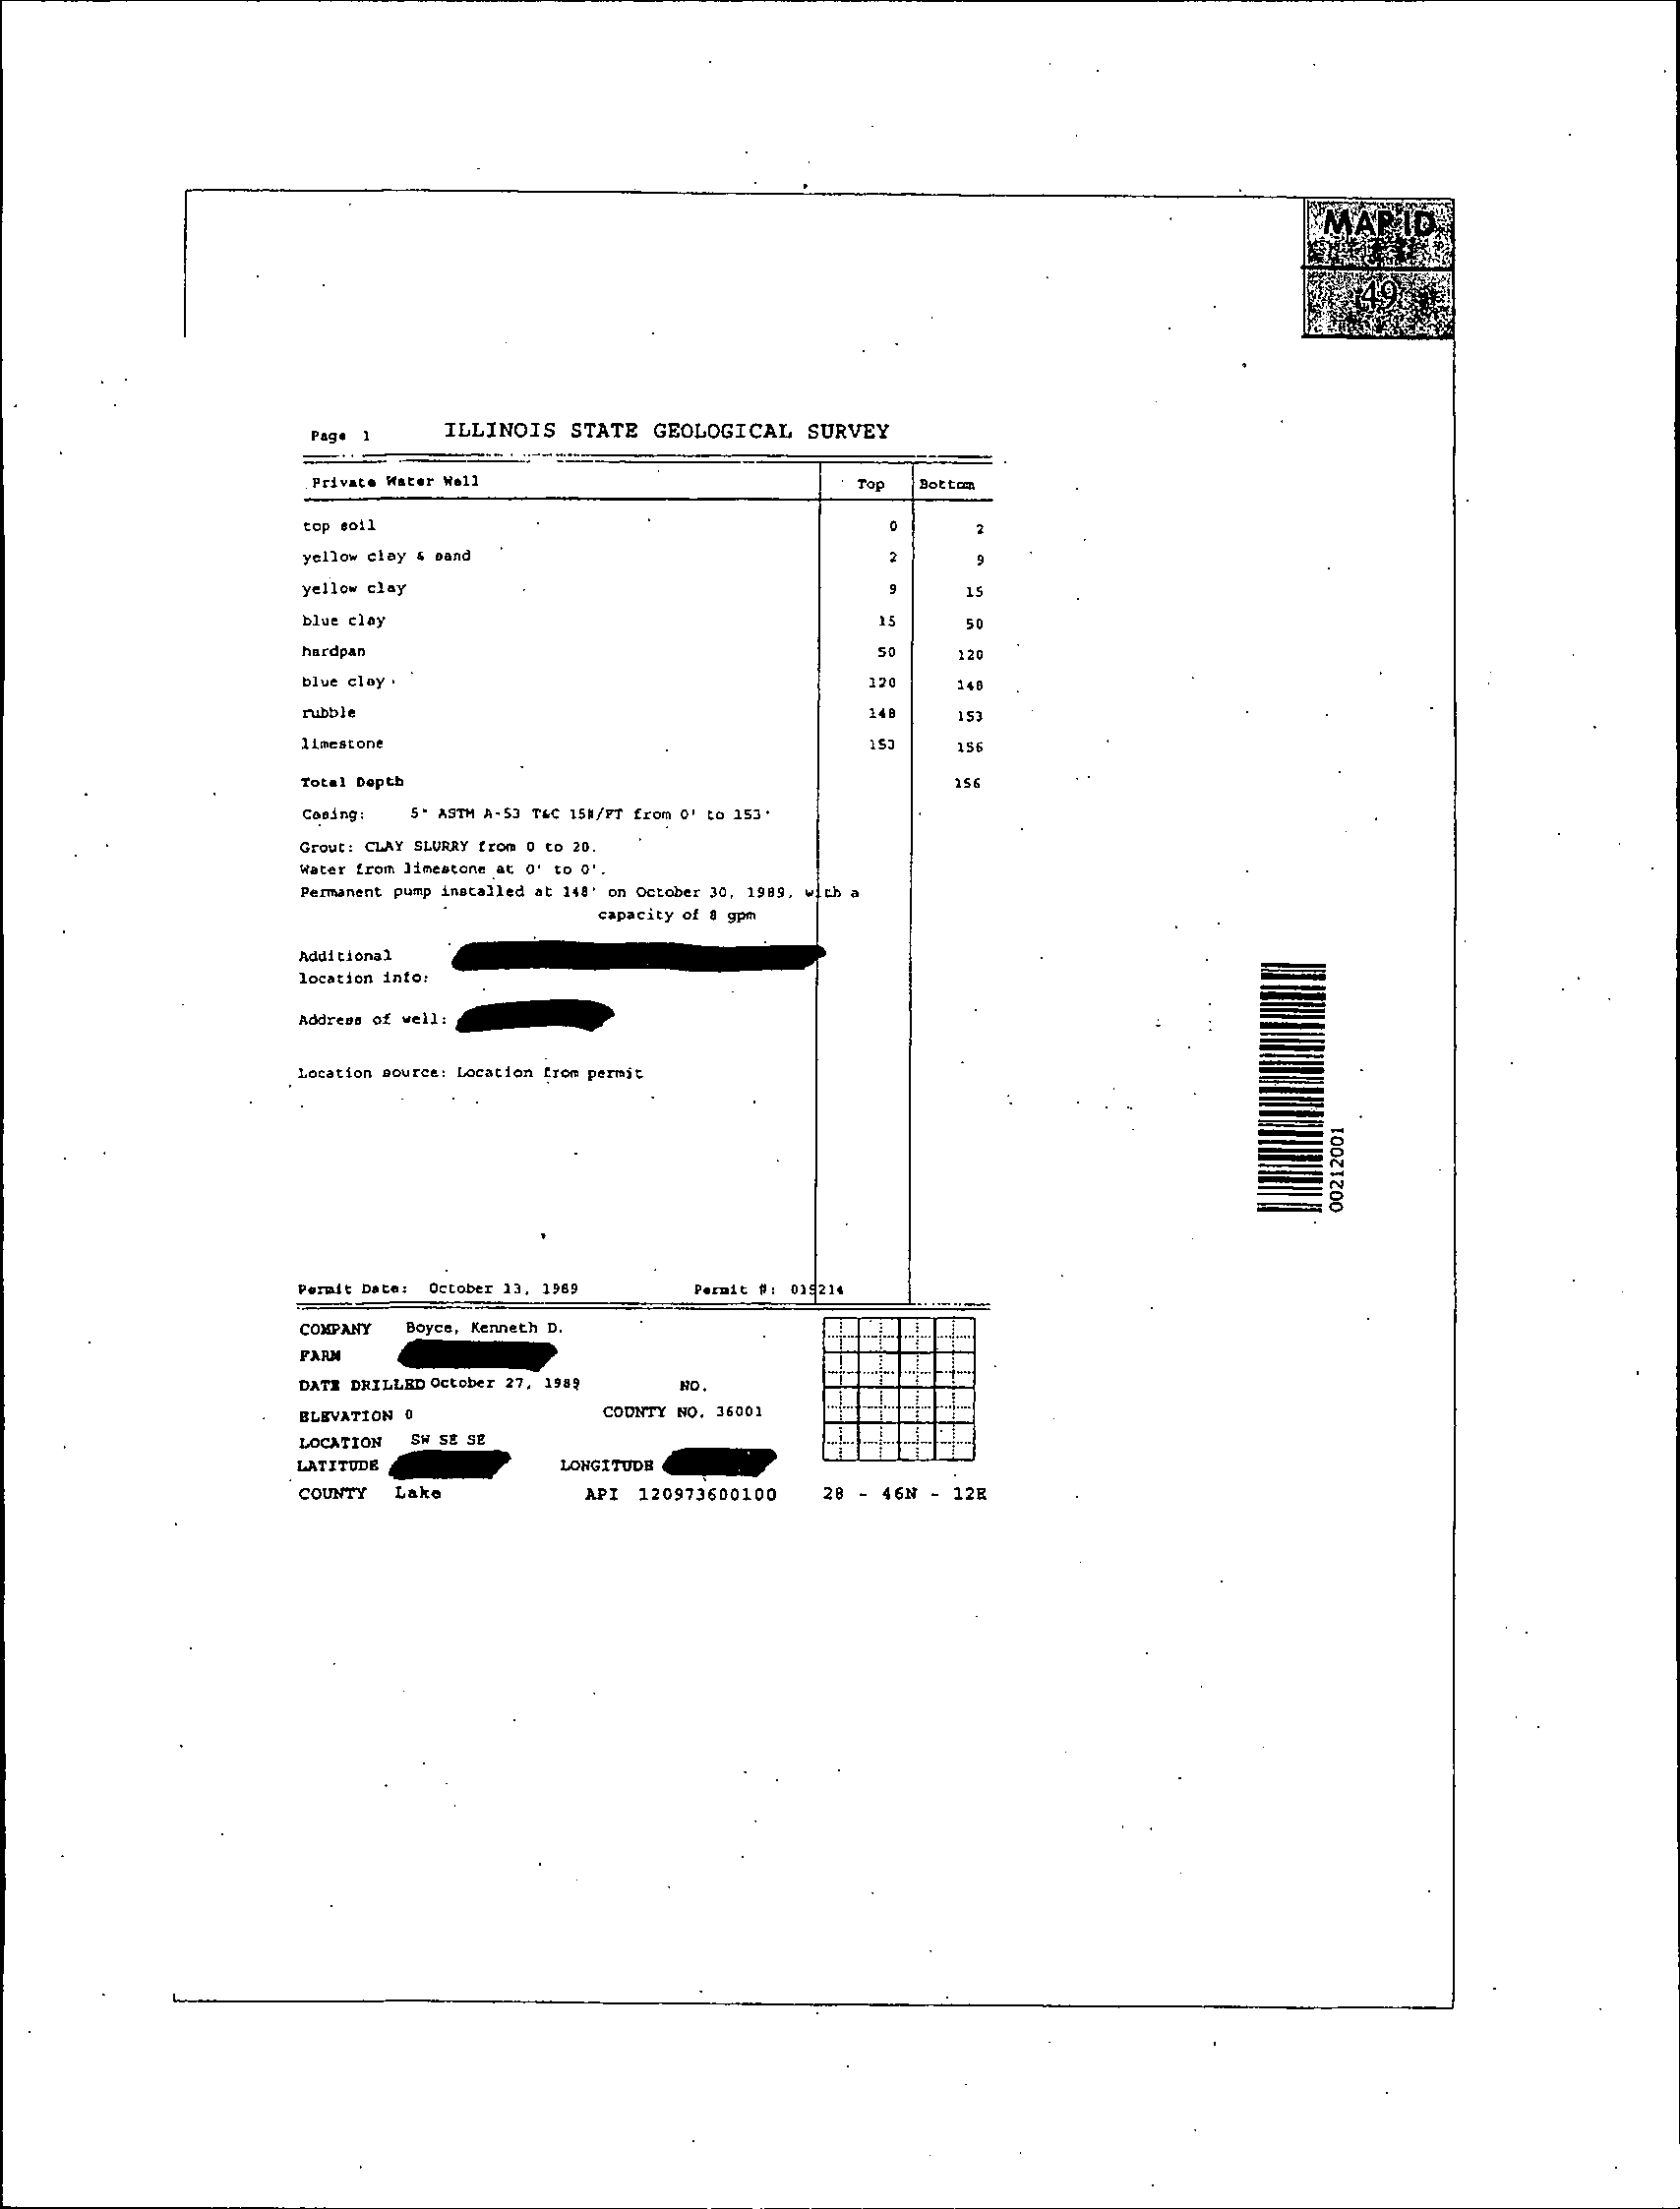
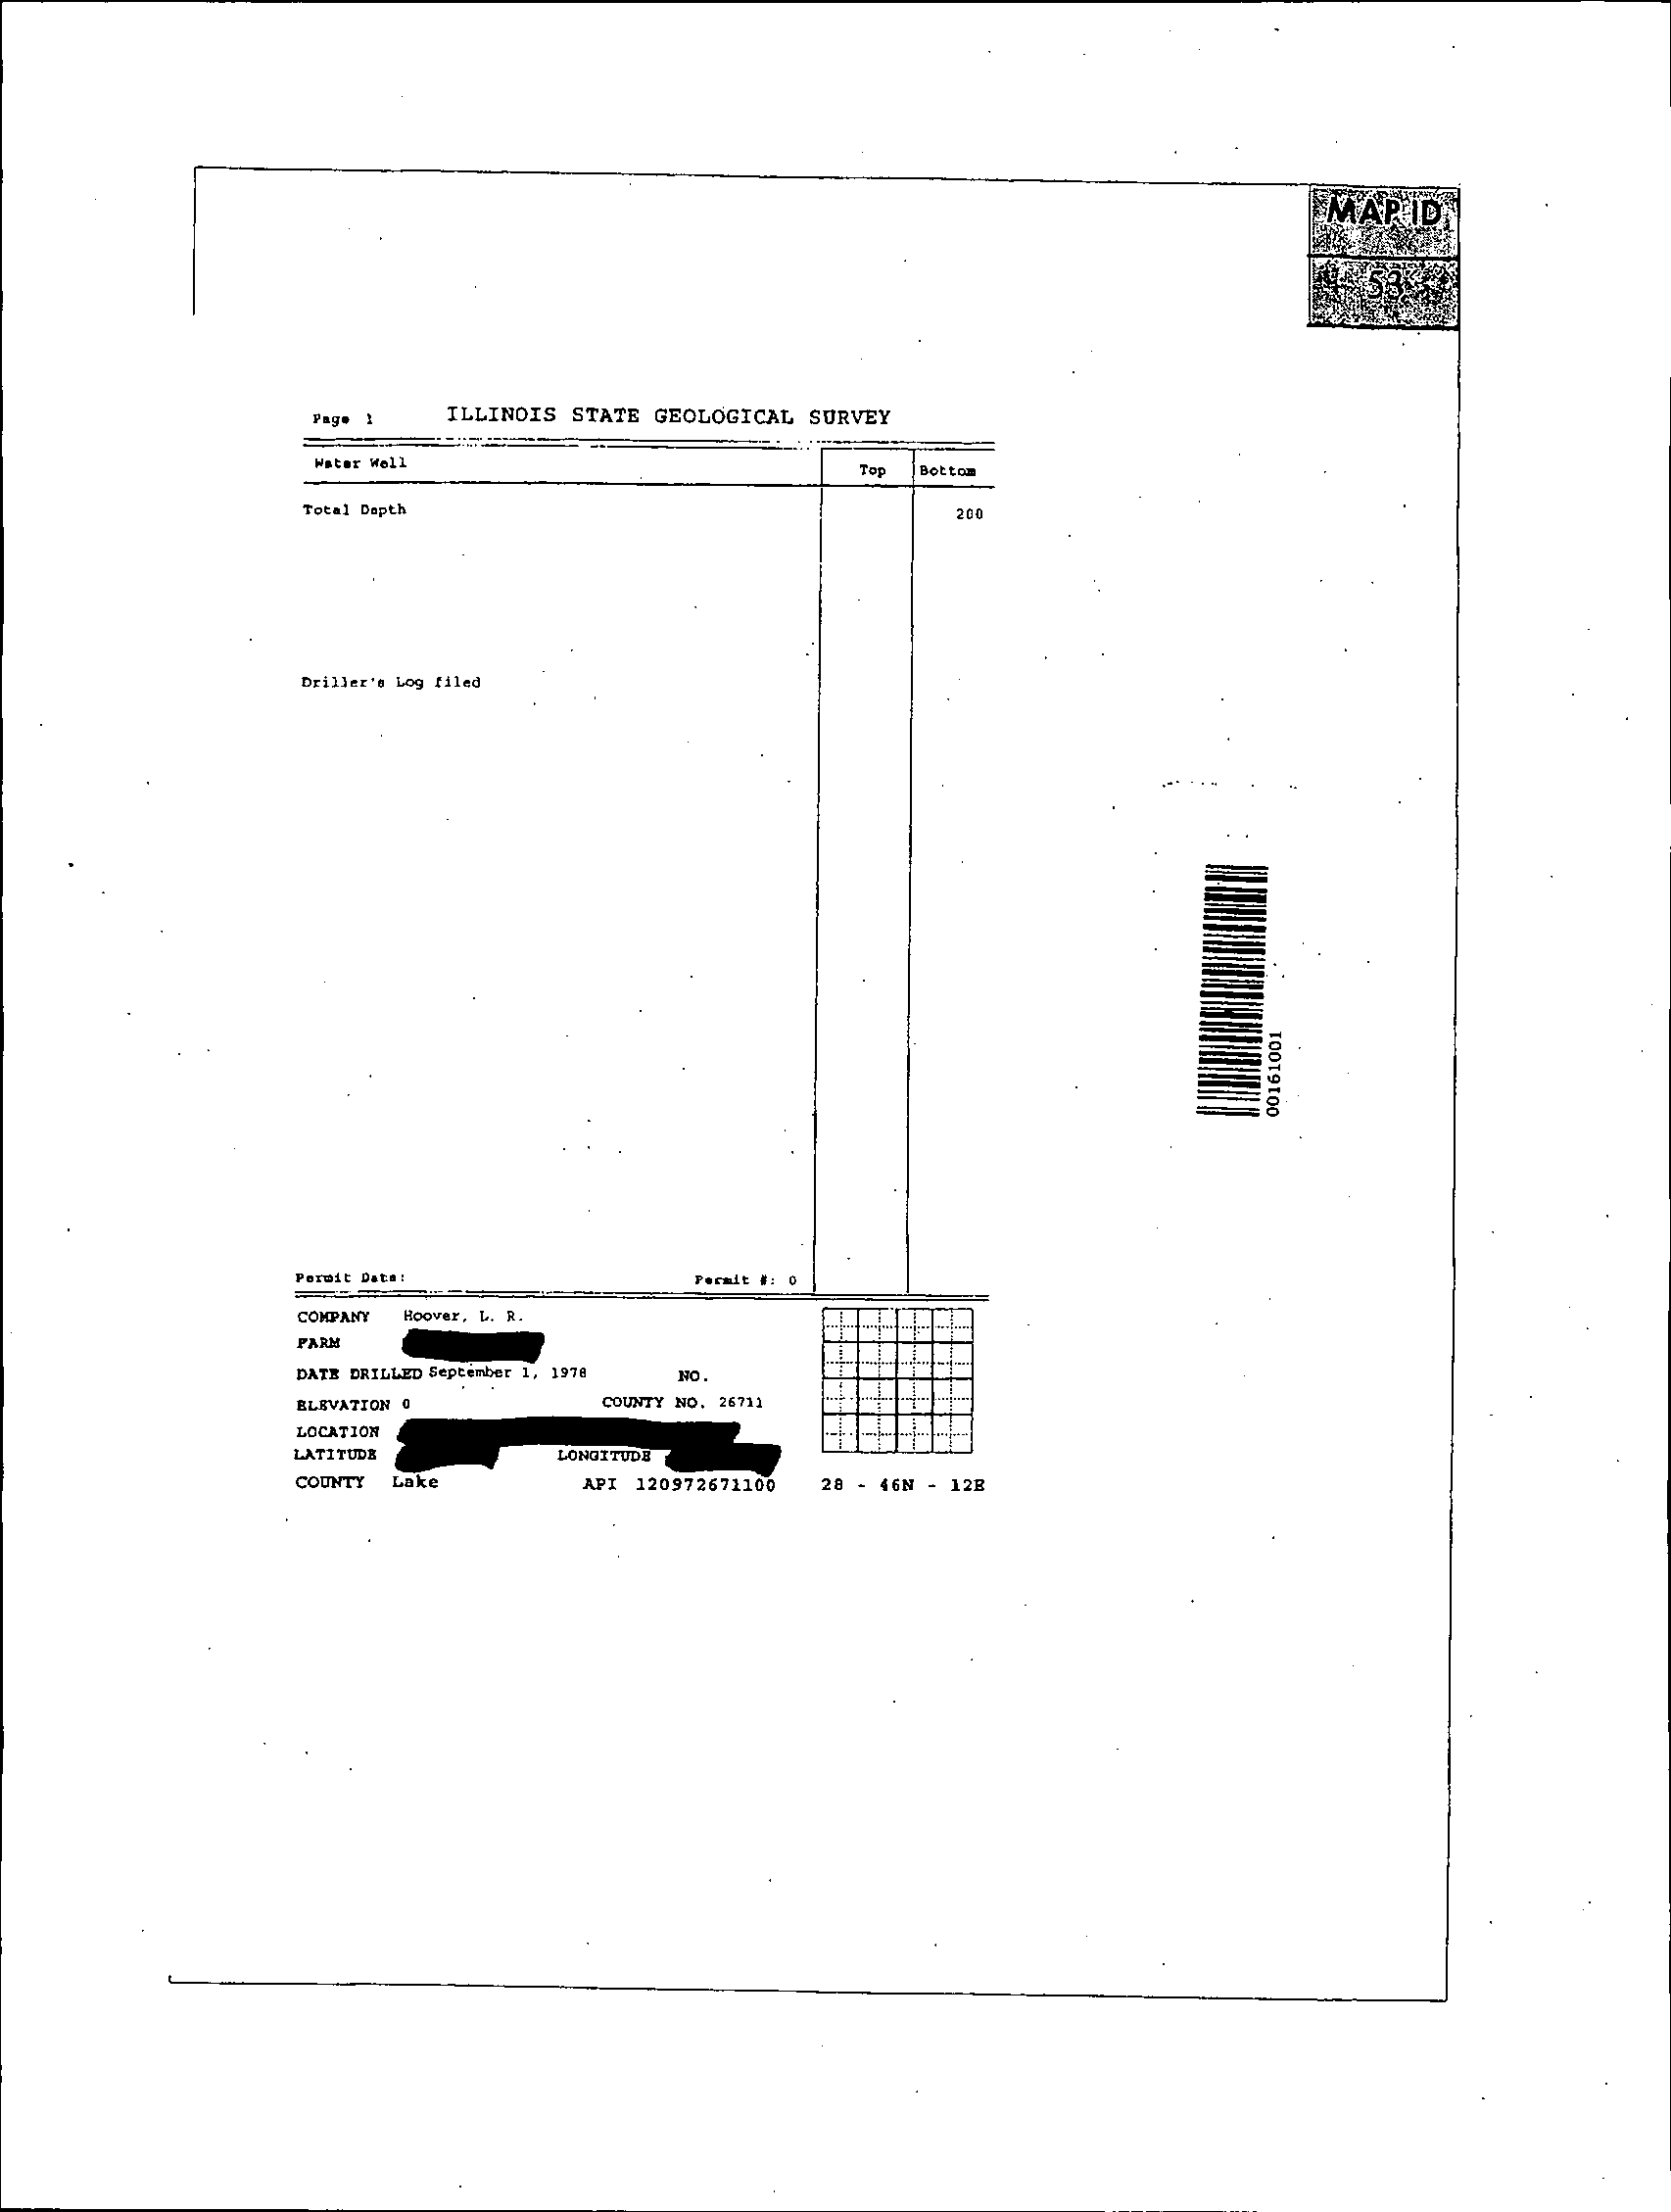
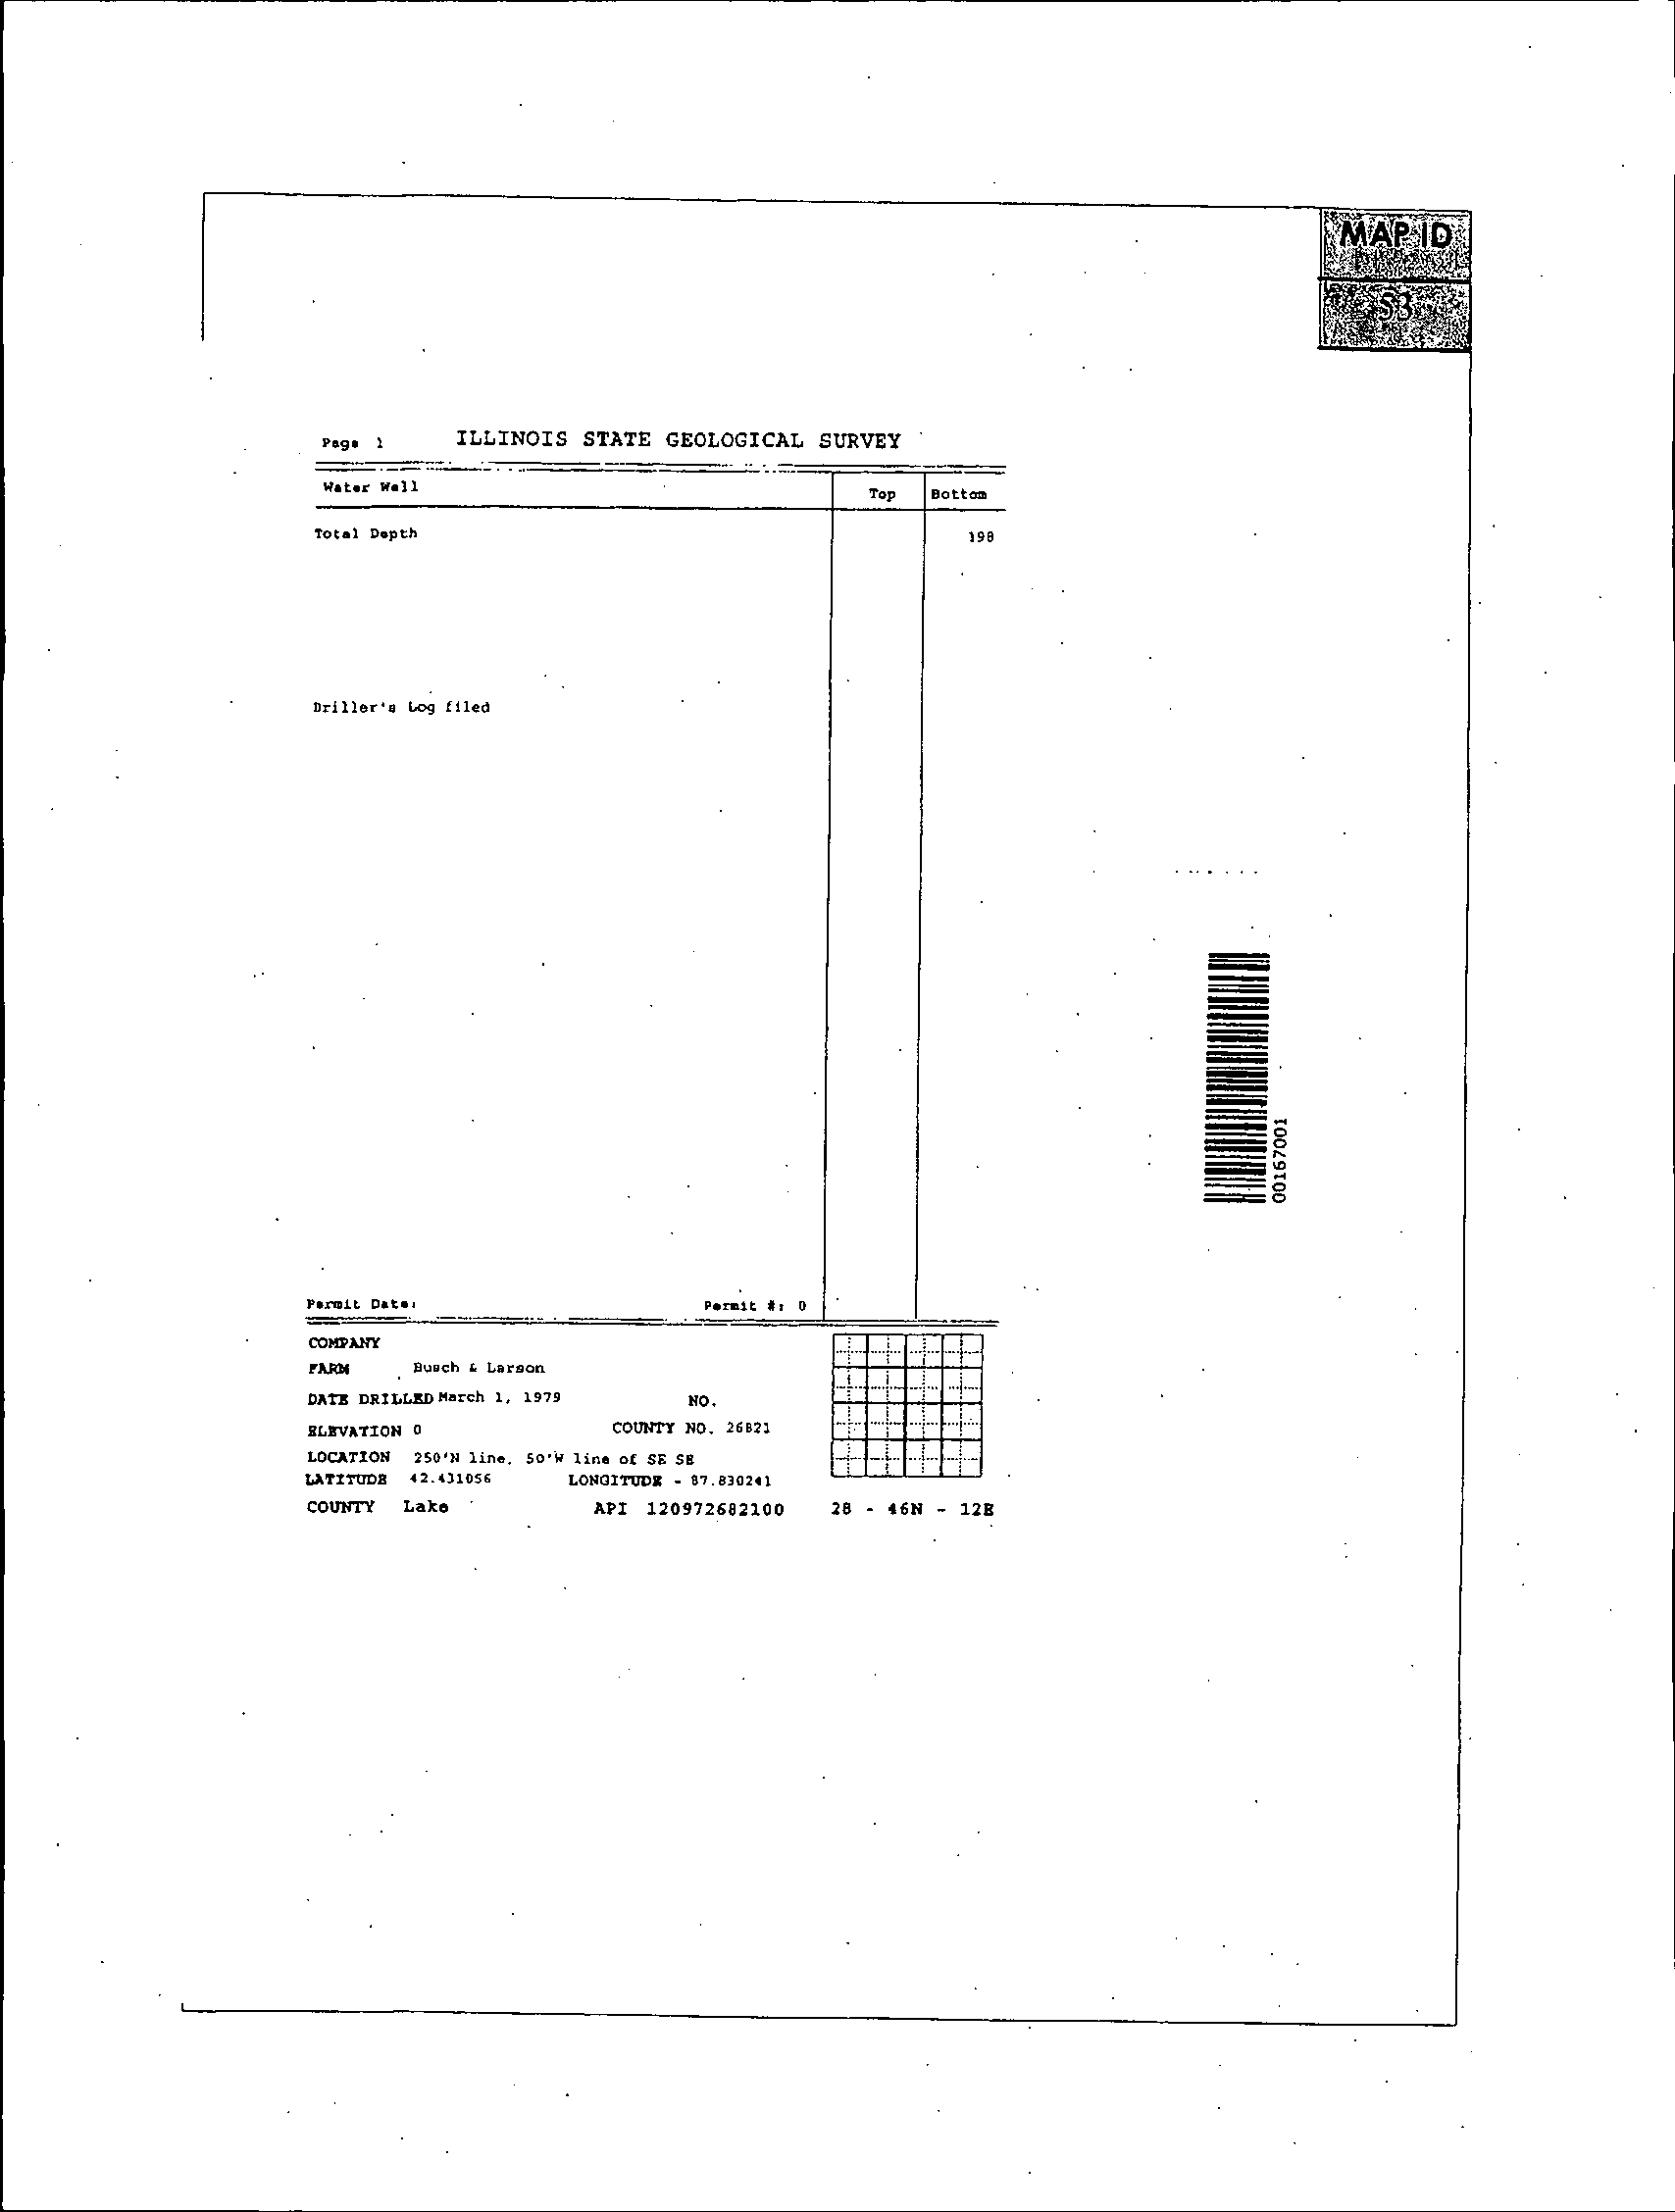
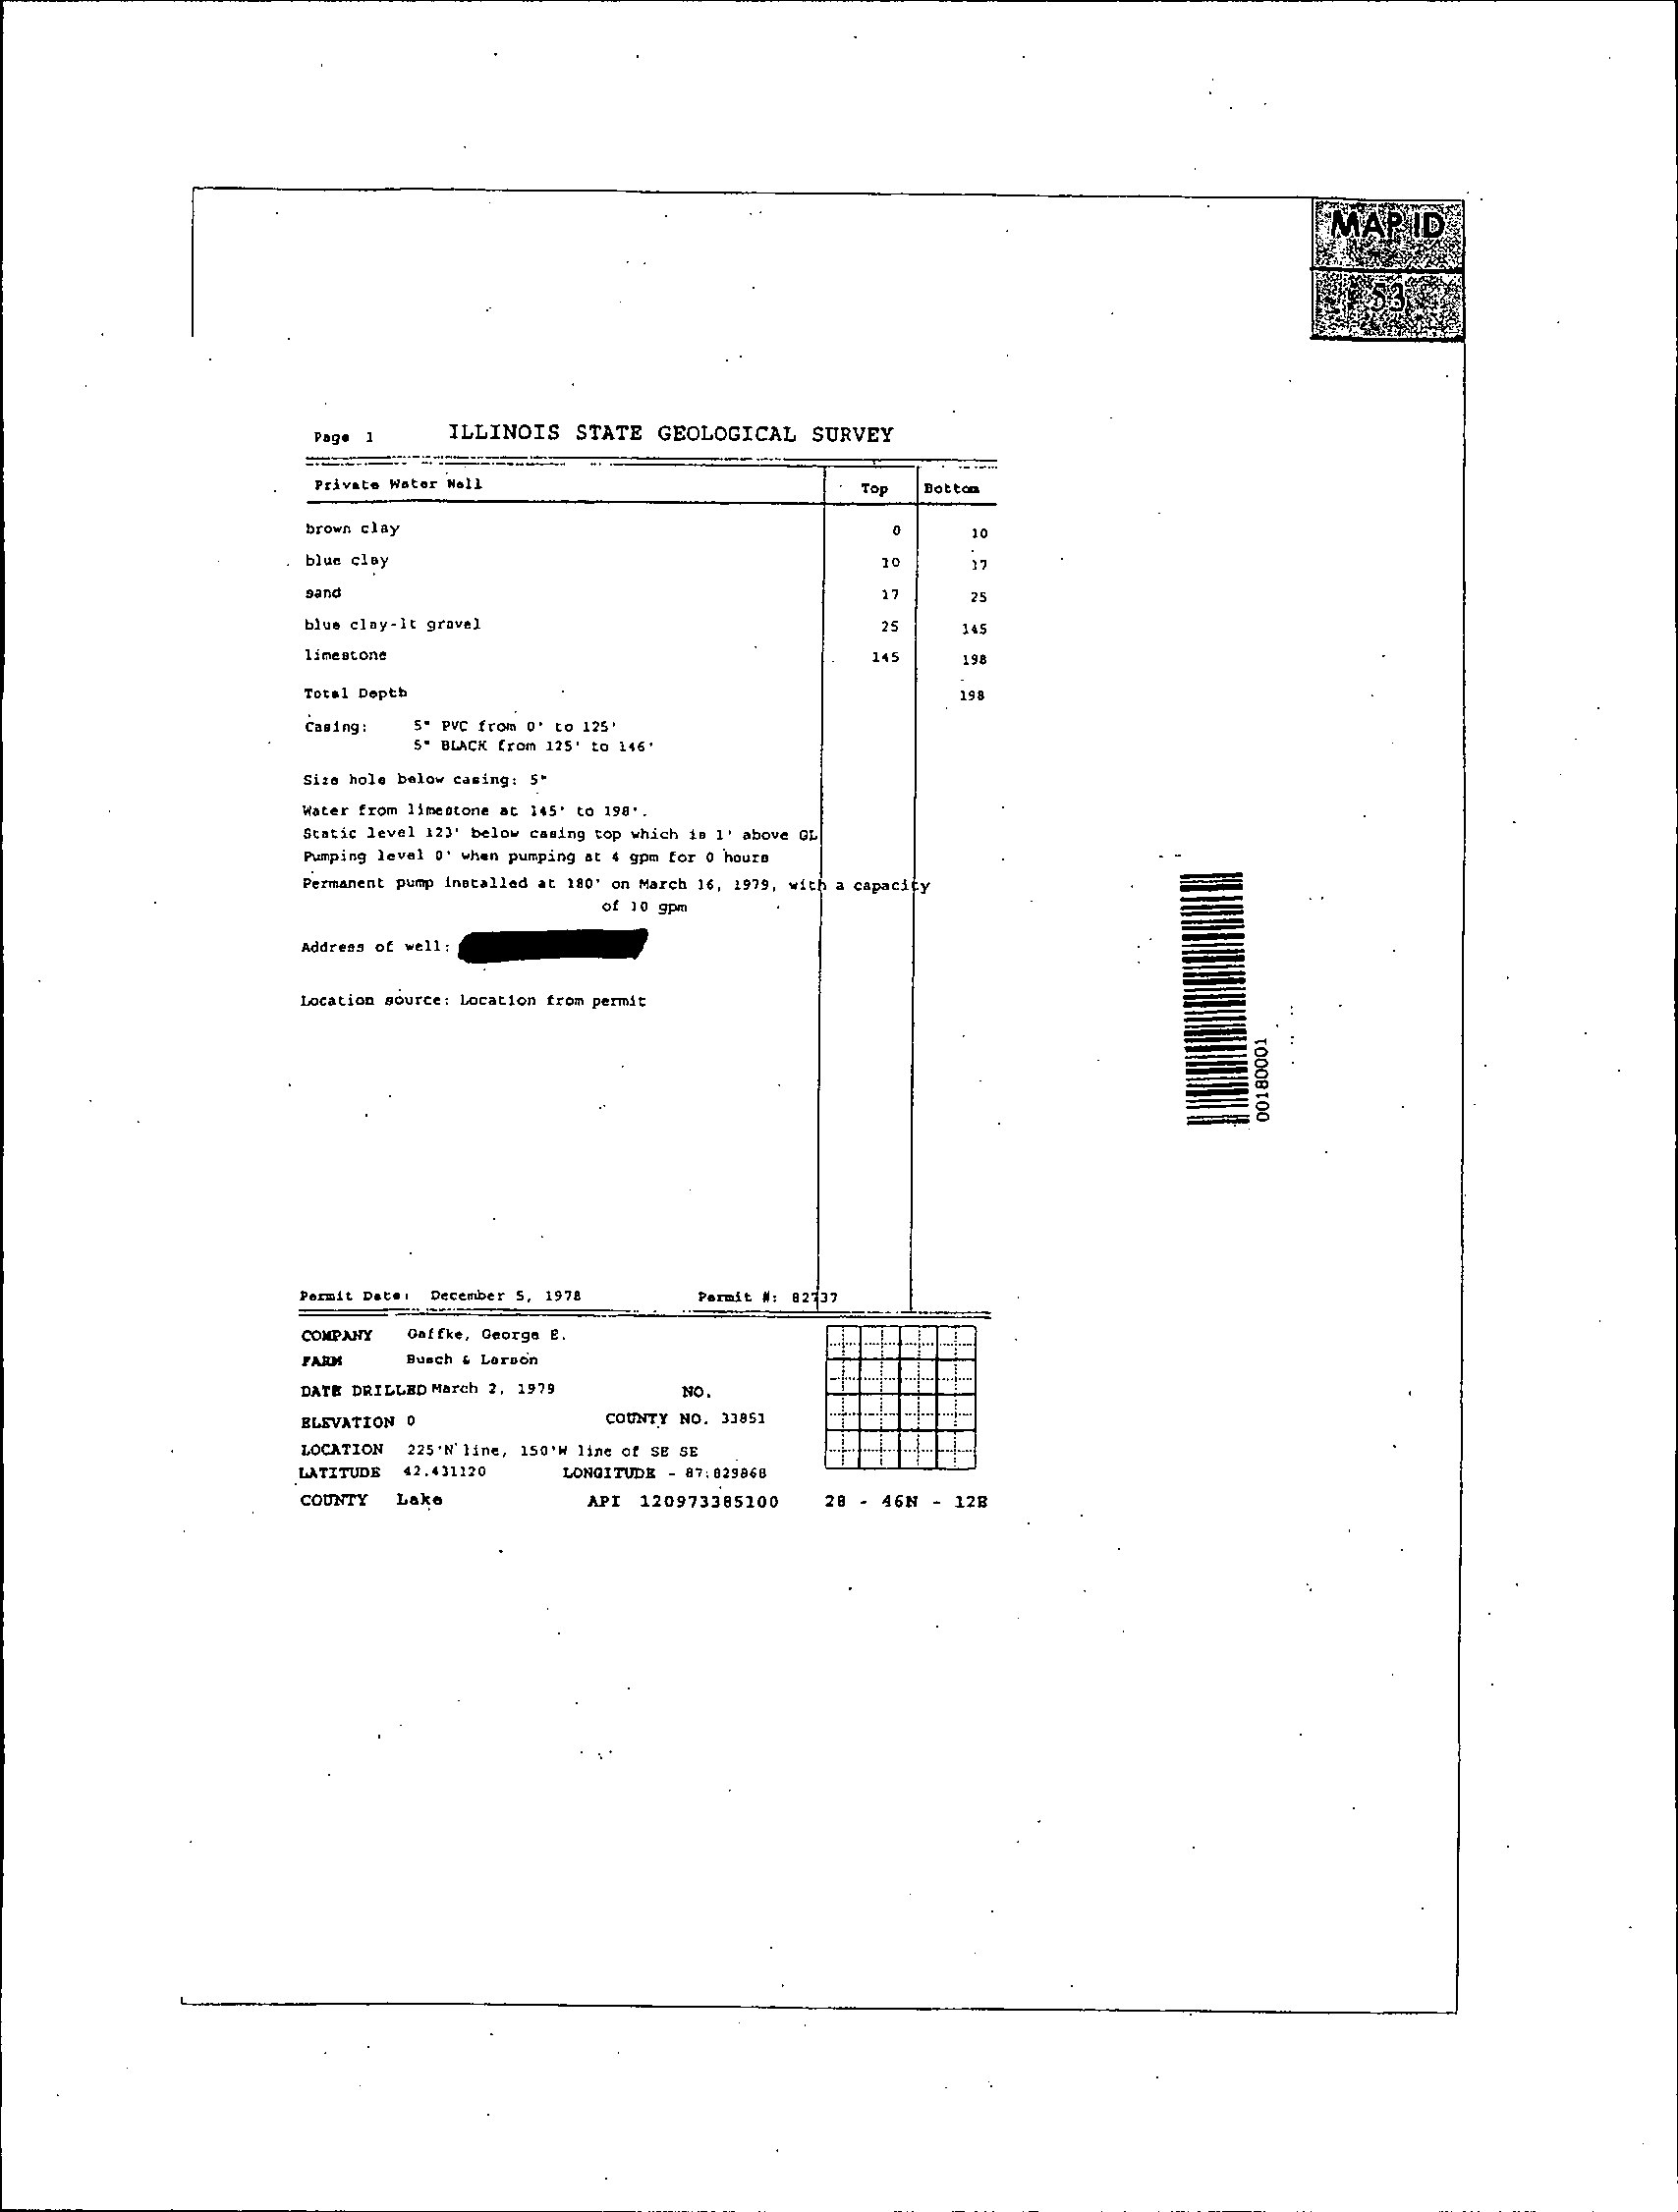
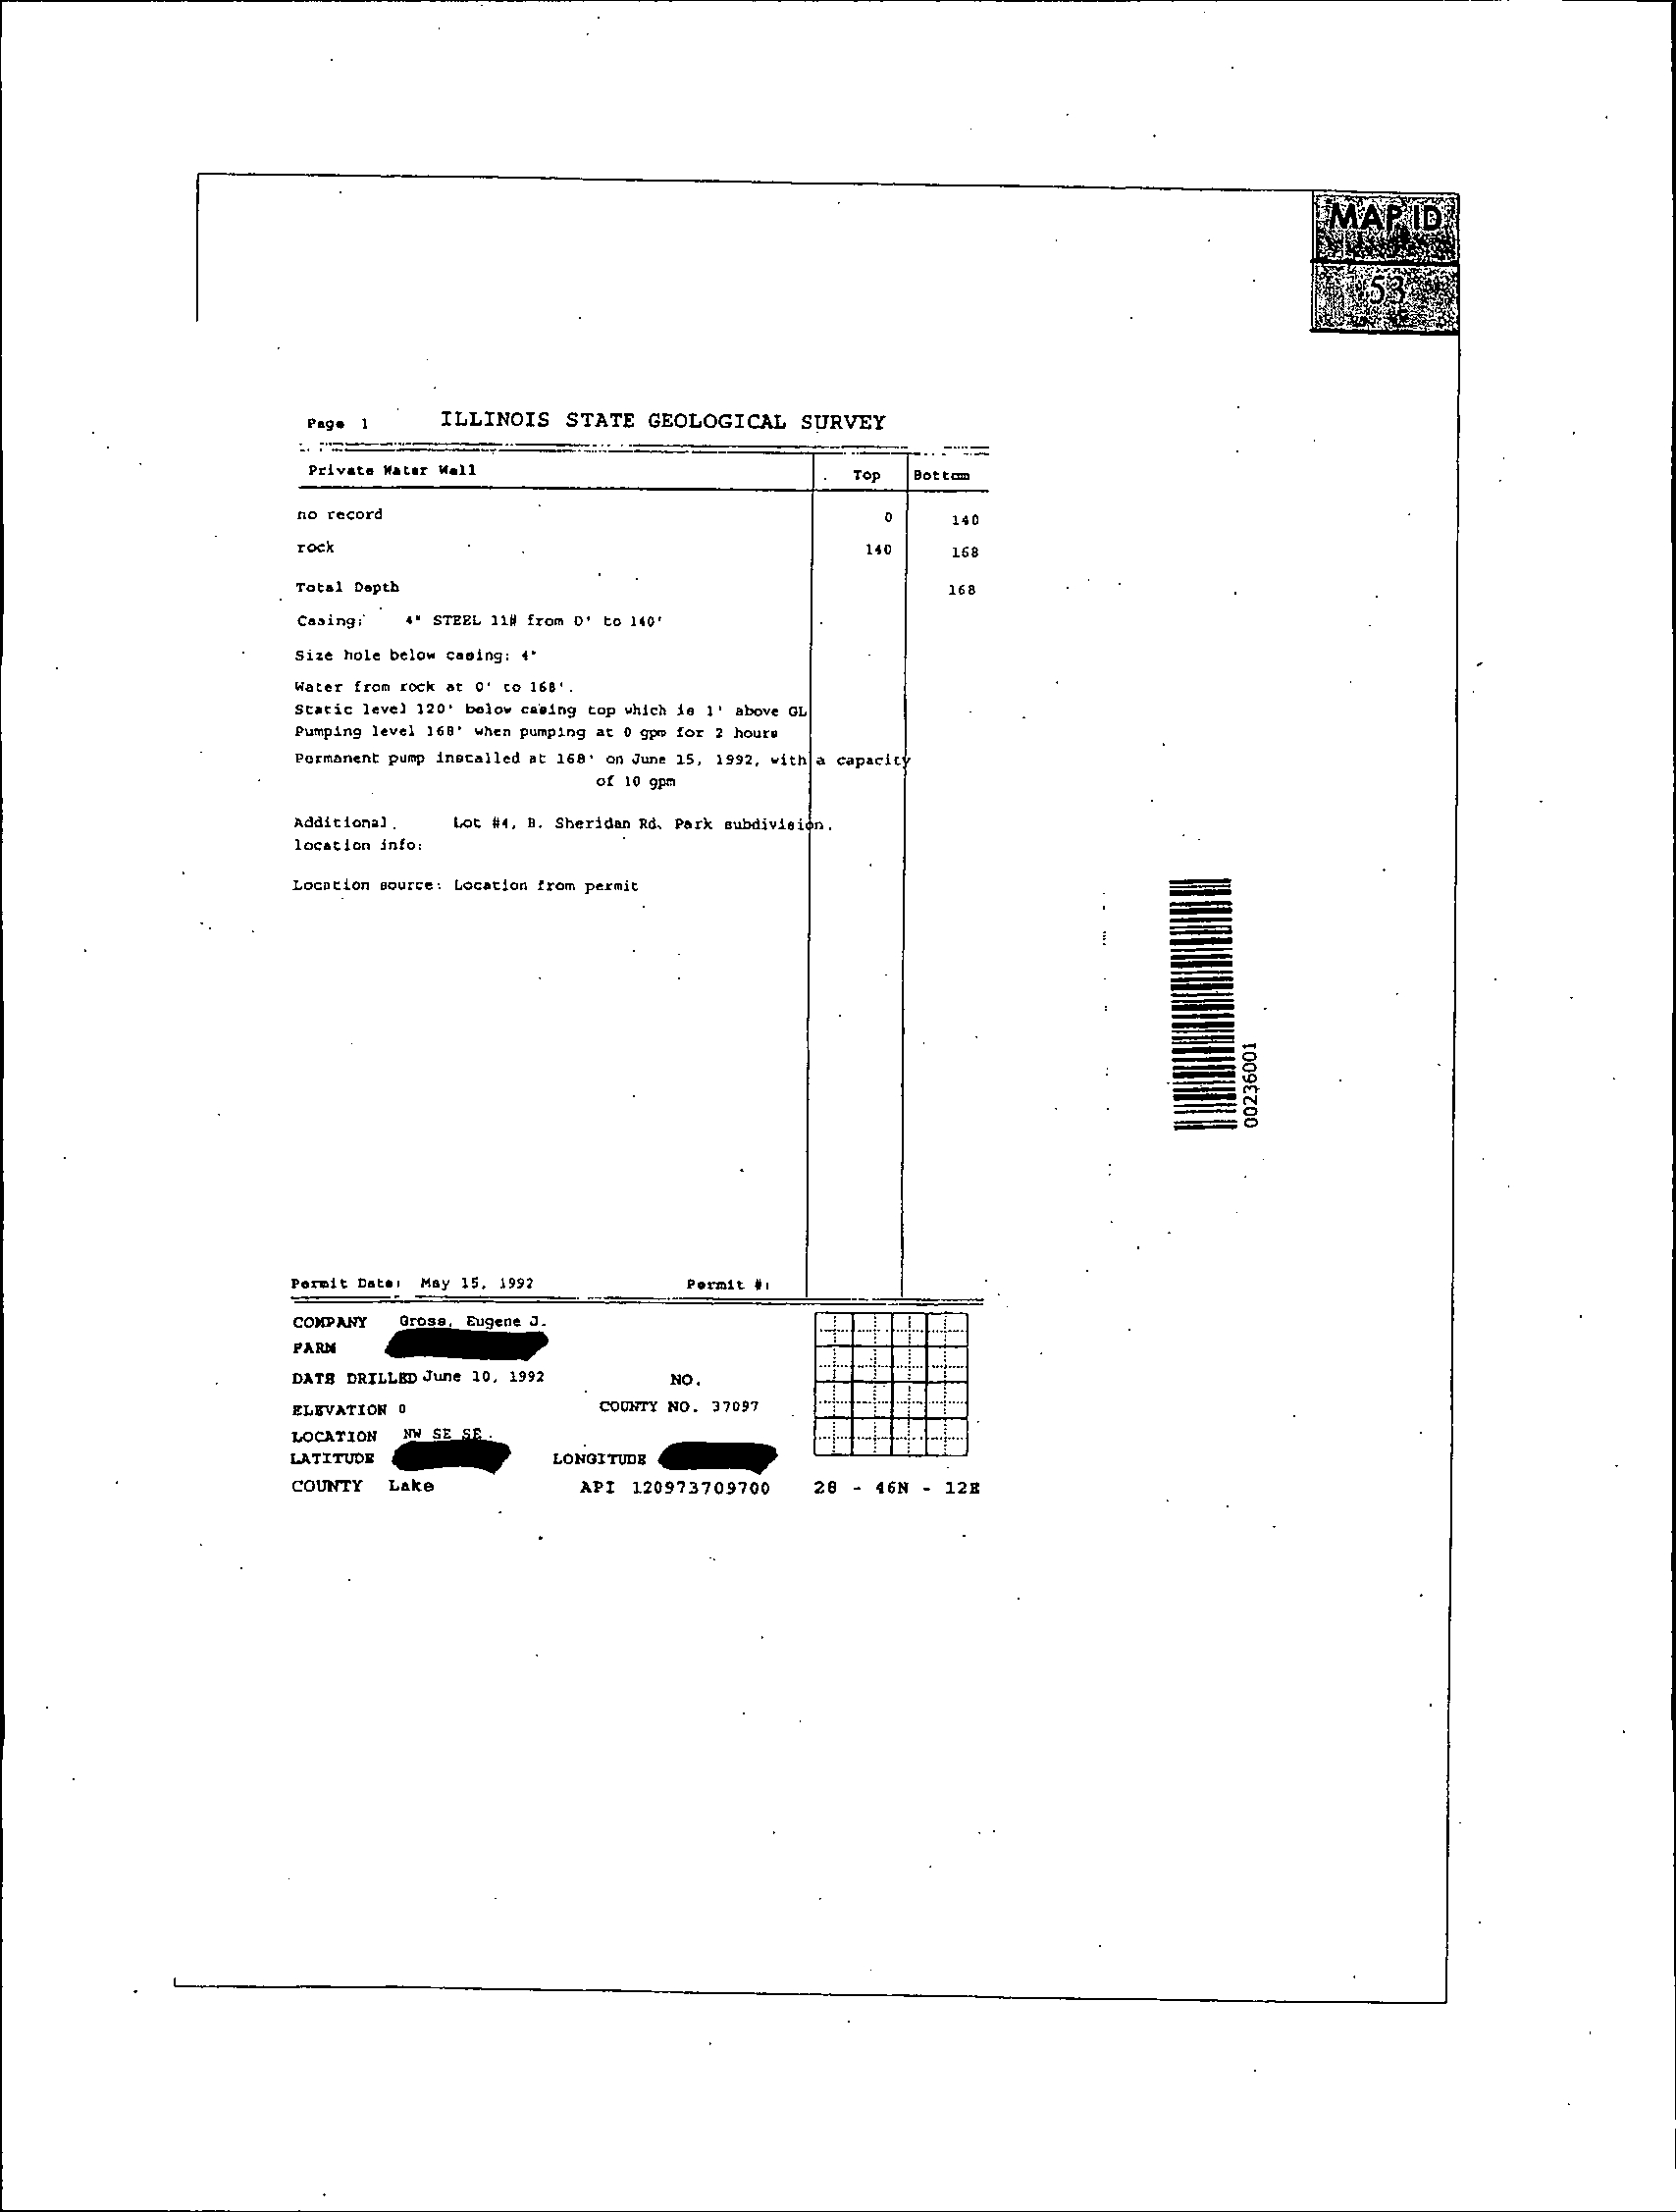
WATER WELL INVENTORY RECORDS
A.1
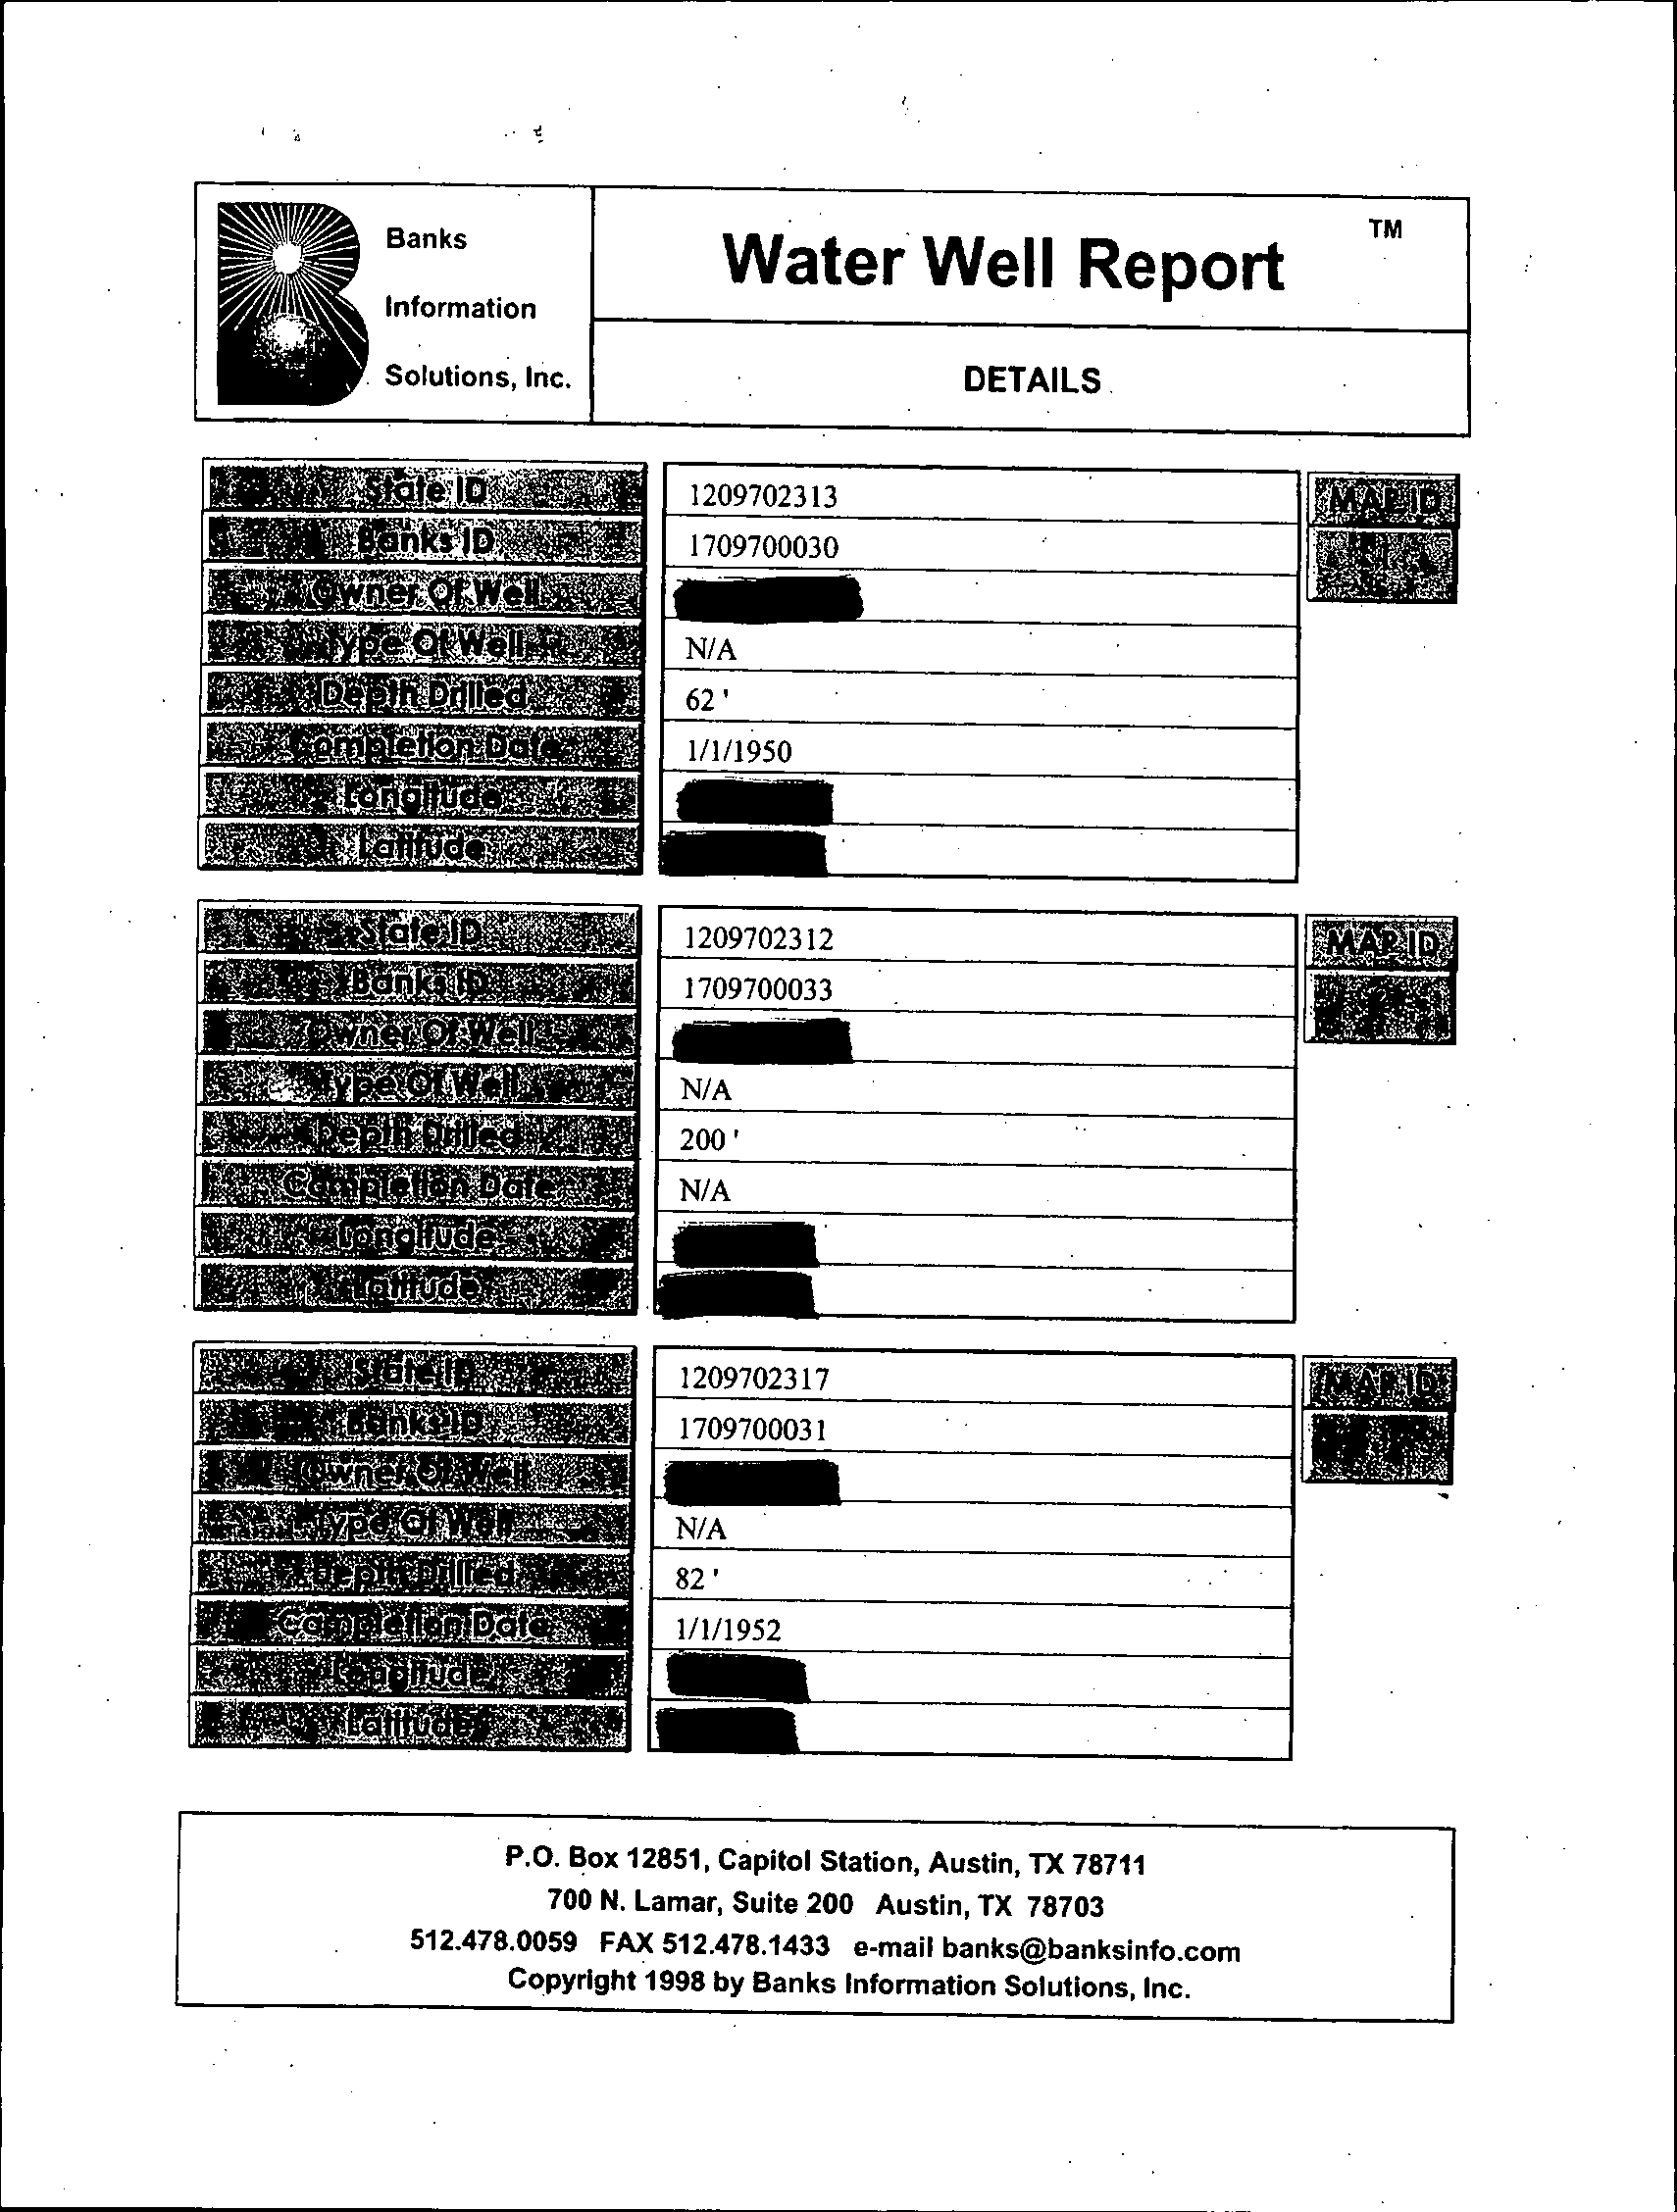
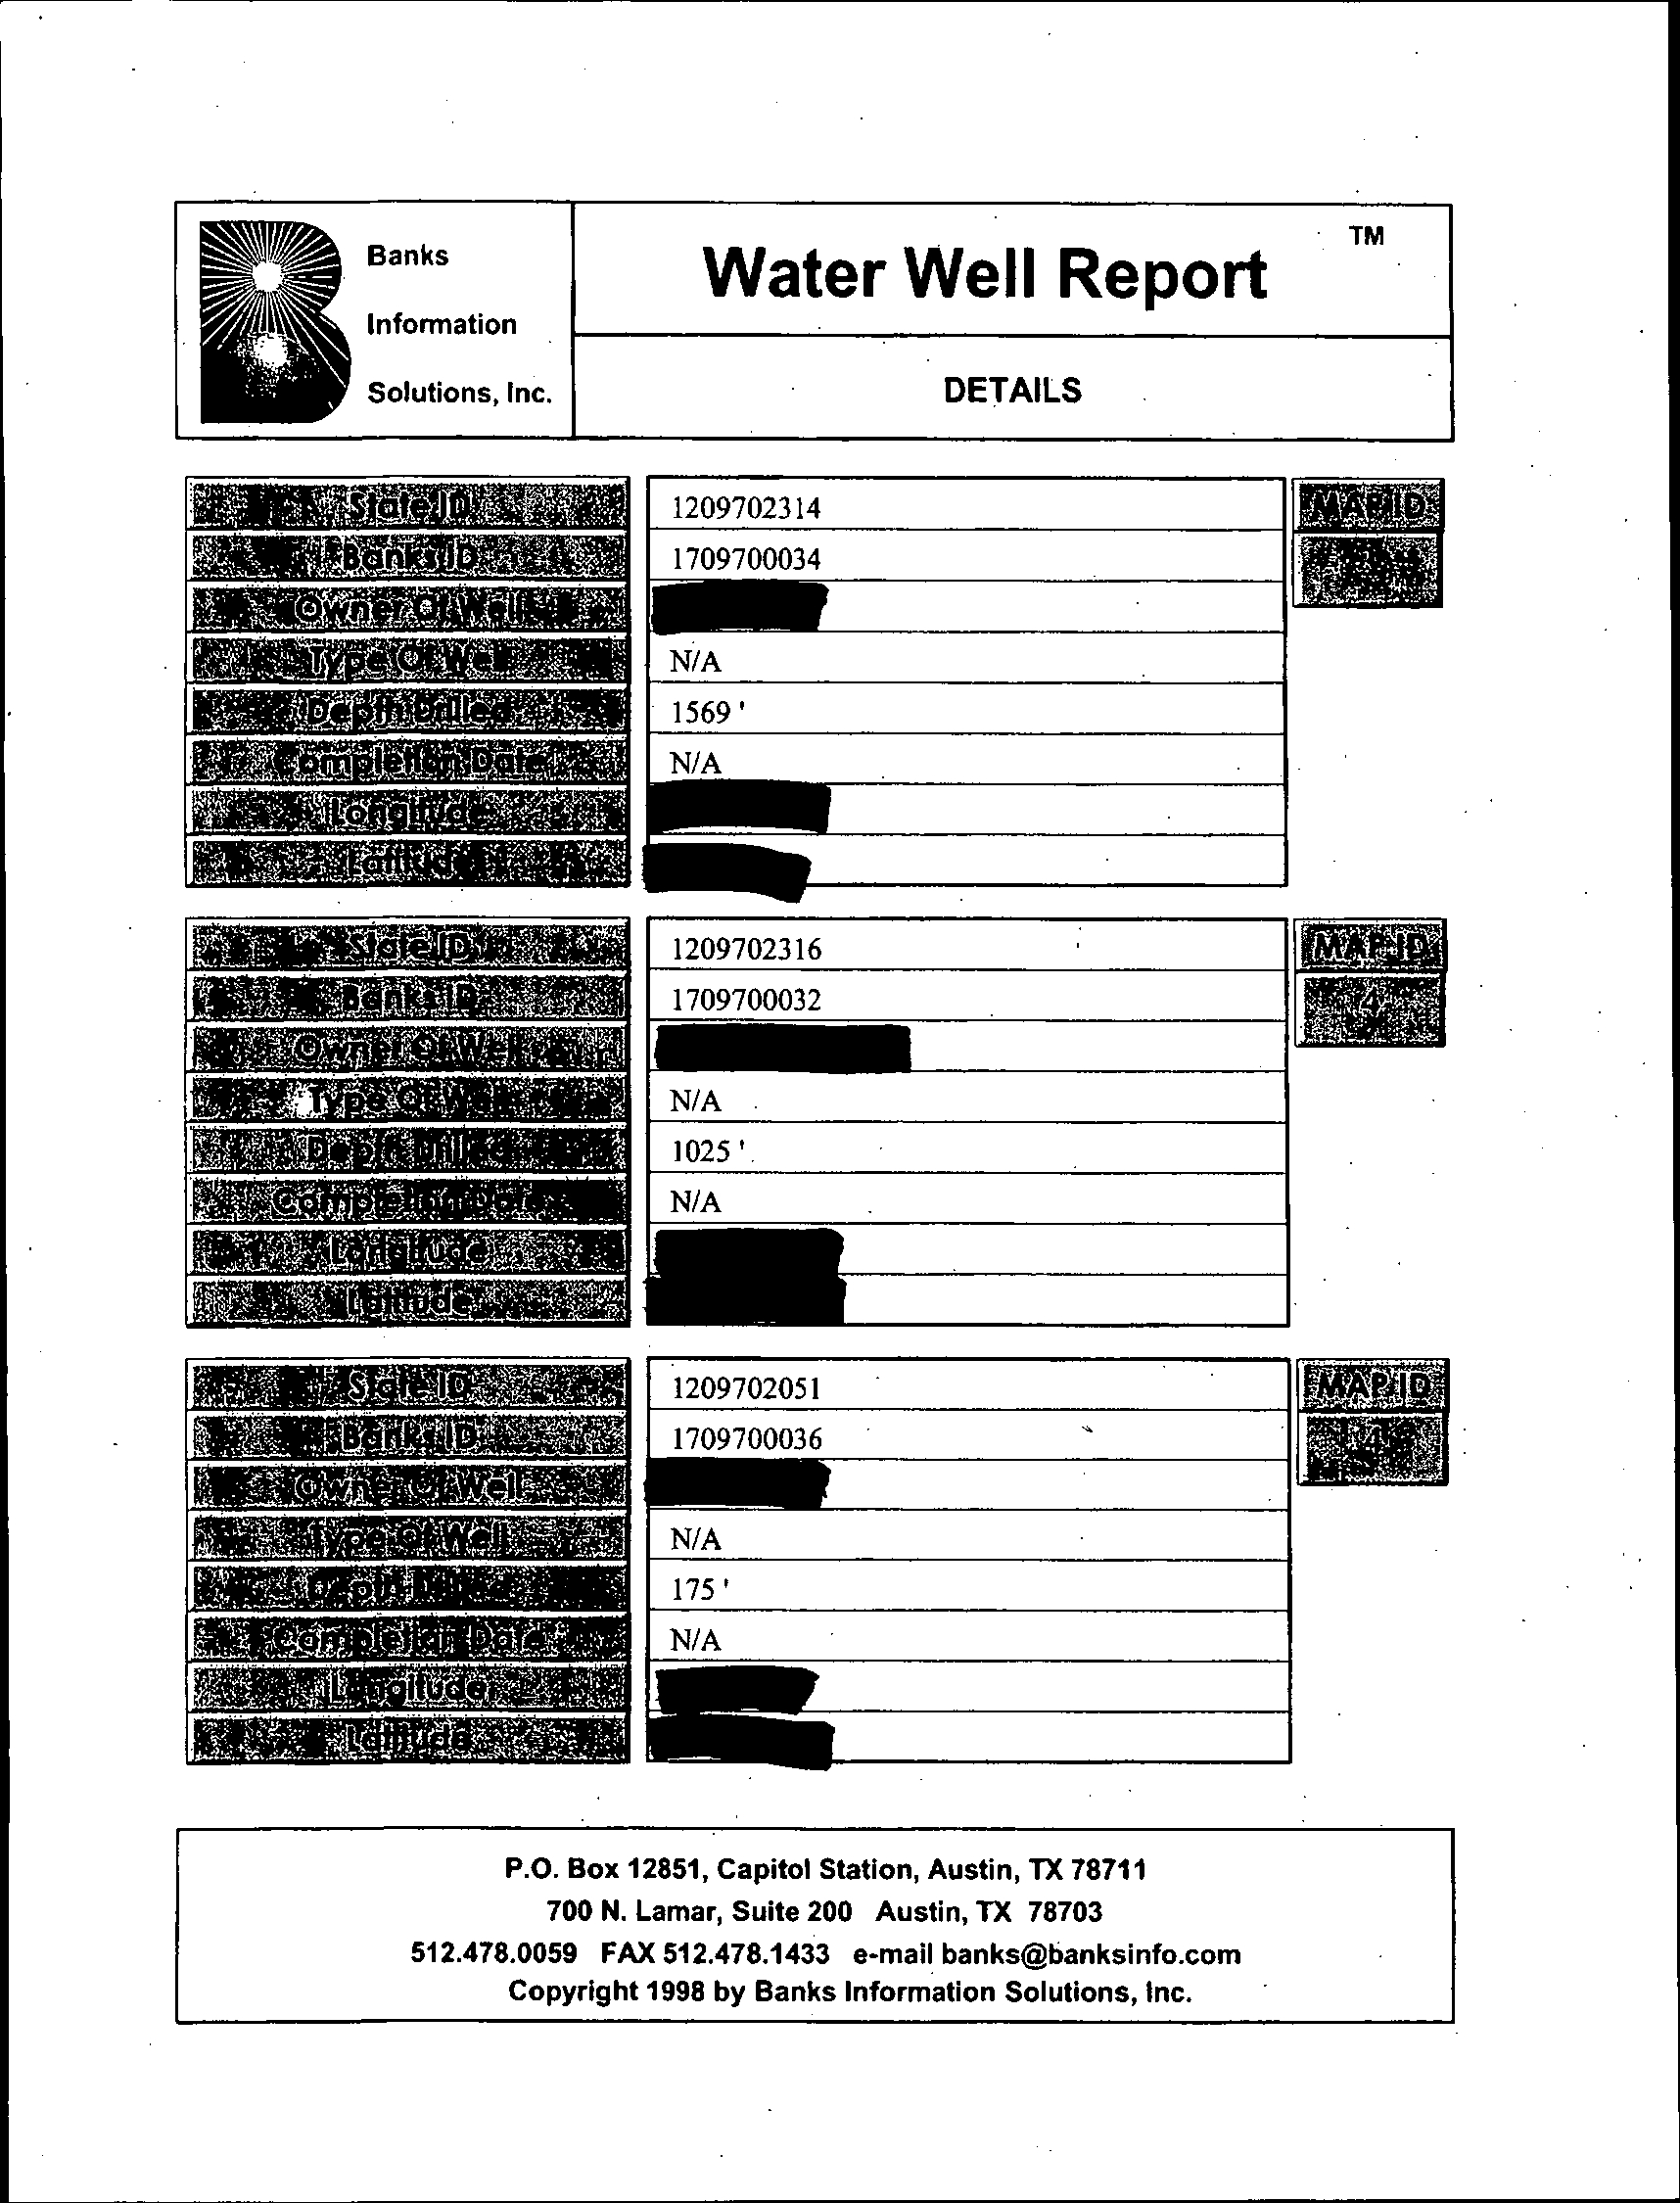
BANKS 2006 WATER WELL REPORT
A.2
ISWS LOGS
APPENDIX B
BORING LOGS
B.1
2006 STRATIGRAPHIC AND INSTRUMENTATION LOGS
B.2
HISTORIC GEOTECHNICAL LOGS
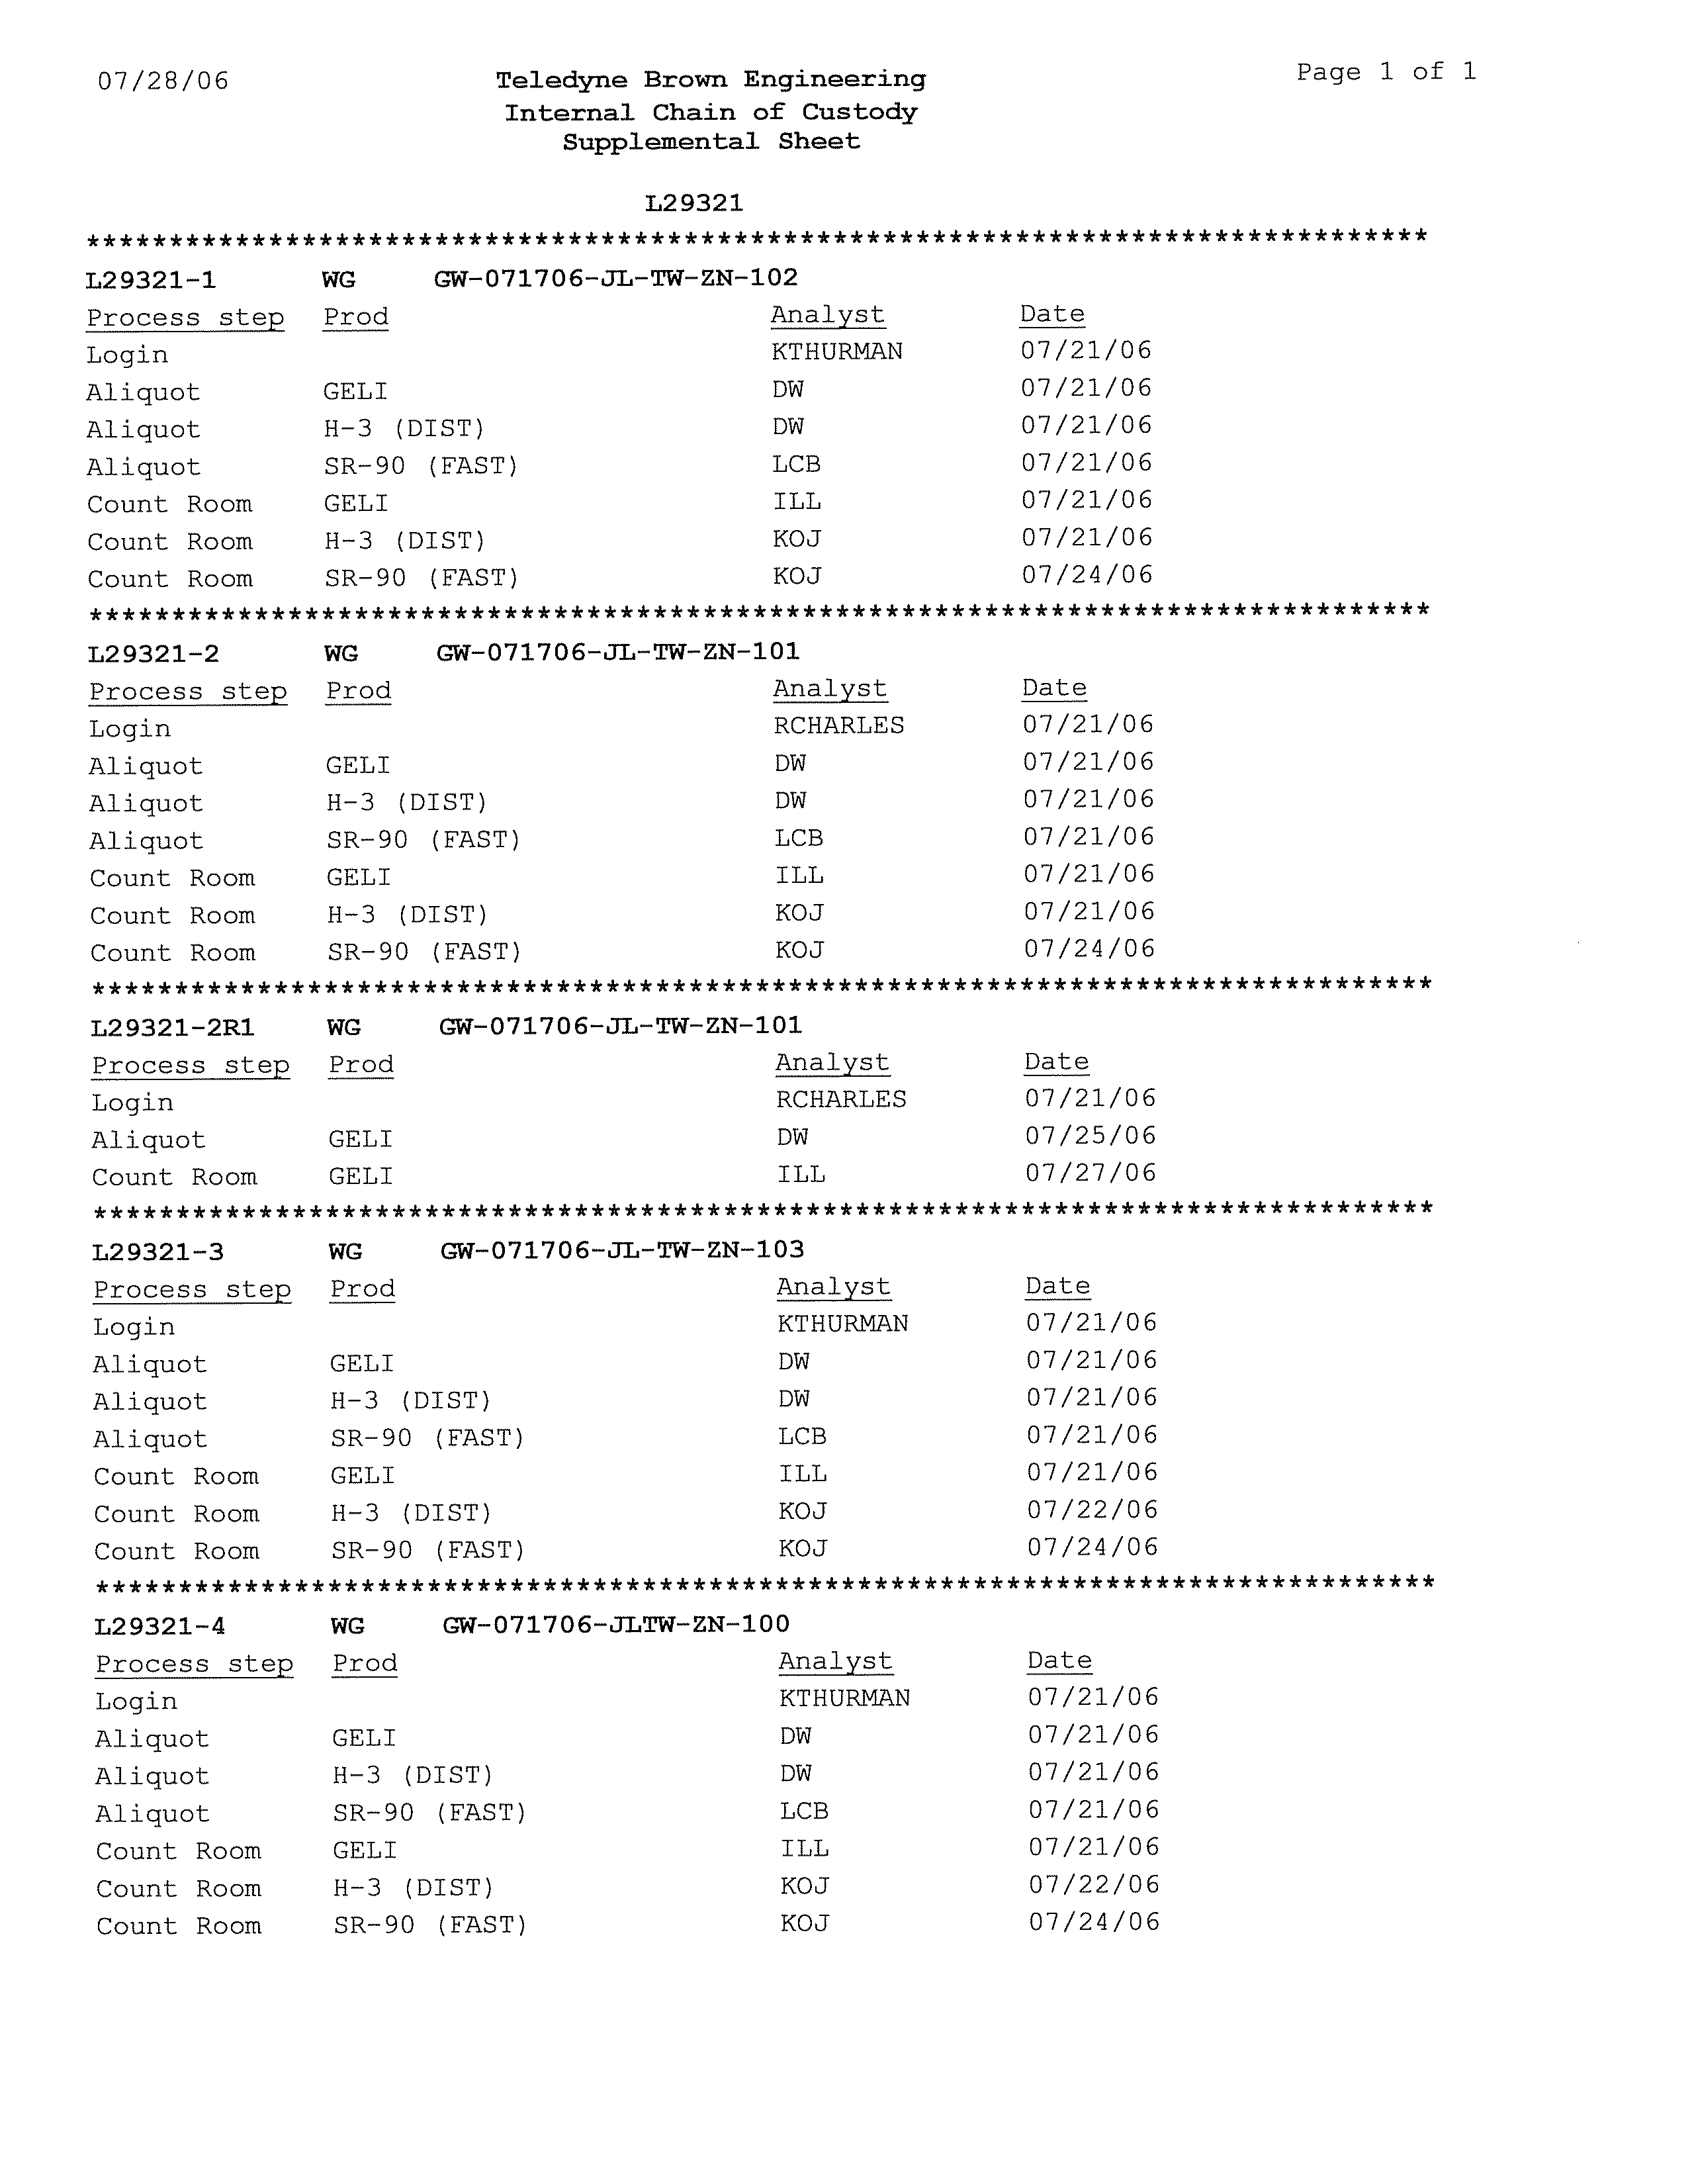
APPENDIX C
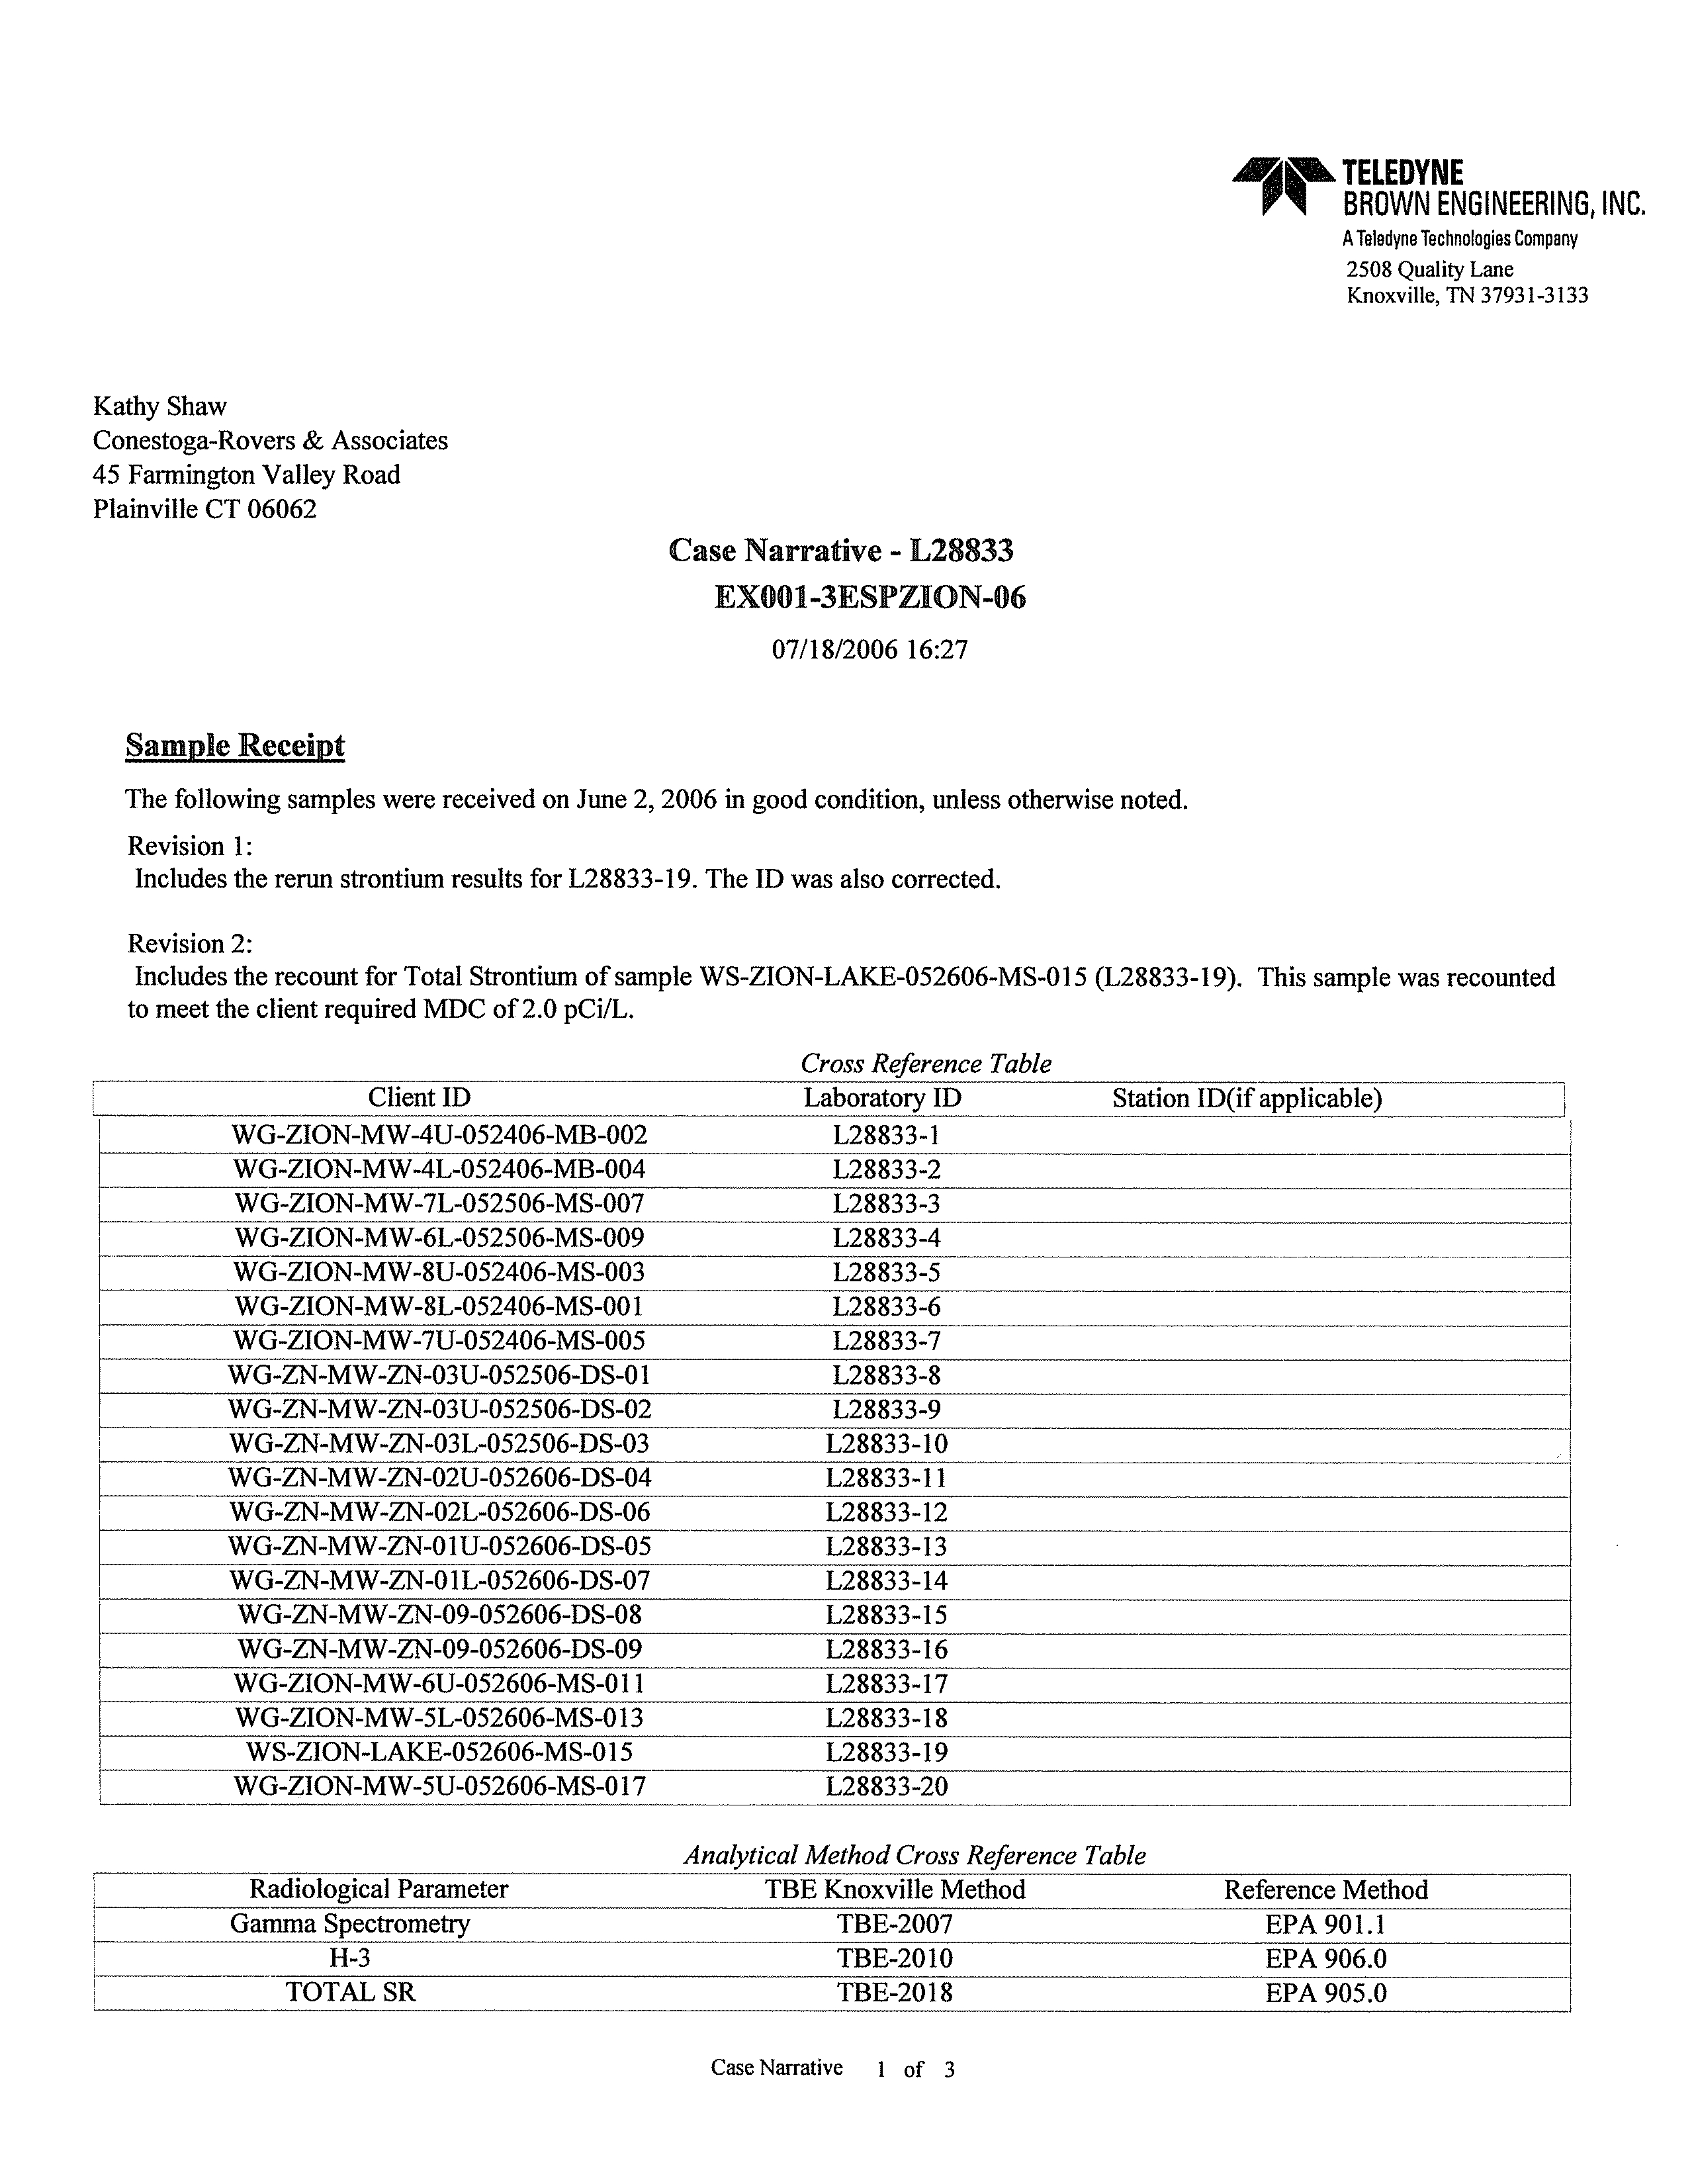
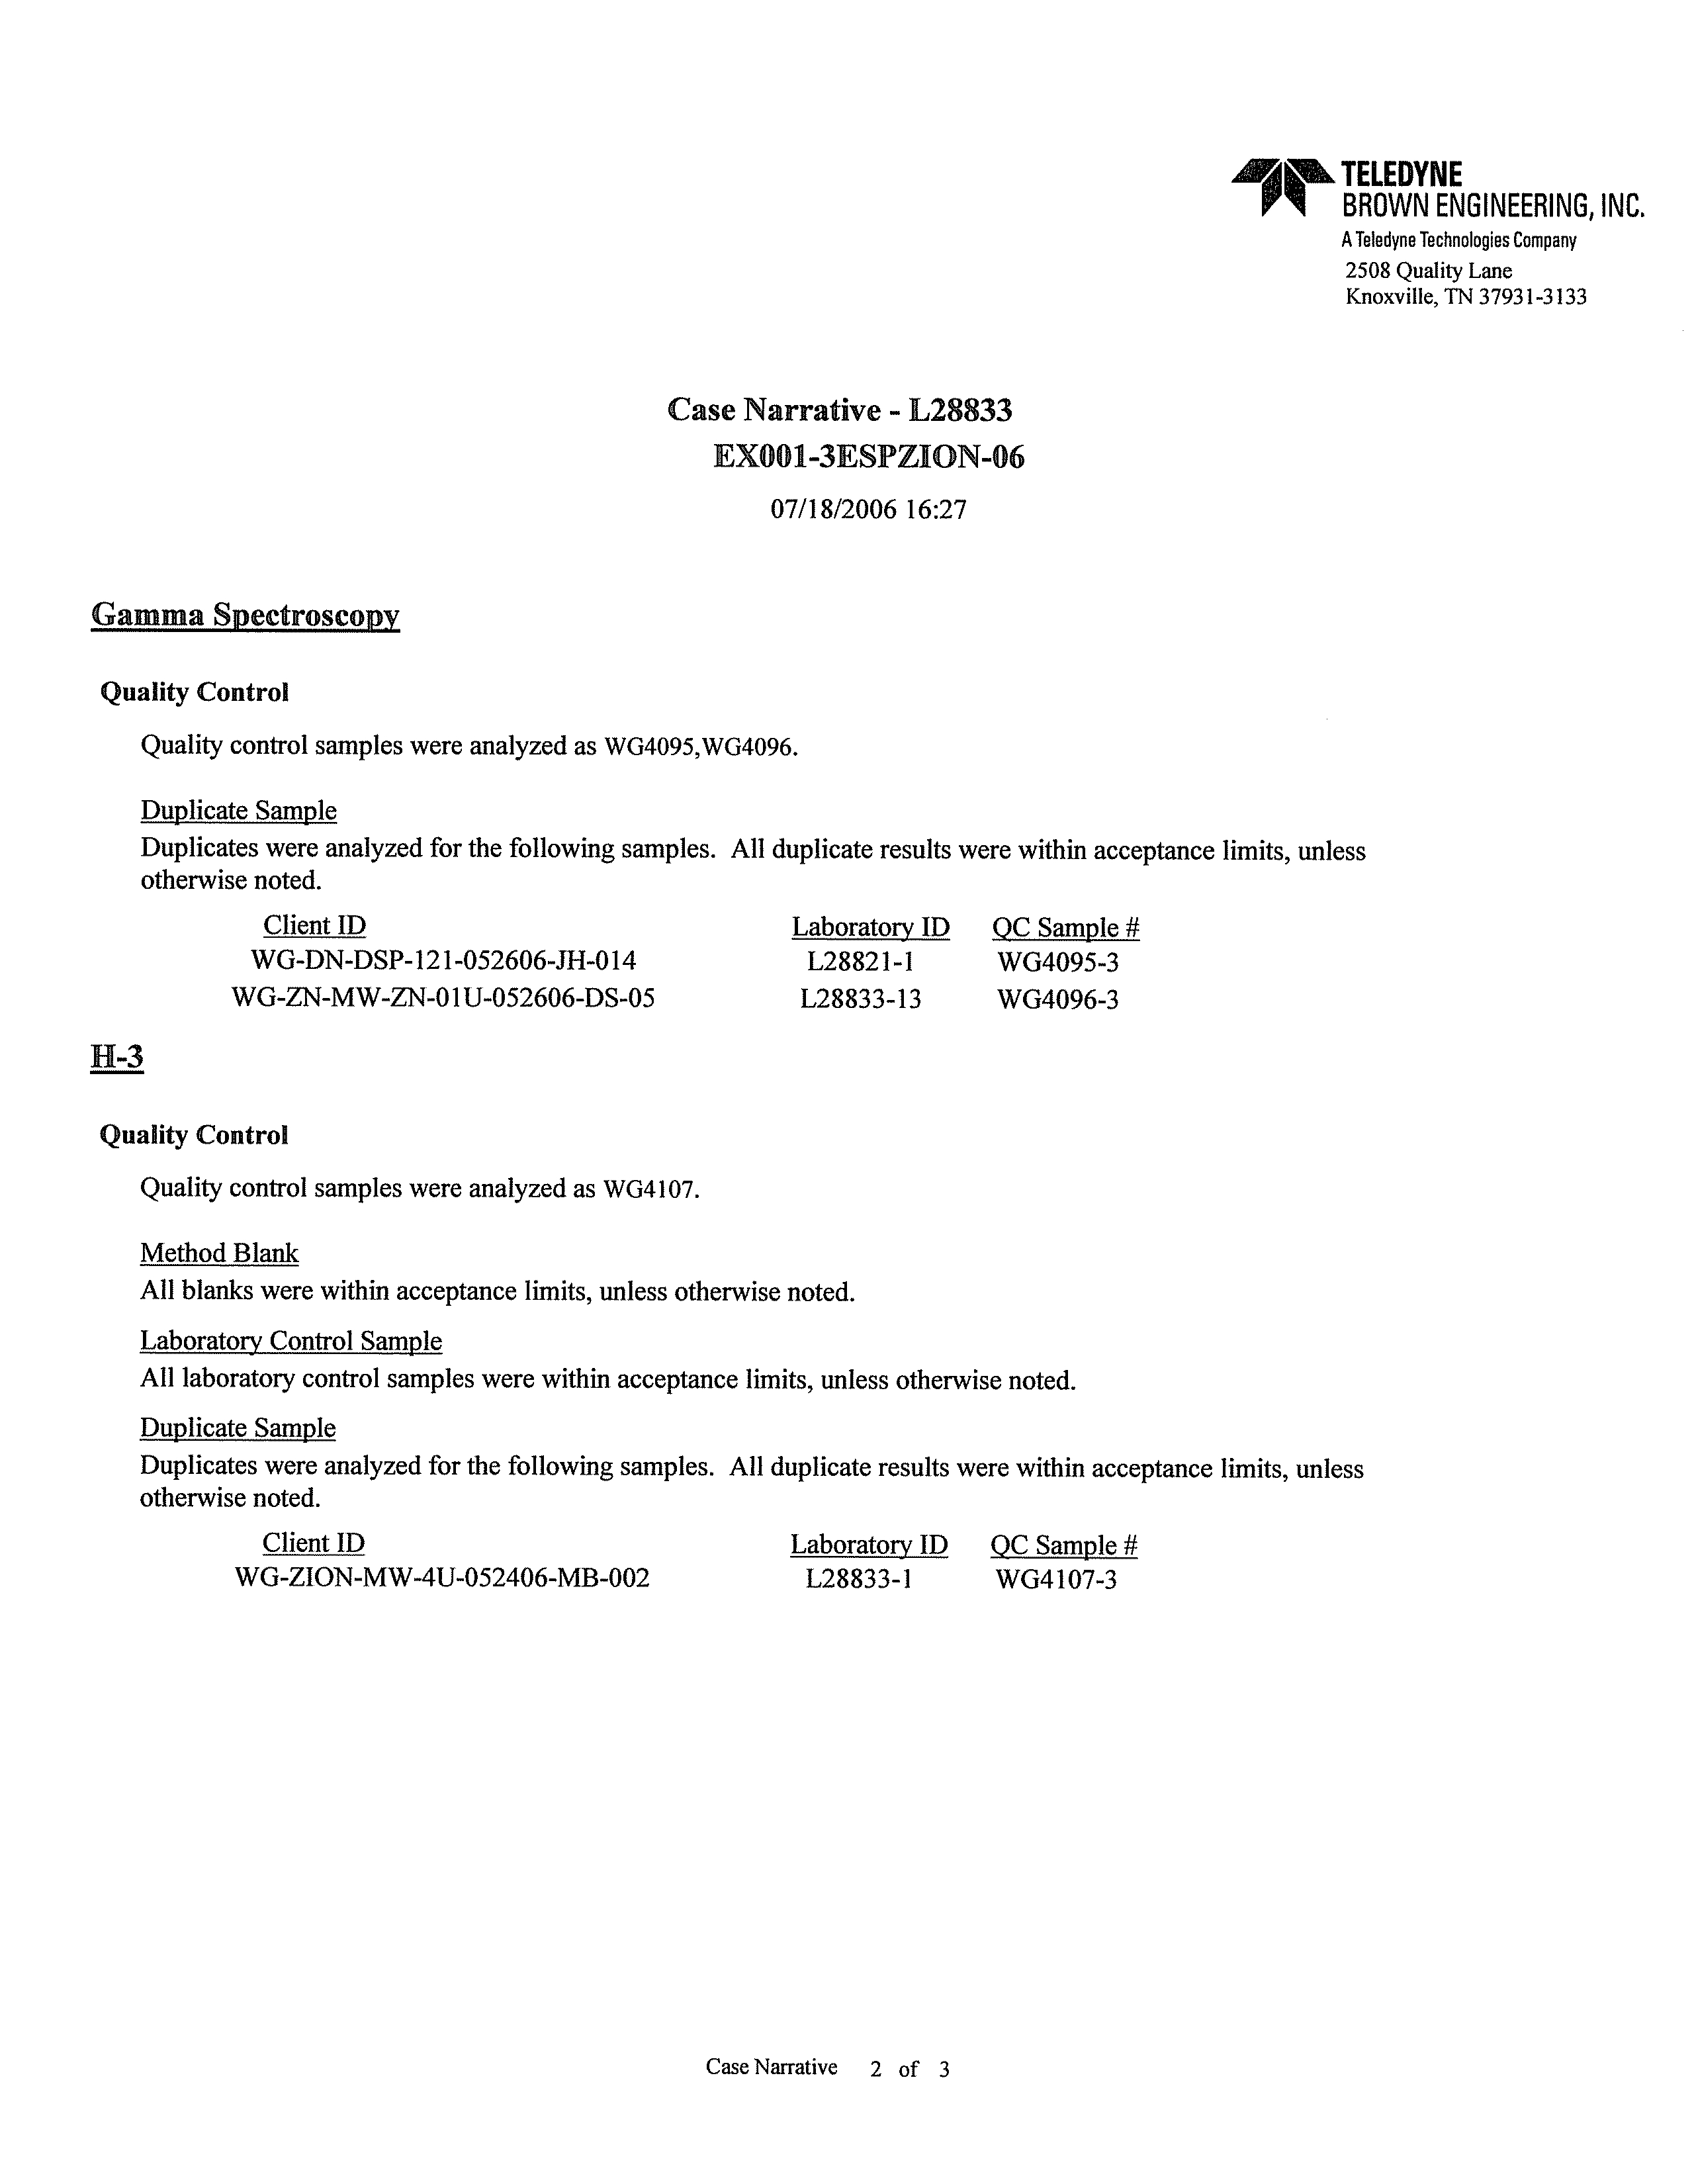
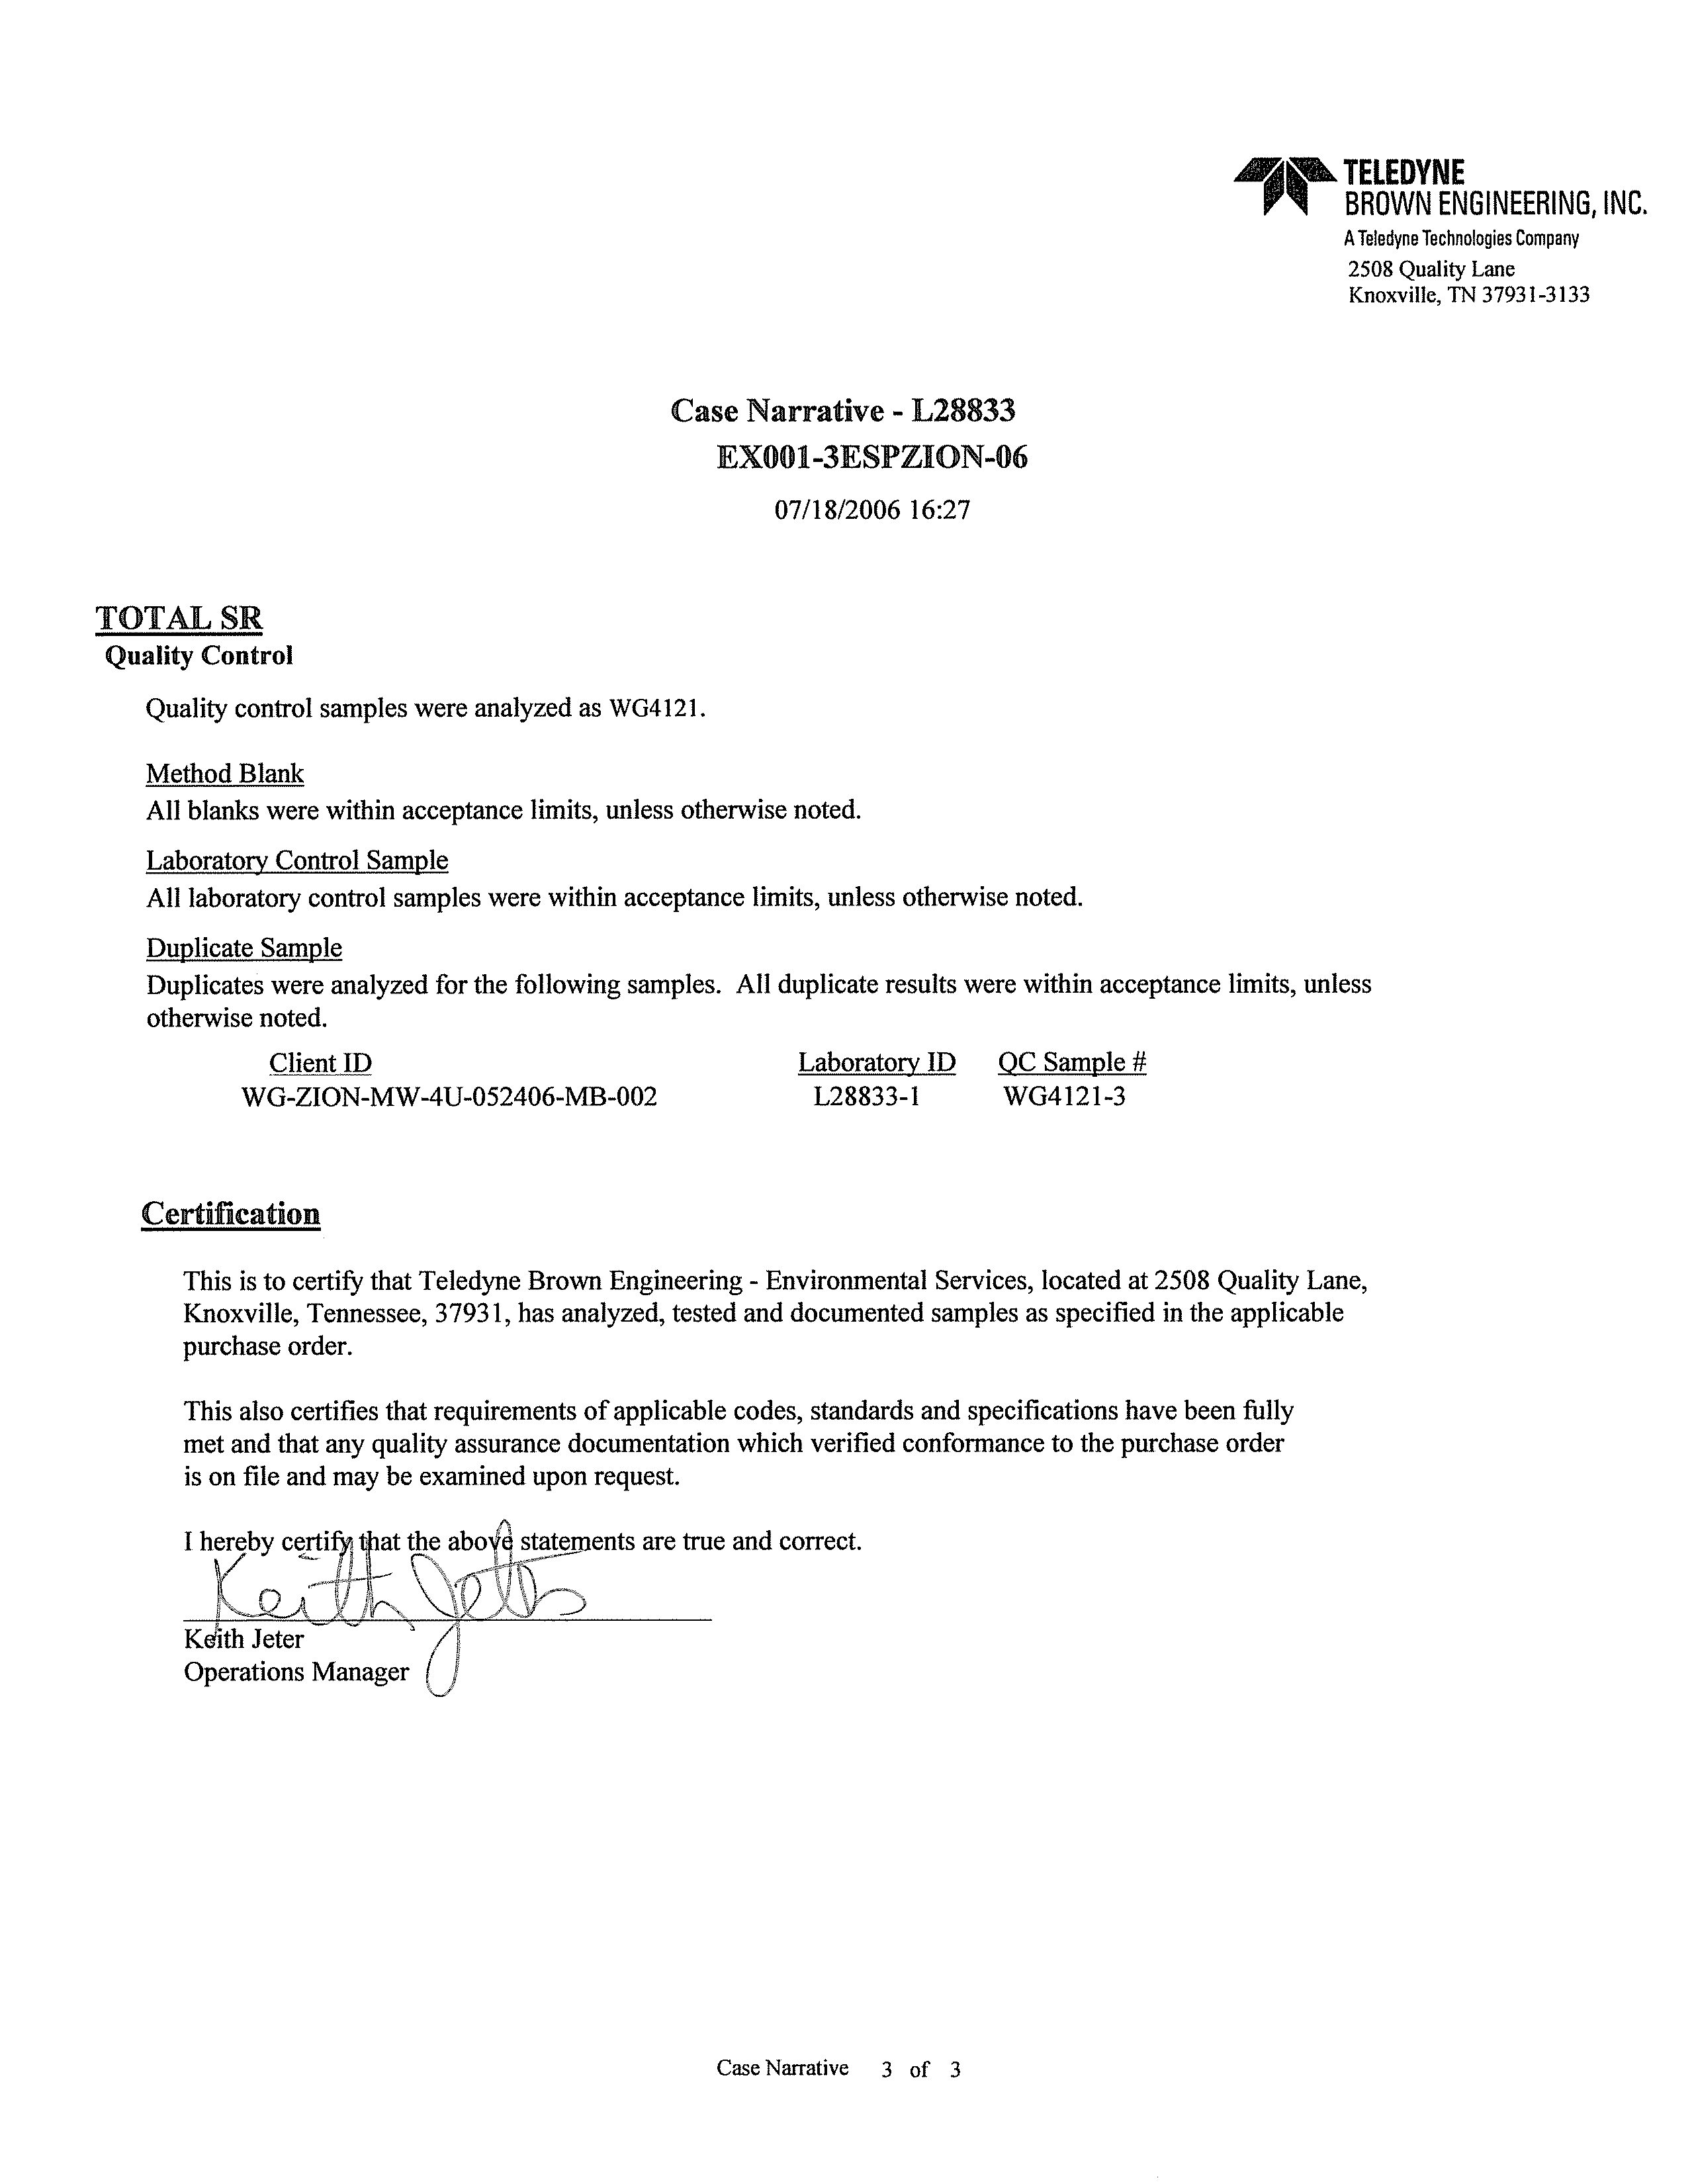
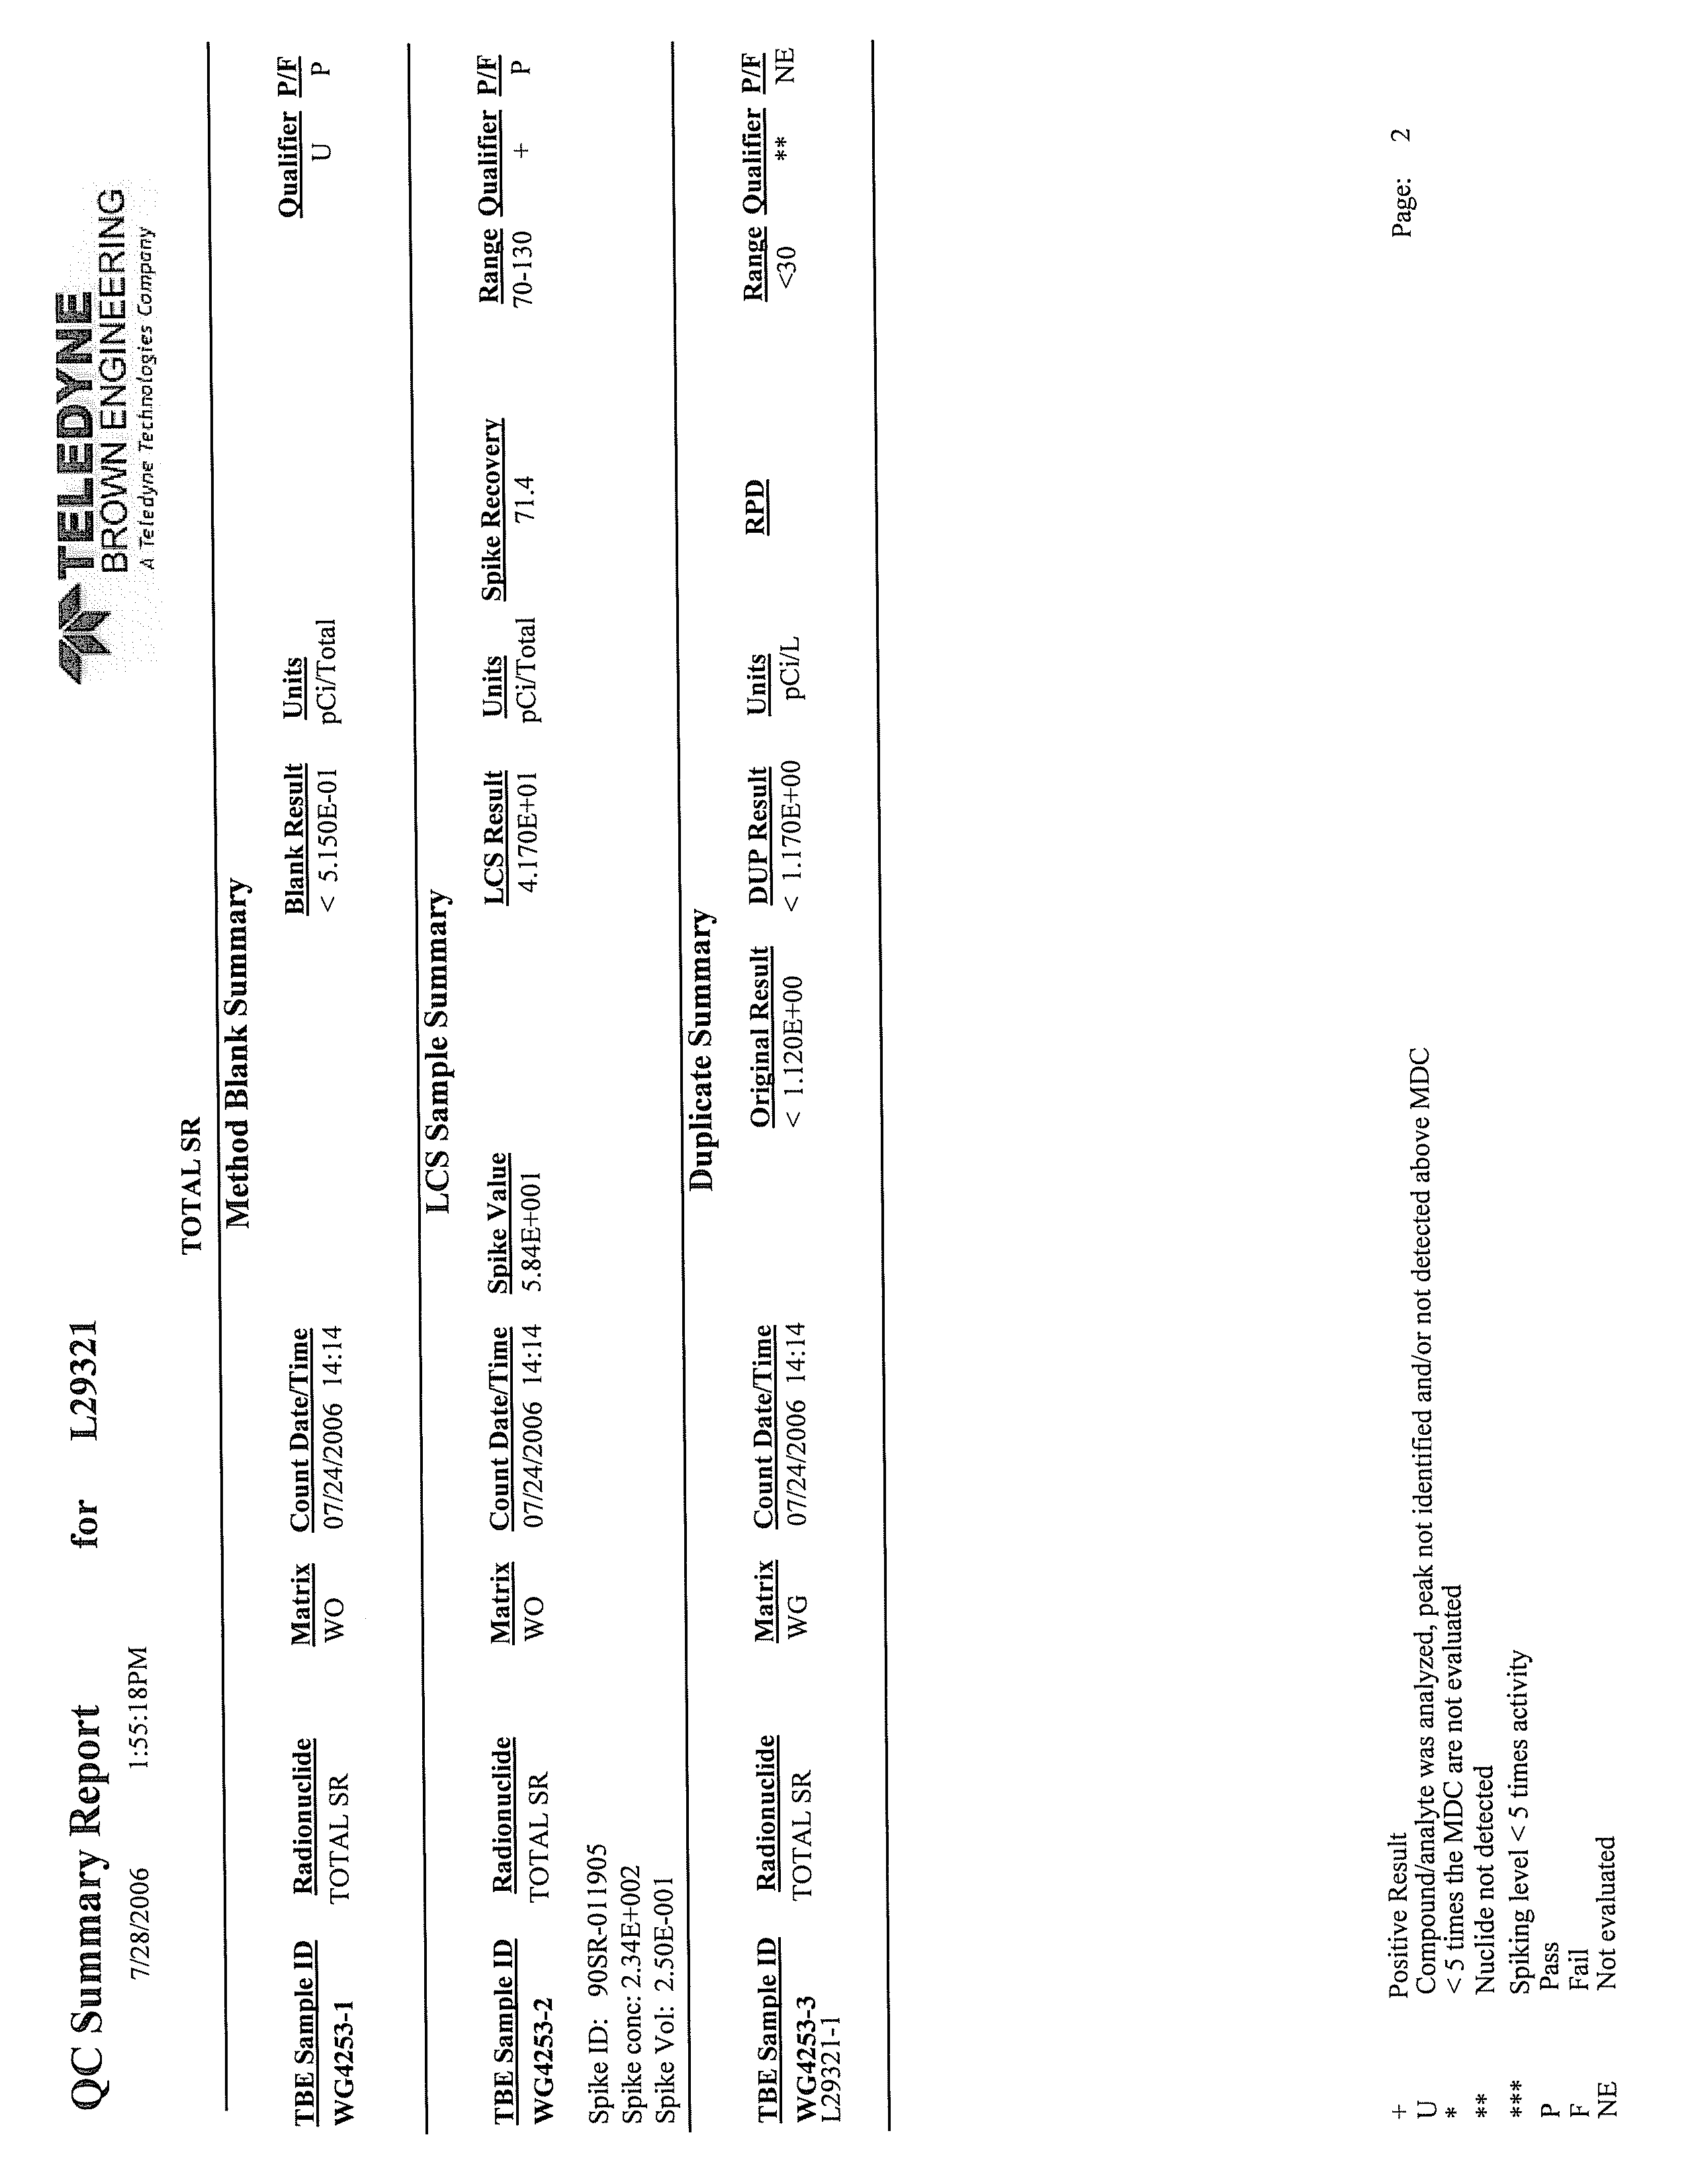
QUALITY ASSURANCE PROGRAM - TELEDYNE BROWN
ENGINEERING, INC.
APPENDIX D
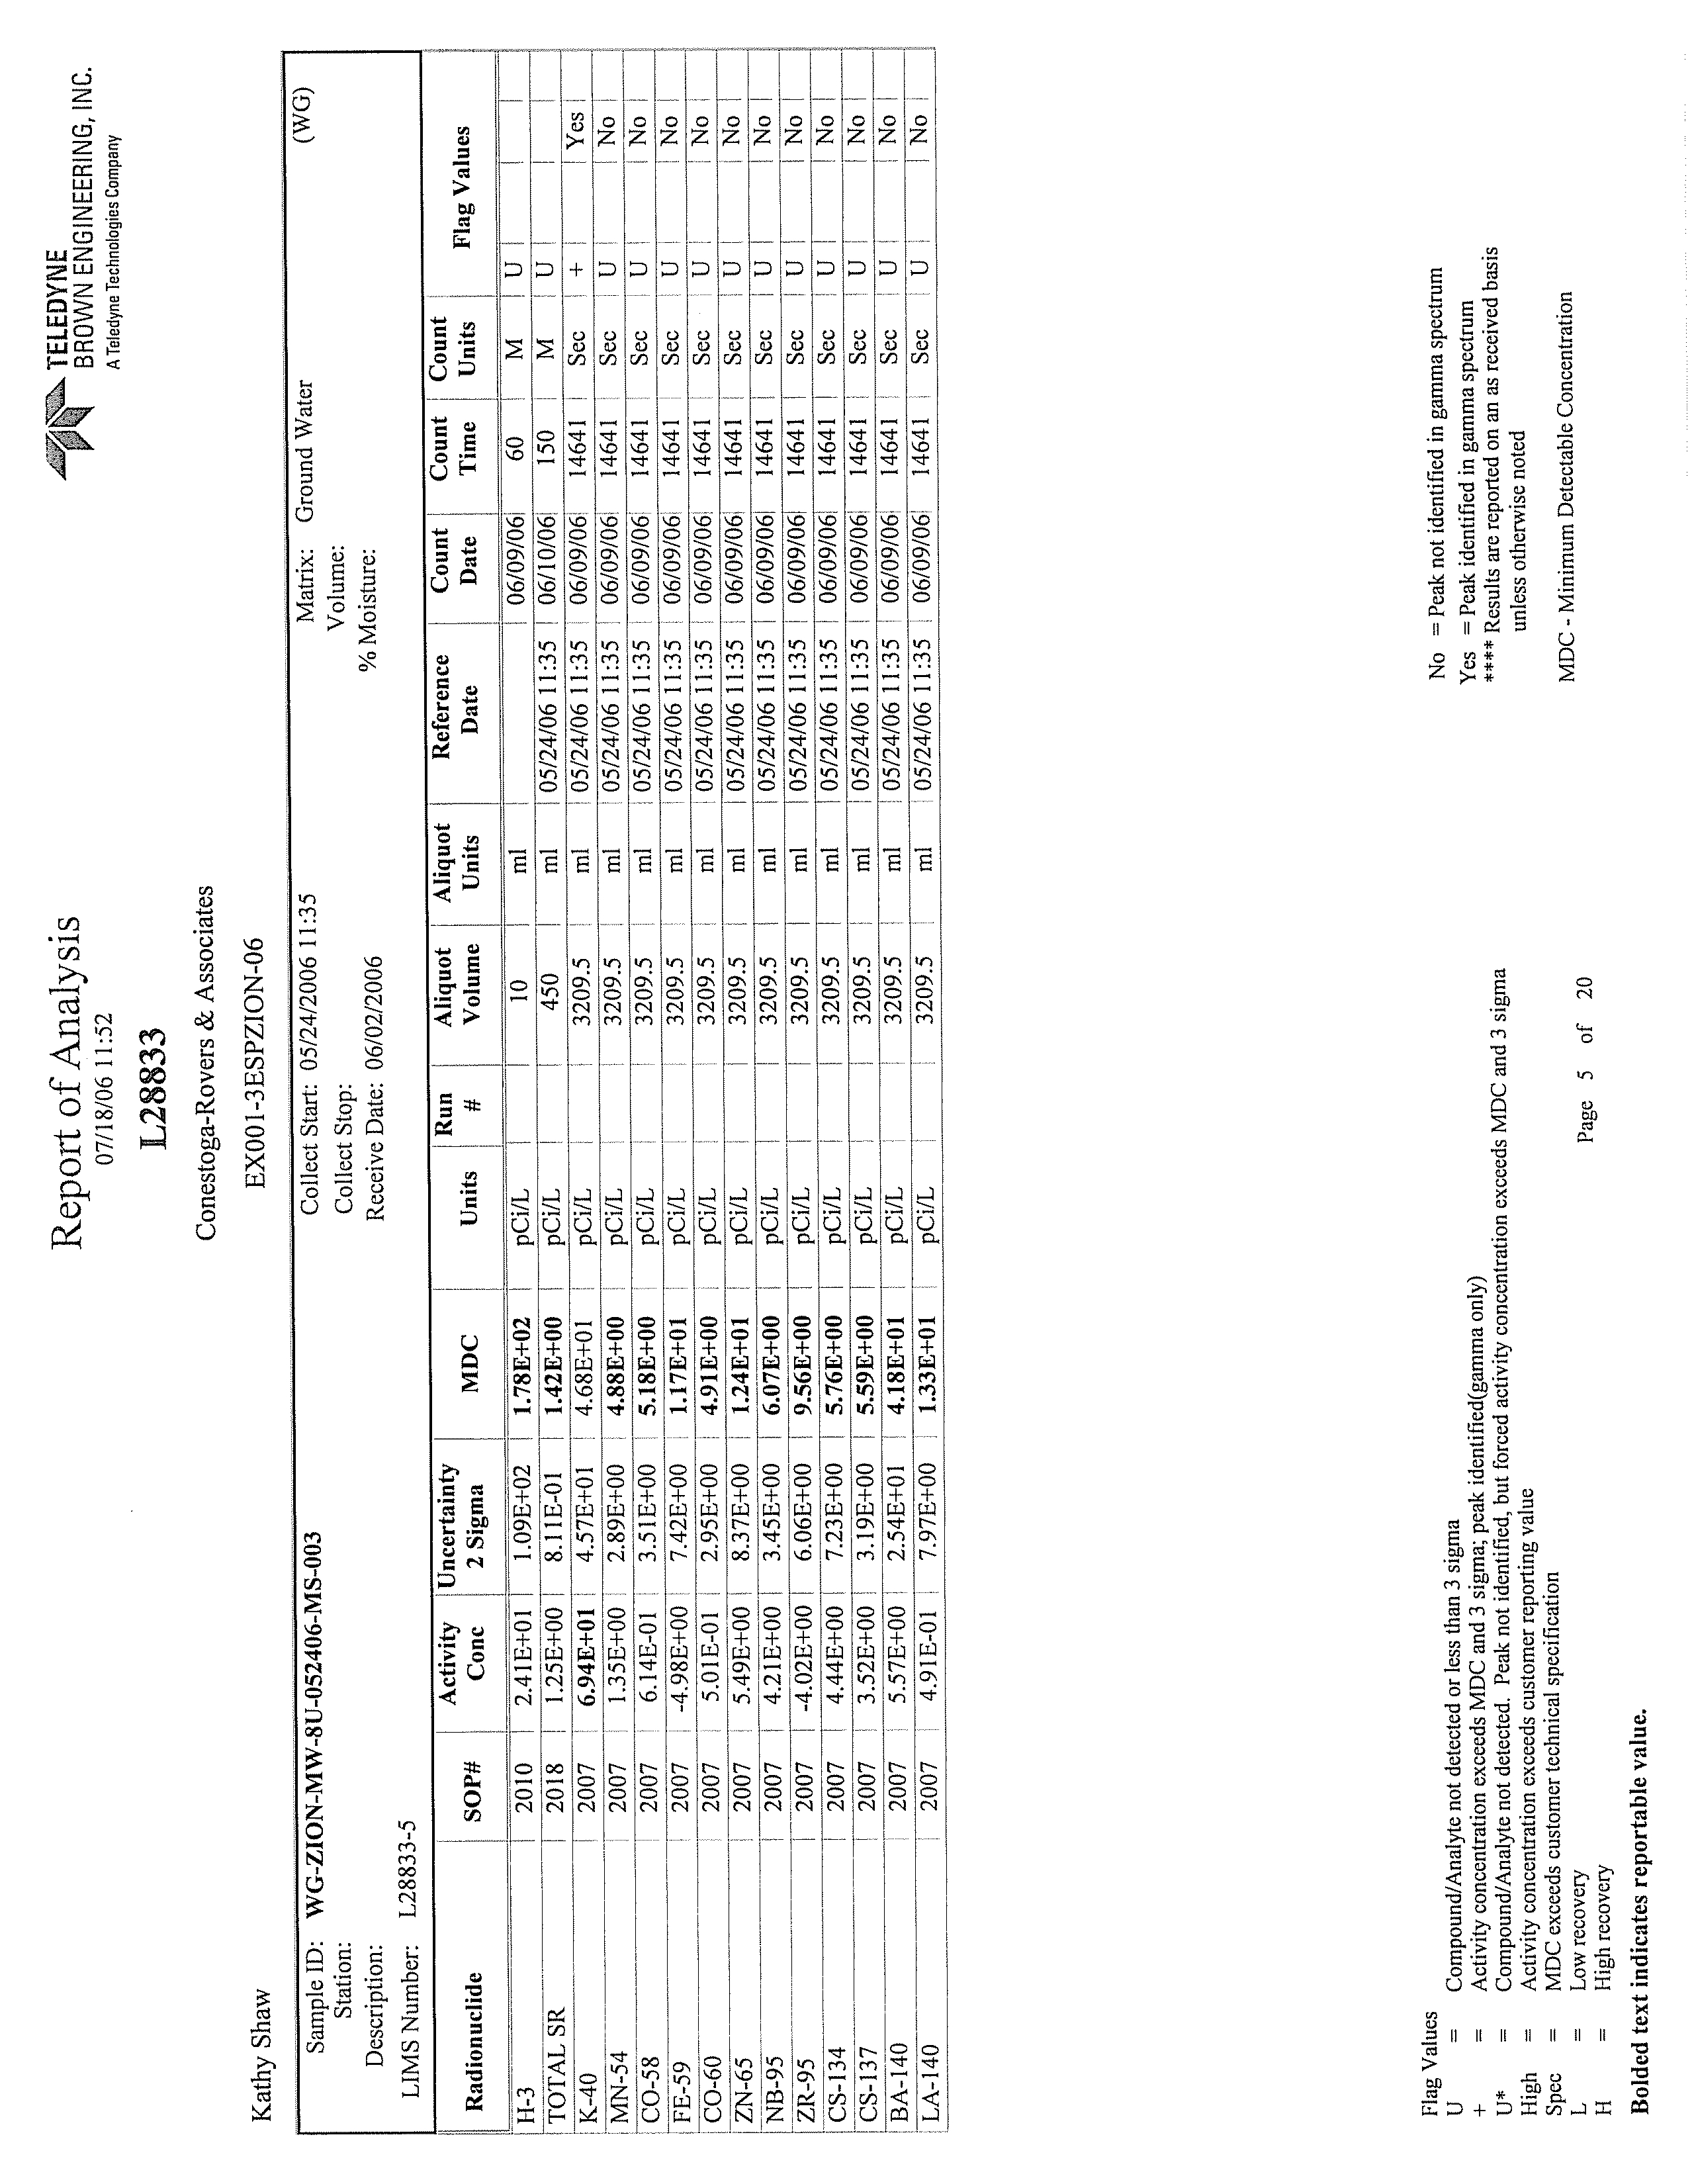
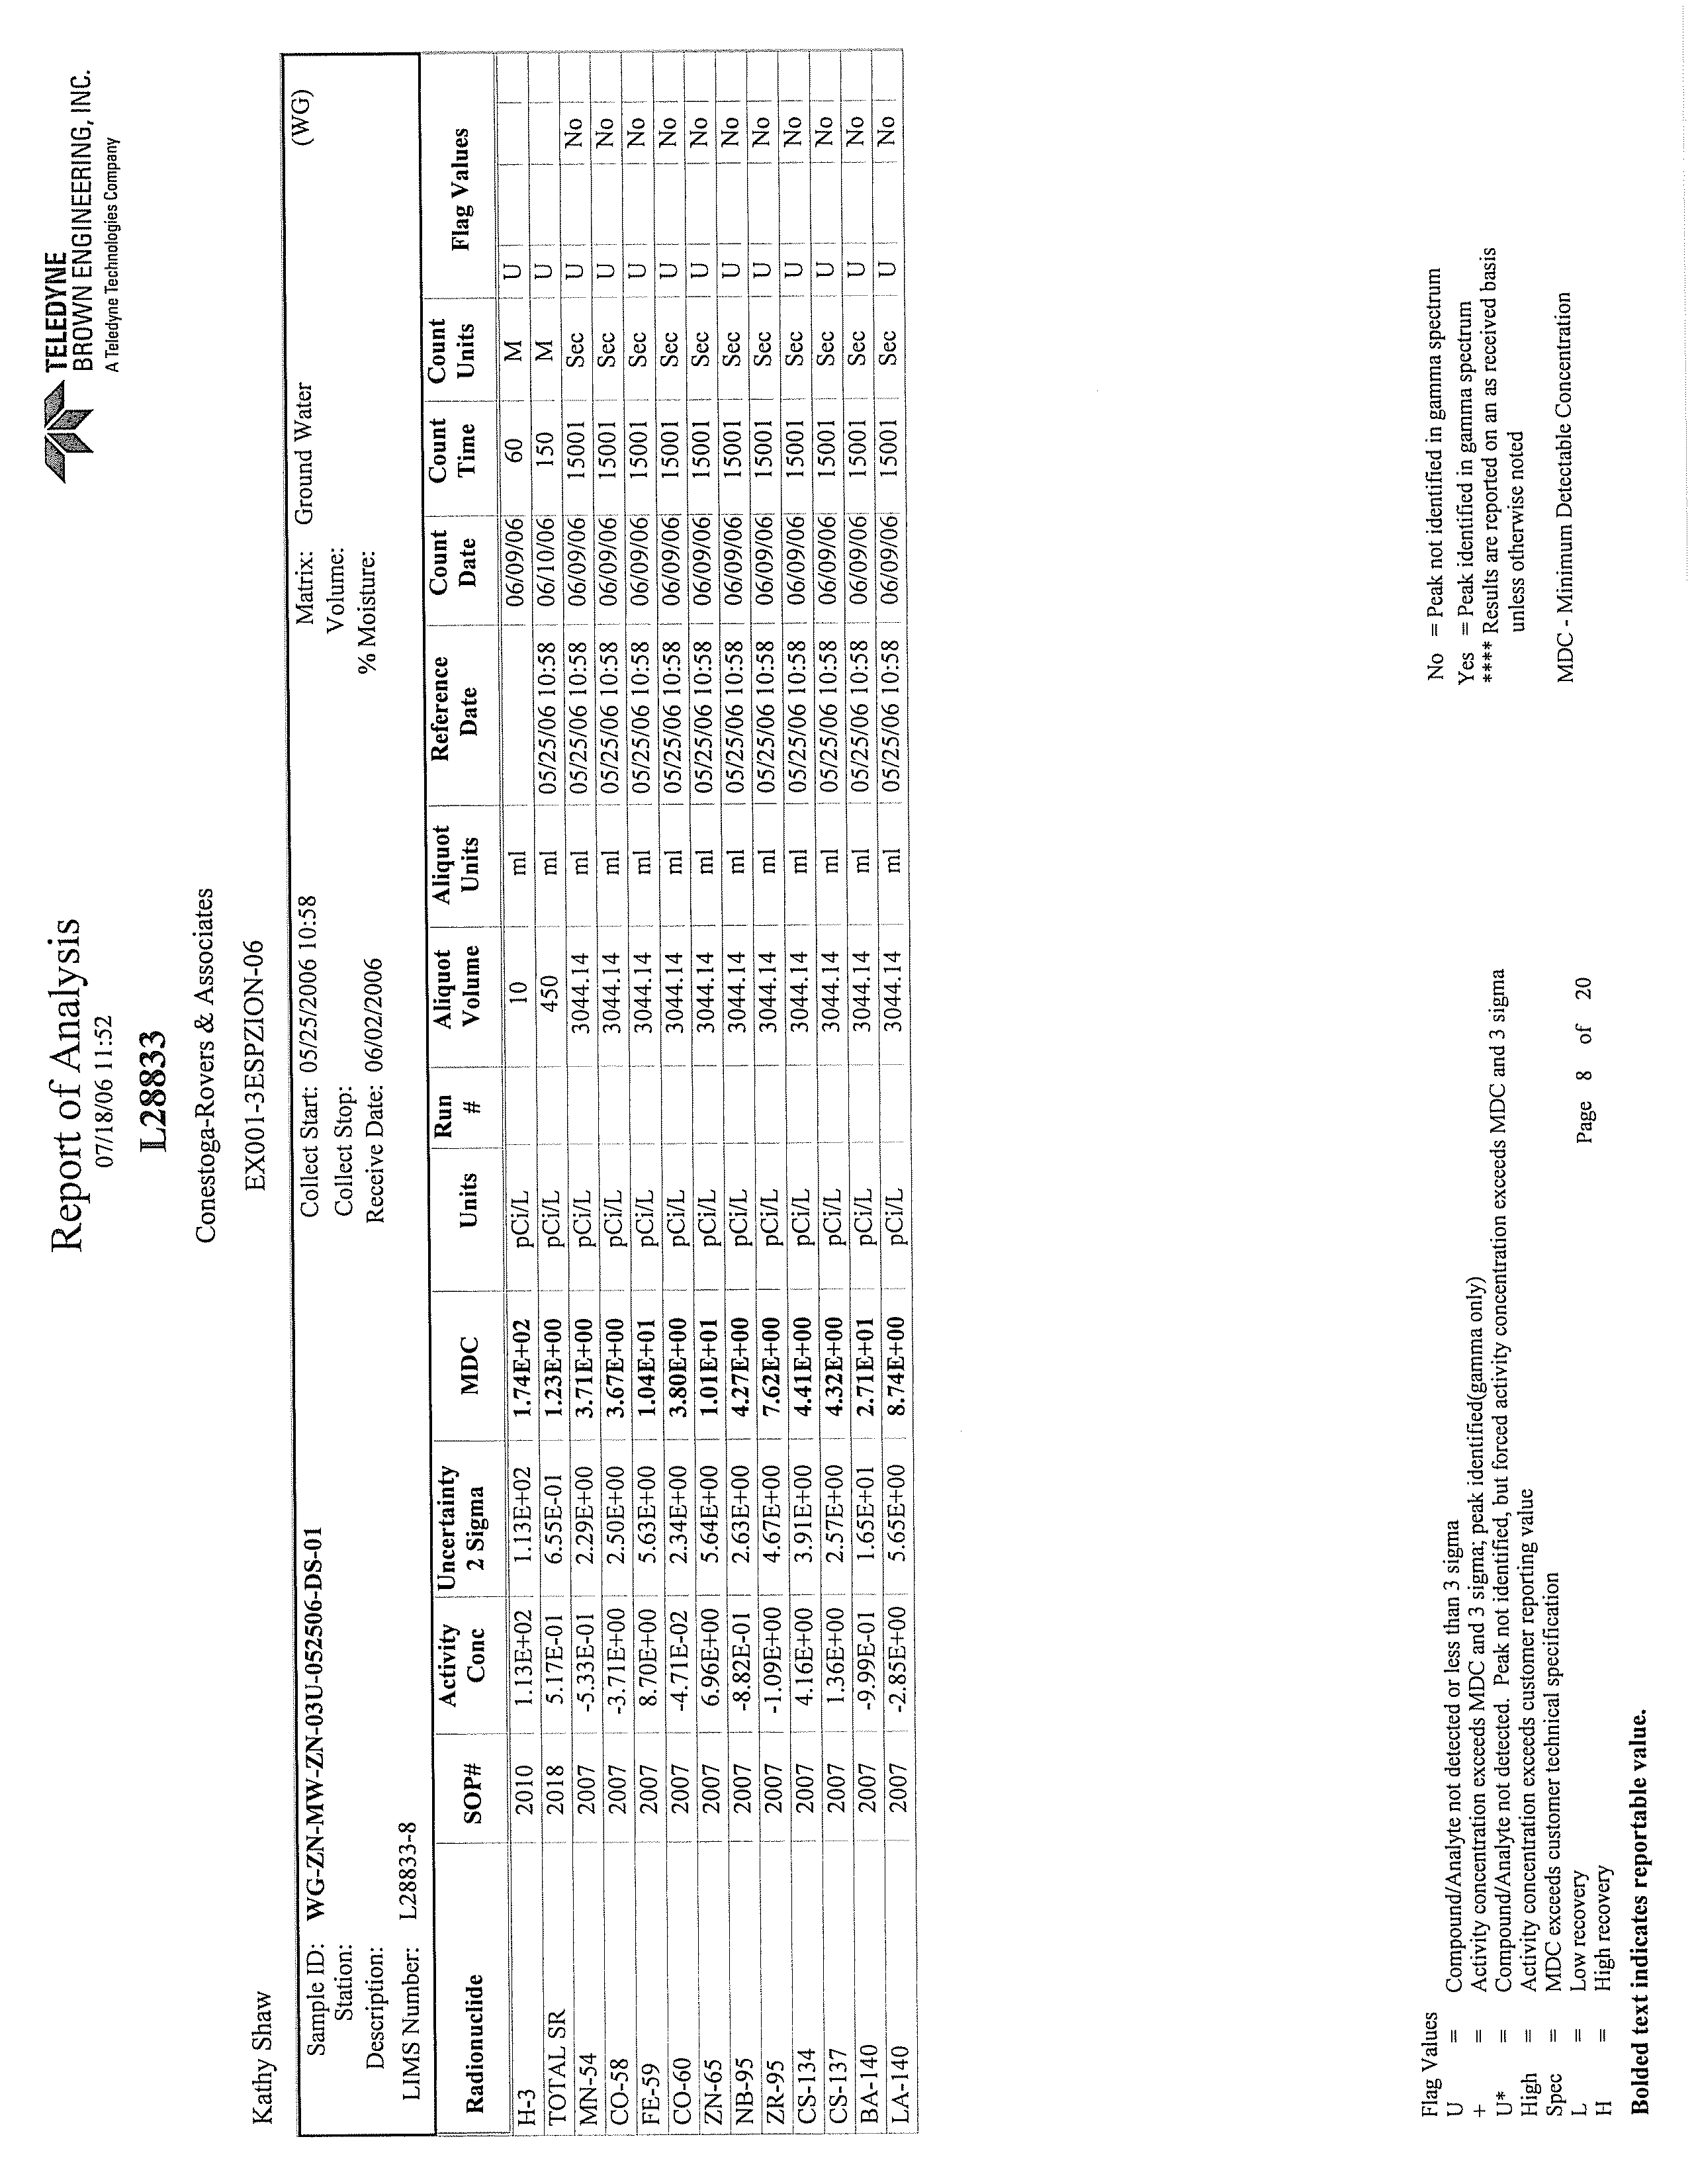
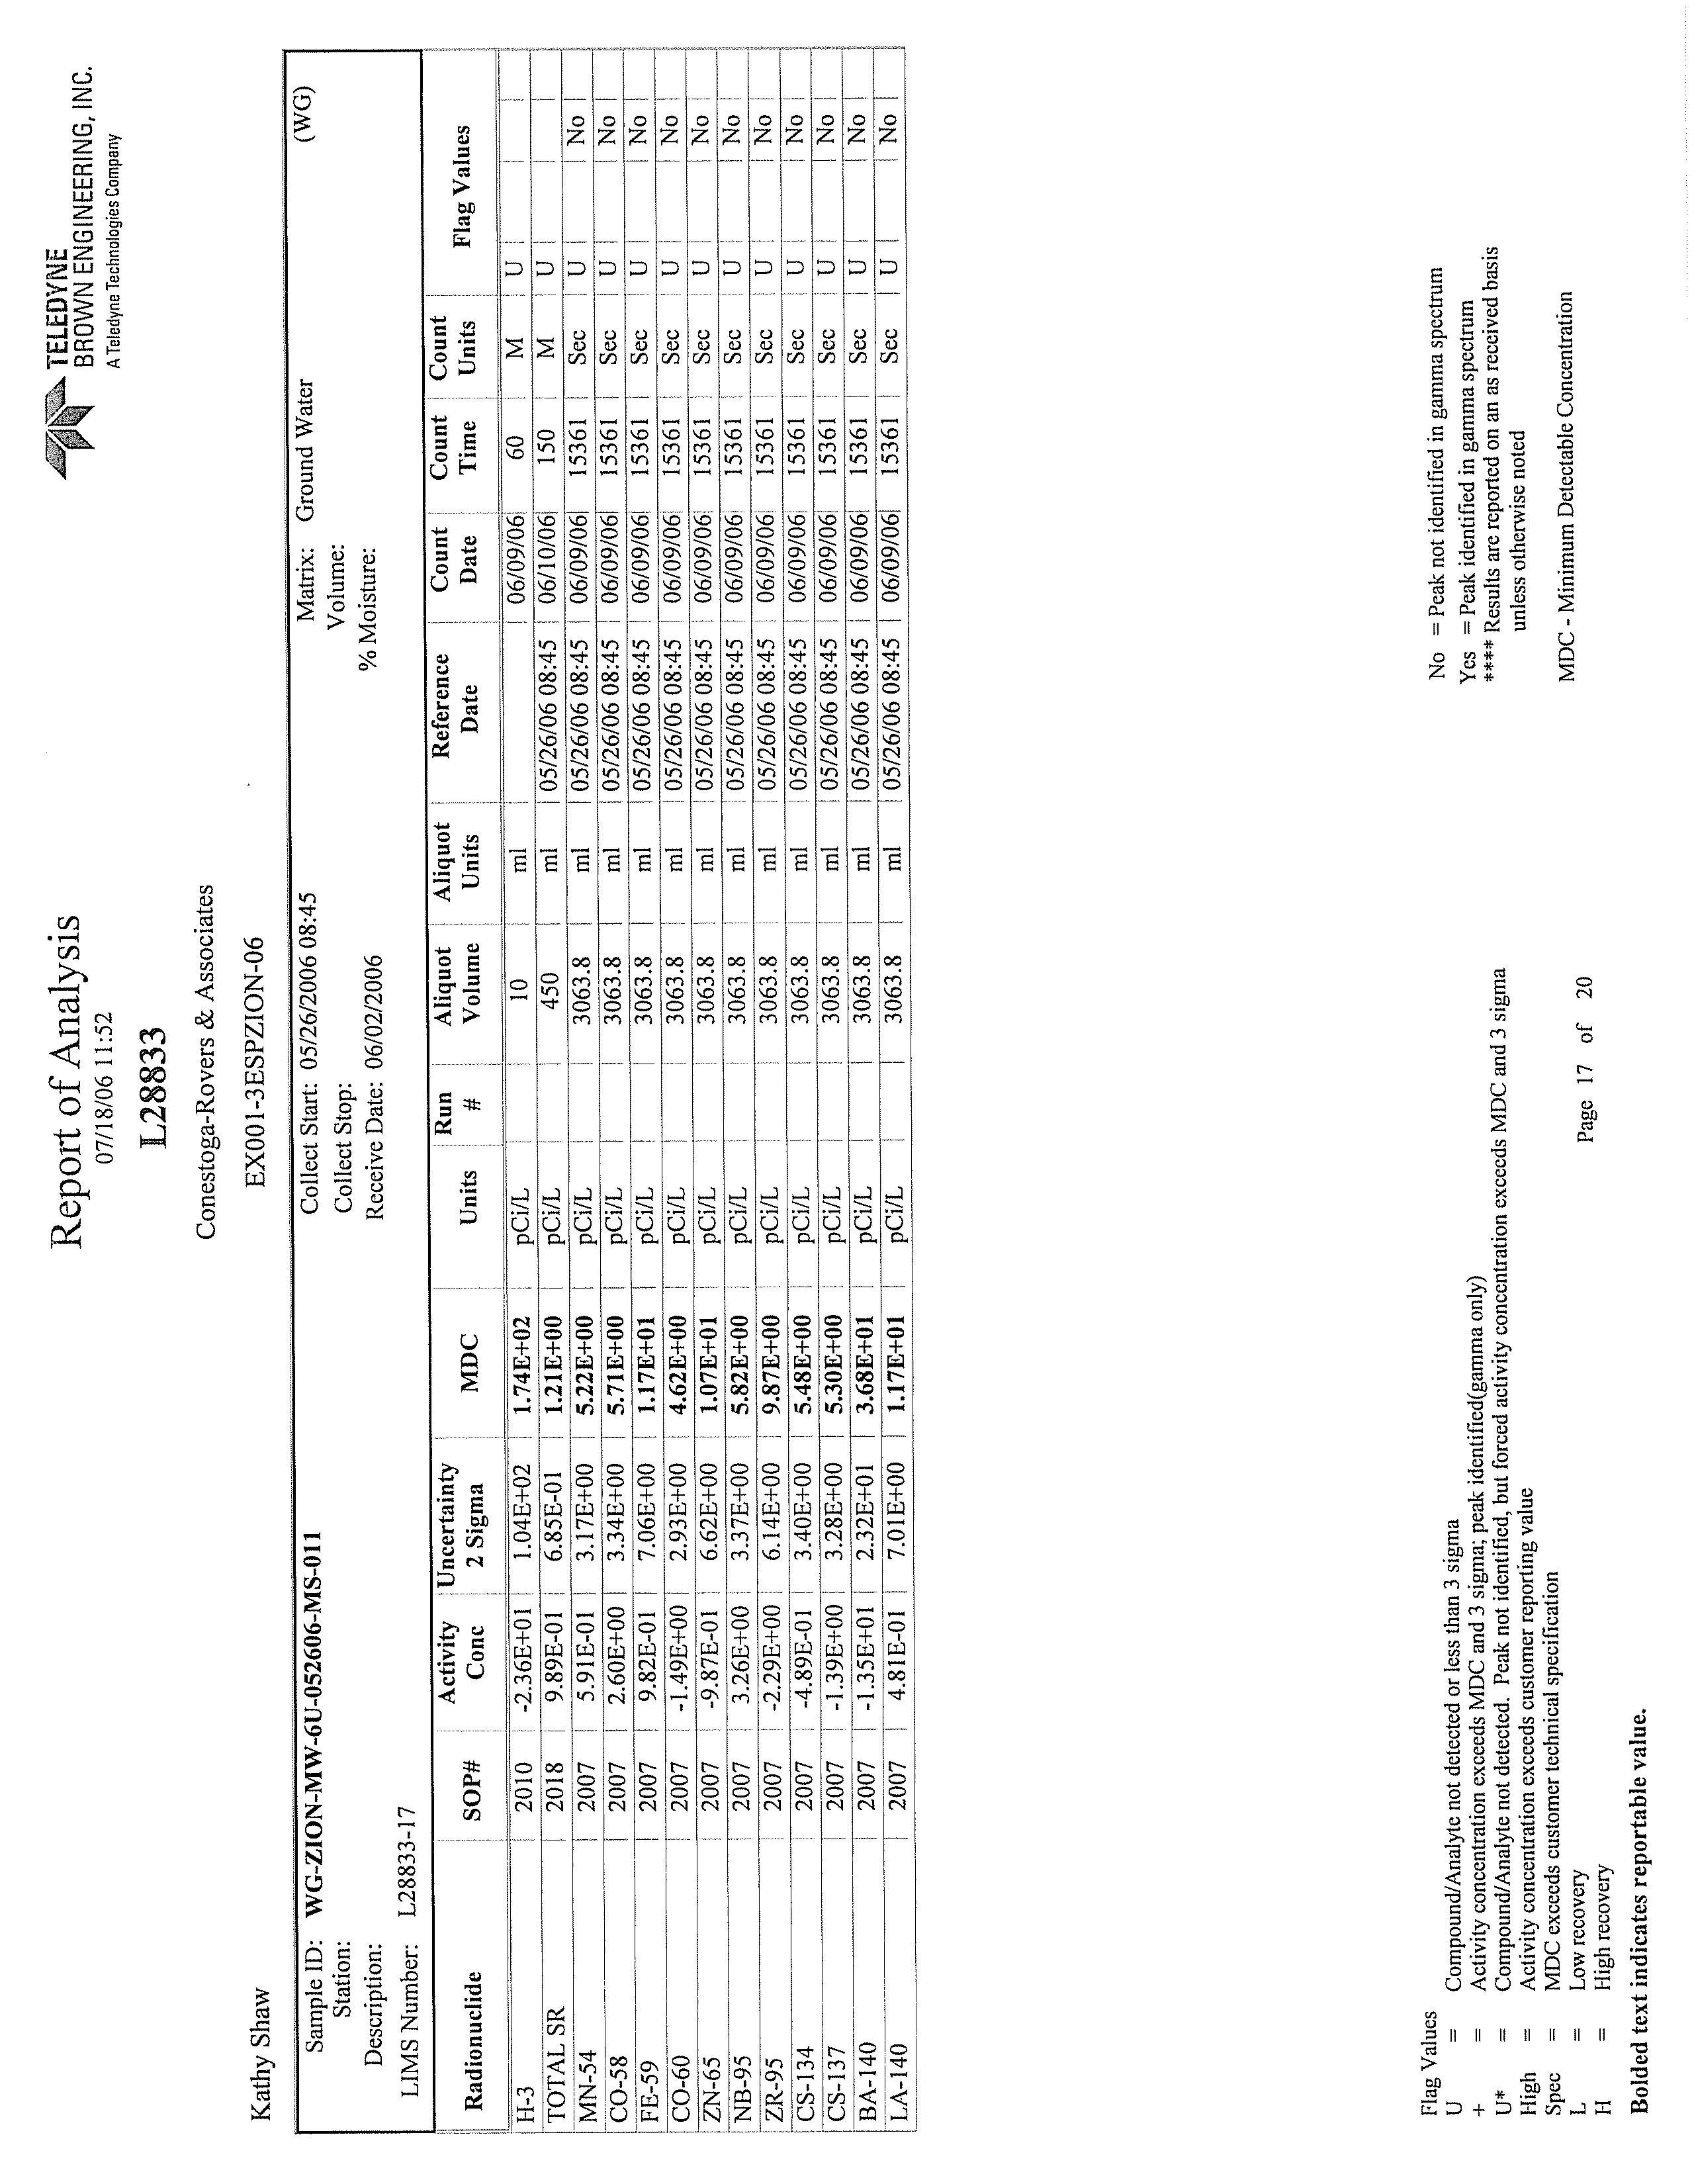
LABORATORY ANALYTICAL REPORTS
APPENDIX E
DATA VALIDATION MEMORANDUM
045136 (22) Zion Station
CONESTOGA-ROVERS & ASSOCIATES
Revision 1
EXECUTIVE SUMMARY
This Hydrogeologic Investigation Report (HIR) documents the results of
Conestoga-Rovers & Associates' (CRA's) May to July 2006 hydrogeologic investigation
pertaining to the Zion Station (Station). CRA prepared this HIR for Exelon as part of its
Fleetwide Program to determine whether groundwater at and in the vicinity of its
nuclear power generating facilities has been adversely impacted by any releases of
radionuclides.
CRA collected and analyzed information on any historical releases, the structures,
components, and areas of the Station that have the potential to release tritium or other
radioactive liquids to the environment and past hydrogeologic investigations at the
Station. CRA used this information, combined with its understanding of groundwater
flow at the Station to identify the Areas for Further Evaluation (AFEs) for the Station.
Fifteen new monitoring wells were installed, including 11 permanent and 4 temporary
monitoring wells. CRA also collected two rounds of water levels from the newly
installed wells and the surface water staff gauge. All groundwater and surface water
samples were analyzed for tritium, strontium-89/90, and gamma-emitting
radionuclides. Field activities were completed between May and July 2006.
The results of the hydrogeologic investigation are:
•
Gamma-emitting radionuclides associated with licensed plant operations were not
detected at concentrations greater than their respective Lower Limits of Detection
(LLDs) in any of the groundwater or surface water samples obtained and analyzed
during the course of this investigation;
•
Strontium-89/90 was not detected at a concentration greater than the LLD of
2.0 picoCuries per liter (pCi/L) in any of the groundwater or surface water samples
obtained and analyzed during the course of this investigation;
•
Tritium was not detected within any area in or adjacent to the Station at levels above
the United States Environmental Protection Agency drinking water standard of
20,000 pCi/L in any of the groundwater or surface water samples obtained and
analyzed during the course of this investigation;
•
Low levels of tritium were detected at concentrations greater than the LLD of
200 pCi/L, which is considered background;
•
Tritium was detected in groundwater samples collected from monitoring well
MW-ZN-01S. These concentrations ranged from less than LLD (most recently) to
586 ± 141 pCi/L (lower interval) and 220 ± 123 pCi/L to 261 ± 124 pCi/L (upper
045136 (22) Zion Station
i
CONESTOGA-ROVERS & ASSOCIATES
Revision 1
interval). The detected concentrations are significantly less than applicable drinking
water standard. The source of tritium in this location is likely attributable to
historical releases in this area. However, the most recent sample results are within
the range of background concentrations;
•
Based on the results of this investigation, tritium is not migrating off the Station
property at detectable concentrations;
•
Based on the results of this investigation, there is no current risk from exposure to
radionuclides associated with licensed plant operations through any of the identified
potential exposure pathways; and
•
Based on the results of this investigation, there are no known active releases into the
groundwater at the Station.
Based upon the information collected to date, CRA recommends that Exelon conduct
periodic monitoring of selected sample locations.
045136 (22) Zion Station
ii
CONESTOGA-ROVERS & ASSOCIATES
Revision 1
1.0
INTRODUCTION
Conestoga-Rovers & Associates (CRA) has prepared this Hydrogeologic Investigation
Report (HIR) for Exelon Generation Company, LLC (Exelon) as part of its fleetwide
program to determine whether groundwater at and near its nuclear power generating
facilities has been adversely impacted by any releases of radionuclides. This report
documents the results of CRA's May 2006 Hydrogeologic Investigation Work Plan
(Work Plan), as well as several other investigative tasks recommended by CRA during
the course of the investigation. These investigations pertain to Exelon's Zion Station
(Station) in Zion, Illinois (see Figure 1.1). The Station is defined as all property,
structures, systems, and components owned and operated by Exelon LLC and located at
101 Shiloh Boulevard, Zion, Lake County, Illinois.
The approximate property
boundaries are depicted on Figure 1.2.
Pursuant to the Work Plan, CRA assessed groundwater quality at the Station in
locations designated as areas for further evaluation (AFEs). The process by which CRA
identified AFEs is discussed in Section 3.0 of this report.
The objectives of the Work Plan were to:
•
characterize the geologic and hydrogeologic conditions at the Station including
subsurface soil types, the presence or absence of confining layers, and the direction
and rate of groundwater flow;
•
characterize the groundwater/surface water interaction at the Station, including a
determination of the surface water flow regime;
•
evaluate groundwater quality at the Station including the vertical and horizontal
extent, quantity, concentrations, and potential sources of tritium and other
radionuclides in the groundwater, if any;
•
define the probable sources of any radionuclides released at the Station;
•
evaluate potential human, ecological, or environmental receptors of any
radionuclides that might have been released to the groundwater; and
•
evaluate whether interim response activities are warranted.
045136 (22) Zion Station
1
CONESTOGA-ROVERS & ASSOCIATES
Revision 1
2.0
STATION DESCRIPTION
The following section presents a general summary of the Station location and definition,
overview of Station operations, surrounding land use, and an overview of both regional
and Station-specific topography, surface water features, geology, hydrogeology, and
groundwater flow conditions. This section also presents an overview of groundwater
use in the area.
2.1
STATION LOCATION
The Station is a former nuclear power generating facility that, in the early spring of 1998,
converted both units' generators to synchronous condensers that provide voltage
stability to the northeast Illinois power grid. The Station encompasses approximately
250 acres (Exelon, 2004). Figure 1.2 presents a Station Boundaries and Features plan.
The Station is located on the eastern edge of Zion between 23rd and 29th Streets, from
the Chicago and Northwestern Railroad tracks to Lake Michigan.
The Station is being maintained and monitored under the "SAFSTOR" (safe storage of
components of the nuclear power plant) phase of decommissioning, as is discussed
below.
2.2
OVERVIEW OF COOLING WATER OPERATIONS
Former Operations
In the mid-1950s, Commonwealth Edison Company (ComEd) purchased about 250 acres
on the eastern edge of Zion. The Station operated as a dual unit pressurized water
reactor plant. A construction permit was issued in December 1968. An operating license
was issued October 19, 1973 for Unit 1 and November 14, 1973 for Unit 2. Commercial
operations commenced in December 1973 for Unit 1 and September 1974 for Unit 2.
Unit 1 operations ended on February 21, 1997 and Unit 2 operations ended on
September 19, 1996. All fuel was removed from the reactor and placed in the spent fuel
pool on April 27, 1997 for Unit 1 and on February 25, 1998 for Unit 2. Commercial
operation of the plant ended on January 14, 1998 when the Unicom Corporation and
ComEd Boards of Directors authorized the permanent cessation of operations at the
Station. Exelon submitted the certification of fuel transfer on March 9, 1998. In addition
045136 (22) Zion Station
2
CONESTOGA-ROVERS & ASSOCIATES
Revision 1
to maintaining the synchronous condensers, the Station's employees also monitor the
safe storage of spent fuel.
Discharges from the Station are subject to the requirements of Nuclear Regulatory
Commission (NRC) Operating Licenses DPR-39 and DPR-48. Discharges from the
Station are also subject to regulation under the Illinois Environmental Protection Agency
(EPA) National Pollutant Discharge Elimination System (NPDES) Permit IL0002763.
The NPDES permit provides limits on parameters such as pH, total suspended solids,
and oil and grease.
Cooling Water Operations 1973-1997
The Station is comprised of two nearly identical pressurized water reactors with
supporting facilities.
Both primary reactor coolant systems were designed by
Westinghouse Corporation and each is comprised of a reactor vessel and four heat
transfer loops. Each loop contains a reactor coolant pump, steam generator, and
associated piping and valves. In addition, each system includes a pressurizer, a
pressurizer relief tank, interconnecting piping, and the instrumentation necessary for
operational control.
Each Containment Building is cylindrical with a shallow dome roof and has a flat slab
foundation. The entire structure is internally lined with a welded steel plate and
completely encloses the primary coolant system, steam generators, reactor coolant loops,
and portions of the auxiliary and engineered safety feature systems.
Heat produced in the reactor was converted to electrical energy by the power conversion
system between 1973 and 1997. A turbine generator converted the thermal energy of
steam produced in the steam generators into mechanical shaft power and then into
electrical energy.
The exhaust steam from the turbine was condensed and deaerated in the main
condenser. The waste heat in the main condenser was removed by the circulating water
system. Circulating water was withdrawn from Lake Michigan, approximately 450 feet
east of the condensate storage tank, via an intake pipe connected to the circulating water
pumps. After circulating through the plant condensers, the cooling water was routed
back to the lake via discharge lines (ComEd, 1999).
045136 (22) Zion Station
3
CONESTOGA-ROVERS & ASSOCIATES
Primary coolant was treated to remove impurities and recirculated through the primary
water (PW) system. Primary coolant was stored in two above ground storage tanks
(ASTs) located on the east side of the Turbine Building.
Revision 1
Secondary cooling water (condensate cooling water) was treated to remove impurities
and recirculated through the condensate (CD/SC) system. Secondary cooling water is
stored in ASTs located on the east side of the Turbine Building.
Circulating water is drawn from Lake Michigan by way of an intake pipe that extends
approximately a half mile into the Lake. Circulating water is returned to Lake Michigan
by way of two discharge pipes that extend approximately a quarter mile into the lake.
Liquid wastes have been discharged under the NRC permit through the blowdown line,
which is piped to the circulating water discharge pipe located east of the Turbine
Building.
Voltage Stabilization and SAFSTOR
The Station is being decommissioned under the NRC regulatory process. The Station is
currently in the "SAFSTOR" phase of the decommissioning process where the Station is
maintained in a condition that allows it to be safely stored and subsequently
decontaminated to levels that permit its release for unrestricted use.
2.3
SURROUNDING LAND USE
The Station is located on the shore of Lake Michigan, in the eastern portion of the City of
Zion, and adjacent to the Illinois Beach State Park.
The Illinois Beach State Park is located along the Lake Michigan shoreline and is divided
into a northern unit and a southern unit, with the Station situated between the two units.
The Illinois Beach State Park encompasses 4,160 acres and received approximately
2.75 million visitors in 1998. The Park is considered a natural resource (ATSDR, 2000).
The land located to the west of the Station is generally undeveloped with a limited
number of industrial/commercial facilities present along Deborah Avenue. Residential
areas and the City of Zion downtown are located west of the Chicago & Northwestern
Railroad, which is west of the Station. Lake Michigan borders the Station to the east.
045136 (22) Zion Station
4
CONESTOGA-ROVERS & ASSOCIATES
Revision 1
2.4
STATION SETTING
The following sections present a summary of the topography, surface water features,
geology, hydrogeology, and groundwater flow conditions in the region surrounding the
Station. The information was primarily gathered from Sections 2.1 and 2.3 of the Zion
Defueled Safety Analysis Report (DSAR) last revision dated October 2004 (Exelon, 2004).
The main references the DSAR relies upon are listed in Section 10.0 of this HIR. CRA
checked and verified all DSAR references that apply to this HIR.
2.4.1
TOPOGRAPHY AND SURFACE WATER FEATURES
Lake County consists of moraines, outwash plains, lake plains, kames, stream terraces,
flood plains, beaches, and bogs. The county is in the Wheaton Morainal country of the
Great Lakes section of the Central Lowland province. Relief in Lake County was caused
by differences in the thickness of deposits left by the most recent glacier. The land
surface gradually slopes to the south or southeast. The highest point in the county,
957 feet above mean sea level (AMSL), is located on Gander Mountain in the northwest
corner of the county. The lowest point is at the Lake Michigan shore near Waukegan.
Several moraines run through the county. From east to west, they are the Lake Border
Morainic System, the Tinley Moraine, the Valparaiso Morainic System, and the Fox Lake
Moraine. In general, Lake County has a poorly defined drainage pattern. Many
drainage ways terminate in depressions and marshes. The land area falls into four
major watersheds and 26 drainage basins. The Chicago River, Des Plaines River, Fox
River, and Lake Michigan watersheds are all shared with neighboring counties in Illinois
and Wisconsin (NRCS, 2005).
The Lake Michigan shoreline between North Chicago, Illinois and Kenosha, Wisconsin
comprises the Zion beach-ridge plain. The Zion beach-ridge plain consists of linear,
generally coast-parallel mounds of sand and gravel that have been built up by wave
action to extend the coast outward into Lake Michigan. The Zion beach-ridge plain has
a maximum width of approximately 1 mile near the City of Zion (Chrzastowski and
Frankie, 2000). The older dunes become root-bound by vegetation resulting in long lines
of sandy ridges separated by linear marshes.
The main portion of the Station is located on a sand ridge that runs parallel to the Lake
Michigan shoreline as shown on Figure 1.2. The area in the immediate vicinity of the
Station has been leveled and is paved. The ground elevation at the main complex is
591 feet AMSL. The average lake level is 577 feet AMSL. The eastern portion of the
045136 (22) Zion Station
5
CONESTOGA-ROVERS & ASSOCIATES
Revision 1
Station is a beach gently sloping to the Lake Michigan shoreline. The area to the west of
the Station is a low-lying wet area.
Lake Michigan has a surface area of 22,300 square miles, with a mean depth of 276 feet
and a volume of 1,170 cubic miles. Lake Michigan has a natural outlet through the
Straits of Mackinac on the north end of the lake and a second outlet through the Illinois
Waterway near Chicago (USEPA, 1995).
The average surface elevation of Lake Michigan is 577 feet AMSL. The surface elevation
of Lake Michigan varies daily and annually, and is affected by hydrologic and
atmospheric conditions and flow through the two outlets. Water levels in Lake
Michigan typically vary about 1 foot in elevation between annual low and high
measurements.
Generally, the lowest levels occur in winter when much of the
precipitation is locked up in ice and snow on land, and dry winter air masses pass over
the lakes enhancing evaporation. Levels are highest in summer after the spring thaw
when runoff increases (USEPA, 1995).
The low-lying wet area on the western portion of the Station is in the watershed of the
Dead River, which flows through the marshy swales located to the west of the
longitudinal sand dunes that follow the Lake Michigan shoreline. The Dead River
passes through the Illinois Beach State Park as shown on Figure 1.1. The Dead River
flows into Lake Michigan at a point approximately 2.3 miles south of the Station. The
Dead River was so named because the mouth is periodically blocked by shifting
sandbars on the Lake Michigan shoreline.
Storm water runoff from the switchyard is captured by the perimeter ditch, which is a
drainage channel that follows the Station's outer fence. The perimeter ditch connects to
Lake Michigan to the north and south of the Protected Area (PA). Figure 2.1 presents a
depiction of the perimeter ditch and the stormwater drainage ditches that control
surface water at the Station. On the western portion of the Station property some of
these drainage systems intercept the shallow groundwater. This is not the case on the
eastern portion of the Station property where the stormwater drainage system is located
above the water table as it drops towards Lake Michigan.
2.4.2
GEOLOGY
This section presents an overview of Station geology based upon the 1967 Foundation
Investigation (Dames and Moore, 1967) and other geologic publications. The Station is
underlain by overburden deposits and a regionally extensive sequence of consolidated
045136 (22) Zion Station
6
CONESTOGA-ROVERS & ASSOCIATES
Revision 1
sedimentary deposits. The major stratigraphic features can be divided into Paleozoic
aged bedrock and Quaternary Period overburden deposits. Figure 2.2 presents a
stratigraphic cross-section representative of bedrock units in Lake County, Illinois.
Figure 2.3 presents a cross-section of the overburden deposits associated with the Zion
beach-ridge plain.
Rocks of the Cambrian through Silurian Periods are marine in origin and were deposited
in a sea that covered all of Illinois (Willman, 1971). The rocks consist of sandstones,
shales, and carbonates for a combined thickness of approximately 2,500 feet. Southerly
long shore currents have eroded the Root River delta and transported the sediments
along the western shore of Lake Michigan to form the Zion beach-ridge plain
(Chrzastowski and Frankie, 2000).
2.4.3
HYDROGEOLOGY
Groundwater in the region occurs in shallow glacial, alluvial, and lacustrine deposits.
The shallow water-bearing zone is isolated from the underlying regional bedrock
aquifers by a significant thickness of glacial or lacustrine silts and clays.
Bedrock units form three major aquifer systems in northeastern Illinois. The uppermost
bedrock aquifer consists of the Silurian dolomites. The underlying Maquoketa Group
shales hydraulically separate the Silurian aquifer from deeper units.
The deeper aquifer systems include the Cambrian-Ordovician aquifer group, which
includes the St. Peter and Ironton-Galesville sandstones. The underlying Eau Claire
Formation hydraulically separates the Cambrian-Ordovician aquifer group from the
deeper Mt. Simon Aquifer (Visocky et al., 1985).
The sandstones of the Mt. Simon Formation are not typically used for potable water
because of undesirable characteristics including high concentrations of total dissolved
solids and natural radioactivity. Crystalline basement rock underlies the Mt. Simon
Formation (Visocky et al., 1985).
Lake Michigan acts as a major regional discharge zone for groundwater.
The
groundwater flow in both unconsolidated deposits and bedrock units in the region is
generally toward the lake; however, localized pumping induces variations in flow
directions in the bedrock aquifers.
045136 (22) Zion Station
7
CONESTOGA-ROVERS & ASSOCIATES
Revision 1
2.5
AREA GROUNDWATER USE
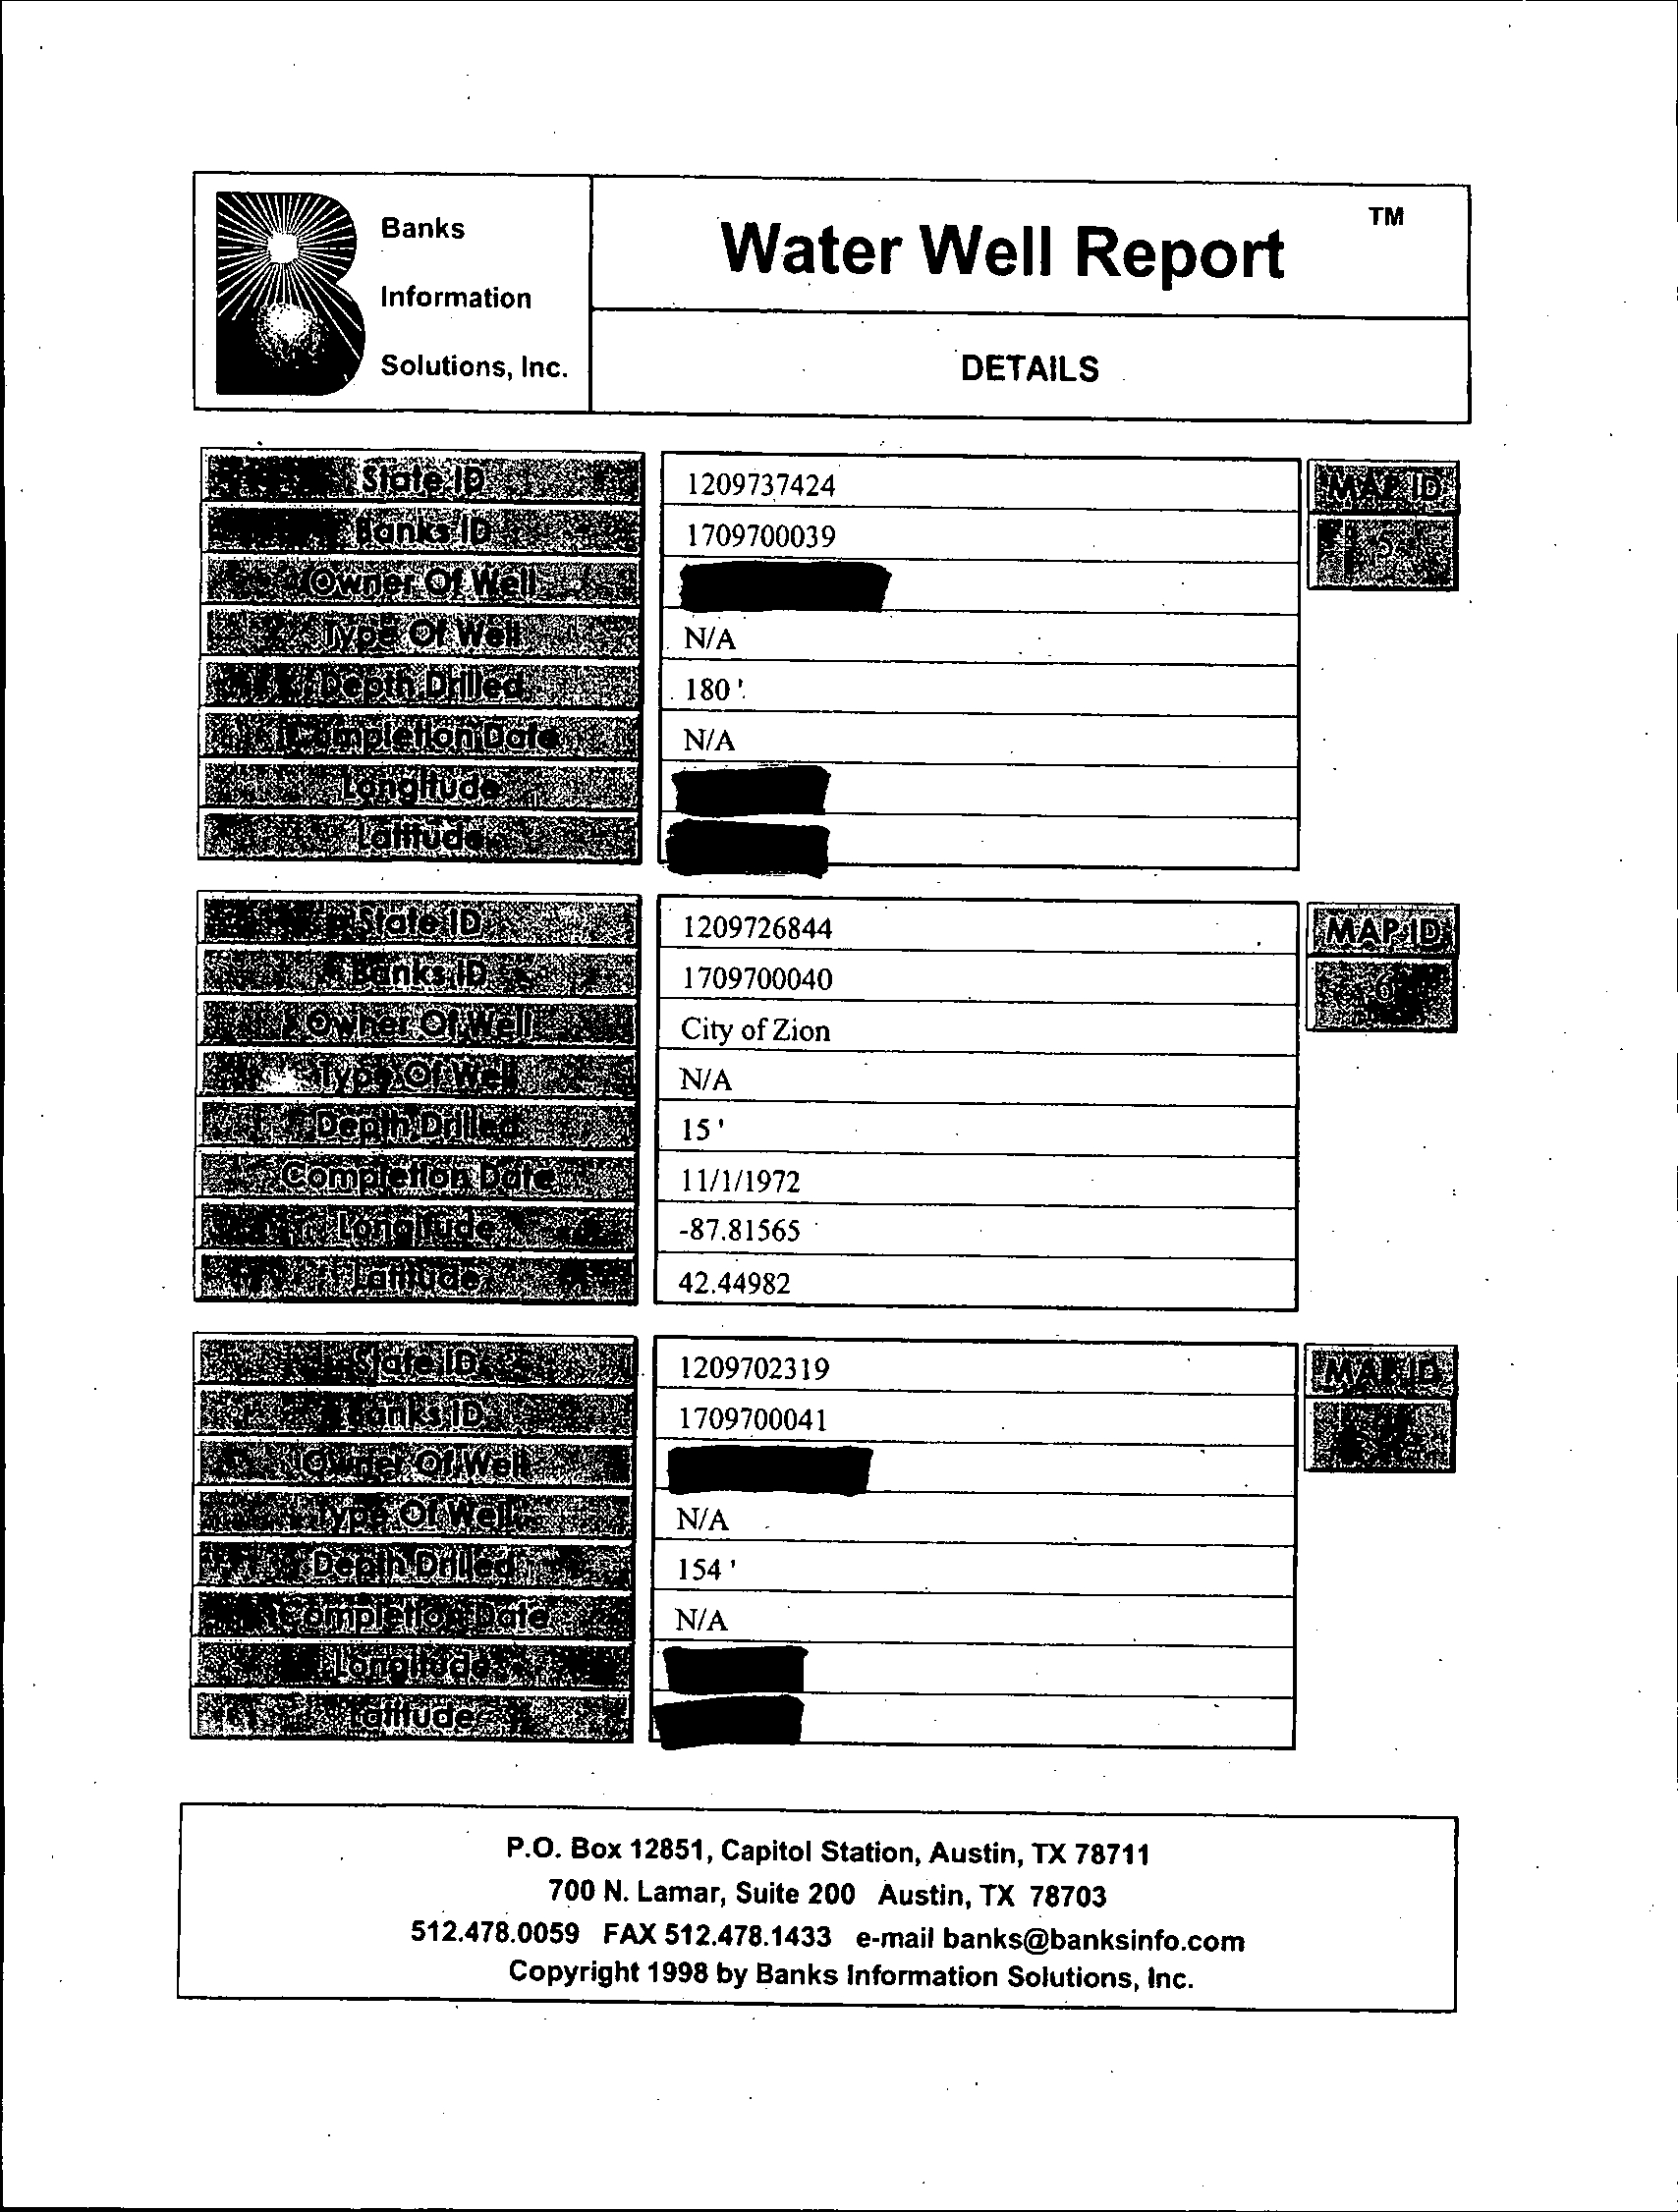
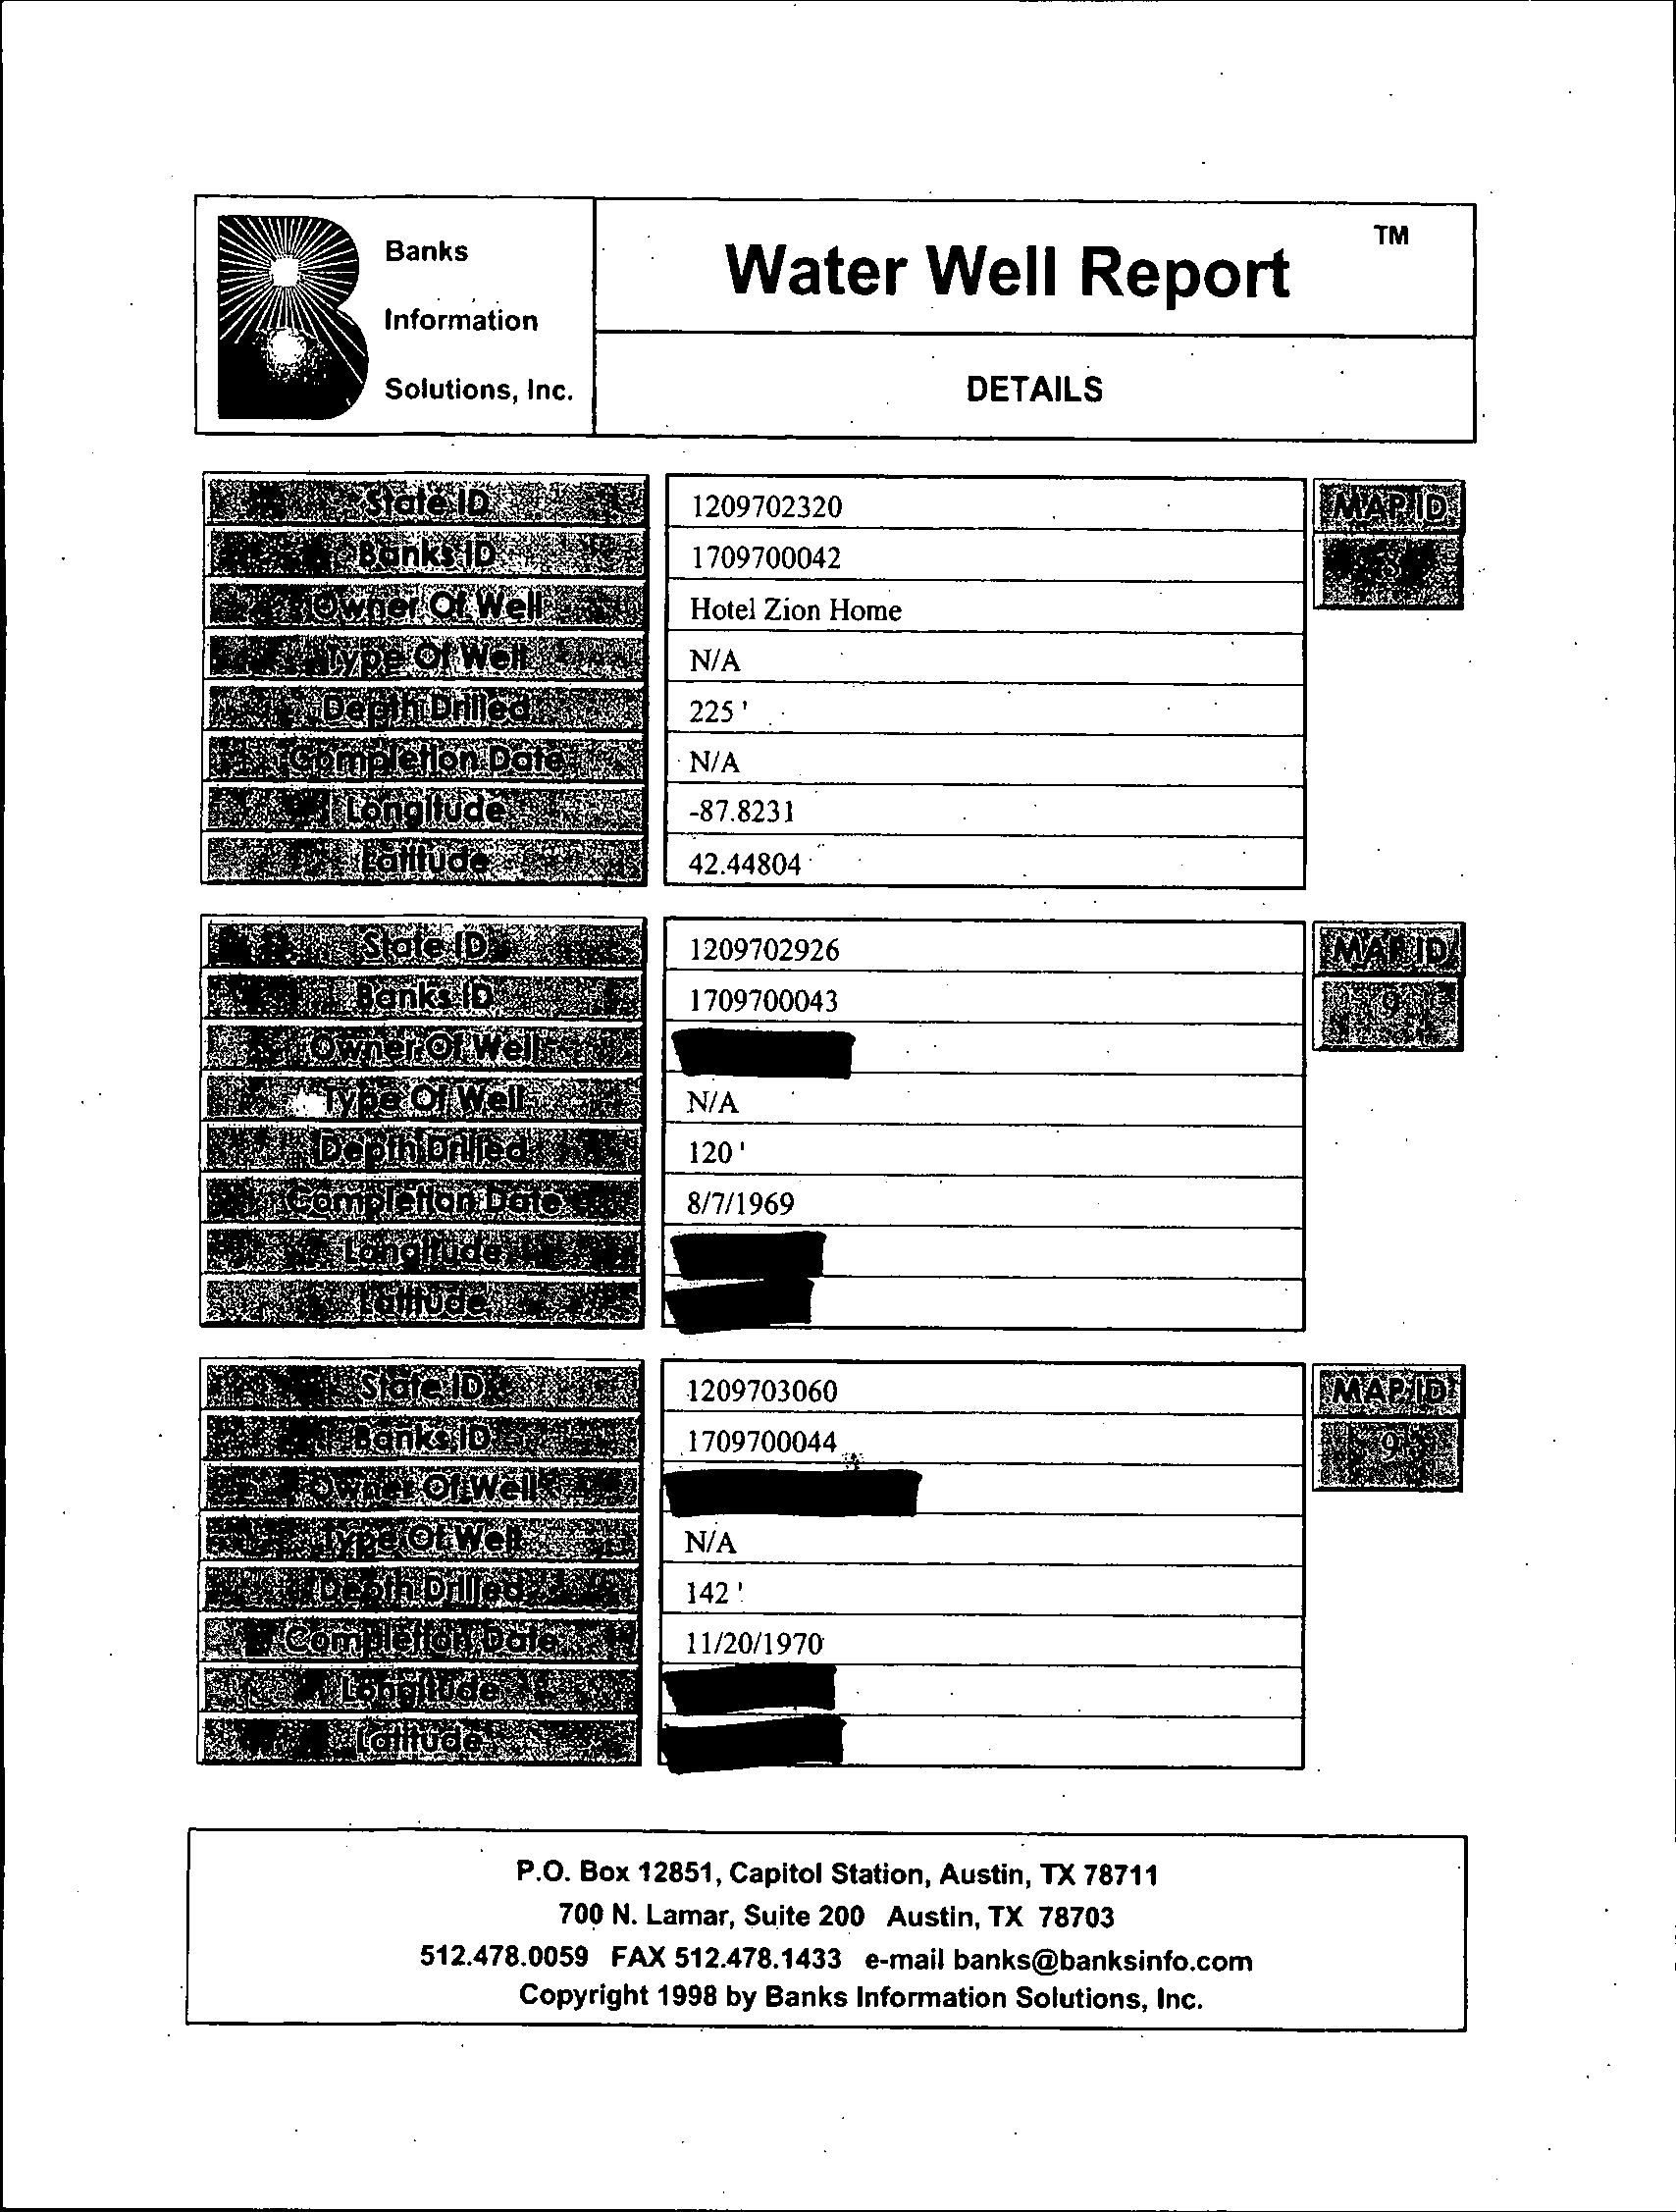
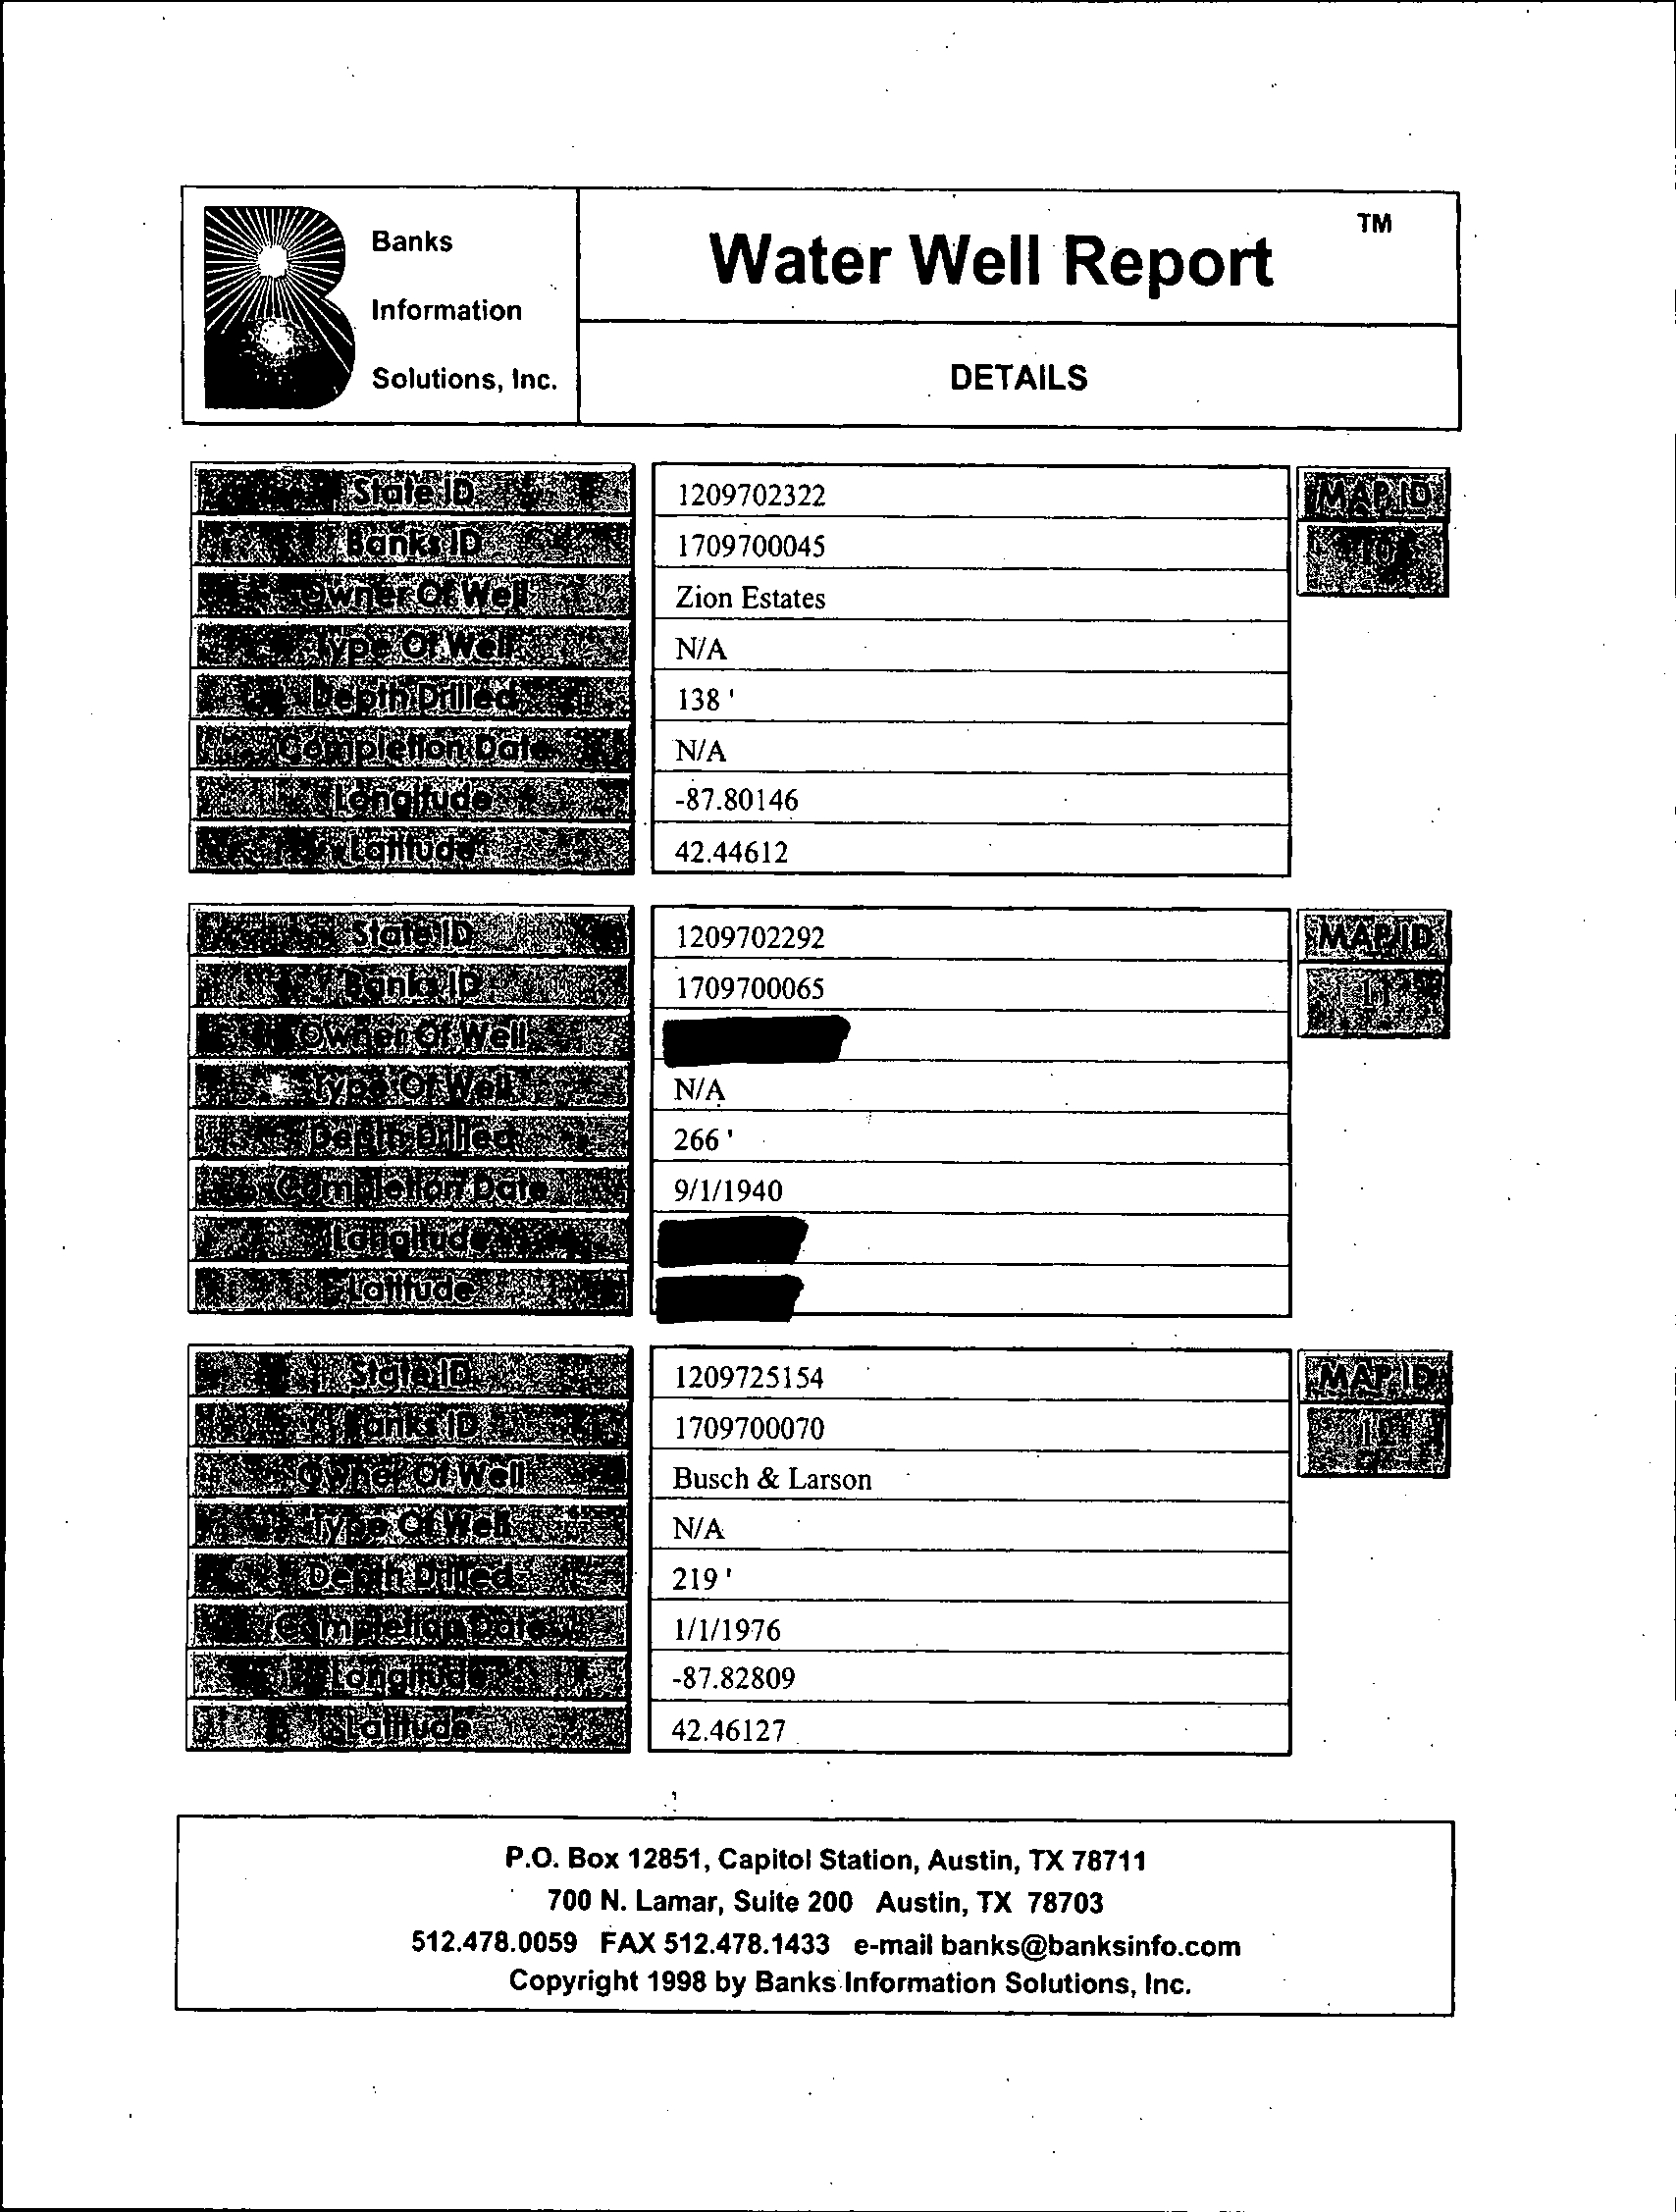
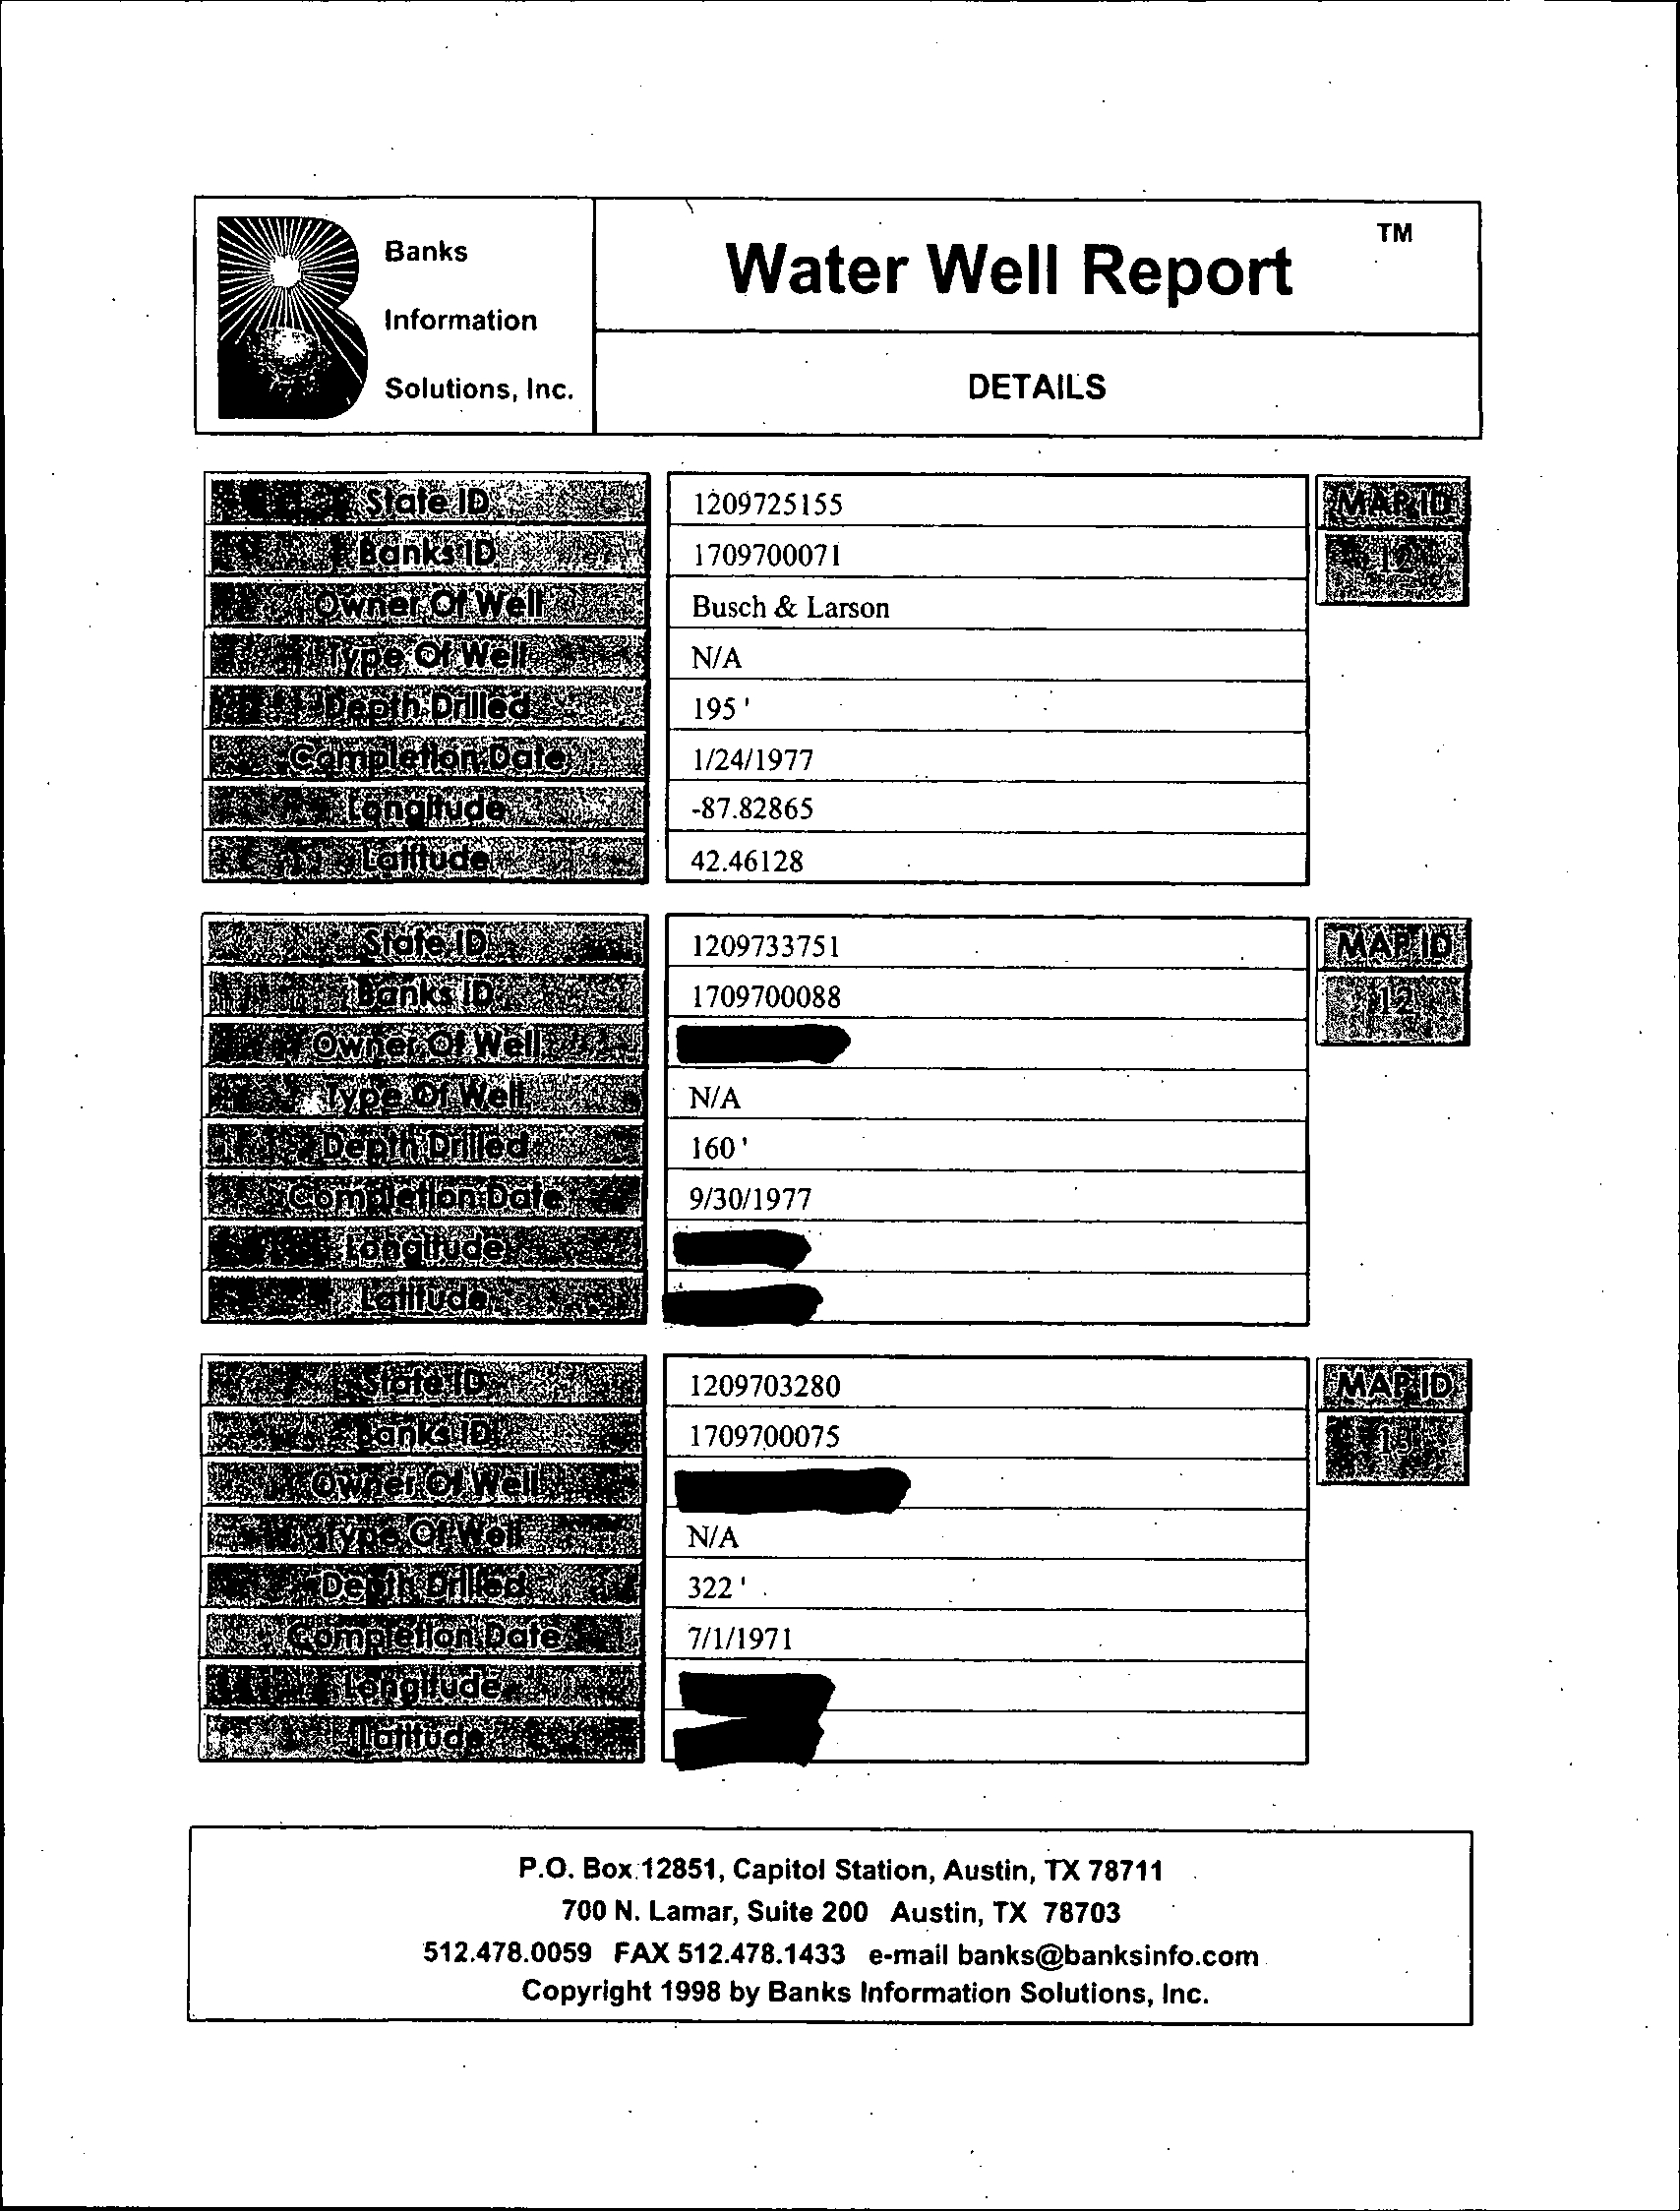
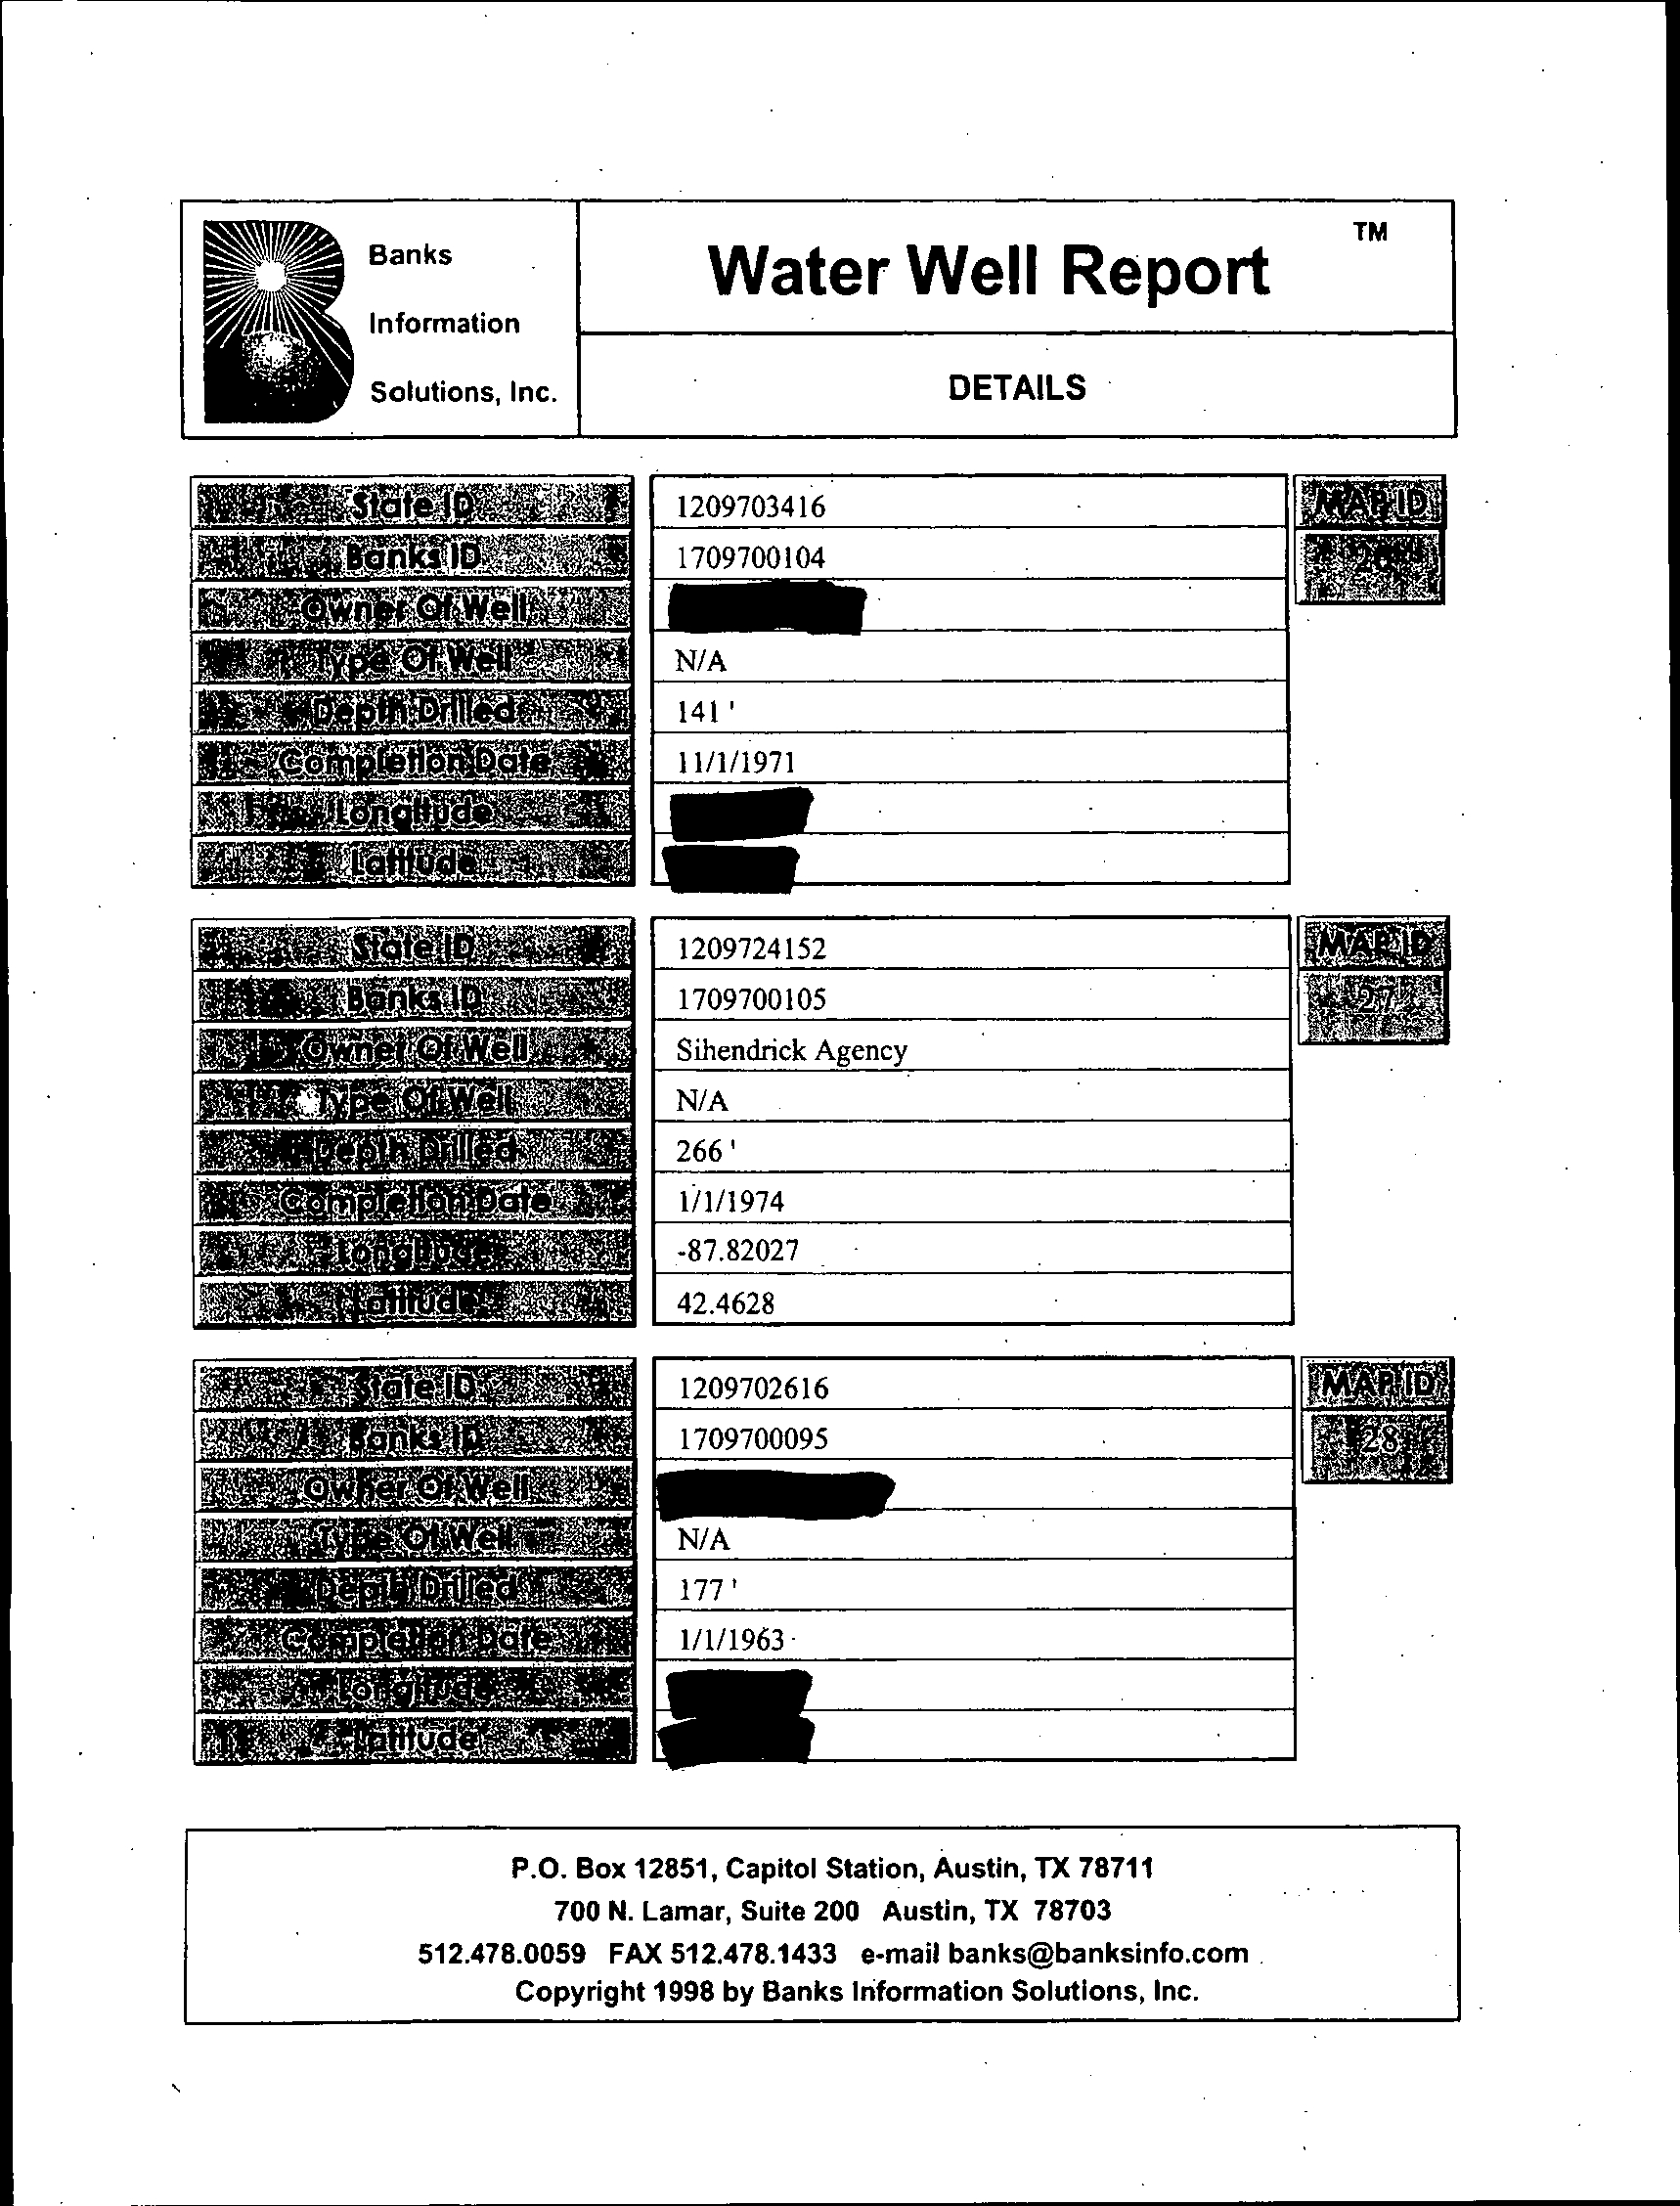
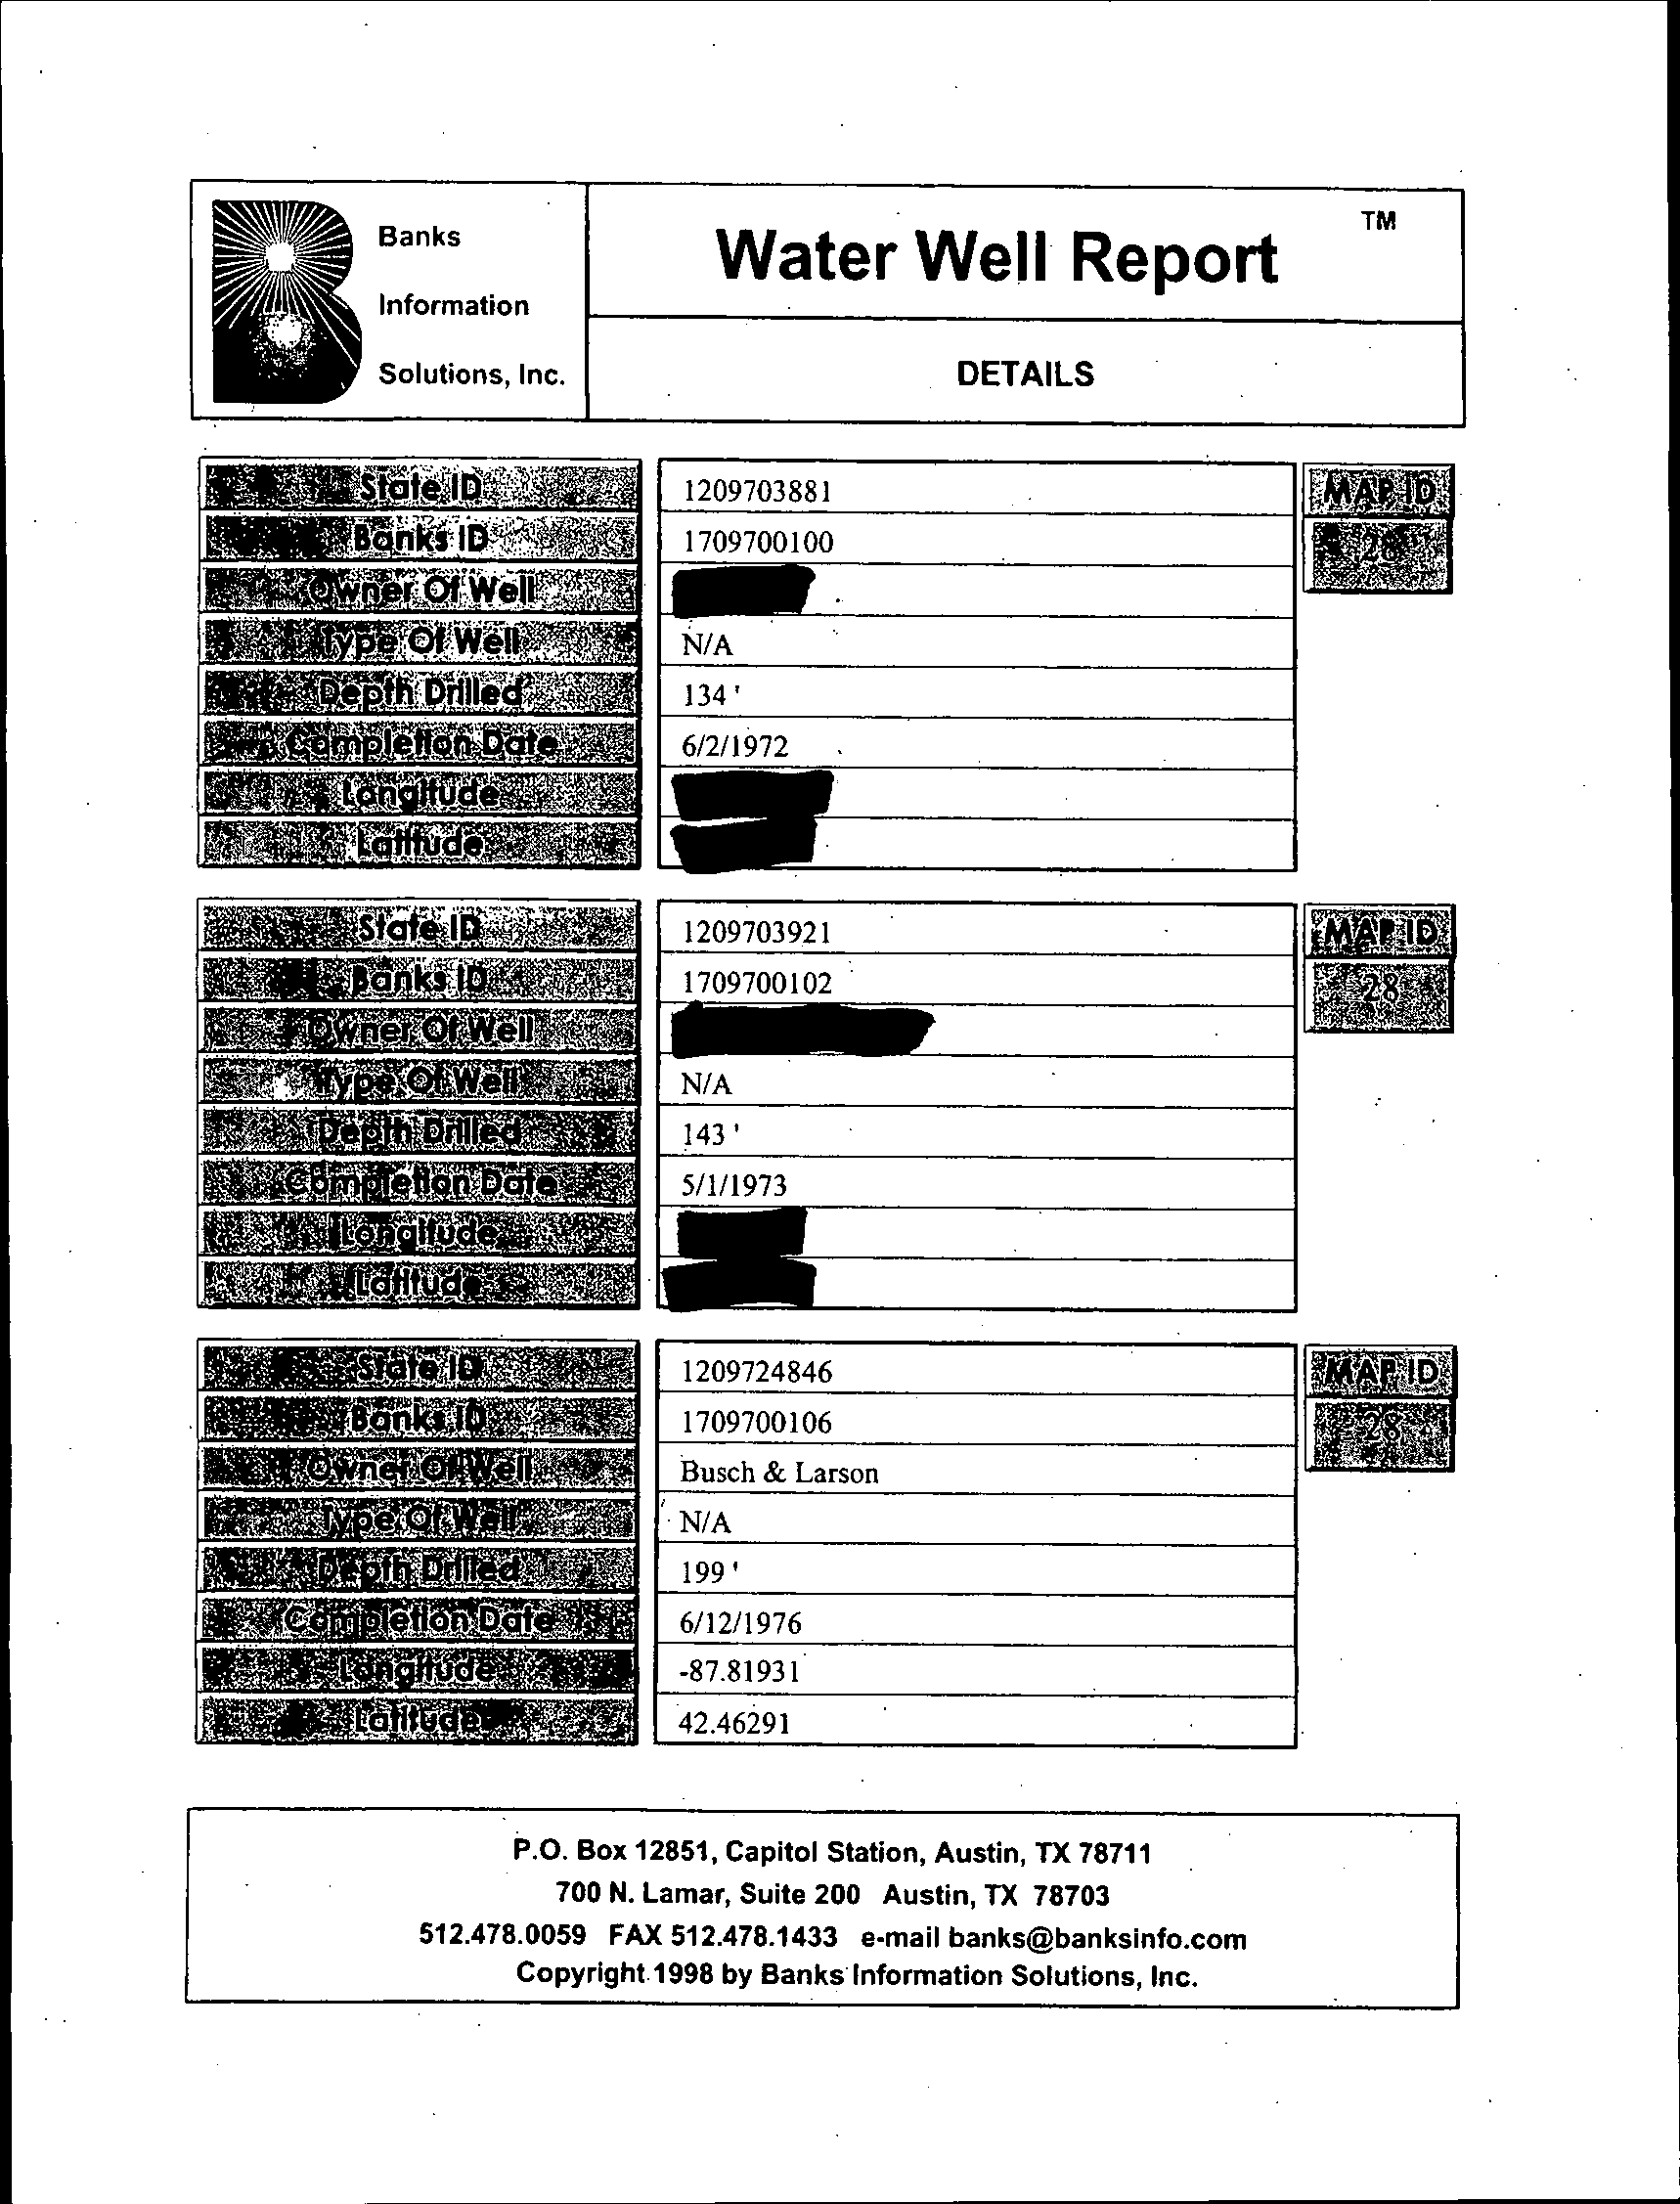
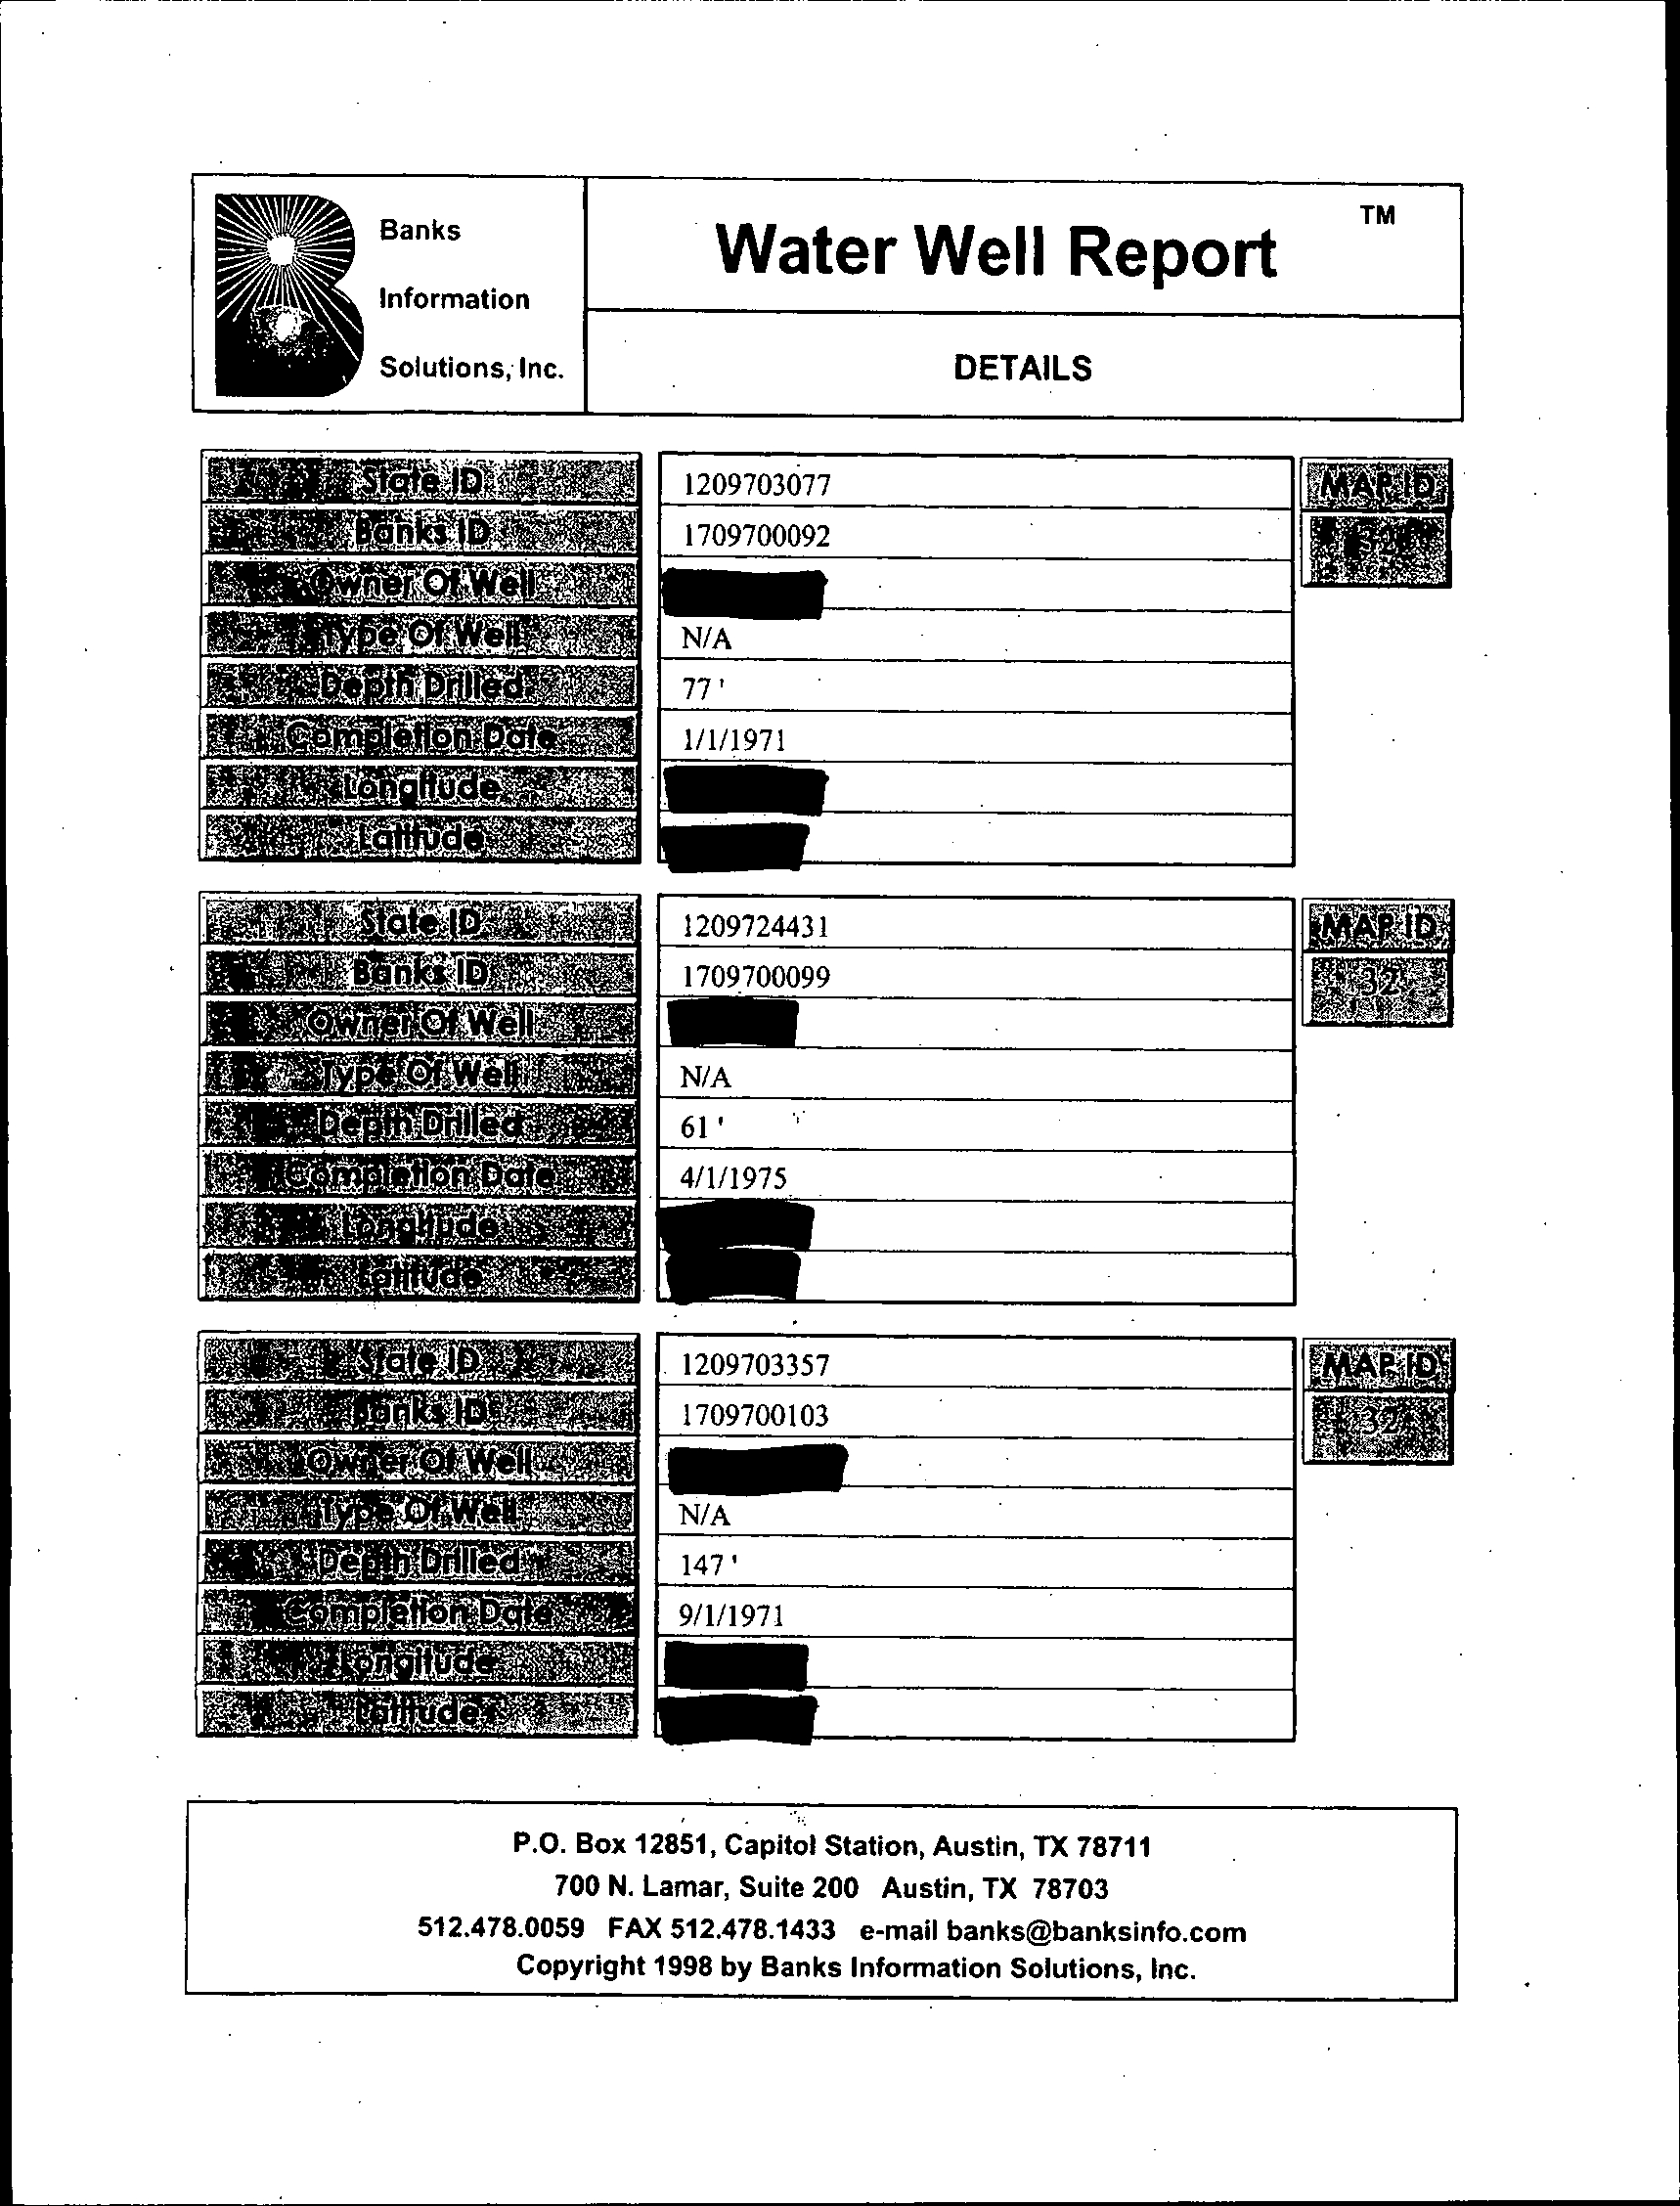
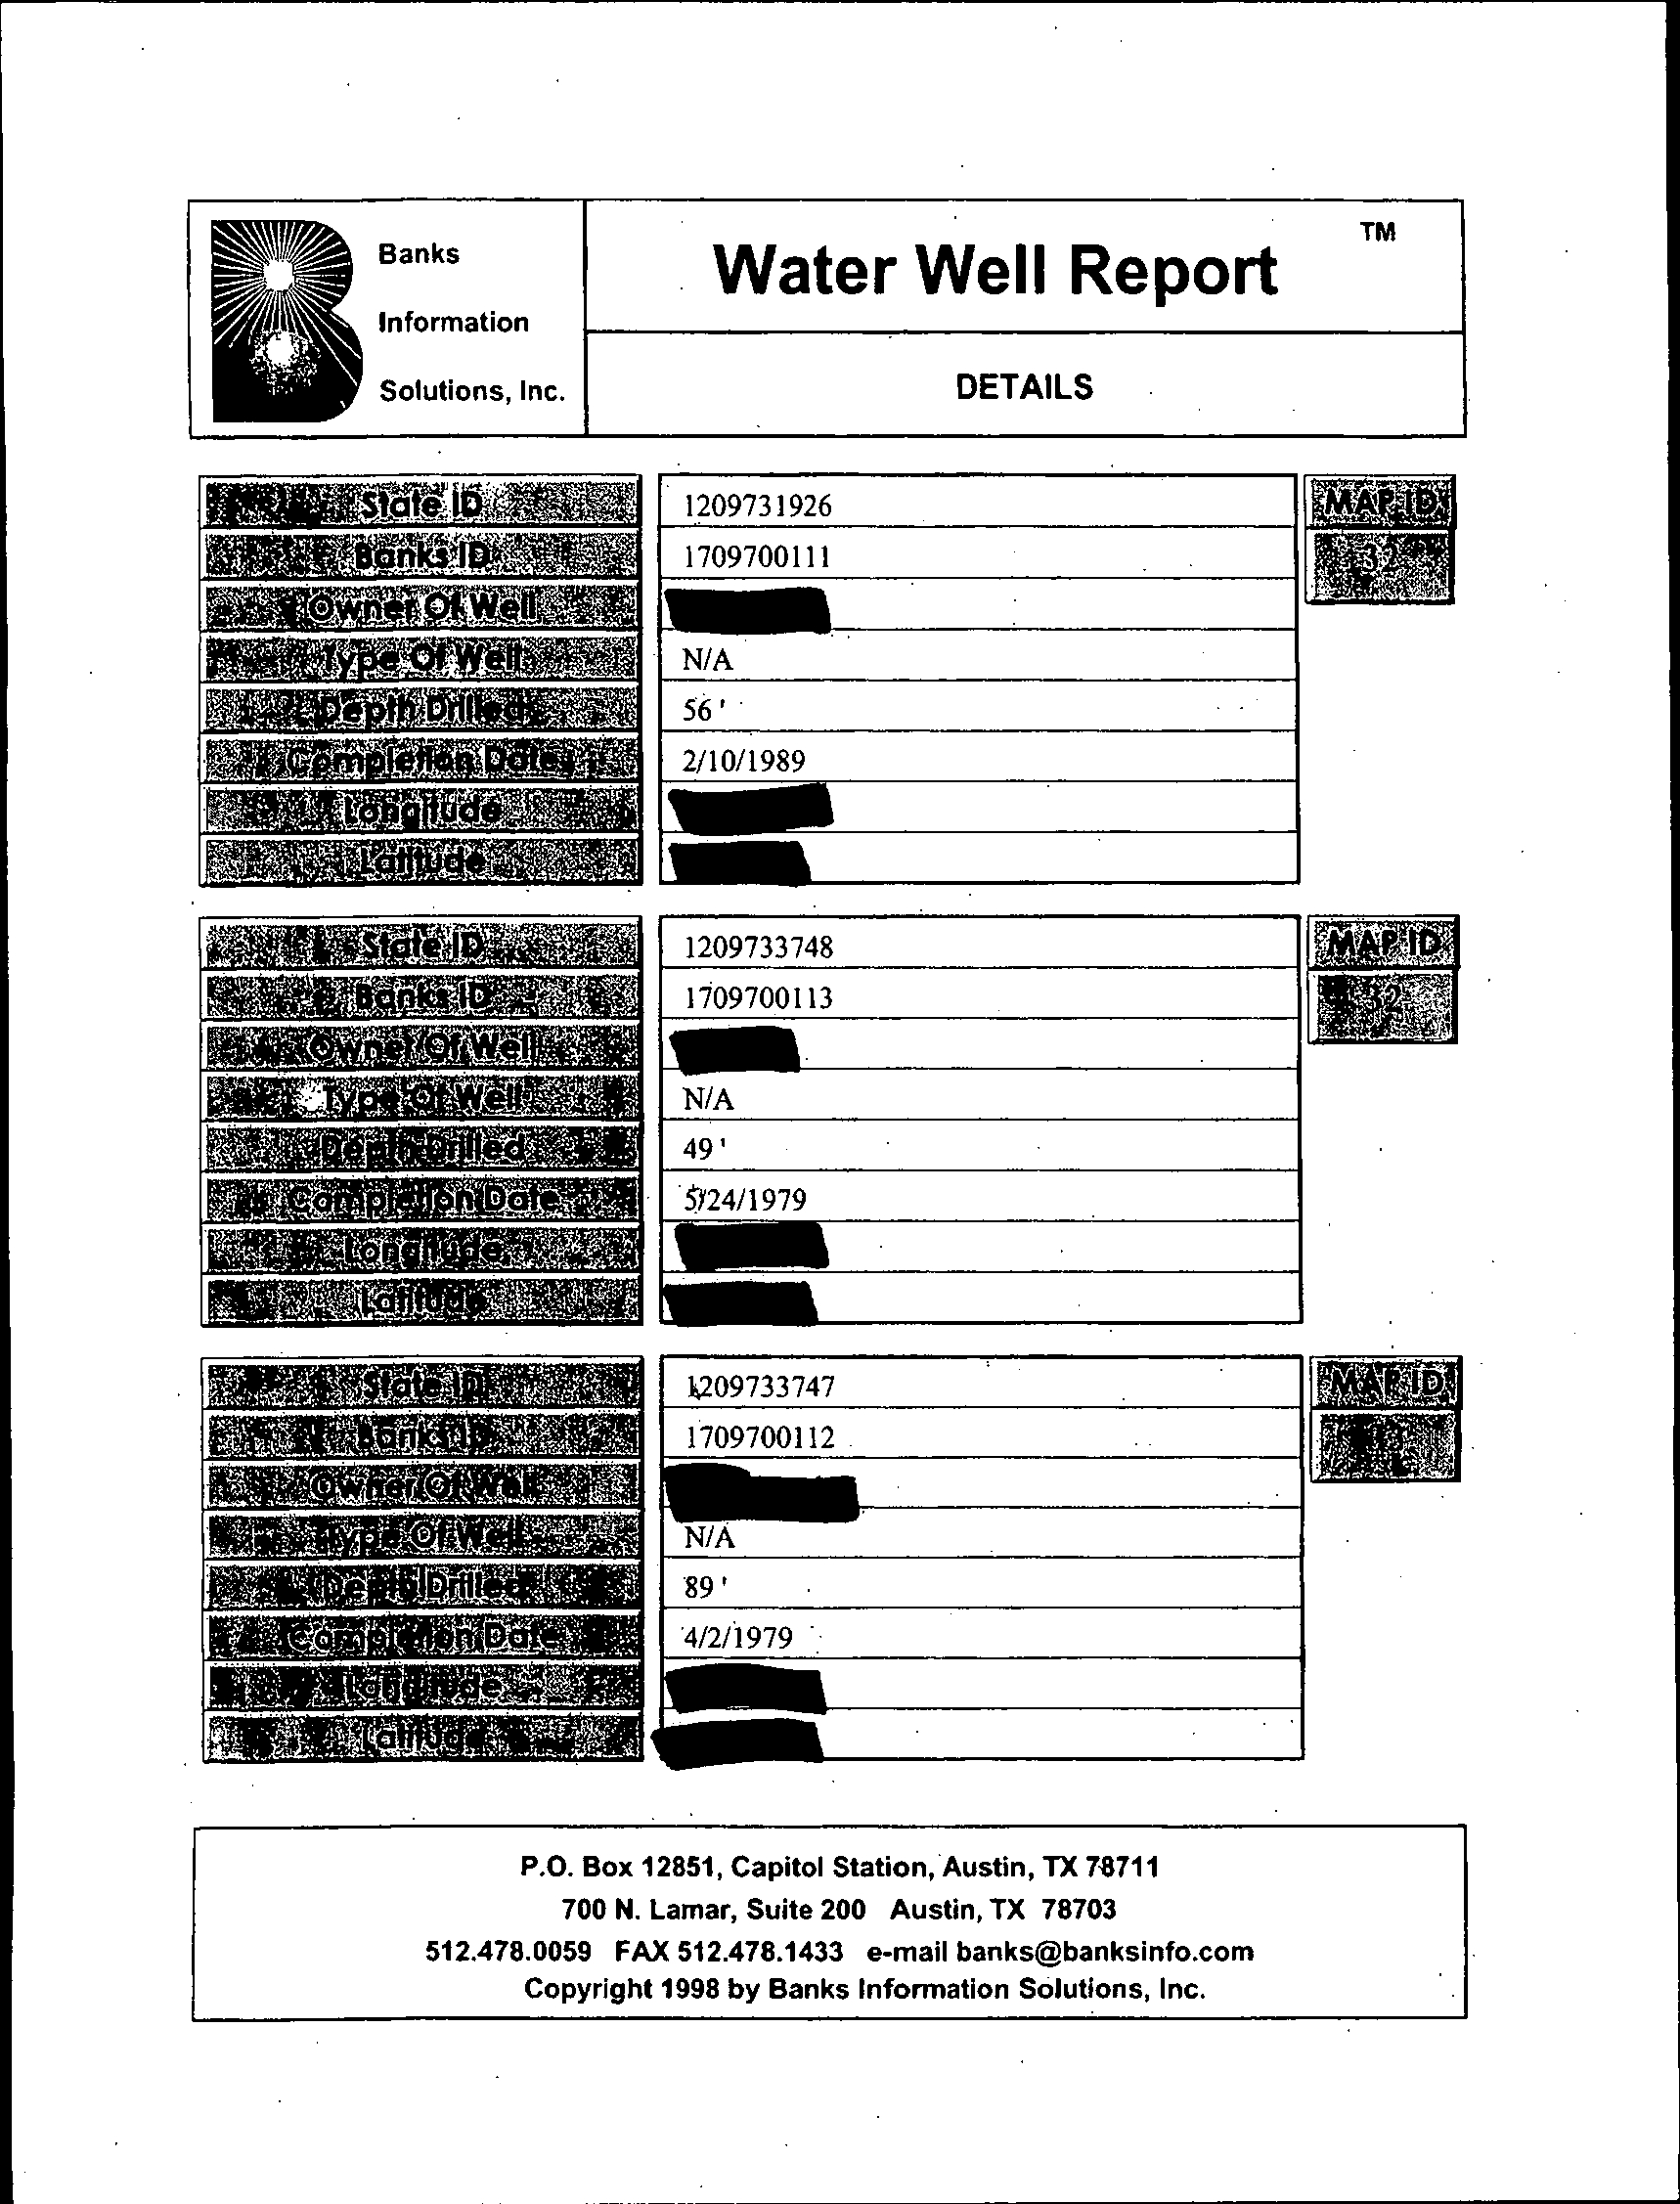
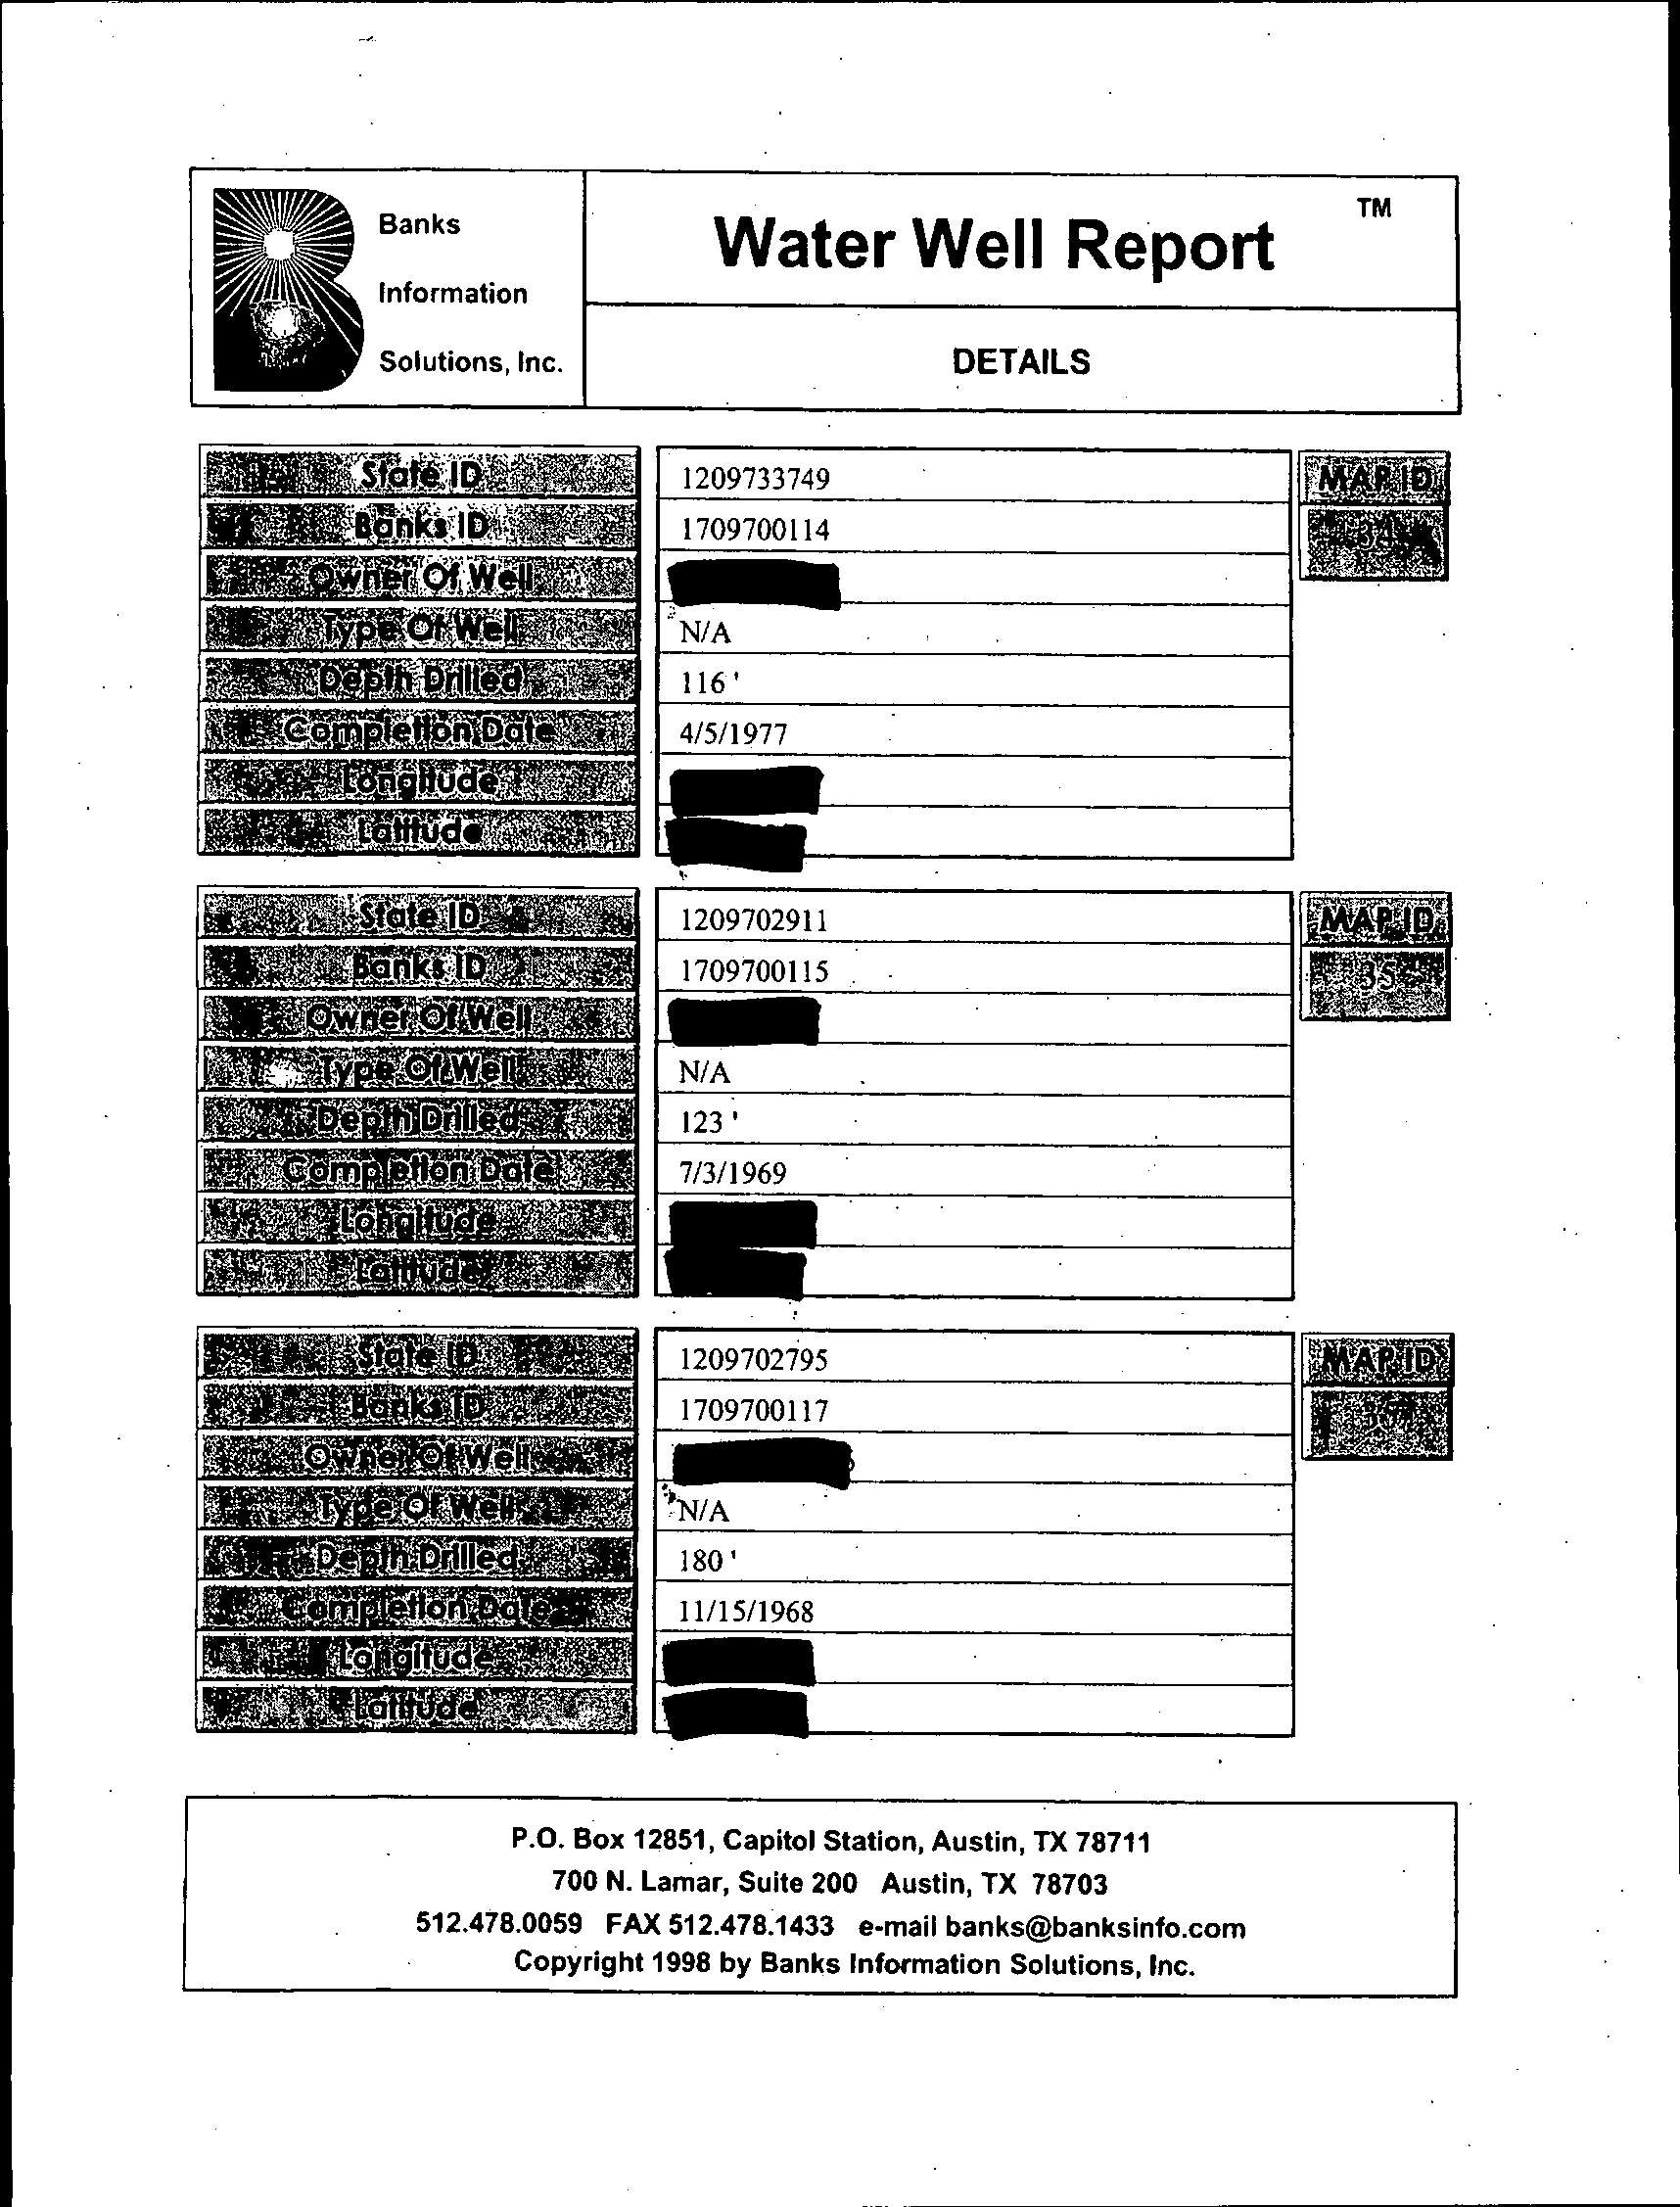
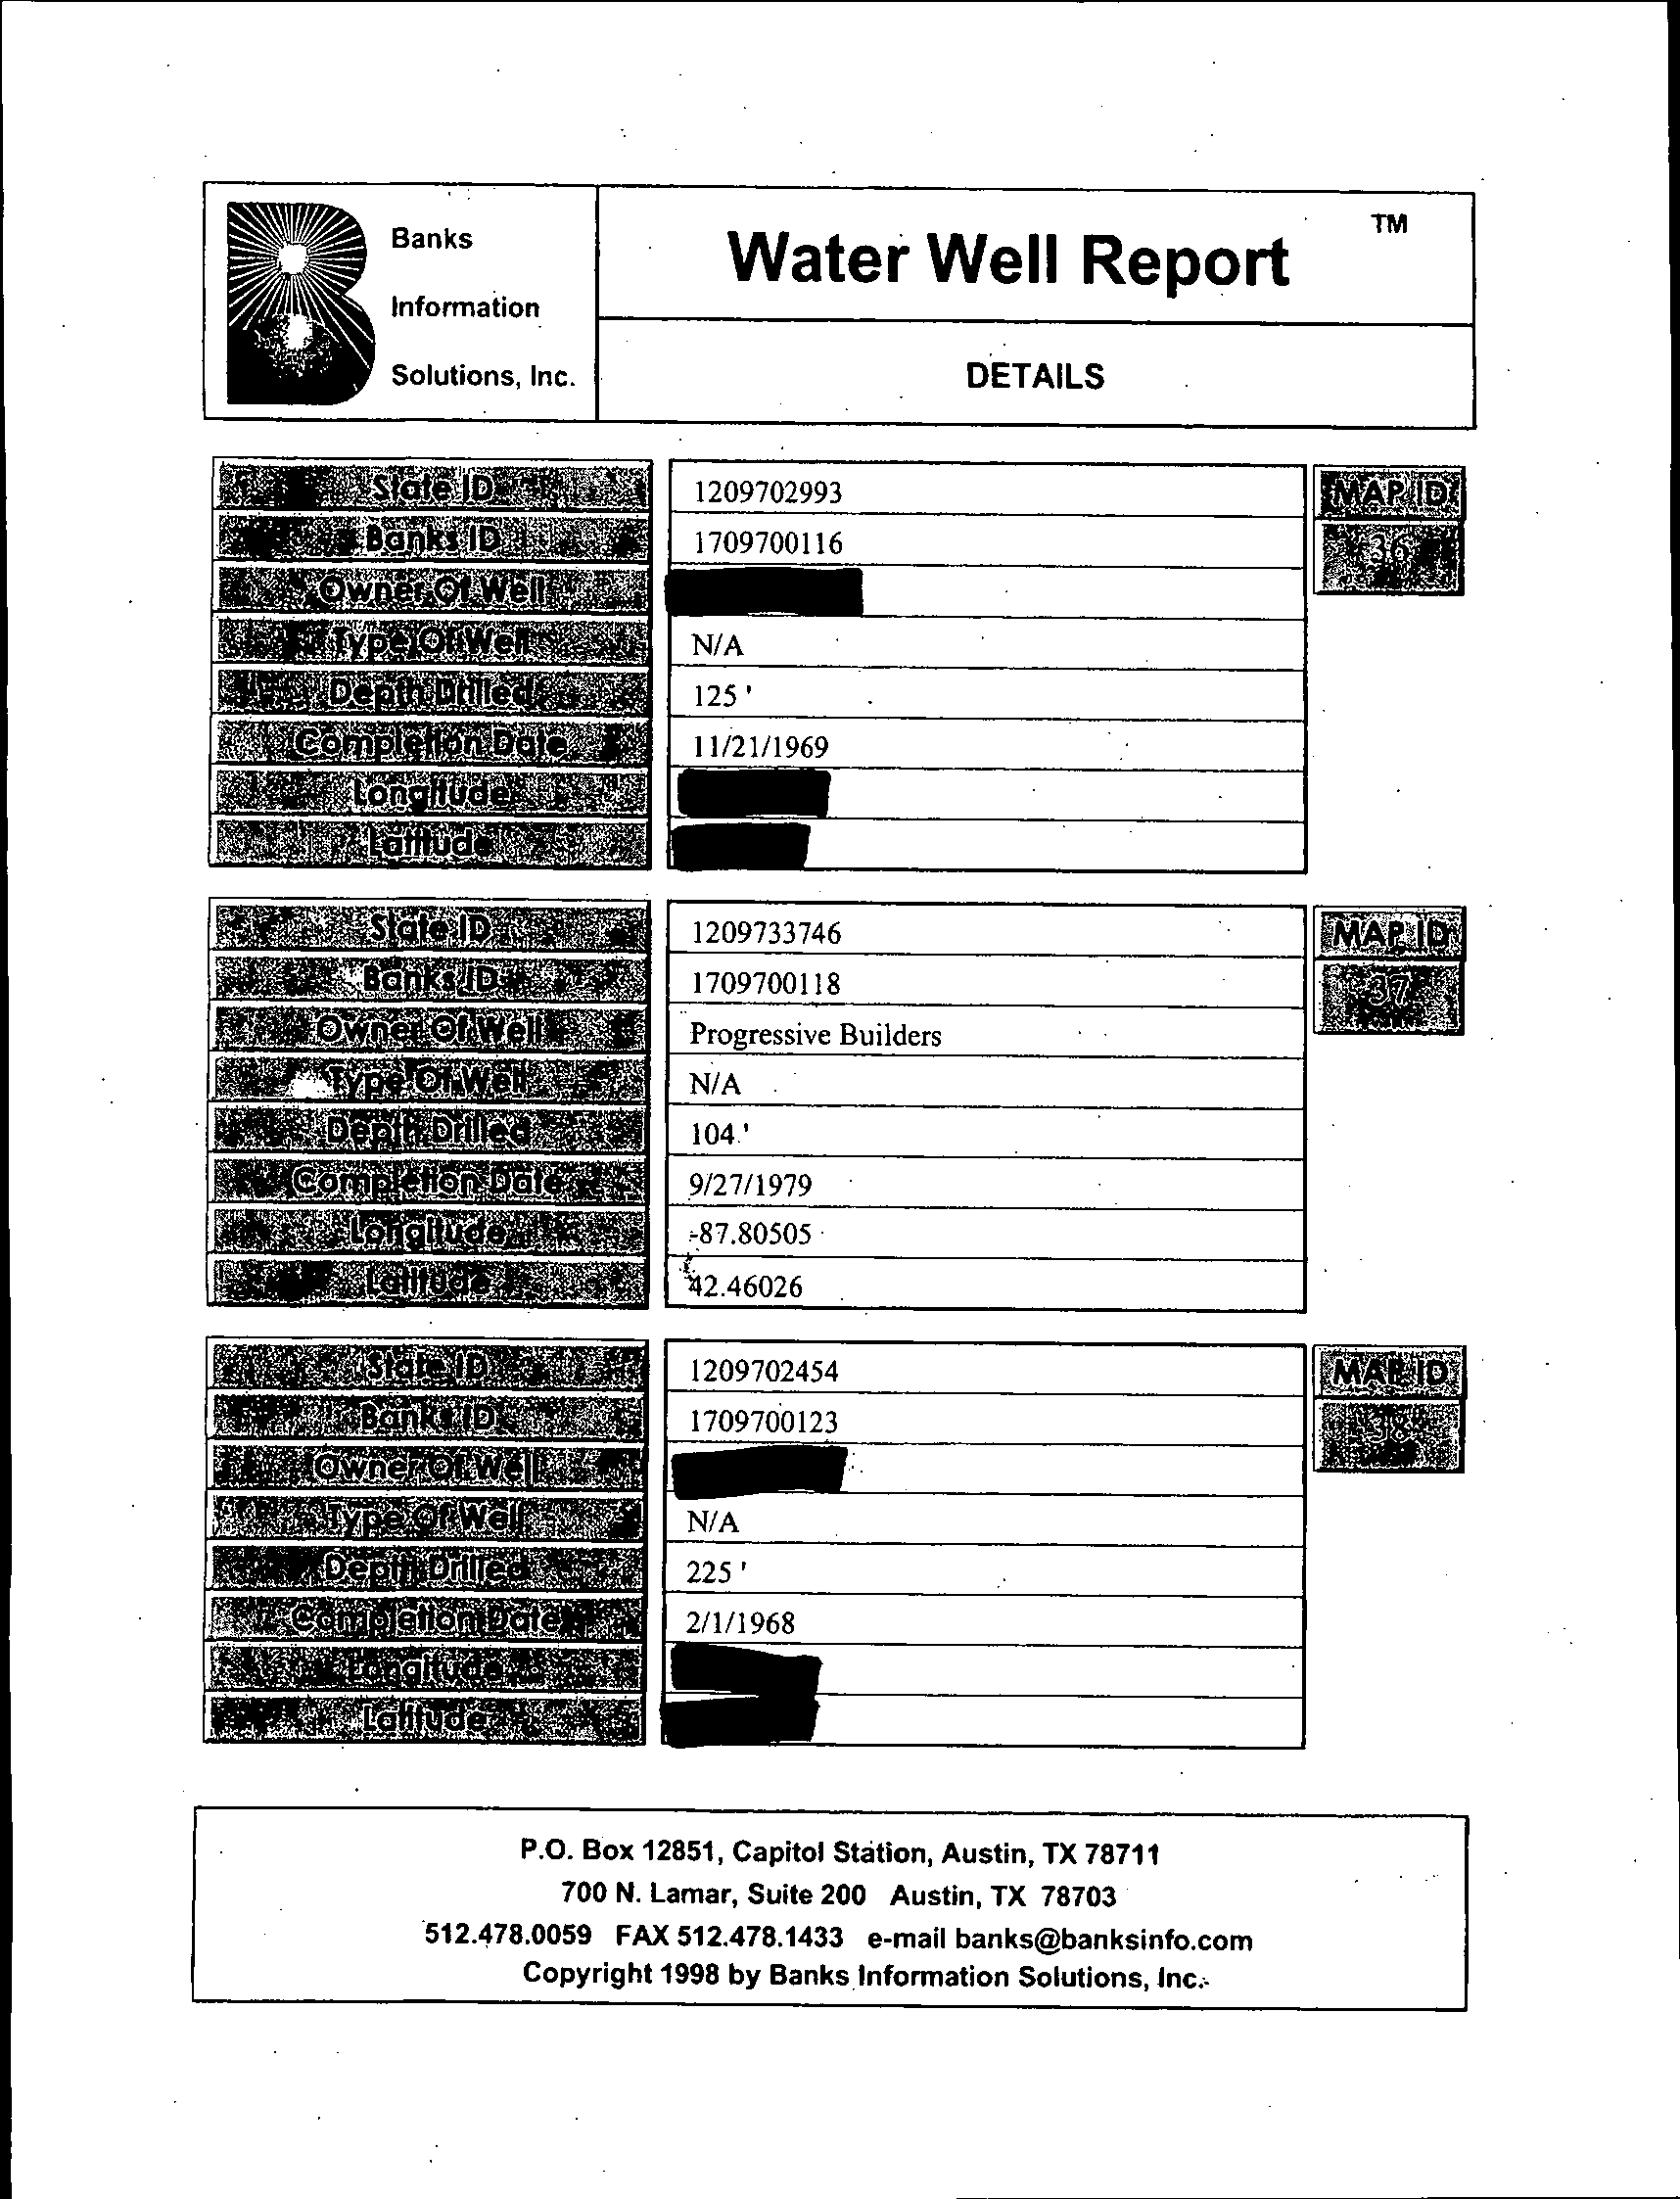
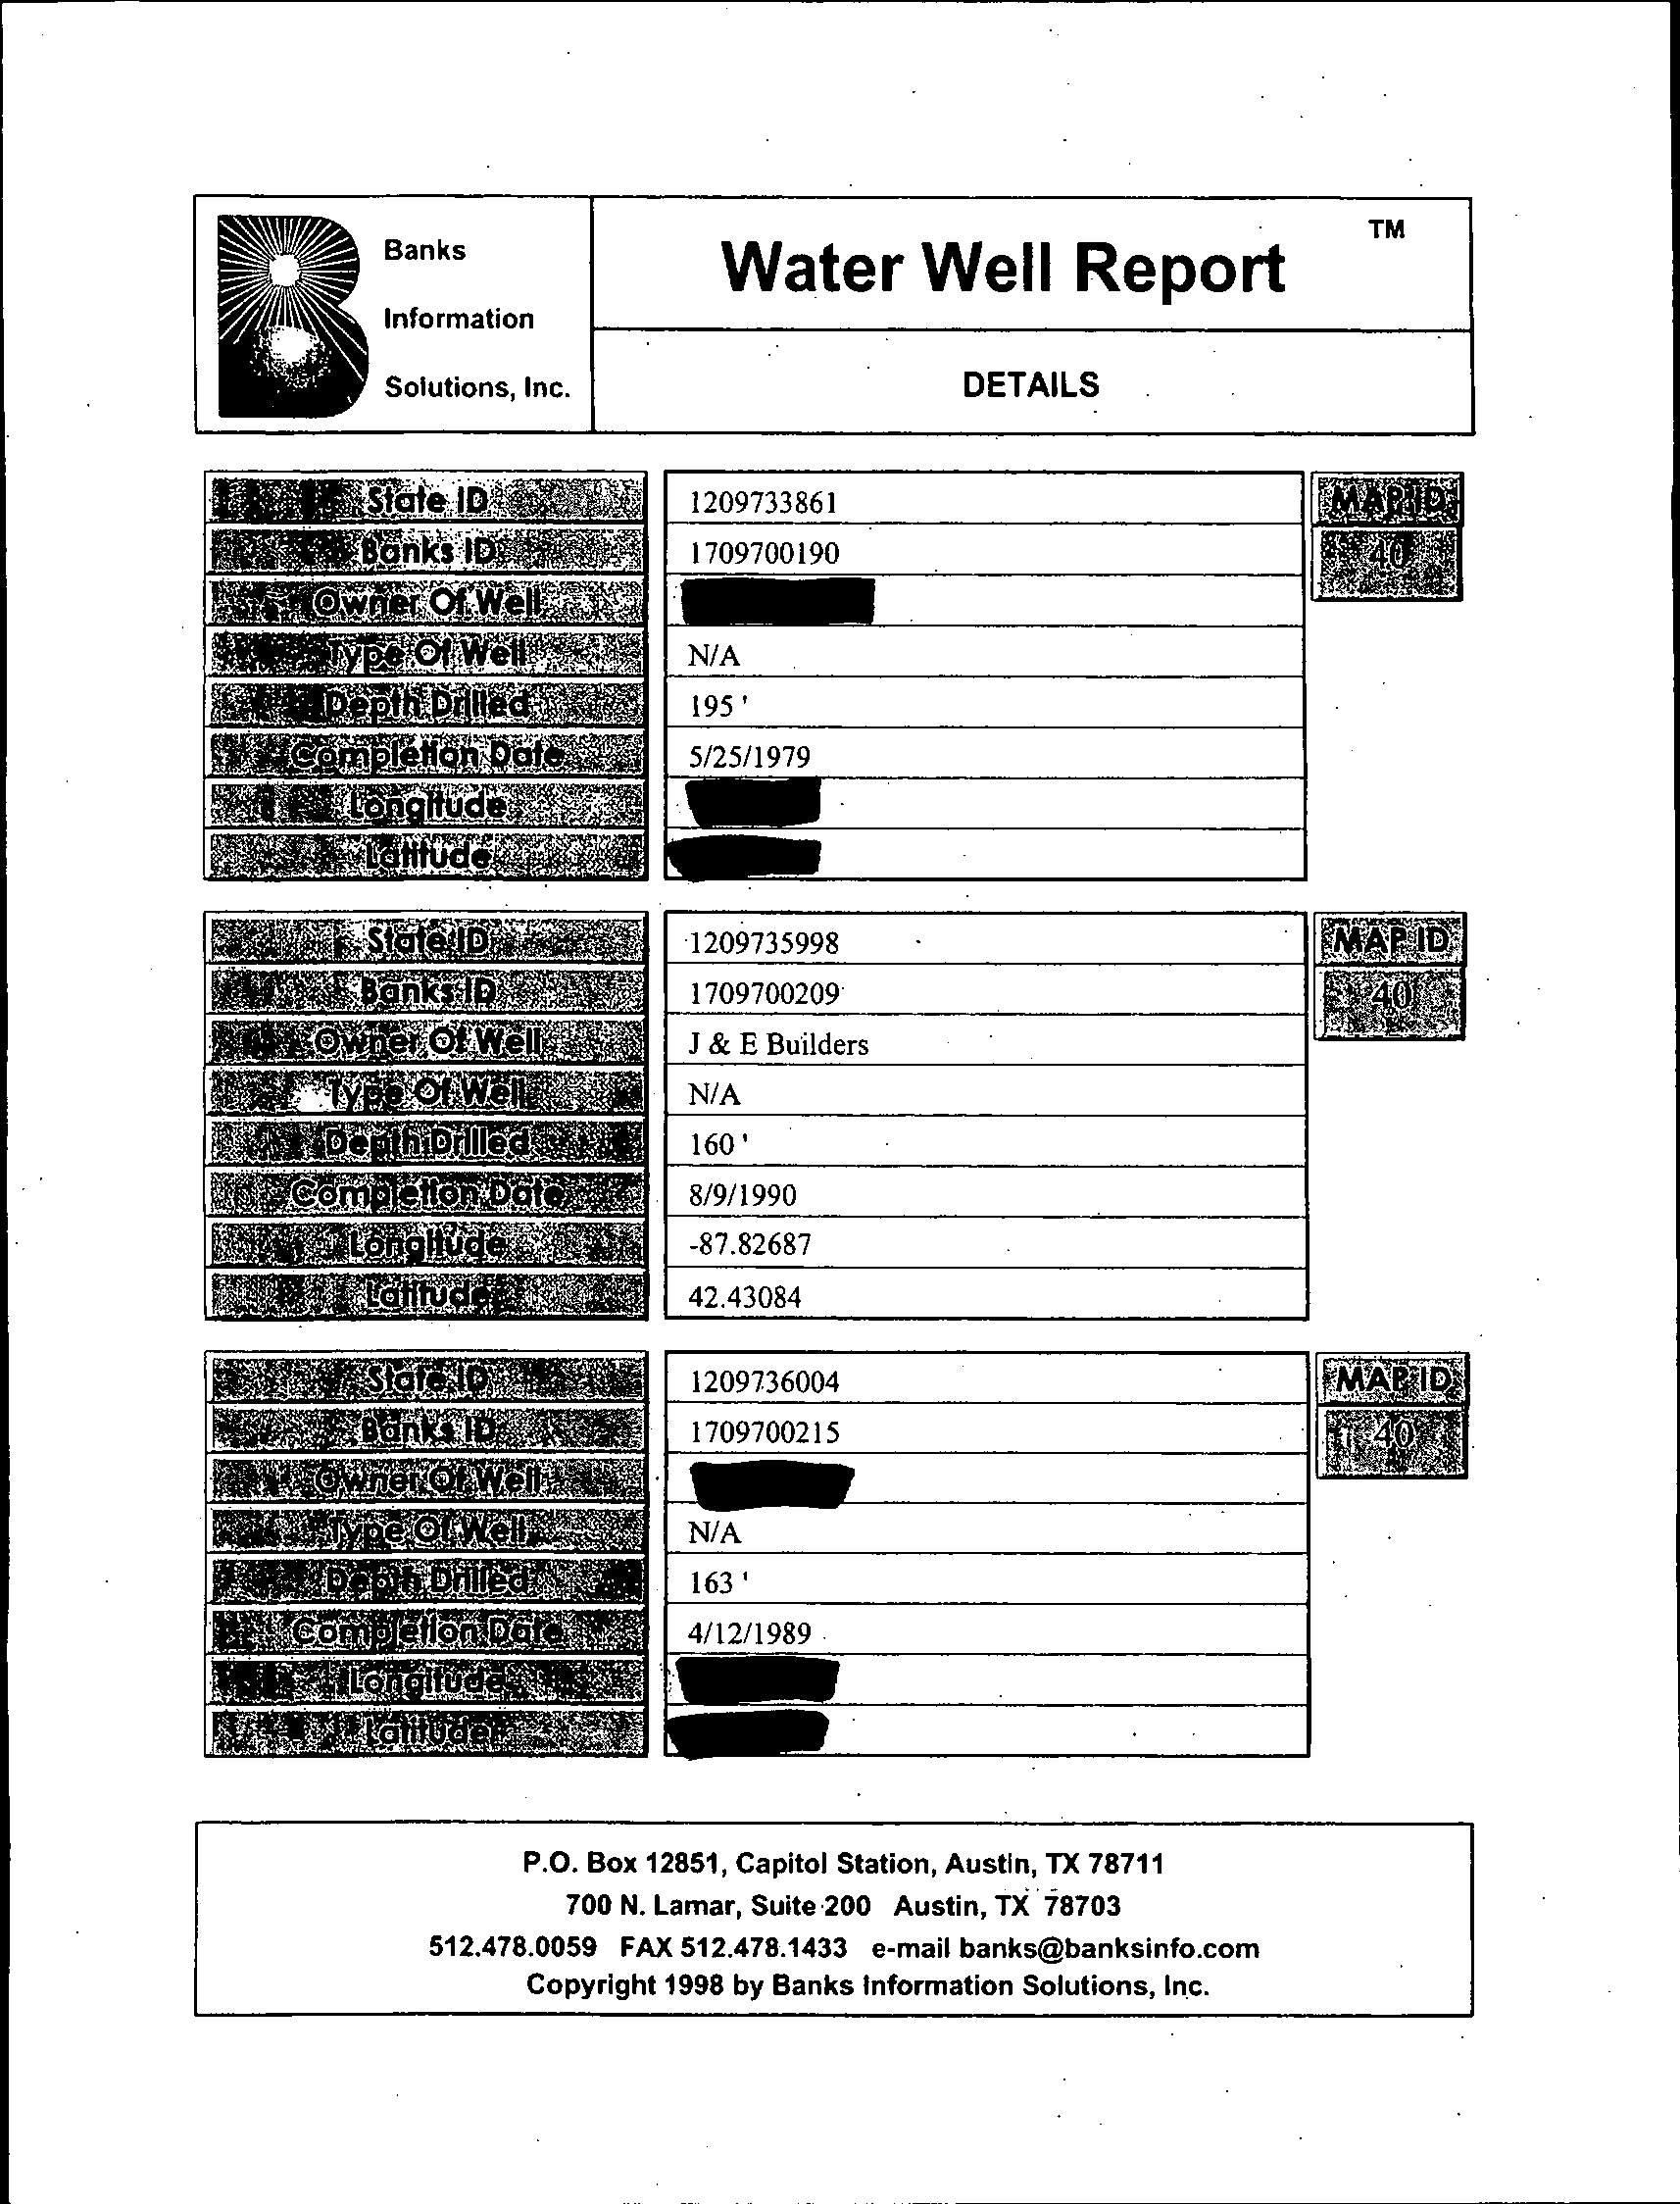
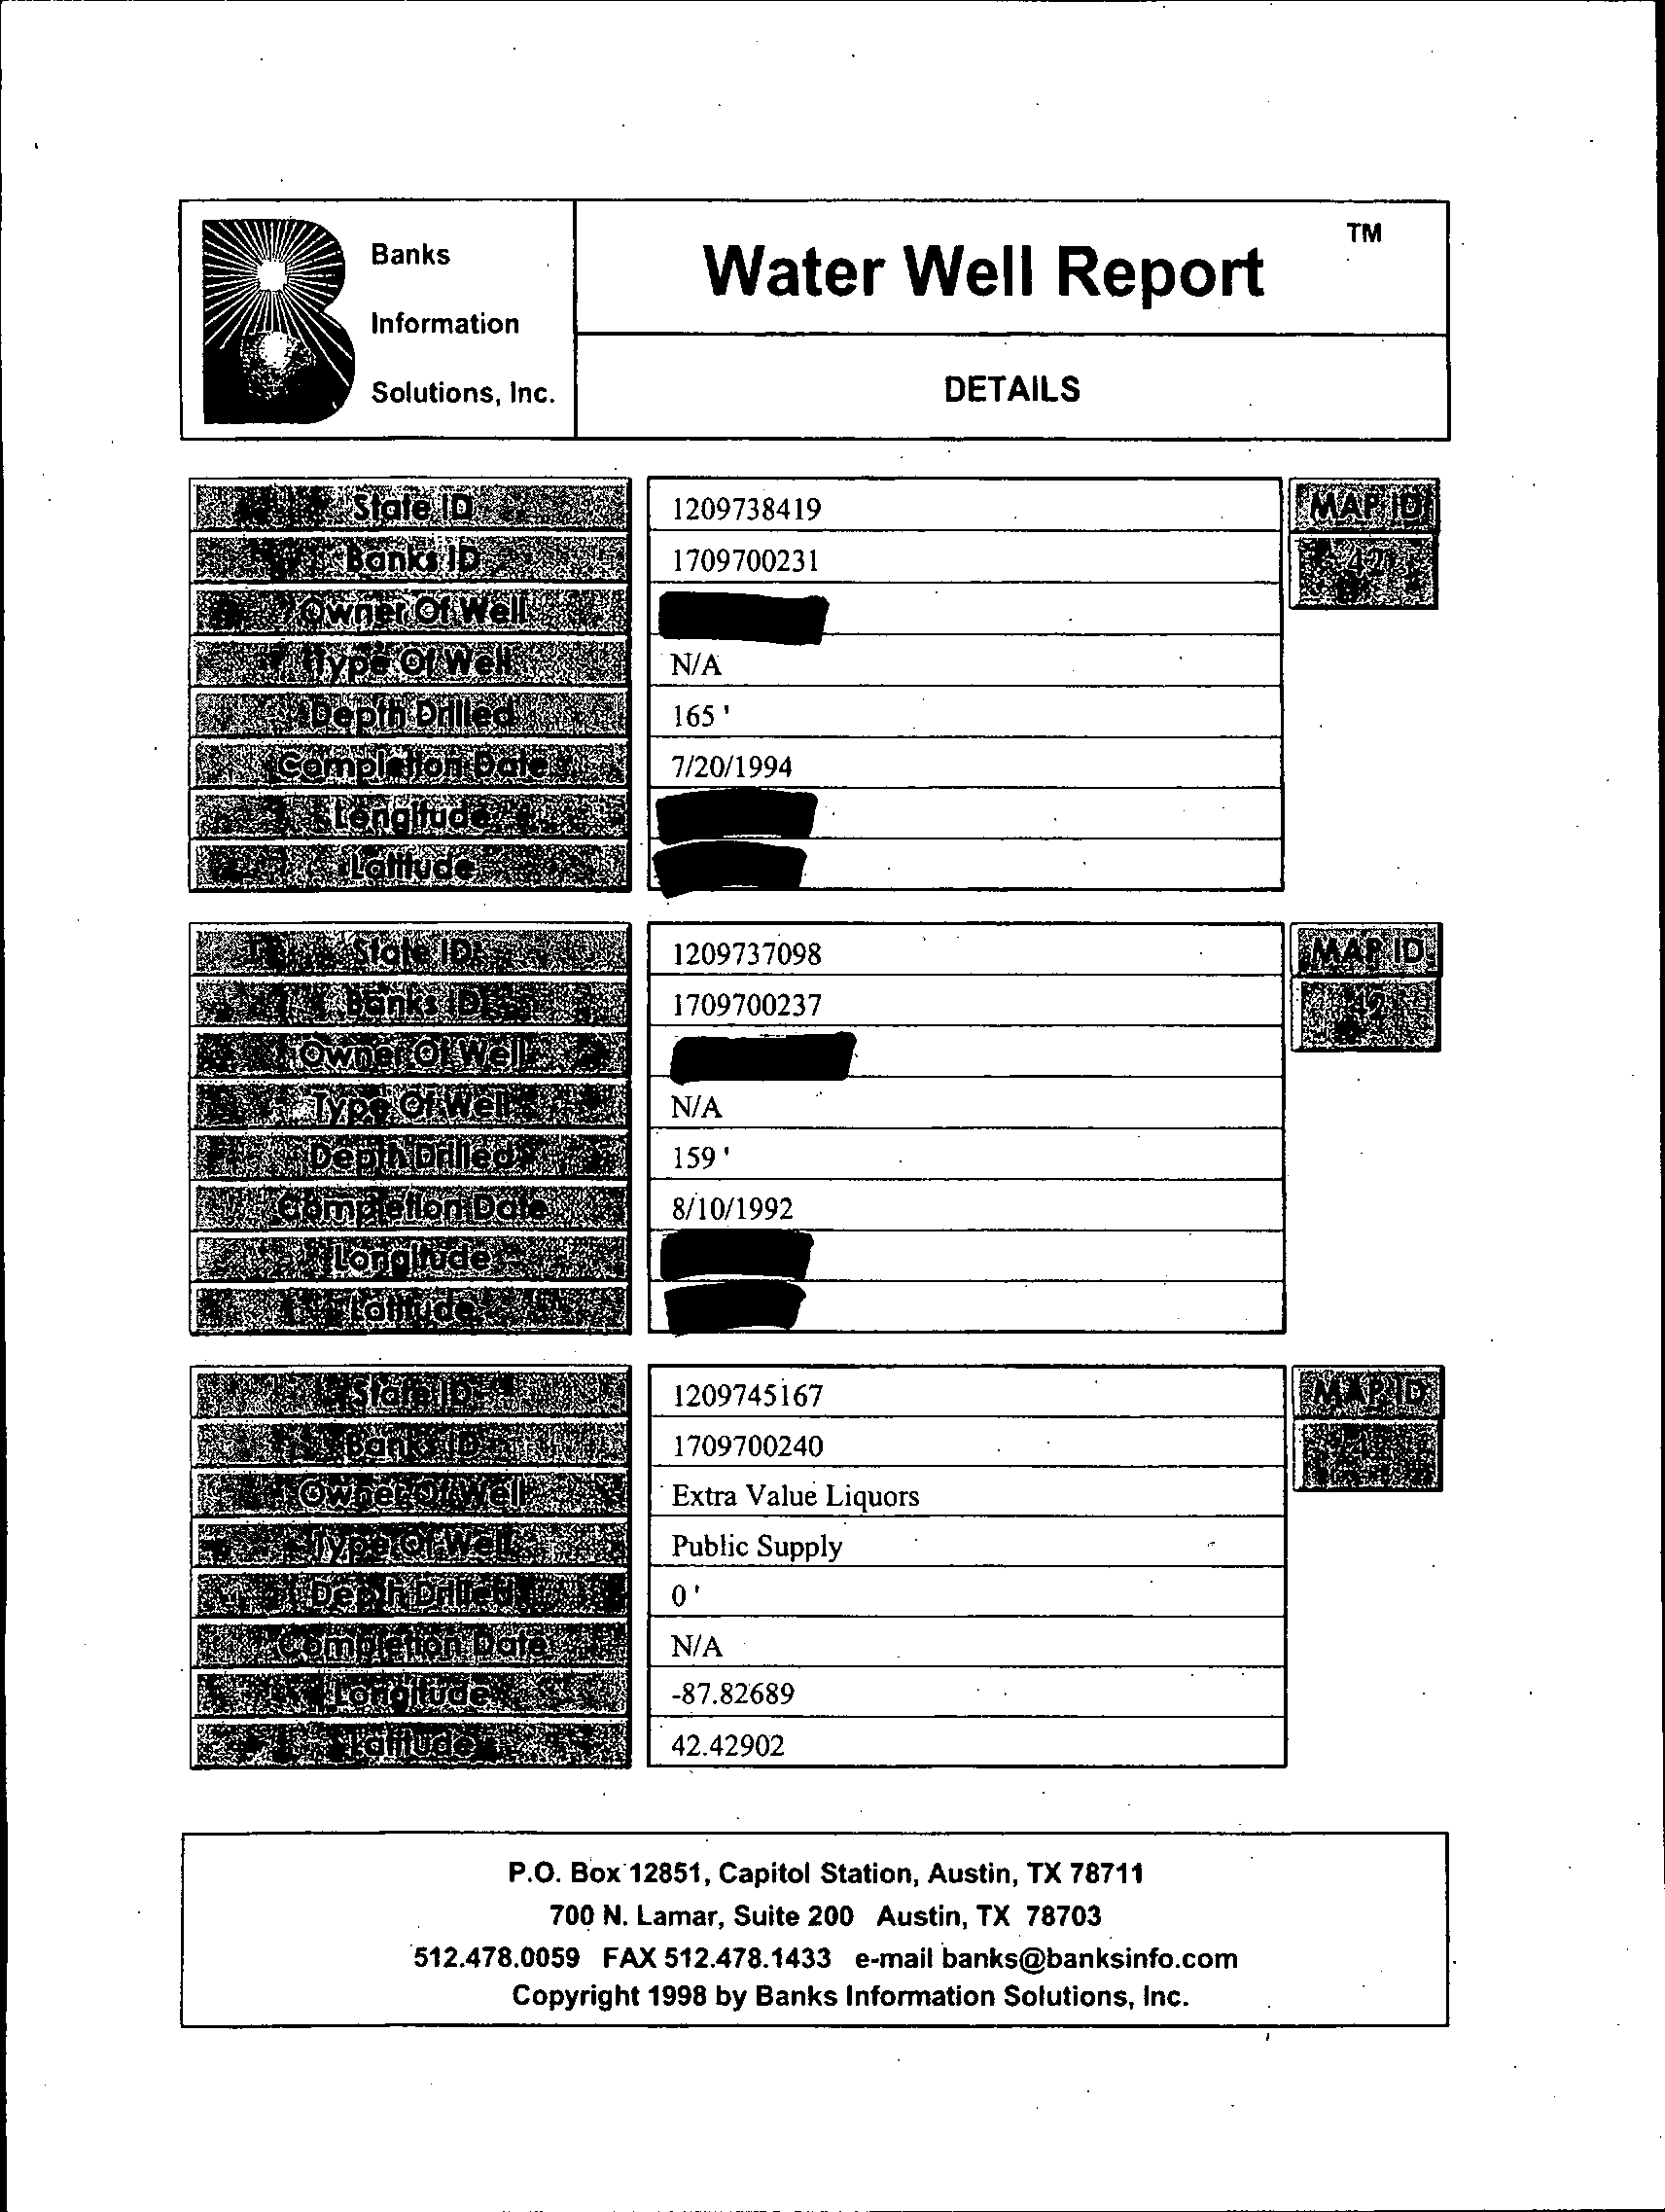
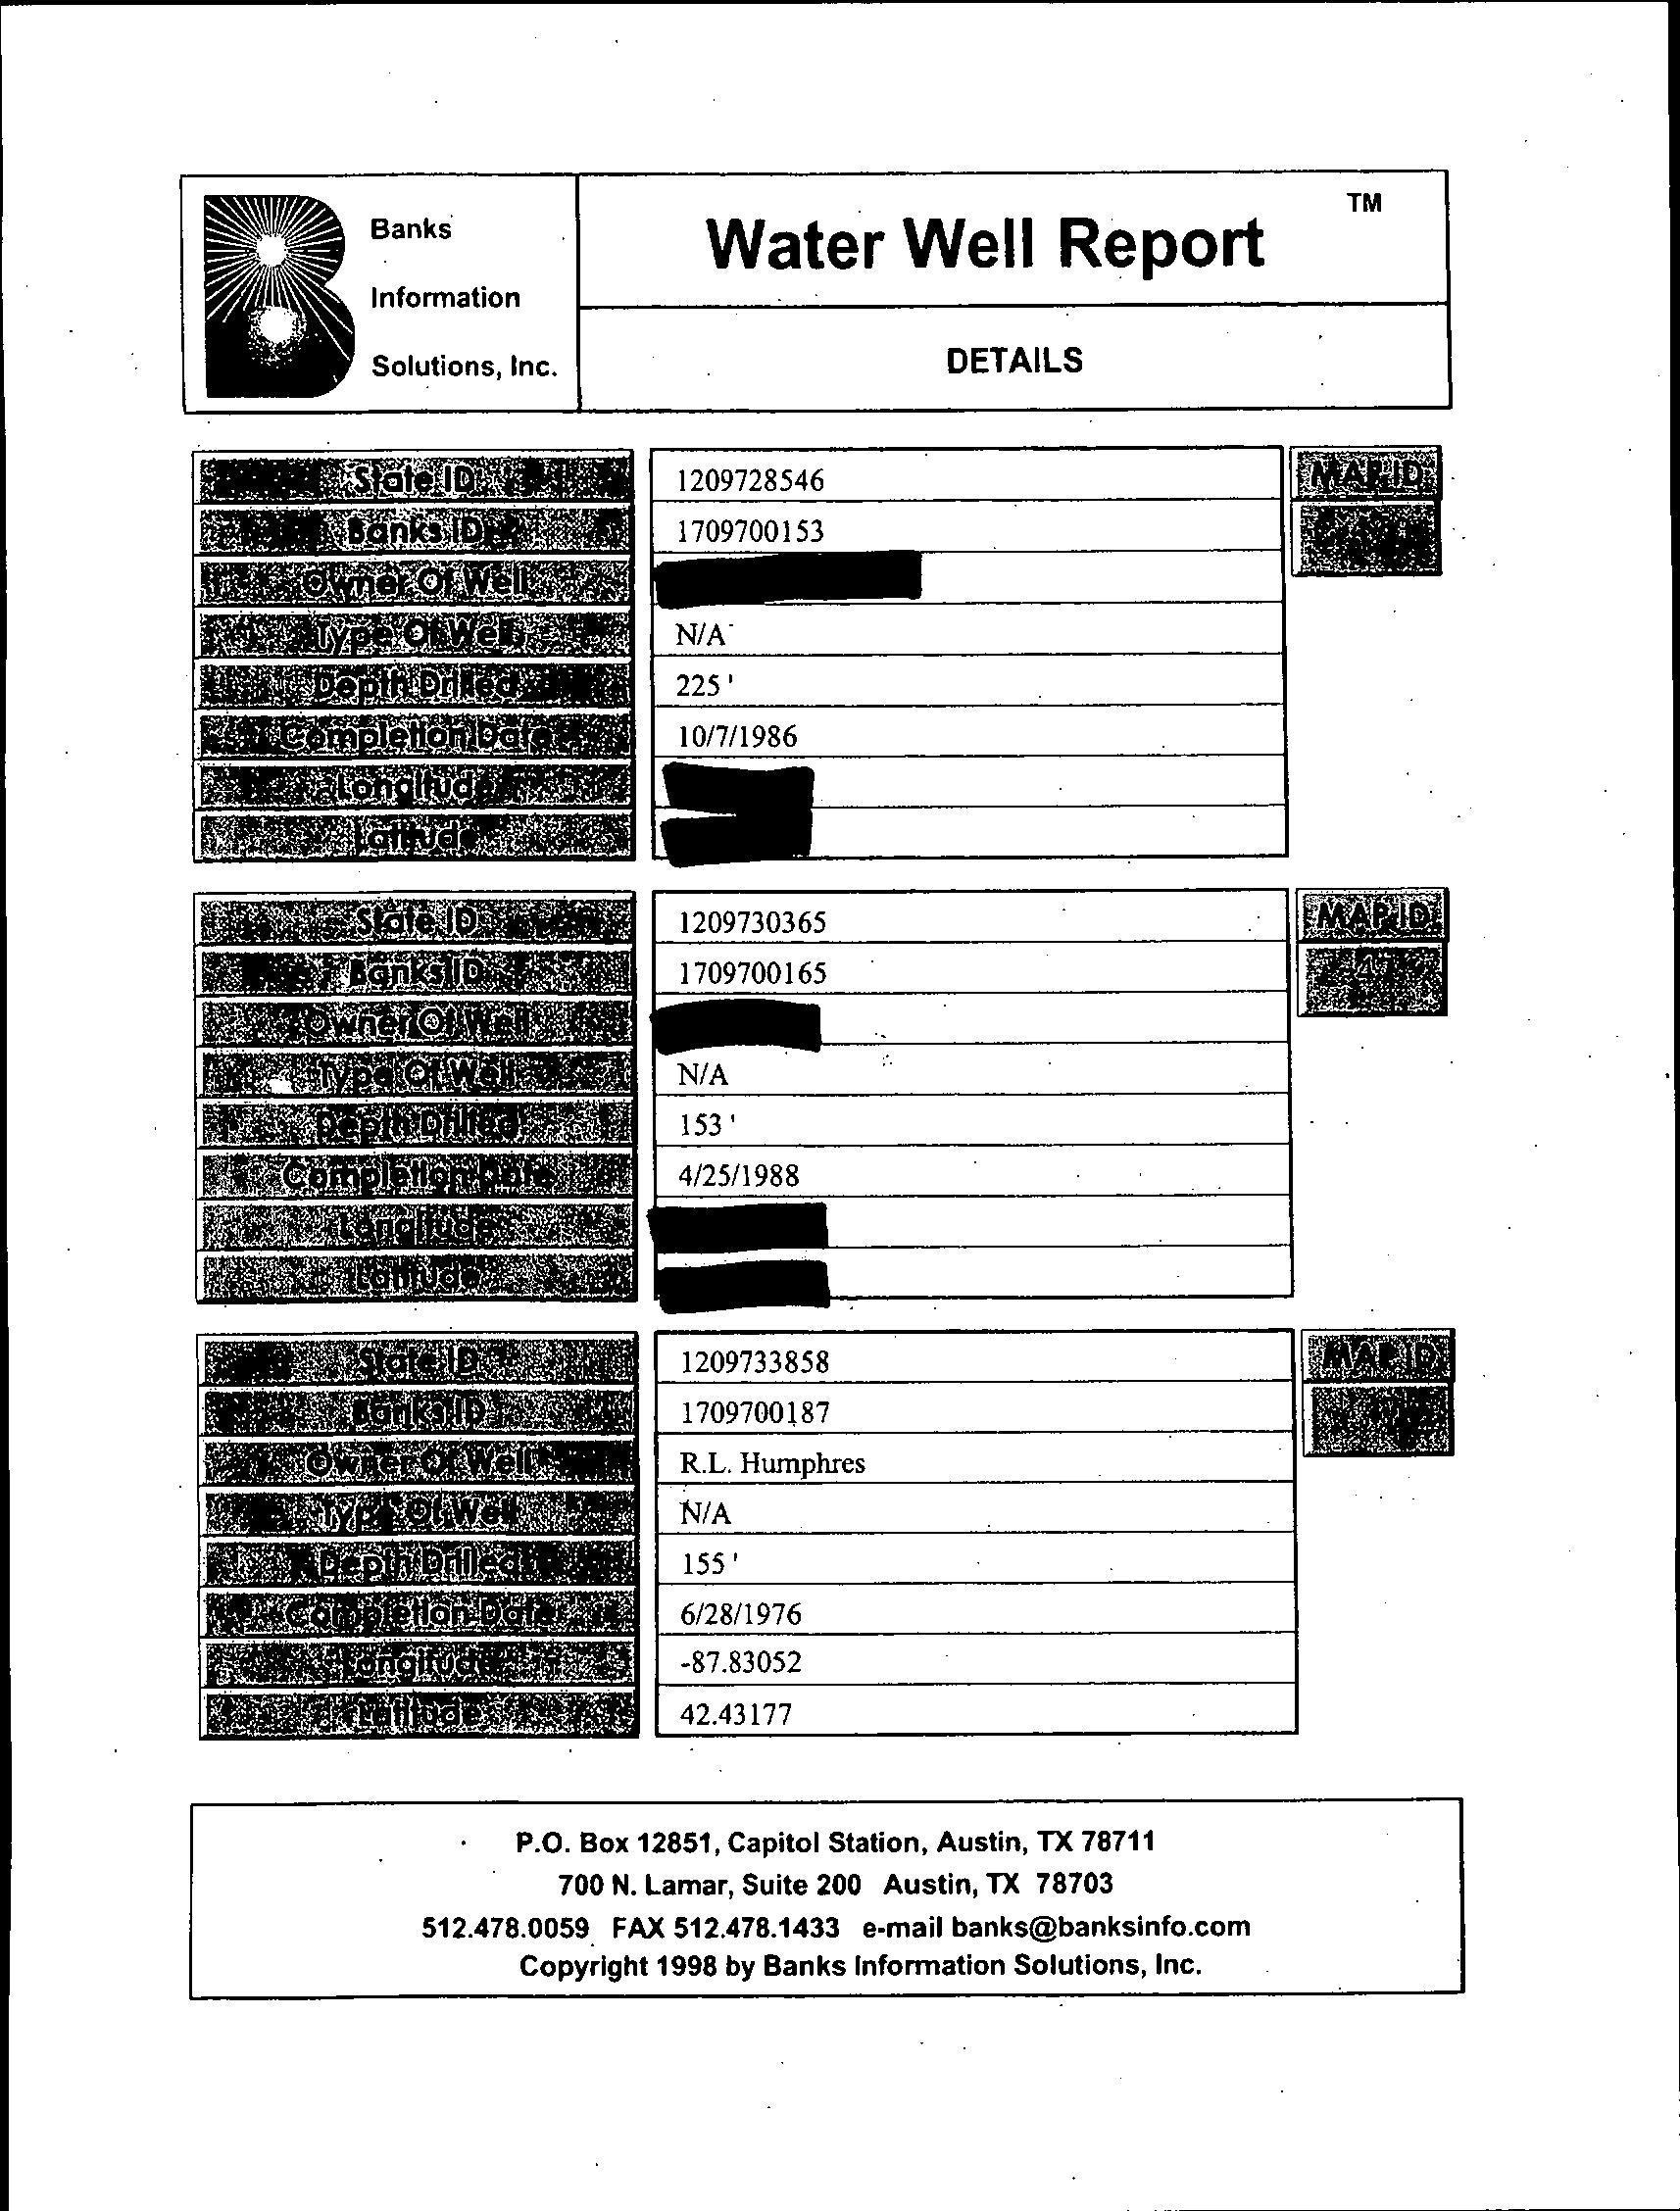
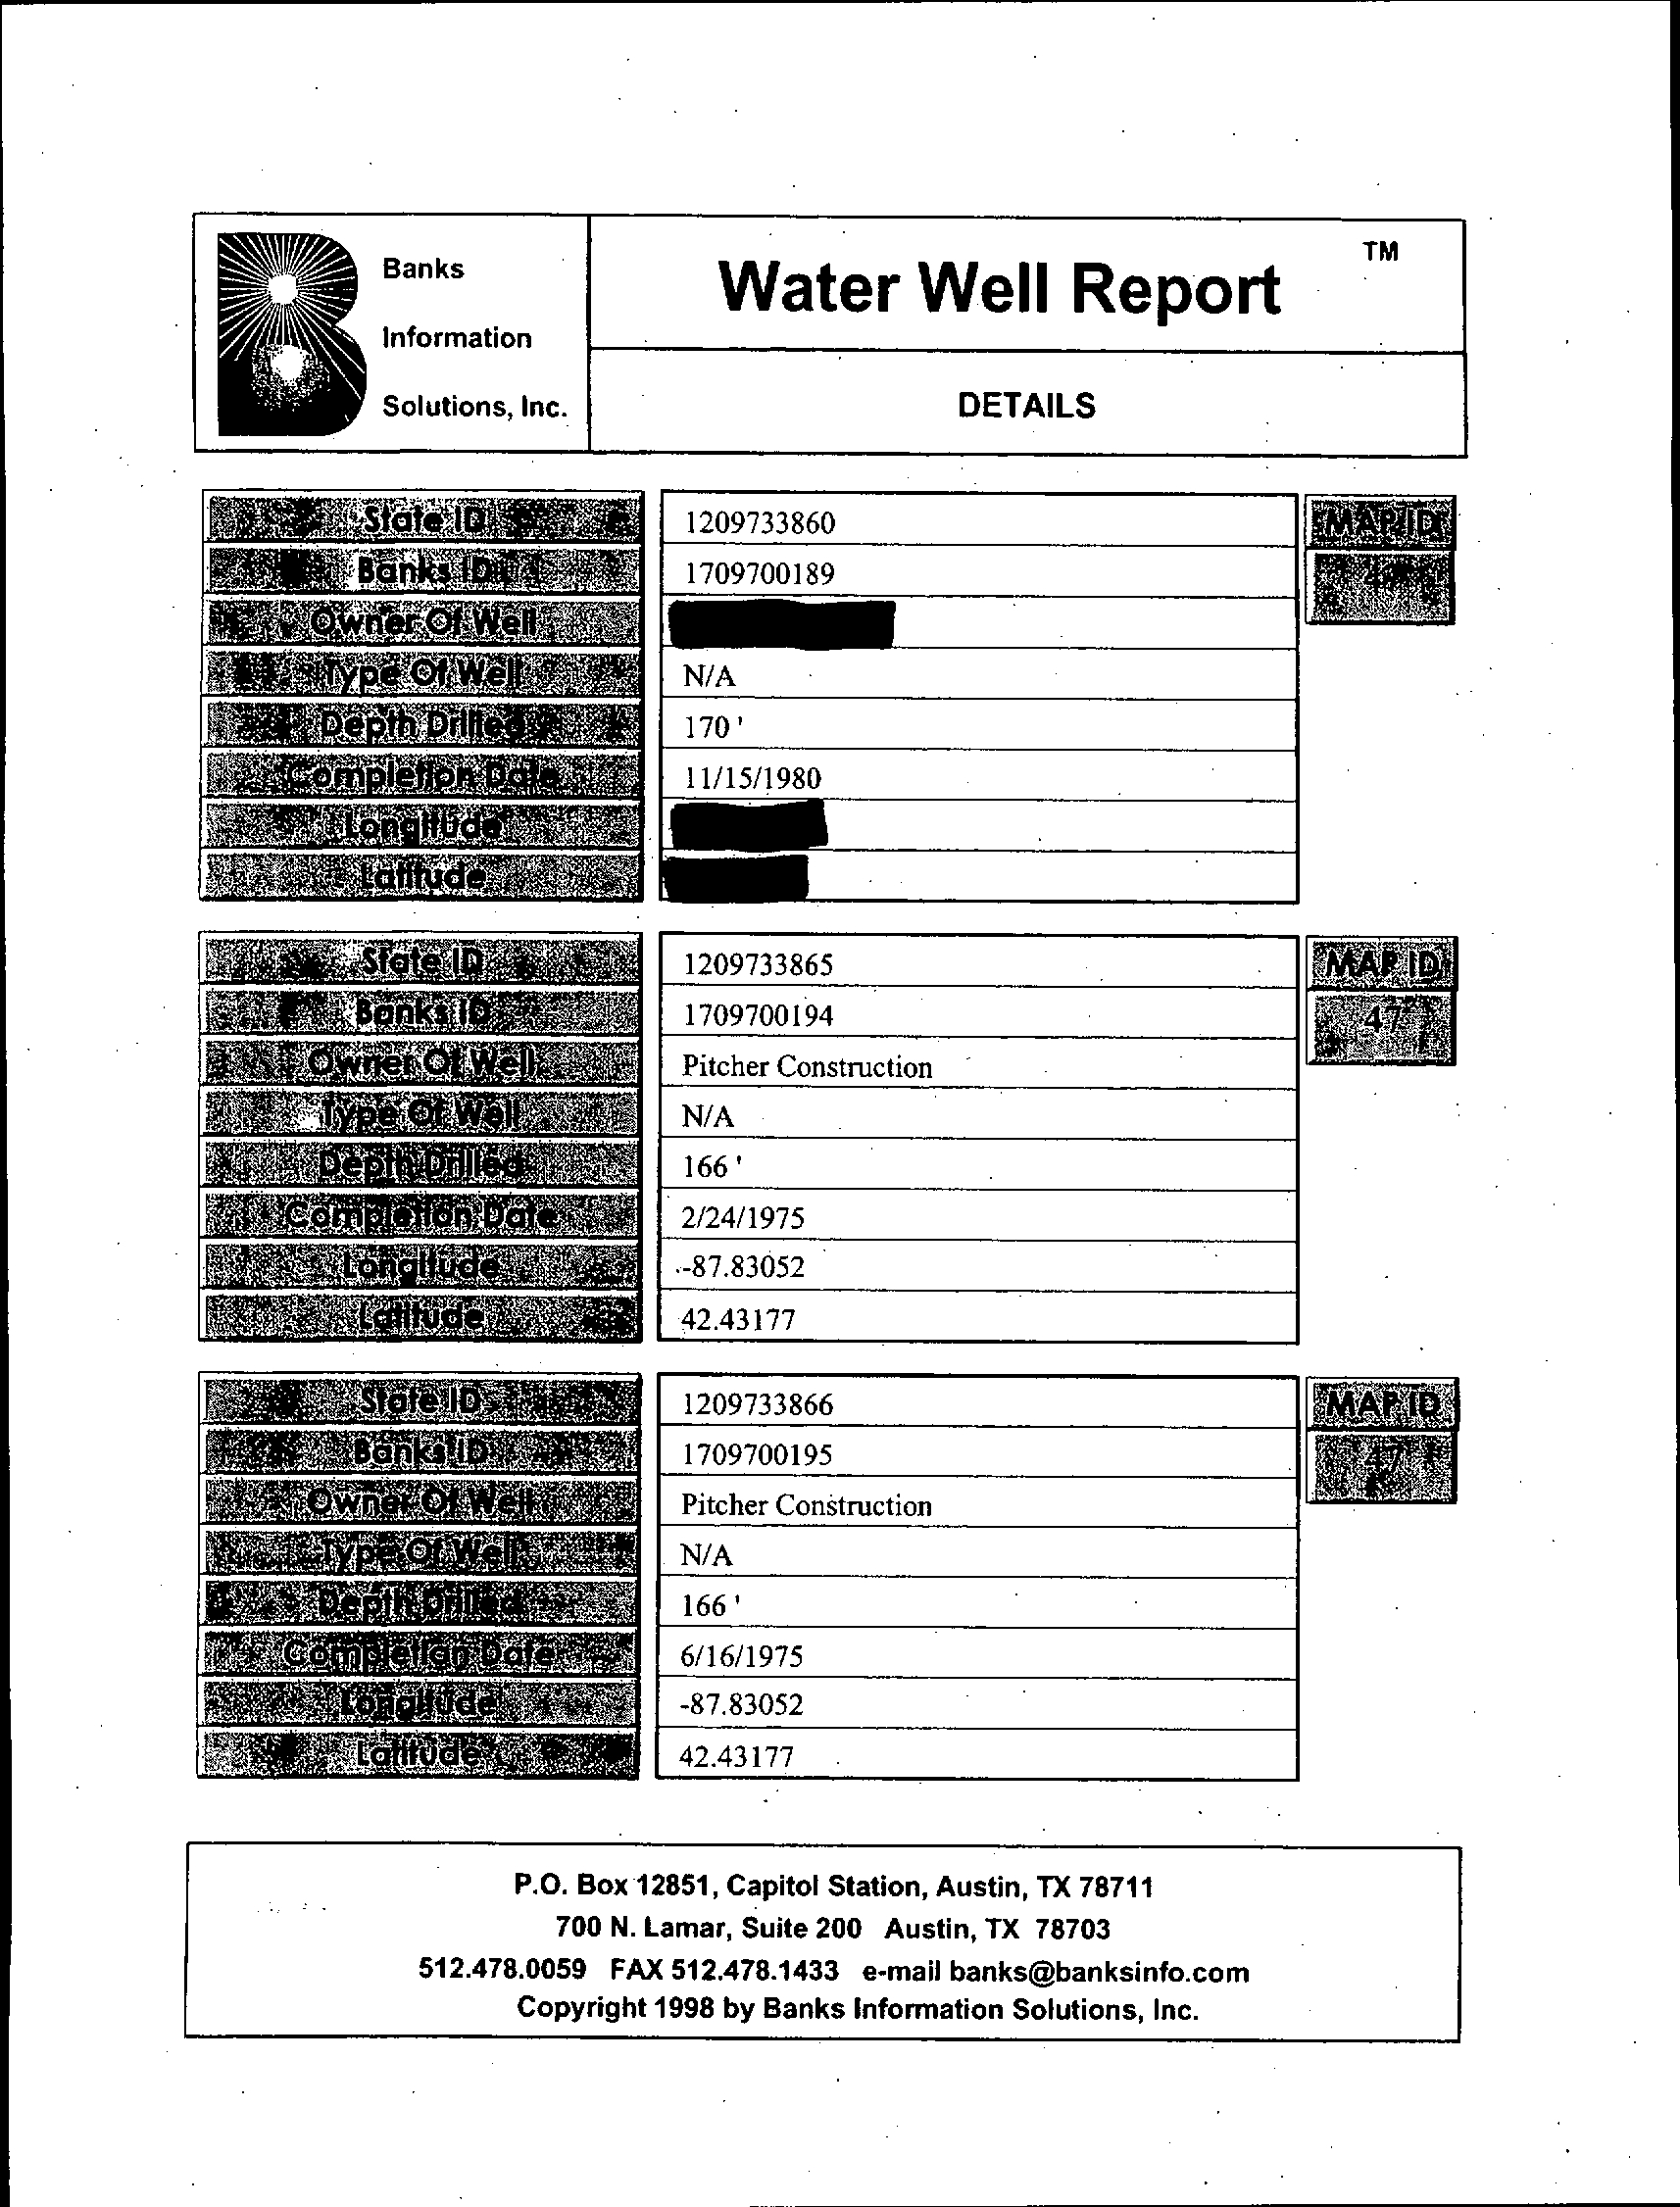
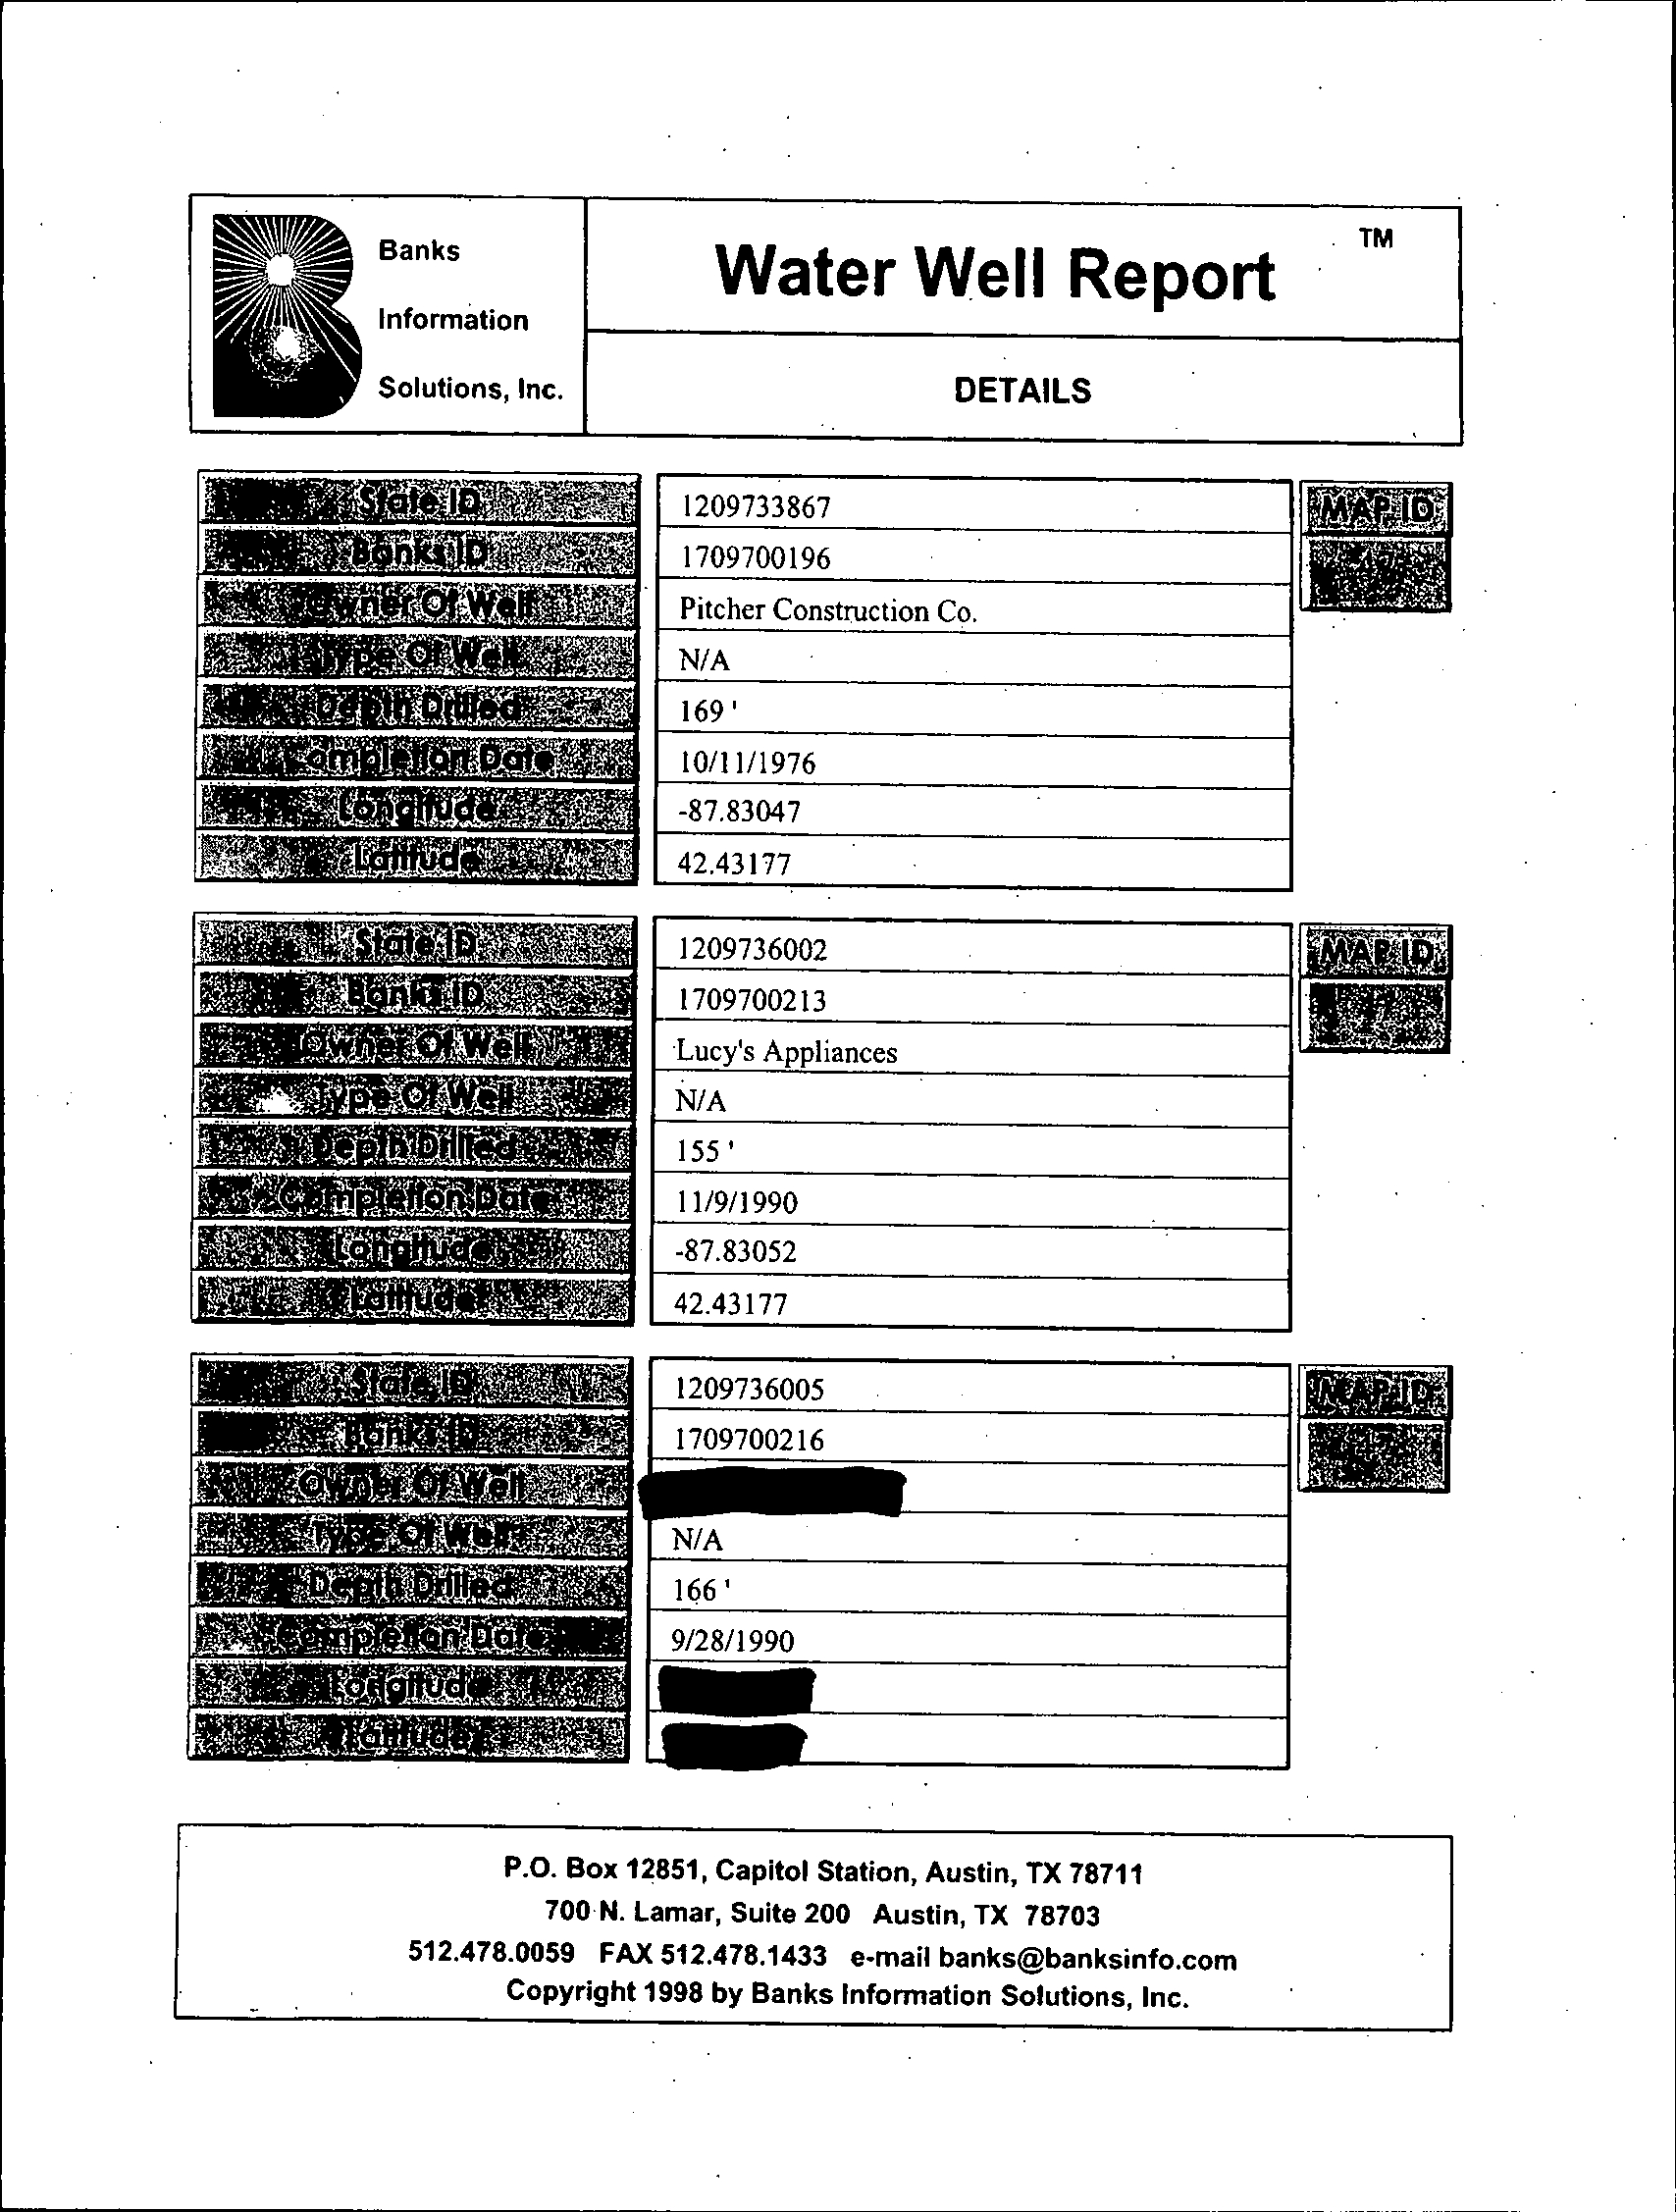
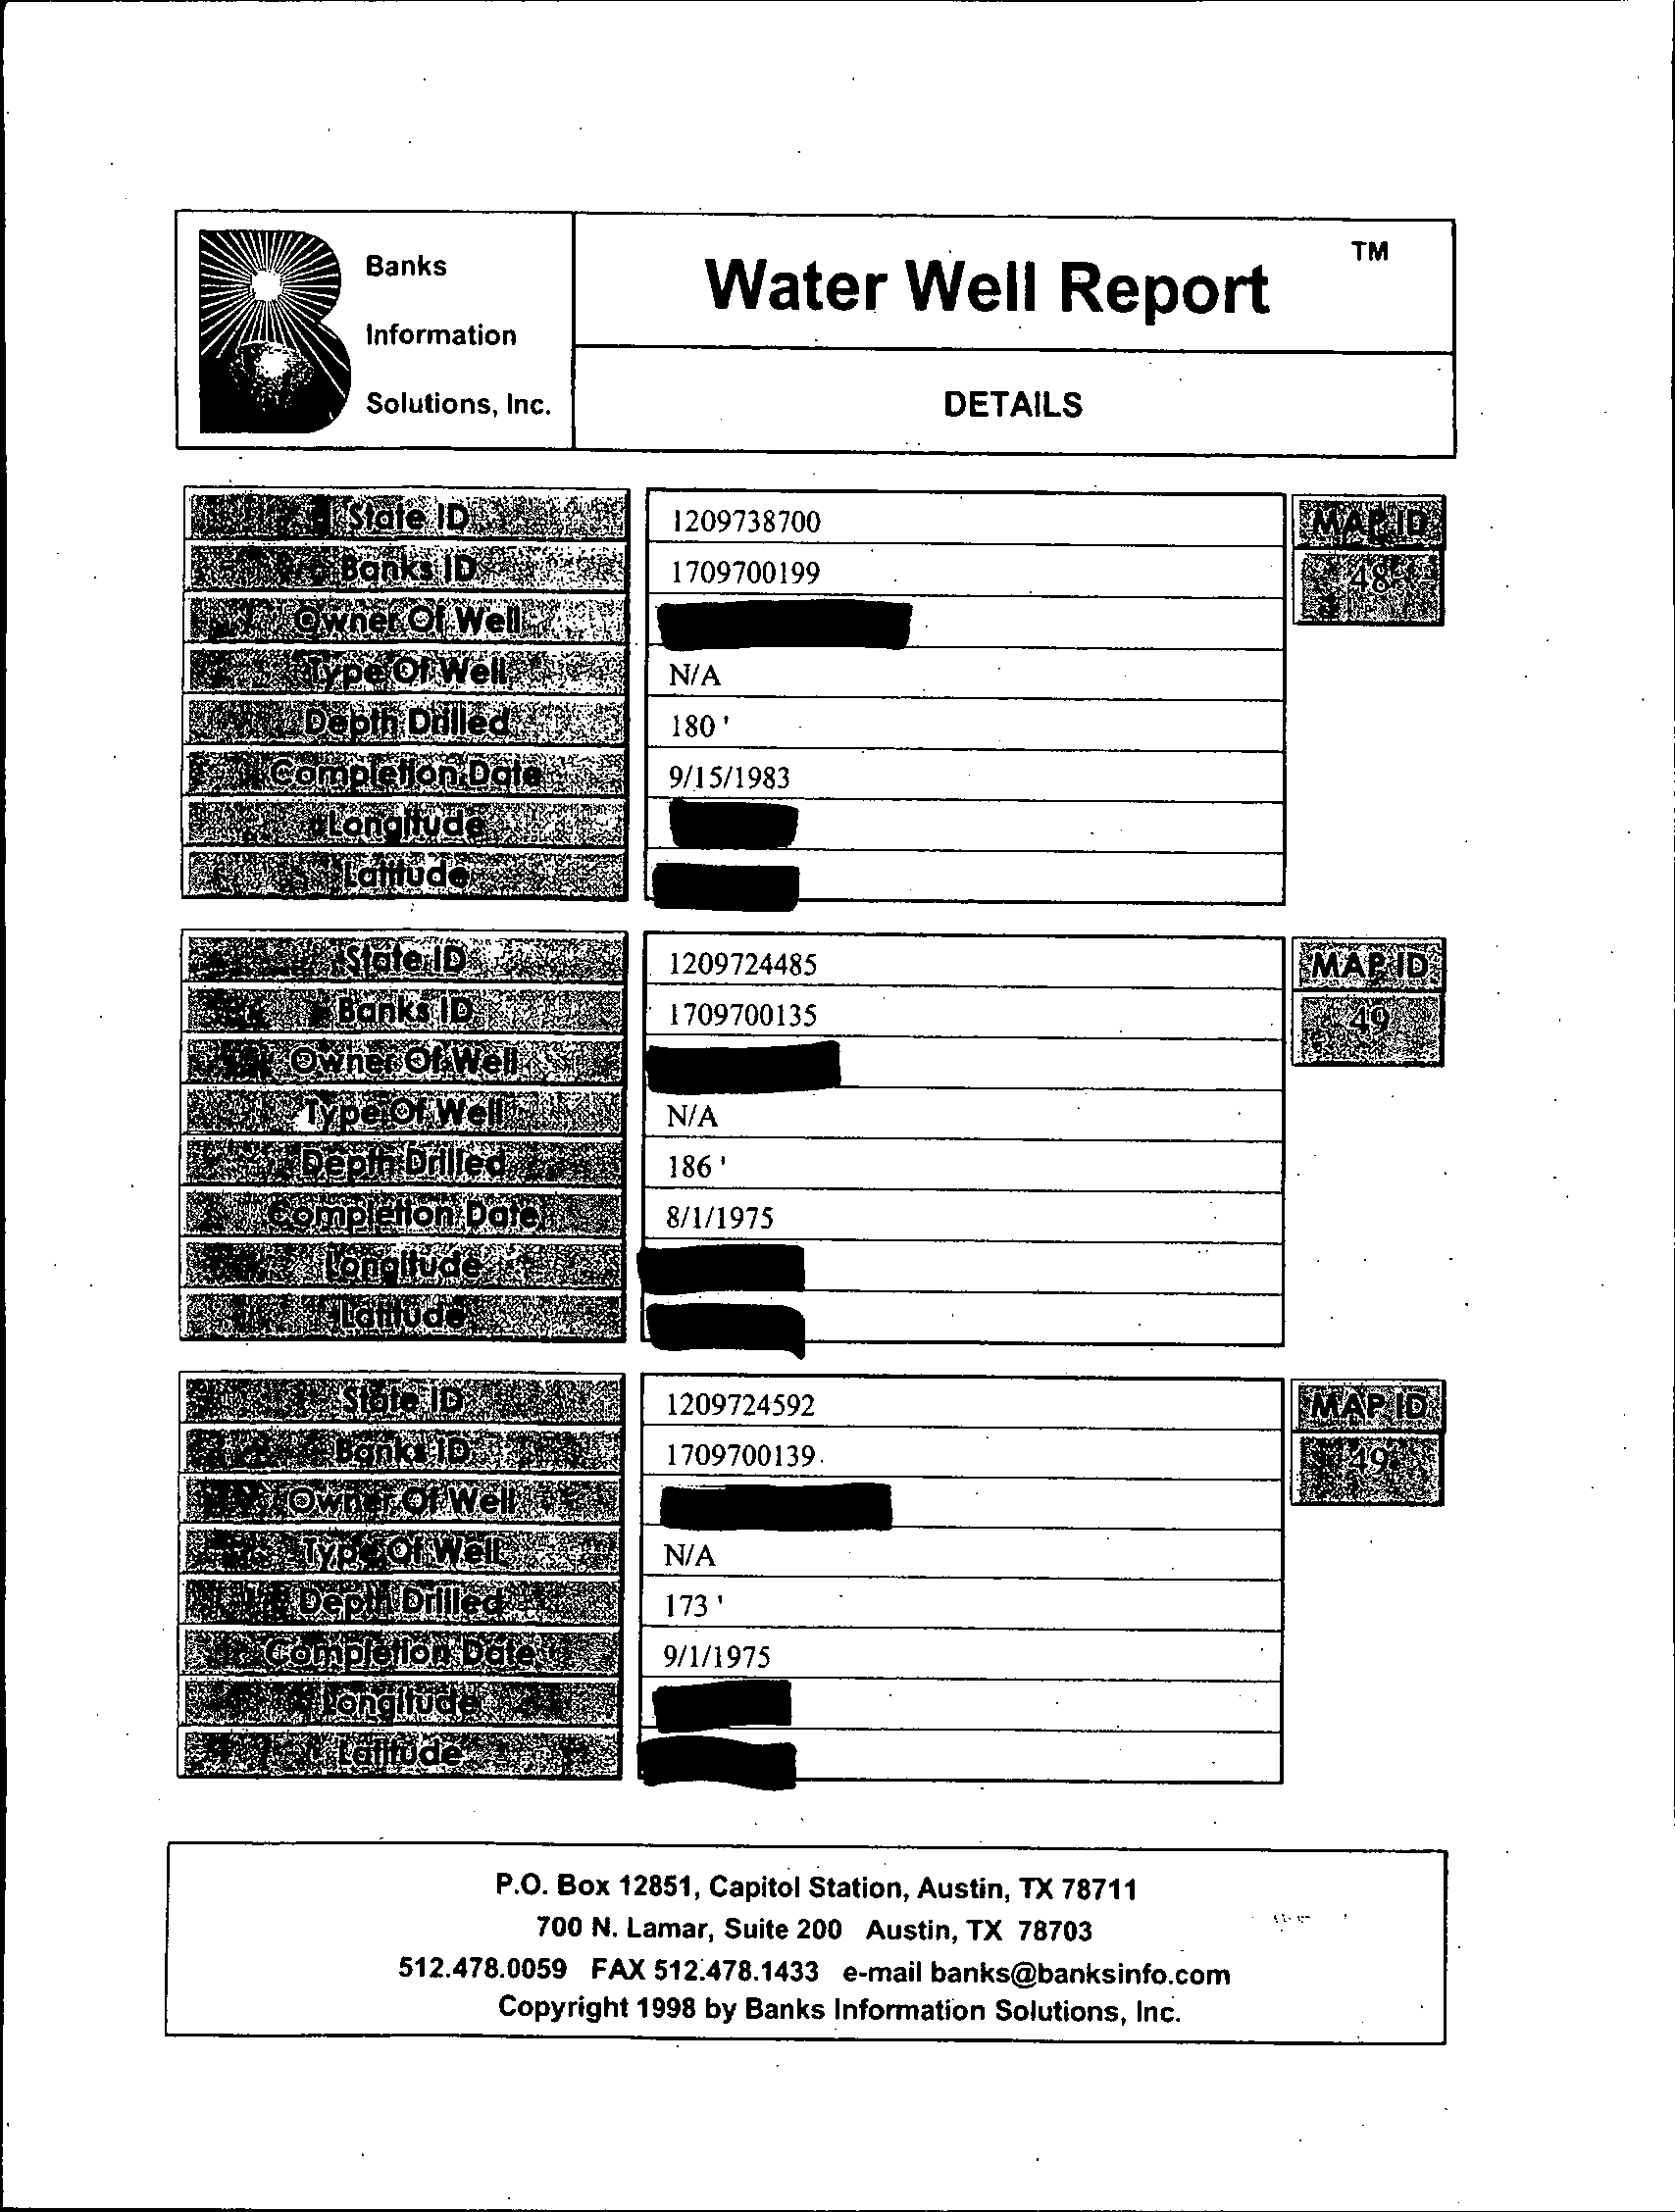
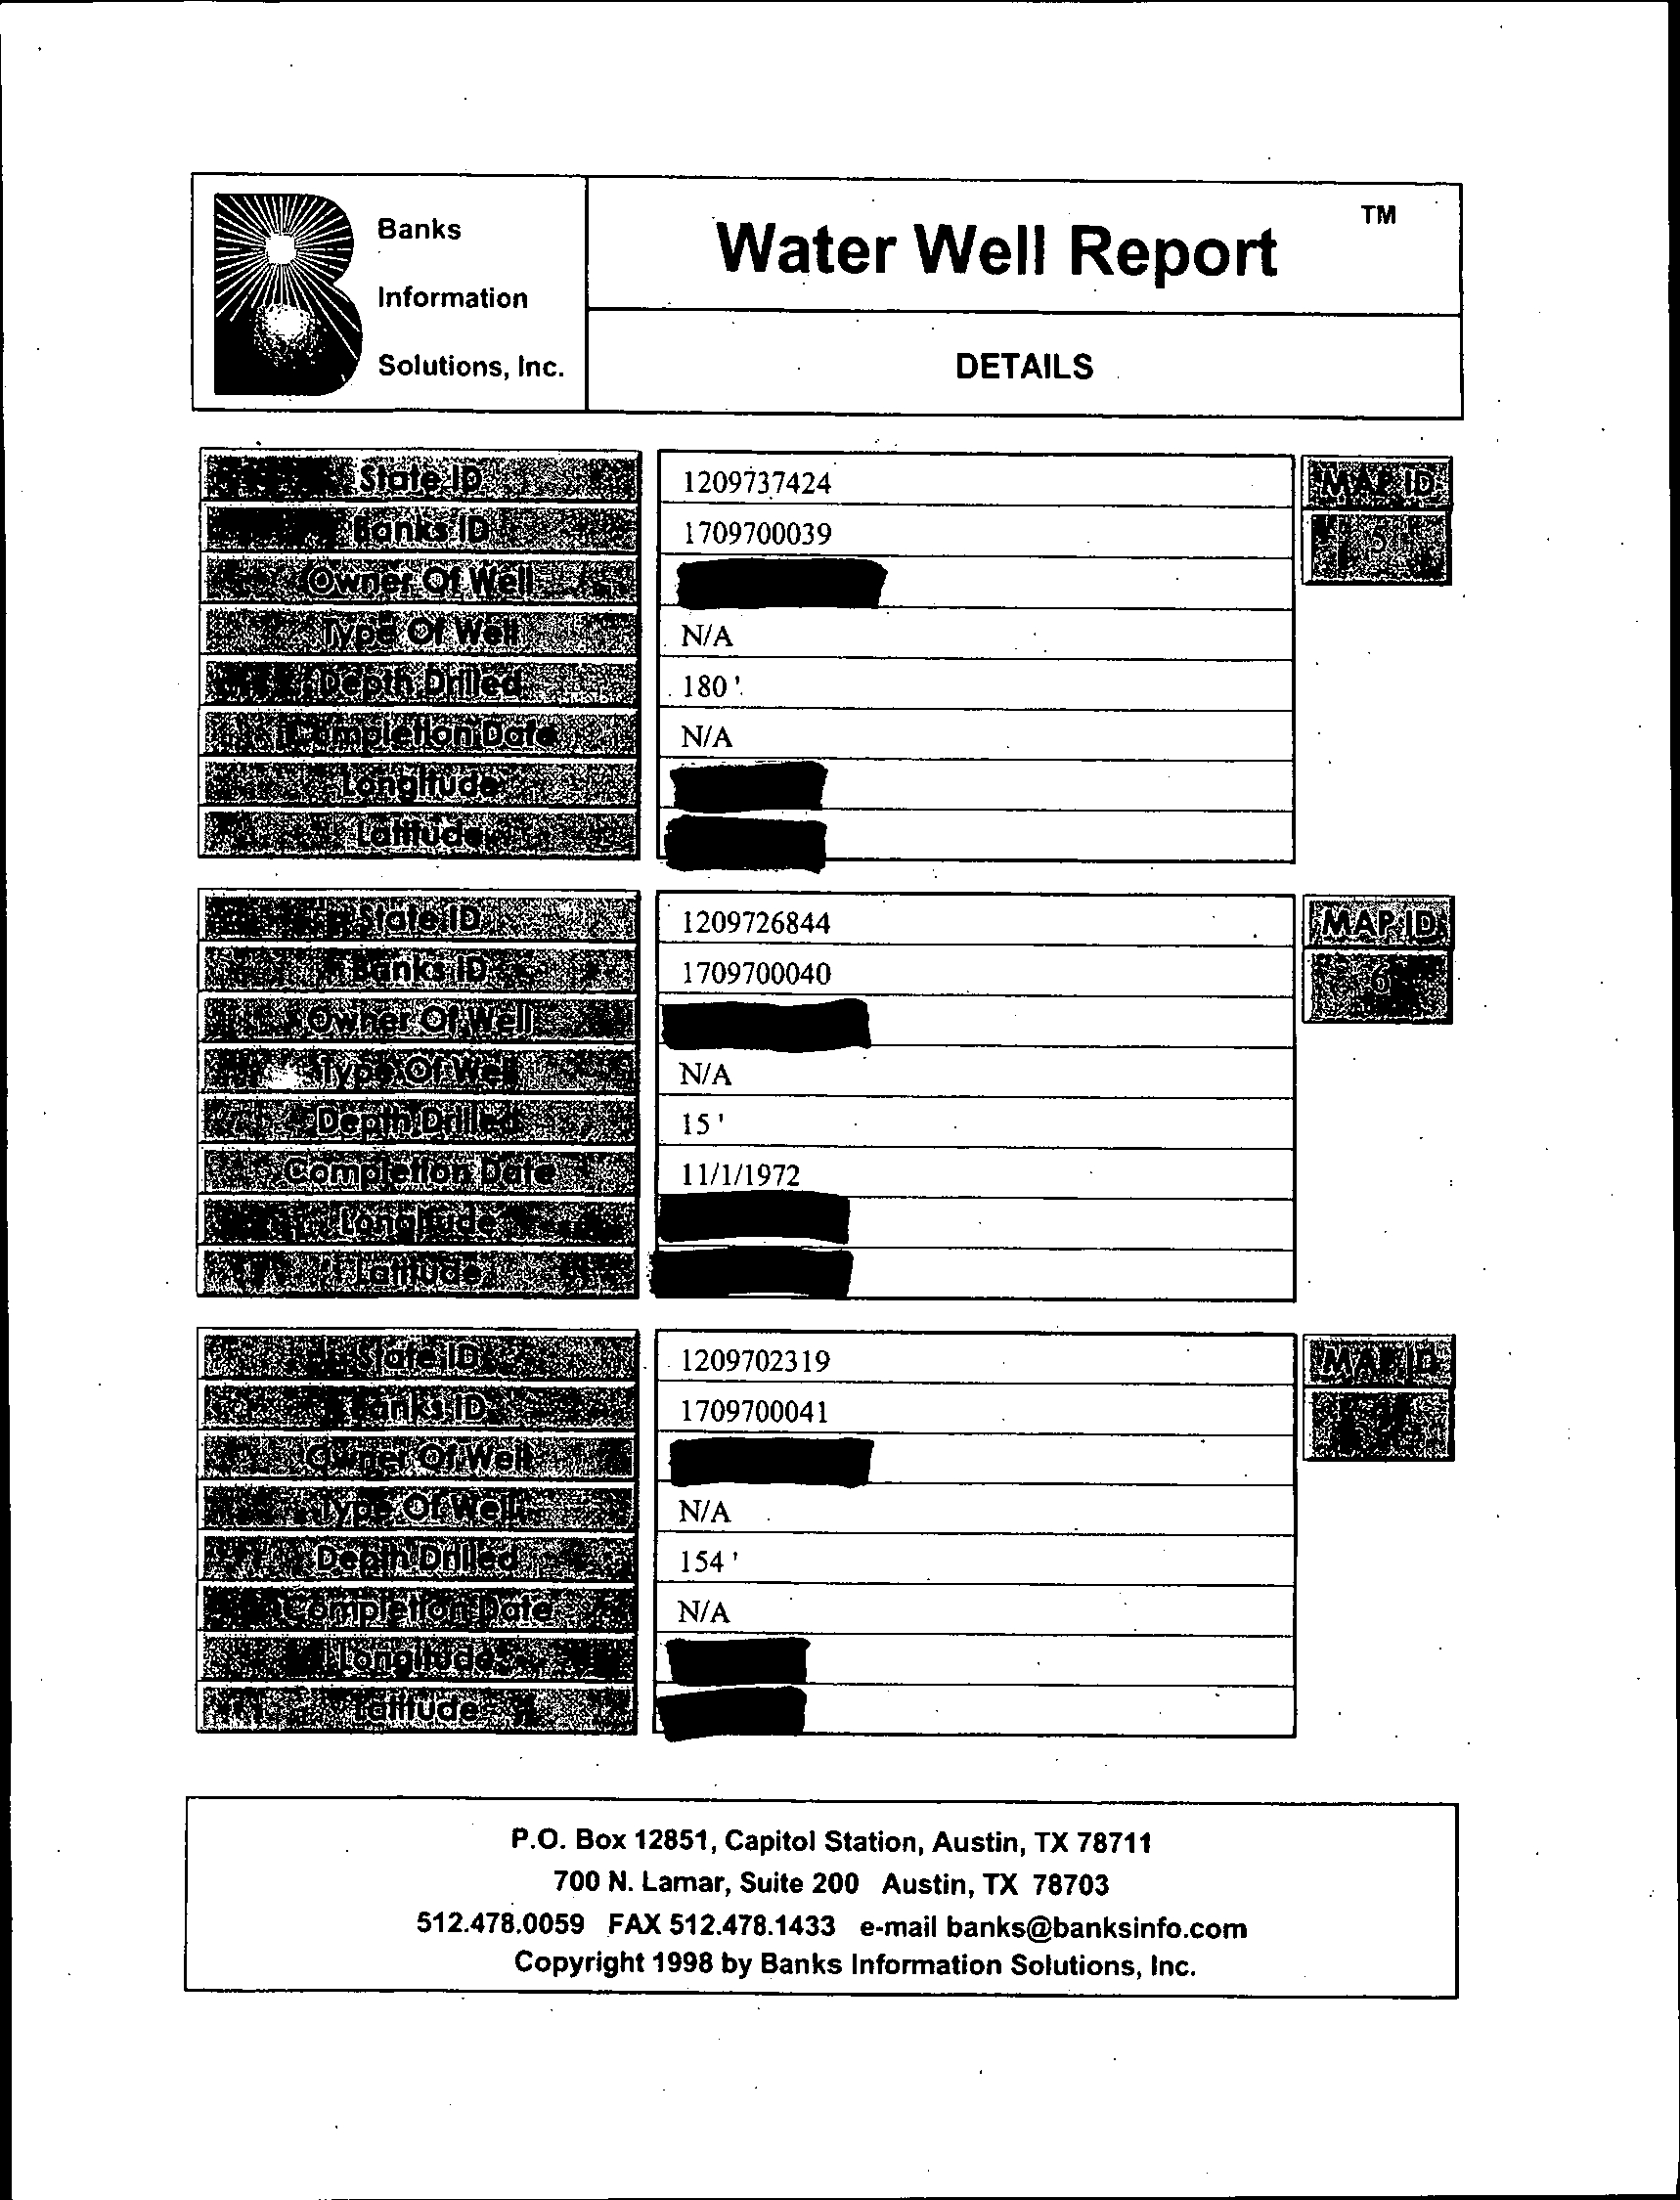
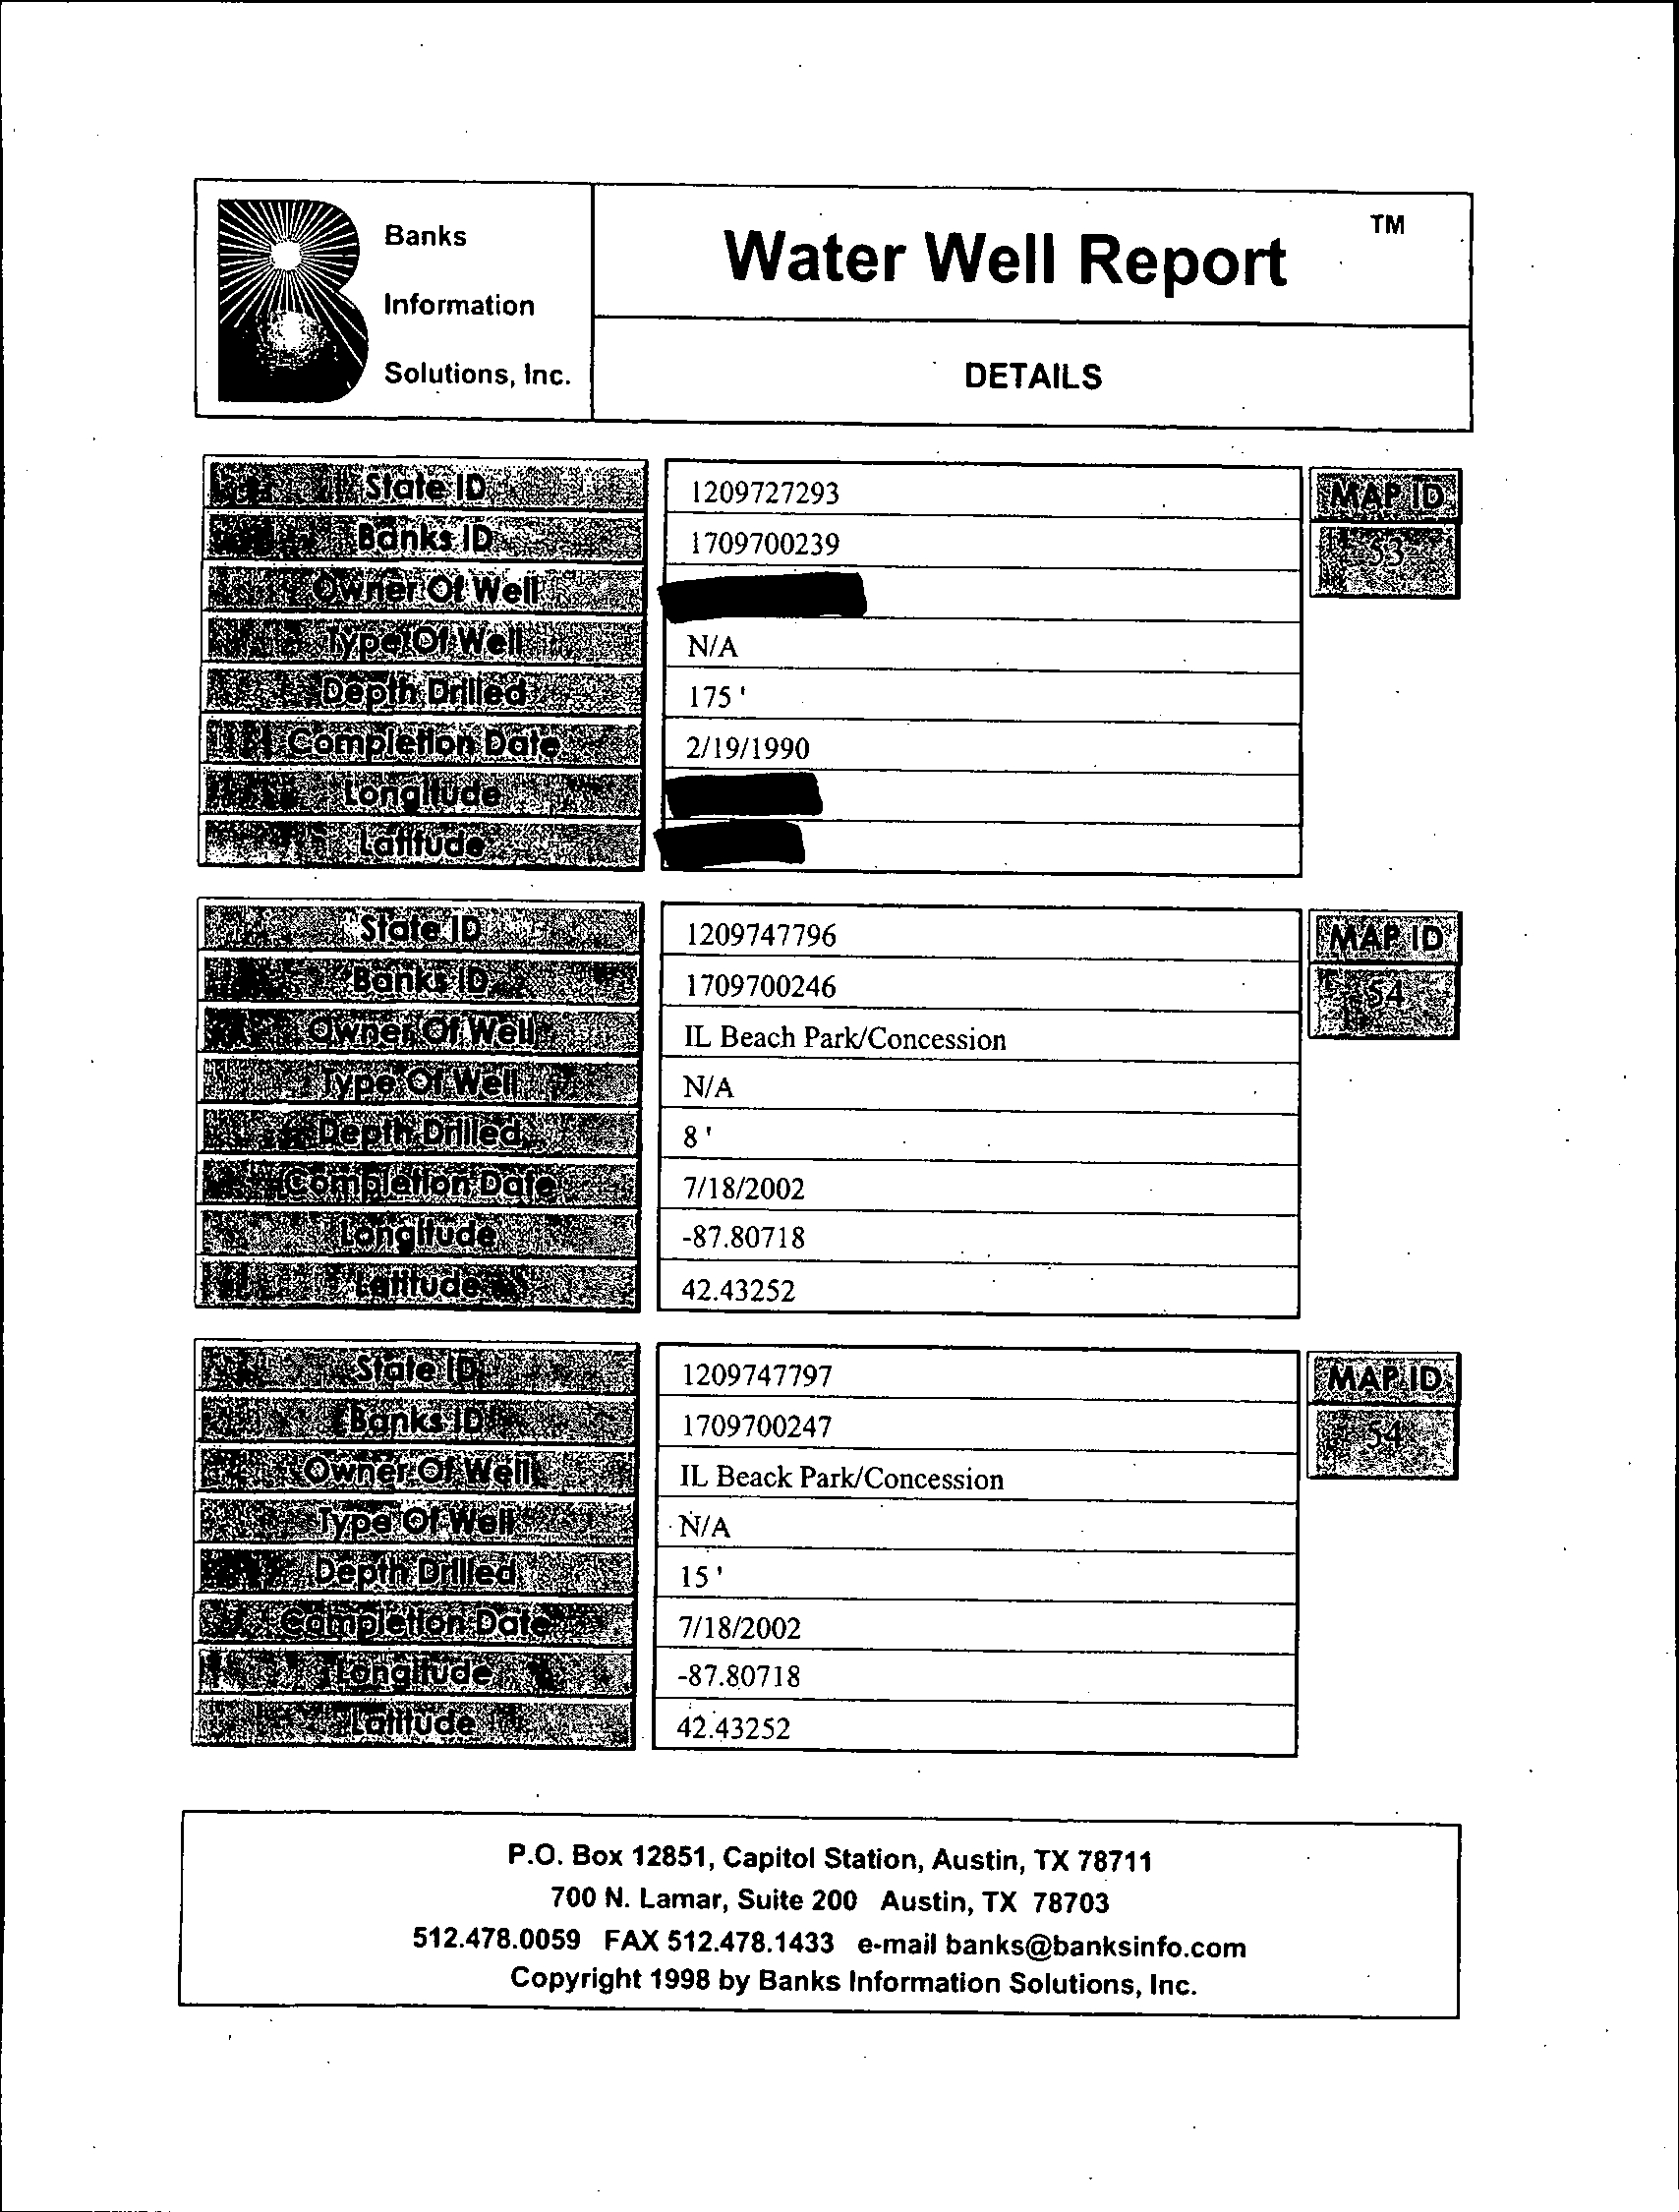
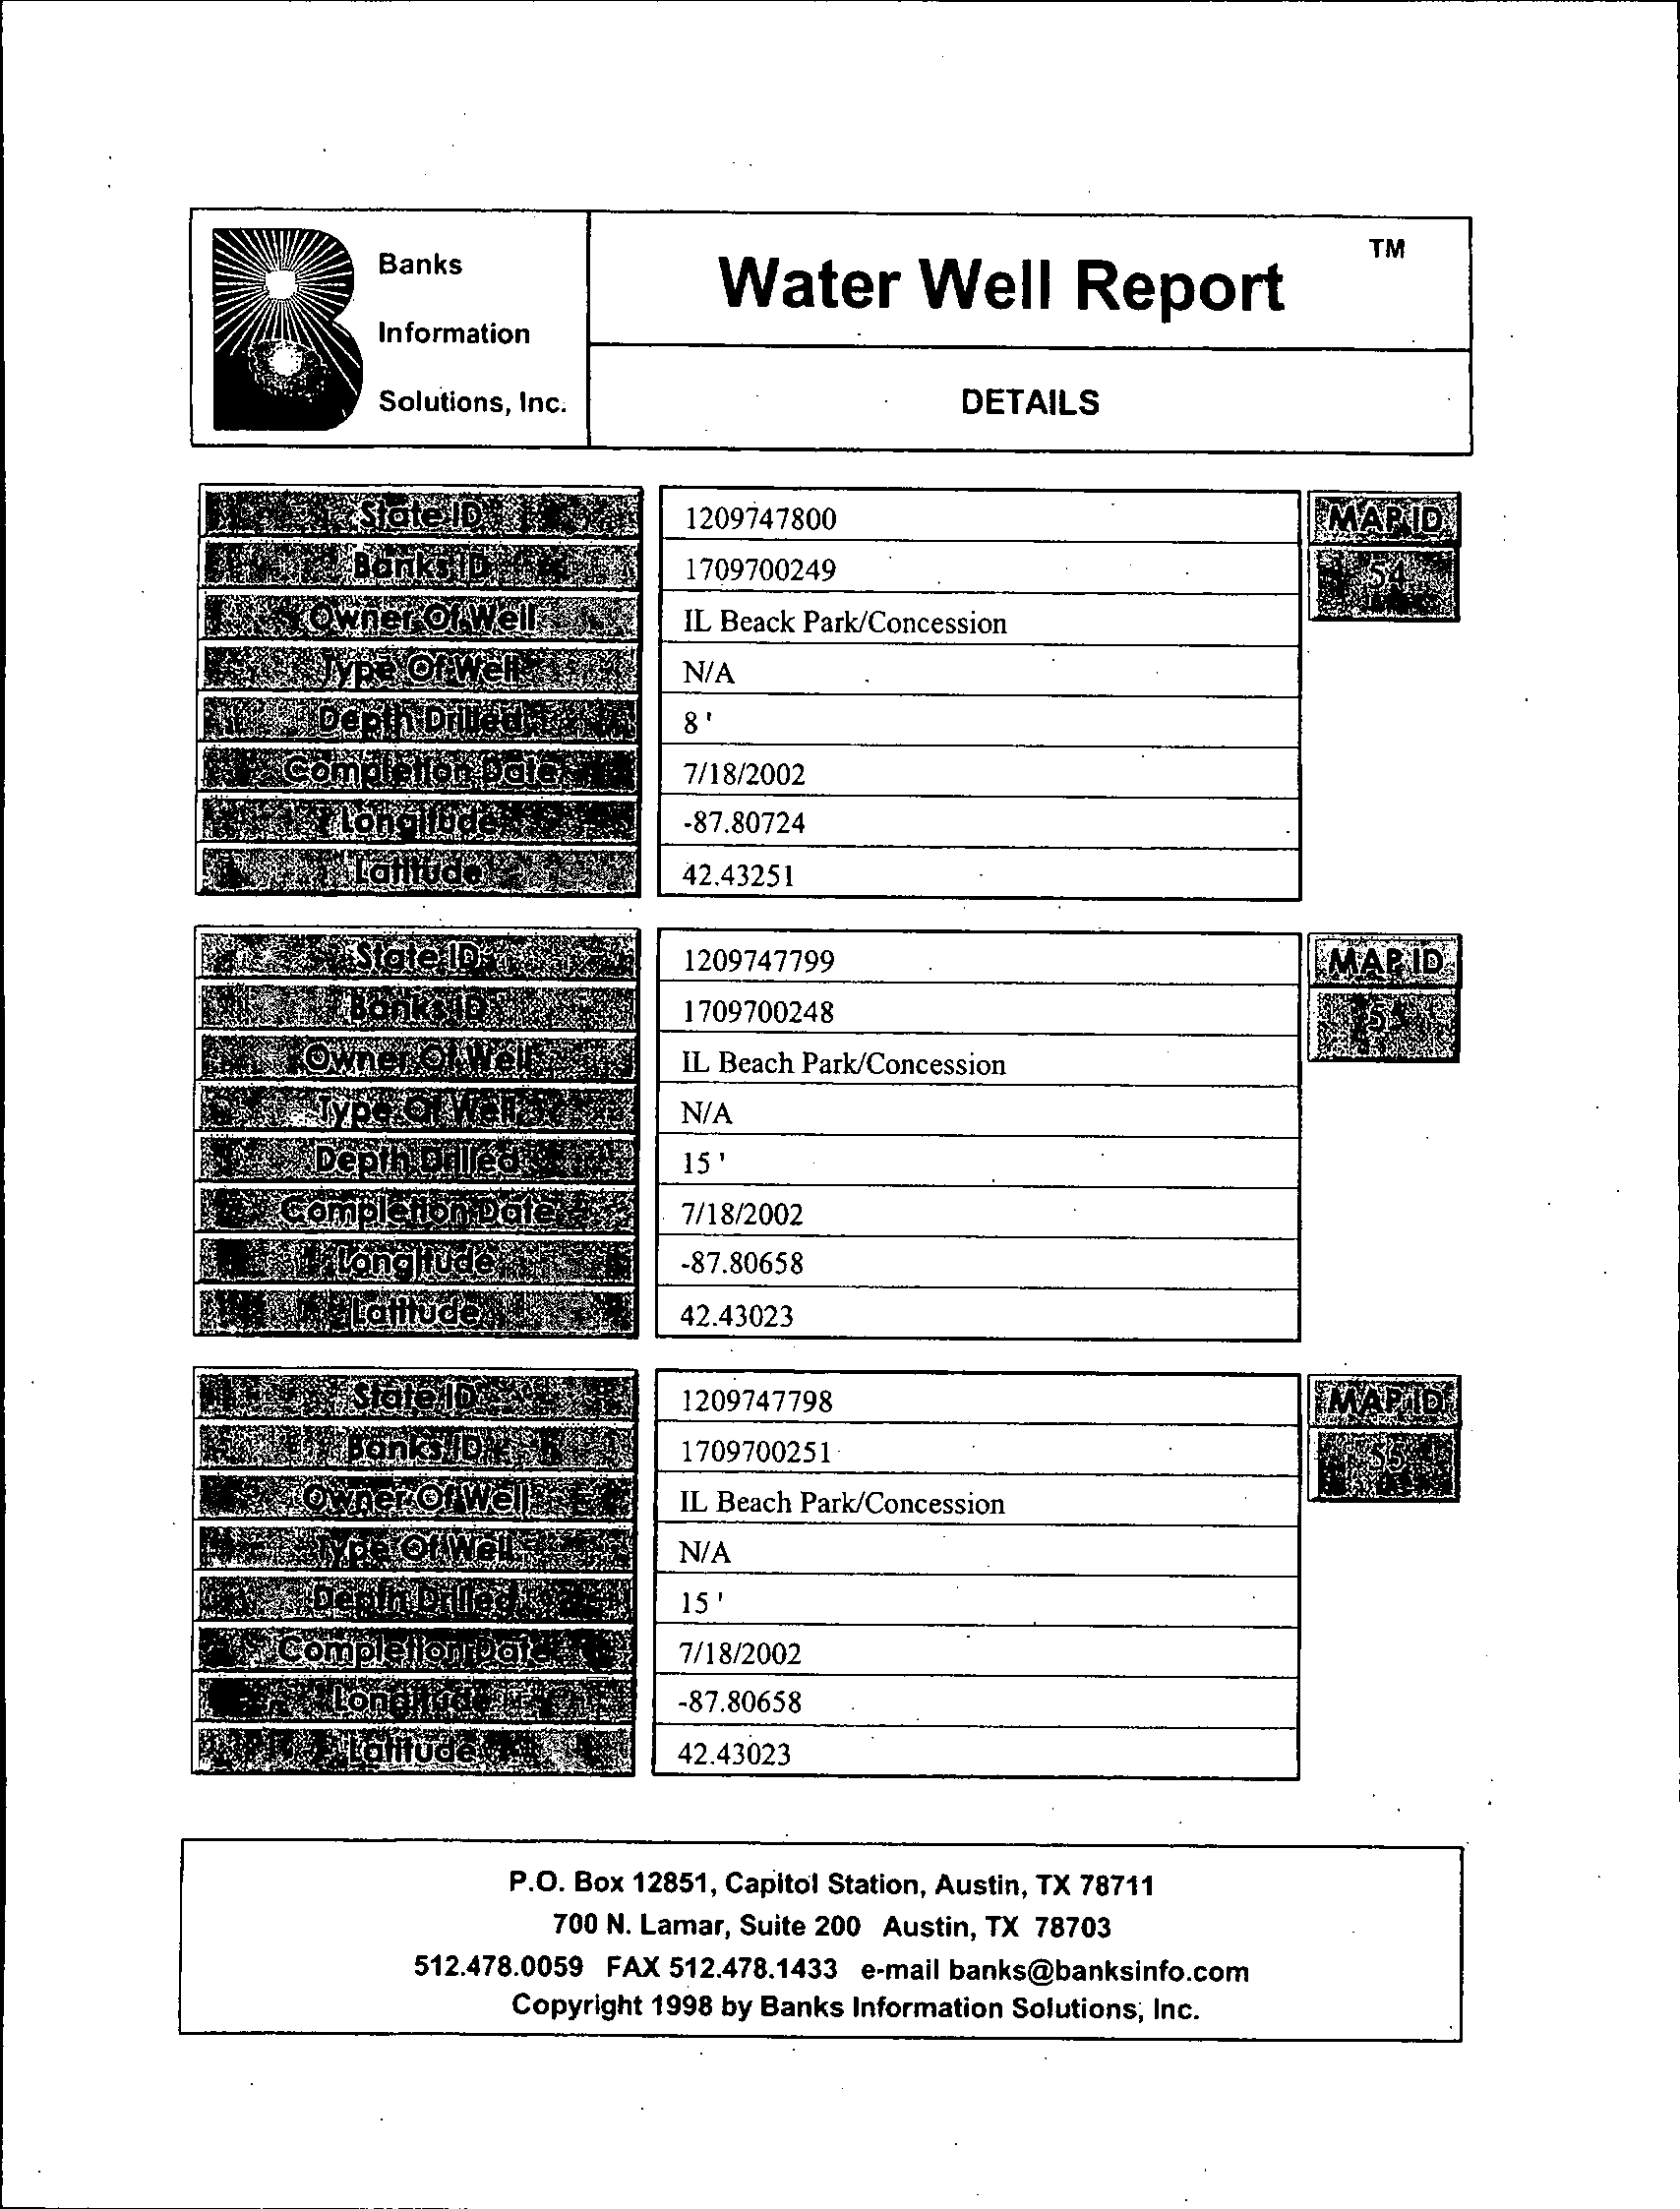
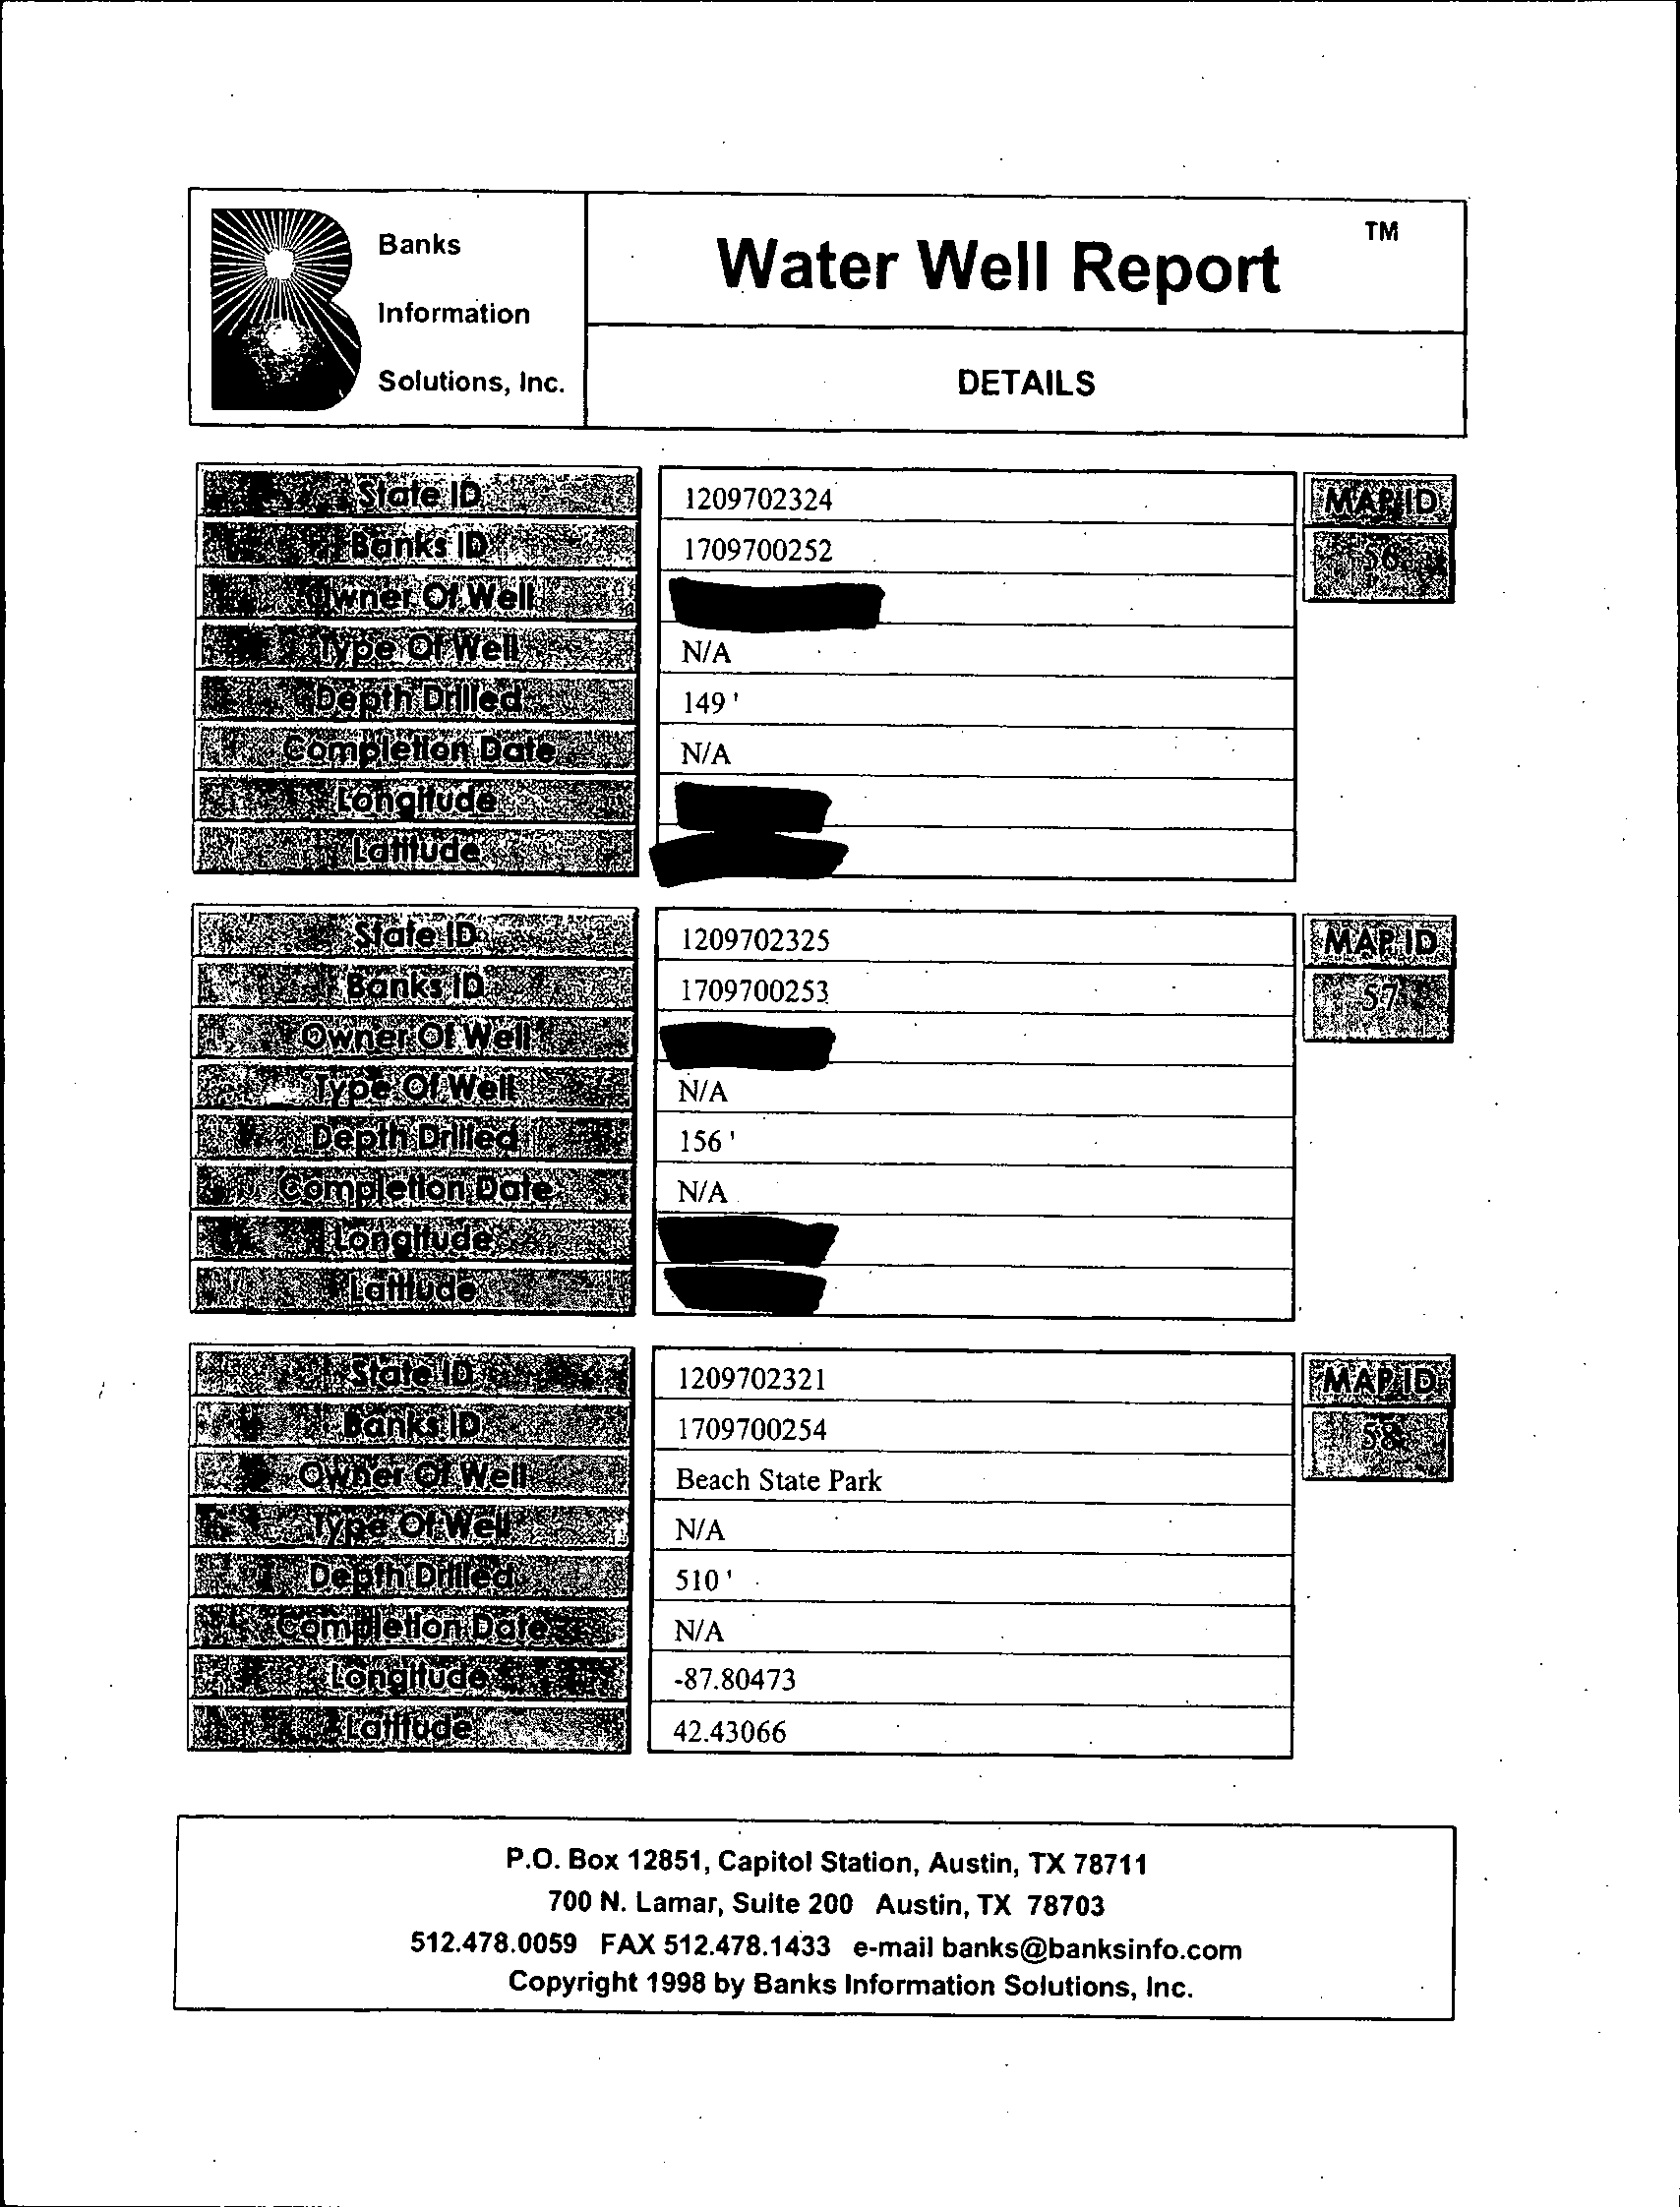
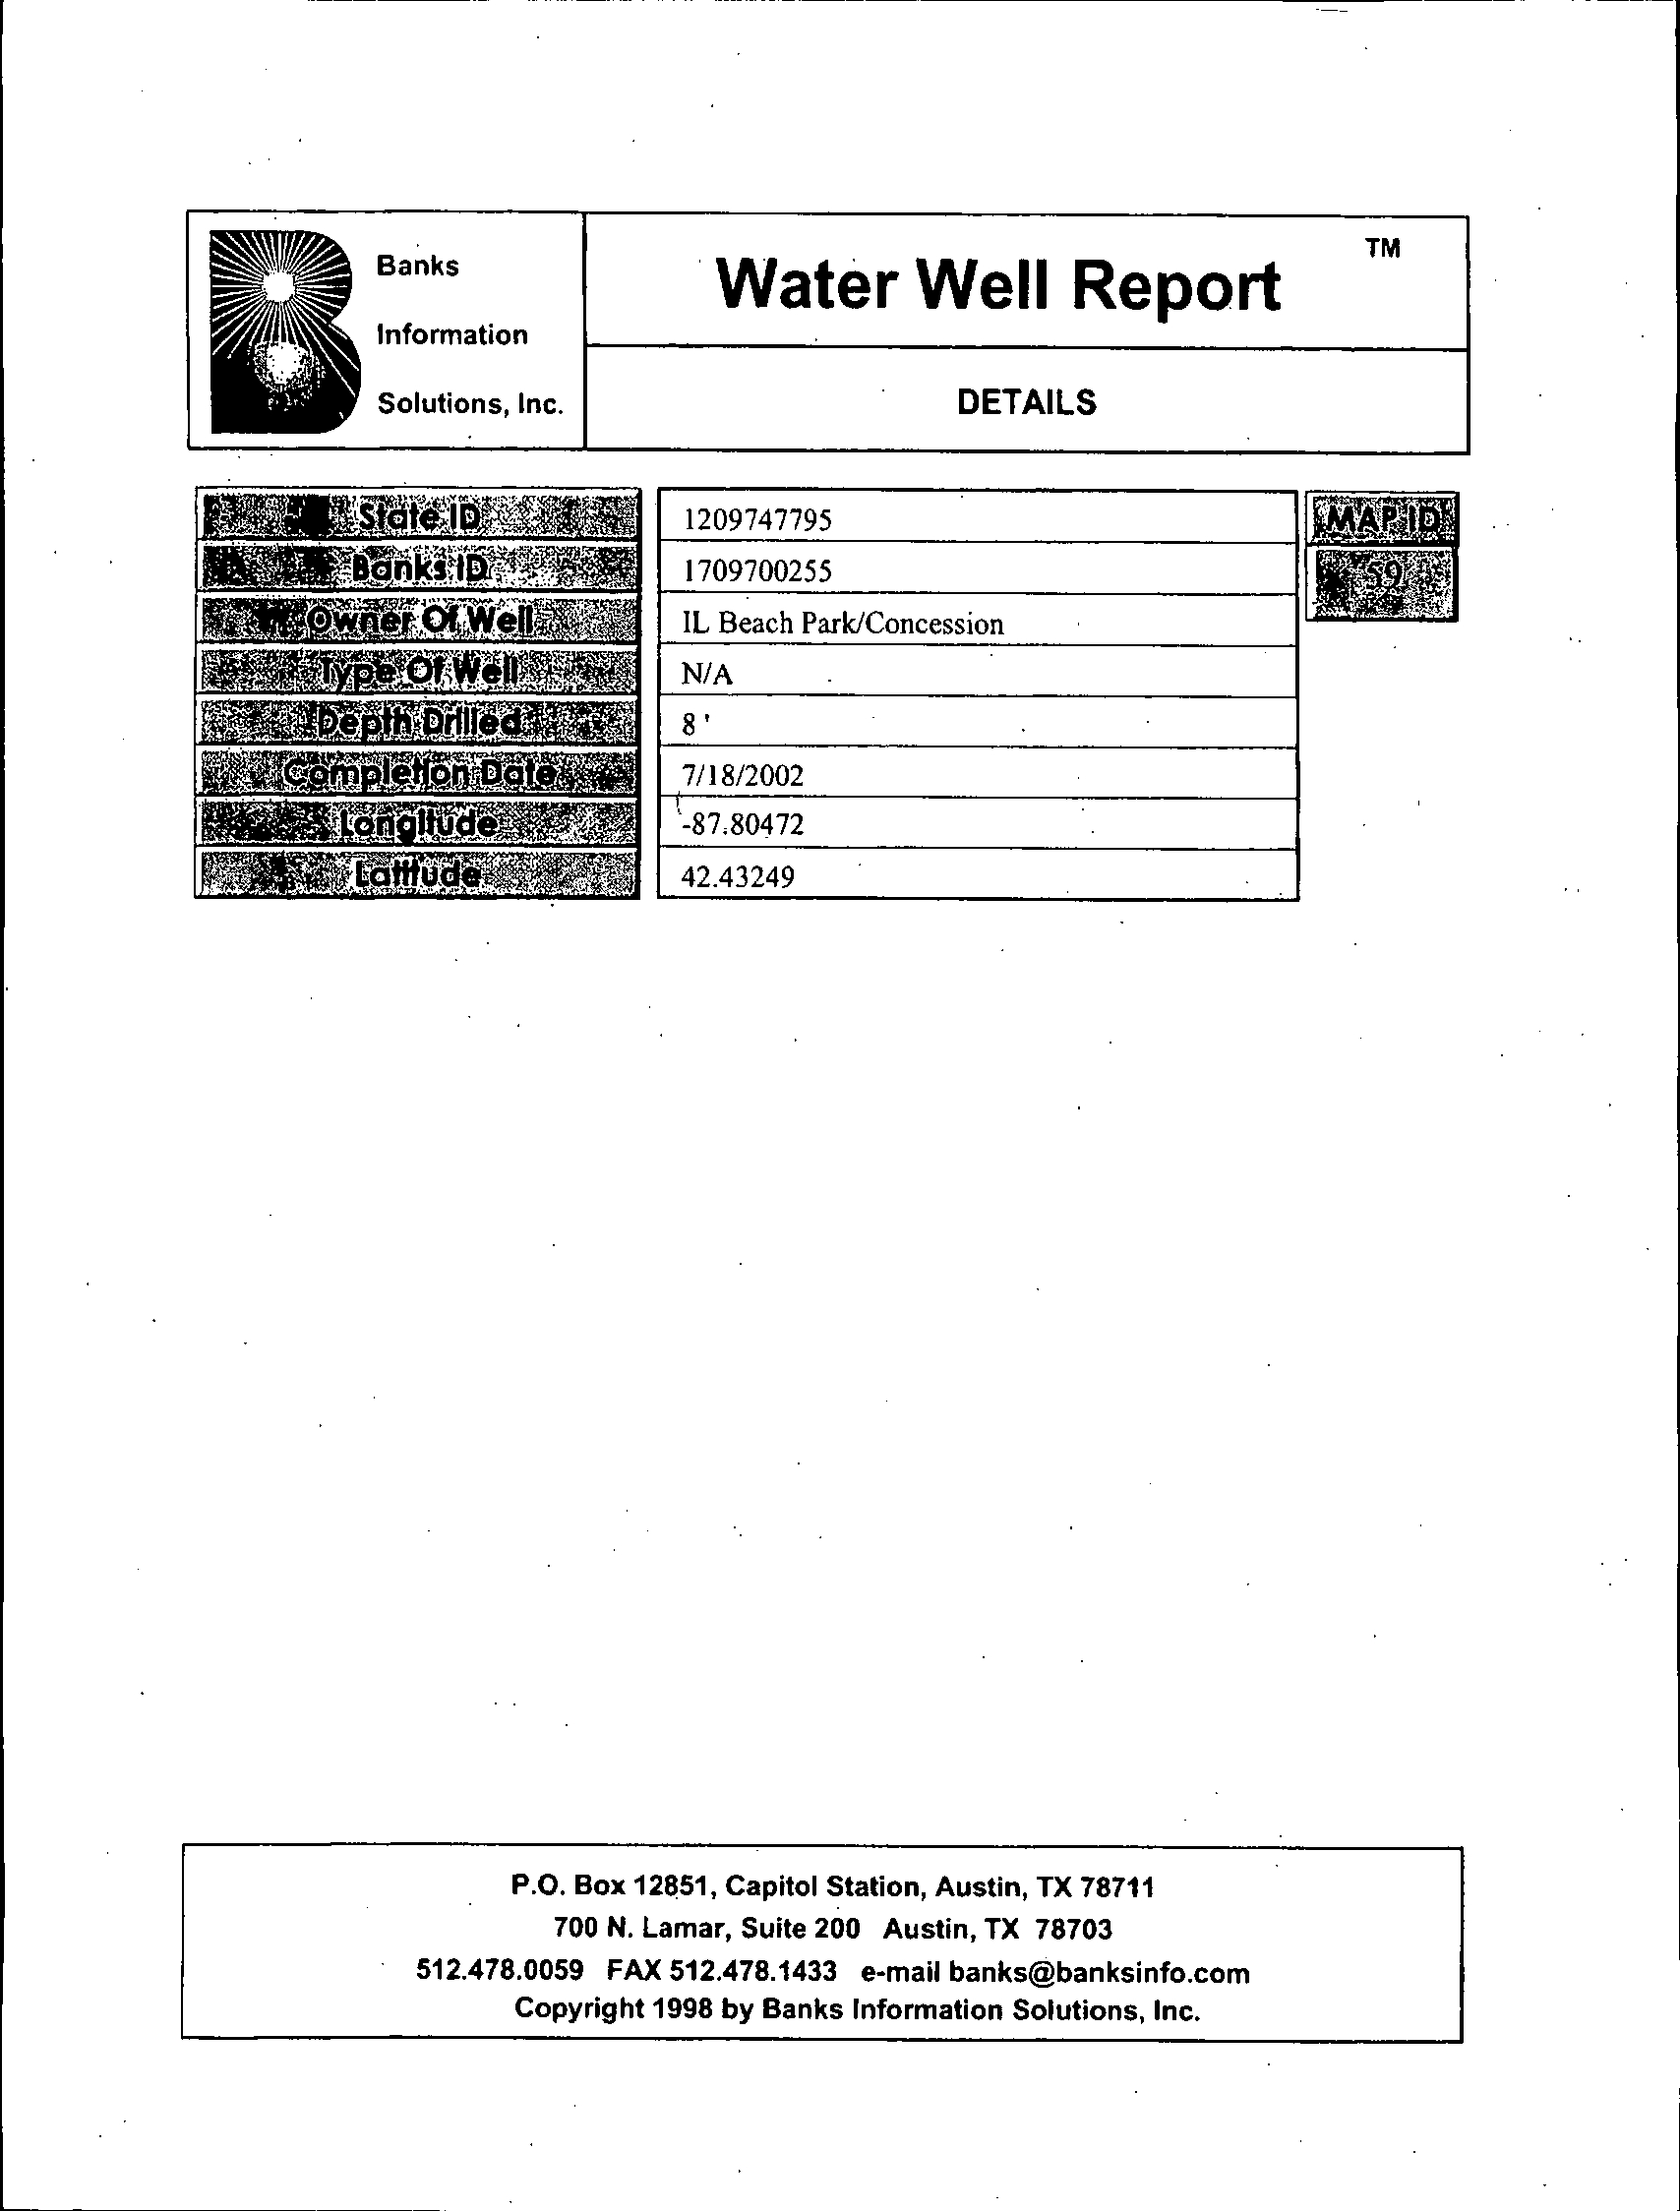
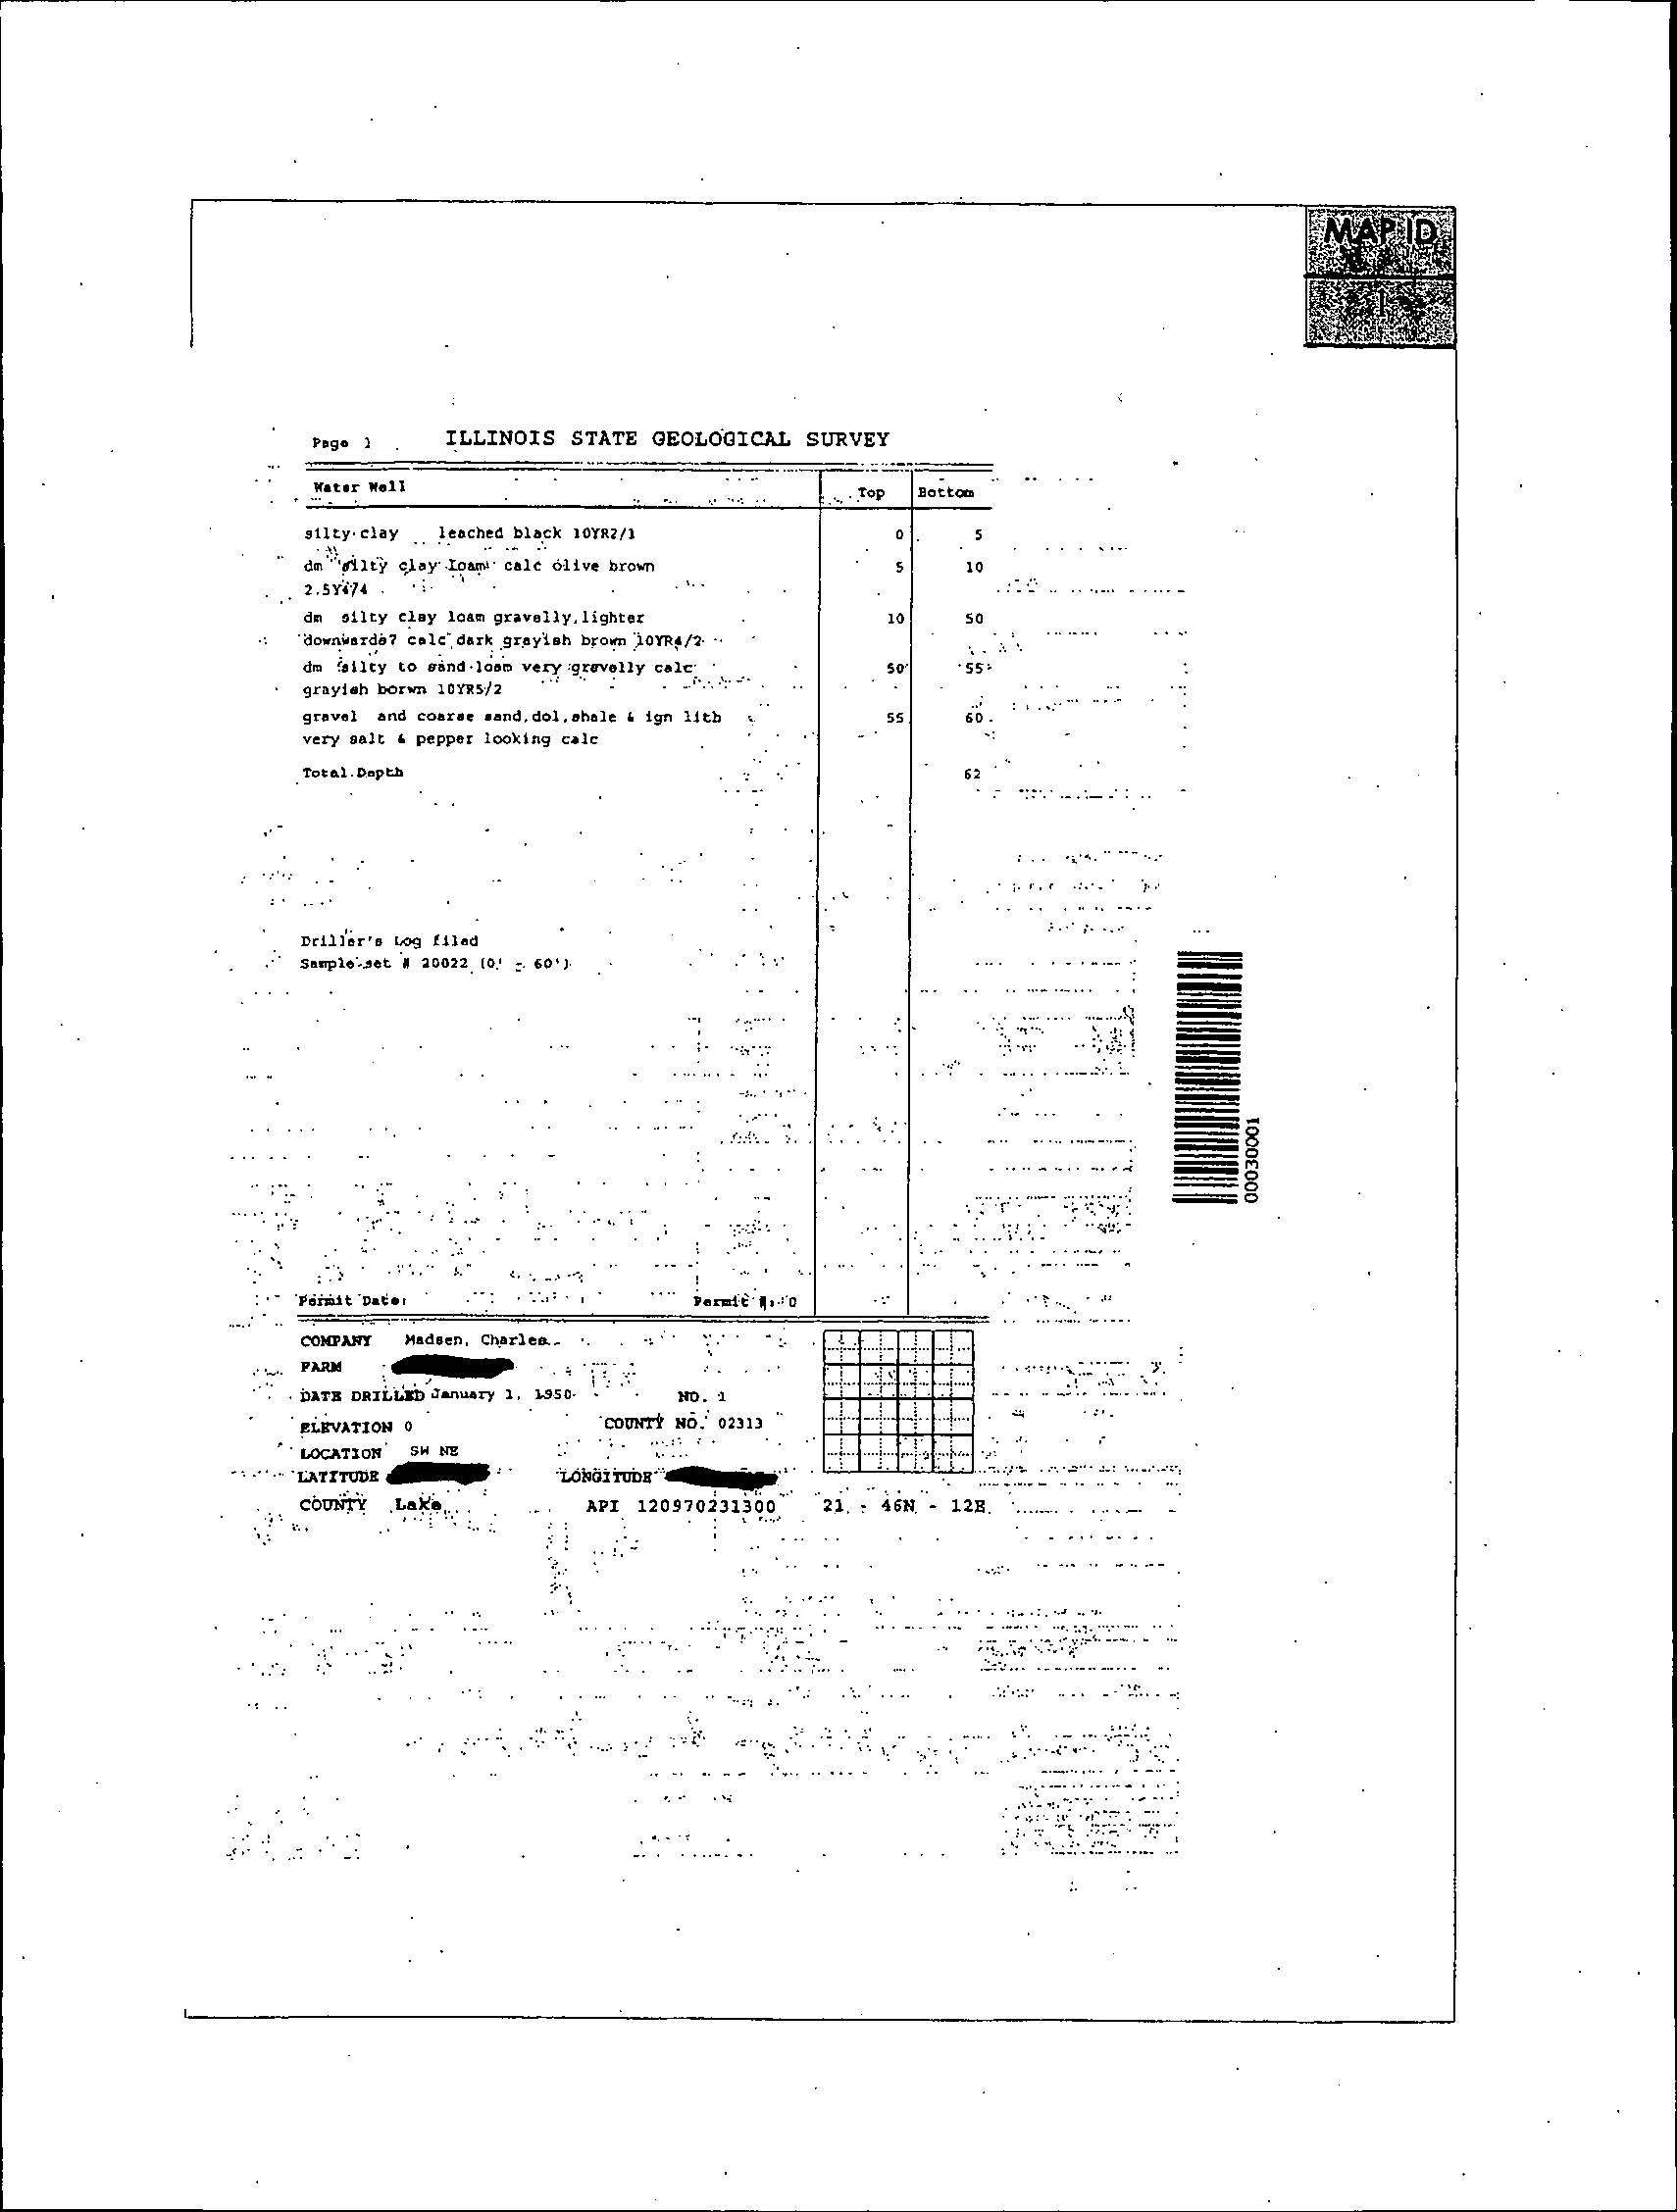
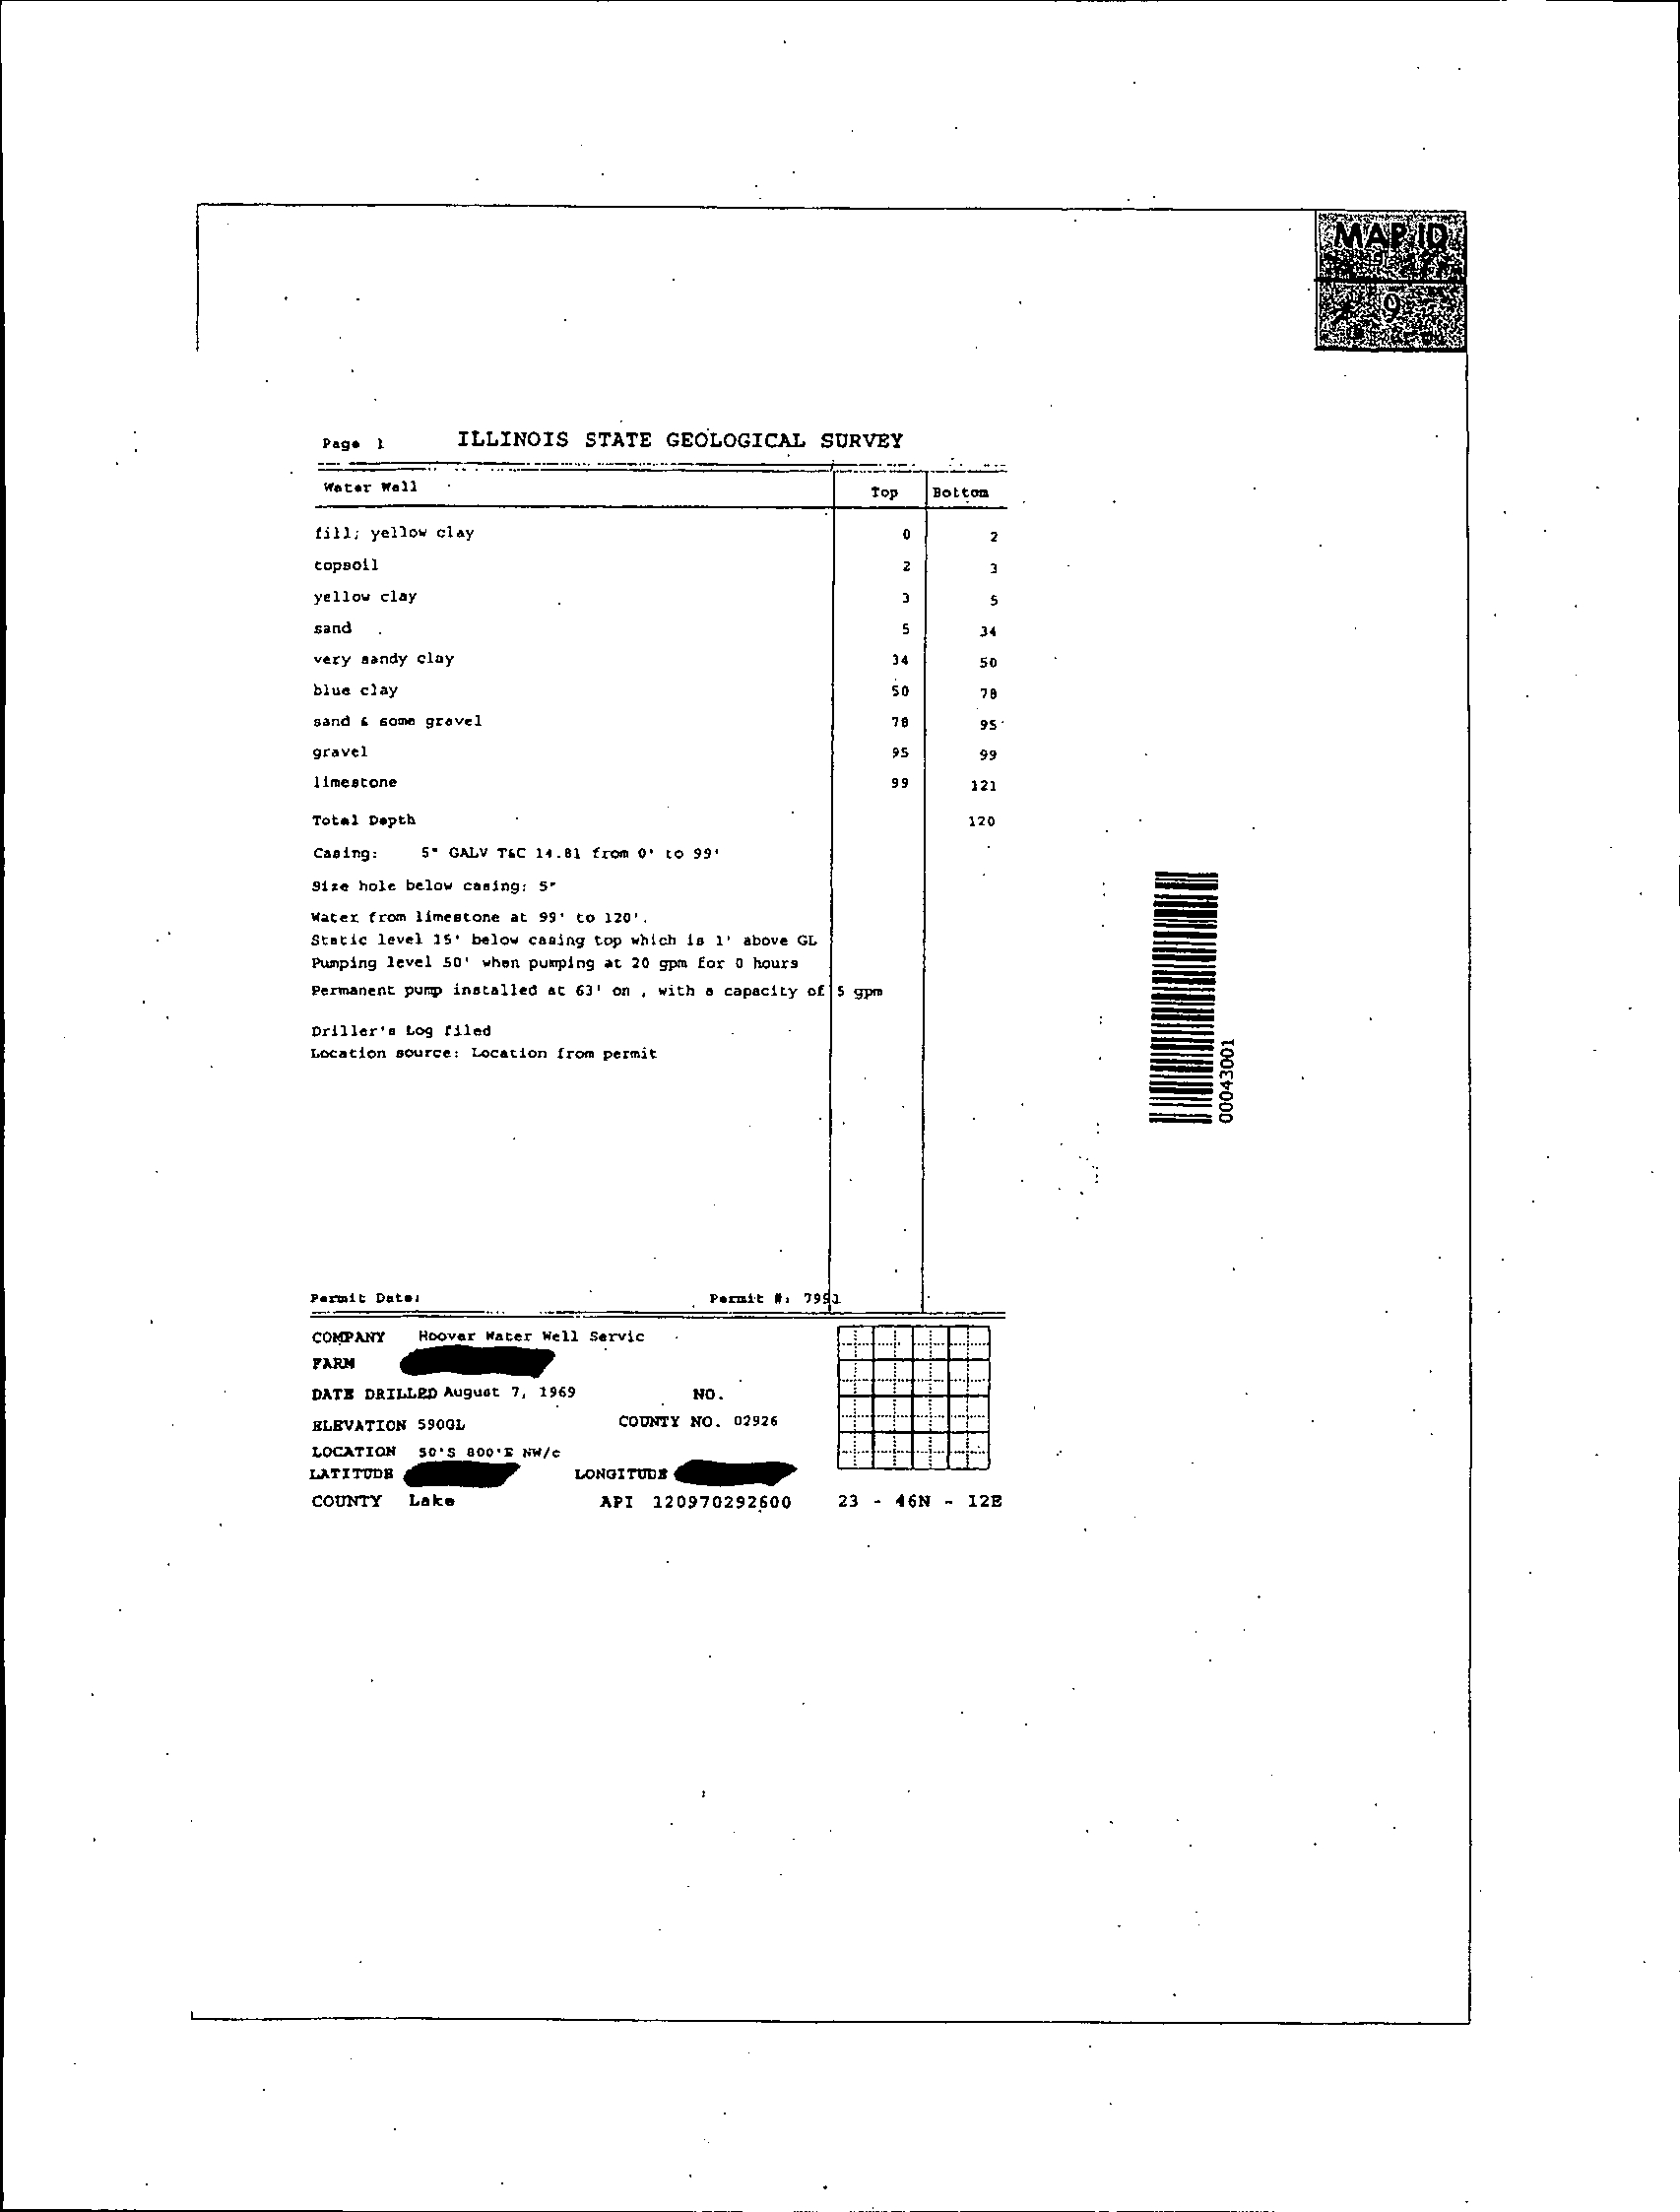
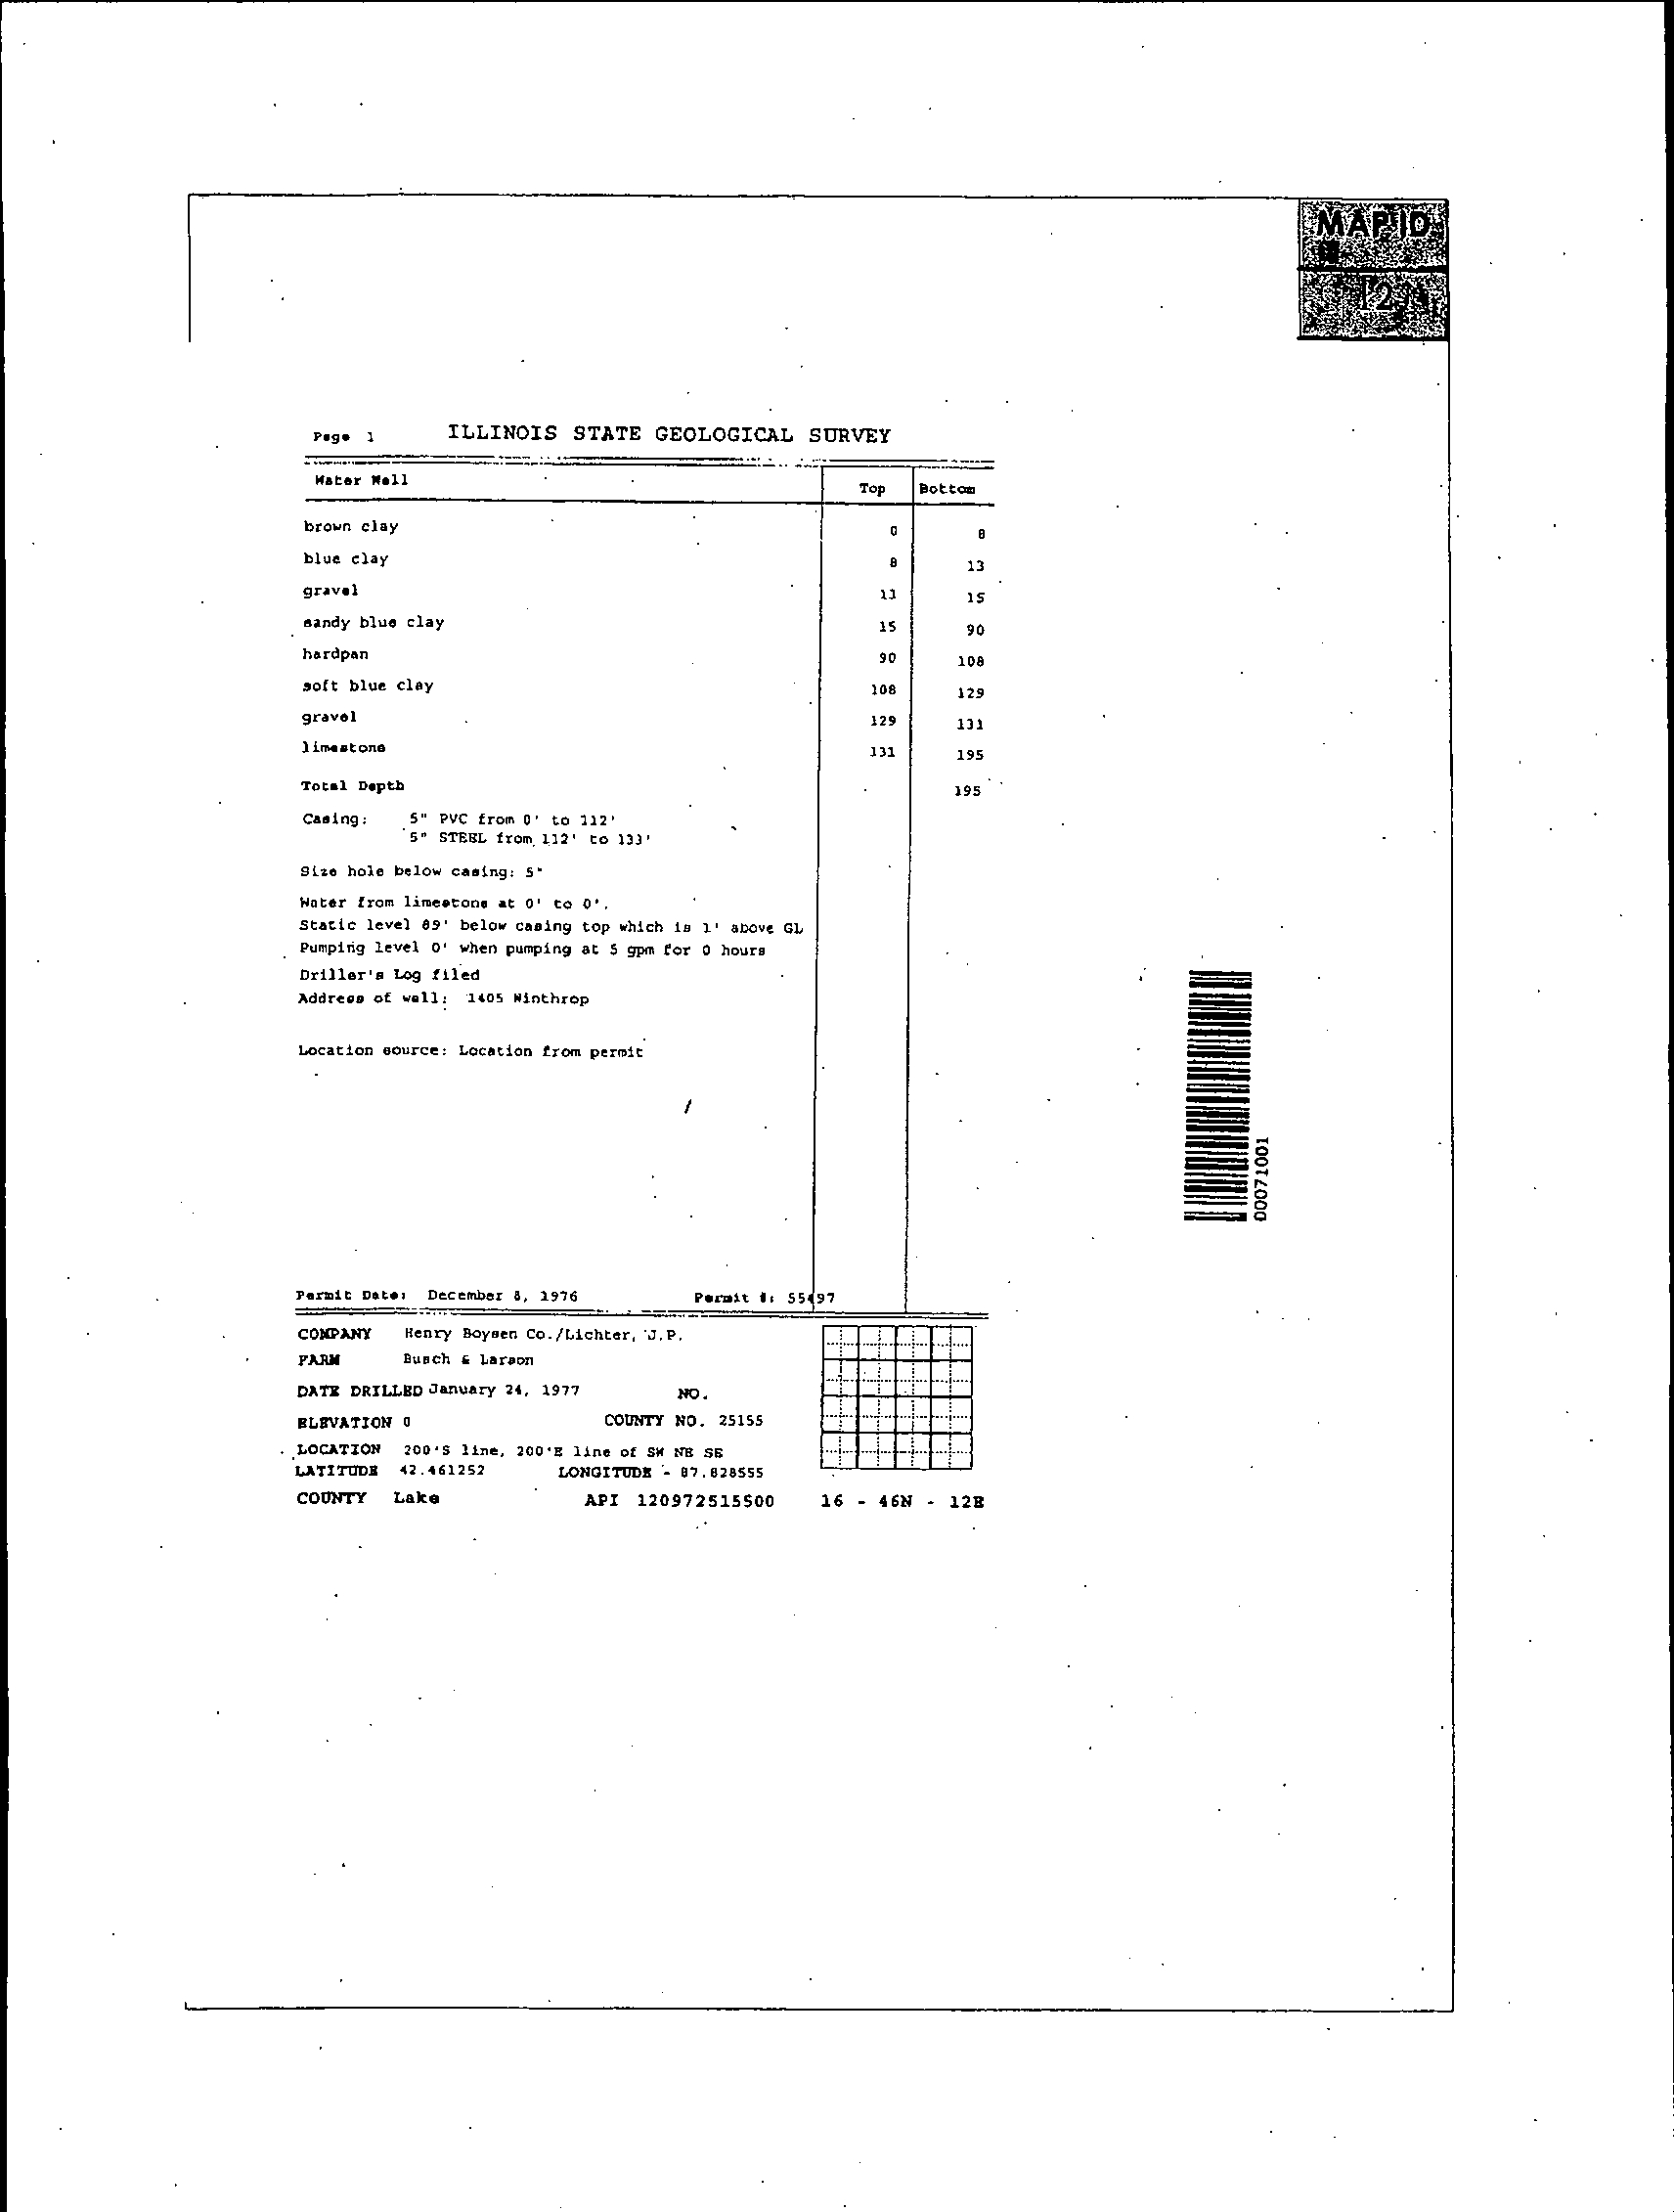
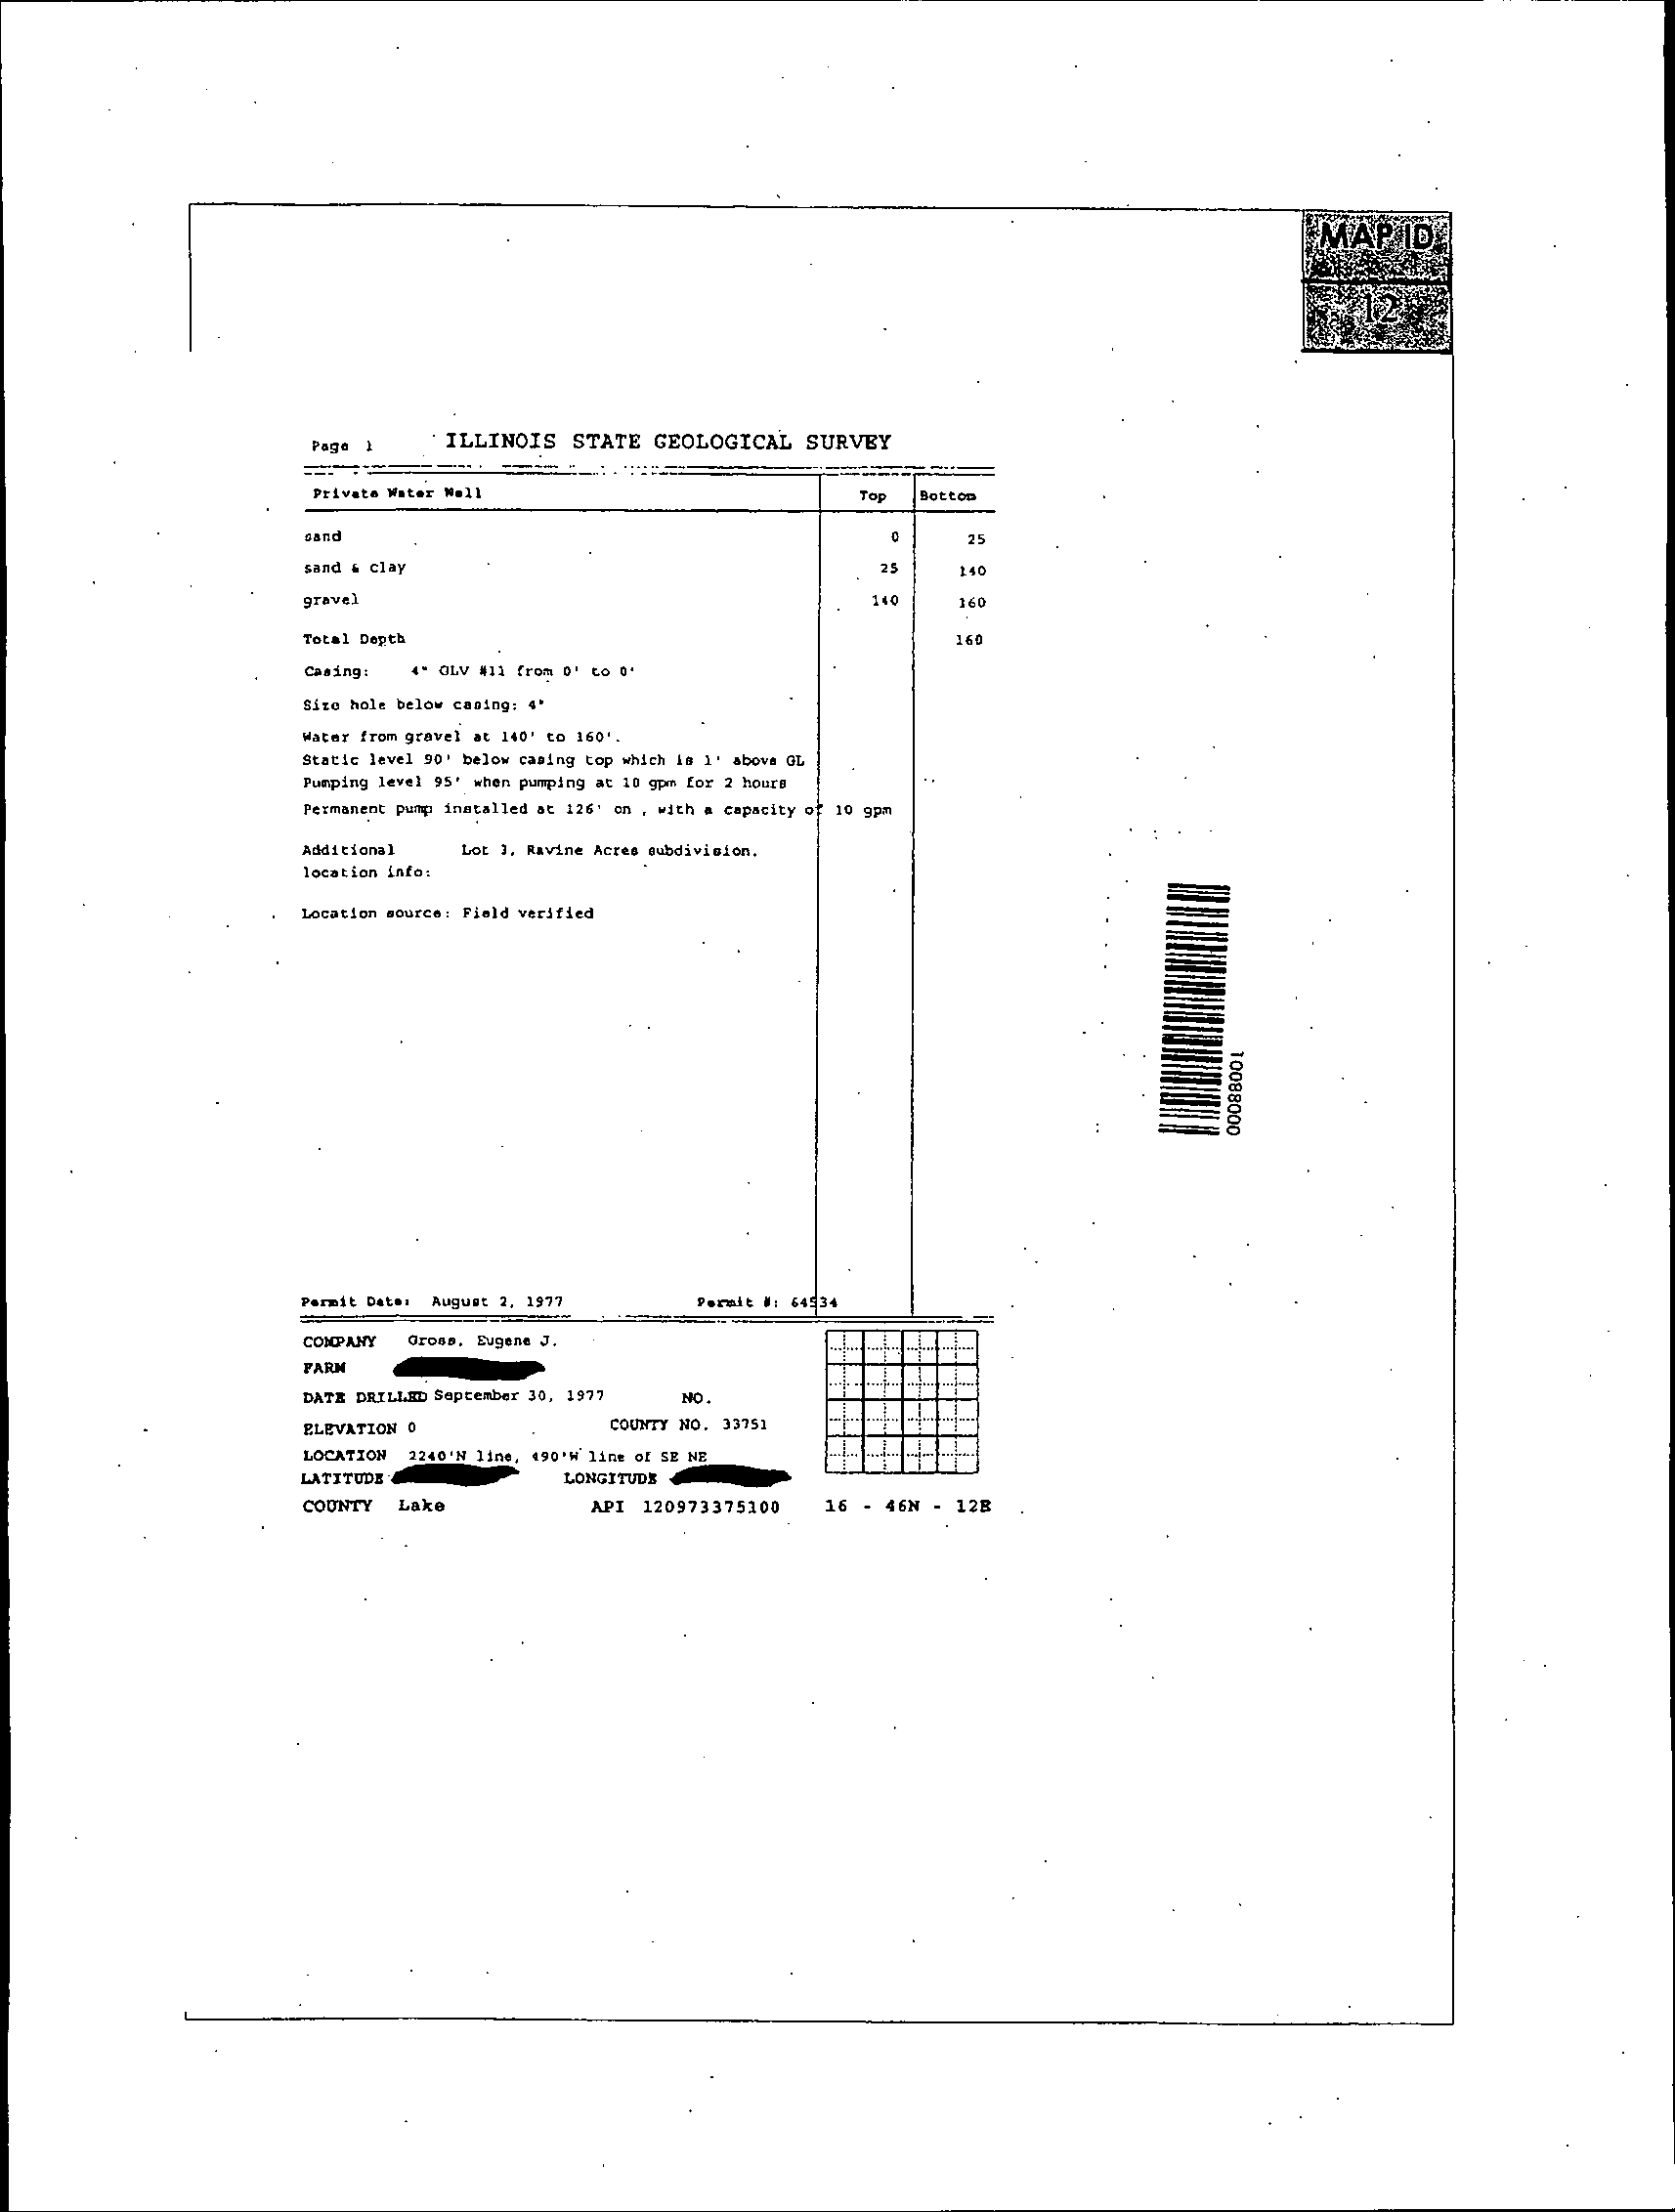
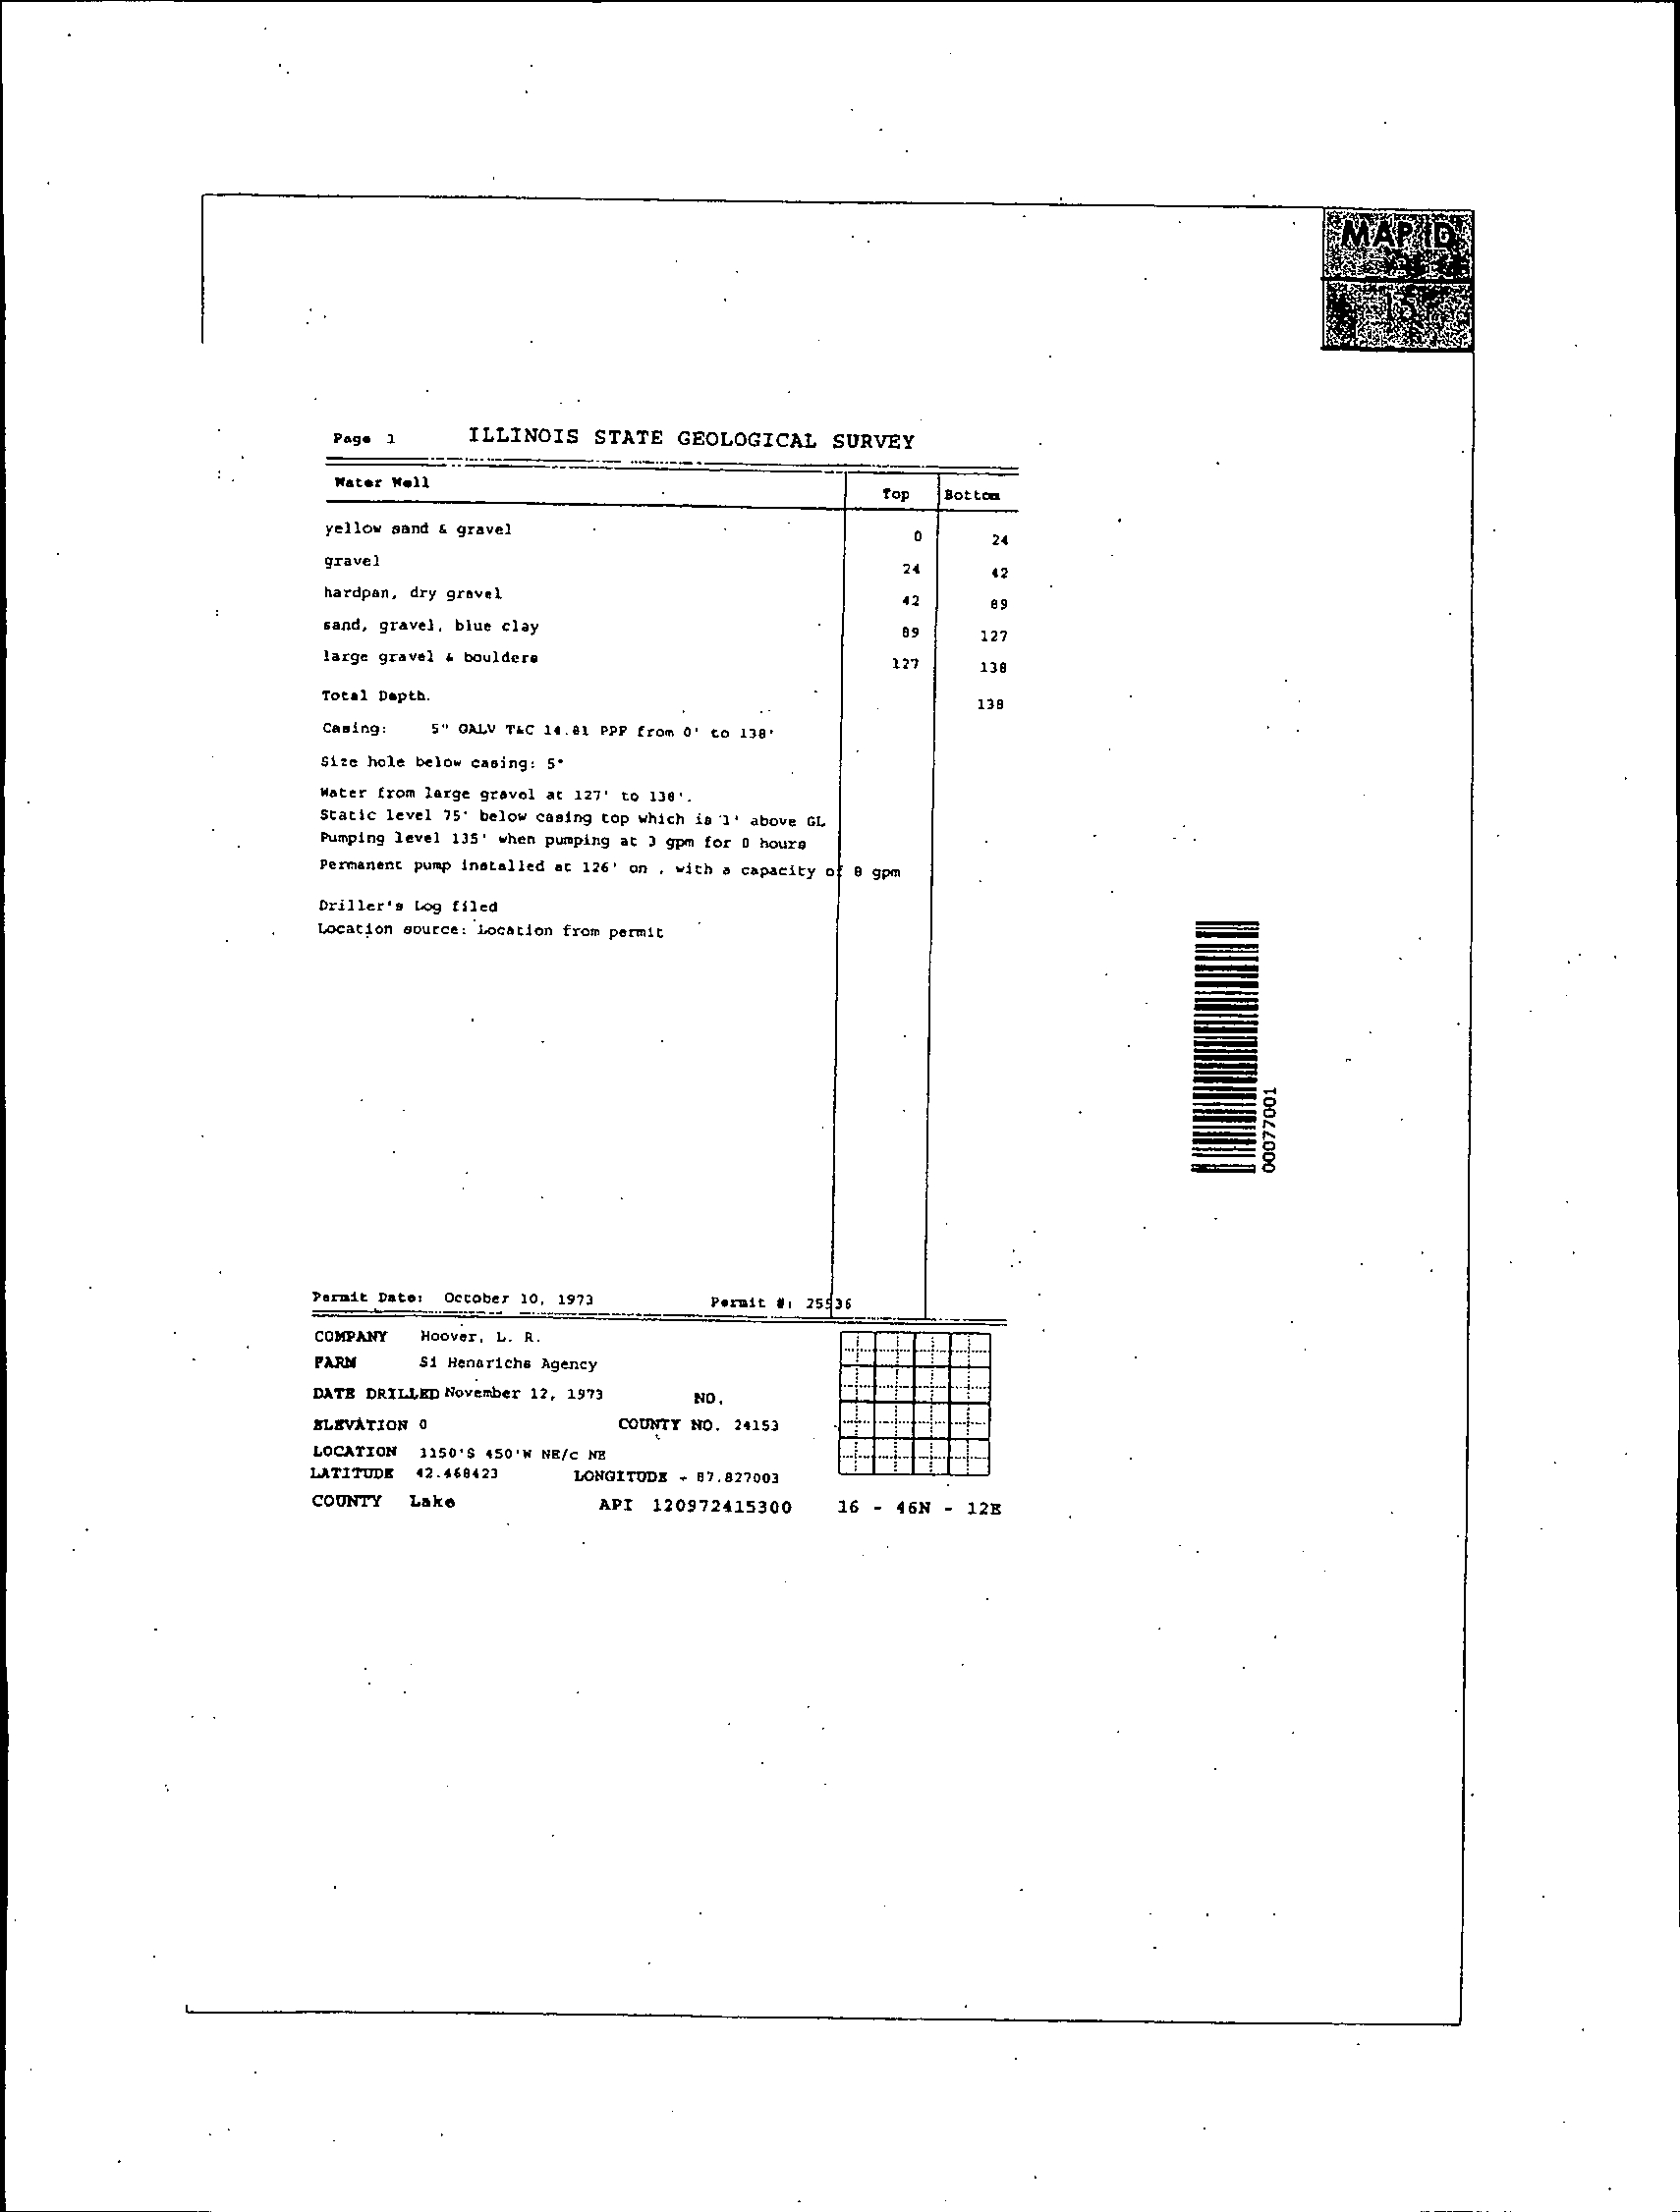
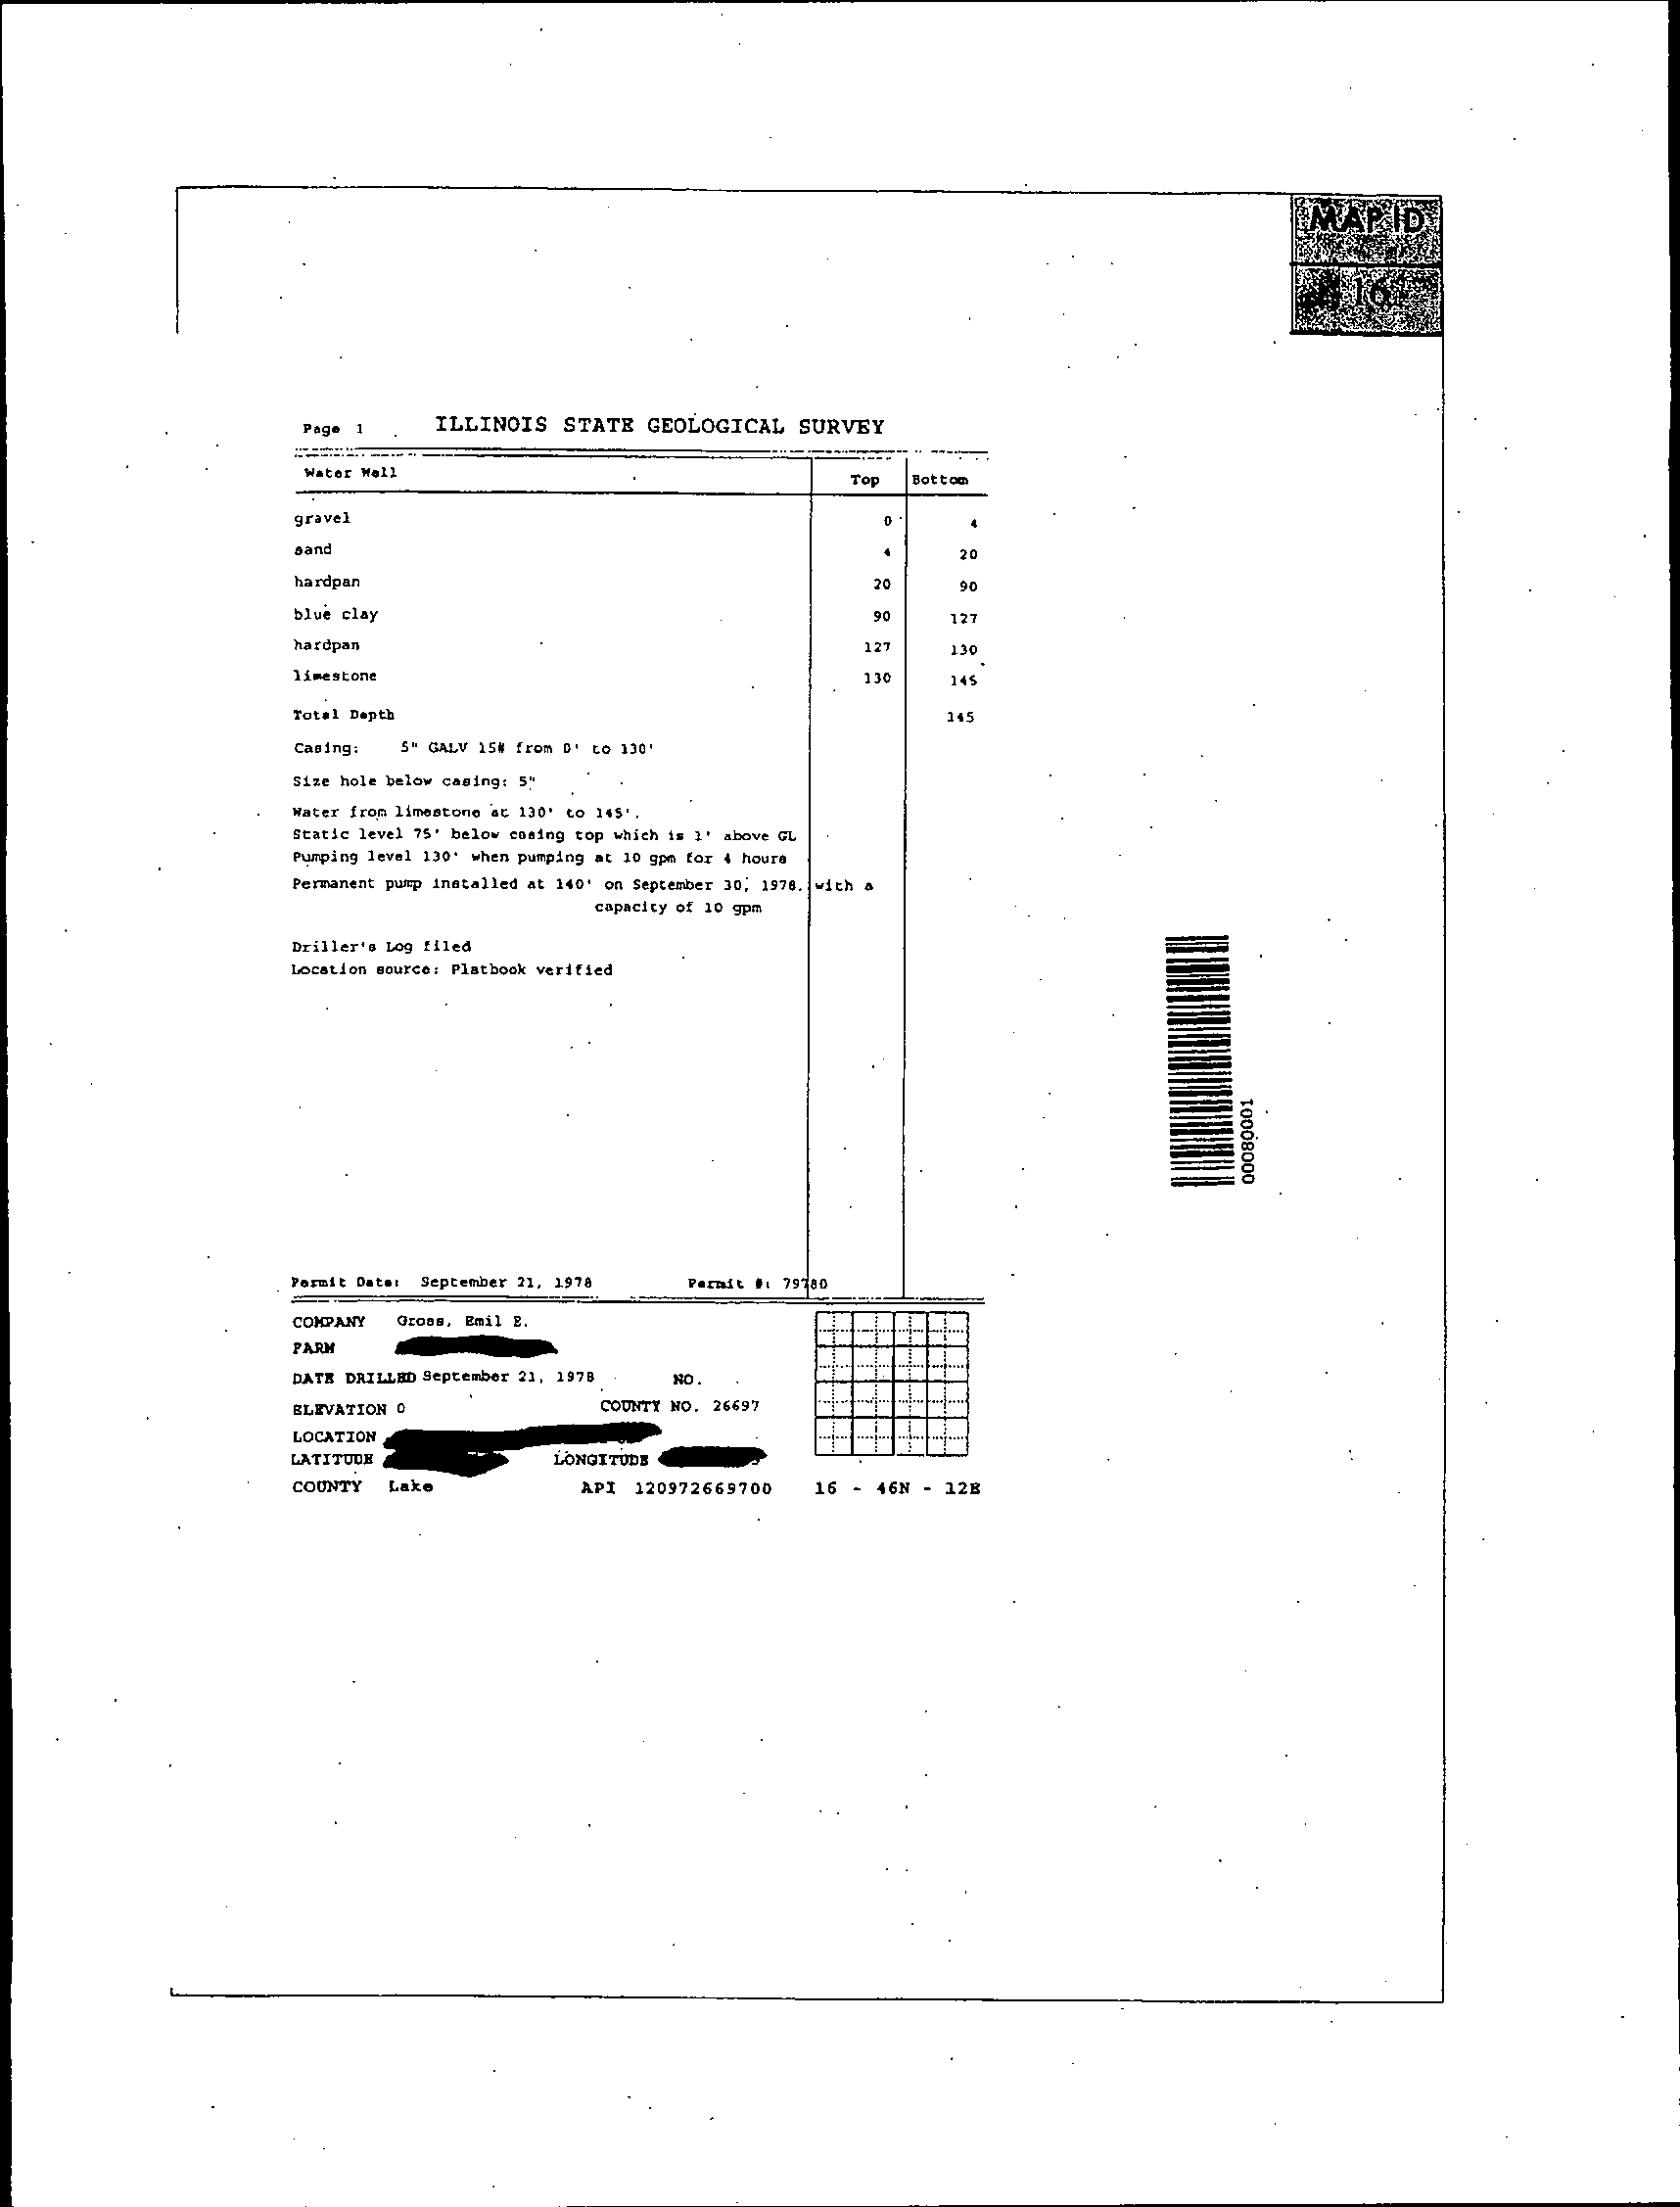
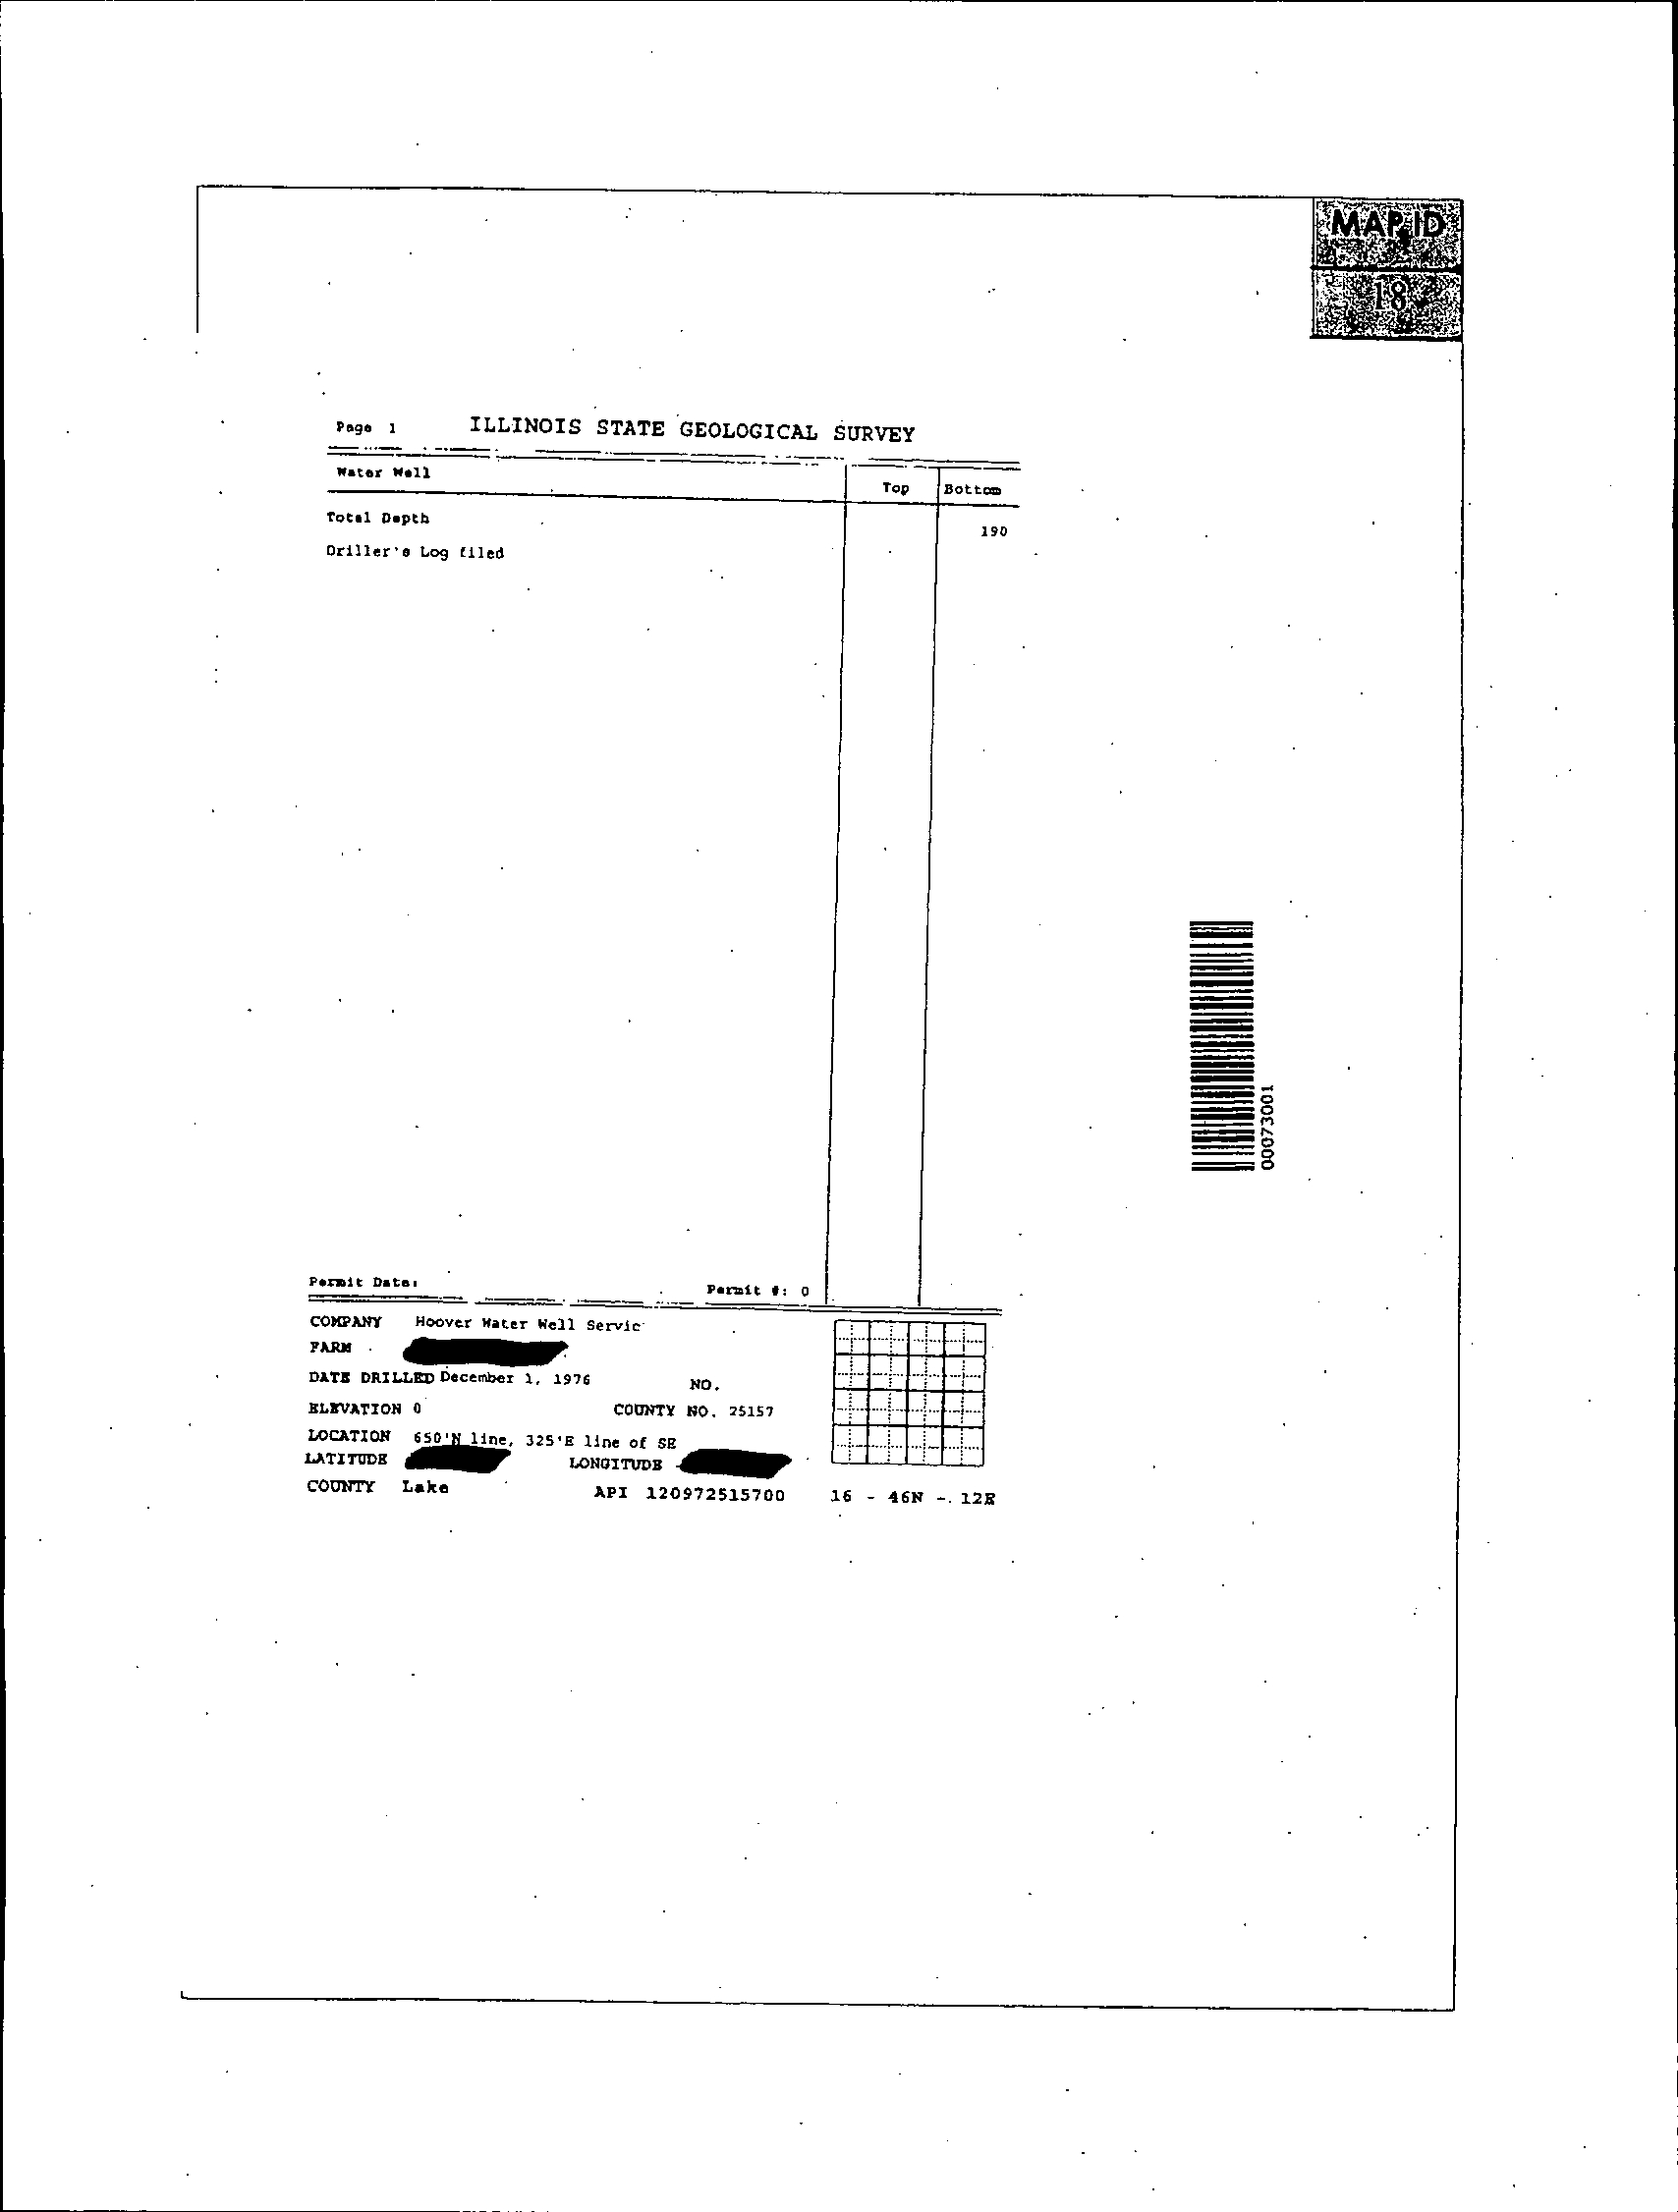
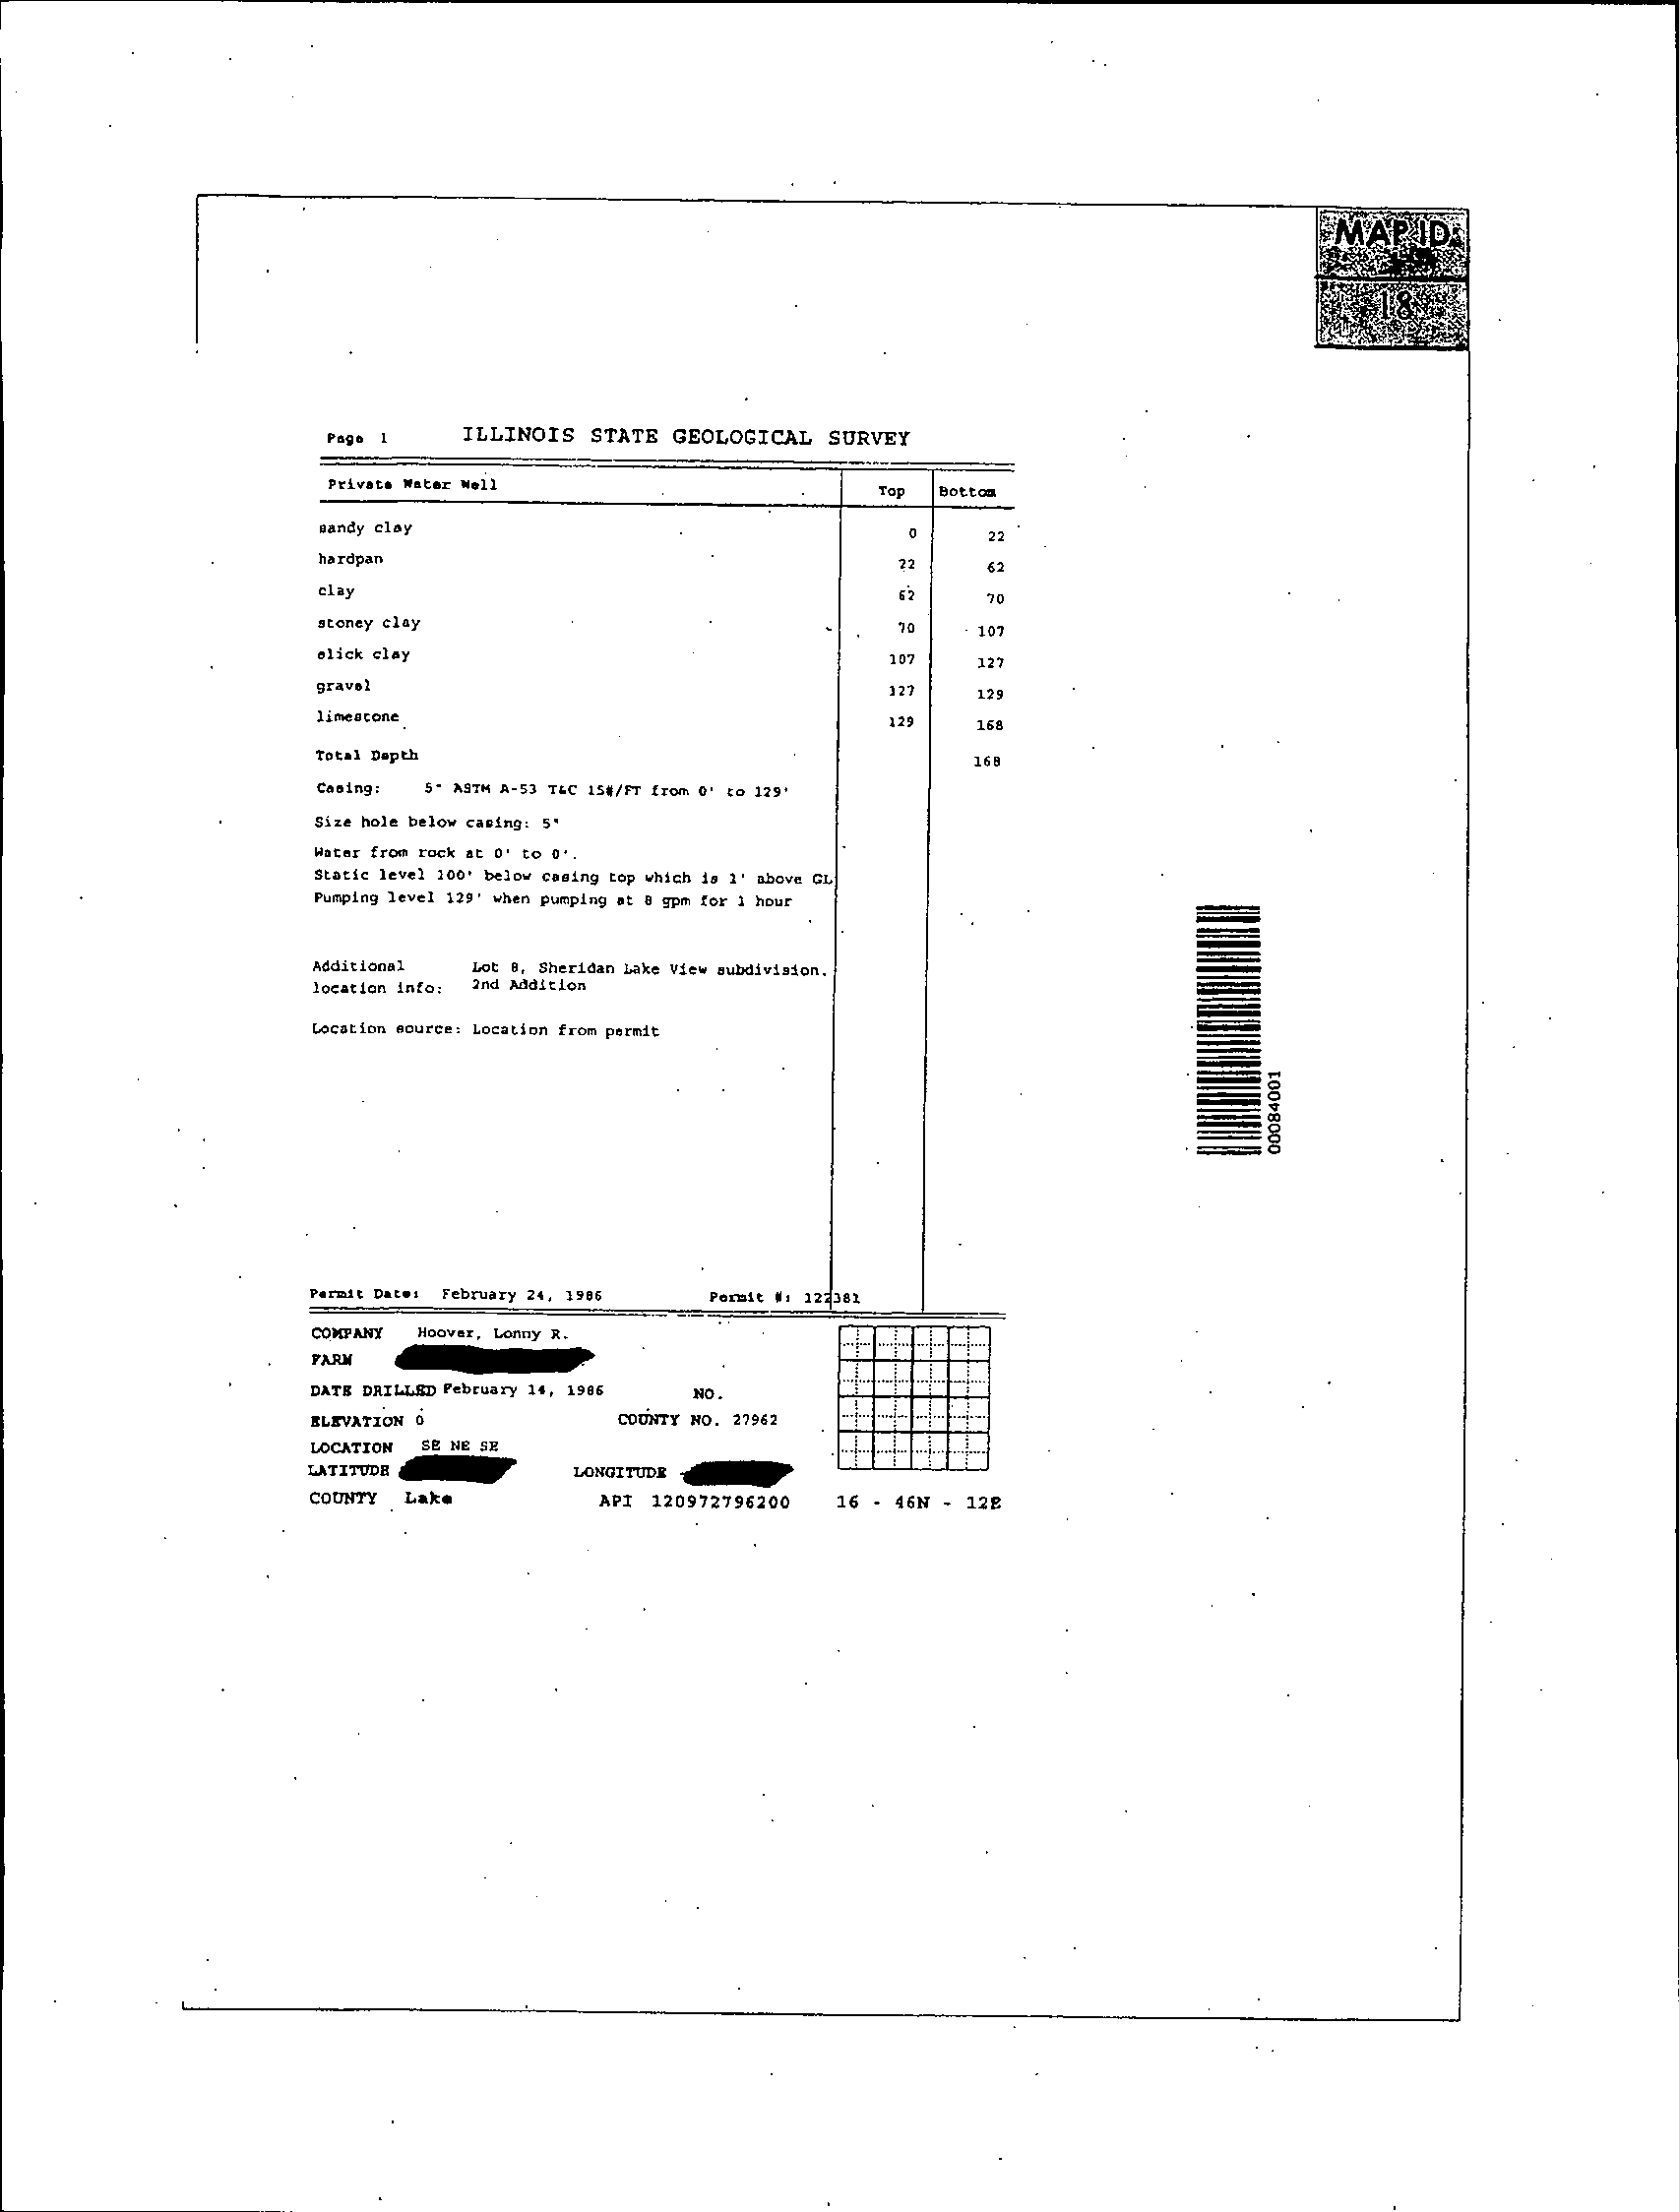
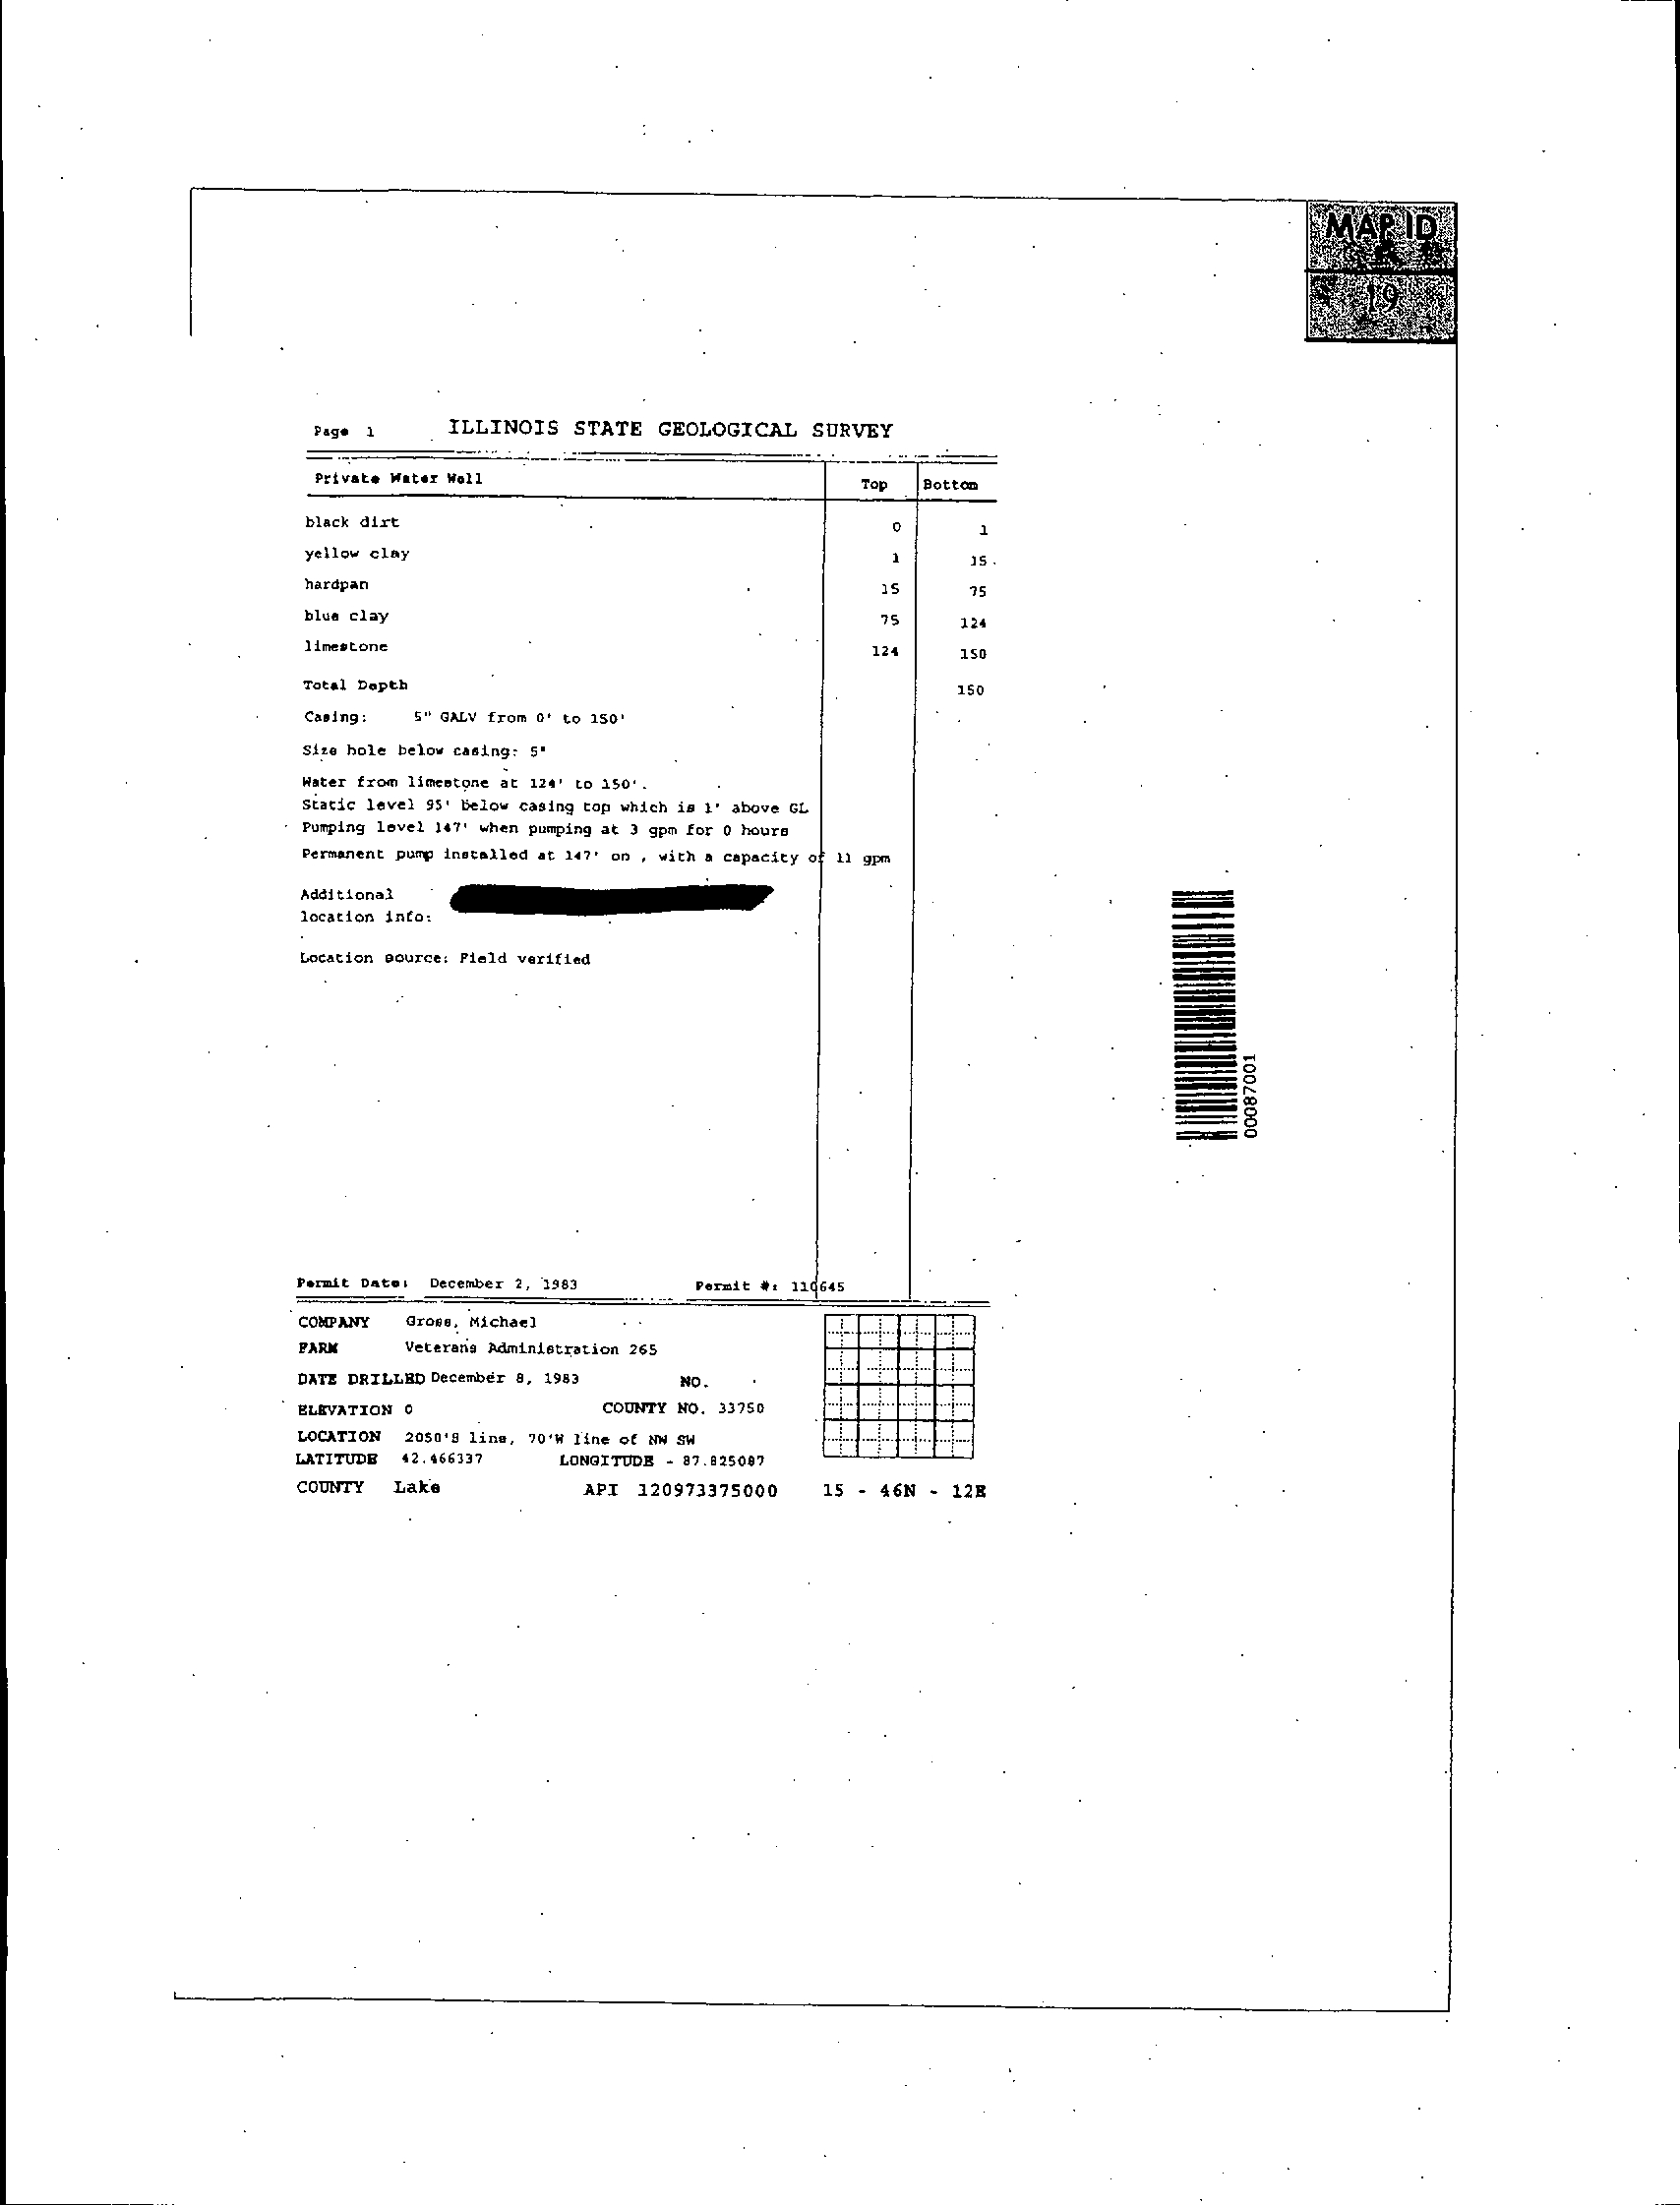
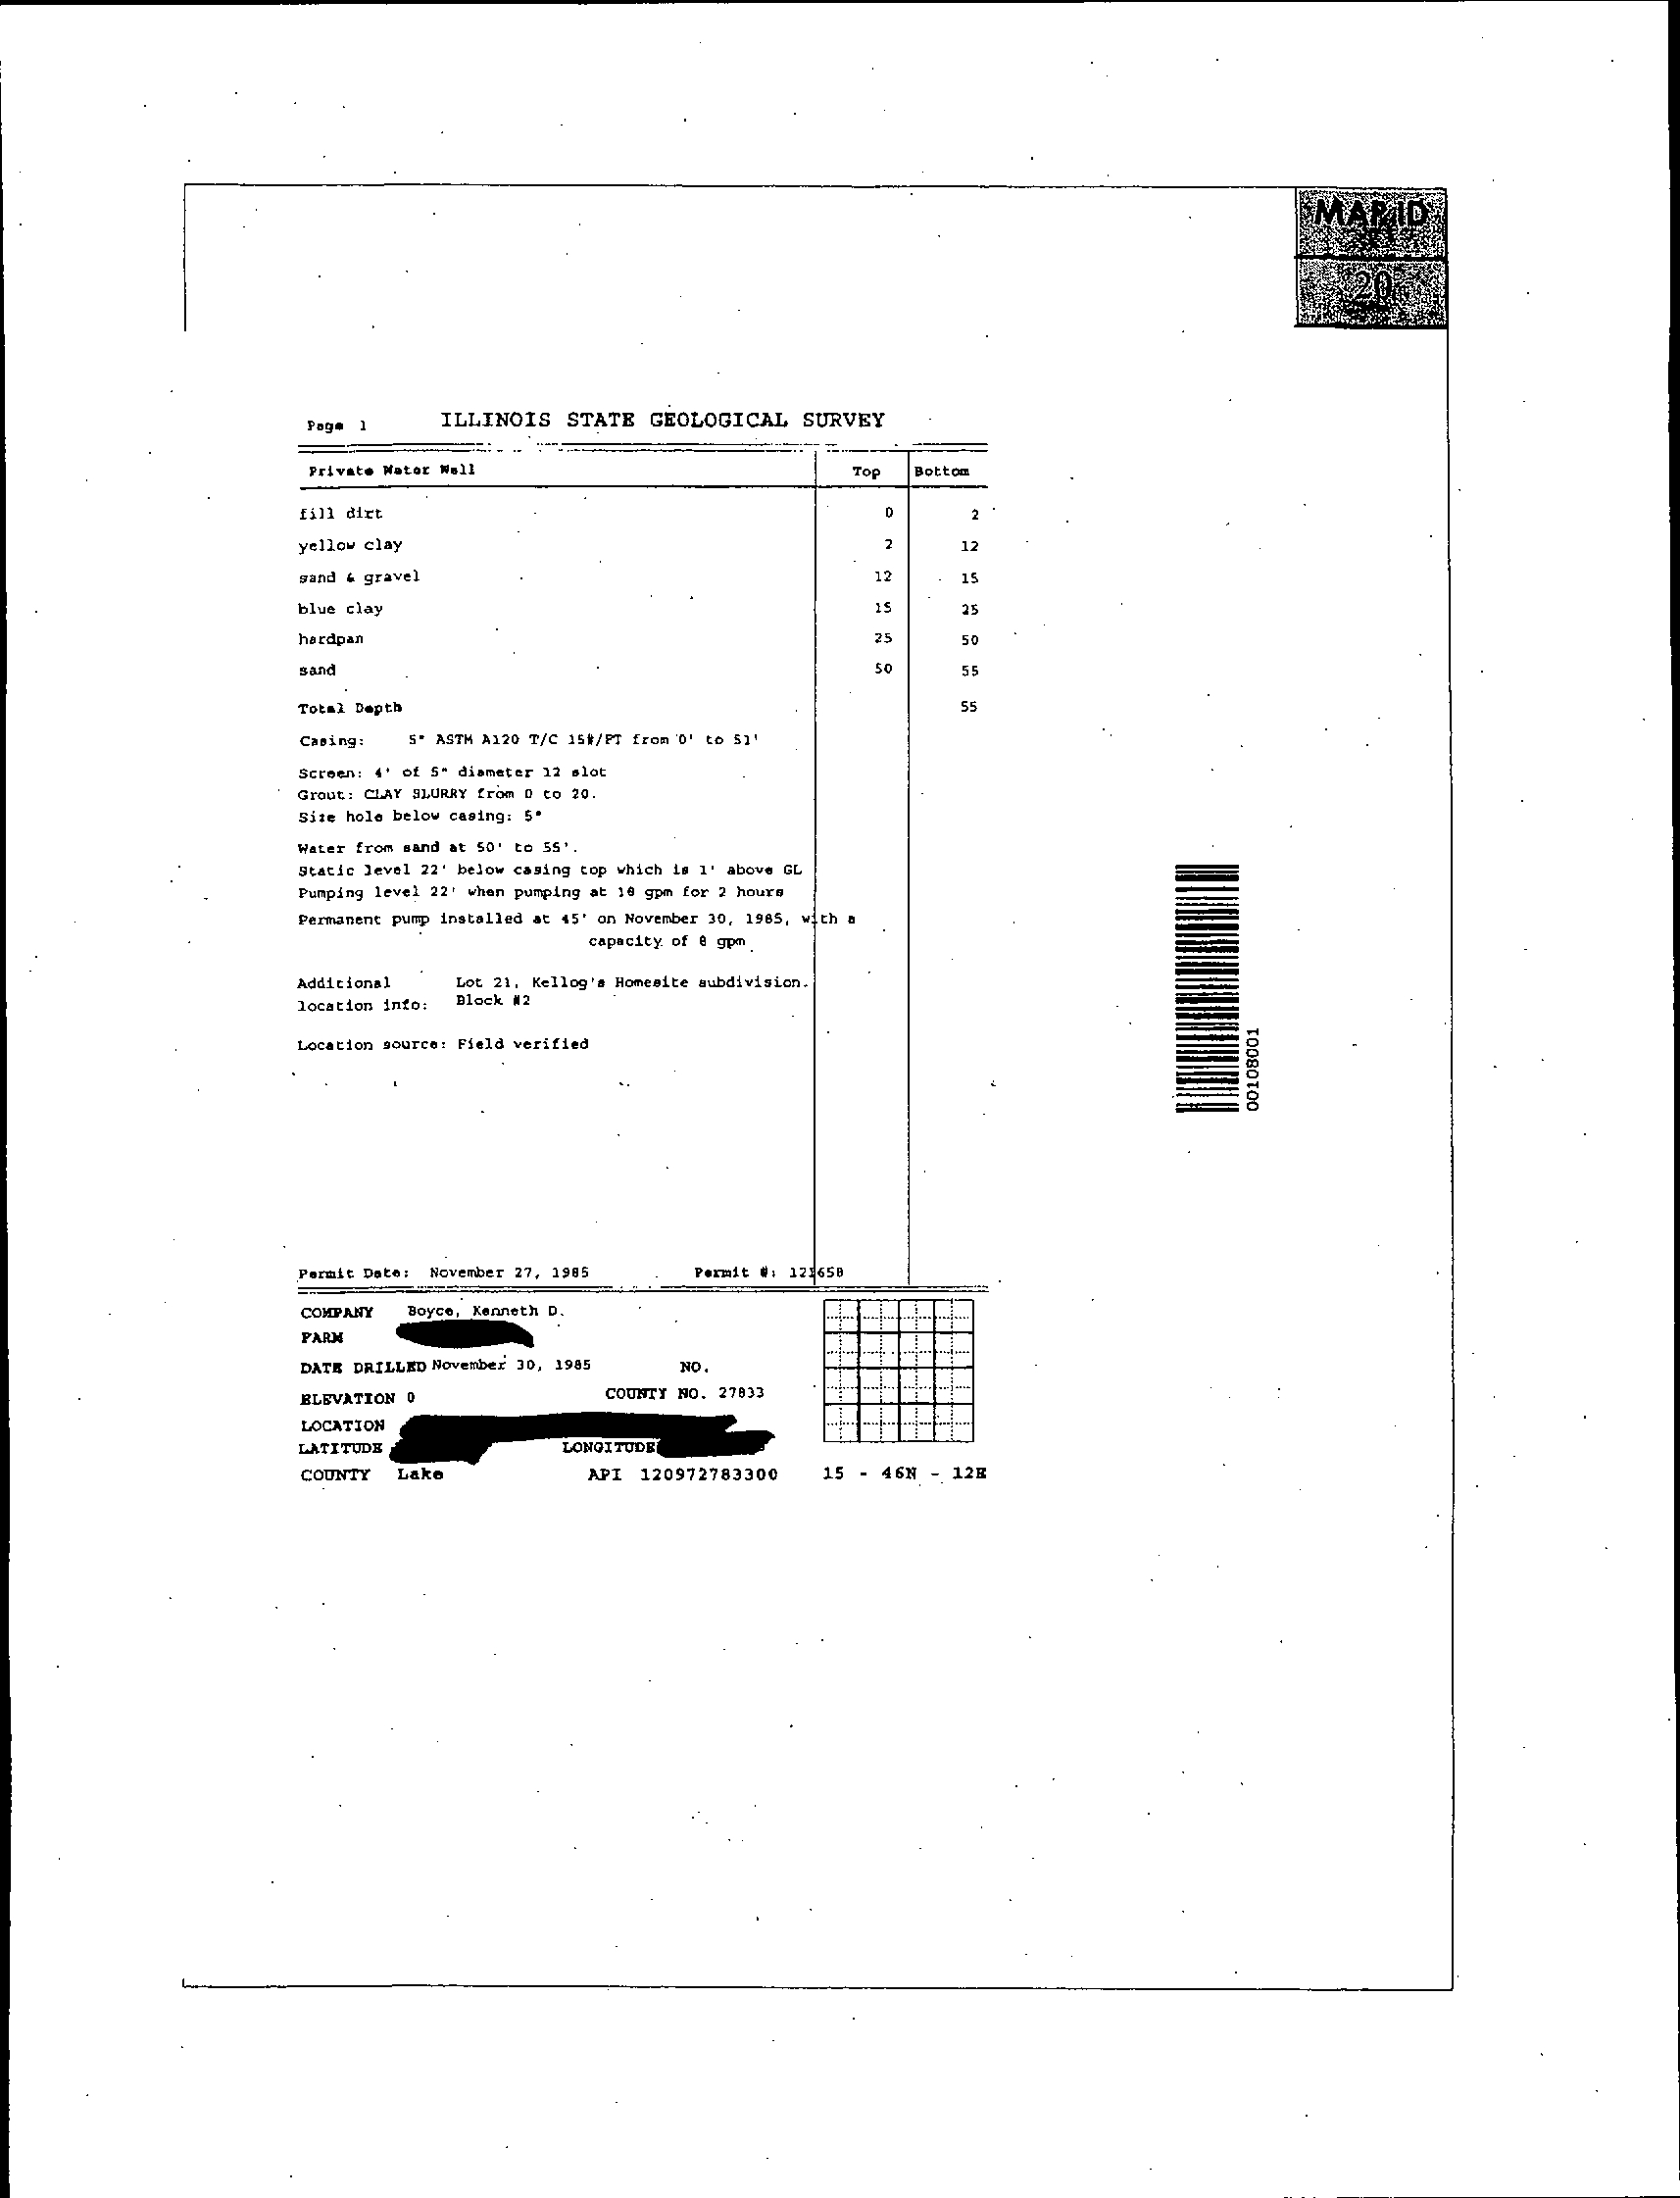
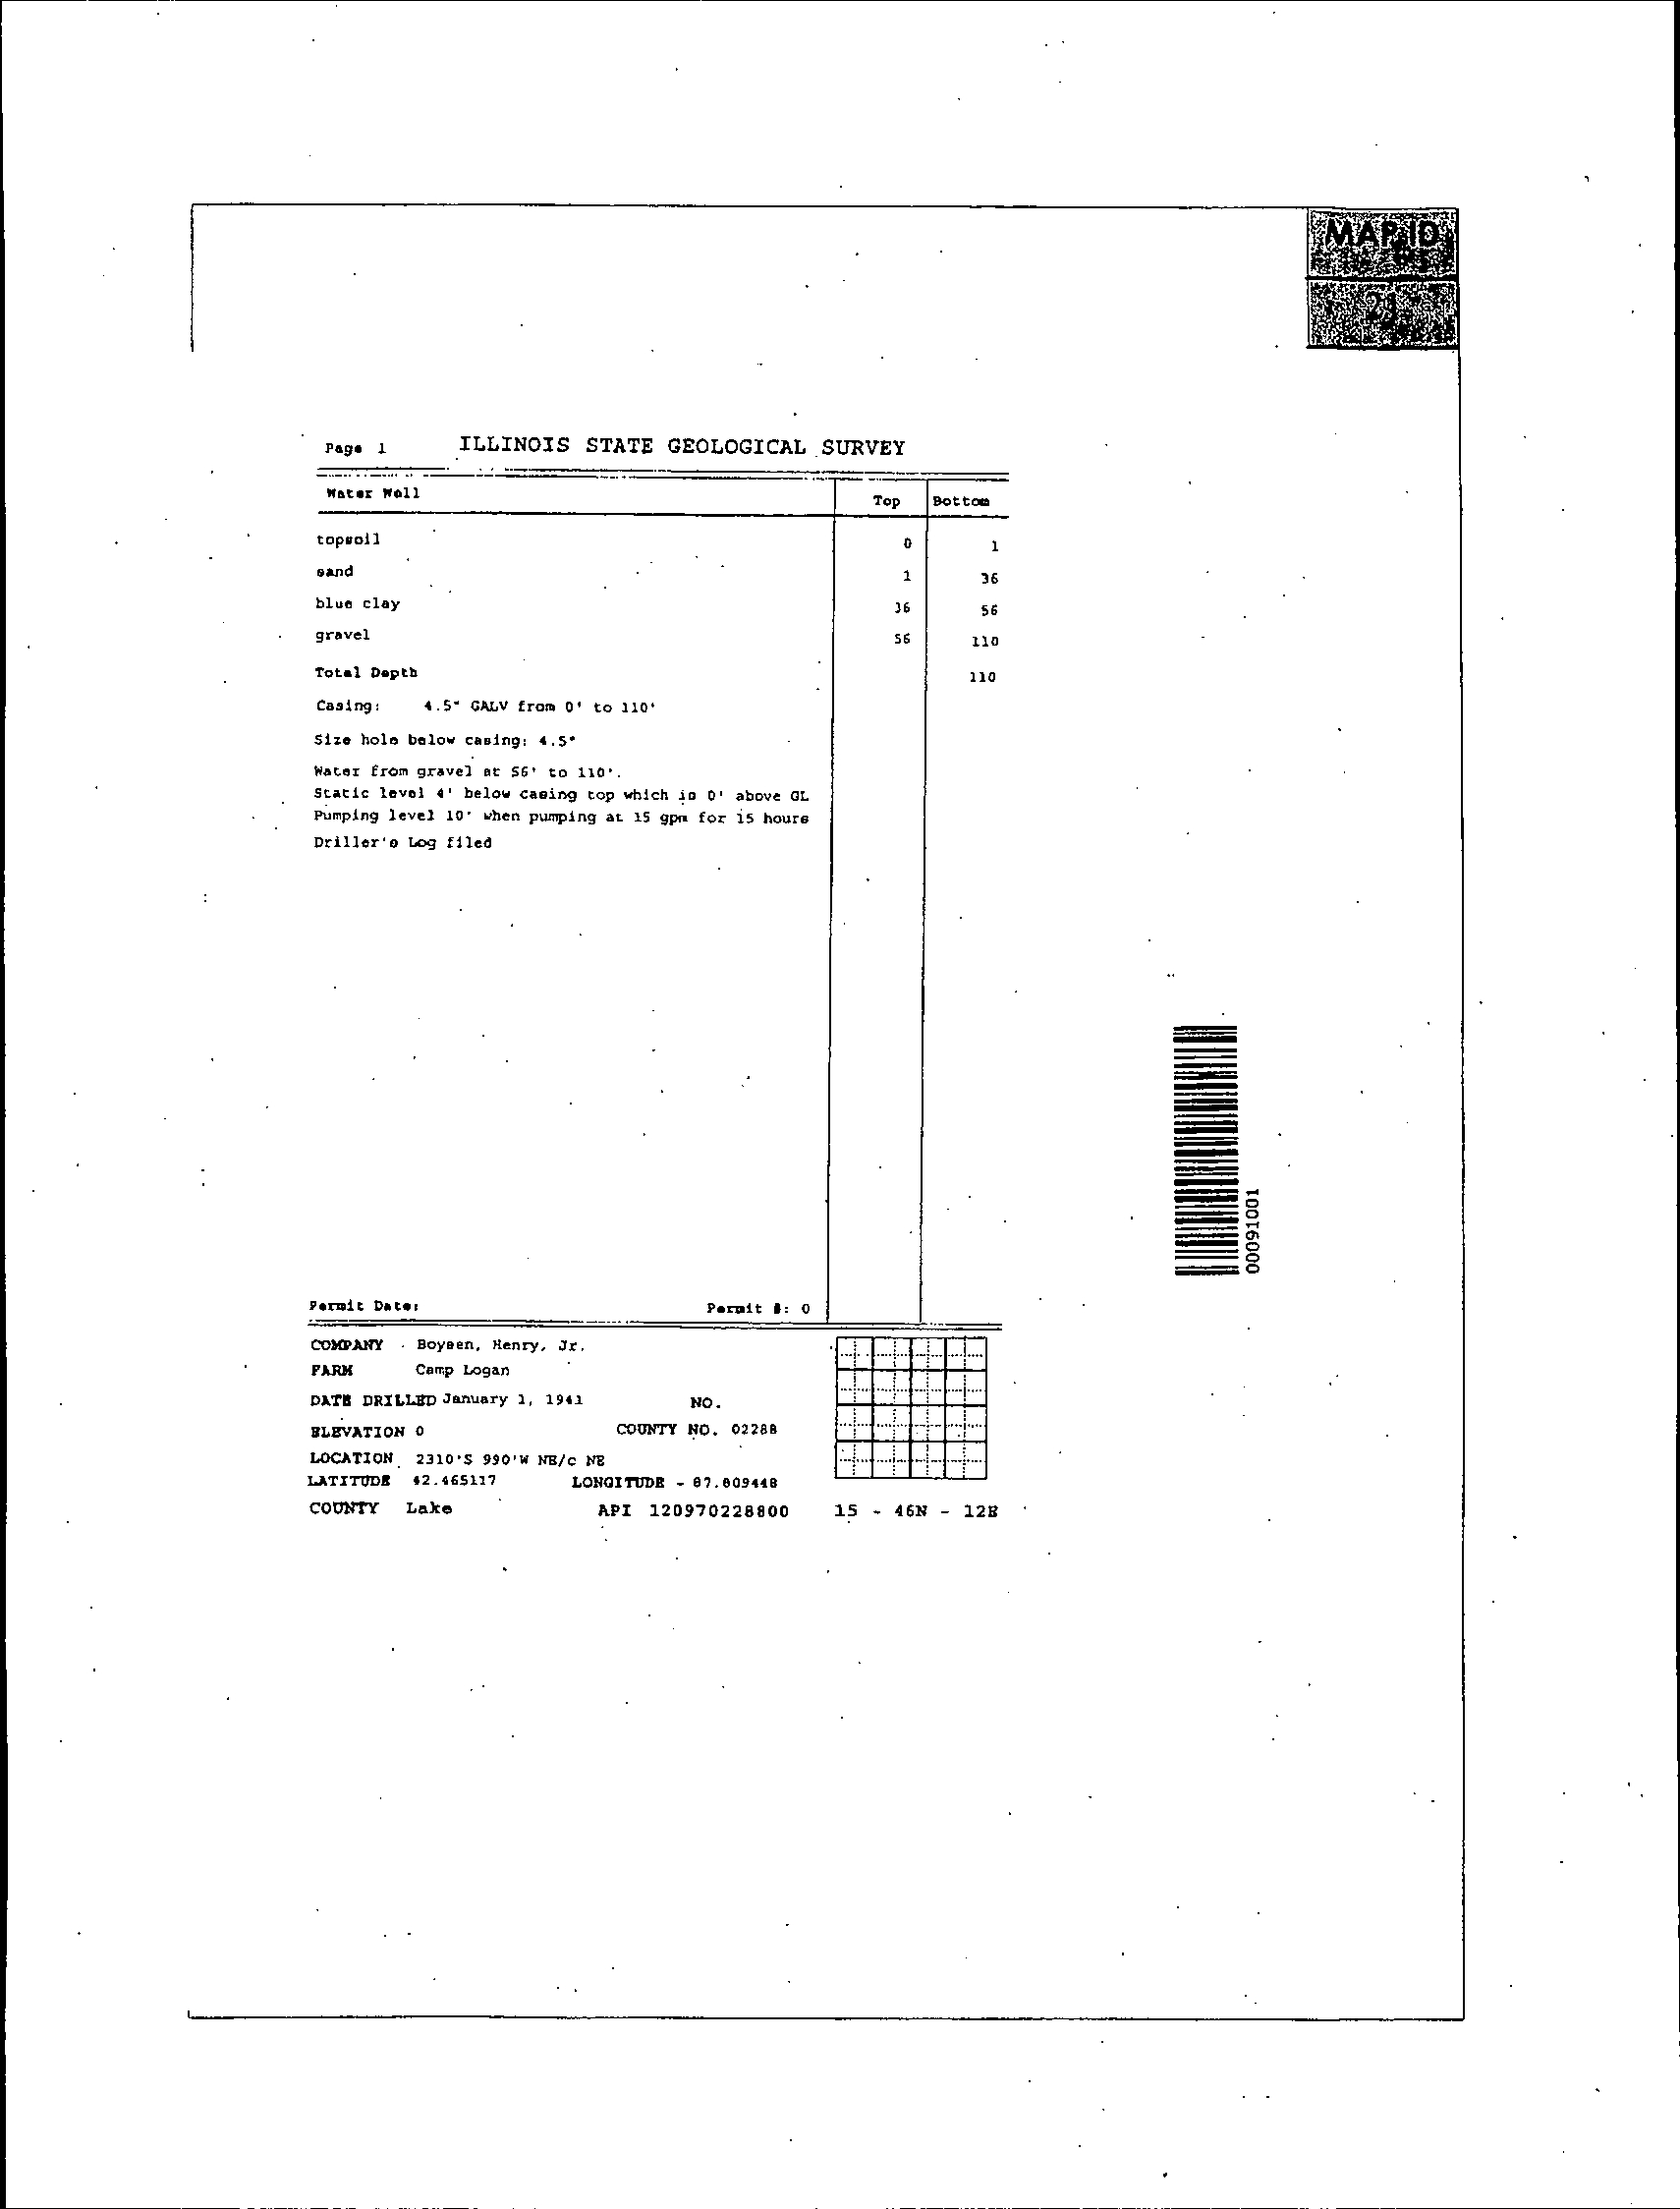
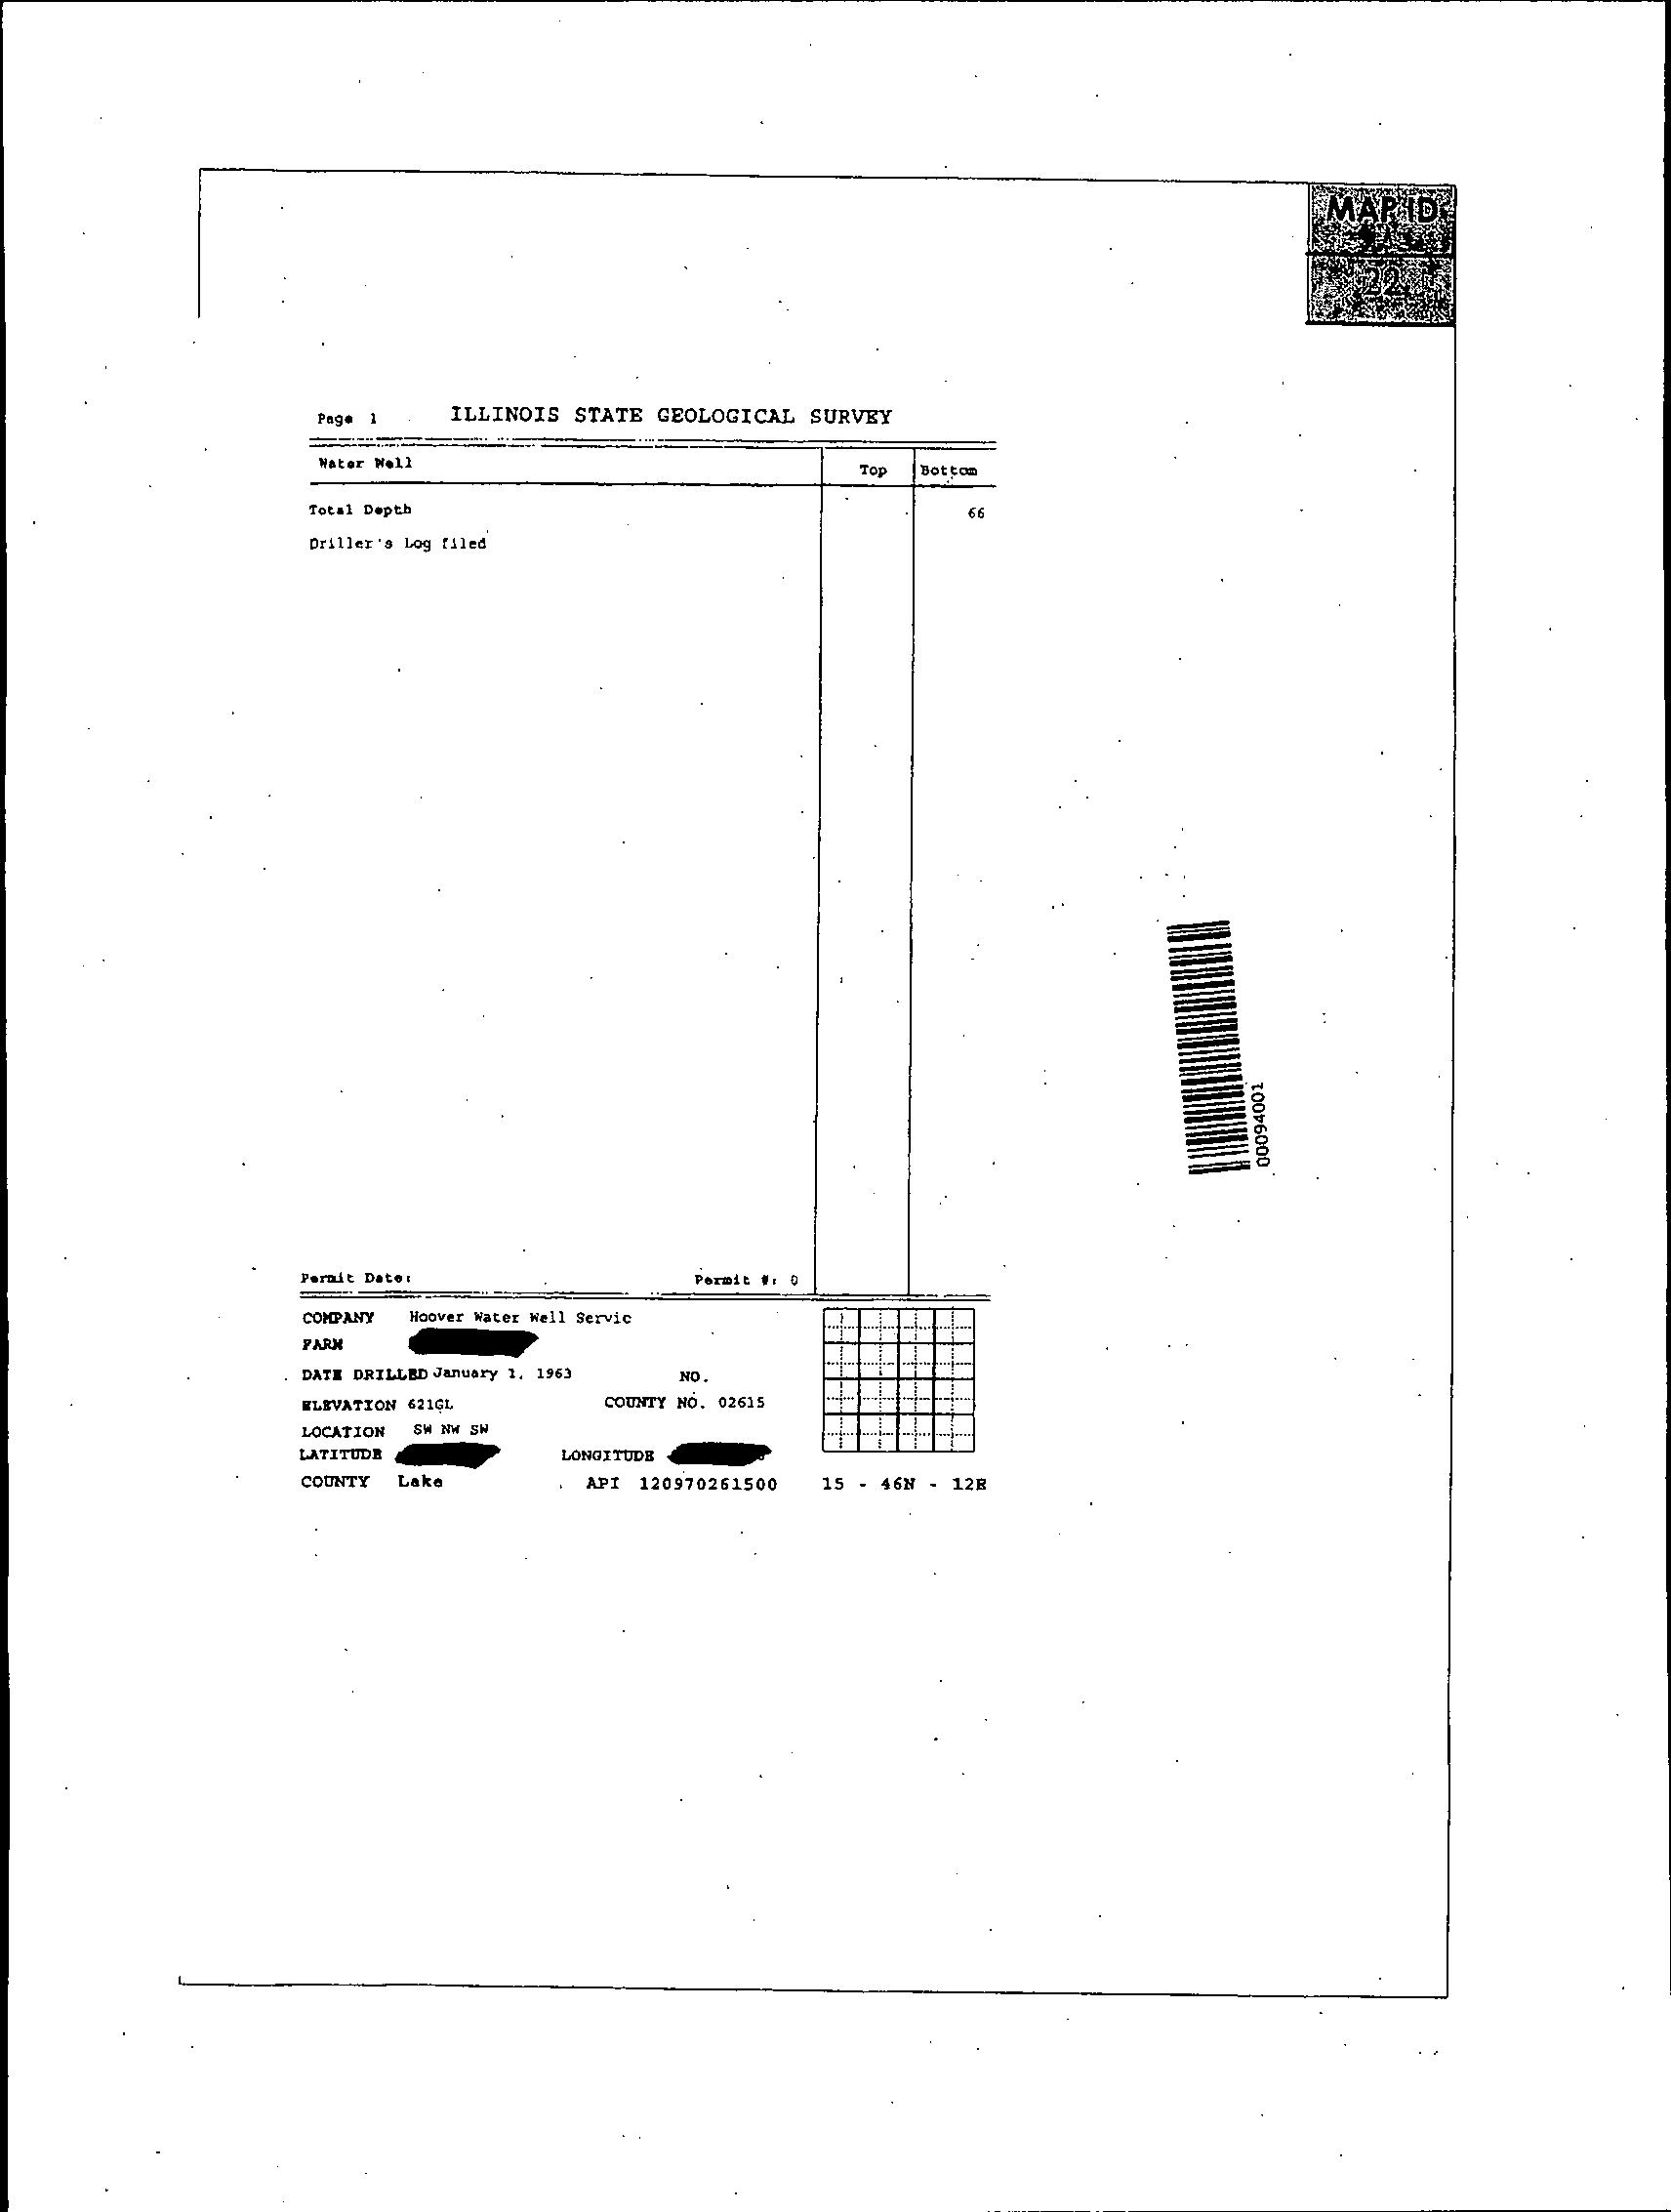
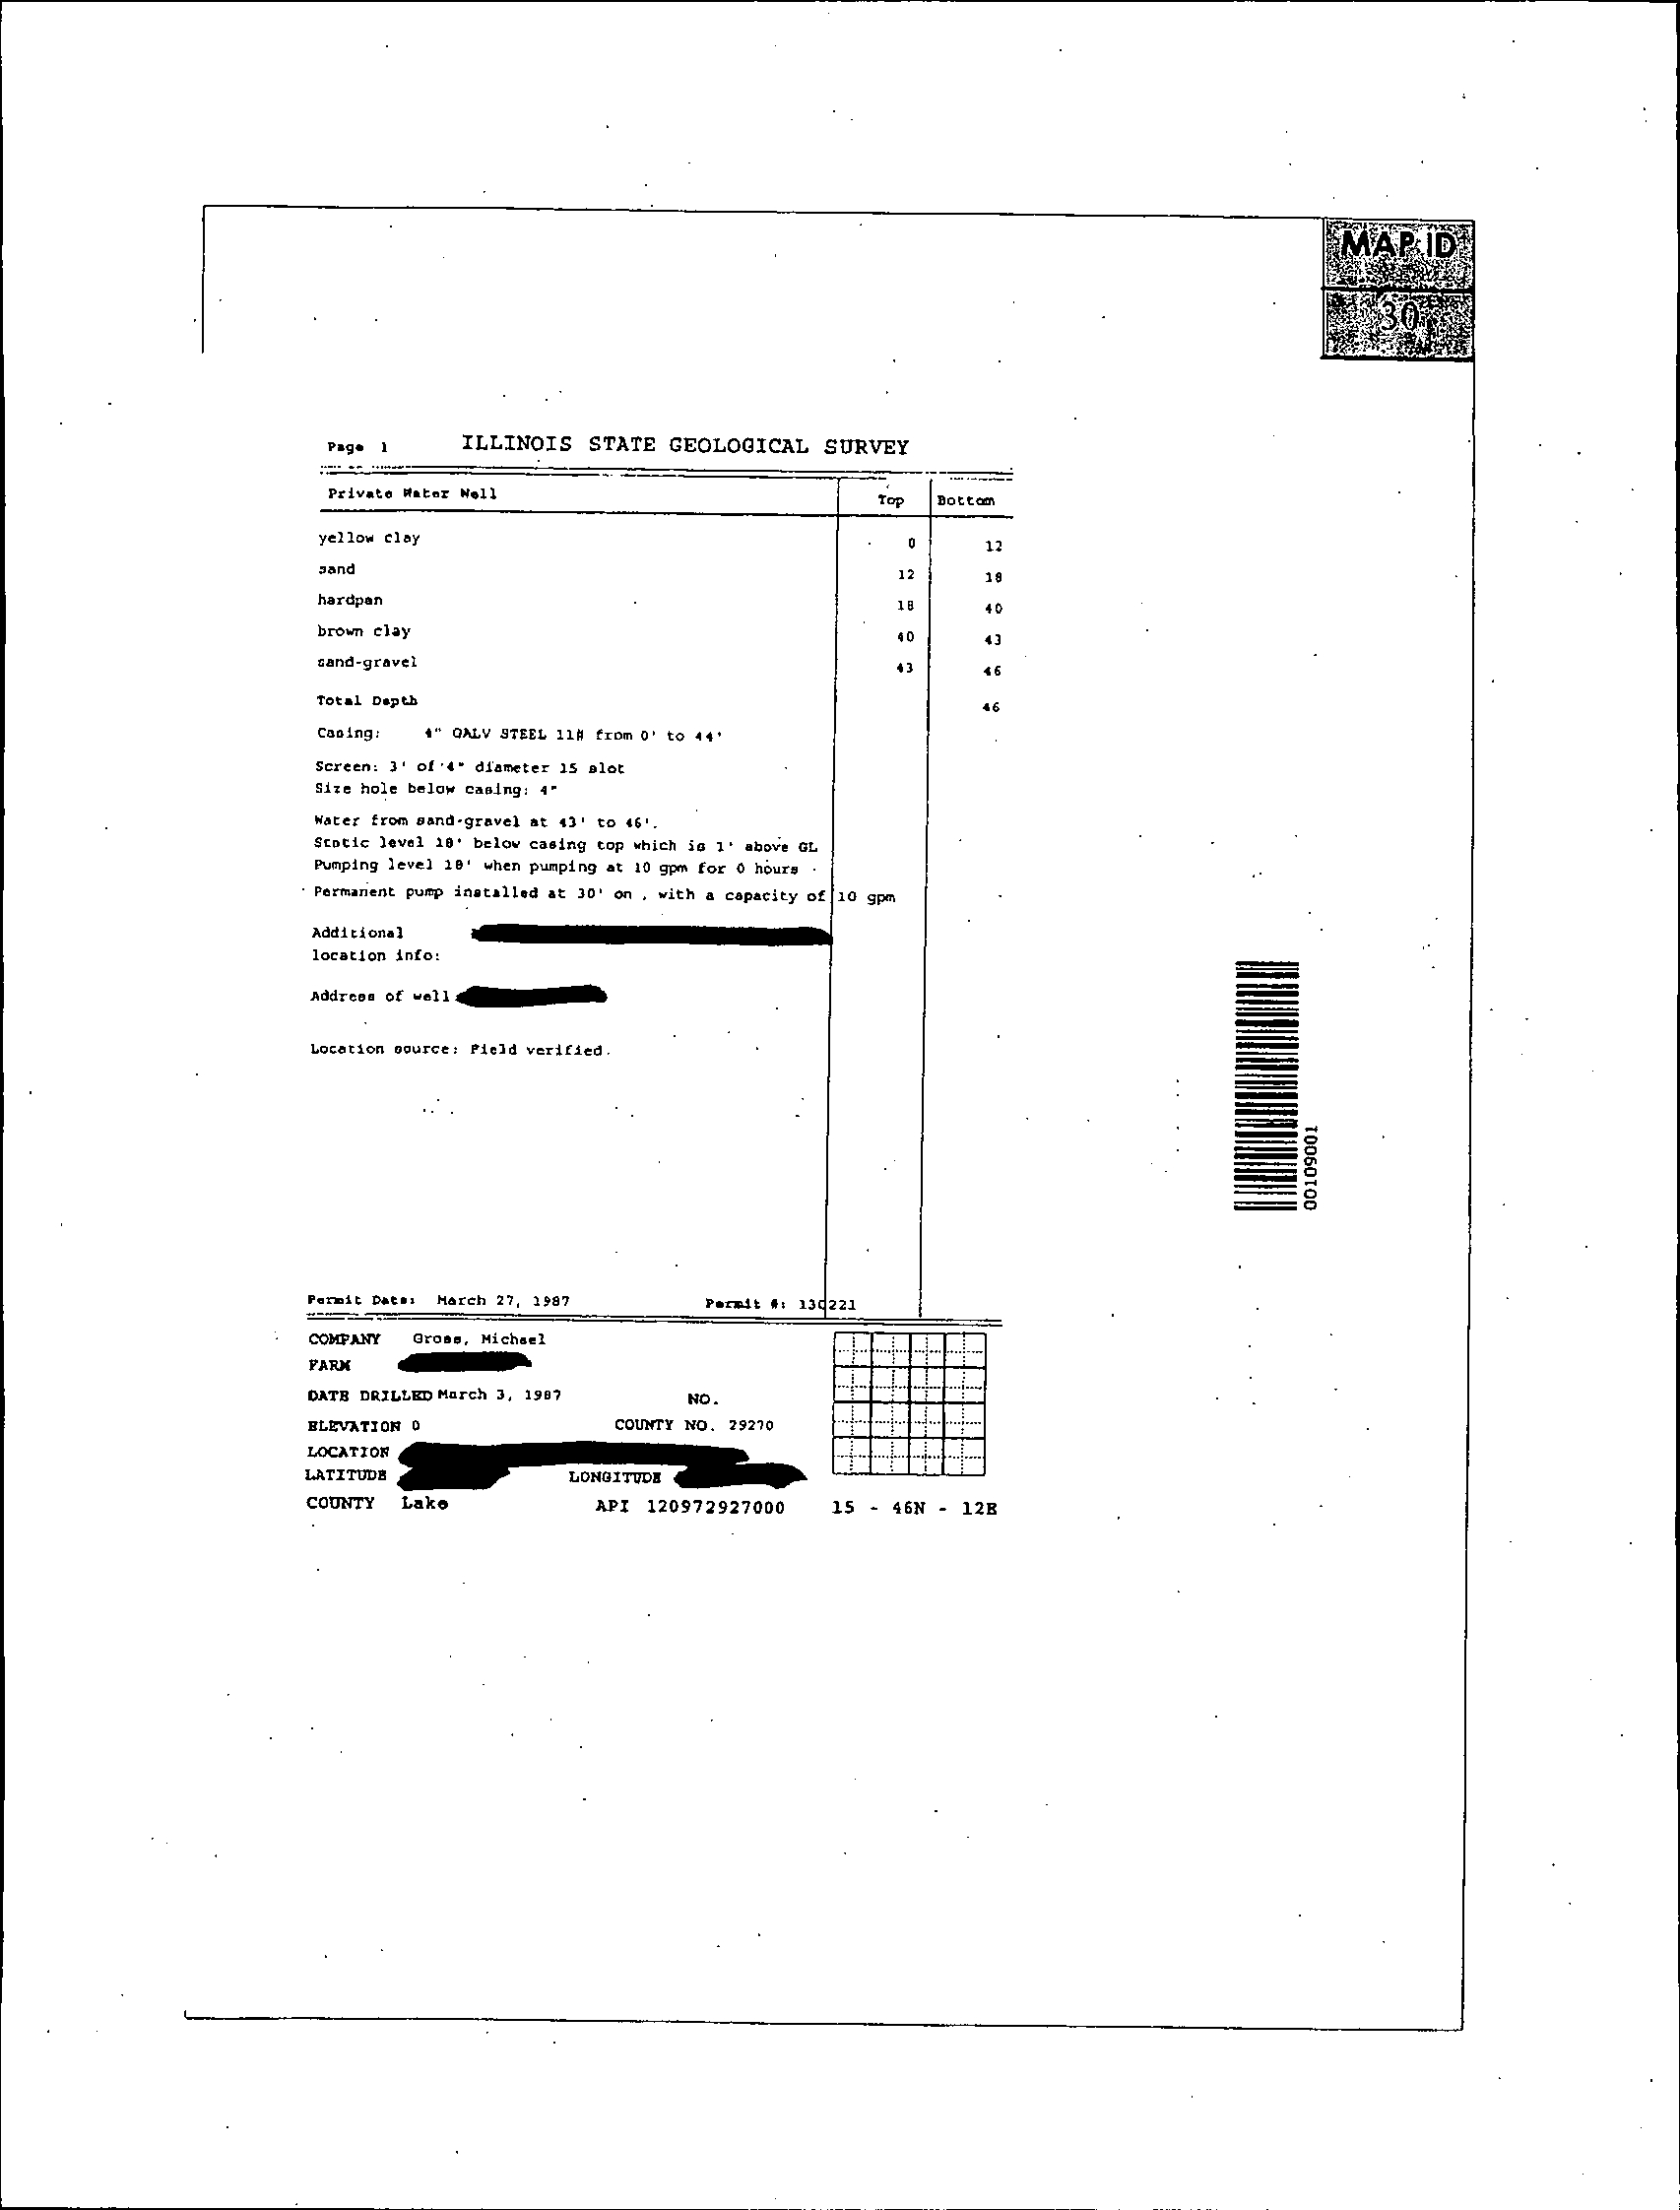
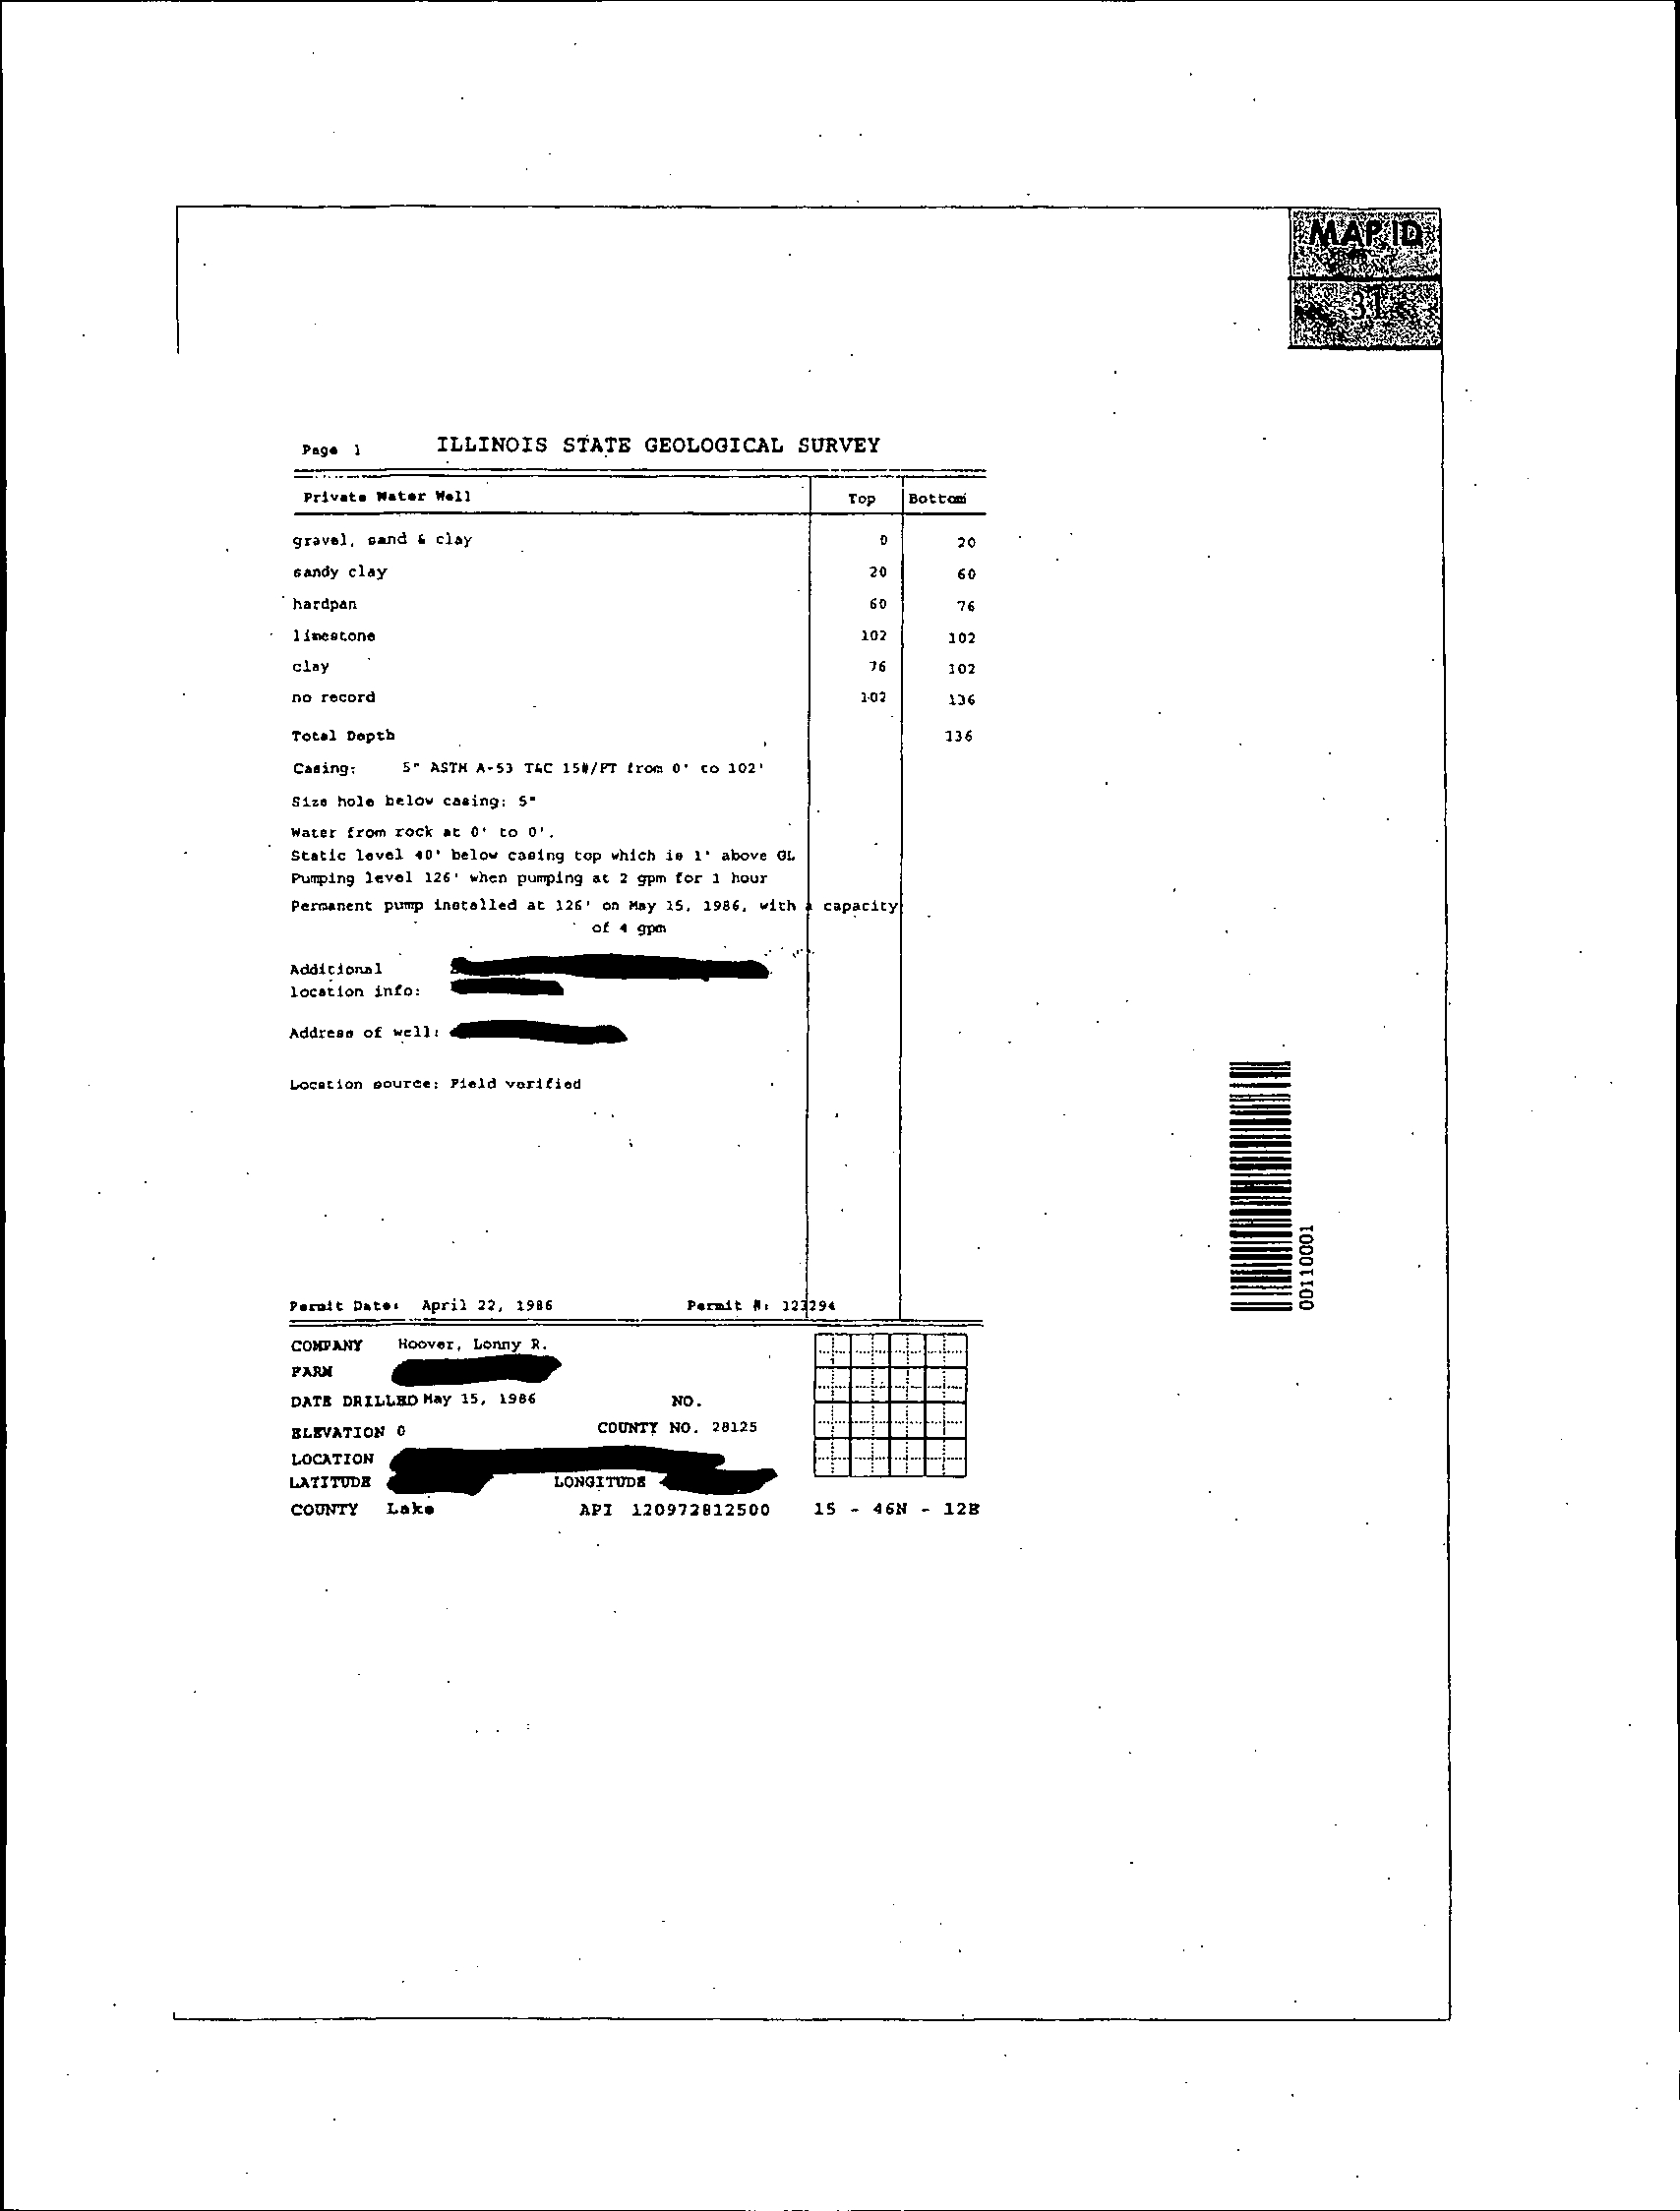
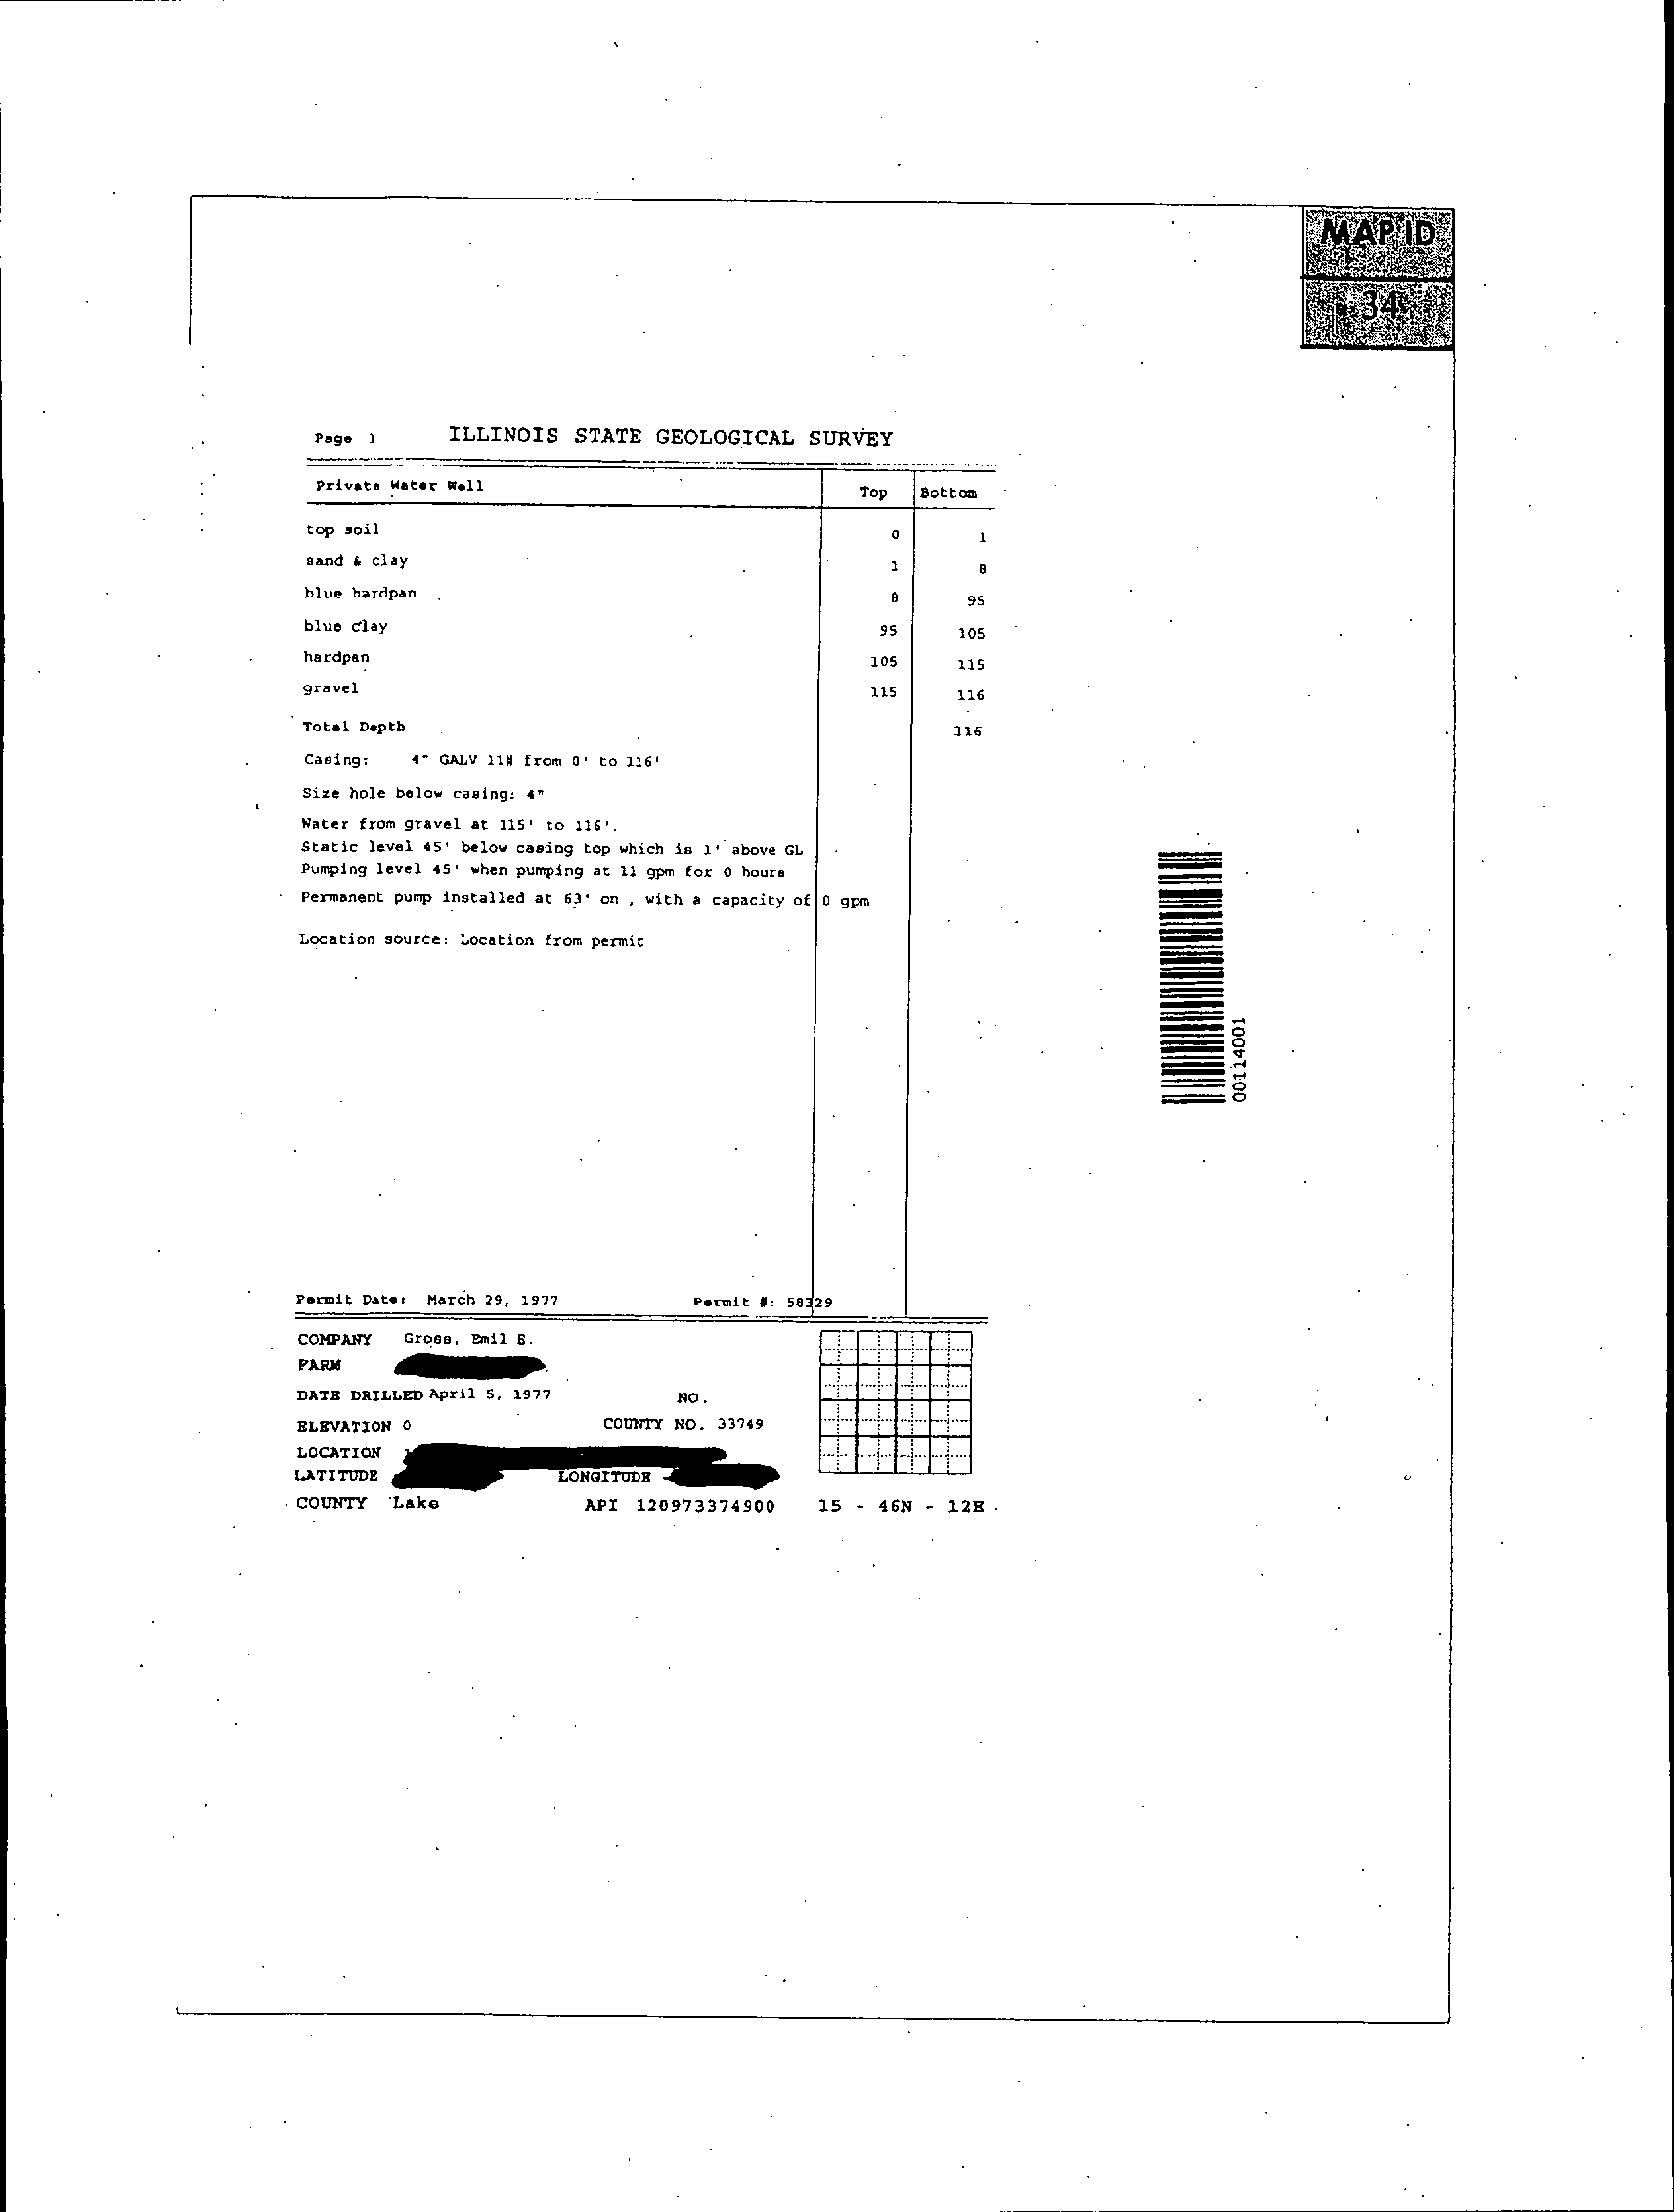
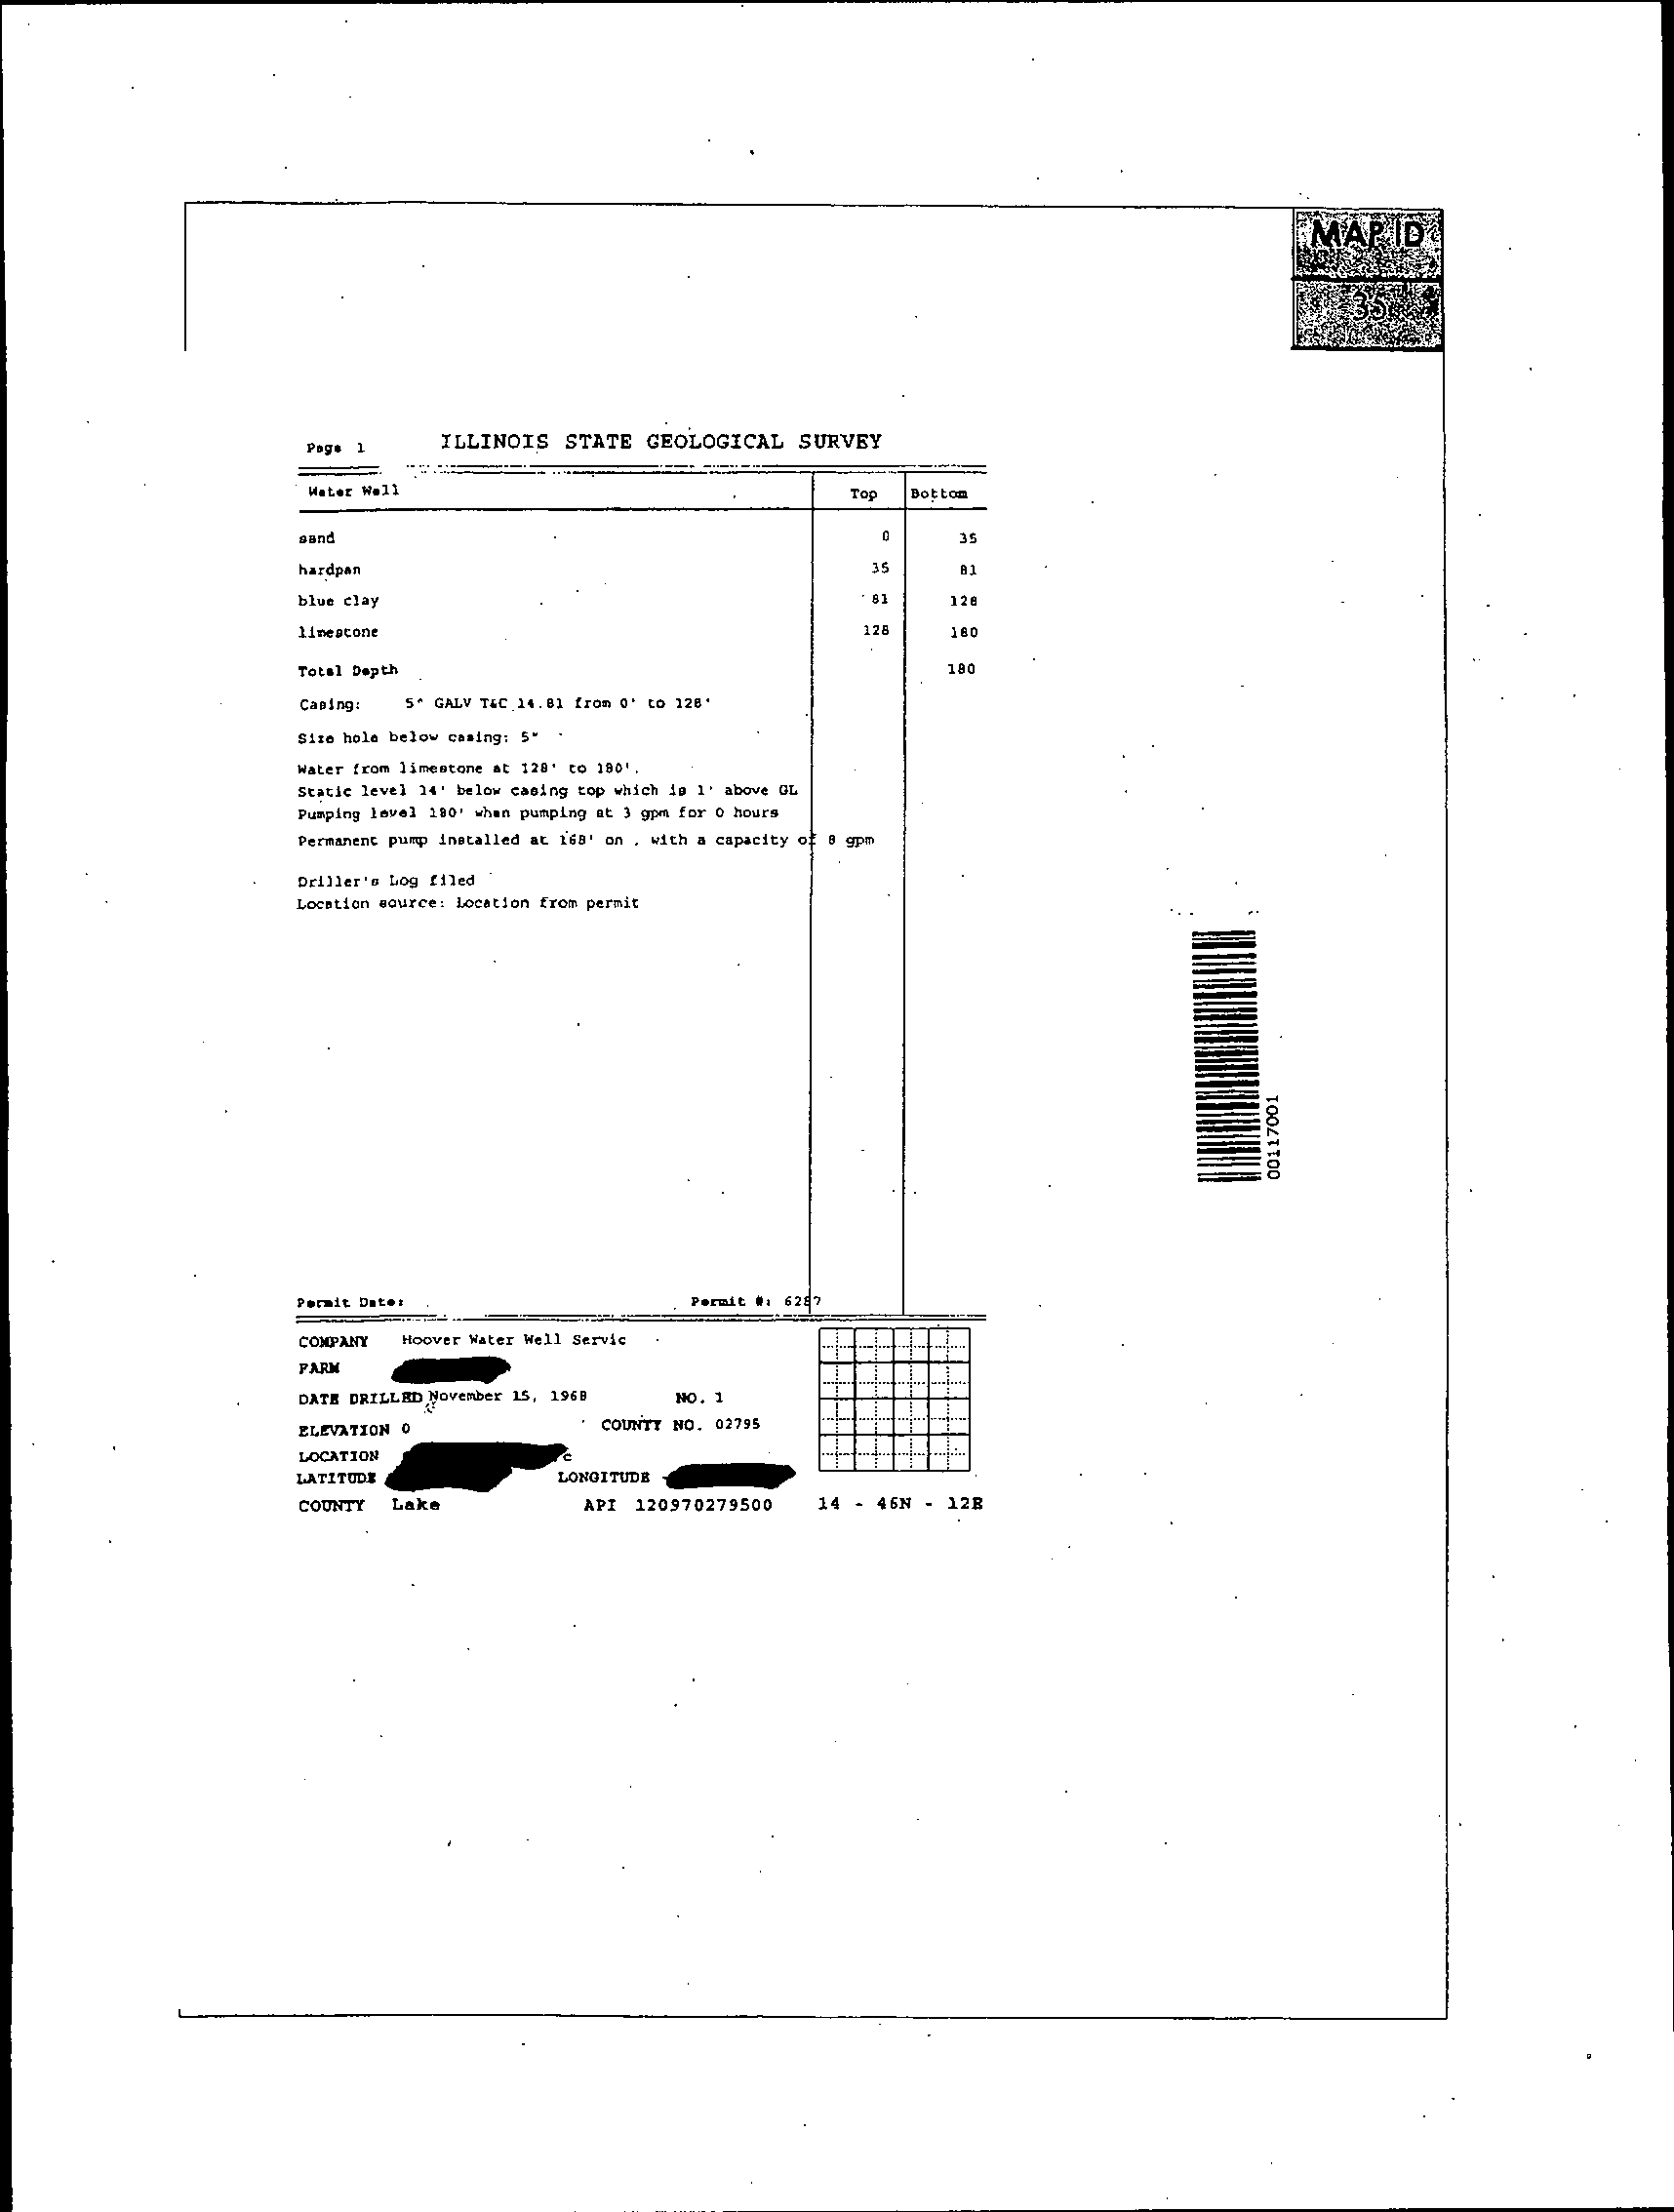
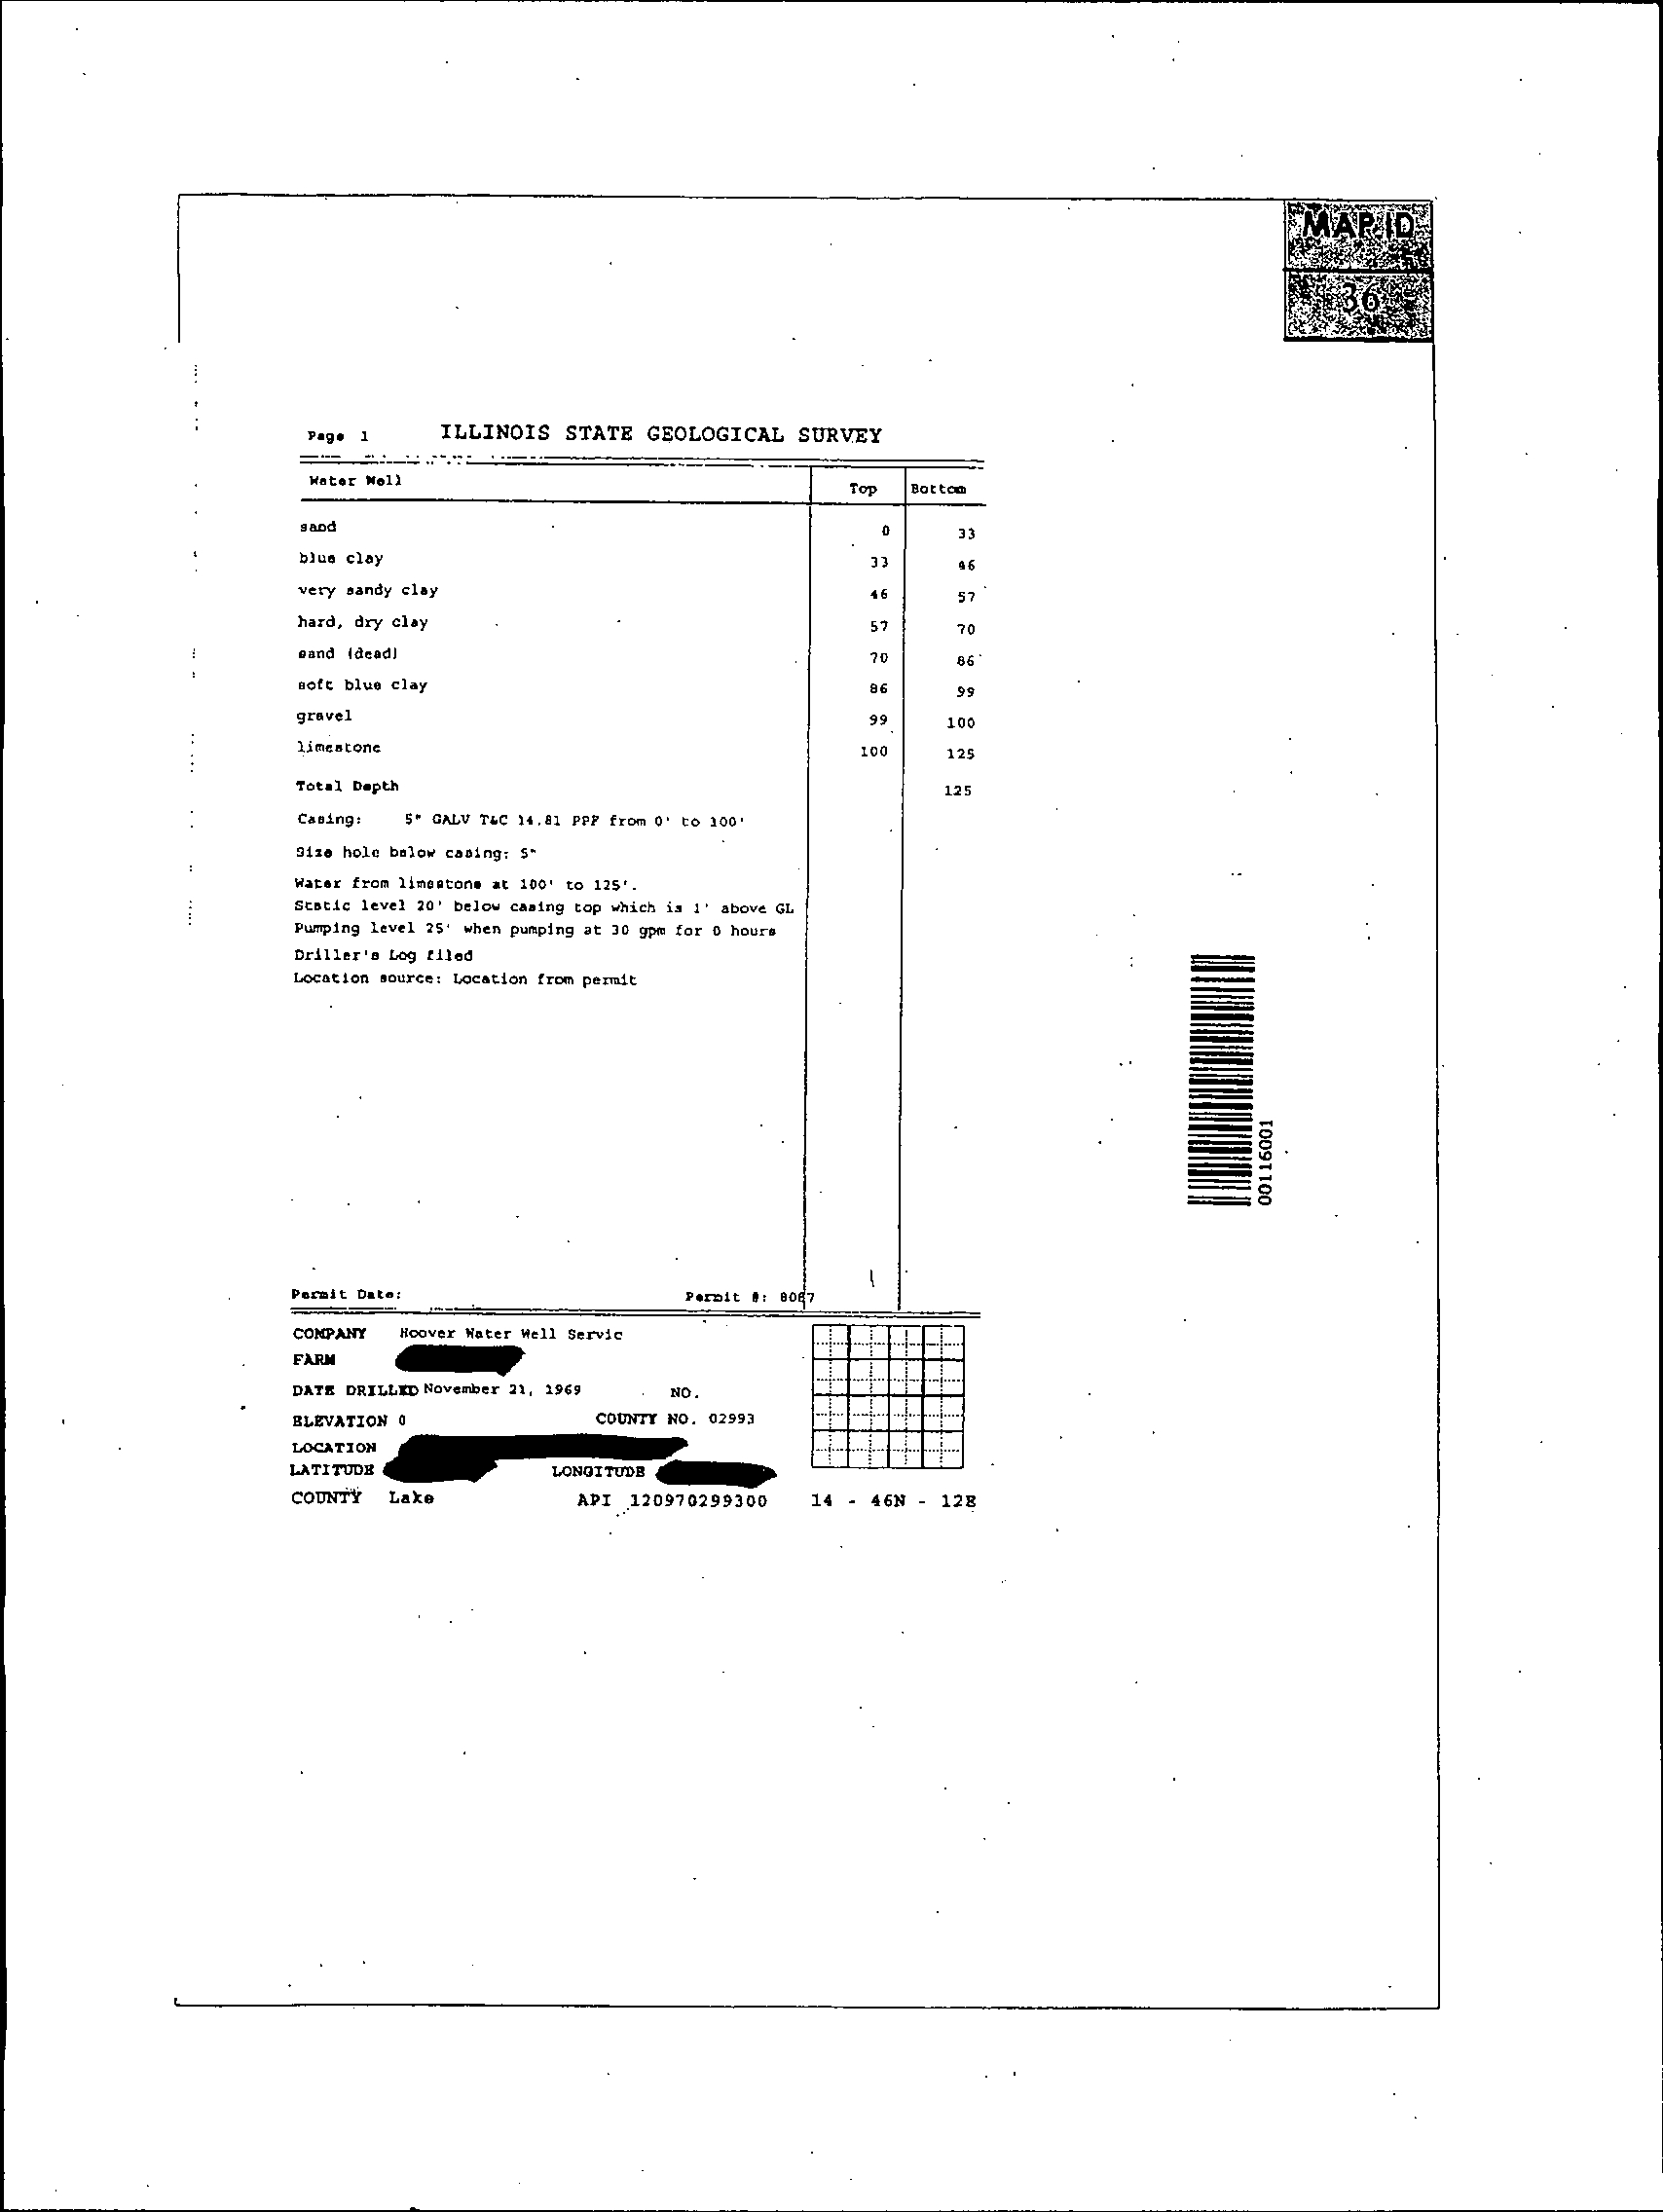
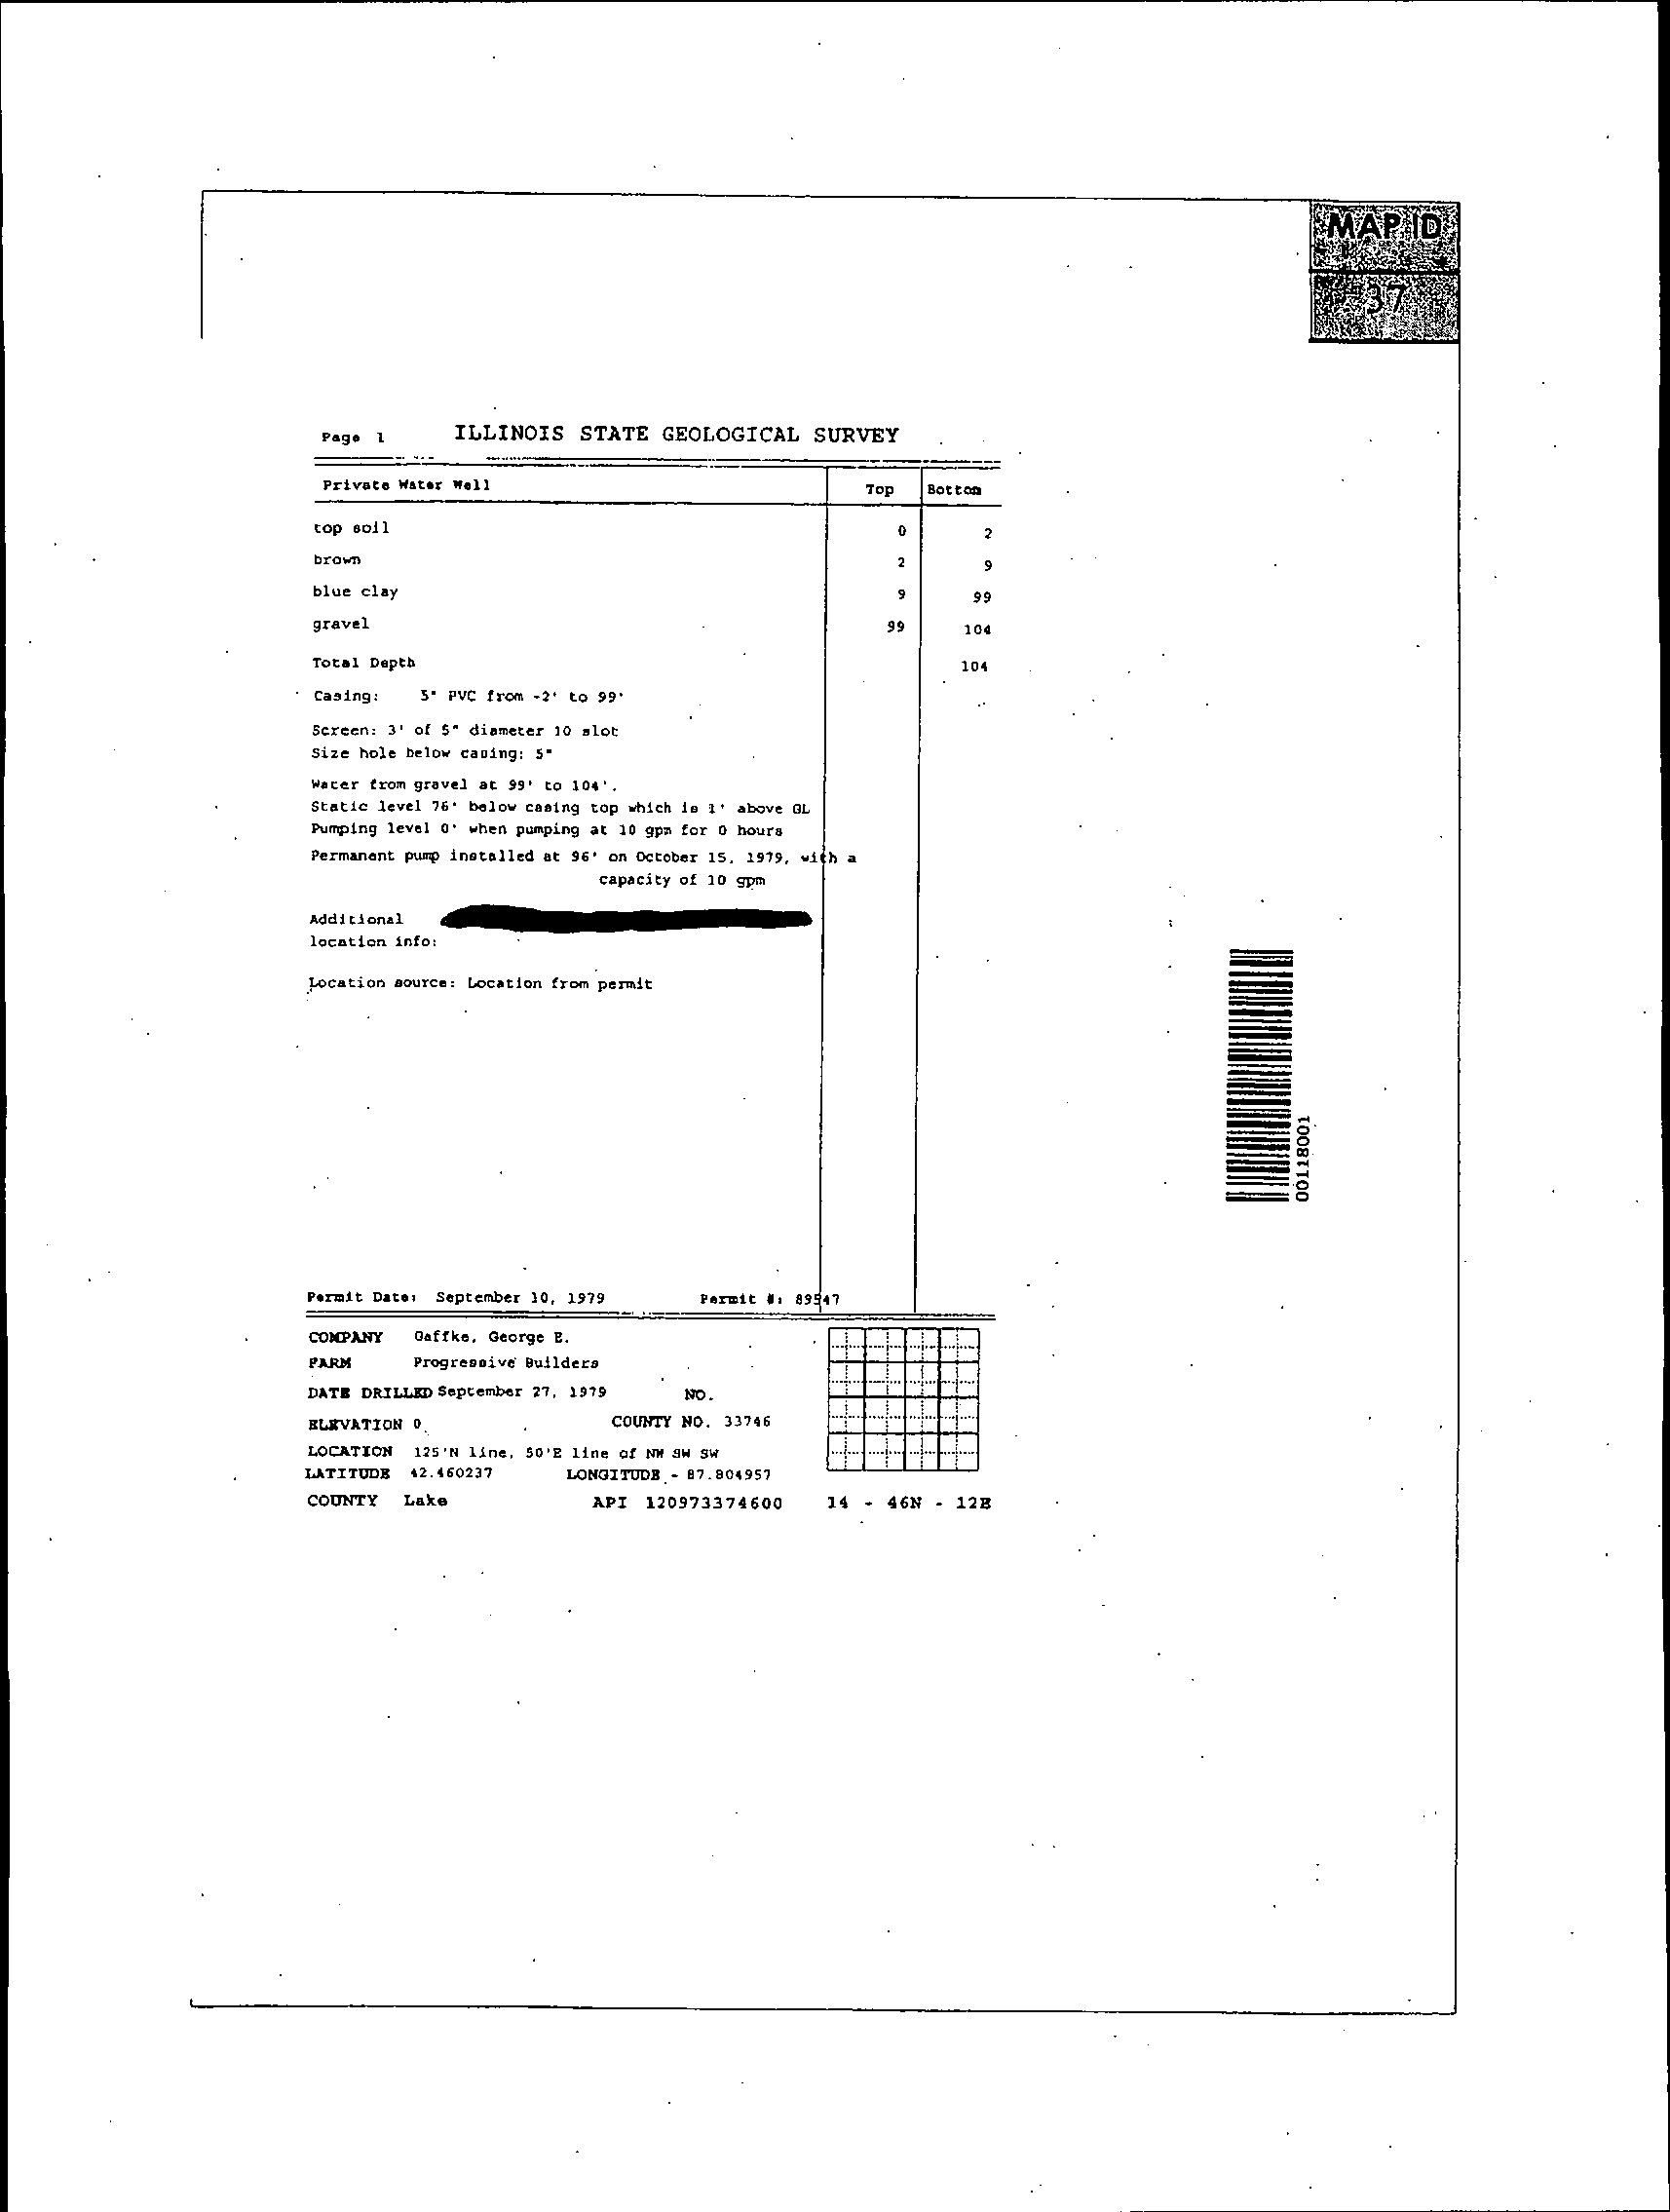
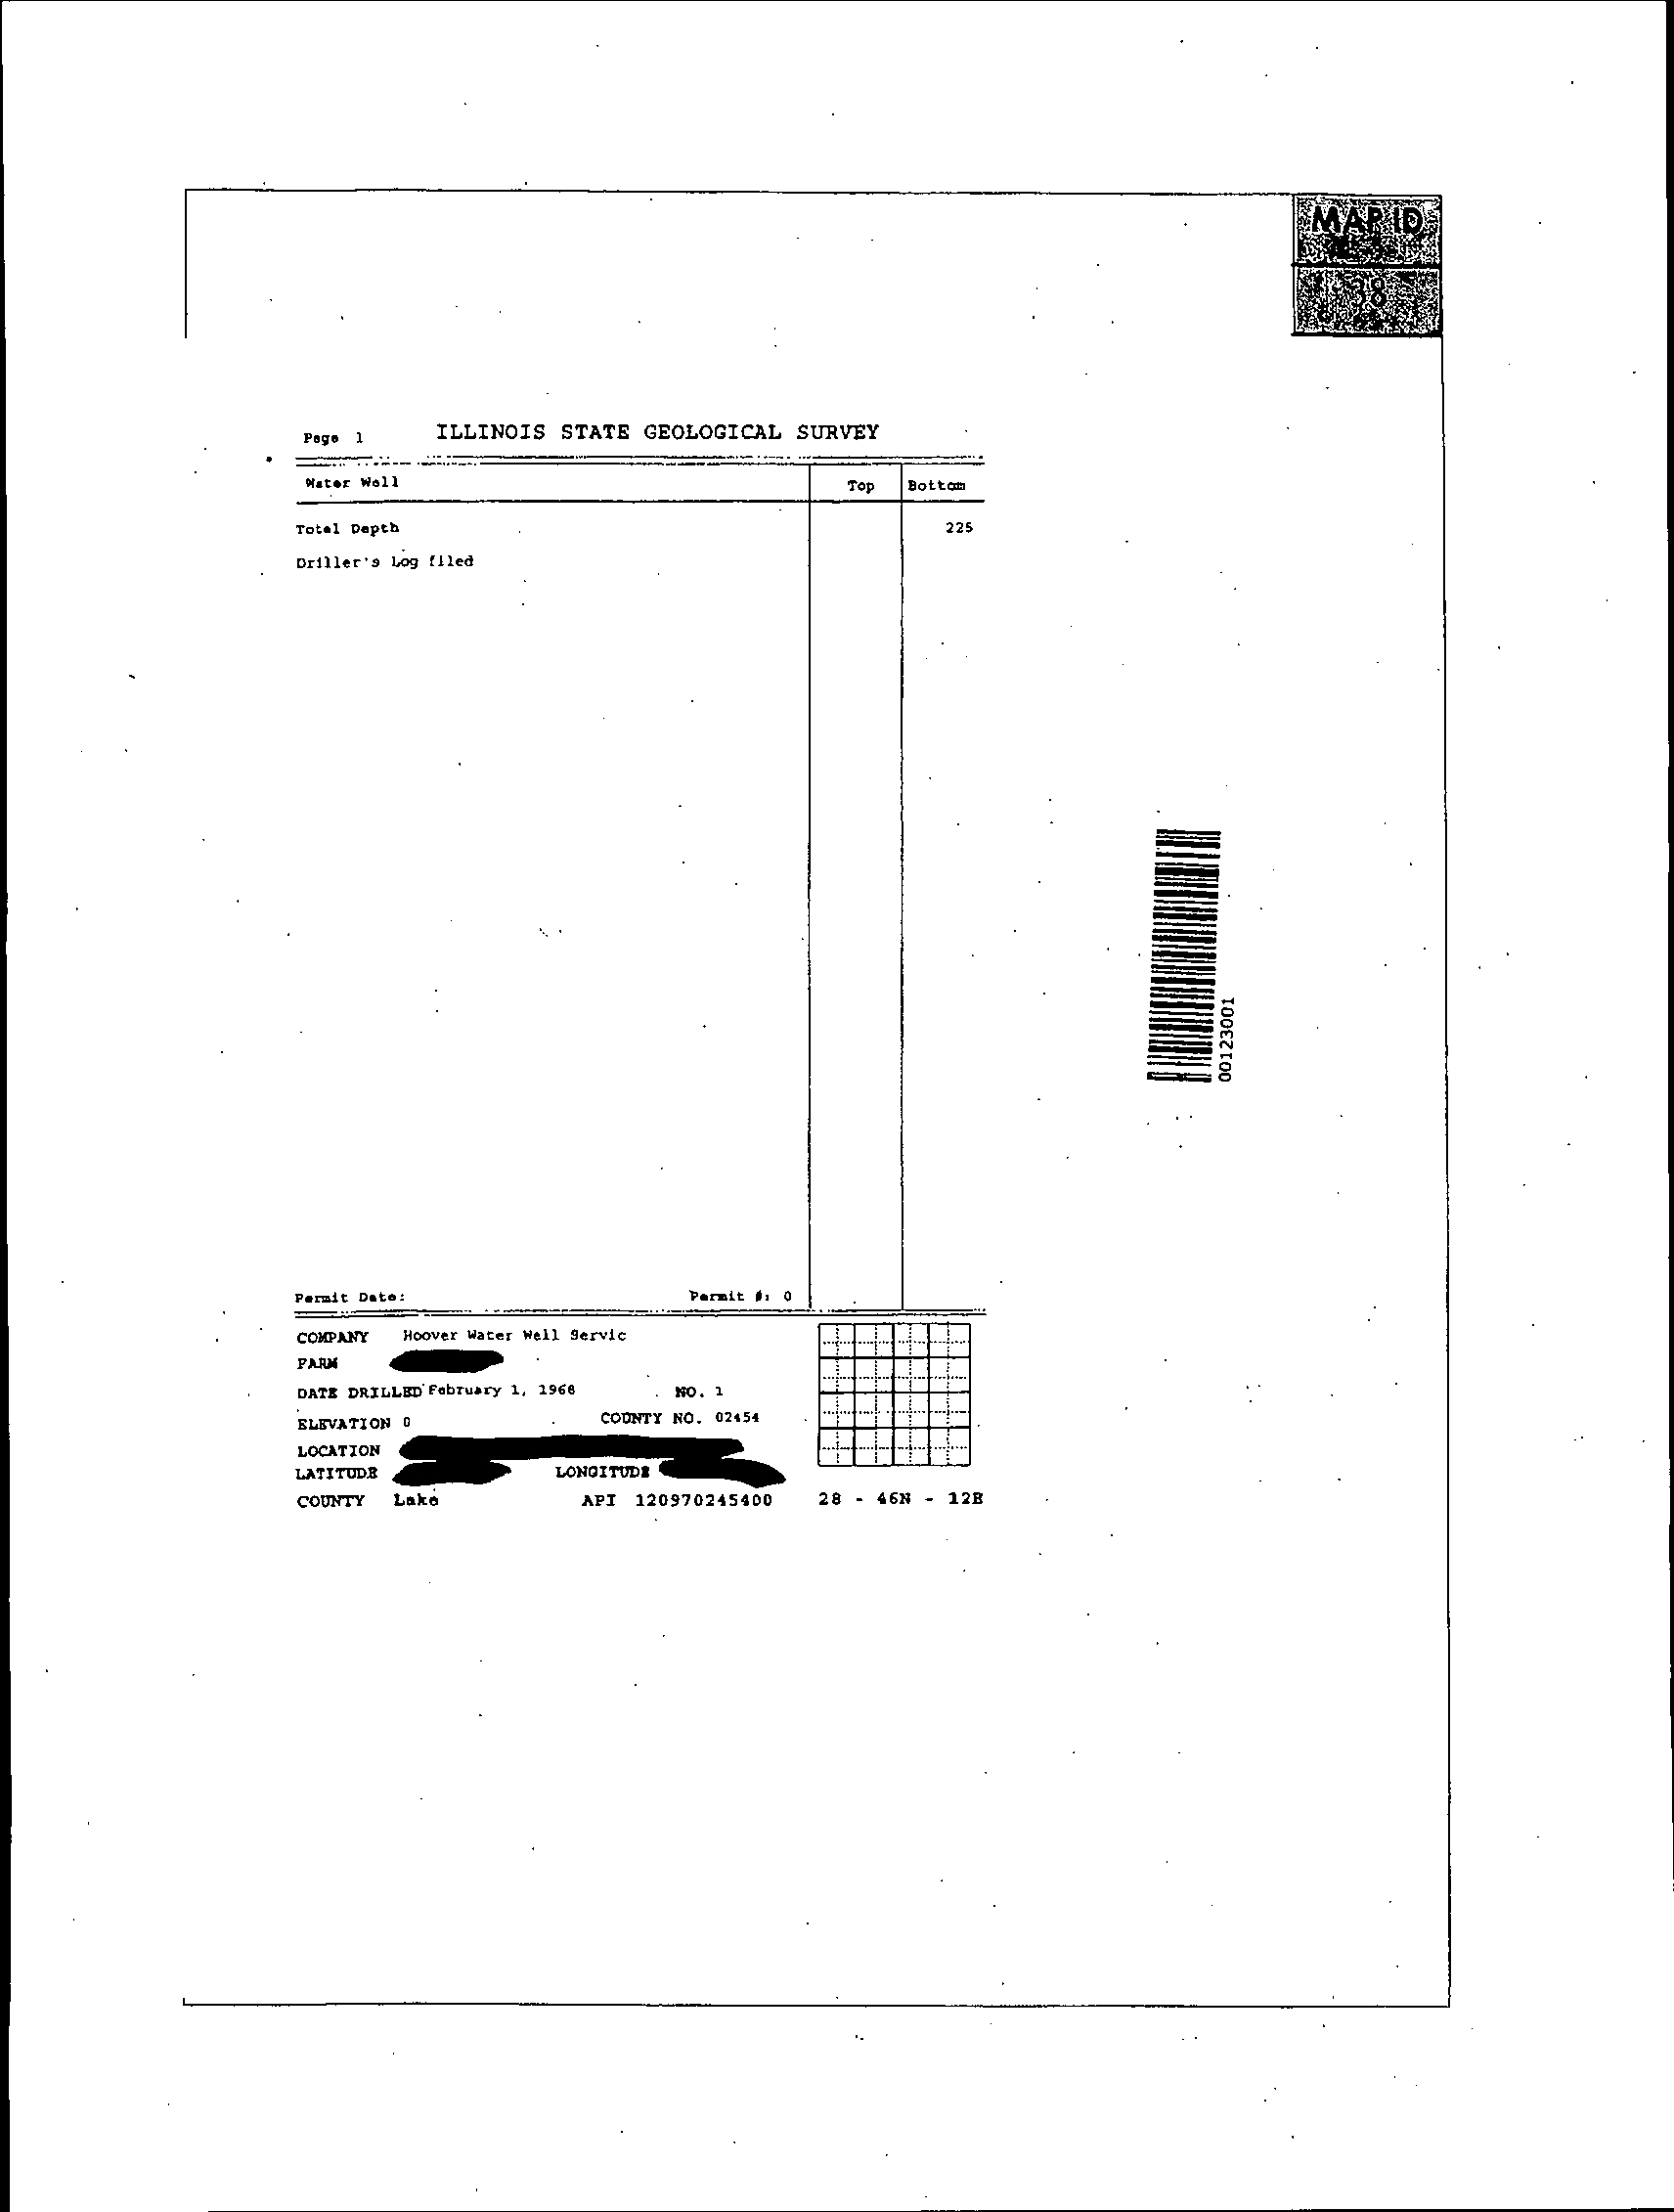
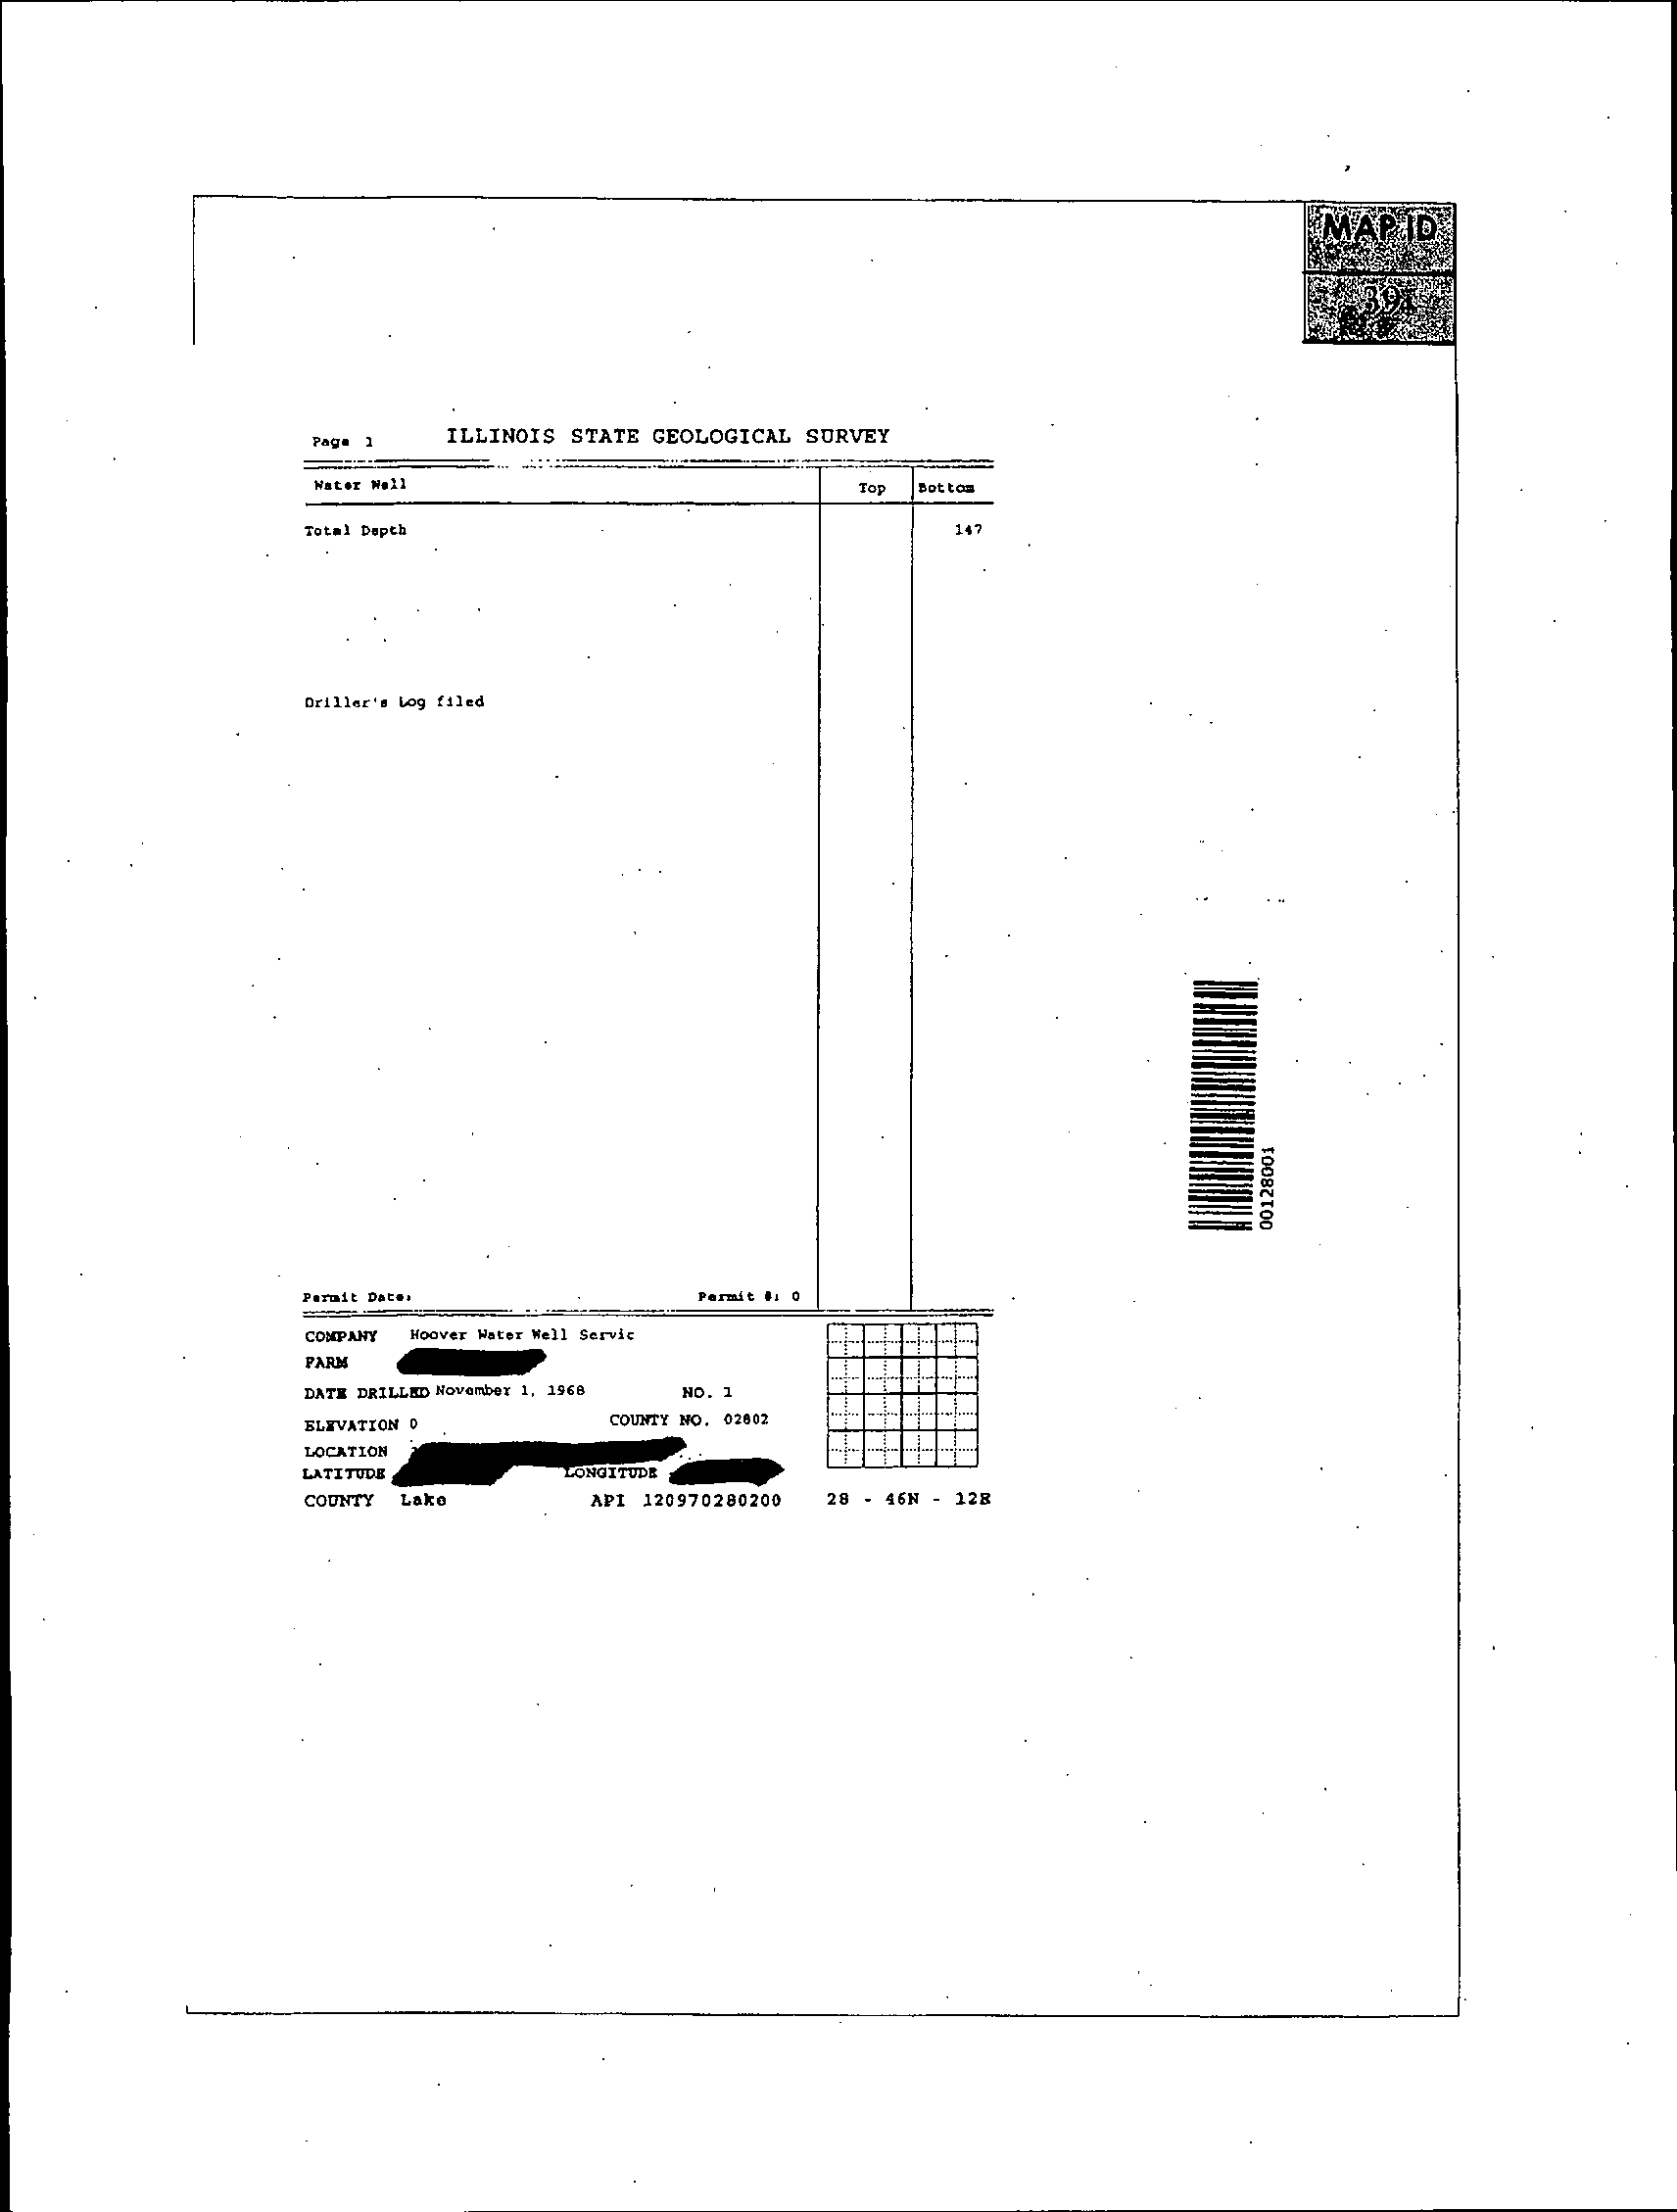
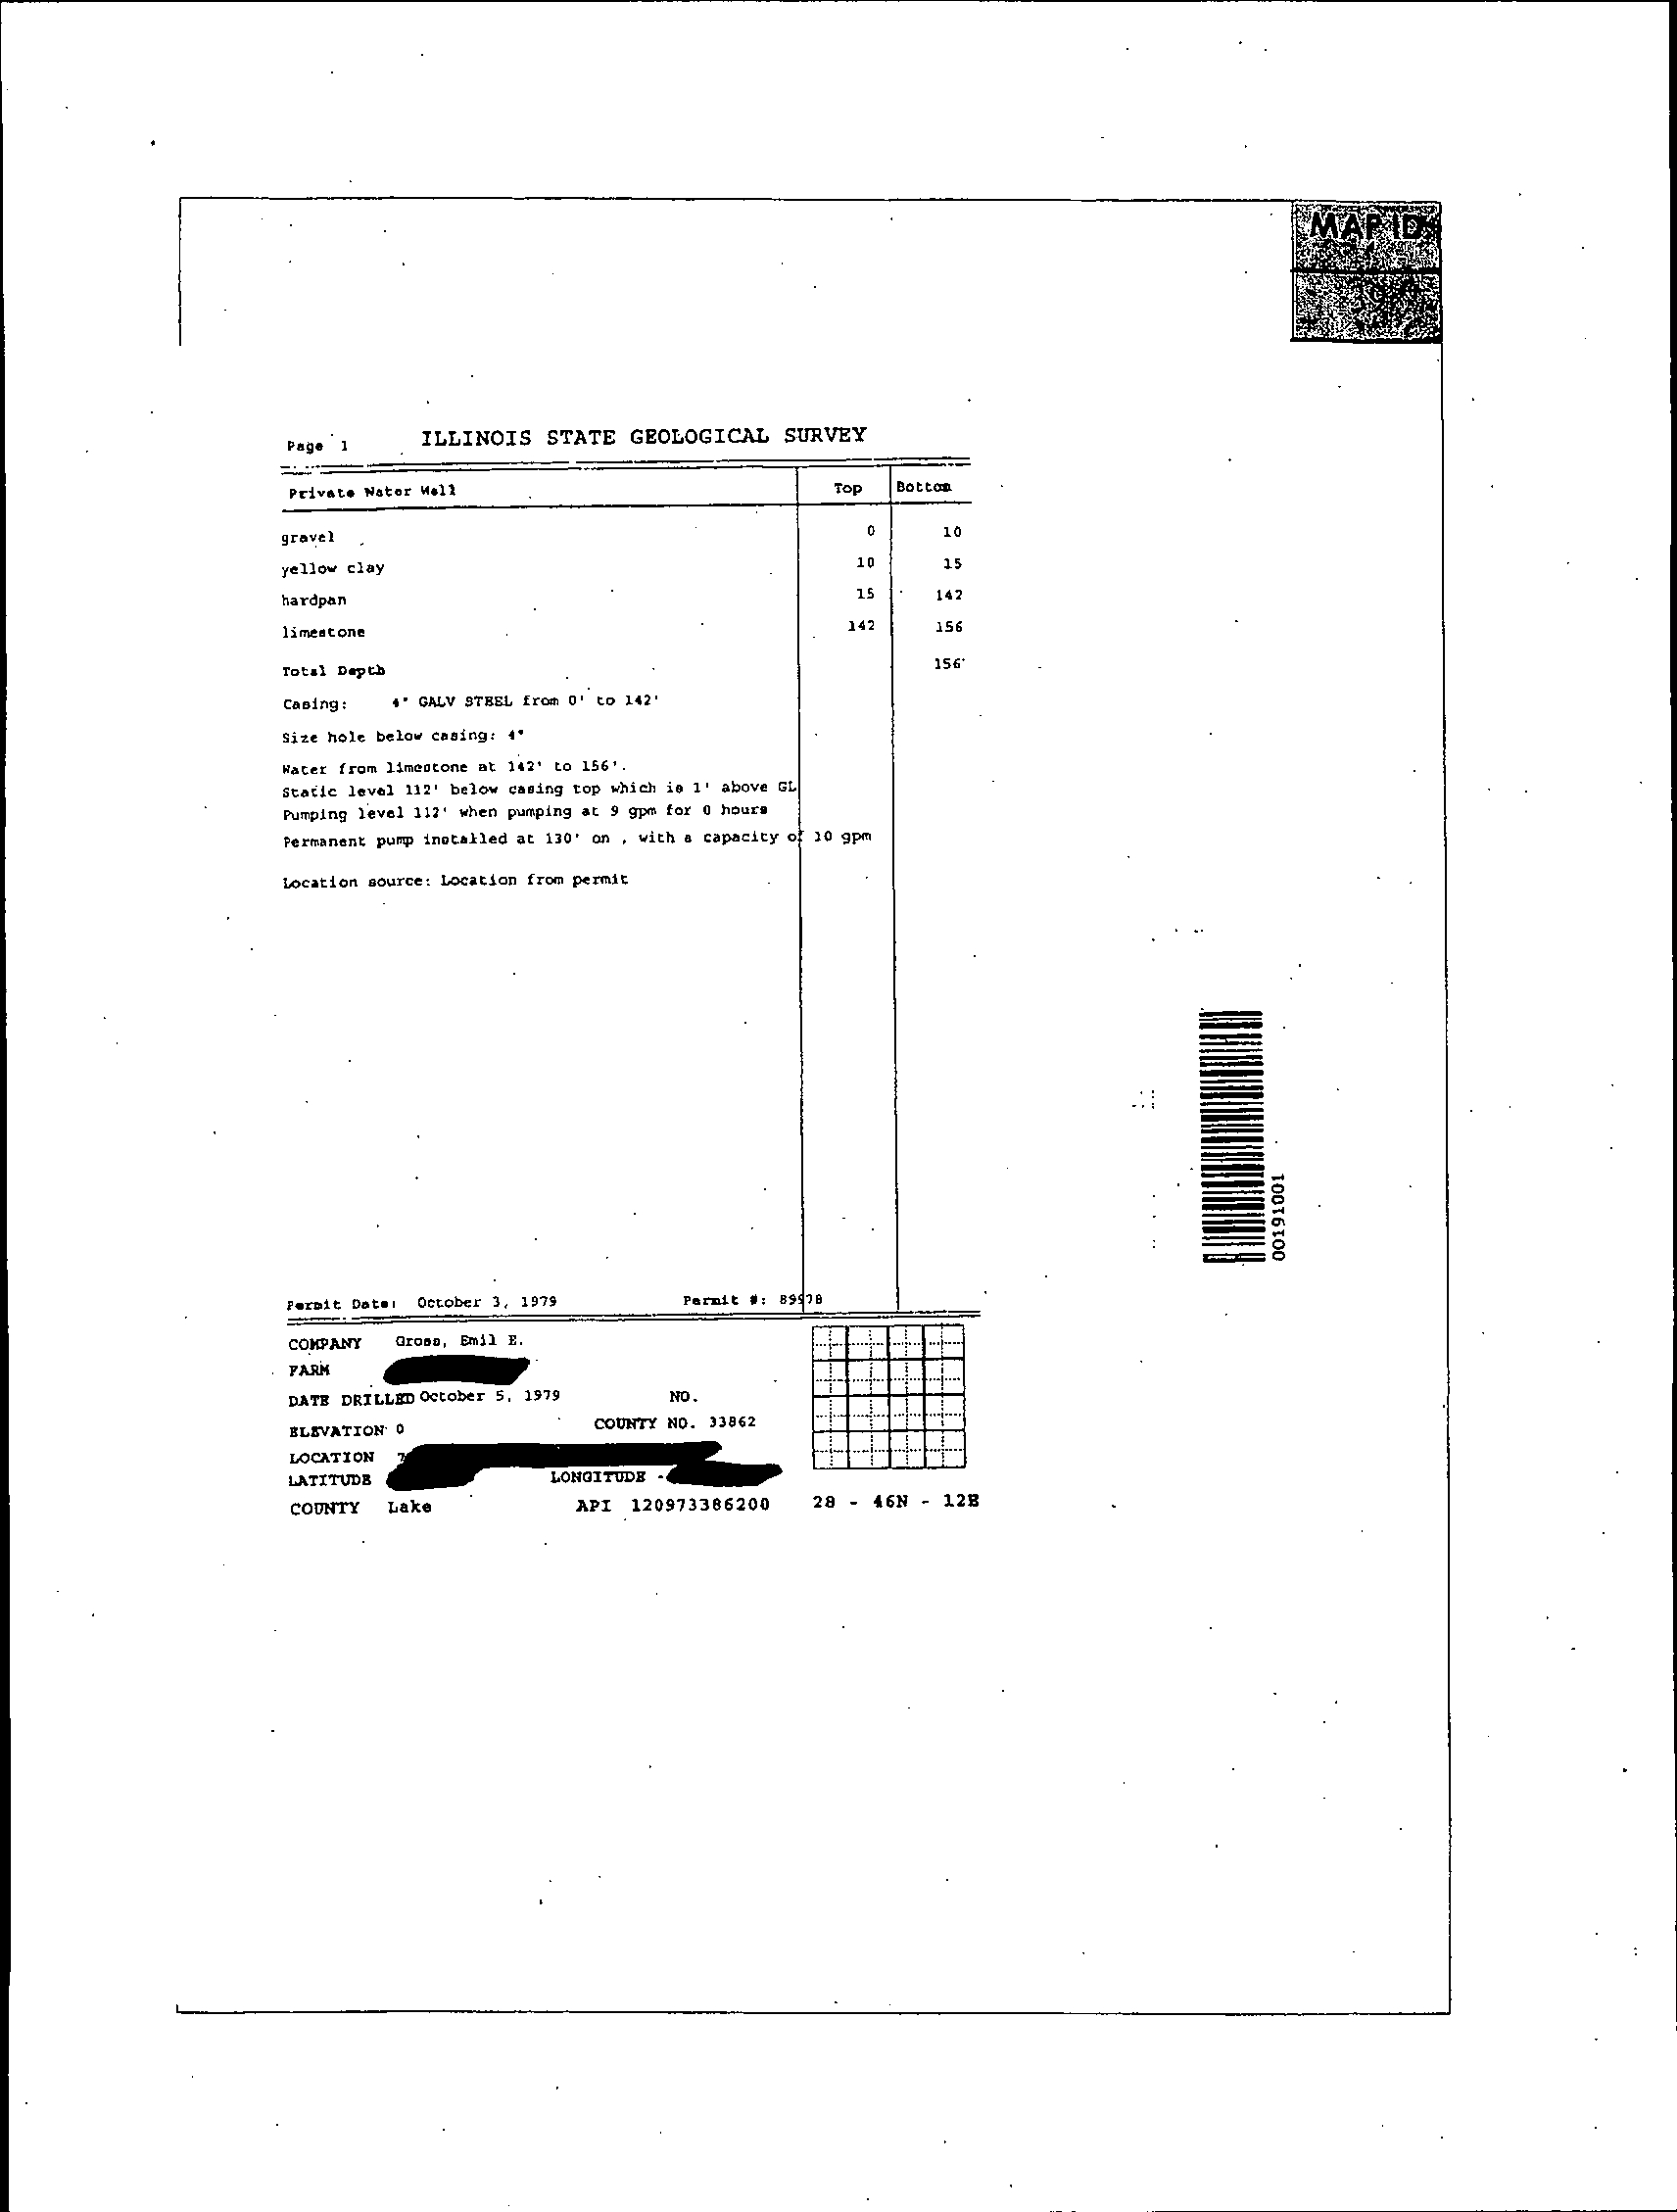
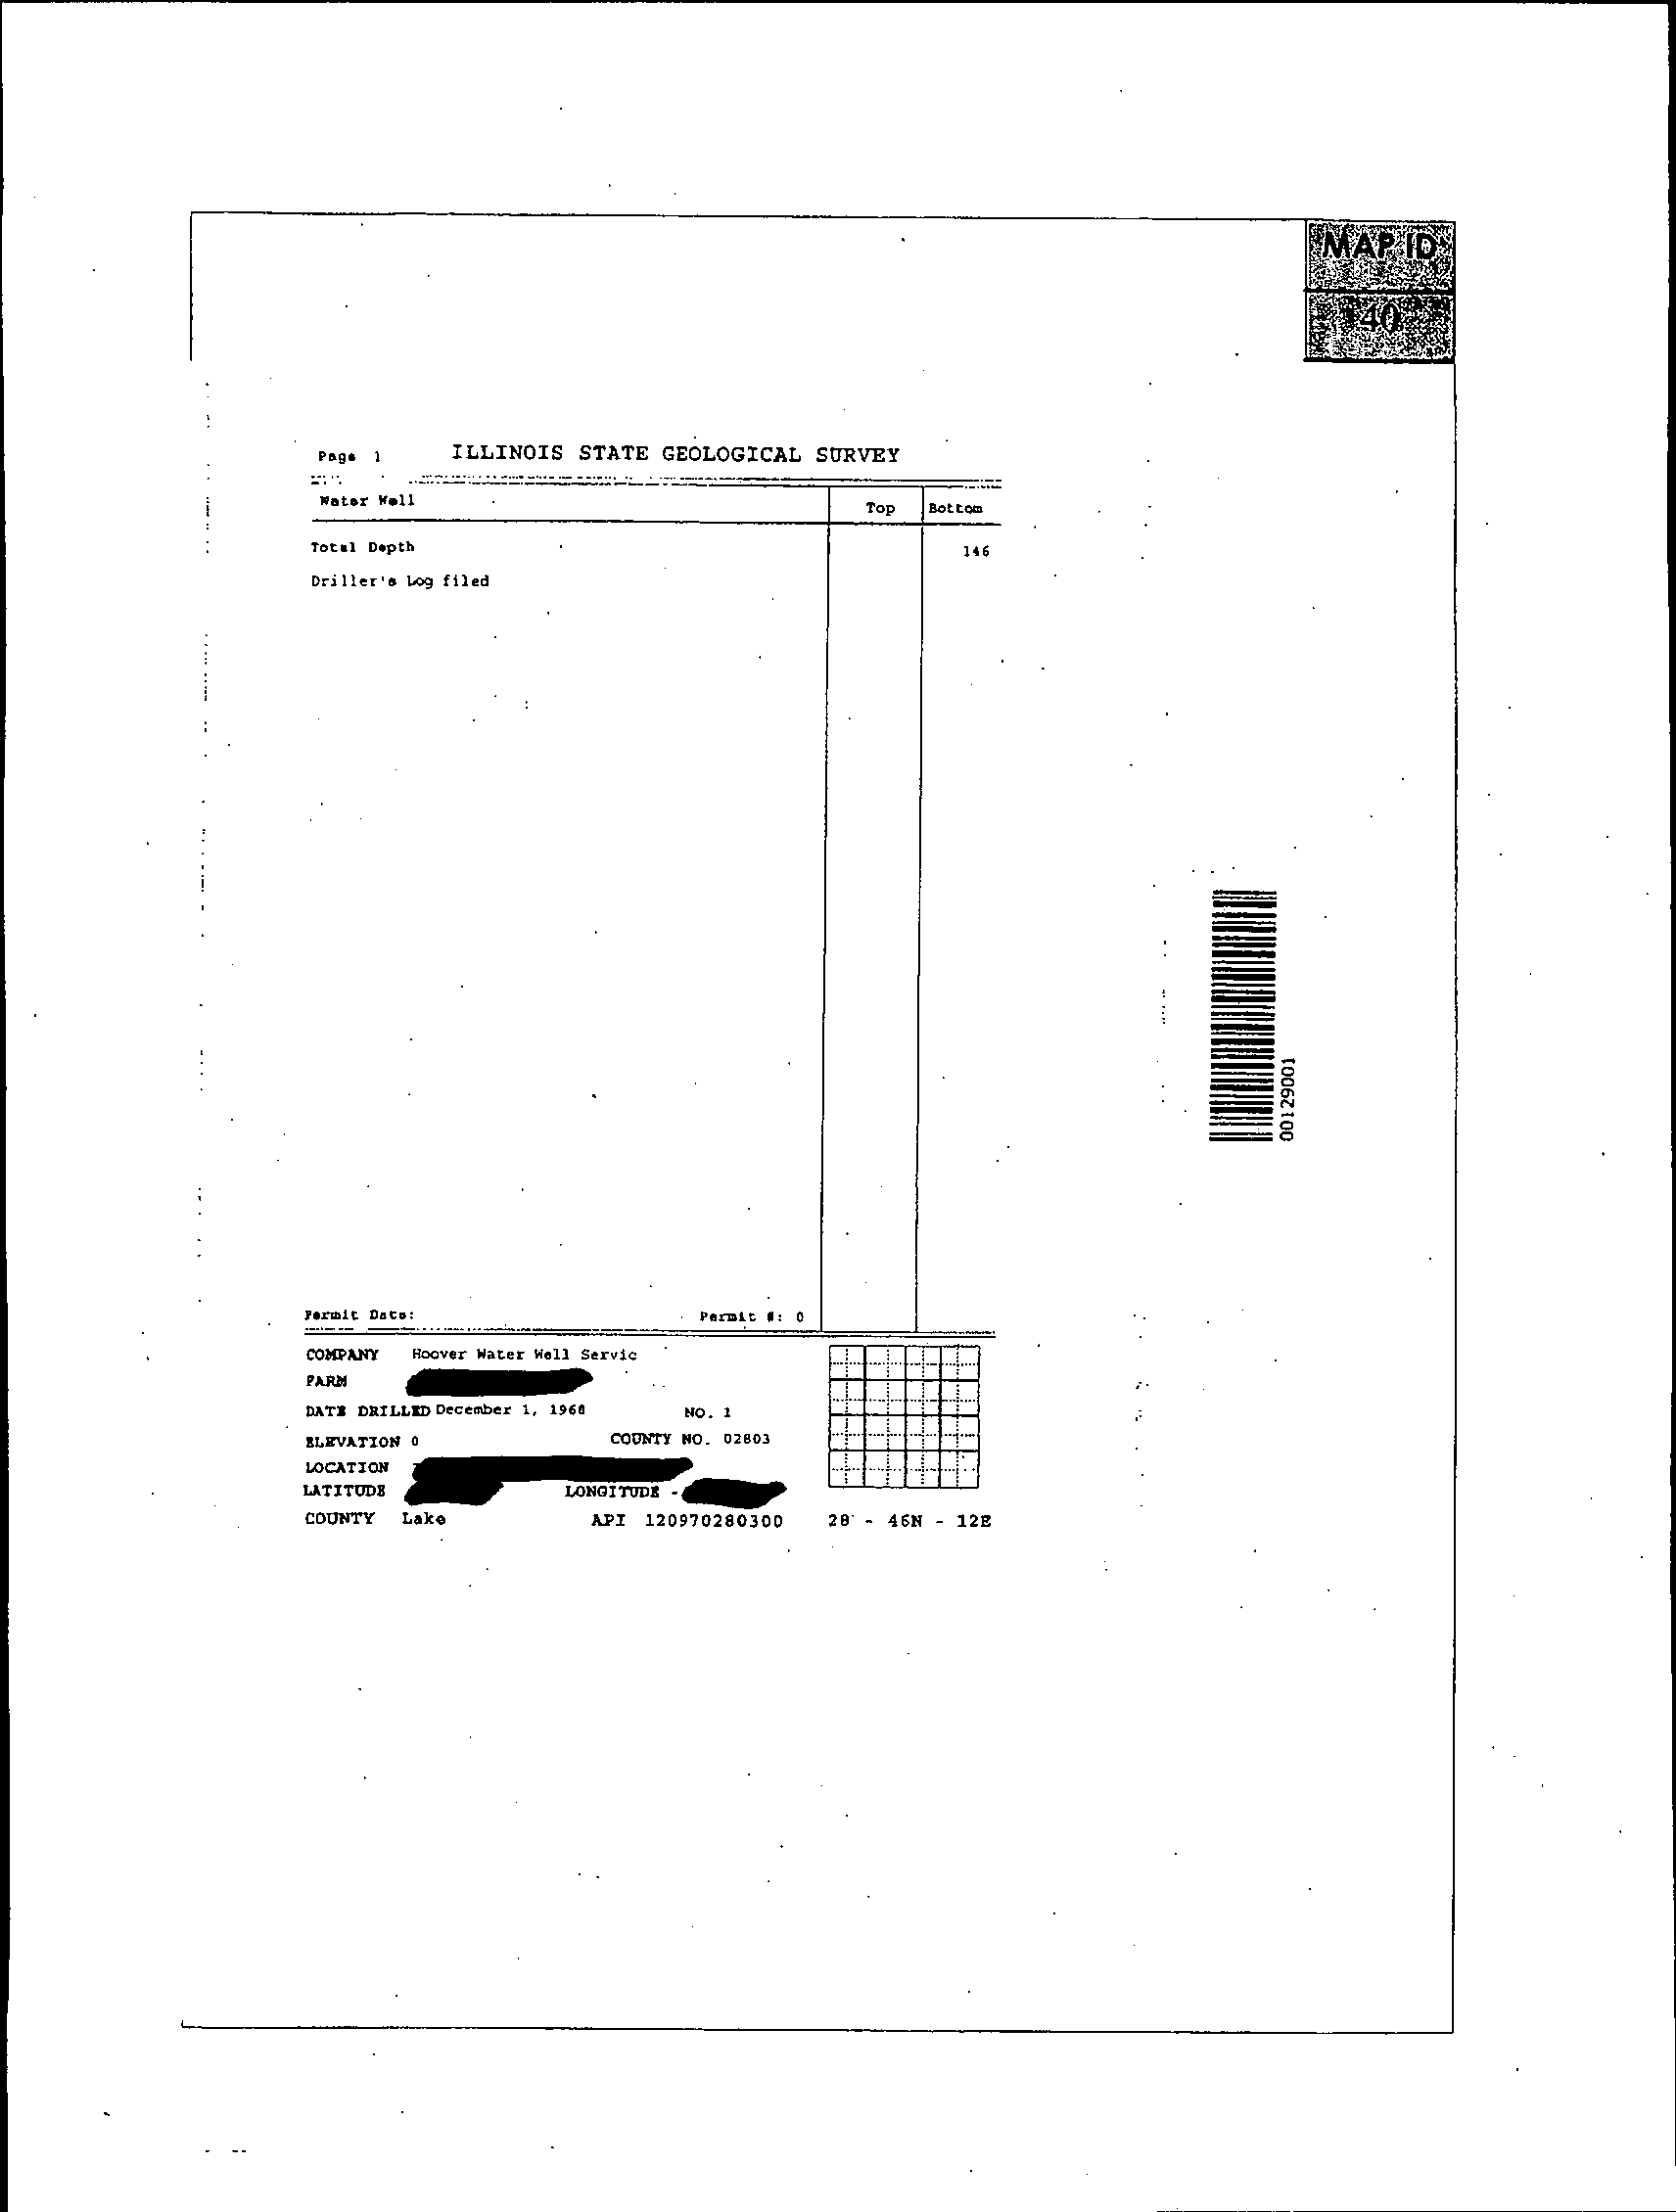
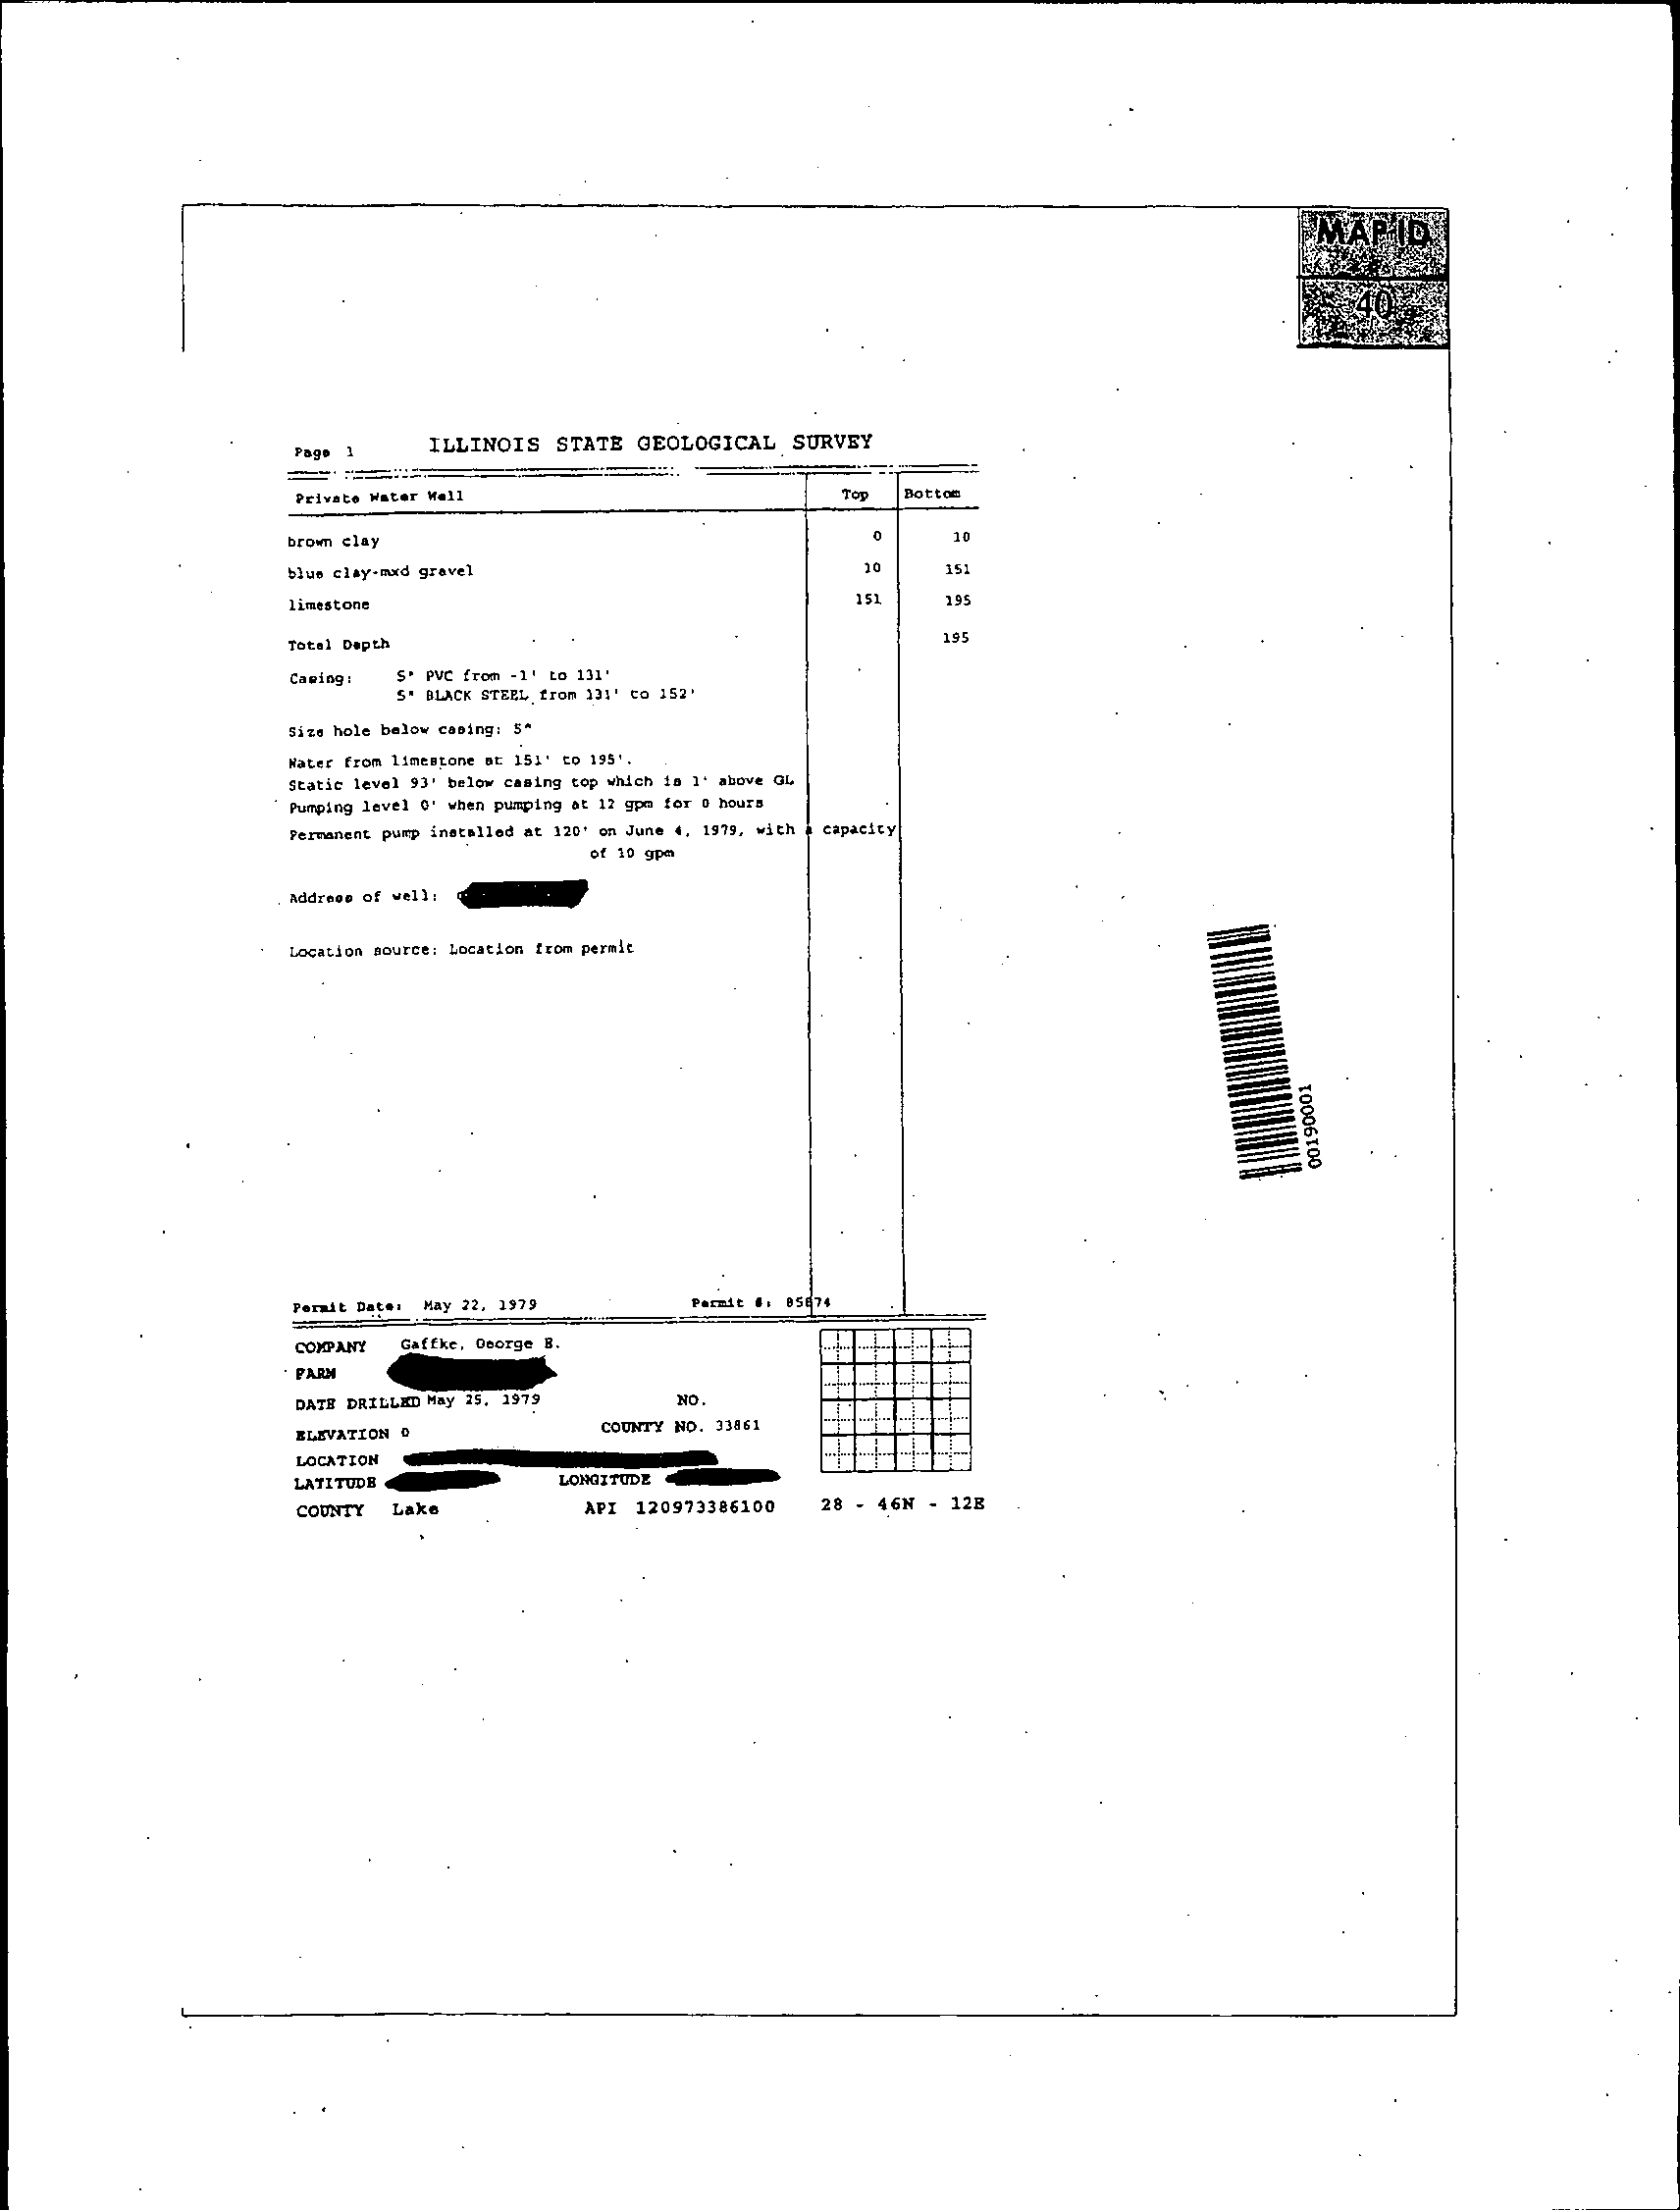
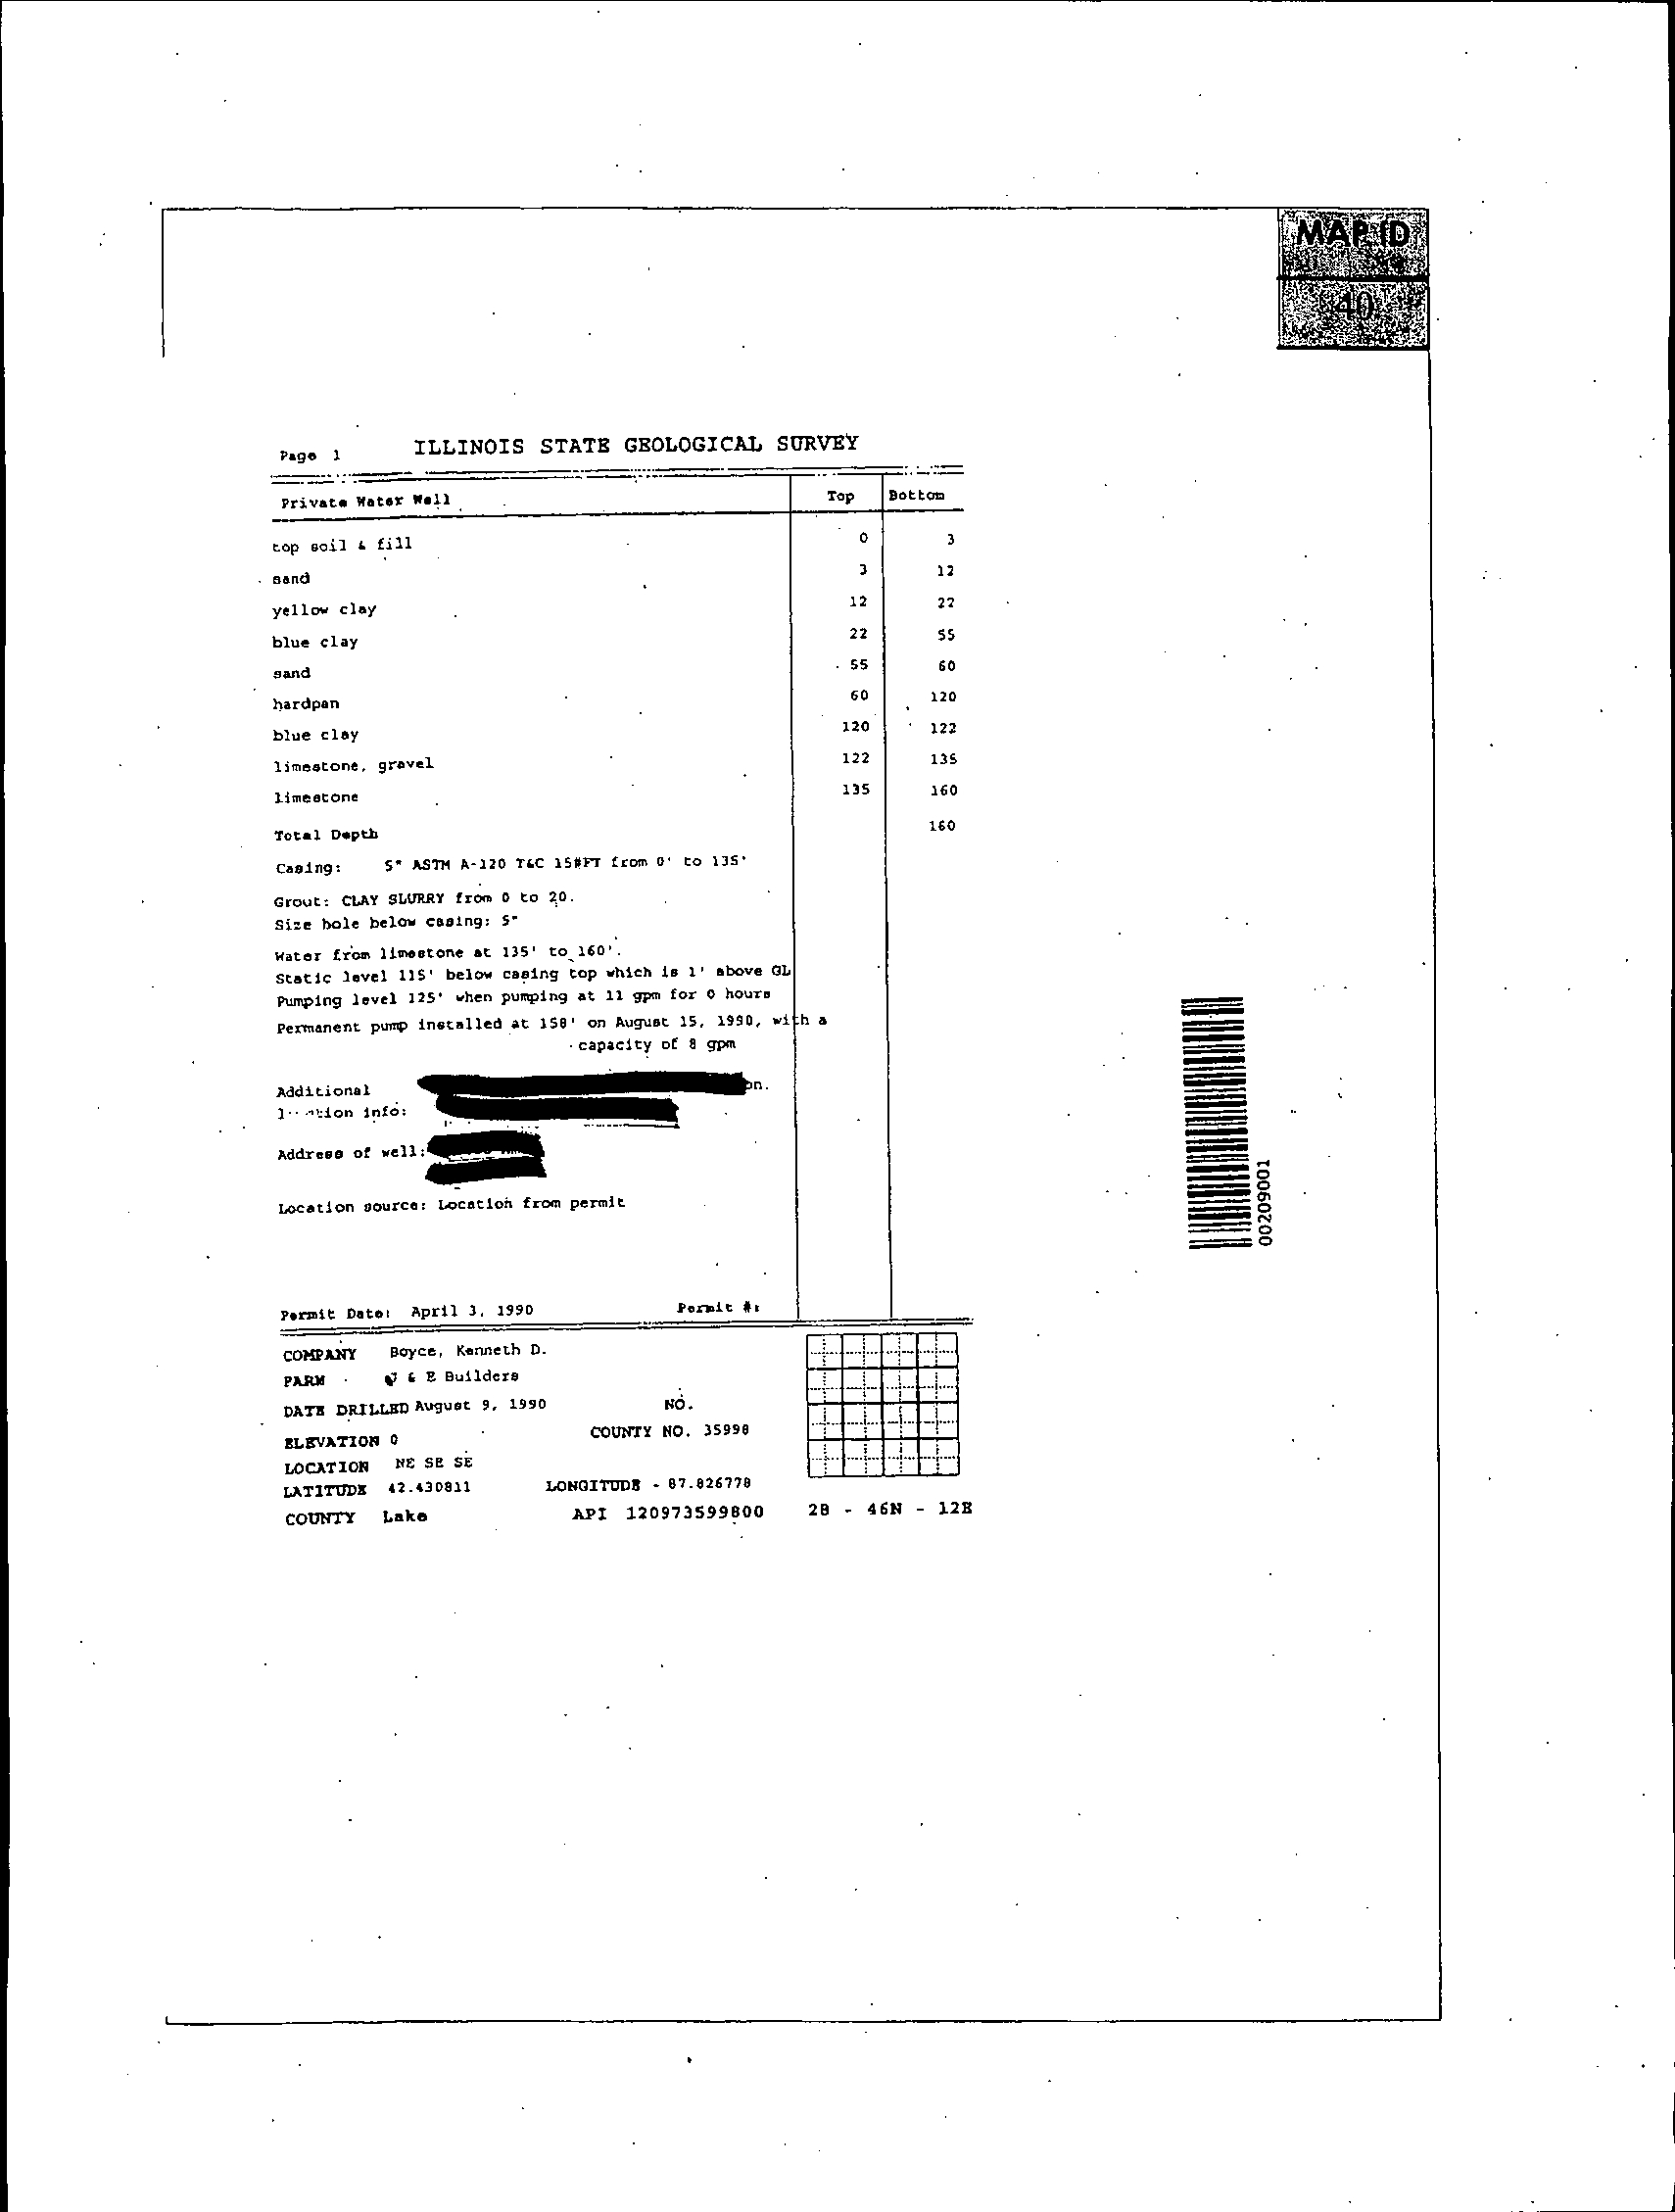
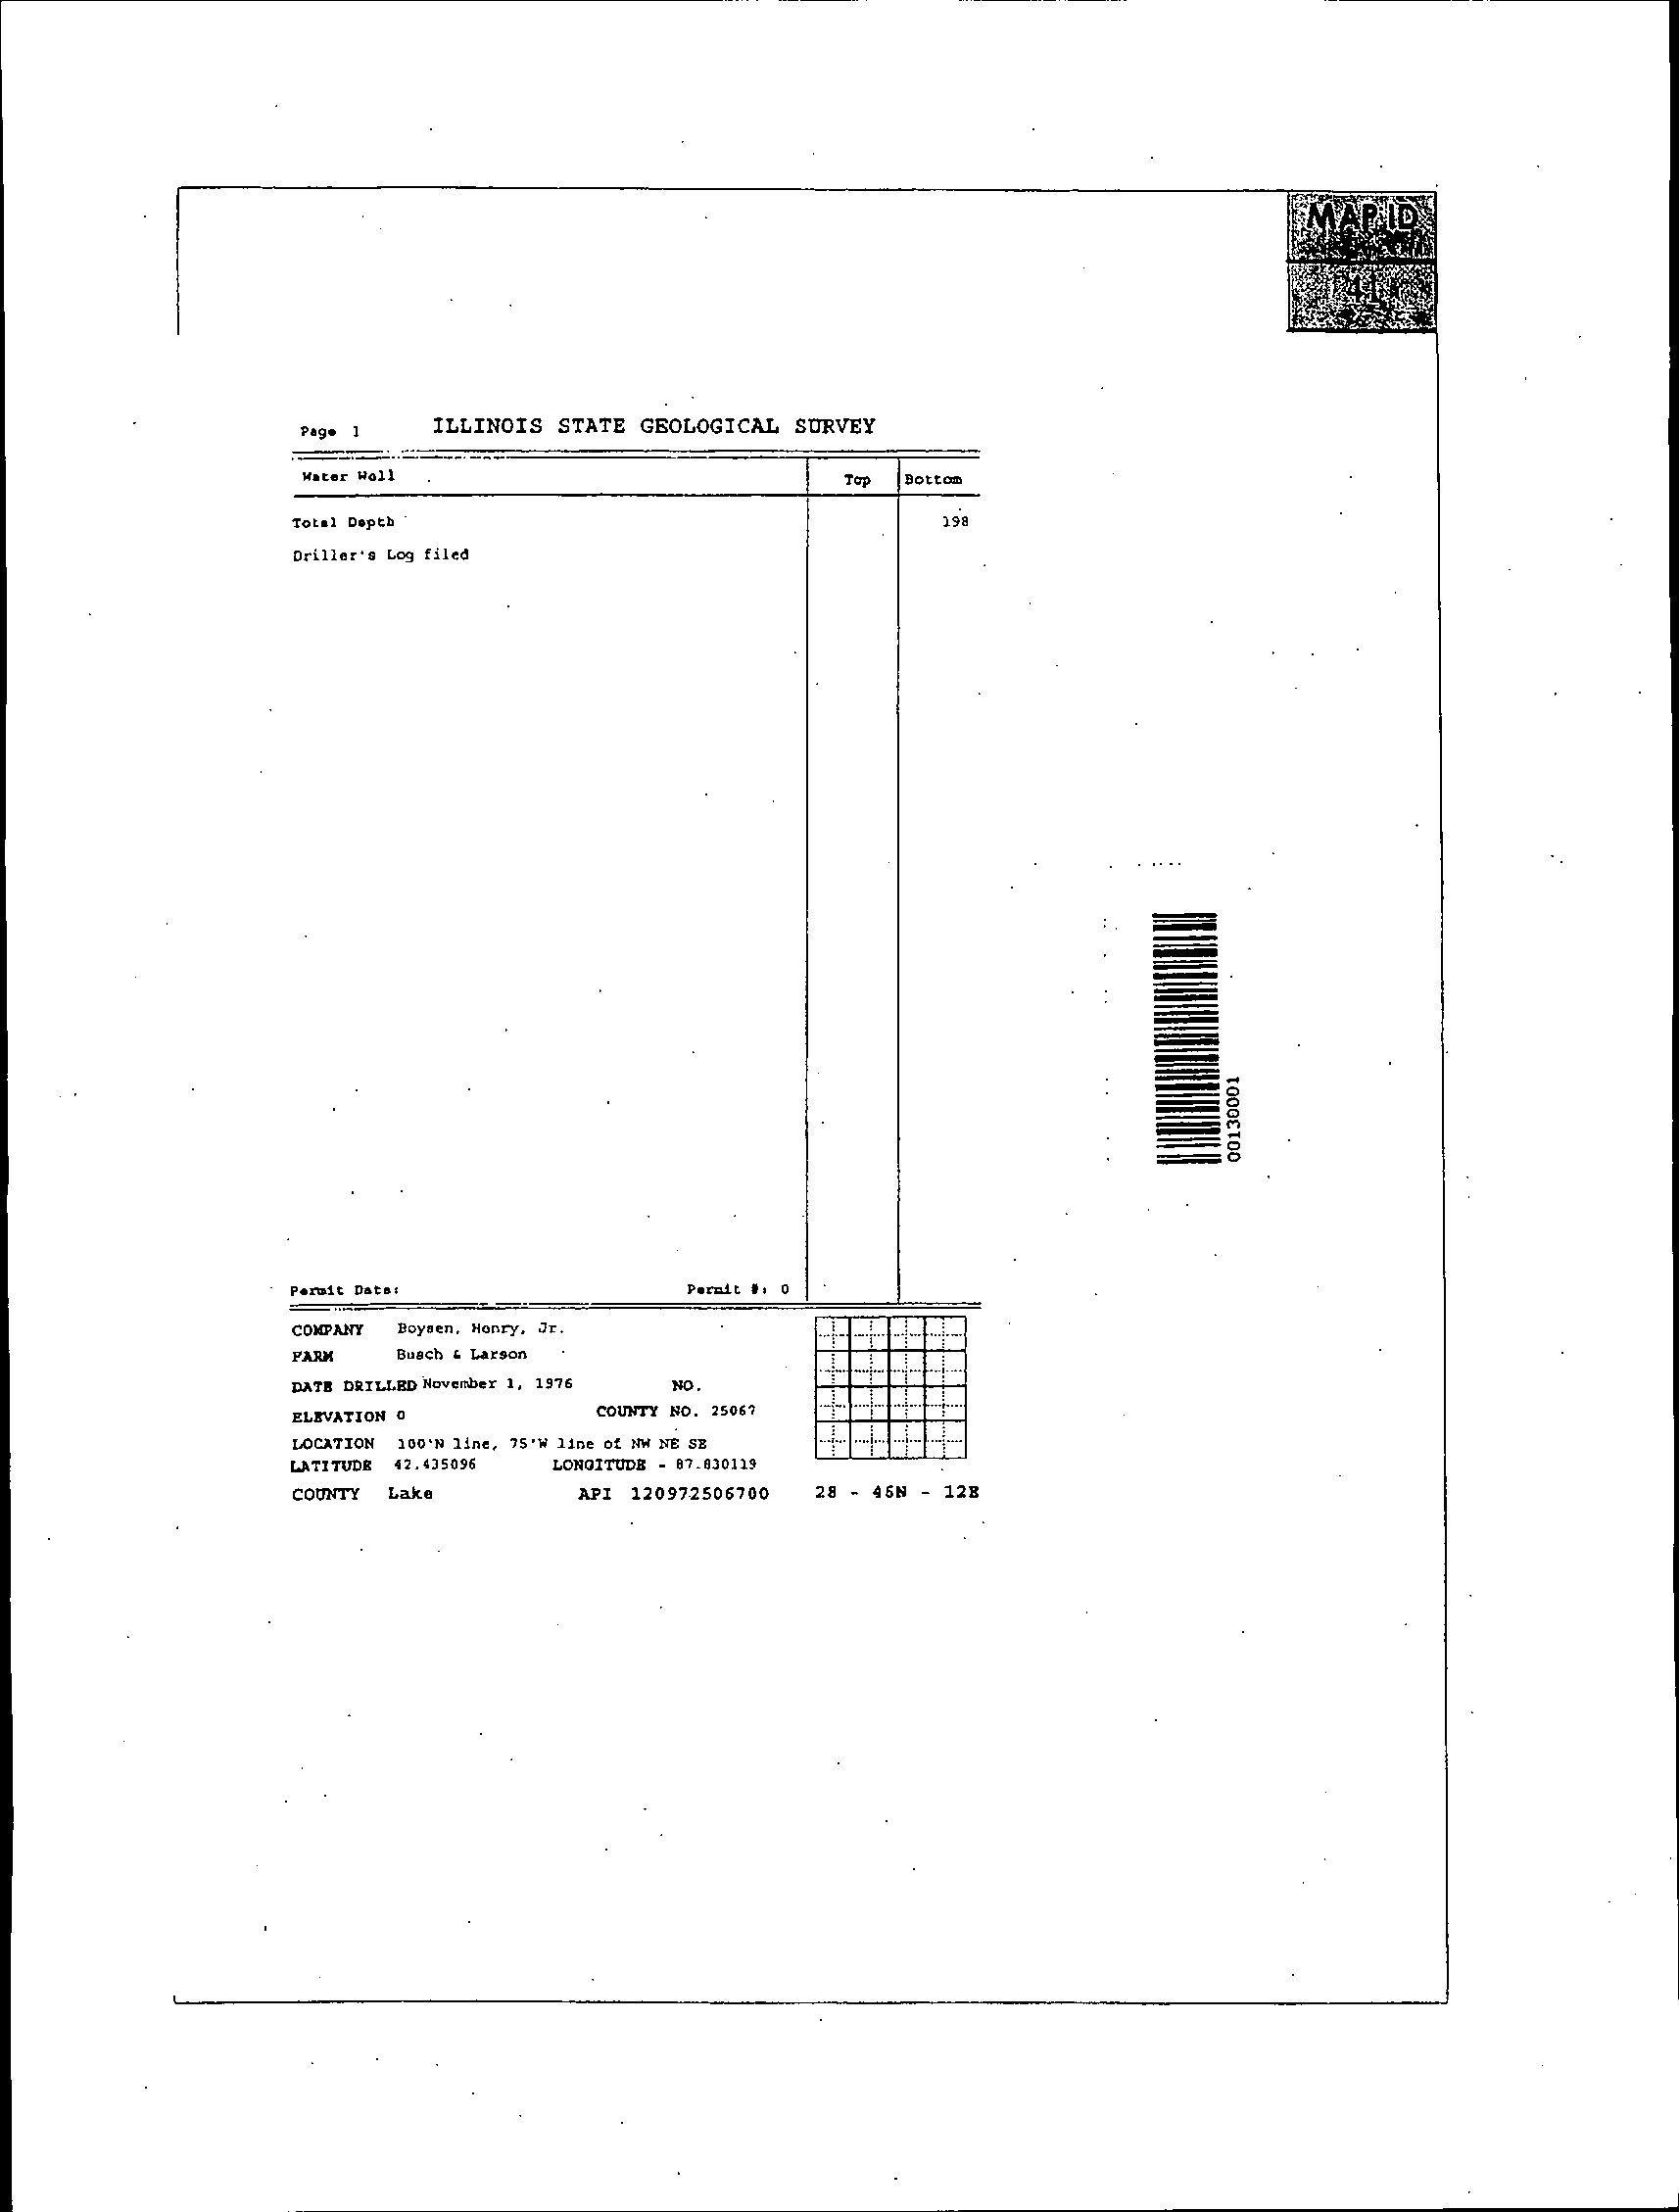
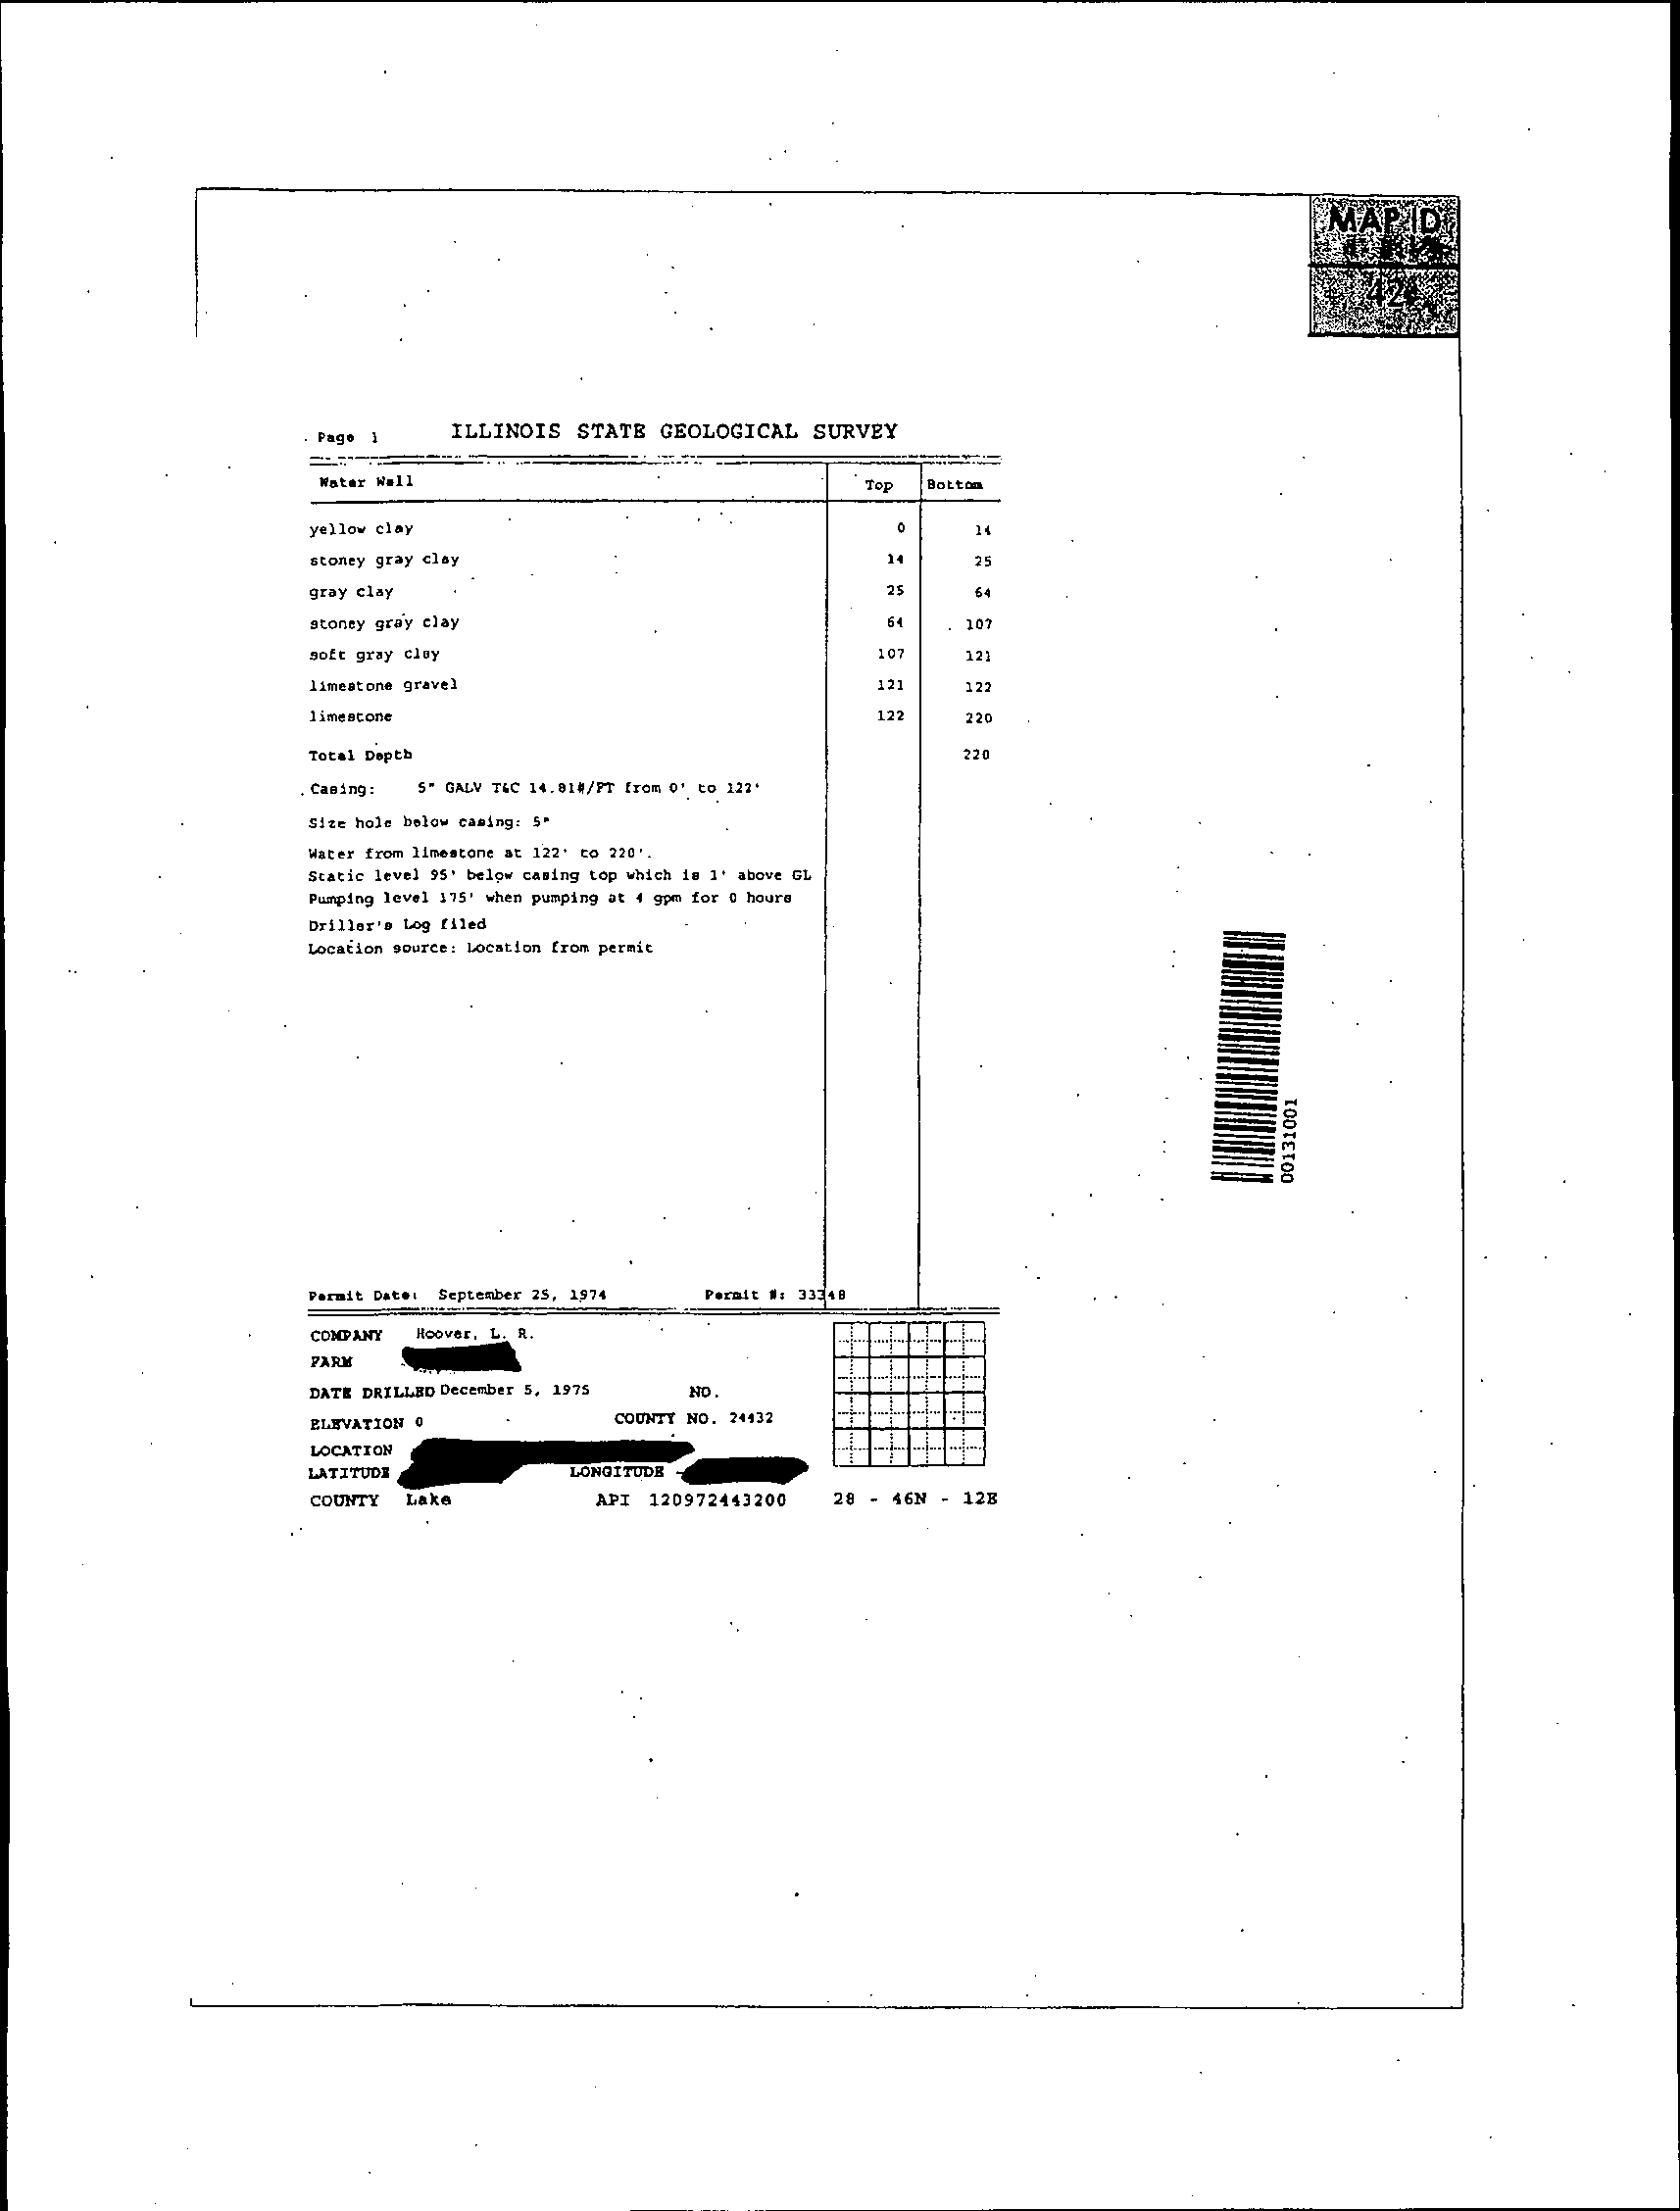
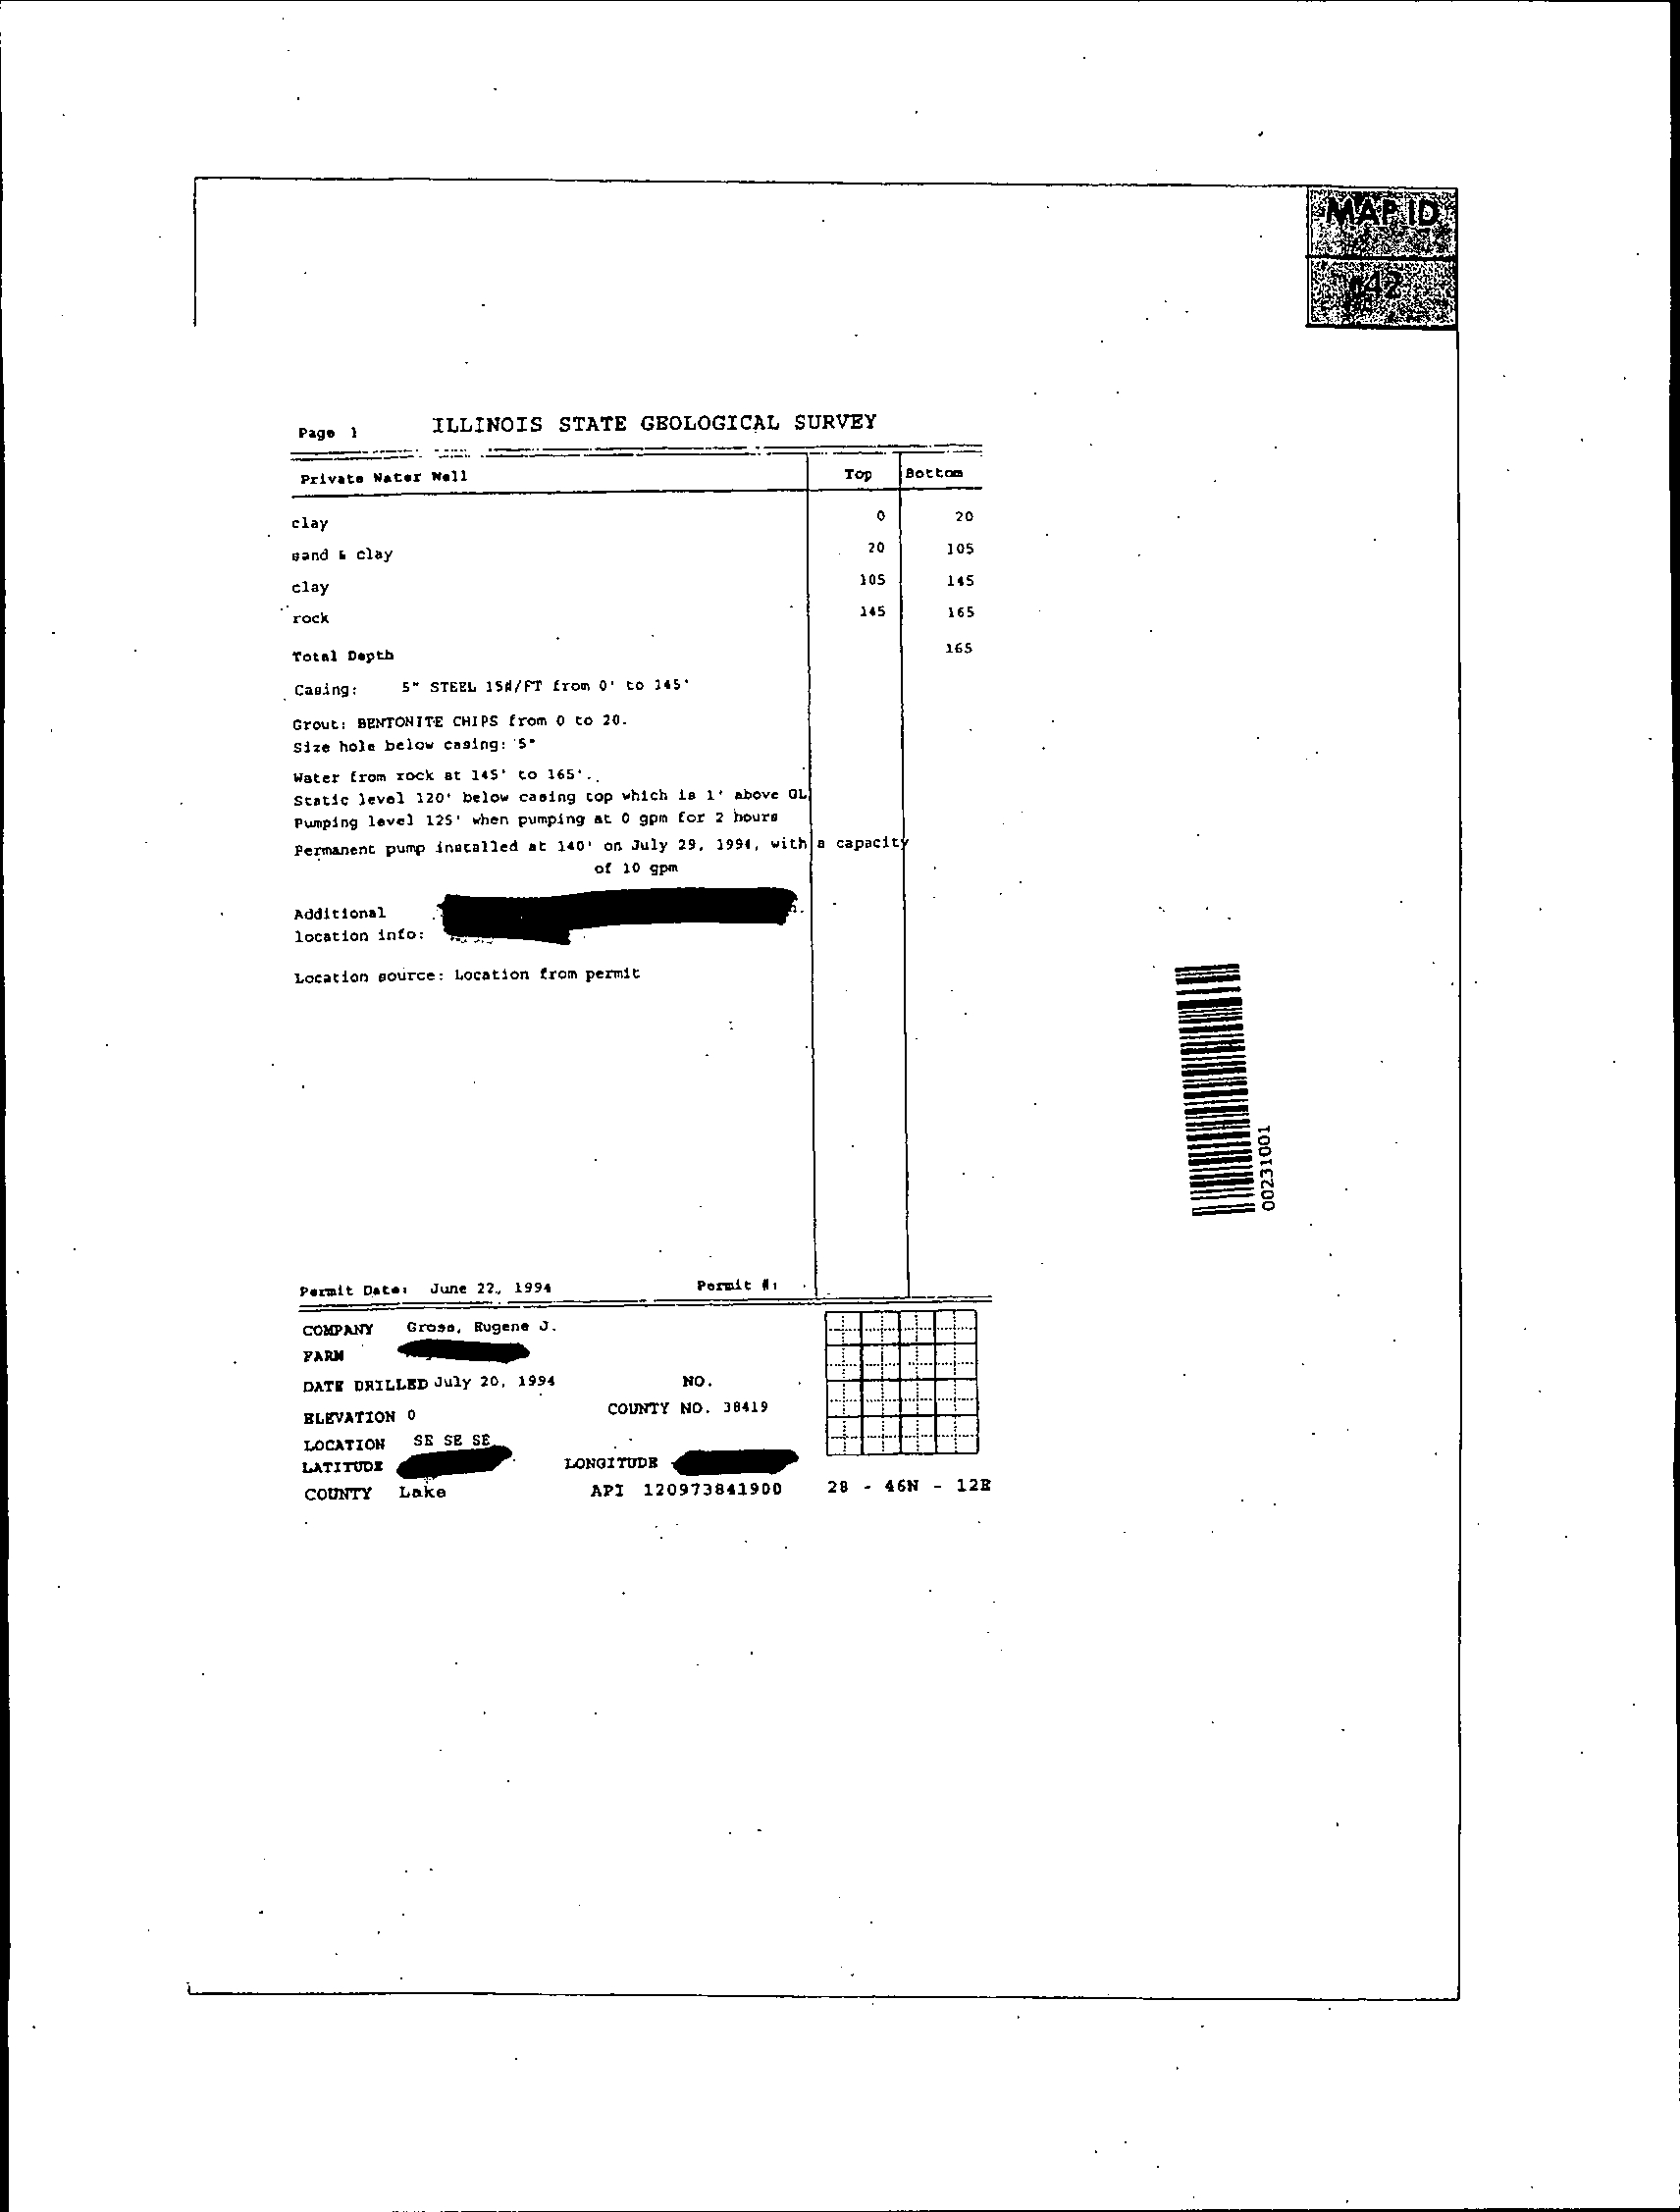
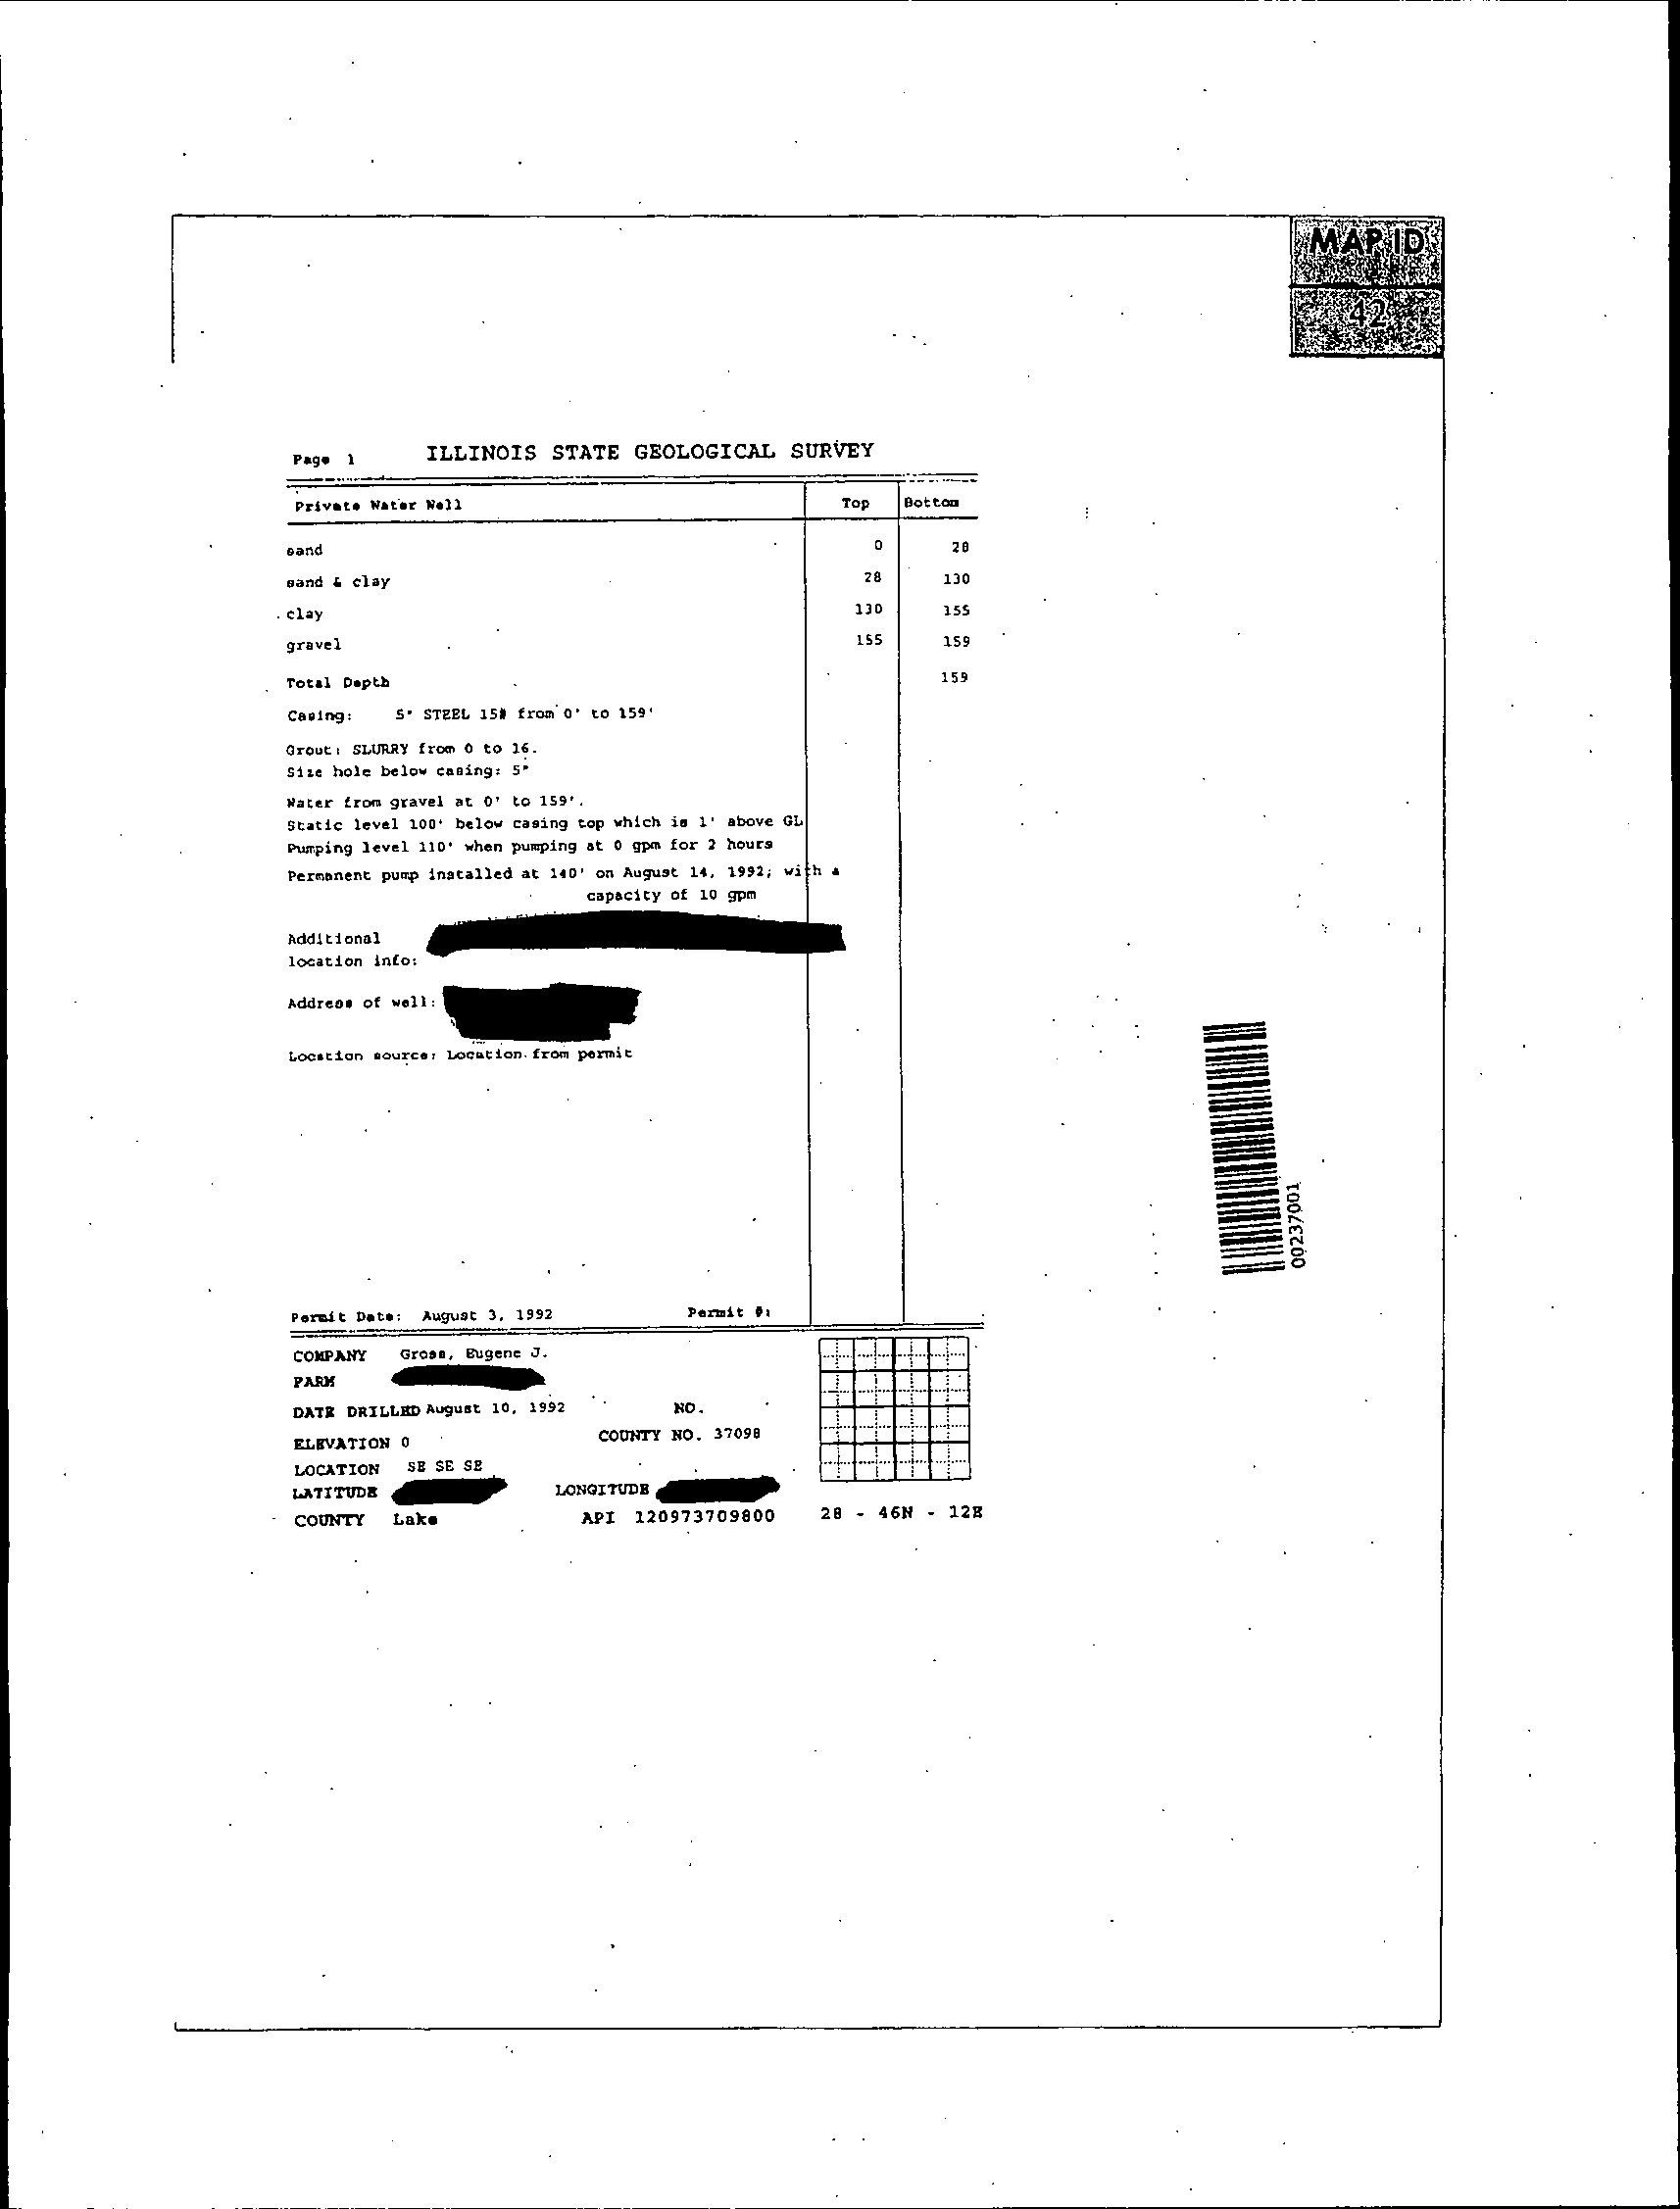
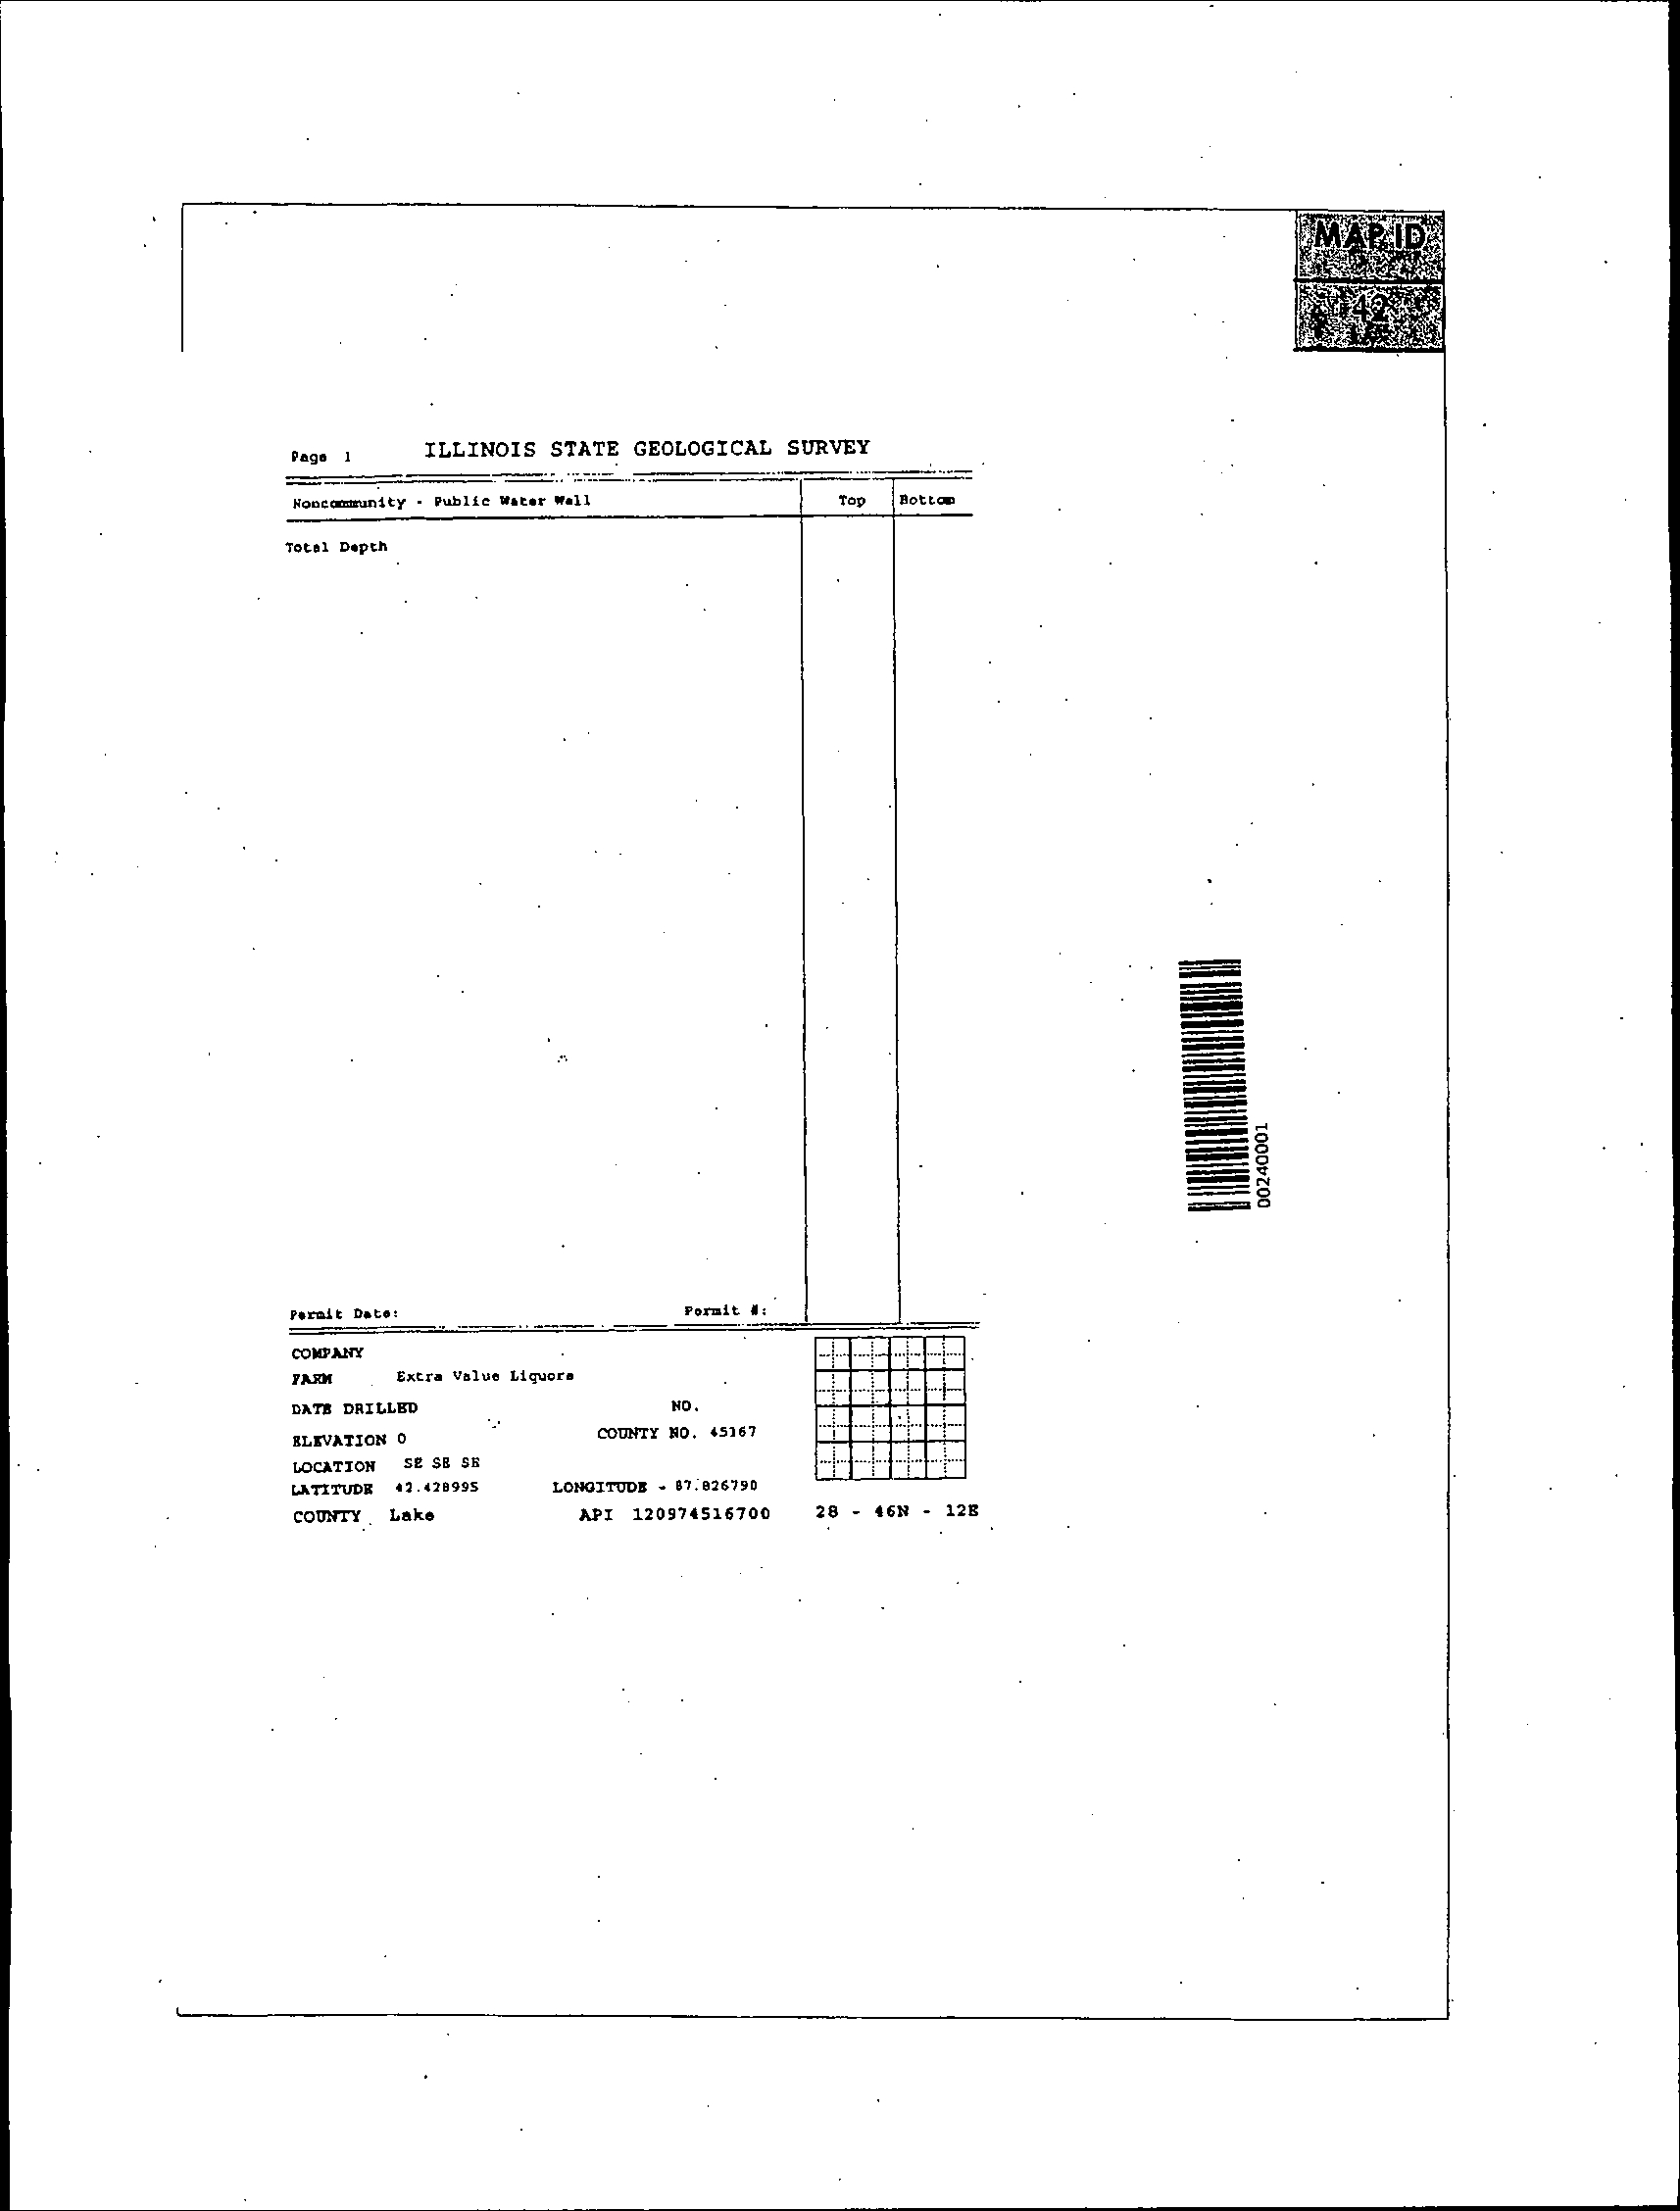
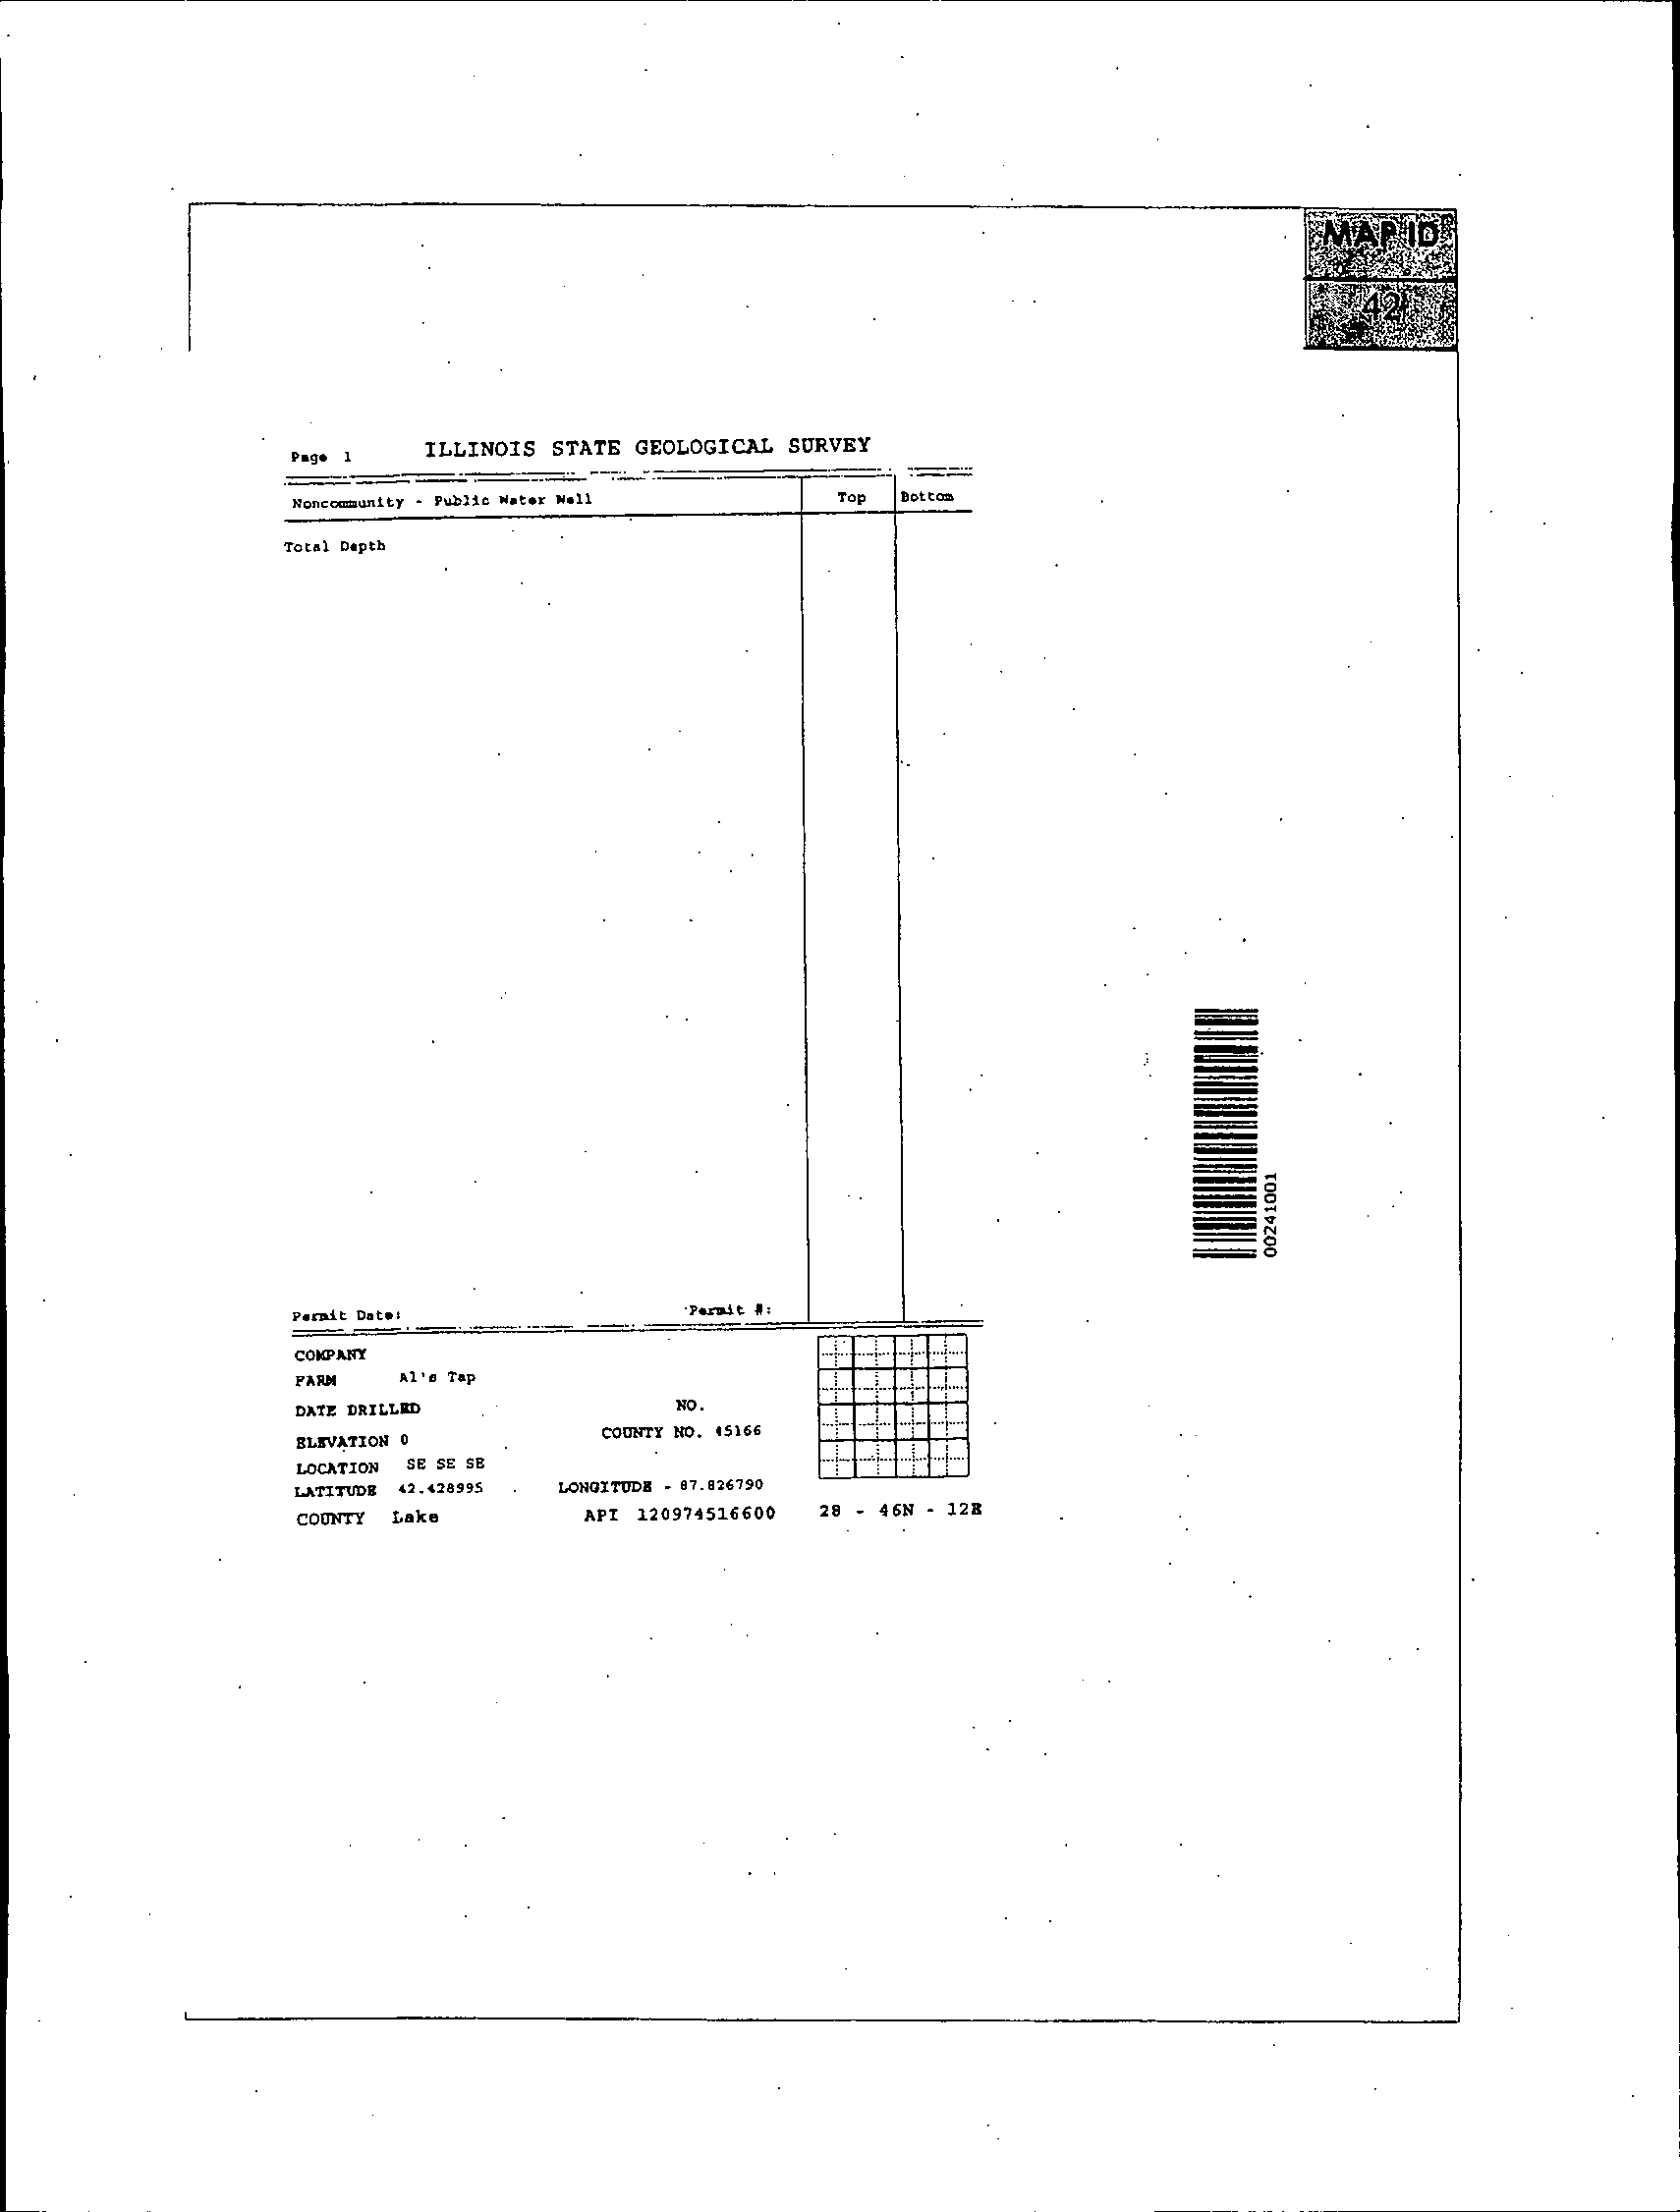
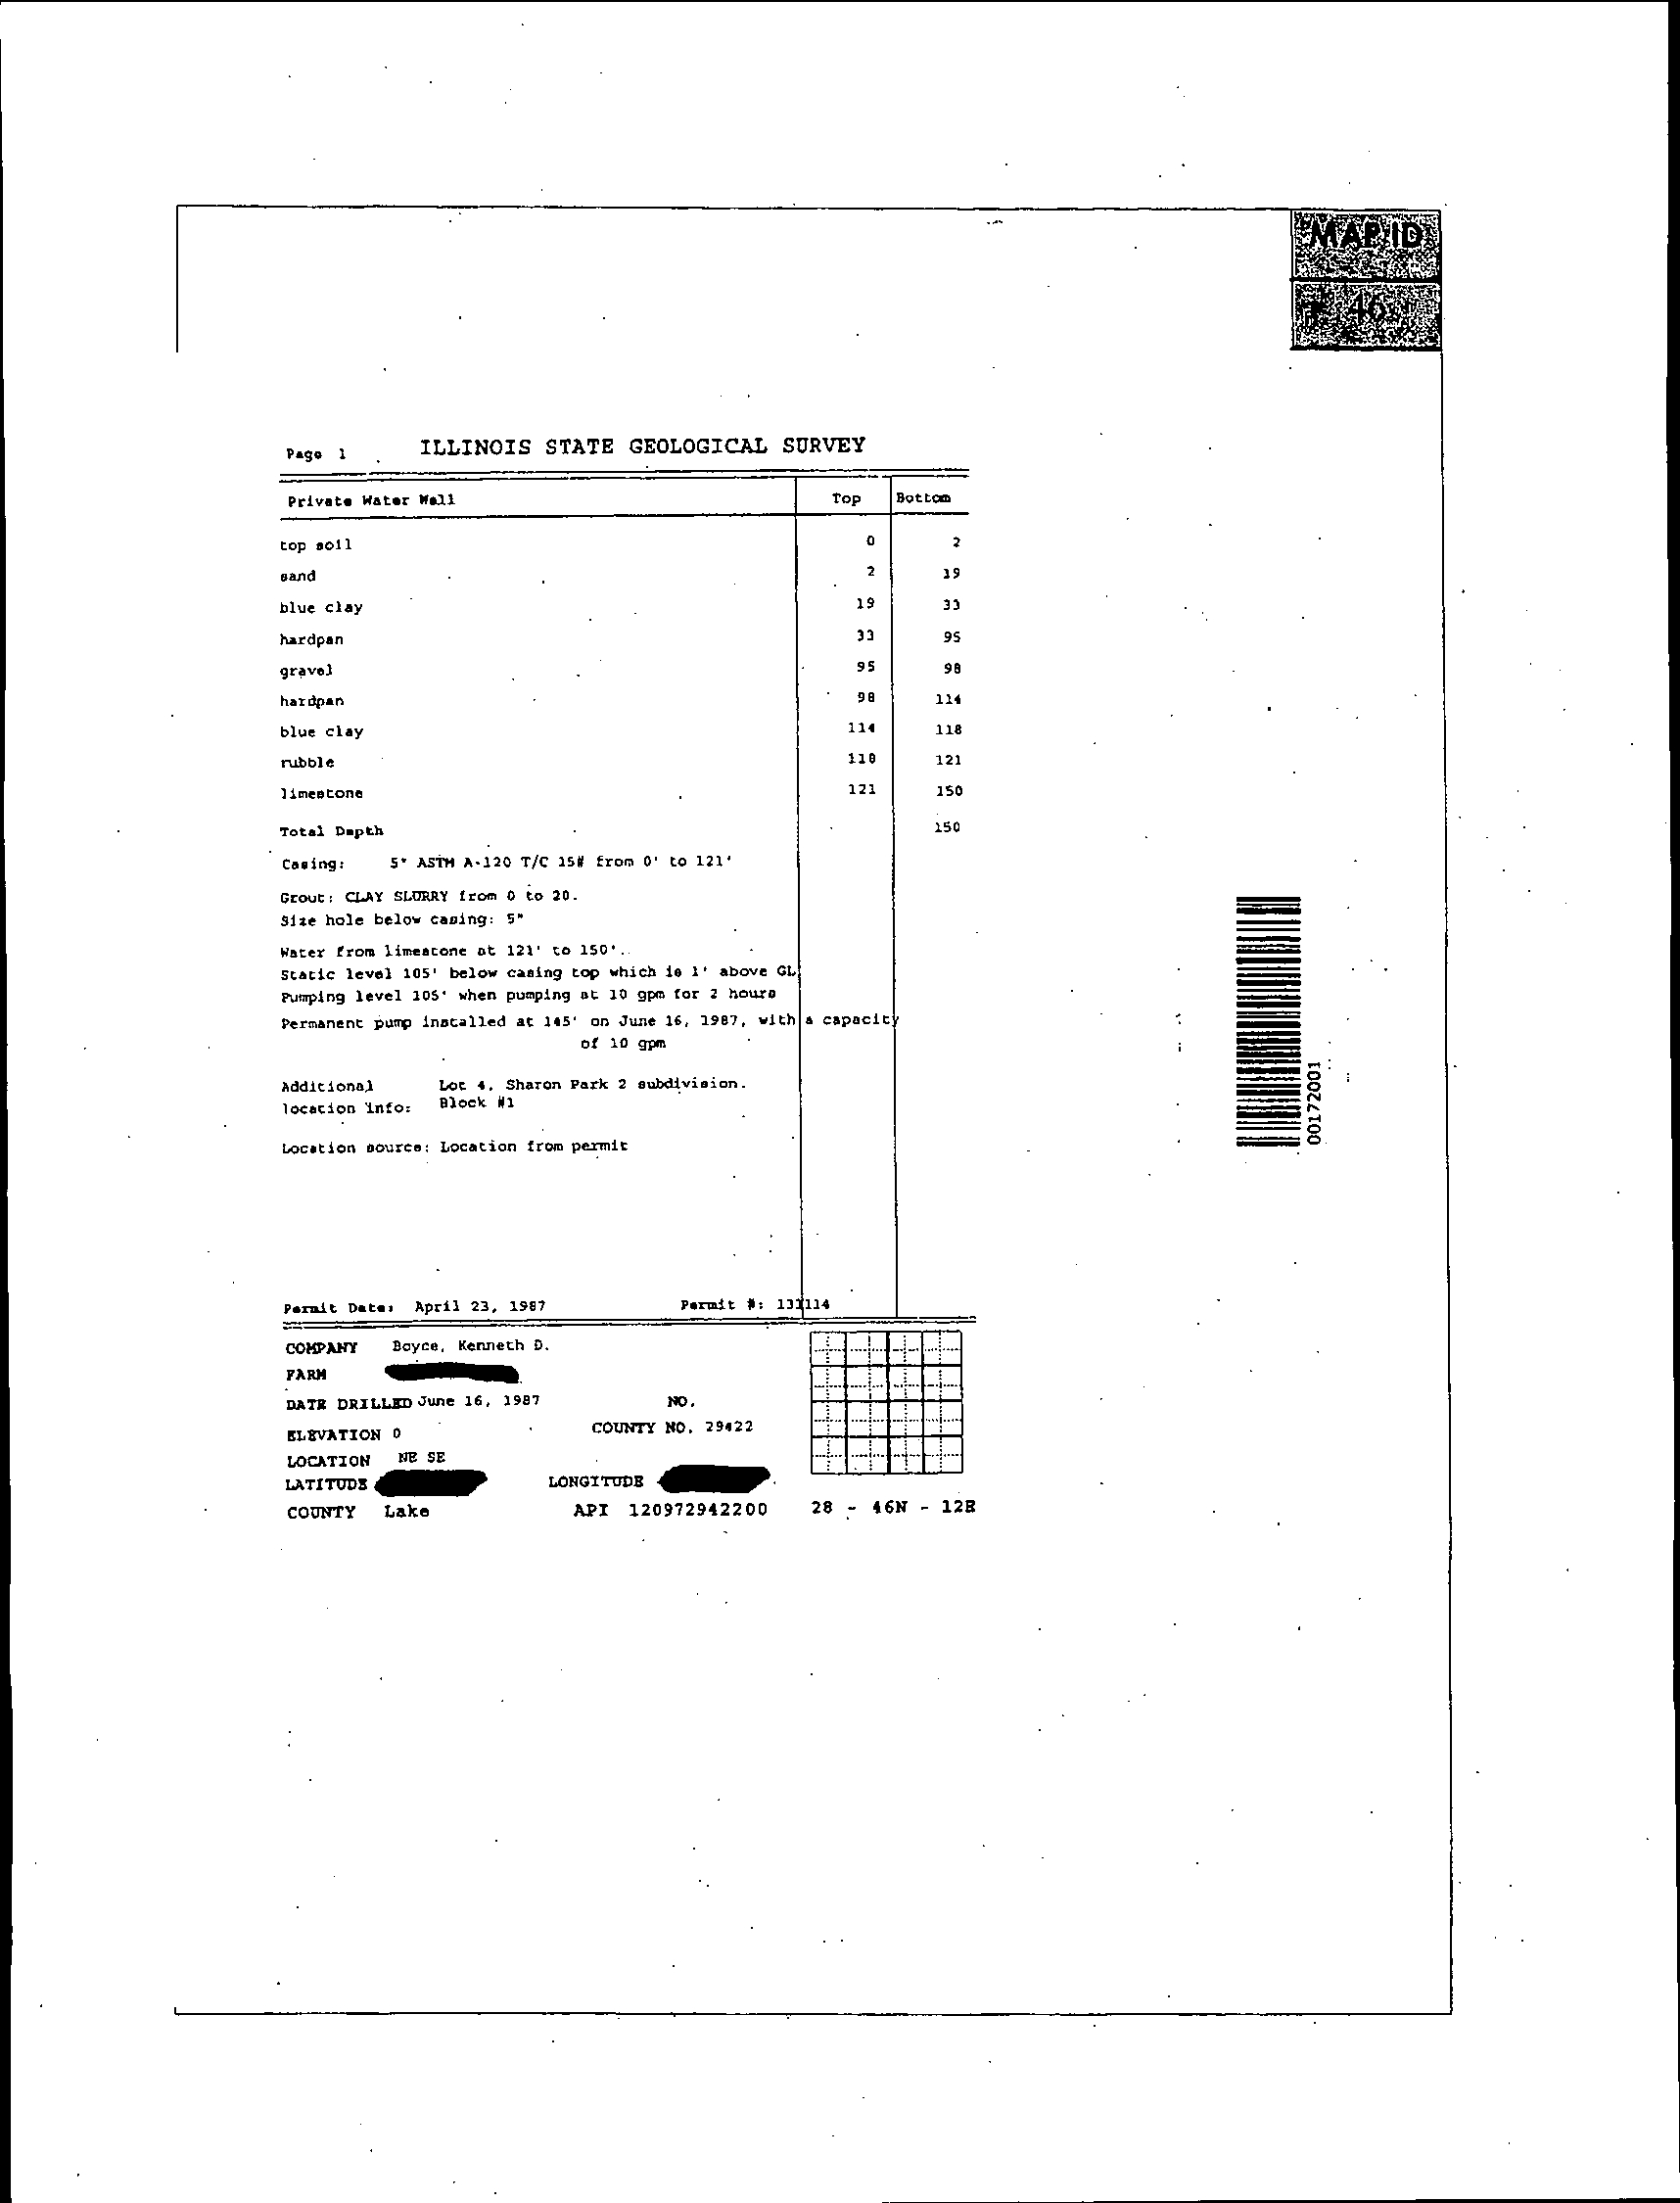
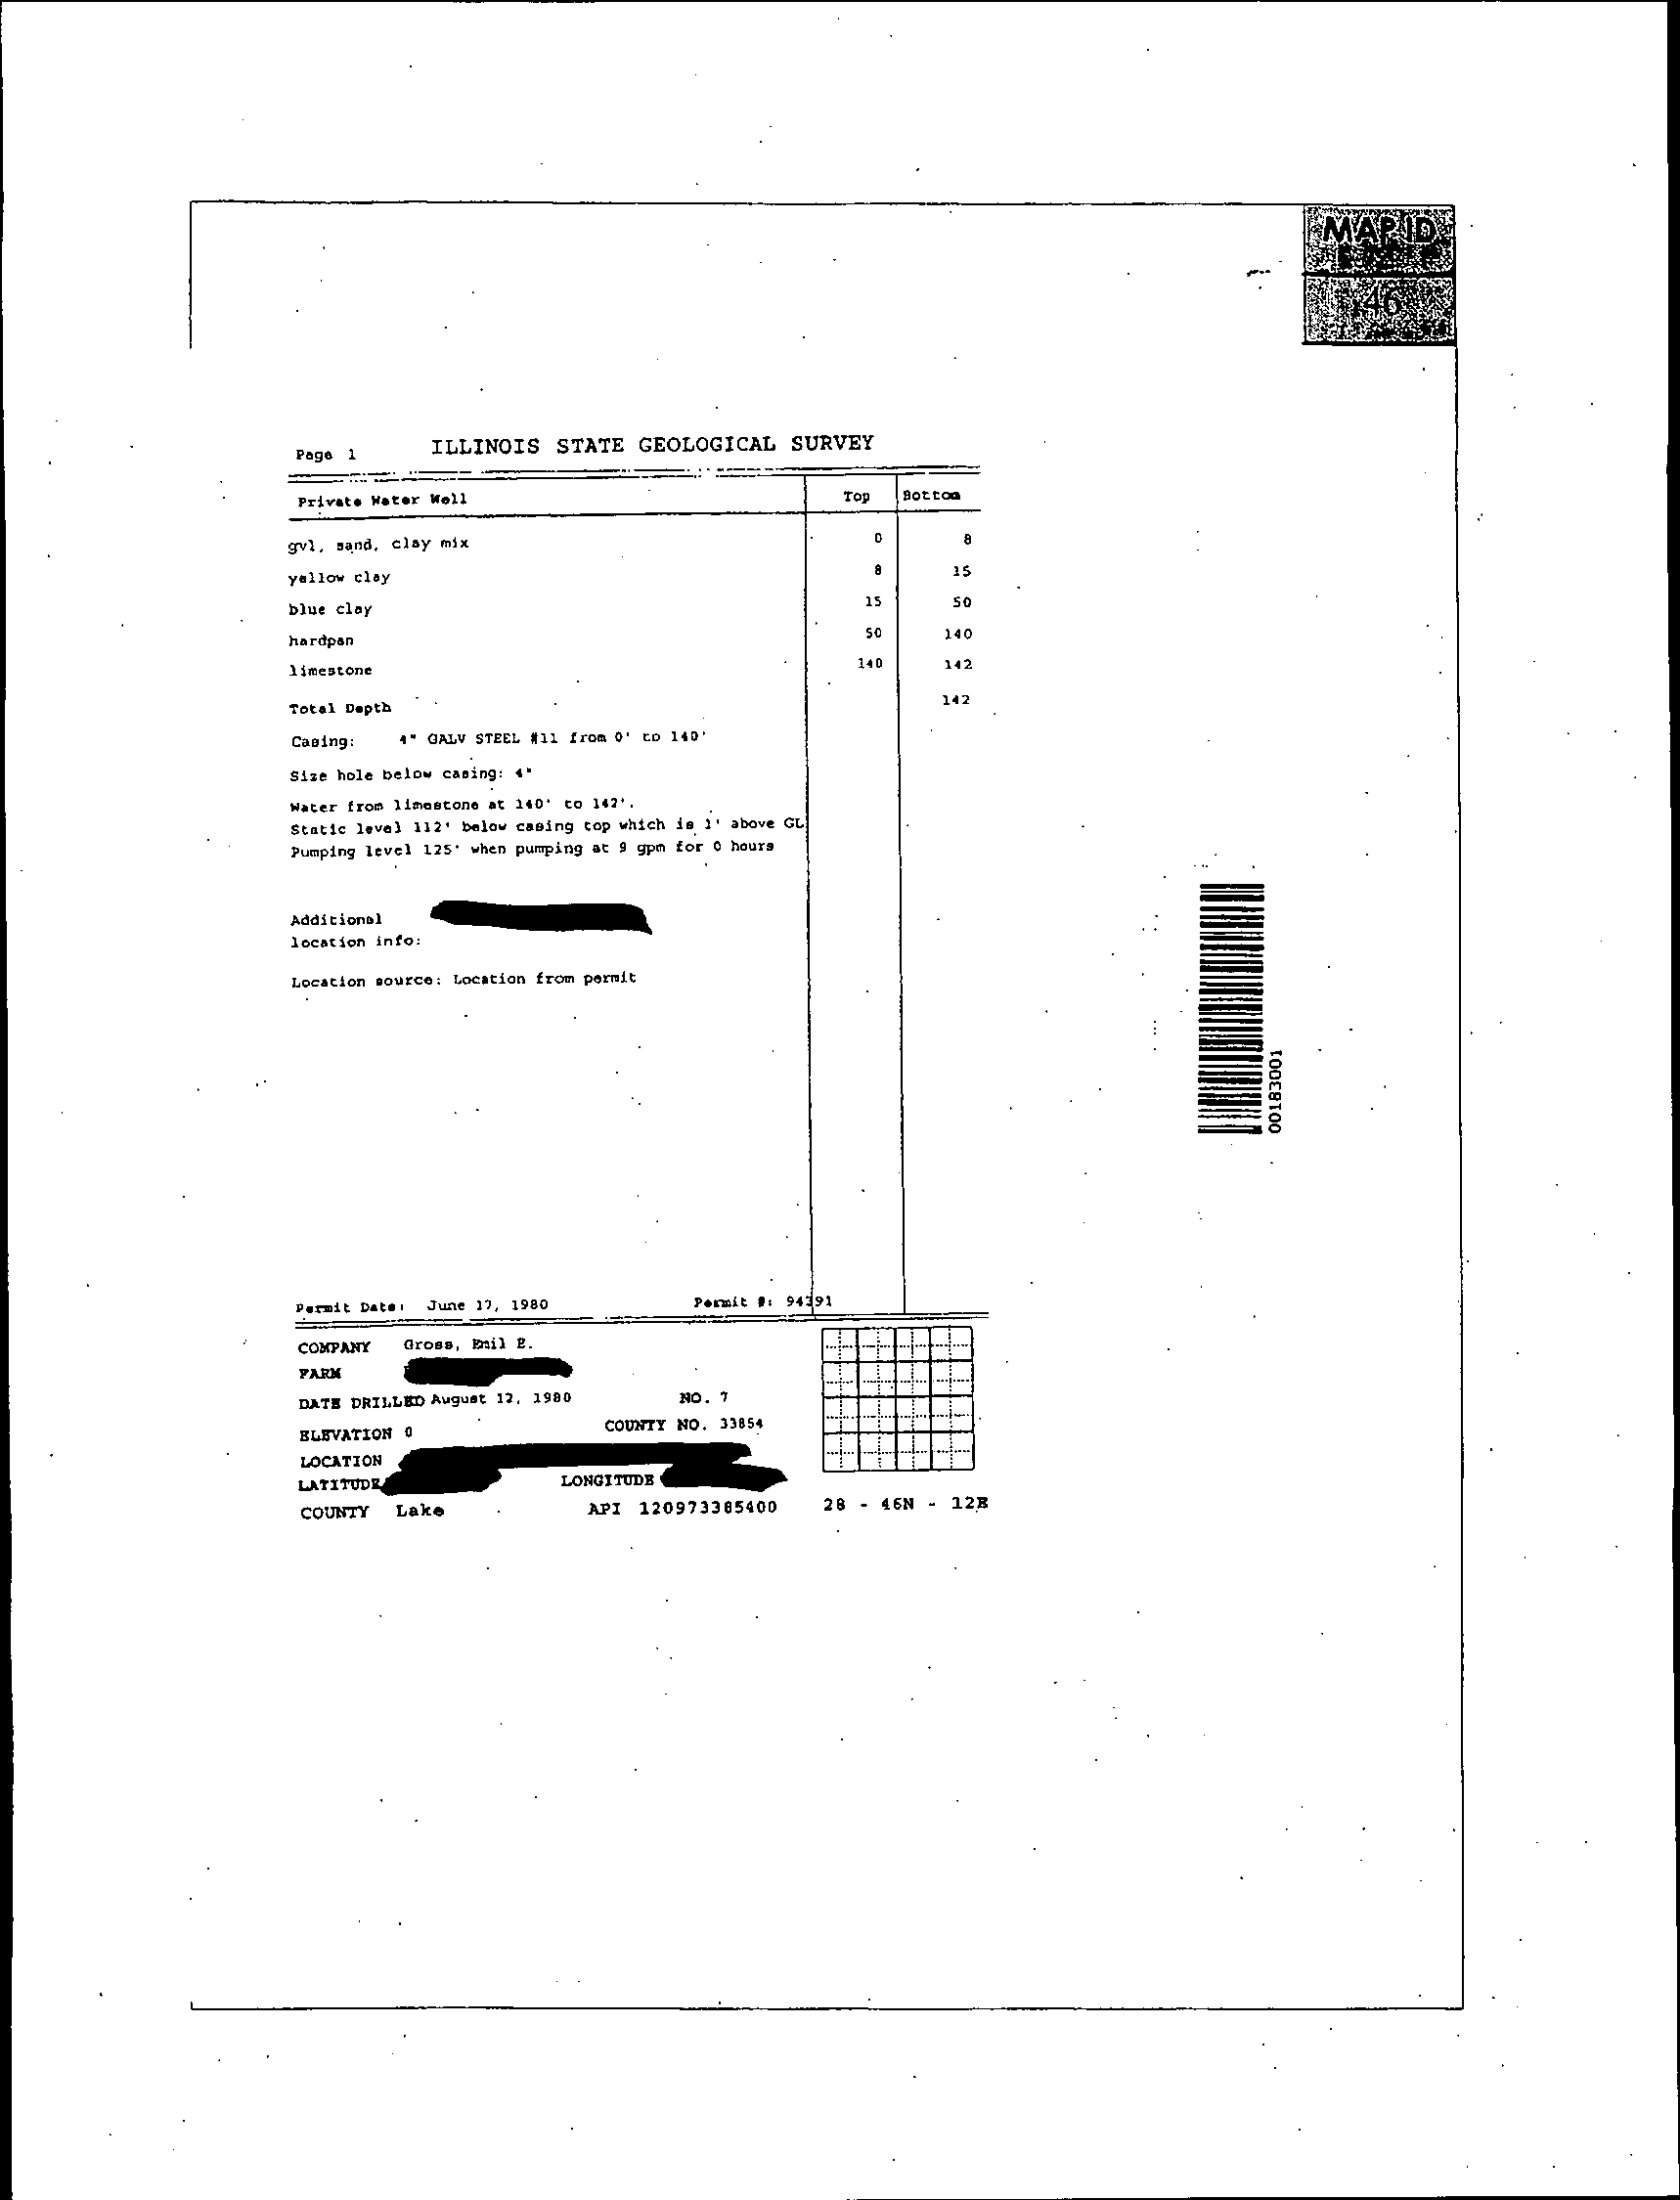
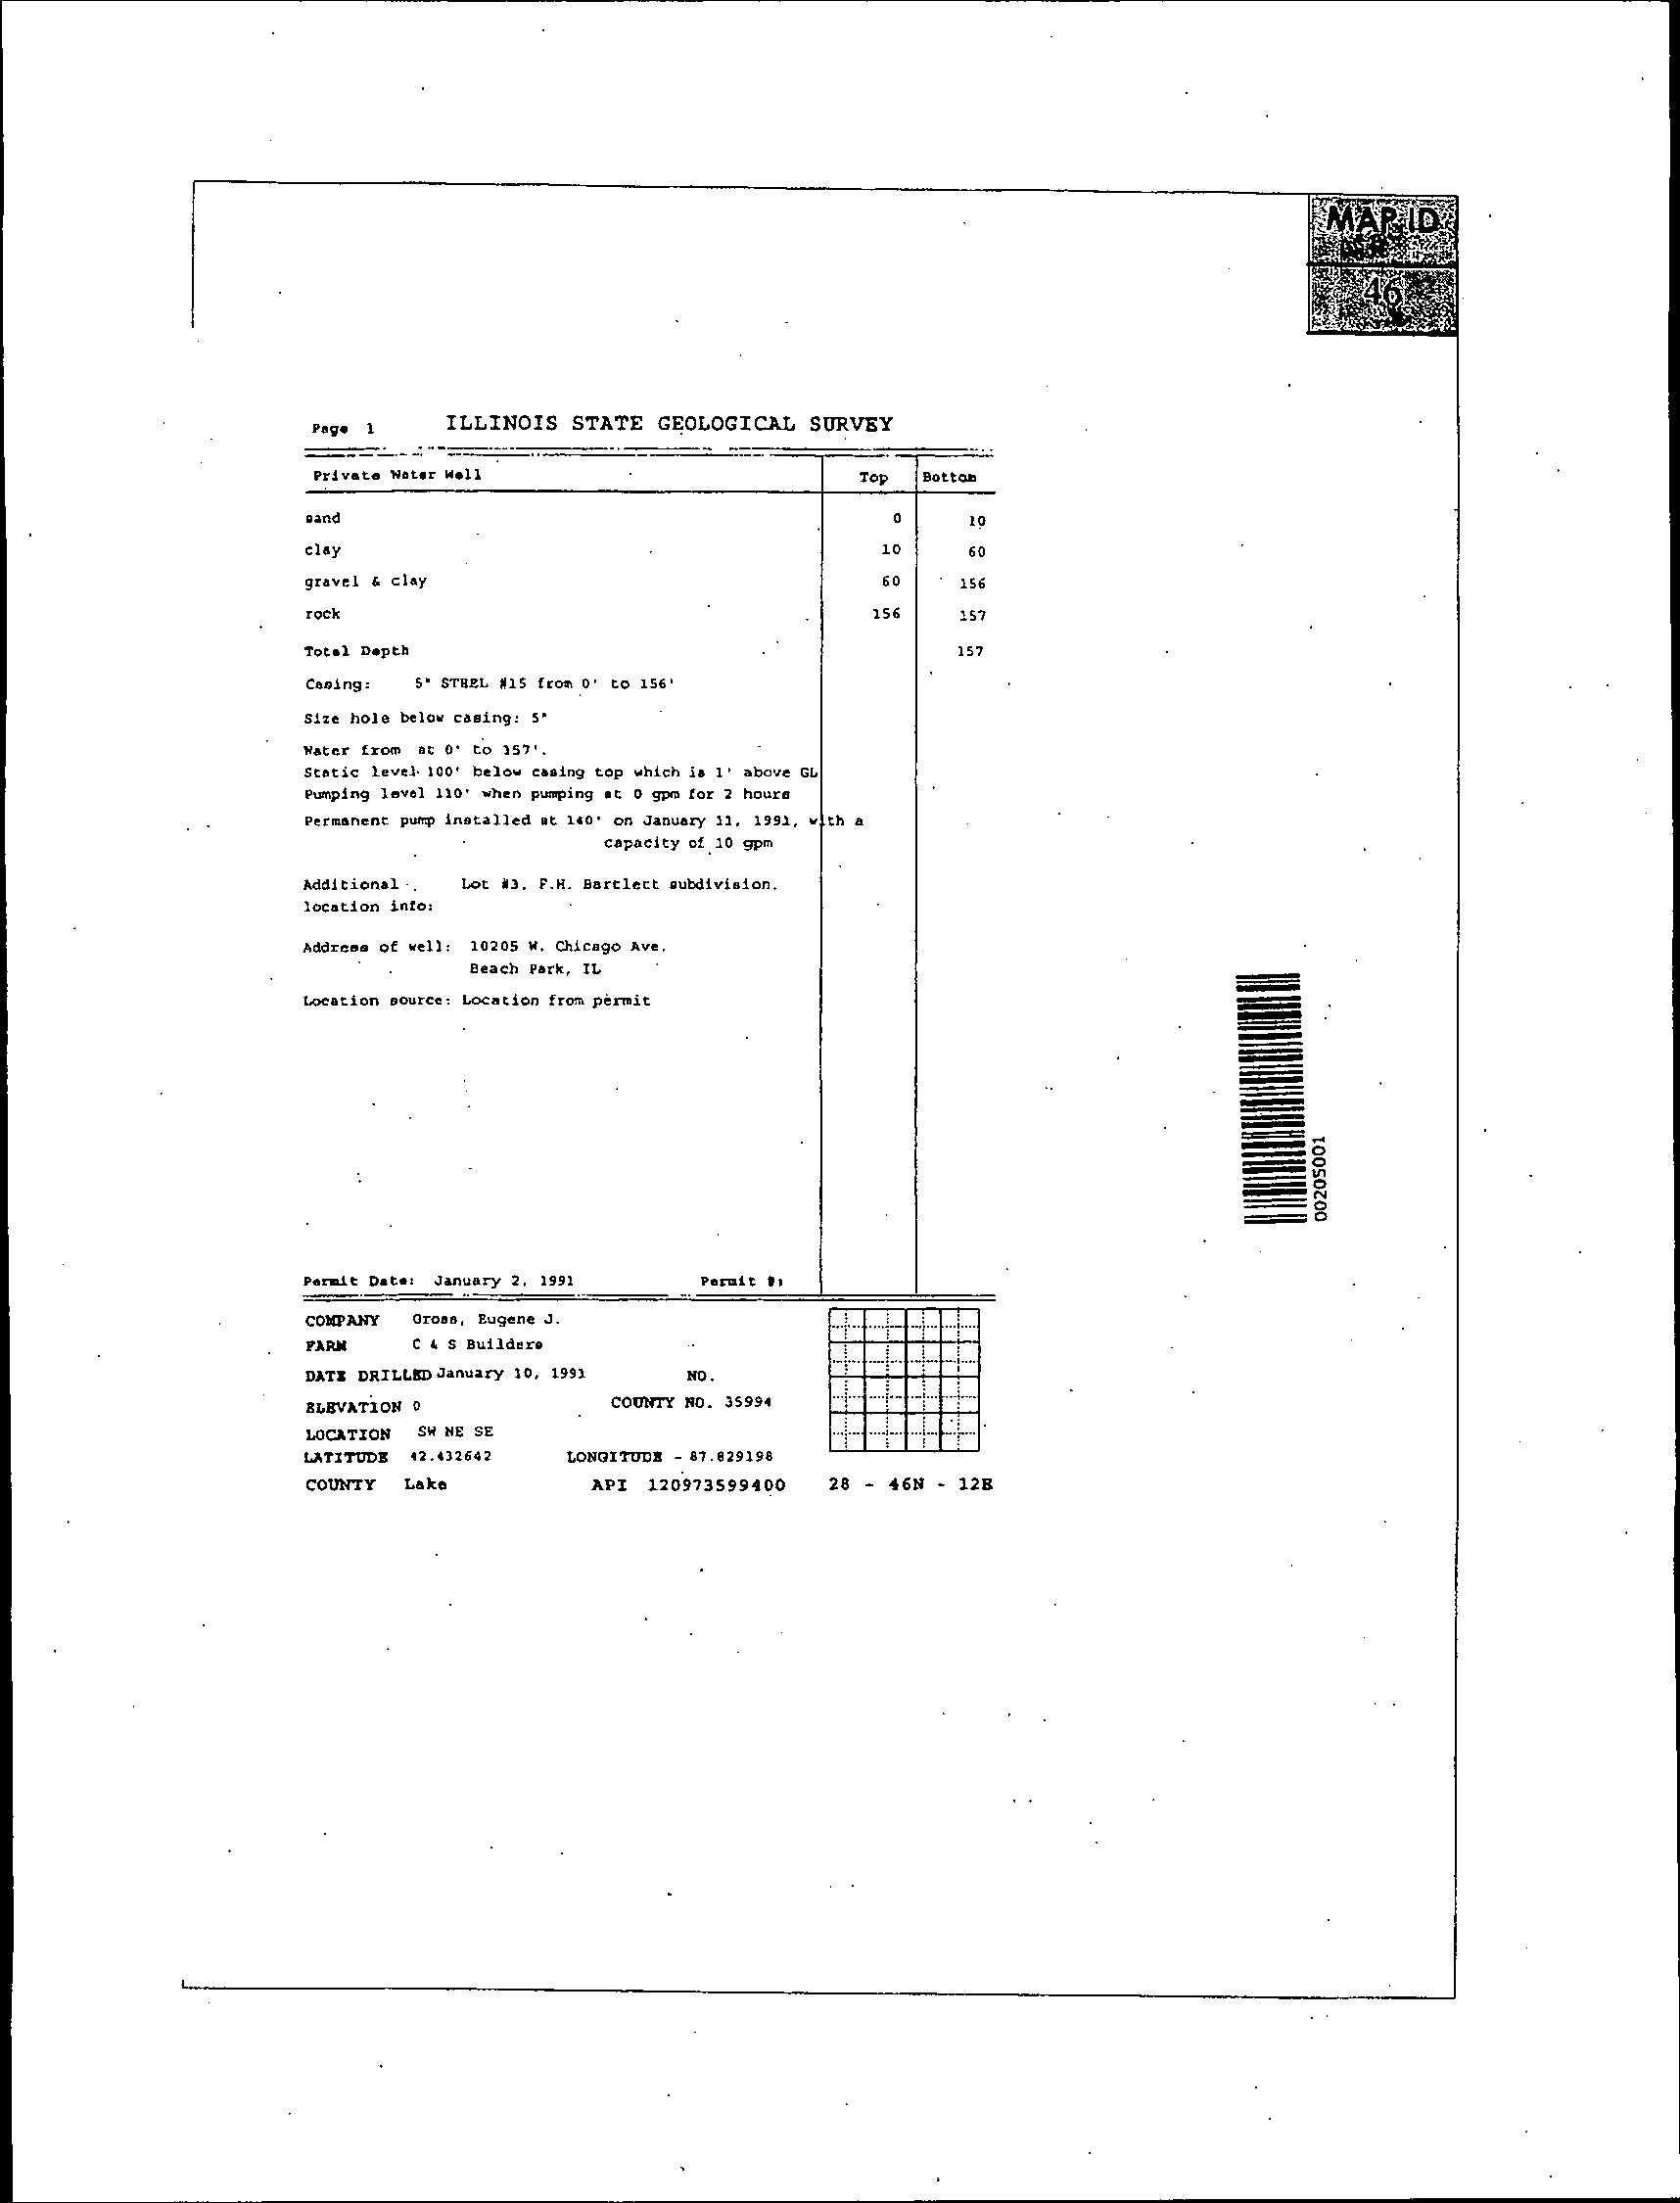
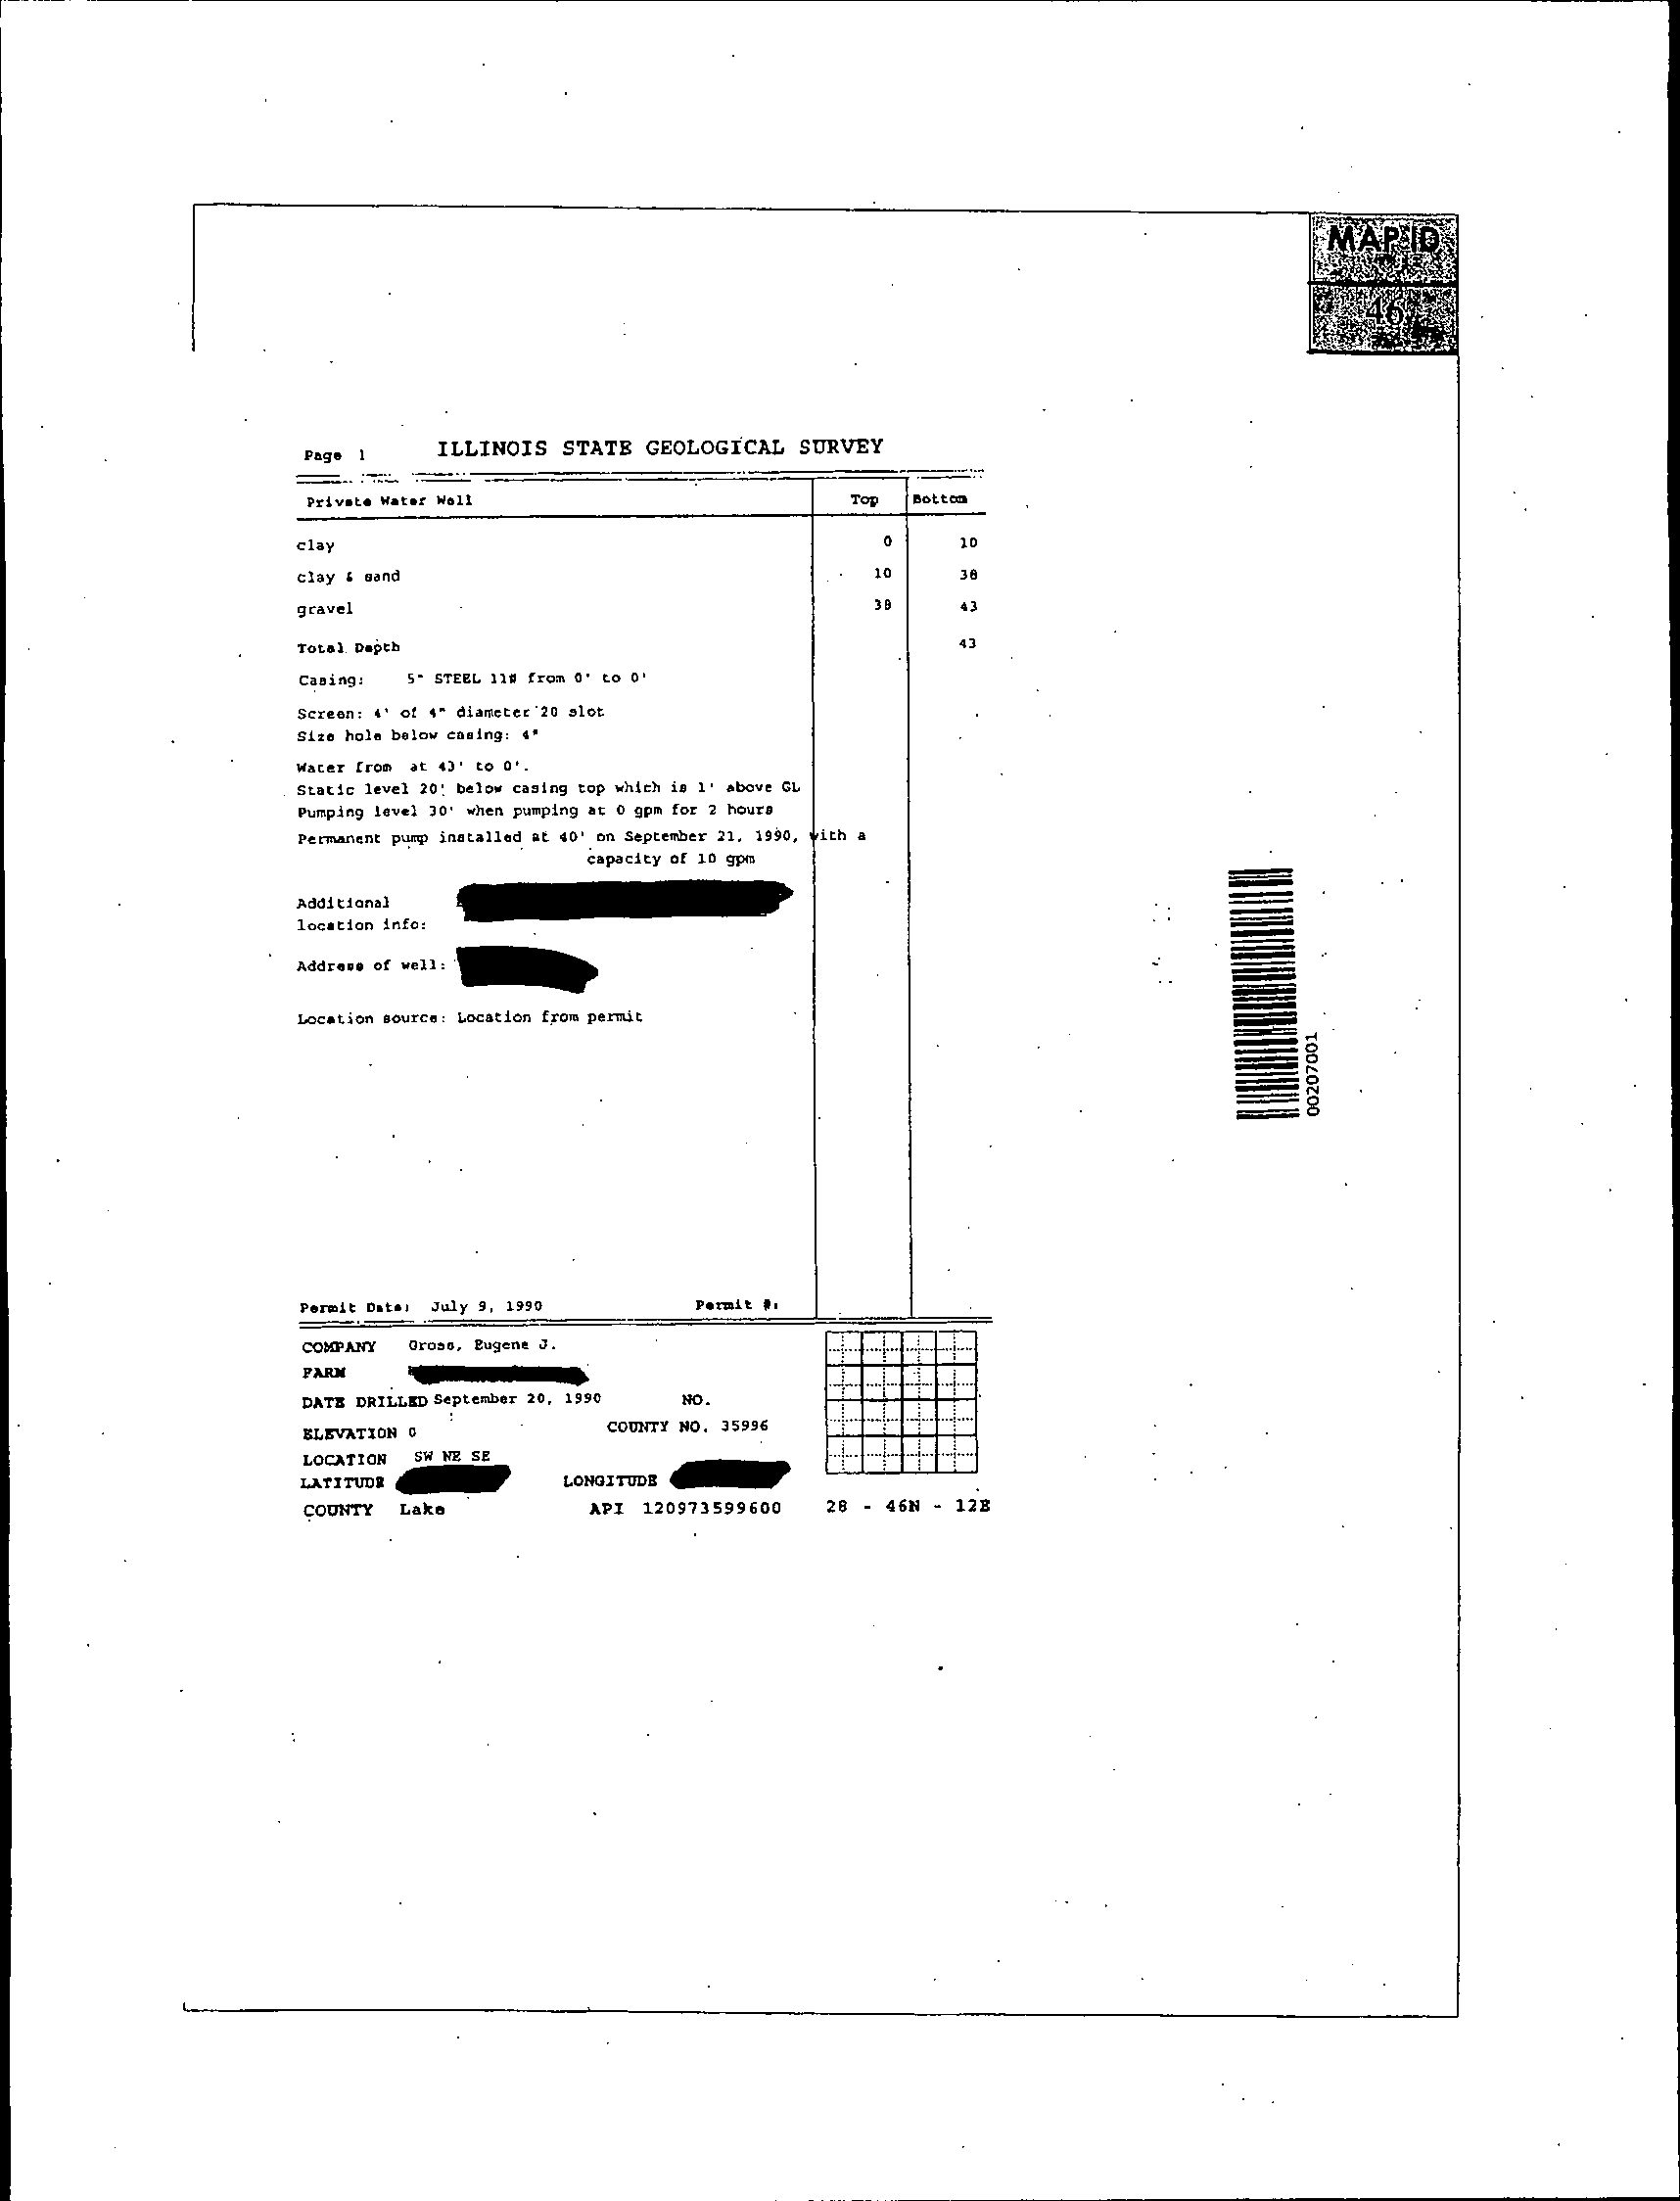
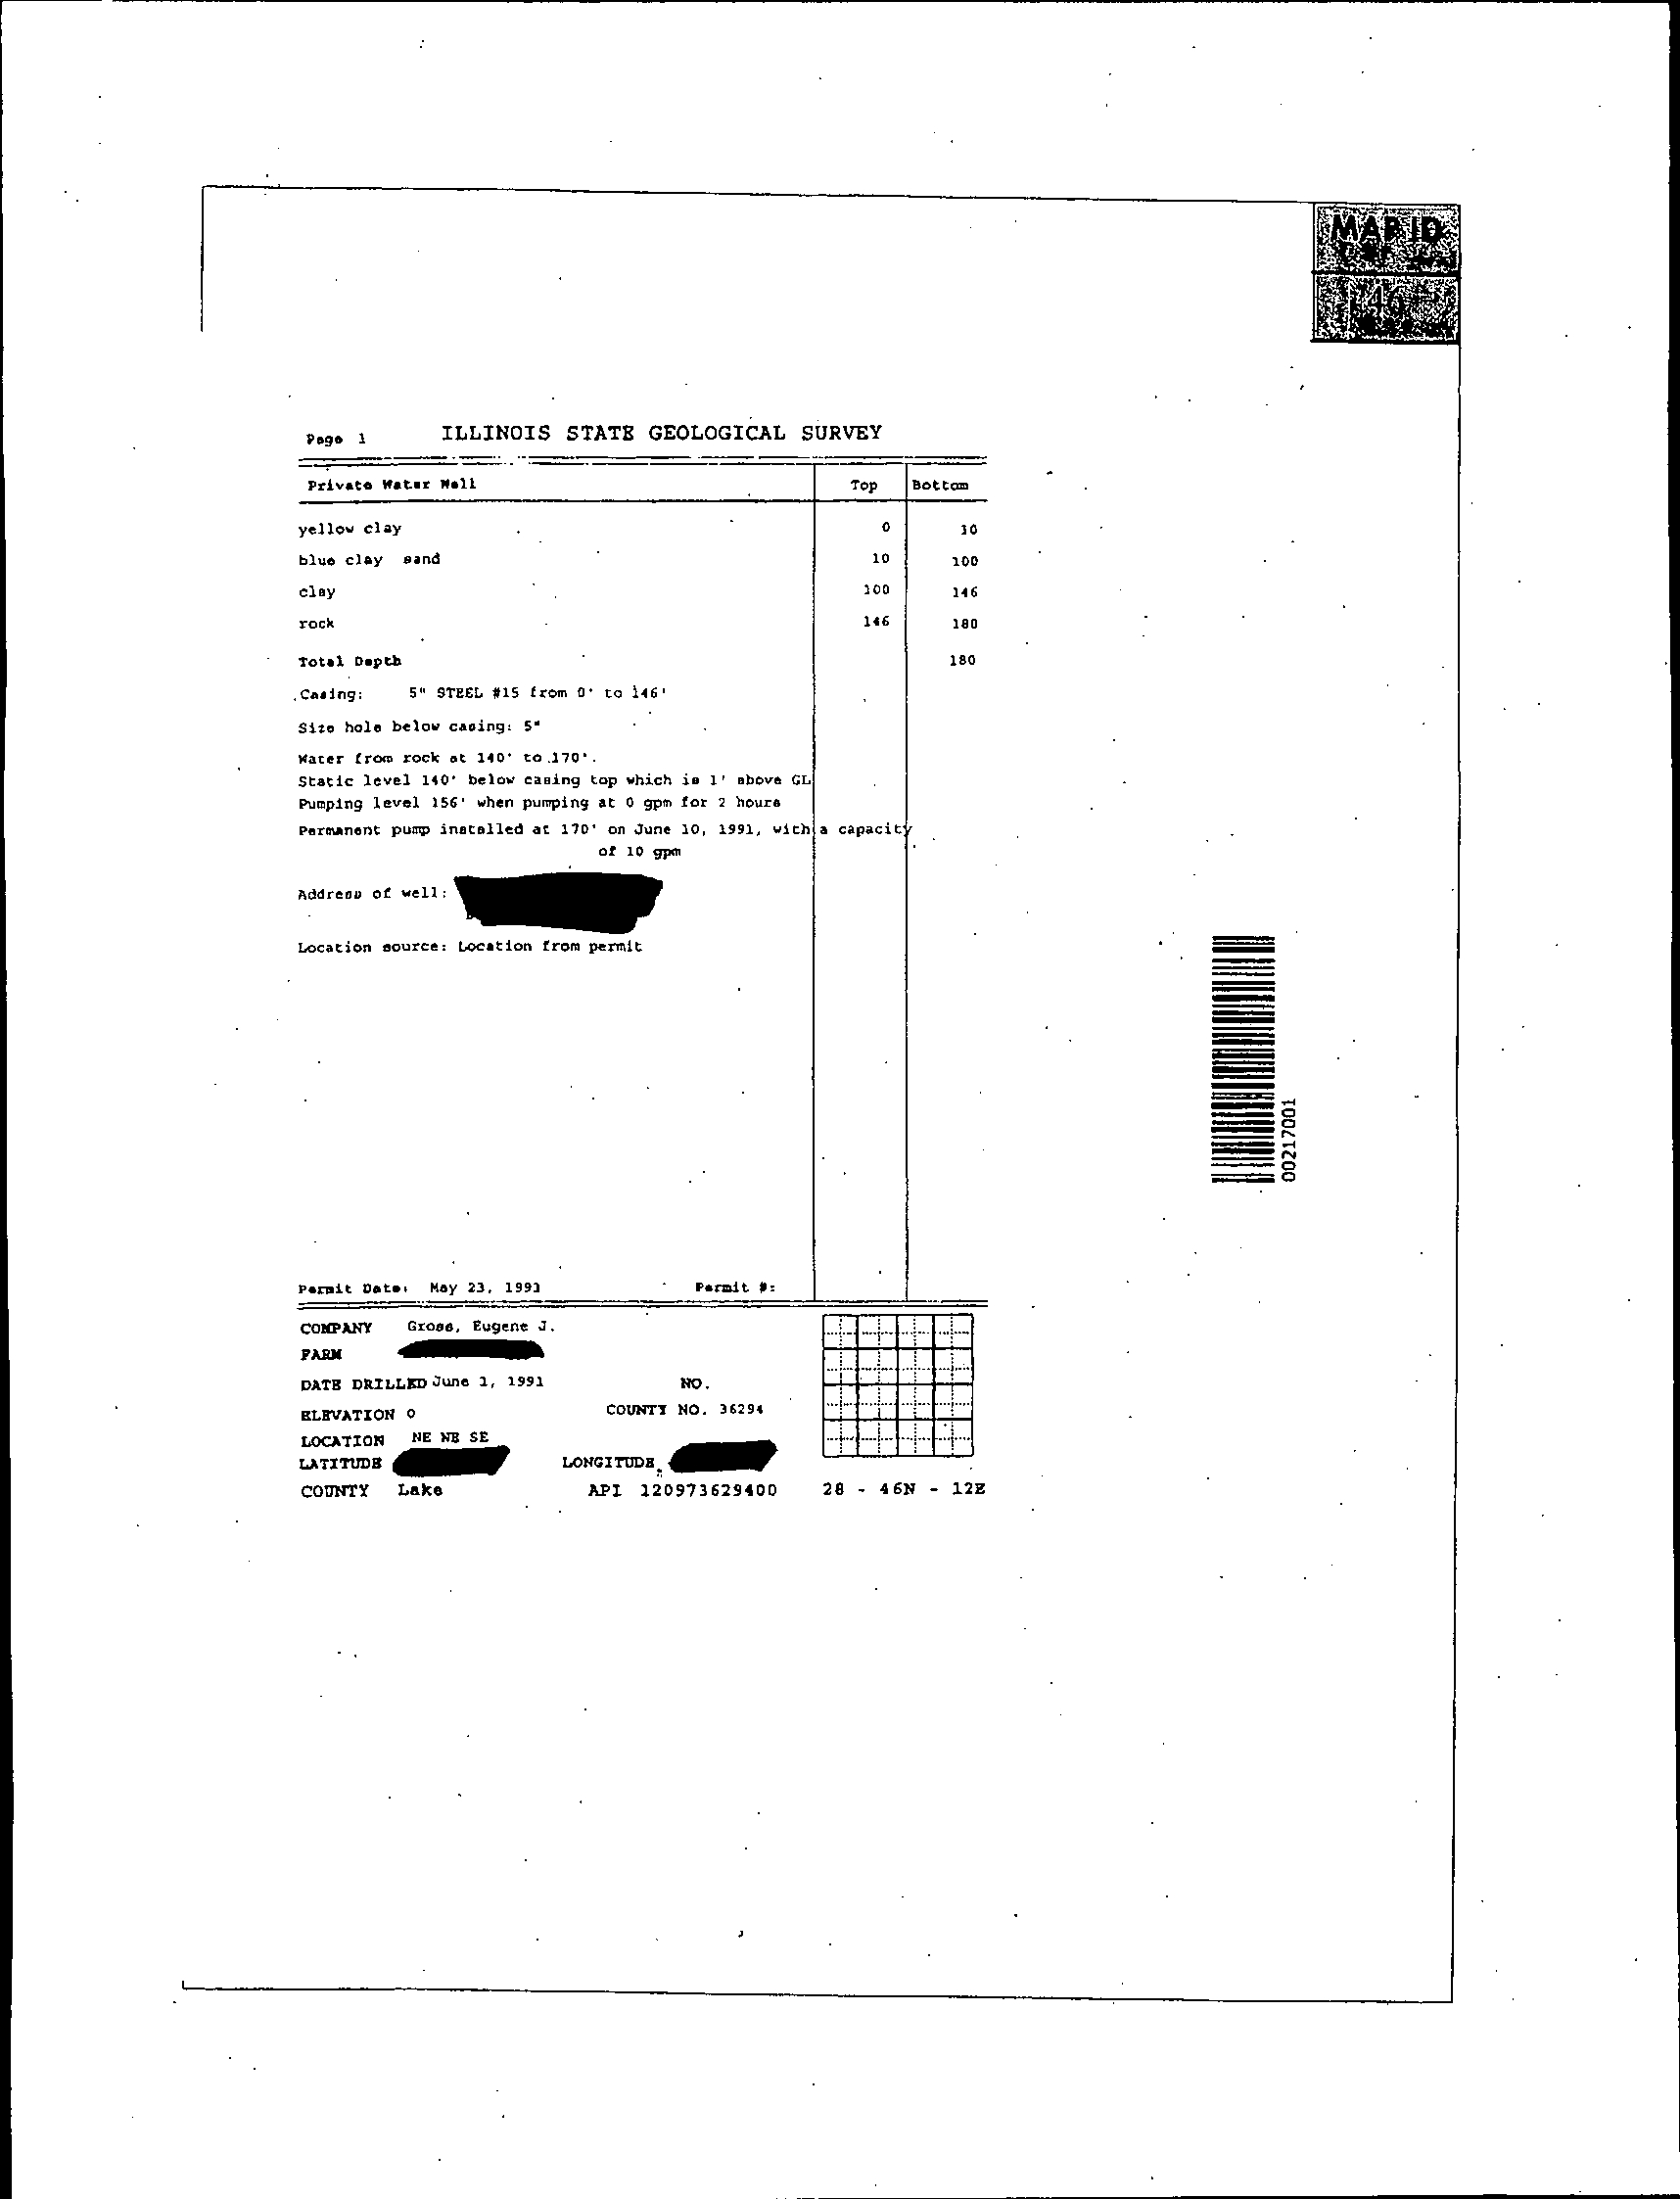
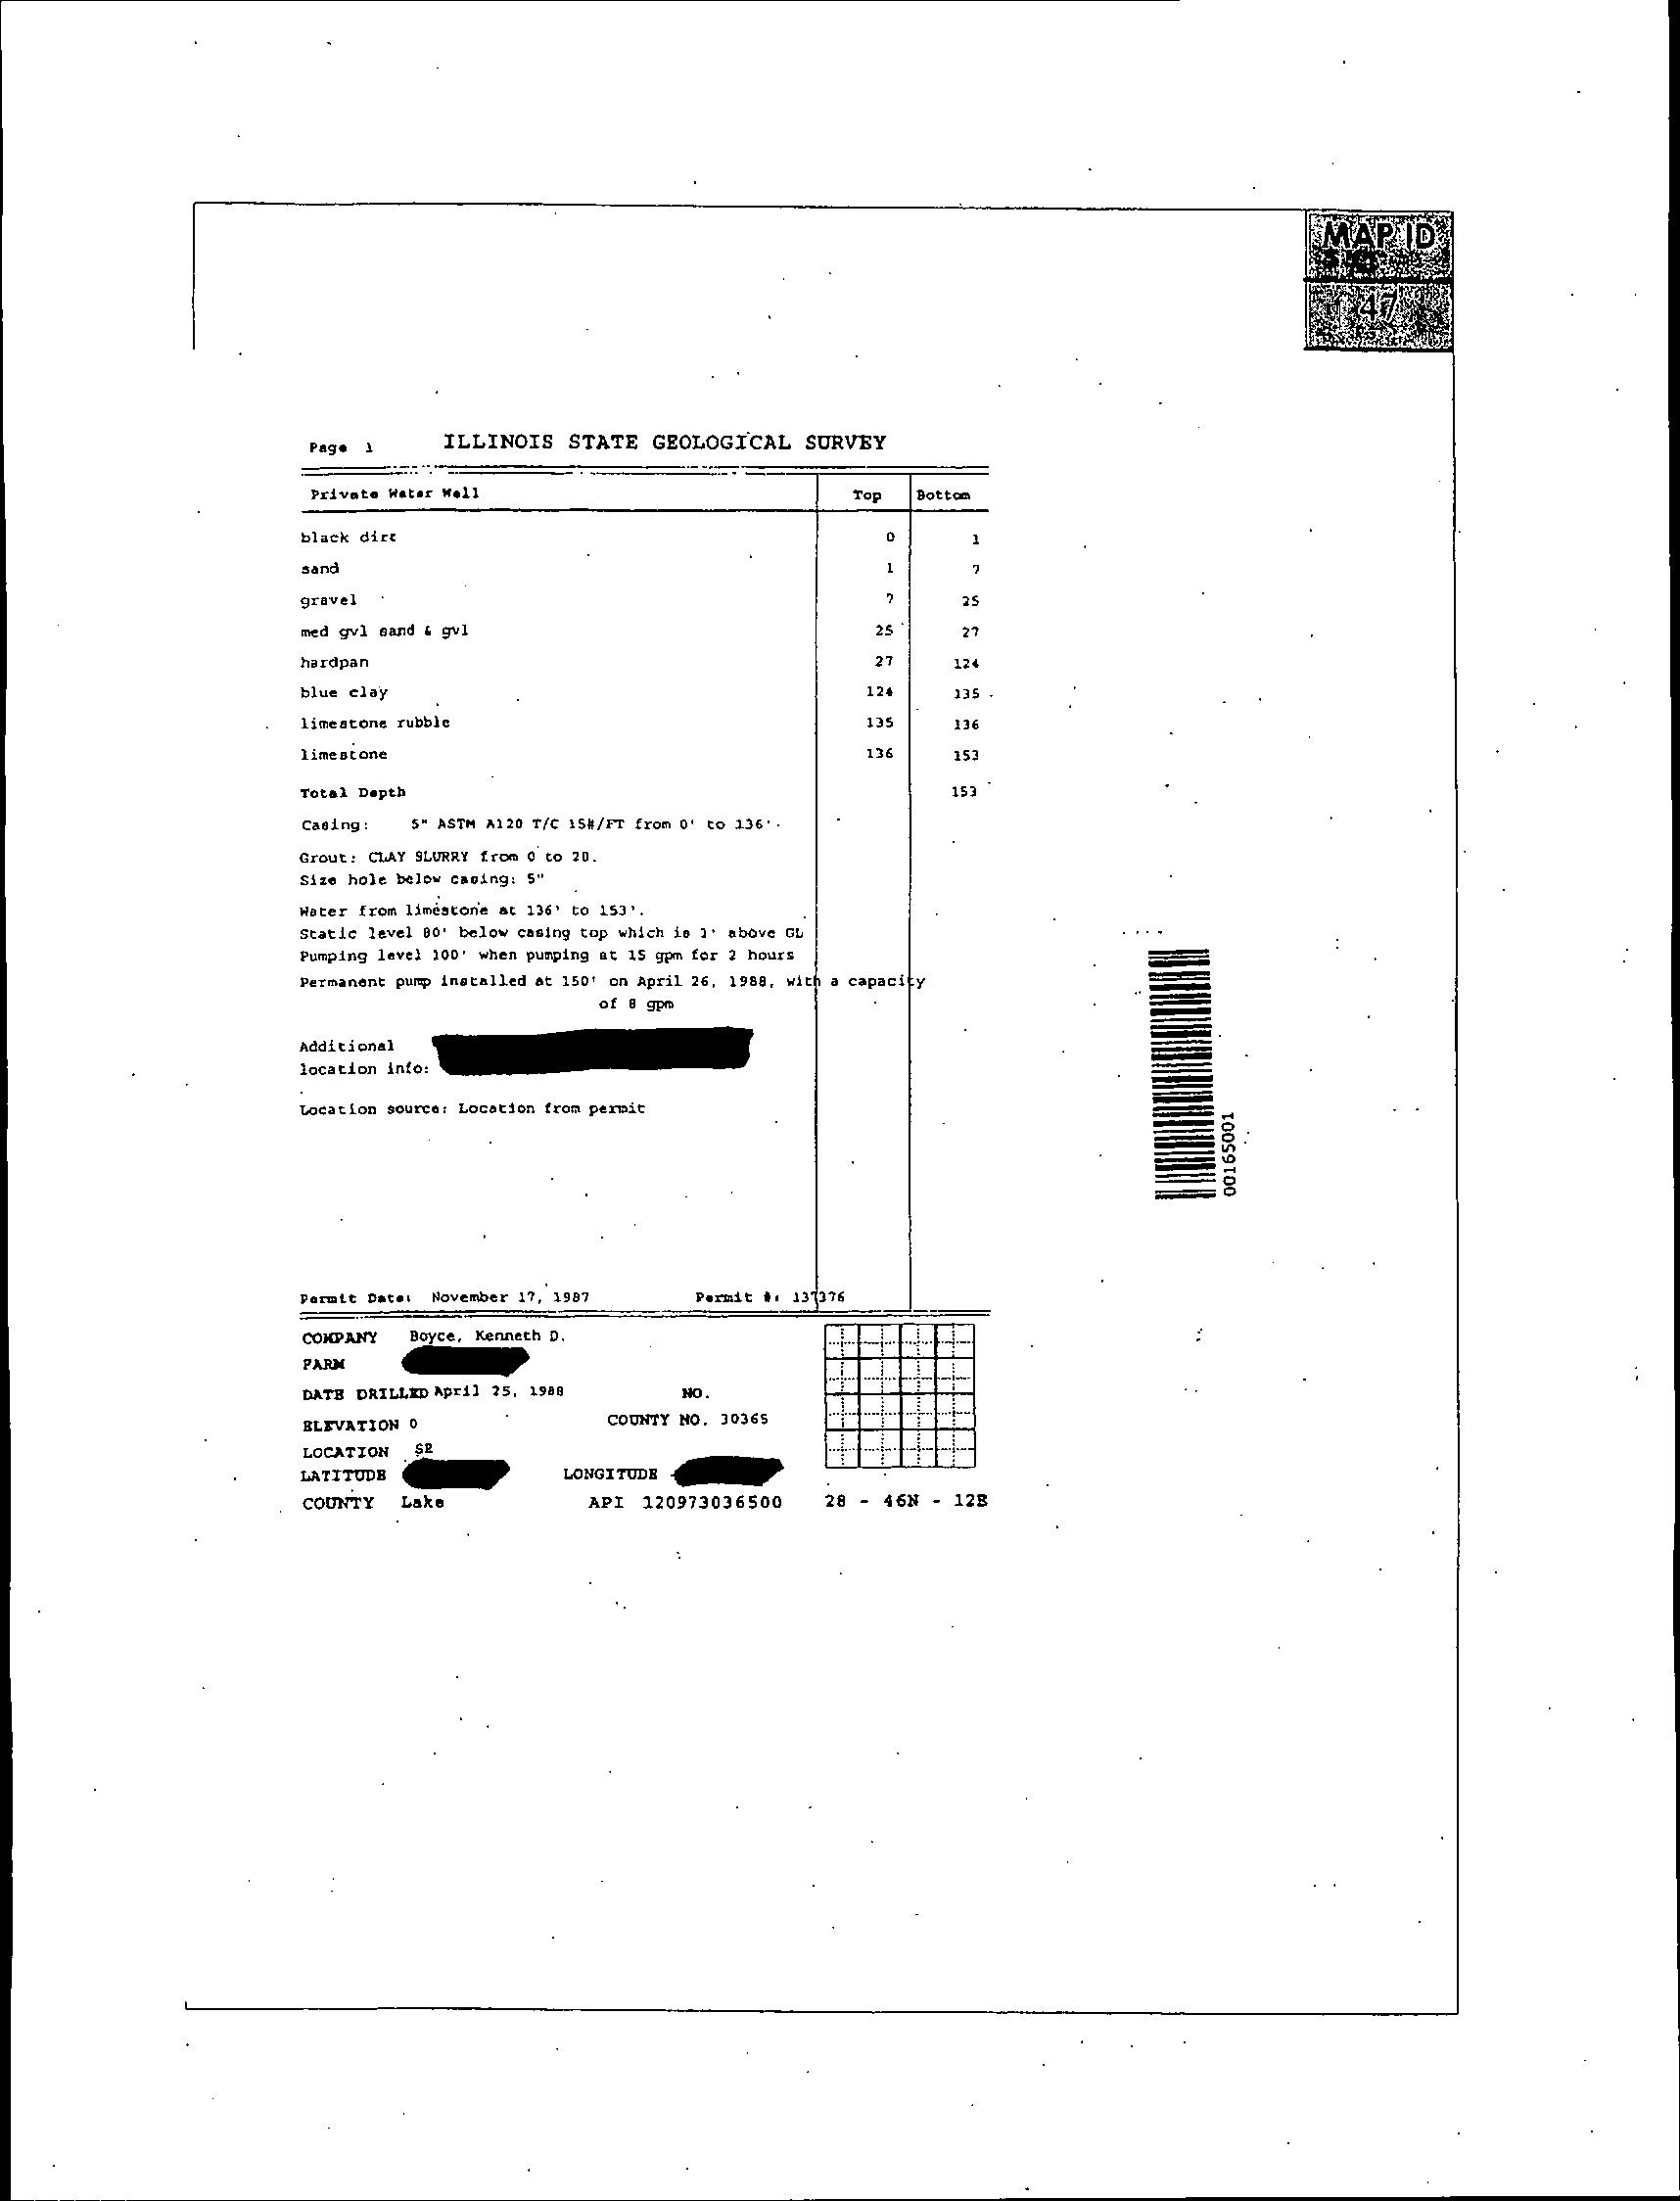
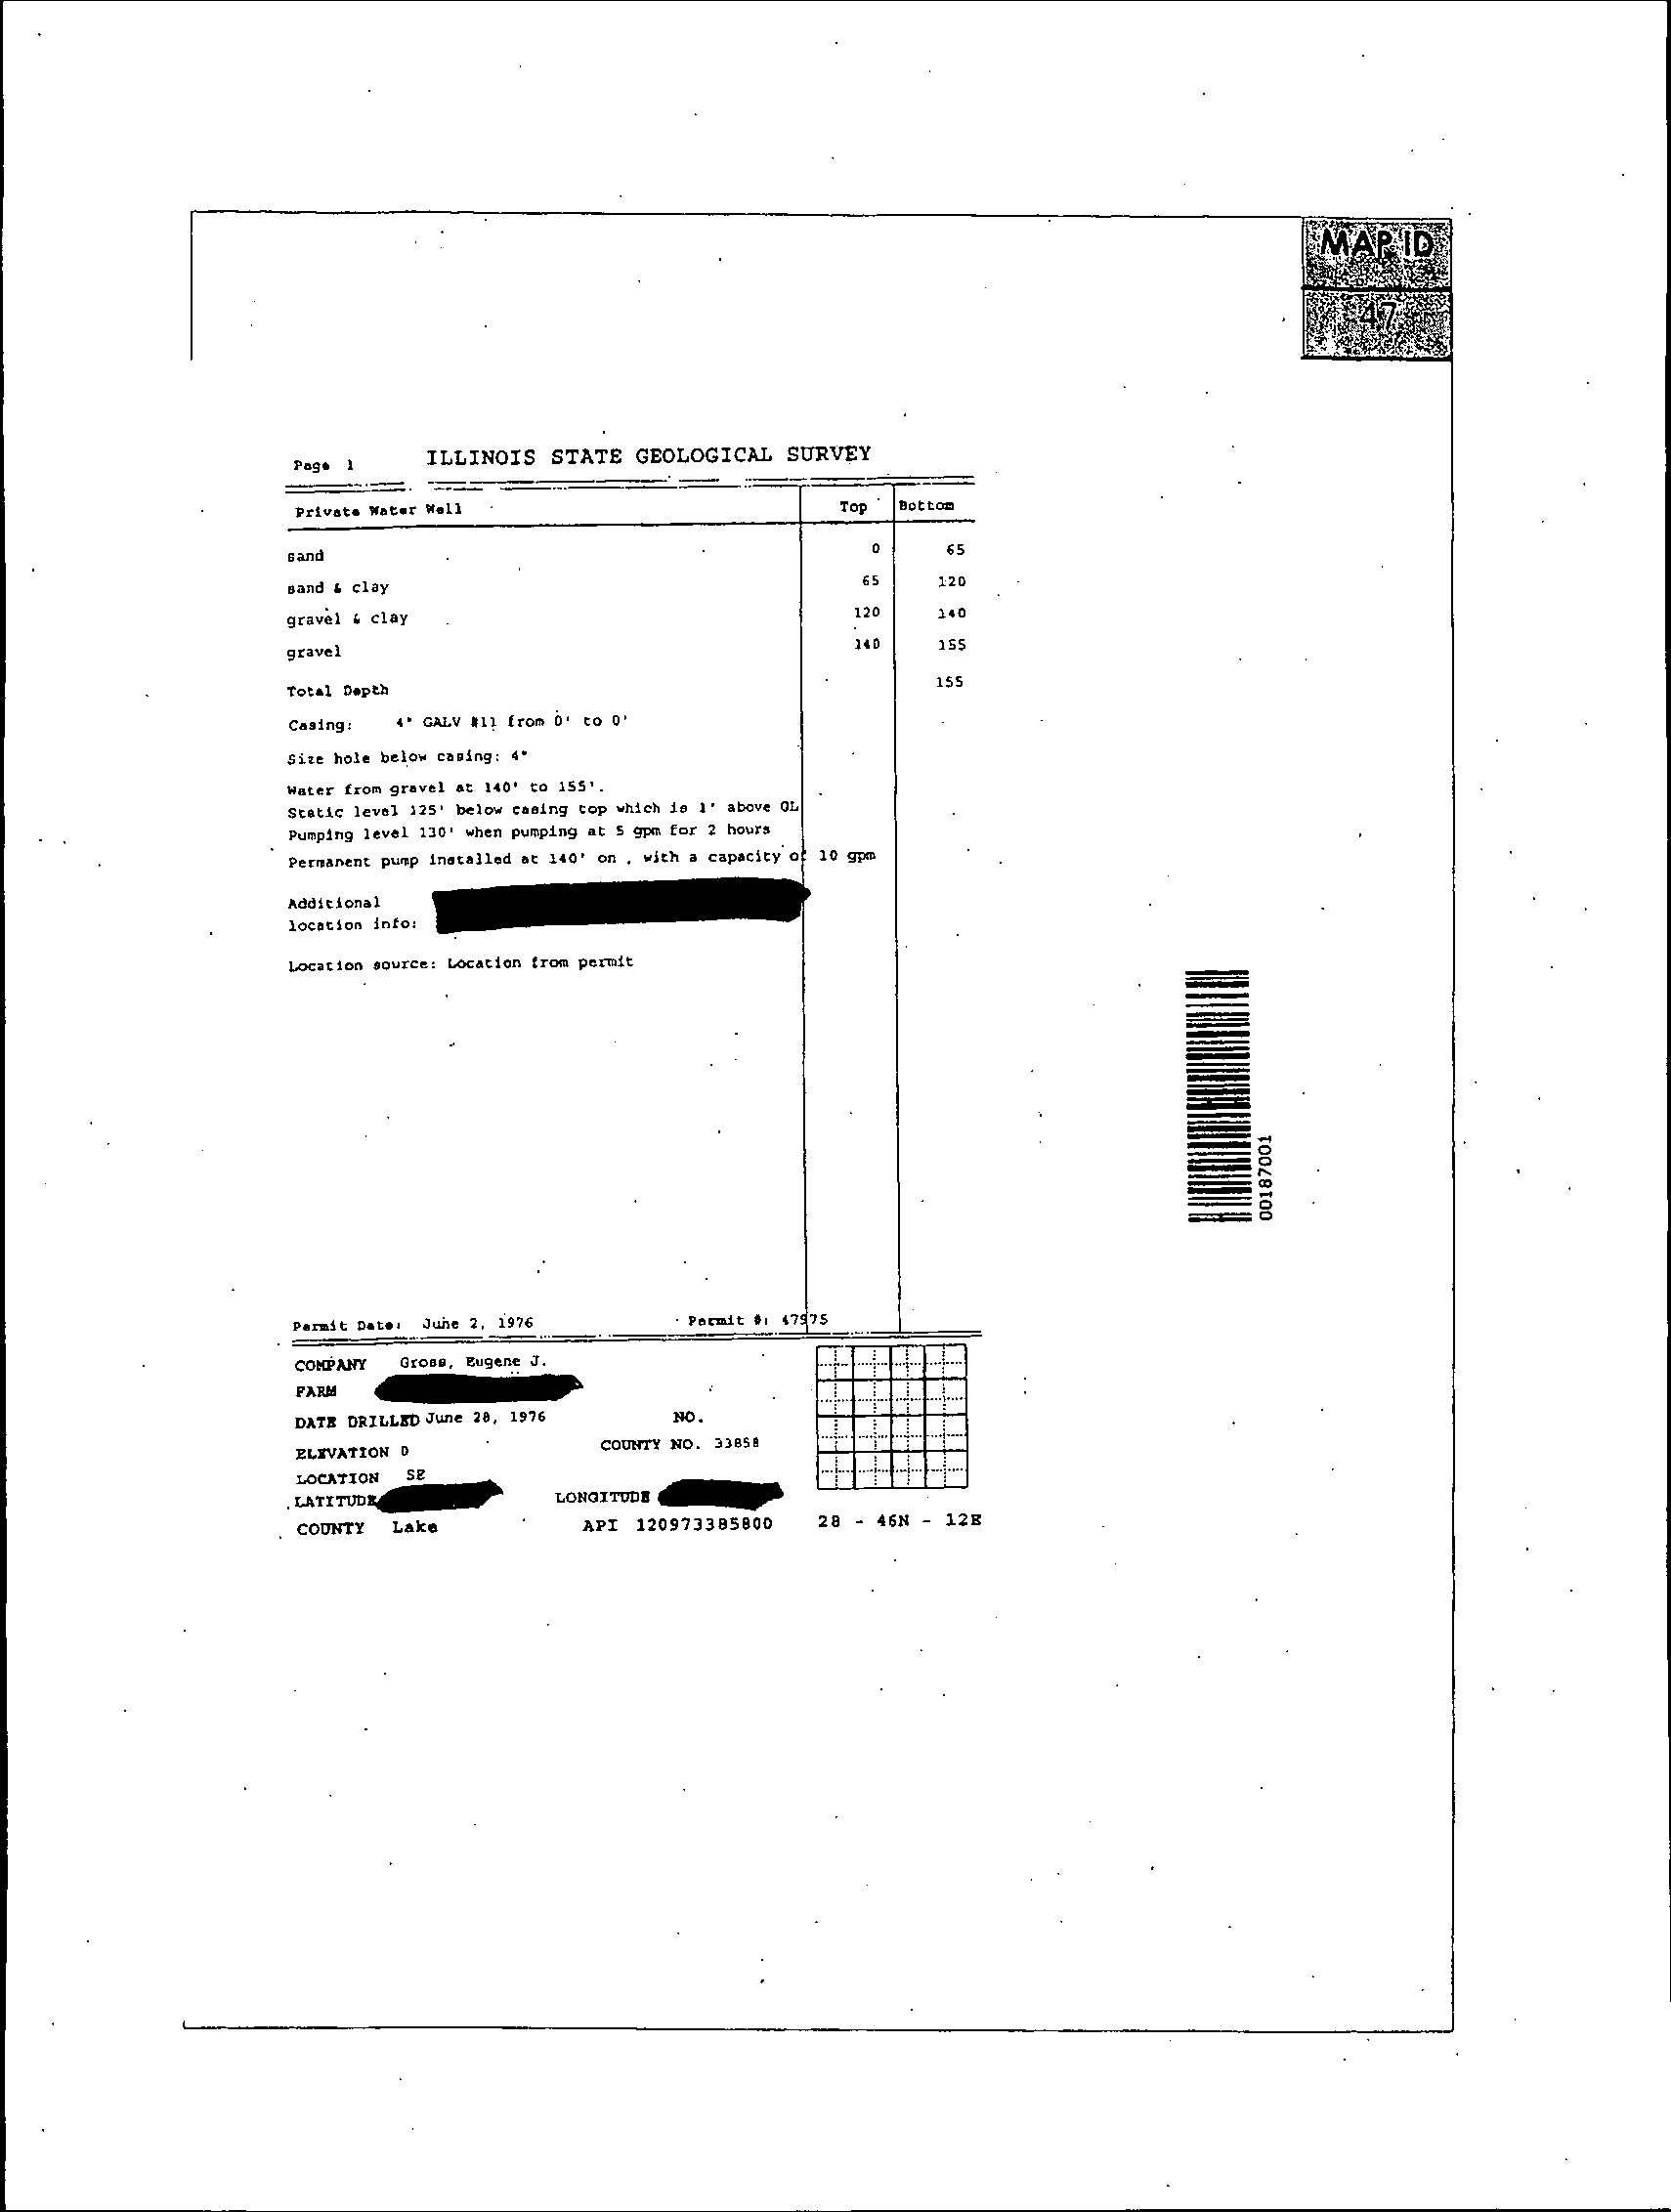
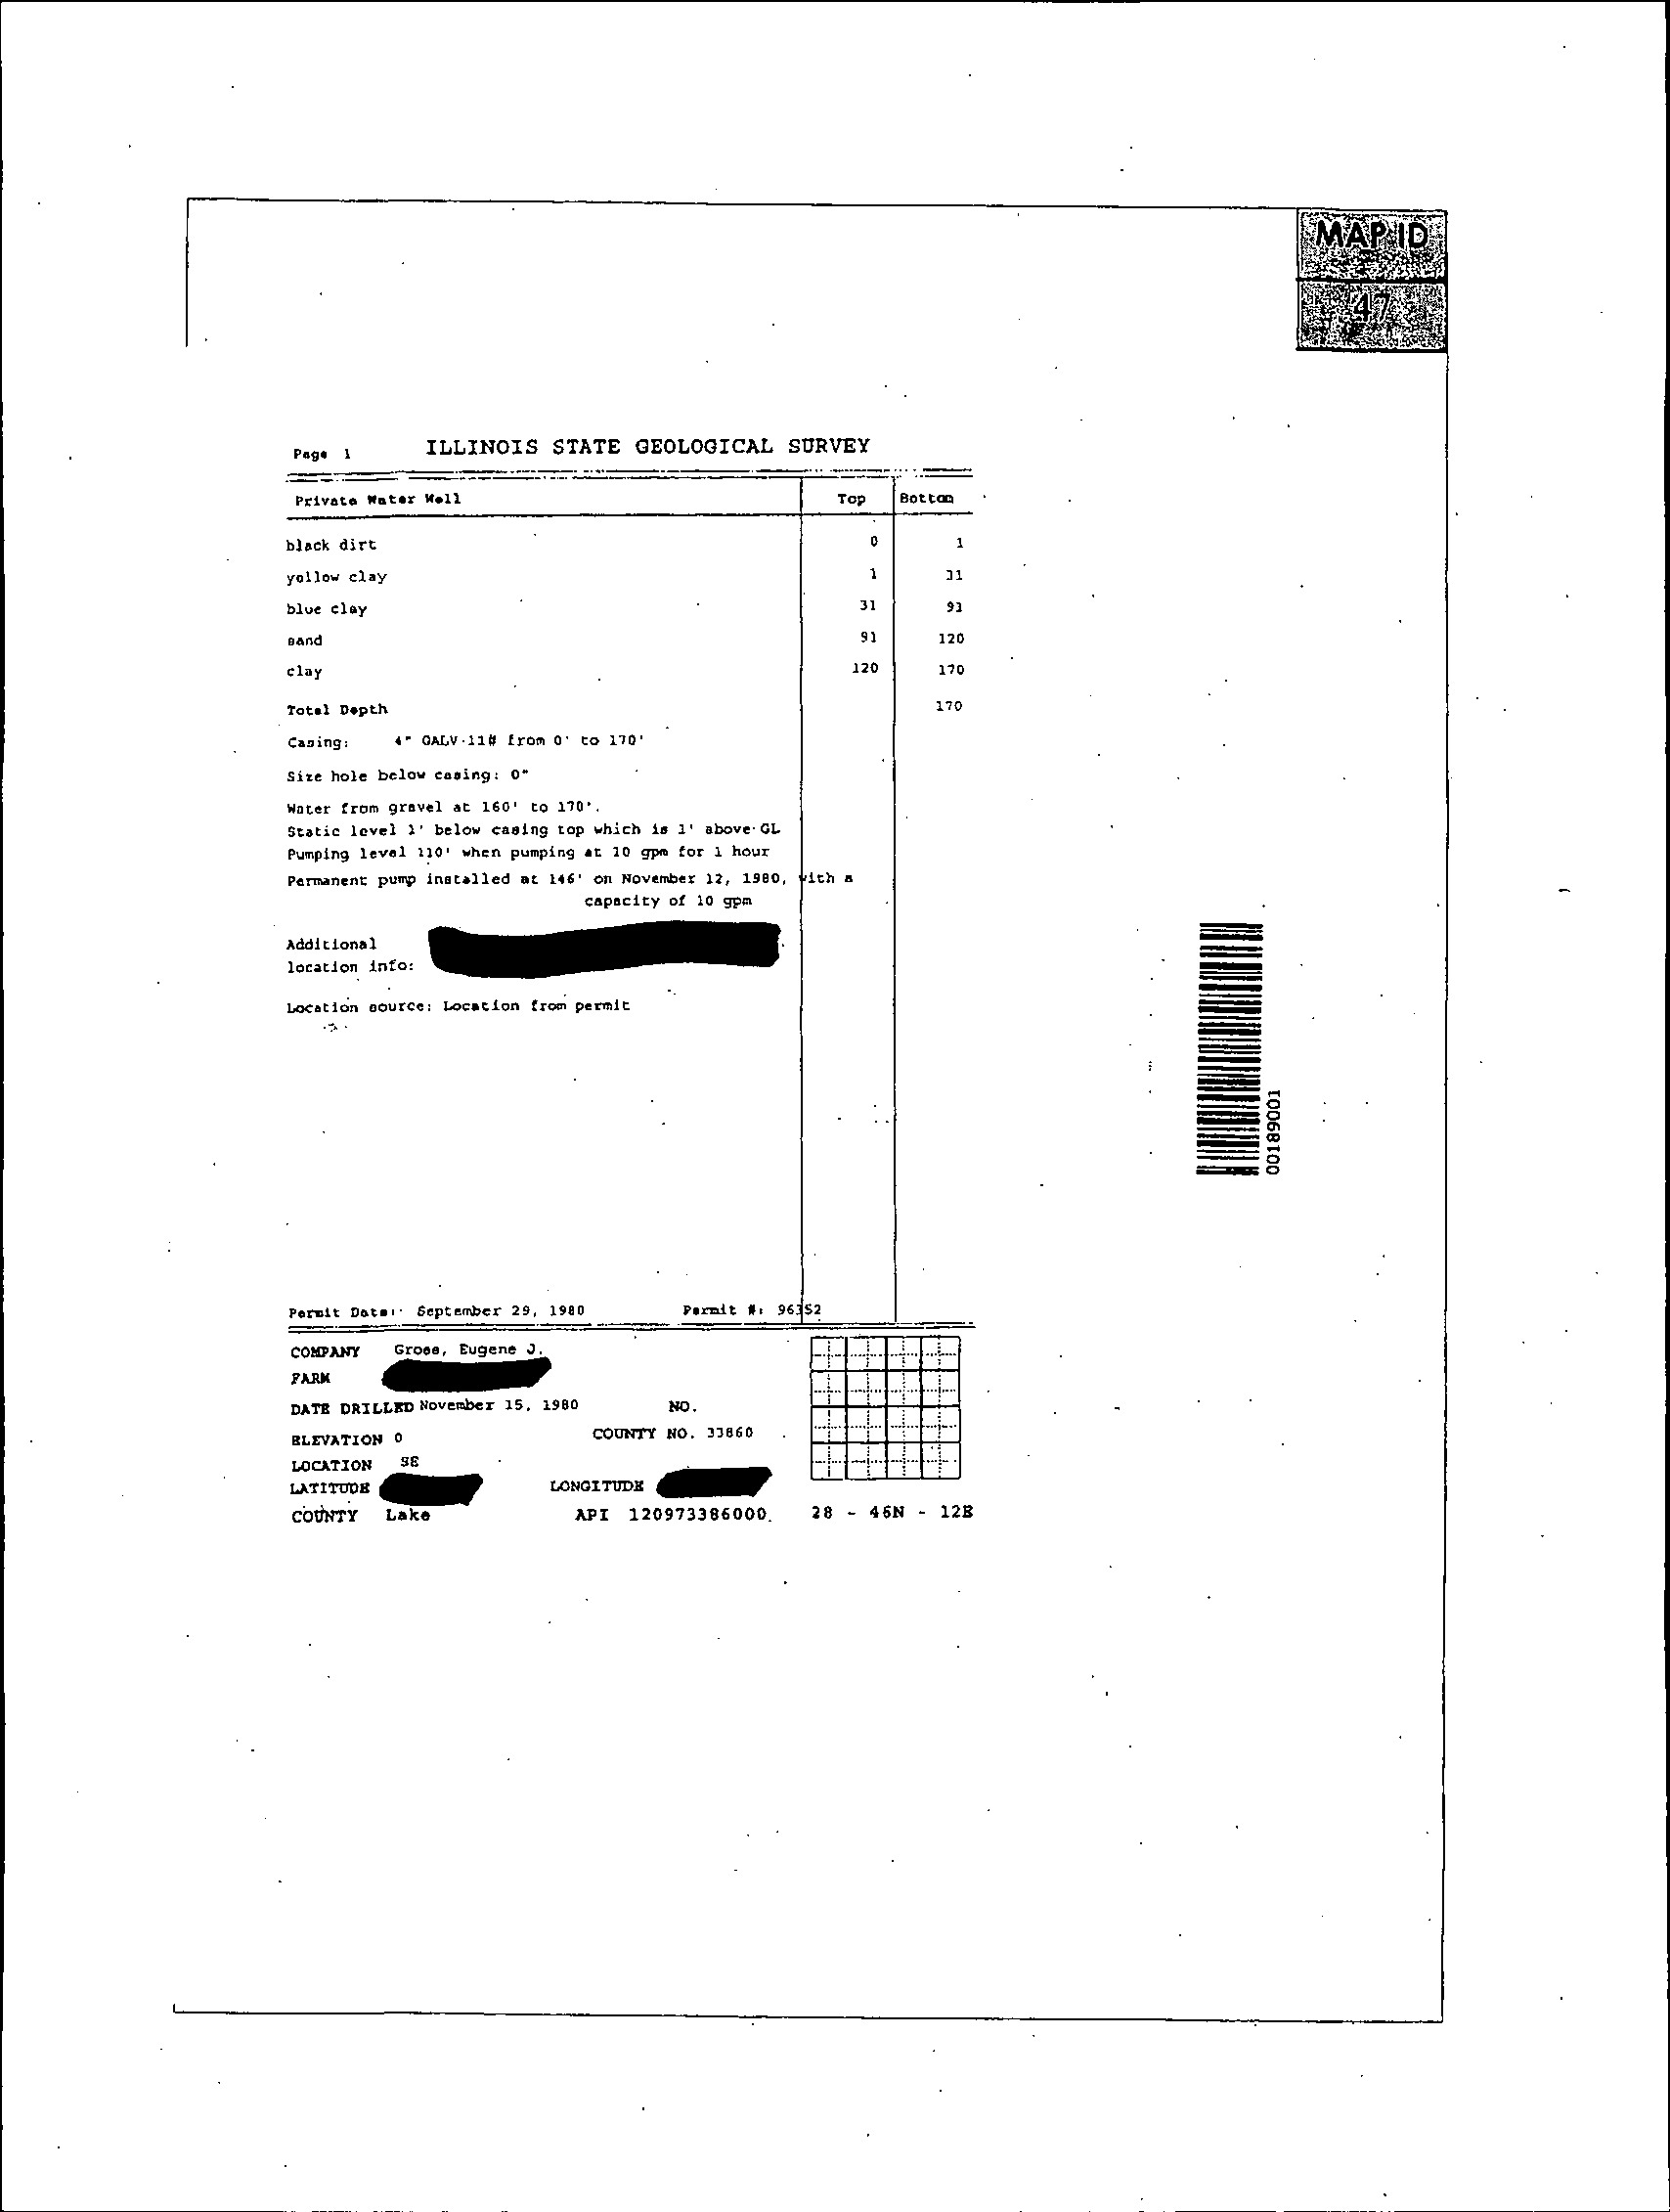
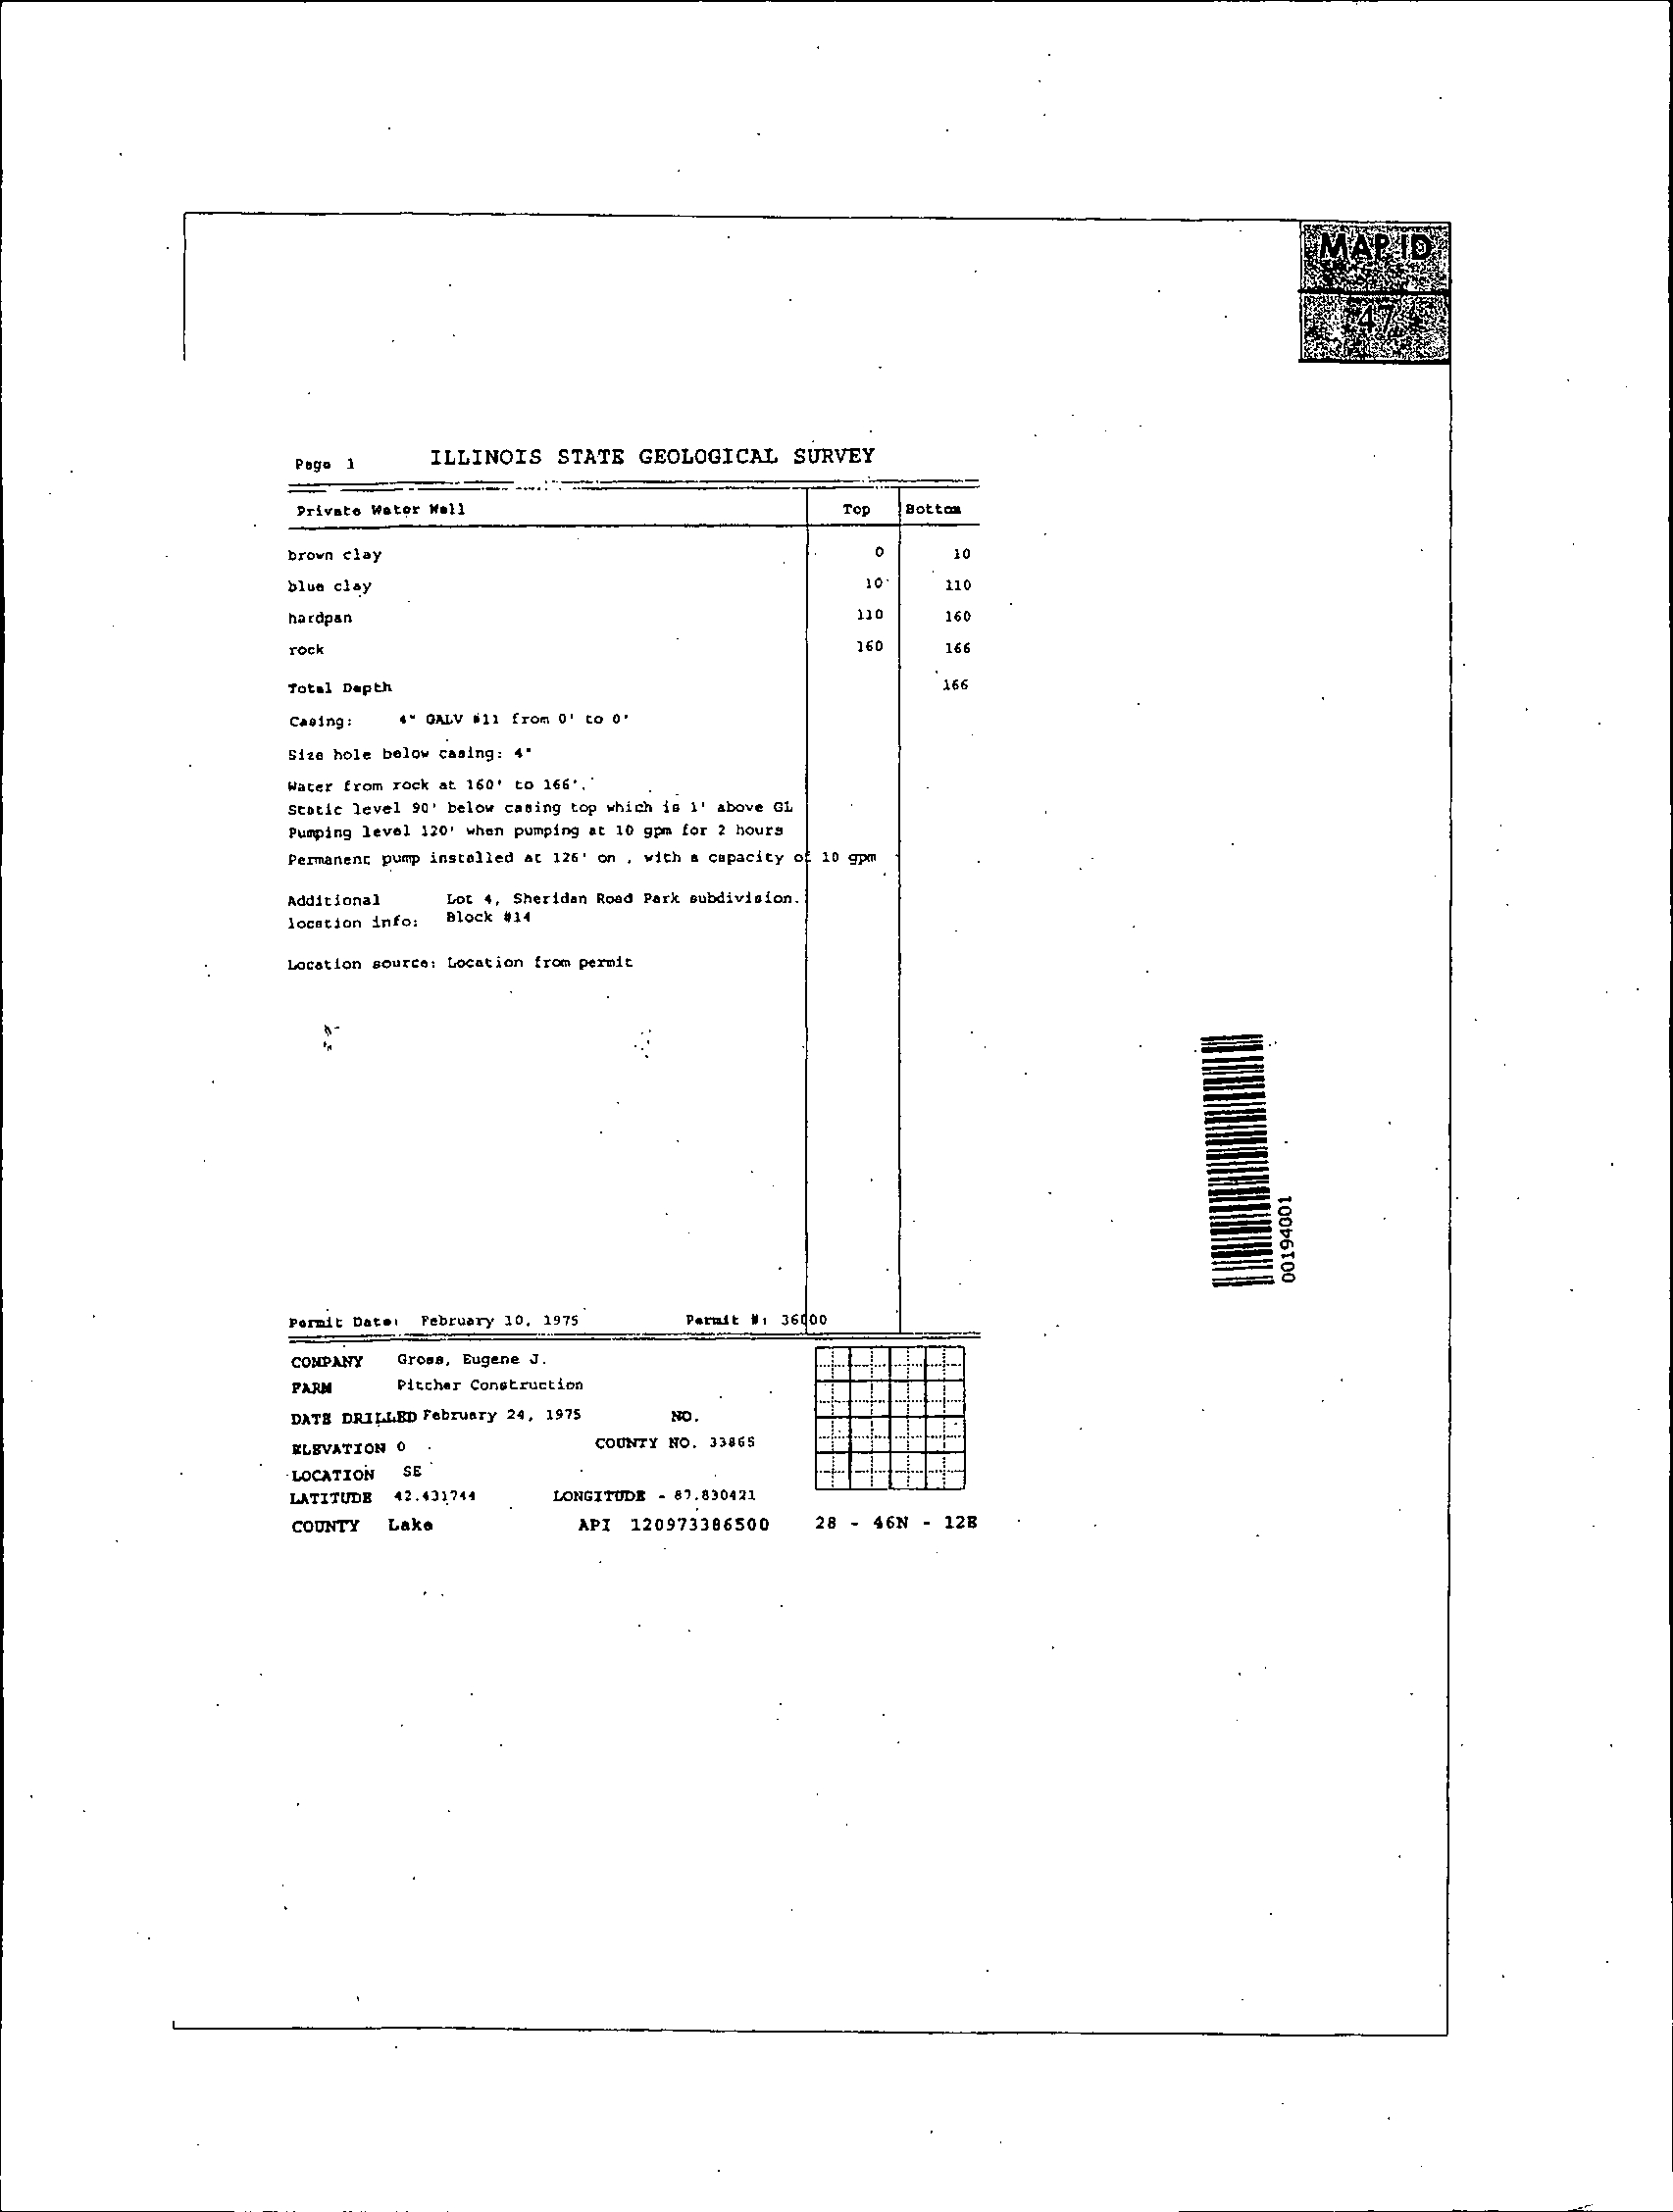
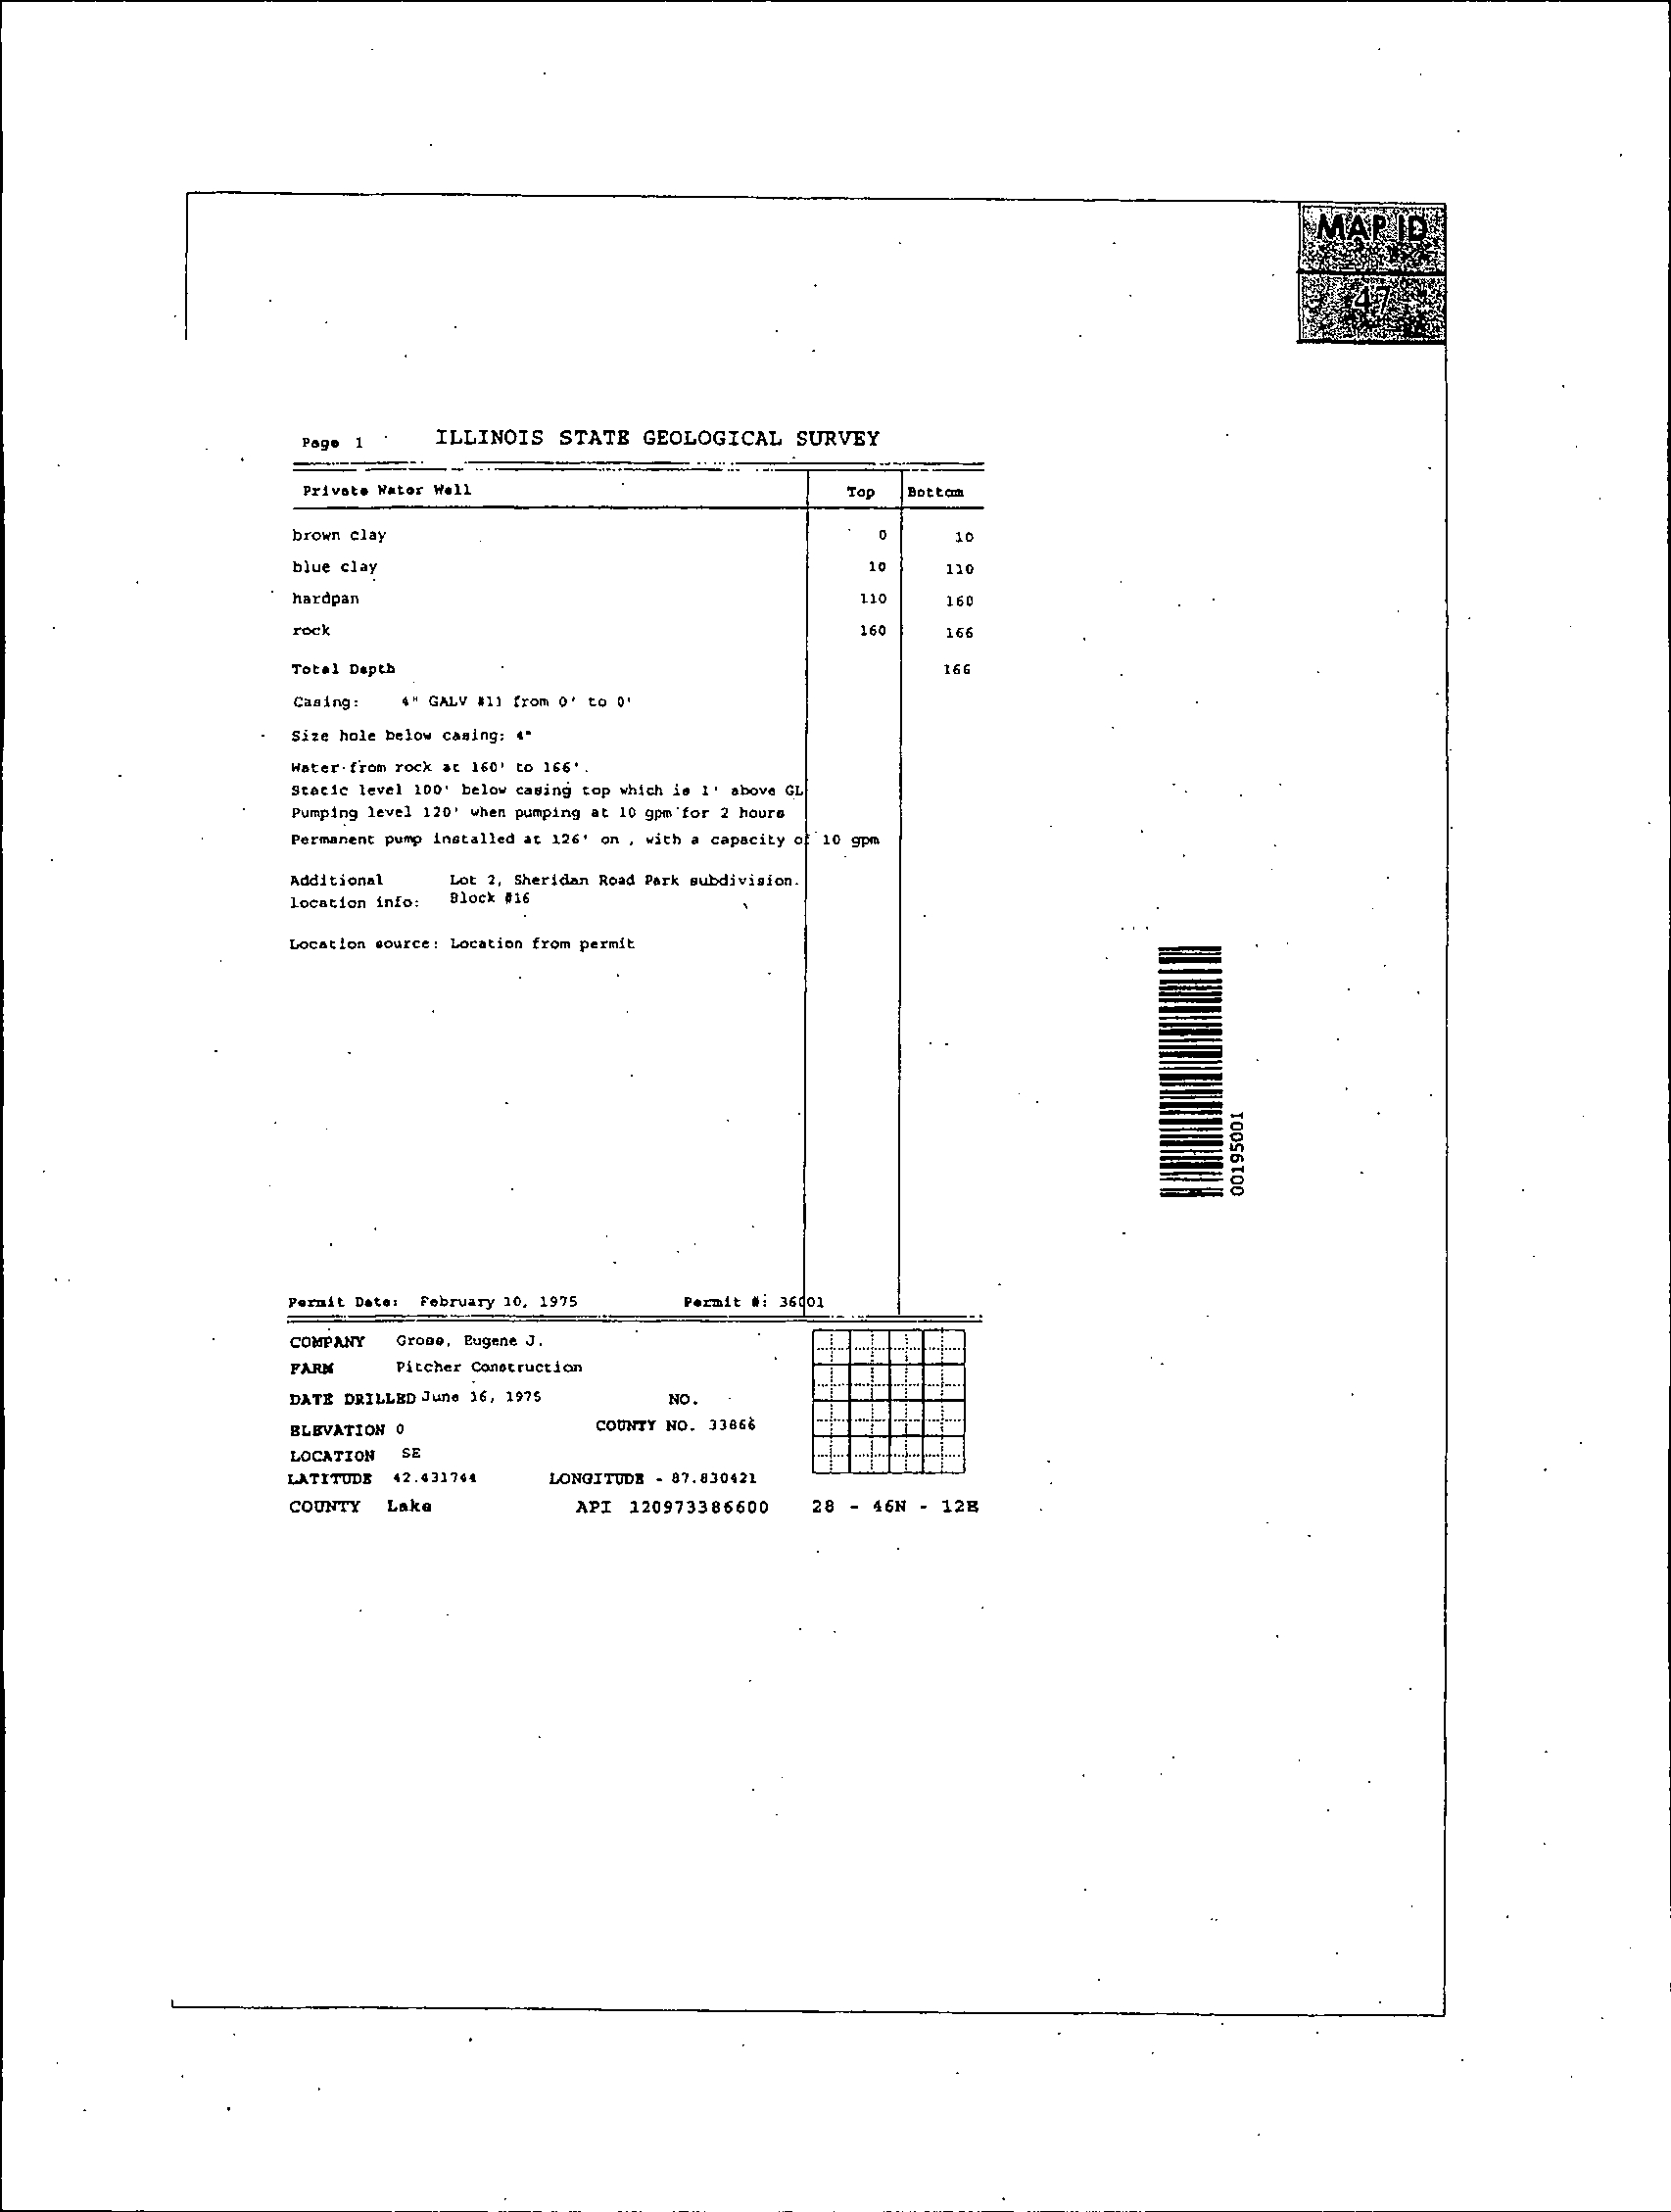
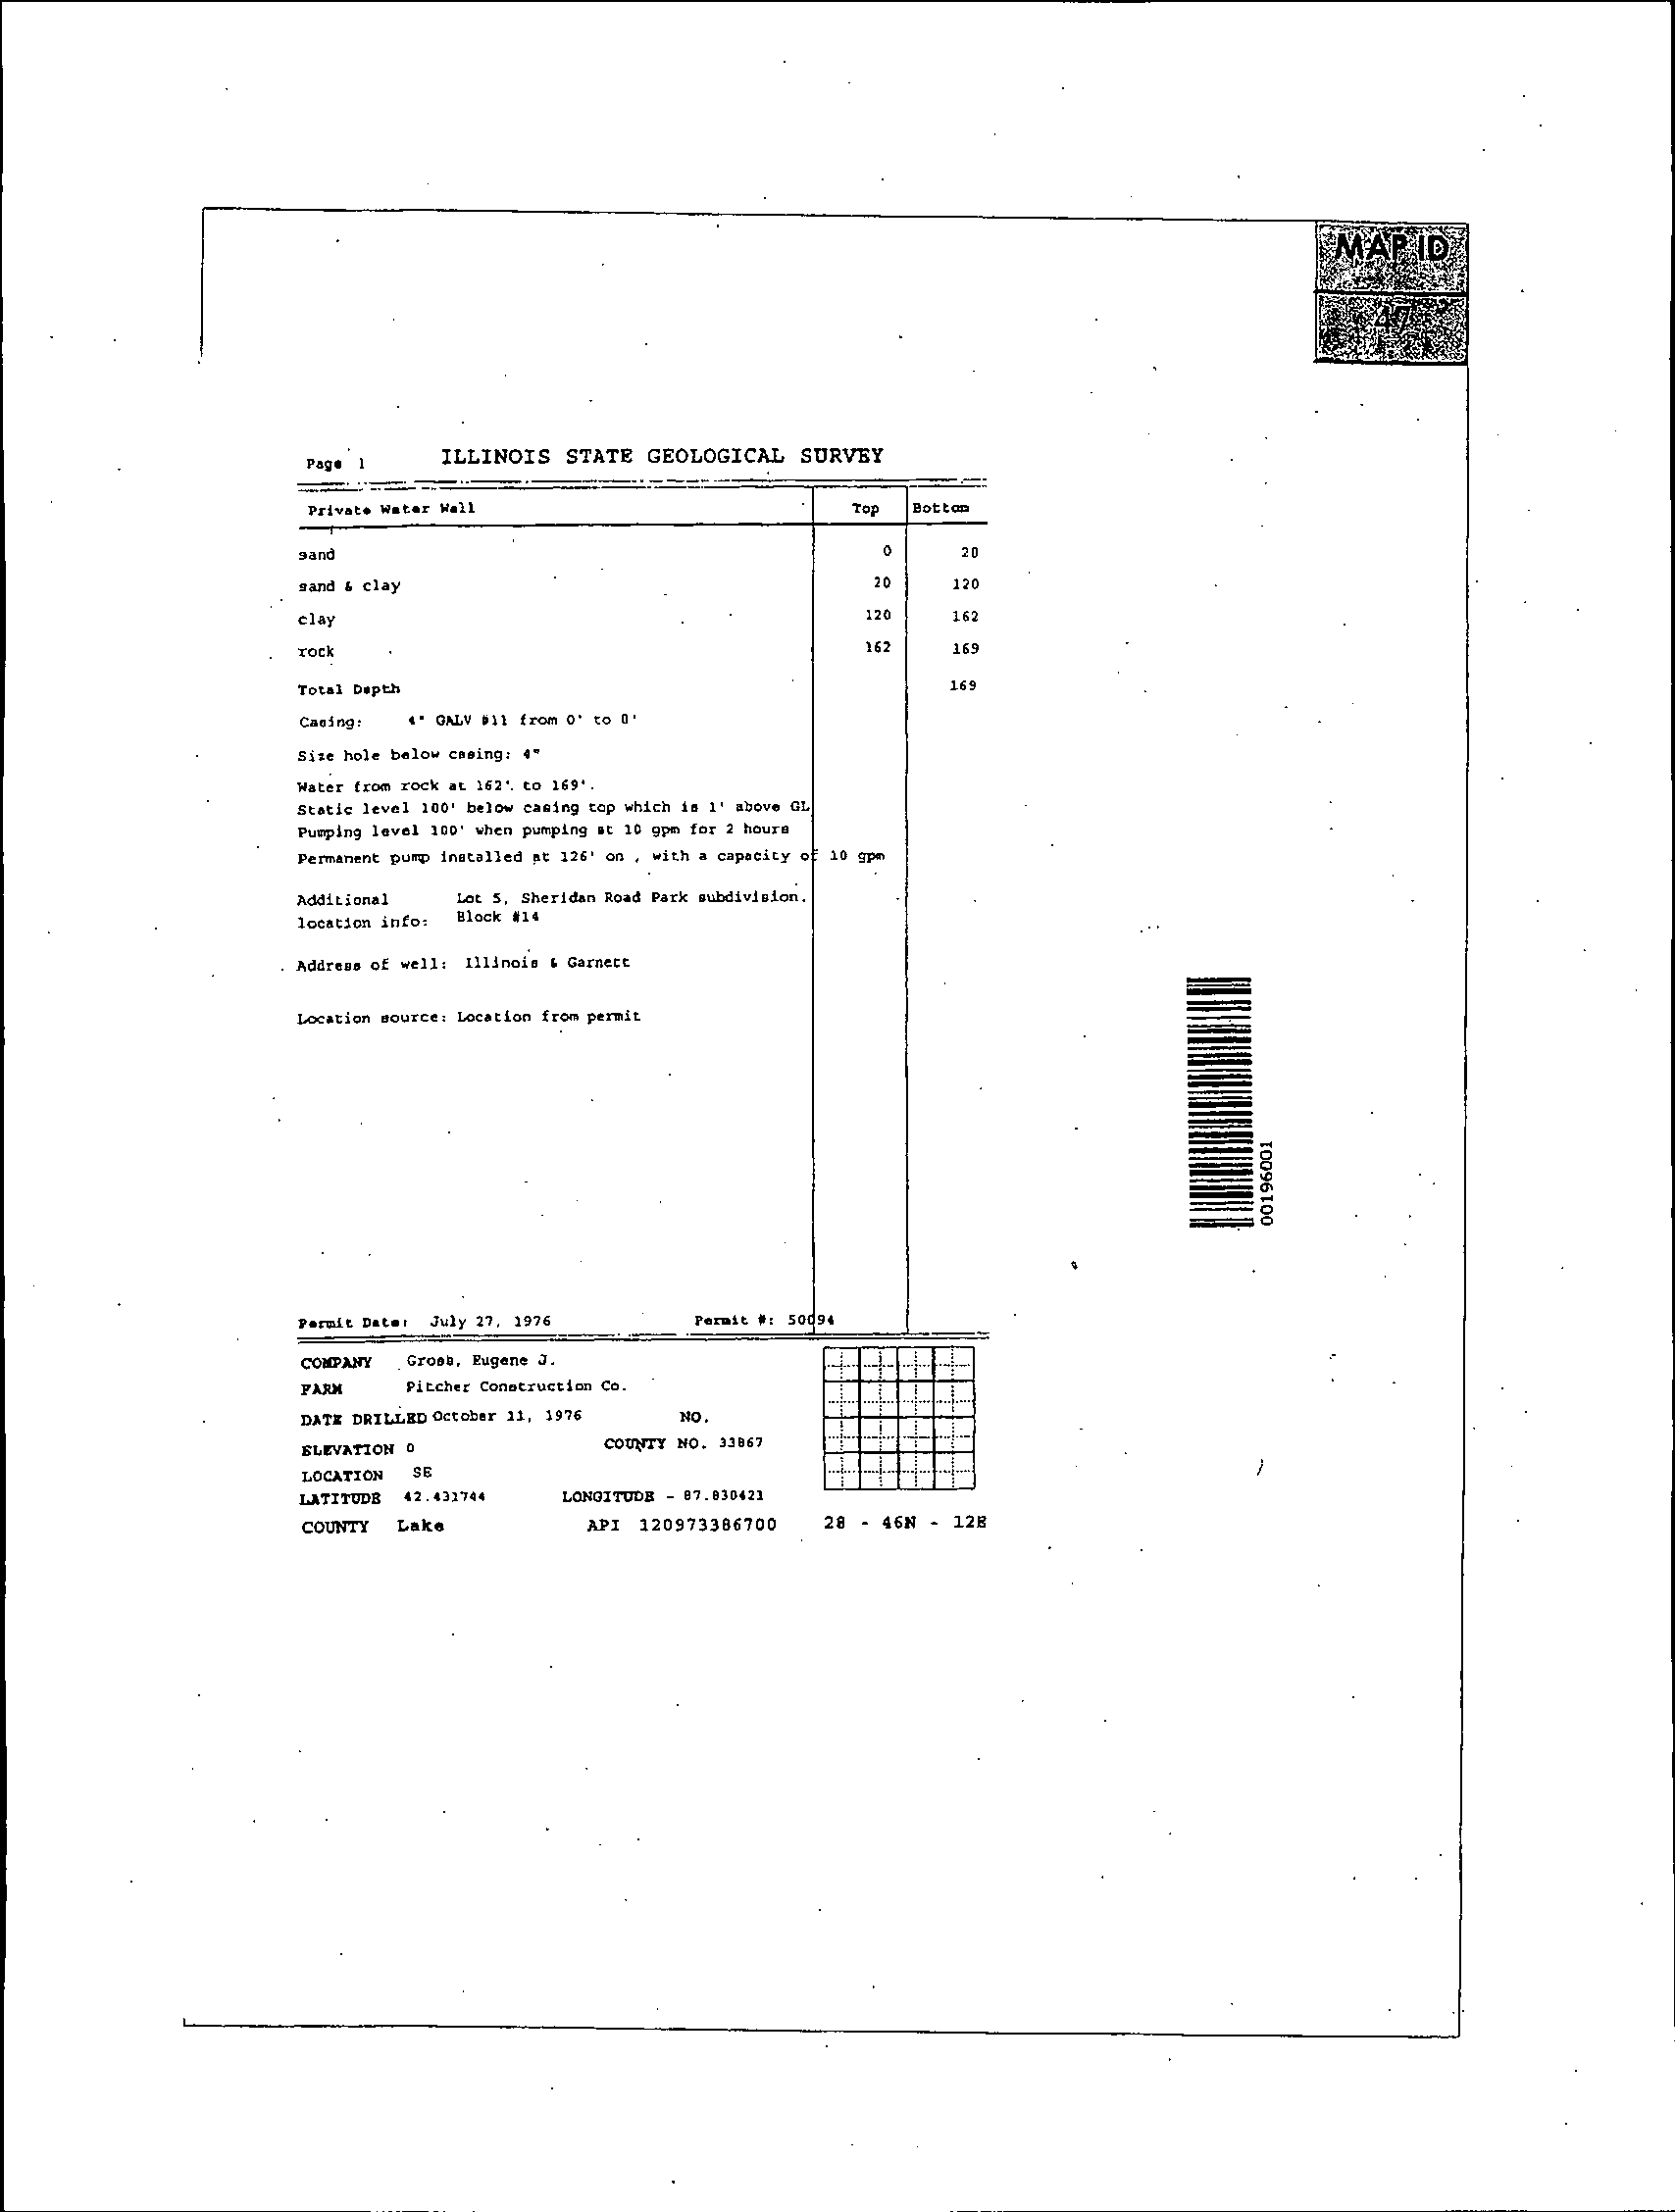
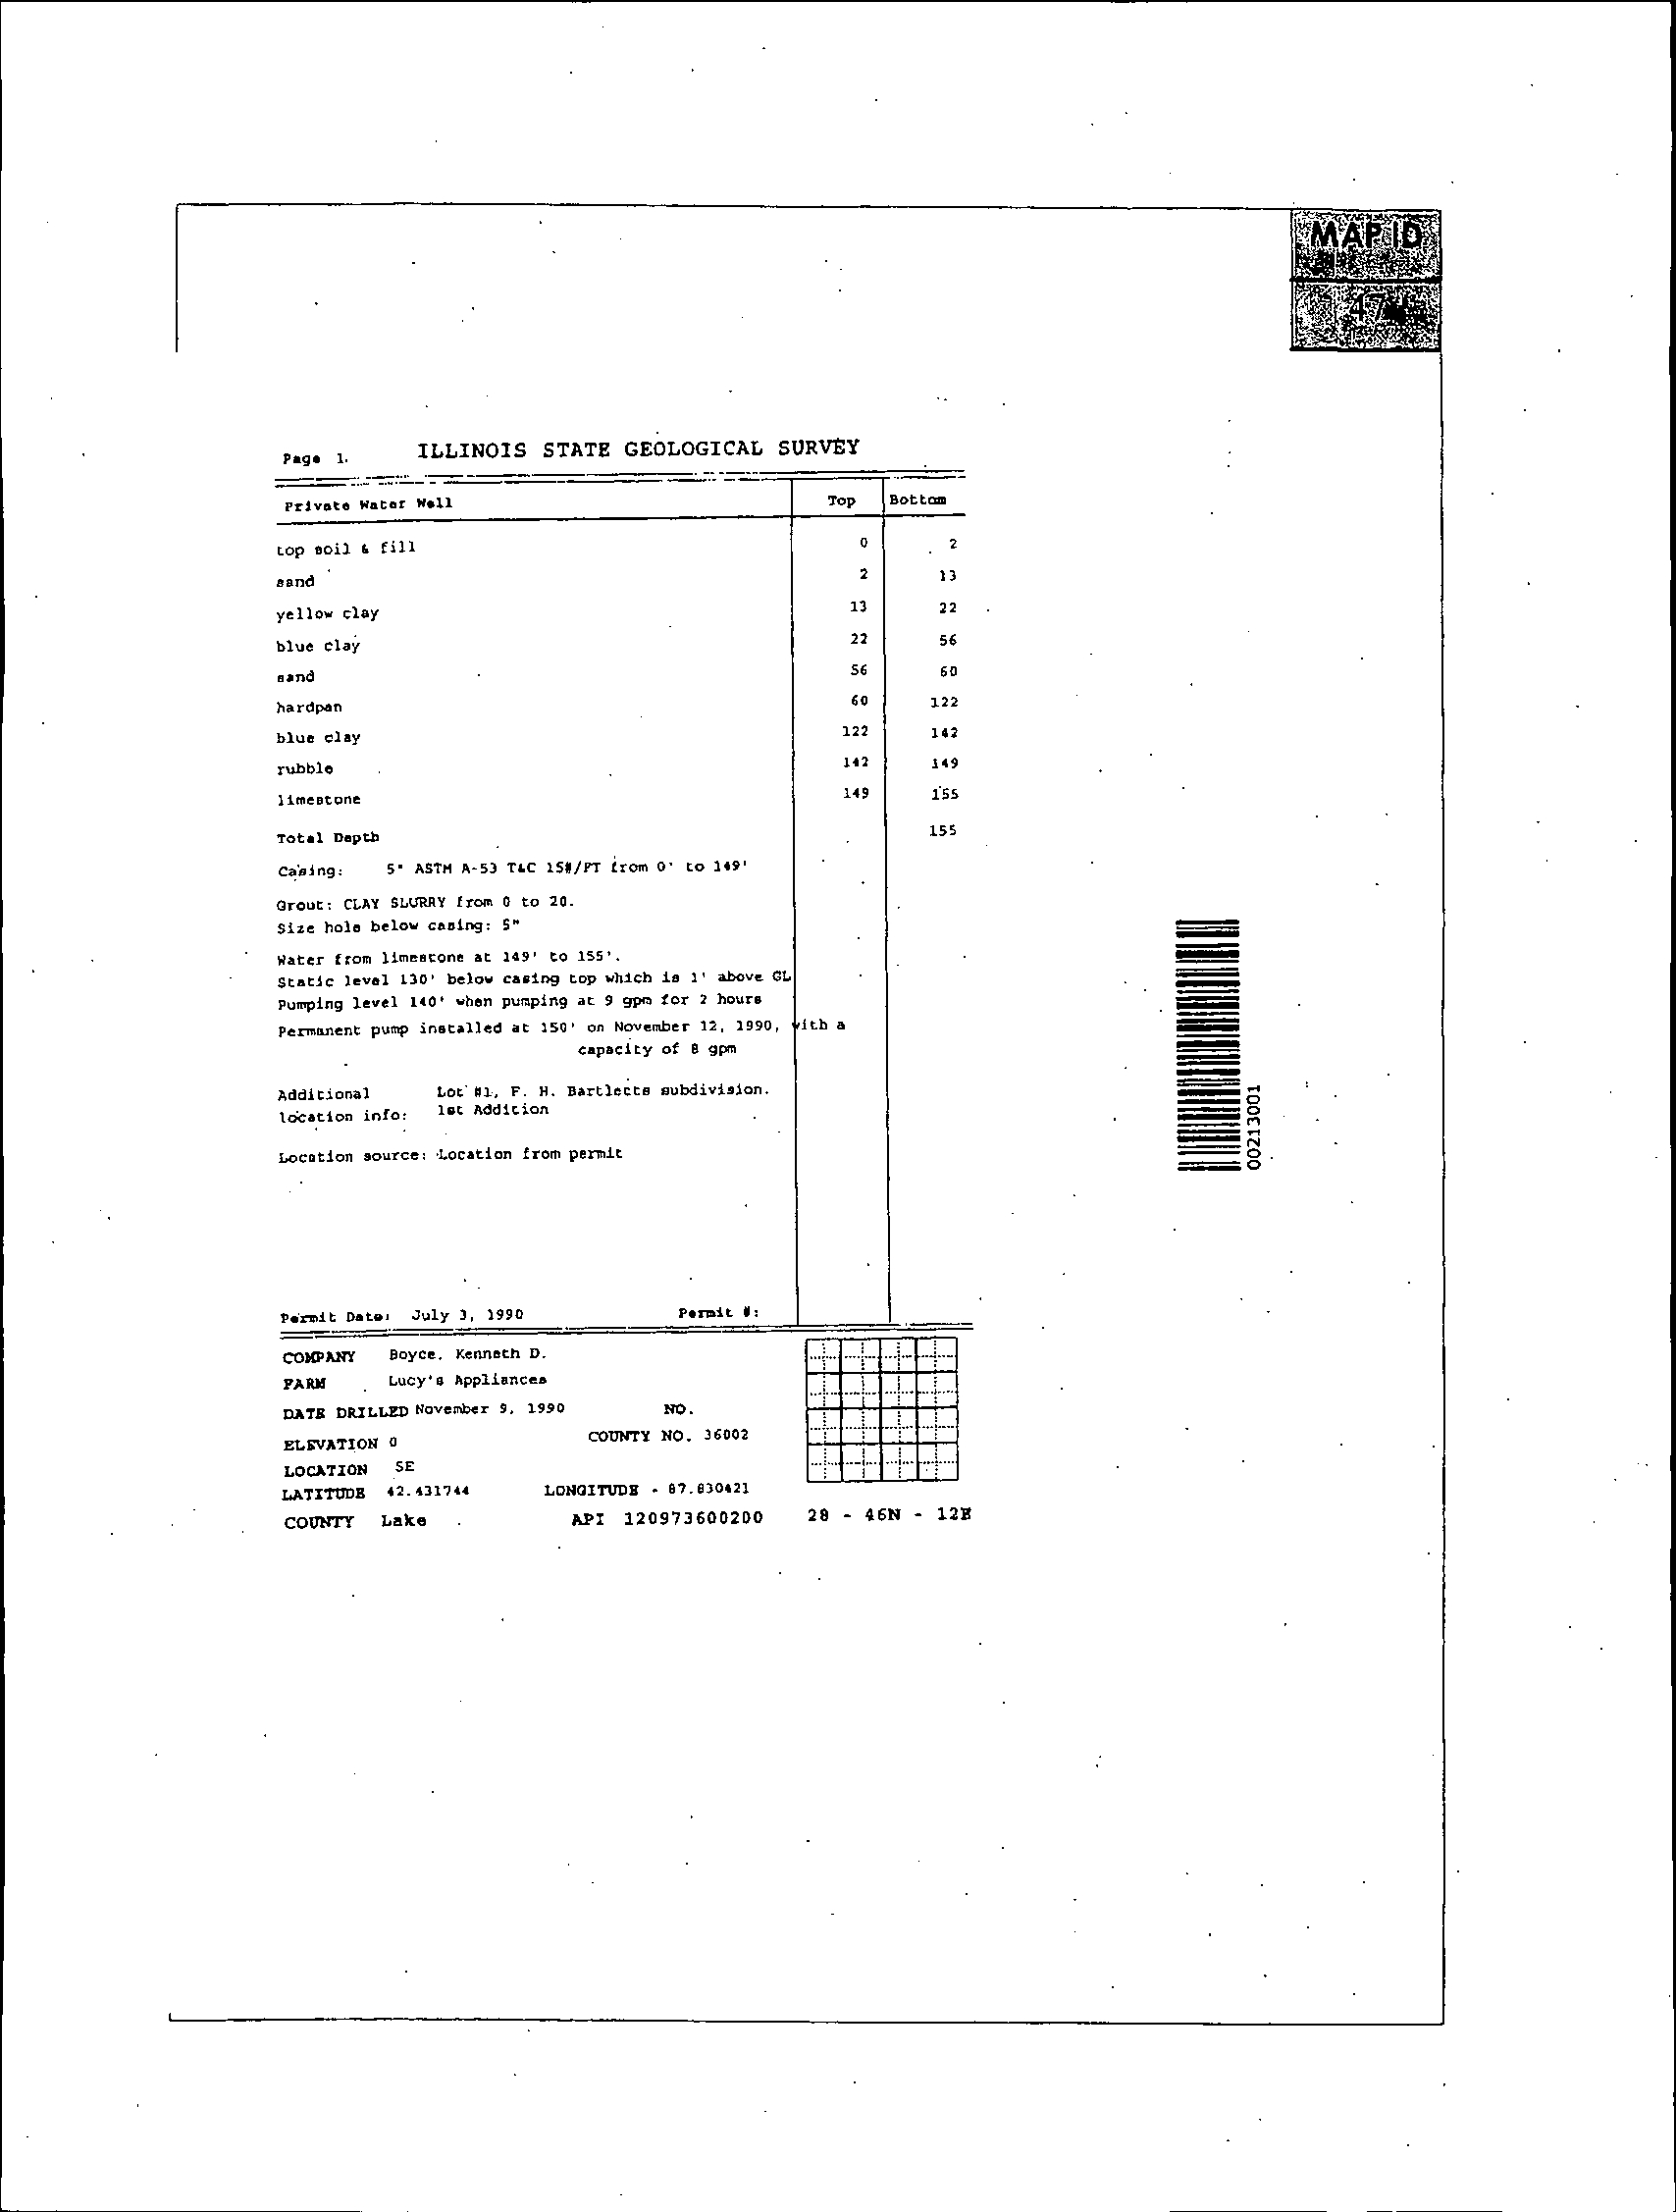
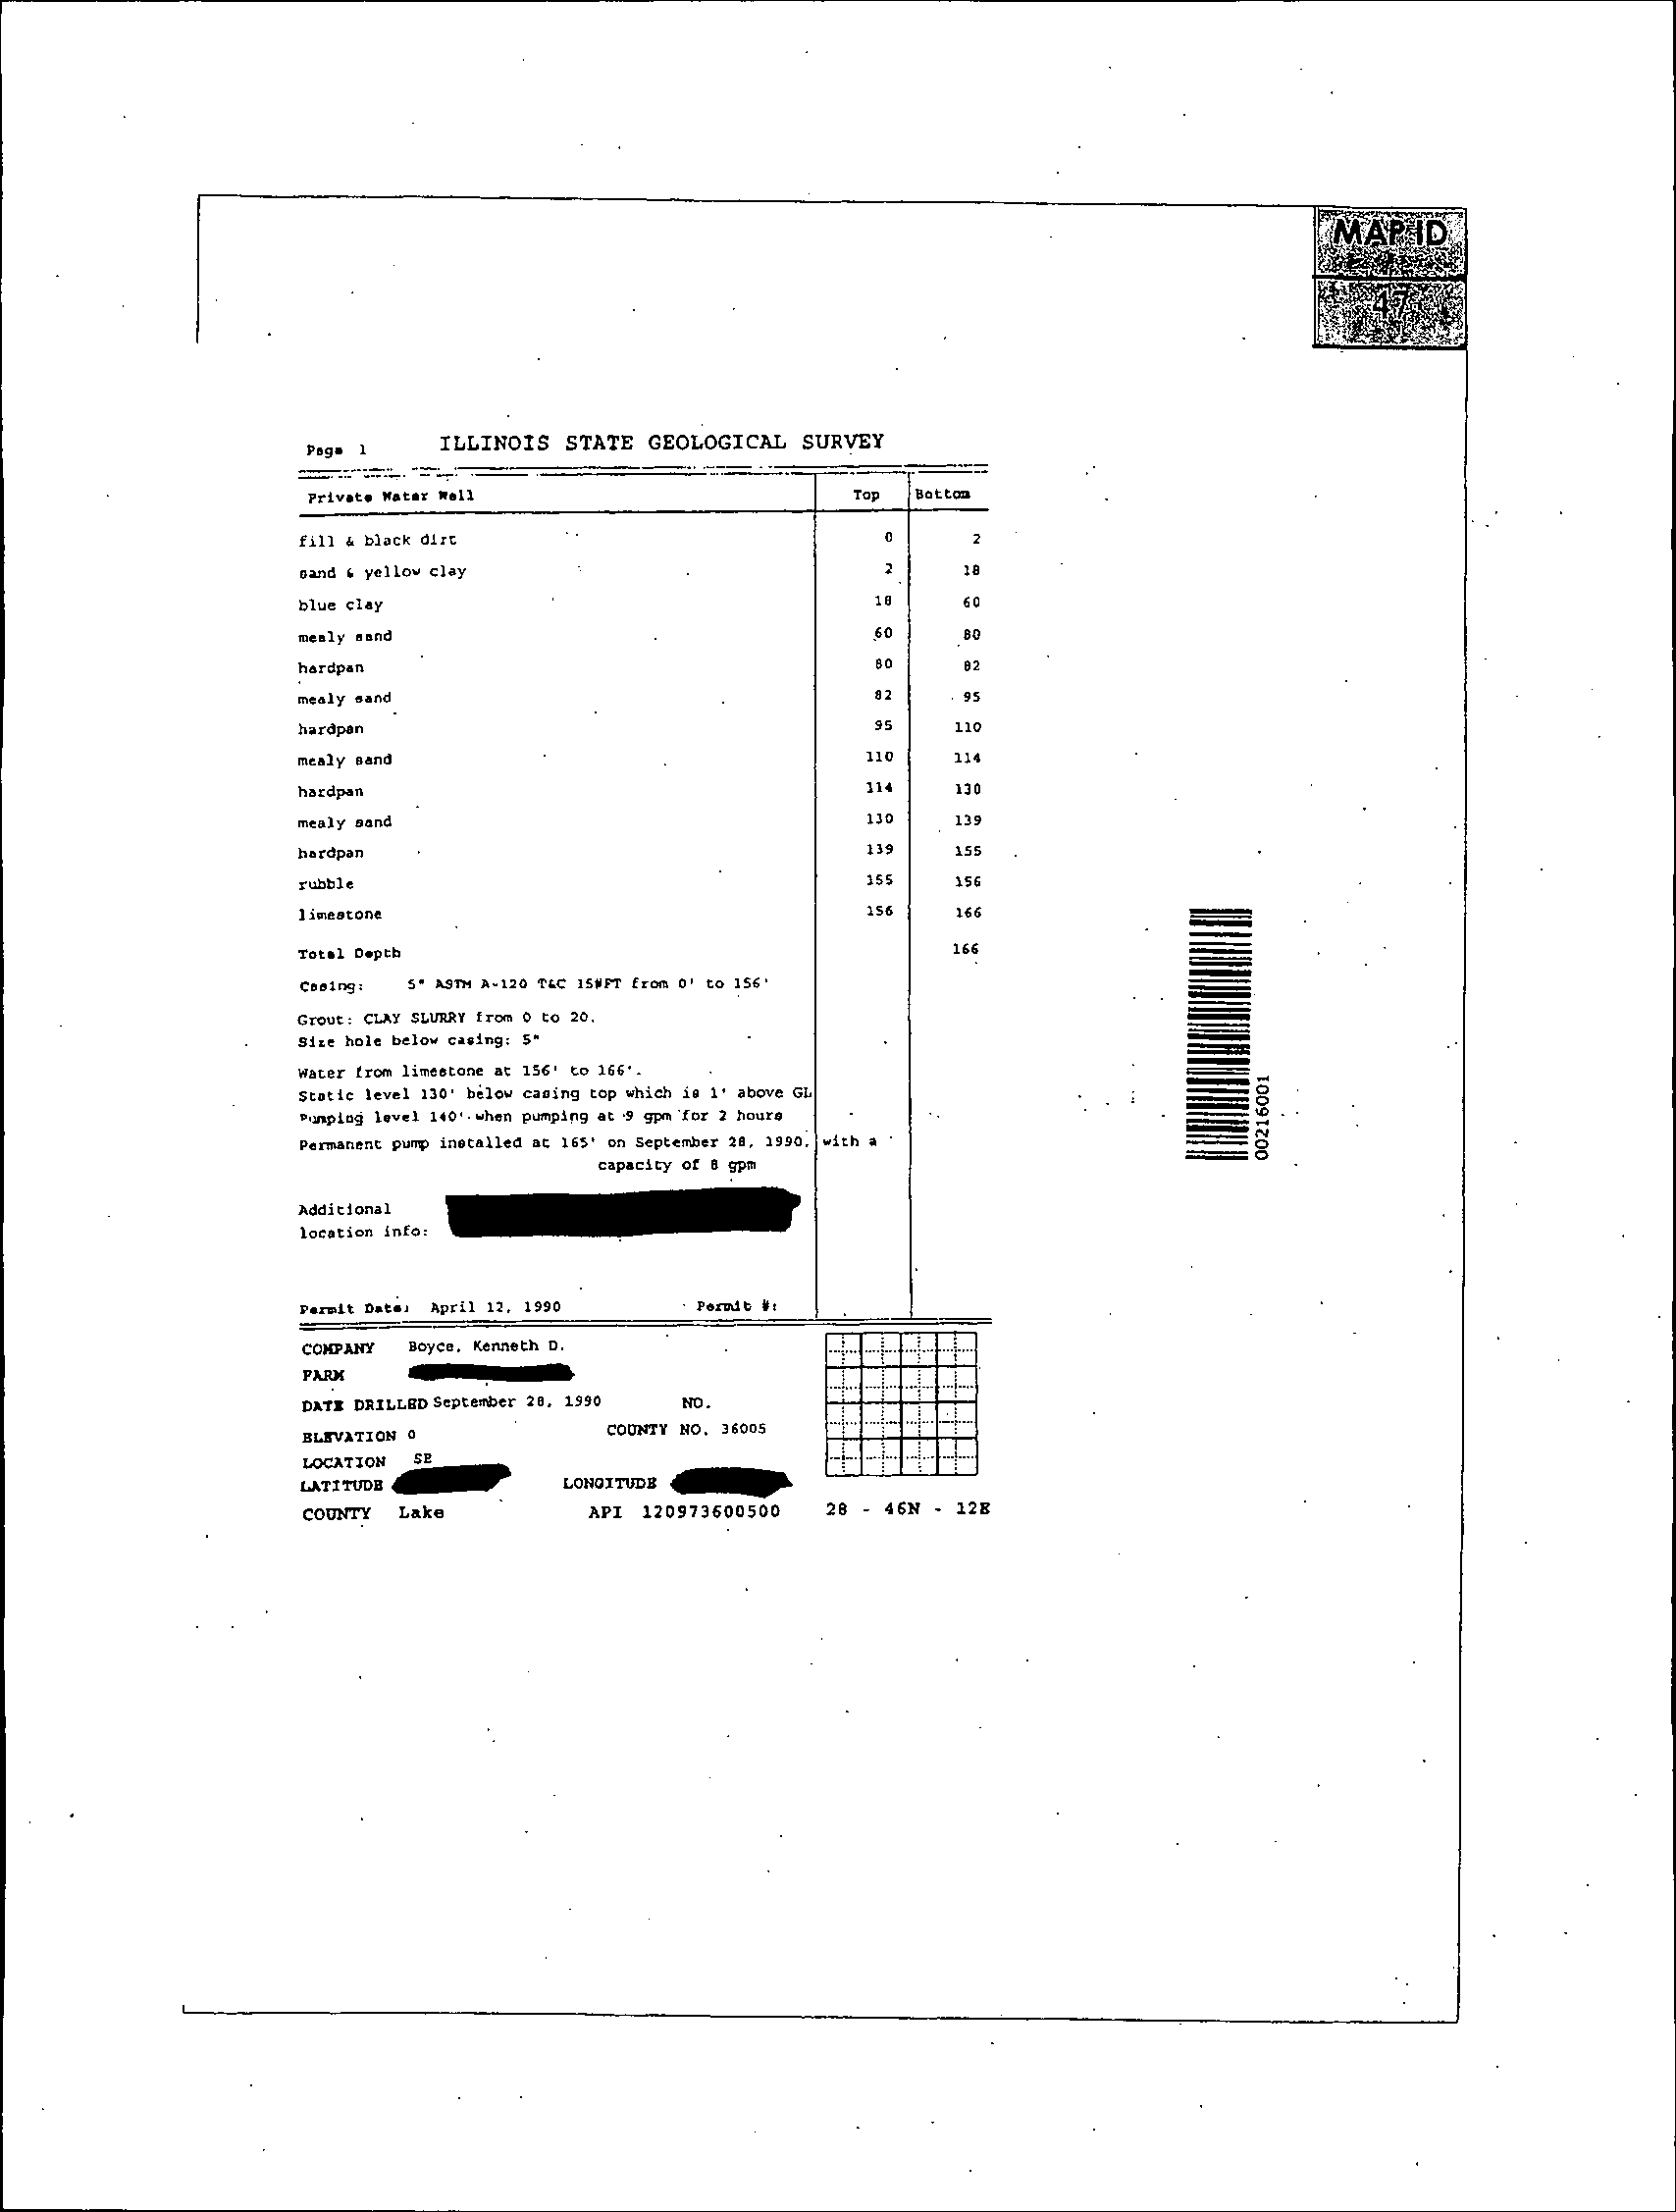
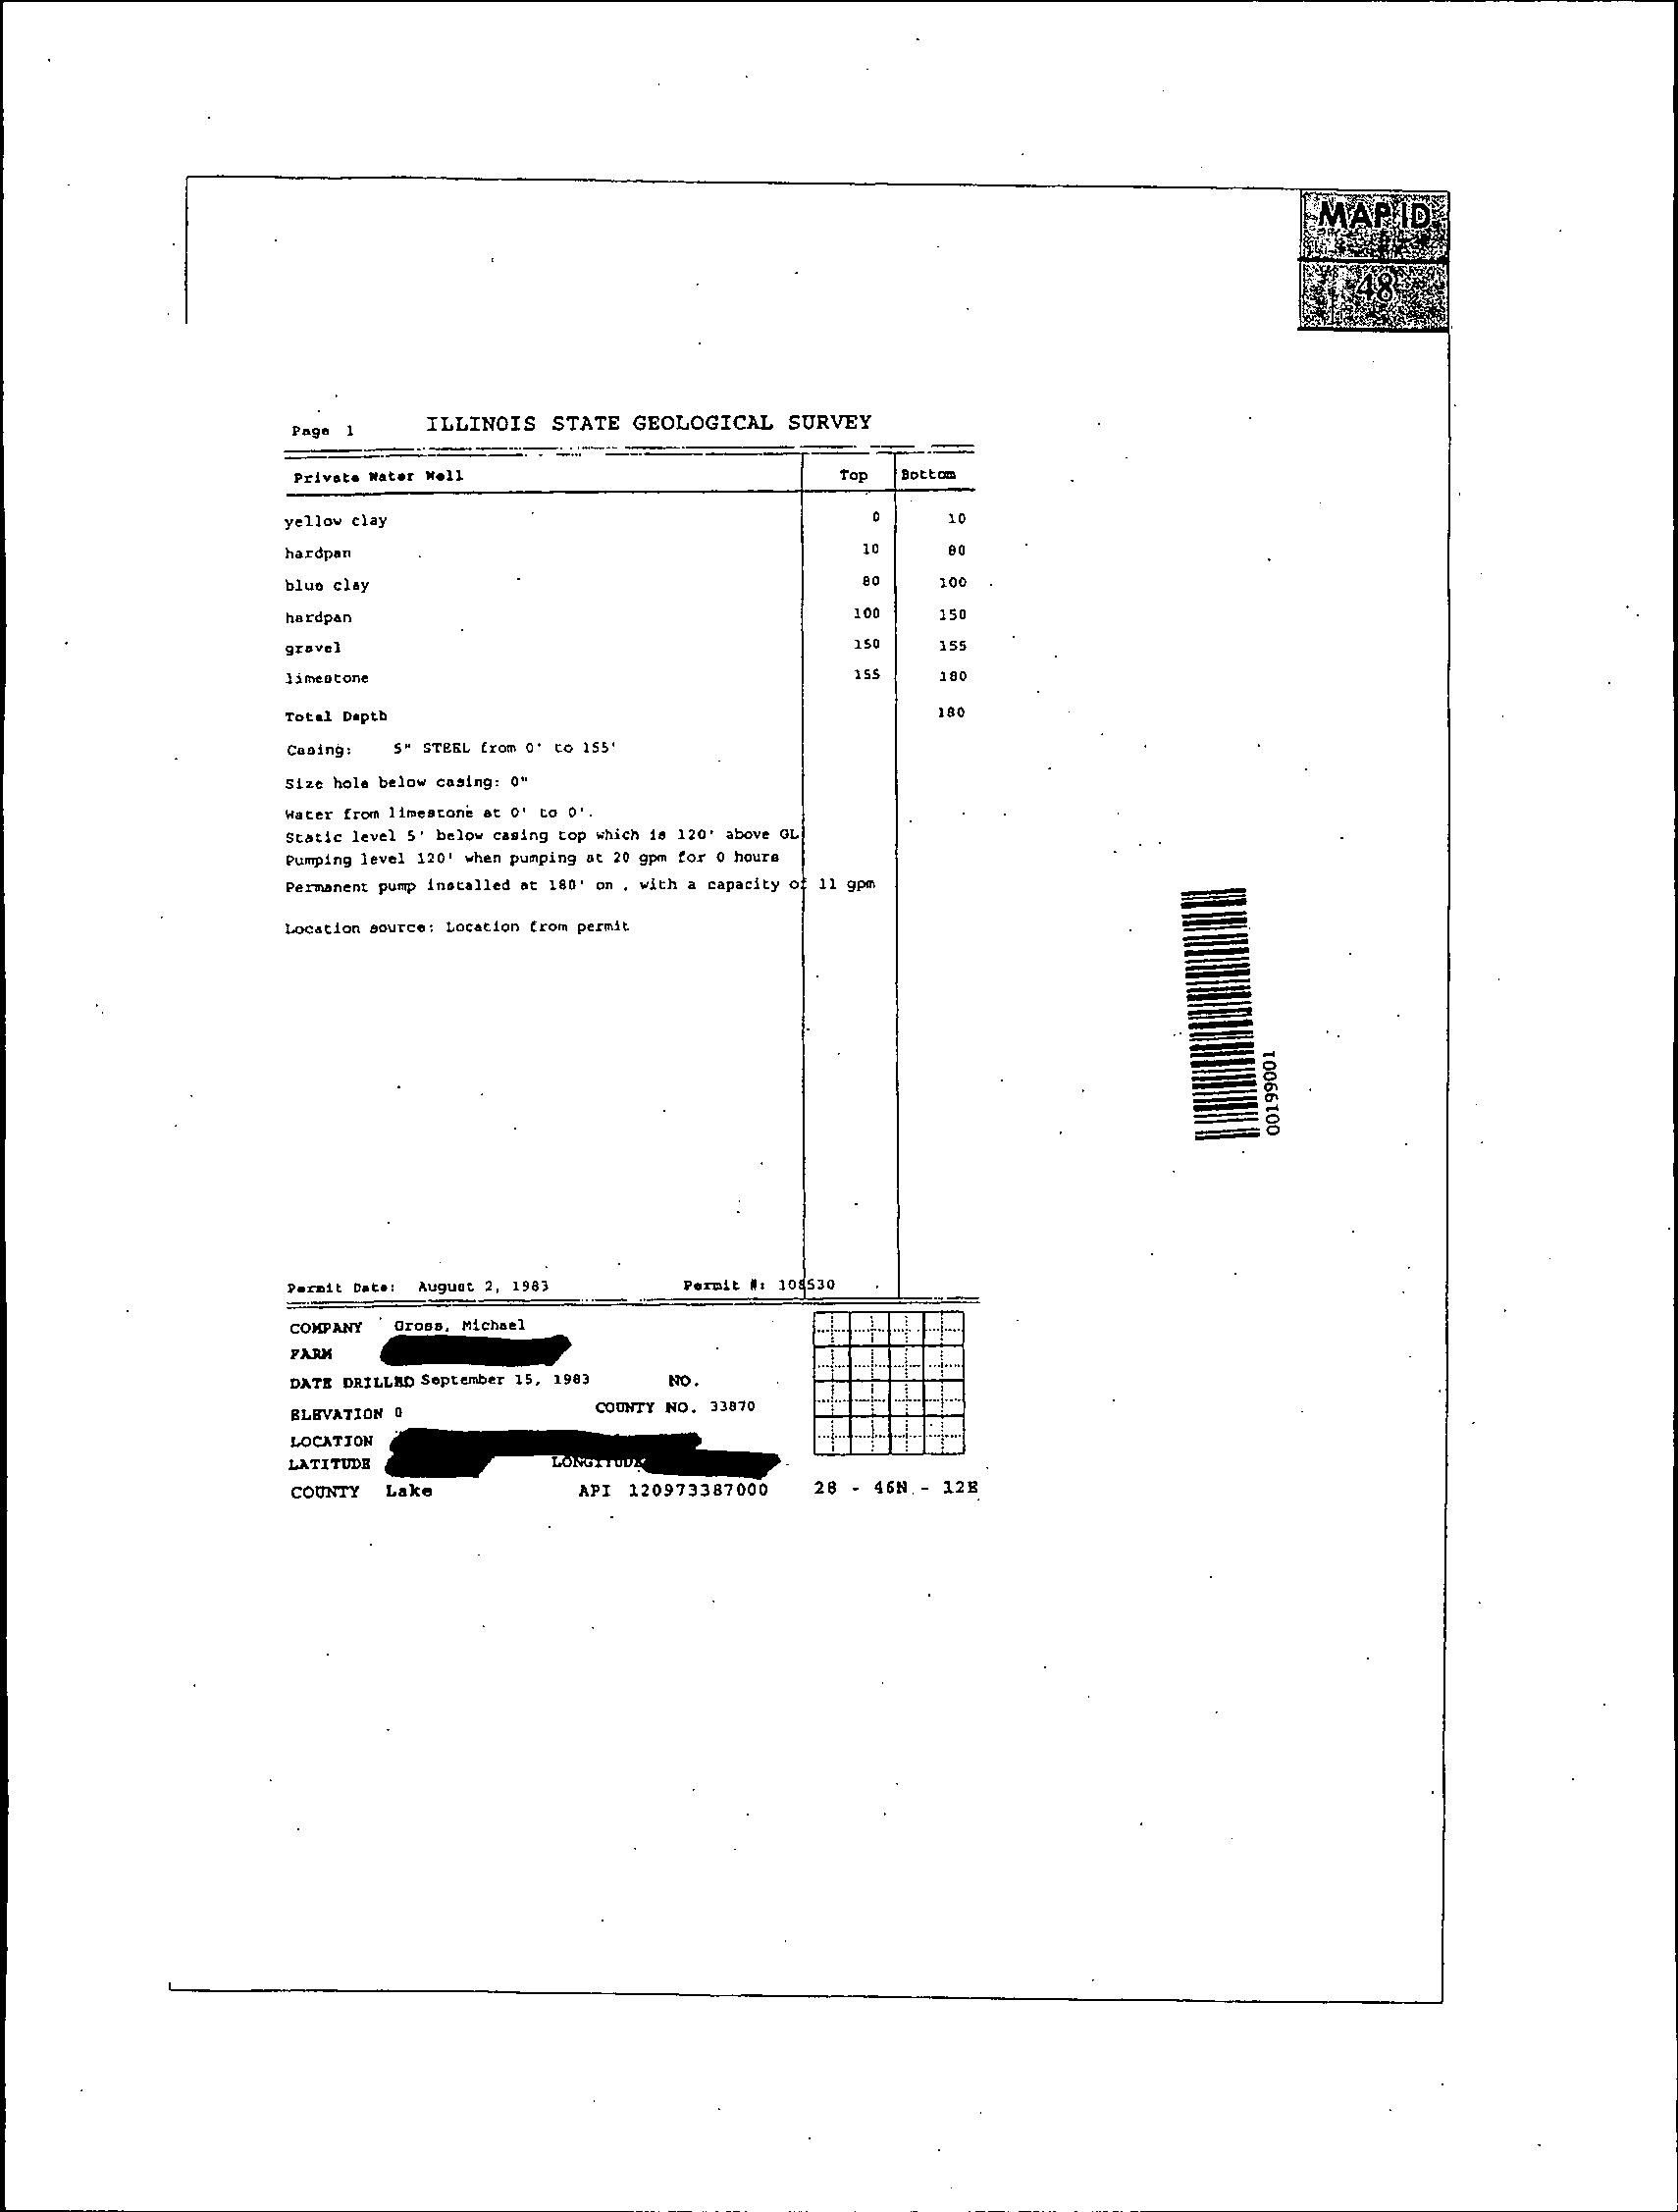
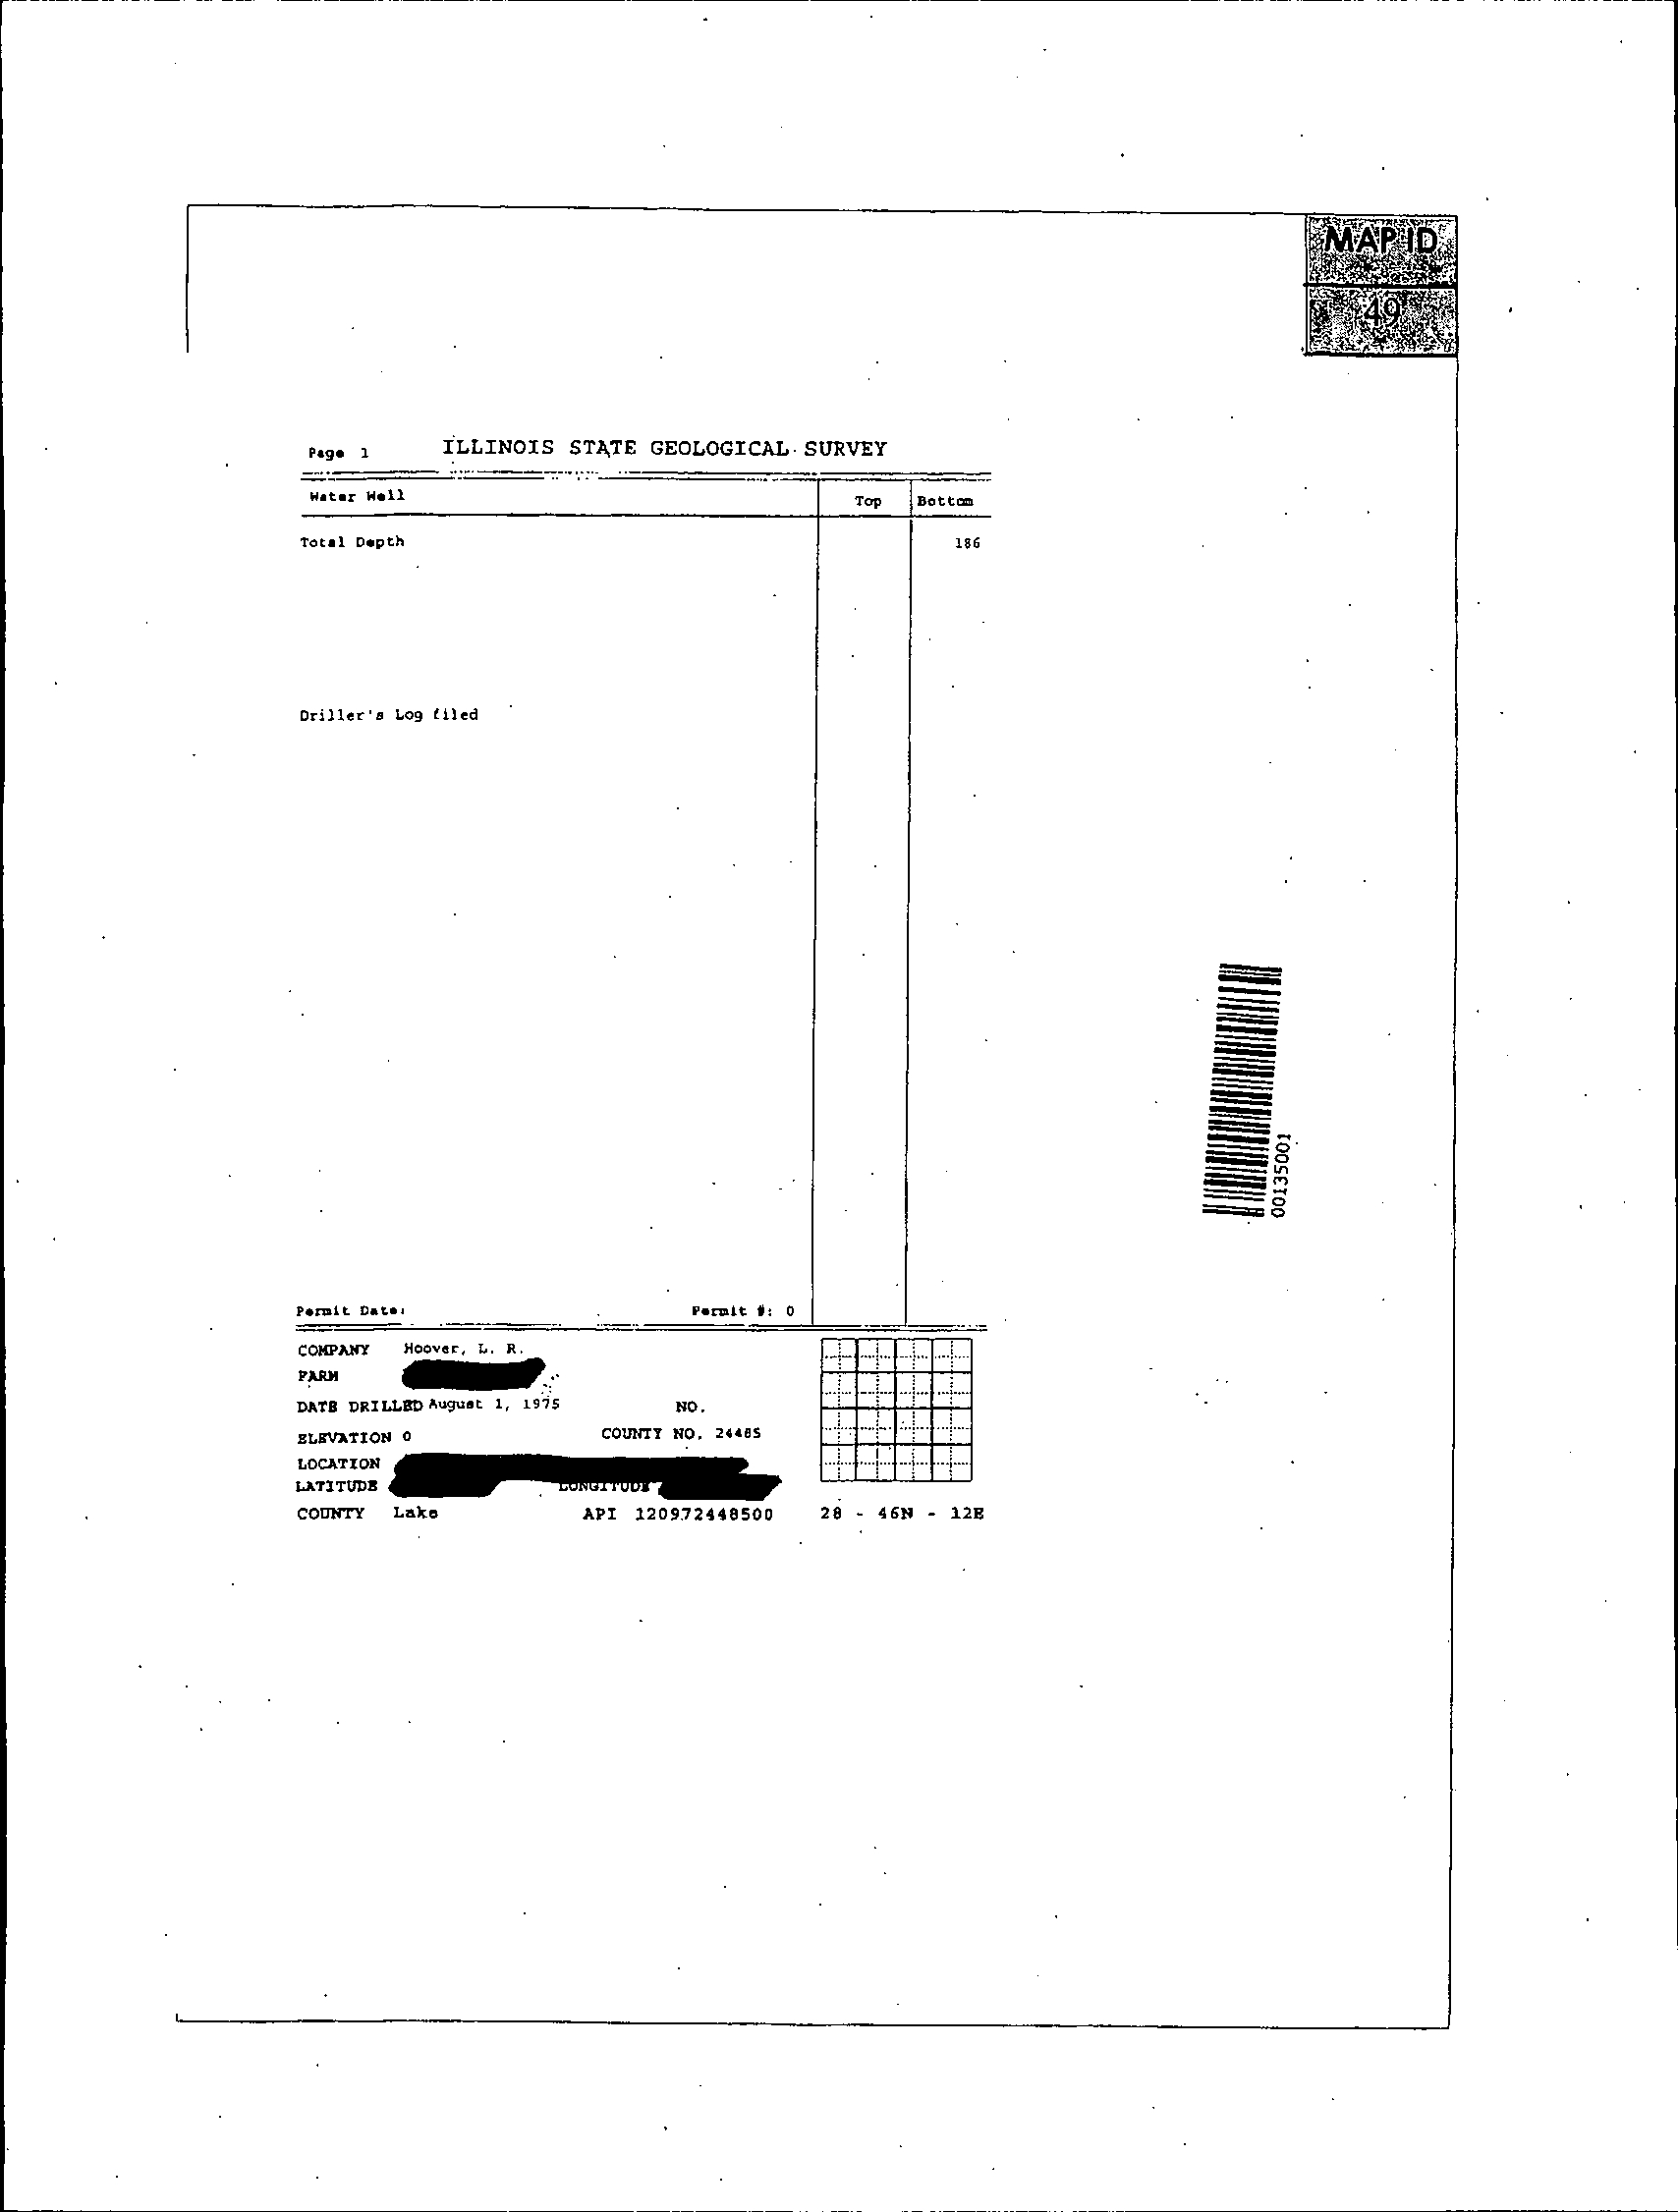
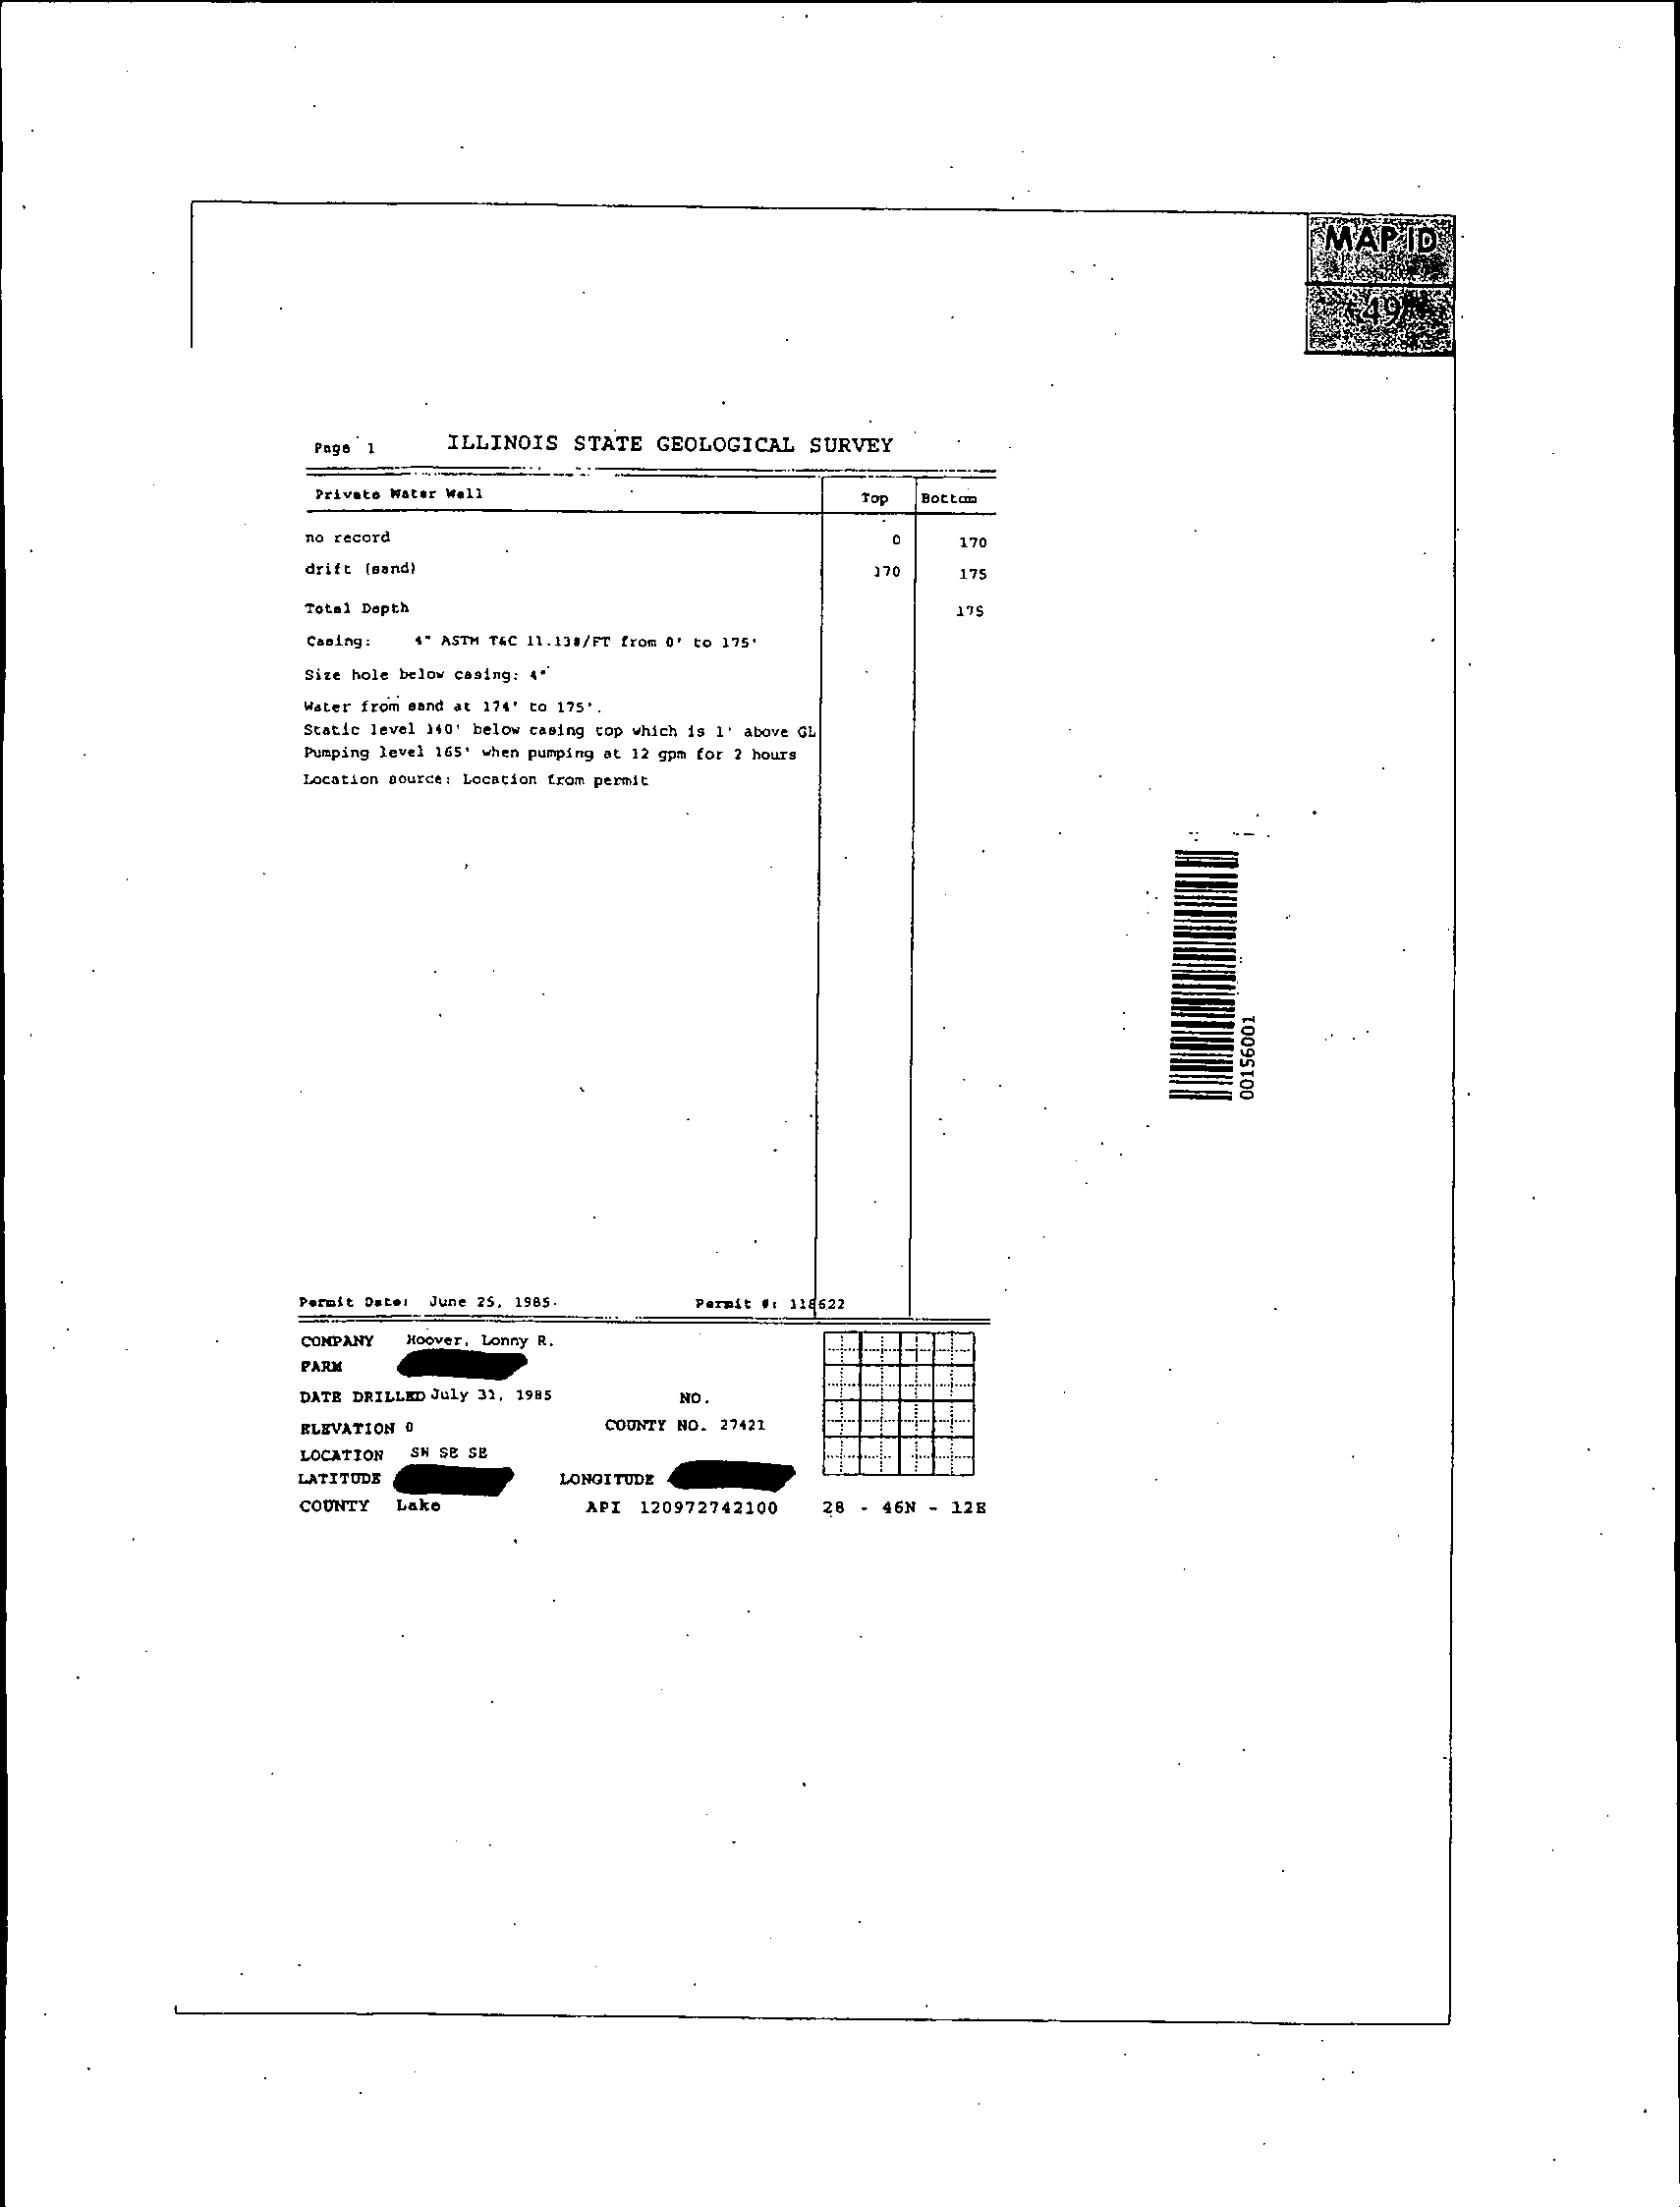
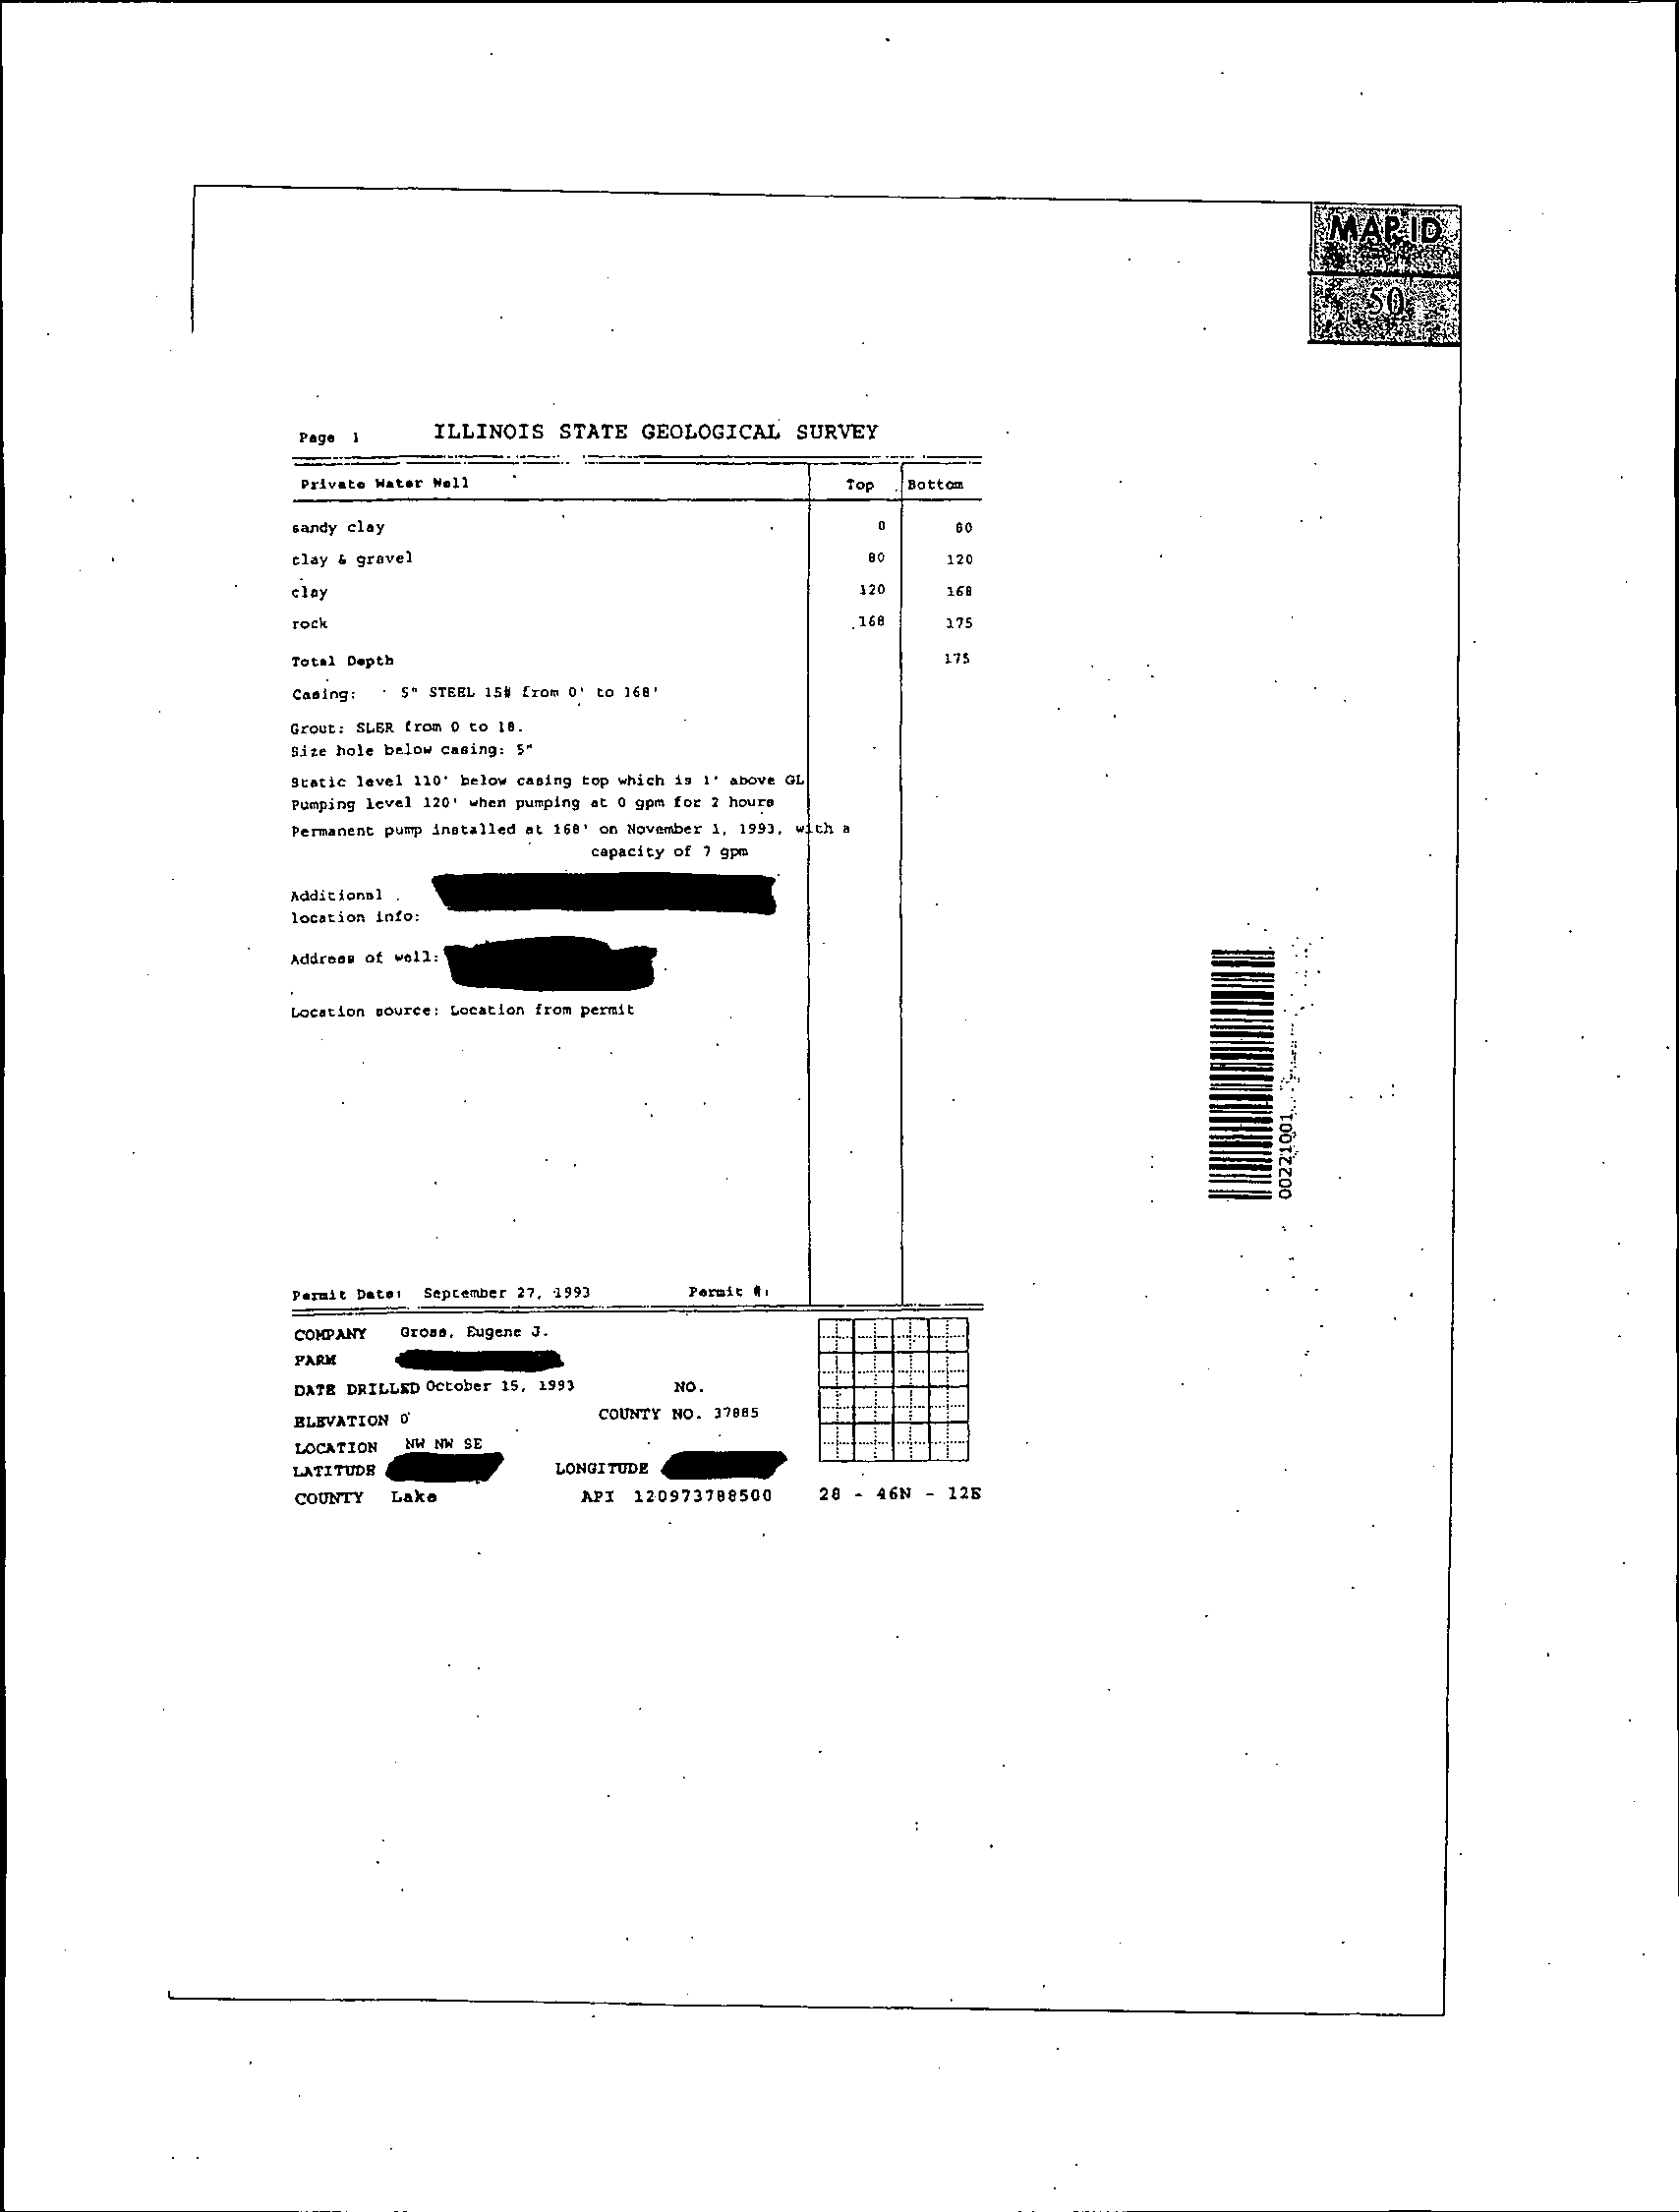
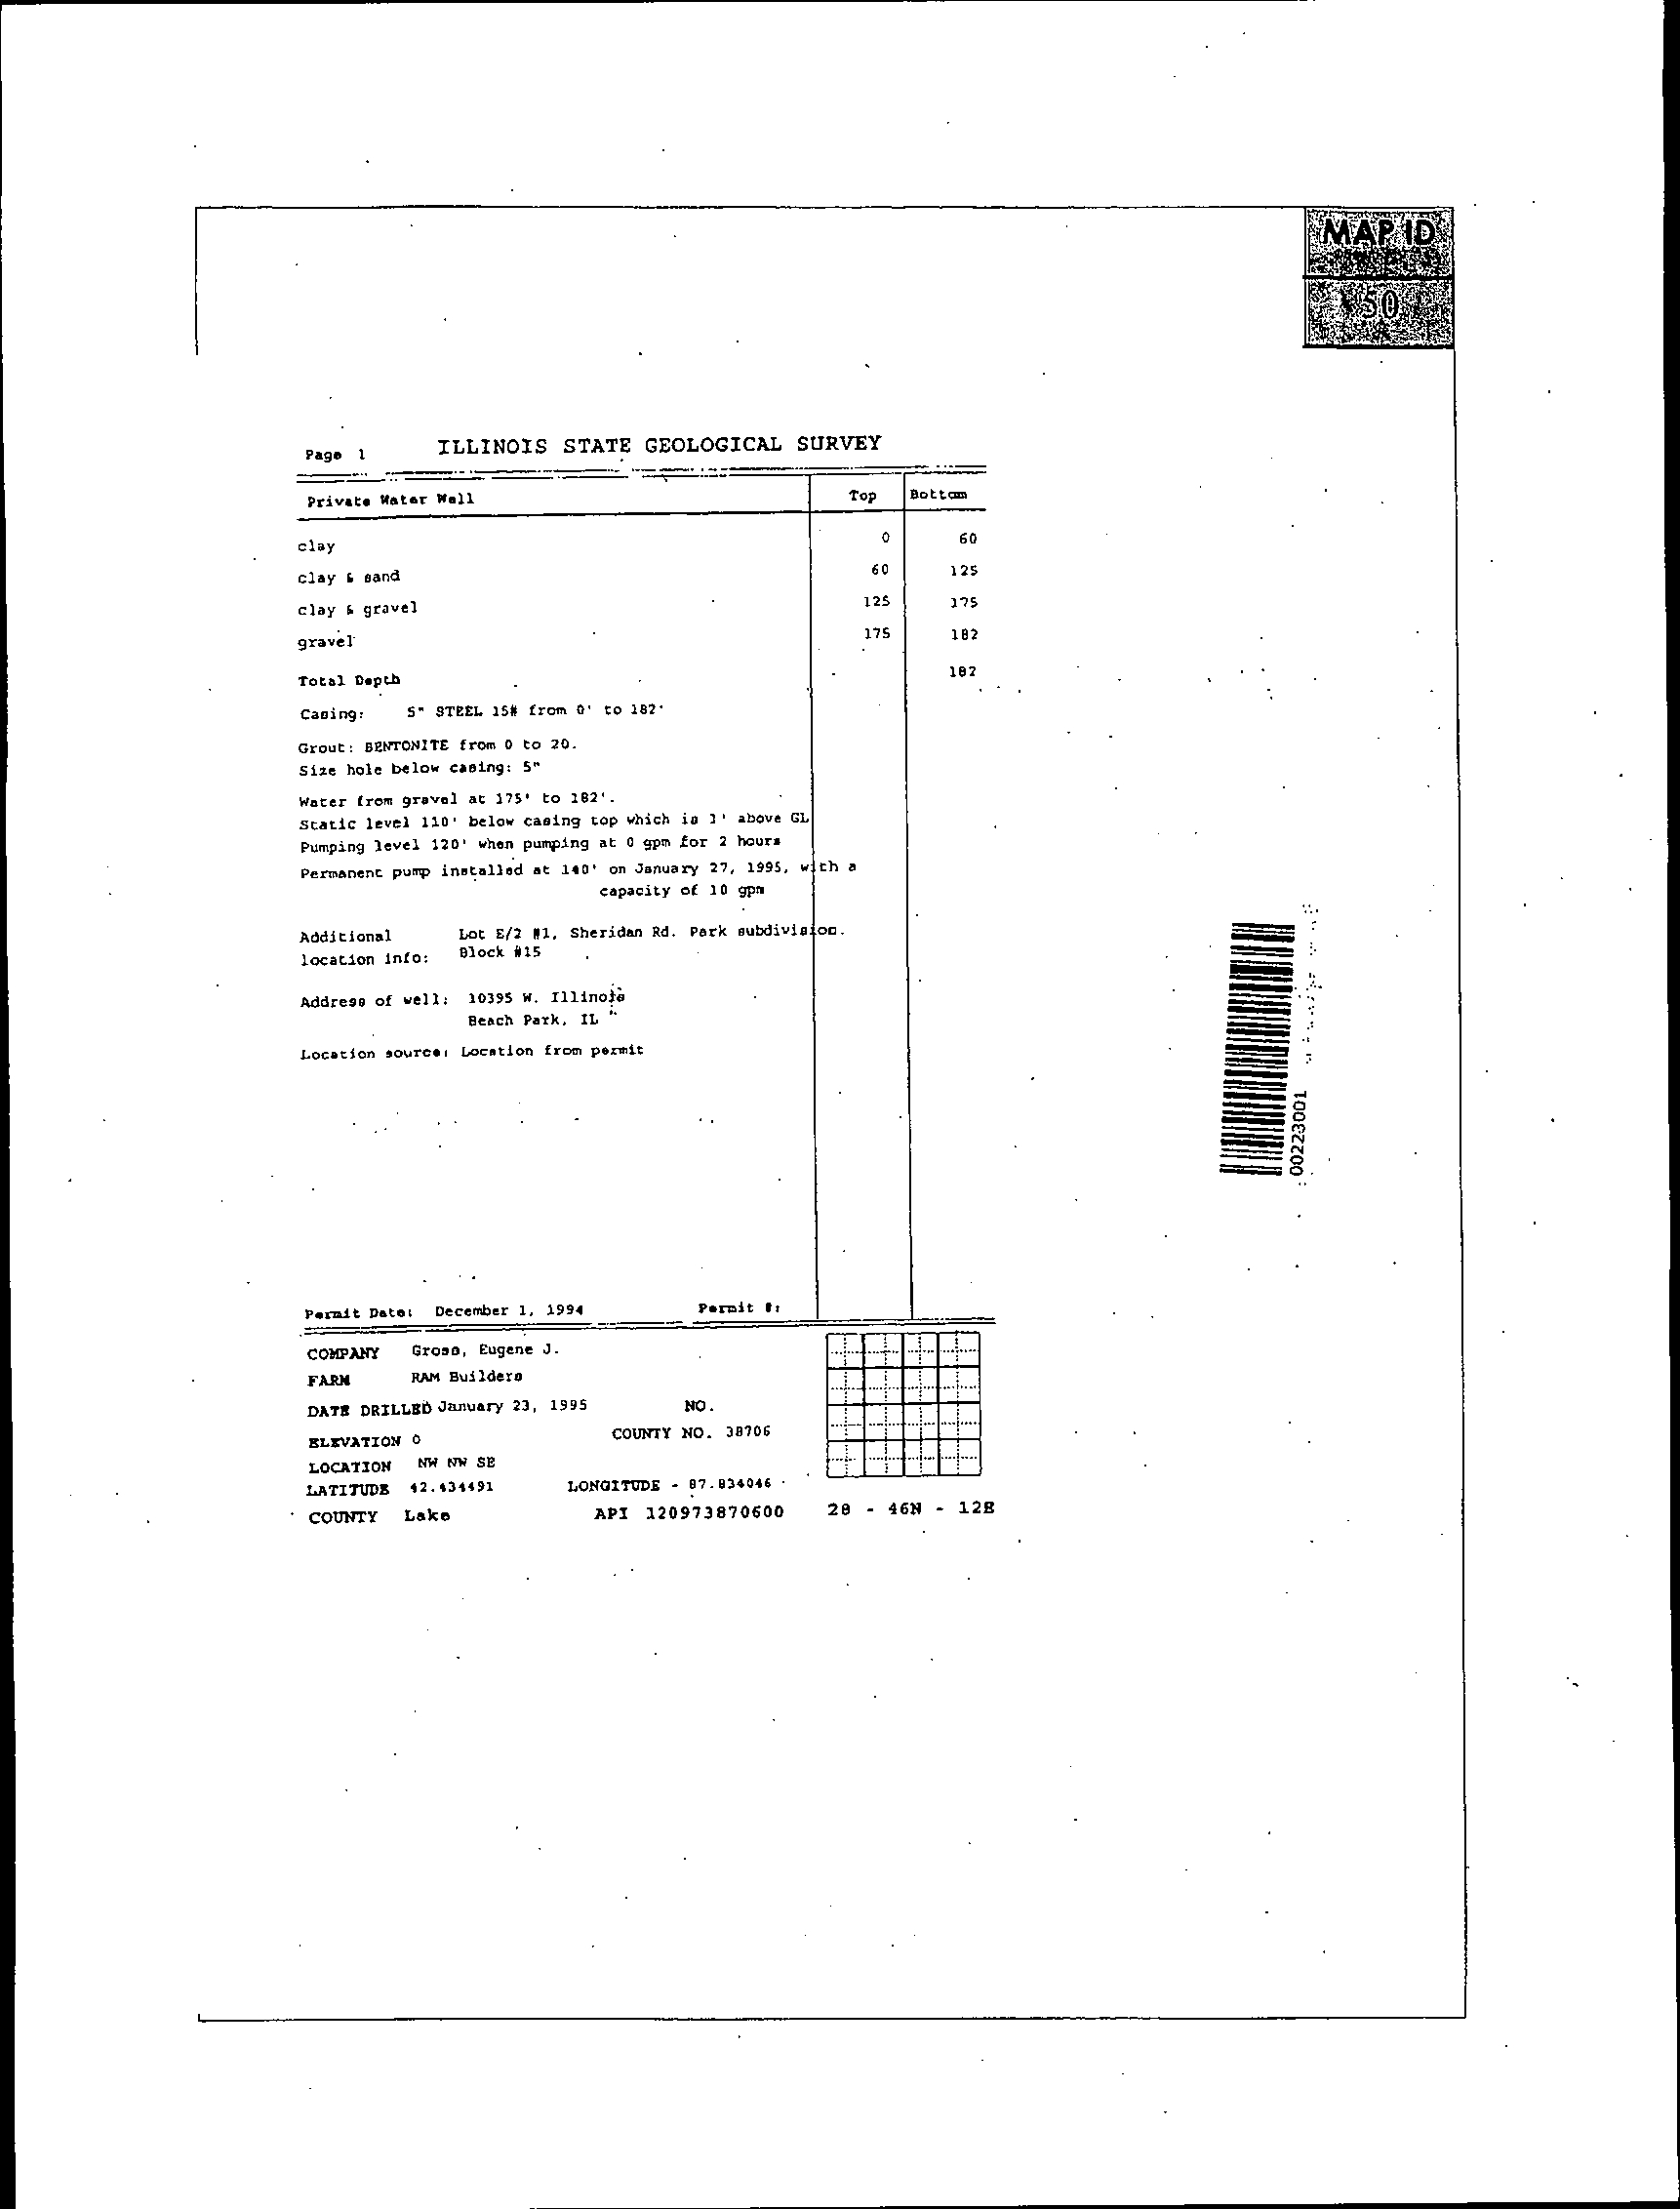
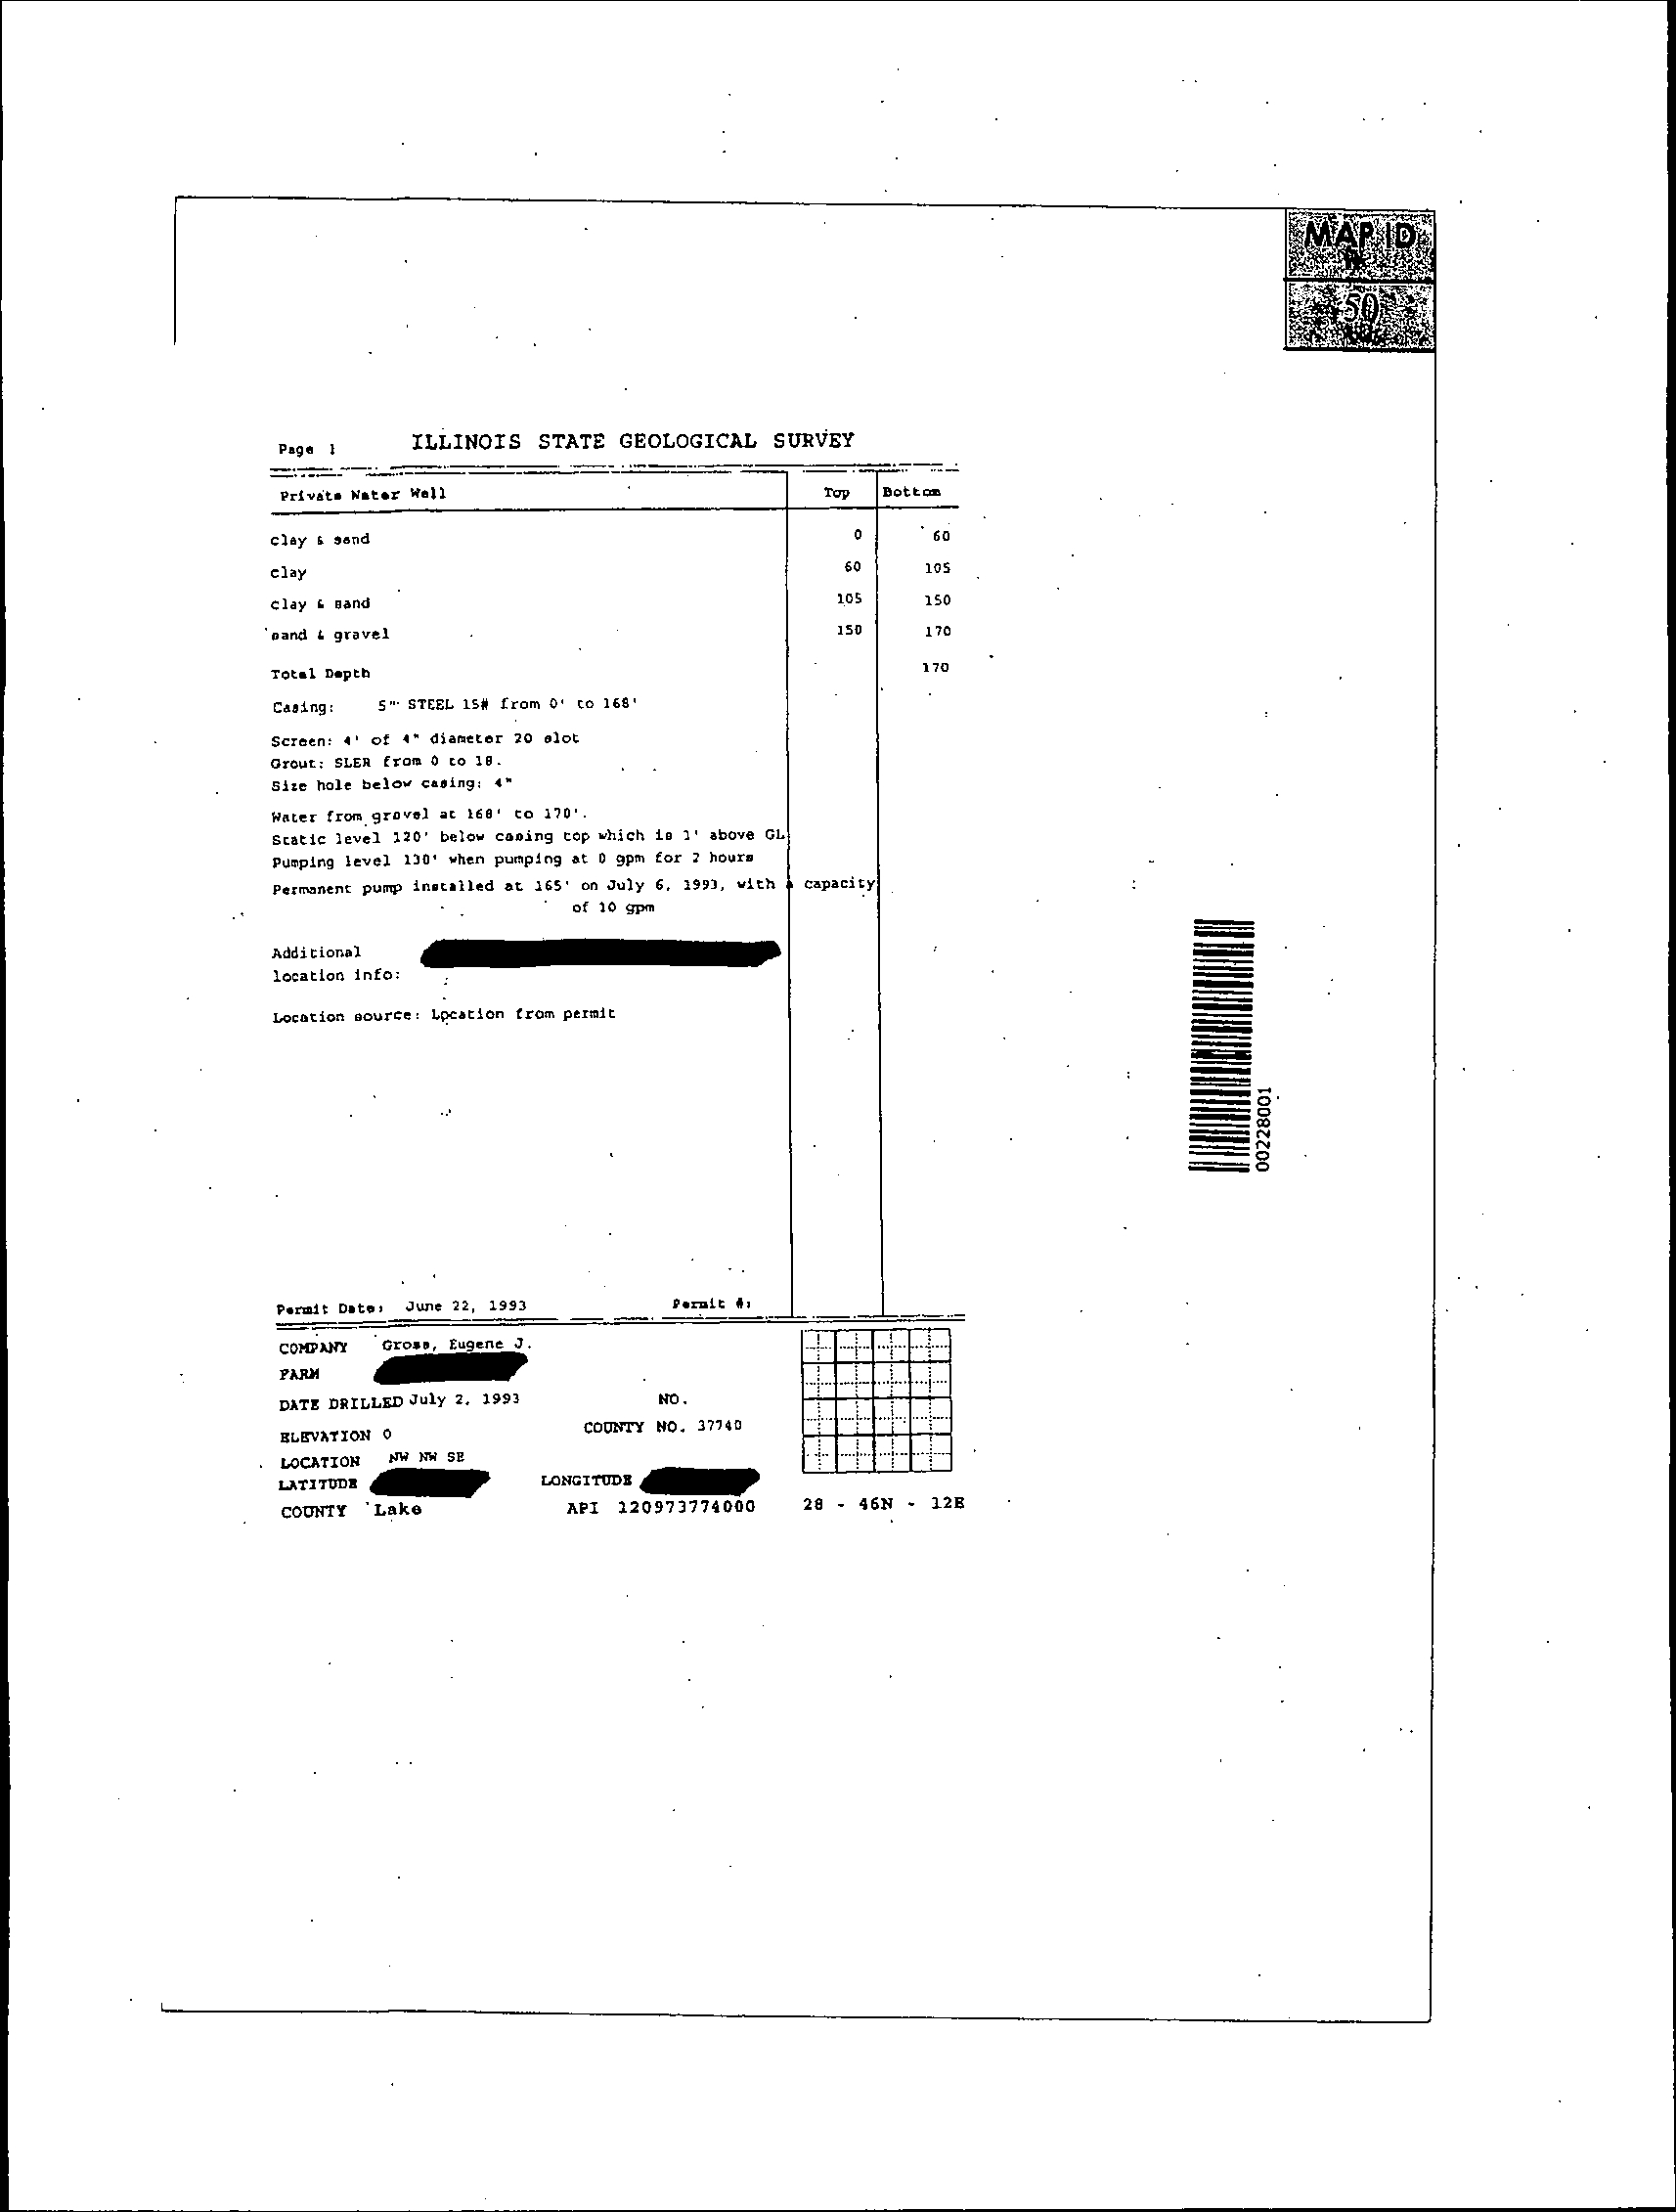
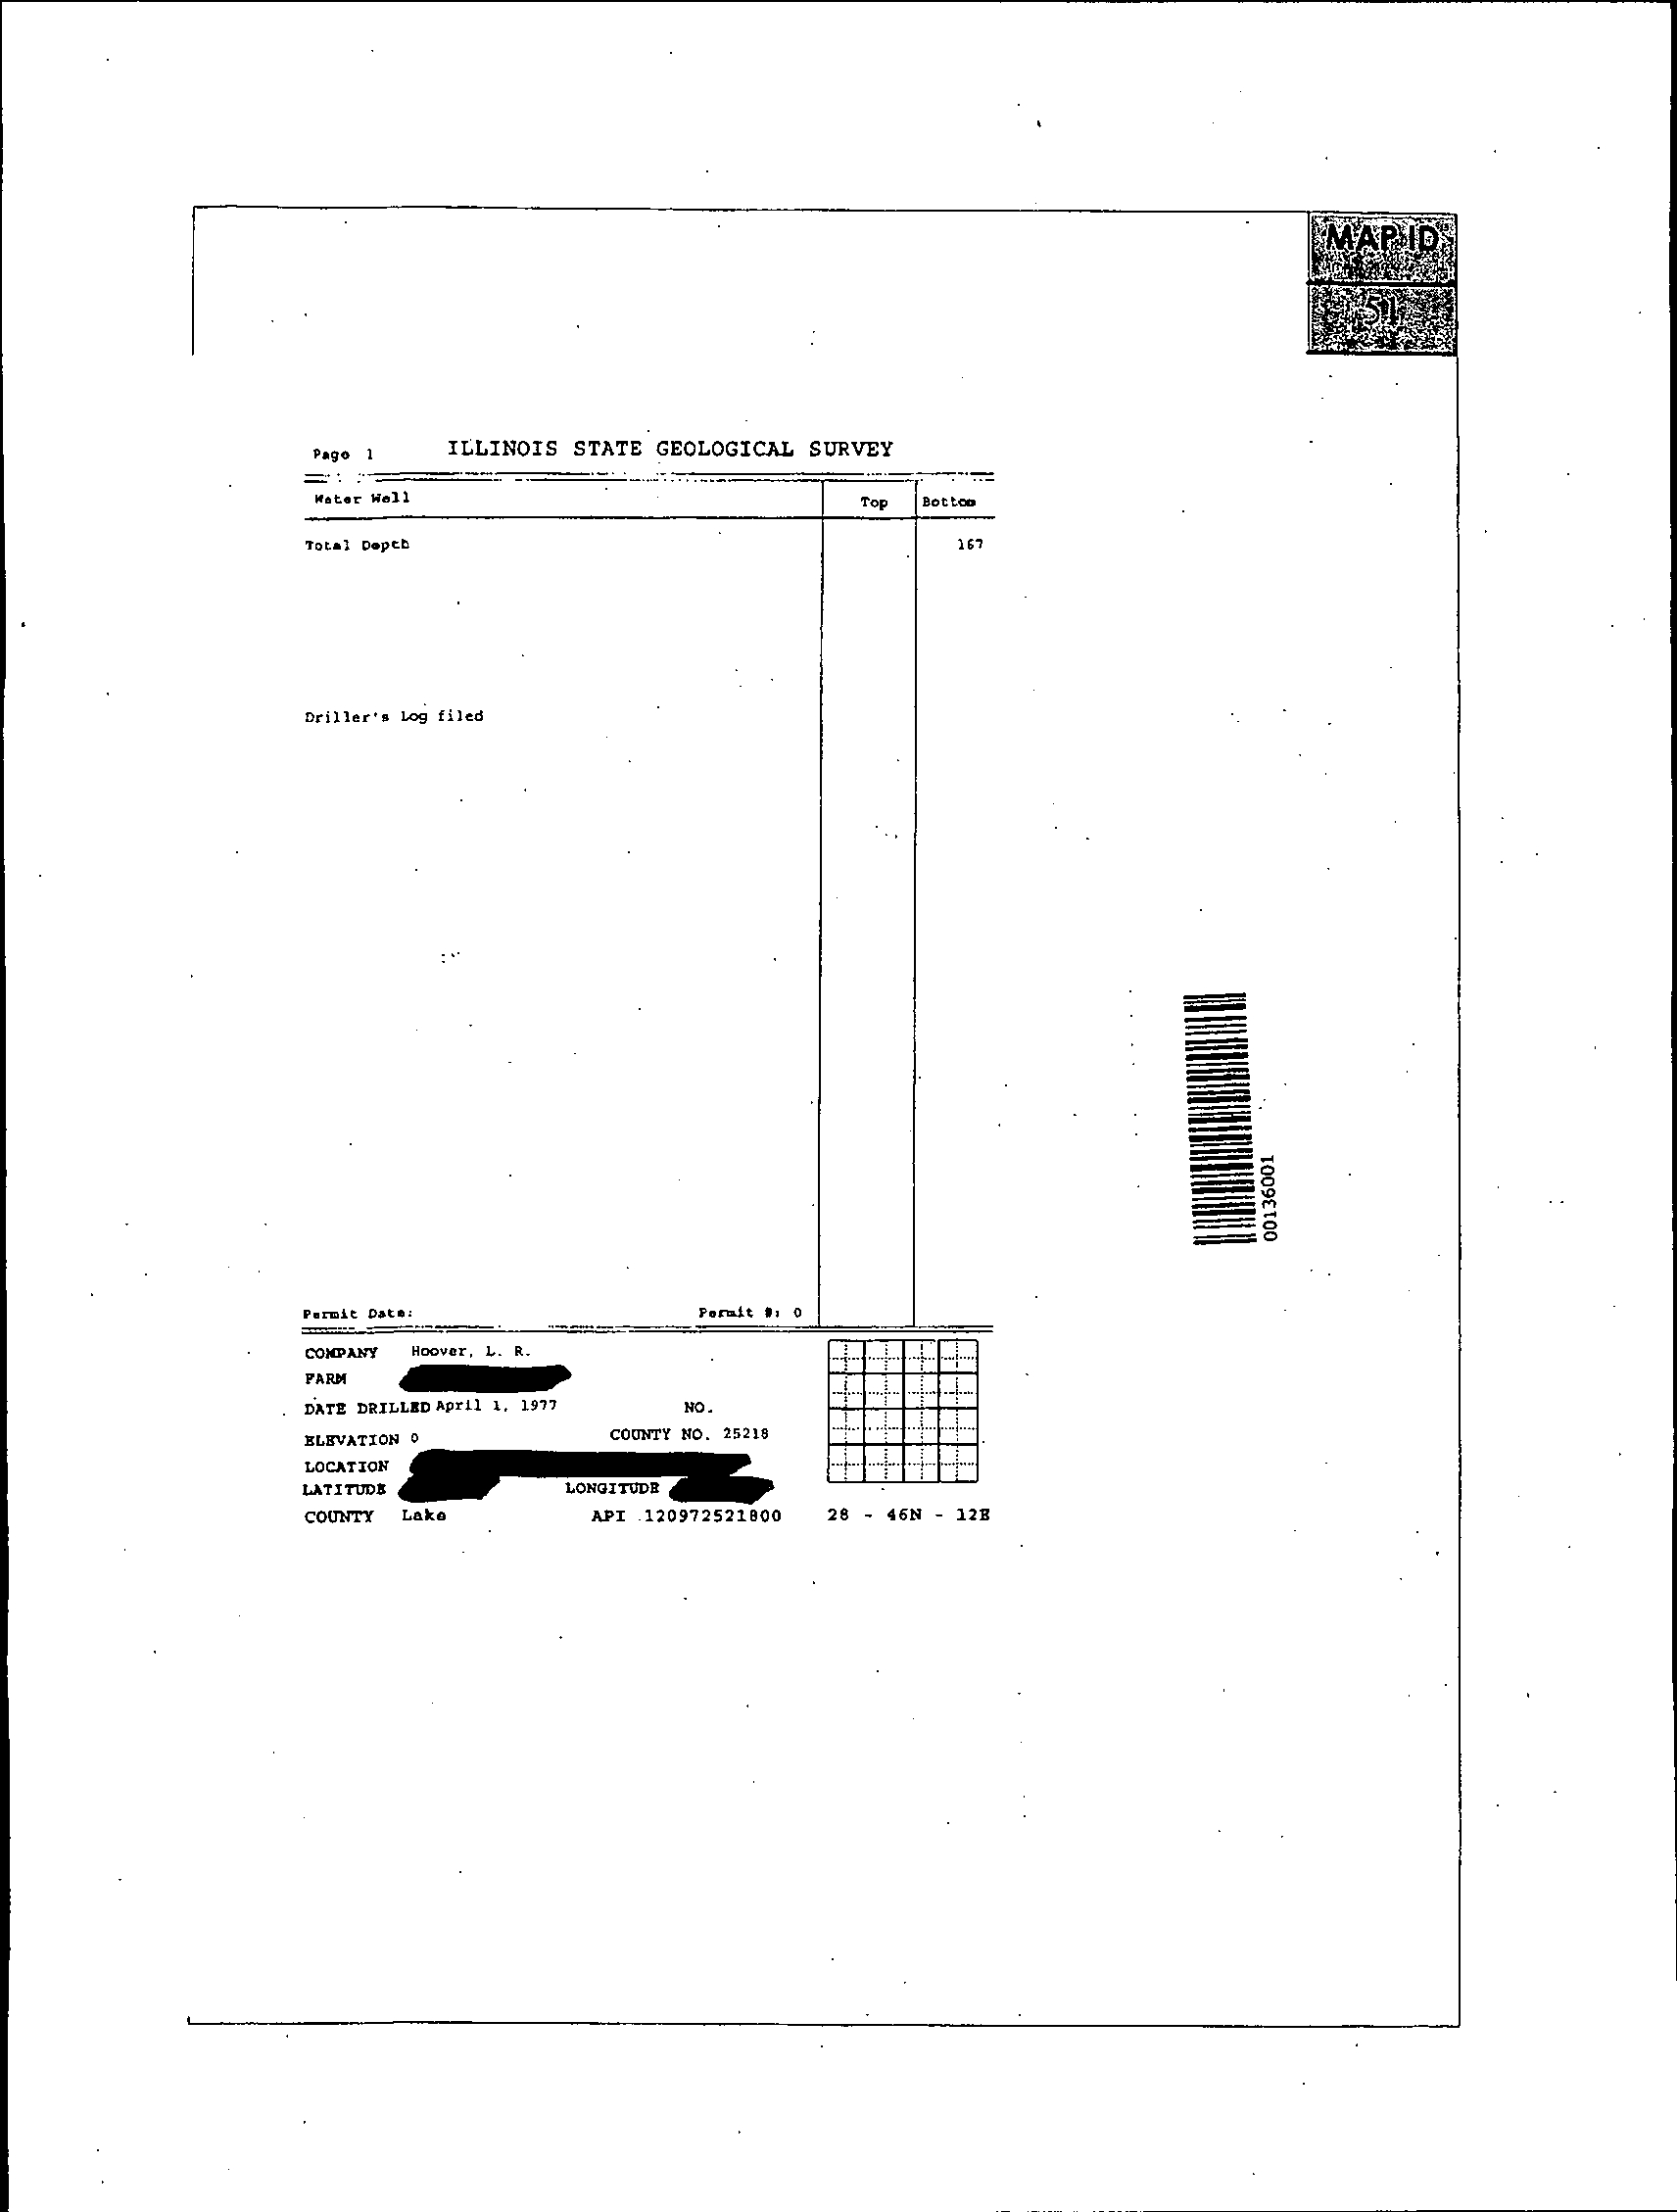
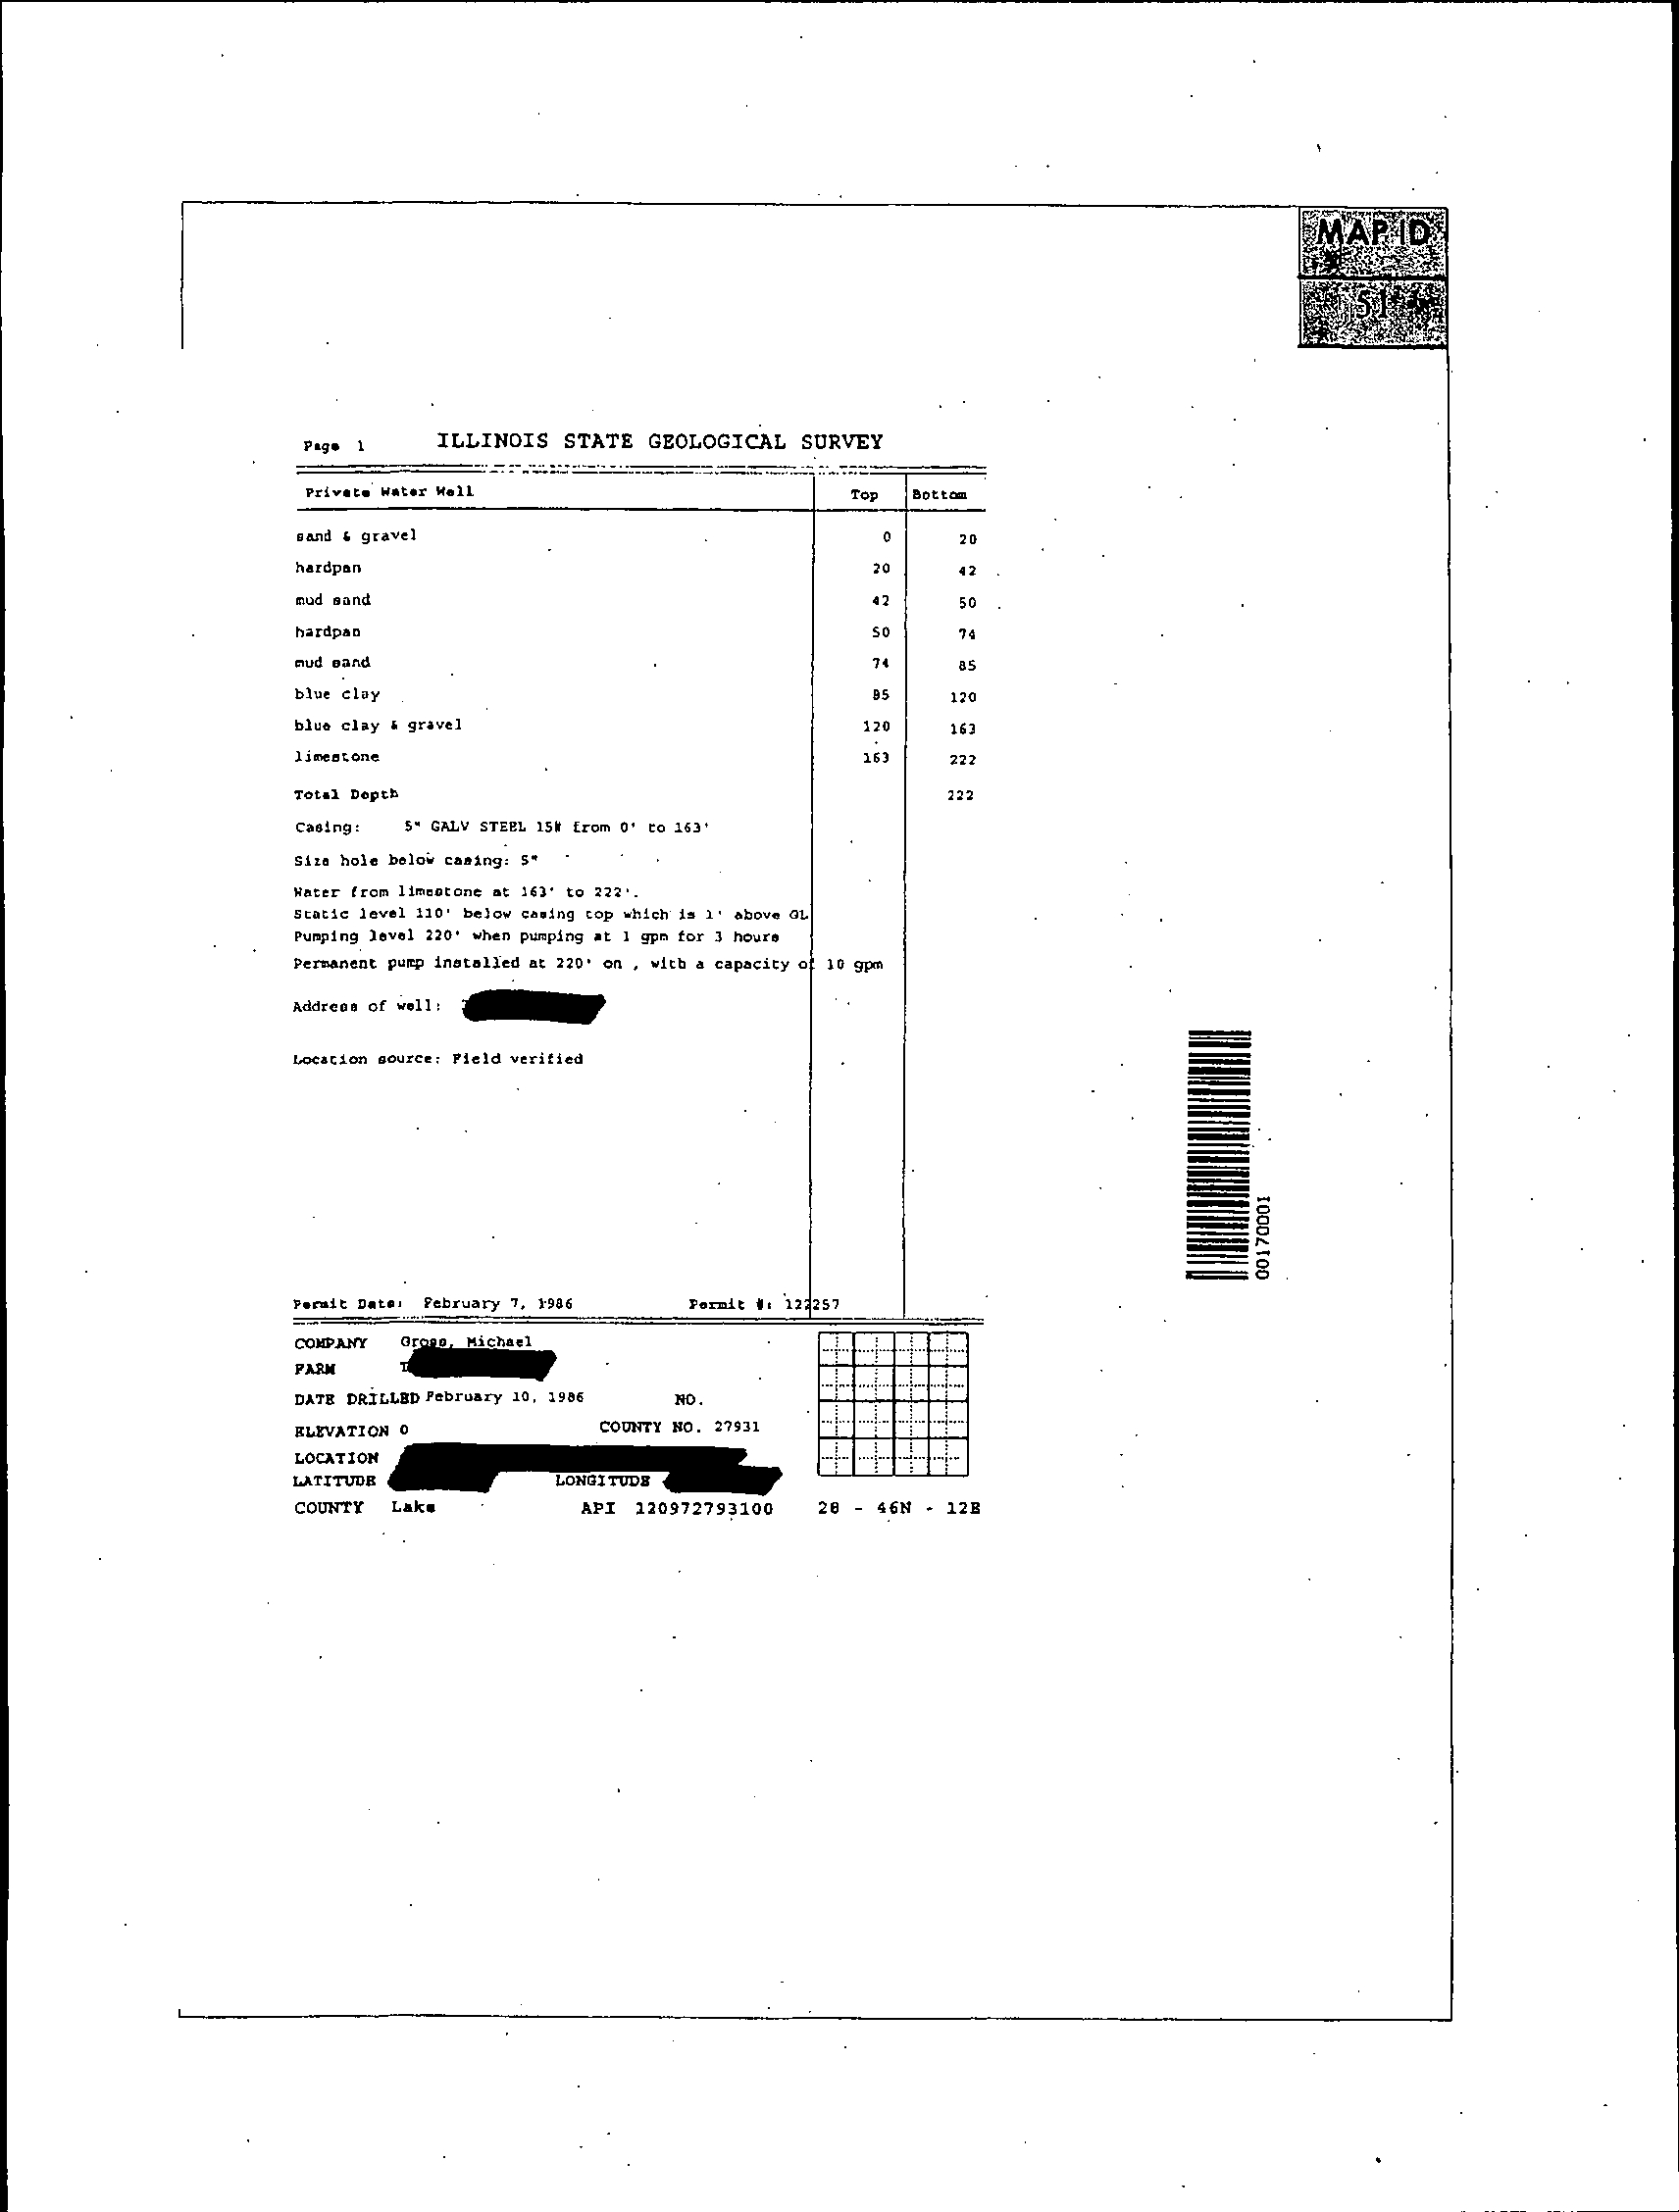
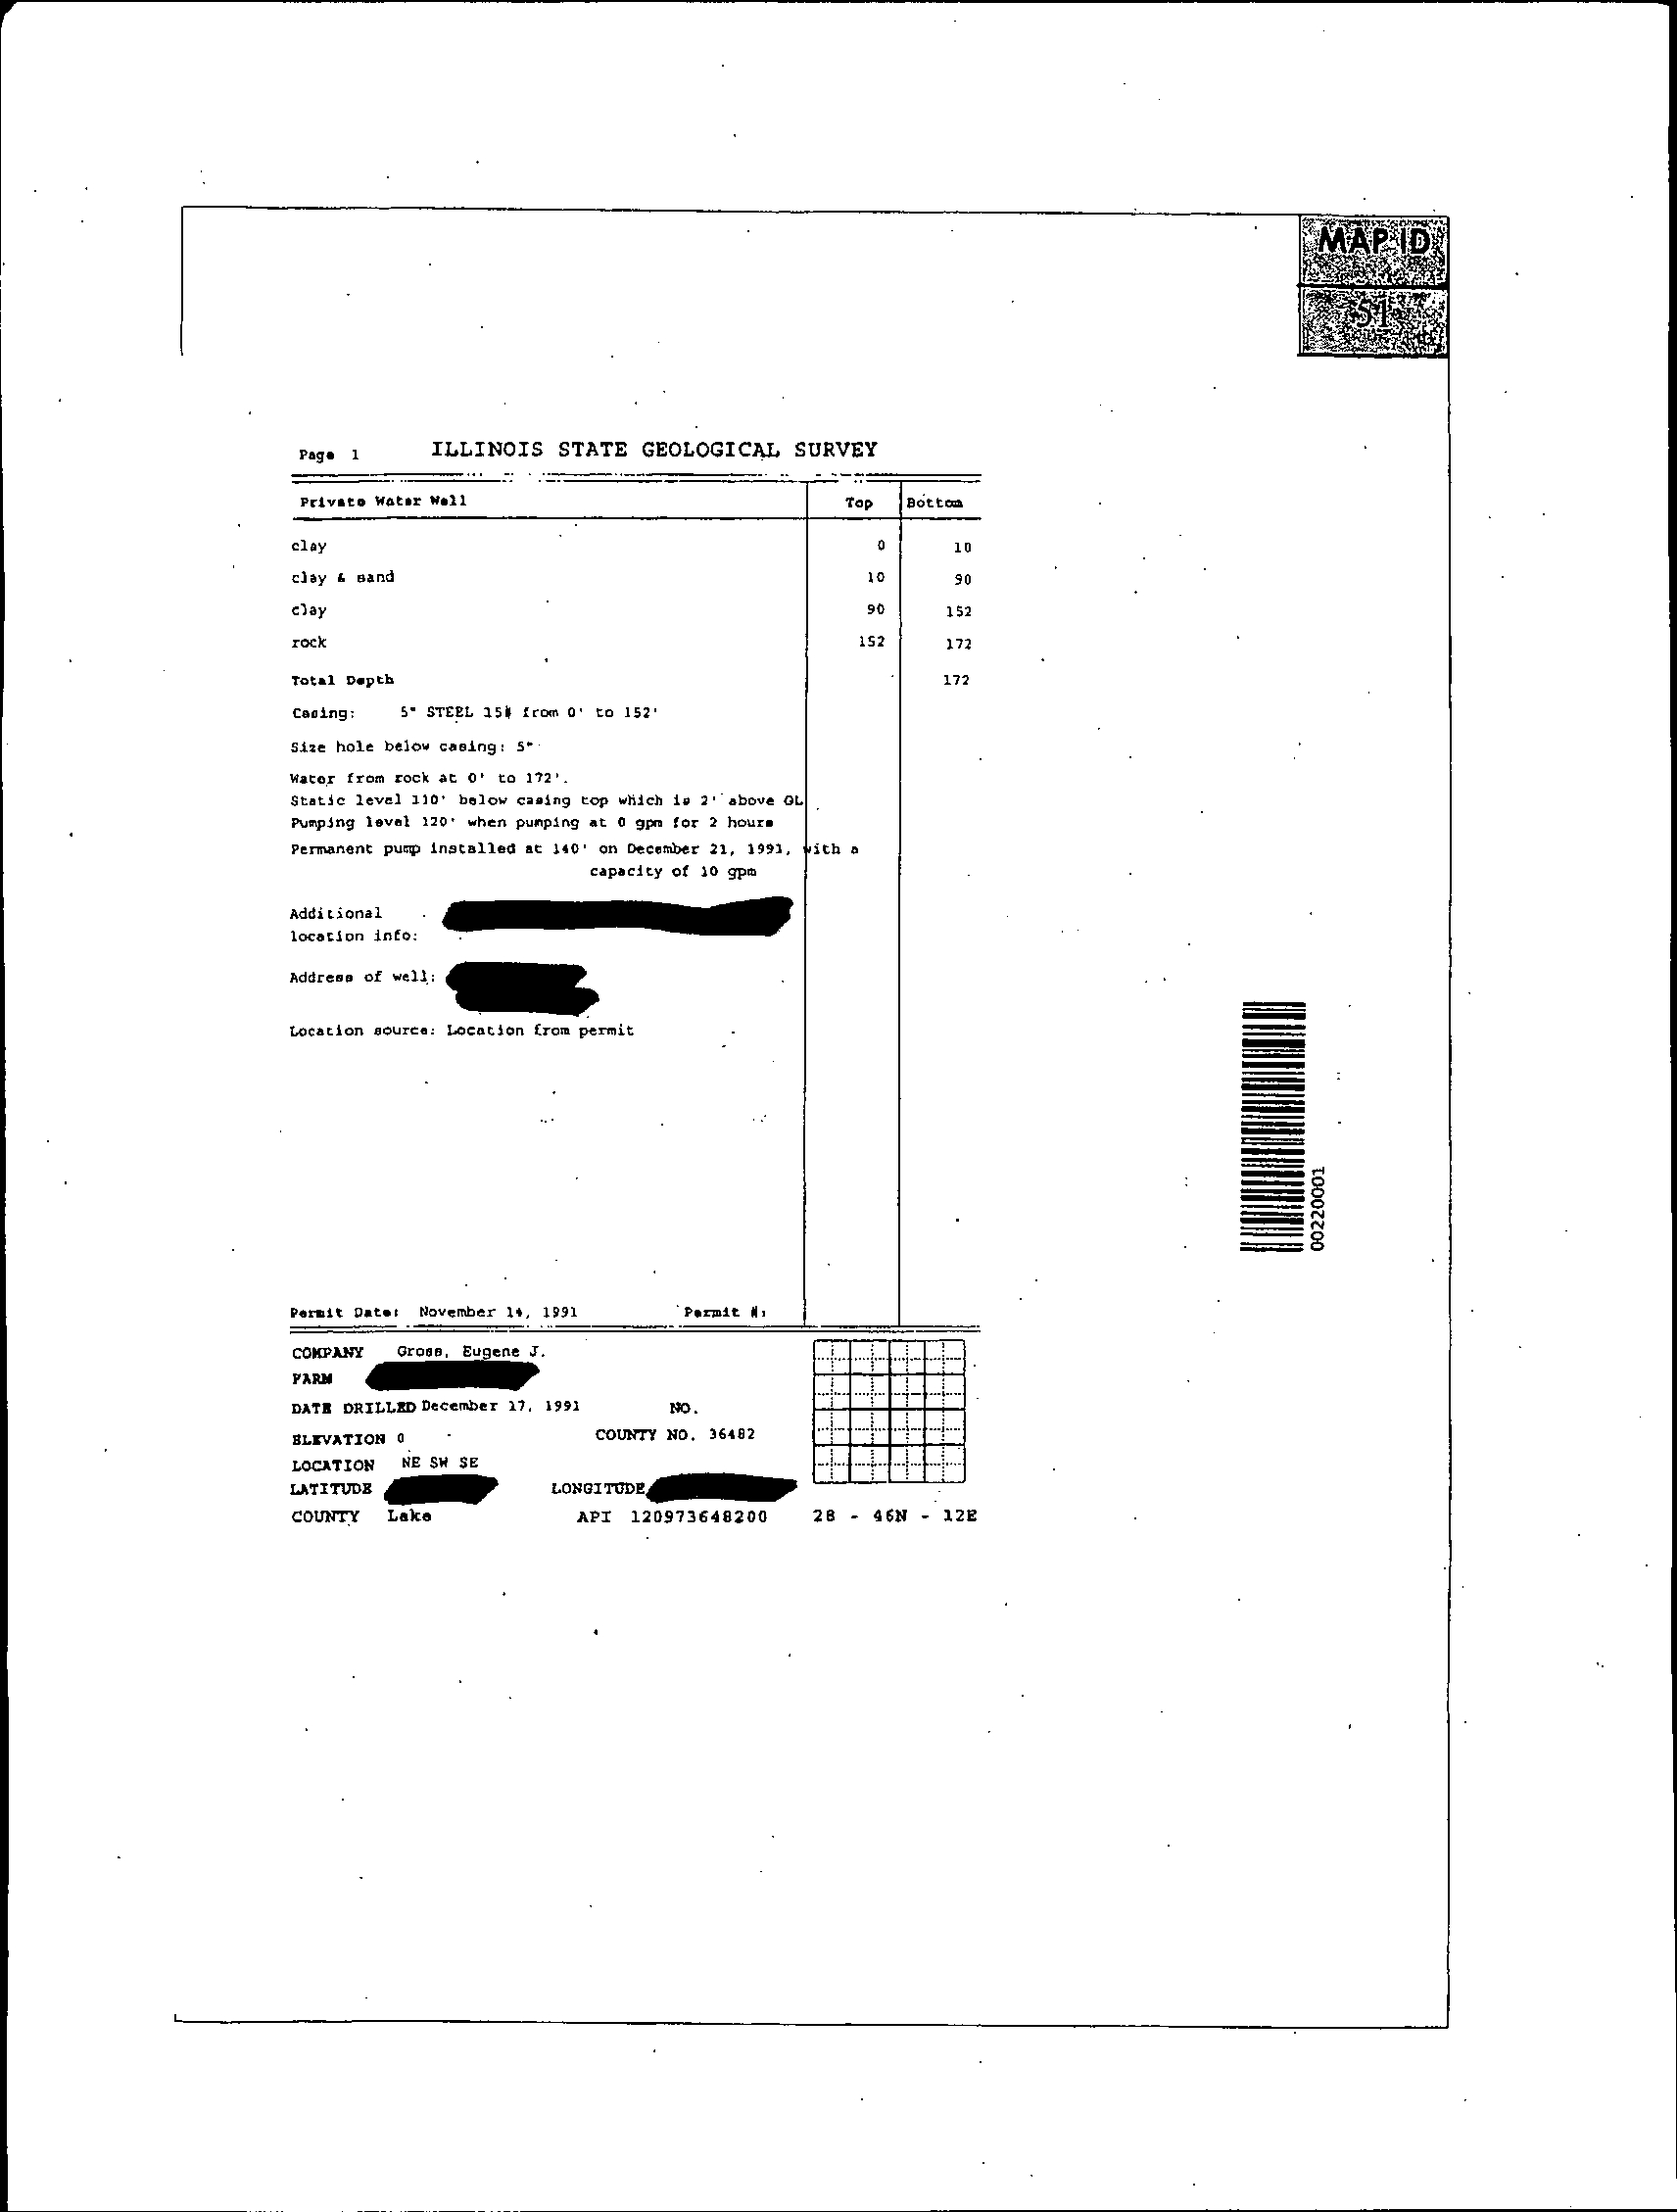
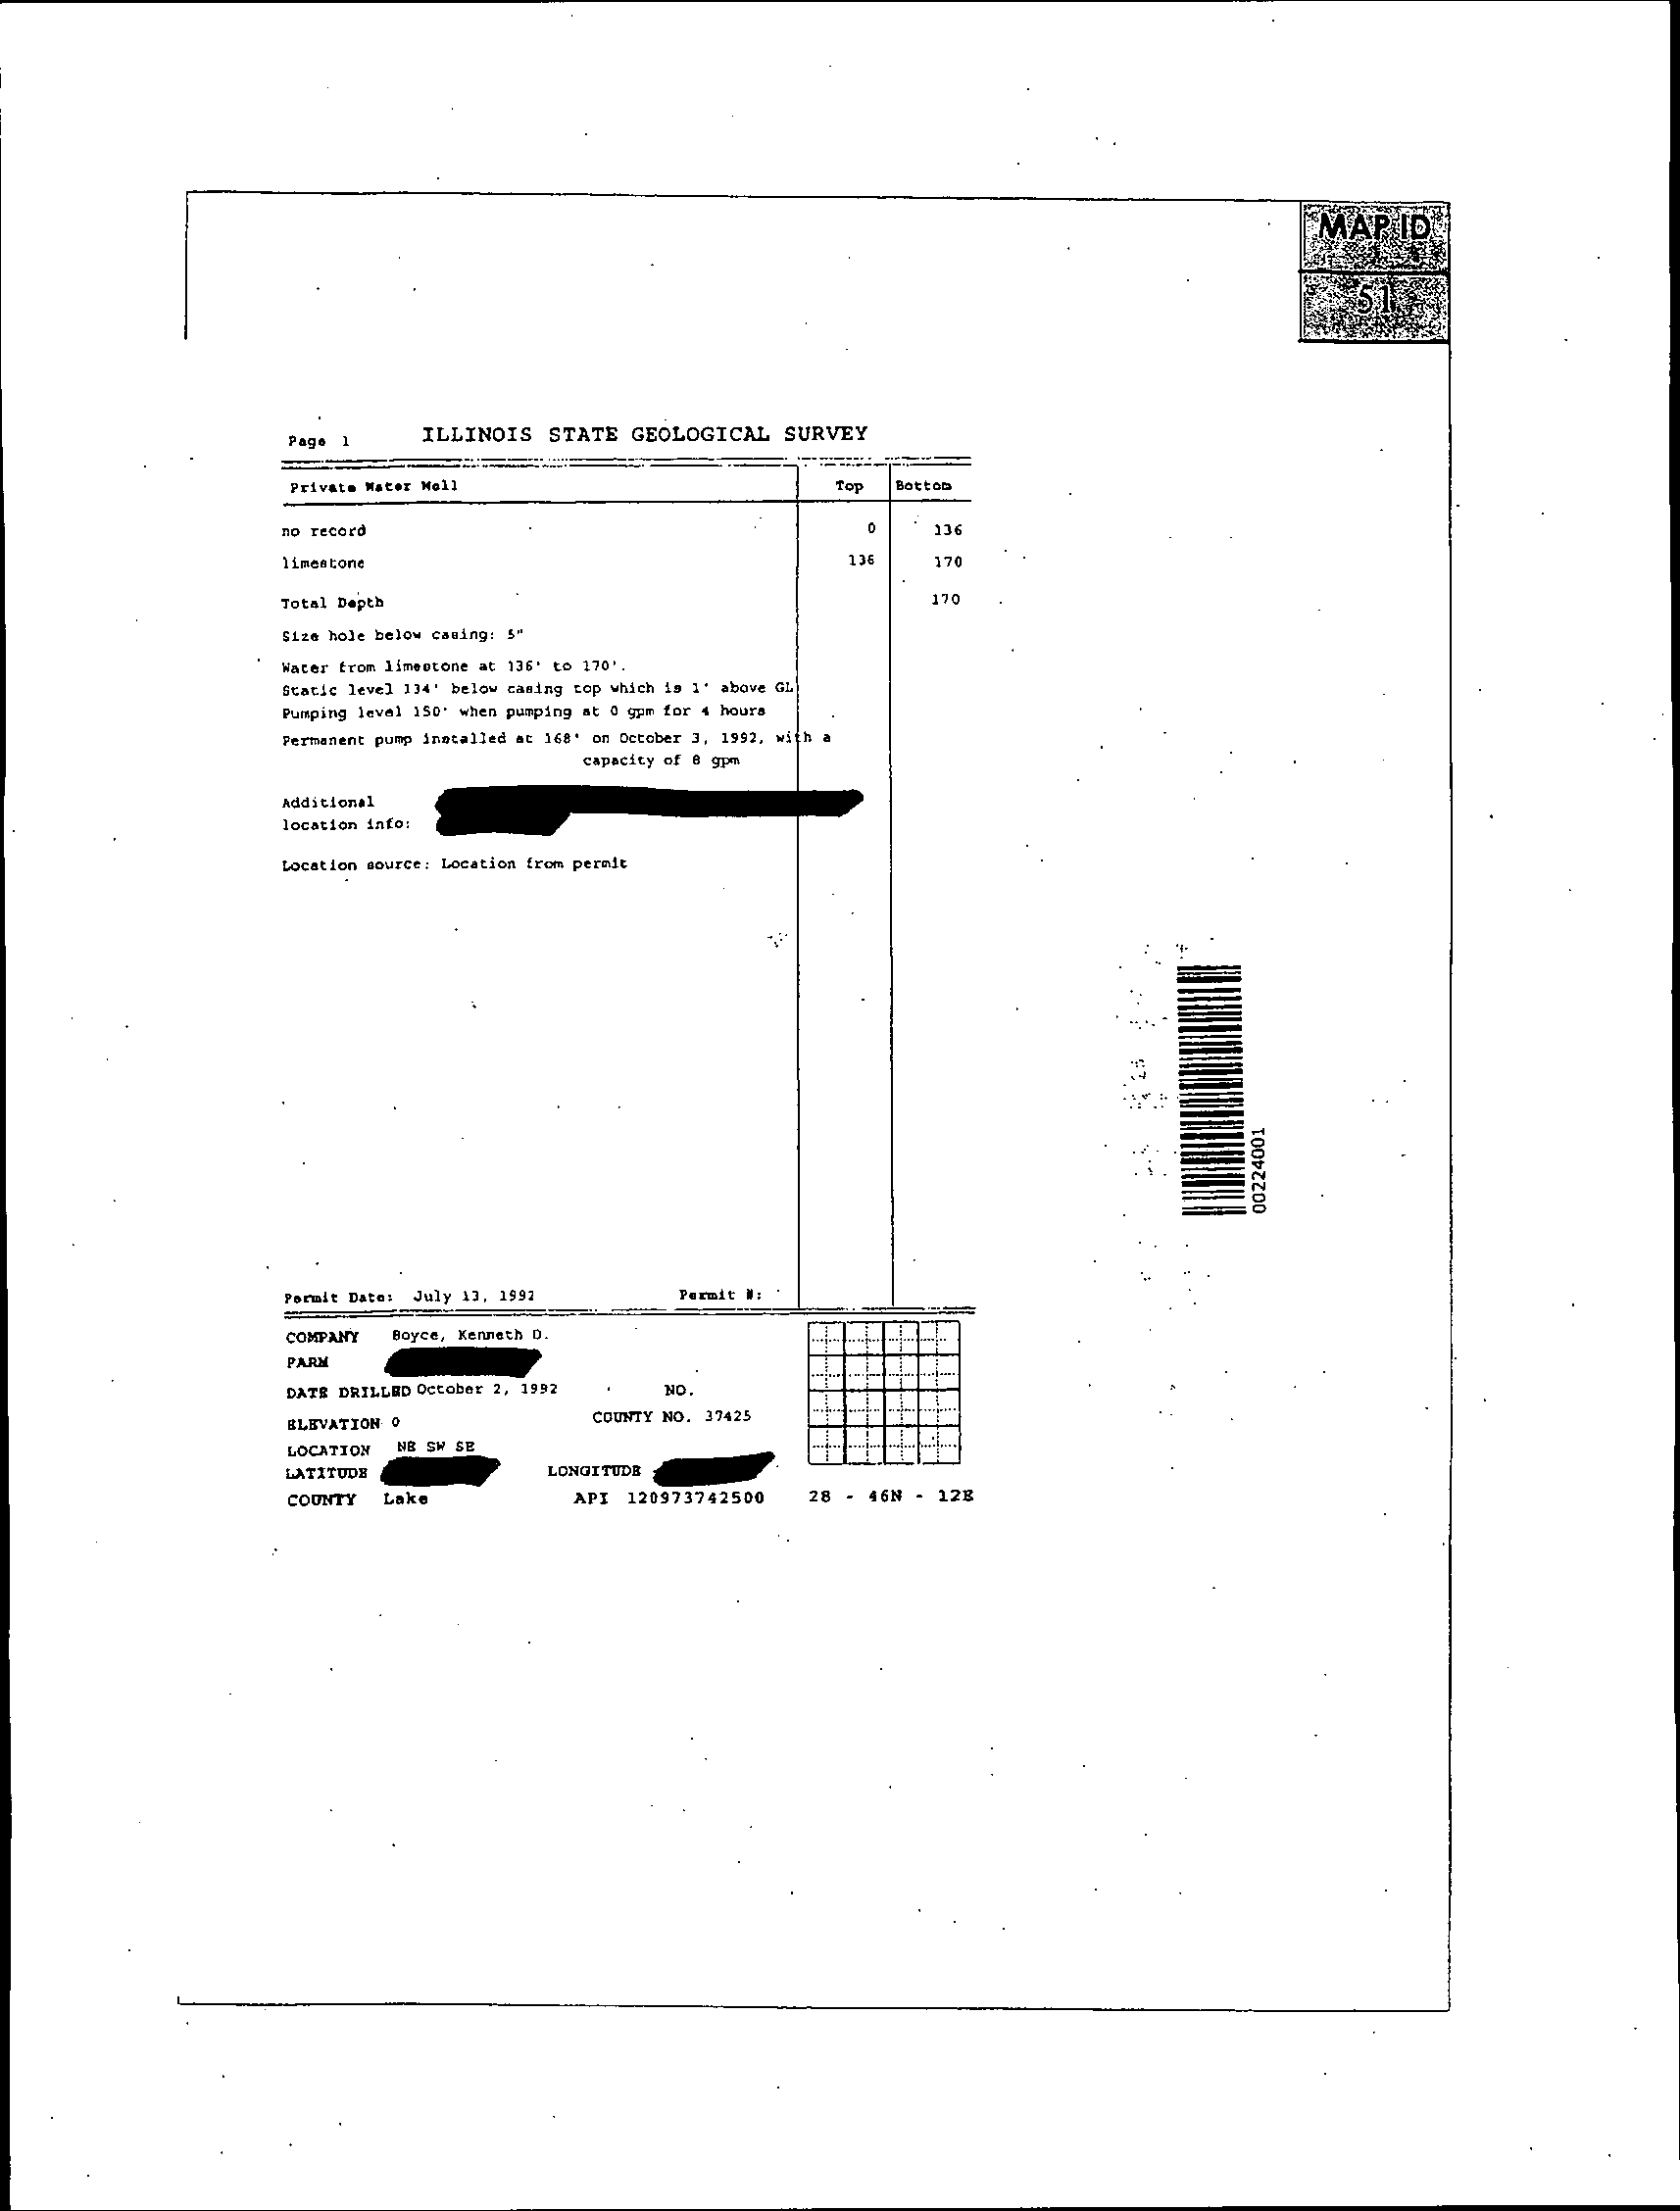
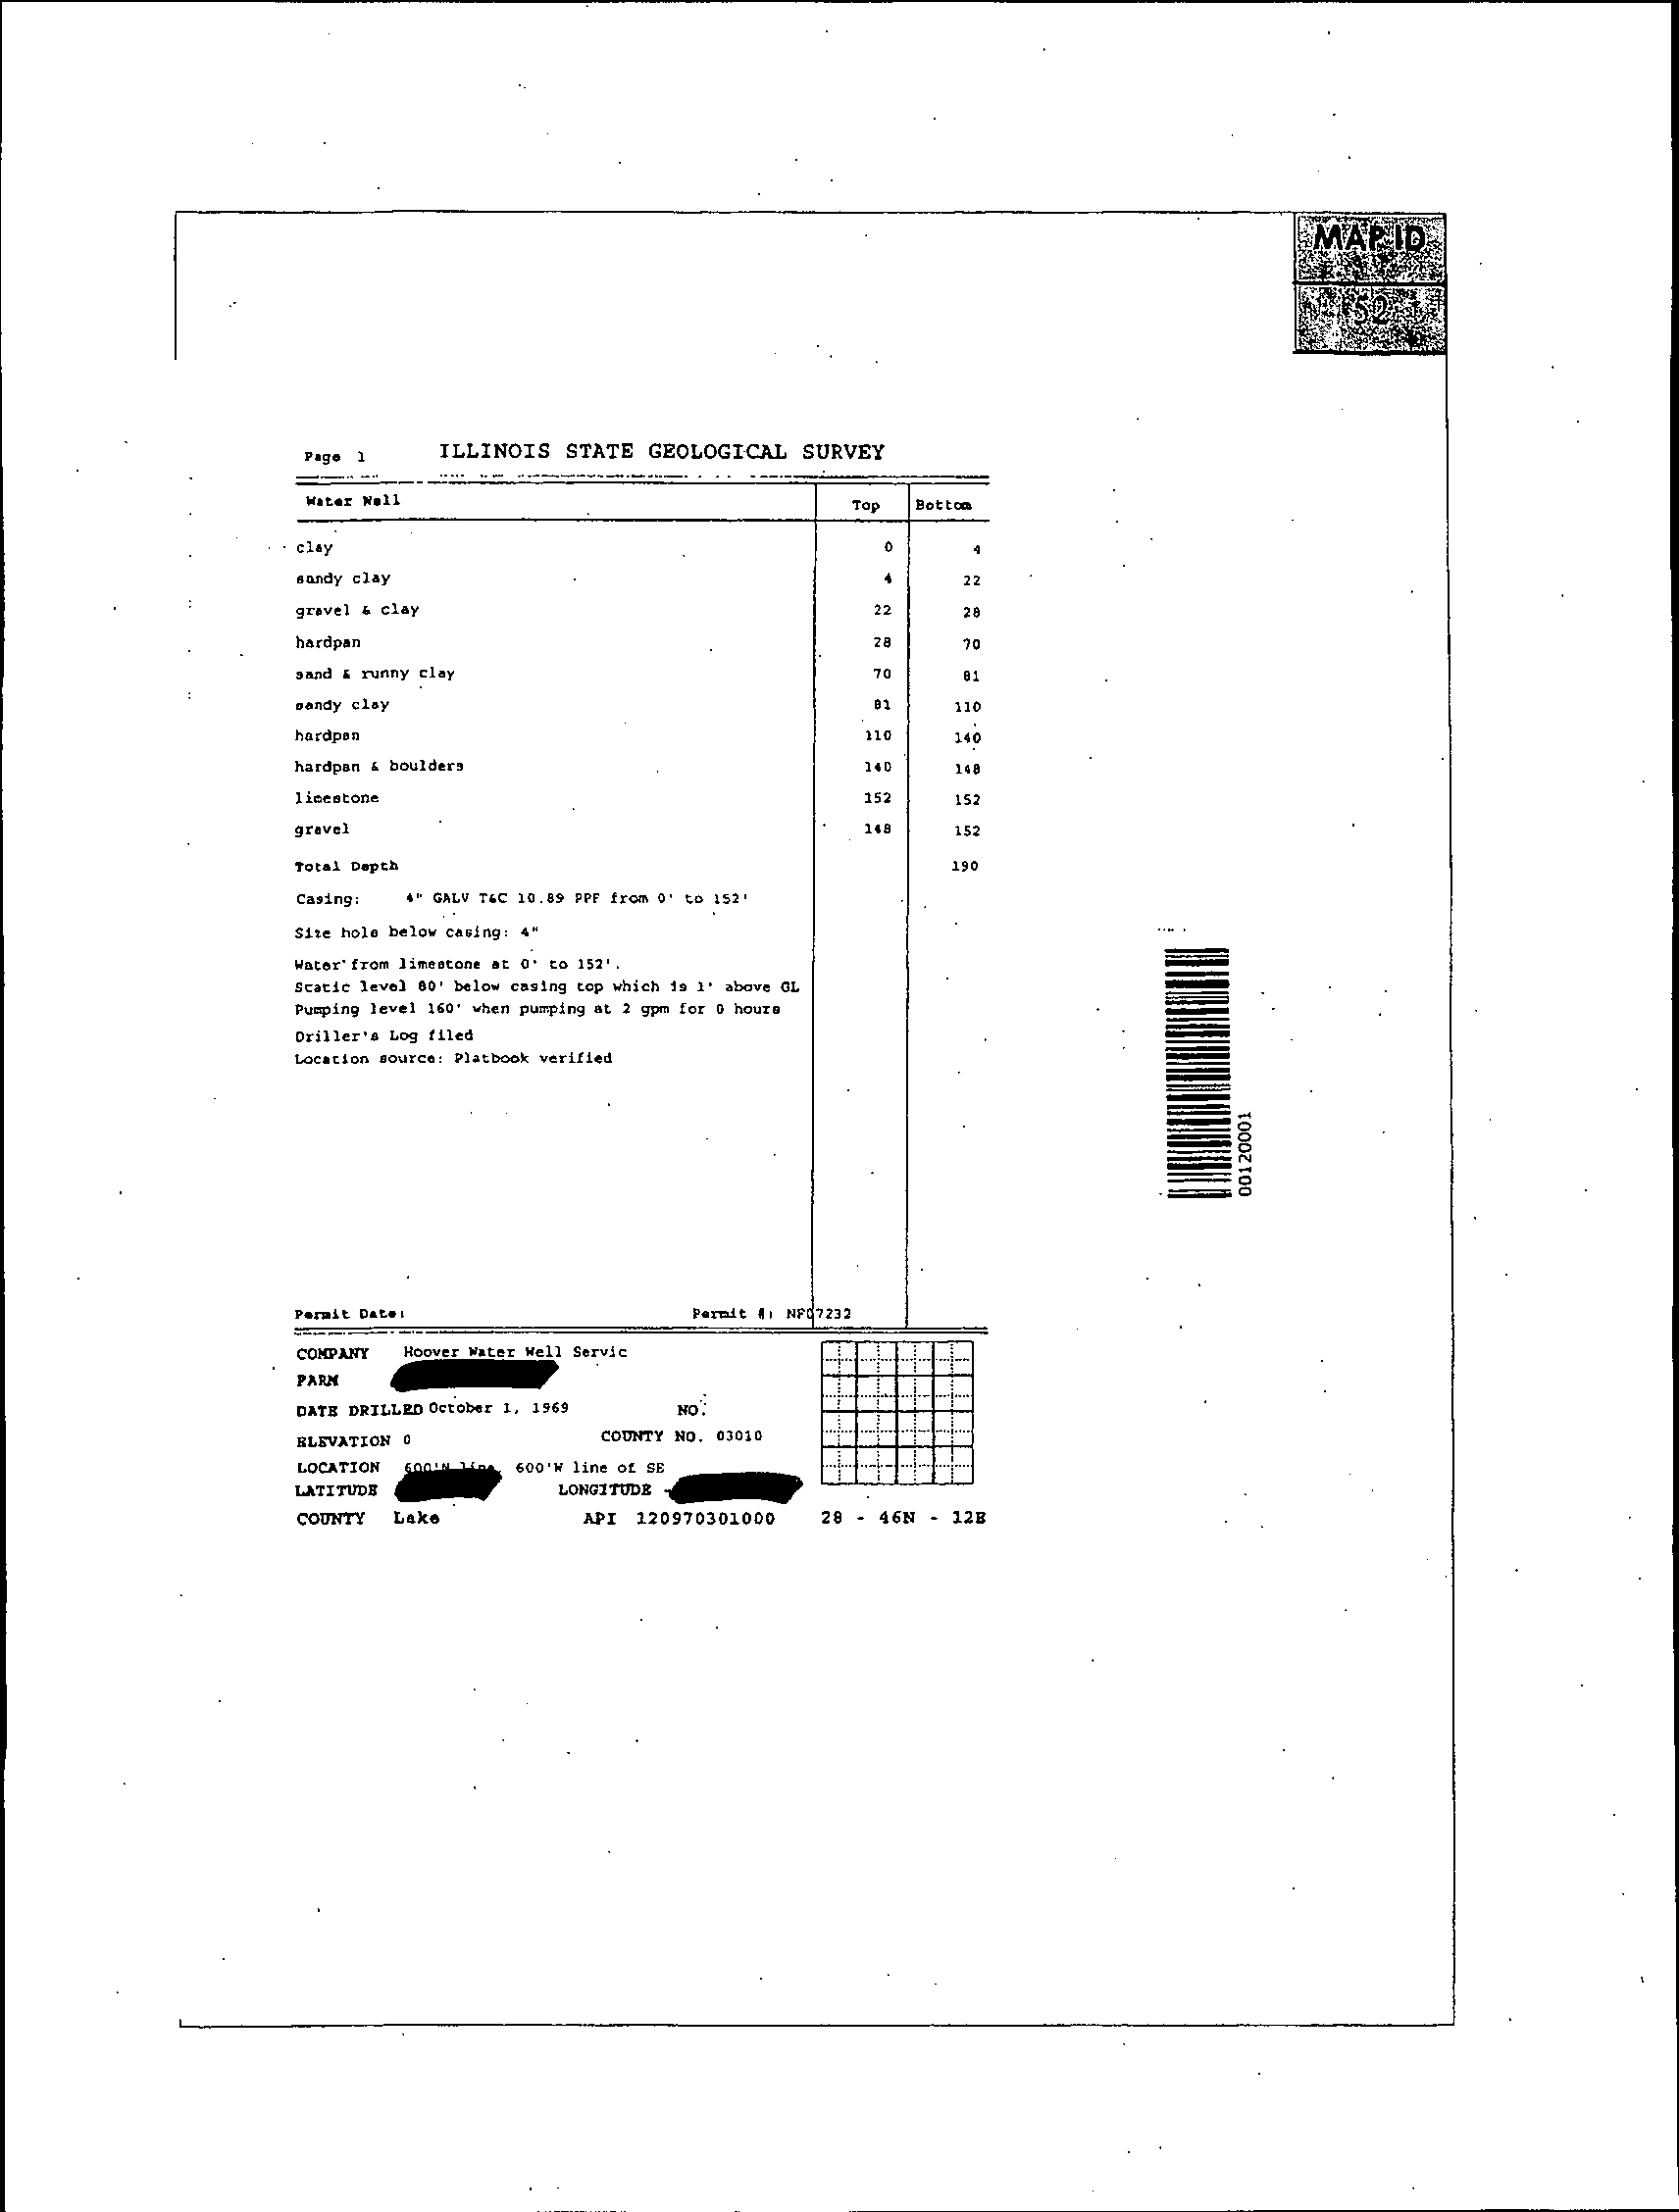
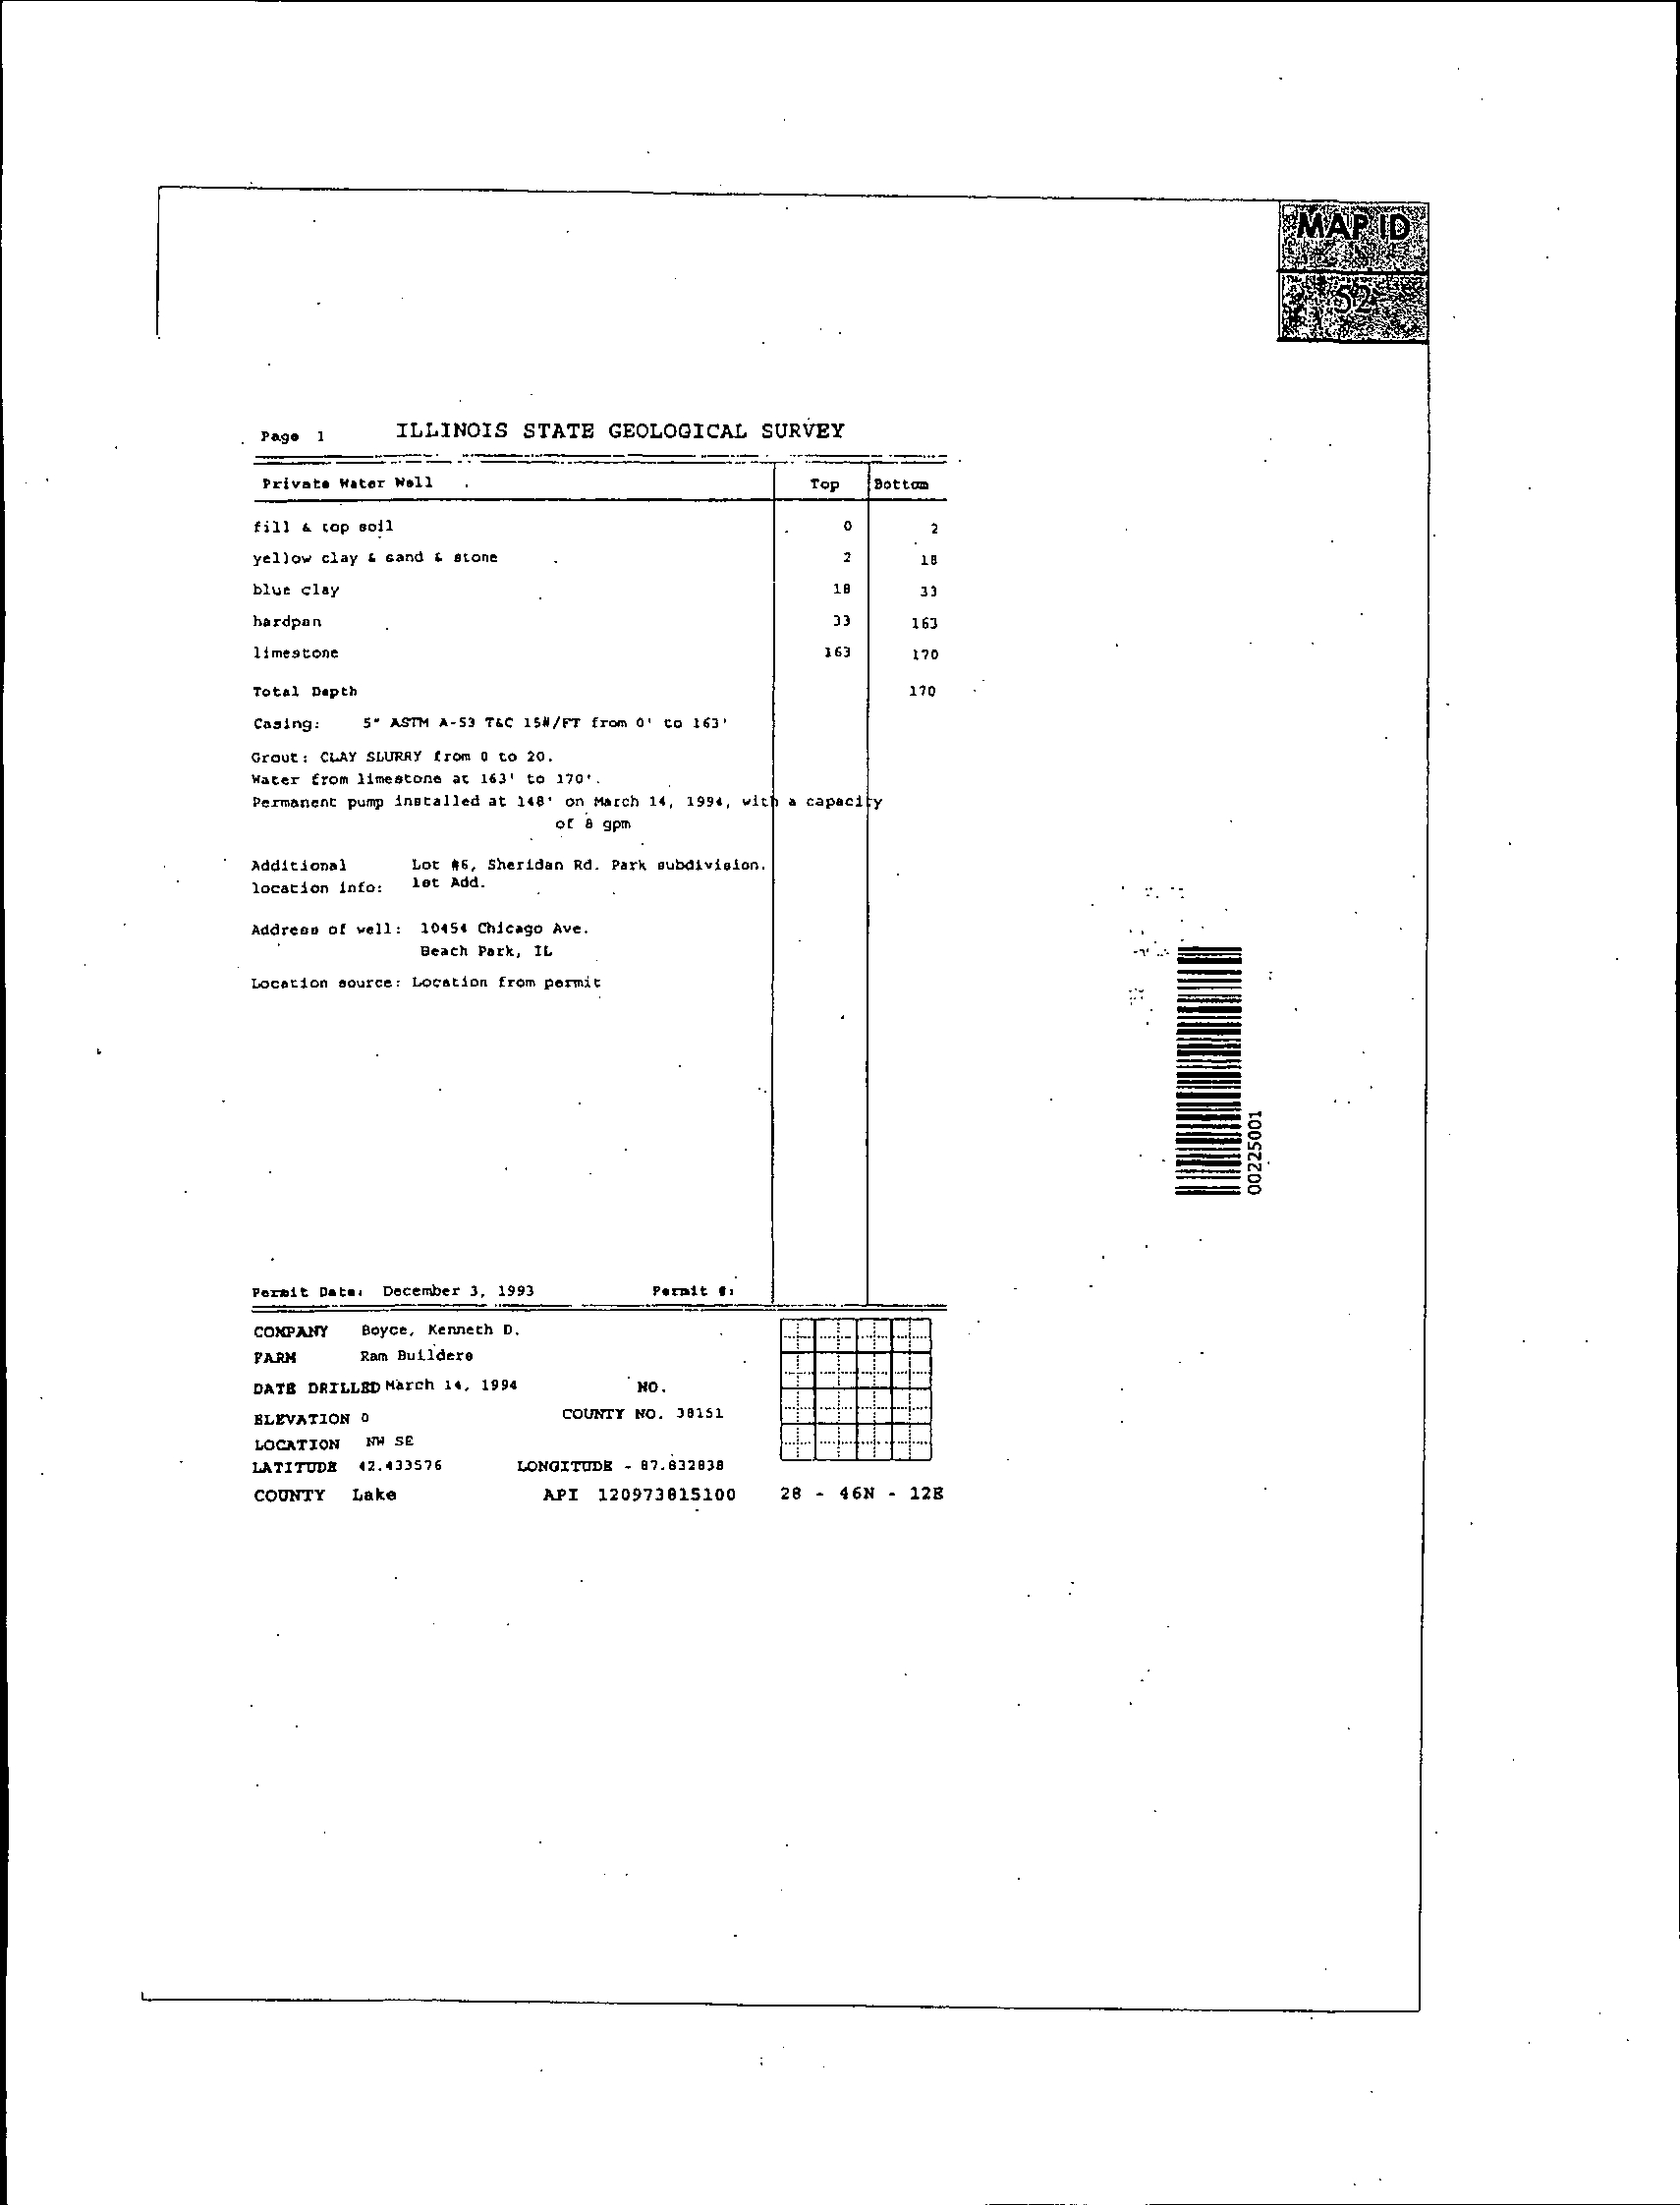
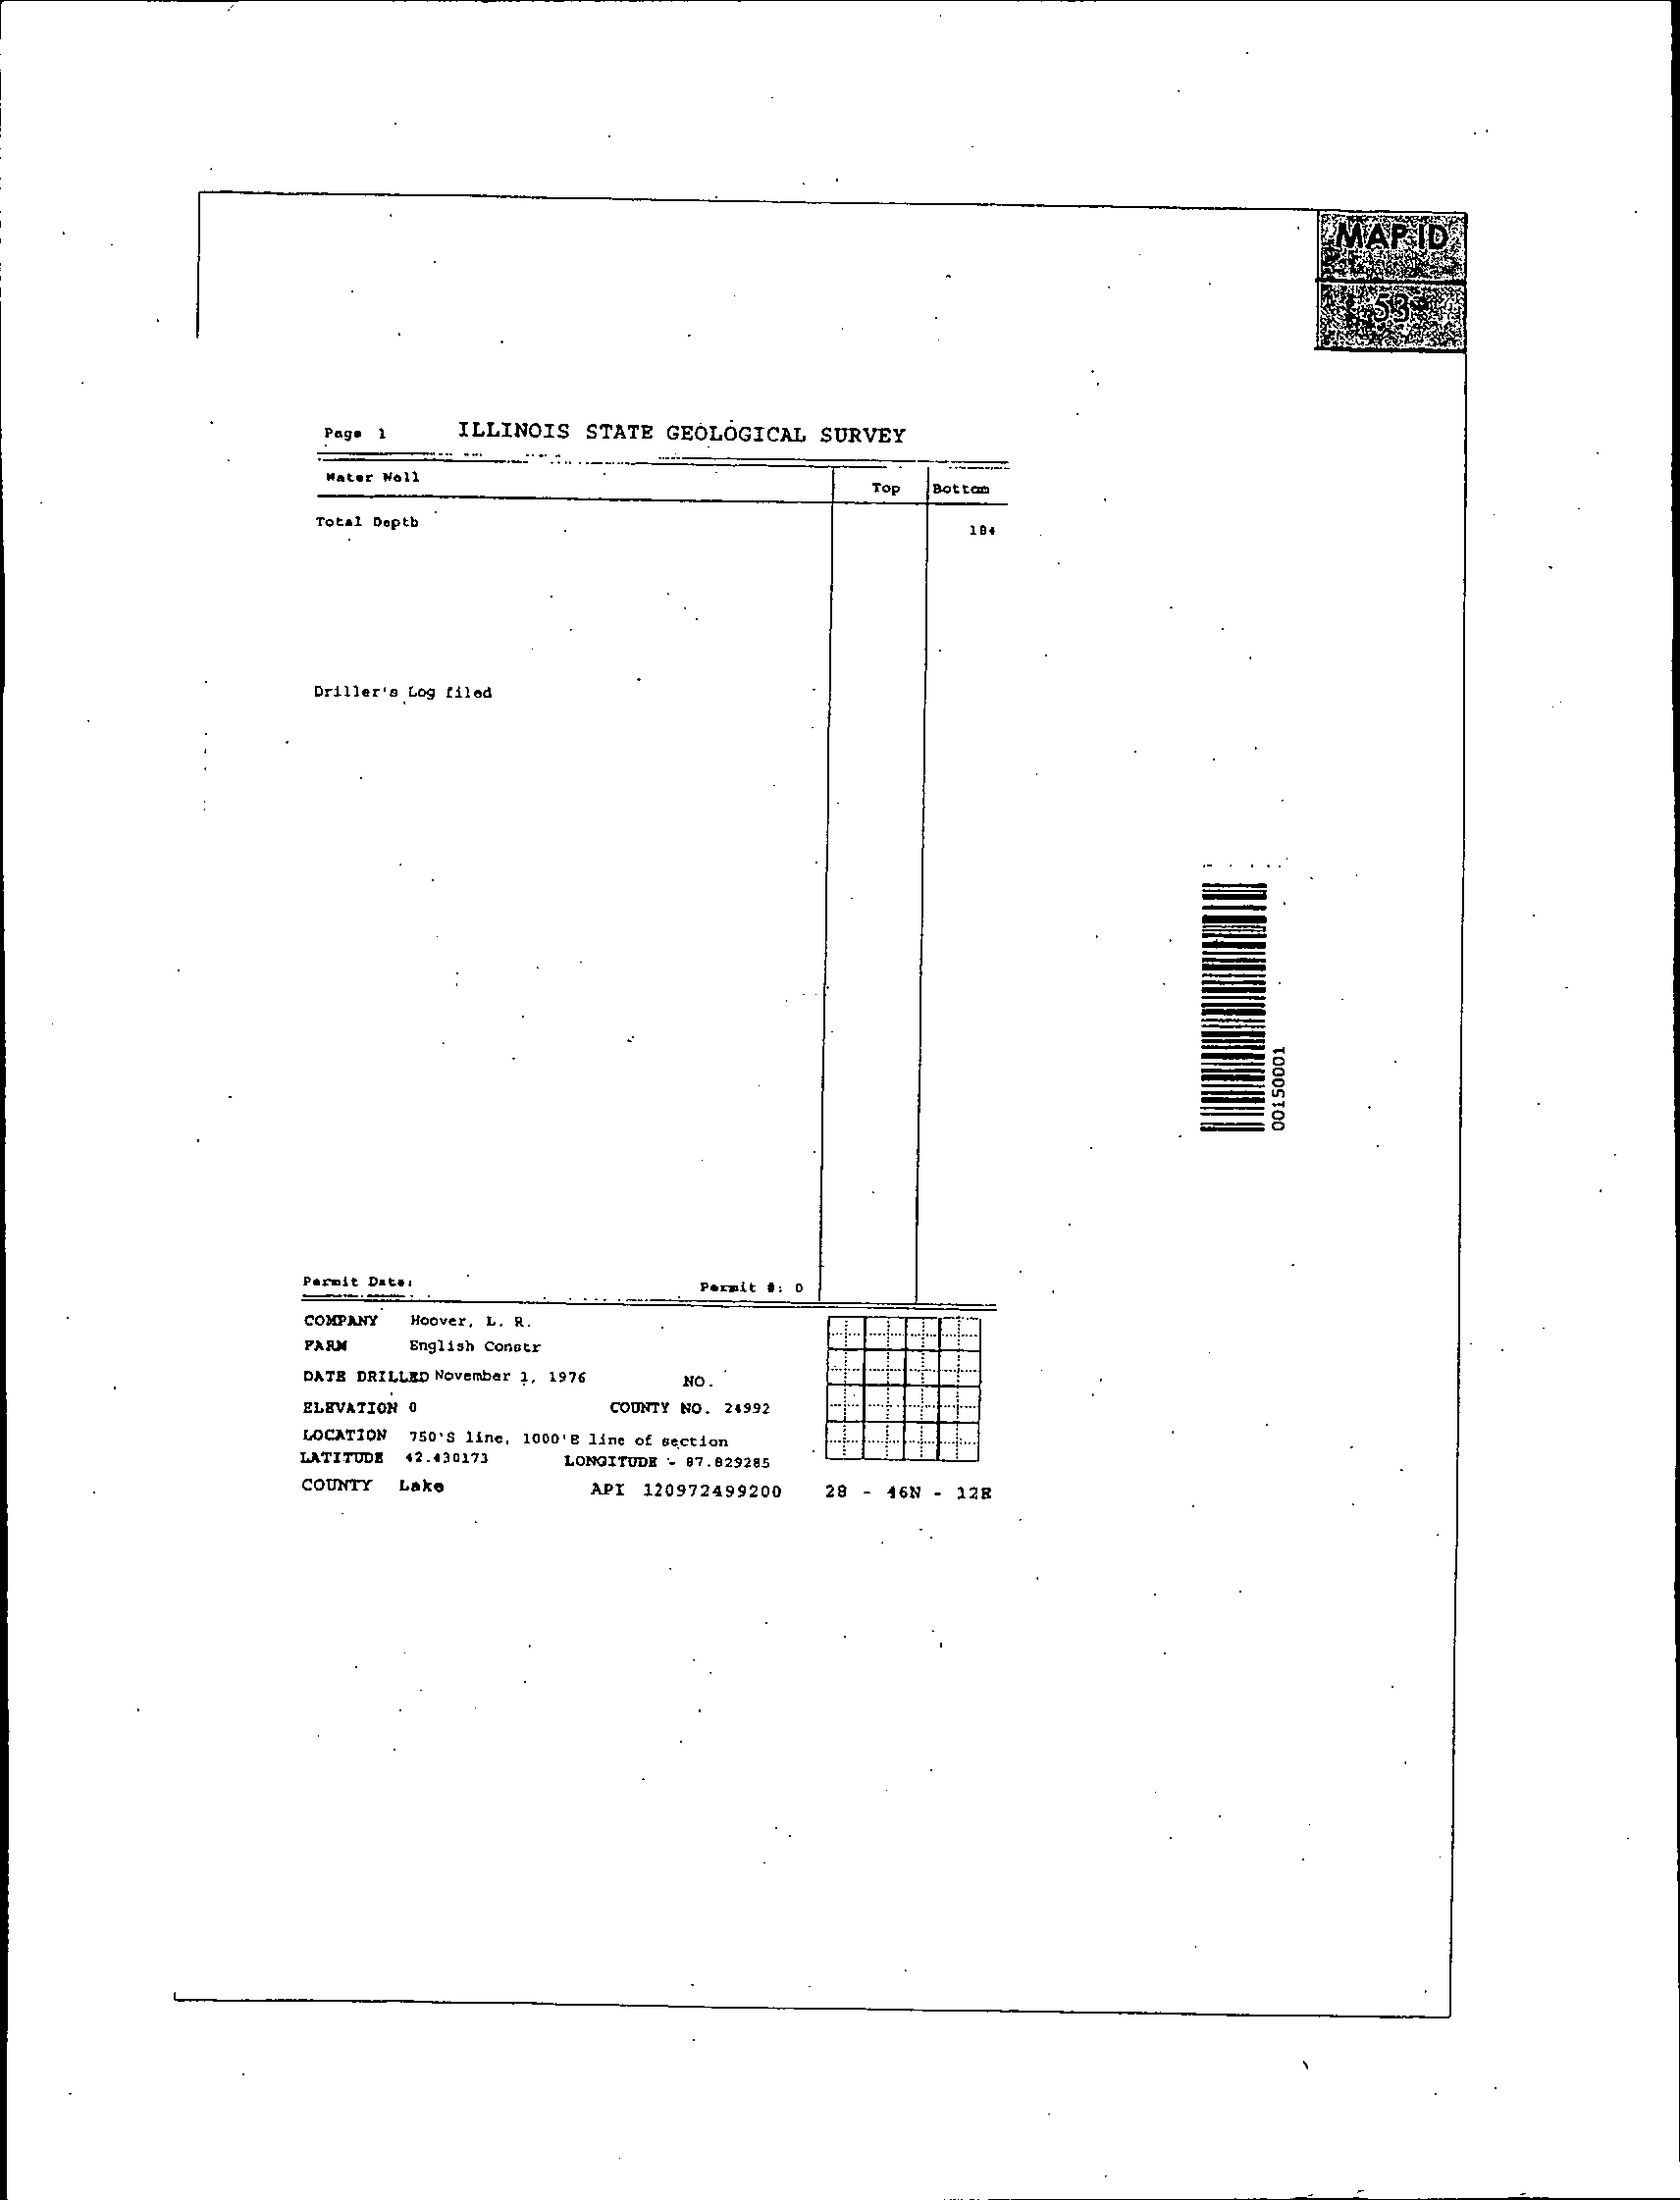
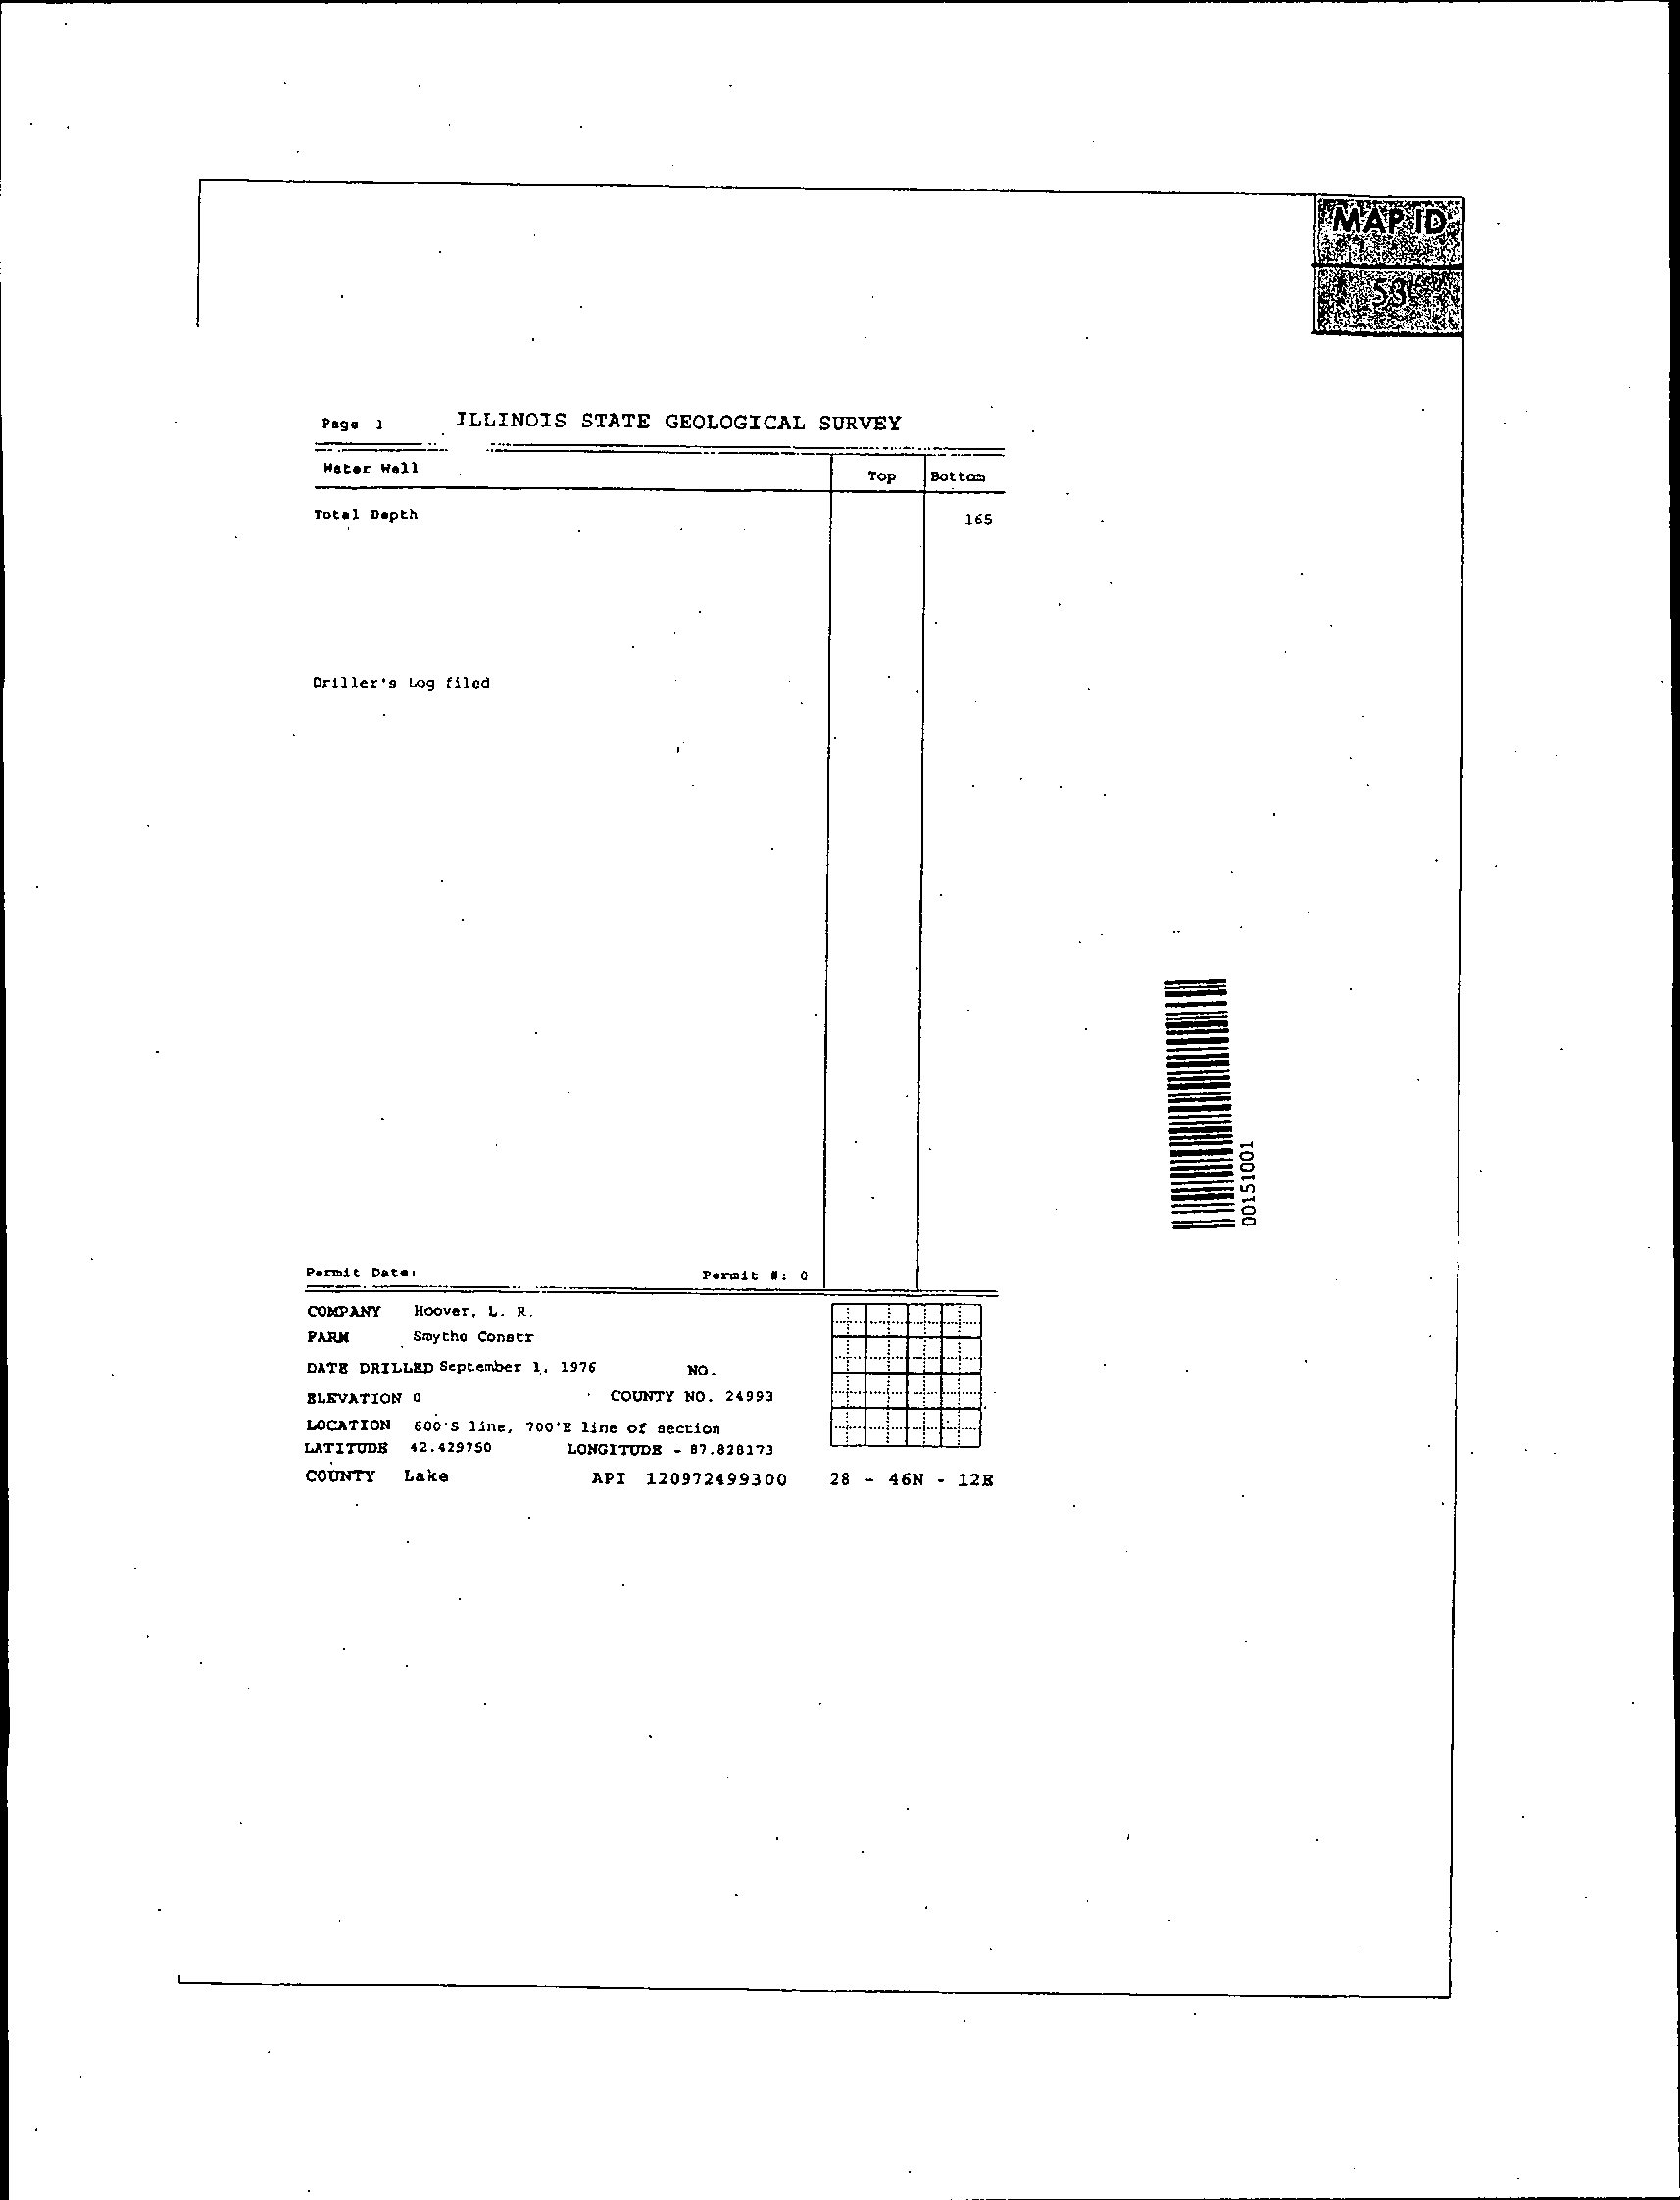
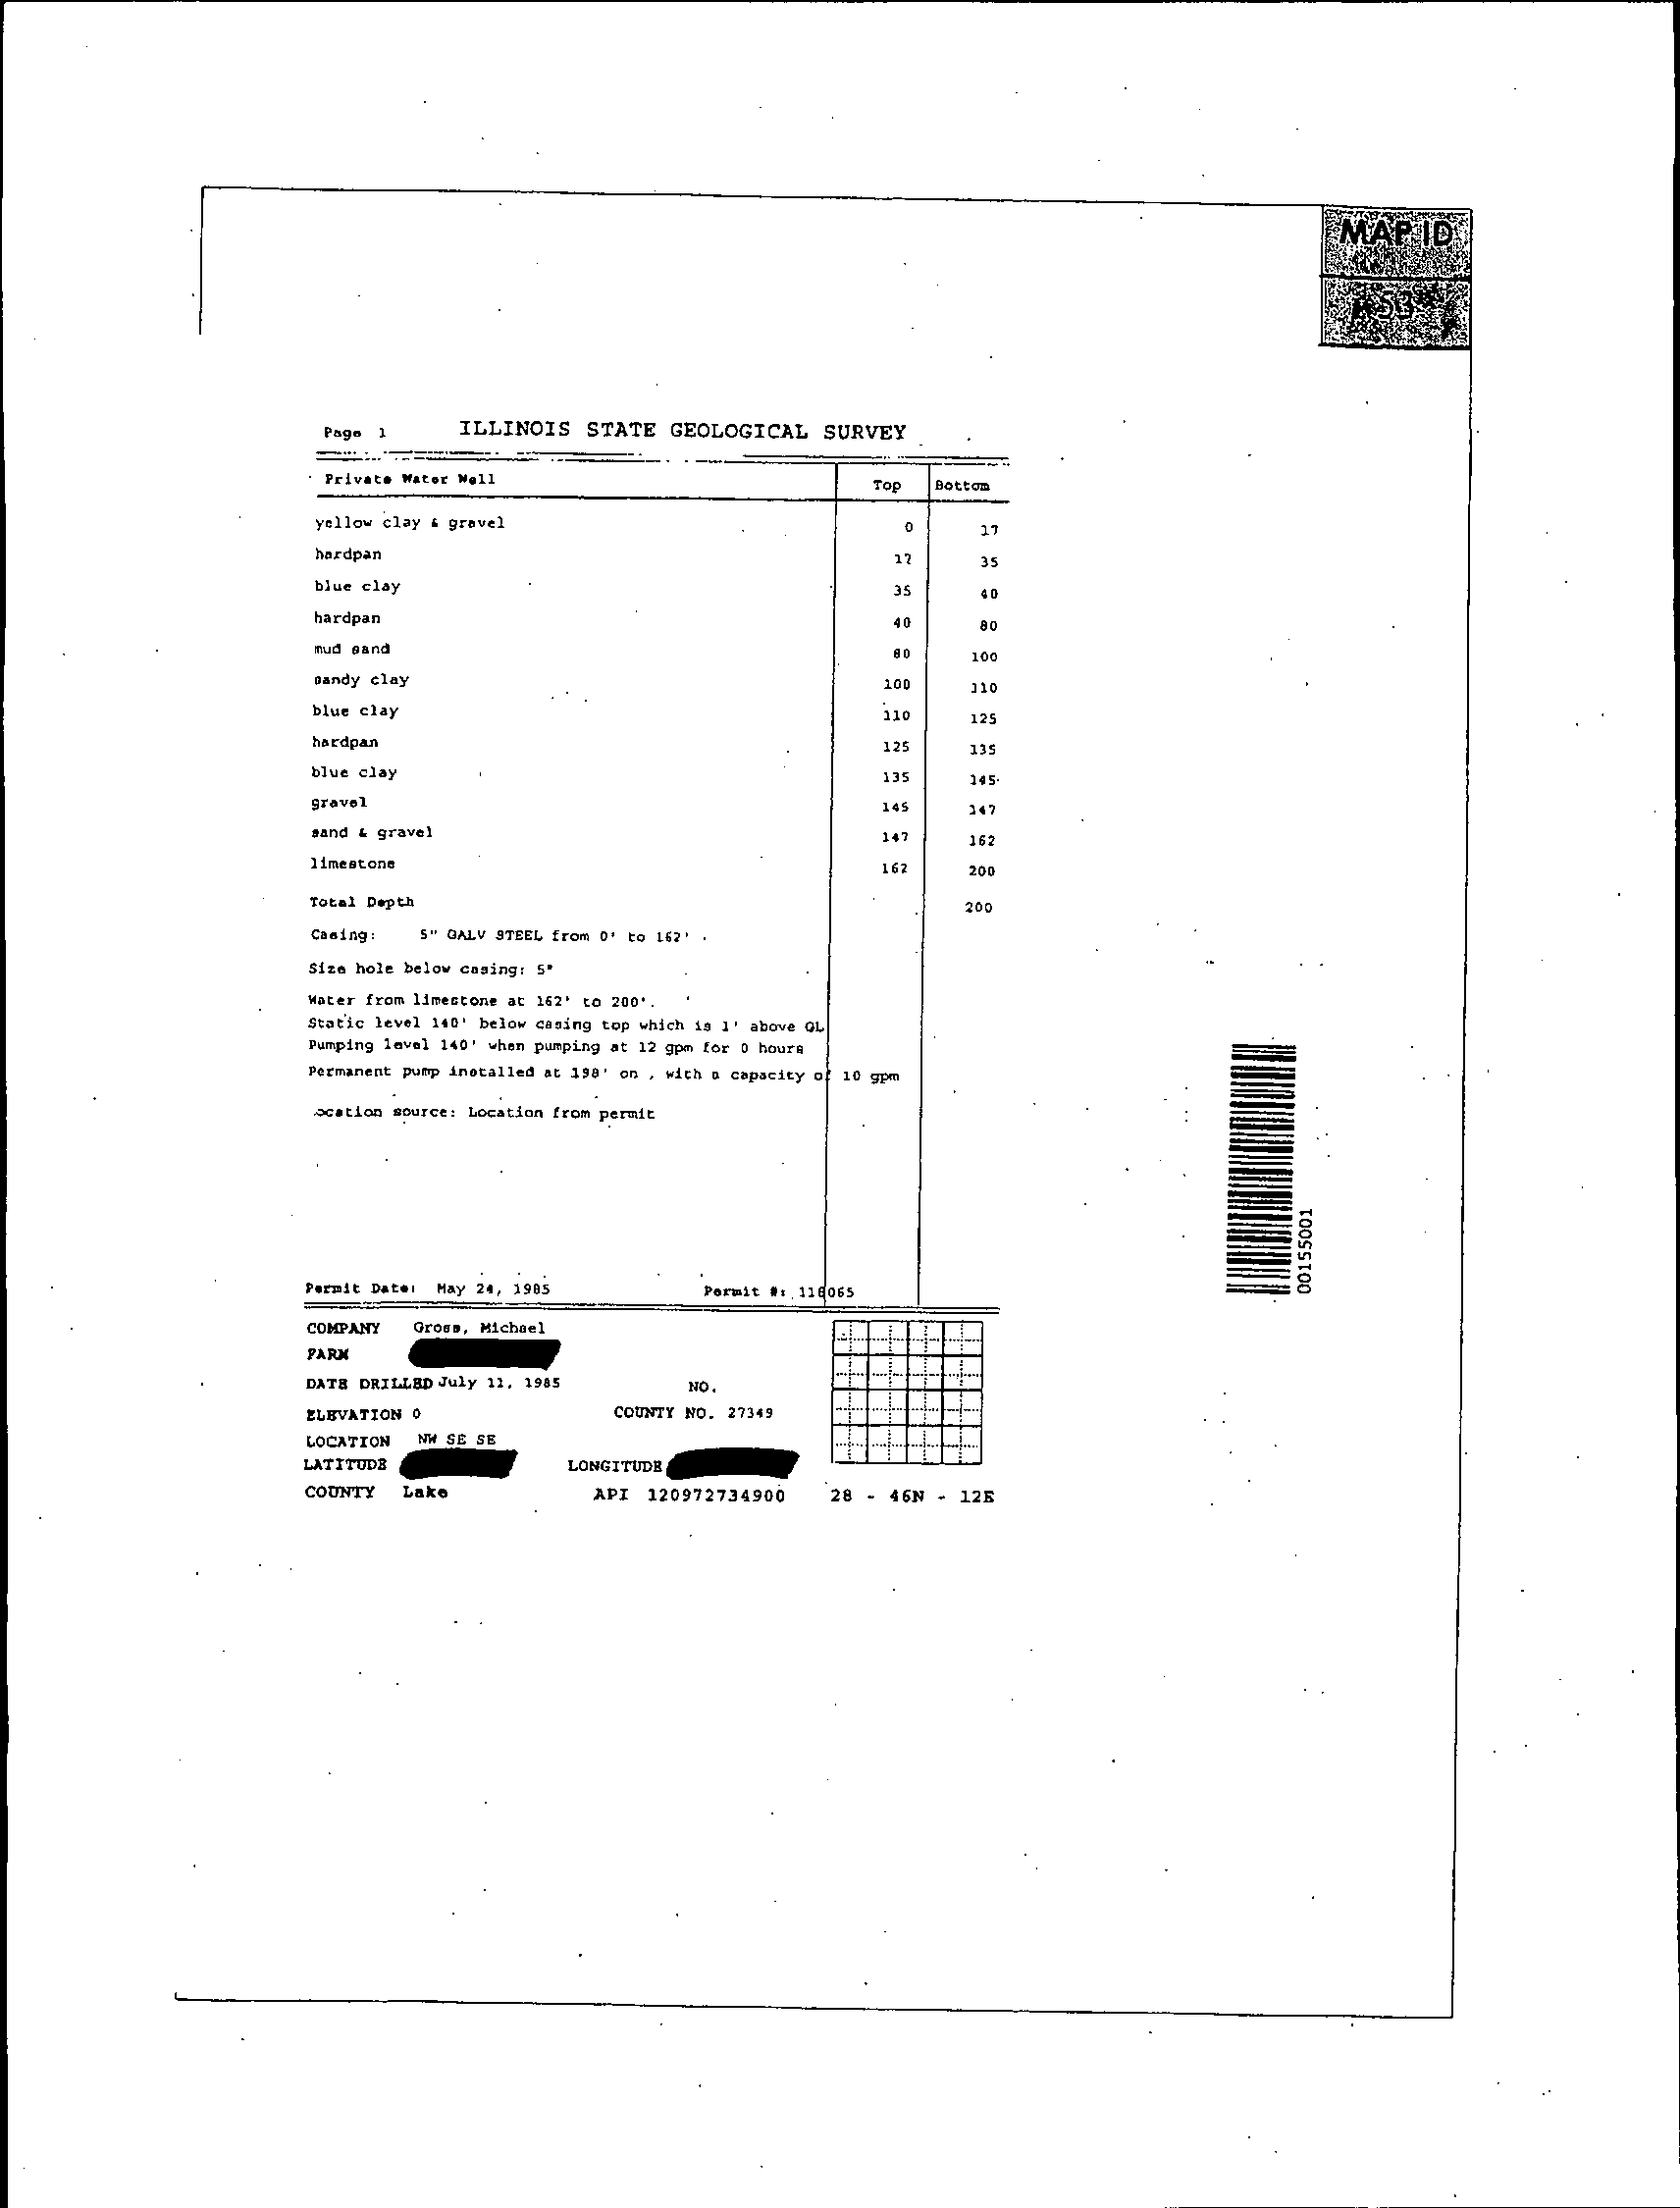
A water well inventory compiled as part of this investigation indicates a number of
wells located (or formerly located) near the Station. The locations of wells in the vicinity
of the Station are provided on Figure 2.4. A water well report was prepared using
Illinois water well databases and associated well logs, and is provided in Appendix A.
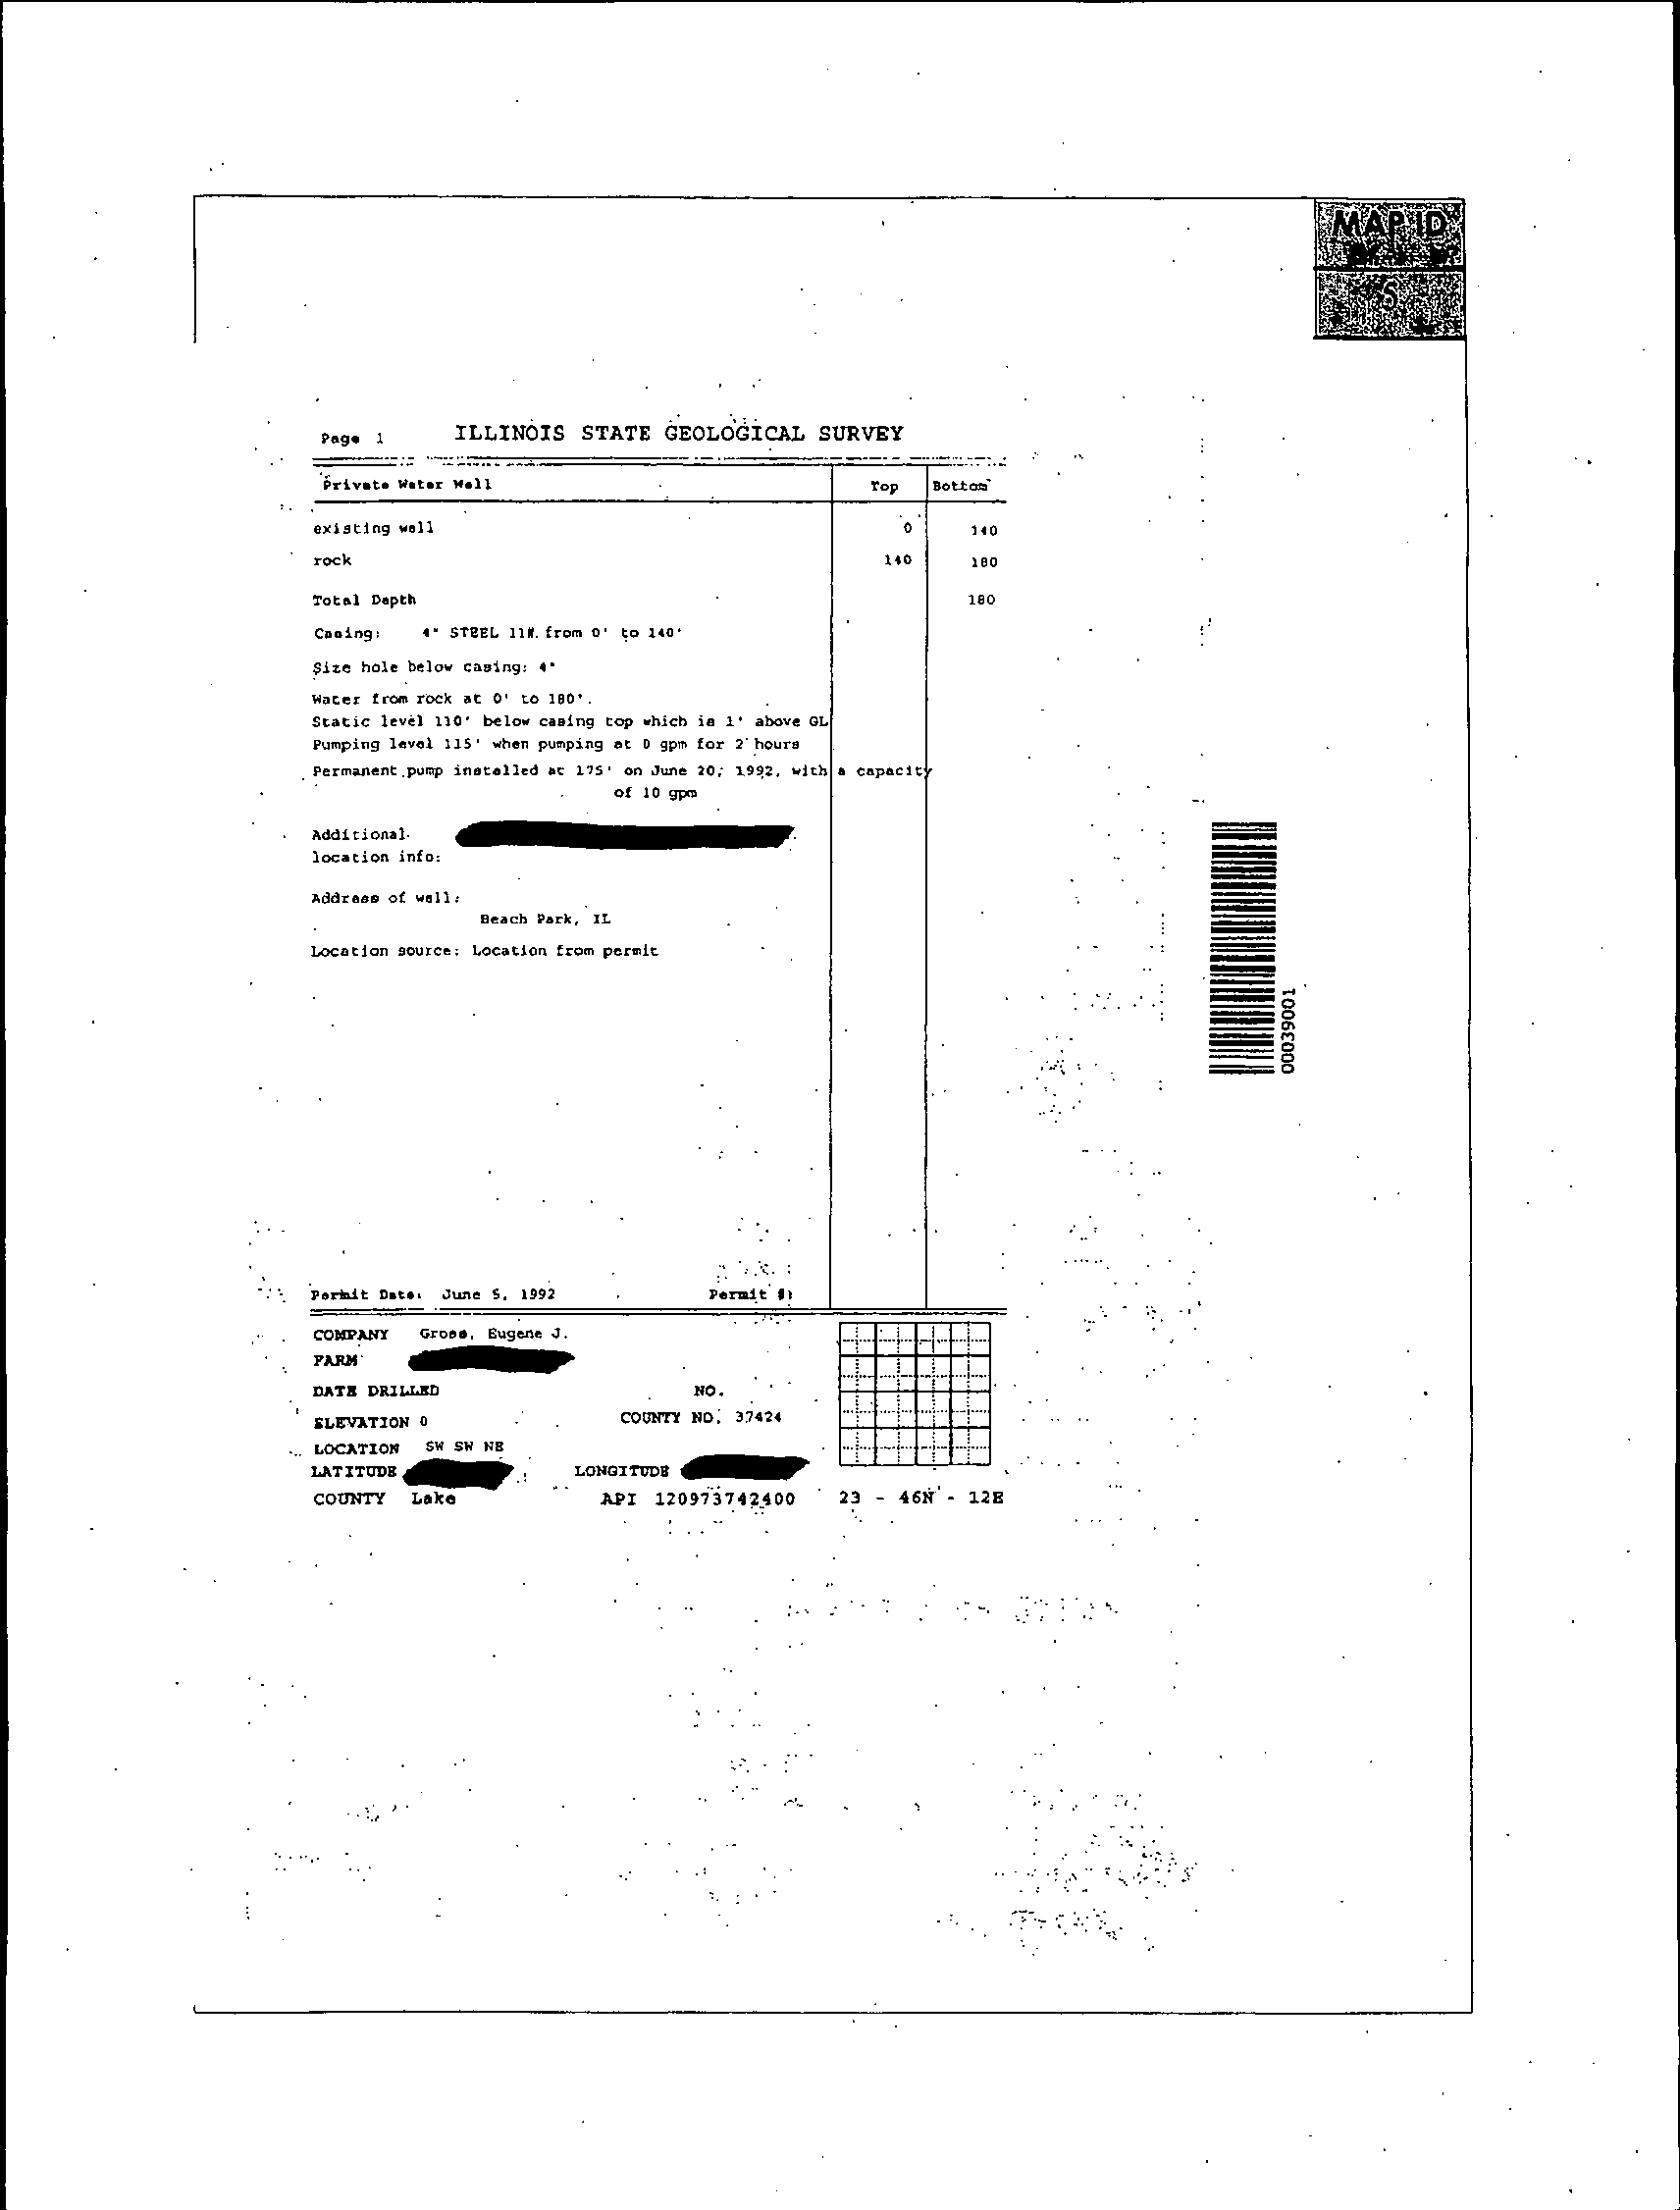
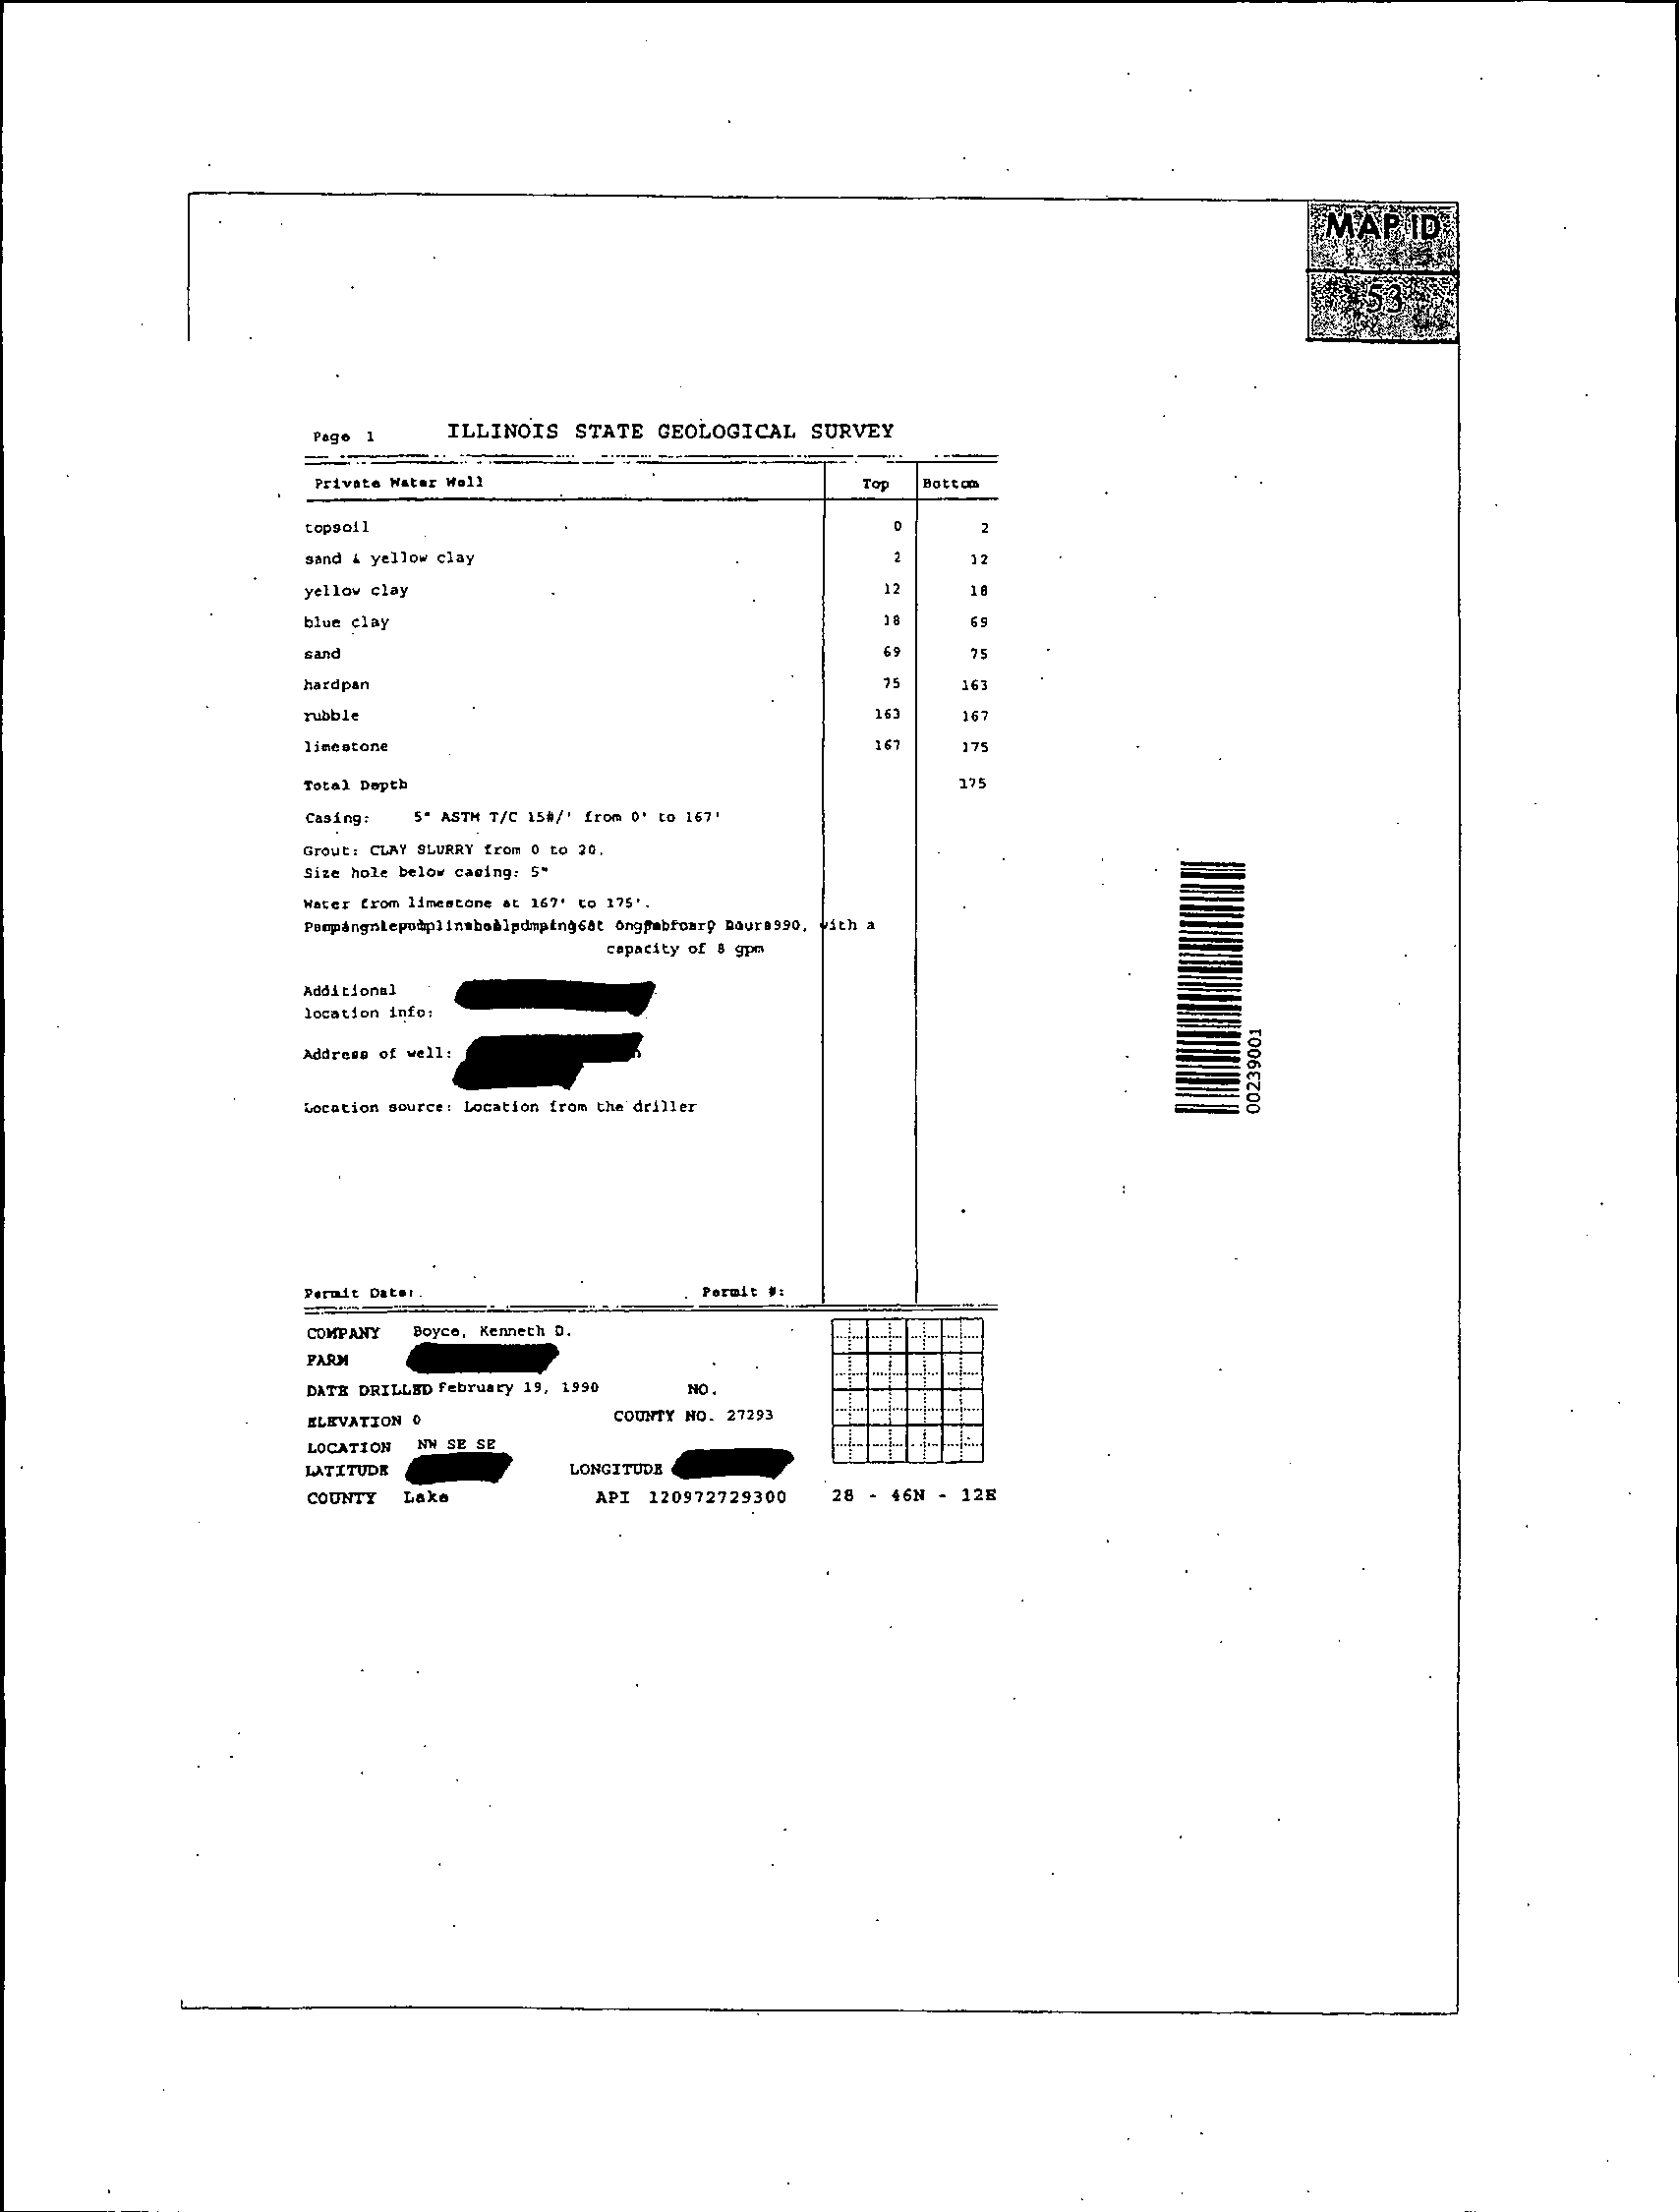
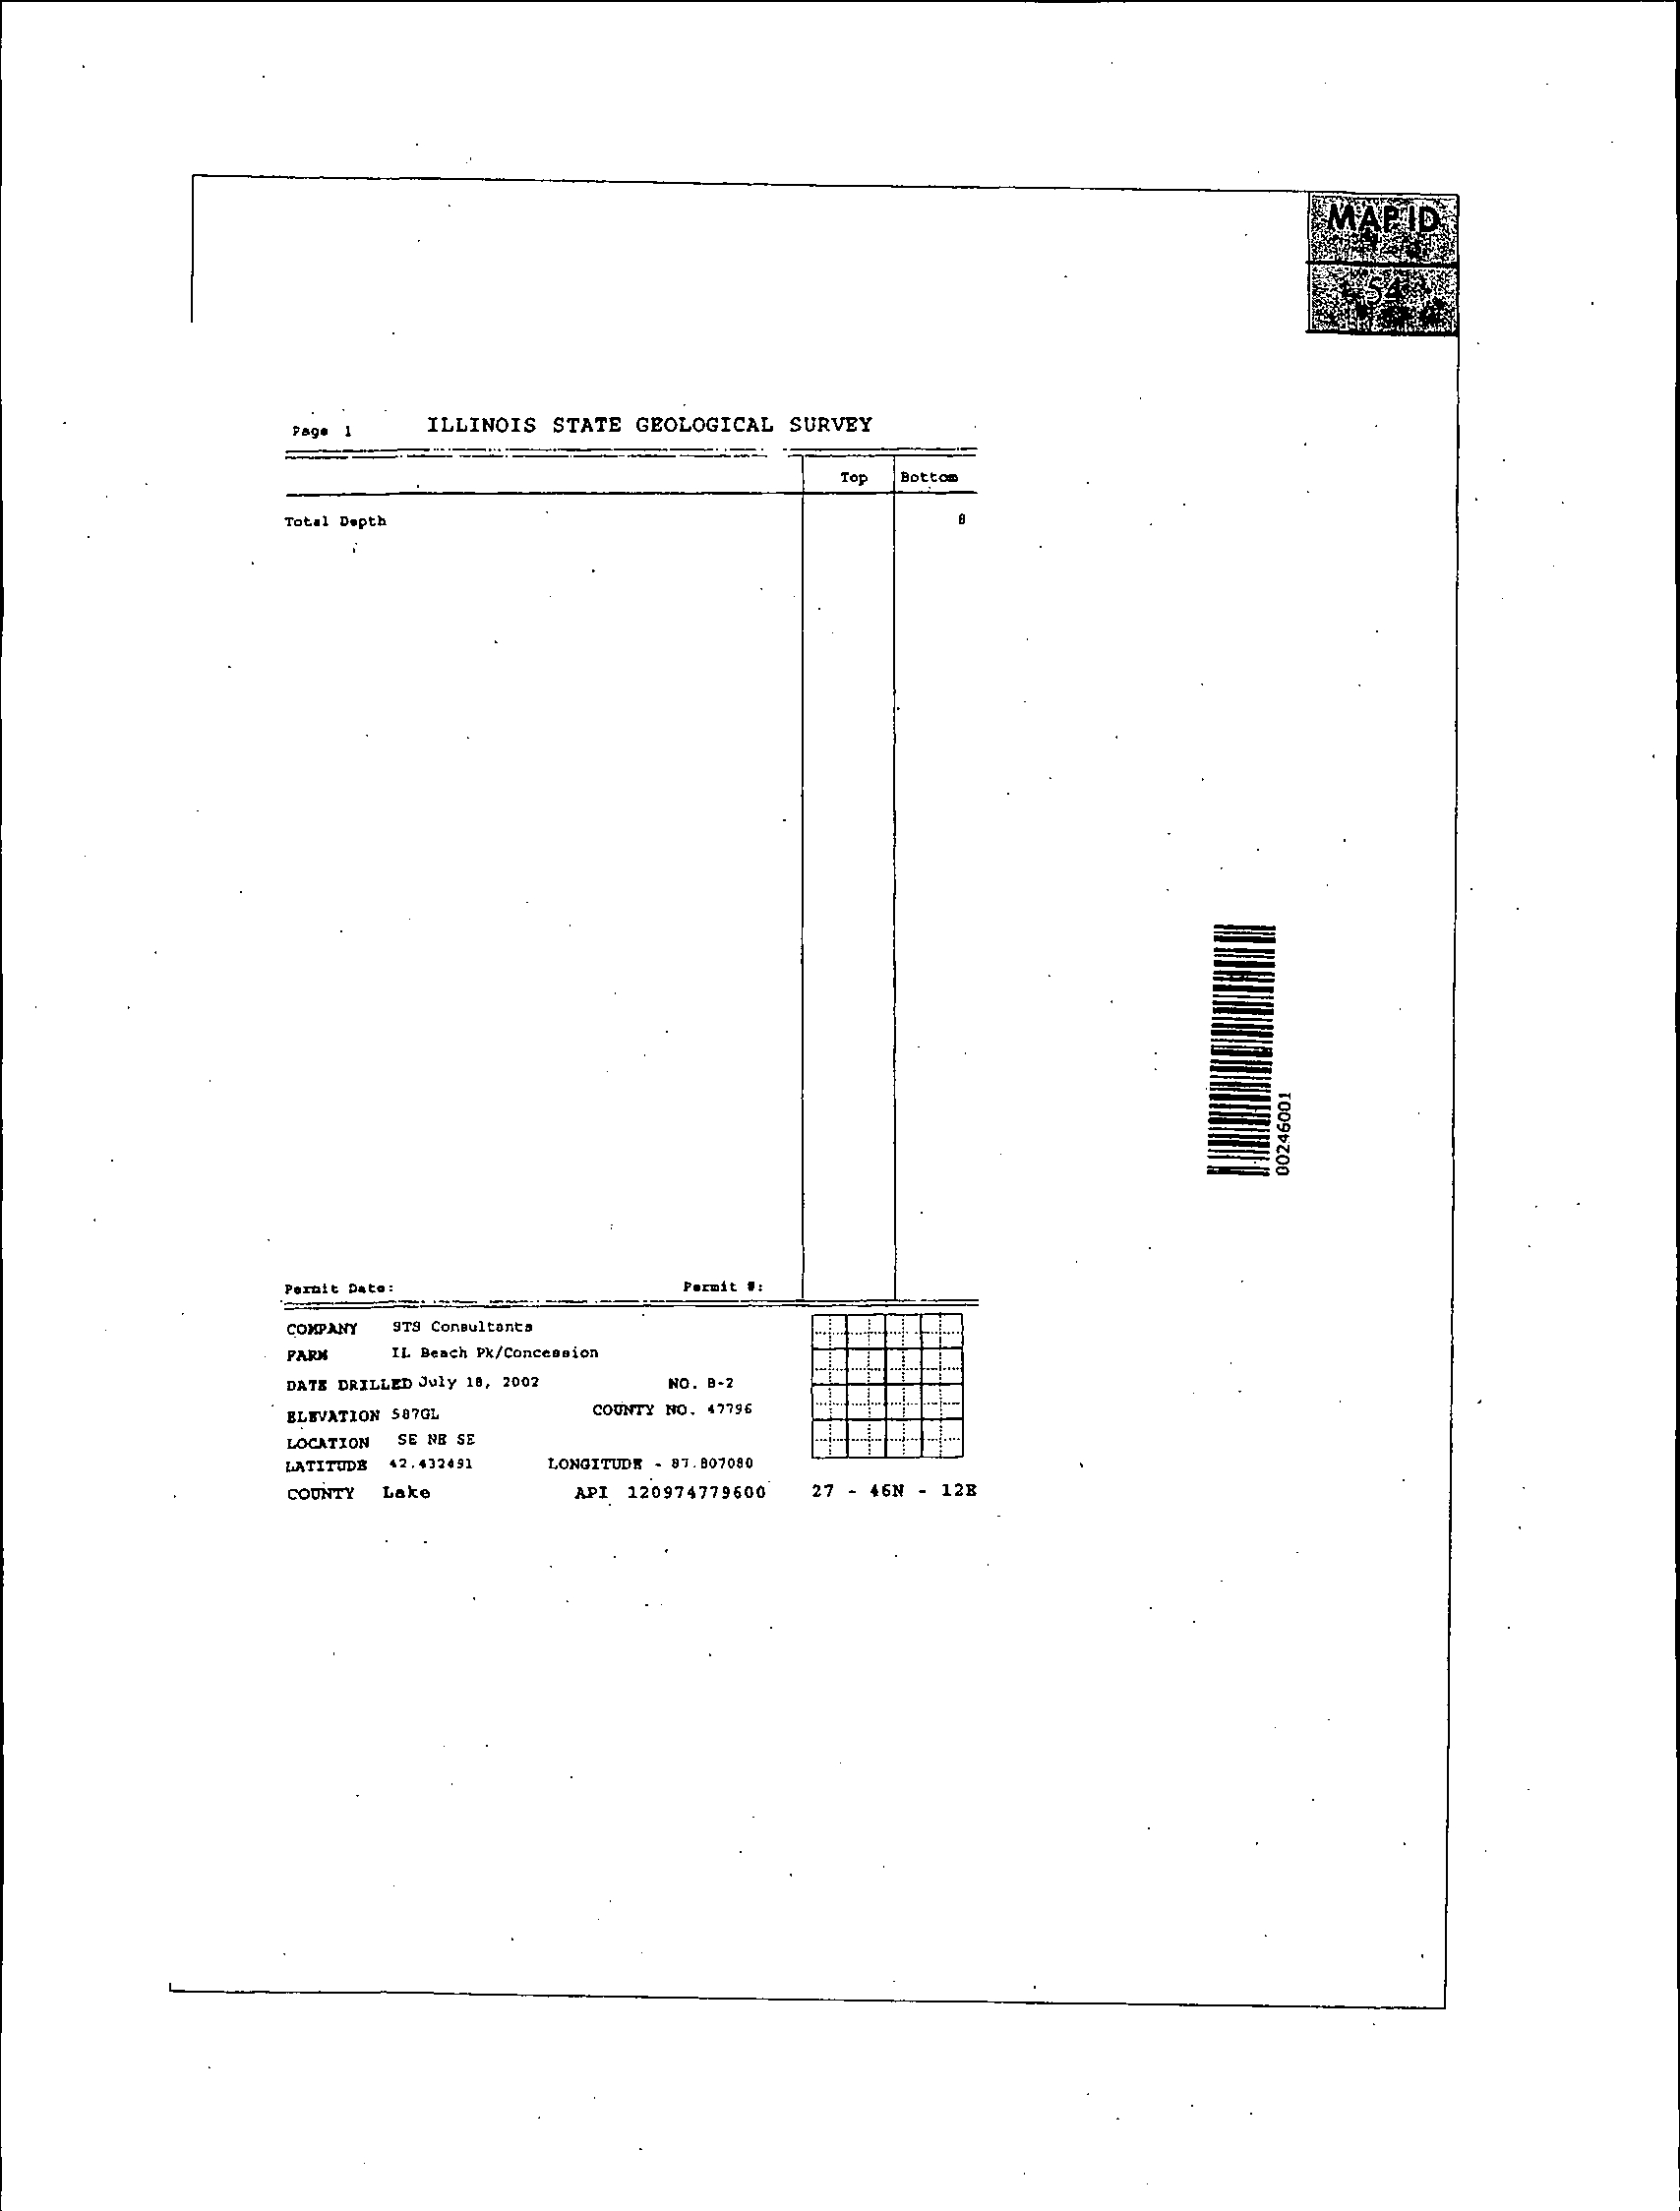
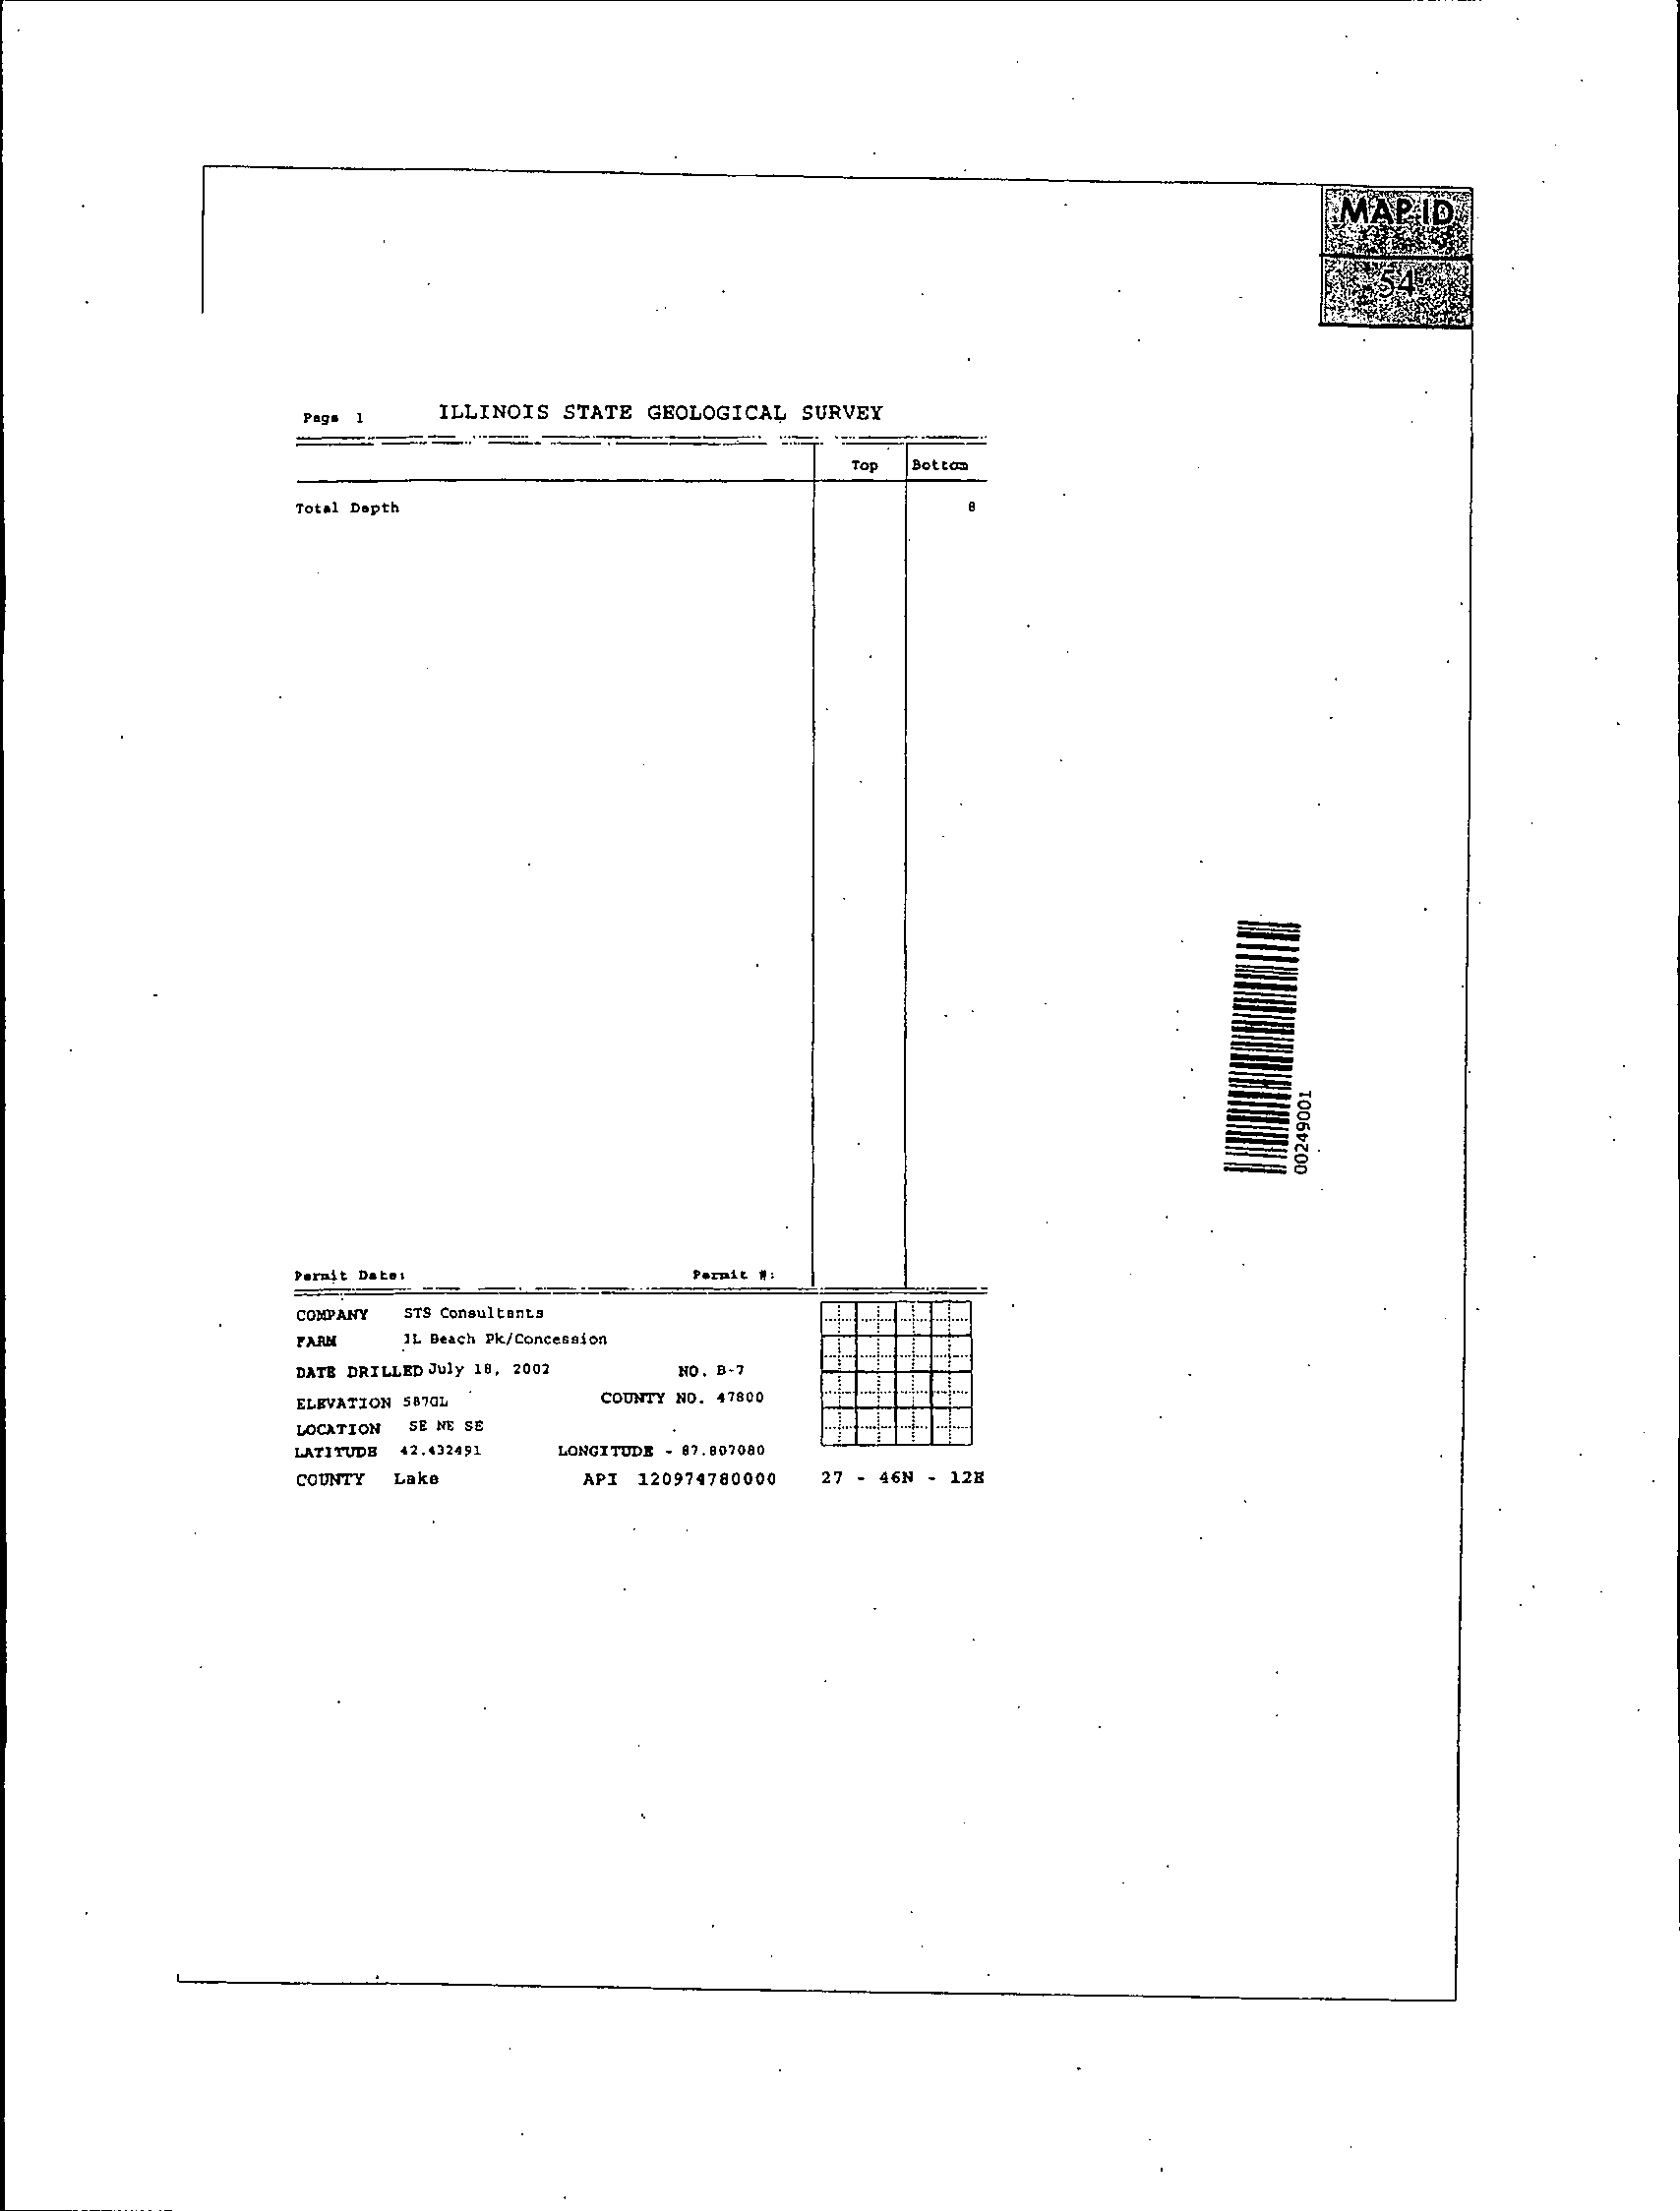
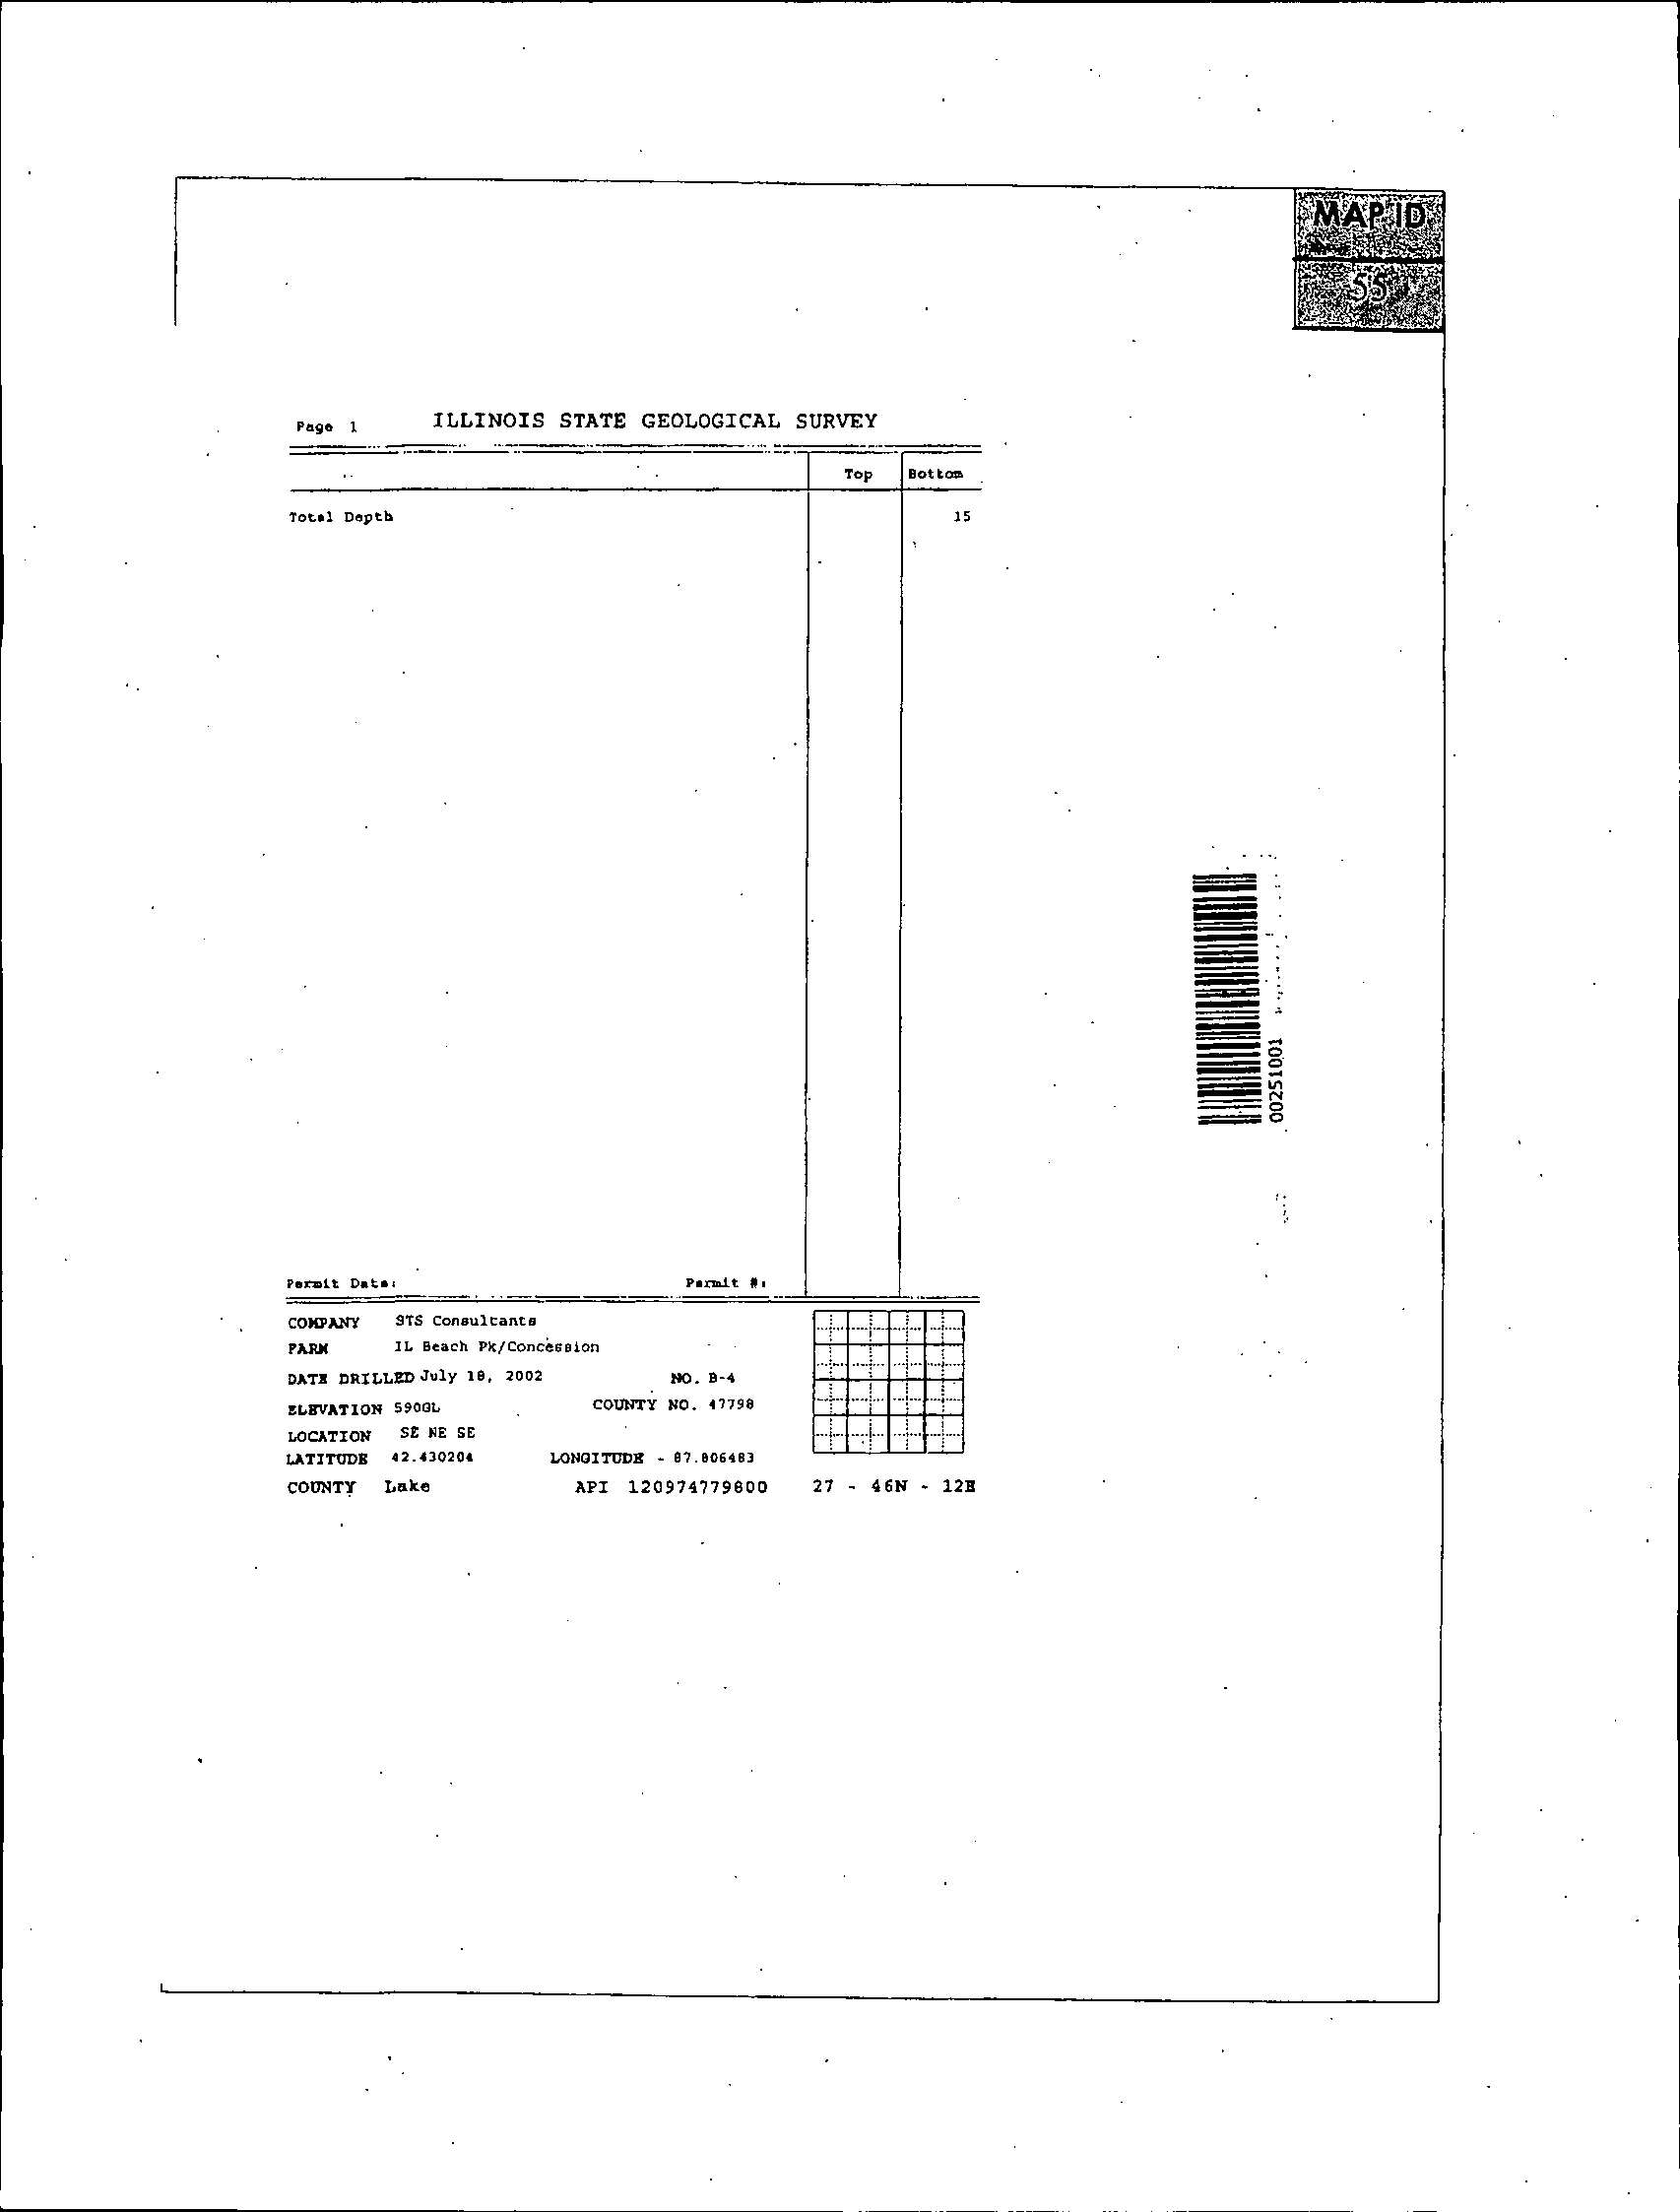
The well records for locations nearest to the Station (map identifiers 5, 6, and 10) are
mis-located (Map Id. 5
1
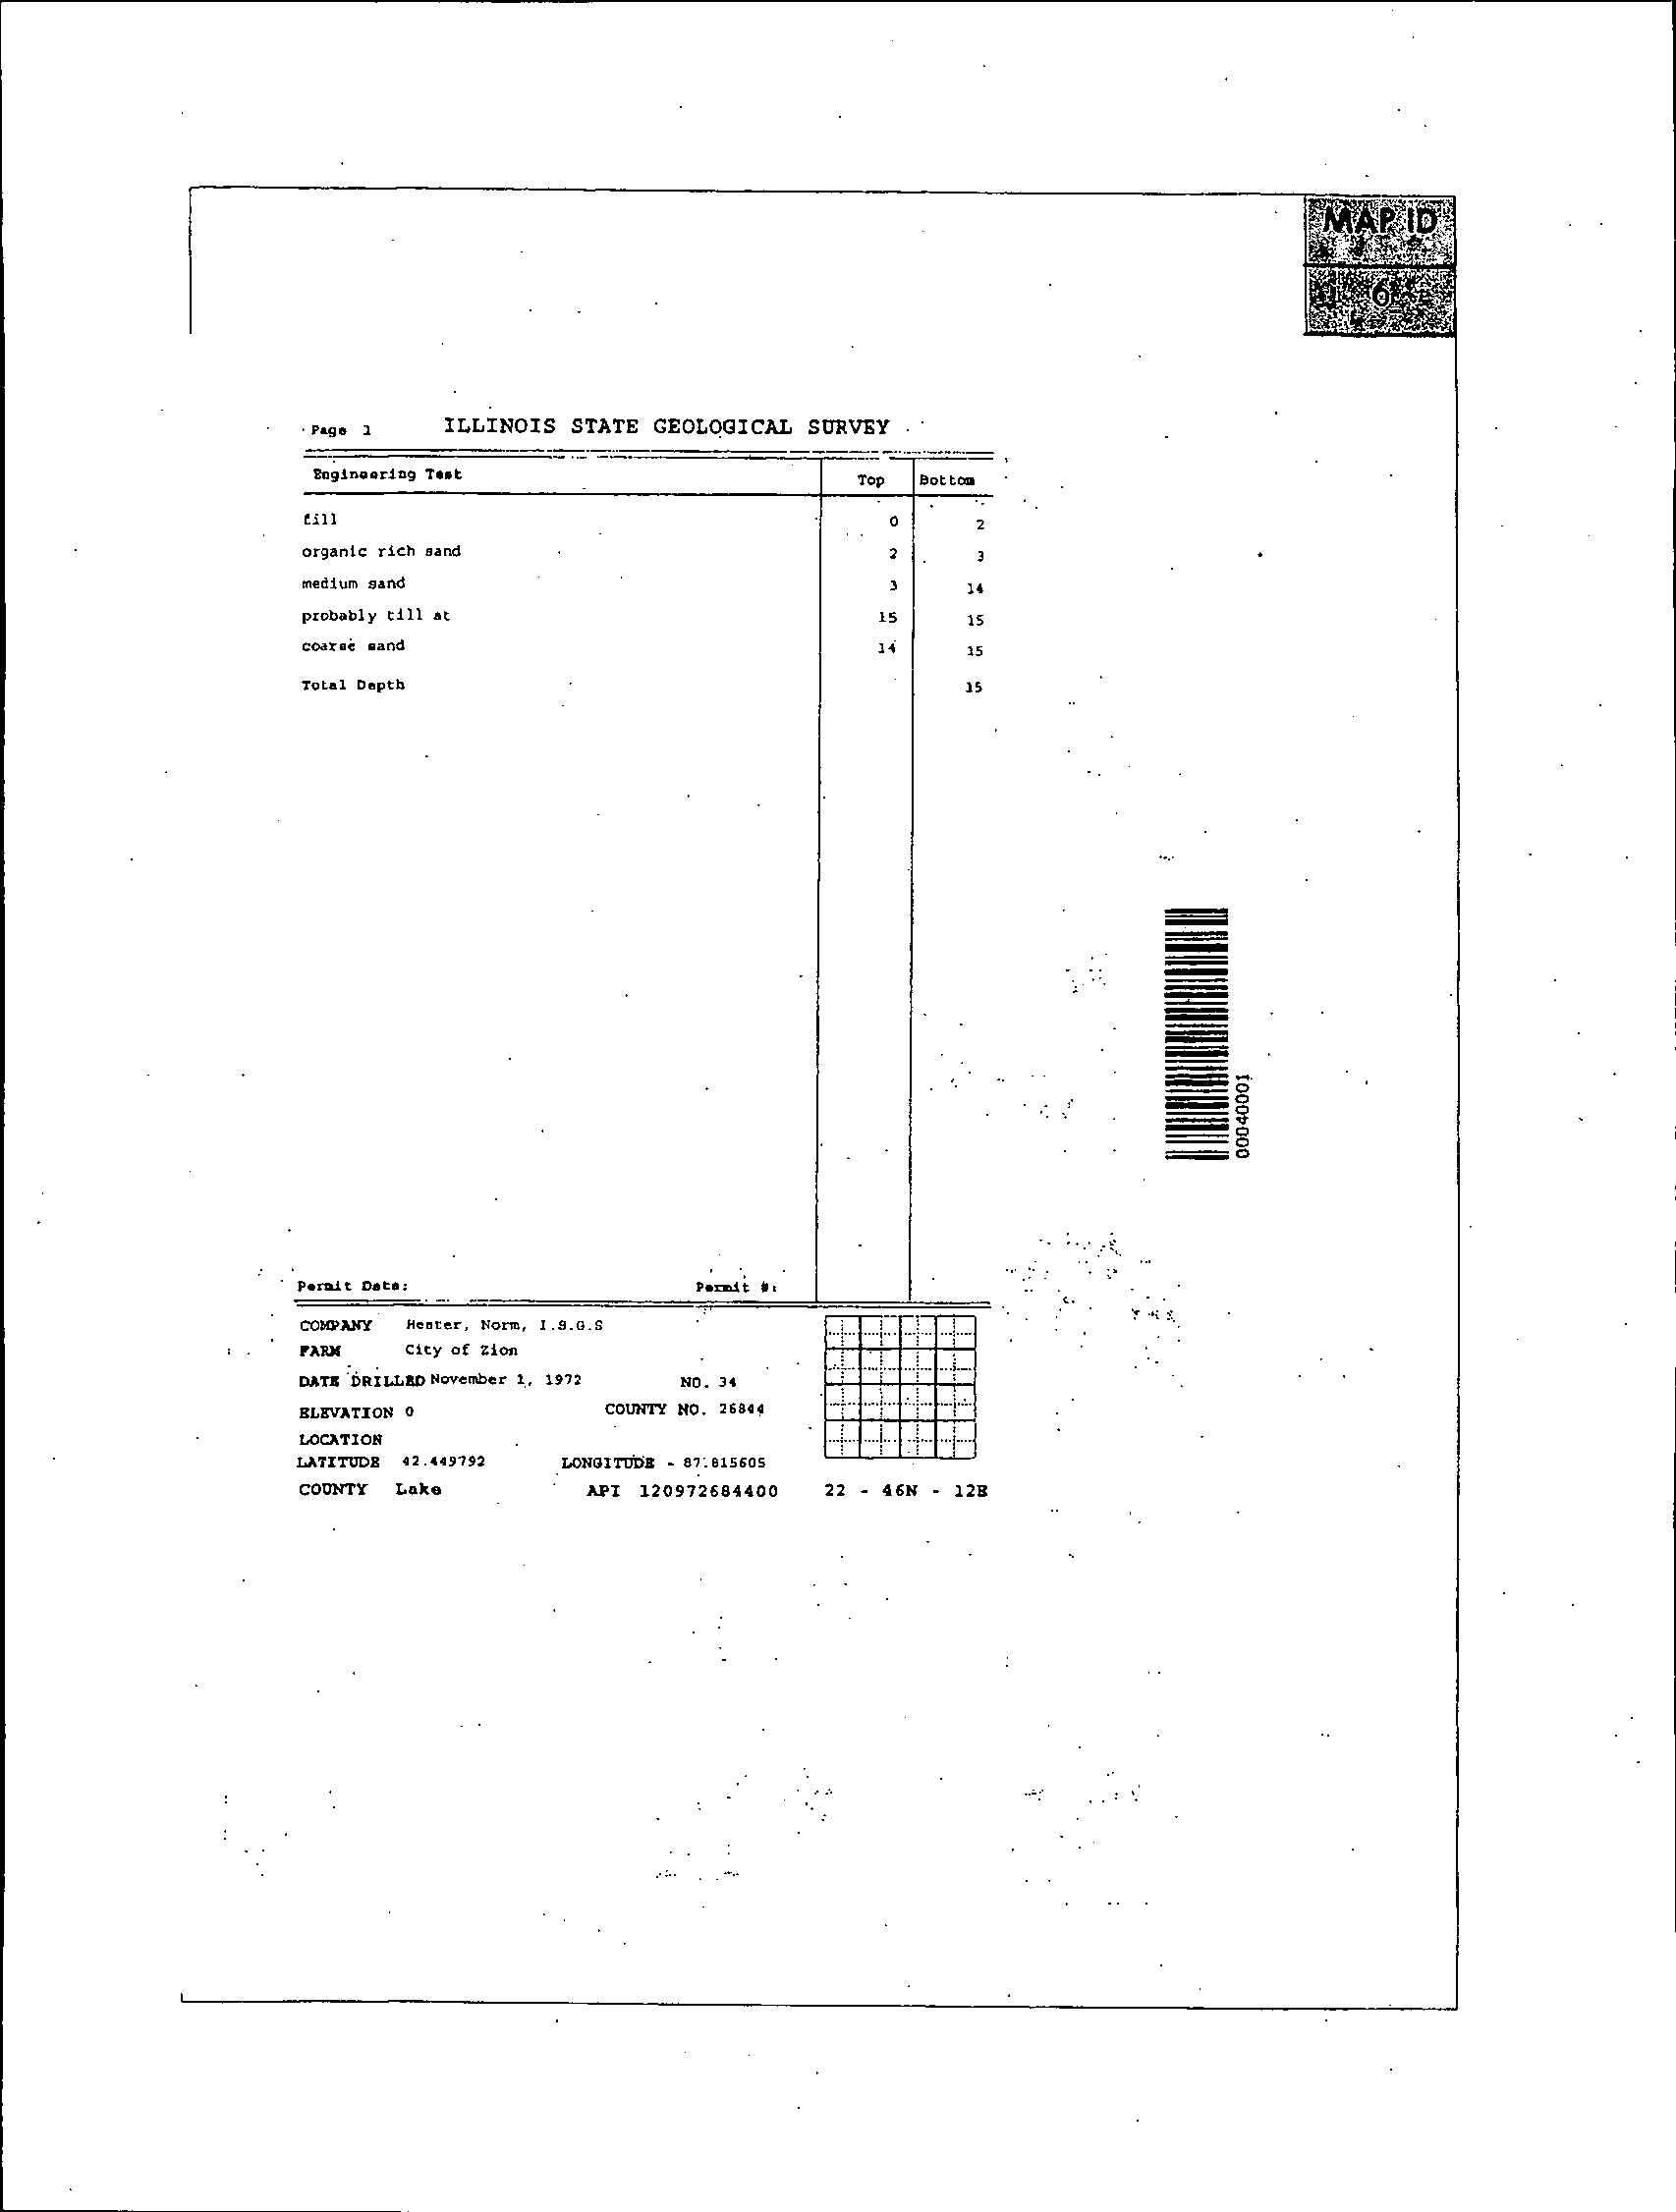
), not a water well (Map Id. 6
2
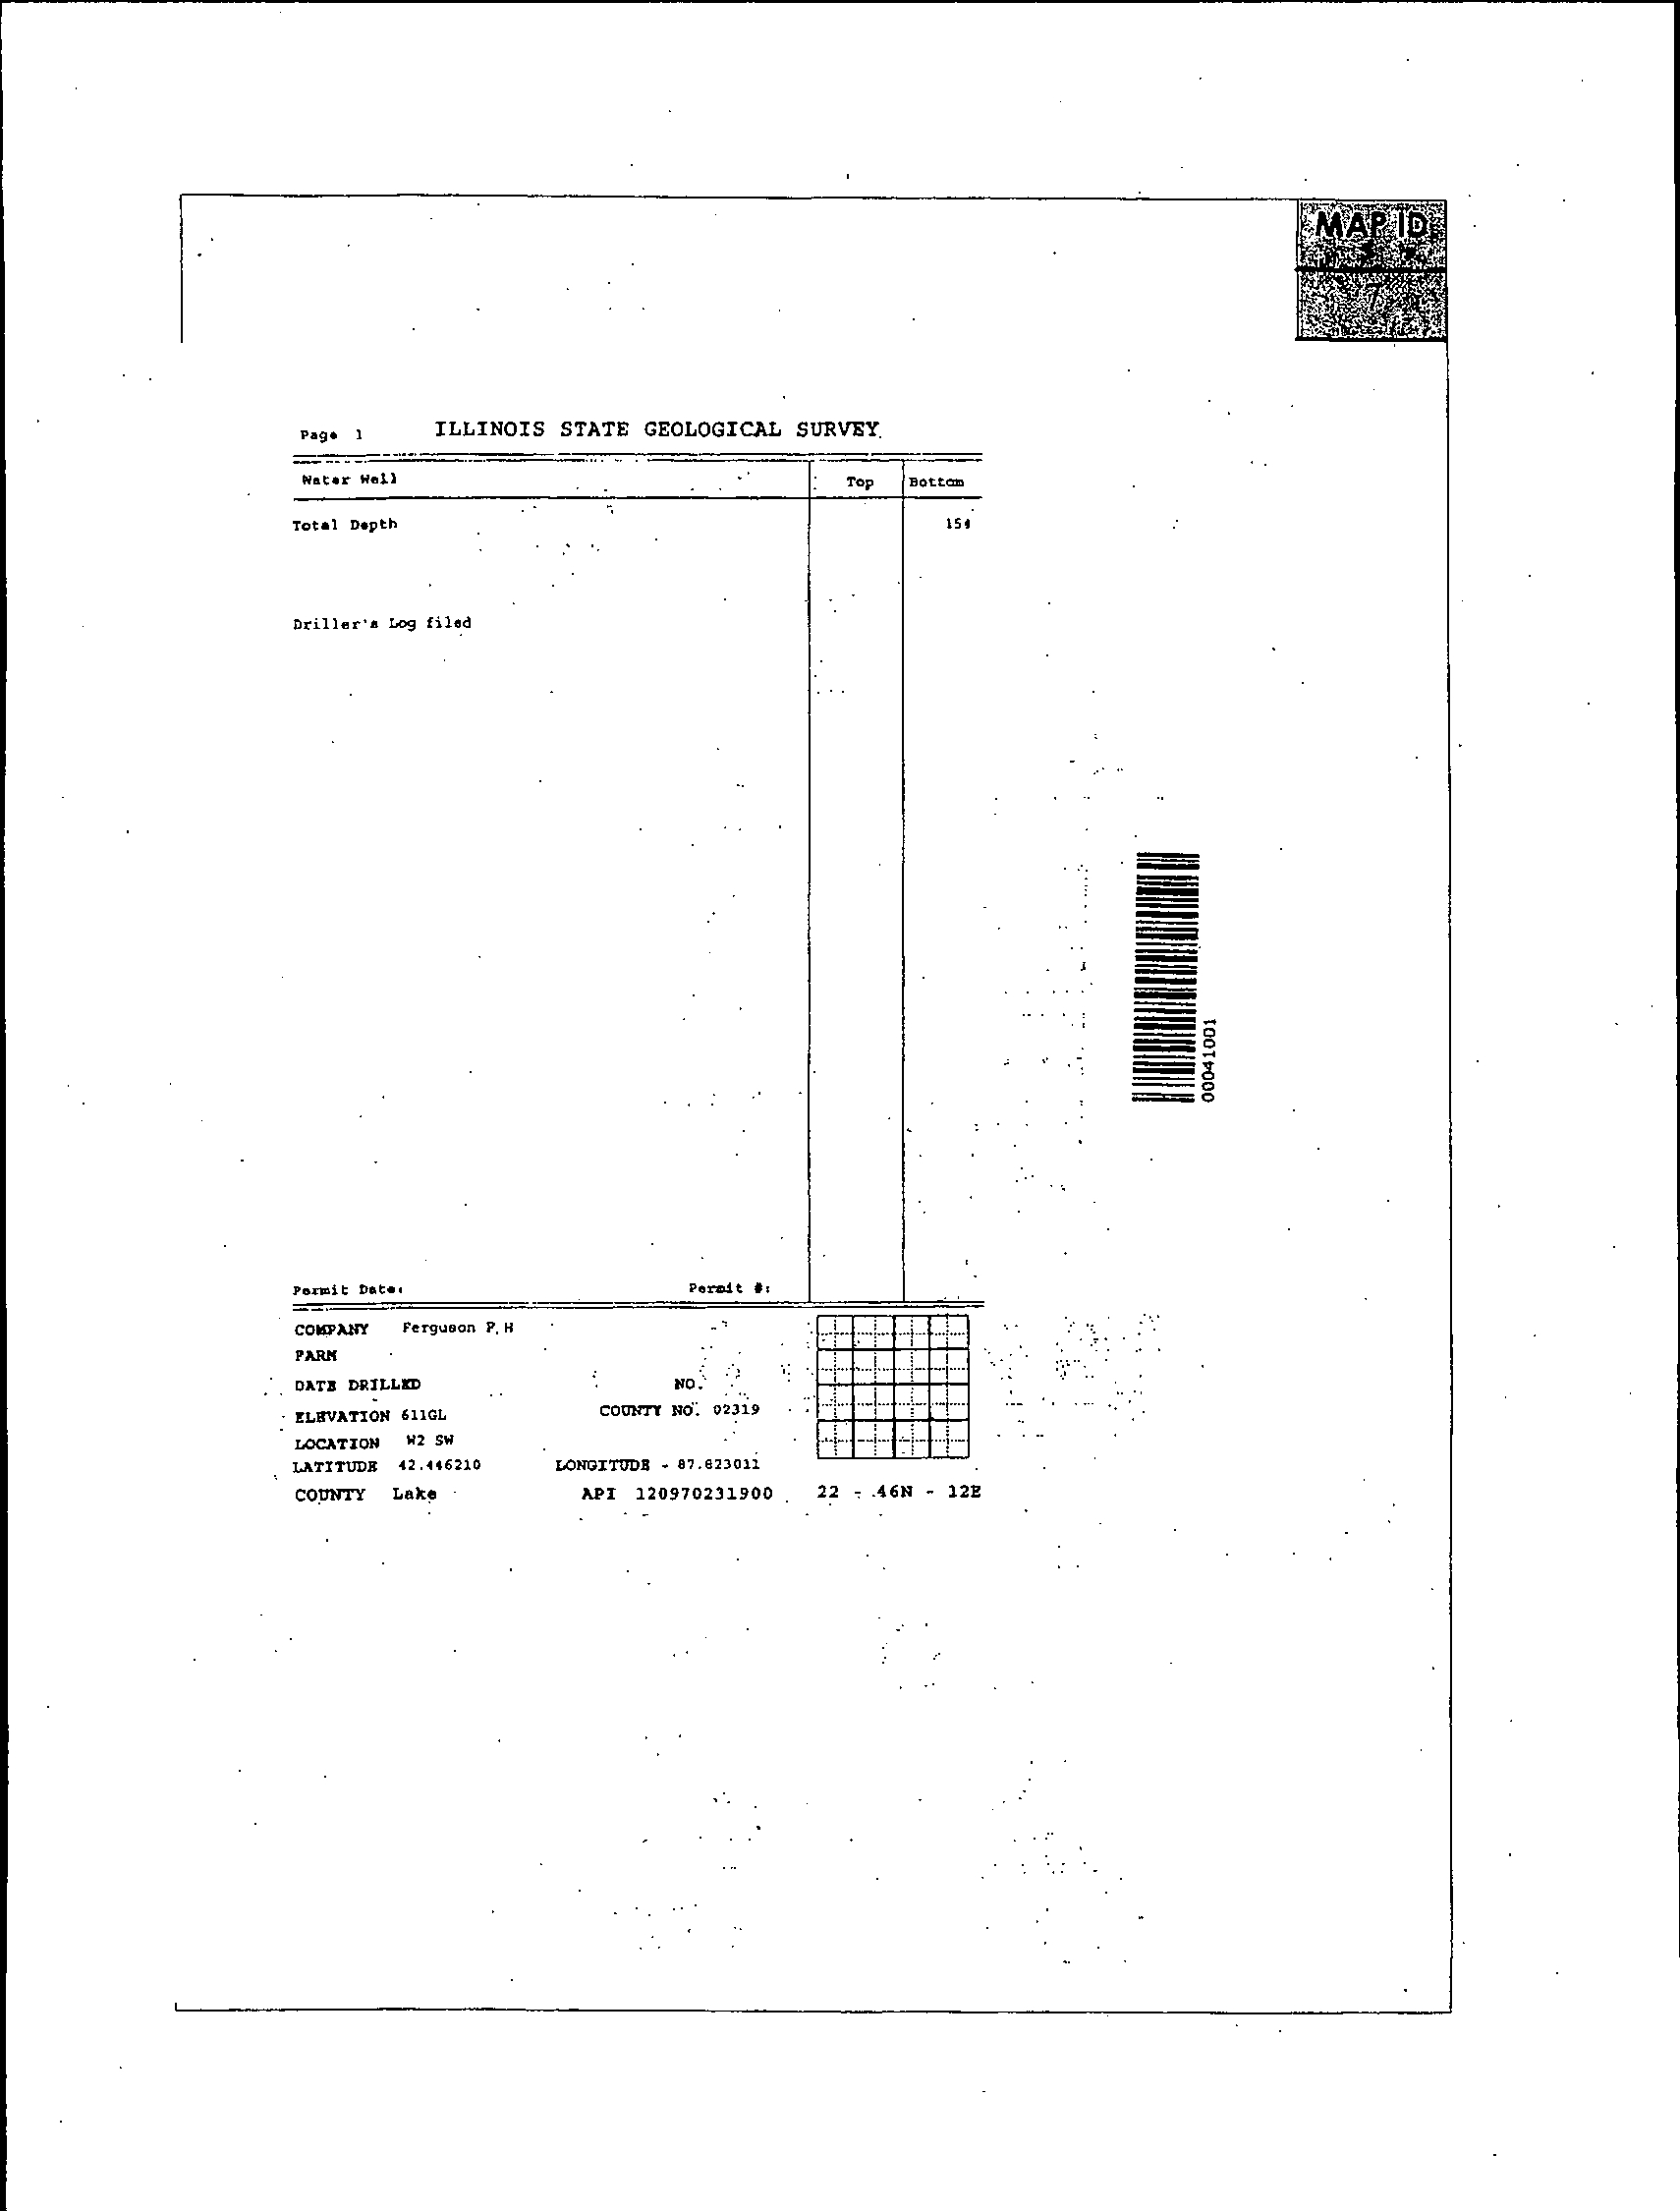
), or no longer exist (Map Ids. 6
and 10
3
). With the exception of Map Ids. 6 and 10, the wells identified in the water well
report have not been field verified and it is expected that many of the wells listed have
been abandoned.
The City of Zion provides municipal water to the City residents and the surrounding
area. The City purchases water from the Lake County Public Water District (LCPWD).
The LCPWD obtains its water from Lake Michigan by means of an intake pipe located
approximately 1.1 mile north of the Station and extending 3,000 feet into the Lake. The
City of Zion municipal code requires all improved properties to be connected to the
City's water supply. It is "unlawful for any person to construct, permit or maintain a
private well or water supply system within the City which uses groundwater as a
potable water supply" (City of Zion, 2004). The only exception is for existing wells
constructed prior to March 2, 2004 at properties located more than 100 feet from the
municipal supply system, which must: 1) enter into an agreement with the City, and
2) demonstrate that the well water is unlikely to contain any contaminant at
concentrations exceeding the United States Environmental Protection Agency (USEPA)
drinking water standards (City of Zion, 2004).
The Station is connected to the Zion municipal water supply and does not use
groundwater in its operations. The Illinois Beach State Park is serviced by municipal
water.
1
Map ID 5 is a private water well at Lot #1, Beach Homeland subdivision, Beach Park, Illinois.
The latitude and longitude listed in the ISWS database is inconsistent with the address listed in
the well log (Beach Park is located between Zion and Waukegan).
2
Map ID 6 is an engineering test hole installed by Norm Hester of the ISGS on November 1, 1972.
The total depth was 15 feet. This boring was installed as part of a study documented in Fraser
and Hester (1974).
045136 (22) Zion Station
8
CONESTOGA-ROVERS & ASSOCIATES
3
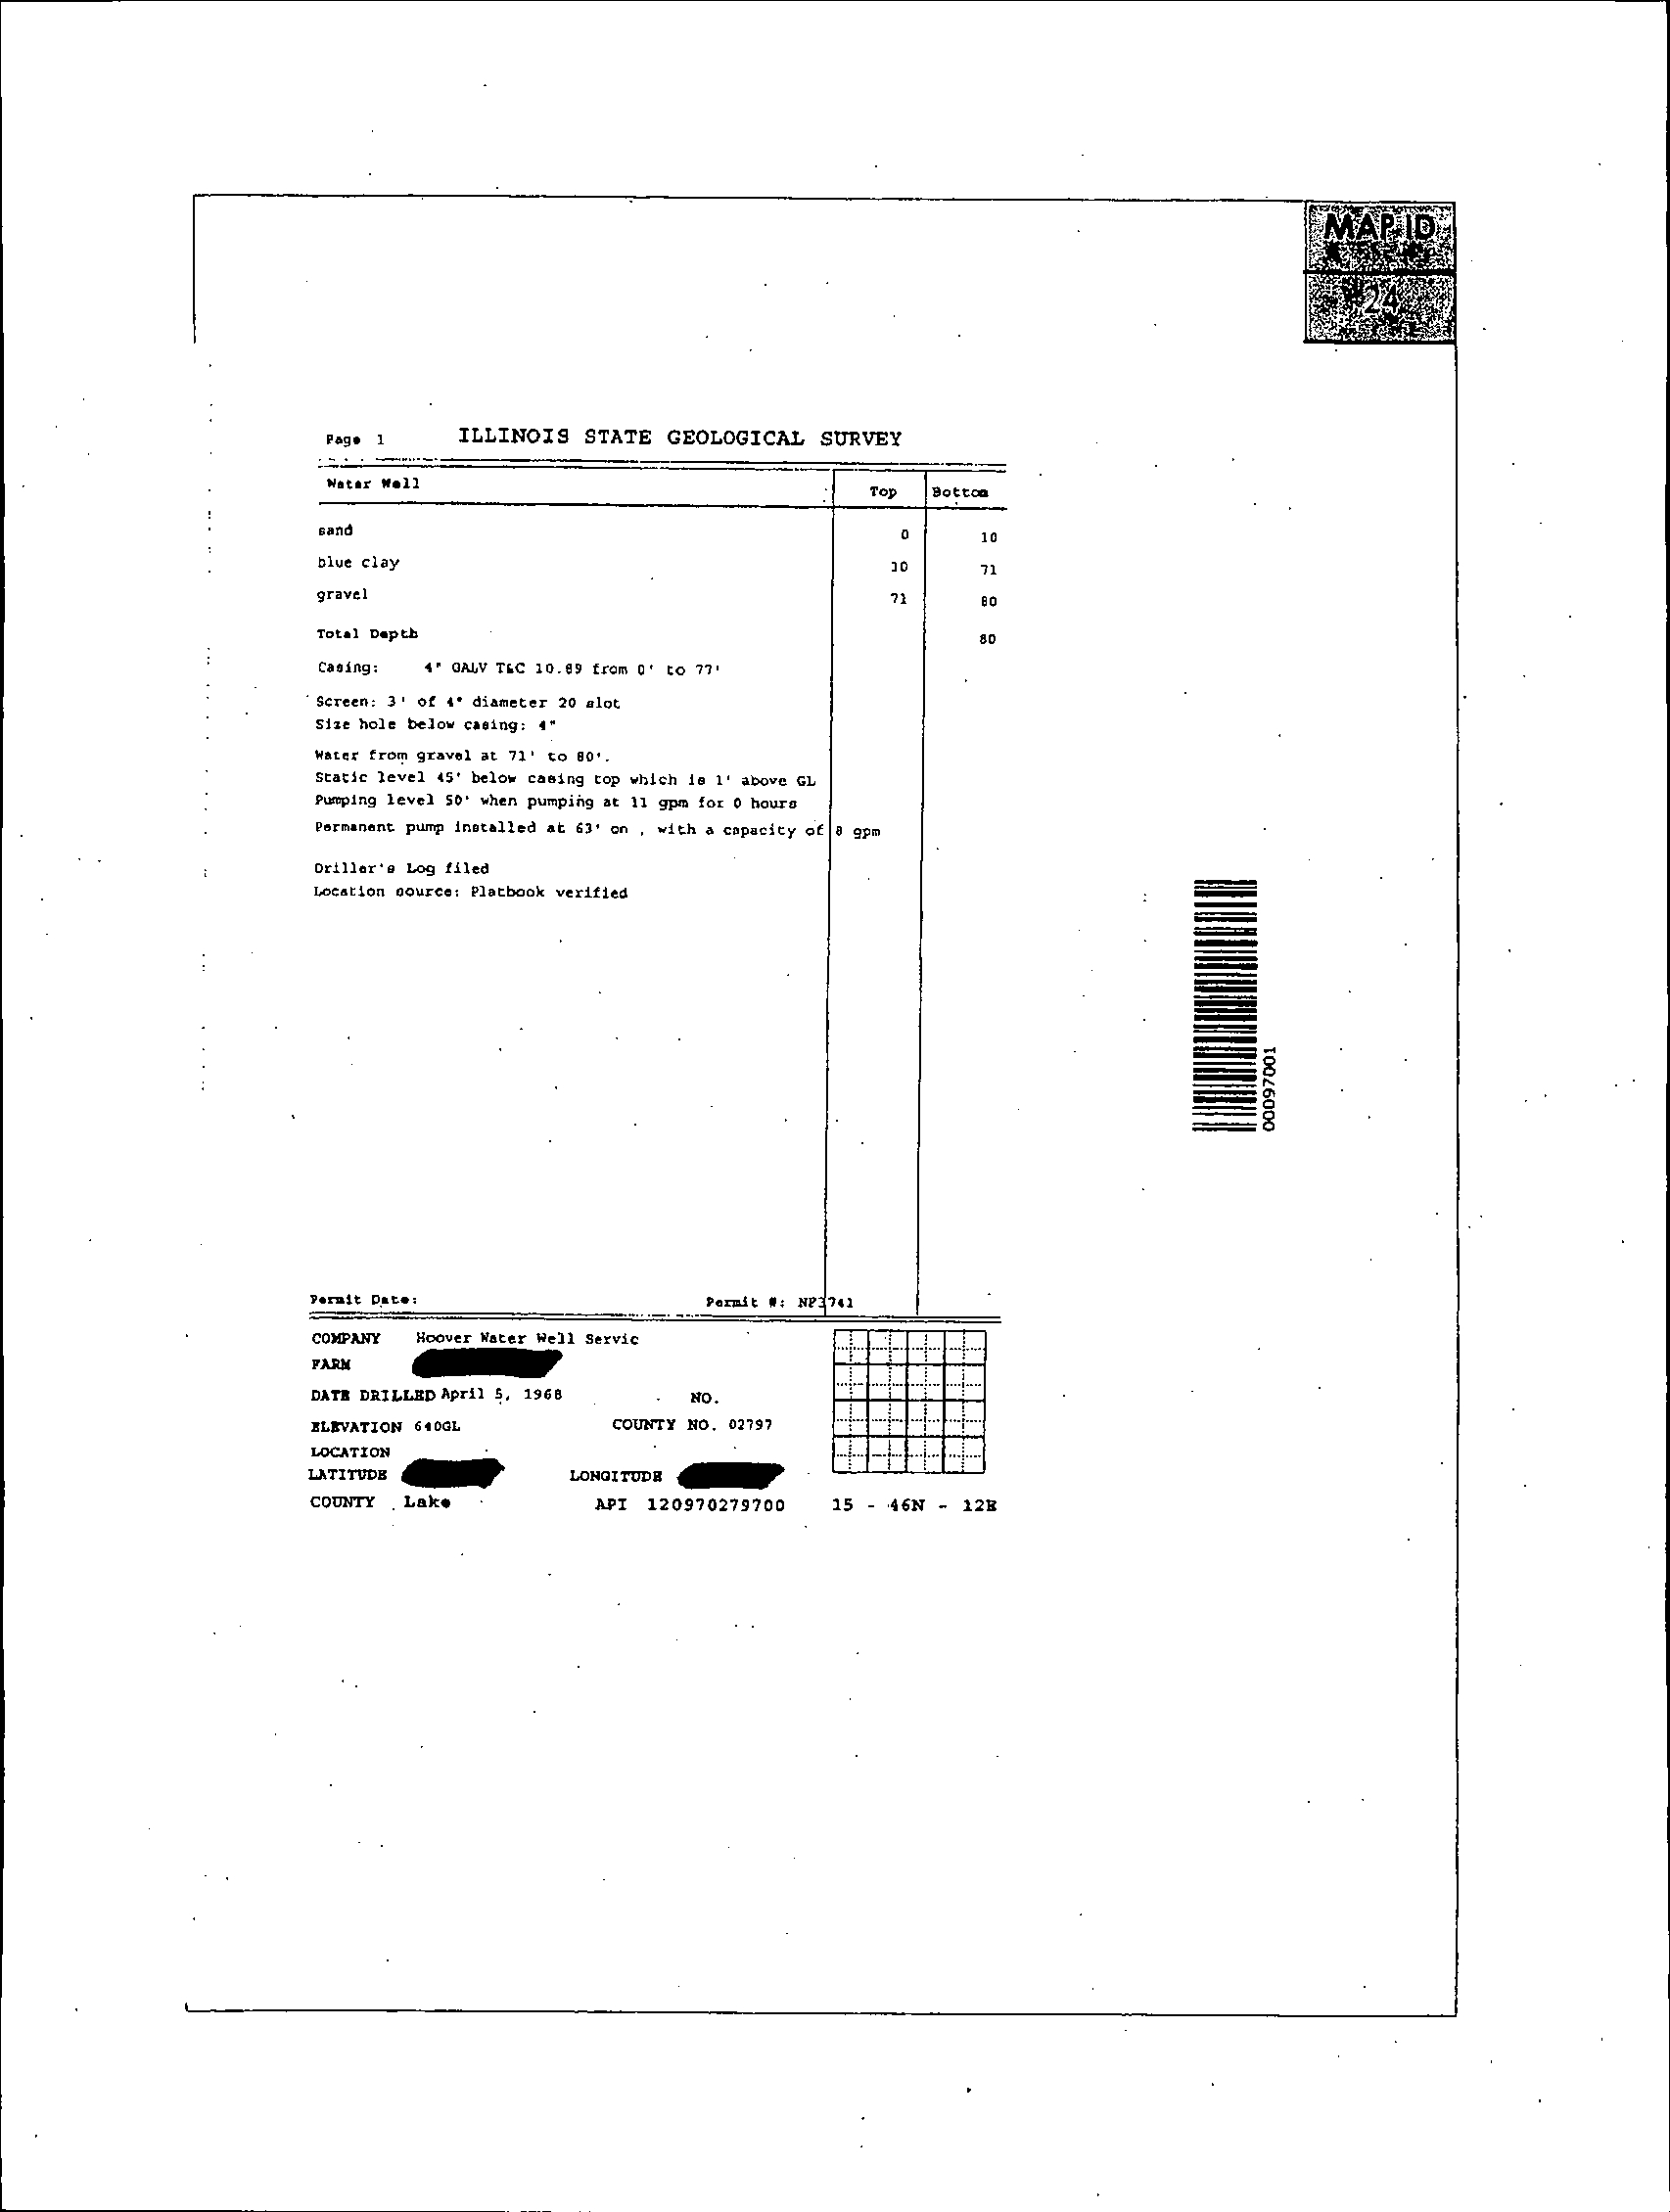
Map ID 10 is a water well installed by F H Ferguson at 'Zion Estates' at an unknown date. The
total depth of the well was 138 feet. The location specified in the well record (42.446046N,
87.800889W) indicates that this well was located on the eastern edge of what is now the Zion
Station. 'Zion Estates' may have been part of the Hosah Beach subdivision (see Bannon-Nilles
2003) which was purchased by ComEd in about 1967. This well is not currently present at the
Zion Station.
Revision 1
3.0
AREAS FOR FURTHER EVALUATION
CRA considered all Station operations in assessing groundwater quality at the Station.
During this process, CRA identified areas at the Station that warranted further
evaluation or "AFEs". This section discusses the process by which AFEs were selected.
CRA's identification of AFEs involved the following components:
•
Station inspection on March 22 to 23, 2006;
•
interviews with Station personnel;
•
evaluation of Station systems;
•
investigation of confirmed and unconfirmed releases of radionuclides; and
•
review of previous Station investigations.
CRA analyzed the information collected from these components combined with
information obtained from CRA's study of hydrogeologic conditions at the Station to
identify those areas where groundwater potentially could be impacted from operations
at the Station.
CRA then designed an investigation to determine whether any confirmed or potential
releases or any other release of radionuclides adversely affected groundwater. This
entailed evaluating whether existing Station groundwater monitoring systems were
sufficient to assess the groundwater quality at the AFEs. If the systems were not
sufficient to adequately investigate groundwater quality associated with any AFE,
additional monitoring wells were installed by CRA.
The following sections describe the above considerations and the identification of AFEs.
The results of CRA's investigation are discussed in Section 5.0.
3.1
SYSTEMS EVALUATIONS
Exelon launched an initiative to systematically assess the structures, systems and
components that store, use, or convey potentially radioactively contaminated liquids.
Maps depicting each of these systems were developed and provided to CRA for review.
The locations of these systems are presented on Figure 3.1. The Station identified a total
of 17 systems that contain or could contain potentially radioactively contaminated
liquids. The following presents a list of these systems.
045136 (22) Zion Station
9
CONESTOGA-ROVERS & ASSOCIATES
Revision 1
System Identification
Description
AD
Auxiliary Drains
AX
Auxiliary Steam
BD
Blowdown System
CF
Cavity Fill
CW
Circulating Water
VC
Chemical and Volume Control
CC
Component Cooling
CD/SC
Condensate and Condensate Storage
MS
Main Steam
PW
Primary Water
RR
Resin Removal
SI
Safety Injection
SW
Service Water
SF
Spent Fuel
TD
Turbine Building Drains
WD
Waste Disposal
WT
Waste Water
After these systems were identified, Exelon developed a list of the various structures,
components and areas of the systems (e.g., piping, tanks, and process equipment) that
handle or could potentially handle any radioactively contaminated liquids.
The
structures, components, and areas may include:
•
aboveground storage tanks;
•
condensate vents;
•
areas where confirmed or potential historical releases, spills, or accidental discharges
may have occurred;
•
pipes;
•
pools;
•
sumps;
•
surface water bodies (i.e., basins, pits, ponds, or lagoons);
•
trenches;
•
underground storage tanks; and
•
vaults.
045136 (22) Zion Station
10
CONESTOGA-ROVERS & ASSOCIATES
Revision 1
The Station then individually evaluated the various system components to determine
the potential for any release of radioactively contaminated liquid to enter the
environment.
Each structure or identified component was evaluated against the
following seven primary criteria:
•
location of the component (i.e., basement or second floor of building);
•
component construction material (i.e., stainless steel or steel tanks);
•
construction methodologies (i.e., welded or mechanical pipe joints);
•
concentration of radioactively contaminated liquid stored or conveyed;
•
amount of radioactively contaminated liquid stored or conveyed;
•
existing controls (i.e., containment and detection); and
•
maintenance history.
System components, which were located inside a building or that otherwise had some
form of secondary containment, such that a release of radioactively contaminated liquid
would not be discharged directly to the environment, were eliminated from further
evaluation. System components that are not located within buildings or did not have
some other form of secondary containment were retained for further qualitative
evaluation of the risk of a release of radioactively contaminated liquid to the
environment and the potential magnitude of any release.
Exelon's risk evaluation took into consideration factors such as:
•
the potential concentration of radionuclides;
•
the volume of liquid stored or managed;
•
the probabilities of the systems actually containing radioactively contaminated
liquid; and
•
the potential for a release of radioactively contaminated liquid from the system
component.
These factors were then used to rank the systems and system components according to
the risk for a potential release of a radioactively contaminated liquid to the environment.
The evaluation process resulted in the identification of structures, components, and
areas to be considered for further evaluation.
045136 (22) Zion Station
11
CONESTOGA-ROVERS & ASSOCIATES
Revision 1
3.2
HISTORICAL RELEASES
CRA also reviewed information concerning confirmed or potential historical releases of
radionuclides at the Station, including reports and documents previously prepared by
Exelon and compiled for CRA's review. CRA evaluated this information in identifying
the AFEs. Any historical releases identified during the course of this assessment that
may have a current impact on Station conditions are further discussed in Section 3.4.
3.3
STATION INVESTIGATIONS
CRA considered previous Station investigations in the process of selecting the AFEs for
the Station. This section presents a summary of the pre-operational radiological
environmental monitoring program (pre-operational REMP), past station investigations,
and the radiological environmental monitoring program (REMP).
3.3.1
PRE-OPERATIONAL RADIOLOGICAL
ENVIRONMENTAL MONITORING PROGRAM
A pre-operational REMP was conducted to establish background radioactivity levels
prior to operation of the Station. The environmental media sampled and analyzed
during the pre-operational REMP were surface water, well water, air particulates, milk,
locally grown vegetables, and aquatic plants and animals (ComEd, 1971). The results of
the monitoring were detailed in the report entitled, 1971 Zion Station Final Safety
Analysis Report, December 1971.
The pre-operational REMP report noted that surface water was sampled at five public
water intakes. Generally, the gross beta radioactivity of Lake Michigan was less than
10 picoCuries per liter (pCi/L) with typical concentrations between 3 pCi/L to 6 pCi/L.
Gross alpha radioactivity was typically less than 3 pCi/L (ComEd, 1971).
Tritium levels in Lake Michigan water were studied in the vicinity of Zion Station
throughout 1970. The concentration of tritium in the surface water samples from the
Lake at Zion ranged from approximately 311
±
20 pCi/L to 374
±
34 pCi/L and averaged
340 pCi/L. There was no statistical difference in average tritium concentrations among
the stations (eight stations from Kenosha to Waukegan) (ComEd, 1971).
045136 (22) Zion Station
12
CONESTOGA-ROVERS & ASSOCIATES
Revision 1
1973 Aerial Radiological Measuring System
An Aerial Radiological Measuring System (ARMS) survey was conducted at the Station
prior to the startup of the reactors in 1973. The ARMS survey was conducted using
small aircraft flying at an altitude between 300 and 500 feet.
Ground-based
measurements were obtained from two locations as part of the study.
Tritium
measurements were not included in the ARMS survey (ComEd, 1999).
The ARMS survey showed that cosmic ray exposure rate was substantially less than the
northern Illinois background radiation level (ComEd, 1999).
Soil samples contained small concentrations of uranium-238 and thorium-232.
Cesium-137 activity in soil samples ranged from 0.276 to 0.40 picoCuries per gram
(pCi/g) (ComEd, 1999).
3.3.2
RADIOLOGICAL ENVIRONMENTAL MONITORING PROGRAM
The REMP at the Station was initiated in 1973. The REMP includes the collection of
multi-media samples including air, surface water, groundwater, fish, sediment, and
vegetation. The samples are analyzed for beta and gamma-emitting radionuclides,
tritium, iodine-131, and/or strontium as established in the procedures developed for the
REMP. The samples are collected at established locations, identified as stations, so that
trends in the data can be monitored.
An annual report is prepared providing a description of the activities performed and the
results of the analysis of the samples collected from the various media. The latest report
generated was prepared by Station personnel and is entitled Final Monthly Progress
Report to Exelon Nuclear, Radiological Environmental Monitoring Program – 2005. This
report concluded that the operation of the Station had no adverse radiological impact on
the environment. The annual report is submitted to the NRC.
Prior to the cessation of power generation in 1998, surface water samples were collected
at the following six locations along Lake Michigan:
•
Kenosha, Wisconsin (intake located 10 miles north of the Station);
•
Lake County Public Water District (intake located 1.1 miles north of the Station);
•
Waukegan, Illinois (intake located 6 miles south of the Station);
•
North Chicago, Illinois (intake located 10 miles south of the Station);
045136 (22) Zion Station
13
CONESTOGA-ROVERS & ASSOCIATES
Revision 1
•
Great Lakes NTS (intake located 13 miles south of the Station); and
•
Lake Forest, Illinois (intake located 16.5 miles south of the Station).
After 1998, surface water samples were collected at the following four locations along
Lake Michigan:
•
Kenosha, Wisconsin (intake located 10 miles north of the Station);
•
Lake County Public Water District (intake located 1.1 miles north of the Station);
•
Waukegan, Illinois (intake located 6 miles south of the Station); and
•
Lake Forest, Illinois (intake located 16.5 miles south of the Station).
Lake Michigan surface water data are collected as part of the REMP.
Tritium
concentrations in surface water samples from Lake Michigan ranged from
non-detect to 660 pCi/L.
3.3.3
DEFUELED SAFETY ANALYSIS REPORT
In October 2004, Exelon updated the Defueled Safety Analysis Report (DSAR). The
DSAR discusses the overall adequacy of the Station for safety, storing, and handling of
fuel and radioactive waste, and to monitor potential radiological effluent release paths.
It provides information on Station and local characteristics such as geography,
demography, meteorology, geology, and hydrogeology.
The DSAR states that intermittent liquid effluents from the Station will not affect
groundwater supplies in the adjacent area in excess of concentrations in 10 CFR 20 due
to local drainage patterns, release rates, and specific features of the sources of water
supplies.
The DSAR also states that the Station's radioactive liquid waste generated is collected,
treated and either recycled or discharged. Discharged liquid wastes are monitored to
assure compliance with 10 CFR 20. Radioactivity levels should not exceed permissible
concentrations at the cooling water outlet in Lake Michigan. The two closest municipal
water intakes are the LCPWD (approximately 1 mile north) and the Waukegan
Waterworks (approximately 6 miles south). The February 2005 REMP report indicates
that there have been no tritium concentrations detected in surface water samples at
concentrations exceeding the lower limit of detection (LLD) of 200 pCi/L.
045136 (22) Zion Station
14
CONESTOGA-ROVERS & ASSOCIATES
Revision 1
3.3.4
WISCONSIN DEPARTMENT OF HEALTH AND
FAMILY SERVICES MONITORING
The Wisconsin Public Health Statutes 254.41 mandates the Department of Health and
Family Services (DHFS) to conduct environmental radiation monitoring around the
nuclear power facilities that impact Wisconsin.
The Station is included in this
monitoring due to its proximity to the Wisconsin border.
In the 2004 Zion
Environmental Radioactivity Survey, the Wisconsin DHFS concluded:
•
air particulate analysis shows no evidence of influence by the Station on air quality;
•
the average yearly exposure of ambient gamma radiation is at background levels
and is comparable to other areas within Wisconsin;
•
the surface water samples showed no unusual concentrations of gross beta, gross
gamma, tritium, and strontium;
•
the gamma isotopic analysis for surface water indicated radioisotopes below their
respective minimum detectable concentration;
•
the gamma isotopic analysis on vegetation detected only a small amount of the
naturally occurring elements potassium-40 and beryllium-7;
•
the gamma isotopic analysis for soil detected potassium-40 and cesium-137. These
were also detected in previous years and are naturally occurring (potassium-40) or
attributable to fallout from previous atmospheric nuclear tests (cesium-137); and
•
doses of radiation as a result of gaseous and liquid effluent are less than the limits
allowed for an average individual as stated in Federal Regulations.
3.4
IDENTIFIED AREAS FOR FURTHER EVALUATION
CRA used the information presented in the above sections along with its understanding
of the hydrogeology at the Station to identify AFEs, which were a primary consideration
in the development of the scope of work in the Work Plan. The establishment of AFEs is
a standard planning practice in hydrogeologic investigations to focus the investigation
activities at areas where there is the greatest potential for impact to groundwater.
Specifically, AFEs were identified based on these six considerations:
•
systems evaluations;
•
risk evaluations;
•
review of confirmed and/or potential releases;
045136 (22) Zion Station
15
CONESTOGA-ROVERS & ASSOCIATES
Revision 1
•
review of documents;
•
review of the hydrogeologic conditions; and
•
Station inspection completed on March 22 and 23, 2006.
Prior to CRA completing its analysis and determination of AFEs, Station personnel
completed an exhaustive review of all historic and current management of systems that
may contain potentially radioactively contaminated liquids.
CRA reviewed the systems identified by the Station, which have the potential for the
release of radioactively contaminated liquids to the environment, and groundwater flow
at the Station. This evaluation allowed CRA to become familiar with Station operations
and potential systems that may impact groundwater. CRA then evaluated information
concerning historic releases as provided by the Station. This information, along with a
review of the results from historic site investigations, was used to refine CRA's
understanding of areas likely to have the highest possibility of impacting groundwater.
Where at risk systems or identified historical releases were located in close proximity or
were located in areas which could not be evaluated separately, the systems and
historical releases were combined into a single AFE. At times, during the Station
investigation, separate AFEs were combined into one or were otherwise altered based on
additional information and consideration. This HIR details the AFEs investigated.
Finally, CRA used its understanding of known hydrogeologic conditions (prior to this
investigation) to identify AFEs. Groundwater flow was an important factor in deciding
whether to combine systems or historical releases into a single AFE or create separate
AFEs. For example, groundwater beneath several systems that contain radioactively
contaminated liquids that flows toward a common discharge point were likely
combined into a single AFE. The AFEs were created based on known groundwater flow
conditions prior to the work completed during this investigation.
Based upon its review of information concerning confirmed or potential historical
releases, historic investigations, and the systems at the Station that have the potential for
release of radioactively contaminated liquids to the environment combined with its
understanding of groundwater flow at the Station, CRA has identified four AFEs (see
Figure 3.1).
045136 (22) Zion Station
16
CONESTOGA-ROVERS & ASSOCIATES
Revision 1
AFE-Zion-1: Main Complex Area
This area was identified to evaluate the main area of the facility, which includes the two
containment structures, the Fuel Building that contains spent fuel, the Auxiliary
Building, and the Turbine Building.
AFE-Zion-2: Unit 1 (Southern) Aboveground Storage Tank (AST) Area
This area was identified to evaluate the quality of groundwater in the area around the
Unit 1 systems including the primary water storage tank, the secondary condensate
tank, oil separator, discharge tunnel, and discharge outfall. This AFE was established
based on information regarding the storage, handling, and historical releases in this
area.
AFE-Zion-3: Unit 2 (Northern) AST Area
This area was identified to evaluate the quality of groundwater in the area around the
Unit 2 systems including the primary water storage tank, secondary condensate tank, oil
separator, discharge tunnel, and discharge outfall. This AFE was established based on
information regarding the storage, handling, and historical releases in this area.
AFE-Zion-4: Wastewater Treatment Plant Area
This area comprises the Wastewater Treatment Plant in the northeast corner of the
Station. Groundwater monitoring was initiated in this area of the Station to evaluate the
wastewater treatment and associated systems.
045136 (22) Zion Station
17
CONESTOGA-ROVERS & ASSOCIATES
Revision 1
4.0
FIELD METHODS
The field investigations completed for this HIR were completed in May to July 2006.
CRA supervised the installation of monitoring wells and a staff gauge, and collected
samples from the newly-installed monitoring wells and the surface water location. The
field investigations were completed in accordance with the methodologies presented in
the Work Plan (CRA, 2006).
The scope of work presented in the Work Plan included the installation and sampling of
nine permanent monitoring wells and the collection of a surface water sample. Based on
the concentrations of tritium detected in monitoring well MW-ZN-01S, additional
investigative activities were recommended by CRA, and implemented in June and
July 2006. The additional investigative tasks included a second round of sampling at
MW-ZN-01S and the installation and sampling of two permanent and four temporary
monitoring wells. The additional investigative activities provided plume delineation
and additional hydraulic information cross-gradient and down-gradient of MW-ZN-01S.
The groundwater sampling events undertaken as part of the investigation are:
•
May 24-26, 2006 sampling of MW-ZN-01S through MW-ZN-09S;
•
June 28, 2006 sampling of MW-ZN-01S (second round);
•
July 17, 2006 sampling of TW-ZN-100 through TW-ZN-103; and
•
July 28, 2006 sampling of MW-ZN-10S and MW-ZN-11S.
4.1
STAFF GAUGE INSTALLATION
Figure 4.1 presents the location of the staff gauge installed as part of this investigation.
CRA installed staff gauge SG-ZN-01, which is a notch in a bridge within the Intake Crib.
The Intake Crib is hydraulically connected to Lake Michigan via the intake tunnel that
extends approximately 1/2 mile into Lake Michigan.
4.2
GROUNDWATER MONITORING WELL INSTALLATION
Prior to completing any ground penetration activities, CRA completed subsurface utility
clearance procedures to minimize the potential of injury to workers and/or damage to
subsurface utility structures.
The subsurface clearance procedures consisted of
completing an electronic survey within a minimum of 10-foot radius of the proposed
location utilizing electromagnetic and ground penetrating radar technology.
045136 (22) Zion Station
18
CONESTOGA-ROVERS & ASSOCIATES
Revision 1
Additionally, a vacuum soft dig was used to verify utilities were not present at the
proposed location to a depth to 10 feet bgs.
Fifteen new monitoring wells were installed for the fleetwide hydrogeologic
investigation, including 11 permanent and 4 temporary monitoring wells. Monitoring
well construction logs are provided in Appendix B. Figure 4.1 presents the location of
the 15 new monitoring wells. These locations were selected based on a review of all data
provided, the hydrogeology at the Station, and current understanding of identified
AFEs, and modified based on conditions encountered during the investigation.
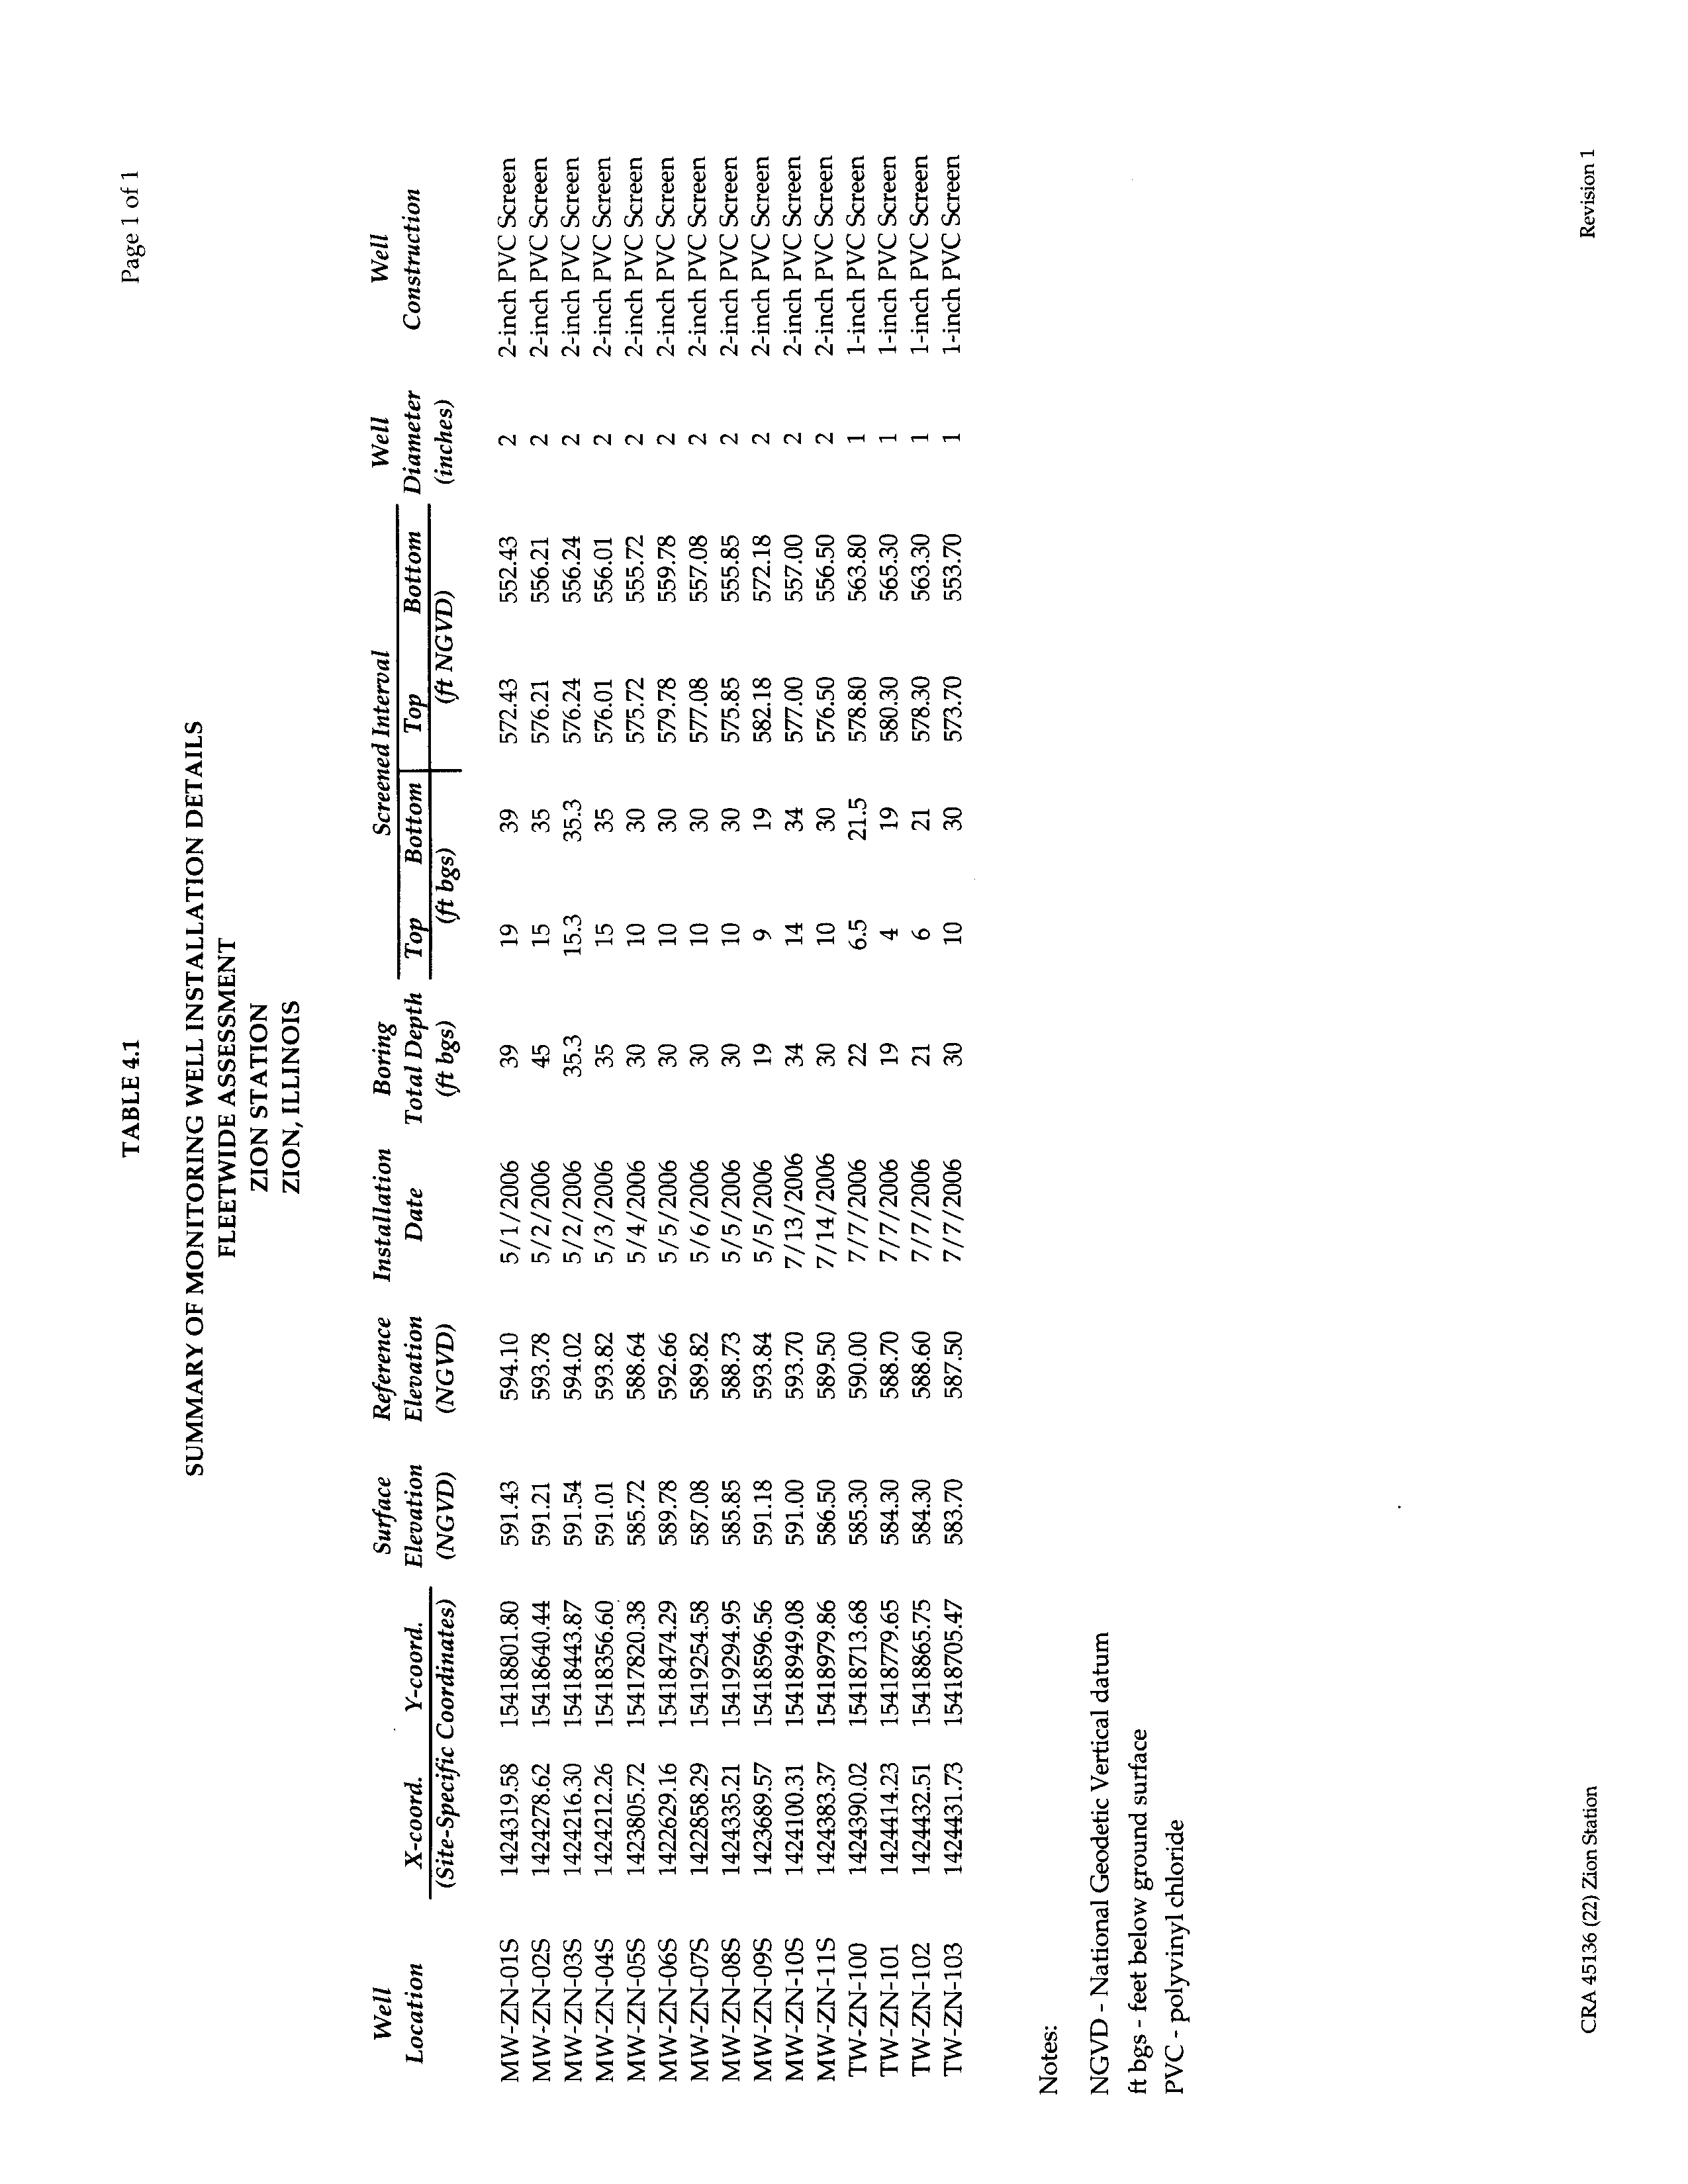
Table 4.1 summarizes the well installation details.
Specific installation protocols for the permanent monitoring wells are described below:
•
the borehole was advanced to the target depth using 4.25-inch inside diameter
hollow-stem augers (HSA);
•
a nominal 2-inch diameter (No. 10 slot) PVC screen, 10 or 20 feet in length, attached
to a sufficient length of 2-inch diameter schedule 40 PVC riser pipe to extend to the
surface, was placed into the borehole through the augers;
•
a filter sand pack consisting of silica sand was installed to a minimum height of
2 feet above the top of the screen as the augers were removed;
•
a minimum 2-foot thick seal consisting of 3/8-inch diameter bentonite pellets or
chips was placed on top of the sand pack and hydrated using potable water;
•
the remaining borehole annulus was sealed to within 3 feet of the surface using pure
bentonite chips (the soft-dig portion of the borehole was backfilled with a mixture of
soil and bentonite); and
•
the remaining portion of the annulus was filled with concrete and a 6-inch diameter
protective above-grade casing. The well head was fitted with a water-tight lockable
cap.
Specific installation protocols for the temporary monitoring wells are described below:
•
the borehole was advanced to the target depth using a 2-inch direct push technology
(DPT) drill rig;
•
a nominal 1-inch diameter (No. 10 slot) PVC screen, 15 or 20 feet in length, attached
to a sufficient length of 1-inch diameter schedule 40 PVC riser pipe to extend to the
surface, was placed into the borehole through the DPT casing;
•
a filter sand pack consisting of silica sand was installed to a minimum height of
2 feet above the top of the screen as the augers were removed;
045136 (22) Zion Station
19
CONESTOGA-ROVERS & ASSOCIATES
Revision 1
•
a minimum 2-foot thick seal consisting of bentonite powder was placed on top of the
sand pack; and
•
the remaining borehole annulus was sealed at the surface using bentonite powder or
chips.
The shallow soil borings completed in unconsolidated materials that were to be used for
monitoring well installation were installed using either DPT or 4.25-inch inside diameter
HSA drilling techniques. The borehole depths ranged from 19 to 45 feet bgs. During the
subsurface utility clearance activities described above, the borehole was periodically
examined and the soil types documented. A description was added to each monitoring
well construction log. The overburden soils were classified using the Unified Soil
Classification System (USCS).
4.3
GROUNDWATER MONITORING WELL DEVELOPMENT
To establish good hydraulic communication with the aquifer and reduce the volume of
sediment in the permanent monitoring wells, well development was conducted in
accordance with the procedure outlined below:
•
monitoring wells were surged using a pre-cleaned bailer for a period of at least
5 minutes;
•
a minimum of one well volume of water was purged using a submersible pump;
•
the monitoring well was surged for 5 minutes again;
•
water was purged from the monitoring well using an electric submersible pump;
•
groundwater was collected at regular intervals and the pH, temperature, and
conductivity were measured using field instruments. These instruments were
calibrated daily according to the manufacturer's specifications.
Additionally,
observations such as color, odor, and turbidity of the purged water were recorded;
and
•
development continued until the turbidity and silt content of the monitoring wells
were significantly reduced and three consistent readings of pH, temperature, and
conductivity were recorded, or a minimum of ten well volumes was purged.
A summary of the monitoring well development parameter measurements is presented
in Table 4.2.
045136 (22) Zion Station
20
CONESTOGA-ROVERS & ASSOCIATES
Revision 1
4.4
SURVEY
The 15 monitoring wells and surface water gauge were surveyed to establish reference
elevations relative to mean sea level. The top of each well casing was surveyed to the
nearest 0.01 foot relative to the National Geodetic Vertical Datum (NGVD), and the
survey point was marked on the well casing. The survey included the ground elevation
at each well to the nearest 0.10 foot relative to the NGVD, and the horizontal well
location to the nearest 1.0 foot. A reference point was also marked on the concrete at the
surface water elevation measuring location.
The Lake Michigan shoreline was surveyed at the Station using a handheld Global
Positioning System (GPS) with an estimated accuracy of ± 12 feet. The GPS survey was
conducted on June 30, 2006.
4.5
GROUNDWATER AND SURFACE WATER
ELEVATION MEASUREMENTS
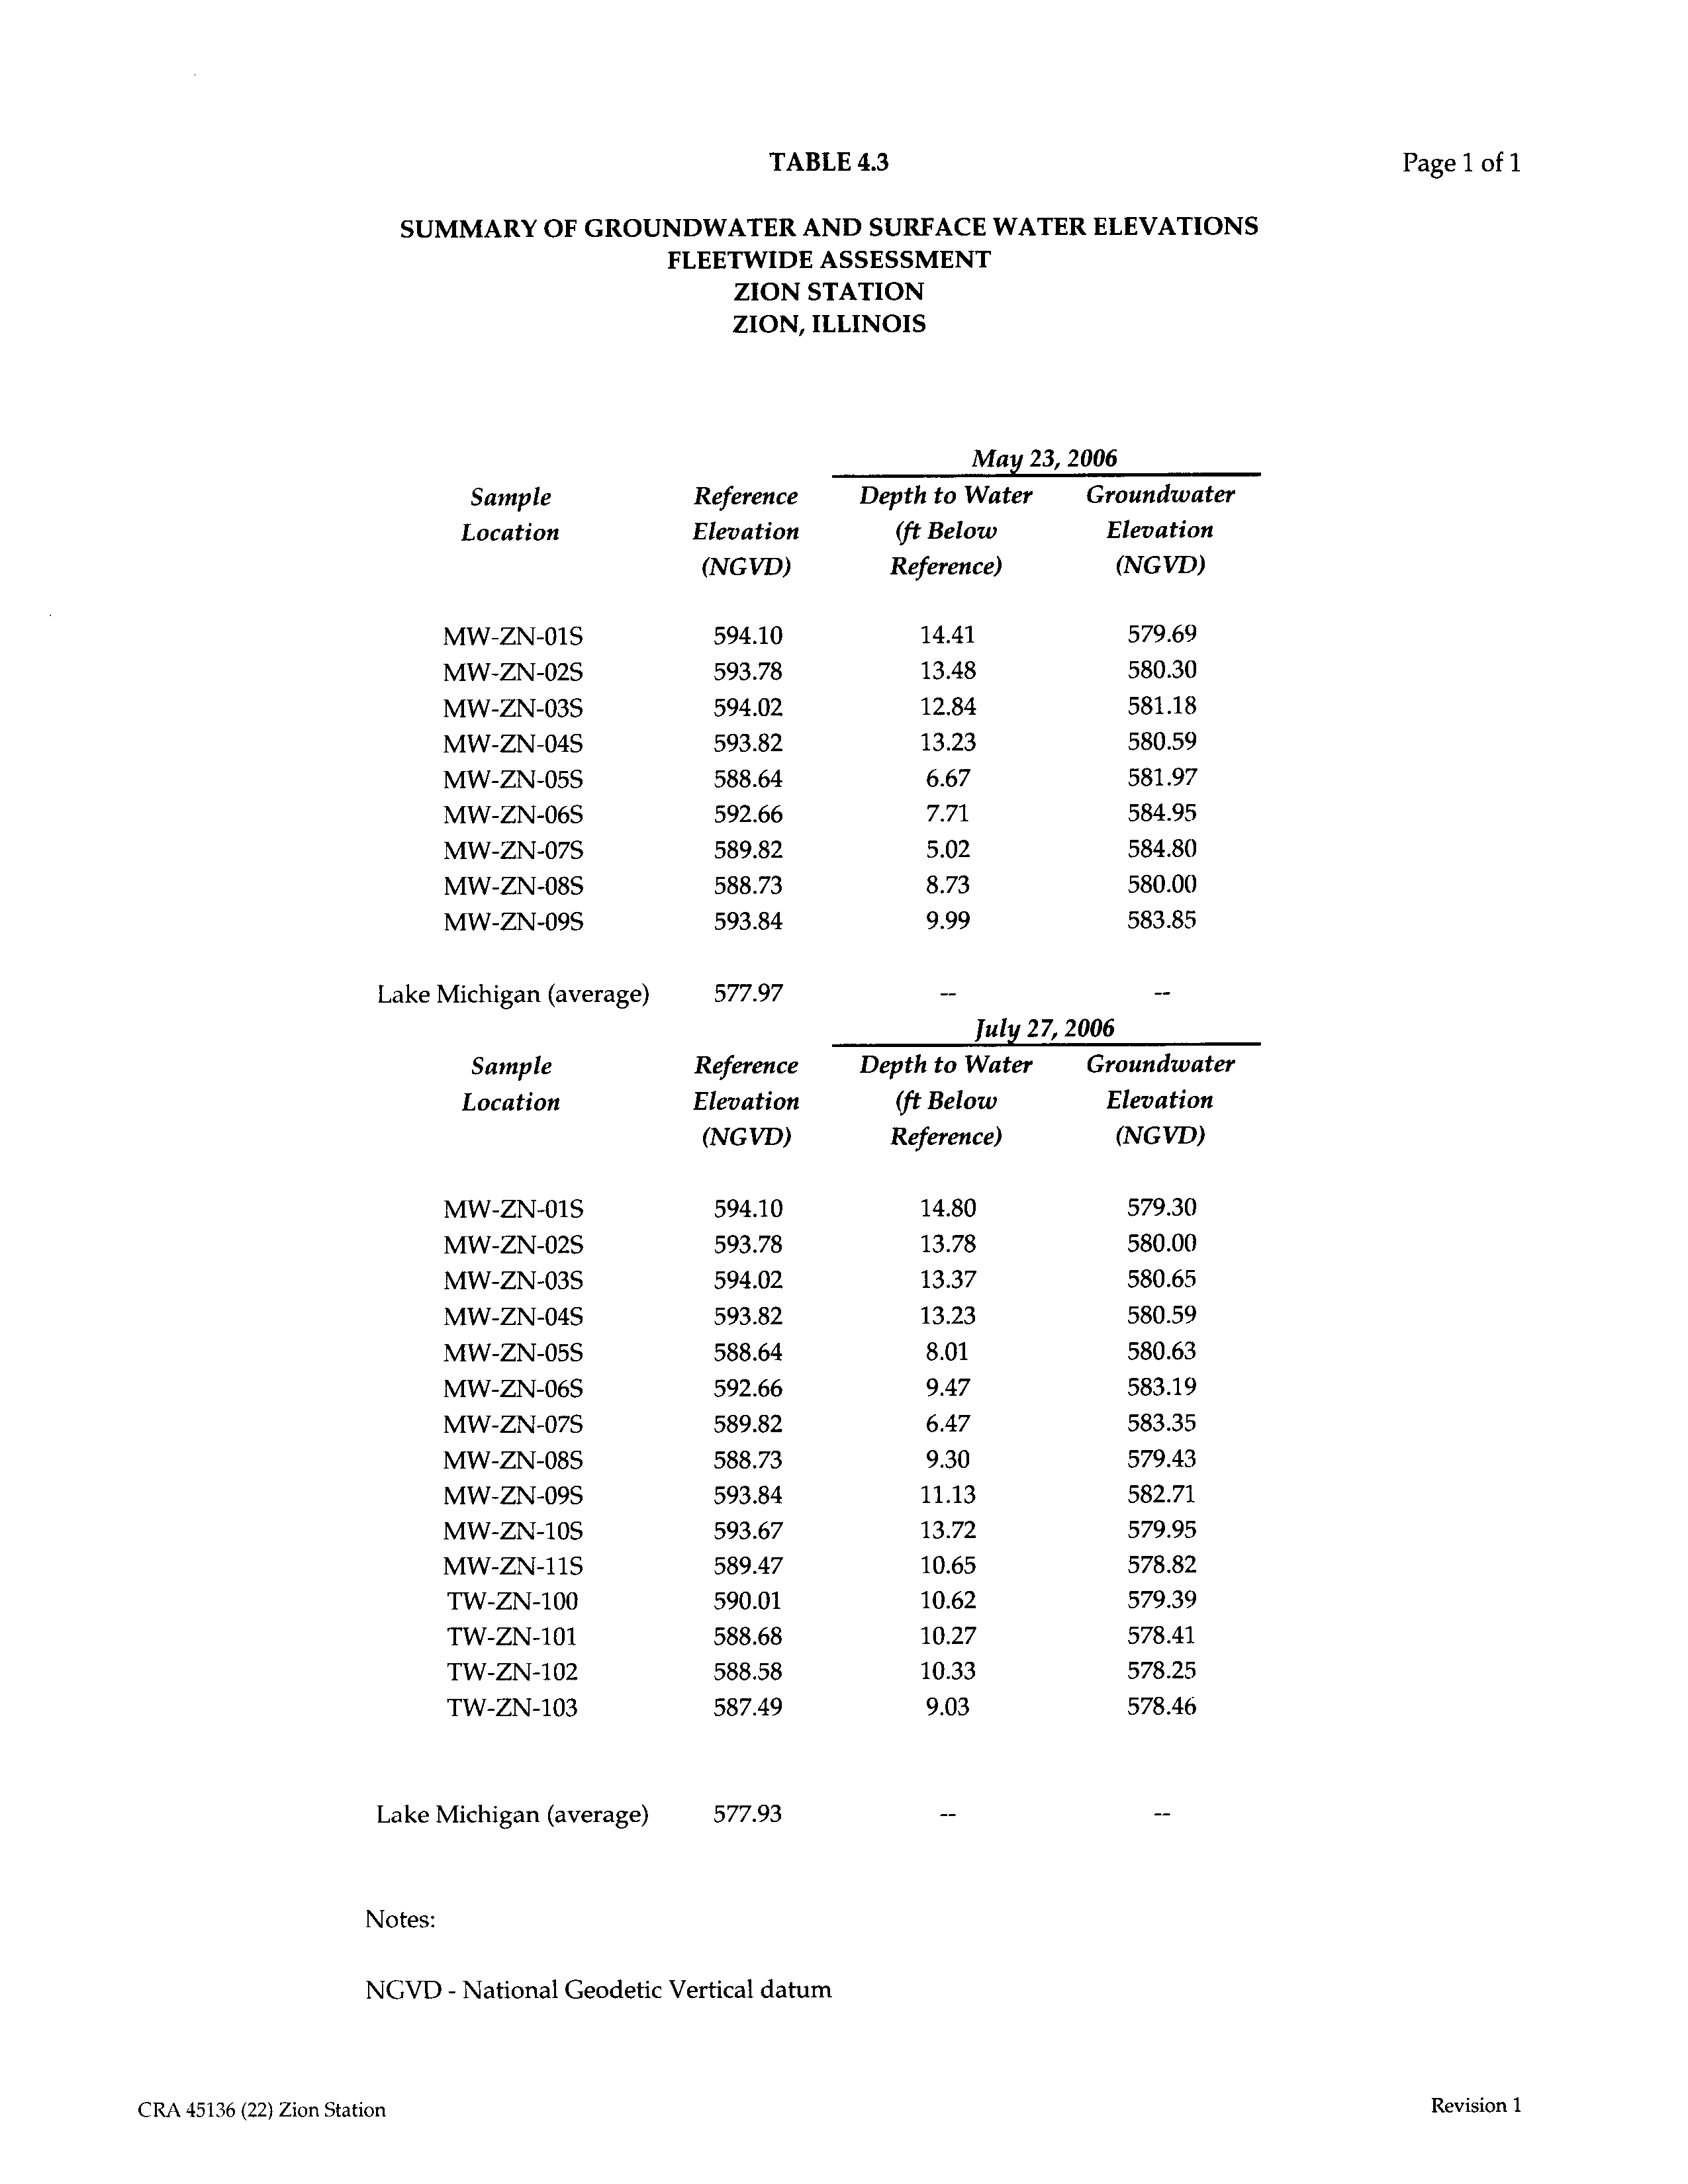
On May 23, 2006 and July 27, 2006, CRA collected water level measurements from the
monitoring wells and the staff gauge at the Station in accordance with the Work Plan.
Based on the measured depth to water from the reference point and the surveyed
elevation of the reference point, the groundwater or surface water elevation was
calculated. A summary of groundwater and surface water elevations is provided in
Table 4.3.
Prior to the water level measurements, the wells and staff gauges were identified and
located. Once the wells were identified, CRA completed a thorough inspection of each
well and noted any deficiencies. Water level measurements were collected using an
electronic depth-to-water probe accurate to
±
0.01 foot. The measurements were made
from the designated location on the inner riser or steel casing of each monitoring well
and reference point on the staff gauge. The water level measurements were obtained
using the following procedures:
•
the proper elevation of the meter was checked by inserting the tip into water and
noting if the contact was registering correctly;
•
the tip was dried, and then slowly lowered into the well or surface water body until
contact with the water was indicated;
•
the tip was slowly raised until the light and/or buzzer just began to activate. This
indicated the static water level;
045136 (22) Zion Station
21
CONESTOGA-ROVERS & ASSOCIATES
Revision 1
•
the reading at the reference point was noted to the nearest hundredth of a foot;
•
the reading was then re-checked; and
•
the water level was then recorded, and the water level meter decontaminated prior
to use at the next location.
Surface water measurements for Lake Michigan were obtained from the National
Oceanic and Atmospheric Administration (NOAA) gauging stations at Milwaukee,
Wisconsin (Station 9087057), and Calumet Harbor, Illinois (Station 9087044) for the date
and time when the water levels in monitoring wells were measured (NOAA, 2006).
Station
Time Period
Median Lake Elevation
9087057 Milwaukee
May 23, 2006 8:00-13:00
577.99
9087044 Calumet Harbor
May 23, 2006 8:00-13:00
577.94
May 23, 2006 8:00-13:00 Average
577.97
9087057 Milwaukee
July 27, 2006 9:15-11:10
577.91
9087044 Calumet Harbor
July 27, 2006 9:15-11:10
577.96
July 27, 2006 9:15-11:10 Average
577.93
4.6
GROUNDWATER AND SURFACE WATER SAMPLE COLLECTION
CRA conducted one round of groundwater sampling during the hydrogeologic
investigation, with additional samples collected from monitoring well MW-ZN-01S. A
total of 15 monitoring wells were sampled between May 24, 2006 and July 28, 2006.
Eleven new permanent monitoring wells were installed. The sampling was scheduled to
allow for 2 weeks to elapse between well development and groundwater sample
collection. Four temporary monitoring wells were installed and sampled in July 2006.
At the monitoring well locations, CRA conducted the sampling using peristaltic pumps
and dedicated polyethylene tubing to employ low flow purging techniques, as described
in Puls and Barcelona (1996).
For permanent monitoring wells with 20-foot screen lengths (MW-ZN-01S through
MW-ZN-08S, MW-ZN-10S and MW-ZN-11S), separate samples were collected from the
lower portion and the upper portion of the screened interval. The lower sampling
interval targets potential releases from deep structural features such as the basement of
the Auxiliary Building. The upper sampling interval targets potential surface and near
surface releases such as spills from the primary cooling water ASTs.
045136 (22) Zion Station
22
CONESTOGA-ROVERS & ASSOCIATES
Revision 1
The groundwater in the monitoring wells was sampled by the following low-flow
procedures:
•
the wells were located and the well identification numbers were verified;
•
a water level measurement was taken;
•
the well was sounded by carefully lowering the water level tape to the bottom of the
well (so as to minimize penetration and disturbance of the well bottom sediment),
and comparing the sounded depth to the installed depth to assess the presence of
any excess sediment or drill cuttings;
•
the pump or tubing was lowered slowly into the well and fixed into place such that
the intake was located at the mid-point of the well screen, or a minimum of 2 feet
above the well bottom/sediment level;
•
the purging was conducted using a pumping rate between 100 to 500 milliliters per
minute. Initial purging began using the lower end of this range. The groundwater
level was monitored to ensure that a drawdown of less than 0.3 foot occurred. If this
criterion was met, the pumping rate was increased dependent on the behavior of the
well. During purging, the pumping rate and groundwater level were measured and
recorded approximately every 10 minutes;
•
the field parameters [pH, temperature, conductivity, oxidation-reduction potential
(ORP), dissolved oxygen (DO), and turbidity] were monitored during the purging to
evaluate the stabilization of the purged groundwater. Stabilization was considered
to be achieved when three consecutive readings for each parameter, taken at
5-minute intervals, were within the following limits:
pH
±
0.1 pH units of the average value of the three readings,
Temperature
±
3 percent of the average value of the three readings,
Conductivity
±
0.005 milliSiemen per centimeter (mS/cm) of the average value
of the three readings for conductivity <1 mS/cm and
±
0.01 mS/cm of the average value of the three readings for
conductivity >1 mS/cm,
ORP
±
10 millivolts (mV) of the average value of the three readings,
DO
±
10 percent of the average value of the three readings, and
Turbidity
±
10 percent of the average value of the three readings, or a final
value of less than 5 nephelometric turbidity units (NTUs);
•
once purging was complete, the groundwater samples were collected directly from
the pump/tubing directly into the sample containers; and
045136 (22) Zion Station
23
CONESTOGA-ROVERS & ASSOCIATES
Revision 1
•
in the event that the groundwater recharge to the monitoring well was insufficient to
conduct the low-flow procedure, the well was pumped dry and allowed to
sufficiently recharge prior to sampling.
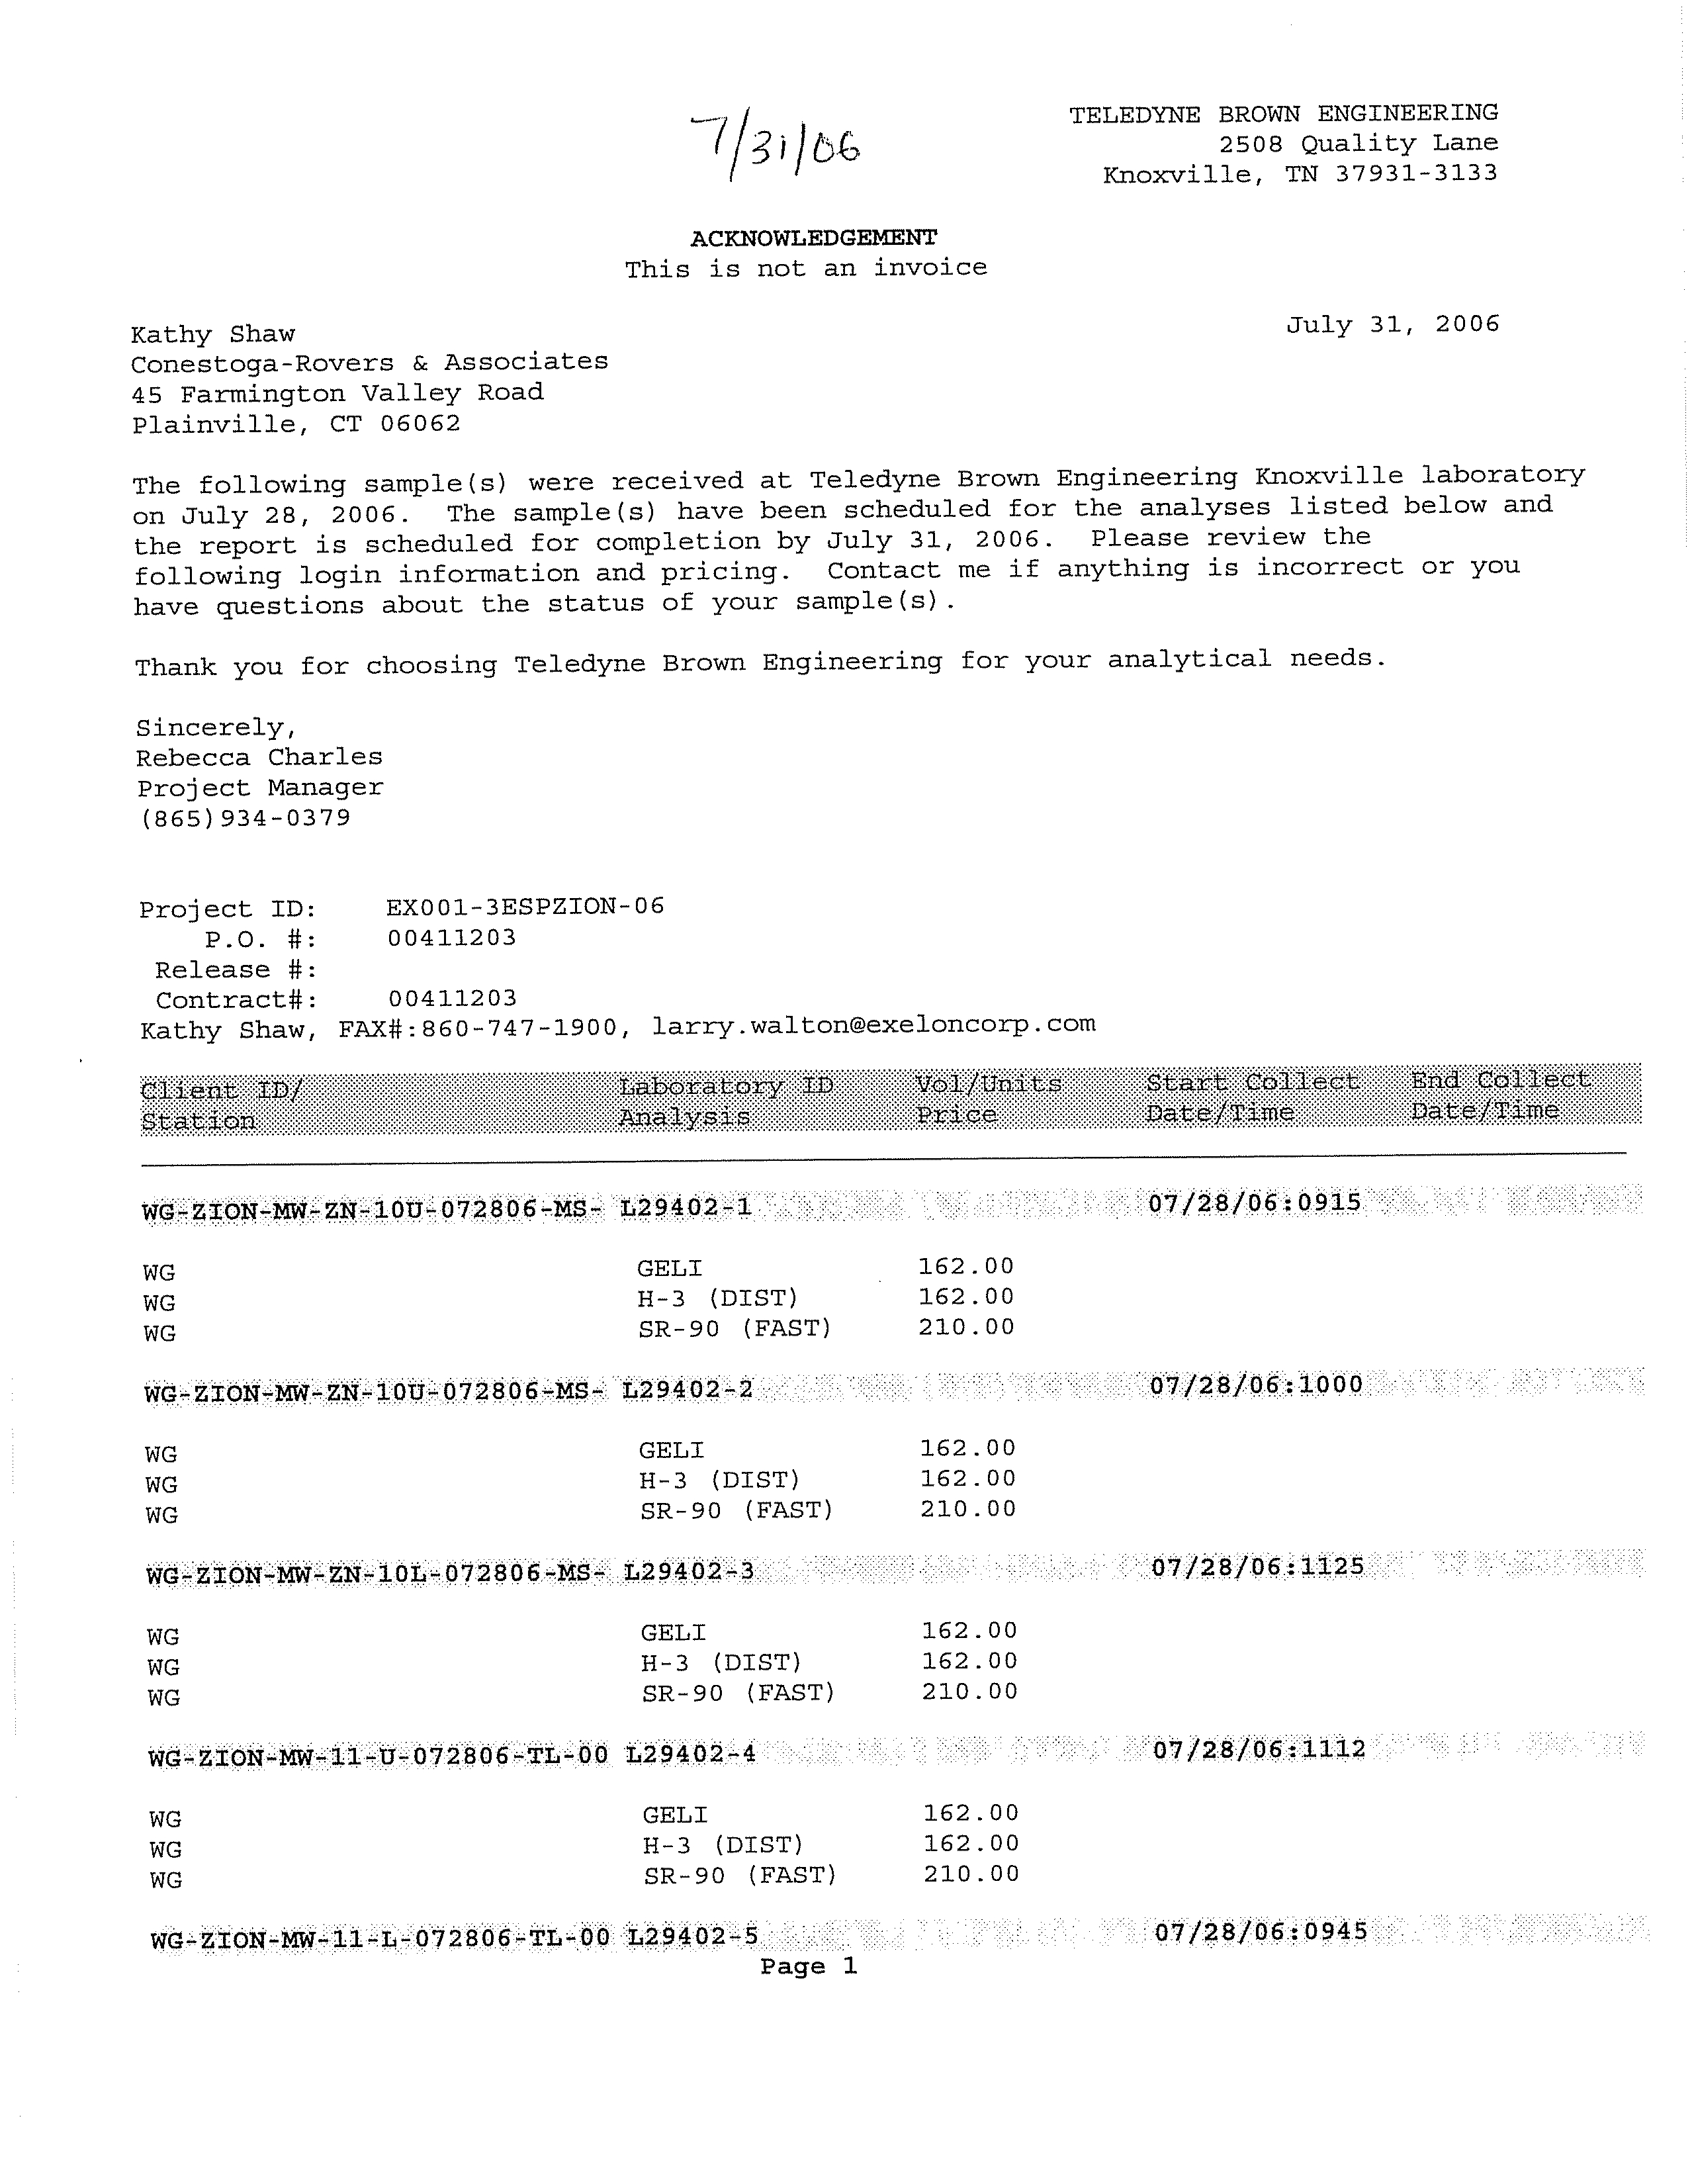
All groundwater samples were labeled with a unique sample number, the date and time,
the parameters to be analyzed, the job number, and the sampler's initials. The samples
were then screened by the Station for shipment to Teledyne Brown Engineering Inc.
(Teledyne Brown).
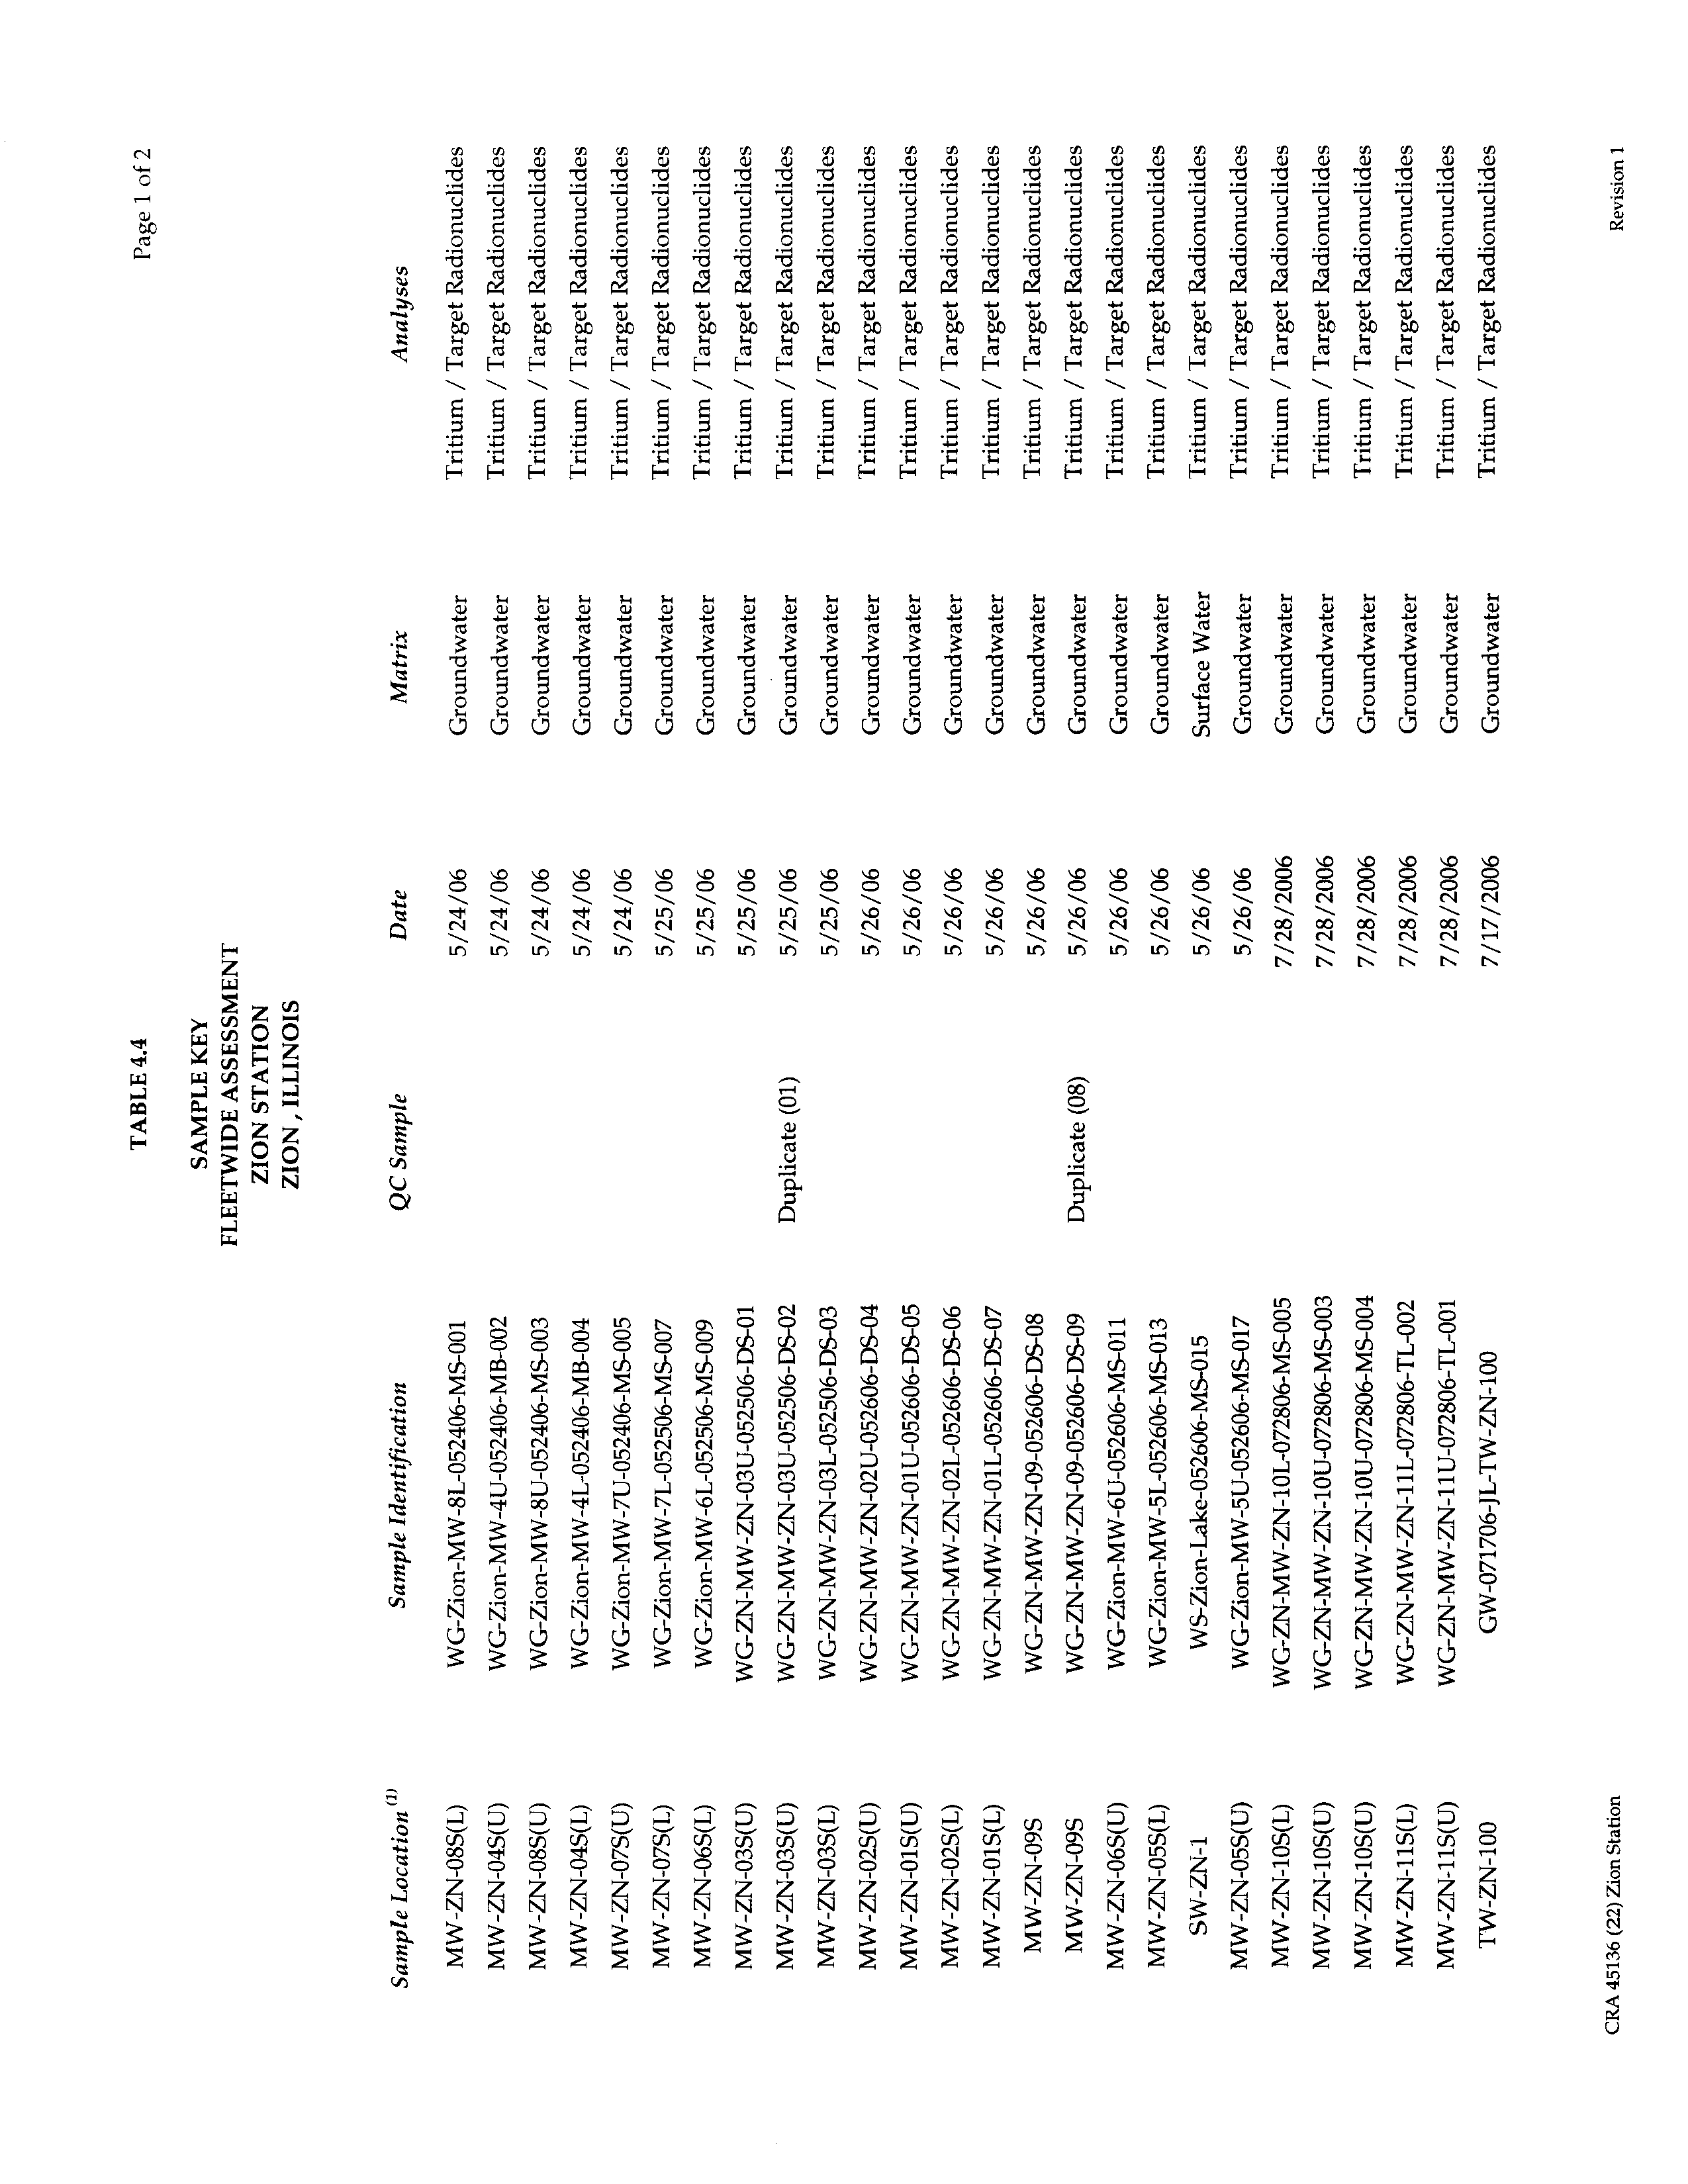
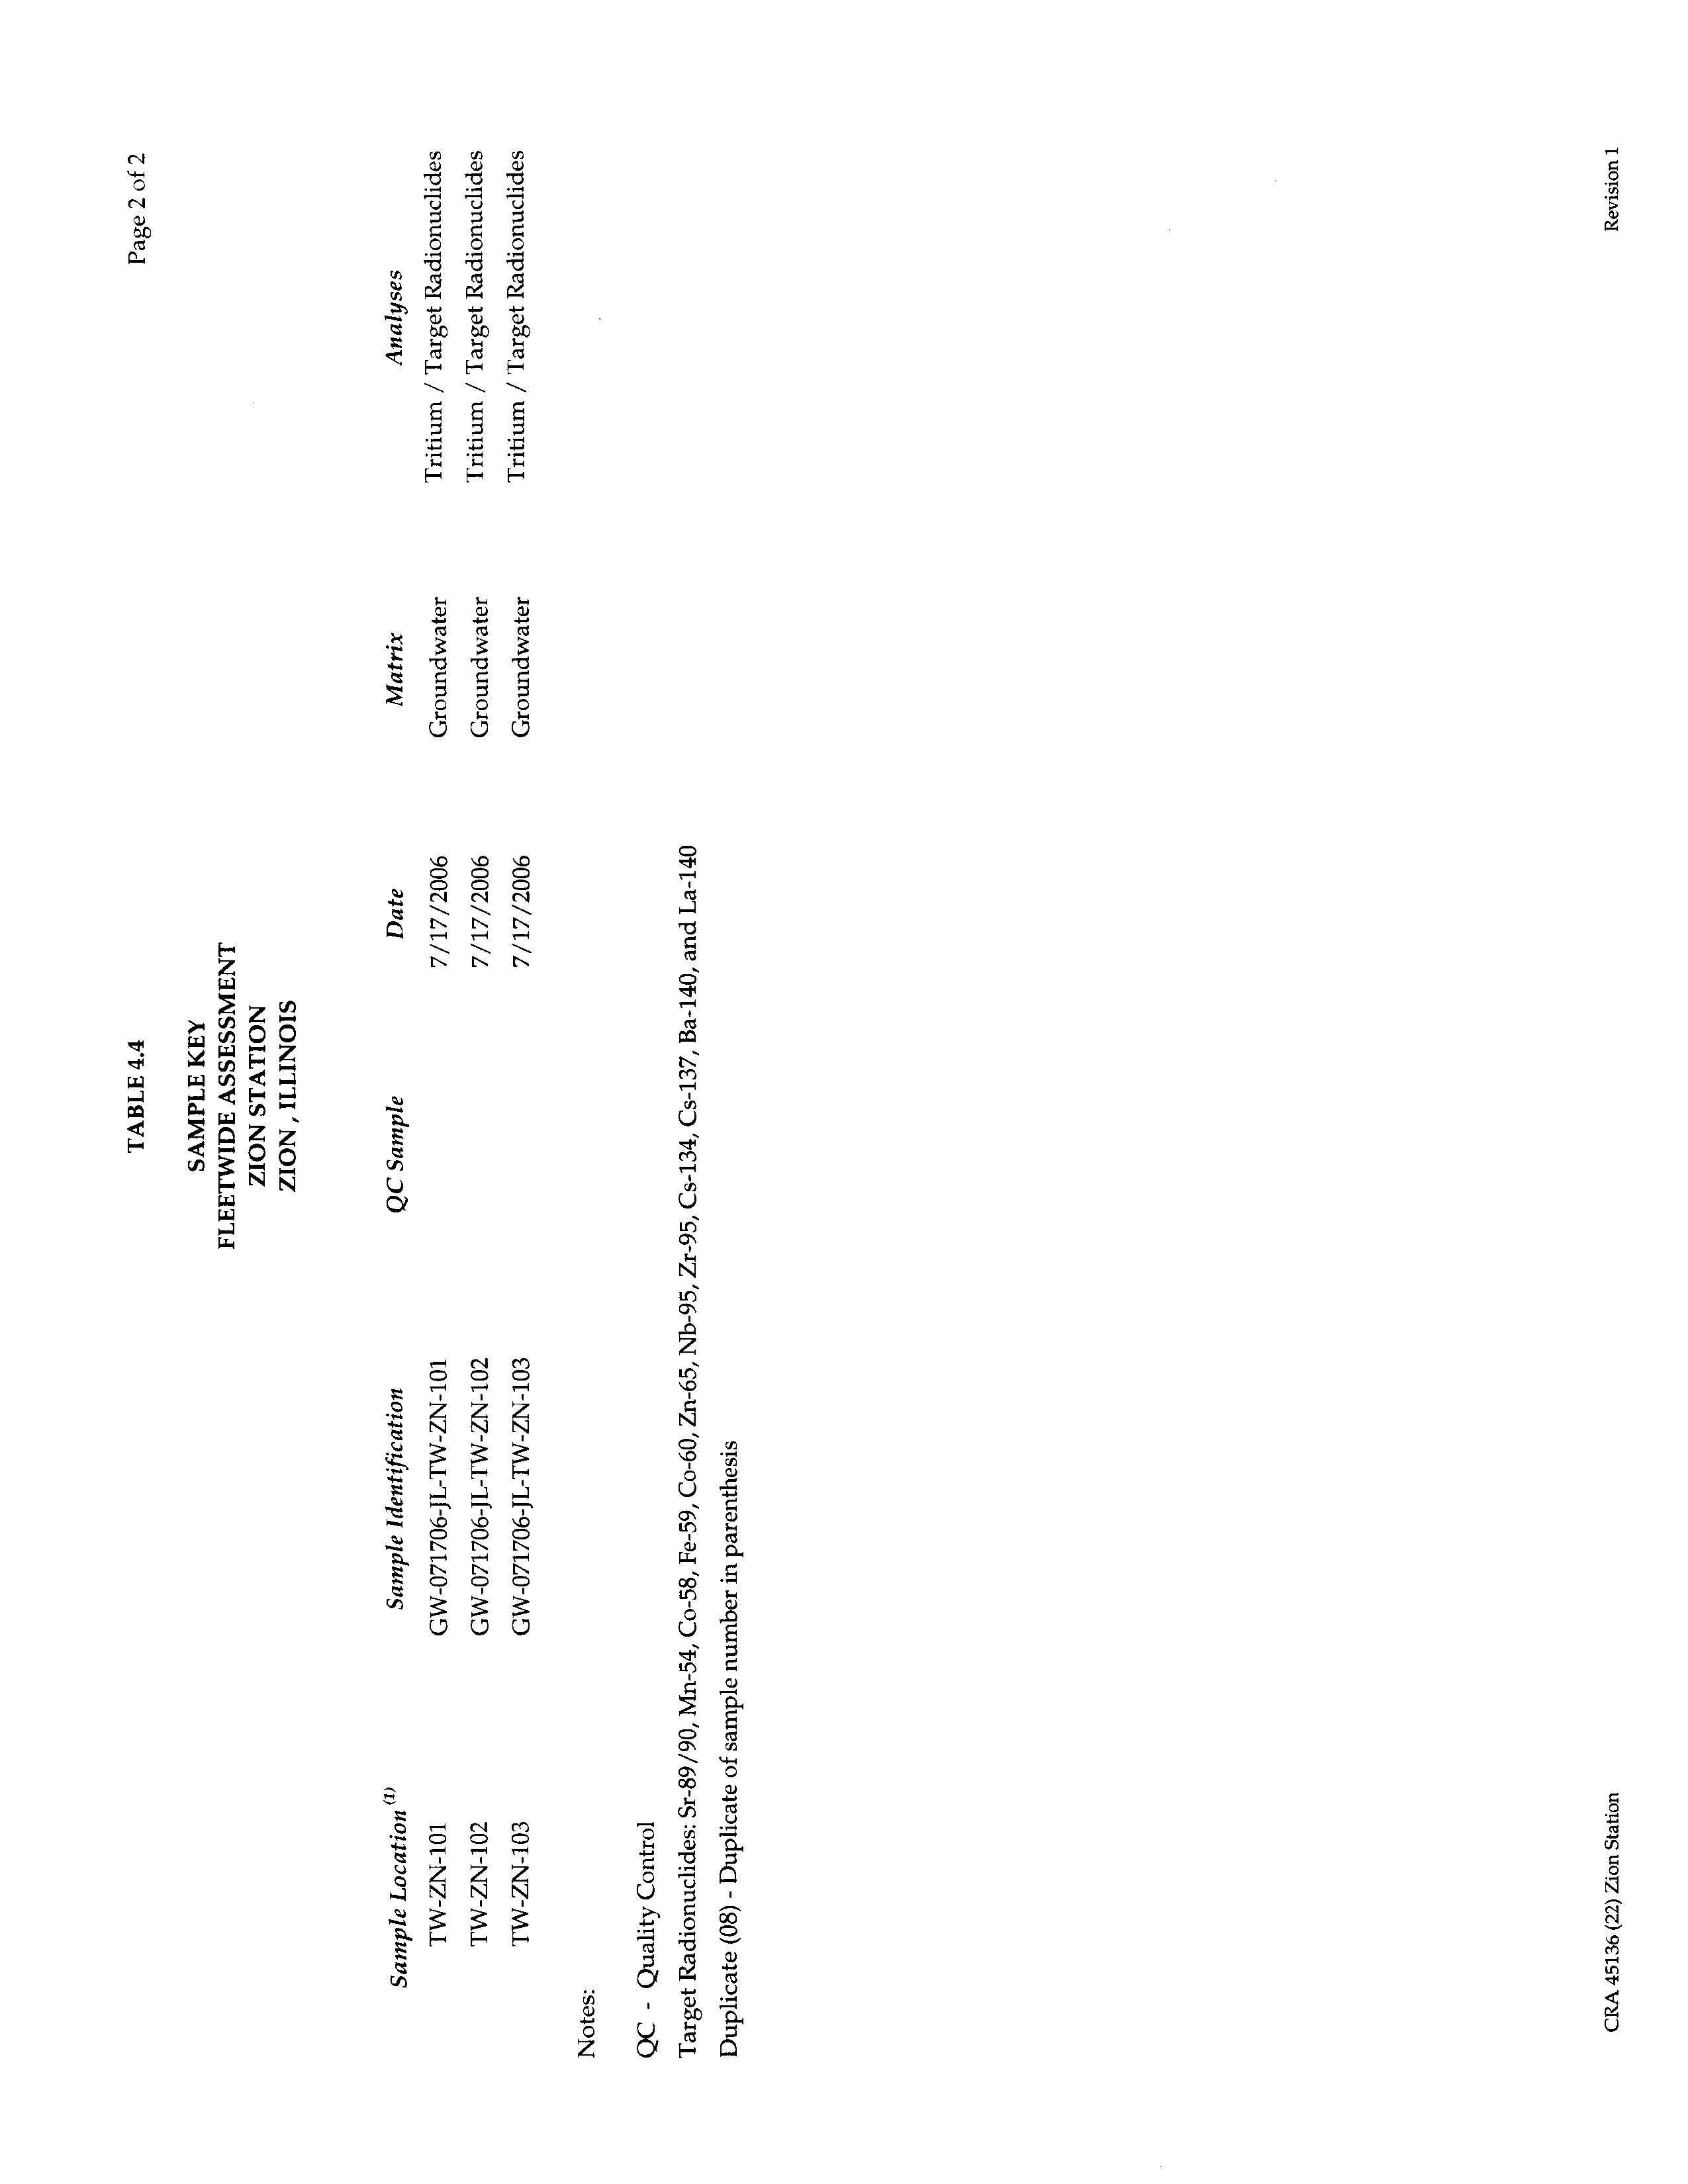
A sample key is presented in Table 4.4; field measurements for the hydrogeologic
investigation are presented in Table 4.5.
CRA containerized the water purged from the monitoring wells during the sampling, as
well as the water purged from all of the wells during the hydrogeologic investigation.
The water was placed into 55-gallon drums, which will be processed by the Station in
accordance with its NPDES permit.
One surface water sample was collected on May 26, 2006 from Lake Michigan at station
SW-ZN-1, adjacent to the Station. The surface water sampling location is presented on
Figure 4.1.
The surface water sample was collected by directly filling the sample container from the
composite sampler at the determined location until completely filled. A sample key is
presented in Table 4.4.
4.7
DATA QUALITY OBJECTIVES
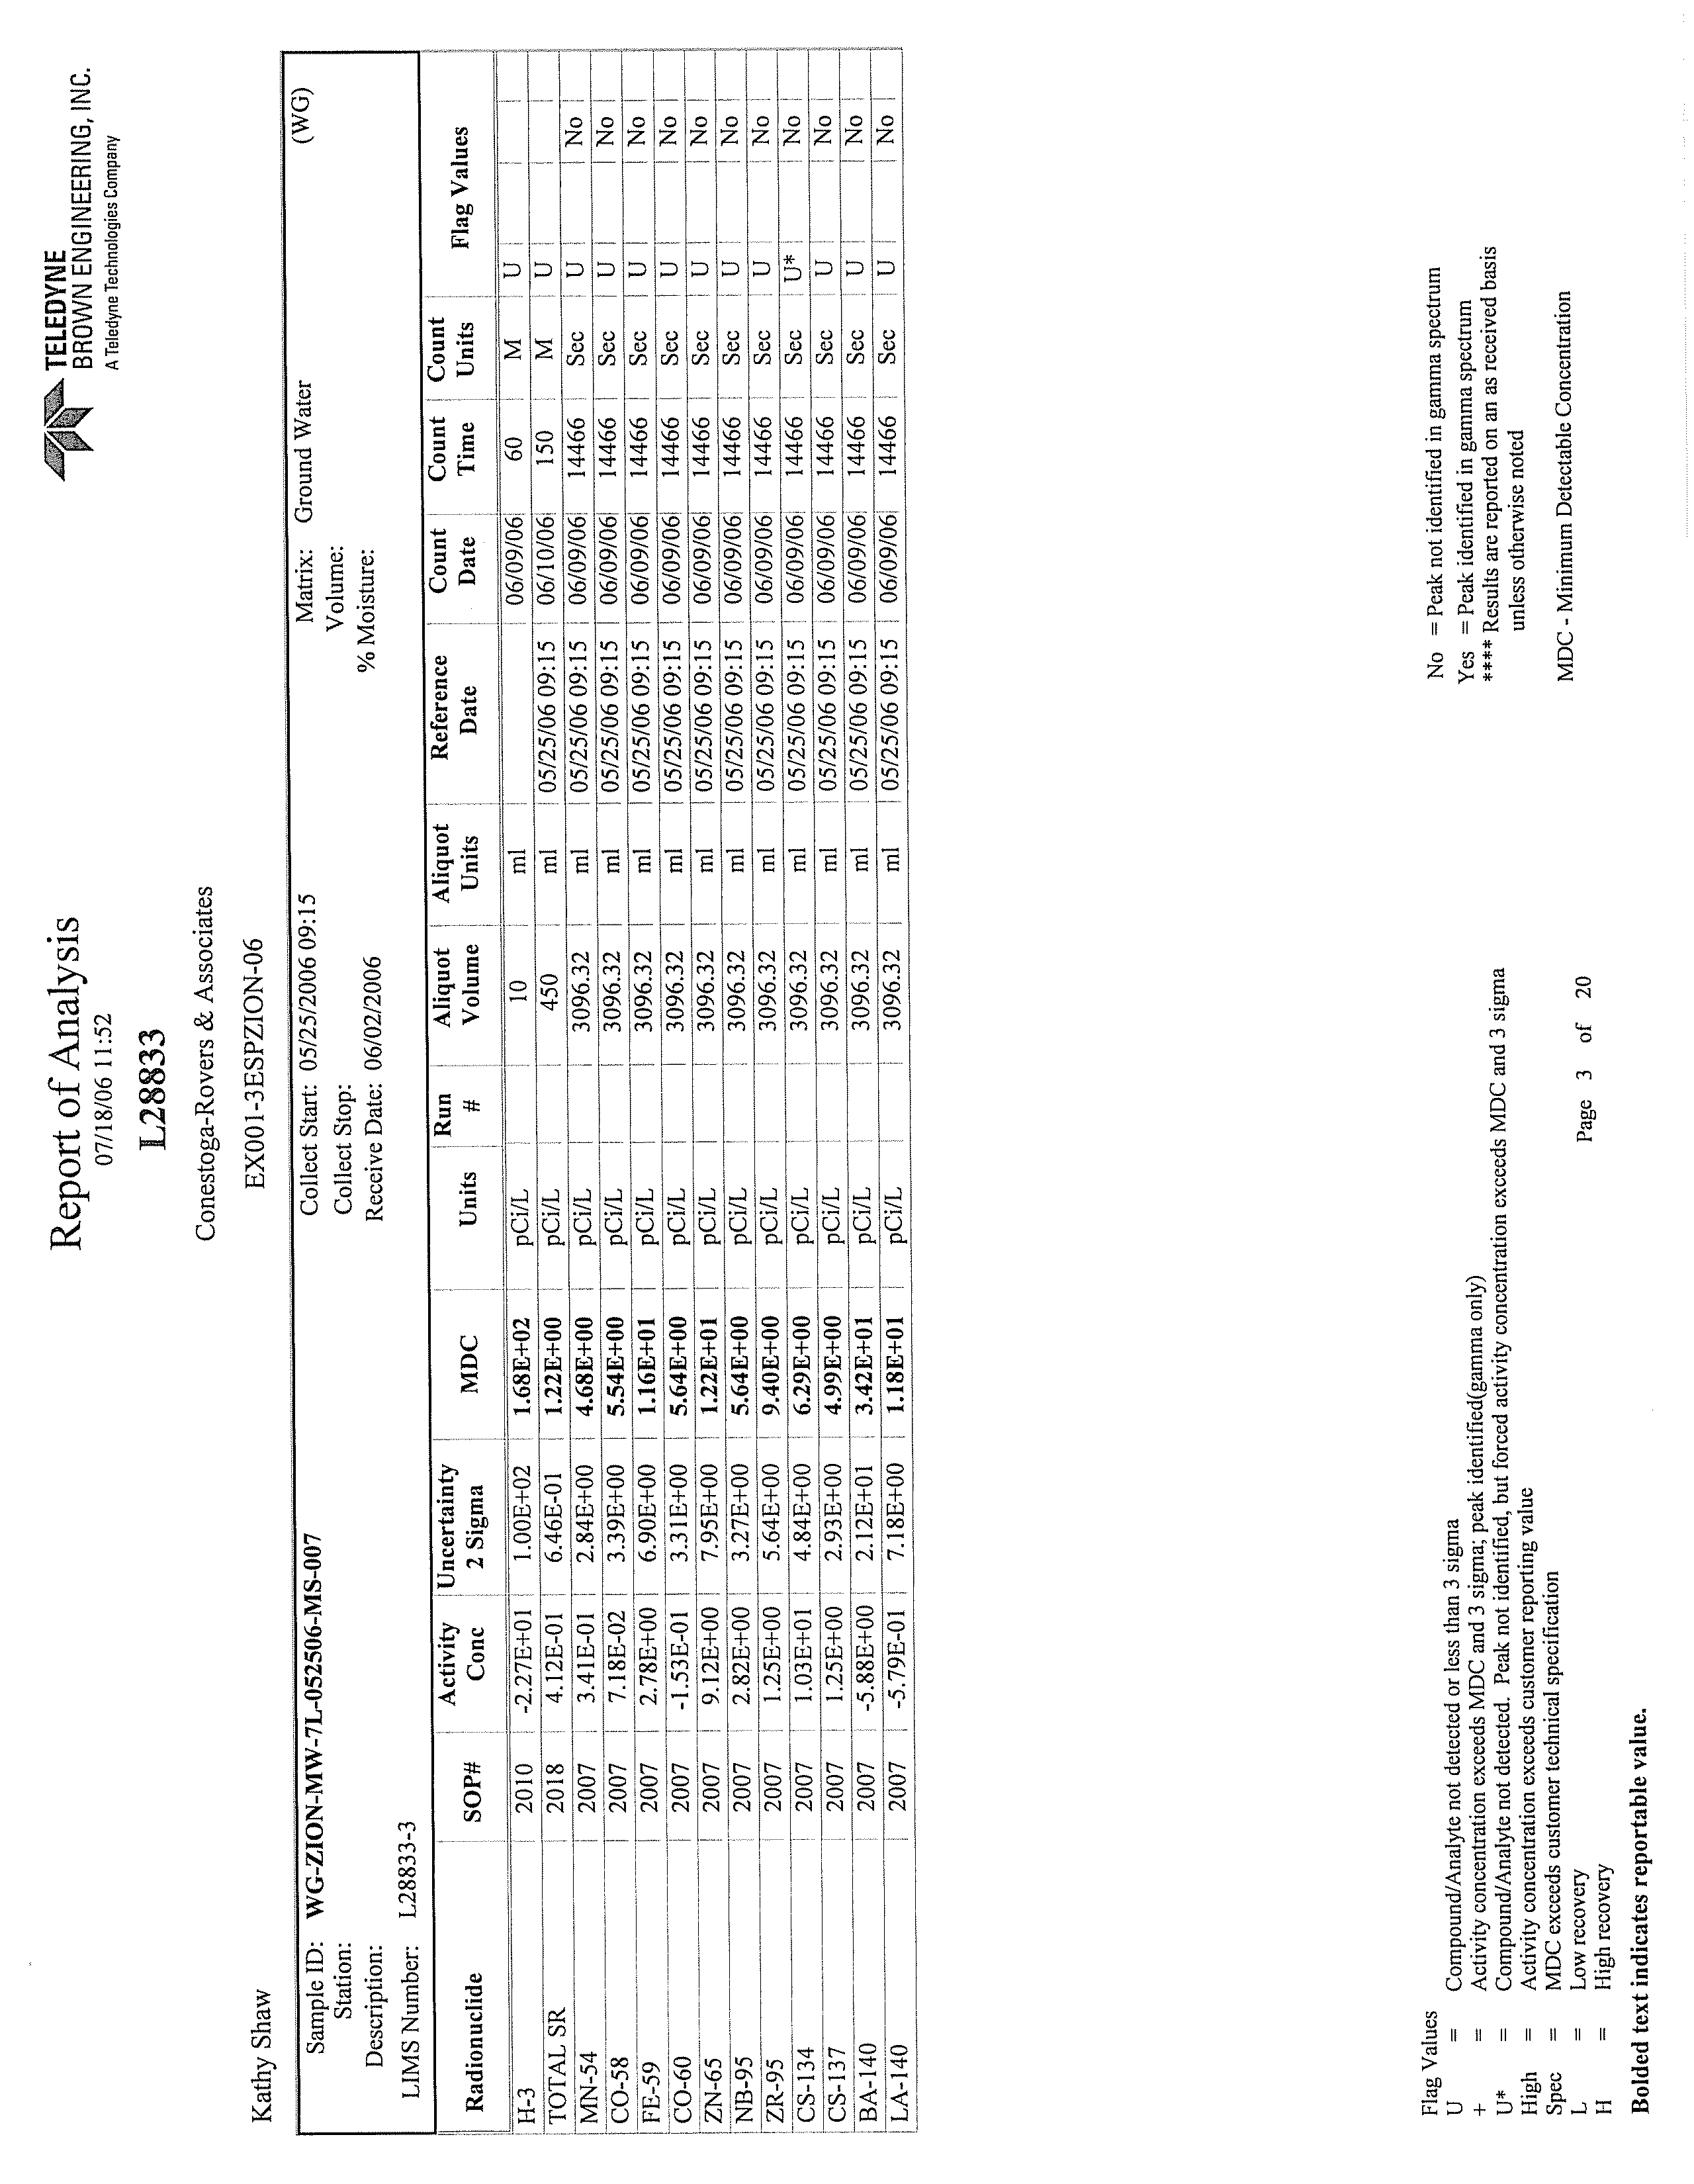
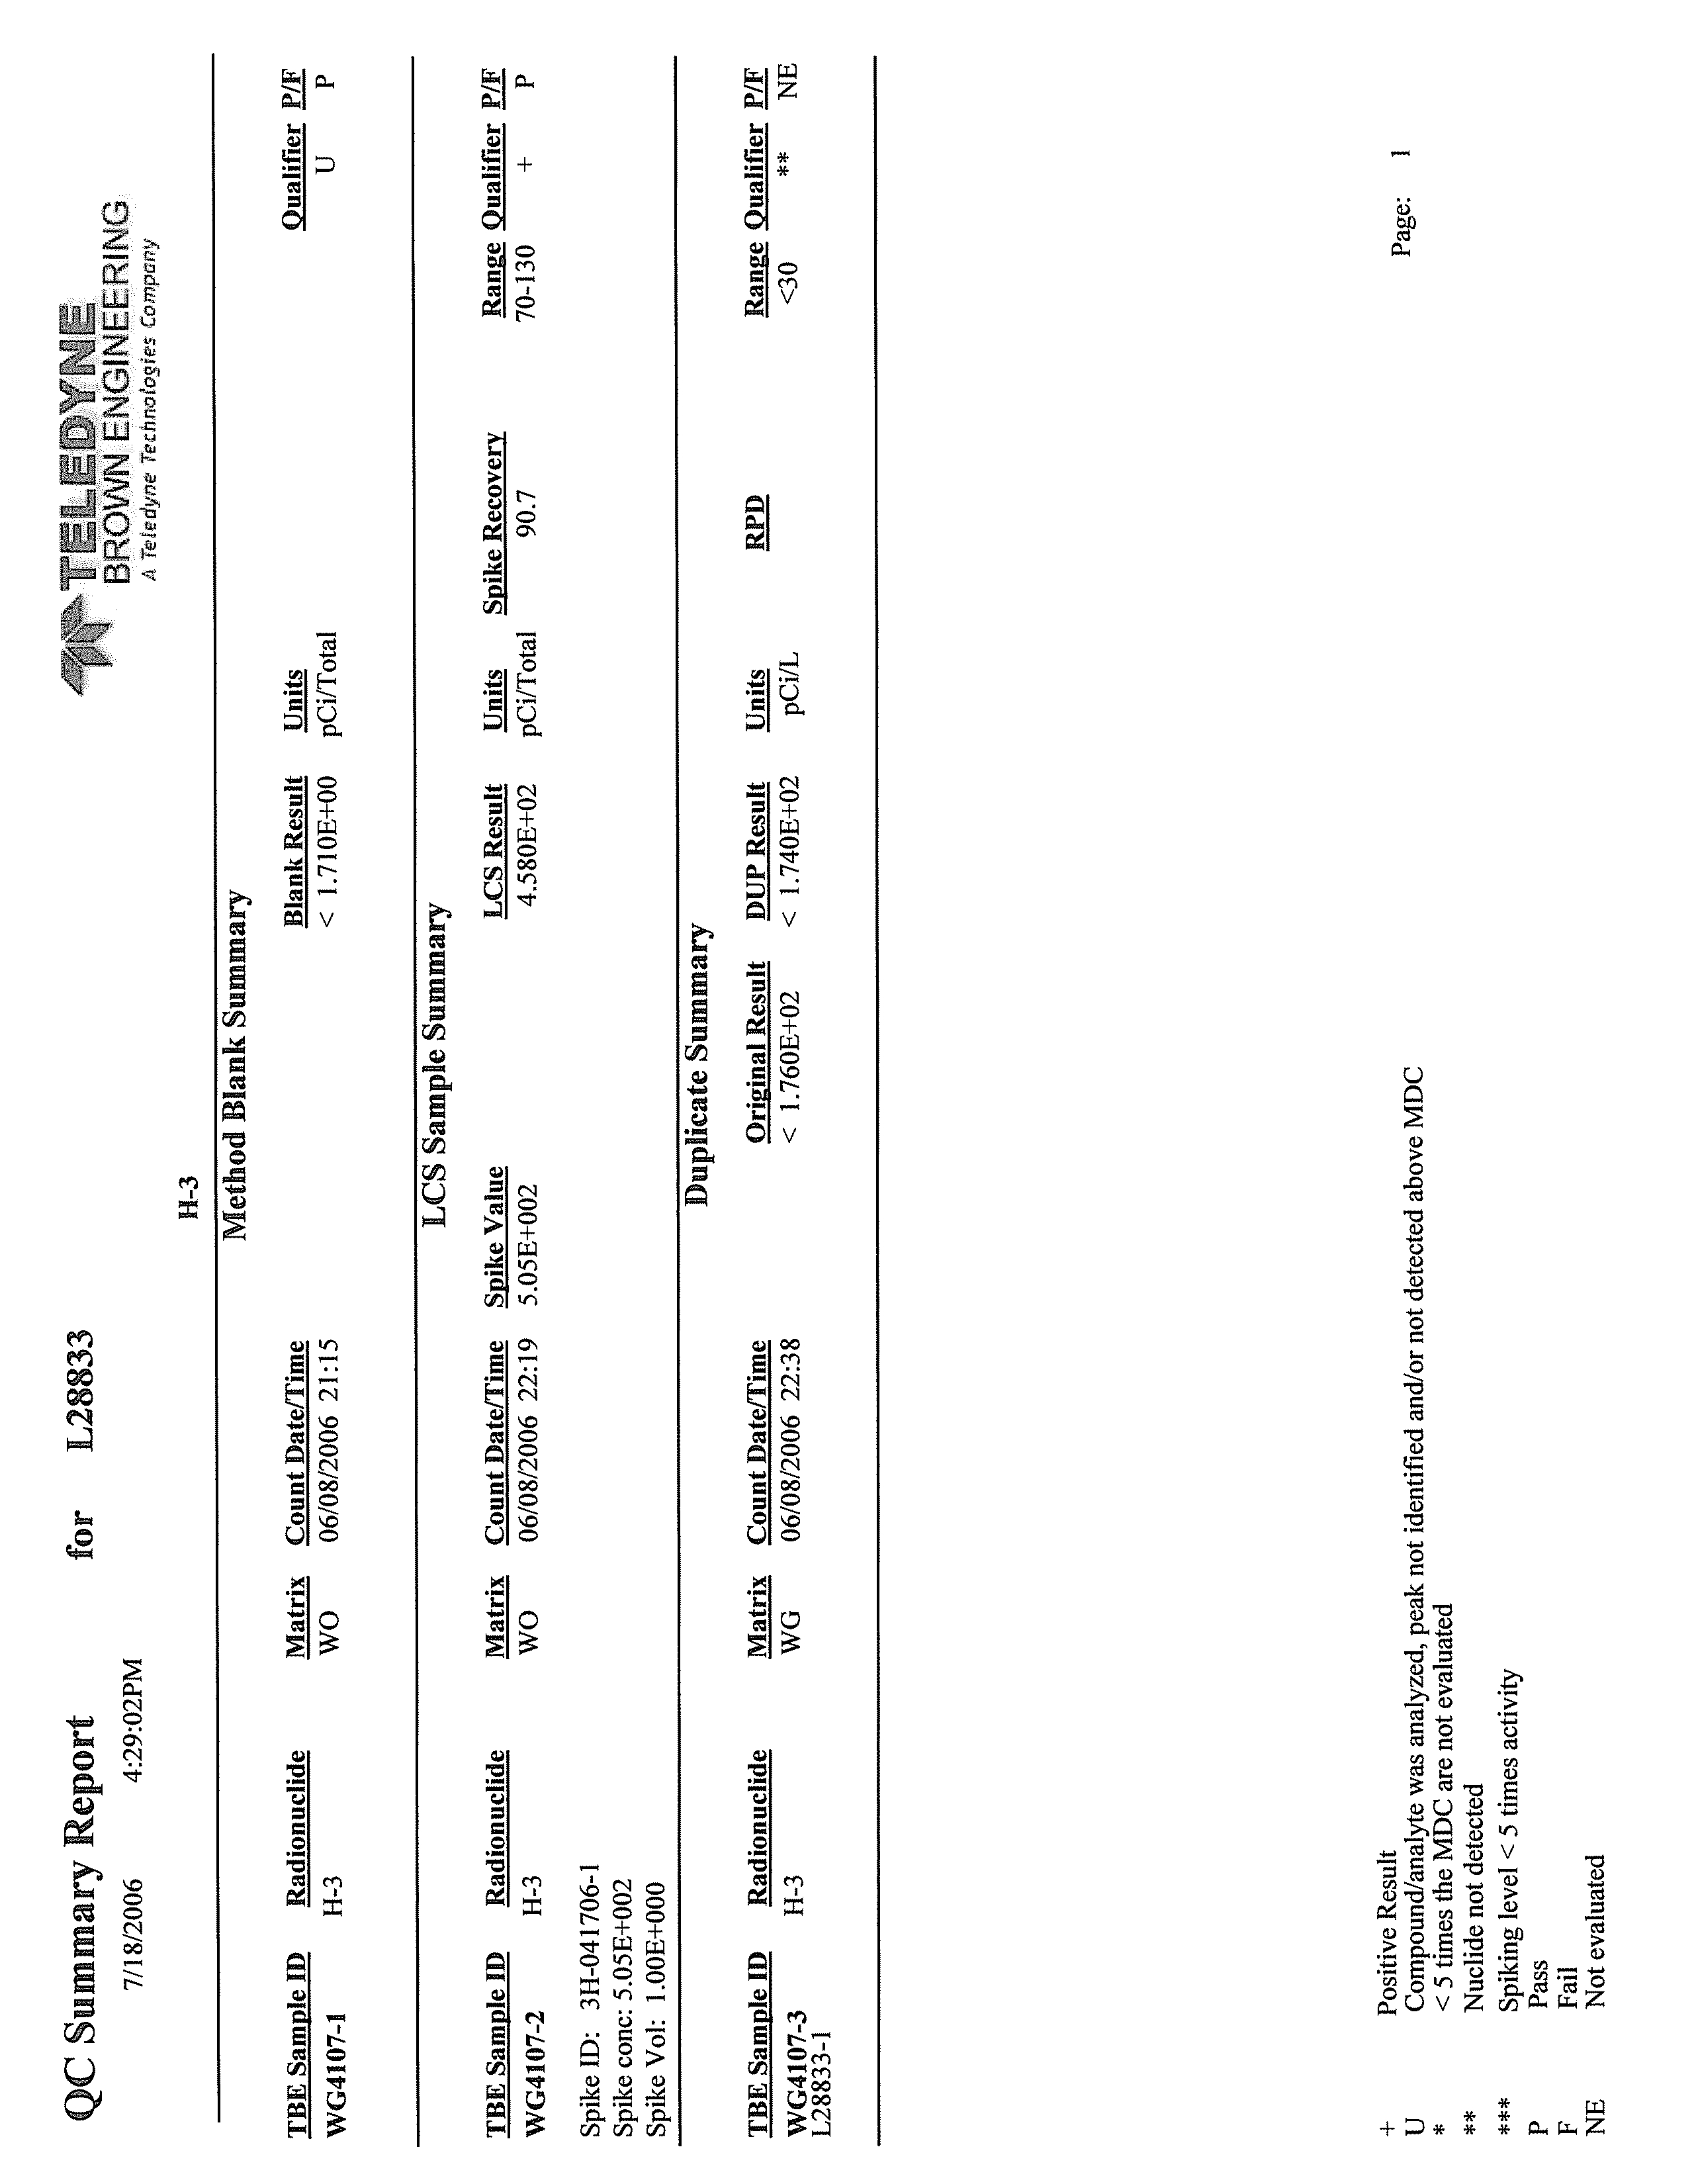
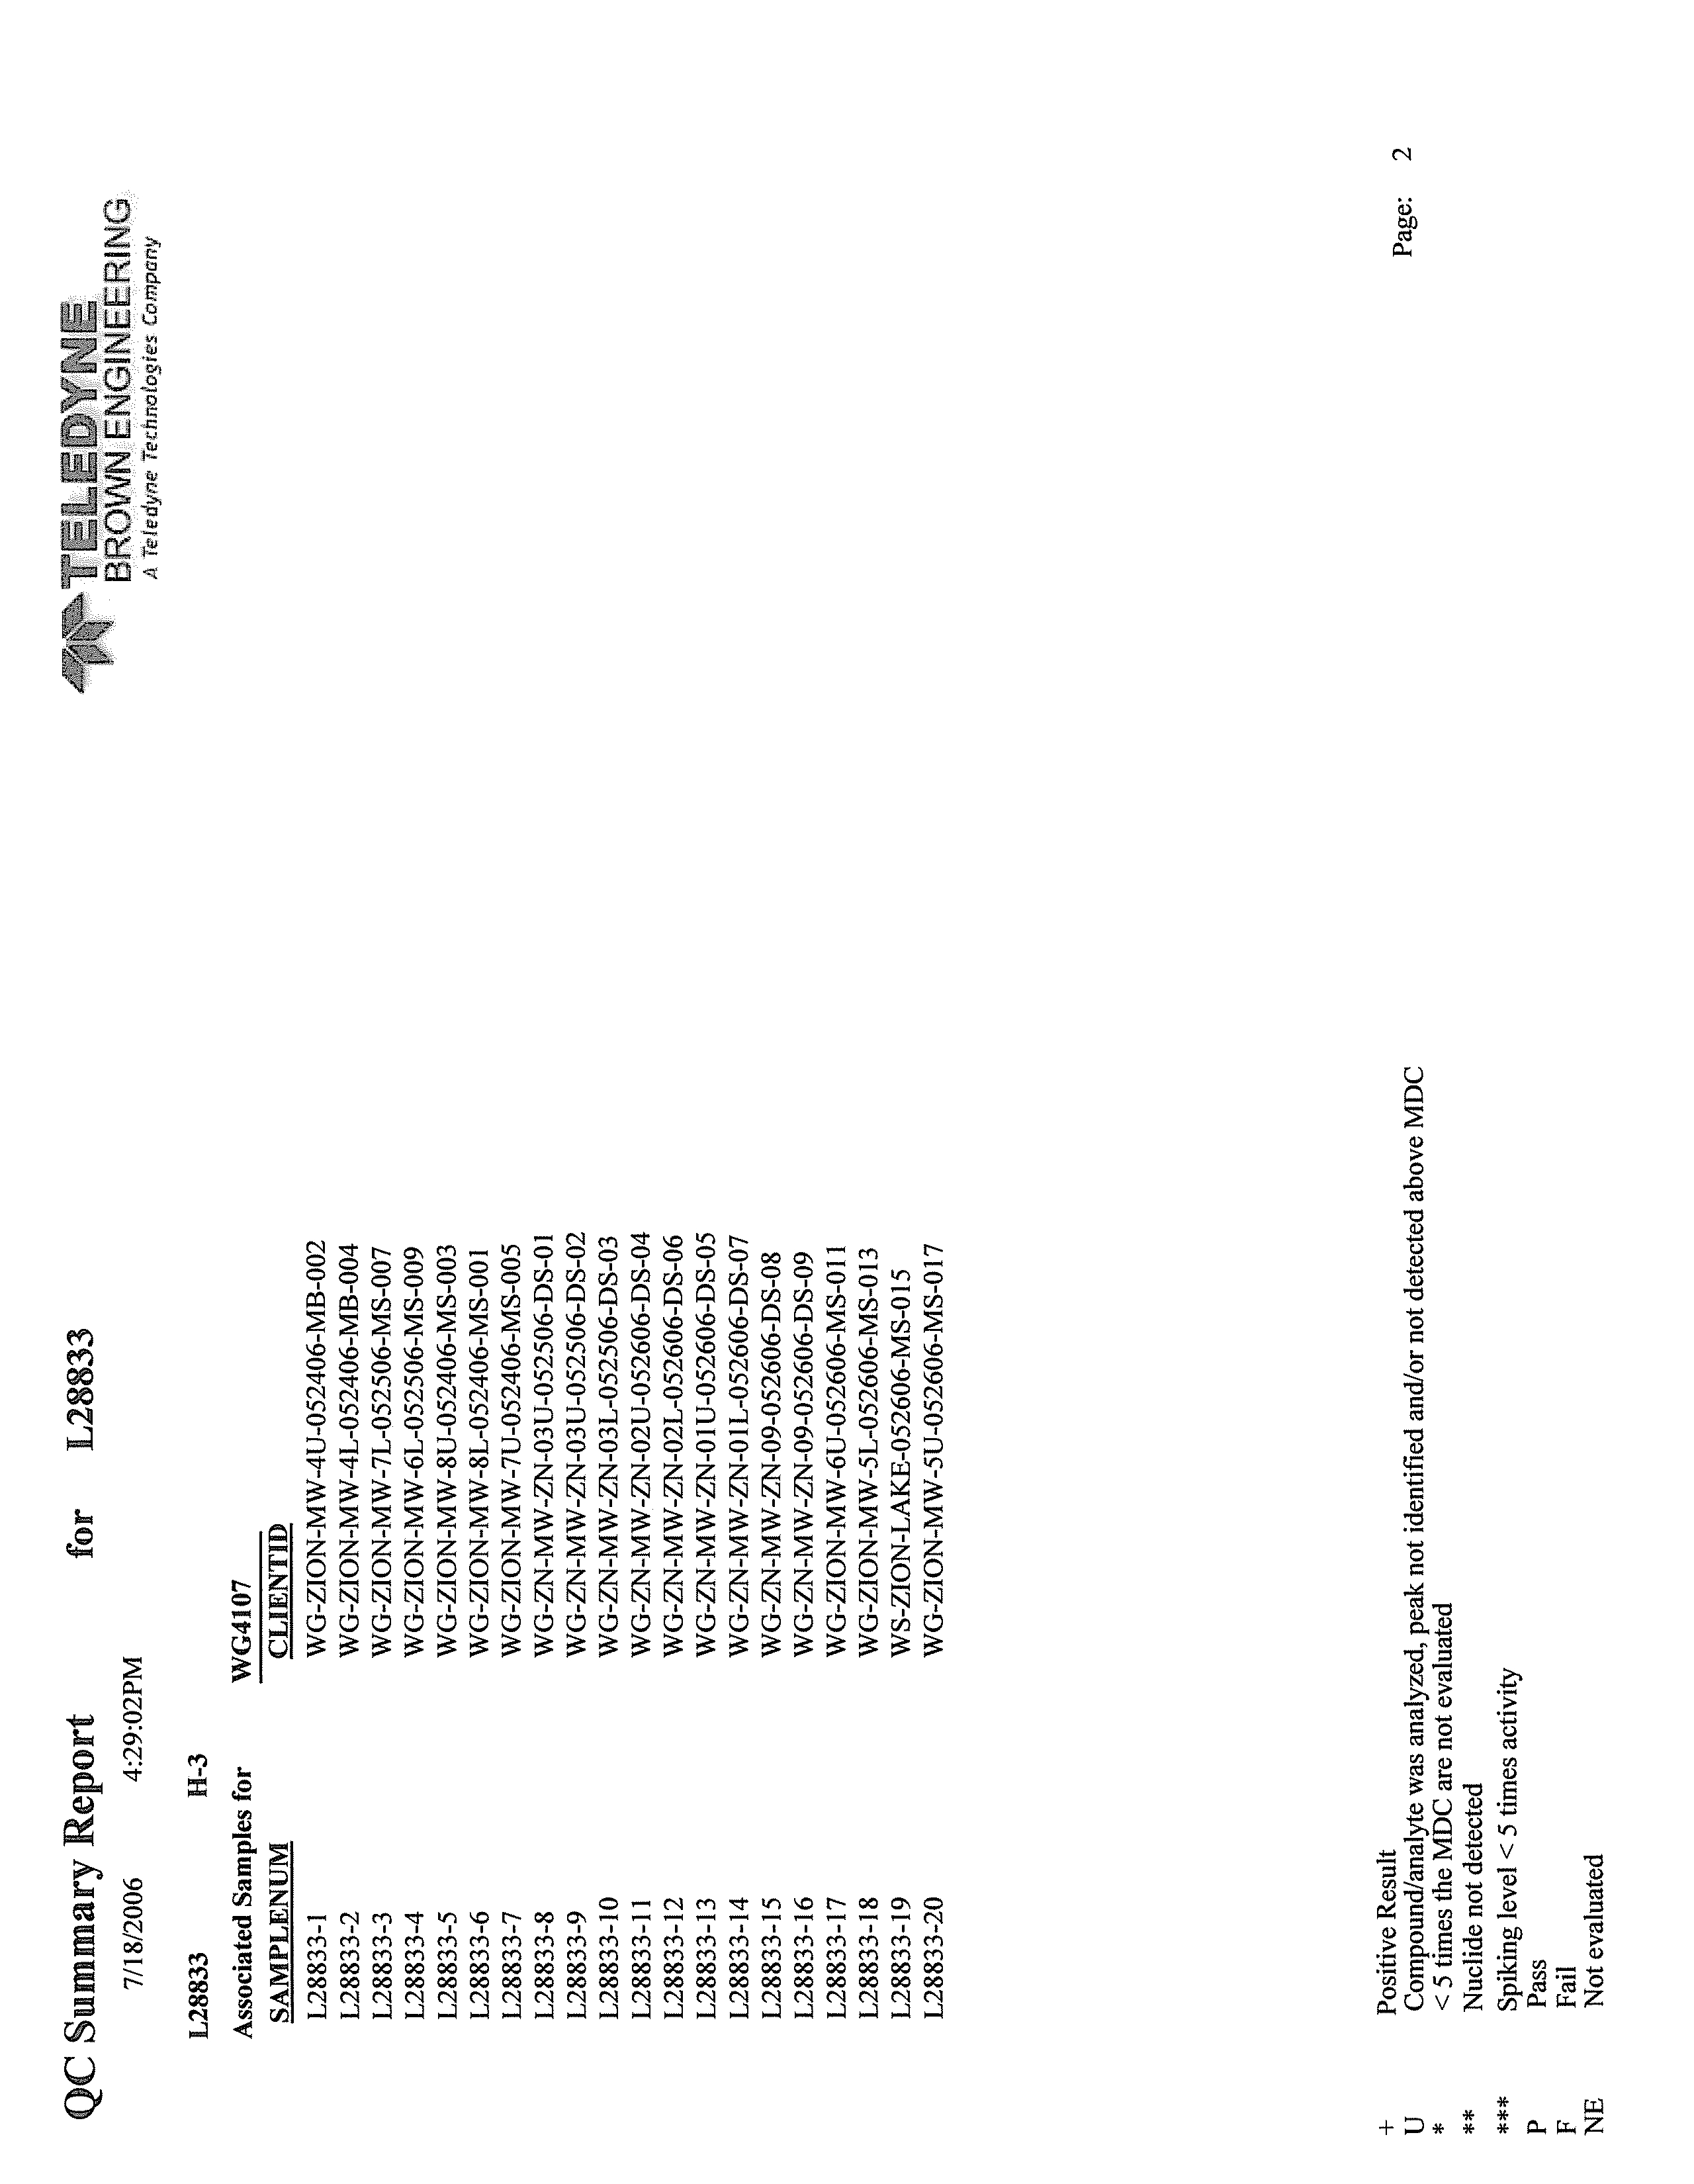
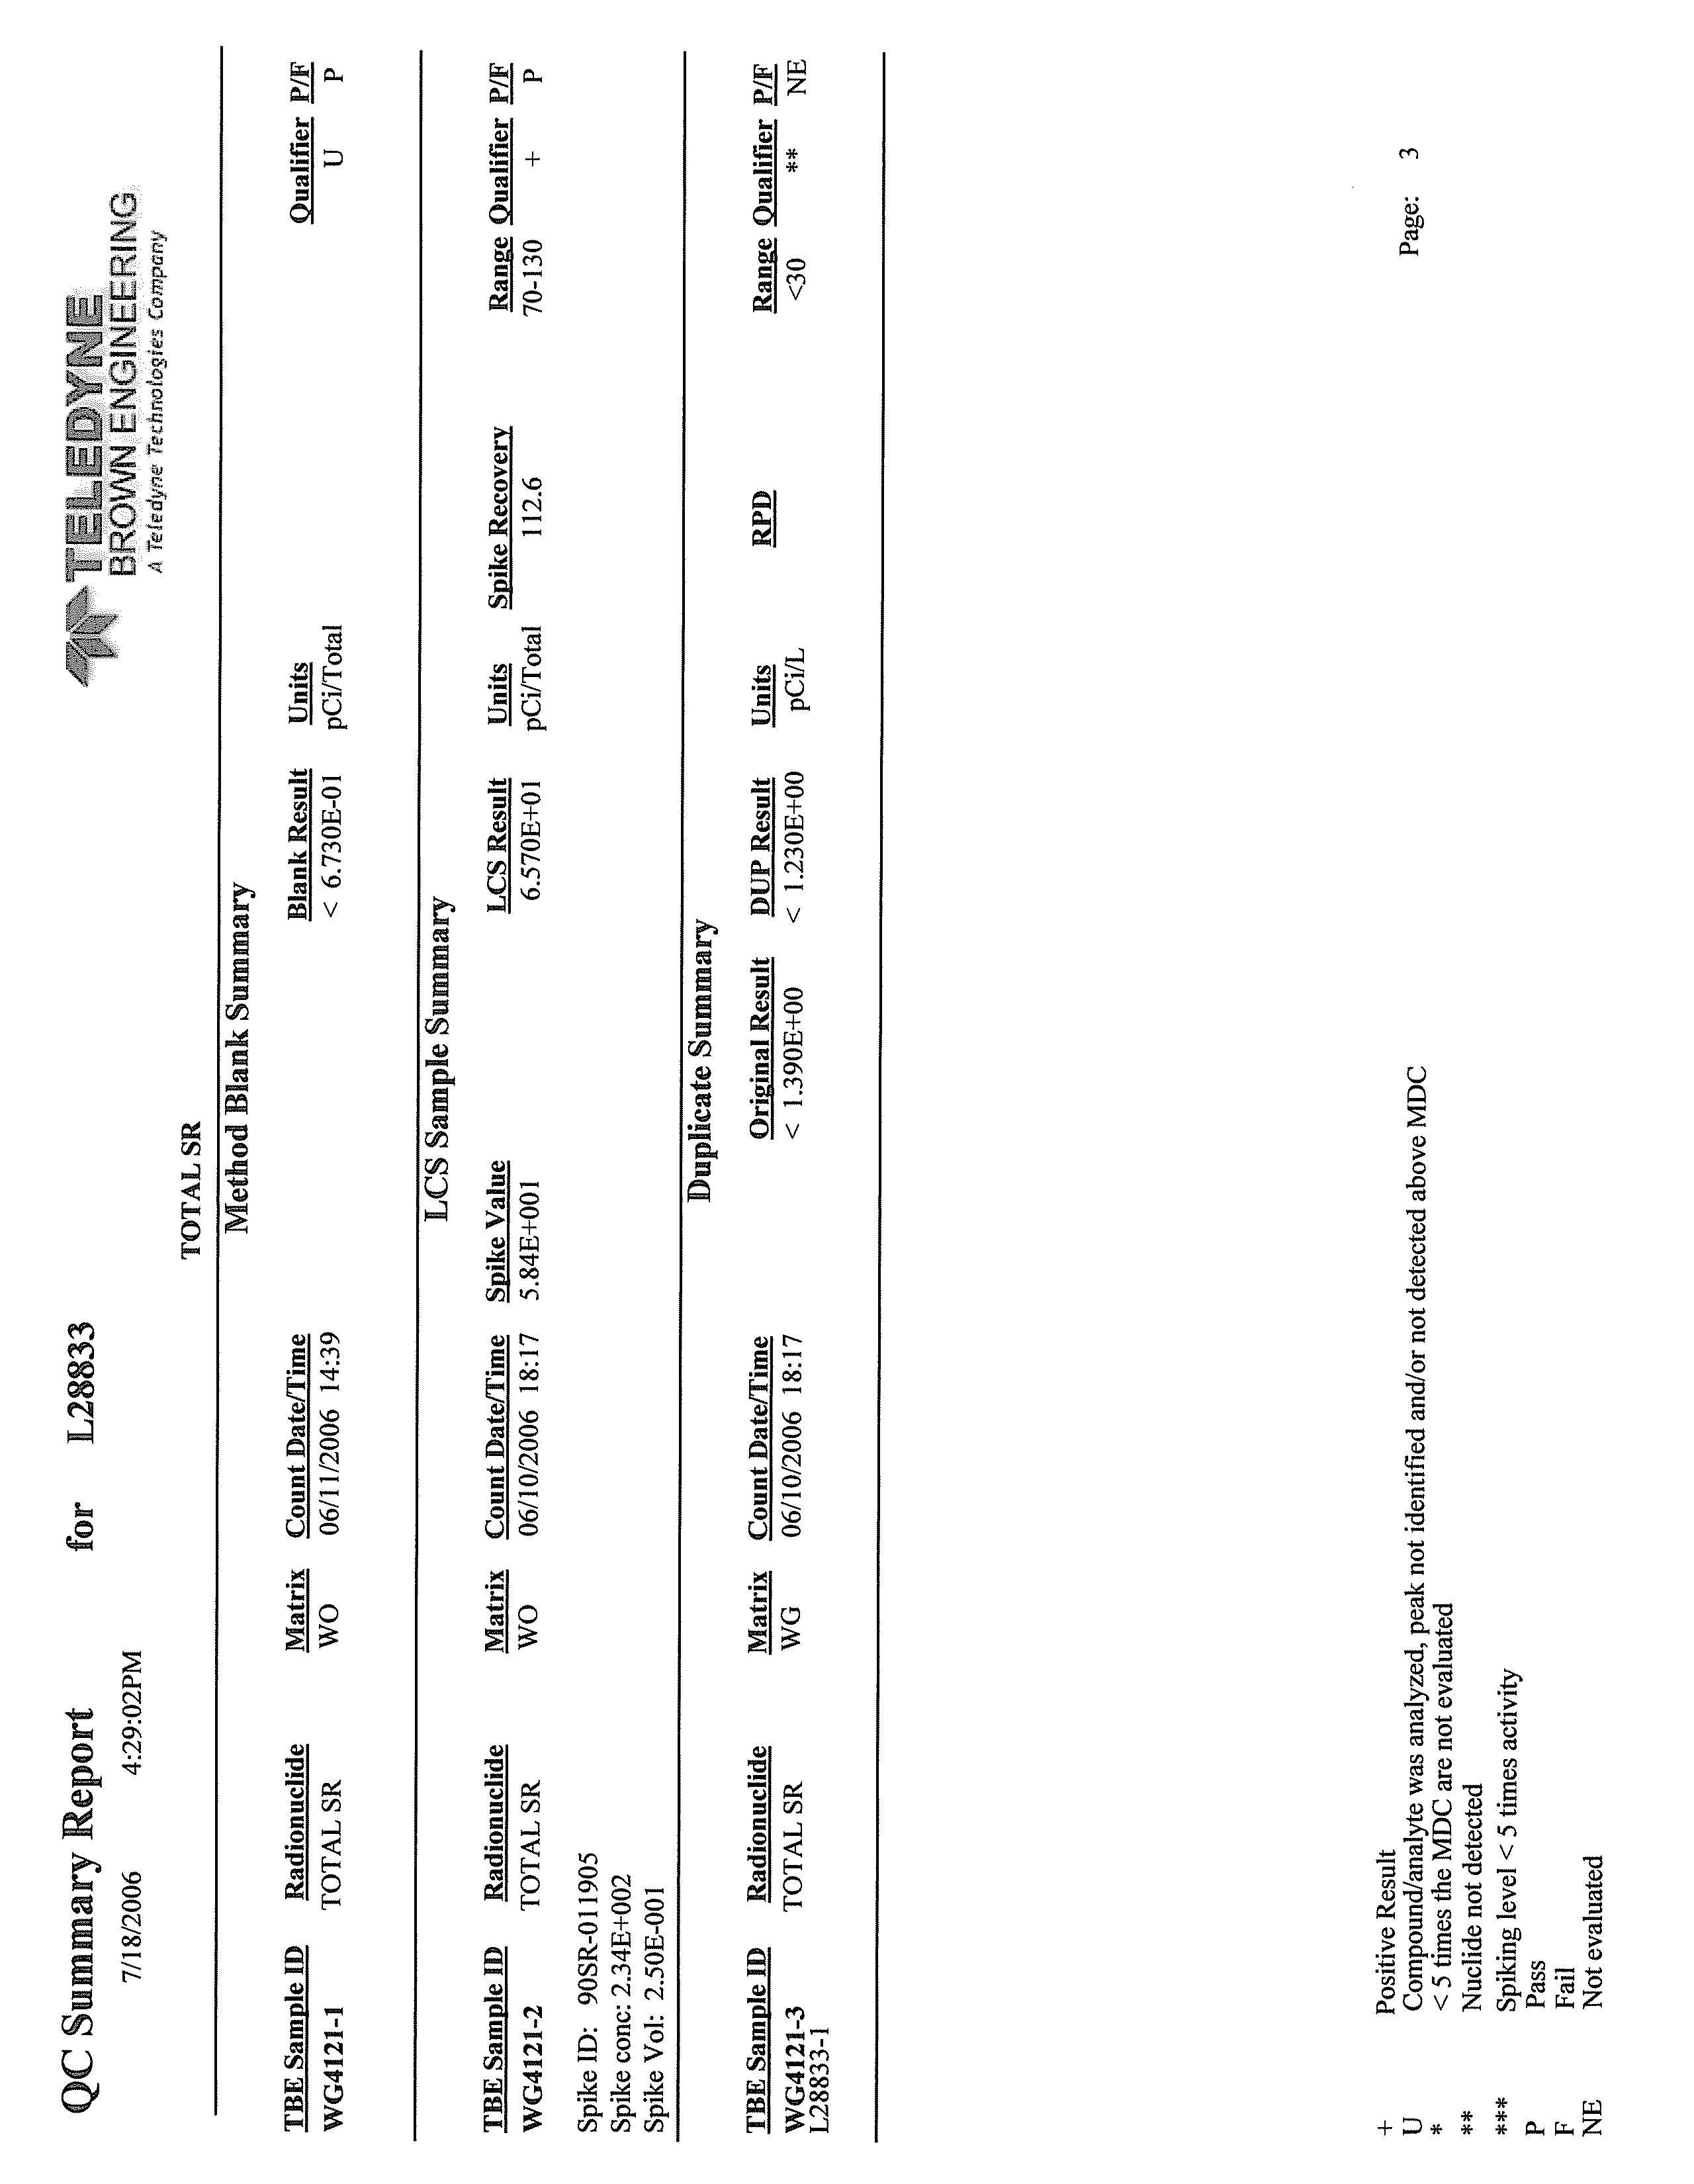
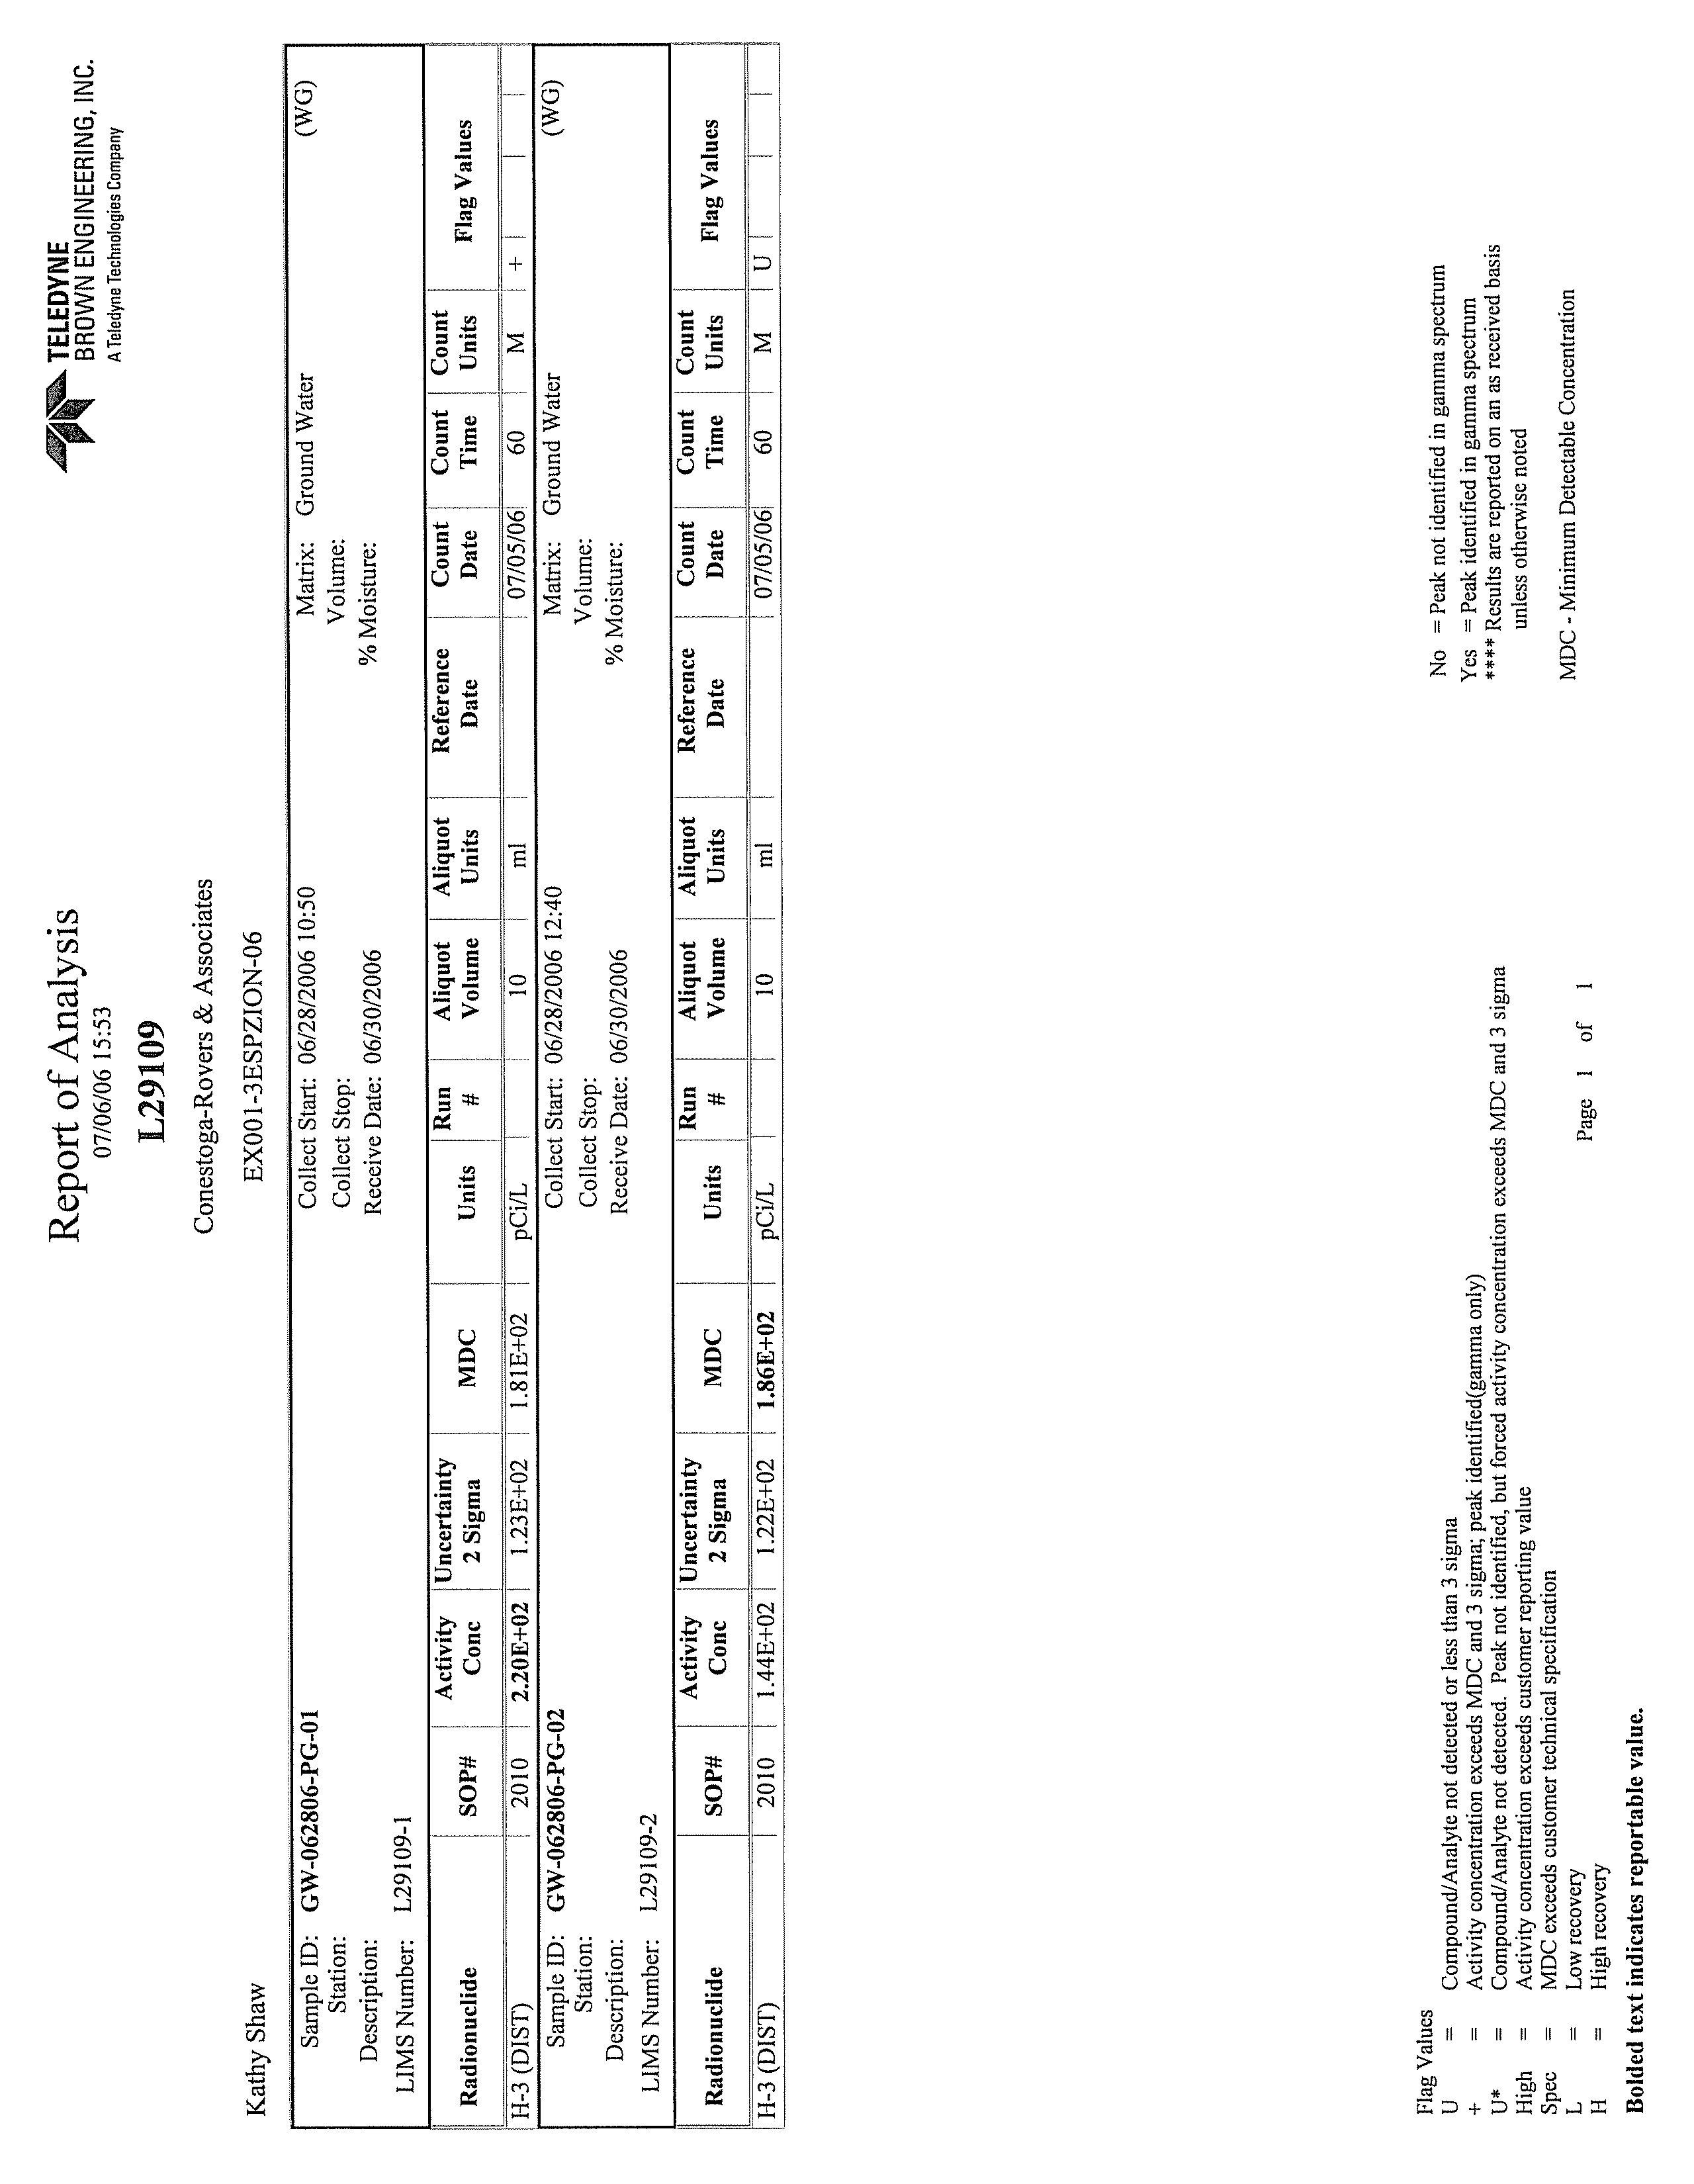
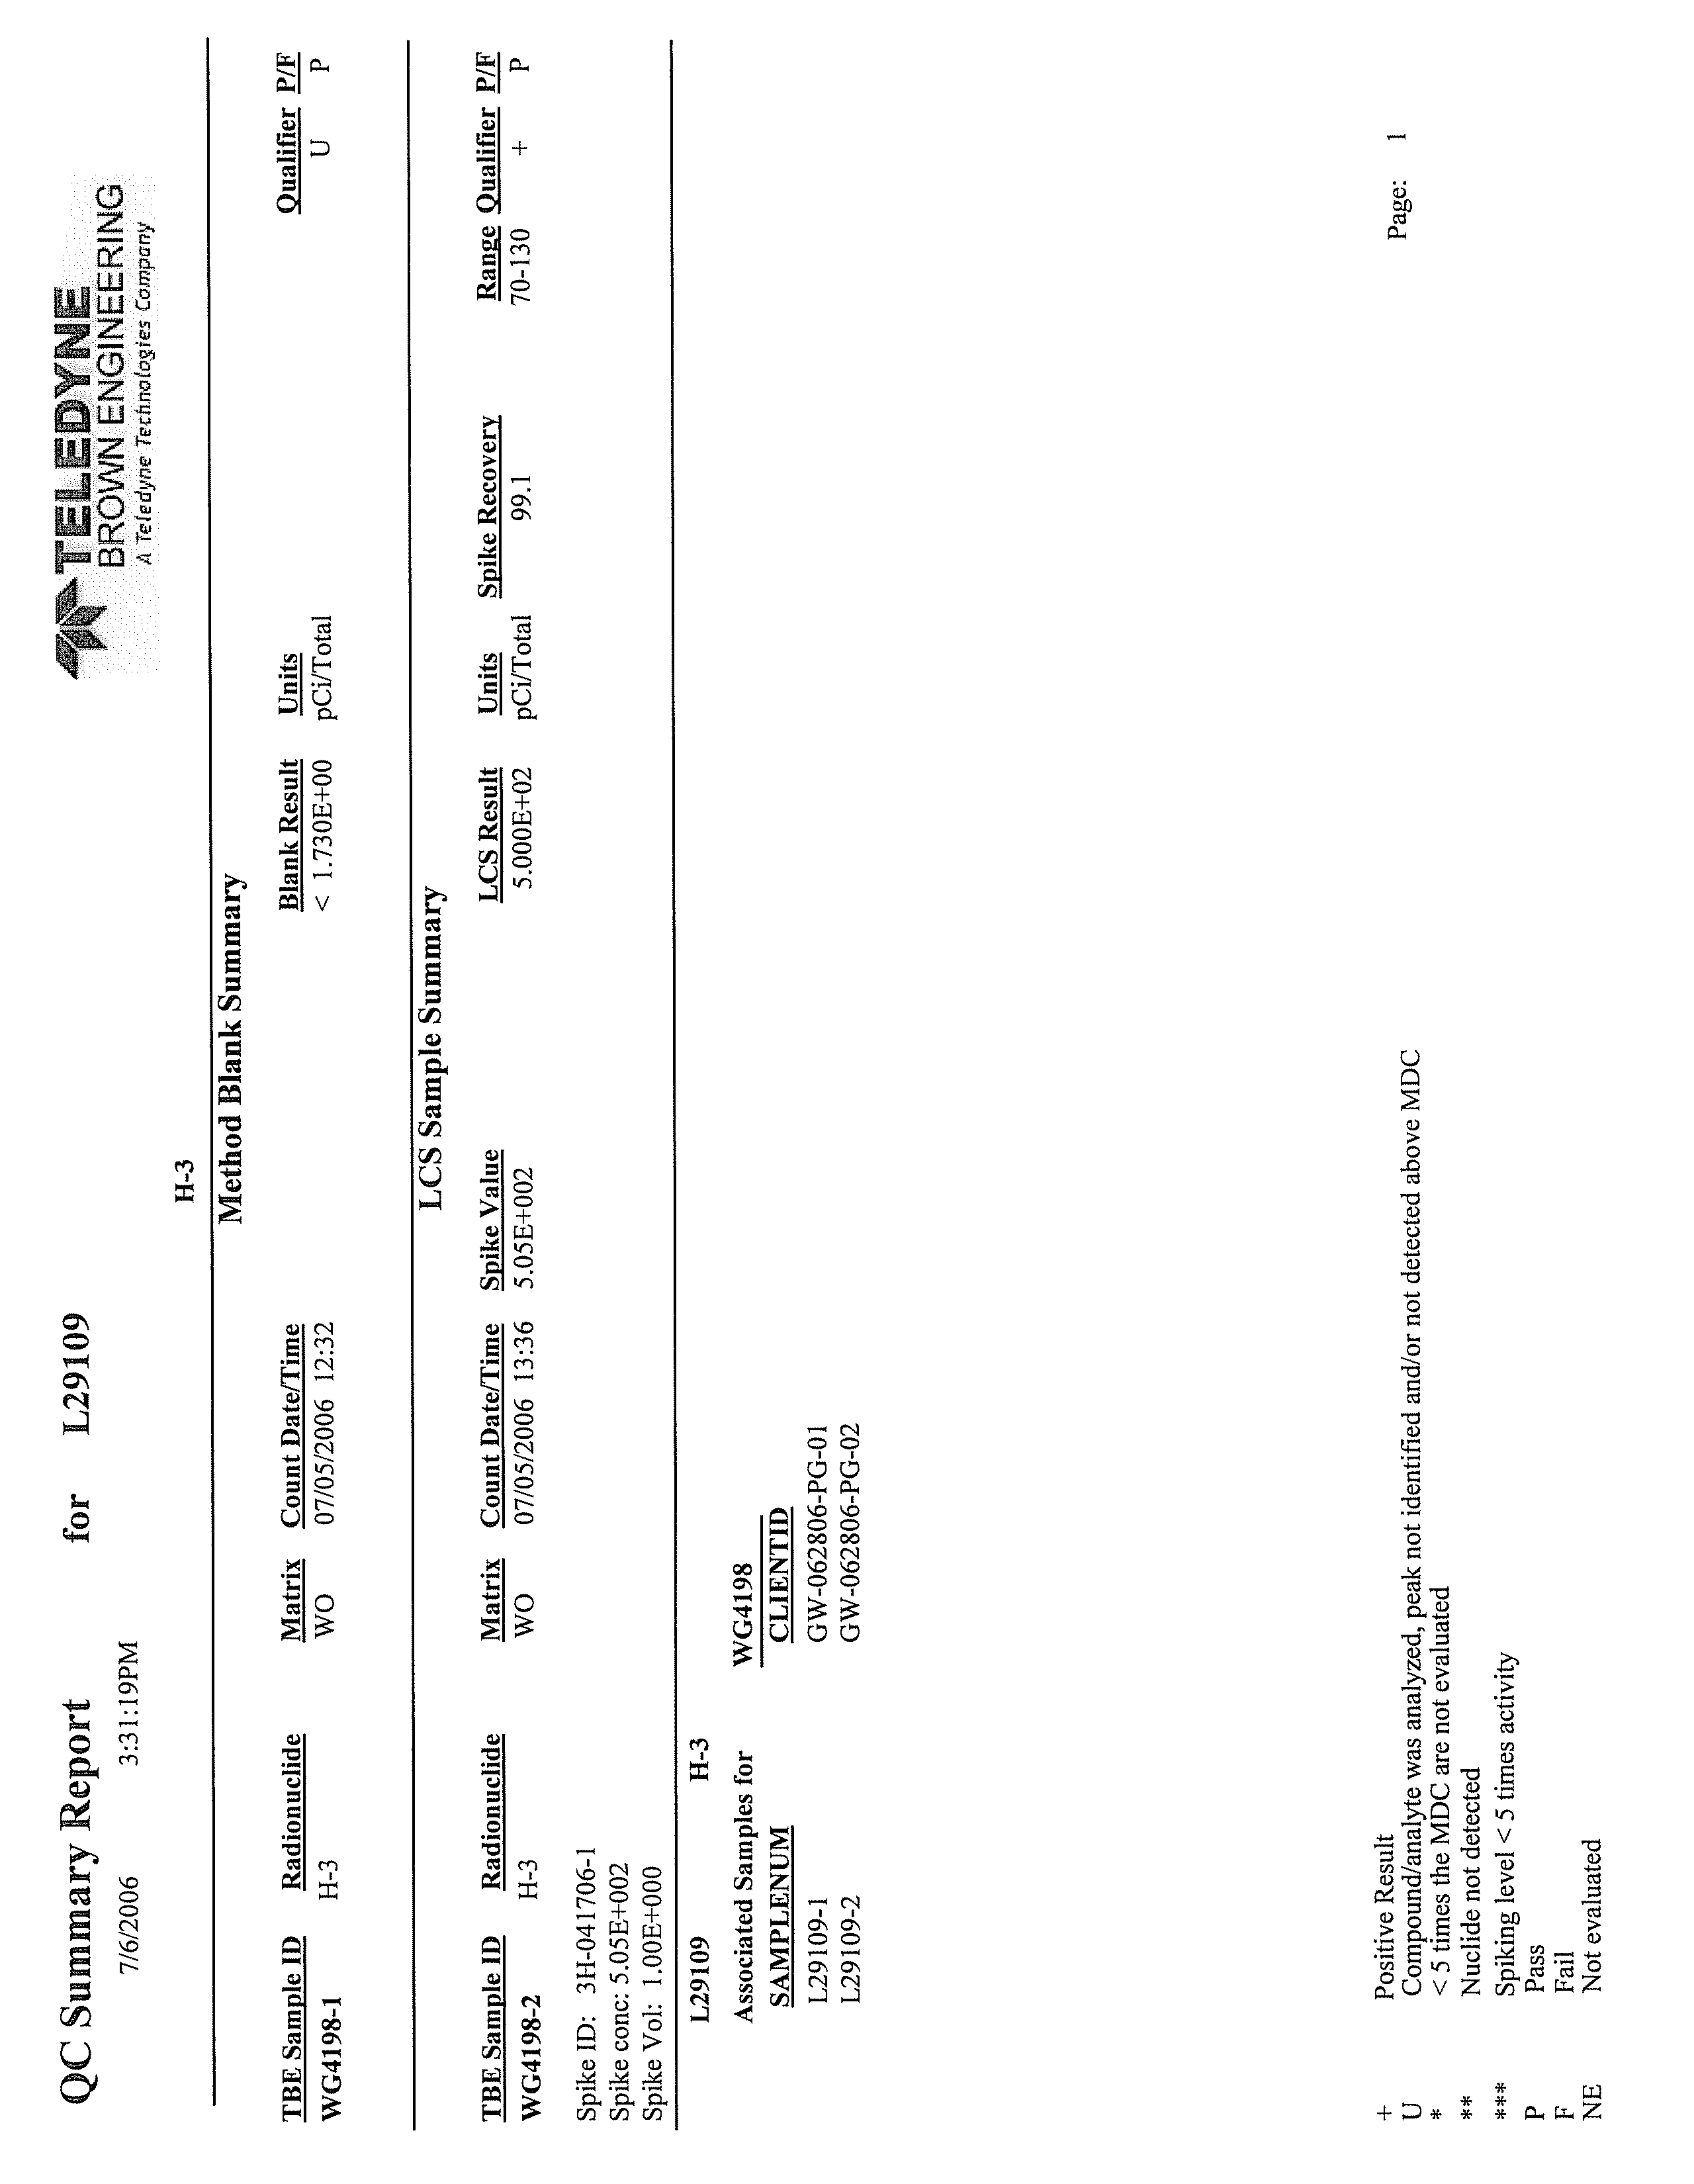
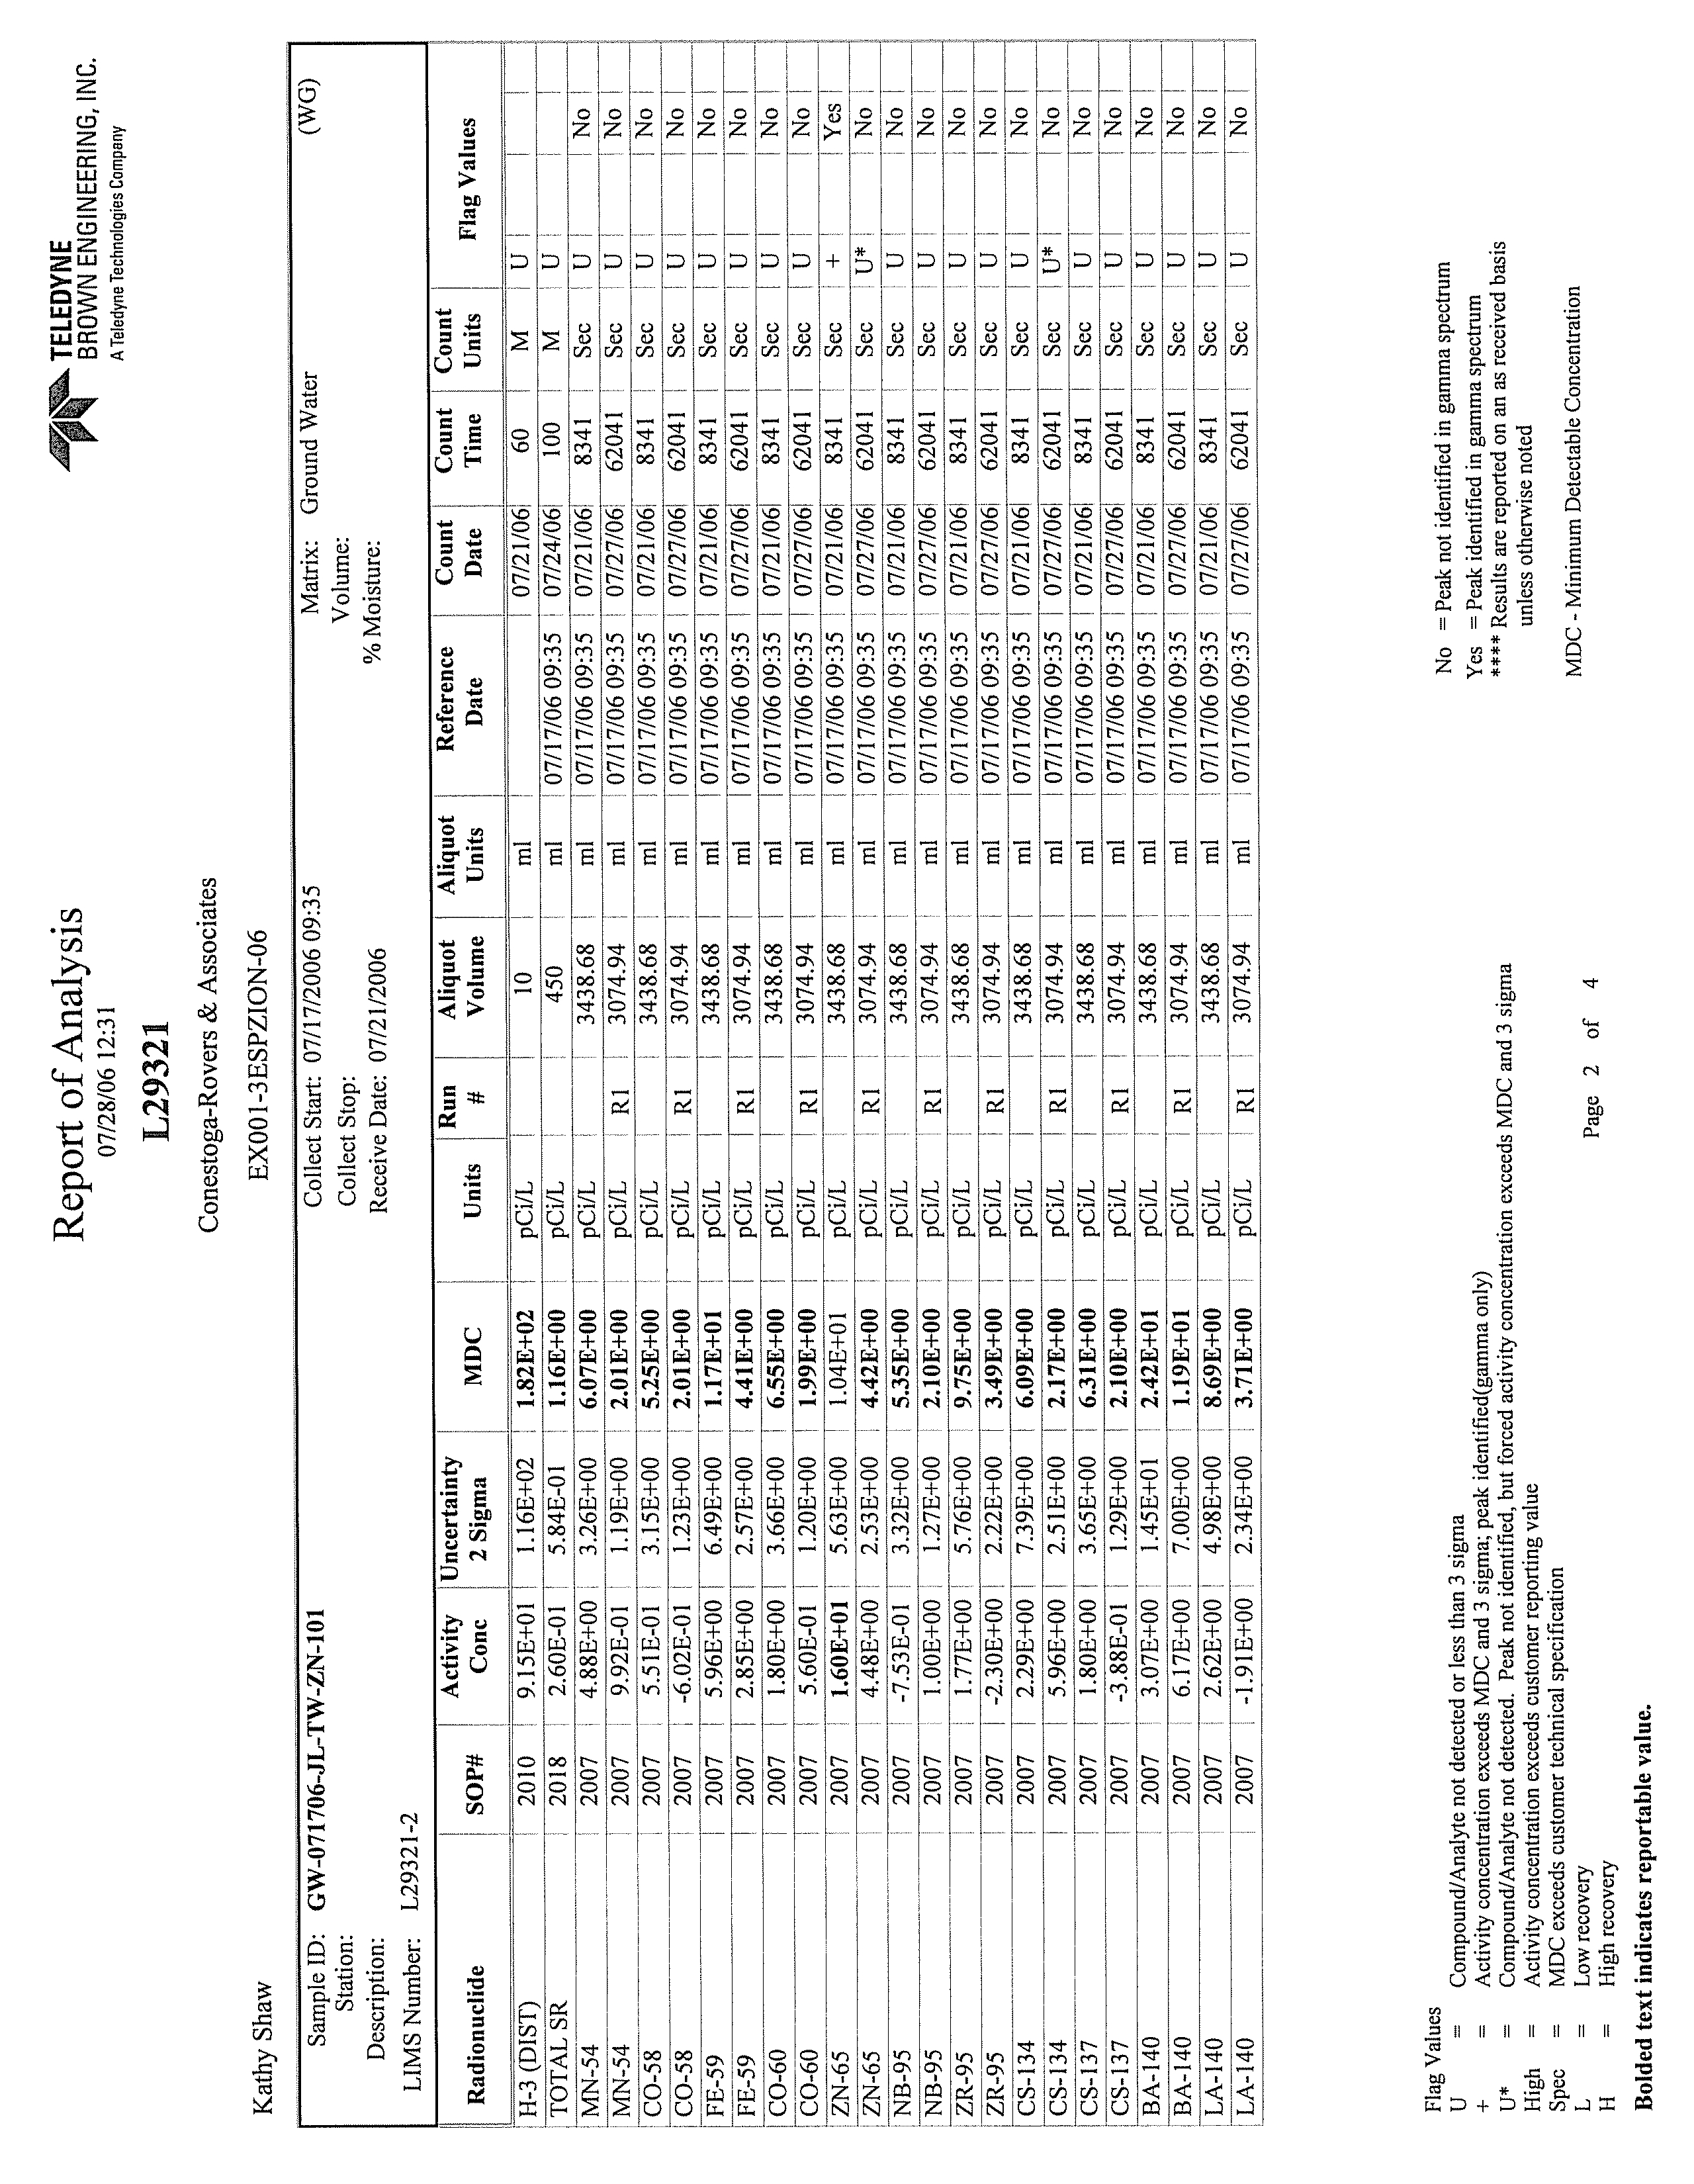
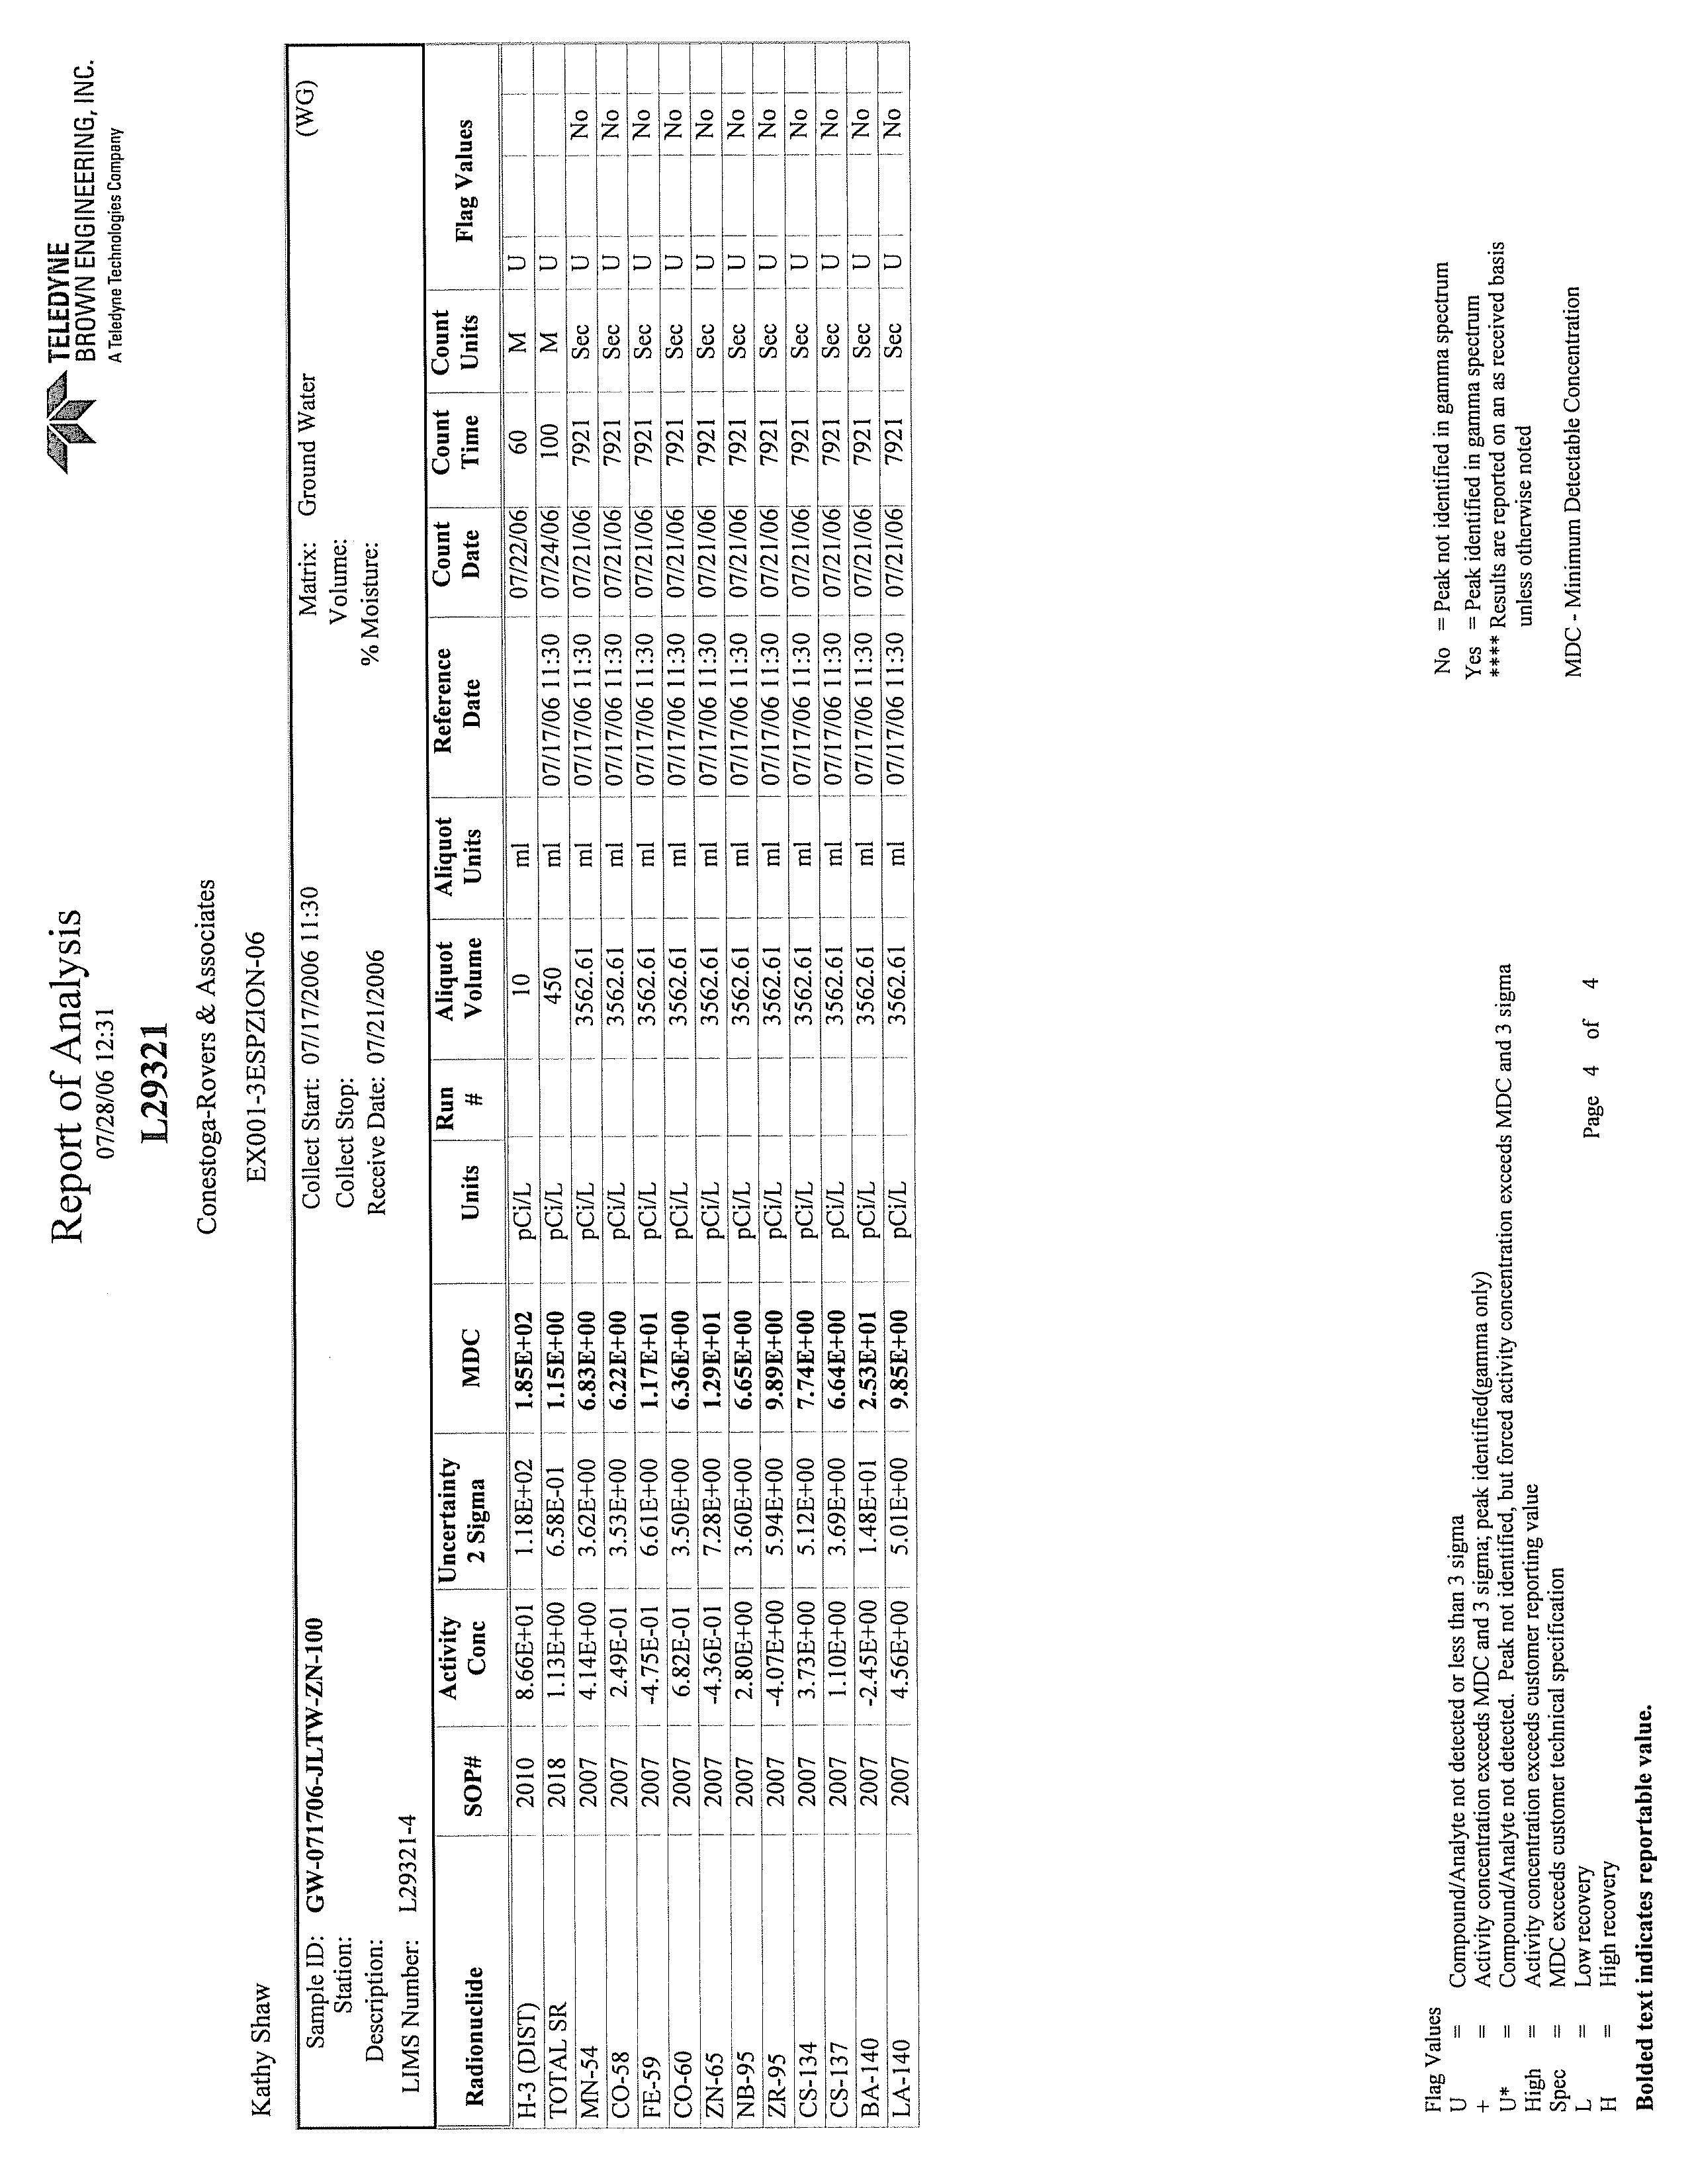
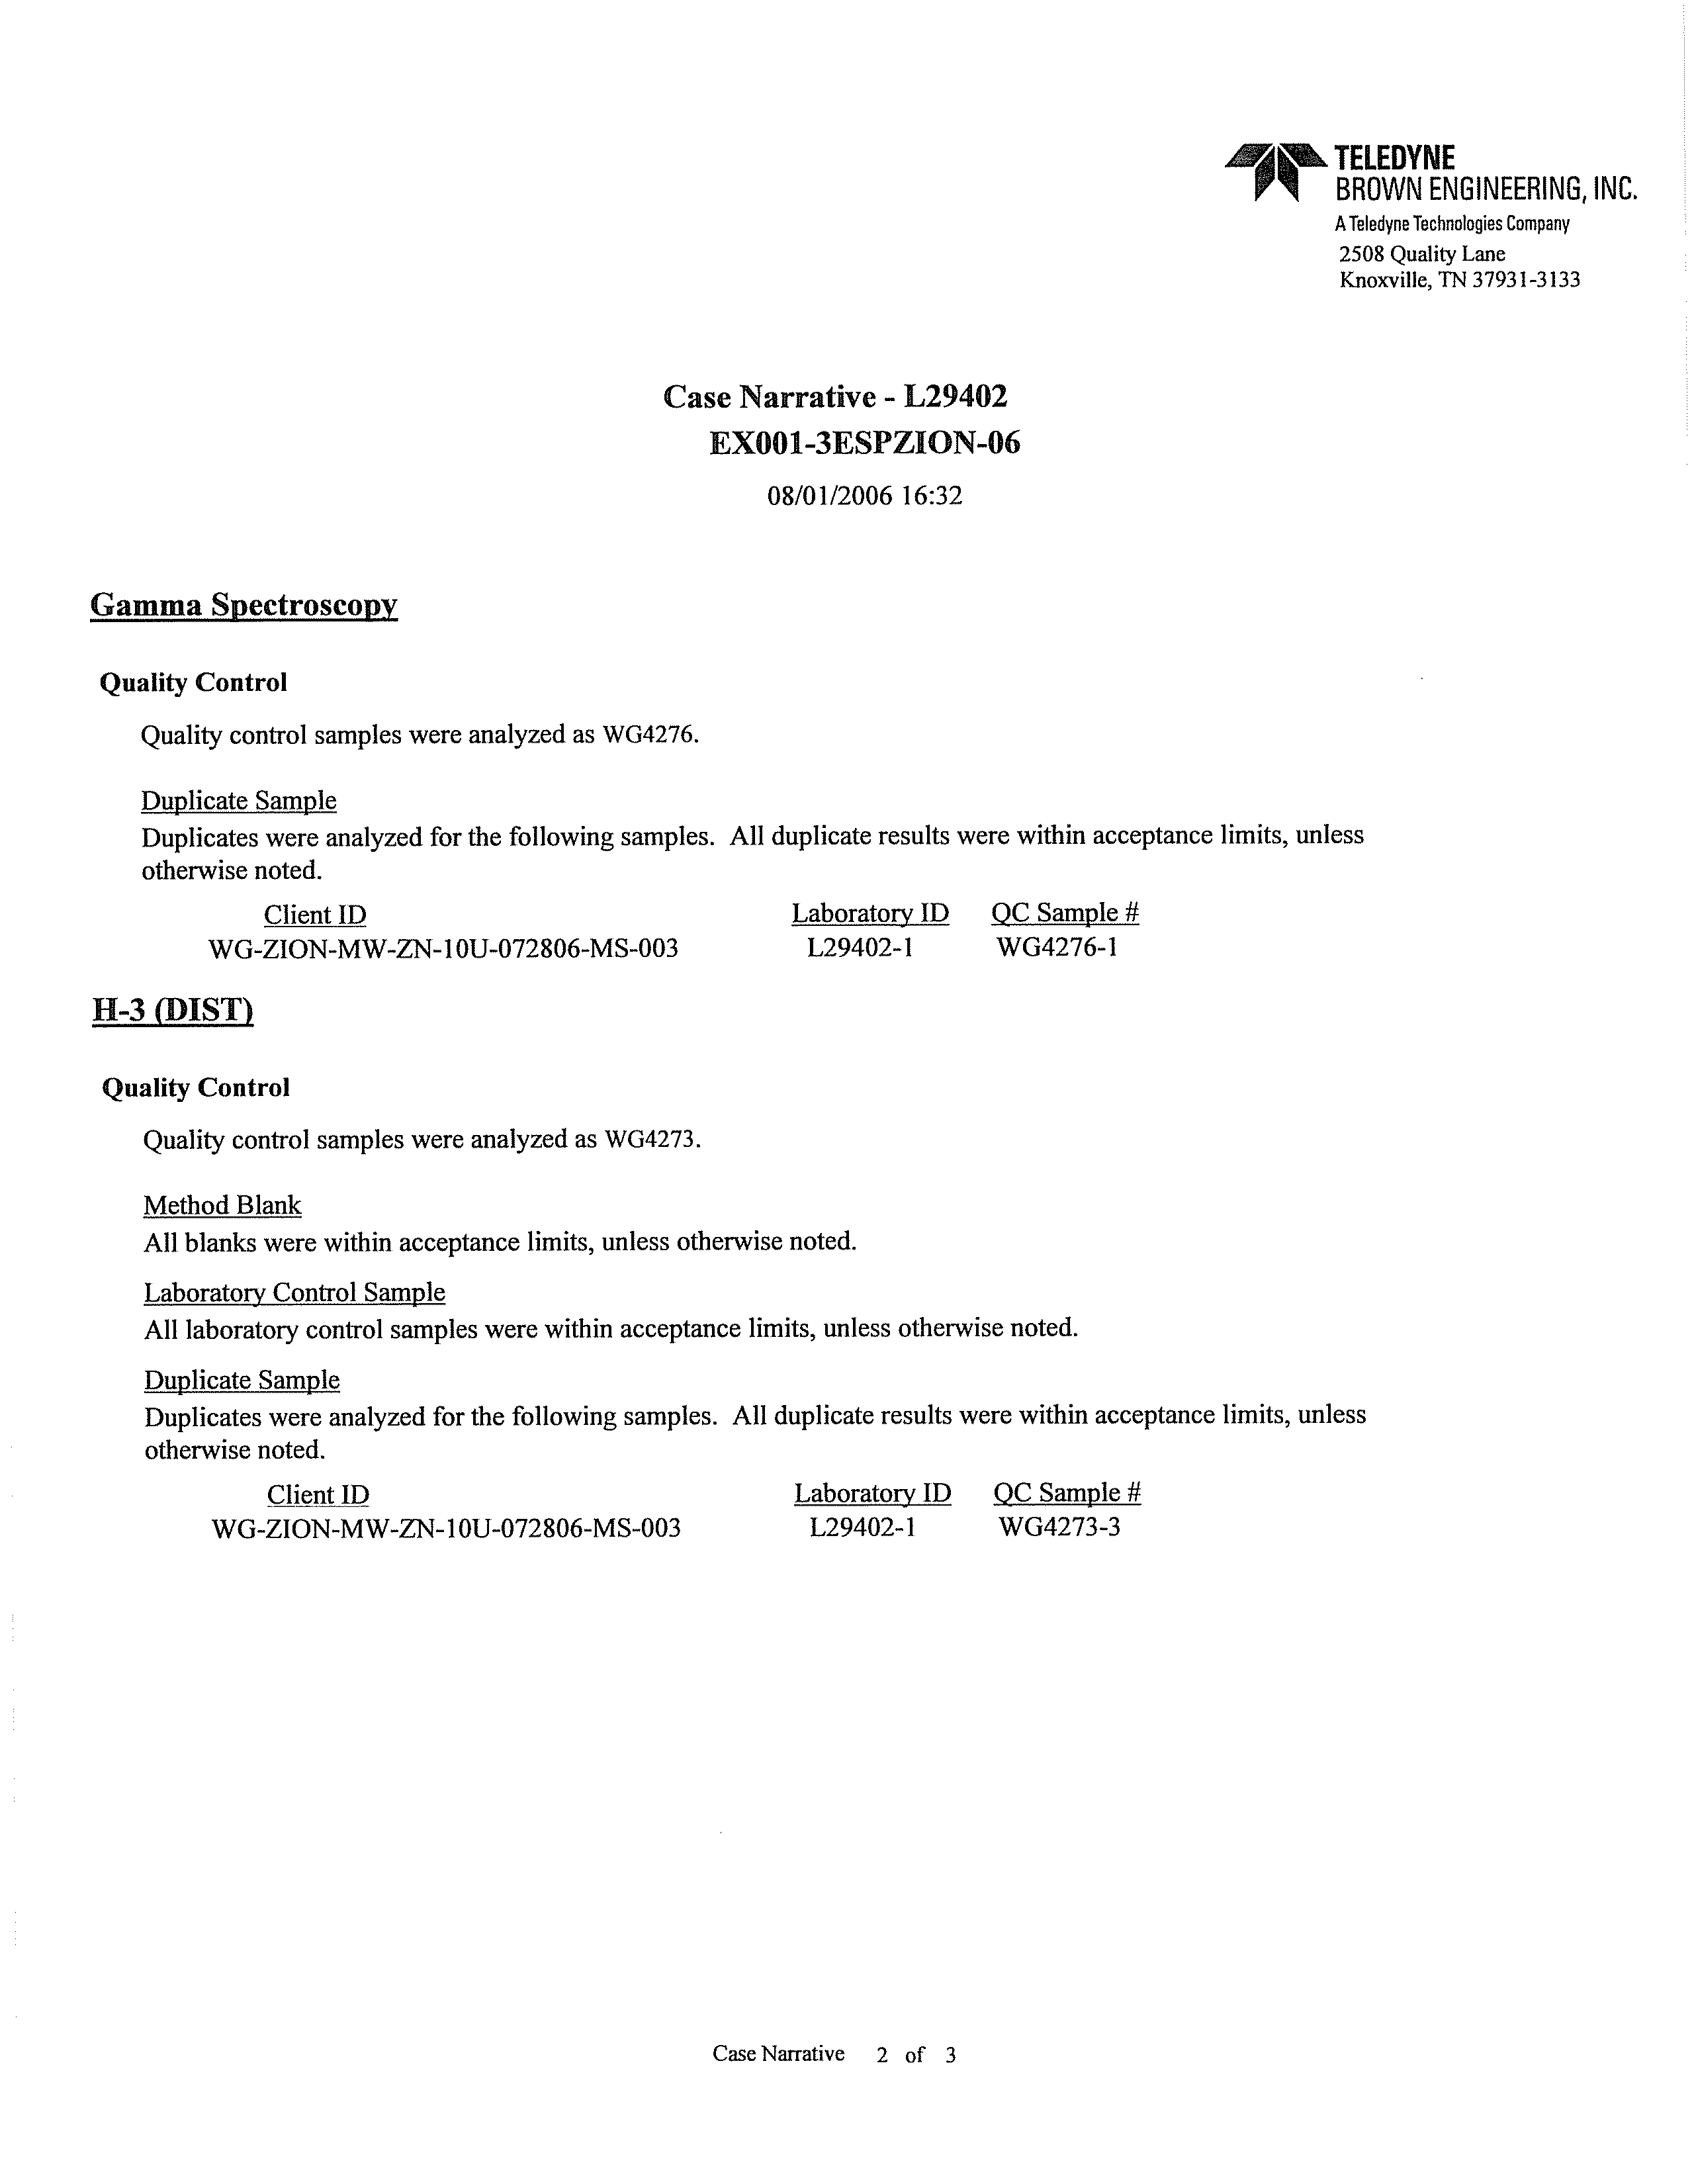
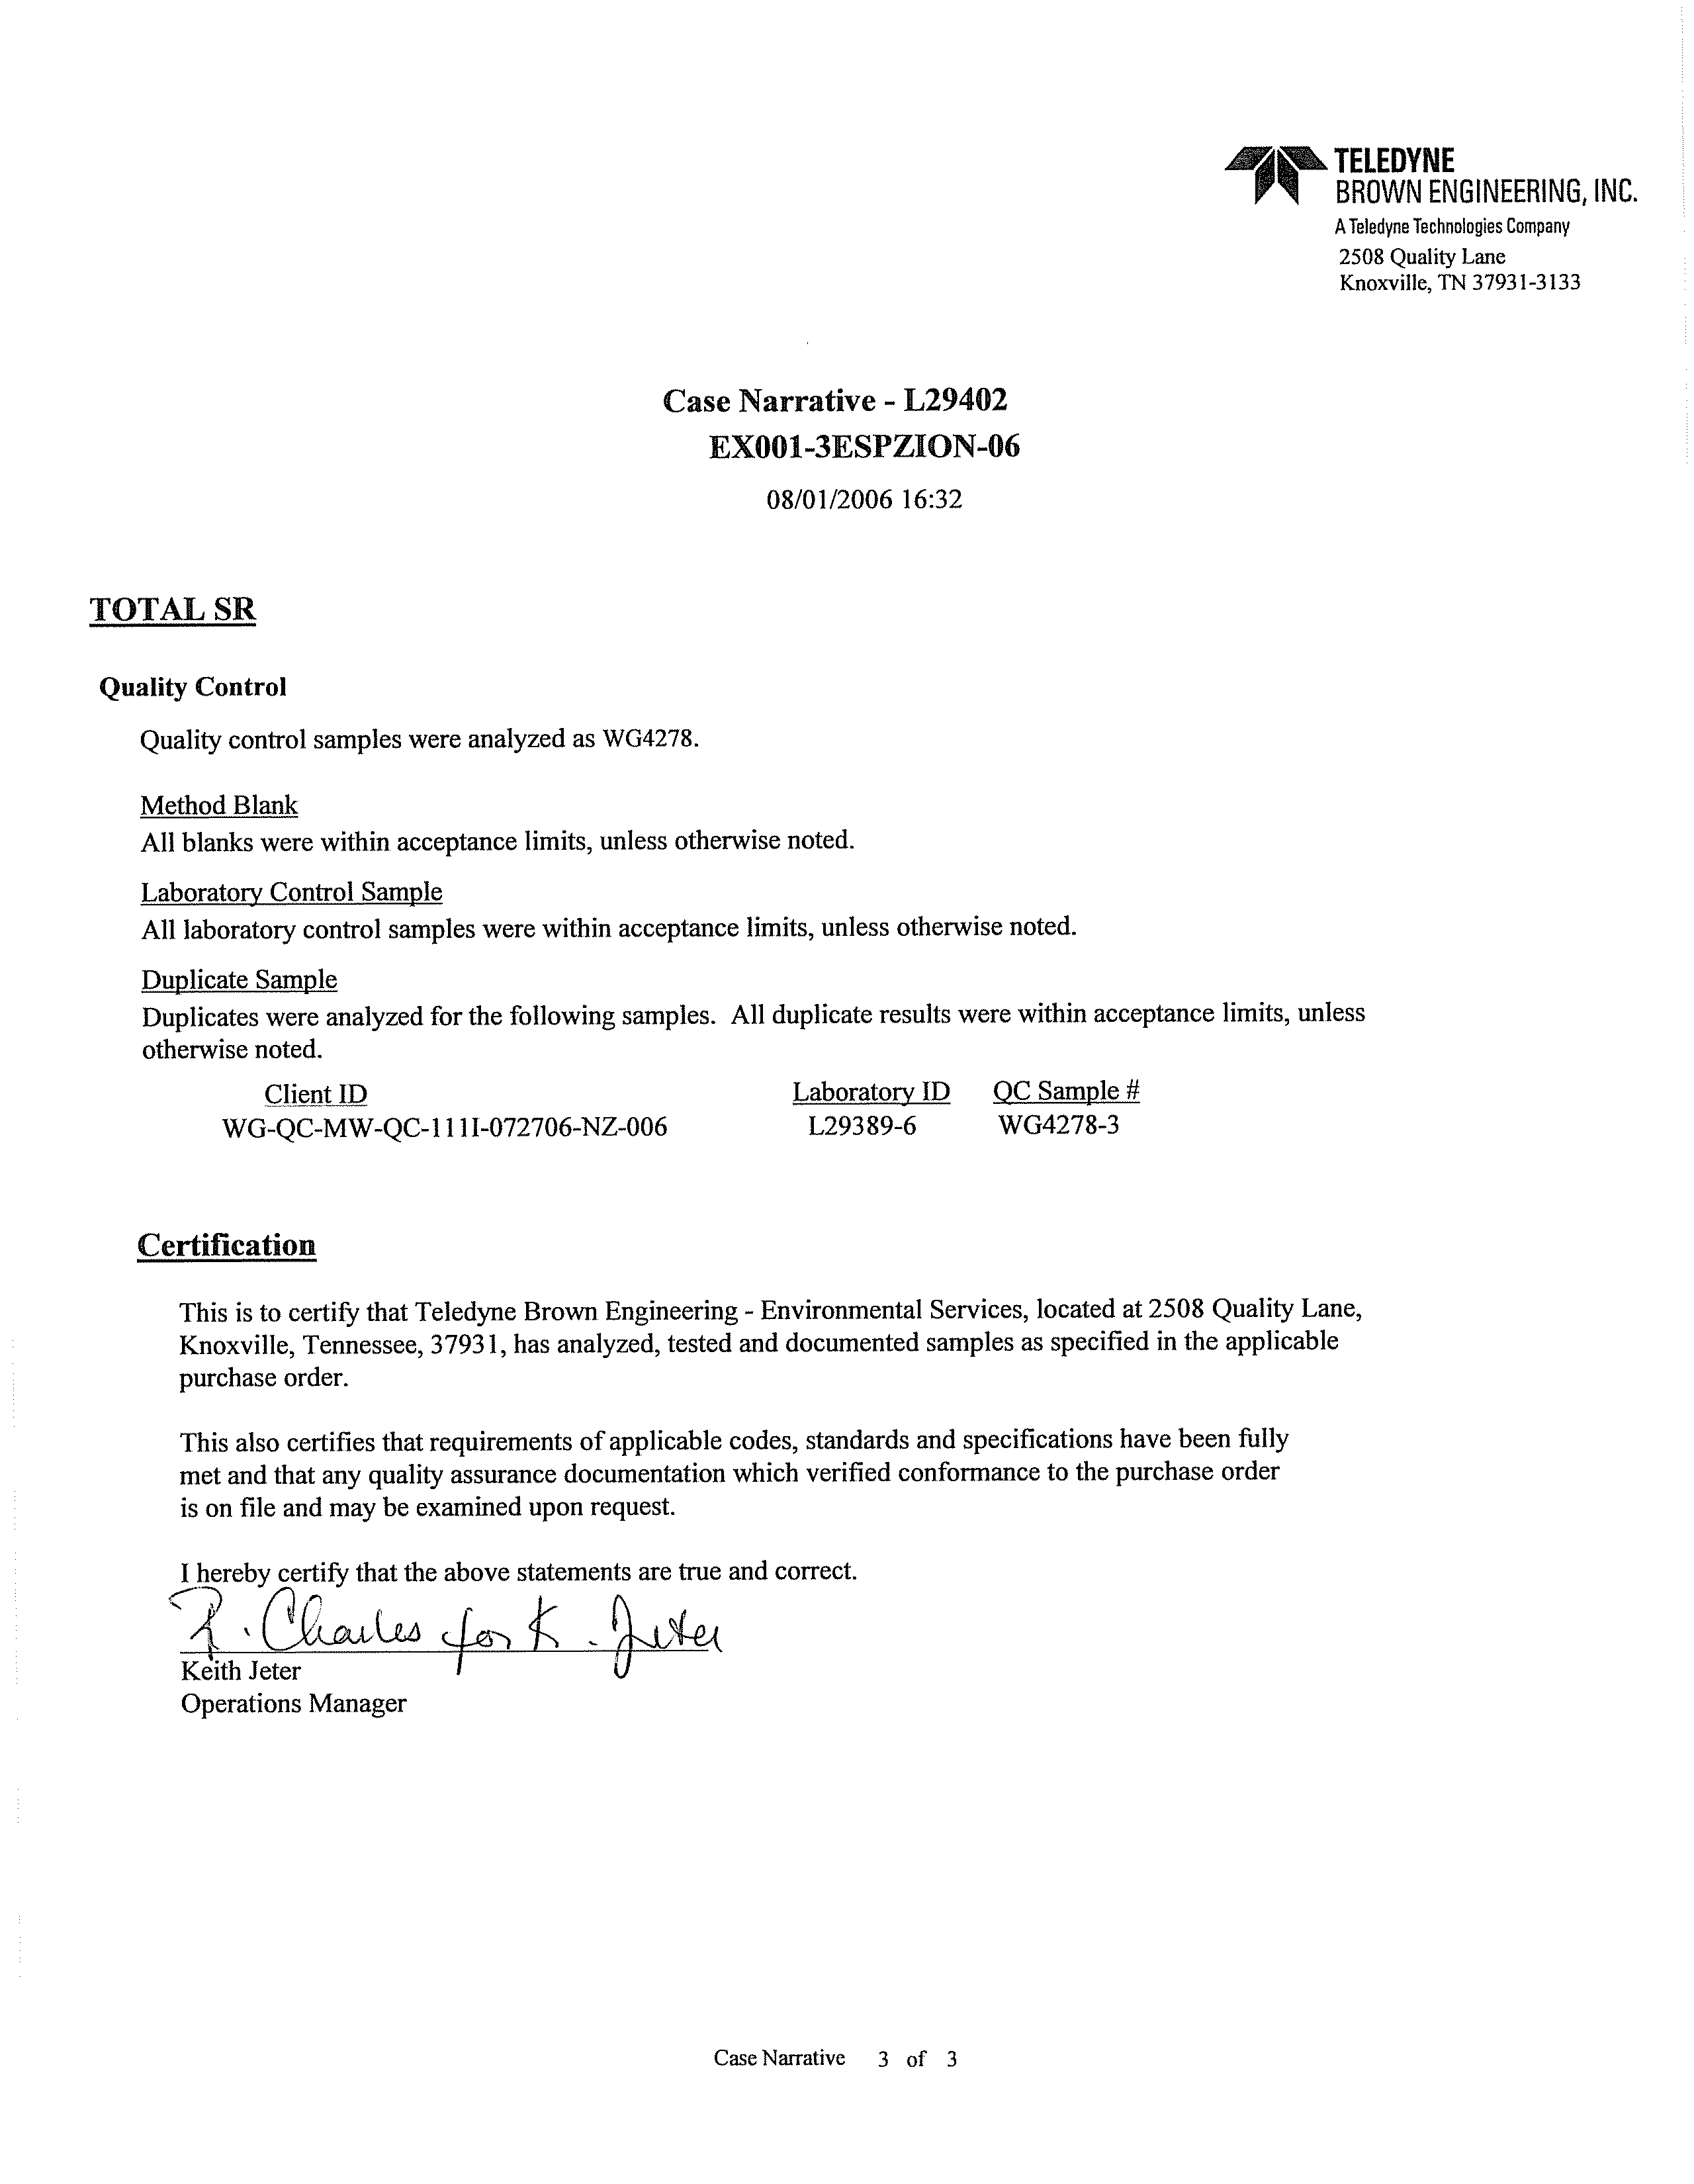
CRA has validated the analytical data to establish the accuracy and completeness of the
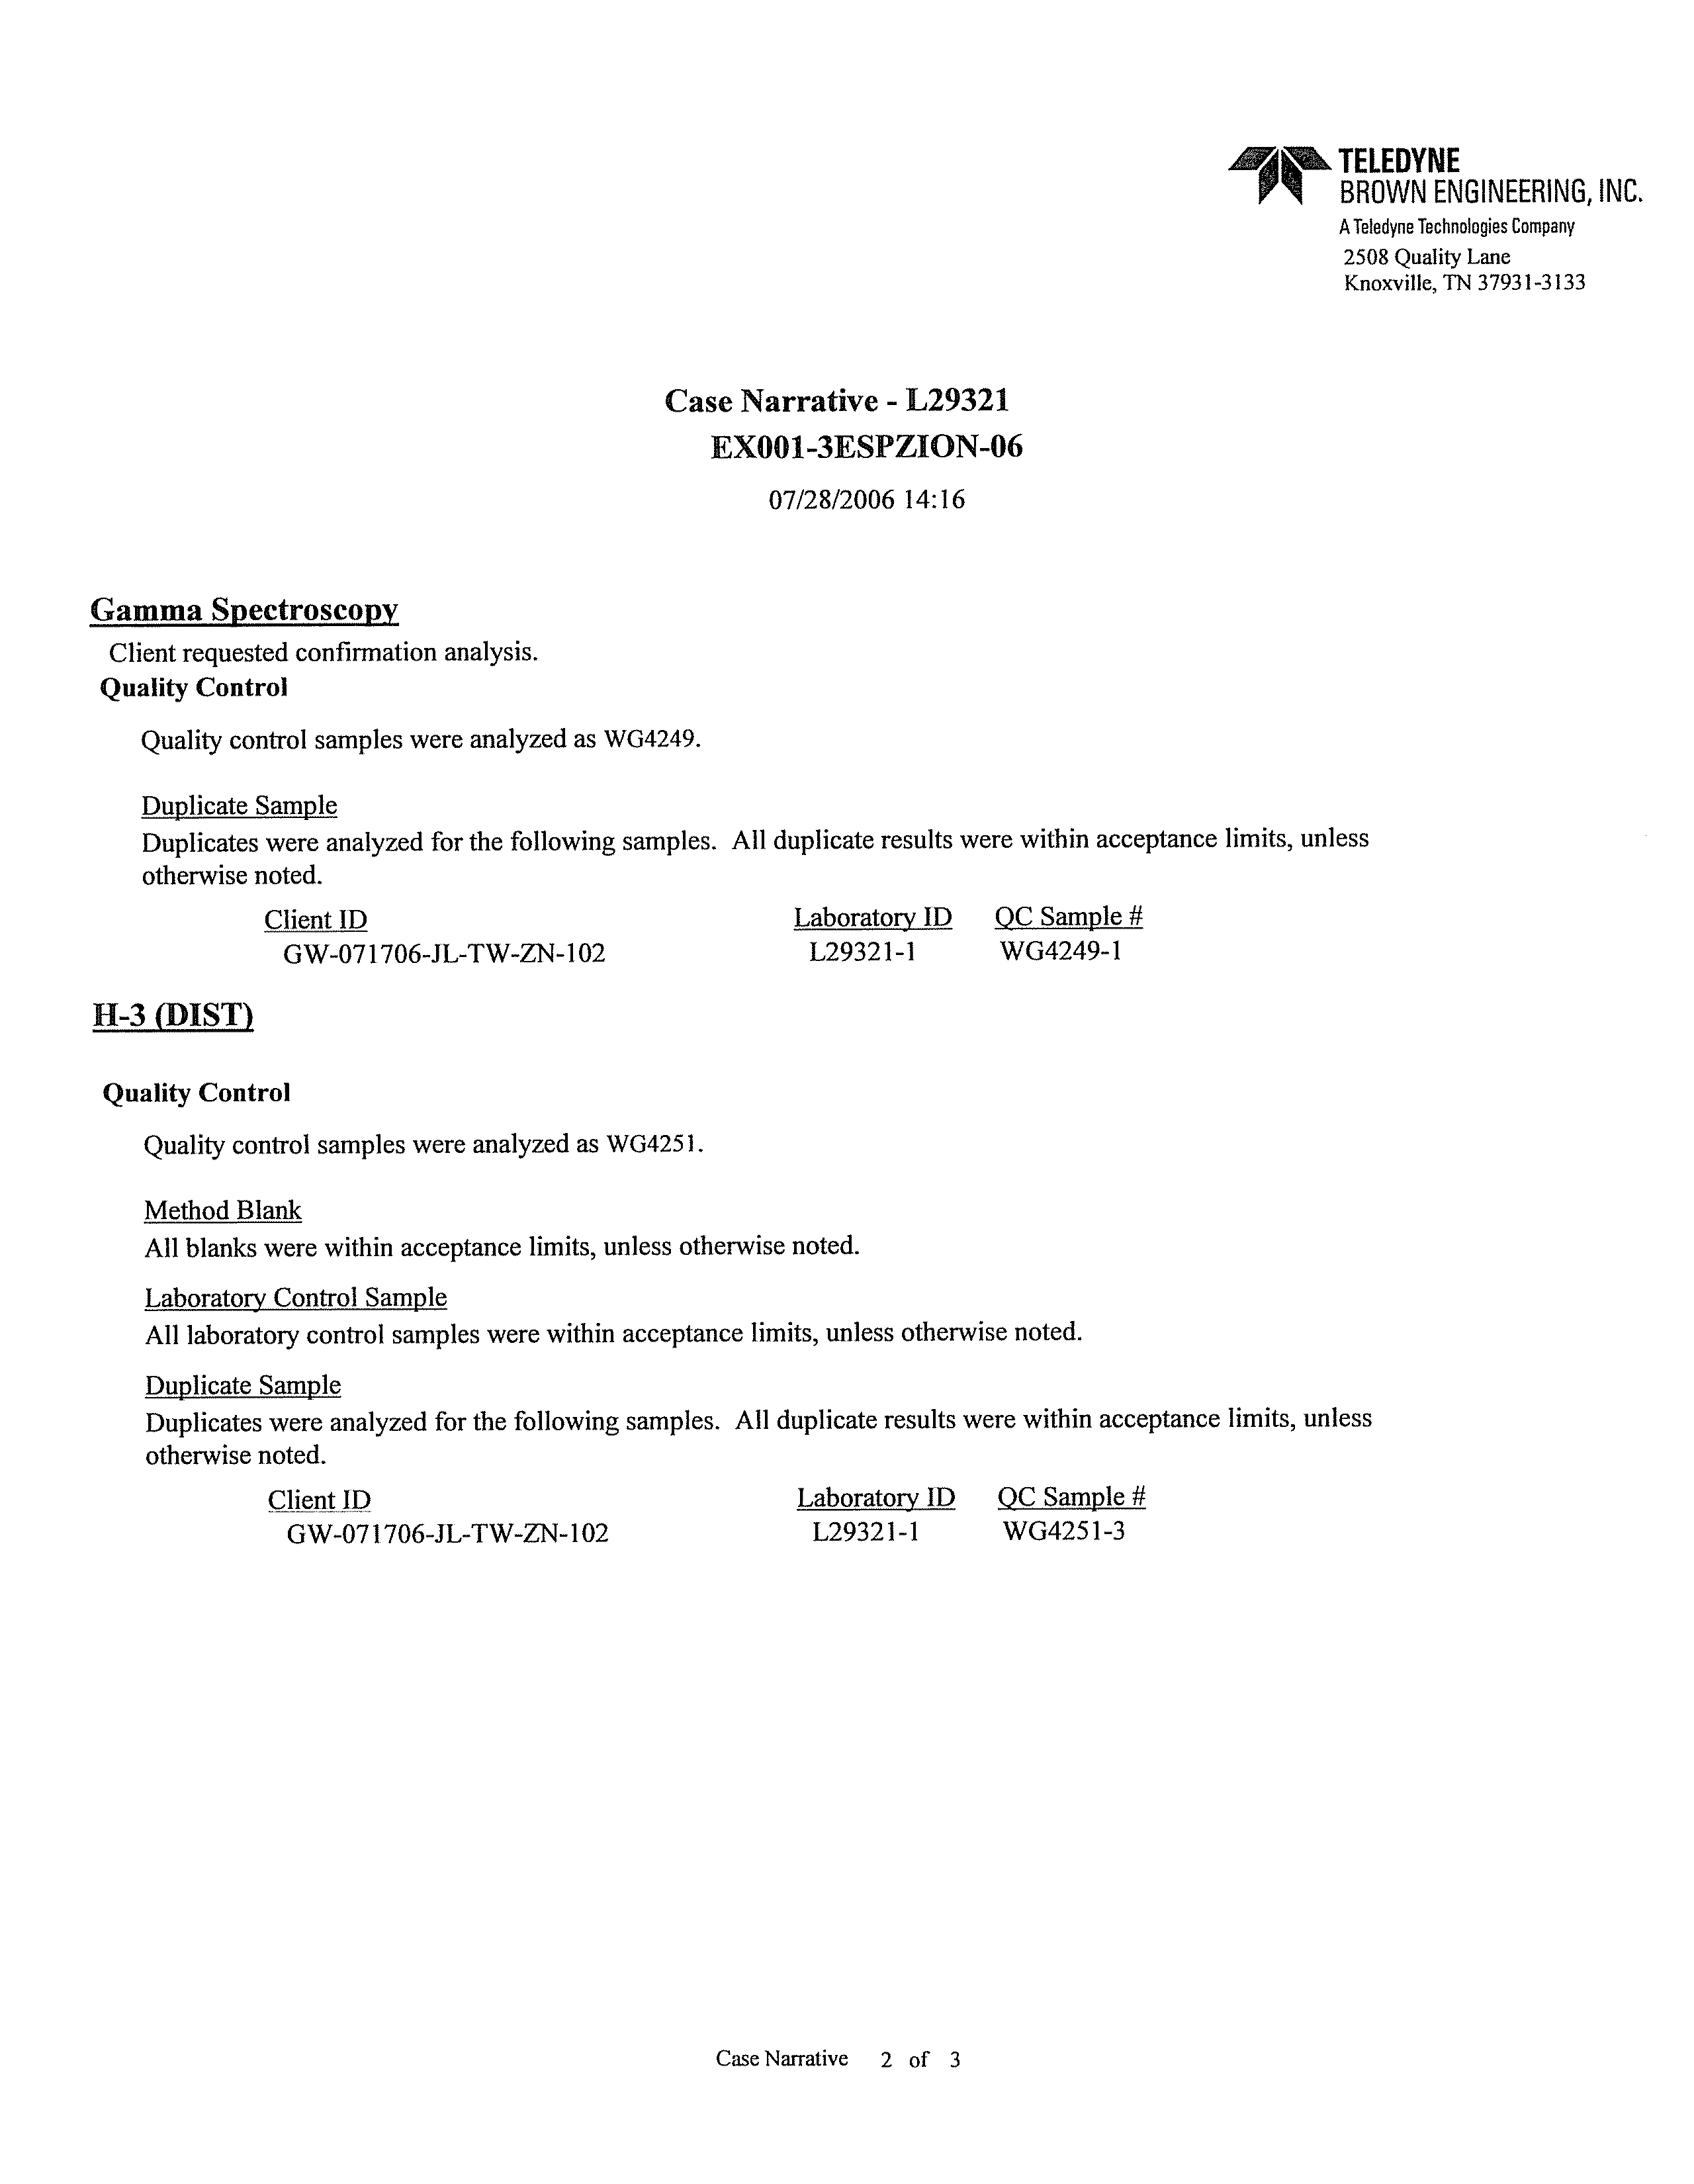
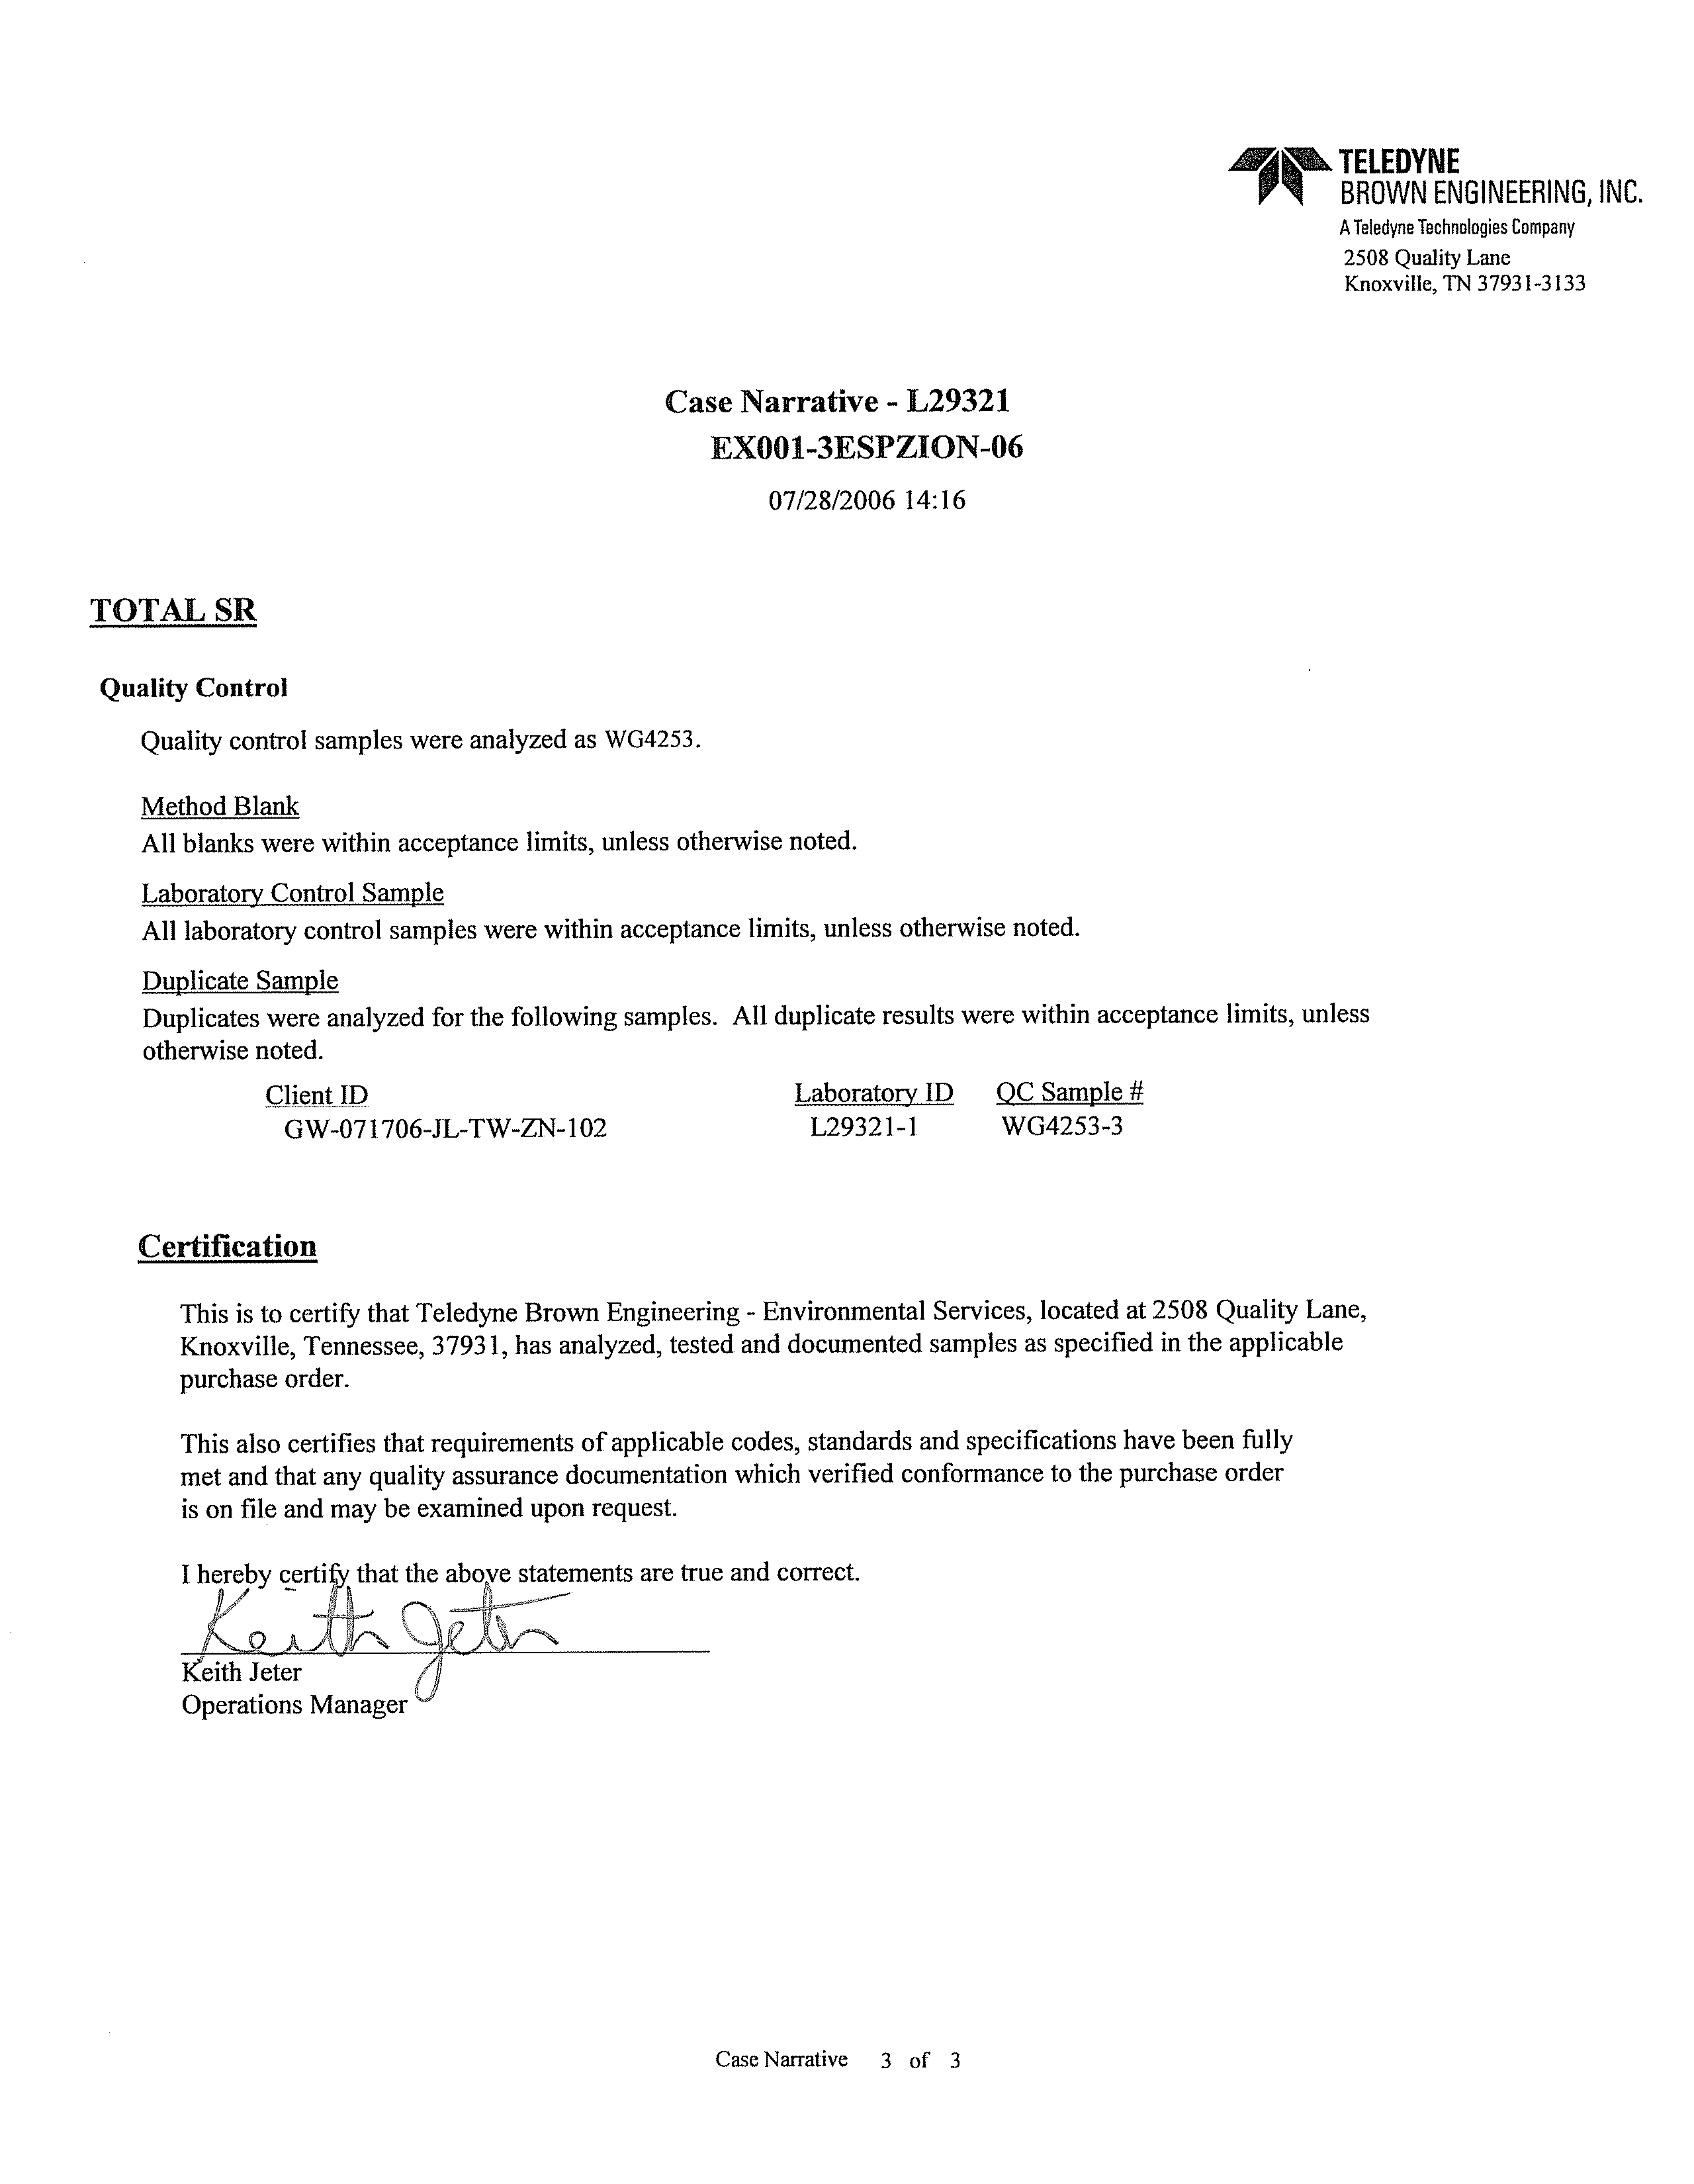
data reported. Teledyne Brown provided the analytical services. The Quality Assurance
Program for the laboratory is described in Appendix C.
Analytical data for
groundwater and surface water samples collected in accordance with the Work Plan are
presented in Appendix D. Data validation reports are presented in Appendix E. The
data validation included the following information and evaluations:
•
sample preservation;
•
sample holding times;
•
laboratory method blanks;
•
laboratory control samples;
045136 (22) Zion Station
24
CONESTOGA-ROVERS & ASSOCIATES
Revision 1
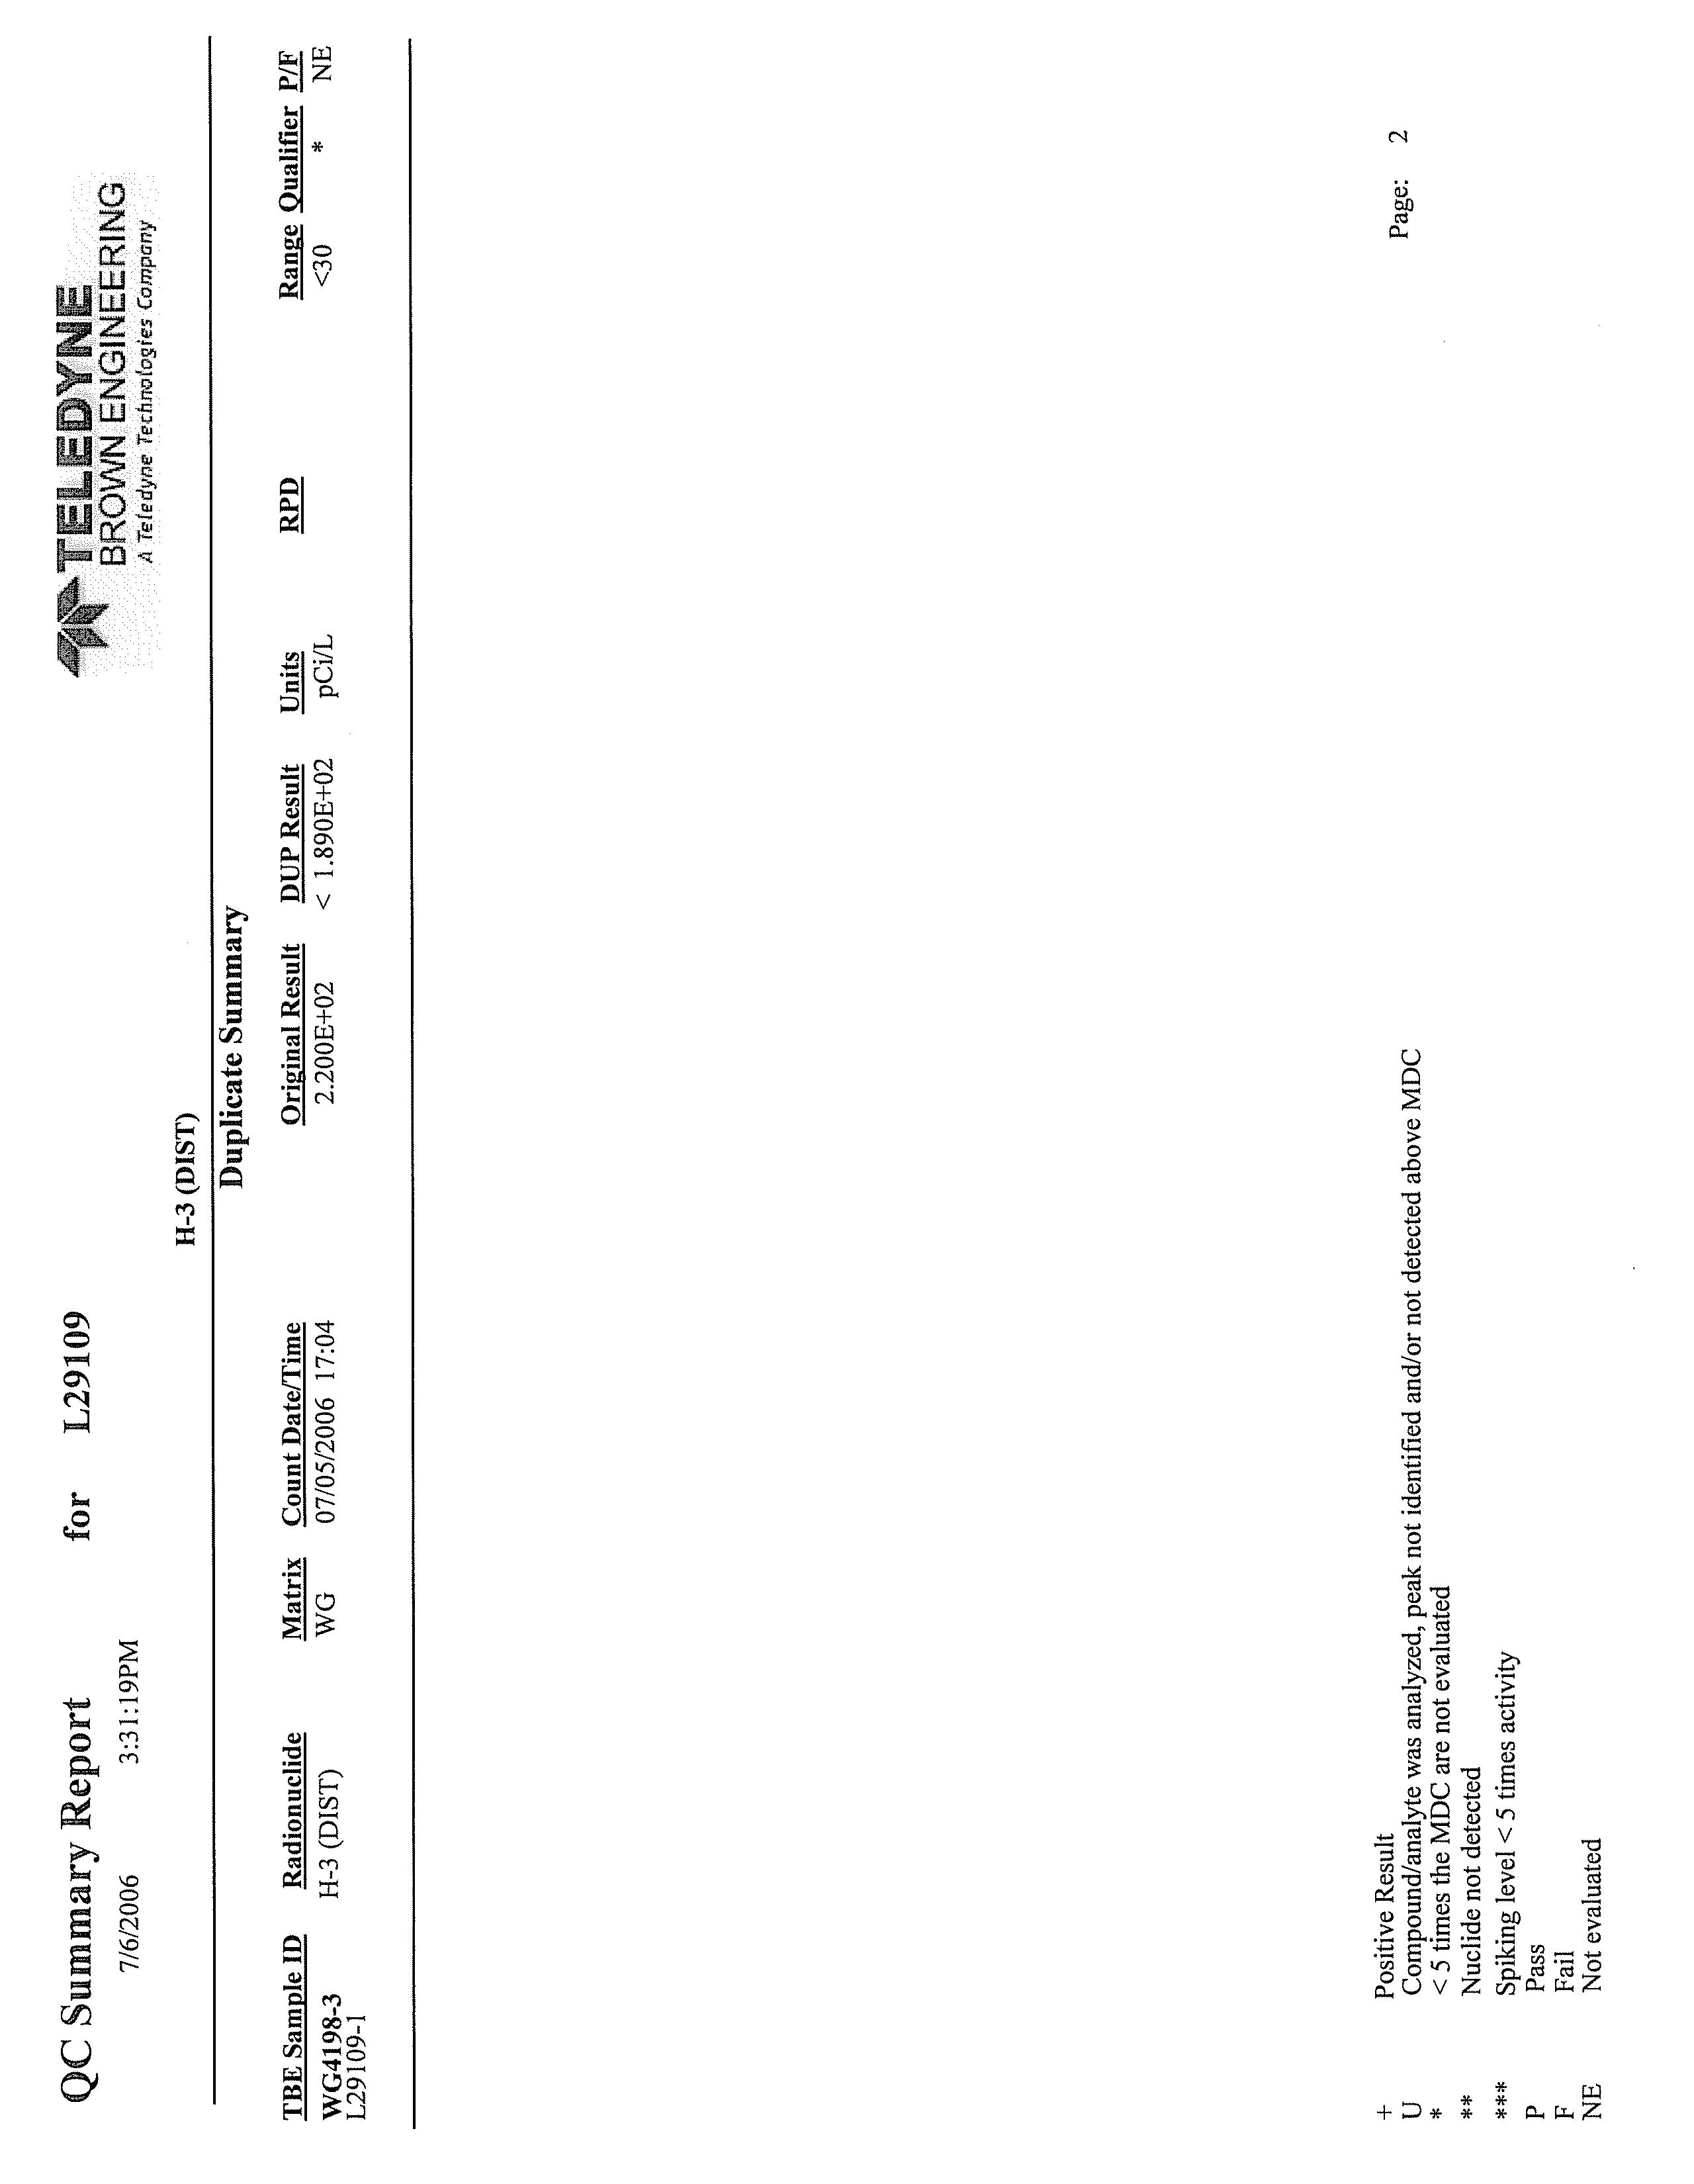
•
laboratory duplicates;
•
verification of laboratory qualifiers; and
•
field quality control (field blanks and duplicates).
Following the completion of field activities, CRA compiled and reviewed the geologic,
hydrogeologic, and analytical data.
The data were reviewed using the following techniques:
•
data tables and databox figures;
•
hydrogeologic cross-sections; and
•
hydraulic analyses.
4.8
SAMPLE IDENTIFICATION
Systematic sample identification codes were used to uniquely identify all samples. The
identification code format used in the field was: WG - Zion – MW-8L – 052406 -
MS - 001. A summary of sample identification numbers is presented in Table 4.4.
WG
-
Sample matrix -groundwater
WS
-
Sample matrix - surface water
Zion
-
Station code
ZN
-
Station code
MW-8L -
Well location
052406
-
Date
MS
-
Sampler initial
001
-
Sample number
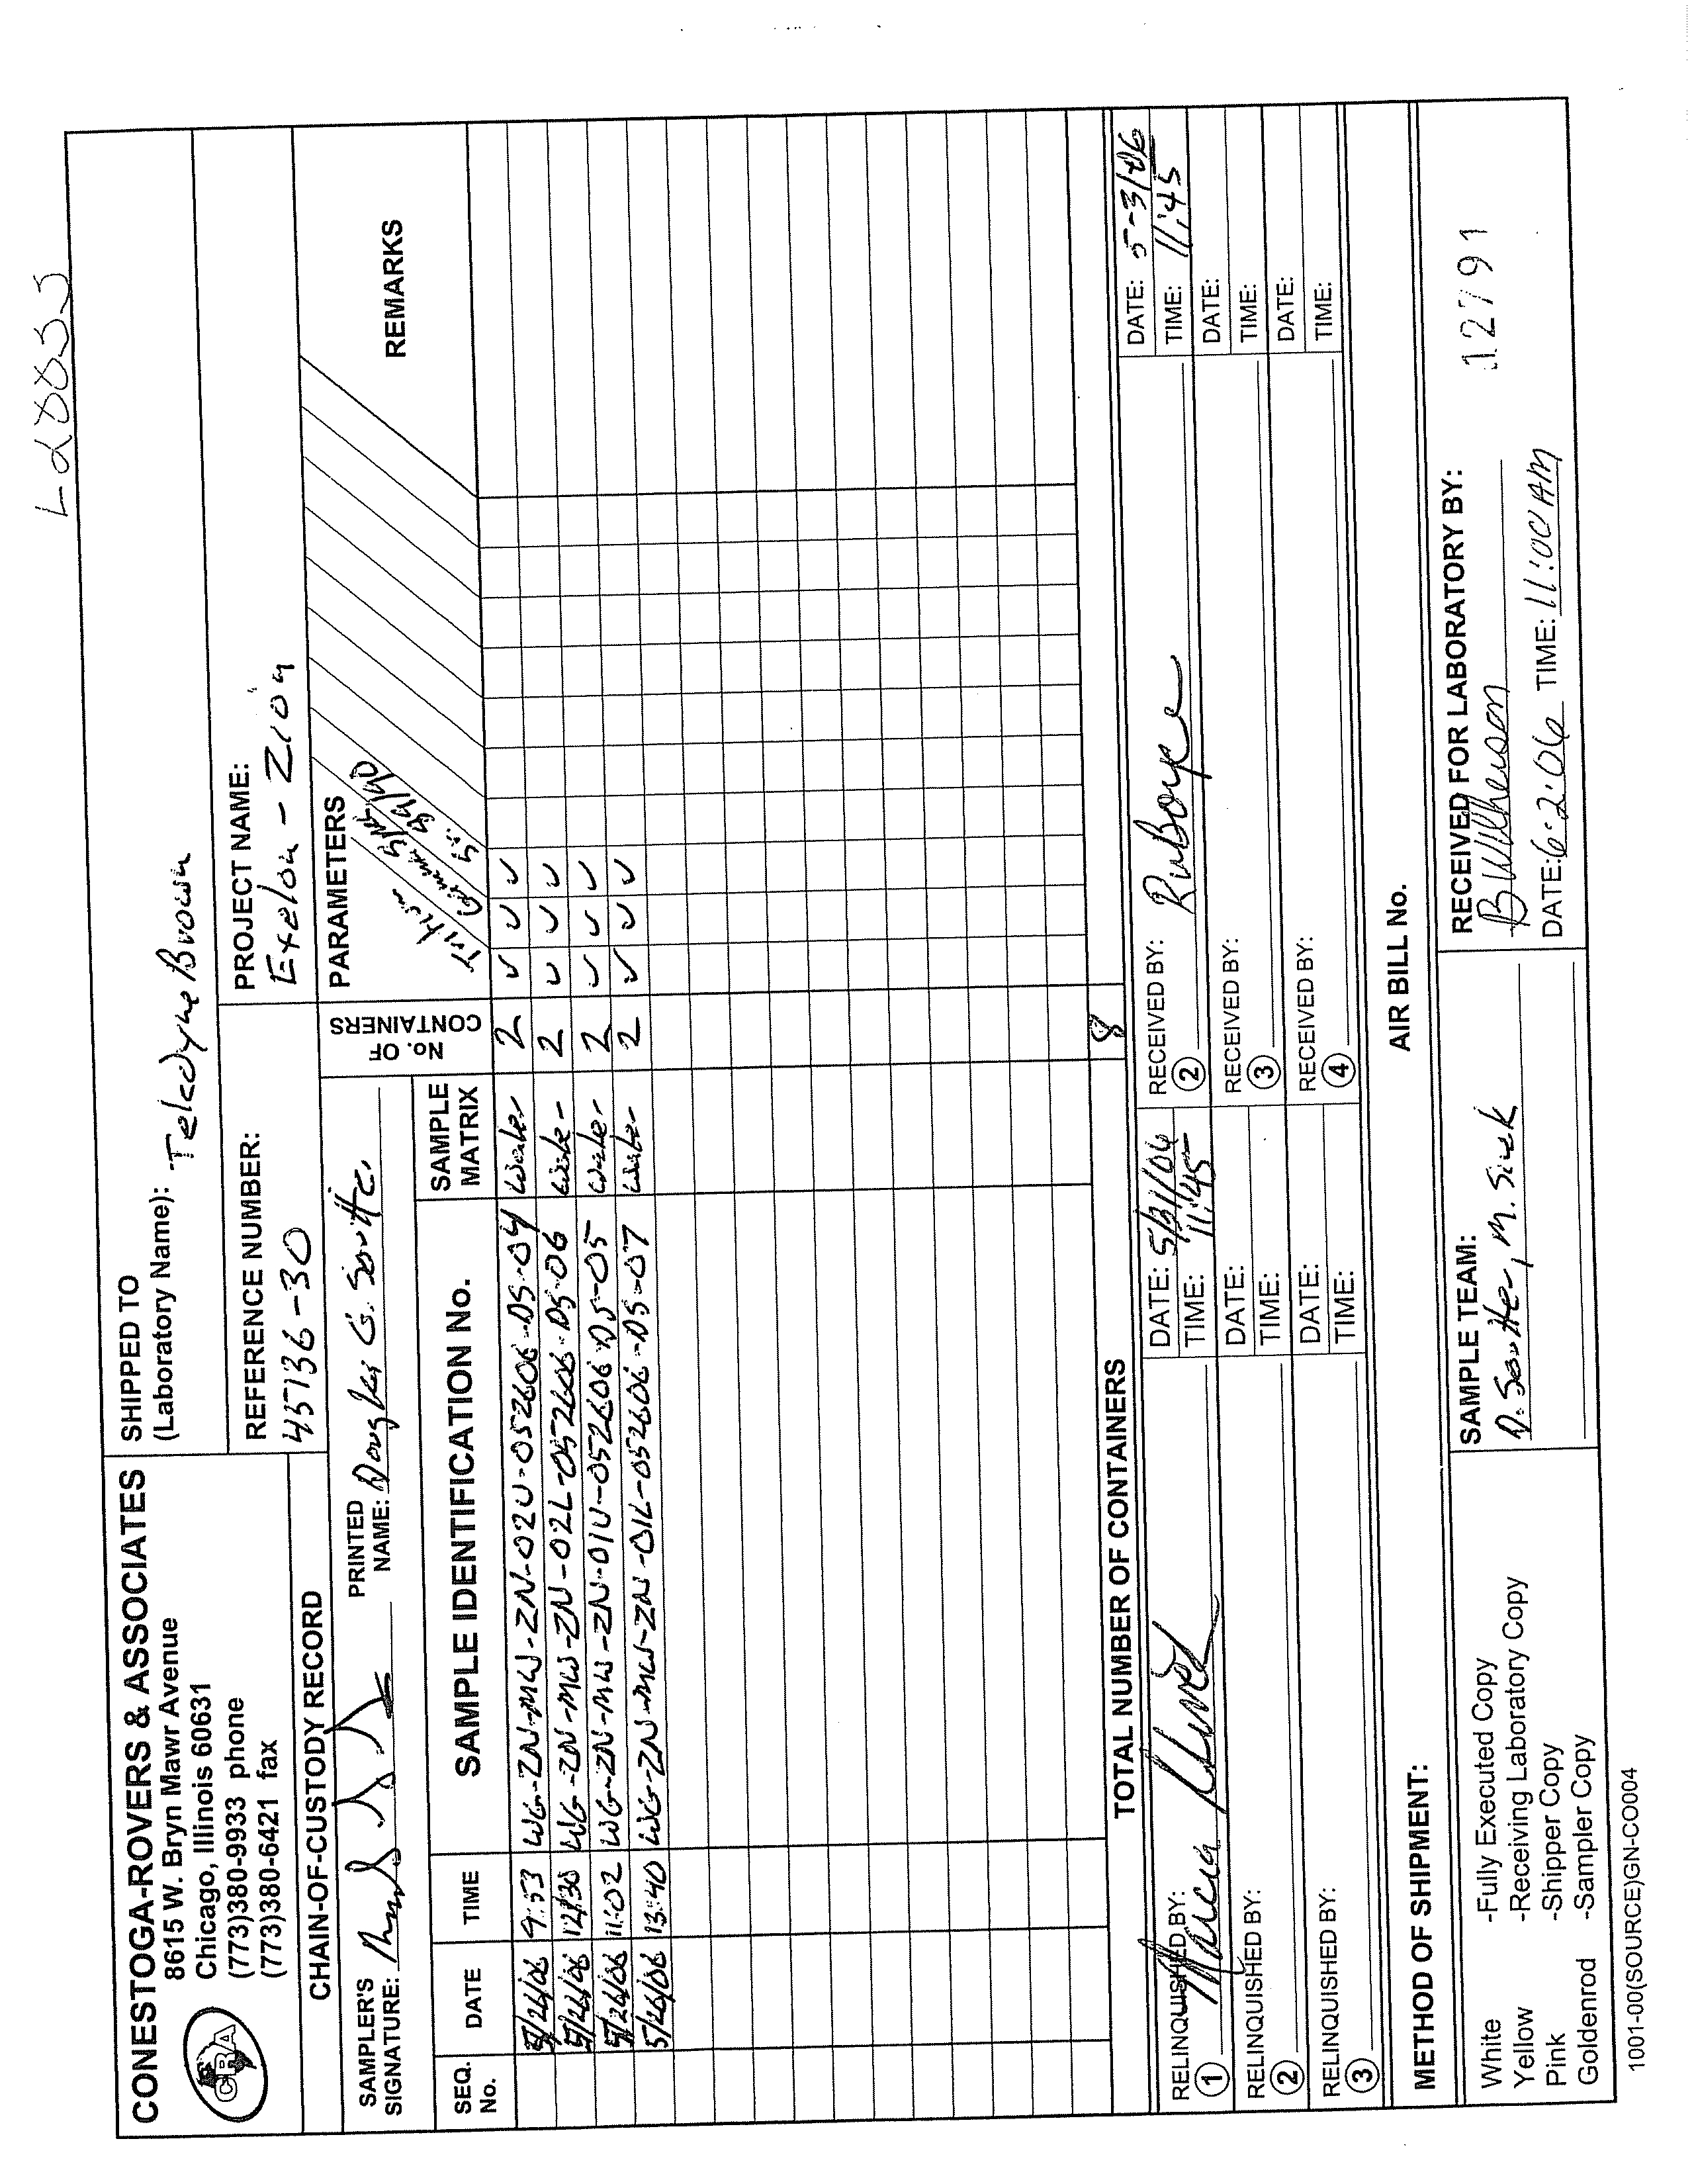
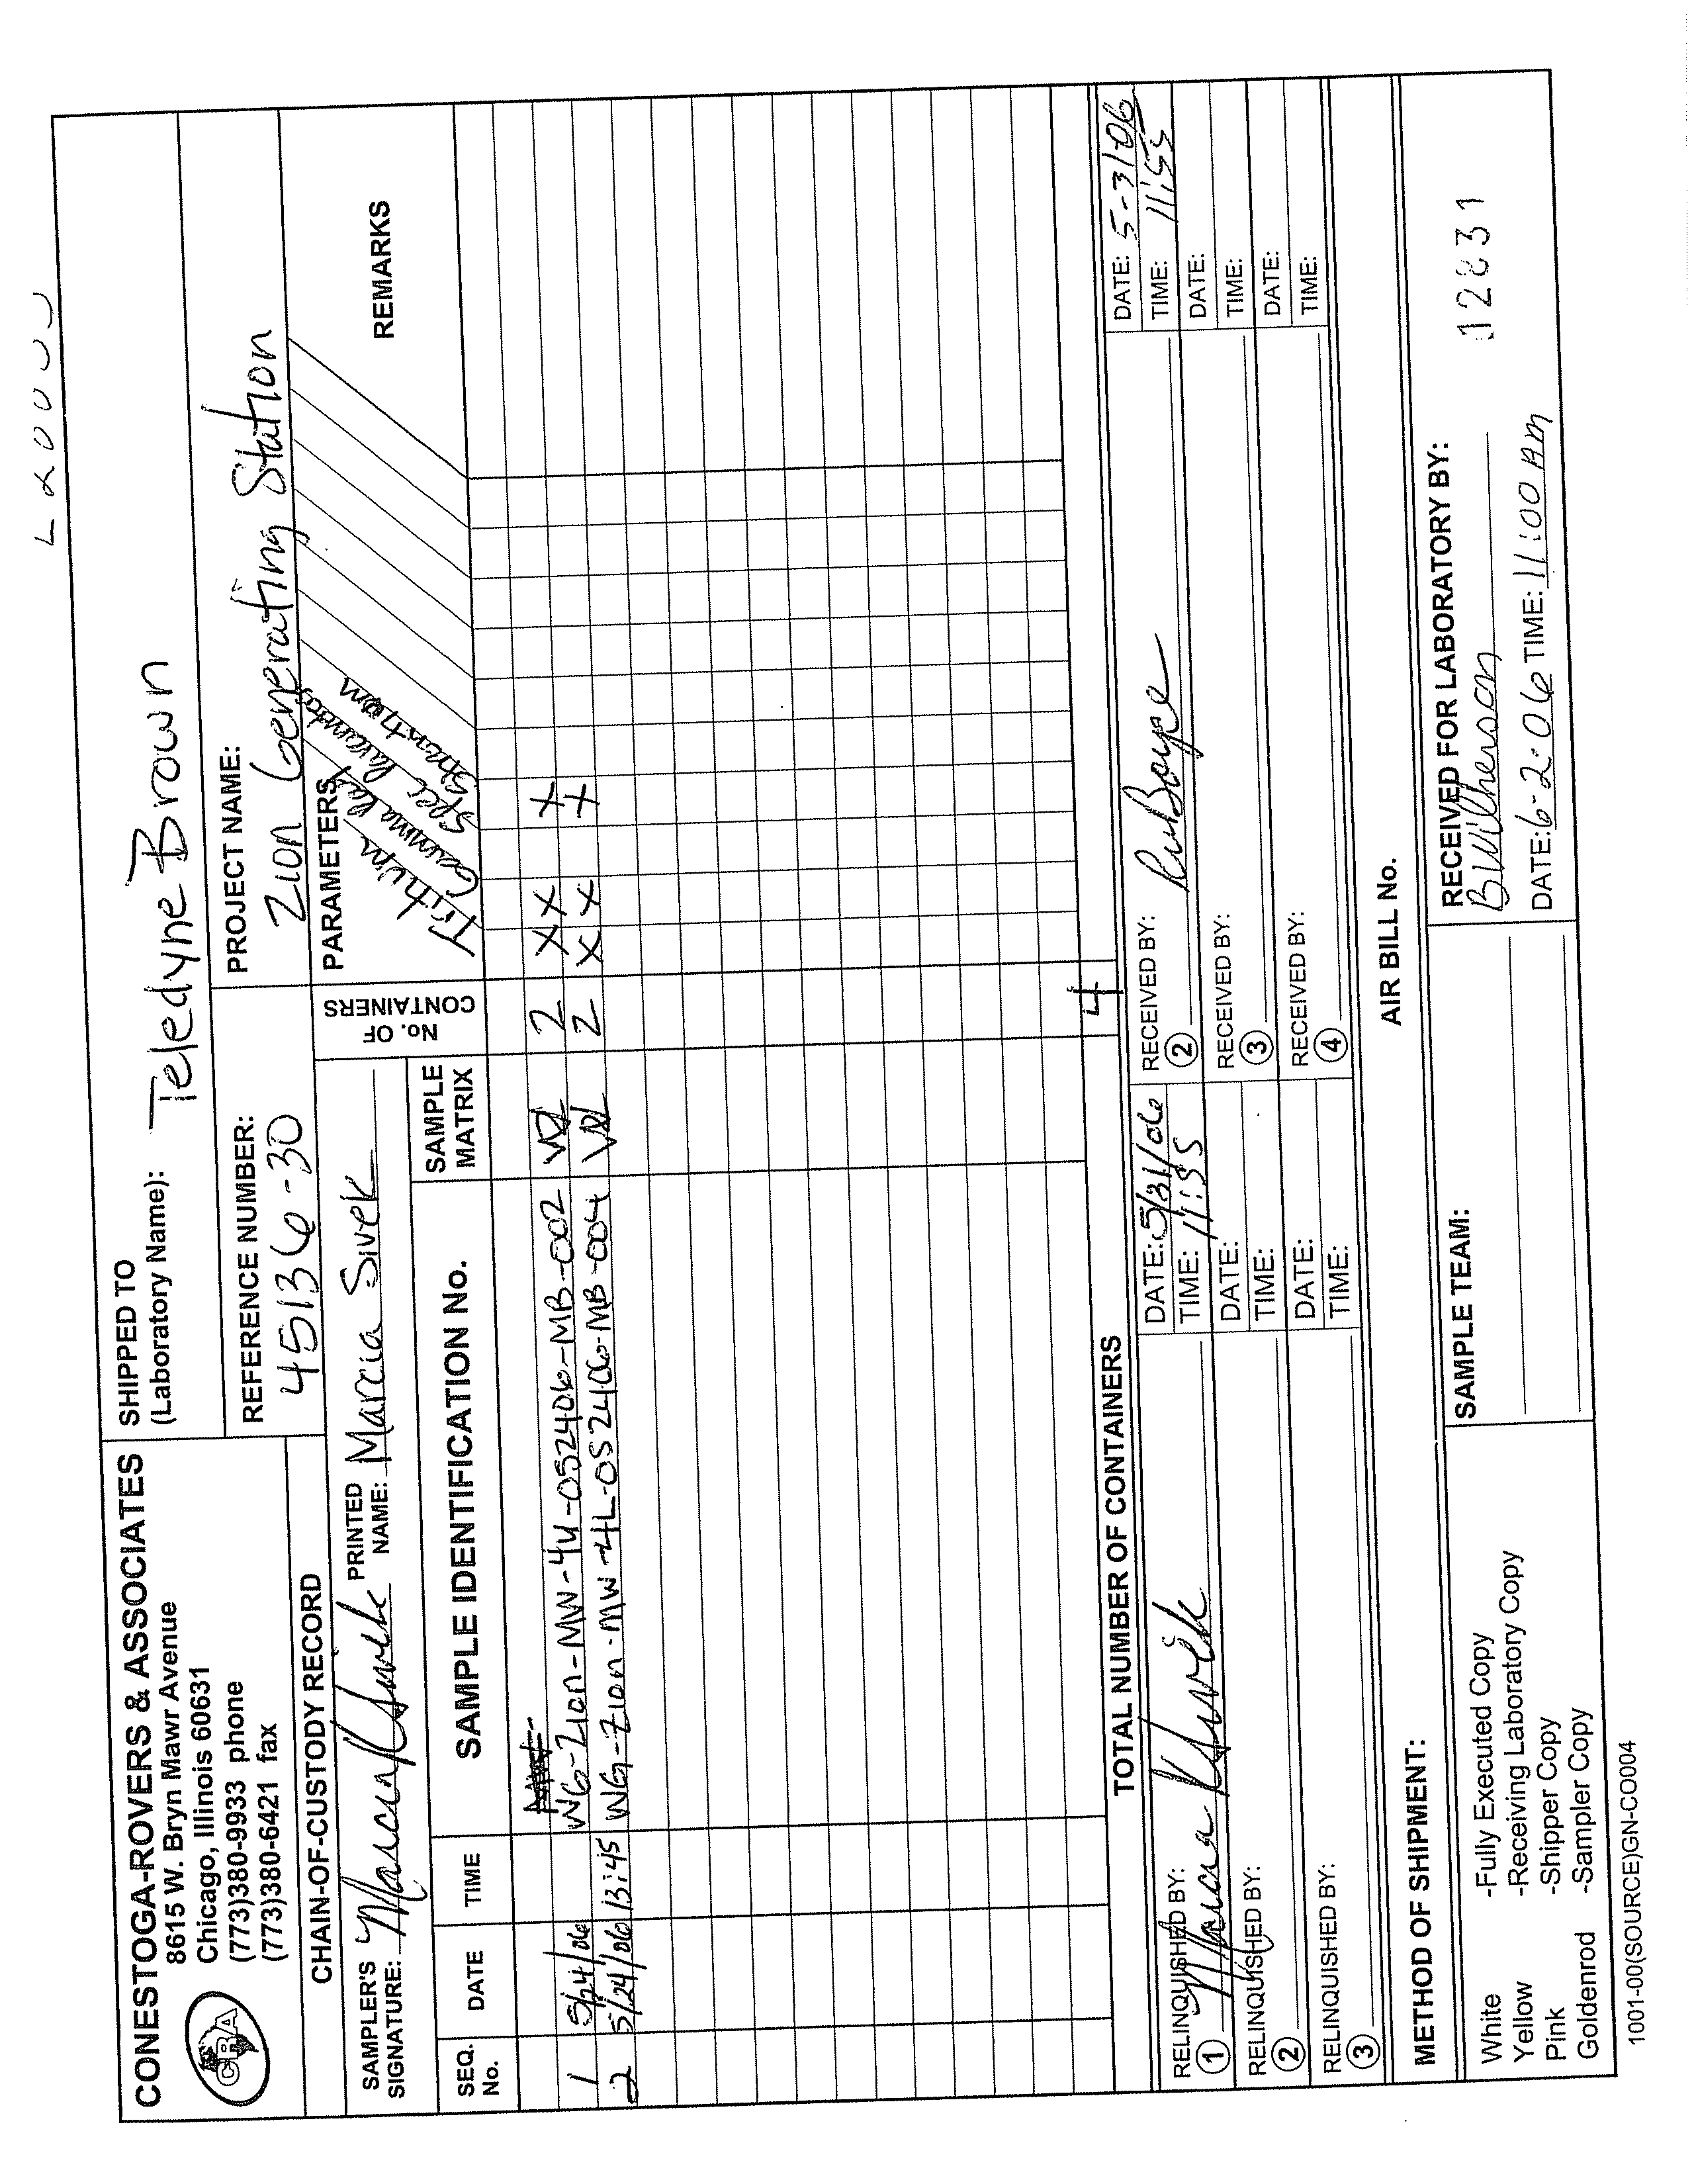
4.9
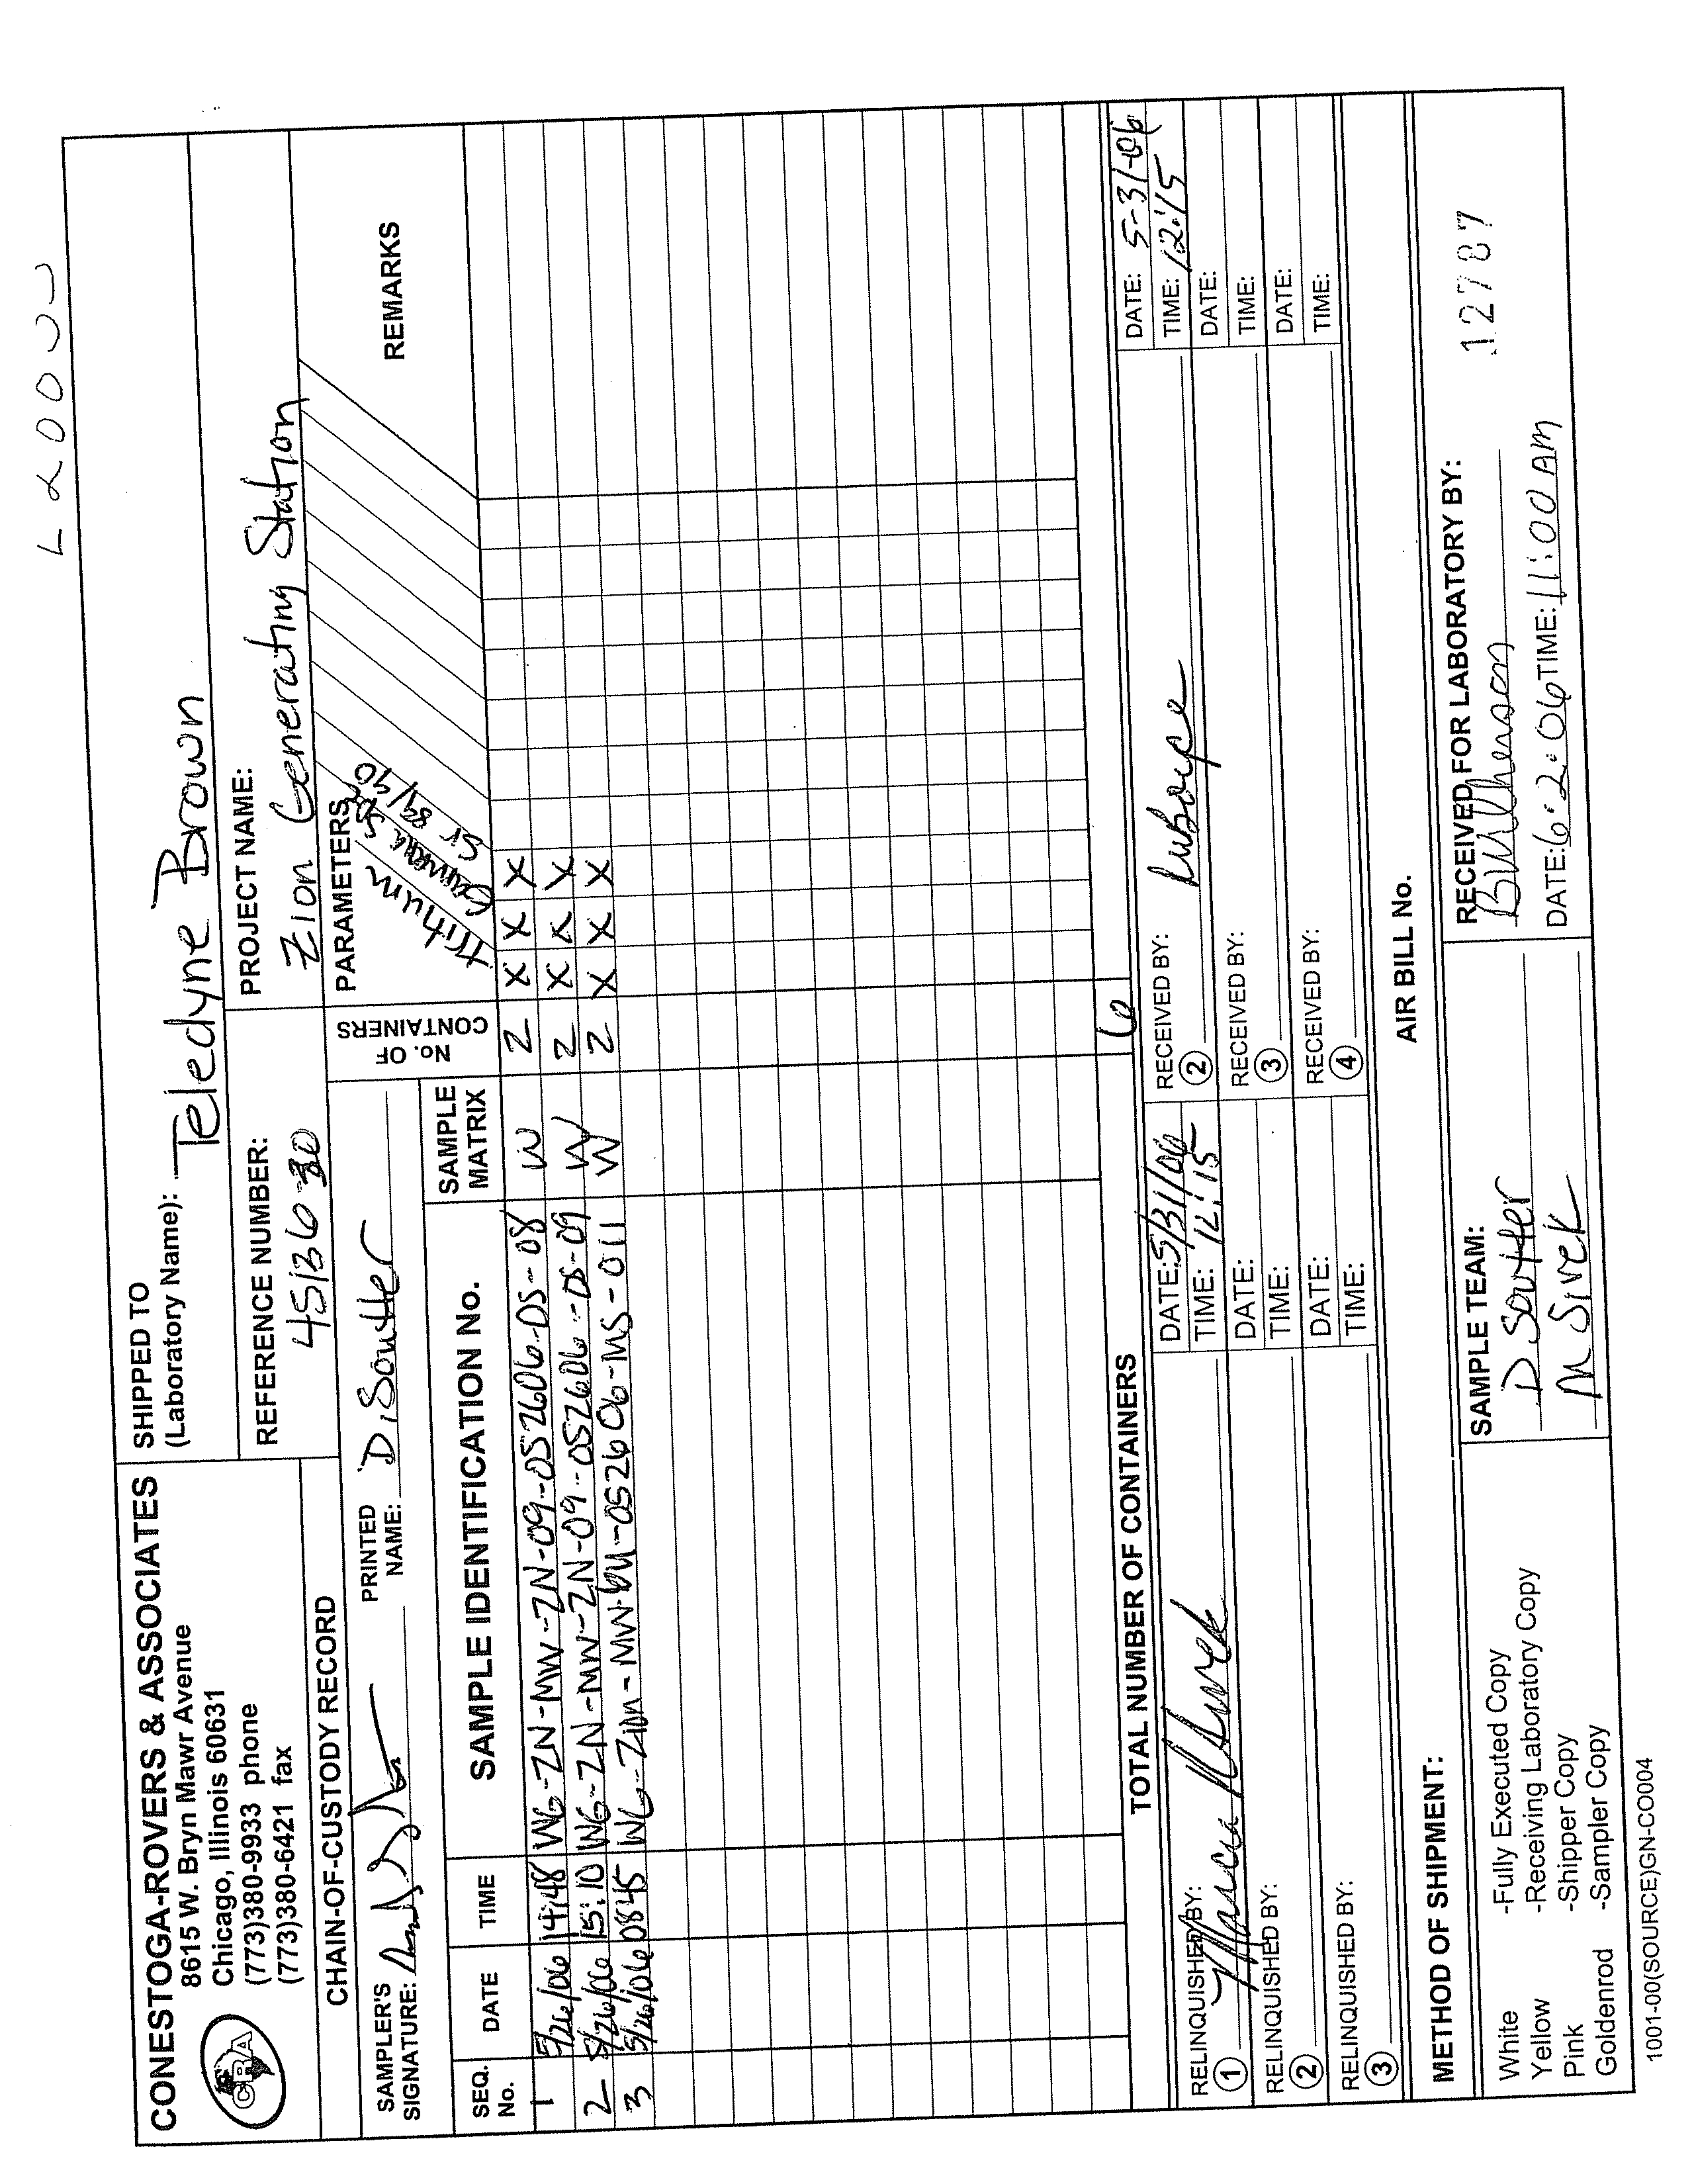
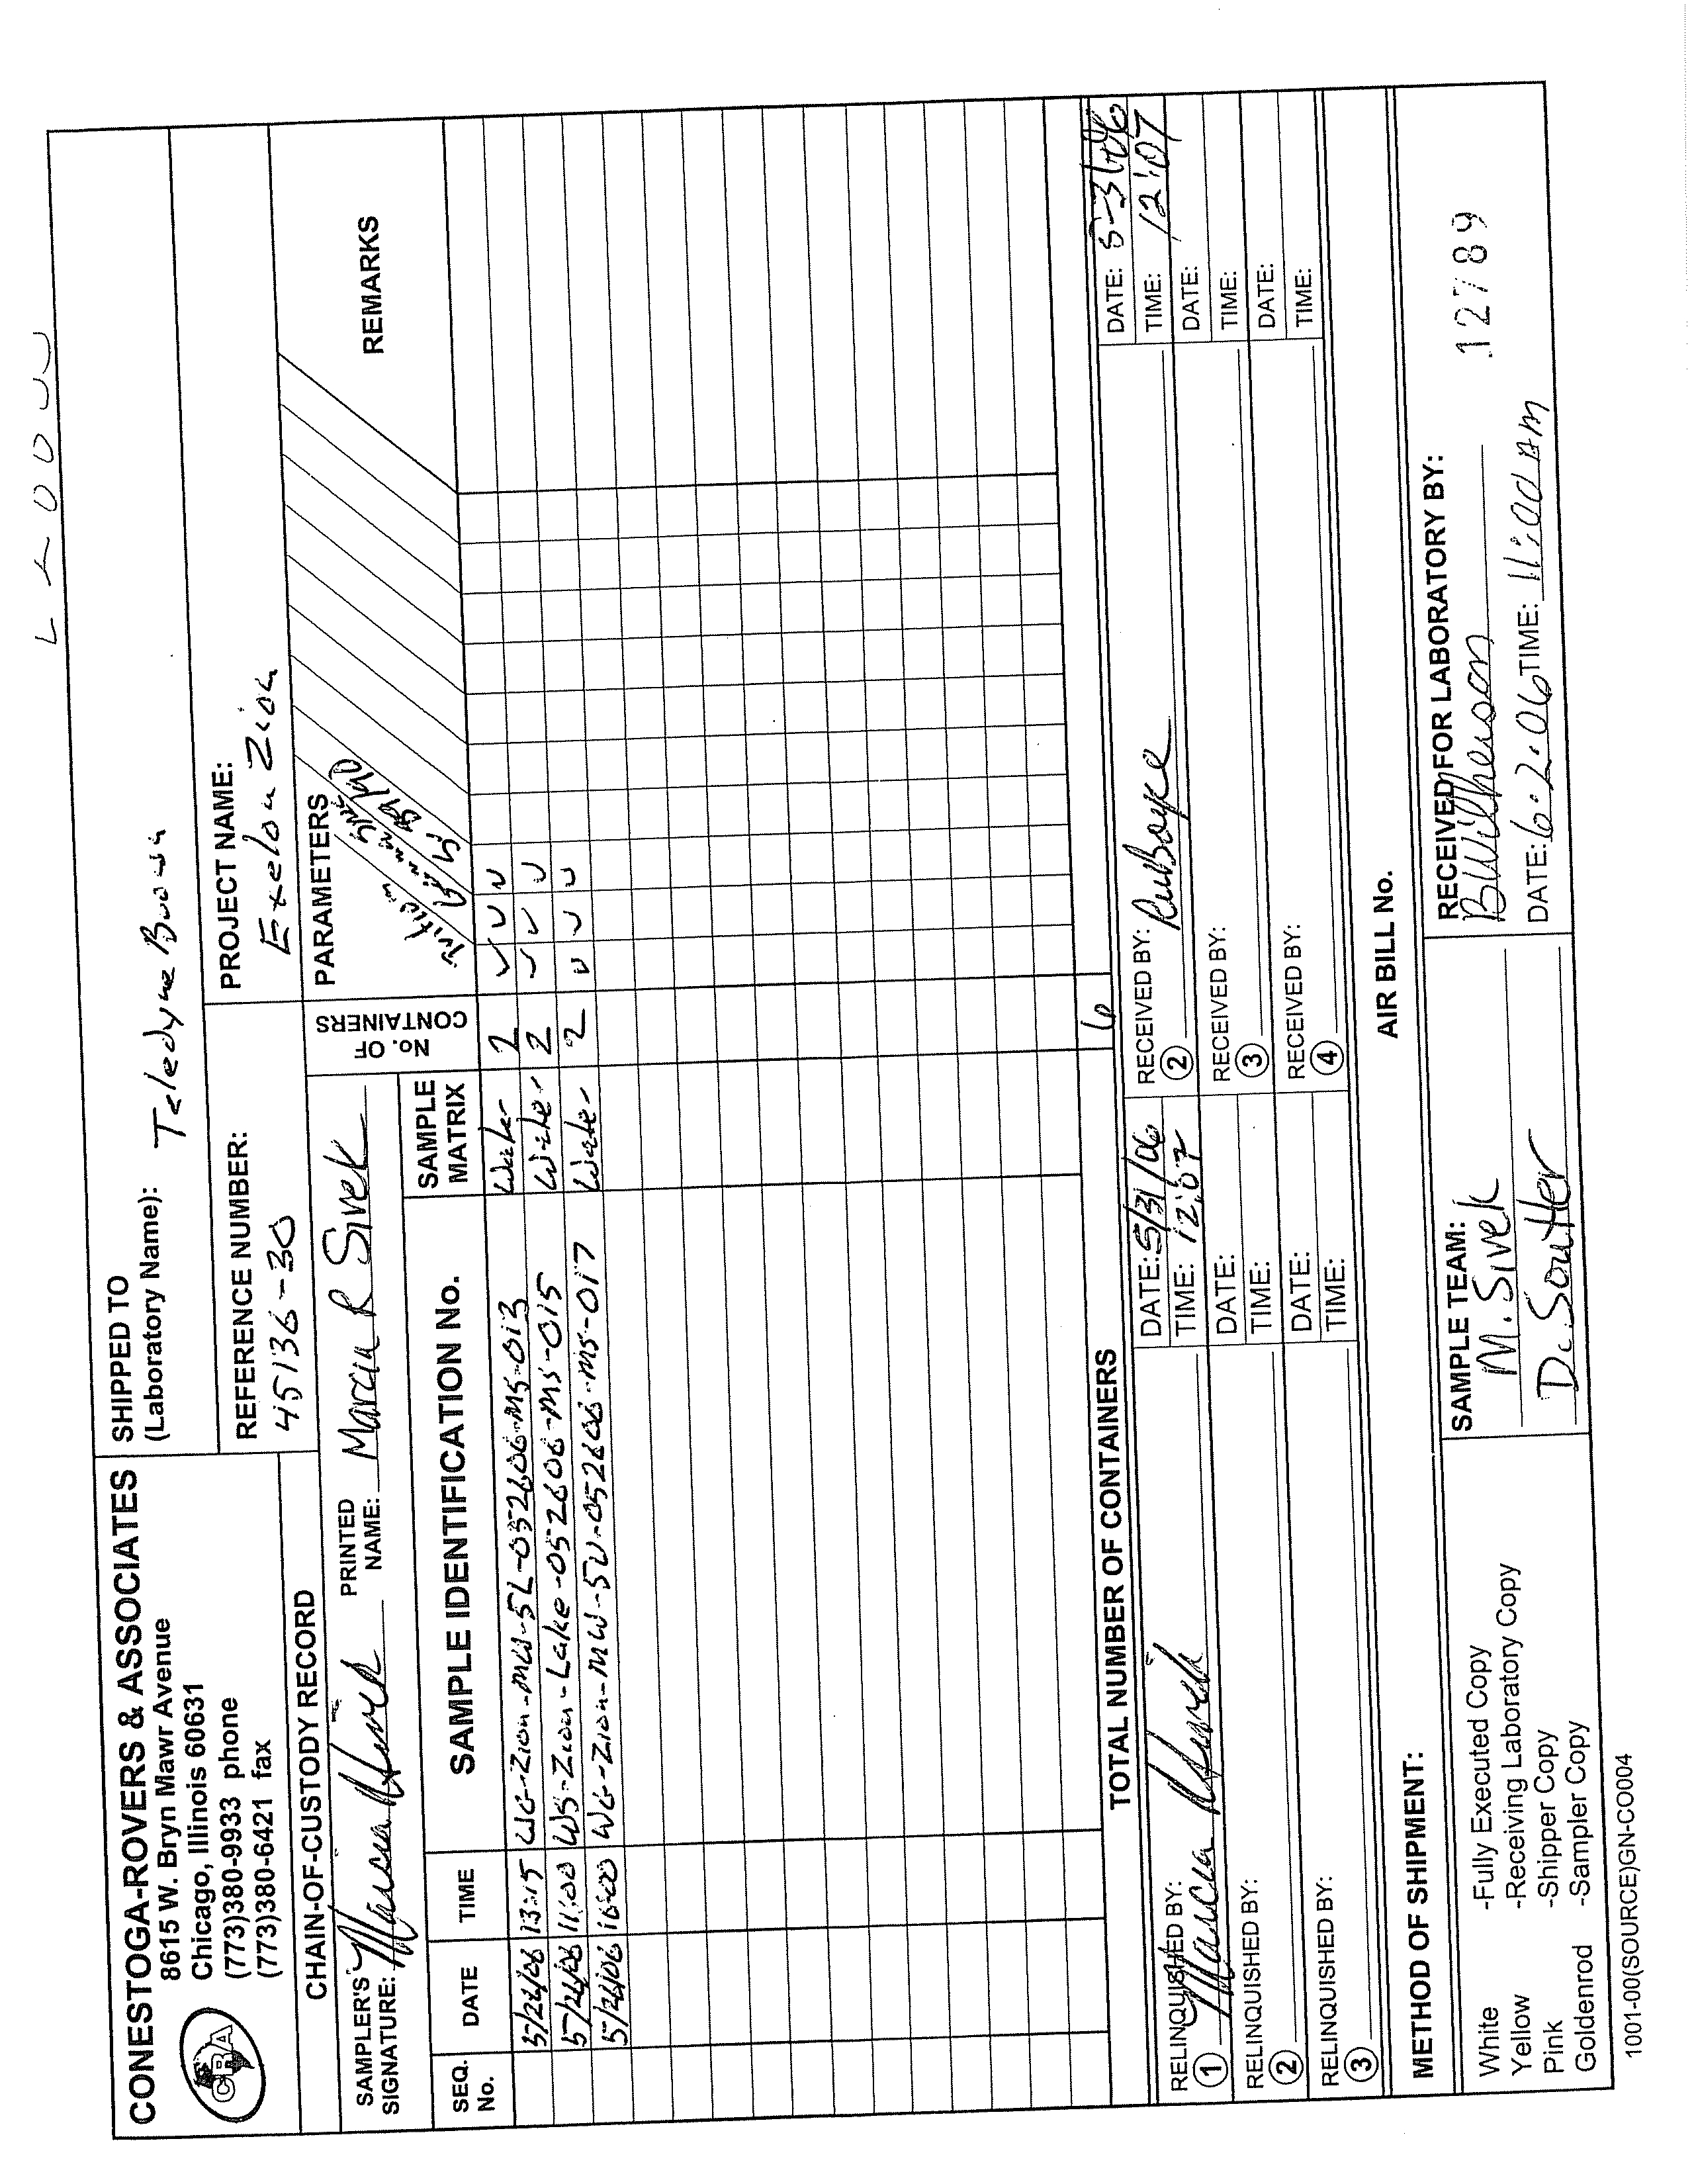
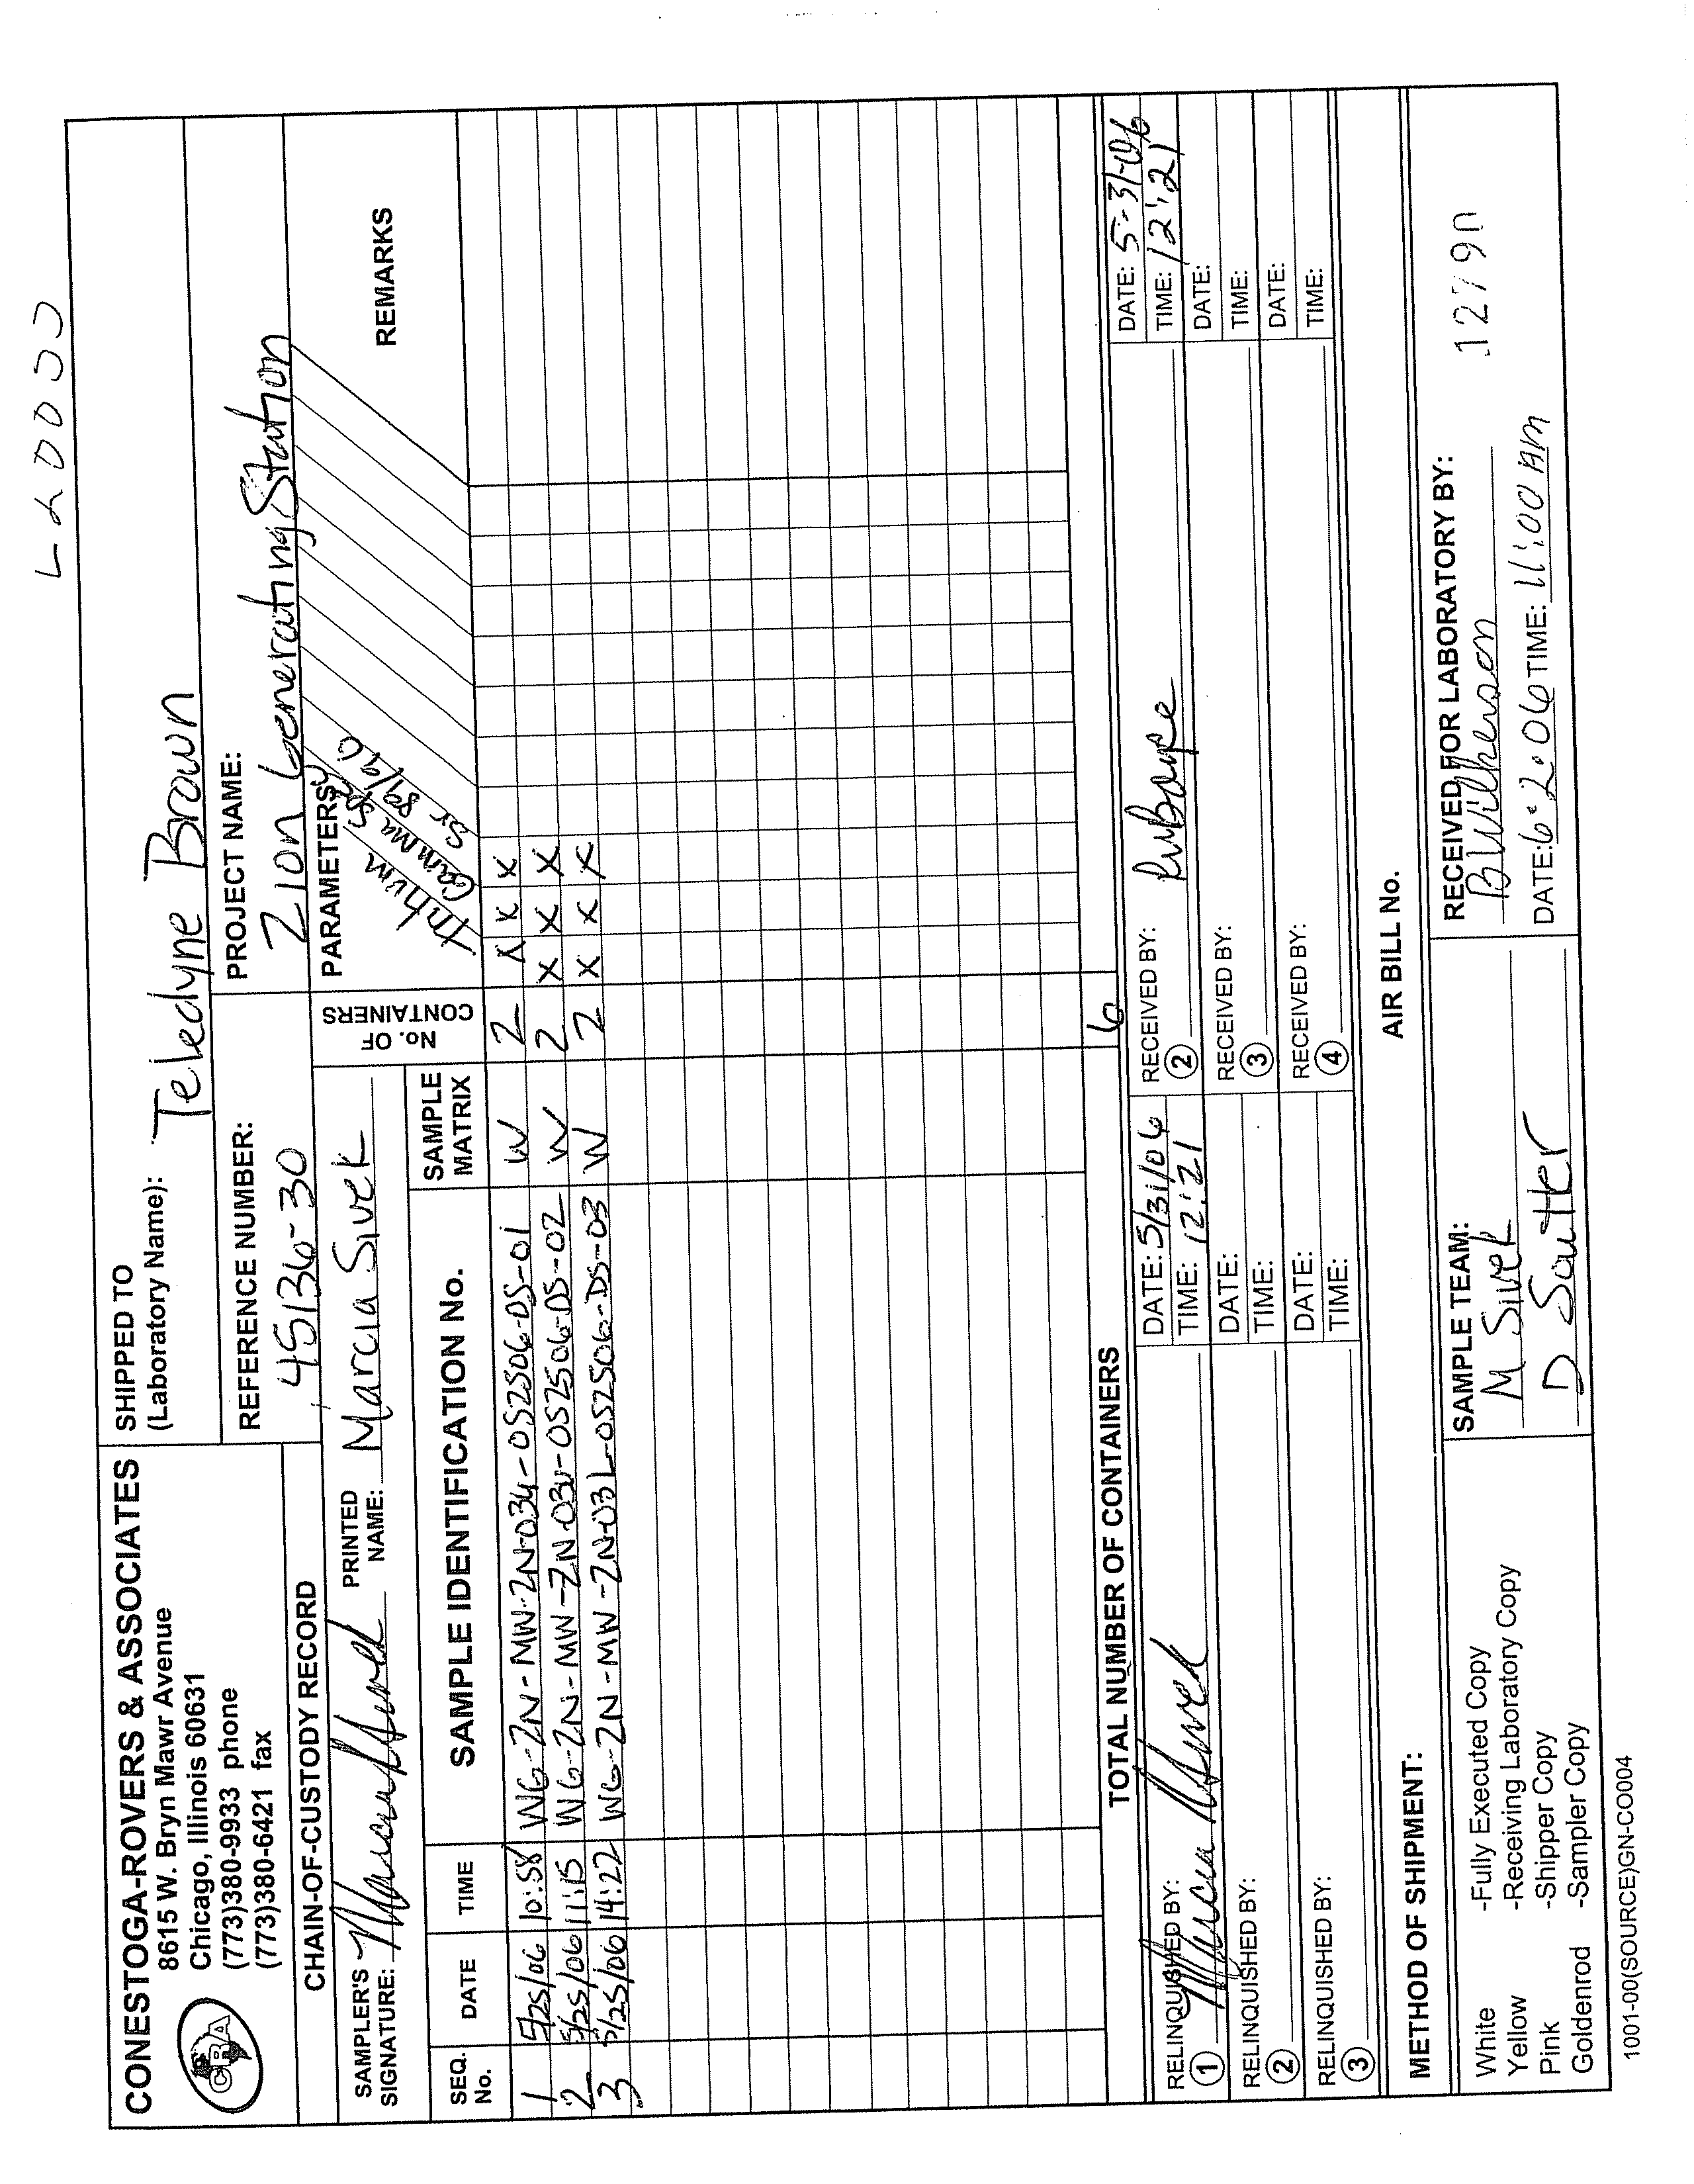
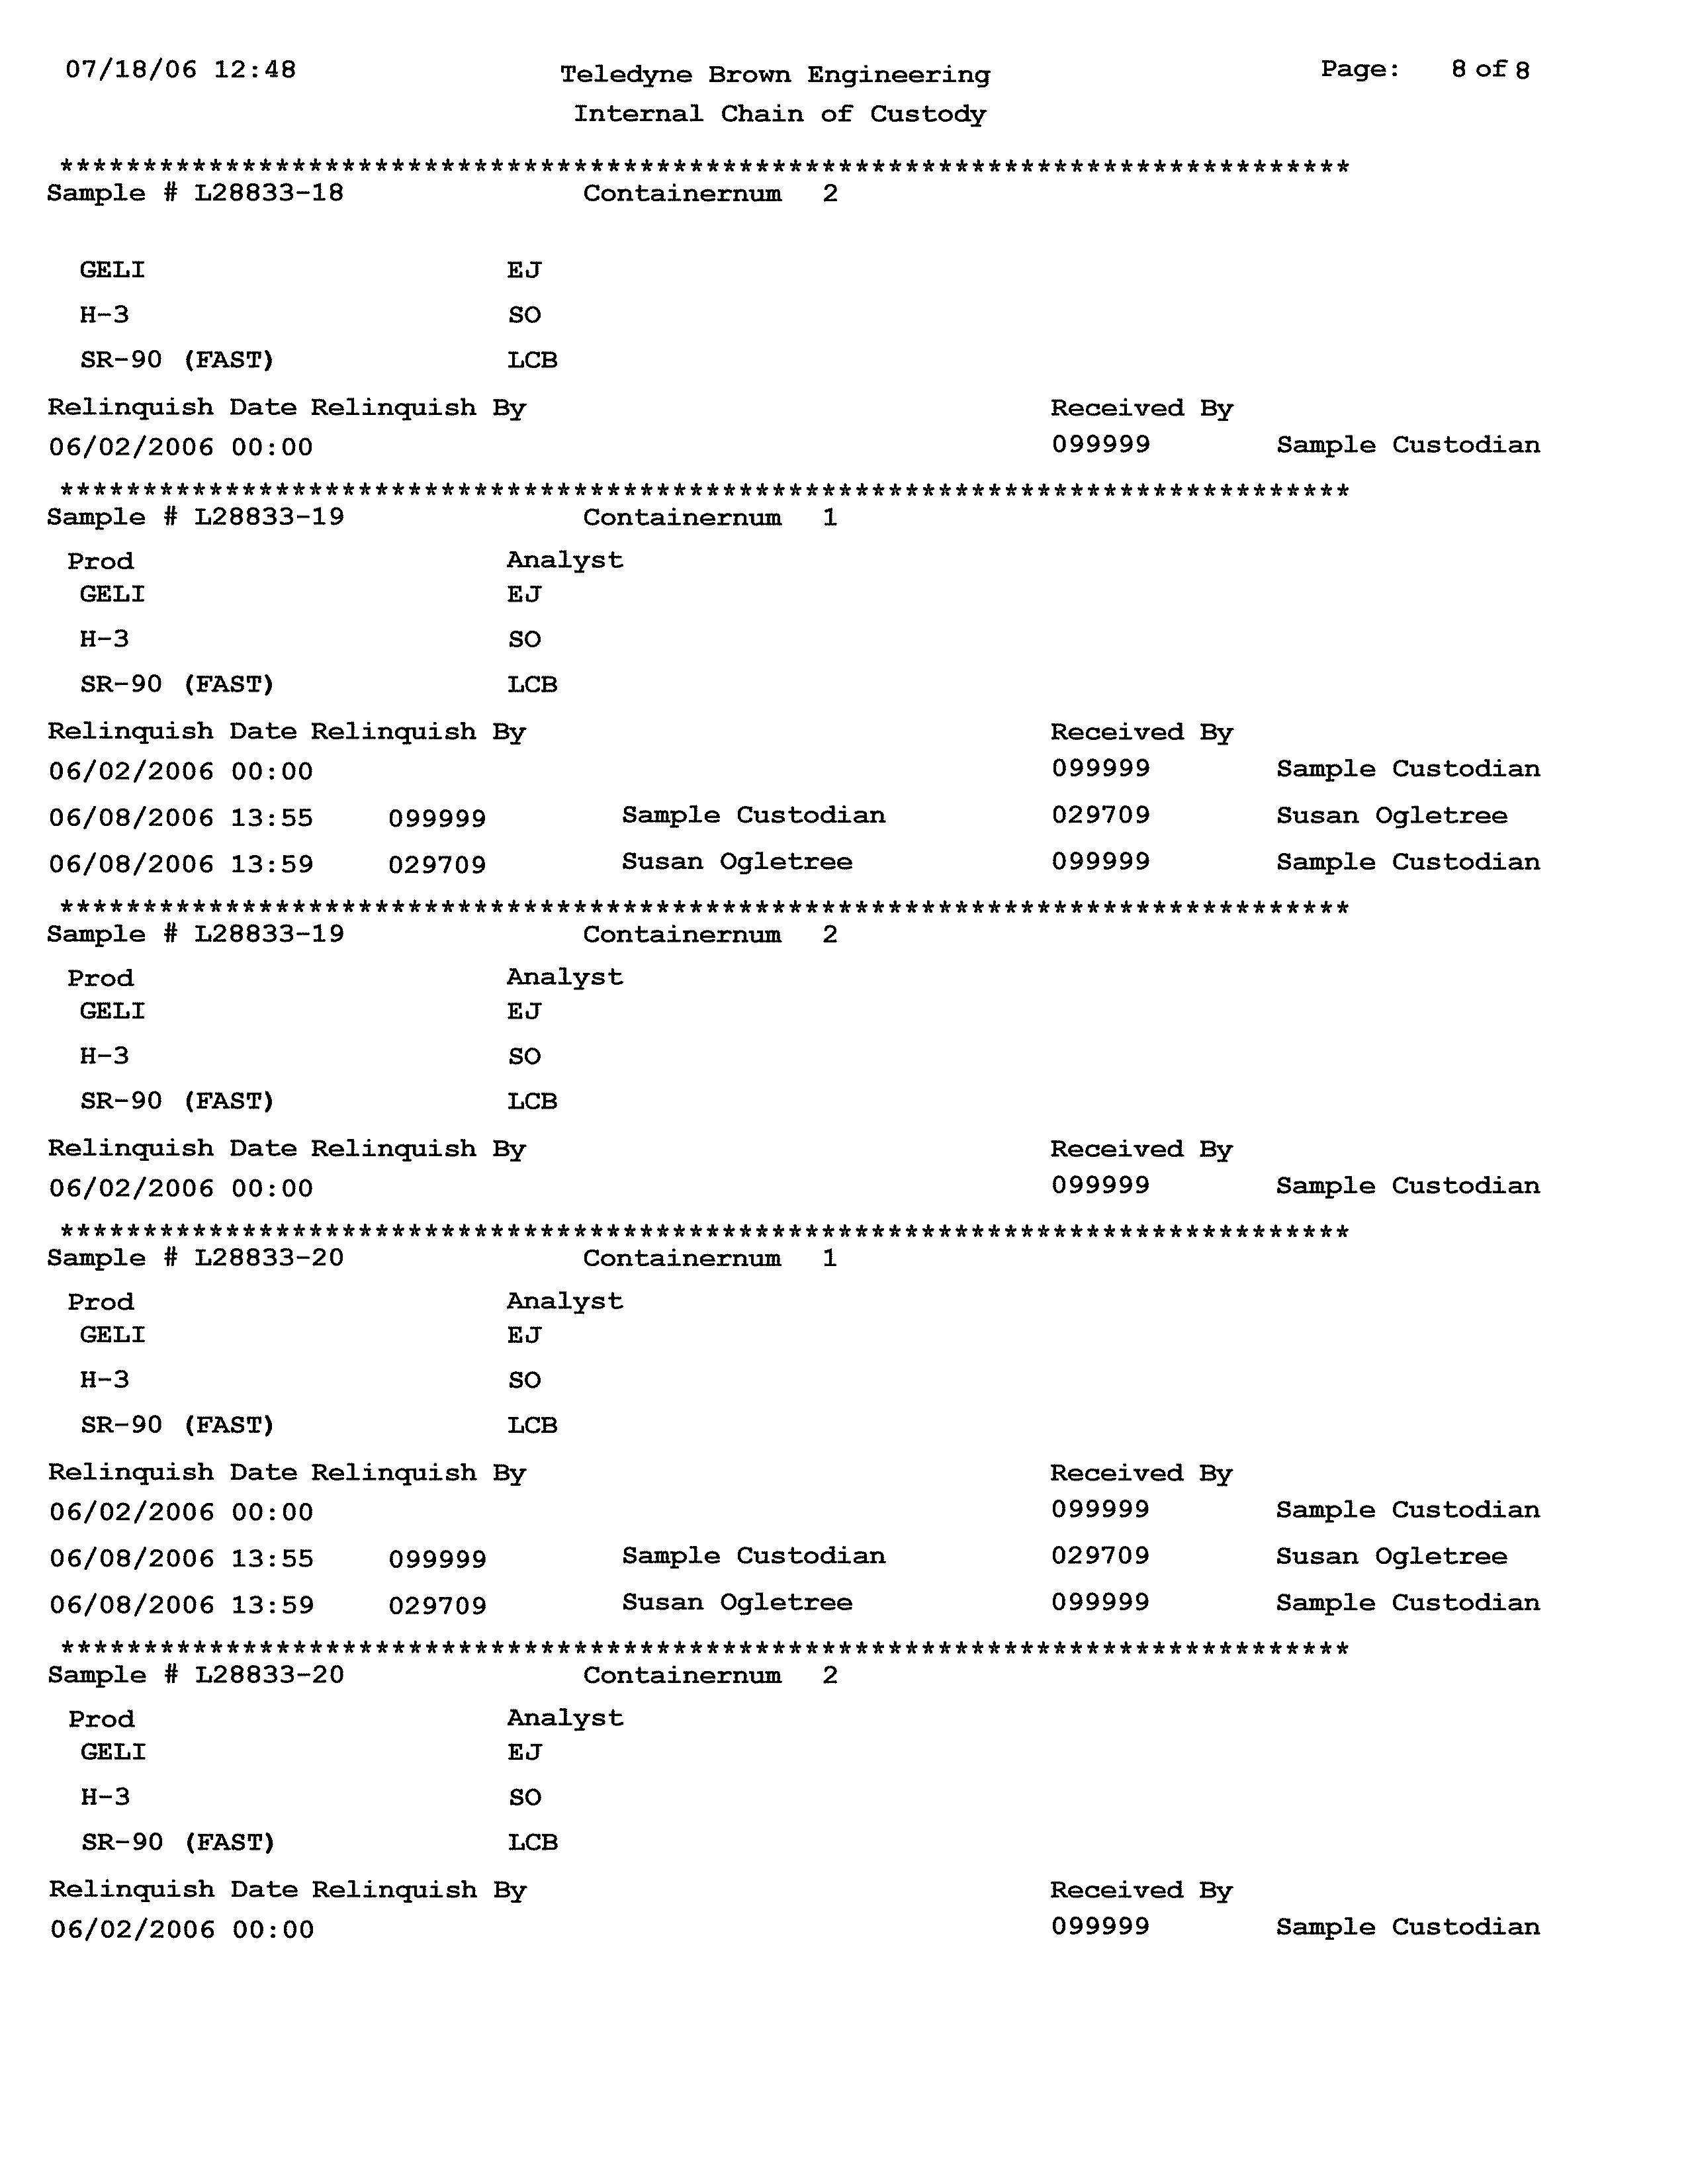
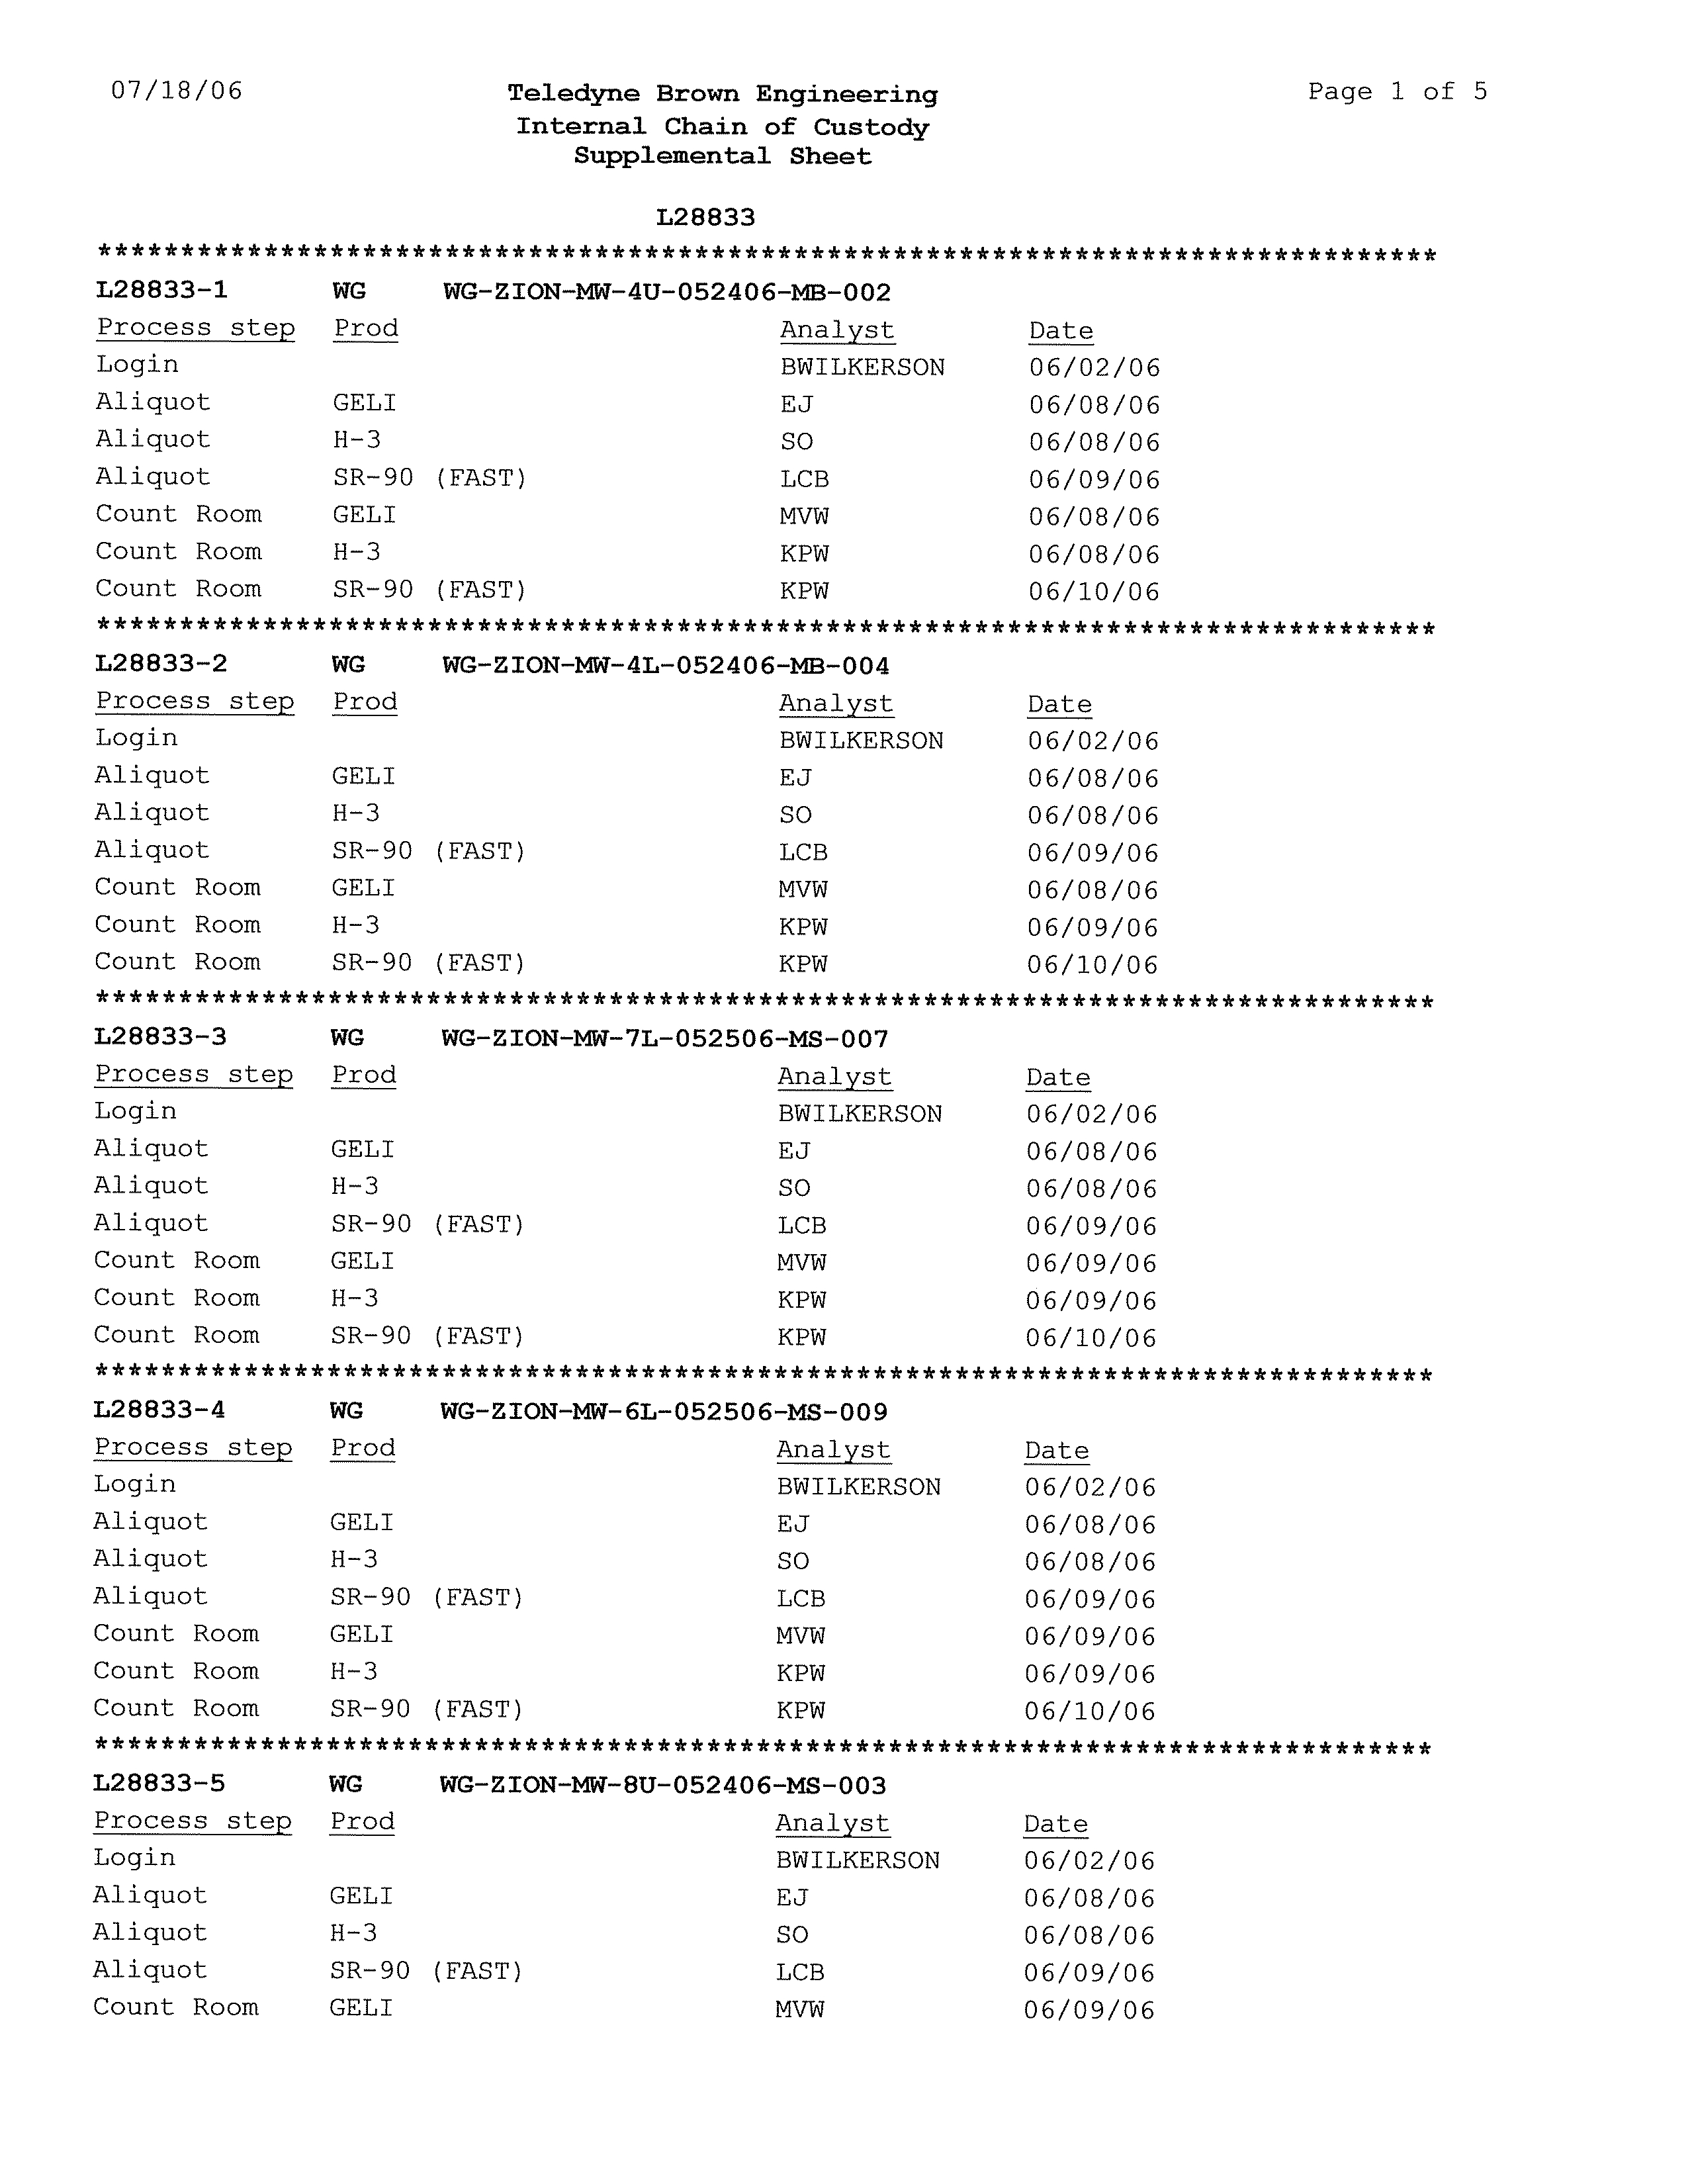
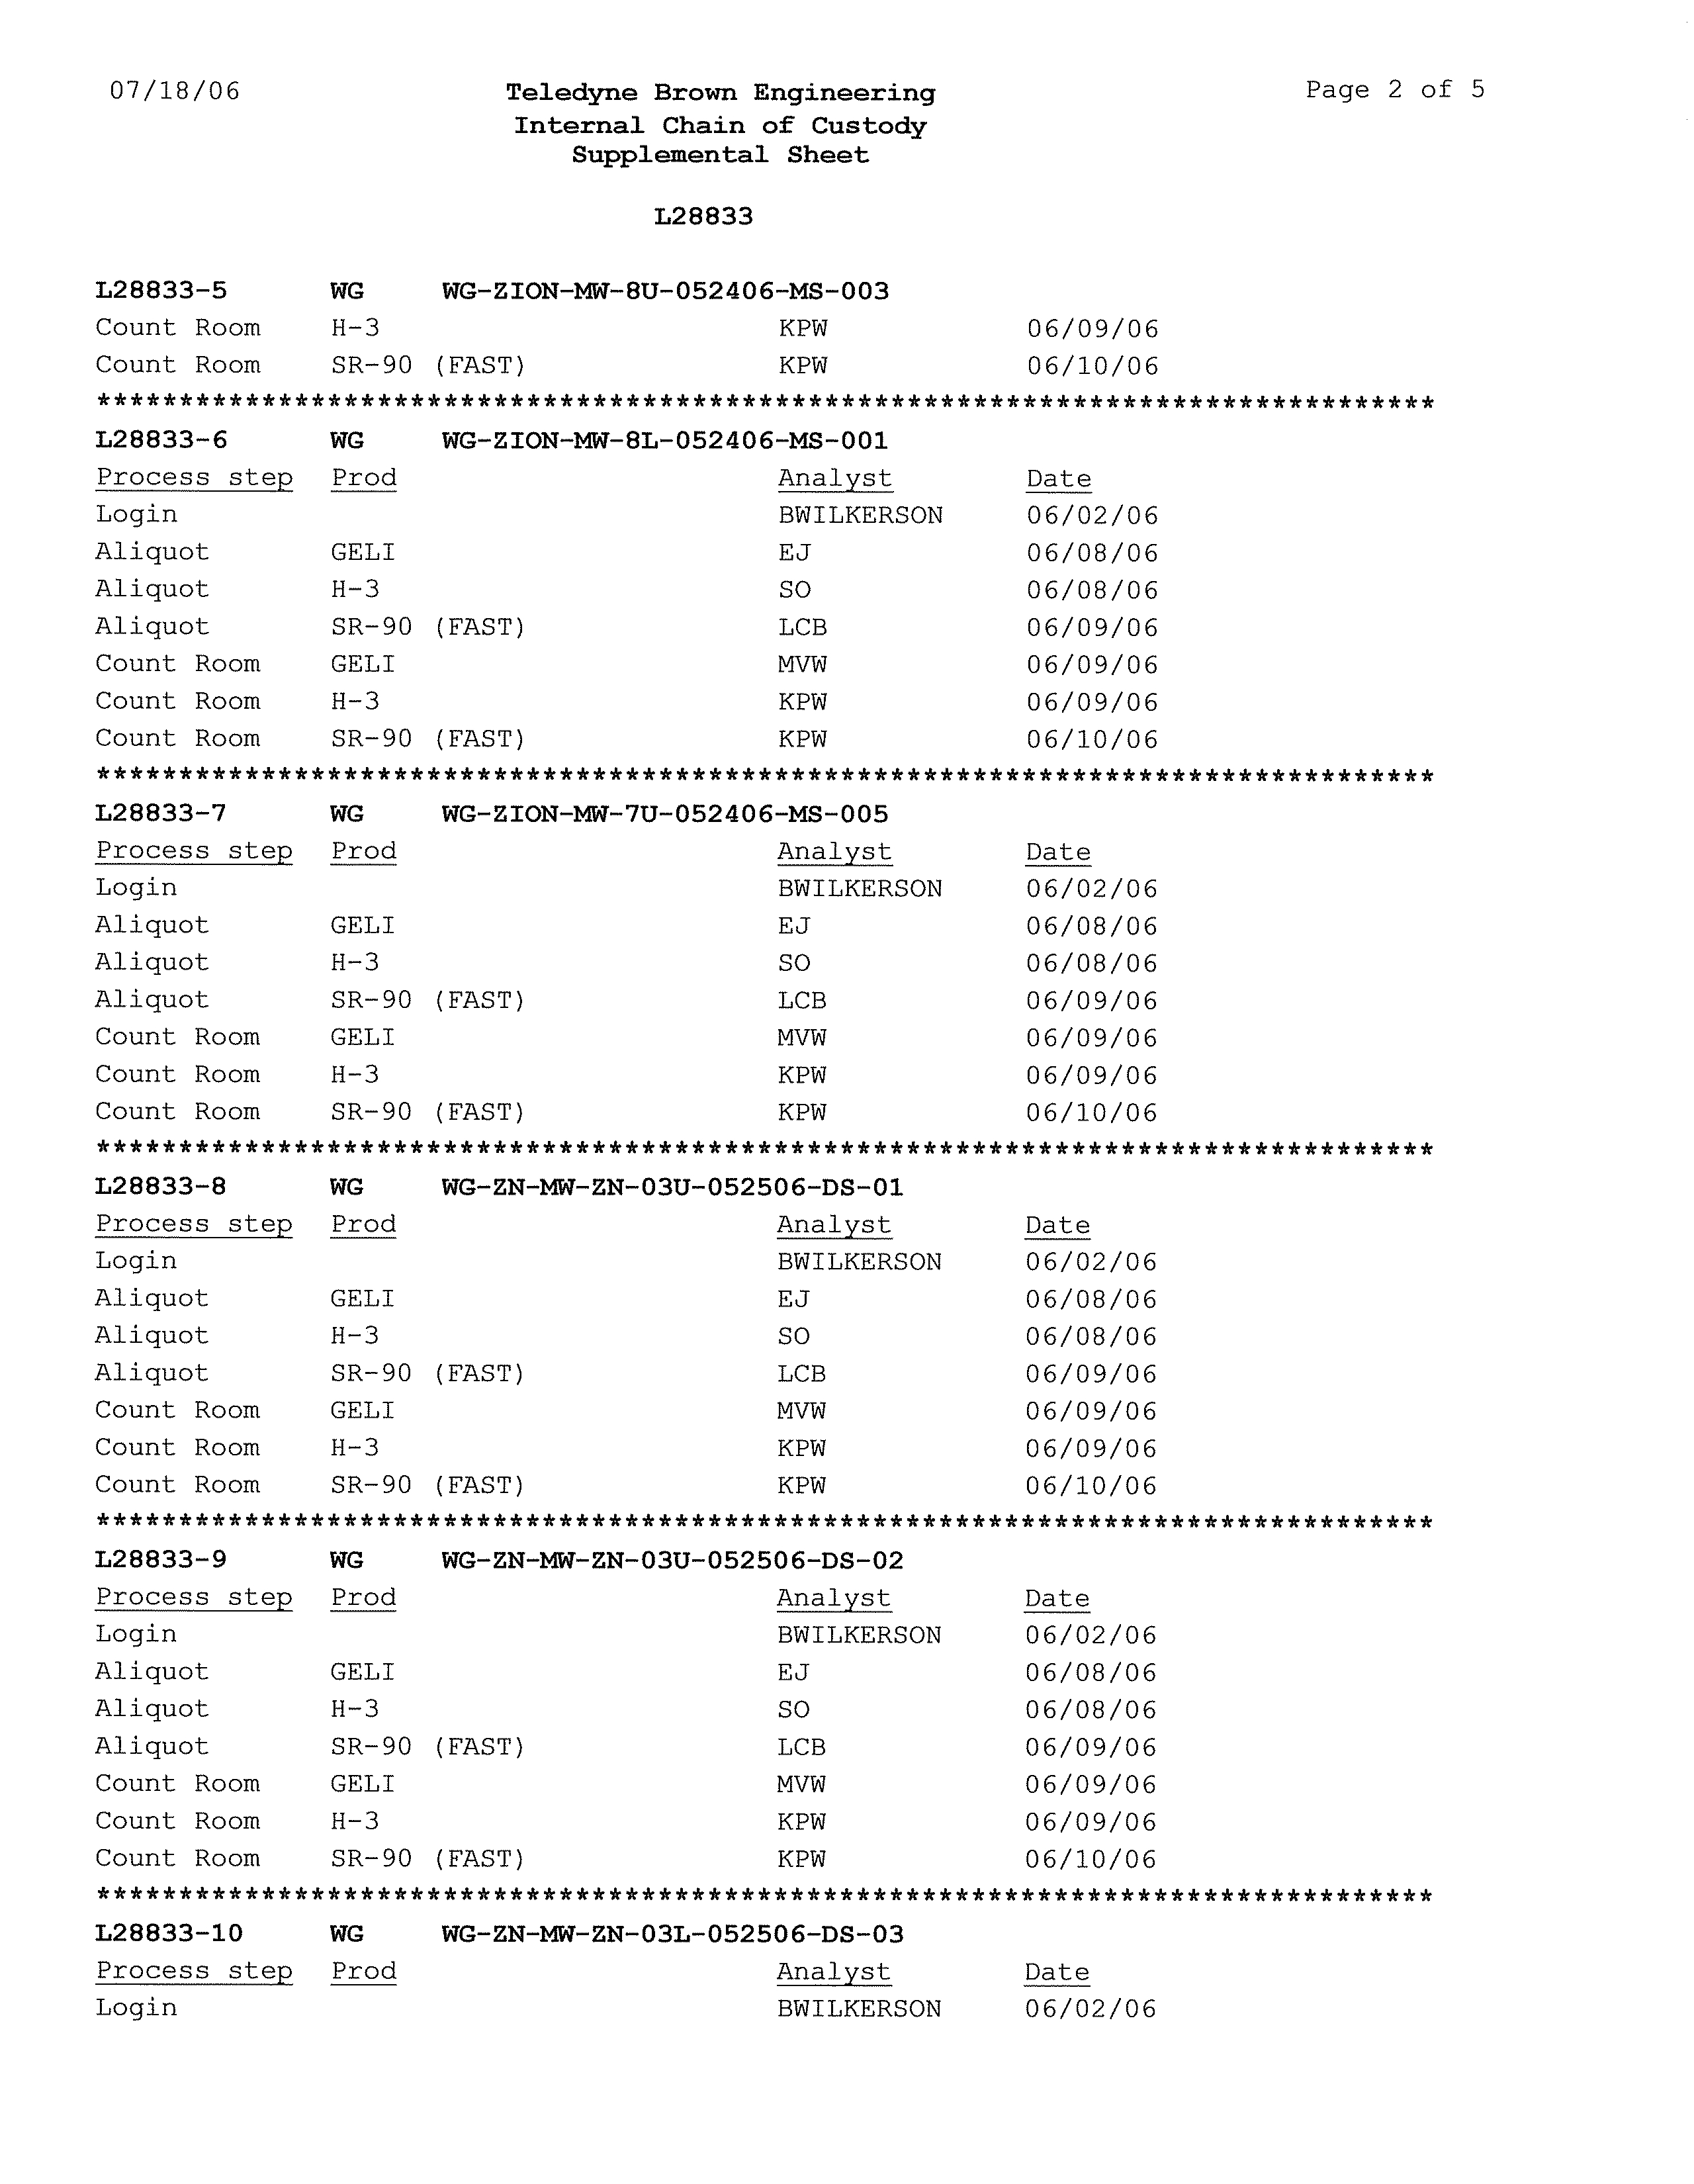
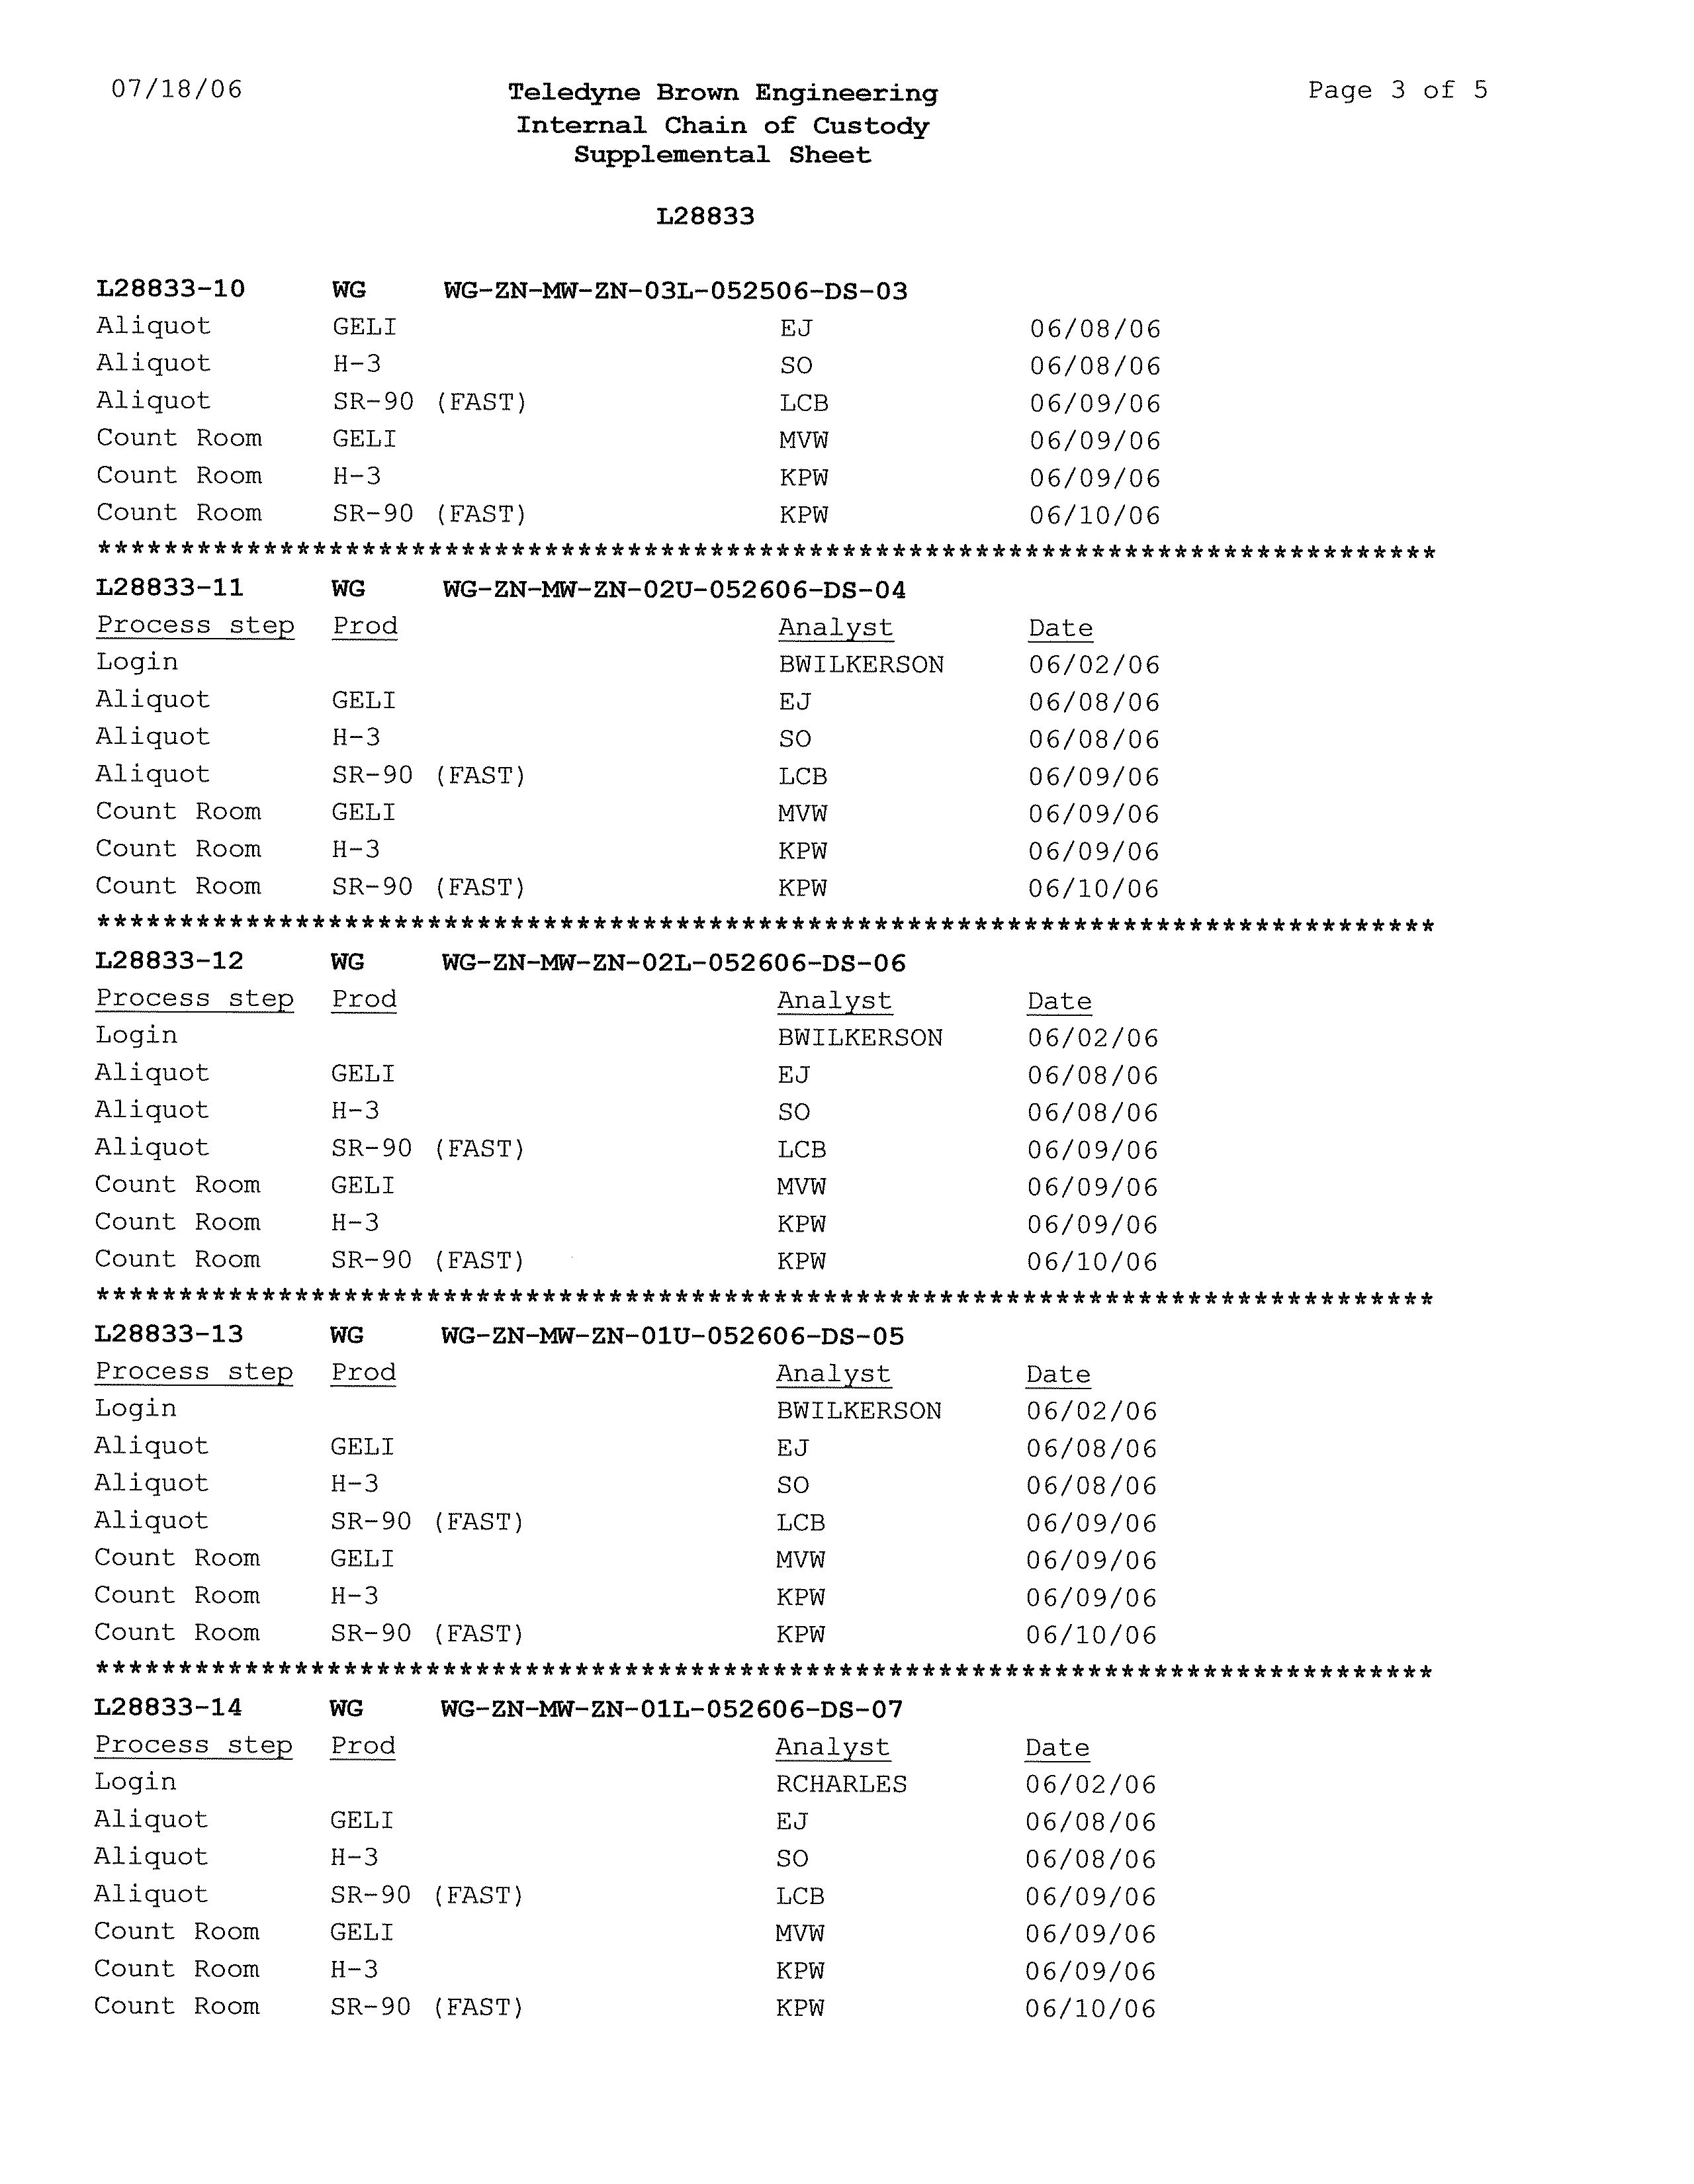
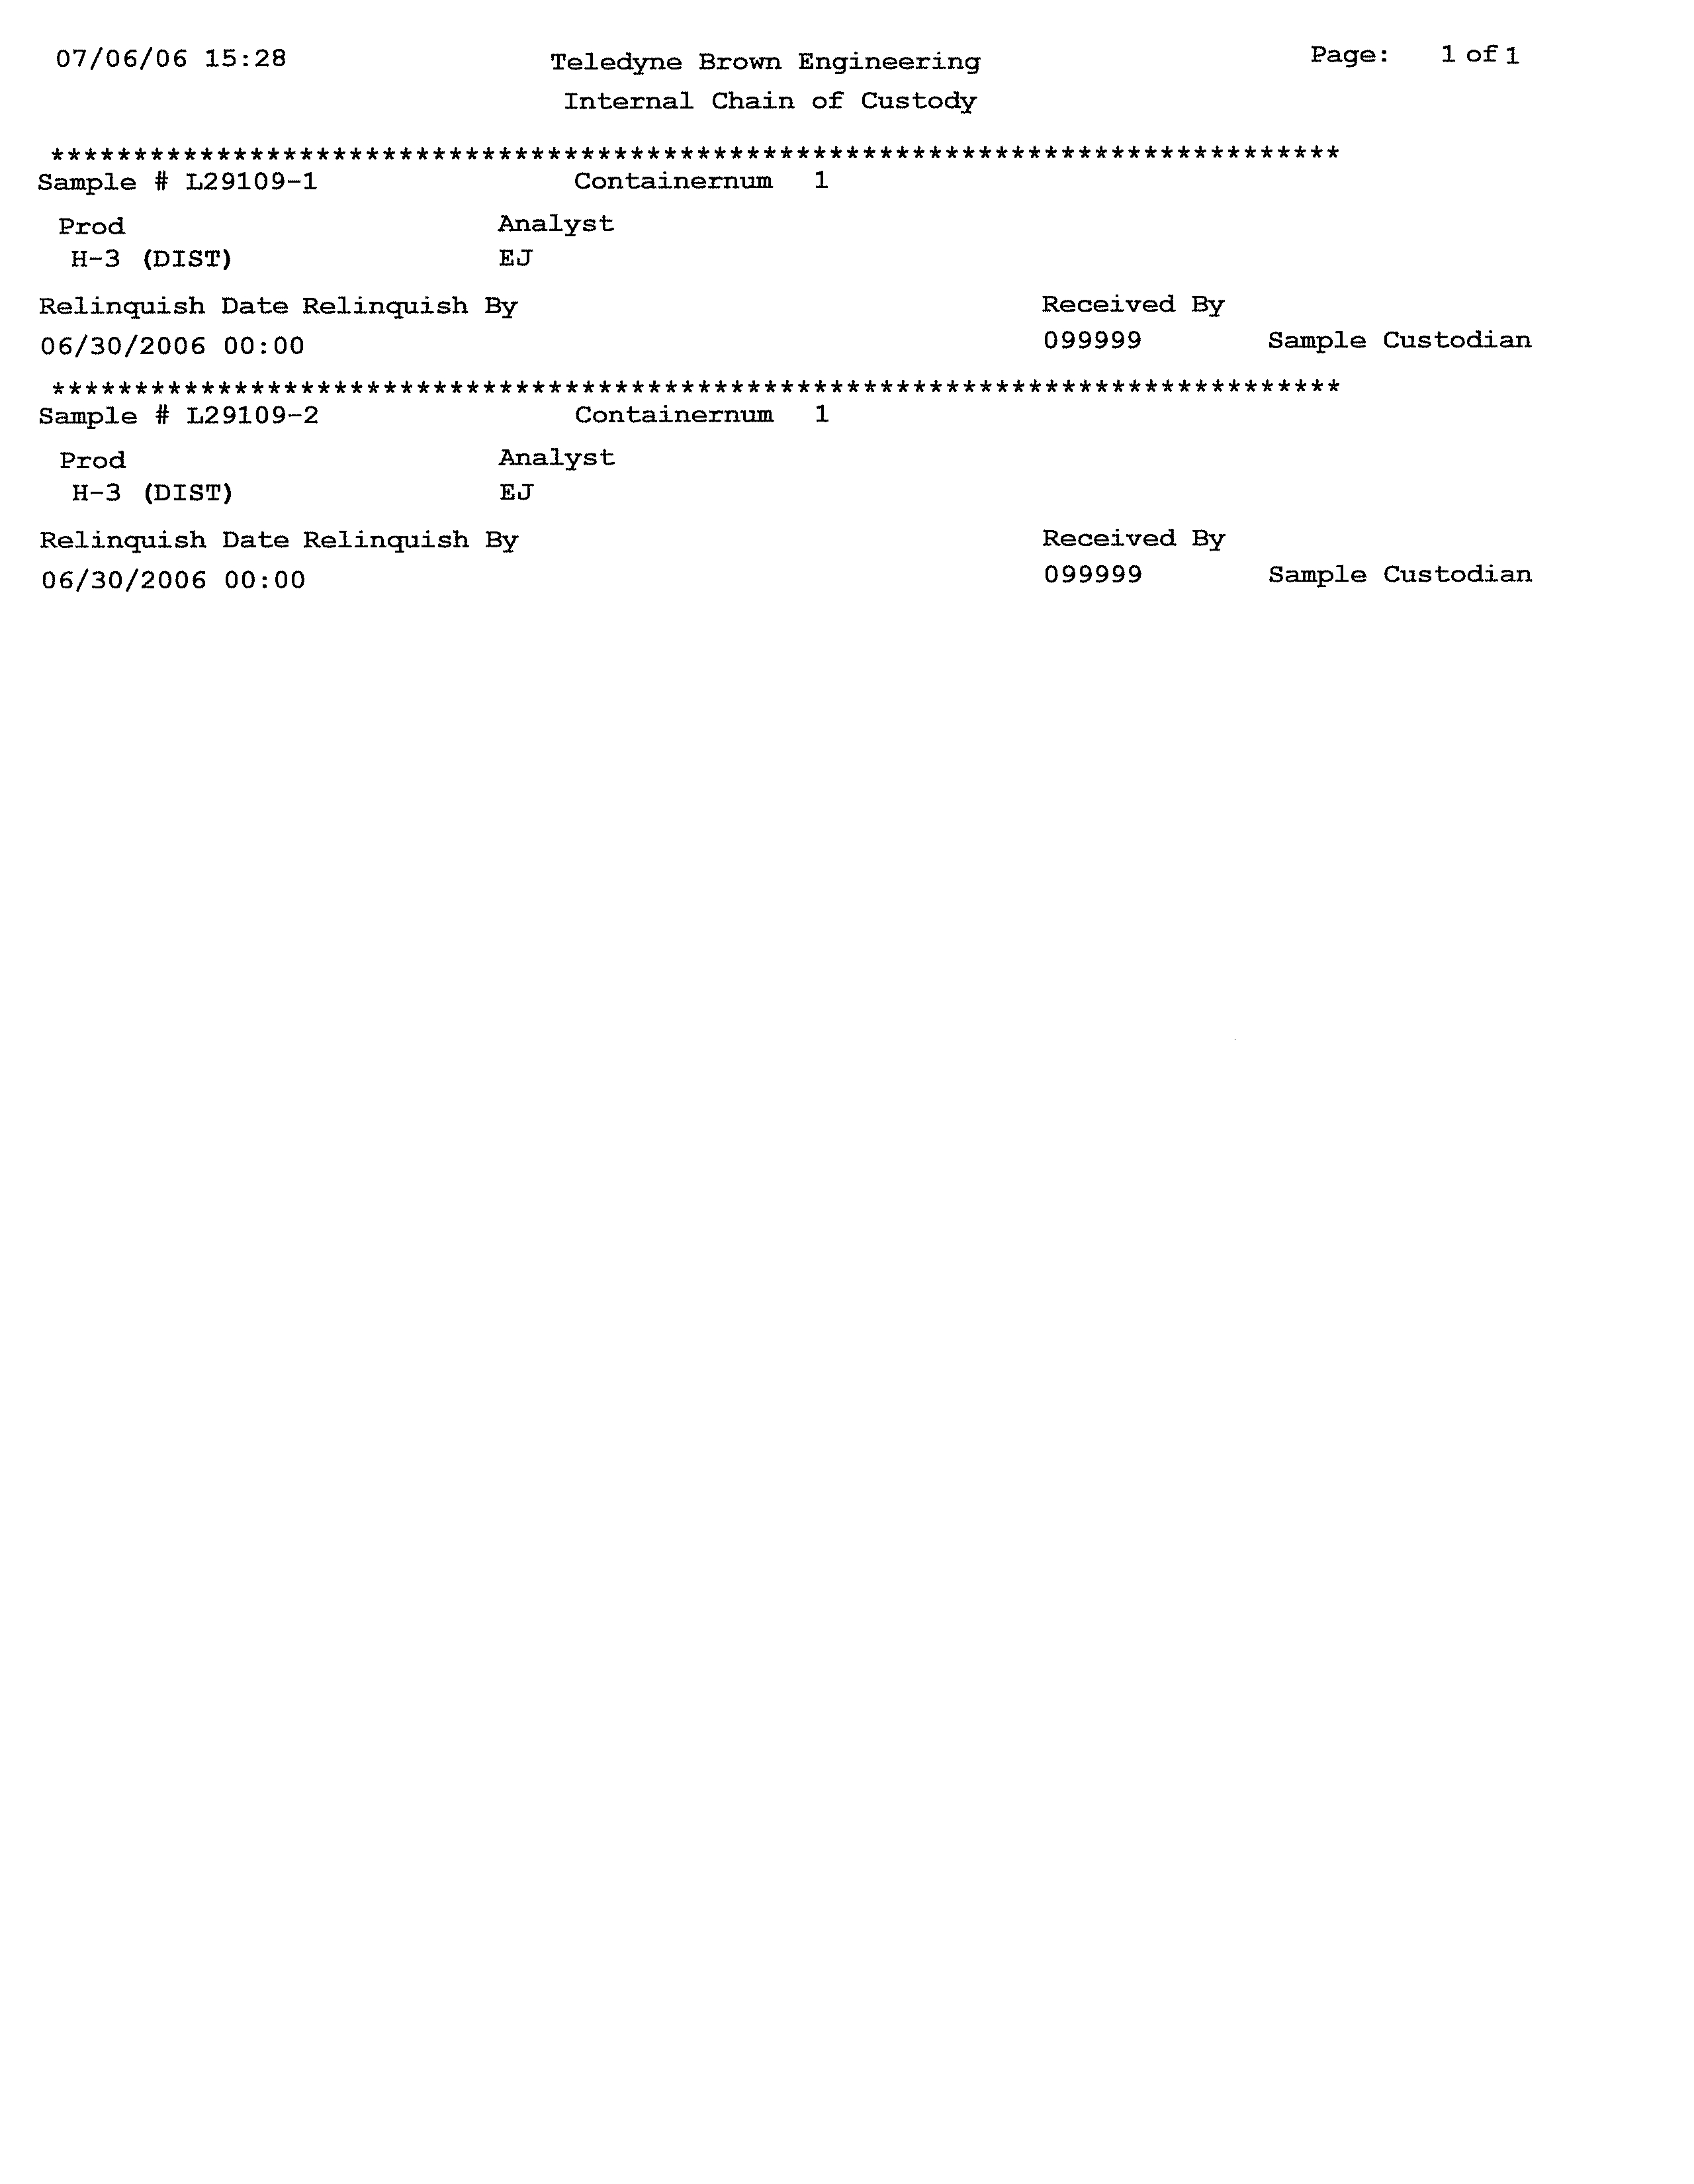
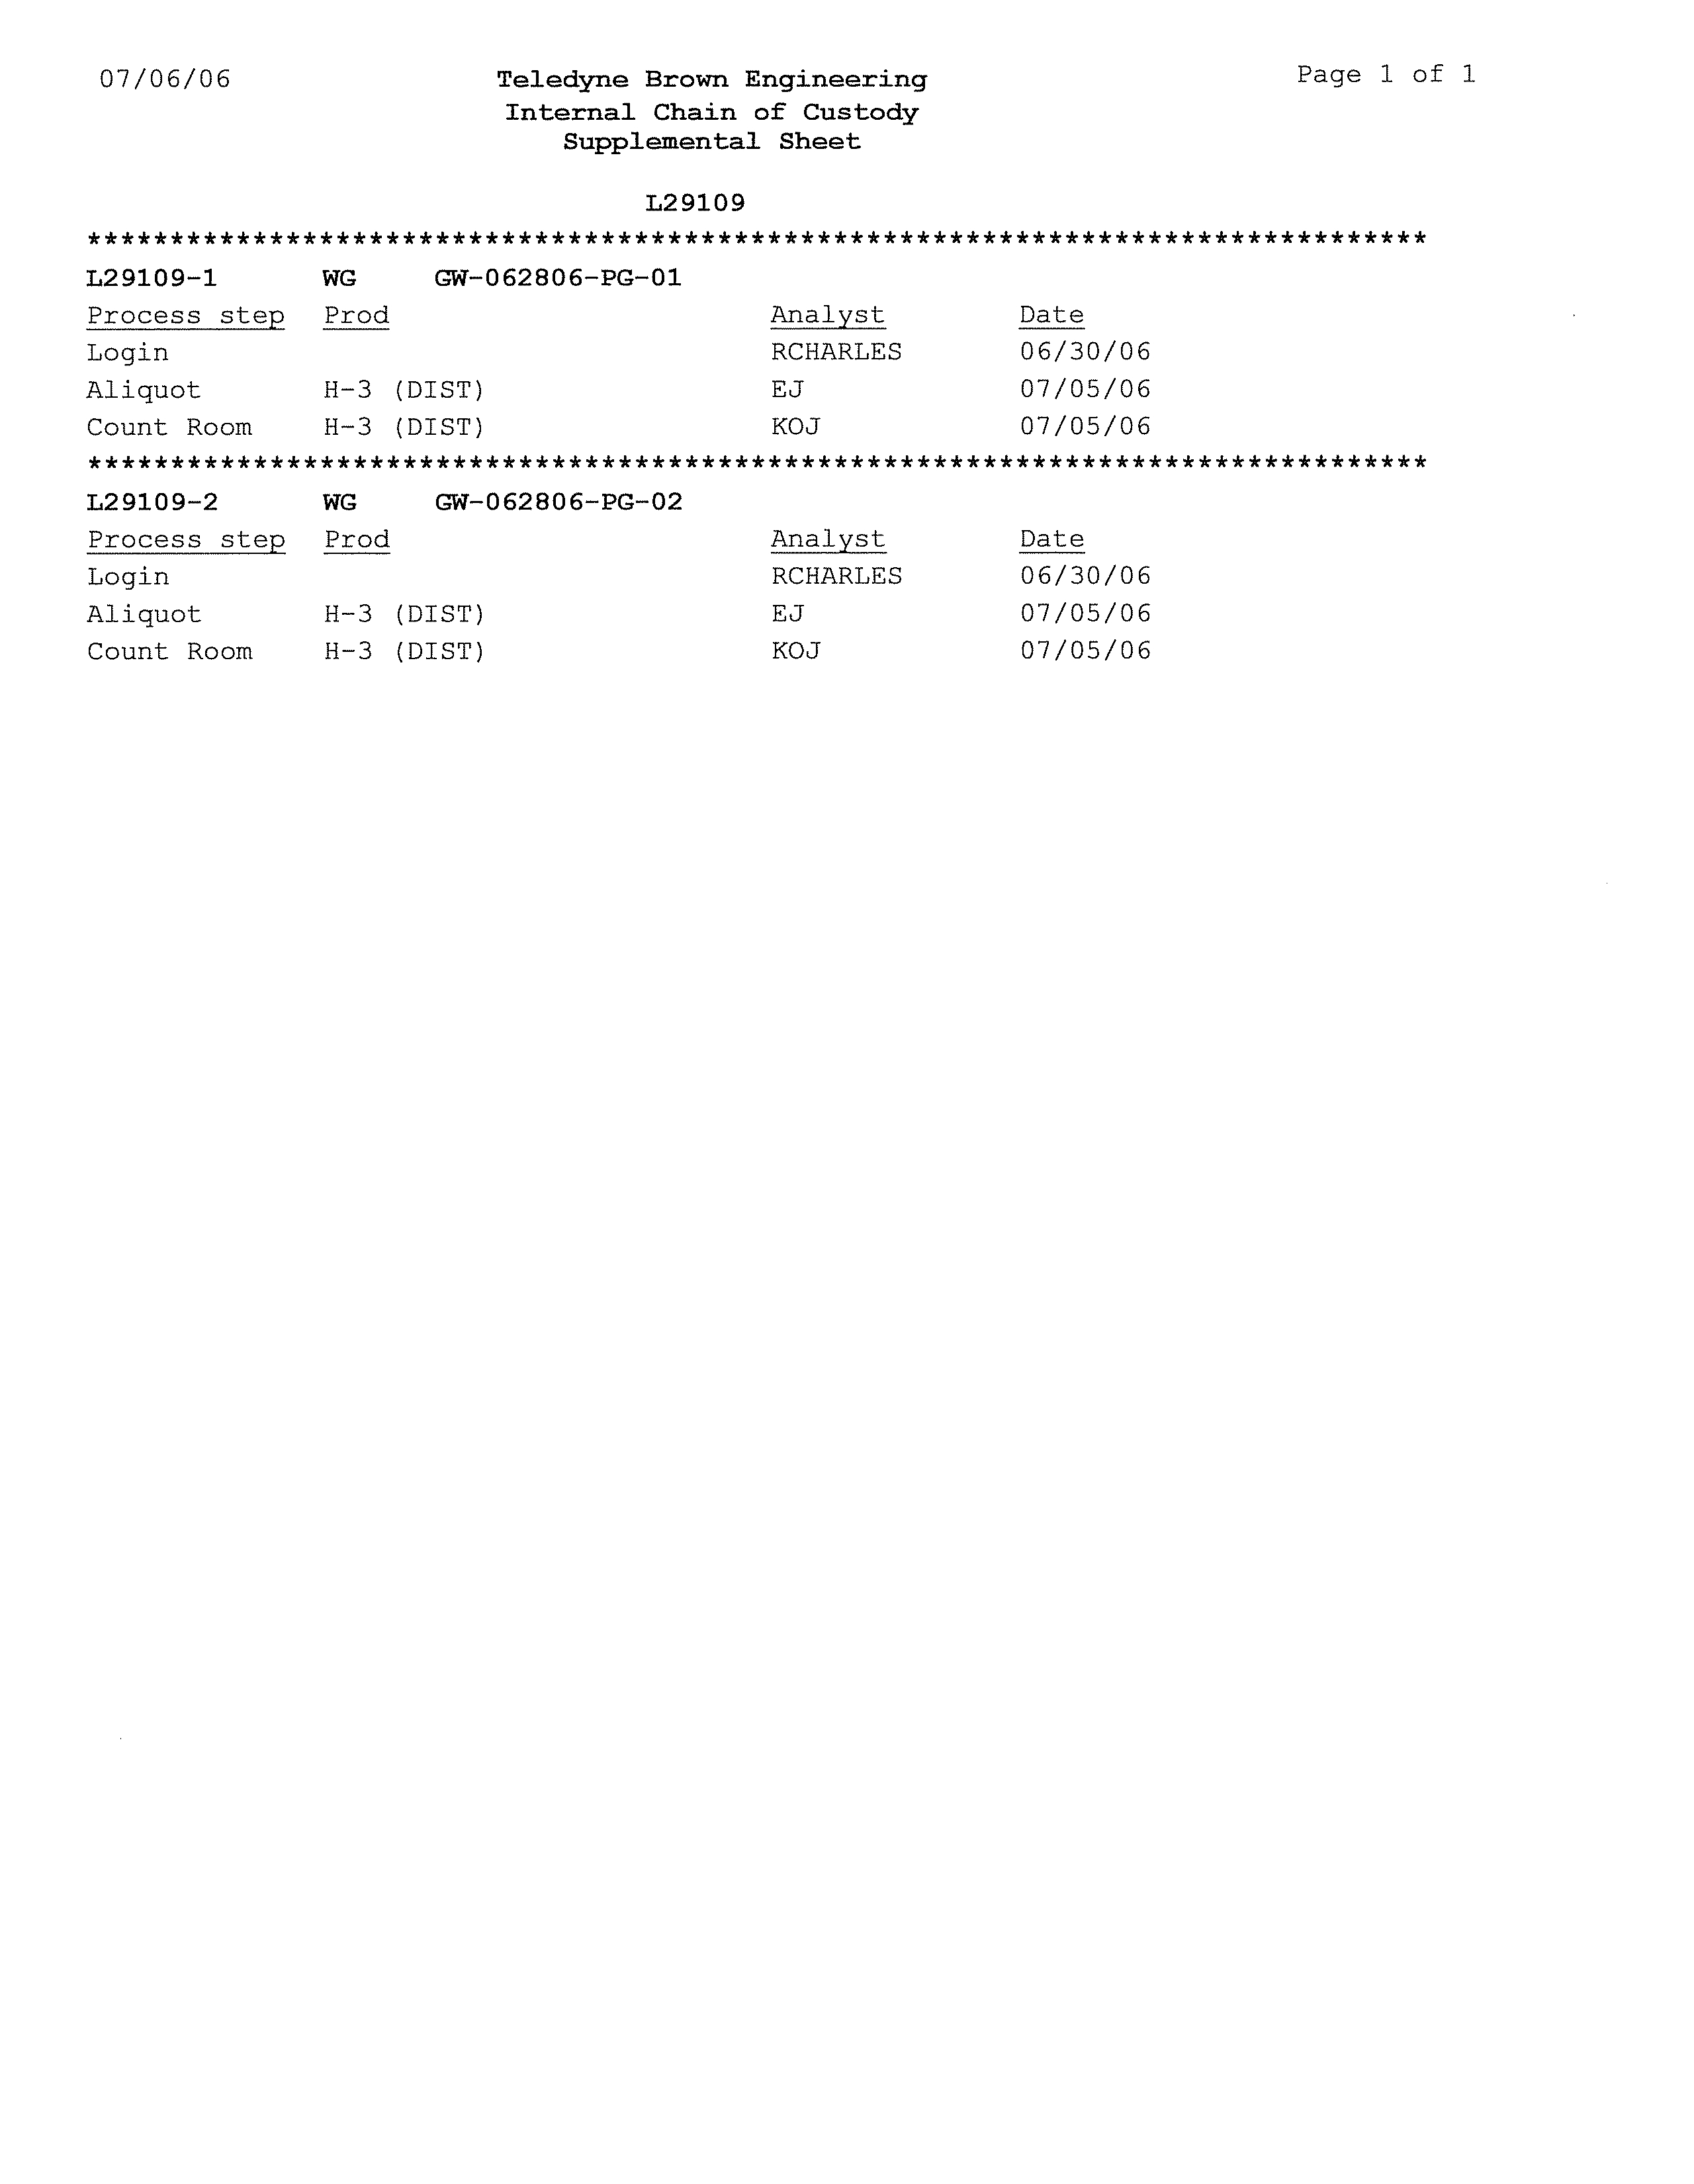
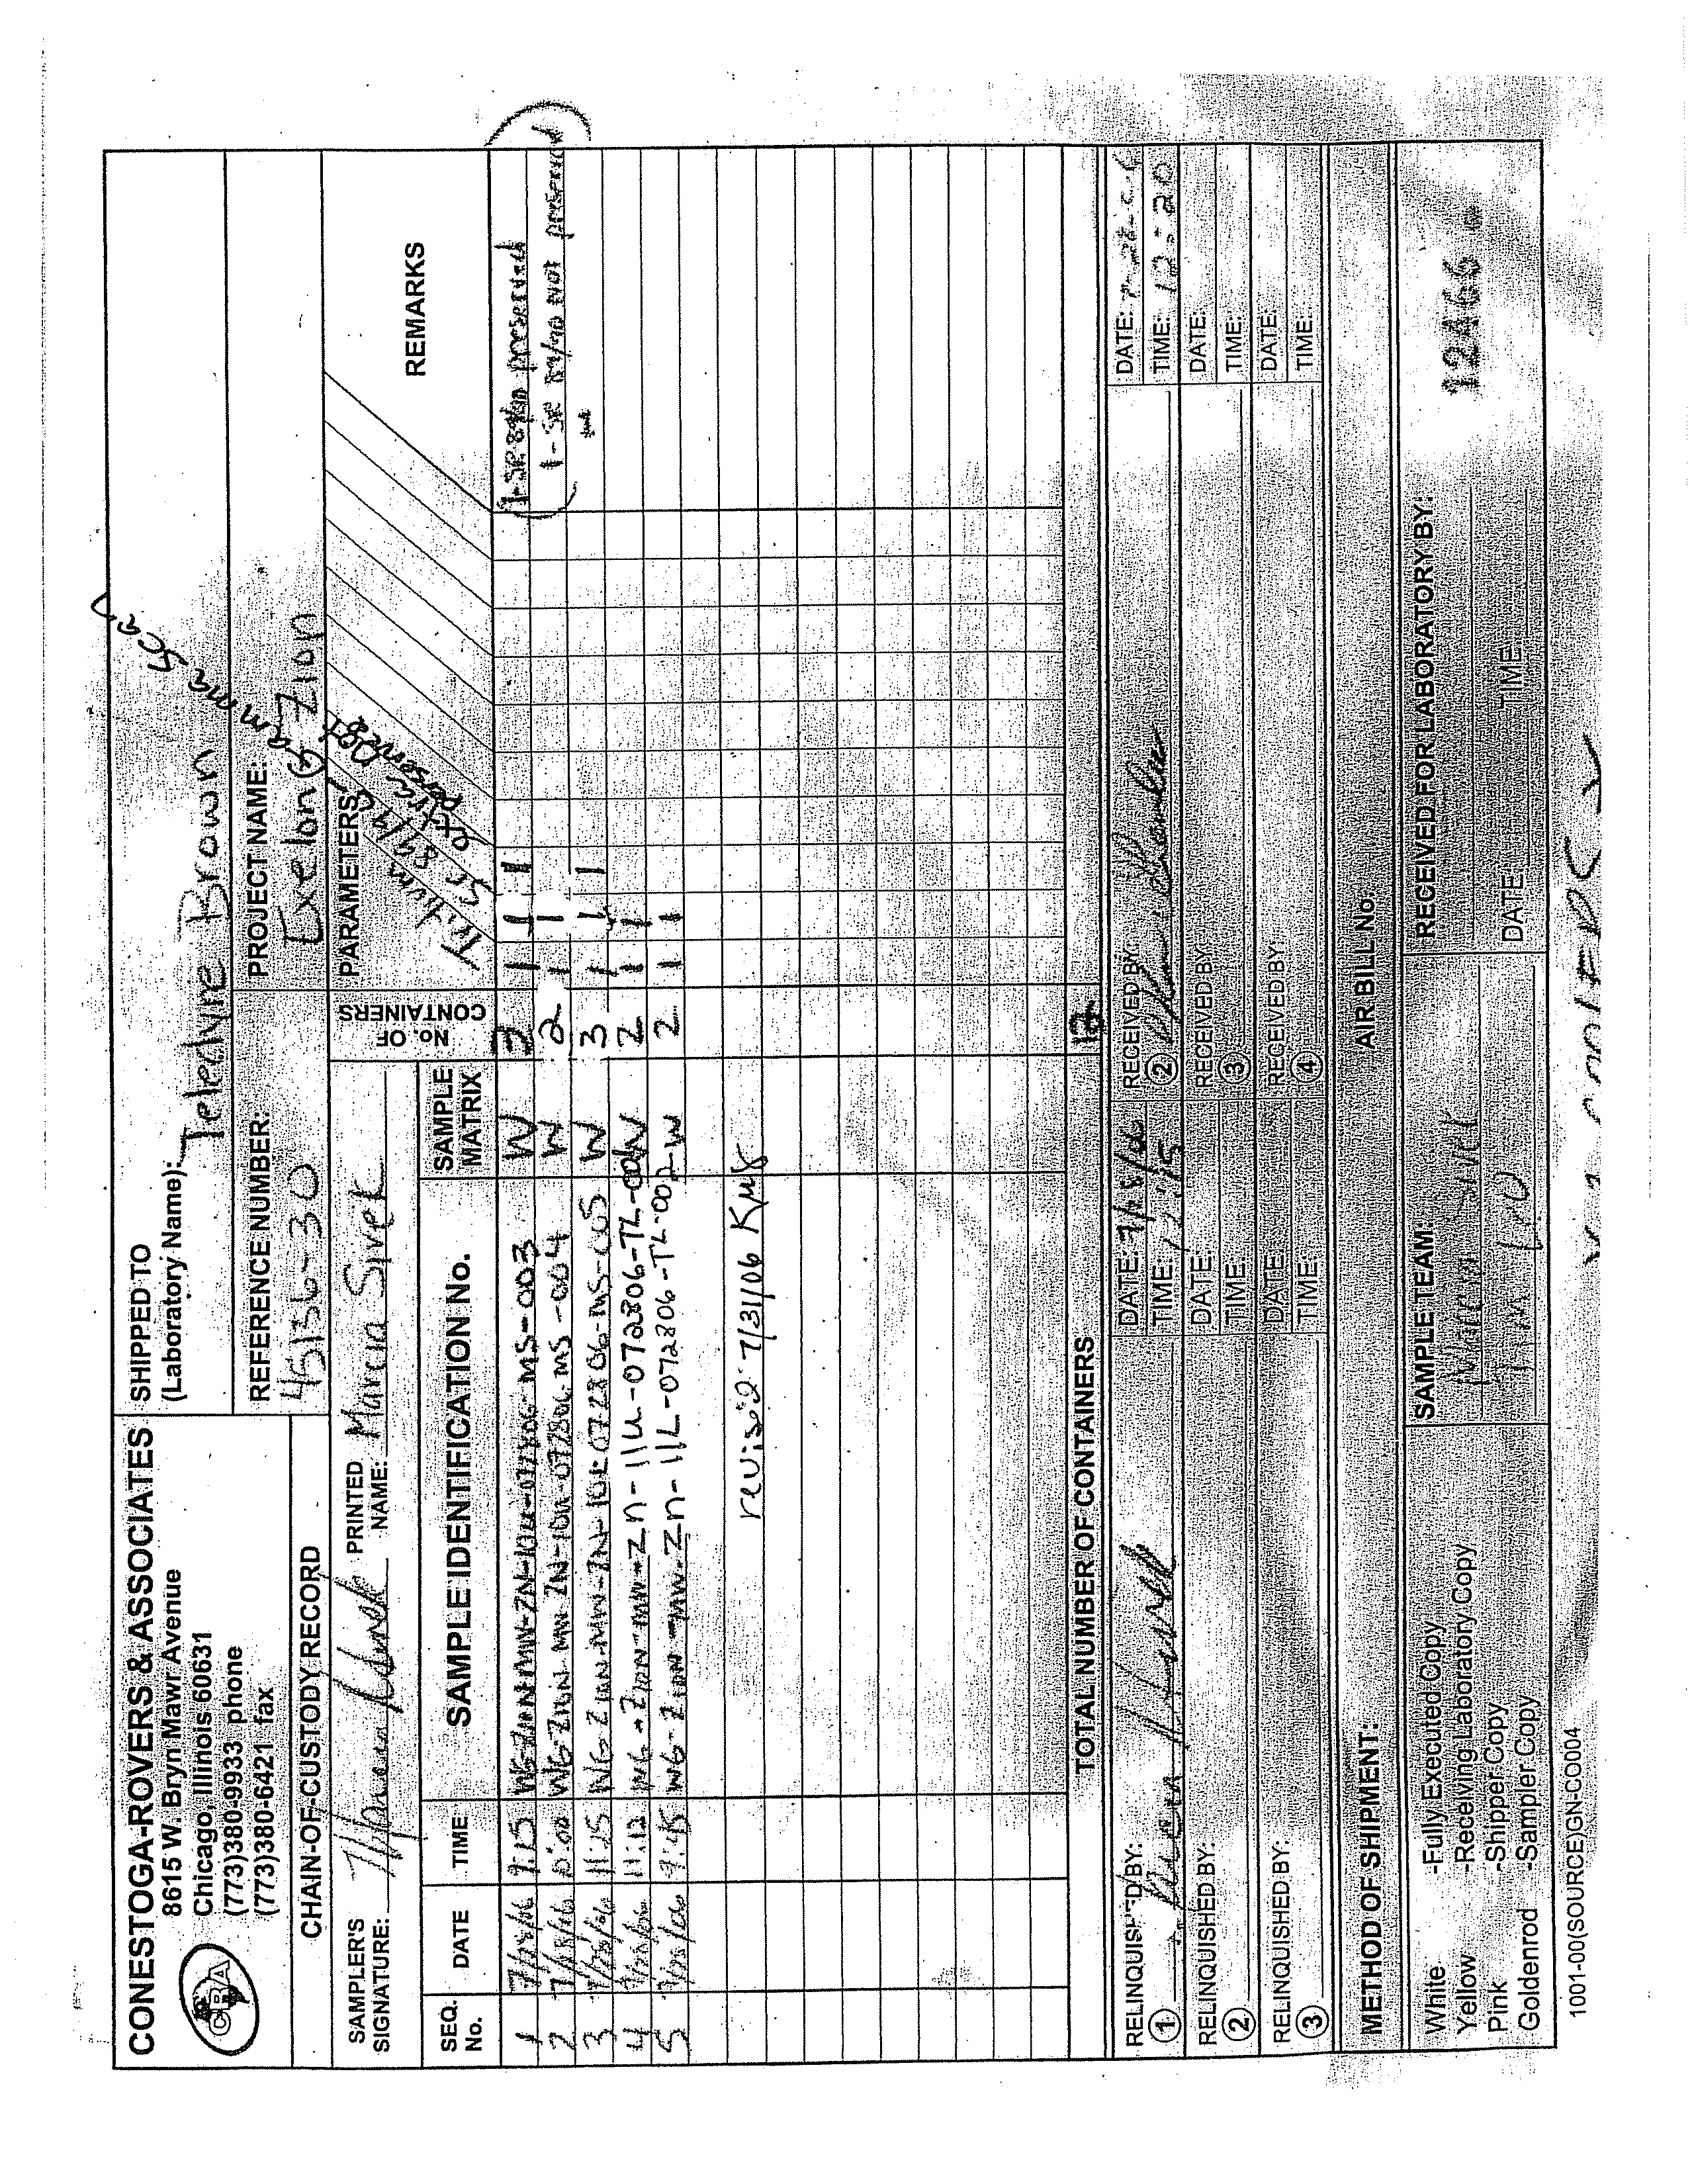
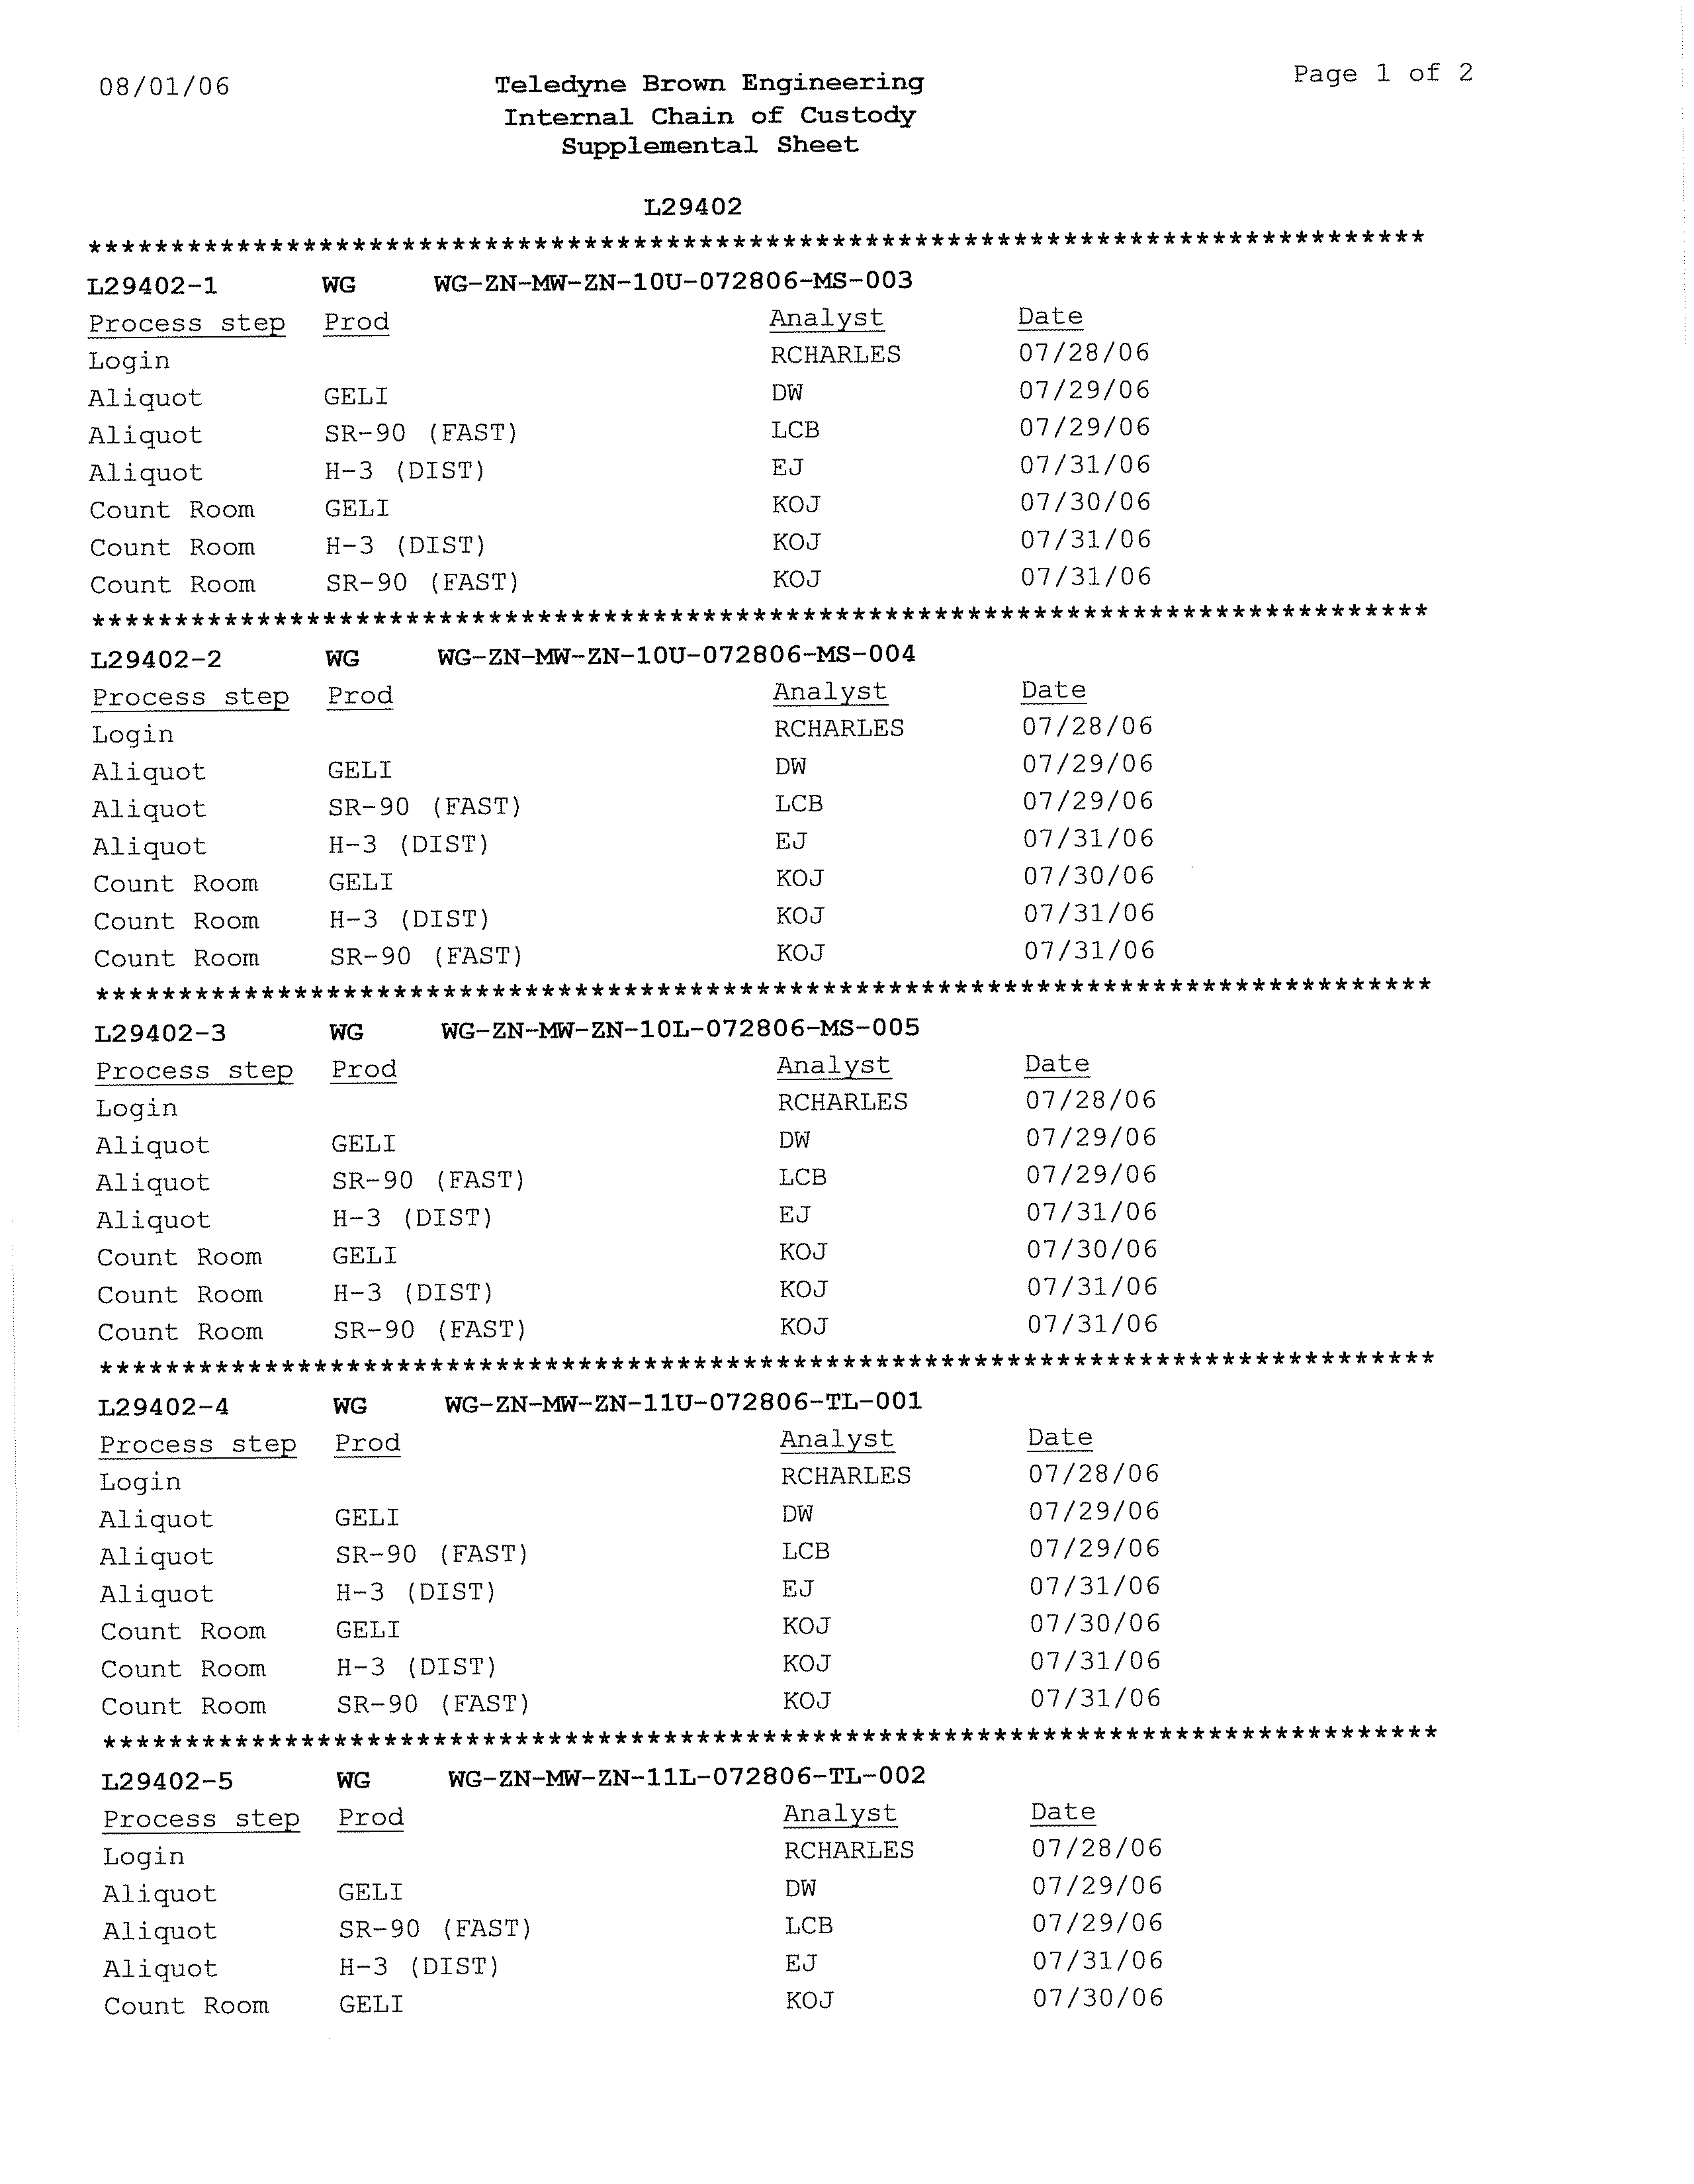
CHAIN-OF-CUSTODY RECORD
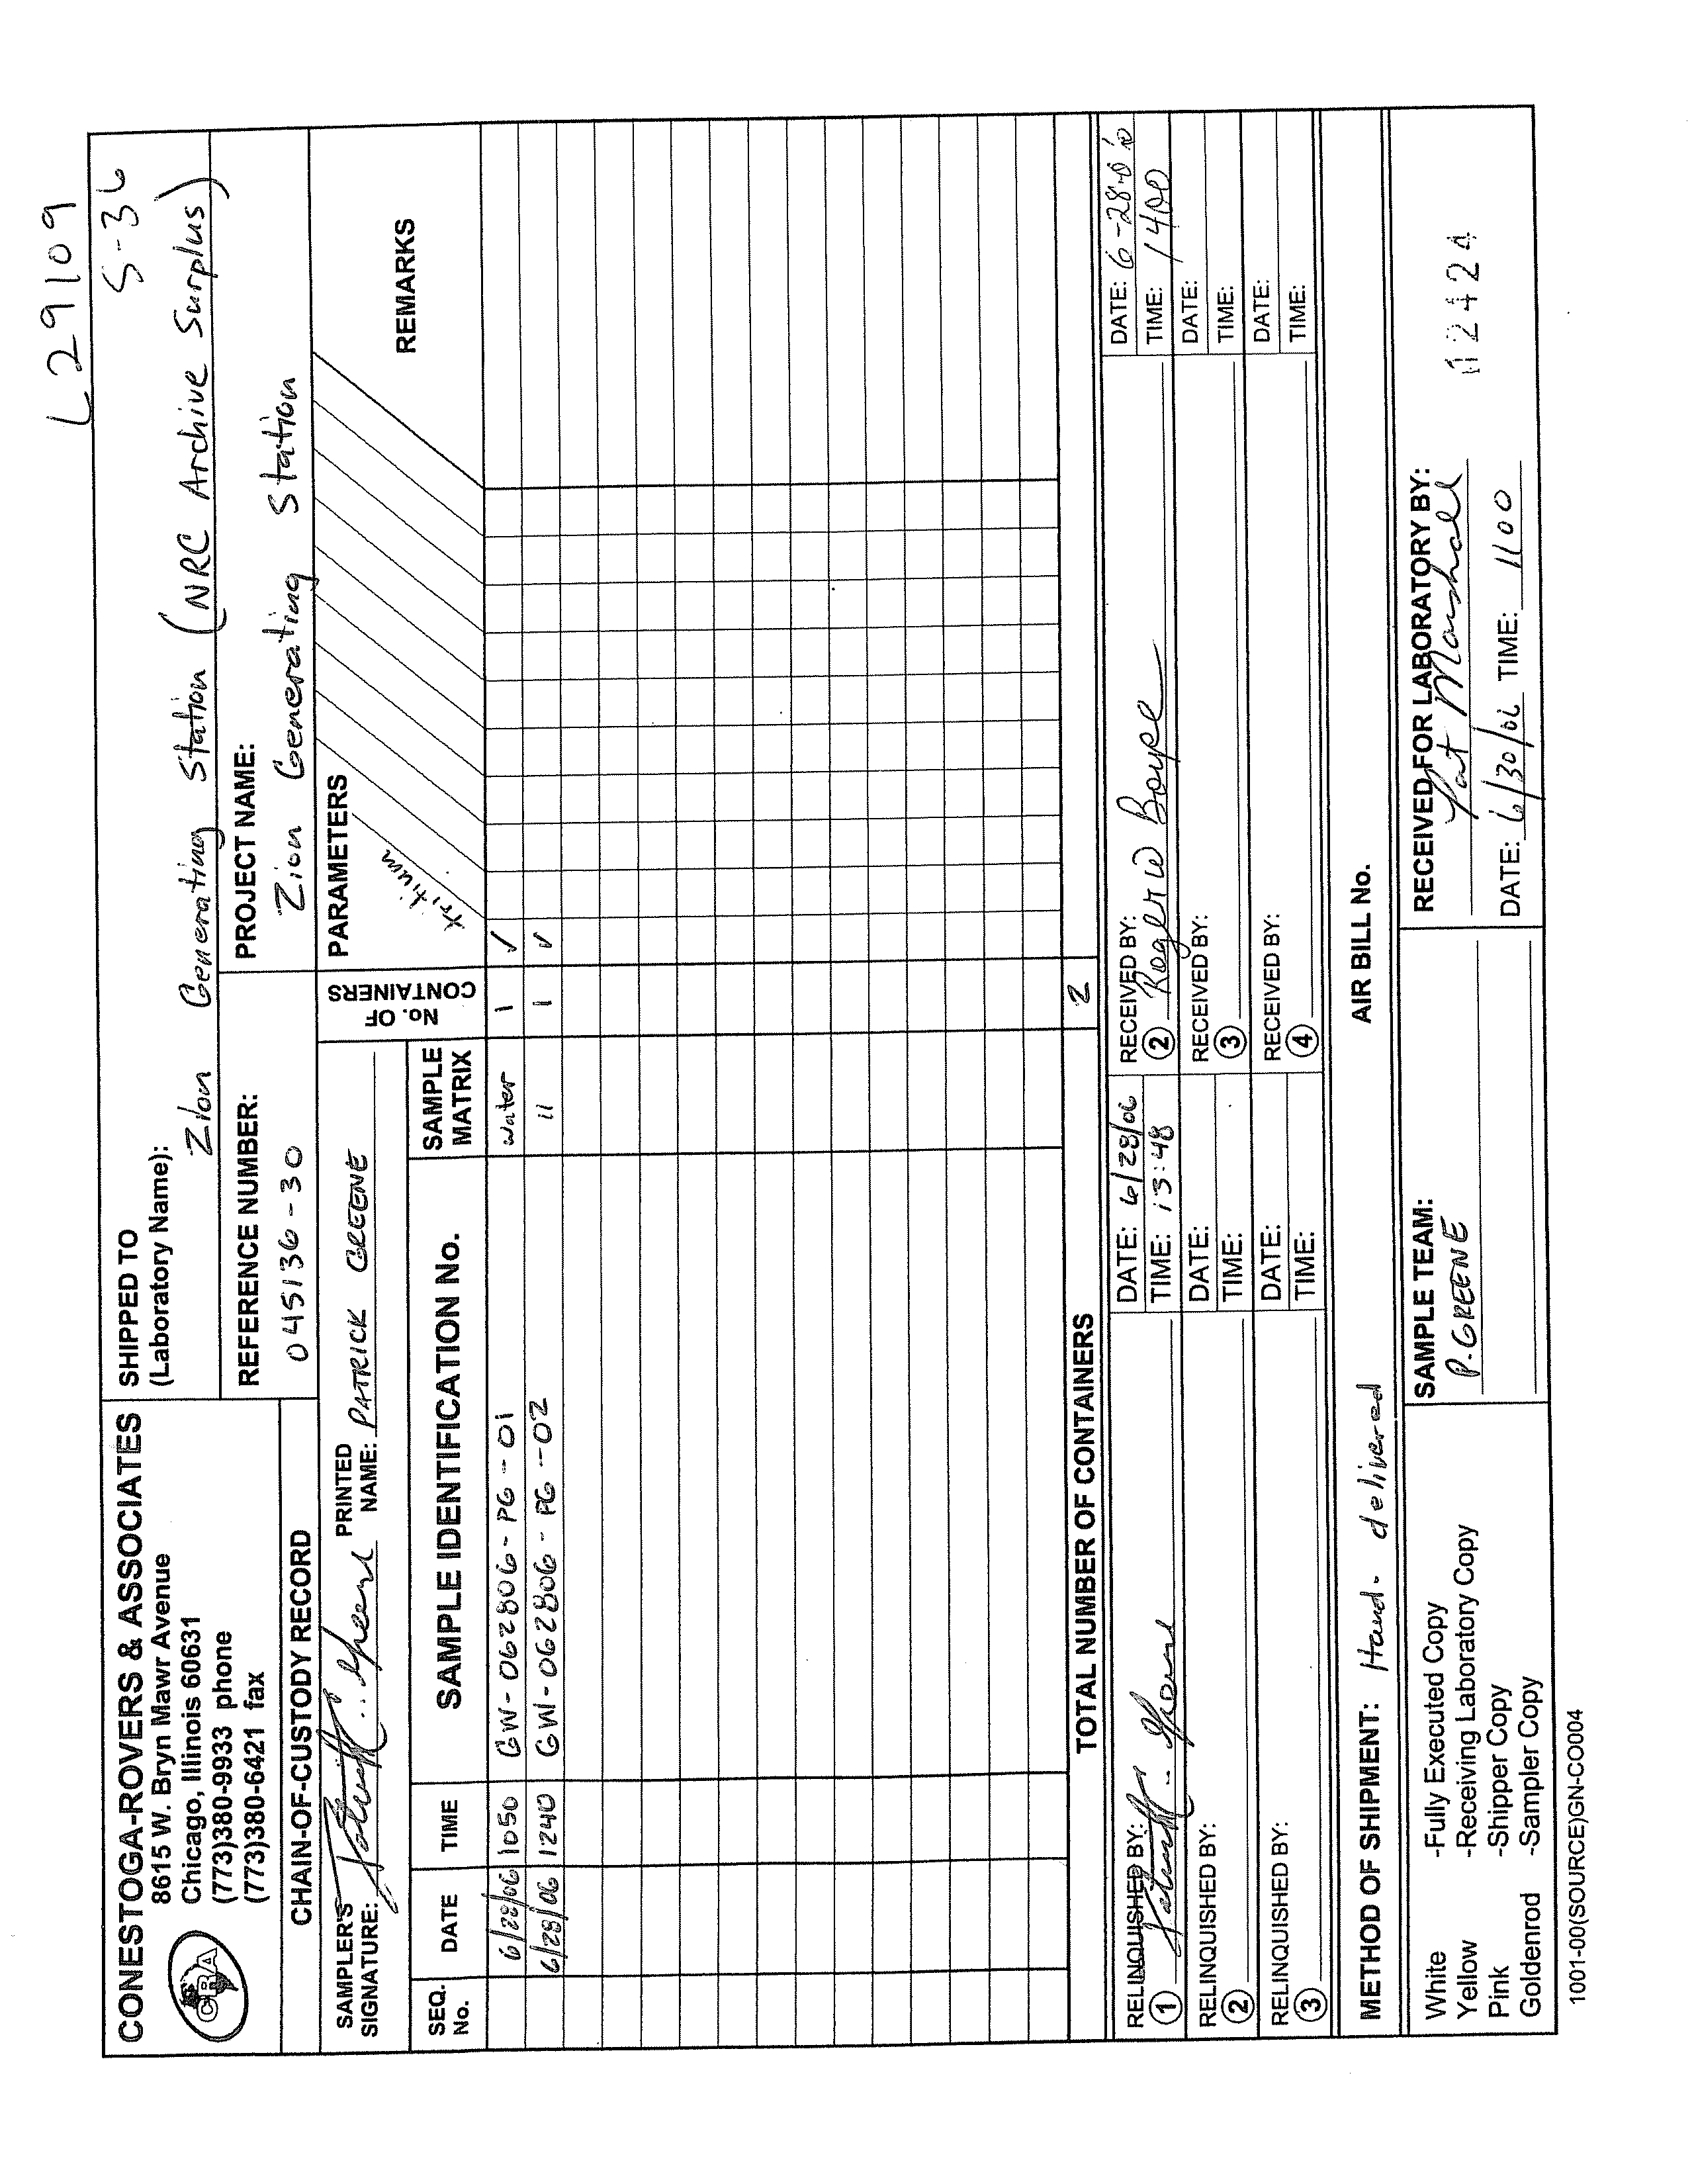
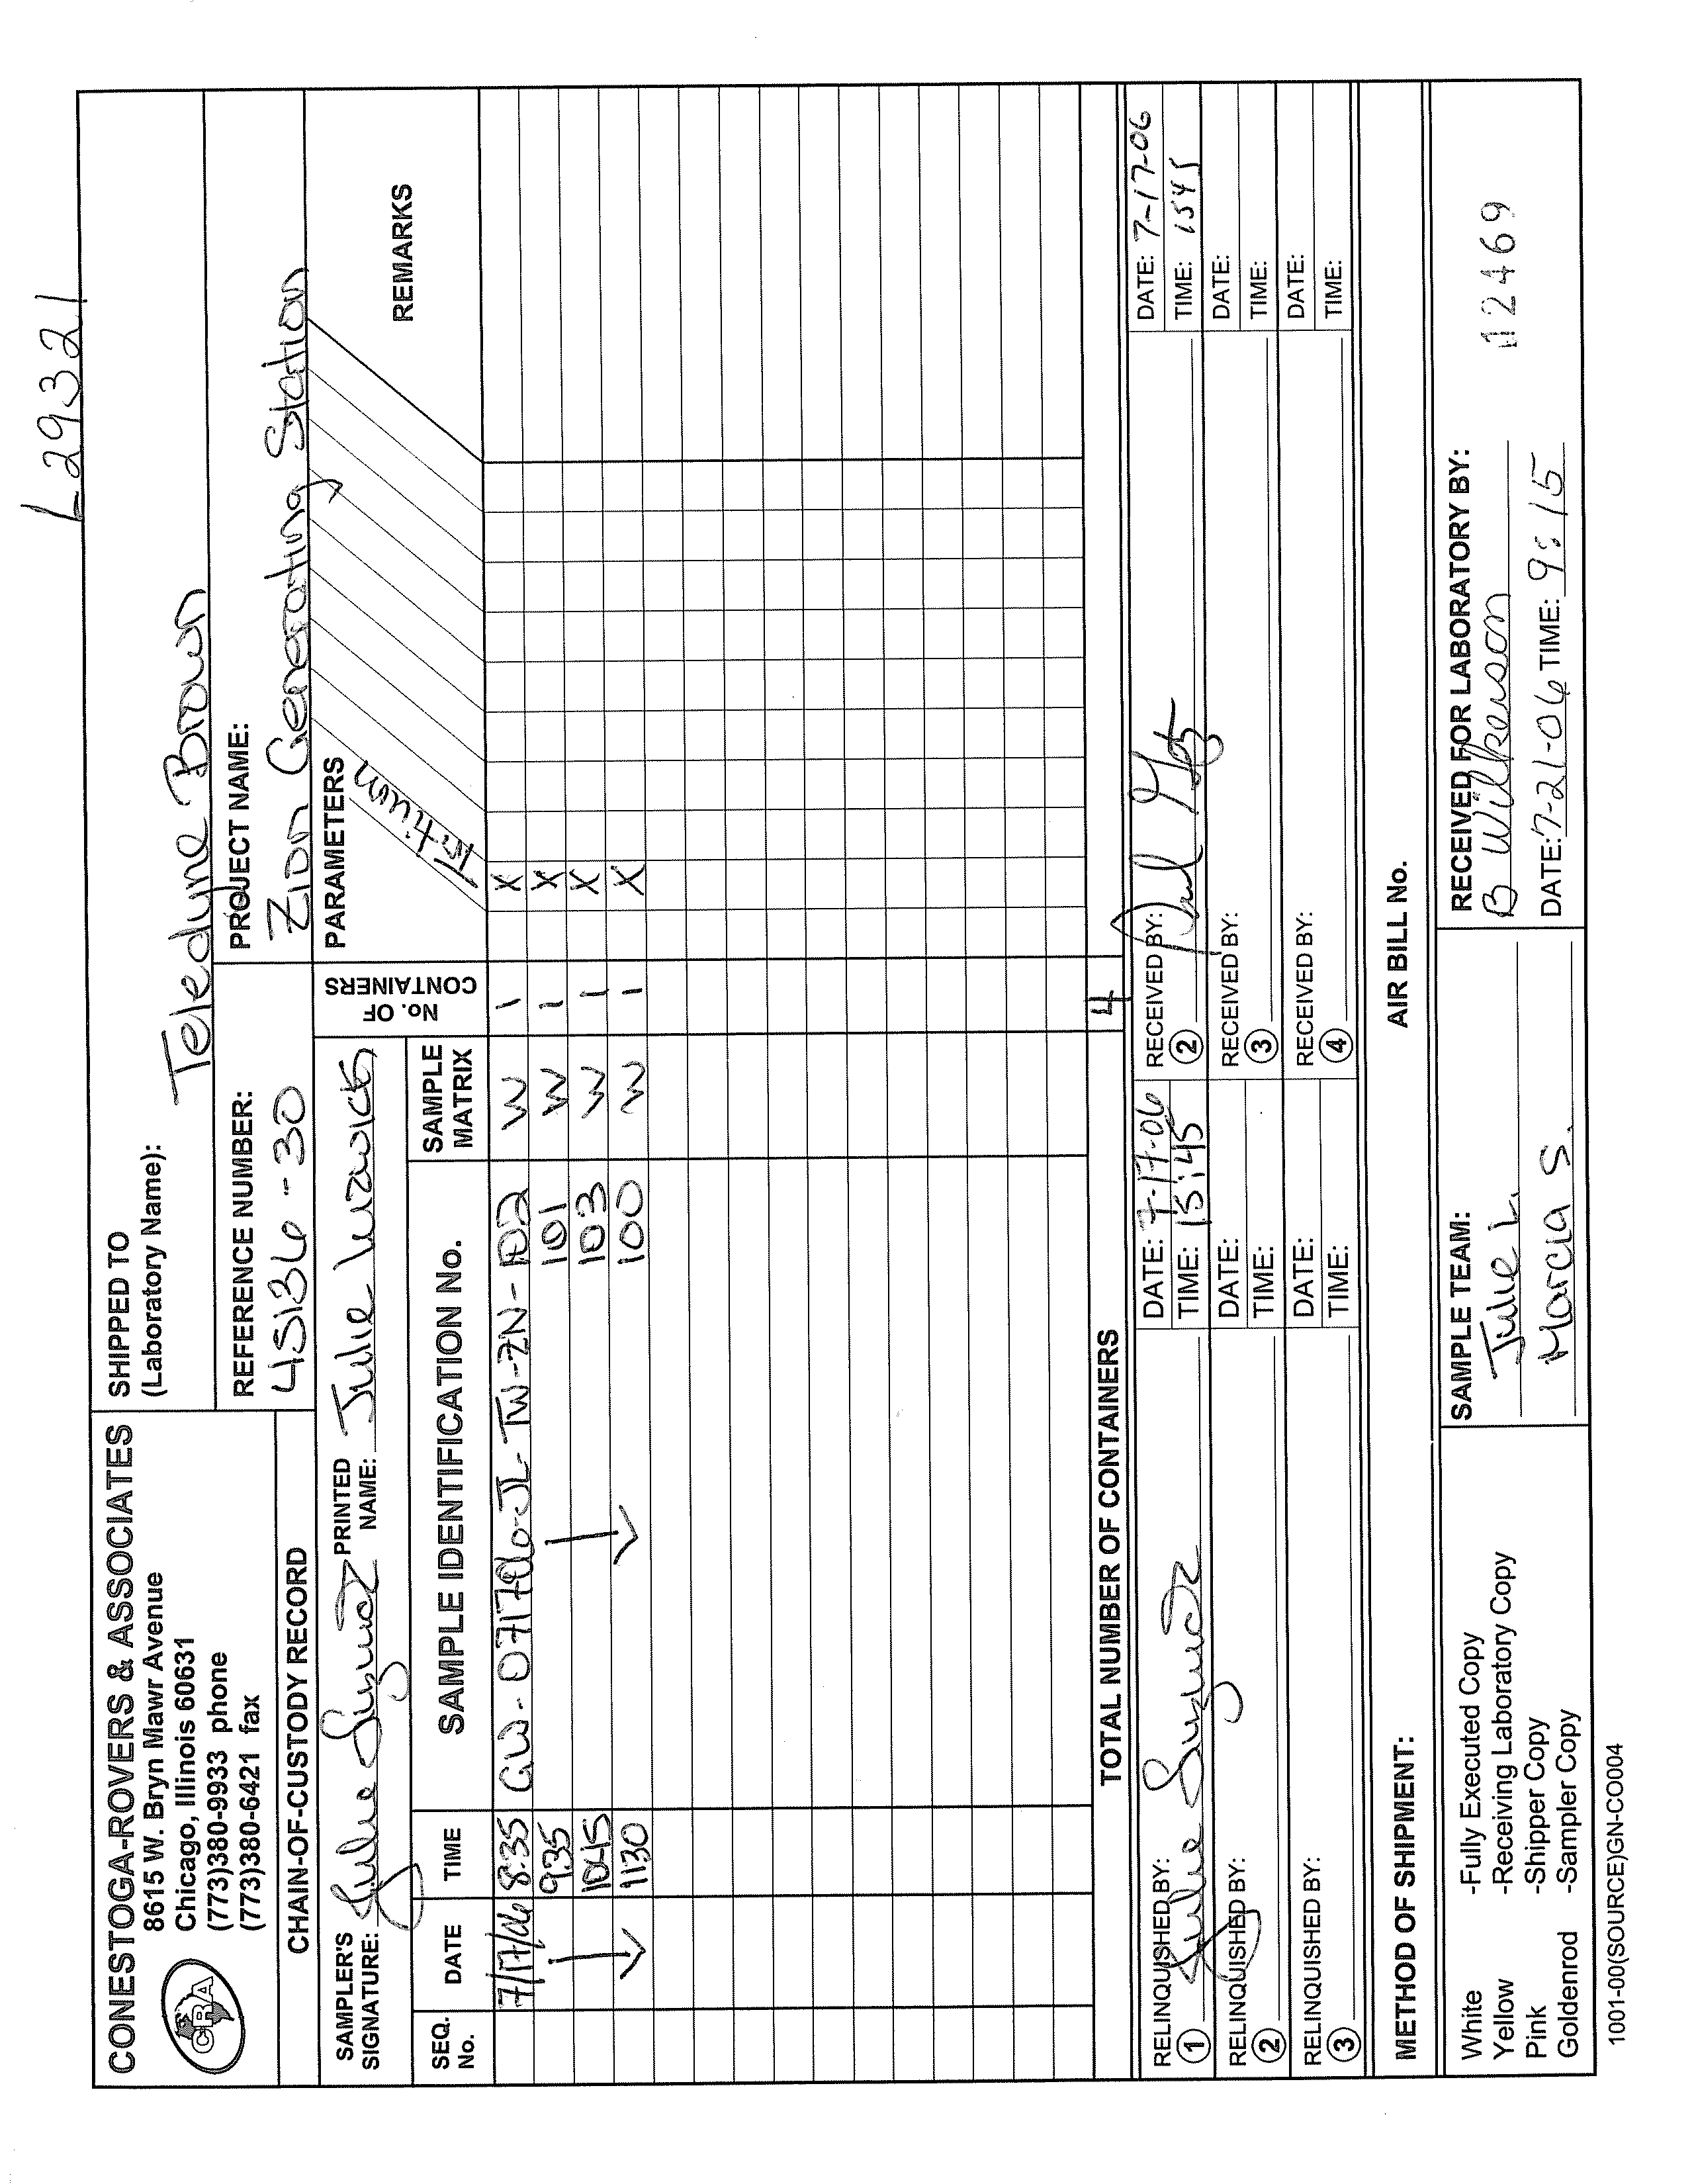
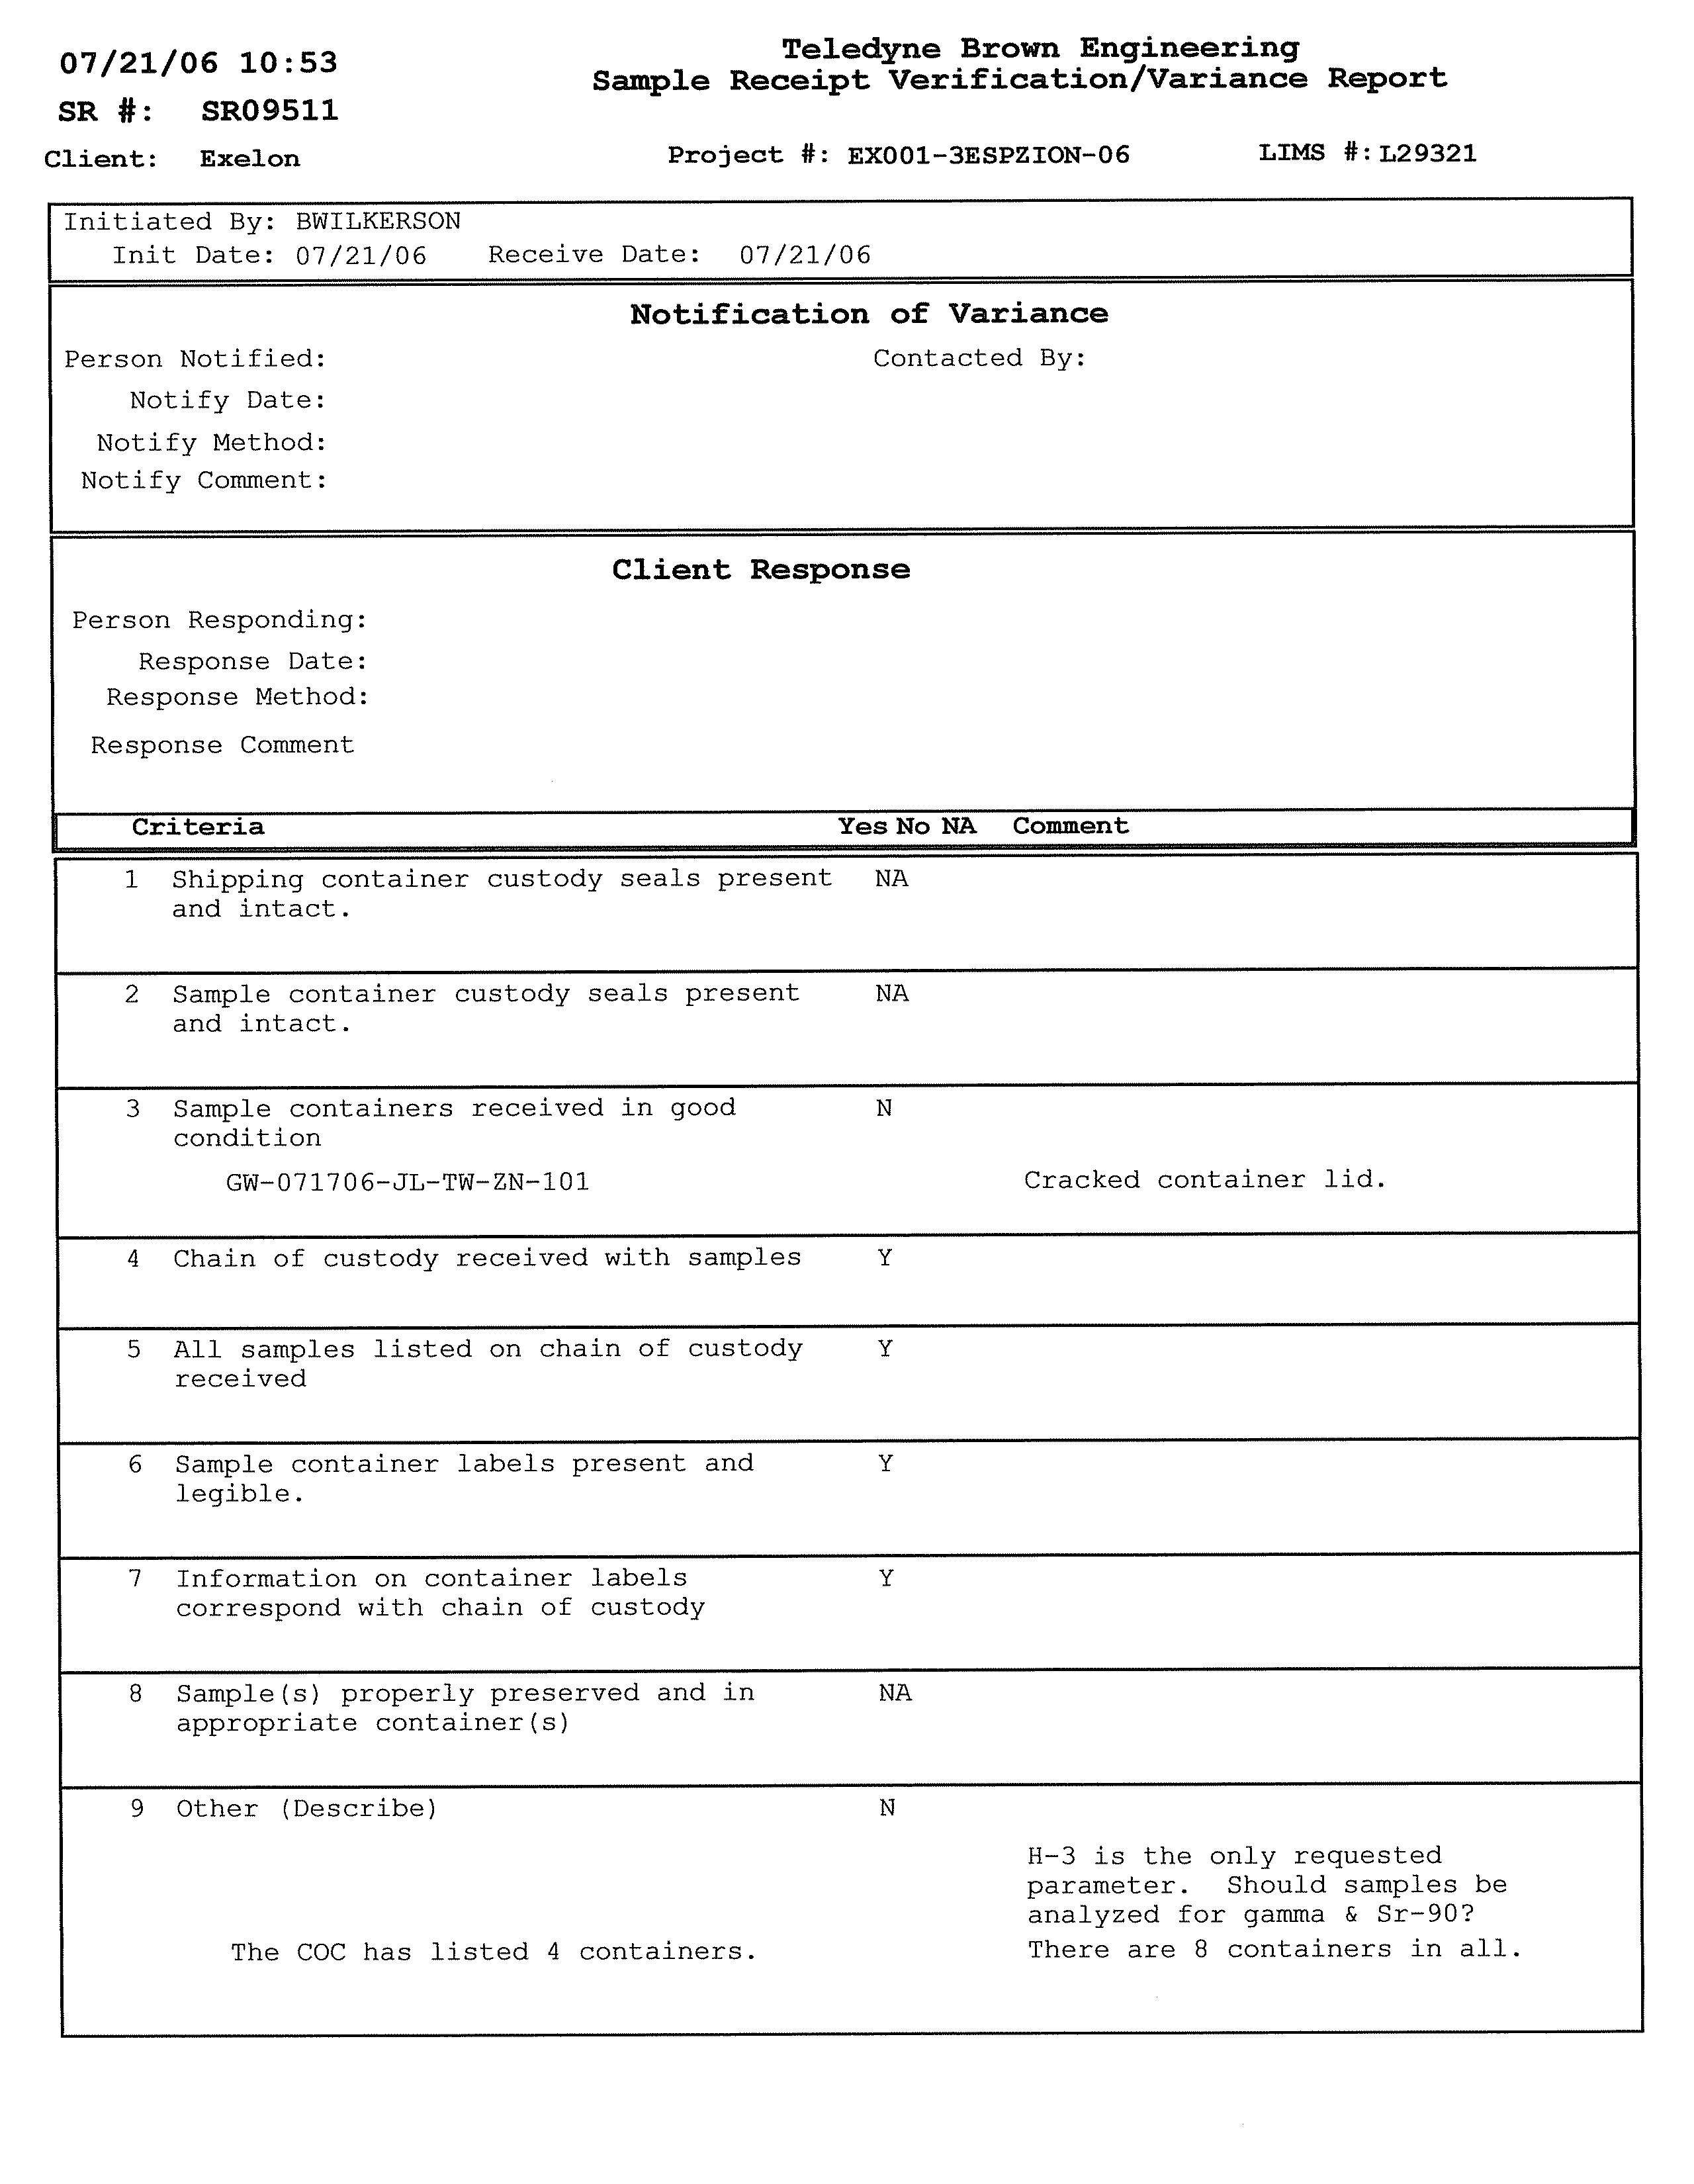
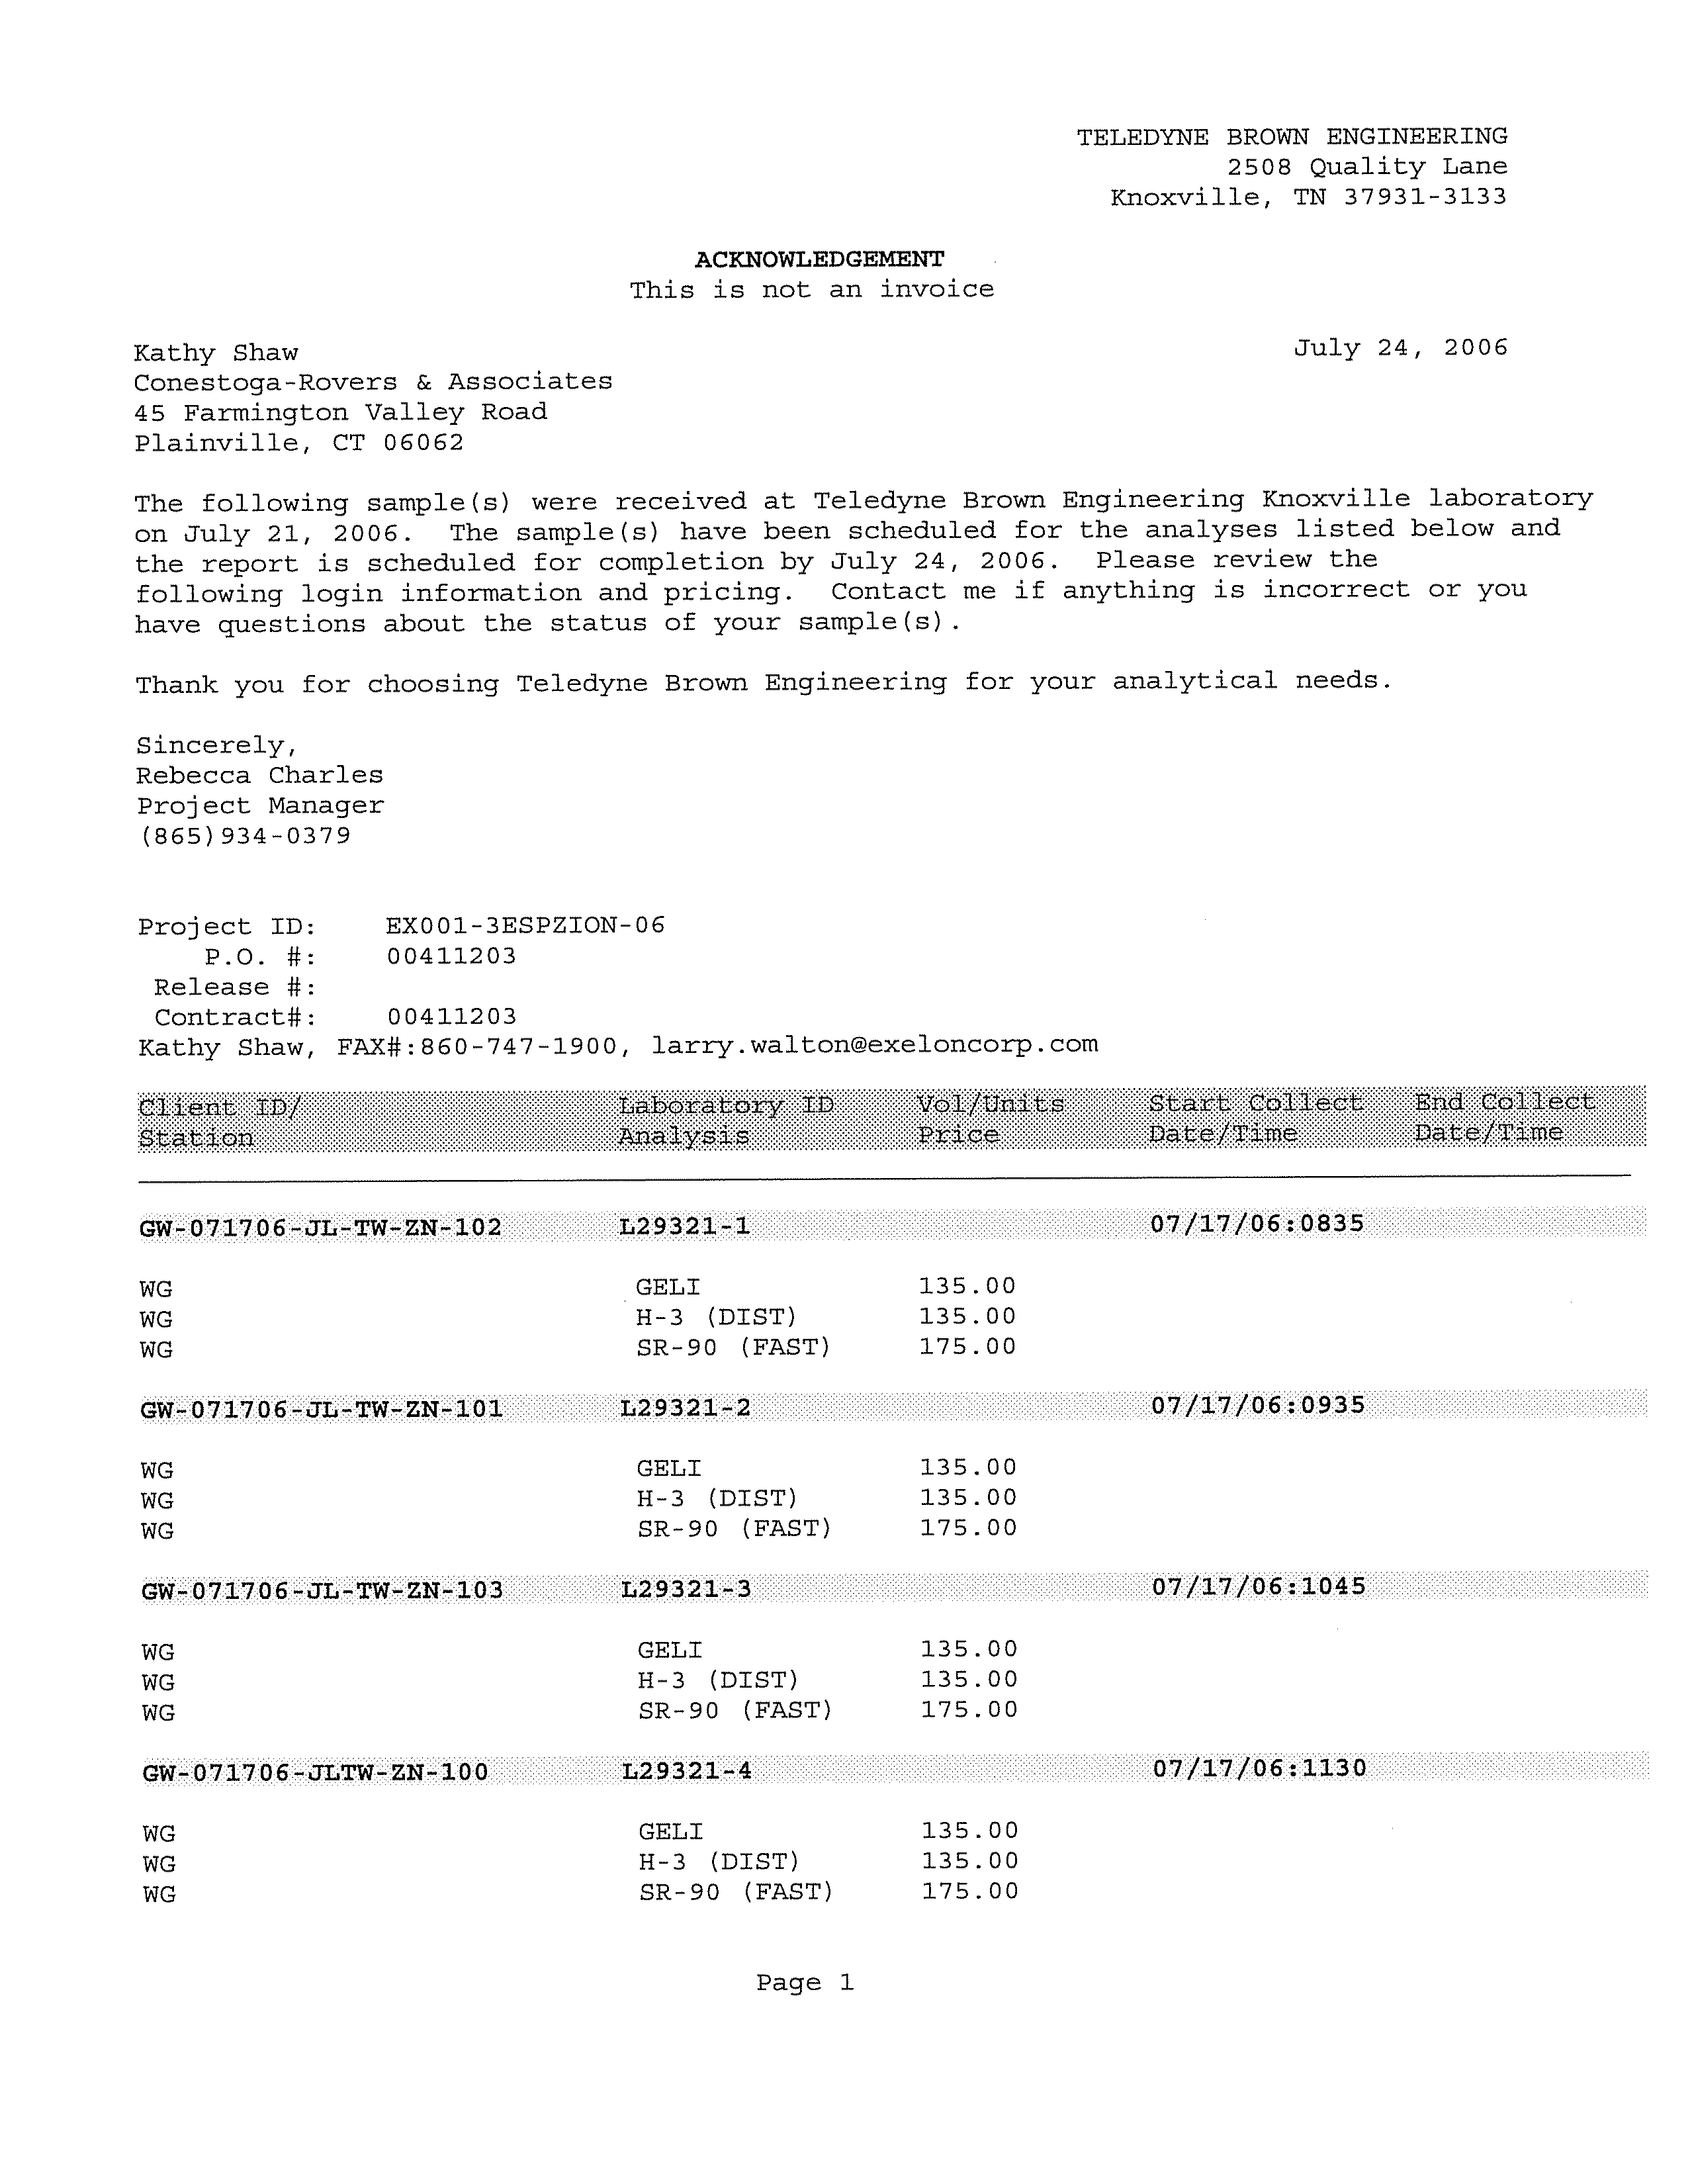
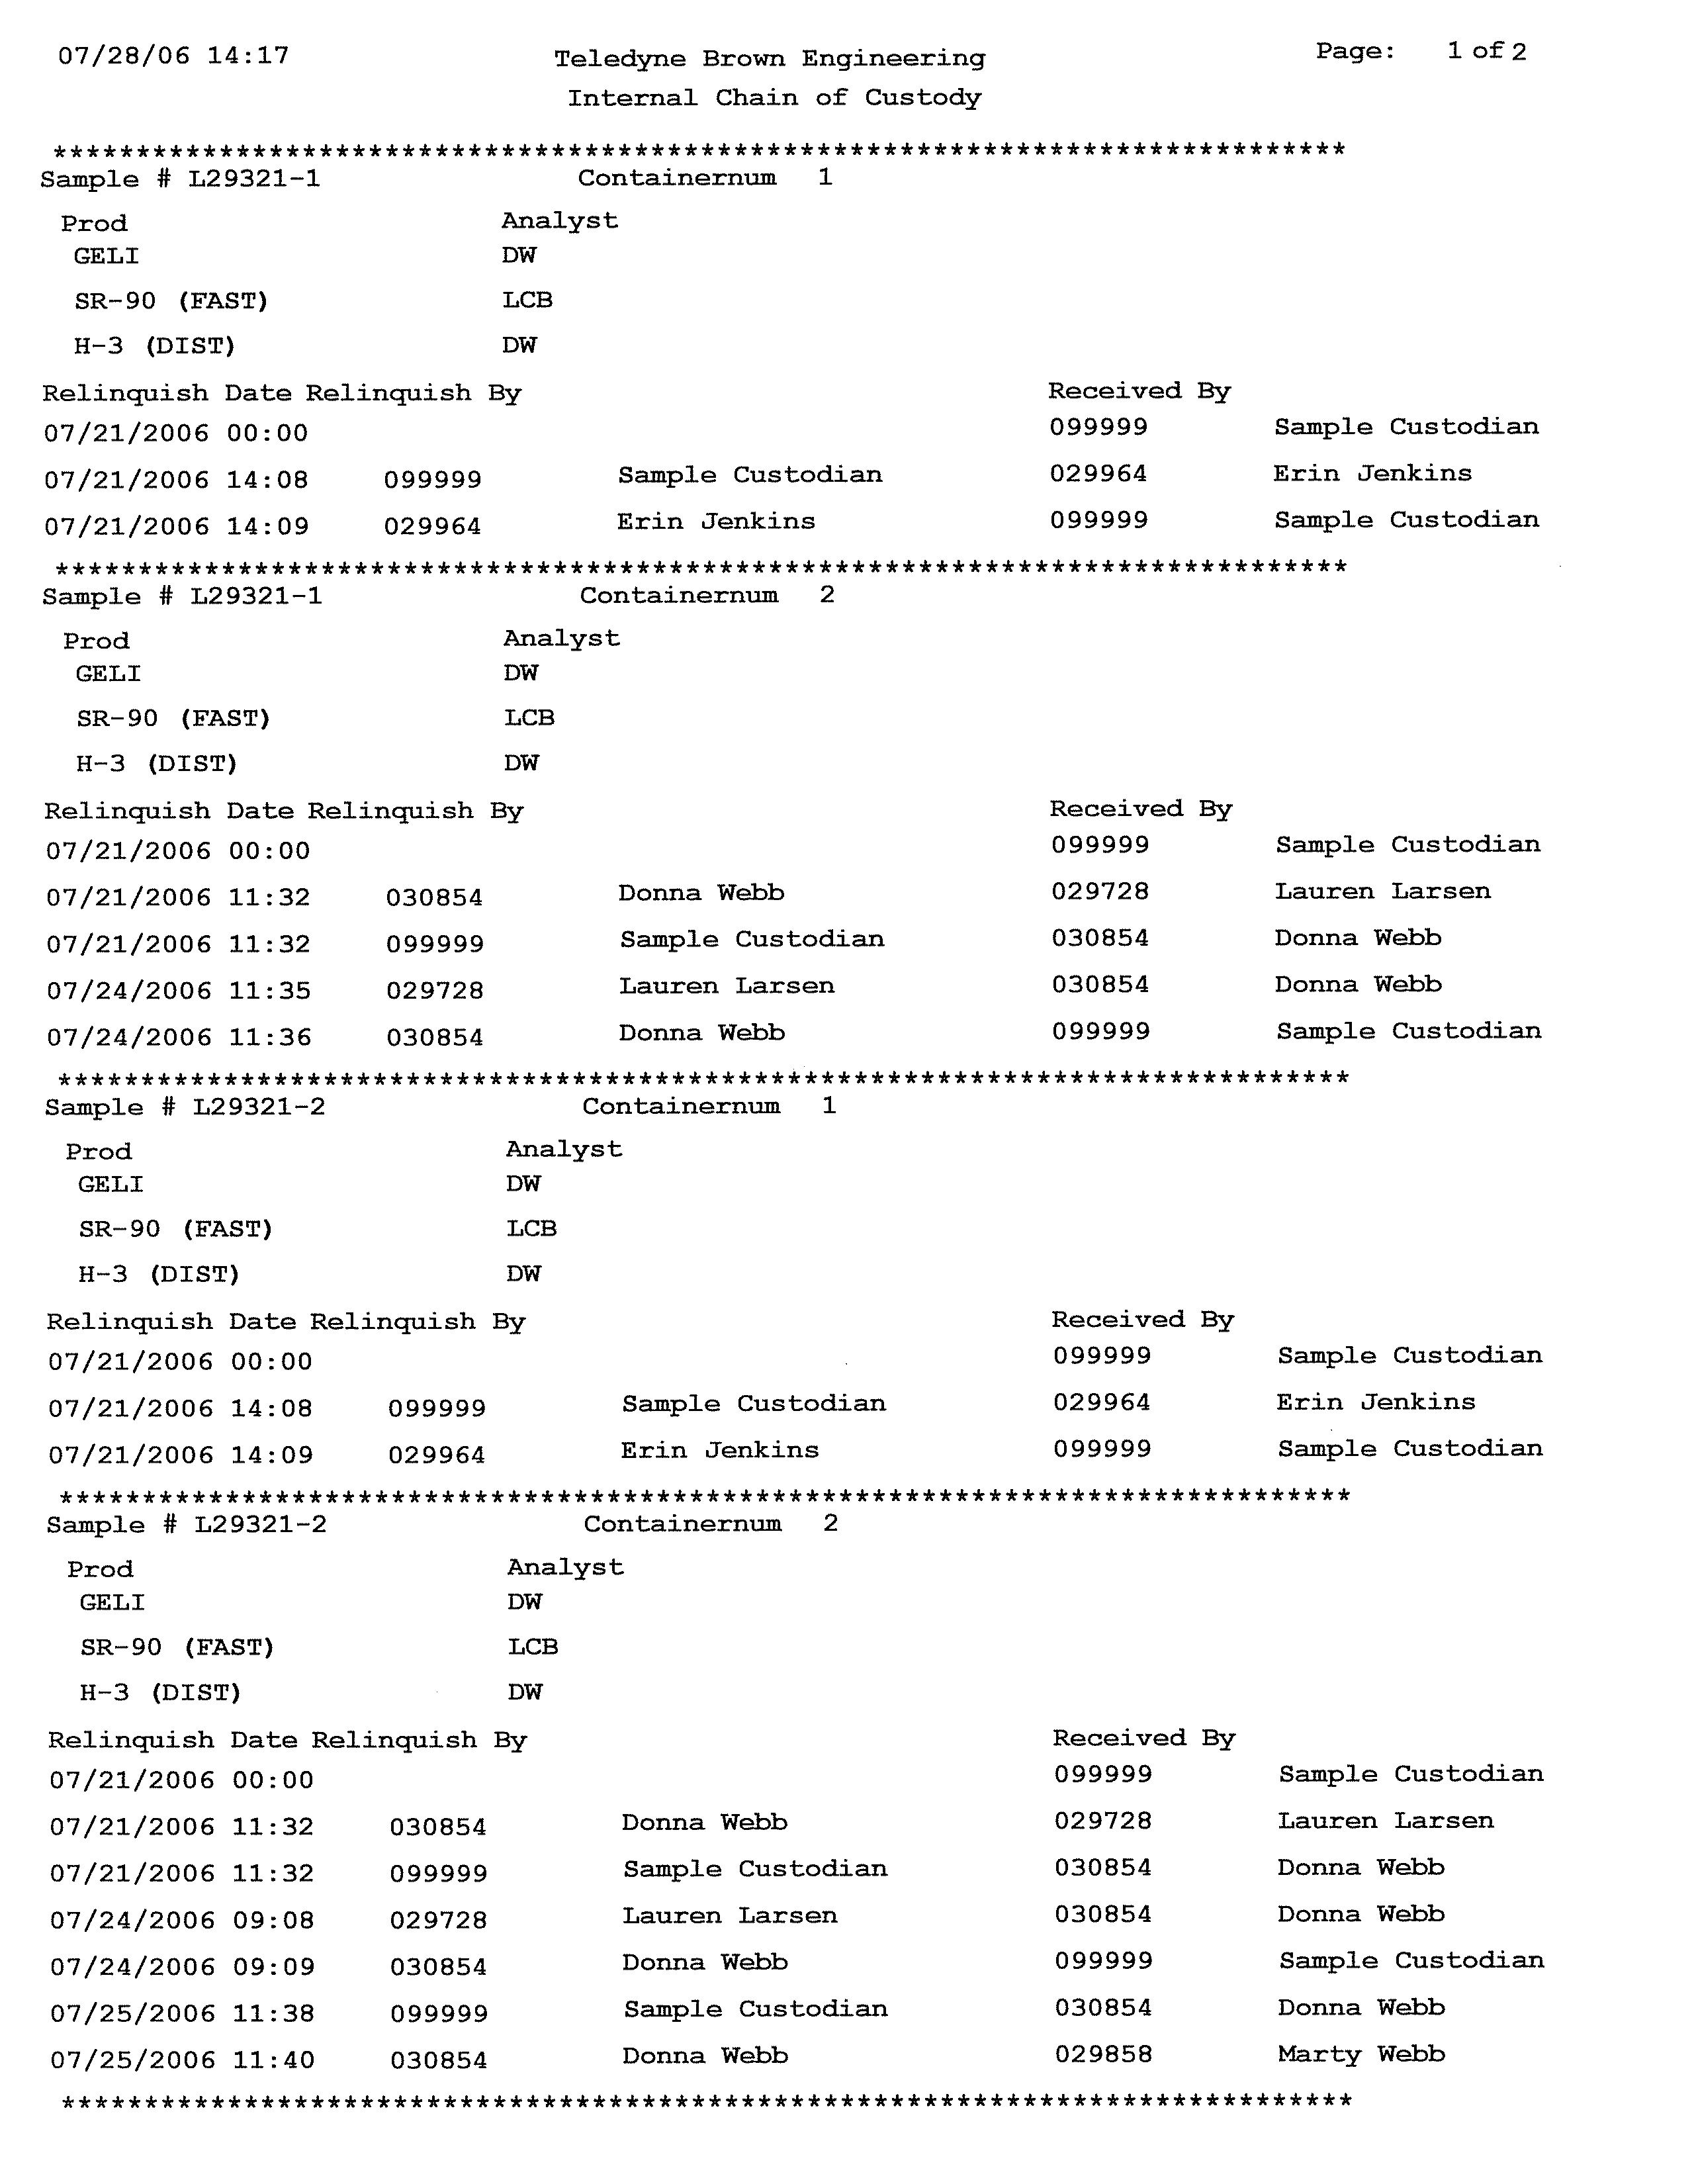
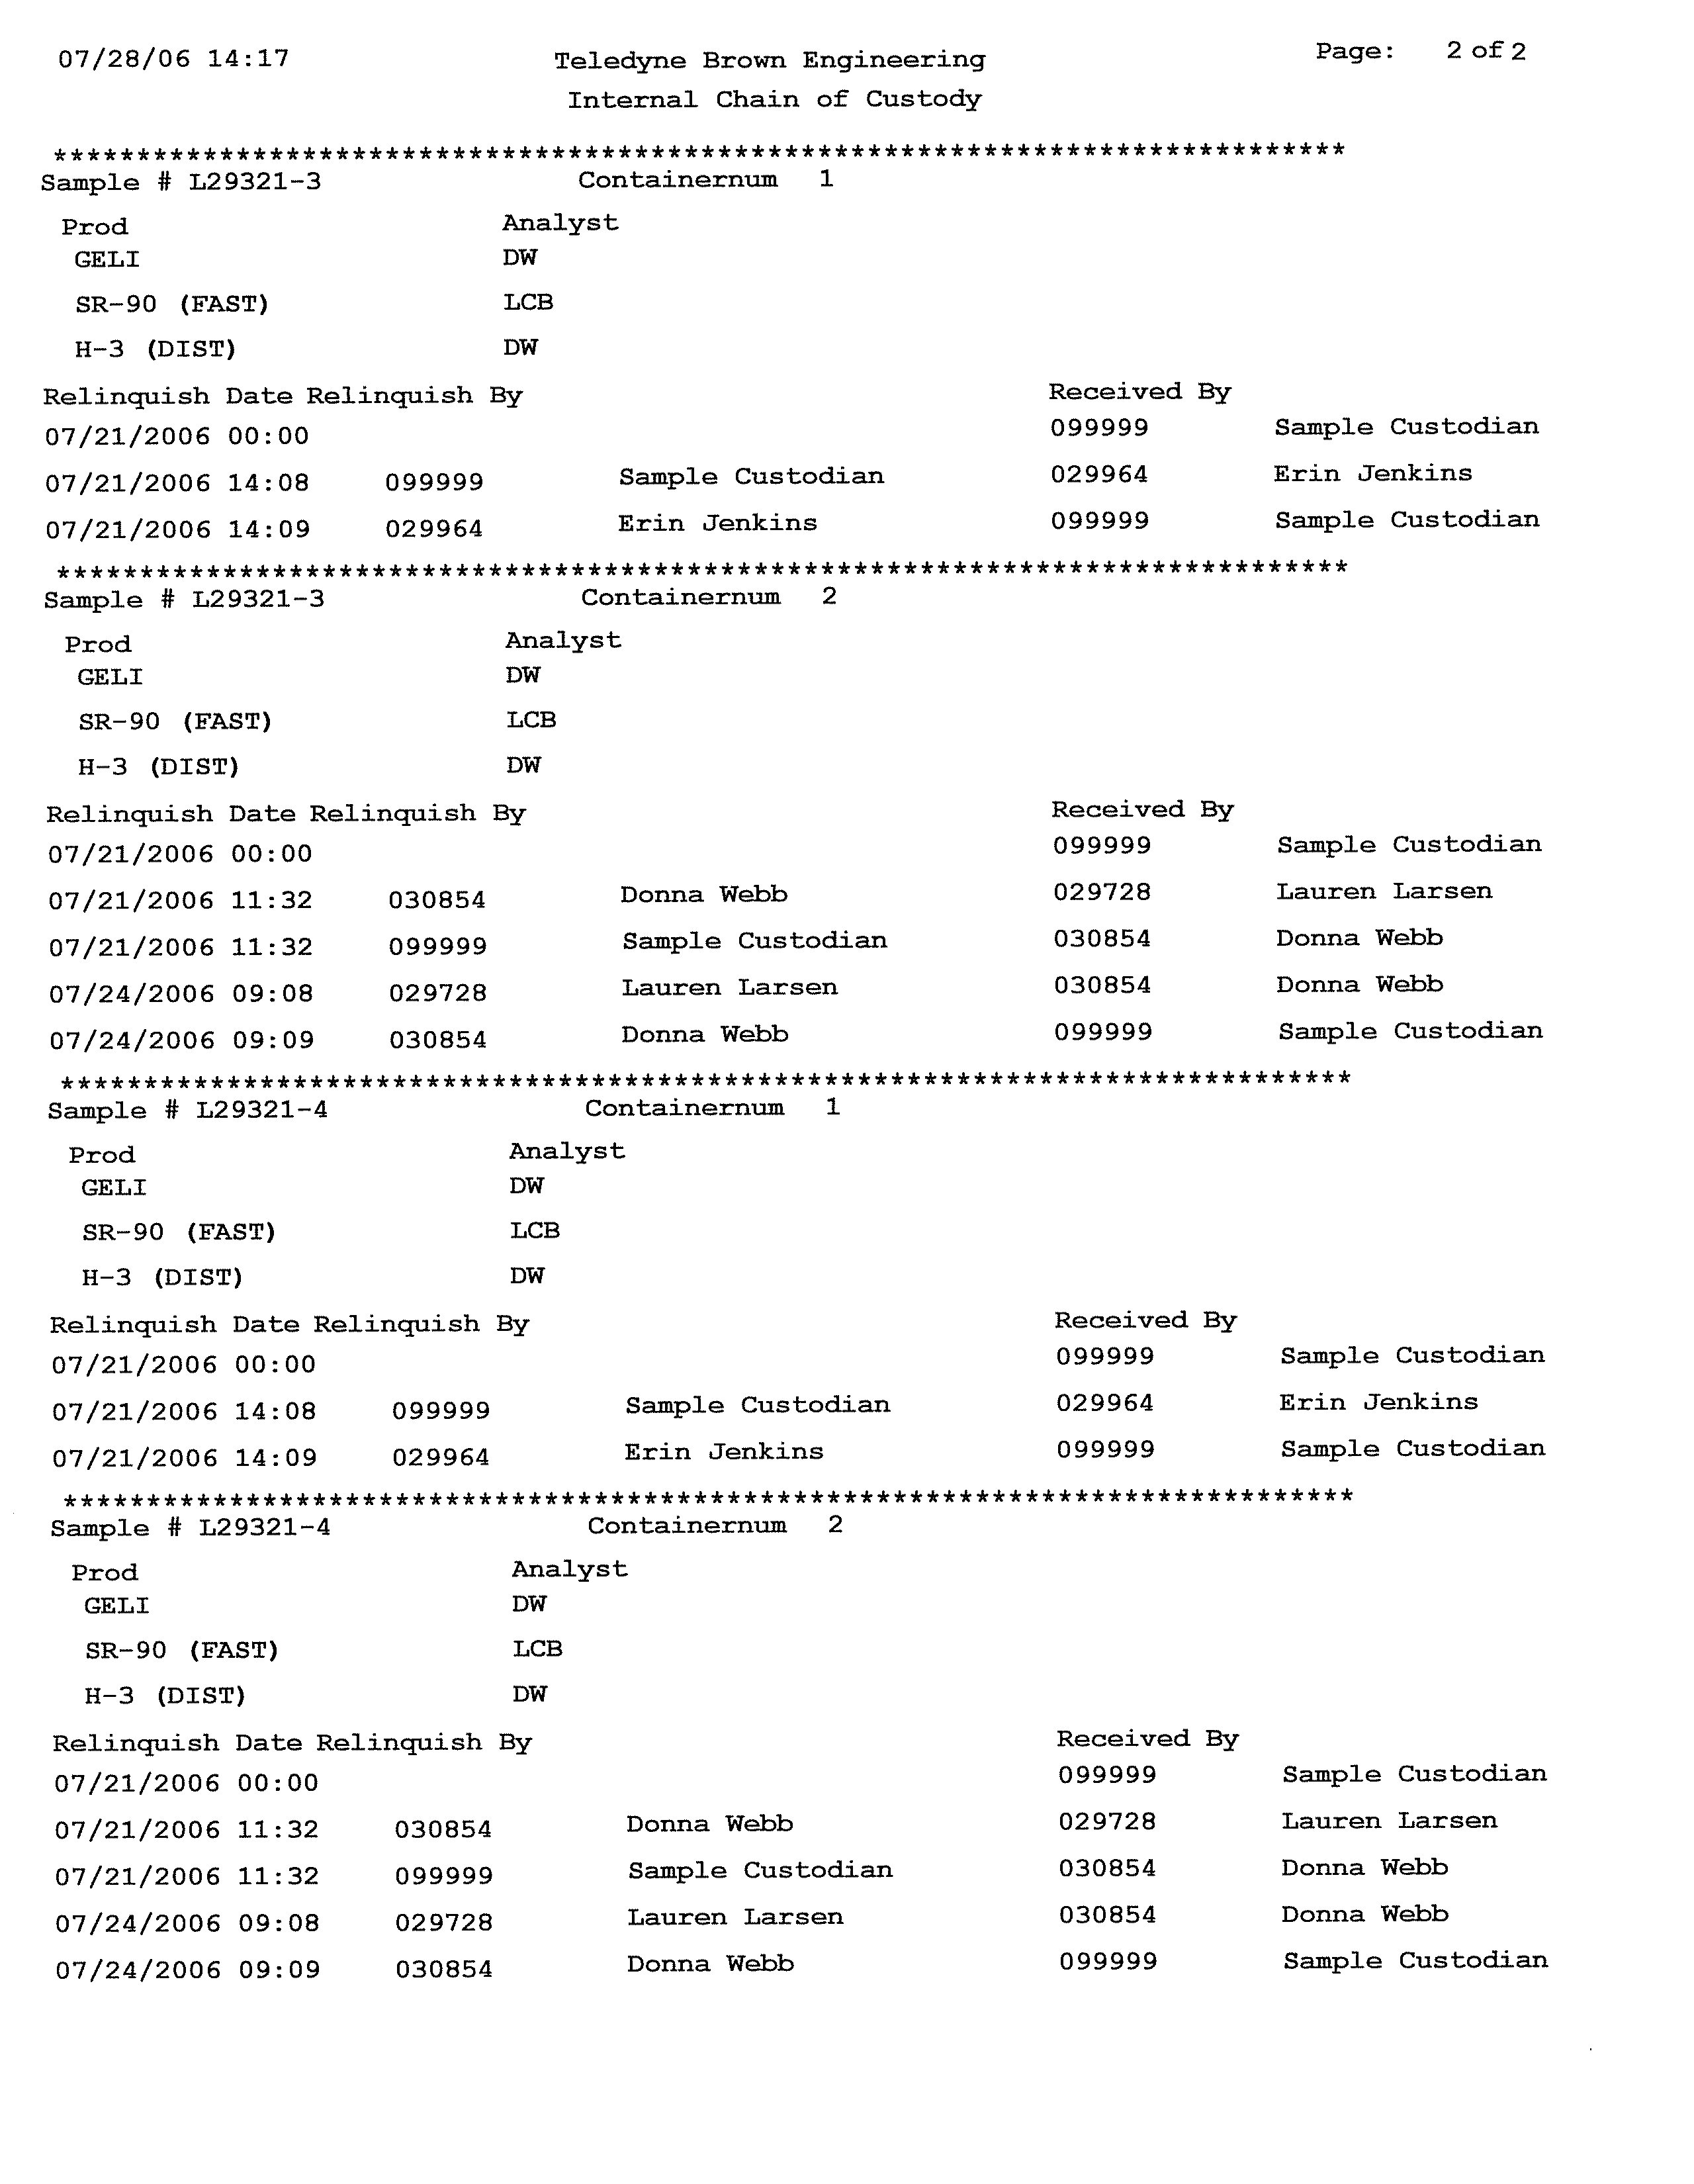
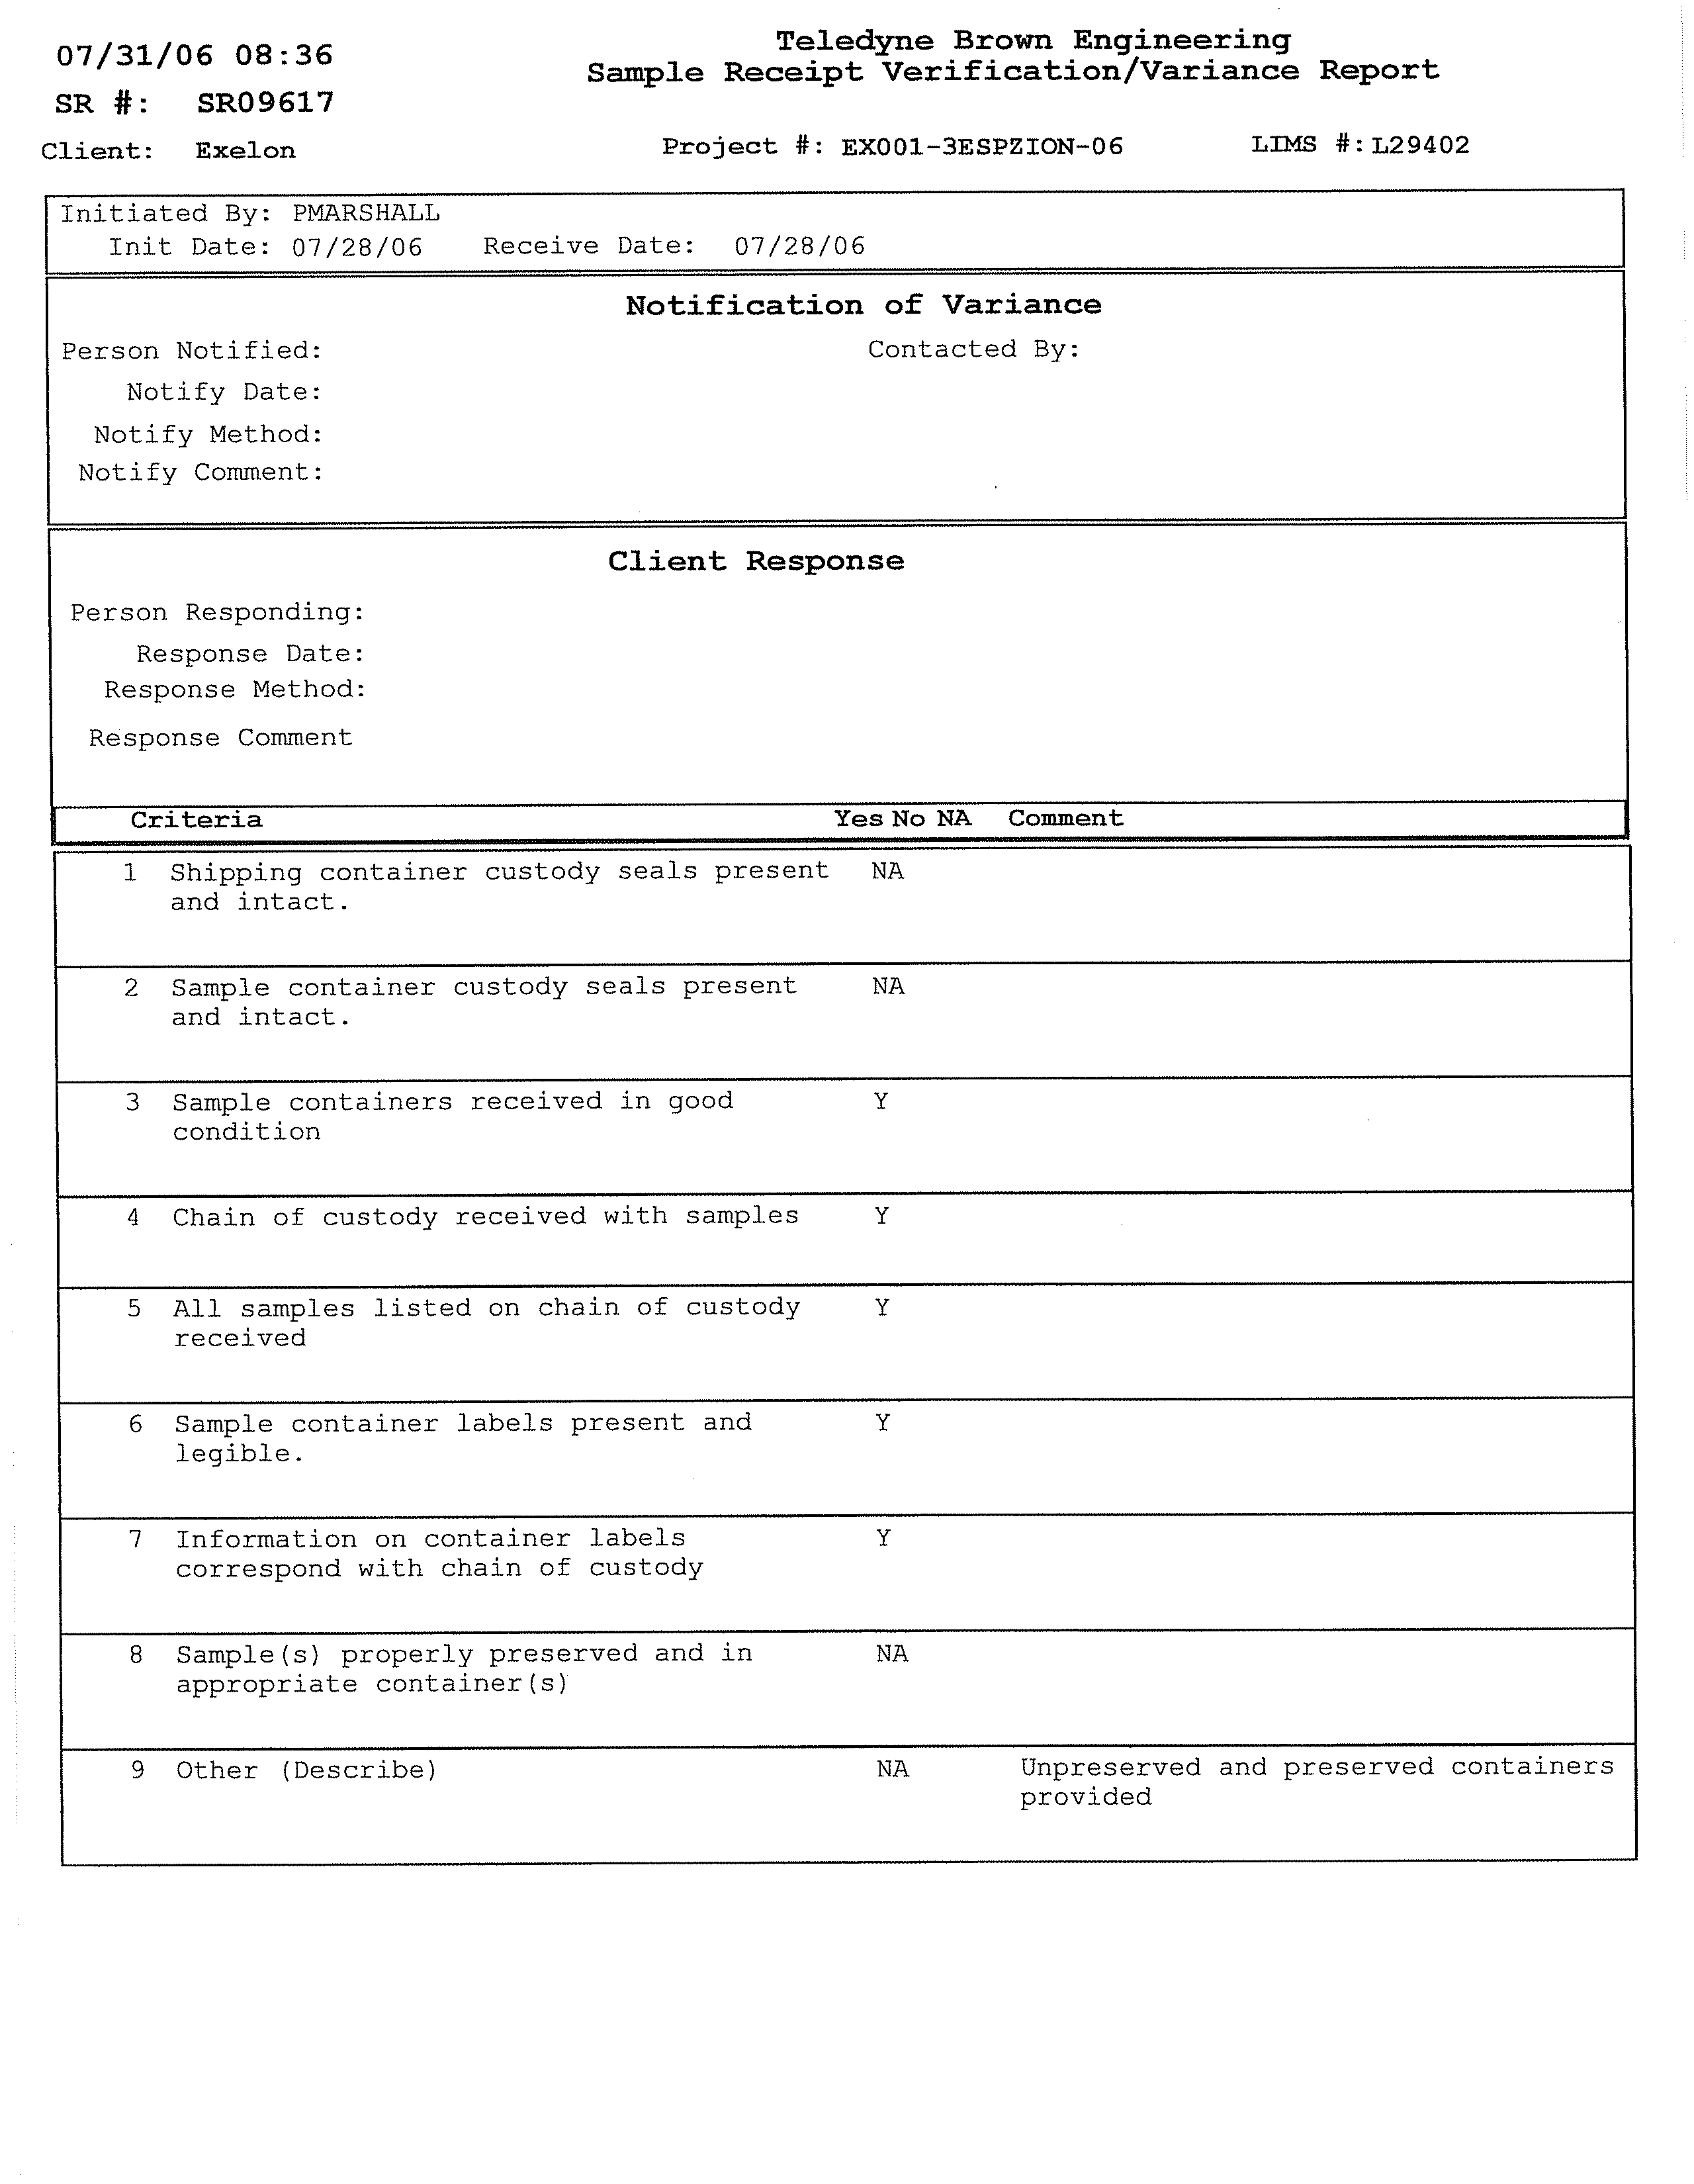
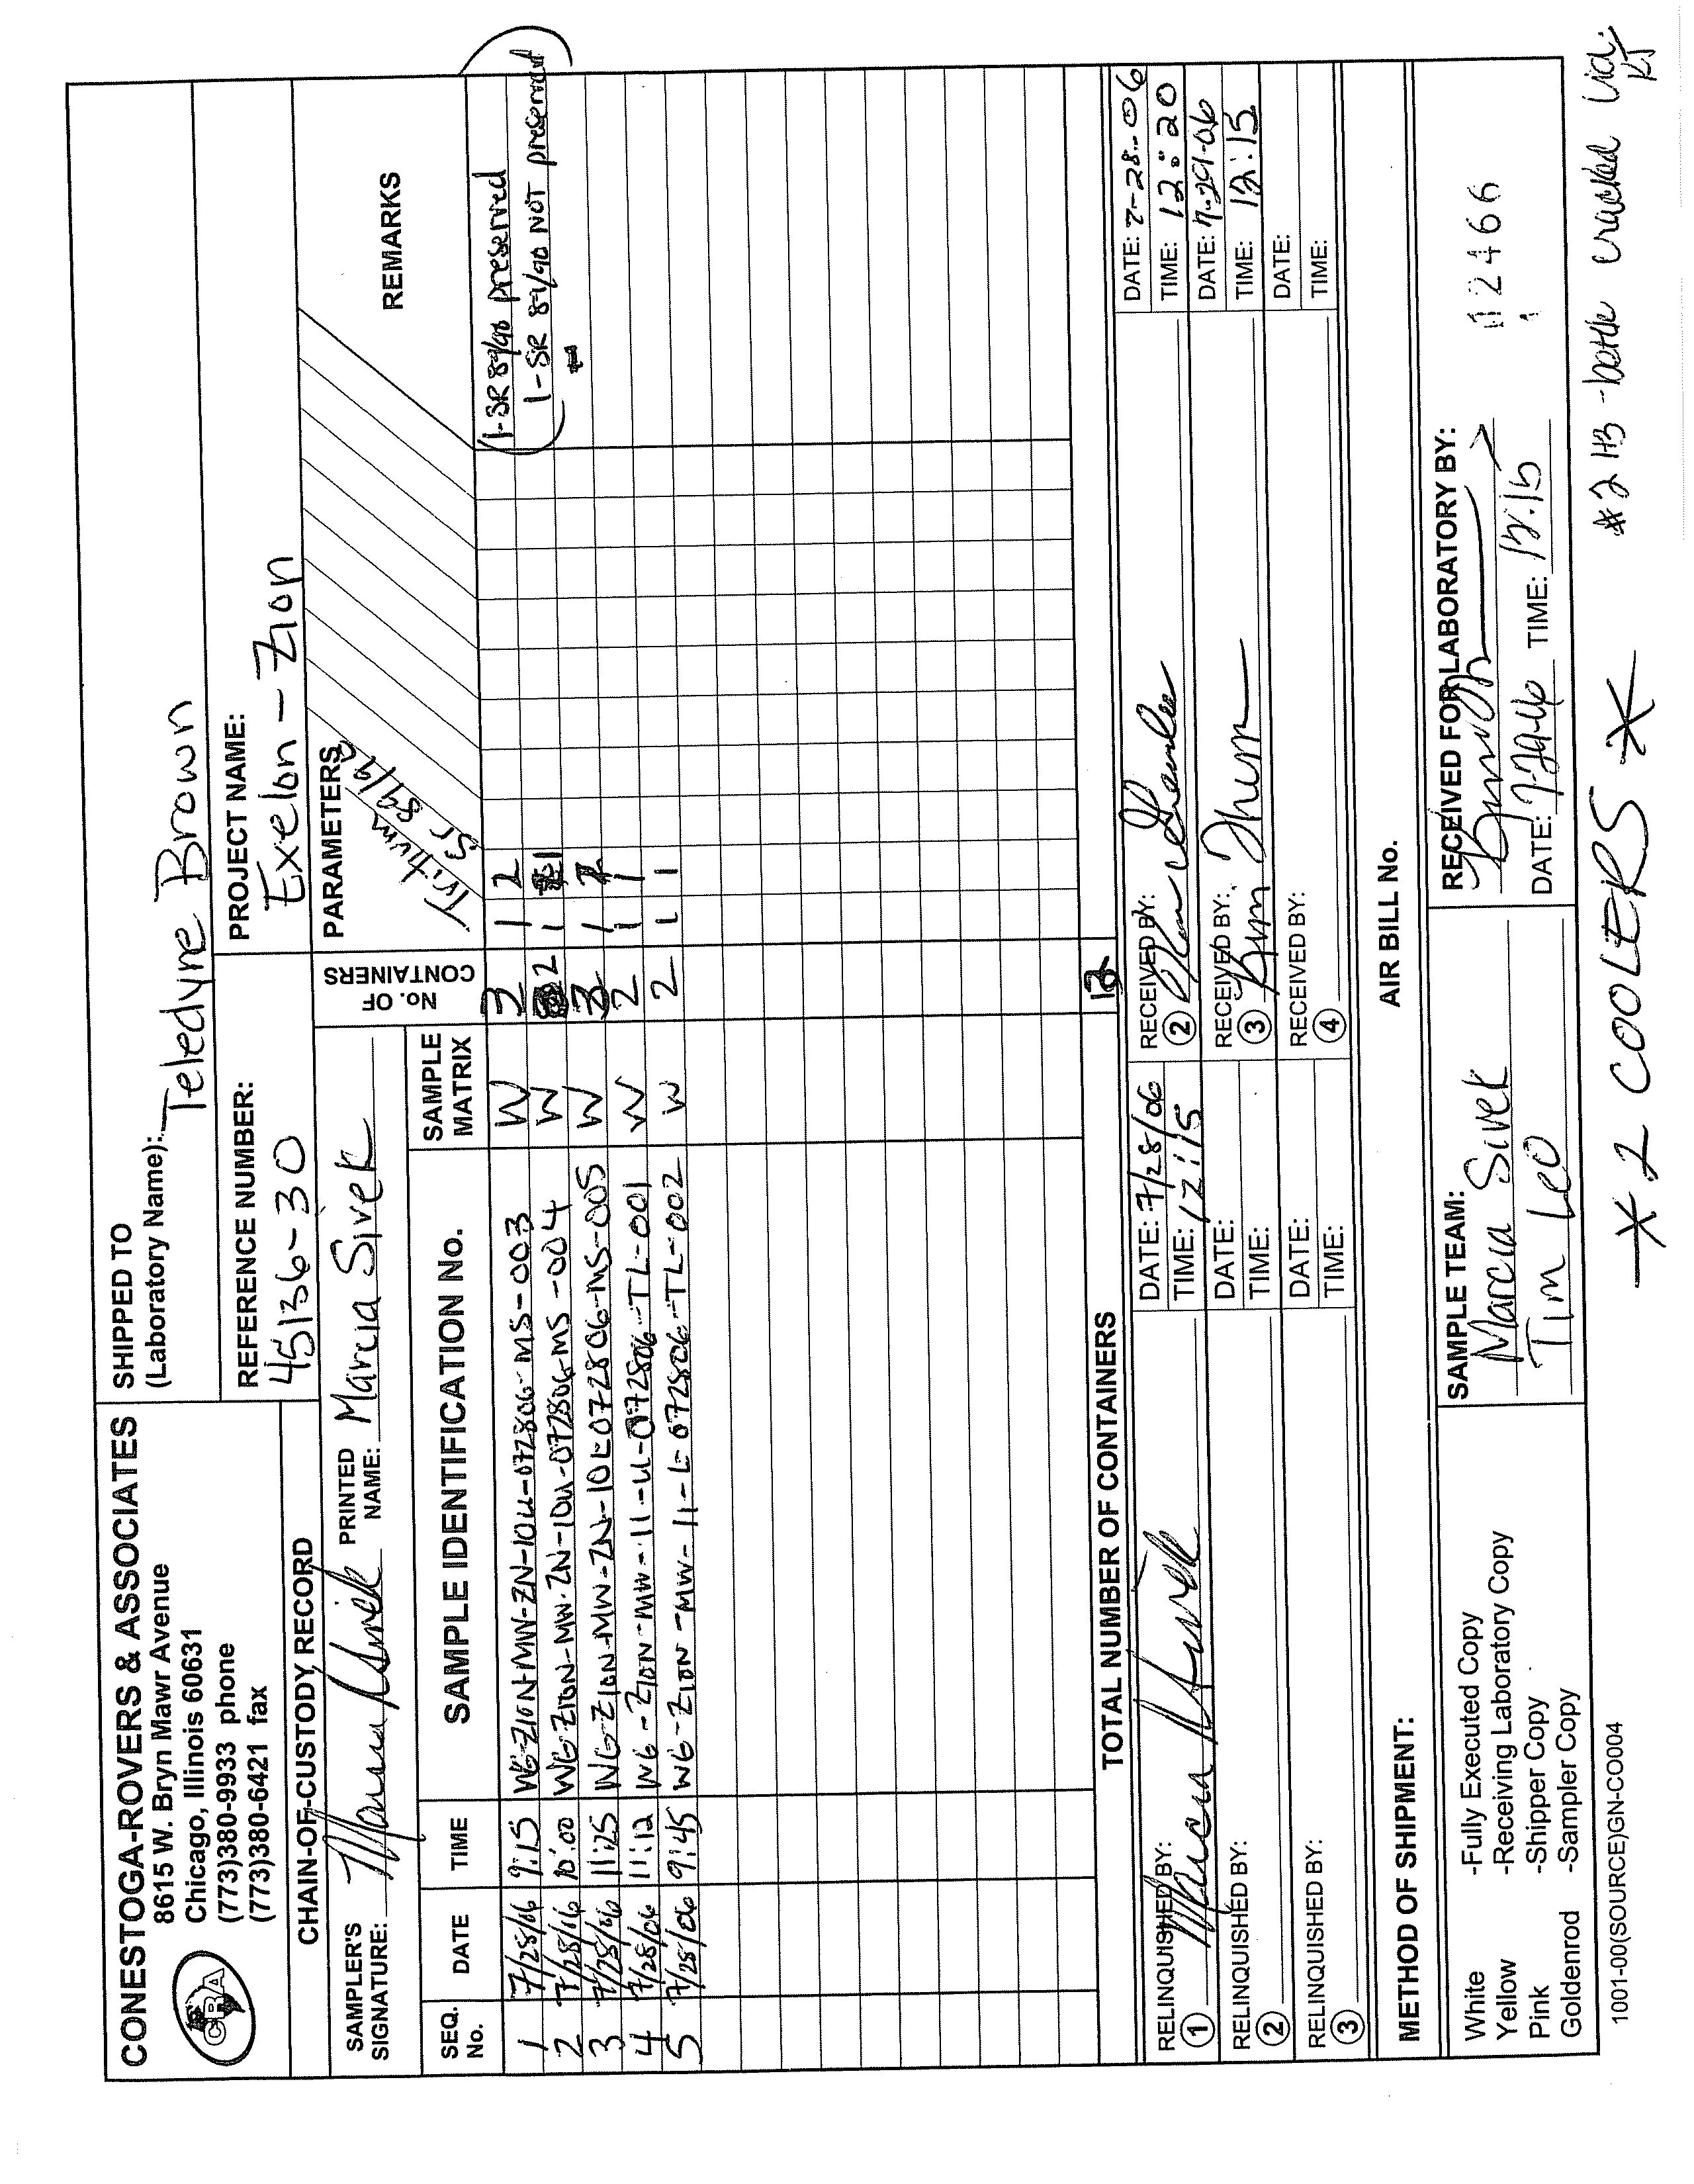
The samples were delivered to Station personnel under chain-of-custody protocol.
Subsequently, the Station shipped the samples under chain-of-custody protocol to
Teledyne Brown for analyses.
045136 (22) Zion Station
25
CONESTOGA-ROVERS & ASSOCIATES
Revision 1
4.10
QUALITY CONTROL SAMPLES
Quality control samples were collected to evaluate the sampling and analysis process.
Field Duplicates
Field duplicates were collected to verify the accuracy of the analytical laboratory by
providing two samples collected at the same location and then comparing the analytical
results for consistency. Field duplicate samples were collected at a frequency of one
duplicate for every ten samples collected. A total of three duplicate samples were
collected. The locations of duplicate samples were selected in the field during the
performance of sample collection activities. The duplicate samples were collected
simultaneously with the actual sample and were analyzed for the same parameters as
the actual samples.
Split Samples
Split samples from permanent monitoring wells and surface water were collected for the
NRC for tritium simultaneously with the actual sample at every sample location. Split
samples were delivered to the Station personnel and (if requested) made available to the
NRC. Split samples from the temporary monitoring wells were collected directly by the
NRC and the Illinois Emergency Management Agency (IEMA).
4.11
ANALYSES
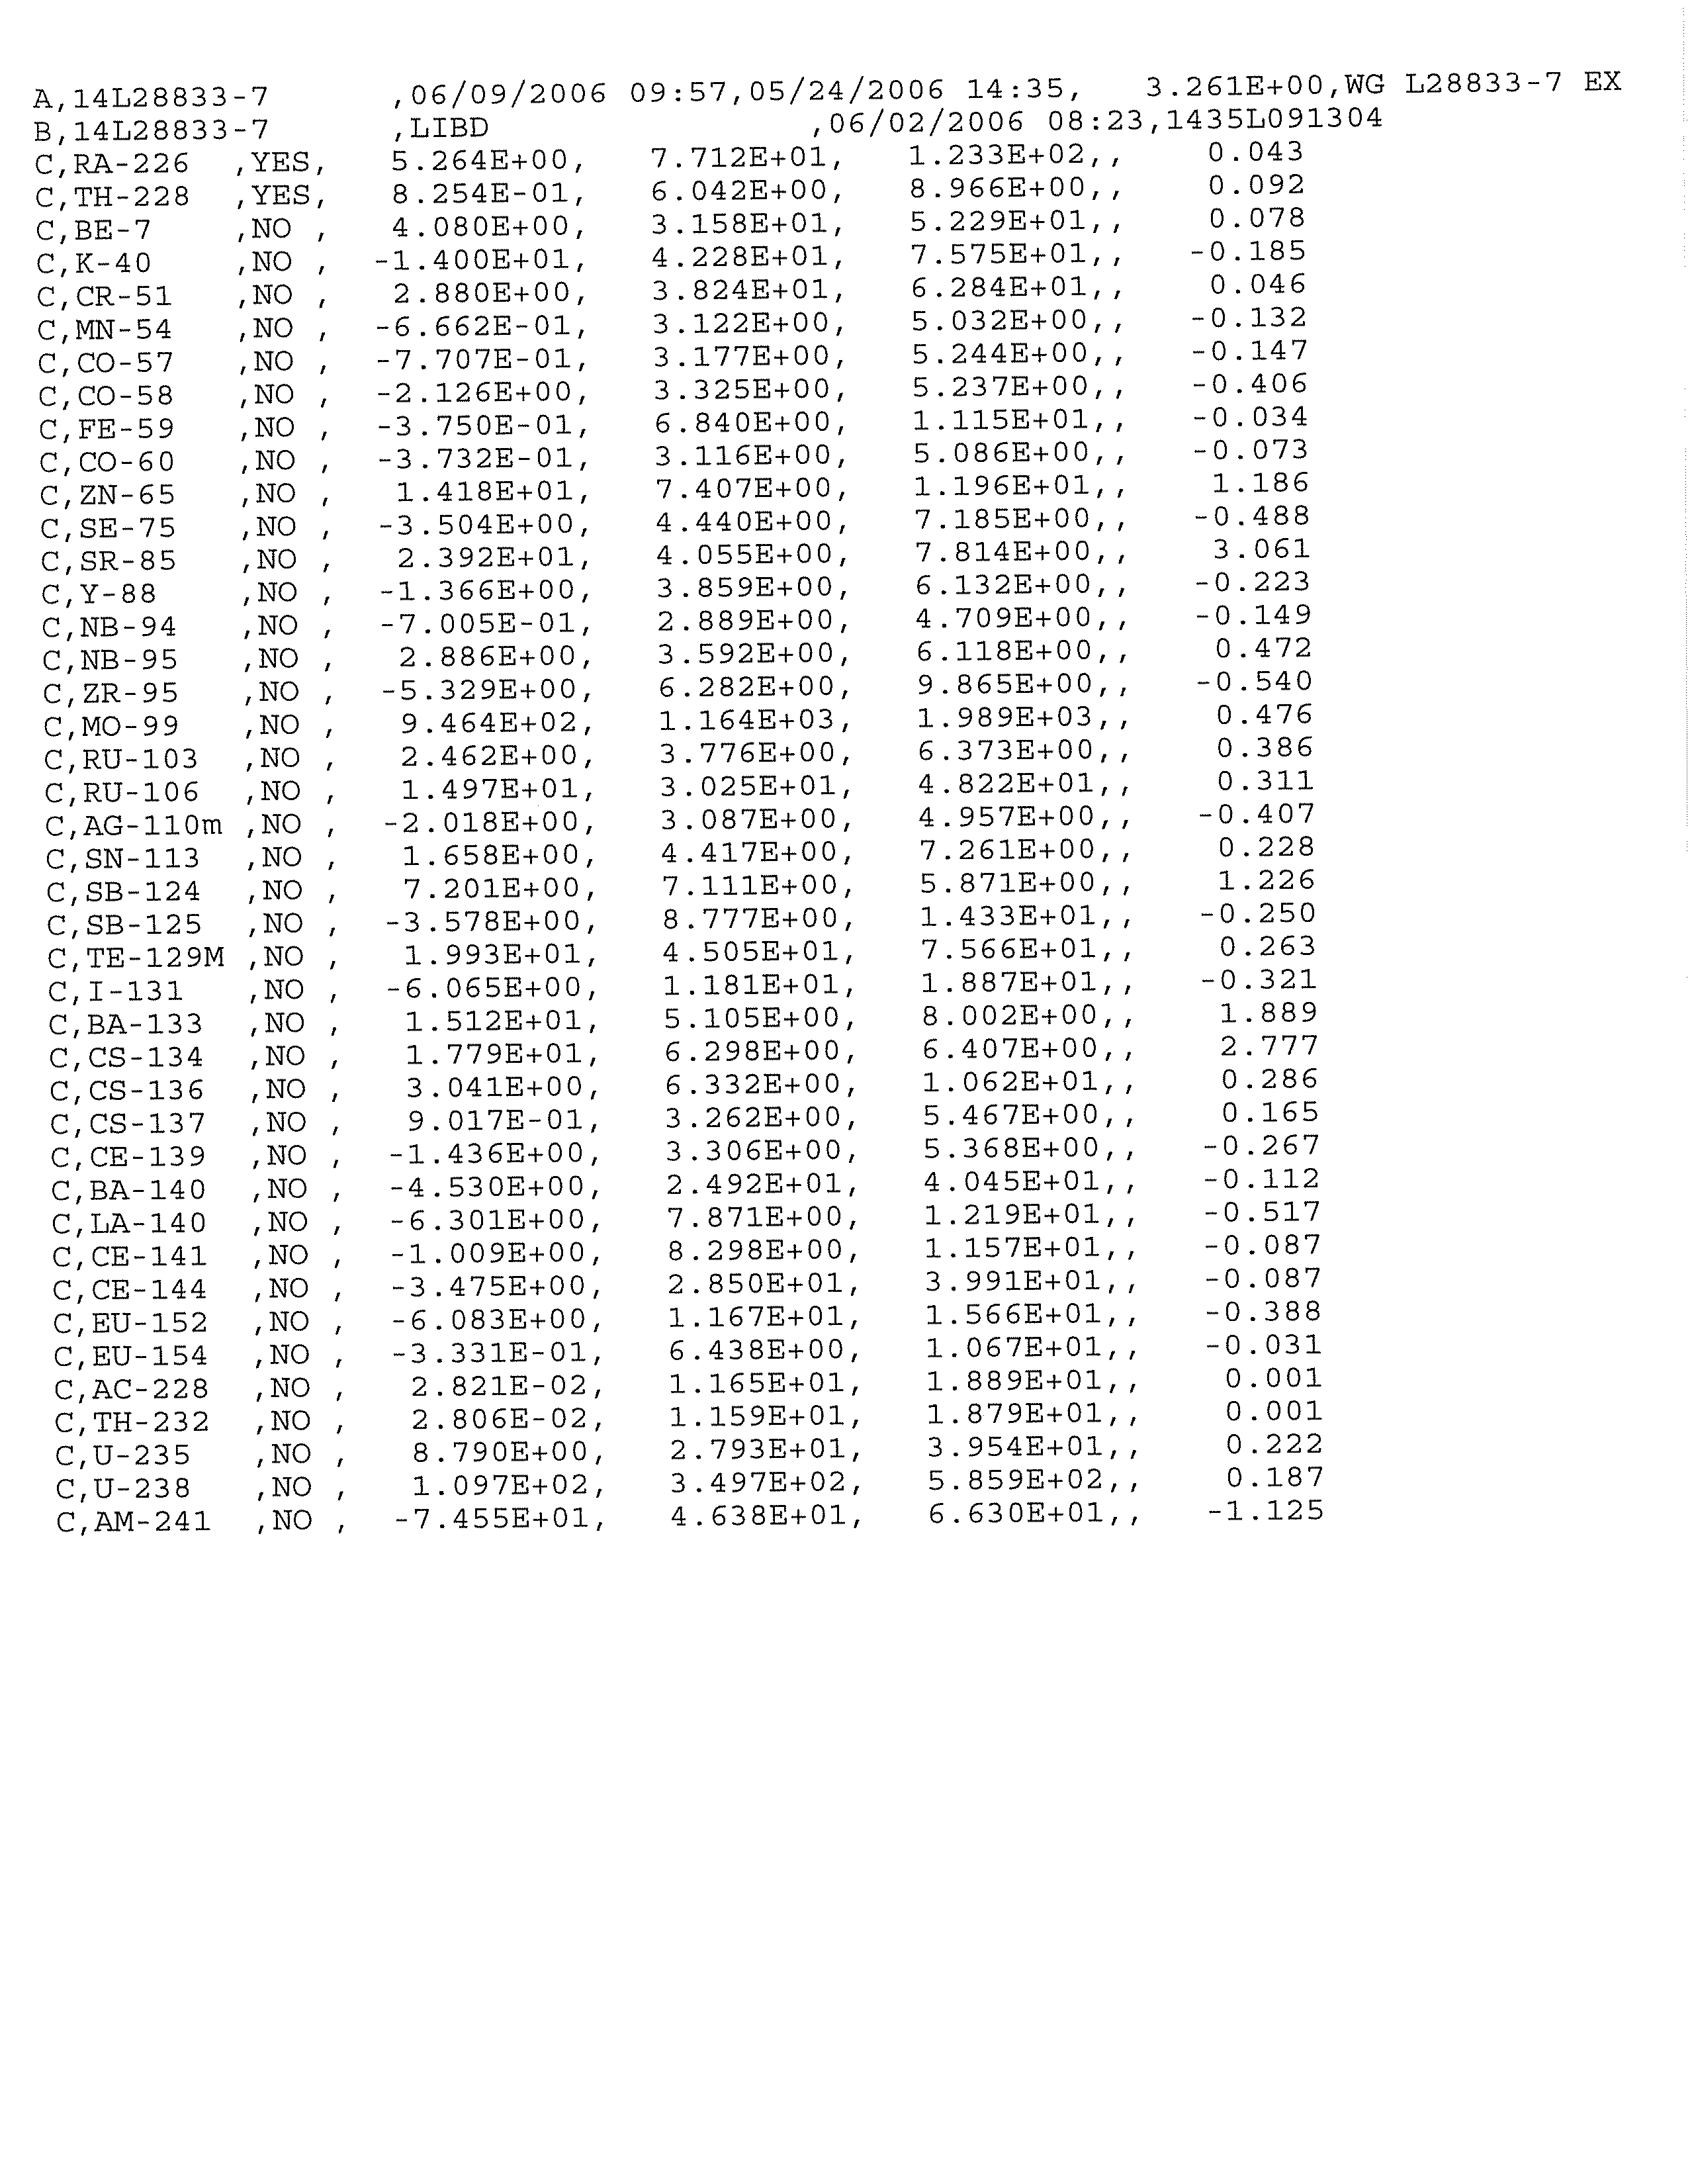
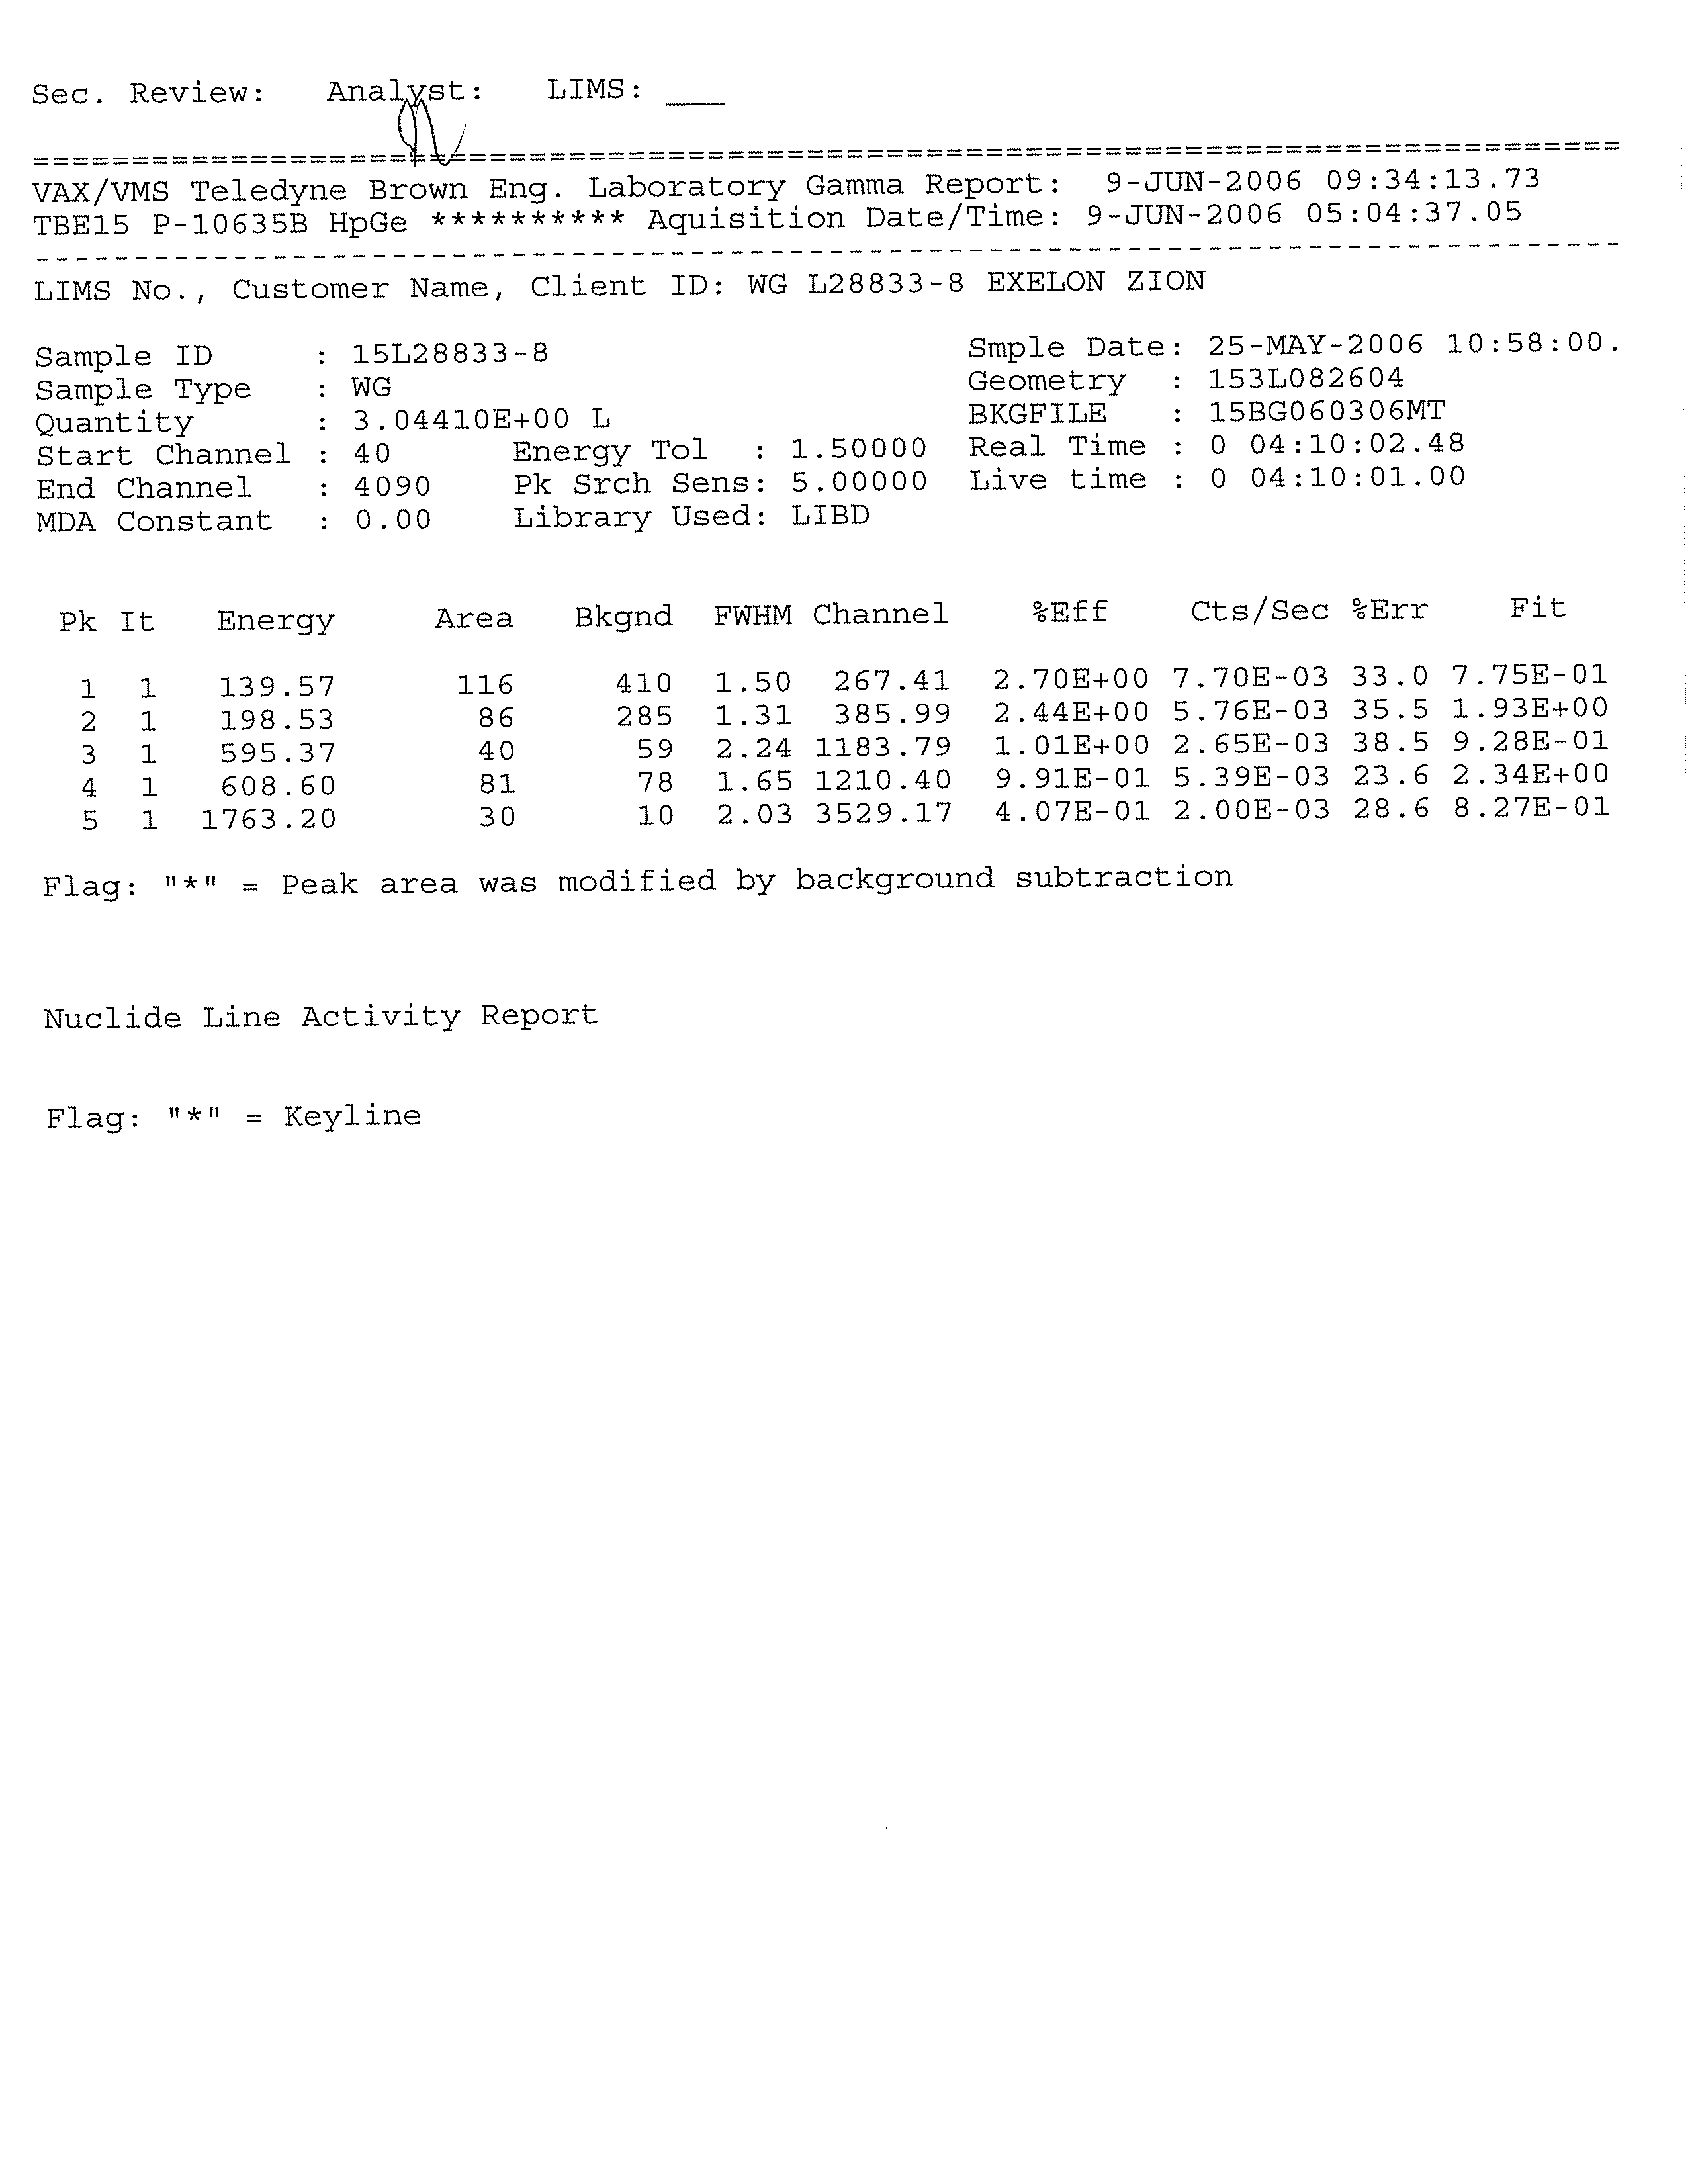
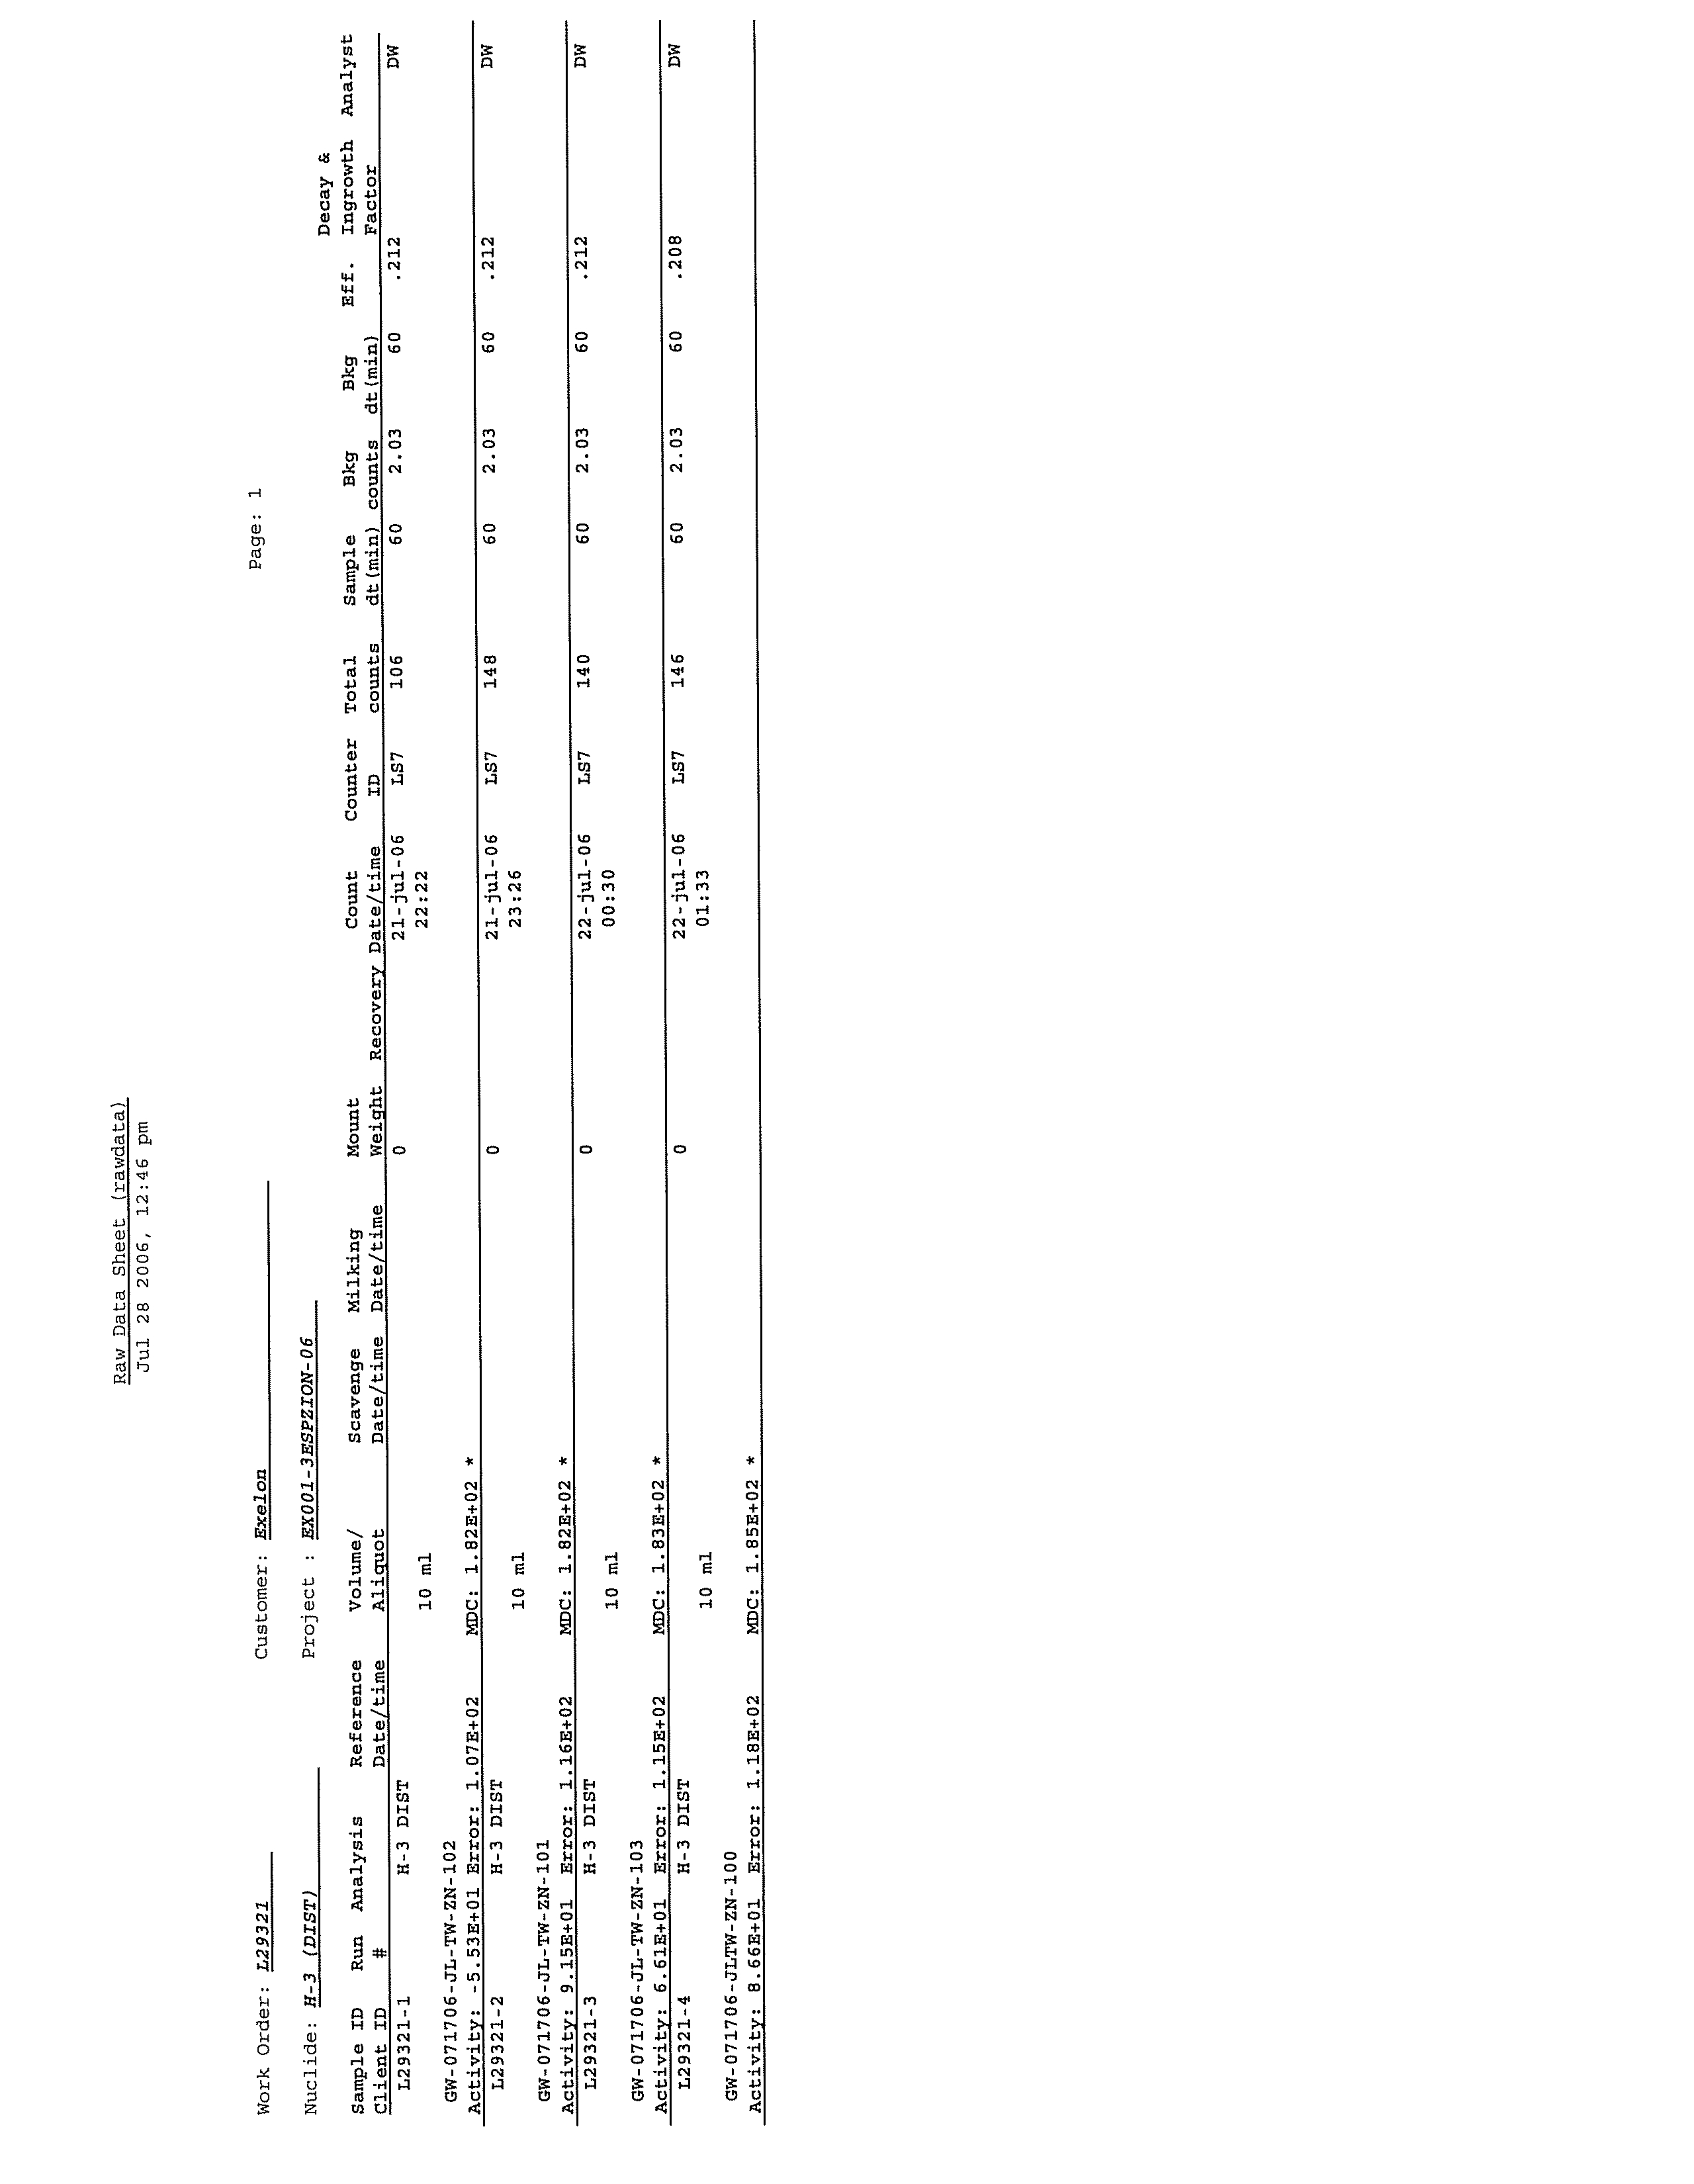
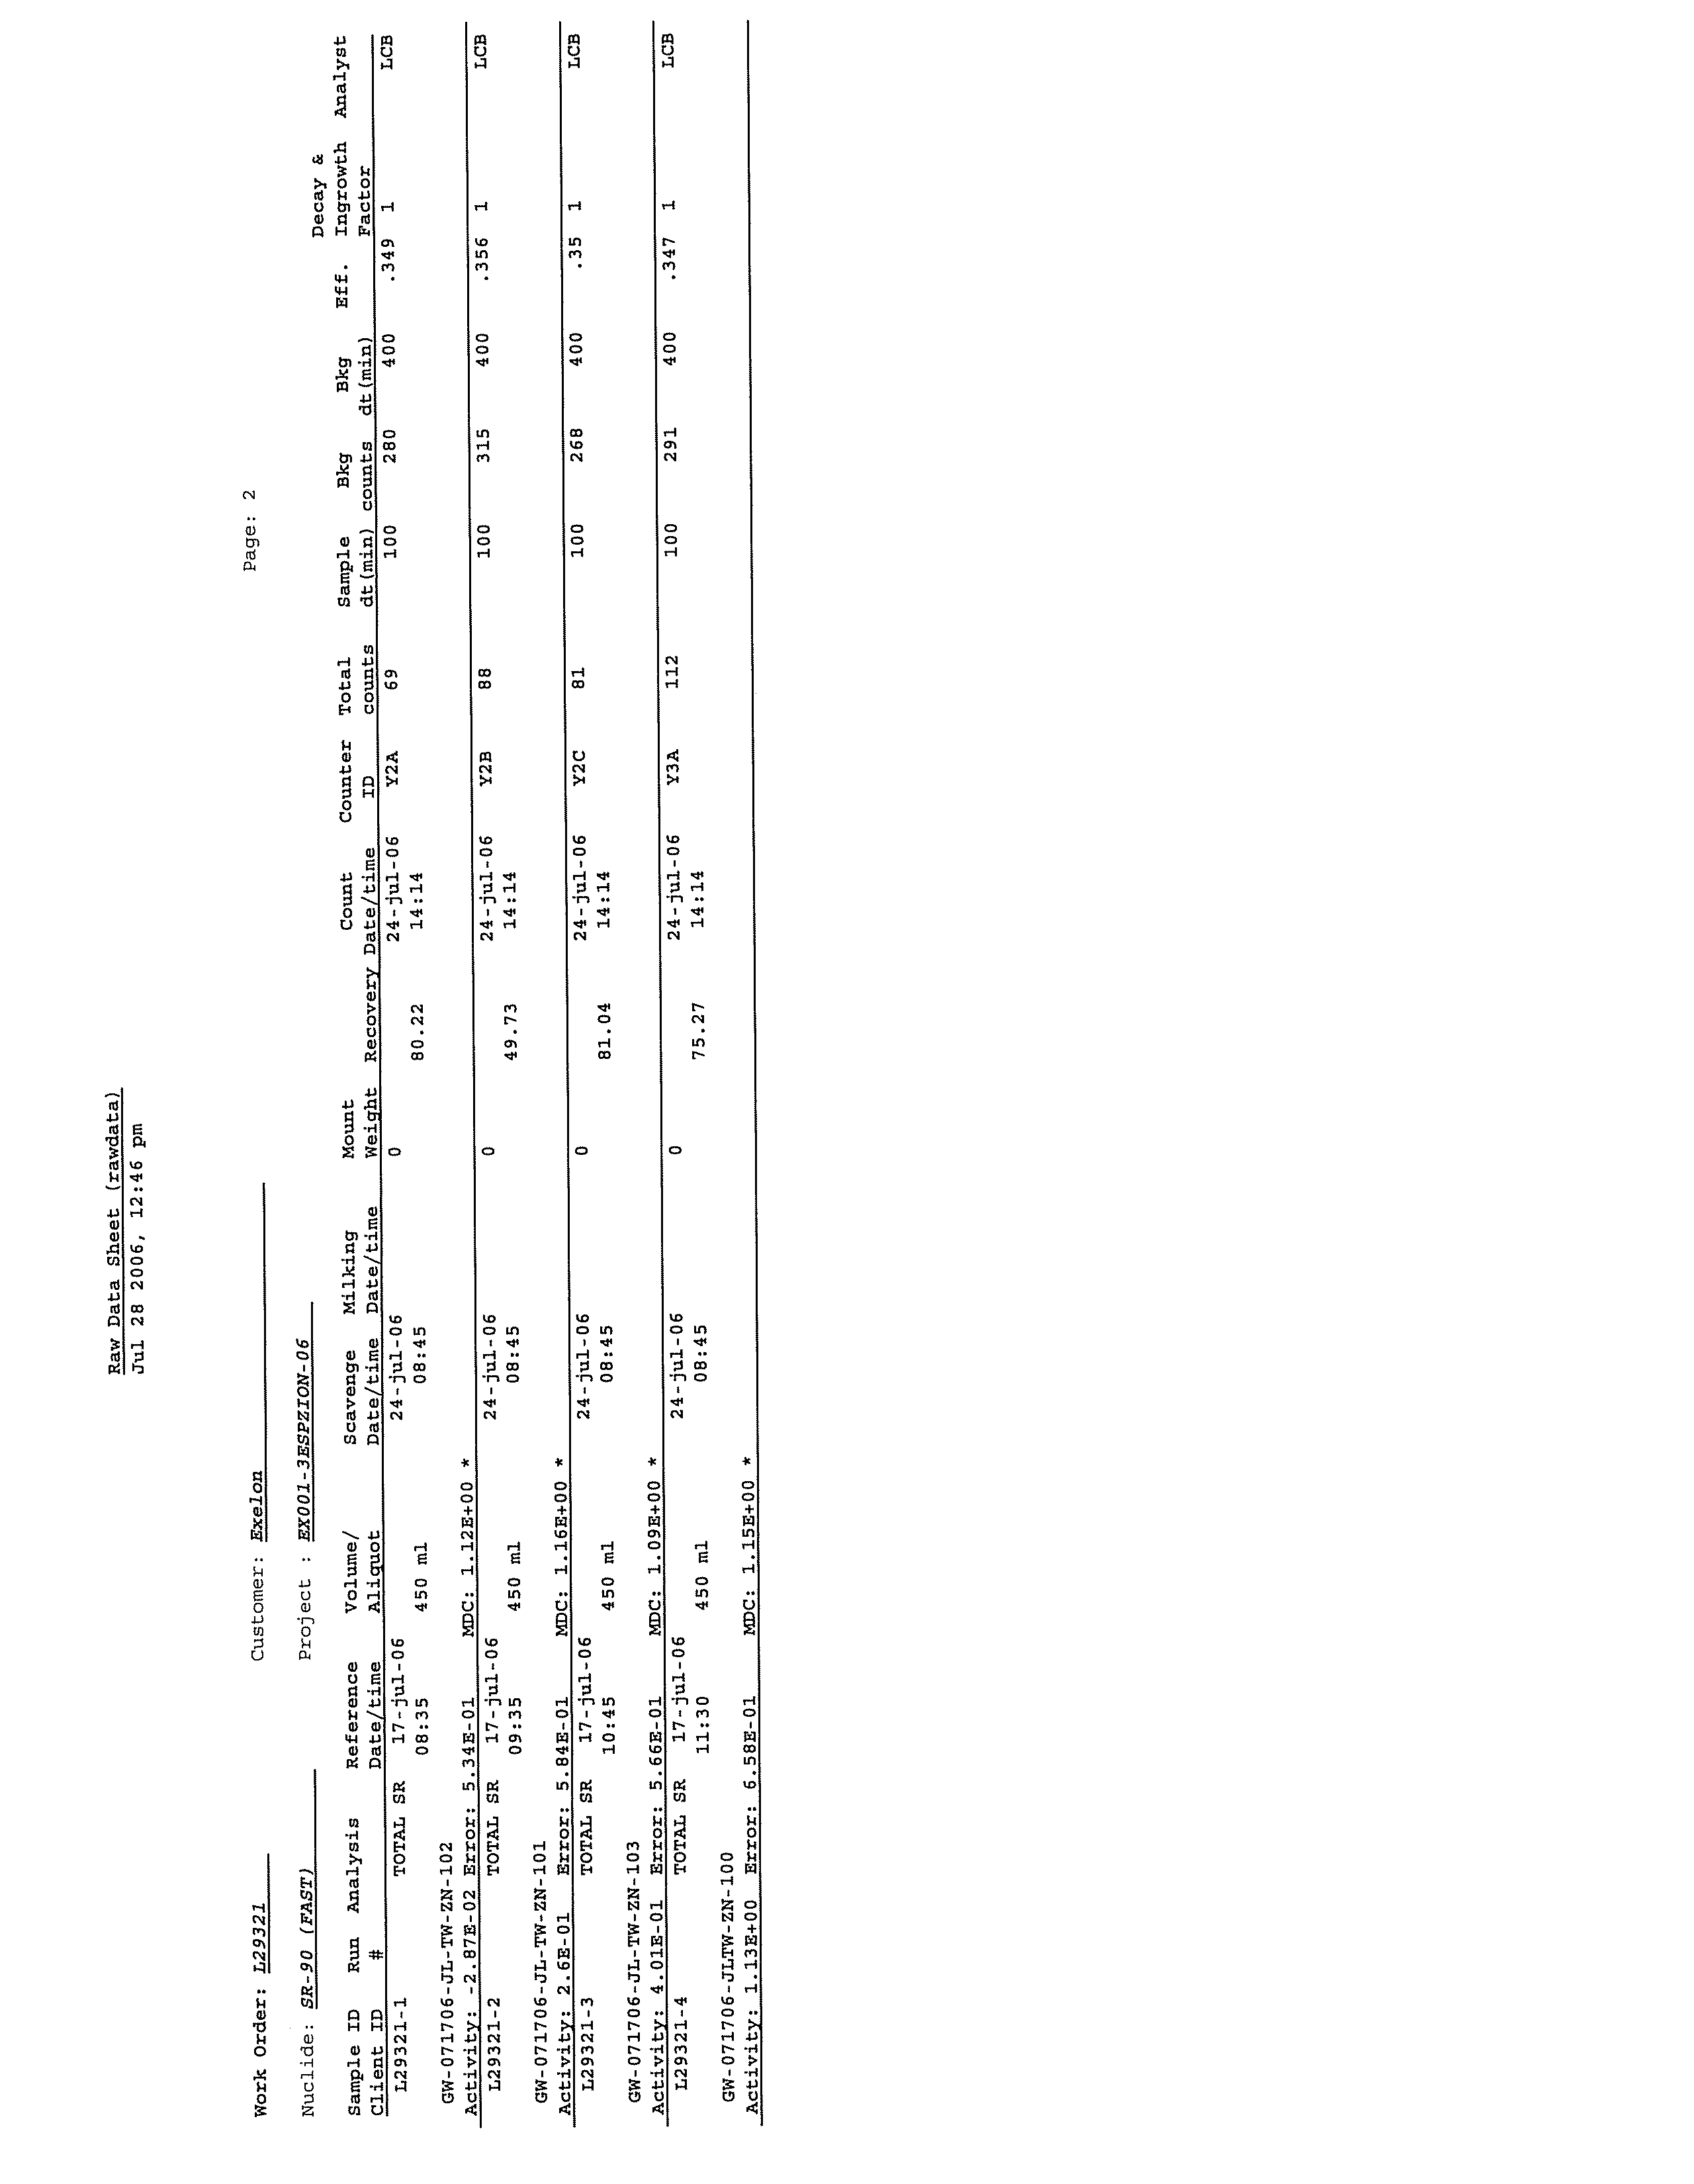
Groundwater and surface water samples were analyzed for tritium and gamma-emitting
radionuclides as
listed in NUREG-1301, and strontium-89/90 as
listed 40 CFR 141.25.
045136 (22) Zion Station
26
CONESTOGA-ROVERS & ASSOCIATES
Revision 1
5.0
RESULTS SUMMARY
This section provides a summary of Station-specific geology and hydrogeology, along
with a discussion of hydraulic gradients, groundwater elevations, and flow directions in
the vicinity of the Station. This section also presents and evaluates the analytical results
obtained from activities performed in accordance with the Work Plan.
5.1
STATION GEOLOGY
Geologic cross-sections in both a south-north and east-west profile have been developed.
Figure 5.1 displays the cross-section locations across the Station and the cross-sections
are provided on Figures 5.2 and 5.3. These cross-section locations were chosen because
of their close proximity to the AFEs and structures potentially influencing groundwater
flow patterns.
The Station is underlain by overburden deposits and a regionally extensive sequence of
consolidated sedimentary deposits as discussed in Section 2.4.3. In descending order,
the following overburden stratigraphic units have been identified and characterized
during the various Station investigations:
•
Upper Sand Unit: Dense to very dense granular soils which range in gradation from
very fine sand to fine to coarse sand, and which contains some gravel and occasional
cobbles and boulders. Depth ranges from the ground surface to an elevation of
approximately 555 feet AMSL.
•
Silt-Clay Unit: Hard silt, silty clay, clayey silt, and sandy silt, which contain some
sand and gravel and occasional cobbles and boulders.
Depth ranges from
approximately 525 feet to 555 feet AMSL.
•
Lower Sand Unit: Dense to very dense sands and silty sands which contain some
gravel, occasional cobbles and boulders, and layers of hard silty clay, clayey silt, and
sandy silt.
Depth ranges from approximately 480 feet to 525 feet AMSL
(ComEd, 1969).
The Upper Sand Unit includes the surficial deposits of the Zion beach-ridge plain and
consists of sand and gravel of the Lake Michigan Formation. The Lake Michigan
Formation
describes
Holocene
shallow-water,
near-shore
beach
sediments
predominantly consisting of medium-grained sand with local lenses of sandy gravel,
and containing beds of silt.
045136 (22) Zion Station
27
CONESTOGA-ROVERS & ASSOCIATES
Revision 1
The Silt-Clay Unit is consistent with quiet water lacustrine deposits and may be
associated with post-glacial Lake Michigan (Nipissing Phase).
The Lower Sand Unit is consistent with recurring sequences of beach and quiet water
lacustrine deposits and may be associated with the extreme Lake level fluctuations. As
Lake levels rose, beach deposits moved westward with the shoreline and were followed
by quiet water silt and clay deposits (a transgressive sequence). As Lake levels fell, the
beach moved eastward with the shoreline (a regressive sequence).
The overburden sediments are underlain by Silurian carbonate bedrock of the Niagaran
Series, which was encountered at depths ranging from 102 to 116 feet bgs
(ComEd, 1969). In northeastern Illinois the Niagaran Series includes the Racine, Sugar
Run, and Joliet Formations (Willman et al., 1975). Below the Silurian carbonates lie
Pre-Cambrian through Ordovician sedimentary rocks, including shales, carbonates, and
sandstone. Crystalline basement rock is located at a depth of approximately 2,500 feet.
The sedimentary bedrock strata are generally horizontal with a gentle dip to the east
(Visocky et al., 1985).
Some of the Station structures are constructed to depths of approximately 60 feet bgs.
Excavations were completed from grade, through the Upper Sand Unit and into the
topmost portion of the Silt-Clay Unit. Excavated sands were stockpiled during the
construction and used as backfill (Exelon, 2004), and are considered to be hydraulically
similar to the Upper Sand Unit.
The fifteen new monitoring wells (MW-ZN-01S, MW-ZN-02S, MW-ZN-03S,
MW-ZN-04S, MW-ZN-05S, MW-ZN-06S, MW-ZN-07S, MW-ZN-08S, MW-ZN-09S,
MW-ZN-10S, MW-ZN-11S, TW-ZN-100, TW-ZN-101, TW-ZN-102, and TW-ZN-103)
were installed within the Upper Sand Unit or fill, which consists of a primarily
fine-grained sand that overlies the Silt-Clay Unit. The monitoring well logs wells are
presented in Appendix B.
Cross-Section A-A' (Figure 5.2) is a north-south profile through the east side of the
Station. It begins at monitoring well MW-ZN-08S and terminates at MW-ZN-05S. This
cross-section transects AFE-Zion-2, AFE-Zion-3, and AFE-Zion-4. This cross-section also
shows the relationship between the groundwater and the geology, excavated areas, and
reactor containment and building foundations.
Cross-Section B-B' (Figure 5.3) is an west-east profile that runs from monitoring well
MW-ZN-07 through the Station to Lake Michigan and intersects AFE-Zion-1 and
045136 (22) Zion Station
28
CONESTOGA-ROVERS & ASSOCIATES
Revision 1
AFE-Zion-3. This cross-section shows the relationship between the groundwater and
geology, and building foundations.
5.2
STATION HYDROGEOLOGY
This section presents the Station hydrogeology, including groundwater flow direction,
man-made influences on groundwater flow, vertical hydraulic gradients, and lateral
groundwater flow and velocity.
5.2.1
GROUNDWATER FLOW DIRECTIONS
The shallow groundwater flows to the east toward Lake Michigan. The building
foundations restrict the groundwater flow, which causes the groundwater to flow
around the Station. As mentioned previously, the shallow water table intercepts the
stormwater drainage ditches in the west area of the Station property, but does appear to
affect the flow of groundwater to the east and toward Lake Michigan. Groundwater
flow directions for May 2006 are provided on Figure 5.4, flow directions for July 2006 are
provided on Figure 5.5.
Both figures present groundwater flow in the shallow
groundwater system. The sheet pile wall limits the flow of groundwater towards Lake
Michigan. Groundwater between the sheet pile wall and the Turbine Building flows to
the north or south around the wall. Although groundwater flow circumscribes the sheet
pile wall, a small component of leakage through the wall is expected.
The sheet pile wall is constructed of MZ-27 steel sheet piling. MZ-27 sheet piling is
comprised of z-shaped sheet steel sections which are 18-inches wide with a 12-inch
offset. The sections are 45 feet long, 3/8-inch thick, and weigh 27 pounds per square
foot of wall.
5.2.2
MAN-MADE INFLUENCES ON GROUNDWATER FLOW
The building foundations of the main complex extend through the Upper Sand Unit and
into the top of the underlying silts and clays. Deep structures include the Reactor
Containment Buildings, the Fuel Storage Building, the Auxiliary Building, the Turbine
Building, and the crib area. The deep building foundations act as hydraulic barriers for
shallow groundwater as is discussed below.
045136 (22) Zion Station
29
CONESTOGA-ROVERS & ASSOCIATES
Revision 1
During the construction of the Station, a sheet pile wall was installed along the Lake
Michigan shoreline to prevent lake water from entering the excavation. The sheet pile
wall was modified over the course of the construction and currently extends to a depth
of approximately 45 feet bgs. The top of the sheet pile wall is lined with boulders and
forms a breakwall, which is shown on Figure 5.3.
Shallow groundwater will flow into the stormwater drainage ditches located on the west
portion of the Station property. However, the groundwater in this area is upgradient of
the PA and areas within the Station that potentially contain tritiated water. As such the
groundwater discharge to these stormwater systems is not expected to be impacted by
tritium.
5.2.3
VERTICAL HYDRAULIC GRADIENTS
The Upper Sand Unit is a high permeability unit that is directly connected to Lake
Michigan, which is a regional discharge feature, and which generally allows unrestricted
lateral groundwater flow. Vertical groundwater flow is limited by the underlying
Silt-Clay Unit, which has a low permeability and is approximately 30 feet thick. To the
extent that vertical flow can occur, the vertical gradient is expected to be upward based
on the artesian pressure observed in the Lower Sand Unit during the 1967 Foundation
Investigation (Dames and Moore, 1967).
5.2.4
LATERAL GROUNDWATER FLOW AND VELOCITY
Fifteen monitoring wells were installed at the Station as part of the 2006 hydrogeologic
investigation. Shallow groundwater is present at a depth less than 12 feet bgs in the
Upper Sand Unit. The shallow water-bearing zone is isolated from the underlying
regional bedrock aquifers by the underlying Silt-Clay Unit. The Silt-Clay Unit is
approximately 30 feet thick and extends approximately 15 feet below the deepest
structural feature at the Station.
Shallow groundwater flows is generally towards Lake Michigan. A potentiometric
surface contour map is provided on Figure 5.4 (May 2006) and Figure 5.5 (July 2006).
The hydraulic gradient ranges from 0.001 feet per foot near the switchyard (west of the
Station) to 0.008 feet per foot near the eastern portion of the Station. The hydraulic
conductivity of the surficial sands is expected to be approximately 12 feet per day based
on the median measurement from a study conducted along the Illinois-Indiana border of
the shallow aquifer along Lake Michigan (USGS, 1996). The velocity of the shallow
045136 (22) Zion Station
30
CONESTOGA-ROVERS & ASSOCIATES
Revision 1
groundwater may be roughly approximated using the Station-specific hydraulic
gradient with the literature value for hydraulic conductivity and a typical value for
porosity. Using the hydraulic gradient range of 0.001 to 0.008 feet per foot with a
hydraulic conductivity of 12 feet per day and an assumed porosity of 0.32 yields a
velocity range of 14 to 110 feet per year (USEPA, 1996).
5.3
GROUNDWATER QUALITY
CRA personnel collected groundwater samples from fifteen wells. The samples were
analyzed for tritium and additional radionuclides. Teledyne Brown provided the
analytical services. The Quality Assurance Program for the laboratory is described in
Appendix C. The analytical data reports are provided in Appendix D.
The analytical data presented herein have been subjected to CRA's data validation
process. CRA has used the data with appropriate qualifiers where necessary.
The data reported in the figures and tables do not include the results of recounts that the
laboratory completed, except if those results ultimately replaced an initial report. The
tables and figures, therefore, include only the first analysis reported by the laboratory.
Where multiple samples were collected over time, then the most recent result has been
used in the discussion, below.
Two samples were collected from two different elevations in each permanent
monitoring well except for monitoring well MW-ZN-09S. The samples were collected at
16 feet above the well bottom for the upper sample and 3 feet above the well bottom for
the lower sample. At monitoring well MW-ZN-09S there was not a sufficient depth of
water for both samples to be collected and a single sample at MW-ZN-09S was collected
at 3 feet above the well bottom, which is the equivalent of an upper sample in the other
monitoring wells.
5.3.1
SUMMARY OF BETA-EMITTING RADIONUCLIDES
ANALYTICAL RESULTS
A summary of the tritium results for the groundwater samples collected during this
investigation is provided in Table 5.1 and shown on Figure 5.6.
Groundwater samples were collected from the upper and lower portions of the screen in
each monitoring well with a 20-foot screen (MW-ZN-01S through MW-ZN-11S with the
045136 (22) Zion Station
31
CONESTOGA-ROVERS & ASSOCIATES
Revision 1
exception of MW-ZN-09S). Groundwater samples were also collected from Temporary
Wells (TW-ZN-100 through TW-ZN-103). All tritium concentrations were below the
USEPA drinking water standard of 20,000 pCi/L. Tritium was not detected greater than
the LLD of 200 pCi/L in samples collected from 14 of the 15 monitoring wells.
Concentrations of tritium exceeding the LLD of 200 pCi/L were only detected in
groundwater samples collected from monitoring well MW-ZN-01S. The concentrations
of tritium detected in the initial round of sampling were 586
±
141 pCi/L in the lower
portion of the screen and 261
±
124 pCi/L in the upper portion of the screen.
MW-ZN-01S was re-sampled on June 28, 2006 and the concentrations of tritium were
less than the LLD of 200 pCi/L in the lower portion of the screen and 220 pCi/L in the
upper portion of the screen.
Strontium-89/90 was not detected at concentrations exceeding the LLD of 2.0 pCi/L. A
summary of the strontium-89/90 results for the groundwater samples collected as part
of the investigation that is the subject of this HIR is provided in Table 5.2 and shown on
Figure 5.7.
5.3.2
SUMMARY OF GAMMA-EMITTING RADIONUCLIDES
ANALYTICAL RESULTS
Gamma-emitting target radionuclides were not detected at concentration greater than
their respective LLD. A summary of the gamma-emitting radionuclides results for the
groundwater samples collected as part of the investigation that is the subject of this HIR
is provided in Table 5.2 and presented graphically on Figure 5.7.
Other non-targeted radionuclides are included in the tables but excluded from
discussion in this report. These radionuclides were either a) naturally occurring and
thus not produced by the Station, or b) could be definitively evaluated as being naturally
occurring due to the lack of presence of other radionuclides, which would otherwise
indicate the potential of production from the Station.
5.3.3
SUMMARY OF FIELD MEASUREMENTS
Table 4.5 presents a summary of monitoring well purging parameters collected during
the well purging and sampling activities. These field measurements included pH,
dissolved oxygen, conductivity, turbidity, and temperature. The field parameters were
typical of a shallow sand aquifer. The pH values ranged from 5.51 standard units to
045136 (22) Zion Station
32
CONESTOGA-ROVERS & ASSOCIATES
Revision 1
10.42 standard units. The conductivity was indicative of a shallow water table system
subject to surface water recharge.
Of note were the elevated turbidity readings above 900 NTU collected from the lower
portion of the screen at MW-ZN-04S; however, the elevated turbidity readings are
indicative of the very loose and fine-grained organic material at this well's lower screen
interval, as shown on the MW-ZN-04S stratigraphic log. Overall, the readings were
within the expected ranges for naturally occurring groundwater.
5.4
SURFACE WATER QUALITY
One surface water sample was collected from Lake Michigan at the location shown on
Figure 4.1. This sample was analyzed for tritium, gamma-emitting radionuclides, and
strontium-89/90. Teledyne Brown provided the analytical services. The Quality
Assurance Program for the laboratory is described in Appendix C. The analytical data
reports are provided in Appendix D.
5.4.1
SUMMARY OF BETA-EMITTING RADIONUCLIDE
ANALYTICAL RESULTS
Tritium was not detected at concentrations exceeding the LLD of 200 pCi/L. A
summary of the tritium result for the surface water sample collected in this investigation
is provided in Table 5.1 and shown on Figure 5.6.
Strontium-89/90 was not detected at concentration exceeding the LLD of 2.0 pCi/L. The
strontium-89/90 result for the surface water sample collected in this investigation is
provided in Table 5.2 and shown on Figure 5.7.
5.4.2
SUMMARY OF GAMMA-EMITTING RADIONUCLIDES
ANALYTICAL RESULTS
Gamma-emitting target radionuclides were not detected at concentration exceeding their
respective LLD. A summary of the gamma-emitting radionuclides results for the surface
water sample collected in this investigation is provided in Table 5.2 and shown on
Figure 5.7.
Other non-targeted radionuclides are included in the tables but excluded from
discussion in this report. These radionuclides were either a) naturally occurring and
045136 (22) Zion Station
33
CONESTOGA-ROVERS & ASSOCIATES
Revision 1
thus not produced by the Station, or b) could be definitively evaluated as being naturally
occurring due to the lack of presence of other radionuclides which would otherwise
indicate the potential of production from the Station.
045136 (22) Zion Station
34
CONESTOGA-ROVERS & ASSOCIATES
Revision 1
6.0
RADIONUCLIDES OF CONCERN AND SOURCE AREAS
This section discusses radionuclides evaluated in this investigation, potential sources of
the radionuclides detected, and their distribution.
6.1
GAMMA-EMITTING RADIONUCLIDES
Gamma-emitting target radionuclides were not detected at concentration exceeding their
respective LLD. Other non-targeted radionuclides were also included in the tables but
excluded from discussion in this report. These radionuclides were either a) naturally
occurring and thus not produced by the Station, or b) could be definitively evaluated as
being naturally occurring due to the lack of presence of other radionuclides which
would otherwise indicate the potential of production from the Station.
6.2
BETA-EMITTING RADIONUCLIDES
Strontium-89/90 was not detected in any of the samples collected at concentrations that
were greater than the LLD of 2.0 pCi/L. Tritium was detected in one of the sixteen total
sample locations. Concentrations of tritium ranged between less than the LLD of
200 pCi/L to 586
±
141 pCi/L.
Since only tritium was detected above the radionuclides' LLDs, the following sections
focus on tritium; specifically, providing general characteristics of tritium, potential
sources, distribution in groundwater, and a conceptual model for migration.
6.3
TRITIUM
This section discusses the general characteristics of tritium, the distribution of tritium in
groundwater and surface water, and the conceptual model of tritium release and
migration.
6.3.1
GENERAL CHARACTERISTICS
Tritium (chemical symbol H-3) is a radioactive isotope of hydrogen. The most common
forms of tritium are tritium gas and tritium oxide, which is also called "tritiated water."
The chemical properties of tritium are essentially those of ordinary hydrogen. Tritiated
045136 (22) Zion Station
35
CONESTOGA-ROVERS & ASSOCIATES
Revision 1
water behaves the same as ordinary water in both the environment and the body.
Tritium can be taken into the body by drinking water, breathing air, eating food, or
absorption through skin. Once tritium enters the body, it disperses quickly and is
uniformly distributed throughout the body. Tritium is excreted primarily through urine
within a month or so after ingestion. Organically bound tritium (tritium that is
incorporated in organic compounds) can remain in the body for a longer period.
Tritium is produced naturally in the upper atmosphere when cosmic rays strike air
molecules.
Tritium is also produced during nuclear weapons explosions, as a
by-product in reactors producing electricity, and in special production reactors, where
the isotopes lithium-7 and/or boron-10 are bombarded to produce tritium.
Although tritium can be a gas, its most common form is in water because, like
non-radioactive hydrogen, radioactive tritium reacts with oxygen to form water.
Tritium replaces one of the stable hydrogen atoms in the water molecule and is called
tritiated water. Like normal water, tritiated water is colorless and odorless. Tritiated
water behaves chemically and physically like non-tritiated water in the subsurface, and
therefore tritiated water will travel at the same velocity as the average groundwater
velocity.
Tritium has a half-life of approximately 12.3 years. It decays spontaneously to helium-3
(
3
He). This radioactive decay releases a beta particle (low-energy electron). The
radioactivity of tritium is the source of the risk of exposure.
Tritium is one of the least dangerous radionuclides because it emits very weak radiation
and leaves the body relatively quickly. Since tritium is almost always found as water, it
goes directly into soft tissues and organs. The associated dose to these tissues is
generally uniform and is dependent on the water content of the specific tissue.
6.3.2
DISTRIBUTION IN STATION GROUNDWATER
This section provides an overview of the lateral and vertical distribution of tritium
detected in groundwater at the Station. Tritium was detected in groundwater at
concentrations exceeding the LLD of 200 pCi/L.
Tritium concentrations in groundwater are presented on Figure 5.6. Tritium was only
detected in groundwater samples from monitoring well MW-ZN-01S in May 2006 from
both the upper sampling interval (261
±
124 pCi/L, 22 feet bgs) and the lower sampling
interval (586
±
141 pCi/L, 35 feet bgs). Tritium was only detected in groundwater
045136 (22) Zion Station
36
CONESTOGA-ROVERS & ASSOCIATES
Revision 1
samples from monitoring well MW-ZN-01S in June 2006 in the upper sampling interval
(220
±
123 pCi/L, 22 feet bgs). Tritium was not detected above the LLD of 200 pCi/L in
June 2006 at the MW-ZN-01S lower sampling interval.
6.3.3
CONCEPTUAL MODEL OF TRITIUM
RELEASE AND MIGRATION
This Section presents CRA's conceptual model of groundwater and tritium migration at
the Station.
A conceptual model of groundwater and tritium migration is provided herein. This
model is then used to discuss the recent detections of tritium observed during the
hydrogeologic investigations presented in this HIR.
Groundwater flows within the Upper Sand Unit at the Station in response to the
regional discharge point located to the east of the Station (Lake Michigan).
Groundwater moving within the Upper Sand Unit is separated from the regional
bedrock aquifer zones by the underlying low-permeability Silt-Clay Unit.
Groundwater in the Upper Sand Unit generally flows to the east and discharges to Lake
Michigan. Groundwater flowing in Upper Sand Unit is affected by the building
foundations which, in some cases, extend into the underlying glacial silts and clays. The
sheet pile wall also limits the flow of groundwater towards Lake Michigan. There is no
indication from the HIR investigation that tritium-impacted groundwater is migrating
off the Station property.
6.3.4
ATTENUATION OF TRITIUM WITHIN THE SHALLOW
GROUNDWATER SYSTEM
Tritium in the groundwater system would be affected by the infiltration from
precipitation recharge. This could result in the upper water table zone of the sand
aquifer having lower concentrations of tritium than deeper portions (these upper and
lower zones are only separated by 10 feet).
The permeable nature of the Upper Sand Unit also supports attenuation of the tritium
through lateral groundwater movement. The dispersion of the tritium as it flows
through the Upper Sand Unit along with its natural decay rate will allow for reduction
in concentrations over time and with distance from a release into the groundwater.
045136 (22) Zion Station
37
CONESTOGA-ROVERS & ASSOCIATES
Revision 1
Tritium was not detected at concentrations exceeding the LLD of 200 pCi/L in the four
temporary wells located downgradient of MW-ZN-01S and in surface water sample
collected from Lake Michigan, which is the ultimate receptor of groundwater discharge
from the Station.
There is no indication from the HIR investigation that
tritium-impacted groundwater is migrating off the Station property.
045136 (22) Zion Station
38
CONESTOGA-ROVERS & ASSOCIATES
Revision 1
7.0
EXPOSURE PATHWAY ASSESSMENT
This section addresses the groundwater impacts from tritium and other radionuclides at
the Station and potential risks to human health and the environment.
Based upon historical knowledge and data related to the Station operations, and based
upon radionuclide analyses of groundwater samples, the primary constituent of concern
(COC) is tritium. The discussions that follow are restricted to the exposure pathways
related to tritium.
Teledyne Brown reports all samples to their statistically derived minimum detectable
concentration (MDC) of approximately 150 to 170 pCi/L, which is associated with
95 percent confidence interval on their hardcopy reports. However, the laboratory uses
a 99 percent confidence range (
±
3-sigma) for determining whether to report the sample
activity concentration as detected or not. This 3-sigma confidence range typically
equates to 150 (± 135.75) pCi/L.
Exelon has specified a LLD of 200 pCi/L for the Fleetwide assessment. Exelon has also
required the laboratory to report related peaks identified at the 95 percent confidence
level (2-sigma).
This HIR, therefore, screens and assesses data using Exelon's LLD of 200 pCi/L. As is
outlined below, this concentration is also a reasonable approximation of the background
concentration of tritium in groundwater at the Station.
7.1
HEALTH EFFECTS OF TRITIUM
Tritium is a radionuclide that decays by emitting a low-energy beta particle that cannot
penetrate deeply into tissue or travel far in air. A person's exposure to tritium is
primarily through the ingestion of water (drinking water) or through ingestion of
water-bearing food products. Inhalation of tritium requires the water to be in a vapor
form (i.e., through evaporation or vaporization due to heating). Inhalation is a minor
exposure route when compared to direct ingestion or drinking of tritiated water.
Absorption of tritium through skin is possible, but tritium exposure is more limited here
versus direct ingestion or drinking of tritiated water.
045136 (22) Zion Station
39
CONESTOGA-ROVERS & ASSOCIATES
Revision 1
7.2
BACKGROUND CONCENTRATIONS OF TRITIUM
The purpose of the following paragraphs is to establish a background concentration
through review of various media.
7.2.1
GROUNDWATER
Tritium is created in the environment from naturally occurring processes both cosmic
and subterranean, as well as from anthropogenic (i.e., man-made) sources. In the upper
atmosphere, "cosmogenic" tritium is produced from the bombardment of stable nuclides
and combines with oxygen to form tritiated water, which will then enter the hydrologic
cycle. Below ground, "lithogenic" tritium is produced by the bombardment of natural
lithium isotopes
6
Li
(92.5% abundance) and
7
Li
(7.5% abundance) present in crystalline
rocks by neutrons produced by the radioactive decay of uranium and thorium.
Lithogenic production of tritium is usually negligible compared to other sources due to
the limited abundance of lithium in rock. The lithogenic tritium is introduced directly to
groundwater.
A major anthropogenic source of tritium comes from the former atmospheric testing of
thermonuclear weapons. Levels of tritium in precipitation increased during the 1950s
and early 1960s, coinciding with the release of significant amounts of tritium to the
atmosphere during nuclear weapons testing prior to the signing of the Limited Test Ban
Treaty in 1963, which prohibited atmospheric nuclear tests.
7.2.2
PRECIPITATION DATA
Precipitation samples are routinely collected at stations around the world for the
analysis of tritium and other radionuclides. Two publicly available databases that
provided tritium concentrations in precipitation are Global Network of Isotopes in
Precipitation (GNIP) and USEPA's RadNet database.
GNIP provides tritium
precipitation concentration data for samples collected world wide from 1960 to 2006.
RadNet provides tritium precipitation concentration data for samples collected at
Stations through the U.S. from 1960 up to and including 2006.
Based on GNIP data for sample stations located in the U.S. Midwest including Chicago,
St. Louis and Madison, Wisconsin, as well as Ottawa, Ontario, and data from the
University of Chicago, tritium concentrations peaked around 1963. This peak, which
approached 10,000 pCi/L for some stations, coincided with the atmospheric testing of
045136 (22) Zion Station
40
CONESTOGA-ROVERS & ASSOCIATES
Revision 1
thermonuclear weapons. Tritium concentrations showed a sharp decline up until 1975
followed by a gradual decline since that time. Tritium concentrations in Midwest
precipitation have typically been below 100 pCi/L since around 1980.
The RadNet database for several stations in the U.S. Midwest (Chicago, Columbus,
Indianapolis, Lansing, Madison, Minneapolis, Painesville, Toledo, and Welsch) did not
show the same trend, which can be attributed to pre-1995 data handling procedures.
The pre-1995 data were rounded to the nearest 100 pCi/L, which dampened out
variances in the data. The post-1995 RadNet data, where rounding was not applied,
exhibit much more scatter, and similar to the GNIP data, the vast majority of the data
were less than 100 pCi/L.
CRA constructed a non-parametric upper tolerance limit with a confidence of 95 percent
and coverage of 95 percent based on RadNet data for USEPA Region 5 from 2004 to
2005. The resulting upper tolerance limit is 133 pCi/L, which indicates that CRA is
95 percent confident that 95 percent of the ambient precipitation concentration results
are below 133 pCi/L. The statistical confidence, however, must be compared with the
limitations of the underlying RadNet data, which does not include the minimum
detectable concentration for a majority of the measurements. Some of the RadNet values
below 200 pCi/L may be approximated. Nevertheless, these results show a background
contribution for precipitation of up to 133 pCi/L.
7.2.3
SURFACE WATER DATA
Tritium concentrations are routinely measured in large surface water bodies, including
Lake Michigan and the Mississippi River. Surface water data from the RadNet database
for Illinois sampling stations include East Moline (Mississippi River), Moline
(Mississippi River), Marseilles (Illinois River), Morris (Illinois River), Oregon (Rock
River), and Zion (Lake Michigan). As is the case for the RadNet precipitation data, the
pre-September 1995 Illinois surface water data was rounded to the nearest 100 pCi/L,
creating a dampening of variances in the data. The post-1995 Illinois surface water data,
similar to the post-1995 Midwest precipitation data, were less than 100 pCi/L, with the
exception of the Moline (Mississippi River) station.
Tritium surface water
concentrations at this location varied between 100 and 800 pCi/L, which may reflect
local natural or anthropogenic inputs.
The RadNet surface water data typically has a reported 'Combined Standard
Uncertainty' of 35 to 50 pCi/L.
According to USEPA, this corresponds to a
± 70 to 100 pCi/L 95 percent confidence bound on each given measurement. Therefore,
045136 (22) Zion Station
41
CONESTOGA-ROVERS & ASSOCIATES
Revision 1
the typical background data provided may be subject to measurement uncertainty of
approximately ± 70 to 100 pCi/L.
7.2.4
DRINKING WATER DATA
Tritium concentrations in drinking water from the RadNet database for three Illinois
sampling stations (Chicago, Morris, and East Chicago) exhibit similar trends as the
precipitation and surface water data. As with the precipitation and surface water data,
the pre-1995 data have dampened out variances due to rounding the data to the nearest
100 pCi/L. The post-1995 results show tritium concentrations in samples of drinking
water were less than 100 pCi/L.
7.2.5
EXPECTED TRITIUM BACKGROUND FOR THE STATION
As reported in the GNIP and RadNet databases, tritium concentrations in U.S. Midwest
precipitation have typically been less than 100 pCi/L since 1980. Tritium concentrations
reported in the RadNet database for Illinois surface water and groundwater, at least
since 1995, have typically been less than 100 pCi/L. Based on USEPA Region 5's 2004 to
2005 RadNet precipitation data, 95 percent of the ambient concentrations of tritiated
water in Illinois are expected to be less than 133 pCi/L, based on a 95 percent confidence
limit. Tritium concentrations in surface water and drinking water at the Station are
expected to be comparable or less based on historical data and trends.
Concentrations in groundwater similar to surface water and drinking water are expected
to be less than precipitation values. The lower groundwater concentrations are related
to the age of the groundwater as compared to the half-life of tritium. Deep aquifers in
proximity to crystalline basement rock, however, can potentially show elevated
concentrations of tritium due to lithogenic sources.
The Pre-Operational REMP report noted that lake water was sampled at five public
water intakes. Generally, the gross beta radioactivity of Lake Michigan was less than
10 pCi/L. Typical values from throughout the Lake were between 3 to 6 pCi/L. Gross
alpha radioactivity was typically less than 3 pCi/L (ComEd, 1971).
Tritium levels in Lake Michigan water were studied in the vicinity of Zion throughout
1970 (prior to the construction of the Station). The concentration of tritium in Lake
Michigan near Zion ranged from approximately 311
±
20 pCi/L to 374
±
34 pCi/L and
averaged 340 pCi/L. There was no statistical difference in average tritium levels among
045136 (22) Zion Station
42
CONESTOGA-ROVERS & ASSOCIATES
Revision 1
the sample locations (eight sample locations from Kenosha to Waukegan)
(ComEd, 1971).
As was noted in Section 7.0, the reporting limits for the tritium results are to an LLD of
200 pCi/L.
This concentration also represents a reasonable representation of
background groundwater quality, given the data for precipitation, surface water, and
drinking water.
Based on the evaluation presented above, the background concentration for tritium at
the Station is reasonably represented by the LLD of 200 pCi/L.
7.3
IDENTIFICATION OF POTENTIAL EXPOSURE
PATHWAYS AND POTENTIAL RECEPTORS
There are two potential exposure pathways for tritium originating in or adjacent to the
Station:
•
potential groundwater migration off the Station property to private and public
groundwater users; and
•
potential groundwater migration off the Station property to Lake Michigan.
The following section provides an overview of each of these two potential exposure
pathways for tritium in groundwater.
7.3.1
POTENTIAL GROUNDWATER MIGRATION TO DRINKING
WATER USERS OFF THE STATION PROPERTY
Based upon the groundwater and surface water data presented in this HIR,
groundwater flow is to the east towards Lake Michigan. The horizontal extent of the
elevated concentrations of tritium in the direction of groundwater flow has been
established, and is limited to the area around MW-ZN-01S. Tritium was not detected in
the four temporary well installed near the shoreline above the LLD of 200 pCi/L. The
tritium concentrations in groundwater samples collected from MW-ZN-01S ranged from
less than LLD (most recently) to 586 ± 141 pCi/L (lower interval), 220 ± 123 pCi/L to
261 ± 124 pCi/L (upper interval), which are significantly less than the USEPA drinking
water standard of 20,000 pCi/L. No tritium was detected above the LLD (200 pCi/L) in
the other fourteen monitoring wells across the Station. In addition, there are no potable
water supply wells downgradient of the Station or of monitoring well MW-ZN-01S.
045136 (22) Zion Station
43
CONESTOGA-ROVERS & ASSOCIATES
Revision 1
The direction of groundwater flow is east towards Lake Michigan. Tritium was not
detected at concentrations greater than the LLD (200 pCi/L) in the four temporary wells
located downgradient of MW-ZN-01S. There is no potentially complete exposure
pathway, and therefore there is no current risk of exposure associated with groundwater
ingestion off the Station property.
7.3.2
POTENTIAL GROUNDWATER MIGRATION TO
SURFACE WATER USERS
Based upon the groundwater and surface water data presented in this HIR,
groundwater flow is to the east towards Lake Michigan. The horizontal extent of the
elevated concentrations of tritium is limited to the area around MW-ZN-01S. The
tritium concentrations detected in groundwater samples collected from MW-ZN-01S
ranged from less than LLD (200 pCi/L) (most recently) to 586 ± 141 pCi/L (lower
interval) and 220 ± 123 pCi/L to 261 ± 124 pCi/L (upper interval), which are
significantly less than the USEPA drinking water standard of 20,000 pCi/L. No tritium
was detected above the LLD (200 pCi/L) in the other 14 monitoring wells across the
Station. In addition, no tritium was detected above the LLD (200 pCi/L) in the
downgradient monitoring wells (MW-ZN-11S and TW-ZN-100 through TW-ZN-103)
and the surface water sample collected from Lake Michigan at station SW-ZN-01,
adjacent to the Station.
The Lake County Public Works Department obtains its water for the City of Zion from
Lake Michigan by means of an intake pipe located approximately 1 mile to the north of
the Station and extending 3,000 feet into the Lake. Since tritium was not detected at
concentrations greater than LLD (200 pCi/L) in the four temporary wells and
MW-ZN-11S (which are downgradient of MW-ZN-01S) or the Lake Michigan surface
water sample, there is an incomplete exposure pathway. Therefore, there is no current
risk of exposure associated with ingestion and recreational use off the Station property.
7.4
SUMMARY OF POTENTIAL TRITIUM EXPOSURE PATHWAYS
There are two potential groundwater exposure pathways for tritium originating at the
Station:
•
groundwater migration off the Station Property to private and public groundwater
users (drinking water exposure); and
045136 (22) Zion Station
44
CONESTOGA-ROVERS & ASSOCIATES
•
groundwater migration off the Station Property to Lake Michigan (drinking water
exposure and recreational exposure).
Revision 1
Based upon the groundwater and surface water data provided and referenced in this
investigation, none of the potential receptors are at risk of exposure to concentrations of
tritium in excess of USEPA drinking water standard (20,000 pCi/L).
7.5
OTHER RADIONUCLIDES
Target radionuclides were not detected at concentrations greater than their respective
LLDs in the groundwater and surface water samples collected. Other non-targeted
radionuclides were also included in the tables but excluded from discussion in this
report. These radionuclides were either a) naturally occurring and thus not produced by
the Station, or b) could be definitively evaluated as being naturally occurring due to the
lack of presence of other radionuclides which would otherwise indicate the potential of
production from the Station.
045136 (22) Zion Station
45
CONESTOGA-ROVERS & ASSOCIATES
Revision 1
8.0
CONCLUSIONS
Based on all of the studies completed to date at the Zion Station, CRA concludes:
Groundwater Flow
•
The water table is in the Upper Sand Unit. The depth to water ranged from
5 to 14 feet bgs.
•
The shallow groundwater at the Station generally flows to the east towards Lake
Michigan.
•
Groundwater
flow
at
the
Station
is
affected
by
the
construction
(basements/foundations) of the Reactor, Turbine, and Auxiliary Buildings, which
were constructed into the Silt-Clay Unit. These buildings are barriers to lateral flow.
•
A sheet pile wall was initially installed to limit the infiltration of Lake Michigan
water into the construction excavation for the main Station buildings. The wall
currently influences groundwater flow on the east side of the Station by diverting
the groundwater around the wall.
Groundwater Quality
•
None of the detected tritium concentrations in the groundwater exceeded the
USEPA drinking water standard of 20,000 pCi/L.
•
Tritium was not detected at concentrations greater than the LLD (200 pCi/L) in 14 of
the 15 monitoring wells collected as part of this investigation.
•
Tritium was detected in groundwater samples collected from monitoring well
MW-ZN-01S. These concentrations ranged from less than LLD (most recently) to
586 ± 141 pCi/L (lower interval) and 220 ± 123 pCi/L to 261 ± 124 pCi/L (upper
interval).
•
Gamma-emitting radionuclides associated with licensed plant operations were not
detected at concentrations greater than their respective LLDs in any of the sample
collected as part of this investigation.
•
Strontium-89/90 was not detected at concentrations greater than the LLD of
2.0 pCi/L in any sample collected as part of this investigation.
•
Tritium is not migrating off the Station property.
045136 (22) Zion Station
46
CONESTOGA-ROVERS & ASSOCIATES
Revision 1
Surface Water Quality
•
Tritium was not detected in the surface water sample at a concentration greater than
the USEPA drinking water standard of 20,000 pCi/L.
•
Tritium was not detected in the surface water sample at a concentration greater than
the LLD of 200 pCi/L.
•
Gamma-emitting radionuclides associated with licensed plant operations were not
detected at concentrations greater than their LLDs in the sample collected as part of
this investigation.
•
Strontium-89/90 was not detected at concentrations greater than the LLD of
2.0 pCi/L in the sample collected as part of this investigation.
AFE-Zion-1: Main Complex Area, AFE-Zion-3: Unit 2 (Northern) AST Area, and
AFE-Zion-4: Wastewater Treatment Plant Area
•
Gamma-emitting radionuclides associated with licensed plant operations were not
detected at concentrations greater than their respective LLDs in any of the
groundwater samples collected from the monitoring wells in the vicinity of AFEs
Zion-1, 3, and 4.
•
Strontium-89/90 was not detected at concentrations greater than the LLD of
2.0 pCi/L in any of the groundwater samples collected from the monitoring wells in
the vicinity of AFEs-Zion-1, 3, and 4.
•
Tritium was detected in groundwater samples collected from monitoring well
MW-ZN-01S. These concentrations ranged from less than LLD (most recently) to
586 ± 141 pCi/L (lower interval) and 220 ± 123 pCi/L to 261 ± 124 pCi/L (upper
interval). The tritium is localized to the area in the vicinity of monitoring well
MW-ZN-01S. No tritium was detected in the four temporary wells and MW-ZN-11S,
located downgradient of monitoring well MW-ZN-01S. This well is located in close
proximity to AFEs Zion 1, 3, and 4. The source of tritium in this location is likely
attributable to historical releases in this area. However, the most recent sample
results are within the range of background concentrations.
AFE-Zion-2: Unit 1 (Southern) Aboveground Storage Tank (AST) Area
•
Gamma-emitting radionuclides associated with licensed plant operations were not
detected at concentrations greater than their respective LLDs in any of the
groundwater samples collected from the monitoring wells in the vicinity of
AFE-Zion-2.
045136 (22) Zion Station
47
CONESTOGA-ROVERS & ASSOCIATES
Revision 1
•
Strontium-89/90 was not detected at concentrations greater than the LLD of
2.0 pCi/L in any of the groundwater samples collected from the monitoring wells in
the vicinity of AFE-Zion-2.
•
Tritium was not detected at concentrations greater than the LLD of 200 pCi/L in any
of the groundwater samples collected from the monitoring wells near AFE-Zion-2.
•
There have been no impacts to groundwater from AFE-Zion-2.
Potential Receptors
Based on the results of this investigation
4
, there is no current risk from exposure to
radionuclides associated with licensed plant operations through any of the identified
potential exposure pathways.
General Conclusions
•
Based on the results of this investigation, tritium is not migrating off the Station
property at detectable concentrations; and
•
Based on the results of this investigation, there are no known active releases into the
groundwater at the Station.
4
Using the LLDs specified in this HIR.
045136 (22) Zion Station
48
CONESTOGA-ROVERS & ASSOCIATES
Revision 1
9.0
RECOMMENDATIONS
The following presents CRA's recommendations for proposed activities to be completed
at the Station.
9.1
DATA GAPS
Based on the results of this hydrogeologic investigation, there are no data gaps
remaining to support CRA’s conclusions regarding the characterization of the
groundwater regime and potential impacts from radionuclides at the Station.
9.2
GROUNDWATER MONITORING
Based upon the information collected to date, CRA recommends that Exelon conduct
periodic monitoring of selected sample locations.
Temporary Well Abandonment
Four temporary wells were installed on the beach between the sheet pile wall and the
normal high water mark. These temporary wells are not expected to survive the winter
due to storms and ice buildup and should be properly abandoned before the onset of
cold weather.
045136 (22) Zion Station
49
CONESTOGA-ROVERS & ASSOCIATES
Revision 1
10.0
REFERENCES
ATSDR, 2000. Public Health Assessment, Asbestos Contamination at Illinois Beach State
Park, Illinois Beach Park, Zion, Lake County, Illinois, EPA Facility Id:
ILD984840140, Illinois Department of Public Health and the Agency for Toxic
Substances and Disease Registry.
Bannon-Nilles, 2003. Phyllis L. Bannon-Nilles, A Park in the Making: the History of the
Development of Illinois Beach State Park, Open File Series 2003-8, Illinois State
Geological Survey, Champaign, Illinois, 2003.
Berg and Kempton, 1988. Richard C. Berg and John P. Kempton, Stack-Unit Mapping of
Geologic Materials in Illinois to a Depth of 15 Meters, Circular 542, Illinois State
Geological Survey, Champaign, Illinois.
Chrzastowski and Frankie 2000. Michael J. Chrzastowski and Wayne T. Frankie, Guide
to the Geology of Illinois Beach State Park and the Zion Beach-Ridge Plain, Lake
County, Illinois, Illinois State Geological Survey, 2000.
City of Zion, 2004. 04-O-9, An Ordinance Amending Sections 94-47 and 94-48 of the City
of Zion Code Relative to the Provision of Water Service, City of Zion, Lake
County, Illinois, passed on March 2, 2004.
City of Zion, 2006. Annual Water Quality Report, Water Testing Performed in 2005, City
of Zion, Zion Public Works Department, June 23, 2006.
ComEd, 1967. Drawing B-1A, Location of Borings, Zion Station, Commonwealth Edison
Co., Chicago, Illinois.
ComEd, 1971. Zion
Station
Final
Safety
Analysis
Report,
Amendment 17,
Commonwealth Edison Company, December 1971.
ComEd, 1999. Zion Station Historical Site Assessment, ComEd Decommissioning
Projects & Zion Station.
ComEd, November 1968. Drawings B-10 through B-14, Log of Borings, Zion Station,
Commonwealth Edison Co., Chicago, Illinois.
CRA, May 2006. Hydrogeologic
Investigation
Work
Plan,
Fleetwide
Tritium
Assessment, Zion Generating Station, Zion, Illinois, prepared for Exelon
Generation Company, LLC by Conestoga-Rovers & Associates, Inc.
Dames and Moore, 1967. Report: Foundation Investigation, Proposed Nuclear Power
Plant, Zion, Illinois (Rough Draft), prepared for the Commonwealth Edison
Company by Dames and Moore, October 9, 1967.
Environmental Inc., 2005. Final Monthly Progress Report to Exelon Nuclear,
Radiological Environmental Monitoring Program (REMP), for Zion Station, Zion,
Illinois, Environmental Incorporated Midwest Laboratory, Northbrook, Illinois.
045136 (22) Zion Station
50
CONESTOGA-ROVERS & ASSOCIATES
Revision 1
Exelon, 2005. Quad Cities Nuclear Power Station, 2004 Annual Radiological
Environmental Operating Report.
Exelon, 2006. Offsite Dose Calculation Manual, Revision 15, Dockets 50-295 and 50-304
(Zion), Exelon Nuclear, February 2006.
Exelon, October 2004. Zion Station Defueled Safety Analysis Report (DSAR) and DSAR
Update, Revision 3, Exelon Generation, Warrenville, Illinois.
Foote, 1982. Gary Ray Foote, Fracture Analysis in Northeastern Illinois and Northern
Indiana, University of Illinois, Urbana, Illinois, 1982.
Fraser and Hester 1974. Gordon S. Fraser and Norman C. Hester, Sediment Distribution
in a Beach Ridge Complex and its Application to Artificial Beach Replenishment,
Environmental Geology Notes #67, Illinois State Geological Survey, 1974.
Hansel, 1983. Ardith K. Hansel, The Wadsworth Till Member of Illinois and the
Equivalent Oak Creek Formation of Wisconsin, in Geoscience Wisconsin, Vol. 7,
July 1983.
International Joint Commission, August 1997. 1995-97 Priorities and Progress Under the
Great
Lakes
Water
Quality
Agreement,
http://www.ijc.org/php/publications/html/pr9597.html
, International Joint
Commission.
Larson and Schaetzl, 2001. Grahame Larson and Randall Schaetzl, Origin and Evolution
of the Great Lakes, in the Journal of Great Lakes Research, Vol. 27, No. 4,
pp. 518-546, 2001.
Nicholas and Healy, 1988. J.R. Nicholas and R.W. Healy, Tritium Migration From a
Low-Level Radioactive-Waste Disposal Site Near Chicago, Illinois, USGS Water
Supply Paper 2333, U.S. Geological Survey, Denver Colorado, 1988.
NOAA, June 2006. NOAA Tides & Currents: Great Lakes Water Level Data,
http://tidesandcurrents.noaa.gov/
, U.S. National Oceanic and Atmospheric
Administration, Center for Operational Oceanographic Products and Services
(CO-OPS), Silver Spring, Maryland.
NRC, 2006. Facility Information Finder, Operating Nuclear Power Reactors,
http://www.nrc.gov/info-finder.html
, U.S. Nuclear Regulatory Commission,
accessed June 29, 2006.
NRCS, June 2005. Soil Survey of Lake County, Illinois, U.S. Department of Agriculture,
Natural Resources Conservation Service.
Puls and Barcelona, April 1996. Low-Flow (Minimal Drawdown) Ground-Water
Sampling Procedures, EPA Ground Water Issue, EPA/540/S-95/504, R.S. Kerr
Environmental Research Center, Ada, Oklahoma.
045136 (22) Zion Station
51
CONESTOGA-ROVERS & ASSOCIATES
Revision 1
045136 (22) Zion Station
52
CONESTOGA-ROVERS & ASSOCIATES
SEWRPC and WGNHS, 2002. Groundwater Resources of Southeastern Wisconsin,
Technical
Report No. 37, Southeastern Wisconsin Regional Planning Commission
and Wisconsin Geological and Natural History Survey, June 2002.
Underwood et al., 2003. Chad A. Underwood,
Michele L. Cooke,
J.A. Simo
and
Maureen
A. Muldoon, Stratigraphic Controls on Vertical Fracture Patterns in
Silurian Dolomite, Northeastern Wisconsin, AAPG Bulletin v. 87, no. 1,
American Association of Petroleum Geologists, January 2003.
University of Wisconsin, 1970.
Pleistocene Geology of Southern Wisconsin, Information
Circular Number 15, Geological and Natural History Survey, University of
Wisconsin, 1970.
US AEC, 1972. Final Environmental Statement Related to Operation of Zion Nuclear
Power
Station Units 1 and 2, Commonwealth Edison Company, Docket
Nos. 50-295 and 50-304, U.S. Atomic Energy Commission, December 1972.
USEPA and Environment Canada, 1995. "The Great Lakes: An Environmental Atlas
and Resource Book", Chicago, Illinois.
USEPA, 1996. Soil
Screening
Guidance: Technical
Background
Document,
EPA/540/R-95/128,
Office of Solid Waste and Emergency Response, United
States Environmental Protection Agency, Washington, DC.
USEPA, May 1996. "Soil Screening Guidance Technical Background Document", Office
of Solid Waste and Emergency Response, Washington, DC EPA/540/R95/128.
USGS, 1996. Robert T. Kay, Richard F. Duwelius, Timothy
A. Brown, Frederick A.
Micke, and Carol A. Witt-Smith, Geohydrology, Water Levels and Directions of
Flow, and Occurrence of Light-Nonaqueous-Phase Liquids on Ground Water in
Northwestern Indiana and the Lake Calumet Area of Northeastern Illinois,
U.S. Geological Survey, De Kalb, Illinois.
Visocky et al., 1985. Adrian P. Visocky, Marvin G. Sherrill, and Keros Cartwright,
Geology, Hydrology, and
Water Quality of the Cambrian and Ordovlclan
Systems In Northern Illinois, Cooperative Groundwater Report 10, Illinois State
Geological Survey, Illinois State Water Survey, Champaign, Illinois.
Willman, 1971. H.B. Willman, Summary of the Geology of the Chicago Area,
Circular 460, Illinois State Geological Survey, Urbana, Illinois.
Zeizel et al., 1962. Arthur J. Zeizel,
William C. Walton,
Robert T. Sasman,
and
Thomas A. Prickett,
Ground-Water Resources of DuPage County, Illinois,
Cooperative Report No. 2, Illinois State Water Survey, Illinois State Geological
Survey, Urbana, Illinois, 1962.
STATION
SOURCE: USGS QUADRANGLE MAP;
0
2000
4000ft
ZION, ILLINOIS (1993)
figure 1.1
STATION LOCATION MAP
ZION STATION
EXELON GENERATION COMPANY, LLC
45136-30(022)GN-WA001 AUG 24/2006
FIGURE 1.2 STATION BOUNDARIES
AND FEATURES
(Withheld)
SOURCES: MAP: USGS QUADRANGLE MAP;
0
400
800ft
ZION, ILLINOIS (1993)
figure 2.1
STATION SURFACE WATER FEATURES
ZION STATION
EXELON GENERATION COMPANY, LLC
45136-30(022)GN-WA024 SEP 07/2006
WELL LOCATIONS: BANKS INFORMATION SOLUTIONS, INC.
WATER WELL REPORT, JUNE 7, 2006
LEGEND
PROPERTY LINE
REVISION 1
DITCH
figure 2.2
REGIONAL STRATIGRAPHIC CROSS-SECTION
ZION STATION
EXELON GENERATION COMPANY, LLC
45136-30(022)GN-WA007 AUG 24/2006
SOURCE: ILLINOIS STATE GEOLOGICAL SURVEY,
INTRODUCTION TO 3-D VISUALIZATION OF
BEDROCK IN LAKE COUNTY, ILLINOIS
figure 2.3
CROSS-SECTION OF THE ZION BEACH-RIDGE PLAIN
ZION STATION
EXELON GENERATION COMPANY, LLC
45136-30(022)GN-WA016 AUG 24/2006
SOURCE: GUIDE TO THE GEOLOGY OF ILLINOIS BEACH STATE PARK
AND THE ZION BEACH-RIDGE PLAIN, LAKE COUNTY,
ILLINOIS STATE GEOLOGICAL SURVEY, 2000.
CROSS-SECTION LOCATION
FIGURE 2.4 PRIVATE/PUBLIC WATER
SUPPLY WELL LOCATIONS
(Withheld)
FIGURE 3.1 AREAS FOR FURTHER
EVALUATION
(Withheld)
FIGURE 4.1 GROUNDWATER AND
SURFACE WATER MONITORING
LOCATIONS
(Withheld)
FIGURE 5.1 STATION GEOLOGIC
CROSS–SECTION LOCATION MAP
(Withheld)
600
590
580
570
560
550
540
530
520
510
500
490
480
470
460
ELEVATION (ft. AMSL)
MW-ZN-05S
MW-ZN-04S
MW-ZN-03S
MW-ZN-02S
BH7 (offset 150' W)
MW-ZN-01S
MW-ZN-08S
500
1000
1500
A'
NORTH
600
590
580
570
560
550
540
530
520
510
500
490
480
470
460
ELEVATION (ft. AMSL)
A
SOUTH
TURBINE BUILDING
INTAKE CRIB
TURBINE BUILDING
DISTANCE (ft.)
INTAKE
LINE
LINE
DISCHARGE
0
BH1 (offset 660' W)
BH70 (offset 61' E)
BH71 (offset 49' E)
BH46 (offset 274' W)
BH19 (offset 488' W)
LINE
DISCHARGE
BOTTOM OF SHEET PILE WALL
MW-ZN-10S (offset 224' W)
MW-ZN-11S (offset 58' E)
Scale:
Source Reference:
Project Manager:
Reviewed By:
Project N
o
:
Date:
Report N
o
:
Drawing N
o
:
THIS BAR MEASURES 1" ON ORIGINAL. ADJUST SCALE ACCORDINGLY.
SCALE VERIFICATION
EXELON GENERATION COMPANY, LLC
ZION, ILLINOIS
GEOLOGIC CROSS SECTION A-A'
ZION STATION
FLEETWIDE ASSESSMENT
S. QUIGLEY
J. RABY
AUGUST 2006
45136-30
022
figure 5.2
45136-30(022)GN-WA023 AUG 09/2006
AS SHOWN
MW-ZN-05S
FILL
UPPER/LOWER SAND UNIT
SILT-CLAY UNIT
BASEMENT / FOUNDATIONS
MEASUREMENTS TAKEN ON MAY 23, 2006
0
600
590
580
570
560
550
540
530
520
510
500
490
480
470
460
ELEVATION (ft. AMSL)
DISTANCE (ft.)
MW-ZN-07S
B
WEST
B'
EAST
MW-ZN-09S
BH7
MW-ZN-02S
CONTAINMENT BUILDING
AUXILIARY BUILDING
TURBINE BUILDING
INTAKE CRIB
LAKE MICHIGAN
BREAK WALL
500
1000
1500
2000
600
590
580
570
560
550
540
530
520
510
500
490
480
470
460
ELEVATION (ft. AMSL)
BH1
INTAKE LINE
DISCHARGE LINE
SHEET PILE WALL
BH19
BH46
BH71
TW-ZN-100 (offset 150.6' N)
TW-ZN-103 (offset 162.9' N)
Scale:
Source Reference:
Project Manager:
Reviewed By:
Project N
o
:
Date:
Report N
o
:
Drawing N
o
:
THIS BAR MEASURES 1" ON ORIGINAL. ADJUST SCALE ACCORDINGLY.
SCALE VERIFICATION
EXELON GENERATION COMPANY, LLC
ZION, ILLINOIS
GEOLOGIC CROSS SECTION B-B'
ZION STATION
FLEETWIDE ASSESSMENT
S. QUIGLEY
J. RABY
AUGUST 2006
45136-30
022
figure 5.3
45136-30(022)GN-WA023 AUG 24/2006
AS SHOWN
MW-ZN-07S
FILL
UPPER/LOWER SAND UNIT
SILT-CLAY UNIT
NIAGARA DOLOMITE
BASEMENT / FOUNDATIONS
MEASUREMENTS TAKEN ON MAY 23, 2006
FIGURE 5.4 POTENTIOMETRIC
SURFACE CONTOURS . MAY 2006 .
SHALLOW GROUNDWATER ZONE
(Withheld)
FIGURE 5.5 POTENTIOMETRIC
SURFACE CONTOURS . JULY 2006 .
SHALLOW GROUNDWATER ZONE
(Withheld)
FIGURE 5.6 TRITIUM
CONCENTRATIONS .
GROUNDWATER AND SURFACE
WATER
(Withheld)
FIGURE 5.7 RADIONUCLIDE
CONCENTRATIONS .
GROUNDWATER AND SURFACE
WATER
(Withheld)
TABLE 4.2
SUMMARY OF MONITORING WELL DEVELOPMENT PARAMATERS
FLEETWIDE ASSESSMENT
ZION STATION
ZION, ILLINOIS
Page 1 of 5
Sample
Gallons
Water
Location
Date
Well Volume Purged
Level
pH
Conductivity Temperature Turbidity
Observations
Pump Type
(gallons)
(Std. Units)
(μS/cm)
1
(°C)
(ntu)
2
MW-ZN-01S
5/3/2006
5.0
5
13.3
NA
NA
NA
NA
brown, turbid, silty
Peristaltic
10
7.46
757
17.0
> 1000
brown, turbid, silty
15
NA
NA
NA
NA
brown, turbid, silty
20
7.38
699
17.0
> 1000
brown, turbid, silty
25
7.20
662
15.7
> 1000
brown, turbid, silty
30
7.31
640
16.1
> 1000
brown, turbid, silty
35
7.33
633
17.1
> 1000
brown, turbid, silty
40
622
16.5
> 1000
brown, turbid, silty
45
7.48
607
19.2
> 1000
brown, turbid, silty
50
7.43
599
16.6
> 1000
brown, turbid, silty
55
7.41
591
16.5
340
brown, turbid, silty
60
7.41
593
16.3
164
brown, turbid, silty
65
7.43
593
16.3
164
brown, turbid, silty
70
7.44
580
17.4
99.6
brown, turbid, silty
75
7.45
589
15.9
95.3
brown, turbid, silty
80
7.43
586
16.1
82
brown, turbid, silty
MW-ZN-02S
5/4/2006
3.5
4
13.6
7.97
653
12.5
> 1000
silty, gray
Peristaltic
8
7.80
614
14.6
> 1000
silty, gray
12
7.74
605
14.5
> 1000
silty, gray
18
7.83
595
14
> 1000
silty, gray
22
7.63
582
13.3
> 1000
silty, gray
26
7.64
577
13
> 1000
silty, gray
30
7.62
199.5
12.6
> 1000
silty, gray
34
7.58
95.6
13.3
> 1000
silty, gray
40
7.57
196.3
12.6
> 1000
silty, gray
44
7.61
195.1
12.9
896
getting less cloudy
48
7.60
96.3
12.8
702
getting less cloudy
CRA 45136 (22) Zion Station
Revision 1
TABLE 4.2
SUMMARY OF MONITORING WELL DEVELOPMENT PARAMATERS
FLEETWIDE ASSESSMENT
ZION STATION
ZION, ILLINOIS
Page 2 of 5
Sample
Gallons
Water
Location
Date
Well Volume Purged
Level
pH
Conductivity Temperature Turbidity
Observations
Pump Type
(gallons)
(Std. Units)
(μS/cm)
1
(°C)
(ntu)
2
MW-ZN-03S
5/5/2006
3.72
4
13.12
7.44
666
11.3
> 1000
cloudy, brown
Peristaltic
8
7.41
628
11.3
> 1000
cloudy, brown
12
7.46
608
10.9
> 1000
cloudy, brown
16
7.43
604
10.5
> 1000
cloudy, brown
20
7.47
200
10.7
> 1000
cloudy, brown
24
7.43
192.2
10.4
> 1000
cloudy, brown
28
7.43
188.8
10.7
> 1000
cloudy, brown
32
7.40
188.0
10.9
834
cloudy, brown
36
7.42
186.1
10.6
838
cloudy, brown
40
7.40
181.3
10.5
> 1000
cloudy, brown
44
7.40
181.7
10.9
> 1000
cloudy, brown
48
7.40
178.9
10.4
> 1000
cloudy, brown
52
7.41
177.0
10.4
1000
cloudy, brown
MW-ZN-04S
5/5/2006
8
14.27
7.24
188.9
12.9
> 1000
cloudy, brown
Peristaltic
12
7.50
185.5
12.6
> 1000
cloudy, brown
16
7.51
553
12.8
> 1000
cloudy, brown
20
7.50
179.0
12.8
> 1000
cloudy, brown
24
7.49
177.6
12.8
689
cloudy, brown
28
7.50
176.5
12.8
508
cloudy, brown
32
7.48
175.2
12.8
312
slightly cloudy, brown
36
7.48
176.0
12.6
267
slightly cloudy, brown
40
7.47
173.4
12.6
180
slightly cloudy, brown
44
7.47
173.4
12.6
114
slightly cloudy, brown
48
7.46
172.2
12.6
85.1
slightly cloudy, brown
52
7.46
171.7
12.6
52.8
slightly cloudy, brown
CRA 45136 (22) Zion Station
Revision 1
TABLE 4.2
SUMMARY OF MONITORING WELL DEVELOPMENT PARAMATERS
FLEETWIDE ASSESSMENT
ZION STATION
ZION, ILLINOIS
Page 3 of 5
Sample
Gallons
Water
Location
Date
Well Volume Purged
Level
pH
Conductivity Temperature Turbidity
Observations
Pump Type
(gallons)
(Std. Units)
(μS/cm)
1
(°C)
(ntu)
2
MW-ZN-05S
5/8/2006
4.1
5
25.63
7.28
140.0
12.4
> 1000
cloudy, brown
Peristaltic
10
7.21
141.5
12.6
879
cloudy, brown
15
7.22
142.3
12.8
> 1000
cloudy, brown
20
7.25
140.7
12.5
588.0
cloudy, brown
25
7.25
142.2
12.5
228.00
slightly cloudy, brown
30
7.25
144.3
12.3
482.00
slightly cloudy, brown
35
7.22
147.1
12.5
60.00
clear
40
7.24
145.2
12.6
32.6
clear
45
7.23
144.5
12.7
19.7
clear
50
7.23
144.6
12.7
16
clear
55
7.25
144.0
12.7
16.2
clear
60
7.25
144.0
12.6
10.2
clear
MW-ZN-06S
5/8/2006
3.52
3.5
3.52
7.12
135.2
12.8
> 1000
silty, gray
Peristaltic
7.0
7.09
133.7
10.3
> 1000
silty, gray
10.5
7.08
137.6
11.0
> 1000
silty, gray
14.0
7.05
137.6
10.3
> 1000
silty, gray
17.5
7.04
139.0
10.7
> 1000
silty, gray
21.0
7.35
122.5
10.8
1000
silty, gray
24.5
7.24
124.7
10.5
232
clearer
28.0
7.13
126.8
10.0
> 1000
clear
31.5
7.07
128.3
10.3
520
clear
35.0
7.08
128.5
10.2
148
silty
38.5
7.03
128.8
10.0
> 1000
silty
41.0
6.99
132.0
10.5
458
clear
44.5
7.10
129.1
10.4
143
clear
48
7.01
131.4
10.5
137.8
clear
CRA 45136 (22) Zion Station
Revision 1
TABLE 4.2
SUMMARY OF MONITORING WELL DEVELOPMENT PARAMATERS
FLEETWIDE ASSESSMENT
ZION STATION
ZION, ILLINOIS
Page 4 of 5
Sample
Gallons
Water
Location
Date
Well Volume Purged
Level
pH
Conductivity Temperature Turbidity
Observations
Pump Type
(gallons)
(Std. Units)
(μS/cm)
1
(°C)
(ntu)
2
MW-ZN-07S
5/8/2006
4.3
4.3
5.20
7.15
139.5
10.5
> 1000
silty, gray
Peristaltic
8.6
7.11
141.3
10.7
> 1000
silty, gray
12.9
7.11
137.6
10.8
> 1000
silty, gray
16.2
7.13
136.1
10.6
> 1000
silty, gray
20.5
7.13
139.0
10.7
> 1000
silty, gray
24.8
7.05
138.6
10.3
> 1000
silty, gray
29.1
7.05
137.6
10.5
872
silty, gray
33.4
7.07
138.2
10.3
569
silty, gray
37.7
7.07
113.7
10.7
> 1000
silty, gray
42.0
7.06
140.1
10.4
520
silty, gray
45.3
7.06
138.5
10.8
213
silty, gray
49.6
7.04
139.3
10.4
89.7
silty, gray
MW-ZN-08S
5/8/2006
3.86
3.9
8.17
7.45
143.6
13.0
> 1000
NA
Peristaltic
9.8
7.47
136.8
12.8
1000
NA
11.7
7.40
138.5
12.9
628
NA
15.6
7.42
139.4
13.3
> 1000
NA
19.5
7.42
138.4
12.6
898
NA
23.4
7.41
138.1
12.6
898
NA
27.3
7.41
141.5
13.3
898
NA
31.2
7.42
138.1
13.0
387
NA
35.1
7.33
138.1
12.6
198
NA
39.0
7.41
138.4
13.0
101
NA
42.9
7.39
139.3
12.4
75.2
NA
46.8
7.42
138.7
12.6
50.9
NA
MW-ZN-09S
5/8/2006
1.58
2
9.89
8.97
158.7
11.9
> 1000
cloudy, gray
Peristaltic
4
9.13
159.7
11.7
> 1000
septic odor
6
9.18
158.6
11.7
> 1000
septic odor
8
9.15
156.3
11.7
484
septic odor
10
9.13
155.3
11.7
245
slightly cloudy, gray
12
9.00
152.1
11.8
> 1000
slightly cloudy, gray
14
9.10
151.1
11.8
277
slightly cloudy, gray
16
9.07
150.2
11.8
44.7
slightly cloudy, gray
18
9.09
148.6
11.8
13.10
clear, septic odor
20
9.09
147.7
11.7
9.93
clear, septic odor
22
9.04
147.2
11.7
8.67
clear, septic odor
CRA 45136 (22) Zion Station
Revision 1
TABLE 4.2
SUMMARY OF MONITORING WELL DEVELOPMENT PARAMATERS
FLEETWIDE ASSESSMENT
ZION STATION
ZION, ILLINOIS
Page 5 of 5
Sample
Gallons
Water
Location
Date
Well Volume Purged
Level
pH
Conductivity Temperature Turbidity
Observations
Pump Type
(gallons)
(Std. Units)
(μS/cm)
1
(°C)
(ntu)
2
MW-ZN-10S
7/14/2006
4
90*
13.58
6.89
913.0
16.7
151.00
cloudy
Peristaltic
94
7.18
776.0
15.0
132.00
cloudy
98
7.26
738.0
14.0
281.00
cloudy
102
7.34
748.0
13.8
112
clear
106
7.37
738.0
13.8
75.5
clear
MW-ZN-11S
7/14/2006
3
3
10.5
7.47
863.0
17.3
>1000
cloudy, brown
Peristaltic
6
7.31
842.0
16.8
>1000
cloudy, brown
9
7.35
839.0
16.1
>1000
cloudy, brown
12
7.36
832.0
16.2
243
clear
15
7.31
828.0
16.0
162
clear
18
7.31
806.0
16.0
88.80
clear
24
7.28
654.0
16.7
>1000
clear
27
7.28
827.0
15.9
258.00
clear
30
7.33
503.0
16.7
83.7
clear
33
7.33
791.0
16.4
52
clear
36
7.27
802
16.2
105
clear
45
7.27
799
15.6
50
clear
51
7.36
792
15.6
23.6
clear
56
7.27
798
15.7
22
clear
Notes:
1
μS/cm - microSiemens per centimeter
2
ntu - nephelometric turbidity units
*
purged 90 gallons from well before taking readings
CRA 45136 (22) Zion Station
Revision 1
TABLE 5.1
ANALYTICAL RESULTS SUMMARY - TRITIUM IN GROUNDWATER AND SURFACE WATER
FLEETWIDE ASSESSMENT
ZION STATION
ZION, ILLINOIS
Page 1 of 1
Sample Location
(1)
Sample Identification
QC Sample
Sample Date Tritium (pCi/L) Result Error
MW-ZN-01S(L)
WG-ZN-MW-ZN-01L-052606-DS-07
5/26/2006
586
+/-141
MW-ZN-01S(L)
GW-062806-PG-02
6/28/2006
ND (200)
-
MW-ZN-01S(U)
WG-ZN-MW-ZN-01U-052606-DS-05
5/26/2006
261
+/-124
MW-ZN-01S(U)
GW-062806-PG-01
6/28/2006
220
+/-123
MW-ZN-02S(L)
WG-ZN-MW-ZN-02L-052606-DS-06
5/26/2006
ND (200)
-
MW-ZN-02S(U)
WG-ZN-MW-ZN-02U-052606-DS-04
5/26/2006
ND (200)
-
MW-ZN-03S(L)
WG-ZN-MW-ZN-03L-052506-DS-03
5/25/2006
ND (200)
-
MW-ZN-03S(U)
WG-ZN-MW-ZN-03U-052506-DS-01
5/25/2006
ND (200)
-
MW-ZN-03S(U)
WG-ZN-MW-ZN-03U-052506-DS-02
Duplicate (01)
5/25/2006
ND (200)
-
MW-ZN-04S(L)
WG-ZION-MW-4L-052406-MB-004
5/24/2006
ND (200)
-
MW-ZN-04S(U)
WG-ZION-MW-4U-052406-MB-002
5/24/2006
ND (200)
-
MW-ZN-05S(L)
WG-ZION-MW-5L-052606-MS-013
5/26/2006
ND (200)
-
MW-ZN-05S(U)
WG-ZION-MW-5U-052606-MS-017
5/26/2006
ND (200)
-
MW-ZN-06S(L)
WG-ZION-MW-6L-052506-MS-009
5/25/2006
ND (200)
-
MW-ZN-06S(U)
WG-ZION-MW-6U-052606-MS-011
5/26/2006
ND (200)
-
MW-ZN-07S(L)
WG-ZION-MW-7L-052506-MS-007
5/25/2006
ND (200)
-
MW-ZN-07S(U)
WG-ZION-MW-7U-052406-MS-005
5/24/2006
ND (200)
-
MW-ZN-08S(L)
WG-ZION-MW-8L-052406-MS-001
5/24/2006
ND (200)
-
MW-ZN-08S(U)
WG-ZION-MW-8U-052406-MS-003
5/24/2006
ND (200)
-
MW-ZN-09S
WG-ZN-MW-ZN-09-052606-DS-08
5/26/2006
ND (200)
-
MW-ZN-09S
WG-ZN-MW-ZN-09-052606-DS-09
Duplicate (08)
5/26/2006
ND (200)
-
MW-ZN-10S(L)
WG-ZN-MW-ZN-10L-072806-MS-005
7/28/2006
ND (200)
-
MW-ZN-10S(U)
WG-ZN-MW-ZN-10U-072806-MS-003
7/28/2006
ND (200)
-
MW-ZN-10S(U)
WG-ZN-MW-ZN-10U-072806-MS-004
7/28/2006
ND (200)
-
MW-ZN-11S(L)
WG-ZN-MW-ZN-11L-072806-TL-002
7/28/2006
ND (200)
-
MW-ZN-11S(U)
WG-ZN-MW-ZN-11U-072806-TL-001
7/28/2006
ND (200)
-
SW-ZN-1
WS-ZION-LAKE-052606-MS-015
5/26/2006
ND (200)
-
TW-ZN-100
GW-071706-JL-TW-ZN-100
7/17/2006
ND (200)
-
TW-ZN-101
GW-071706-JL-TW-ZN-101
7/17/2006
ND (200)
-
TW-ZN-102
GW-071706-JL-TW-ZN-102
7/17/2006
ND (200)
-
TW-ZN-103
GW-071706-JL-TW-ZN-103
7/17/2006
ND (200)
-
Notes:
Samples analyzed
by: Teledyne Brown Engineering, Inc.
(1) Sample locations include the well identifier followed by
a sample depth indicator of 'U' for the upper portion of
the screen or 'L' for the lower portion of the screen.
ND ( ) - Not detected at a concentration above the LLD. Value in parentheses is the LLD.
LLD - Lower limit of detection.
- -
Non-detect value, +/- value not reported.
CRA 45136 (22) Zion Station
q014aI-XT-WG-all-45136-30-MC
8/10/2006
Revision 1
TABLE 5.2
ANALYTICAL RESULTS SUMMARY - RADIONUCLIDES IN GROUNDWATER AND SURFACE WATER
FLEETWIDE ASSESSMENT
ZION STATION
ZION, ILLINOIS
Page 1 of 10
Sample Location
(1)
:
MW-ZN-01S(L)
MW-ZN-01S(L)
MW-ZN-01S(U)
MW-ZN-01S(U)
MW-ZN-02S(L)
MW-ZN-02S(L)
Sample
Identification:
WG-ZN-MW-ZN-01L-052606-DS-07
Result
WG-ZN-MW-ZN-01U-052606-DS-05
Result
WG-ZN-MW-ZN-02L-052606-DS-06
Result
Sample
Date:
5/26/2006
Error
5/26/2006
Error
5/26/2006
Error
Units
Target
Radionuclides
Barium-140
pCi/L
ND (60)
-
ND (60)
-
ND (60)
-
Cesium-134
pCi/L
ND (10)
-
ND (10)
-
ND (10)
-
Cesium-137
pCi/L
ND (18)
-
ND (18)
-
ND (18)
-
Cobalt-58
pCi/L
ND (15)
-
ND (15)
-
ND (15)
-
Cobalt-60
pCi/L
ND (15)
-
ND (15)
-
ND (15)
-
Iron-59
pCi/L
ND (30)
-
ND (30)
-
ND (30)
-
Lanthanum-140
pCi/L
ND (15)
-
ND (15)
-
ND (15)
-
Manganese-54
pCi/L
ND (15)
-
ND (15)
-
ND (15)
-
Niobium-95
pCi/L
ND (10)
-
ND (10)
-
ND (10)
-
Strontium-89/90 (Total)
pCi/L
ND (2)
-
ND (2)
-
ND (2)
-
Zinc-65
pCi/L
ND (30)
-
ND (30)
-
ND (30)
-
Zirconium-95
pCi/L
ND (10)
-
ND (10)
-
ND (10)
-
Non-Target Radionuclides
(2)
Actinium-228
pCi/L
35.23
+/-10.3
RNI
-
RNI
-
Potassium-40
pCi/L
53.04
+/-34.2
RNI
-
81.03
+/-42.45
Notes:
Samples analyzed
by: Teledyne Brown
(1) - Sample locations include the well
identifier followed by
a depth indicator
of 'U' for the upper portion of the screen
or 'L' for the lower portion of the screen.
(2) - Radionuclide is naturally
occurring.
RNI- Radionuclide Not Identified during
analysis.
ND ( ) - Not detected at a concentration above the LLD. Value in parentheses is the LLD.
LLD - Lower limit of detection.
U* - Compound/Analyte
not detected.
Peak not identified, but forced activity
concentration exceeds Minimum
Detectable Concentration and 3 sigma.
- -
Non-detect value, +/- value not reported.
CRA 45136 (22) Zion Station
q014aI-XT-WG-all-45136-30-MC
8/10/2006
Revision 1
TABLE 5.2
ANALYTICAL RESULTS SUMMARY - RADIONUCLIDES IN GROUNDWATER AND SURFACE WATER
FLEETWIDE ASSESSMENT
ZION STATION
ZION, ILLINOIS
Page 2 of 10
Sample Location
(1)
:
Sample
Identification:
Sample
Date:
Units
Target
Radionuclides
Barium-140
pCi/L
Cesium-134
pCi/L
Cesium-137
pCi/L
Cobalt-58
pCi/L
Cobalt-60
pCi/L
Iron-59
pCi/L
Lanthanum-140
pCi/L
Manganese-54
pCi/L
Niobium-95
pCi/L
Strontium-89/90 (Total)
pCi/L
Zinc-65
pCi/L
Zirconium-95
pCi/L
Non-Target Radionuclides
(2)
Actinium-228
pCi/L
Potassium-40
pCi/L
Notes:
Samples analyzed
by: Teledyne Brown
(1) - Sample locations include the well
identifier followed by
a depth indicator
of 'U' for the upper portion of the screen
or 'L' for the lower portion of the screen.
(2) - Radionuclide is naturally
occurring.
RNI- Radionuclide Not Identified during
analysis.
ND ( ) - Not detected at a concentration above the LLD. Valu
LLD - Lower limit of detection.
U* - Compound/Analyte
not detected.
Peak not identified, but forced activity
concentration exceeds Minimum
Detectable Concentration and 3 sigma.
- -
Non-detect value, +/- value not reported.
MW-ZN-02S(U)
MW-ZN-02S(U)
MW-ZN-03S(L)
MW-ZN-03S(L)
MW-ZN-03S(U)
MW-ZN-03S(U)
WG-ZN-MW-ZN-02U-052606-DS-04
Result
WG-ZN-MW-ZN-03L-052506-DS-03
Result
WG-ZN-MW-ZN-03U-052506-DS-01
Result
5/26/2006
Error
5/25/2006
Error
5/25/2006
Error
ND (60)
-
ND (60)
-
ND (60)
-
ND (10)
-
ND (10)
-
ND (10)
-
ND (18)
-
ND (18)
-
ND (18)
-
ND (15)
-
ND (15)
-
ND (15)
-
ND (15)
-
ND (15)
-
ND (15)
-
ND (30)
-
ND (30)
-
ND (30)
-
ND (15)
-
ND (15)
-
ND (15)
-
ND (15)
-
ND (15)
-
ND (15)
-
ND (10)
-
ND (10)
-
ND (10)
-
ND (2)
-
ND (2)
-
ND (2)
-
ND (30)
-
ND (30)
-
ND (30)
-
ND (10)
-
ND (10)
-
ND (10)
-
RNI
-
RNI
-
RNI
-
73.65
+/-44.47
RNI
-
RNI
-
CRA 45136 (22) Zion Station
q014aI-XT-WG-all-45136-30-MC
8/10/2006
Revision 1
TABLE 5.2
ANALYTICAL RESULTS SUMMARY - RADIONUCLIDES IN GROUNDWATER AND SURFACE WATER
FLEETWIDE ASSESSMENT
ZION STATION
ZION, ILLINOIS
Page 3 of 10
Sample Location
(1)
:
Sample
Identification:
Sample
Date:
Units
Target
Radionuclides
Barium-140
pCi/L
Cesium-134
pCi/L
Cesium-137
pCi/L
Cobalt-58
pCi/L
Cobalt-60
pCi/L
Iron-59
pCi/L
Lanthanum-140
pCi/L
Manganese-54
pCi/L
Niobium-95
pCi/L
Strontium-89/90 (Total)
pCi/L
Zinc-65
pCi/L
Zirconium-95
pCi/L
Non-Target Radionuclides
(2)
Actinium-228
pCi/L
Potassium-40
pCi/L
Notes:
Samples analyzed
by: Teledyne Brown
(1) - Sample locations include the well
identifier followed by
a depth indicator
of 'U' for the upper portion of the screen
or 'L' for the lower portion of the screen.
(2) - Radionuclide is naturally
occurring.
RNI- Radionuclide Not Identified during
analysis.
ND ( ) - Not detected at a concentration above the LLD. Valu
LLD - Lower limit of detection.
U* - Compound/Analyte
not detected.
Peak not identified, but forced activity
concentration exceeds Minimum
Detectable Concentration and 3 sigma.
- -
Non-detect value, +/- value not reported.
MW-ZN-03S(U)
MW-ZN-03S(U)
MW-ZN-04S(L)
MW-ZN-04S(L)
MW-ZN-04S(U)
MW-ZN-04S(U)
WG-ZN-MW-ZN-03U-052506-DS-02
Result
WG-ZION-MW-4L-052406-MB-004
Result
WG-ZION-MW-4U-052406-MB-002
Result
5/25/2006
Error
5/24/2006
Error
5/24/2006
Error
Duplicate
ND (60)
-
ND (60)
-
ND (60)
-
ND (10) U*
-
ND (10)
-
ND (10)
-
ND (18)
-
ND (18)
-
ND (18)
-
ND (15)
-
ND (15)
-
ND (15)
-
ND (15)
-
ND (15)
-
ND (15)
-
ND (30)
-
ND (30)
-
ND (30)
-
ND (15)
-
ND (15)
-
ND (15)
-
ND (15)
-
ND (15)
-
ND (15)
-
ND (10)
-
ND (10)
-
ND (10)
-
ND (2)
-
ND (2)
-
ND (2)
-
ND (30) U*
-
ND (30)
-
ND (30)
-
ND (10)
-
ND (10)
-
ND (10)
-
RNI
-
RNI
-
RNI
-
RNI
-
85.89
+/-44.24
RNI
-
CRA 45136 (22) Zion Station
q014aI-XT-WG-all-45136-30-MC
8/10/2006
Revision 1
TABLE 5.2
ANALYTICAL RESULTS SUMMARY - RADIONUCLIDES IN GROUNDWATER AND SURFACE WATER
FLEETWIDE ASSESSMENT
ZION STATION
ZION, ILLINOIS
Page 4 of 10
Sample Location
(1)
:
Sample
Identification:
Sample
Date:
Units
Target
Radionuclides
Barium-140
pCi/L
Cesium-134
pCi/L
Cesium-137
pCi/L
Cobalt-58
pCi/L
Cobalt-60
pCi/L
Iron-59
pCi/L
Lanthanum-140
pCi/L
Manganese-54
pCi/L
Niobium-95
pCi/L
Strontium-89/90 (Total)
pCi/L
Zinc-65
pCi/L
Zirconium-95
pCi/L
Non-Target Radionuclides
(2)
Actinium-228
pCi/L
Potassium-40
pCi/L
Notes:
Samples analyzed
by: Teledyne Brown
(1) - Sample locations include the well
identifier followed by
a depth indicator
of 'U' for the upper portion of the screen
or 'L' for the lower portion of the screen.
(2) - Radionuclide is naturally
occurring.
RNI- Radionuclide Not Identified during
analysis.
ND ( ) - Not detected at a concentration above the LLD. Valu
LLD - Lower limit of detection.
U* - Compound/Analyte
not detected.
Peak not identified, but forced activity
concentration exceeds Minimum
Detectable Concentration and 3 sigma.
- -
Non-detect value, +/- value not reported.
MW-ZN-05S(L)
MW-ZN-05S(L)
MW-ZN-05S(U)
MW-ZN-05S(U)
MW-ZN-06S(L)
MW-ZN-06S(L)
WG-ZION-MW-5L-052606-MS-013
Result
WG-ZION-MW-5U-052606-MS-017
Result
WG-ZION-MW-6L-052506-MS-009
Result
5/26/2006
Error
5/26/2006
Error
5/25/2006
Error
ND (60)
-
ND (60)
-
ND (60)
-
ND (10)
-
ND (10)
-
ND (10) U*
-
ND (18)
-
ND (18)
-
ND (18)
-
ND (15)
-
ND (15)
-
ND (15)
-
ND (15)
-
ND (15)
-
ND (15)
-
ND (30)
-
ND (30)
-
ND (30)
-
ND (15)
-
ND (15)
-
ND (15)
-
ND (15)
-
ND (15)
-
ND (15)
-
ND (10)
-
ND (10)
-
ND (10) U*
-
ND (2)
-
ND (2)
-
ND (2)
-
ND (30)
-
ND (30)
-
ND (30) U*
-
ND (10)
-
ND (10)
-
ND (10)
-
RNI
-
RNI
-
RNI
-
RNI
-
RNI
-
RNI
-
CRA 45136 (22) Zion Station
q014aI-XT-WG-all-45136-30-MC
8/10/2006
Revision 1
TABLE 5.2
ANALYTICAL RESULTS SUMMARY - RADIONUCLIDES IN GROUNDWATER AND SURFACE WATER
FLEETWIDE ASSESSMENT
ZION STATION
ZION, ILLINOIS
Page 5 of 10
Sample Location
(1)
:
Sample
Identification:
Sample
Date:
Units
Target
Radionuclides
Barium-140
pCi/L
Cesium-134
pCi/L
Cesium-137
pCi/L
Cobalt-58
pCi/L
Cobalt-60
pCi/L
Iron-59
pCi/L
Lanthanum-140
pCi/L
Manganese-54
pCi/L
Niobium-95
pCi/L
Strontium-89/90 (Total)
pCi/L
Zinc-65
pCi/L
Zirconium-95
pCi/L
Non-Target Radionuclides
(2)
Actinium-228
pCi/L
Potassium-40
pCi/L
Notes:
Samples analyzed
by: Teledyne Brown
(1) - Sample locations include the well
identifier followed by
a depth indicator
of 'U' for the upper portion of the screen
or 'L' for the lower portion of the screen.
(2) - Radionuclide is naturally
occurring.
RNI- Radionuclide Not Identified during
analysis.
ND ( ) - Not detected at a concentration above the LLD. Valu
LLD - Lower limit of detection.
U* - Compound/Analyte
not detected.
Peak not identified, but forced activity
concentration exceeds Minimum
Detectable Concentration and 3 sigma.
- -
Non-detect value, +/- value not reported.
MW-ZN-06S(U)
MW-ZN-06S(U)
MW-ZN-07S(L)
MW-ZN-07S(L)
MW-ZN-07S(U)
MW-ZN-07S(U)
WG-ZION-MW-6U-052606-MS-011
Result
WG-ZION-MW-7L-052506-MS-007
Result
WG-ZION-MW-7U-052406-MS-005
Result
5/26/2006
Error
5/25/2006
Error
5/24/2006
Error
ND (60)
-
ND (60)
-
ND (60)
-
ND (10)
-
ND (10) U*
-
ND (10) U*
-
ND (18)
-
ND (18)
-
ND (18)
-
ND (15)
-
ND (15)
-
ND (15)
-
ND (15)
-
ND (15)
-
ND (15)
-
ND (30)
-
ND (30)
-
ND (30)
-
ND (15)
-
ND (15)
-
ND (15)
-
ND (15)
-
ND (15)
-
ND (15)
-
ND (10)
-
ND (10)
-
ND (10)
-
ND (2)
-
ND (2)
-
ND (2)
-
ND (30)
-
ND (30)
-
ND (30) U*
-
ND (10)
-
ND (10)
-
ND (10)
-
RNI
-
RNI
-
RNI
-
RNI
-
RNI
-
RNI
-
CRA 45136 (22) Zion Station
q014aI-XT-WG-all-45136-30-MC
8/10/2006
Revision 1
TABLE 5.2
ANALYTICAL RESULTS SUMMARY - RADIONUCLIDES IN GROUNDWATER AND SURFACE WATER
FLEETWIDE ASSESSMENT
ZION STATION
ZION, ILLINOIS
Page 6 of 10
Sample Location
(1)
:
Sample
Identification:
Sample
Date:
Units
Target
Radionuclides
Barium-140
pCi/L
Cesium-134
pCi/L
Cesium-137
pCi/L
Cobalt-58
pCi/L
Cobalt-60
pCi/L
Iron-59
pCi/L
Lanthanum-140
pCi/L
Manganese-54
pCi/L
Niobium-95
pCi/L
Strontium-89/90 (Total)
pCi/L
Zinc-65
pCi/L
Zirconium-95
pCi/L
Non-Target Radionuclides
(2)
Actinium-228
pCi/L
Potassium-40
pCi/L
Notes:
Samples analyzed
by: Teledyne Brown
(1) - Sample locations include the well
identifier followed by
a depth indicator
of 'U' for the upper portion of the screen
or 'L' for the lower portion of the screen.
(2) - Radionuclide is naturally
occurring.
RNI- Radionuclide Not Identified during
analysis.
ND ( ) - Not detected at a concentration above the LLD. Valu
LLD - Lower limit of detection.
U* - Compound/Analyte
not detected.
Peak not identified, but forced activity
concentration exceeds Minimum
Detectable Concentration and 3 sigma.
- -
Non-detect value, +/- value not reported.
MW-ZN-08S(L)
MW-ZN-08S(L)
MW-ZN-08S(U)
MW-ZN-08S(U)
MW-ZN-09S
MW-ZN-09S
WG-ZION-MW-8L-052406-MS-001
Result
WG-ZION-MW-8U-052406-MS-003
Result
WG-ZN-MW-ZN-09-052606-DS-08
Result
5/24/2006
Error
5/24/2006
Error
5/26/2006
Error
ND (60)
-
ND (60)
-
ND (60)
-
ND (10) U*
-
ND (10)
-
ND (10)
-
ND (18)
-
ND (18)
-
ND (18)
-
ND (15)
-
ND (15)
-
ND (15)
-
ND (15)
-
ND (15)
-
ND (15)
-
ND (30)
-
ND (30)
-
ND (30)
-
ND (15)
-
ND (15)
-
ND (15)
-
ND (15)
-
ND (15)
-
ND (15)
-
ND (10)
-
ND (10)
-
ND (10)
-
ND (2)
-
ND (2)
-
ND (2)
-
ND (30)
-
ND (30)
-
ND (30)
-
ND (10)
-
ND (10)
-
ND (10)
-
RNI
-
RNI
-
RNI
-
RNI
-
69.37
+/-45.71
RNI
-
CRA 45136 (22) Zion Station
q014aI-XT-WG-all-45136-30-MC
8/10/2006
Revision 1
TABLE 5.2
ANALYTICAL RESULTS SUMMARY - RADIONUCLIDES IN GROUNDWATER AND SURFACE WATER
FLEETWIDE ASSESSMENT
ZION STATION
ZION, ILLINOIS
Page 7 of 10
Sample Location
(1)
:
Sample
Identification:
Sample
Date:
Units
Target
Radionuclides
Barium-140
pCi/L
Cesium-134
pCi/L
Cesium-137
pCi/L
Cobalt-58
pCi/L
Cobalt-60
pCi/L
Iron-59
pCi/L
Lanthanum-140
pCi/L
Manganese-54
pCi/L
Niobium-95
pCi/L
Strontium-89/90 (Total)
pCi/L
Zinc-65
pCi/L
Zirconium-95
pCi/L
Non-Target Radionuclides
(2)
Actinium-228
pCi/L
Potassium-40
pCi/L
Notes:
Samples analyzed
by: Teledyne Brown
(1) - Sample locations include the well
identifier followed by
a depth indicator
of 'U' for the upper portion of the screen
or 'L' for the lower portion of the screen.
(2) - Radionuclide is naturally
occurring.
RNI- Radionuclide Not Identified during
analysis.
ND ( ) - Not detected at a concentration above the LLD. Valu
LLD - Lower limit of detection.
U* - Compound/Analyte
not detected.
Peak not identified, but forced activity
concentration exceeds Minimum
Detectable Concentration and 3 sigma.
- -
Non-detect value, +/- value not reported.
MW-ZN-09S
MW-ZN-09S
MW-ZN-10S(L)
MW-ZN-10S(L)
MW-ZN-10S(U)
MW-ZN-10S(U)
WG-ZN-MW-ZN-09-052606-DS-09
Result
WG-ZN-MW-ZN-10L-072806-MS-005
Result
WG-ZN-MW-ZN-10U-072806-MS-003
Result
5/26/2006
Error
7/28/2006
Error
7/28/2006
Error
Duplicate
ND (60)
-
ND (60)
-
ND (60)
-
ND (10)
-
ND (10)
-
ND (10)
-
ND (18)
-
ND (18)
-
ND (18)
-
ND (15)
-
ND (15)
-
ND (15)
-
ND (15)
-
ND (15)
-
ND (15)
-
ND (30)
-
ND (30)
-
ND (30)
-
ND (15)
-
ND (15)
-
ND (15)
-
ND (15)
-
ND (15)
-
ND (15)
-
ND (10)
-
ND (10)
-
ND (10)
-
ND (2)
-
ND (2)
-
ND (2)
-
ND (30)
-
ND (30)
-
ND (30)
-
ND (10)
-
ND (10)
-
ND (10)
-
RNI
-
RNI
-
RNI
-
RNI
-
RNI
-
83.66
+/-42.25
CRA 45136 (22) Zion Station
q014aI-XT-WG-all-45136-30-MC
8/10/2006
Revision 1
TABLE 5.2
ANALYTICAL RESULTS SUMMARY - RADIONUCLIDES IN GROUNDWATER AND SURFACE WATER
FLEETWIDE ASSESSMENT
ZION STATION
ZION, ILLINOIS
Page 8 of 10
Sample Location
(1)
:
Sample
Identification:
Sample
Date:
Units
Target
Radionuclides
Barium-140
pCi/L
Cesium-134
pCi/L
Cesium-137
pCi/L
Cobalt-58
pCi/L
Cobalt-60
pCi/L
Iron-59
pCi/L
Lanthanum-140
pCi/L
Manganese-54
pCi/L
Niobium-95
pCi/L
Strontium-89/90 (Total)
pCi/L
Zinc-65
pCi/L
Zirconium-95
pCi/L
Non-Target Radionuclides
(2)
Actinium-228
pCi/L
Potassium-40
pCi/L
Notes:
Samples analyzed
by: Teledyne Brown
(1) - Sample locations include the well
identifier followed by
a depth indicator
of 'U' for the upper portion of the screen
or 'L' for the lower portion of the screen.
(2) - Radionuclide is naturally
occurring.
RNI- Radionuclide Not Identified during
analysis.
ND ( ) - Not detected at a concentration above the LLD. Valu
LLD - Lower limit of detection.
U* - Compound/Analyte
not detected.
Peak not identified, but forced activity
concentration exceeds Minimum
Detectable Concentration and 3 sigma.
- -
Non-detect value, +/- value not reported.
MW-ZN-10S(U)
MW-ZN-10S(U)
MW-ZN-11S(L)
MW-ZN-11S(L)
MW-ZN-11S(U)
MW-ZN-11S(U)
WG-ZN-MW-ZN-10U-072806-MS-004
Result
WG-ZN-MW-ZN-11L-072806-TL-002
Result
WG-ZN-MW-ZN-11U-072806-TL-001
Result
7/28/2006
Error
7/28/2006
Error
7/28/2006
Error
ND (60)
-
ND (60)
-
ND (60)
-
ND (10) U*
-
ND (10) U*
-
ND (10) U*
-
ND (18)
-
ND (18)
-
ND (18)
-
ND (15)
-
ND (15)
-
ND (15)
-
ND (15)
-
ND (15)
-
ND (15)
-
ND (30)
-
ND (30)
-
ND (30)
-
ND (15)
-
ND (15)
-
ND (15)
-
ND (15)
-
ND (15)
-
ND (15)
-
ND (10)
-
ND (10)
-
ND (10)
-
ND (2)
-
ND (2)
-
ND (2)
-
ND (30) U*
-
ND (30)
-
ND (30) U*
-
ND (10)
-
ND (10)
-
ND (10)
-
RNI
-
RNI
-
RNI
-
RNI
-
RNI
-
RNI
-
CRA 45136 (22) Zion Station
q014aI-XT-WG-all-45136-30-MC
8/10/2006
Revision 1
TABLE 5.2
ANALYTICAL RESULTS SUMMARY - RADIONUCLIDES IN GROUNDWATER AND SURFACE WATER
FLEETWIDE ASSESSMENT
ZION STATION
ZION, ILLINOIS
Page 9 of 10
Sample Location
(1)
:
Sample
Identification:
Sample
Date:
Units
Target
Radionuclides
Barium-140
pCi/L
Cesium-134
pCi/L
Cesium-137
pCi/L
Cobalt-58
pCi/L
Cobalt-60
pCi/L
Iron-59
pCi/L
Lanthanum-140
pCi/L
Manganese-54
pCi/L
Niobium-95
pCi/L
Strontium-89/90 (Total)
pCi/L
Zinc-65
pCi/L
Zirconium-95
pCi/L
Non-Target Radionuclides
(2)
Actinium-228
pCi/L
Potassium-40
pCi/L
Notes:
Samples analyzed
by: Teledyne Brown
(1) - Sample locations include the well
identifier followed by
a depth indicator
of 'U' for the upper portion of the screen
or 'L' for the lower portion of the screen.
(2) - Radionuclide is naturally
occurring.
RNI- Radionuclide Not Identified during
analysis.
ND ( ) - Not detected at a concentration above the LLD. Valu
LLD - Lower limit of detection.
U* - Compound/Analyte
not detected.
Peak not identified, but forced activity
concentration exceeds Minimum
Detectable Concentration and 3 sigma.
- -
Non-detect value, +/- value not reported.
SW-ZN-1
SW-ZN-1
TW-ZN-100
TW-ZN-100
TW-ZN-101
TW-ZN-101
TW-ZN-101
TW-ZN-101
WS-ZION-LAKE-052606-MS-015
Result
GW-071706-JL-TW-ZN-100
Result
GW-071706-JL-TW-ZN-101
Result
GW-071706-JL-TW-ZN-101
Result
5/26/2006
Error
7/17/2006
Error
7/17/2006
Error
7/17/2006
Error
Re-run
ND (60)
-
ND (60)
-
ND (60)
-
ND (60)
-
ND (10)
-
ND (10)
-
ND (10)
-
ND (10) U*
-
ND (18)
-
ND (18)
-
ND (18)
-
ND (18)
-
ND (15)
-
ND (15)
-
ND (15)
-
ND (15)
-
ND (15)
-
ND (15)
-
ND (15)
-
ND (15)
-
ND (30)
-
ND (30)
-
ND (30)
-
ND (30)
-
ND (15)
-
ND (15)
-
ND (15)
-
ND (15)
-
ND (15)
-
ND (15)
-
ND (15)
-
ND (15)
-
ND (10)
-
ND (10)
-
ND (10)
-
ND (10)
-
ND (2)
-
ND (2)
-
ND (2)
-
-
-
ND (30)
-
ND (30)
-
ND (30)
-
ND (30) U*
-
ND (10)
-
ND (10)
-
ND (10)
-
ND (10)
-
RNI
-
RNI
RNI
-
RNI
-
106.8
+/-48.41
RNI
--
RNI
-
RNI
-
CRA 45136 (22) Zion Station
q014aI-XT-WG-all-45136-30-MC
8/10/2006
Revision 1
TABLE 5.2
ANALYTICAL RESULTS SUMMARY - RADIONUCLIDES IN GROUNDWATER AND SURFACE WATER
FLEETWIDE ASSESSMENT
ZION STATION
ZION, ILLINOIS
Page 10 of 10
Sample Location
(1)
:
Sample
Identification:
Sample
Date:
Units
Target
Radionuclides
Barium-140
pCi/L
Cesium-134
pCi/L
Cesium-137
pCi/L
Cobalt-58
pCi/L
Cobalt-60
pCi/L
Iron-59
pCi/L
Lanthanum-140
pCi/L
Manganese-54
pCi/L
Niobium-95
pCi/L
Strontium-89/90 (Total)
pCi/L
Zinc-65
pCi/L
Zirconium-95
pCi/L
Non-Target Radionuclides
(2)
Actinium-228
pCi/L
Potassium-40
pCi/L
Notes:
Samples analyzed
by: Teledyne Brown
(1) - Sample locations include the well
identifier followed by
a depth indicator
of 'U' for the upper portion of the screen
or 'L' for the lower portion of the screen.
(2) - Radionuclide is naturally
occurring.
RNI- Radionuclide Not Identified during
analysis.
ND ( ) - Not detected at a concentration above the LLD. Valu
LLD - Lower limit of detection.
U* - Compound/Analyte
not detected.
Peak not identified, but forced activity
concentration exceeds Minimum
Detectable Concentration and 3 sigma.
- -
Non-detect value, +/- value not reported.
TW-ZN-102
TW-ZN-102
TW-ZN-103
TW-ZN-103
GW-071706-JL-TW-ZN-102
Result
GW-071706-JL-TW-ZN-103
Result
7/17/2006
Error
7/17/2006
Error
ND (60)
-
ND (60)
-
ND (10)
-
ND (10)
-
ND (18)
-
ND (18)
-
ND (15)
-
ND (15)
-
ND (15)
-
ND (15)
-
ND (30)
-
ND (30)
-
ND (15)
-
ND (15)
-
ND (15)
-
ND (15)
-
ND (10)
-
ND (10)
-
ND (2)
-
ND (2)
-
ND (30)
-
ND (30)
-
ND (10)
-
ND (10)
-
RNI
-
RNI
-
RNI
-
RNI
-
CRA 45136 (22) Zion Station
q014aI-XT-WG-all-45136-30-MC
8/10/2006
Revision 1
Revision 0
045136 (22) Zion Station
APPENDIX A
WATER WELL INVENTORY RECORDS
A.1
BANKS 2006 WATER WELL REPORT
A.2
ISWS LOGS
Revision 0
045136 (22) Zion Station
A.1
BANKS 2006 WATER WELL REPORT
Water Well Report
June 7, 2006
™
Banks
Information
Solutions, Inc.
Conestoga-Rovers & Associates
8615 W Bryn Mawr Avenue
Chicago, IL 60631
Zion Generating Station
Zion, IL
Lake County
060706-001
CLIENT
SITE
P.O. Box 12851, Capitol Station, Austin, TX 78711
700 N. Lamar, Suite 200 Austin, TX 78703
512.478.0059 FAX 512.478.1433 e-mail banks@banksinfo.com
Copyright 1998 by Banks Information Solutions, Inc.
Water Well Report
Map of Wells within 1 Mile
(Withheld)
Revision 0
045136 (22) Zion Station
A.2
ISWS LOGS
Revision 1
045136 (22) Zion Station
APPENDIX B
BORING LOGS
B.1
2006 STRATIGRAPHIC AND INSTRUMENTATION LOGS
B.2
HISTORICAL GEOTECHNICAL LOGS
Revision 1
045136 (22) Zion Station
B.1
2006 STRATIGRAPHIC AND INSTRUMENTATION LOGS
1
2
3
4
5
6
7
8
9
10
11
12
13
0
55
80
80
65
95
95
90
90
100
75
0
70
10
16
15
19
29
44
62
21
44
25
28
29
50
GRAVEL
SAND (FILL) - trace to some gravel, trace
organics, fine to medium grained, brown,
moist
SP-SAND, trace to some gravel, loose to
compact, wet, fine to medium grained, brown
SM-SAND, with trace to some silt, trace
gravel, compact, fine grained, brown, wet
- dense to very dense at 23.0ft BGS
SP-SAND, trace to some silt, compact to
dense, fine grained, brown, wet
- getting coarser and grey for next 6" at 27.5ft
BGS
ML-SILT, dense, fine grained, grey, wet
CL-CLAY, till (clay, trace to some silt, trace
4" 0 / above
ground
protective
casing
Concrete
2" 0 / PVC
Well Riser
Bentonite
Seal
4.25" 0/
Borehole
2" 0 / PVC
Well Screen
Sand
591.33
581.43
574.43
567.43
562.18
552.43
551.93
INTERVAL
SAMPLE
REC (%)
NUMBER
'N' VALUE
(OVERBURDEN)
Page 1 of 2
MW-ZN-01S
STRATIGRAPHIC AND INSTRUMENTATION LOG
2
4
6
8
10
12
14
16
18
20
22
24
26
28
30
32
34
36
38
DEPTH
ft BGS
PROJECT NAME: ZION GENERATION STATION
PROJECT NUMBER: 45136-30
CLIENT: EXELON GENERATION COMPANY LLC
LOCATION: ZION, ILLINOIS
HOLE DESIGNATION:
STRATIGRAPHIC DESCRIPTION & REMARKS
NOTES:
MEASURING POINT ELEVATIONS MAY CHANGE; REFER TO CURRENT ELEVATION TABLE
DATE COMPLETED: May 1, 2006
DRILLING METHOD: Vacuum/HSA
FIELD PERSONNEL: D. NICHOLLS
OVERBURDEN LOG 45136-30.GPJ CRA_CORP.GDT 6/15/06
Monitoring Well
TOP OF RISER
GROUND SURFACE
ELEV.
ft
AMSL
594.10
591.43
gravel), dense, grey, gravel, very well
embedded in finer matrix, dry, till
END OF BOREHOLE @ 39.5ft BGS
WELL DETAILS
Screened interval:
572.43 to 551.93ft AMSL
19.00 to 39.50ft BGS
Length: 20.5ft
Diameter: 2in
Slot Size: 10
Material: PVC
Sand Pack:
574.43 to 551.93ft AMSL
17.00 to 39.50ft BGS
Material: #5 Quartz Sand
INTERVAL
SAMPLE
REC (%)
NUMBER
'N' VALUE
(OVERBURDEN)
Page 2 of 2
MW-ZN-01S
STRATIGRAPHIC AND INSTRUMENTATION LOG
42
44
46
48
50
52
54
56
58
60
62
64
66
68
70
72
74
76
78
DEPTH
ft BGS
PROJECT NAME: ZION GENERATION STATION
PROJECT NUMBER: 45136-30
CLIENT: EXELON GENERATION COMPANY LLC
LOCATION: ZION, ILLINOIS
HOLE DESIGNATION:
STRATIGRAPHIC DESCRIPTION & REMARKS
NOTES:
MEASURING POINT ELEVATIONS MAY CHANGE; REFER TO CURRENT ELEVATION TABLE
DATE COMPLETED: May 1, 2006
DRILLING METHOD: Vacuum/HSA
FIELD PERSONNEL: D. NICHOLLS
OVERBURDEN LOG 45136-30.GPJ CRA_CORP.GDT 6/15/06
Monitoring Well
ELEV.
ft
AMSL
1
2
3
4
5
6
7
8
9
10
11
12
13
14
15
15
30
30
30
30
40
95
50
30
50
40
10
25
8
4
--
18
19
5
6
20
9
4
17
19
64
2
GRAVEL & GRASS
SAND with GRAVEL (FILL), presence of
organics (trace), fine grained, brown, moist
SAND (FILL), trace to with silt, trace gravel,
very loose to compact, fine grained, brown,
moist
- trace organics, piece of wood, black (1cm x
1cm) at 13.5ft BGS
- getting wet at 14.0ft BGS
CL-SILTY CLAY TILL (silty clay, trace sand,
trace gravel), fine grained, brownish-grey, wet
SM-SILT & SAND, trace clay, trace gravel,
very loose, fine grained, brown, wet, clay till
lenses observed within sandy material
between 0.5" to 4" in thickness
SW-SAND, medium to coarse grained, trace
silt, compact, wet
CL-CLAY TILL (clay, trace to with silt, trace
gravel, trace sand), compact, grey, moist,
coarse material well embedded in fine matrix
SILT & SAND, trace clay, trace gravel, very
loose to loose, brown, wet, 1" to 3" thick
lenses
4" 0 / above
ground
protective
casing
Concrete
Bentonite and
Cuttings
2" 0 / PVC
Well Riser
Bentonite
Seal
4.25" 0/
Borehole
2" 0 / PVC
Well Screen
Sand
Bentonite
591.11
581.21
571.21
570.96
556.21
555.71
555.21
INTERVAL
SAMPLE
REC (%)
NUMBER
'N' VALUE
(OVERBURDEN)
Page 1 of 2
MW-ZN-02S
STRATIGRAPHIC AND INSTRUMENTATION LOG
2
4
6
8
10
12
14
16
18
20
22
24
26
28
30
32
34
36
38
DEPTH
ft BGS
PROJECT NAME: ZION GENERATION STATION
PROJECT NUMBER: 45136-30
CLIENT: EXELON GENERATION COMPANY LLC
LOCATION: ZION, ILLINOIS
HOLE DESIGNATION:
STRATIGRAPHIC DESCRIPTION & REMARKS
NOTES:
MEASURING POINT ELEVATIONS MAY CHANGE; REFER TO CURRENT ELEVATION TABLE
DATE COMPLETED: May 2, 2006
DRILLING METHOD: Vacuum/HSA
FIELD PERSONNEL: D. NICHOLLS
OVERBURDEN LOG 45136-30.GPJ CRA_CORP.GDT 6/15/06
Monitoring Well
TOP OF RISER
GROUND SURFACE
ELEV.
ft
AMSL
593.78
591.21
15
16
40
40
9
12
of clay observed
END OF BOREHOLE @ 45.5ft BGS
Bentonite
WELL DETAILS
Screened interval:
576.21 to 556.21ft AMSL
15.00 to 35.00ft BGS
Length: 20ft
Diameter: 2in
Slot Size: 10
Material: PVC
Sand Pack:
577.91 to 556.21ft AMSL
13.30 to 35.00ft BGS
Material: #5 Quartz Sand
545.71
INTERVAL
SAMPLE
REC (%)
NUMBER
'N' VALUE
(OVERBURDEN)
Page 2 of 2
MW-ZN-02S
STRATIGRAPHIC AND INSTRUMENTATION LOG
42
44
46
48
50
52
54
56
58
60
62
64
66
68
70
72
74
76
78
DEPTH
ft BGS
PROJECT NAME: ZION GENERATION STATION
PROJECT NUMBER: 45136-30
CLIENT: EXELON GENERATION COMPANY LLC
LOCATION: ZION, ILLINOIS
HOLE DESIGNATION:
STRATIGRAPHIC DESCRIPTION & REMARKS
NOTES:
MEASURING POINT ELEVATIONS MAY CHANGE; REFER TO CURRENT ELEVATION TABLE
DATE COMPLETED: May 2, 2006
DRILLING METHOD: Vacuum/HSA
FIELD PERSONNEL: D. NICHOLLS
OVERBURDEN LOG 45136-30.GPJ CRA_CORP.GDT 6/15/06
Monitoring Well
ELEV.
ft
AMSL
WELL DETAILS
Screened interval:
576.29 to 555.54ft AMSL
15.25 to 36.00ft BGS
Length: 20.75ft
1
2
3
4
5
6
7
8
9
10
11
12
13
70
50
20
20
20
30
15
10
15
5
30
100
40
25
9
6
6
4
18
35
1
7
1
5
8
10
GRAVEL
SAND (FILL), trace to with silt, trace to with
gravel, fine grained, brown, moist
SM-SAND WITH SILT, fine grained, trace
gravel, compact, brown, moist
CL-SILTY CLAY TILL (silty clay, trace gravel,
trace sand), compact, moist, grey
ML-SILT & SAND, trace gravel, very loose to
loose, greyish brown, wet
ML-SILT WITH SAND, trace clay, trace
gravel, fine grained, very loose,
brownish-grey, wet, 0.5" to 2" clay lenses, with
silt, trace gravel, trace sand, very loose, wet,
brownish-grey
CL-CLAY TILL (clay, some silt, trace sand
and gravel), loose, grey, wet
END OF BOREHOLE @ 36.0ft BGS
4" 0 / above
ground
protective
casing
Concrete
Bentonite and
Cuttings
2" 0 / PVC
Well Riser
Bentonite
Seal
4.25" 0/
Borehole
2" 0 / PVC
Well Screen
Sand
591.44
581.54
580.54
579.54
574.54
556.54
555.54
INTERVAL
SAMPLE
REC (%)
NUMBER
'N' VALUE
(OVERBURDEN)
Page 1 of 2
MW-ZN-03S
STRATIGRAPHIC AND INSTRUMENTATION LOG
2
4
6
8
10
12
14
16
18
20
22
24
26
28
30
32
34
36
38
DEPTH
ft BGS
PROJECT NAME: ZION GENERATION STATION
PROJECT NUMBER: 45136-30
CLIENT: EXELON GENERATION COMPANY LLC
LOCATION: ZION, ILLINOIS
HOLE DESIGNATION:
STRATIGRAPHIC DESCRIPTION & REMARKS
NOTES:
MEASURING POINT ELEVATIONS MAY CHANGE; REFER TO CURRENT ELEVATION TABLE
DATE COMPLETED: May 2, 2006
DRILLING METHOD: Vacuum/HSA
FIELD PERSONNEL: D. NICHOLLS
OVERBURDEN LOG 45136-30.GPJ CRA_CORP.GDT 6/15/06
Monitoring Well
TOP OF RISER
GROUND SURFACE
ELEV.
ft
AMSL
594.02
591.54
Diameter: 2in
Slot Size: 10
Material: PVC
Sand Pack:
578.54 to 555.54ft AMSL
13.00 to 36.00ft BGS
Material: #5 Quartz Sand
INTERVAL
SAMPLE
REC (%)
NUMBER
'N' VALUE
(OVERBURDEN)
Page 2 of 2
MW-ZN-03S
STRATIGRAPHIC AND INSTRUMENTATION LOG
42
44
46
48
50
52
54
56
58
60
62
64
66
68
70
72
74
76
78
DEPTH
ft BGS
PROJECT NAME: ZION GENERATION STATION
PROJECT NUMBER: 45136-30
CLIENT: EXELON GENERATION COMPANY LLC
LOCATION: ZION, ILLINOIS
HOLE DESIGNATION:
STRATIGRAPHIC DESCRIPTION & REMARKS
NOTES:
MEASURING POINT ELEVATIONS MAY CHANGE; REFER TO CURRENT ELEVATION TABLE
DATE COMPLETED: May 2, 2006
DRILLING METHOD: Vacuum/HSA
FIELD PERSONNEL: D. NICHOLLS
OVERBURDEN LOG 45136-30.GPJ CRA_CORP.GDT 6/15/06
Monitoring Well
ELEV.
ft
AMSL
1
2
3
4
5
6
7
8
9
10
11
12
13
40
95
70
80
100
90
100
55
90
65
80
70
100
1
29
18
35
25
23
24
29
41
10
15
31
20
SAND & SILT (FILL), trace gravel, trace
cobbles, fine grained, brown, dry
SM-SAND & SILT(FILL), trace clay, trace
gravel, loose to compact, fine grained, brown,
moist
- 3" thick layer of silty clay till (silty clay, trace
sand & gravel), compact grey, moist at 11.0ft
BGS
- getting wet at 12.0ft BGS
- thick layer of sandy organic material, very
soft, black, wet (no odor presence of roots)
at 13.8ft BGS
- 3" thick layer of silty clay till (silty clay, trace
sand & gravel), compact grey, moist at 23.0ft
BGS
- getting softer (very soft), saturated at 24.0ft
BGS
- silt with sand, trace clay, compact, brown,
wet at 29.0ft BGS
- 0.5" x 0.4" diagonal layer of dark grey to
black organic material, very loose, fine
grained, wet at 30.0ft BGS
ML-SILT, trace to with sand, trace clay, loose,
grey wet
CL-CLAY TILL (clay with silt, trace sand &
gravel), dense, grey, dry
END OF BOREHOLE @ 36.0ft BGS
4" 0 / above
ground
protective
casing
Concrete
Bentonite and
Cuttings
2" 0 / PVC
Well Riser
Bentonite
Seal
4.25" 0/
Borehole
Sand
2" 0 / PVC
Well Screen
WELL DETAILS
Screened interval:
576.01 to 556.01ft AMSL
15.00 to 35.00ft BGS
Length: 20ft
583.01
557.51
555.21
555.01
INTERVAL
SAMPLE
REC (%)
NUMBER
'N' VALUE
(OVERBURDEN)
Page 1 of 2
MW-ZN-04S
STRATIGRAPHIC AND INSTRUMENTATION LOG
2
4
6
8
10
12
14
16
18
20
22
24
26
28
30
32
34
36
38
DEPTH
ft BGS
PROJECT NAME: ZION GENERATION STATION
PROJECT NUMBER: 45136-30
CLIENT: EXELON GENERATION COMPANY LLC
LOCATION: ZION, ILLINOIS
HOLE DESIGNATION:
STRATIGRAPHIC DESCRIPTION & REMARKS
NOTES:
MEASURING POINT ELEVATIONS MAY CHANGE; REFER TO CURRENT ELEVATION TABLE
DATE COMPLETED: May 3, 2006
DRILLING METHOD: Vacuum/HSA
FIELD PERSONNEL: D. NICHOLLS
OVERBURDEN LOG 45136-30.GPJ CRA_CORP.GDT 6/15/06
Monitoring Well
TOP OF RISER
GROUND SURFACE
ELEV.
ft
AMSL
593.82
591.01
Diameter: 2in
Slot Size: 10
Material: PVC
Sand Pack:
578.01 to 556.01ft AMSL
13.00 to 35.00ft BGS
Material: #5 Quartz Sand
INTERVAL
SAMPLE
REC (%)
NUMBER
'N' VALUE
(OVERBURDEN)
Page 2 of 2
MW-ZN-04S
STRATIGRAPHIC AND INSTRUMENTATION LOG
42
44
46
48
50
52
54
56
58
60
62
64
66
68
70
72
74
76
78
DEPTH
ft BGS
PROJECT NAME: ZION GENERATION STATION
PROJECT NUMBER: 45136-30
CLIENT: EXELON GENERATION COMPANY LLC
LOCATION: ZION, ILLINOIS
HOLE DESIGNATION:
STRATIGRAPHIC DESCRIPTION & REMARKS
NOTES:
MEASURING POINT ELEVATIONS MAY CHANGE; REFER TO CURRENT ELEVATION TABLE
DATE COMPLETED: May 3, 2006
DRILLING METHOD: Vacuum/HSA
FIELD PERSONNEL: D. NICHOLLS
OVERBURDEN LOG 45136-30.GPJ CRA_CORP.GDT 6/15/06
Monitoring Well
ELEV.
ft
AMSL
1
2
3
4
5
6
7
8
9
10
11
12
13
40
70
70
60
65
60
70
80
75
70
4.5
80
50
1
29
18
35
25
23
24
29
41
10
15
41
20
3.0
4.5
11
10.2
9.8
11
9.8
10.1
10.3
9.7
18
10.1
8.4
SAND & SILT (FILL), trace gravel, fine
grained, brown, dry
SM-SAND, trace to some silt, very soft, fine to
medium grained, brown, wet
GP-GRAVEL & SAND, trace silt, loose to
compact, medium to coarse grained, dark
brown, wet
SM-SAND, trace silt, compact, fine to medium
grained, brown, wet, trace gravel
- finer, silt & sand, (4" thick layer, black) at
9.0ft BGS
- finer, silt & sand, (4" thick layer, black) at
11.5ft BGS
- finer, silt & sand, (4" thick layer, black) at
13.0ft BGS
- silt, grey at 15.0ft BGS
SP-SAND, trace silt, medium to coarse
grained, brown to grey, wet
SM-SAND, trace silt, compact, fine to medium
grained, brown, wet, trace gravel
- finer, silt & sand at 21.5ft BGS
CL-CLAY, trace silt, trace sand, trace of
brown to black organics, compact, wet
SP-SAND, medium to coarse grained, grey
compact, wet
SM-SAND, trace silt, compact, grey, fine
grained, wet
ML-SILT, trace sand, compact, grey, fine
grained, moist
END OF BOREHOLE @ 30.0ft BGS
4" 0 / above
ground
protective
casing
Concrete
Bentonite and
Cuttings
Bentonite
Seal
2" 0 / PVC
Well Riser
4.25" 0/
Borehole
Sand
2" 0 / PVC
Well Screen
WELL DETAILS
Screened interval:
575.72 to 555.72ft AMSL
10.00 to 30.00ft BGS
Length: 20ft
Diameter: 2in
Slot Size: 10
Material: PVC
Sand Pack:
577.82 to 555.72ft AMSL
7.90 to 30.00ft BGS
Material: #5 Quartz Sand
581.72
578.92
577.72
566.72
565.72
561.72
560.22
559.72
558.72
555.72
INTERVAL
SAMPLE
REC (%)
NUMBER
'N' VALUE
PID (PPM)
(OVERBURDEN)
Page 1 of 1
MW-ZN-05S
STRATIGRAPHIC AND INSTRUMENTATION LOG
2
4
6
8
10
12
14
16
18
20
22
24
26
28
30
32
34
36
38
DEPTH
ft BGS
PROJECT NAME: ZION GENERATION STATION
PROJECT NUMBER: 45136-30
CLIENT: EXELON GENERATION COMPANY LLC
LOCATION: ZION, ILLINOIS
HOLE DESIGNATION:
STRATIGRAPHIC DESCRIPTION & REMARKS
NOTES:
MEASURING POINT ELEVATIONS MAY CHANGE; REFER TO CURRENT ELEVATION TABLE
DATE COMPLETED: May 4, 2006
DRILLING METHOD: Vacuum/HSA
FIELD PERSONNEL: D. NICHOLLS
OVERBURDEN LOG 45136-30.GPJ CRA_CORP.GDT 6/15/06
Monitoring Well
TOP OF RISER
GROUND SURFACE
ELEV.
ft
AMSL
588.64
585.72
PROJECT NAME: ZION GENERATION STATION
PROJECT NUMBER: 45136-30
CLIENT: EXELON GENERATION COMPANY LLC
LOCATION: ZION, ILLINOIS
HOLE DESIGNATION:
STRATIGRAPHIC DESCRIPTION & REMARKS
NOTES:
MEASURING POINT ELEVATIONS MAY CHANGE; REFER TO CURRENT ELEVATION TABLE
DATE COMPLETED: May 5, 2006
DRILLING METHOD: Vacuum/HSA
FIELD PERSONNEL: D. NICHOLLS
OVERBURDEN LOG 45136-30.GPJ CRA_CORP.GDT 6/15/06
Monitoring Well
TOP OF RISER
GROUND SURFACE
ELEV.
ft
AMSL
592.66
589.78
1
2
3
4
5
6
7
8
9
10
70
60
60
40
70
60
60
60
50
70
18
17
46
40
24
58
51
51
37
40
1.0
2.0
1.0
1.0
SAND with SILT, trace gravel, brown, moist
SM-SAND, some silt, soft, fine, grained,
brown, wet
GM-SAND & GRAVEL, medium to coarse
grained, compact, grey, wet
SM-SAND, some silt, soft, fine, grained,
brown, wet
GM-SAND & GRAVEL, medium to coarse
grained, compact, grey, wet
SM-SAND, some silt, soft, fine, grained,
brown, wet
GM-SAND & GRAVEL, medium to coarse
grained, compact, grey, wet
ML-SILT, some sand, fine grained, greyish
brown, trace gravel, compact to dense, wet
GM-SAND & GRAVEL, trace silt, compact to
dense, brown, wet, coarser grained
ML-SILT, trace sand, brown, dense, fine
grained, wet
CL-CLAY, (clay till, trace silt, trace sand &
gravel), gravel well embedded in finer matrix,
very dense, grey, moist to dry
END OF BOREHOLE @ 30.0ft BGS
4" 0 / above
ground
protective
casing
Concrete
Bentonite and
Cuttings
Bentonite
2" 0 / PVC
Well Riser
4.25" 0/
Borehole
Sand
2" 0 / PVC
Well Screen
WELL DETAILS
Screened interval:
579.78 to 559.78ft AMSL
10.00 to 30.00ft BGS
Length: 20ft
Diameter: 2in
Slot Size: 10
Material: PVC
Sand Pack:
581.53 to 559.78ft AMSL
8.25 to 30.00ft BGS
Material: #5 Quartz Sand
579.78
578.78
577.78
576.78
575.78
574.78
573.78
564.78
564.18
560.78
559.78
INTERVAL
SAMPLE
REC (%)
NUMBER
'N' VALUE
PID (PPM)
(OVERBURDEN)
Page 1 of 1
MW-ZN-06S
STRATIGRAPHIC AND INSTRUMENTATION LOG
2
4
6
8
10
12
14
16
18
20
22
24
26
28
30
32
34
36
38
DEPTH
ft BGS
Monitoring Well
TOP OF RISER
GROUND SURFACE
ELEV.
ft
AMSL
589.82
587.08
1
2
3
4
5
6
7
8
9
10
11
12
13
40
50
40
50
60
50
50
70
50
50
50
80
0
0
16
25
50
29
56
43
35
19
82
31
28
50
SAND with SILT, trace gravel, fine grained,
brown, moist
SM-SAND WITH SILT, trace gravel, very
loose, fine grained, brown, wet
GM-GRAVELLY SAND, trace silt, loose to
compact, medium grained, brown, wet
SM-SAND, trace silt, trace to with gravel, fine
to coarse grained, compact, brown, wet
- less gravel at 10.0ft BGS
GM-GRAVELLY SAND, trace silt, loose to
compact, medium grained, brown, wet
ML-SILT & SAND, loose to compact, fine
grained, brown, wet
SW-SAND, coarse grained, compact to
dense, brown, wet
ML-SILT & SAND, trace gravel, dense, brown,
fine grained, wet
ML-SILT, trace sand, compact, grey, wet, fine
grained
SM-SAND & SILT, compact, brown, wet, fine
grained
ML-SILT, trace sand, very dense, grey, wet
SM-SAND & SILT, compact, brown, wet, fine
grained
ML-SILT, trace sand, grey, wet, fine grained
SM-SAND & SILT, compact, brown, wet
ML-SILT, trace sand, grey, wet, fine grained
END OF BOREHOLE @ 30.0ft BGS
4" 0 / above
ground
protective
casing
Concrete
Bentonite and
Cuttings
Bentonite
Seal
2" 0 / PVC
Well Riser
4.25" 0/
Borehole
Sand
2" 0 / PVC
Well Screen
WELL DETAILS
Screened interval:
577.08 to 557.08ft AMSL
10.00 to 30.00ft BGS
Length: 20ft
Diameter: 2in
Slot Size: 10
Material: PVC
Sand Pack:
579.28 to 557.08ft AMSL
7.80 to 30.00ft BGS
Material: #5 Quartz Sand
583.08
581.08
579.08
575.58
571.28
570.08
569.58
565.28
565.08
563.58
563.08
562.08
561.08
560.08
557.08
INTERVAL
SAMPLE
REC (%)
NUMBER
'N' VALUE
(OVERBURDEN)
Page 1 of 1
MW-ZN-07S
STRATIGRAPHIC AND INSTRUMENTATION LOG
2
4
6
8
10
12
14
16
18
20
22
24
26
28
30
32
34
36
38
DEPTH
ft BGS
PROJECT NAME: ZION GENERATION STATION
PROJECT NUMBER: 45136-30
CLIENT: EXELON GENERATION COMPANY LLC
LOCATION: ZION, ILLINOIS
HOLE DESIGNATION:
STRATIGRAPHIC DESCRIPTION & REMARKS
NOTES:
MEASURING POINT ELEVATIONS MAY CHANGE; REFER TO CURRENT ELEVATION TABLE
DATE COMPLETED: May 8, 2006
DRILLING METHOD: Vacuum/HSA
FIELD PERSONNEL: D. NICHOLLS
OVERBURDEN LOG 45136-30.GPJ CRA_CORP.GDT 6/15/06
1
2
3
4
5
6
7
8
9
10
11
12
60
70
85
60
80
70
60
70
60
60
80
25
13
28
11
33
19
13
54
24
11
23
57
10.6
13.8
11.6
11.0
9.1
9.7
10.4
9.3
9.6
10.2
10.4
--
SAND, trace silt, trace gravel, trace organics,
fine grained, moist
SM-SAND, trace silt, trace gravel, compact,
fine to coarse grained, brown, wet
GP-GRAVEL, trace sand, medium to coarse
grained, compact, brown, wet
ML-SILT, trace sand, loose to compact, fine
grained, brown, wet
SM-SAND, trace gravel, medium to coarse
grained, loose to compact, brown, wet
ML-SILT, trace fine sand, brown, compact to
dense, wet
SM-SAND & SILT, fine to medium grained,
very loose to compact, brown, wet
ML-SILT, trace sand, compact to dense, fine
grained, brown, wet
SM-SAND, trace, silt, fine to coarse grained,
very loose to loose, brown, wet
ML-SILT, trace sand, compact, brownish-grey,
wet
SM-SAND, trace silt, medium to coarse
grained, loose, brown, wet
ML-SILT, trace sand, compact to dense, grey,
wet
- SM, 6" thick layer of sand, medium to coarse
grained, compact brown, wet at 21.0ft BGS
- SM, 6" thick layer of sand, medium to coarse
grained, compact brown, wet at 23.0ft BGS
- CL, 2" thick layer of clay, trace silt, grey, wet,
compact at 25.5ft BGS
- SM, 6" thick layer of sand, medium to coarse
grained, compact brown, wet at 25.9ft BGS
- SM, 6" thick layer of sand, medium to coarse
grained, compact brown, wet at 27.6ft BGS
ML-SAND & SILT, compact to very dense,
fine to coarse grained, brown, wet
END OF BOREHOLE @ 30.0ft BGS
4" 0 / above
ground
protective
casing
Concrete
Bentonite and
Cuttings
Bentonite
Seal
2" 0 / PVC
Well Riser
4.25" 0/
Borehole
Sand
2" 0 / PVC
Well Screen
WELL DETAILS
Screened interval:
575.85 to 555.85ft AMSL
10.00 to 30.00ft BGS
Length: 20ft
Diameter: 2in
Slot Size: 10
Material: PVC
Sand Pack:
578.15 to 555.85ft AMSL
7.70 to 30.00ft BGS
Material: #5 Quartz Sand
579.85
578.85
577.85
576.85
574.35
573.85
570.35
569.85
568.35
567.85
566.85
557.85
555.85
INTERVAL
SAMPLE
REC (%)
NUMBER
'N' VALUE
PID (PPM)
(OVERBURDEN)
Page 1 of 1
MW-ZN-08S
STRATIGRAPHIC AND INSTRUMENTATION LOG
2
4
6
8
10
12
14
16
18
20
22
24
26
28
30
32
34
36
38
DEPTH
ft BGS
PROJECT NAME: ZION GENERATION STATION
PROJECT NUMBER: 45136-30
CLIENT: EXELON GENERATION COMPANY LLC
LOCATION: ZION, ILLINOIS
HOLE DESIGNATION:
STRATIGRAPHIC DESCRIPTION & REMARKS
NOTES:
MEASURING POINT ELEVATIONS MAY CHANGE; REFER TO CURRENT ELEVATION TABLE
DATE COMPLETED: May 5, 2006
DRILLING METHOD: Vacuum/HSA
FIELD PERSONNEL: D. NICHOLLS
OVERBURDEN LOG 45136-30.GPJ CRA_CORP.GDT 6/15/06
Monitoring Well
TOP OF RISER
GROUND SURFACE
ELEV.
ft
AMSL
588.73
585.85
1
2
3
4
5
75
20
5
90
50
25
10
1
3
1
5.2
6.0
6.0
4.0
4.0
SAND WITH SILT (FILL), trace gravel, trace
cobbles, fine grained, moist
SM-SAND & SILT (FILL), trace gravel, up to
2" diameter trace cobbles, very loose to
compact, fine grained, moist to wet
GM-GRAVEL WITH SAND (FILL), trace silt,
very loose, grey, well rounded gravel, wet
END OF BOREHOLE @ 20.0ft BGS
Refusal on Unknown Material
4" 0 / above
ground
protective
casing
Concrete
Bentonite and
Cuttings
Bentonite
Seal
2" 0 / PVC
Well Riser
4.25" 0/
Borehole
Sand
2" 0 / PVC
Well Screen
WELL DETAILS
Screened interval:
582.18 to 572.18ft AMSL
9.00 to 19.00ft BGS
Length: 10ft
Diameter: 2in
Slot Size: 10
Material: PVC
Sand Pack:
584.43 to 572.18ft AMSL
6.75 to 19.00ft BGS
Material: #5 Quartz Sand
581.18
573.68
571.18
INTERVAL
SAMPLE
REC (%)
NUMBER
'N' VALUE
PID (PPM)
(OVERBURDEN)
Page 1 of 1
MW-ZN-09S
STRATIGRAPHIC AND INSTRUMENTATION LOG
2
4
6
8
10
12
14
16
18
20
22
24
26
28
30
32
34
36
38
DEPTH
ft BGS
PROJECT NAME: ZION GENERATION STATION
PROJECT NUMBER: 45136-30
CLIENT: EXELON GENERATION COMPANY LLC
LOCATION: ZION, ILLINOIS
HOLE DESIGNATION:
STRATIGRAPHIC DESCRIPTION & REMARKS
NOTES:
MEASURING POINT ELEVATIONS MAY CHANGE; REFER TO CURRENT ELEVATION TABLE
DATE COMPLETED: May 3, 2006
DRILLING METHOD: Vacuum/HSA
FIELD PERSONNEL: D. NICHOLLS
OVERBURDEN LOG 45136-30.GPJ CRA_CORP.GDT 6/15/06
Monitoring Well
TOP OF RISER
GROUND SURFACE
ELEV.
ft
AMSL
593.84
591.18
Page 1 of 2
NUMBER
INTERVAL
SAMPLE
REC (%)
MW-ZN-10
STRATIGRAPHIC AND INSTRUMENTATION LOG
2
4
6
8
10
12
14
16
18
20
22
24
26
28
30
32
34
36
38
DEPTH
ft BGS
PROJECT NAME: ZION GENERATION STATION
PROJECT NUMBER: 45136-30
CLIENT: EXELON GENERATION COMPANY LLC
LOCATION: ZION, ILLINOIS
HOLE DESIGNATION:
STRATIGRAPHIC DESCRIPTION & REMARKS
0
0
0
0
0
0
0
Vac cleared to 11.0ft BGS
Sand, fine grained, trace to some silt, some
gravel, dry to moist, brown
Sand, some silt and gravel, fine grained, loose,
dark brown, wet
Silty and fine sand, trace gravel, trace clay,
loose to compact, lighter brown, moist
- saturated at 15.0ft BGS
- trace organics, black, fine grained at 16.5ft
BGS
- 4" thick layer of silty clay, soft, trace organics,
trace silt, trace of gravel embedded within
finer matrix at 18.0ft BGS
Sand, trace silt, fine to medium grained, loose,
grayish brown, wet
Silt and fine sand, loose, fine grained, brownish
gray, wet
Sand, trace gravel, trace silt, loose, brown, wet
- compact at 30.0ft BGS
Silt, trace sand, compact, fine grained, wet,
brownish gray
END OF BOREHOLE @ 34.0ft BGS
Concrete
Soil Cuttings
and Bentonite
4" 0 / Steel
Well Casing
Bentonite
Sand
2" 0 / PVC
Well Screen
0
0
0
0
0
580.0
579.0
568.0
566.0
564.5
558.5
557.0
'N' VALUE
PID (PPM)
(OVERBURDEN)
NOTES:
MEASURING POINT ELEVATIONS MAY CHANGE; REFER TO CURRENT ELEVATION TABLE
DATE COMPLETED: July 13, 2006
DRILLING METHOD: Vacuum/HSA
FIELD PERSONNEL: D. NICHOLLS
OVERBURDEN LOG 45136-30.GPJ CRA_CORP.GDT 8/6/06
Monitoring Well
TOP OF RISER
GROUND SURFACE
ELEV.
ft
AMSL
593.7
591.0
'N' VALUE
PID (PPM)
(OVERBURDEN)
Page 2 of 2
NUMBER
INTERVAL
SAMPLE
REC (%)
MW-ZN-10
STRATIGRAPHIC AND INSTRUMENTATION LOG
42
44
46
48
50
52
54
56
58
60
62
64
66
68
70
72
74
76
78
DEPTH
ft BGS
PROJECT NAME: ZION GENERATION STATION
PROJECT NUMBER: 45136-30
CLIENT: EXELON GENERATION COMPANY LLC
LOCATION: ZION, ILLINOIS
HOLE DESIGNATION:
STRATIGRAPHIC DESCRIPTION & REMARKS
NOTES:
MEASURING POINT ELEVATIONS MAY CHANGE; REFER TO CURRENT ELEVATION TABLE
DATE COMPLETED: July 13, 2006
DRILLING METHOD: Vacuum/HSA
FIELD PERSONNEL: D. NICHOLLS
OVERBURDEN LOG 45136-30.GPJ CRA_CORP.GDT 8/6/06
Monitoring Well
ELEV.
ft
AMSL
WELL DETAILS
Screened interval:
577.0 to 557.0ft AMSL
14.0 to 34.0ft BGS
Length: 20ft
Diameter: 2in
Slot Size: 10
Material: PVC
Sand Pack:
579.0 to 557.0ft AMSL
12.0 to 34.0ft BGS
Material: Silica Sand #5
0
0
0
0
0
0
0
0
0
0
Vac cleared to 10.0ft BGS
Sand, some gravel, trace of silt, fine grained,
brown, moist
- wet at 9.0ft BGS
Sand, trace silt, trace gravel, fine to medium
grained, compact, brown, wet
- 7" thick layer of gravel with coarse sand,
dense, wet, brown at 16.0ft BGS
- 8" thick layer of gravel with coarse sand,
dense, wet, brown at 17.0ft BGS
- 6" thick layer of silt, trace sand, dense, fine
grained, grayish-brown, wet at 19.5ft BGS
- 8" thick layer of gravel with coarse sand,
dense, wet, brown at 21.0ft BGS
- 6" thick layer of coarse sand, dense, wet,
brown at 23.0ft BGS
- 6" thick layer of silt, trace sand, dense, fine
grained, grayish-brown, wet at 23.5ft BGS
Silt, trace sand, compact, fine grained,
grayish-brown, wet
Sand, trace silt, trace gravel, fine to medium
grained, compact, brown, wet
Silt, trace sand, compact, fine grained,
grayish-brown, wet
END OF BOREHOLE @ 30.0ft BGS
Concrete
Soil Cuttings
and Bentonite
4" 0 / Steel
Well Casing
Bentonite
Sand
2" 0 / PVC
Well Screen
WELL DETAILS
Screened interval:
576.5 to 556.5ft AMSL
10.0 to 30.0ft BGS
Length: 20ft
Diameter: 2in
Slot Size: 10
Material: PVC
Sand Pack:
578.5 to 556.5ft AMSL
8.0 to 30.0ft BGS
Material: Silica Sand #5
576.5
559.5
558.5
557.5
556.5
'N' VALUE
PID (PPM)
(OVERBURDEN)
Page 1 of 1
NUMBER
INTERVAL
SAMPLE
REC (%)
MW-ZN-11
STRATIGRAPHIC AND INSTRUMENTATION LOG
2
4
6
8
10
12
14
16
18
20
22
24
26
28
30
32
34
36
38
DEPTH
ft BGS
PROJECT NAME: ZION GENERATION STATION
PROJECT NUMBER: 45136-30
CLIENT: EXELON GENERATION COMPANY LLC
LOCATION: ZION, ILLINOIS
HOLE DESIGNATION:
STRATIGRAPHIC DESCRIPTION & REMARKS
NOTES:
MEASURING POINT ELEVATIONS MAY CHANGE; REFER TO CURRENT ELEVATION TABLE
DATE COMPLETED: July 14, 2006
DRILLING METHOD: Vacuum/HSA
FIELD PERSONNEL: D. NICHOLLS
OVERBURDEN LOG 45136-30.GPJ CRA_CORP.GDT 8/6/06
Monitoring Well
TOP OF RISER
GROUND SURFACE
ELEV.
ft
AMSL
589.5
586.5
(SW) Fine grained sand, dry
(SP) Med-Fine grained sand, saturated
(SP) Coarse grained sand, larger stones,
saturated
END OF BOREHOLE @ 21.5ft BGS
Bentonite
Seal
2" 0 / Borehole
Sand
1" 0 / PVC
Well Screen
WELL DETAILS
Screened interval:
578.8 to 563.8ft AMSL
6.5 to 21.5ft BGS
Length: 15ft
Diameter: 1in
Slot Size: 10
Material: PVC
Sand Pack:
579.8 to 563.8ft AMSL
5.5 to 21.5ft BGS
Material: Sand
577.8
571.8
563.8
'N' VALUE
(OVERBURDEN)
Page 1 of 1
NUMBER
INTERVAL
SAMPLE
REC (%)
TW-ZN-100
STRATIGRAPHIC AND INSTRUMENTATION LOG
2
4
6
8
10
12
14
16
18
20
22
24
26
28
30
32
34
36
38
DEPTH
ft BGS
PROJECT NAME: ZION GENERATION STATION
PROJECT NUMBER: 45136-30
CLIENT: EXELON GENERATION COMPANY LLC
LOCATION: ZION, ILLINOIS
HOLE DESIGNATION:
STRATIGRAPHIC DESCRIPTION & REMARKS
NOTES:
MEASURING POINT ELEVATIONS MAY CHANGE; REFER TO CURRENT ELEVATION TABLE
DATE COMPLETED: July 7, 2006
DRILLING METHOD: Geoprobe
FIELD PERSONNEL: M. BORKOWSKI
OVERBURDEN LOG 45136-30.GPJ CRA_CORP.GDT 8/6/06
Monitoring Well
TOP OF RISER
GROUND SURFACE
ELEV.
ft
AMSL
590.0
585.3
(SW) Fine grained sand, dry
(SP) Med-Fine grained sand, saturated
(SP) Coarse grained sand, larger stones,
saturated
END OF BOREHOLE @ 19.0ft BGS
Bentonite
Seal
2" 0 / Borehole
Sand
1" 0 / PVC
Well Screen
WELL DETAILS
Screened interval:
580.3 to 565.3ft AMSL
4.0 to 19.0ft BGS
Length: 15ft
Diameter: 1in
Slot Size: 10
Material: PVC
Sand Pack:
581.3 to 565.3ft AMSL
3.0 to 19.0ft BGS
Material: Sand
576.8
570.8
565.3
'N' VALUE
(OVERBURDEN)
Page 1 of 1
NUMBER
INTERVAL
SAMPLE
REC (%)
TW-ZN-101
STRATIGRAPHIC AND INSTRUMENTATION LOG
2
4
6
8
10
12
14
16
18
20
22
24
26
28
30
32
34
36
38
DEPTH
ft BGS
PROJECT NAME: ZION GENERATION STATION
PROJECT NUMBER: 45136-30
CLIENT: EXELON GENERATION COMPANY LLC
LOCATION: ZION, ILLINOIS
HOLE DESIGNATION:
STRATIGRAPHIC DESCRIPTION & REMARKS
NOTES:
MEASURING POINT ELEVATIONS MAY CHANGE; REFER TO CURRENT ELEVATION TABLE
DATE COMPLETED: July 7, 2006
DRILLING METHOD: Geoprobe
FIELD PERSONNEL: M. BORKOWSKI
OVERBURDEN LOG 45136-30.GPJ CRA_CORP.GDT 8/6/06
Monitoring Well
TOP OF RISER
GROUND SURFACE
ELEV.
ft
AMSL
588.7
584.3
(SW) Fine grained sand, dry
(SP) Med-Fine grained sand, saturated
(SP) Coarse grained sand, larger stones,
saturated
END OF BOREHOLE @ 21.0ft BGS
Bentonite
Seal
2" 0 / Borehole
Sand
1" 0 / PVC
Well Screen
WELL DETAILS
Screened interval:
578.3 to 563.3ft AMSL
6.0 to 21.0ft BGS
Length: 15ft
Diameter: 1in
Slot Size: 10
Material: PVC
Sand Pack:
579.3 to 563.3ft AMSL
5.0 to 21.0ft BGS
Material: Sand
576.8
570.8
563.3
'N' VALUE
(OVERBURDEN)
Page 1 of 1
NUMBER
INTERVAL
SAMPLE
REC (%)
TW-ZN-102
STRATIGRAPHIC AND INSTRUMENTATION LOG
2
4
6
8
10
12
14
16
18
20
22
24
26
28
30
32
34
36
38
DEPTH
ft BGS
PROJECT NAME: ZION GENERATION STATION
PROJECT NUMBER: 45136-30
CLIENT: EXELON GENERATION COMPANY LLC
LOCATION: ZION, ILLINOIS
HOLE DESIGNATION:
STRATIGRAPHIC DESCRIPTION & REMARKS
NOTES:
MEASURING POINT ELEVATIONS MAY CHANGE; REFER TO CURRENT ELEVATION TABLE
DATE COMPLETED: July 7, 2006
DRILLING METHOD: Geoprobe
FIELD PERSONNEL: M. BORKOWSKI
OVERBURDEN LOG 45136-30.GPJ CRA_CORP.GDT 8/6/06
Monitoring Well
TOP OF RISER
GROUND SURFACE
ELEV.
ft
AMSL
588.6
584.3
(SW) Fine grained sand, dry
(SP) Med-Fine grained sand, saturated
(SP) Coarse grained sand, larger stones,
saturated
END OF BOREHOLE @ 30.0ft BGS
Bentonite
Seal
2" 0 / Borehole
Sand
1" 0 / PVC
Well Screen
WELL DETAILS
Screened interval:
573.7 to 553.7ft AMSL
10.0 to 30.0ft BGS
Length: 20ft
Diameter: 1in
Slot Size: 10
Material: PVC
Sand Pack:
574.7 to 553.7ft AMSL
9.0 to 30.0ft BGS
Material: Sand
576.2
570.2
553.7
'N' VALUE
(OVERBURDEN)
Page 1 of 1
NUMBER
INTERVAL
SAMPLE
REC (%)
TW-ZN-103
STRATIGRAPHIC AND INSTRUMENTATION LOG
2
4
6
8
10
12
14
16
18
20
22
24
26
28
30
32
34
36
38
DEPTH
ft BGS
PROJECT NAME: ZION GENERATION STATION
PROJECT NUMBER: 45136-30
CLIENT: EXELON GENERATION COMPANY LLC
LOCATION: ZION, ILLINOIS
HOLE DESIGNATION:
STRATIGRAPHIC DESCRIPTION & REMARKS
NOTES:
MEASURING POINT ELEVATIONS MAY CHANGE; REFER TO CURRENT ELEVATION TABLE
DATE COMPLETED: July 7, 2006
DRILLING METHOD: Geoprobe
FIELD PERSONNEL: M. BORKOWSKI
OVERBURDEN LOG 45136-30.GPJ CRA_CORP.GDT 8/6/06
Monitoring Well
TOP OF RISER
GROUND SURFACE
ELEV.
ft
AMSL
587.5
583.7
Revision 0
045136 (22) Zion Station
B.2
HISTORICAL GEOTECHNICAL LOGS
Revision 0
045136 (22) Zion Station
APPENDIX C
QUALITY ASSURANCE PROGRAM - TELEDYNE BROWN ENGINEERING, INC.
Page 2 of 32
TABLE OF CONTENTS
Section
Title
Page
1.0
KNOXVILLE QAM SECTION INTRODUCTION
7
2.0
QUALITY SYSTEM
10
2.1
Policy
10
2.2
Quality System Structure
10
2.3
Quality System Objectives
10
2.4
Personnel Orientation, Training, and Qualification
11
3.0
ORGANIZATION, AUTHORITY, AND RESPONSIBILITY
12
4.0
PERSONNEL ORIENTATION, DATA INTEGRITY, TRAINING,
AND QUALIFICATION
13
4.1
Orientation
13
4.2
Data Integrity
13
4.3
Training
13
4.4
Qualification
13
4.5
Records
13
5.0
CUSTOMER INTERFACES
14
5.1
Interface Personnel
14
5.2
Bid Requests and Tenders
14
5.3
Contracts
14
5.4
TBE’s Expectation of Customers
14
5.5
Customer Satisfaction
15
5.5.1
Customer Complaints
15
5.5.2
Customer Confidentiality
15
6.0
DOCUMENTATION GENERATION AND CONTROL
16
6.1
General
16
6.2
New Documentation
16
6.3
Documentation Changes
16
Page 3 of 32
TABLE OF CONTENTS - Continued
6.4
Documentation Lists and Distributions
16
6.5
Other Documentation
16
6.6
Documentation Reviews
16
7.0
DESIGN OF LABORATORY CONTROLS
17
7.1
General
17
7.2
Facility
17
7.3
Technical Processes and Methods
17
7.3.1
Operational Flow
17
7.3.2
Methods
18
7.3.3
Data Reduction and Analysis
18
7.4
Verification of Technical Processes, Methods, and Software
18
7.4.1
Operational Flow Verification
18
7.4.2
Method Verifications
18
7.4.3
Data Reduction and Analysis Verification
18
7.5
Design of Quality Controls
18
7.5.1
General
19
7.5.2
Demonstration of Capability (D of C)
19
7.5.3
Process Control Checks
19
7.6
Counting Instrument Controls
20
8.0
PURCHASING AND SUBCONTRACT CONTROLS
21
8.1
General
21
8.2
Source Selection
21
8.3
Procurement of Supplies and Support Services
21
8.3.1
Catalog Supplies
21
8.3.2
Support Services
21
8.3.3
Equipment and Software
22
8.4
Subcontracting of Analytical Services
22
8.5
Acceptance of Items or Services
22
Page 4 of 32
TABLE OF CONTENTS - Continued
9.0
TEST SAMPLE IDENTIFICATION AND CONTROL
23
9.1
Sample Identification
23
9.2
LIMS
23
9.3
Sample Control
23
10.0
SPECIAL PROCESSES, INSPECTION, AND TEST
24
10.1
Special Processes
24
10.2
Inspections and Tests
24
10.2.1 Intra Laboratory Checks (QC Checks)
24
10.2.2 Inter Laboratory Checks
24
10.2.3 Data Reviews
24
10.3
Control of Sampling of Samples
24
10.4
Reference Standards / Material
24
10.4.1 Weights and Temperatures
25
10.4.2 Radioactive Materials
25
11.0
EQUIPMENT MAINTENANCE AND CALIBRATION
26
11.1
General
26
11.2
Support Equipment
26
11.3
Instruments
26
11.4
Nonconformances and Corrective Actions
26
11.5
Records
27
12.0
NONCONFORMANCE CONTROLS
28
12.1
General
28
12.2
Responsibility and Authority
28
12.3
10CFR21 Reporting
28
Page 5 of 32
TABLE OF CONTENTS - Continued
13.0
CORRECTIVE AND PREVENTIVE ACTIONS
29
13.1
General
29
13.2
Corrective Actions
29
13.3
Preventive Actions
29
14.0
RESULTS ANALYSIS AND REPORTING
30
14.1
General
30
14.2
Results Review
30
14.3
Reports
30
15.0
RECORDS
31
15.1
General
31
15.2
Type of Records
31
15.3
Storage and Retention
31
15.4
Destruction or Disposal
31
16.0
ASSESSMENTS
32
16.1
General
32
16.2
Audits
32
16.3
Management Reviews
32
Page 6 of 32
REVISION HISTORY
Revision 7
Complete re-write
January 1, 2005
Bill Meyer
Revision 8
Updated organization
chart, minor change to
1.0, 4.4, 7.5.3.2,
10.2.3, and 12.3
Page 7 of 32
1.0
Knoxville QAM Section Introduction
This Quality Assurance Manual (QAM) and related Procedures describes the
Knoxville Environmental Services Laboratory’s QA system. This system is designed
to meet multiple quality standards imposed by Customers and regulatory agencies
including:
NRC’s 10 CFR 50 Appendix B
NRC’s Regulatory Guide 4.15
DOE’s Order 414.1
DOE’s QSAS
ANSI N 42.23
ANSI N 13.30
NELAC Standard, Chapter 5
The Environmental Services (ES) Laboratory does low level radioactivity
analyses for Power Plants and other customers. It primarily analyzes environmental
samples (natural products from around plants such as milk), in-plant samples (air
filters, waters), bioassay samples from customer’s employees, and waste disposal
samples (liquids and solids).
Potable and non-potable water samples are tested using methods based on
EPA standards as cited in State licenses (see Procedure 4010). The listing [current
as of initial printing of this Manual – see current index for revision status and
additions / deletions] of implementing Procedures (SOPs) covering Administration,
Methods, Counting Instruments, Technical, Miscellaneous, and LIMS is shown in
Table 1-1. Reference to these Procedures by number is made throughout this QAM.
Table 1-1
Number
Title
Part 1
Administrative Procedures
1001
Validation and Verification of Computer Programs for Radiochemistry Data
Reduction
1002
Organization and Responsibility
1003
Control, Retention, and Disposal of Quality Assurance Records
1004
Definitions
1005
Data Integrity
1006
Job Descriptions
1007
Training and Certifications
1008
Procedure and Document Control
1009
Calibration System
1010
Nonconformance Controls
1011
10CFR21 Reporting
1012
Corrective Action and Preventive Action
Page 8 of 32
Number
Title
1013
Internal Audits and Management Reviews
1014
RFP, Contract Review, and Order Entry (formerly 4001)
1015
Procurement Controls
Part 2
Method Procedures
2001
Alpha Isotopic and Plutonium-241
2002
Carbon-14 Activity in Various Matrices
2003
Carbon-14 and Tritium in Soils, Solids, and Biological Samples; Harvey
Oxidizer Method
2004
Cerium-141 and Cerium-144 by Radiochemical Separation
2005
Cesium-137 by Radiochemical Separation
2006
Iron-55 Activity in Various Matrices
2007
Gamma Emitting Radioisotope Analysis
2008
Gross Alpha and/or Gross Beta Activity in Various Matrices
2009
Gross Beta Minus Potassium-40 Activity in Urine and Fecal Samples
2010
Tritium and Carbon-14 Analysis by Liquid Scintillation
2011
Tritium Analysis in Drinking Water by Liquid Scintillation
2012
Radioiodine in Various Matrices
2013
Radionickel Activity in Various Matrices
2014
Phosphorus-32 Activity in Various Matrices
2015
Lead-210 Activity in Various Matrices
2016
Radium-226 Analysis in Various Matrices
2017
Total Radium in Water Samples
2018
Radiostrontium Analysis by Chemical Separation
2019
Radiostrontium Analysis by Ion Exchange
2020
Sulfur-35 Analysis
2021
Technetium-99 Analysis by Eichrom Resin Separation
2022
Total Uranium Analysis by KPA
2023
Compositing of Samples
2024
Dry Ashing of Environmental Samples
2025
Preparation and Standardization of Carrier Solutions
2026
Radioactive Reference Standard Solutions and Records
2027
Glassware Washing and Storage
2028
Moisture Content of Various Matrices
2029
Polonium-210 Activity in Various Matrices
2030
Promethium-147 Analysis
Page 9 of 32
Number
Title
Part 3
Instrument Procedures
3001
Calibration and Control of Gamma-Ray Spectrometers
3002
Calibration of Alpha Spectrometers
3003
Calibration and Control of Alpha and Beta Counting Instruments
3004
Calibration and Control of Liquid Scintillation Counters
3005
Calibration and Operation of pH Meters
3006
Balance Calibration and Check
3008
Negative Results Evaluation Policy
3009
Use and Maintenance of Mechanical Pipettors
3010
Microwave Digestion System Use and Maintenance
Part 4
Technical Procedures
4001
Not Used
4002
QC Checks on Data
4003
Sample Regent and Control
4004
Data Package Preparation and Reporting
4005
Blank, Spike, and Duplicate Controls
4006
Inter-Laboratory Comparison Study Process
4007
Method Basis and Initial Validation Process
4008
Not Used
4009
MDL Controls
4010
State Certification Process
4011
Accuracy, Precision, Efficiency, and Bias Controls and Data Quality Objectives
4012
Not Used
4013
Not Used
4014
Facility Operation and Control
4015
Documentation of Analytical Laboratory Logbooks (formerly 1002)
4016
Total Propagated Uncertainty (formerly 1004)
4017
LIMS Operation
4018
Instrument Calibration System
4019
Radioactive Reference Material Standards
Part 5
Miscellaneous Procedures
5001
Laboratory Hood Operations
5002
Operation and Maintenance of Deionized Water System
5003
Waste Management
5004
Acid Neutralization and Purification System Operation Procedure
Page 10 of 32
Part 6
LIMS
6001
LIMS Raw Data Processing and Reporting
6002
Software Development and/or Pilots of COTS Packages
6003
Software Change and Version Control
6004
Backup of Data and System Files
6005
Disaster Recovery Plan
6006
LIMS Hardware
6007
LIMS User Access
6008
LIMS Training
6009
LIMS Security
2.0
QUALITY SYSTEM
The TBE-ES QA system is designed to comply with multiple customer- and
regulatory agency-imposed specifications related to quality. This quality system
applies to all activities of TBE-ES that affect the quality of analyses performed by the
laboratory.
2.1
Policy
The TBE quality policy, given in Company Policy P-501, is “TBE will
continually improve our processes and effectiveness in providing products and
services that exceed our customer’s expectations.”
This policy is amplified by this Laboratory’s commitment, as attested to by the
title page signatures, to perform all work to good professional practices and to
deliver high quality services to our customers with full data integrity. (See Section
4.0 and Procedure 1005).
2.2
Quality System Structure
The Quality System is operated by the organizations described in Section 3.0
of this Manual. The Quality System is described in this Manual and in the
Procedures Manual, both of which are maintained by the QA Manager. Procedures
are divided into 6 sections – Administrative, Methods, Equipments, Technical,
Miscellaneous, and LIMS. This Manual is structured as shown in the Table of
Contents and refers to Procedures when applicable.
Cross references to the
various imposed quality specifications are contained in Appendices to this Manual.
2.3
Quality System Objectives
The Quality System is established to meet the objective of assuring all
operations are planned and executed in accordance with system requirements. The
Quality System also assures that performance evaluations are performed (see
Procedure 4006), and that appropriate verifications are performed (see Procedures
in the 1000 and 4000 series) to further assure compliance. Verification includes
Page 11 of 32
examination of final reports (prior to submittal to customers) to determine their
quality (see Procedure 4004).
To further these objectives, various in-process assessments of data, as well
as assessments of the system, via internal audits and management reviews, are
performed. Both internal experts and customer / regulatory agencies perform further
assessments of the system and compliance to requirements.
2.4
Personnel Orientation, Training, and Qualification
TBE provides indoctrination and training to employees and performs
proficiency evaluation of technical personnel. This effort is described in Section 4.0.
Page 12 of 32
3.0
ORGANIZATION, AUTHORITY, AND RESPONSIBILITY
TBE has established an effective organization for conducting laboratory
analyses at the Knoxville Environmental Services Laboratory.
The basic
organization is shown in Figure 3-1. Detail organization charts with names,
authorities, and responsibilities are given in Procedure 1002. Job descriptions are
given in Procedure 1006.
This organization provides clearly established Quality Assurance authorities,
duties, and functions. QA has the organizational freedom needed to:
(1)
Identify problems
(2)
Stop nonconforming work
(3)
Initiate investigations
(4)
Recommend corrective and preventive actions
(5)
Provide solutions or recommend solutions
(6)
Verify implementation of actions
All Laboratory personnel have the authority and resources to do their
assigned duties and have the freedom to act on problems. The QA personnel have
direct, independent access to Company management as shown in Figure 3-1.
Figure 3.1. Laboratory Organization
President
VP
Administration & QA
VP
Environmental
Product Assurance
Director
Lab QA Manager
Lab Operations
Manager
Program
Managers
Lab
Supervisor
Administration
Staff
Page 13 of 32
4.0 PERSONNEL ORIENTATION, DATA INTEGRITY, TRAINING, AND
QUALIFICATION
4.1
Orientation
All laboratory personnel must receive orientation to the quality program if their
work can affect quality. Orientation includes a brief review of customer- and
regulatory agency-imposed quality requirements, the structure of the QAM, and the
implementing procedures. The goal of orientation is to cover the nature and goals of
the QA program.
4.2
Data Integrity
The primary output of the Laboratory is data. Special emphasis and training
in data integrity is given to all personnel whose work provides or supports data
delivery. The Laboratory Data Integrity Procedure (Procedure 1005) describes
training, personnel attestations, and monitoring operations. Annual reviews are
required.
4.3
Training
The Quality Assurance Manager (QAM) maintains a training matrix indicating
which laboratory personnel need training in which specific Procedures. This matrix
is updated when personnel change or change assignments. All personnel are
trained per these requirements and procedures. This training program is described
in Procedure 1007. The assigned responsibilities for employees are described in
Procedure 1002 (See Section 3.0) on Organization and in Procedure 1006, Job
Descriptions. Refresher training or re-training is given annually as appropriate.
4.4
Qualification
Personnel are qualified as required by their job description. Management and
non-analysts are evaluated based on past experience, education, and
management’s assessment of their capabilities. Formal qualification is required of
analysts and related technical personnel who perform laboratory functions. Each
applicable person is given training and then formally evaluated by the Operations
Manager (or his designees) and by QA. Each analyst must initially demonstrate
capability to perform each assigned analytical effort. Each year, thereafter, he or
she must perform similar analyses on Interlab Comparison Samples (see Procedure
4006) or on equivalent blanks and spikes samples. Acceptable results extend
qualifications (certification). Unacceptable results require retraining in the subject
method / Procedures. (See Procedure 1007 for added information, records, forms,
etc. used.)
4.5
Records
Records of training subjects, contents, attendees, instructors, and
certifications are maintained by QA.
Page 14 of 32
5.0
CUSTOMER INTERFACES
5.1
Interface Personnel
The Laboratory has designated Program Managers as the primary interface
with all customers. Other interfaces may be the QA Manager or the Lab Operations
Manager.
5.2
Bid Requests and Tenders
The Program Managers respond to customer requests for bids and proposals
per Procedure 1014 for bids, proposals, and contract reviews. They clarify customer
requests so both the customer and the lab staff understand requests. As responses
are developed, internal reviews are conducted to ensure that requirements are
adequately defined and documented and to verify that the Laboratory has adequate
resources in physical capabilities, personal skills, and technical information to
perform the work. Accreditation needs are reviewed. If subcontracts are required to
perform any analysis, the subcontractor is similarly evaluated and the client notified
in writing of the effort. Most qualifications are routine with standard pricing and the
review of these quotes is performed by the Program Manager. Larger or more
complex quotes are reviewed by the Operations Manager and the QA Manager (or
designees). Evidence of review is by initialing and dating applicable papers,
signatures on quotations, or by memo.
5.3
Contracts
The Program Manager’s receive contract awards (oral or written) and
generate the work planning for initiation preparation (charge numbers, data structure
or contents in LIMS, etc.). They review contracts for possible differences from
quotations and, if acceptable, contracts are processed. Documentation of the review
is by initials and date as a minimum. Contract changes receive similar reviews and
planning.
5.4
TBE’s Expectation of Customers
TBE expects customers to provide samples suitable for lab analysis. These
expectations include:
Accurate and unambiguous identification of samples
Proper collection and preservation of samples
Use of appropriate containers free from external and internal
contamination
Integrity preservation during shipment and timely delivery of samples that
are age sensitive
Adequate sized samples that allow for retest, if needed
Specification of unique MOA/MDC requirements
Alerting the lab about abnormal samples (high activity, different chemical
contents, etc.)
Chain of custody initiation, when required.
Page 15 of 32
5.5
Customer Satisfaction
TBE’s quality policy centers on customer satisfaction (See 2.0). TBE will
work to satisfy customers through full compliance with contract requirements,
providing accurate data and properly responding to any questions or complaints.
Customers are provided full cooperation in their monitoring of Laboratory
performance. Customers are notified if any applicable State Accreditation is
withdrawn, revoked, or suspended.
5.5.1 Customer Complaints
Any customer complaints are documented and tracked to closure. Most
complaints concern analysis data and are received by Program Managers. They
log each such complaint, order retests for verification, and provide documented
results to customers. Complaints may also be received by QA or Operations.
If complaints are other than re-test type, the nonconformance and corrective
action systems (Sections 12 and 13) are used to resolve them and record all actions
taken.
5.5.2 Customer Confidentiality
All laboratory personnel maintain confidentiality of customer-unique
information.
Page 16 of 32
6.0
DOCUMENTATION GENERATION & CONTROL
6.1
General
The documentation generation and control system is detailed in Procedure
1008. An overview is given below. The basic quality system documents are
described in Section 2.0.
6.2
New Documentation
Each Procedure and this QAM is written by appropriate personnel, validated if
applicable (see Section 7.0), reviewed for adequacy, completeness, and
correctness, and, if acceptable, accepted by the authorized approver [QA Manager,
Operations Manager (or their designee)]. Both approvals are required if a Procedure
affects both QA and Operations. (See Responsibilities in Section 3.0).
These
procedures control the quality measurements and their accuracy.
Each document carries a unique identification number, a revision level, dates,
page numbers and total page count, and approver identification and sign off. If TBE
writes code for software, the software is version identified and issued after
Verification and Validation per Section 7.0.
6.3
Documentation Changes
Each change is reviewed in the same manner and by the same people as
new documentation. Revision identifications are updated and changes indicated by
side bars, italicized words, or by revision description when practical. Obsolete
revisions are maintained by QA after being identified as obsolete.
6.4
Documentation Lists and Distributions
Computer indexes of documents are maintained by Quality showing the
current authorized revision level of each document. These revisions are placed on
the Laboratory server and obsolete ones are removed so that all personnel have
only the current documents. If hard copies are produced and distributed, separate
distribution lists are maintained indicating who has them and their revision level(s).
Copies downloaded off the server are uncontrolled unless verified by the user (on
the computer) to be the latest revision.
6.5
Other Documentation
In addition to TBE-generated documentation, QA maintains copies of
applicable specifications, regulations, and standard methods.
6.6
Documentation Reviews
Each issued document is reviewed at least every third year by the approving
personnel. This review determines continued suitability for use and compliance with
requirements.
Page 17 of 32
7.0
DESIGN OF LABORATORY CONTROLS
7.1
General
The Laboratory and its operating procedures are designed specifically for low
level (environmental and in-plant) radioactive sample analysis. The various aspects
of the laboratory design include the following which are discussed in subsequent
paragraphs of this Section:
(a) Facility
(b) Technical Processes and Methods
(c) Verification of Design of Processes, Methods, and Software.
(d) Design of Quality Controls
(e) Counting Instrument Controls
7.2
Facility
The facility was designed and built in 2000 to facilitate correct performance of
operations in accordance with good laboratory practices and regulatory
requirements. It provides security for operations and samples. It separates sample
storage areas based on activity levels, separates wet chemistry from counting
instrumentation for contamination control, and provides space and electronic
systems for documentation, analysis, and record storage. Procedure 4014 describes
the facility, room uses, layouts, etc.
7.3
Technical Processes and Methods
7.3.1 Operational Flow
The laboratory design provides for sample receipt and storage (including
special environmental provisions for perishable items) where samples are received
from clients and other labs (see Section 9.0). The samples are logged into the
computer based Laboratory Information Management System (LIMS) and receive
unique identification numbers and bar code labels. (See Procedure 4017 for LIMS
description and user procedures). The Program Managers then plan the work and
assure LIMS contains any special instructions to analysts. Samples then go to
sample preparation, wet chemistry (for chemical separation), and counting based on
the radionuclides. See Procedures in the 2000 and 3000 series. Analysts perform
the required tasks with data being entered into logbooks, LIMS, and counting
equipment data systems as appropriate. Results are collected and reviewed by the
Operations Manager and Program Managers and reports to clients are generated
(See Section 14.0). All records (electronic or hard copy) are maintained in files or in
back-up electronic copies (see Section 15.0). After the required hold periods and
client notification and approval, samples are disposed of in compliance with
regulatory requirements (see Procedures 5003 and 5004).
Page 18 of 32
7.3.2 Methods
The laboratory methods documented in the 2000 and 3000 series of
Procedures were primarily developed by senior TBE laboratory personnel based on
years of experience at our prior facility in New Jersey. They have been improved,
supplemented and implemented here. Where EPA or other accepted national
methods exist (primarily for water analyses under State certification programs - see
Procedure 4010), the TBE methods conform to the imposed requirements or State
accepted alternate requirements. Any method modifications are documented and
described in the Procedure. There are no nationally recognized methods for most
other analysis methods but references to other method documents are noted where
applicable.
7.3.3 Data Reduction and Analysis
Whenever possible automatic data capture and computerized data reduction
programs are used. Calculations are either performed using commercial software
(counting system operating systems) or TBE developed and validated software is
used (see 7.4 below). Analysis of reduced data is performed as described in Section
14.0 and Procedure 4004.
7.4
Verification of Technical Processes, Methods, and Software
7.4.1 Operational Flow Verification
The entire QA Manual and related procedures describe the verification of
elements of the technical process flow and the establishment of quality check points,
reviews, and controls.
7.4.2 Method Verifications
Methods are verified and validated per Procedure 4007 prior to use unless
otherwise agreed to by the client. For most TBE methods initial validation occurred
well in the past. New or significantly revised Methods receive initial validation by
demonstration of their performance using known analytes (NIST traceable) in
appropriate matrices. Sufficient samples are run to obtain statistical data that
provides evidence of process capability and control, establishes detection levels
(see procedure 4009), bias and precision data (see Procedure 4011). All method
procedures and validation data are available to respective clients. Also see Section
7.5 below for the Demonstration of Capability program.
7.4.3 Data Reduction and Analysis Verification
Data reduction and analysis verification is performed by personnel who did
not generate the data. (See Section 14.0).
7.5
Design of Quality Controls
Page 19 of 32
7.5.1 General
There are multiple quality controls designed into the laboratory operations.
Many of these are described elsewhere in this manual and include personnel
qualification (Section 4.0), Document control (6.0), Sample identification and control
(9.0), Use of reference standards (10.0), intra- and inter- laboratory tests (10.0), etc.
This Section describes the basic quality control systems used to verify Method
capability and performance.
7.5.2 Demonstration of Capability (D of C)
The demonstration of capability system verifies and documents that the
method, analyst, and the equipment can perform within acceptable limits. The D of C
is certified for each combination of analyte, method, and instrument type. D of C's
are certified based on objective evidence at least annually. This program is
combined with the analyst D of C program (See Section 4.0). Initial D of C's use the
method validation effort as covered above. Subsequent D of C's use Inter-
Laboratory samples (Procedure 4006) or, if necessary, laboratory generated
samples using NIST traceable standards. If results are outside of control limits, re-
demonstration is required after investigation and corrective action is accomplished
(See Sections 12.0 and 13.0)
7.5.3 Process Control Checks
Process control checks are designed to include Inter-Lab samples, Intra-lab
QC check samples, and customer provided check samples. 10% of laboratory
analysis samples are for process control purposes.
7.5.3.1 Inter- Lab Samples.
Inter-lab samples are procured or
obtained from sources providing analytes of interest in matrices similar to normal
client samples. These samples may be used for Demonstration of Capability of
analyst's, equipment and methods. They also provide for independent insight into
the lab's process capabilities. Any value reported as being in the warning zone (over
2 sigma) is reviewed and improvements taken. Any value failing (over 3 sigma) is
documented on an NCR and formal investigation per Section 12.0 and 13.0 is
performed. If root causes are not clearly understood and fixed, re-tests are required
using lab prepared samples (See Procedure 4006).
7.5.3.2 QC Samples.
QC samples, along with Inter-lab samples and
customer check samples, are 10% of the annual lab workload for the applicable
analyte and method. If batch processing is used, some specifications require specific
checks with each batch or each day rather than as continuous process controls.
(See Procedure 4005)
QC samples consist of multiple types of samples including:
(a) Method blanks
(b) Blank spikes
(c) Matrix spikes
Page 20 of 32
(d) Duplicates
(e) Tracers and carriers
Acceptance limits for these samples are given in Procedures or in lab
standards. The number, frequency, and use of these sample types varies with the
method, matrix, and supplemental requirements. The patterns of use versus method
and the use of the resulting test data is described in Procedure 4005.
7.5.3.3 Customer Provided Check Samples.
Customers may
provide blind check samples and duplicates to aid in their evaluation of the
Laboratory. When the lab is notified that samples are check samples their results are
included in the QC sample percentage counts. Any reported problems are treated as
formal complaints and investigated per Section 5.
7.6
Counting Instrument Controls
The calibration of instruments is their primary control and is described in
Section 11.0. In addition, counting procedures (3000 series) also specify use of
background checks (method blank data is not used for this) to evaluate possible
counting equipment contamination. Instrument calibration checks using a lab
standard from a different source than the one used for calibration are also used.
Background data can be used to adjust client and test data. Checks with lab
standards indicate potential calibration changes.
Page 21 of 32
8.0
PURCHASING AND SUBCONTRACT CONTROLS
8.1
General
Procurement and Subcontracts efforts use the Huntsville-based Cost Point
computer system to process orders.
The Laboratory-generated Purchase
Requisitions are electronically copied into Purchase Orders in Huntsville. The
Laboratory also specifies sources to be used. Procured items and services are
received at the Laboratory where receiving checks and inspections are made.
Laboratory Procedure 1015 provides details on the procurement control system at
the Laboratory and references the Huntsville procedures as applicable.
8.2
Source Selection
Sources for procurements of items and services are evaluated and approved
by QA as described in Procedure 1015. Nationally recognized catalog item sources
are approved by the QA Manager based on reputation. Maintenance services by an
approved distributor or the equipment manufacturing company are pre-approved.
Sources for other services are evaluated by QA, based on service criticality to the
quality system, by phone, mail out, or site visit.
Subcontract sources for laboratory analysis services are only placed with
accredited laboratories (by NELAP, NUPIC, State, Client, etc.) as applicable for the
type of analysis to be performed. QA maintains lists of approved vendors and
records of evaluations performed.
8.3
Procurement of Supplies and Support Services
8.3.1 Catalog Supplies
The Laboratory procures reagents, processing chemicals, laboratory
“glassware,” consumables, and other catalog items from nationally known vendors
and to applicable laboratory grades, purities, concentrations, accuracy levels, etc.
Purchase Requisitions for these items specify catalog numbers or similar call-outs
for these off-the-shelf items. Requisitions are generated by the personnel in the lab
needing the item and are approved by the Operations or Production Manager.
Reagents are analytical reagent grade only.
8.3.2 Support Services
Purchase Requisitions for support services (such as balance
calibration, equipment maintenance, etc.) are processed as in 8.3.1 but technical
requirements are specified and reviewed before approvals are given.
Page 22 of 32
8.3.3 Equipment and Software
Purchase Requisitions for new equipment, software programs, and
major facility modifications affecting the quality system are reviewed and approved
by the Operations Manager and the QA Manager.
8.4
Subcontracting of Analytical Services
When necessary, the Laboratory may subcontract analytical services required
by a client. This may be because of special needs, infrequency of analysis, etc.
Applicable quality and regulatory requirements are imposed in the Purchase
Requisition and undergo a technical review by QA. TBE reserves the right of access
by TBE and our client for verification purposes.
8.5
Acceptance of Items or Services
Items and services affecting the quality system are verified at receipt based
on objective evidence supplied by the vendor. Supply items are reviewed by the
requisitioner and, if acceptable, are accepted via annotation on the vendor packing
list or similar document. Similarly, equipment services are accepted by the
requisitioning lab person. Calibration services are accepted by QA based on
certification reviews. (See Section 11.0.)
Data reports from analytical subcontractors are evaluated by Program
Managers and subsequently by the Operations Manager (or designee) as part of
client report reviews.
Items are not used until accepted and if items or services are rejected, QA is
notified and nonconformance controls per Section 12.0 are followed. Vendors may
be removed from the approved vendor’s list if their performance is unacceptable.
Page 23 of 32
9.0
TEST SAMPLE IDENTIFICATION AND CONTROL
9.1
Sample Identification
Incoming samples are inspected for customer identification, container
condition, chain of custody forms, and radioactivity levels. If acceptable, the sample
information is entered into LIMS which generates bar coded labels for attachment to
the sample(s). The labels are attached and samples stored in the assigned location.
If environmental controls are needed (refrigeration, freezing, etc.), the samples are
placed in these storage locations. If not acceptable, the Program Manager is
notified, the customer contacted, and the problem resolved (return of sample, added
data receipts, etc.). See Procedure 4003 for more information on sample receipt.
9.2
LIMS
The LIMS is used to schedule work, provide special information to analysts,
and record all actions taken on samples. See Procedure 4017 and the 6000 series
of procedures for more information on LIMS operations.
9.3
Sample Control
The sample, with its bar coded label, is logged out to the applicable lab
operation where the sample is processed per the applicable methods (Procedures
2000 and 3000). The LIMS-assigned numbers are used for identification through all
operations to record data. Data is entered into LIMS, log books (kept by the
analysts) or equipment data systems to record data. The combination of LIMS,
logbooks, and equipment data systems provide the Chain of Custody data and
document all actions taken on samples. Unused sample portions are returned to its
storage area for possible verification use. Samples are discarded after required time
limits are passed and after client notification and approval, if required.
Page 24 of 32
10.0 SPECIAL PROCESSES, INSPECTION, AND TEST
10.1 Special Processes
The Laboratory’s special processes are the methods used to analyze a
sample and control equipment. These methods are defined in Procedures in the
2000 and 3000 series. These processes are performed to the qualified methods
(see Section 7.0) by qualified people (see 4.0).
10.2 Inspections and Tests
The quality of the process is monitored by indirect means. This program
involves calibration checks on counting equipments (see Section 11.0), intra-
laboratory checks, and inter-laboratory checks. In addition, some customers submit
quality control check samples (blinds, duplicates, external reference standards). All
generated data gets independent reviews.
10.2.1 Intra Laboratory Checks (QC Checks)
The quantity and types of checks varies with the method, but basic checks
which may include blanks, spiked blanks, matrix spikes, matrix spike duplicates, and
duplicates are used as appropriate for customer samples. This process is described
in Procedure 4005 and in Section 7.0.
10.2.2 Inter Laboratory Checks
TBE participates in Inter-lab performance evaluation (check) programs with
multiple higher level labs. These programs provide blind matrices for the types of
matrix/analyte combinations routinely processed by the Lab, if available. This
program is described in Procedure 4006.
10.2.3 Data Reviews
Raw data and reports are reviewed by the Operations Manager, or
designees.
This review checks for data logic, expected results, procedure
compliance, etc. (See Section 14.0).
10.3 Control of Sampling of Samples
Samples for analysis are supplied by customers preferably in quantities
sufficient to allow re-verification analyses if needed. The samples are prepared for
analysis by analysts and then an aliquot (partial sample extraction) is taken from the
homogeneous customer sample for the initial analysis. Methods specify standard
volumes of sample material required. Sampling data is recorded in LIMS and/or
logbooks.
10.4 Reference Standards / Material
Page 25 of 32
10.4.1 Weights and Temperatures
Reference standards are used by the Laboratory’s calibration vendor to
calibrate the Labs working instruments measuring weights and thermometers.
10.4.2 Radioactive Materials
Reference radioactive standards, traceable to NIST, are procured from higher
level laboratories. These reference materials are maintained in the standards area
and are diluted down for use by laboratory analysts. All original and diluted volumes
are fully traceable to source, procedure, analyst, dilution, and acquisition dates. See
Section 11.0 and Procedure 1009.
Page 26 of 32
11.0 EQUIPMENT MAINTENANCE AND CALIBRATION
11.1 General
There are two types of equipment used by the Laboratory:
support
equipment (scales, glassware, weights, thermometers, etc.) and instruments for
counting. Standards traceable to NIST are used for calibration and are of the
needed accuracy for laboratory operations. Procedures 1009, 4018, and 4019
describe the calibration and maintenance programs.
11.2 Support Equipment
Analytical support equipment is purchased with the necessary accuracies and
appropriate calibration data. If needed, initial calibration by the Laboratory or its
calibration vendor is performed. Recalibration schedules are established and
equipment recalibrated by the scheduled date by a calibration vendor or by
Laboratory personnel. Maintenance is performed, as needed, per manufacturer’s
manuals or lab procedures.
In addition to calibrations and recalibrations, checks are made on the
continued accuracy of items as described in Procedure 1009. Records are
maintained of calibration and specified checks.
11.3 Instruments
Instruments receive initial calibration using radioactive sources traceable to
NIST. The initial calibration establishes statistical limits of variation that are used to
set control limits for future checks and recalibration. This process is described in
Procedure 4018. Instruments are maintained per Instrument Manual requirements.
Recalibrations are performed per the Procedure.
Between calibrations, check sources are used to assure no significant
changes have occurred in the calibration of items. Background checks are
performed to check for possible radioactive contamination. Background values are
used to adjust sample results. Hardware and software are safeguarded from
adjustments that could invalidate calibrations or results.
11.4 Nonconformances and Corrective Actions
If calibrations or checks indicate a problem, the nonconformance system
(Section 12.0) and corrective action system (Section 13.0) are initiated to document
the problem and its resolution. Equipment is promptly removed from service if
questionable.
Page 27 of 32
11.5 Records
Records of calibrations are maintained.
Calibration certificates from
calibration vendors are maintained by QA. Other calibration data and check data is
maintained in log books, LIMS, or instrument software as appropriate and as
described in Procedures 1009, 4018, and 4019.
Page 28 of 32
12.0 NONCONFORMANCE CONTROLS
12.1 General
The nonconformance control system is implemented whenever a
nonconforming condition on any aspect of Laboratory analysis, testing, or results
exist. The system takes graded actions based on the nature and severity of the
nonconformance. Nonconforming items or processes are controlled to prevent
inadvertent use. Nonconformances are documented and dispositioned. Notification
is made to affected organizations, including clients. Procedure 1010 describes the
procedures followed. Sample results are only reported after resolution.
12.2 Responsibility and Authority
Each Laboratory employee has the responsibility to report nonconformances
and the authority to stop performing nonconforming work or using nonconforming
equipment. Laboratory supervision can disposition and take corrective actions on
minor problems.
Any significant problem is documented by QA using the
Laboratory’s NCR system per Procedure 1010. QA conducts or assures the conduct
of cause analyses, disposition of items or data, and initiation of corrective action if
the nonconformance could recur.
12.3 10CFR21 Reporting
The QA Manager reviews NCRs for possible need of customer and/or NRC
notification per the requirements of 10CFR21. Procedure 1011 is followed in this
review and for any required reporting.
Page 29 of 32
13.0 CORRECTIVE AND PREVENTIVE ACTIONS
13.1 General
The Laboratory takes corrective actions on significant nonconformances (see
Section 12.0). It also initiates preventive and improvement actions per the Company
Quality Policy (see Section 2.0). The procedures for Corrective Action/Preventive
Action systems are contained in Procedure 1012.
13.2 Corrective Actions
Corrective actions are taken by Operations and Quality to promptly correct
significant conditions adverse to quality. The condition is identified and cause
analysis is performed to identify root causes. Solutions are evaluated and the
optimum one selected that will prevent recurrence, can be implemented by the
Laboratory, allows the Laboratory to meet its other goals, and is commensurate with
the significance of the problem. All steps are documented, action plans developed
for major efforts, and reports made to Management. QA verifies the implementation
effectiveness. Procedure 1012 provides instructions and designates authorities and
responsibilities.
13.3 Preventive Actions
Preventive actions are improvements intended to reduce the potential for
nonconformances. Possible preventive actions are developed from suggestions
from employees and from analysis of Laboratory technical and quality systems by
management. If preventive actions or improvements are selected for investigation,
the issues, investigation, recommendations, and implementation actions are
documented. Follow up verifies effectiveness.
Page 30 of 32
14.0 RESULTS ANALYSIS AND REPORTING
14.1 General
The Laboratory’s role is to provide measurement-based information to clients
that is technically valid, legally defensible, and of known quality.
14.2 Results Review
The results obtained from analytical efforts are collected and reviewed by the
Operations Manager and the Program Manager.
This review verifies the
reasonableness and consistency of the results. It includes review of sample and the
related QC activity data. Procedure 4002 describes the process. Any deficiencies
are corrected by re-analyses, recalculations, or corrective actions per Sections 12.0
and 13.0. Use of the LIMS with its automatic data loading features (see Procedure
4017) minimizes the possibility of transcription or calculation errors.
14.3 Reports
Reports range from simple results reporting to elaborate analytical reports
based on the client requirements and imposed specifications and standards. (See
Procedure 4004.) Reports present results accurately, clearly, unambiguously,
objectively, and as required by the applicable Method(s).
Reports include
reproduction restrictions, information on any deviations from methods, and any
needed data qualifiers based on QC data. If any data is supplied by analytical
subcontractors (see Section 8.0), it is clearly identified and attributed to that
Laboratory by either name or accreditation number.
If results are faxed or transmitted electronically, confidentiality statements are
included in case of receipt by other than the intended client.
Reports are approved by the Program Manager and Operations Manager and
record copies kept in file (See Section 15.0).
Page 31 of 32
15.0 RECORDS
15.1 General
The Laboratory collects generated data and information related to quality or
technical data and maintains them as records. Records are identified, prepared,
reviewed, placed in storage, and maintained as set forth in Procedure 1003.
15.2 Type of Records
All original observations, calculations, derived data, calibration data, and test
reports are included. In addition QA data such as audits, management reviews,
corrective and preventive actions, manuals, and procedures are included.
15.3 Storage and Retention
Records are stored in files after completion in the lab. Files are in specified
locations and under the control of custodians. Filing systems provide for retrieval.
Electronic files are kept on Company servers (with regular back up) or on media
stored in fireproof file cabinets. Records are kept in Laboratory files for at least 2
years after the last entry and then in Company files for another year as a minimum.
Some customers specify larger periods – up to 7 years – which is also met. Generic
records supporting multiple customers are kept for the longest applicable period.
15.4 Destruction or Disposal
Records may be destroyed after the retention period and after client
notification and acceptance, if required. If the Laboratory closes, records will go in to
company storage in Huntsville unless otherwise directed by customers. If the
Laboratory is sold, either the new owner will accept record ownership or the records
will go into Company storage as stated above.
Page 32 of 32
16.0 ASSESSMENTS
16.1 General
Assessments consist of internal audits and management reviews as set forth
in Procedure 1013.
16.2 Audits
Internal audits are planned, performed at least annually on all areas of the
quality system, and are performed by qualified people who are as independent as
possible from the activity audited.
(The Laboratory’s small size inhibits full
independence in some technical areas.) Audits are coordinated by the Quality
Manager who assures audit plans and checklists are generated and the results
documented. Reports include descriptions of any findings and provide the auditor’s
assessment of the effectiveness of the audited activity. Report data includes
personnel contacted.
Audit findings are reviewed with management and corrective actions agreed
to and scheduled. Follow up is performed by QA to verify accomplishment and
effectiveness of the corrective action.
16.3 Management Reviews
The Annual Quality Assurance Report, prepared for some clients, is the
Management Review vehicle. These reports cover audit results, corrective and
preventive actions, external assessments, and QC and inter-laboratory performance
checks. The report is reviewed with Management by the QA Manager for the
continued suitability of the Quality Program and its effectiveness. Any needed
improvements are defined, documented, and implemented. Follow ups are made to
verify implementation and effectiveness.
Revision 1
045136 (22) Zion Station
APPENDIX D
LABORATORY ANALYTICAL REPORTS
L28833 R2 / 1 of 162
L28833 R2 / 2 of 162
L28833 R2 / 3 of 162
L28833 R2 / 4 of 162
L28833 R2 / 5 of 162
L28833 R2 / 6 of 162
L28833 R2 / 7 of 162
L28833 R2 / 8 of 162
L28833 R2 / 9 of 162
L28833 R2 / 10 of 162
L28833 R2 / 11 of 162
L28833 R2 / 12 of 162
L28833 R2 / 13 of 162
L28833 R2 / 14 of 162
L28833 R2 / 15 of 162
L28833 R2 / 16 of 162
L28833 R2 / 17 of 162
L28833 R2 / 18 of 162
L28833 R2 / 19 of 162
L28833 R2 / 20 of 162
L28833 R2 / 21 of 162
L28833 R2 / 22 of 162
L28833 R2 / 23 of 162
L28833 R2 / 24 of 162
L28833 R2 / 25 of 162
L28833 R2 / 26 of 162
L28833 R2 / 27 of 162
L28833 R2 / 28 of 162
L28833 R2 / 29 of 162
L28833 R2 / 30 of 162
L28833 R2 / 31 of 162
L28833 R2 / 32 of 162
L28833 R2 / 33 of 162
L28833 R2 / 34 of 162
L28833 R2 / 35 of 162
L28833 R2 / 36 of 162
L28833 R2 / 37 of 162
L28833 R2 / 38 of 162
L28833 R2 / 39 of 162
L28833 R2 / 40 of 162
L28833 R2 / 41 of 162
L28833 R2 / 42 of 162
L28833 R2 / 43 of 162
L28833 R2 / 44 of 162
L28833 R2 / 45 of 162
L28833 R2 / 46 of 162
L28833 R2 / 47 of 162
L28833 R2 / 48 of 162
L28833 R2 / 49 of 162
L28833 R2 / 50 of 162
L28833 R2 / 51 of 162
L28833 R2 / 52 of 162
L28833 R2 / 53 of 162
L28833 R2 / 54 of 162
L28833 R2 / 55 of 162
L28833 R2 / 56 of 162
L28833 R2 / 57 of 162
L28833 R2 / 58 of 162
L28833 R2 / 59 of 162
L28833 R2 / 60 of 162
L28833 R2 / 61 of 162
L28833 R2 / 62 of 162
L28833 R2 / 63 of 162
L28833 R2 / 64 of 162
L28833 R2 / 65 of 162
L28833 R2 / 66 of 162
L28833 R2 / 67 of 162
L28833 R2 / 68 of 162
L28833 R2 / 69 of 162
L28833 R2 / 70 of 162
L28833 R2 / 71 of 162
L28833 R2 / 72 of 162
L28833 R2 / 73 of 162
L28833 R2 / 74 of 162
L28833 R2 / 75 of 162
L28833 R2 / 76 of 162
L28833 R2 / 77 of 162
L28833 R2 / 78 of 162
L28833 R2 / 79 of 162
L28833 R2 / 80 of 162
L28833 R2 / 81 of 162
L28833 R2 / 82 of 162
L28833 R2 / 83 of 162
L28833 R2 / 84 of 162
L28833 R2 / 85 of 162
L28833 R2 / 86 of 162
L28833 R2 / 87 of 162
L28833 R2 / 88 of 162
L28833 R2 / 89 of 162
L28833 R2 / 90 of 162
L28833 R2 / 91 of 162
L28833 R2 / 92 of 162
L28833 R2 / 93 of 162
L28833 R2 / 94 of 162
L28833 R2 / 95 of 162
L28833 R2 / 96 of 162
L28833 R2 / 97 of 162
L28833 R2 / 98 of 162
L28833 R2 / 99 of 162
L28833 R2 / 100 of 162
L28833 R2 / 101 of 162
L28833 R2 / 102 of 162
L28833 R2 / 103 of 162
L28833 R2 / 104 of 162
L28833 R2 / 105 of 162
L28833 R2 / 106 of 162
L28833 R2 / 107 of 162
L28833 R2 / 108 of 162
L28833 R2 / 109 of 162
L28833 R2 / 110 of 162
L28833 R2 / 111 of 162
L28833 R2 / 112 of 162
L28833 R2 / 113 of 162
L28833 R2 / 114 of 162
L28833 R2 / 115 of 162
L28833 R2 / 116 of 162
L28833 R2 / 117 of 162
L28833 R2 / 118 of 162
L28833 R2 / 119 of 162
L28833 R2 / 120 of 162
L28833 R2 / 121 of 162
L28833 R2 / 122 of 162
L28833 R2 / 123 of 162
L28833 R2 / 124 of 162
L28833 R2 / 125 of 162
L28833 R2 / 126 of 162
L28833 R2 / 127 of 162
L28833 R2 / 128 of 162
L28833 R2 / 129 of 162
L28833 R2 / 130 of 162
L28833 R2 / 131 of 162
L28833 R2 / 132 of 162
L28833 R2 / 133 of 162
L28833 R2 / 134 of 162
L28833 R2 / 135 of 162
L28833 R2 / 136 of 162
L28833 R2 / 137 of 162
L28833 R2 / 138 of 162
L28833 R2 / 139 of 162
L28833 R2 / 140 of 162
L28833 R2 / 141 of 162
L28833 R2 / 142 of 162
L28833 R2 / 143 of 162
L28833 R2 / 144 of 162
L28833 R2 / 145 of 162
L28833 R2 / 146 of 162
L28833 R2 / 147 of 162
L28833 R2 / 148 of 162
L28833 R2 / 149 of 162
L28833 R2 / 150 of 162
L28833 R2 / 151 of 162
L28833 R2 / 152 of 162
L28833 R2 / 153 of 162
L28833 R2 / 154 of 162
L28833 R2 / 155 of 162
L28833 R2 / 156 of 162
L28833 R2 / 157 of 162
L28833 R2 / 158 of 162
L28833 R2 / 159 of 162
L28833 R2 / 160 of 162
L28833 R2 / 161 of 162
L28833 R2 / 162 of 162
L29109 1 of 17
L29109 2 of 17
L29109 3 of 17
L29109 4 of 17
L29109 5 of 17
L29109 6 of 17
L29109 7 of 17
L29109 8 of 17
L29109 9 of 17
L29109 10 of 17
L29109 11 of 17
L29109 12 of 17
L29109 13 of 17
L29109 14 of 17
L29109 15 of 17
L29109 16 of 17
L29109 17 of 17
L29402 1 of 61
L29402 2 of 61
L29402 3 of 61
L29402 4 of 61
L29402 5 of 61
L29402 6 of 61
L29402 7 of 61
L29402 8 of 61
L29402 9 of 61
L29402 10 of 61
L29402 11 of 61
L29402 12 of 61
L29402 13 of 61
L29402 14 of 61
L29402 15 of 61
L29402 16 of 61
L29402 17 of 61
L29402 18 of 61
L29402 19 of 61
L29402 20 of 61
L29402 21 of 61
L29402 22 of 61
L29402 23 of 61
L29402 24 of 61
L29402 25 of 61
L29402 26 of 61
L29402 27 of 61
L29402 28 of 61
L29402 29 of 61
L29402 30 of 61
L29402 31 of 61
L29402 32 of 61
L29402 33 of 61
L29402 34 of 61
L29402 35 of 61
L29402 36 of 61
L29402 37 of 61
L29402 38 of 61
L29402 39 of 61
L29402 40 of 61
L29402 41 of 61
L29402 42 of 61
L29402 43 of 61
L29402 44 of 61
L29402 45 of 61
L29402 46 of 61
L29402 47 of 61
L29402 48 of 61
L29402 49 of 61
L29402 50 of 61
L29402 51 of 61
L29402 52 of 61
L29402 53 of 61
L29402 54 of 61
L29402 55 of 61
L29402 56 of 61
L29402 57 of 61
L29402 58 of 61
L29402 59 of 61
L29402 60 of 61
L29402 61 of 61
Revision 1
045136 (22) Zion Station
APPENDIX E
DATA VALIDATION MEMORANDUM