Worldwide Engineering , Environmental , Construction , and IT Services
Revision 1
Certain figures in this Report contain sensitive, security-
related information protected from public disclosure by
Federal and State law. This Report is suitable for
public disclosure only after these figures are removed.
HYDROGEOLOGIC INVESTIGATION REPORT
FLEETWIDE ASSESSMENT
DRESDEN GENERATING STATION
MORRIS, ILLINOIS
Prepared For:
Exelon Generation Company, LLC
DISCLAIMER:
SOME FORMATTING CHANGES MAY HAVE OCCURRED WHEN
THE ORIGINAL DOCUMENT WAS PRINTED TO PDF; HOWEVER,
THE ORIGINAL CONTENT REMAINS UNCHANGED.
SEPTEMBER 2006
R
EF. NO. 045136 (15)
Prepared by:
Conestoga-Rovers
& Associates
651 Colby Drive
Waterloo, Ontario
Canada N2V 1C2
Office: (519) 884-0510
Fax:
(519) 884-0525
web: http:\\www.CRAworld.com
Revision 1
TABLE OF CONTENTS
Page
EXECUTIVE SUMMARY.................................................................................................................... i
1.0
INTRODUCTION ...................................................................................................................1
2.0
STATION DESCRIPTION .....................................................................................................2
2.1
STATION LOCATION .......................................................................................2
2.2
OVERVIEW OF COOLING WATER OPERATION.......................................2
2.3
SURROUNDING LAND USE ...........................................................................4
2.4
STATION SETTING............................................................................................5
2.4.1
TOPOGRAPHY AND SURFACE WATER FEATURES.................................5
2.4.2
GEOLOGY............................................................................................................6
2.4.3
HYDROGEOLOGY .............................................................................................8
2.5
AREA GROUNDWATER USE..........................................................................8
3.0
AREAS FOR FURTHER
EVALUATION...........................................................................10
3.1
SYSTEMS EVALUATIONS..............................................................................10
3.2
HISTORICAL RELEASES ................................................................................13
3.3
STATION INVESTIGATIONS.........................................................................13
3.3.1
POWER PLANT DOCUMENTS-UFSAR REPORT ......................................13
3.3.2
RETEC GROUNDWATER INVESTIGATION STUDY ...............................13
3.3.3
GROUNDWATER MONITORING PROGRAM...........................................14
3.3.4
RADIOLOGICAL ENVIRONMENTAL MONITORING PROGRAM ......14
3.4
IDENTIFIED AREAS FOR FURTHER EVALUATION ...............................15
4.0
FIELD METHODS.................................................................................................................18
4.1
SURFACE WATER ELEVATION MONITORING POINTS .......................18
4.2
GROUNDWATER MONITORING WELL INSTALLATION.....................18
4.3
GROUNDWATER MONITORING WELL DEVELOPMENT ....................19
4.4
SURVEY ..............................................................................................................20
4.5
GROUNDWATER AND SURFACE WATER ELEVATION
MEASUREMENTS
............................................................................................20
4.6
GROUNDWATER AND SURFACE WATER SAMPLE COLLECTION...21
4.7
DATA QUALITY OBJECTIVES.......................................................................23
4.8
SAMPLE IDENTIFICATION...........................................................................24
4.9
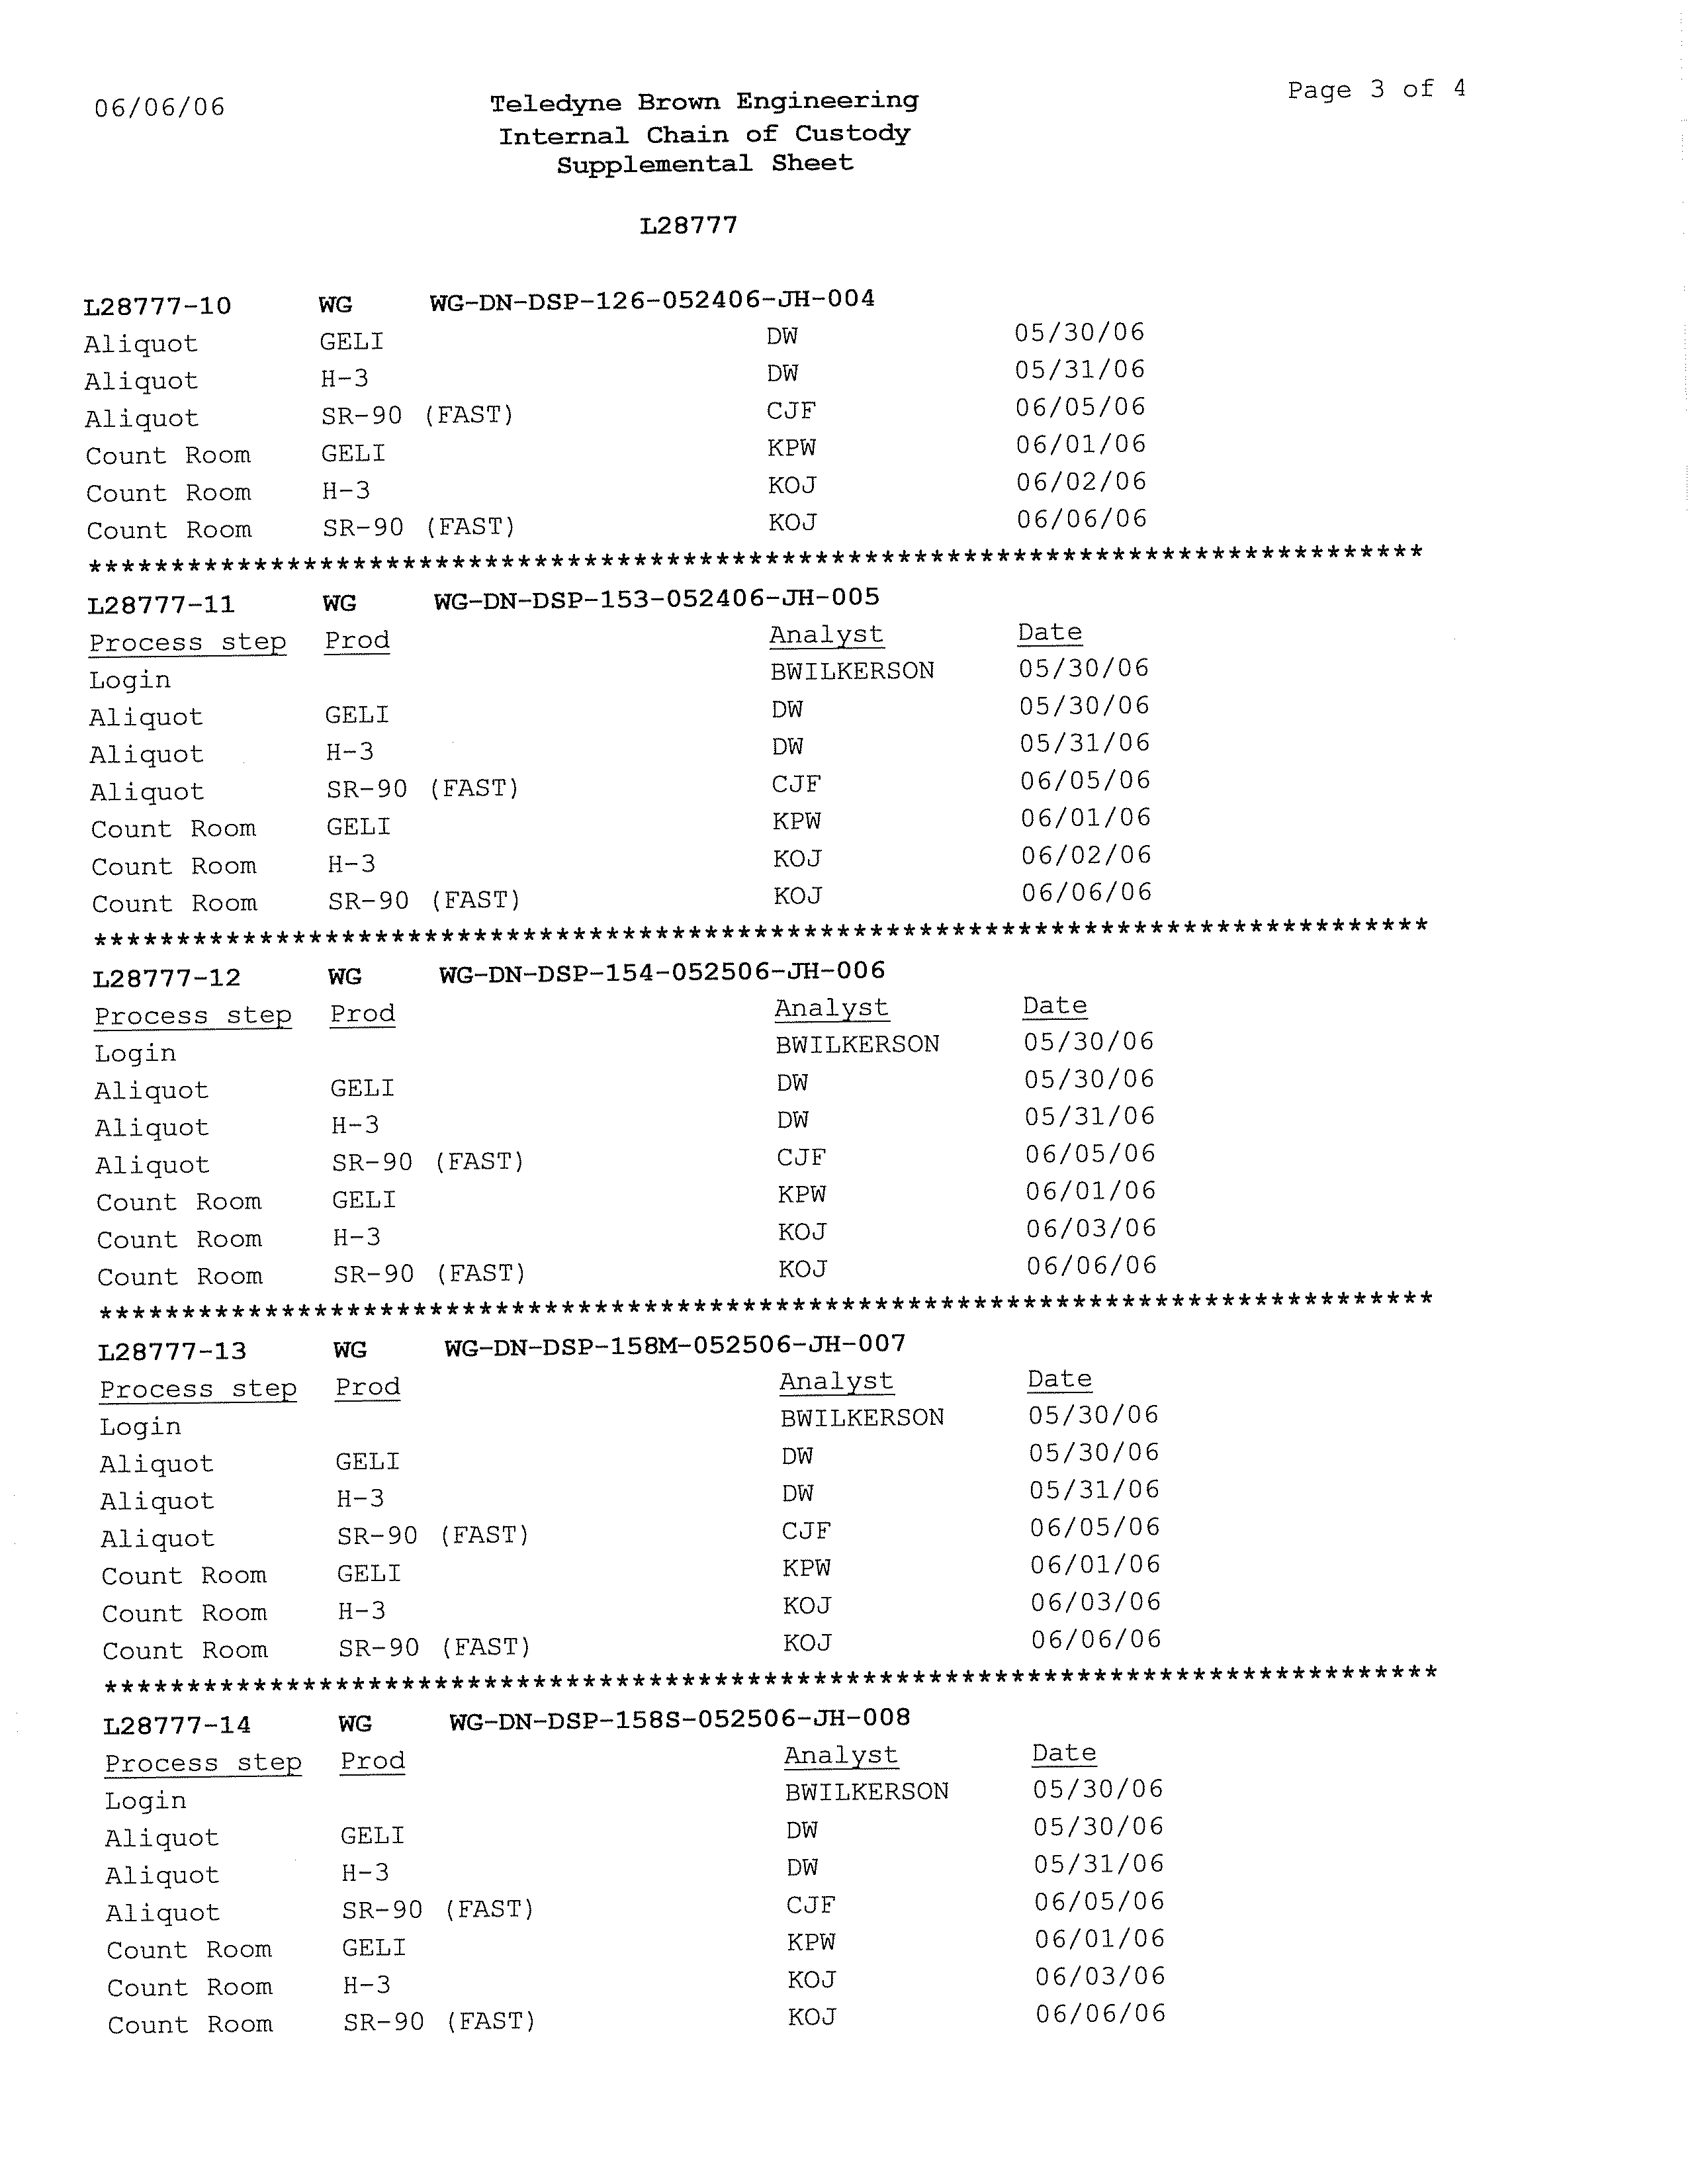
CHAIN-OF-CUSTODY RECORD...................................................................25
4.10
QUALITY CONTROL SAMPLES ...................................................................25
4.11
ANALYSES.........................................................................................................25
5.0
RESULTS SUMMARY..........................................................................................................26
5.1
STATION GEOLOGY .......................................................................................26
5.2
STATION HYDROGEOLOGY ........................................................................28
5.2.1
GROUNDWATER FLOW DIRECTIONS ......................................................28
5.2.2
MAN-MADE INFLUENCE ON GROUNDWATER FLOW
.......................29
045136 (15) Dresden Generating Station
CONESTOGA-ROVERS & ASSOCIATES
Revision 1
TABLE OF CONTENTS
Page
5.2.3
VERTICAL HYDRAULIC GRADIENTS........................................................31
5.2.4
LATERAL GROUNDWATER FLOW AND VELOCITY.............................32
5.3
GROUNDWATER QUALITY..........................................................................32
5.3.1
SUMMARY OF BETA-EMITTING RADIONUCLIDES
ANALYTICAL
RESULTS.................................................................................33
5.3.2
SUMMARY OF GAMMA-EMITTING RADIONUCLIDES
ANALYTICAL
RESULTS.................................................................................34
5.3.3
SUMMARY OF FIELD MEASUREMENTS ...................................................34
5.4
SURFACE WATER QUALITY.........................................................................34
5.4.1
SUMMARY OF BETA-EMITTING RADIONUCLIDES
ANALYTICAL
RESULTS.................................................................................35
5.4.2
SUMMARY OF GAMMA-EMITTING RADIONUCLIDES
ANALYTICAL
RESULTS.................................................................................35
6.0
RADIONUCLIDES OF CONCERN AND SOURCE AREAS .........................................36
6.1
GAMMA-EMITTING RADIONUCLIDES.....................................................36
6.2
BETA-EMITTING RADIONUCLIDES ...........................................................36
6.3
TRITIUM.............................................................................................................37
6.3.1
GENERAL CHARACTERISTICS....................................................................37
6.3.2
DISTRIBUTION IN STATION GROUNDWATER.......................................38
6.3.3
DISTRIBUTION IN STATION SURFACE WATER......................................42
6.3.4
CONCEPTUAL MODEL OF TRITIUM RELEASE
AND MIGRATION
...........................................................................................42
6.4
STRONTIUM......................................................................................................44
6.4.1
GENERAL CHARACTERISTICS....................................................................44
6.4.2
DISTRIBUTION IN STATION GROUNDWATER.......................................44
6.4.3
DISTRIBUTION IN STATION SURFACE WATER......................................46
7.0
EXPOSURE PATHWAY ASSESSMENT............................................................................47
7.1
HEALTH EFFECTS OF TRITIUM...................................................................47
7.2
BACKGROUND CONCENTRATIONS
OF TRITIUM ................................48
7.2.1
GROUNDWATER.............................................................................................48
7.2.2
PRECIPITATION DATA..................................................................................48
7.2.3
SURFACE WATER DATA ...............................................................................49
7.2.4
DRINKING WATER DATA ............................................................................50
7.2.5
EXPECTED TRITIUM BACKGROUND FOR THE STATION ...................51
7.3
IDENTIFICATION OF POTENTIAL EXPOSURE
PATHWAYS AND POTENTIAL RECEPTORS
............................................52
7.3.1
POTENTIAL GROUNDWATER MIGRATION TO
DRINKING WATER
USERS AT THE STATION PROPERTY ...................52
7.3.2
POTENTIAL GROUNDWATER MIGRATION TO
DRINKING WATER
USERS OFF THE STATION PROPERTY .................53
045136 (15) Dresden Generating Station
CONESTOGA-ROVERS & ASSOCIATES
Revision 1
TABLE OF CONTENTS
Page
7.3.3
POTENTIAL GROUNDWATER MIGRATION TO SURFACE
WATER
USERS OFF THE STATION PROPERTY .......................................53
7.3.4
POTENTIAL SURFACE WATER MIGRATION TO
GROUNDWATER AND SURFACE WATER OFF
THE STATION
PROPERTY.............................................................................54
7.4
SUMMARY OF POTENTIAL TRITIUM
EXPOSURE PATHWAYS ..........54
7.5
OTHER RADIONUCLIDES.............................................................................55
8.0
CONCLUSIONS....................................................................................................................56
9.0
RECOMMENDATIONS.......................................................................................................61
9.1
FILL DATA GAPS .............................................................................................61
9.2
GROUNDWATER MONITORING ................................................................61
10.0
REFERENCES........................................................................................................................62
045136 (15) Dresden Generating Station
CONESTOGA-ROVERS & ASSOCIATES
Revision 1
LIST OF FIGURES
(Following Text)
FIGURE 1.1
STATION LOCATION MAP
FIGURE 2.1
STATION BOUNDARIES AND FEATURES
FIGURE 2.2
COOLING WATER FLOW DIAGRAM
FIGURE 2.3
REGIONAL GEOLOGIC CROSS-SECTION
FIGURE 3.1
AREAS FOR FURTHER EVALUATION
FIGURE 4.1
SURFACE WATER MONITORING LOCATIONS
FIGURE 4.2
GROUNDWATER MONITORING LOCATIONS
FIGURE 5.1
LOCAL GEOLOGIC CROSS-SECTION LOCATIONS
FIGURE 5.2
LOCAL GEOLOGIC CROSS-SECTION A-A'
FIGURE 5.3
LOCAL GEOLOGIC CROSS-SECTION B-B'
FIGURE 5.4
POTENTIOMETRIC SURFACE CONTOURS AUGUST 2006 -
SHALLOW GROUNDWATER ZONE
FIGURE 5.5
POTENTIOMETRIC SURFACE CONTOURS AUGUST 2006 -
INTERMEDIATE GROUNDWATER ZONE
FIGURE 5.6
TRITIUM CONCENTRATIONS - SHALLOW GROUNDWATER
ZONE
FIGURE 5.7
TRITIUM CONCENTRATIONS - INTERMEDIATE GROUNDWATER
ZONE
FIGURE 5.8
RADIONUCLIDE CONCENTRATIONS - SHALLOW GROUNDWATER
ZONE AUGUST 2006
FIGURE 5.9
RADIONUCLIDE CONCENTRATIONS - INTERMEDIATE
GROUNDWATER ZONE AUGUST 2006
045136 (15) Dresden Generating Station
CONESTOGA-ROVERS & ASSOCIATES
Revision 1
LIST OF FIGURES
(Following Text)
FIGURE 6.1
HYDROGEOLOGIC PROFILE - A-A'
FIGURE 6.2
HYDROGEOLOGIC PROFILE - B-B'
FIGURE 6.3
HYDROGEOLOGIC PROFILE - C-C'
045136 (15) Dresden Generating Station
CONESTOGA-ROVERS & ASSOCIATES
Revision 1
LIST OF TABLES
(Following Text)
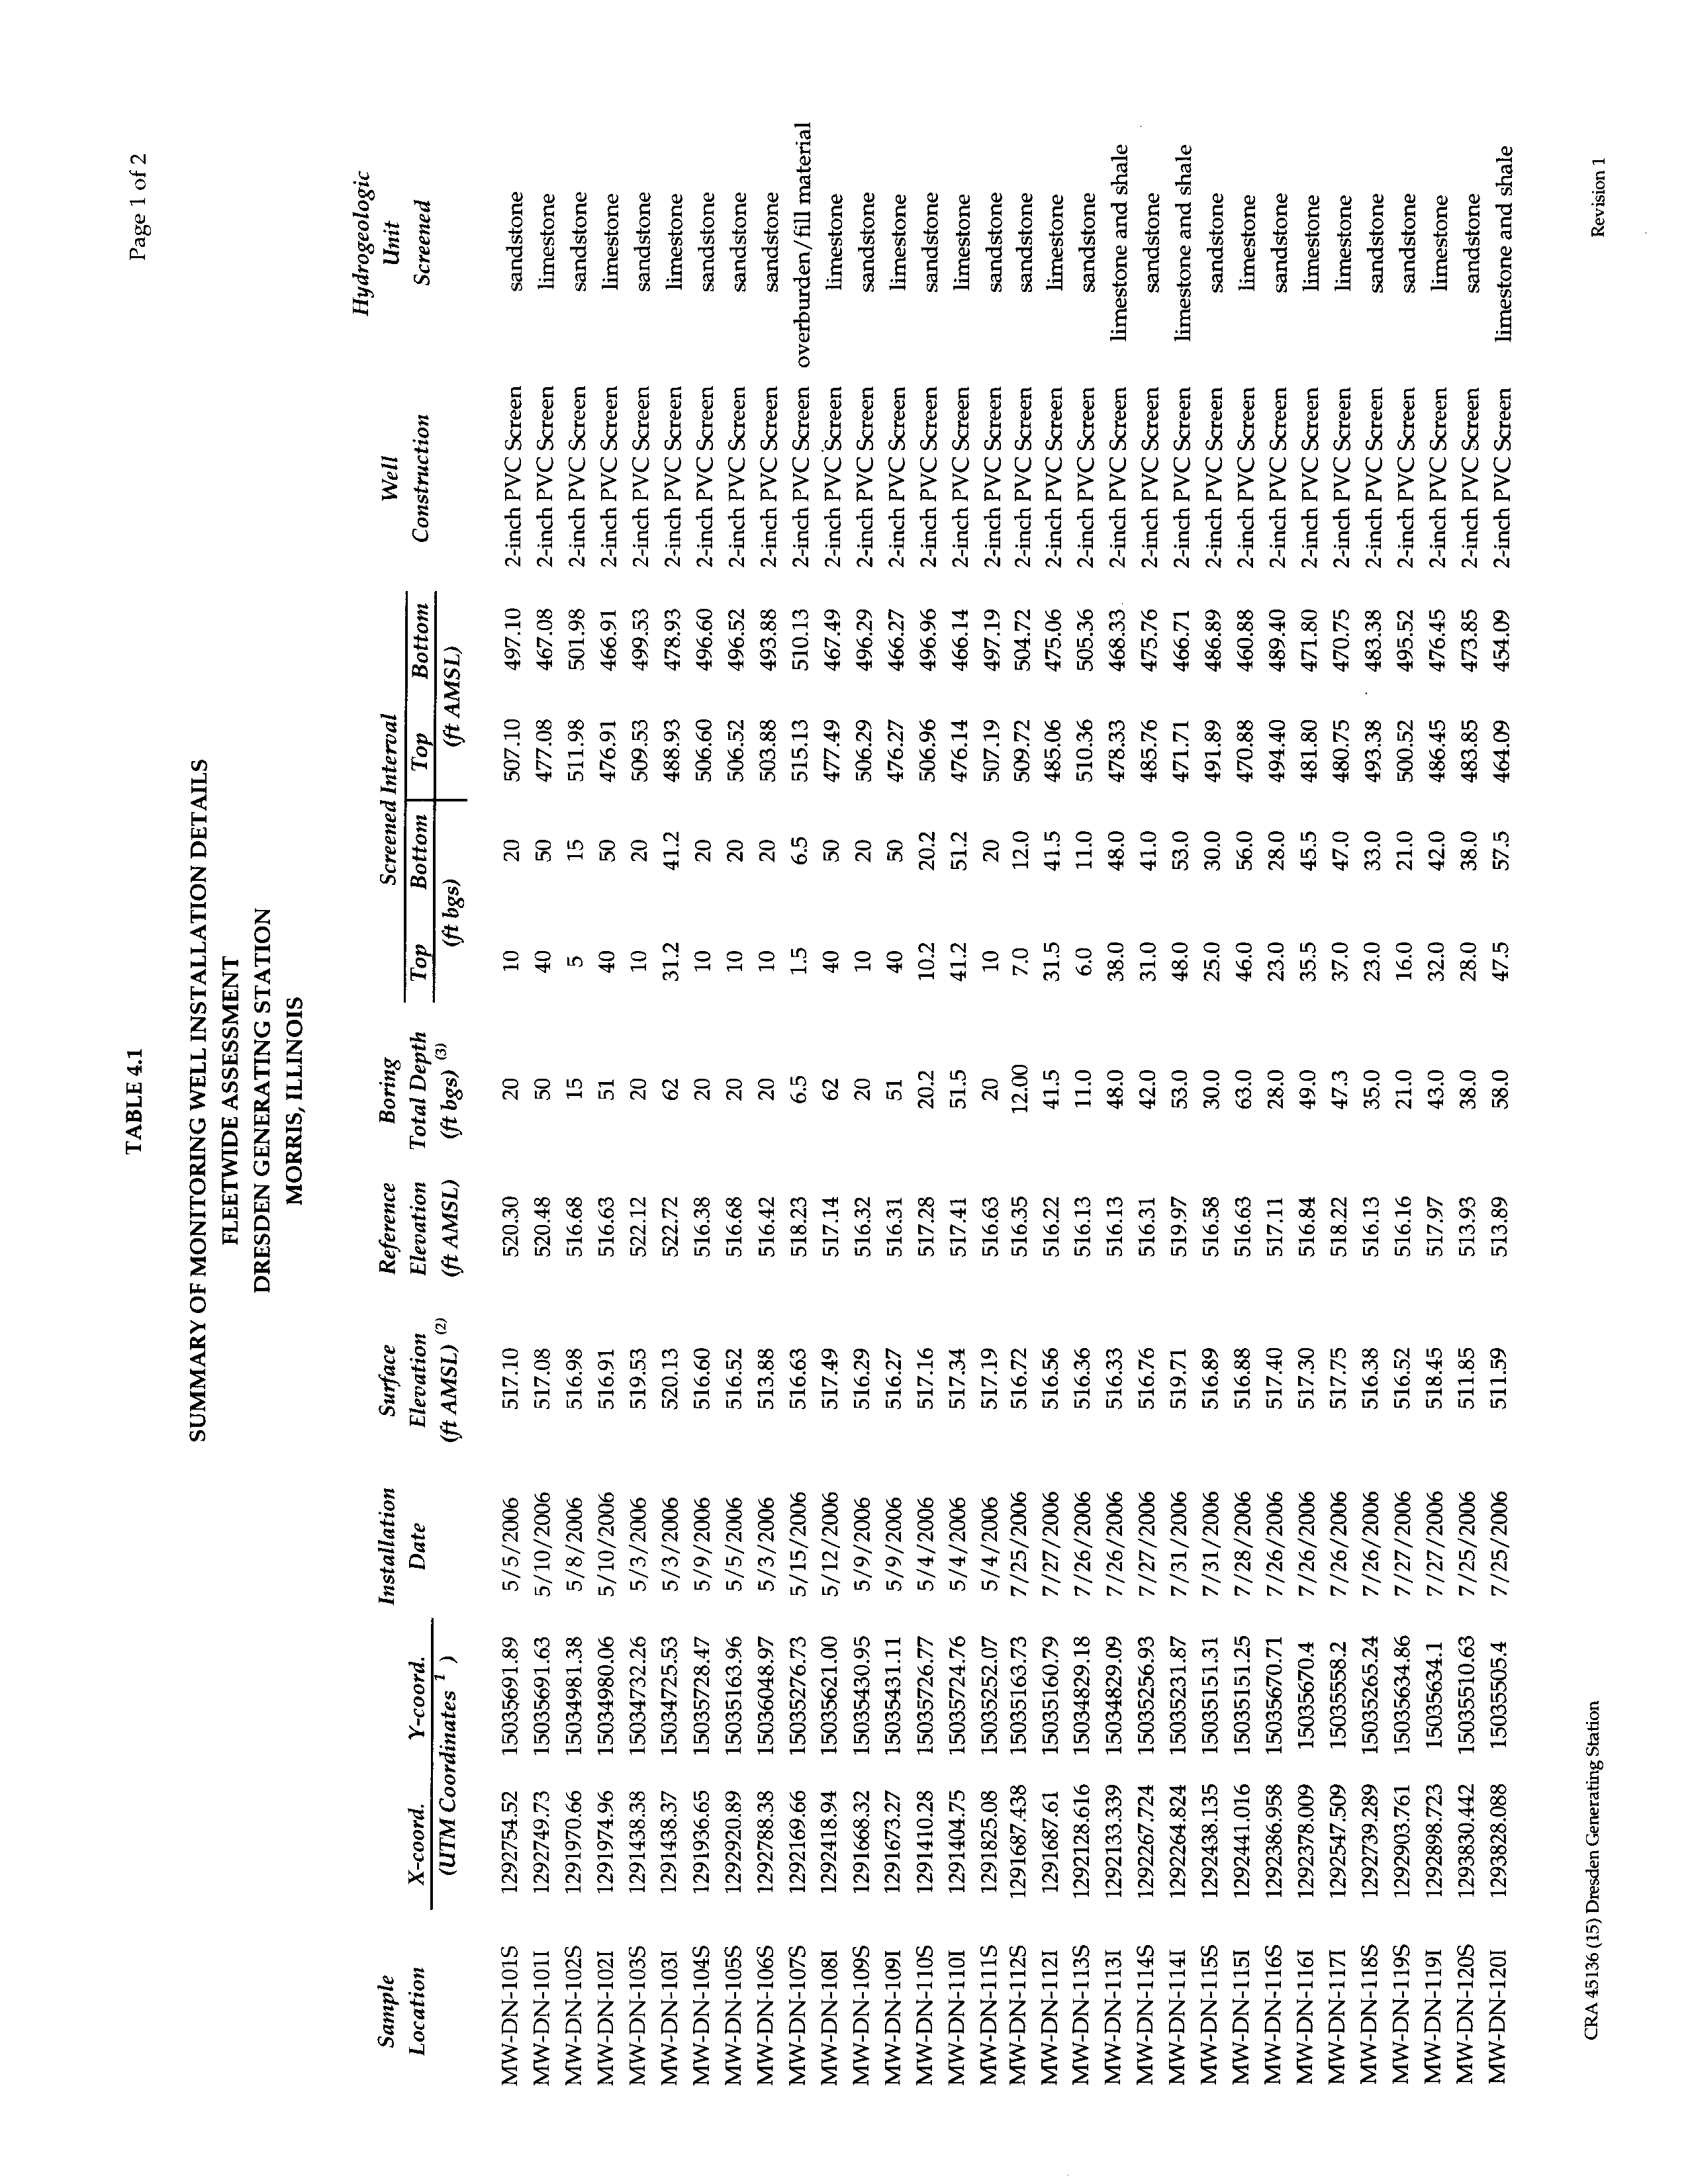
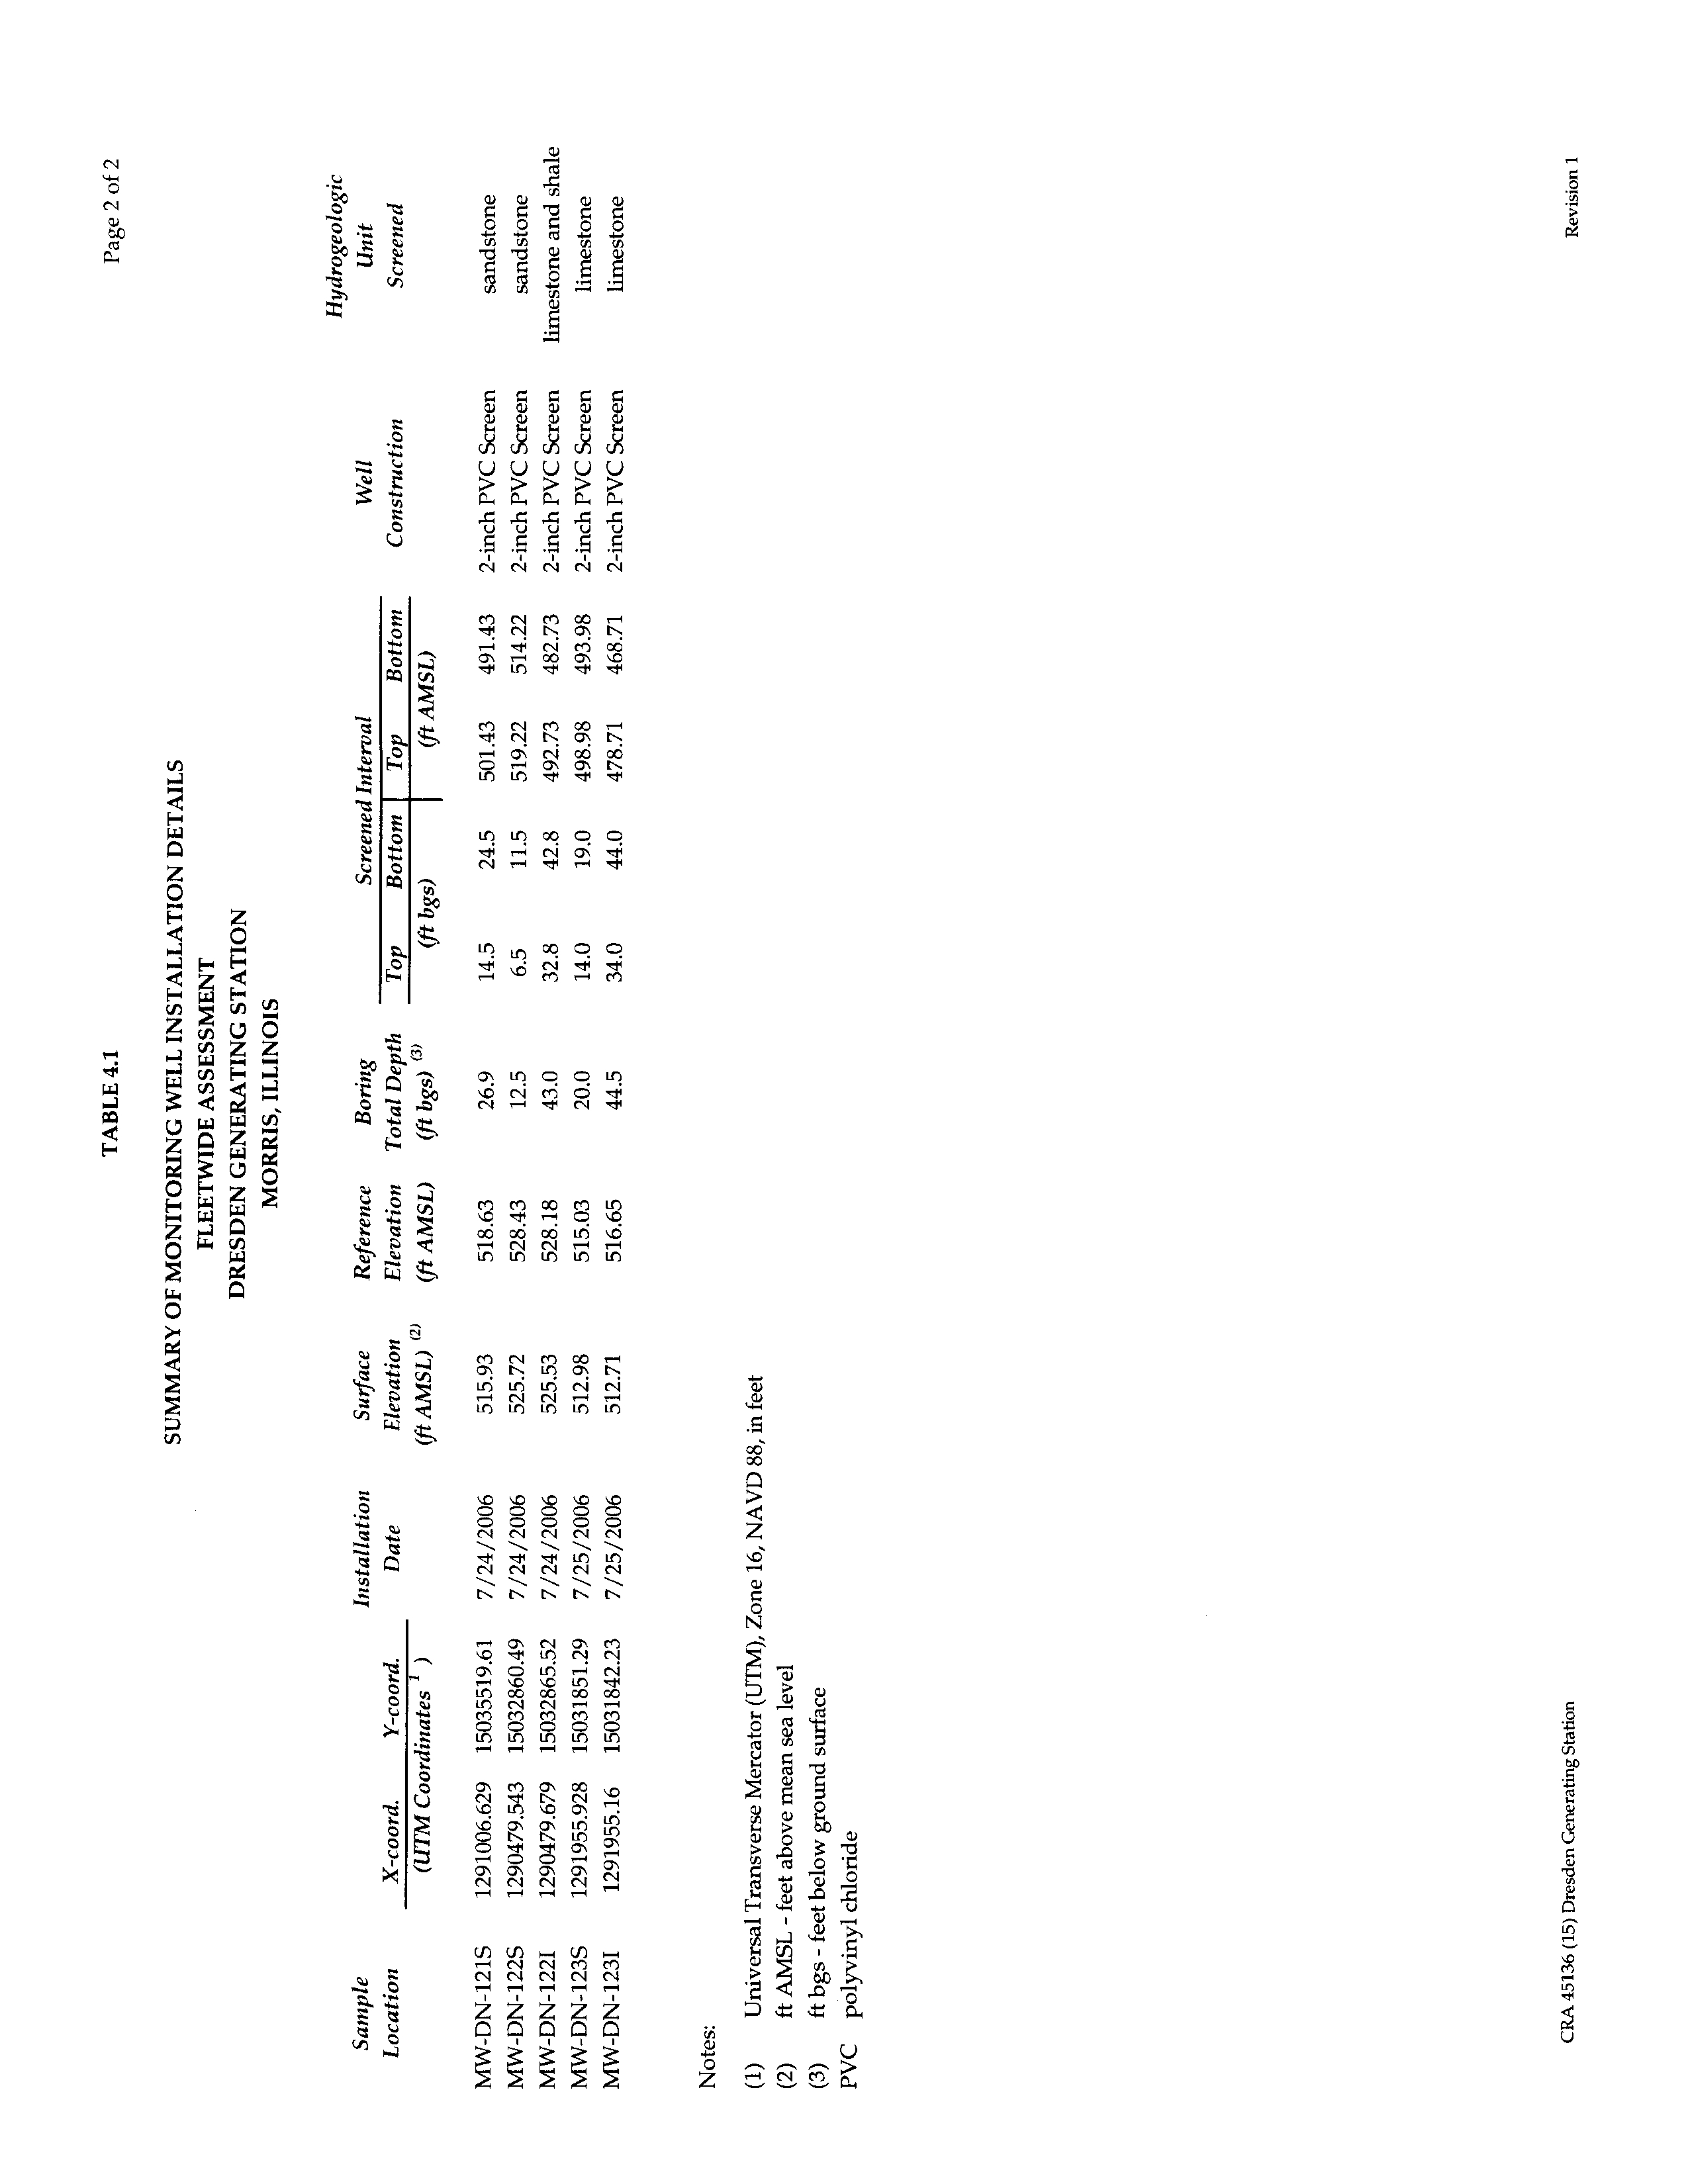
TABLE 4.1
SUMMARY OF MONITORING WELL INSTALLATION DETAILS
TABLE 4.2
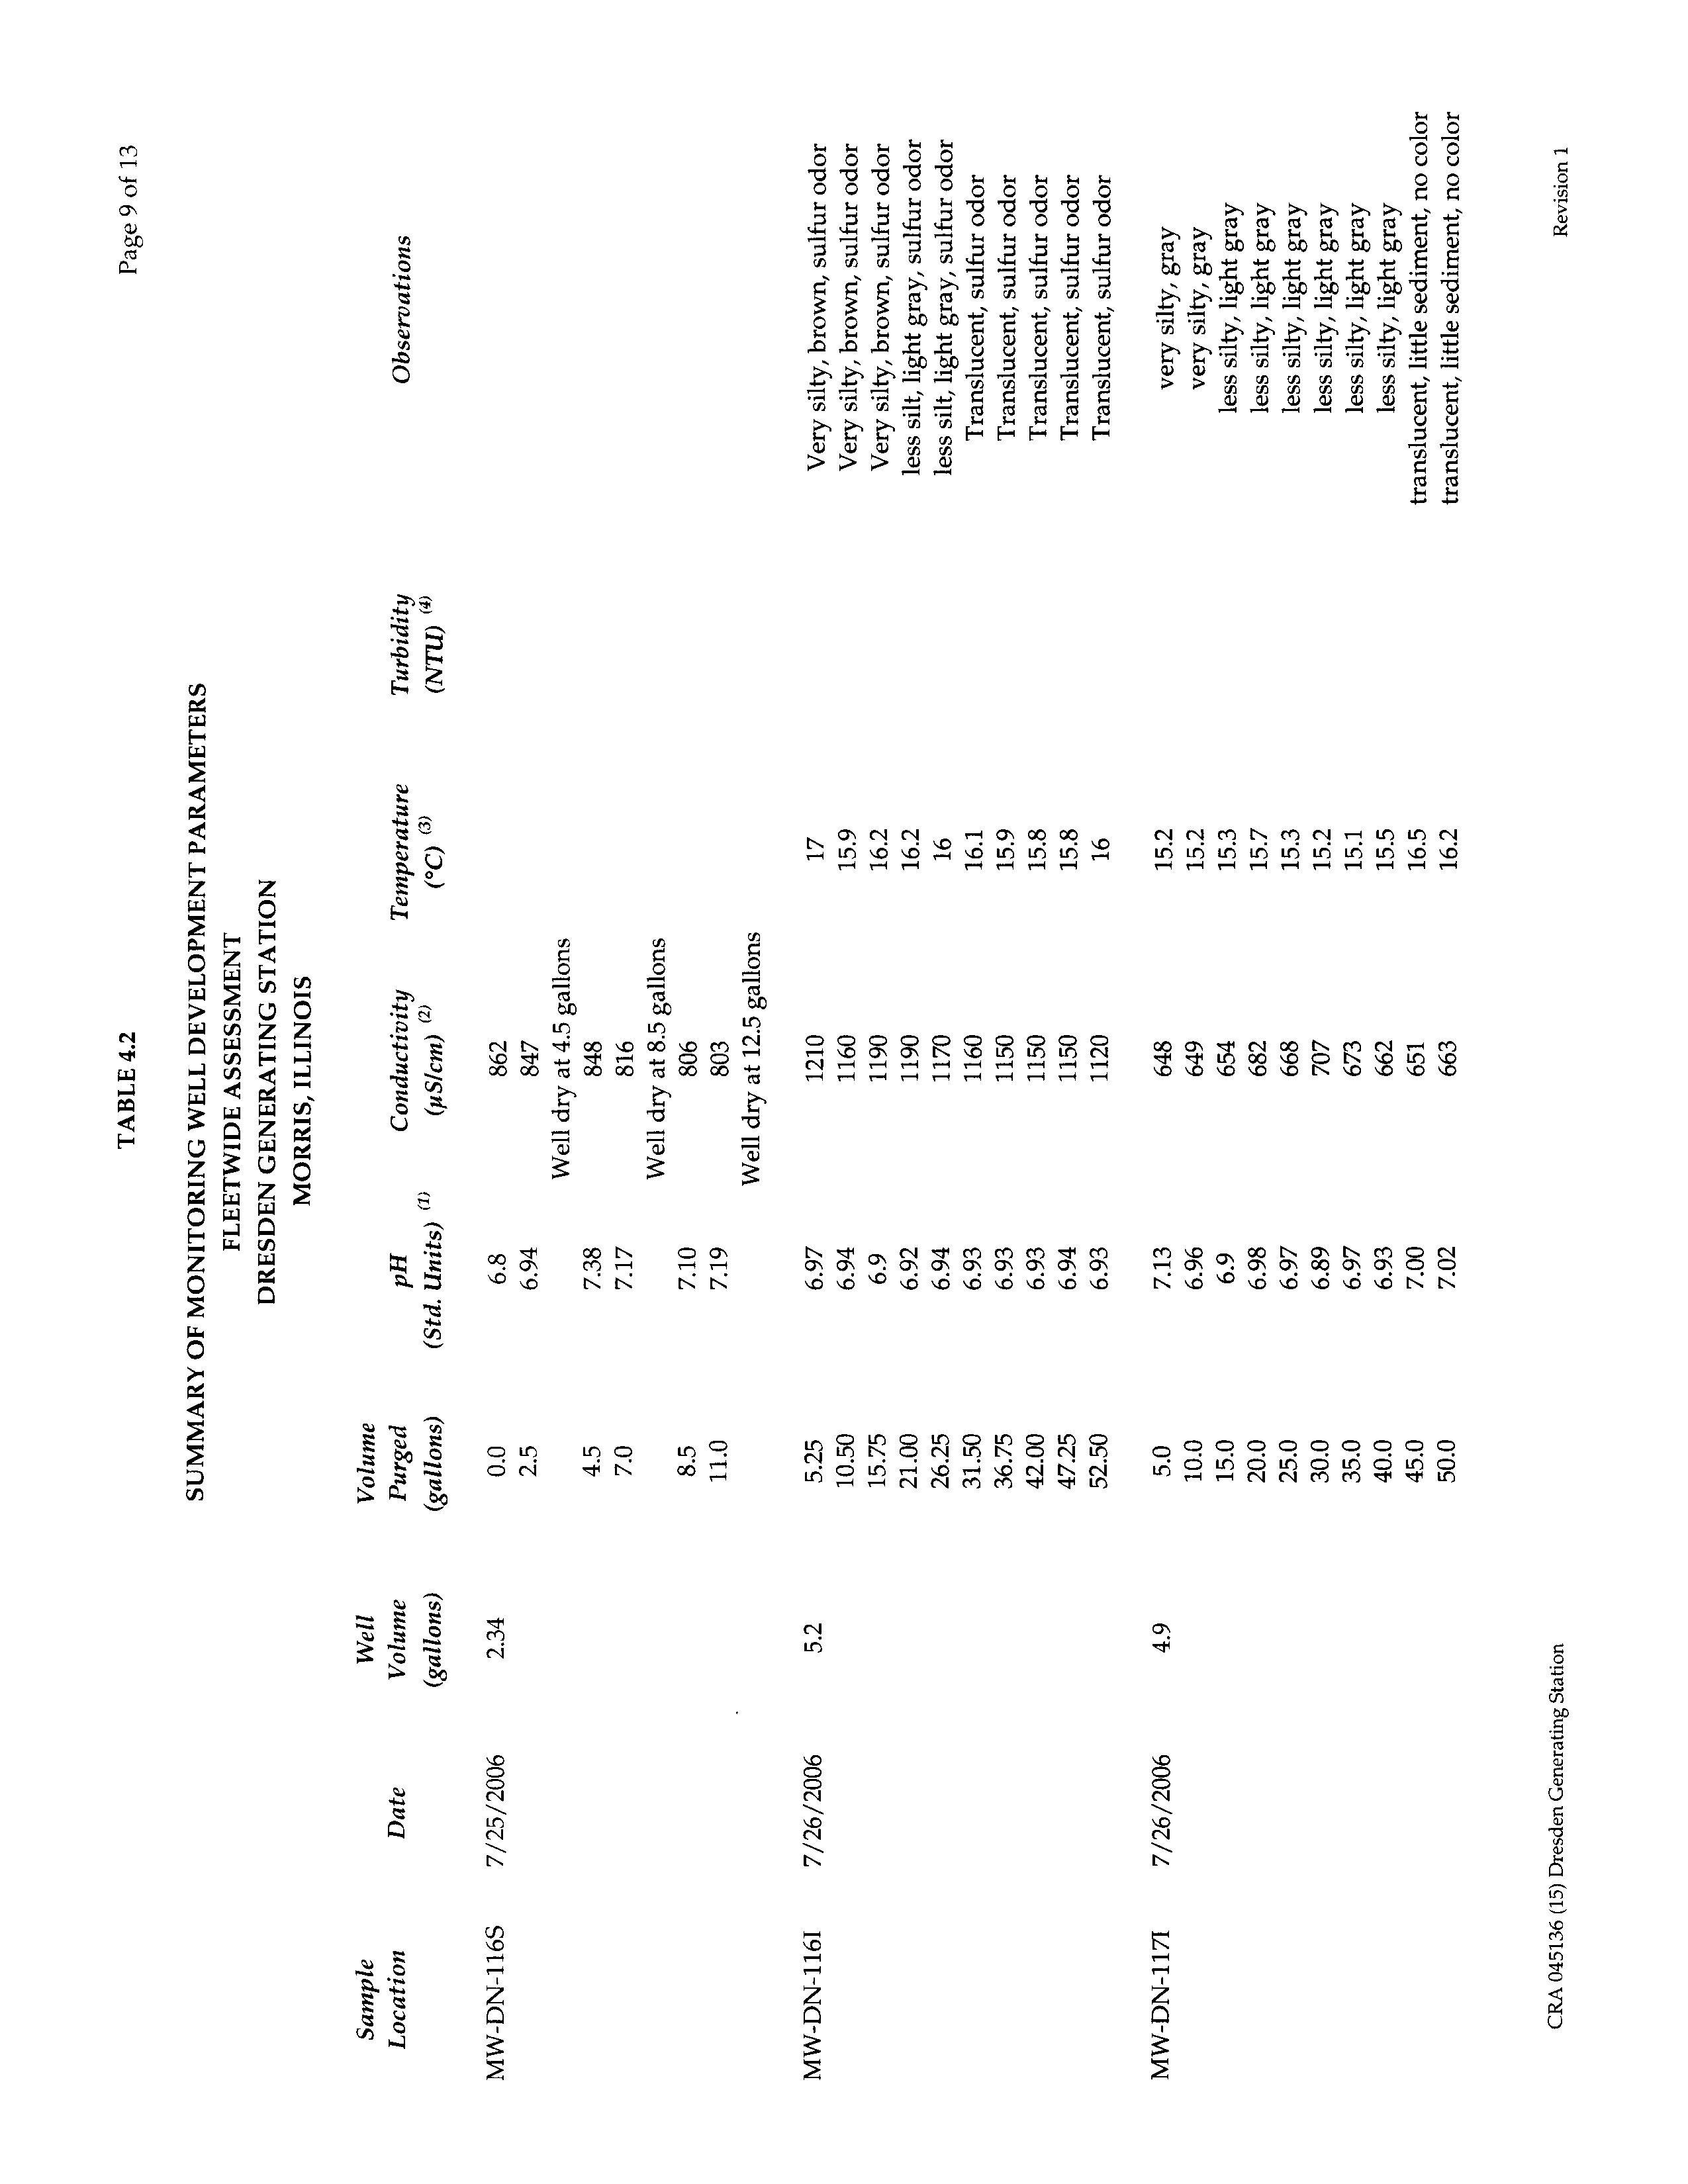
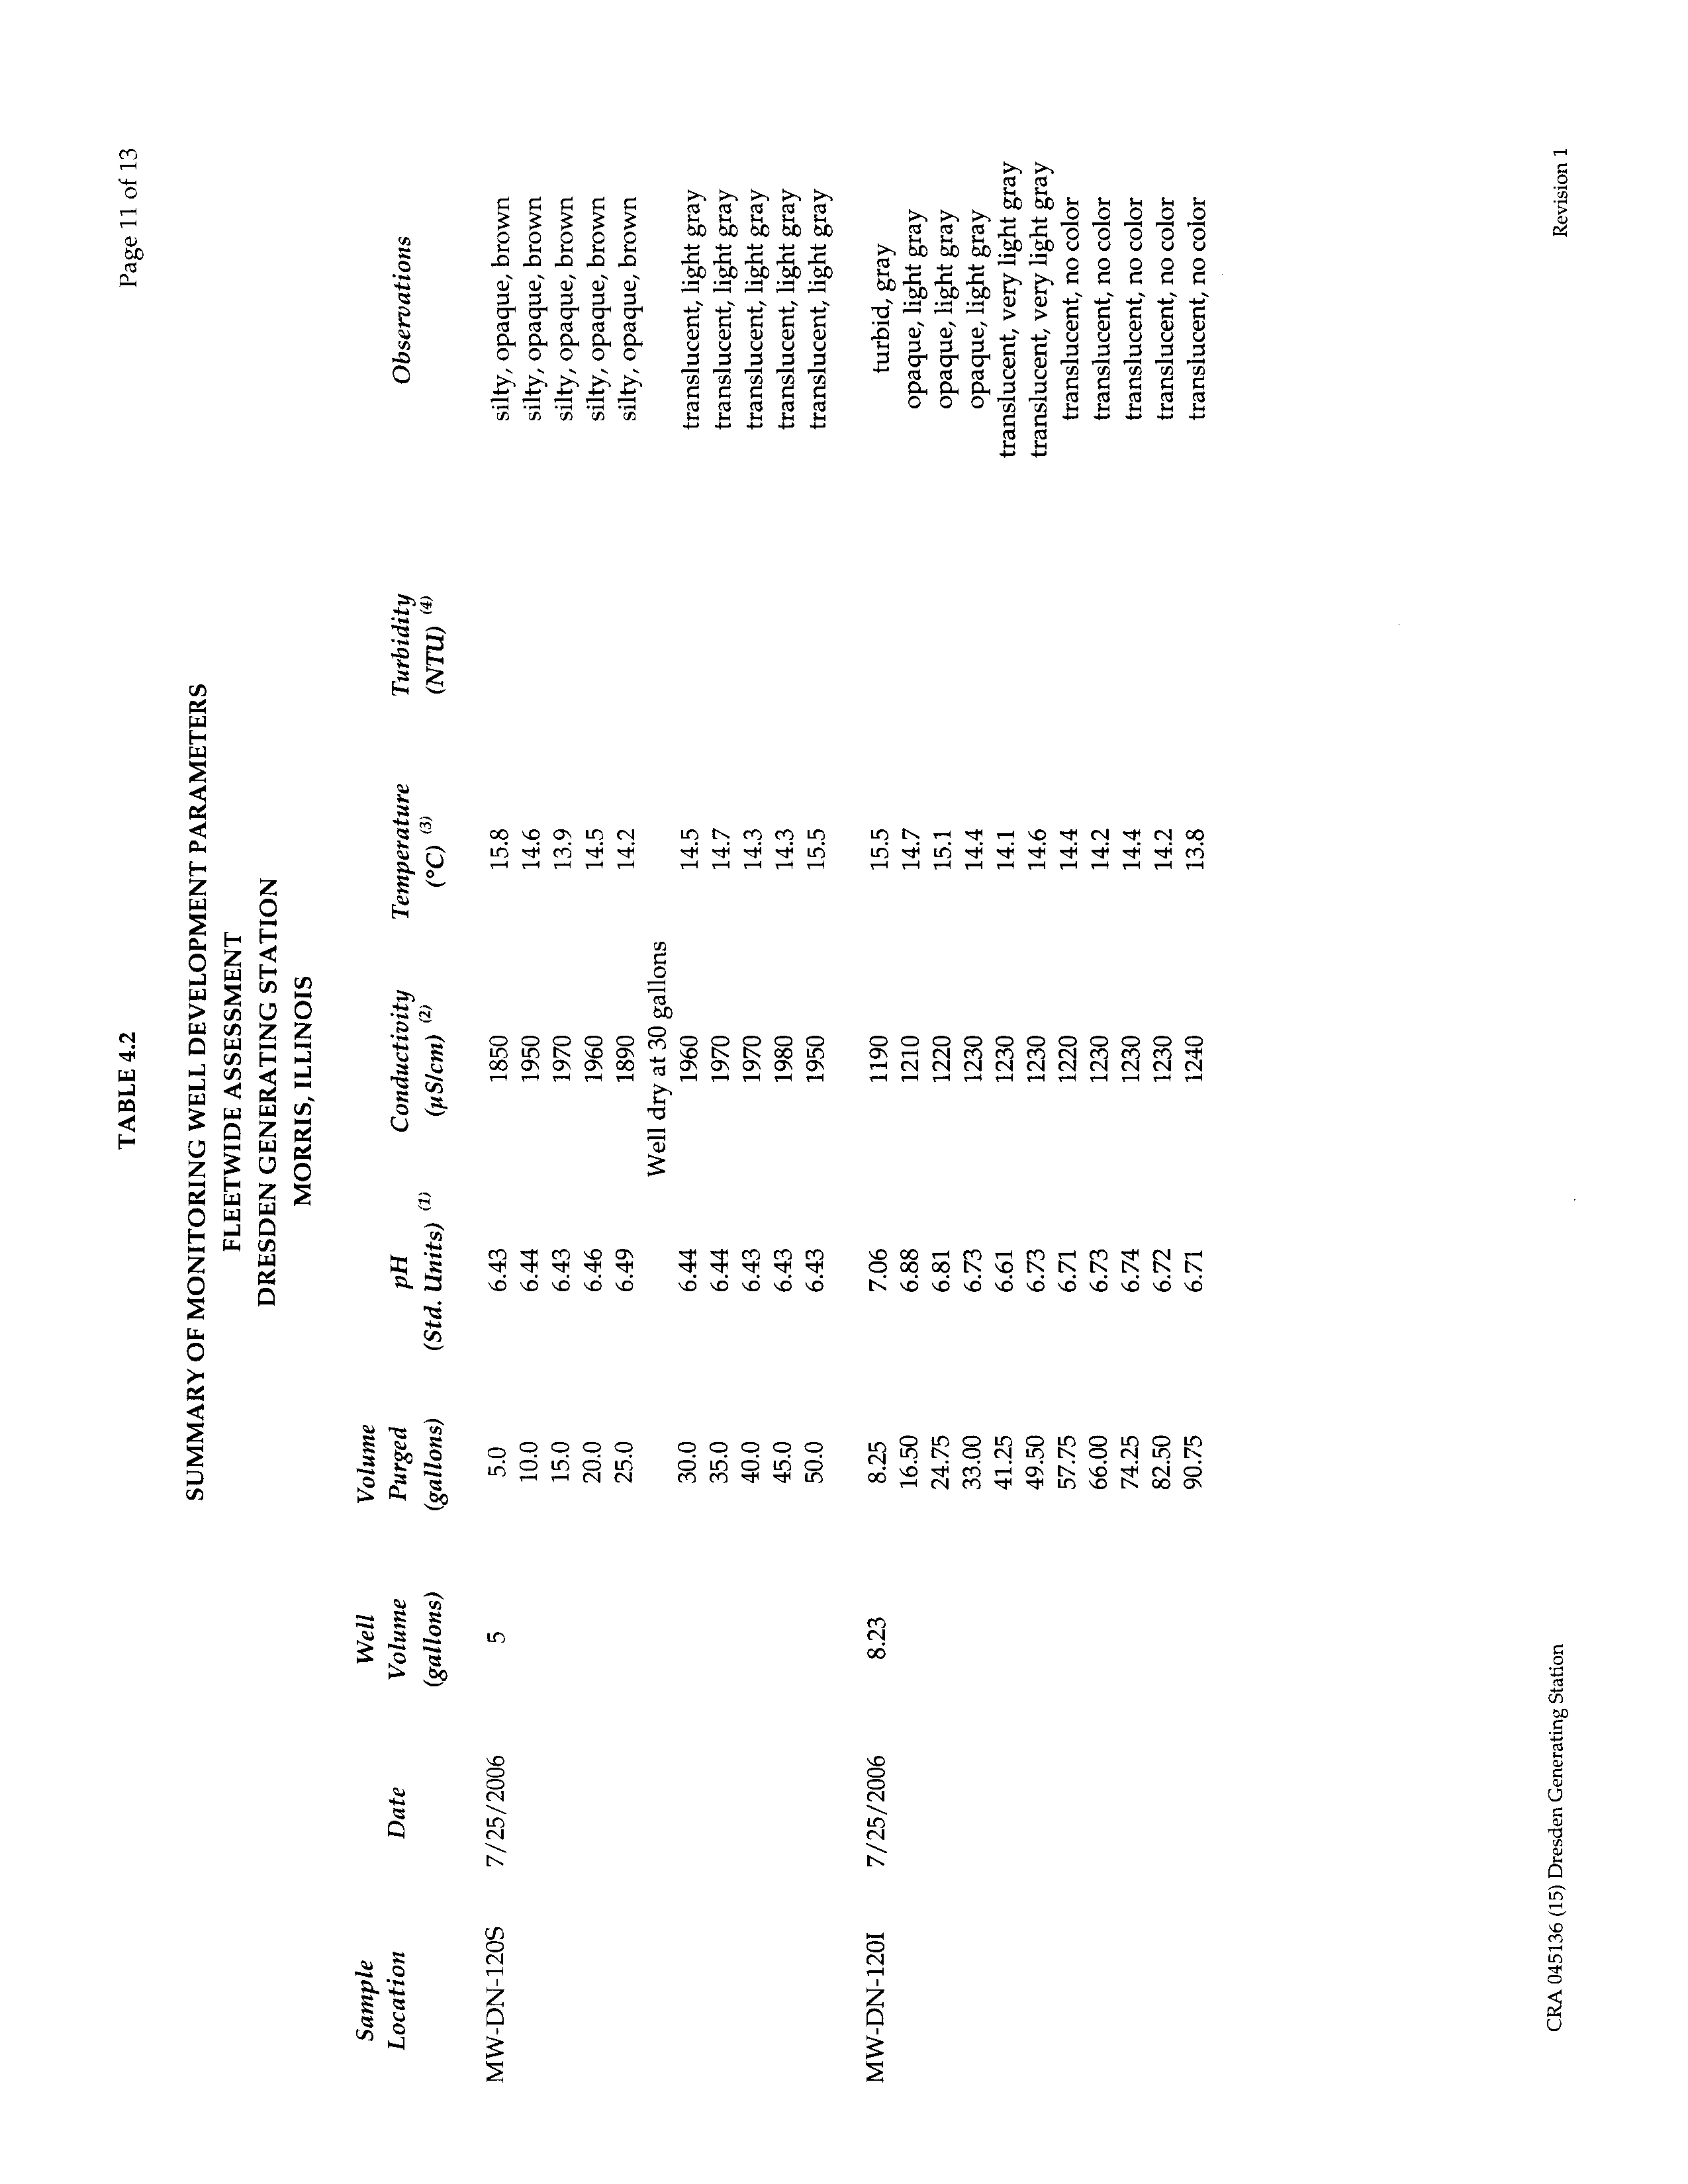
SUMMARY OF MONITORING WELL DEVELOPMENT PARAMETERS
TABLE 4.3
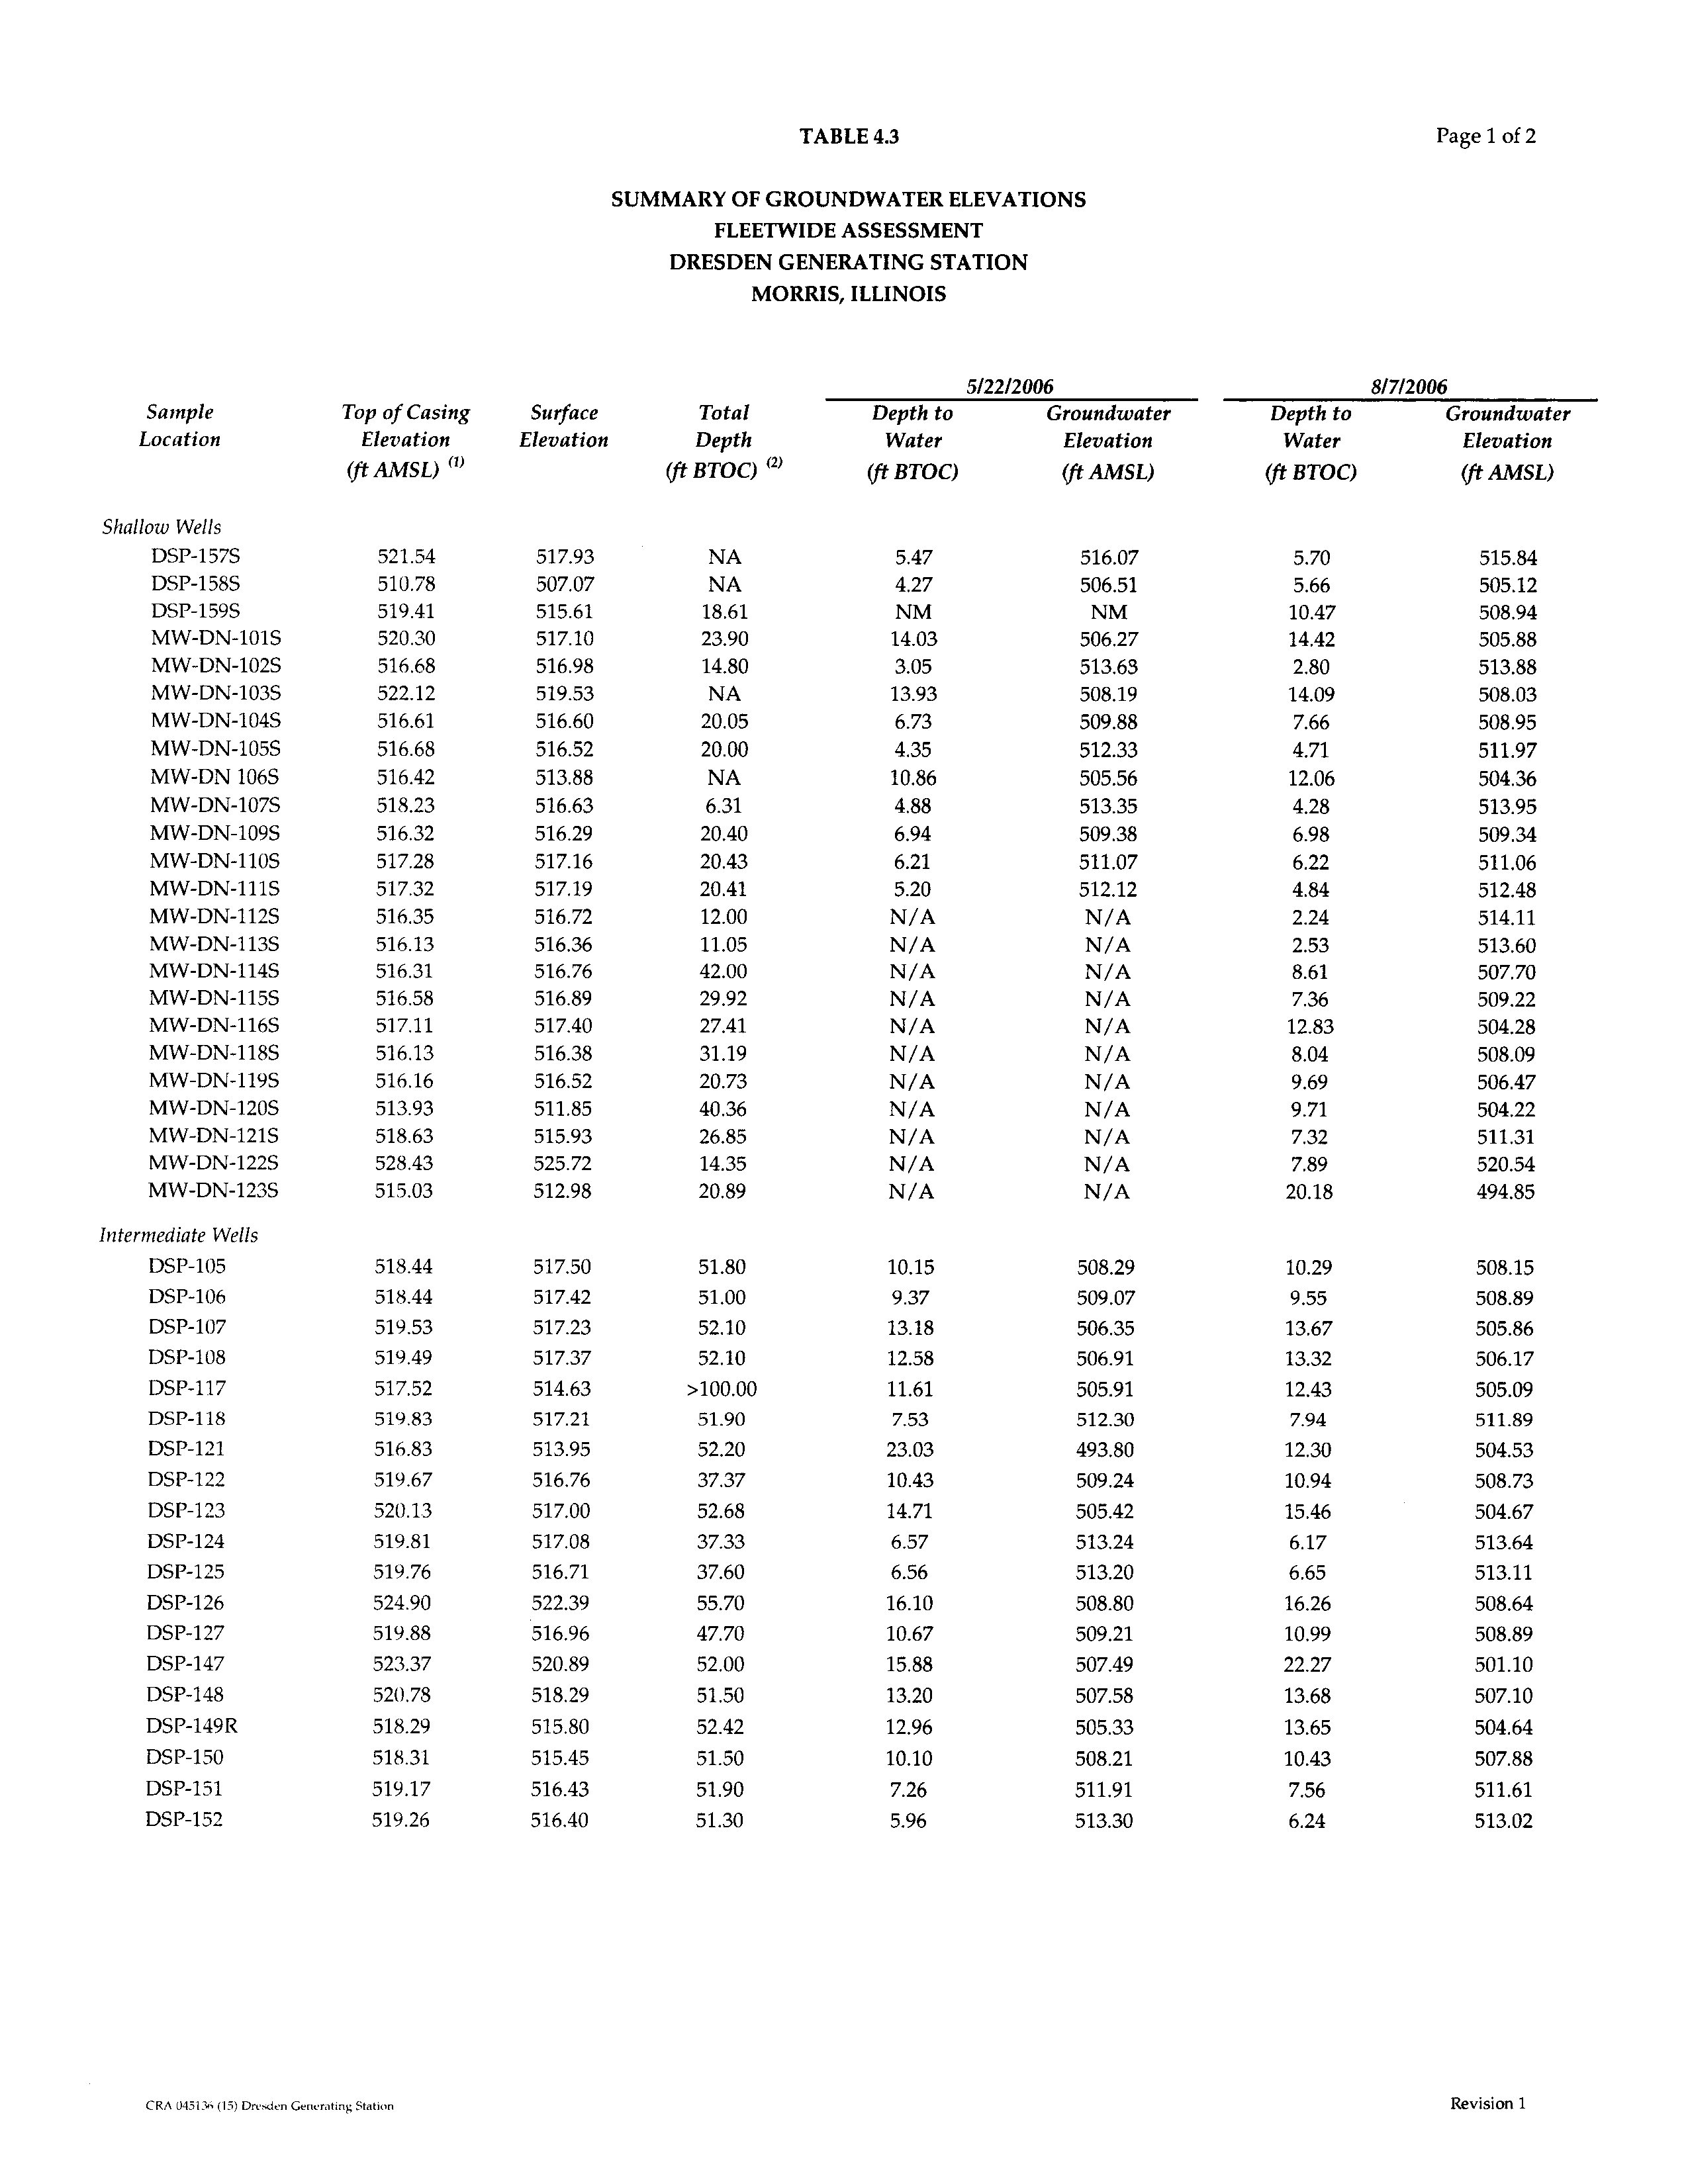
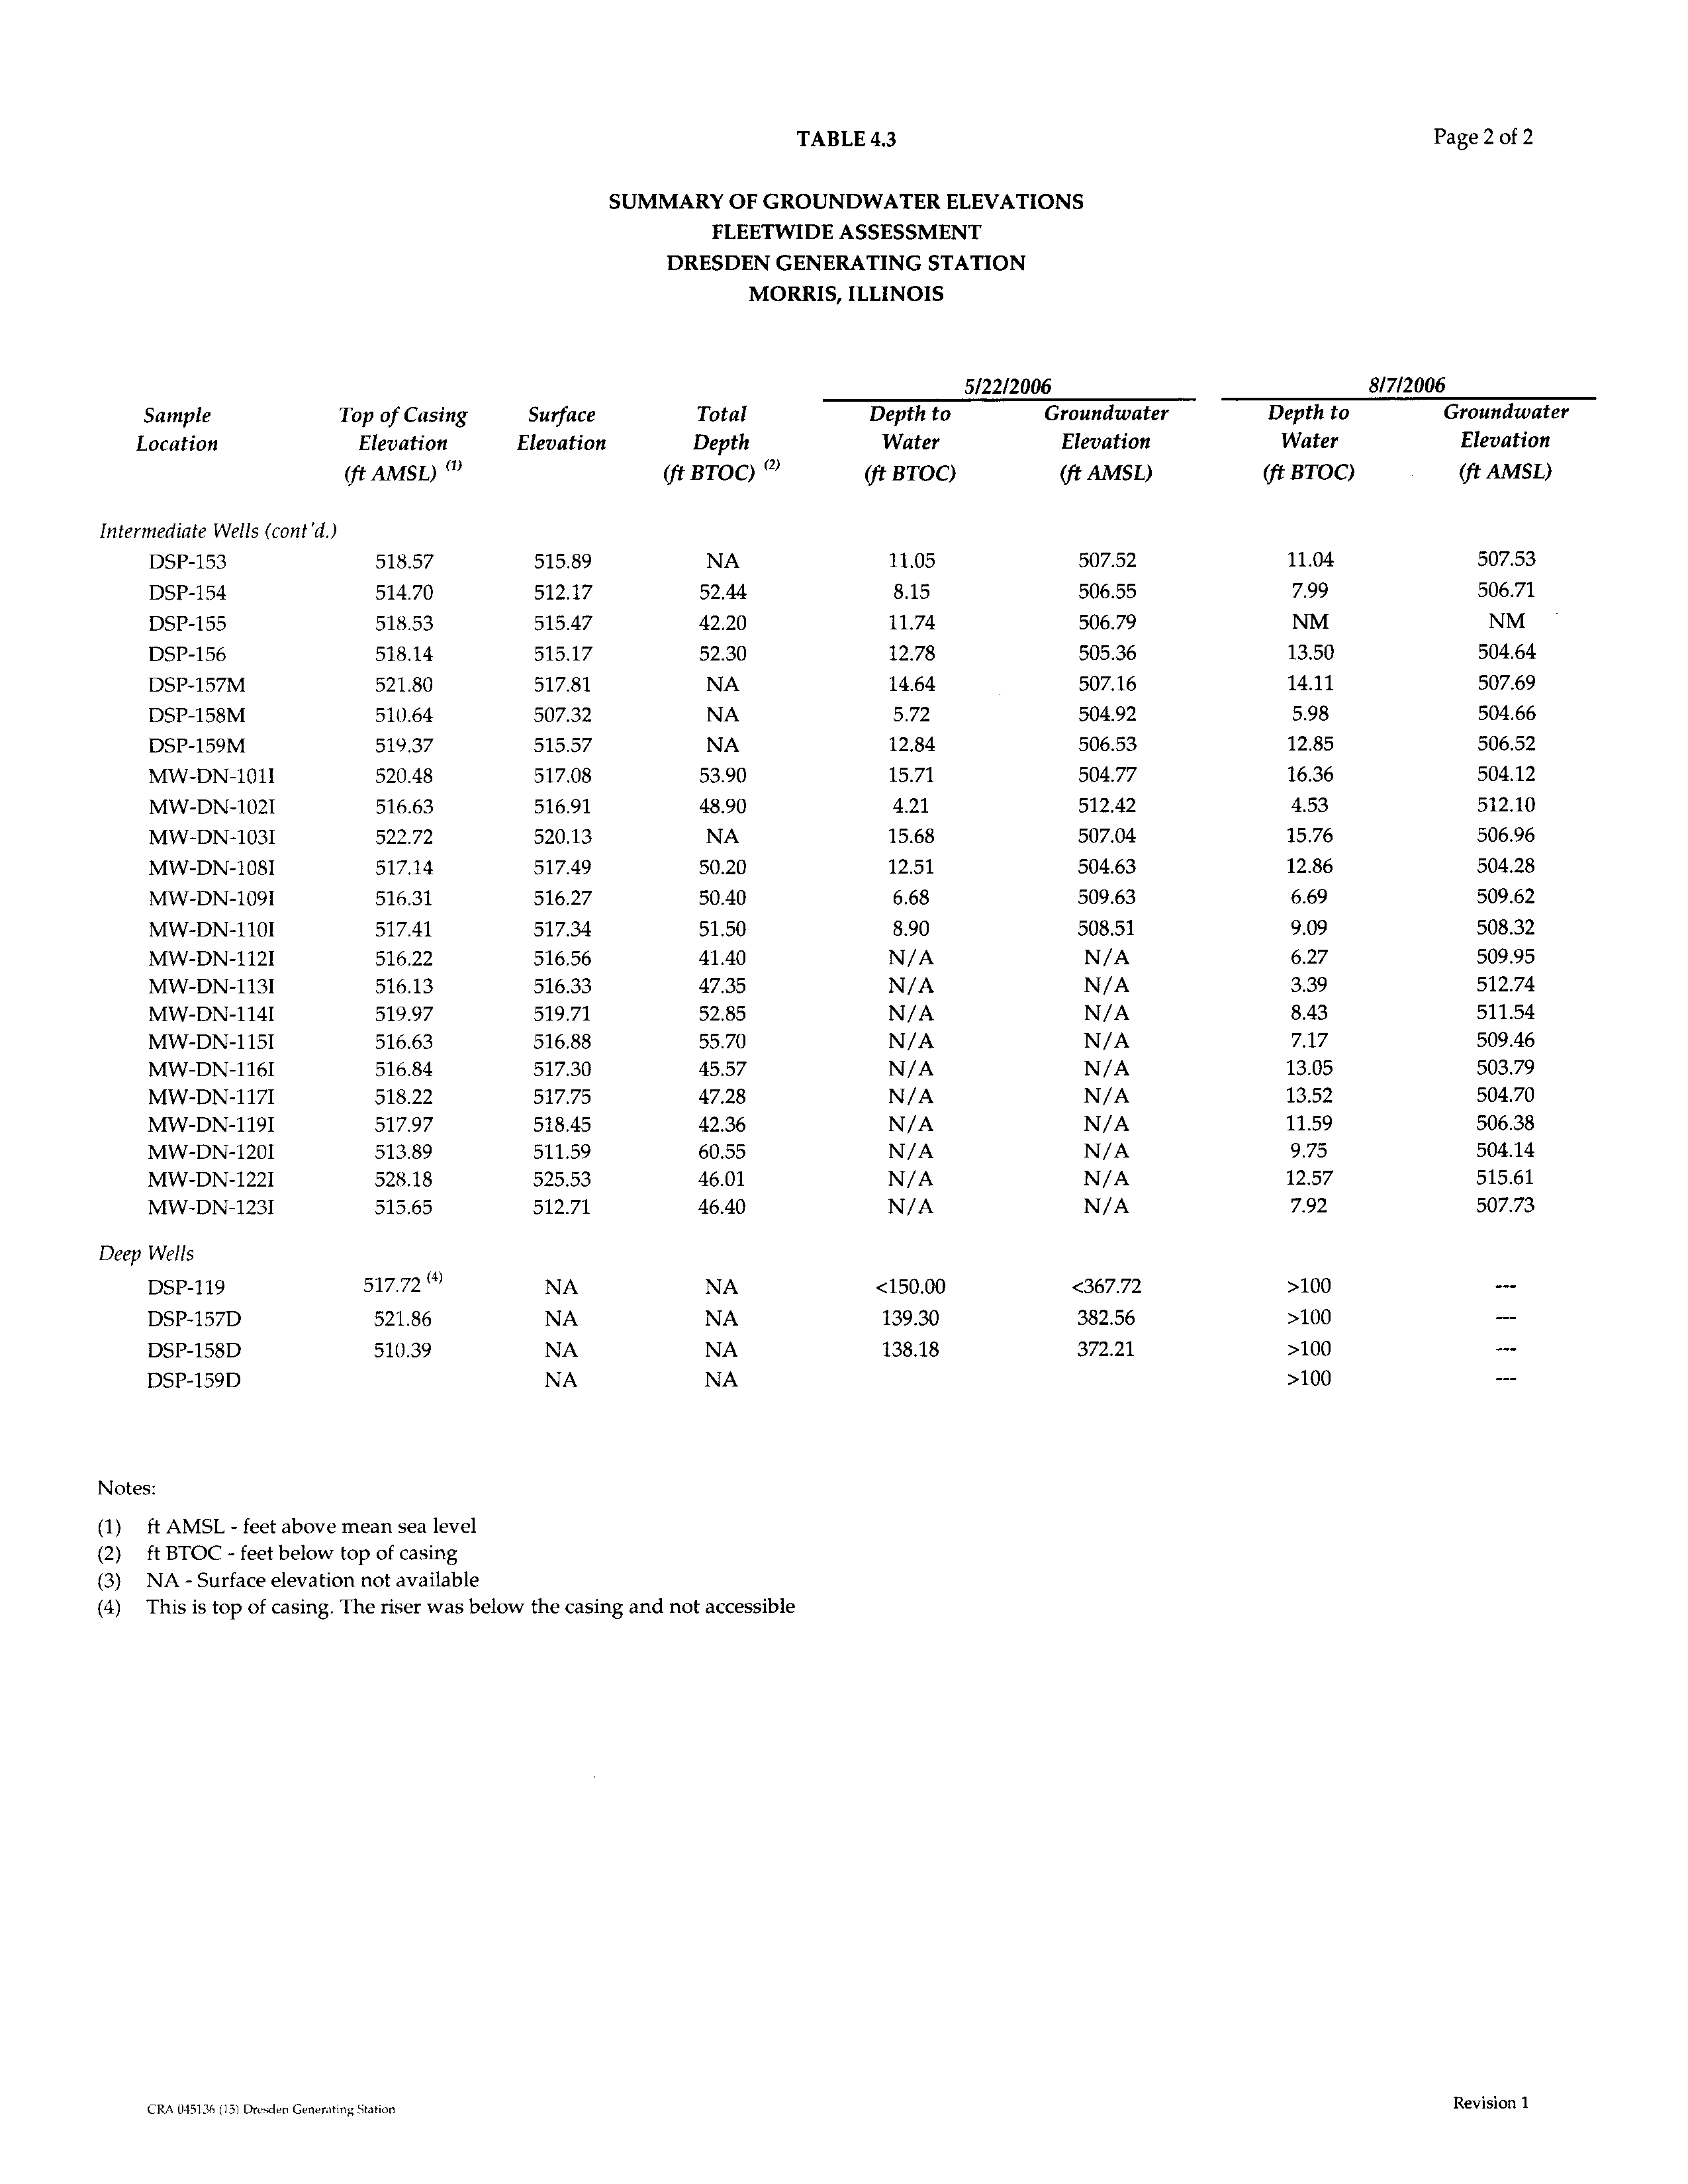
SUMMARY OF GROUNDWATER ELEVATIONS
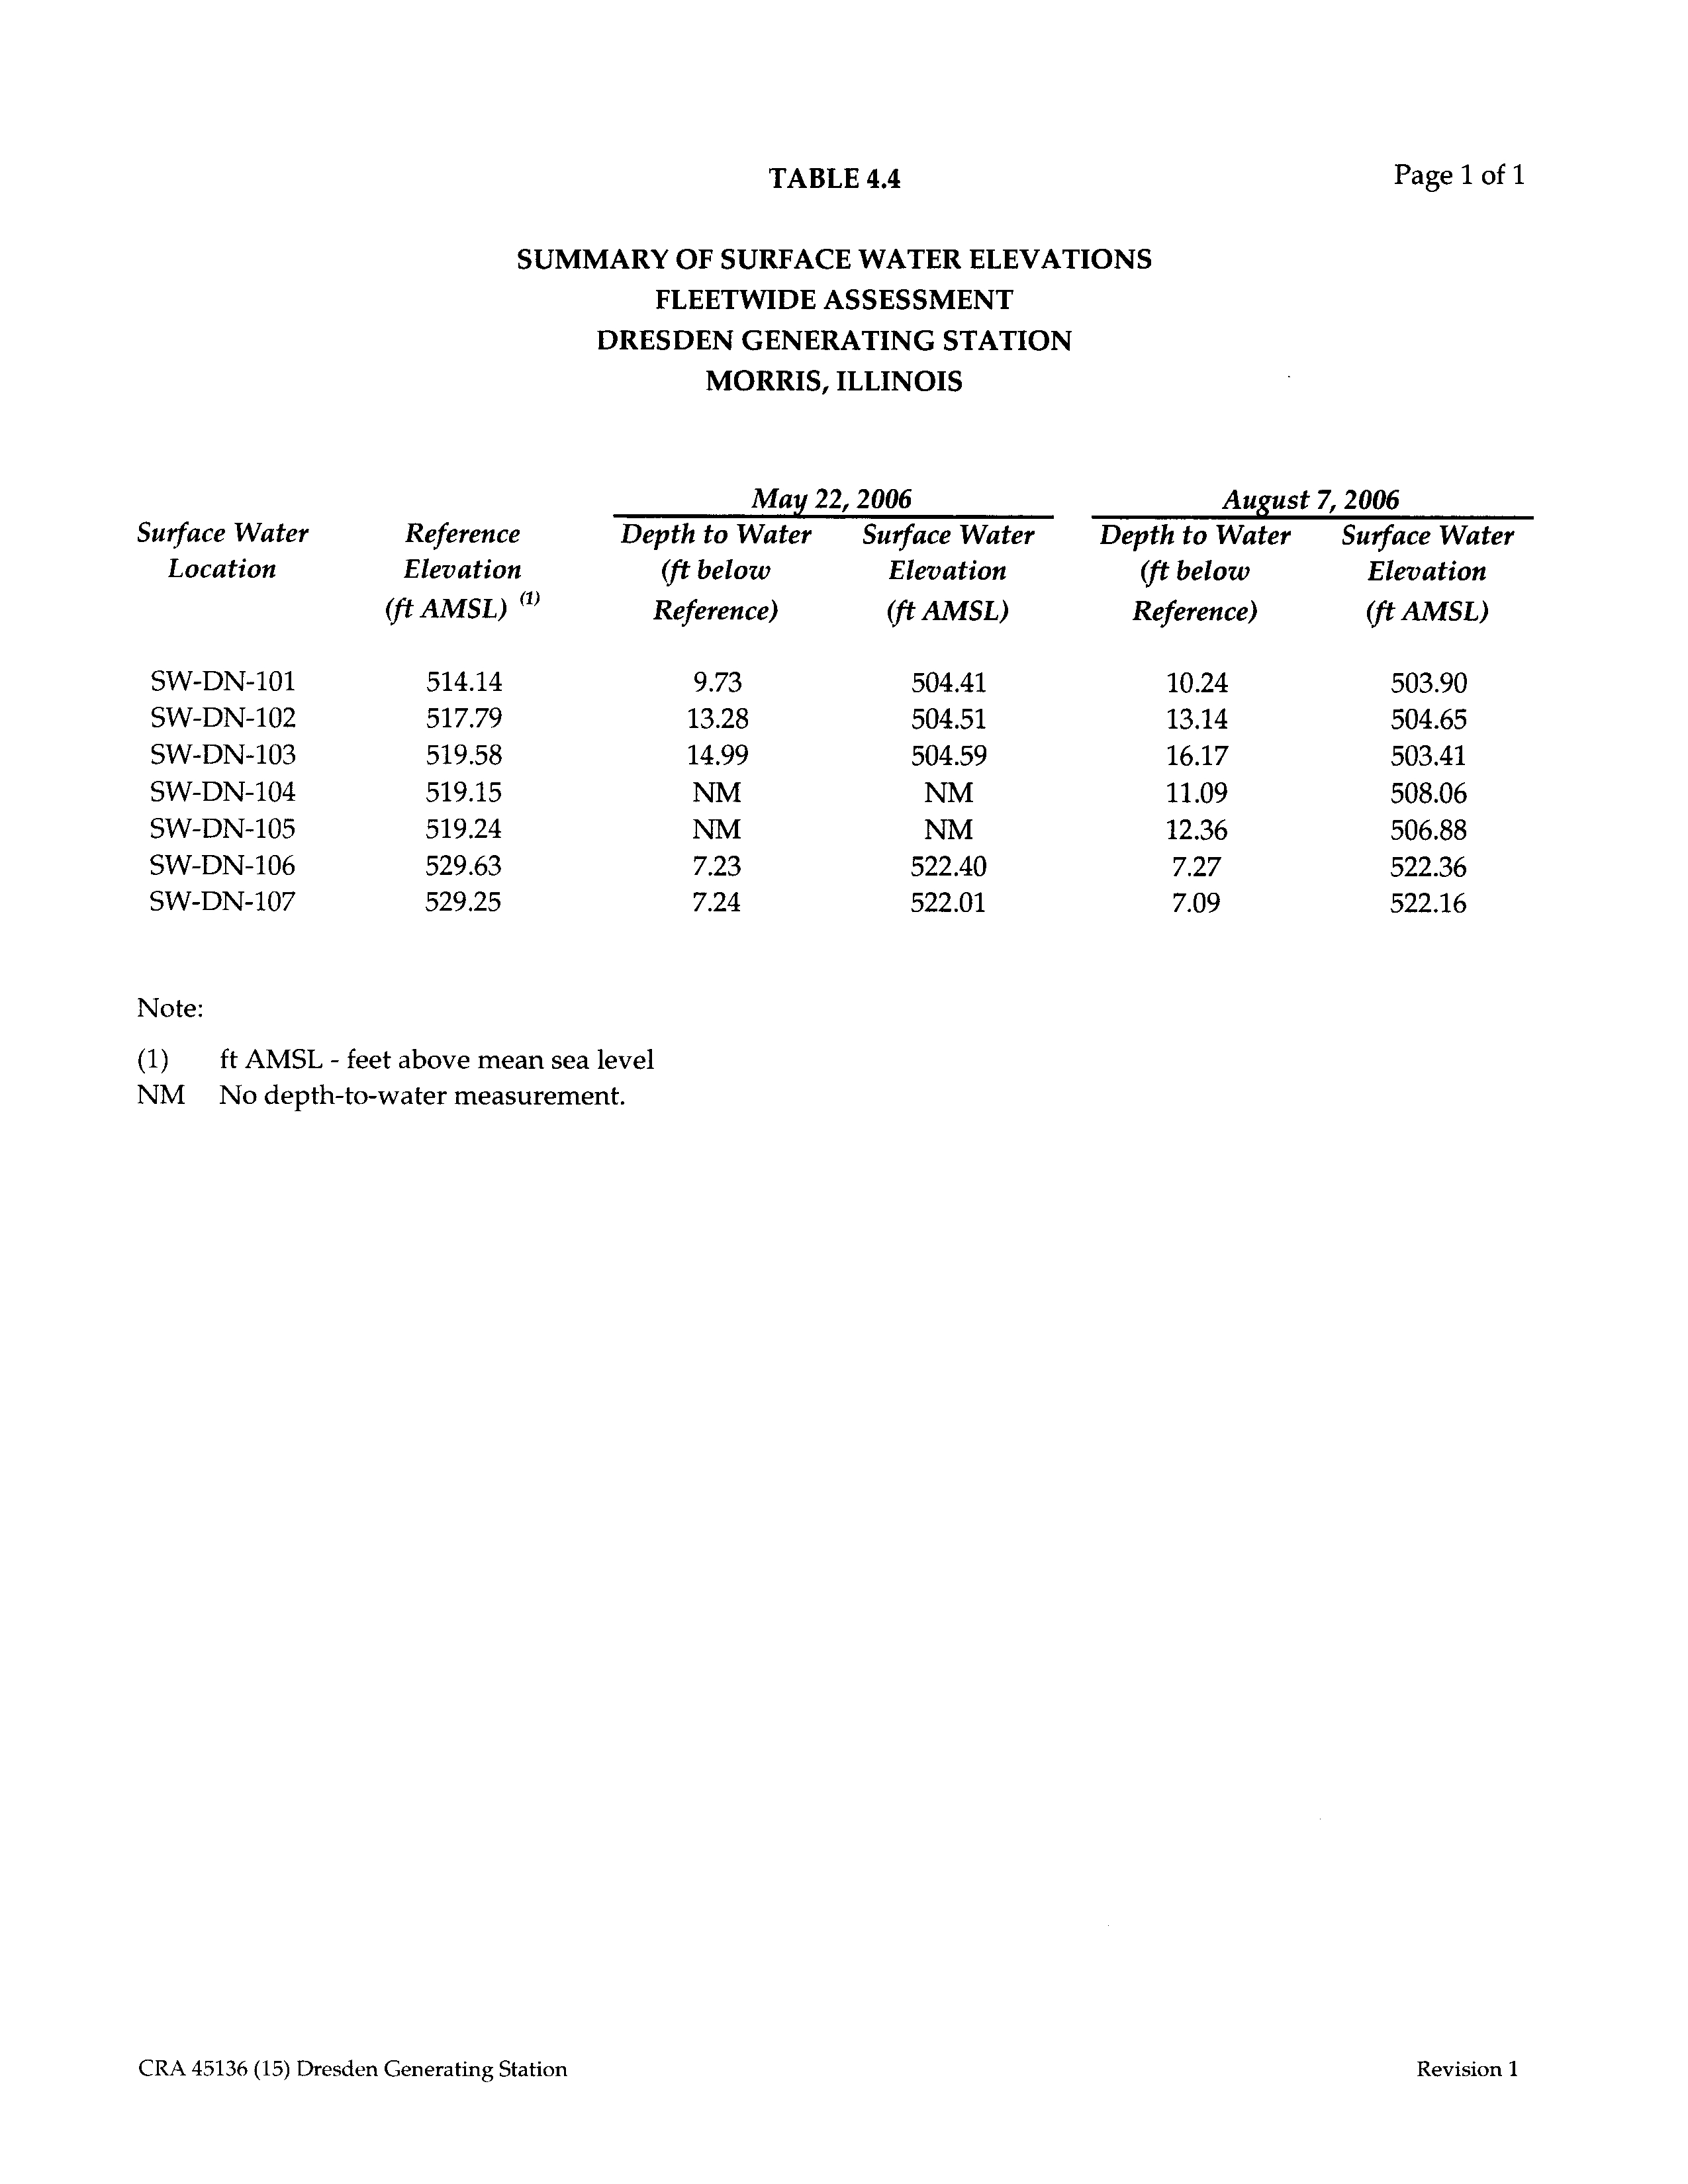
TABLE 4.4
SUMMARY OF SURFACE WATER ELEVATIONS
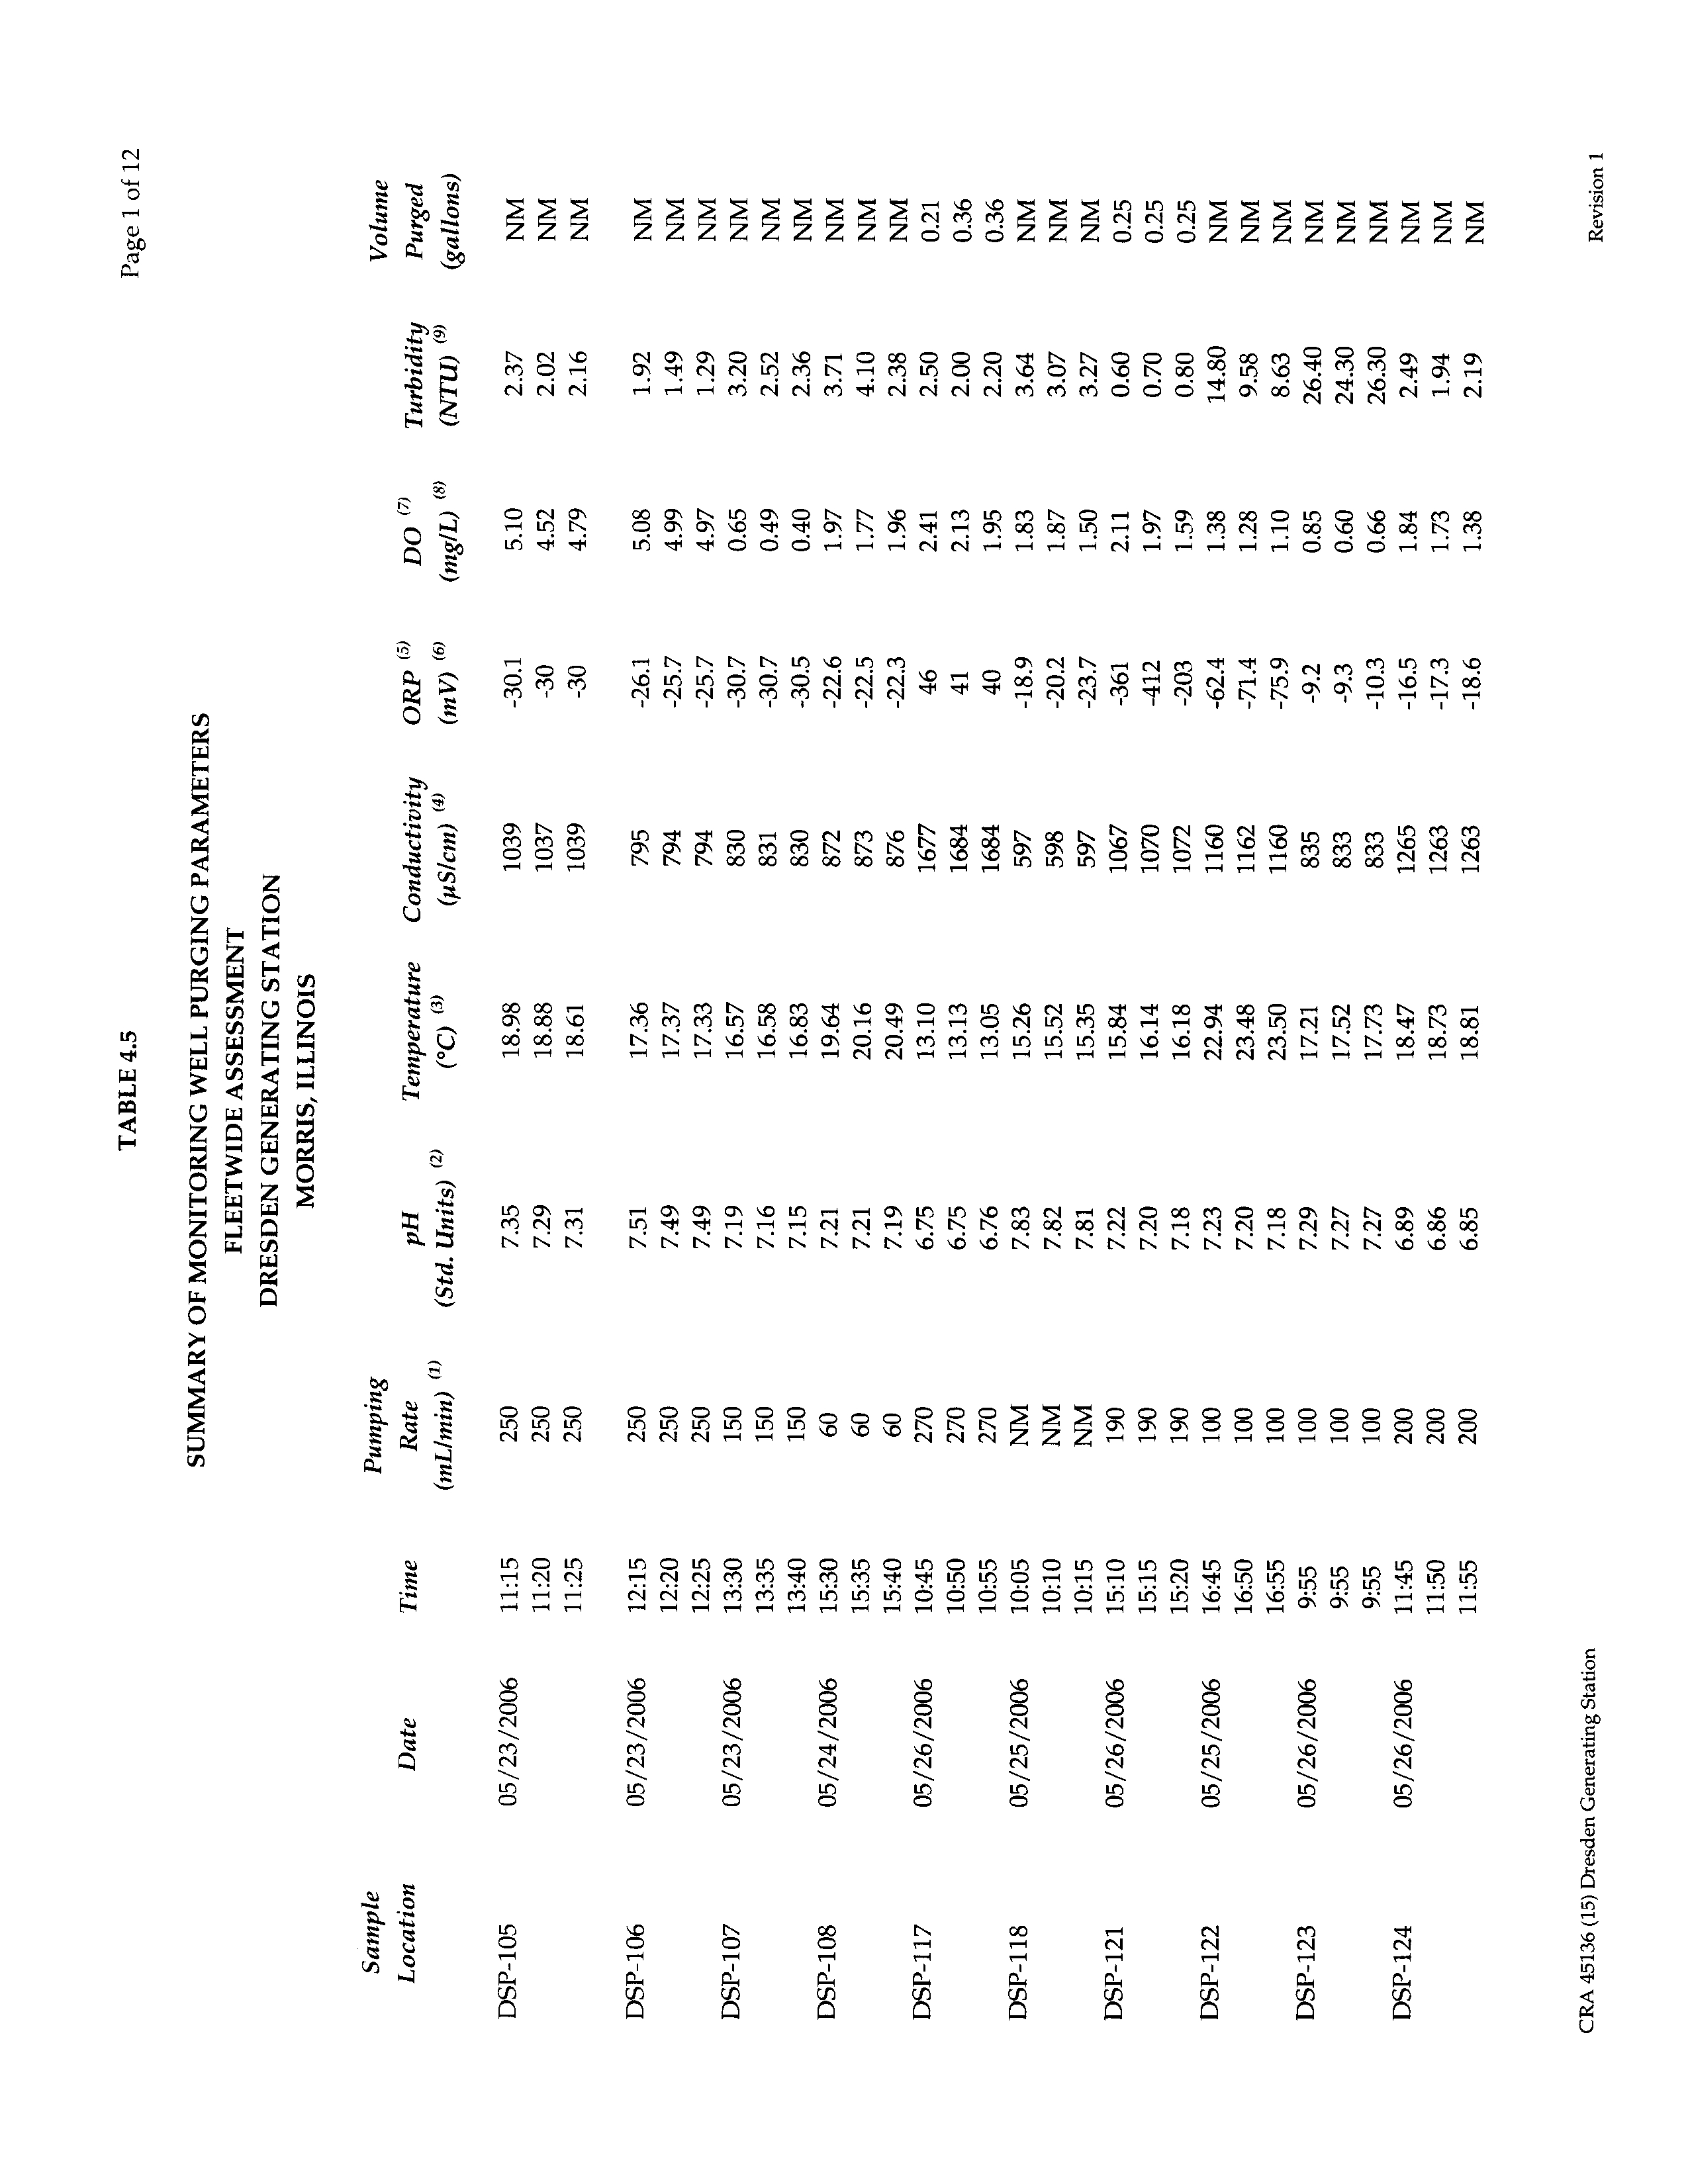
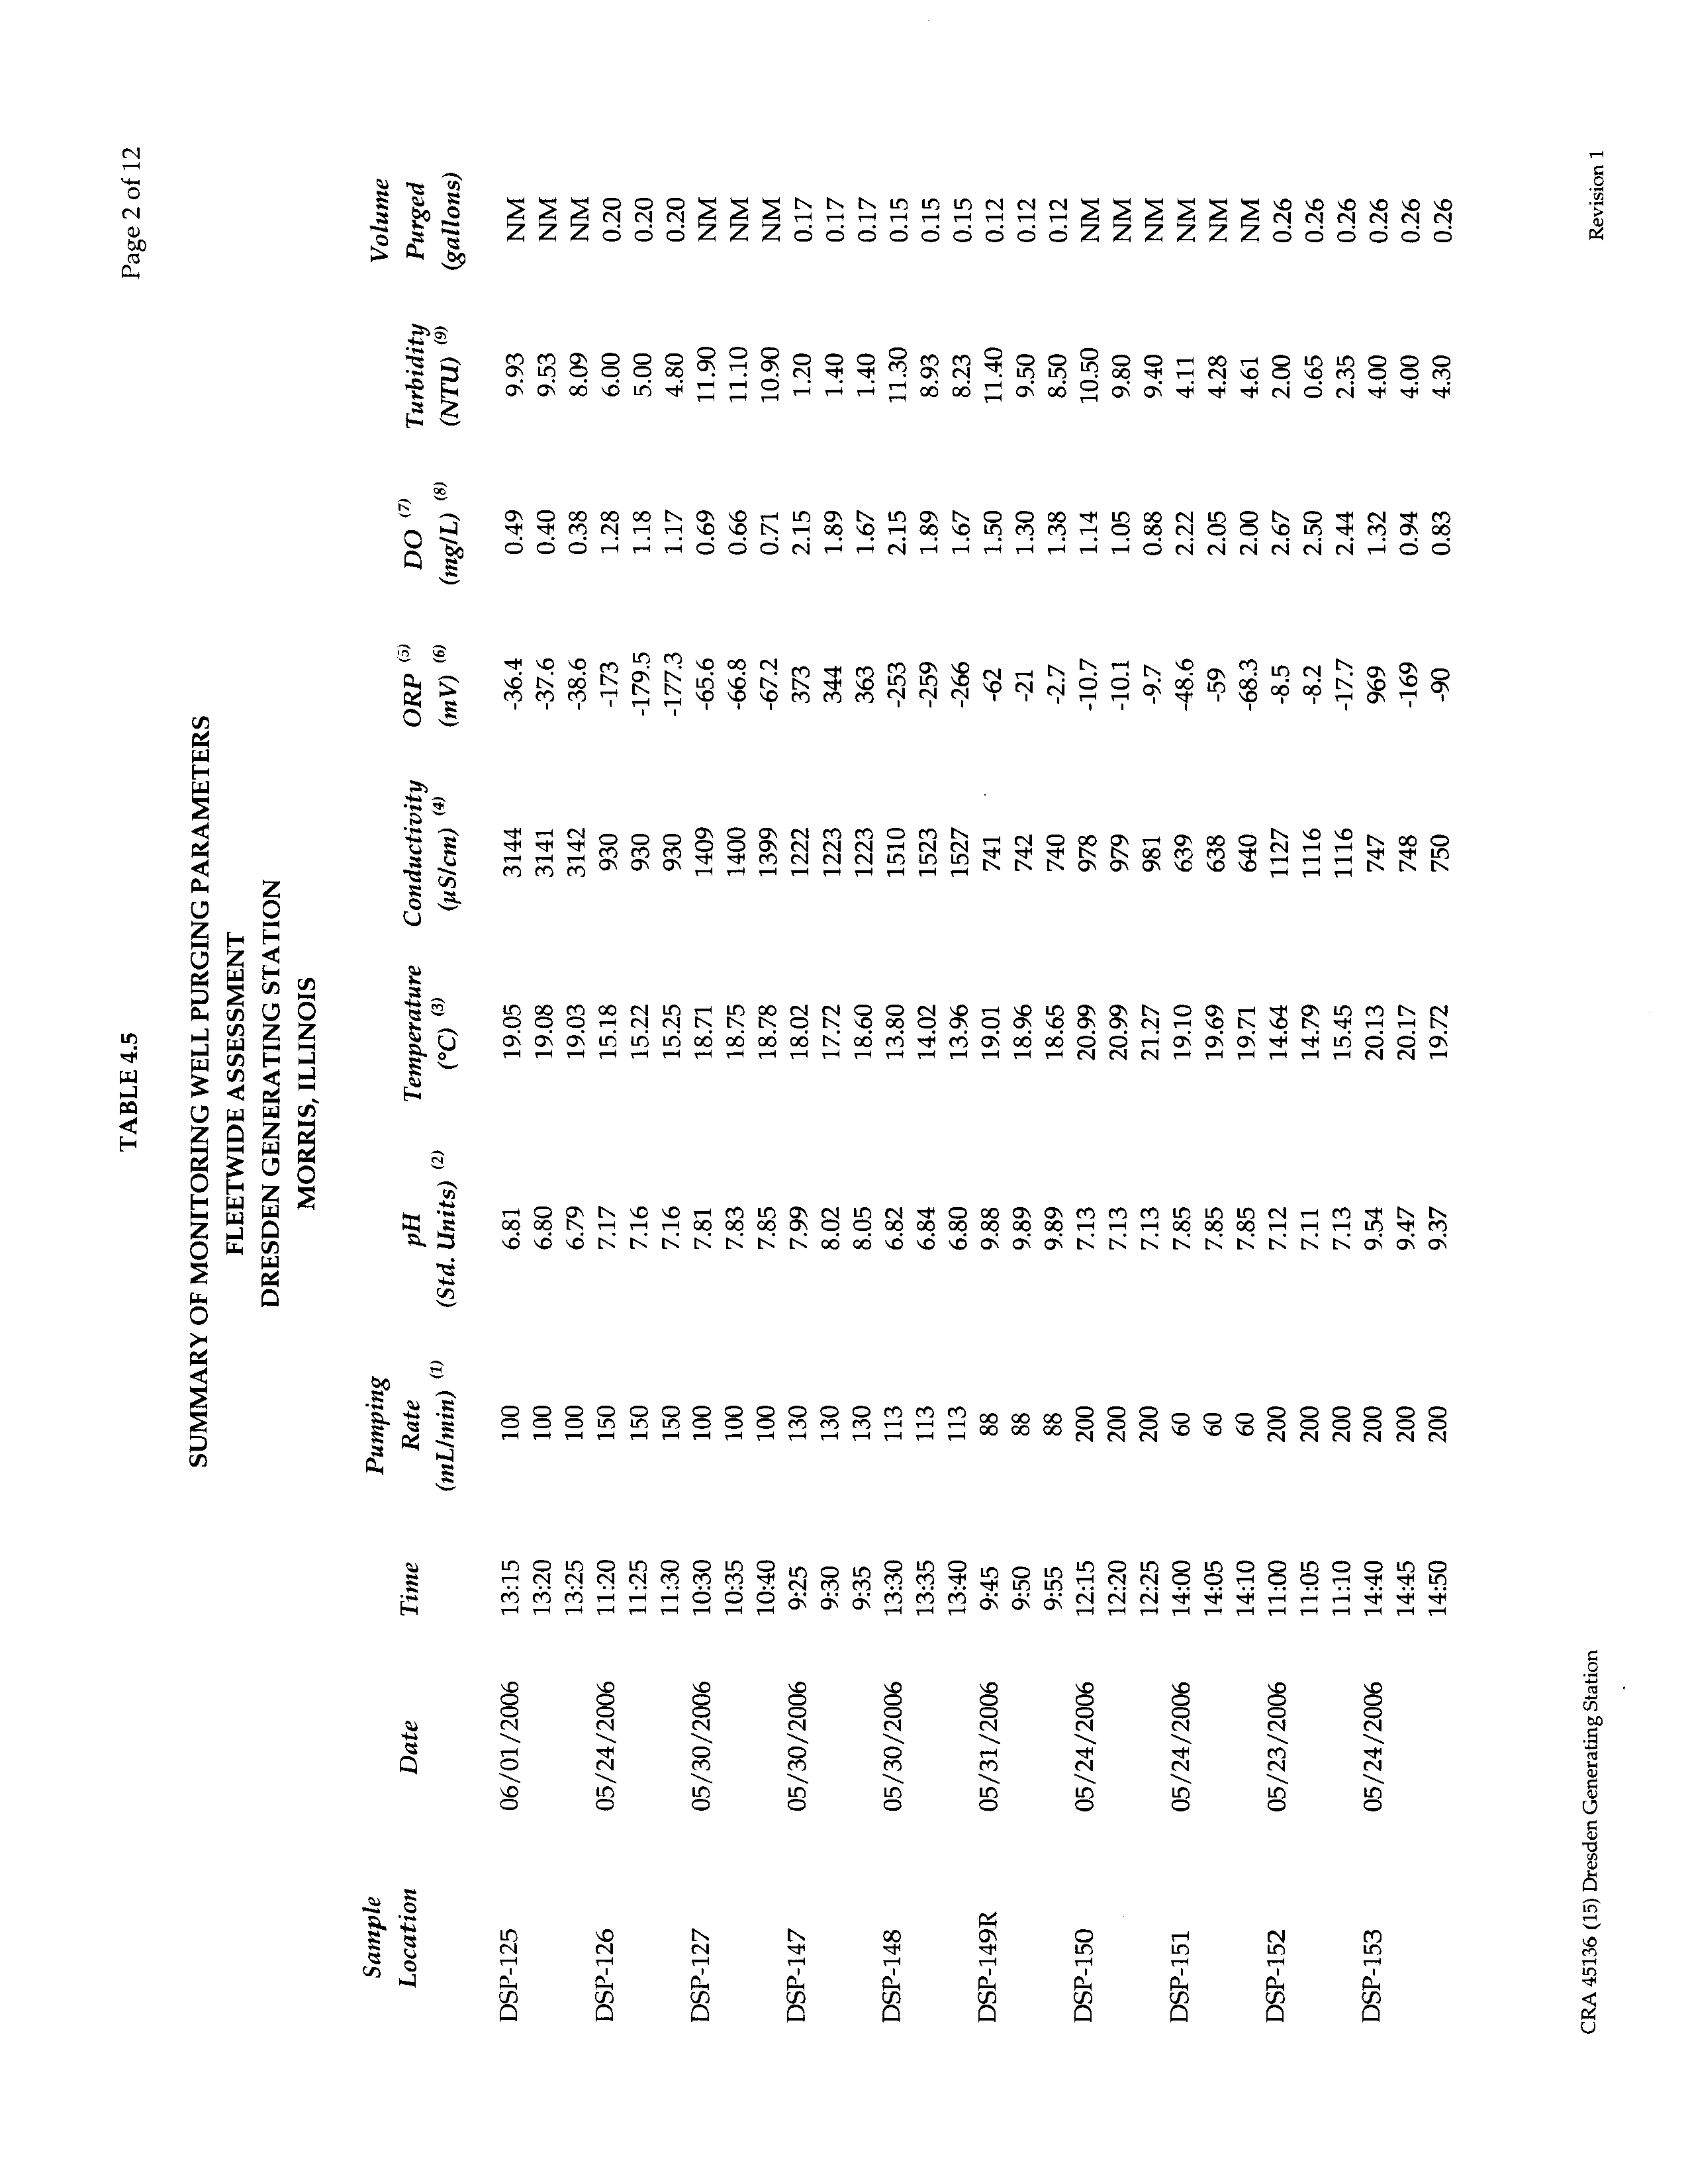
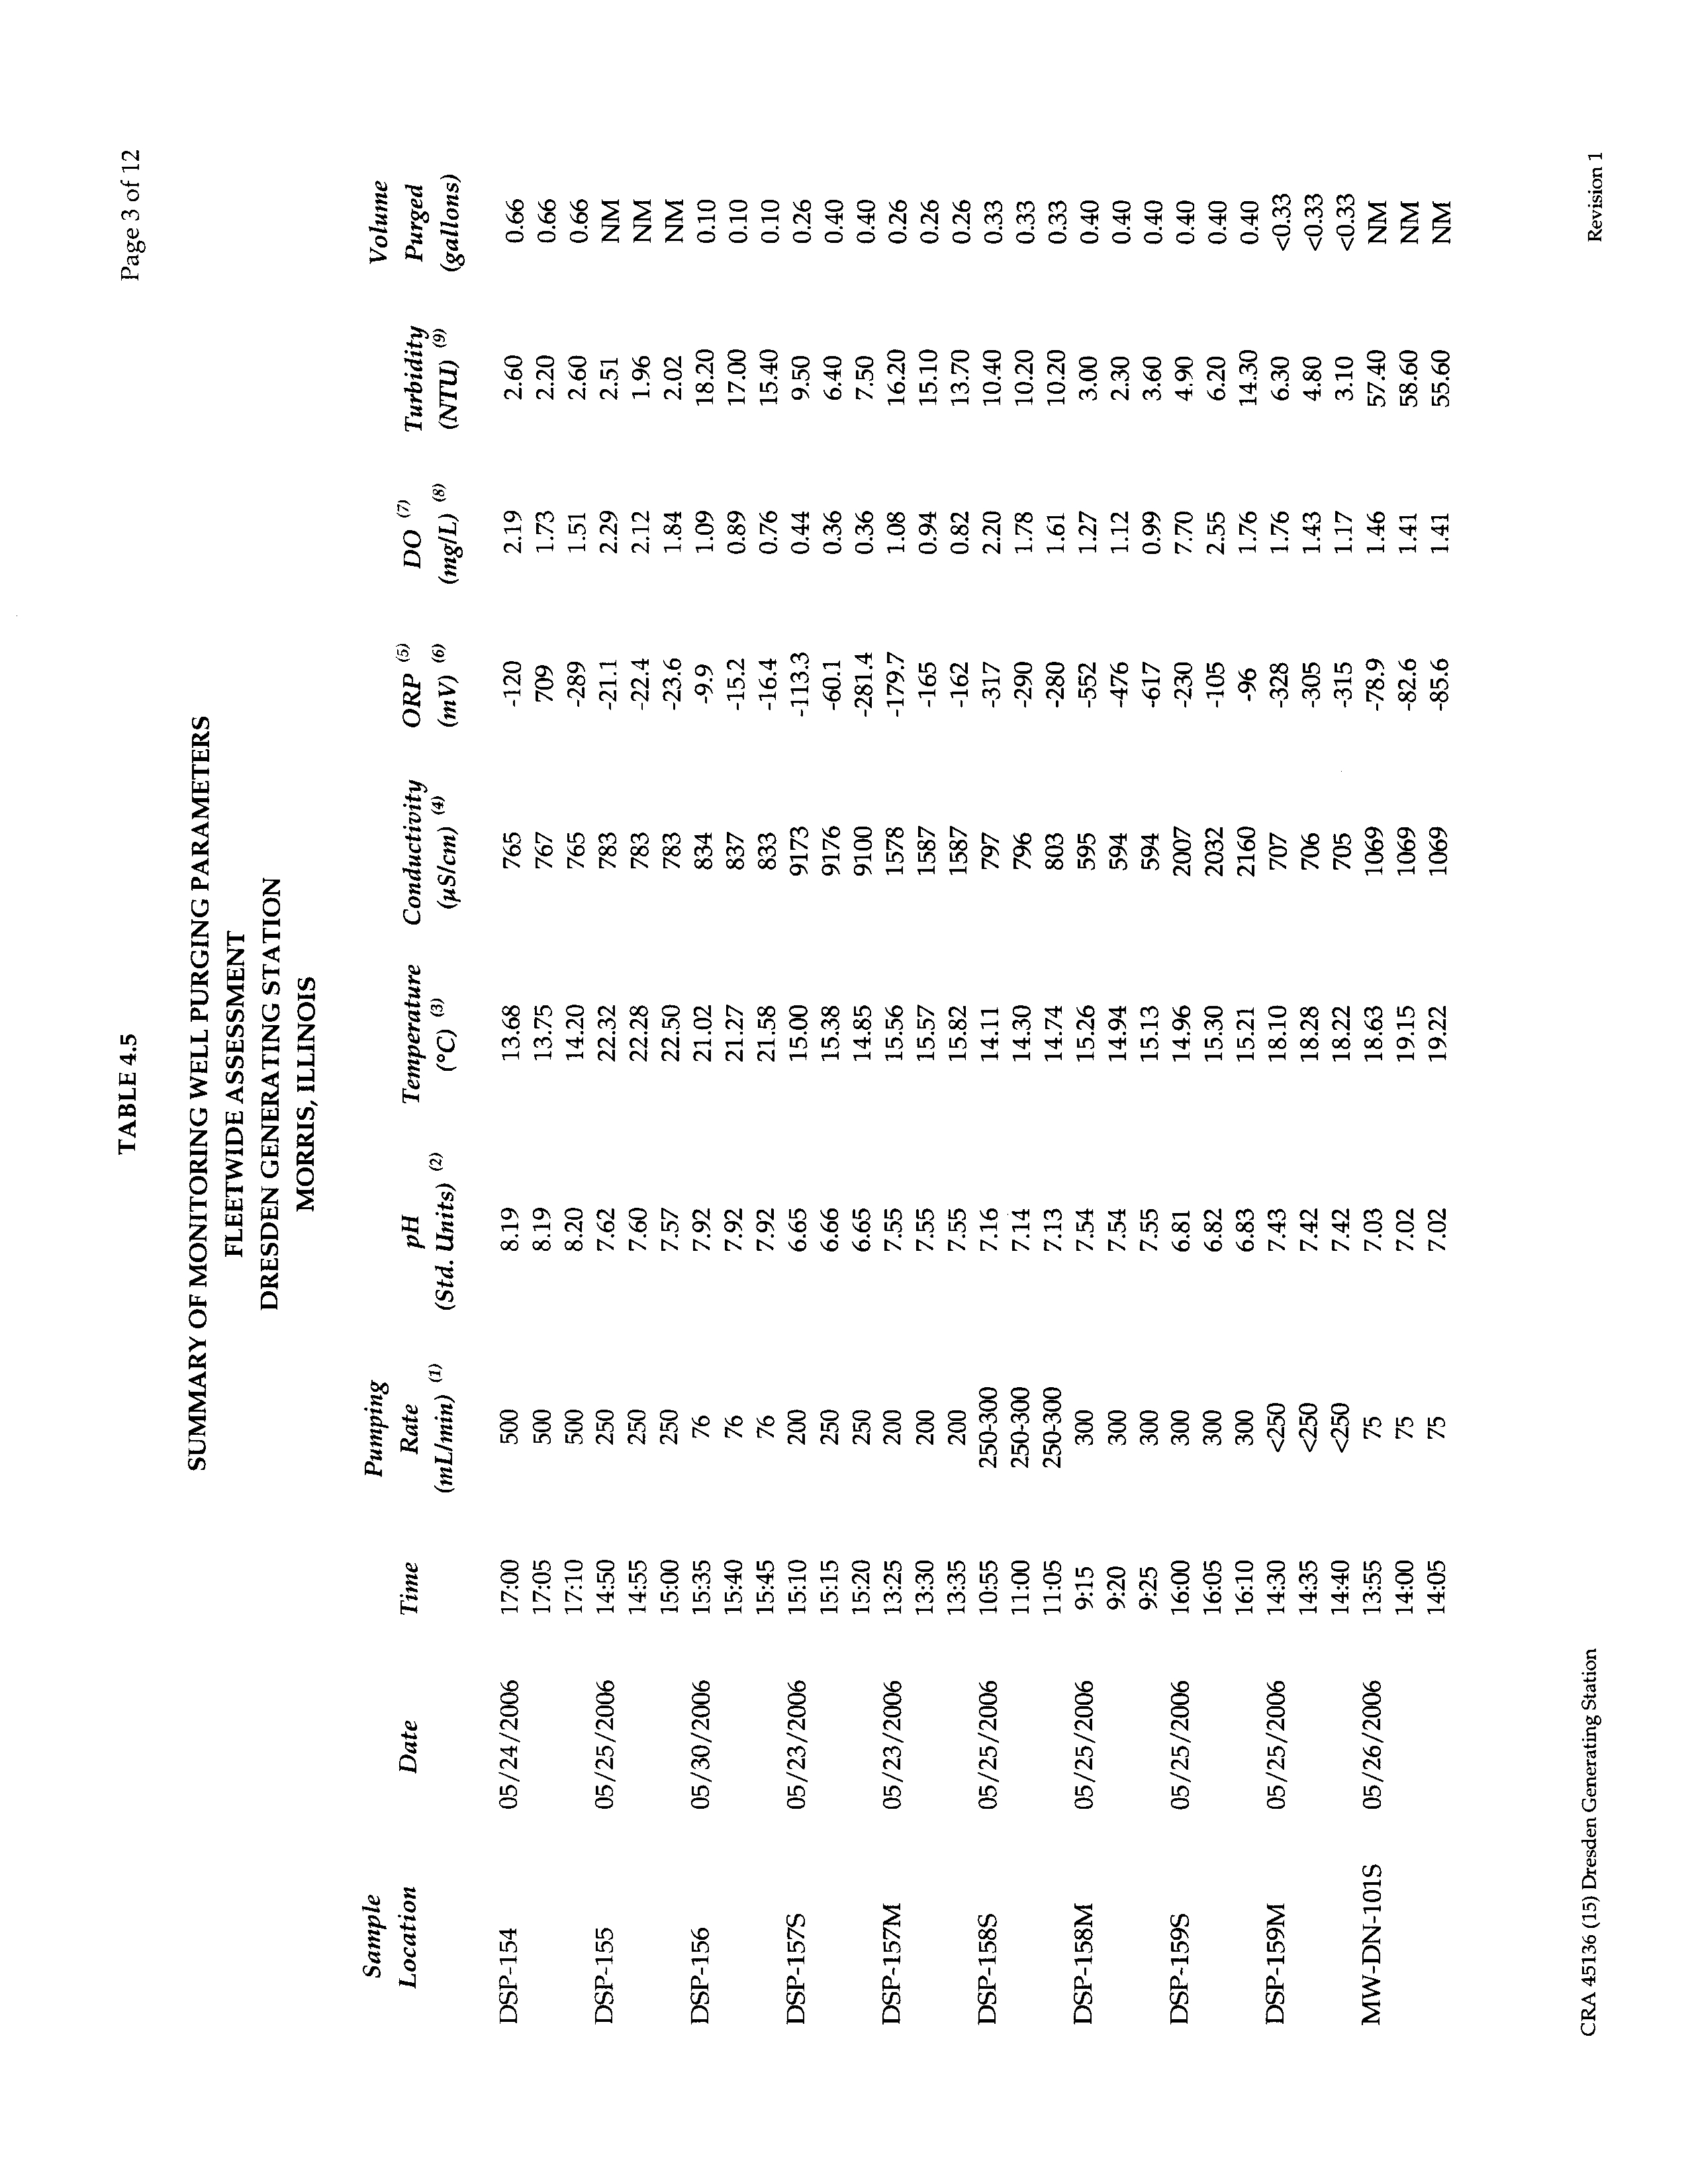
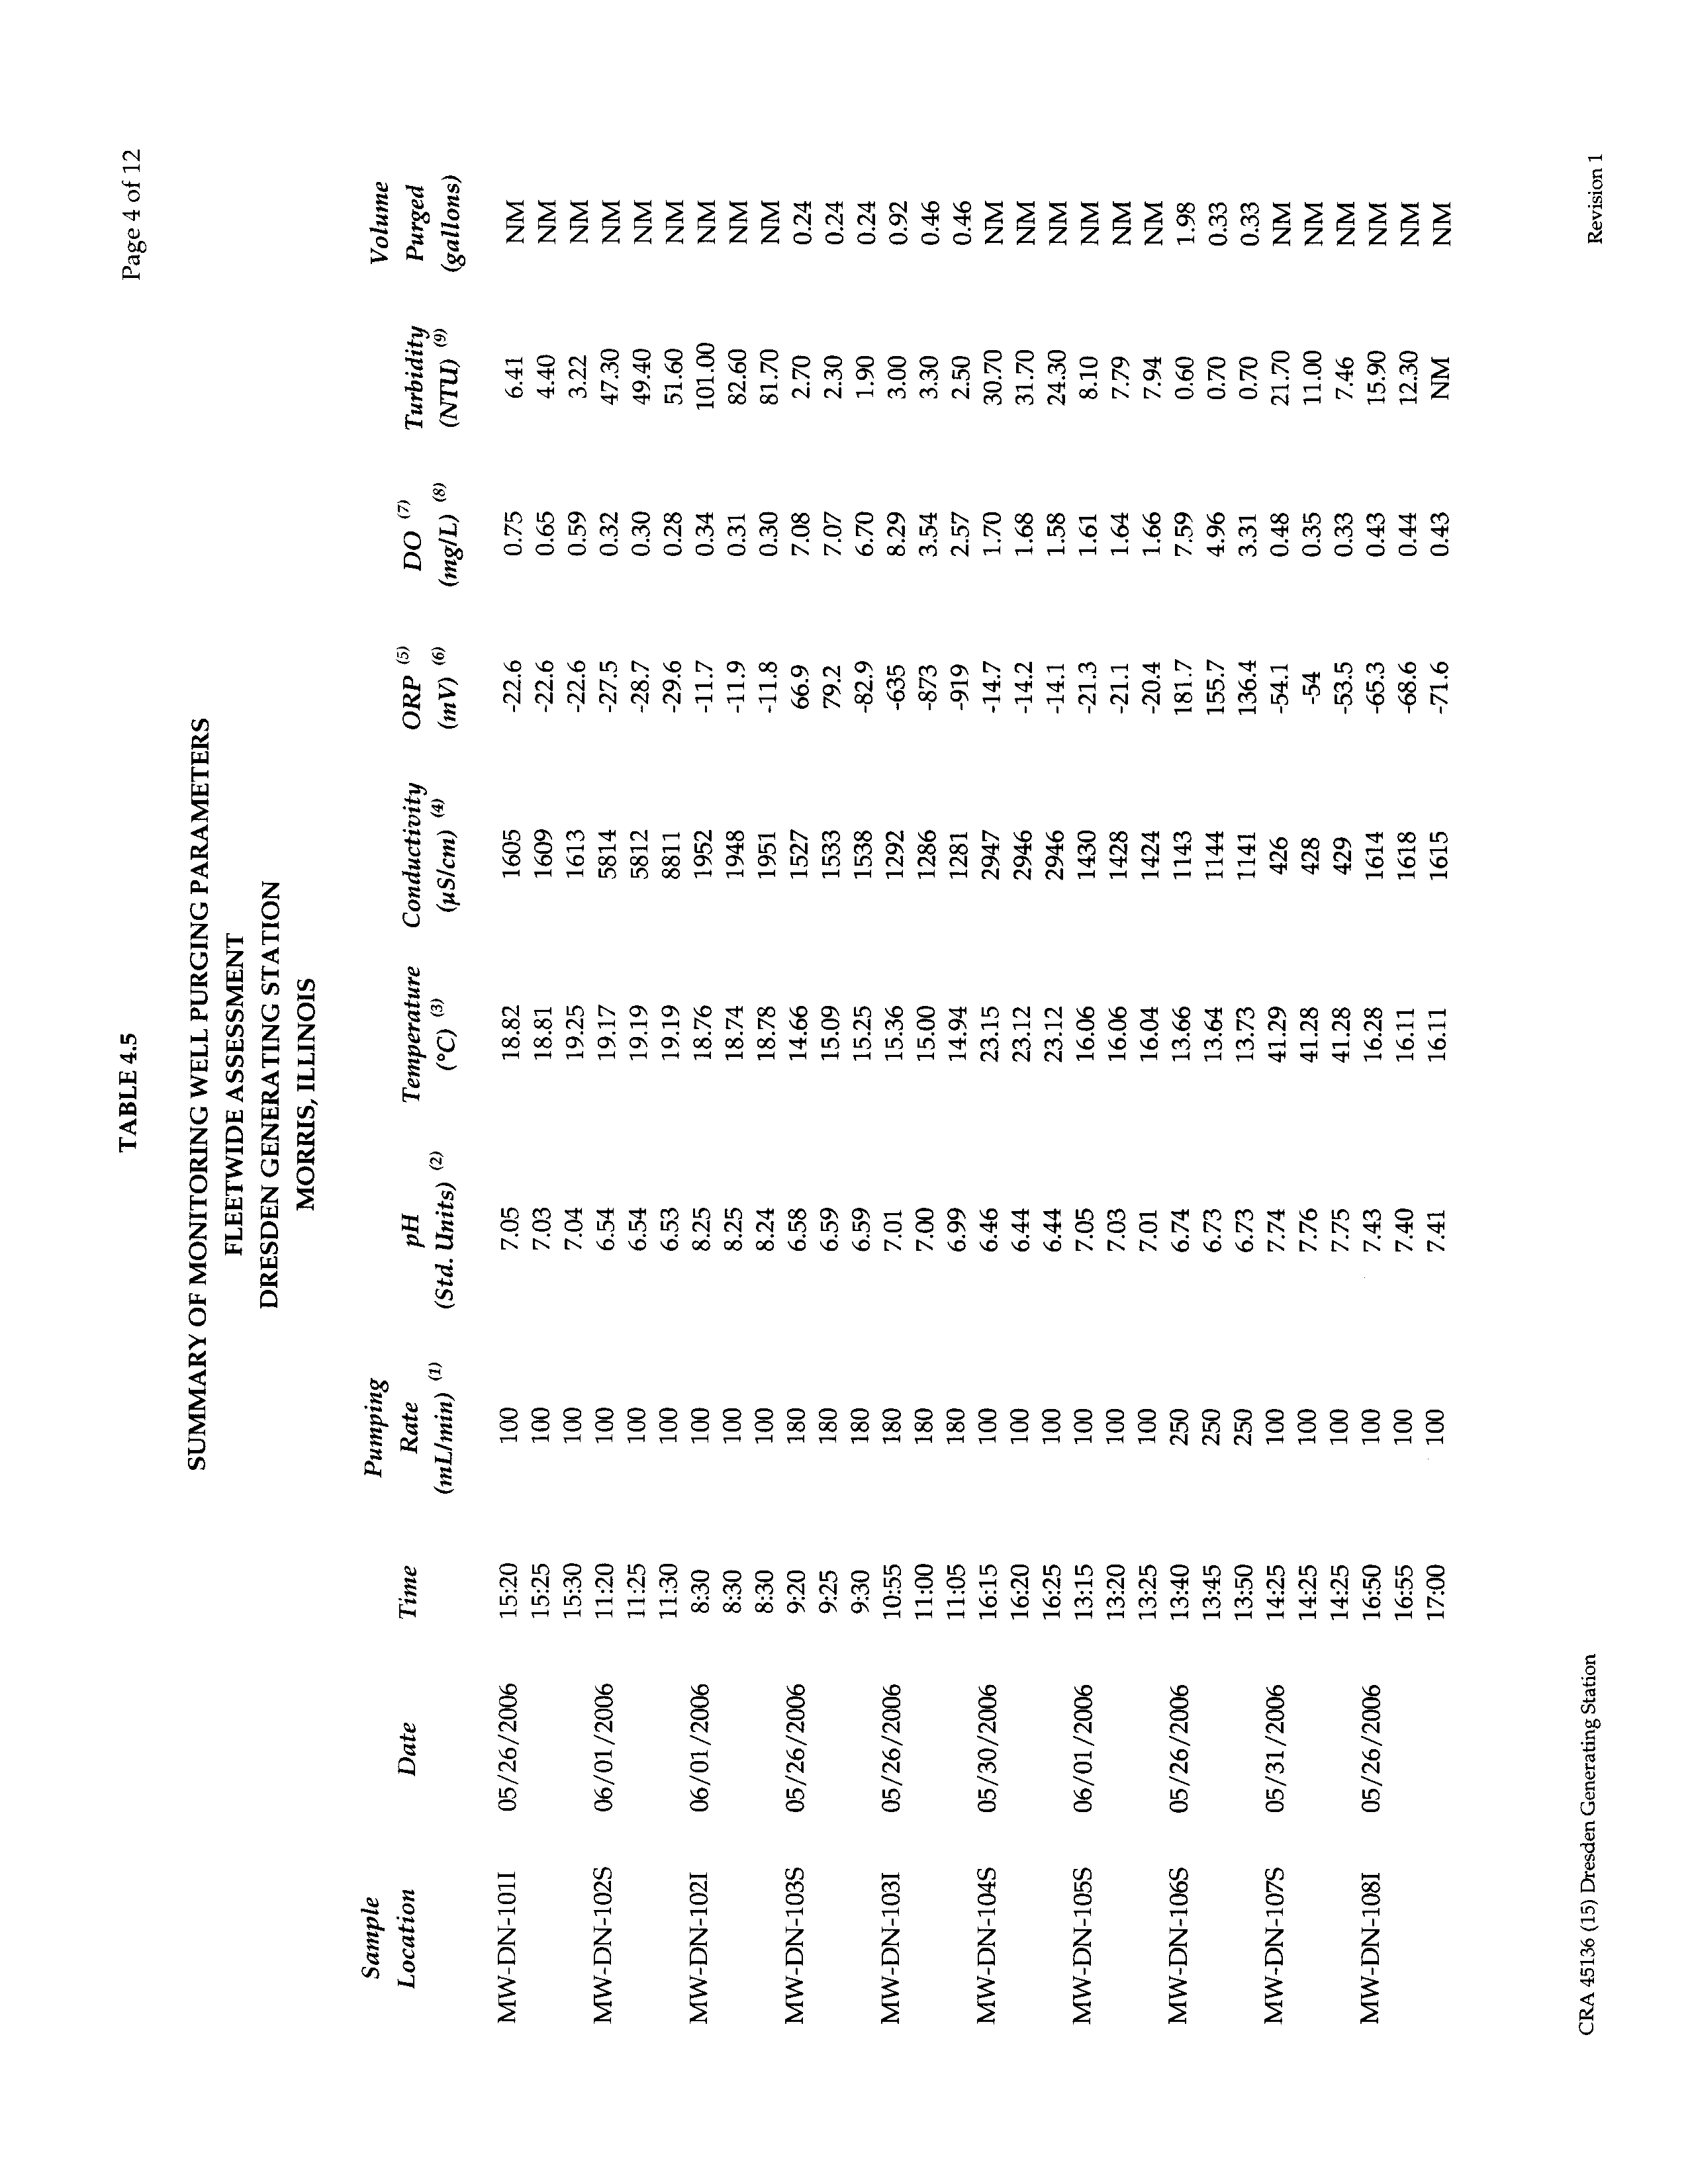
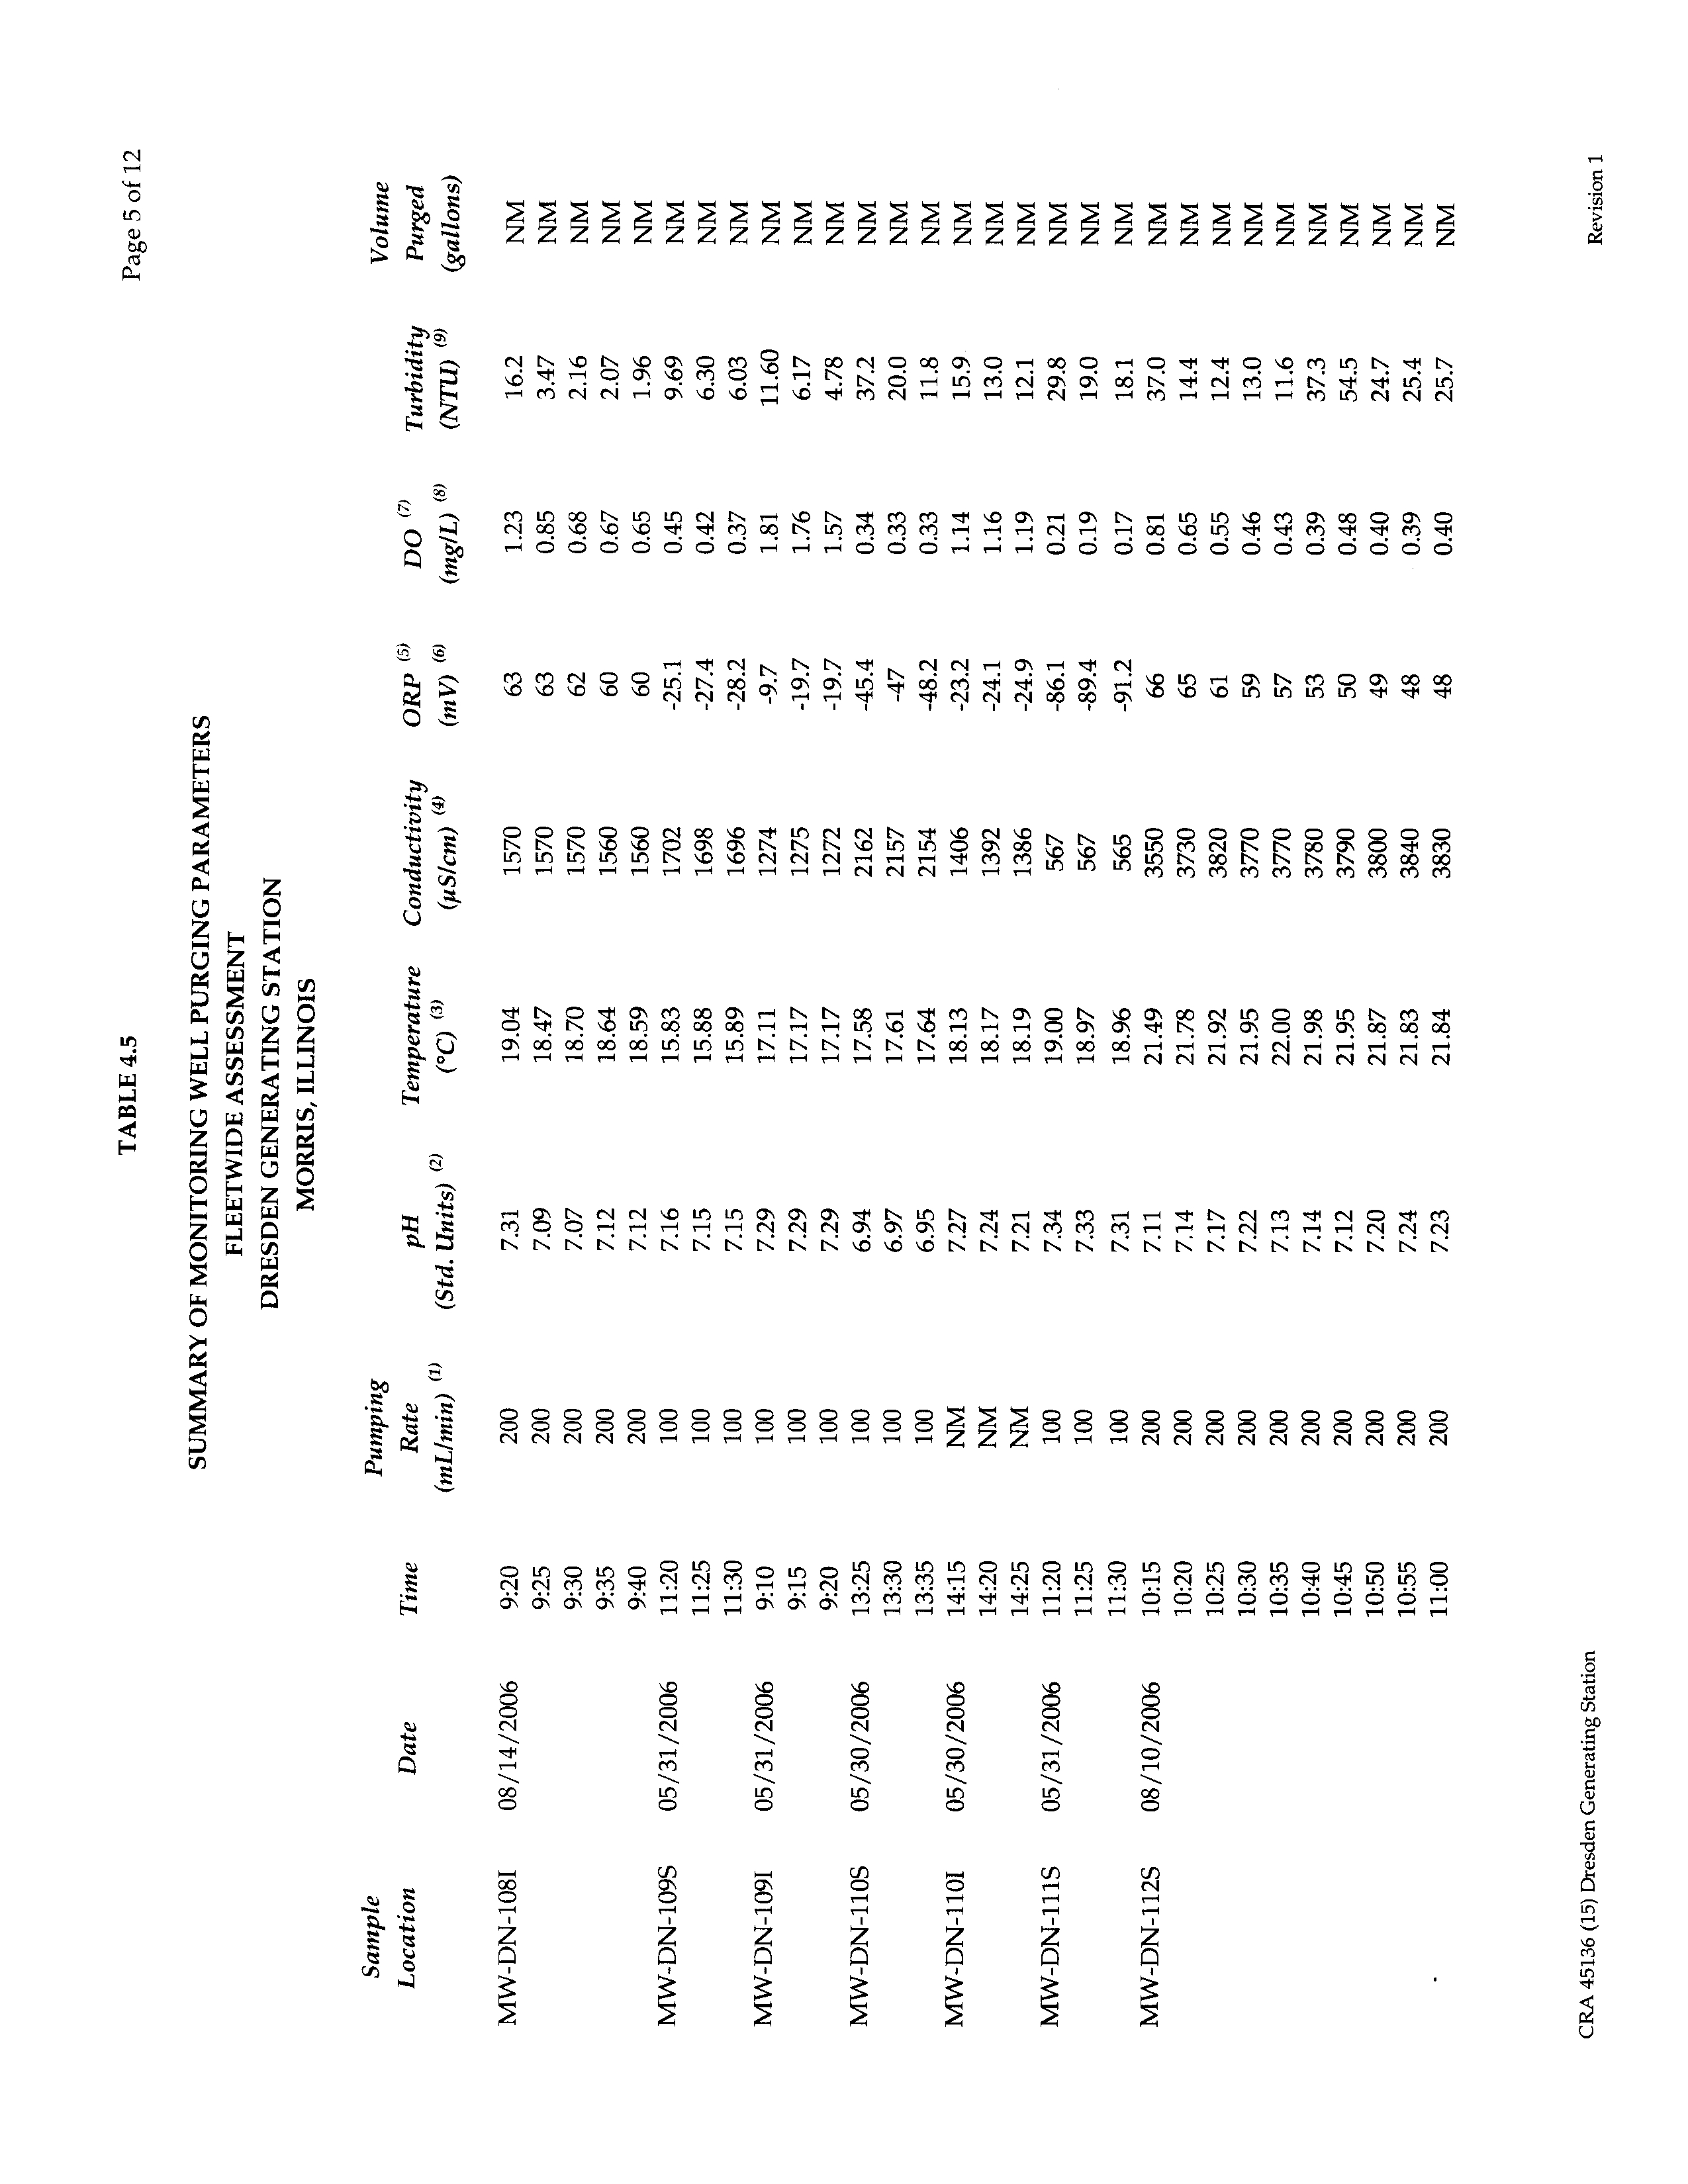
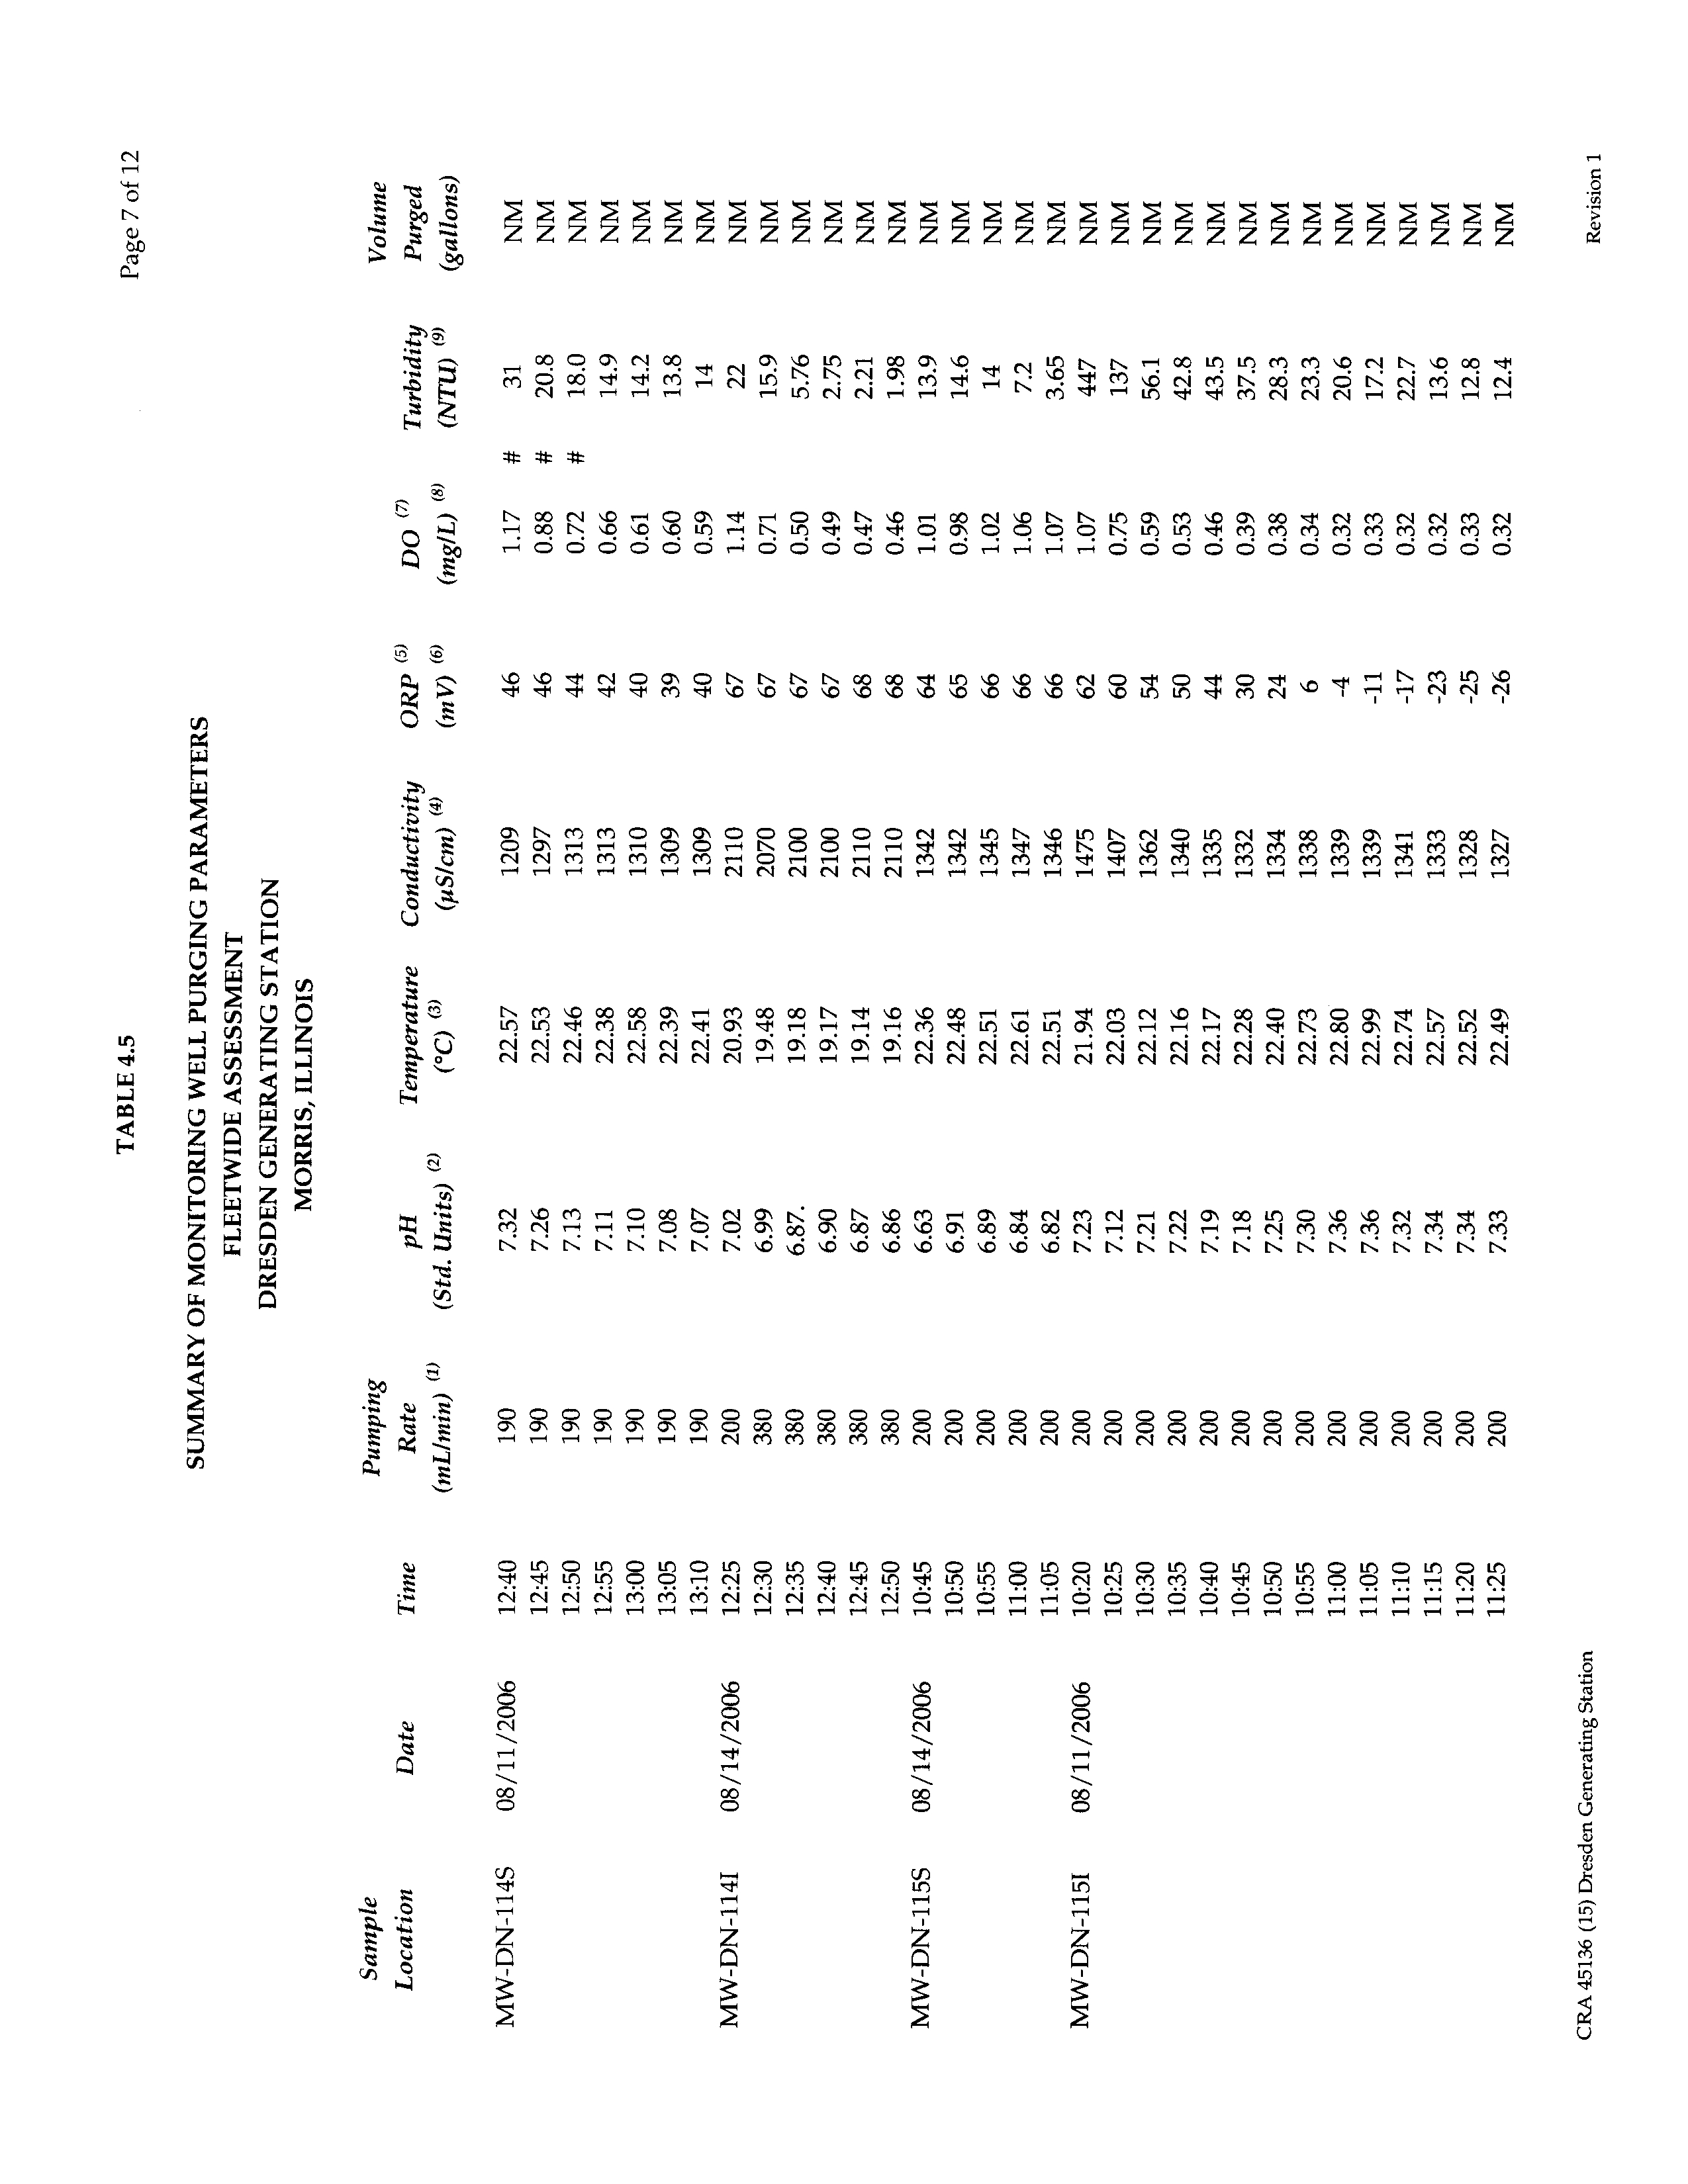
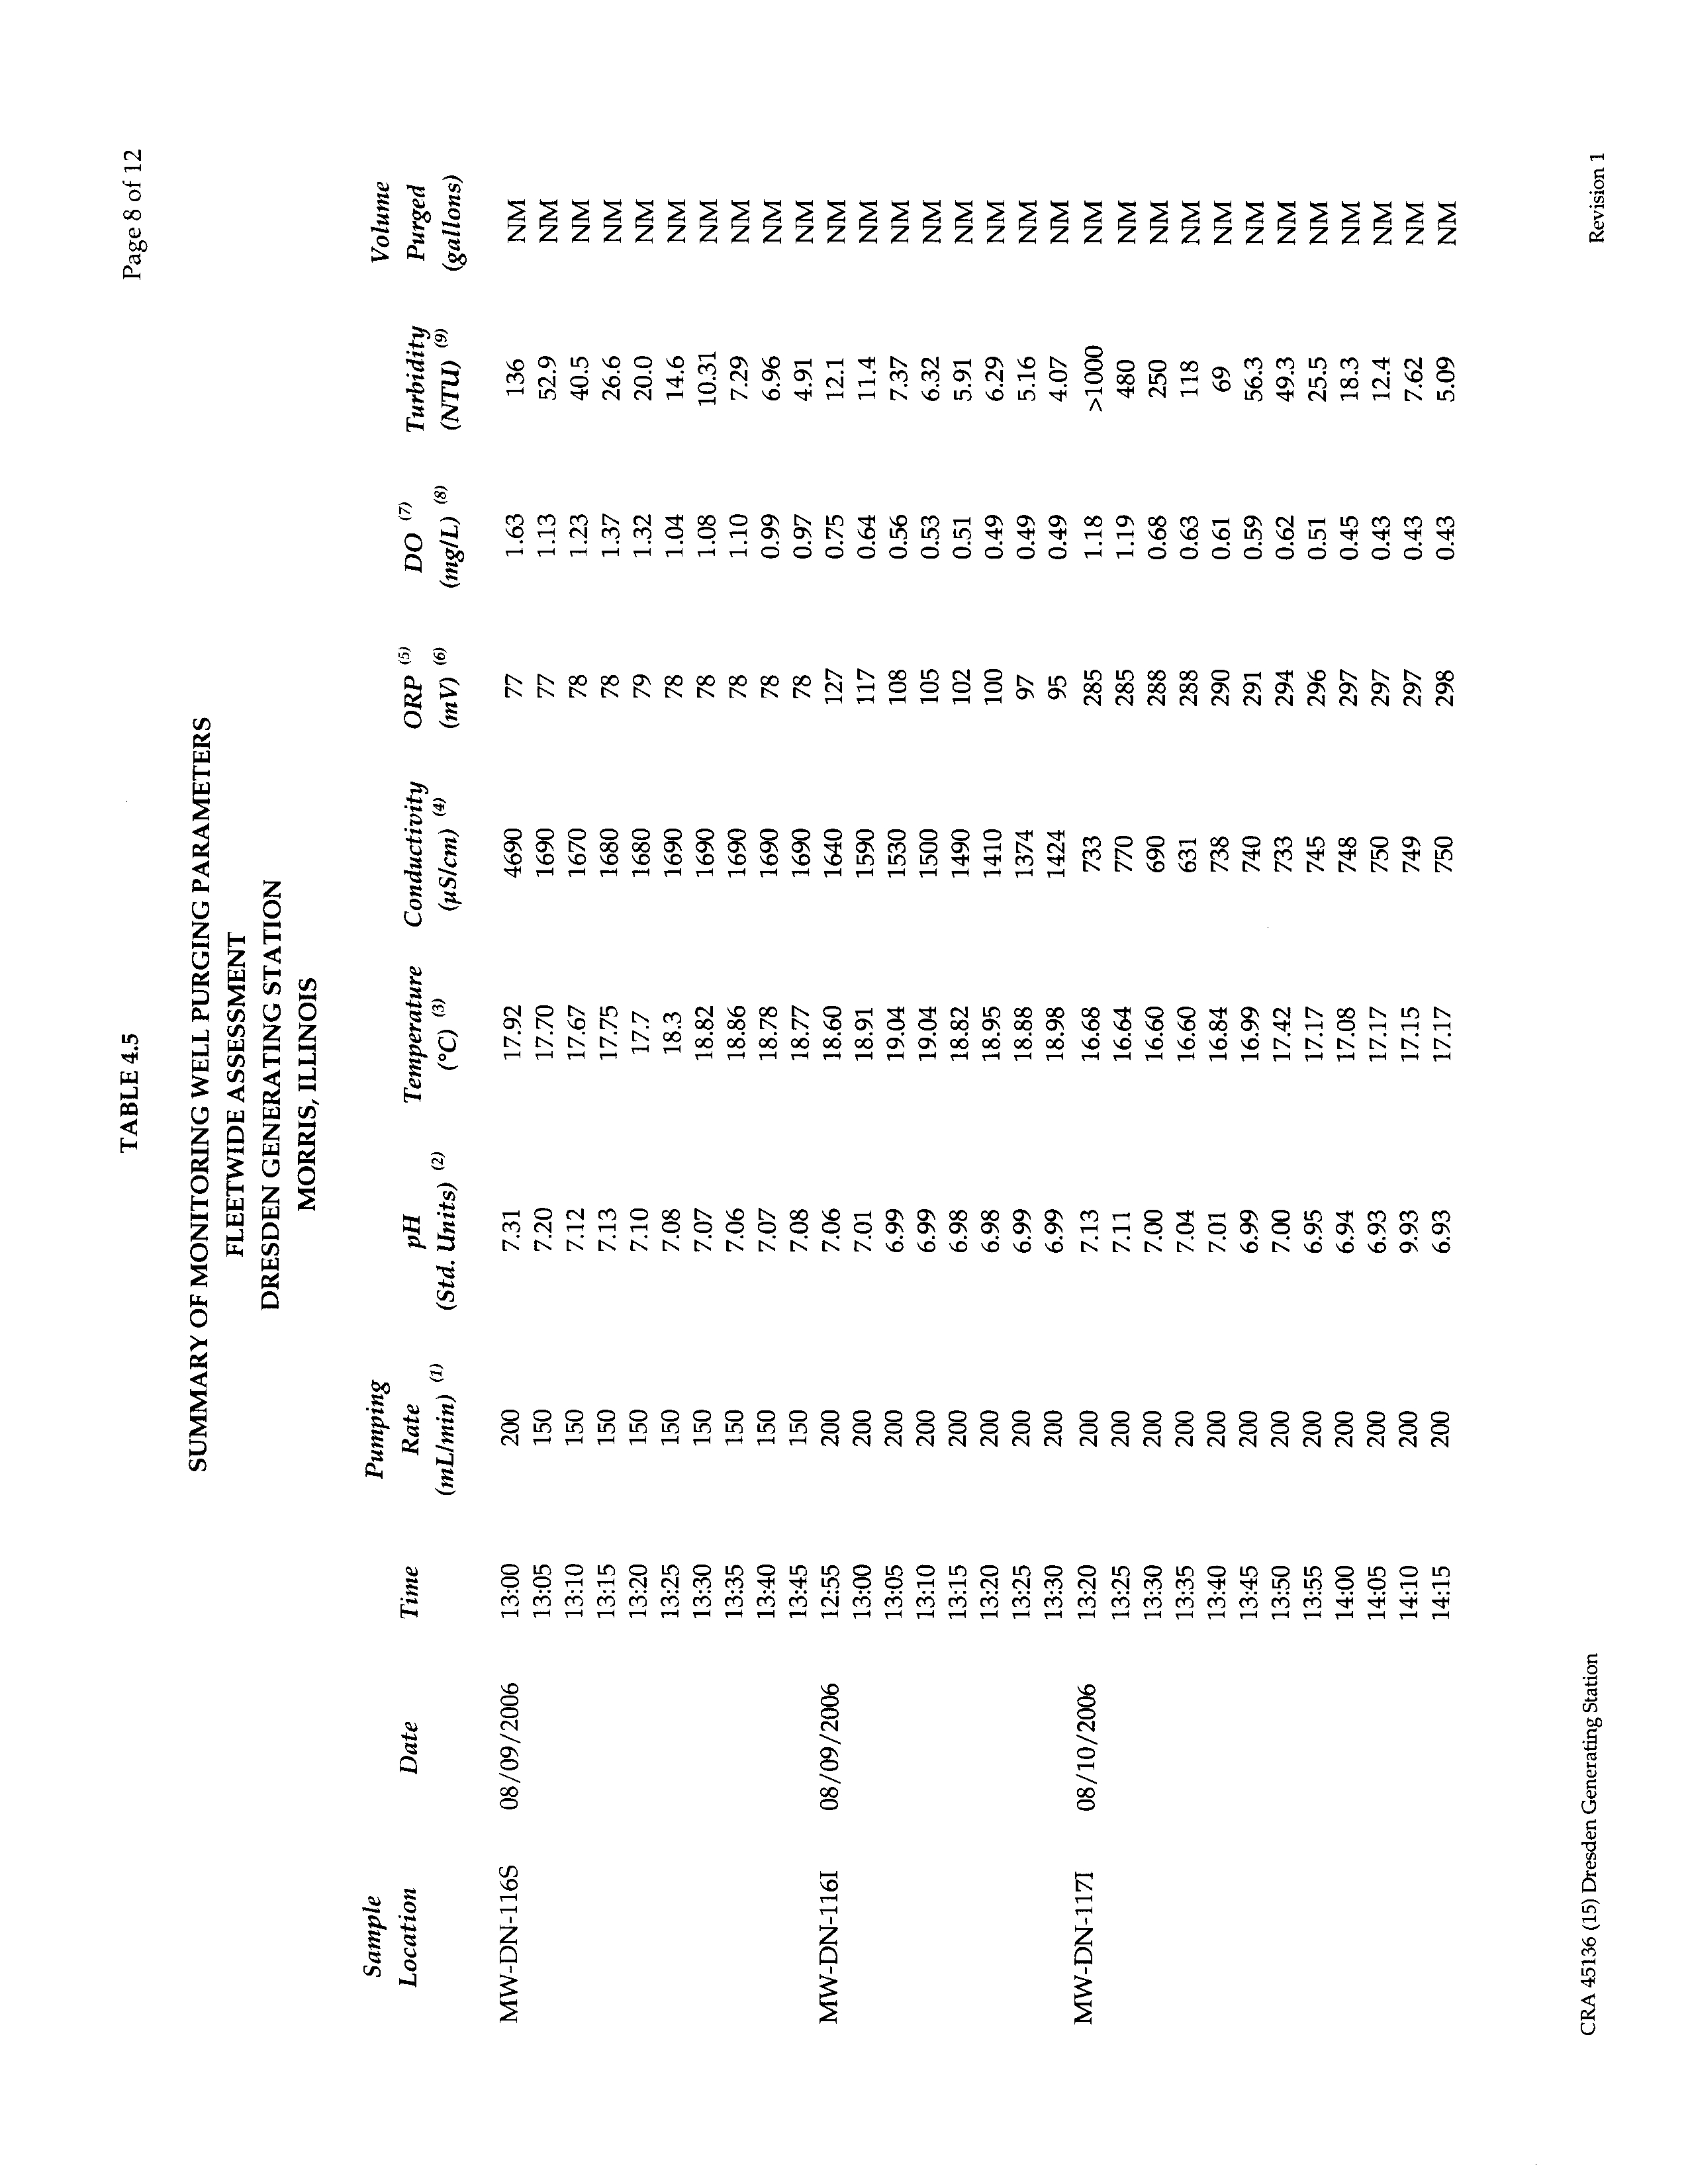
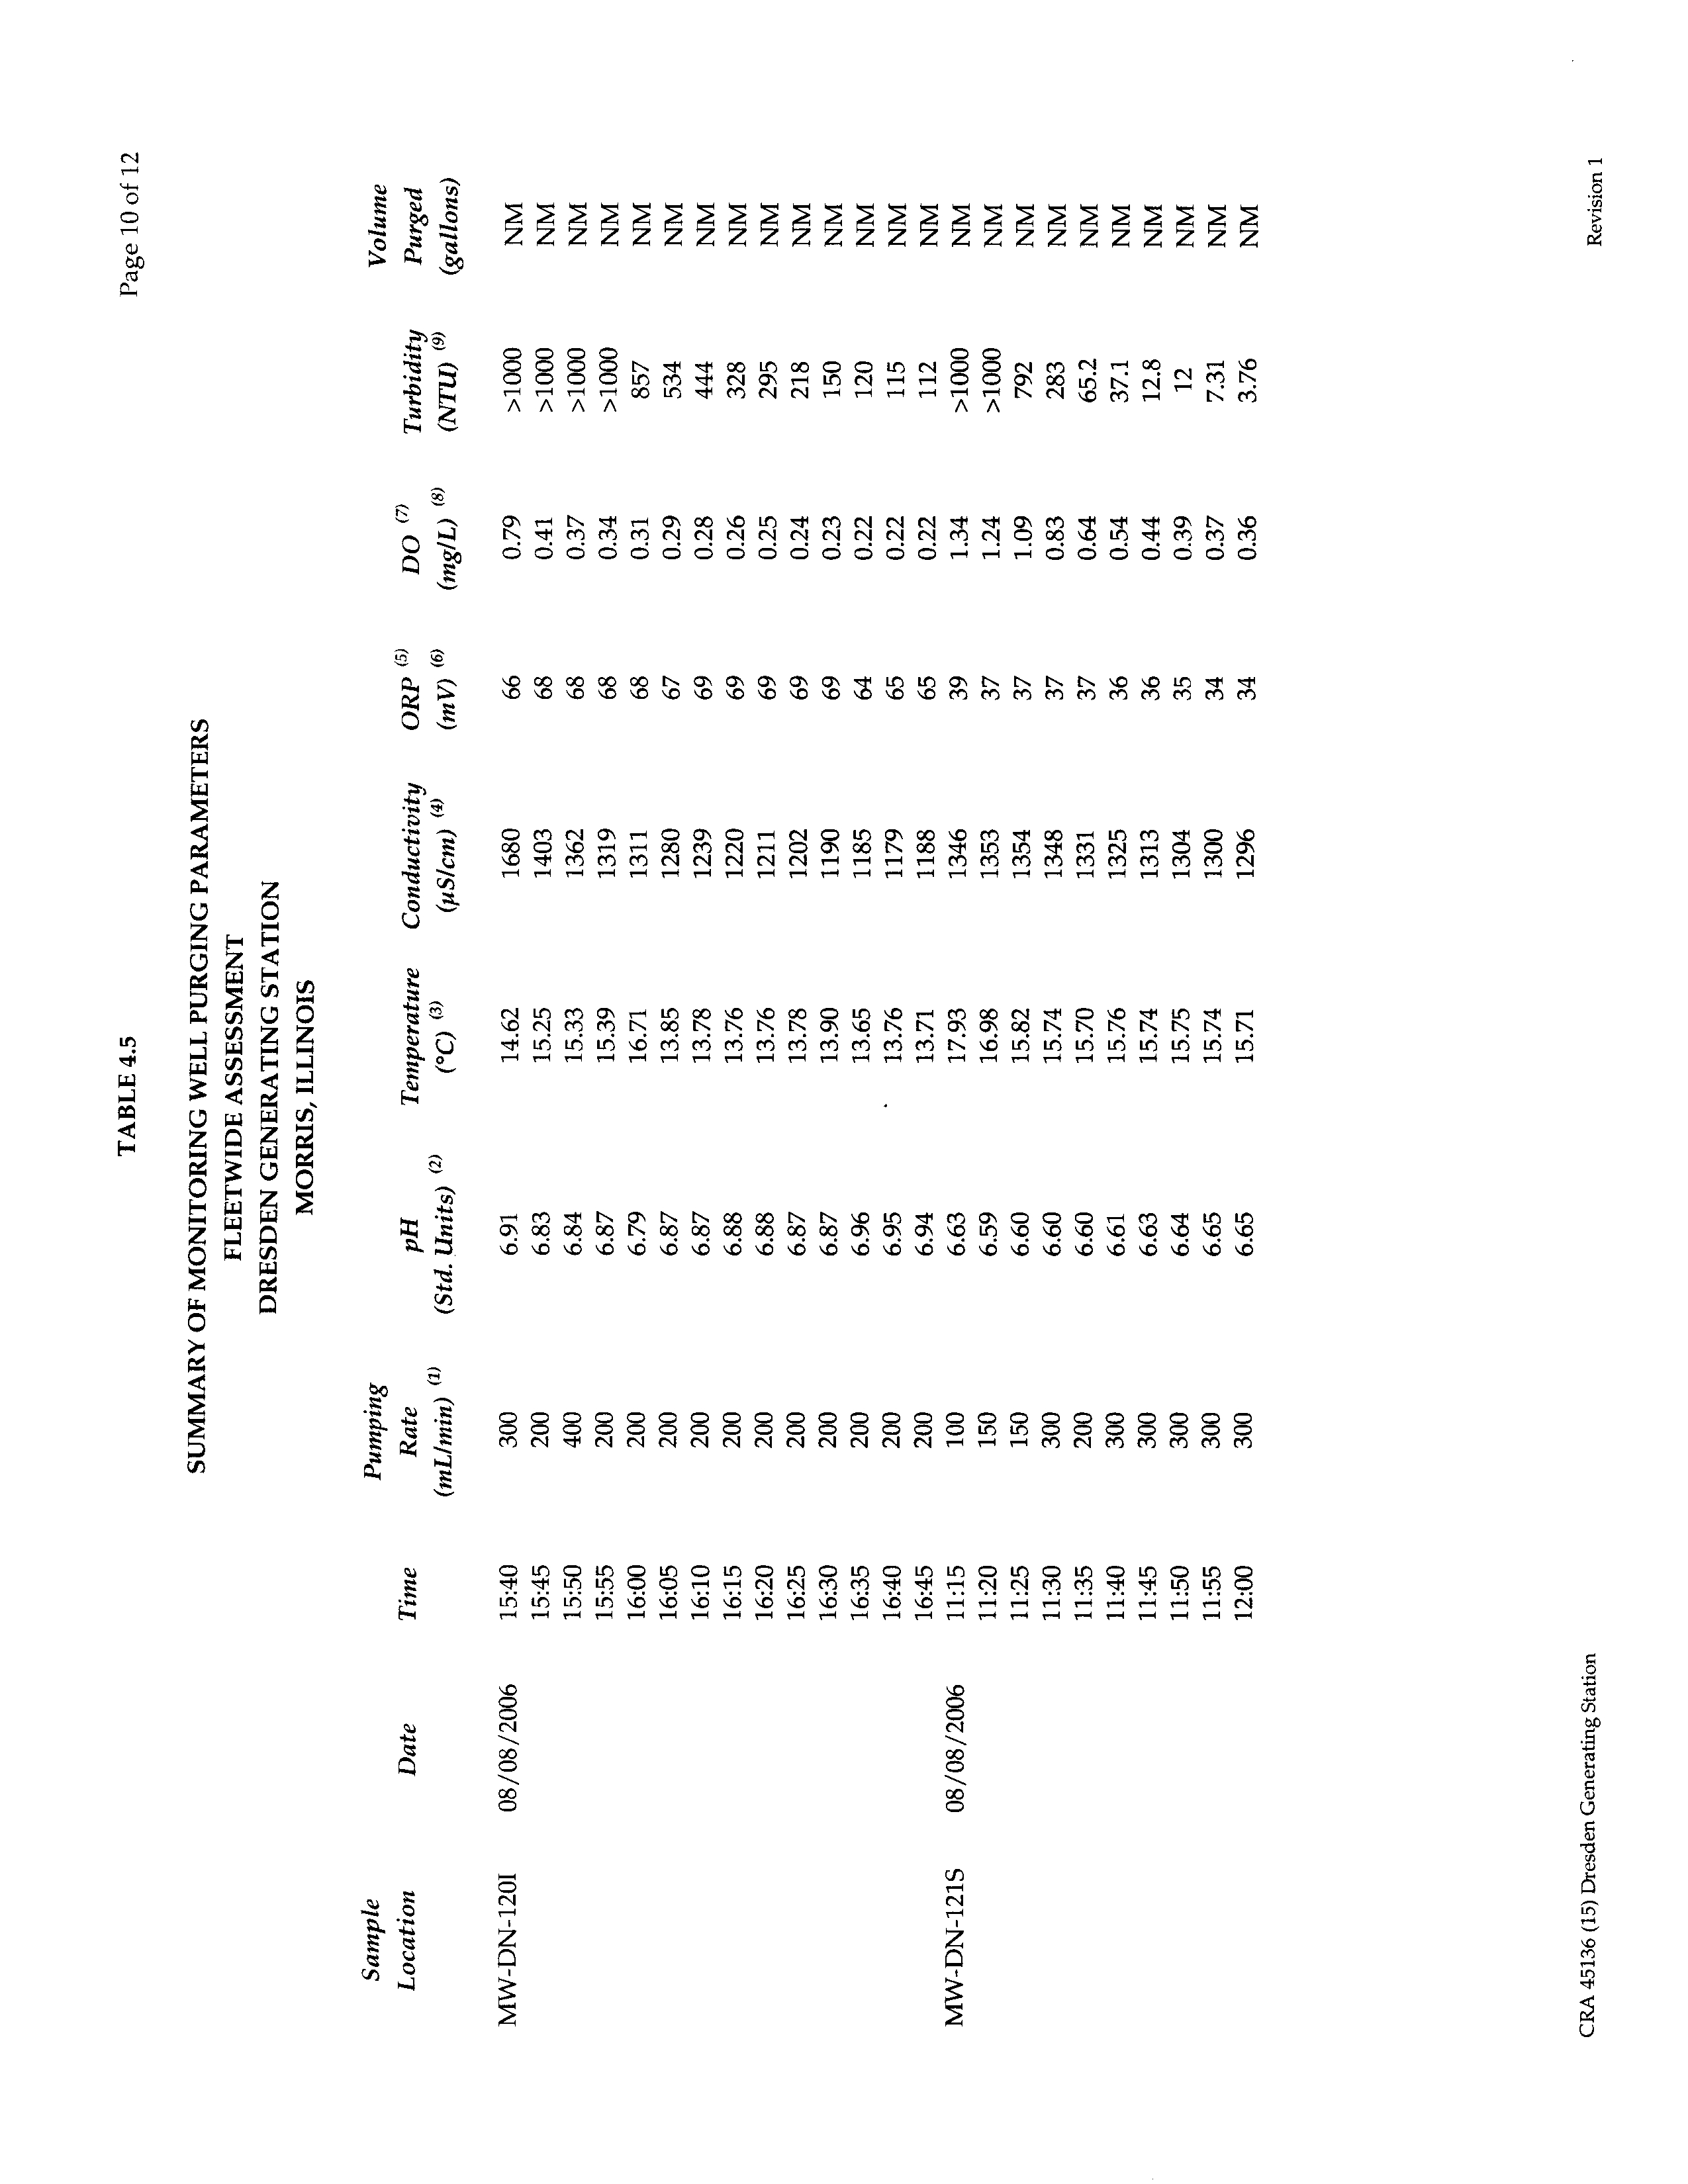
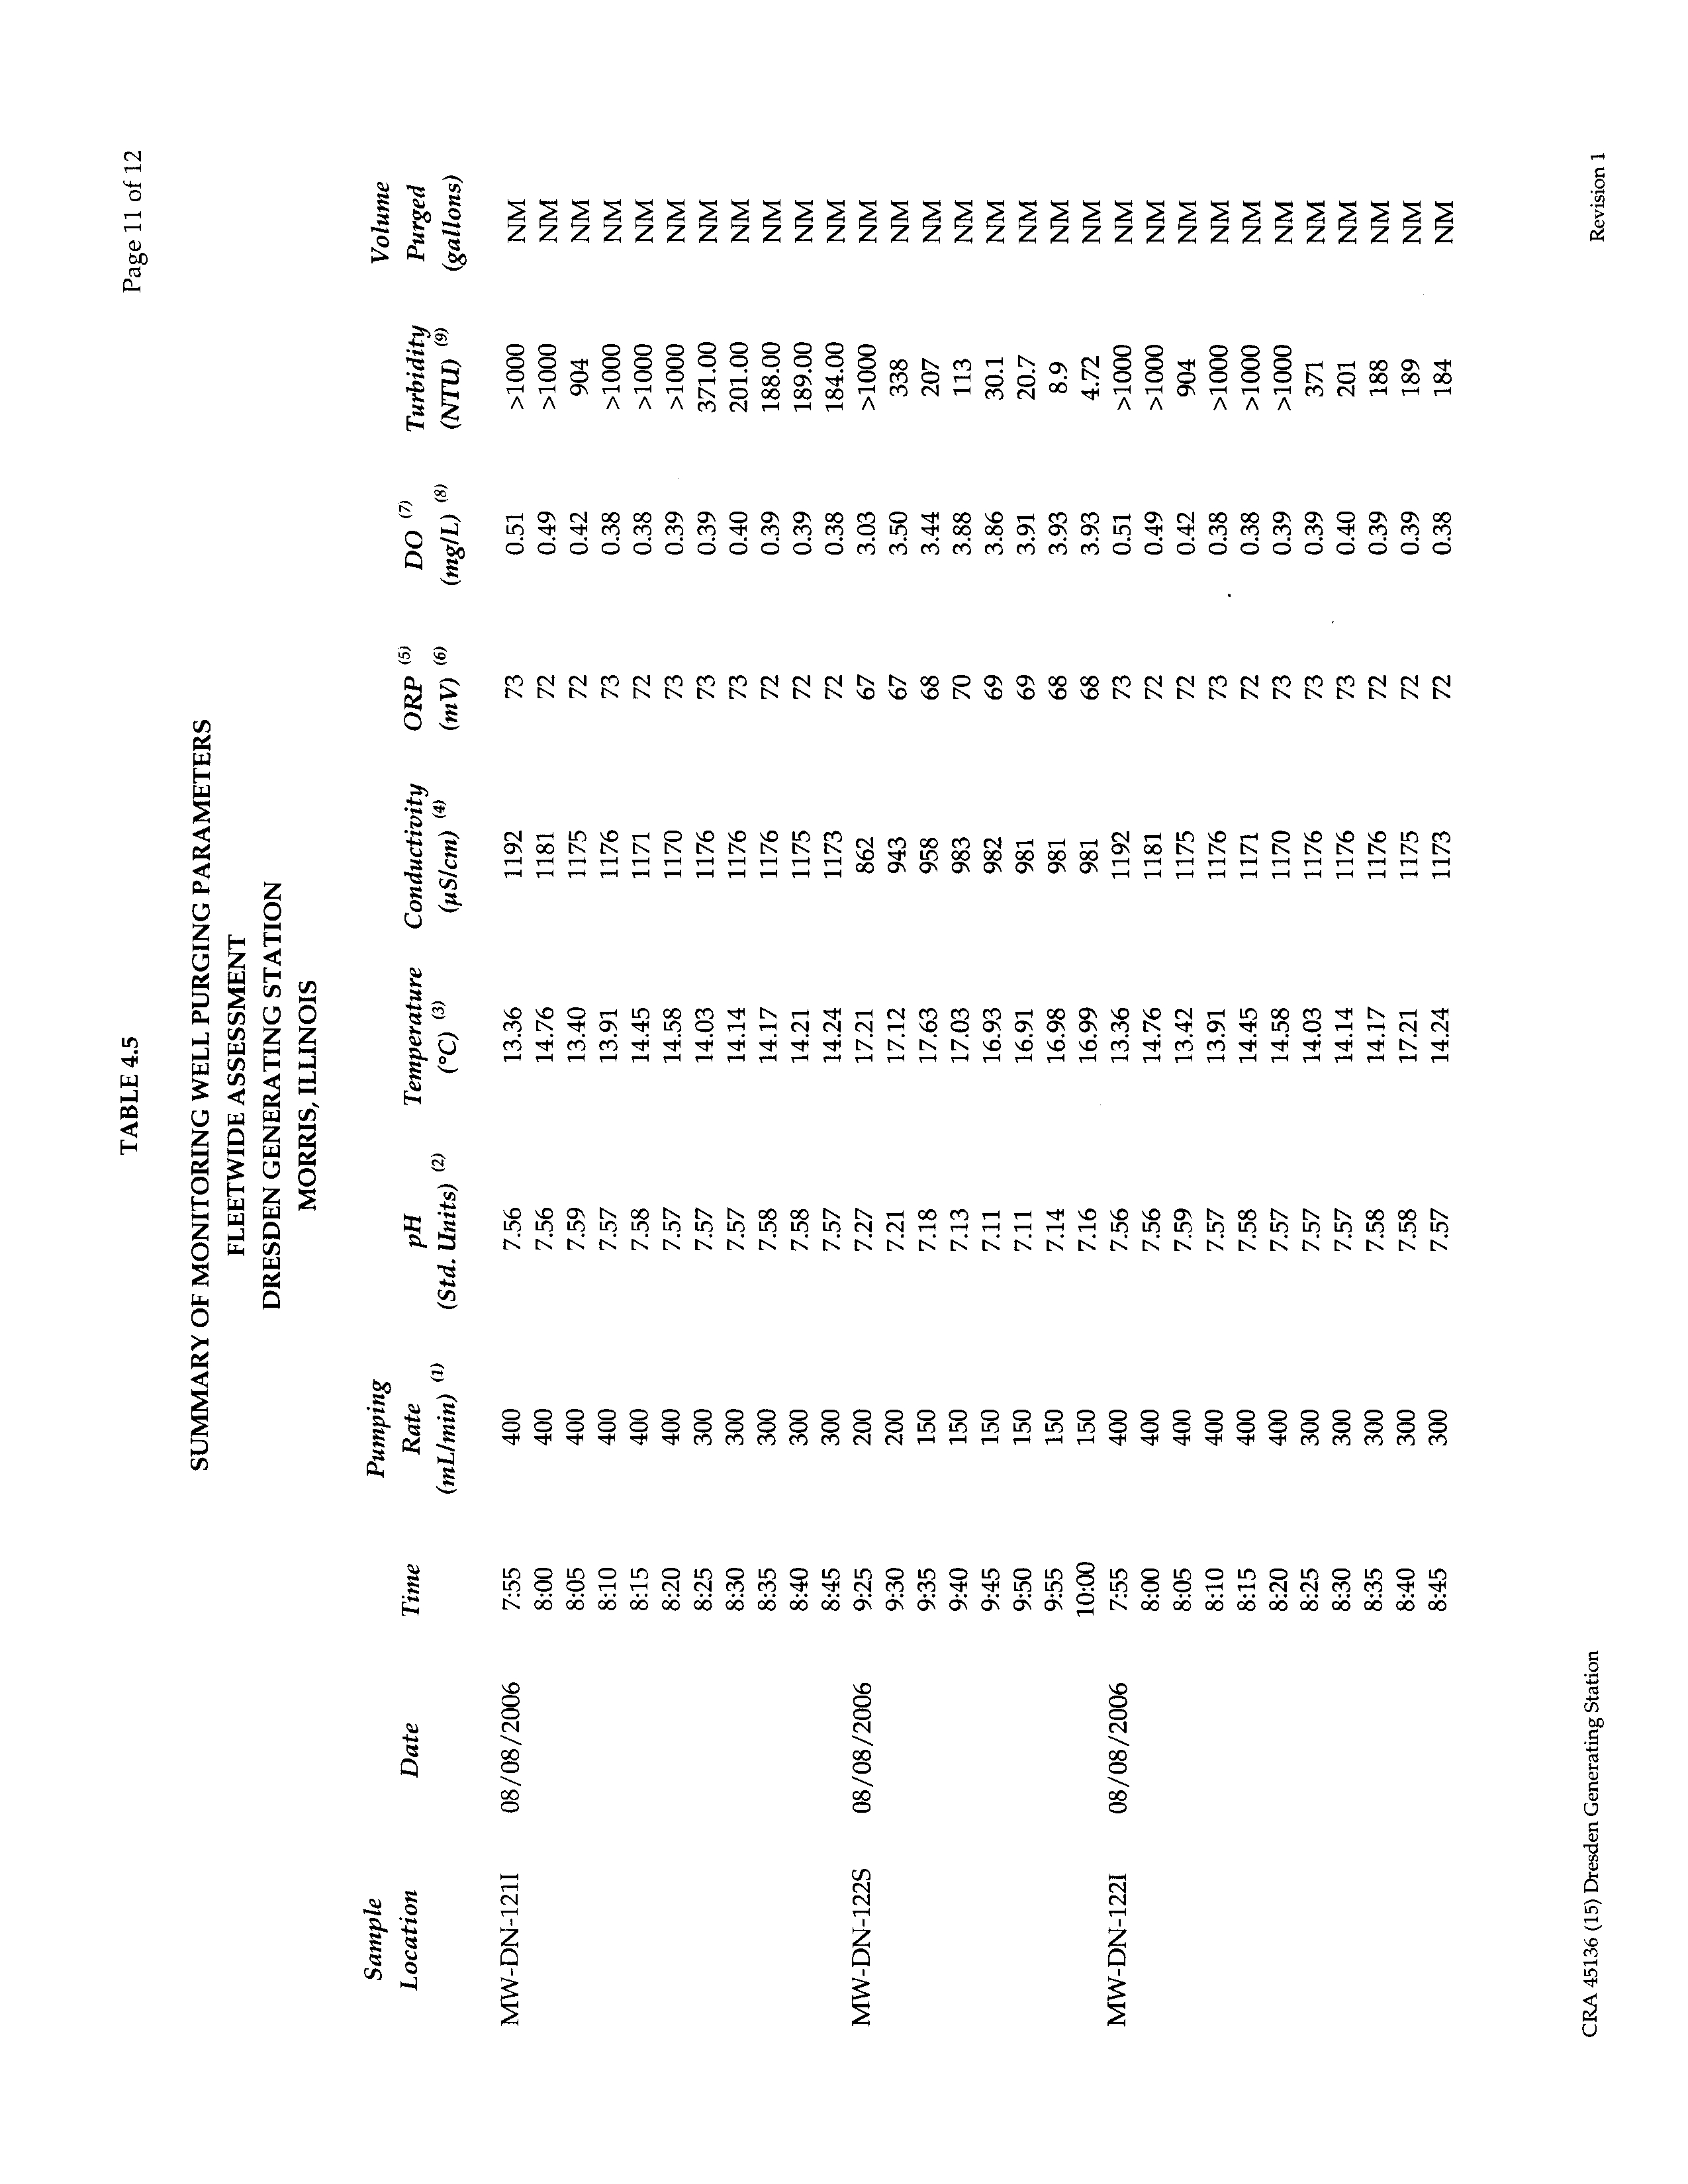
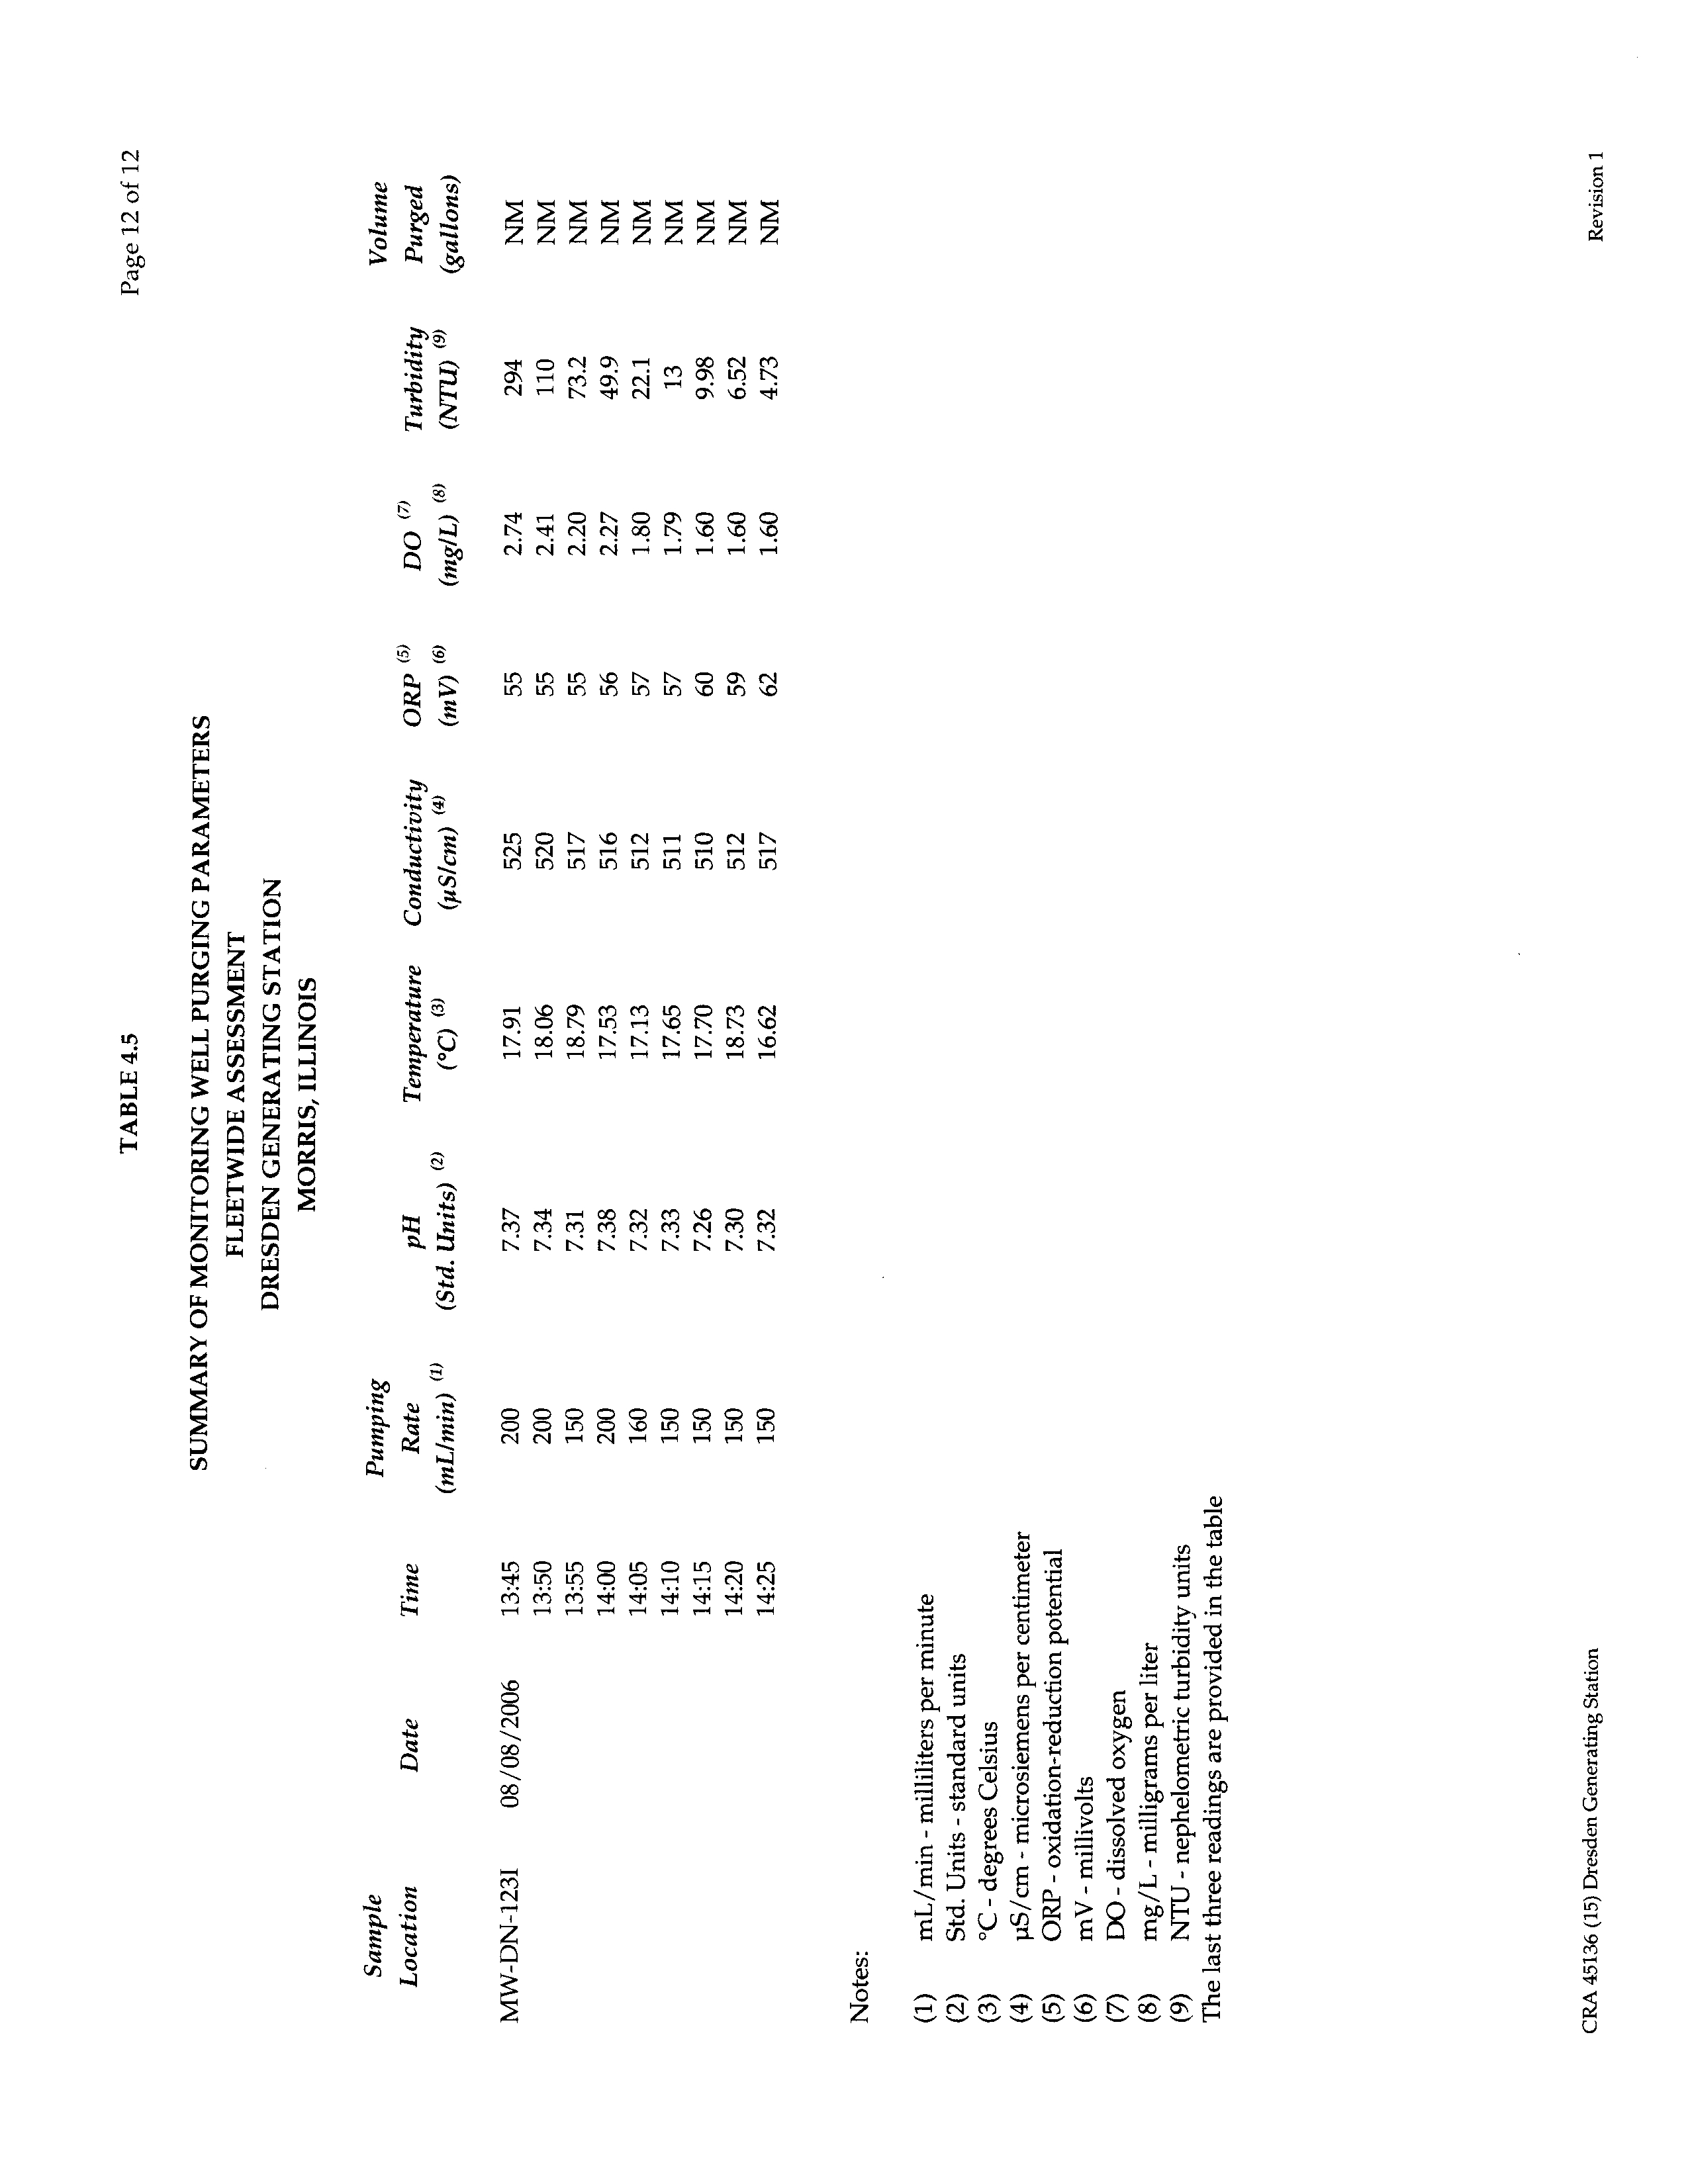
TABLE 4.5
SUMMARY OF MONITORING WELL PURGING PARAMETERS
TABLE 4.6
SAMPLE KEY
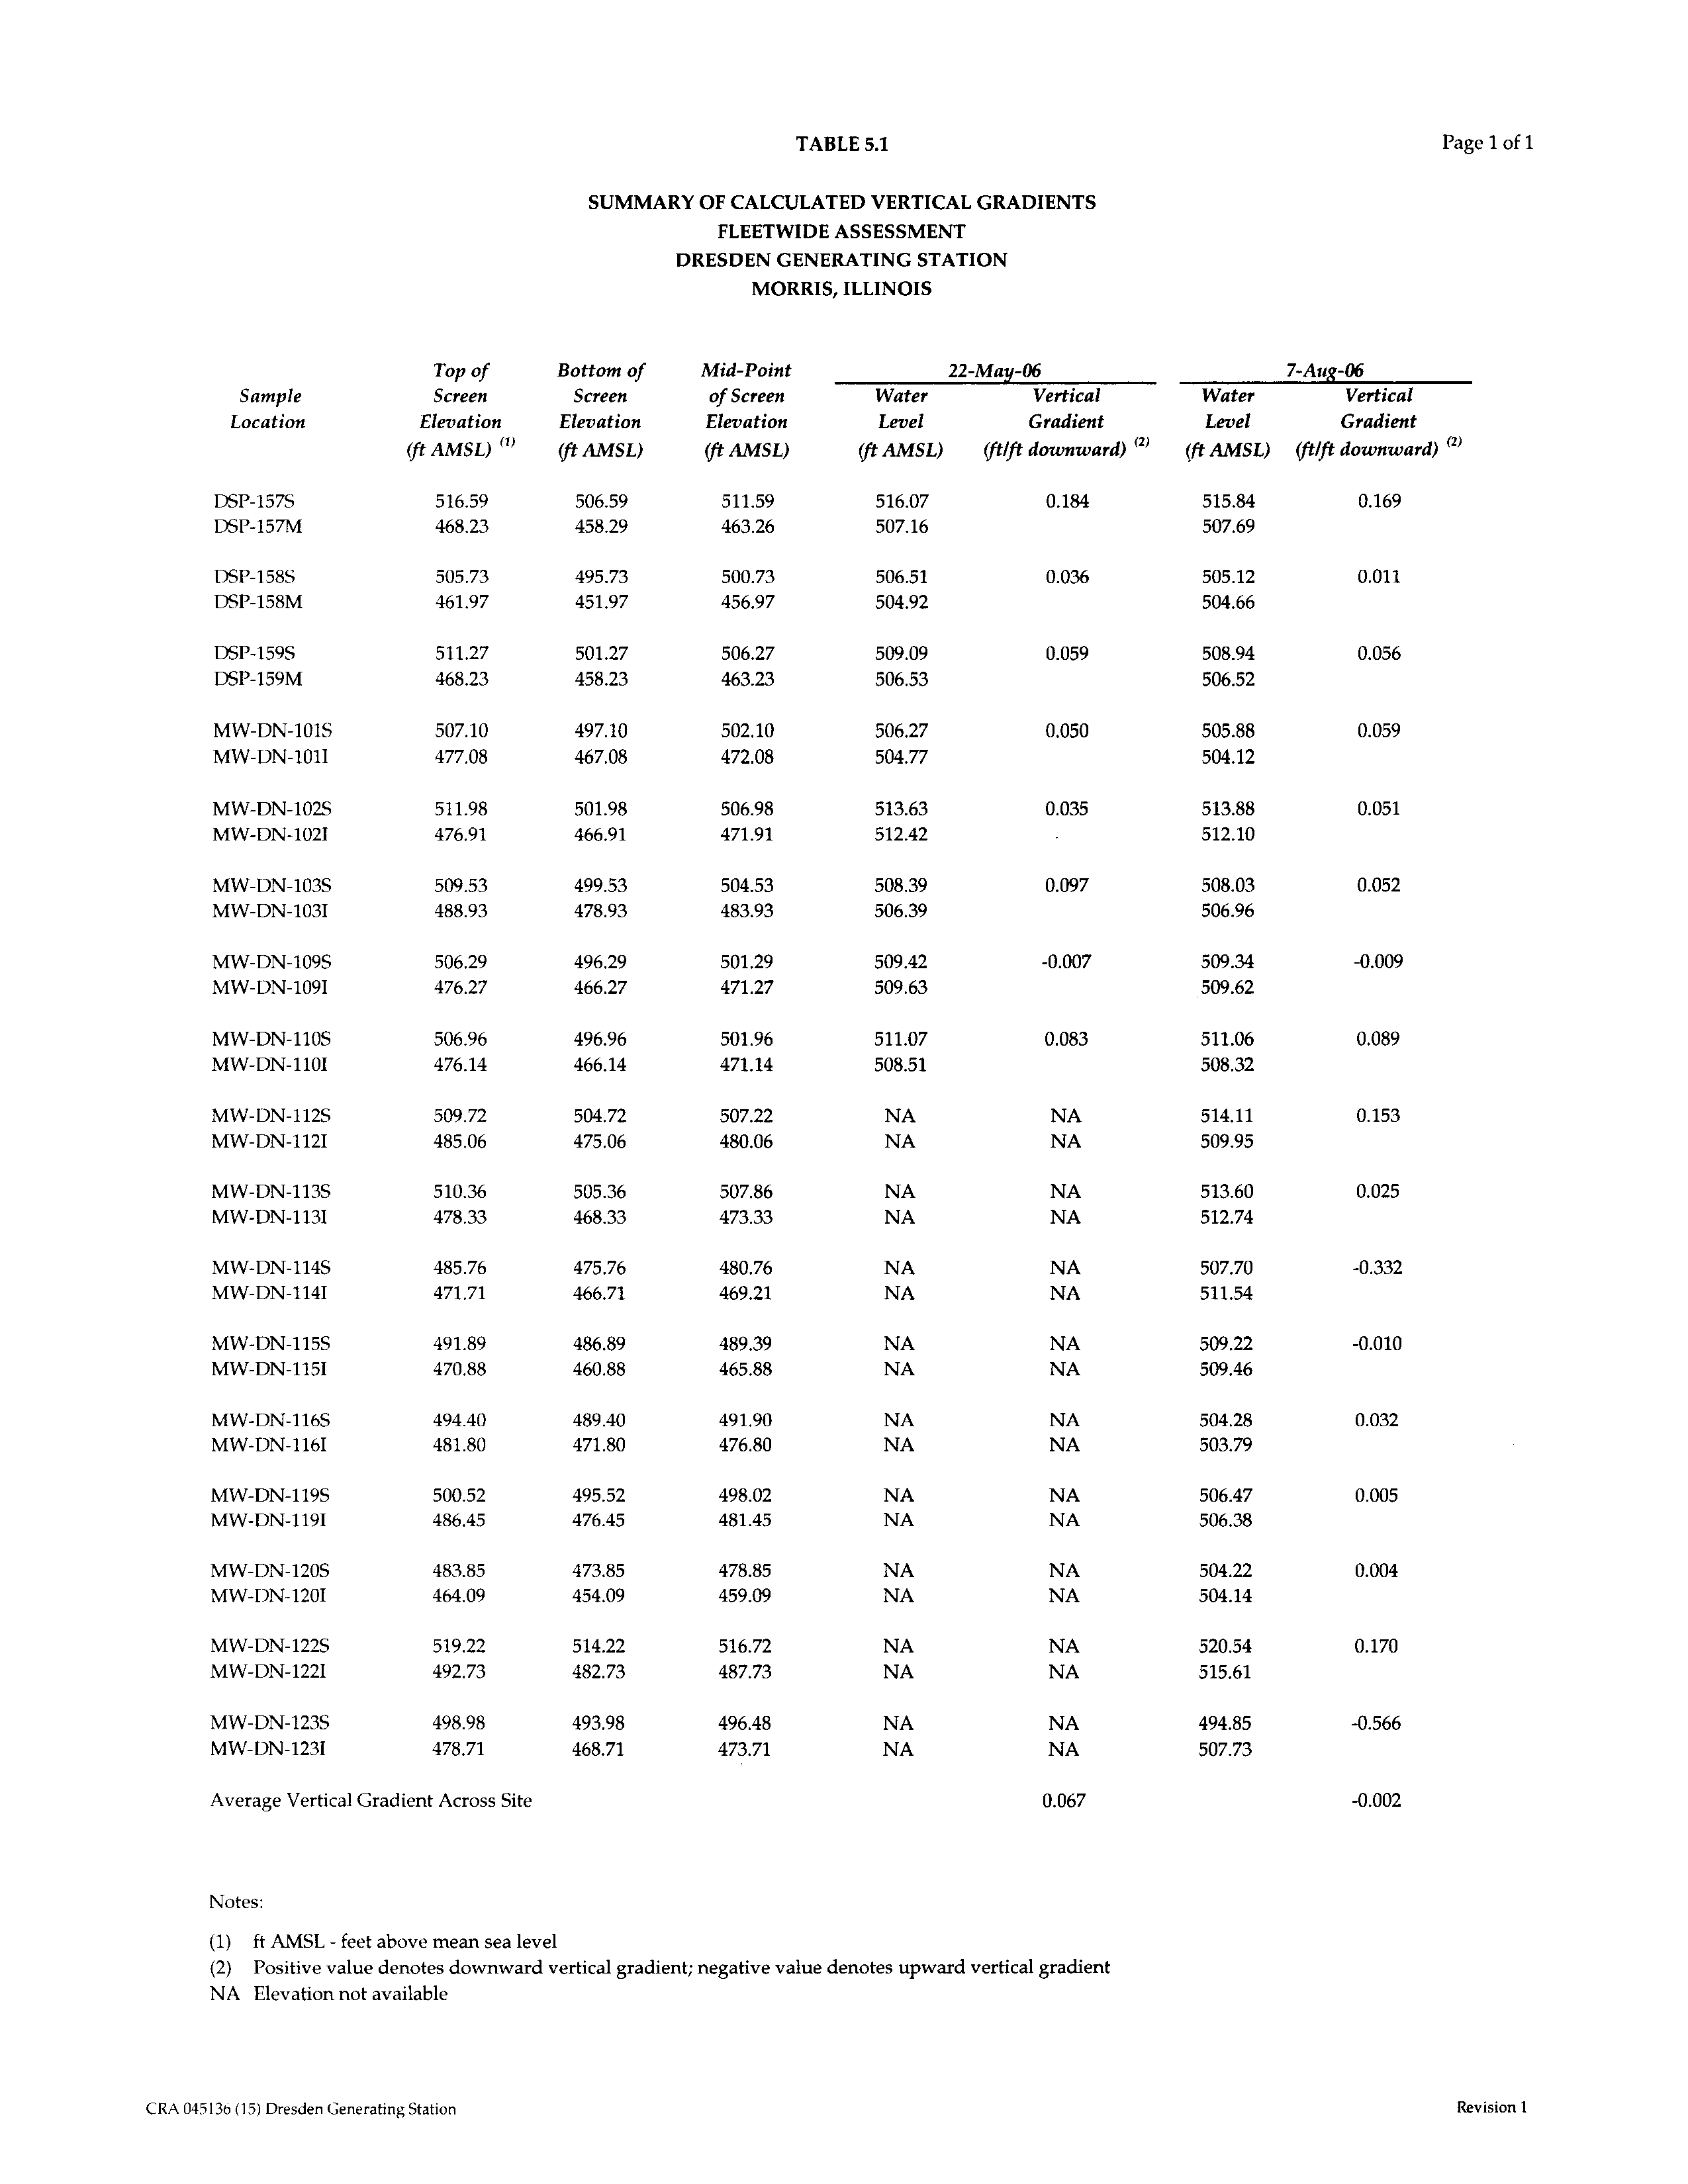
TABLE 5.1
SUMMARY OF CALCULATED VERTICAL GRADIENTS
TABLE 5.2
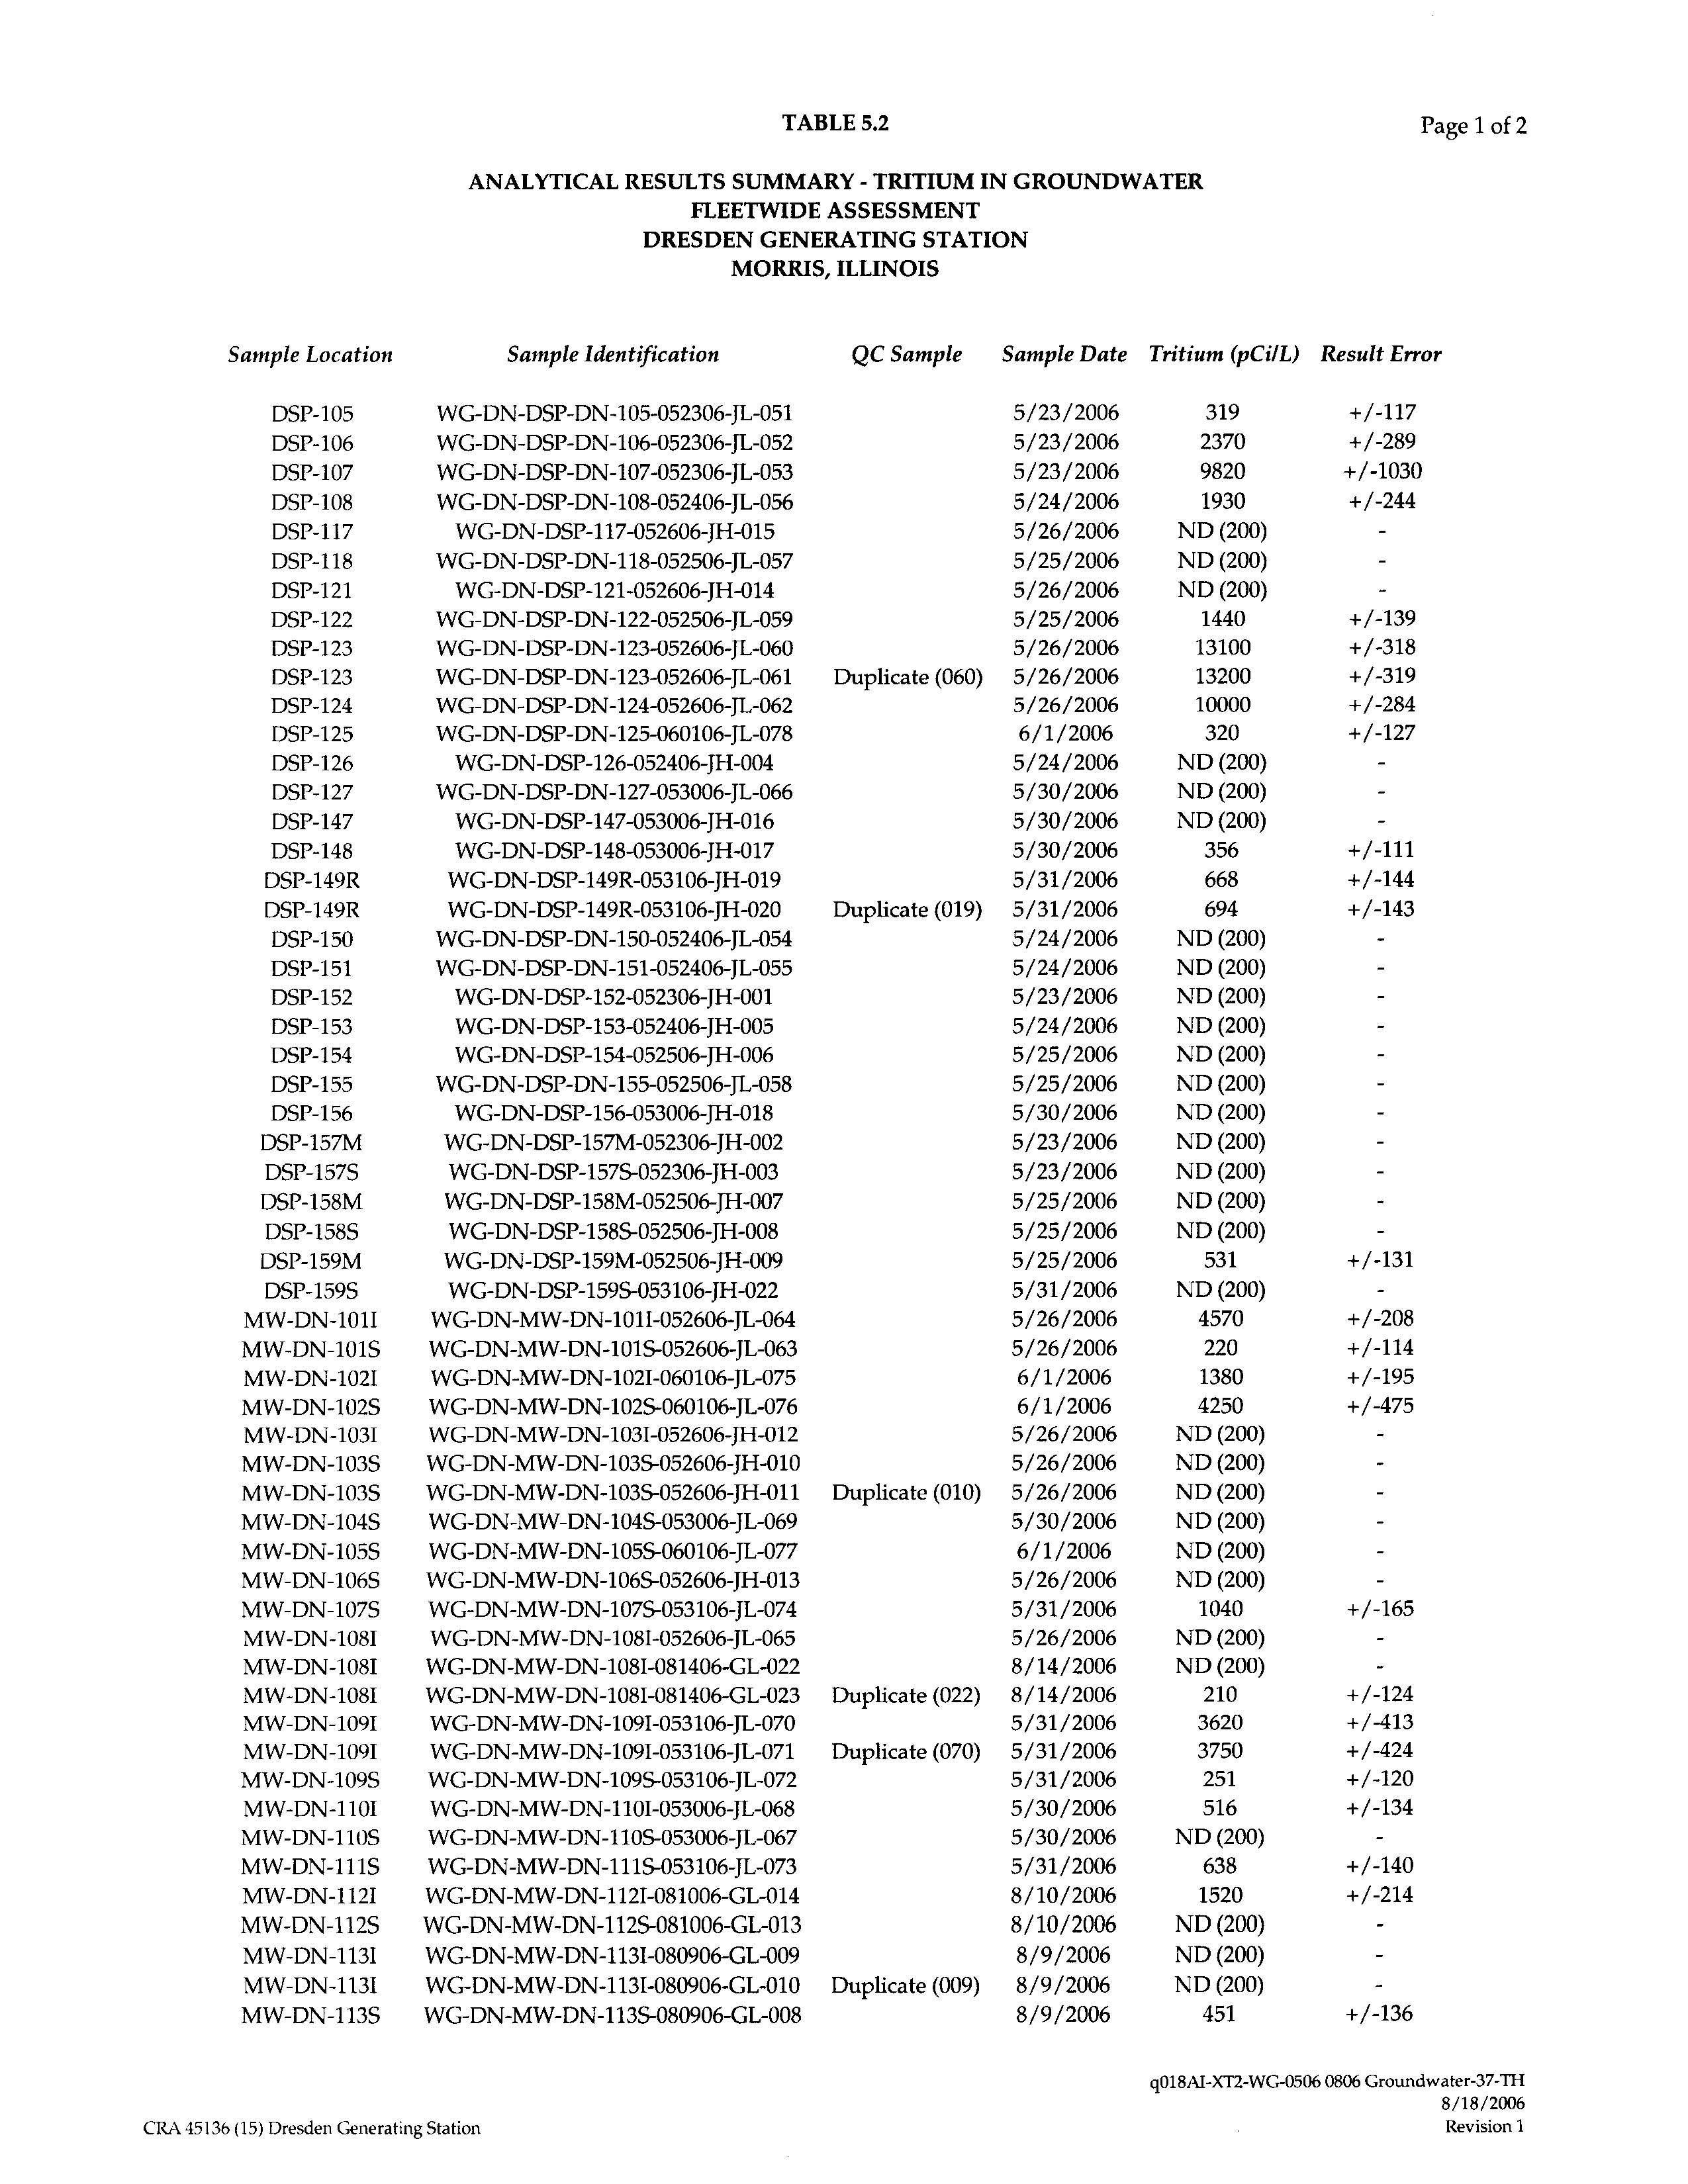
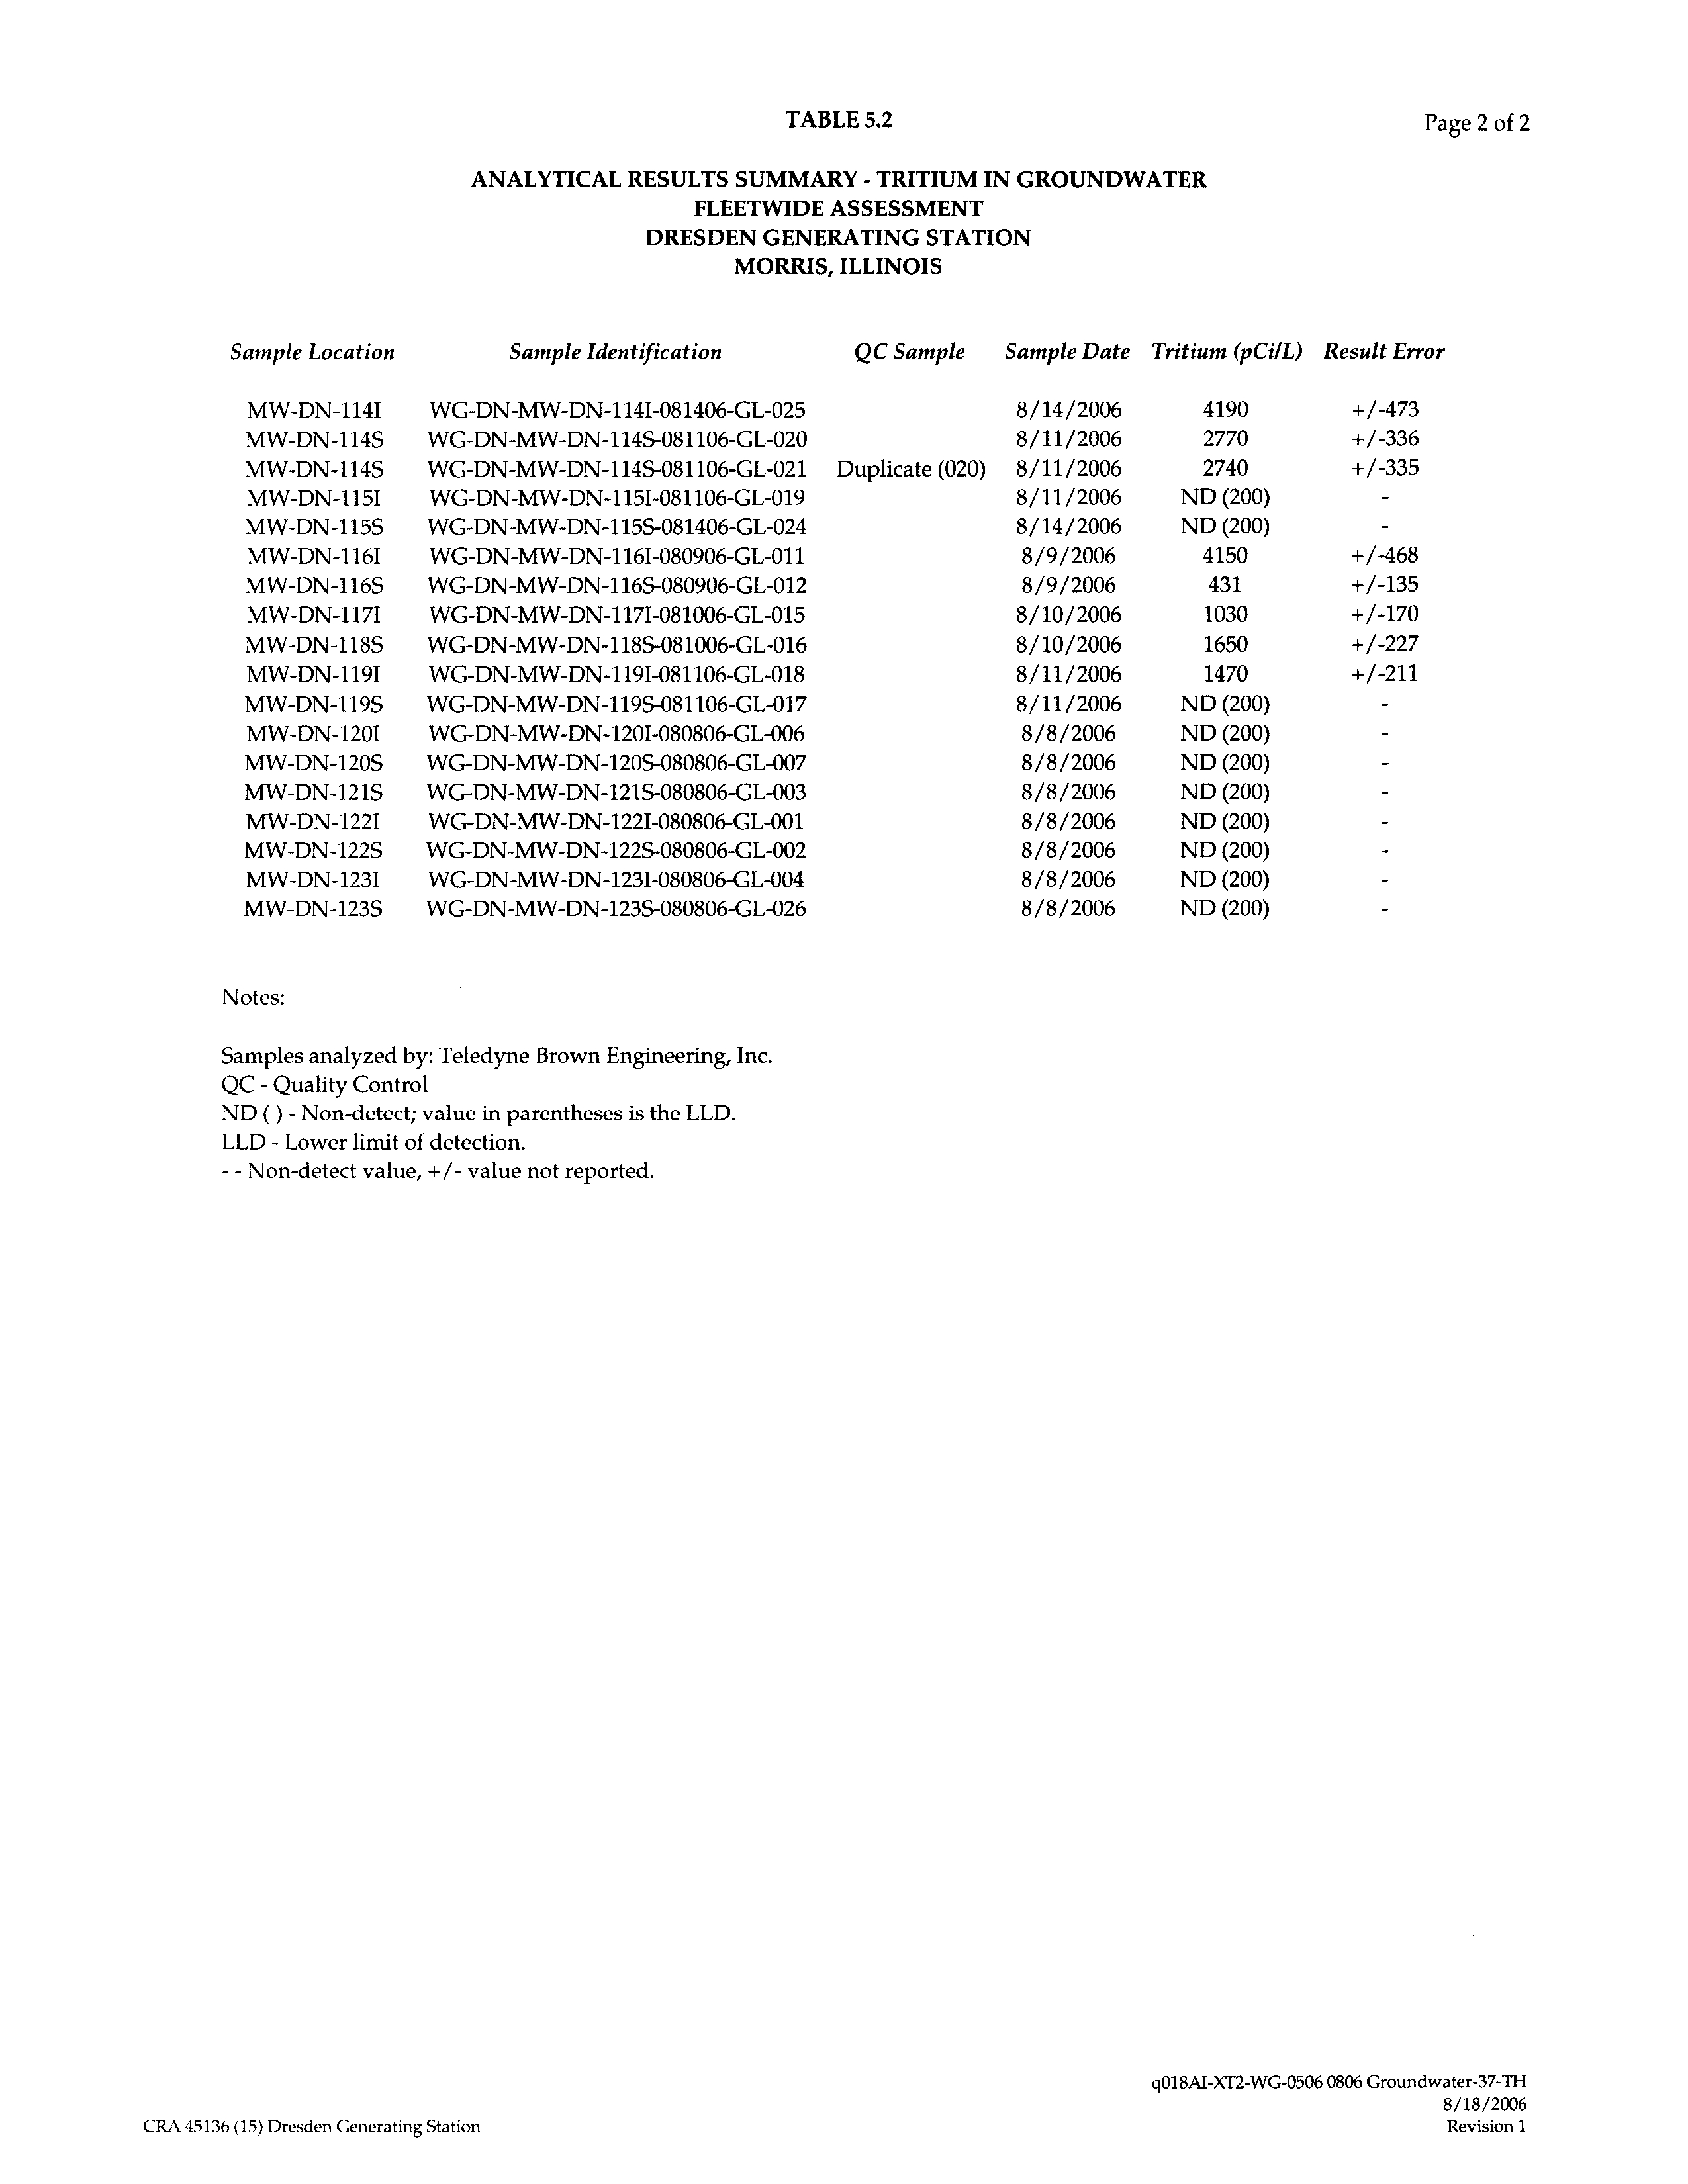
ANALYTICAL RESULTS SUMMARY - TRITIUM IN GROUNDWATER
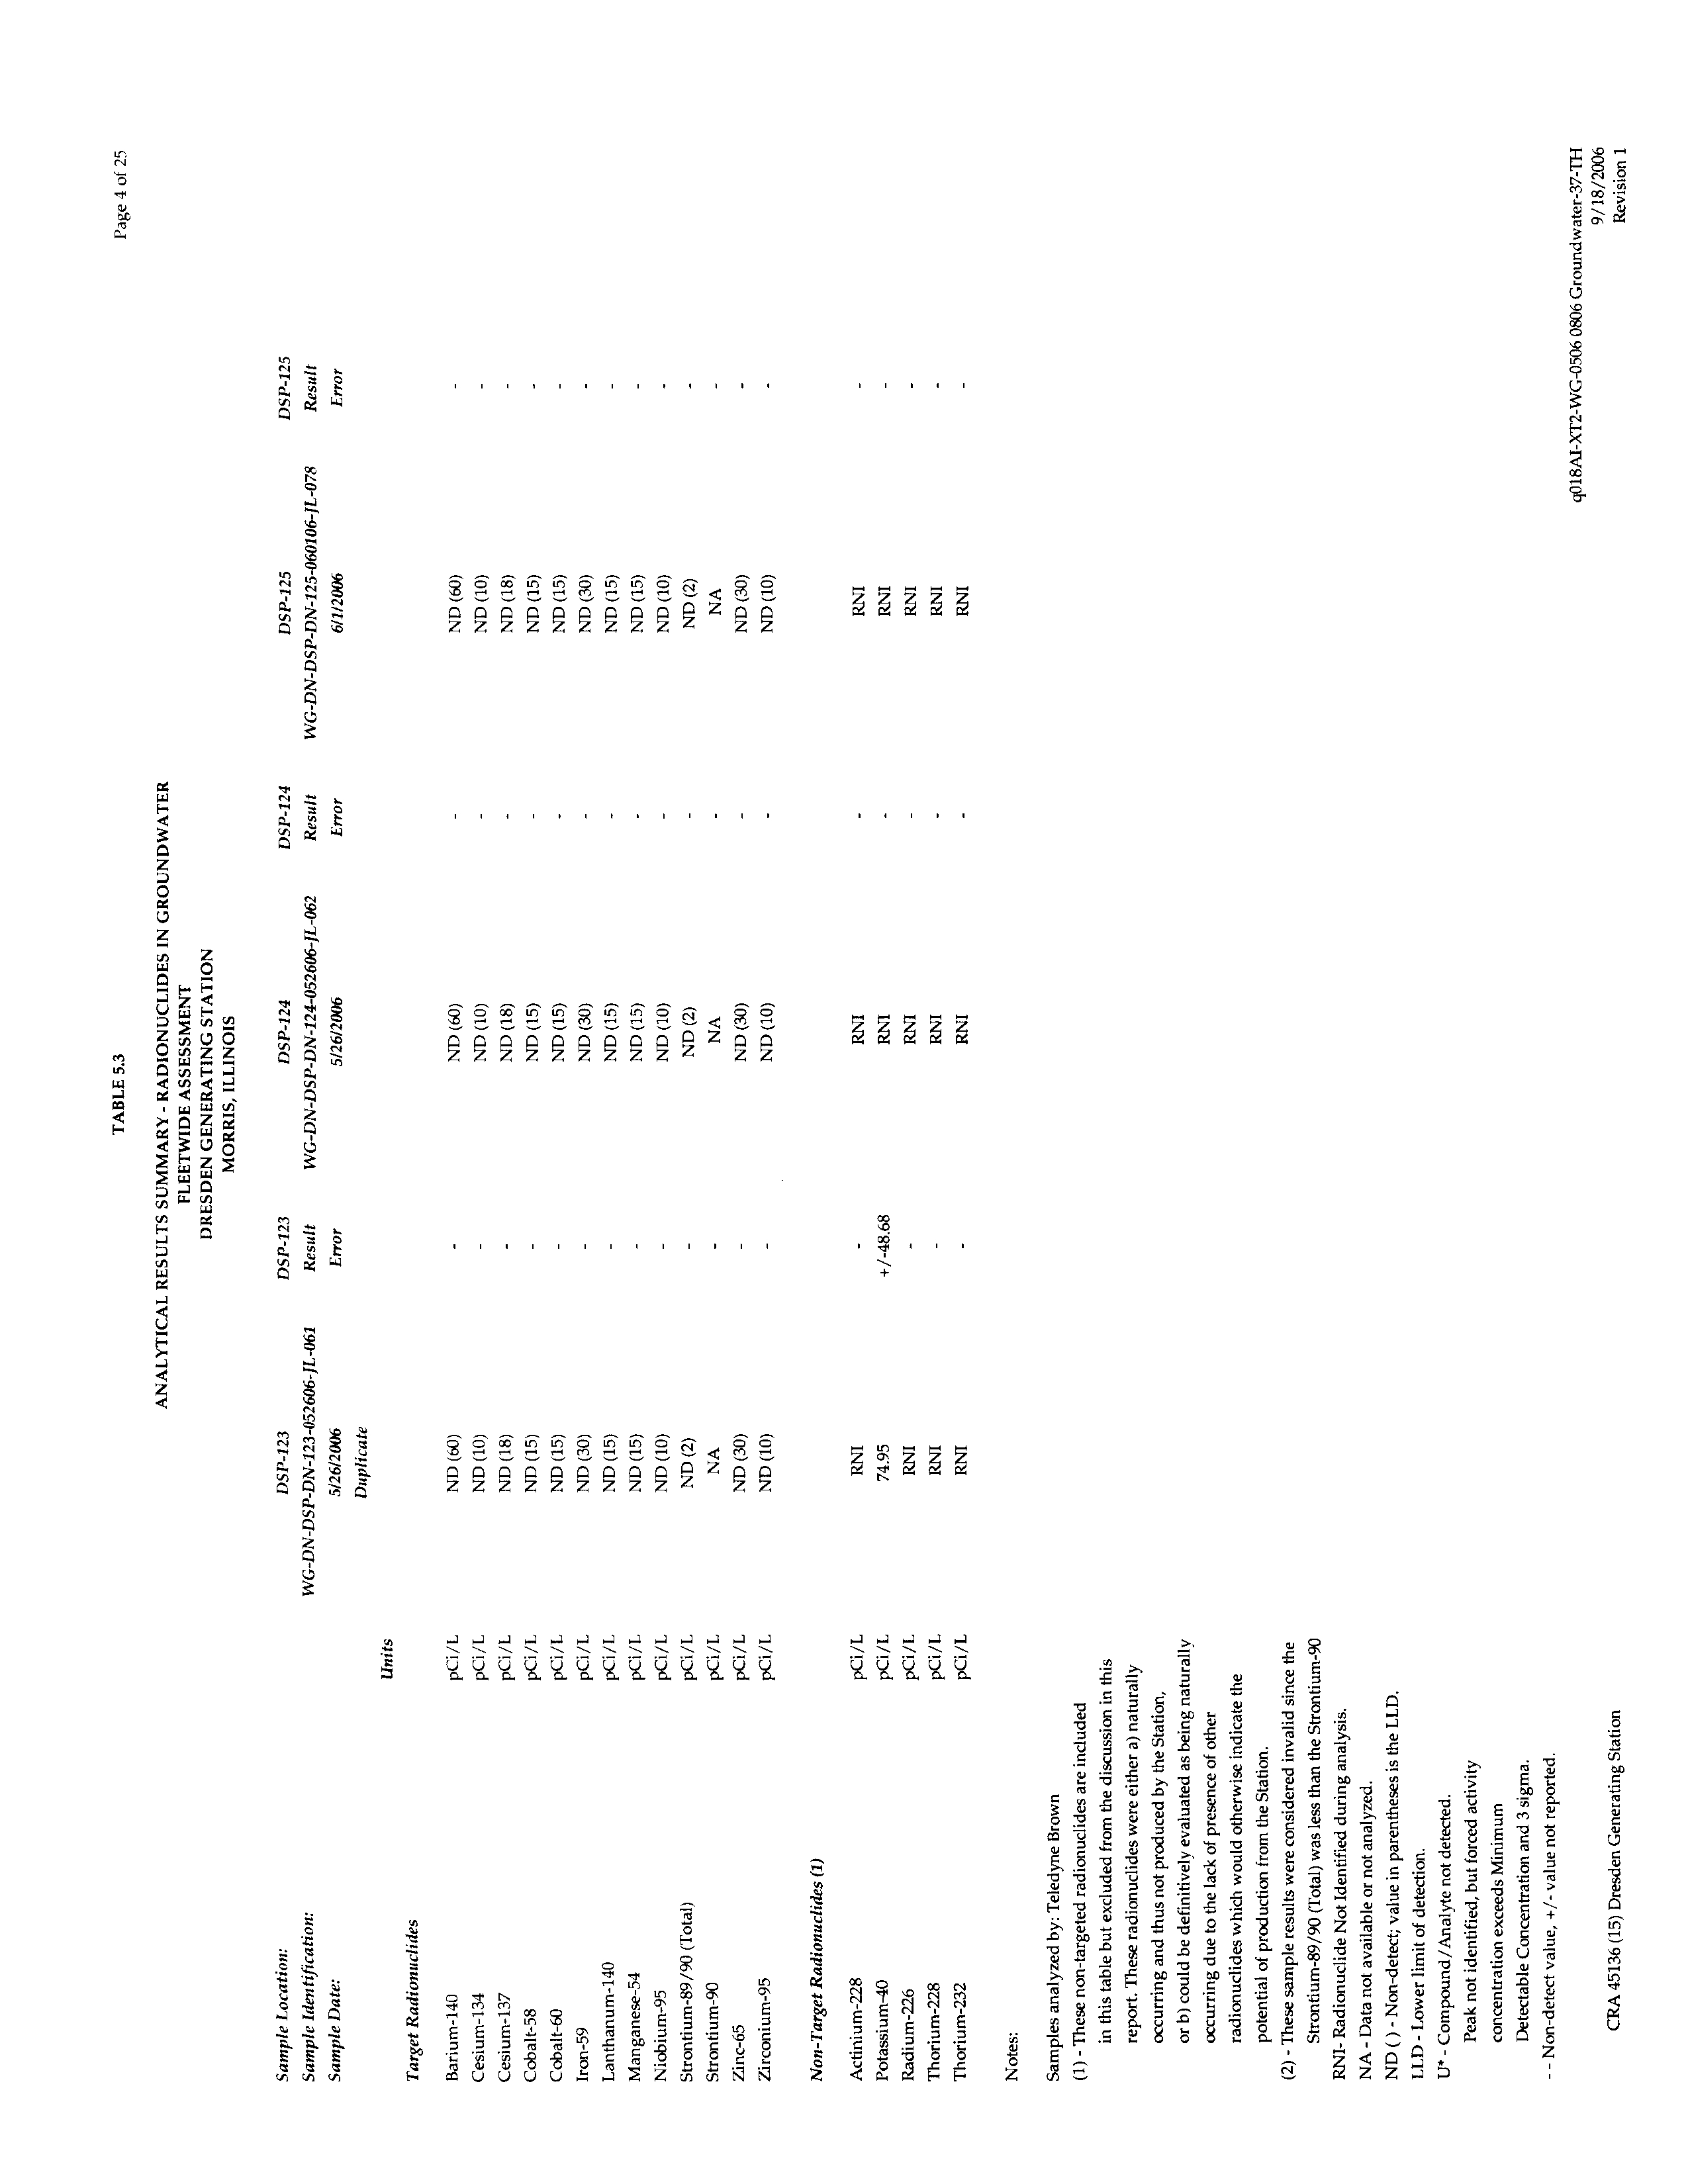
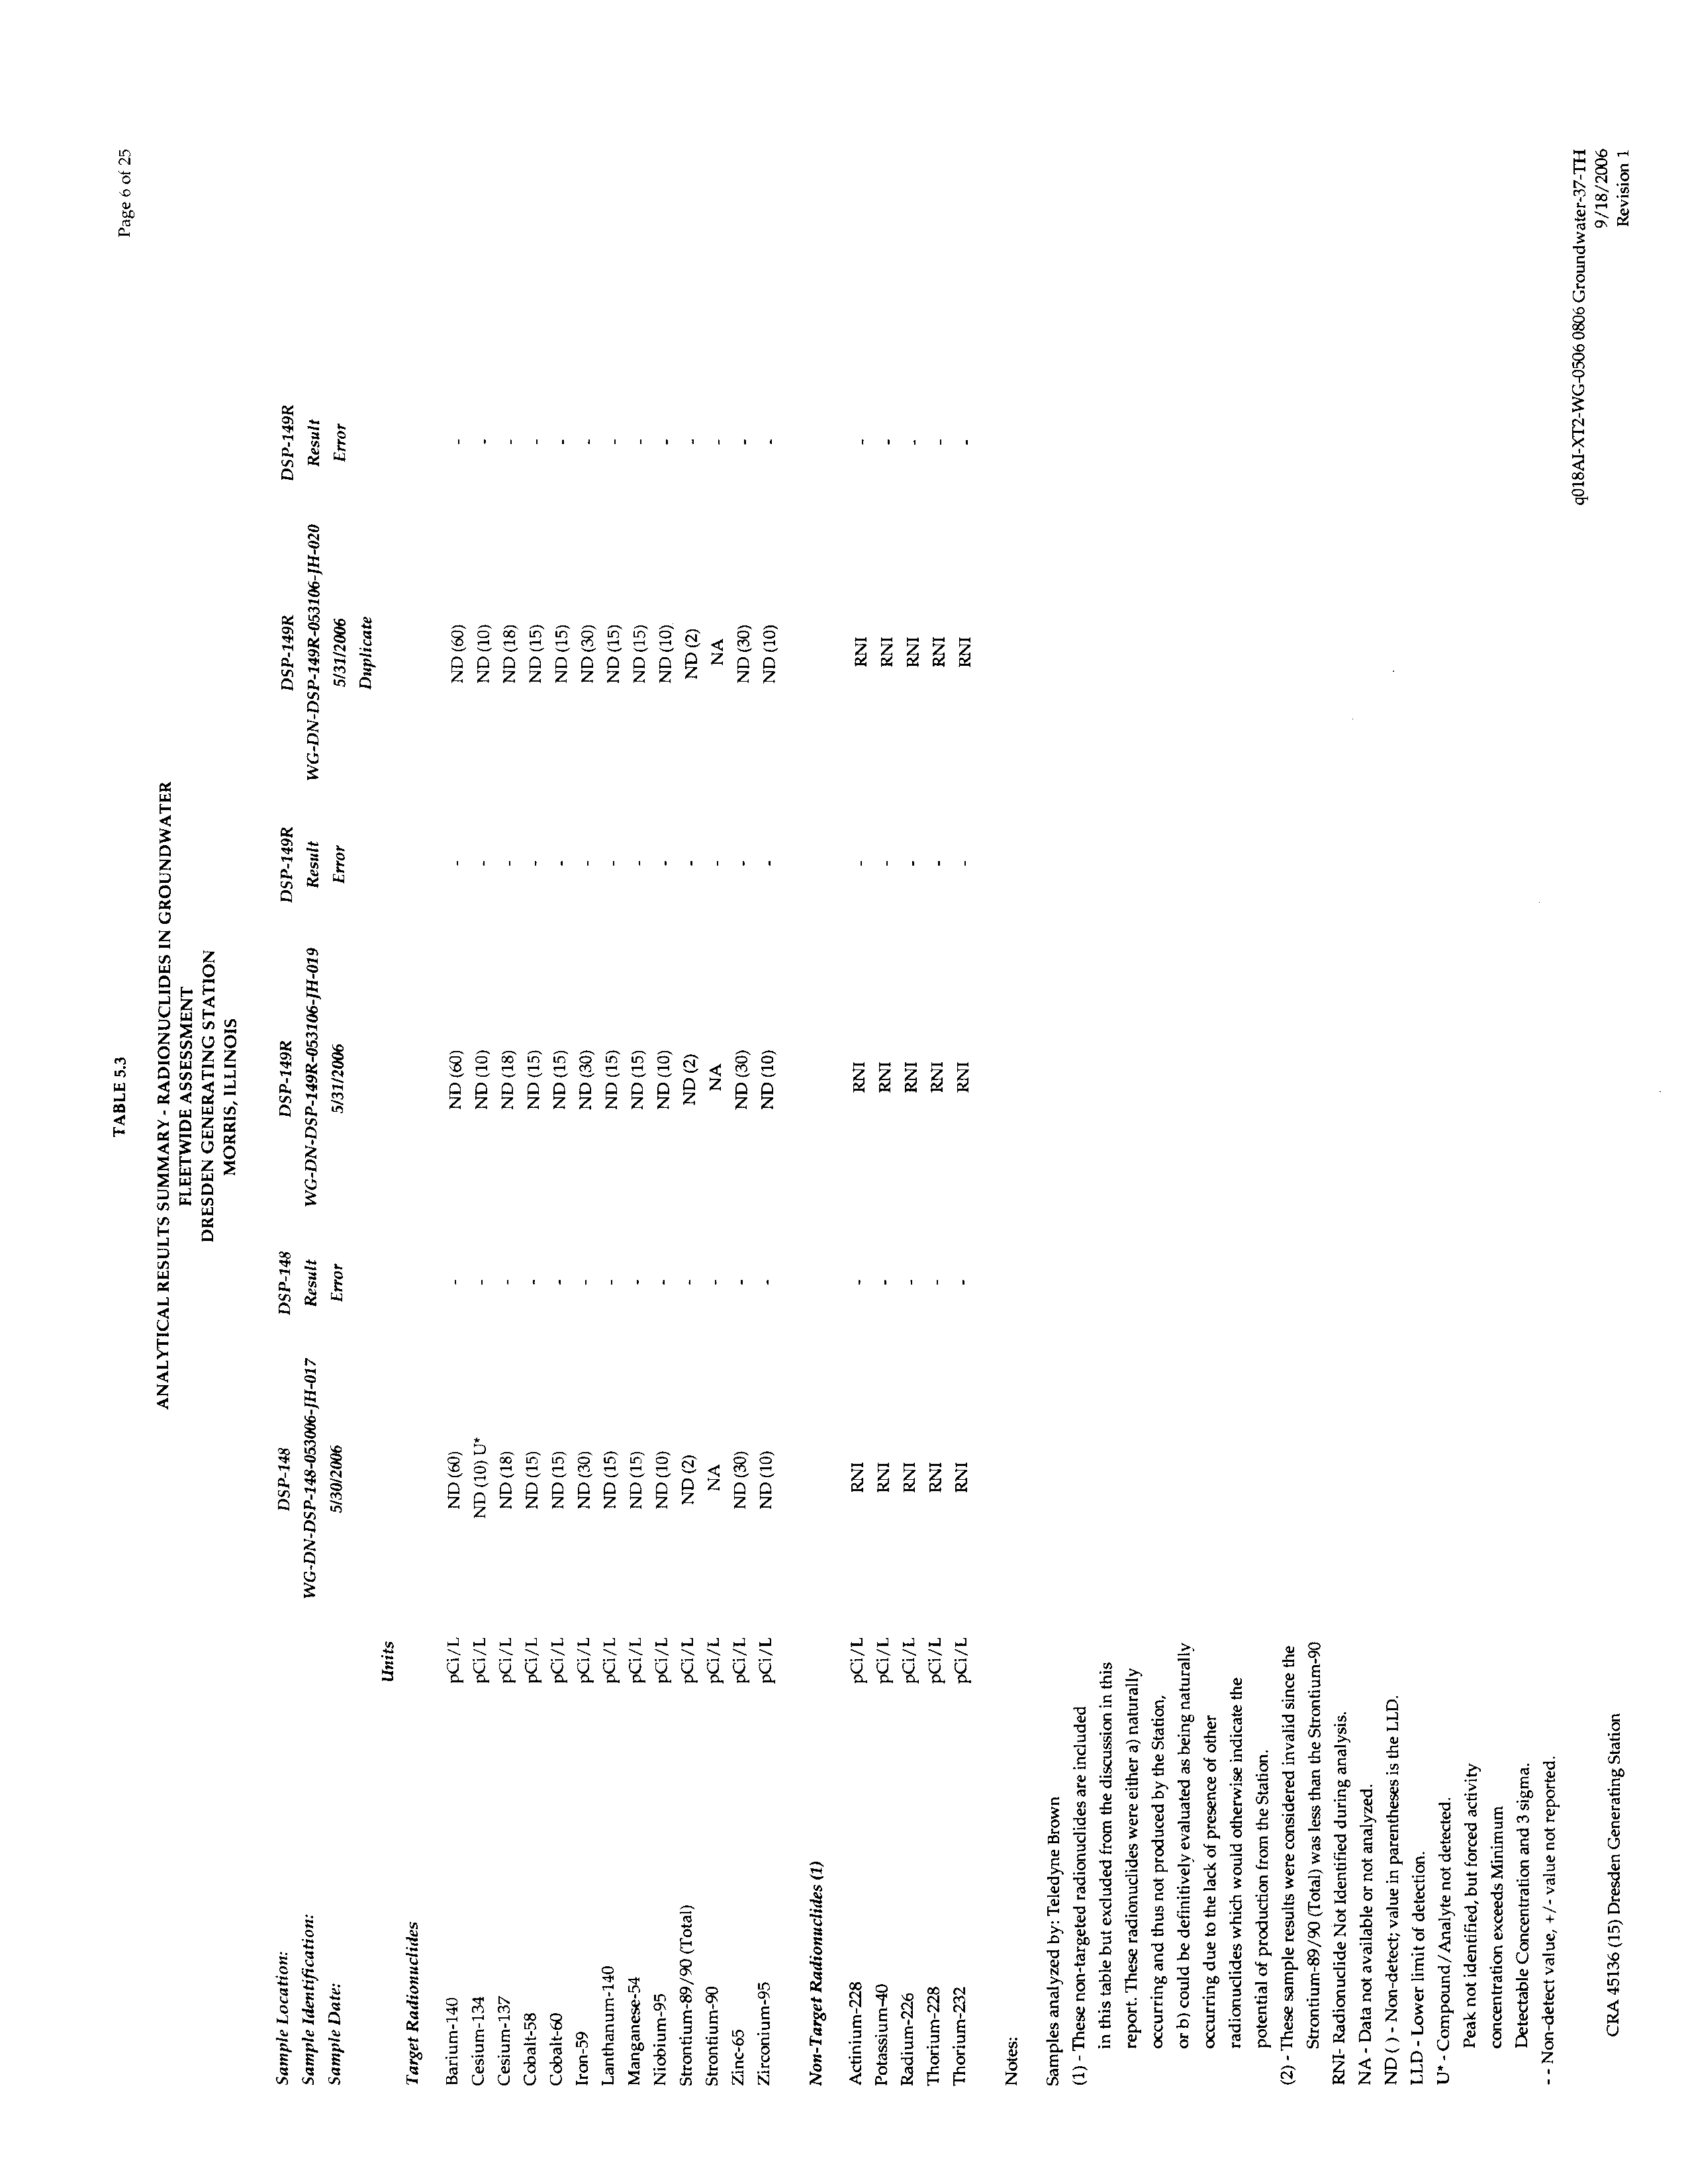
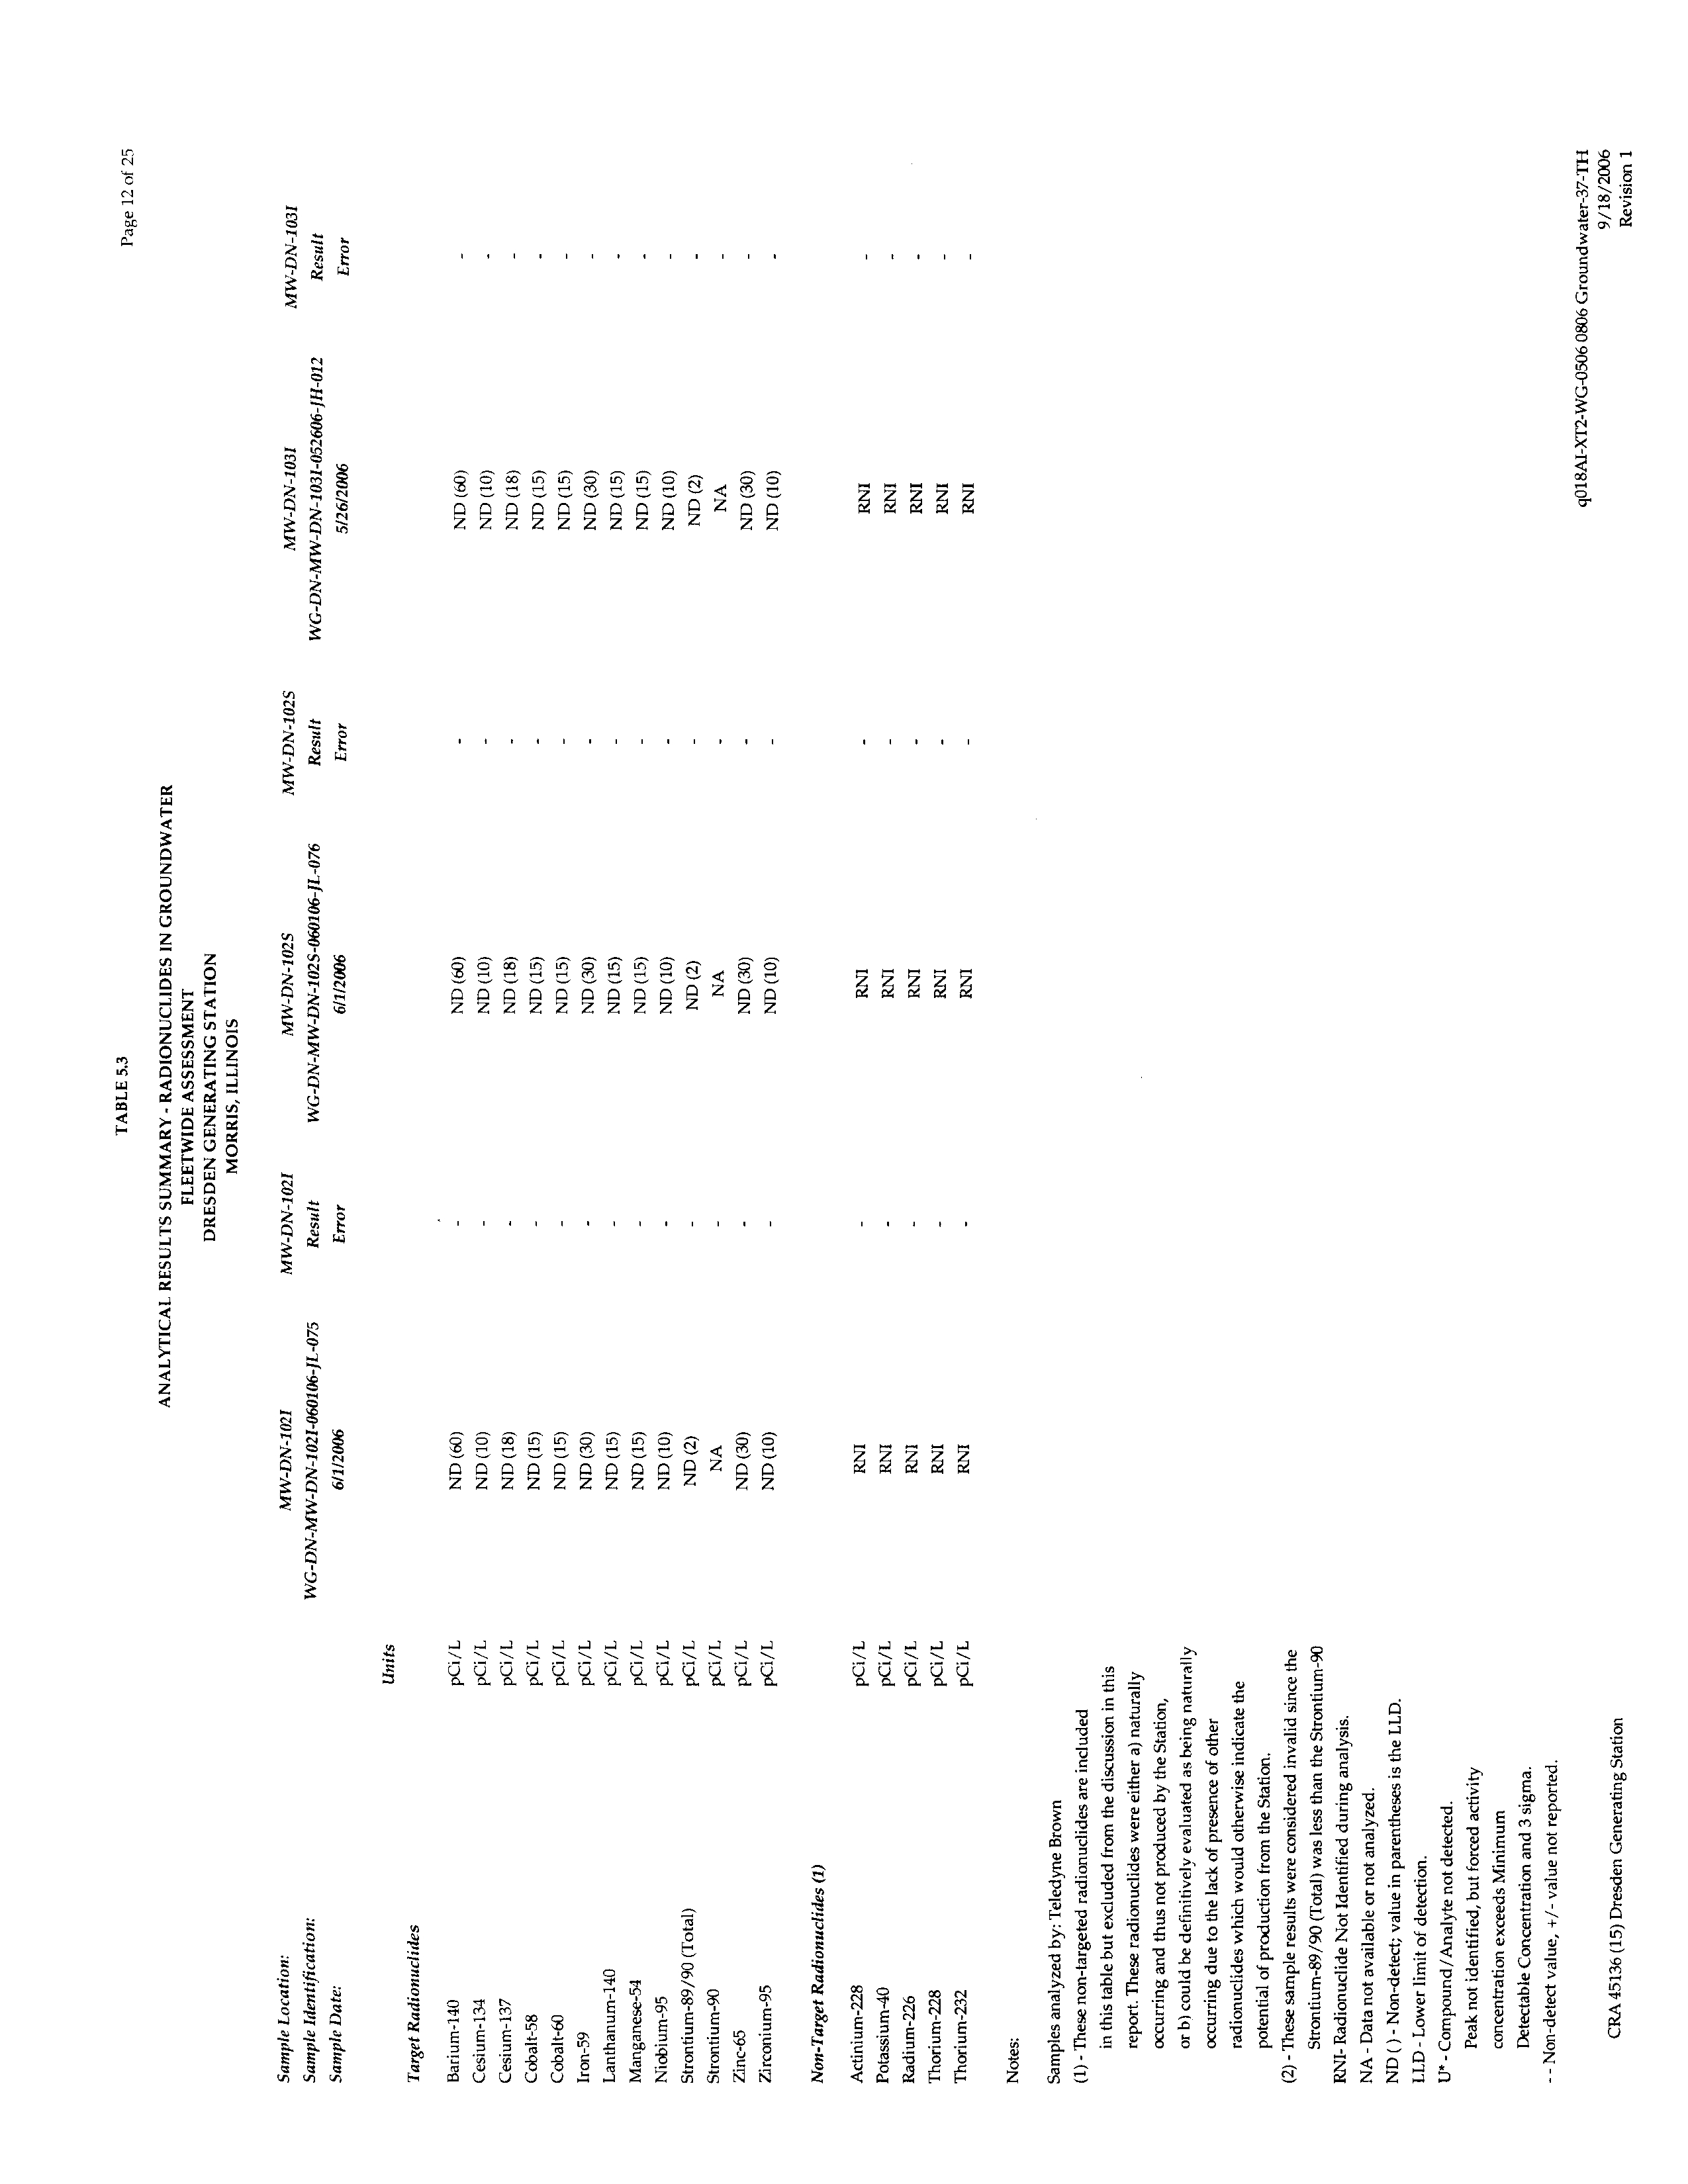
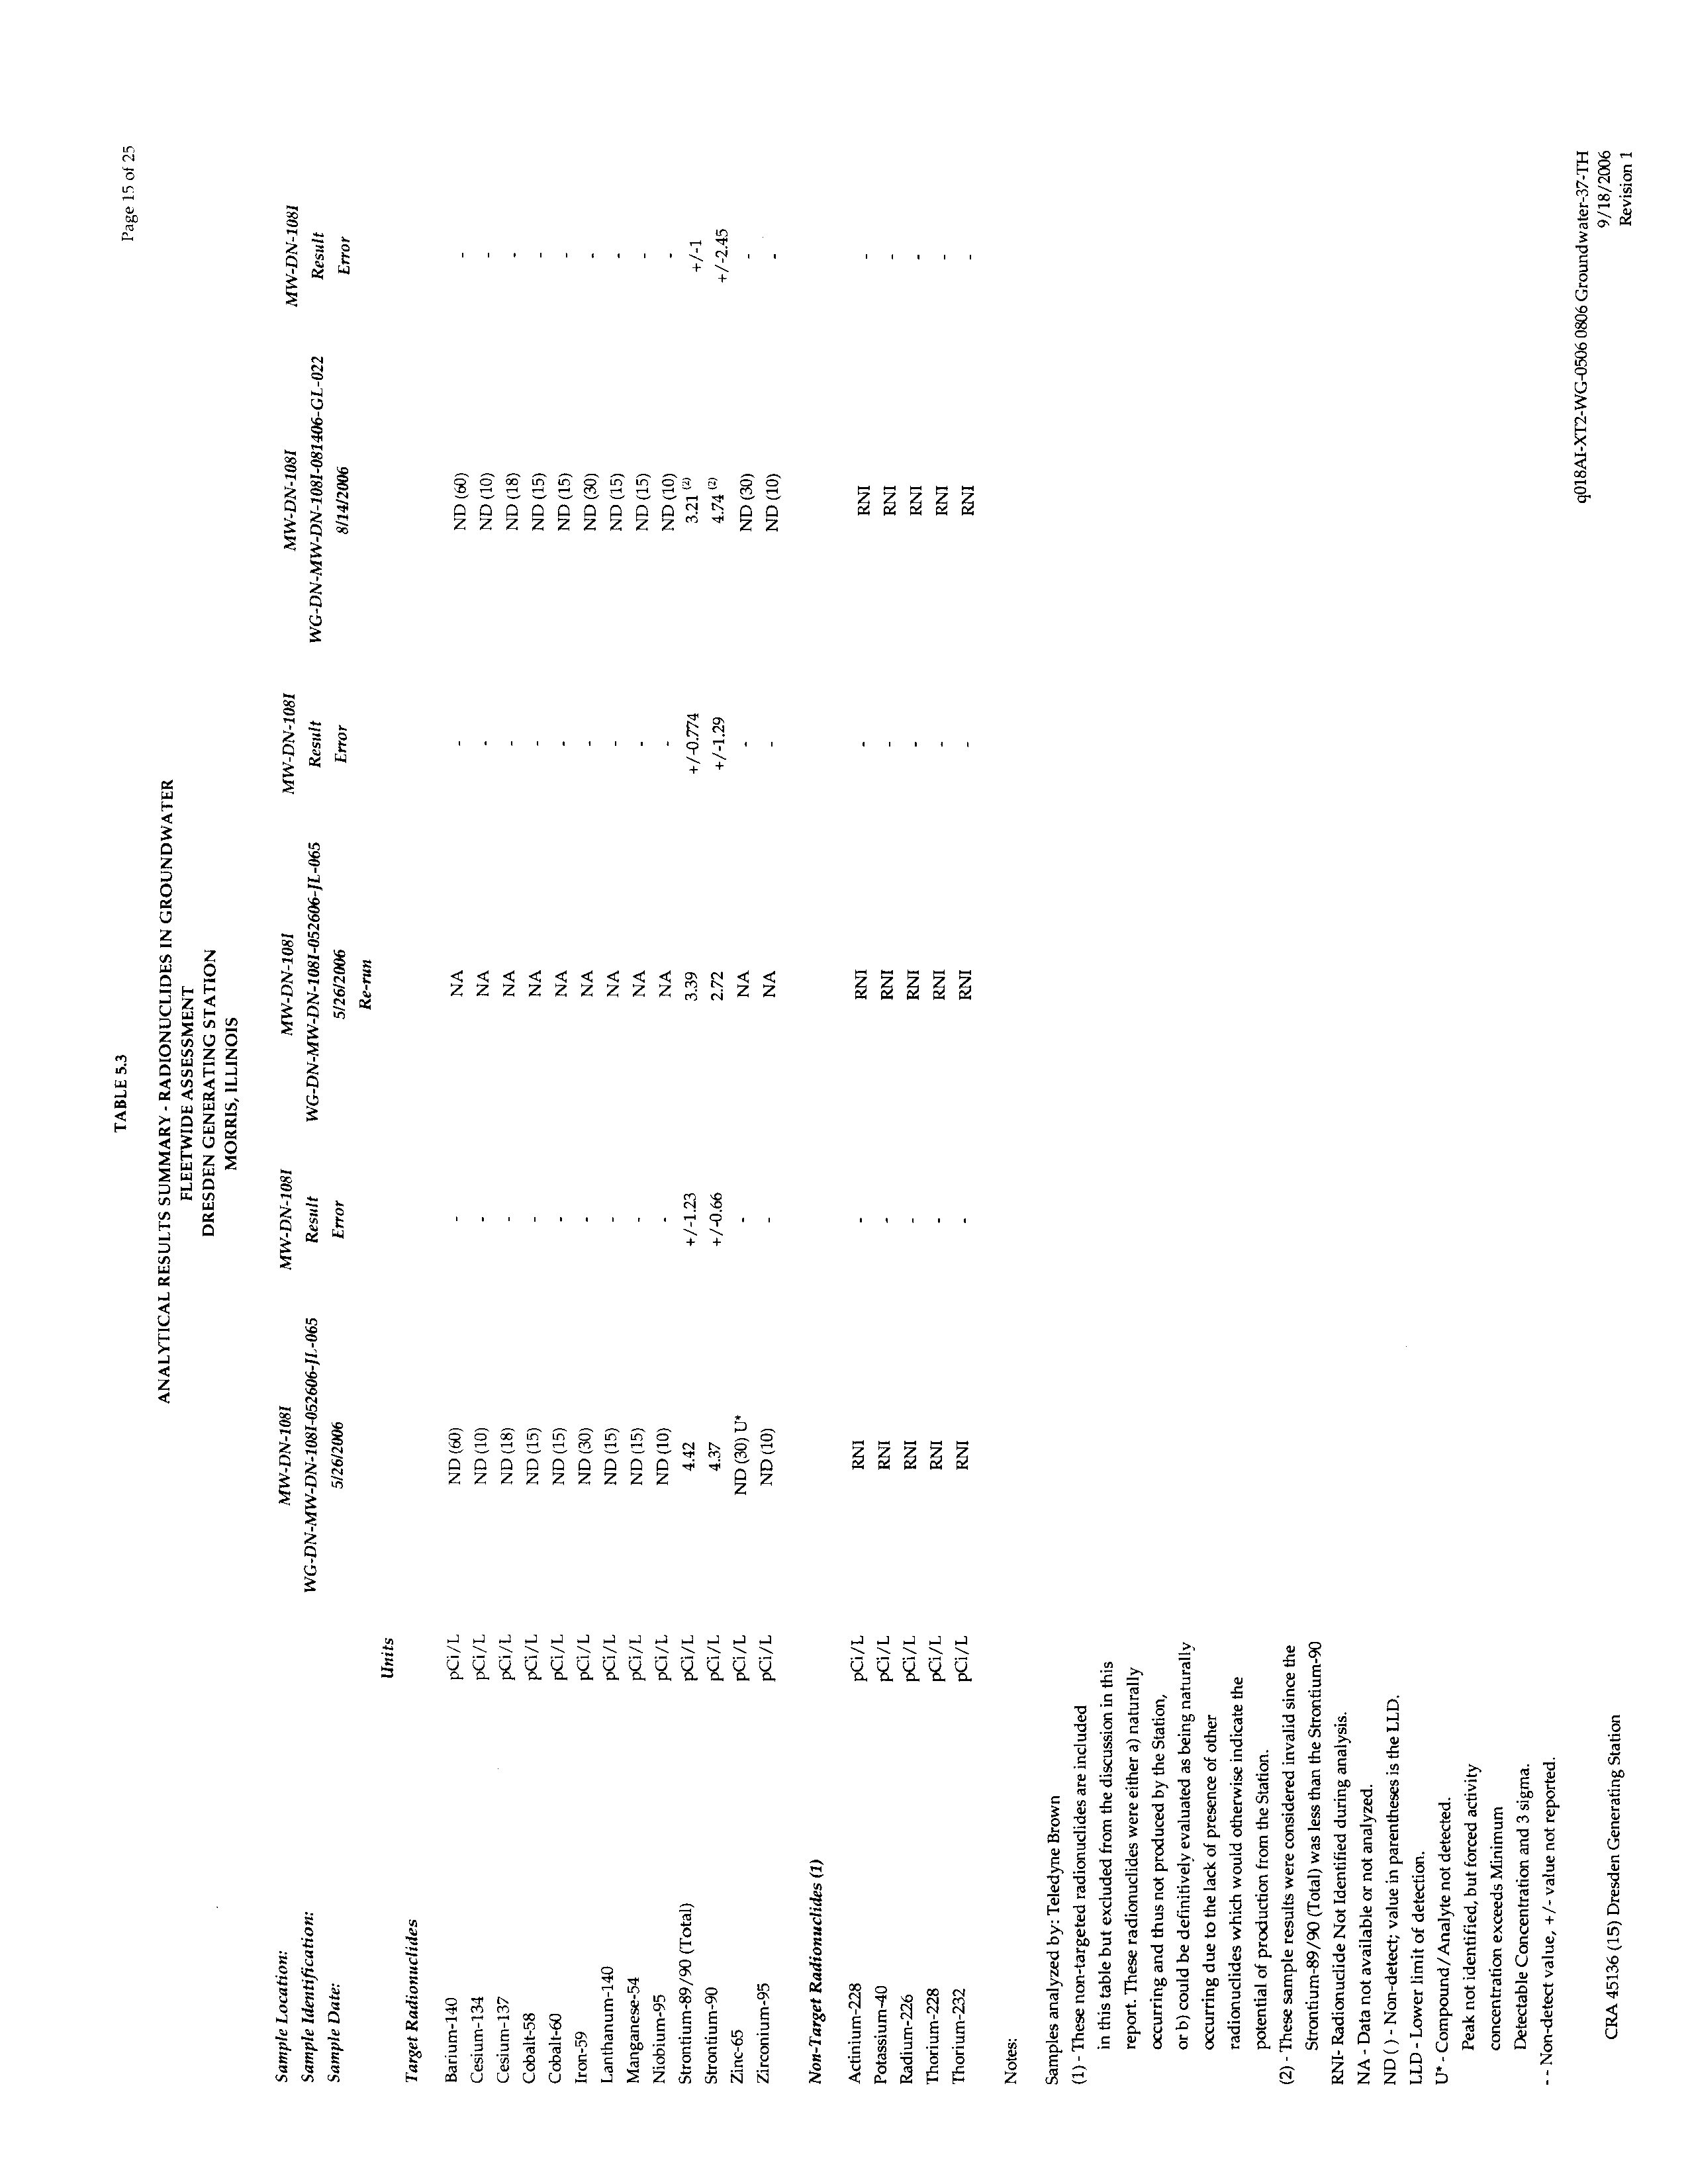
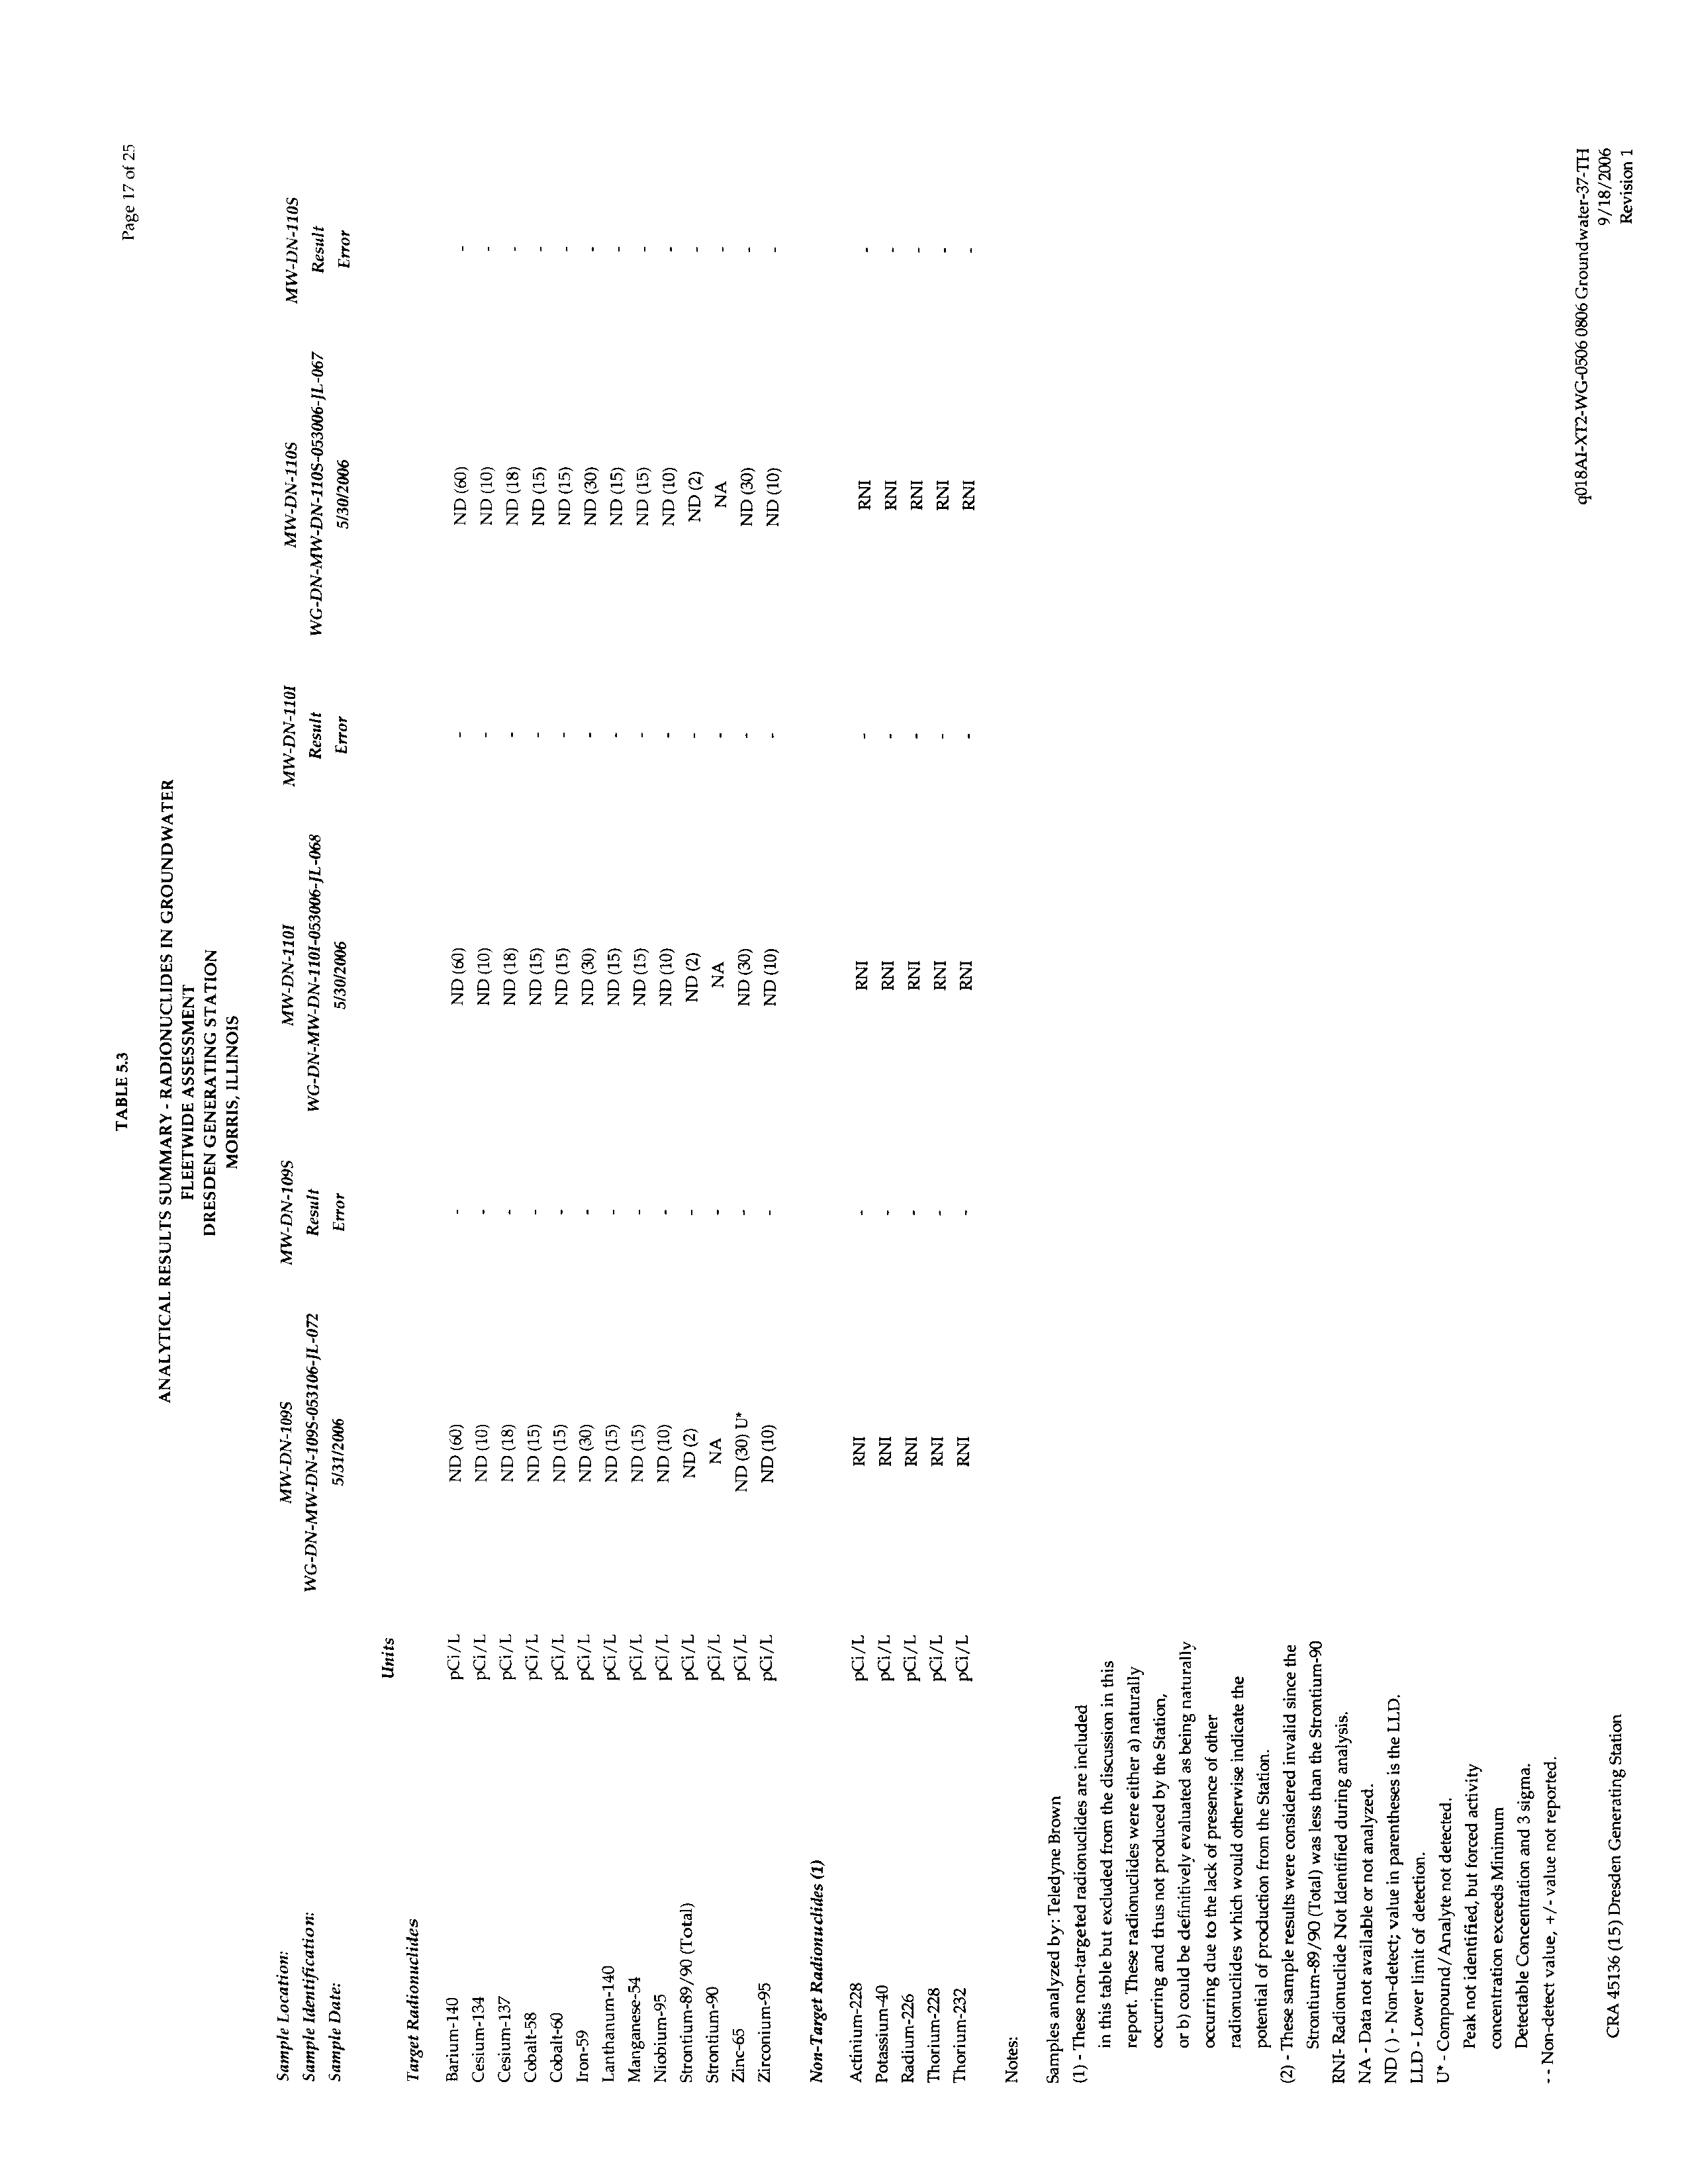
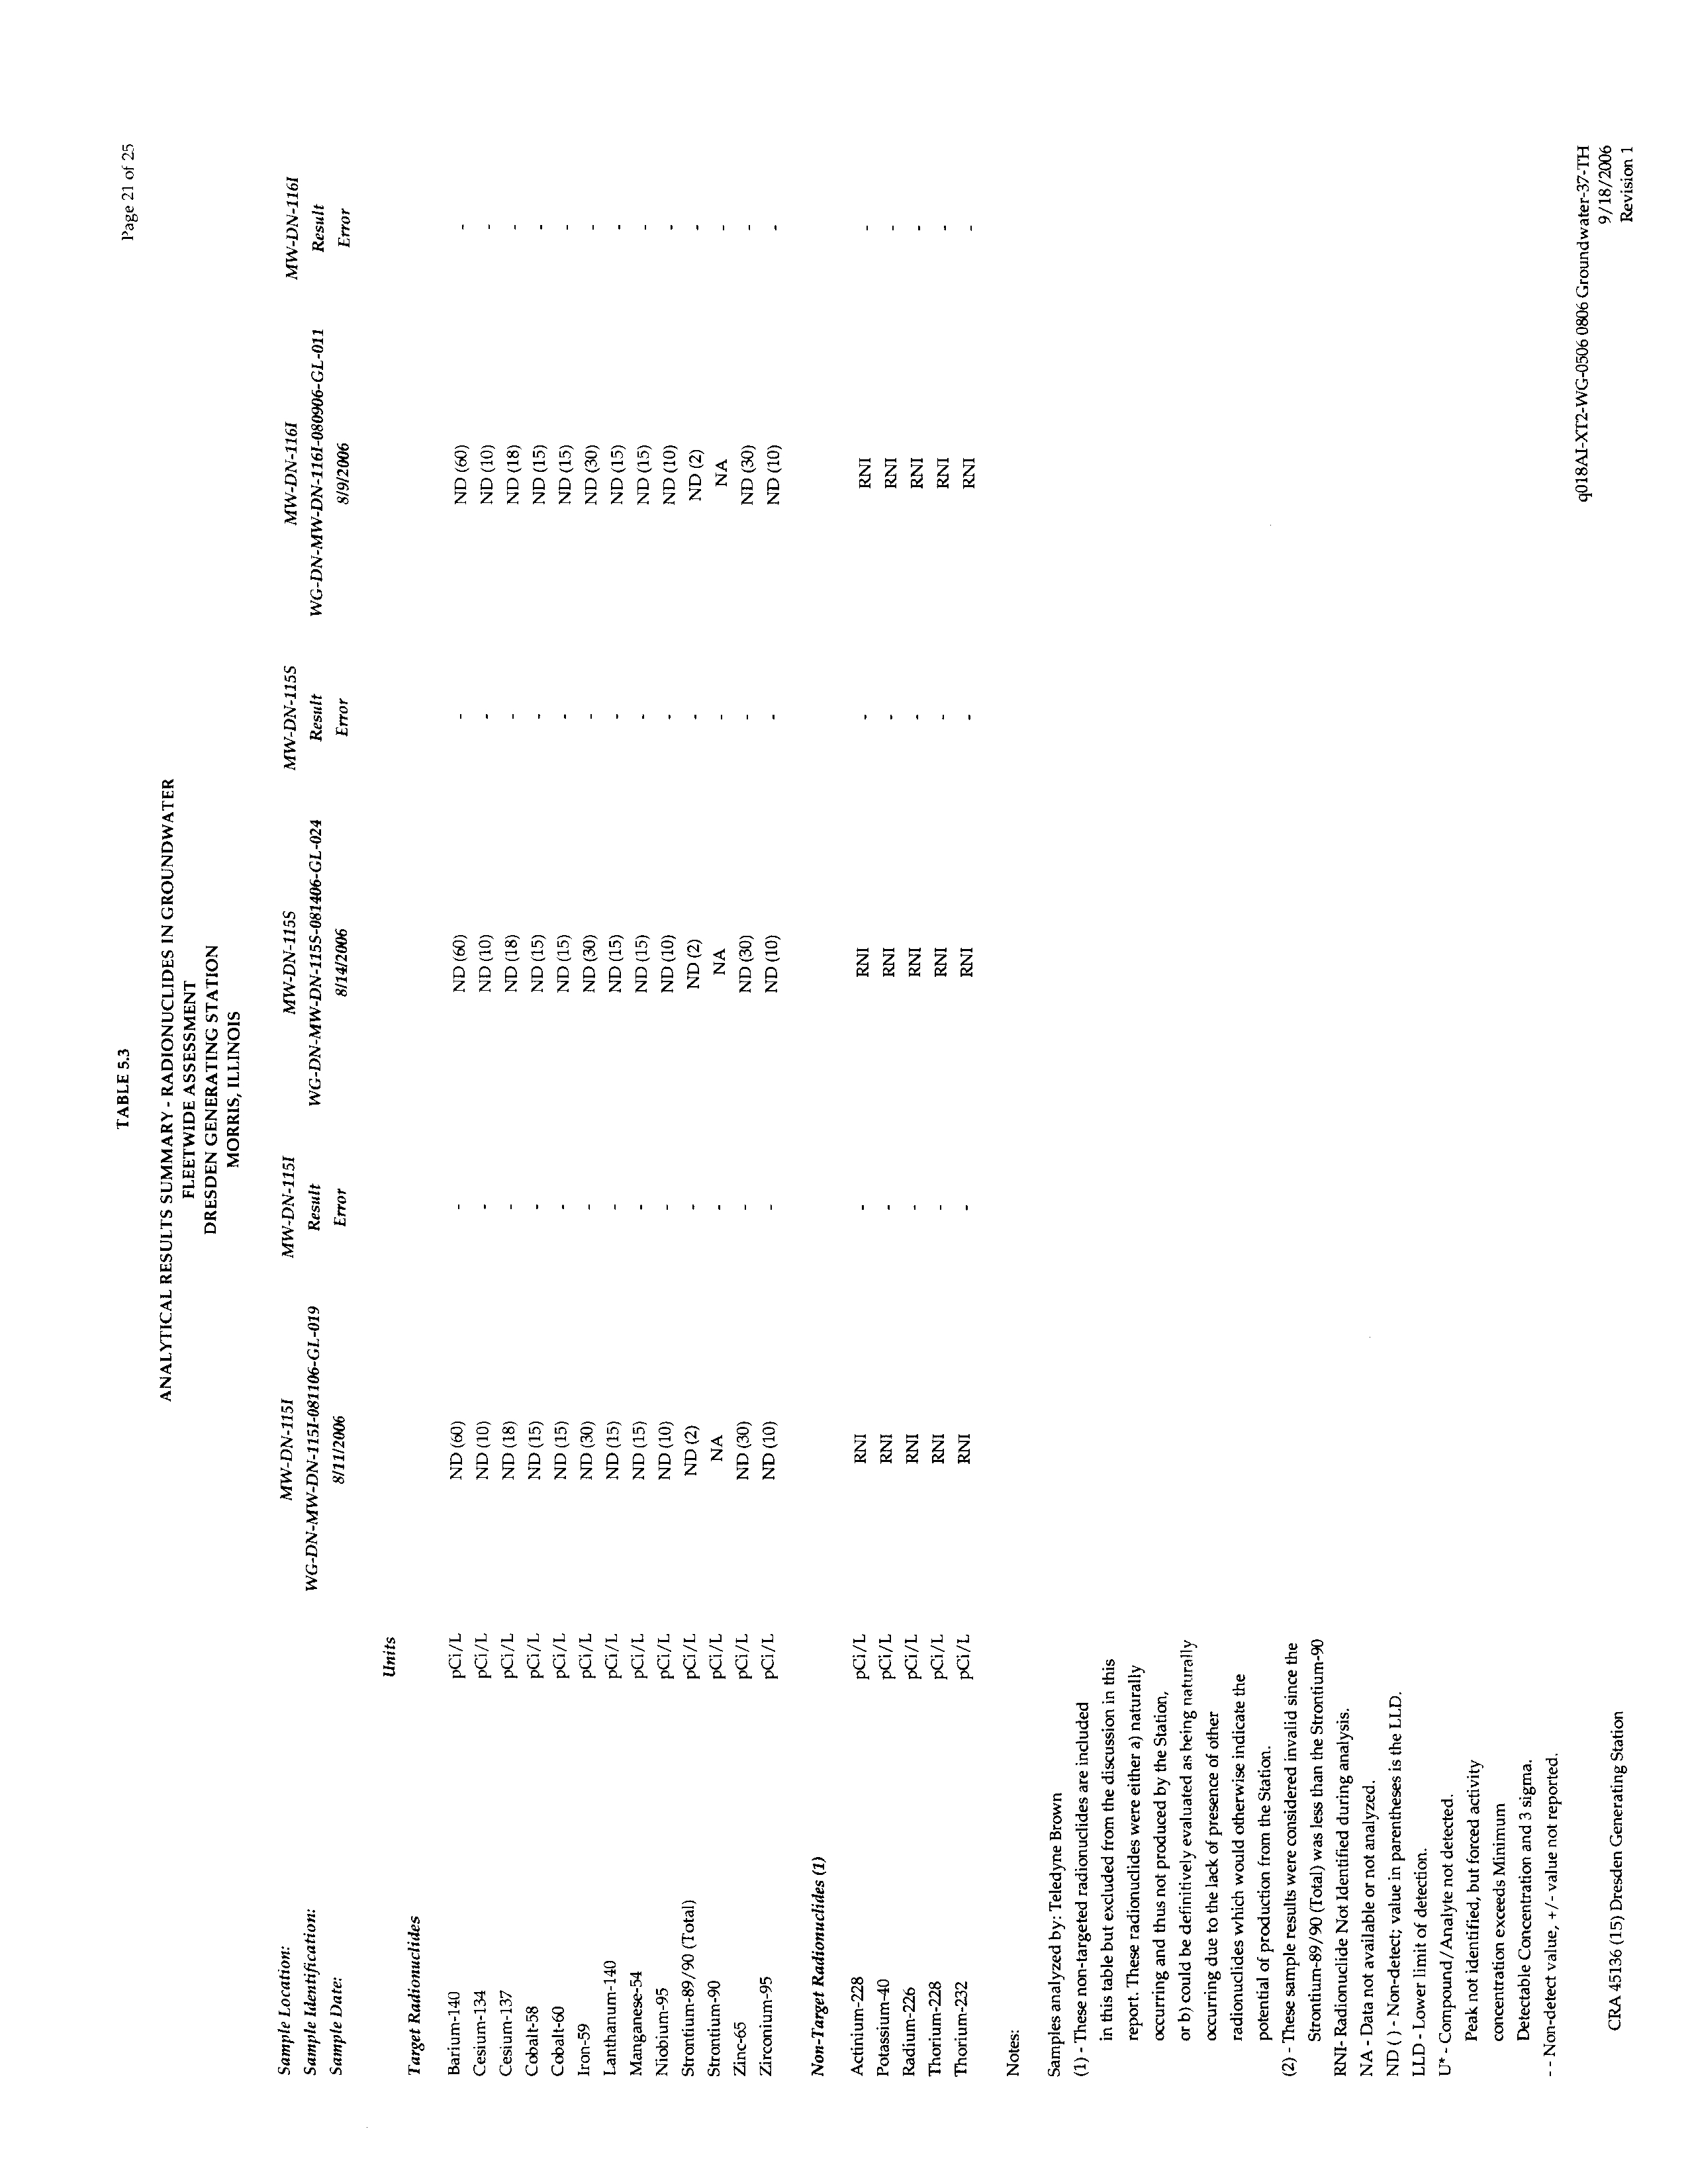
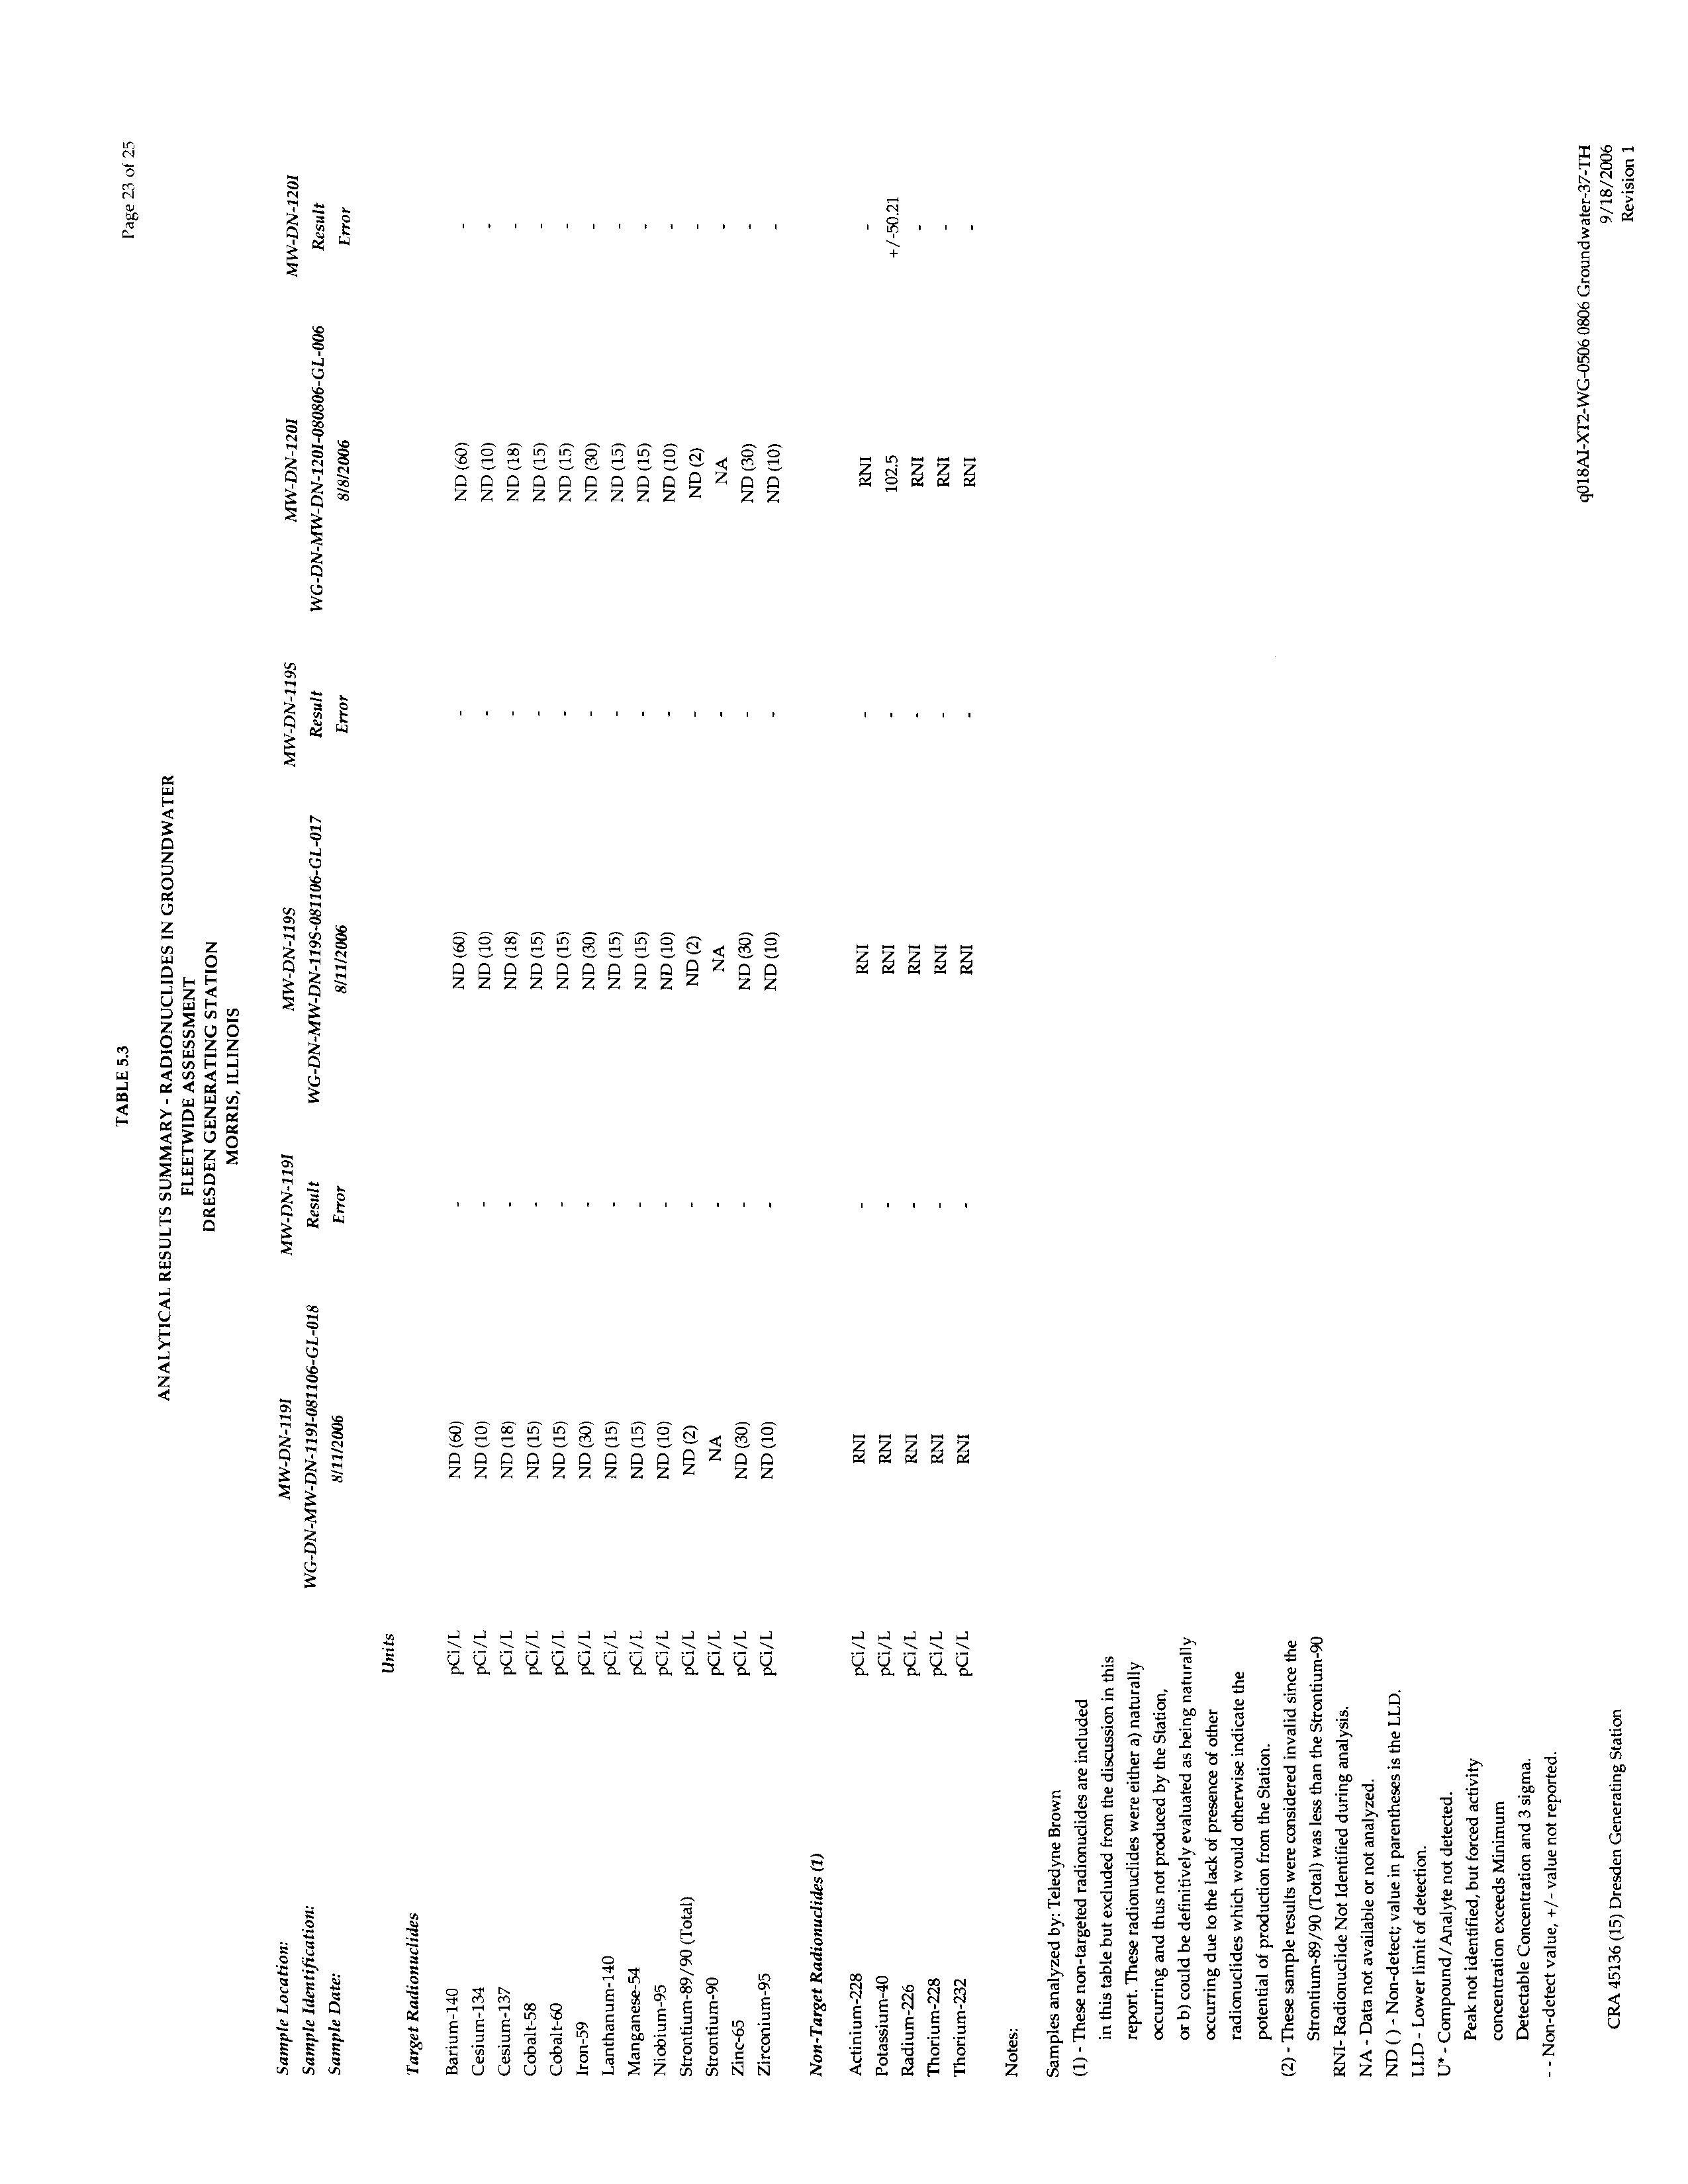
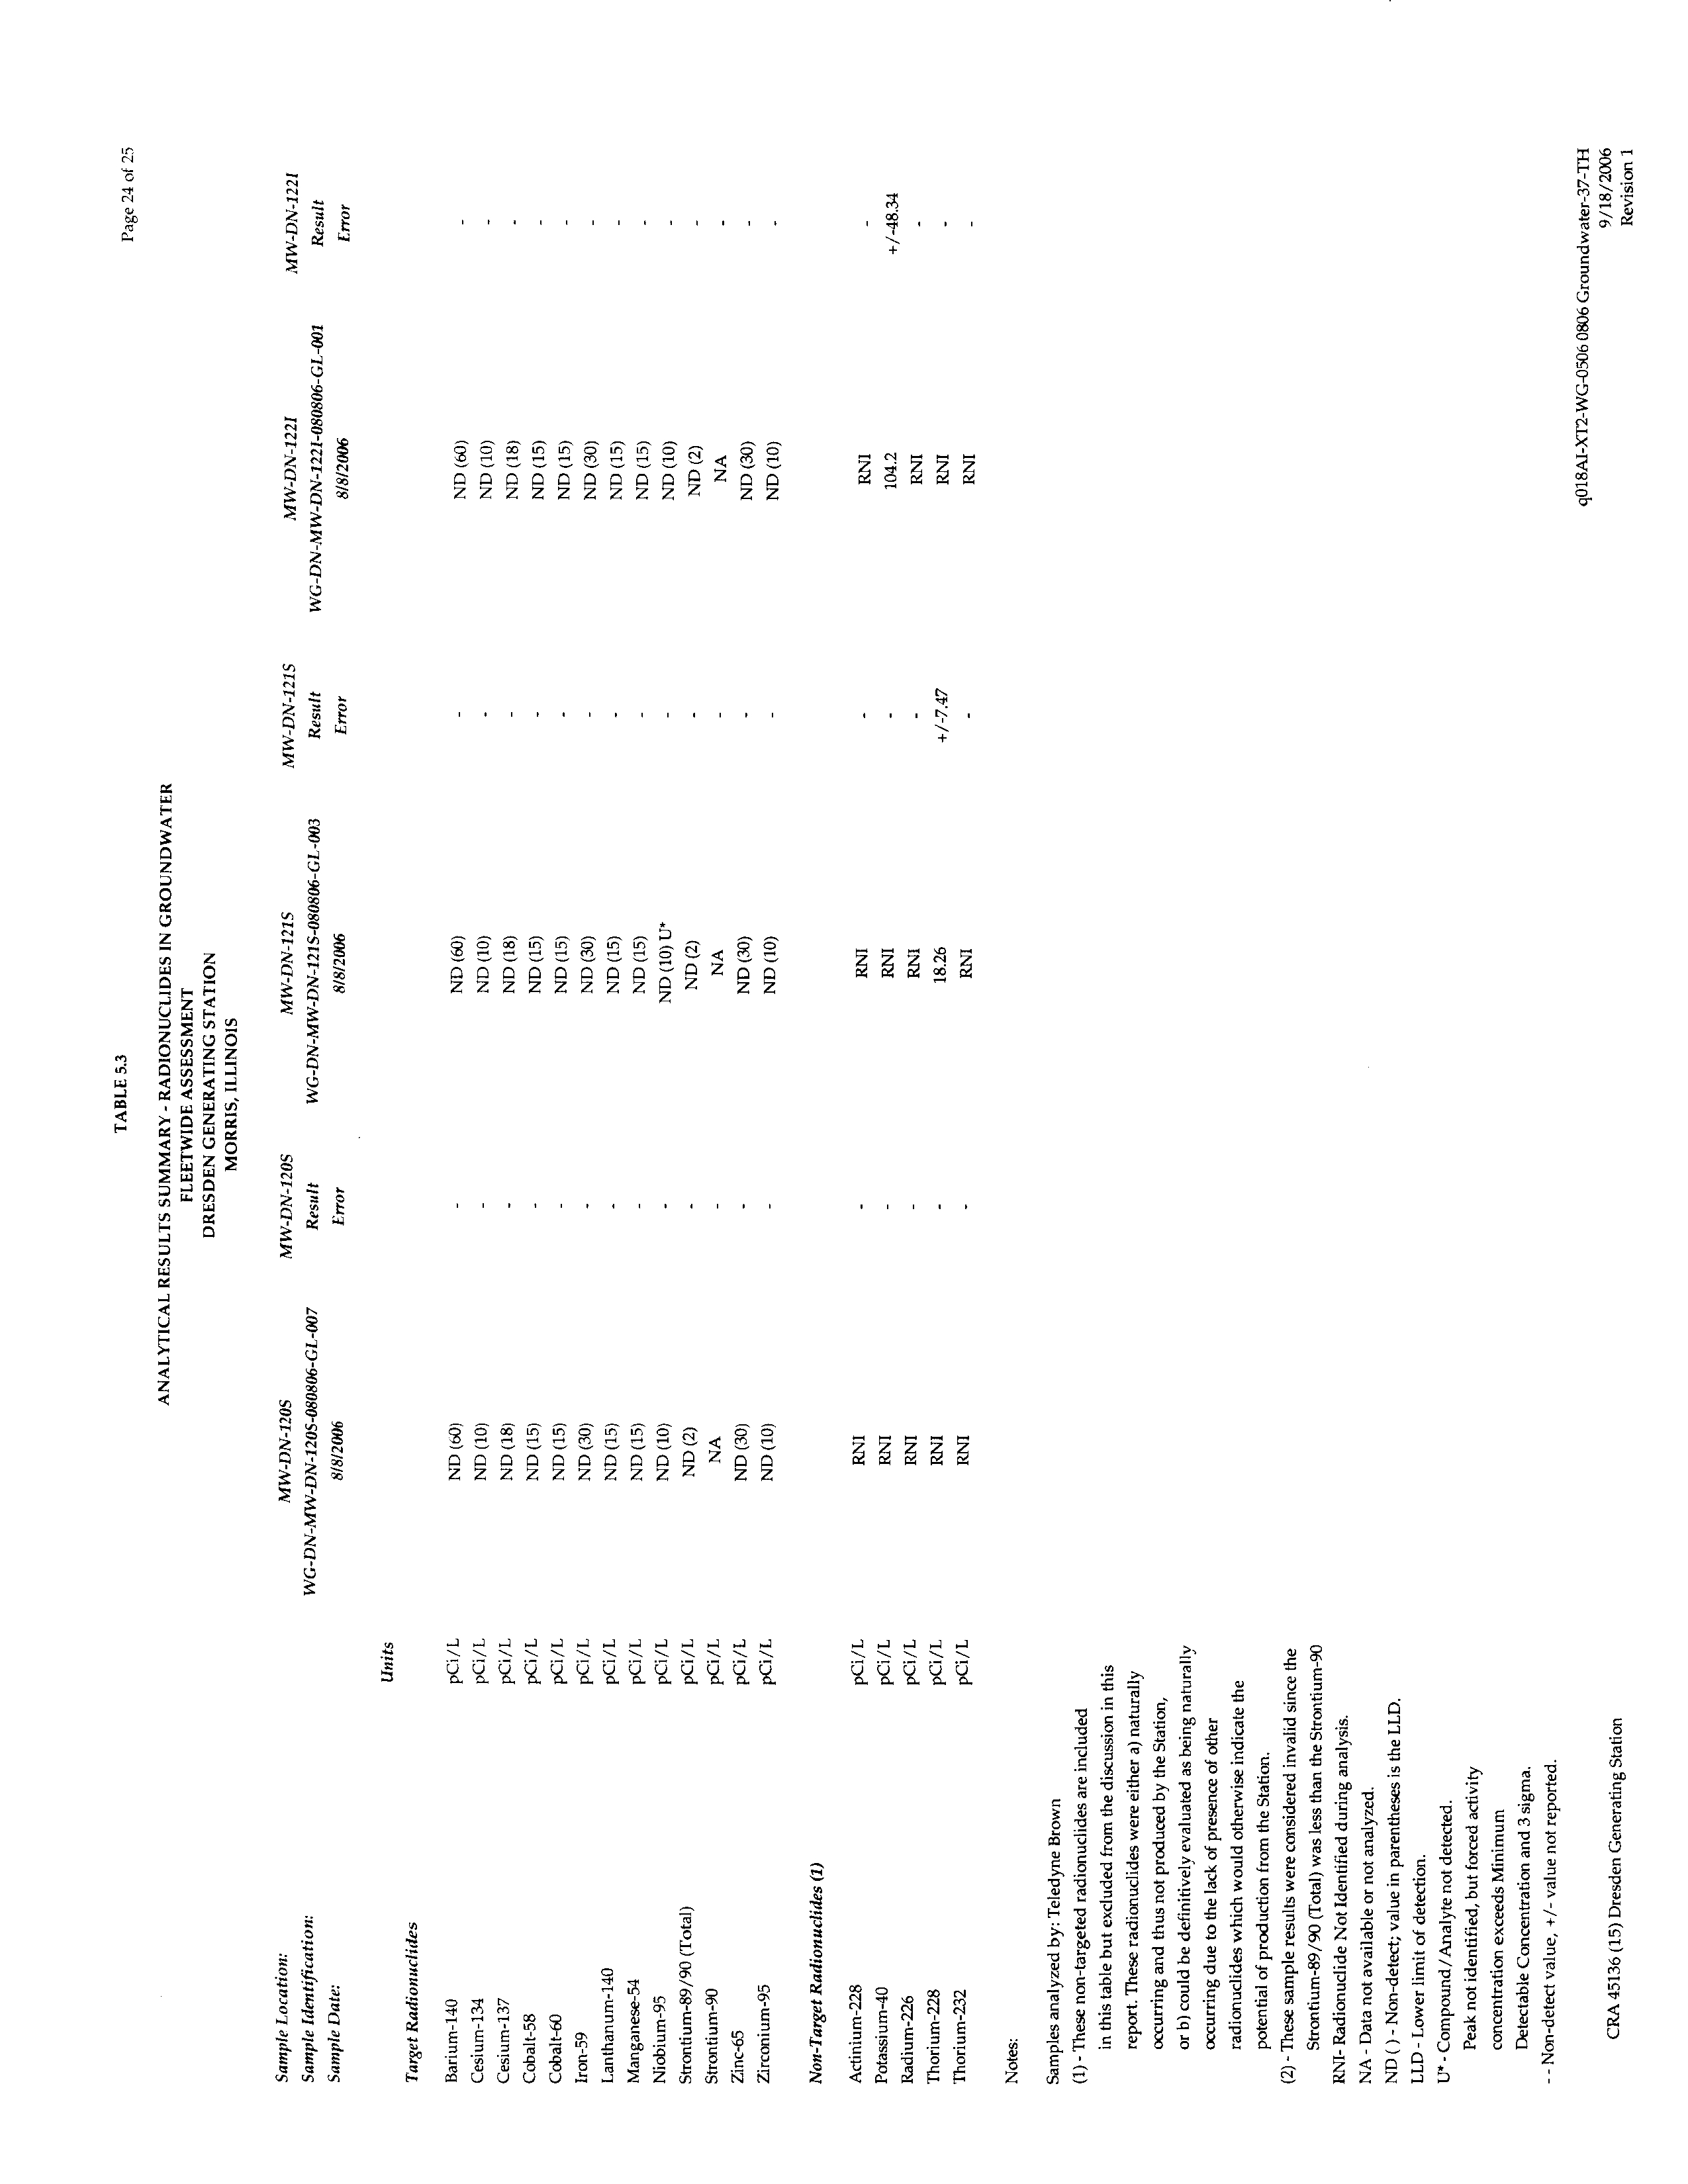
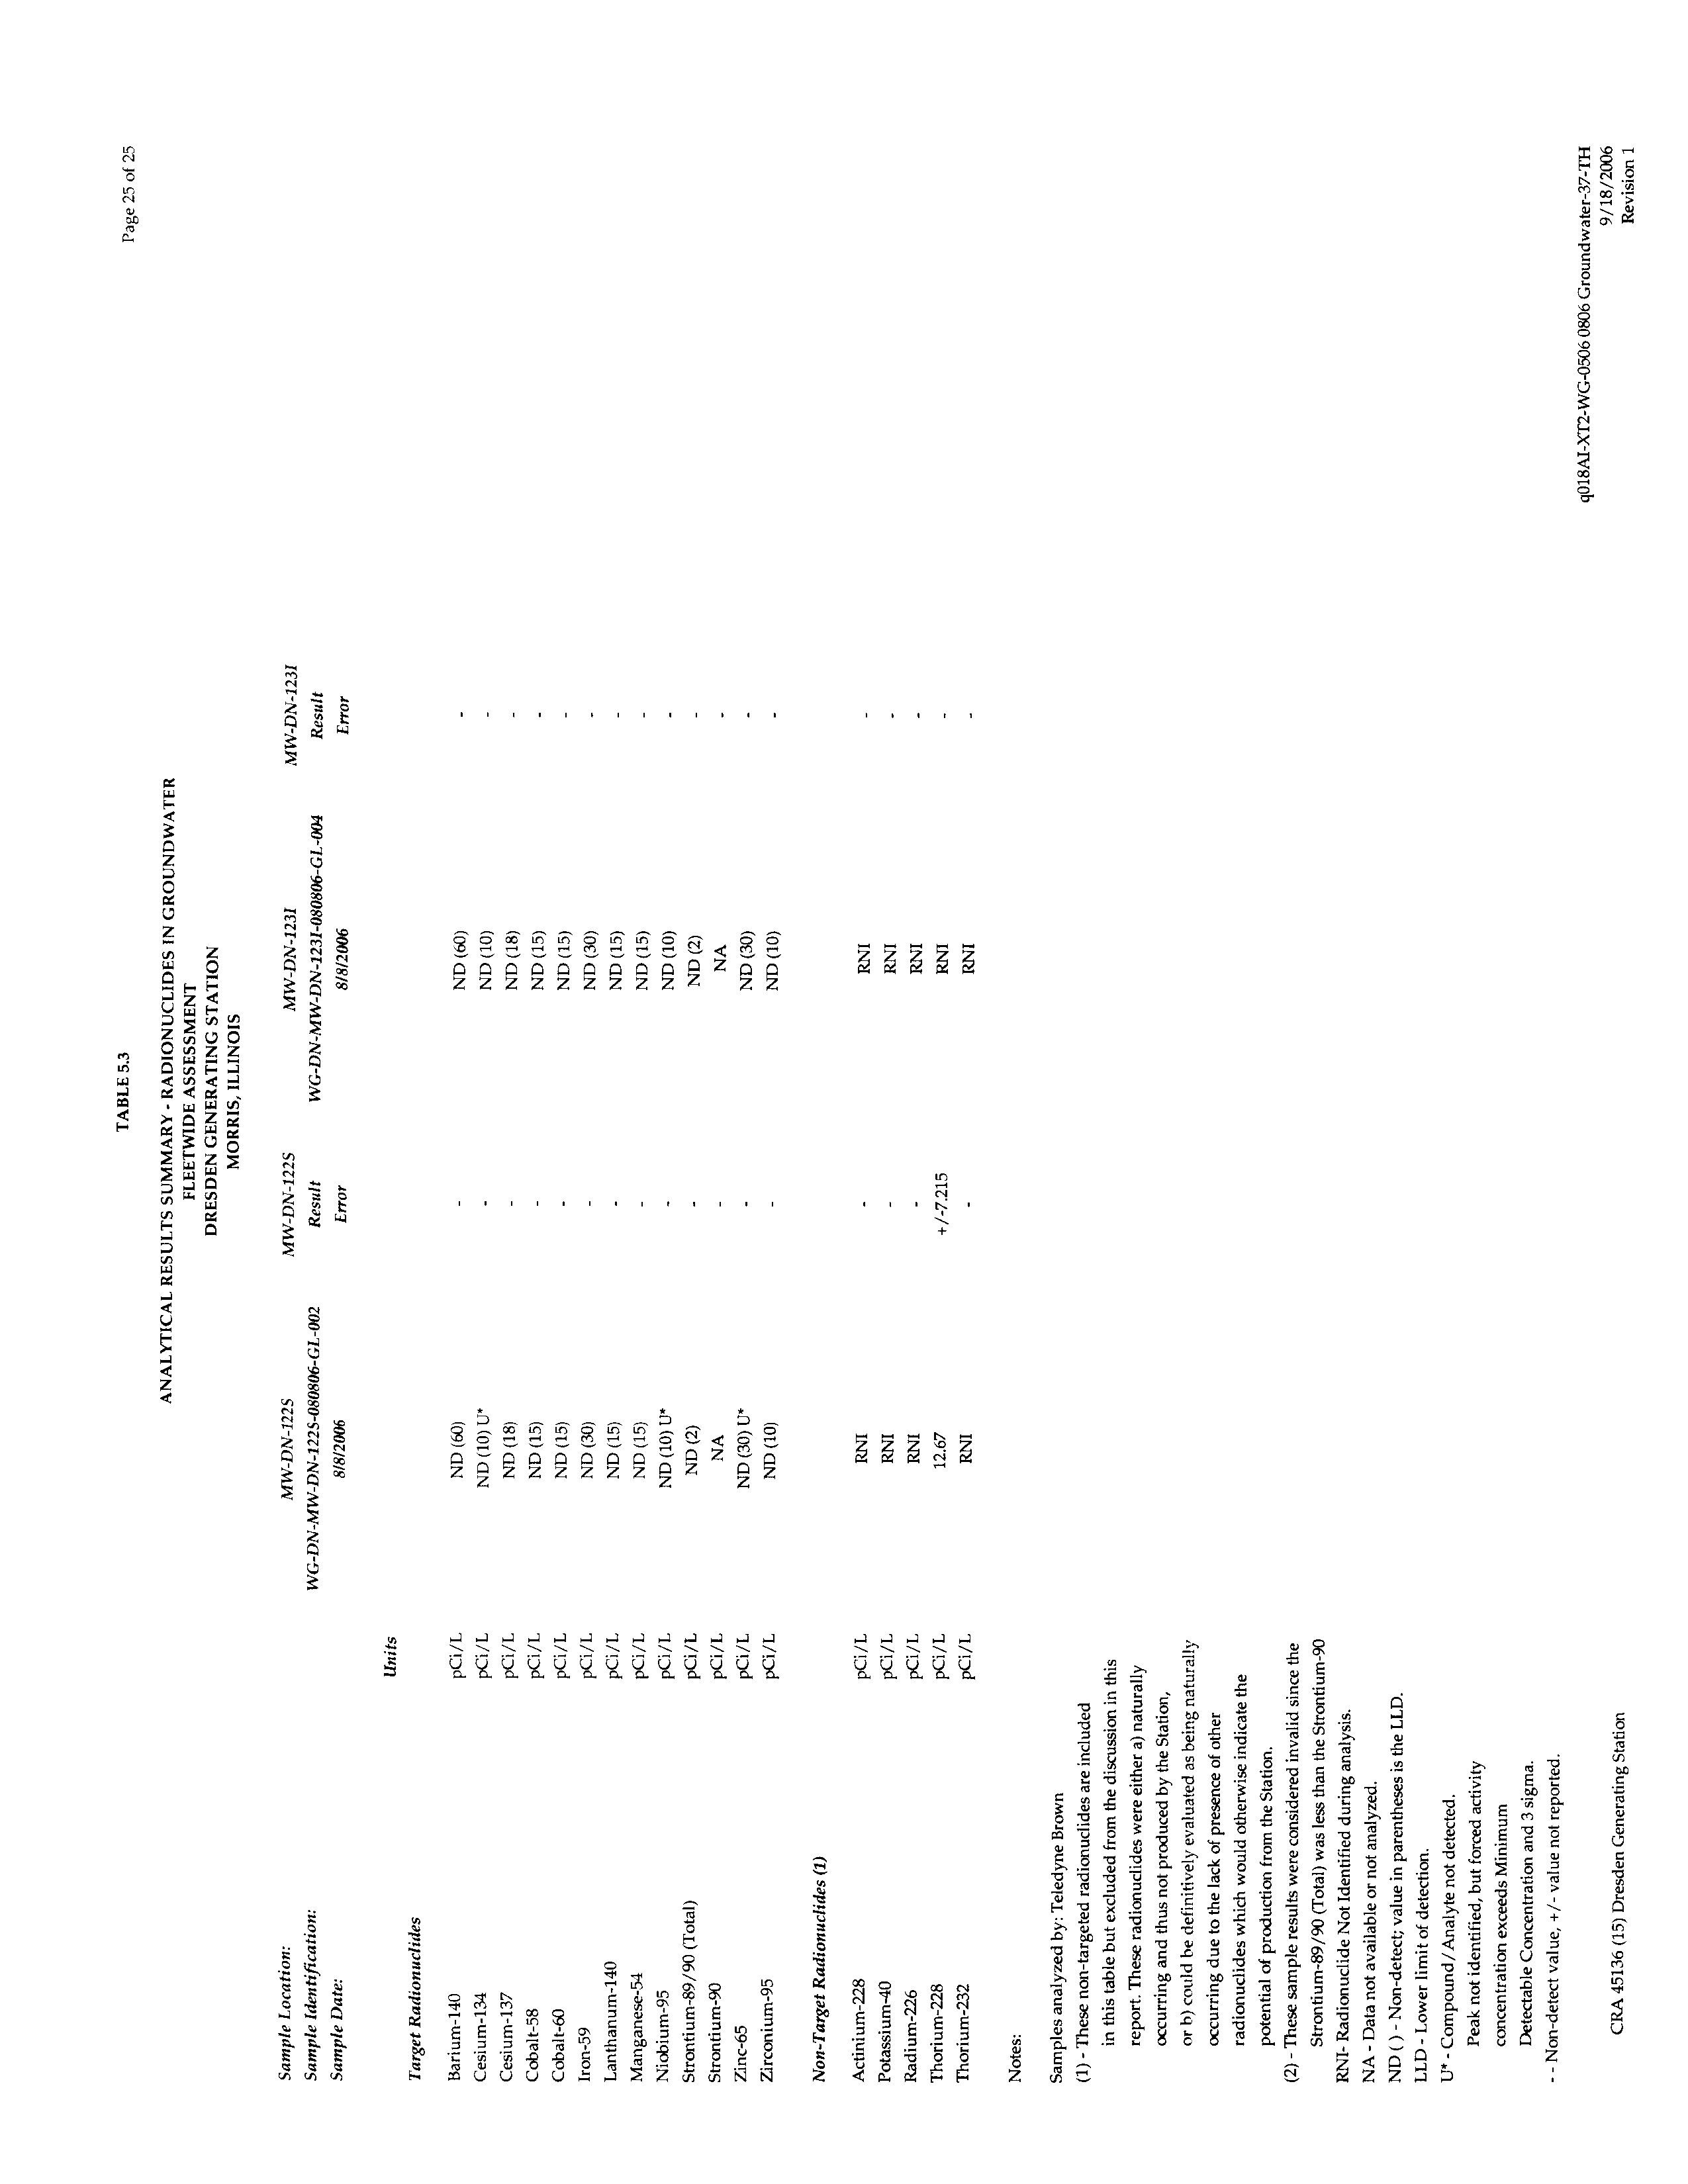
TABLE 5.3
ANALYTICAL RESULTS SUMMARY - RADIONUCLIDES IN
GROUNDWATER
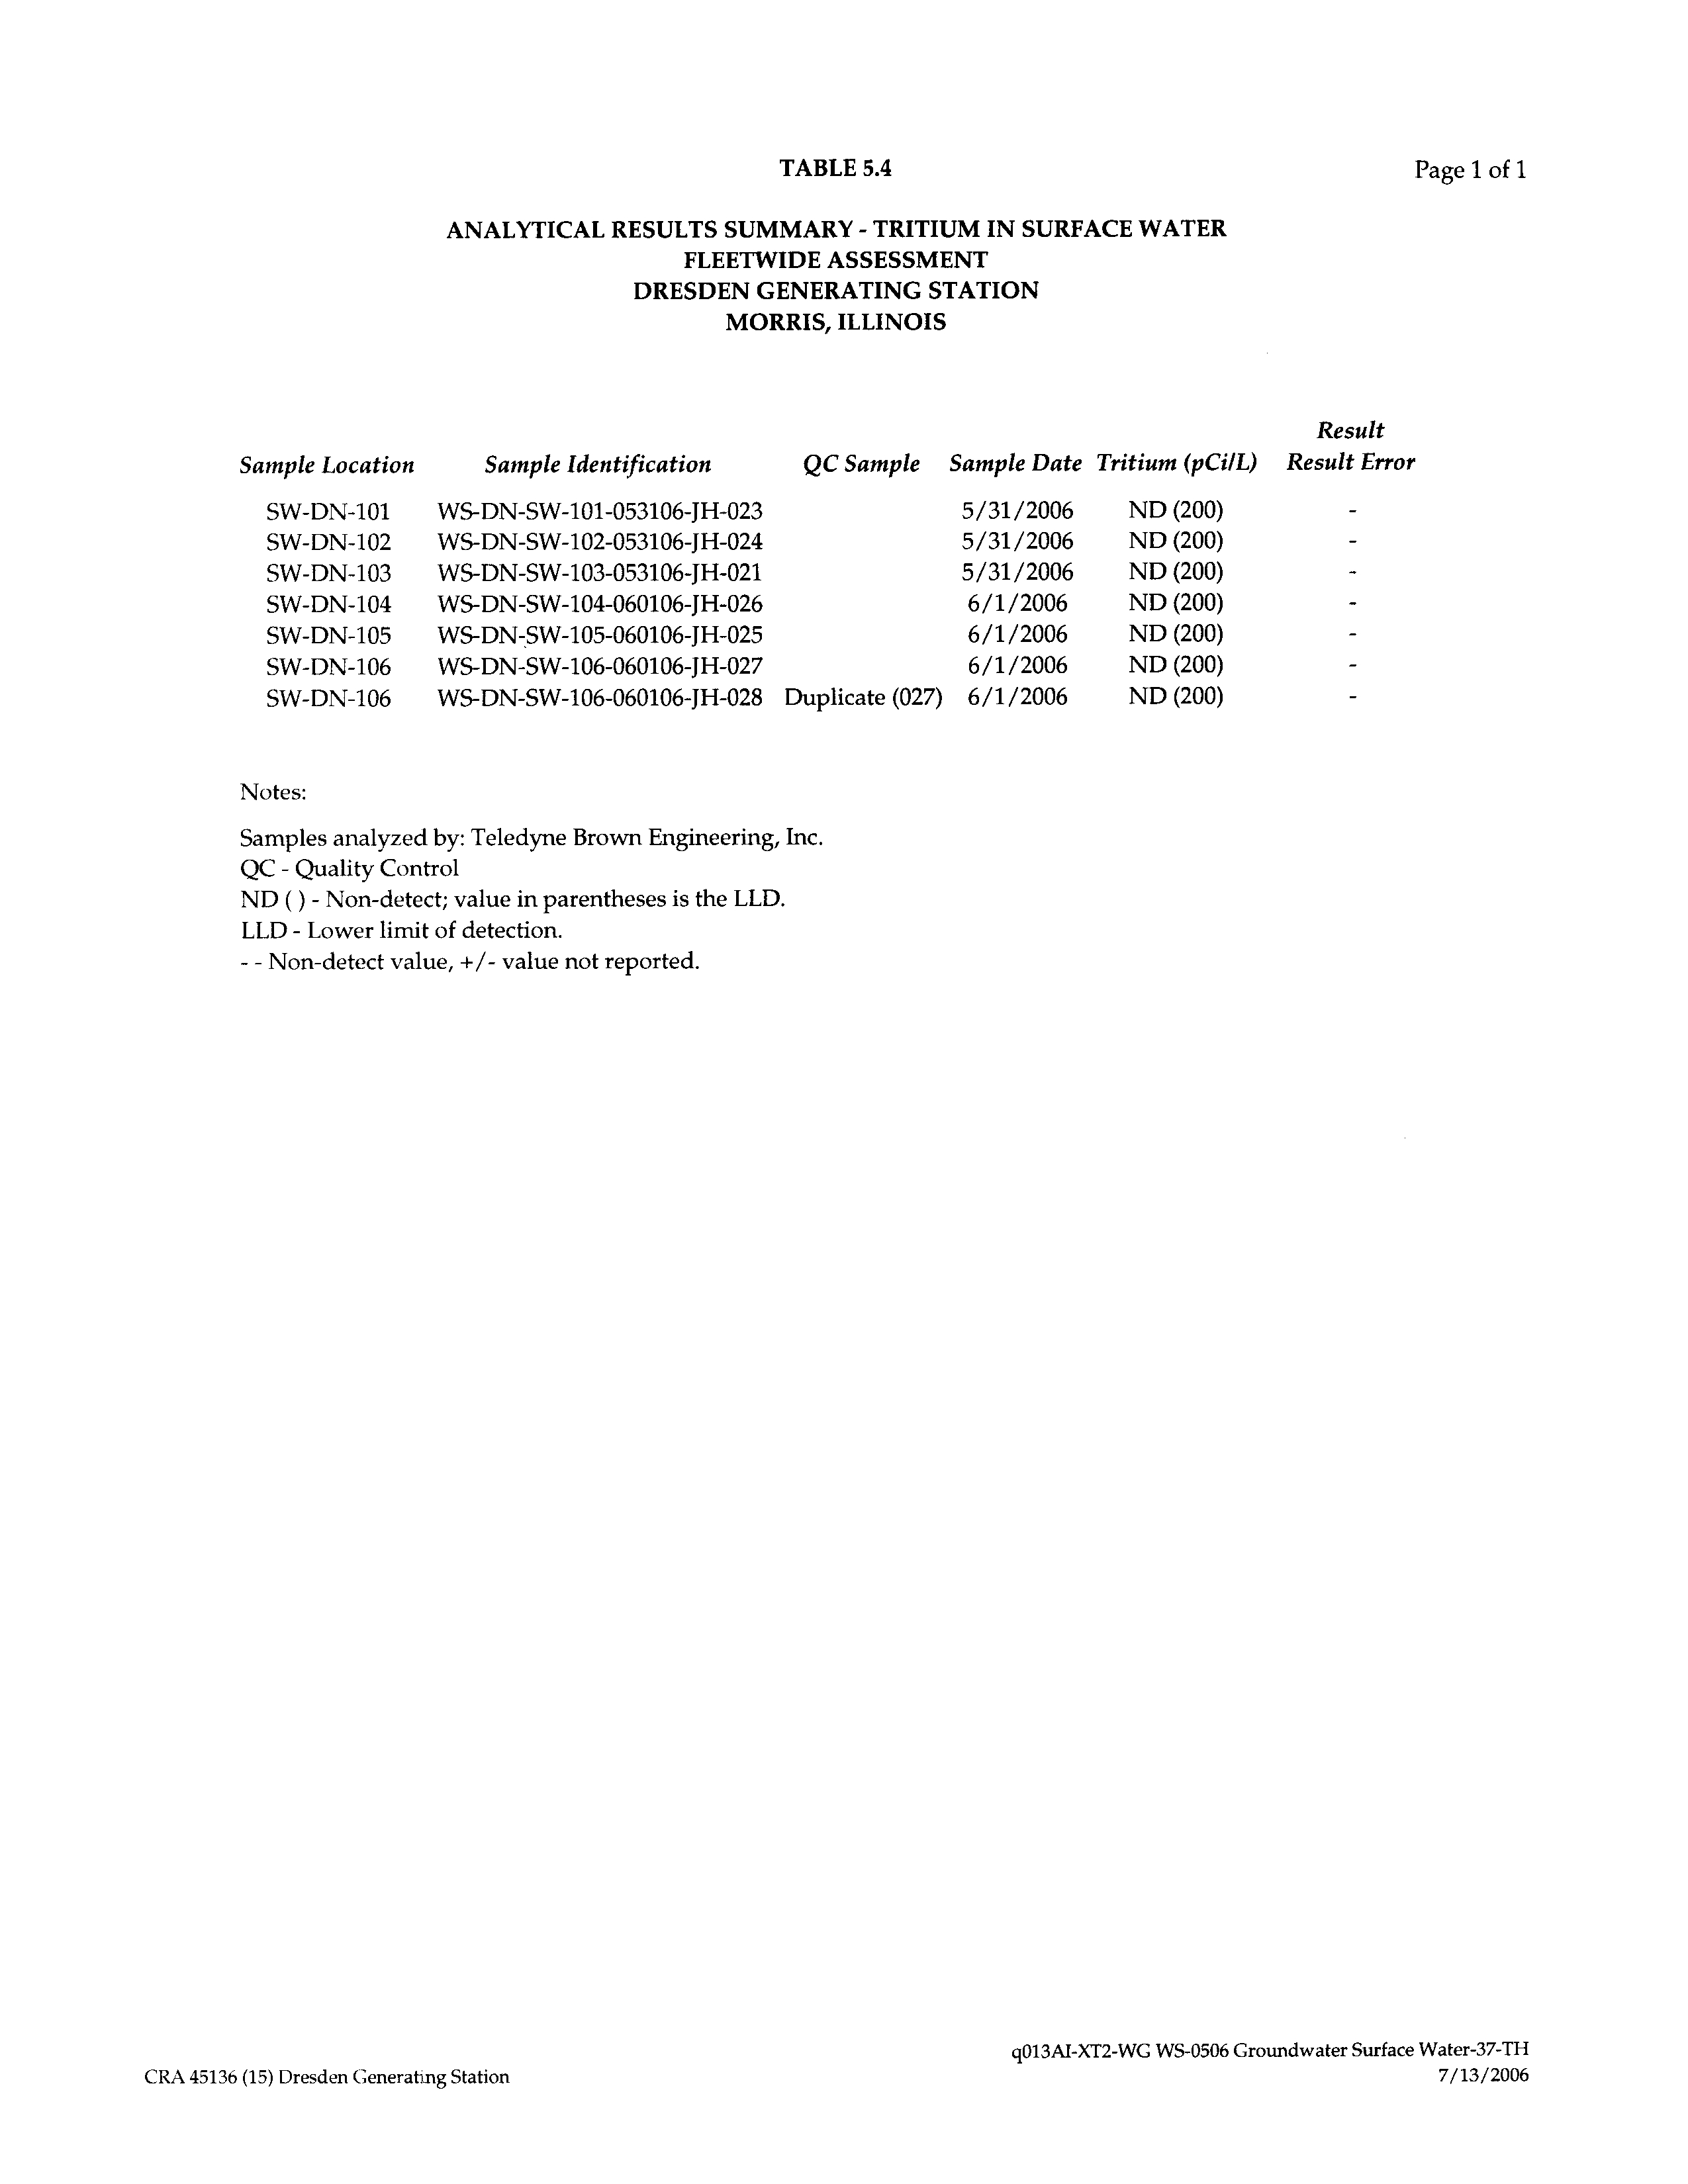
TABLE 5.4
ANALYTICAL RESULTS SUMMARY - TRITIUM IN SURFACE WATER
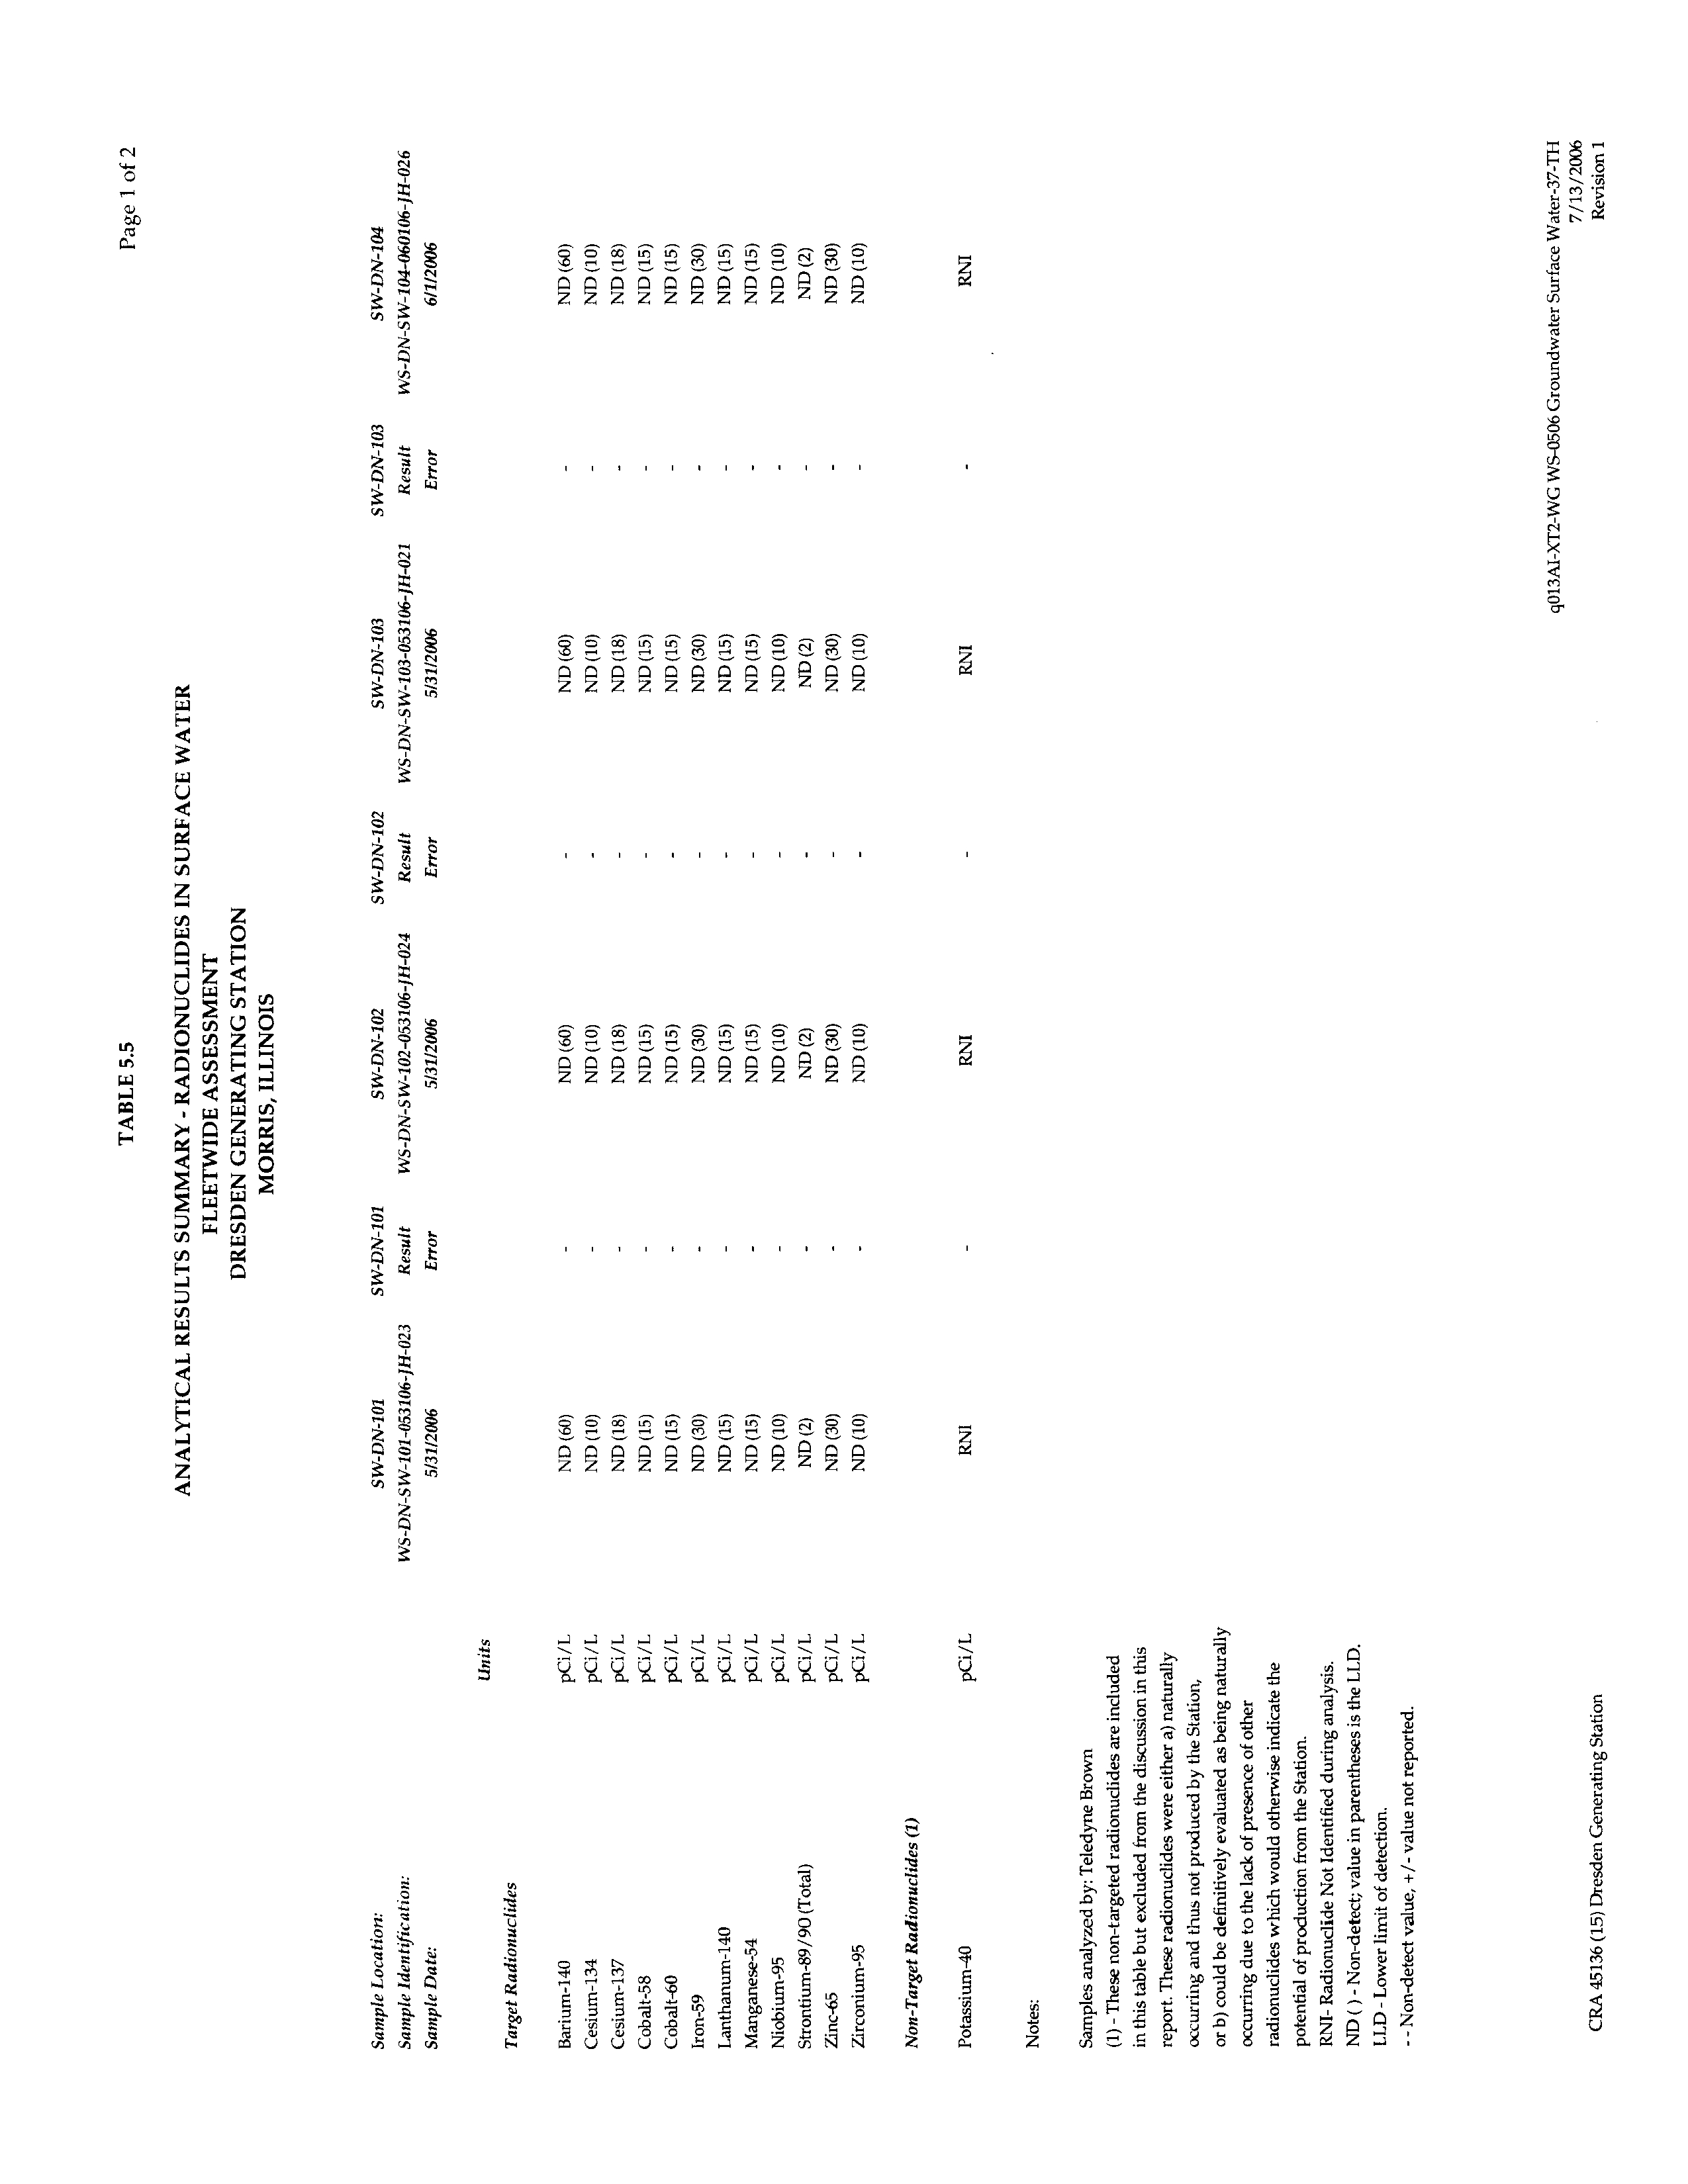
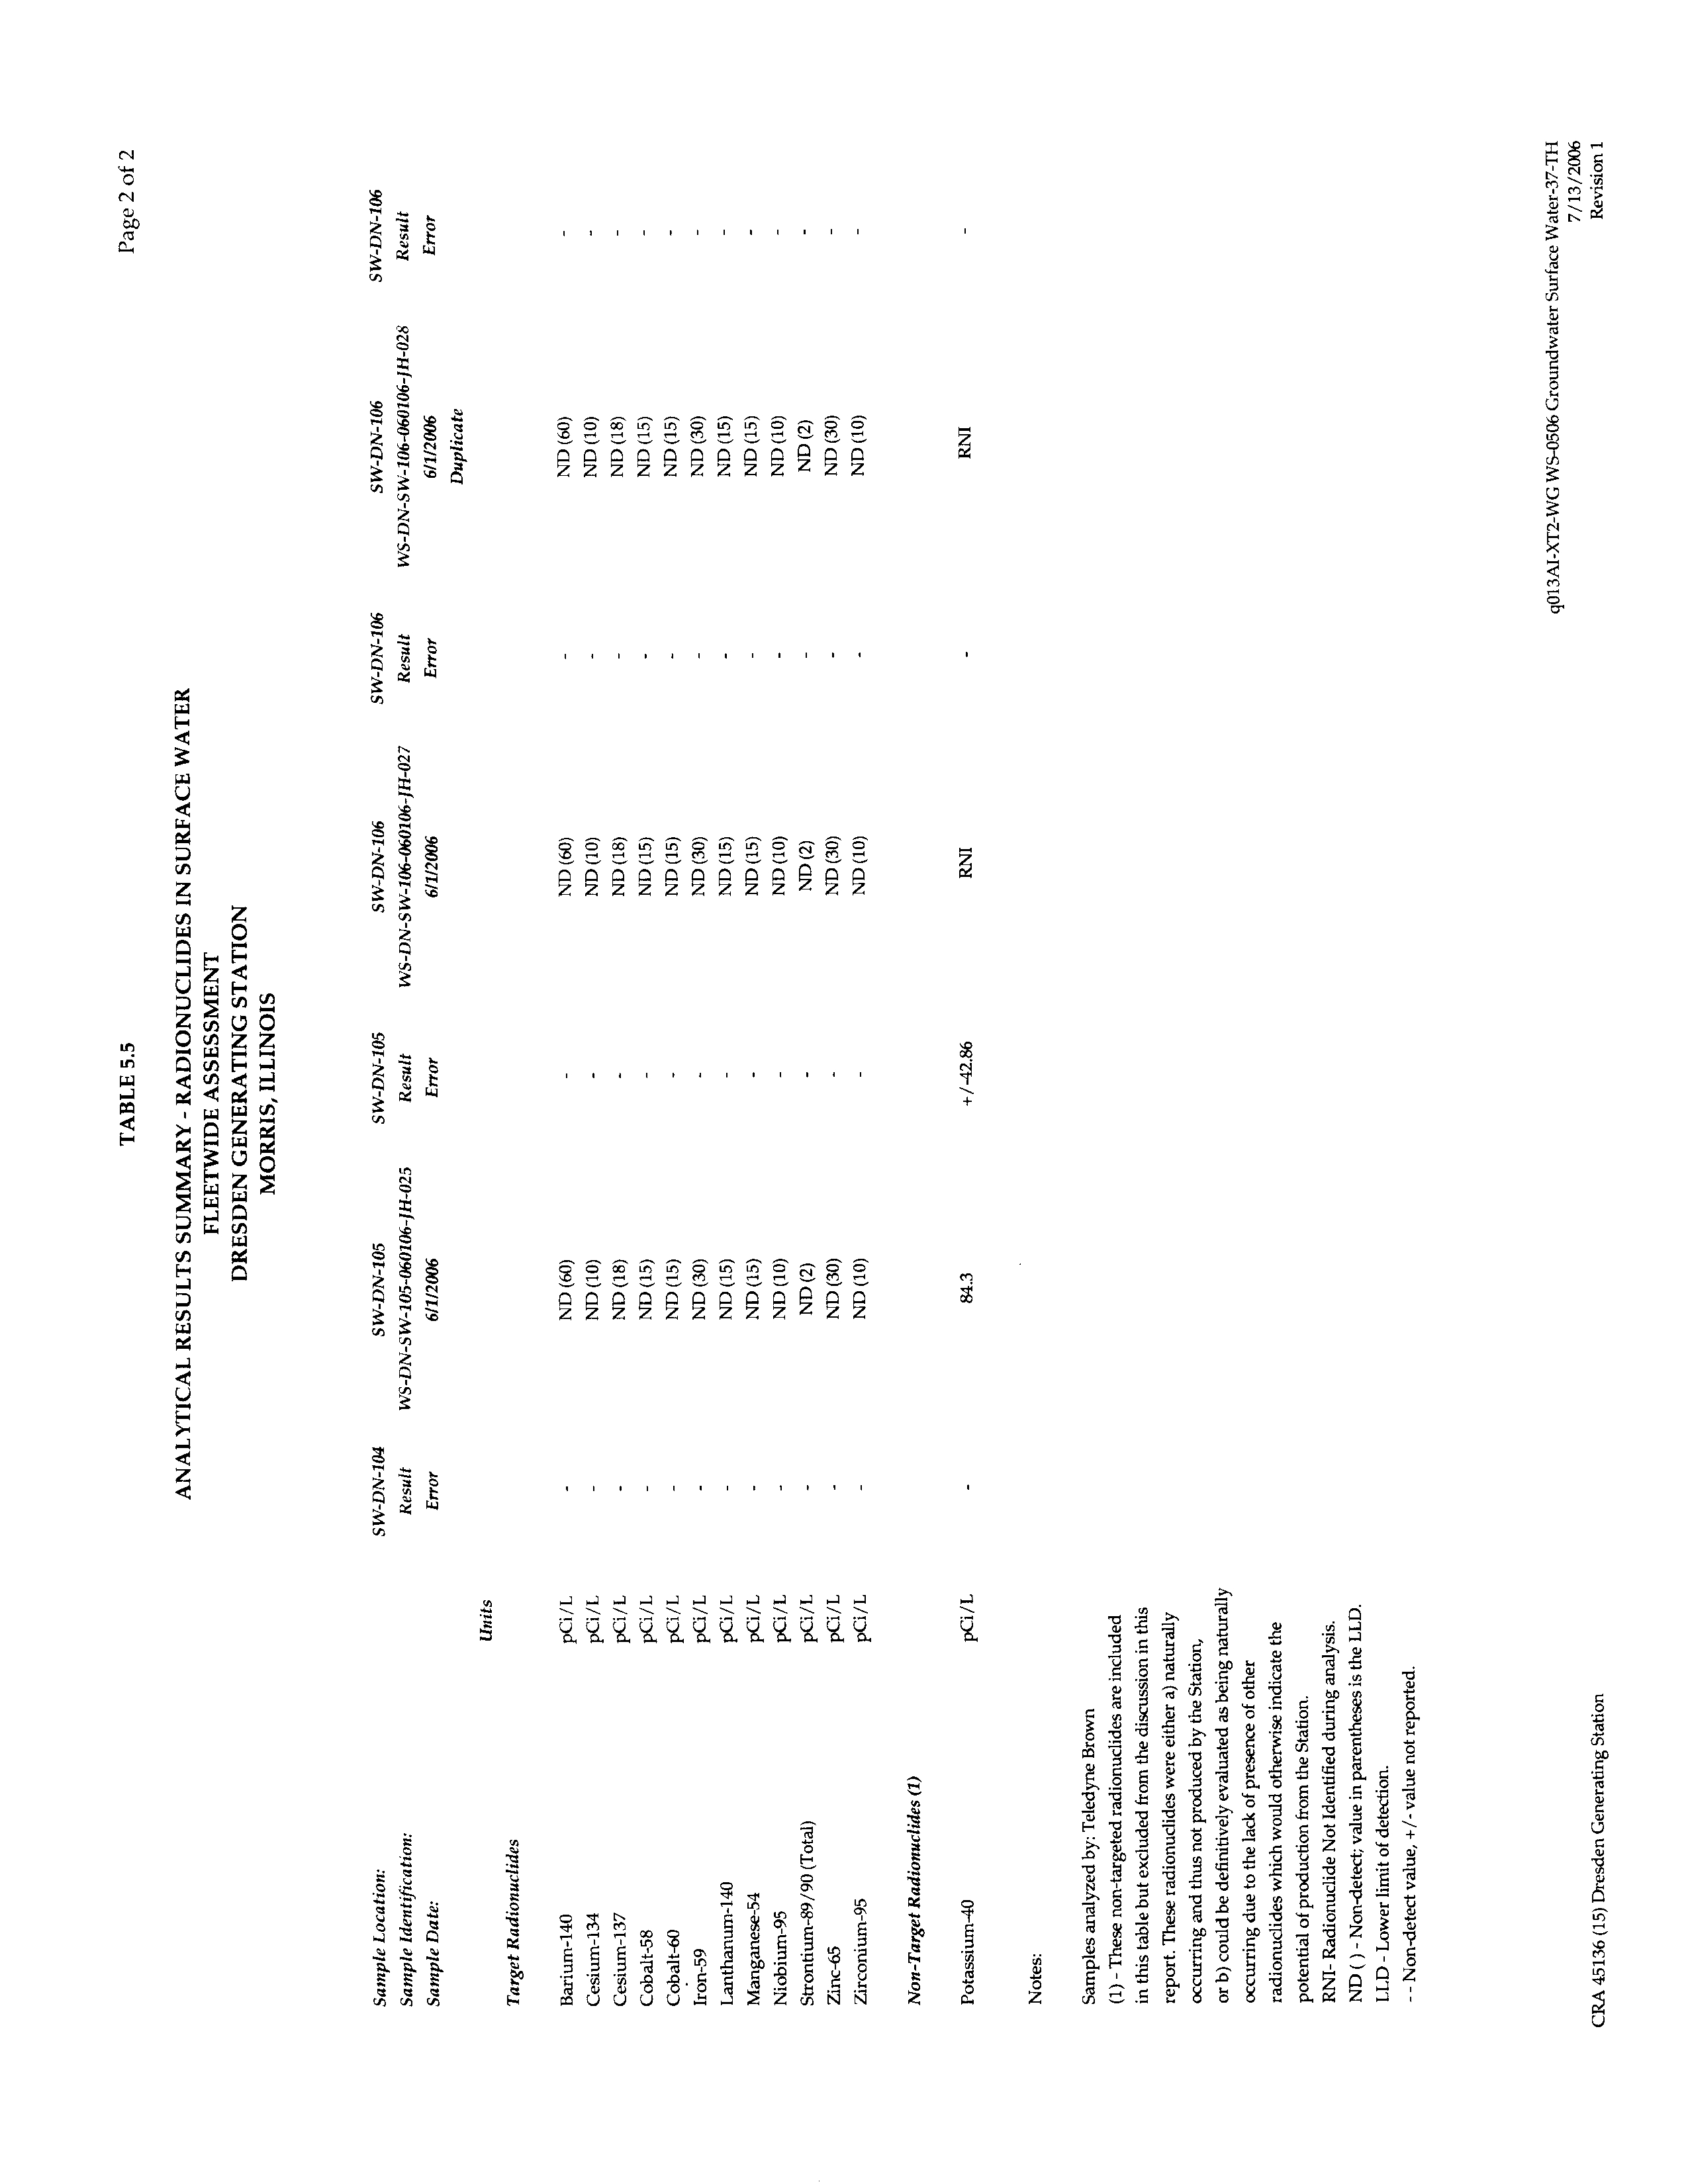
TABLE 5.5
ANALYTICAL RESULTS SUMMARY - RADIONUCLIDES IN SURFACE
WATER
045136 (15) Dresden Generating Station
CONESTOGA-ROVERS & ASSOCIATES
Revision 1
LIST OF APPENDICES
APPENDIX A
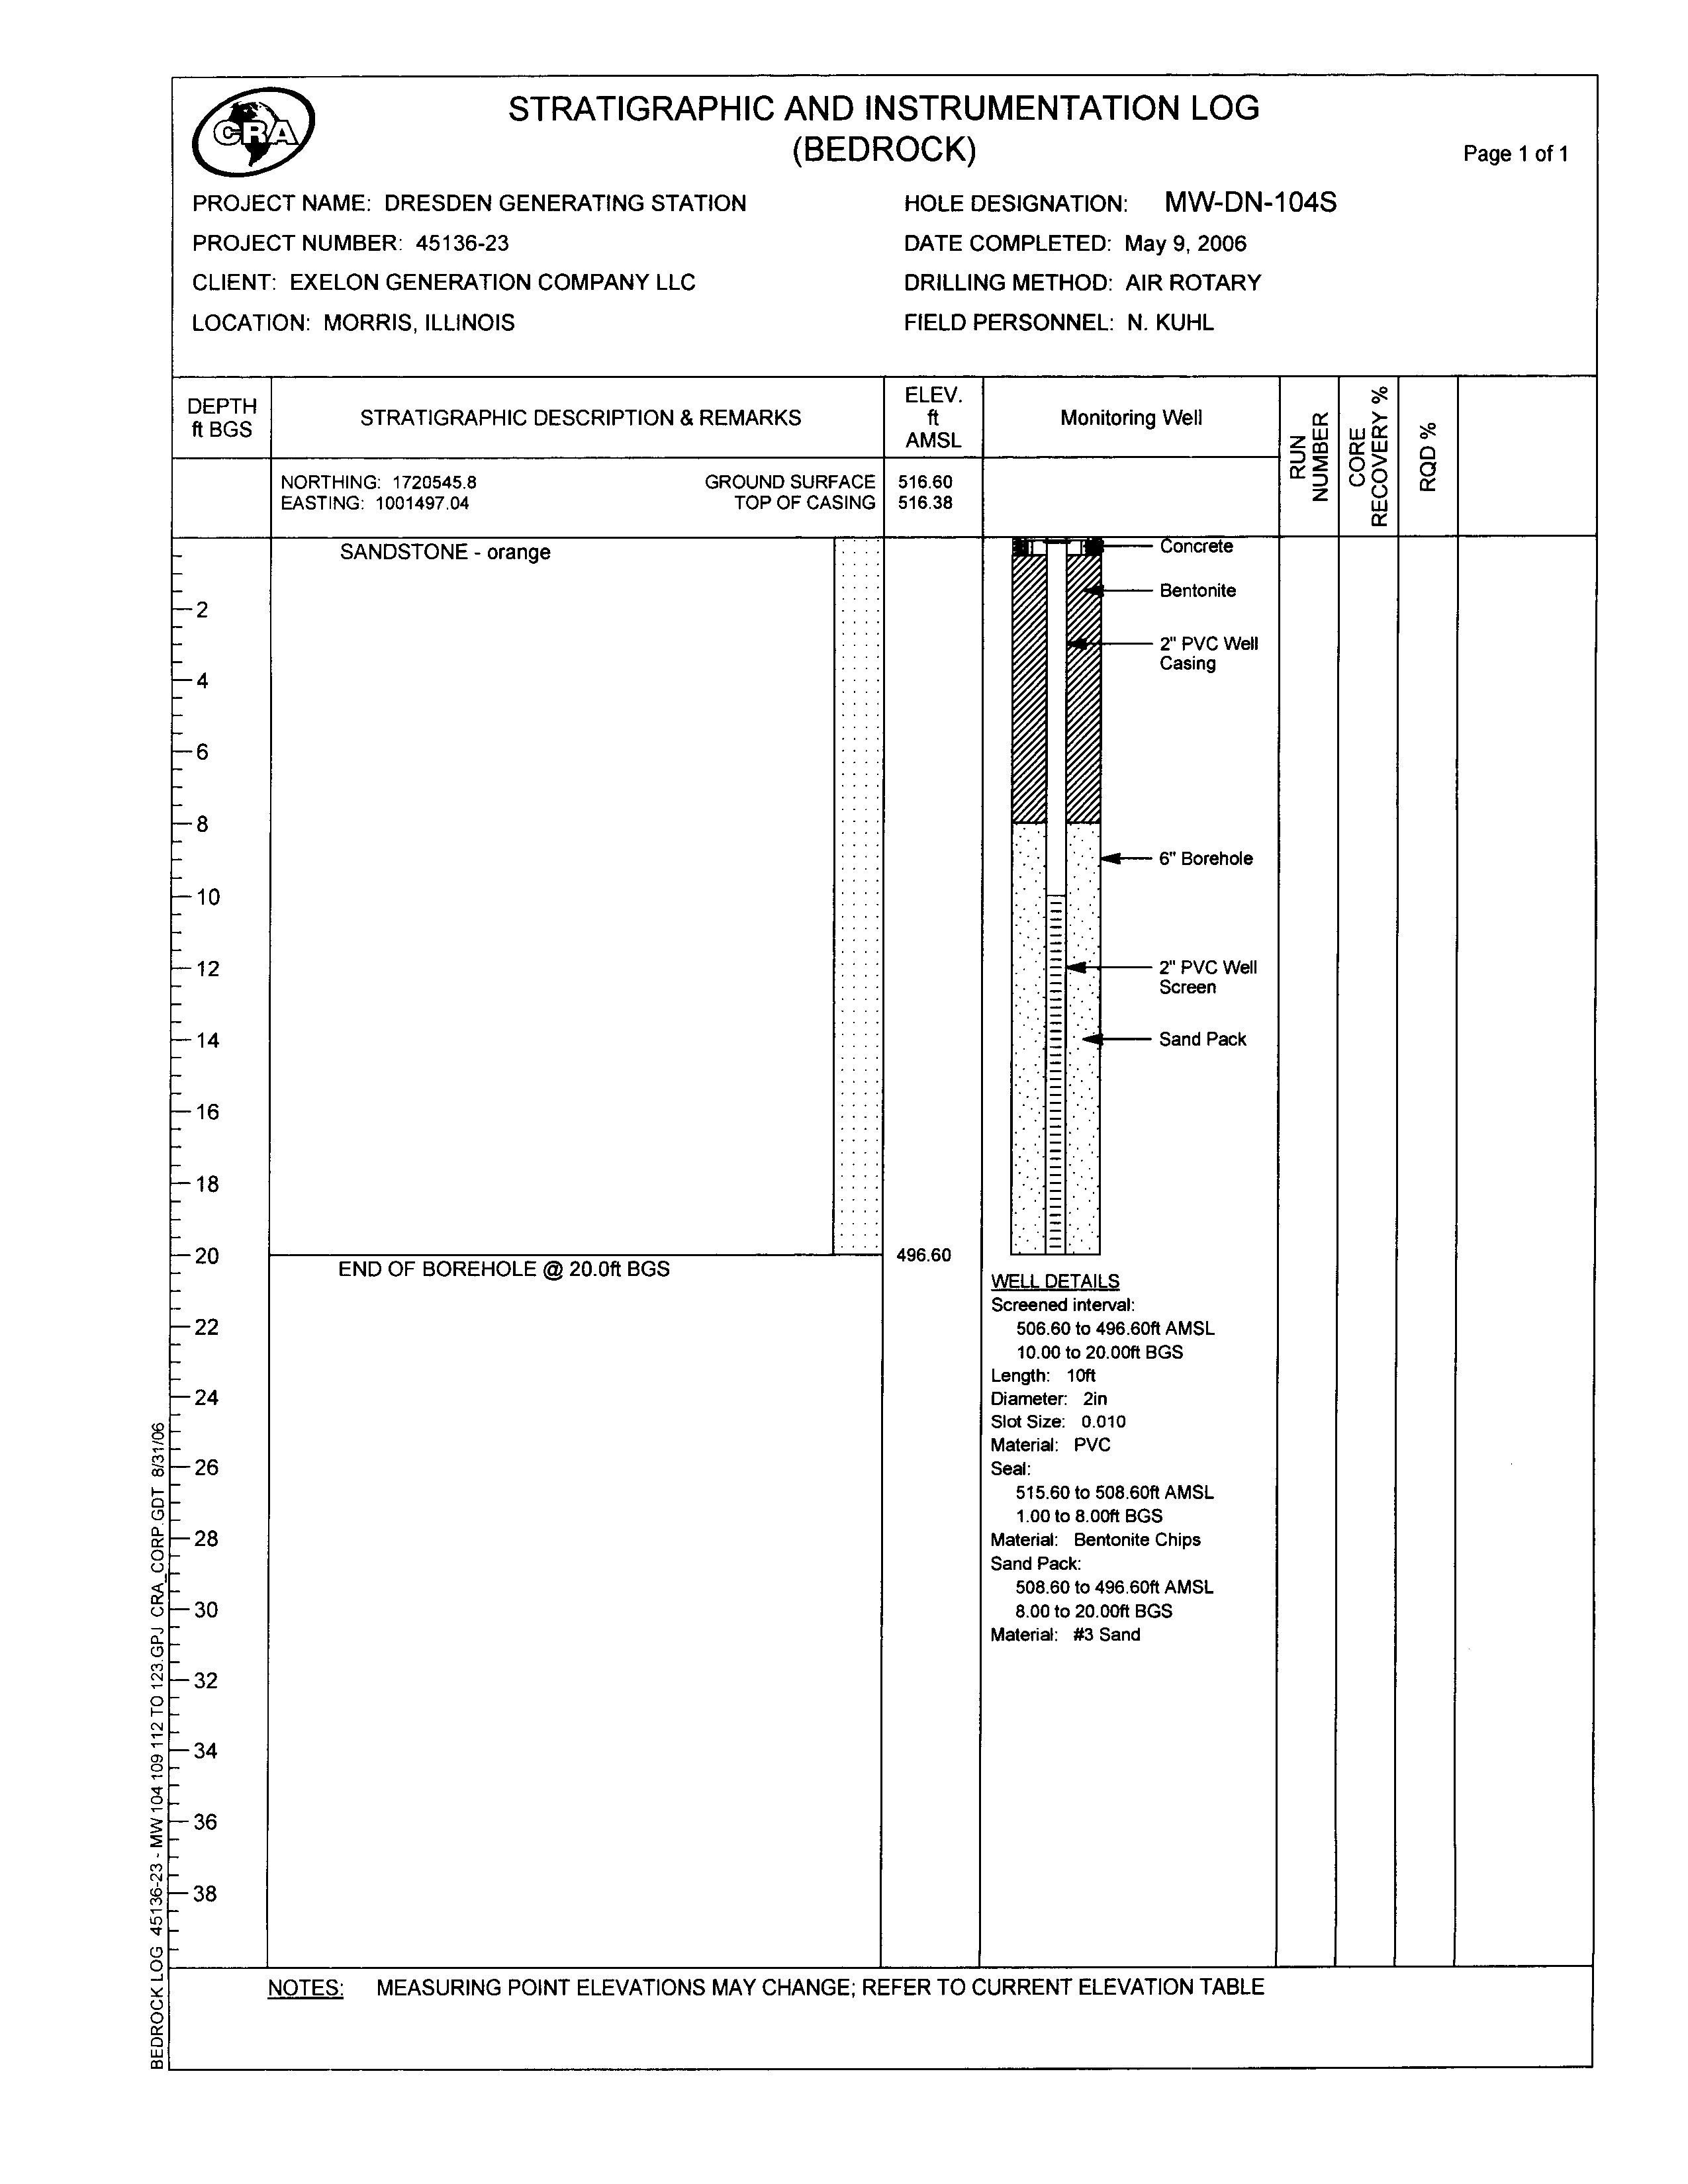
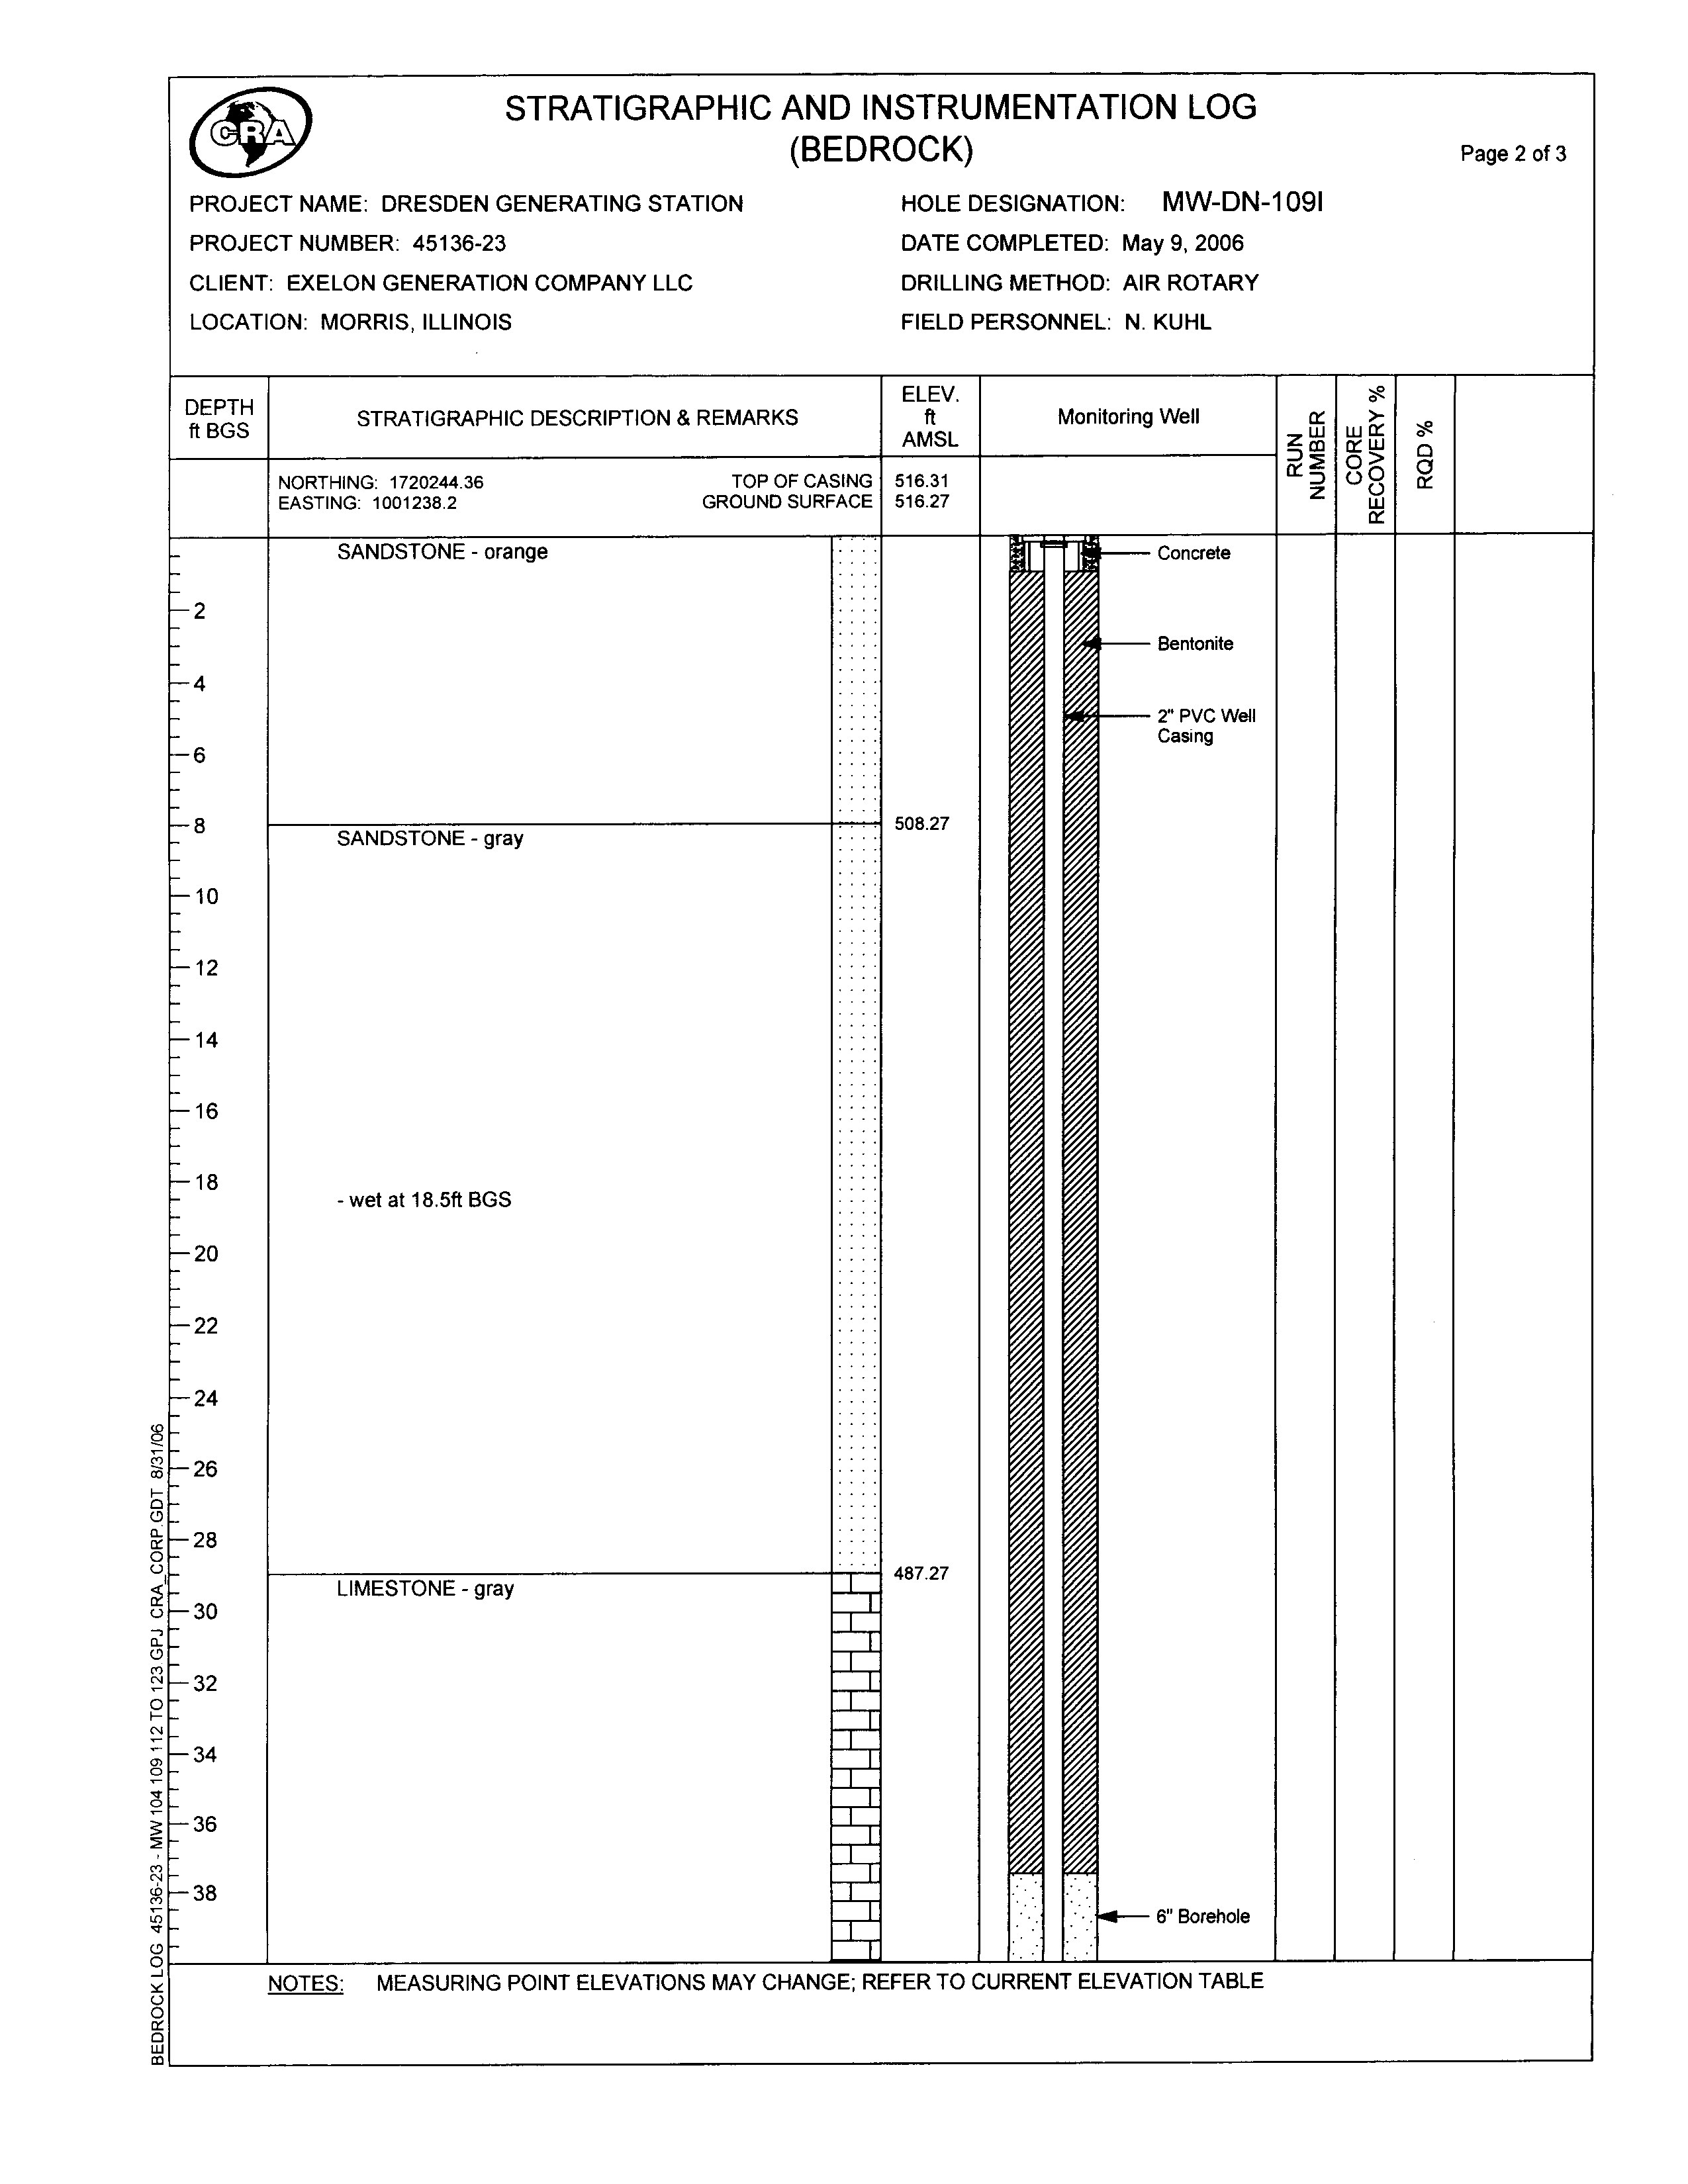
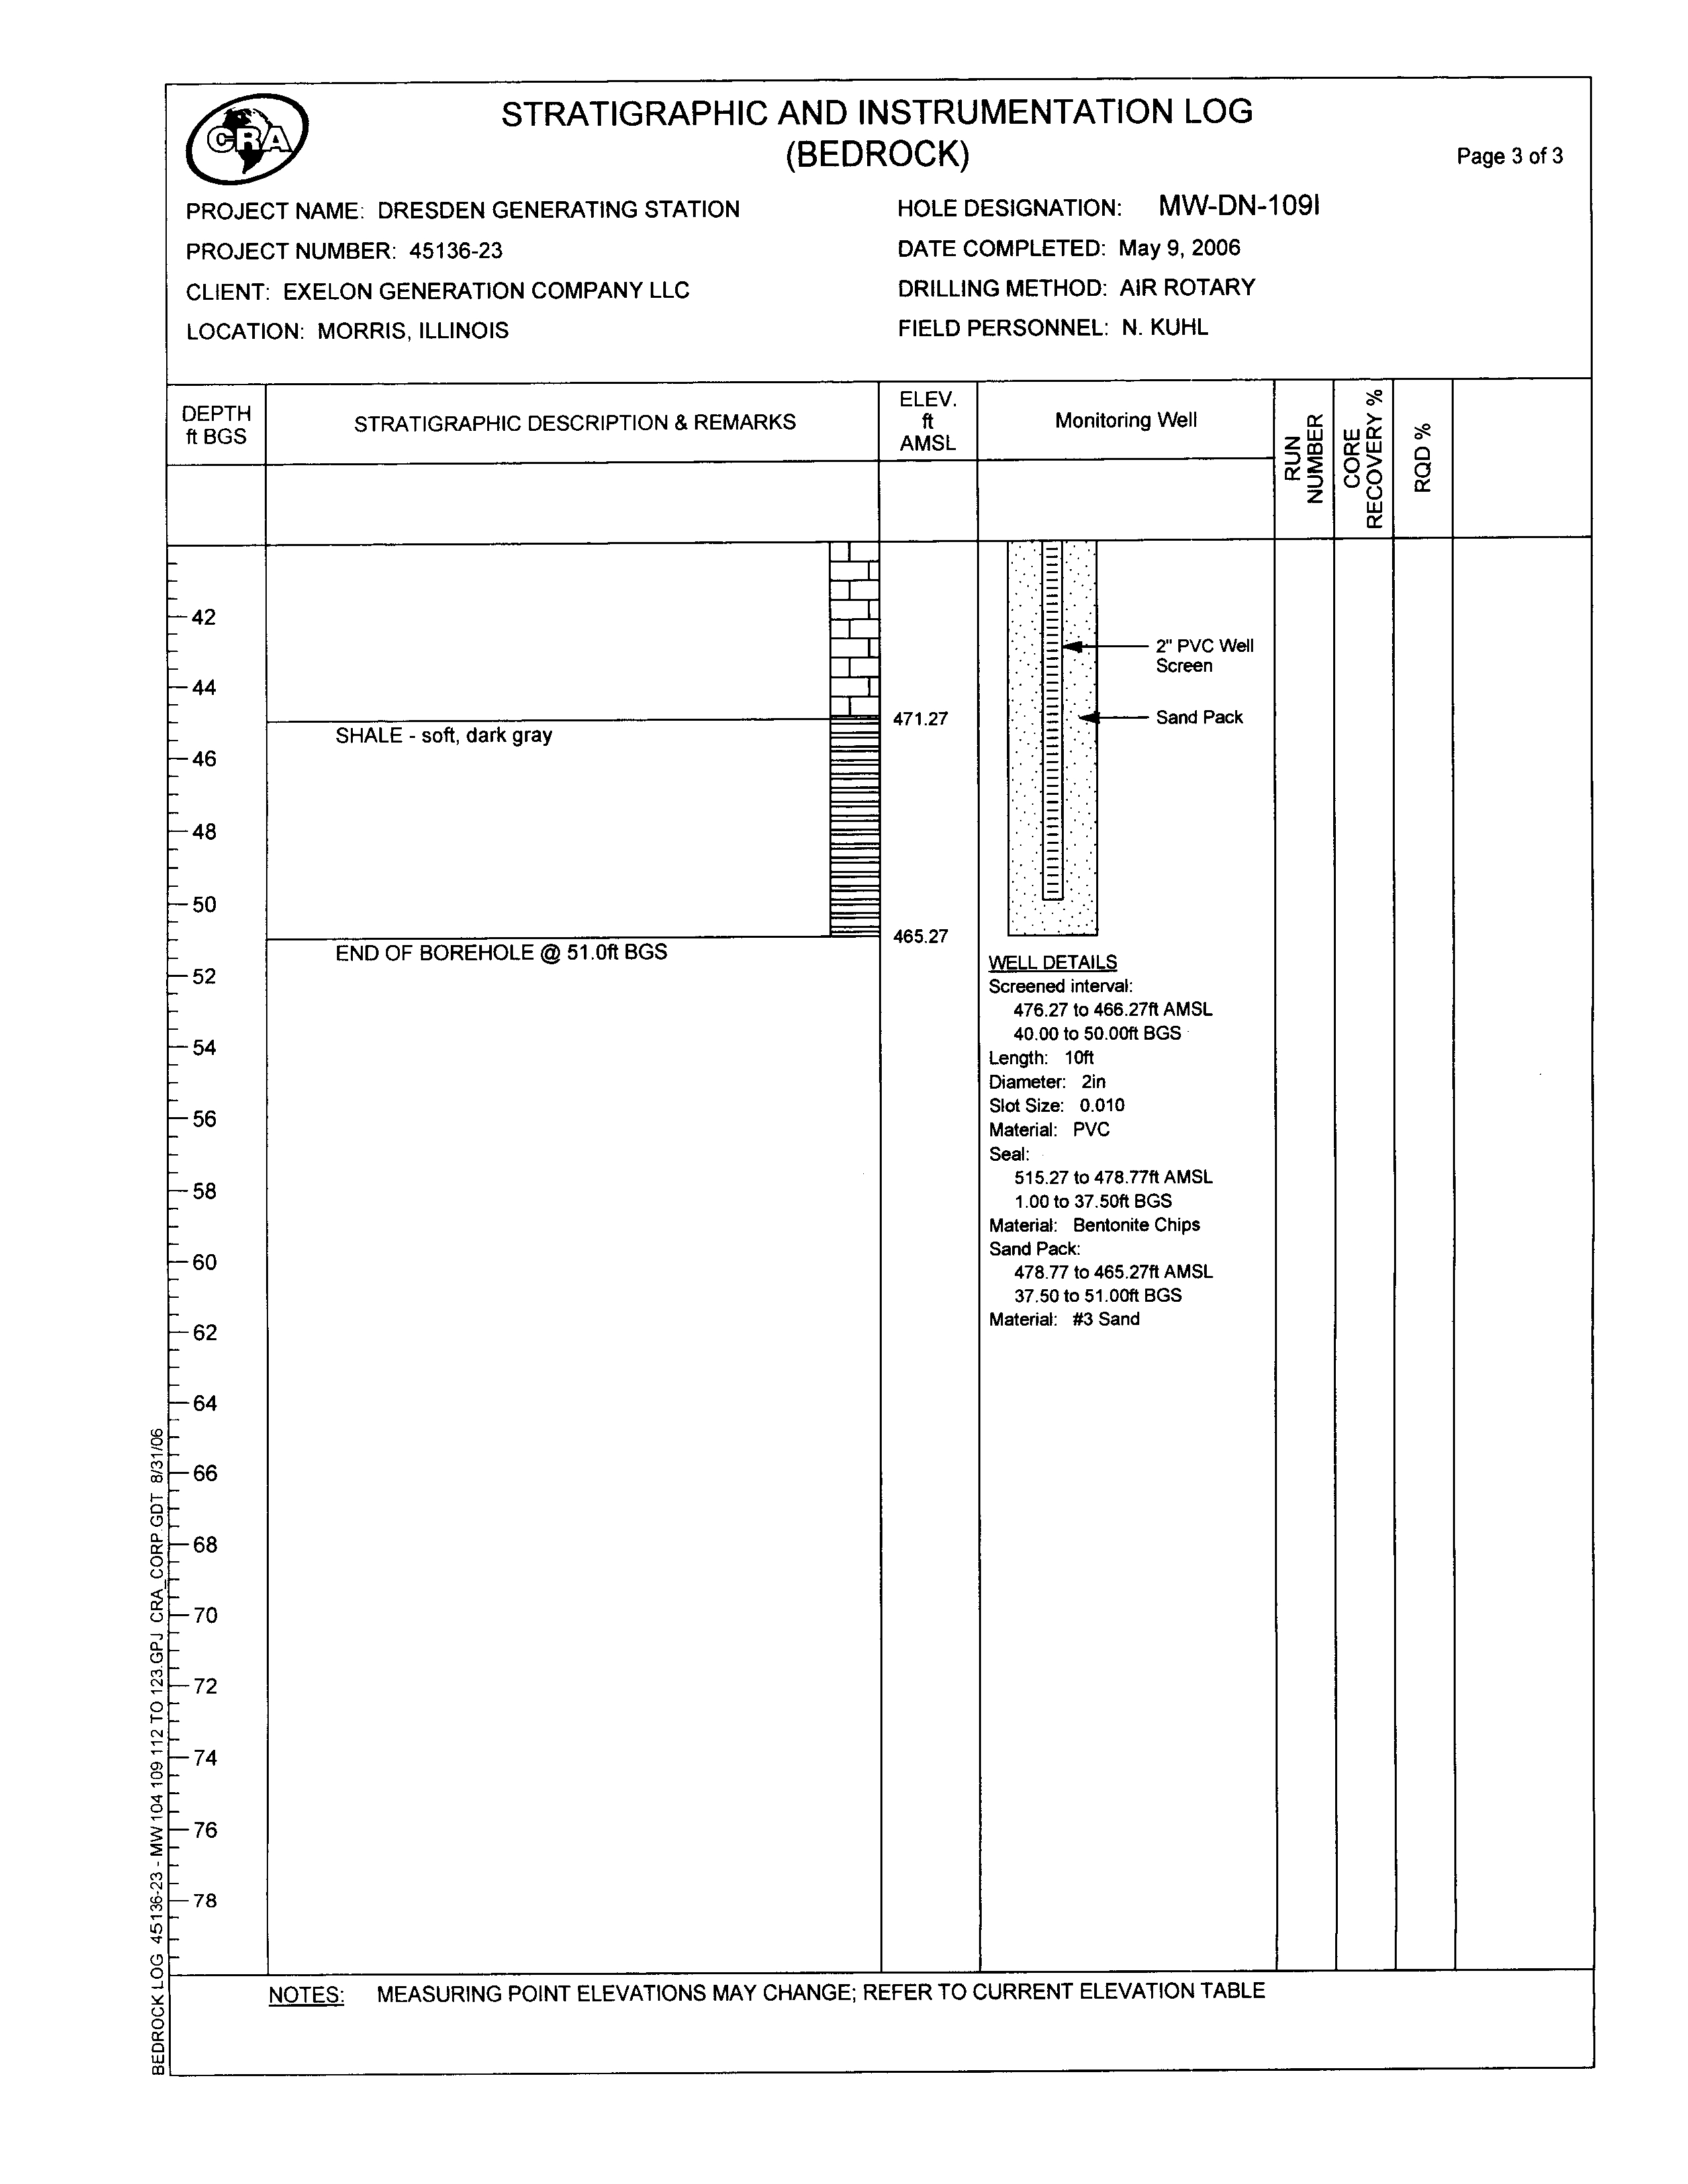
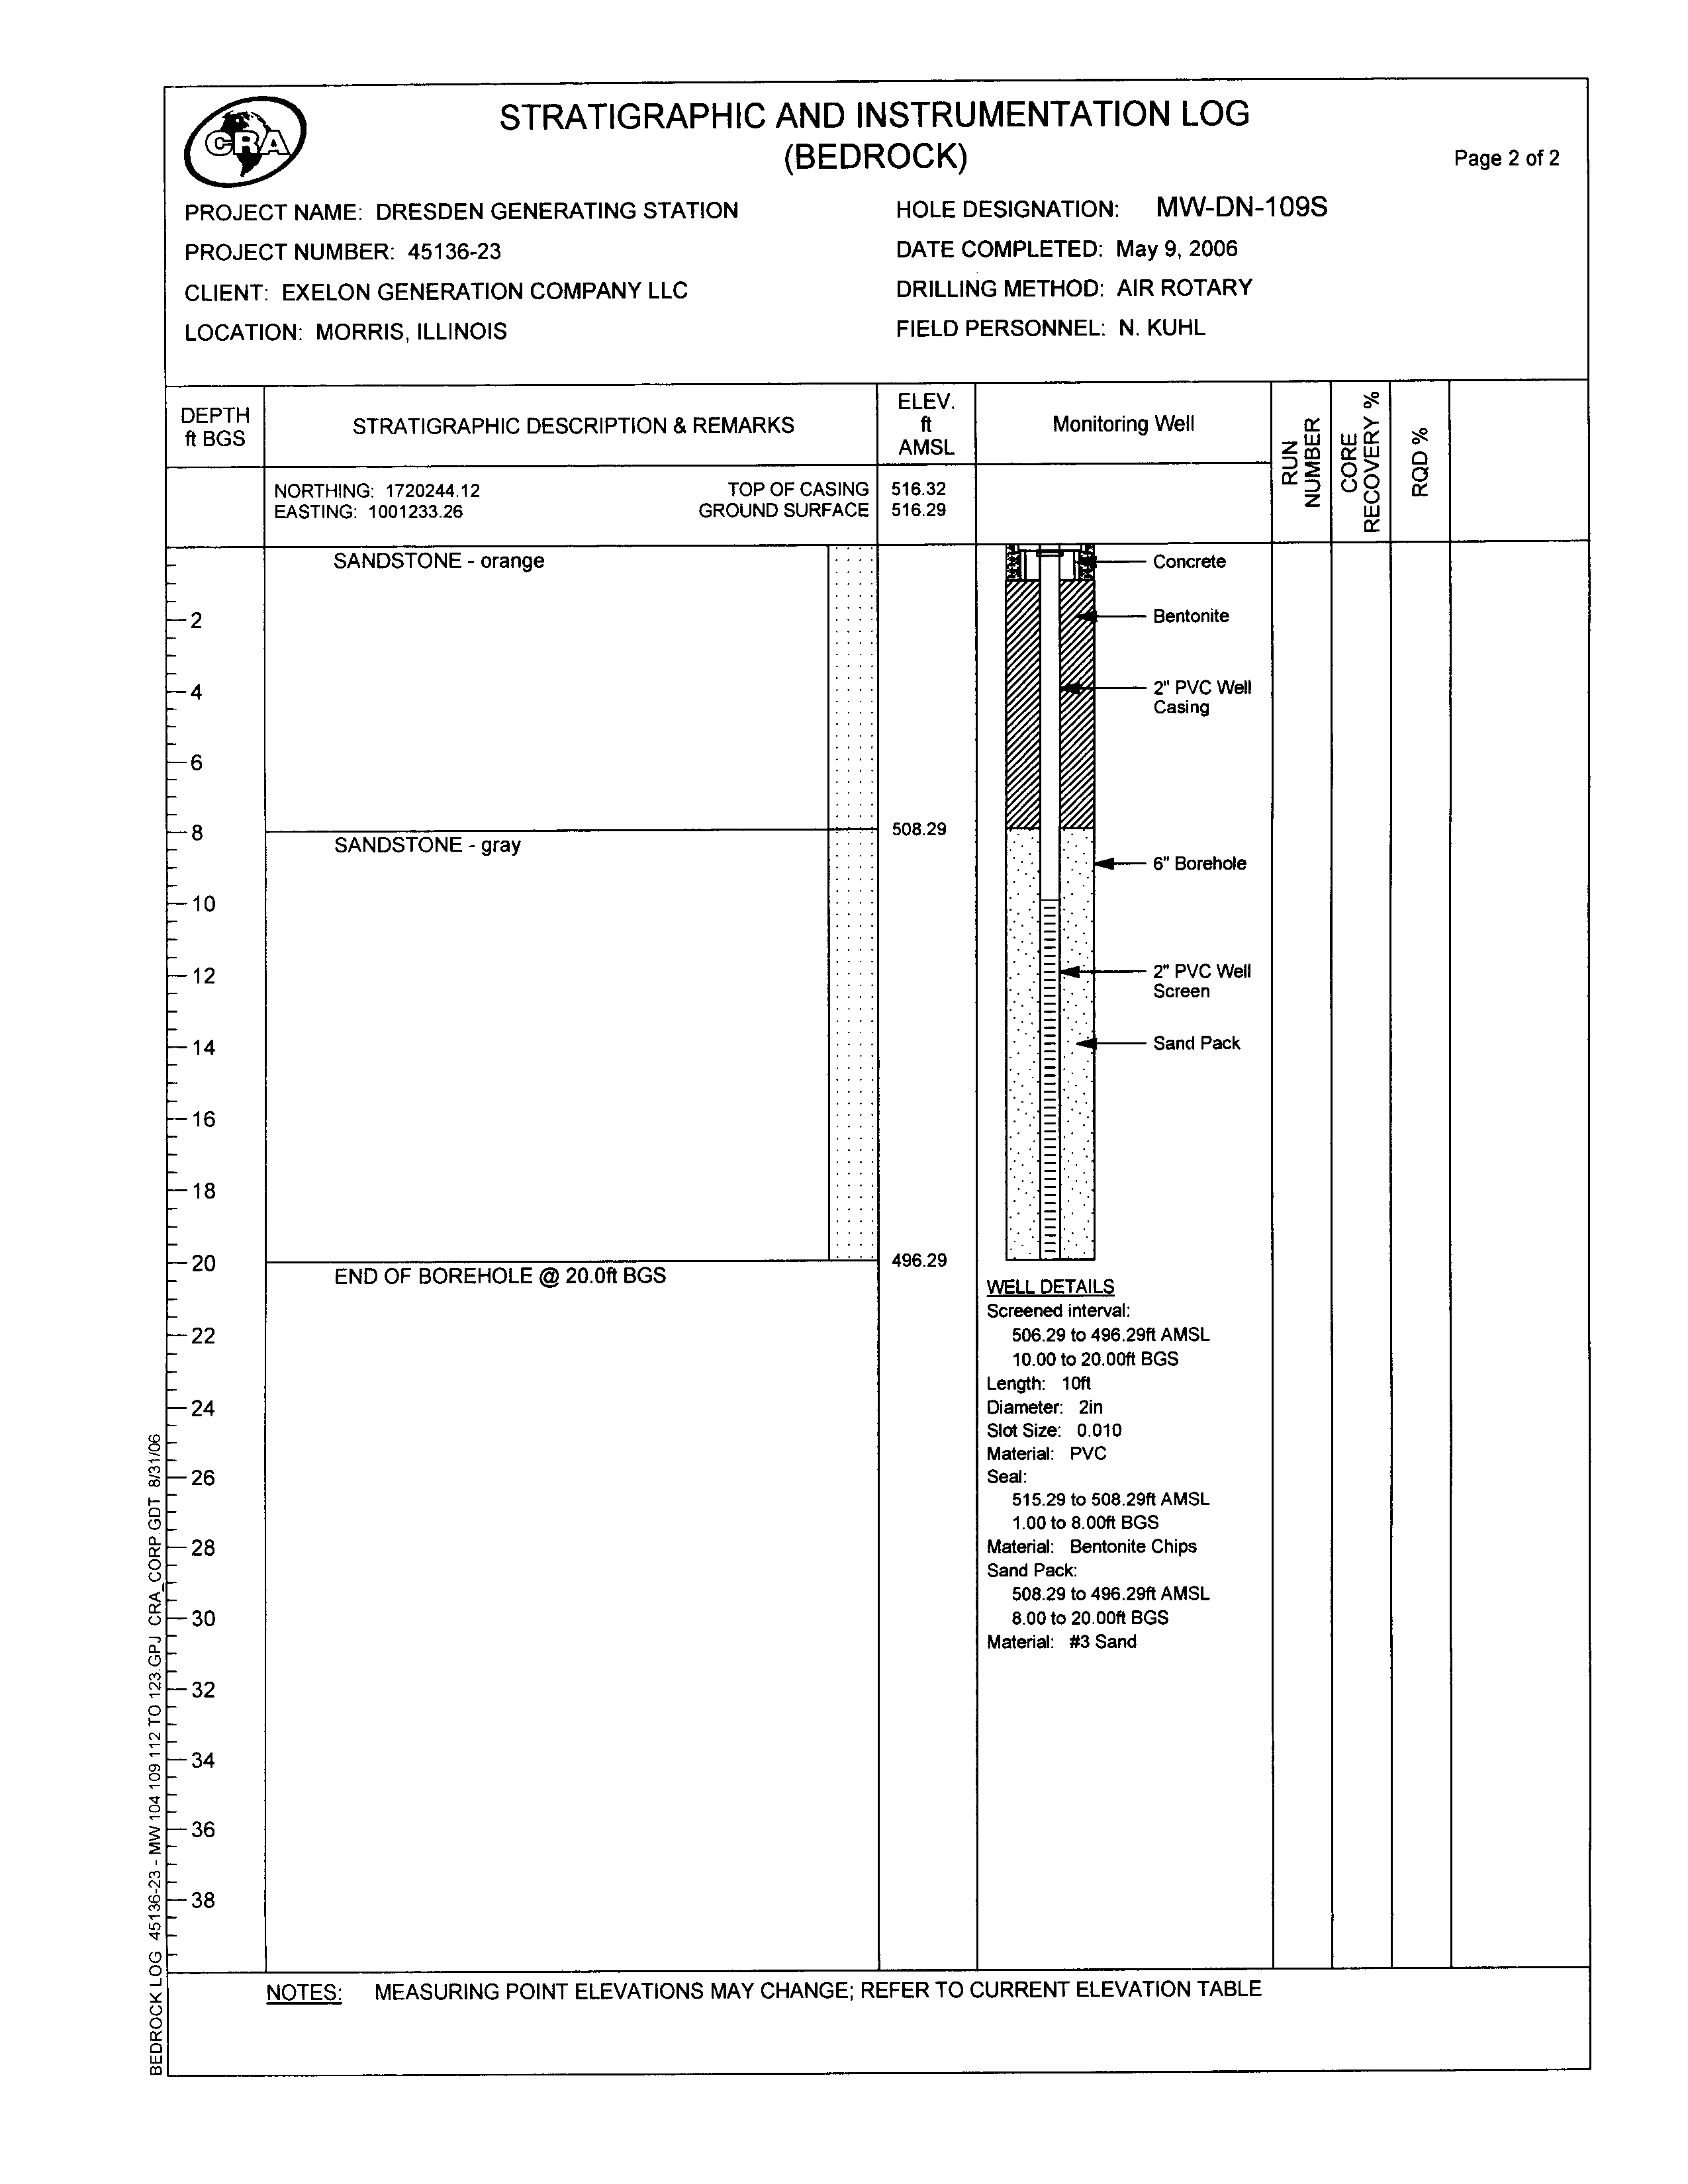
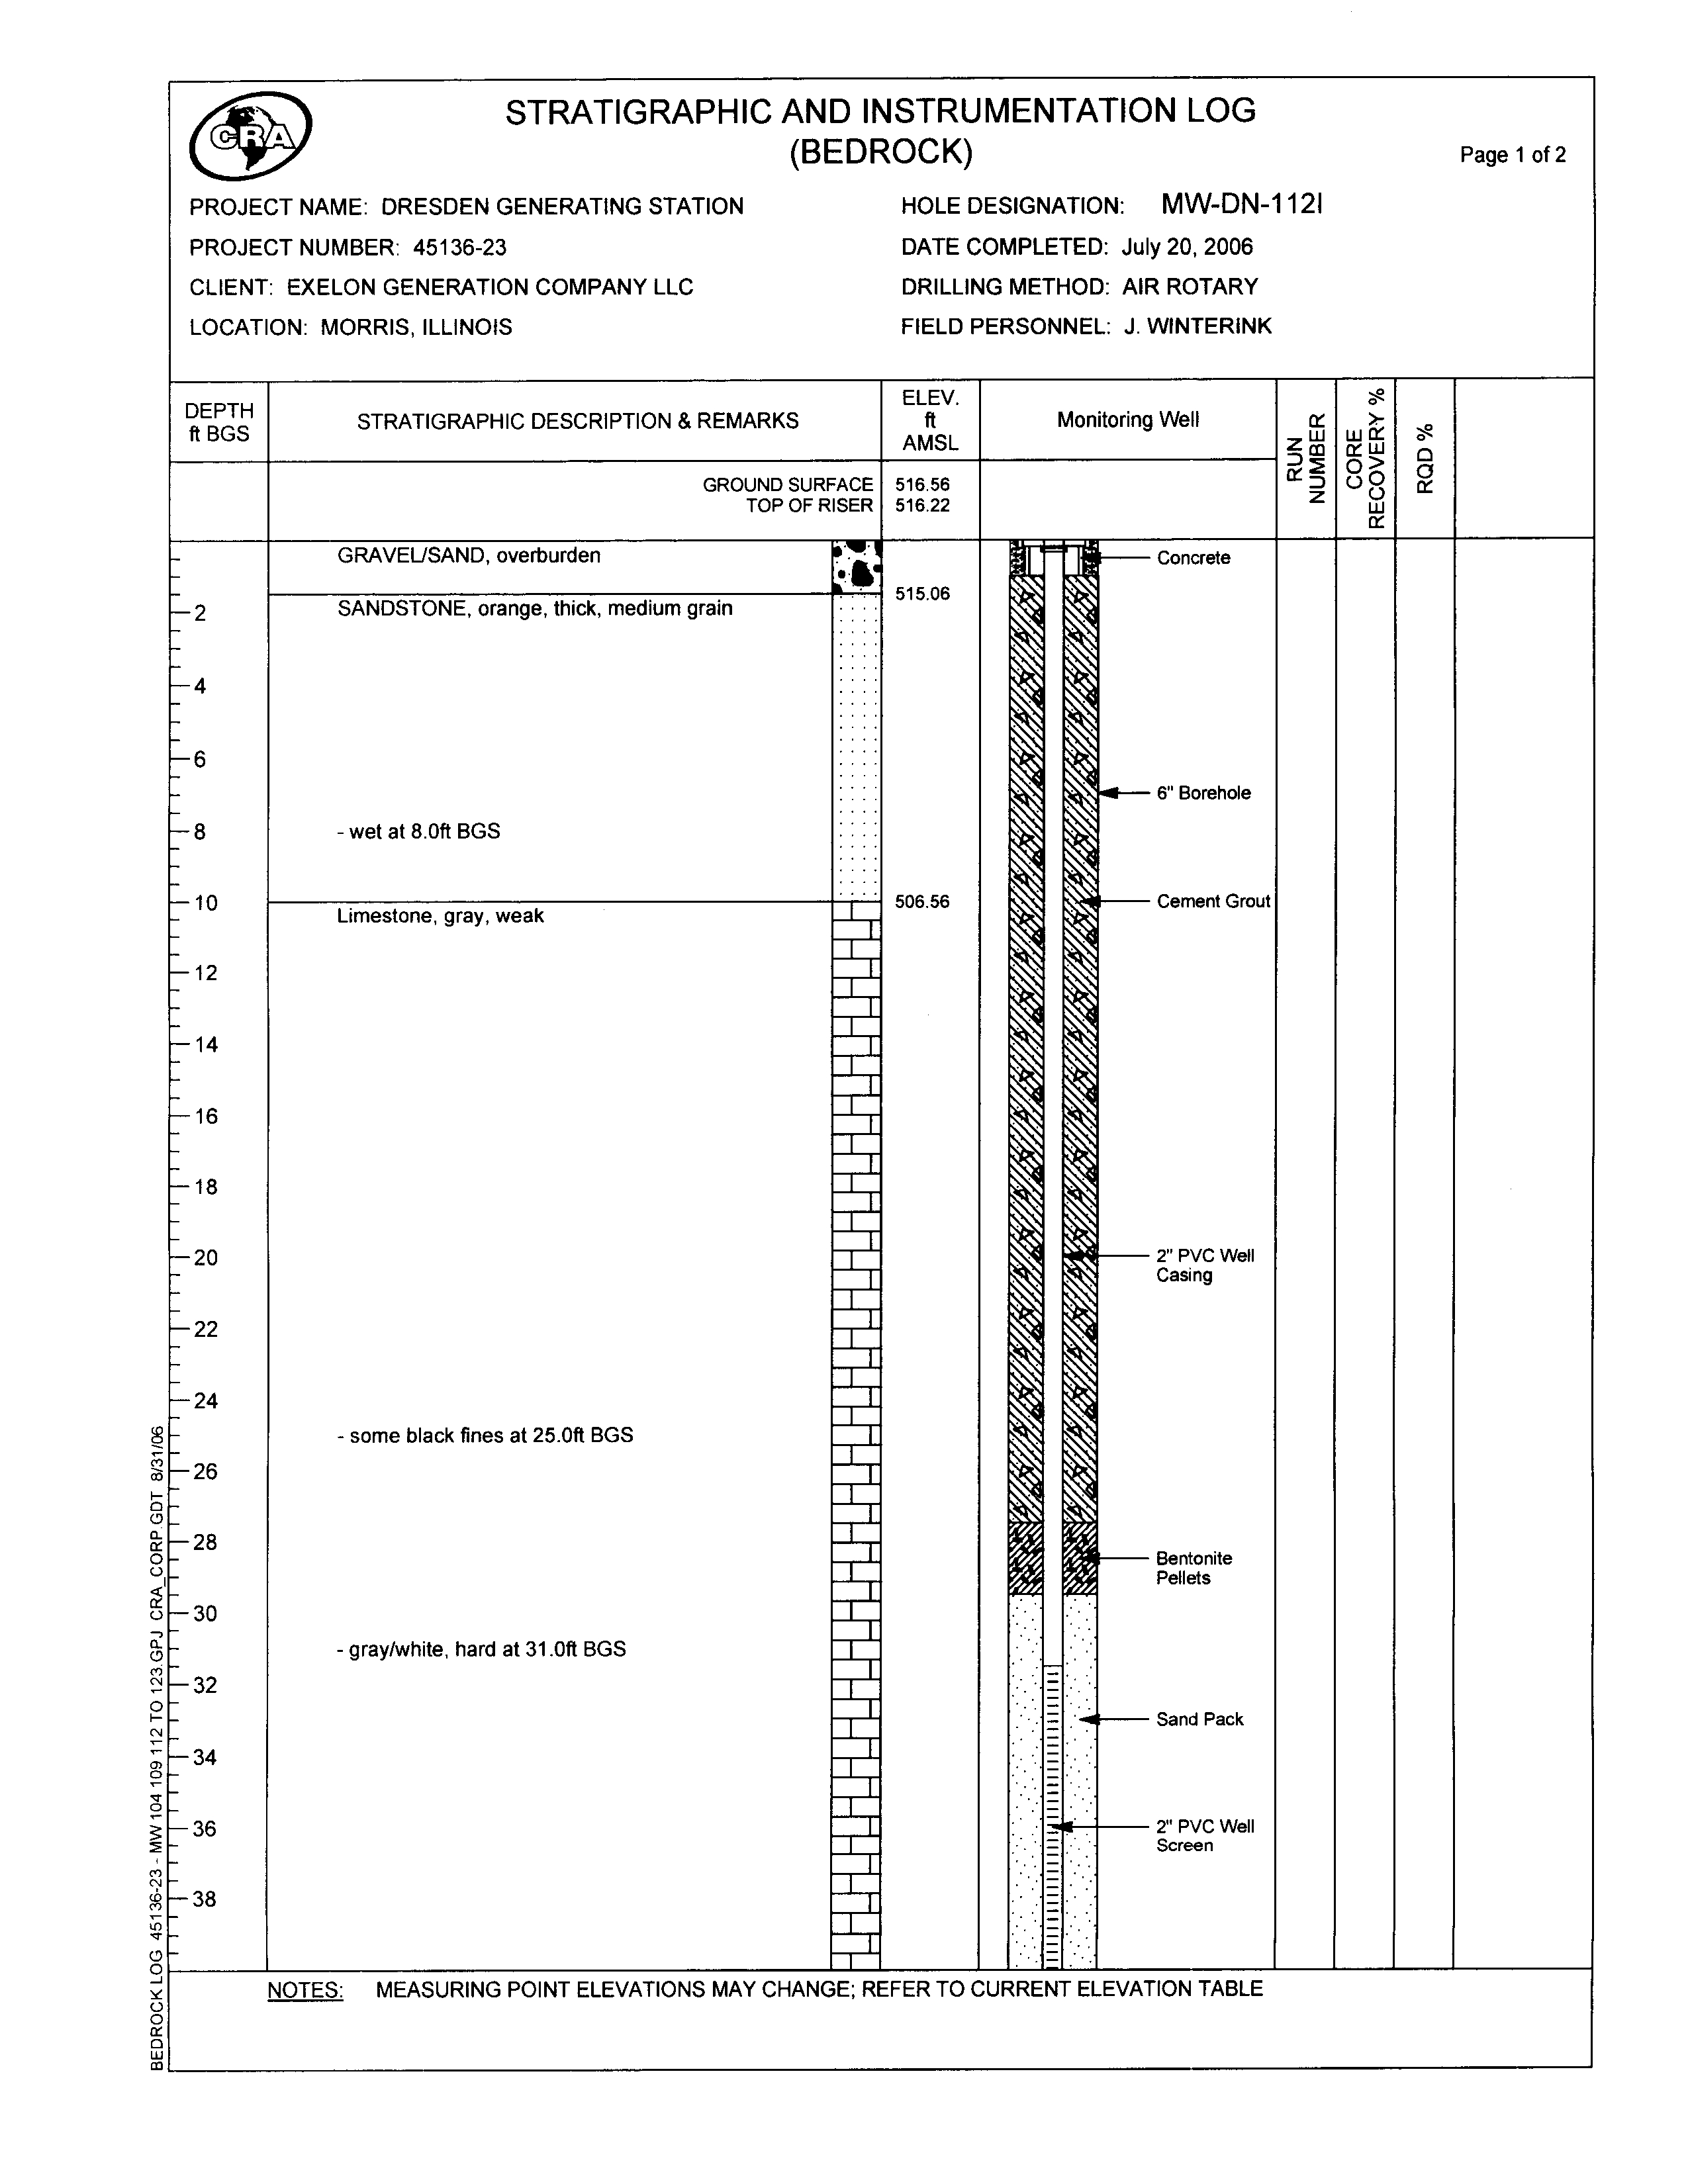
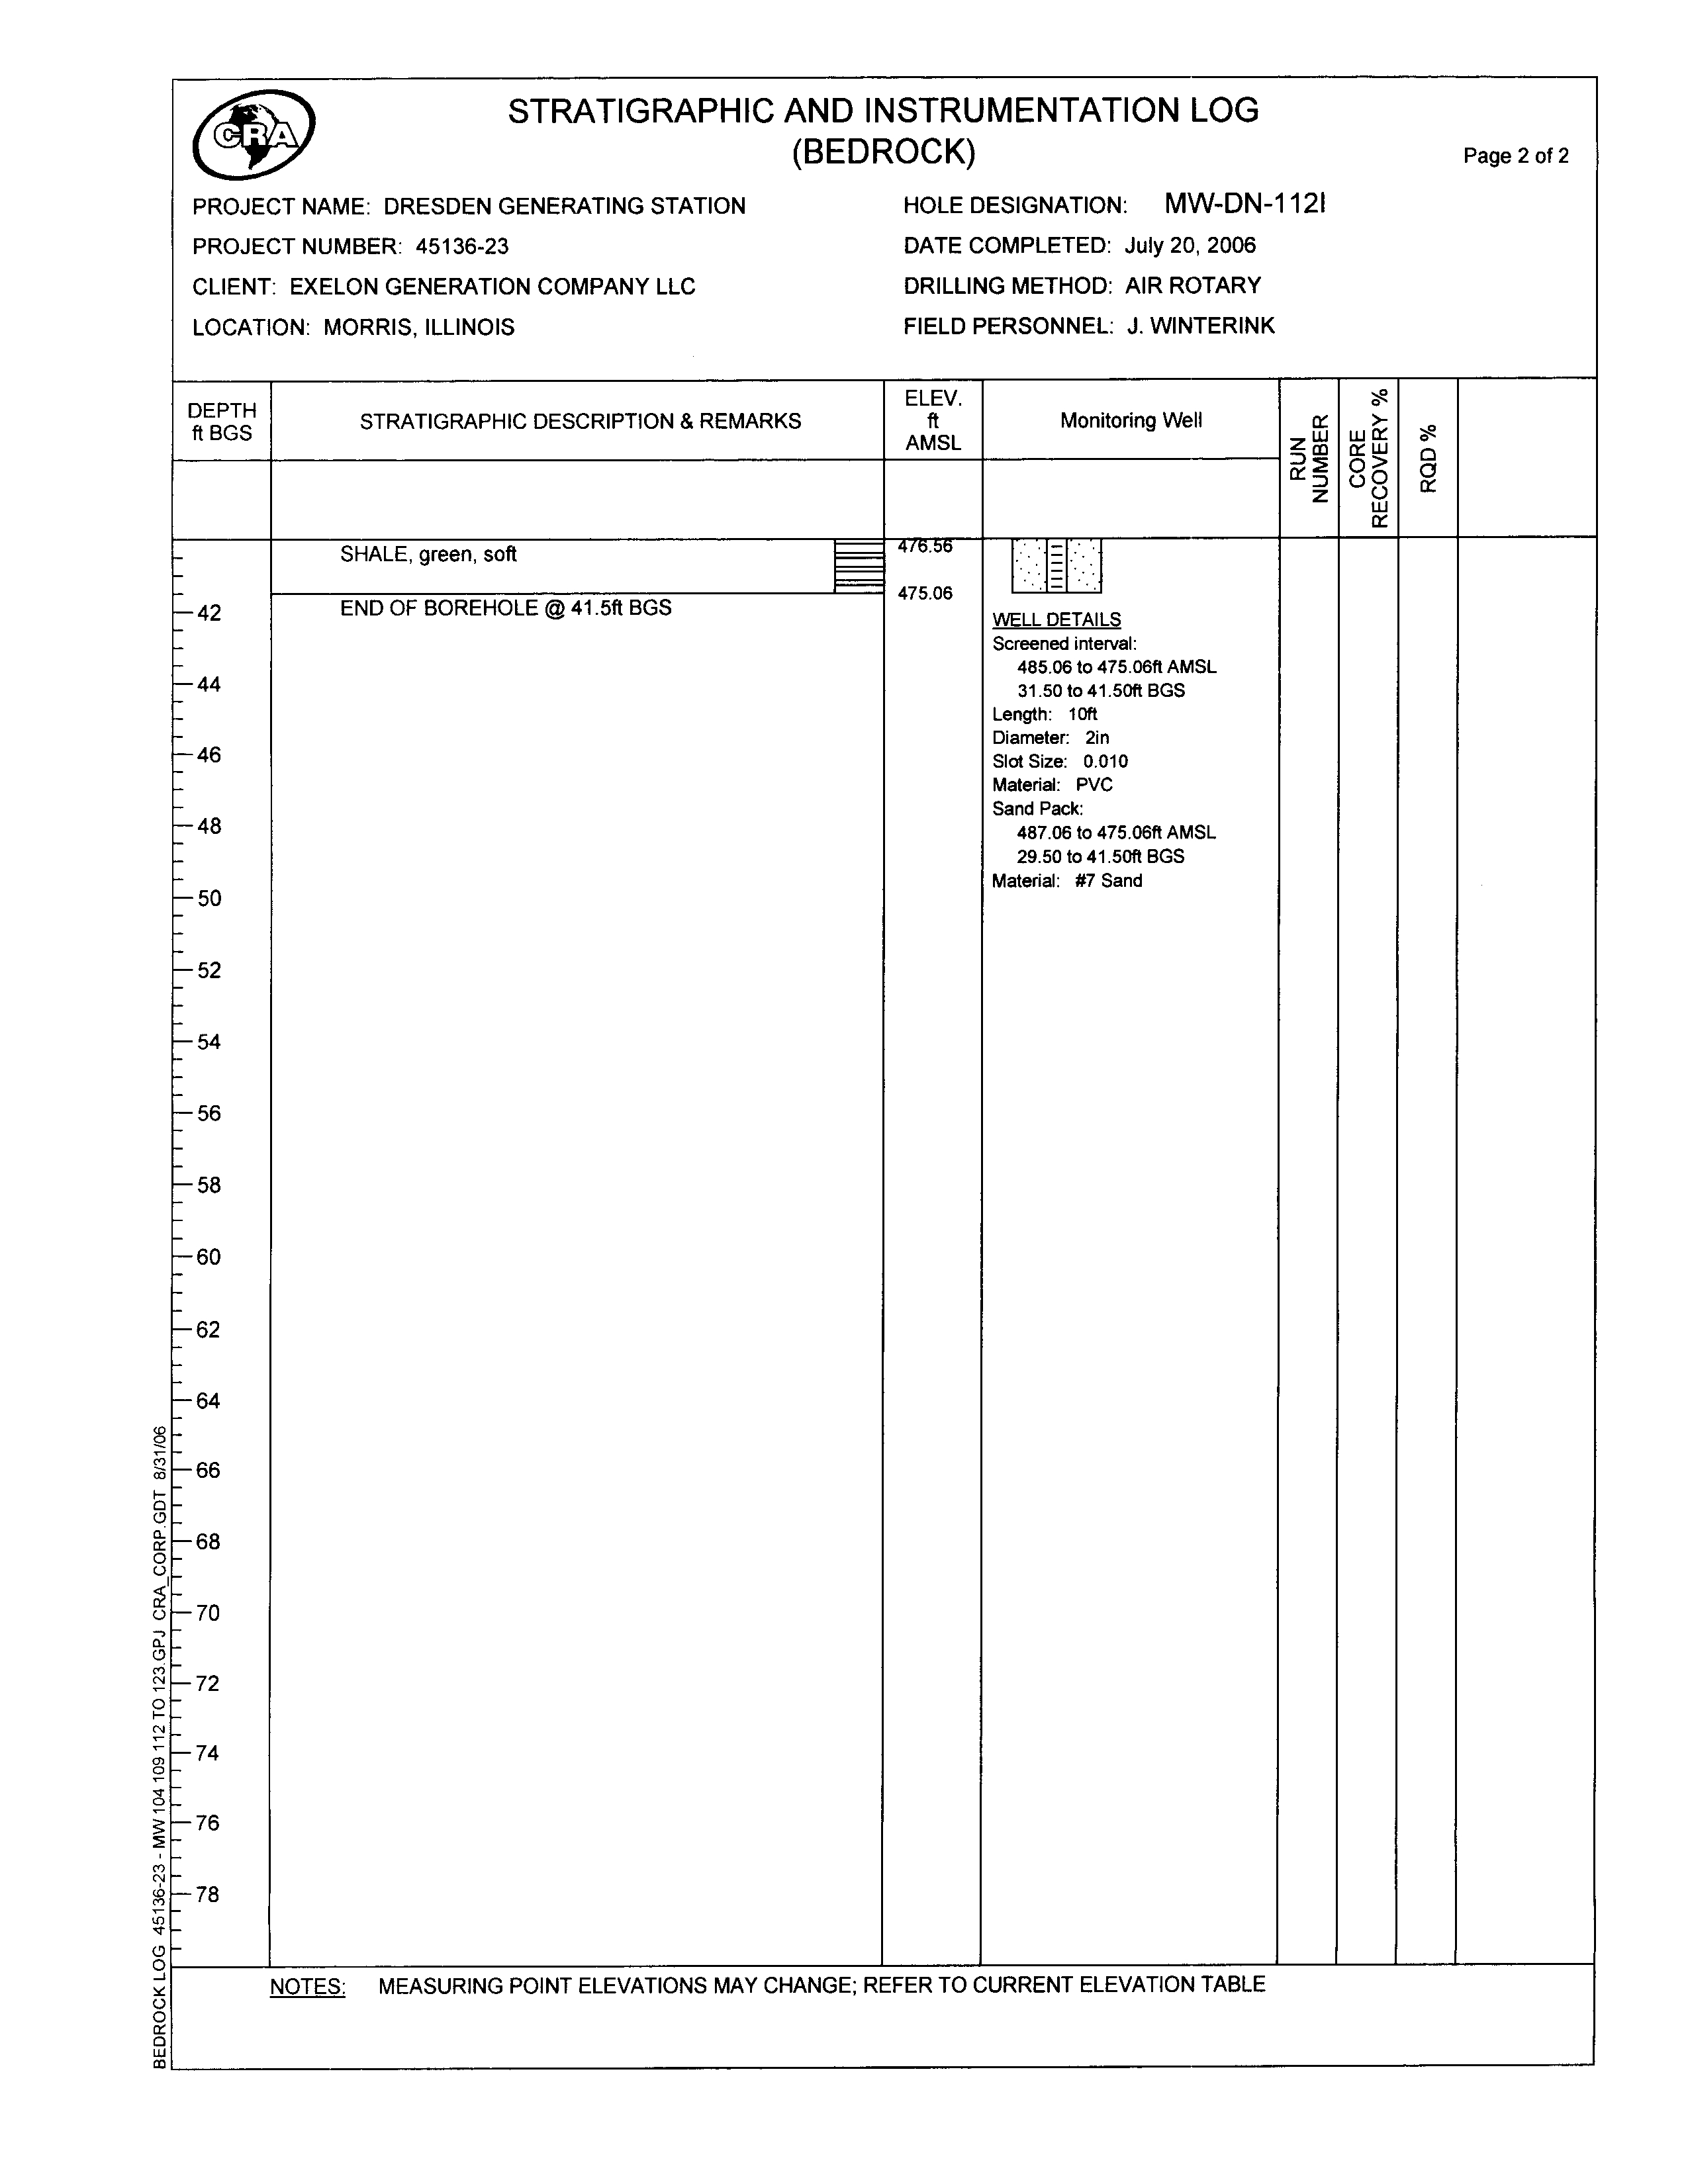
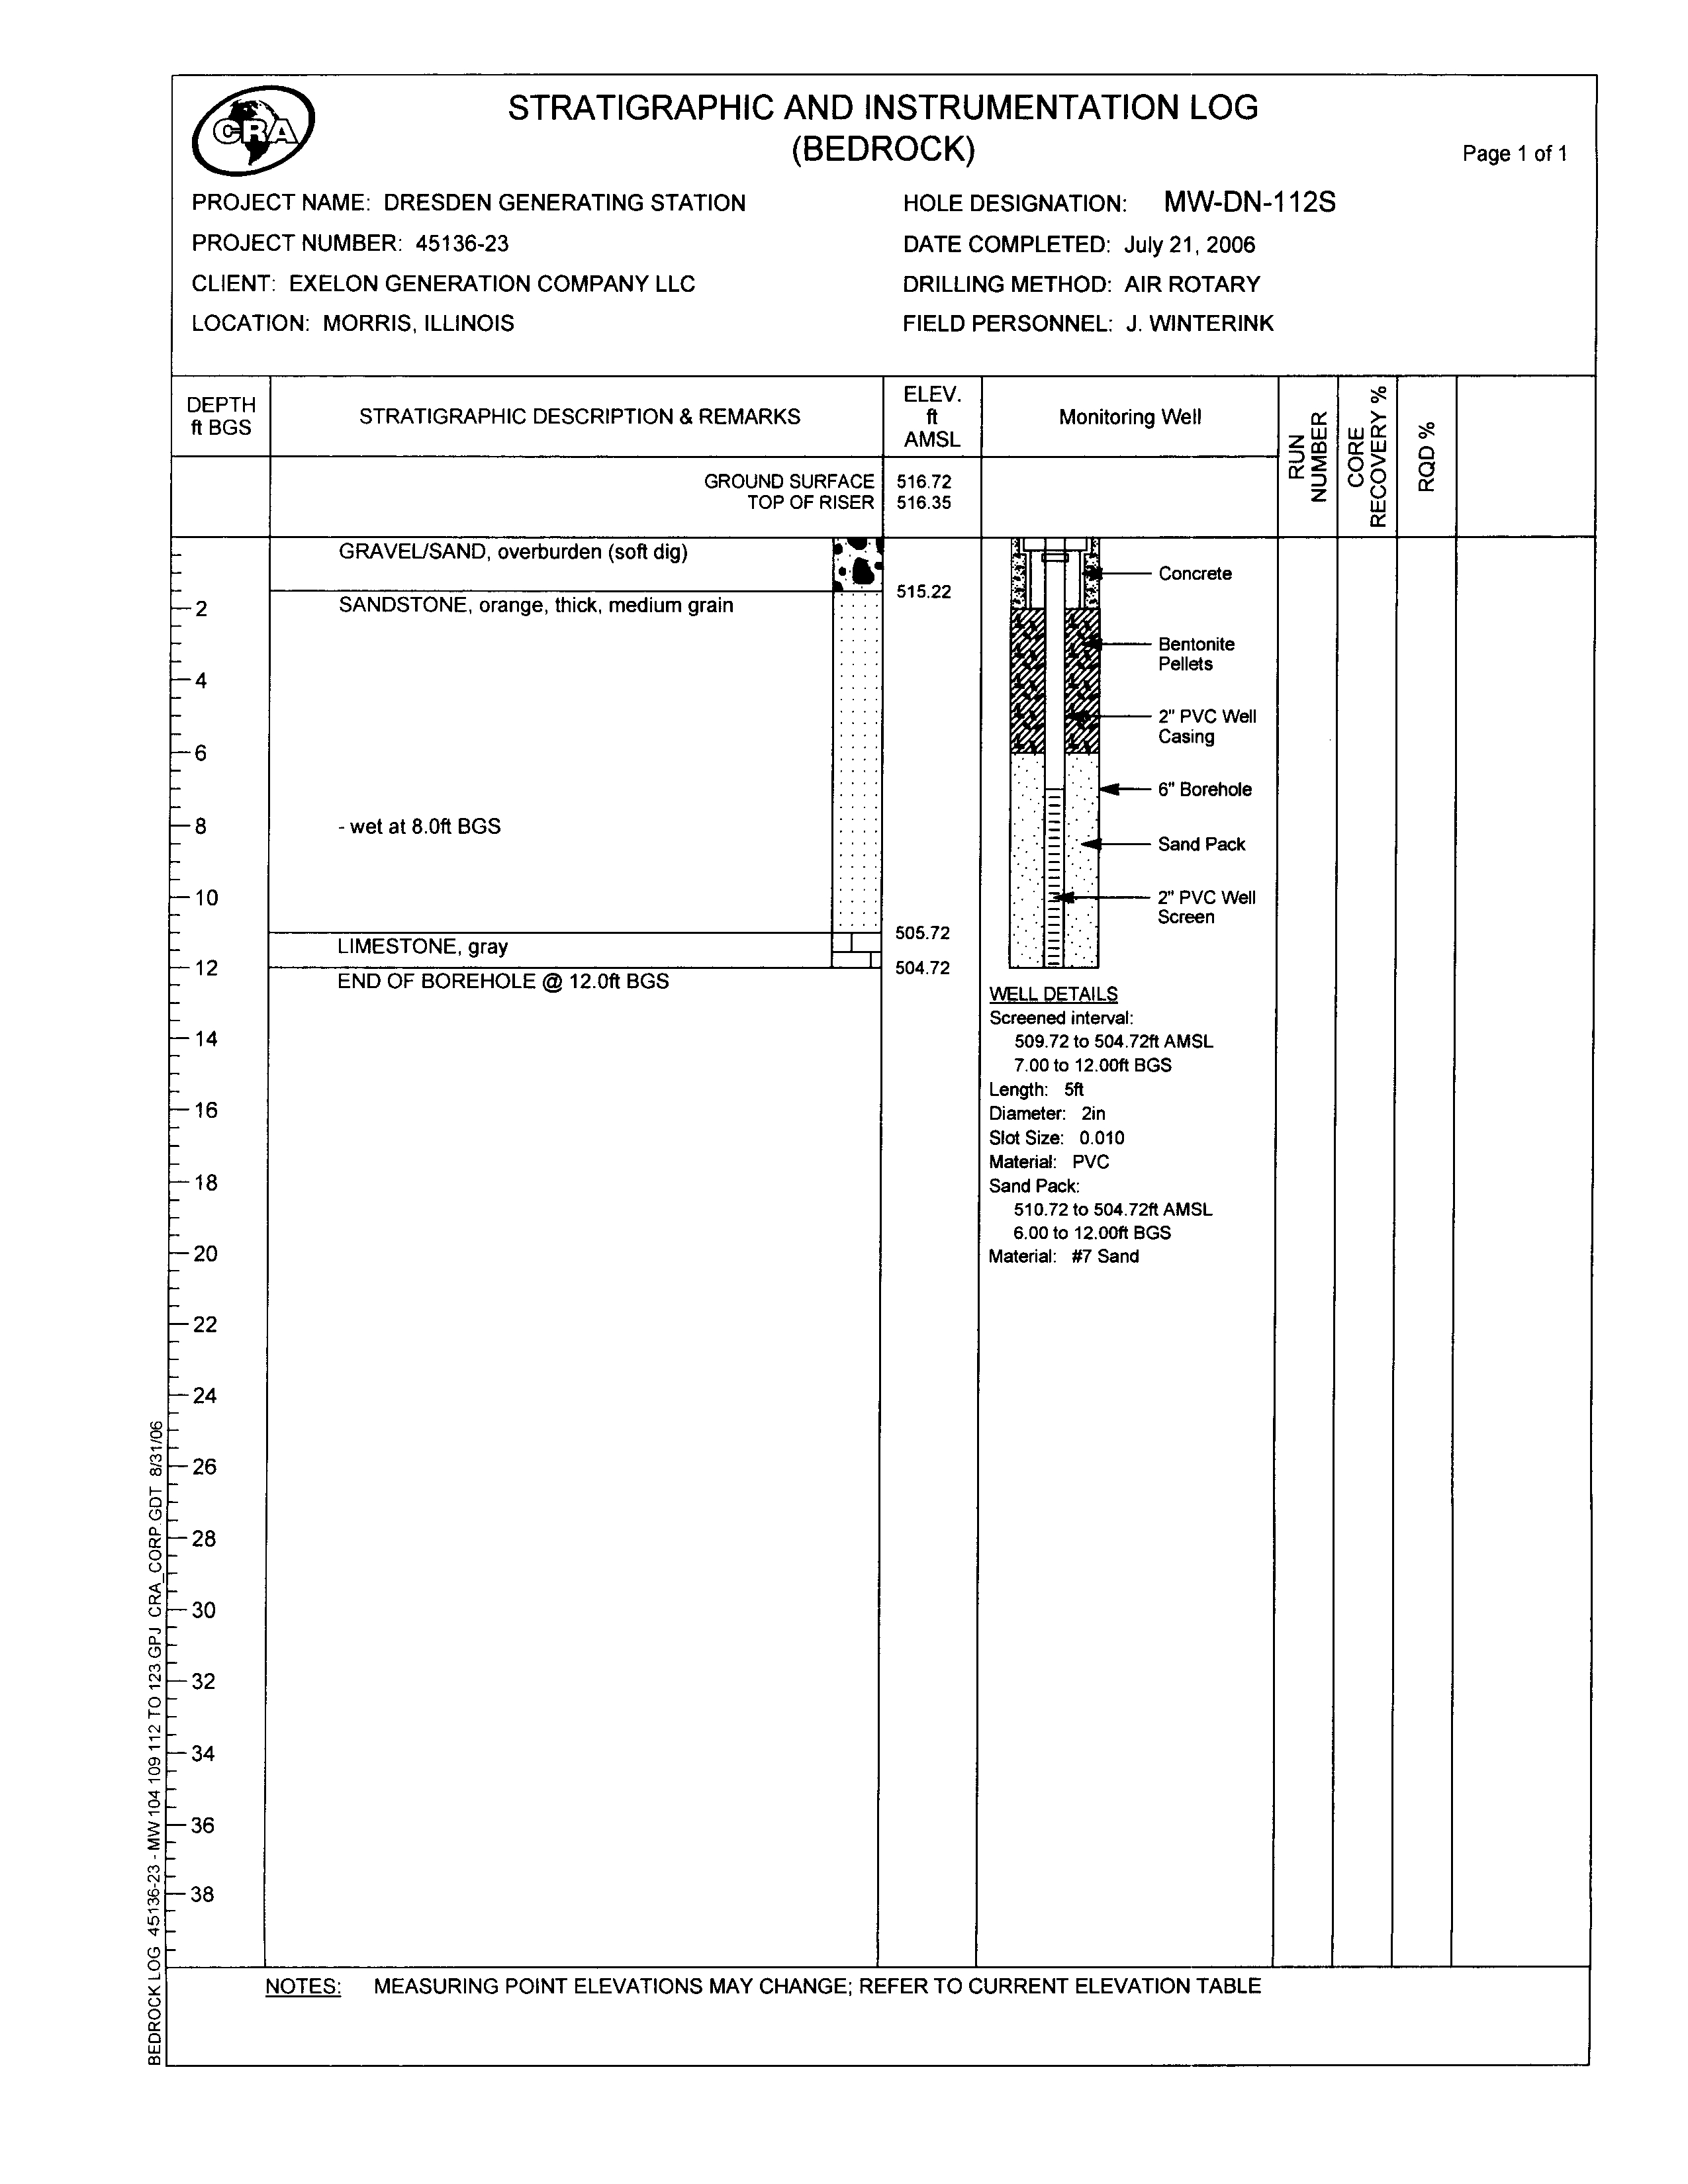
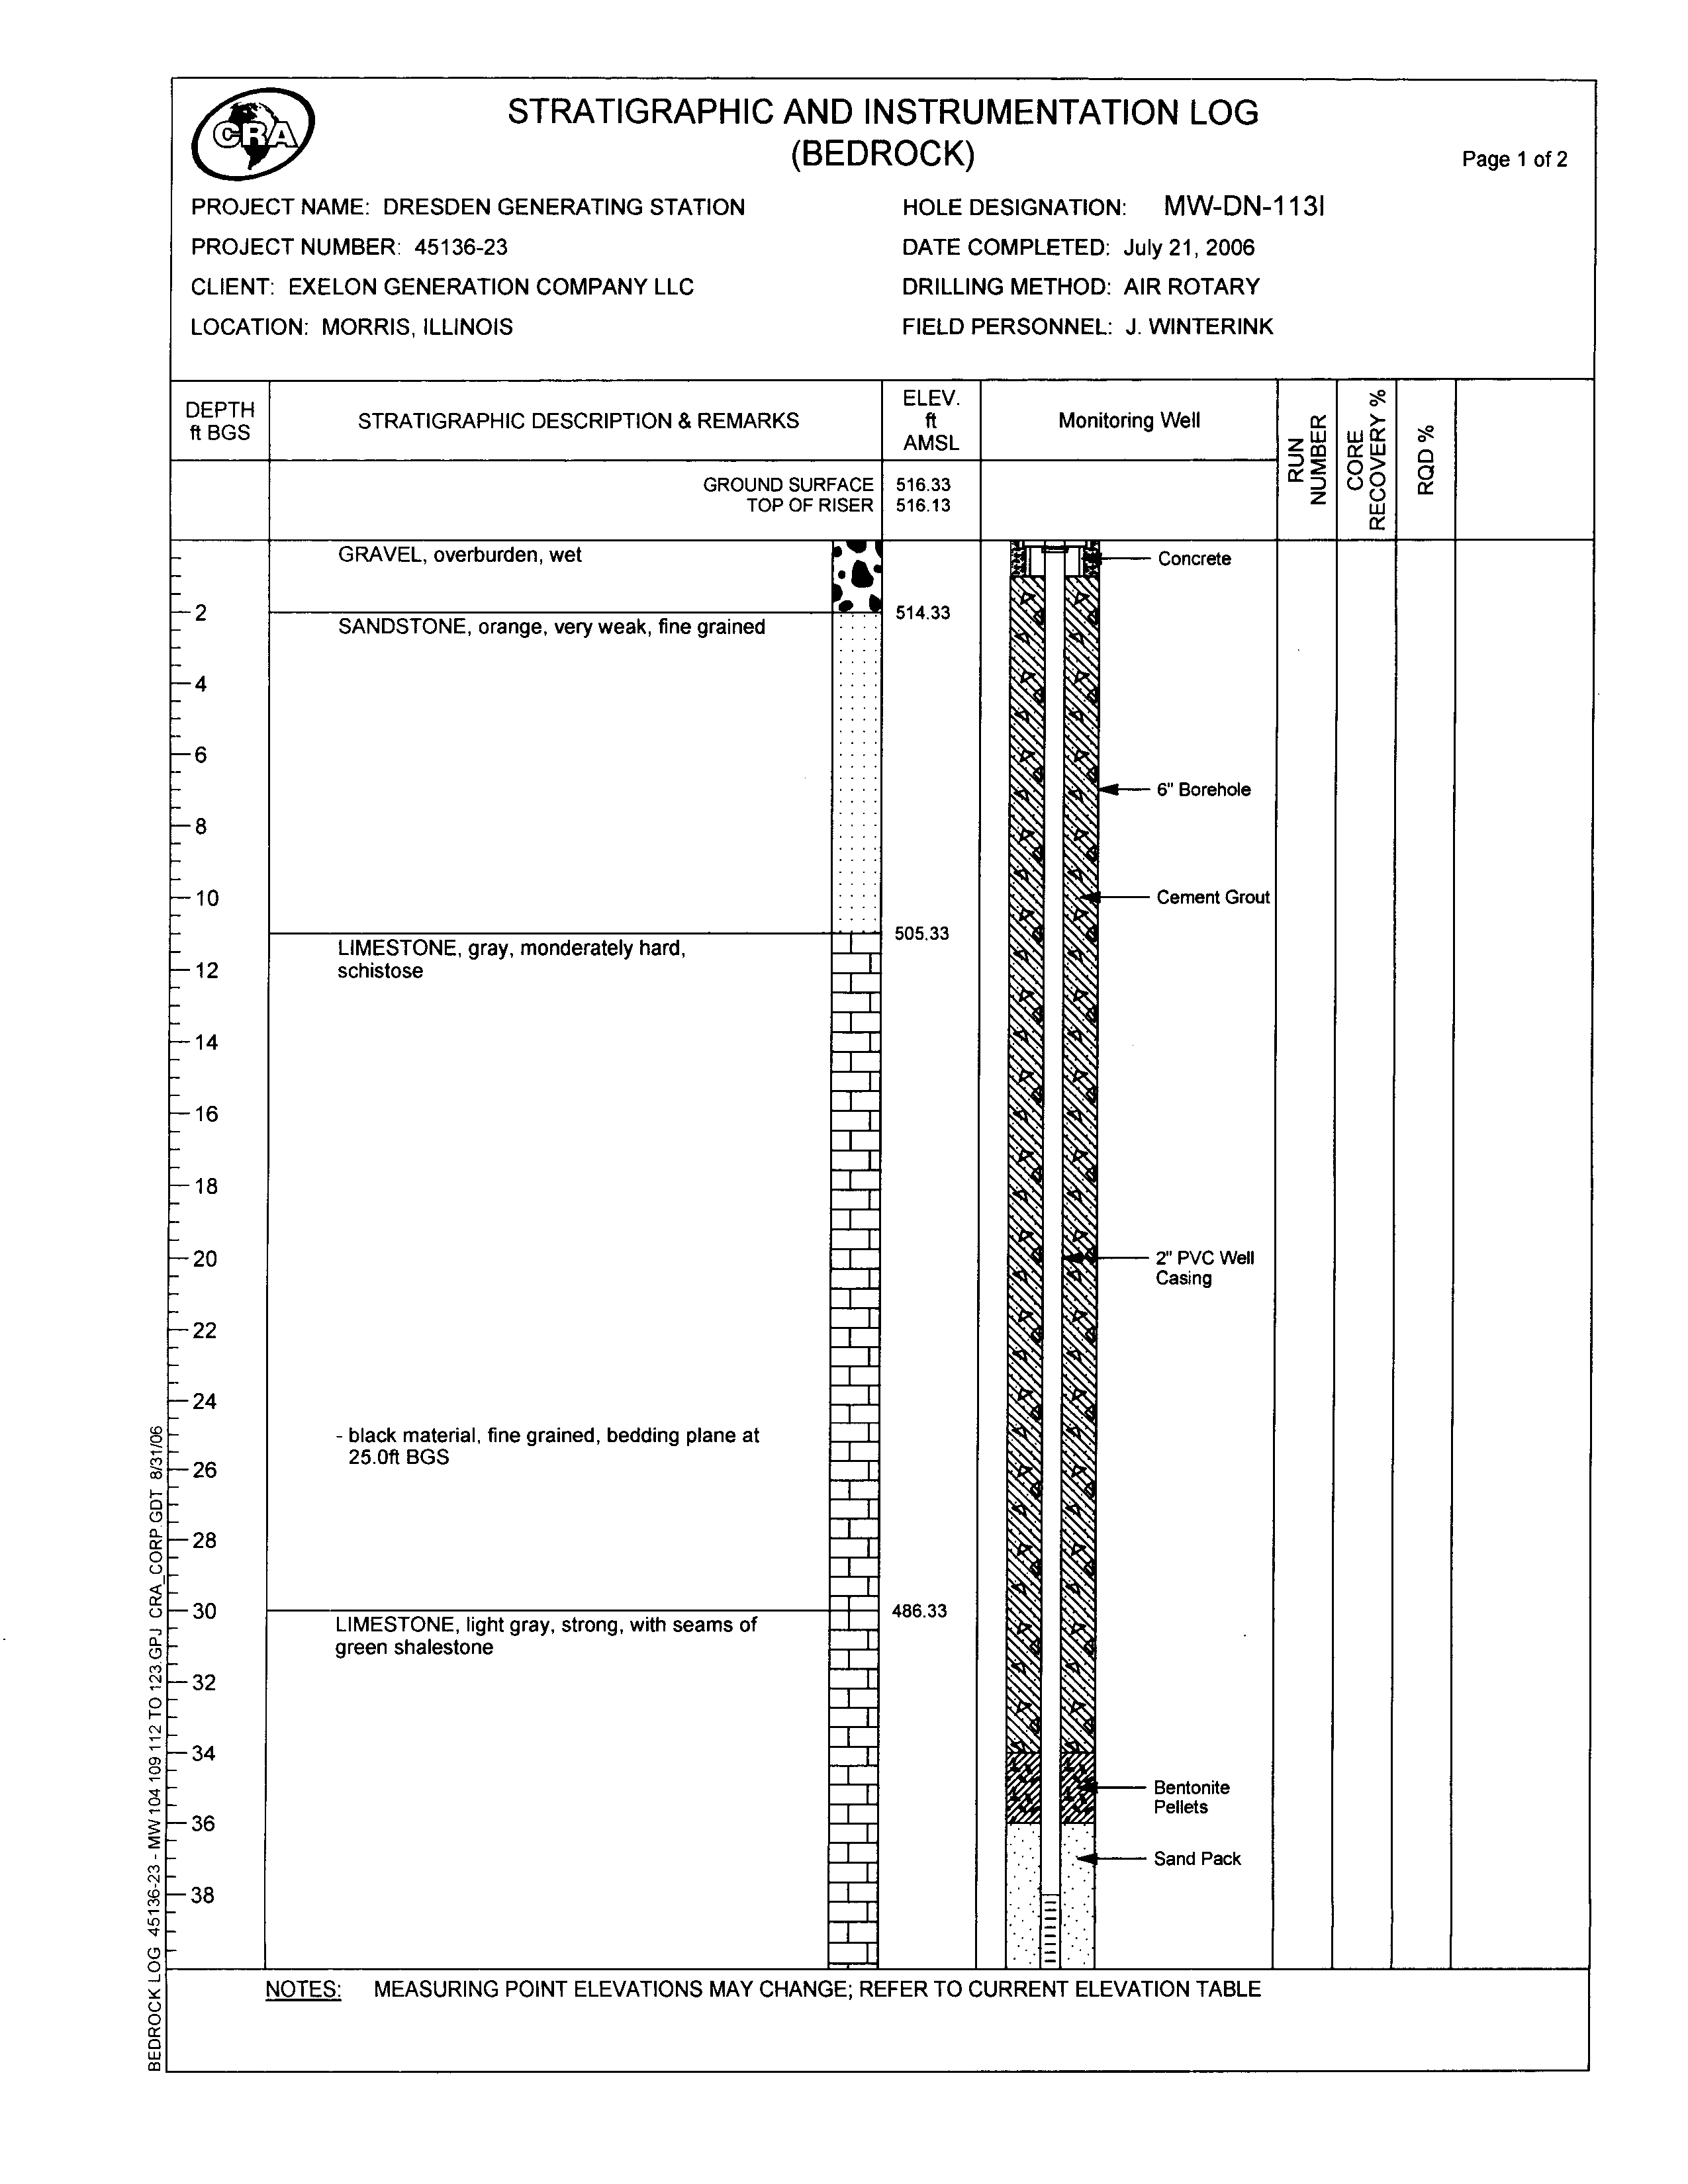
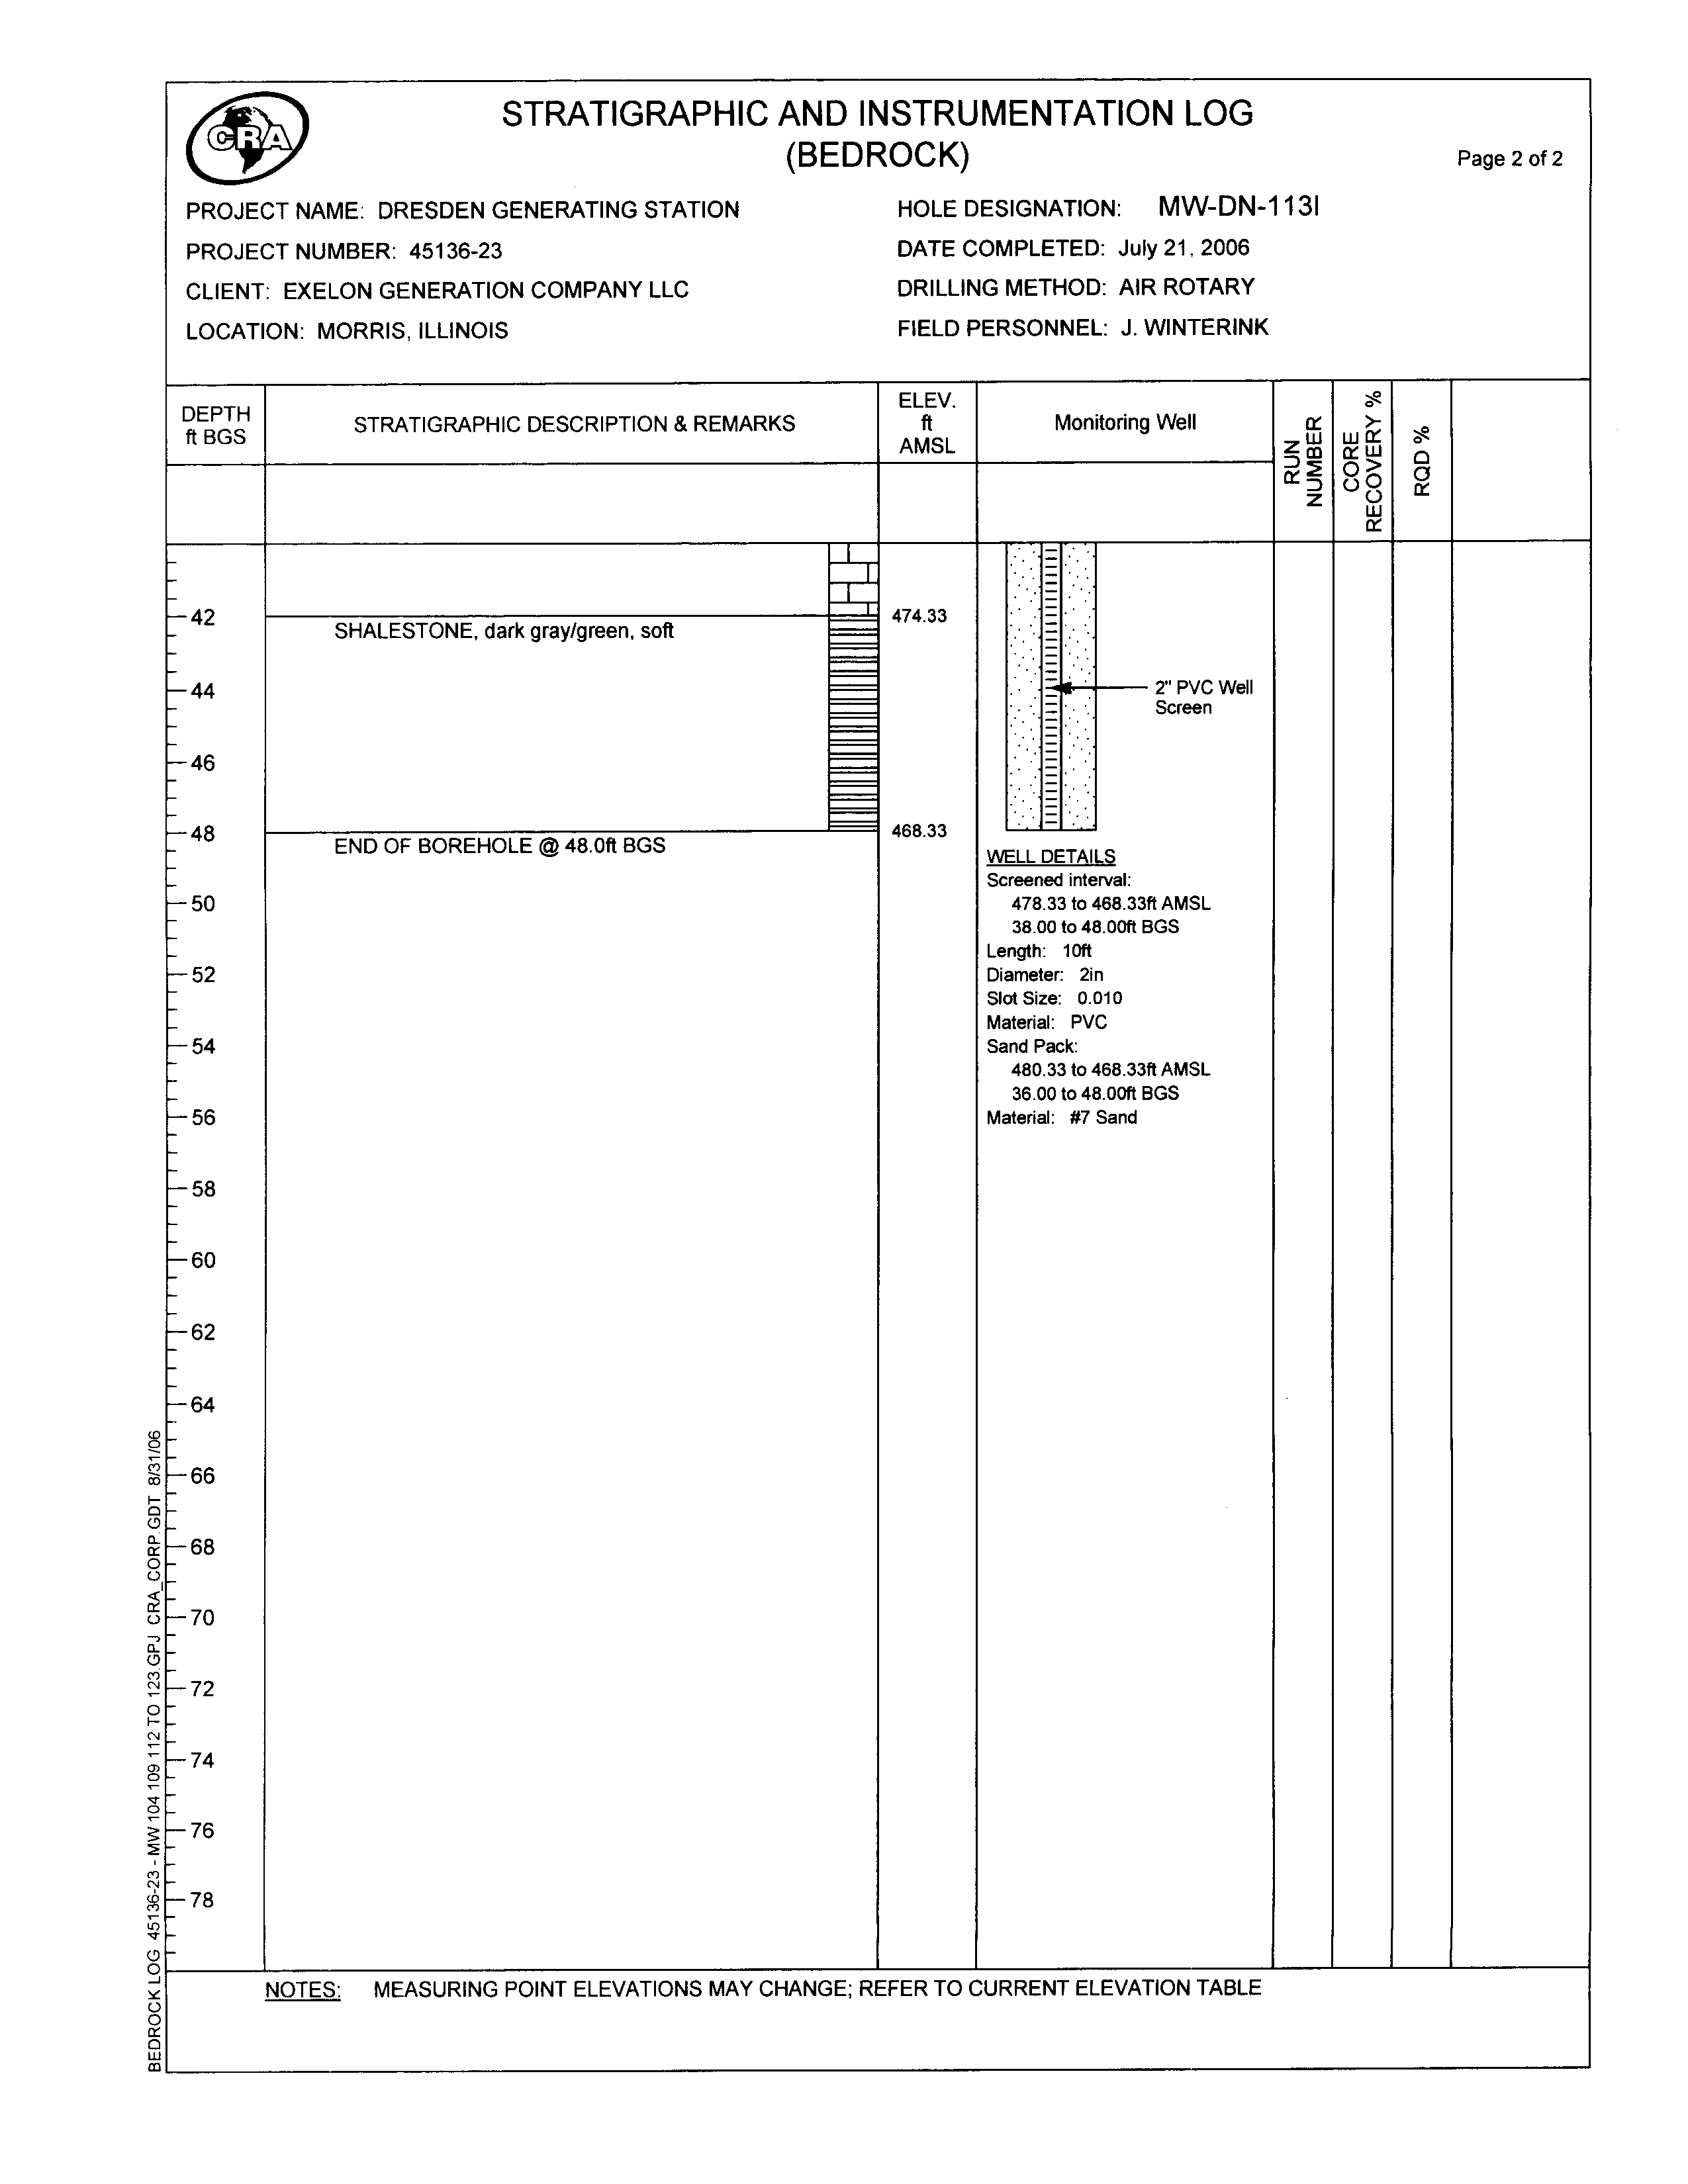
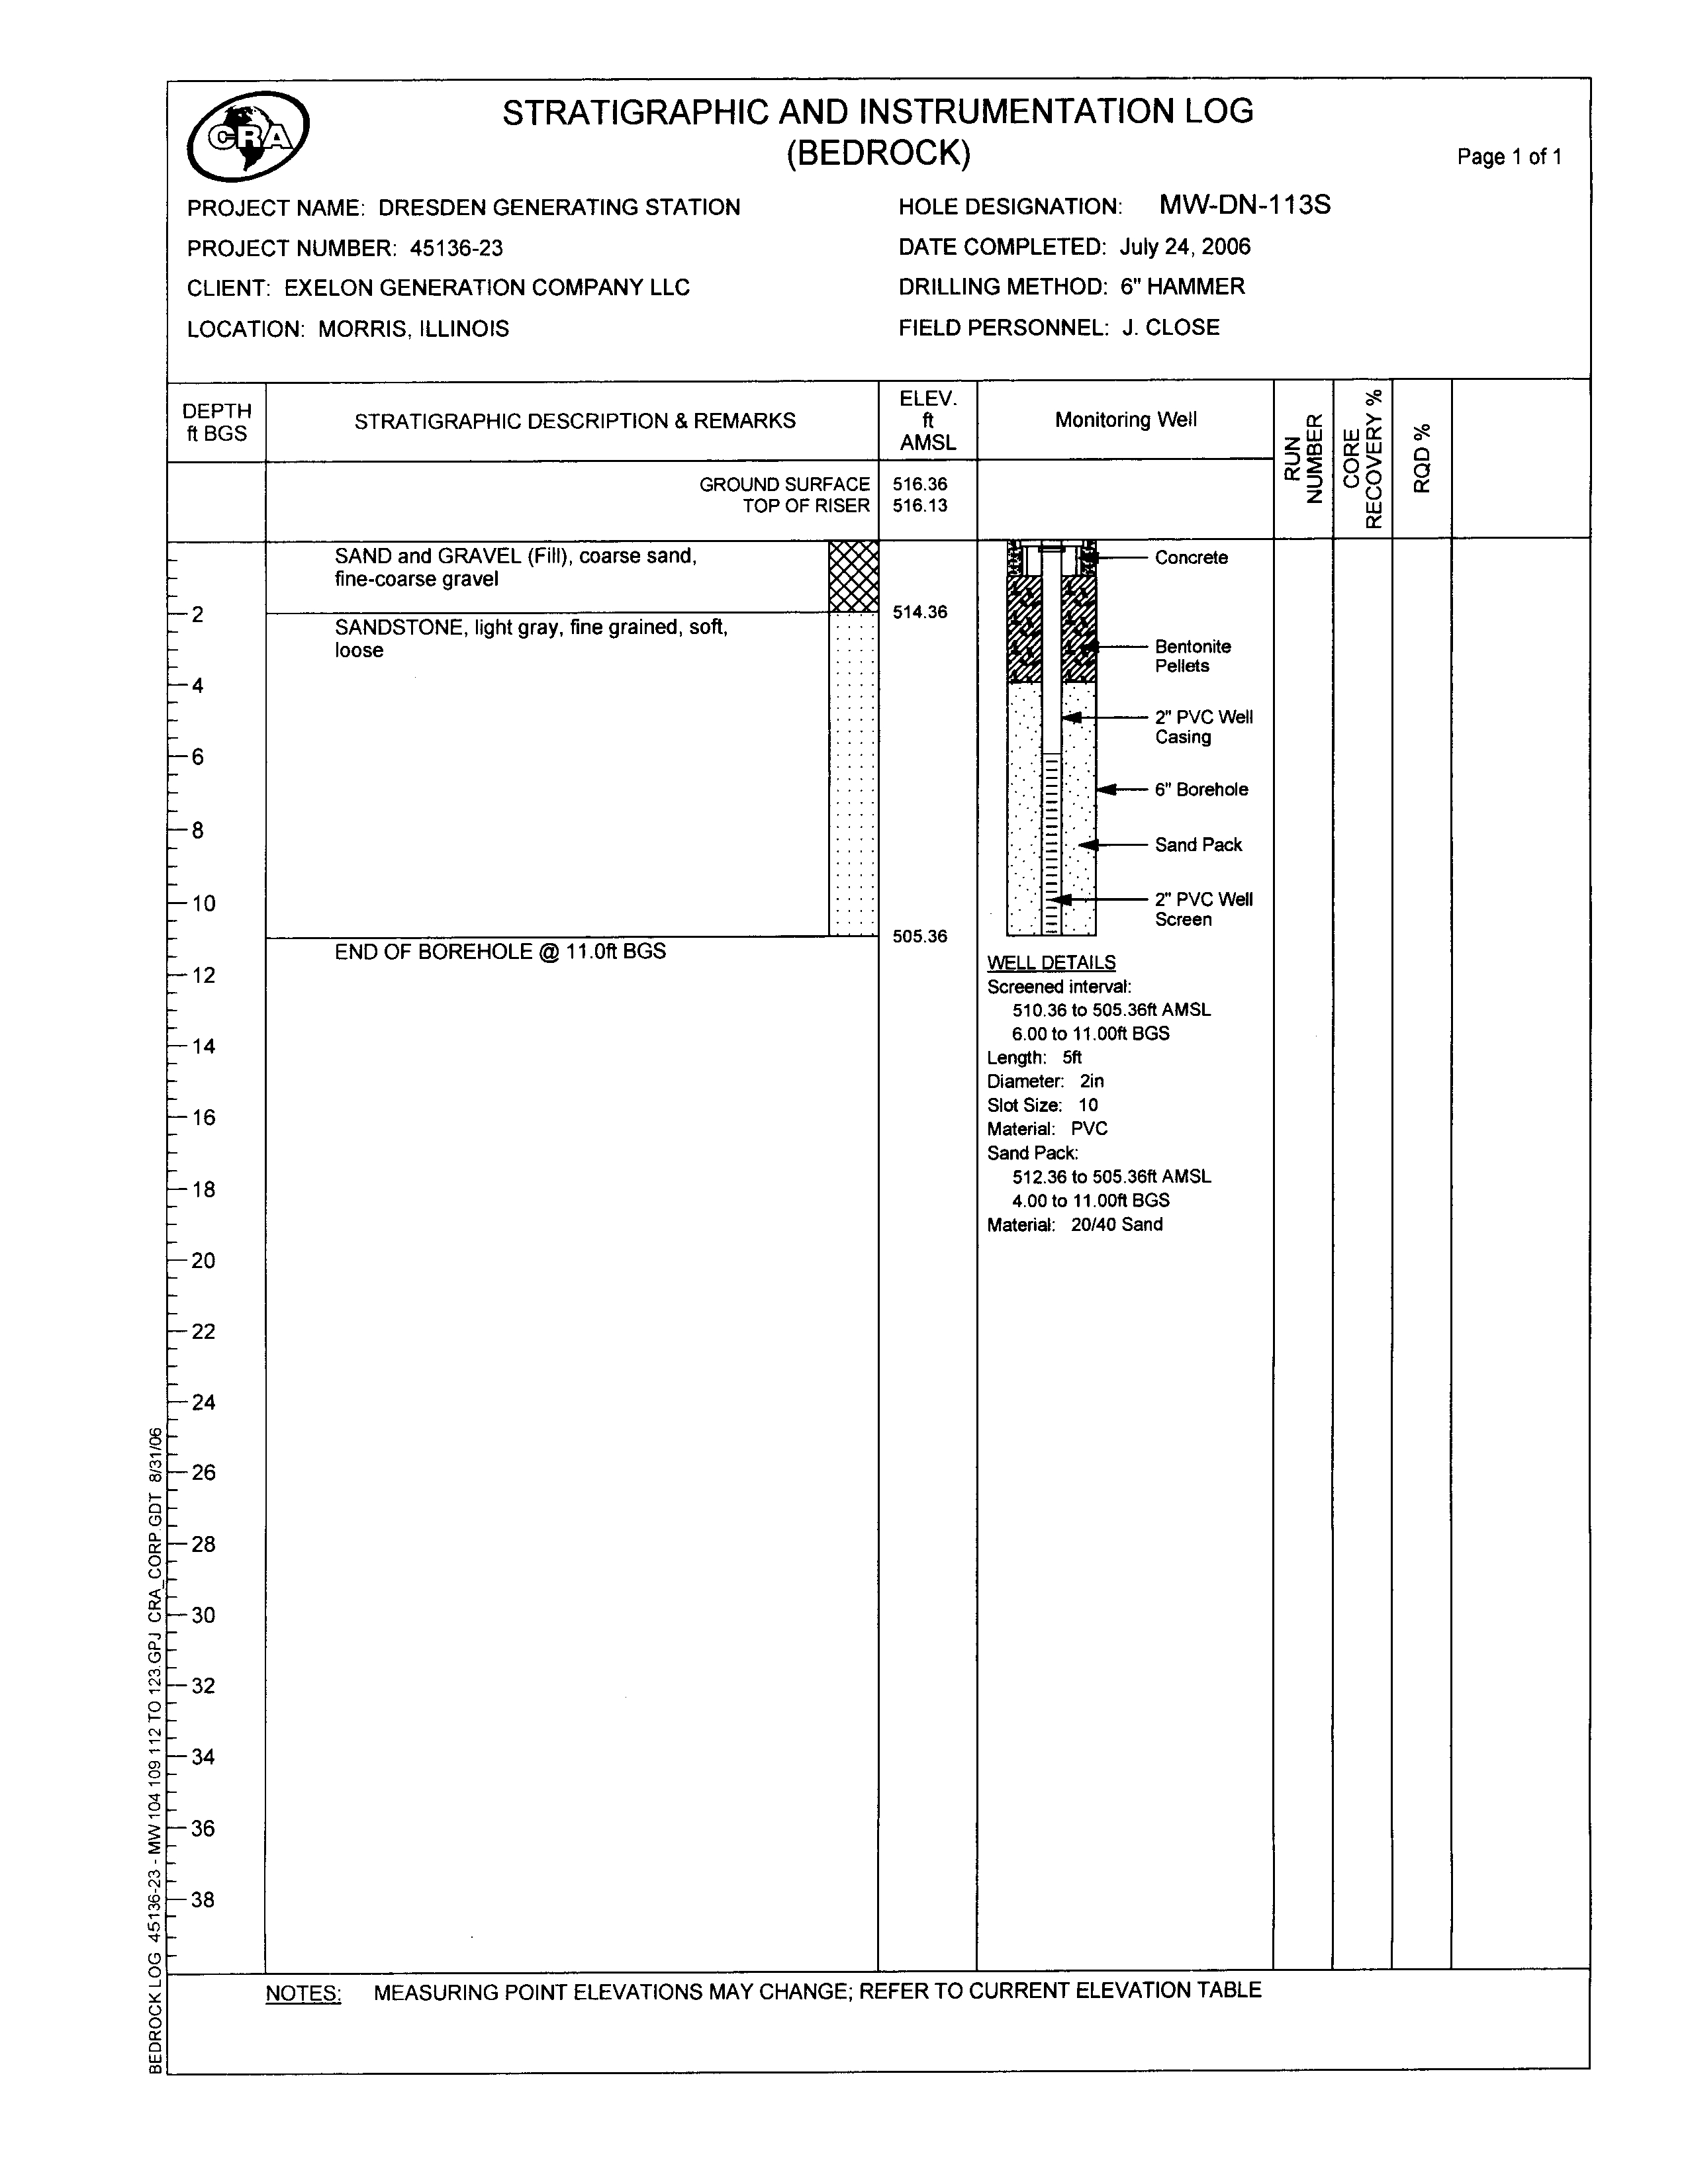
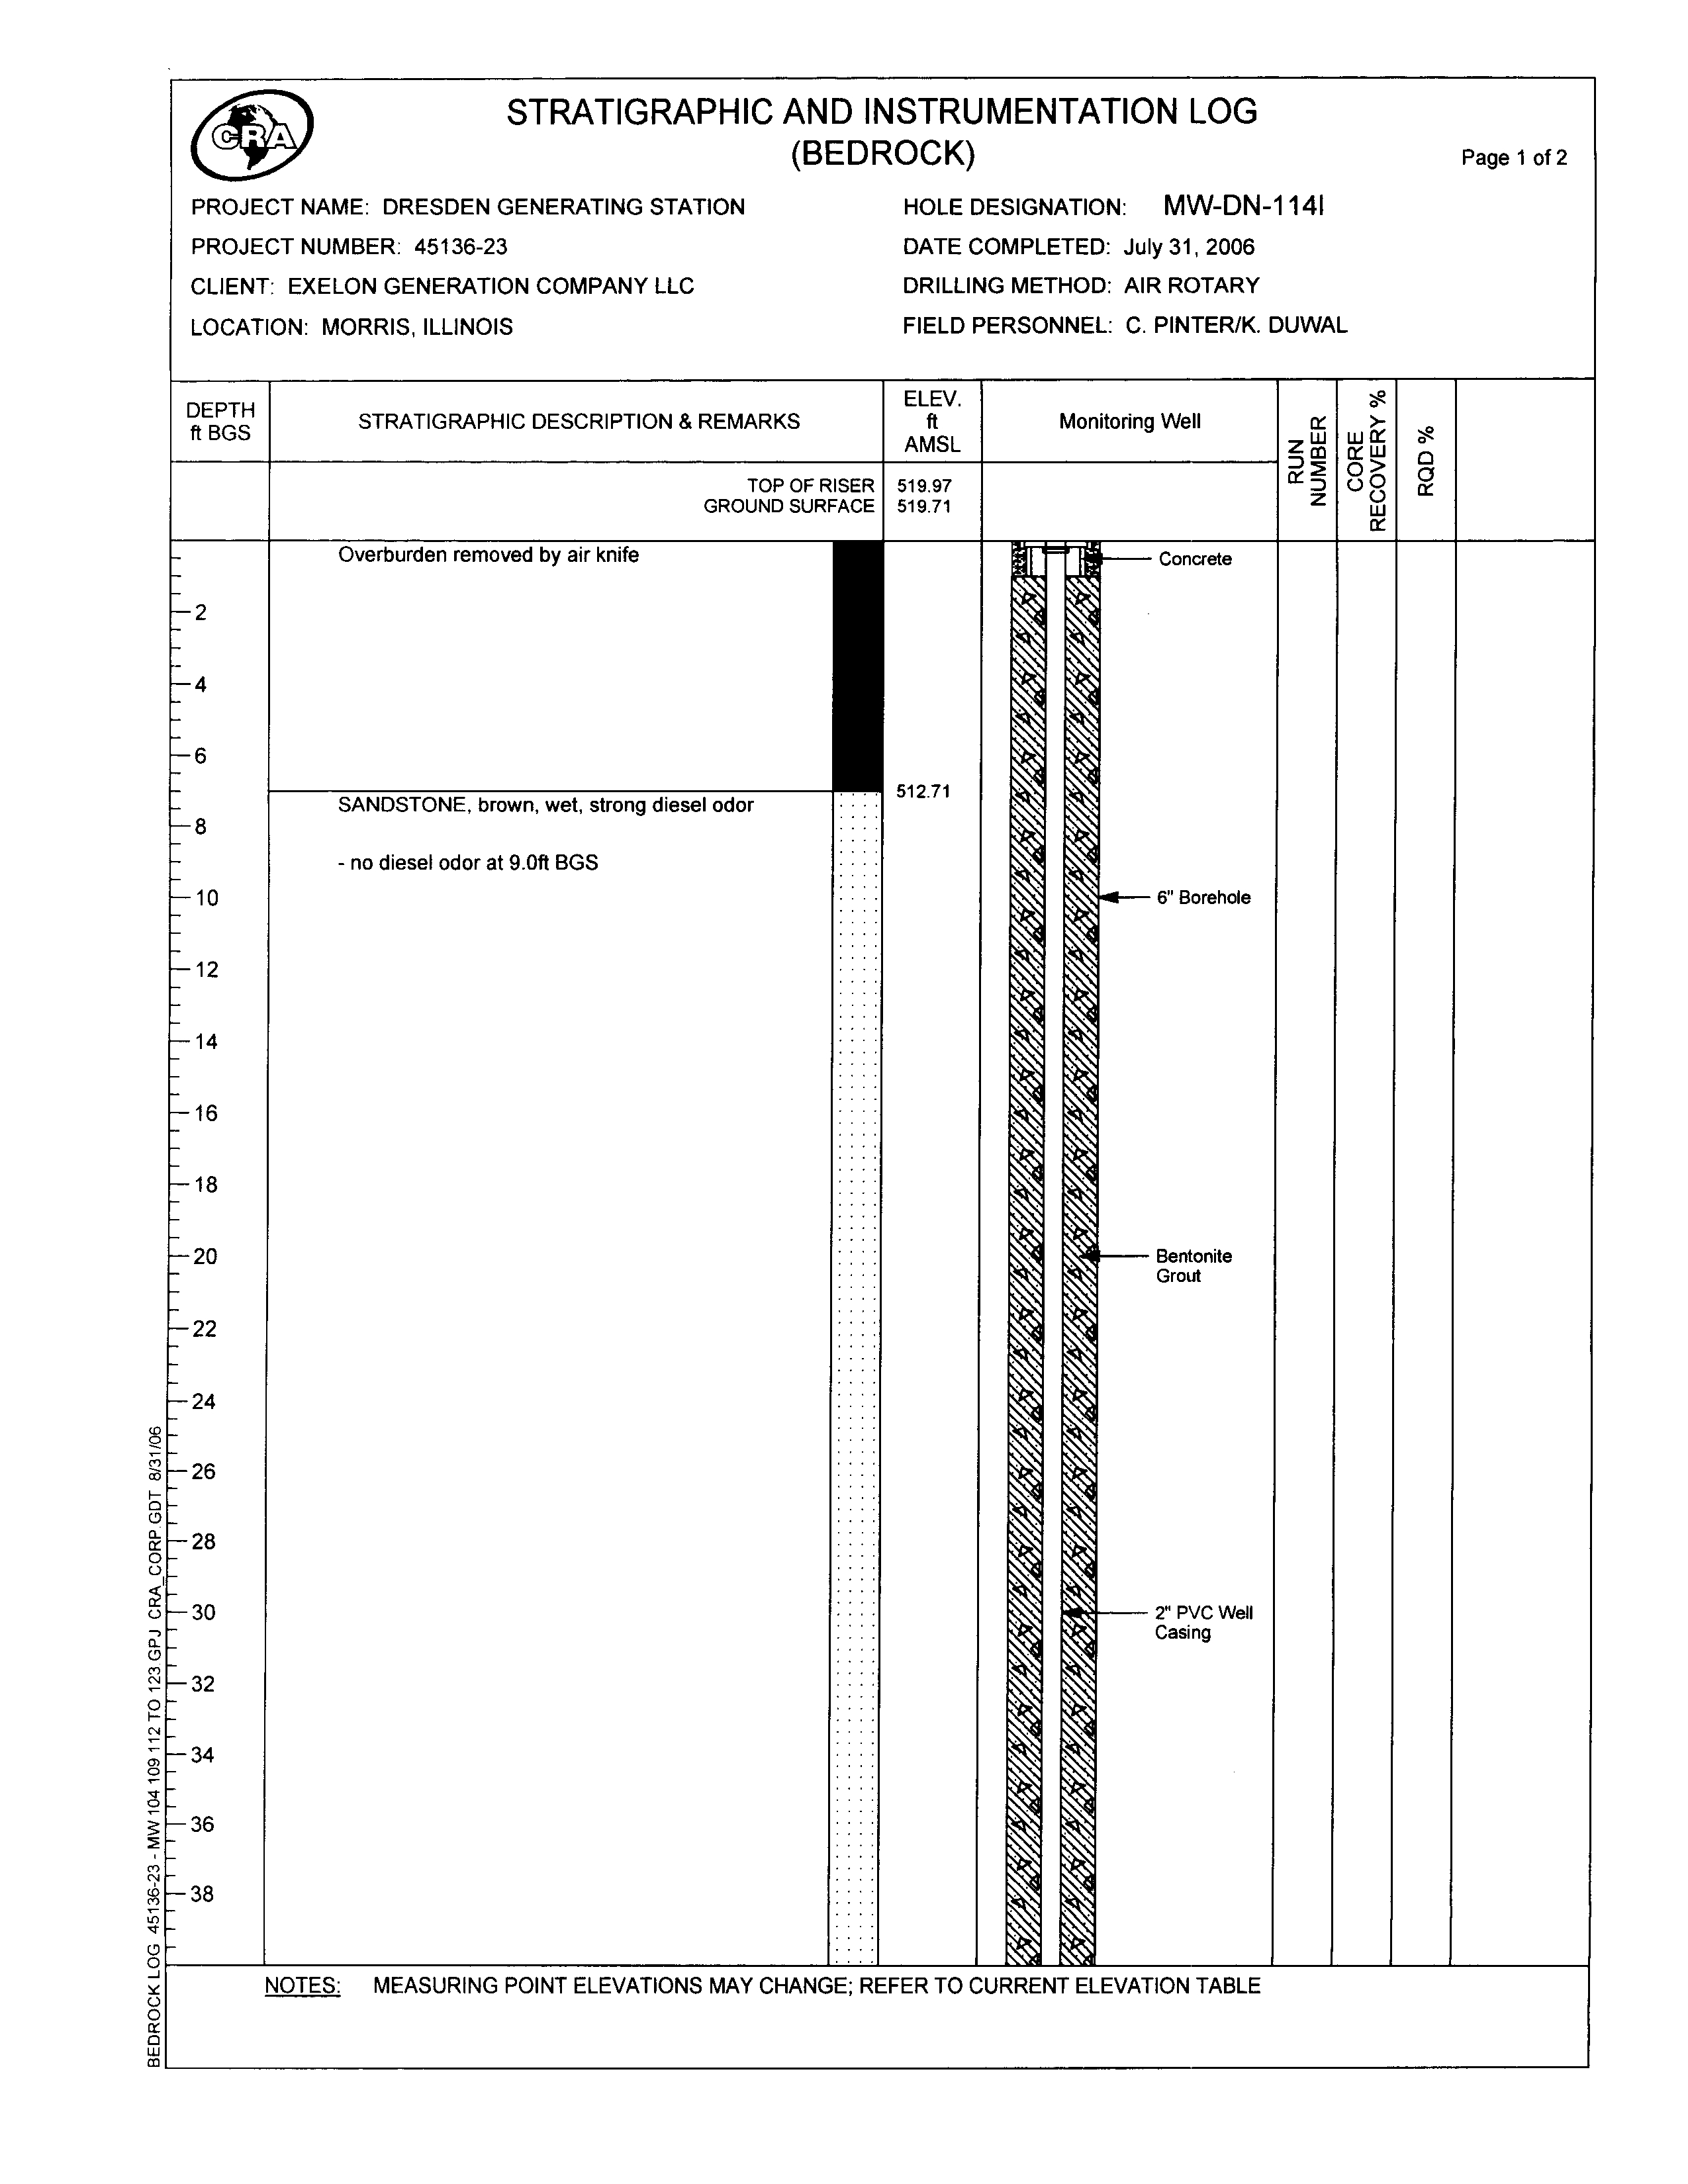
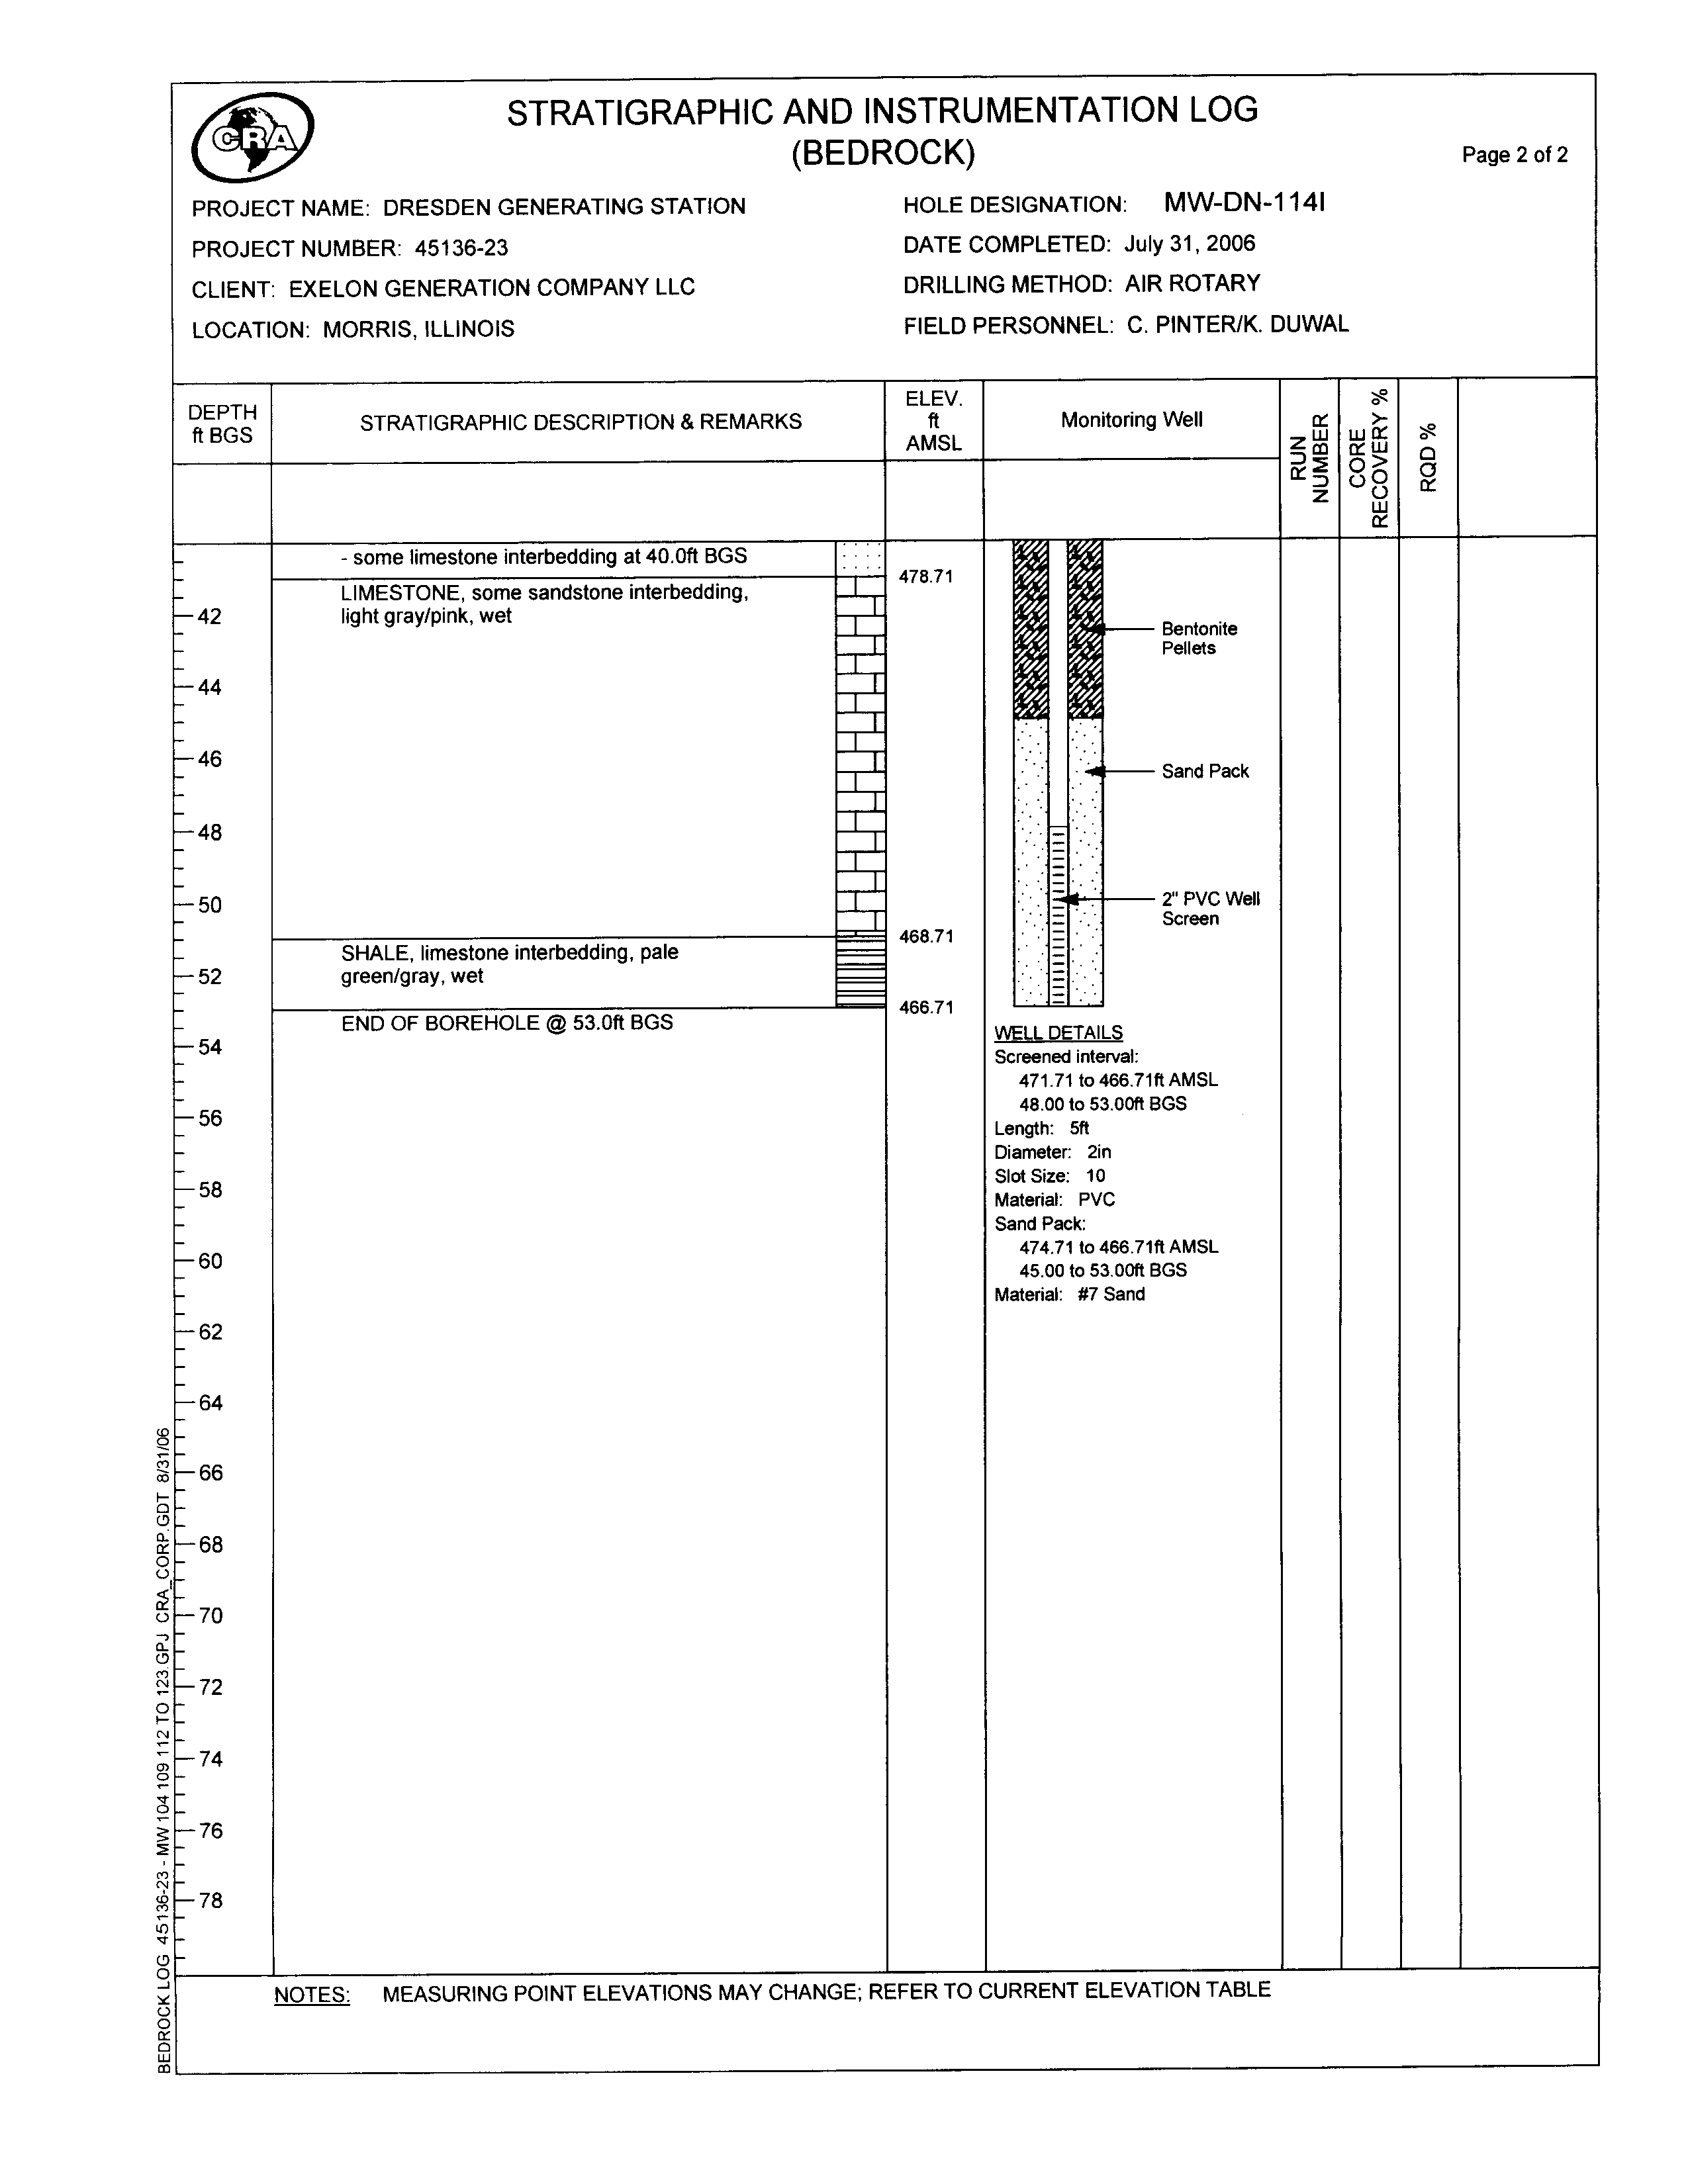
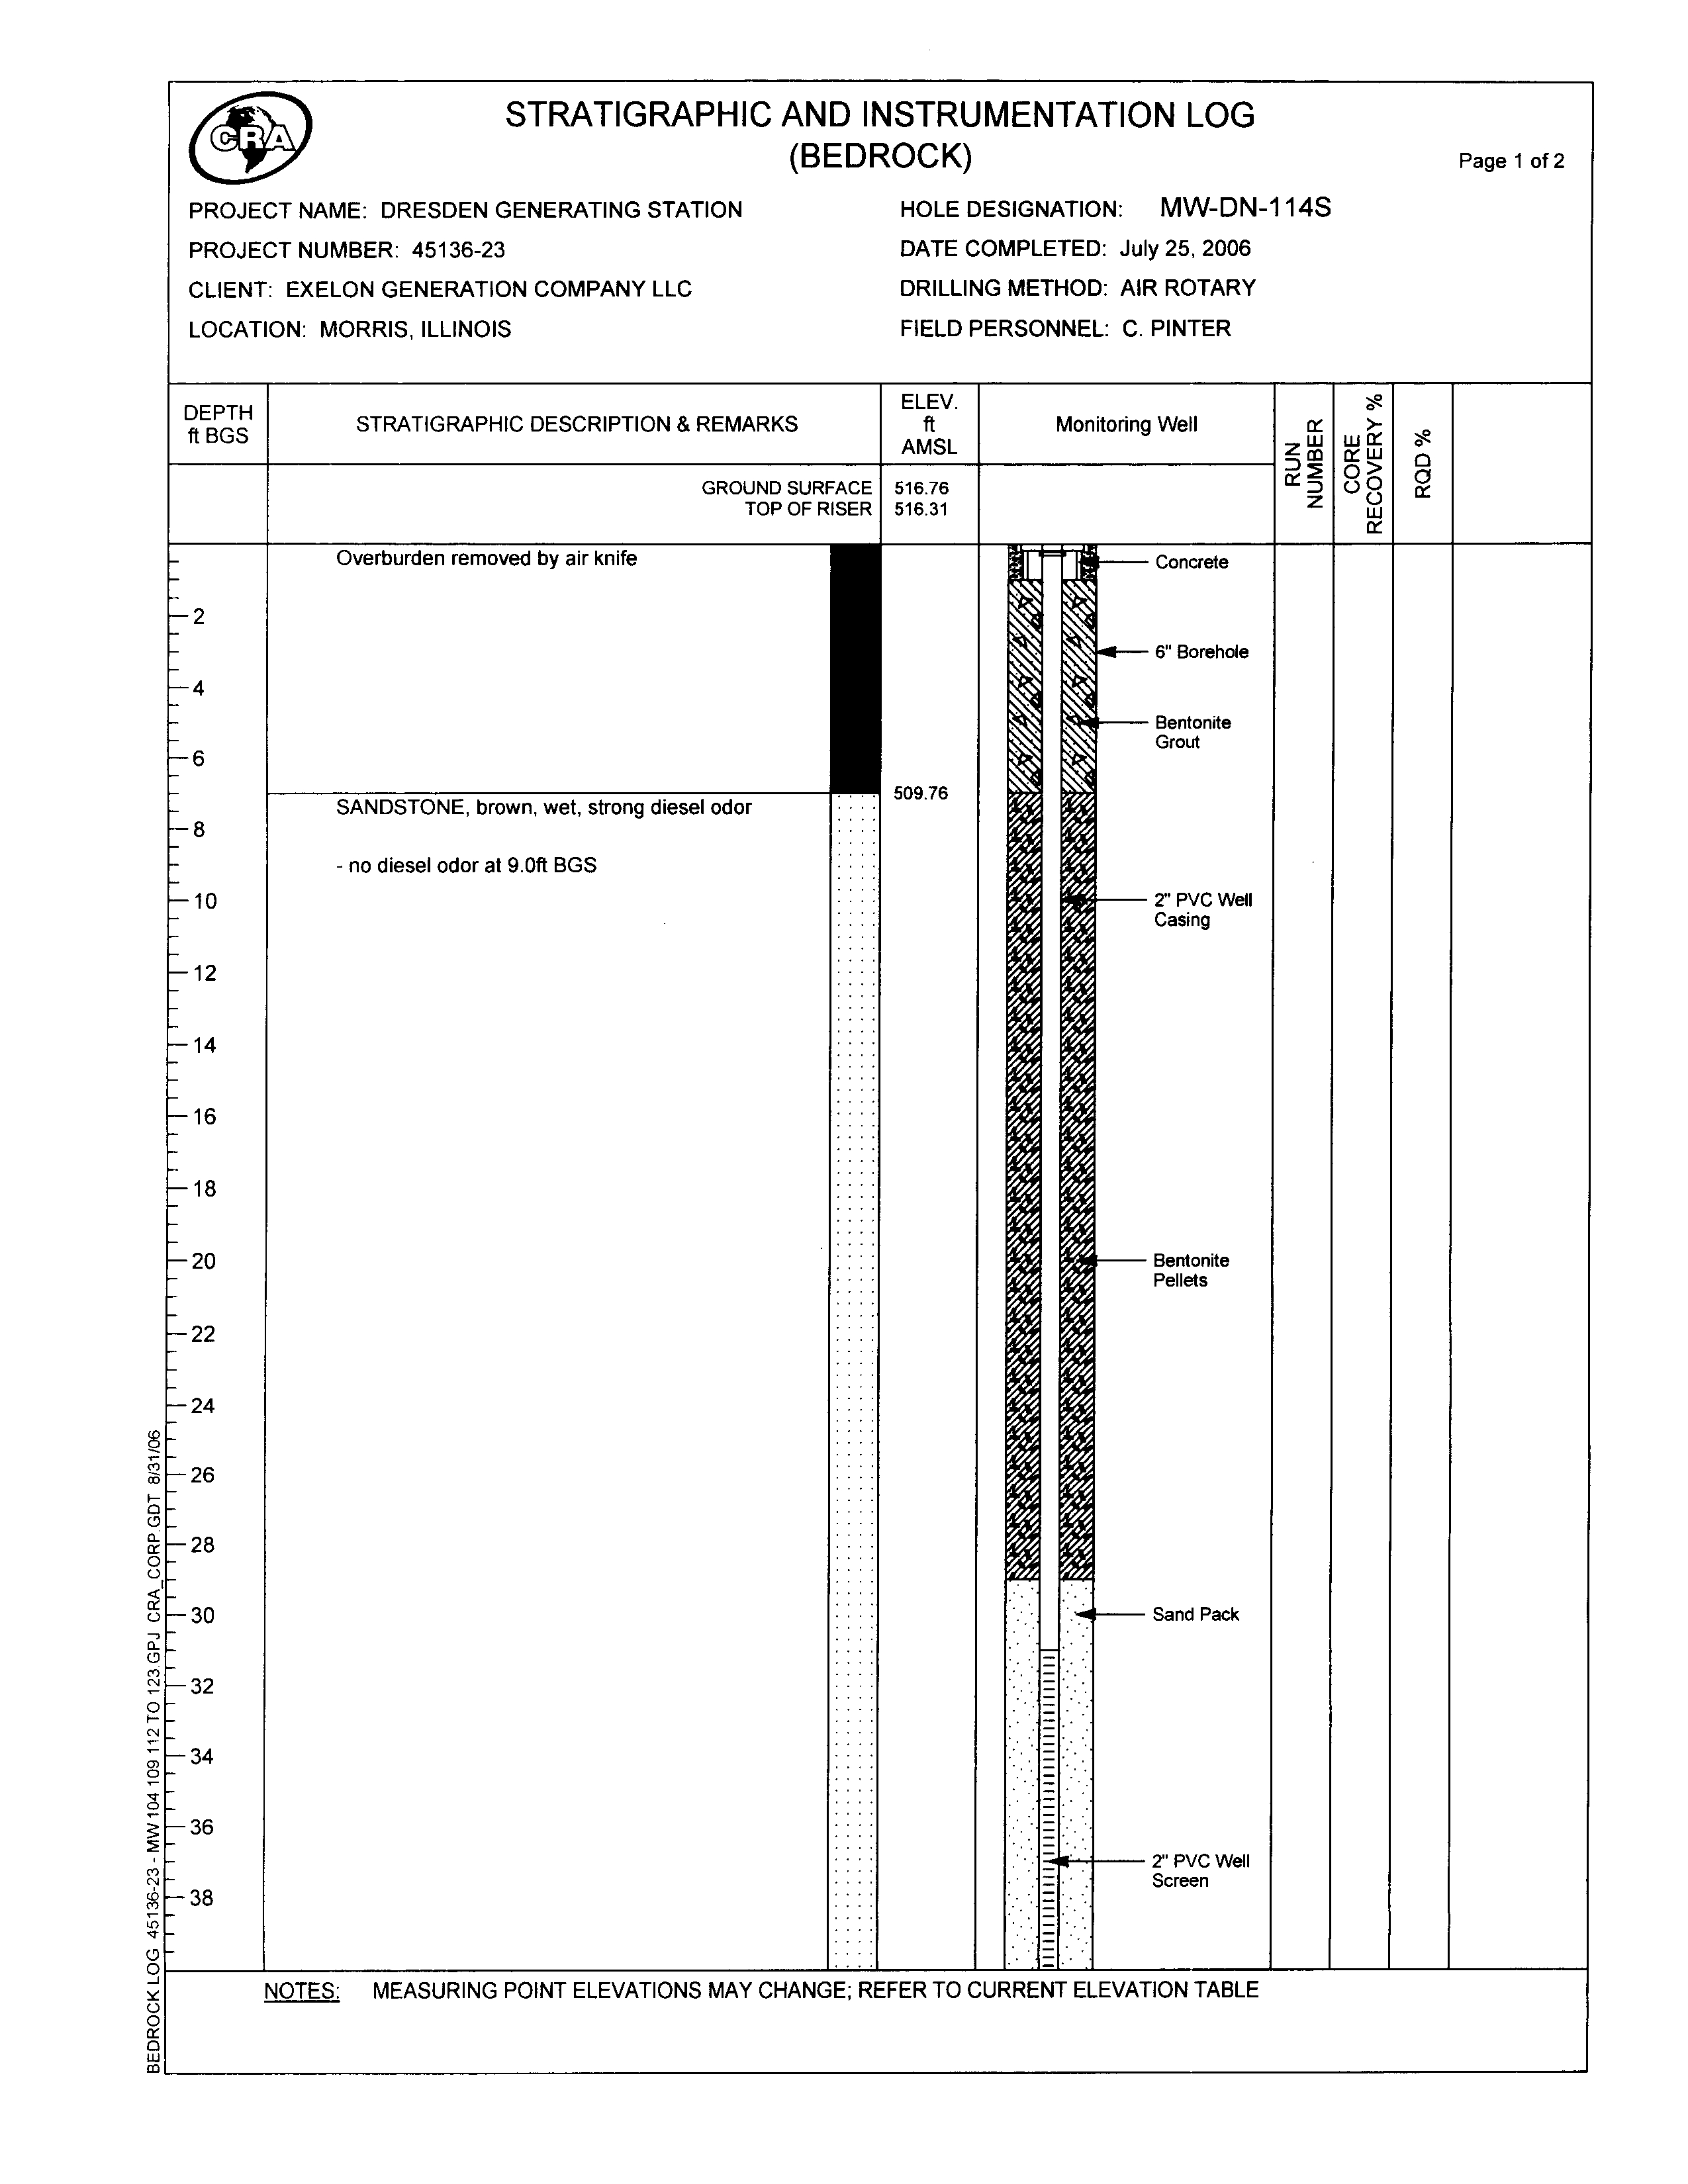
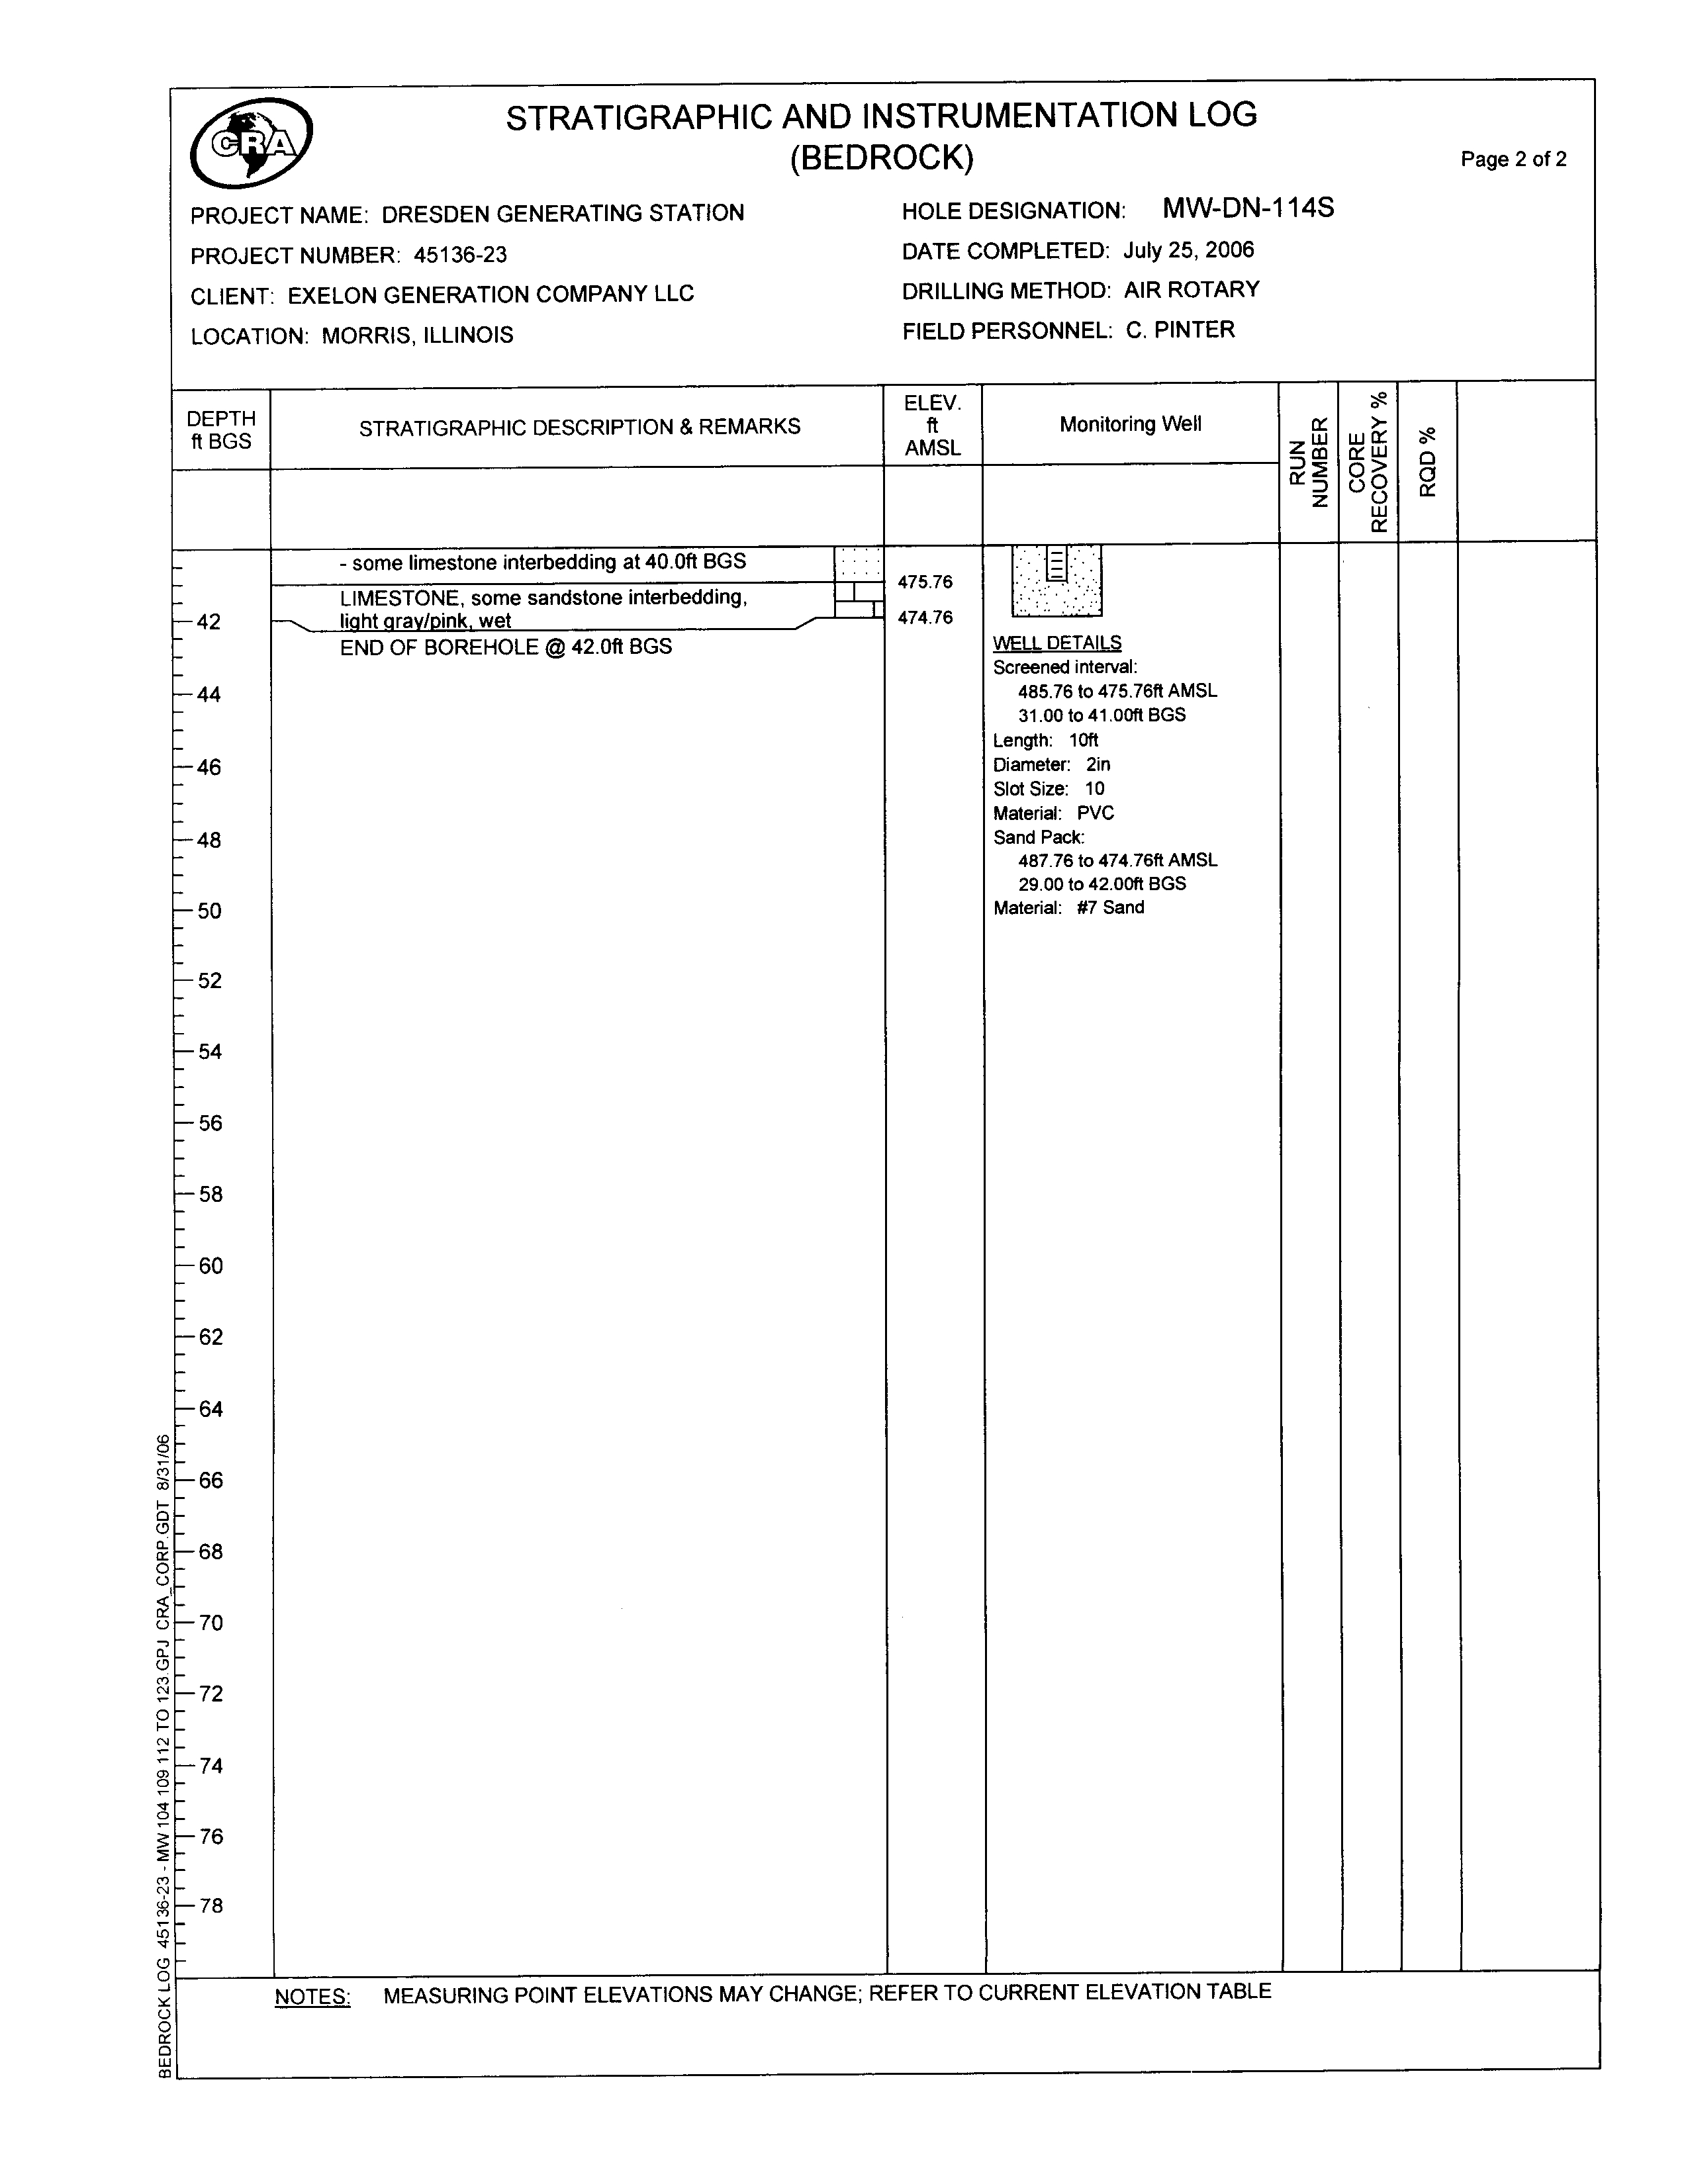
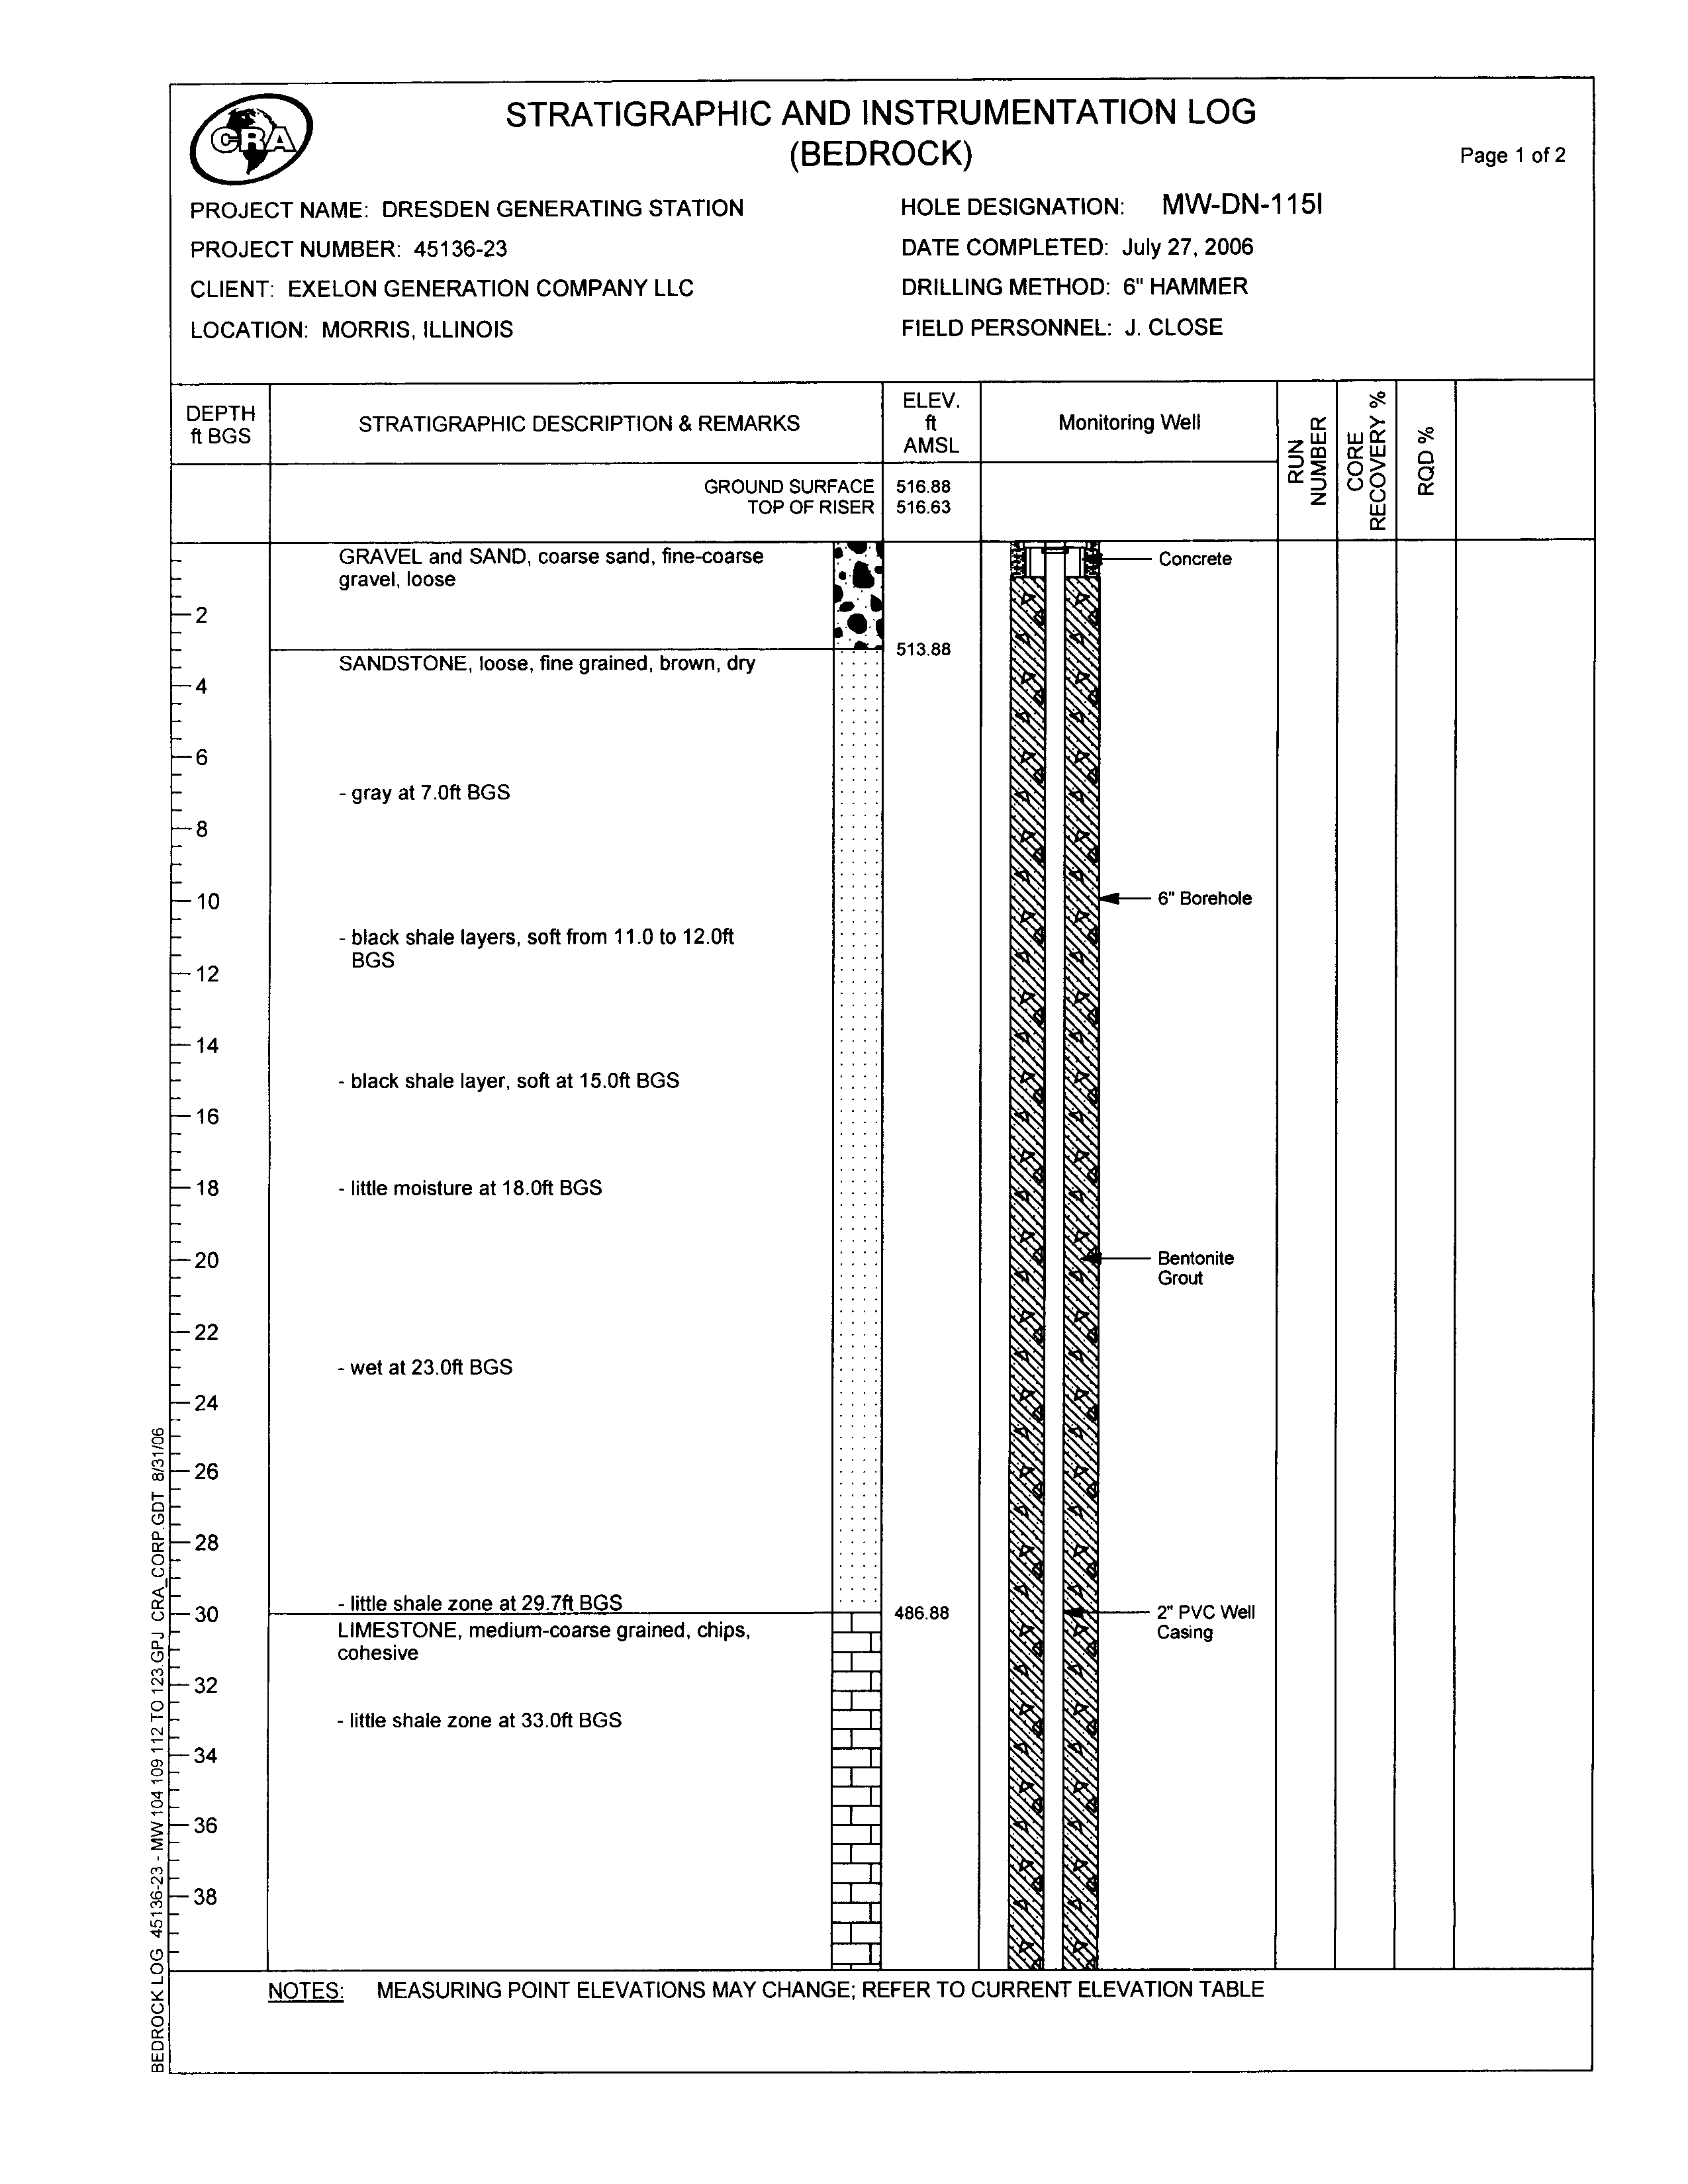
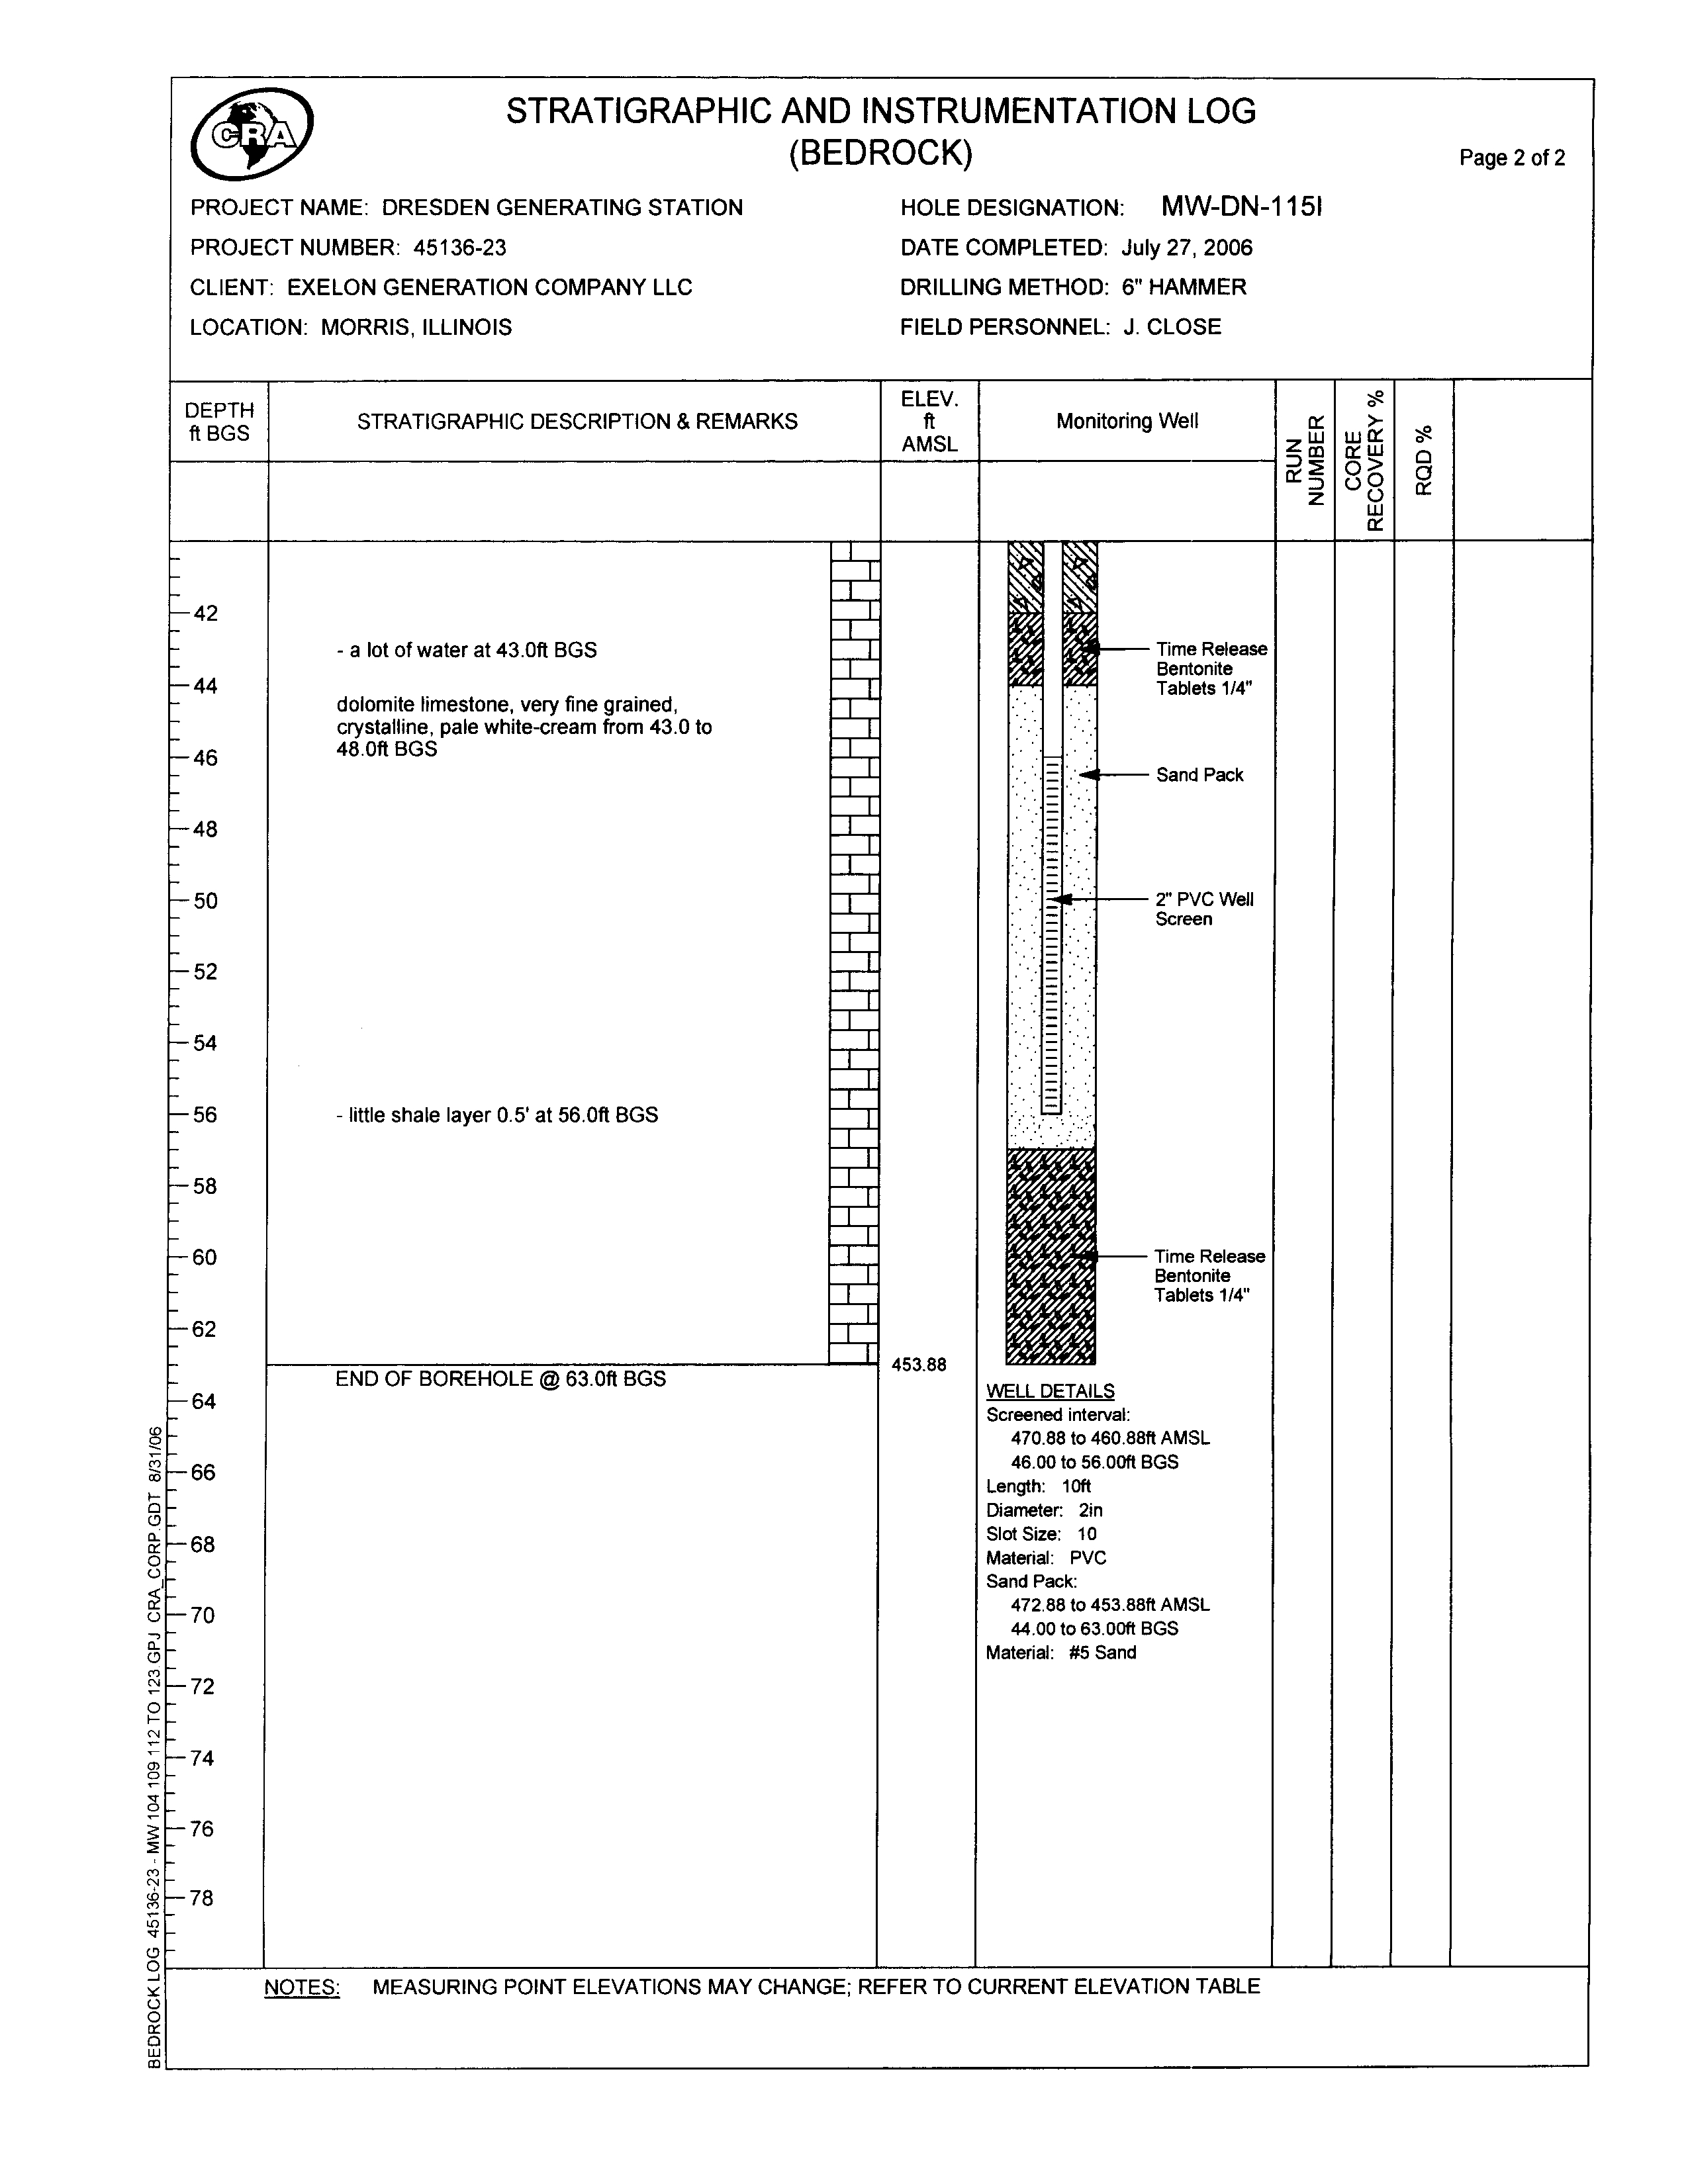
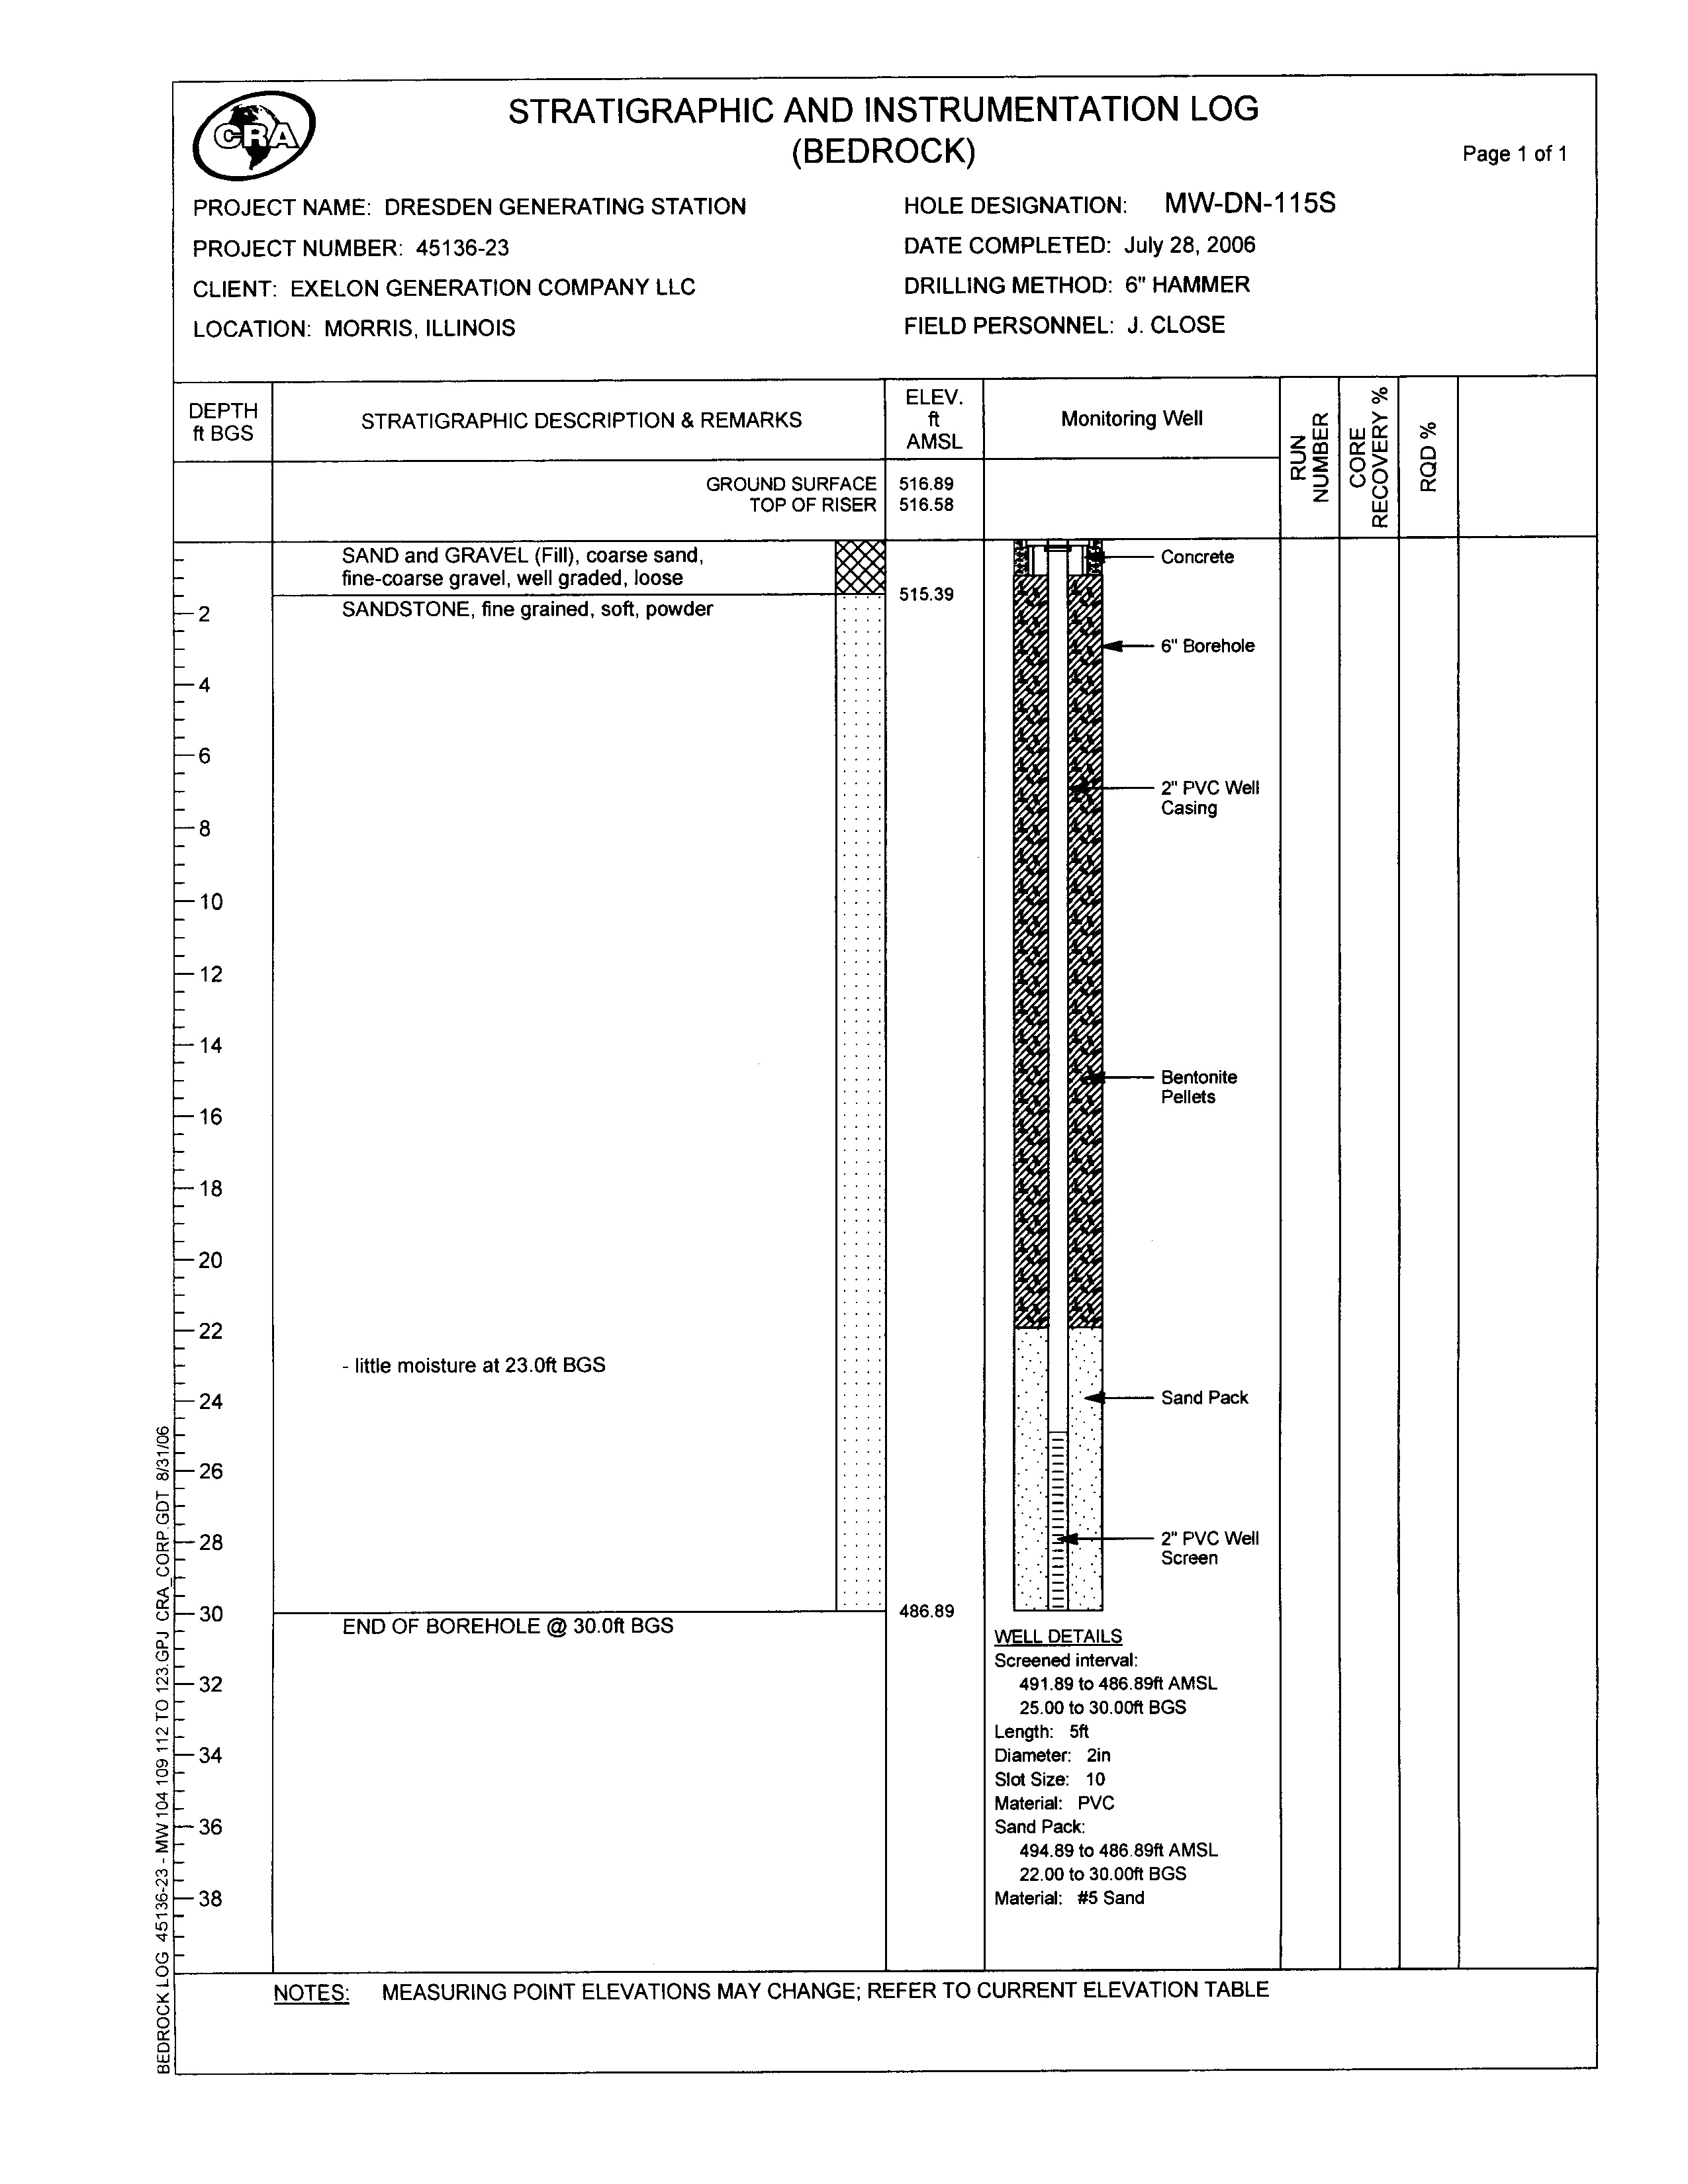
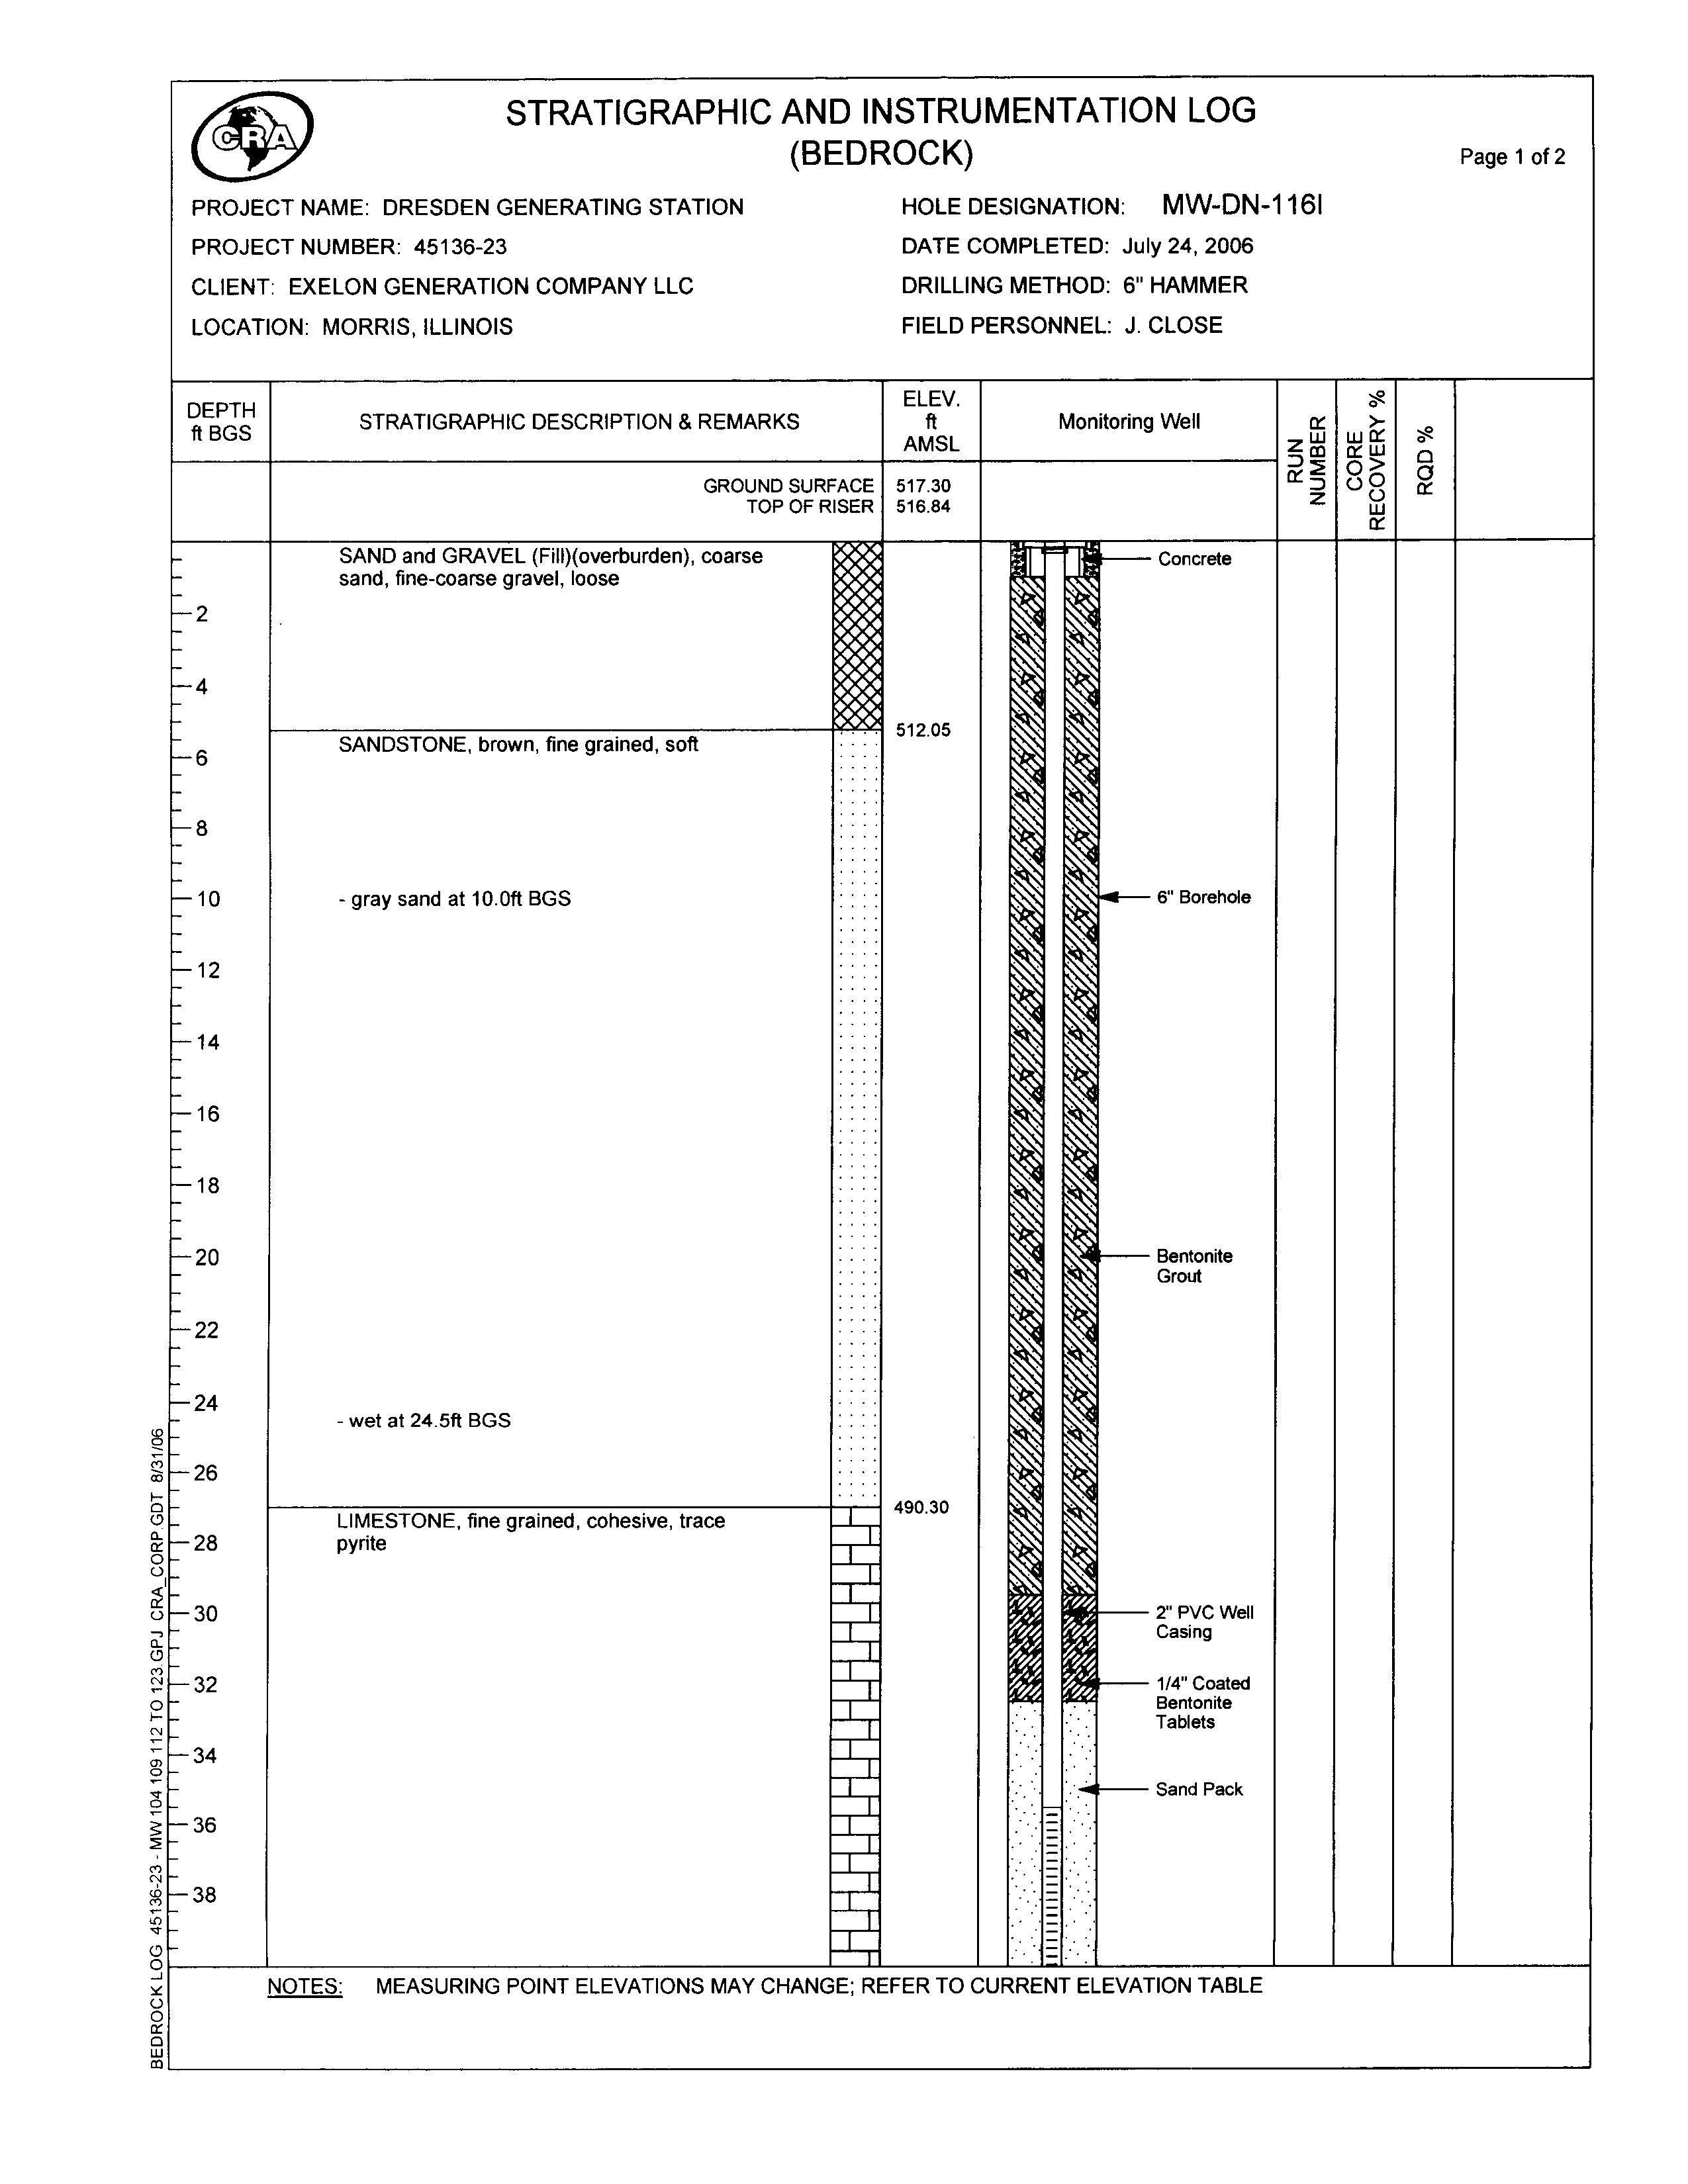
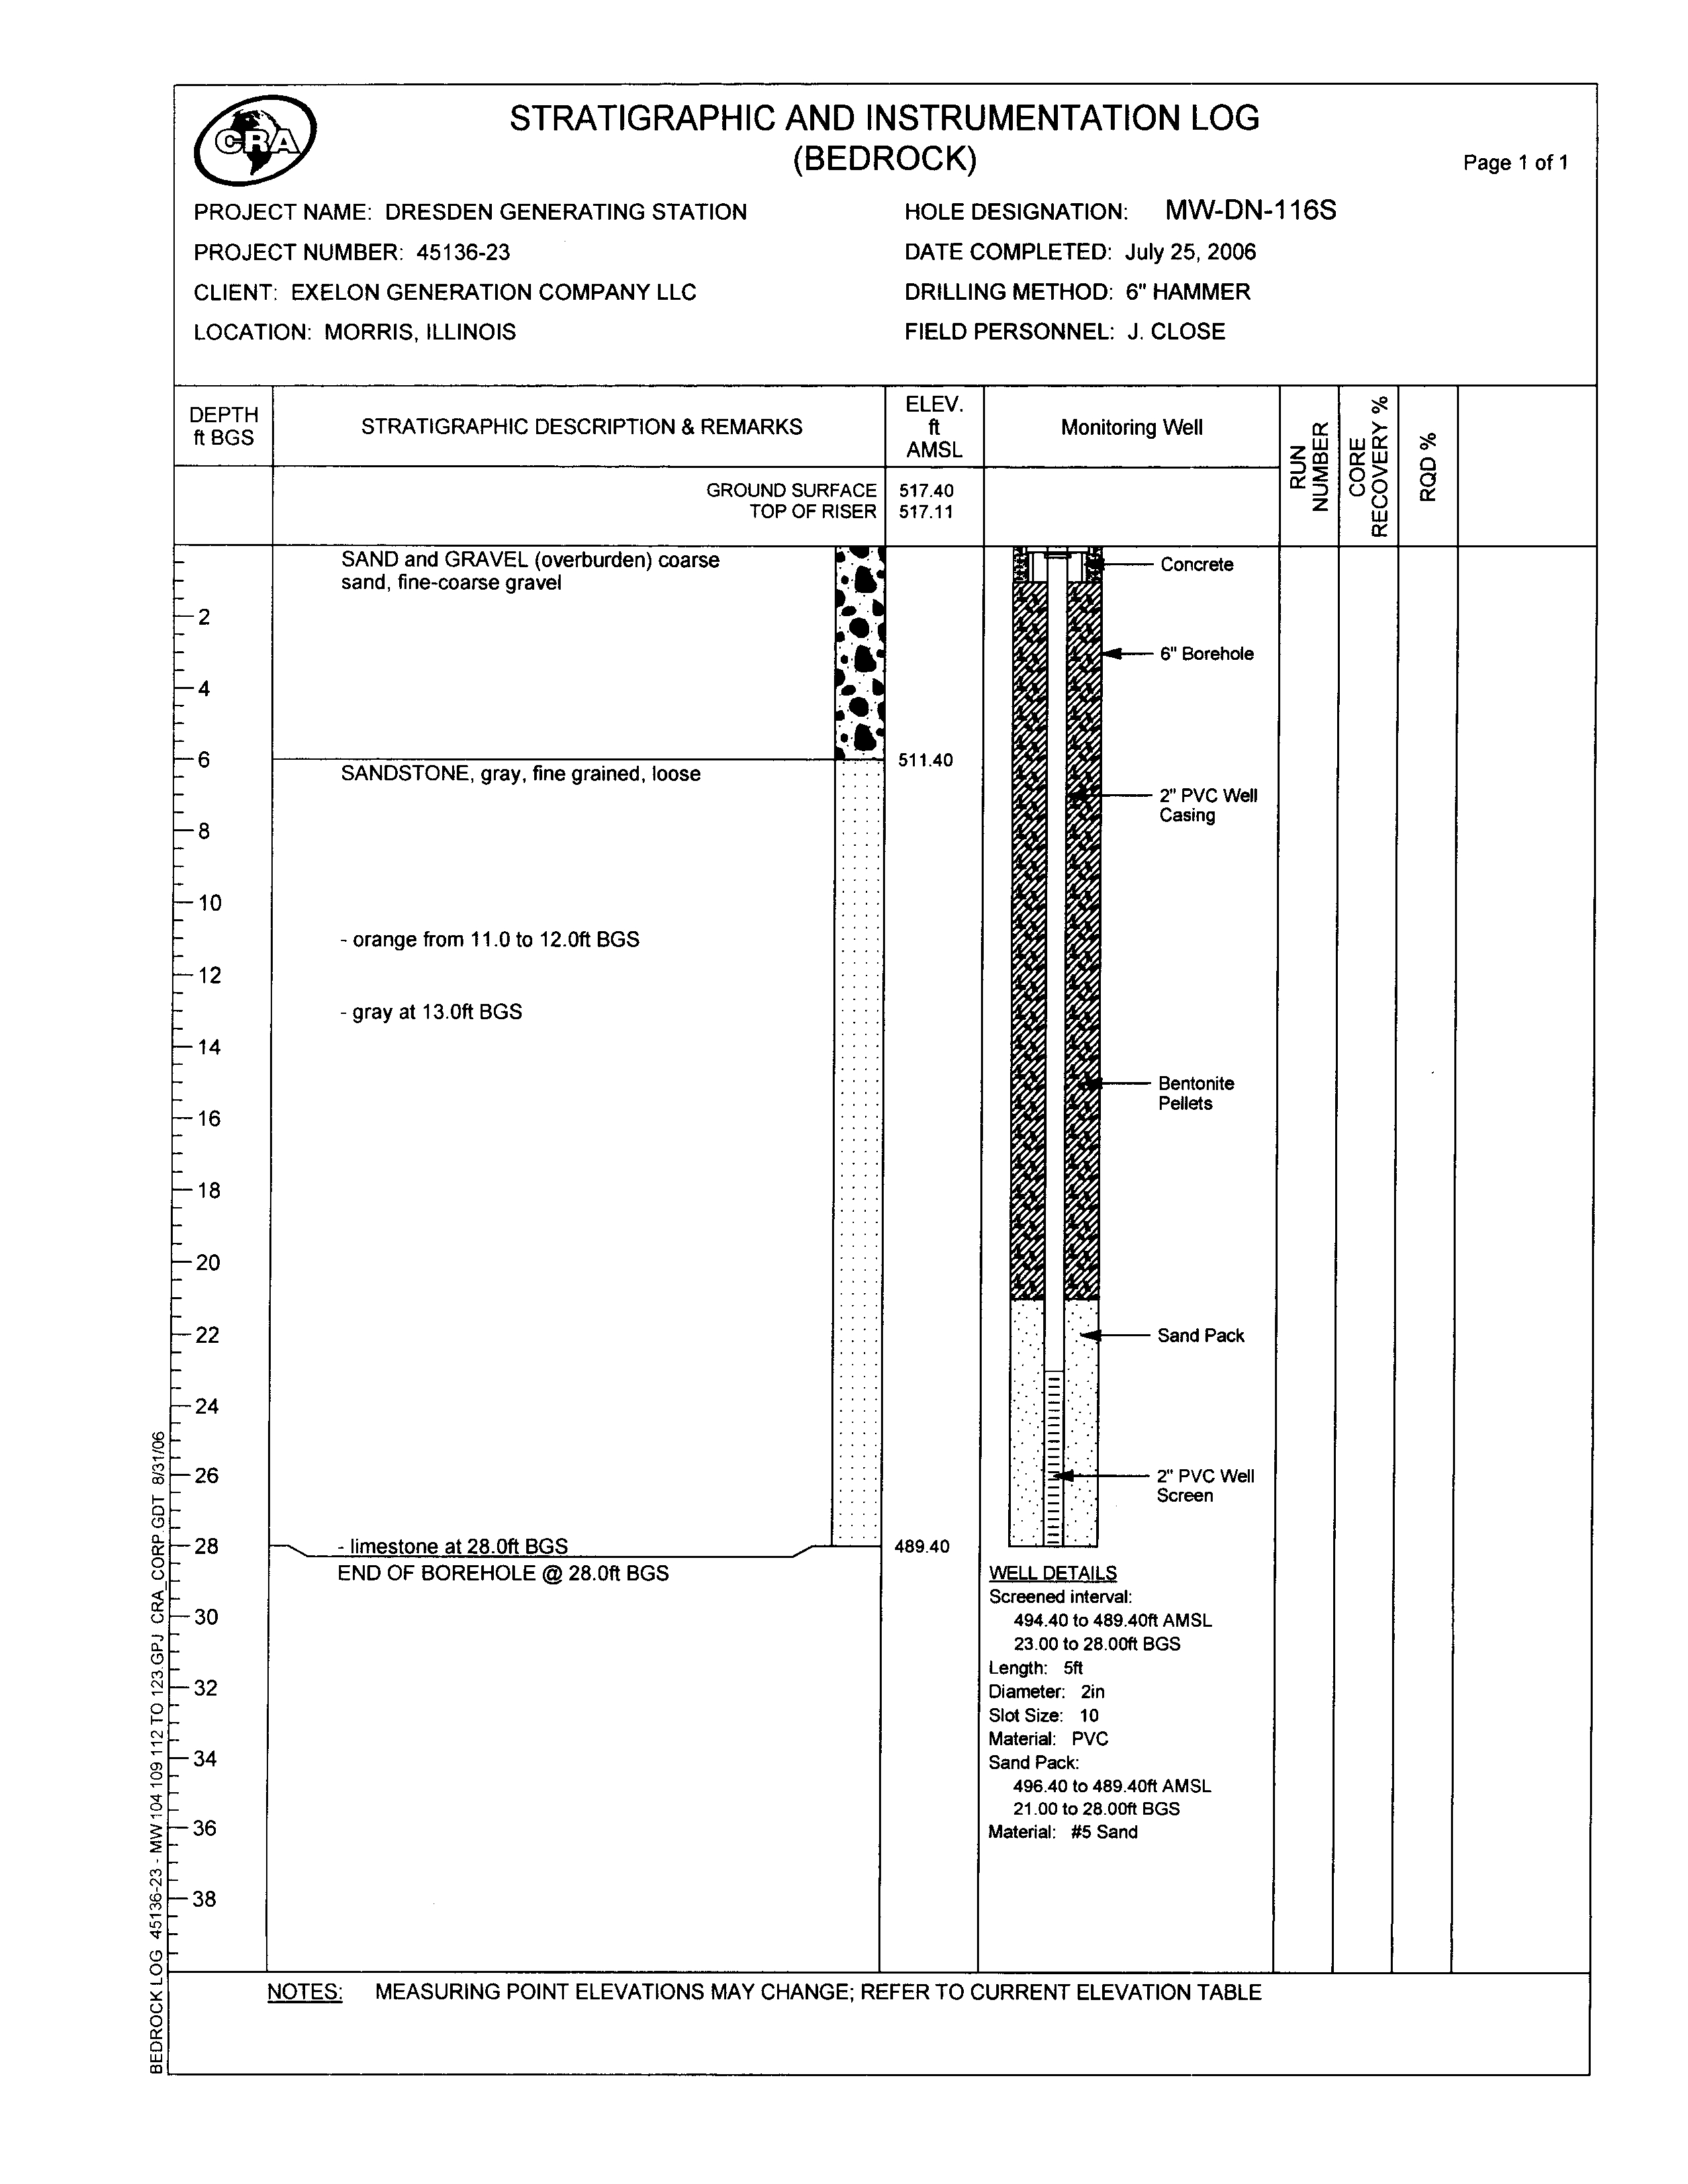
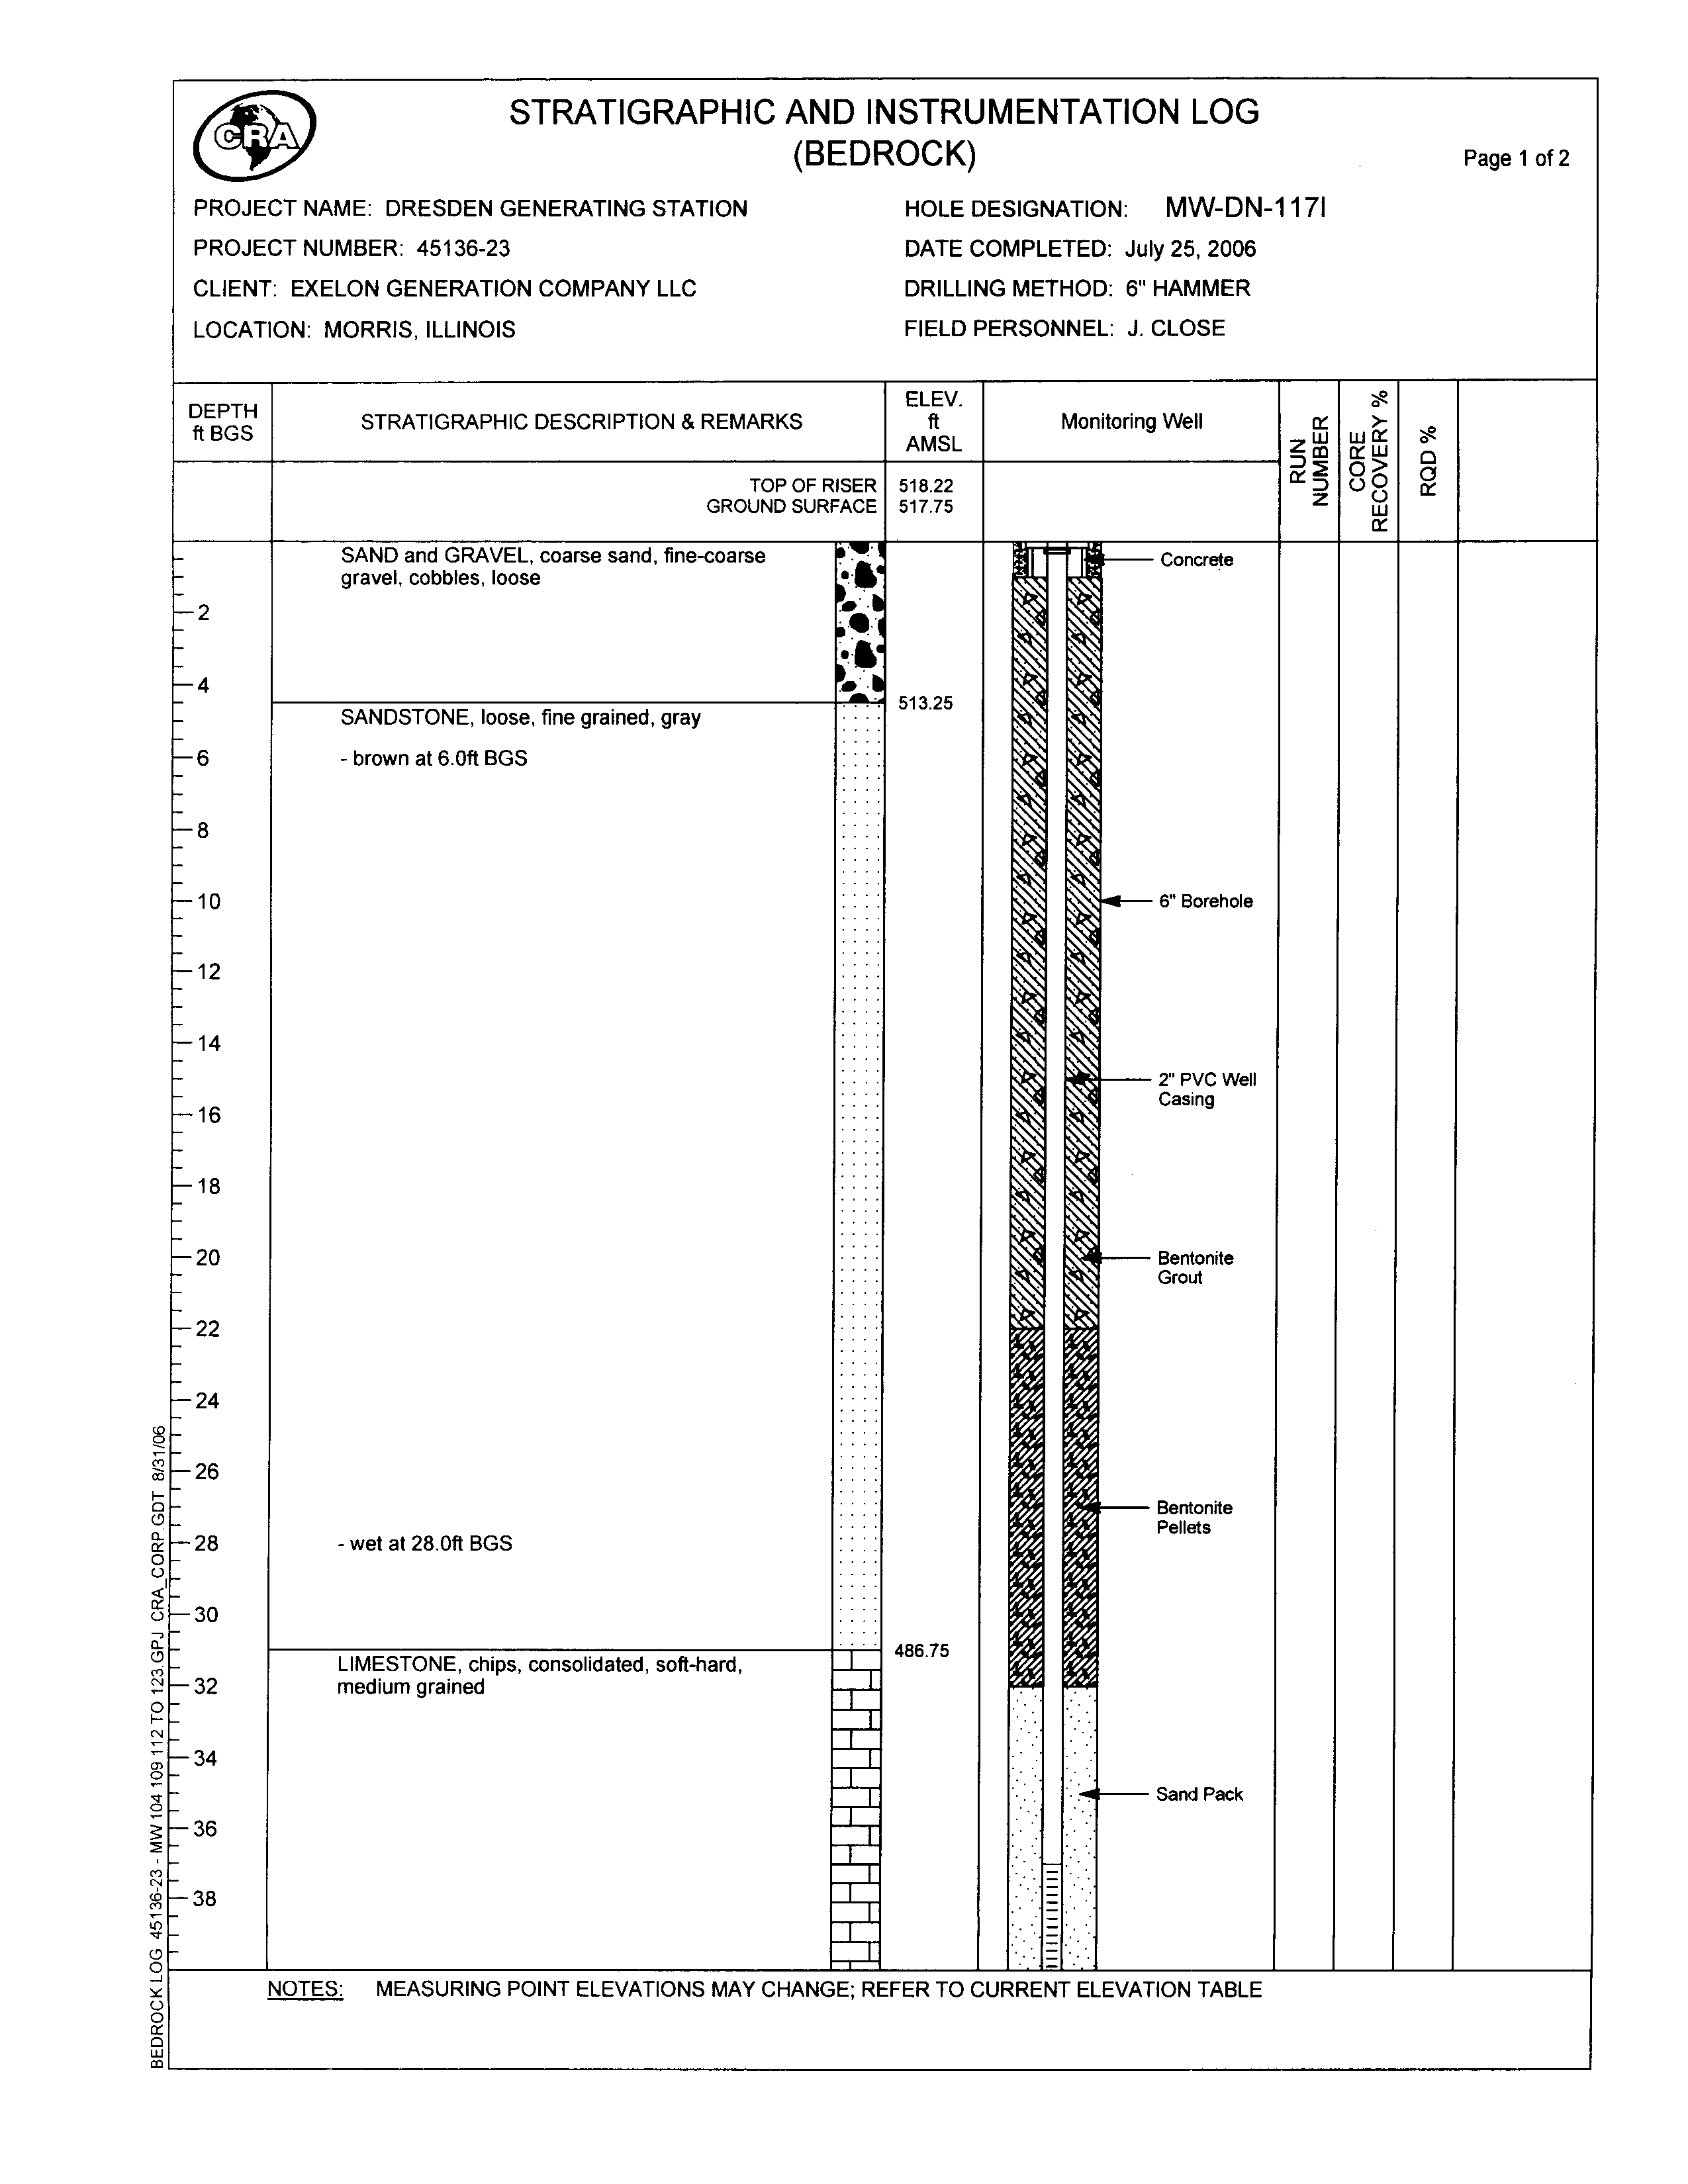
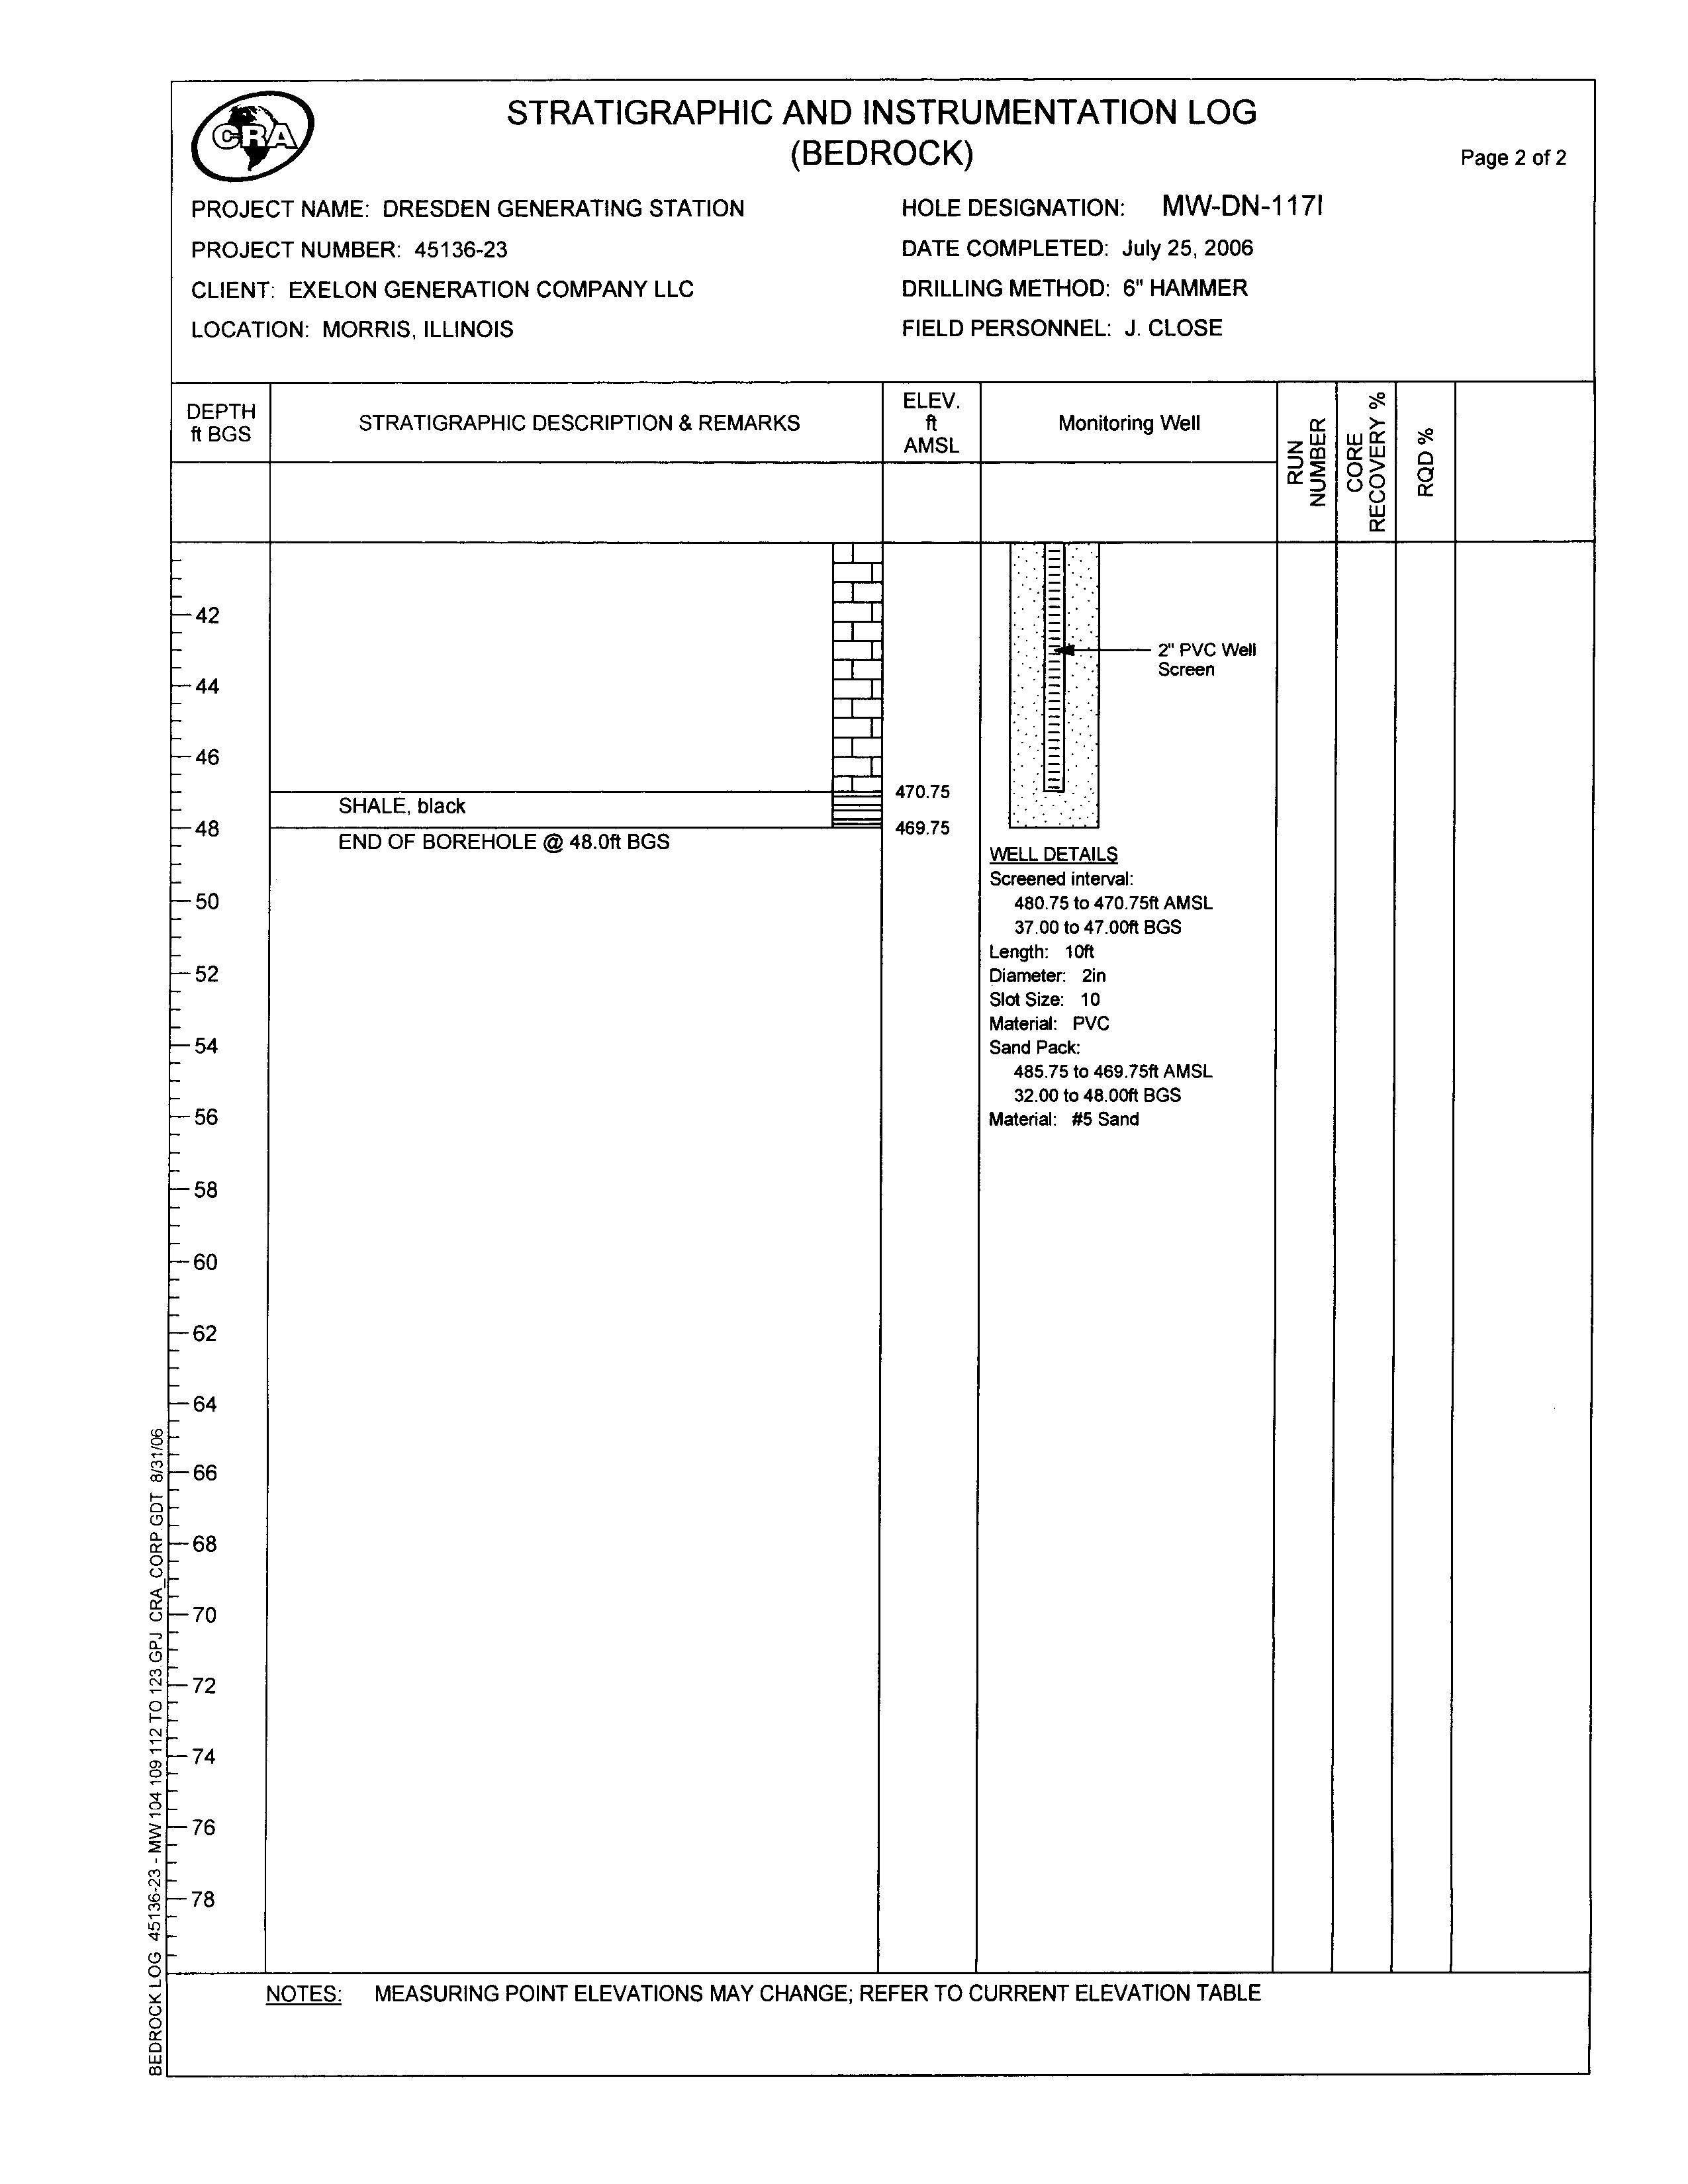
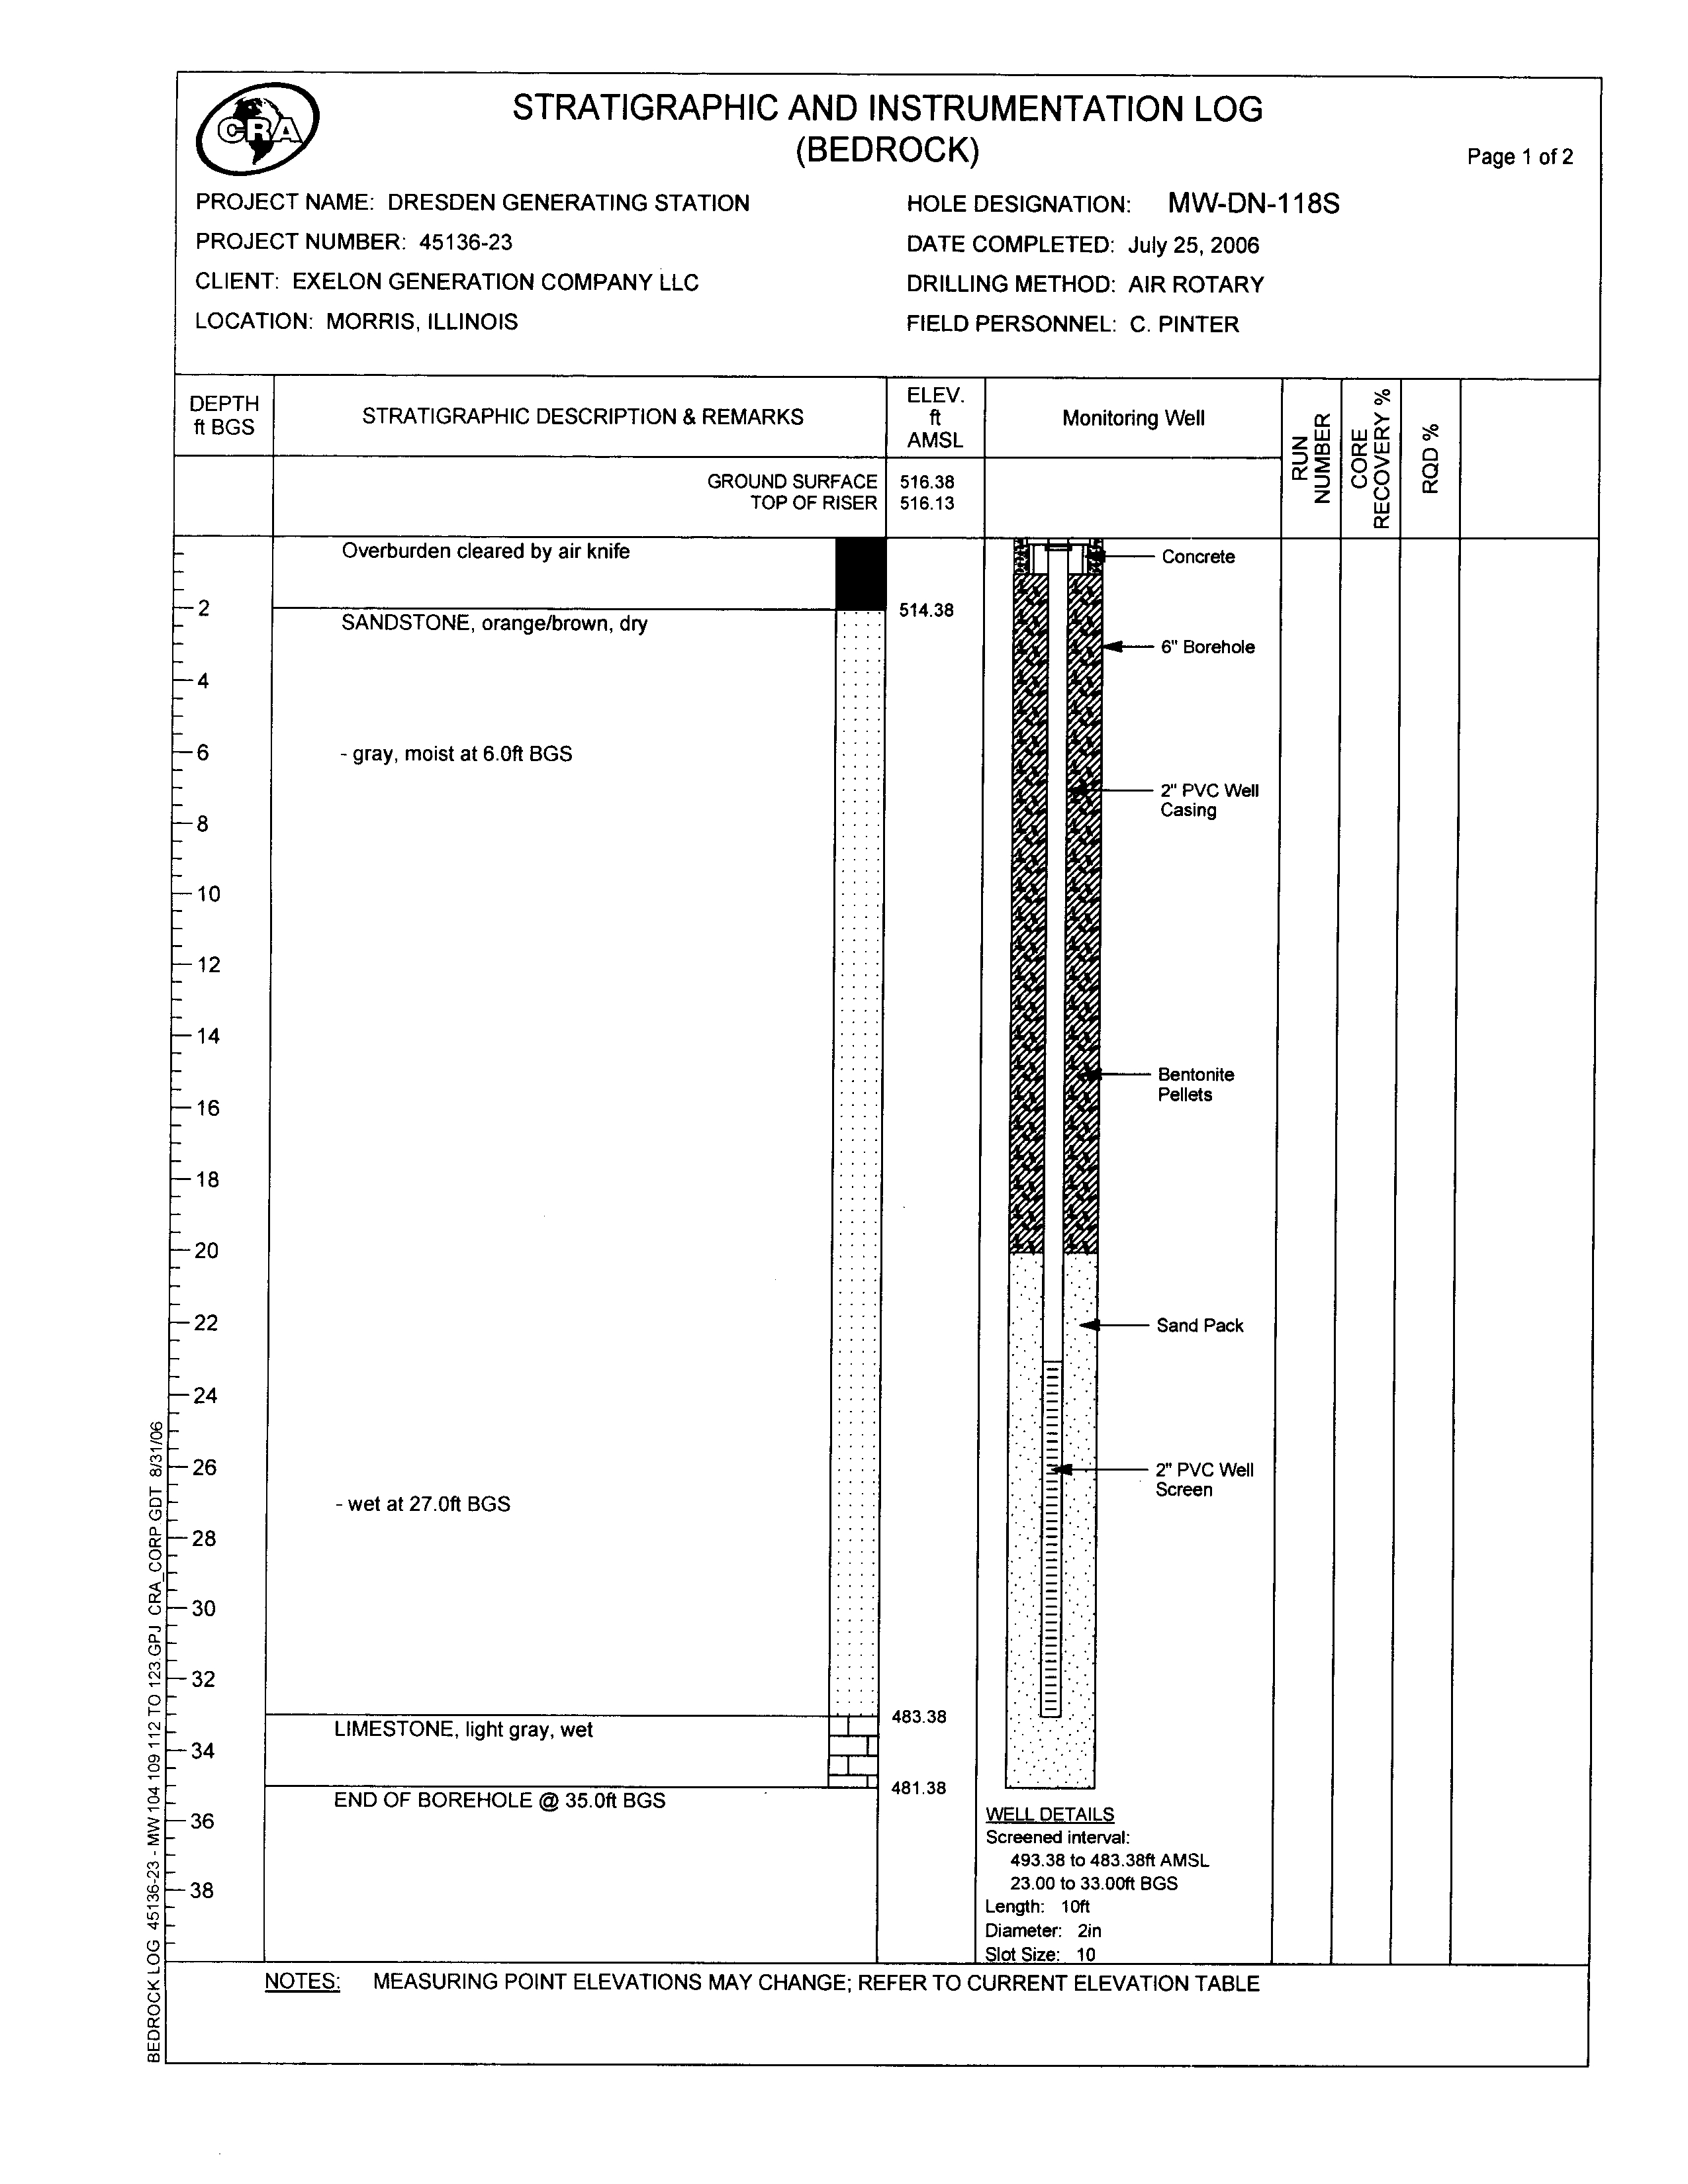
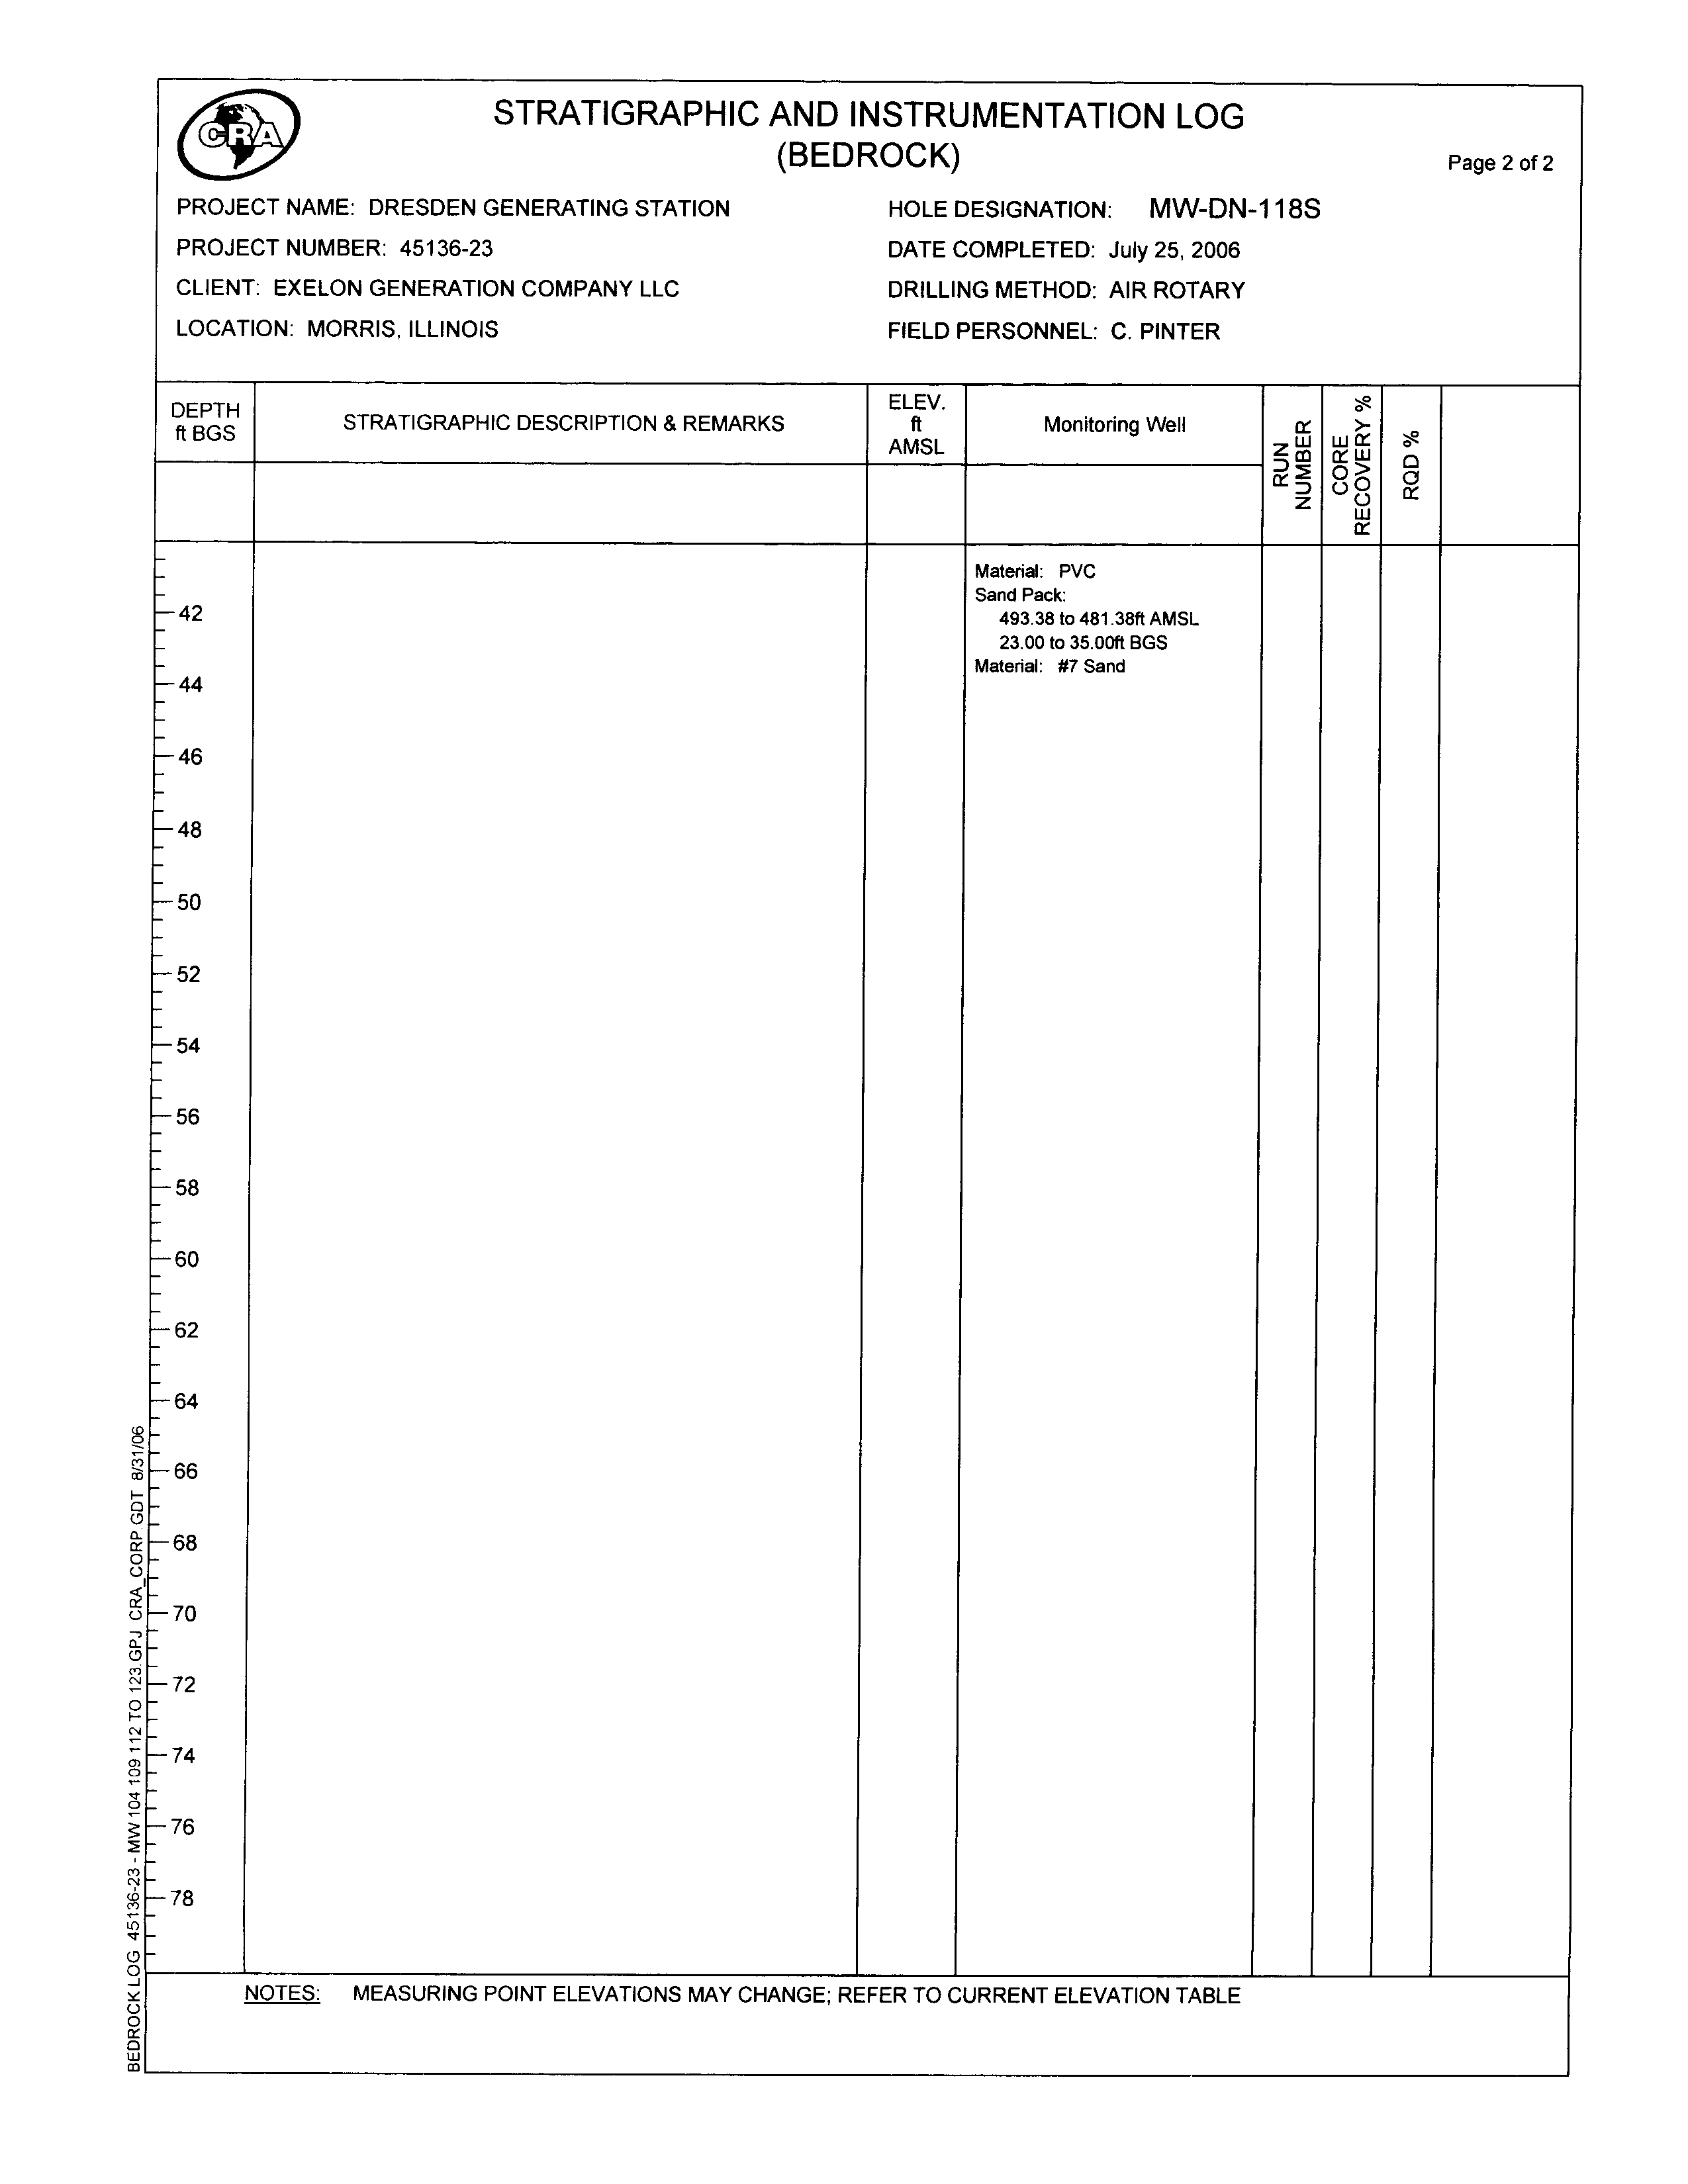
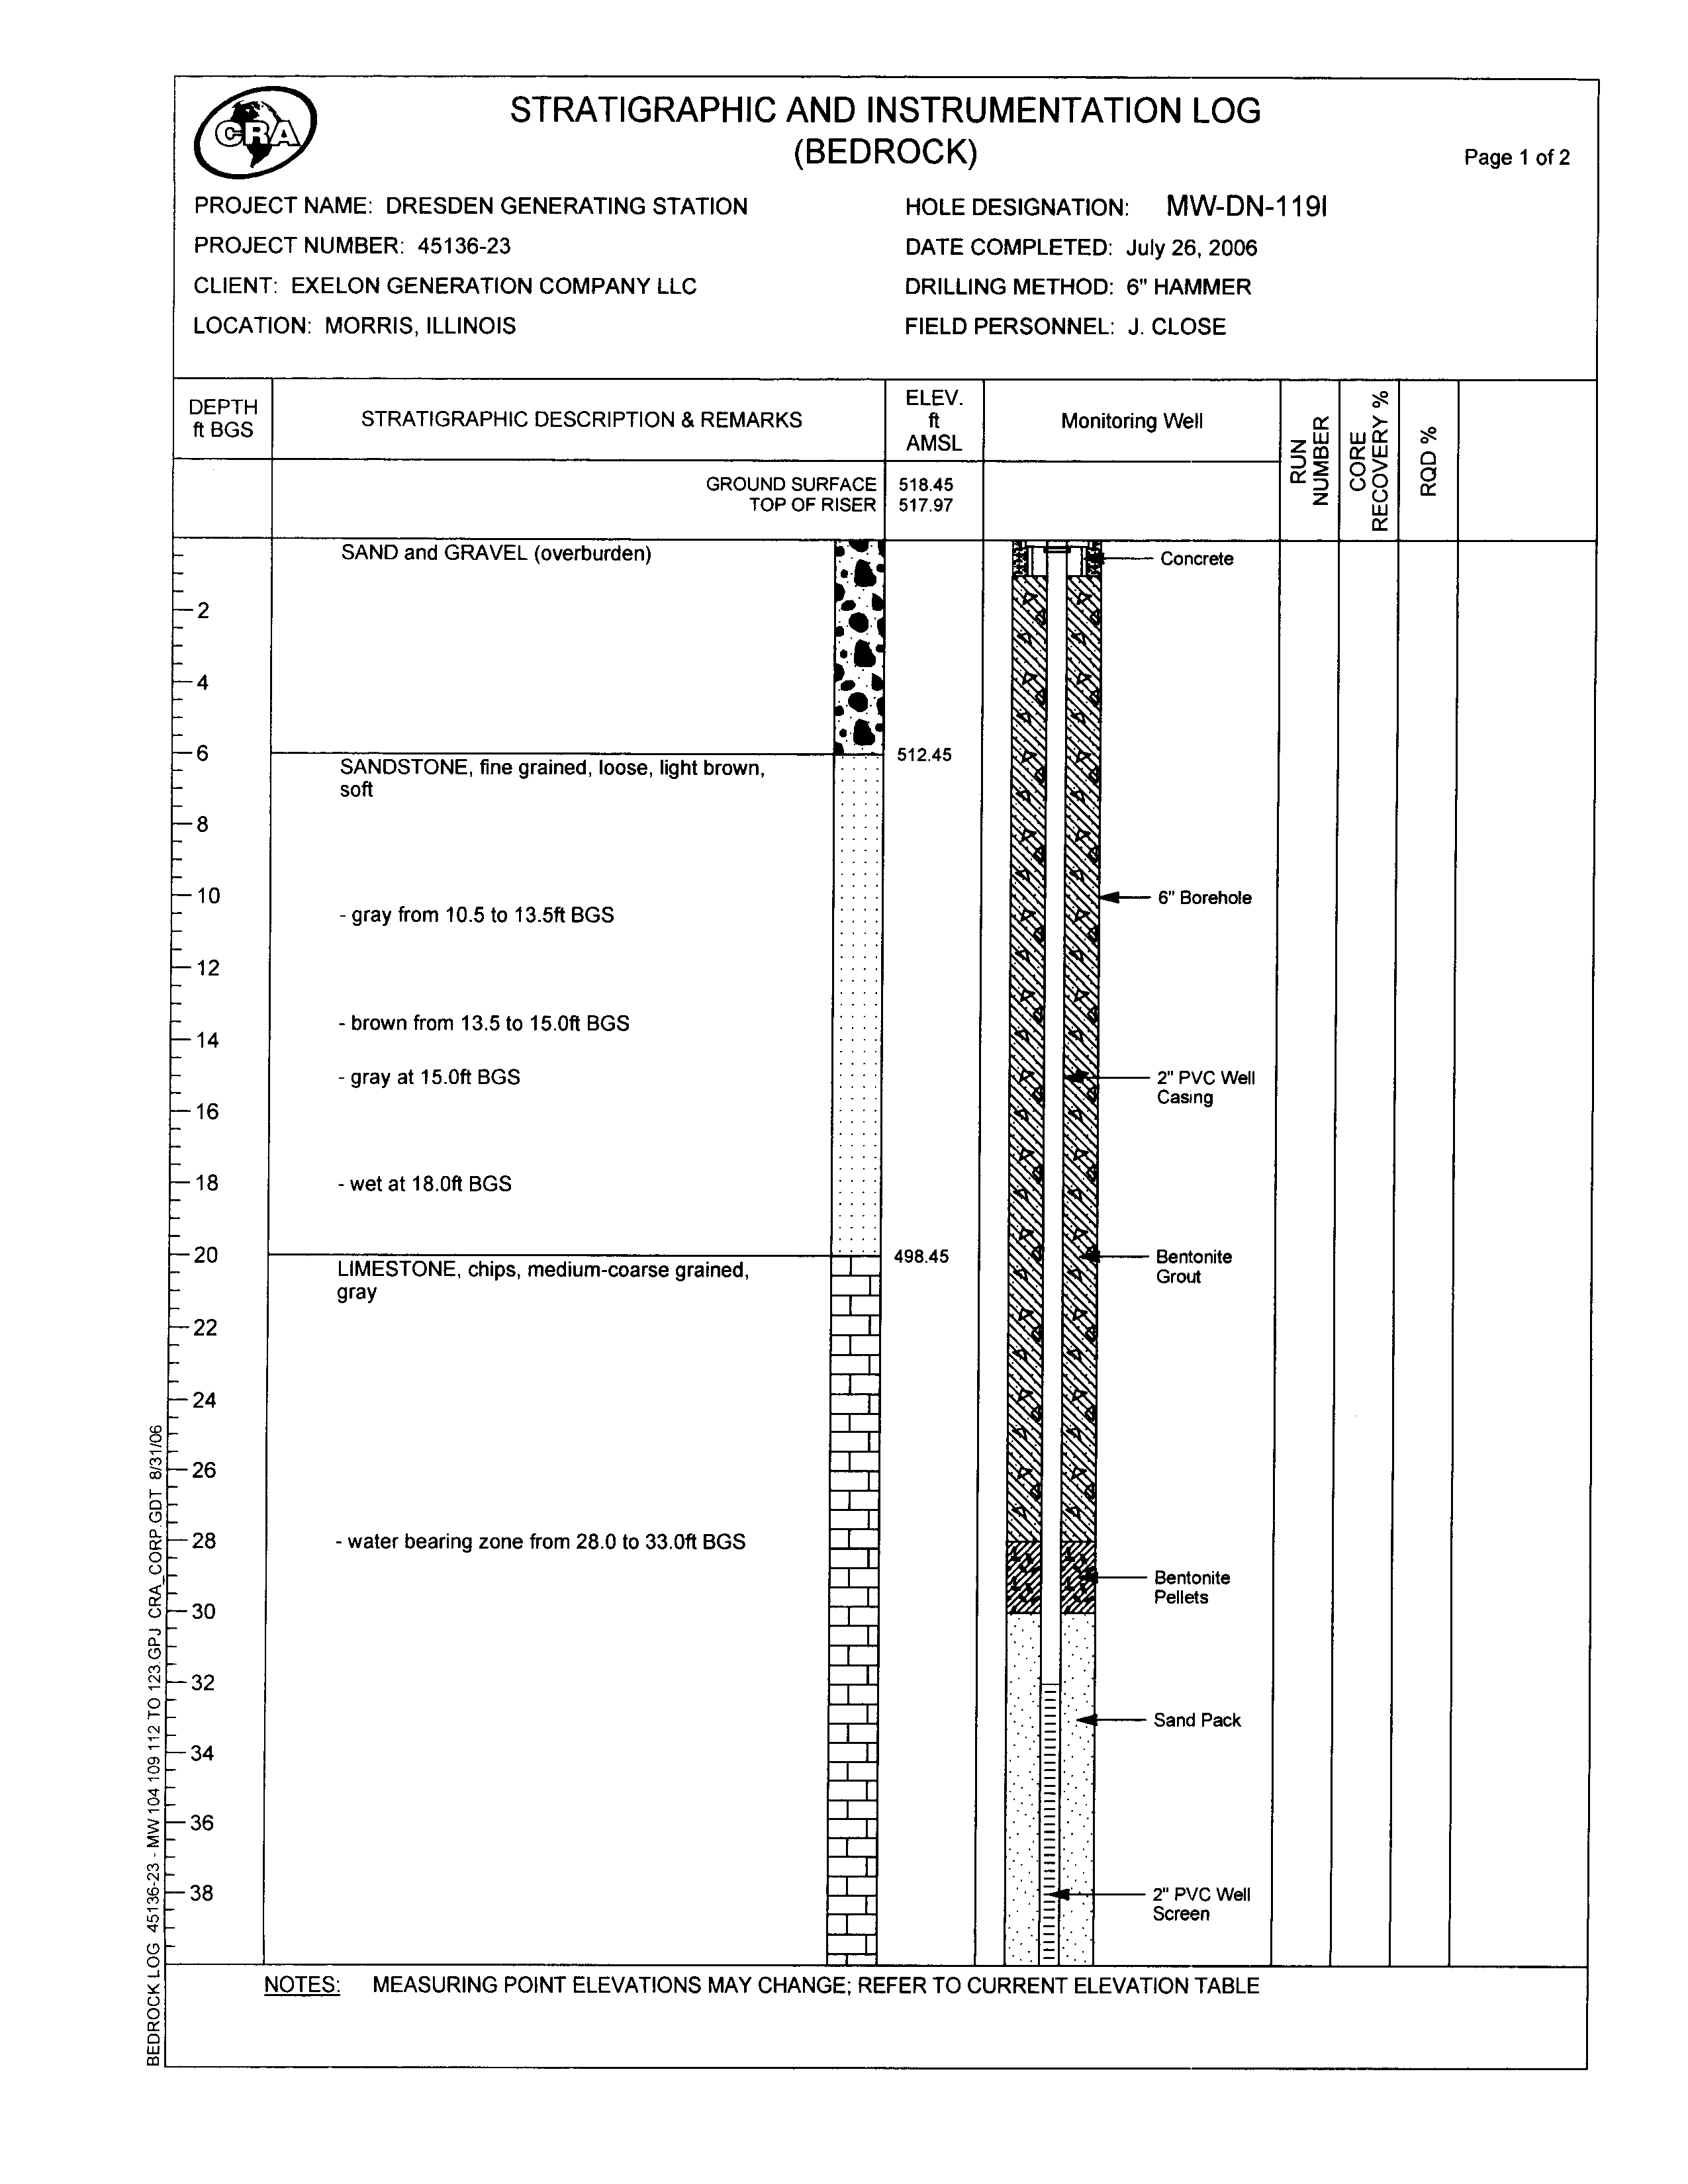
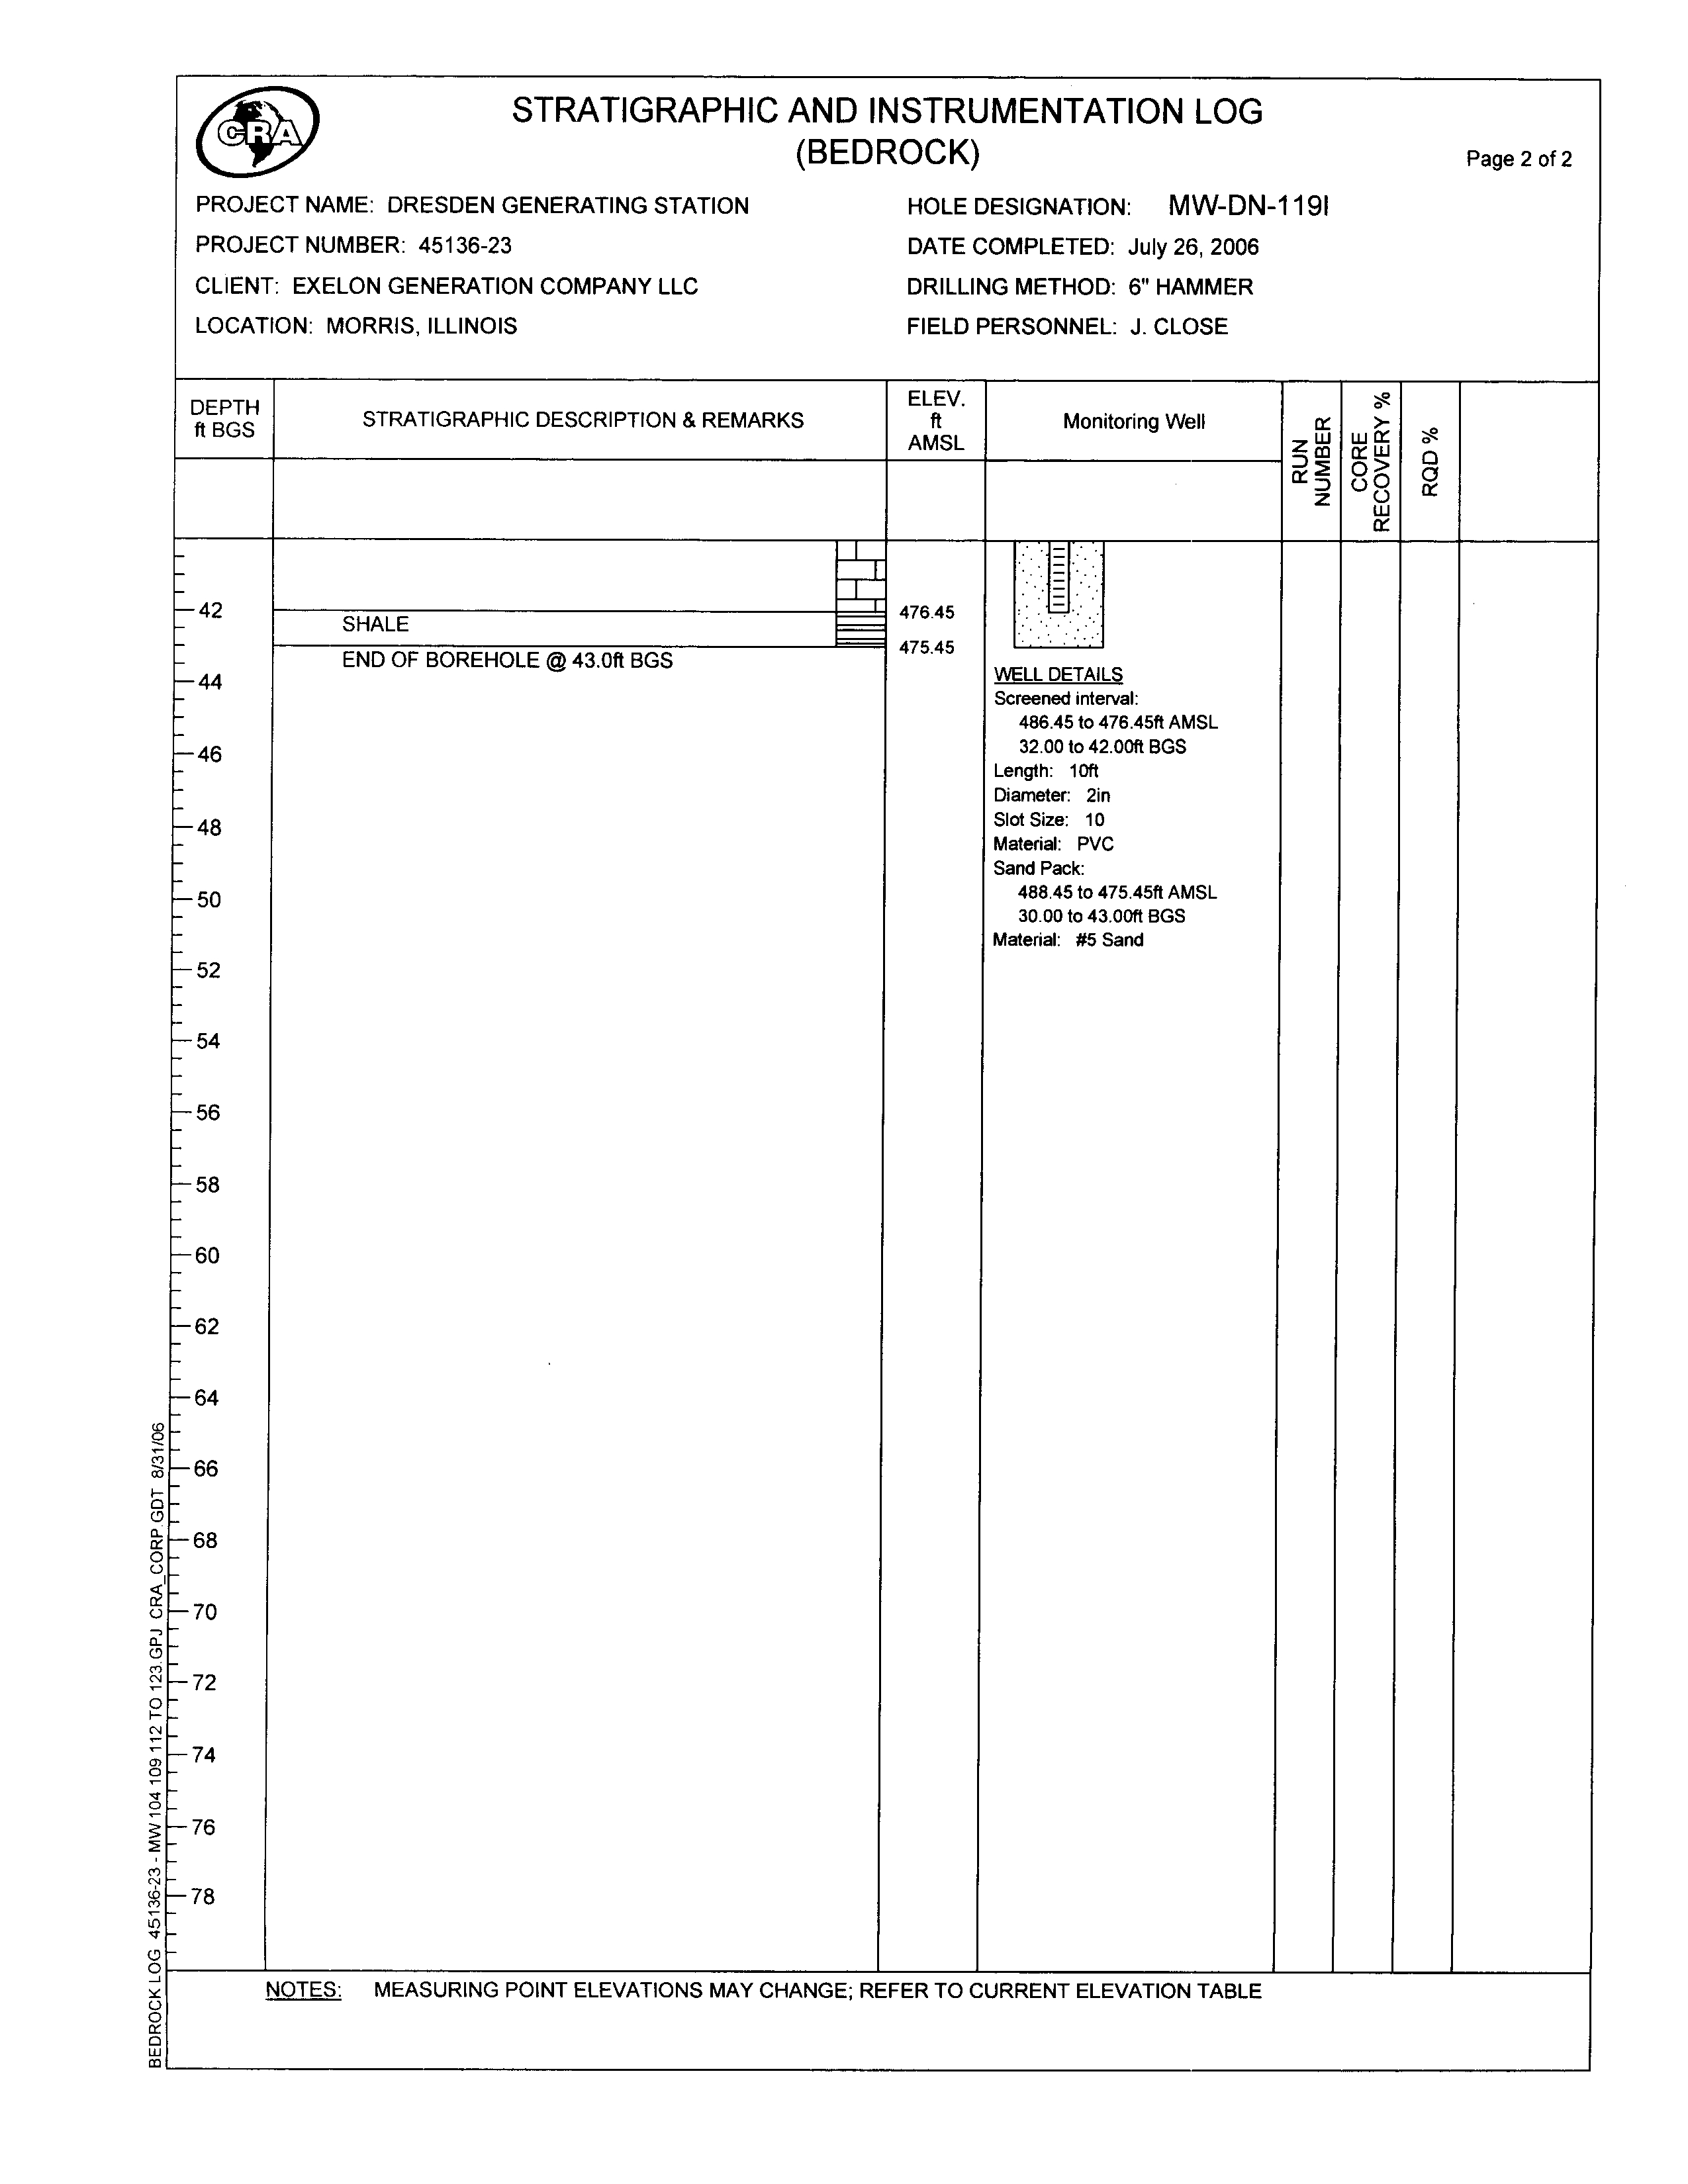
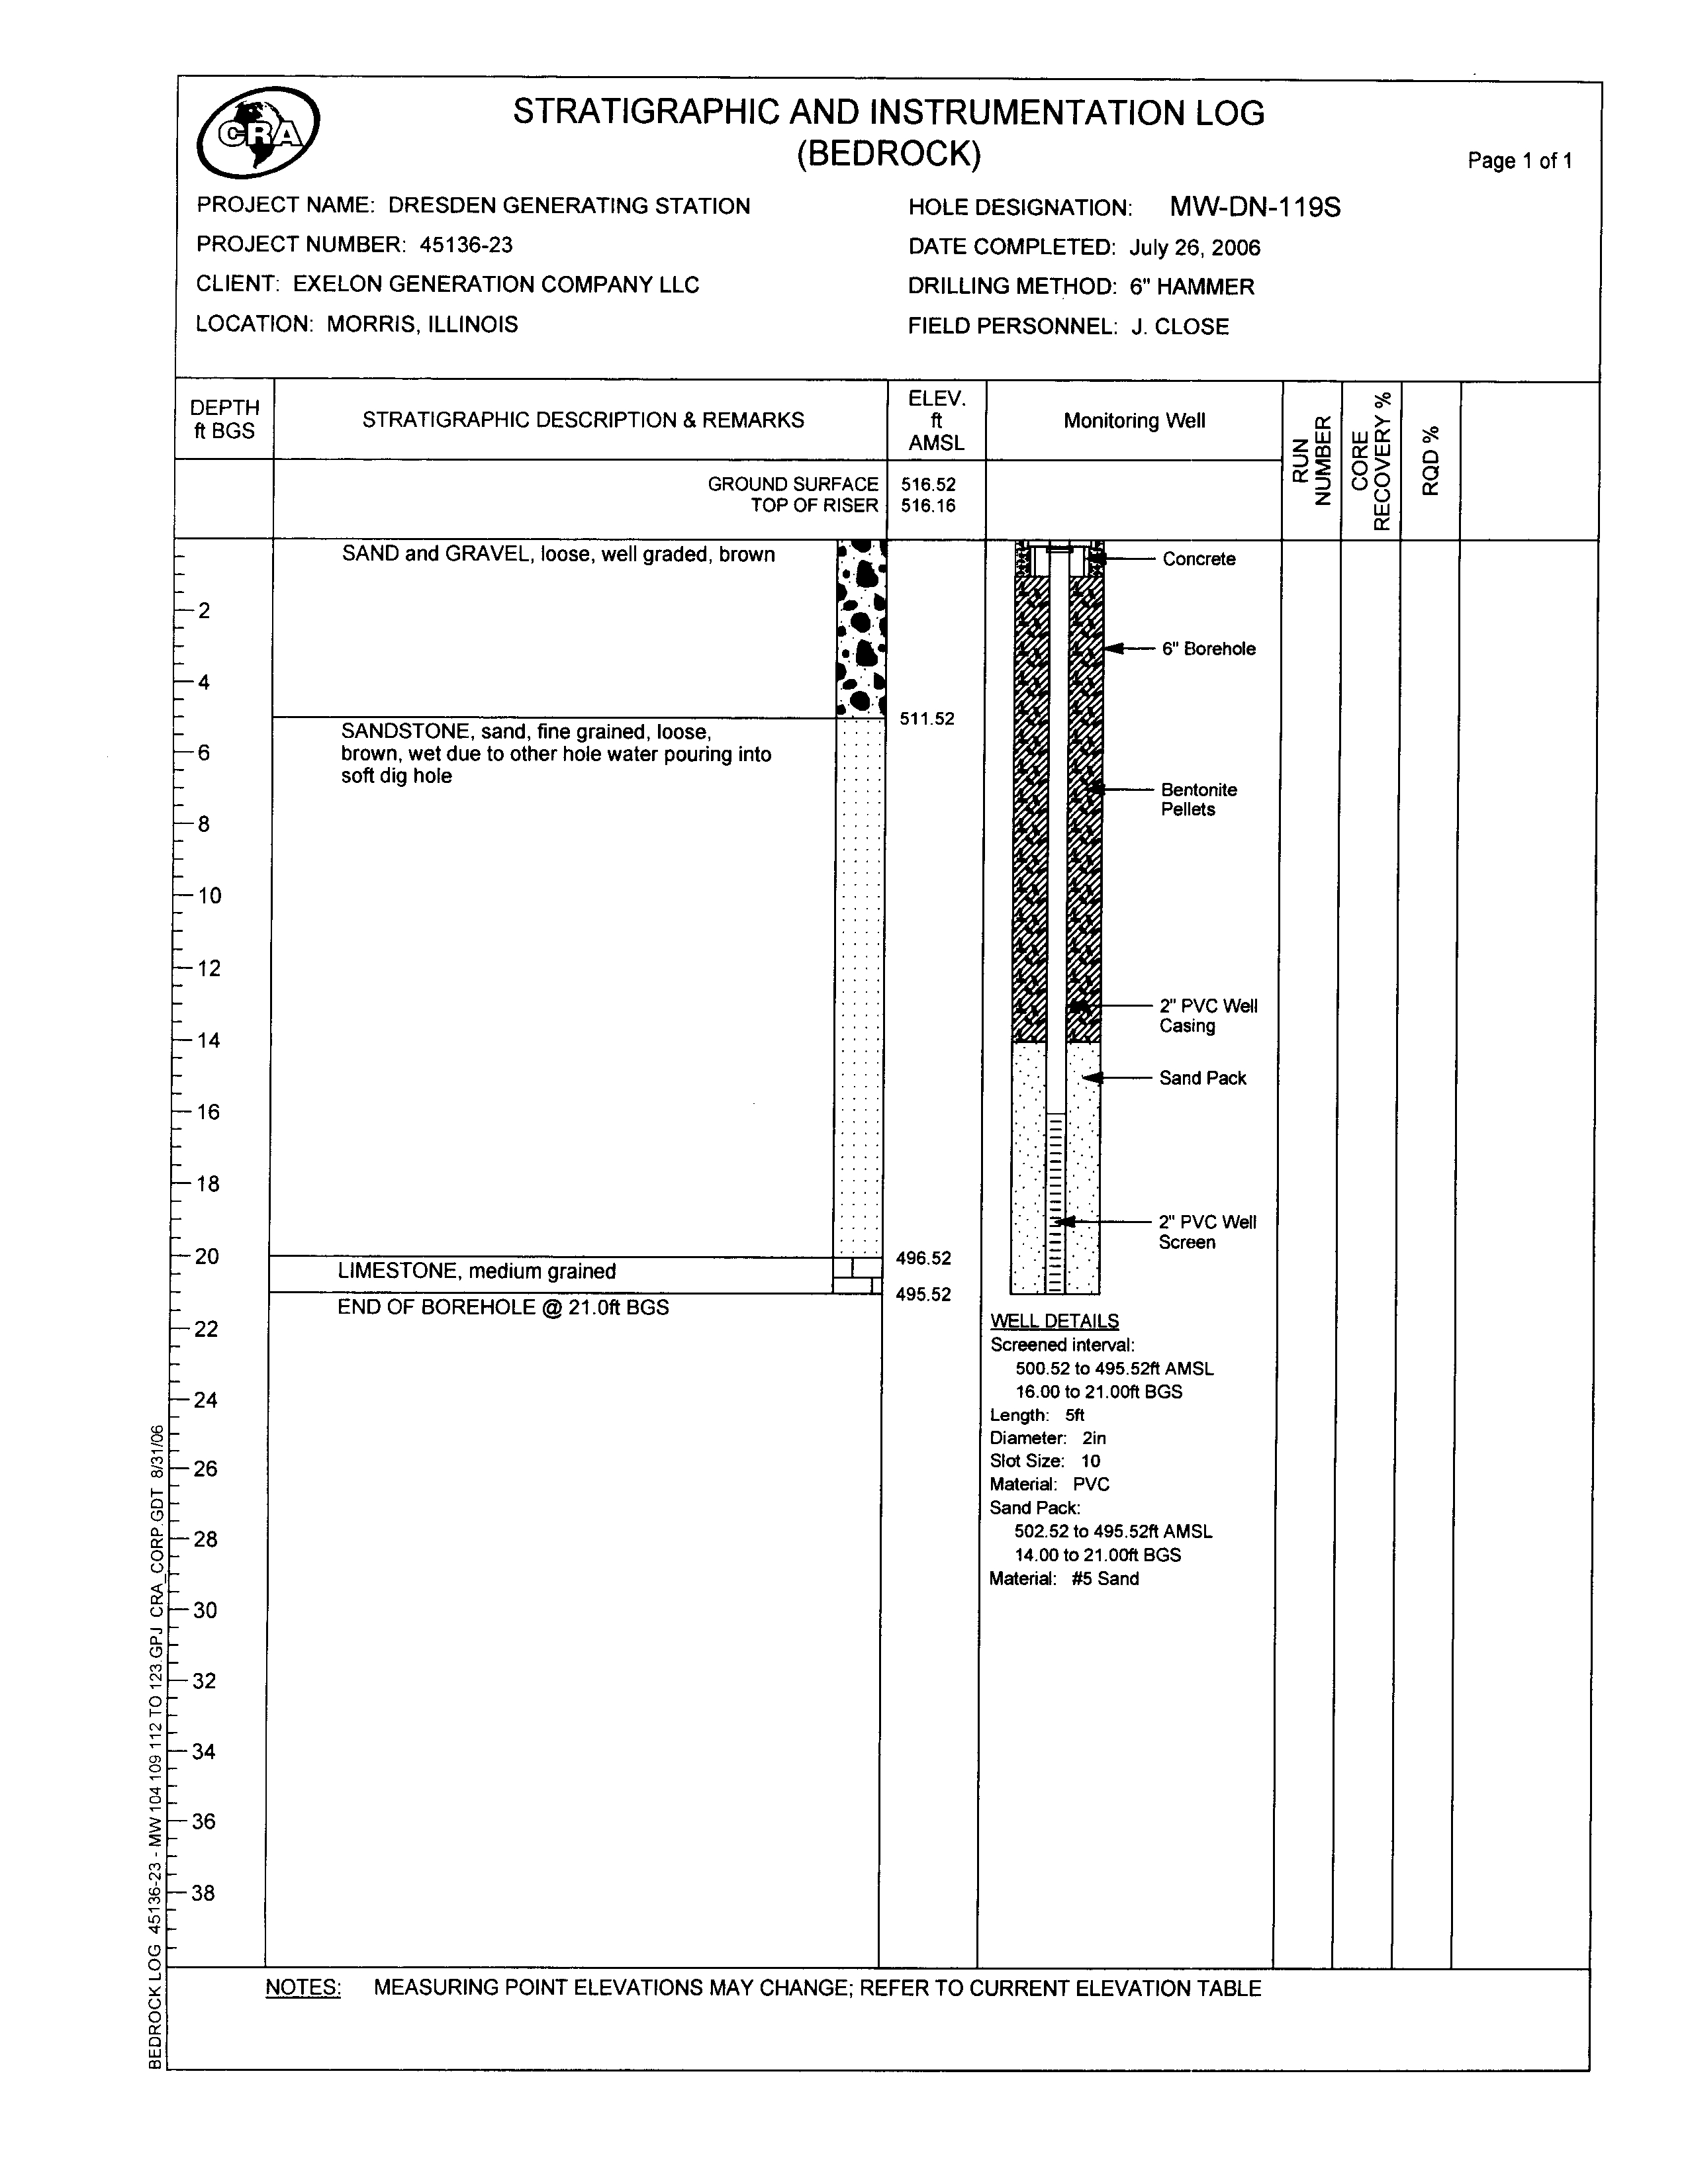
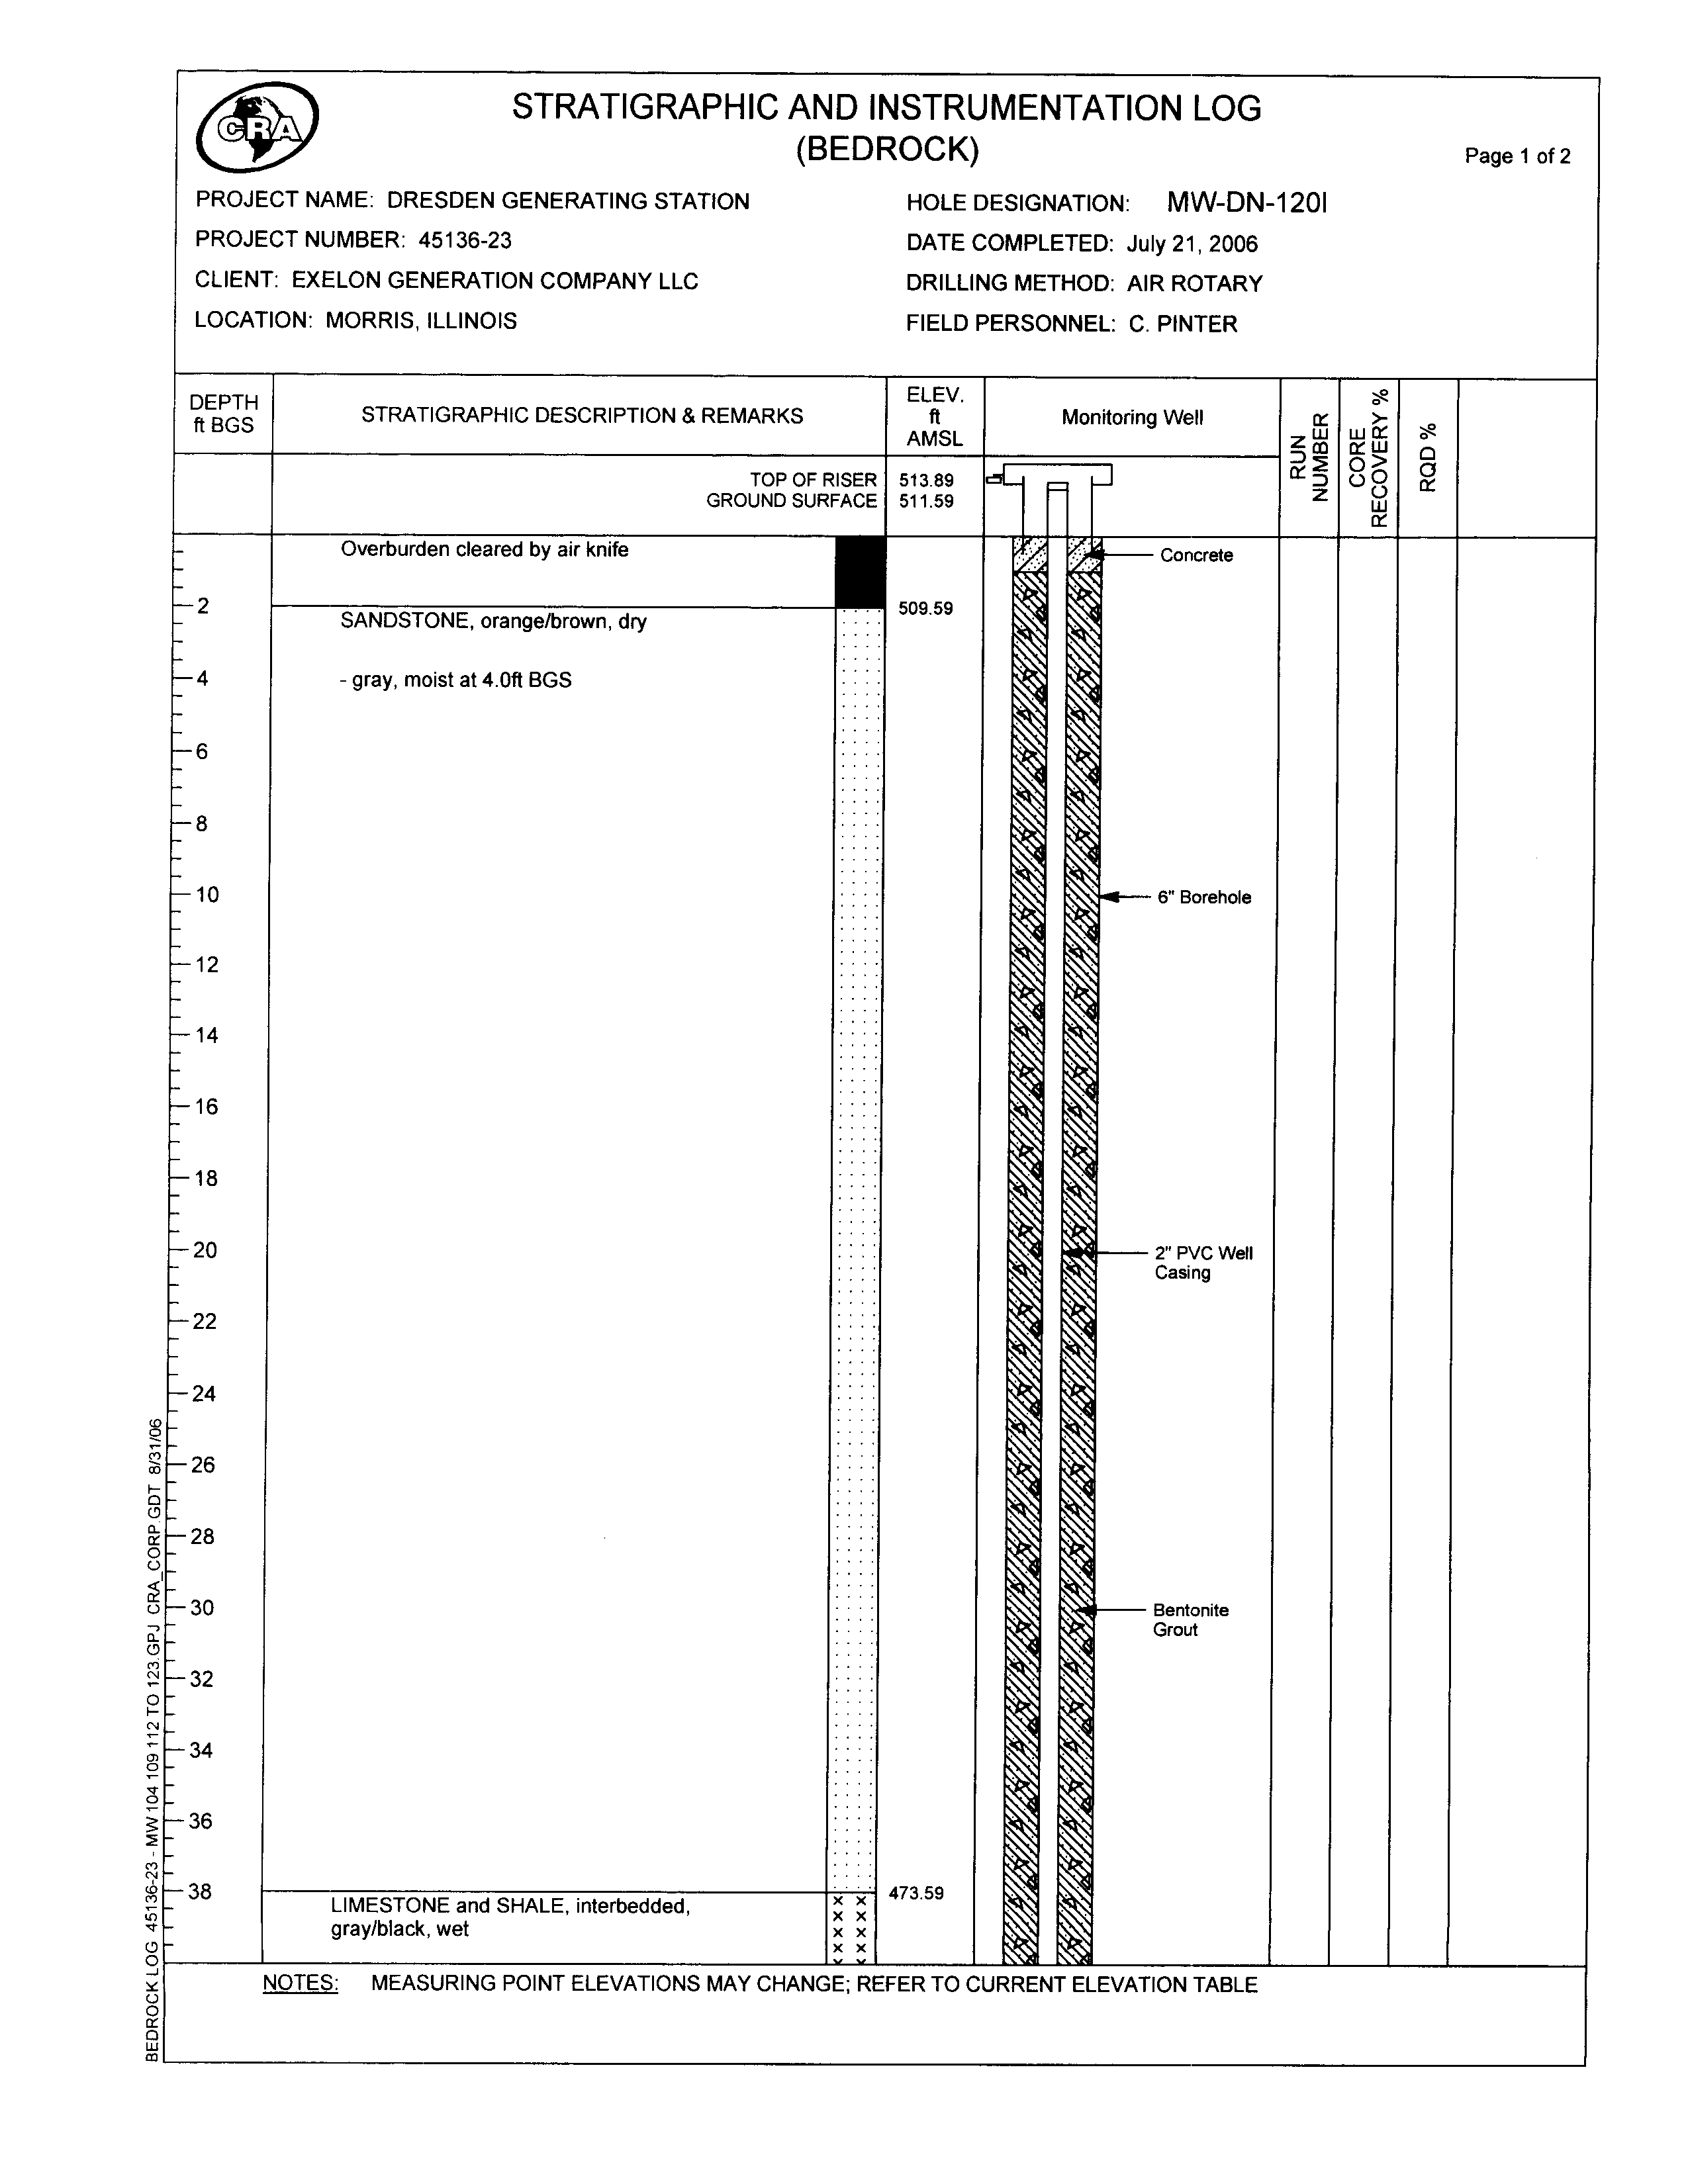
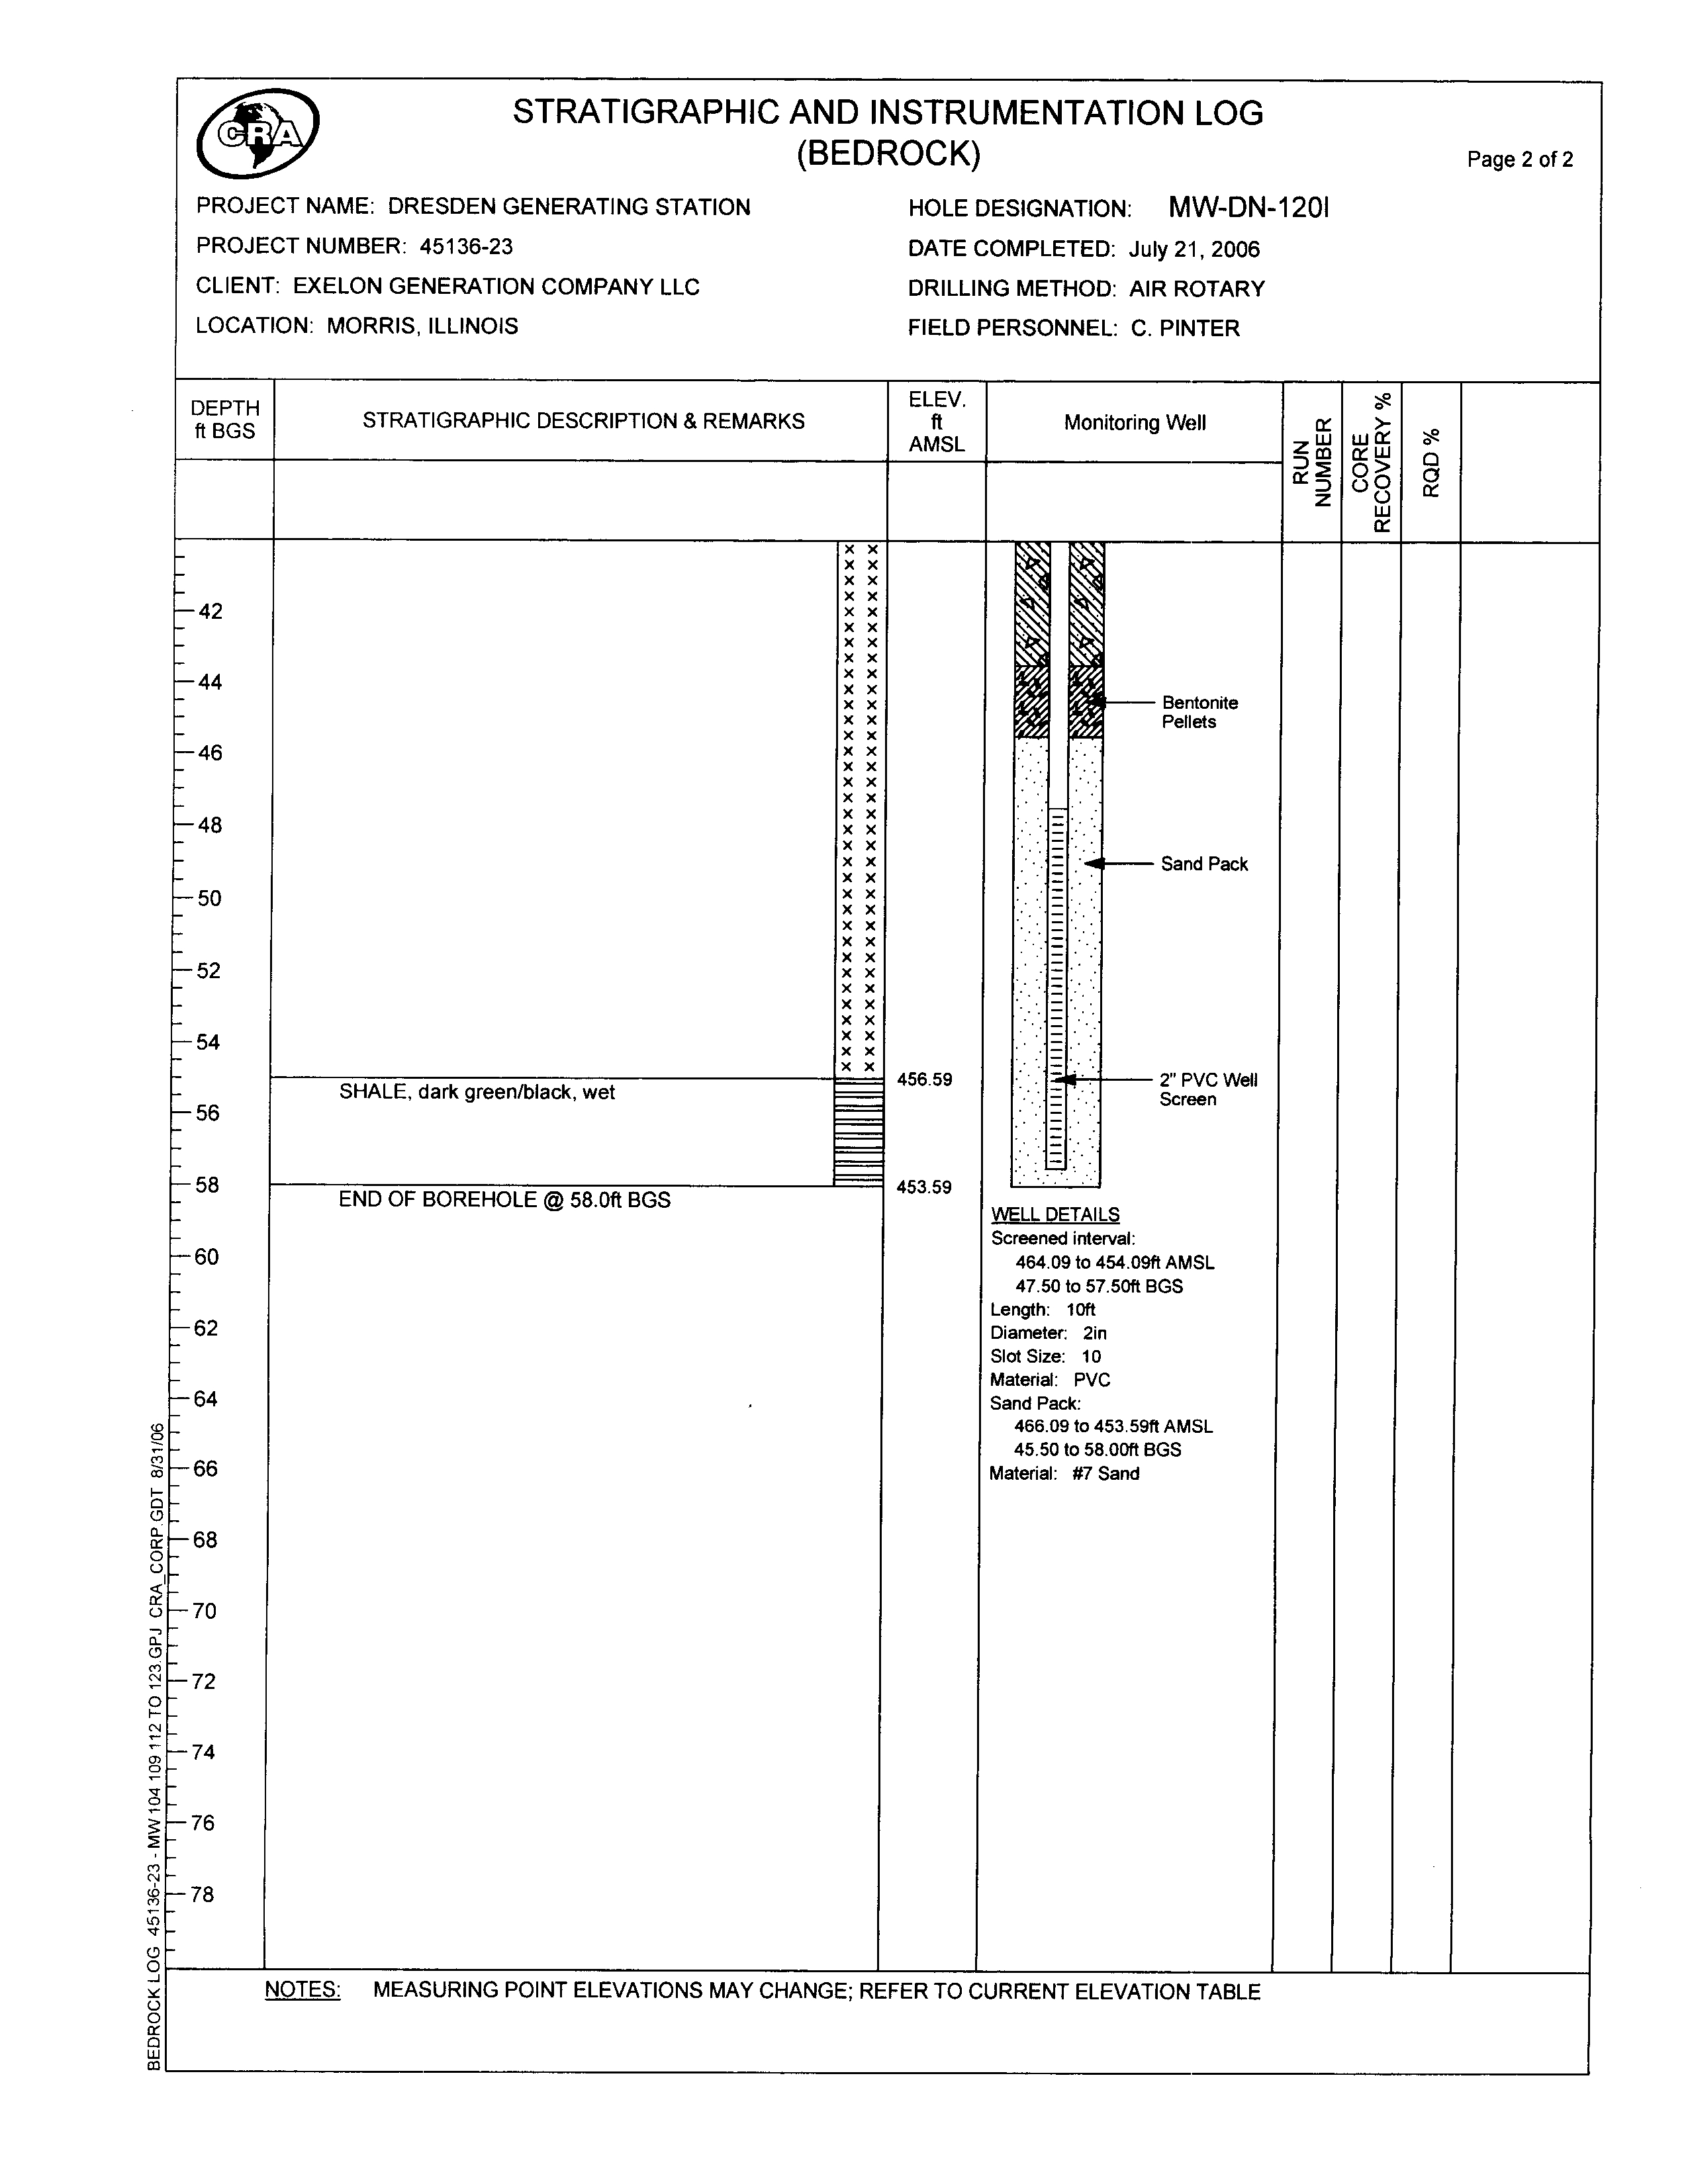
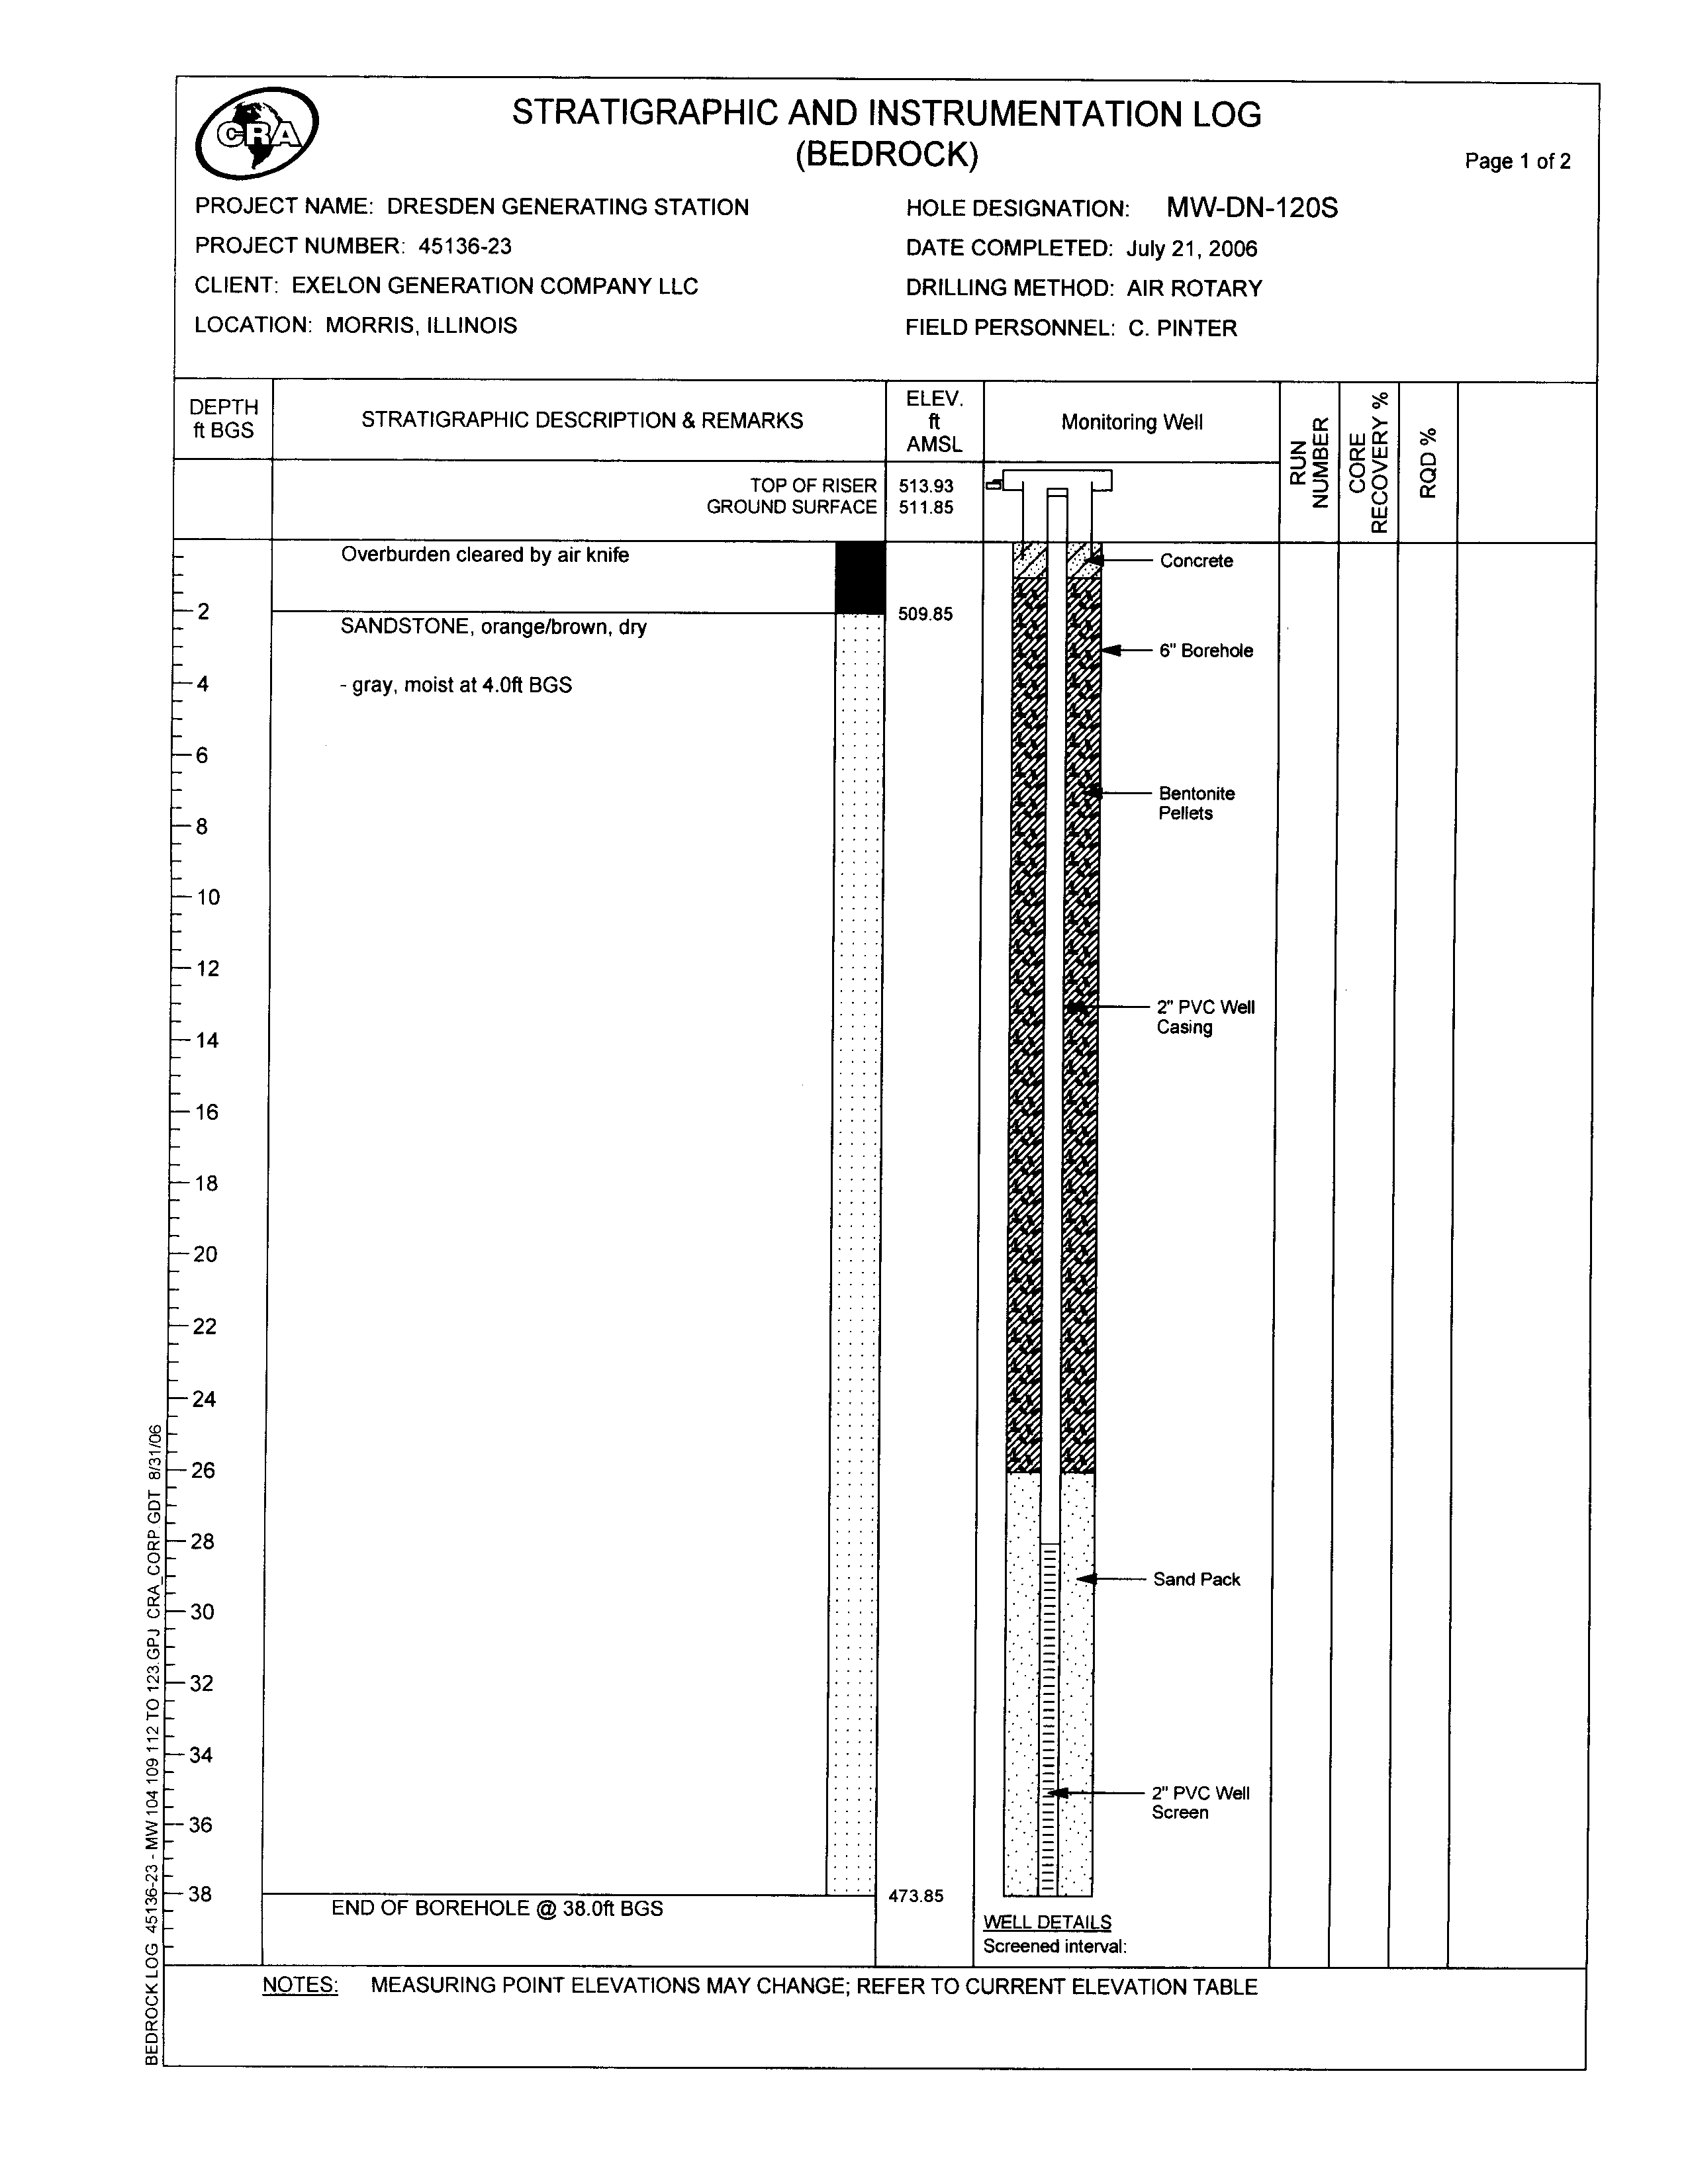
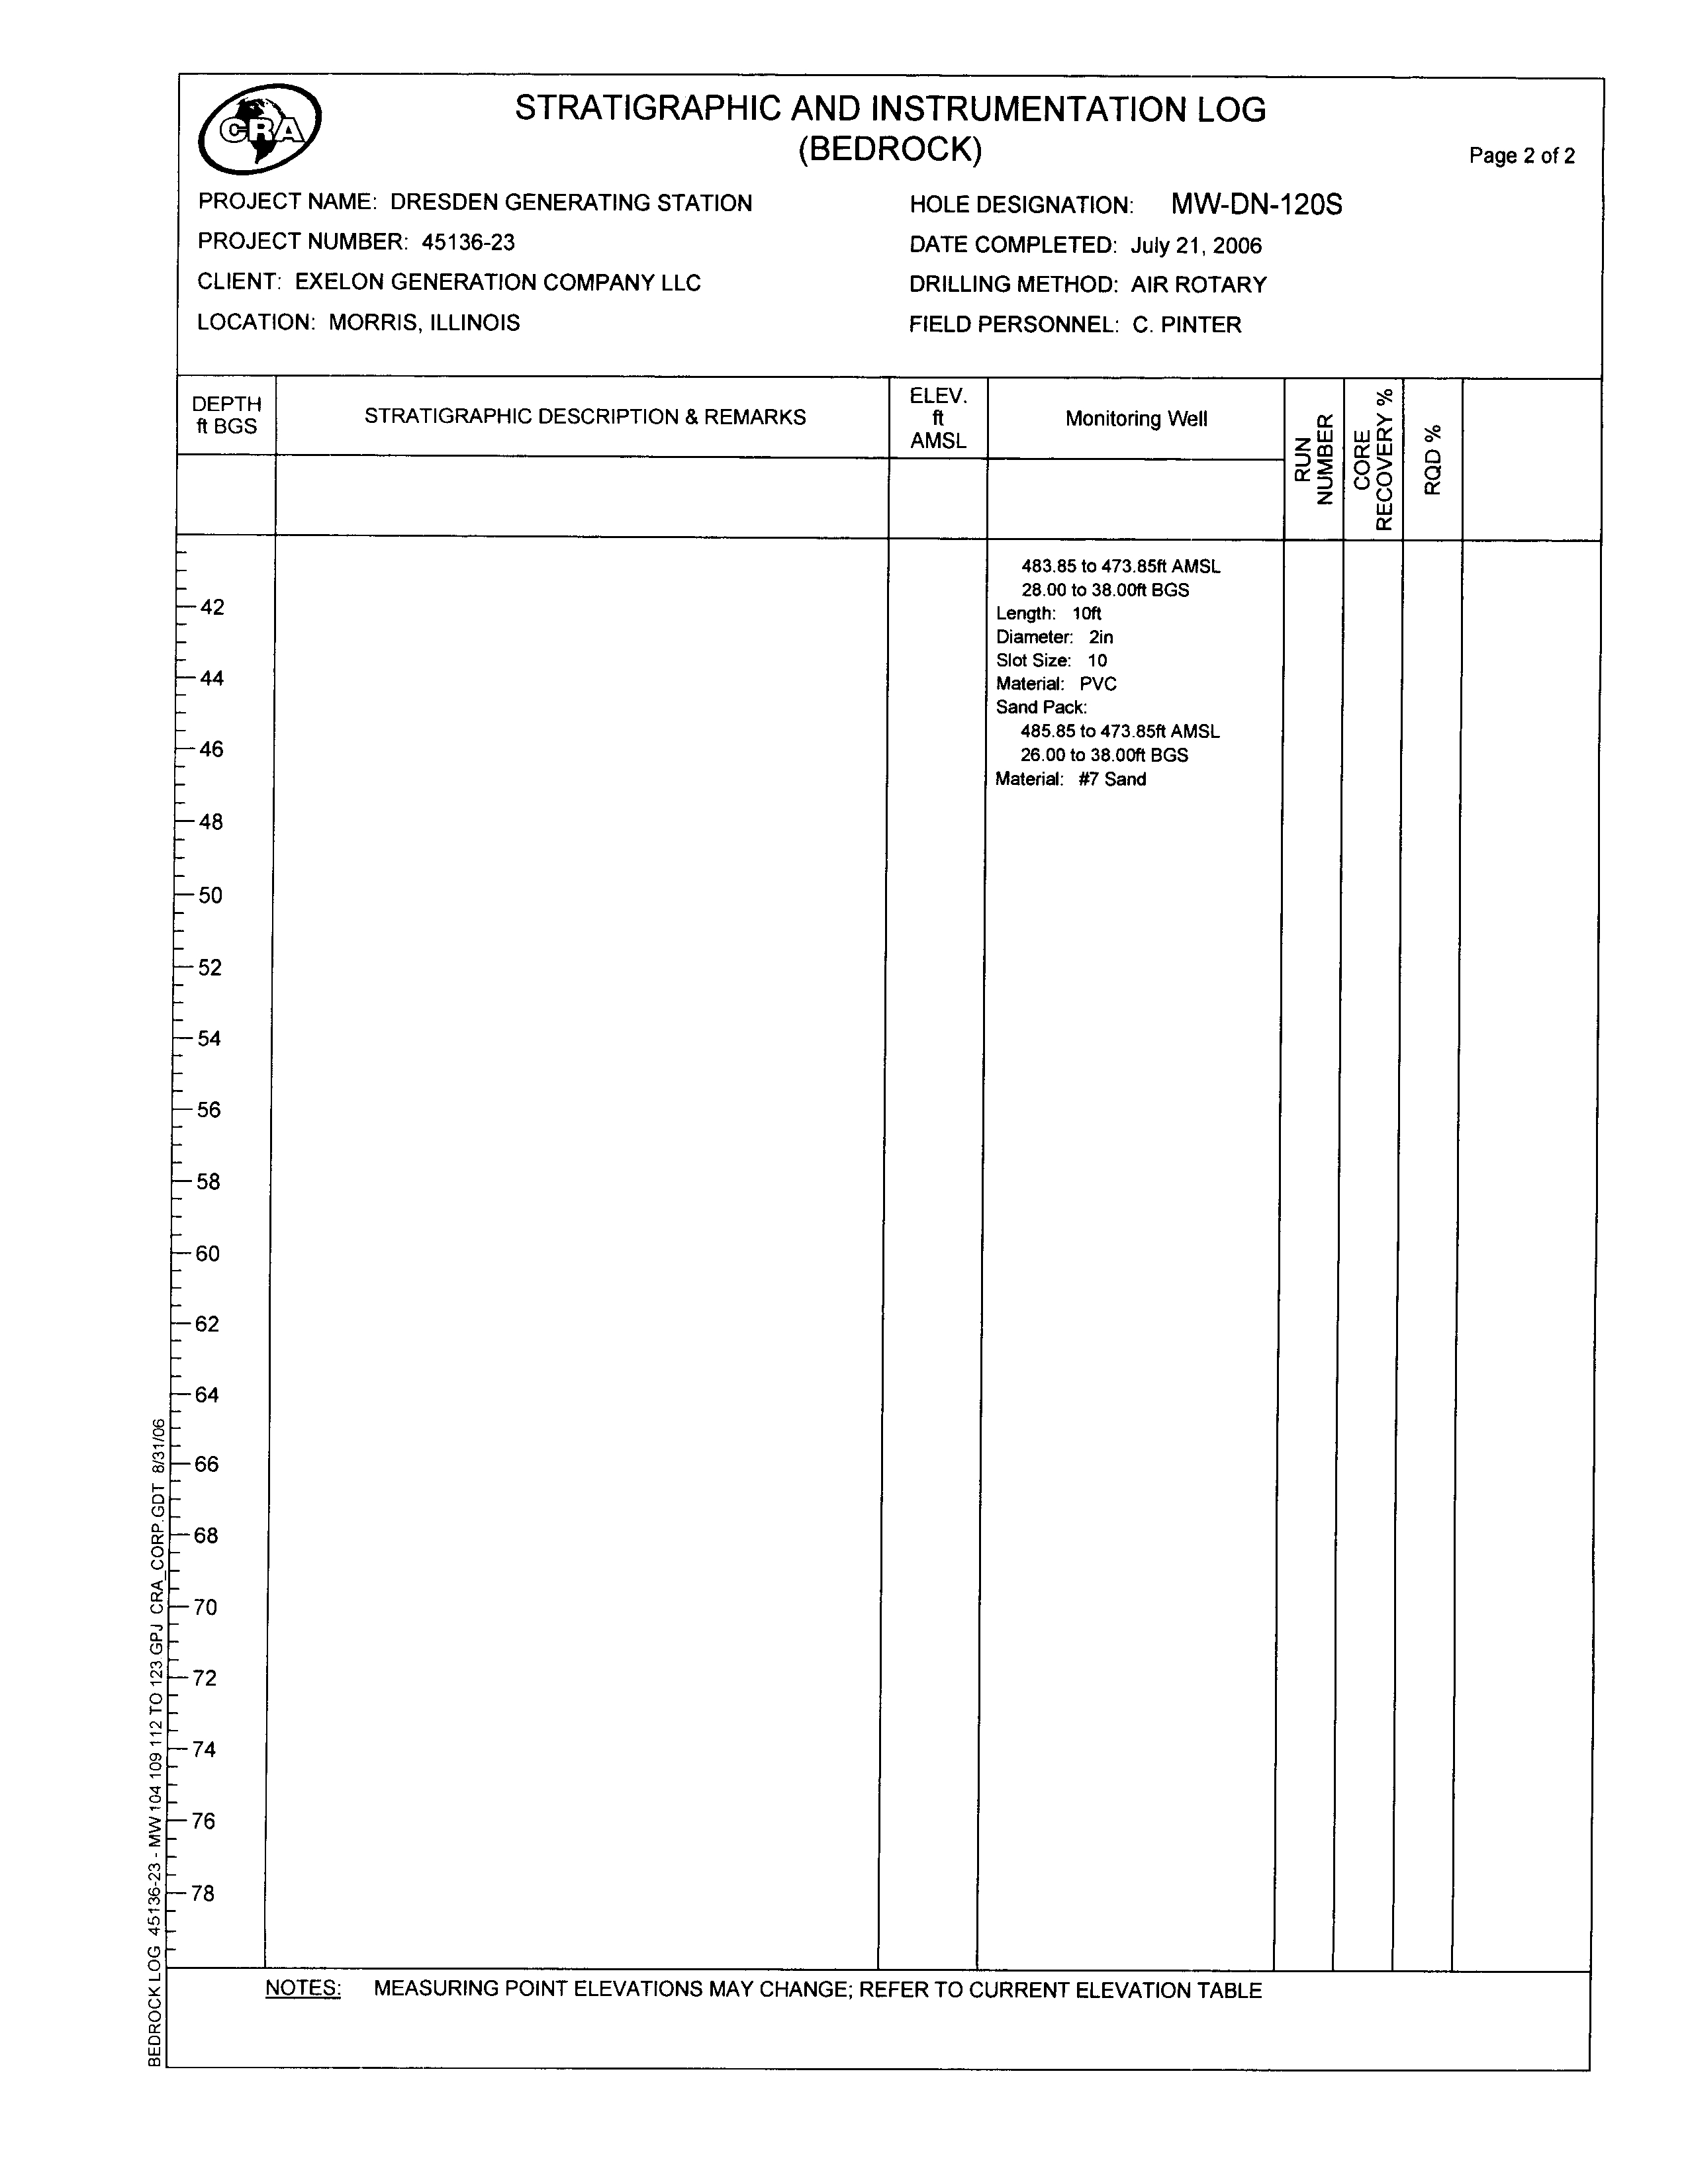
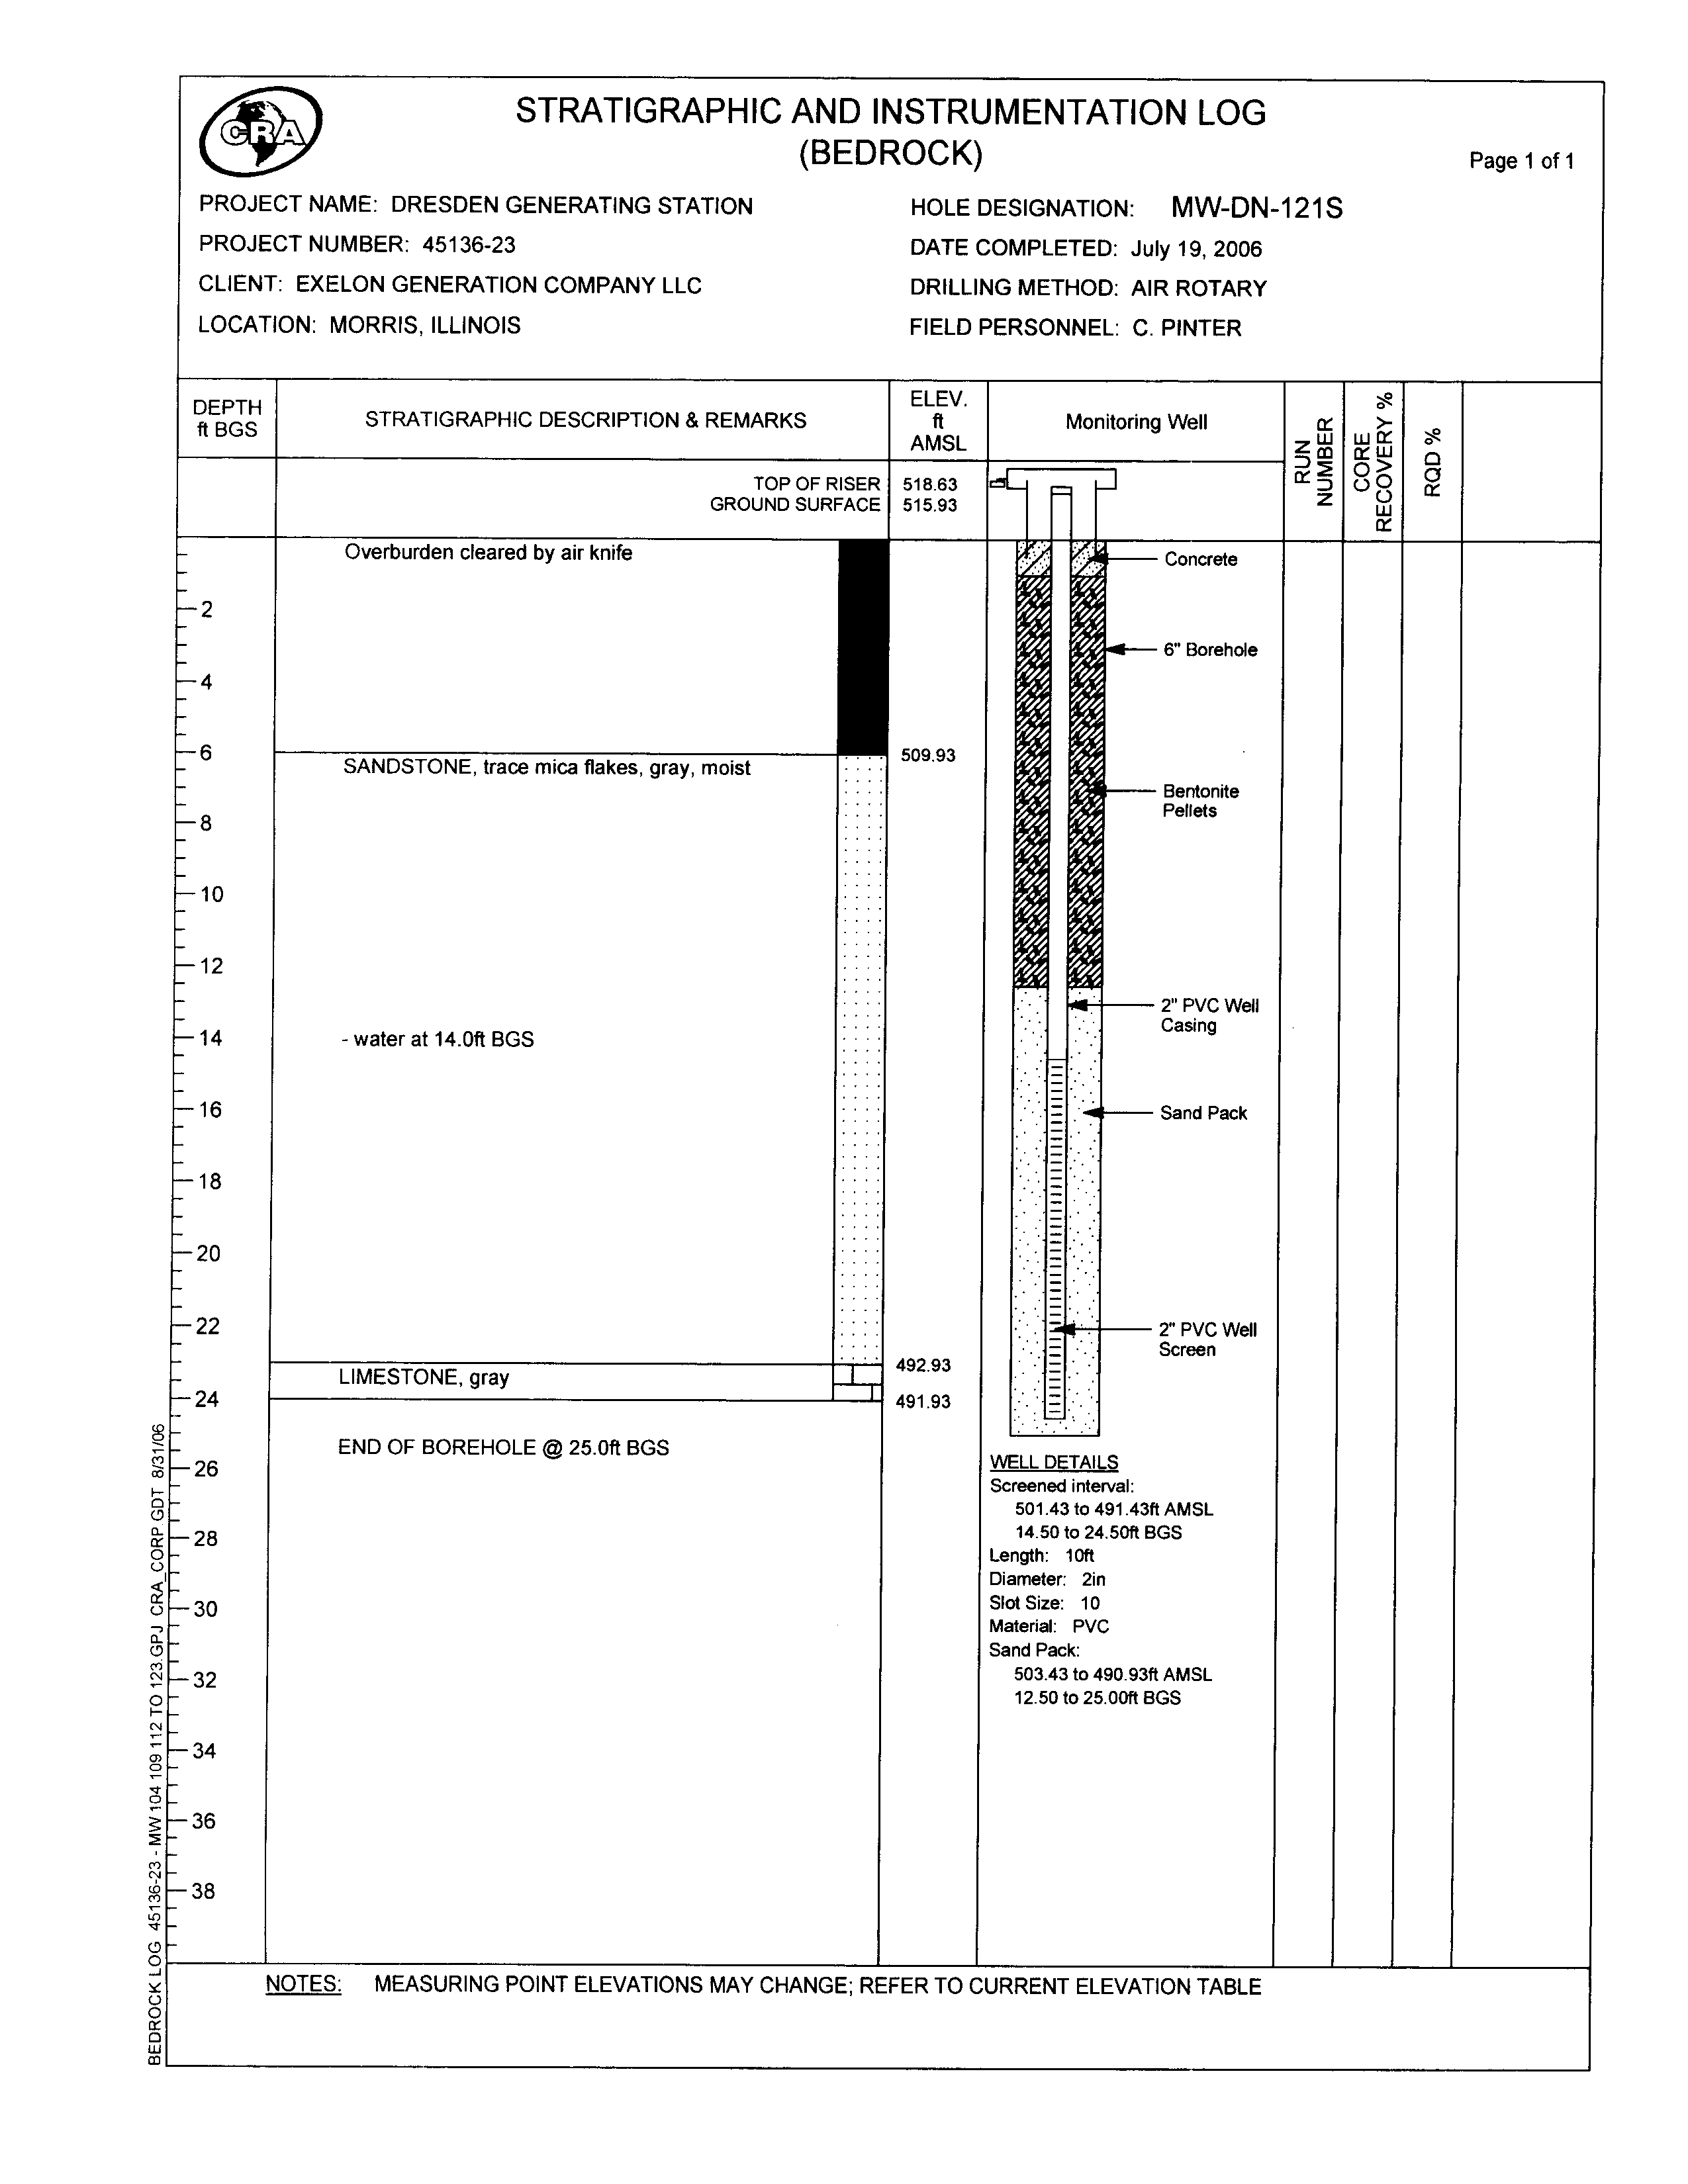
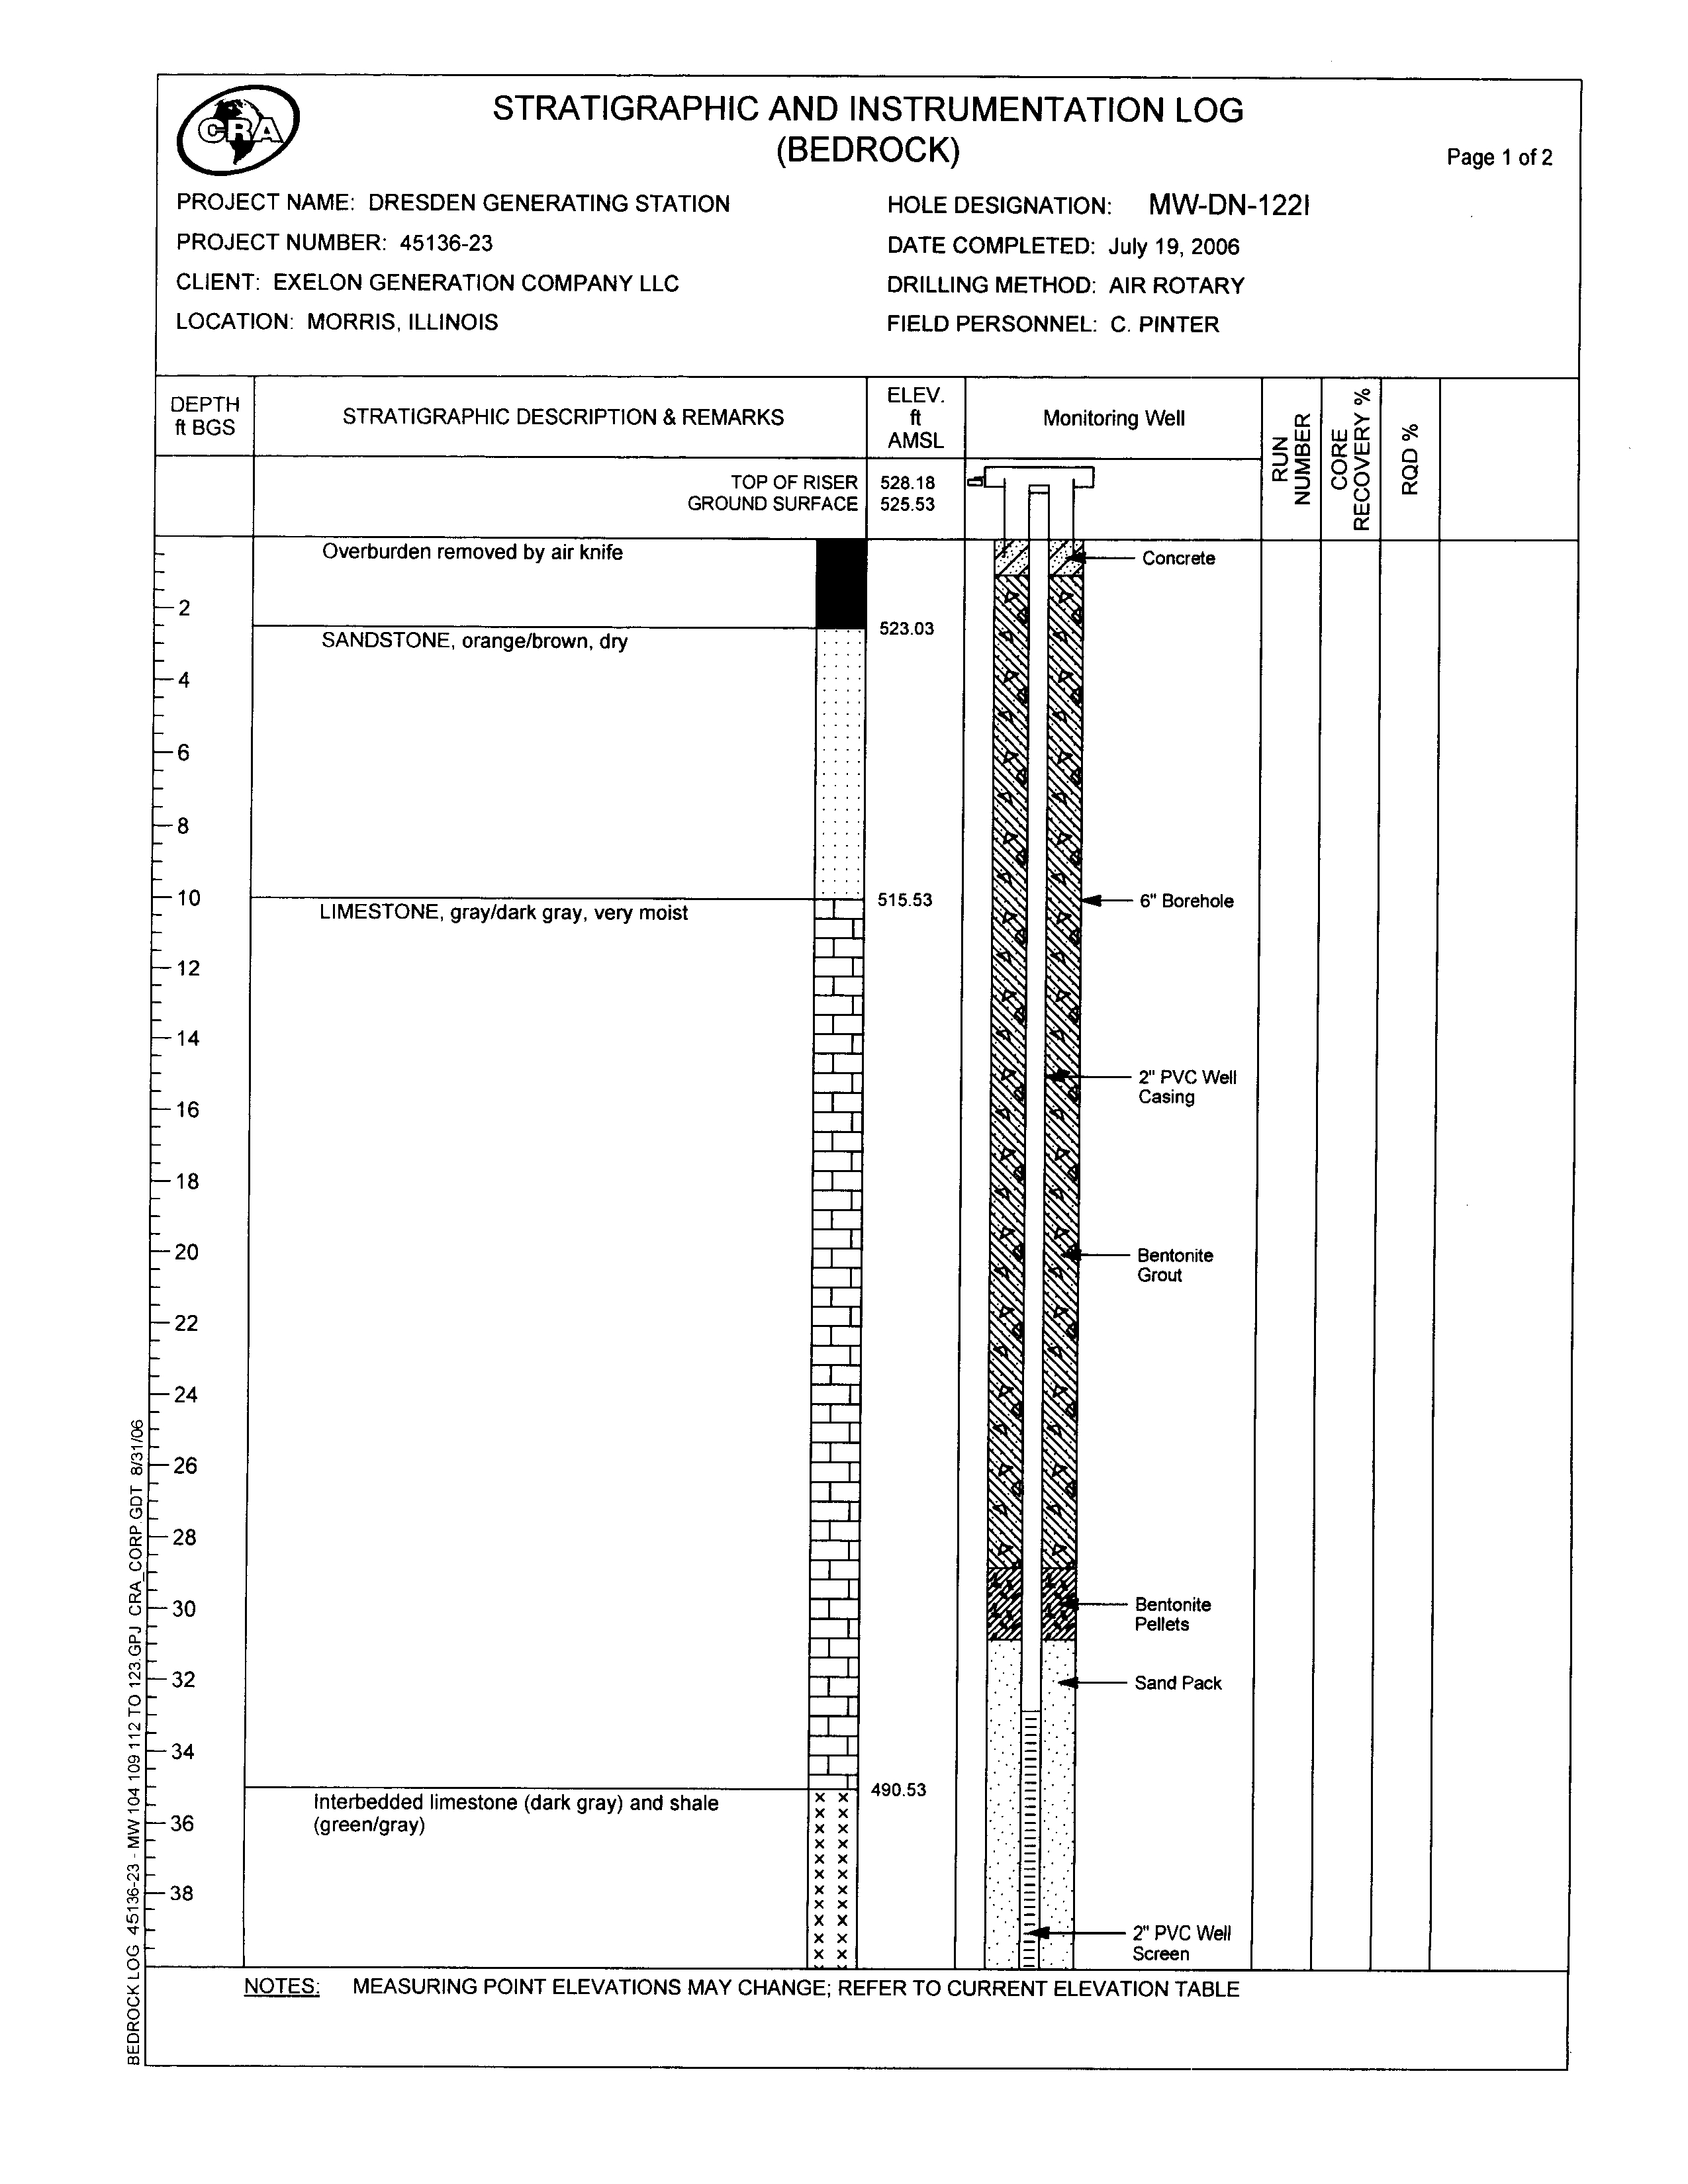
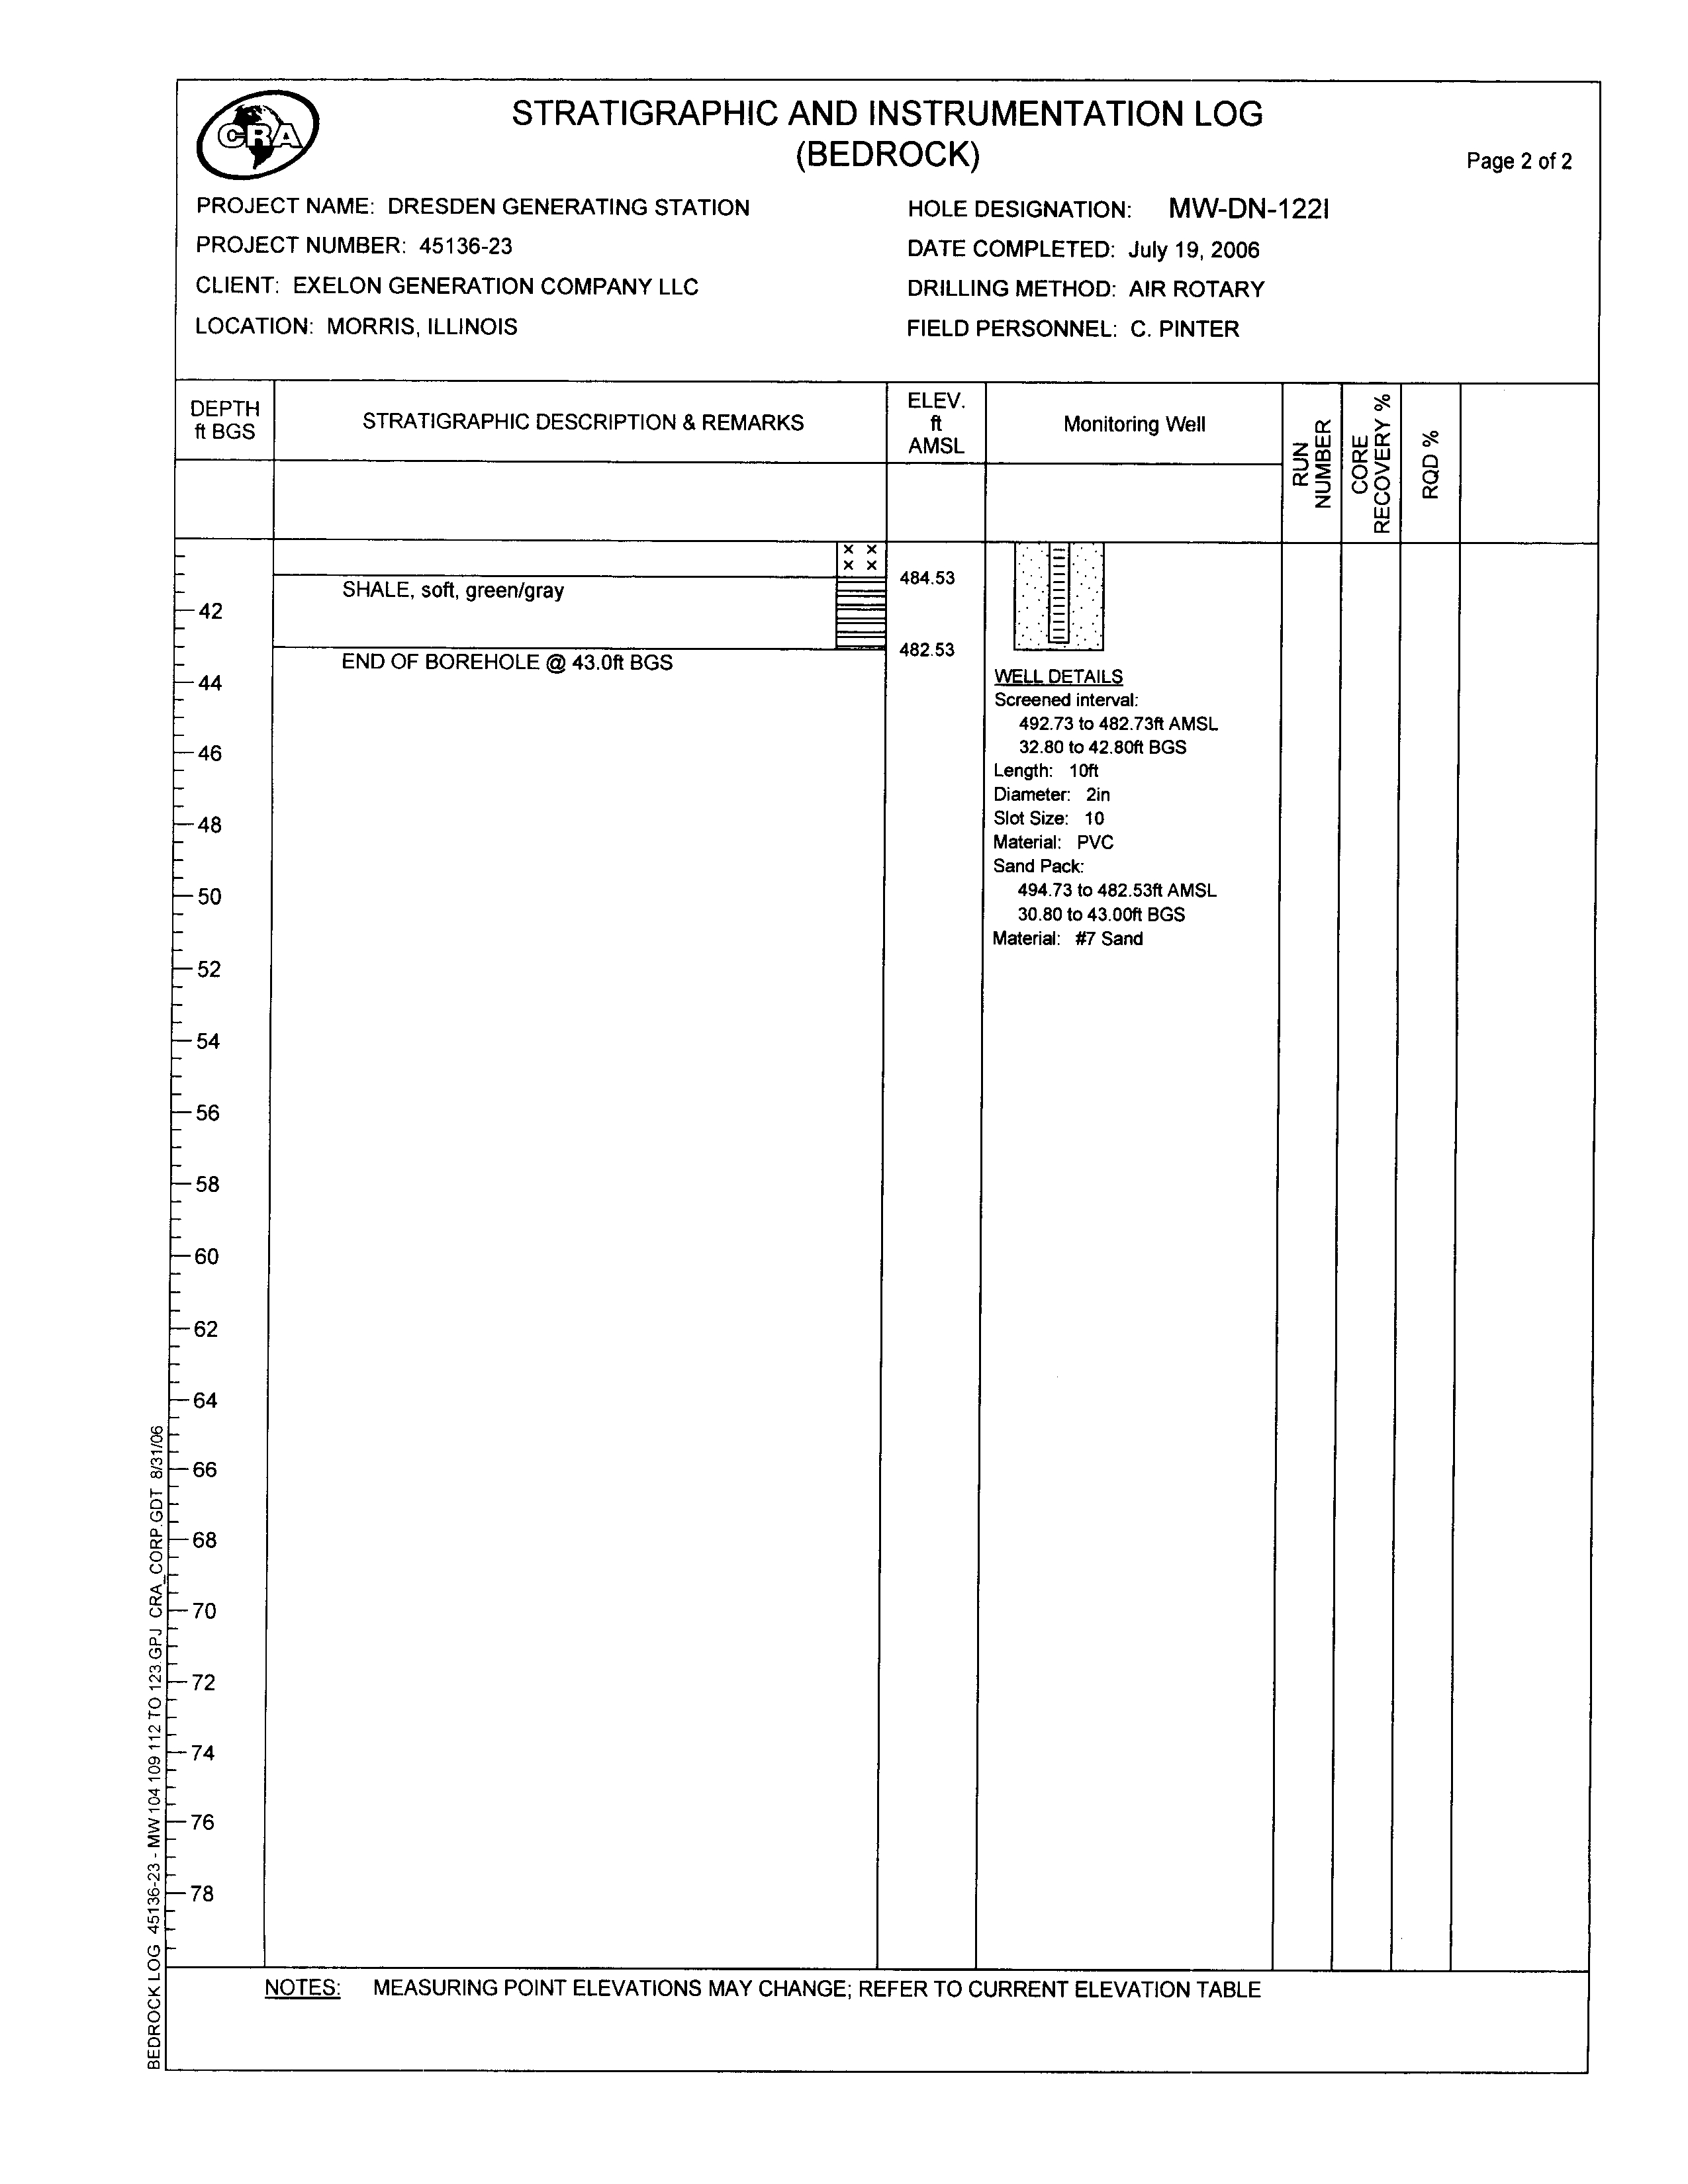
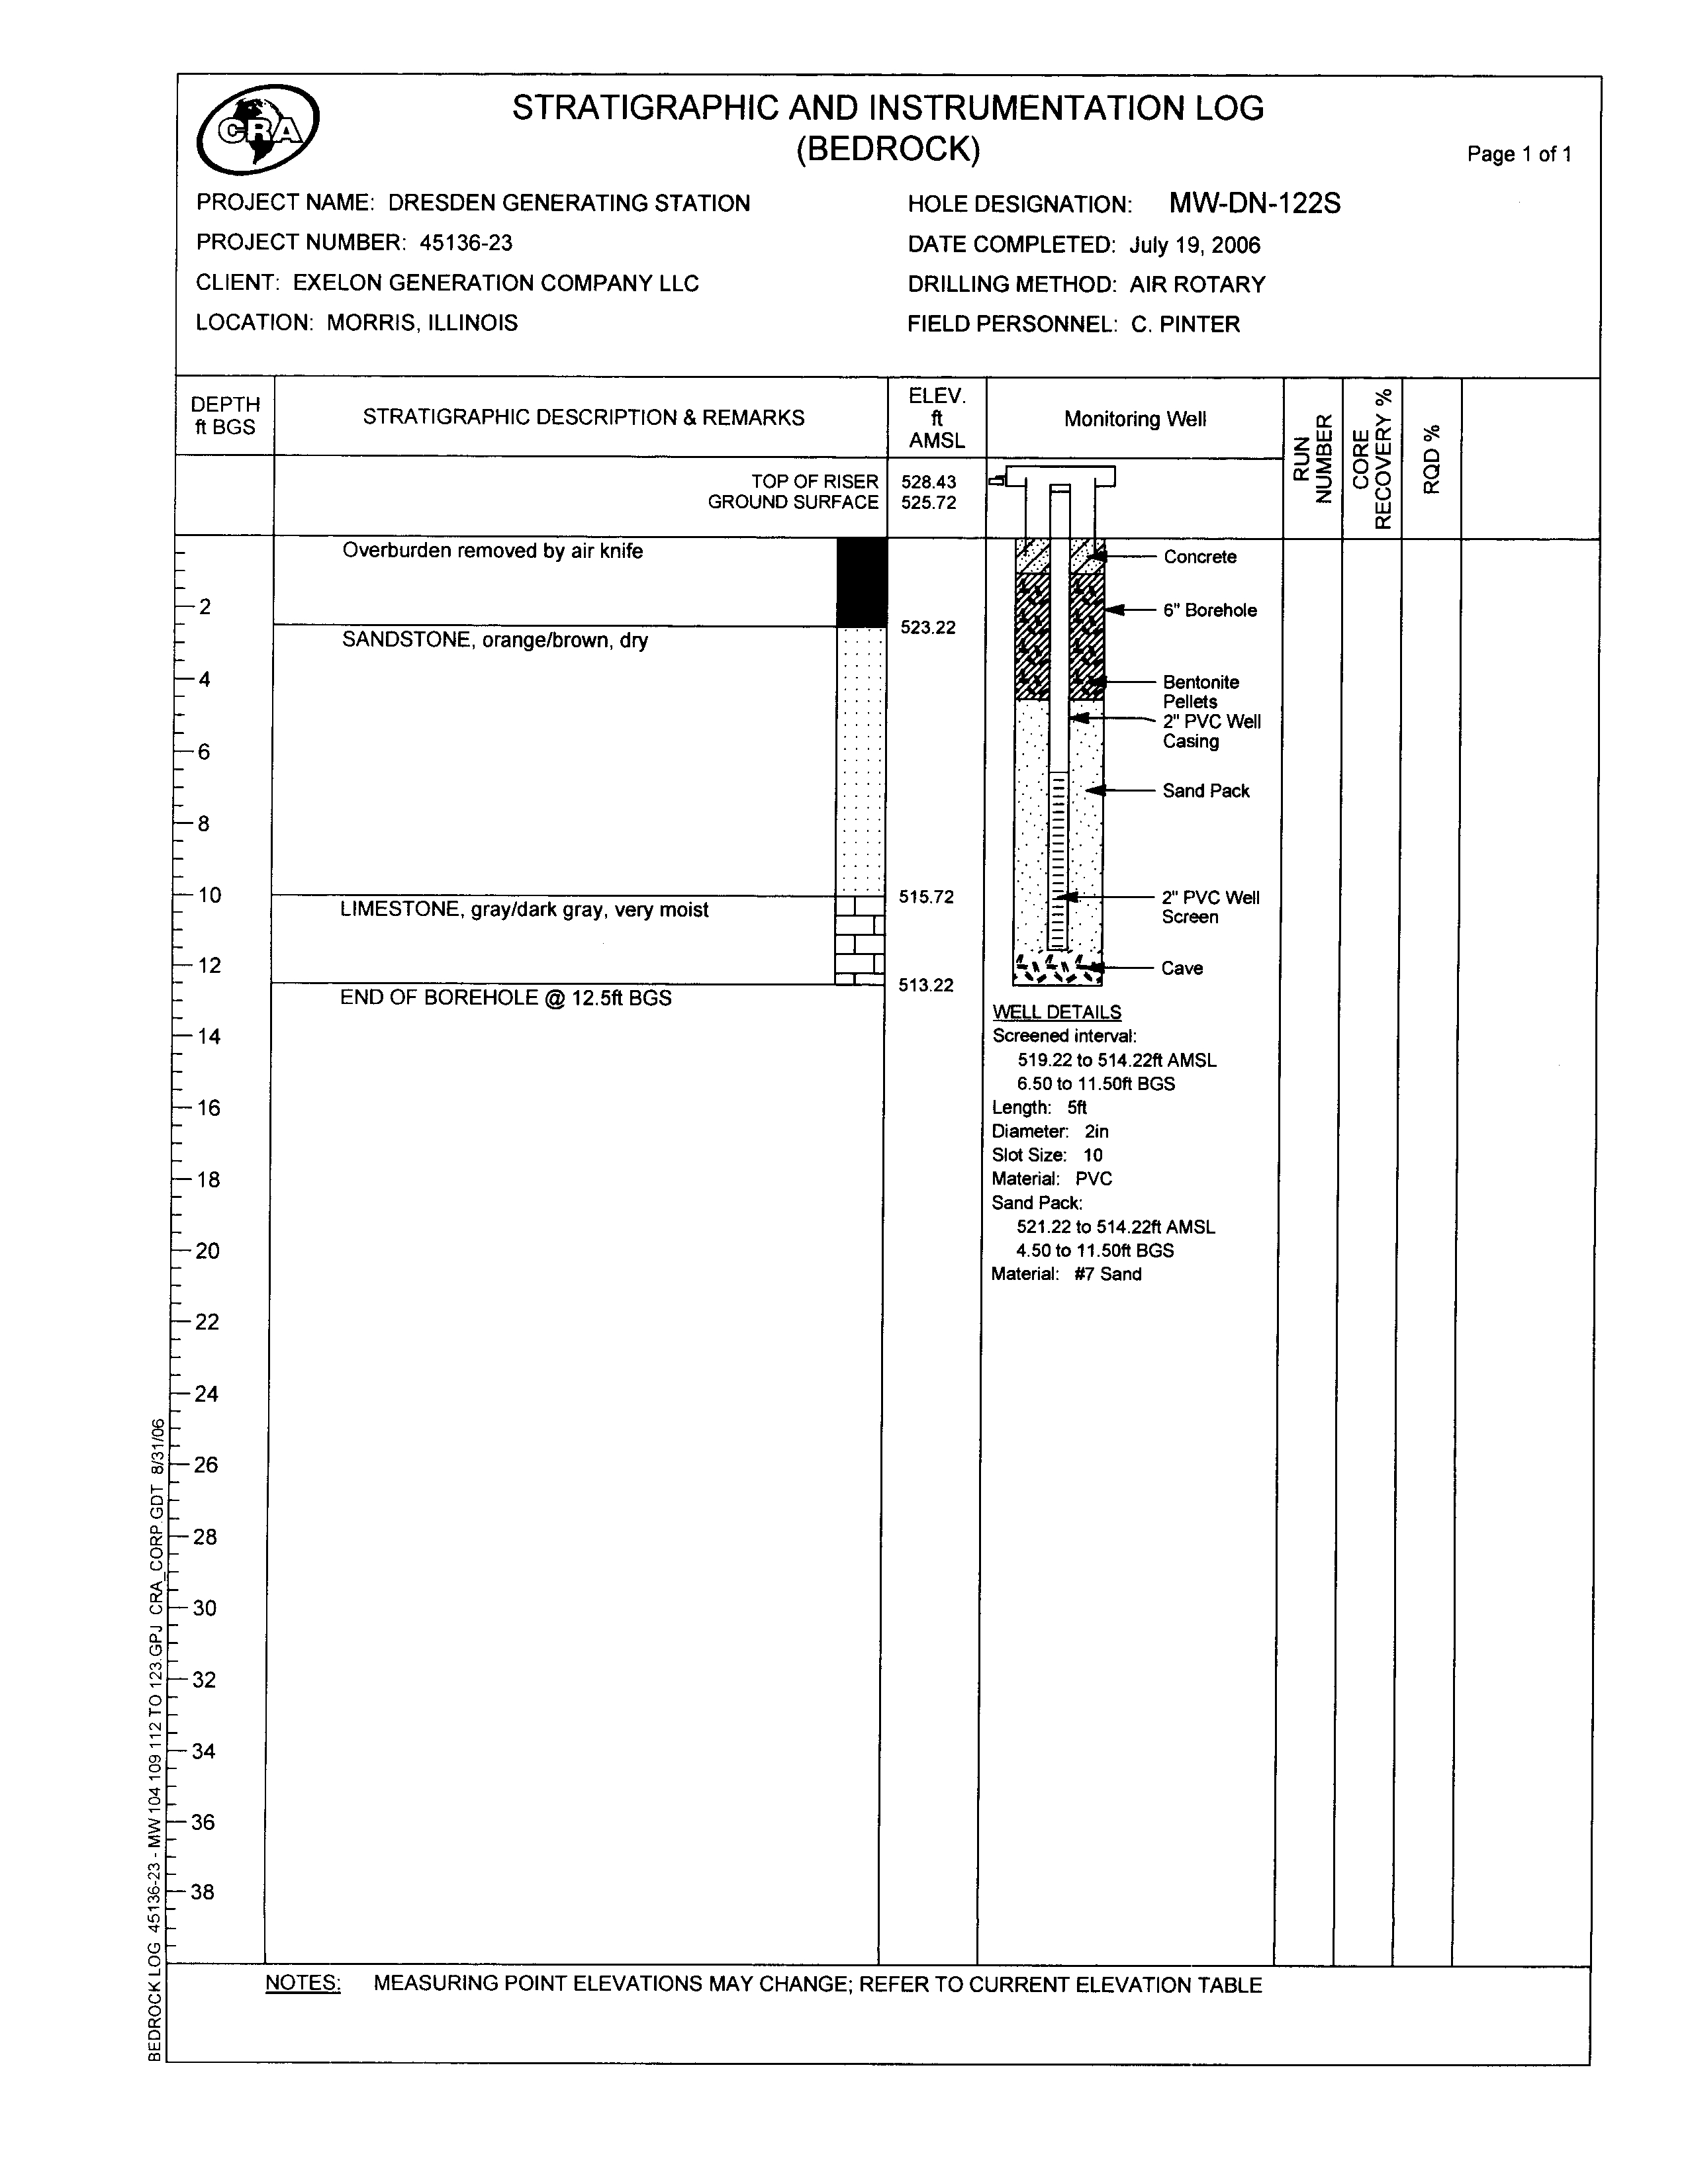
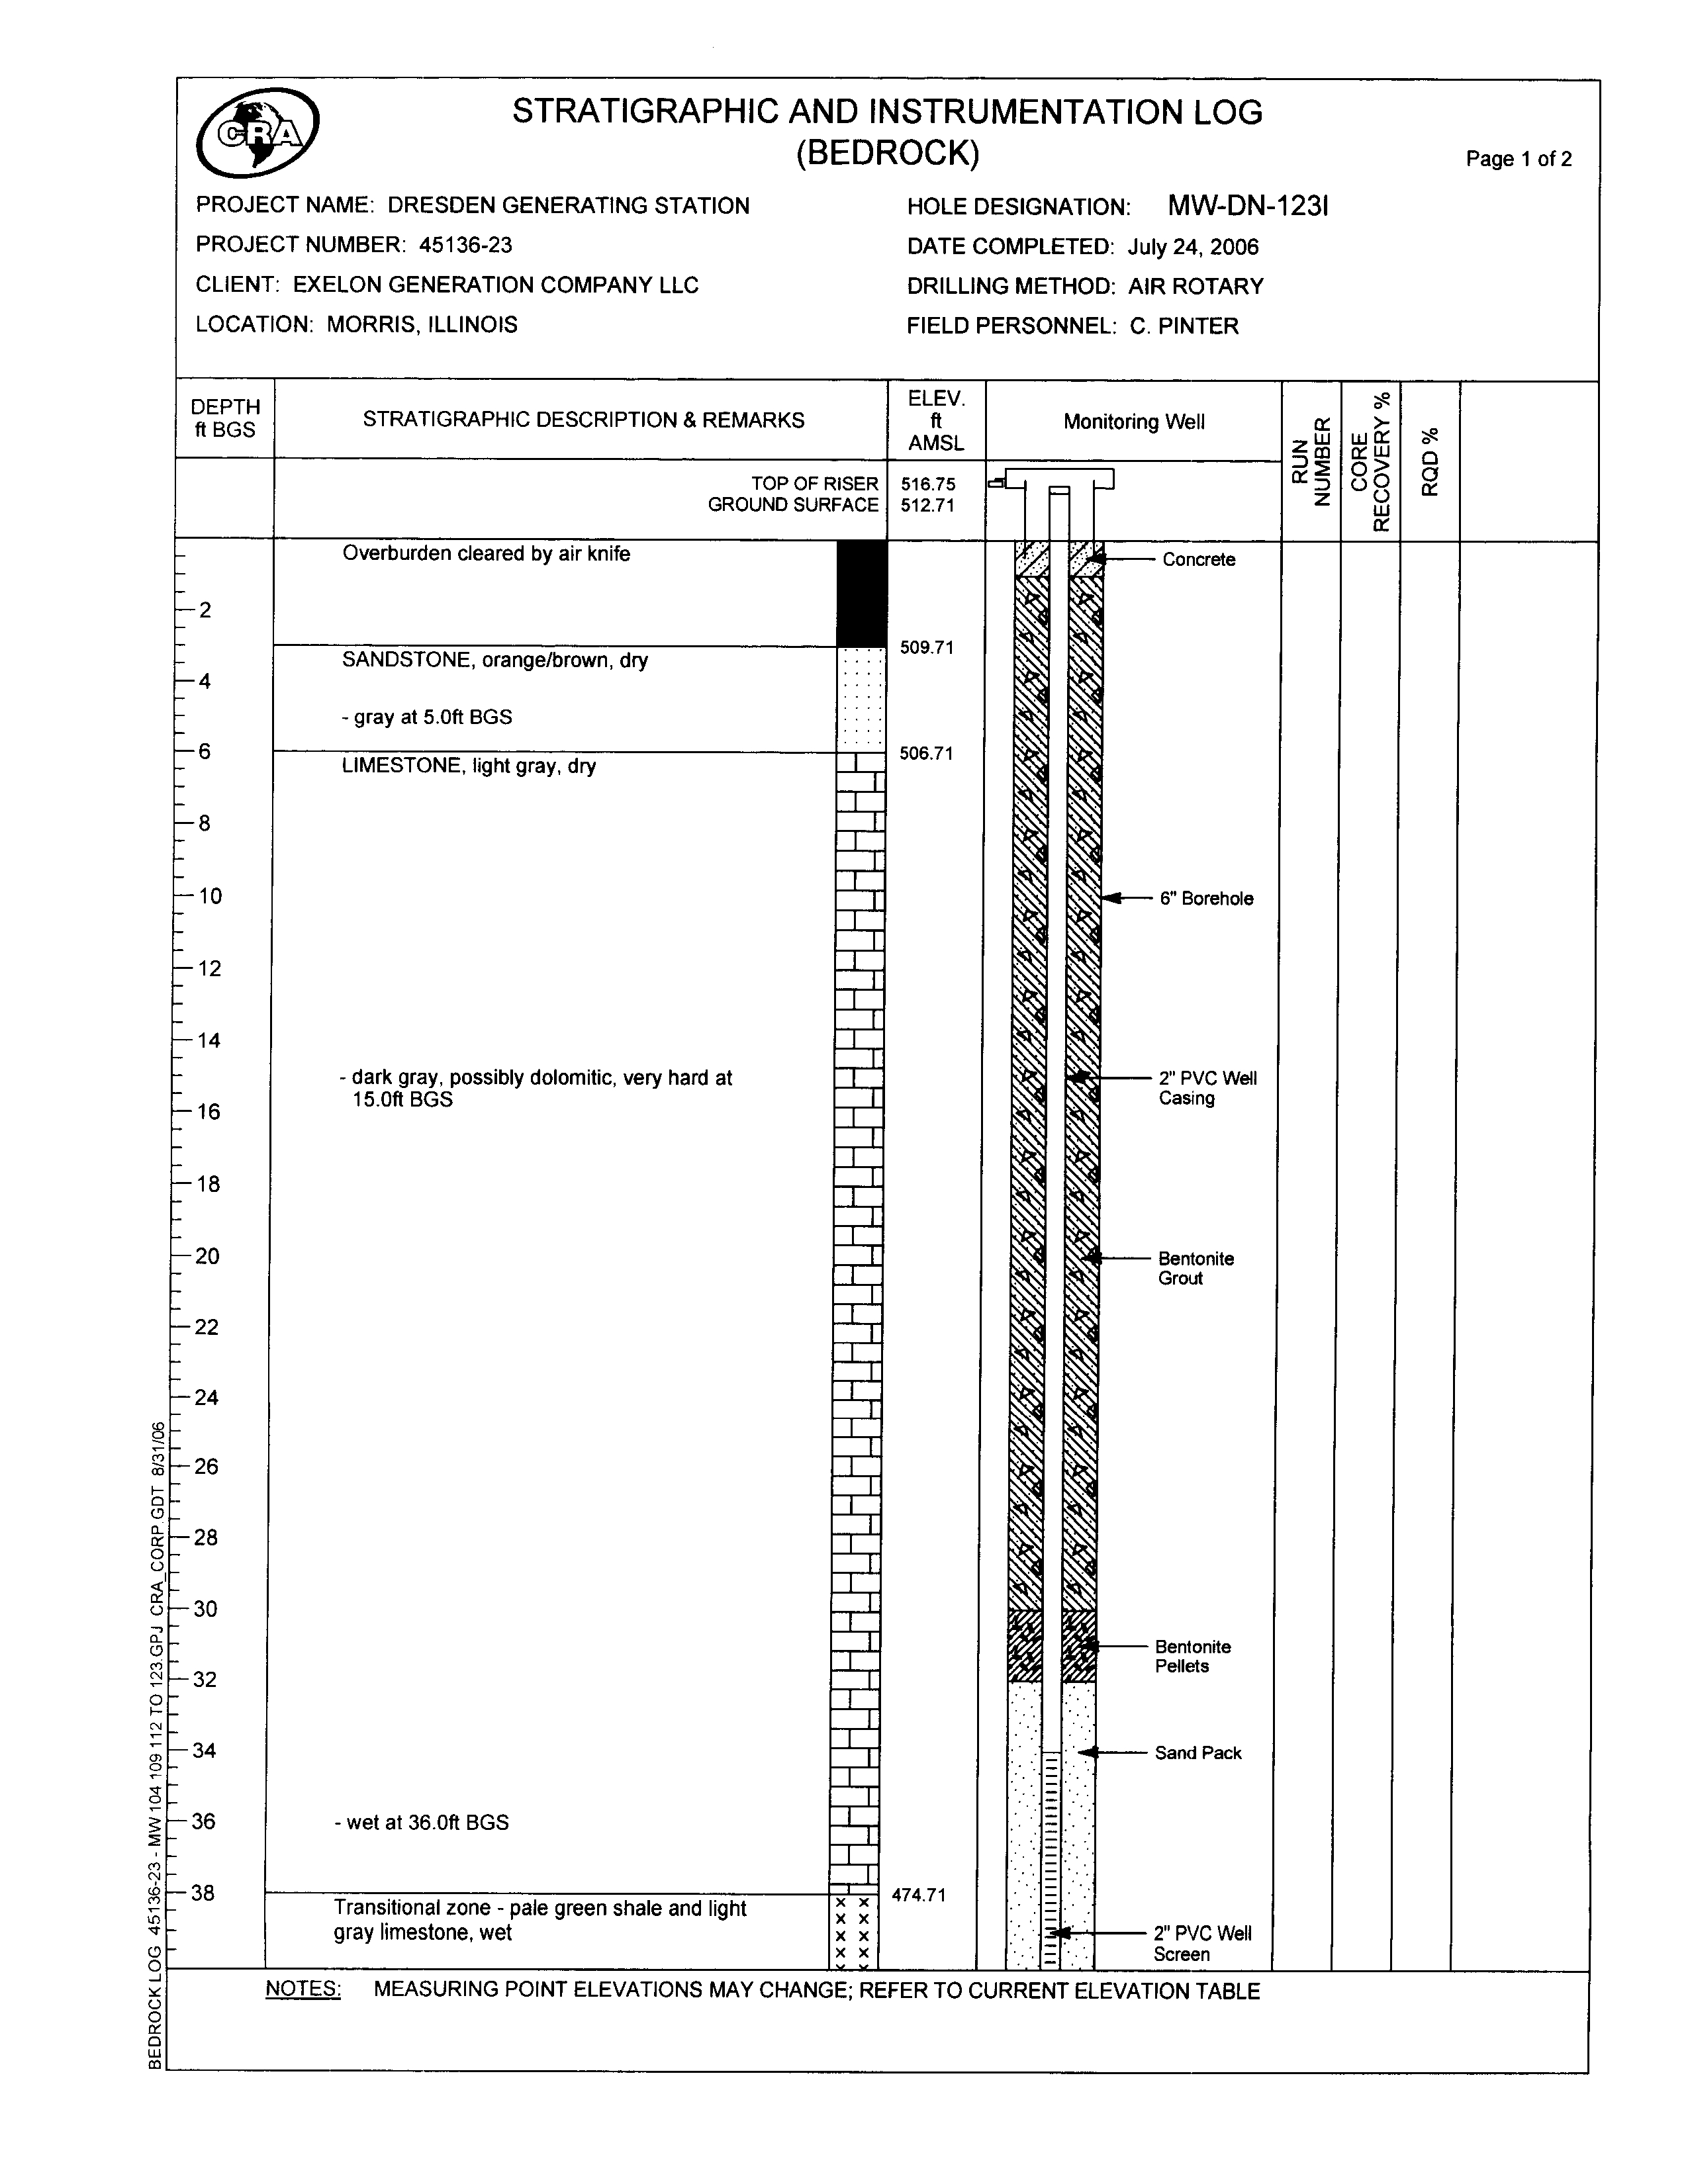
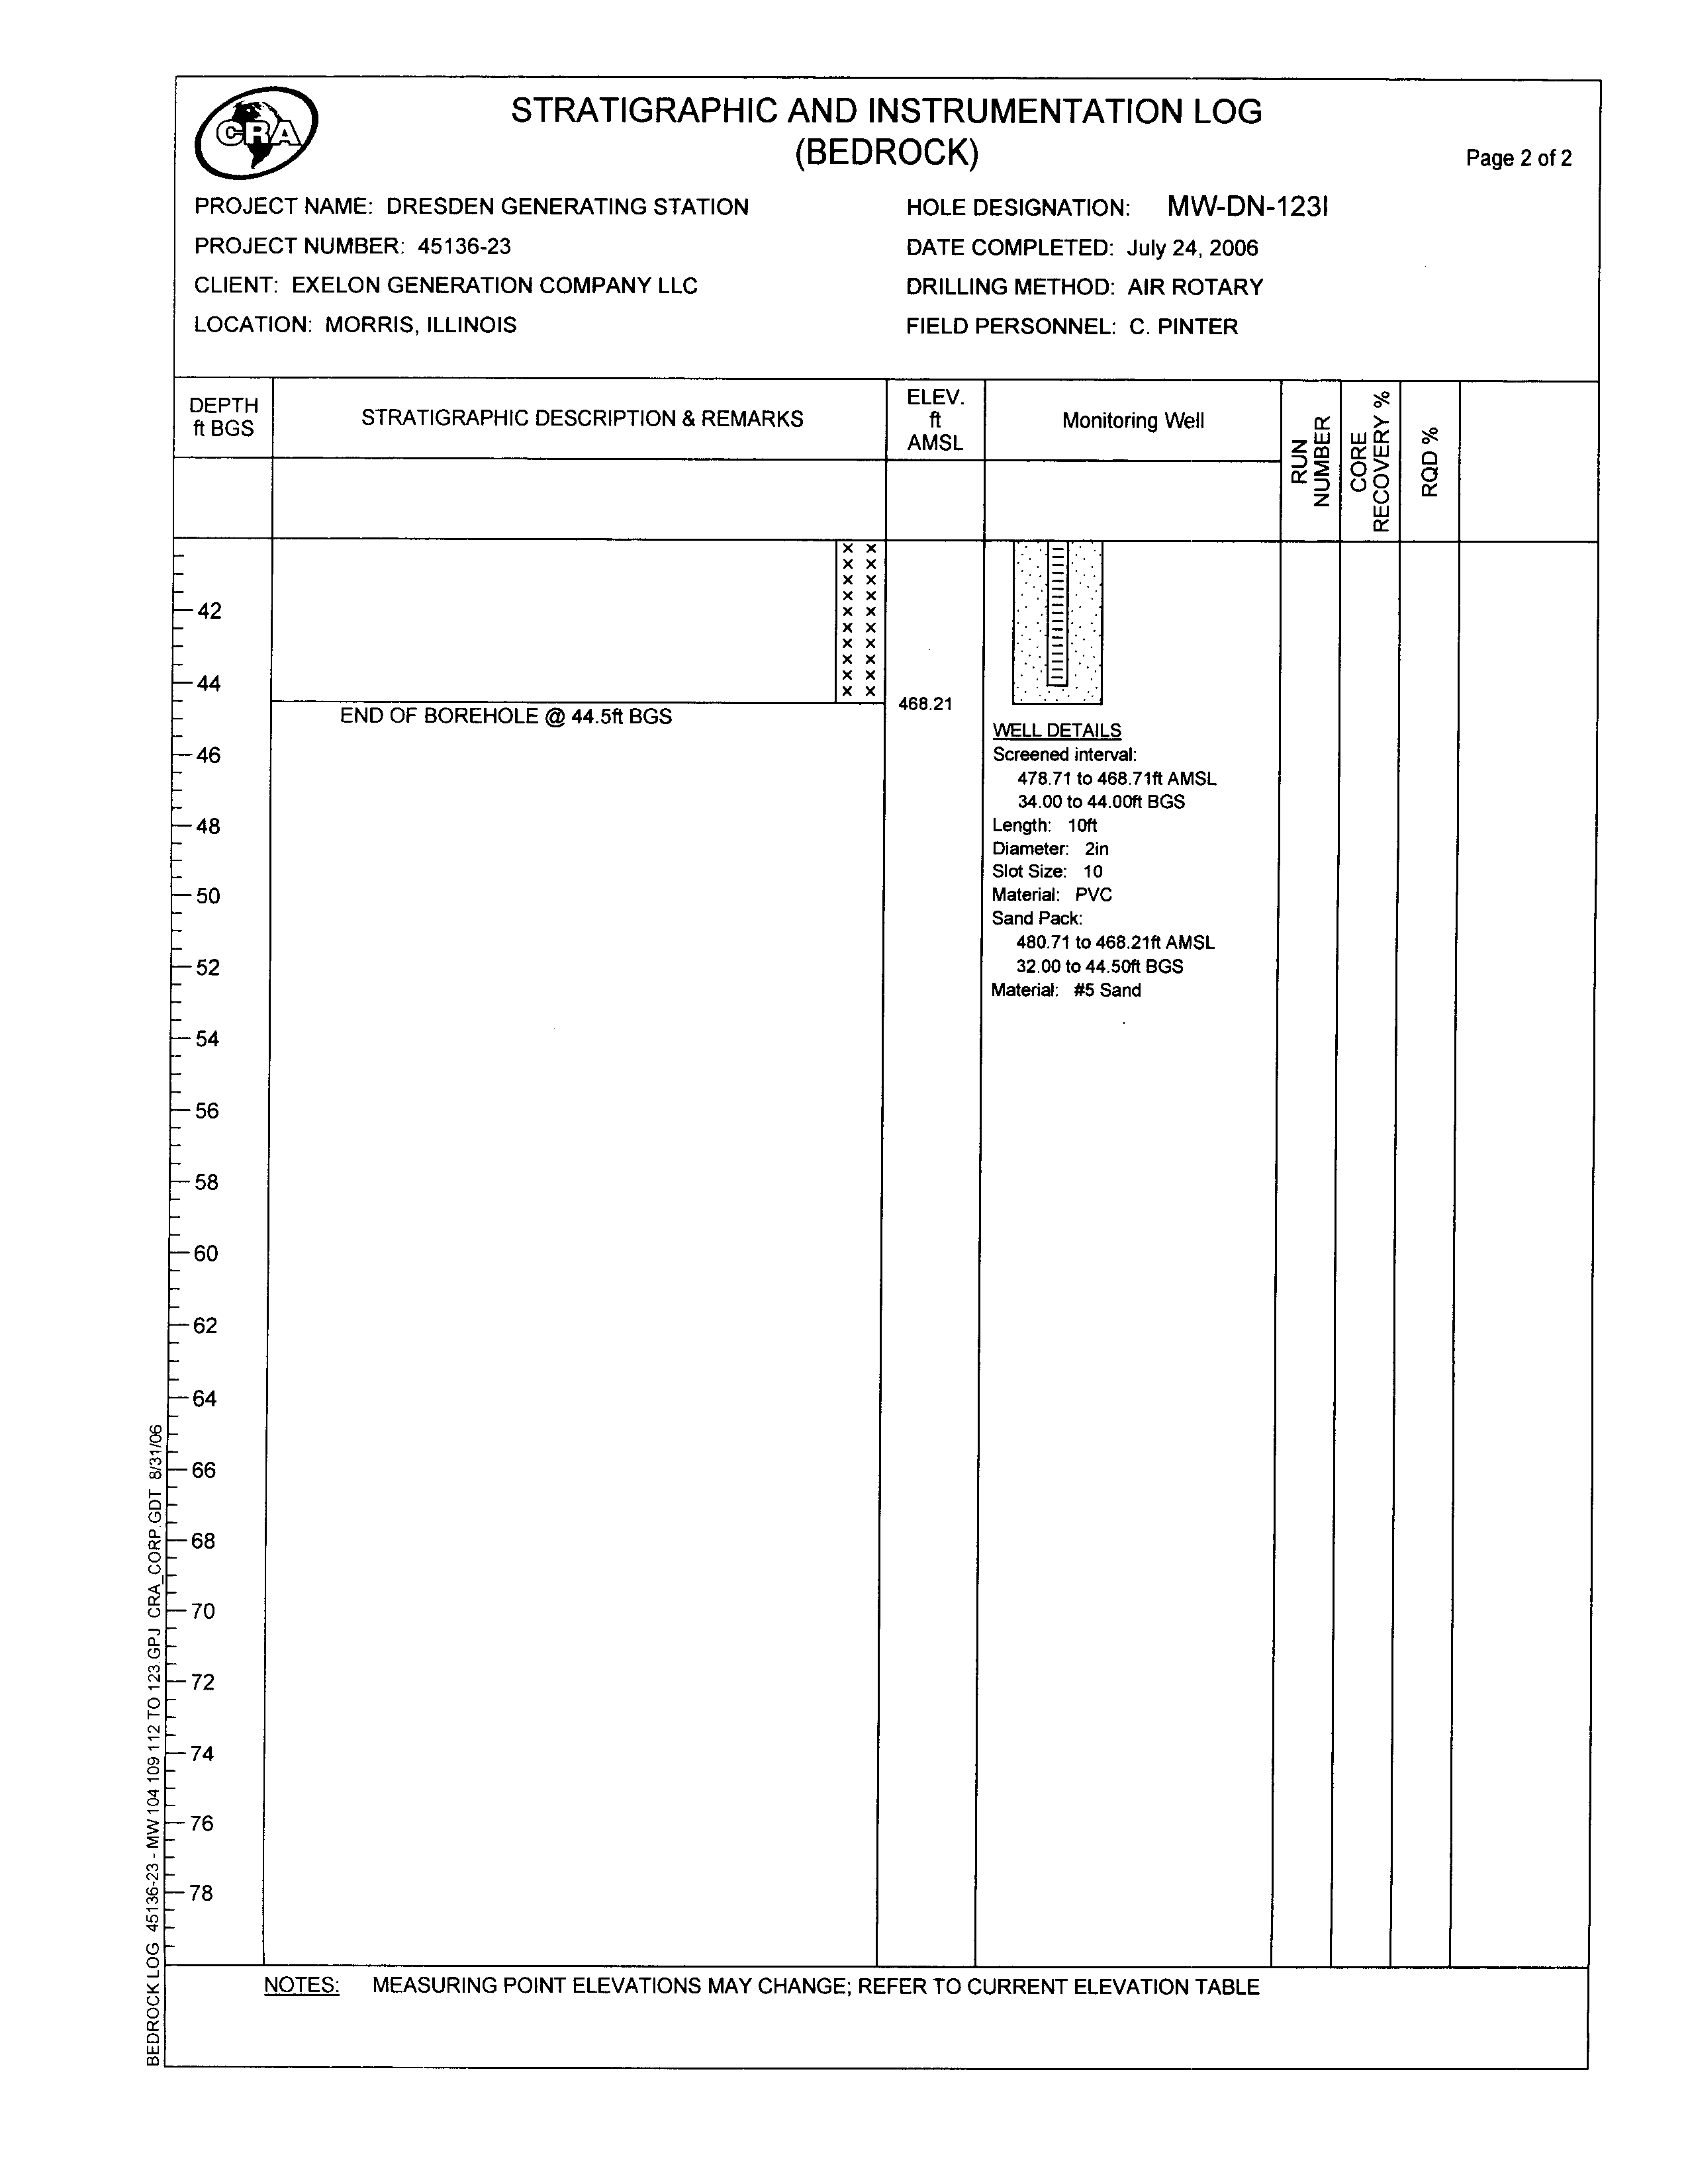
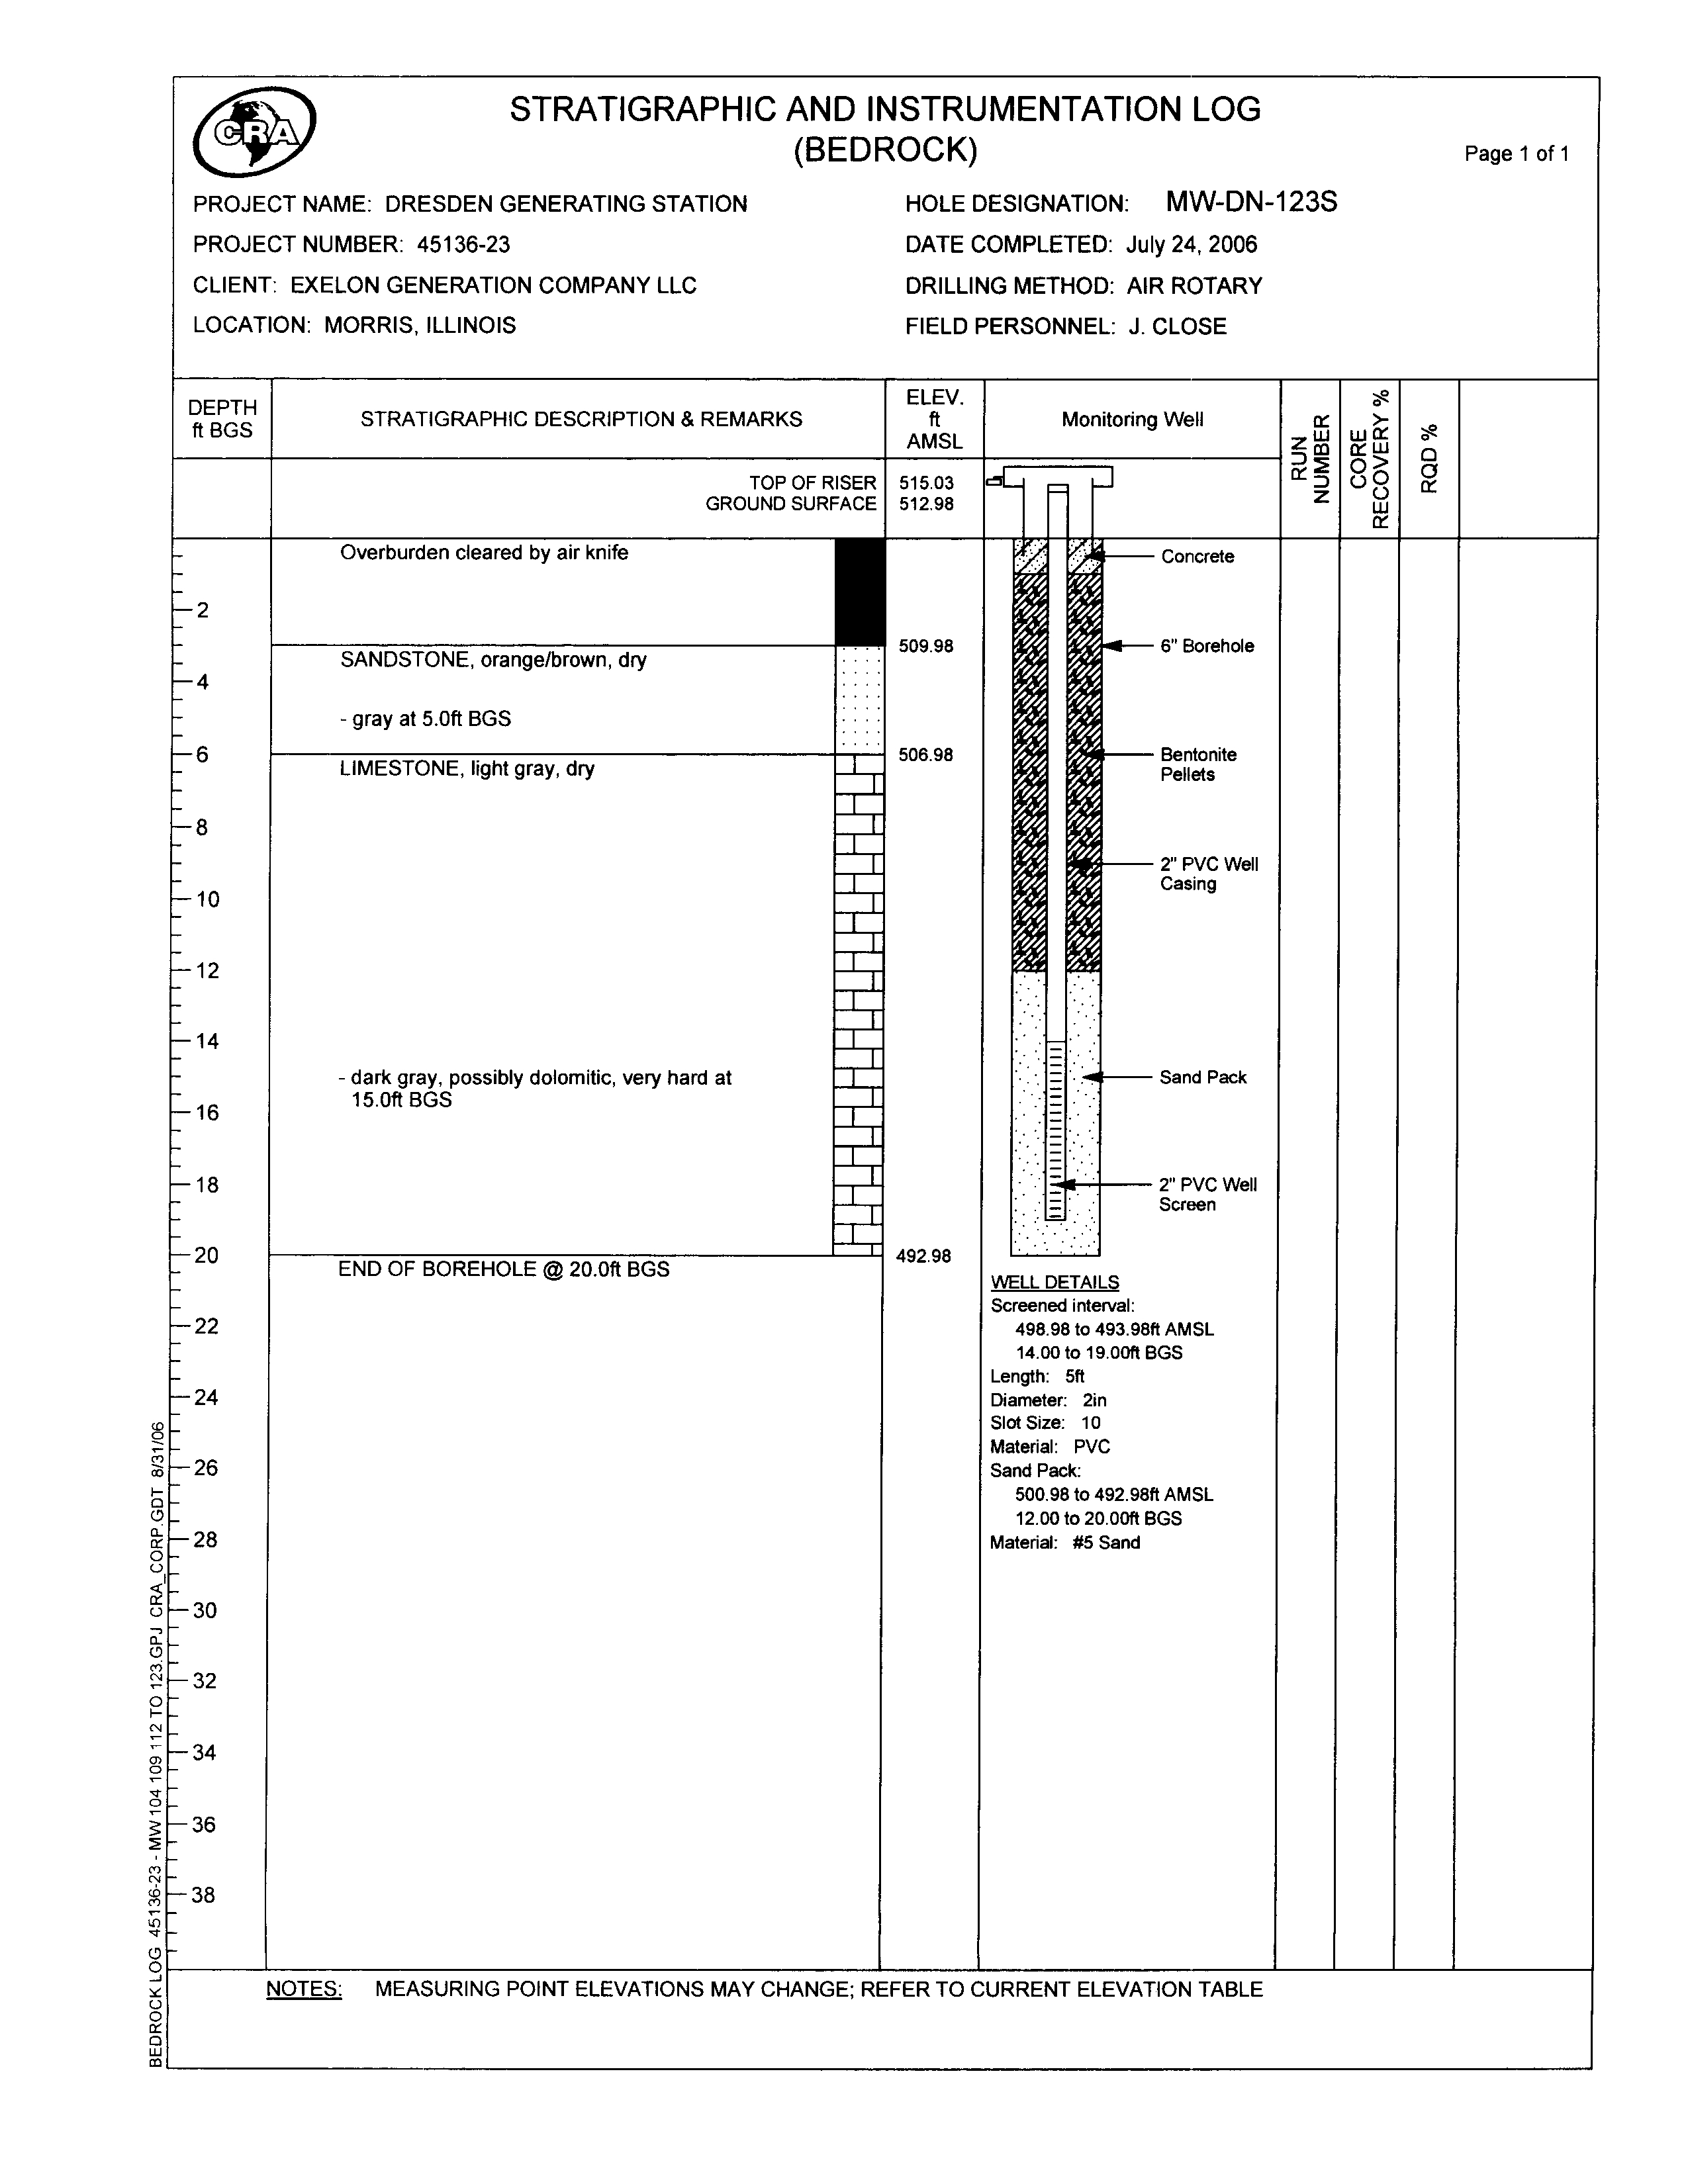
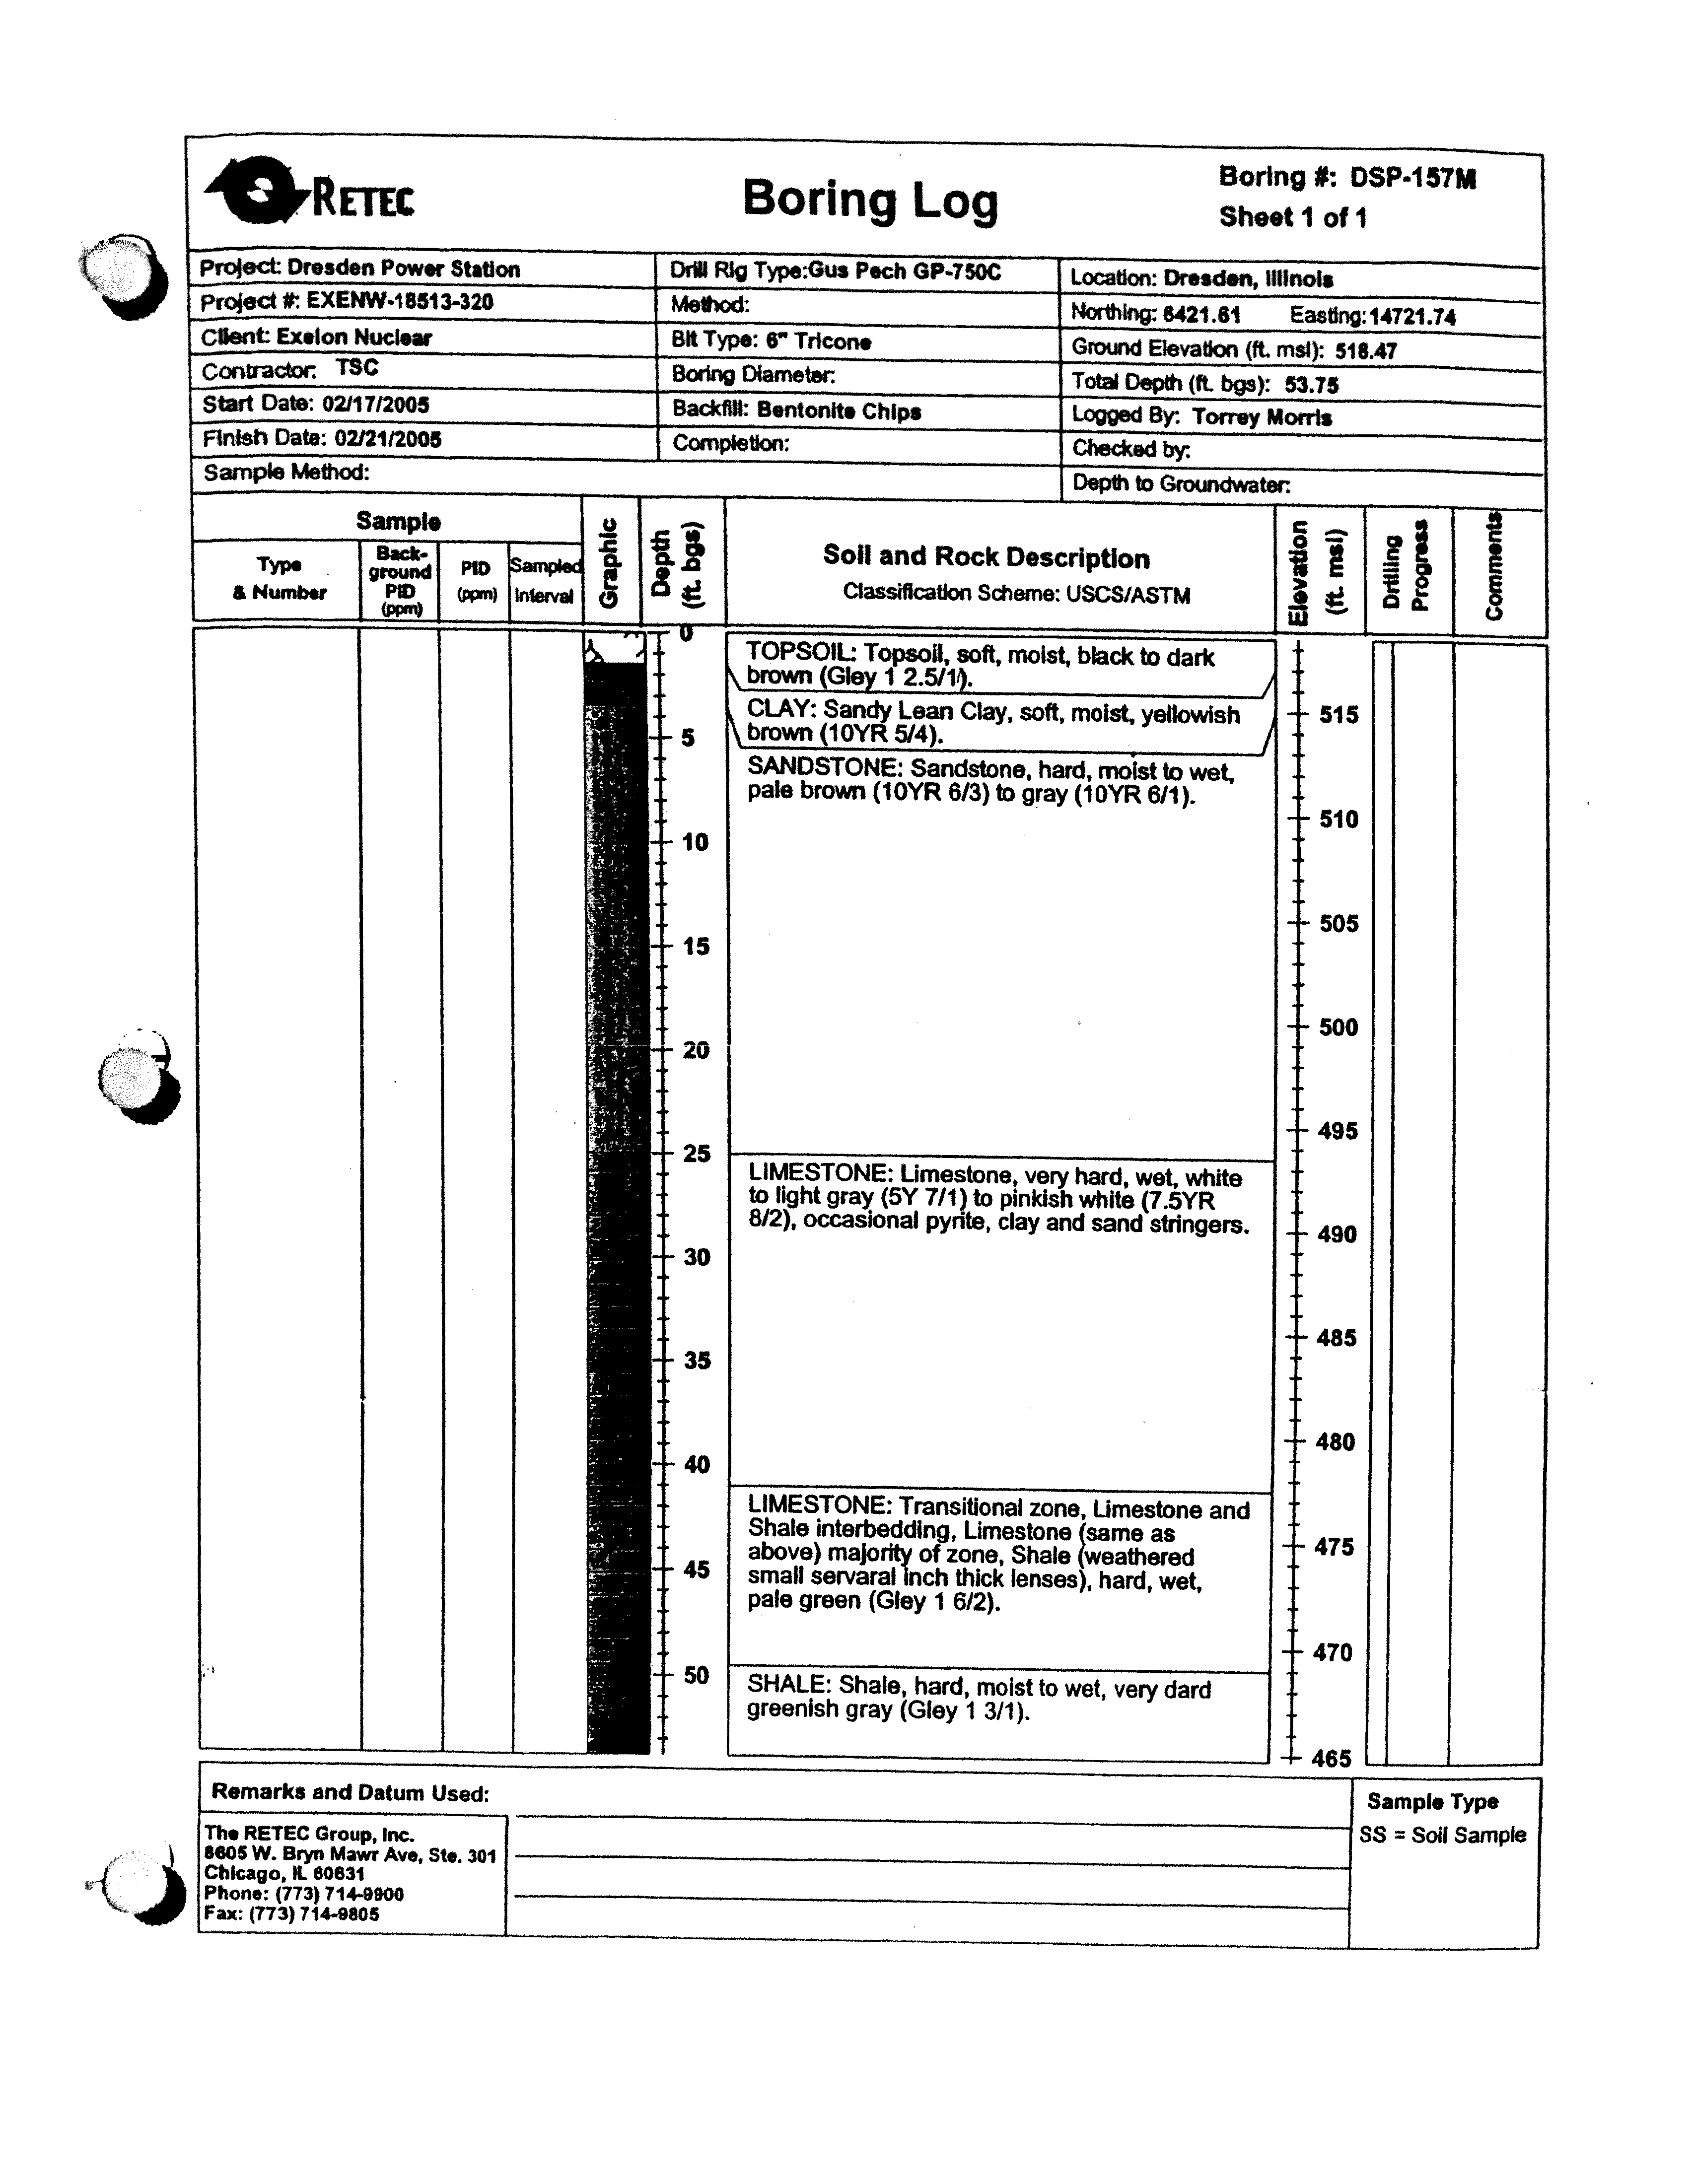
MONITORING WELL LOGS
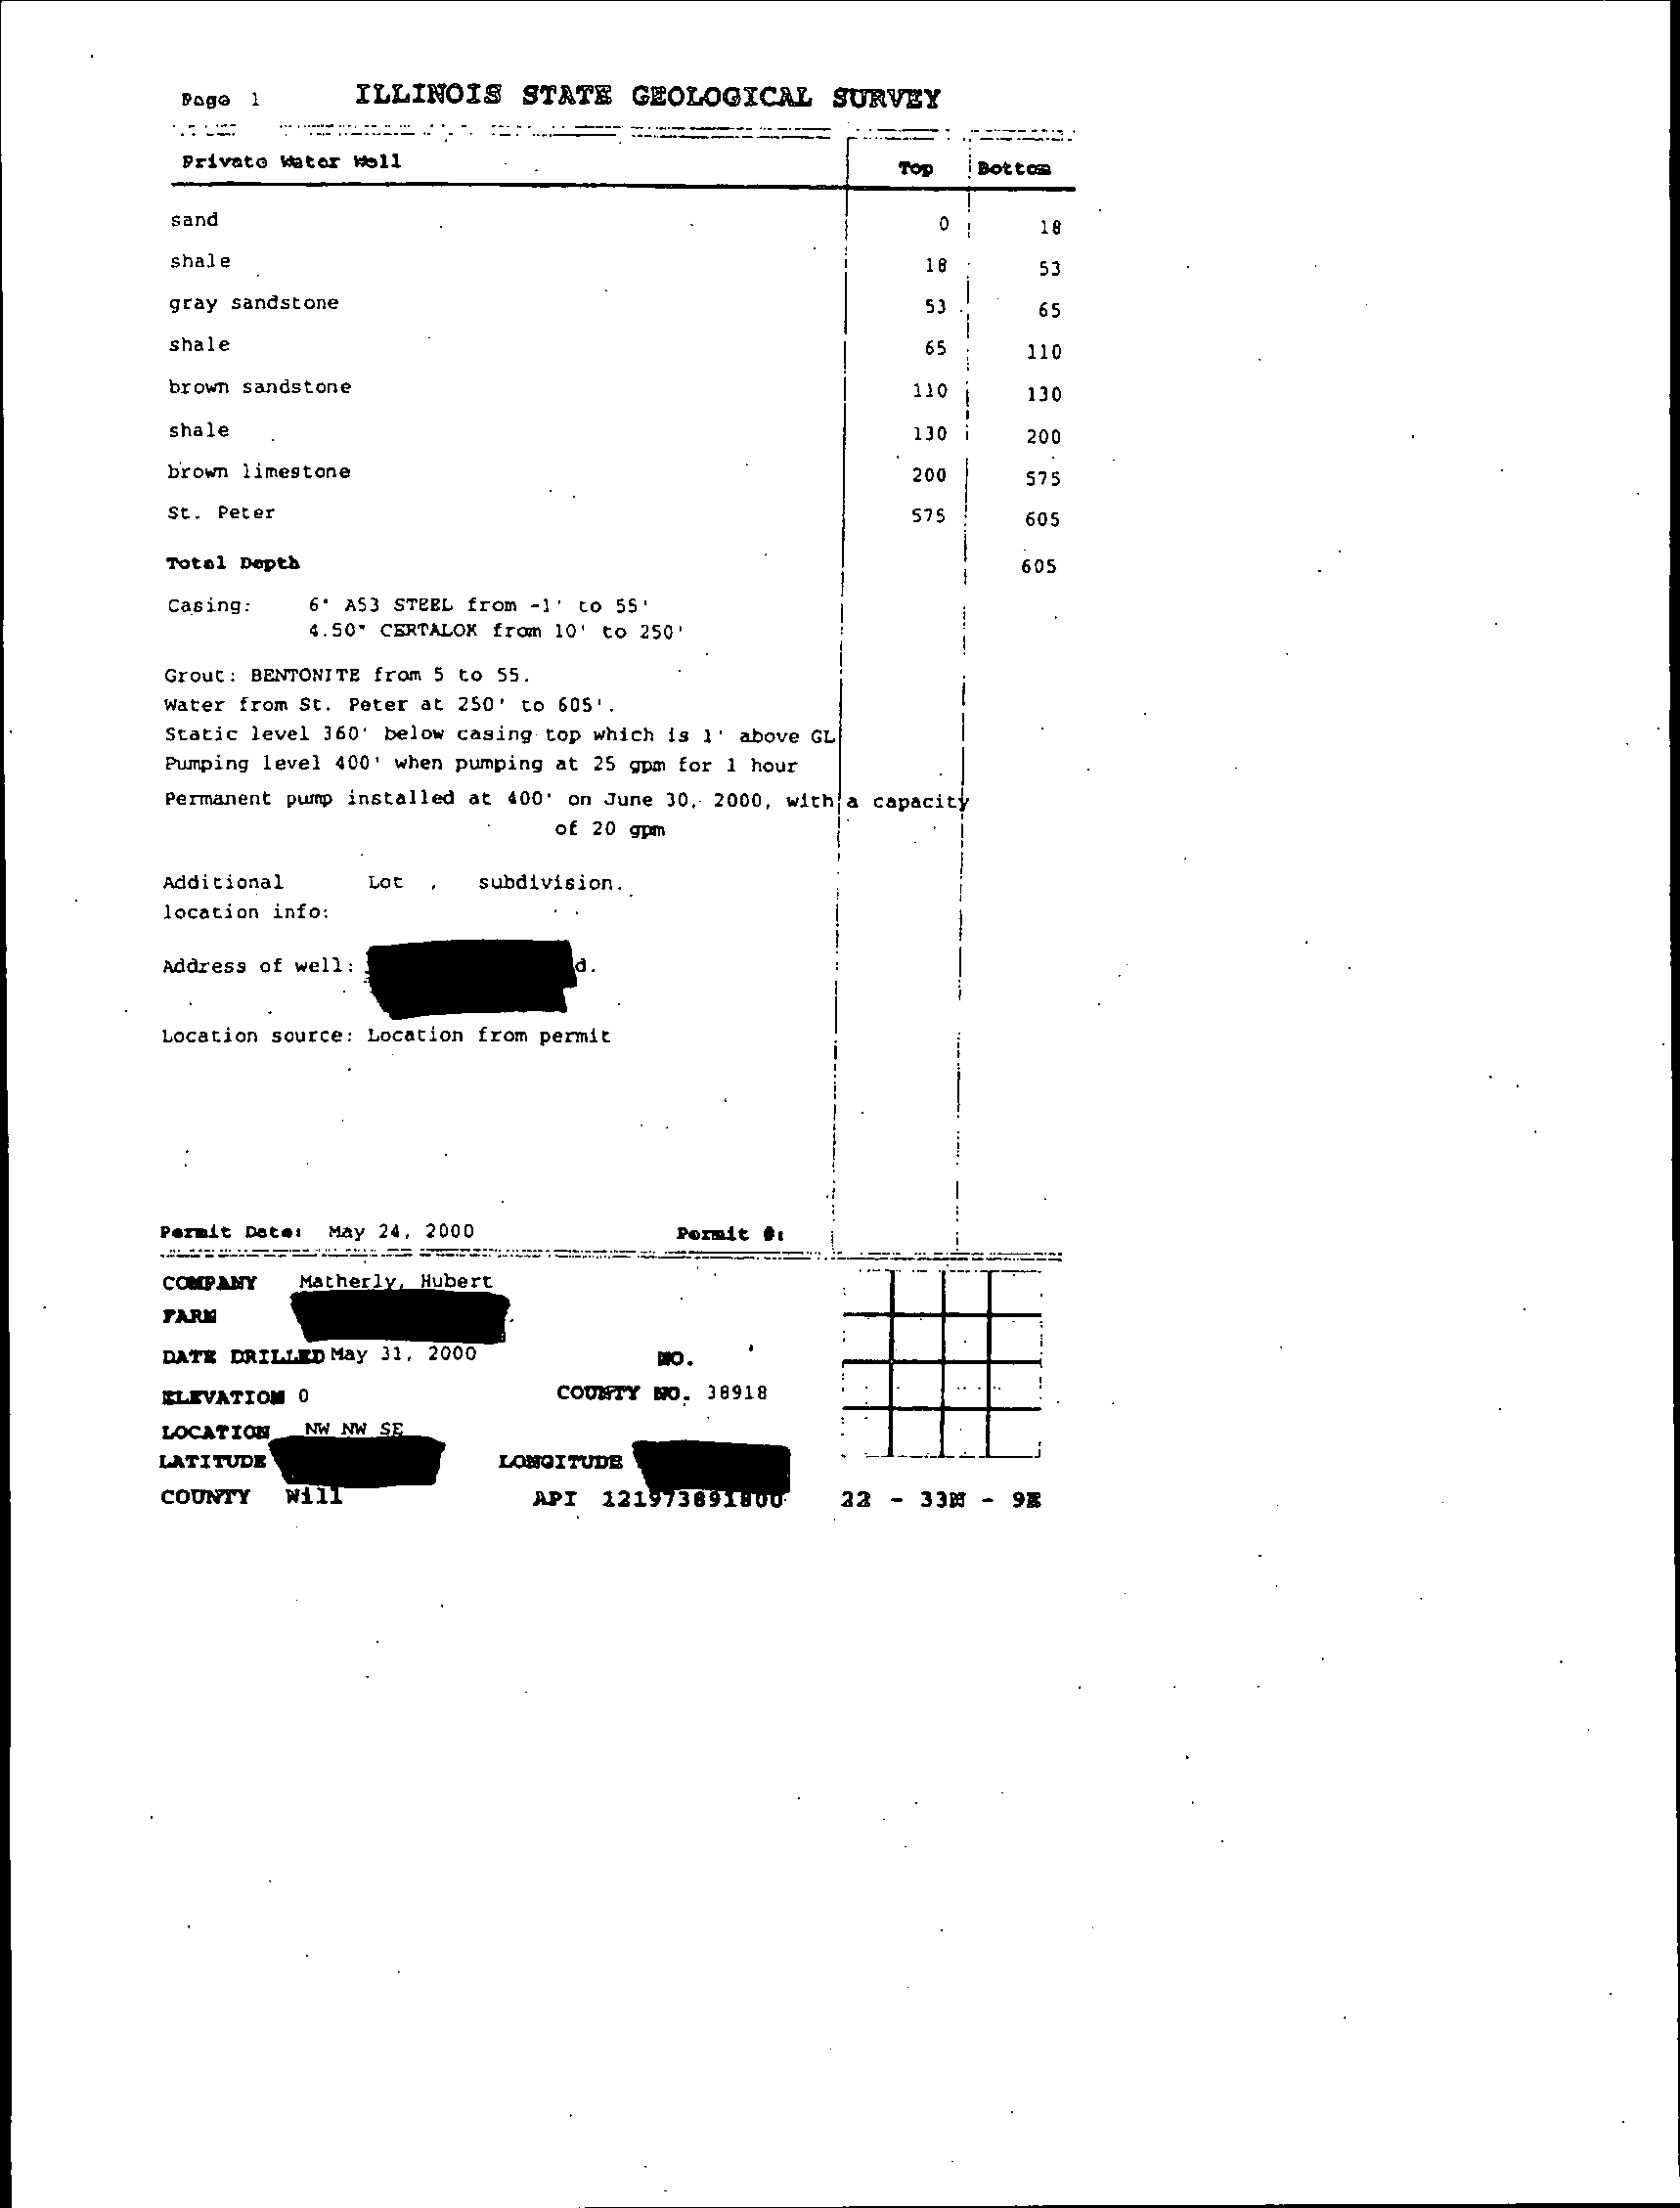
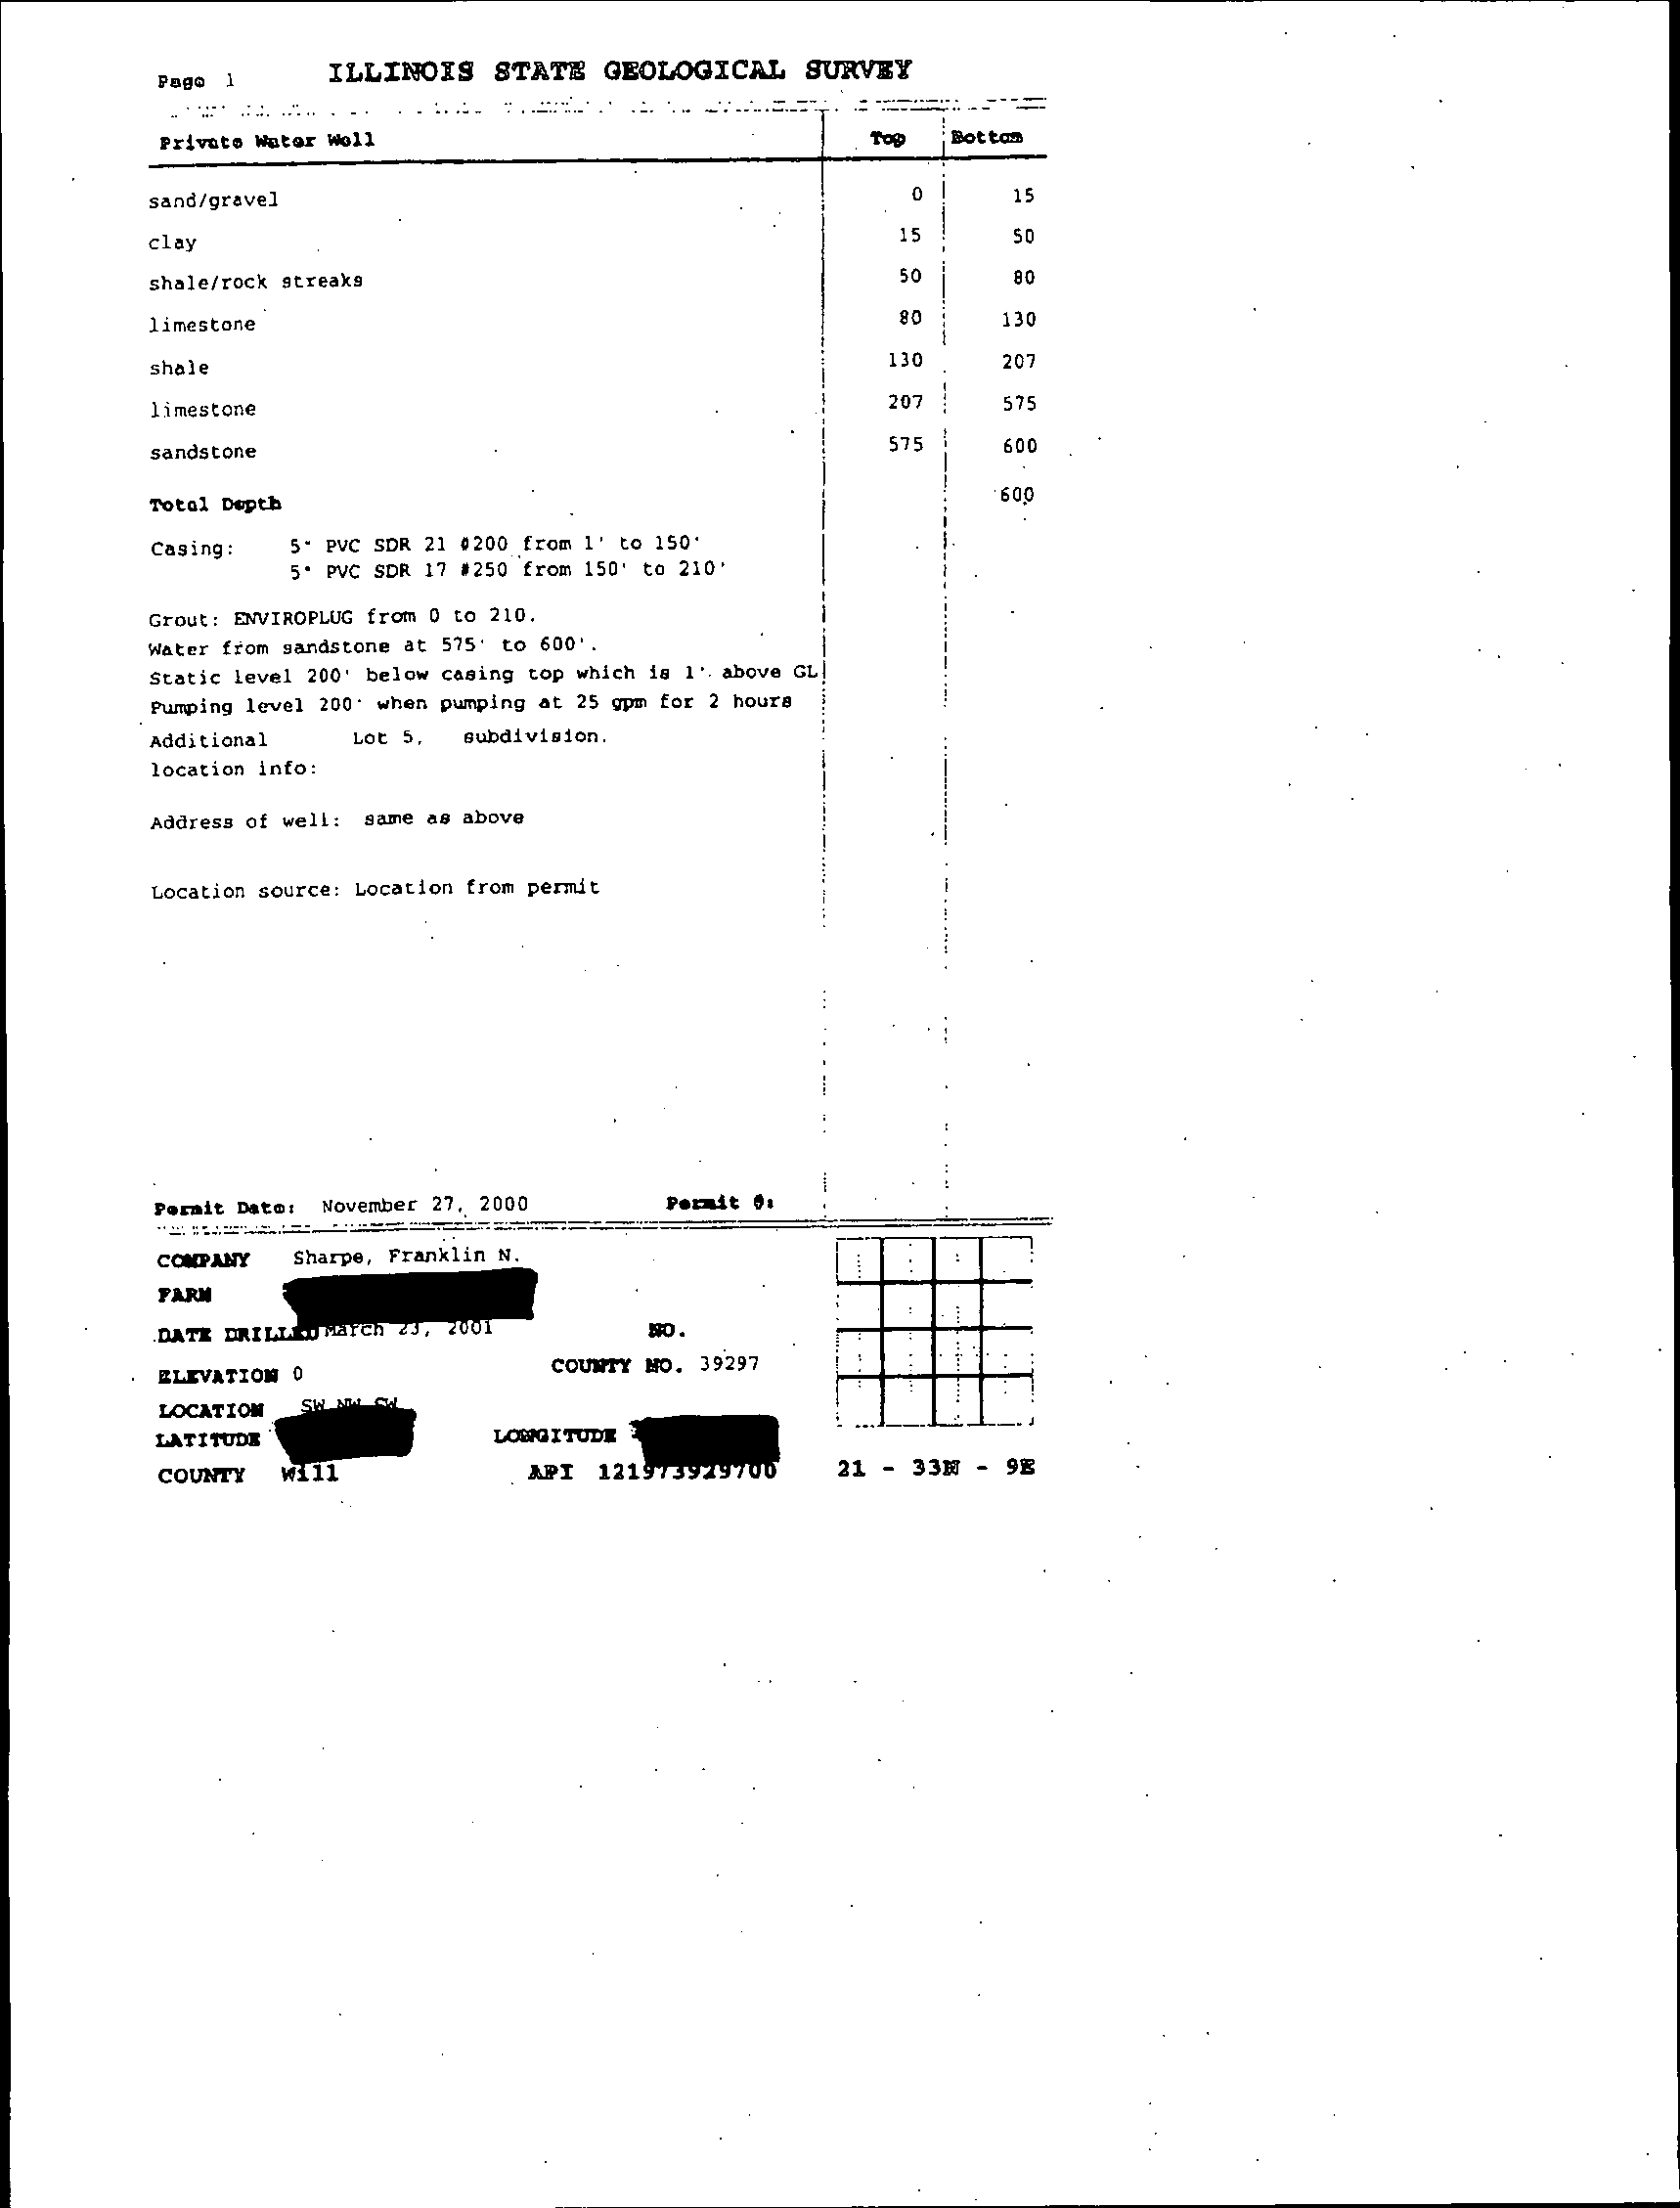
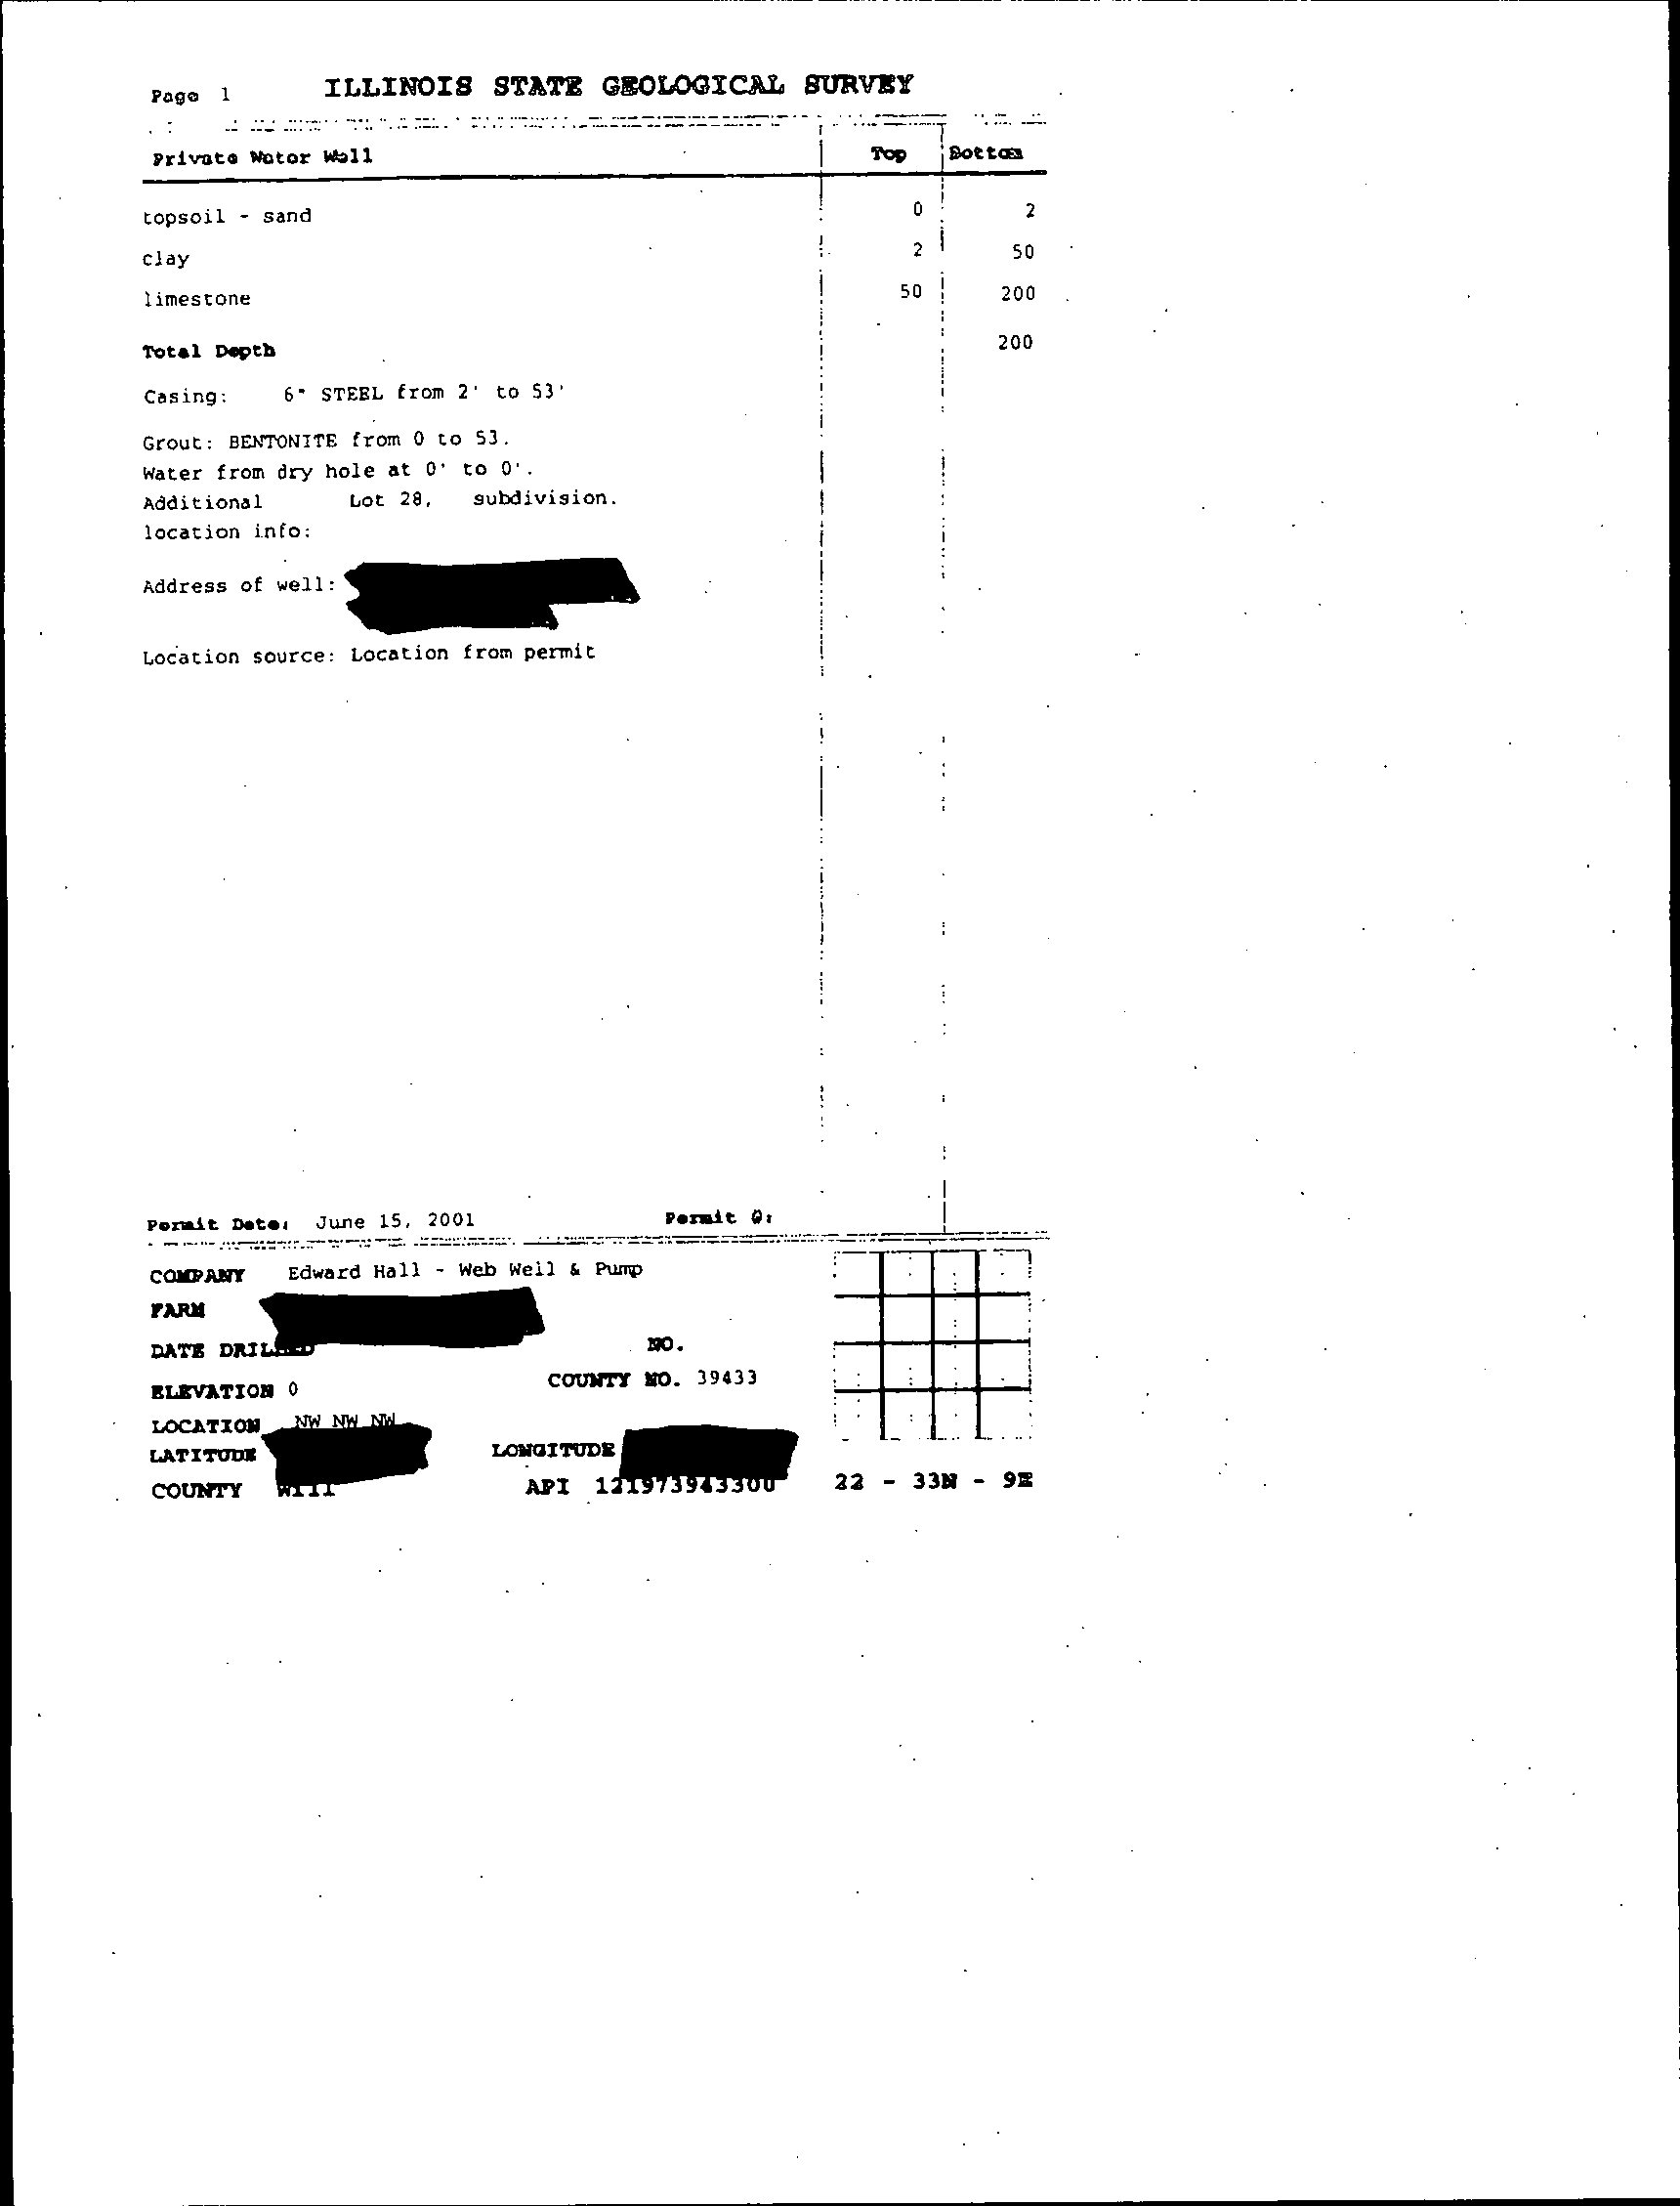
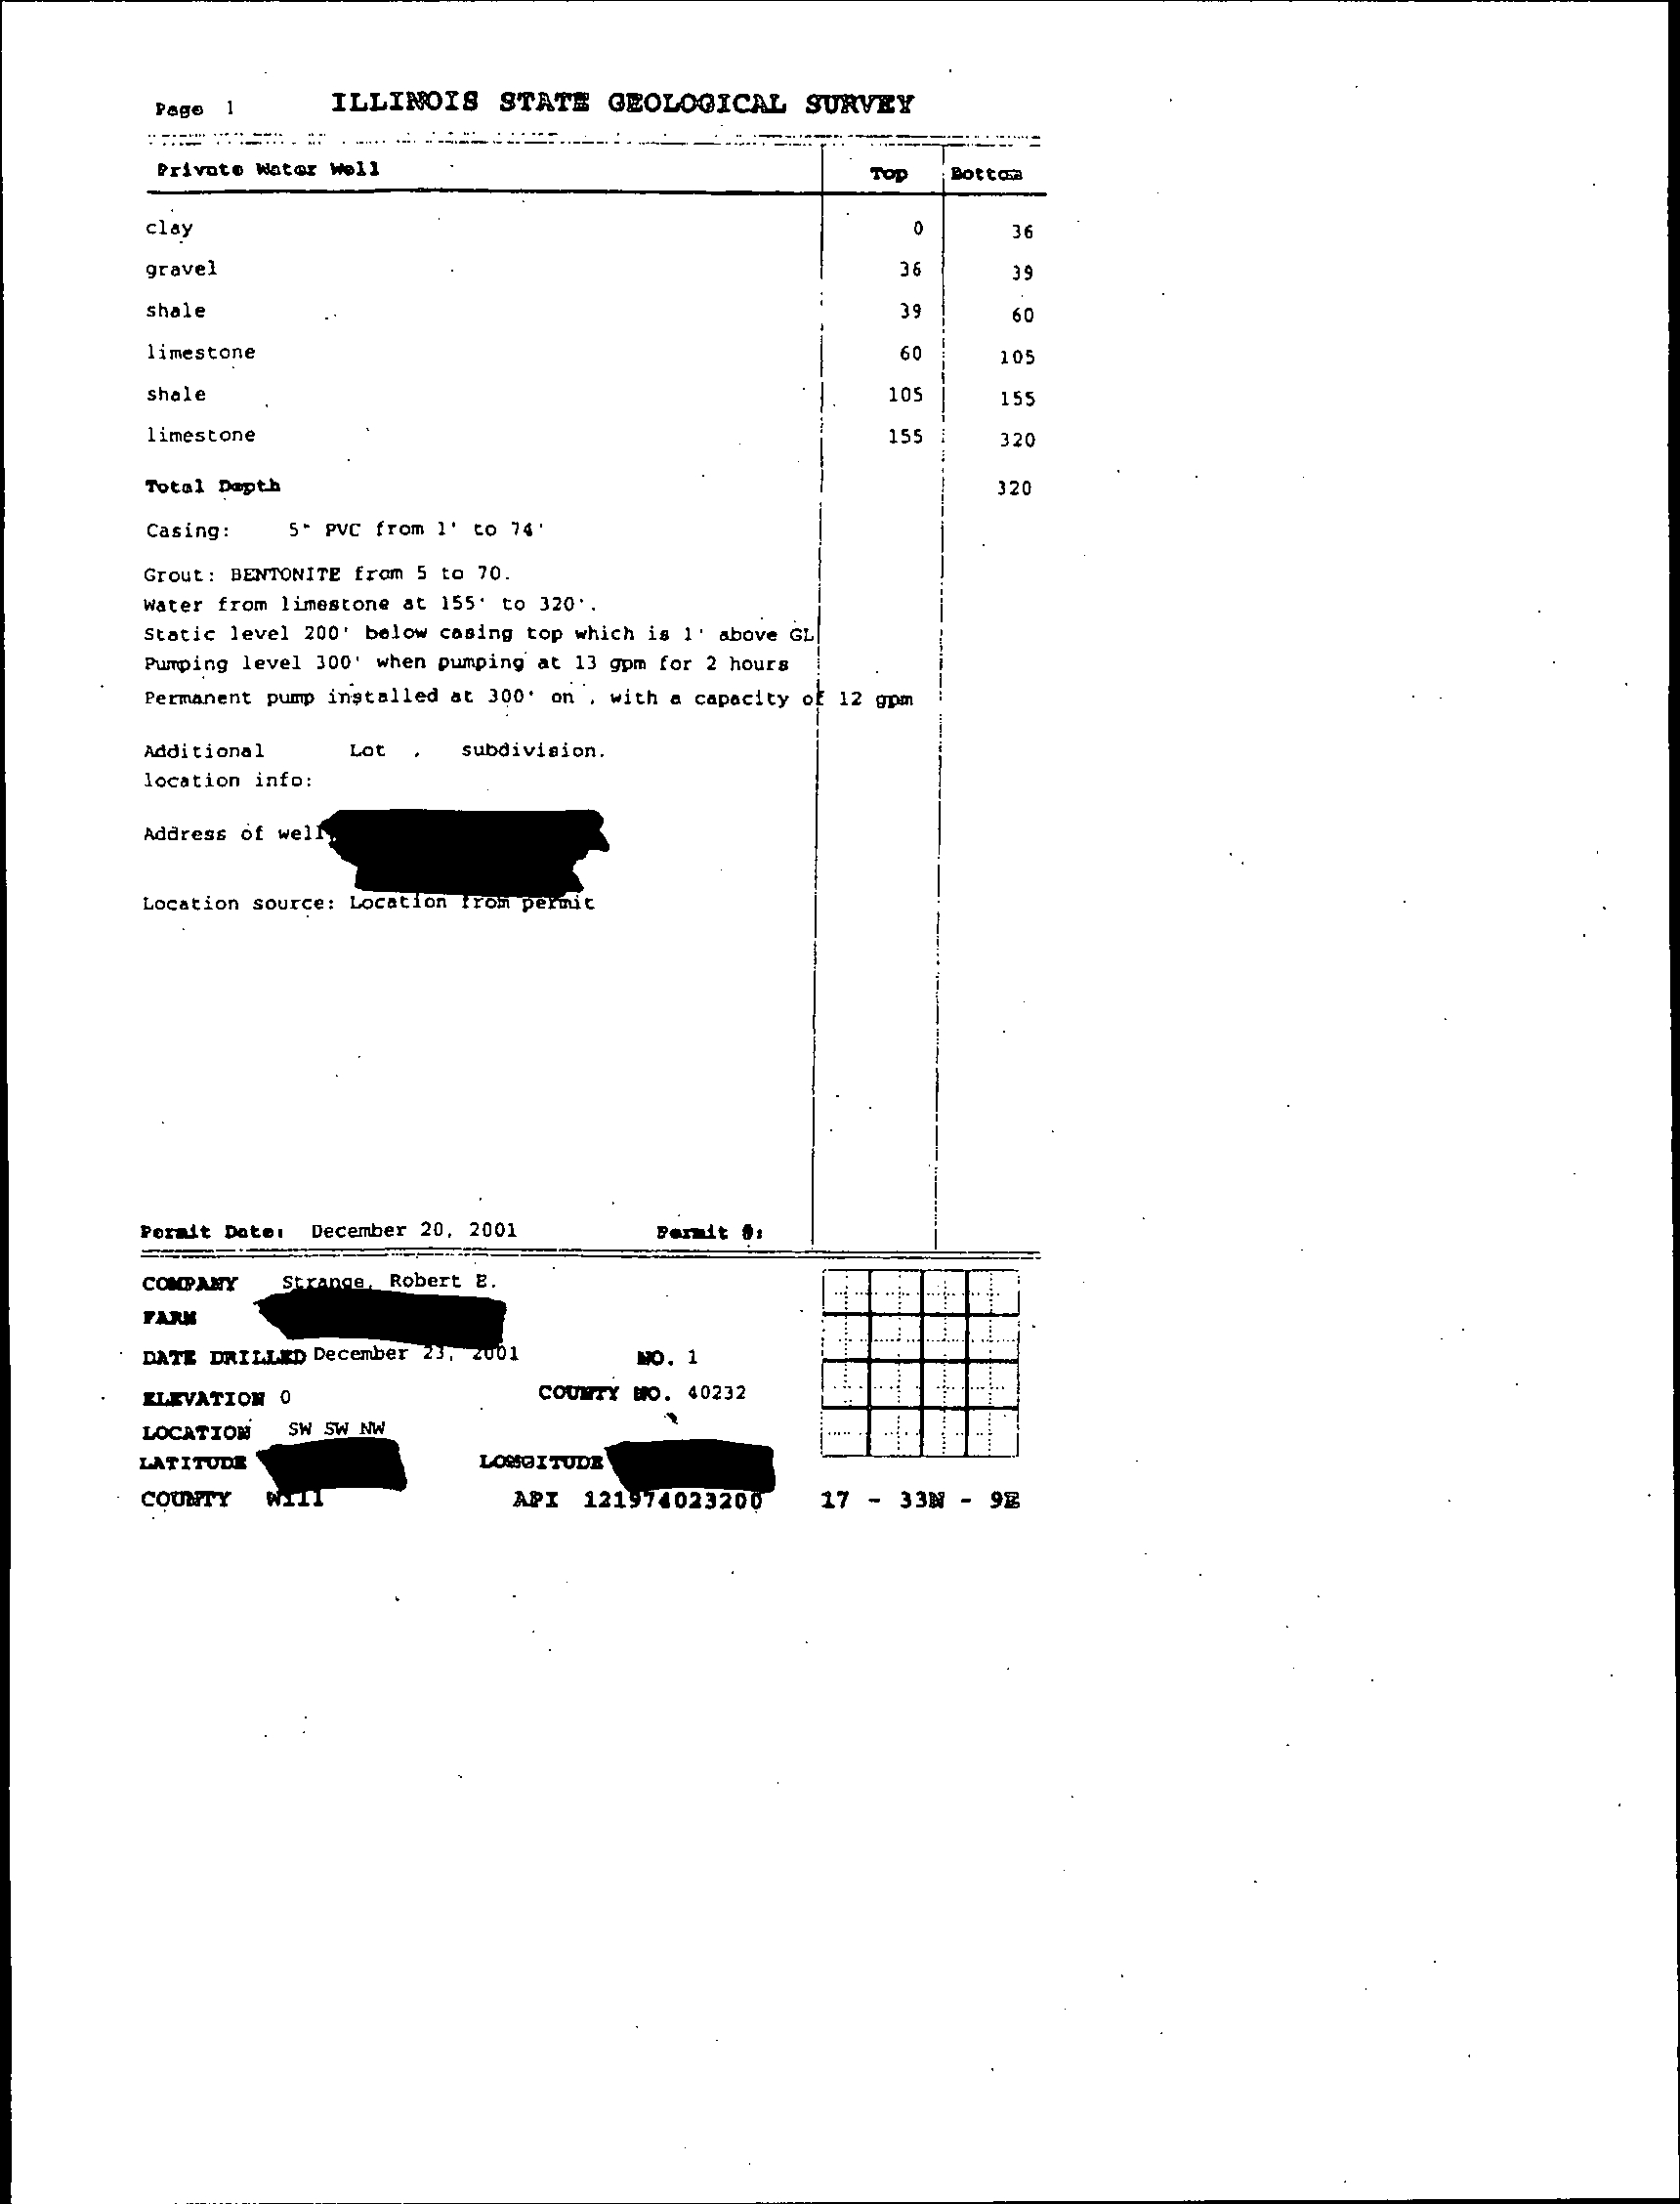
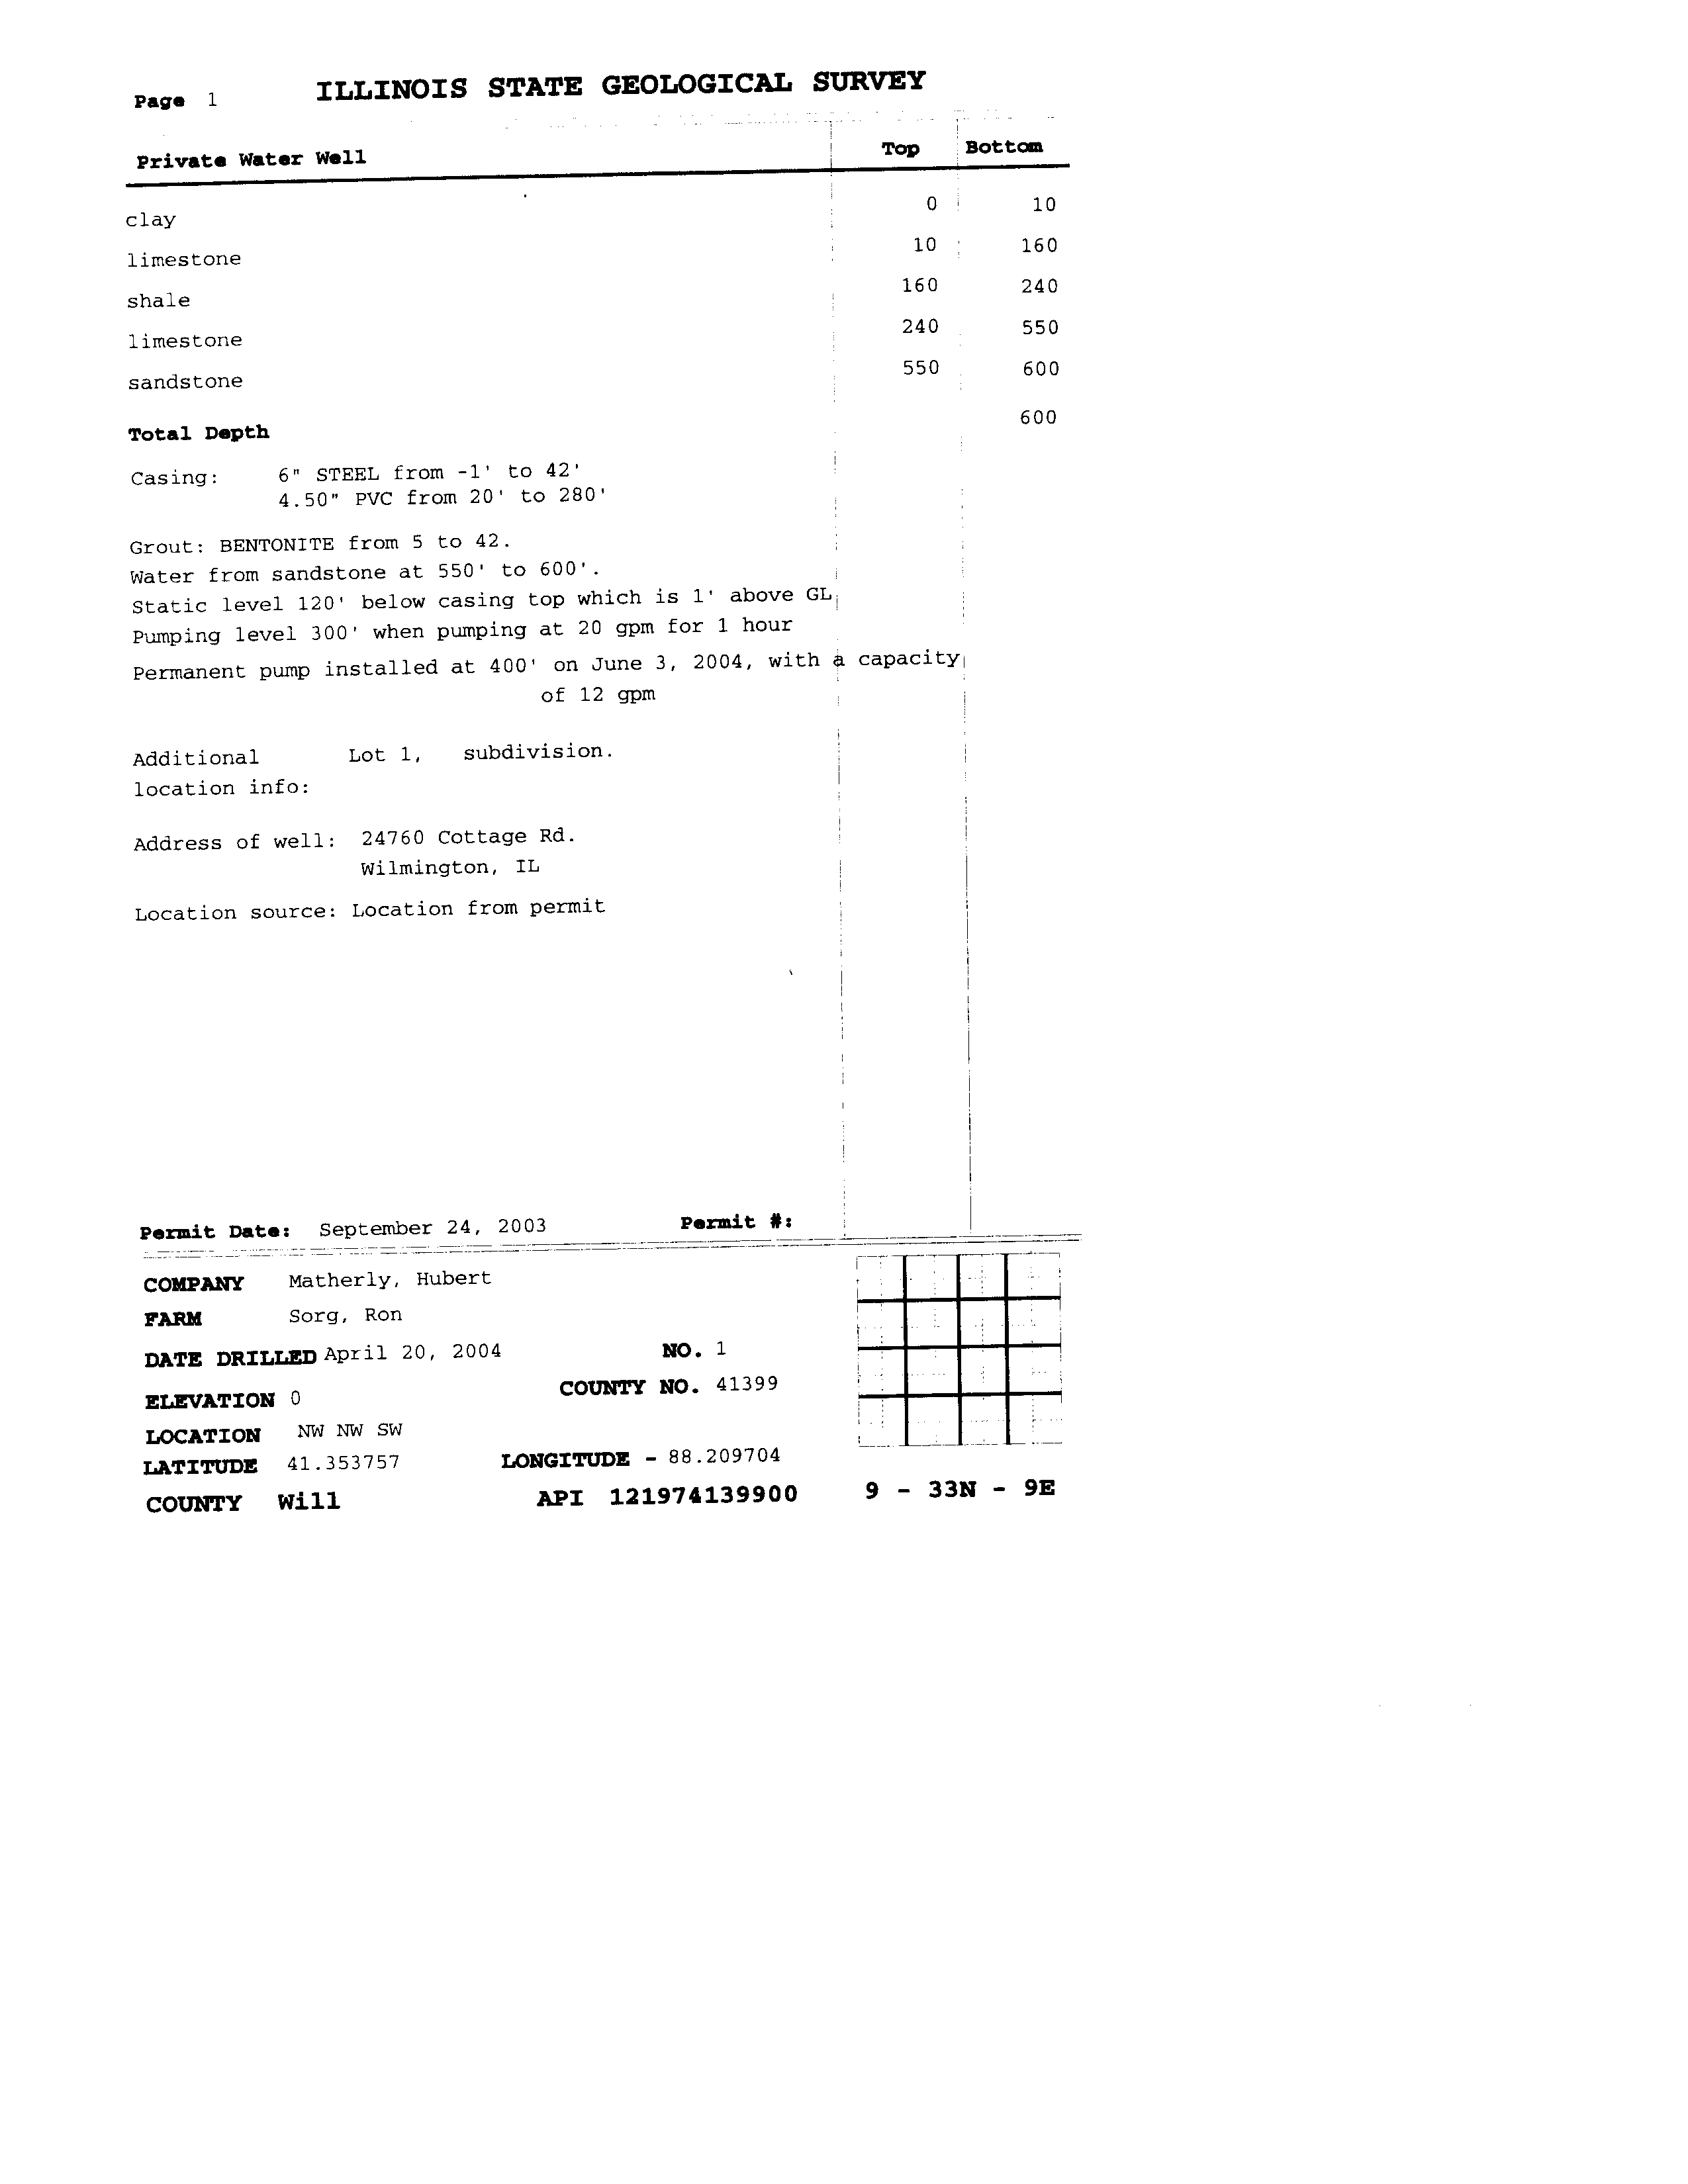
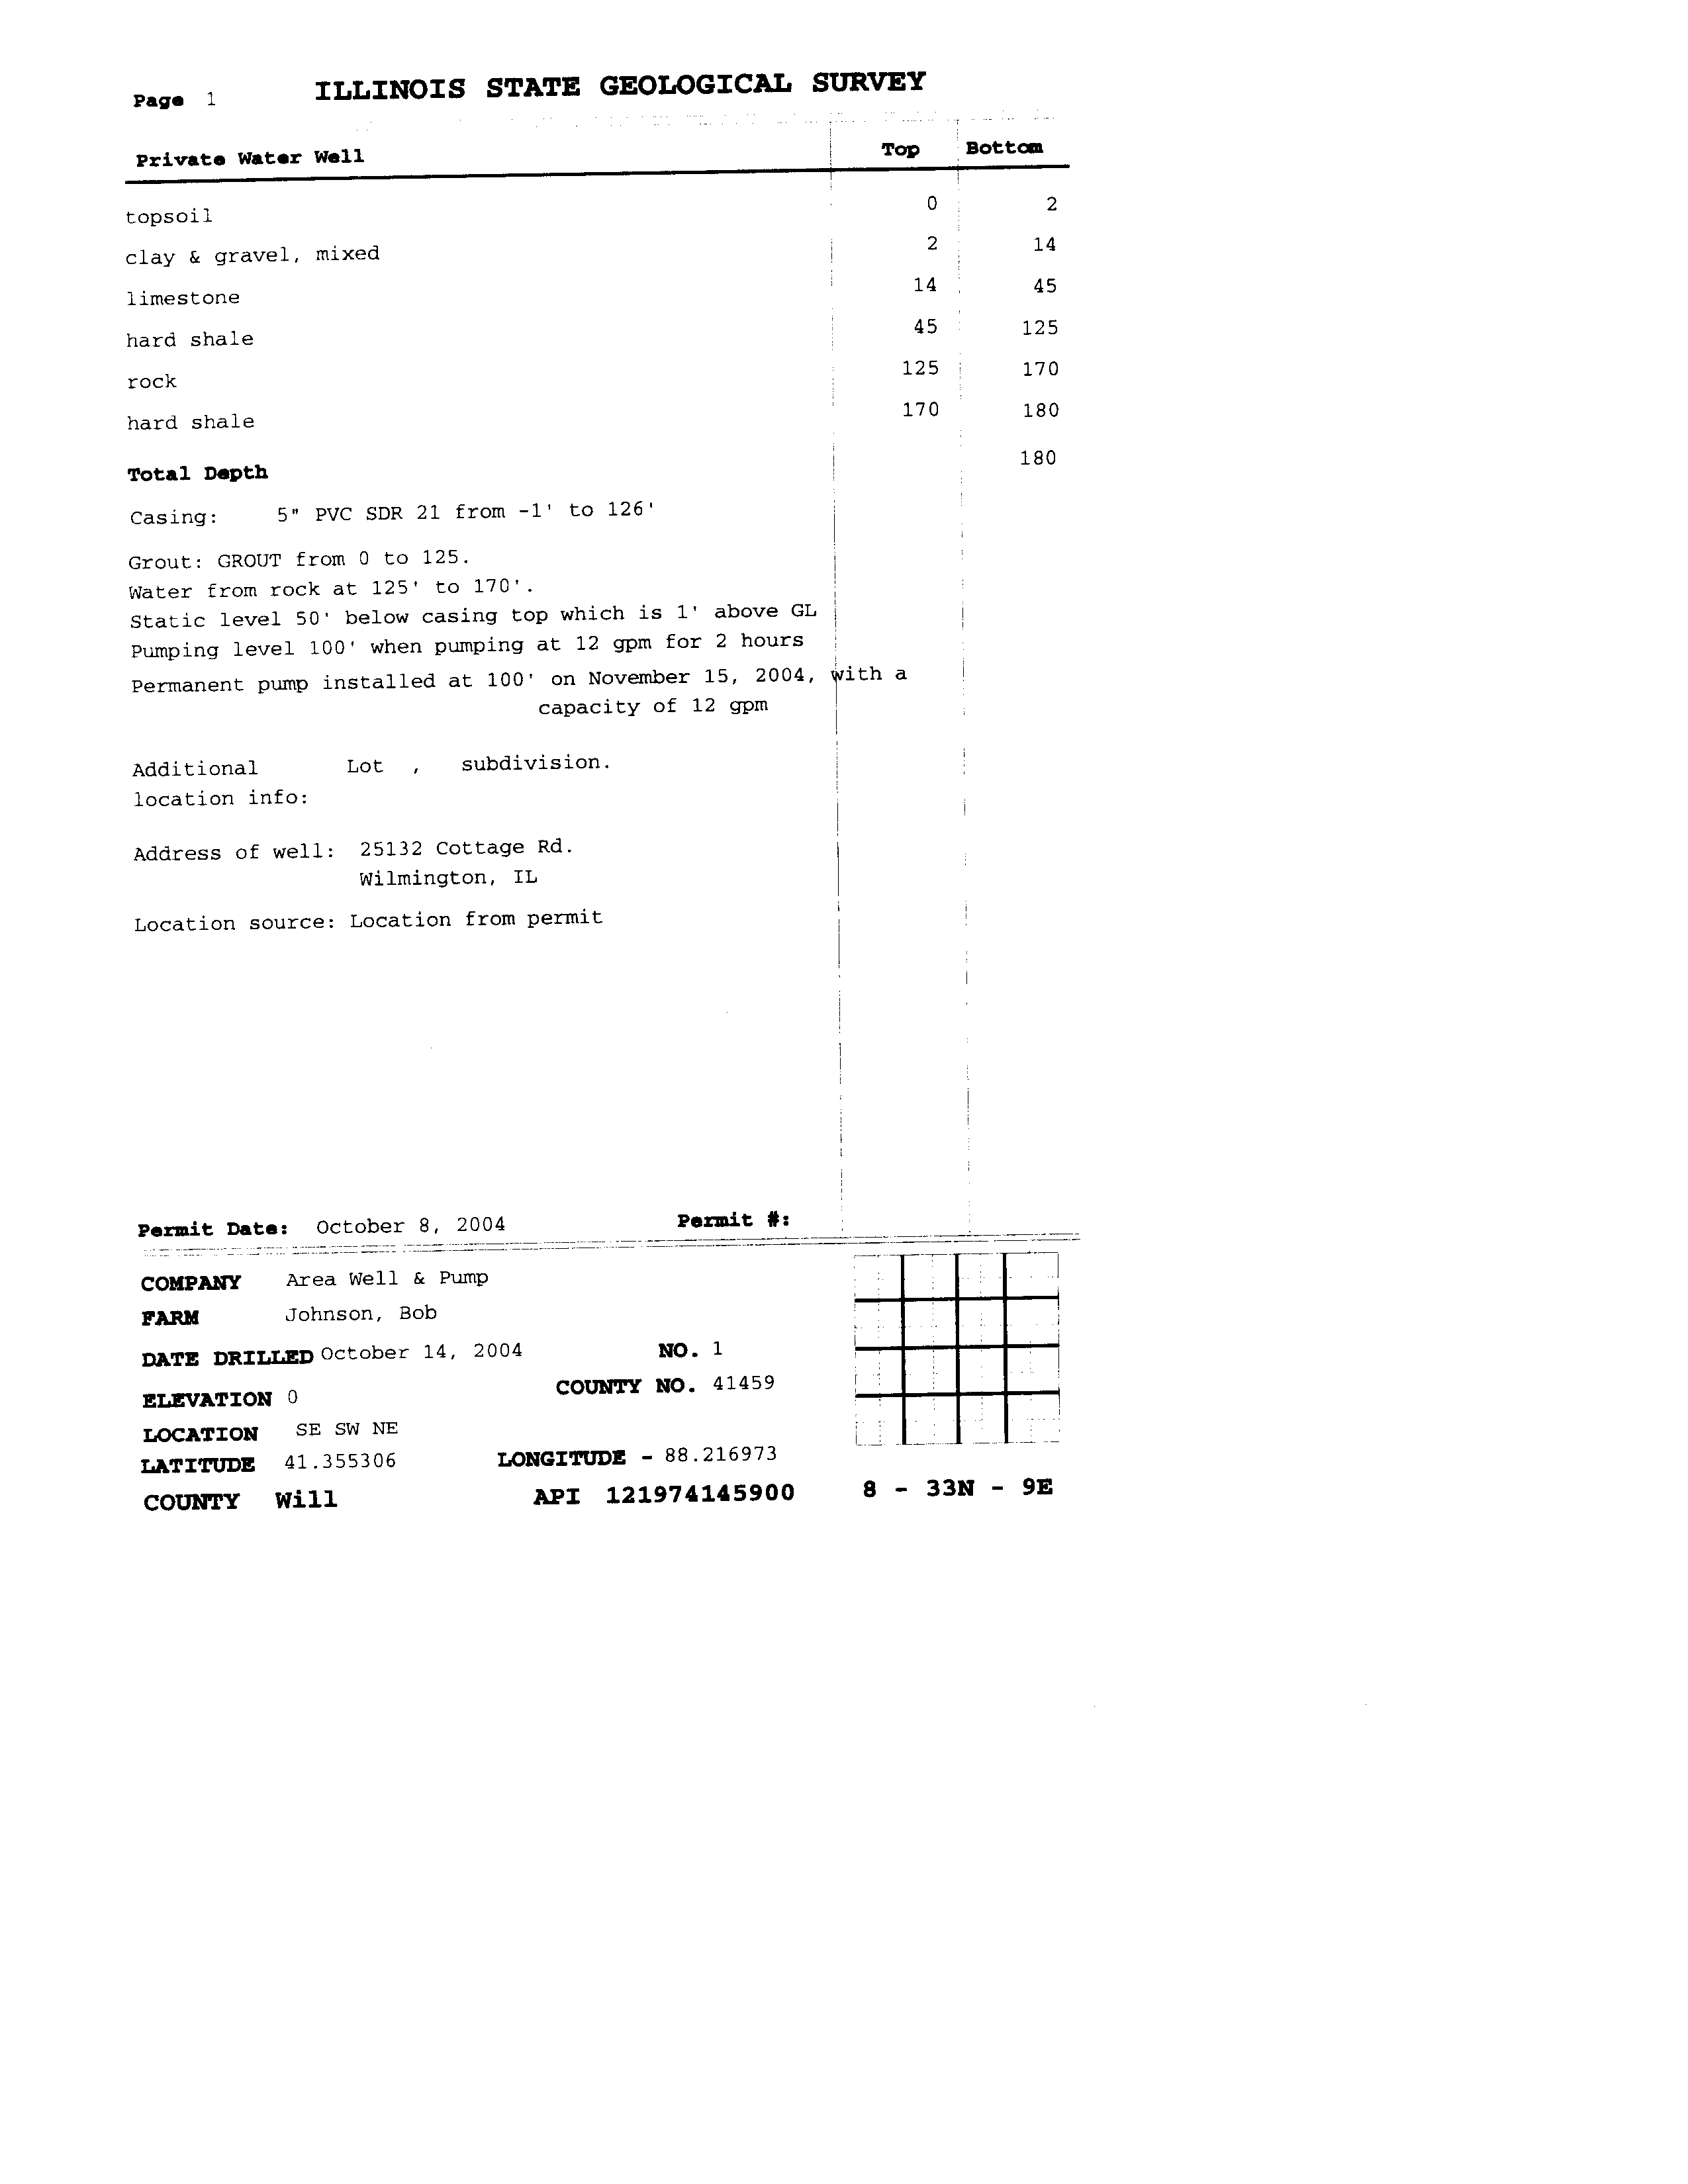
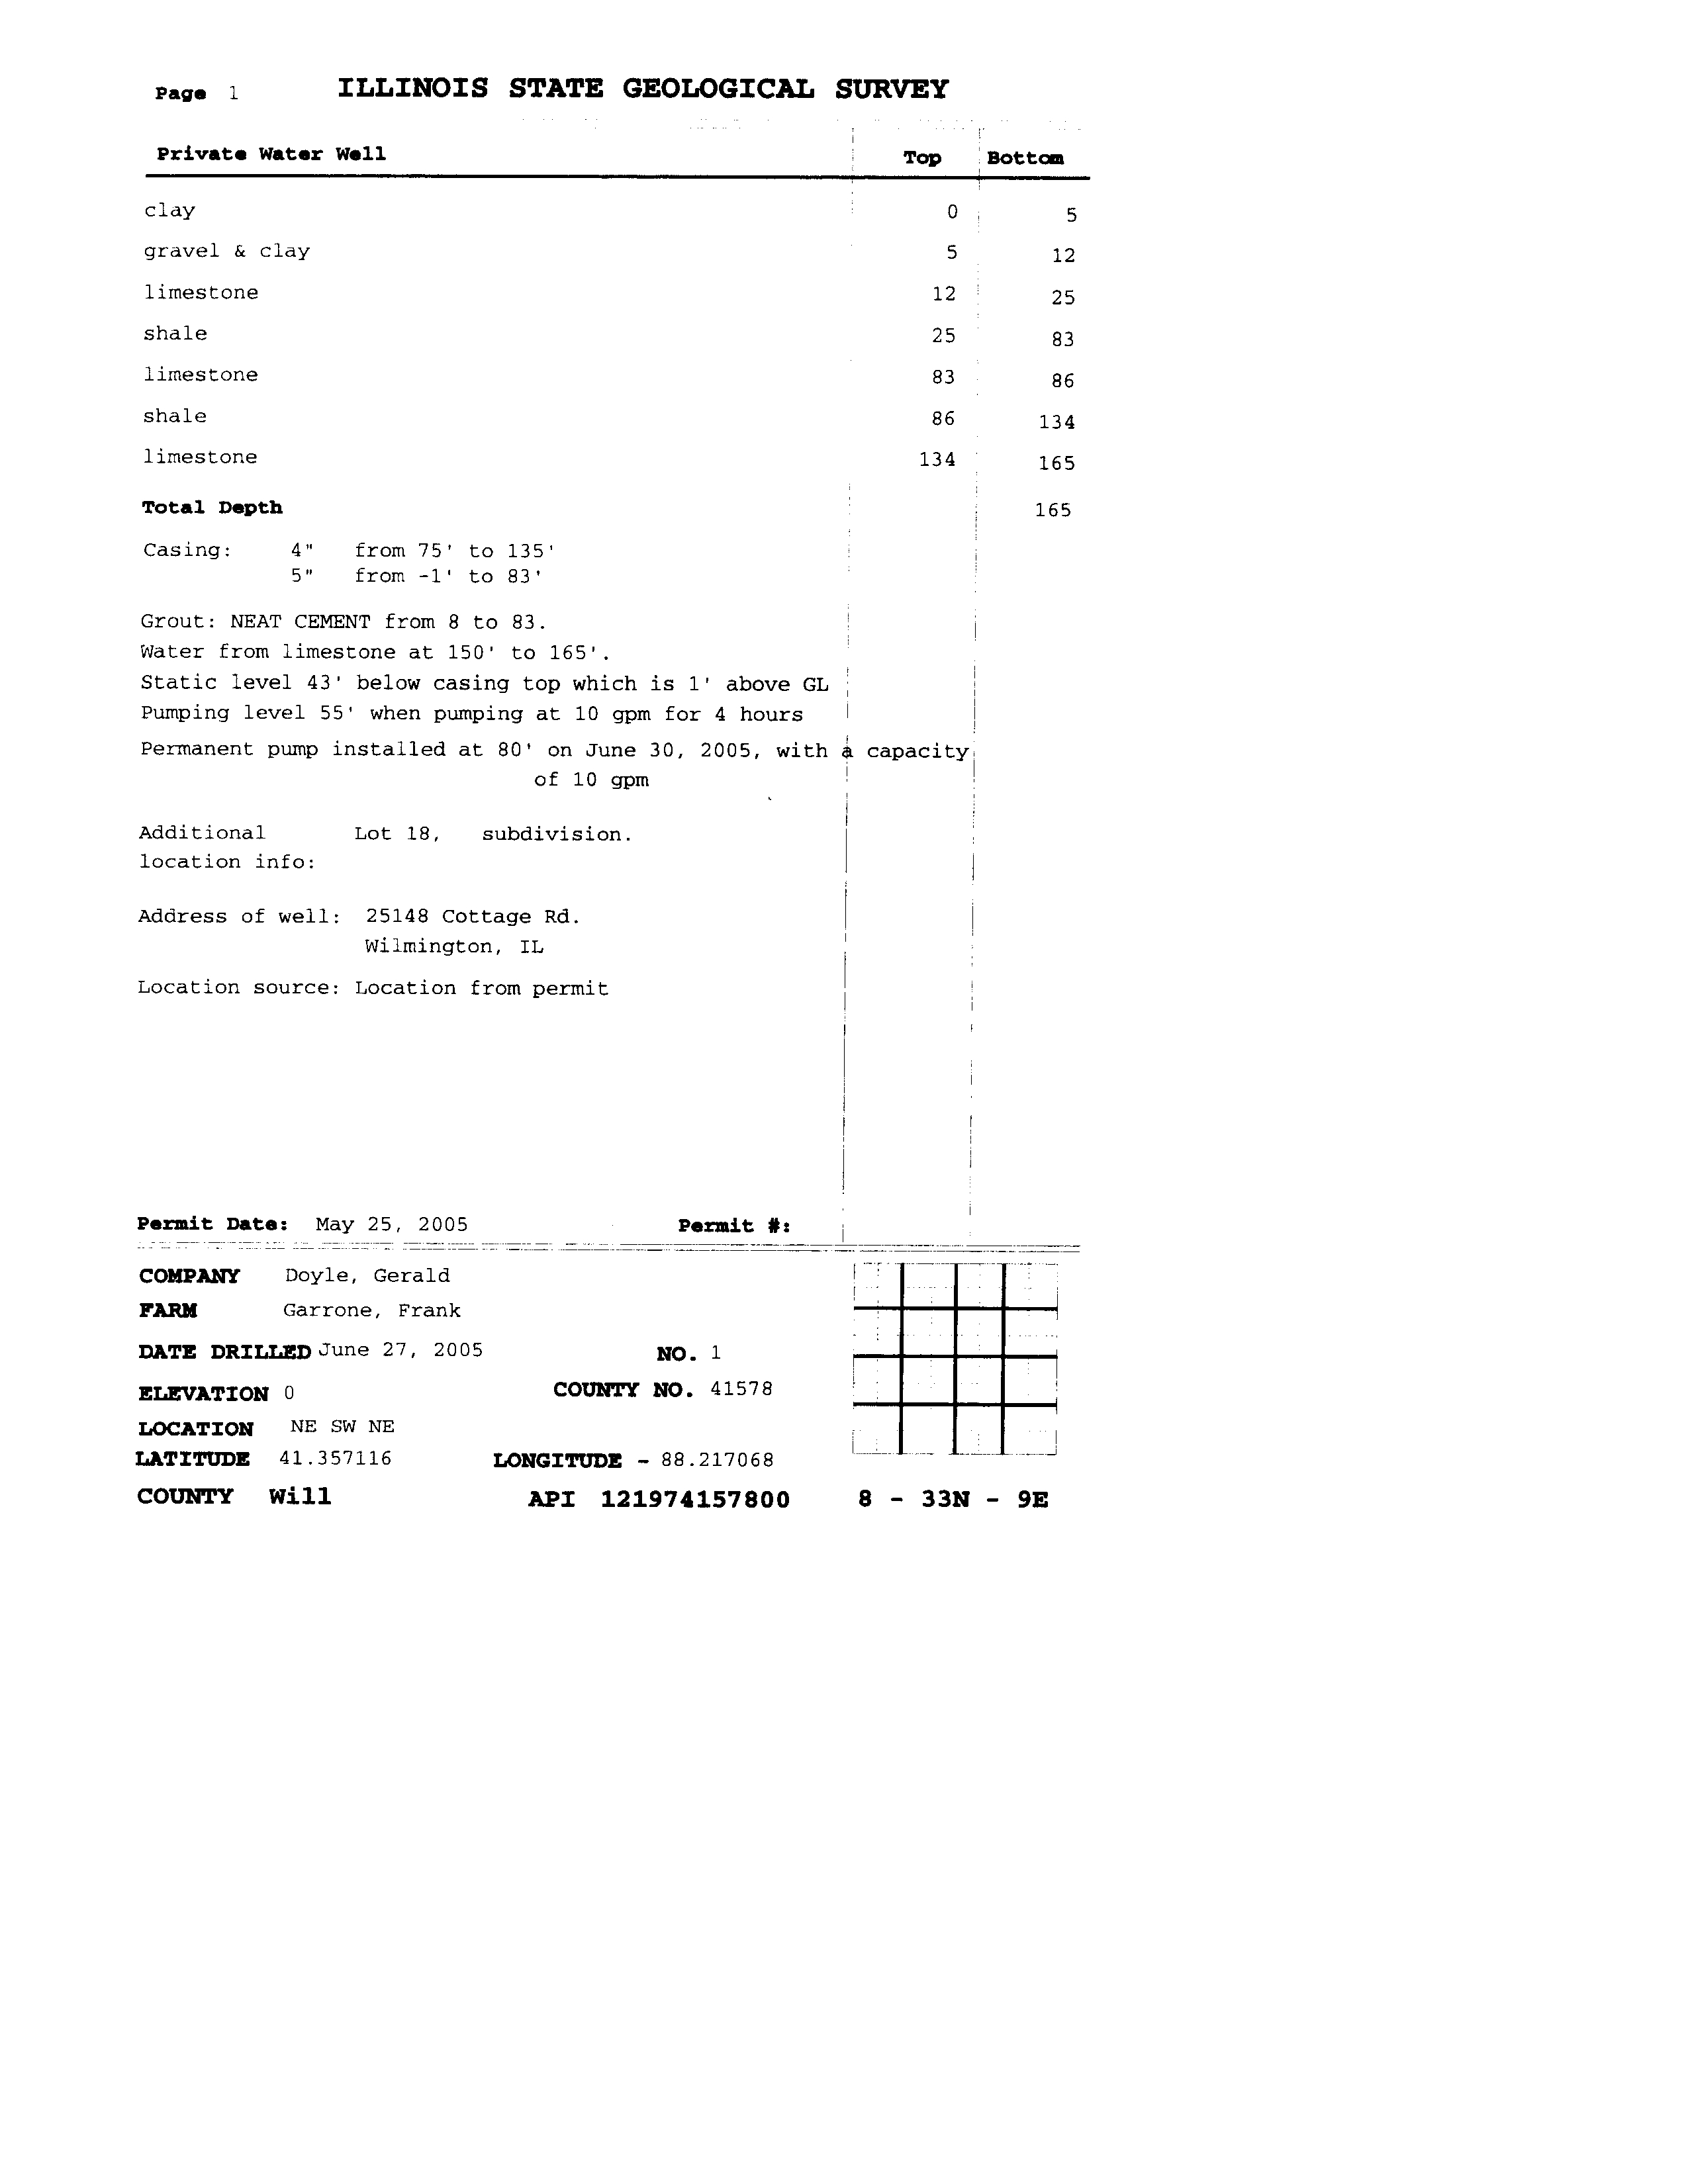
APPENDIX B
WATER SUPPLY WELL INVENTORY
APPENDIX C
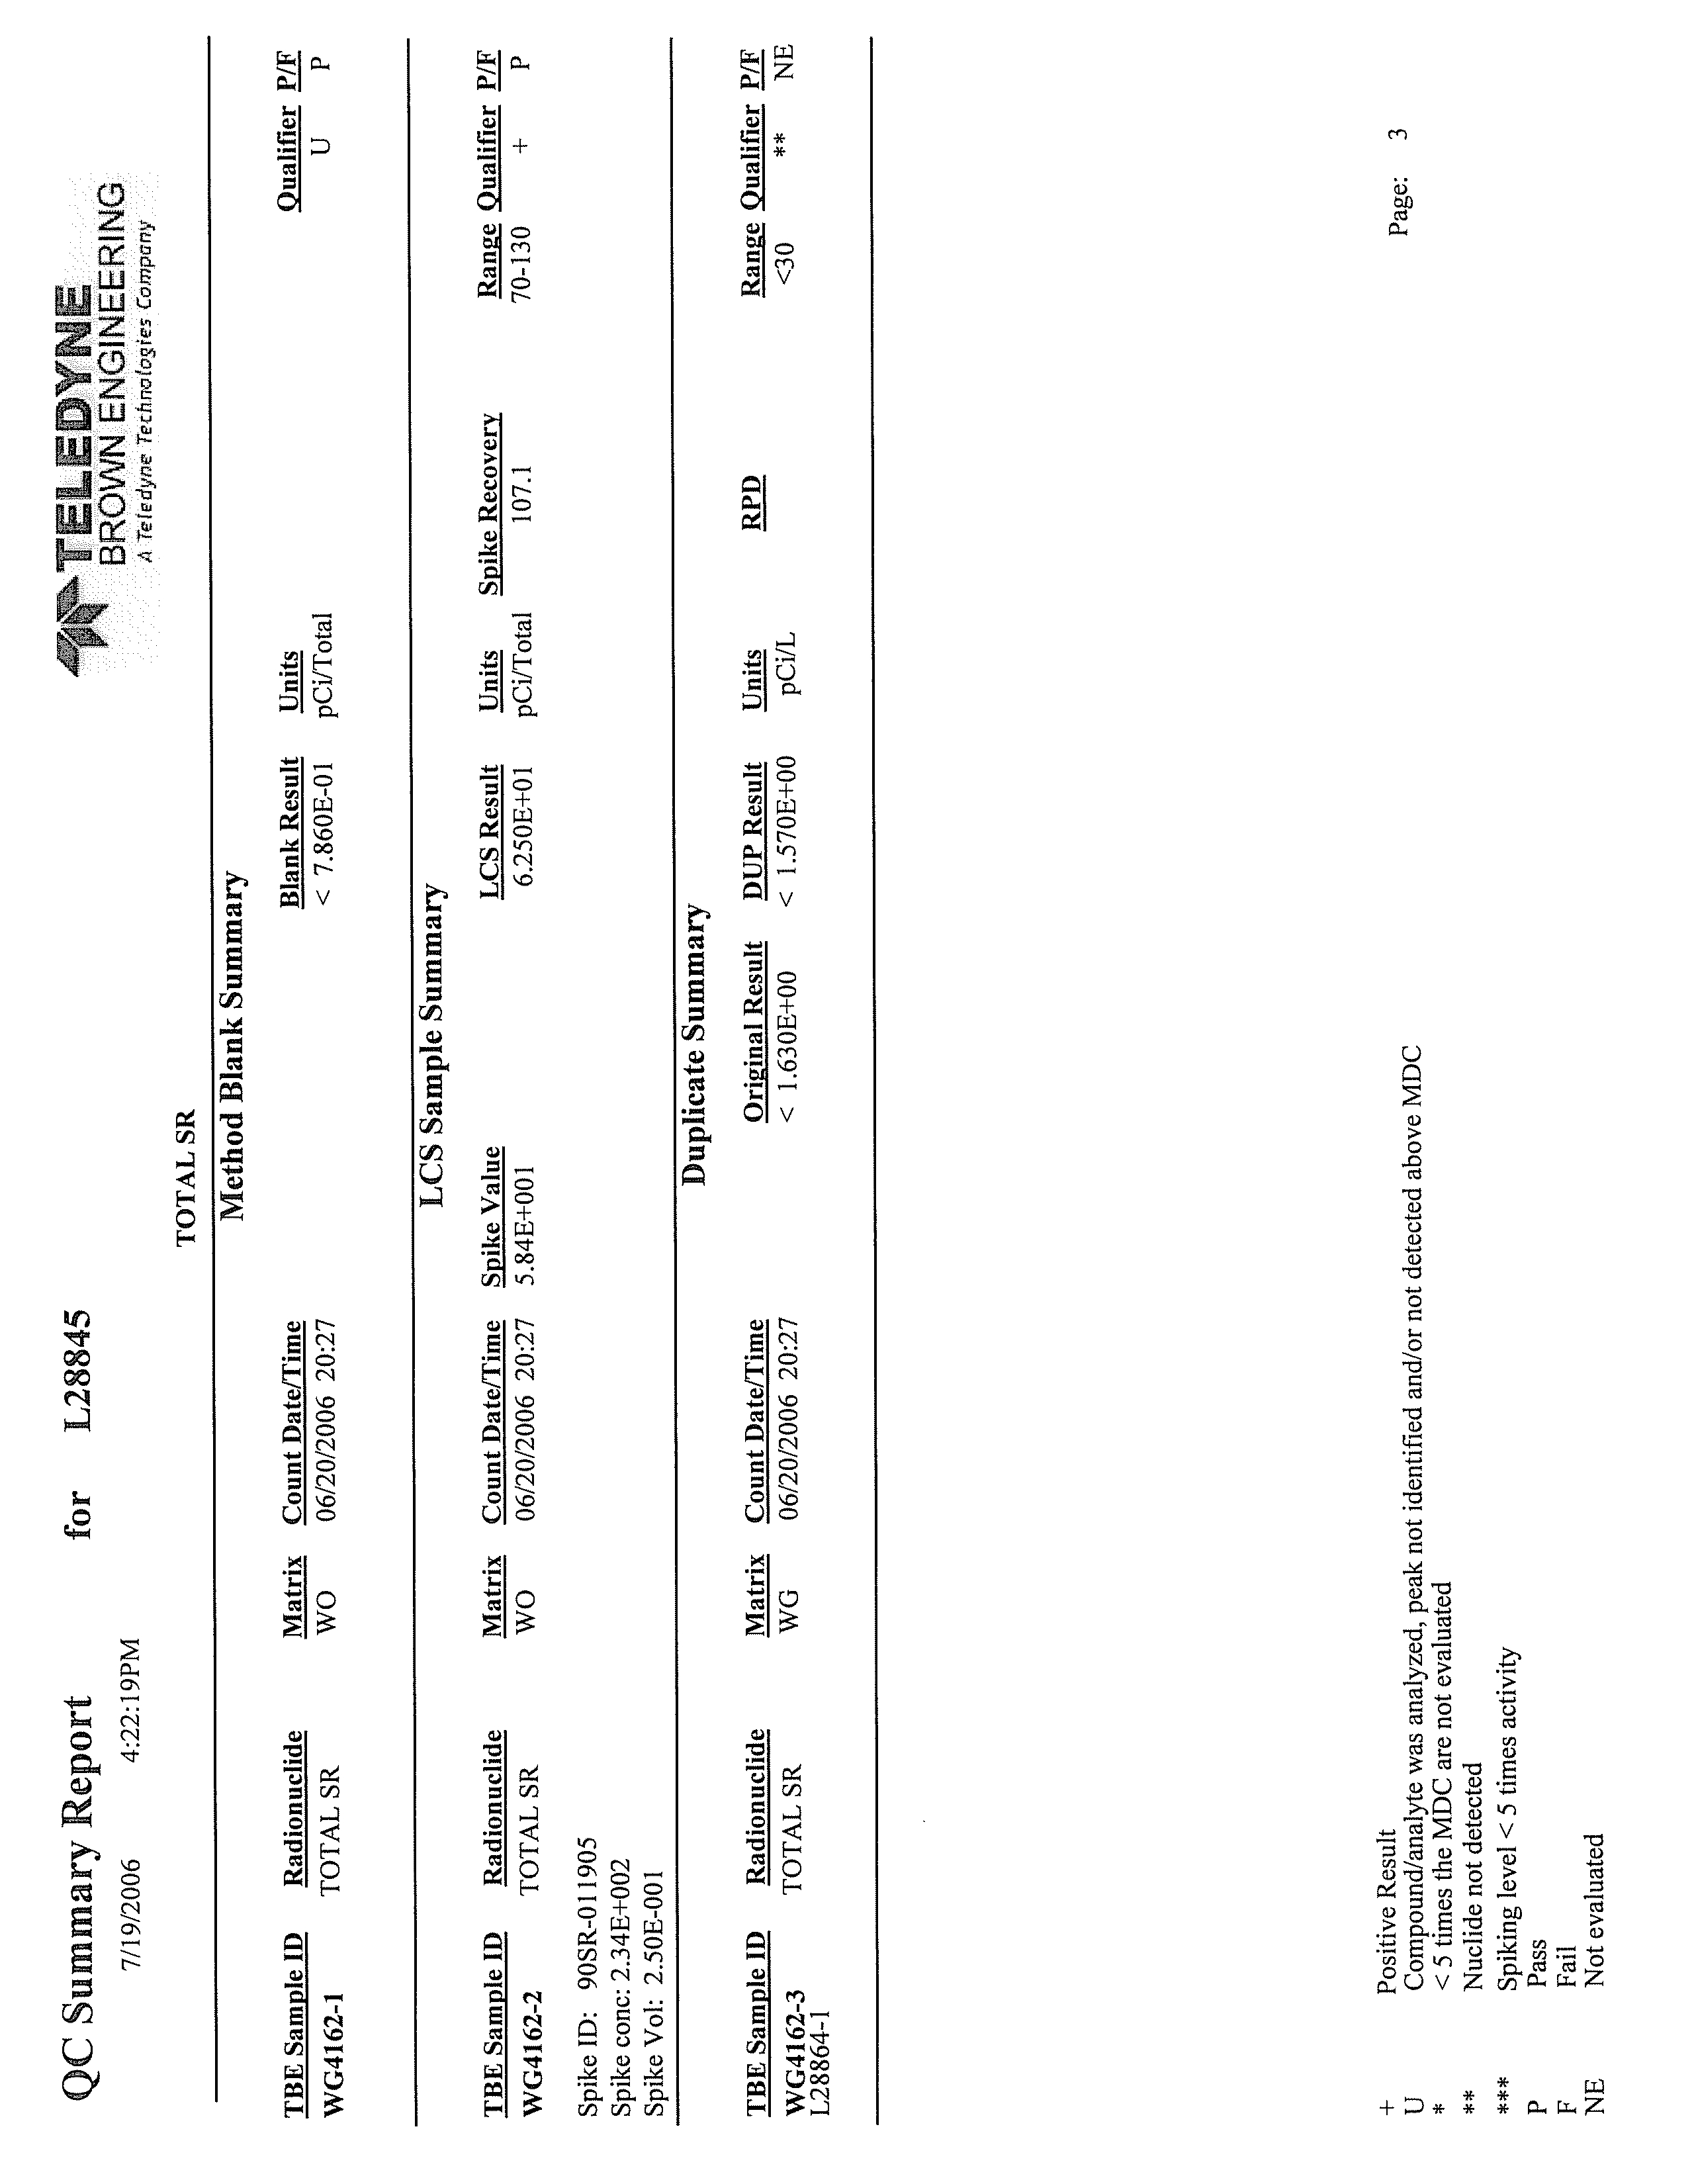
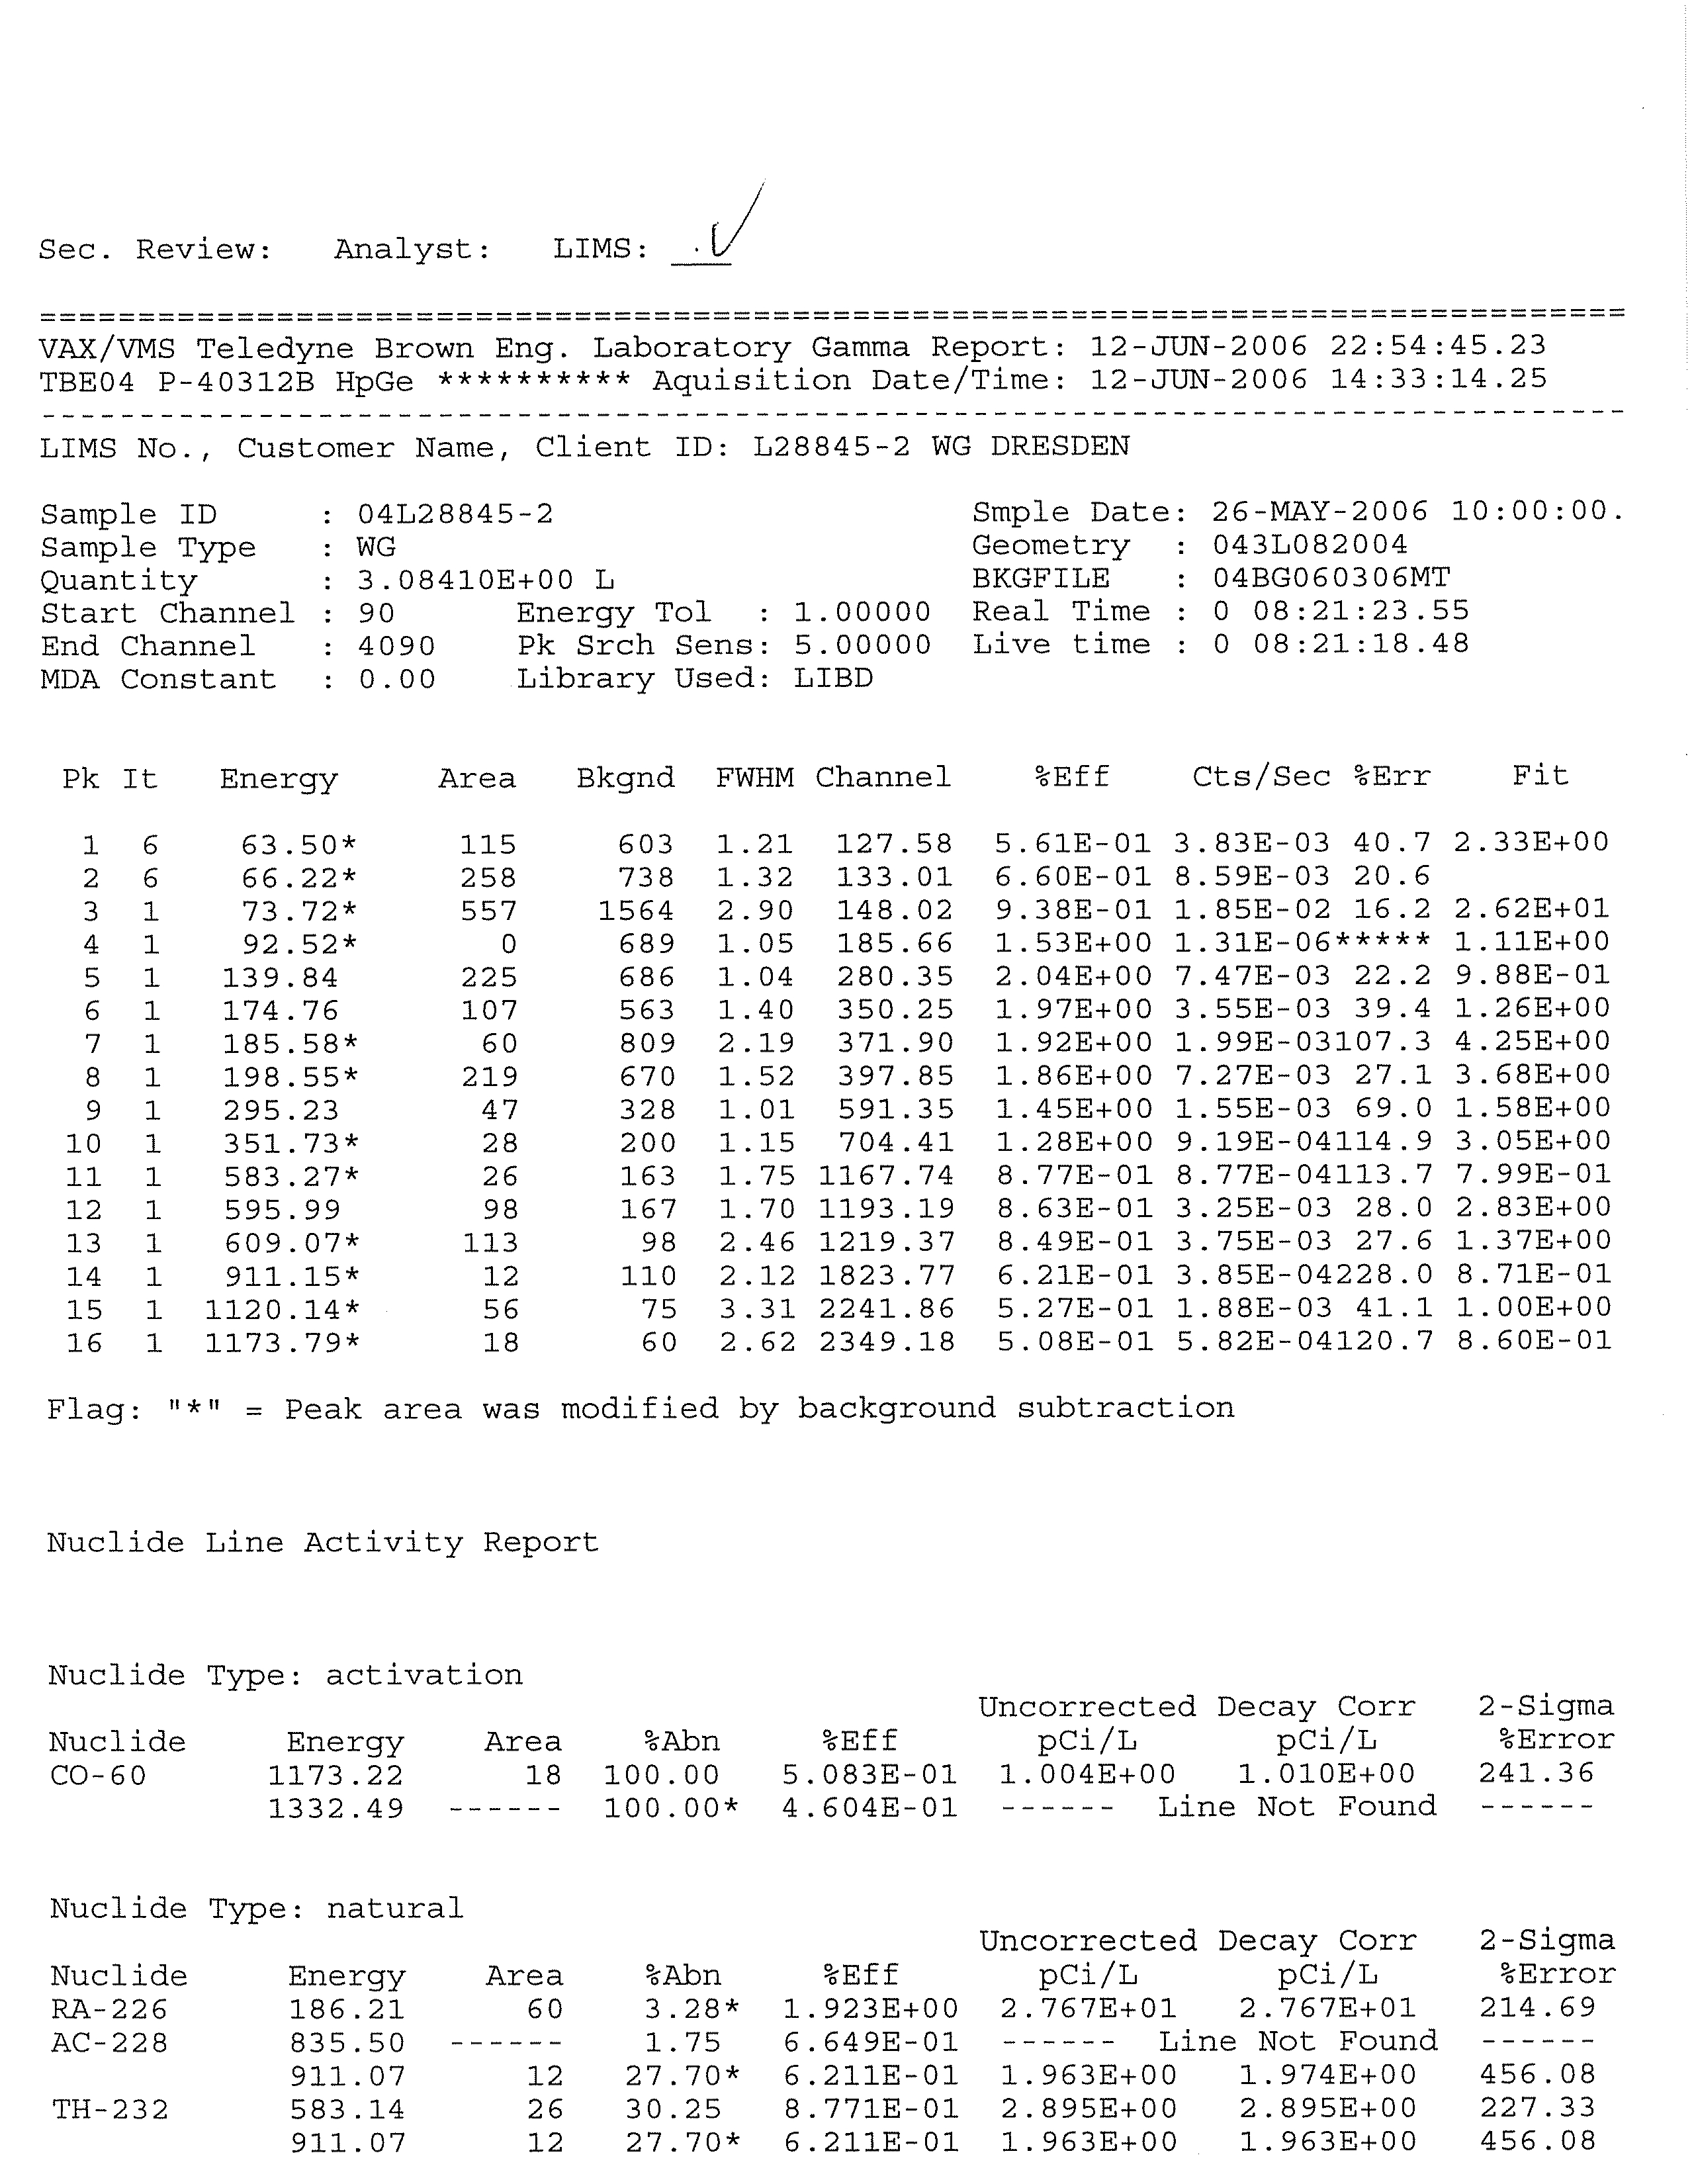
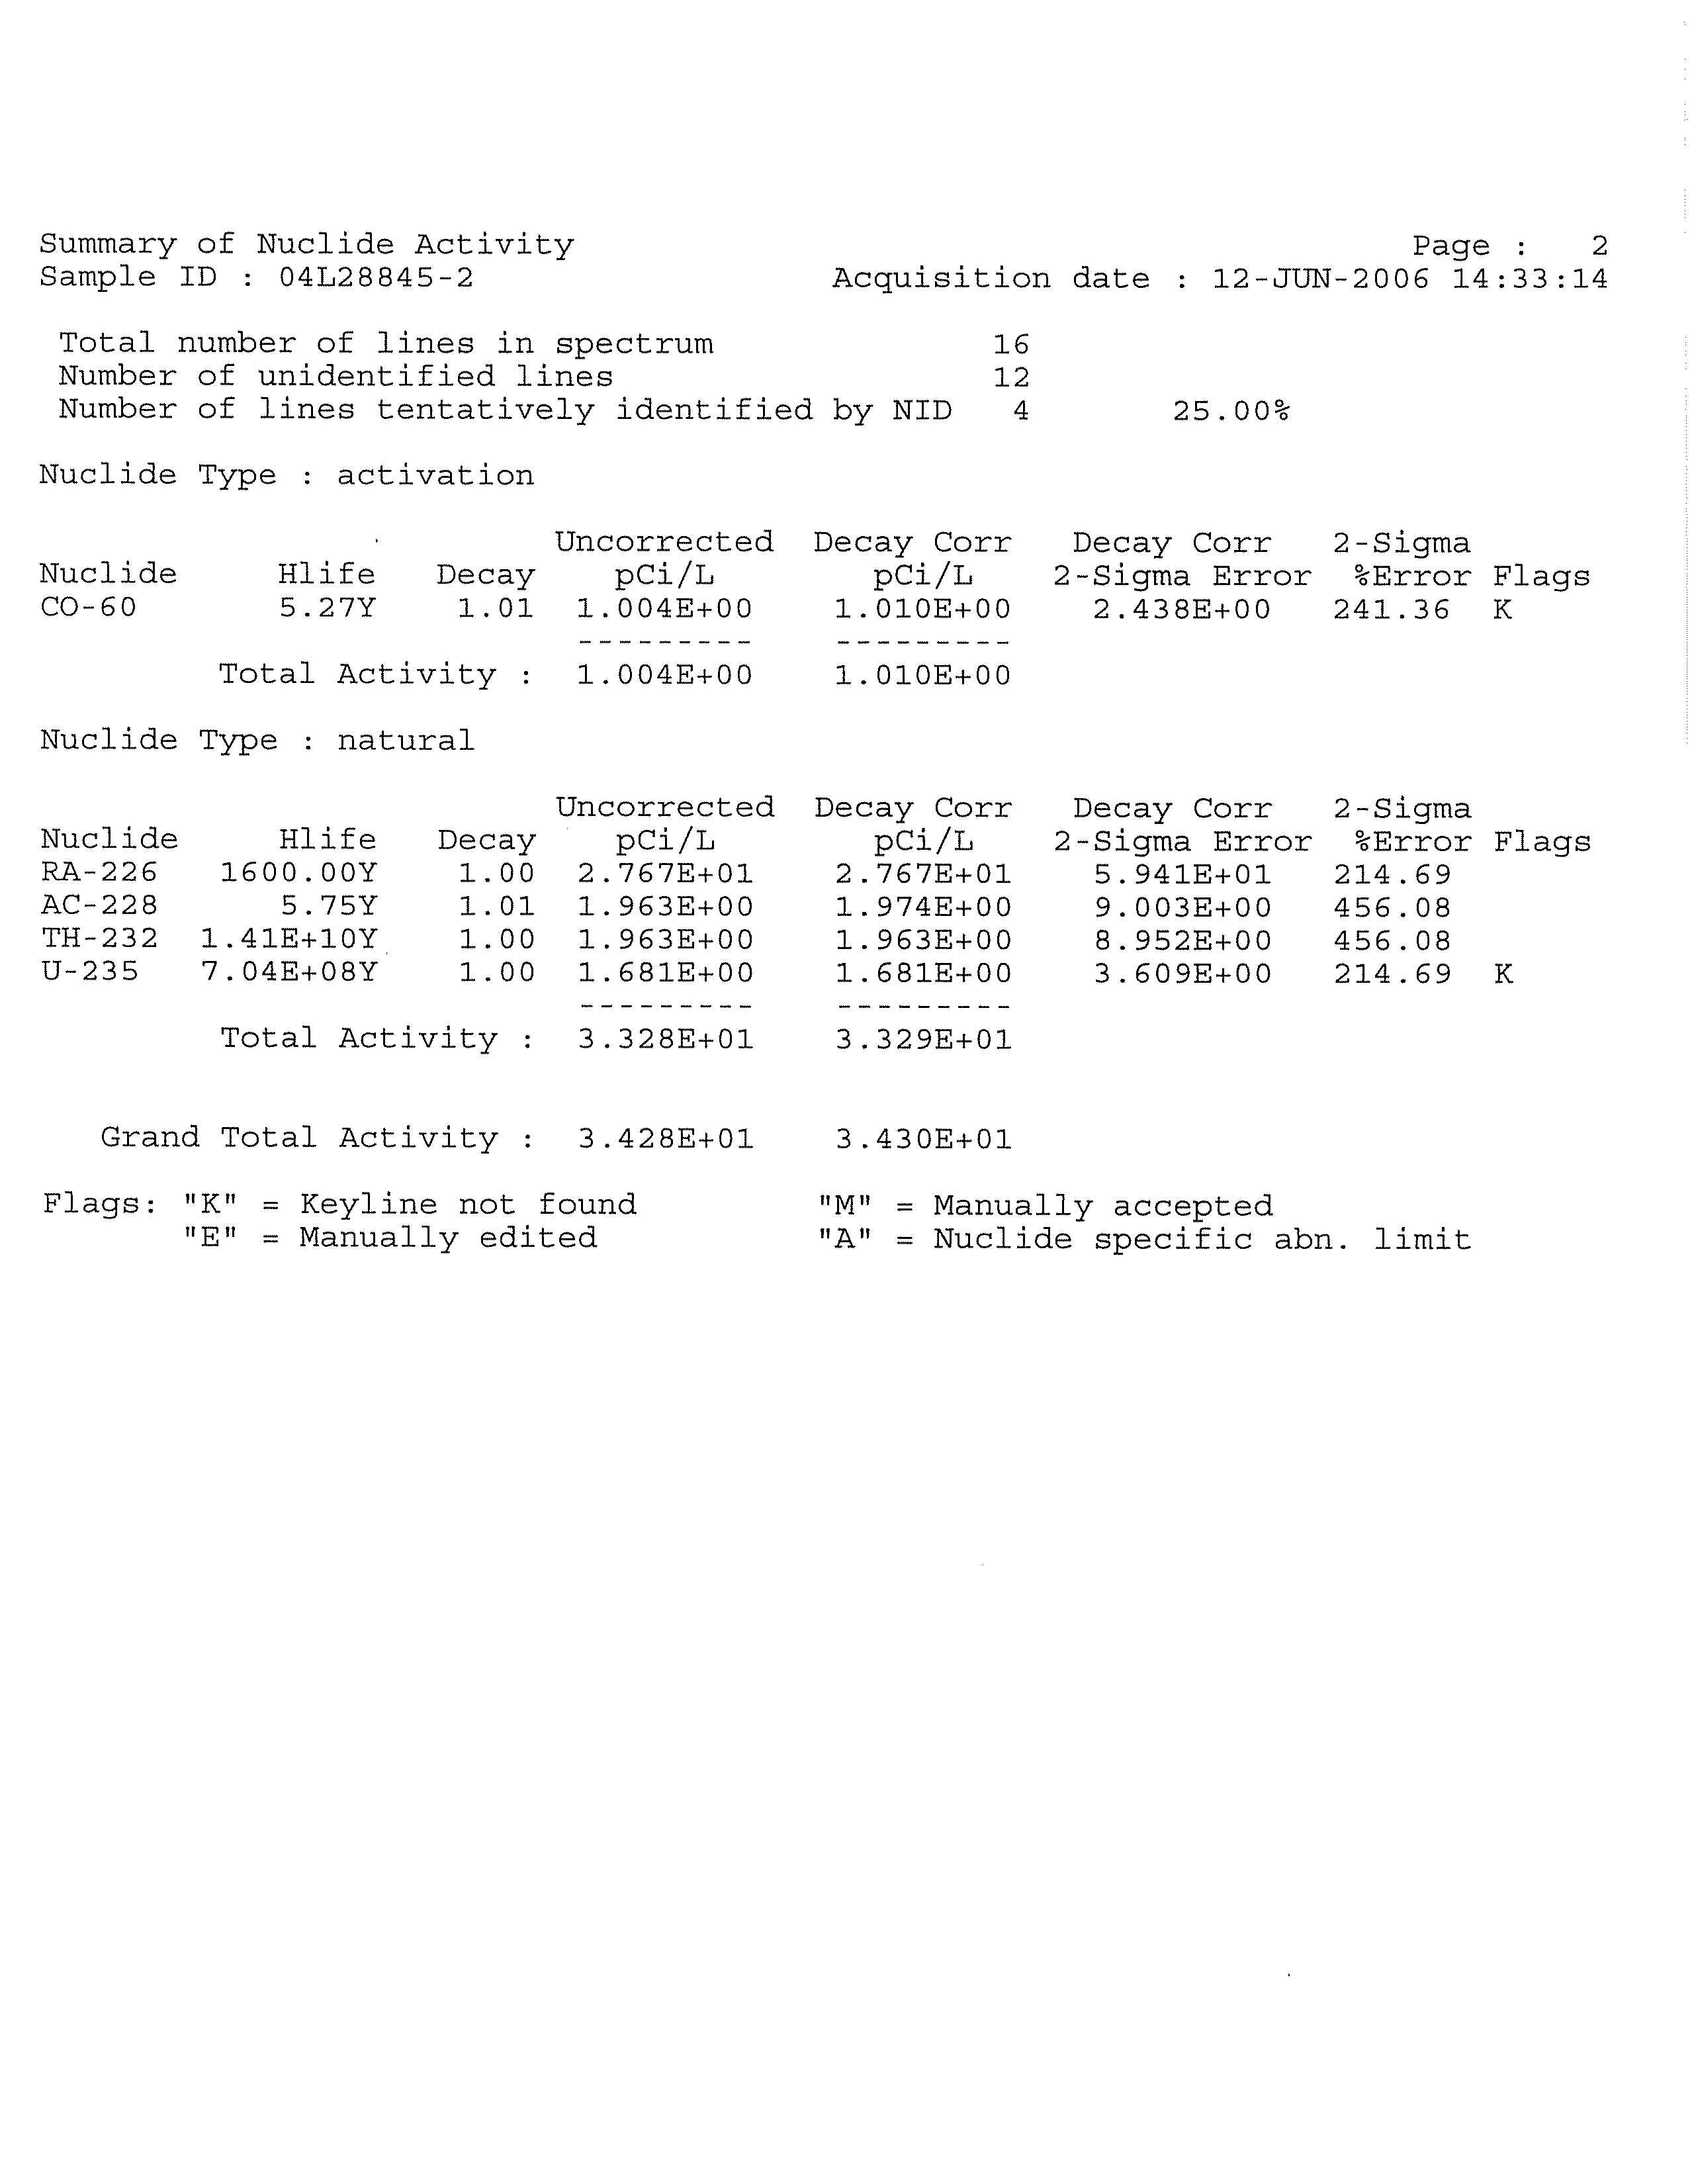
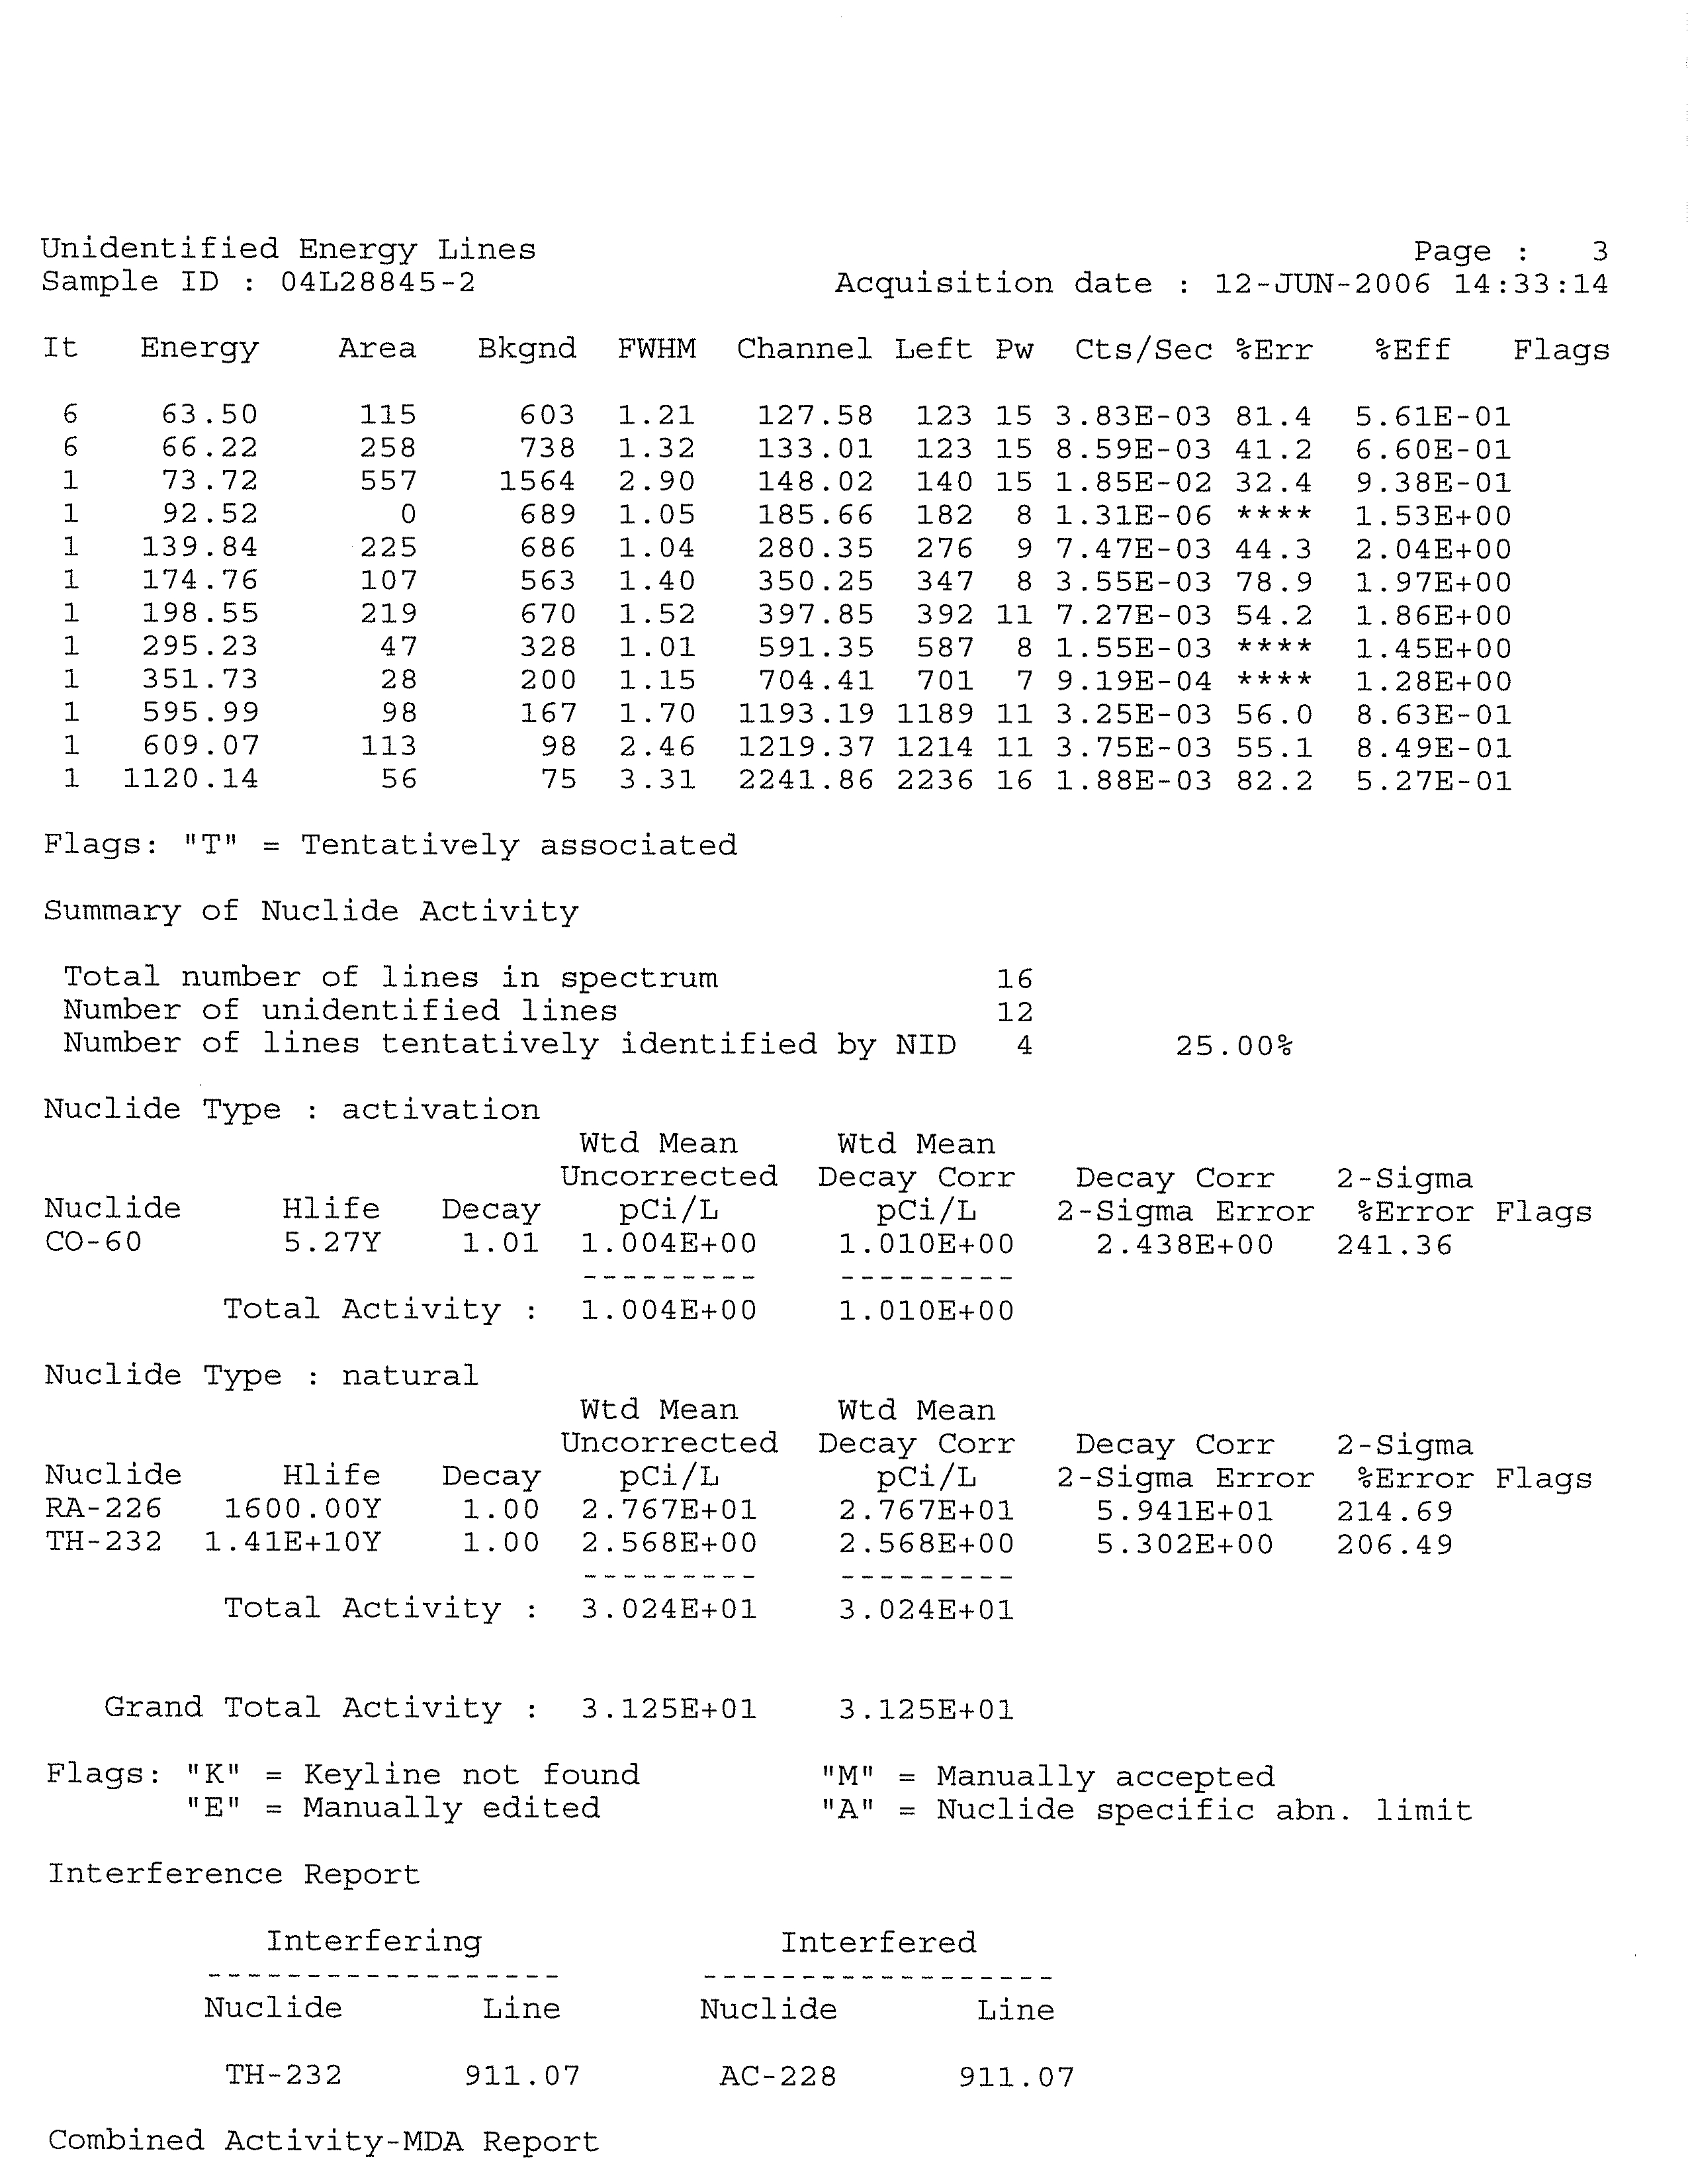
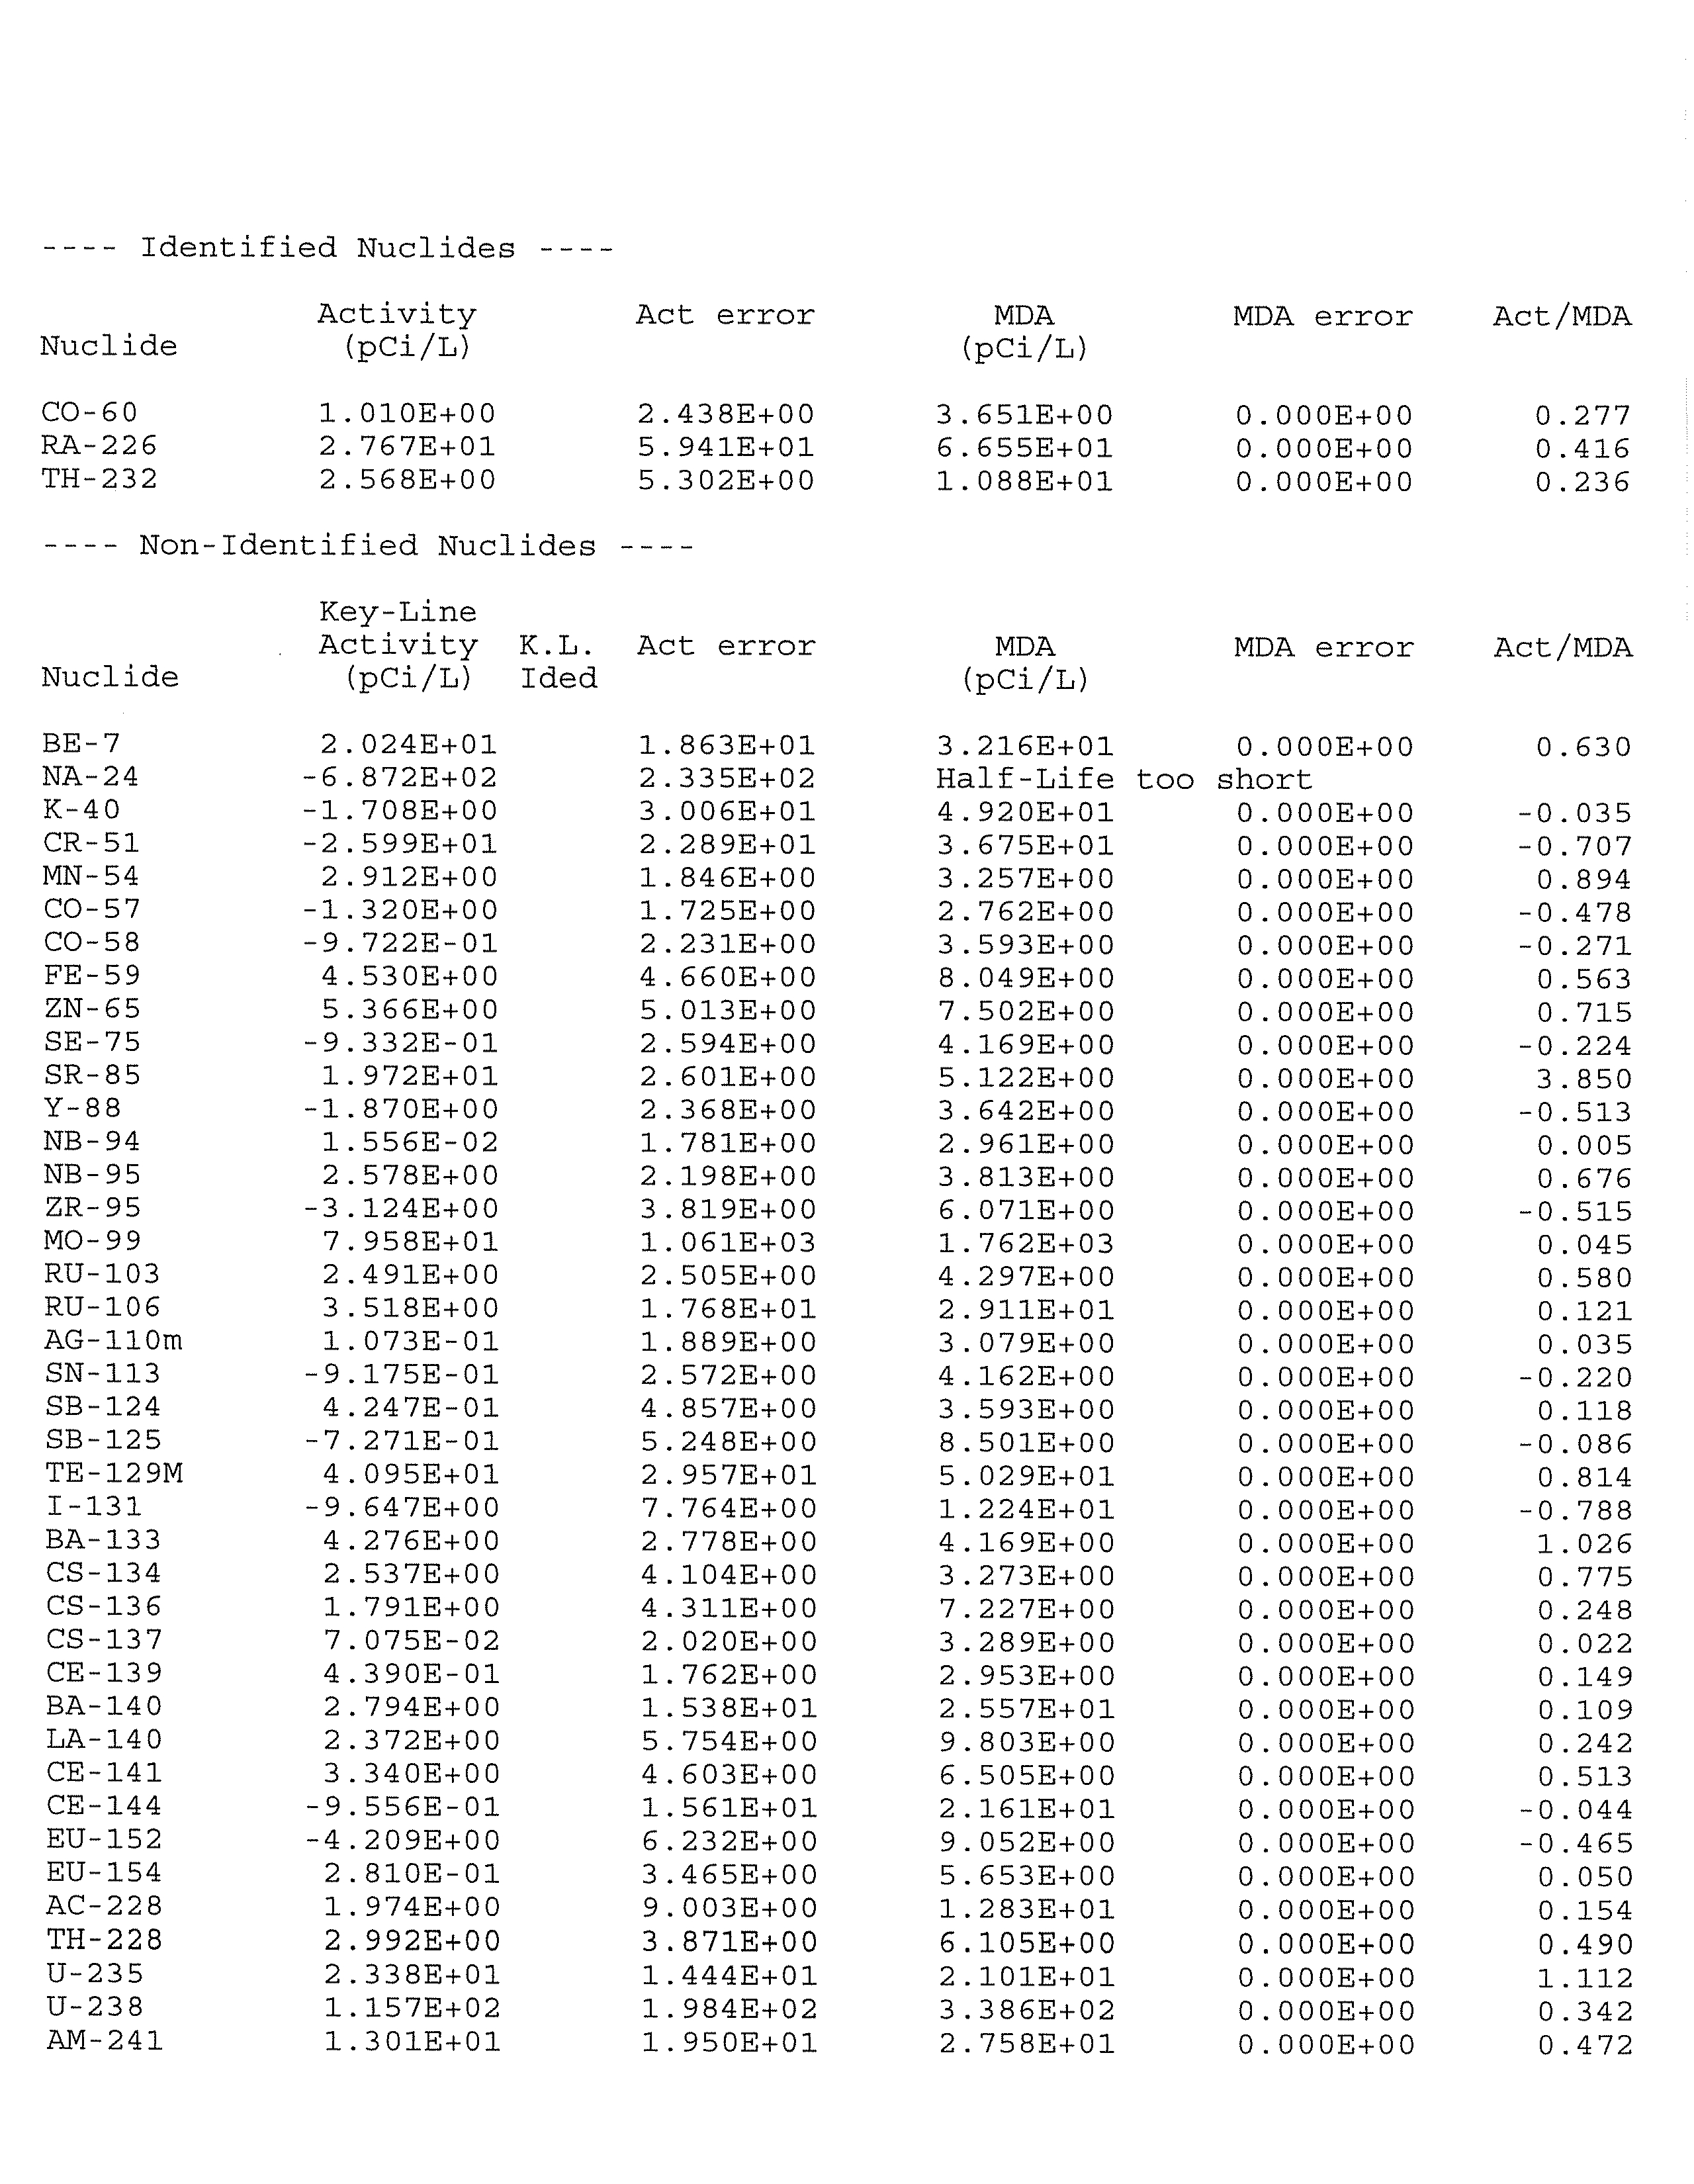
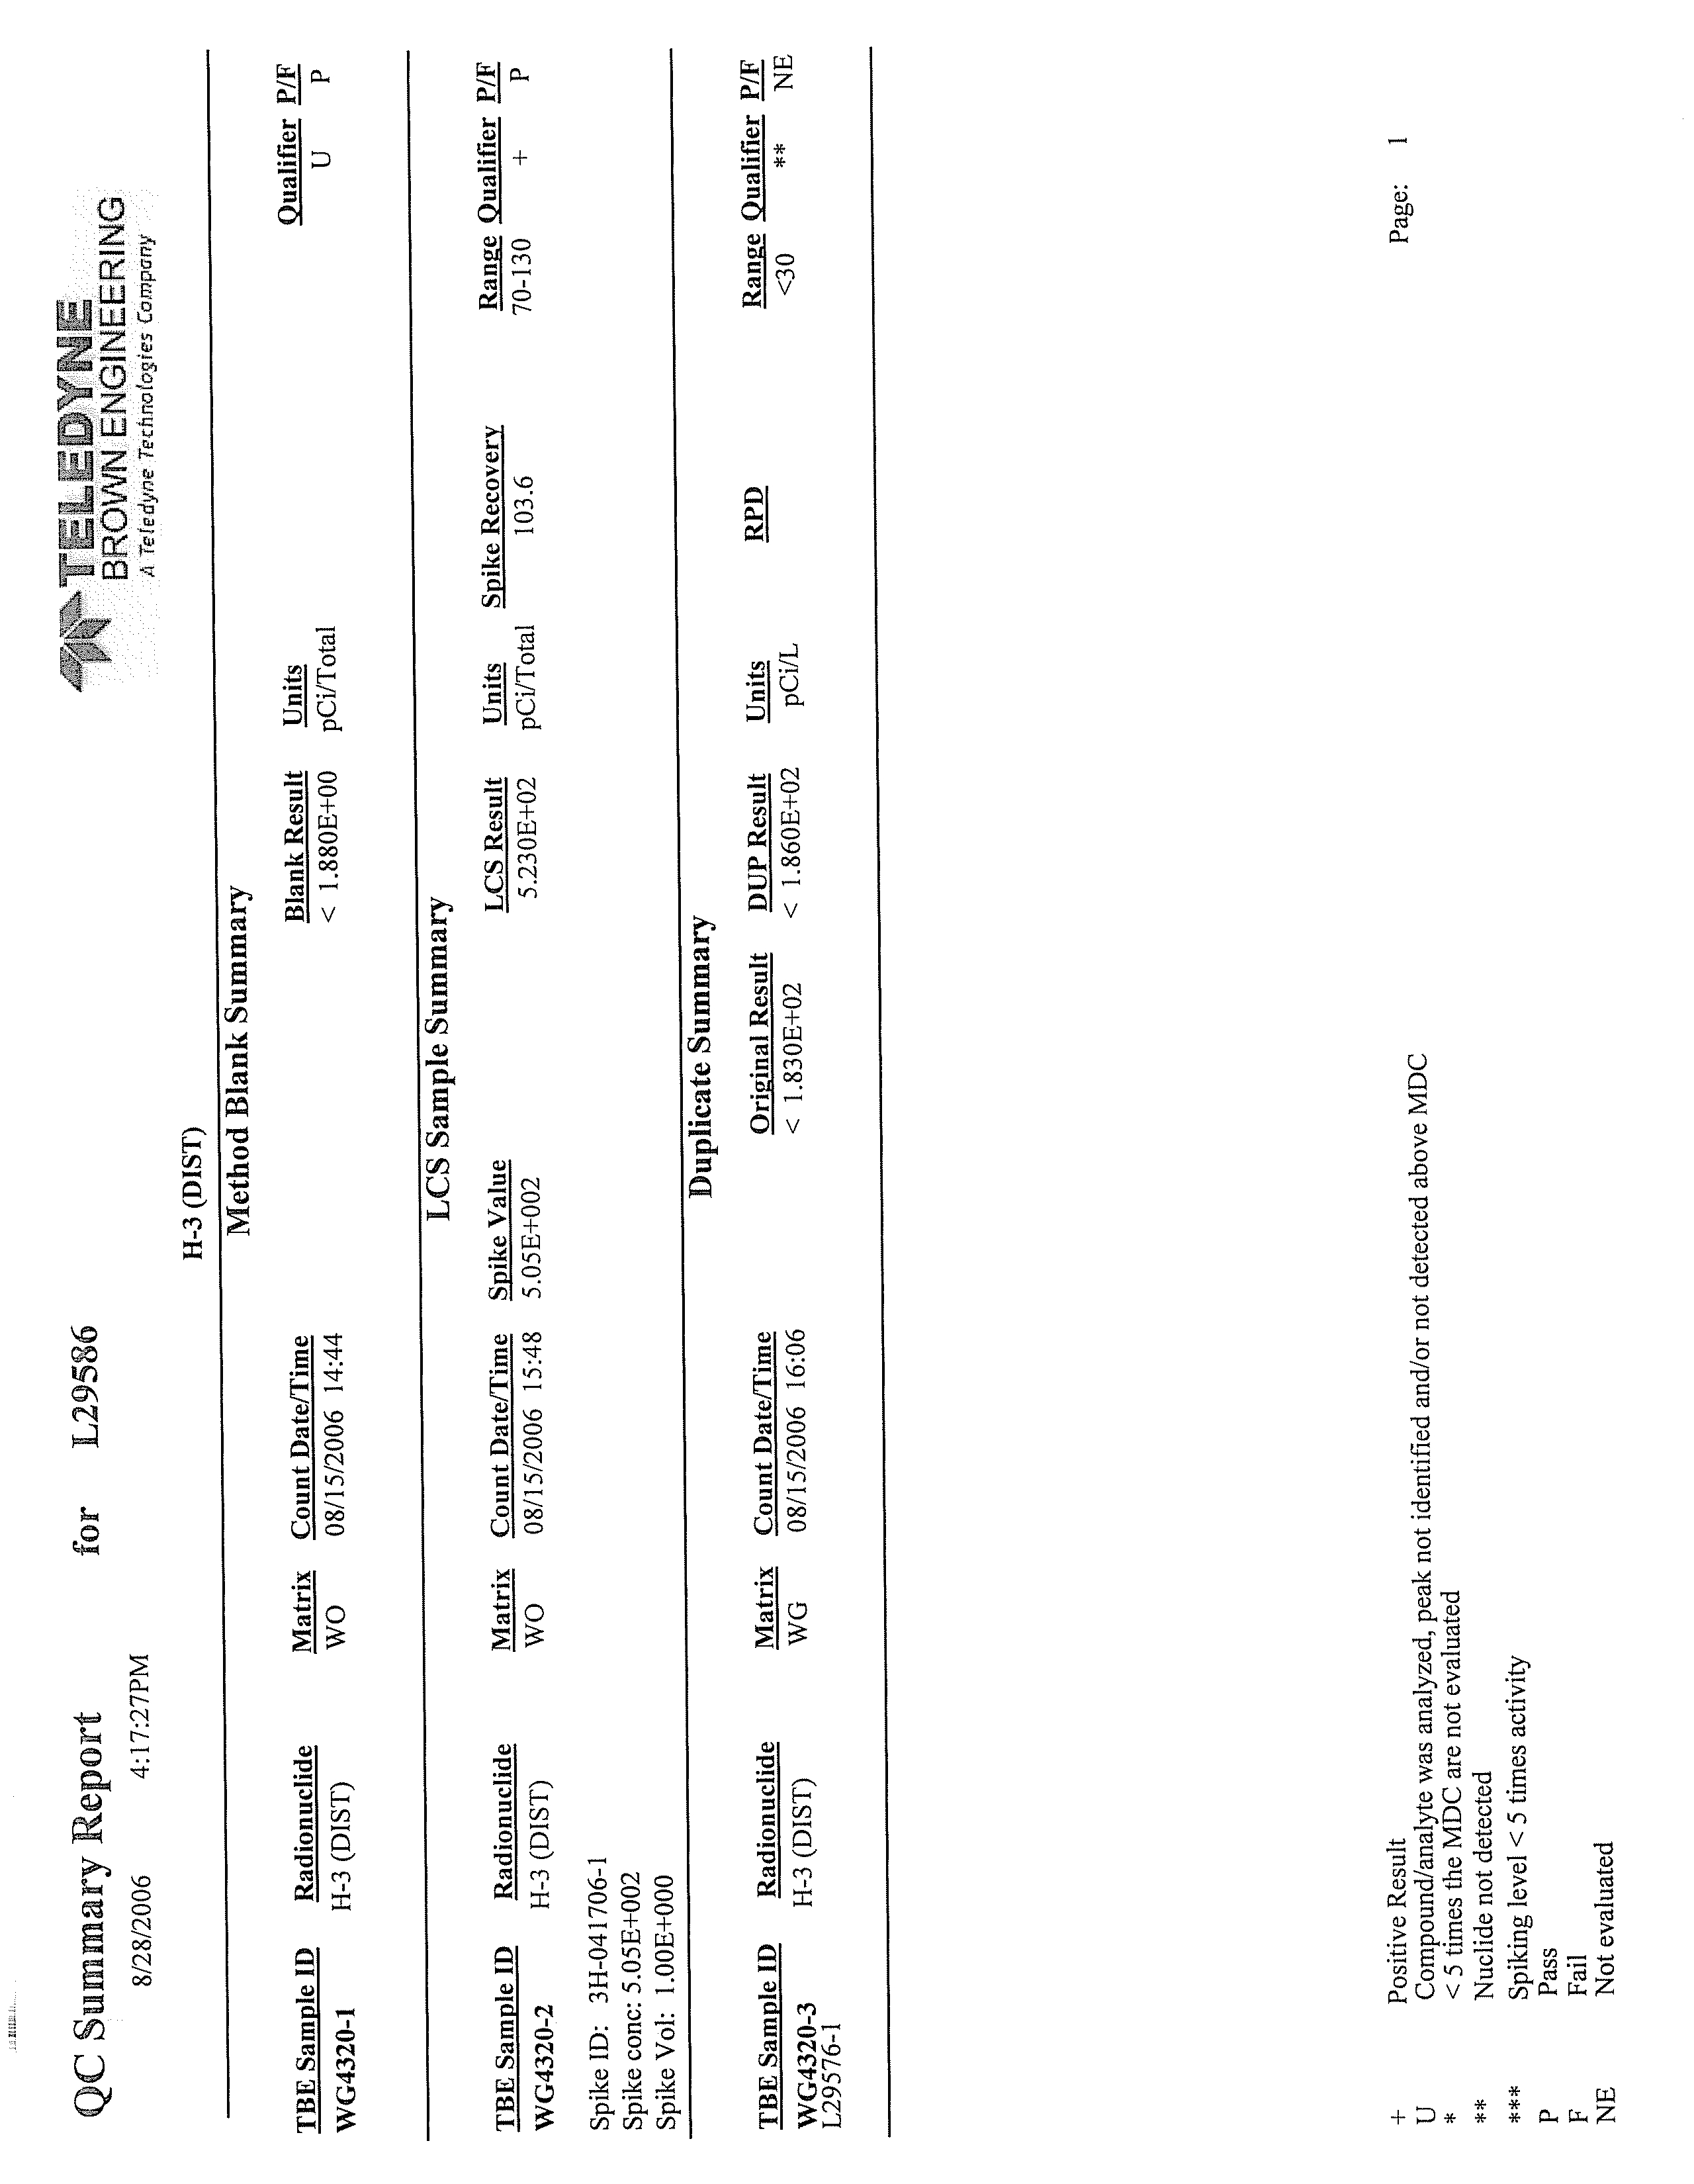
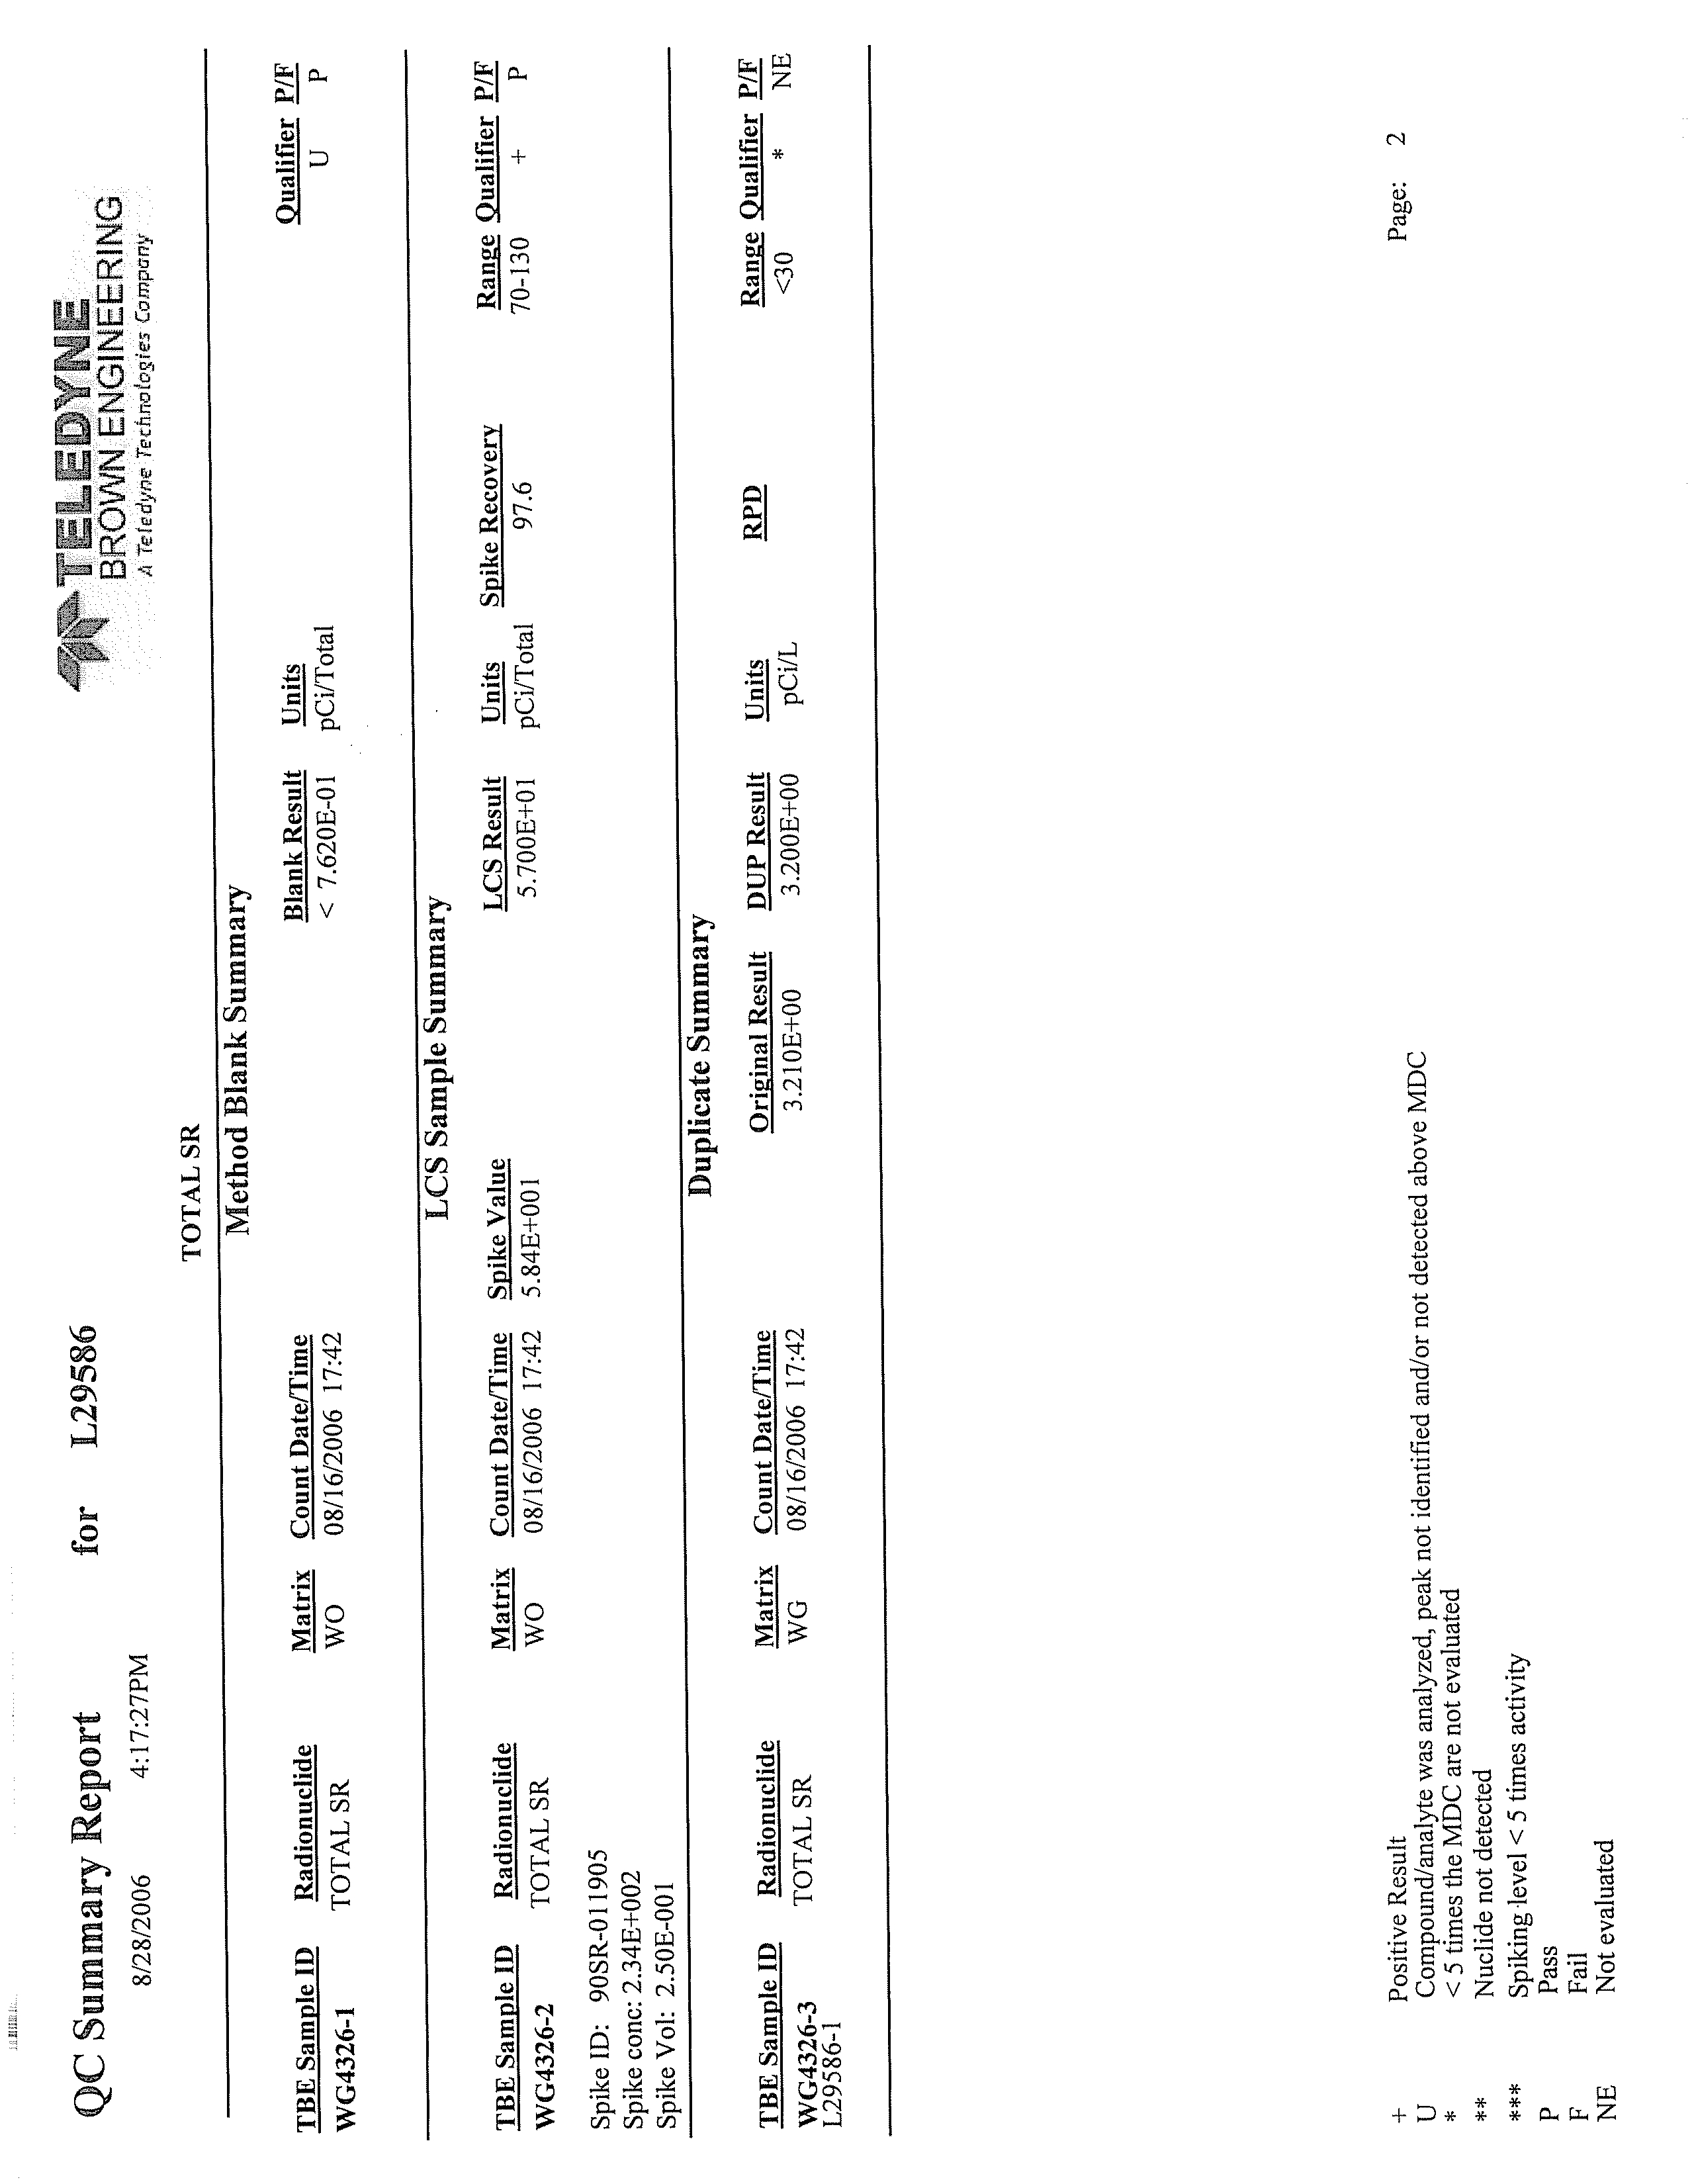
QUALITY ASSURANCE PROGRAM - TELEDYNE BROWN
ENGINEERING, INC.
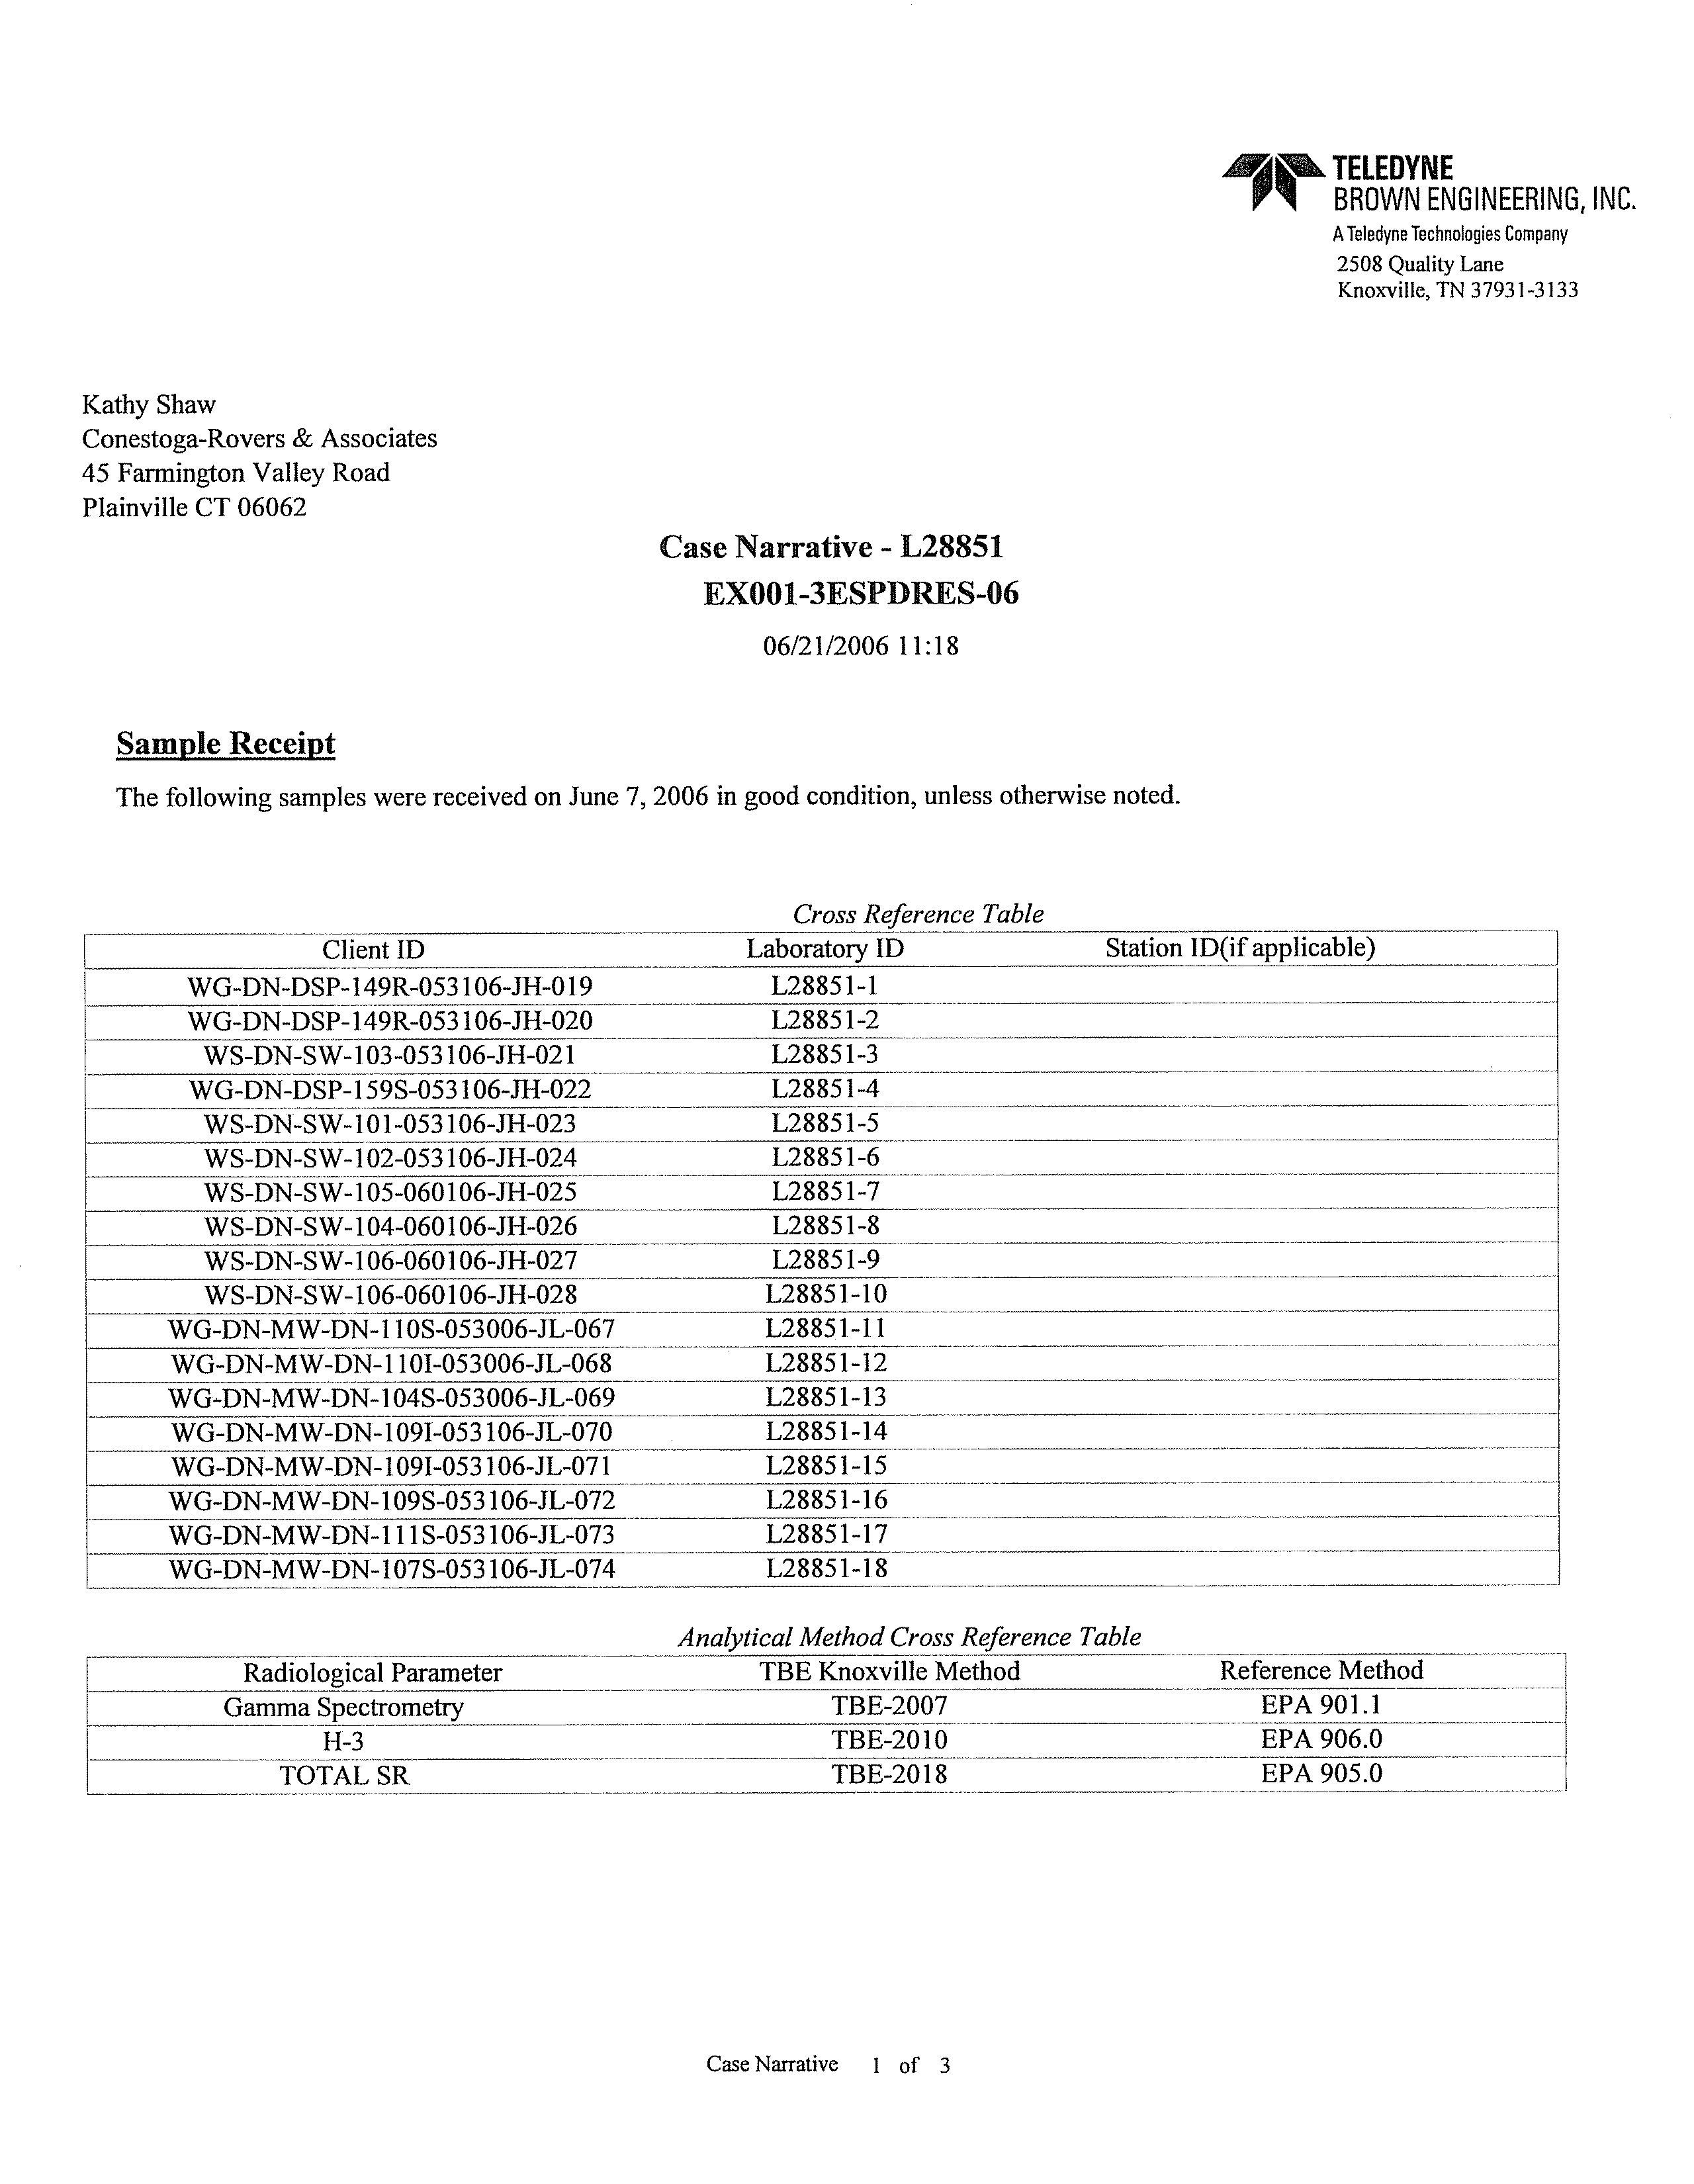
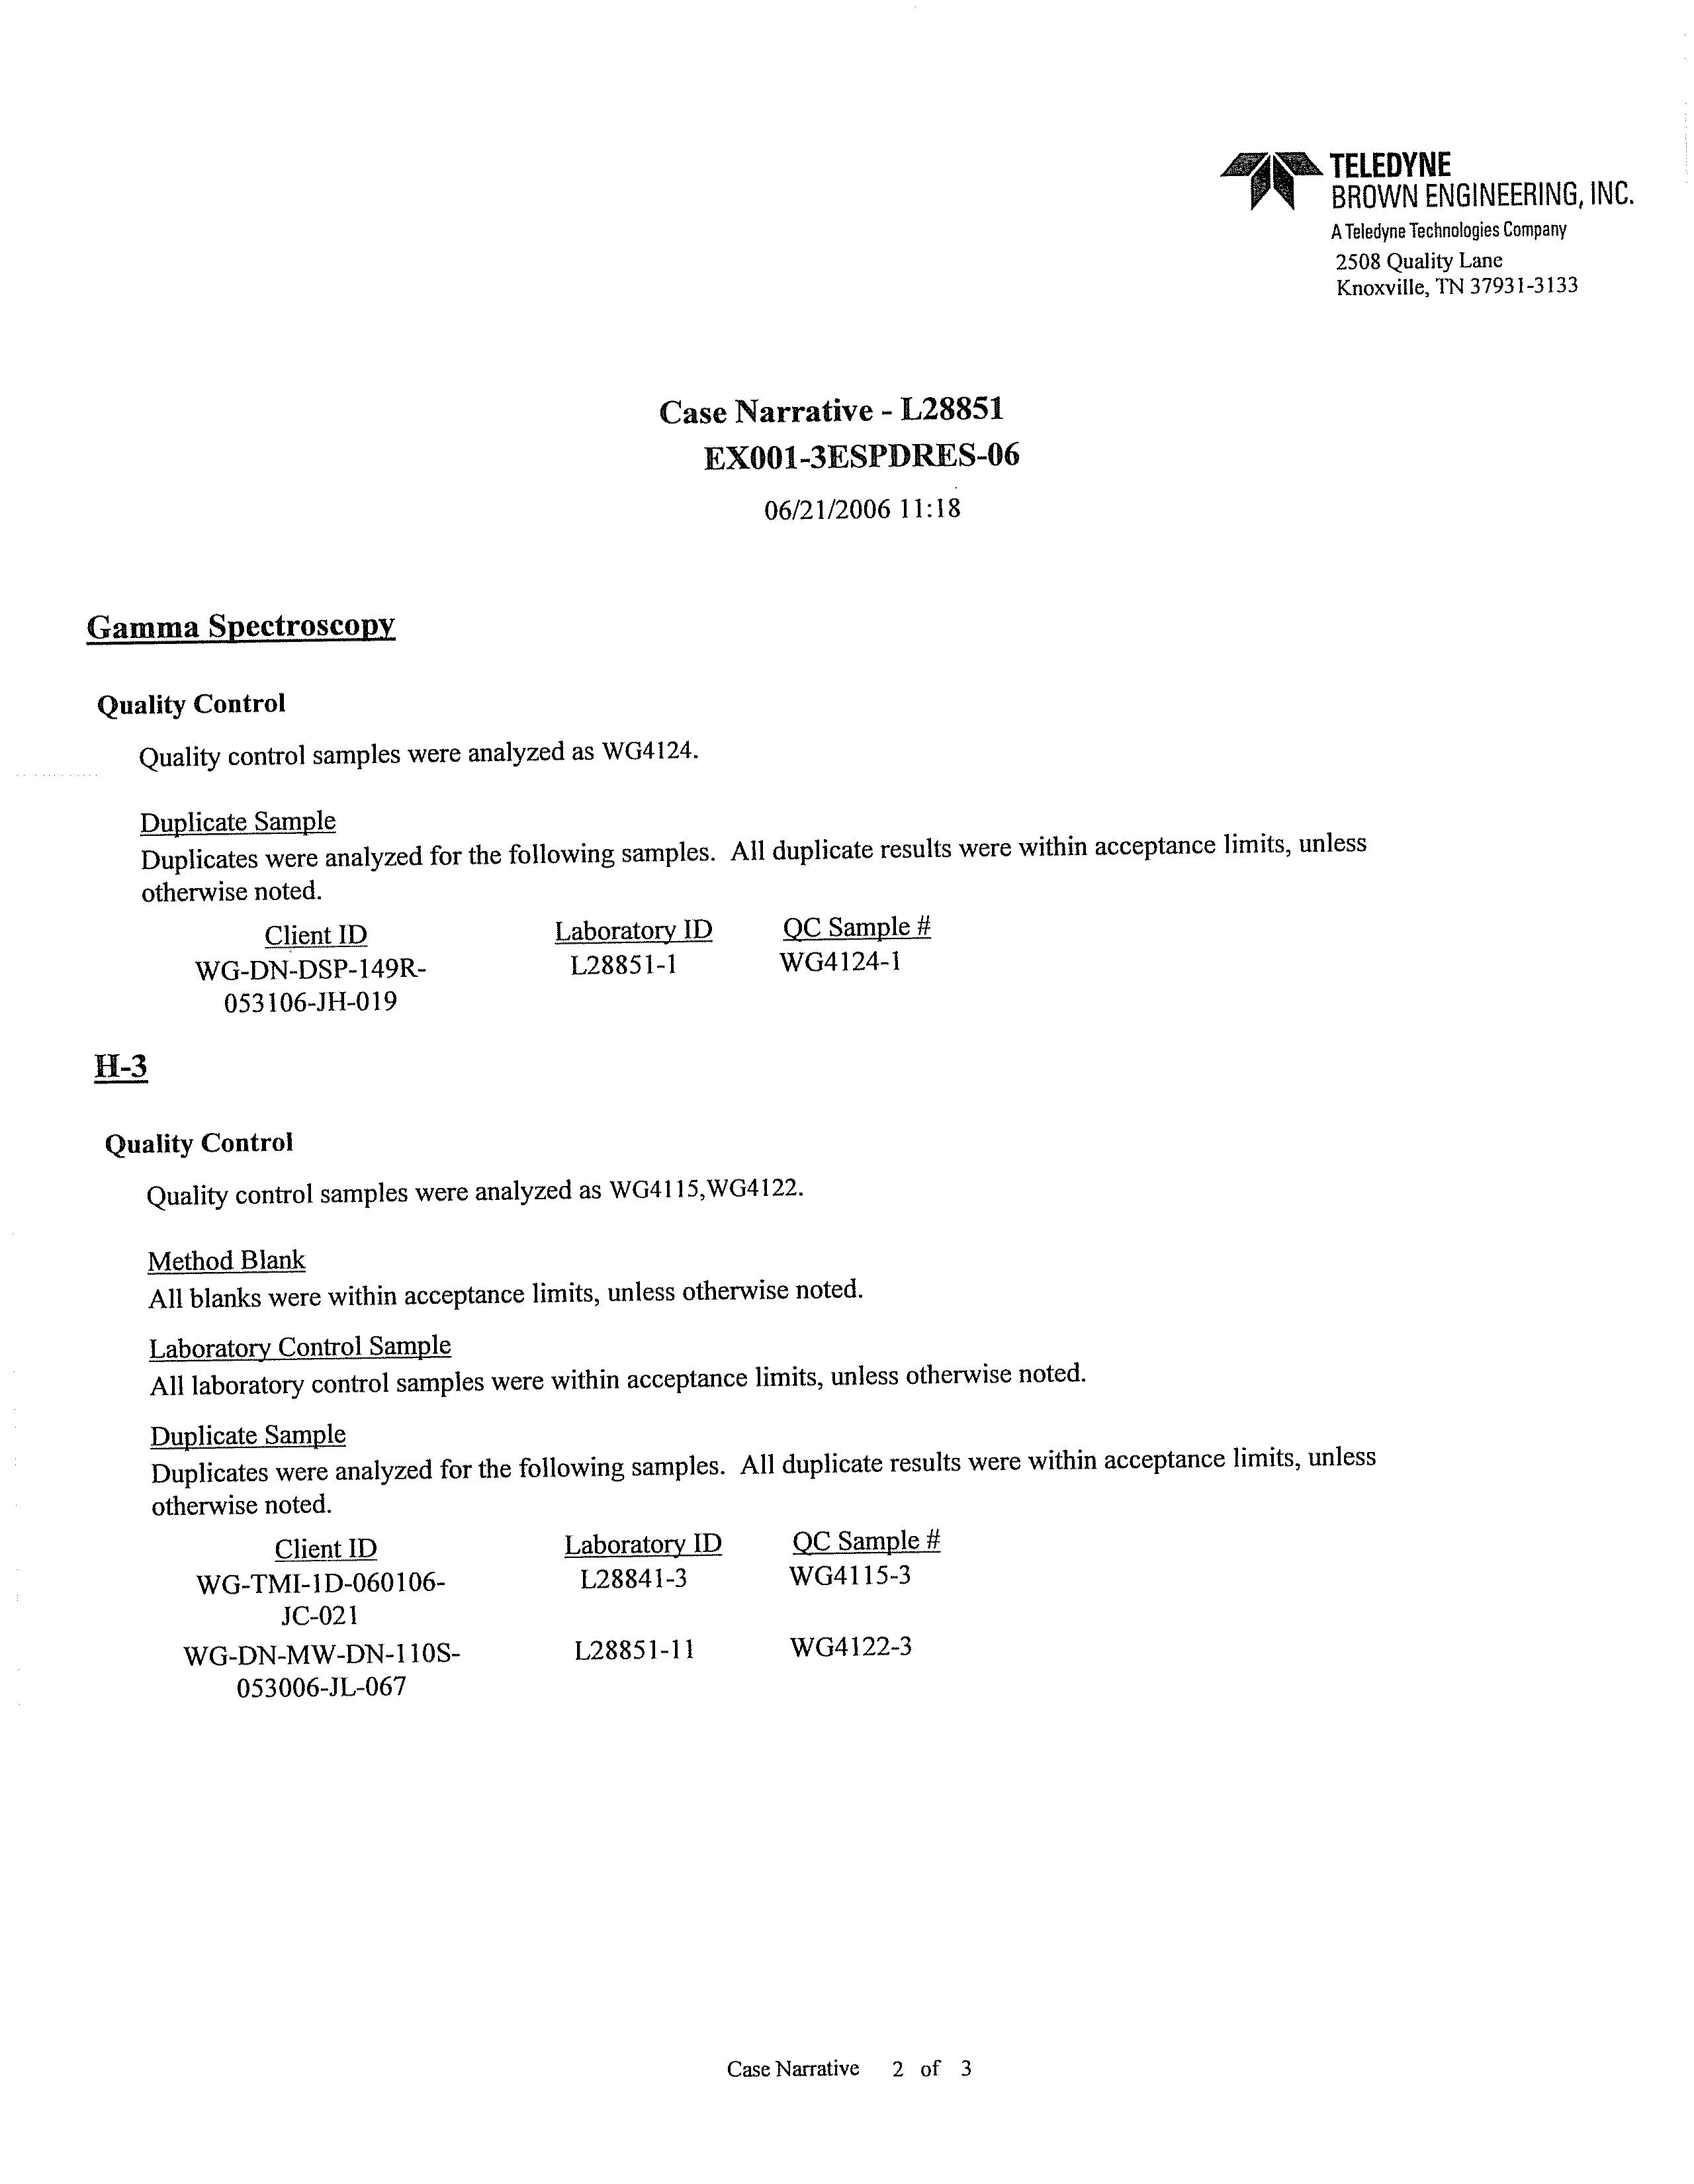
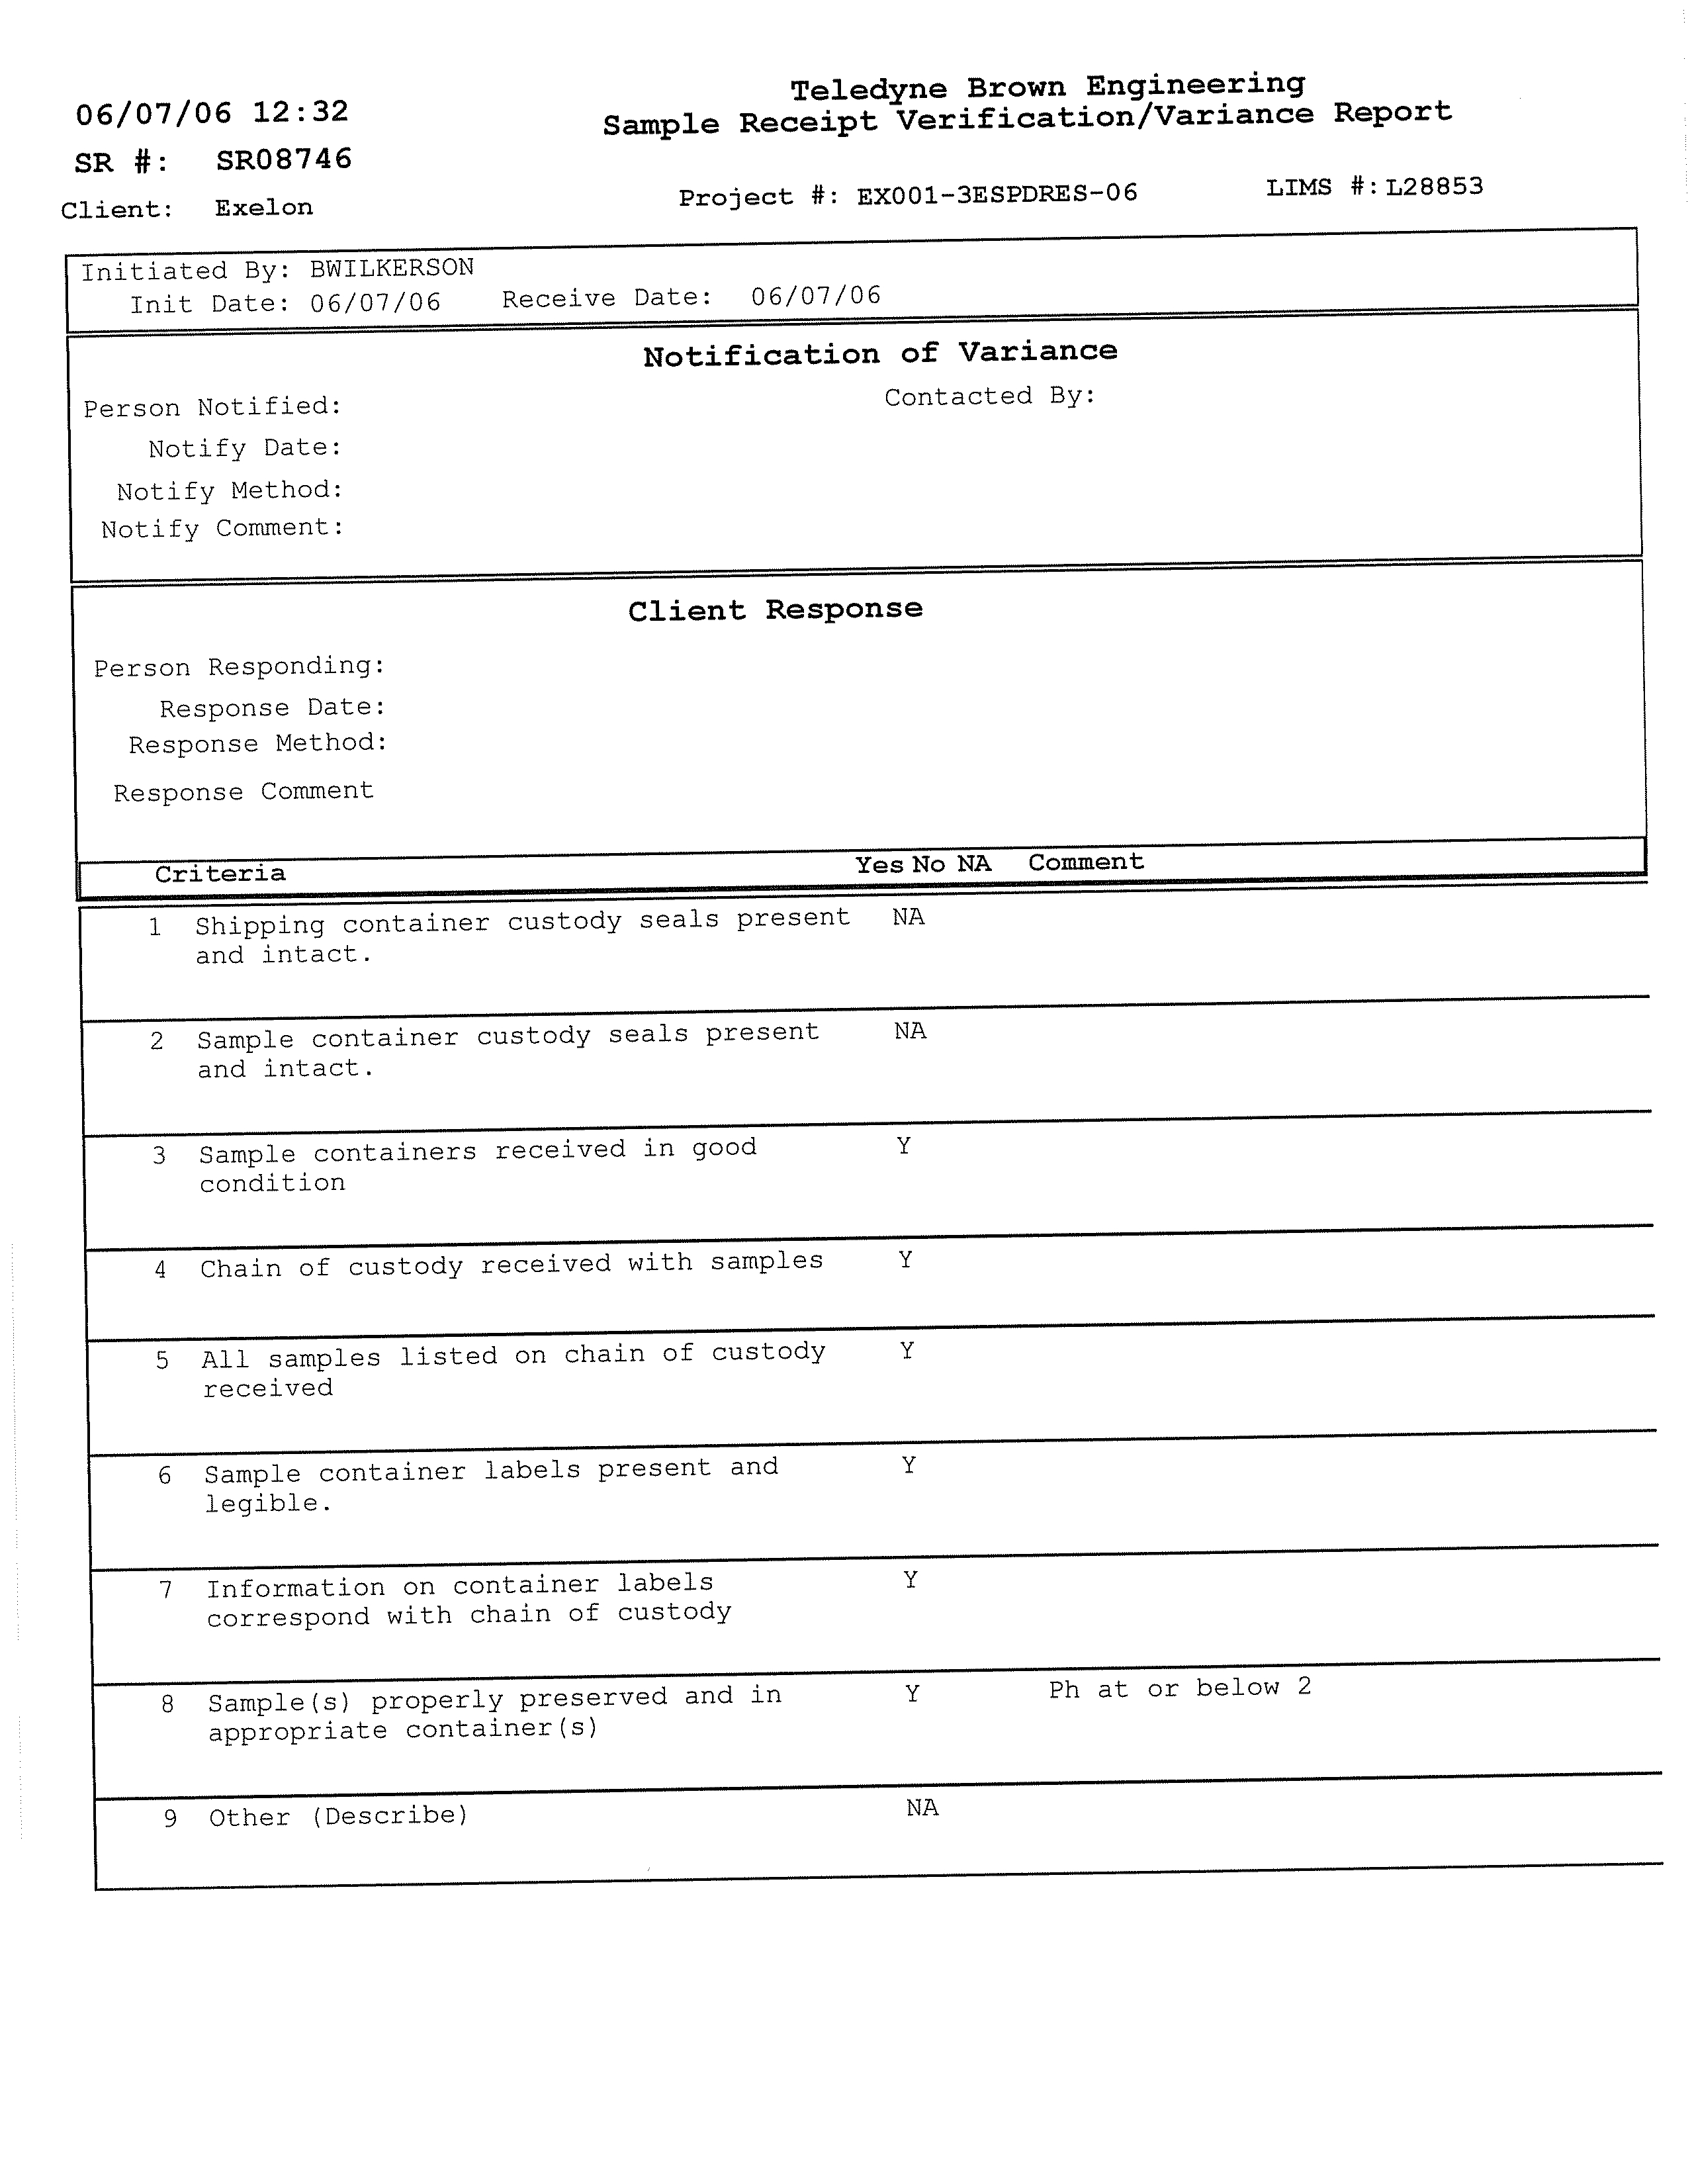
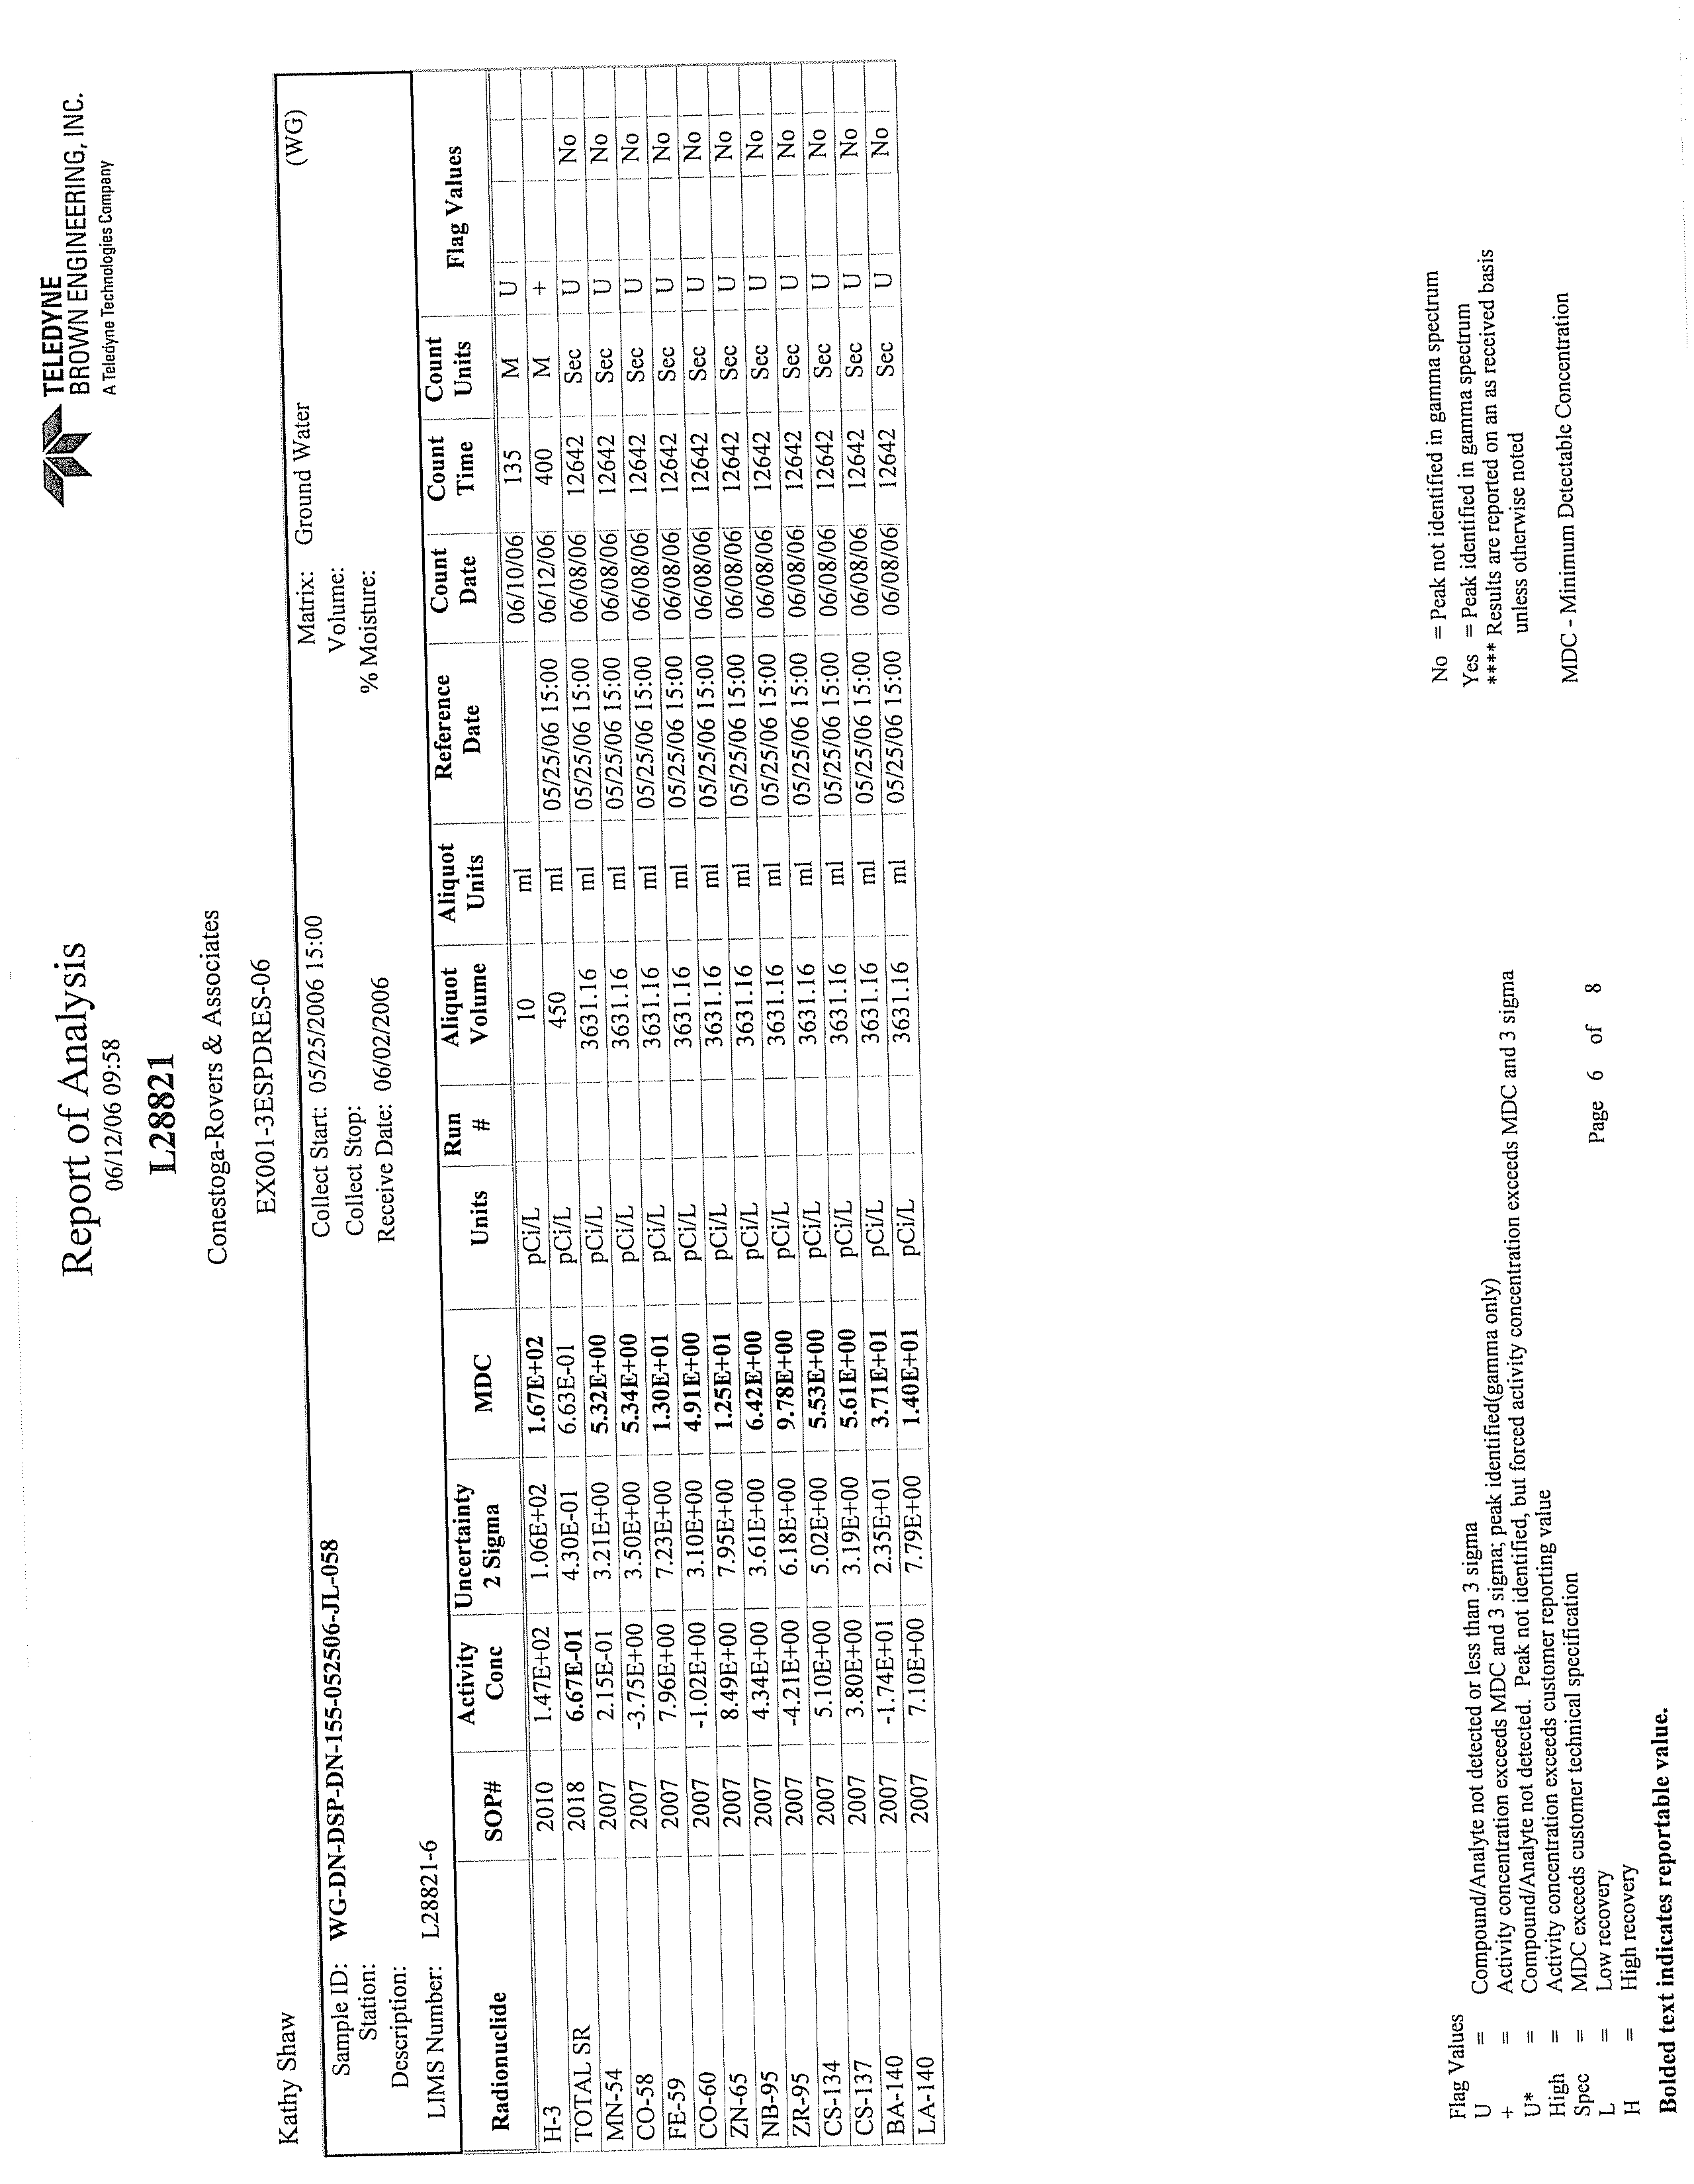
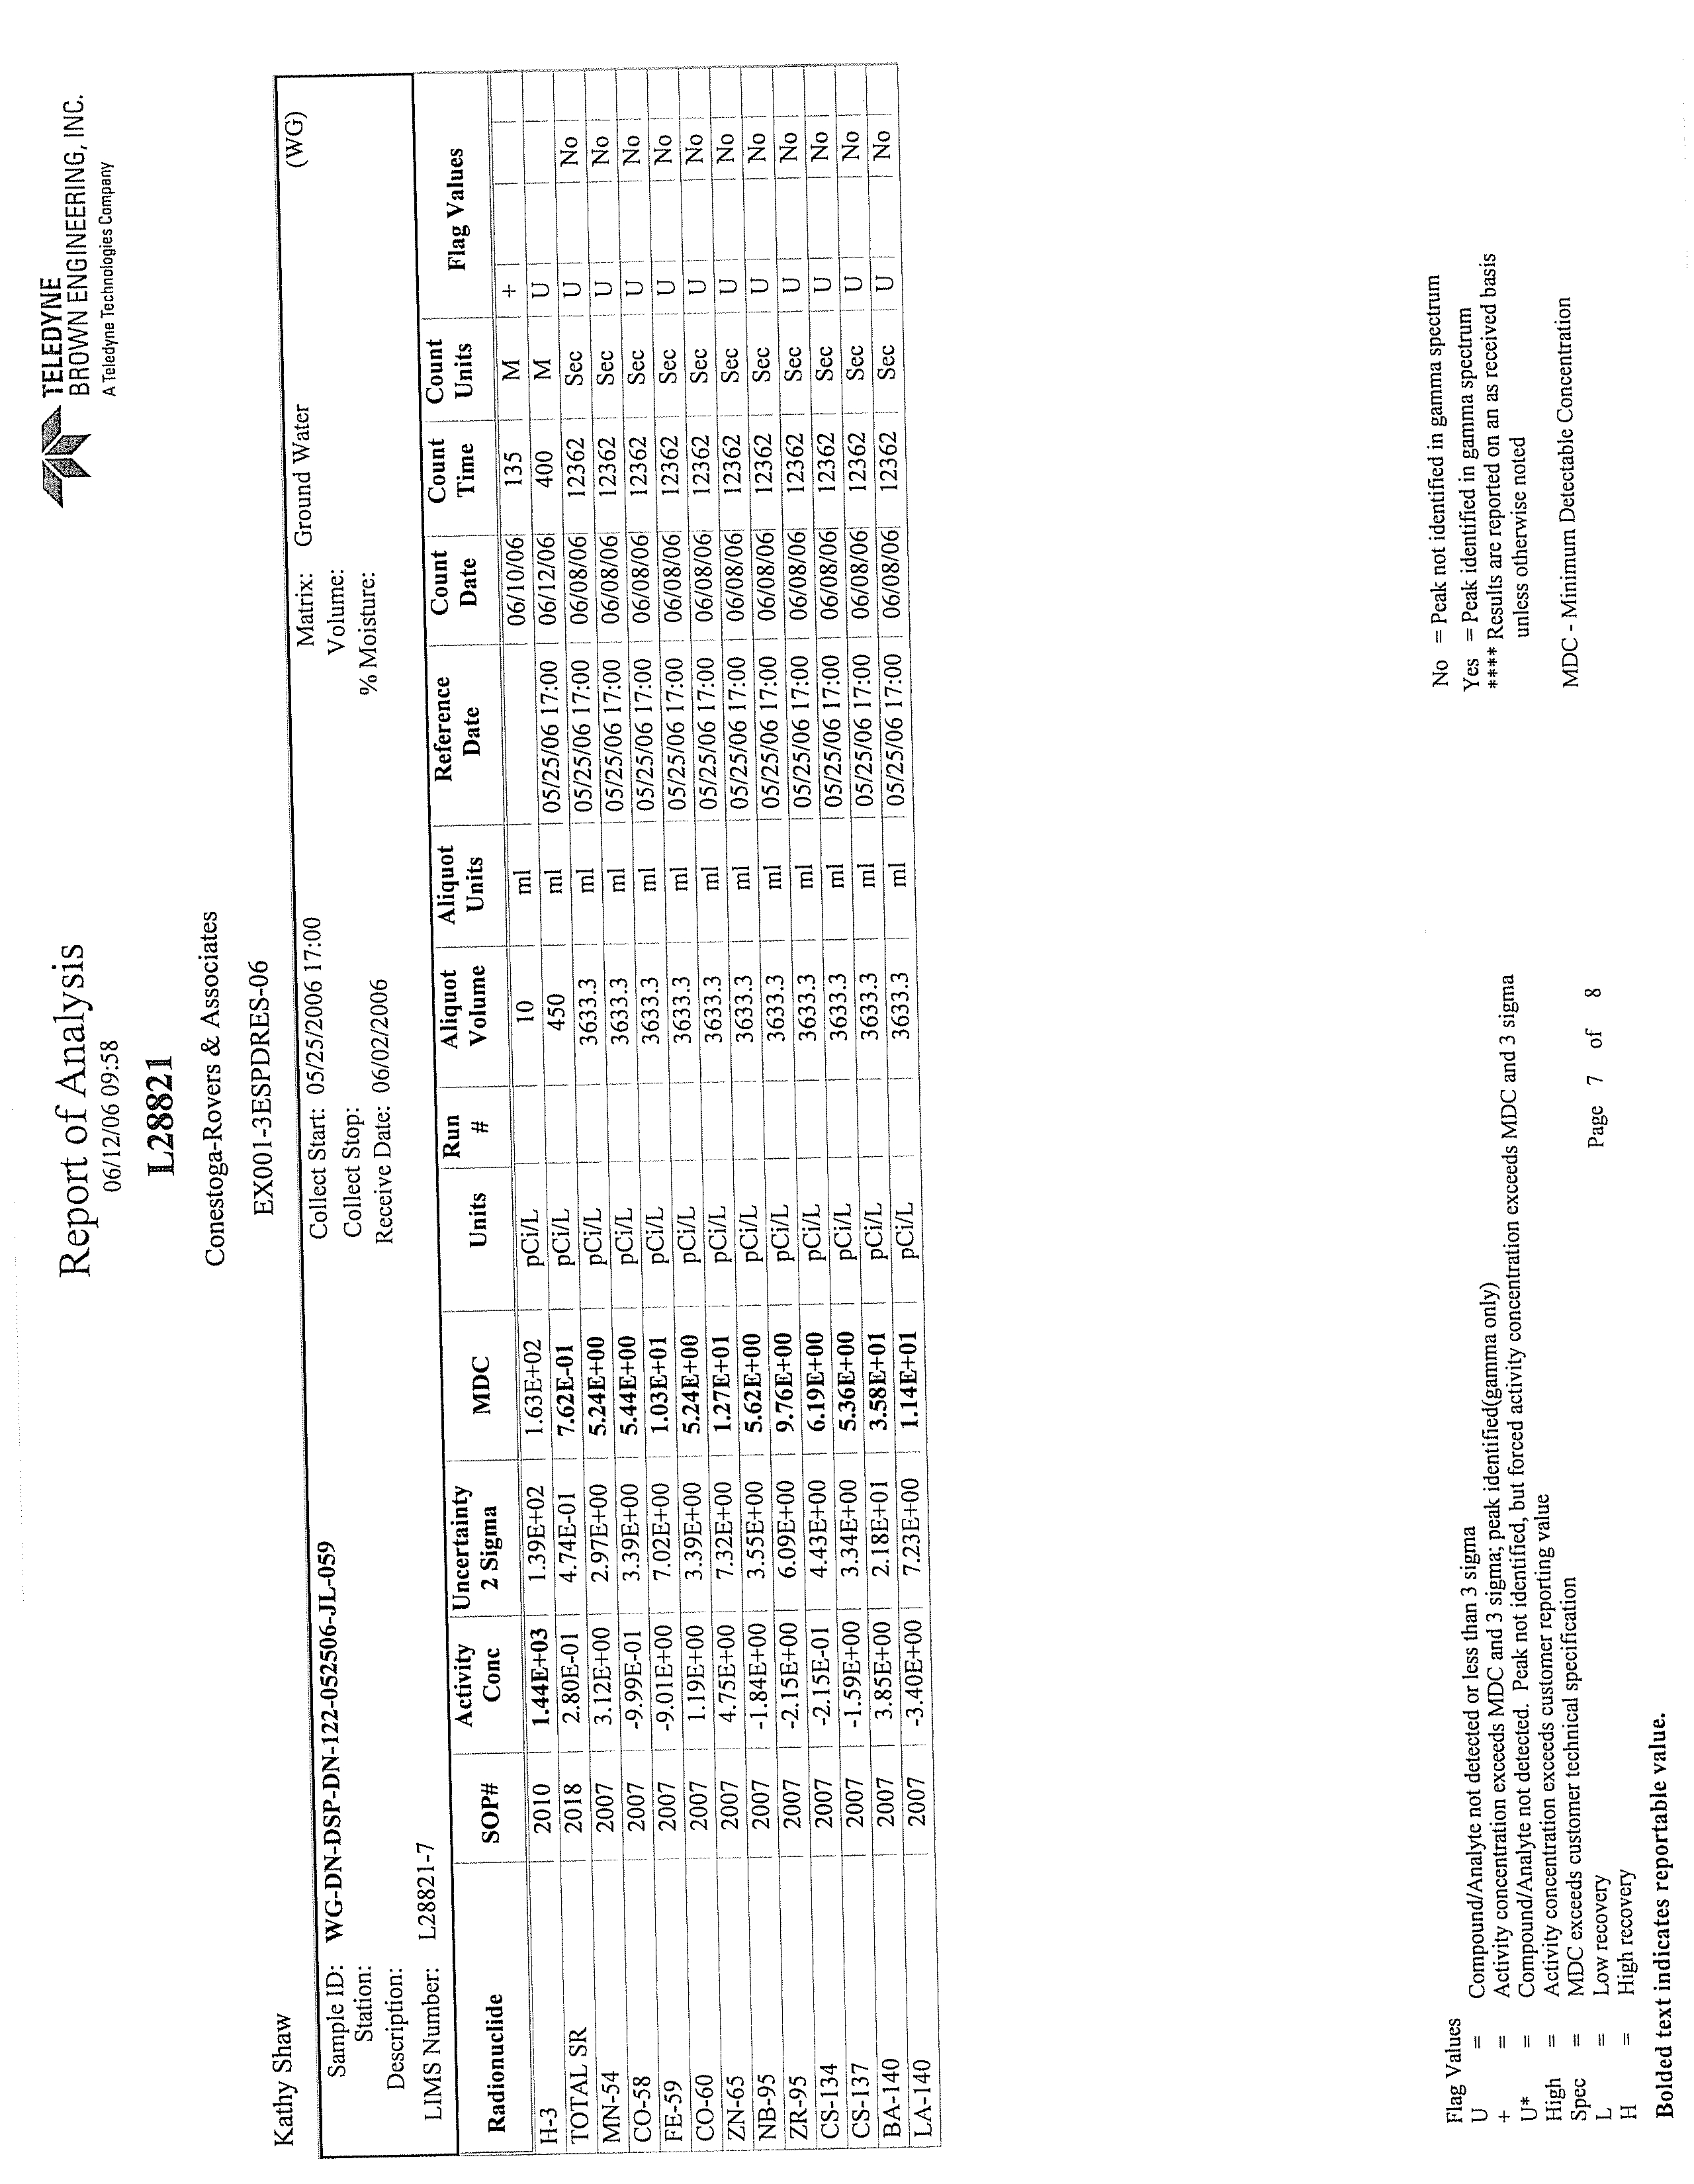
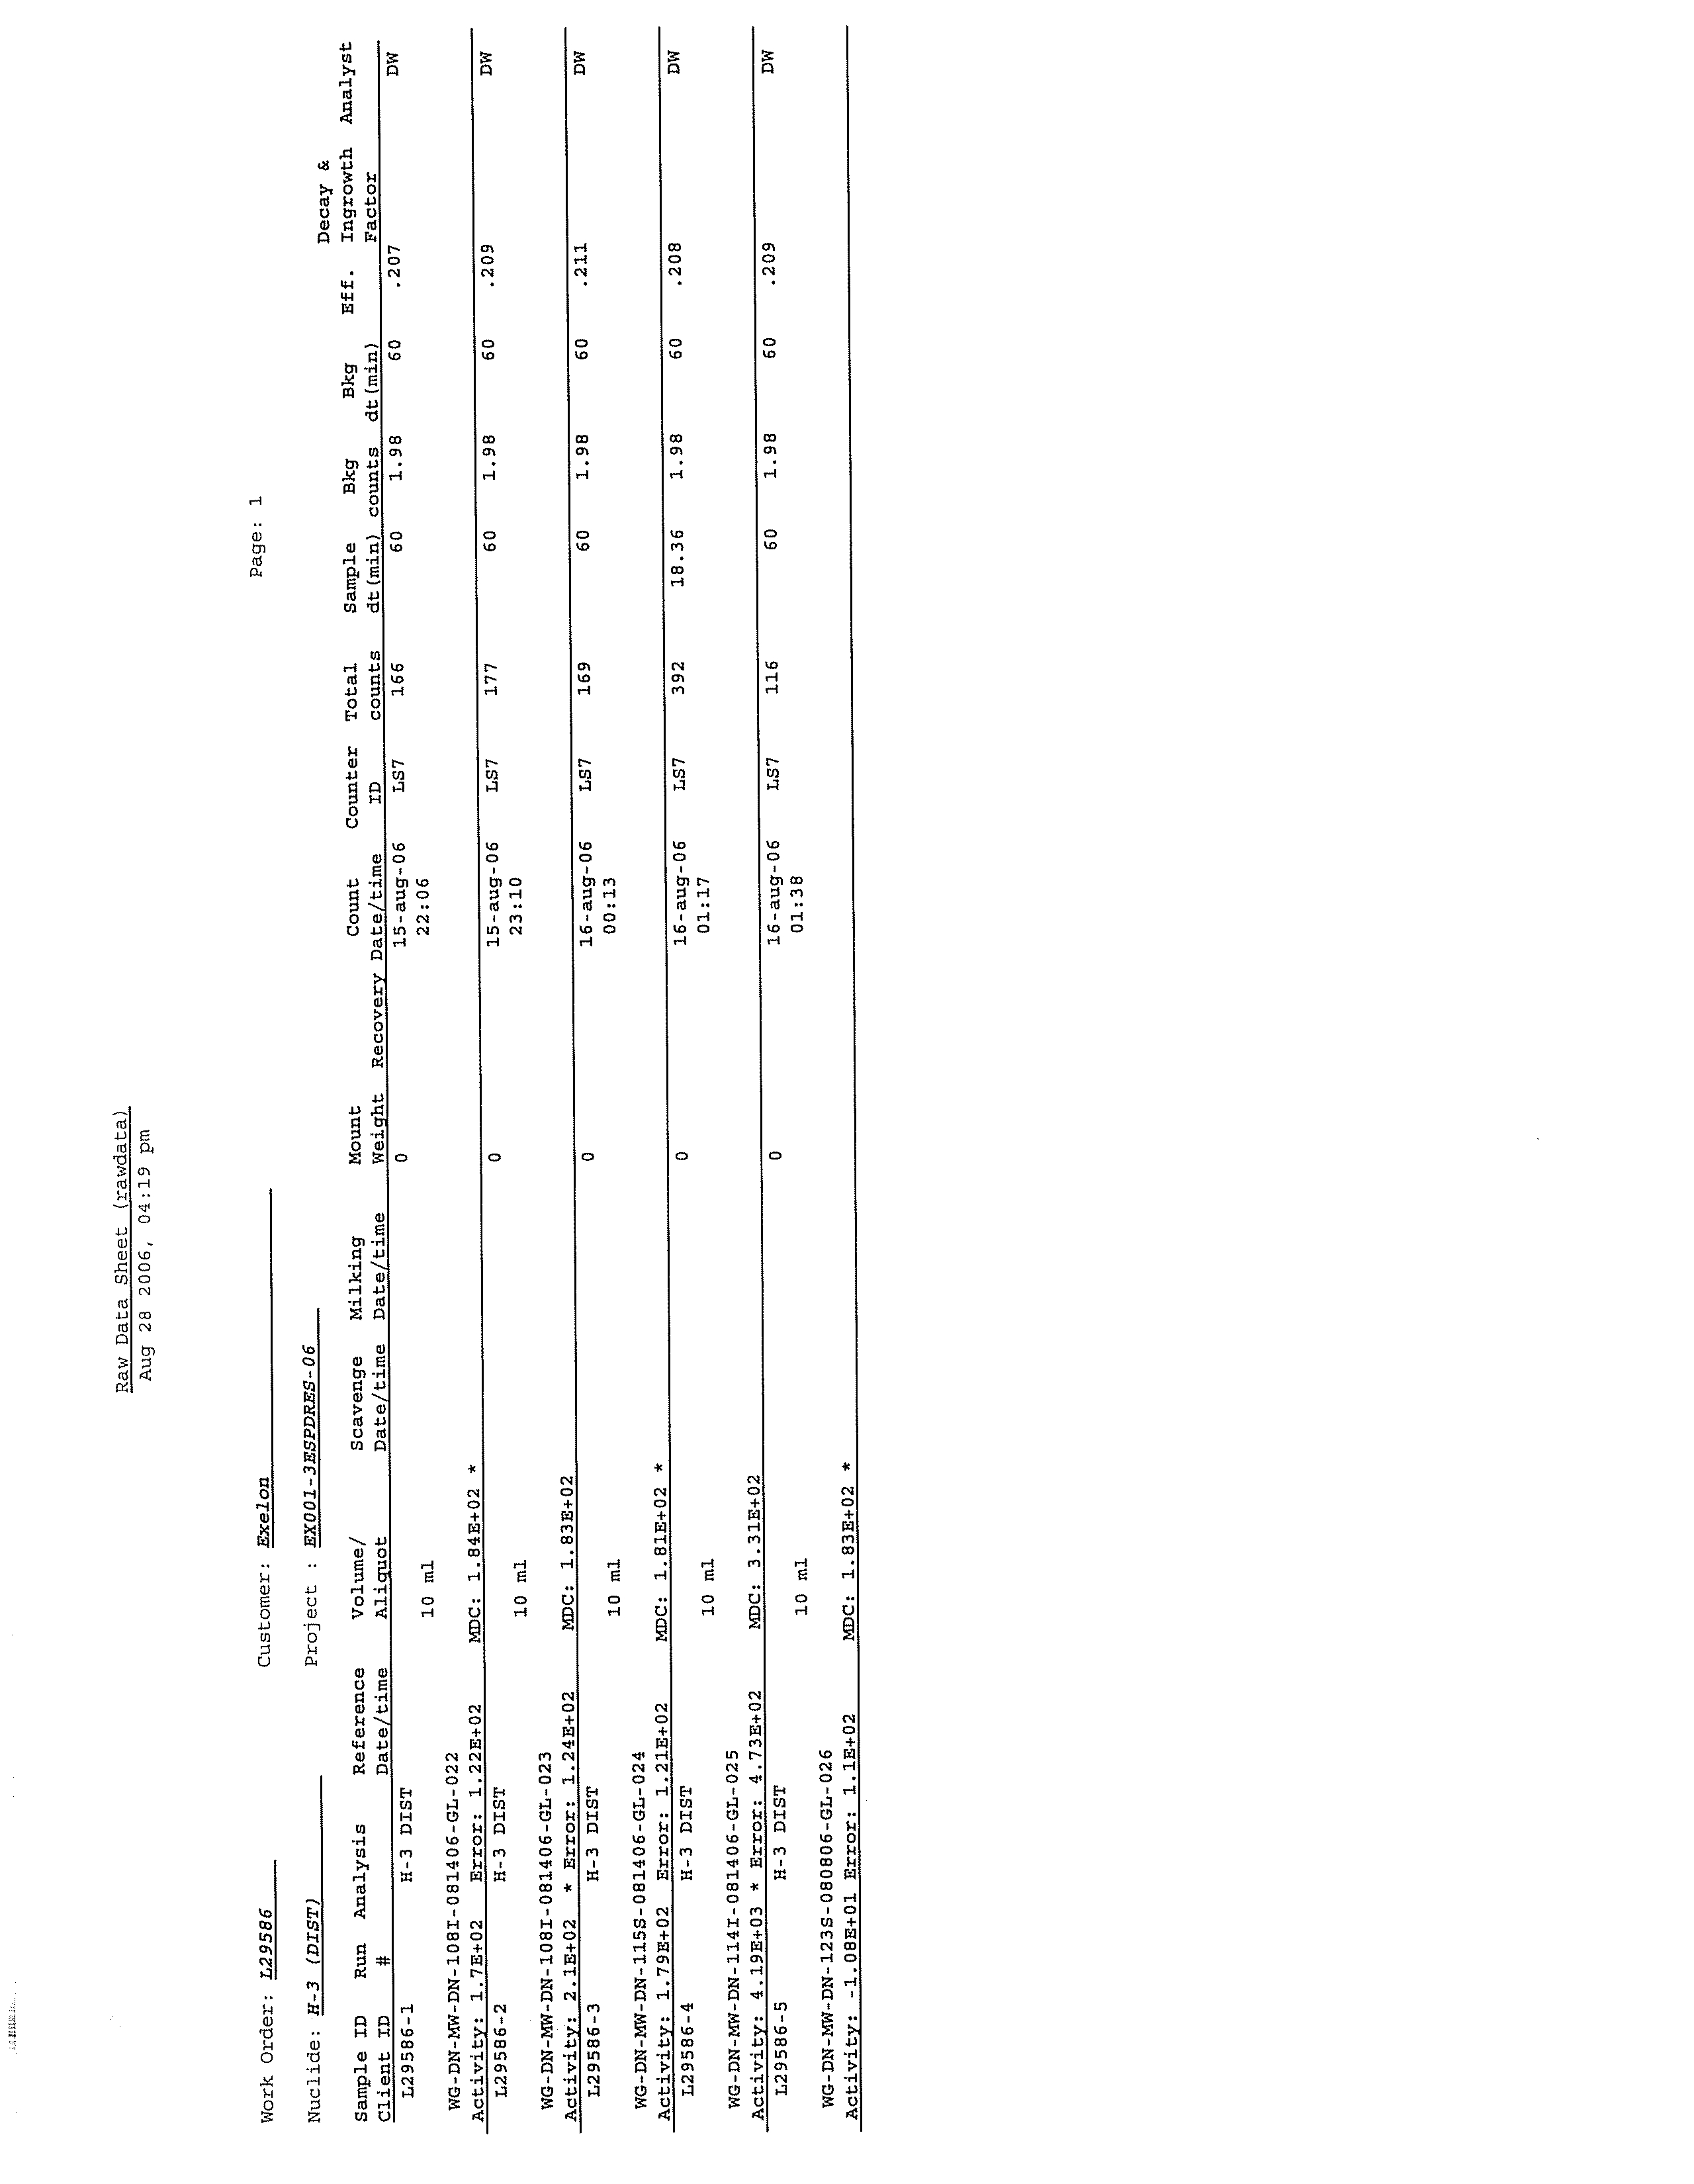
APPENDIX D
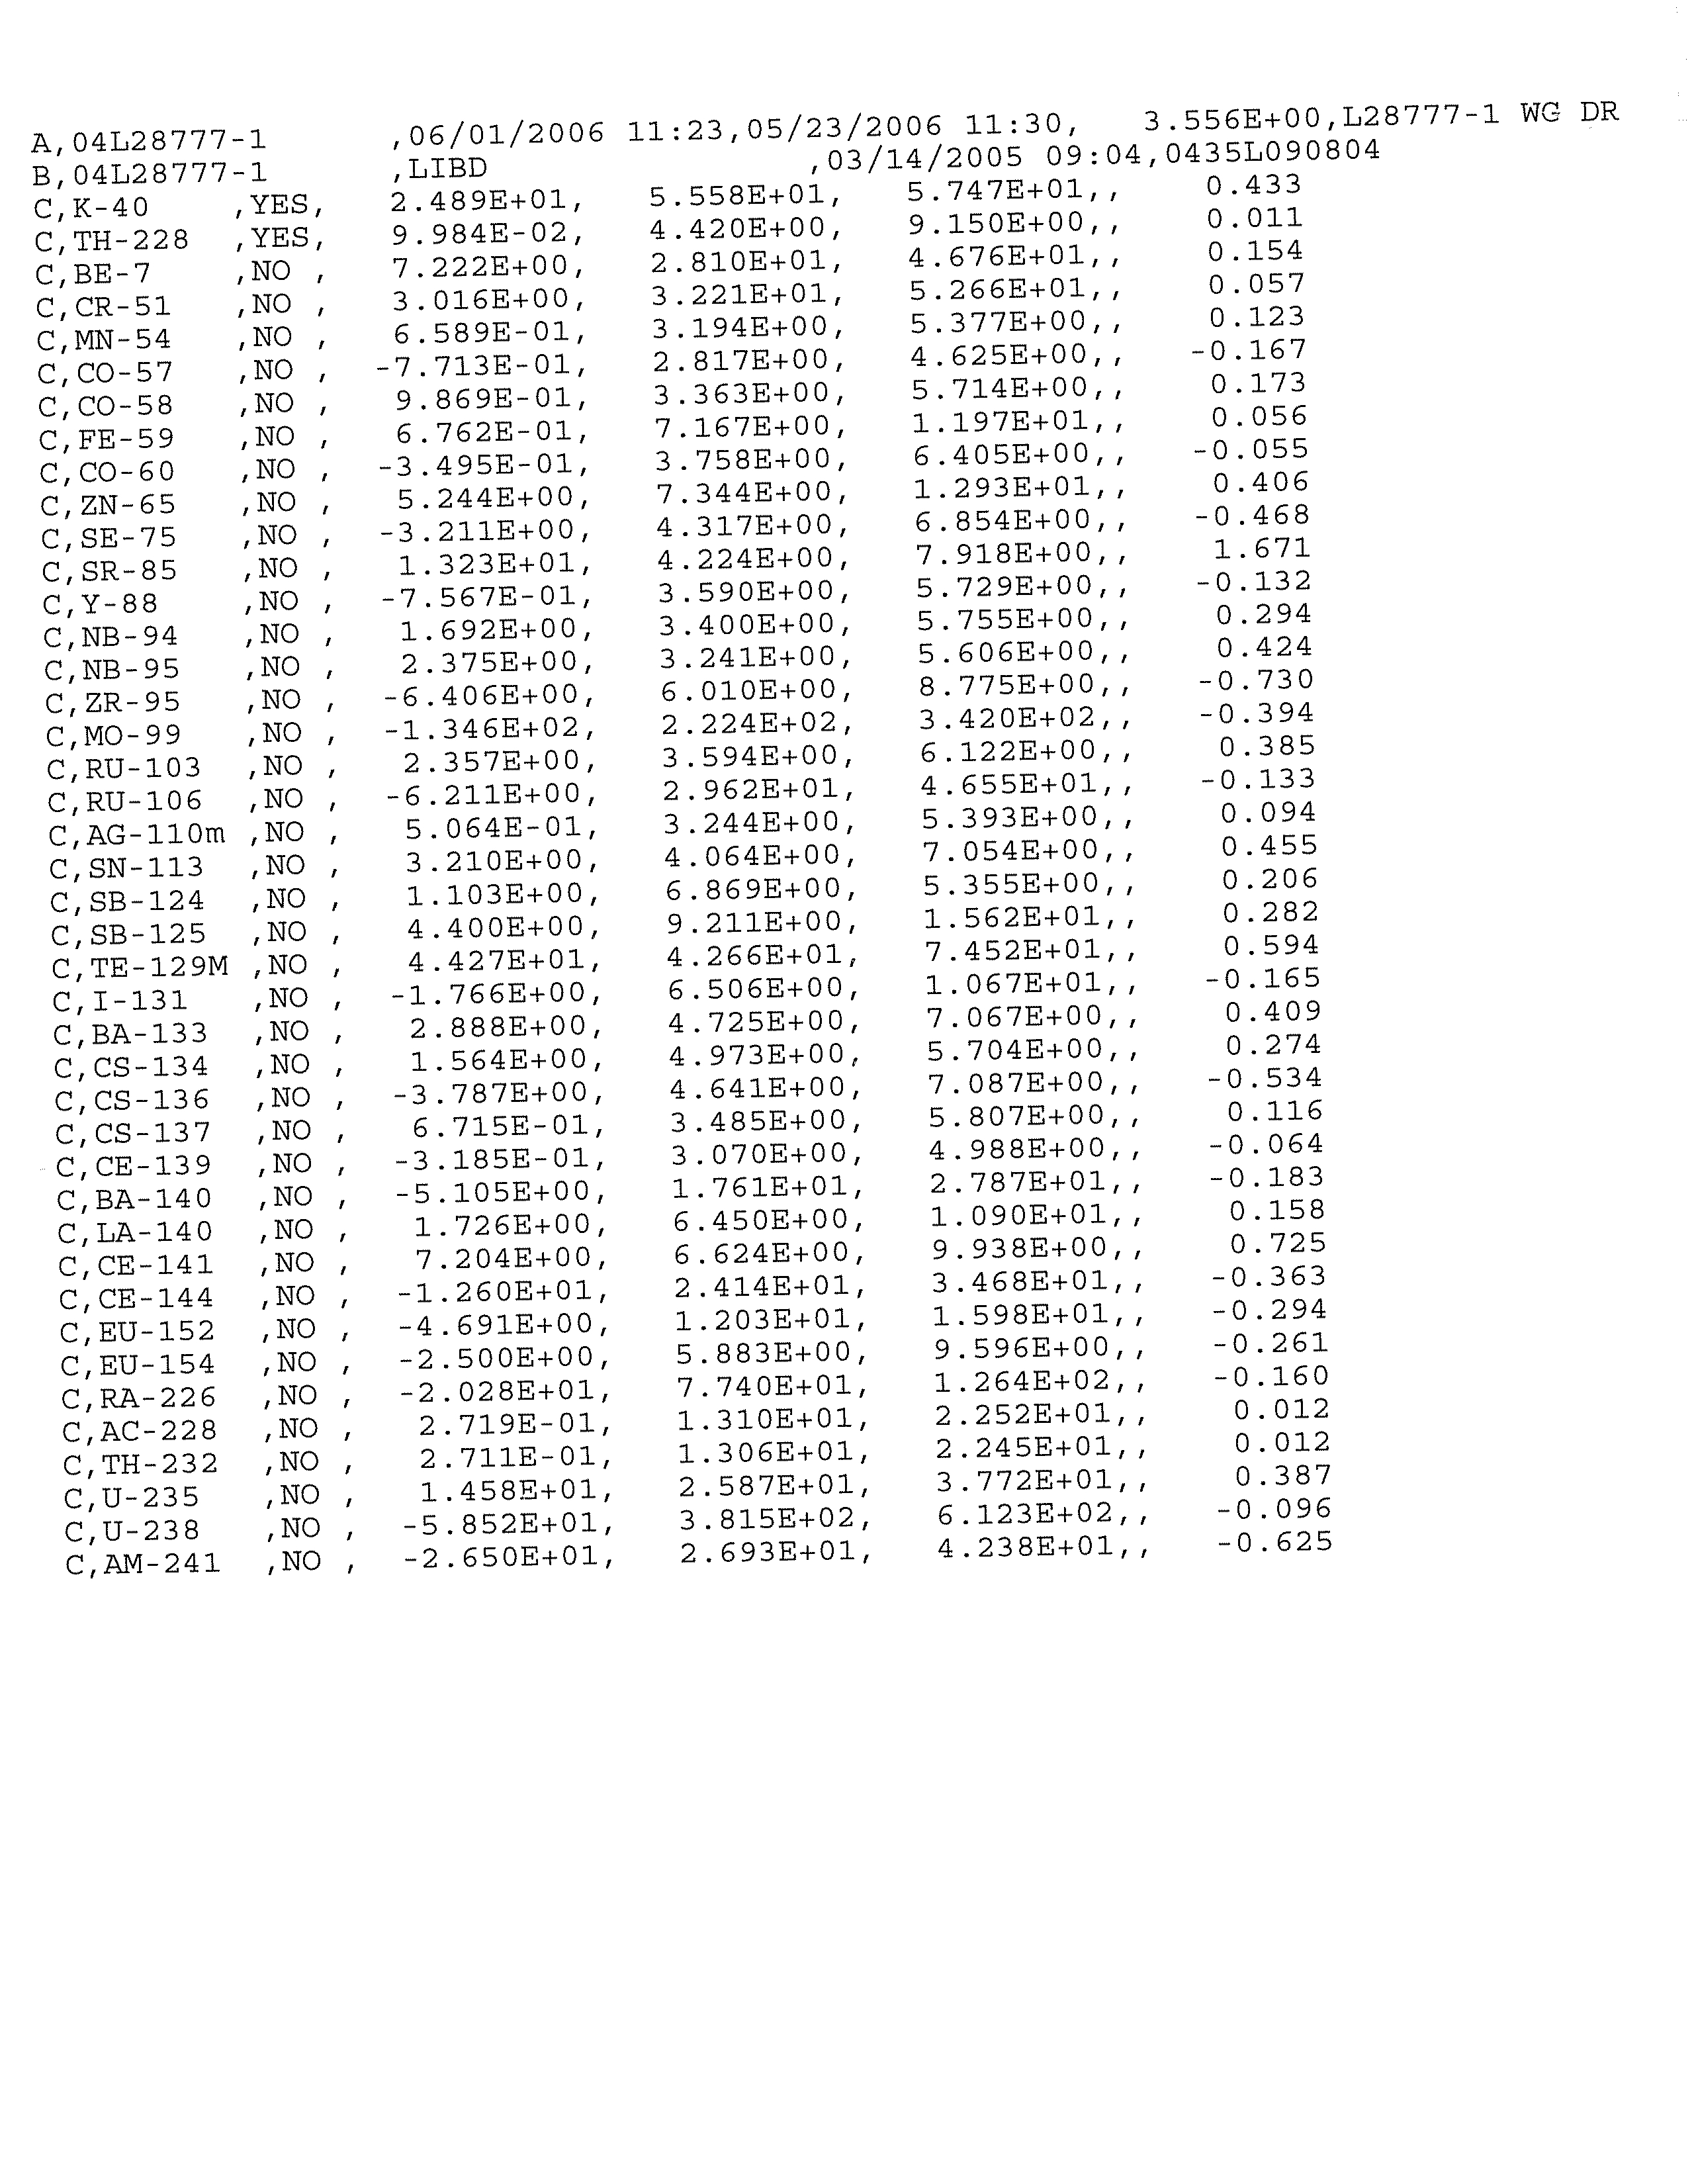
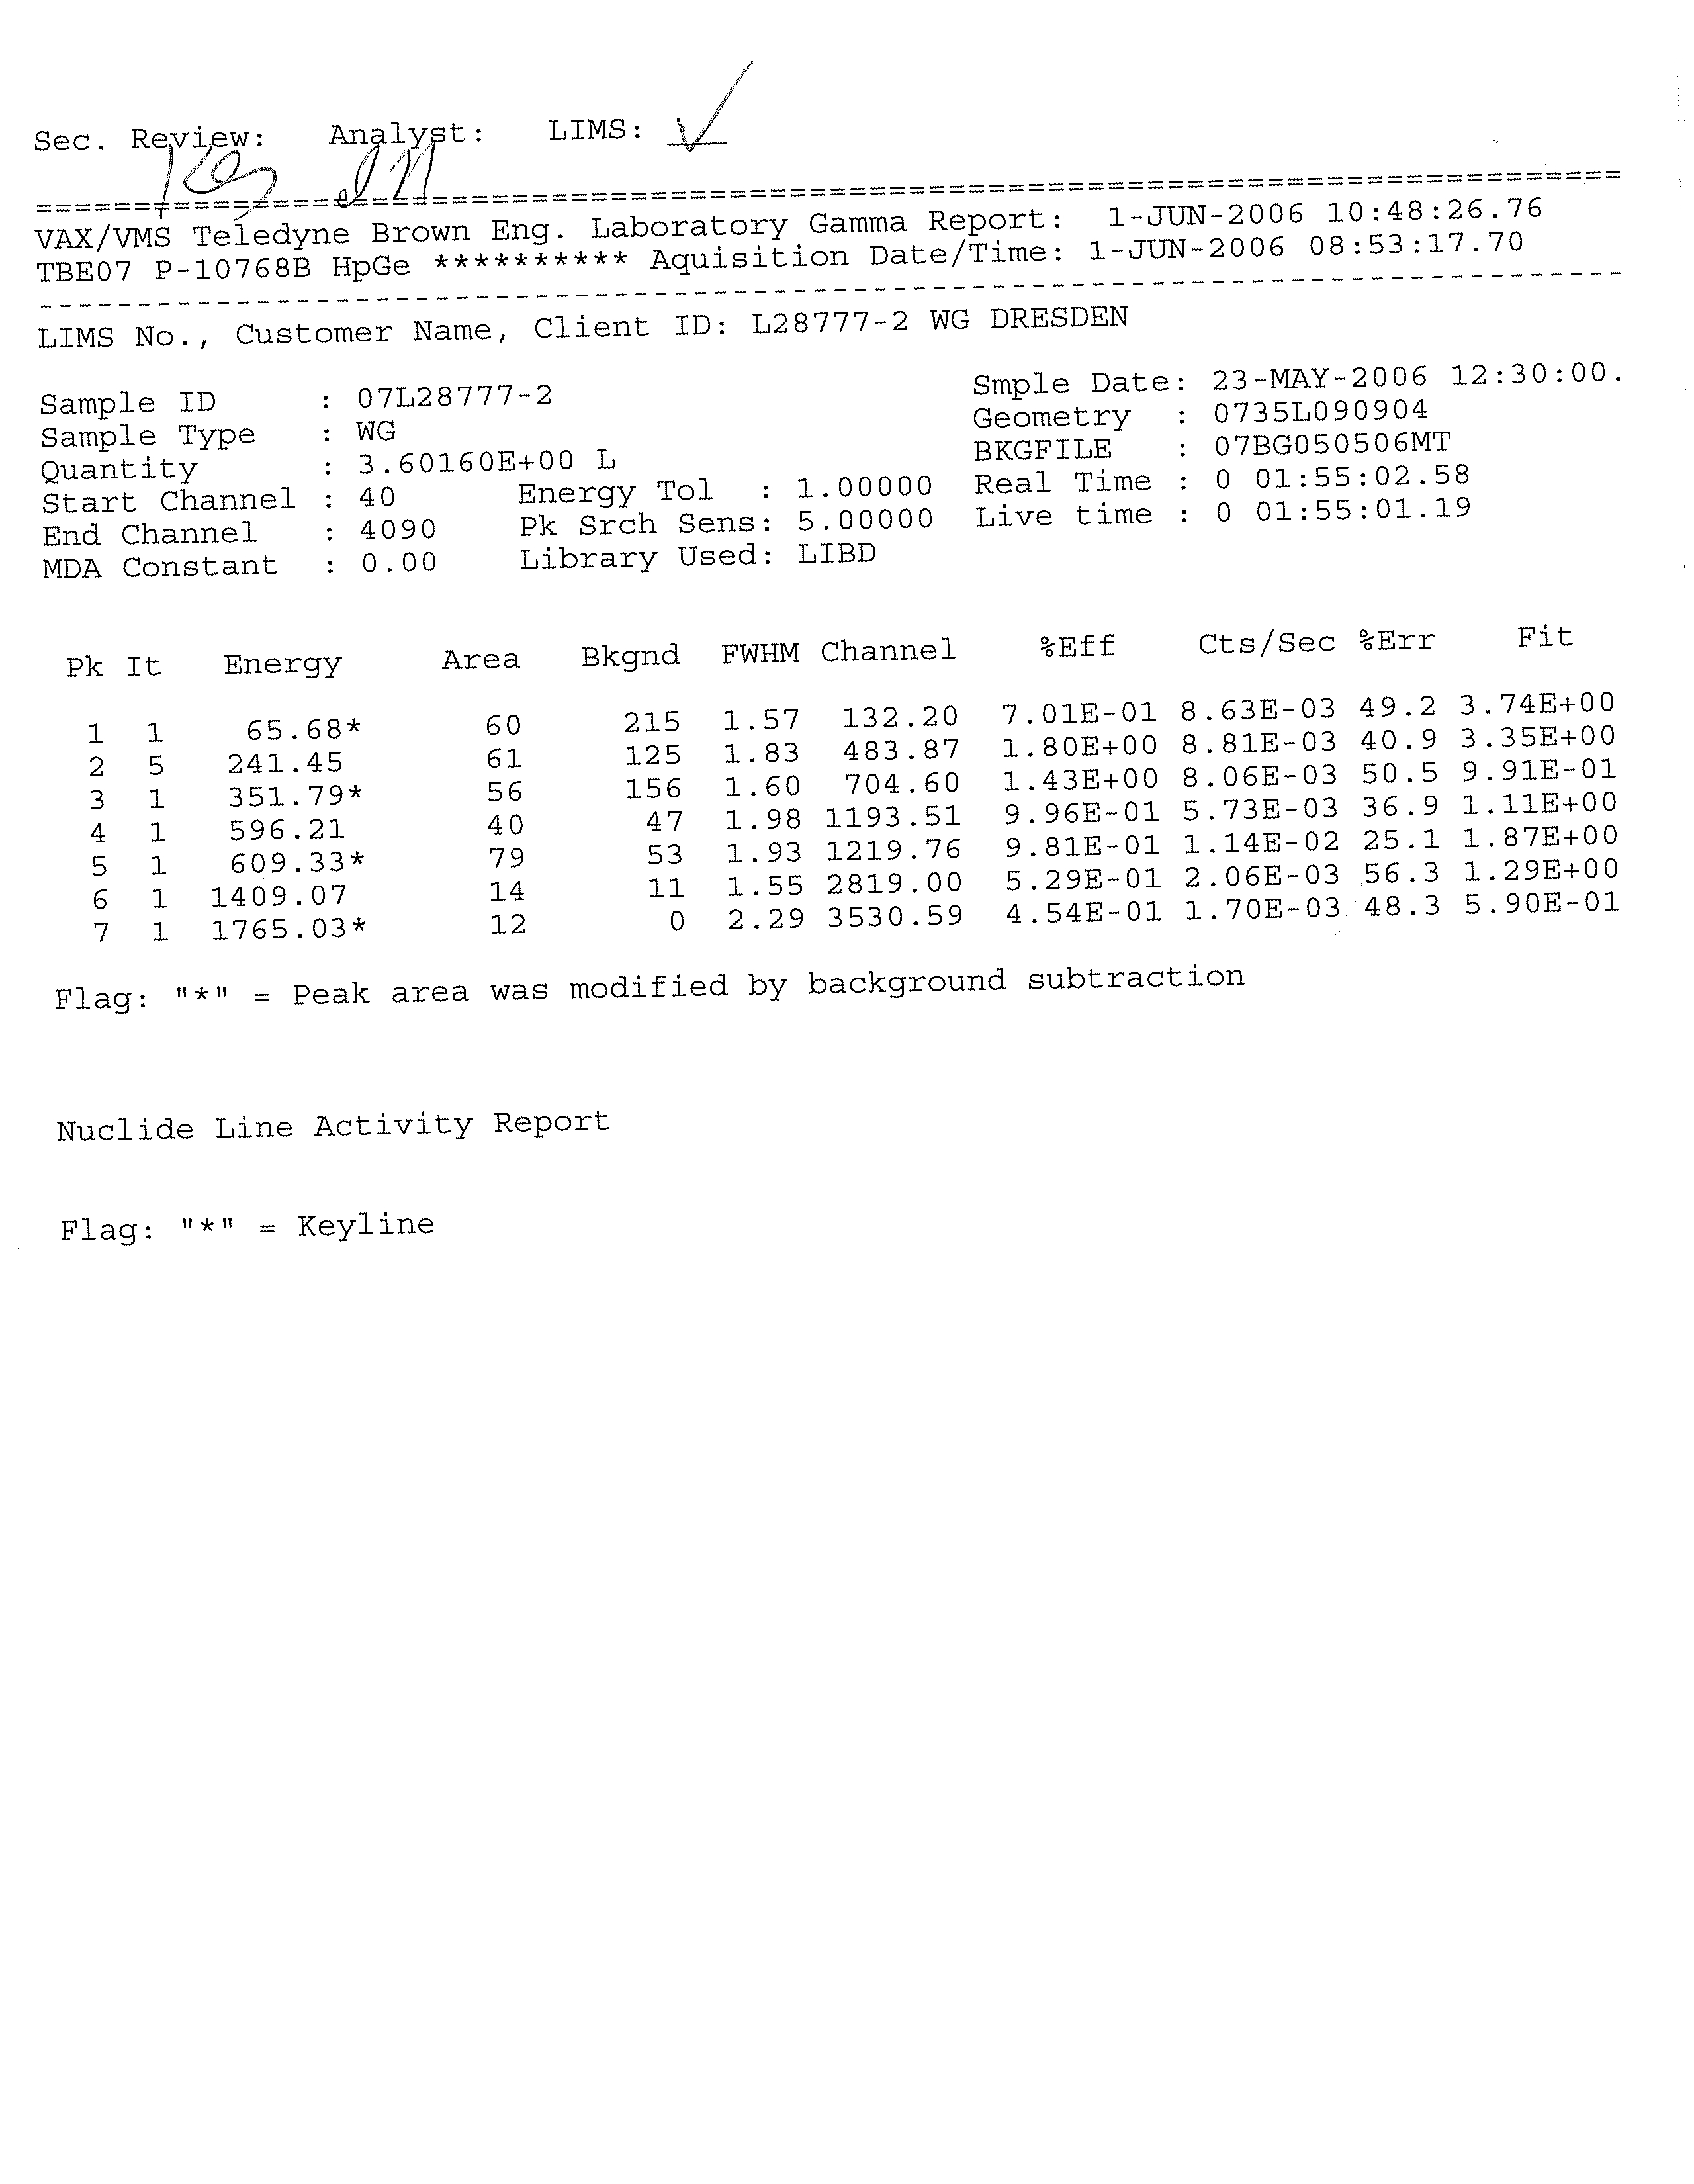
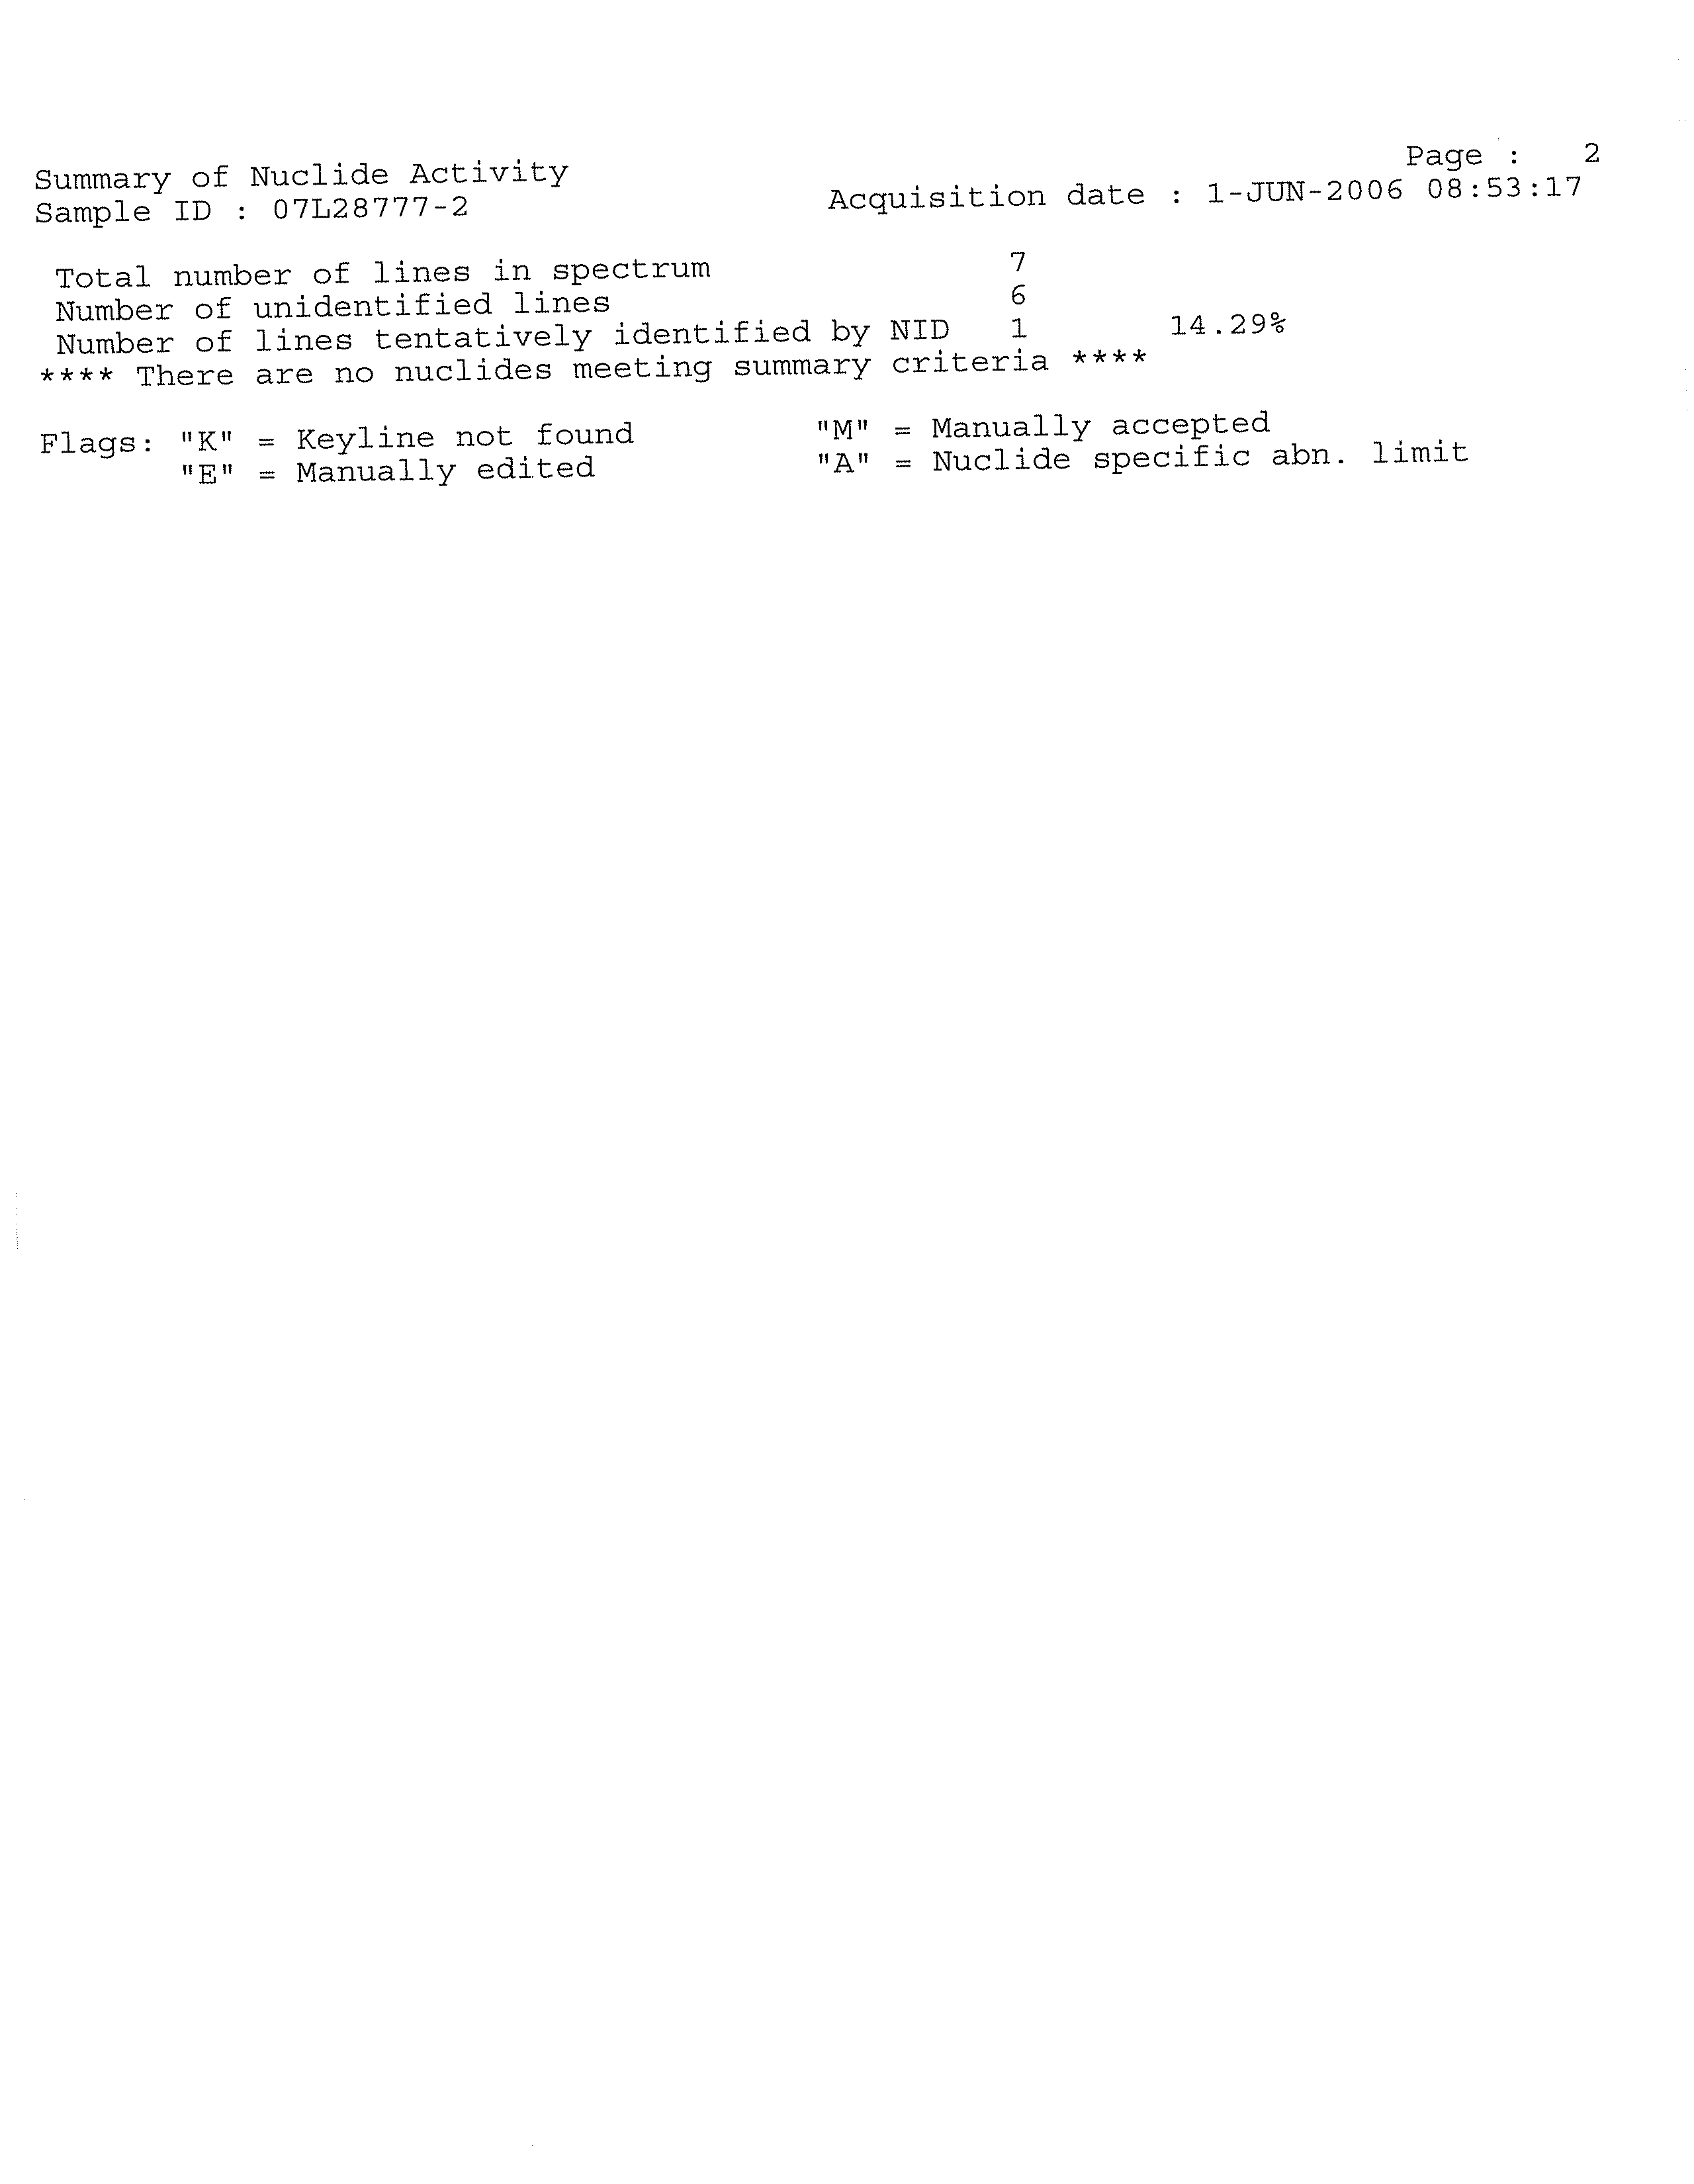
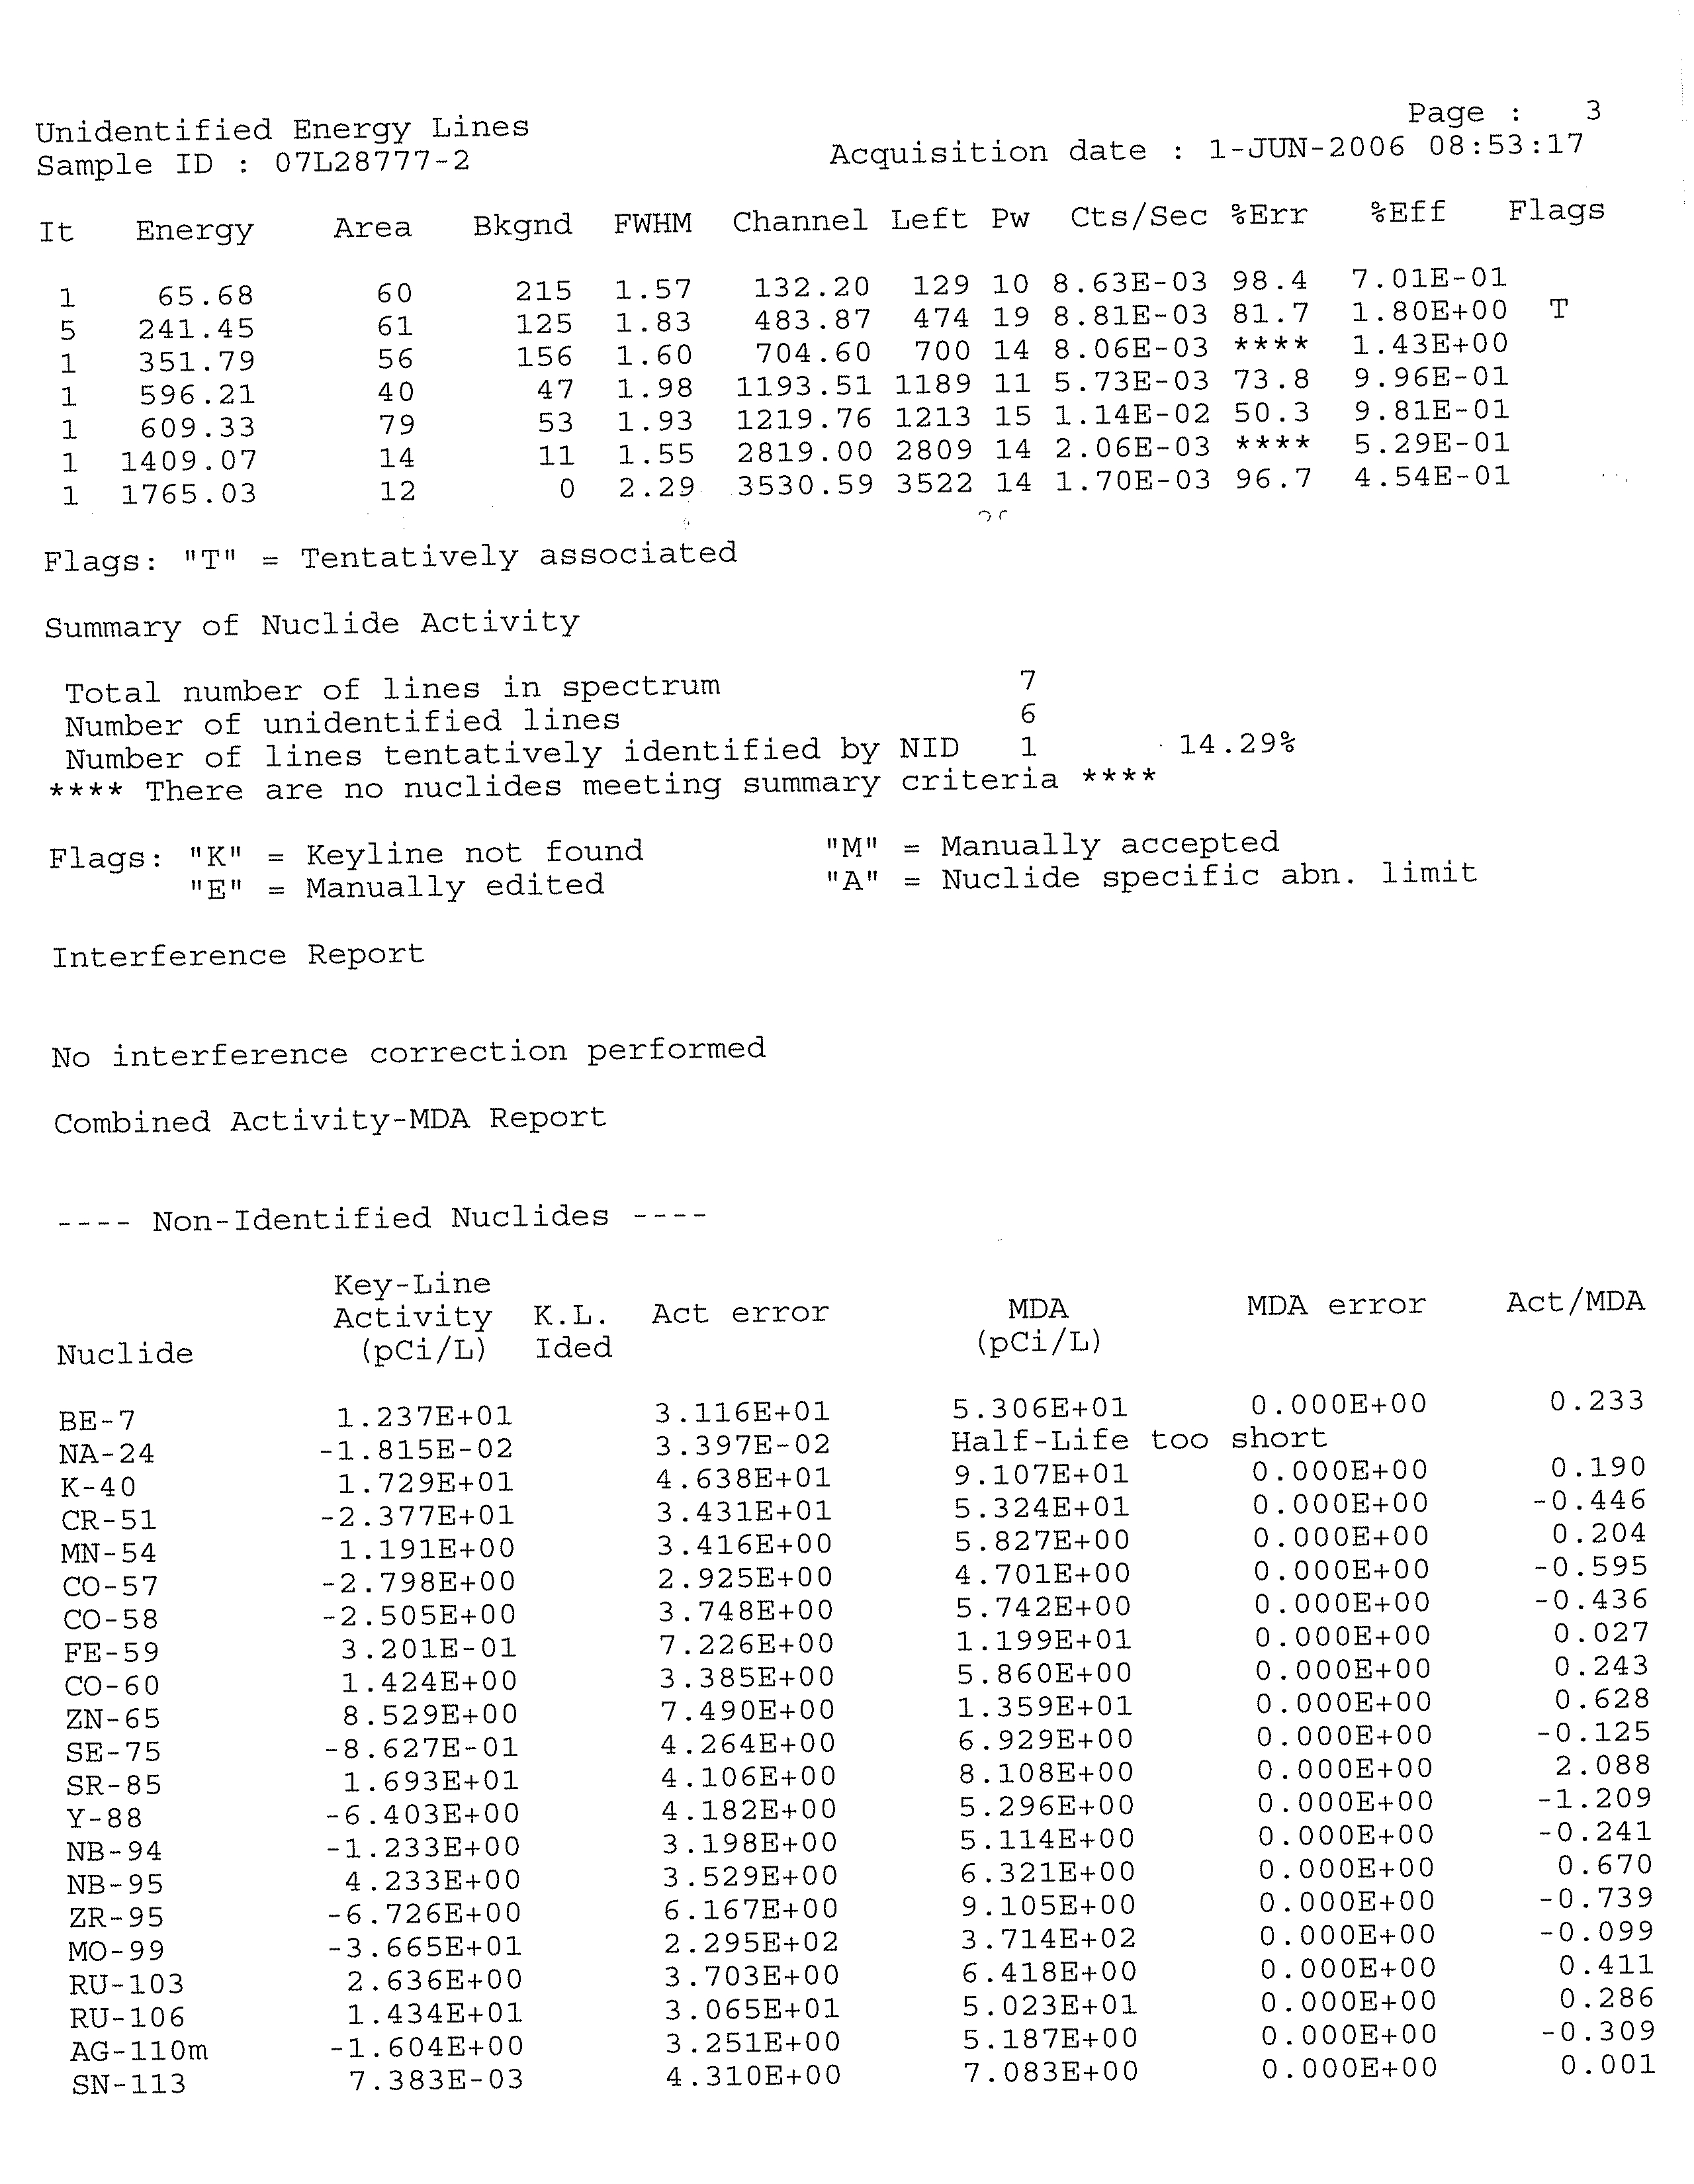
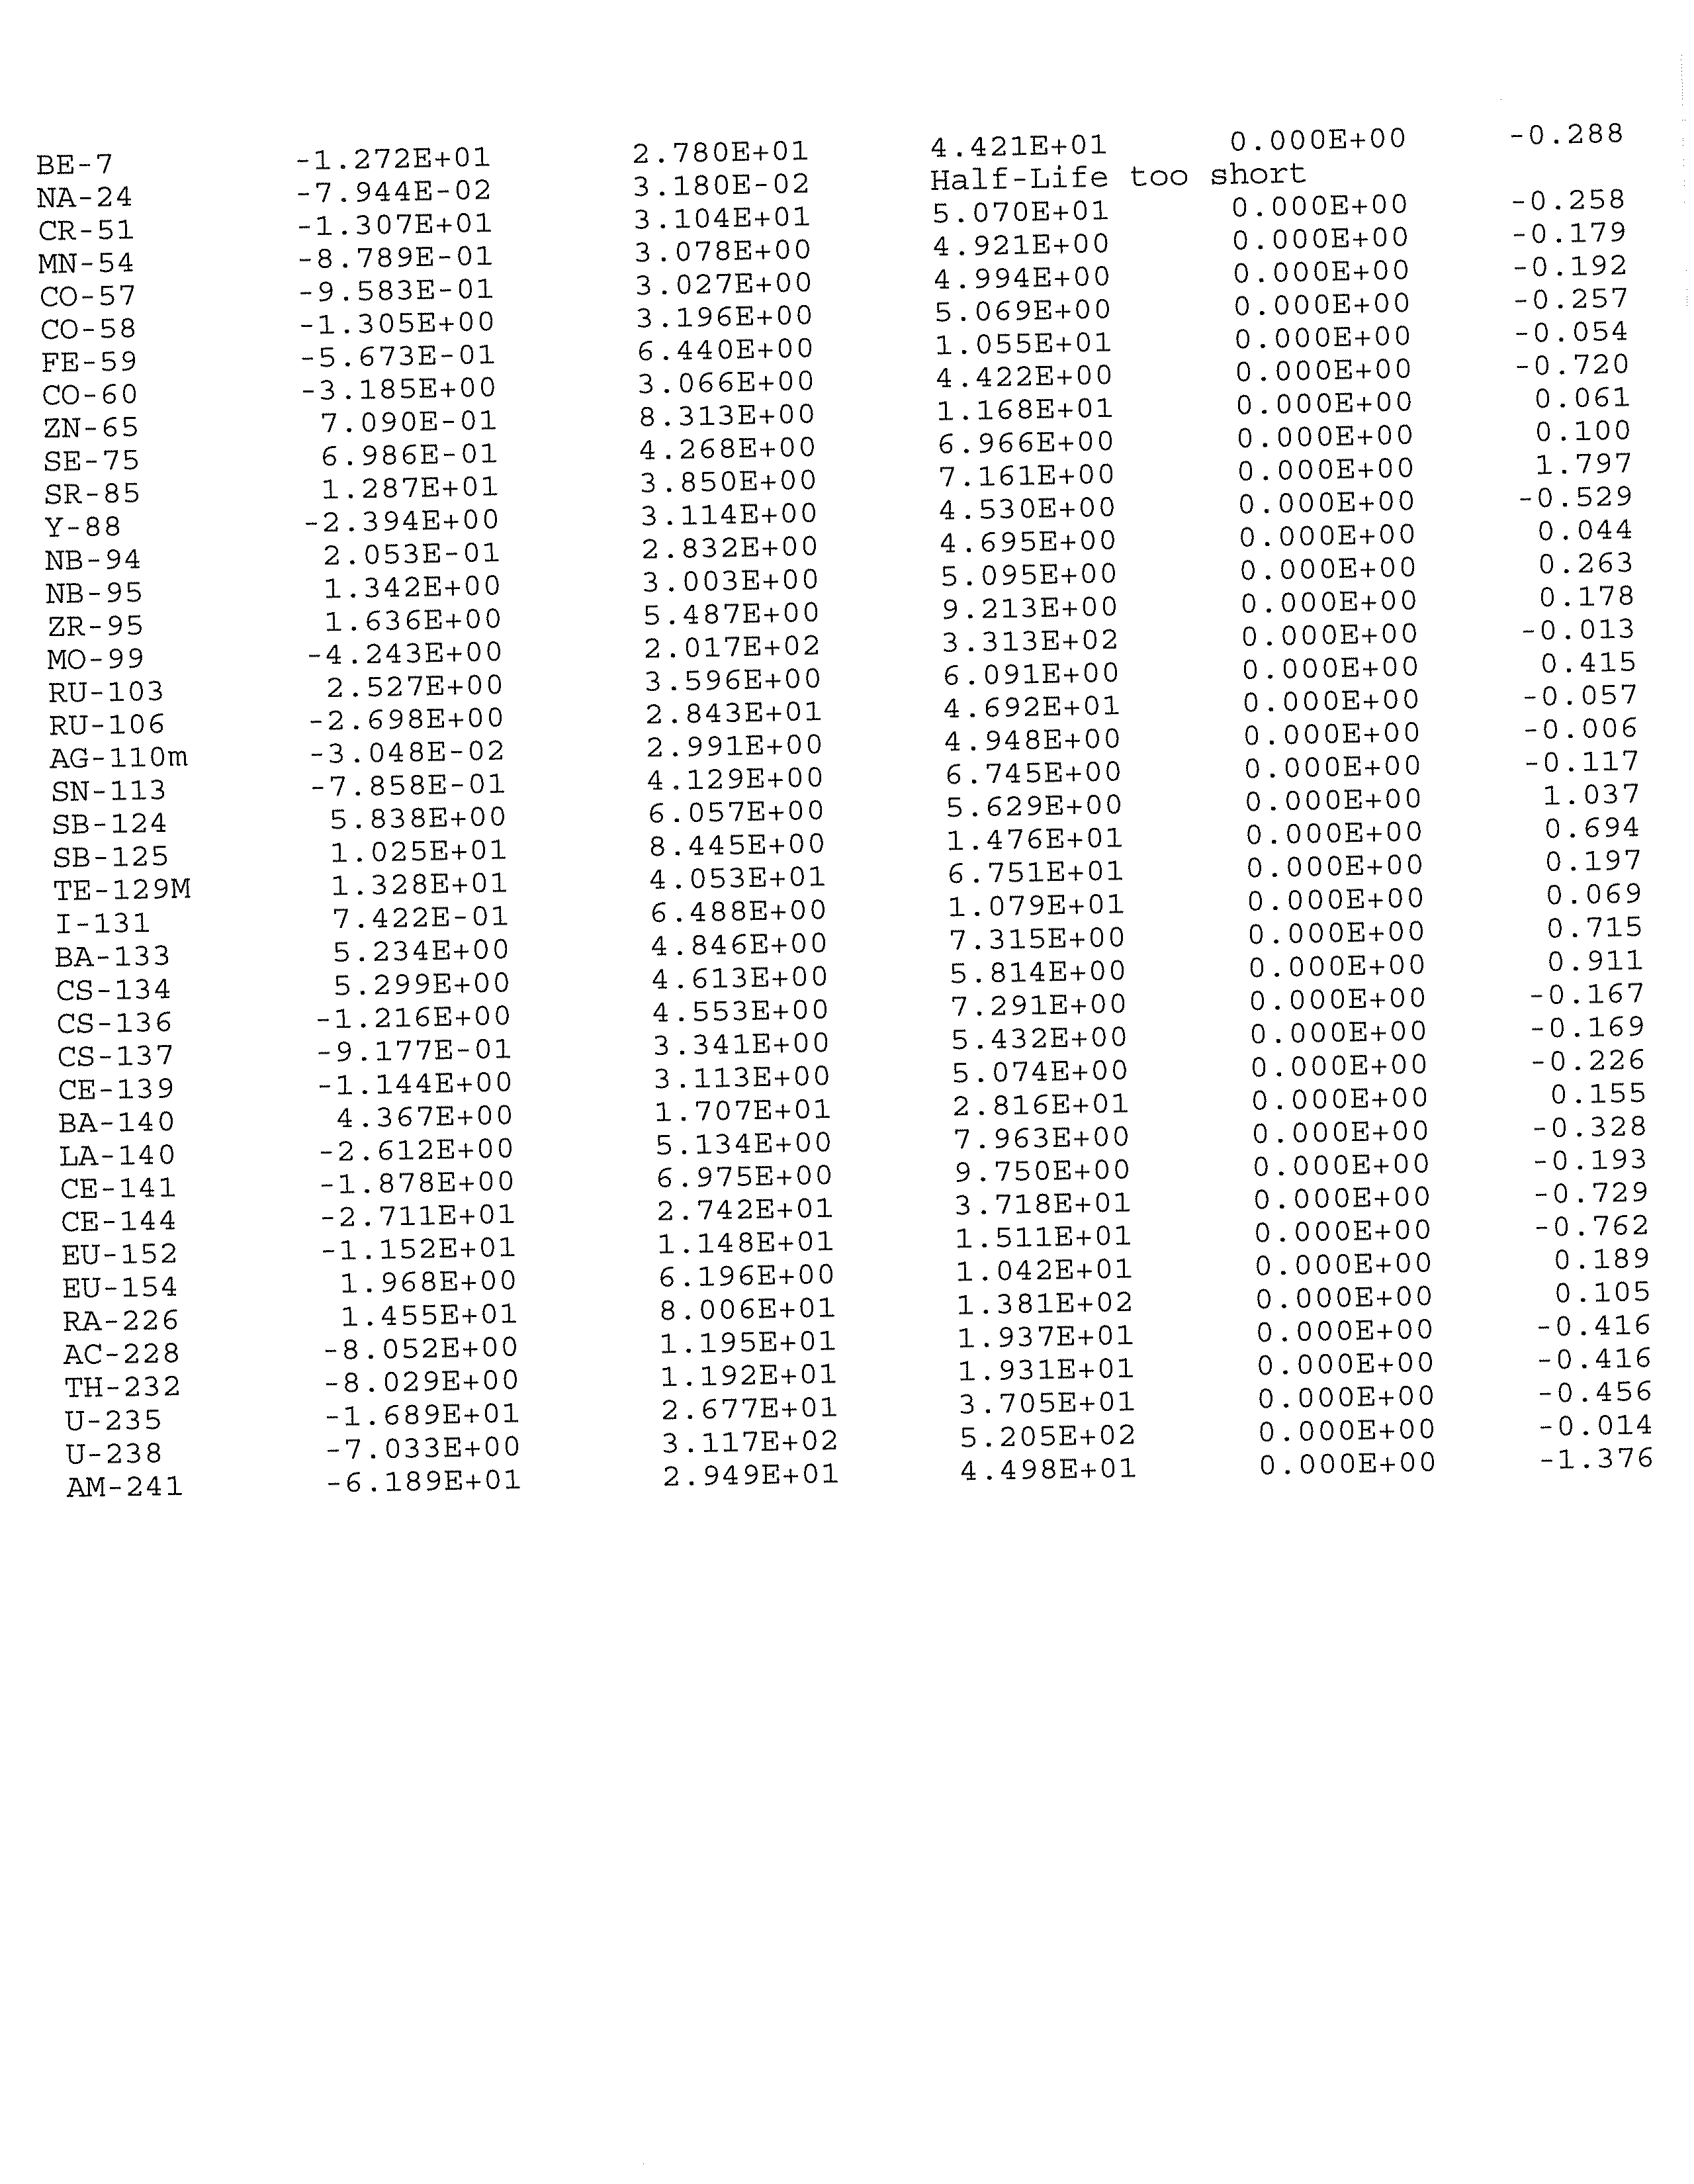
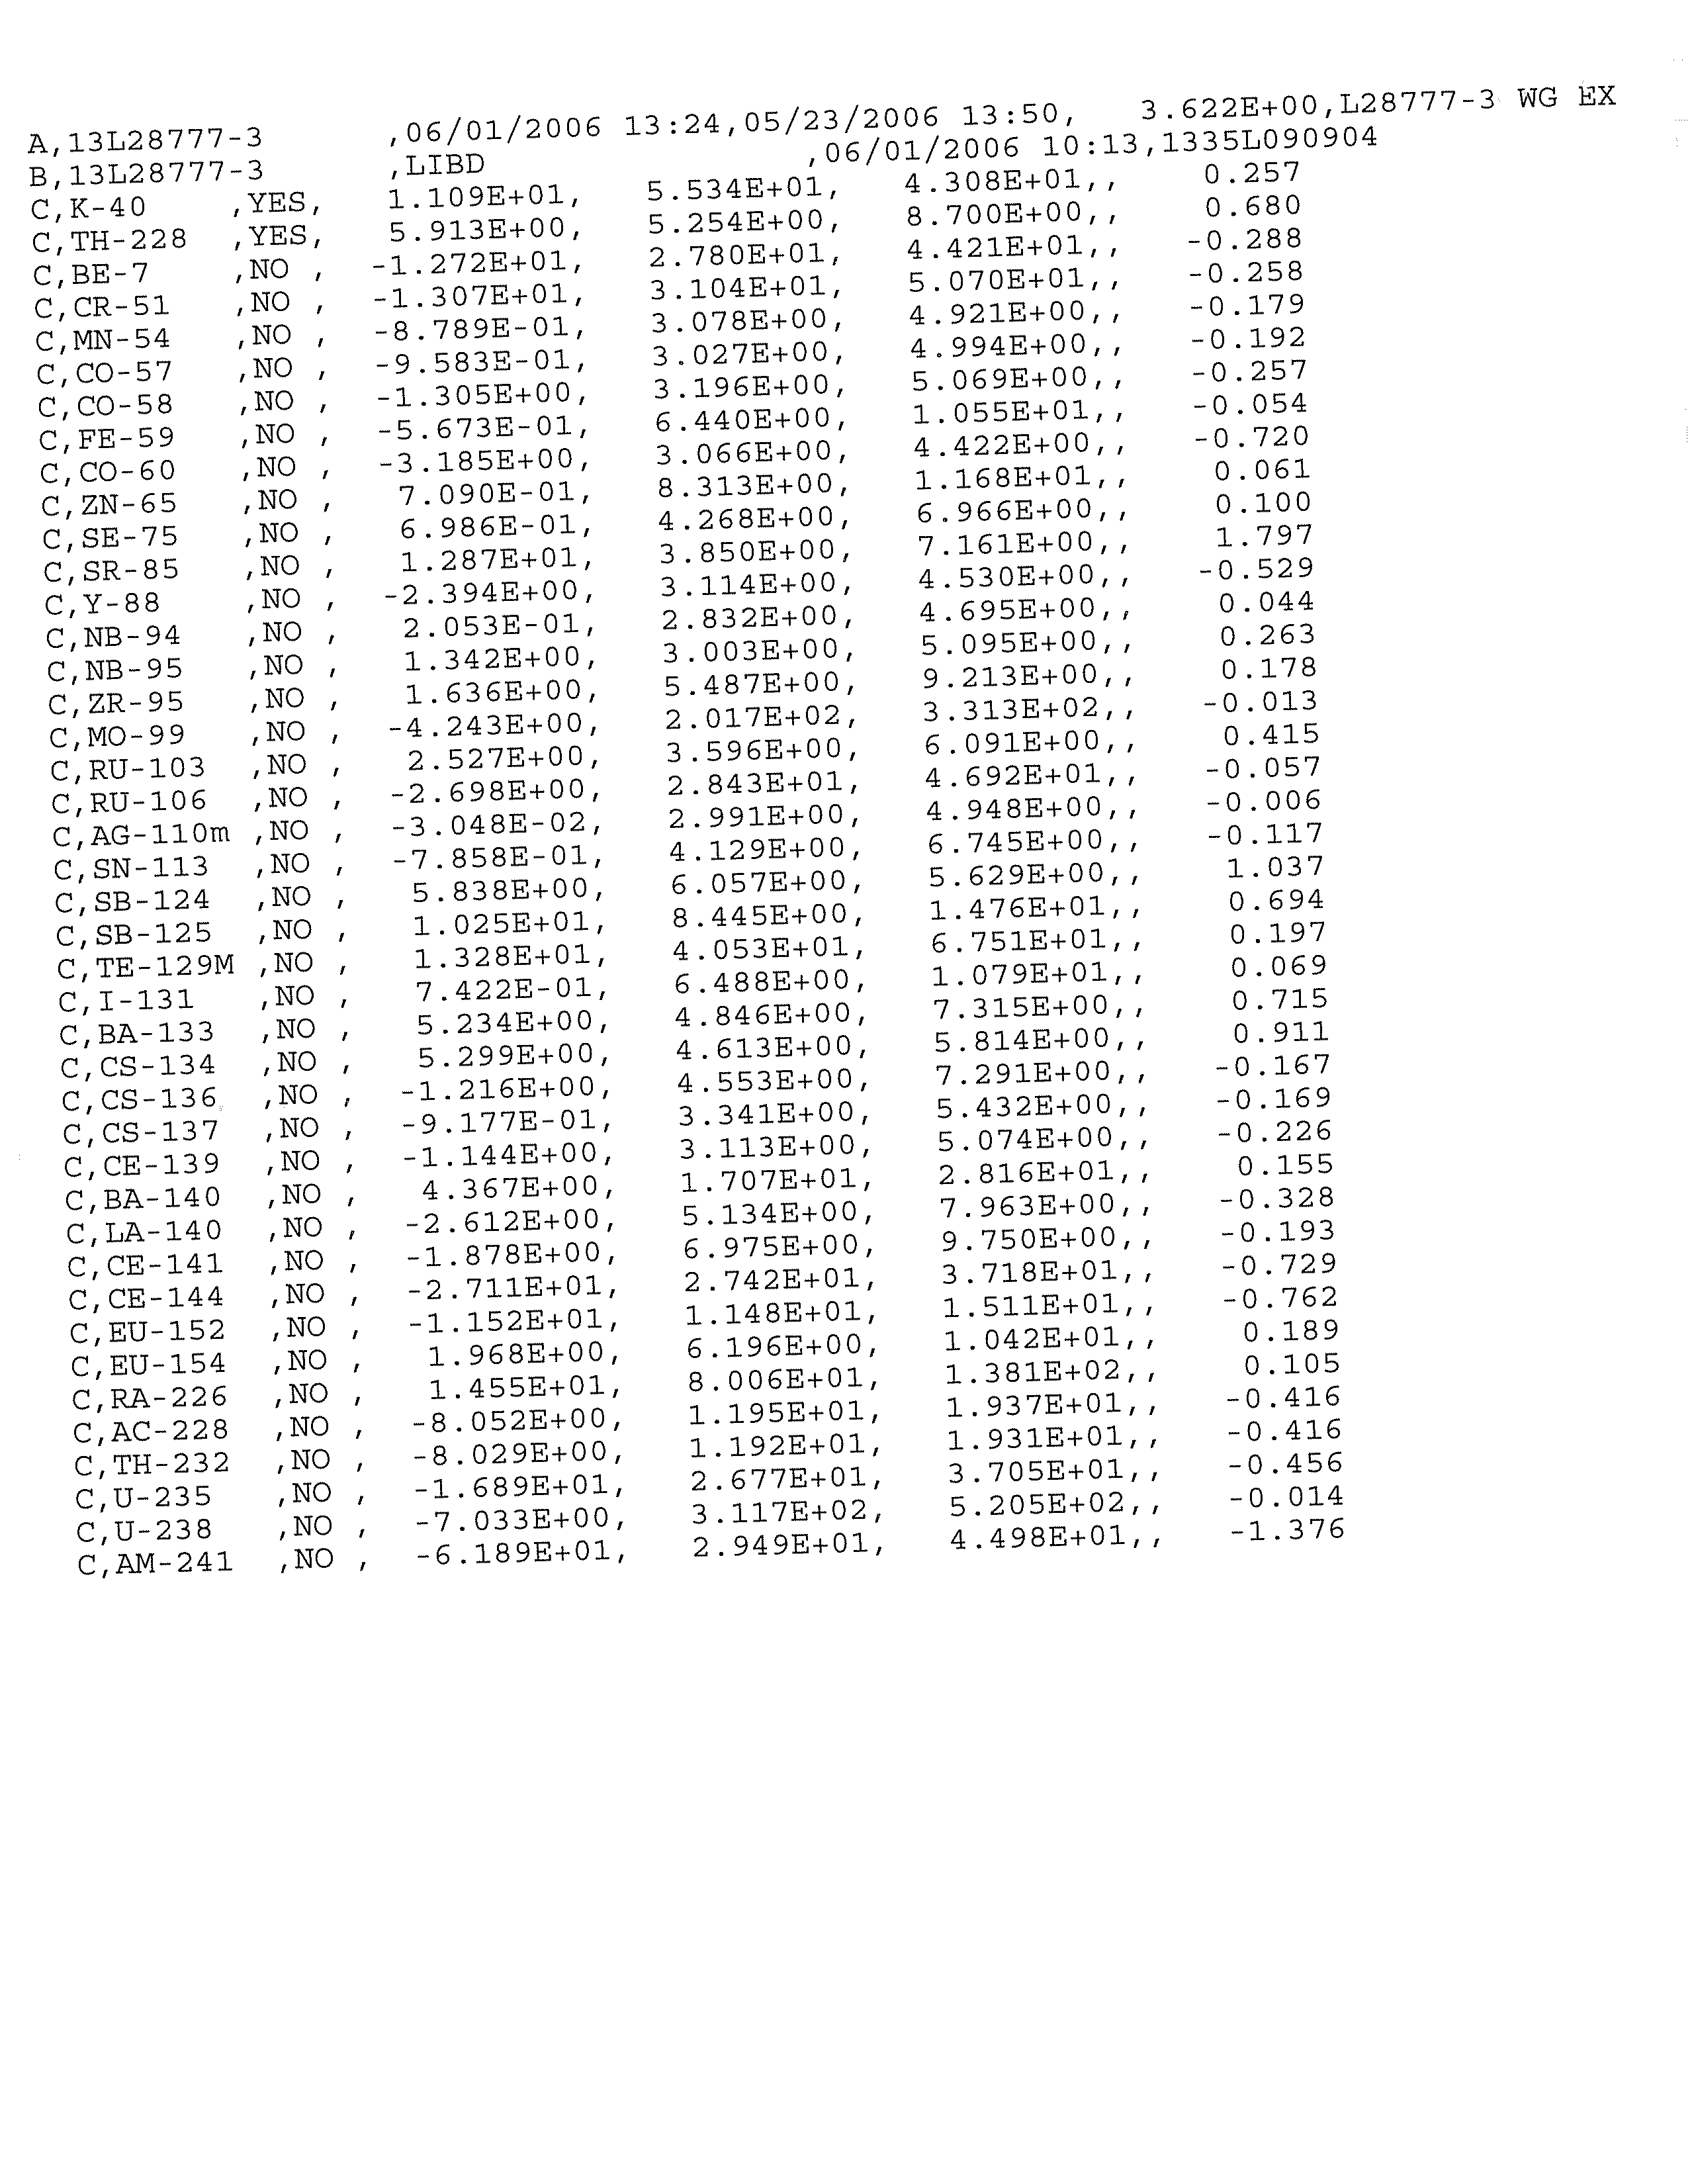
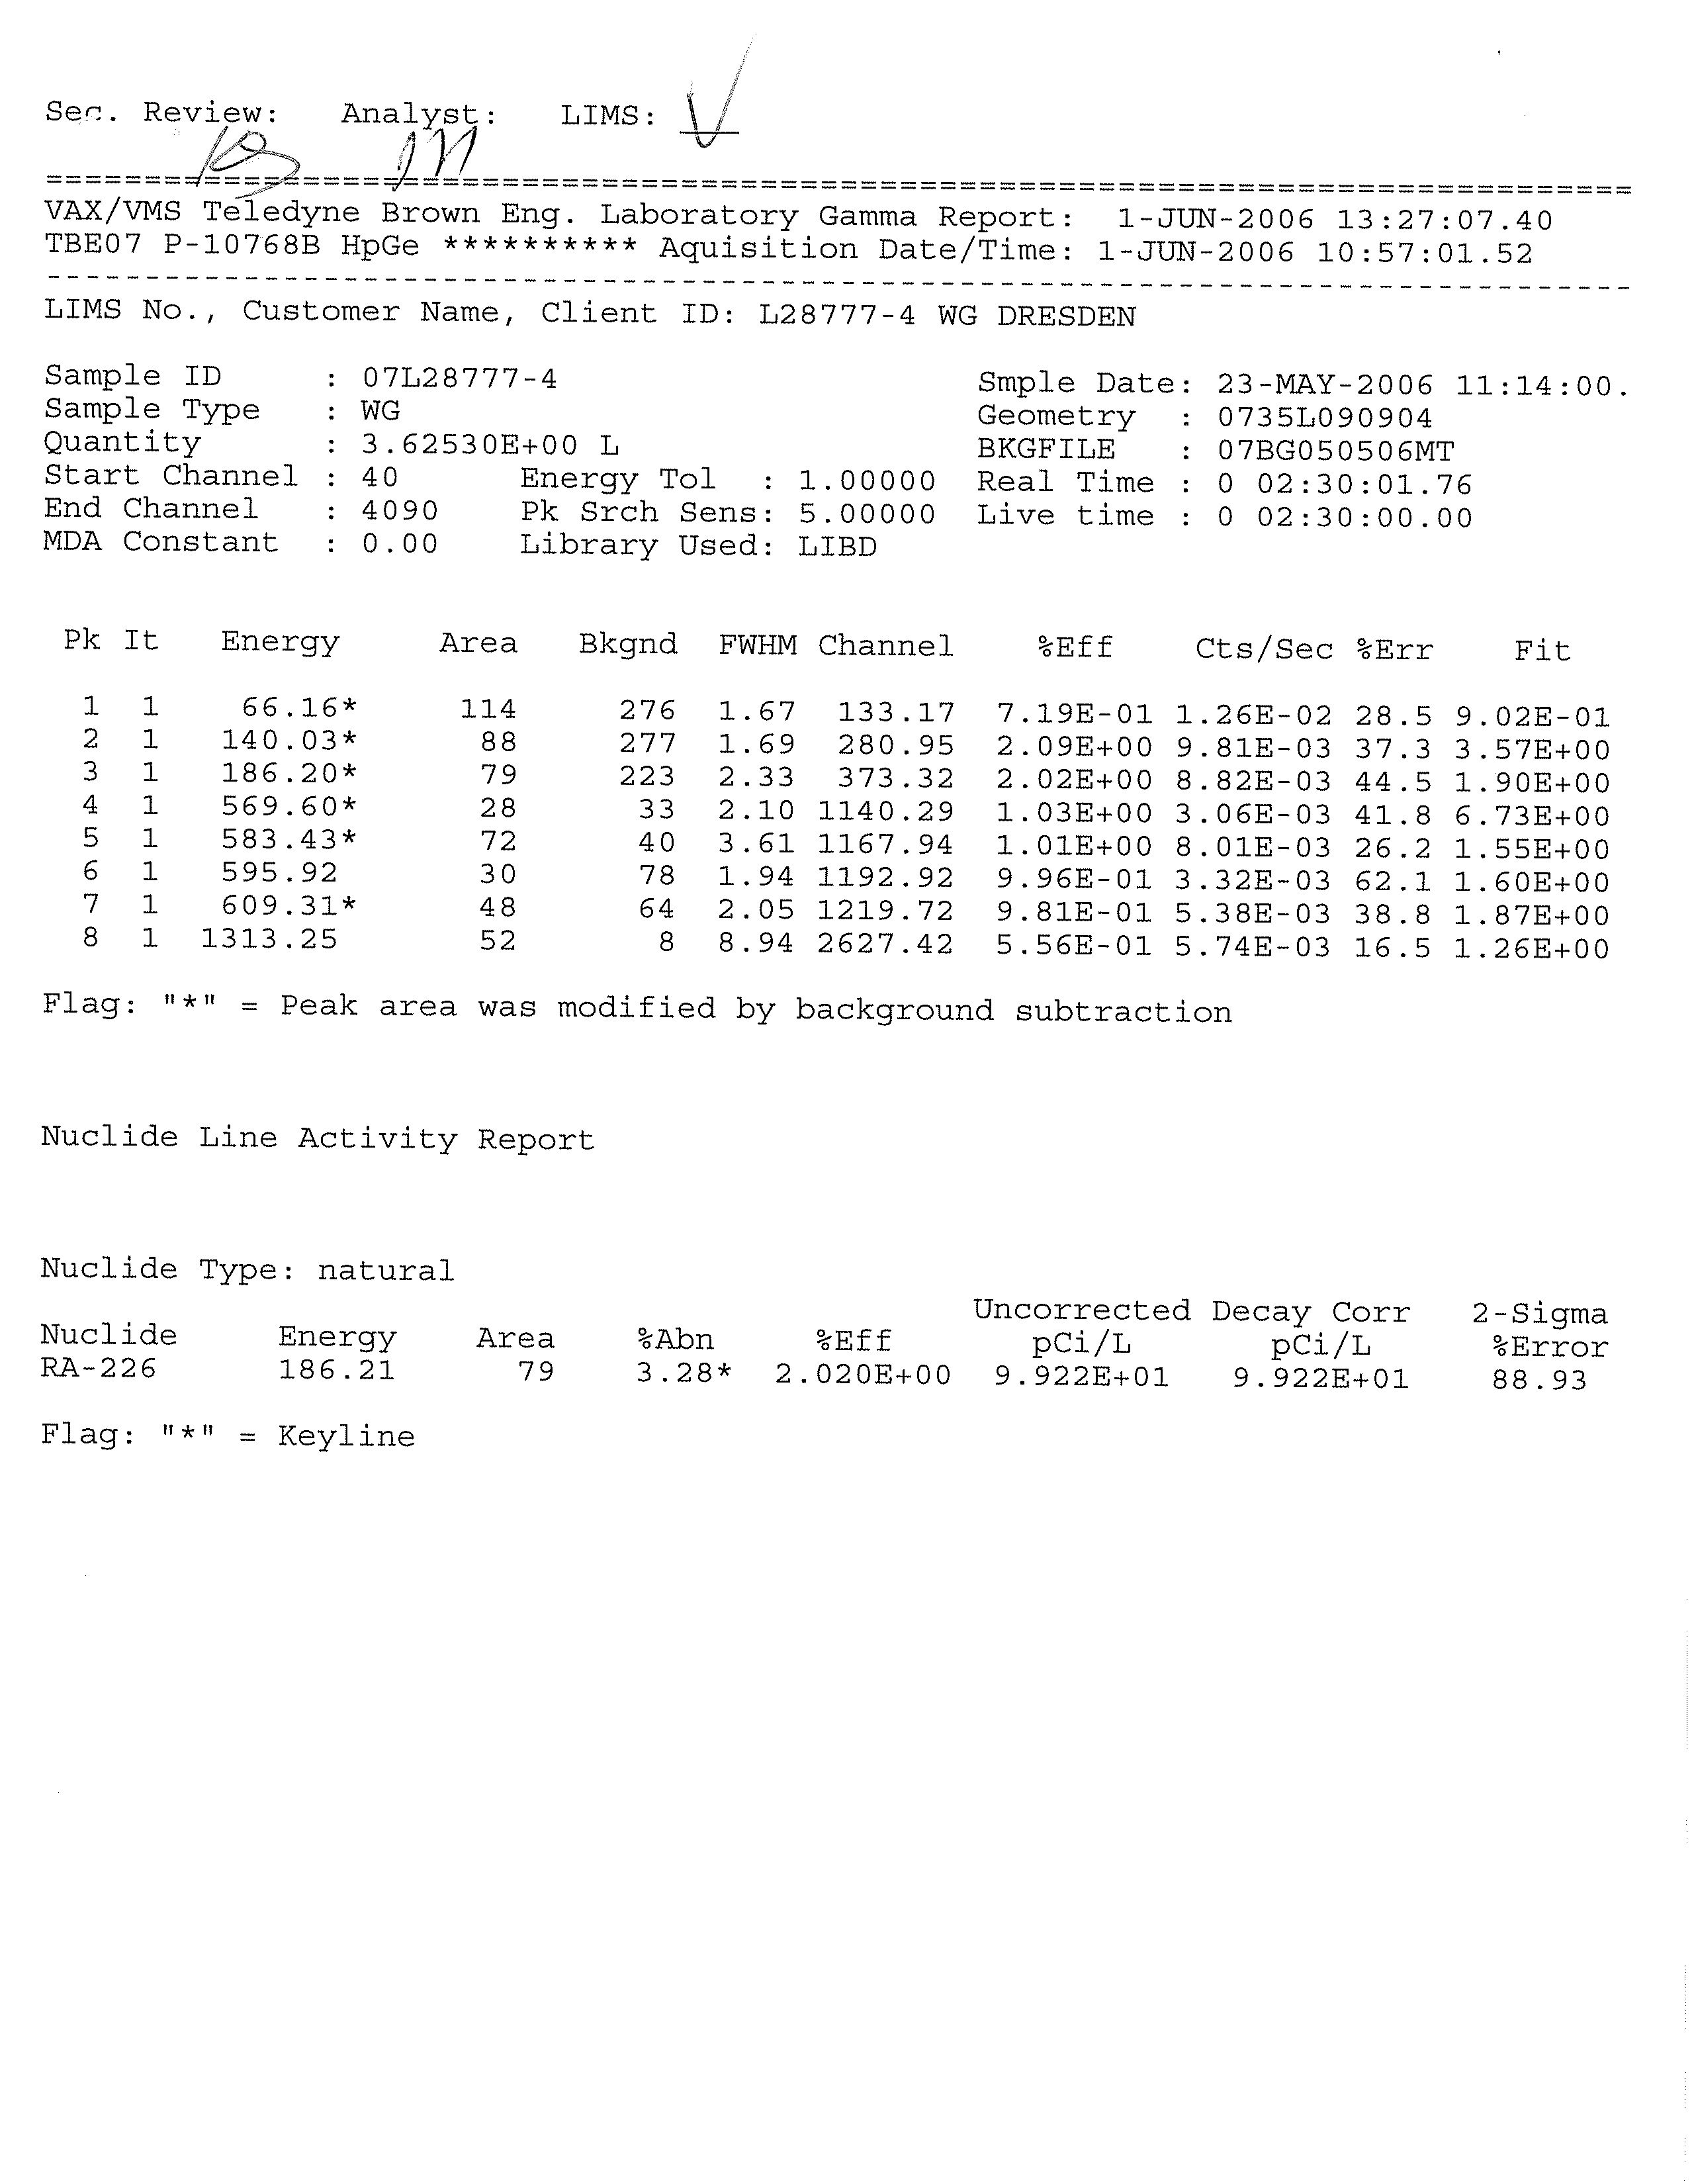
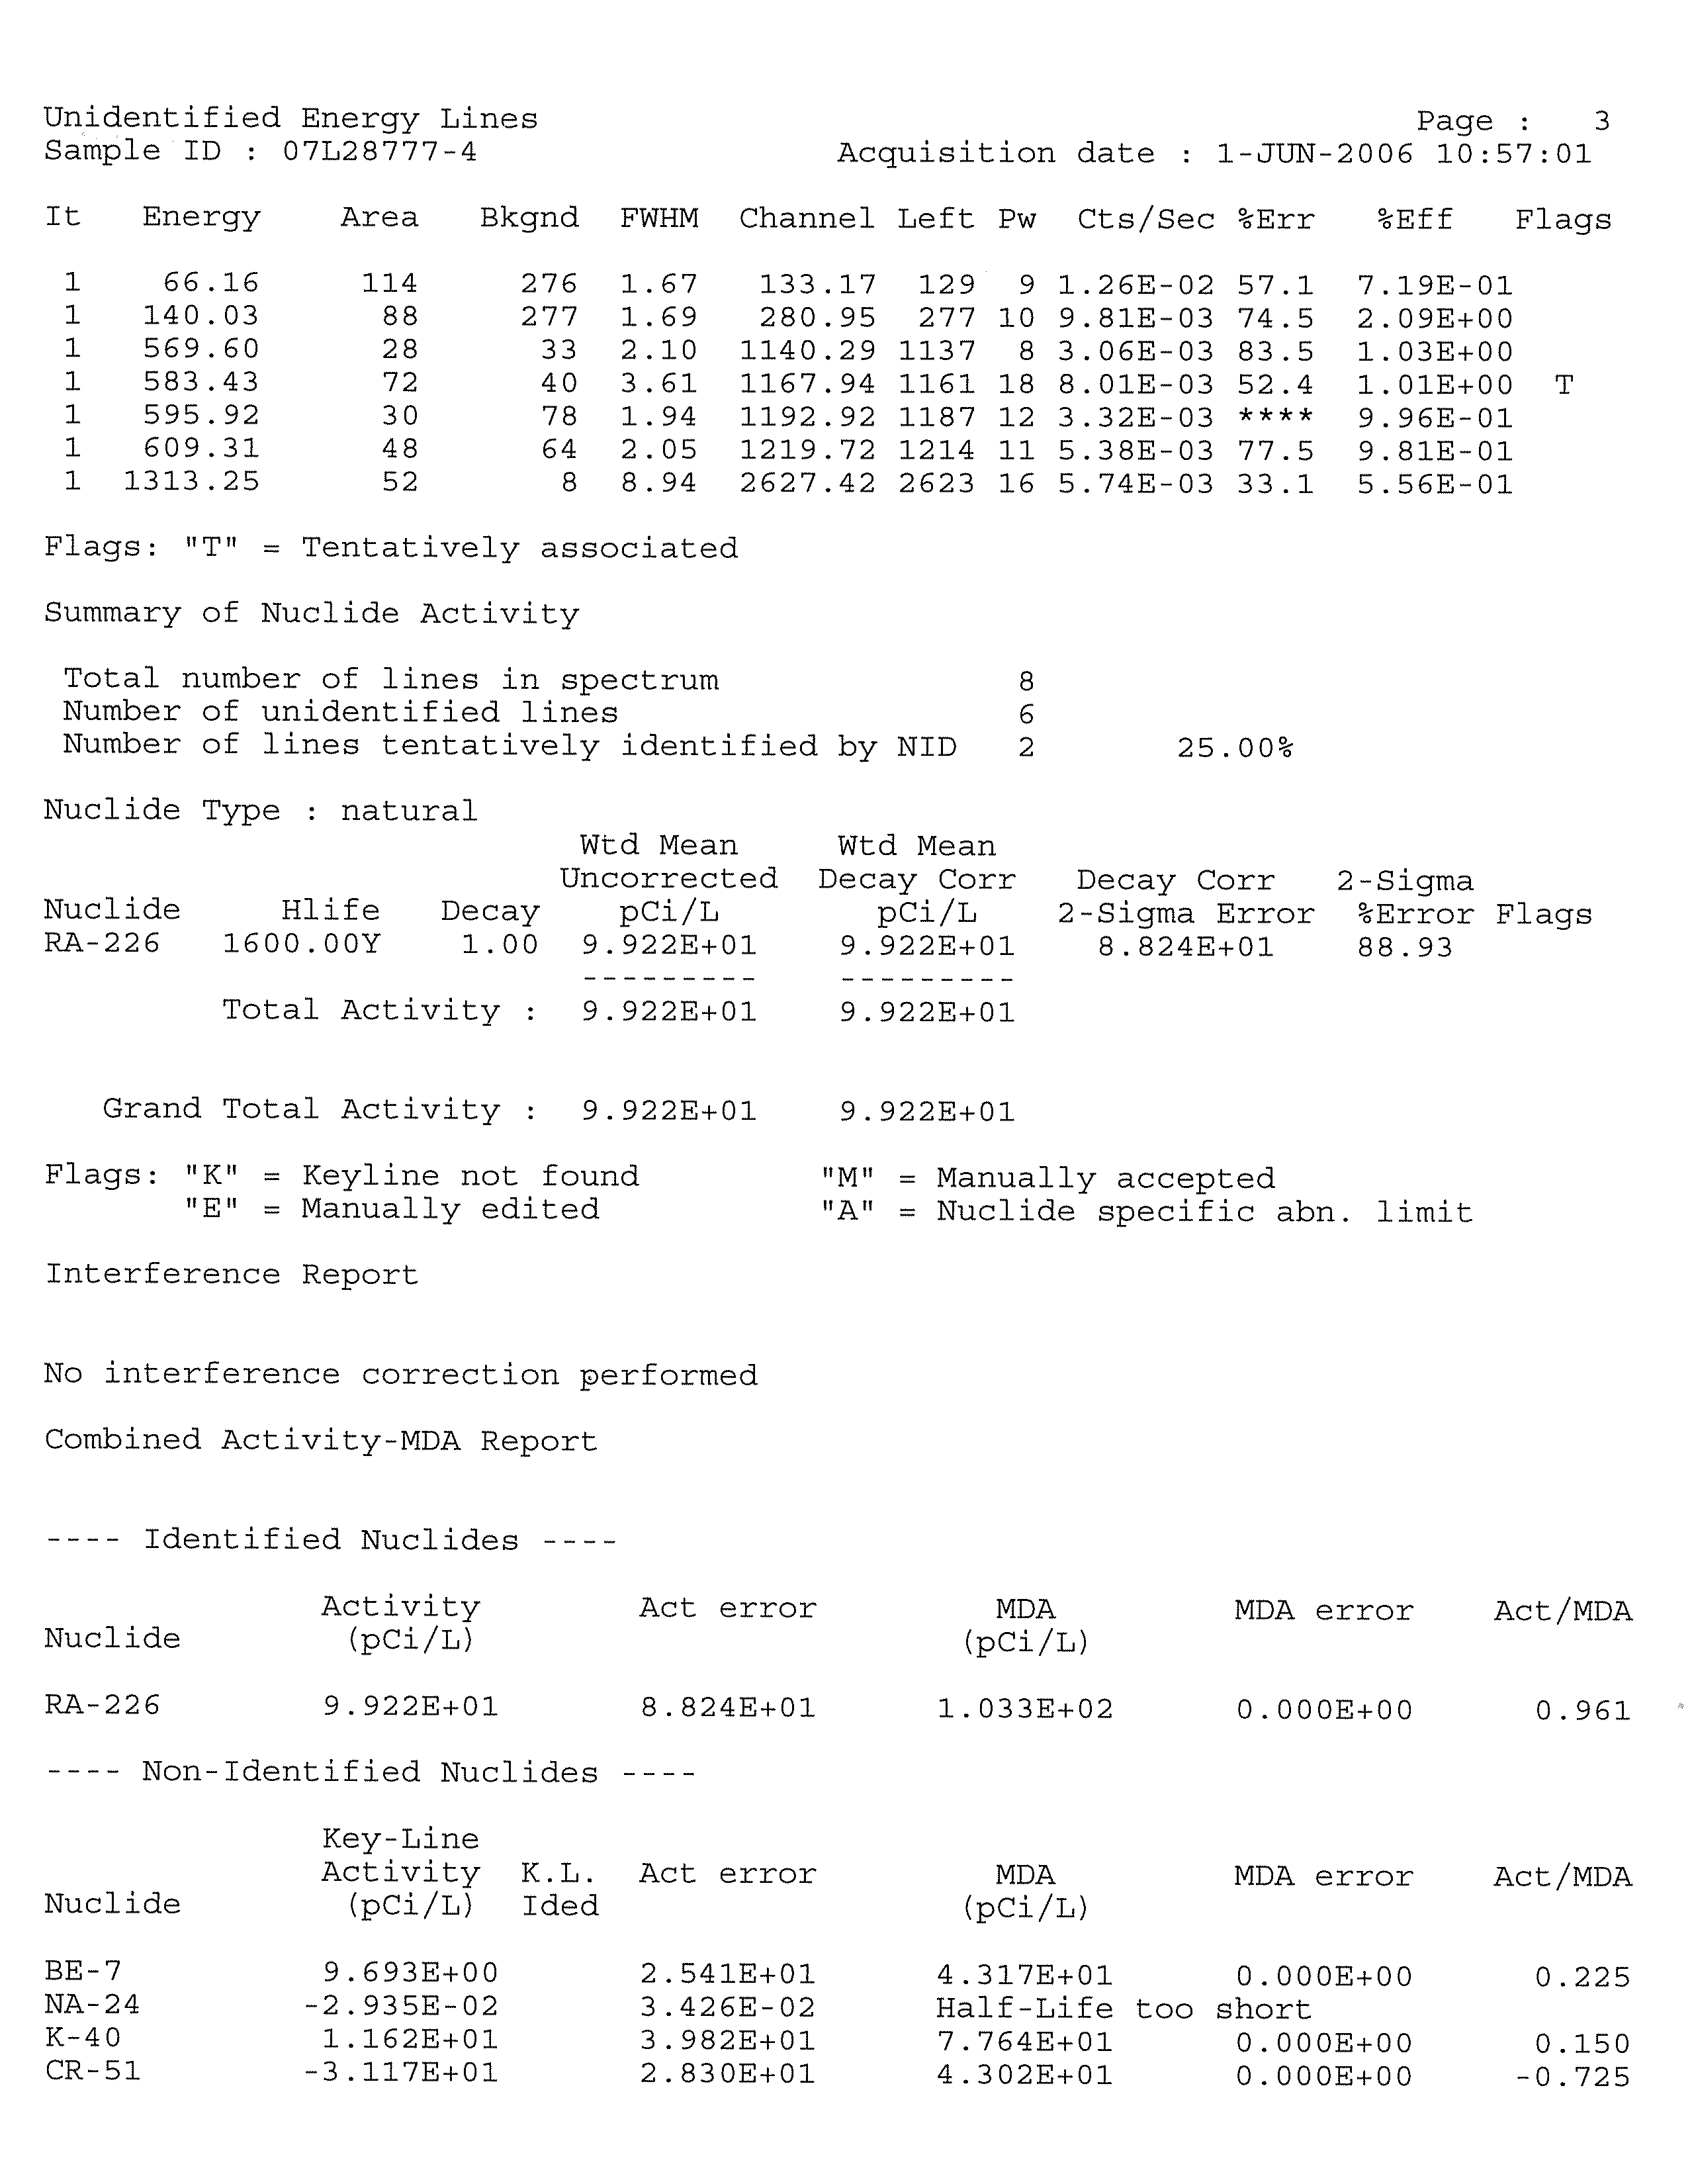
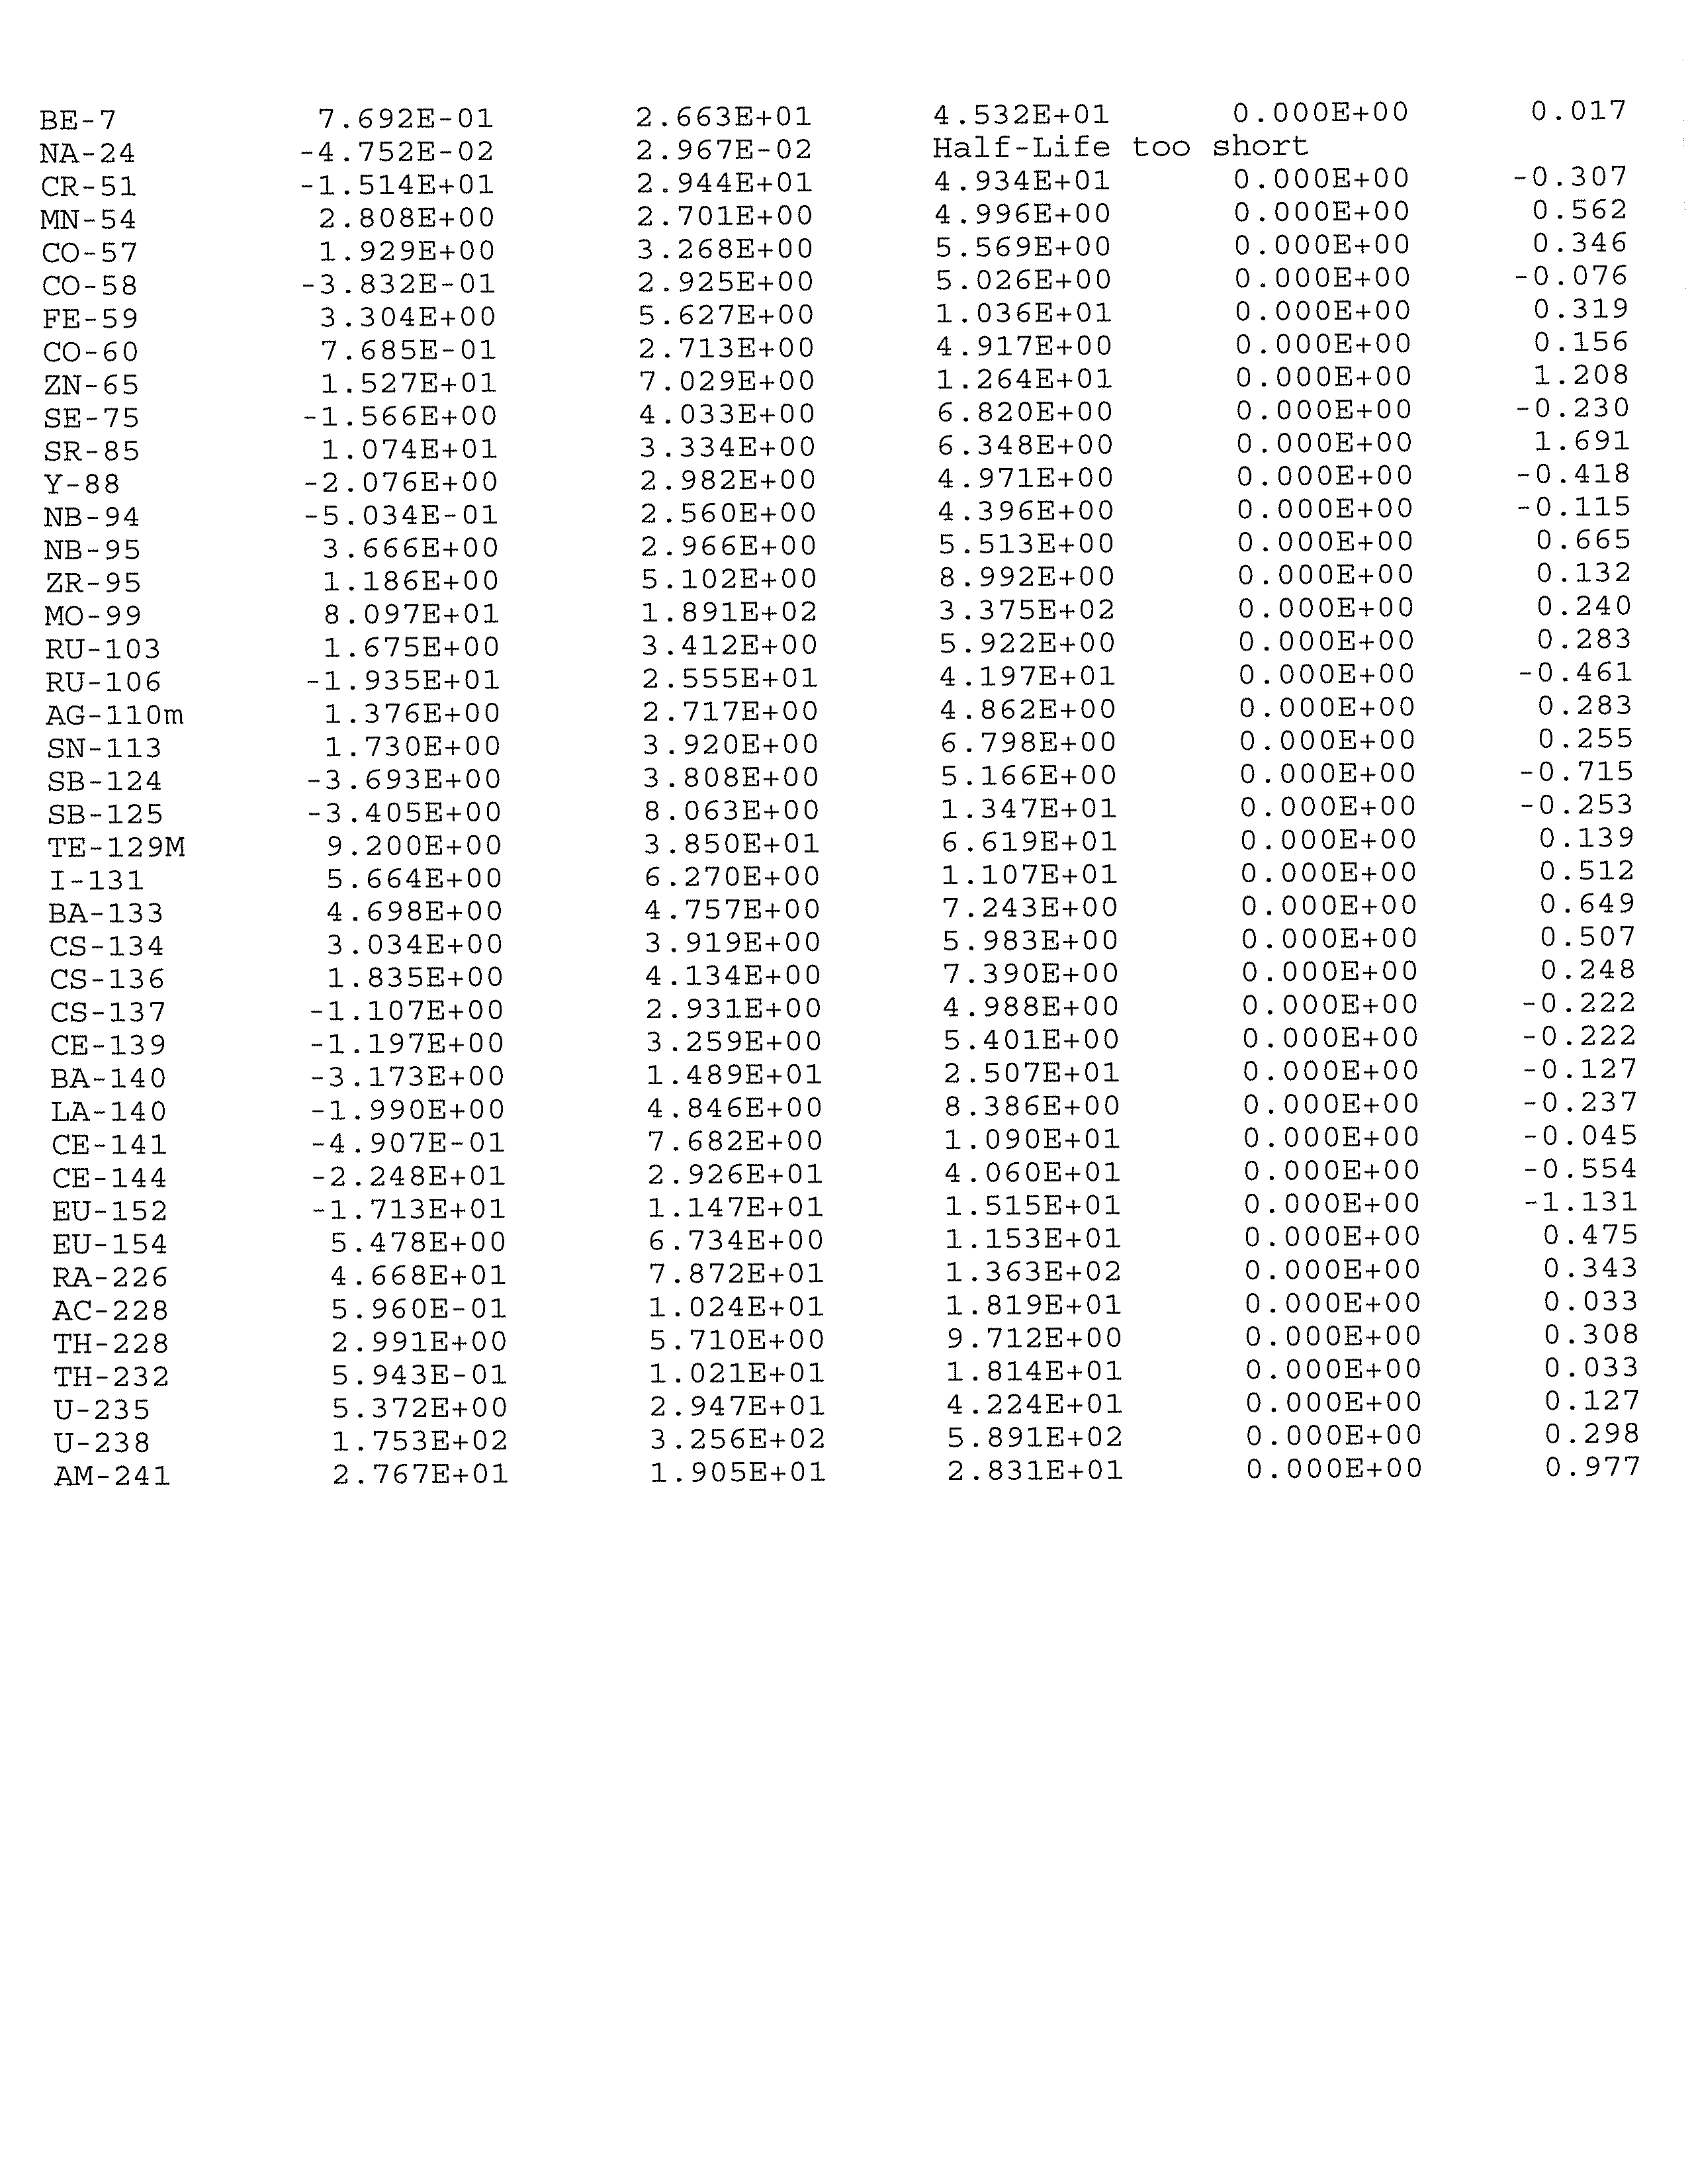
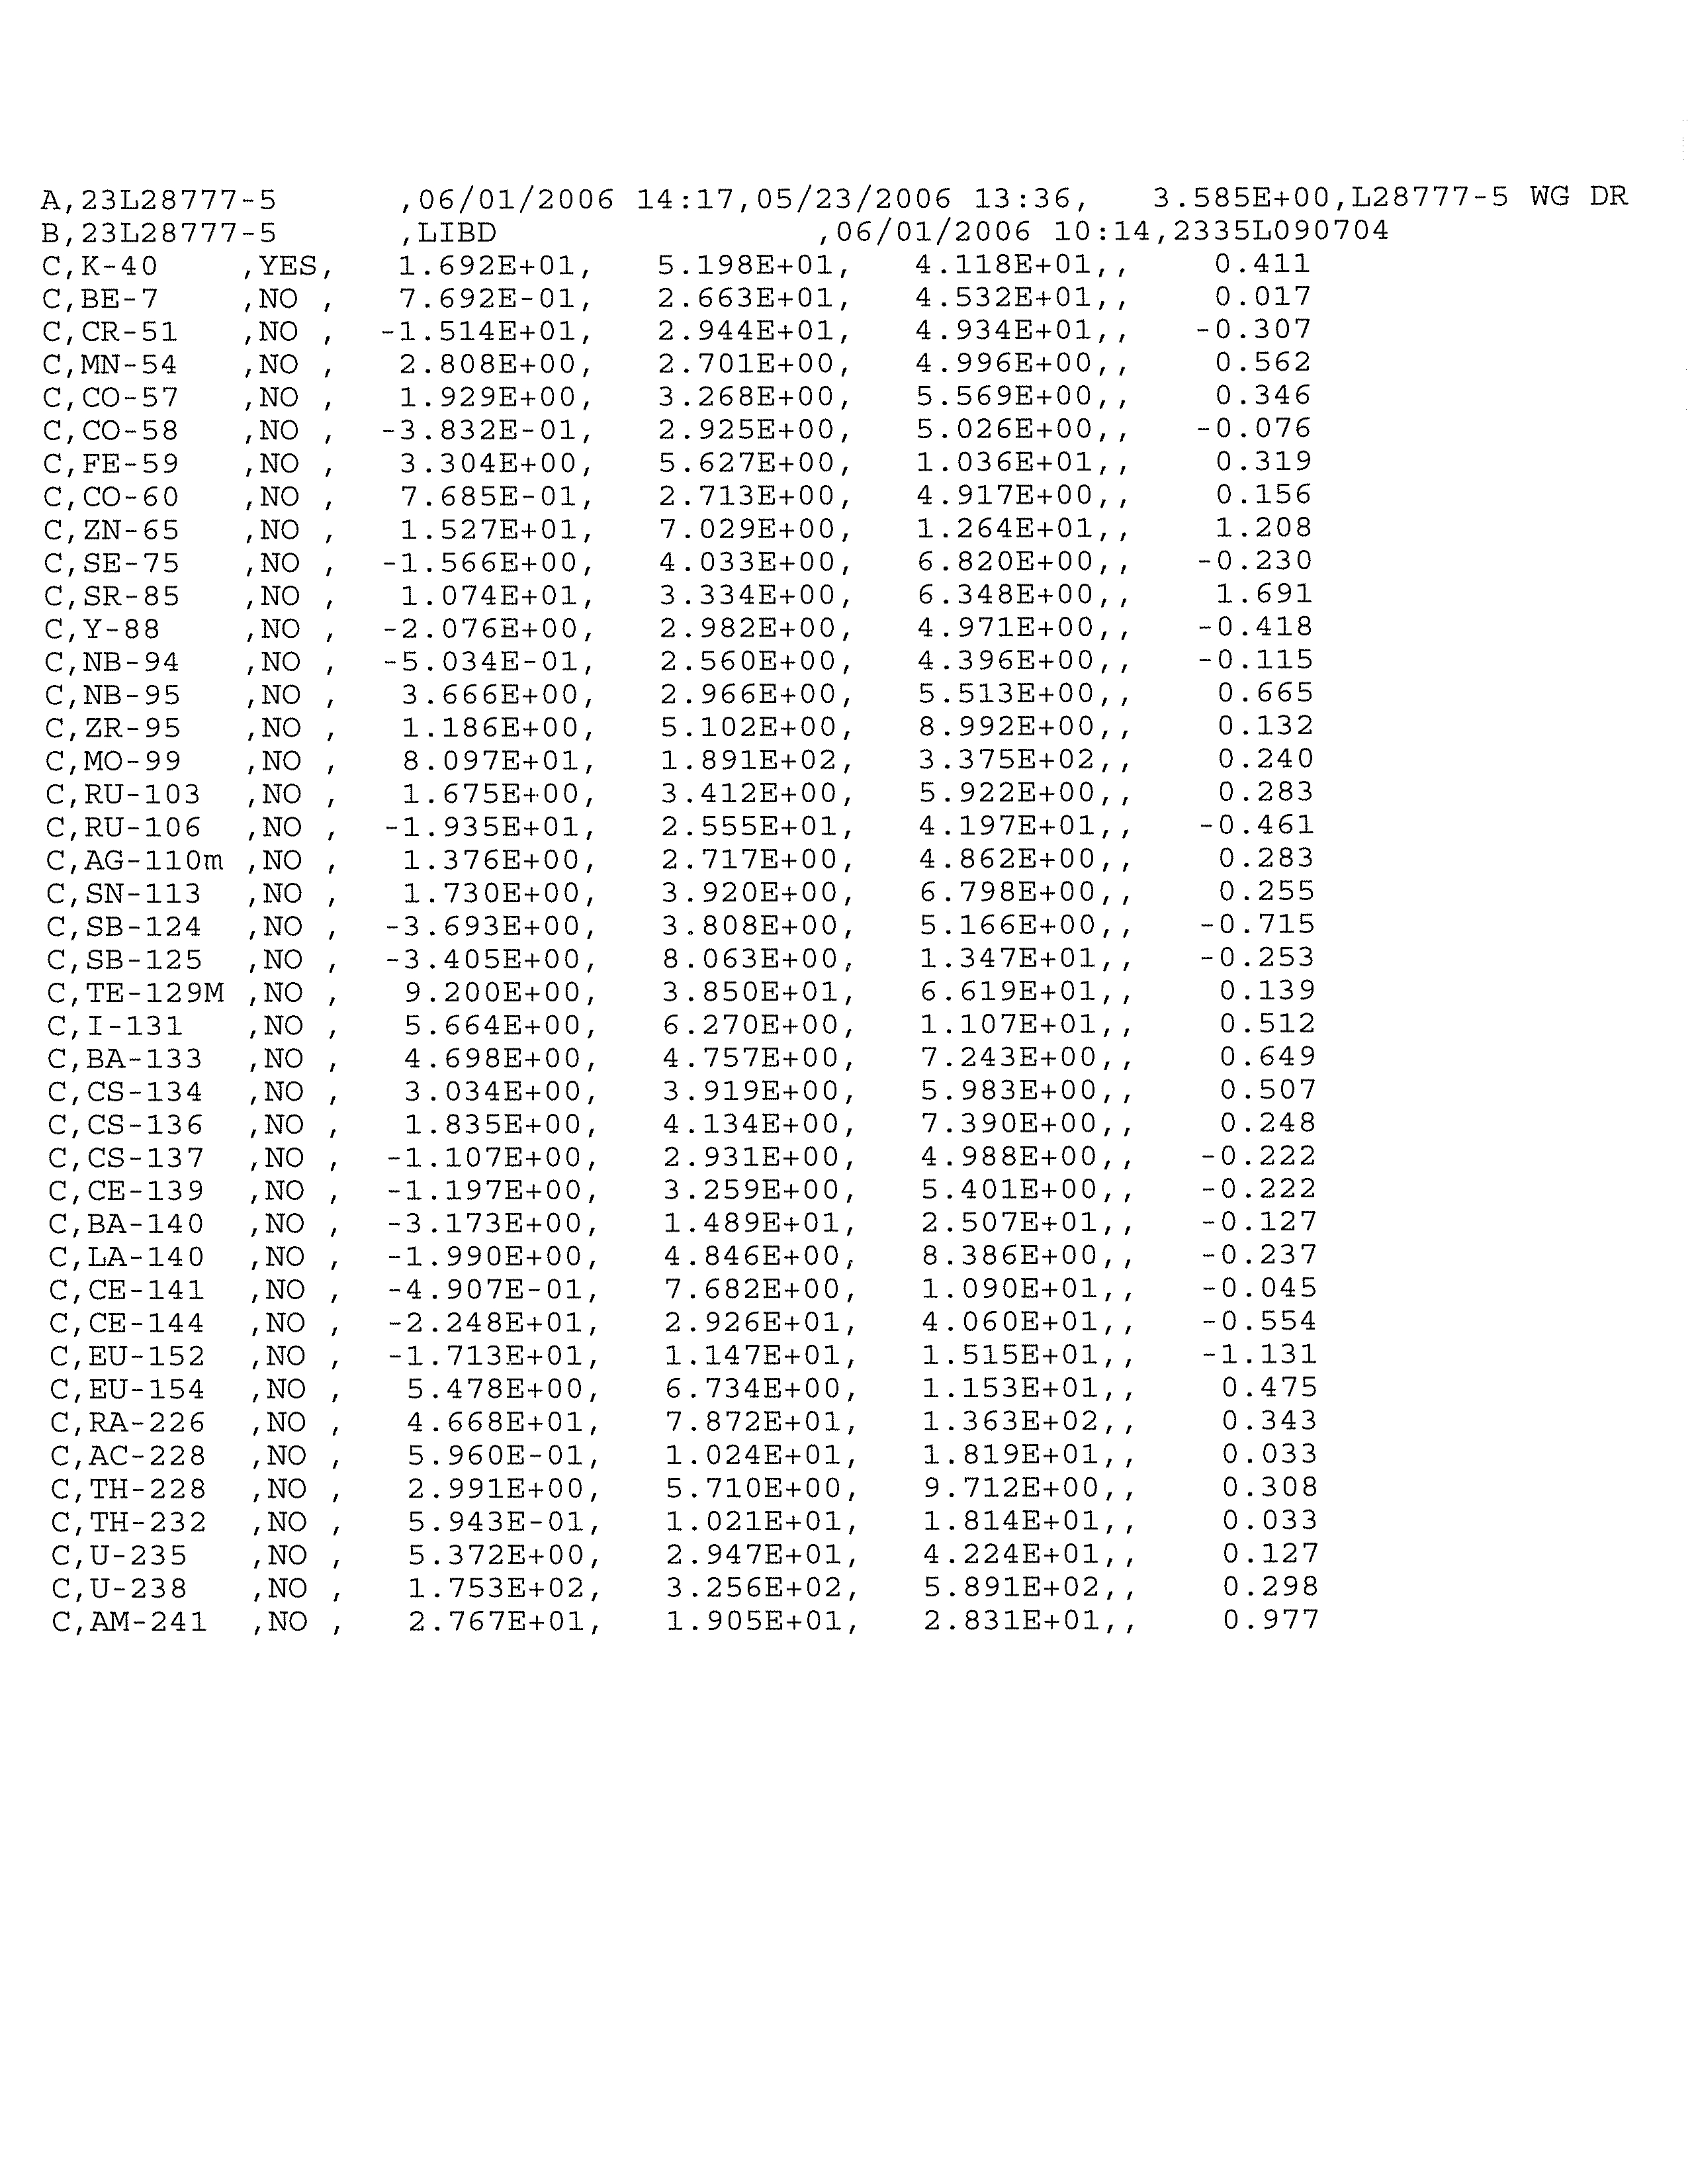
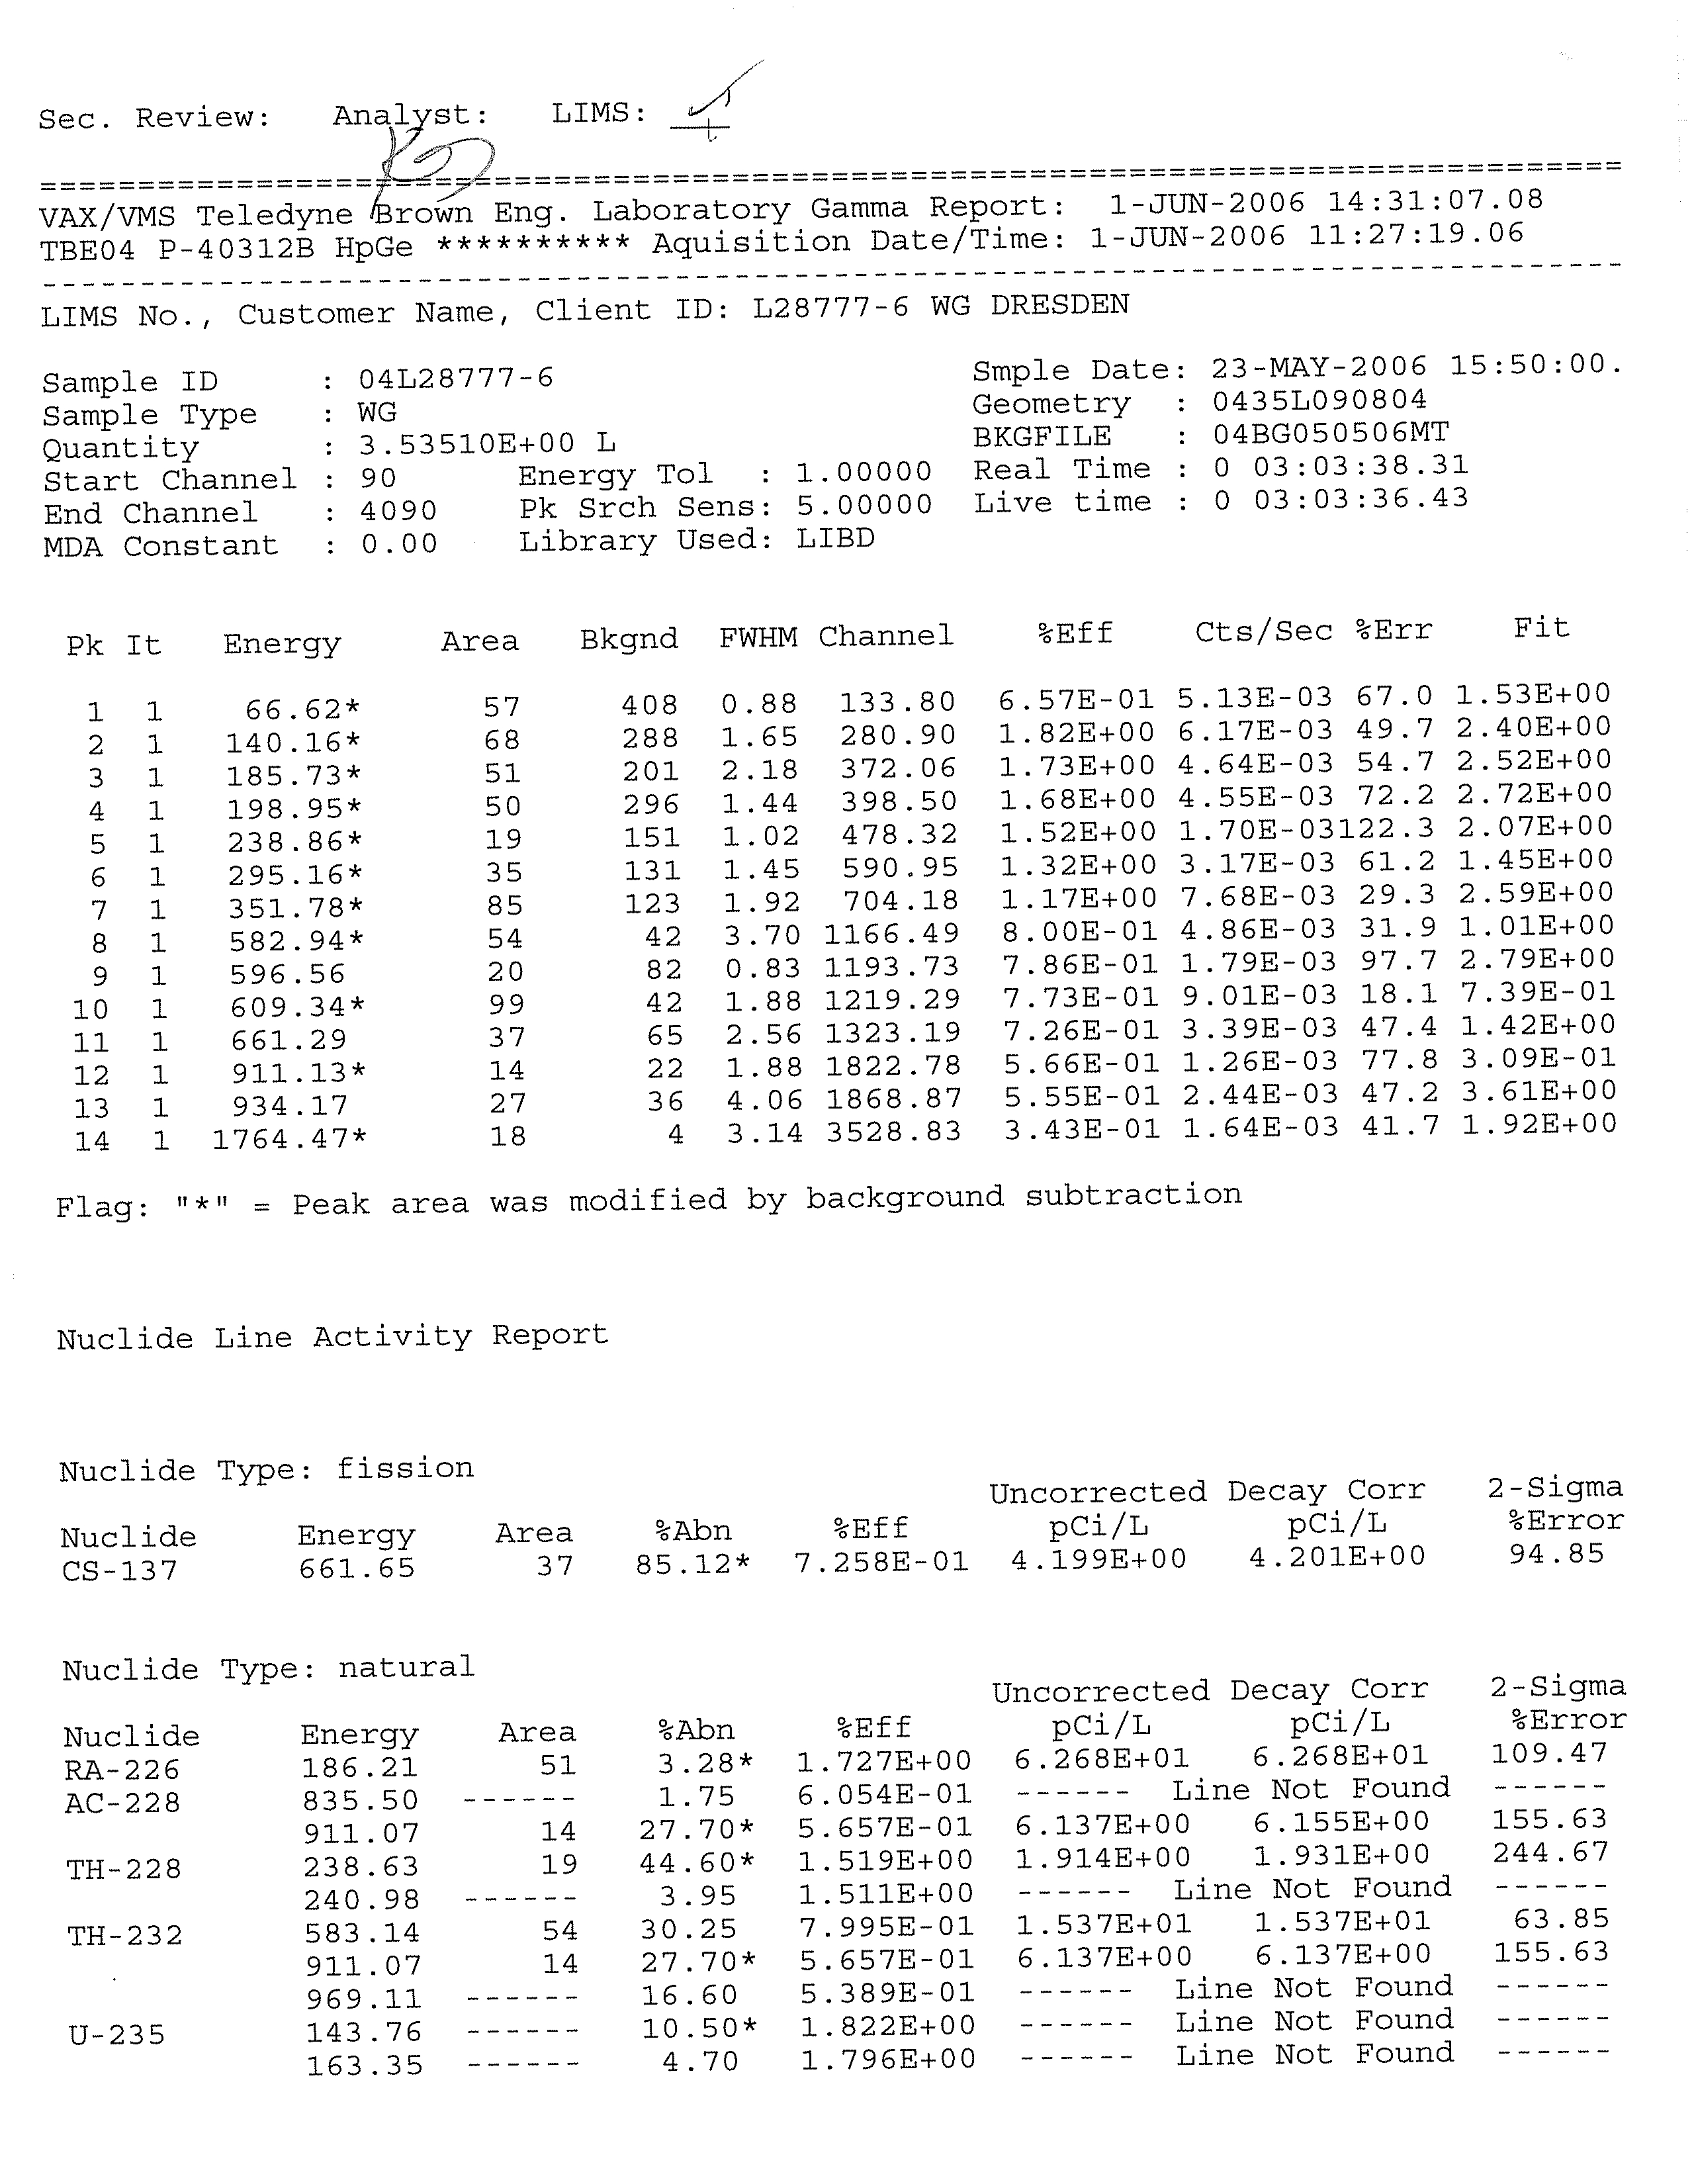
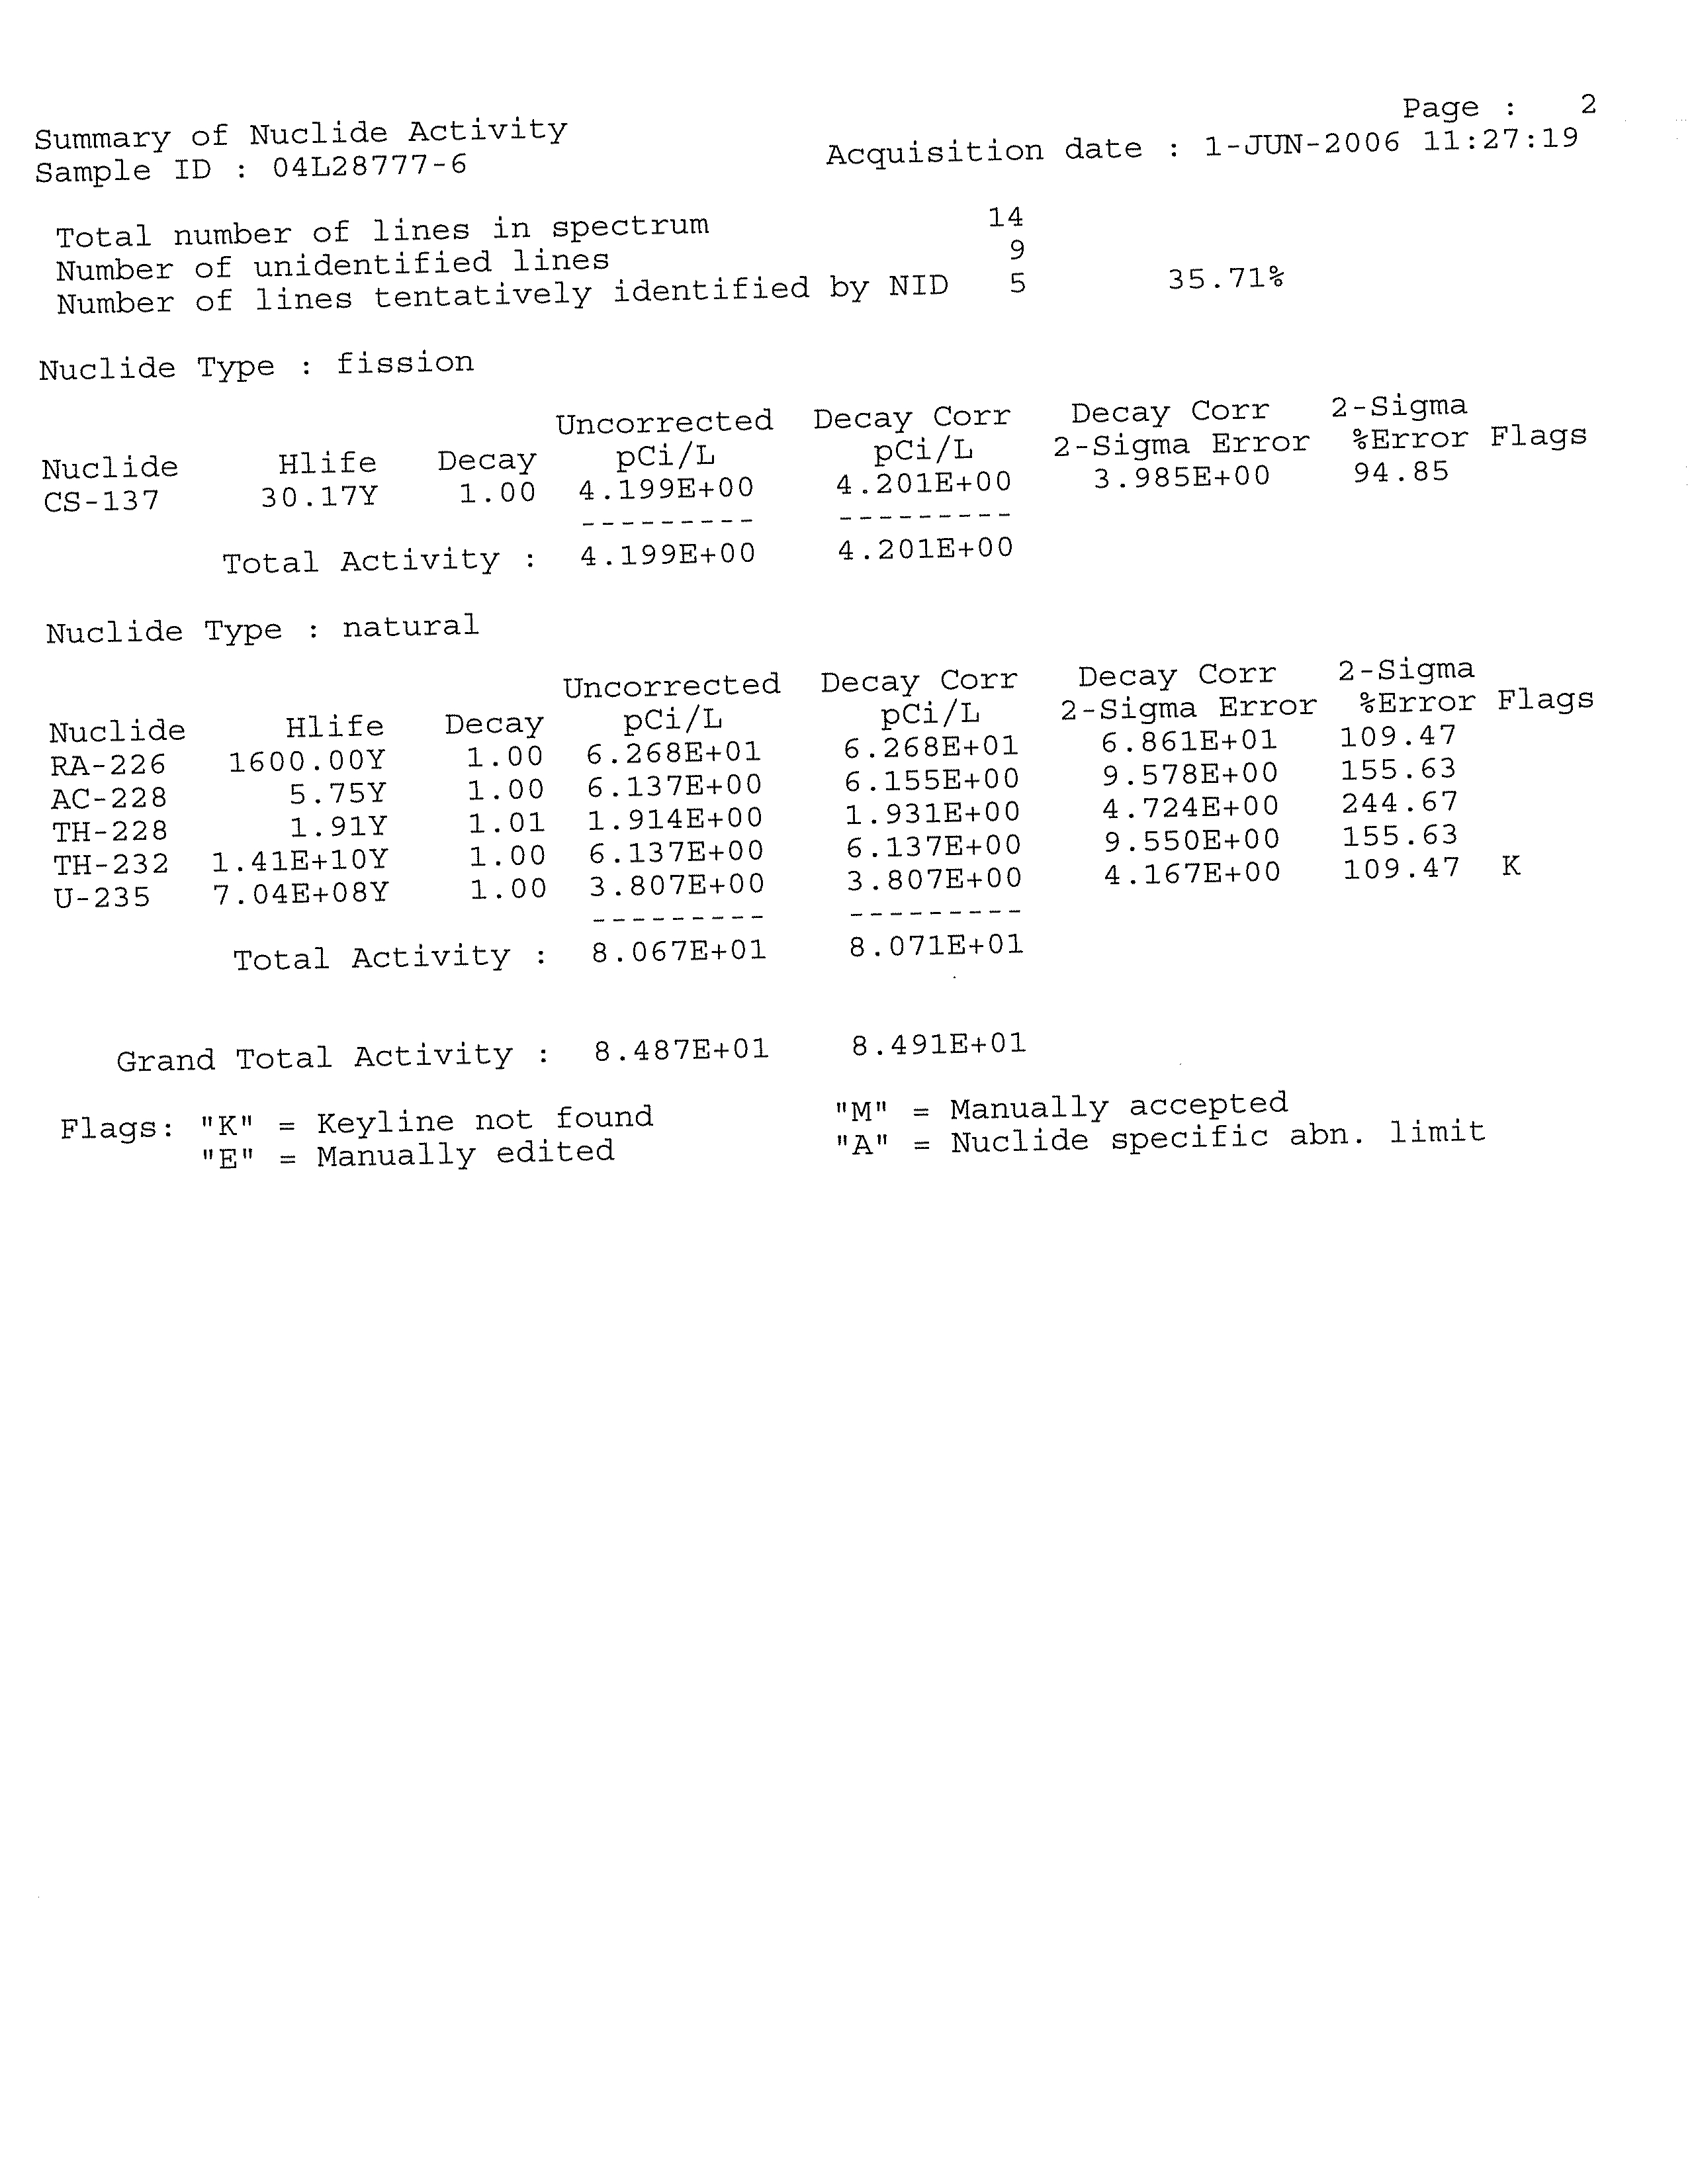
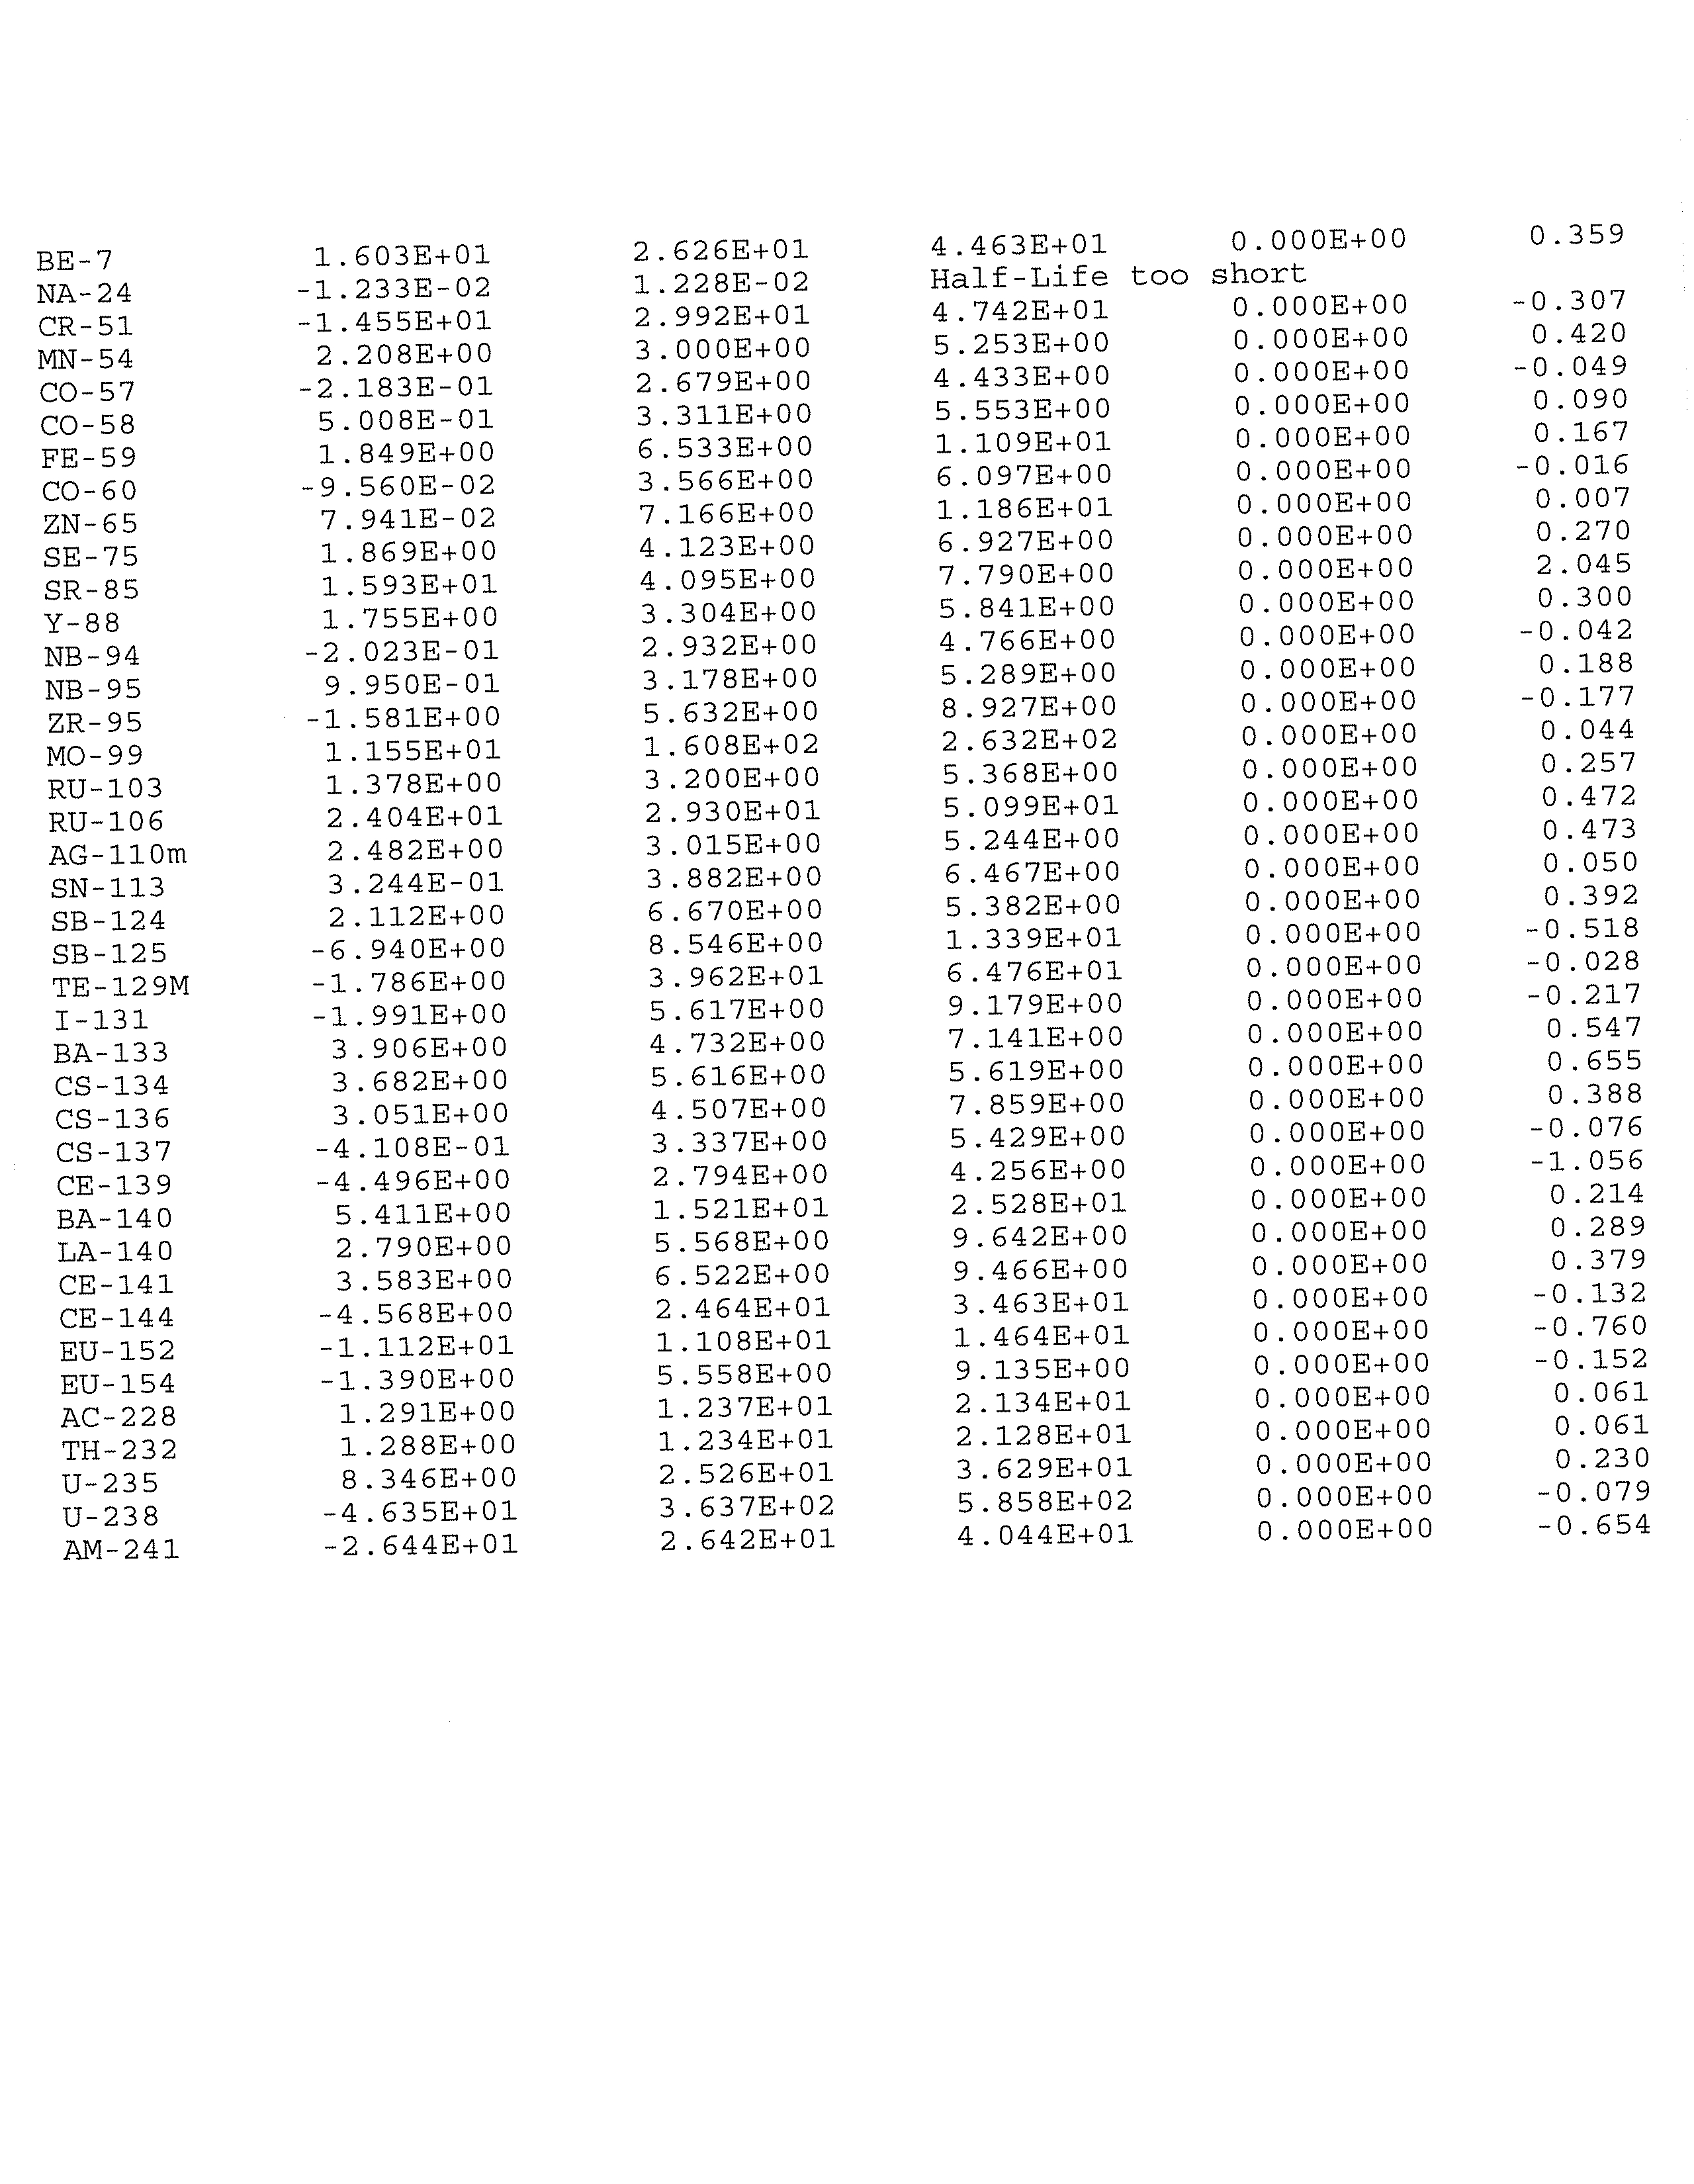
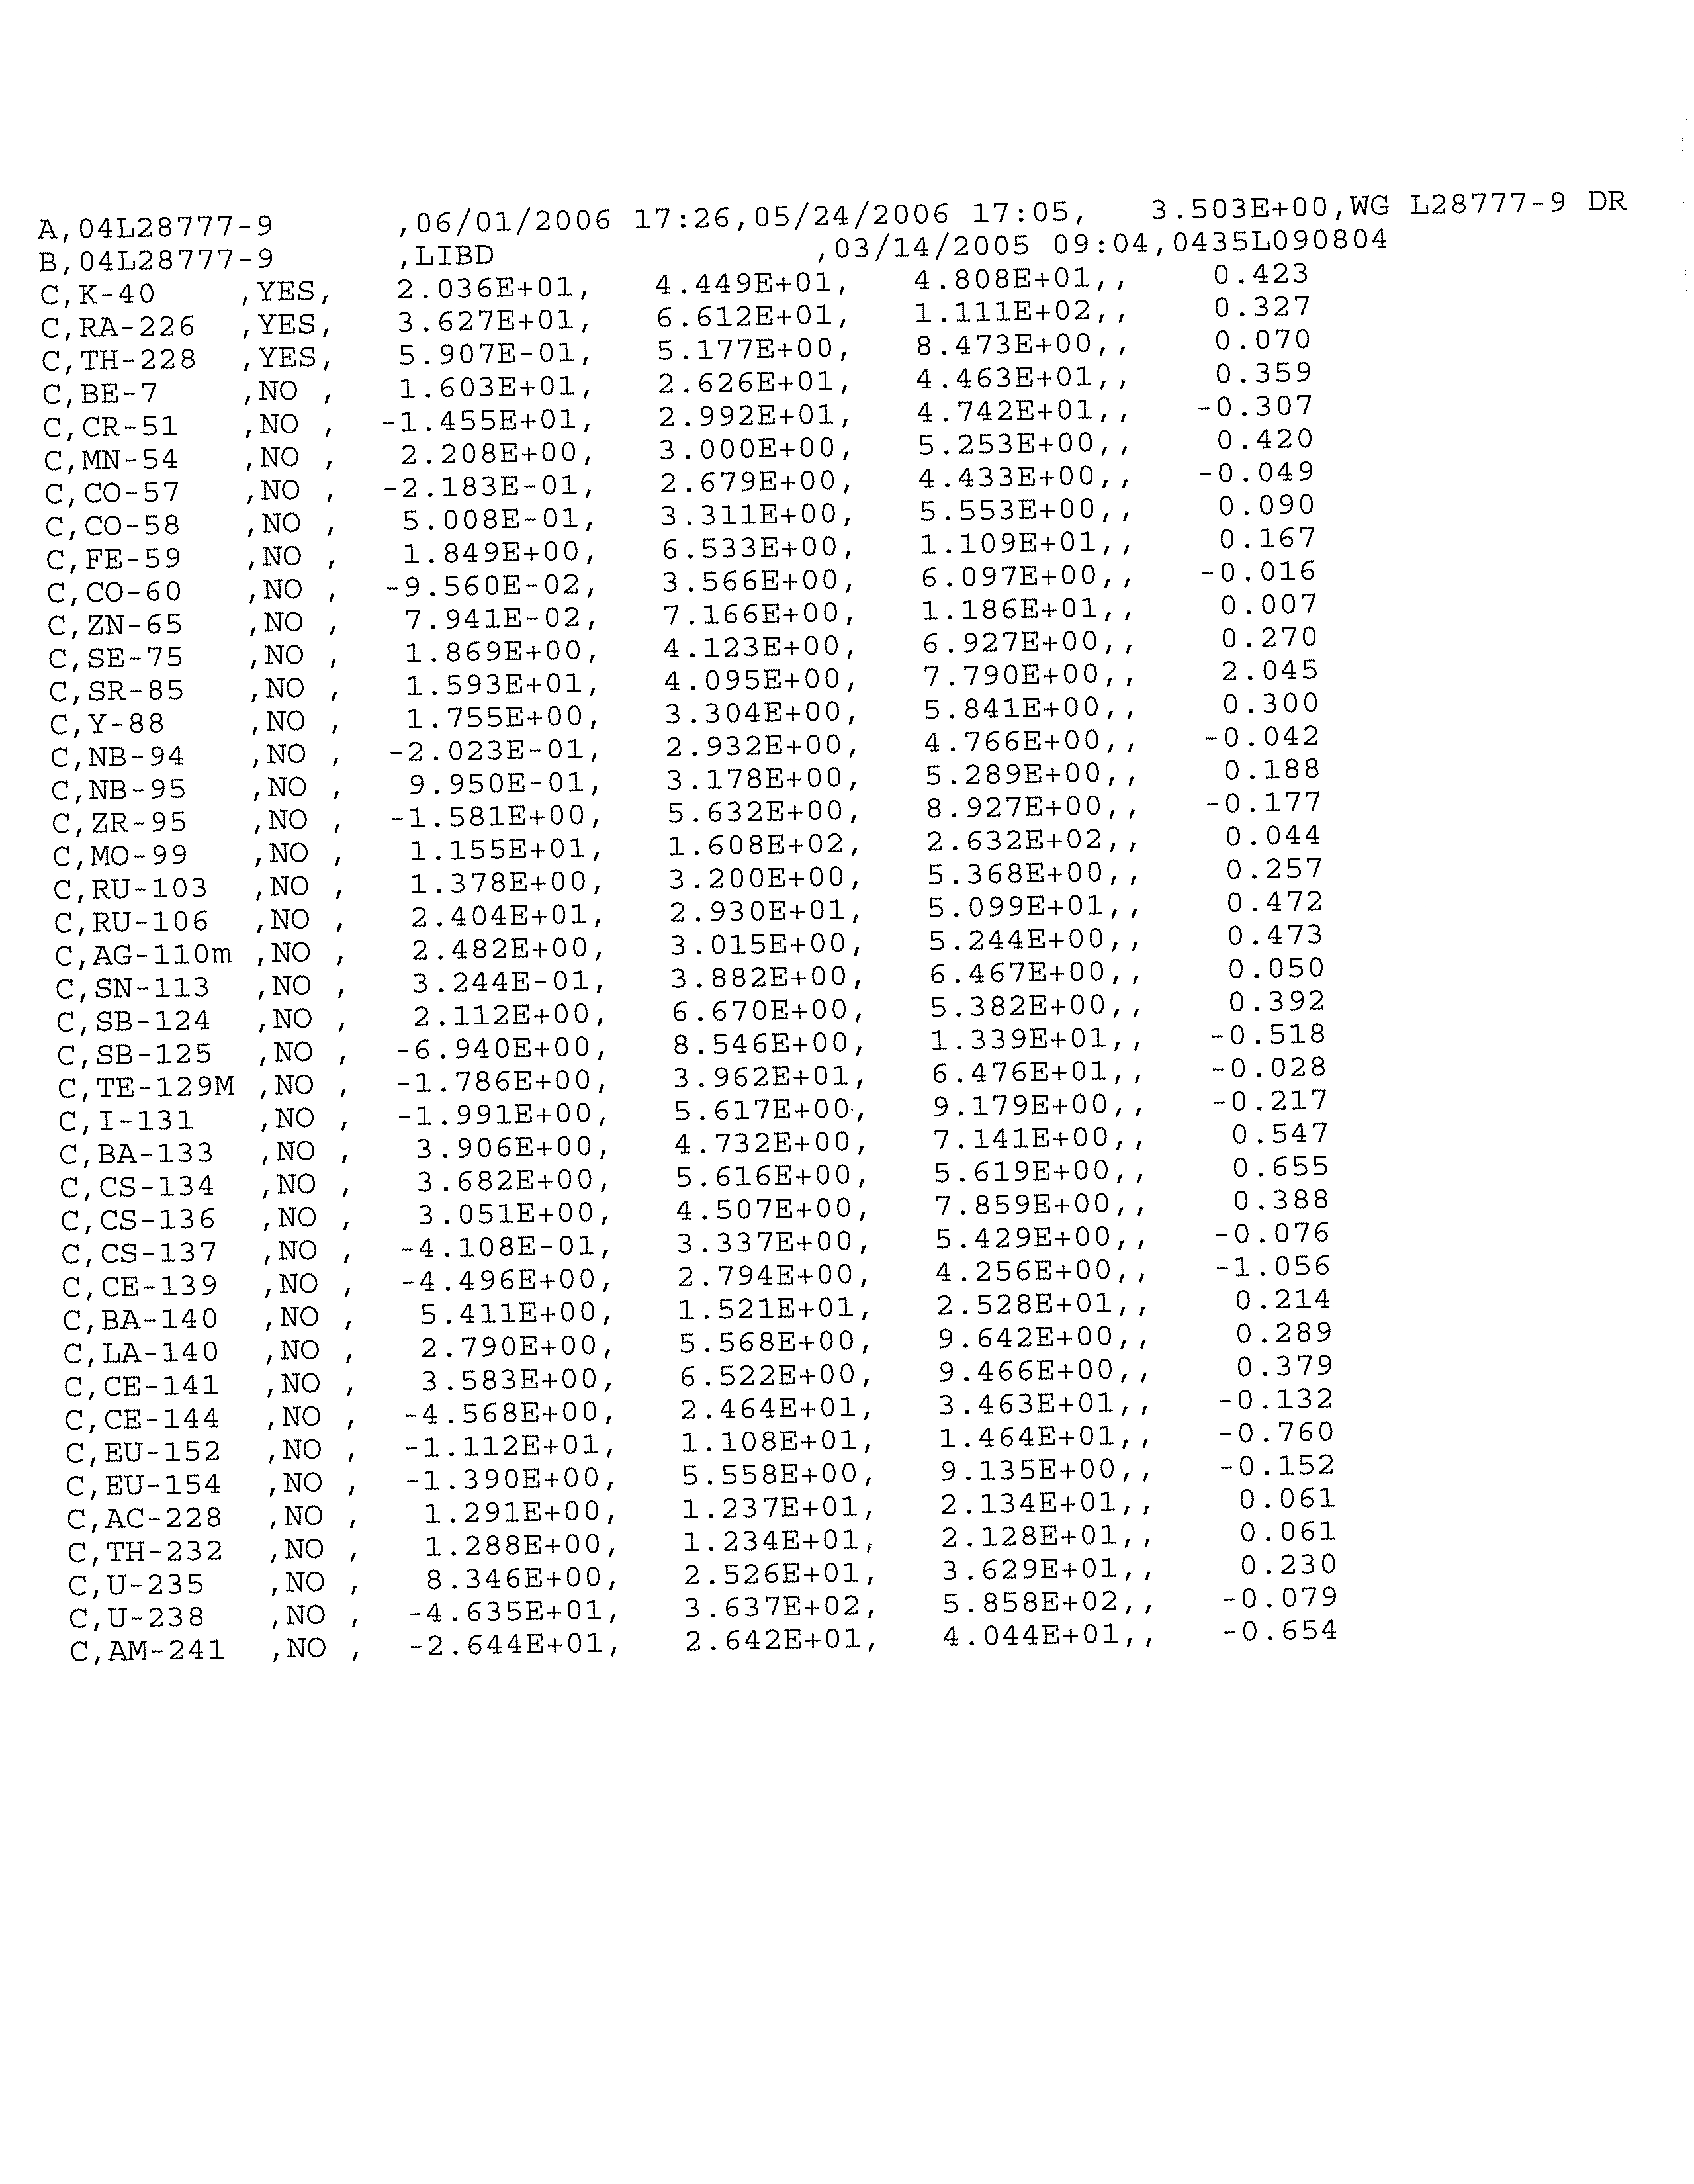
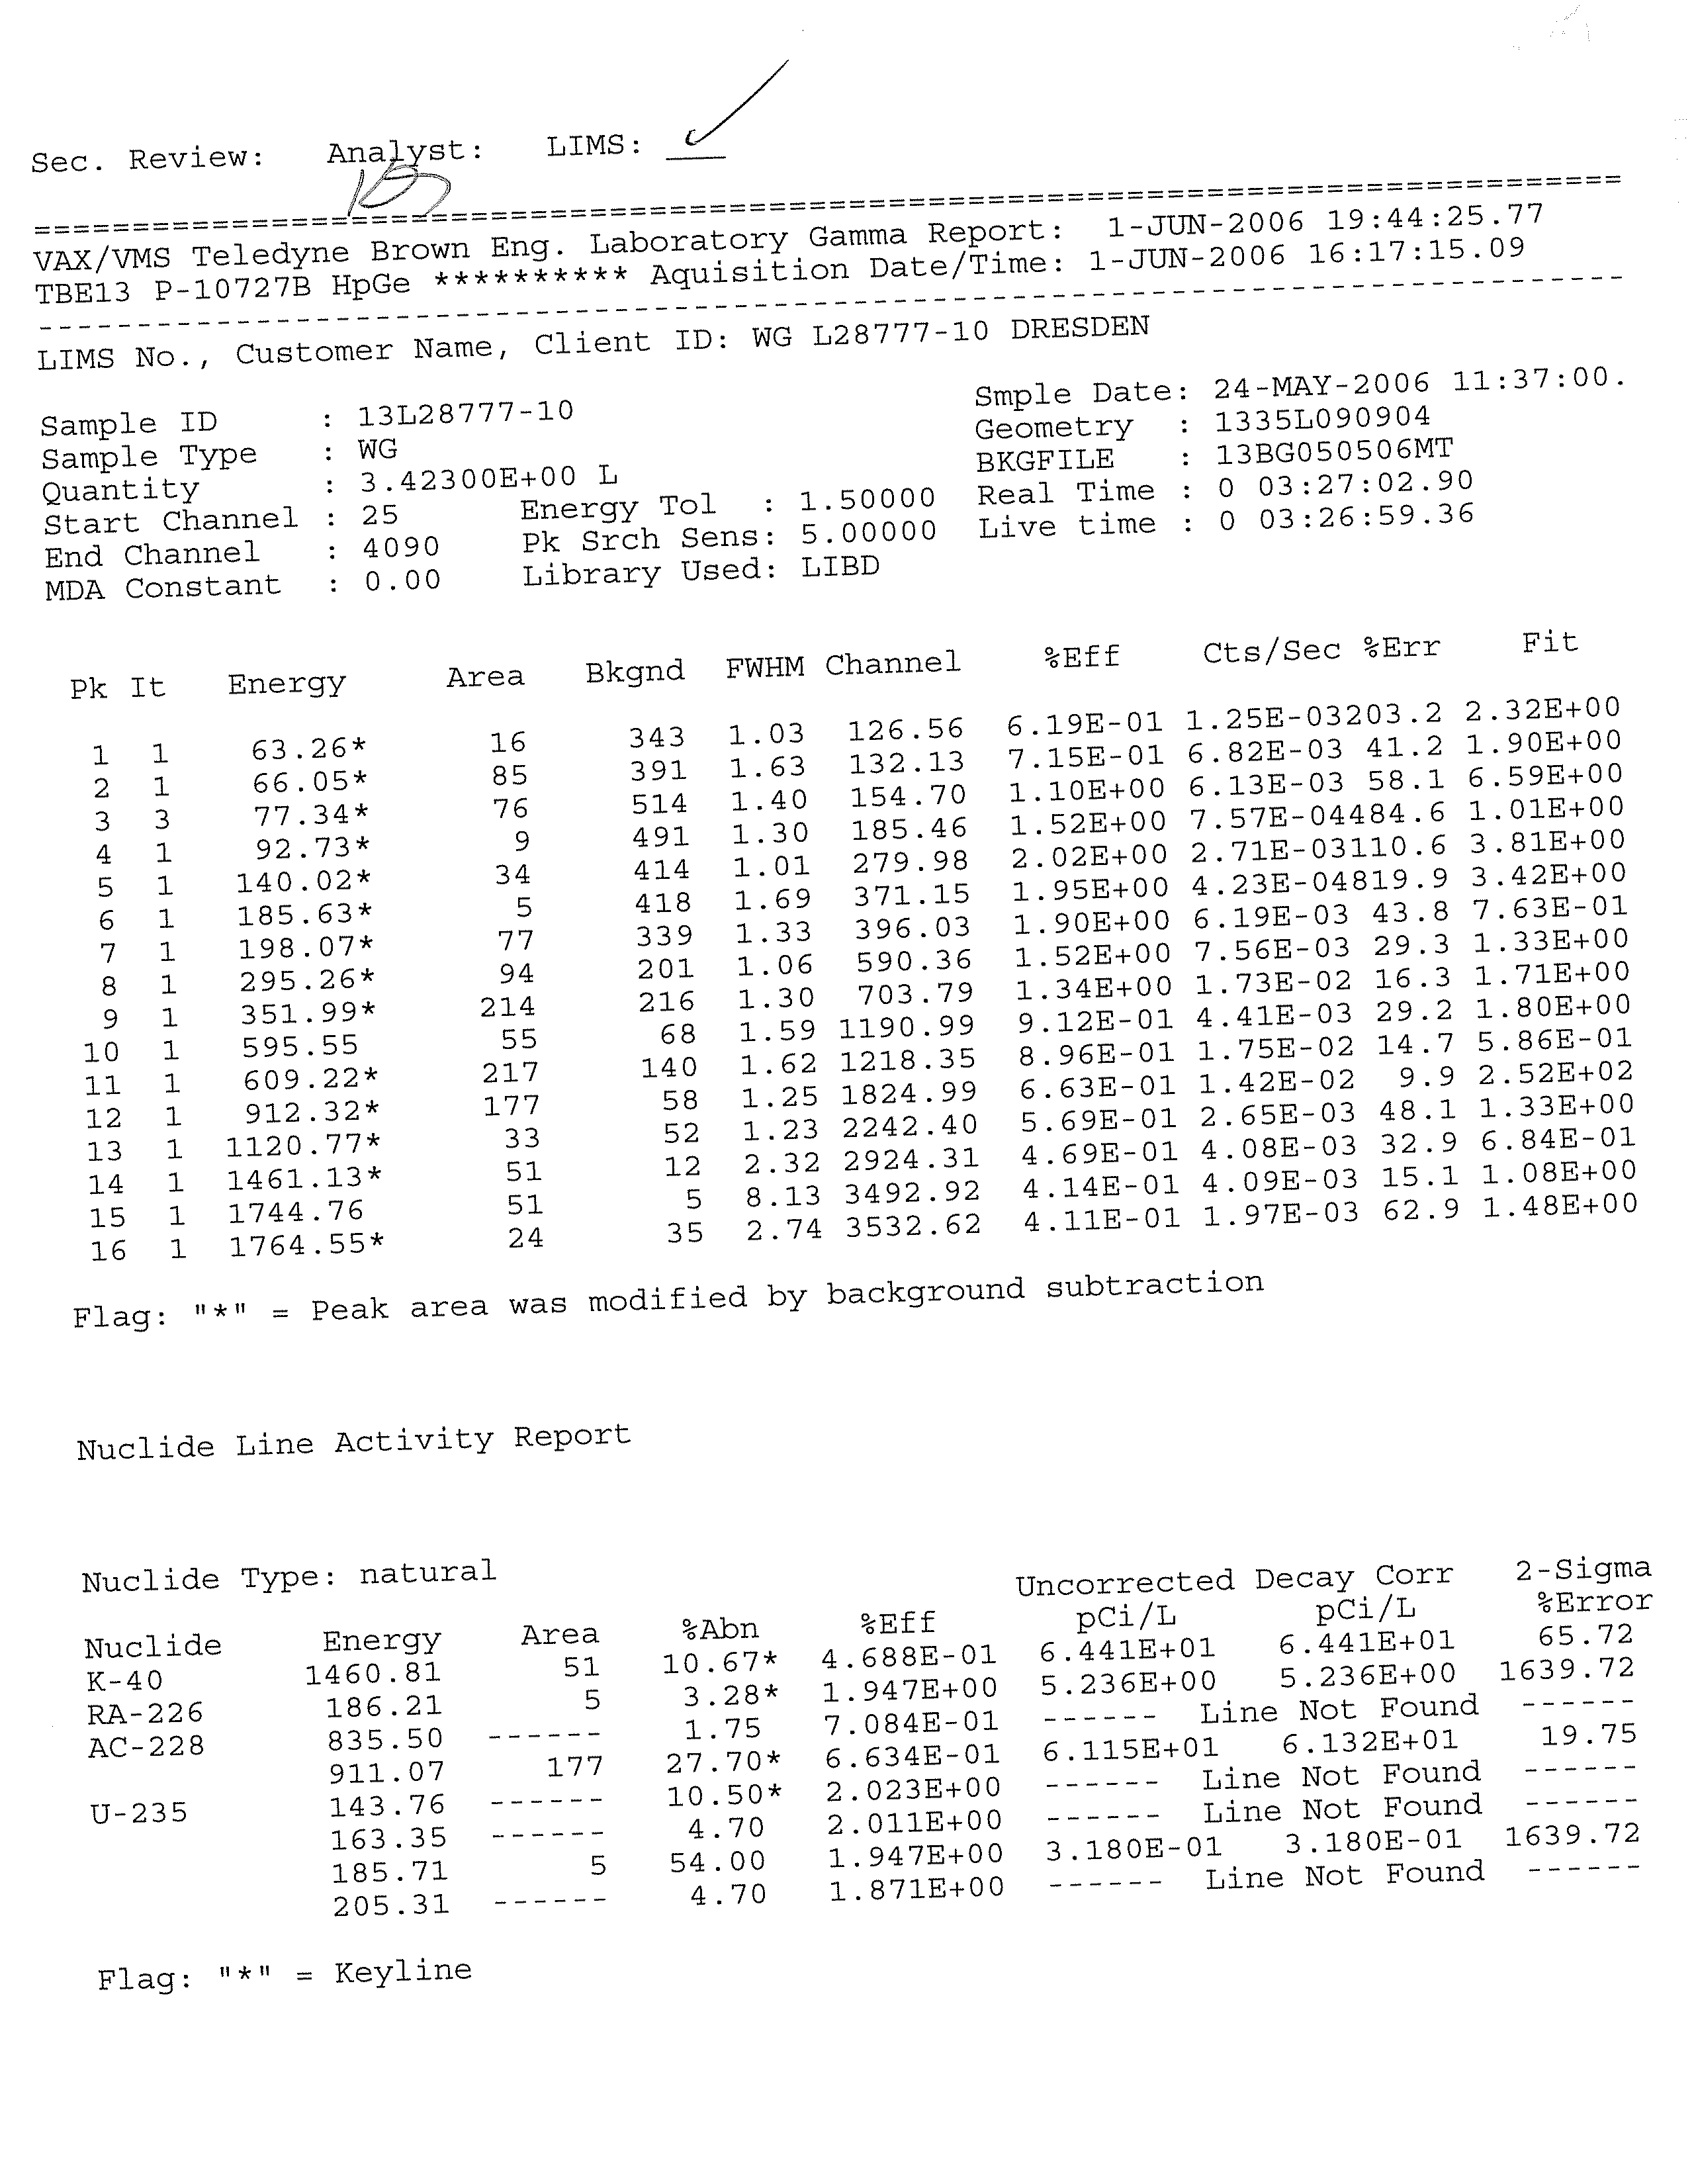
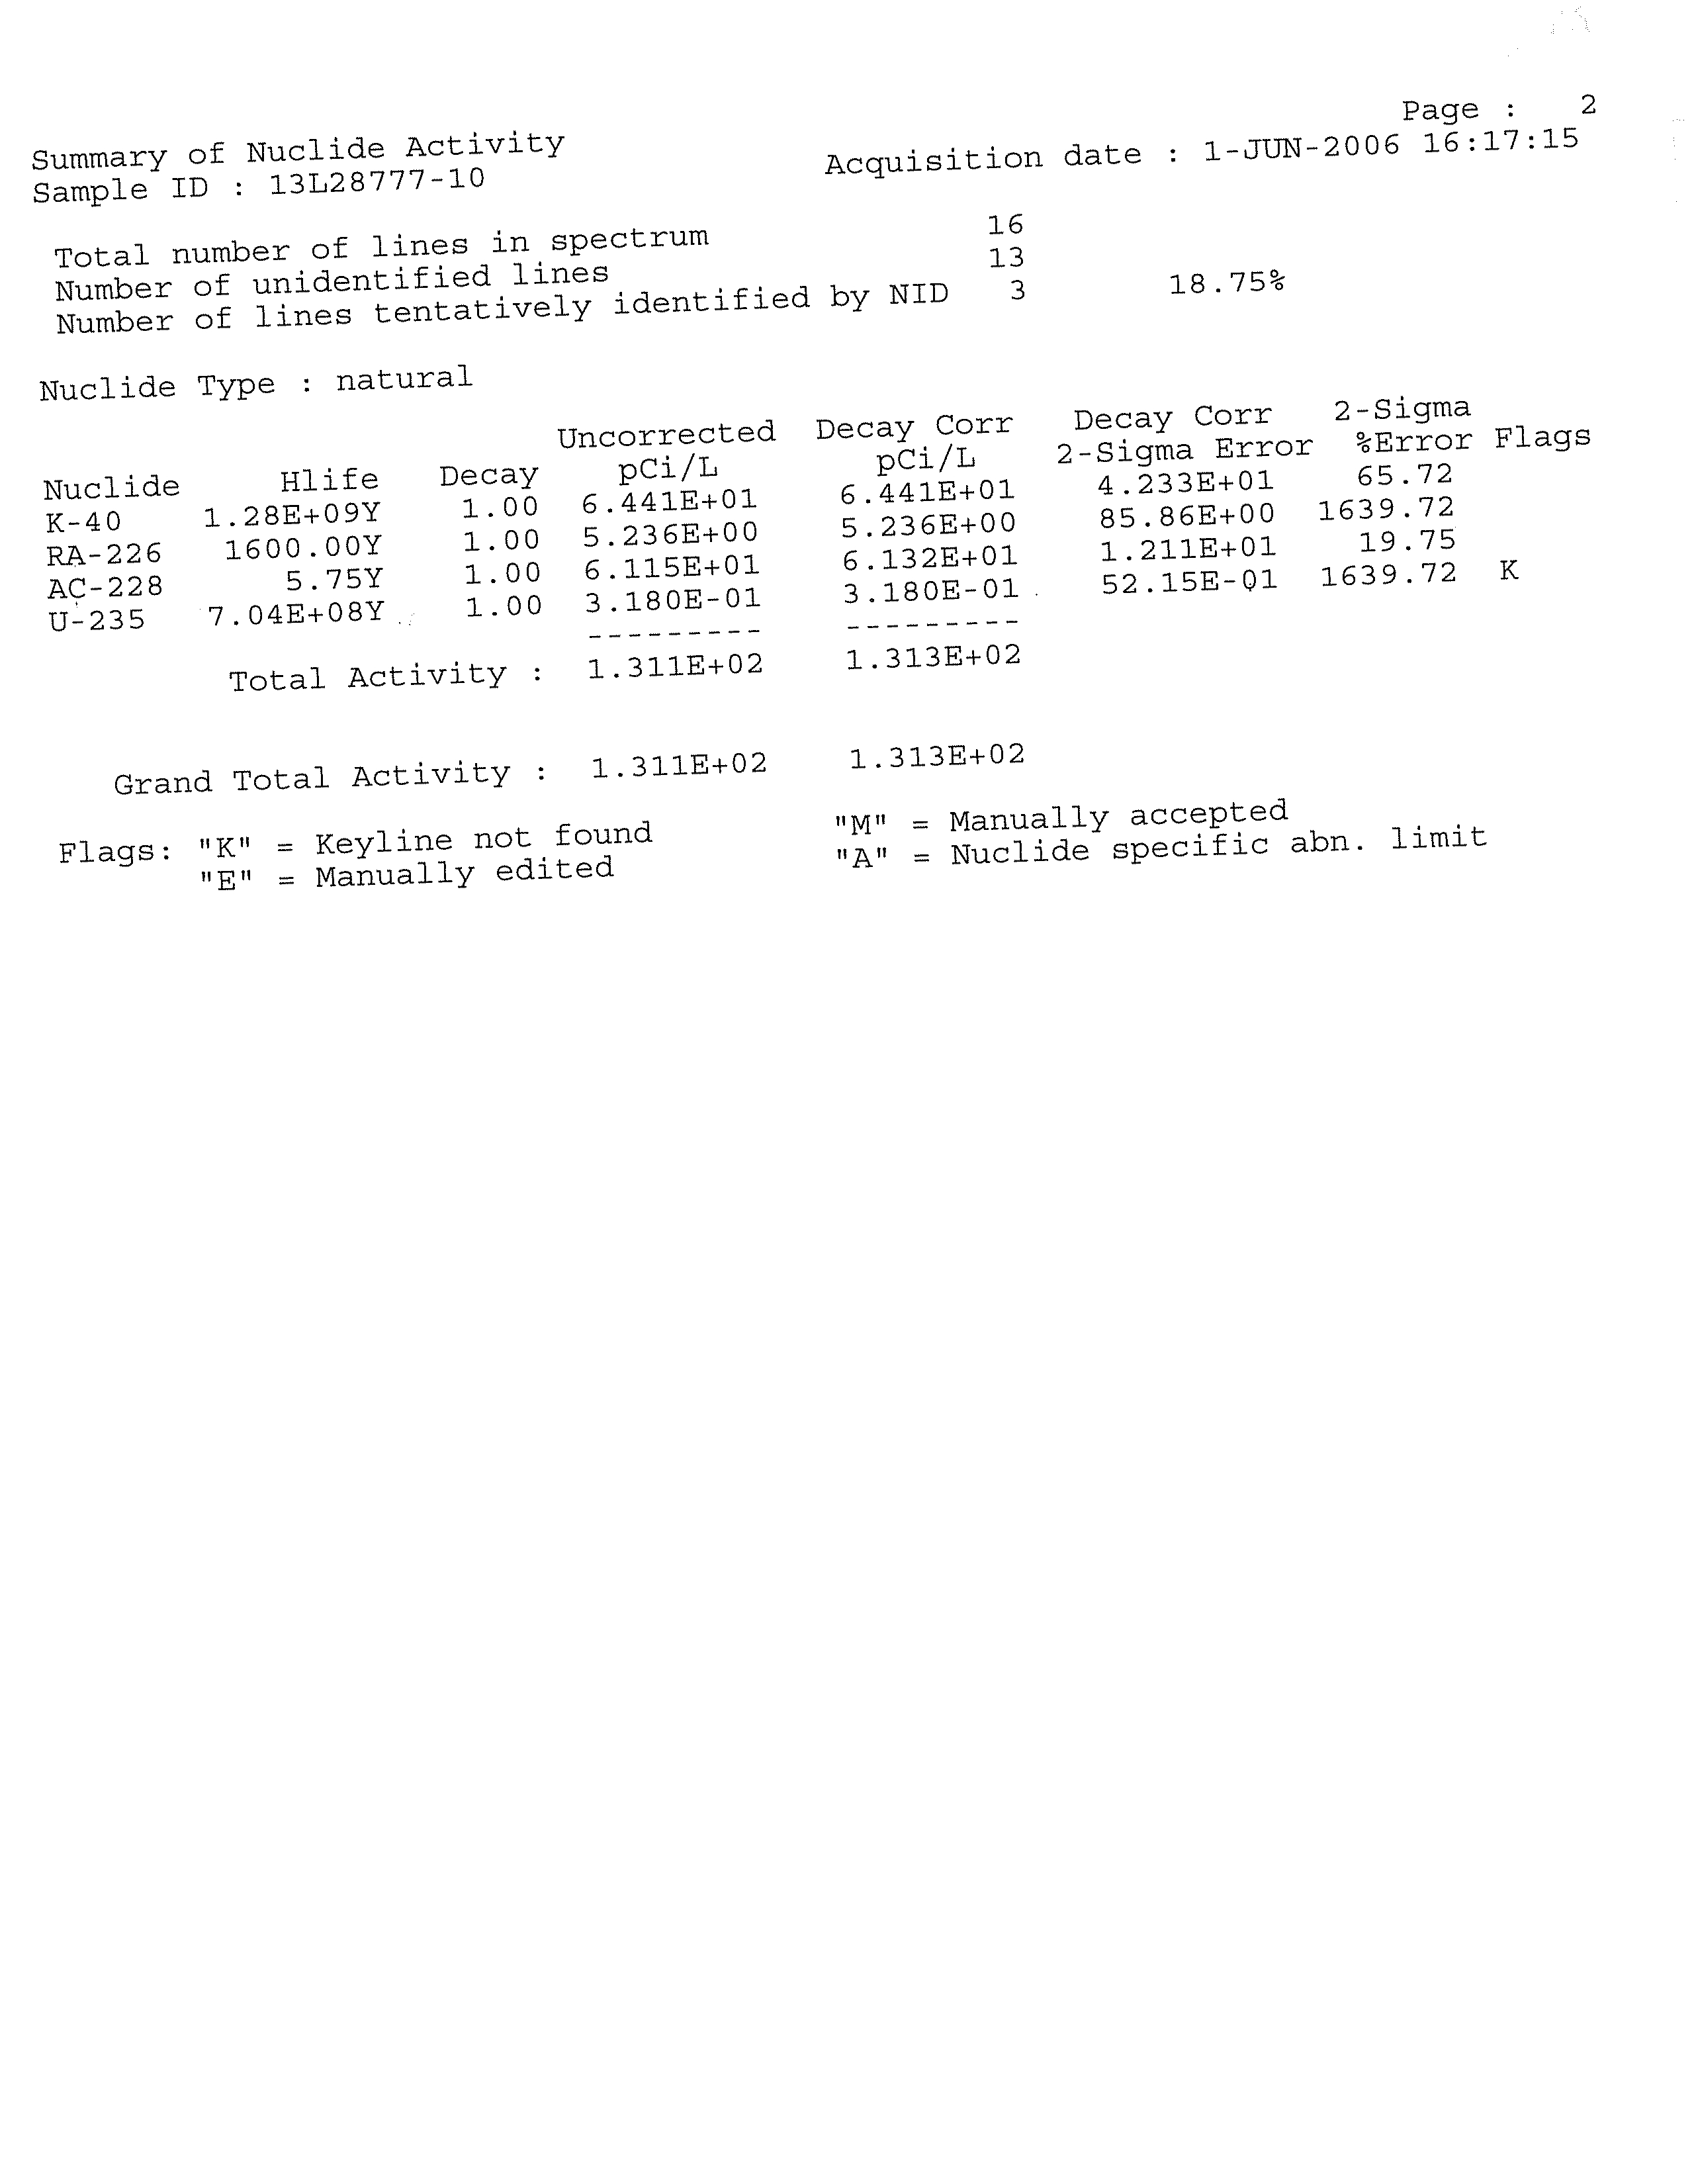
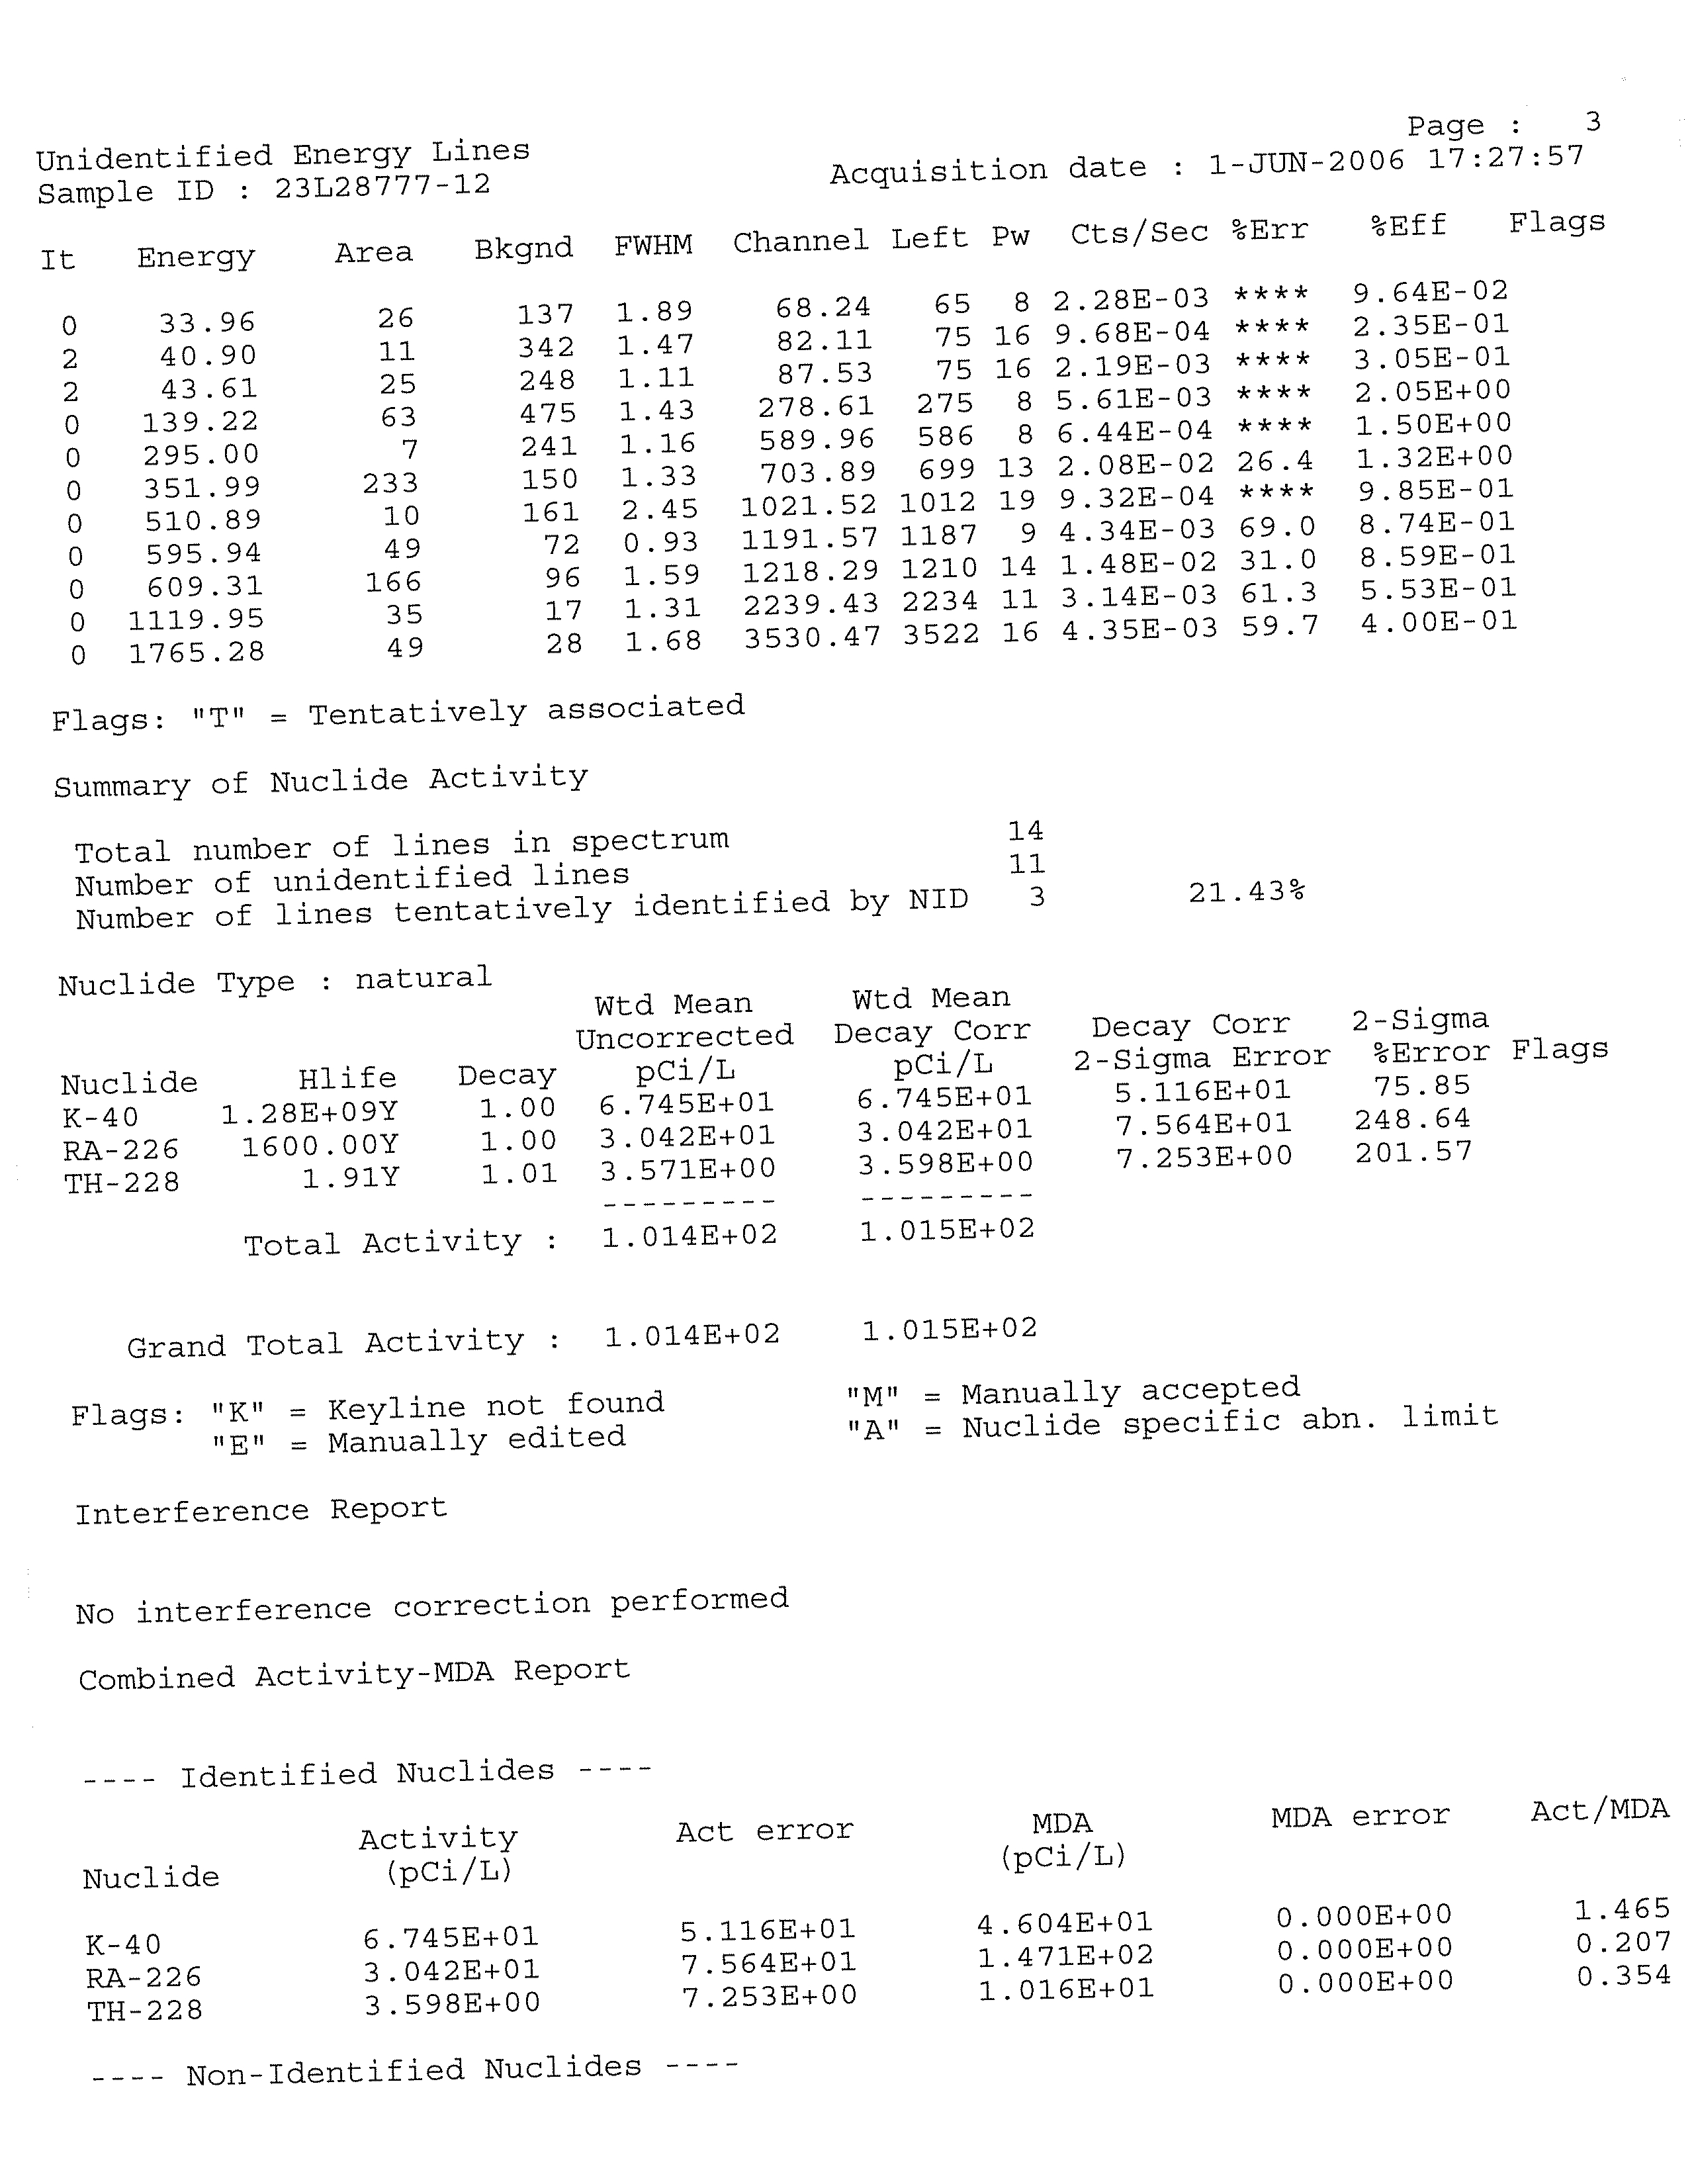
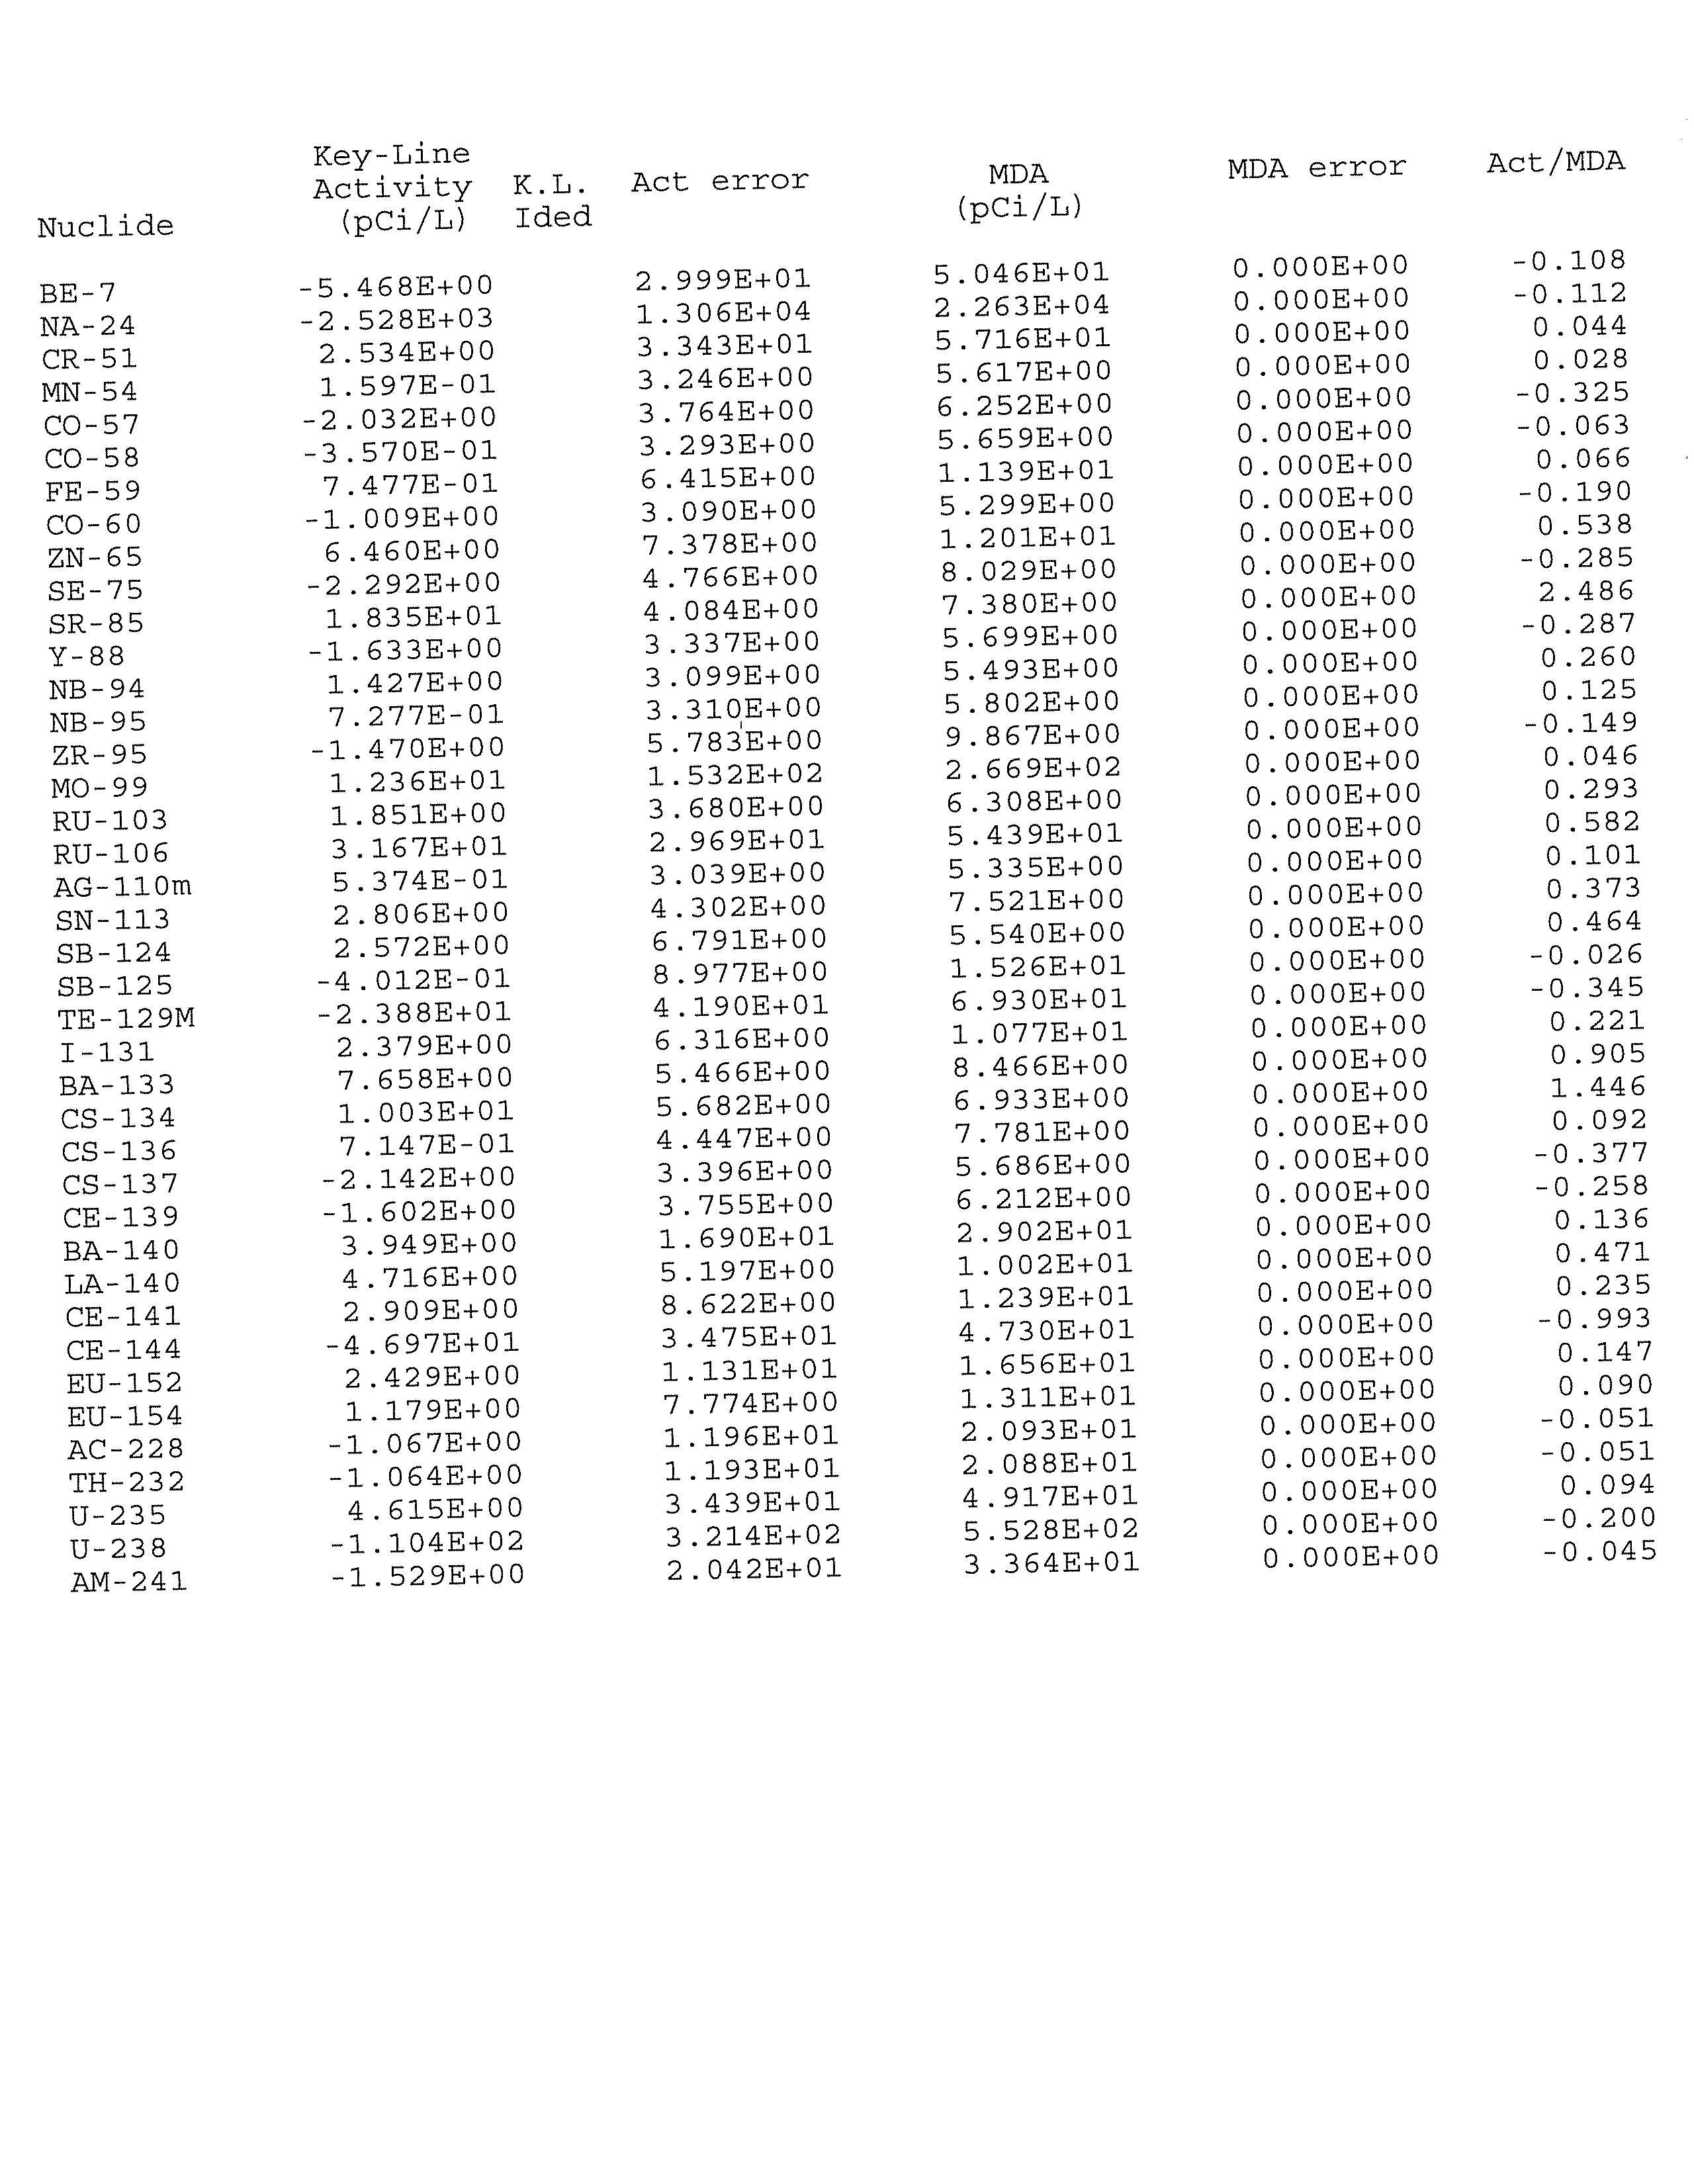
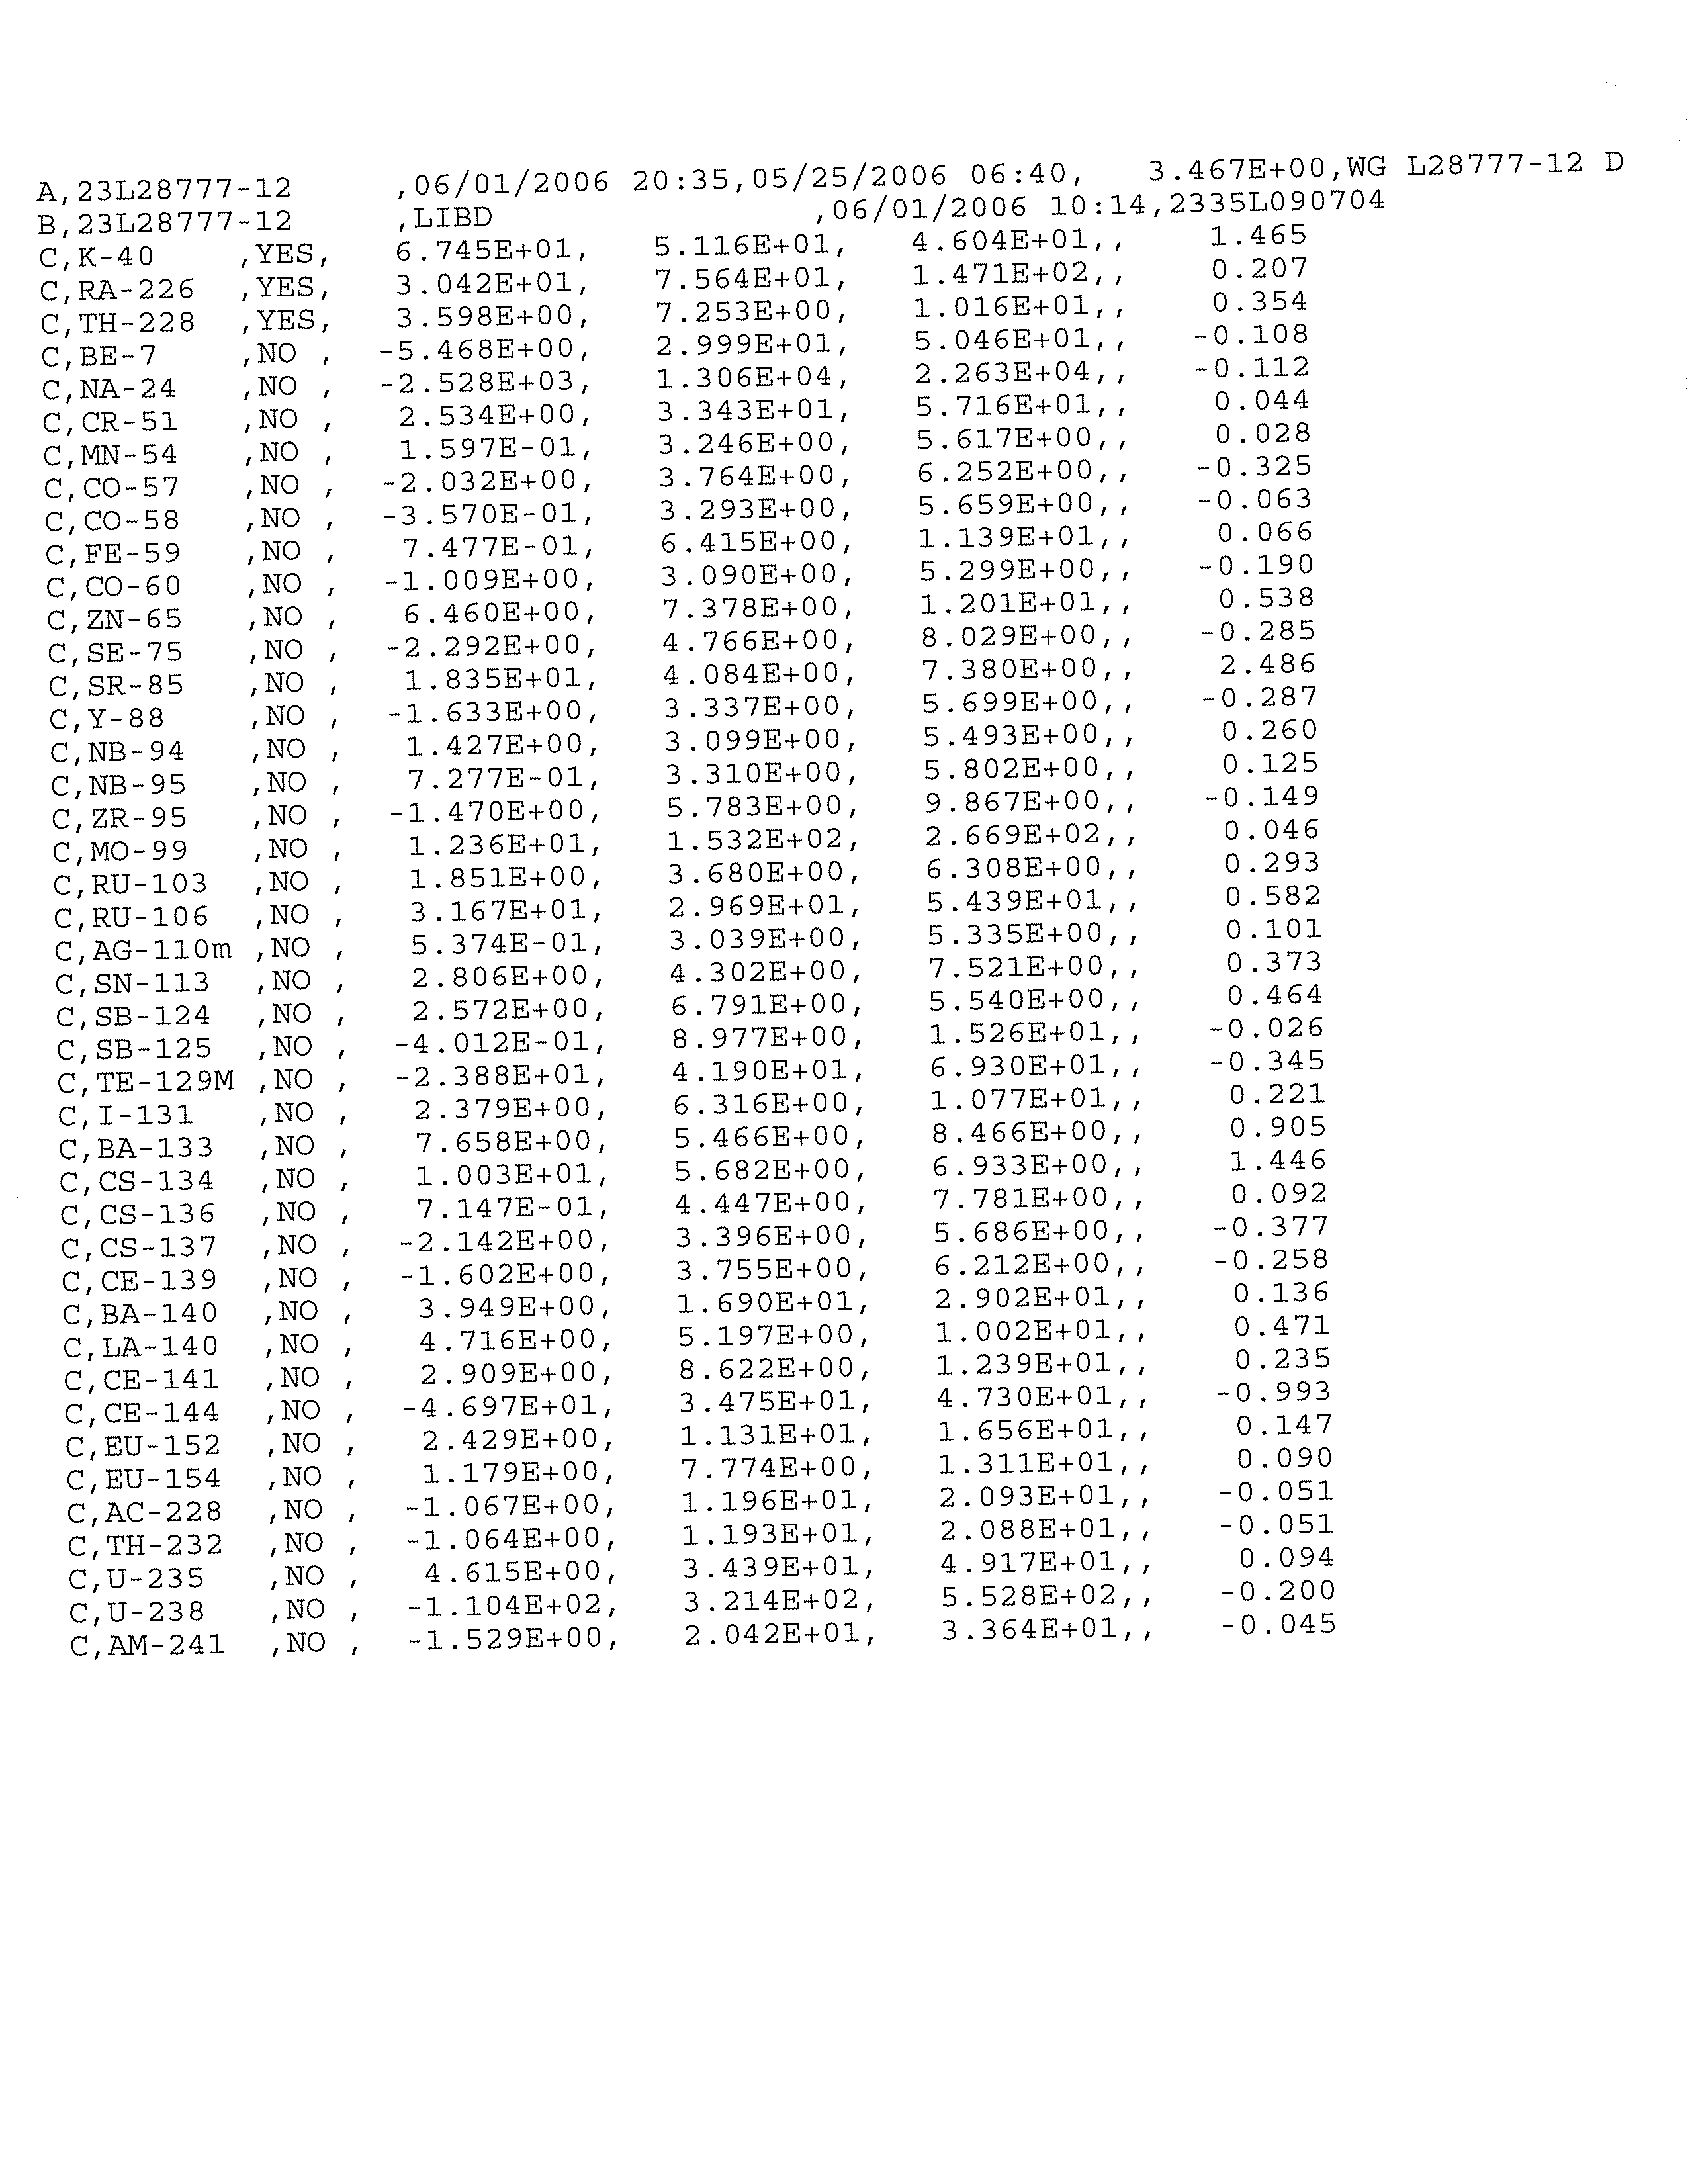
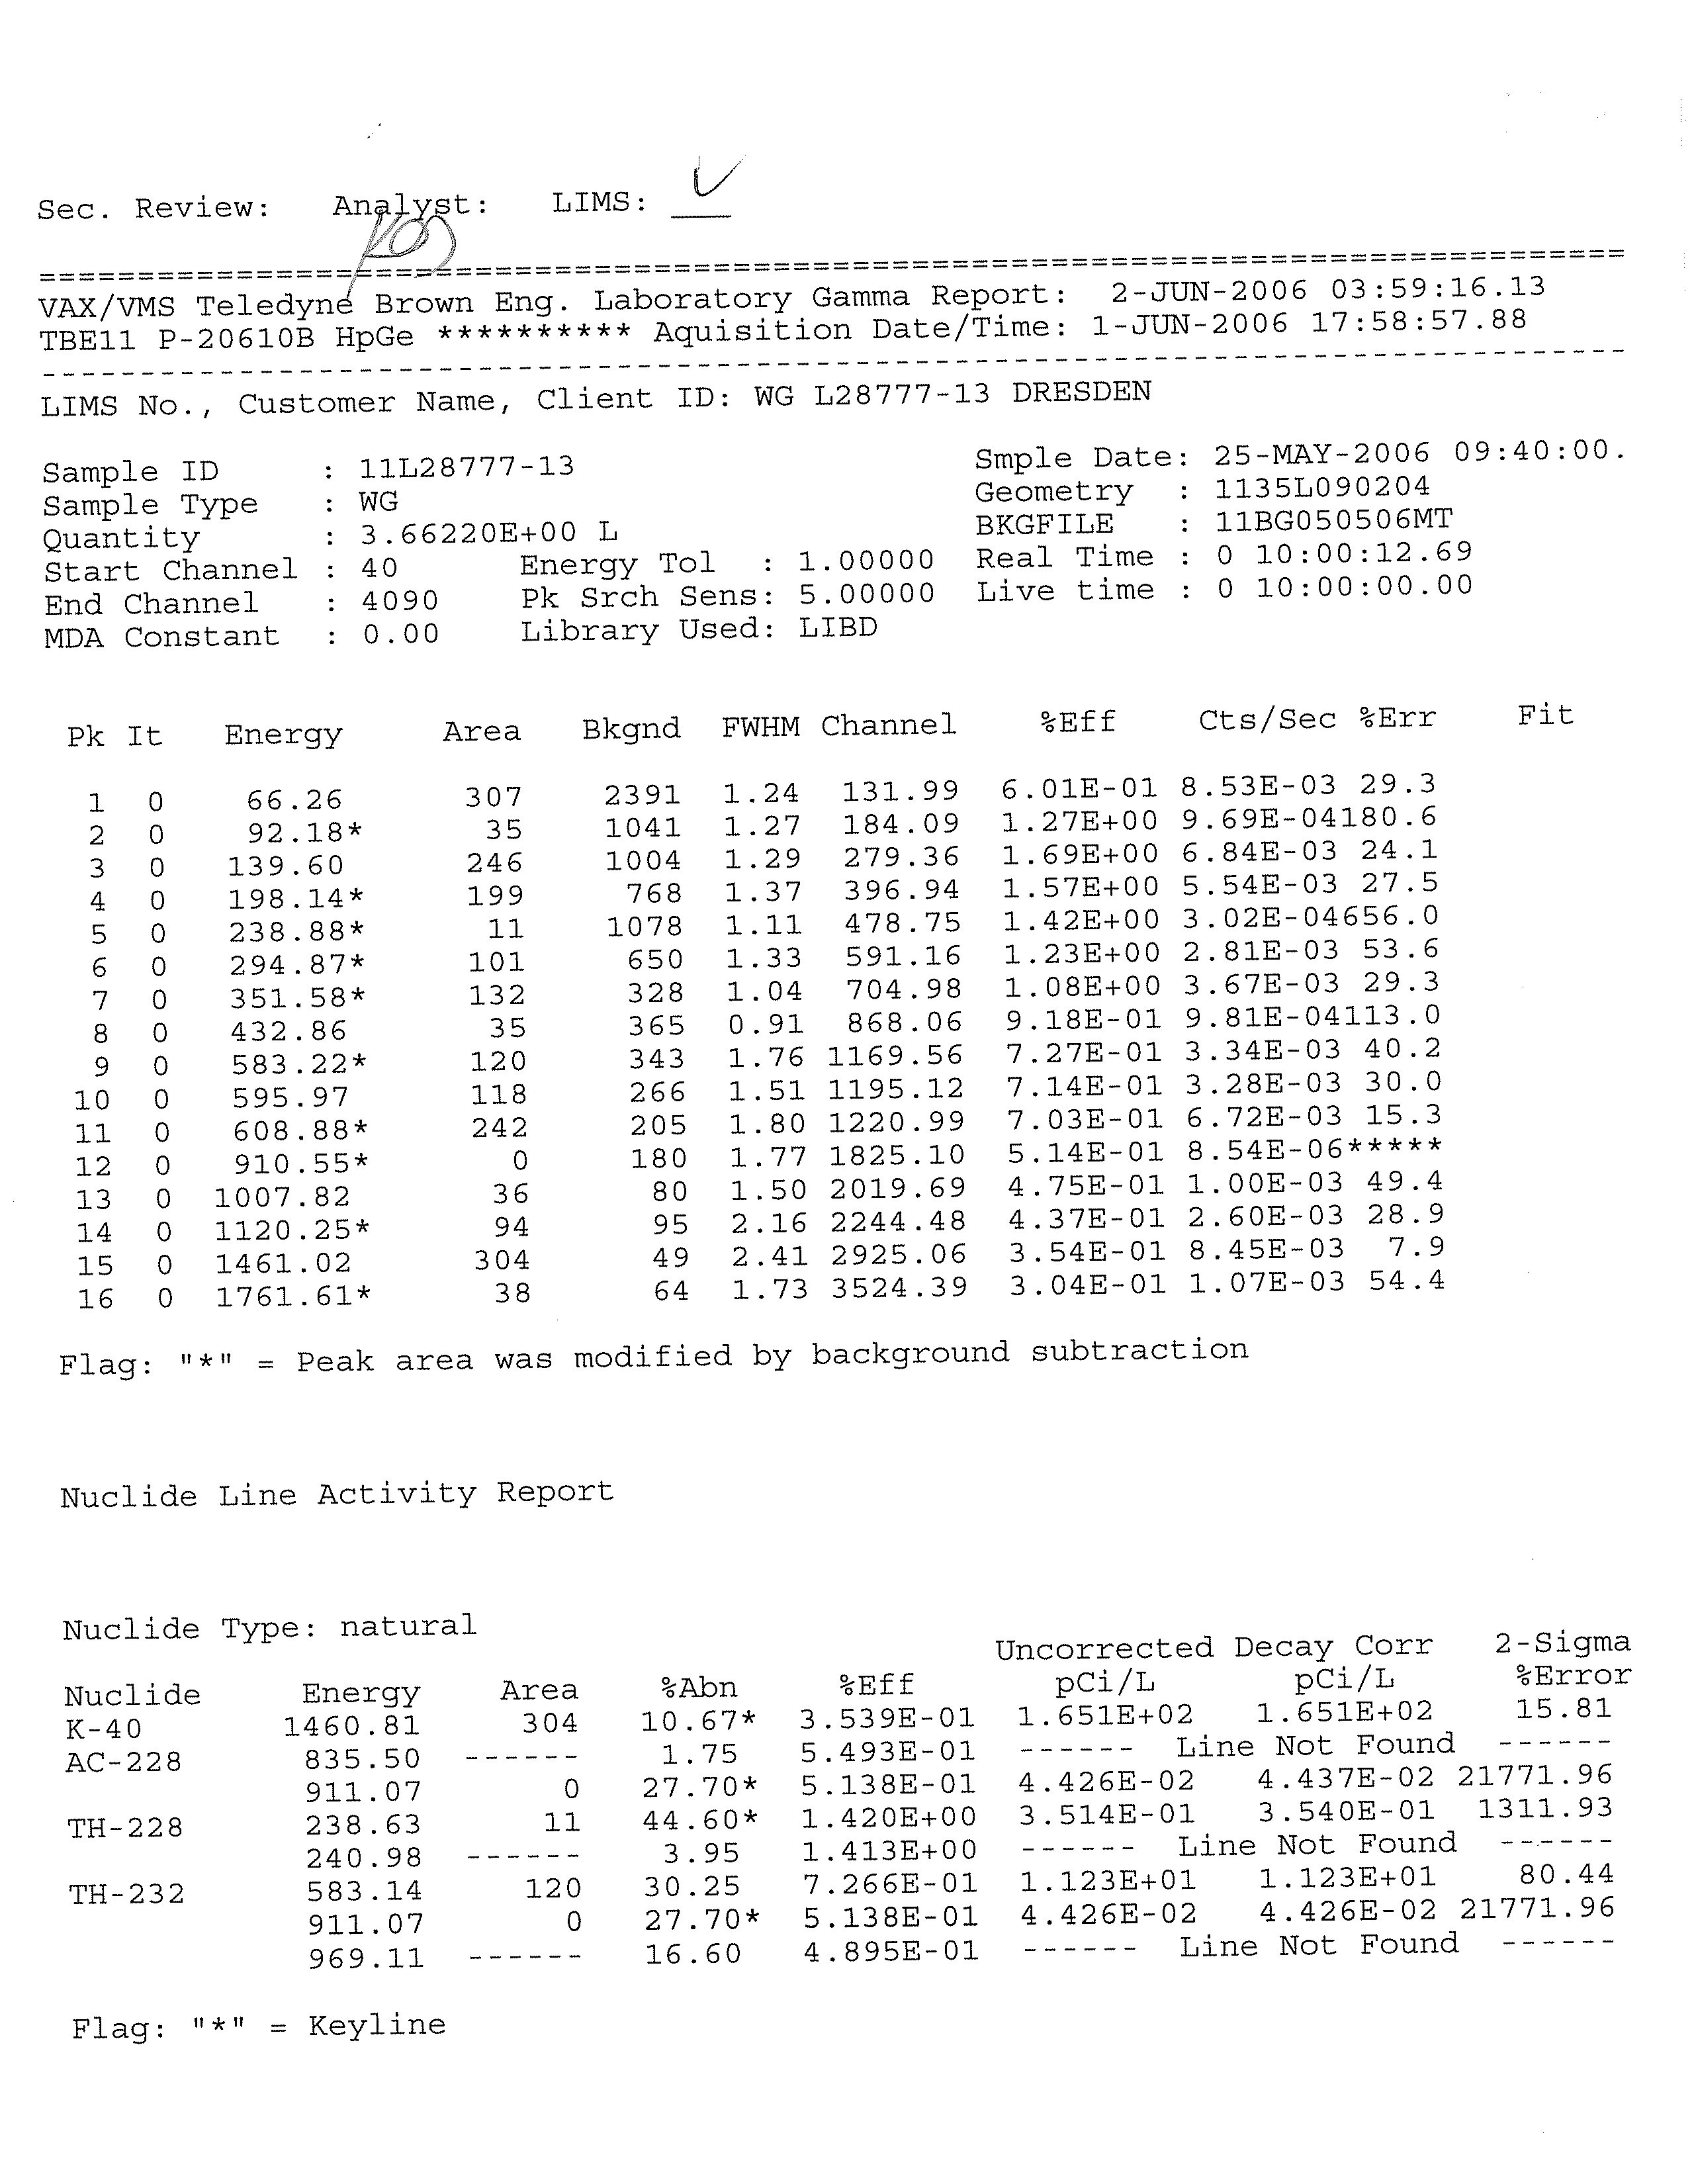
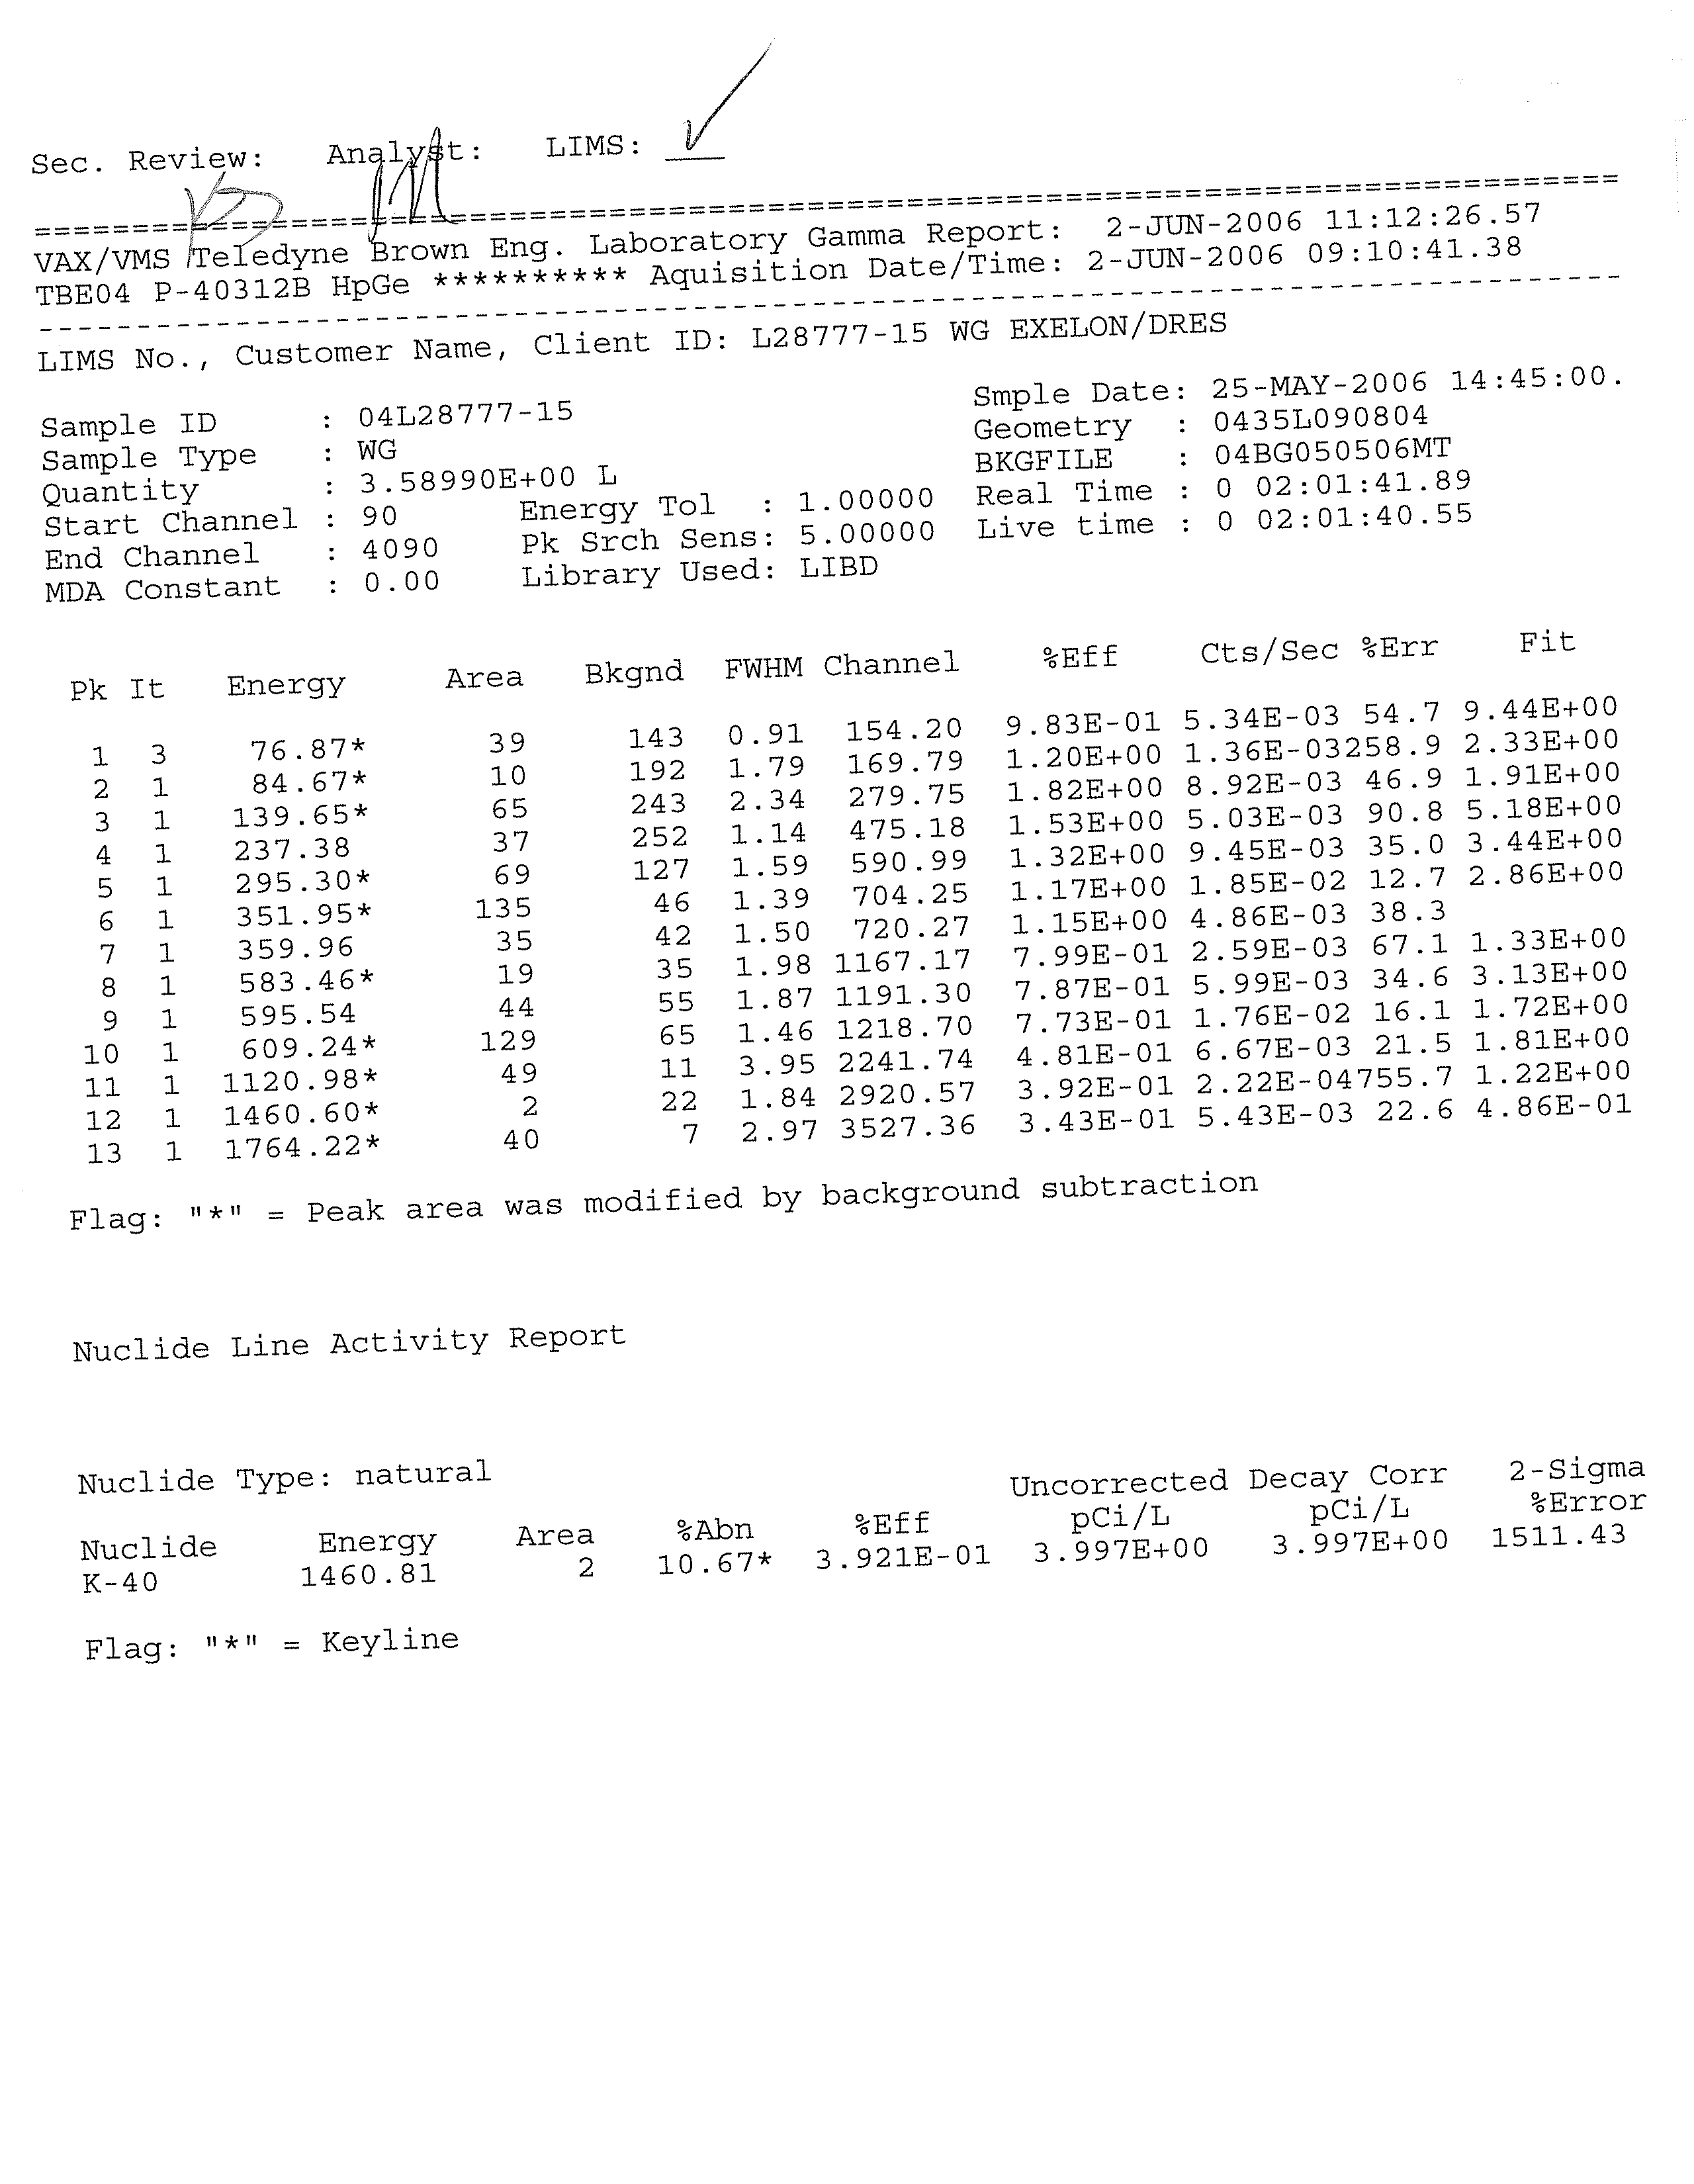
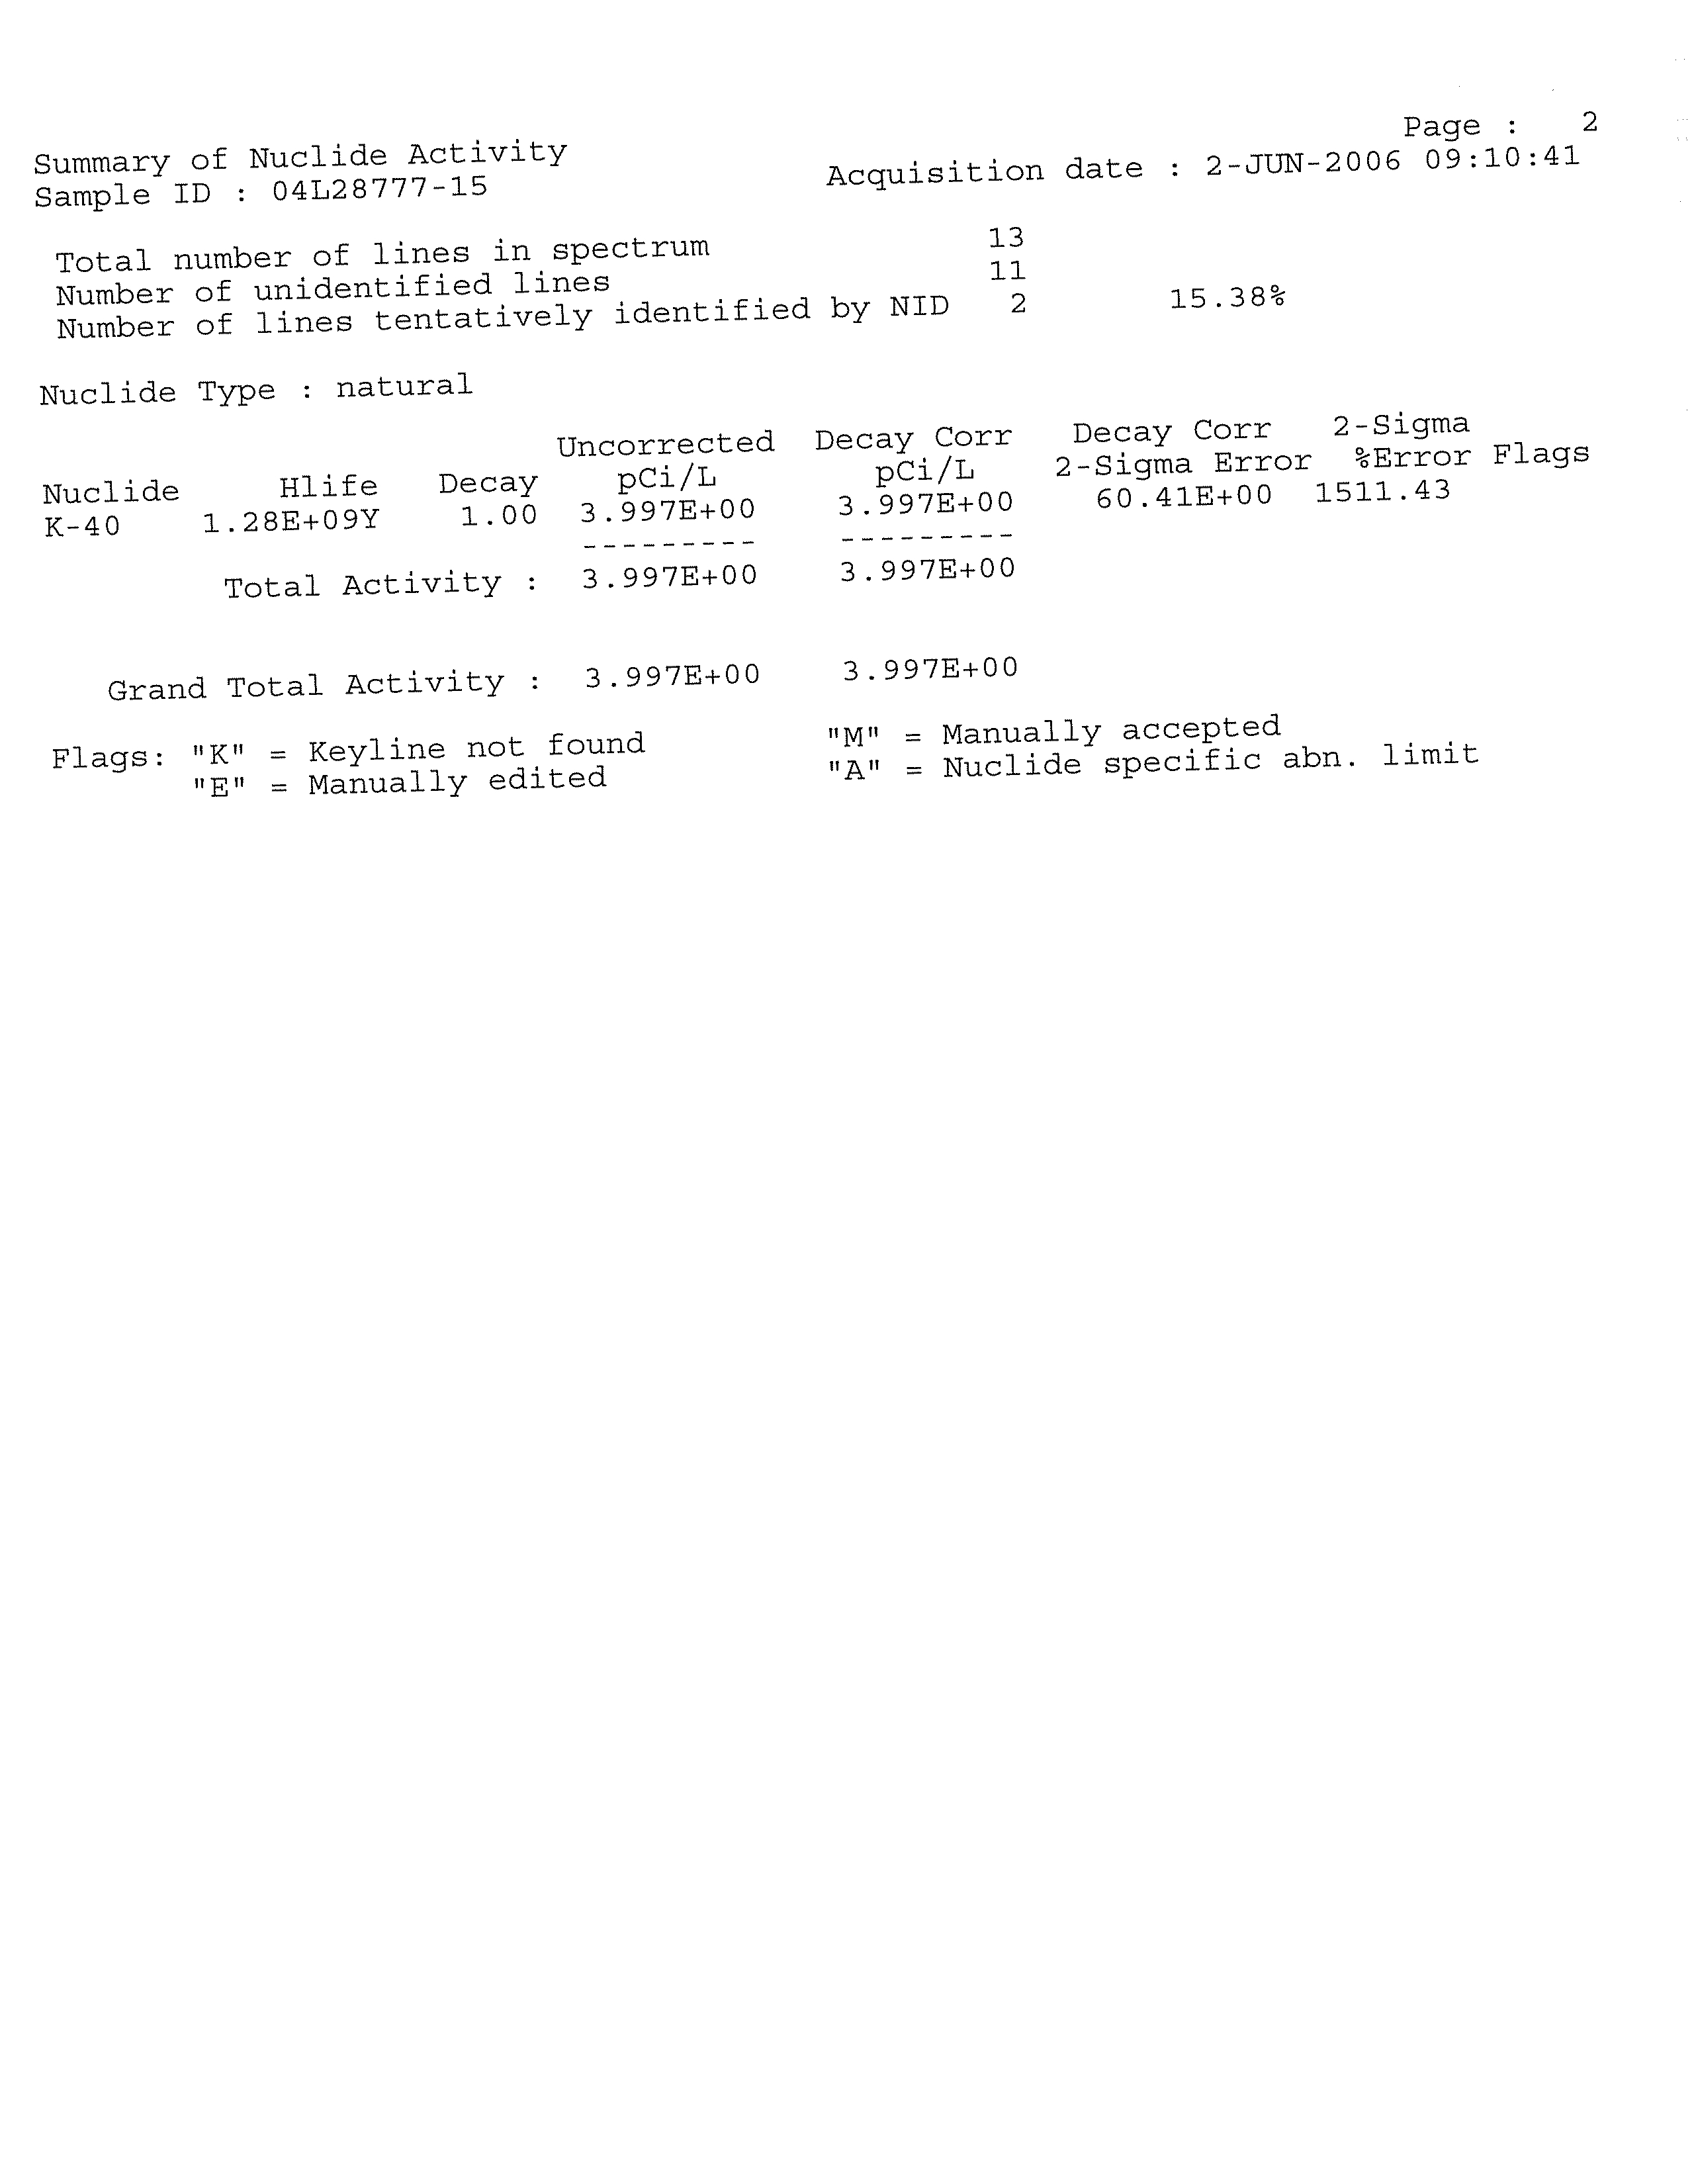
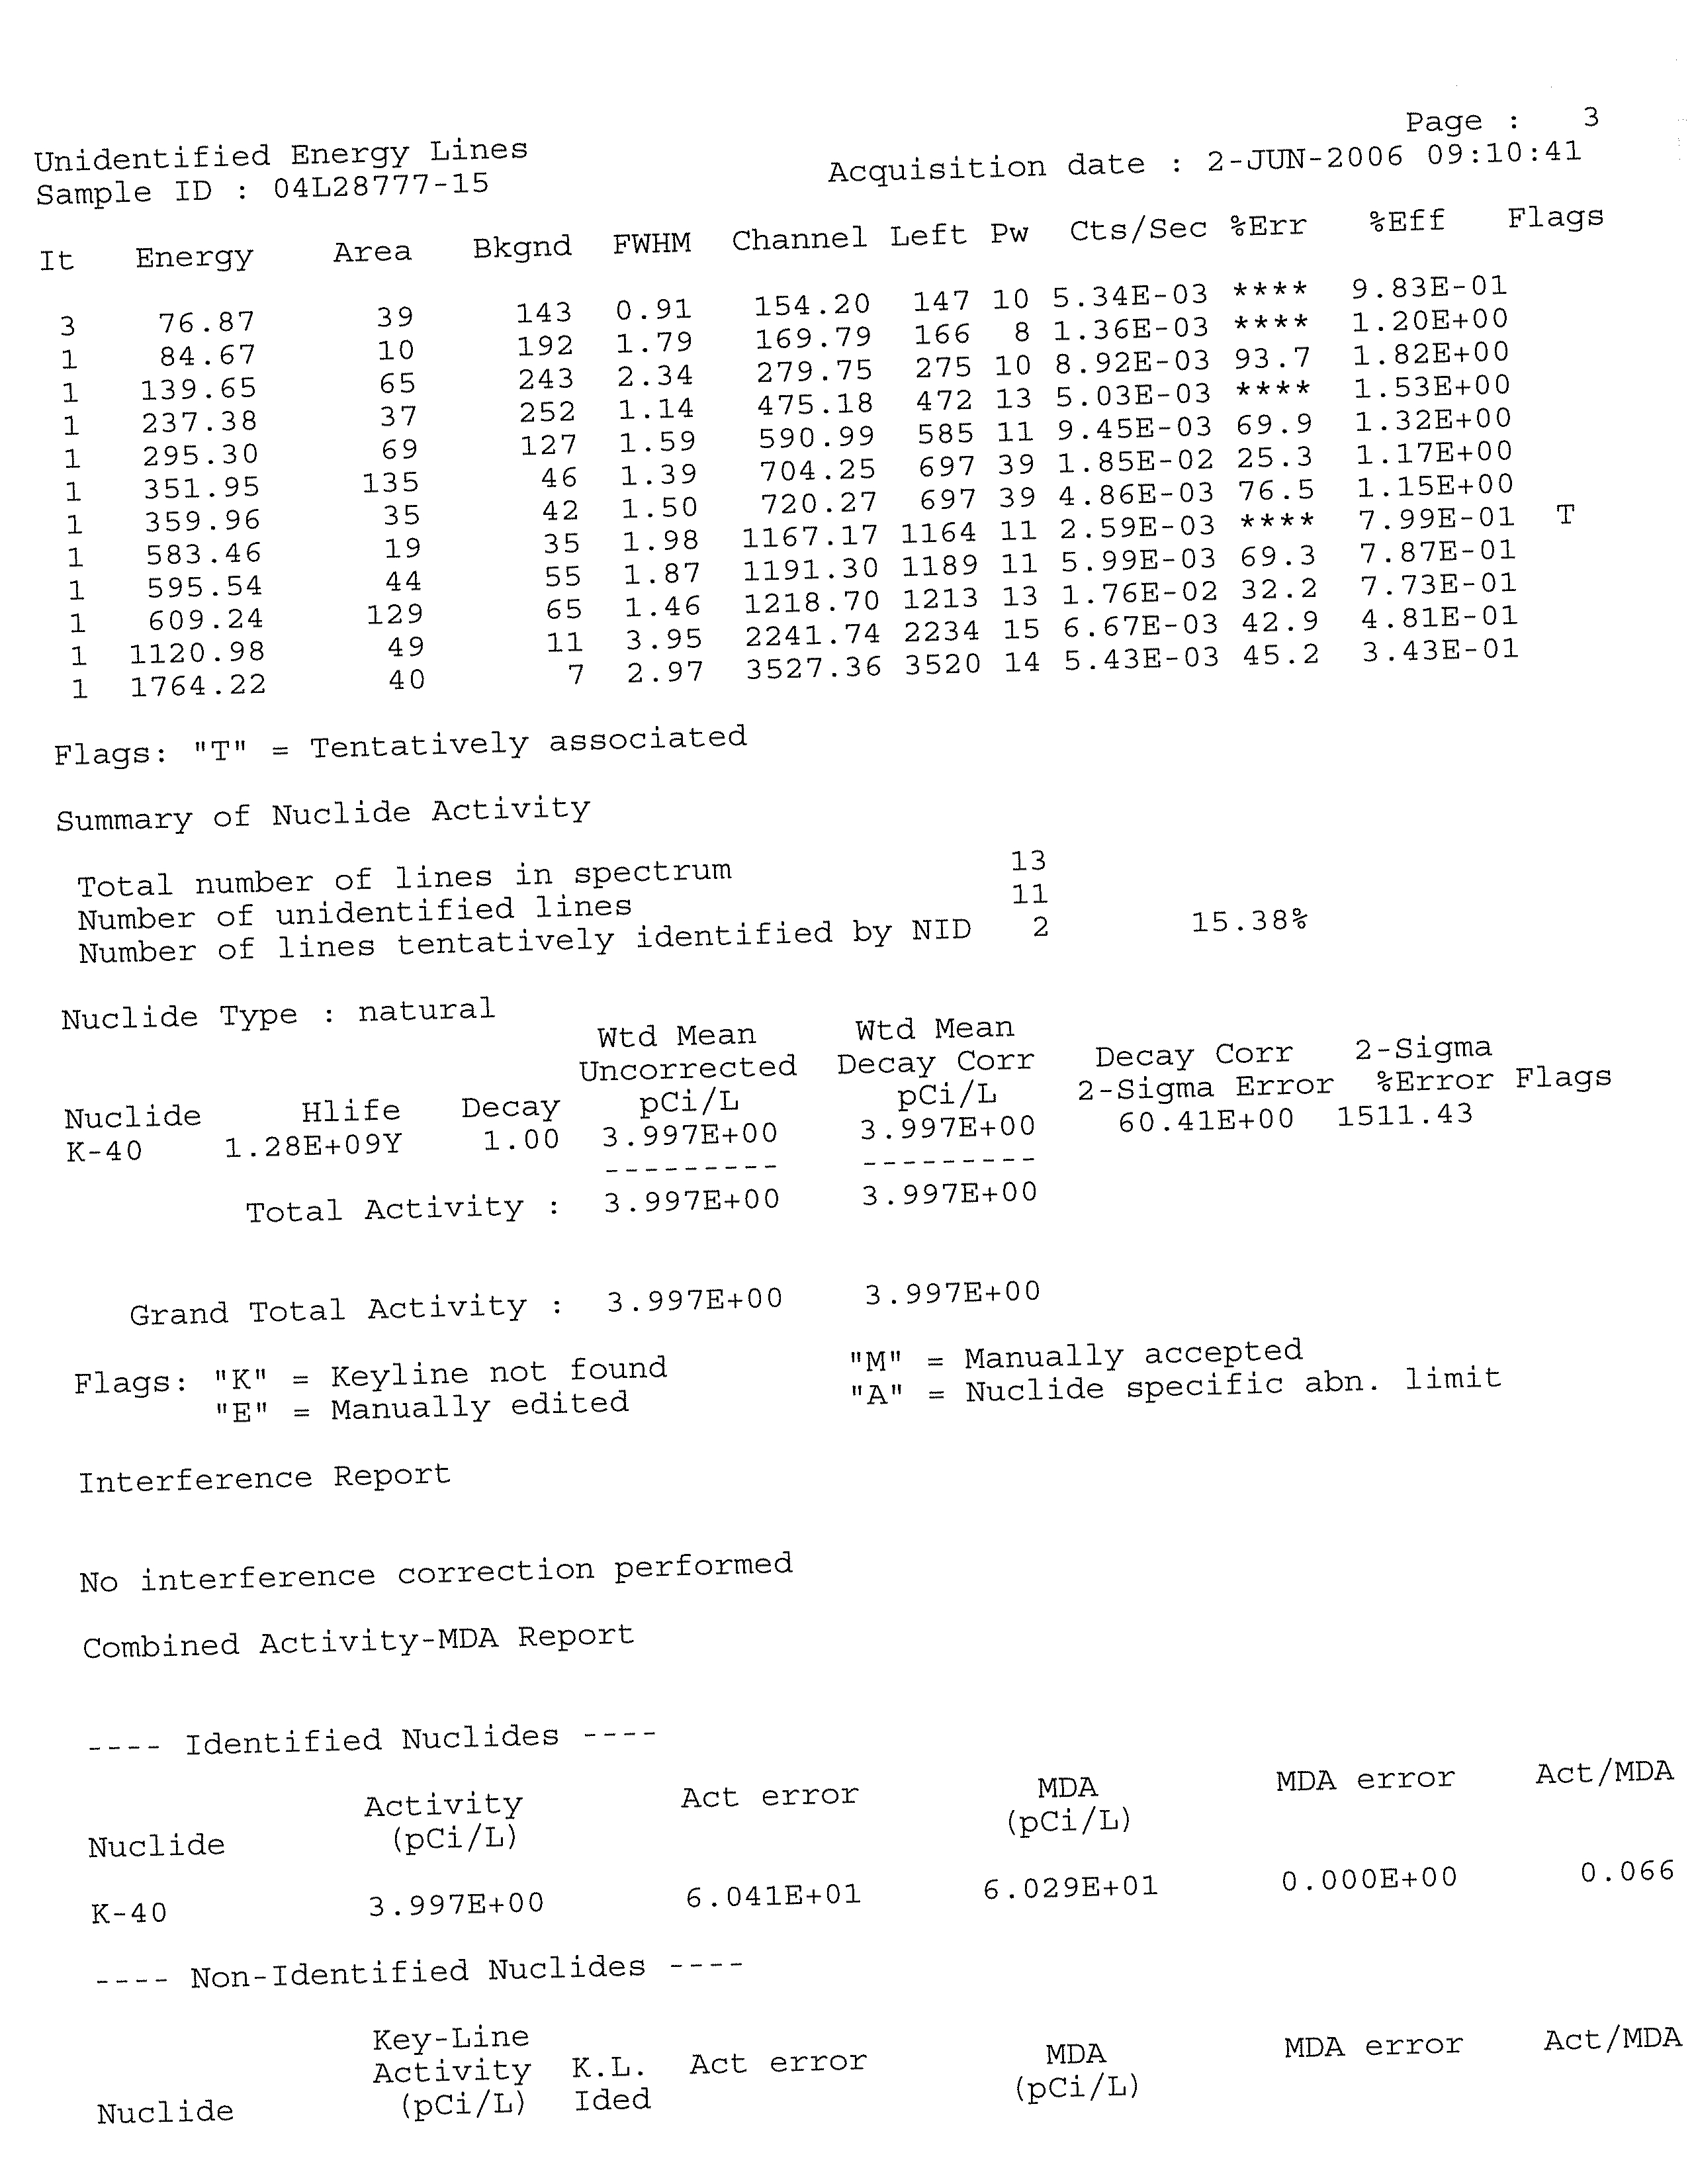
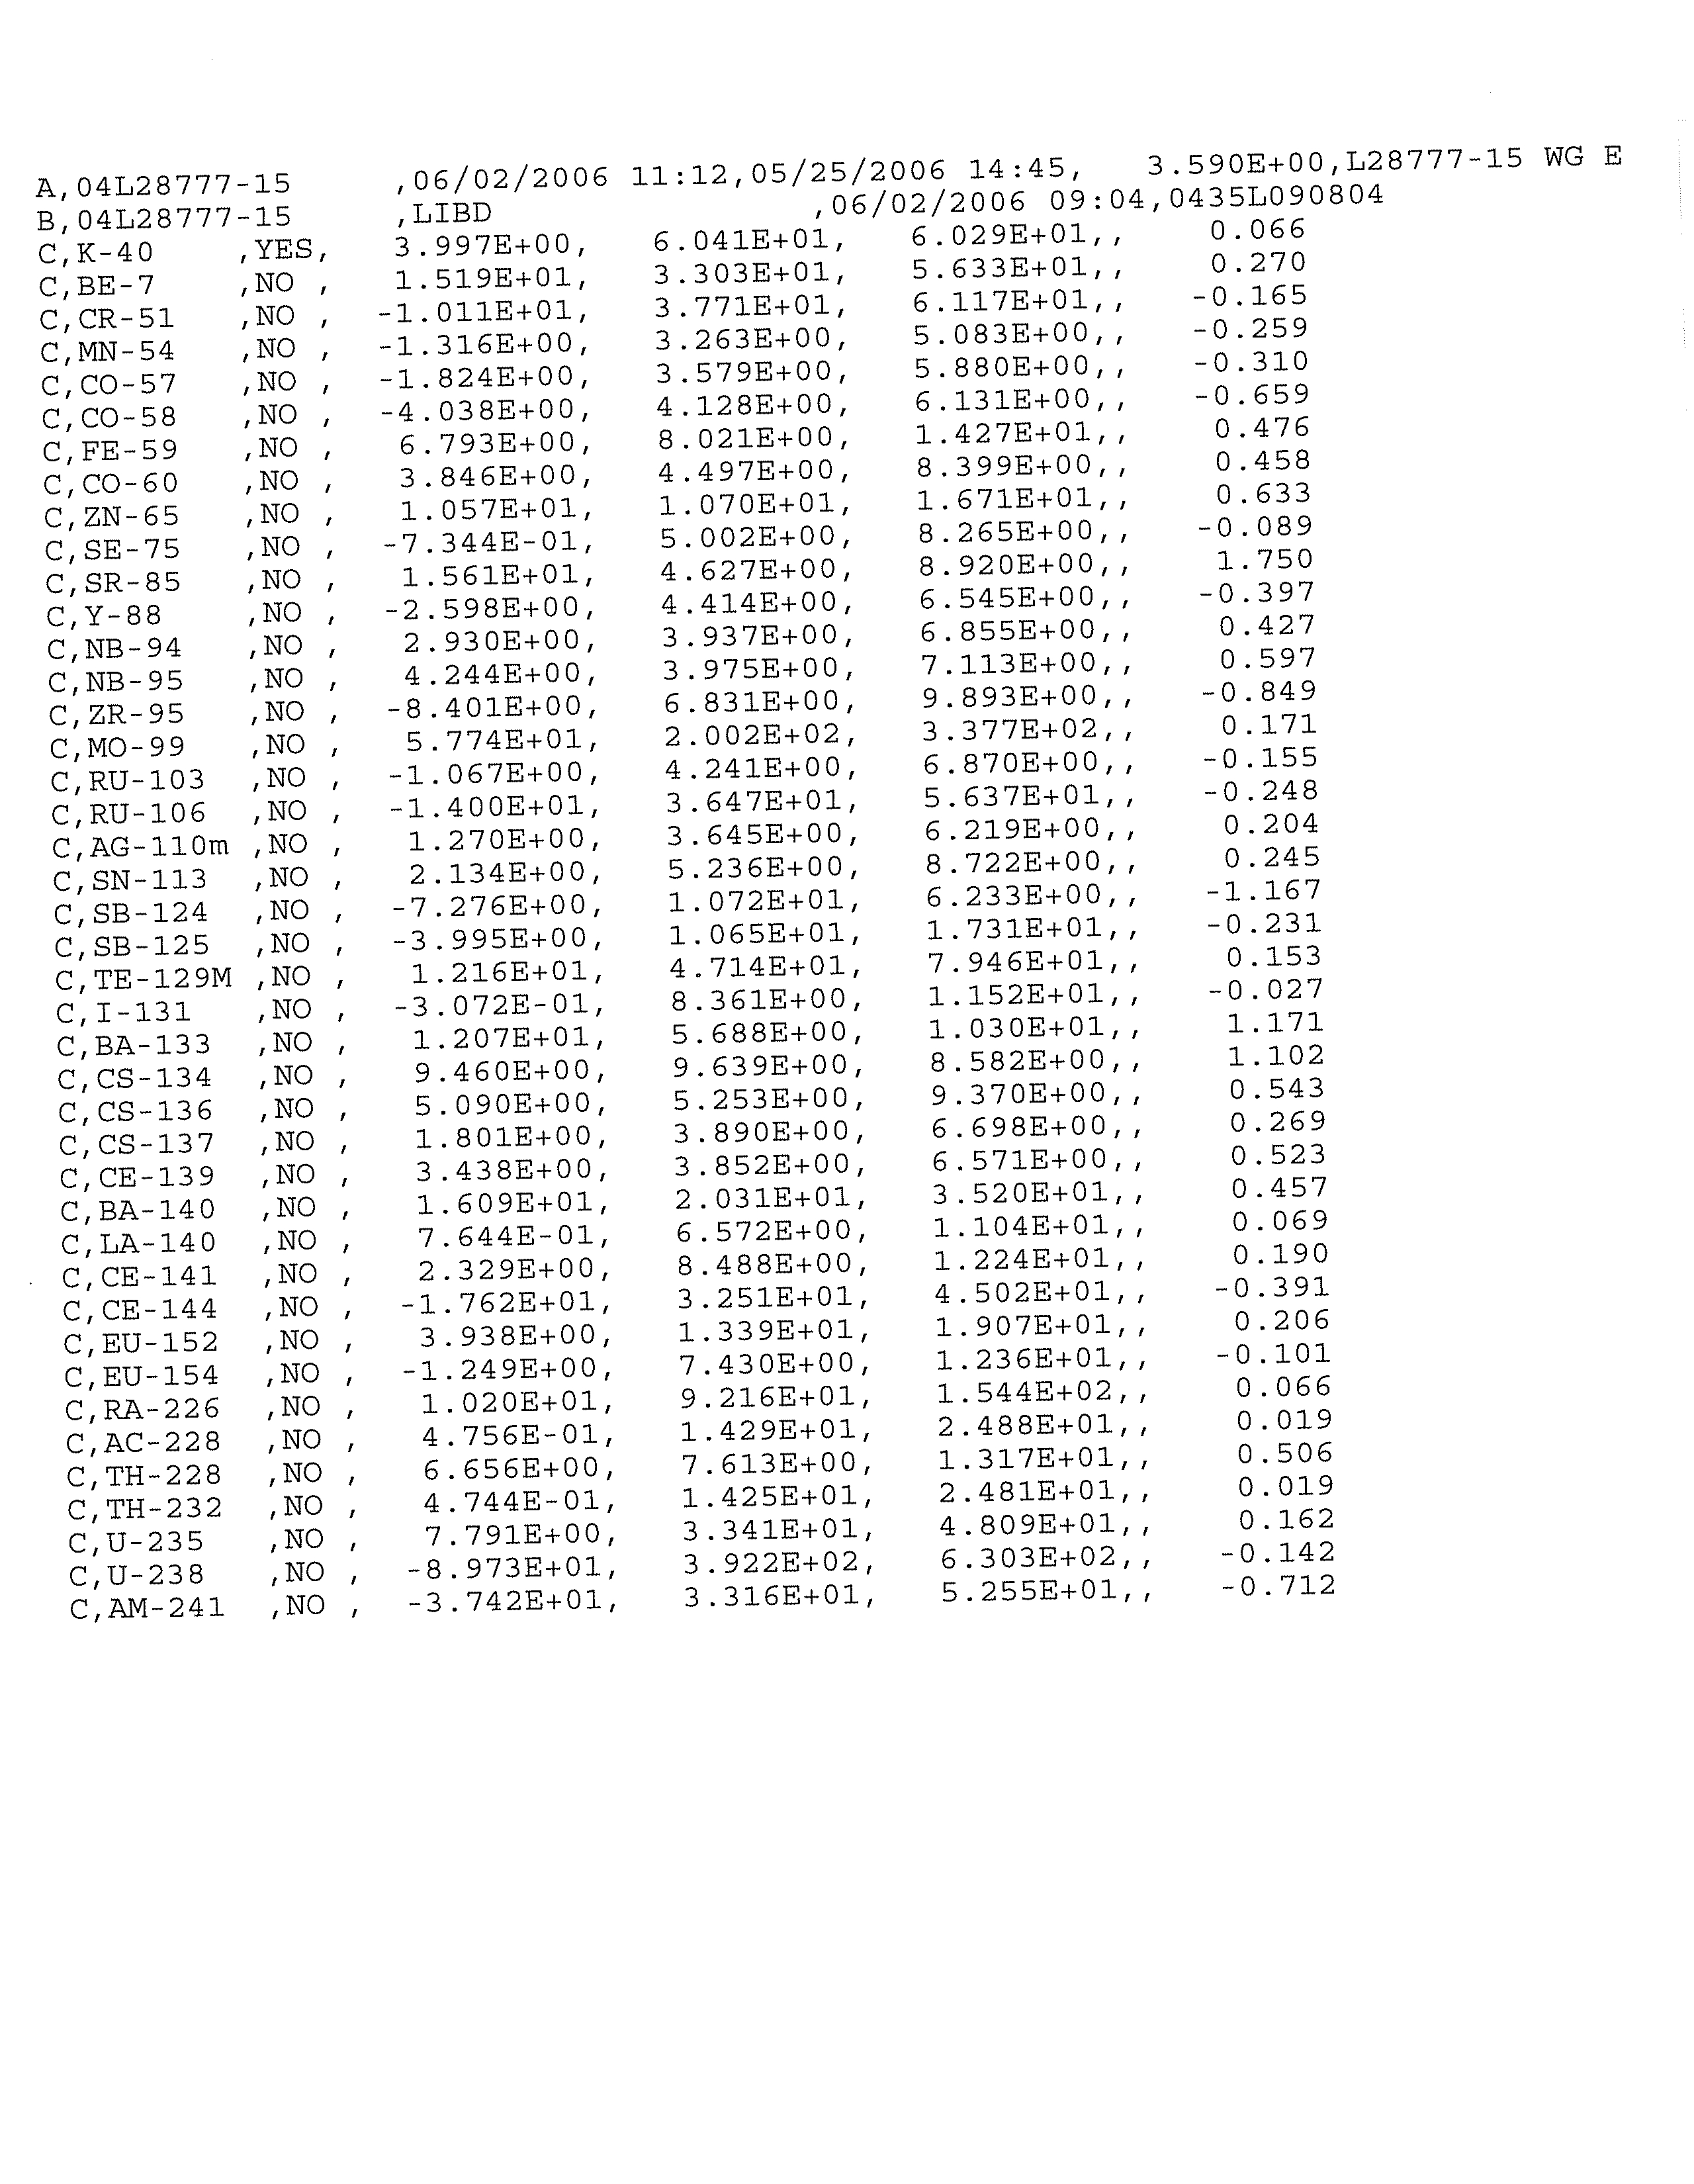
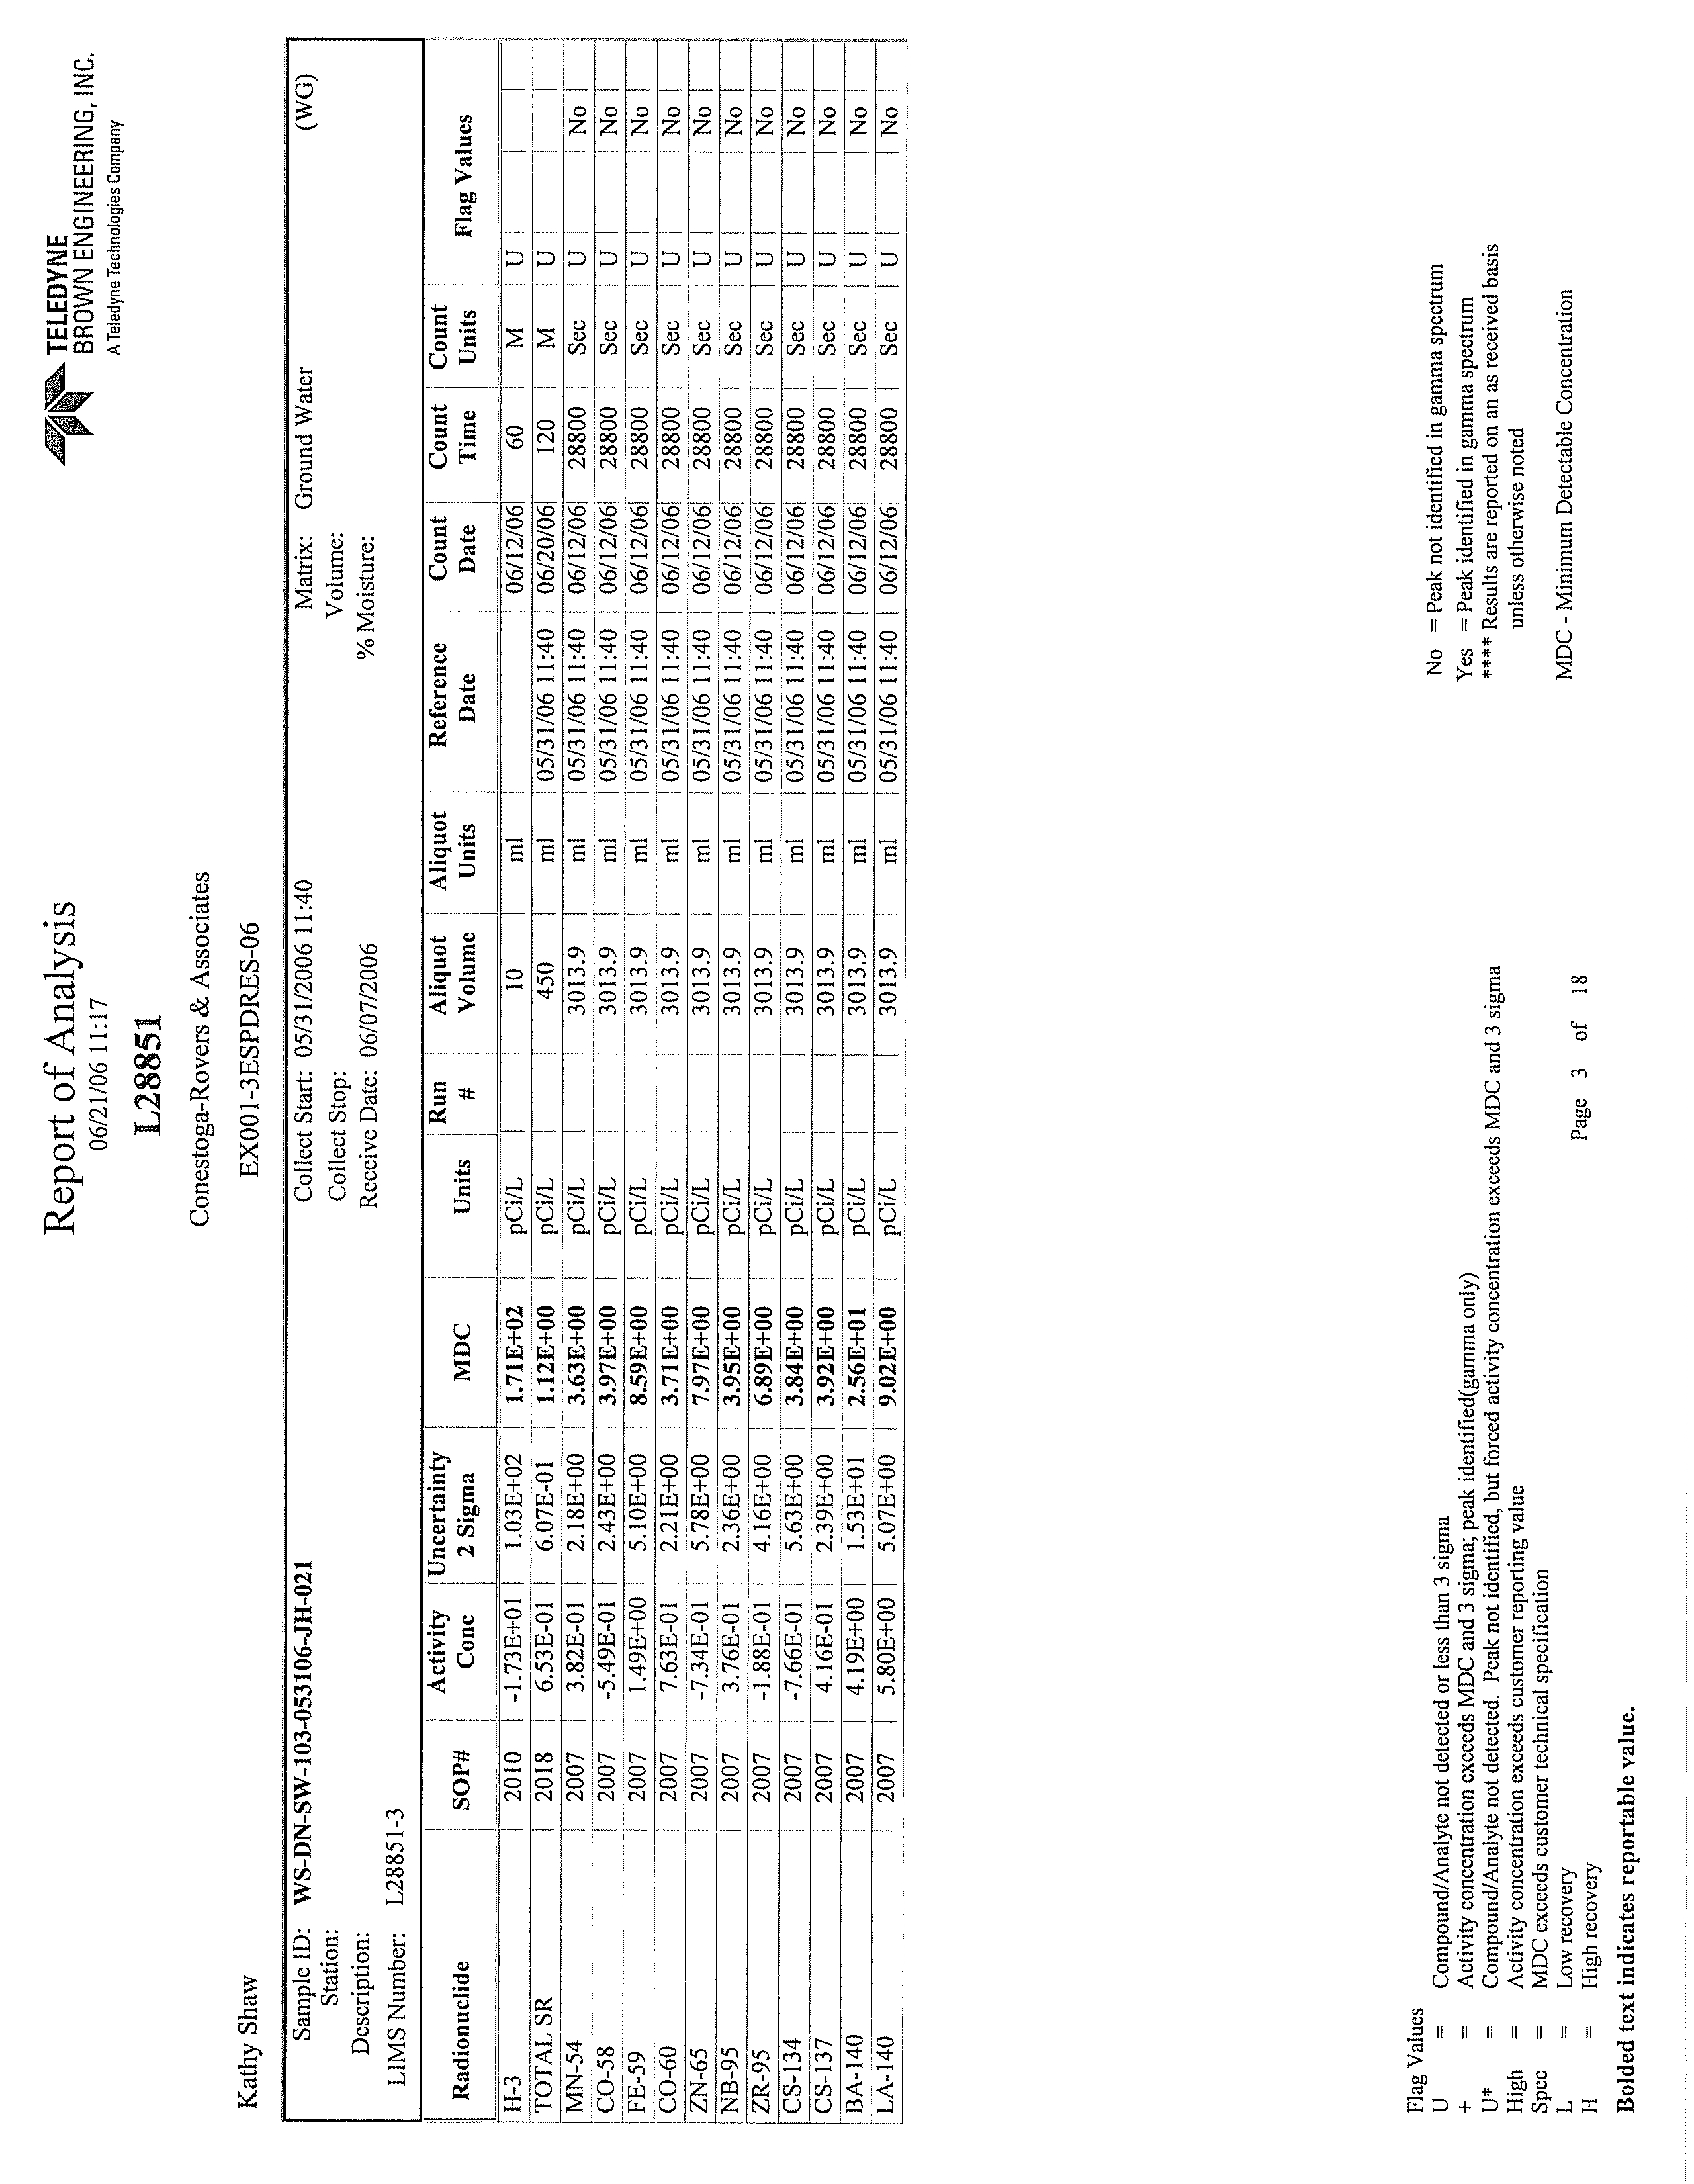
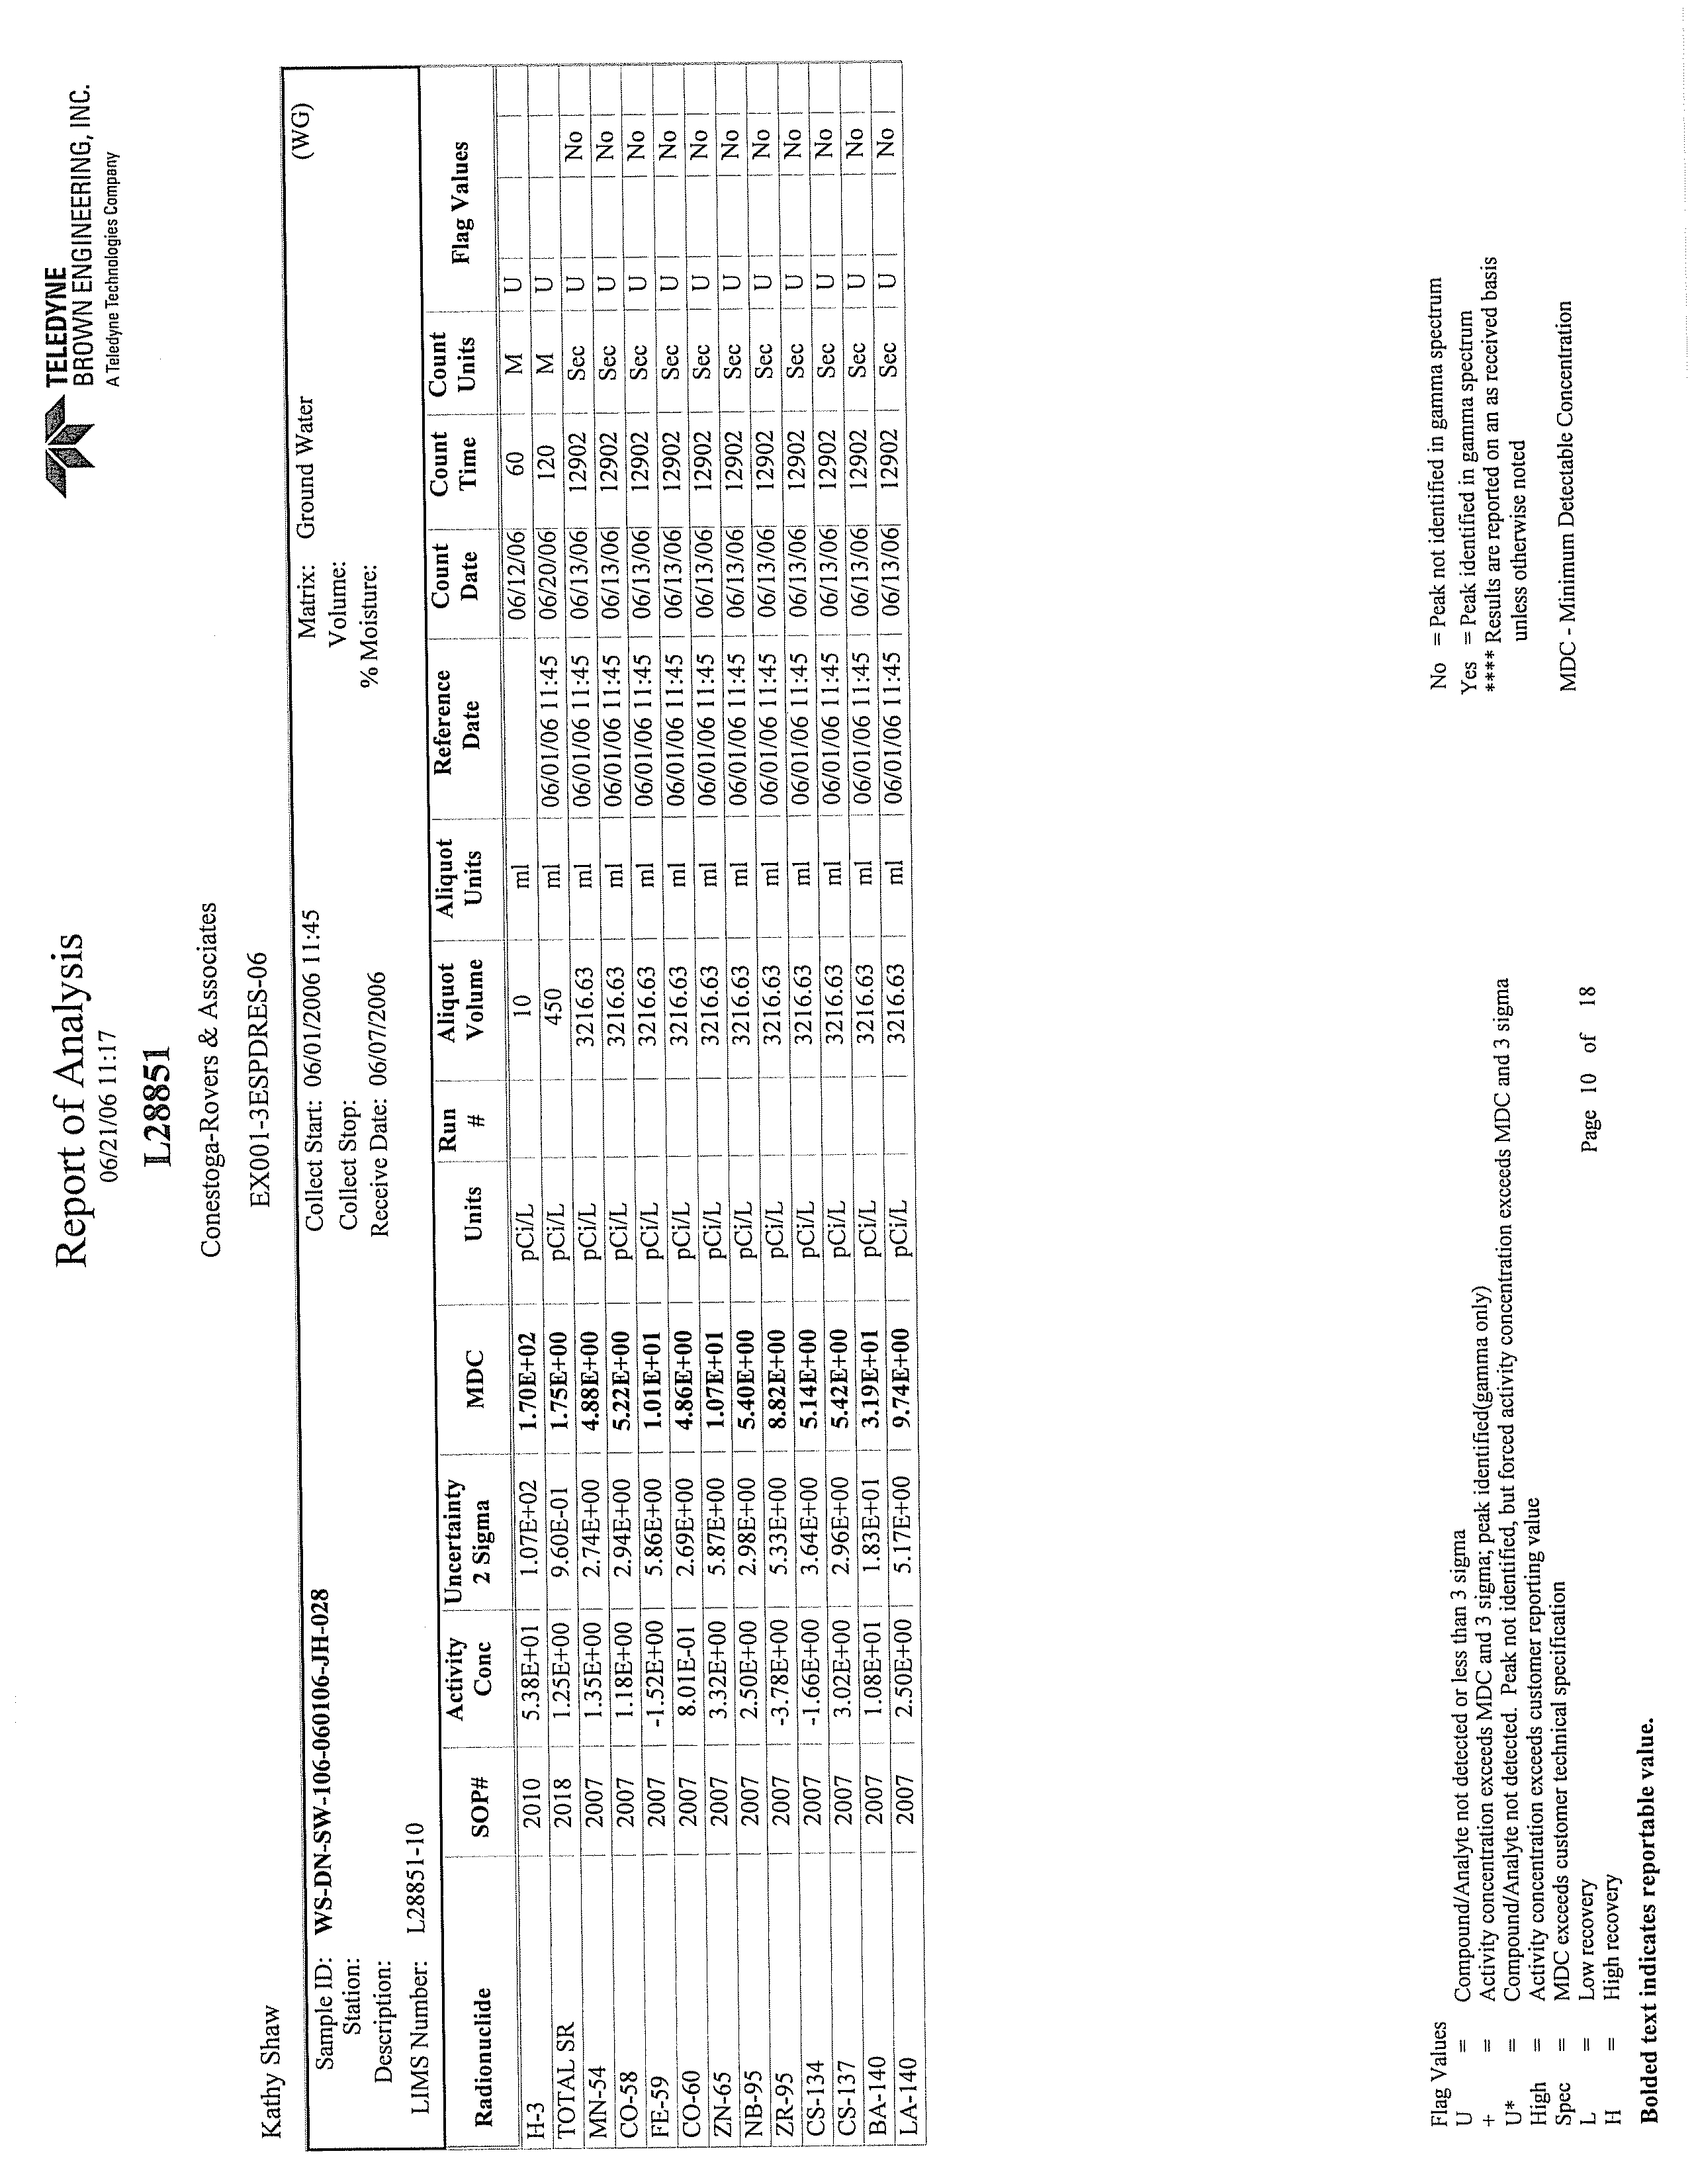
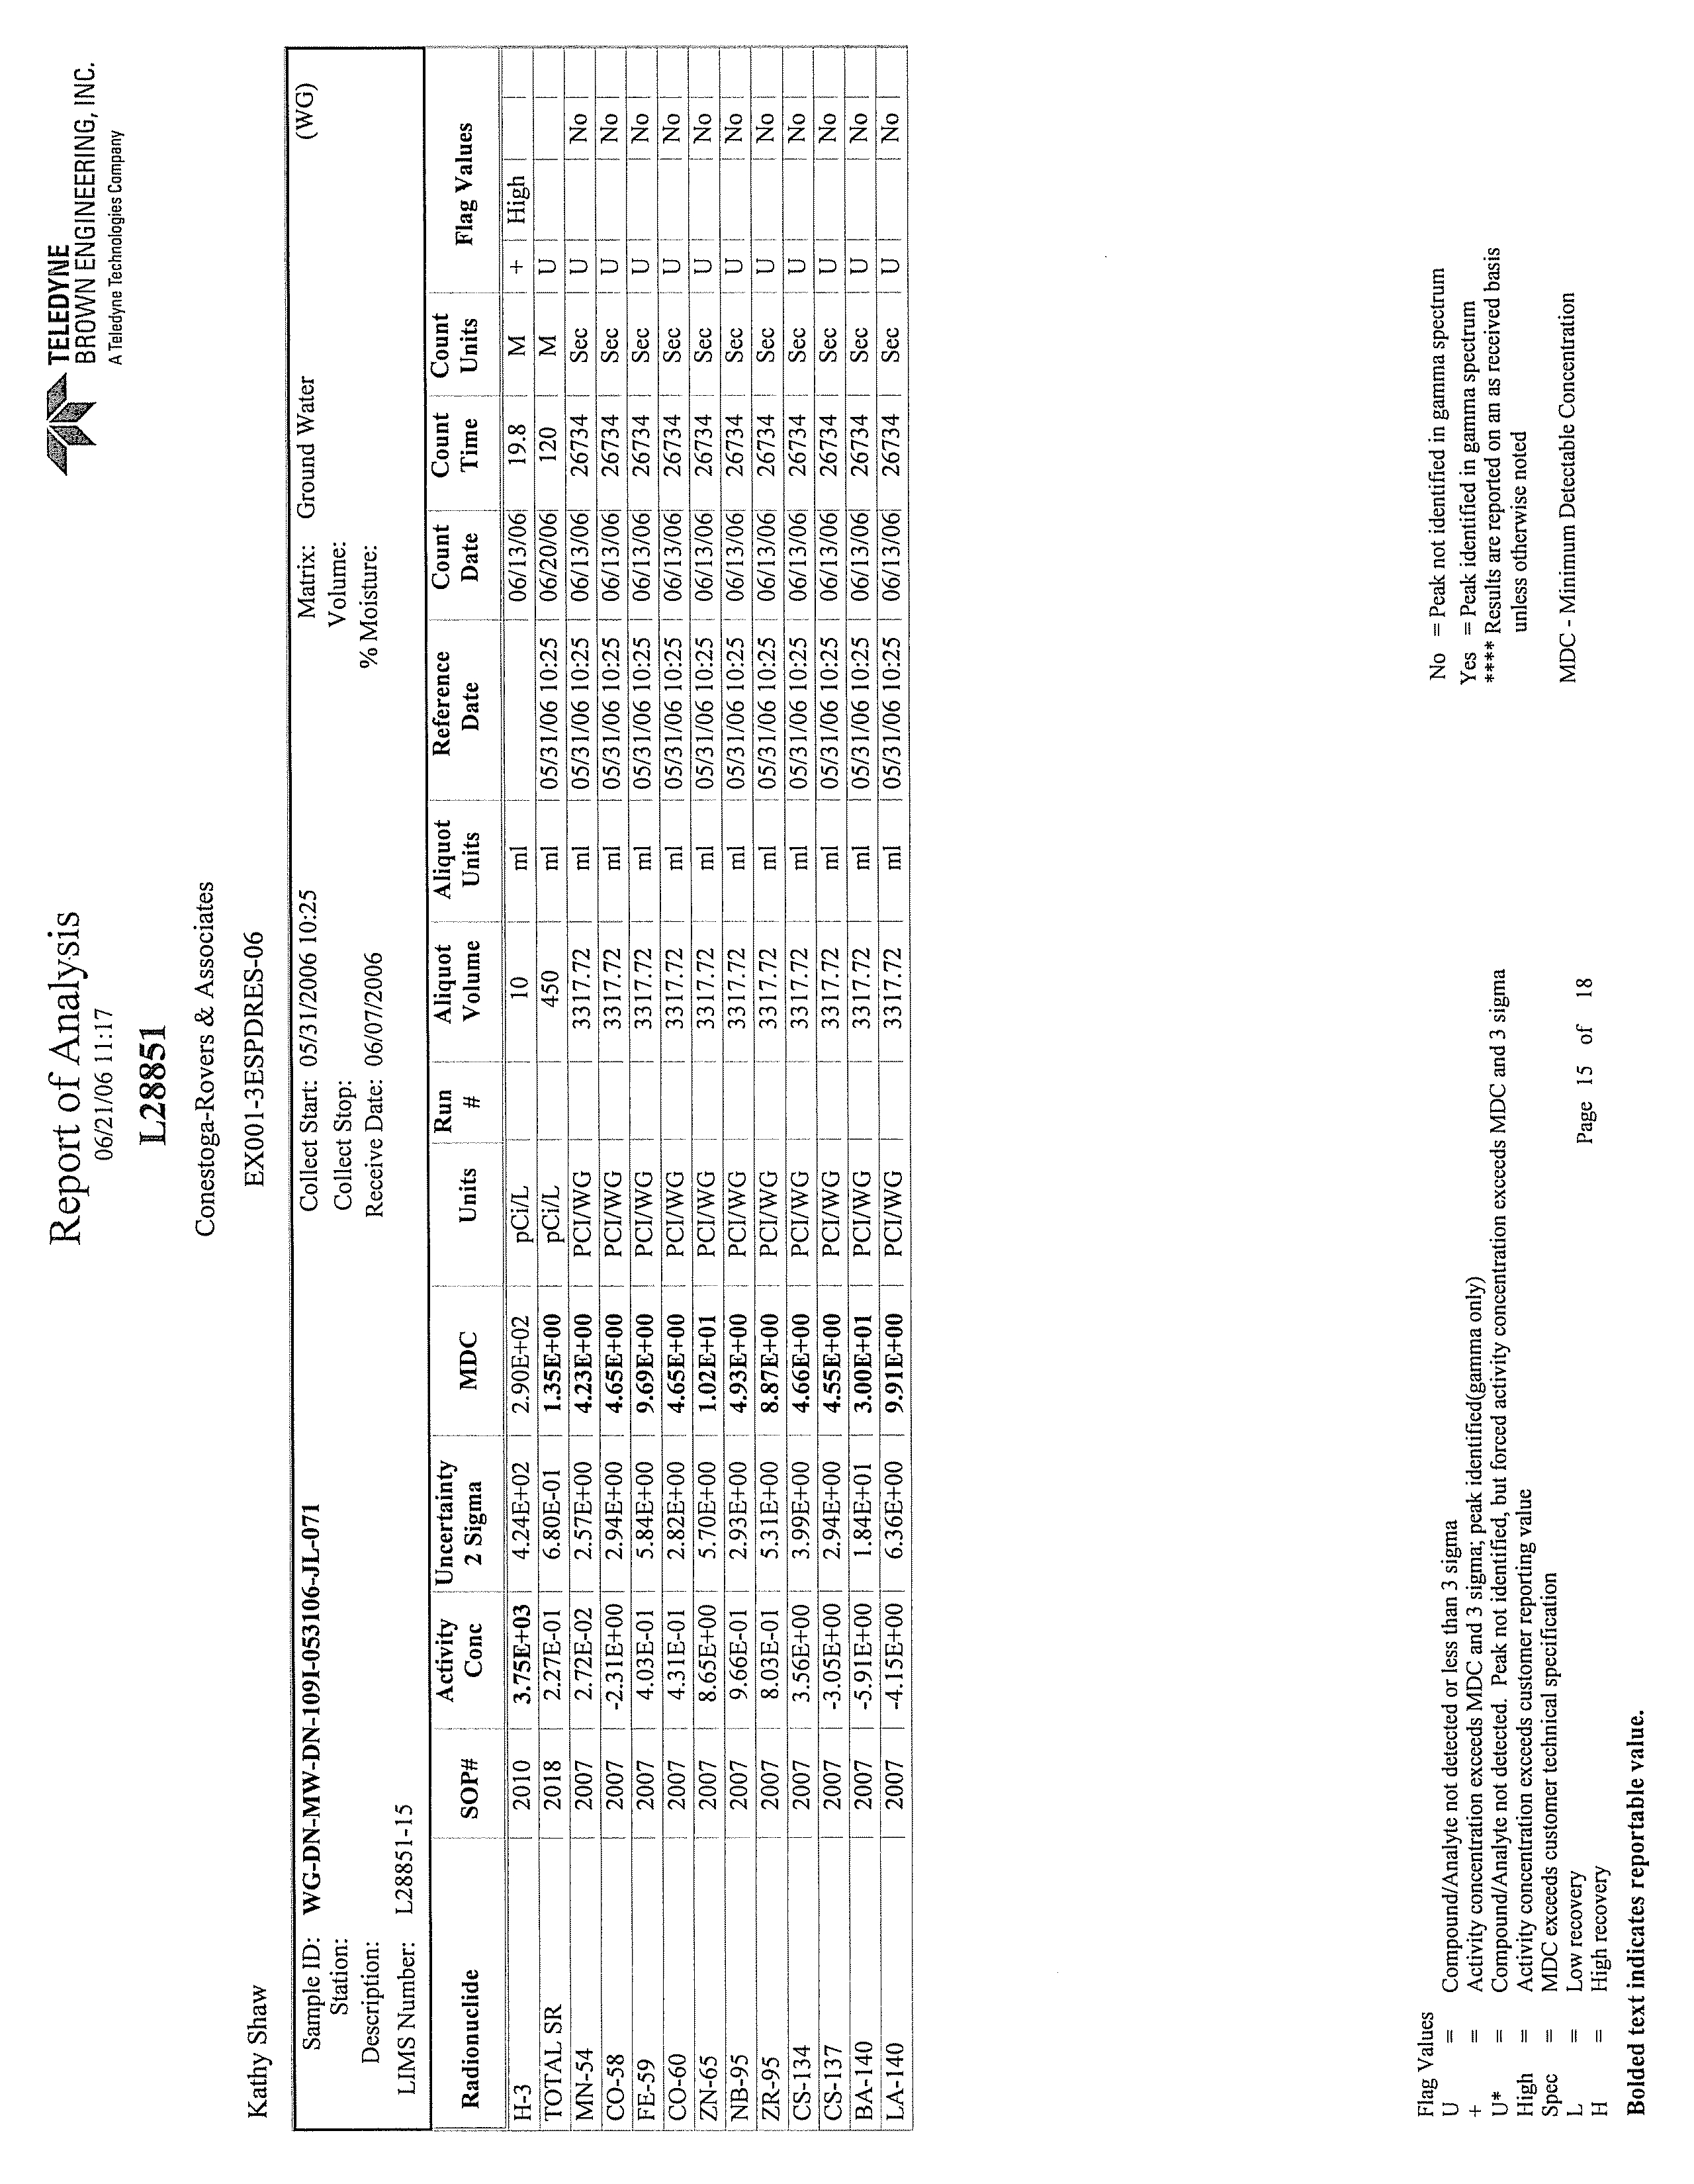
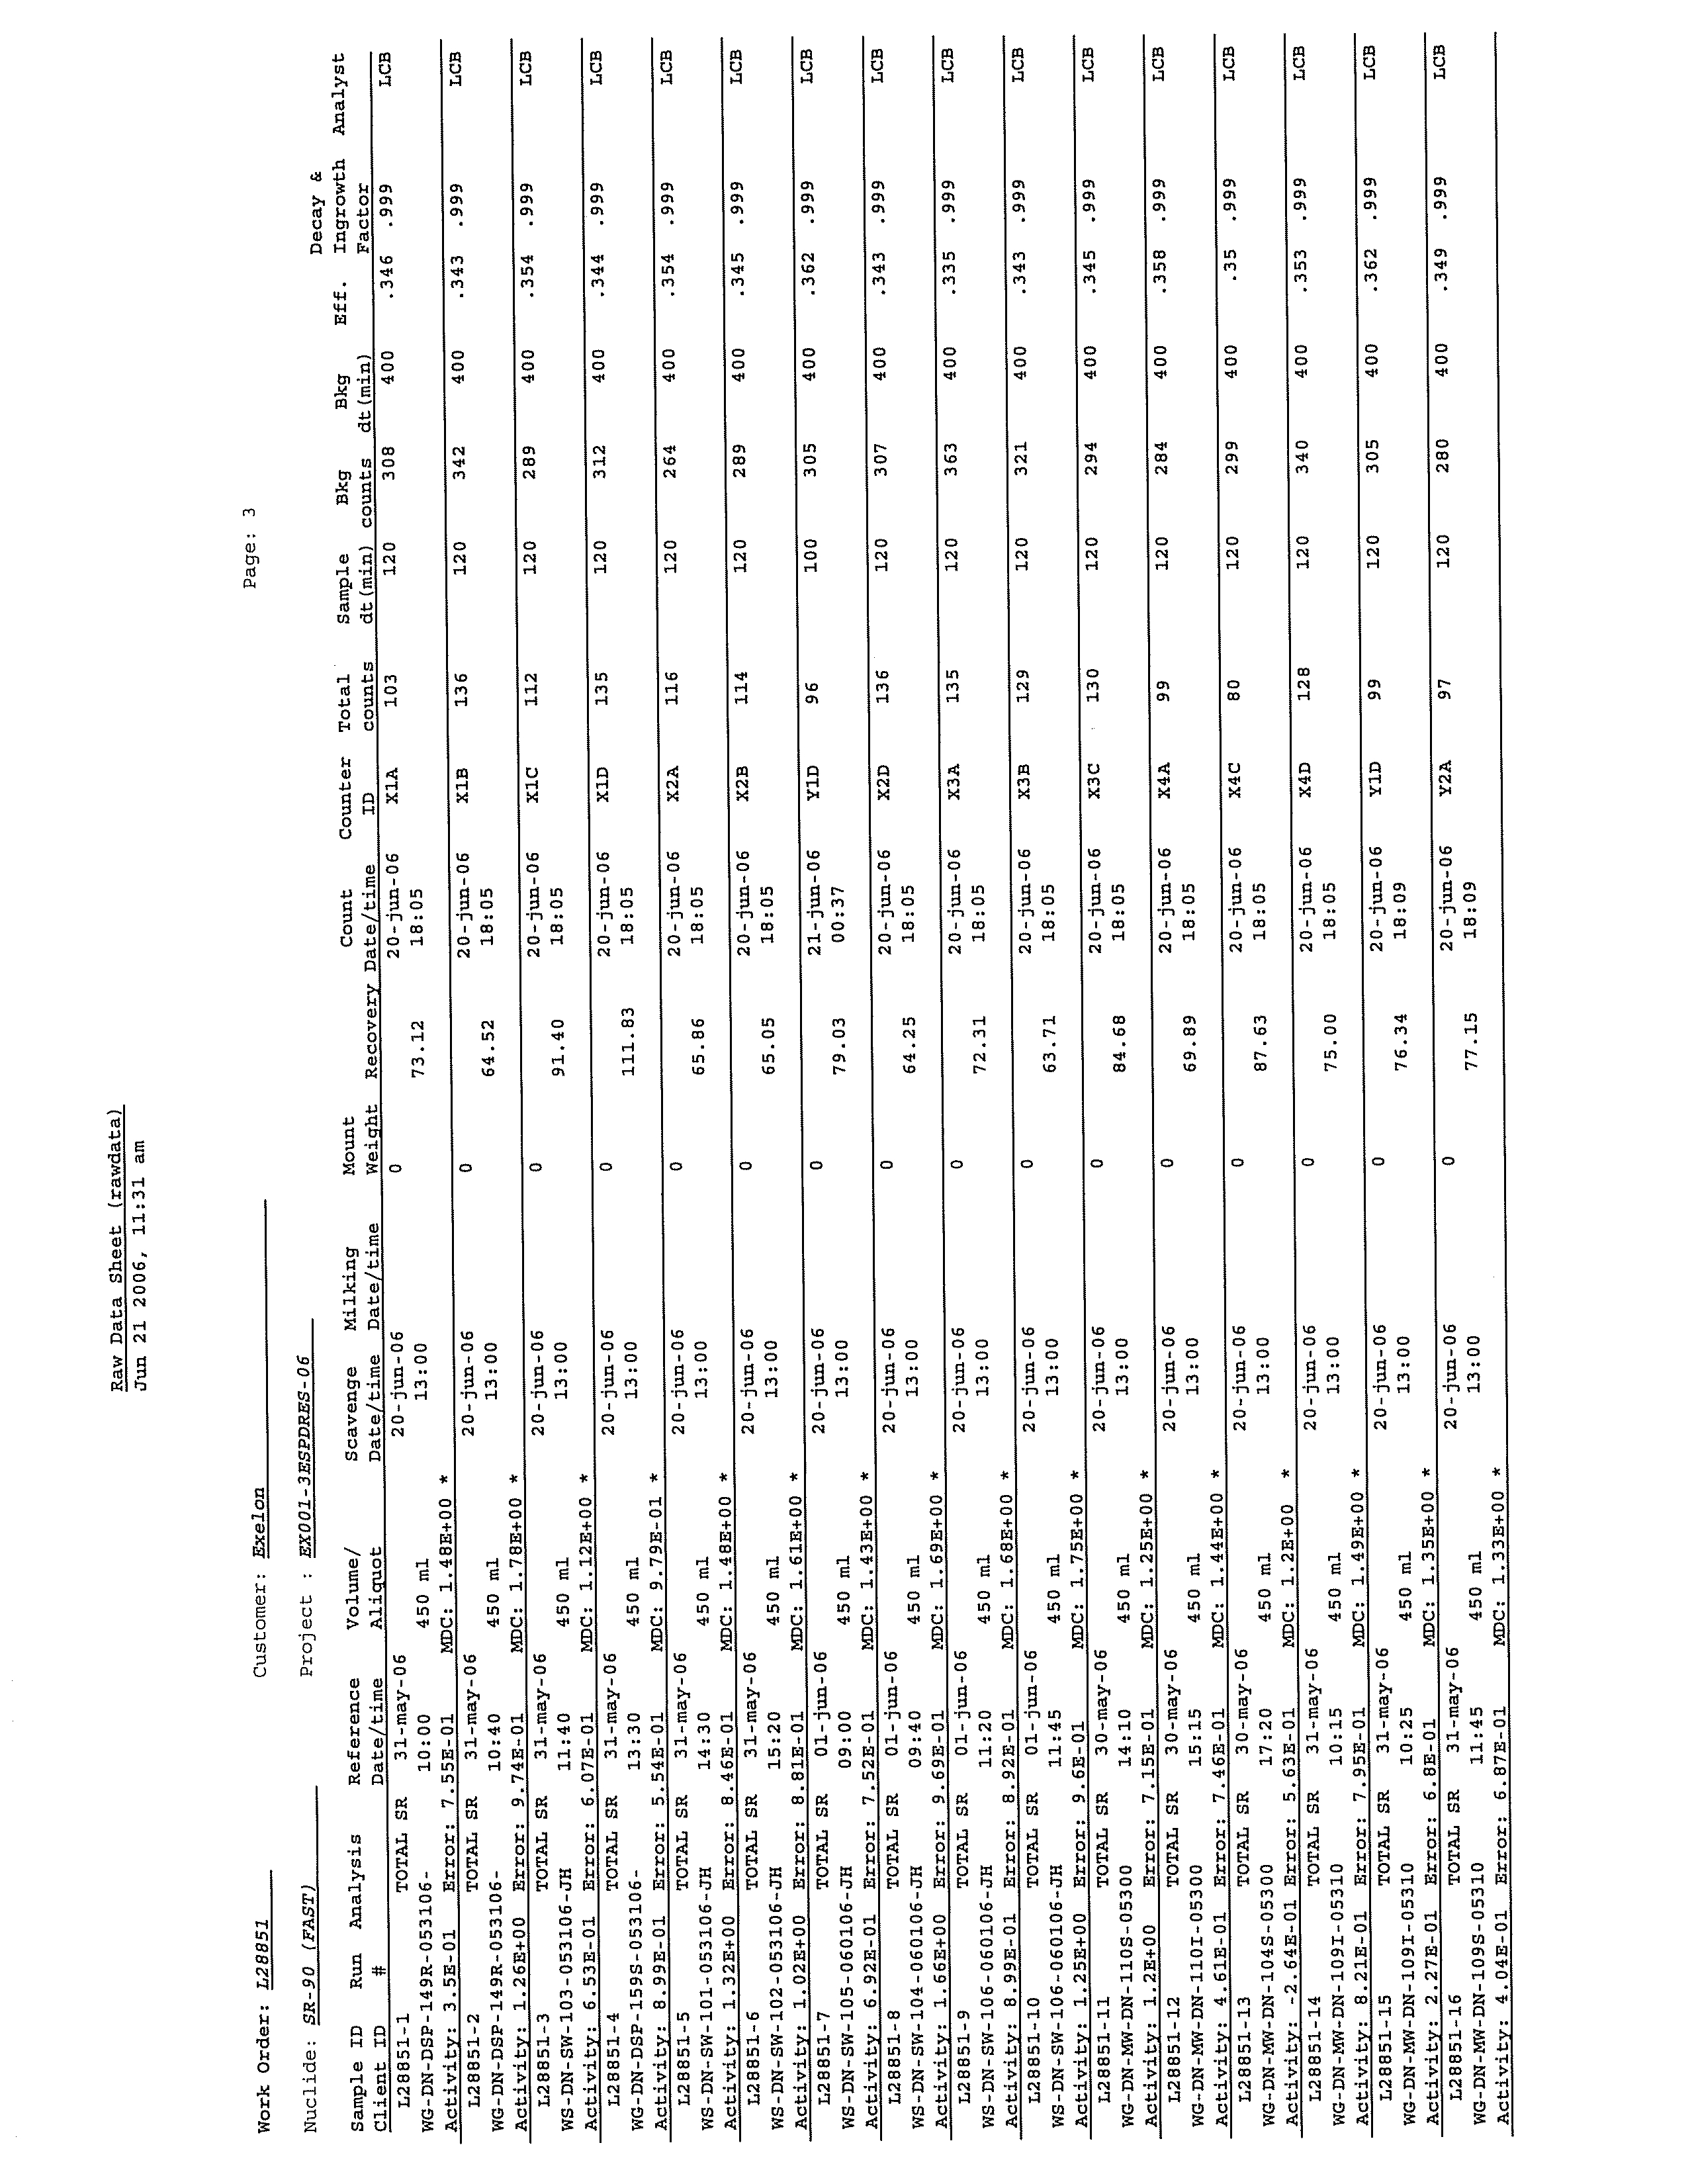
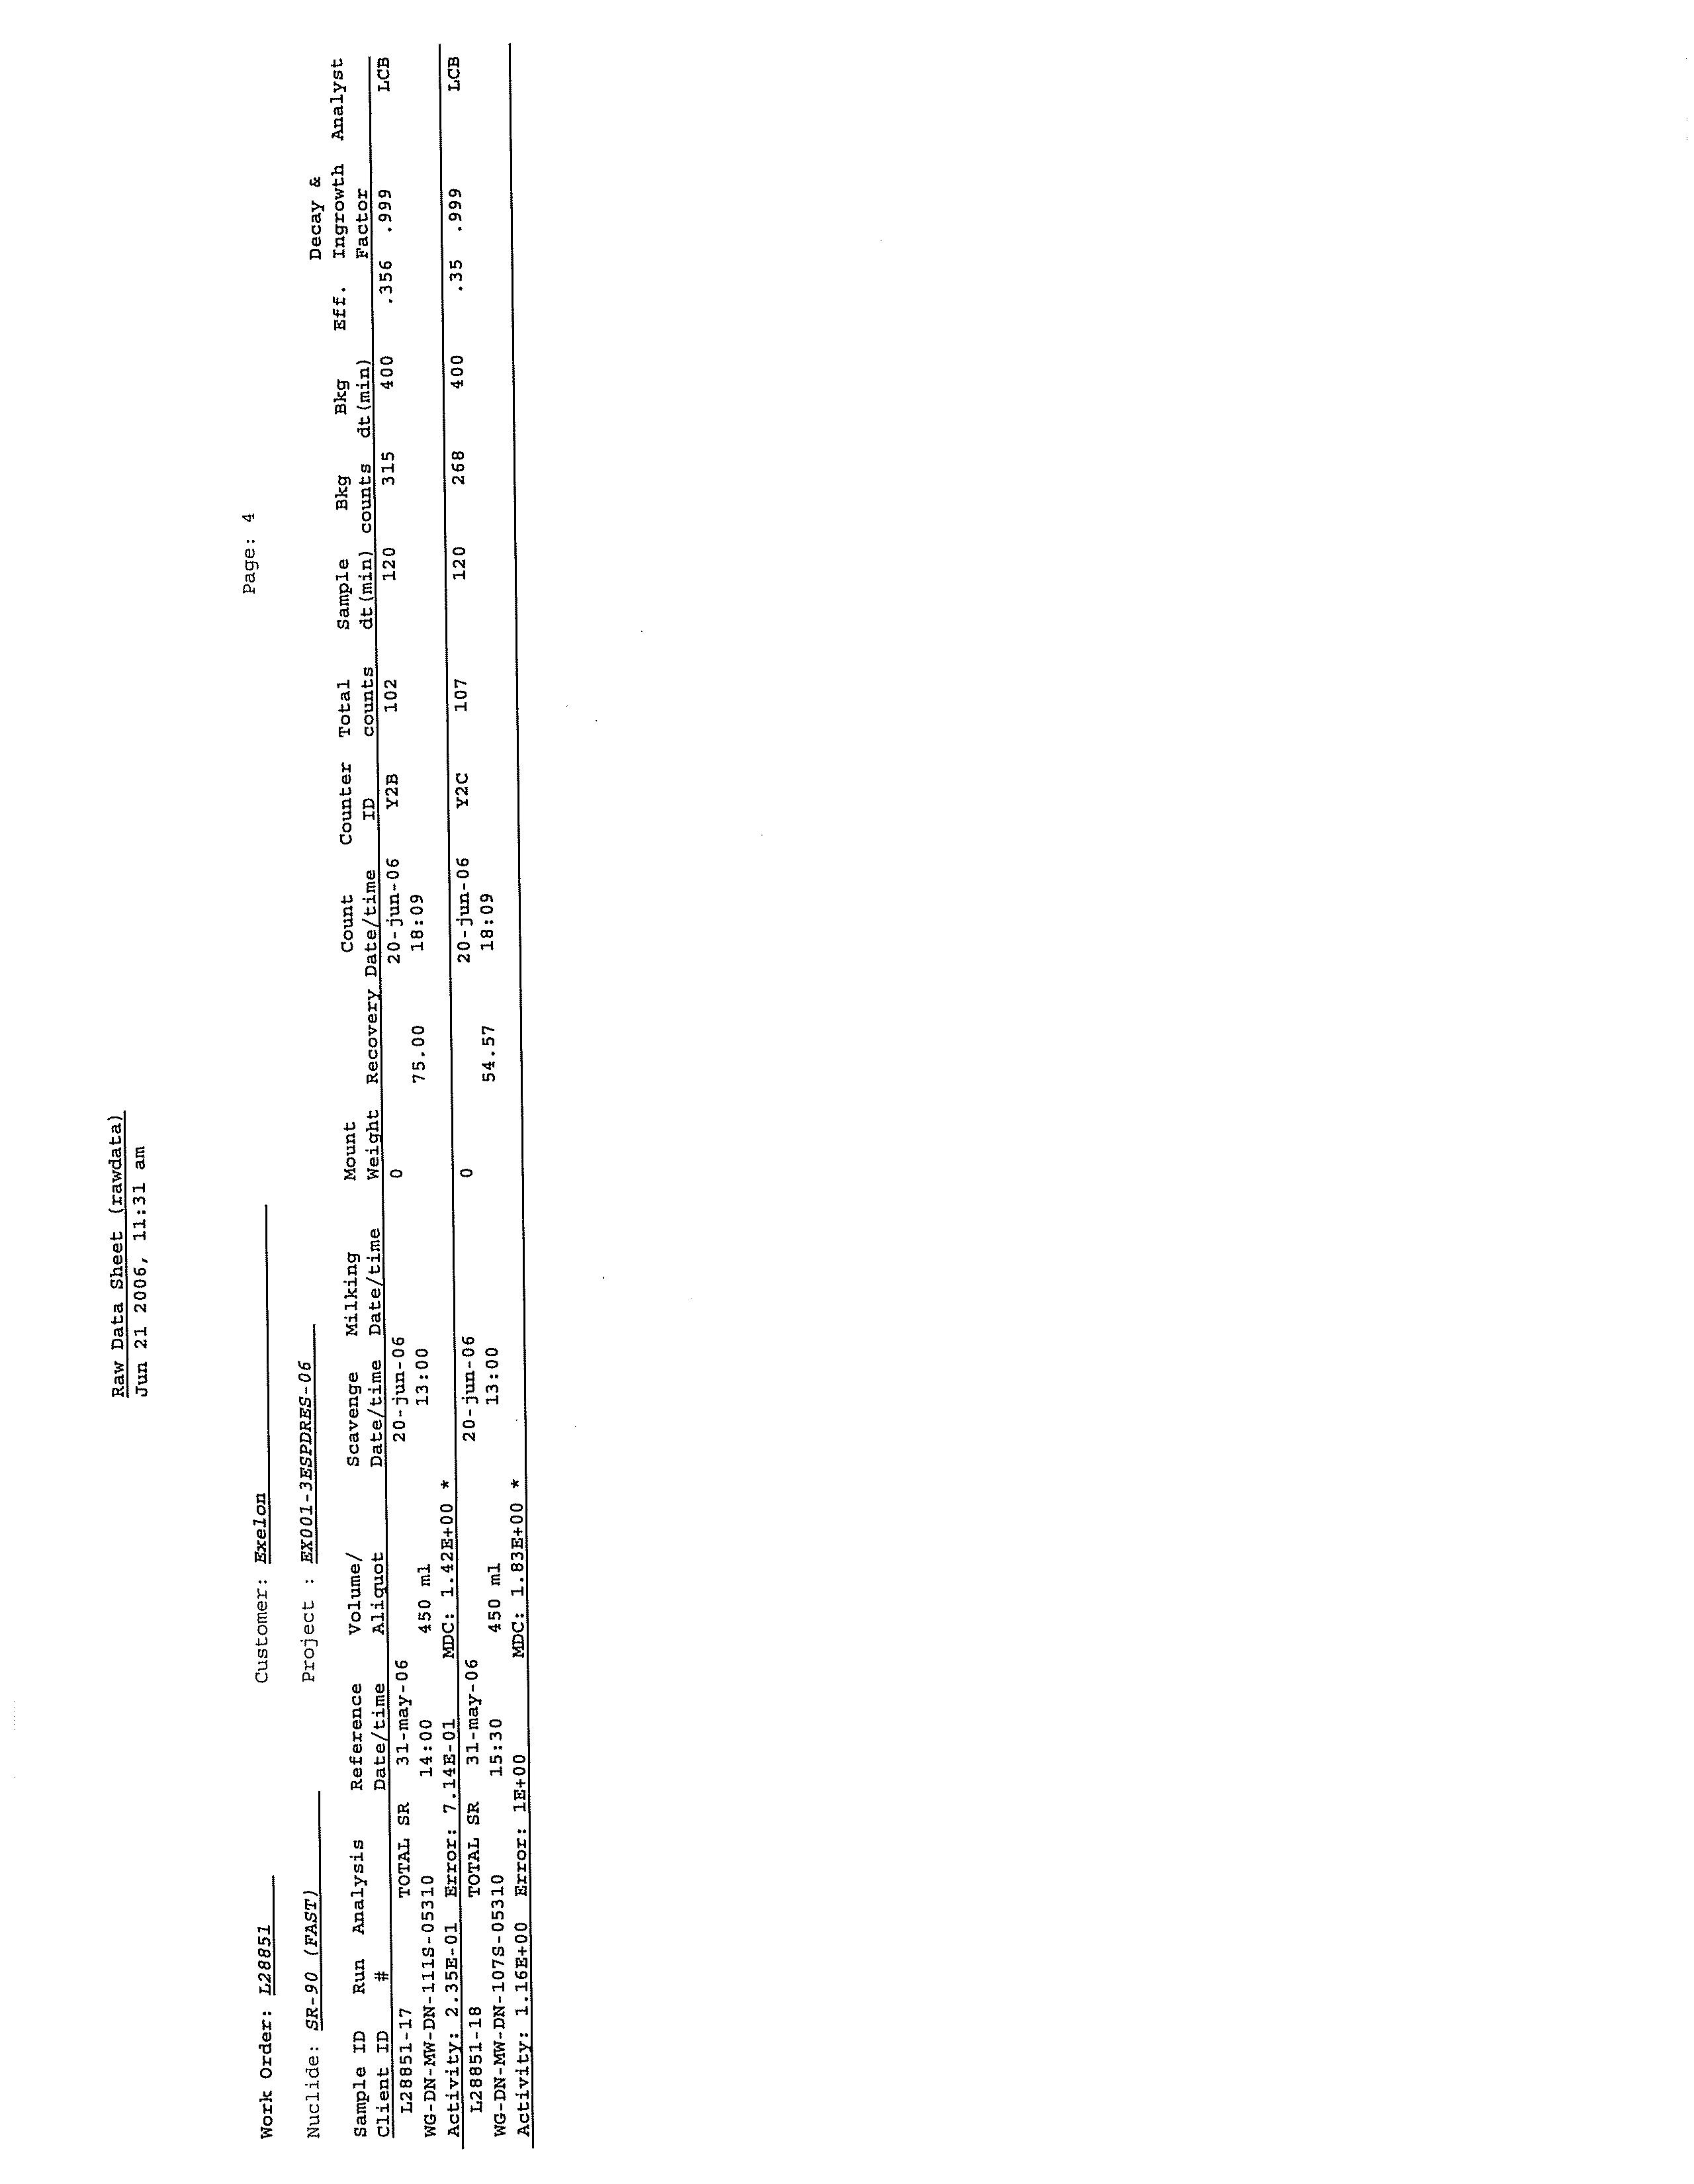
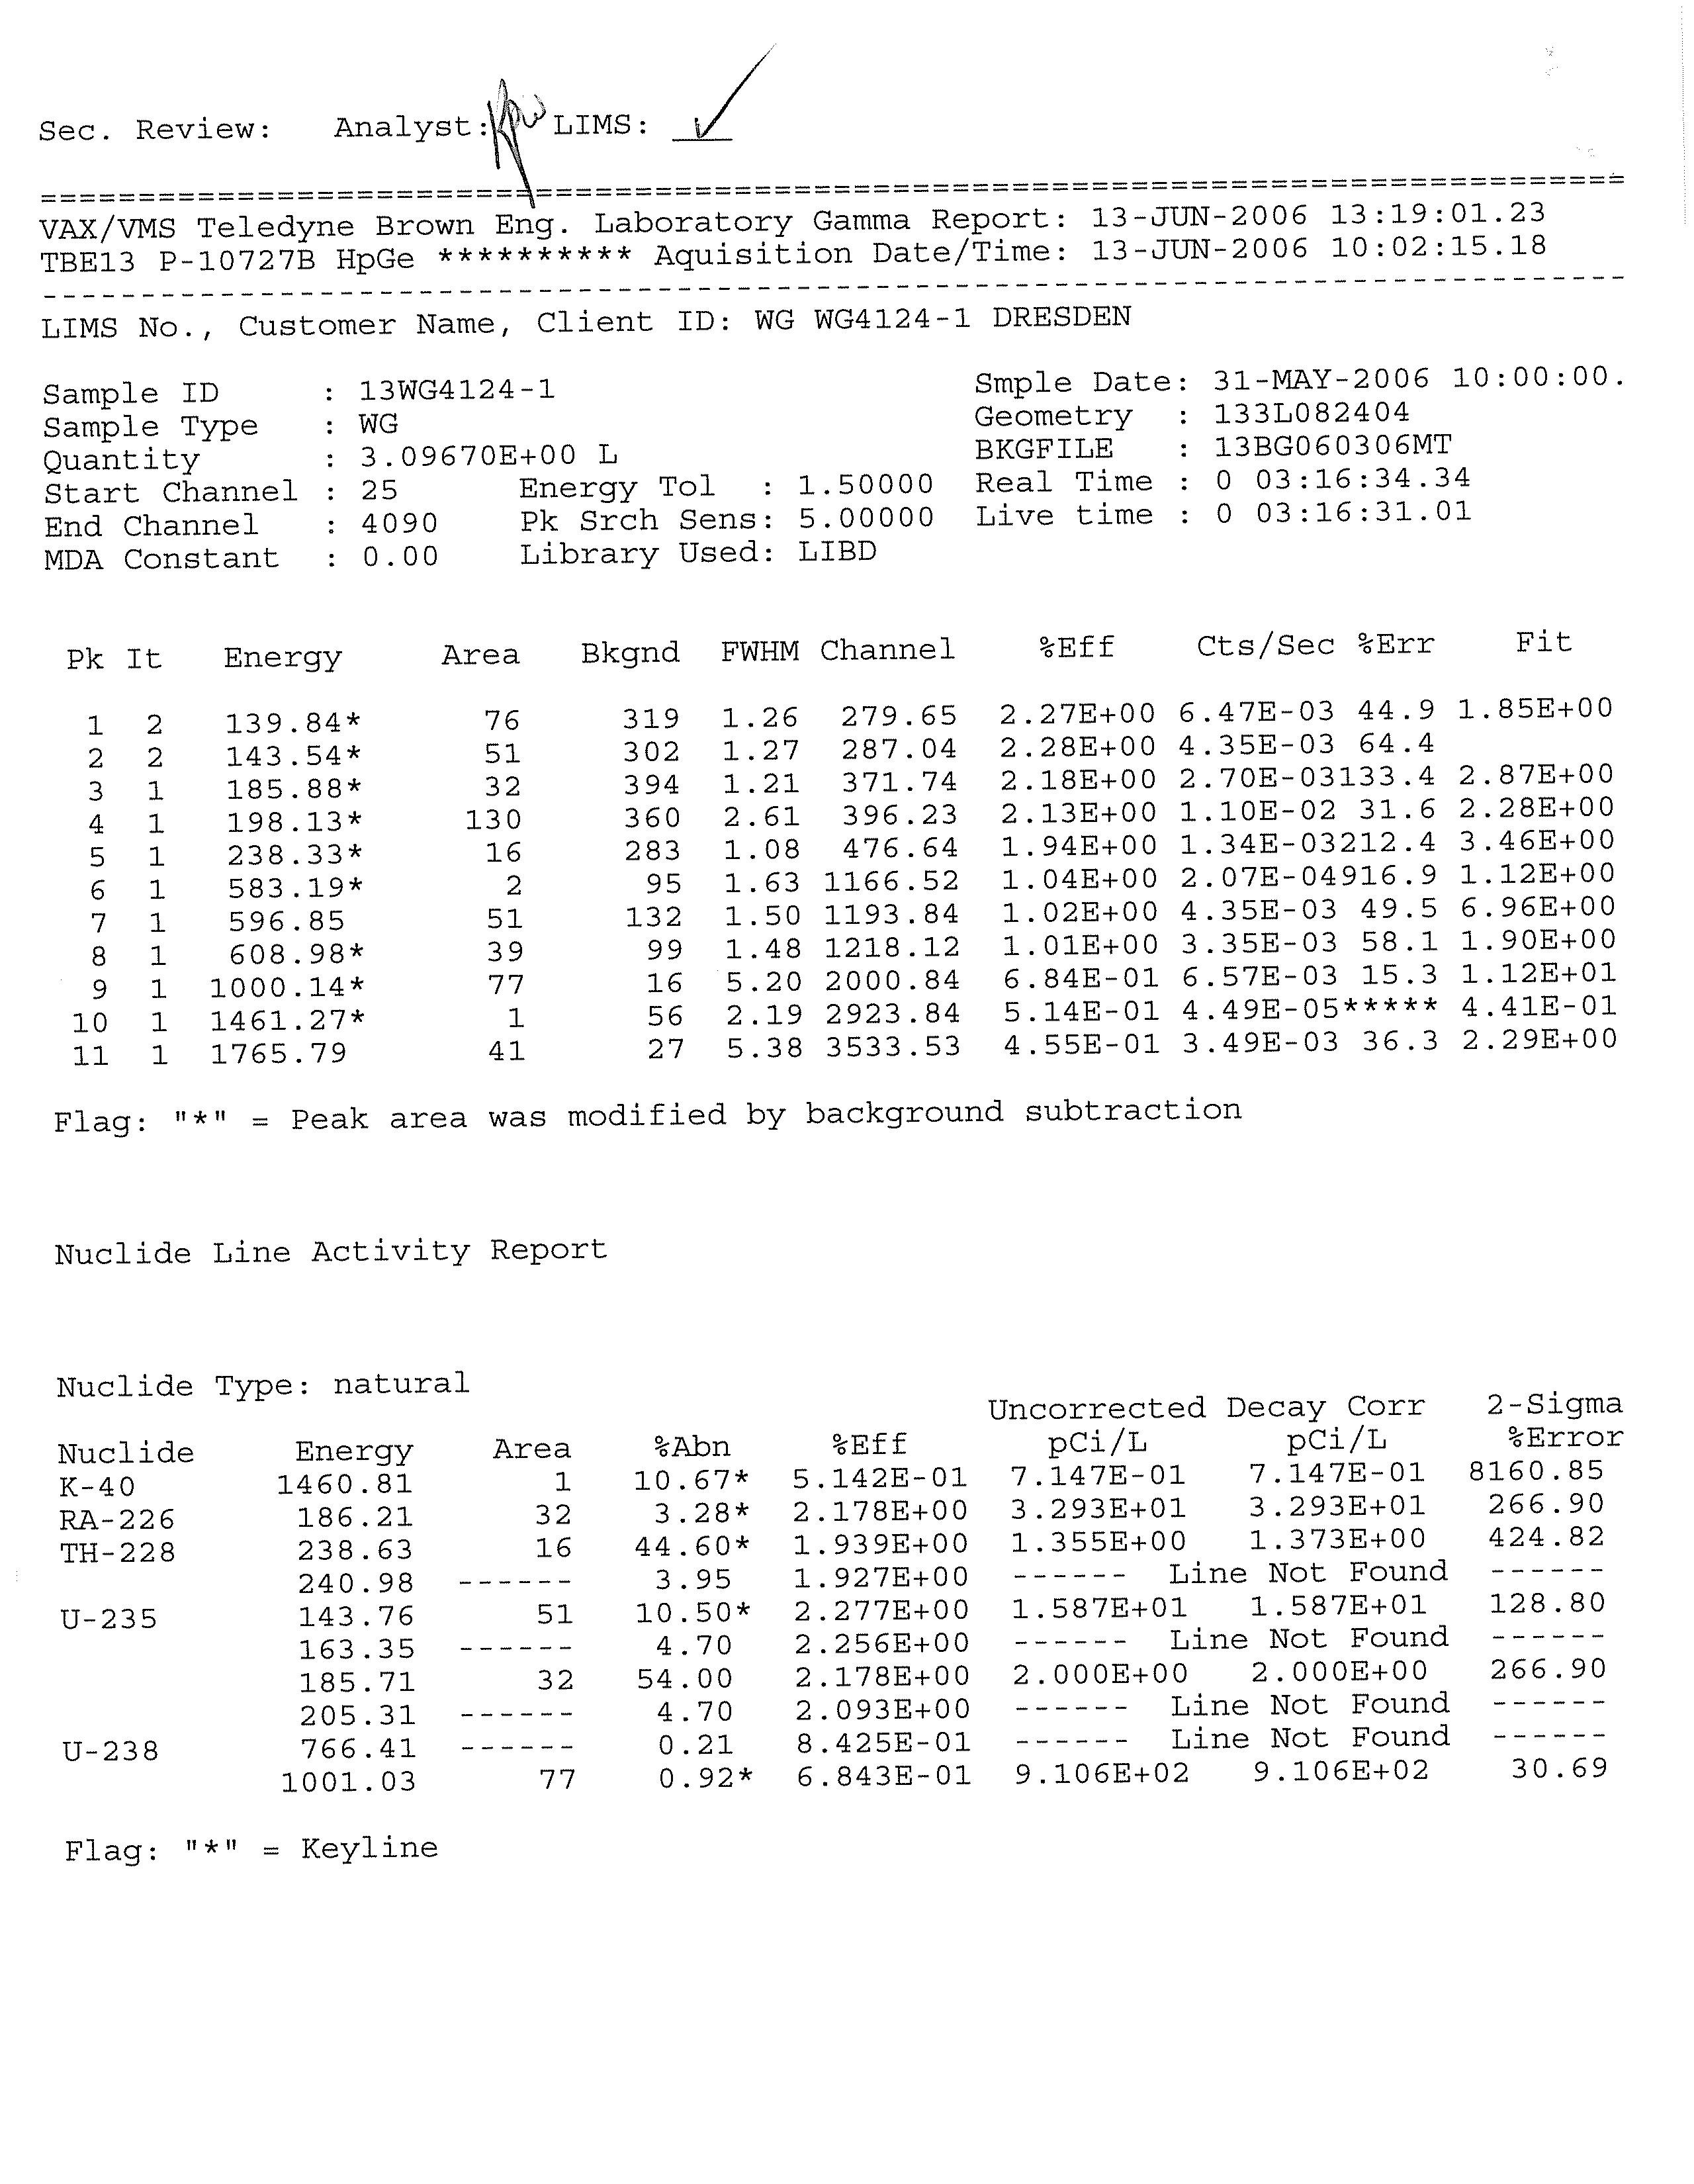
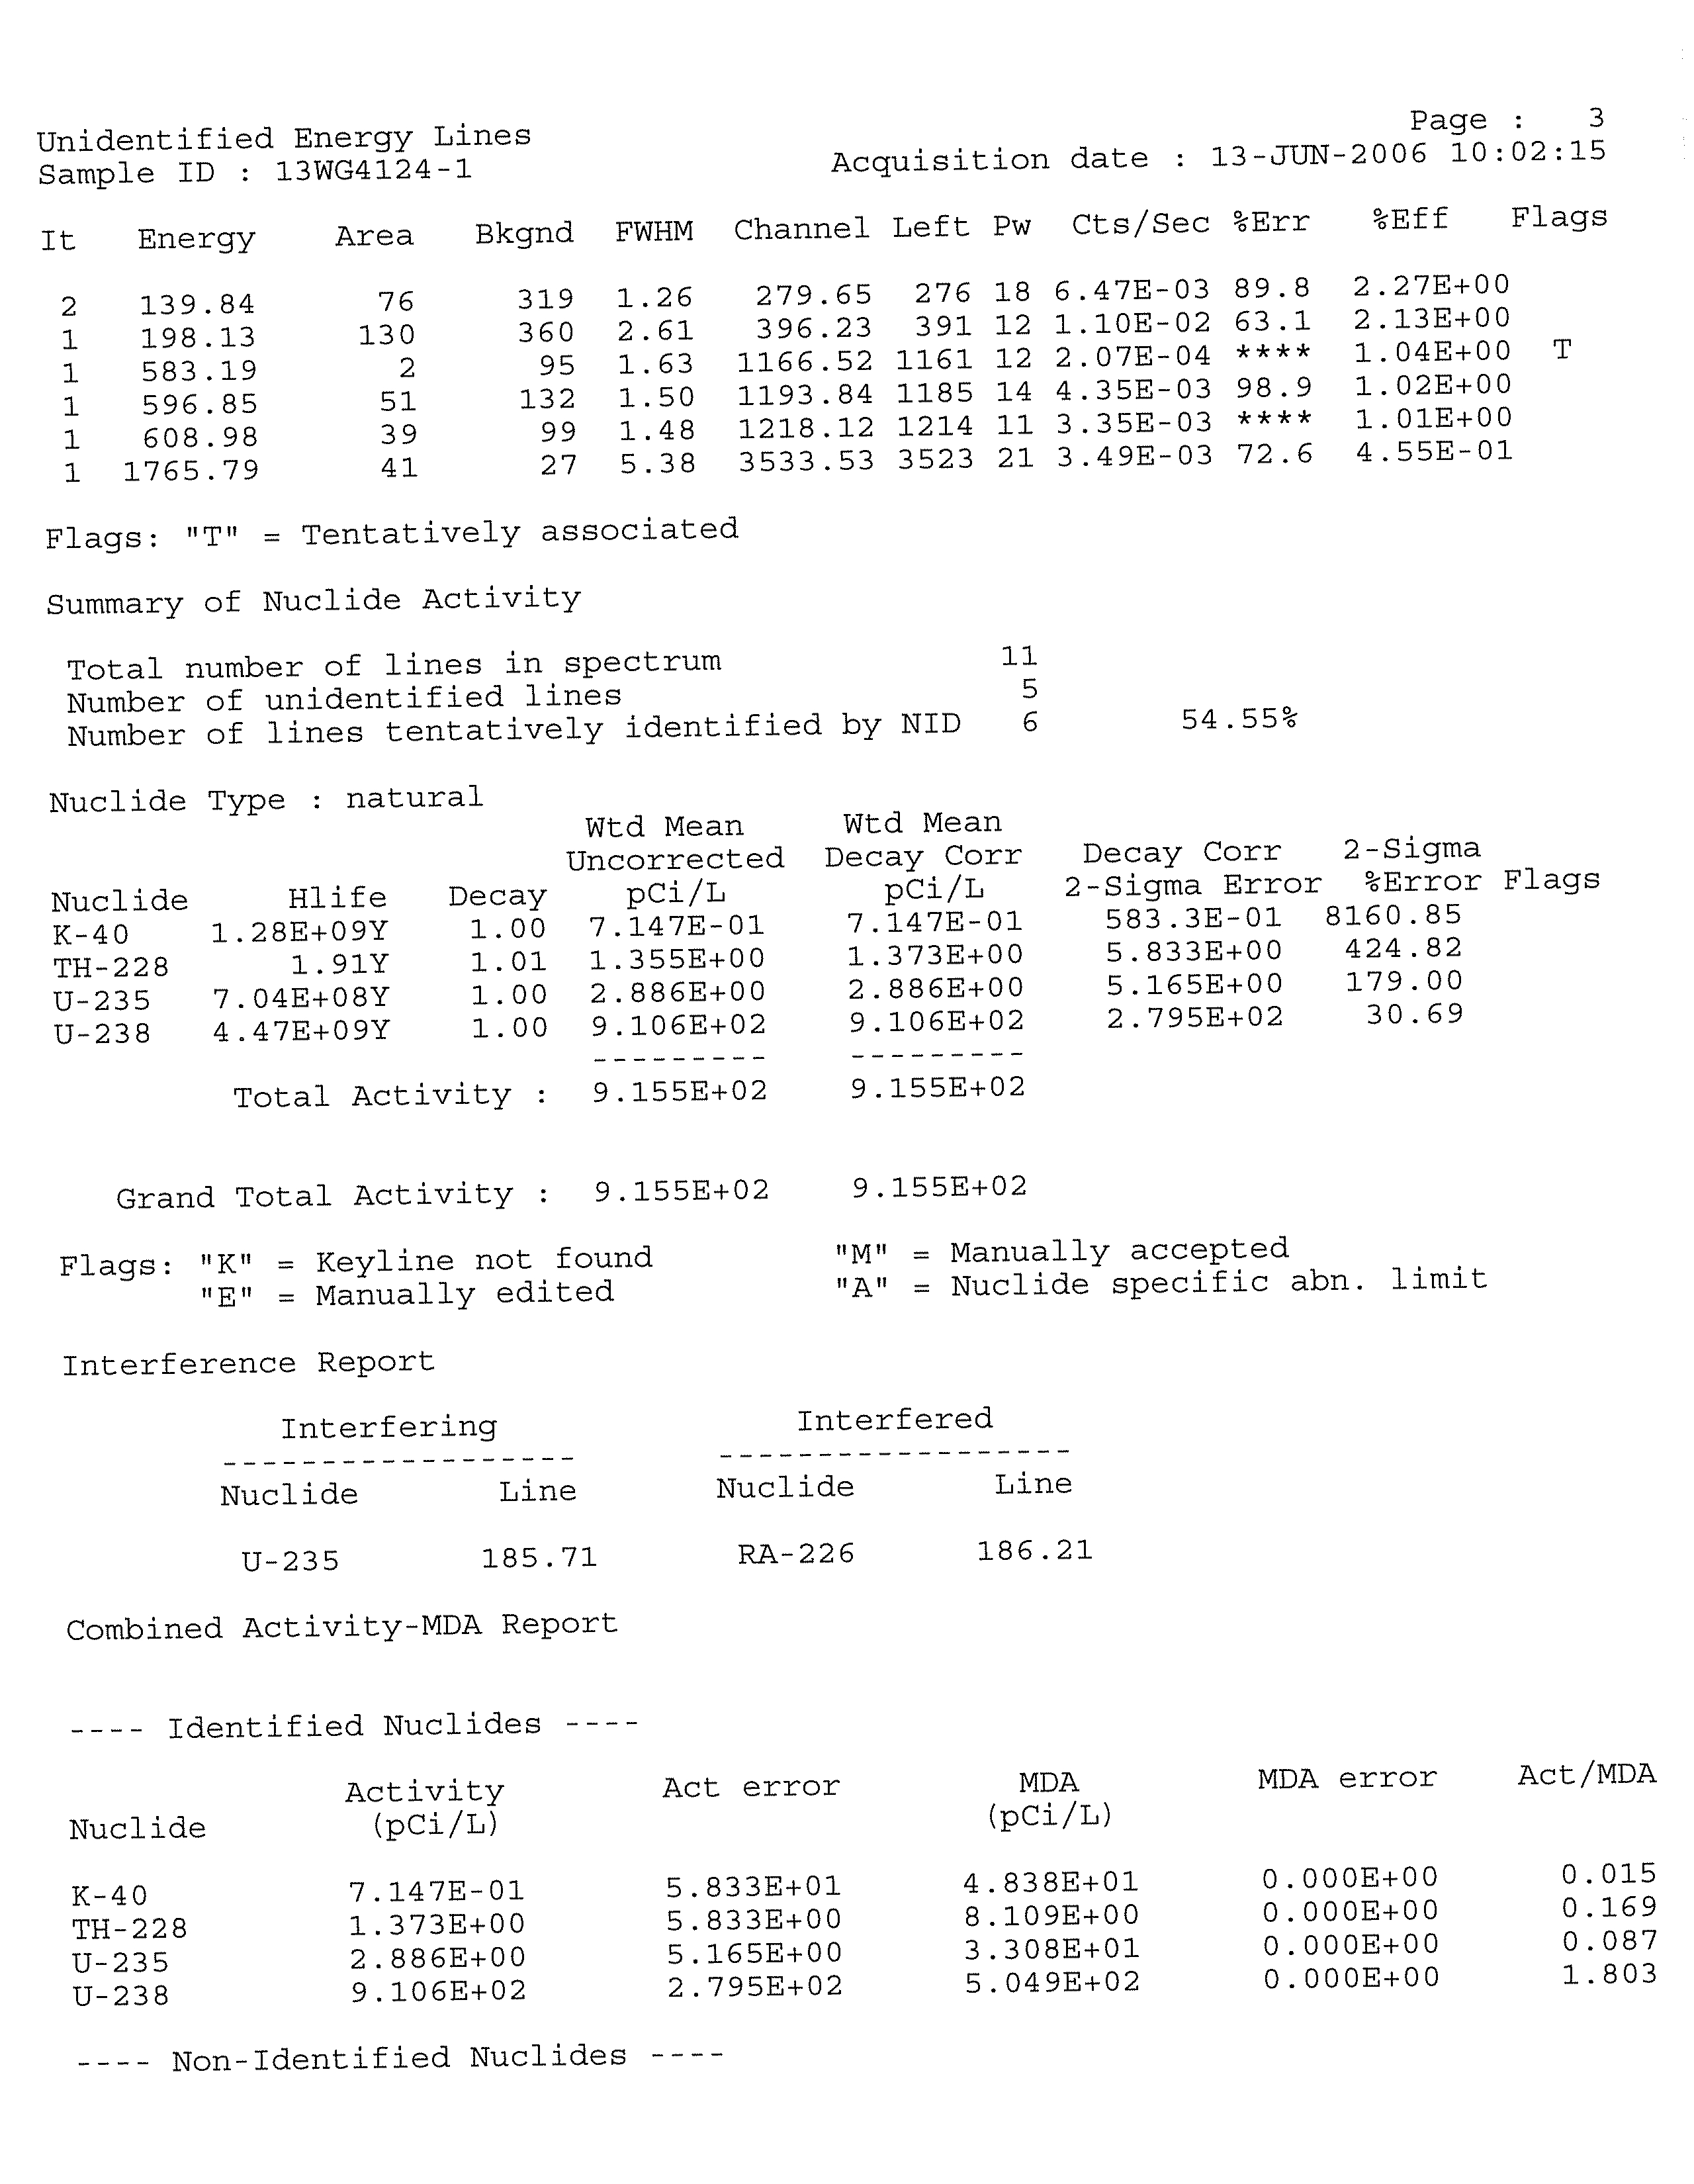
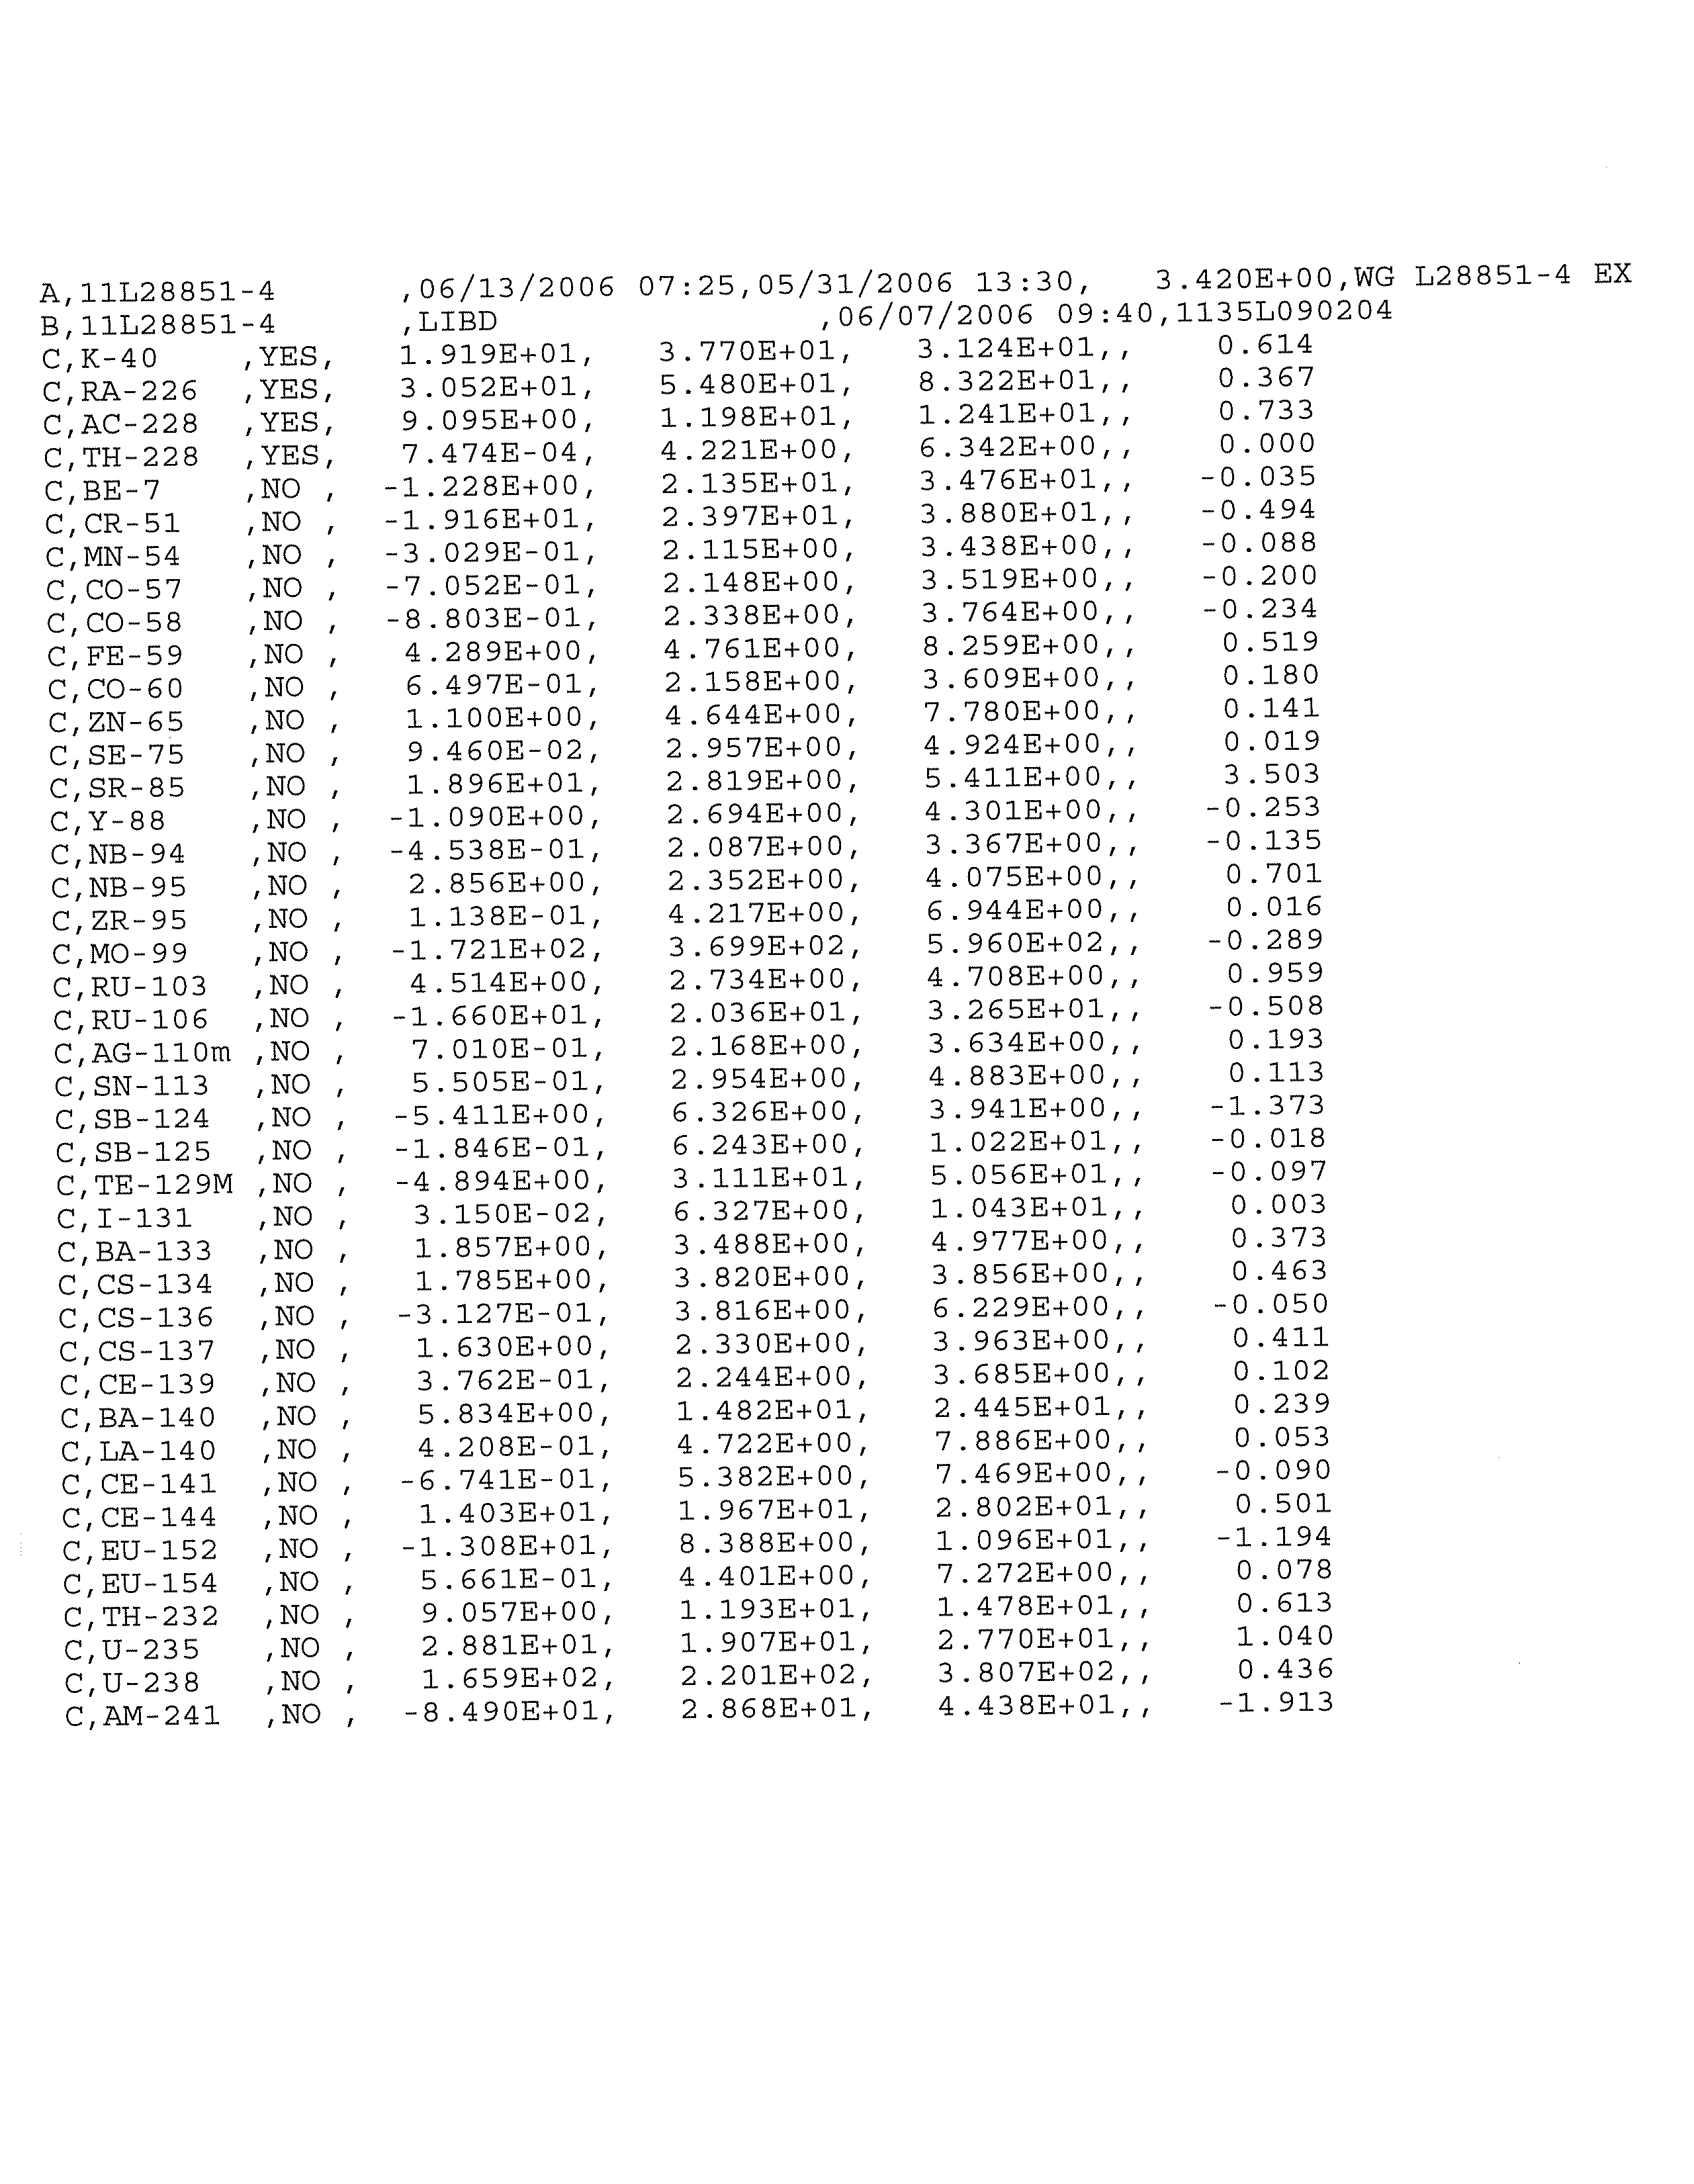
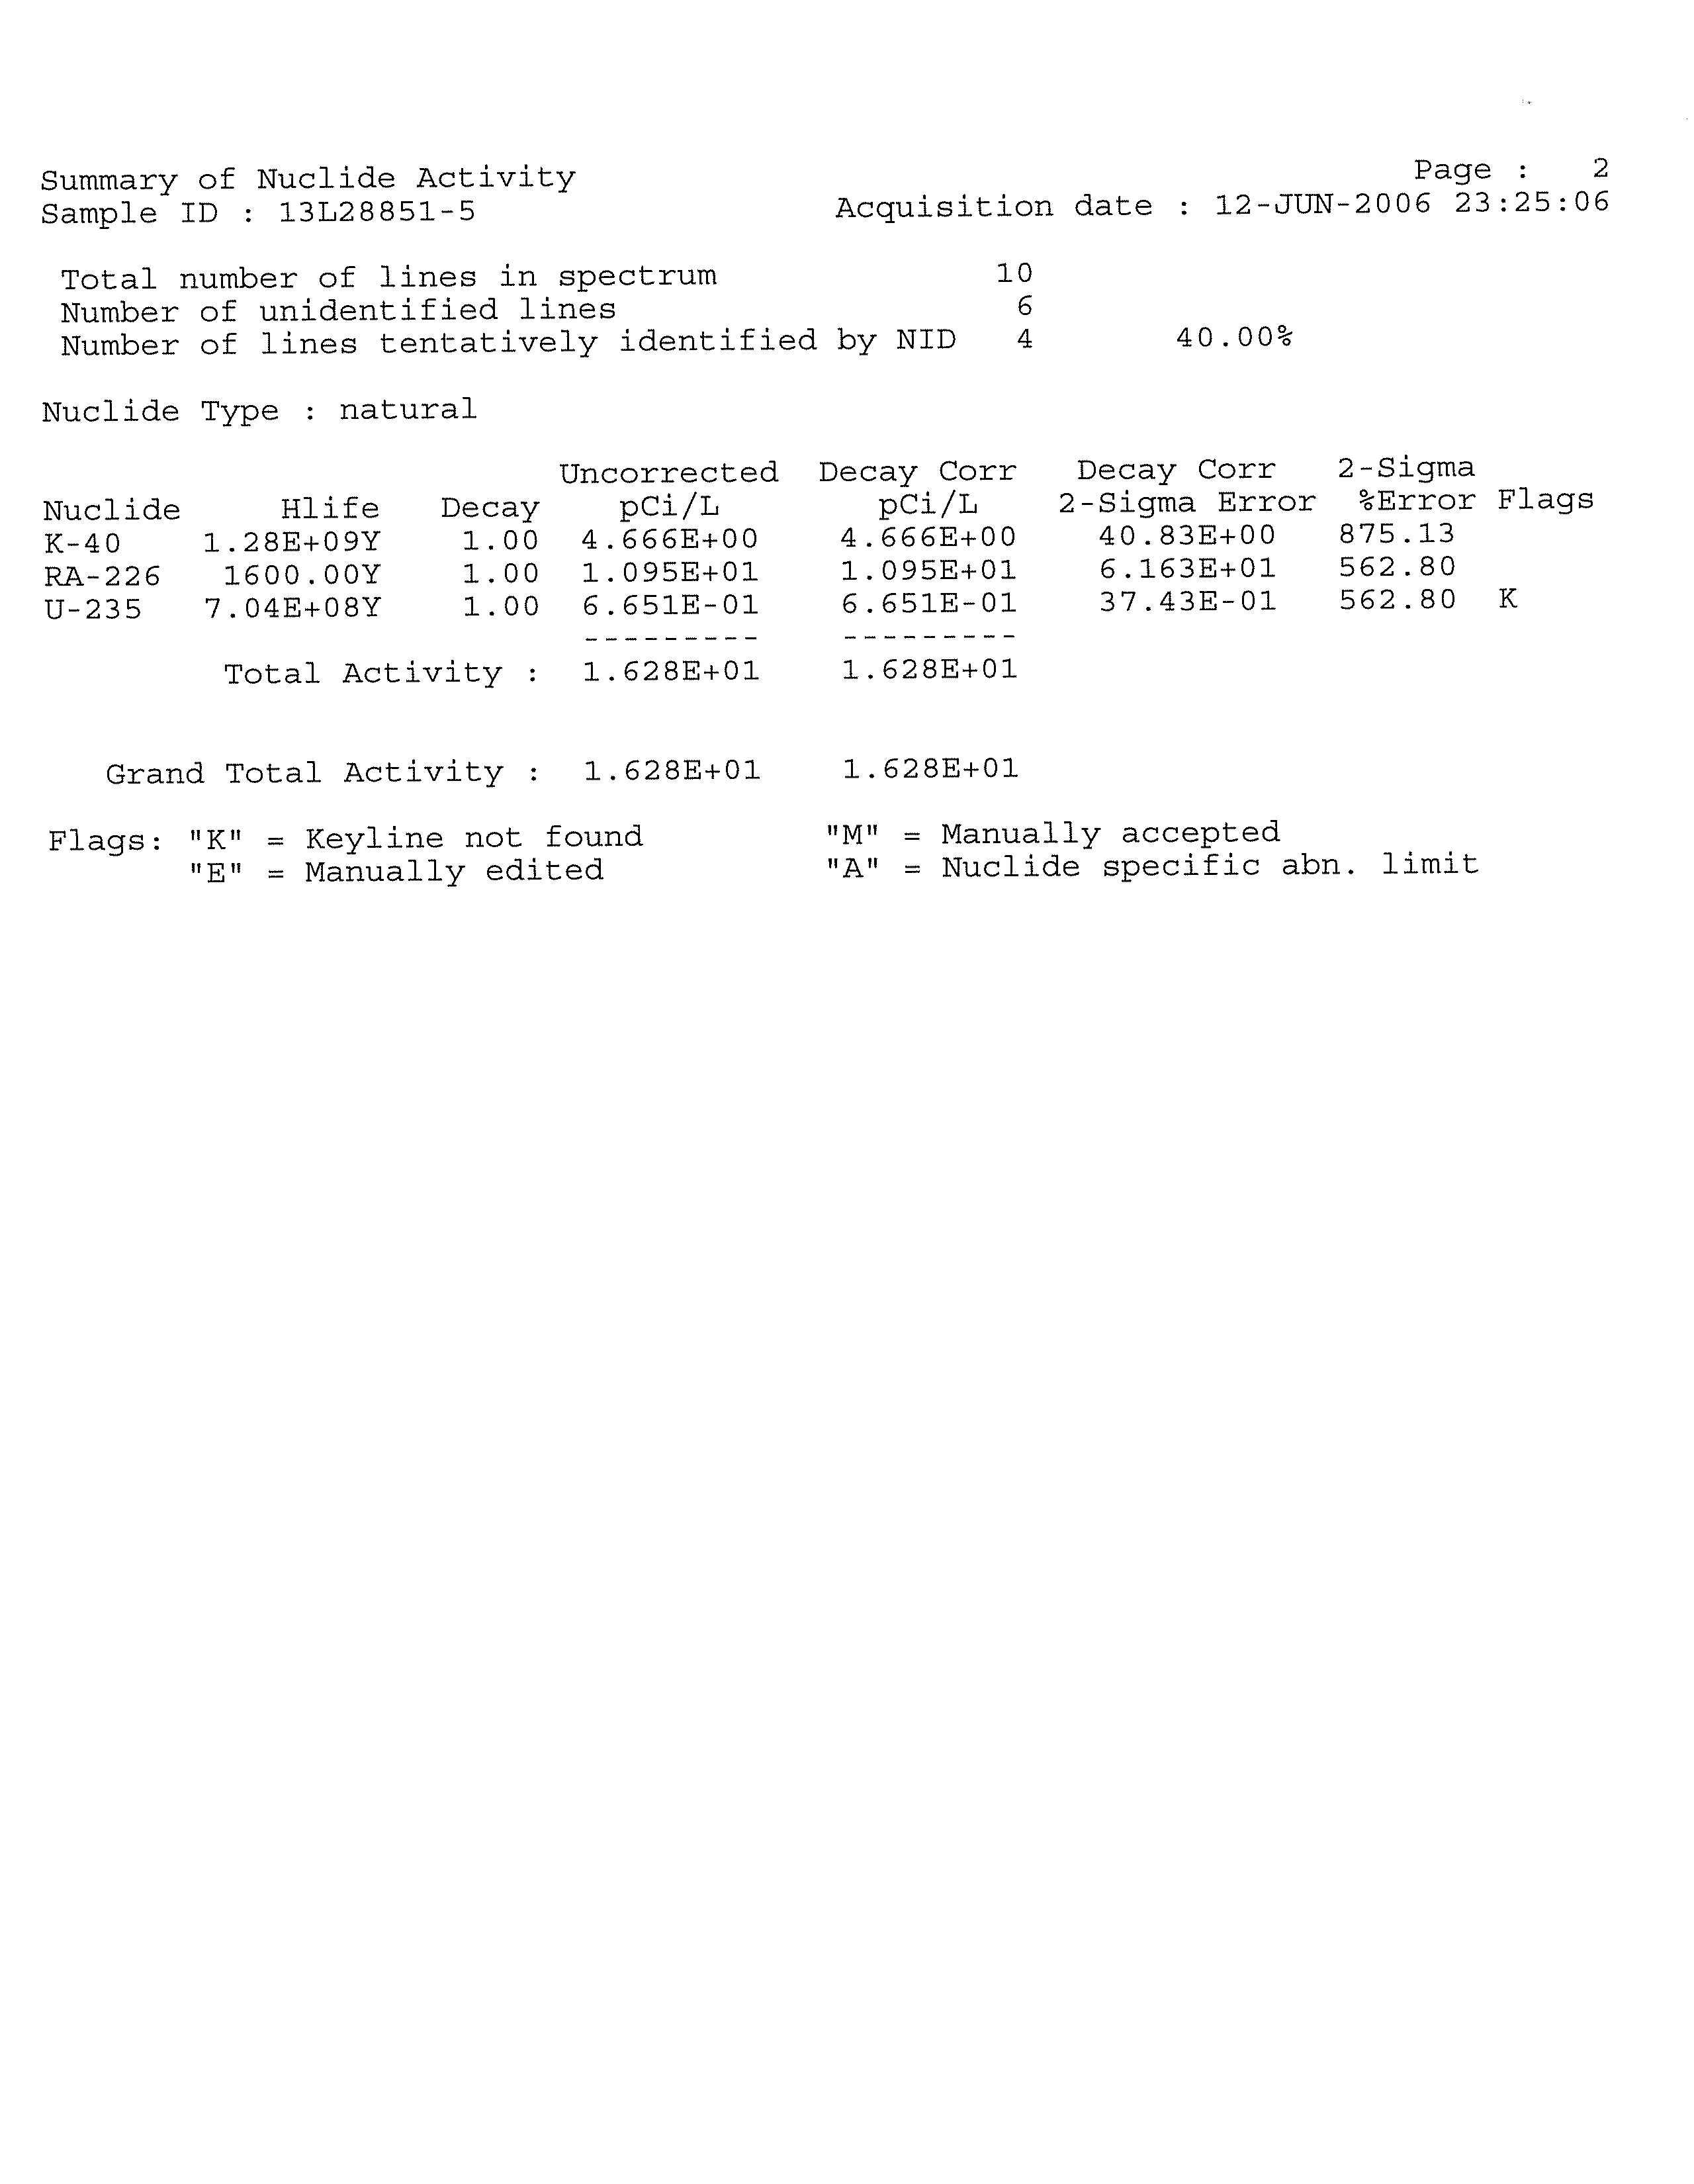
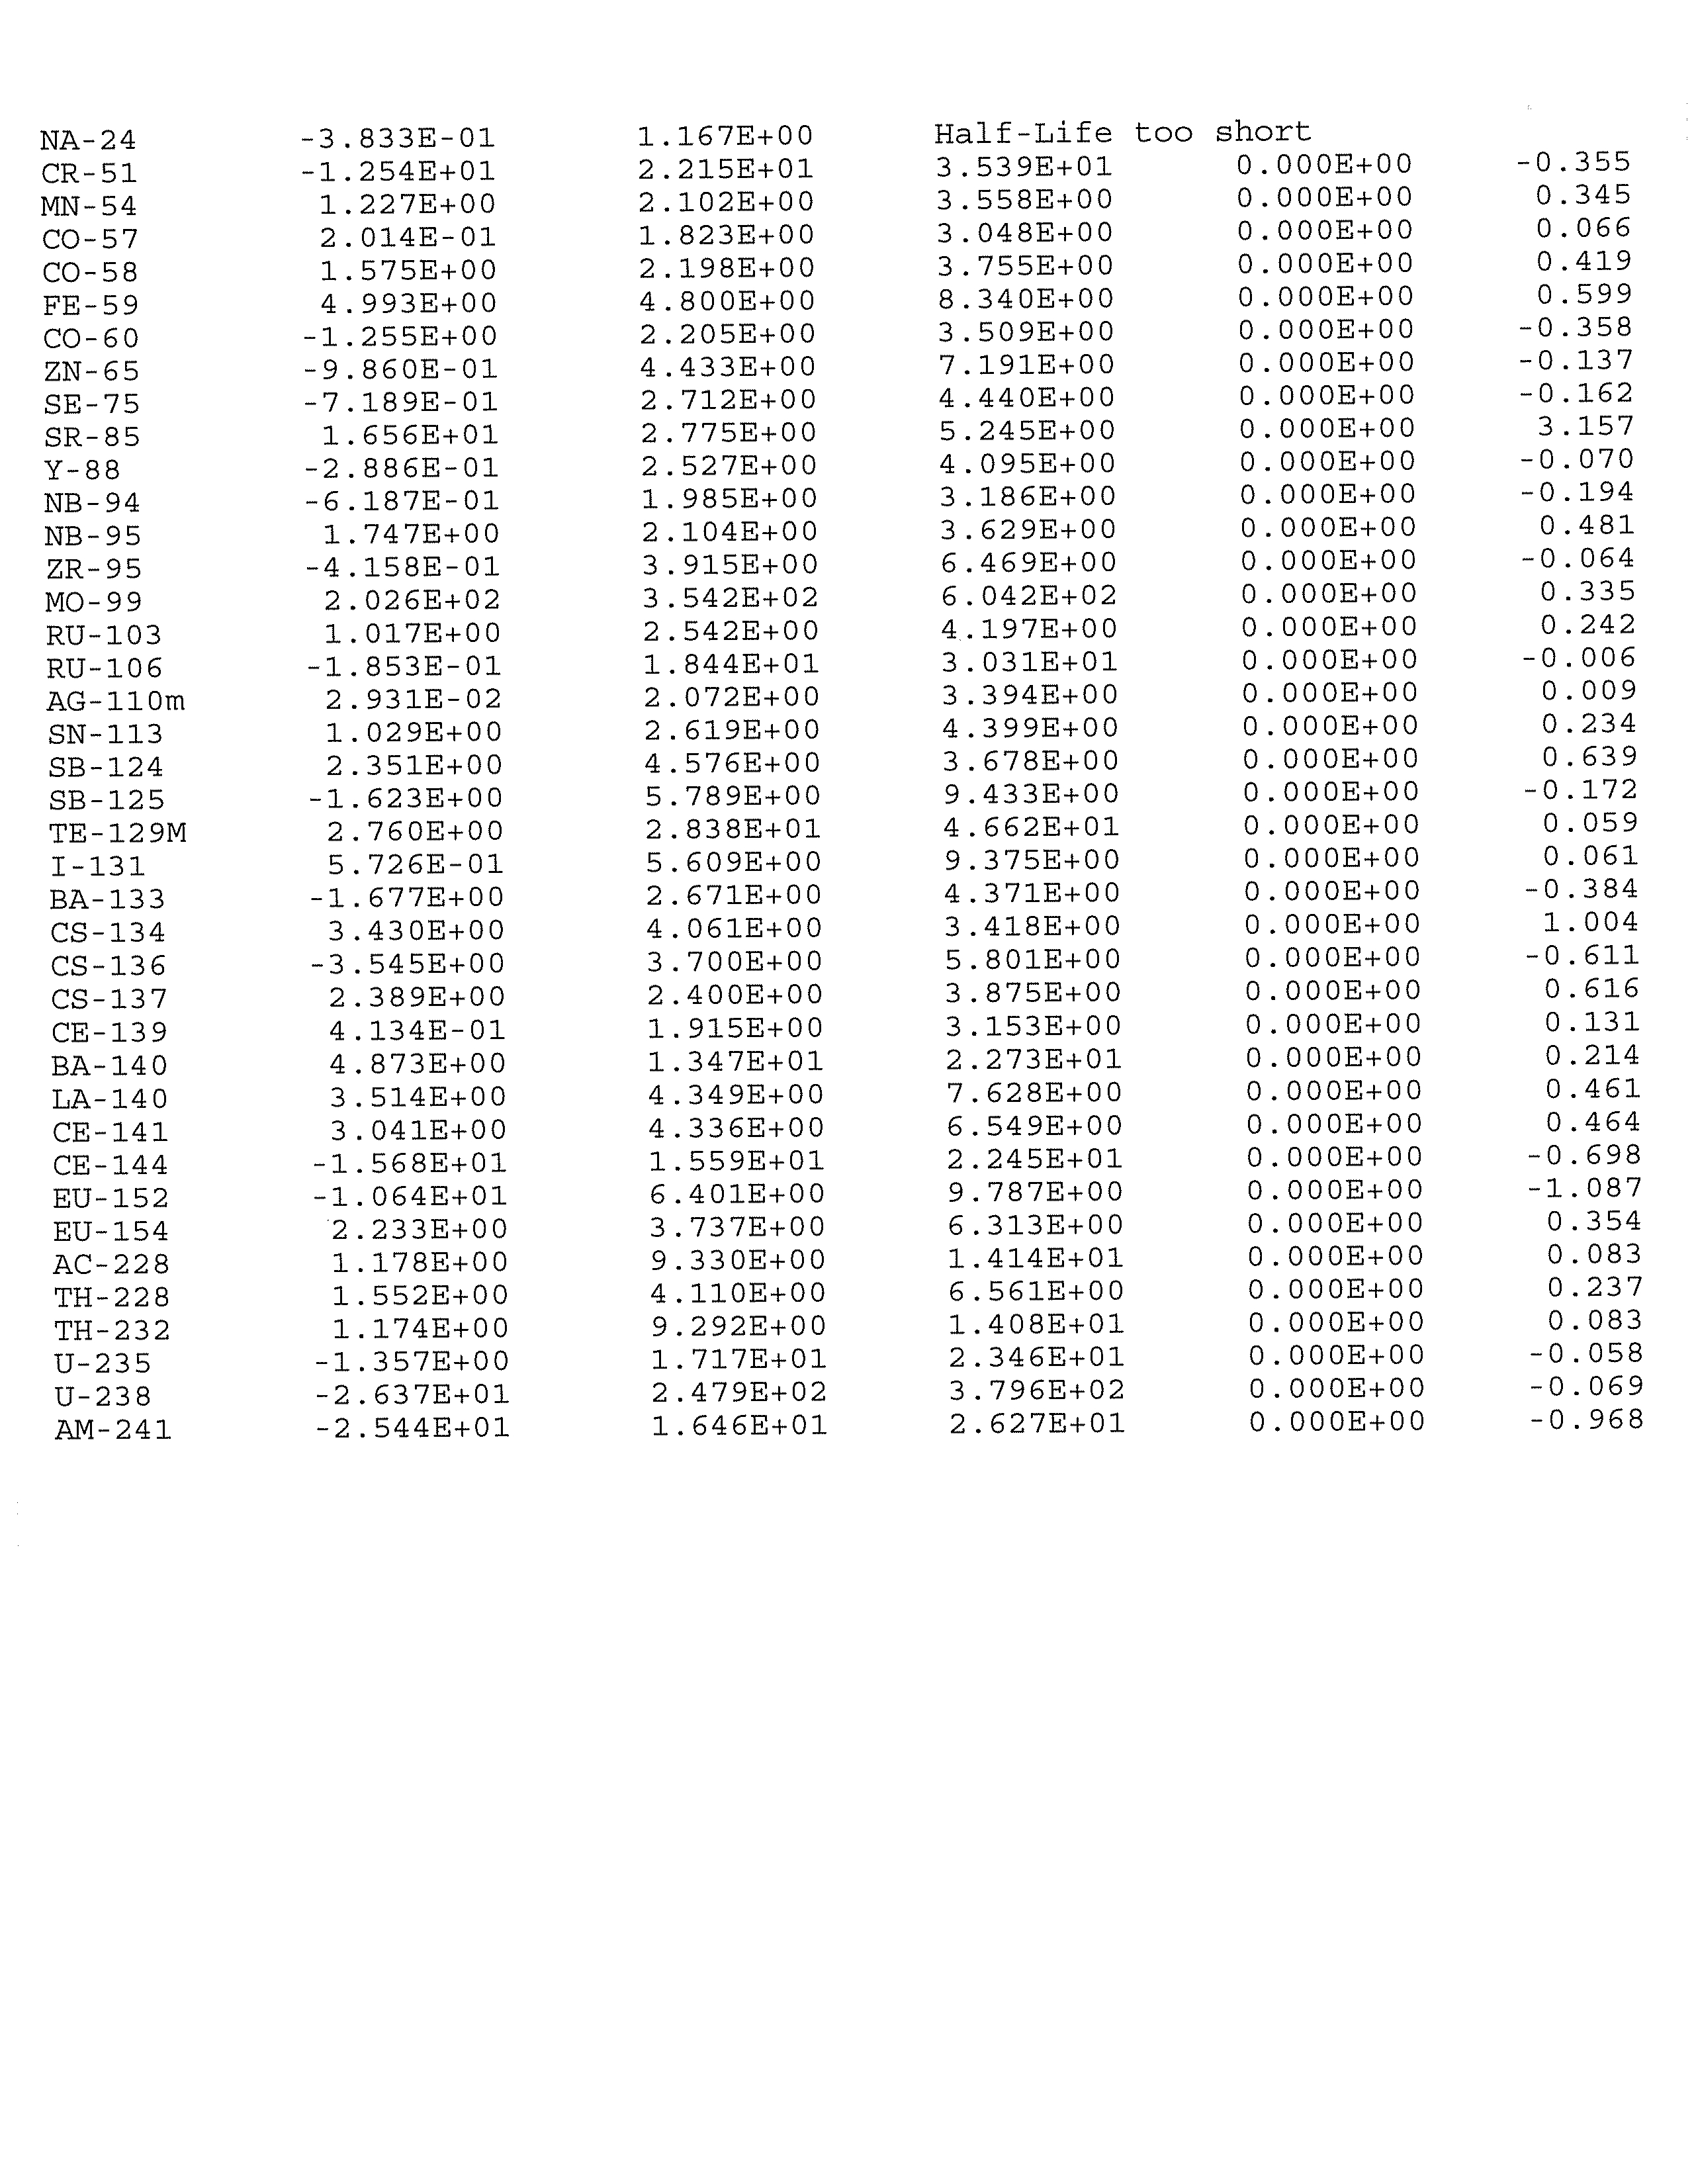
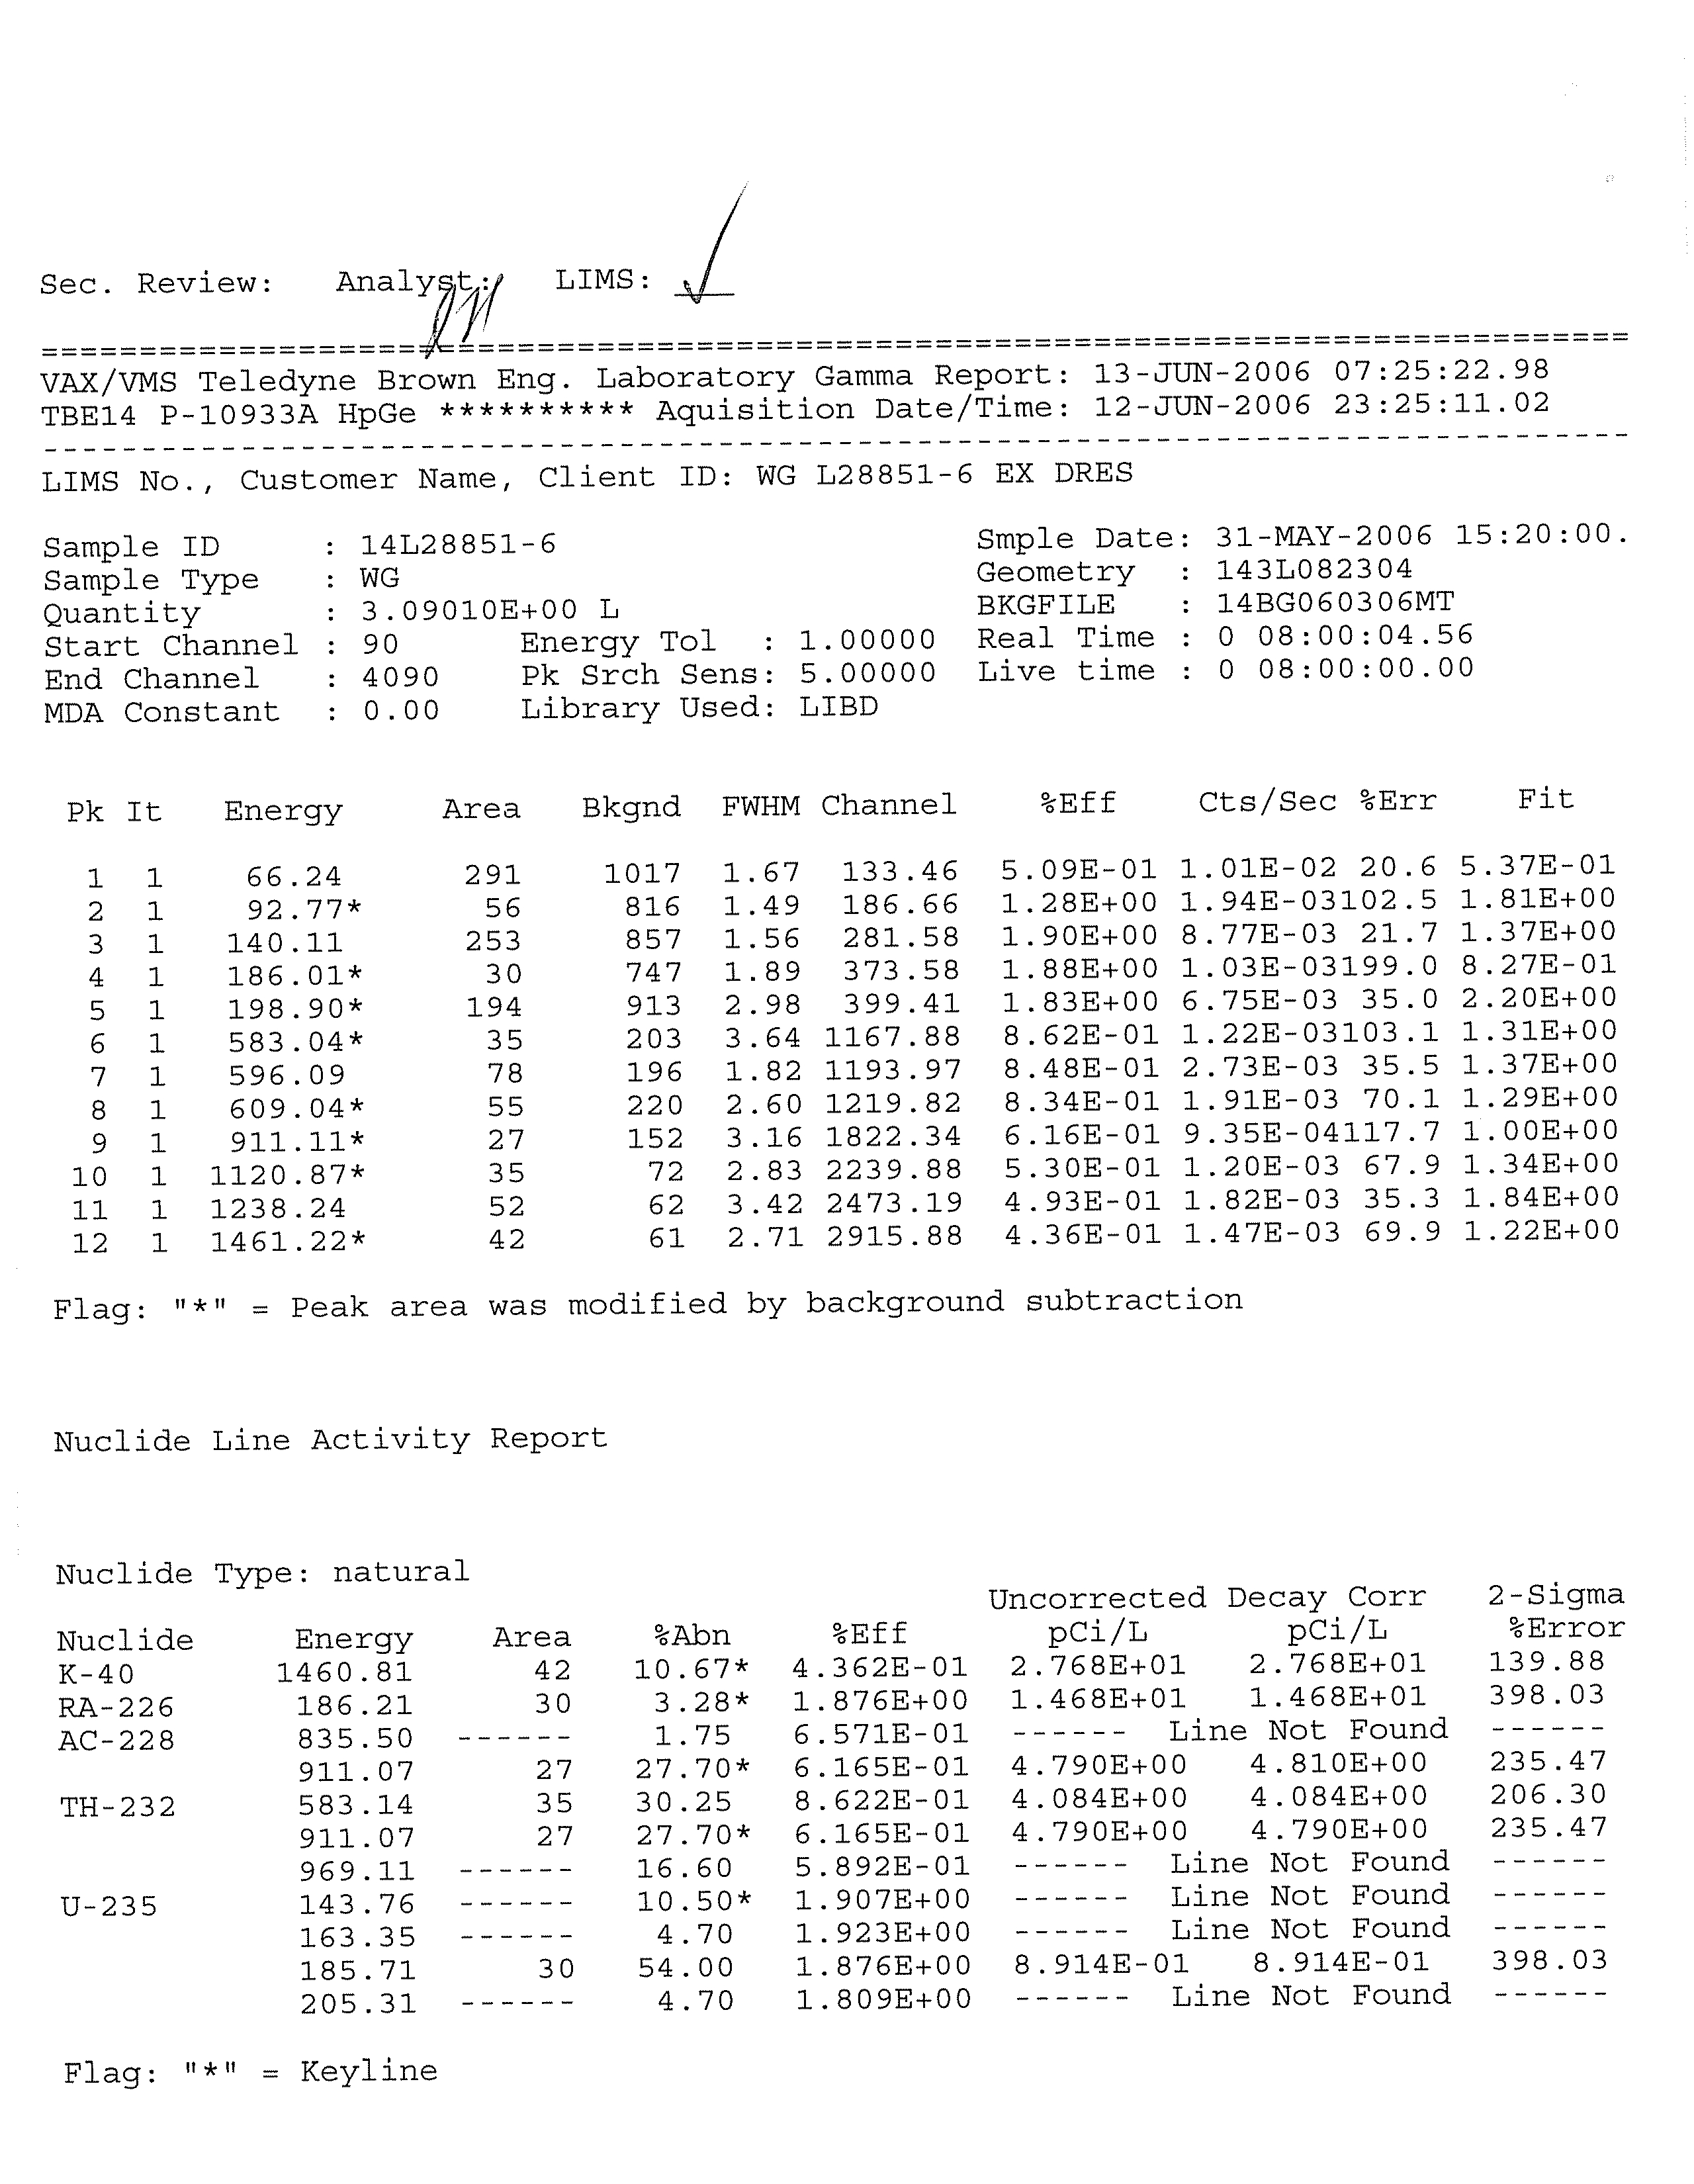
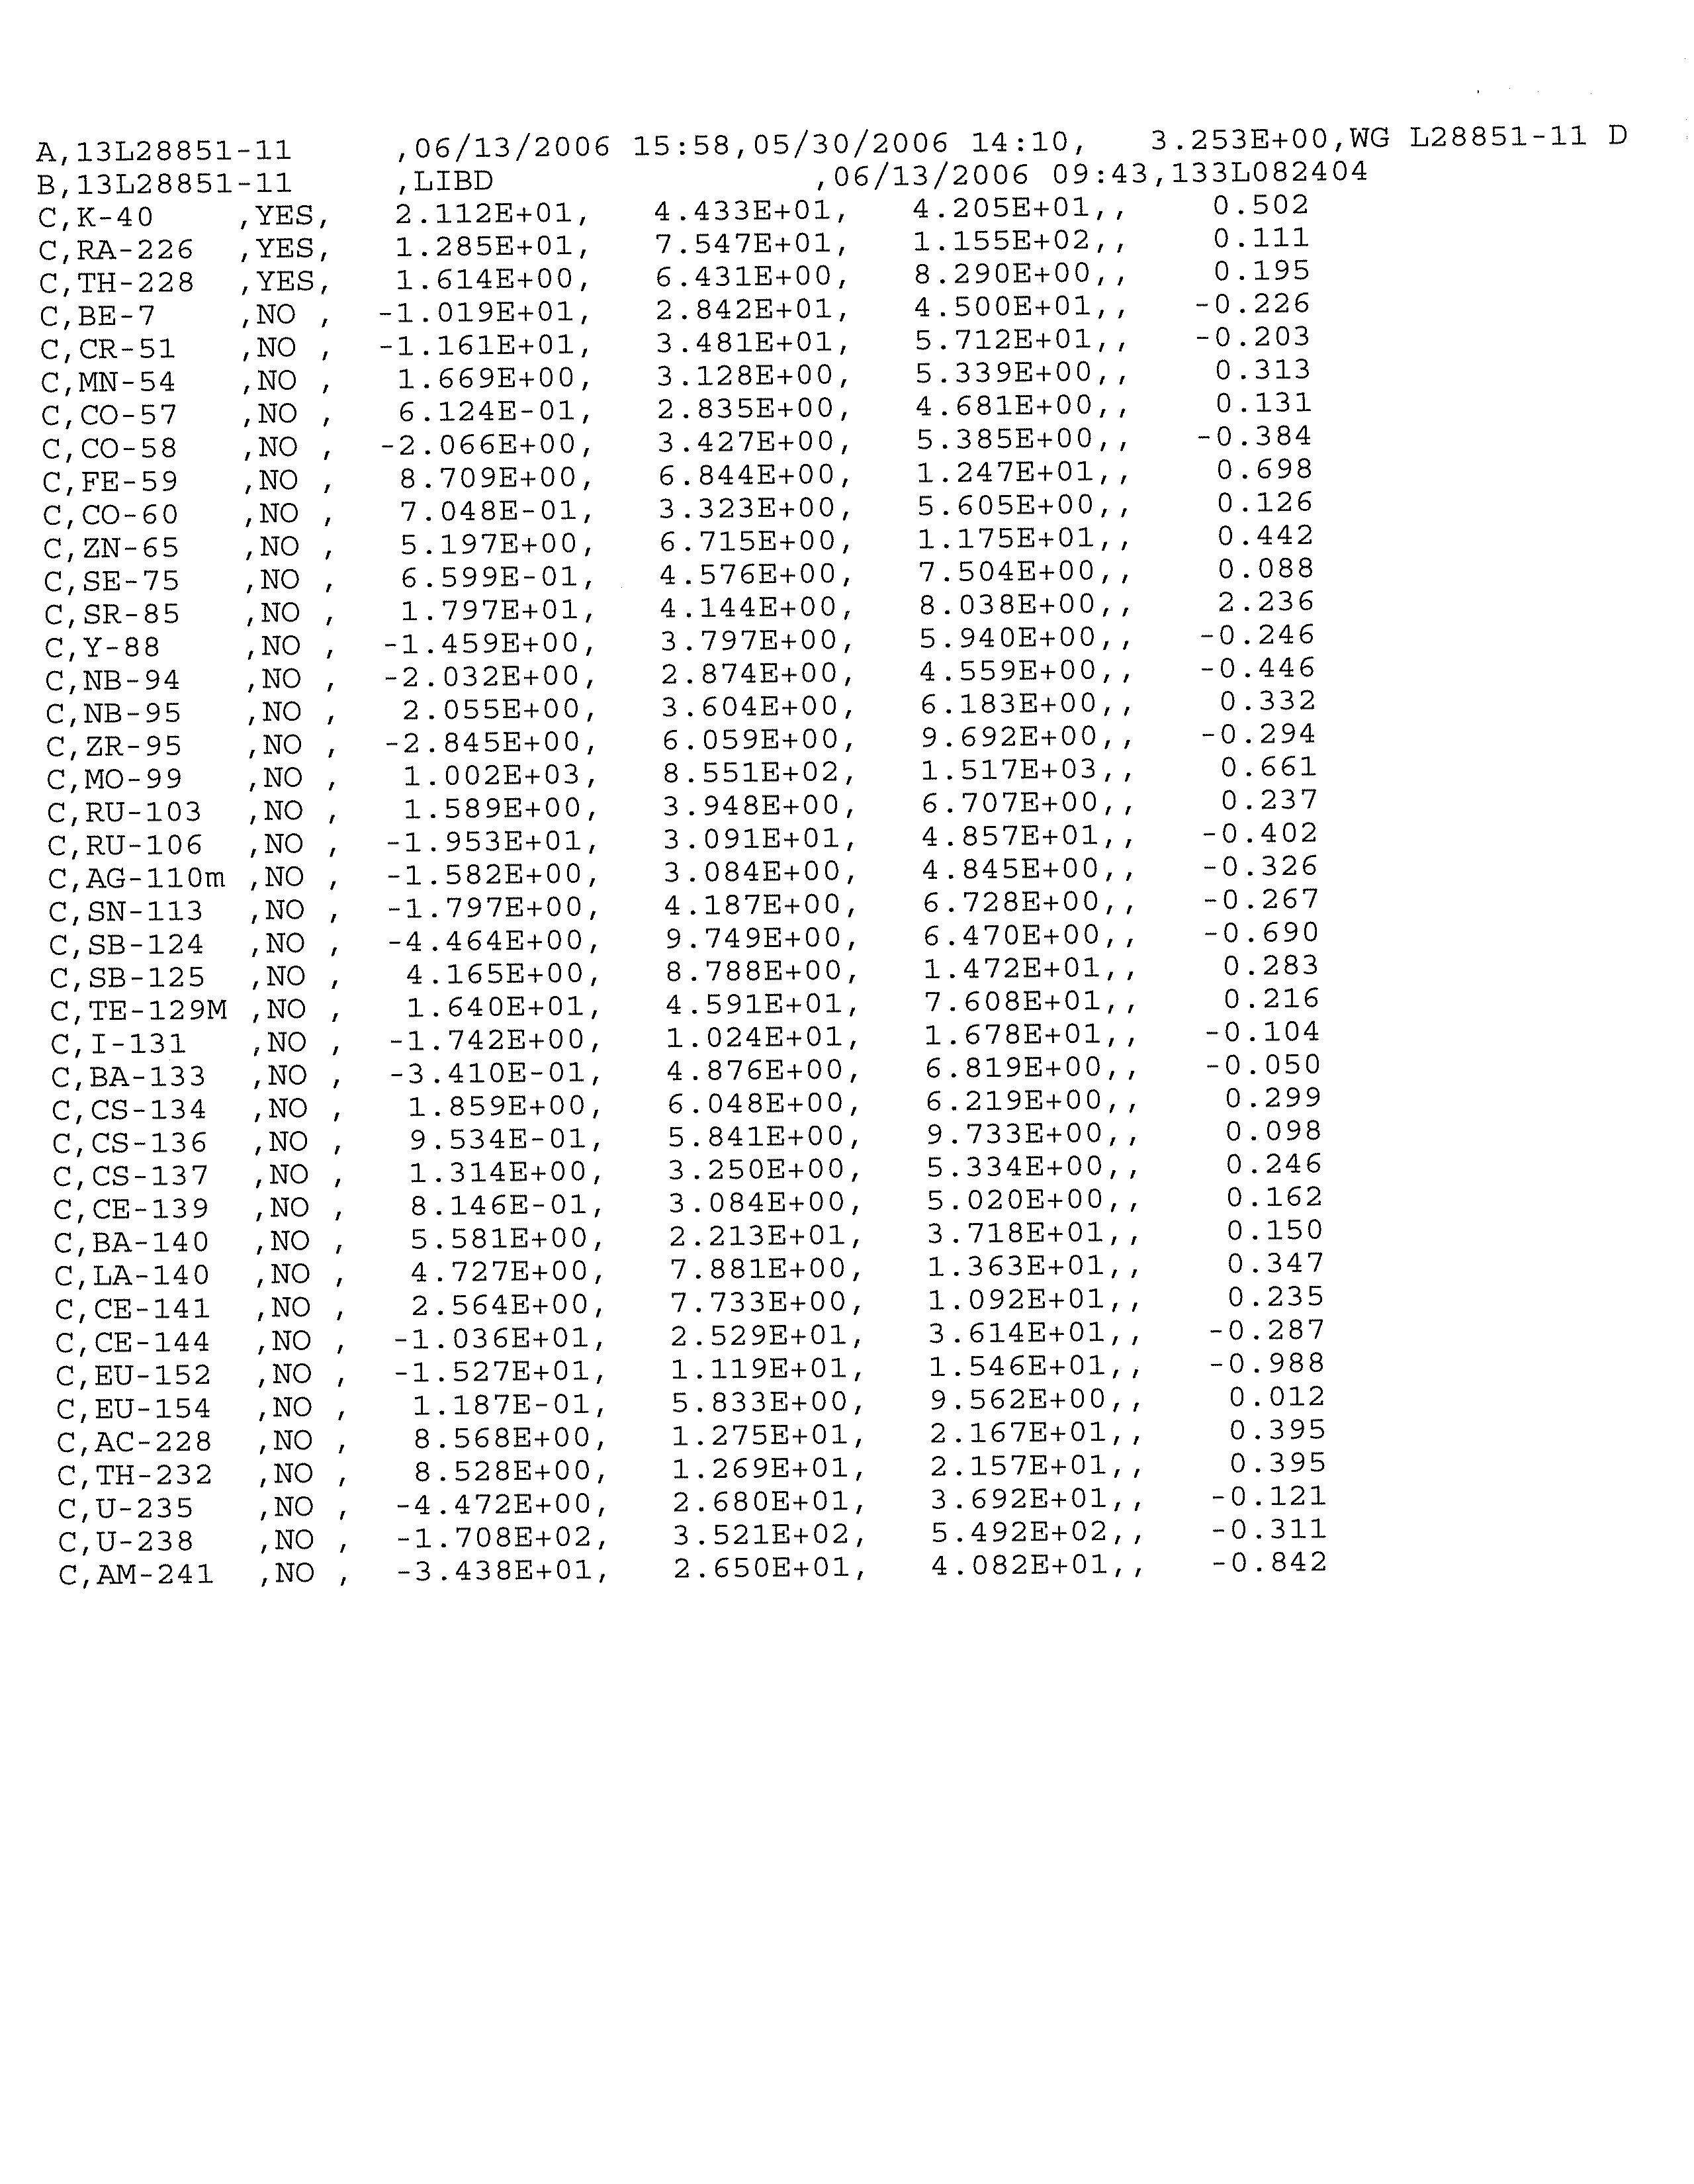
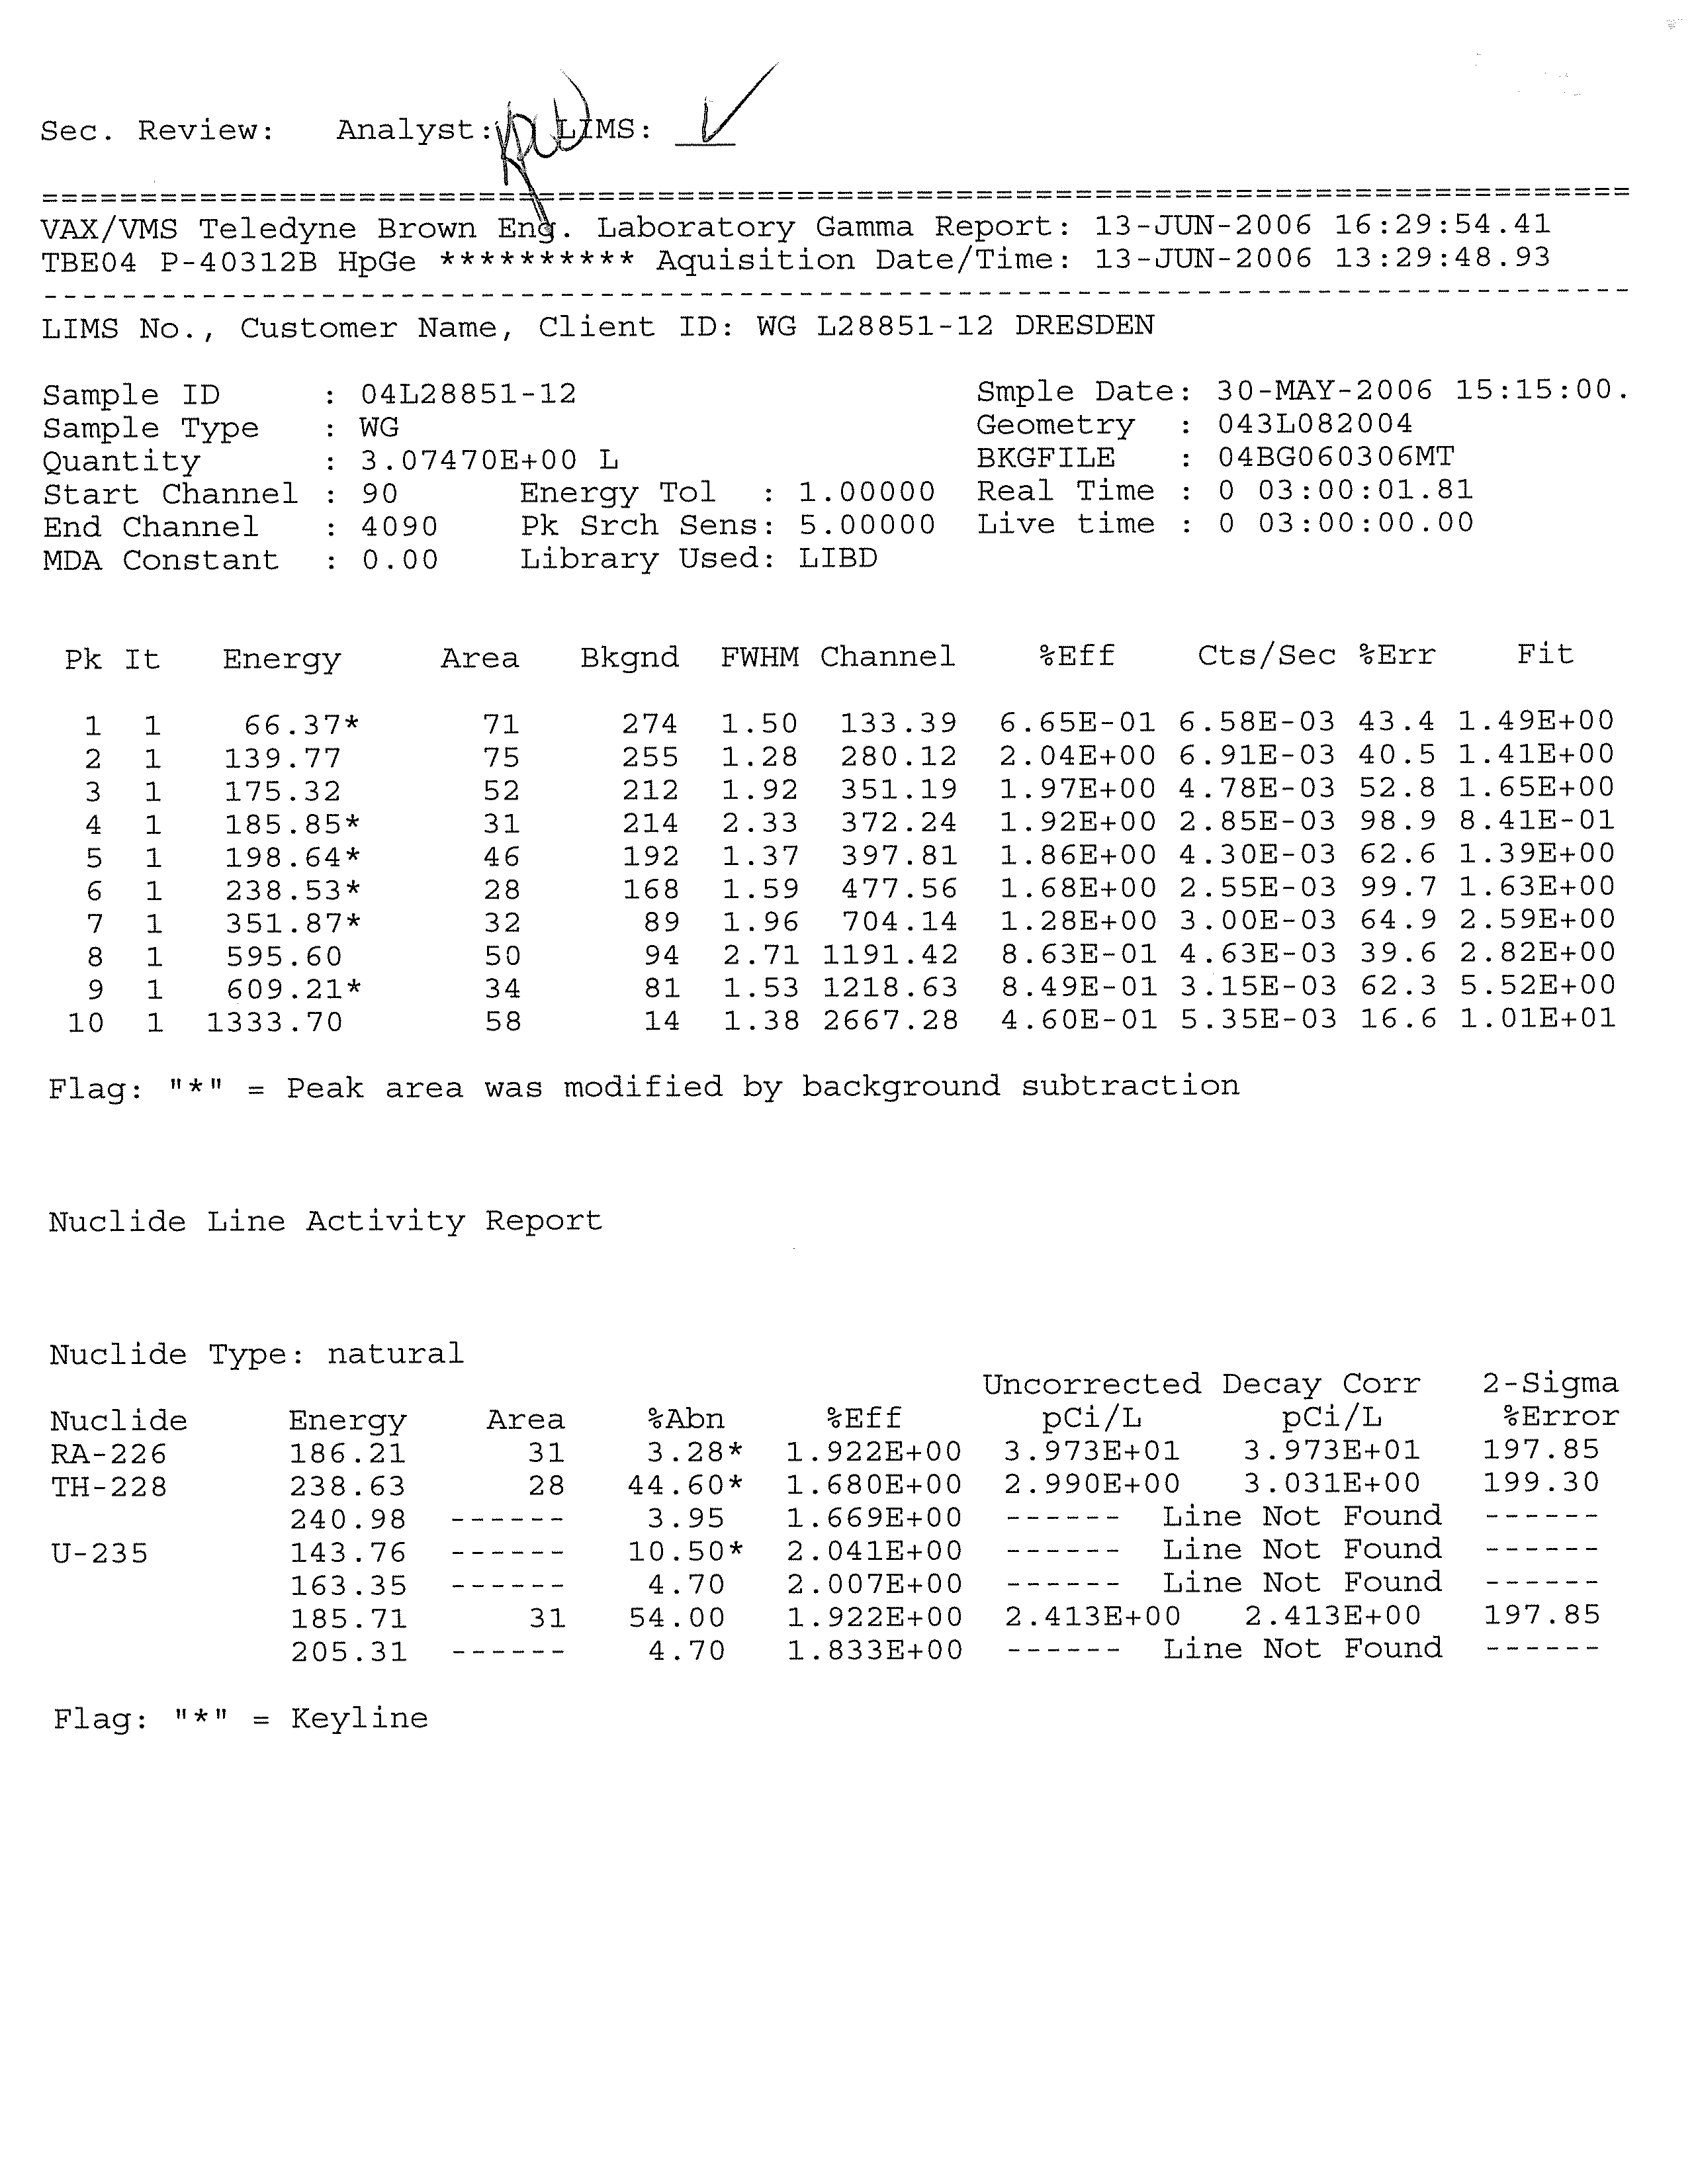
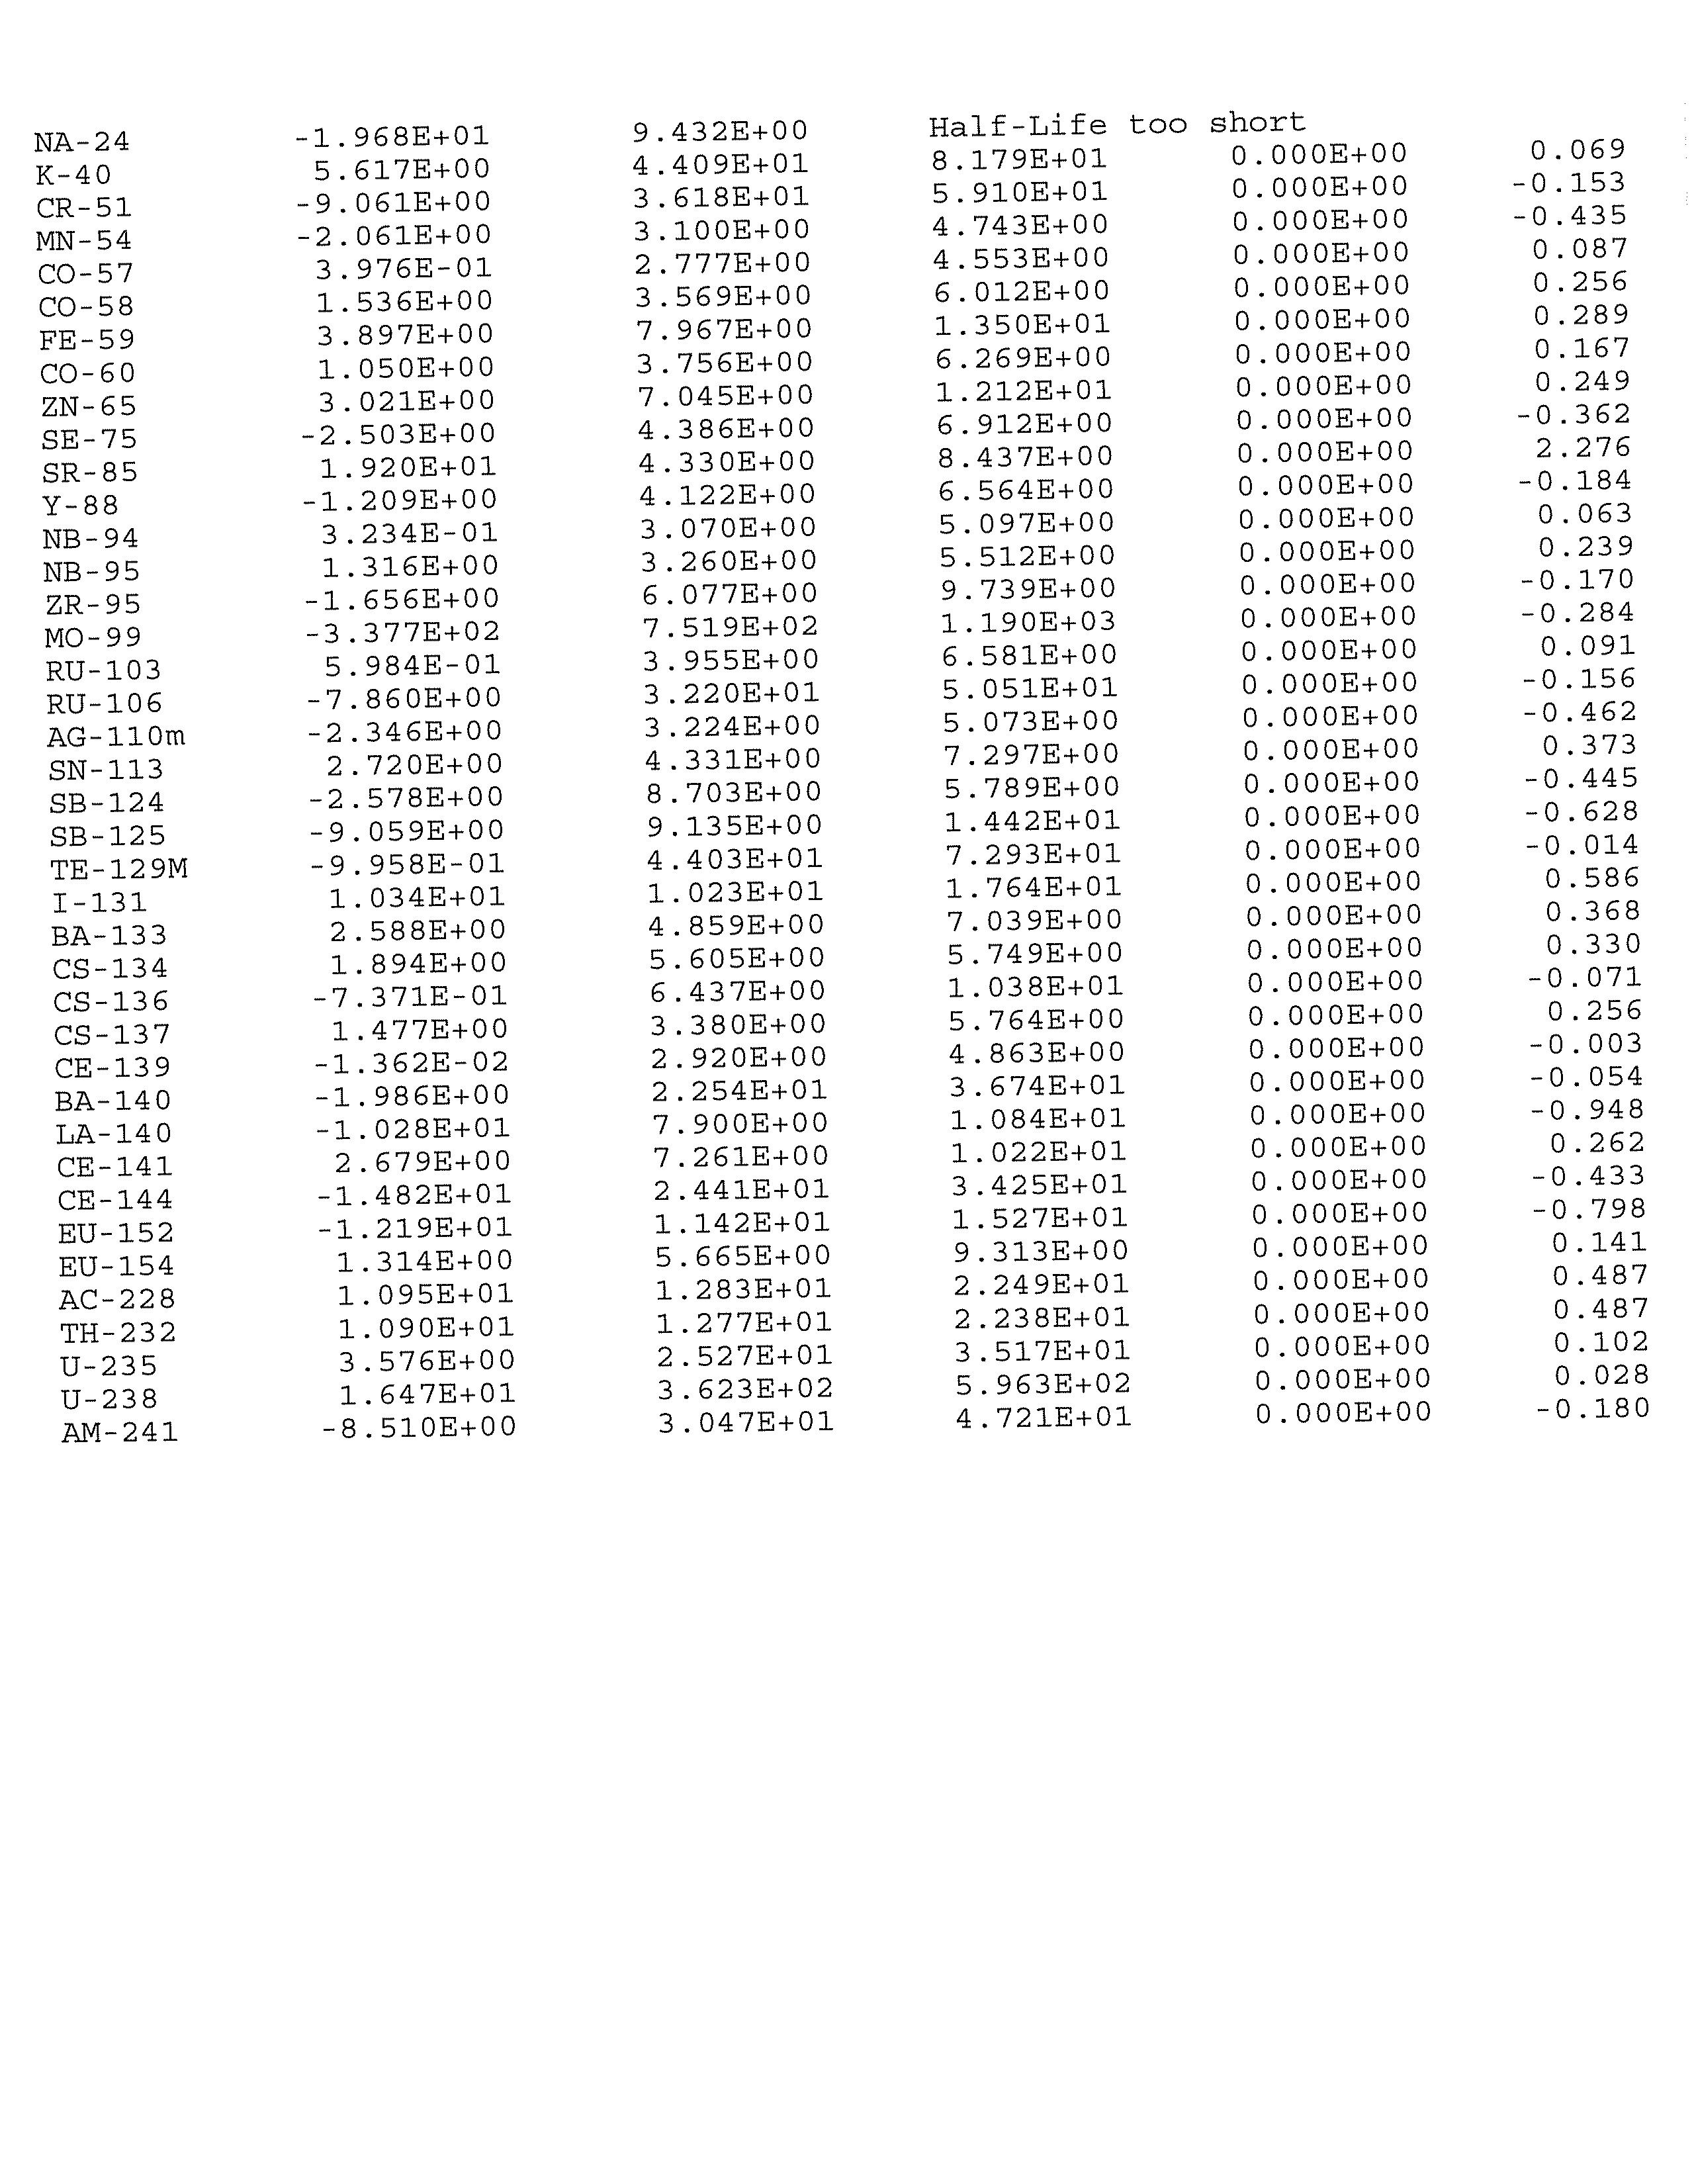
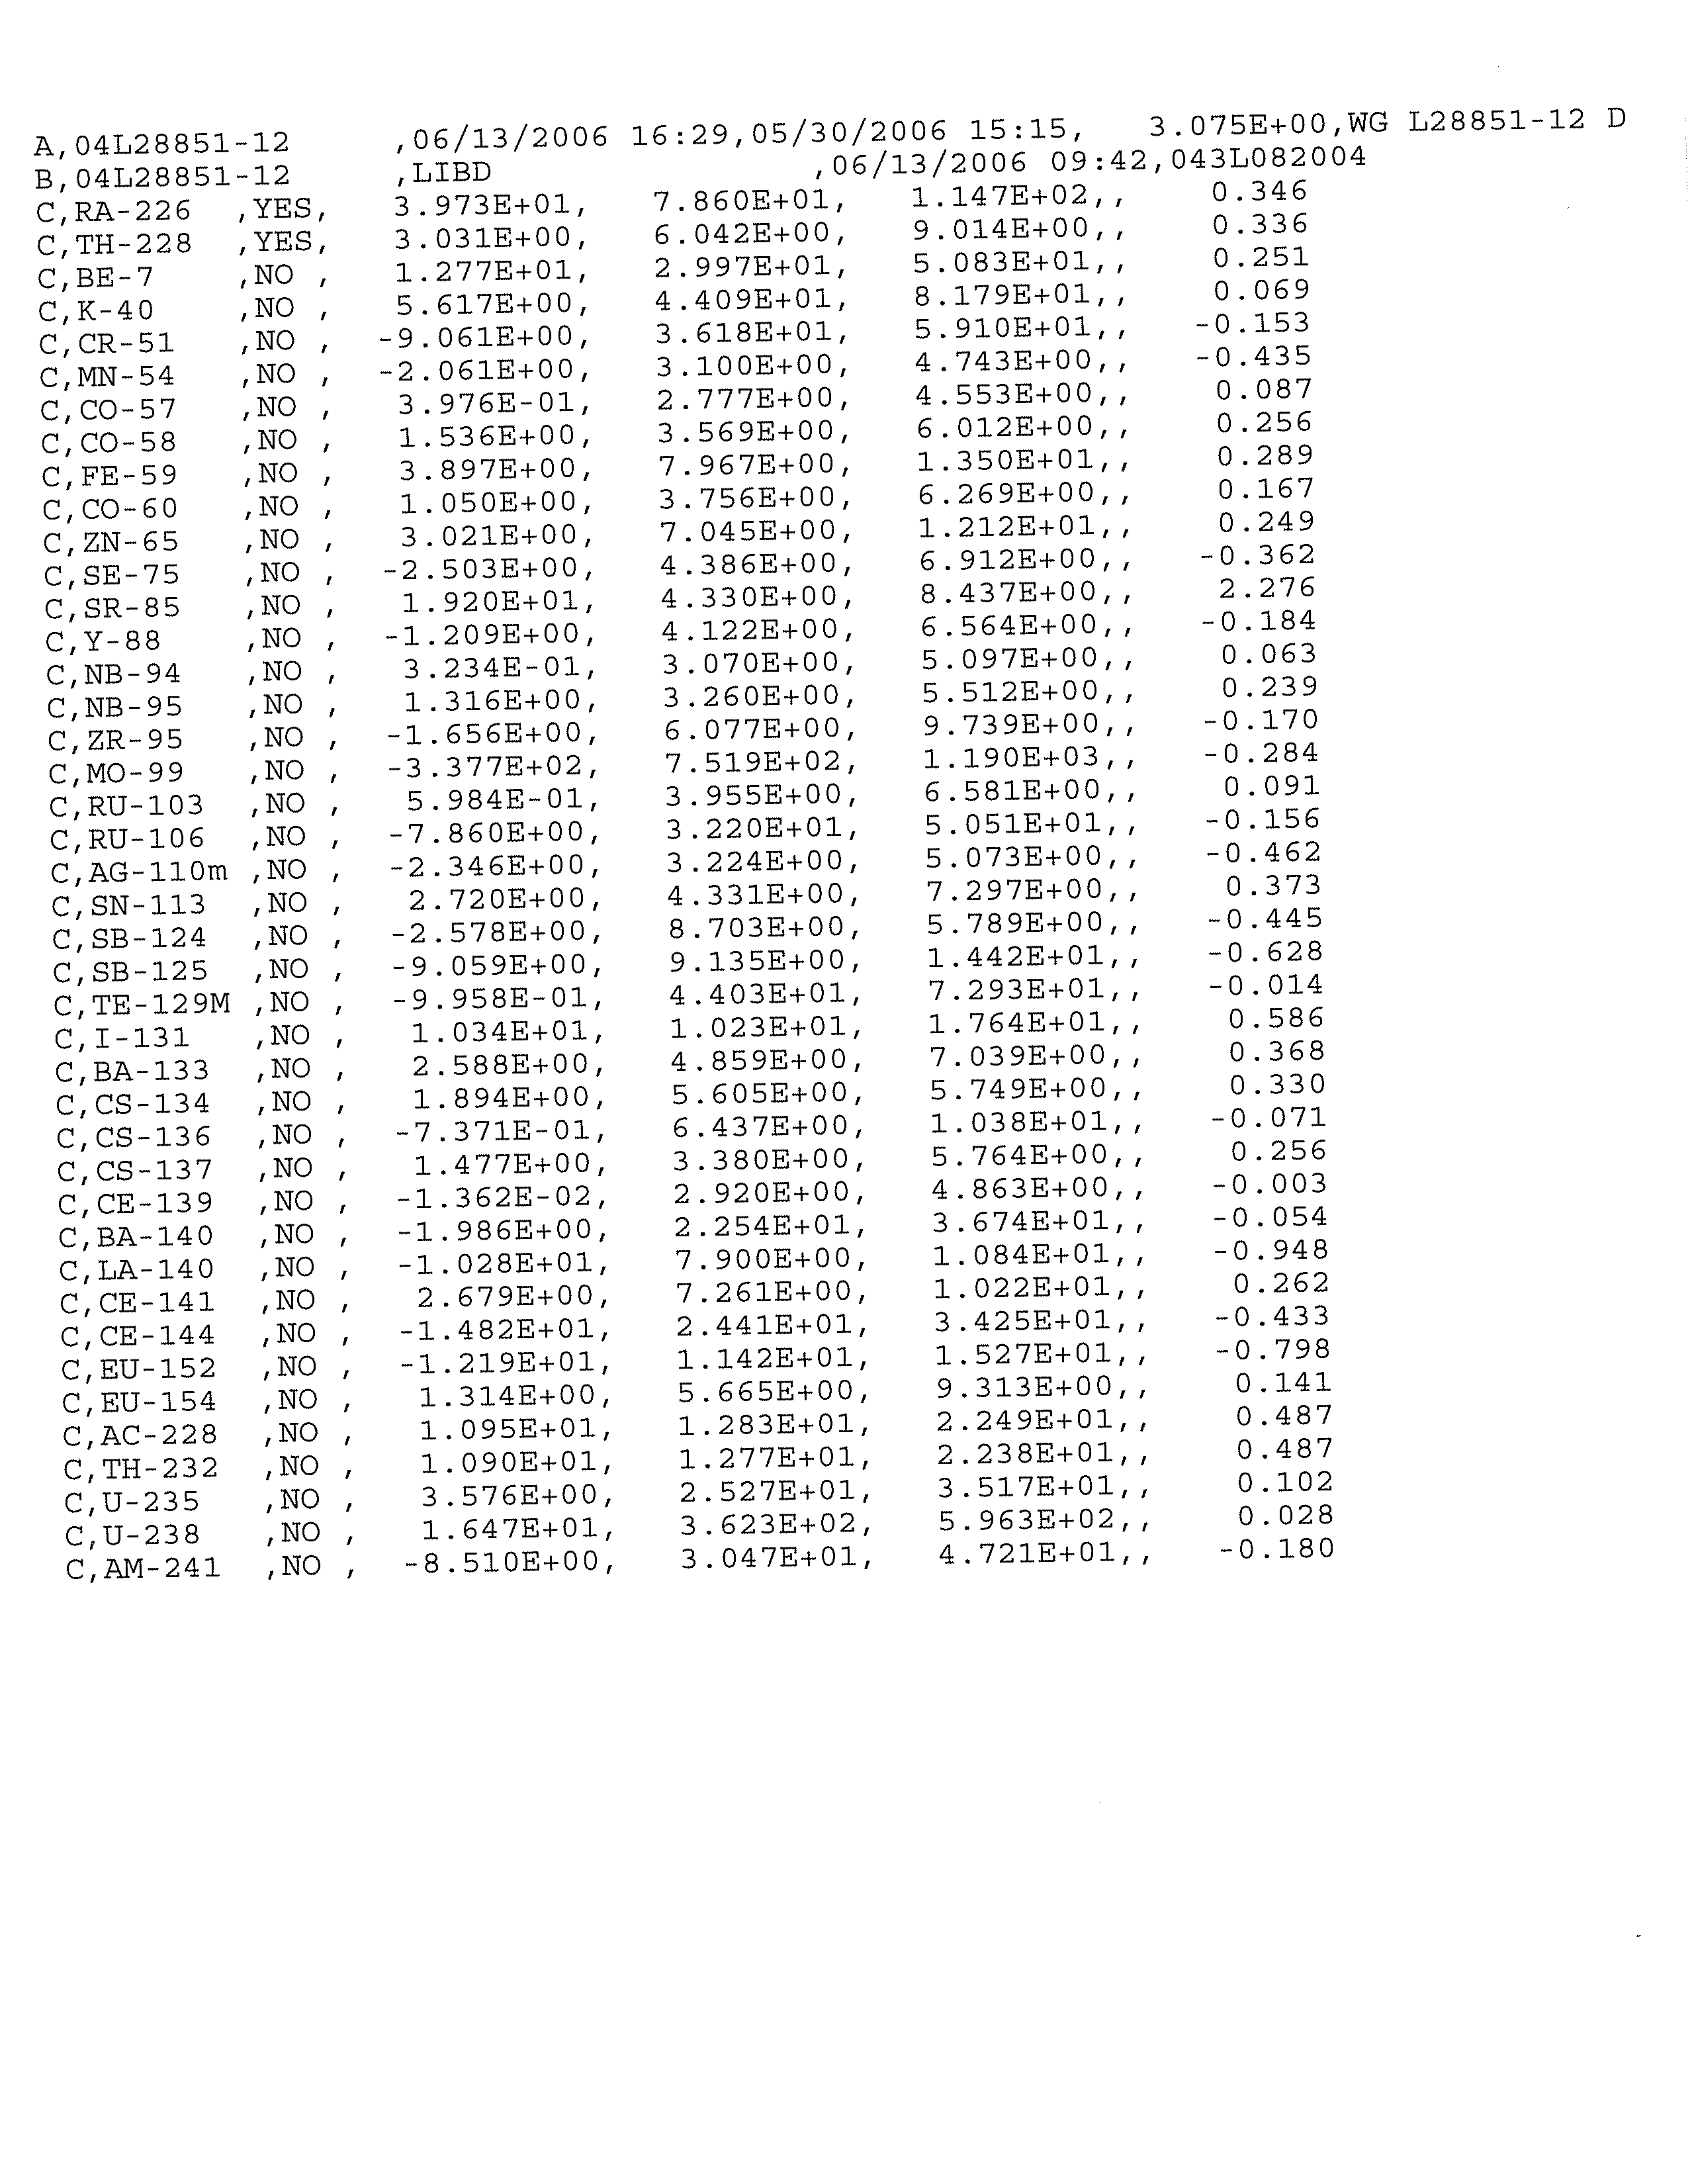
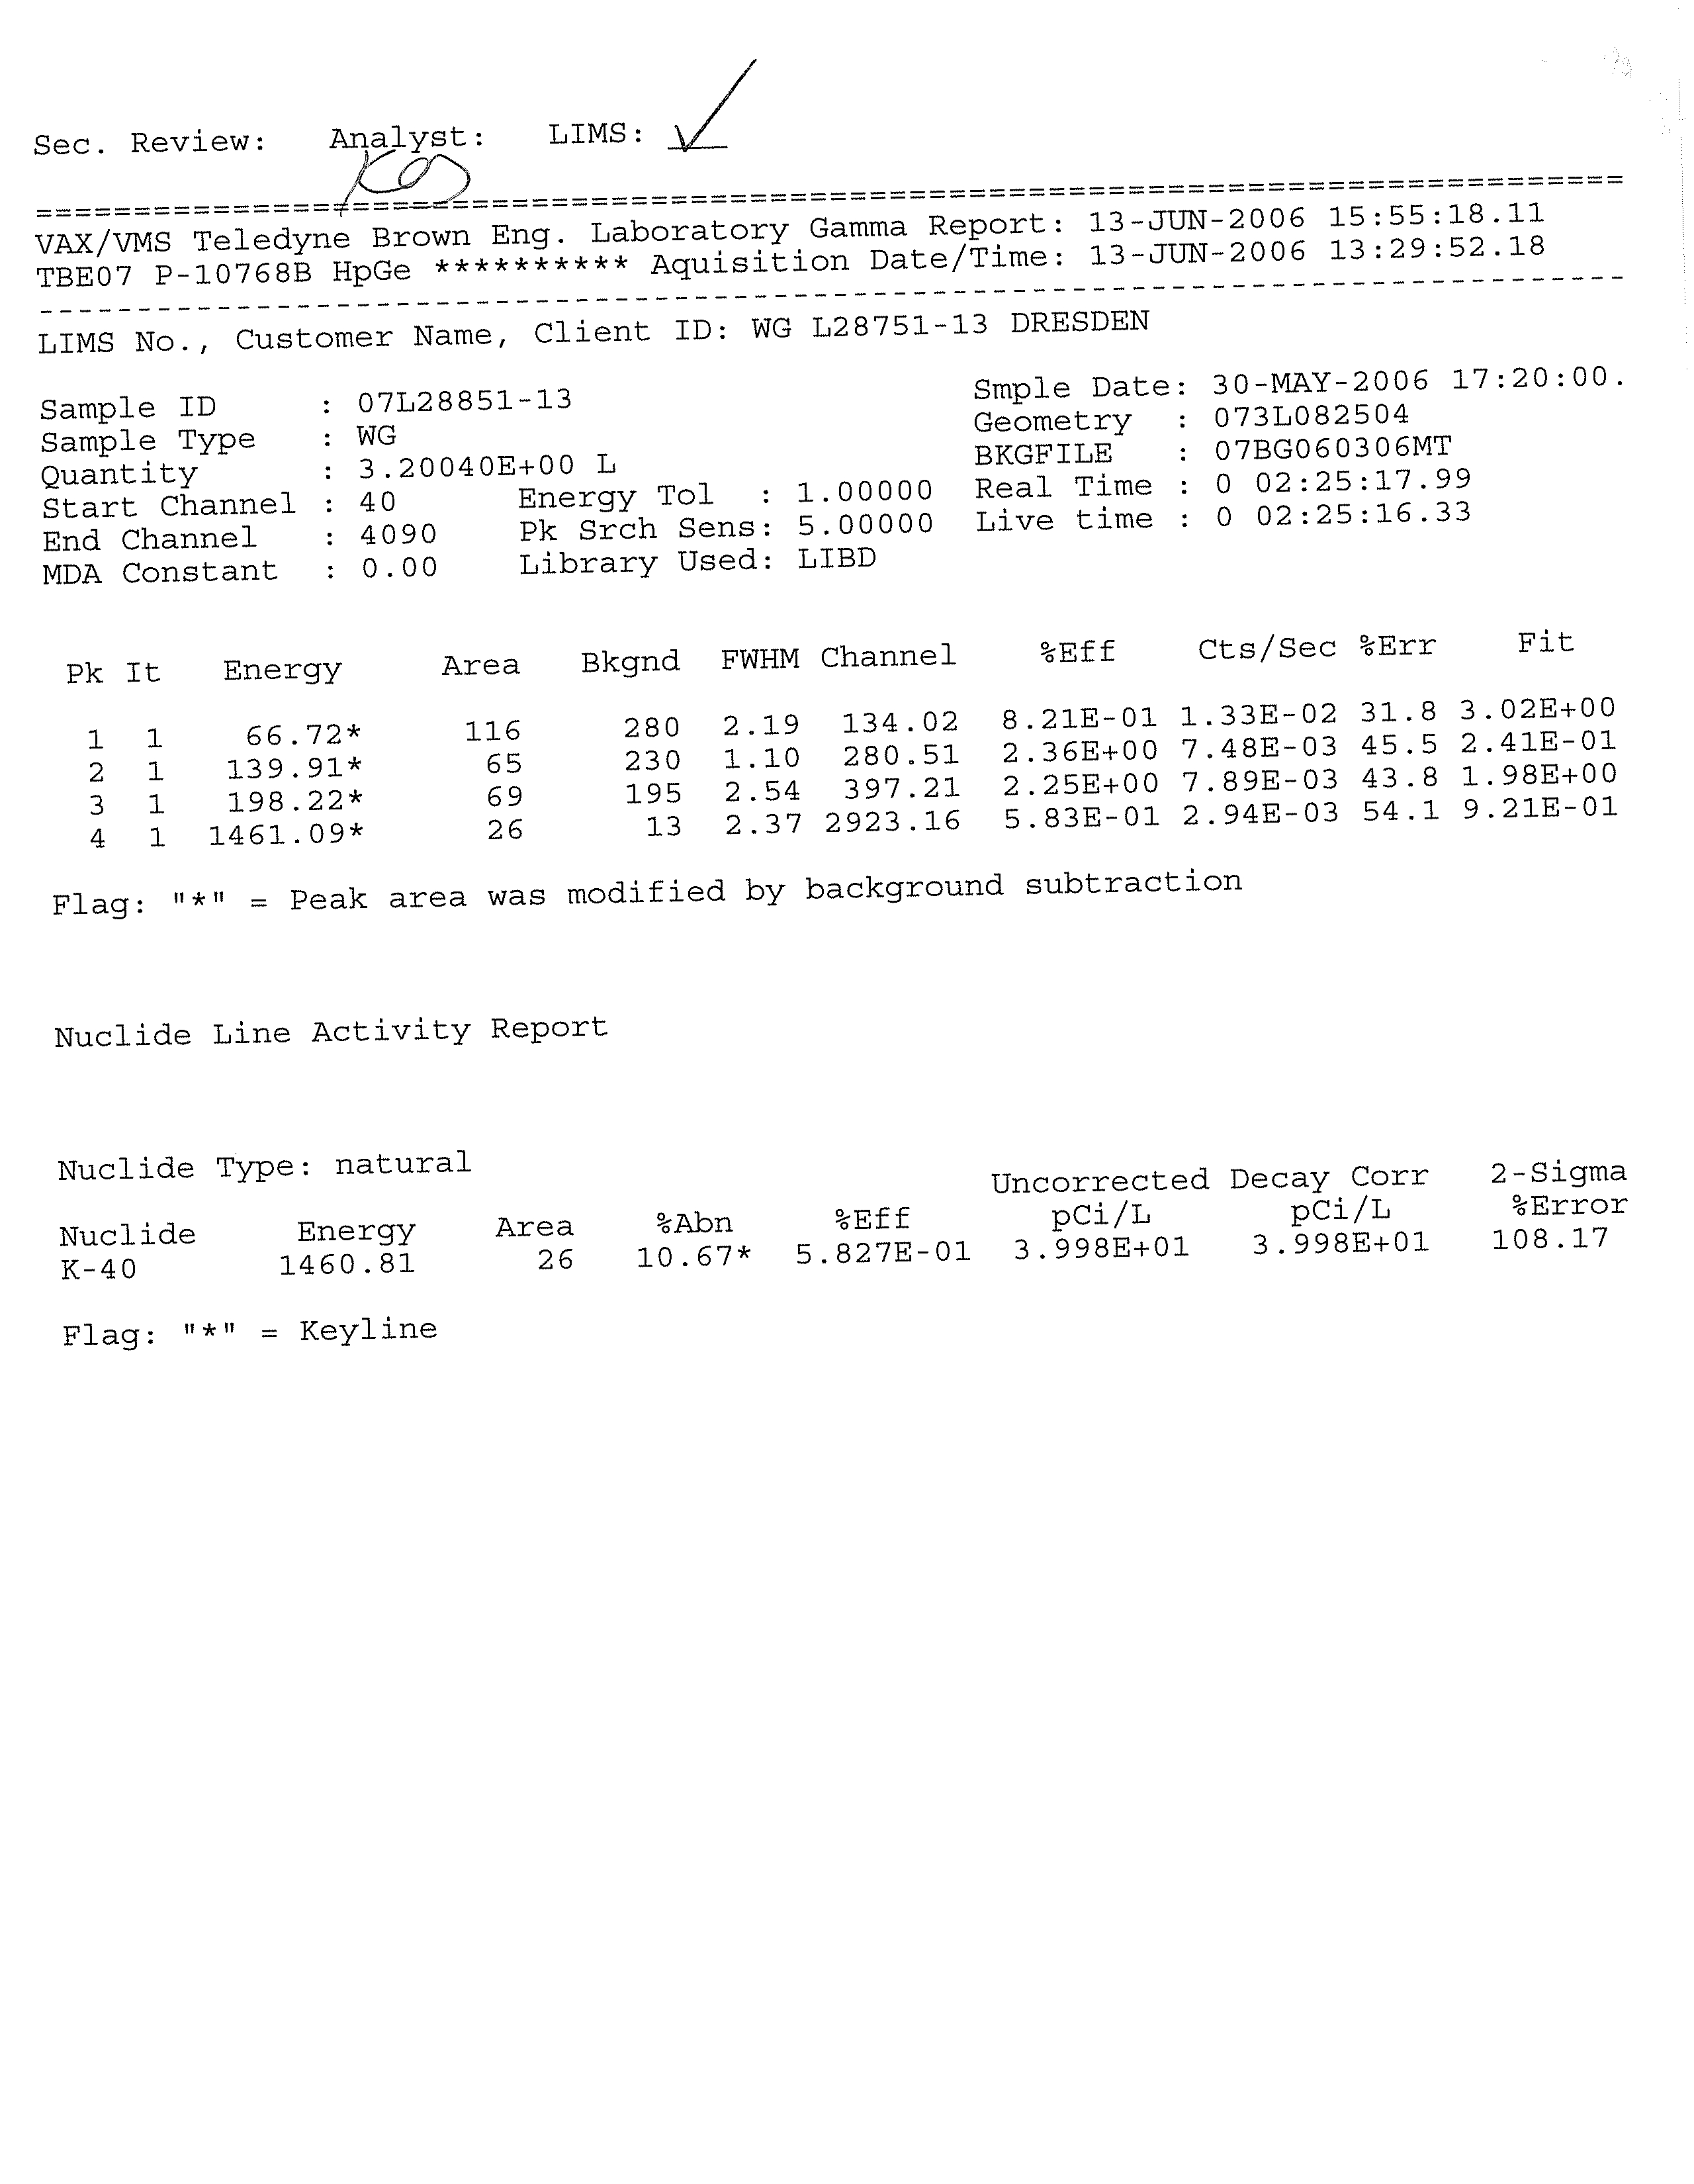
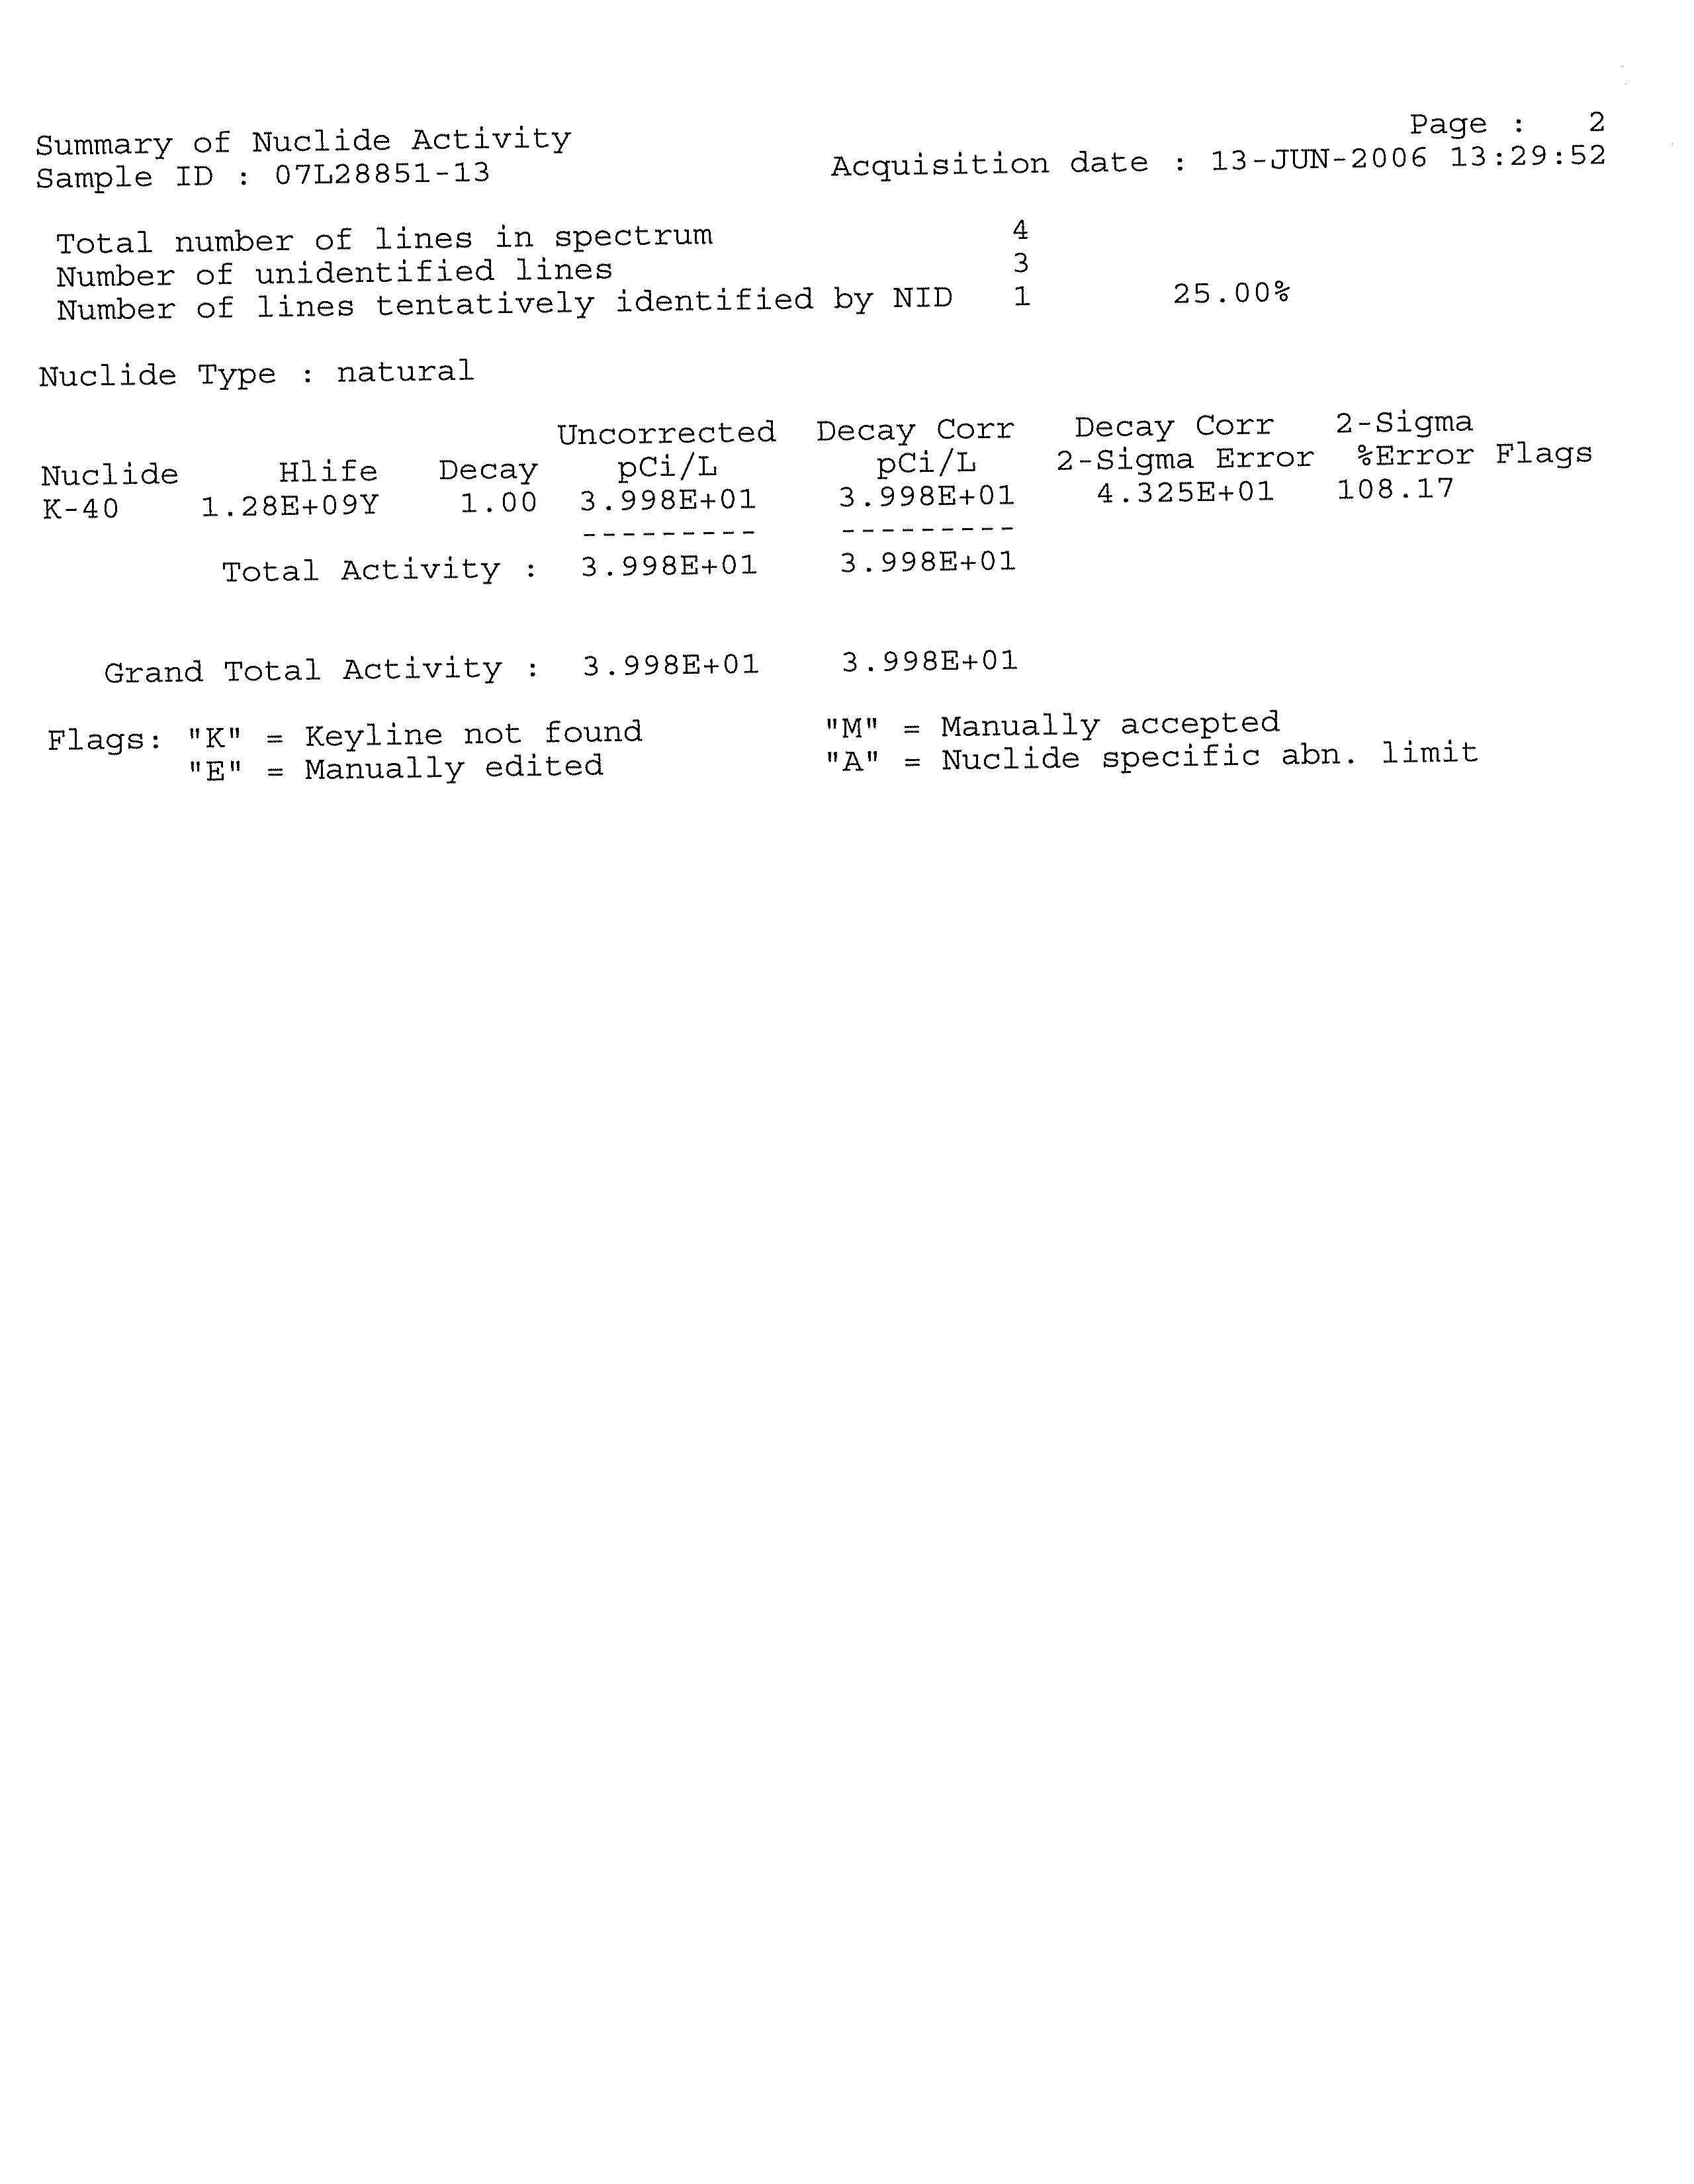
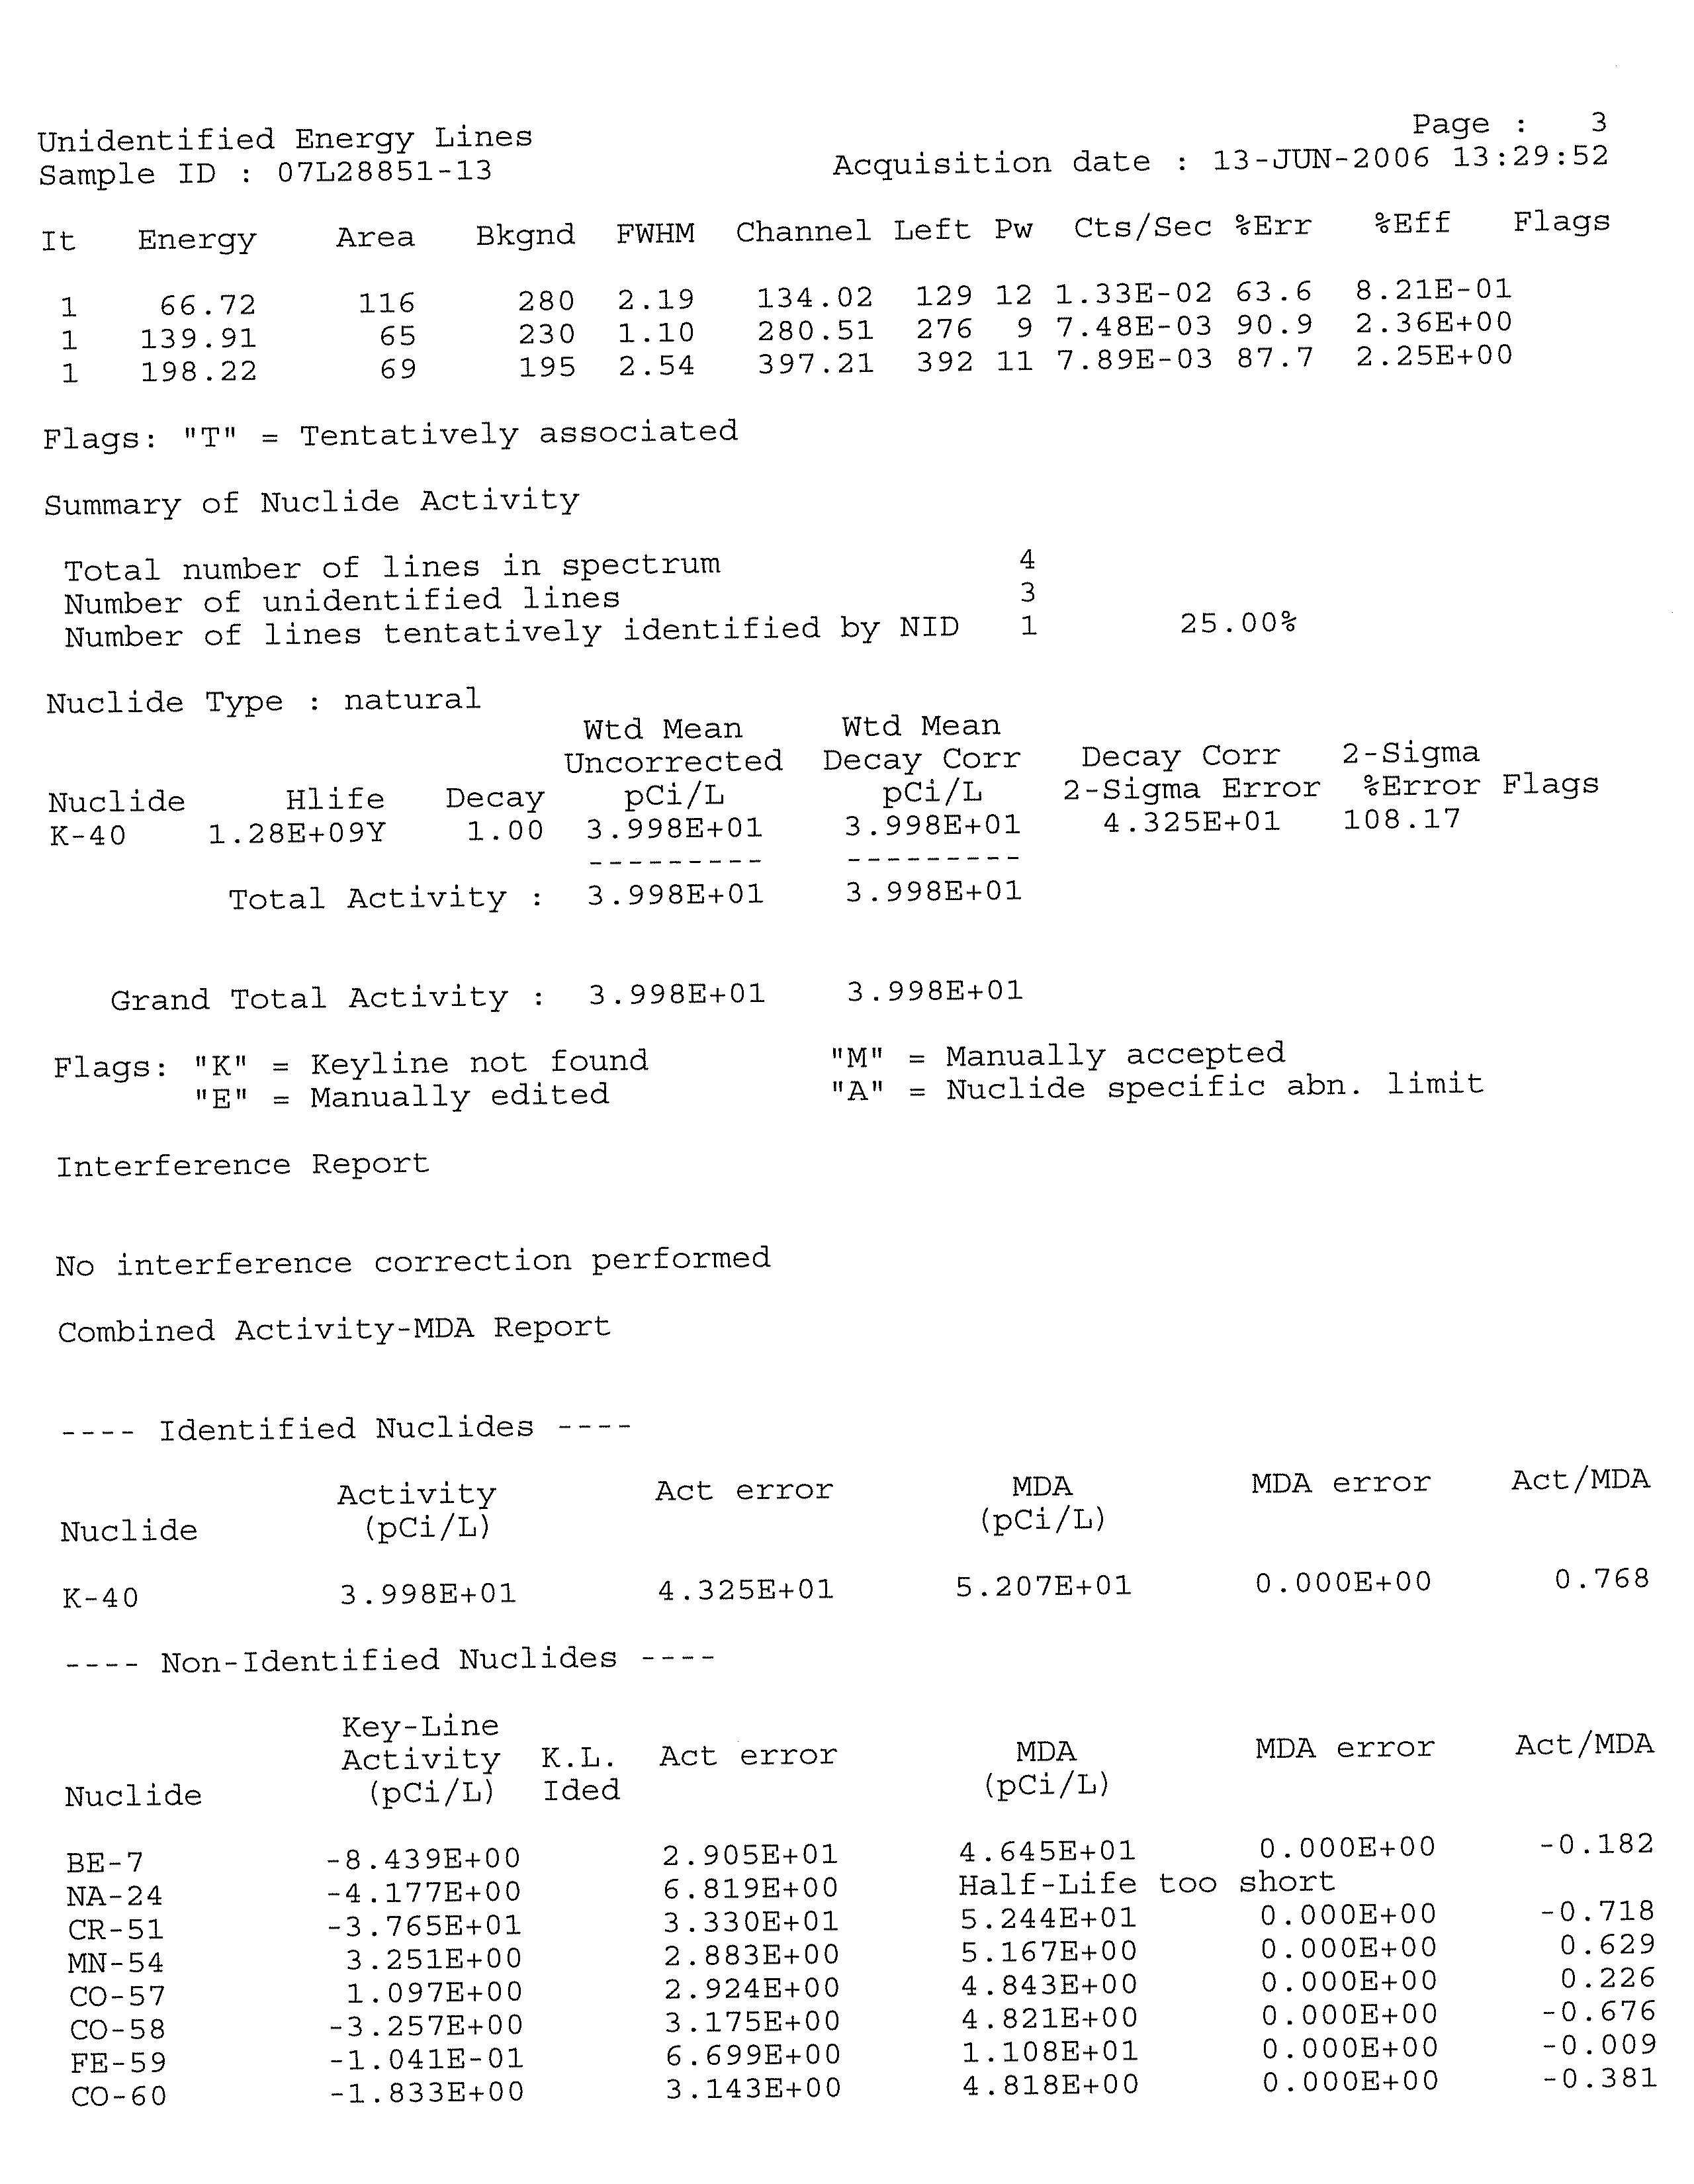
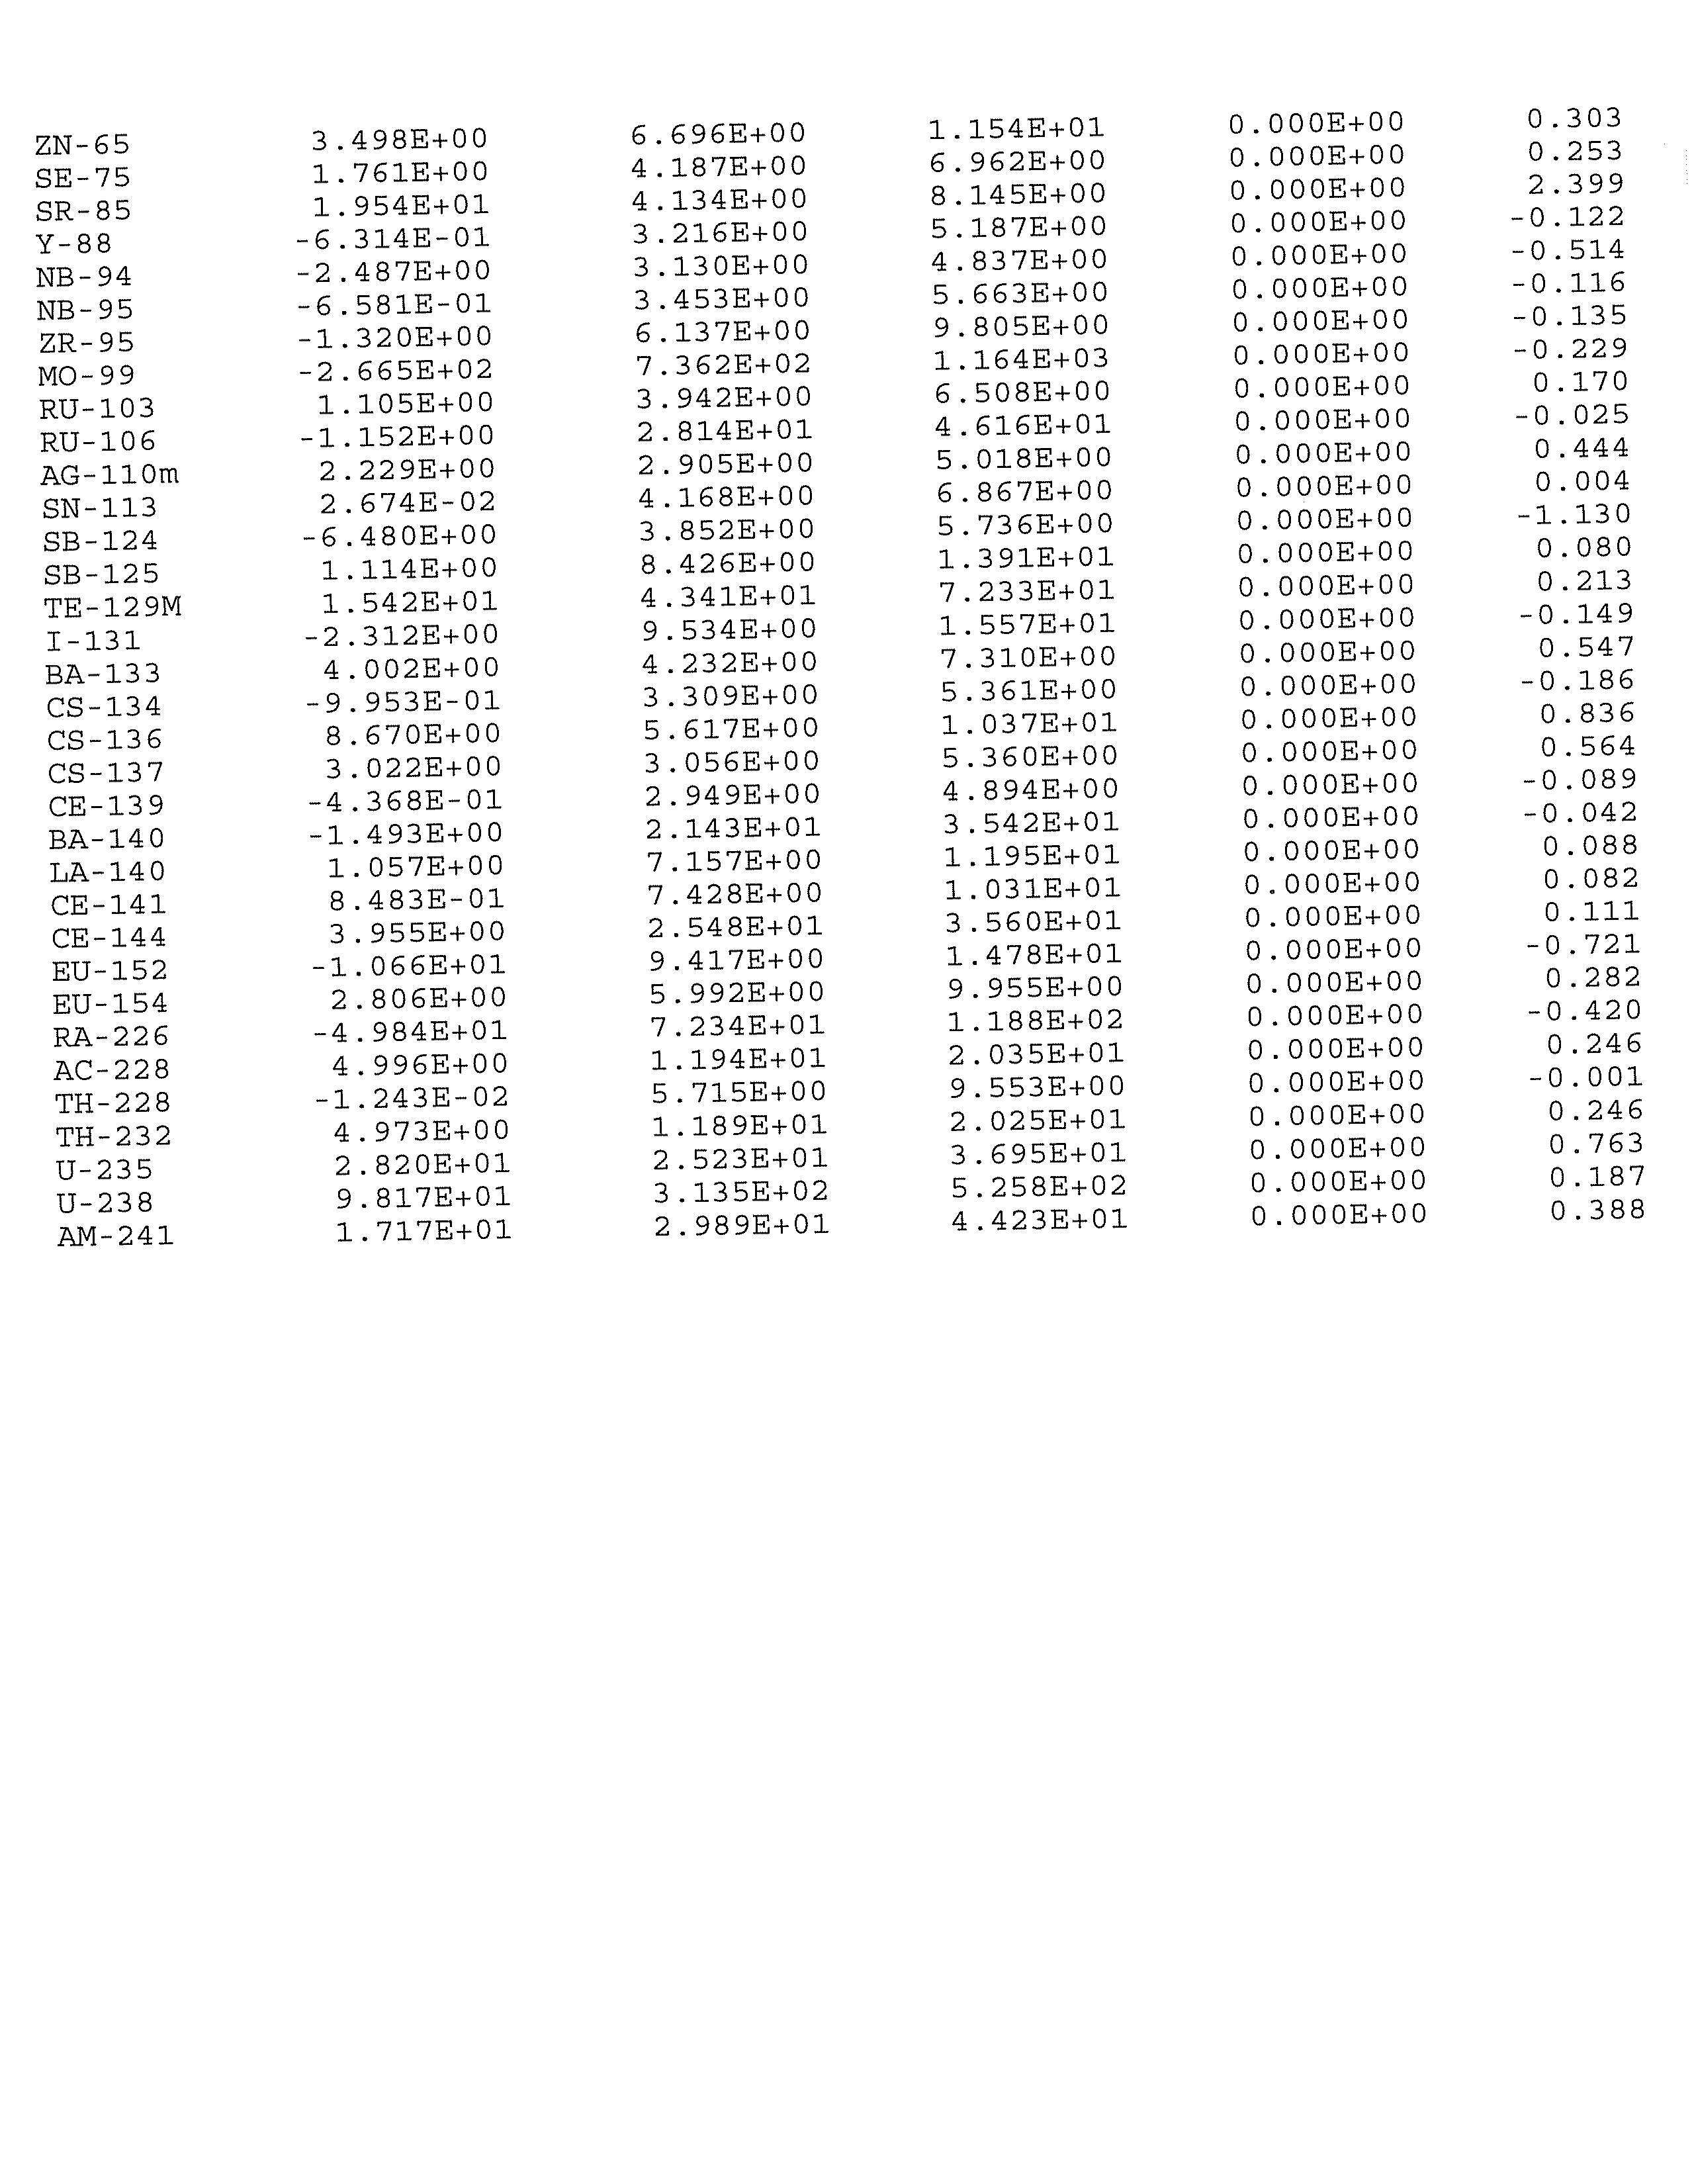
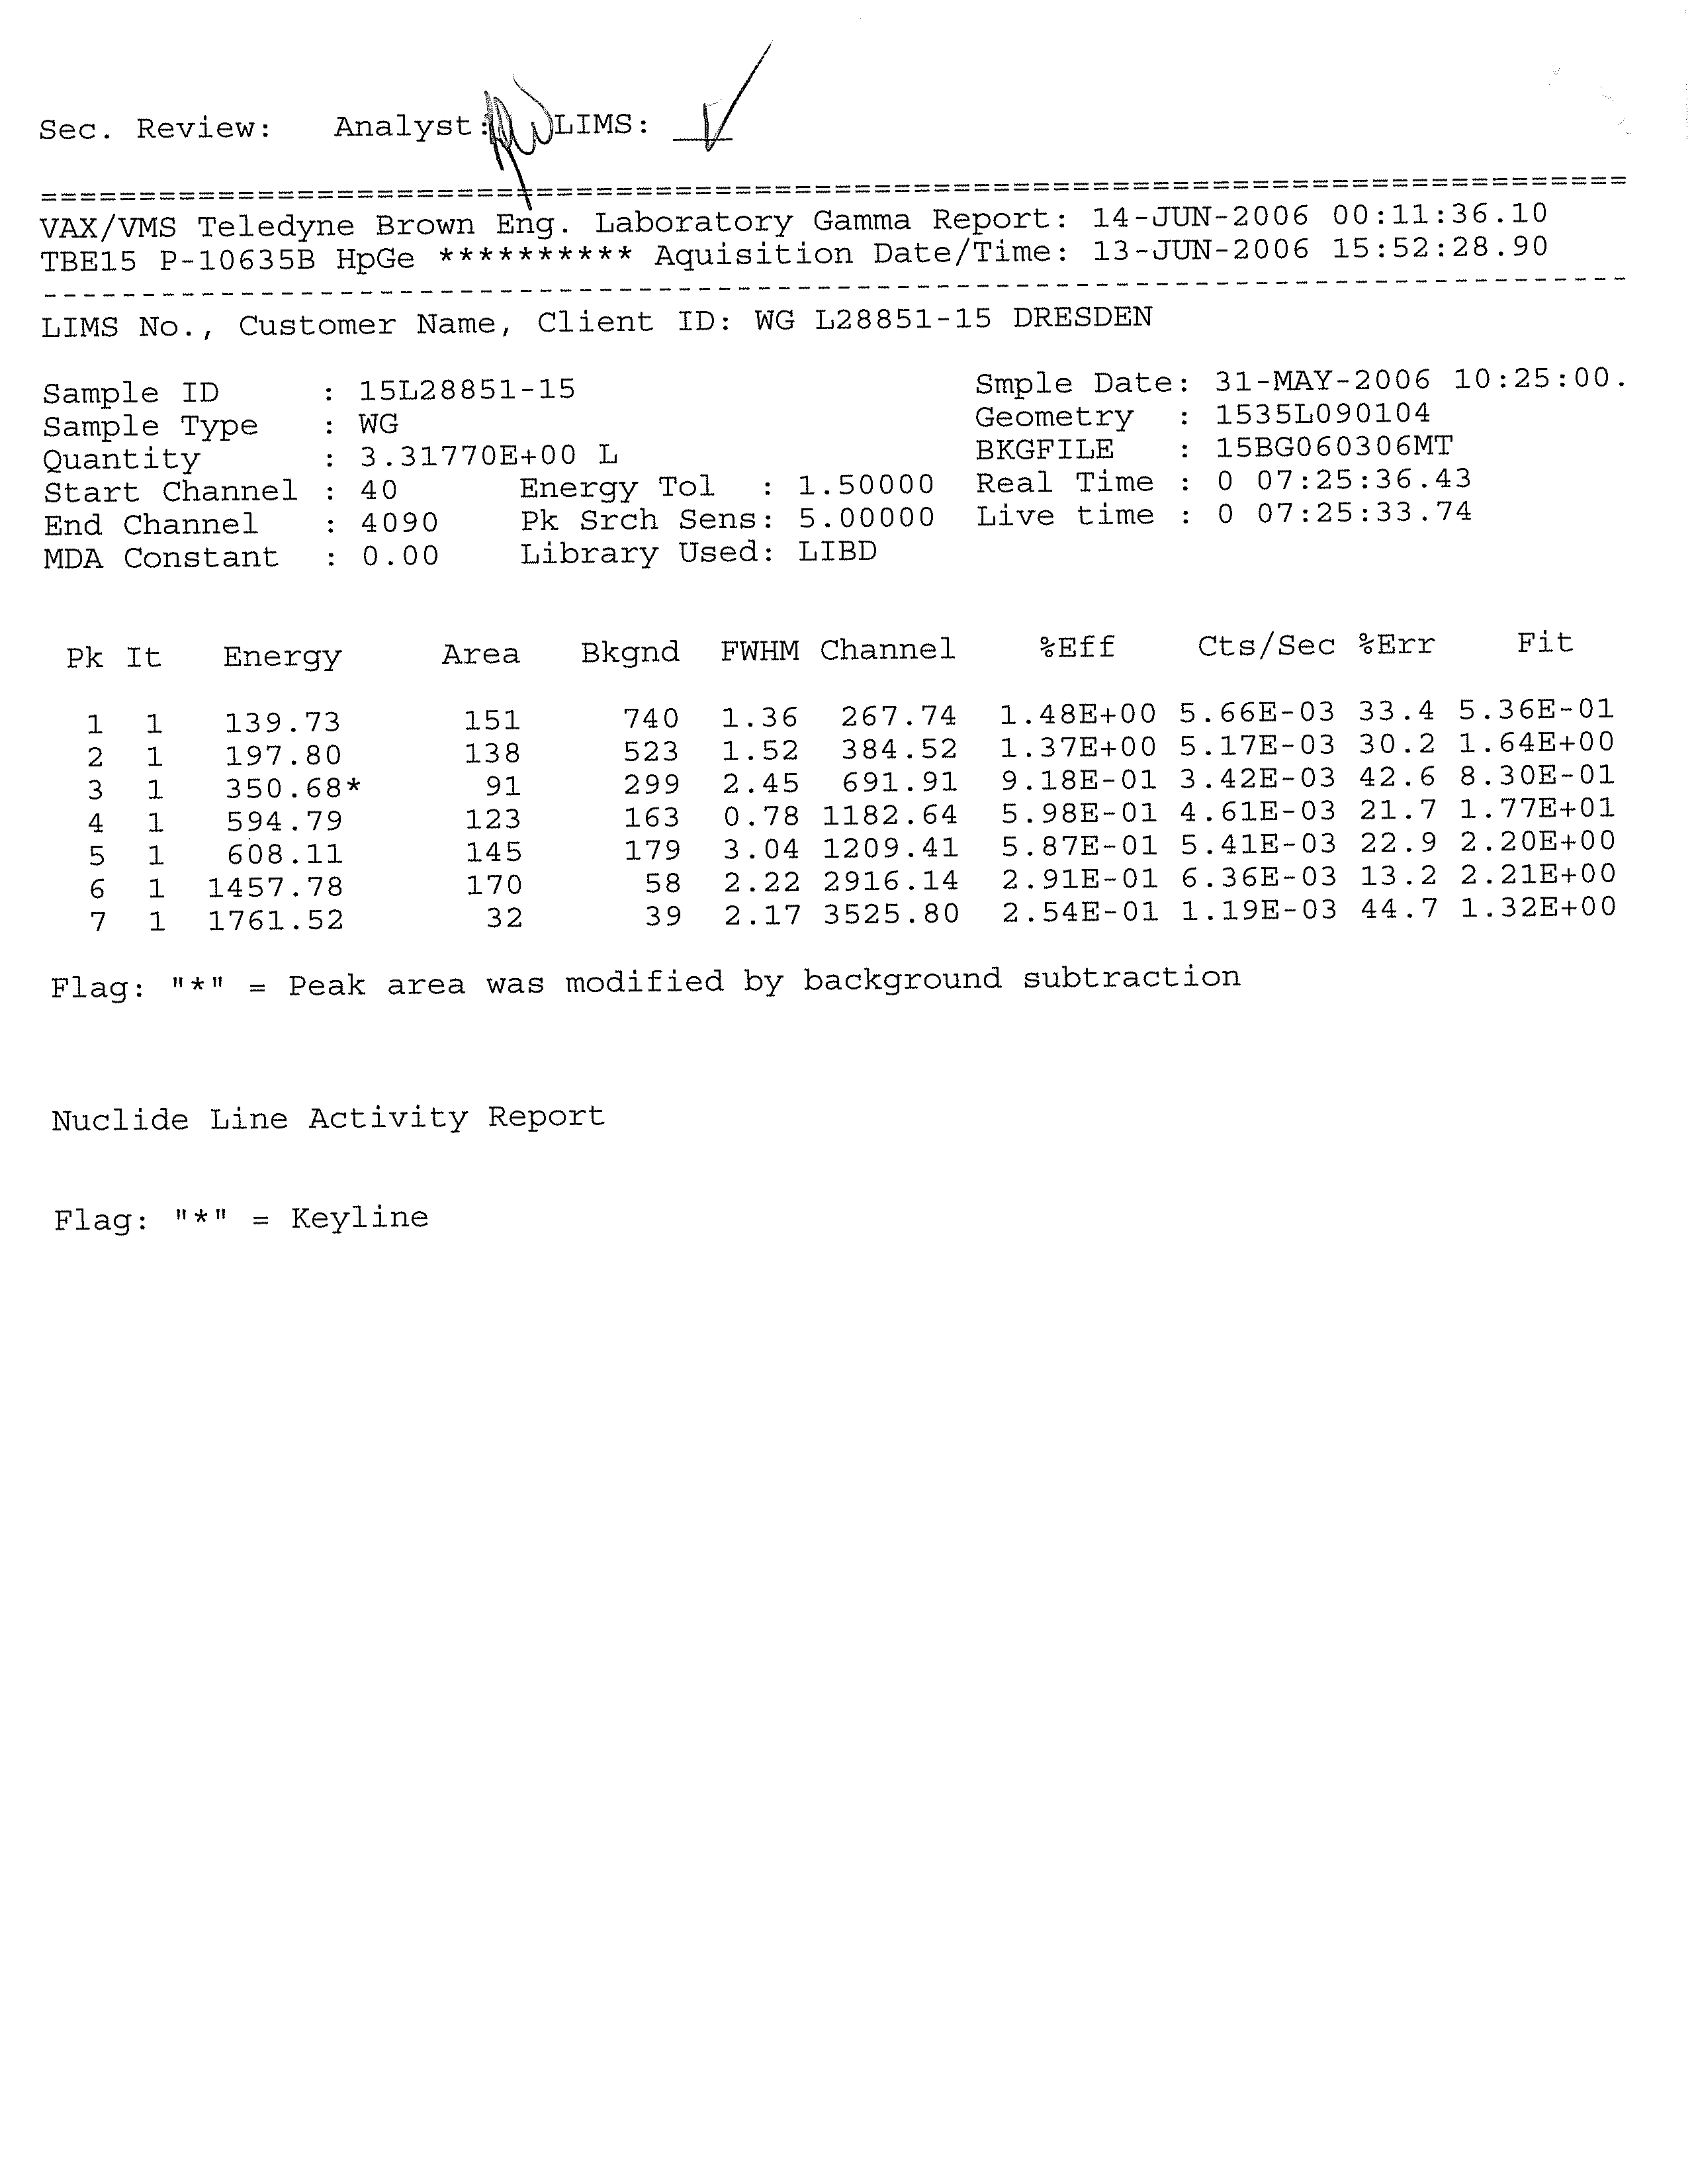
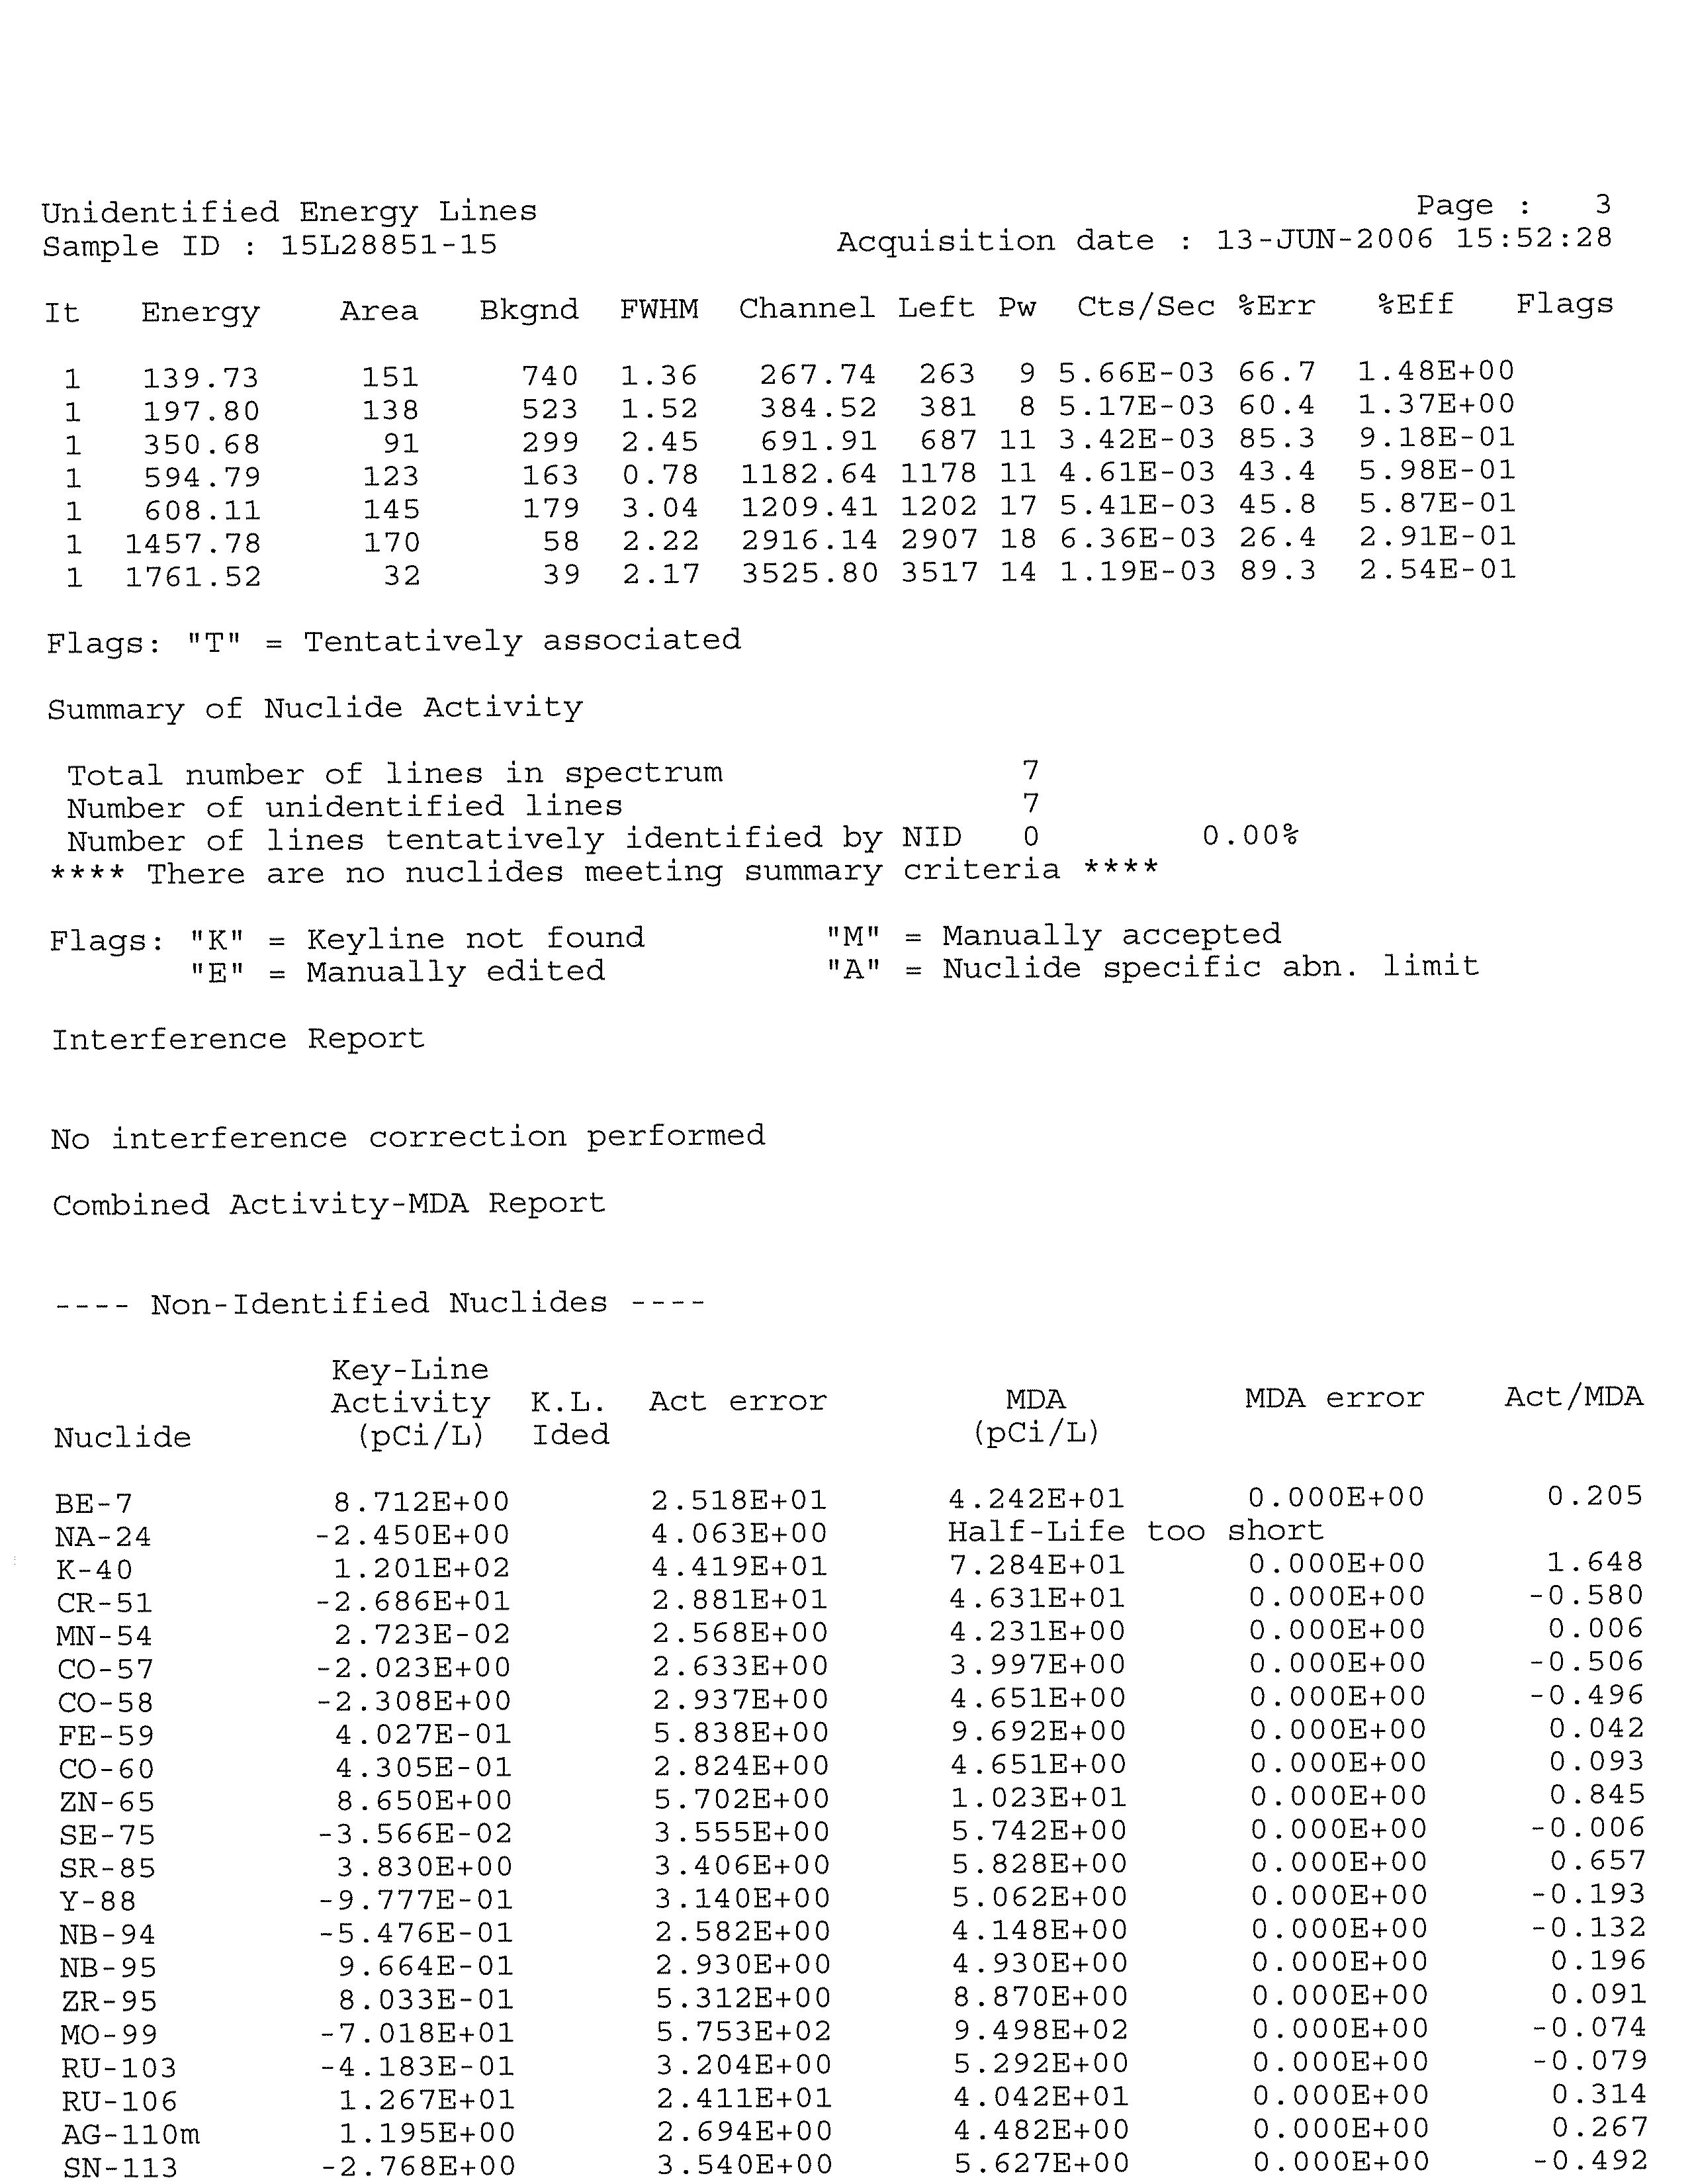
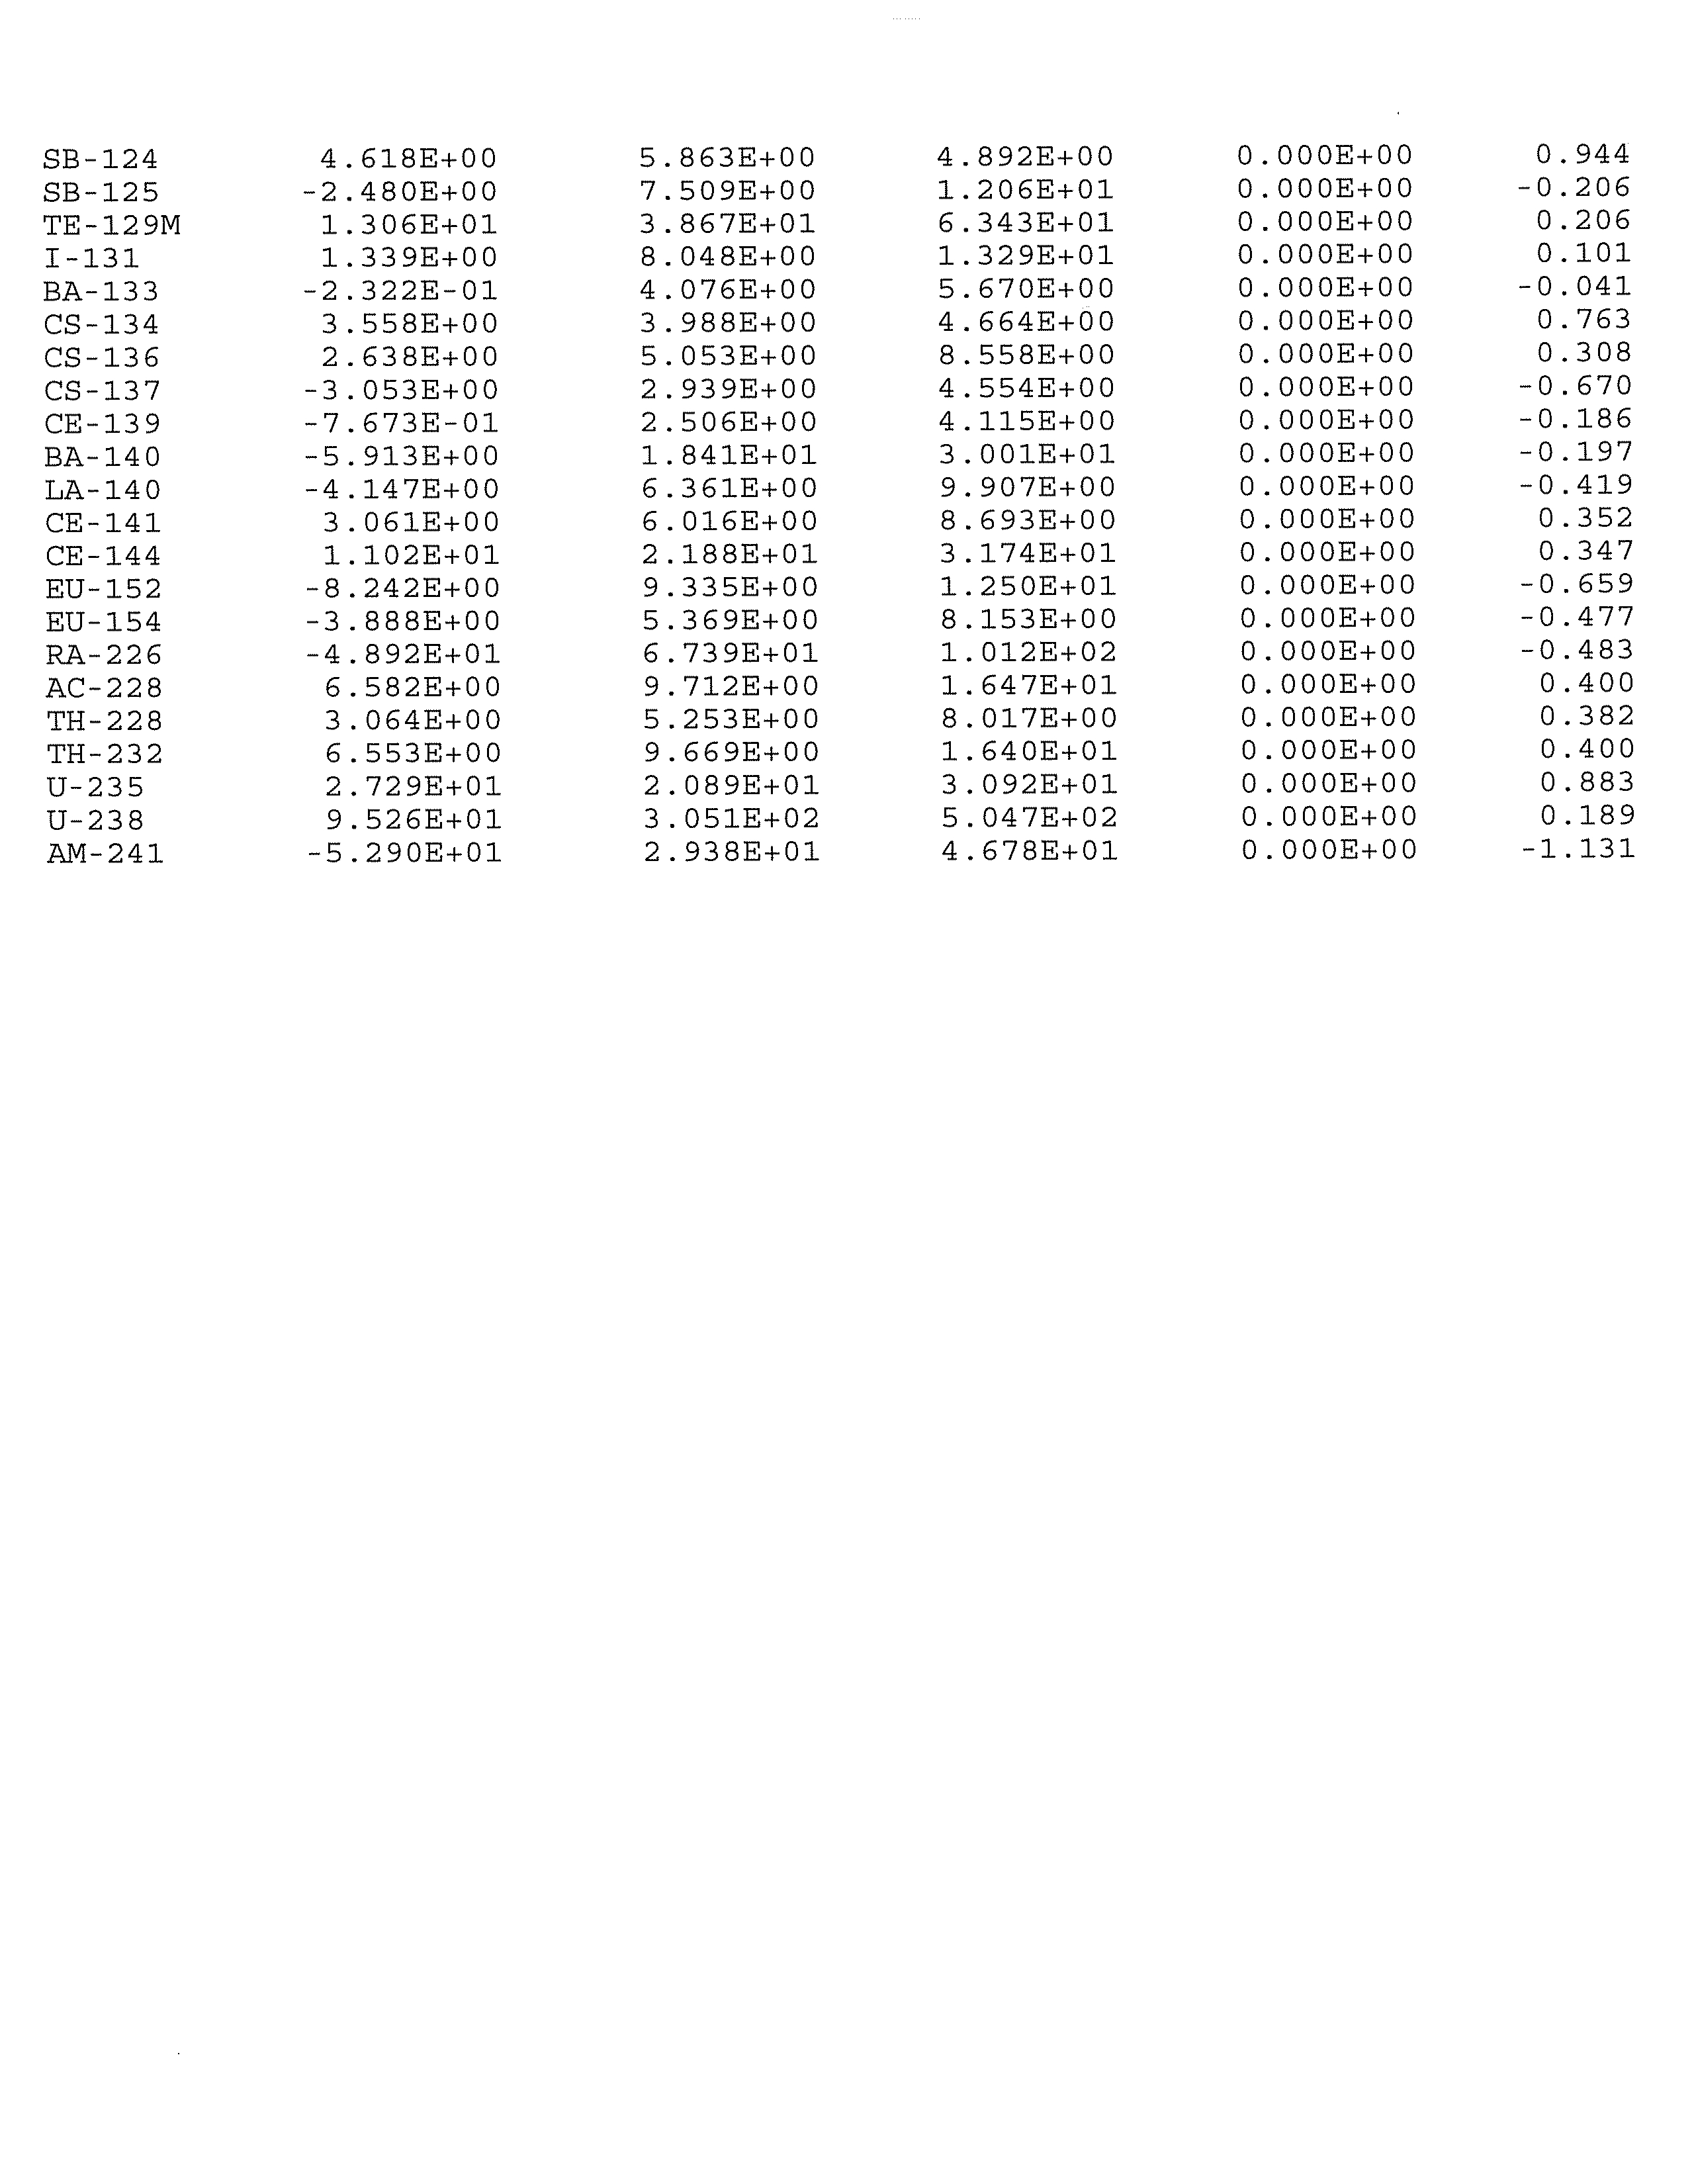
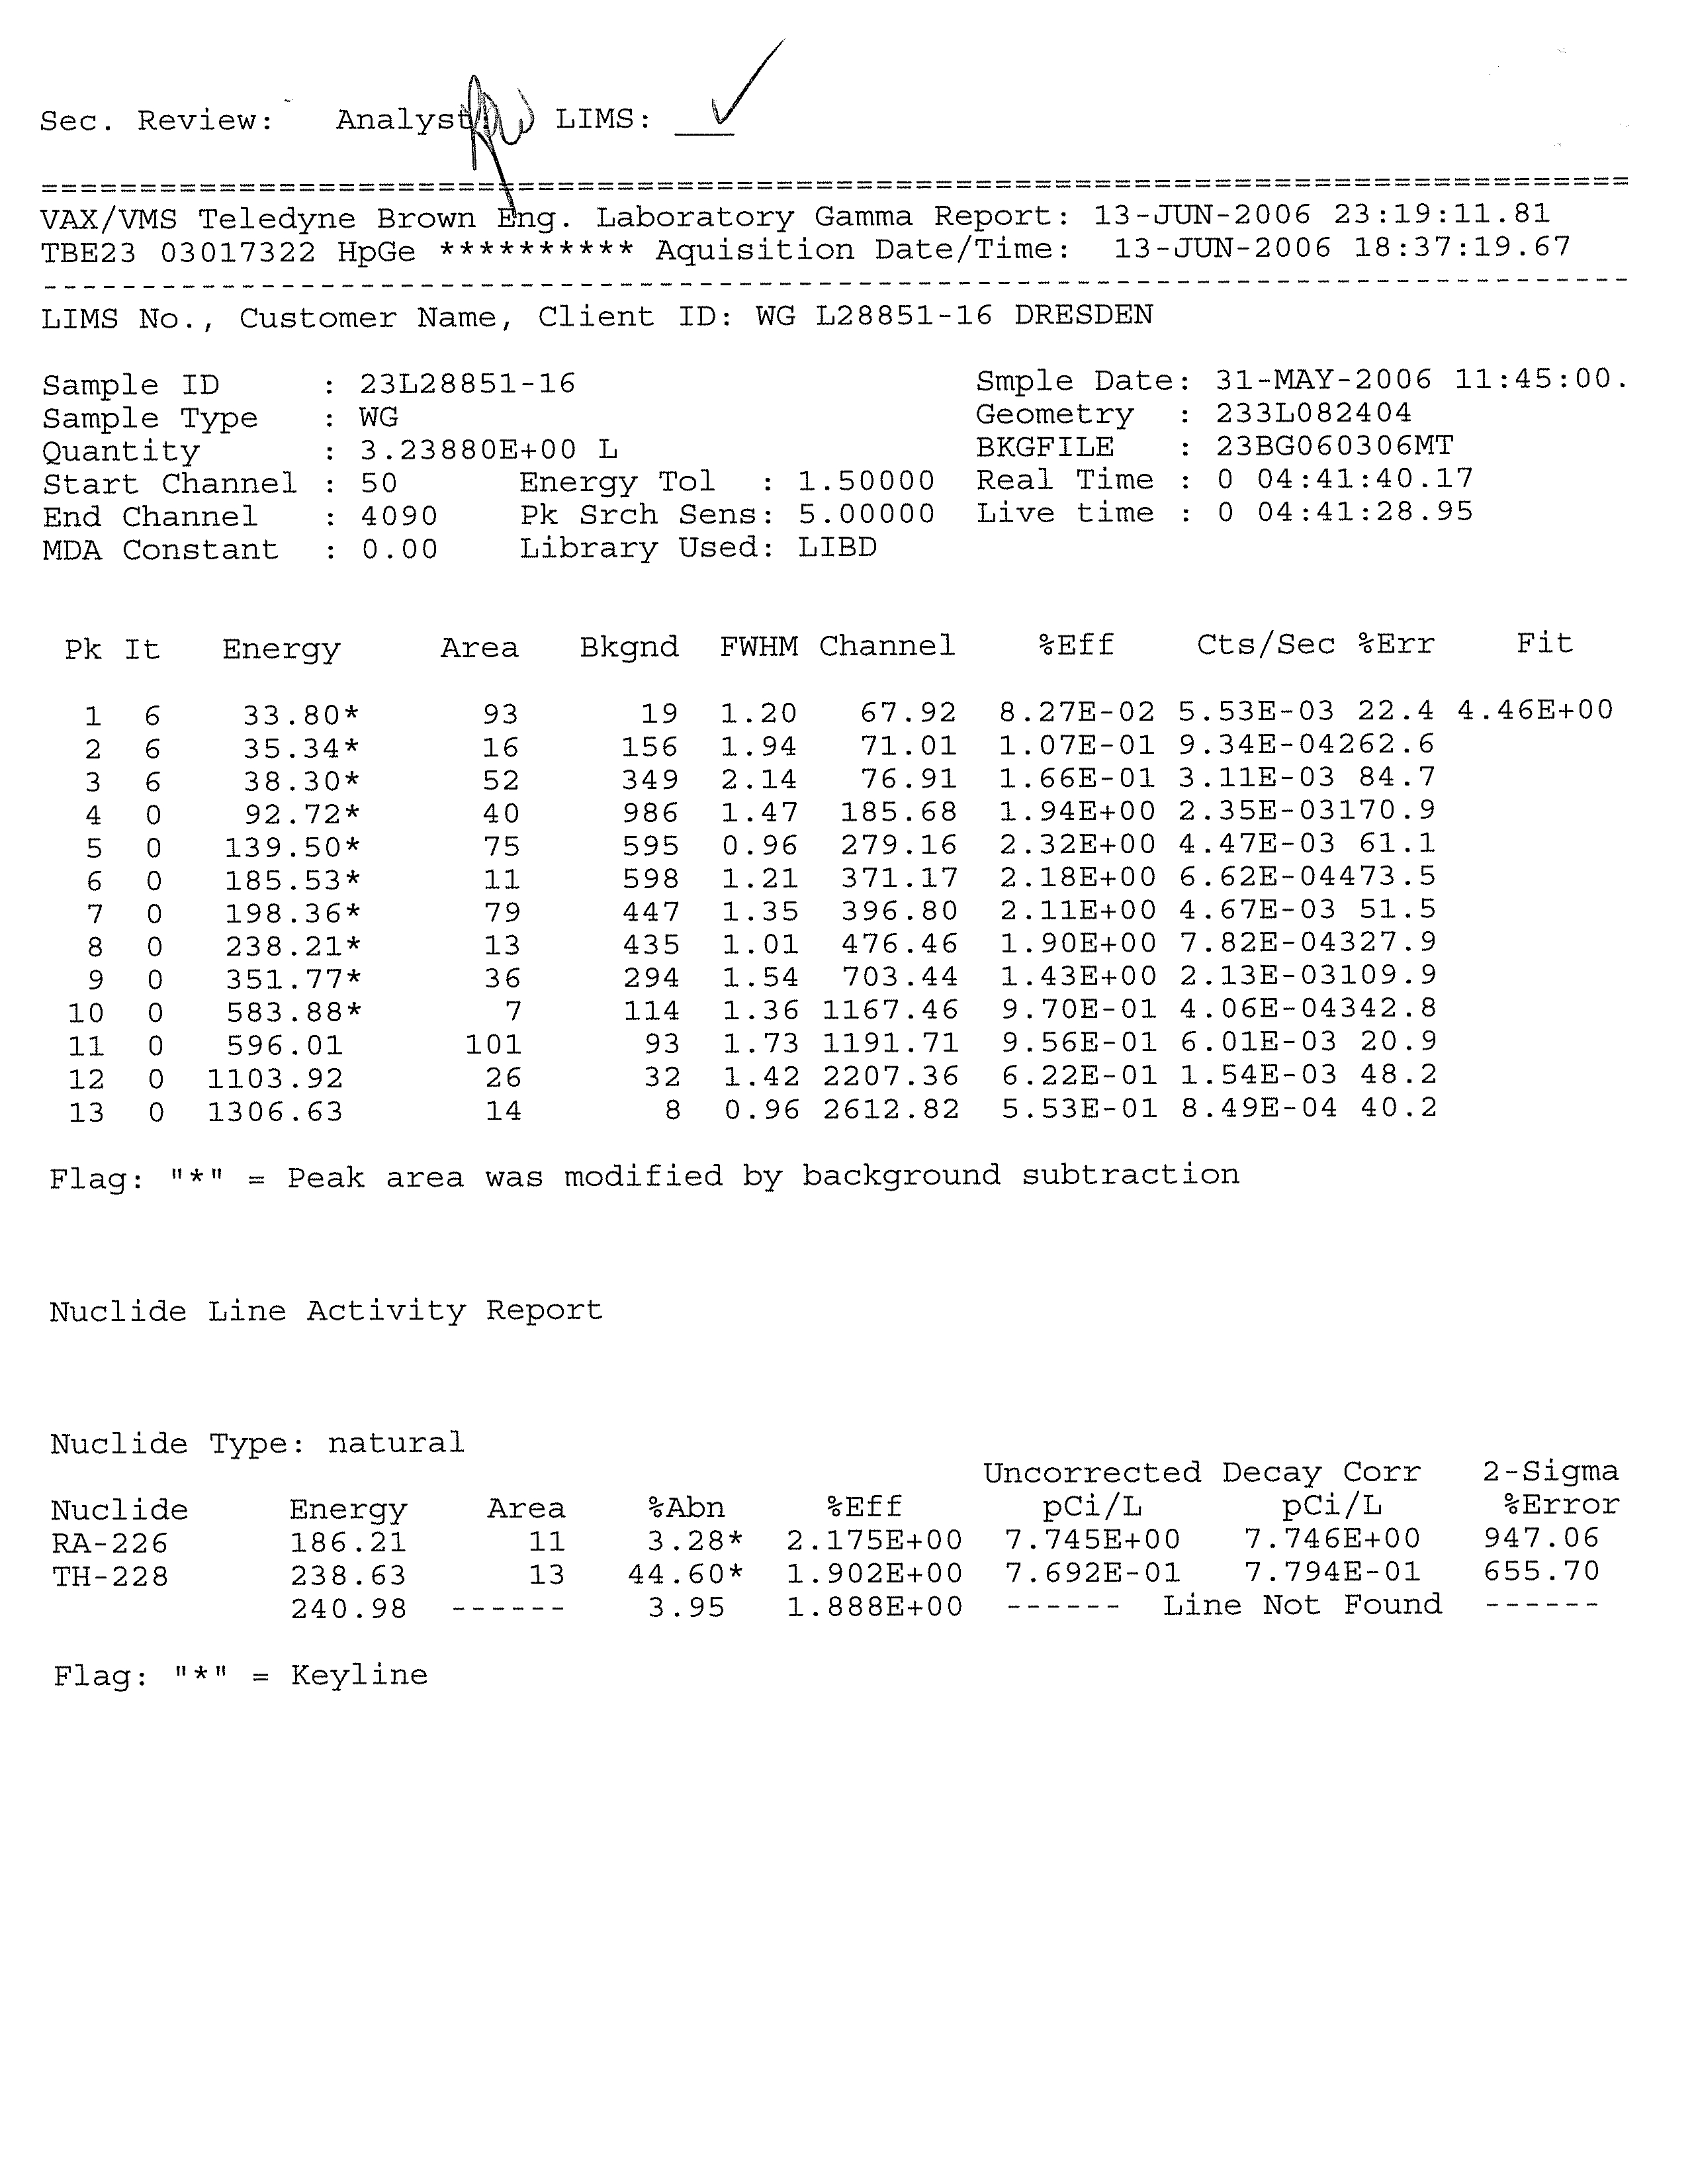
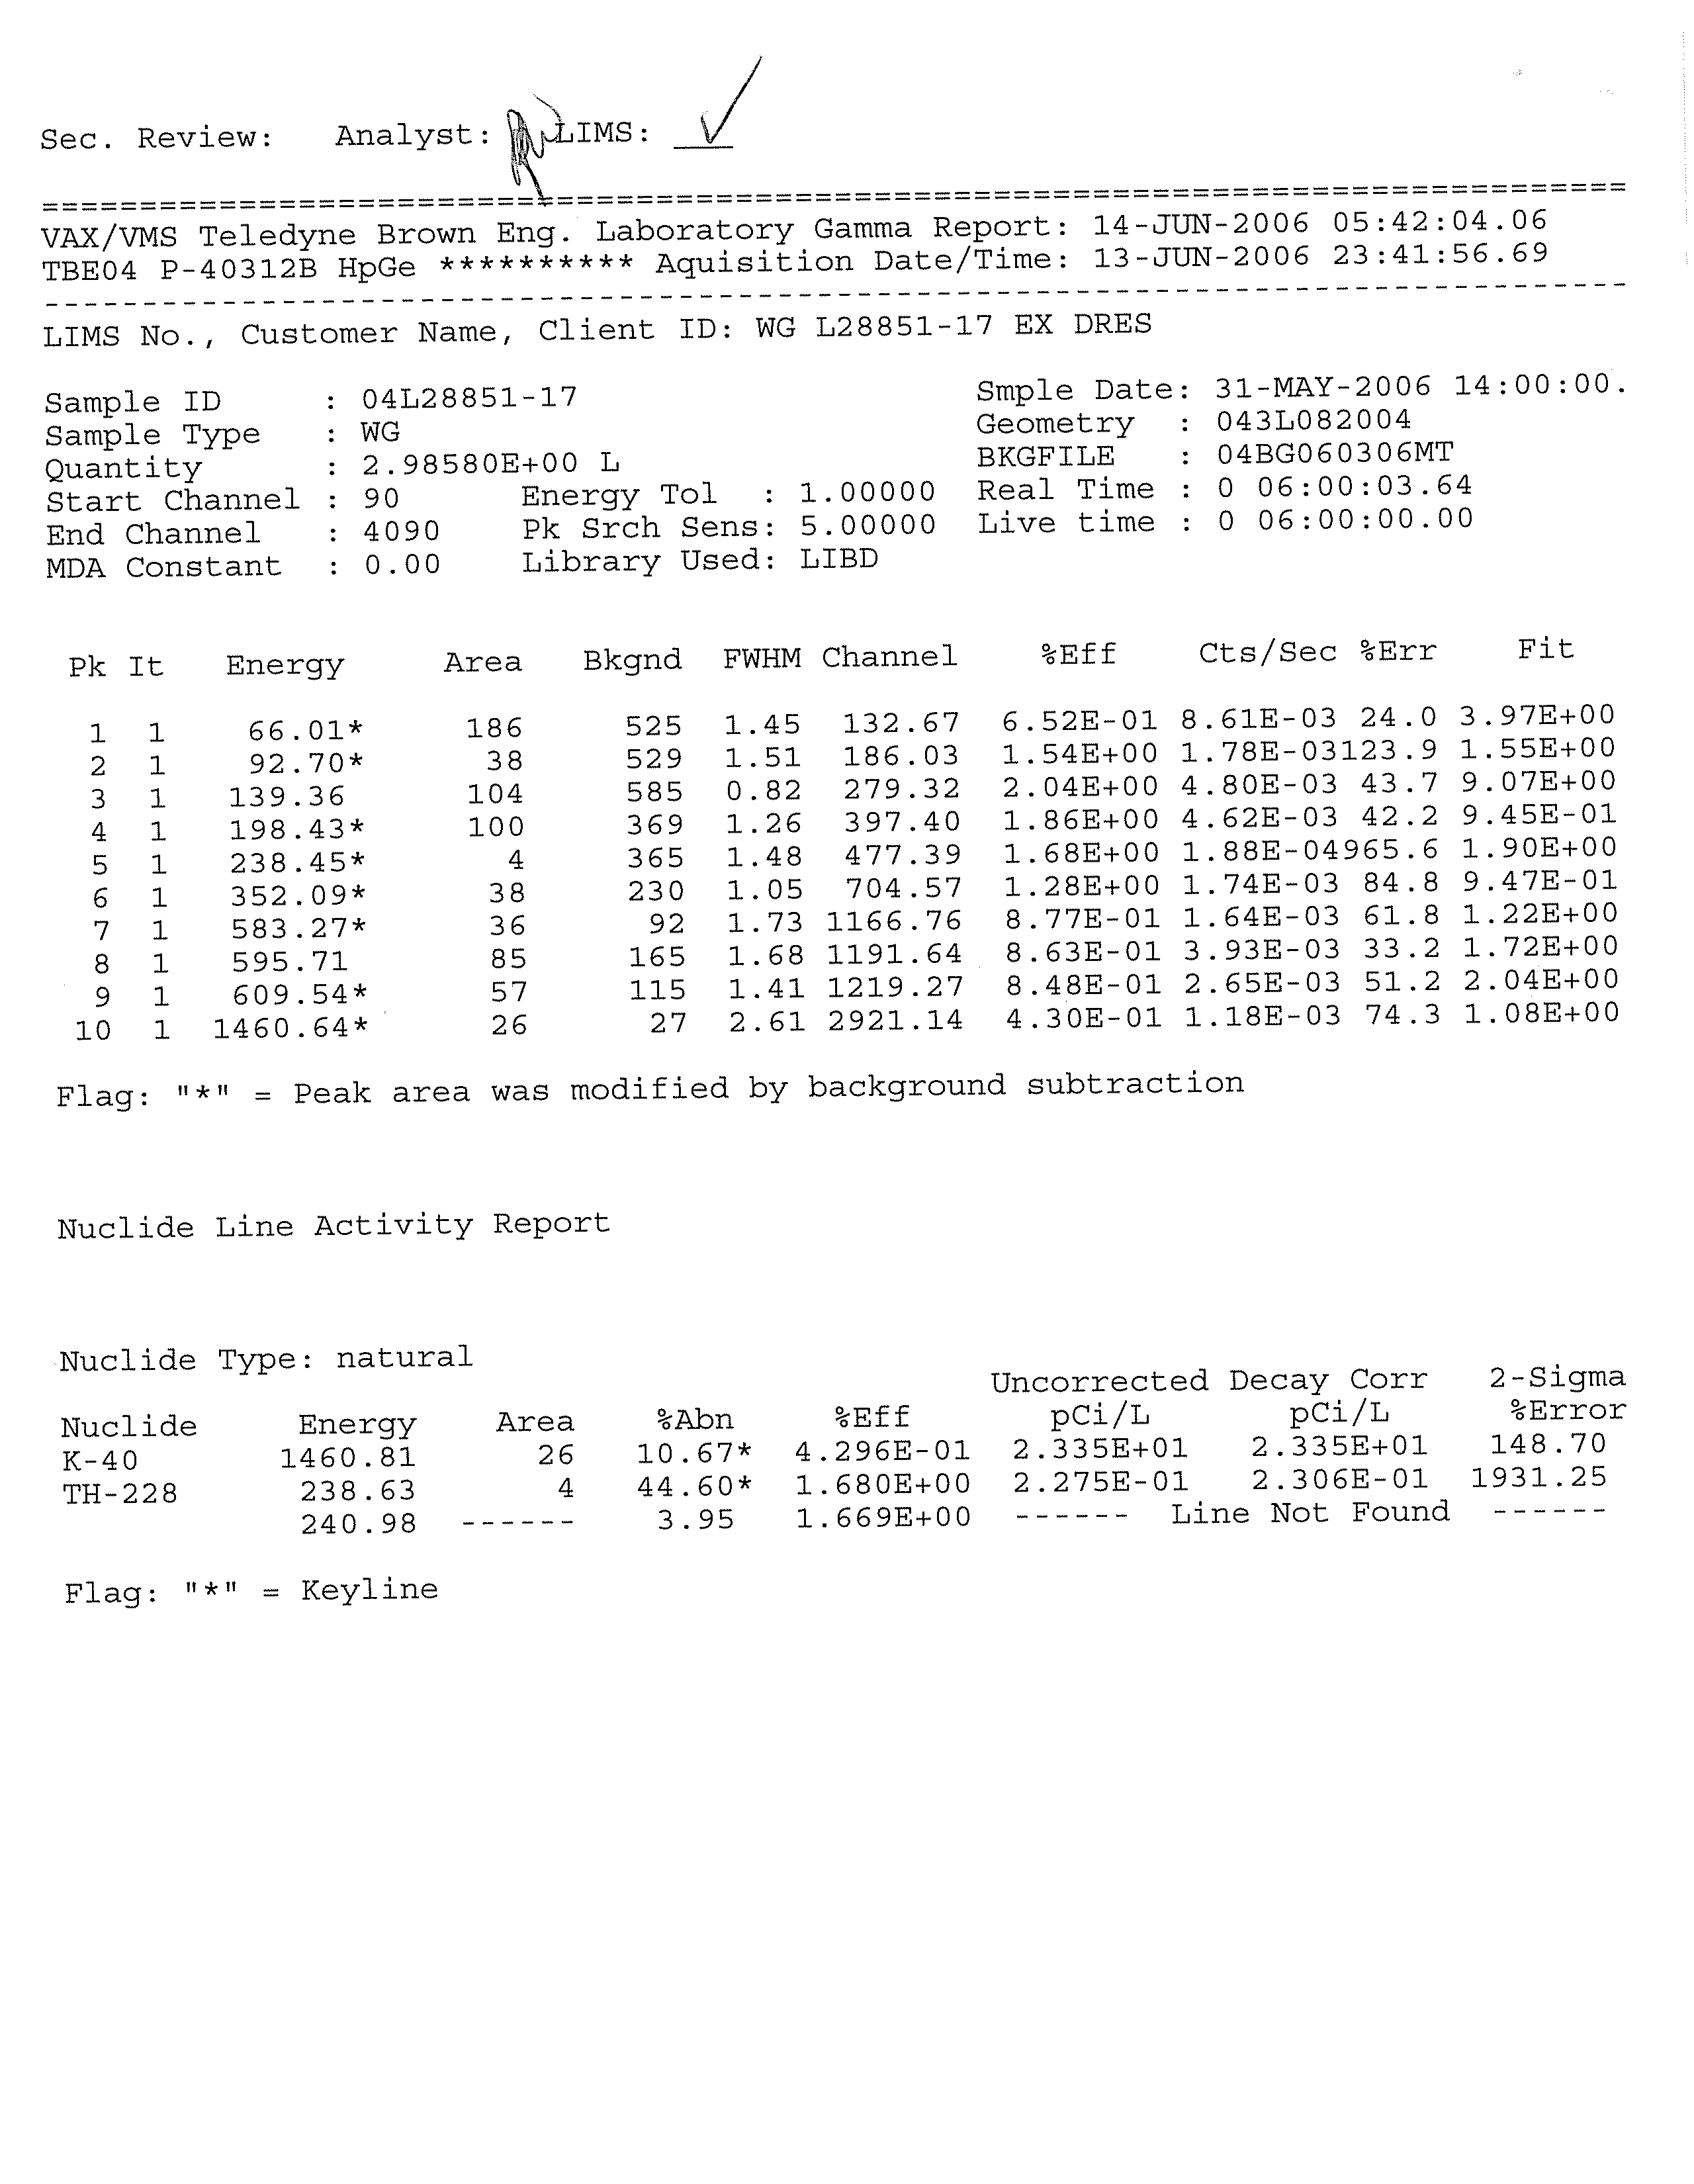
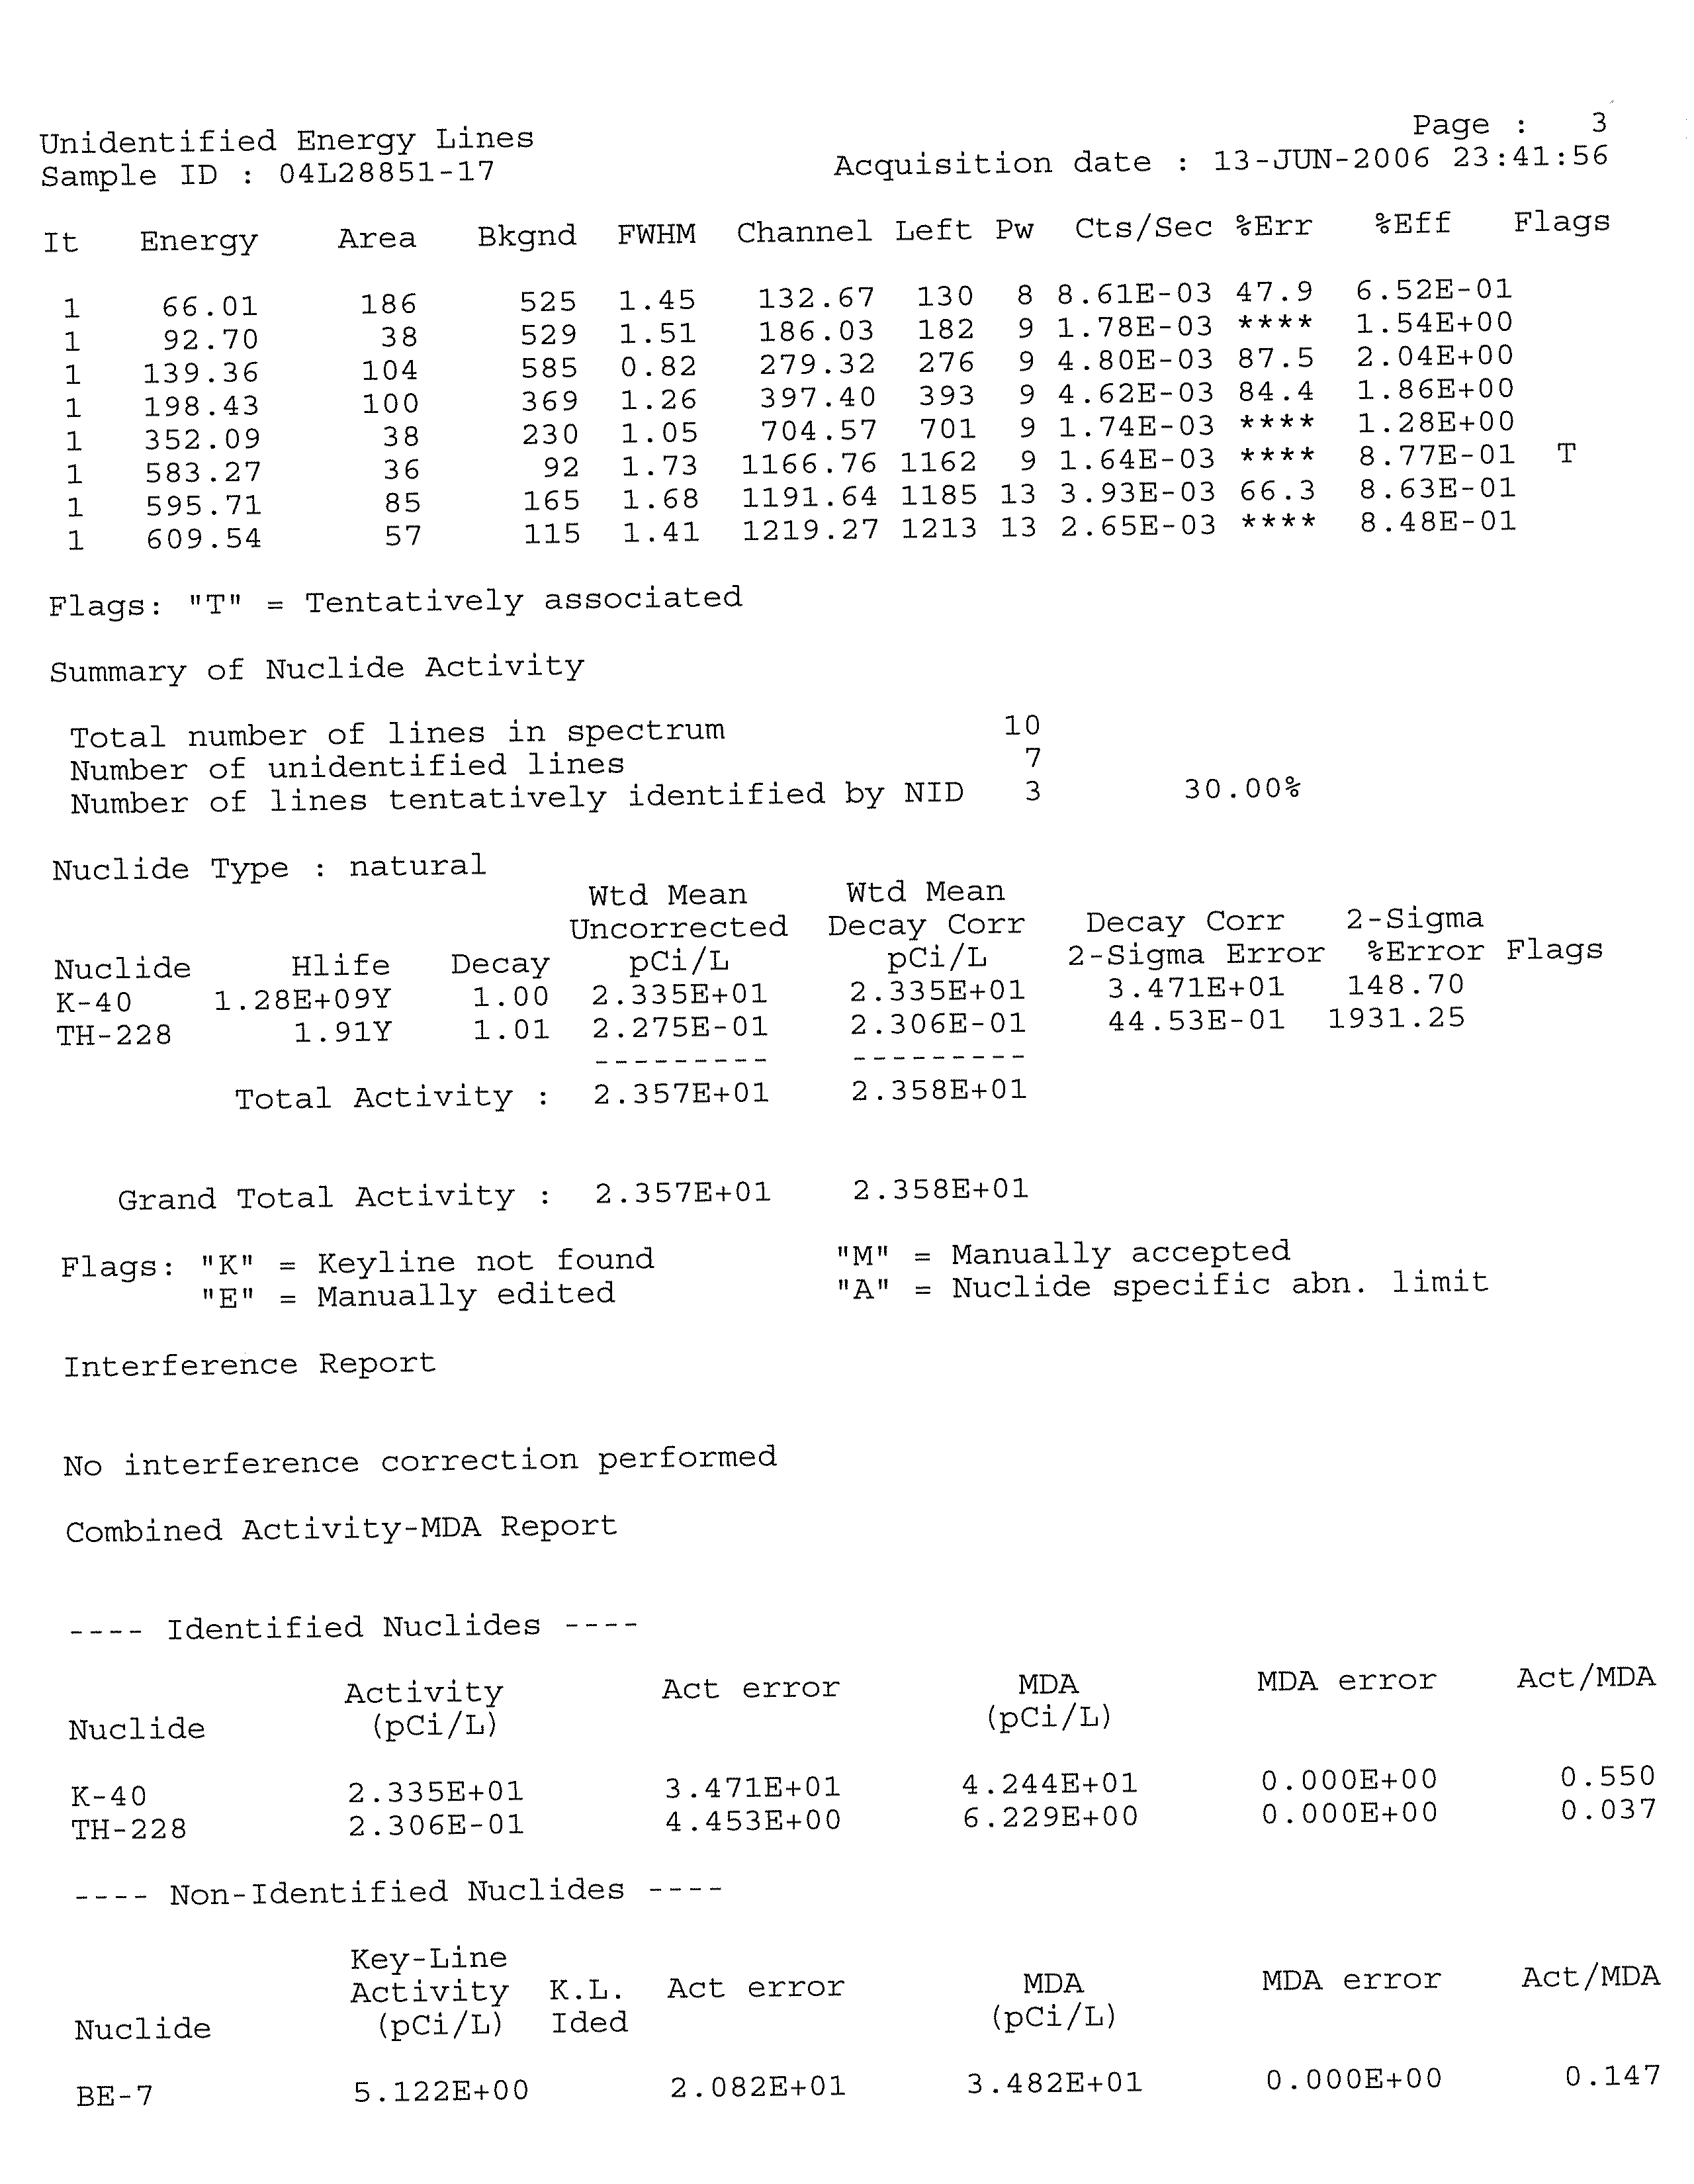
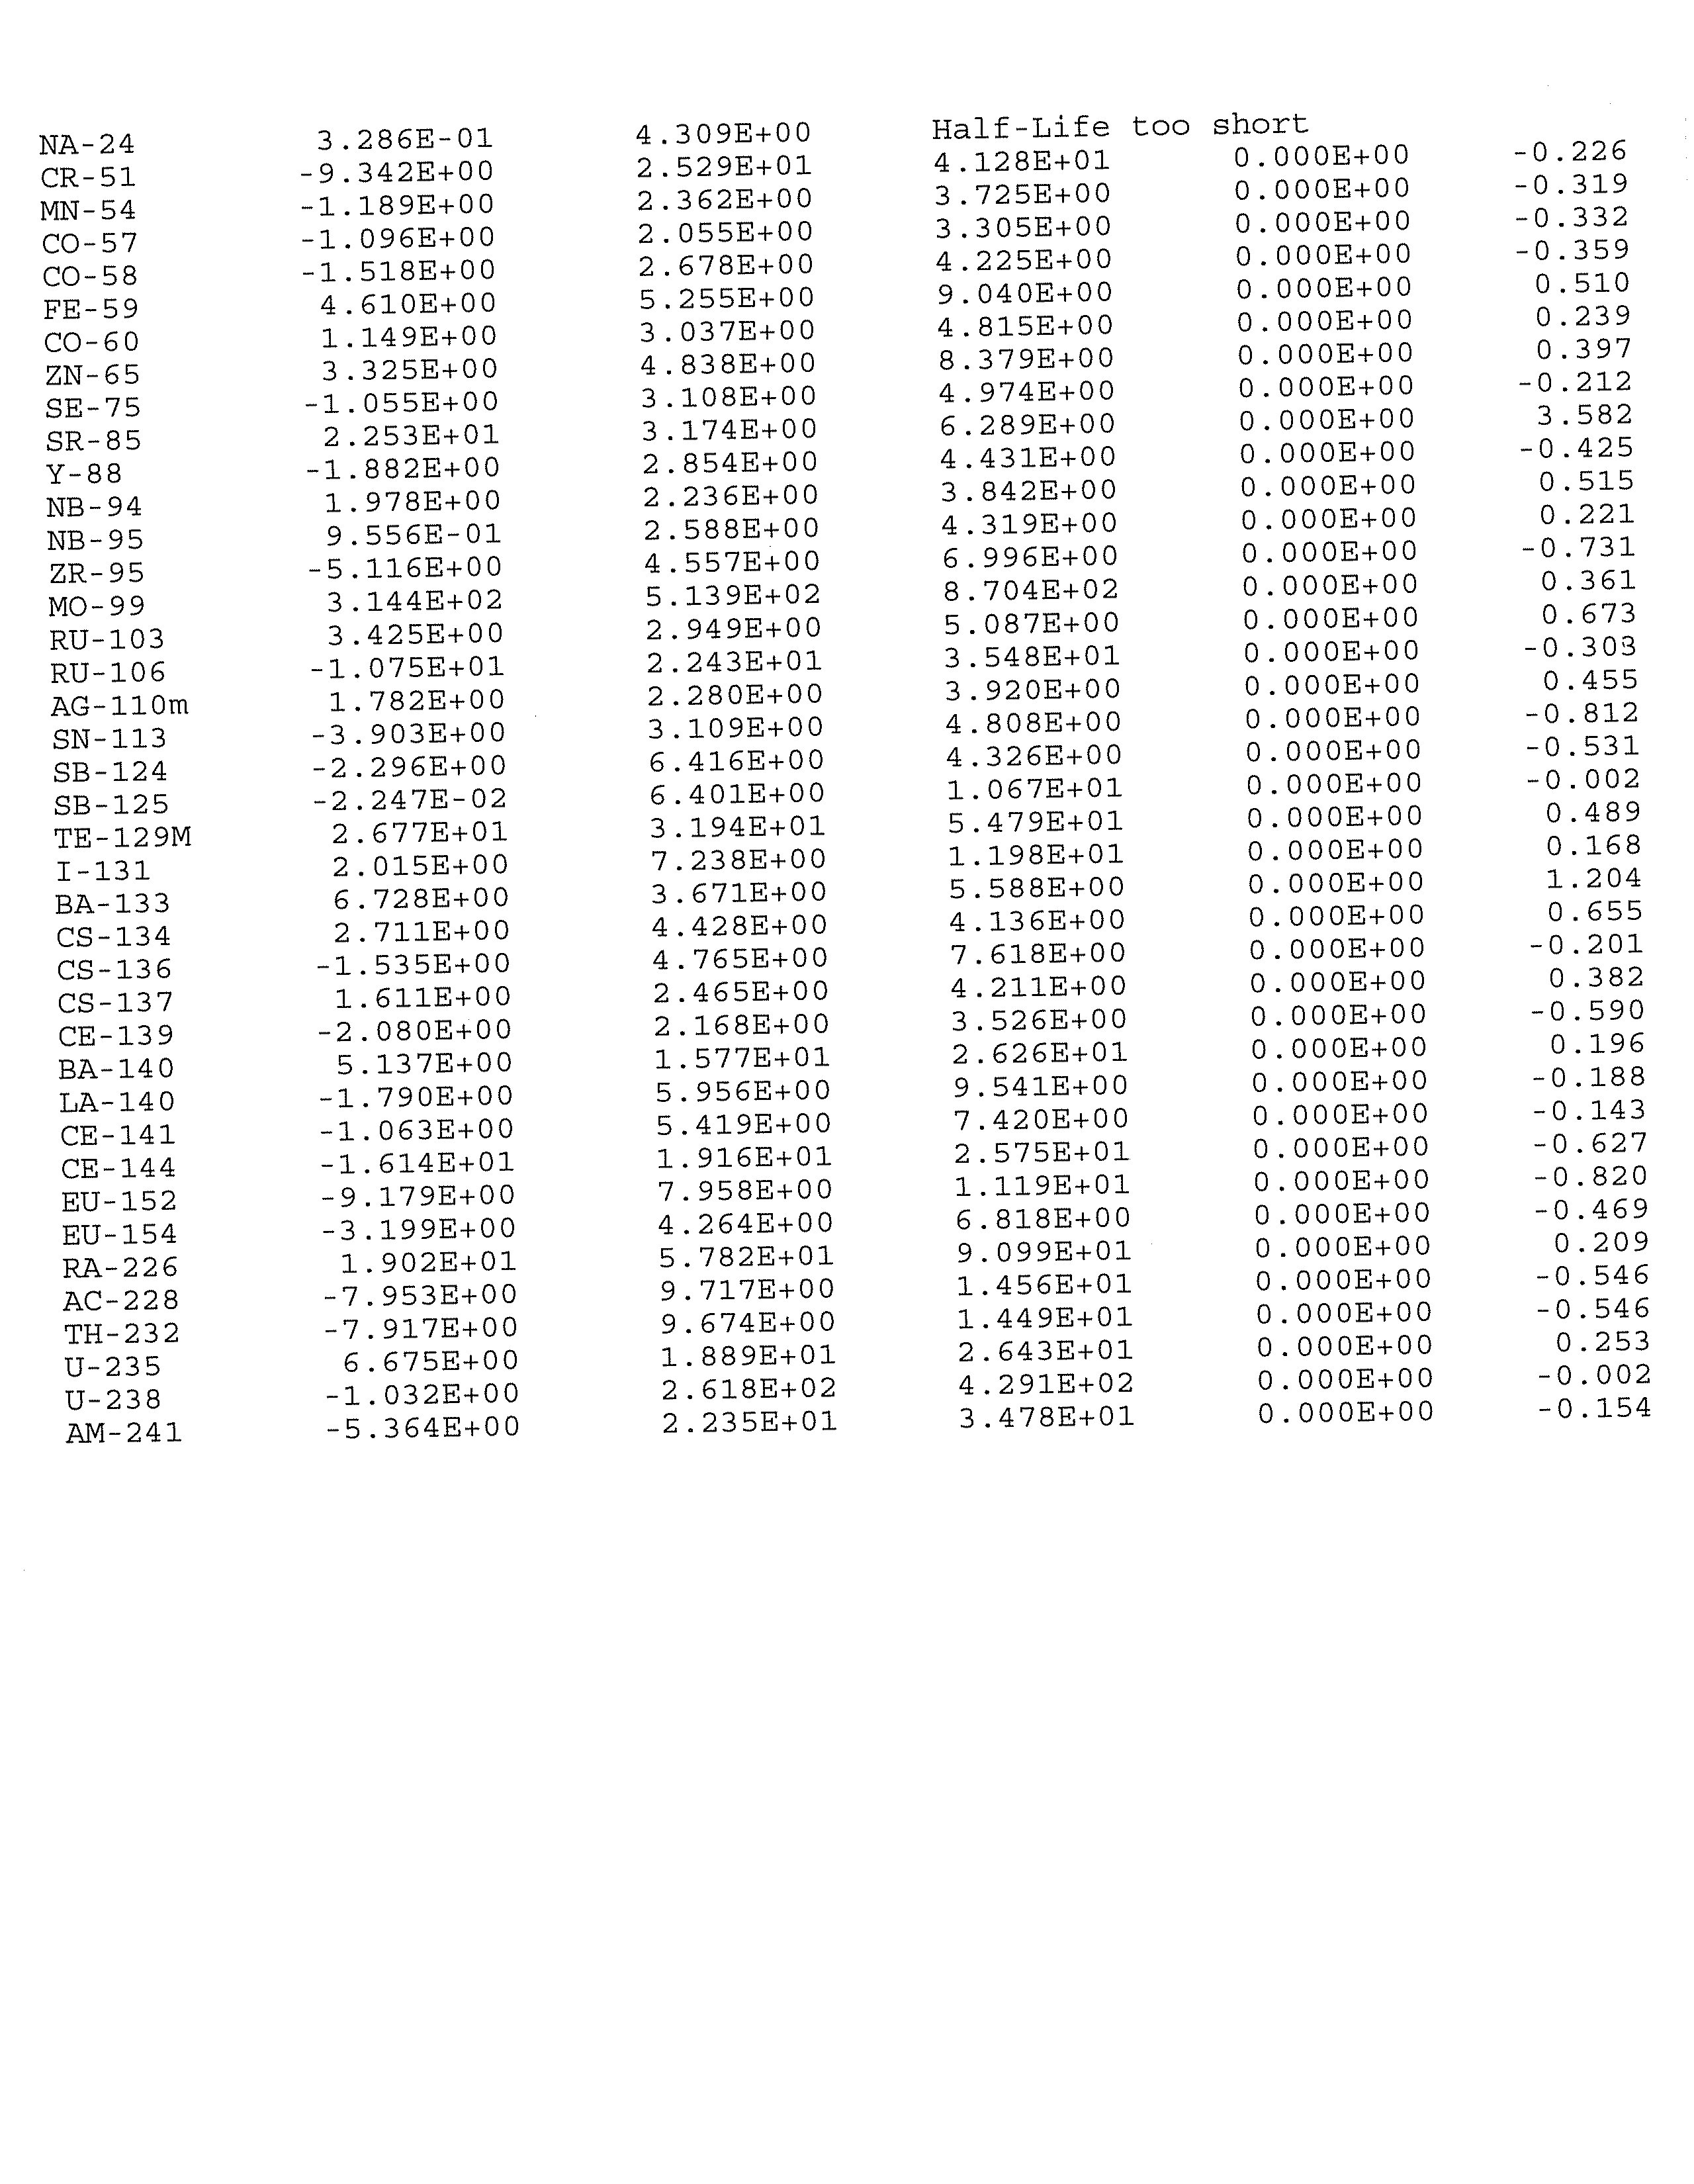
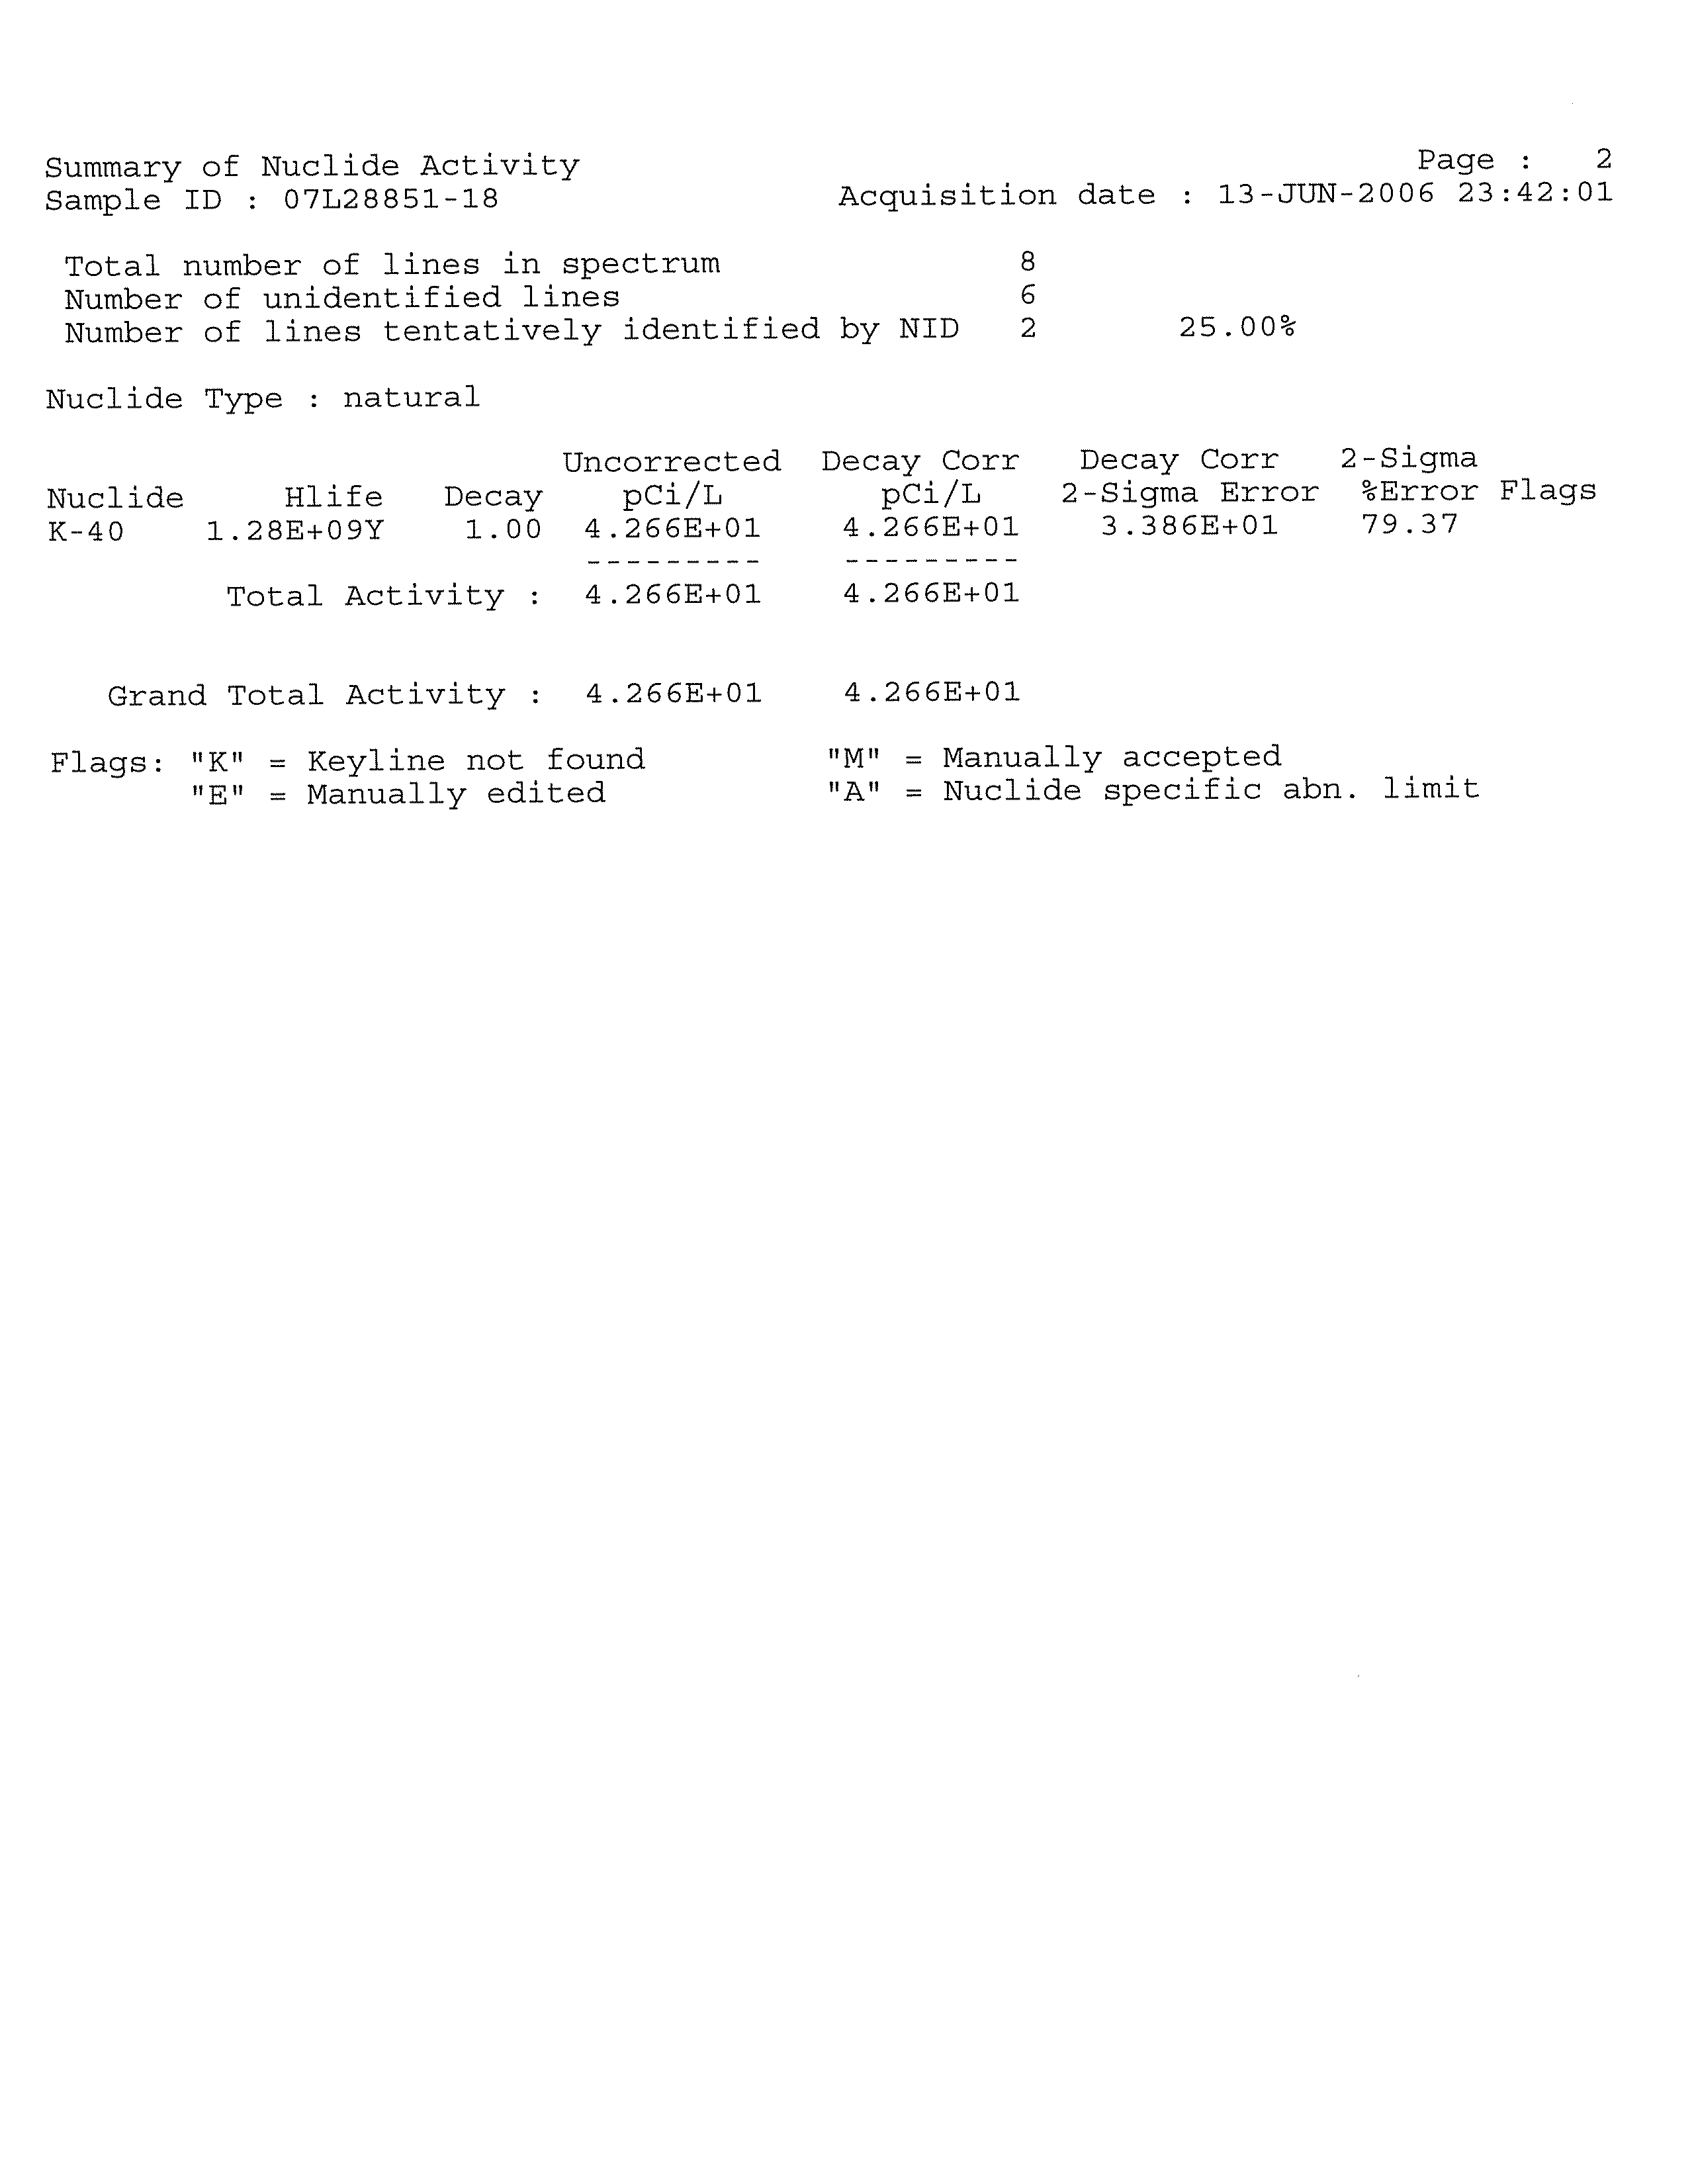
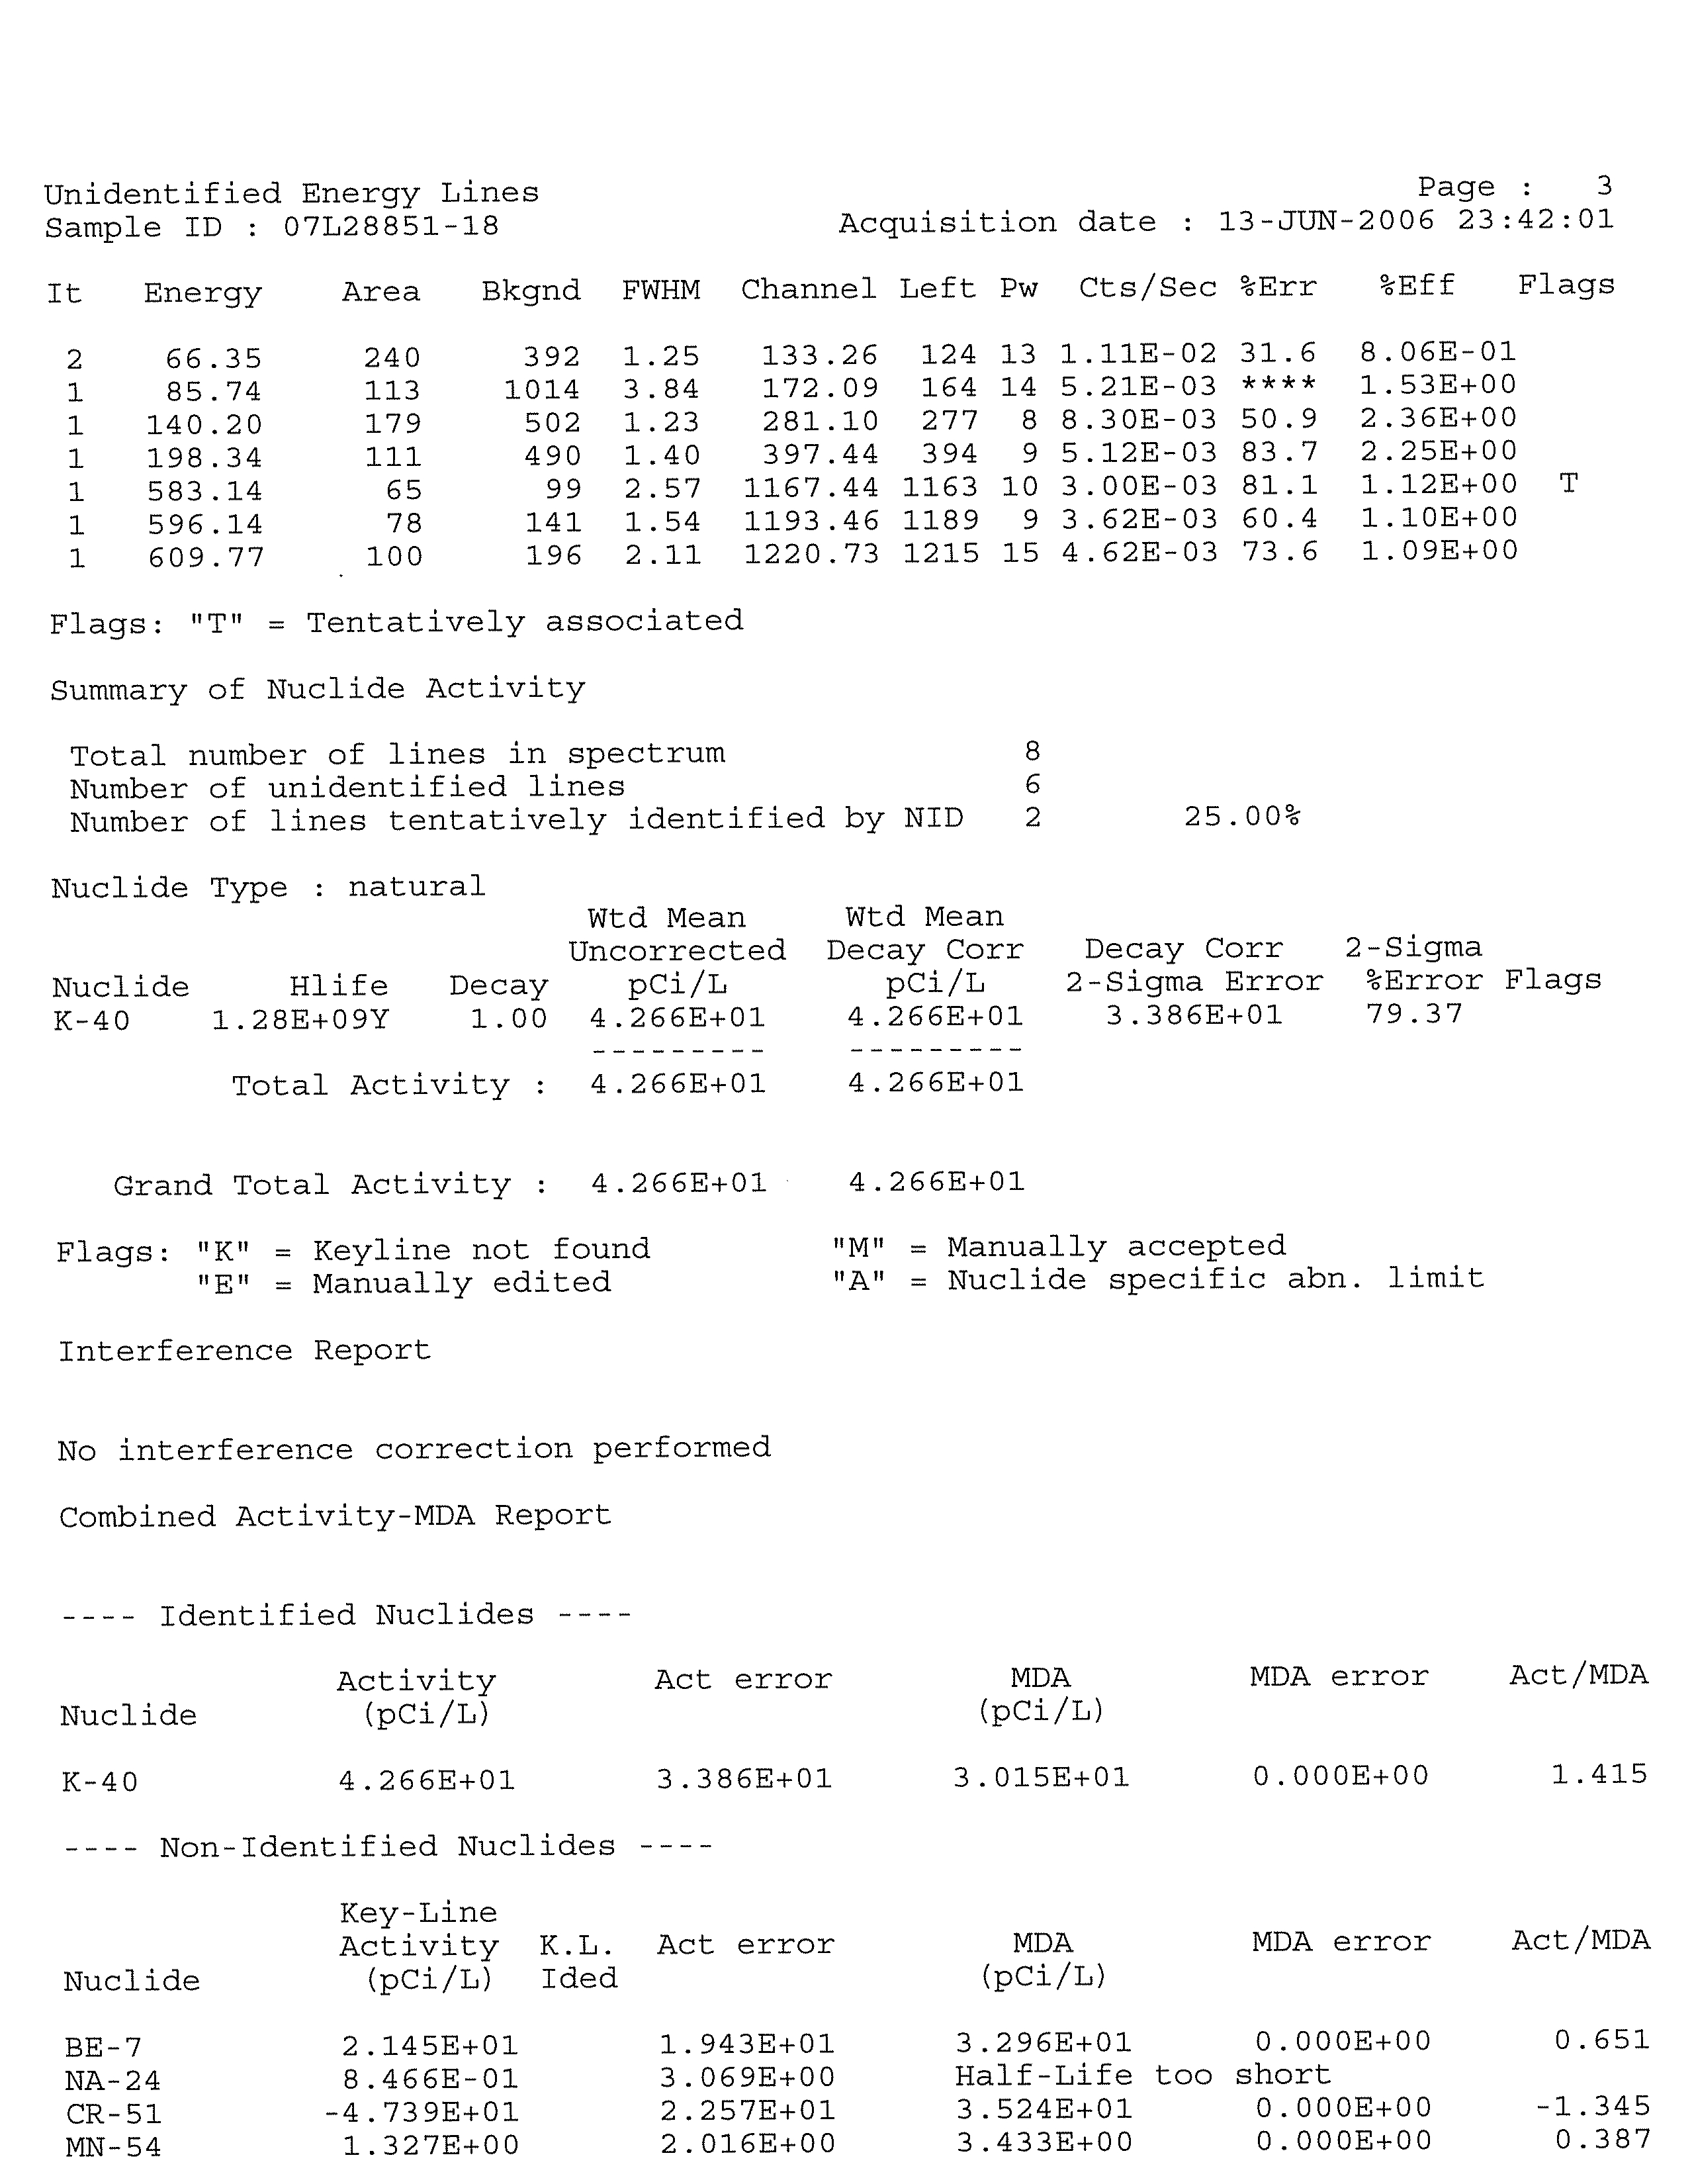
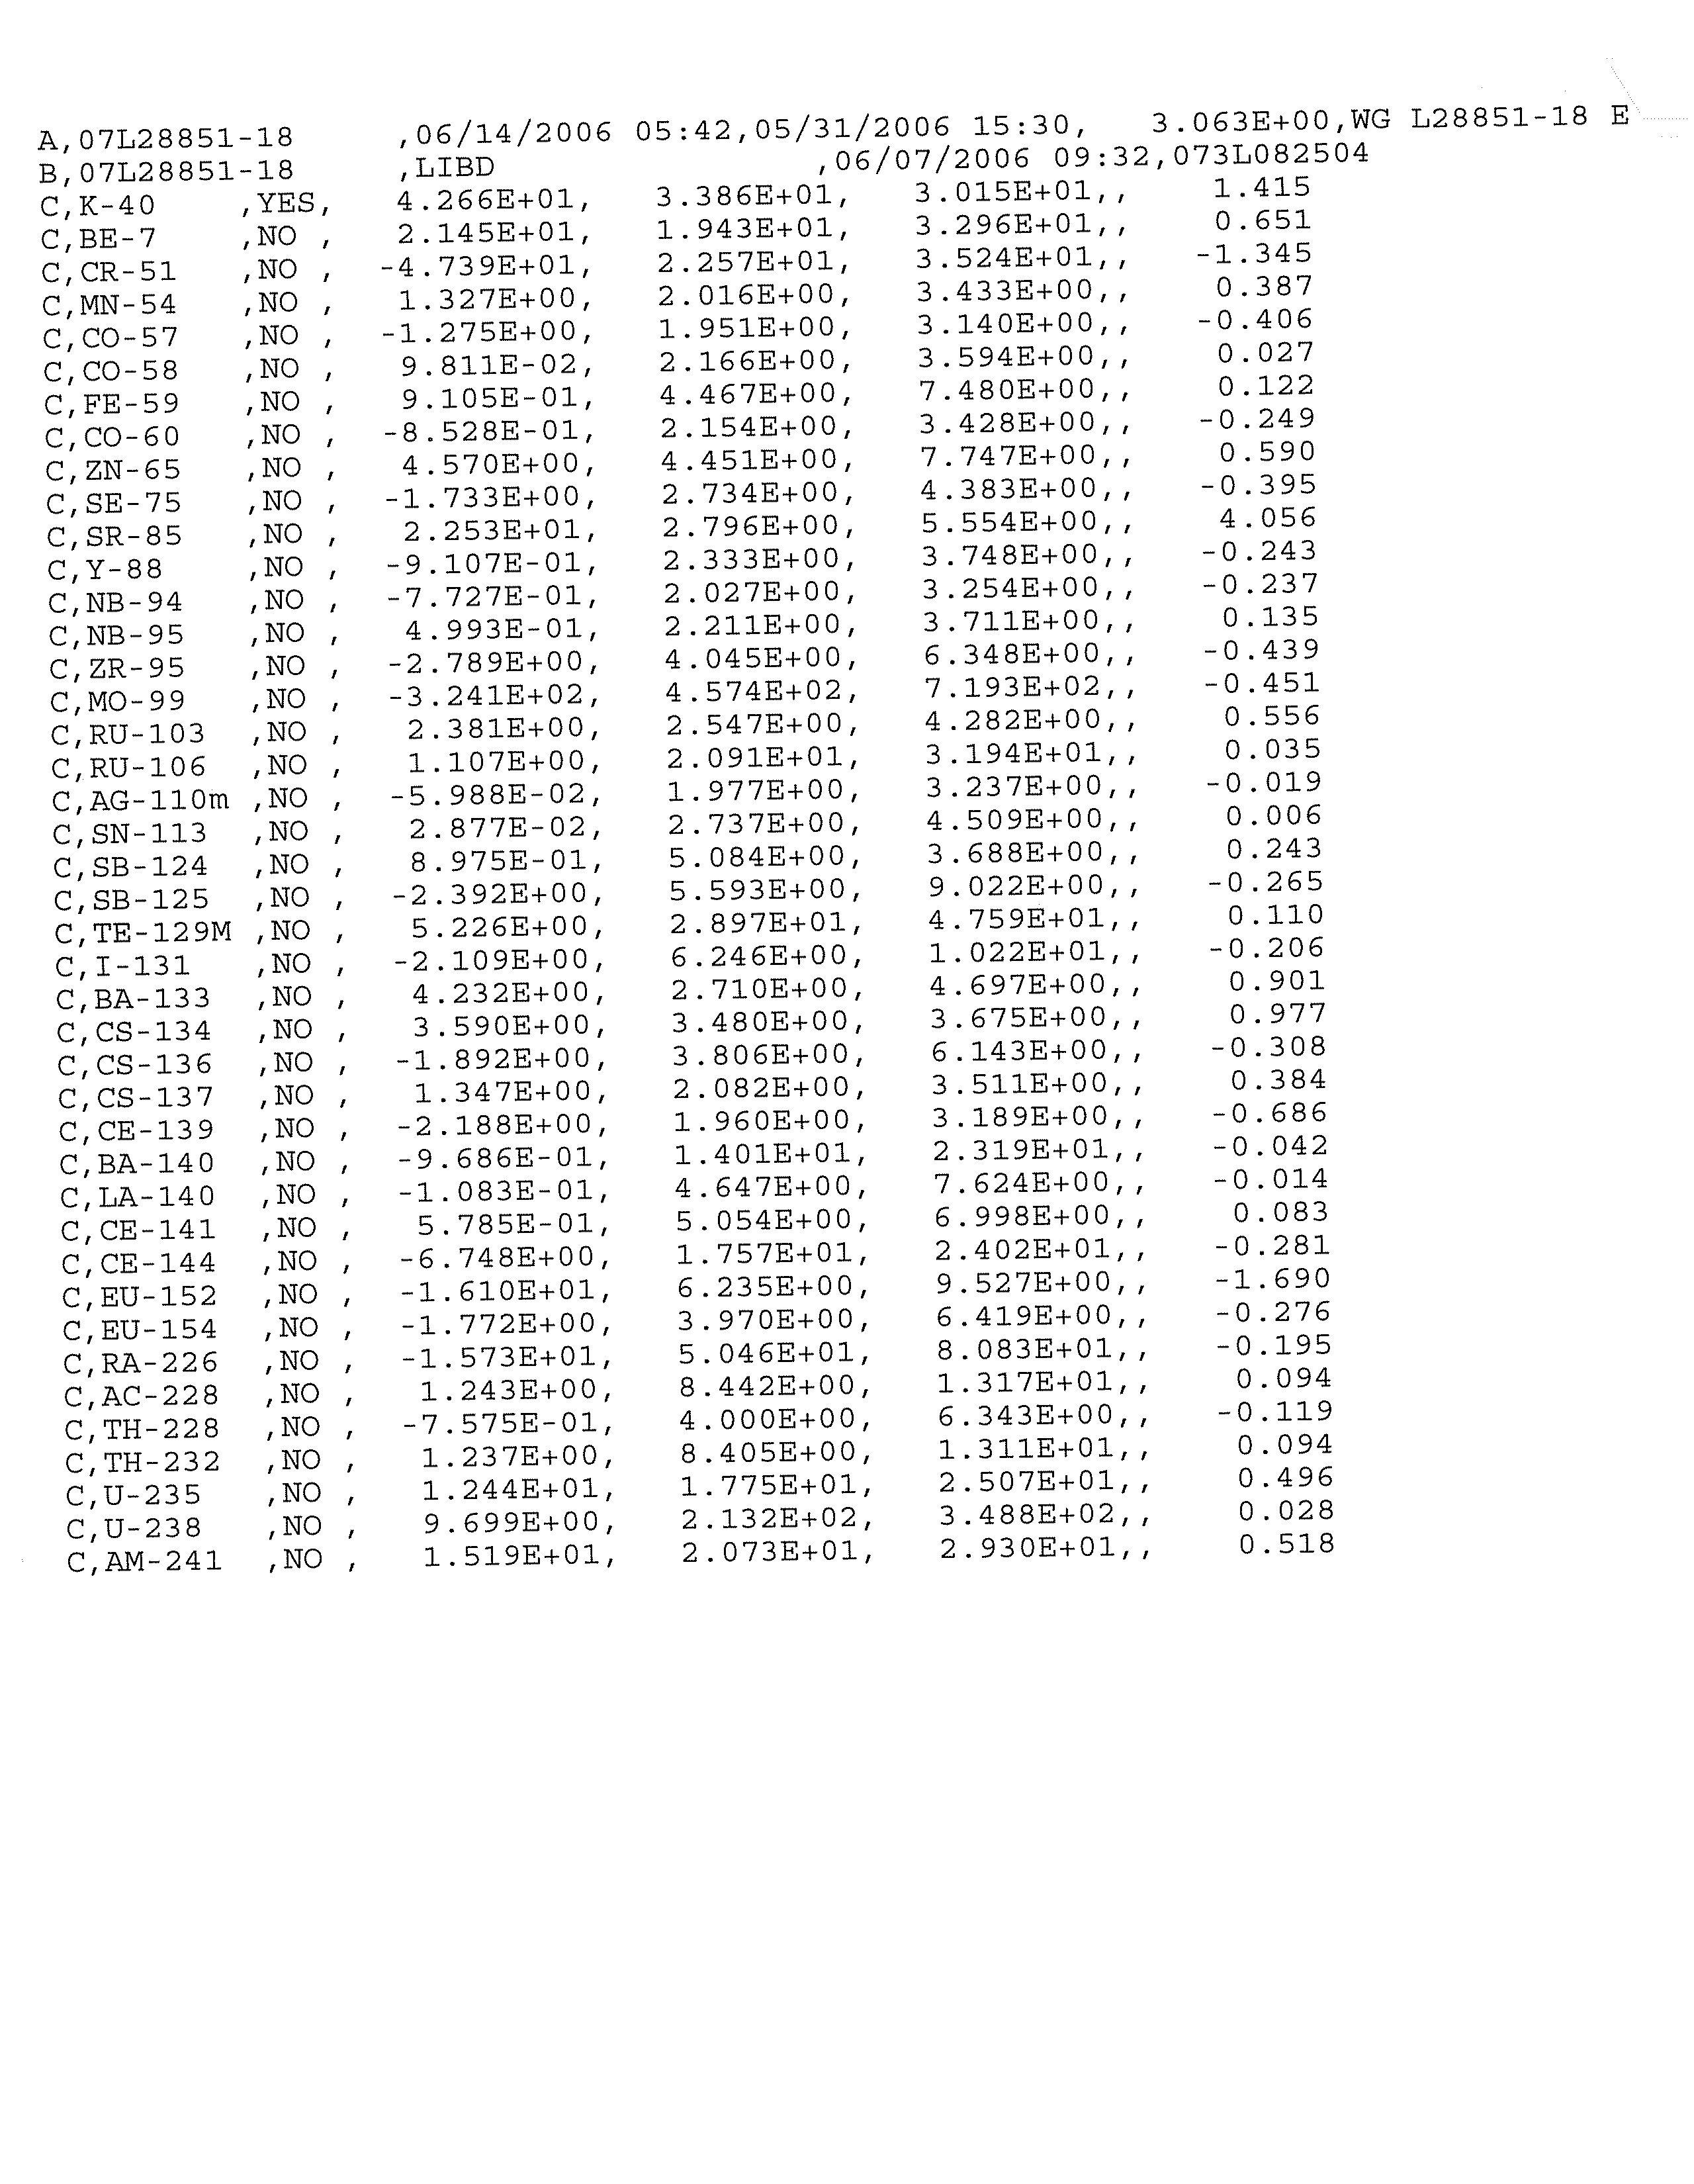
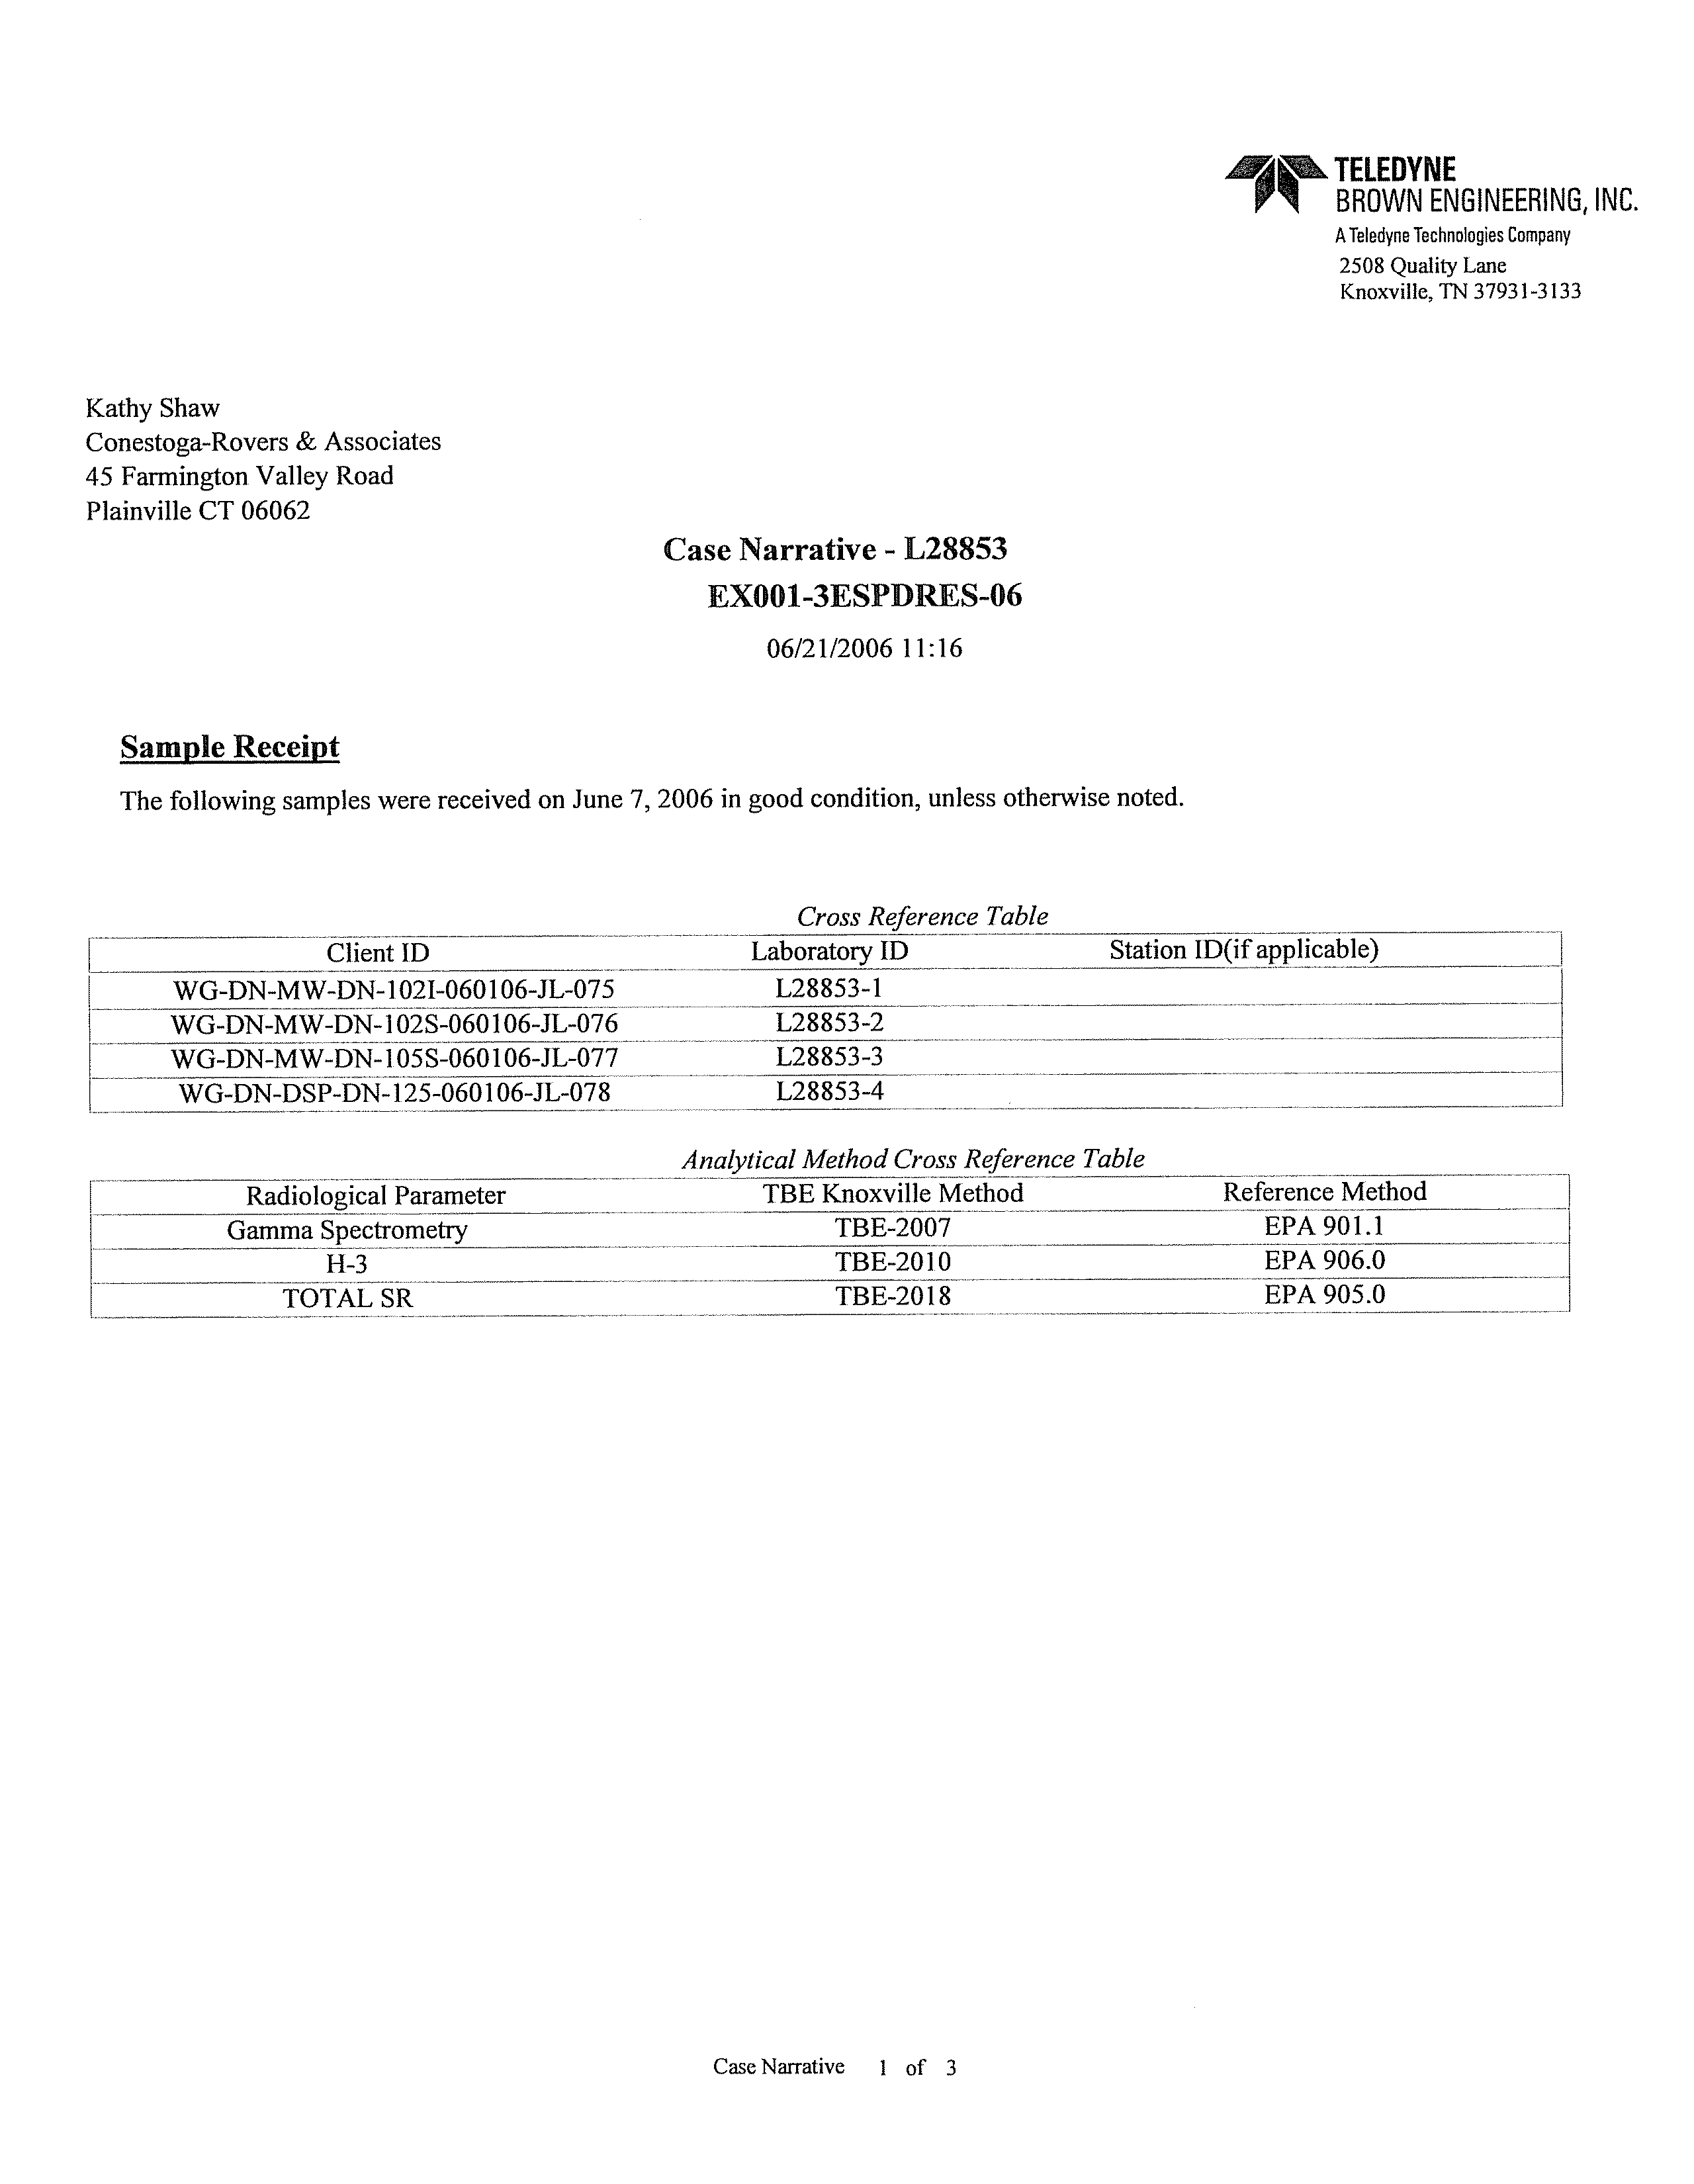
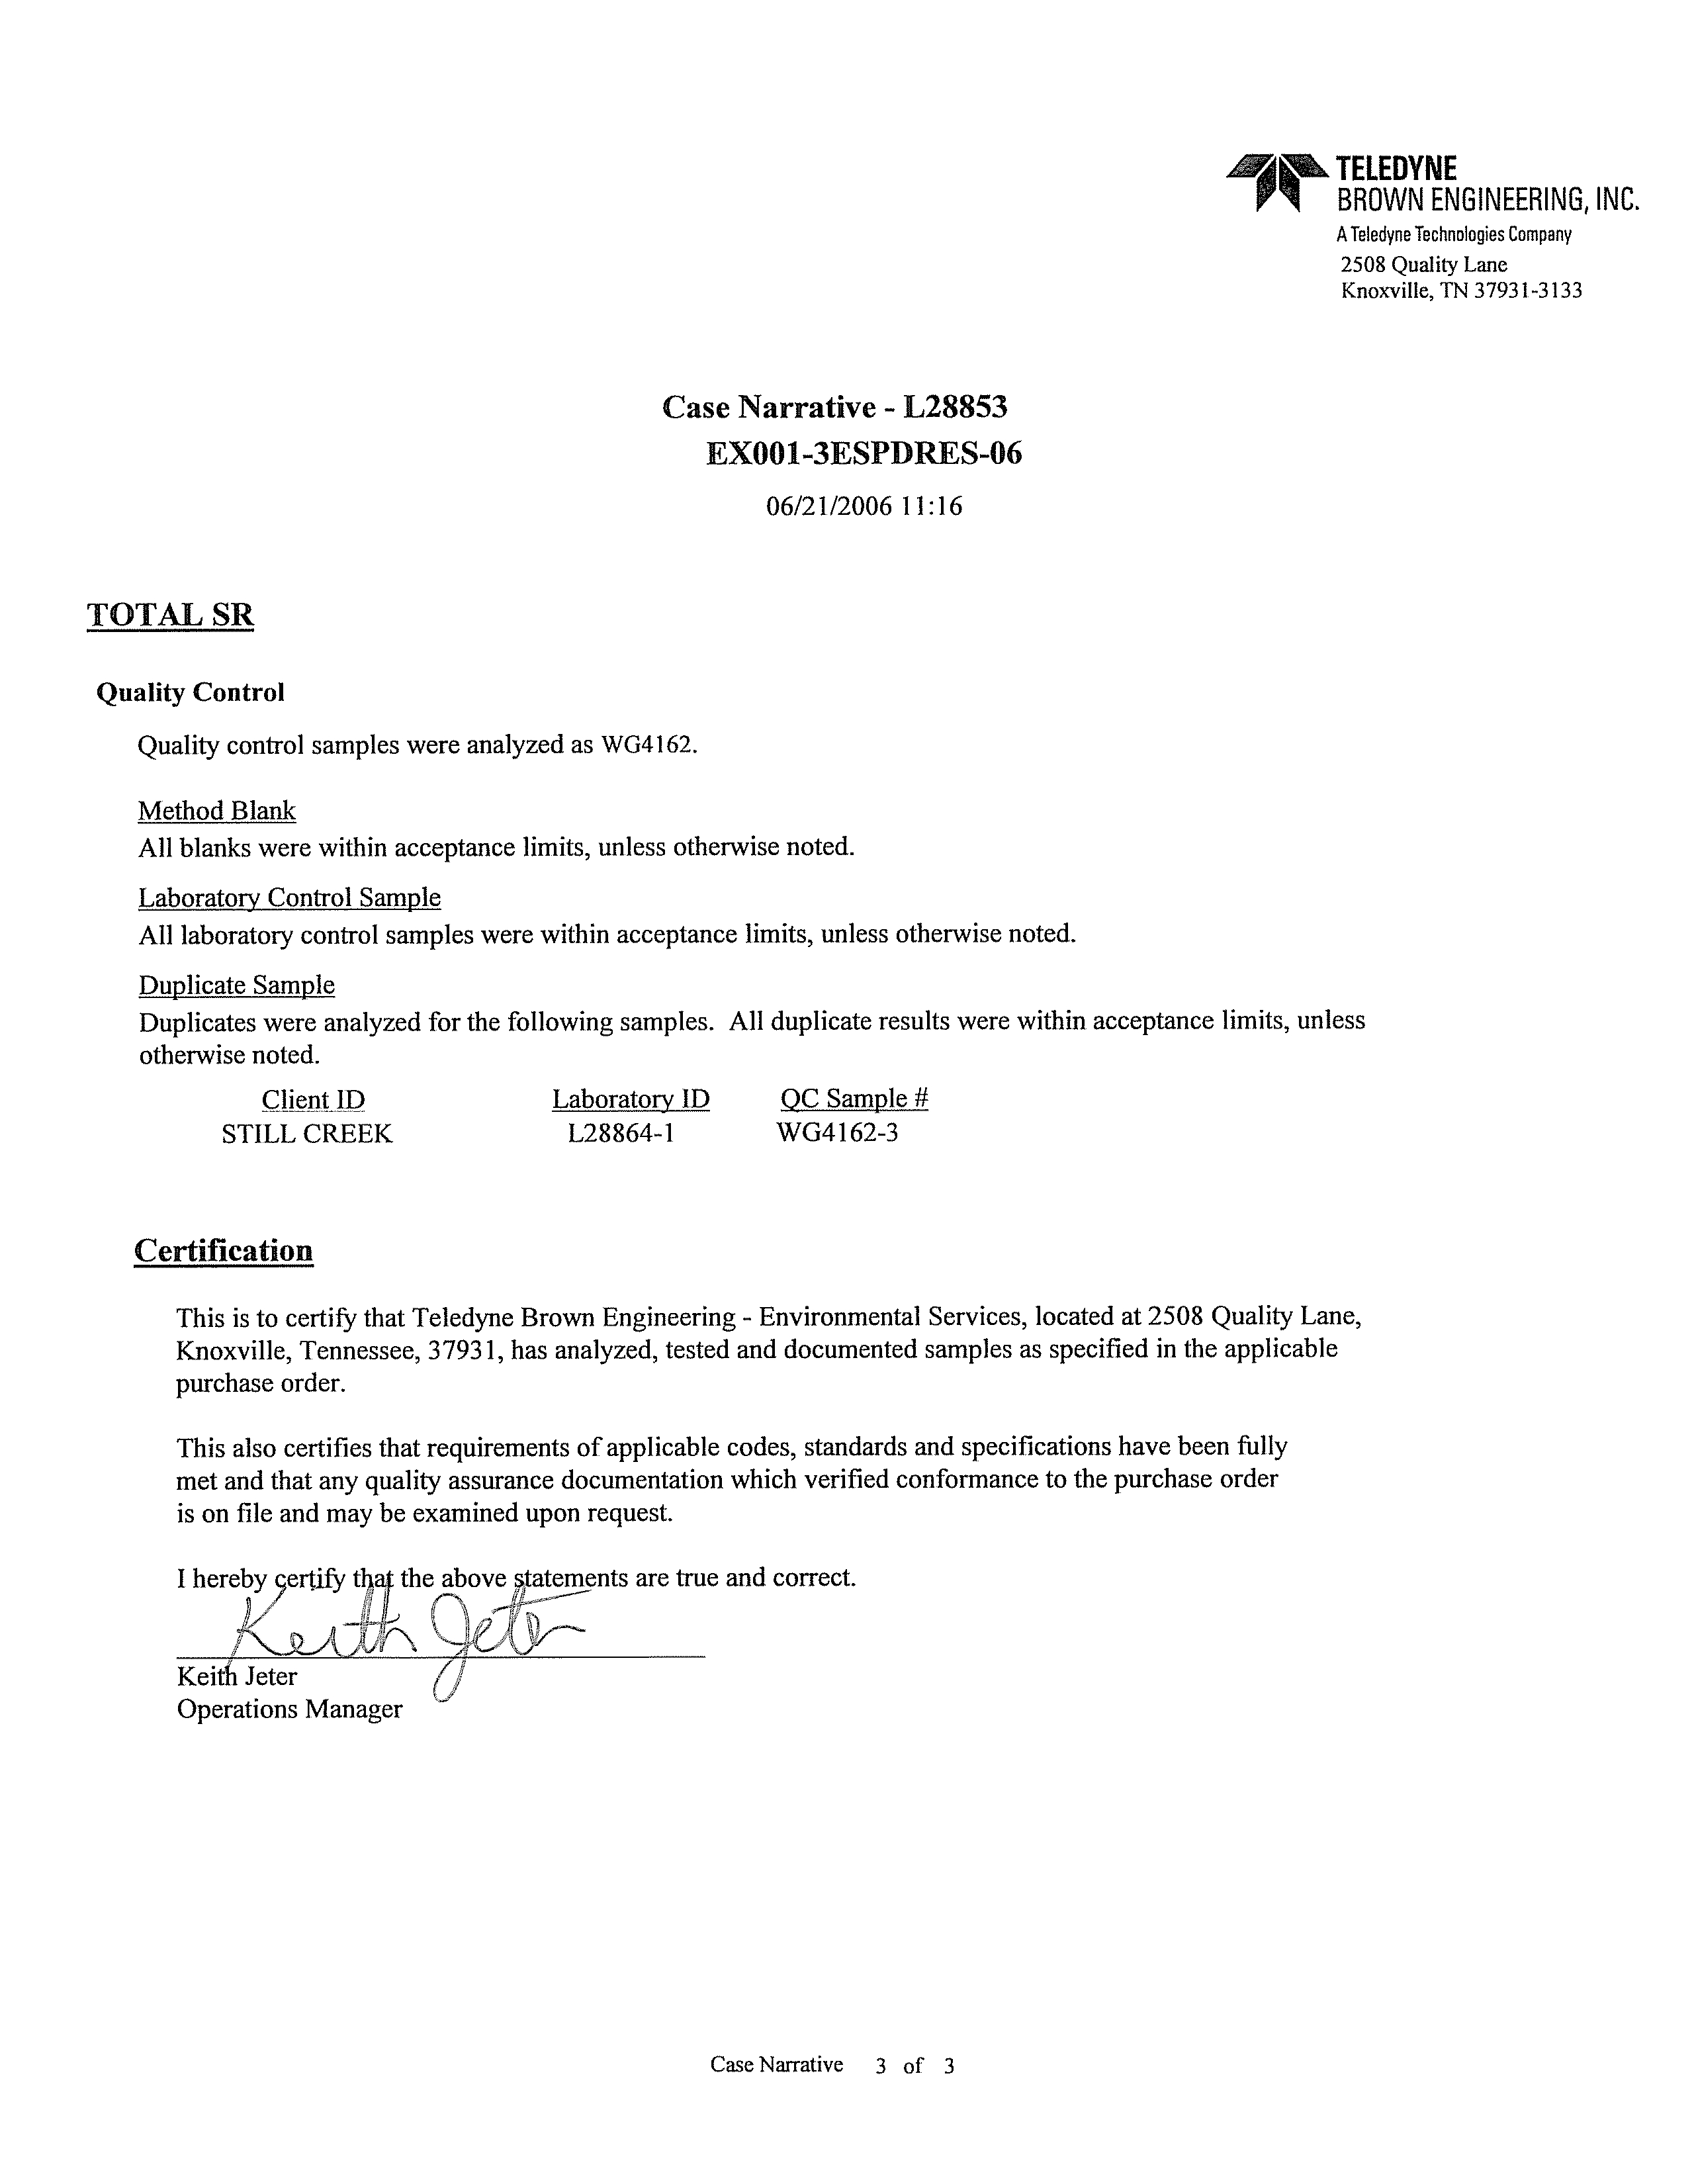
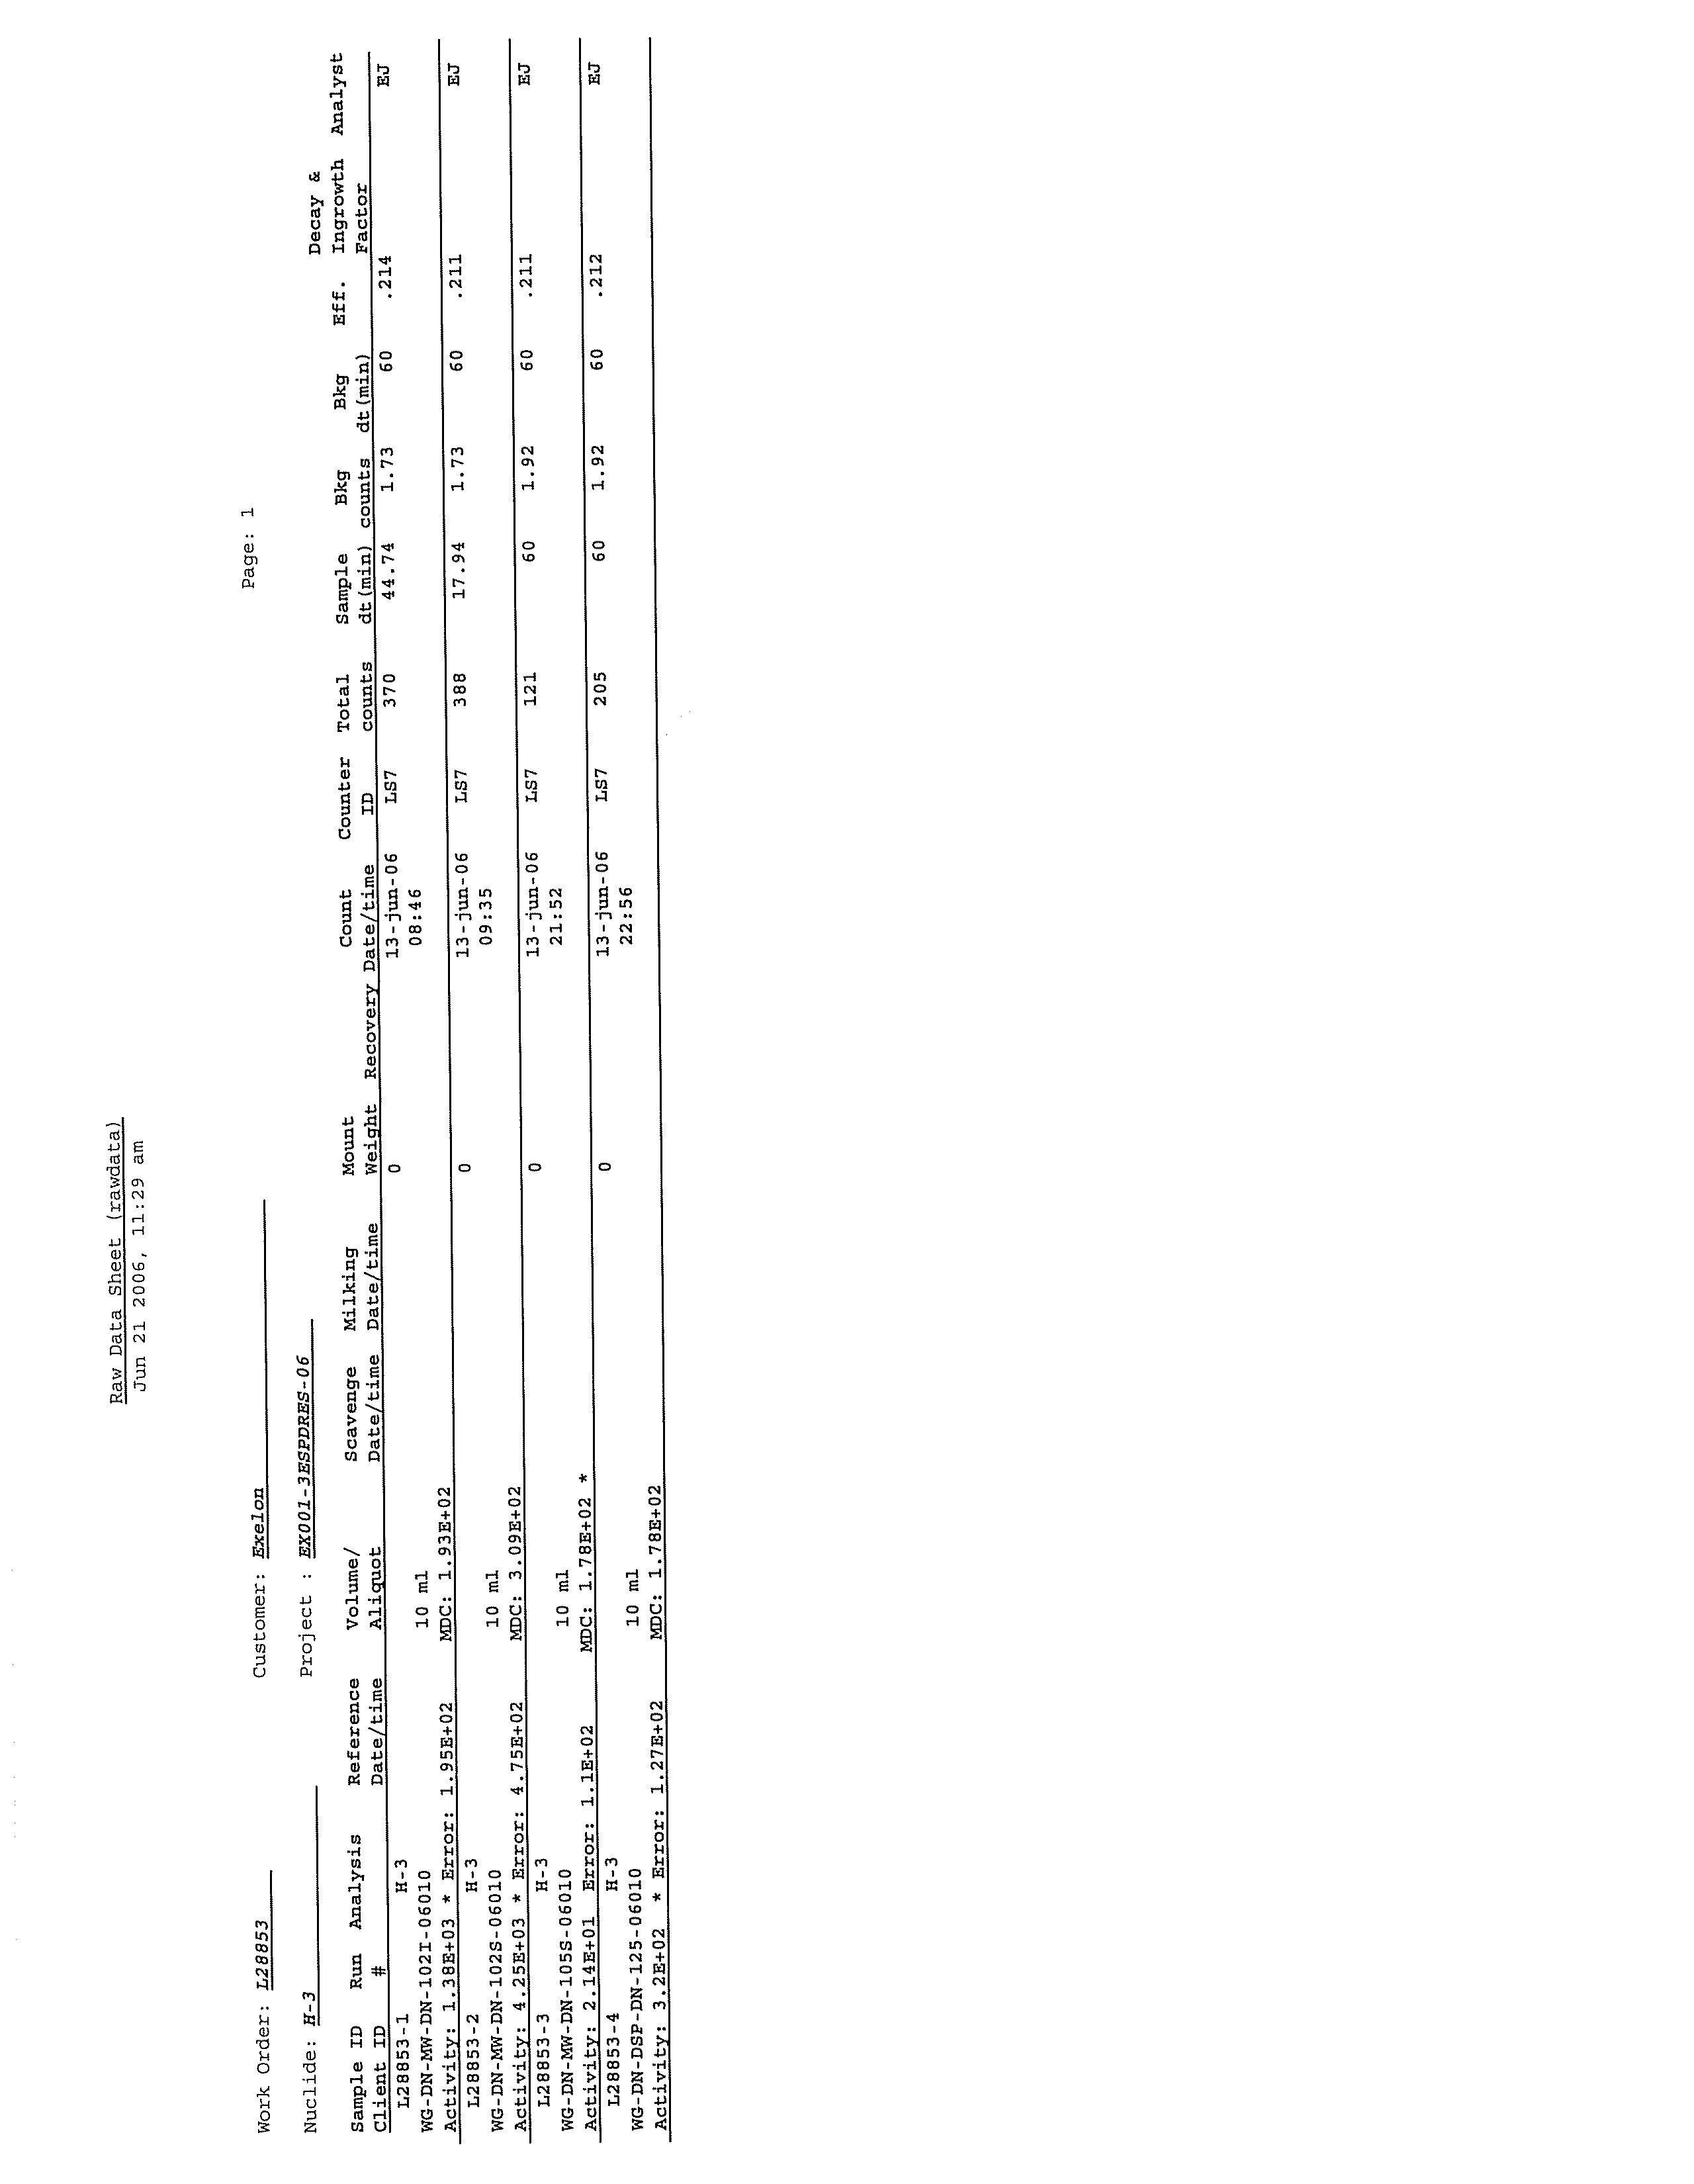
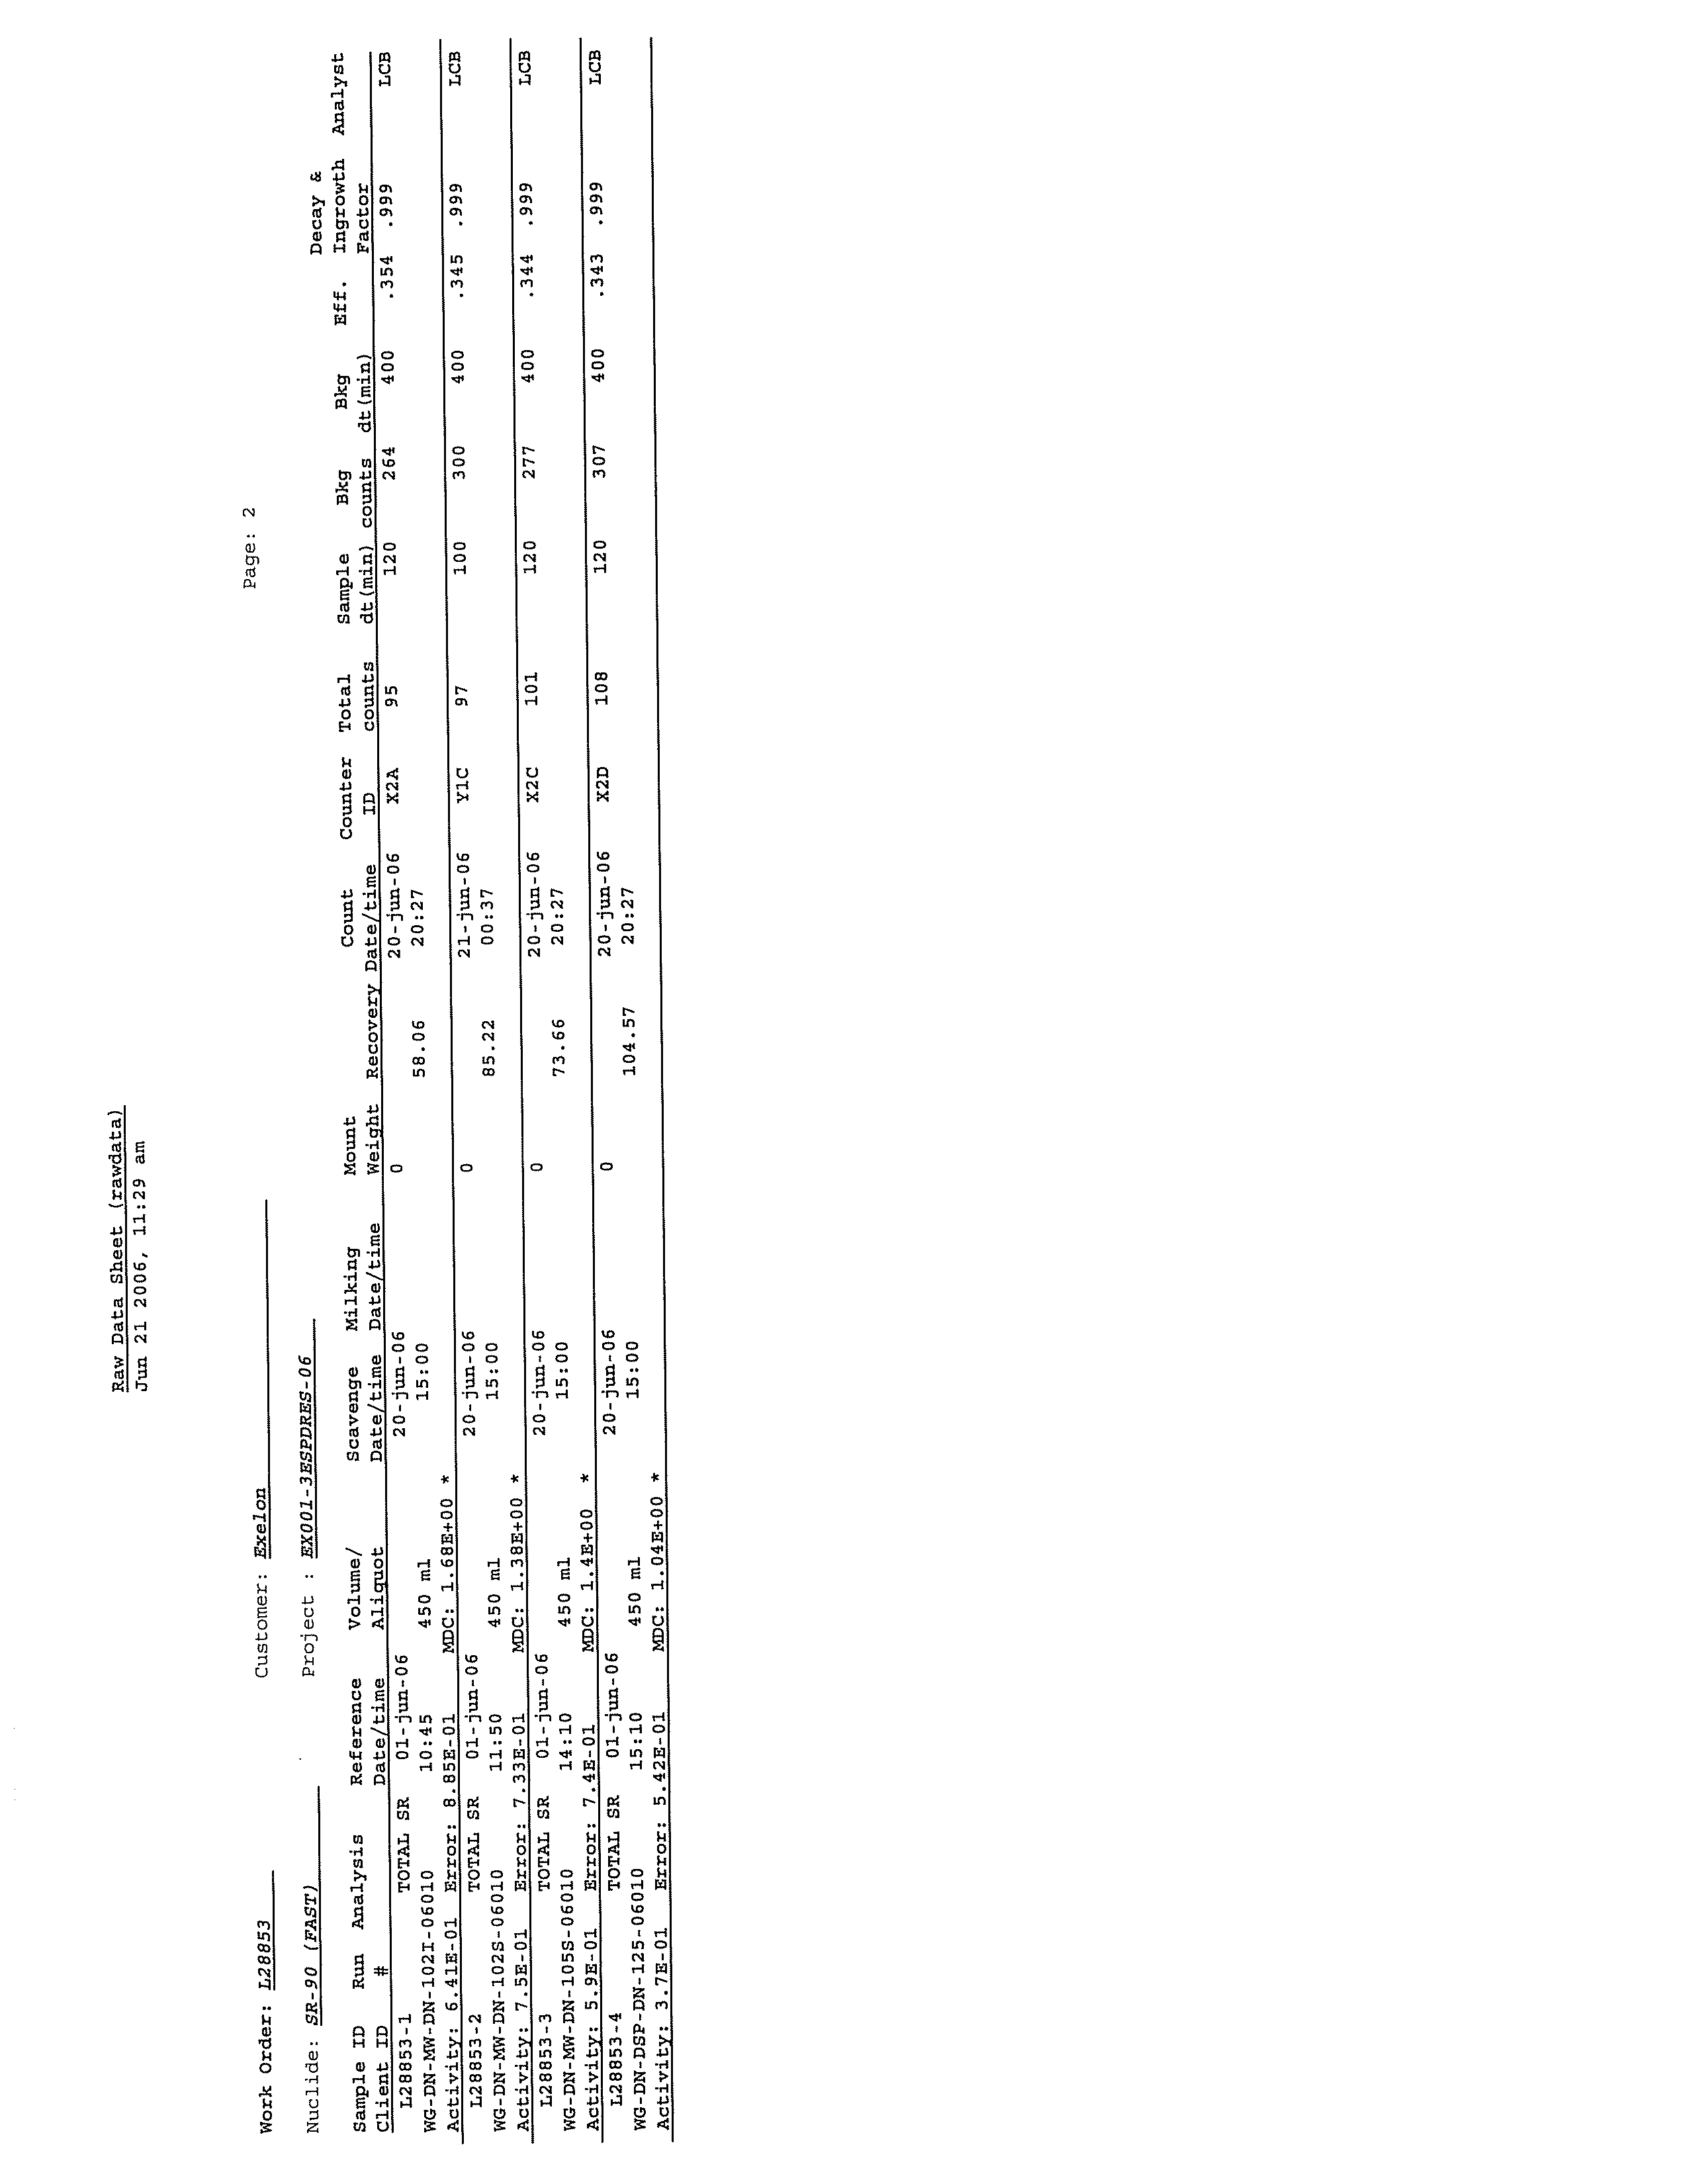
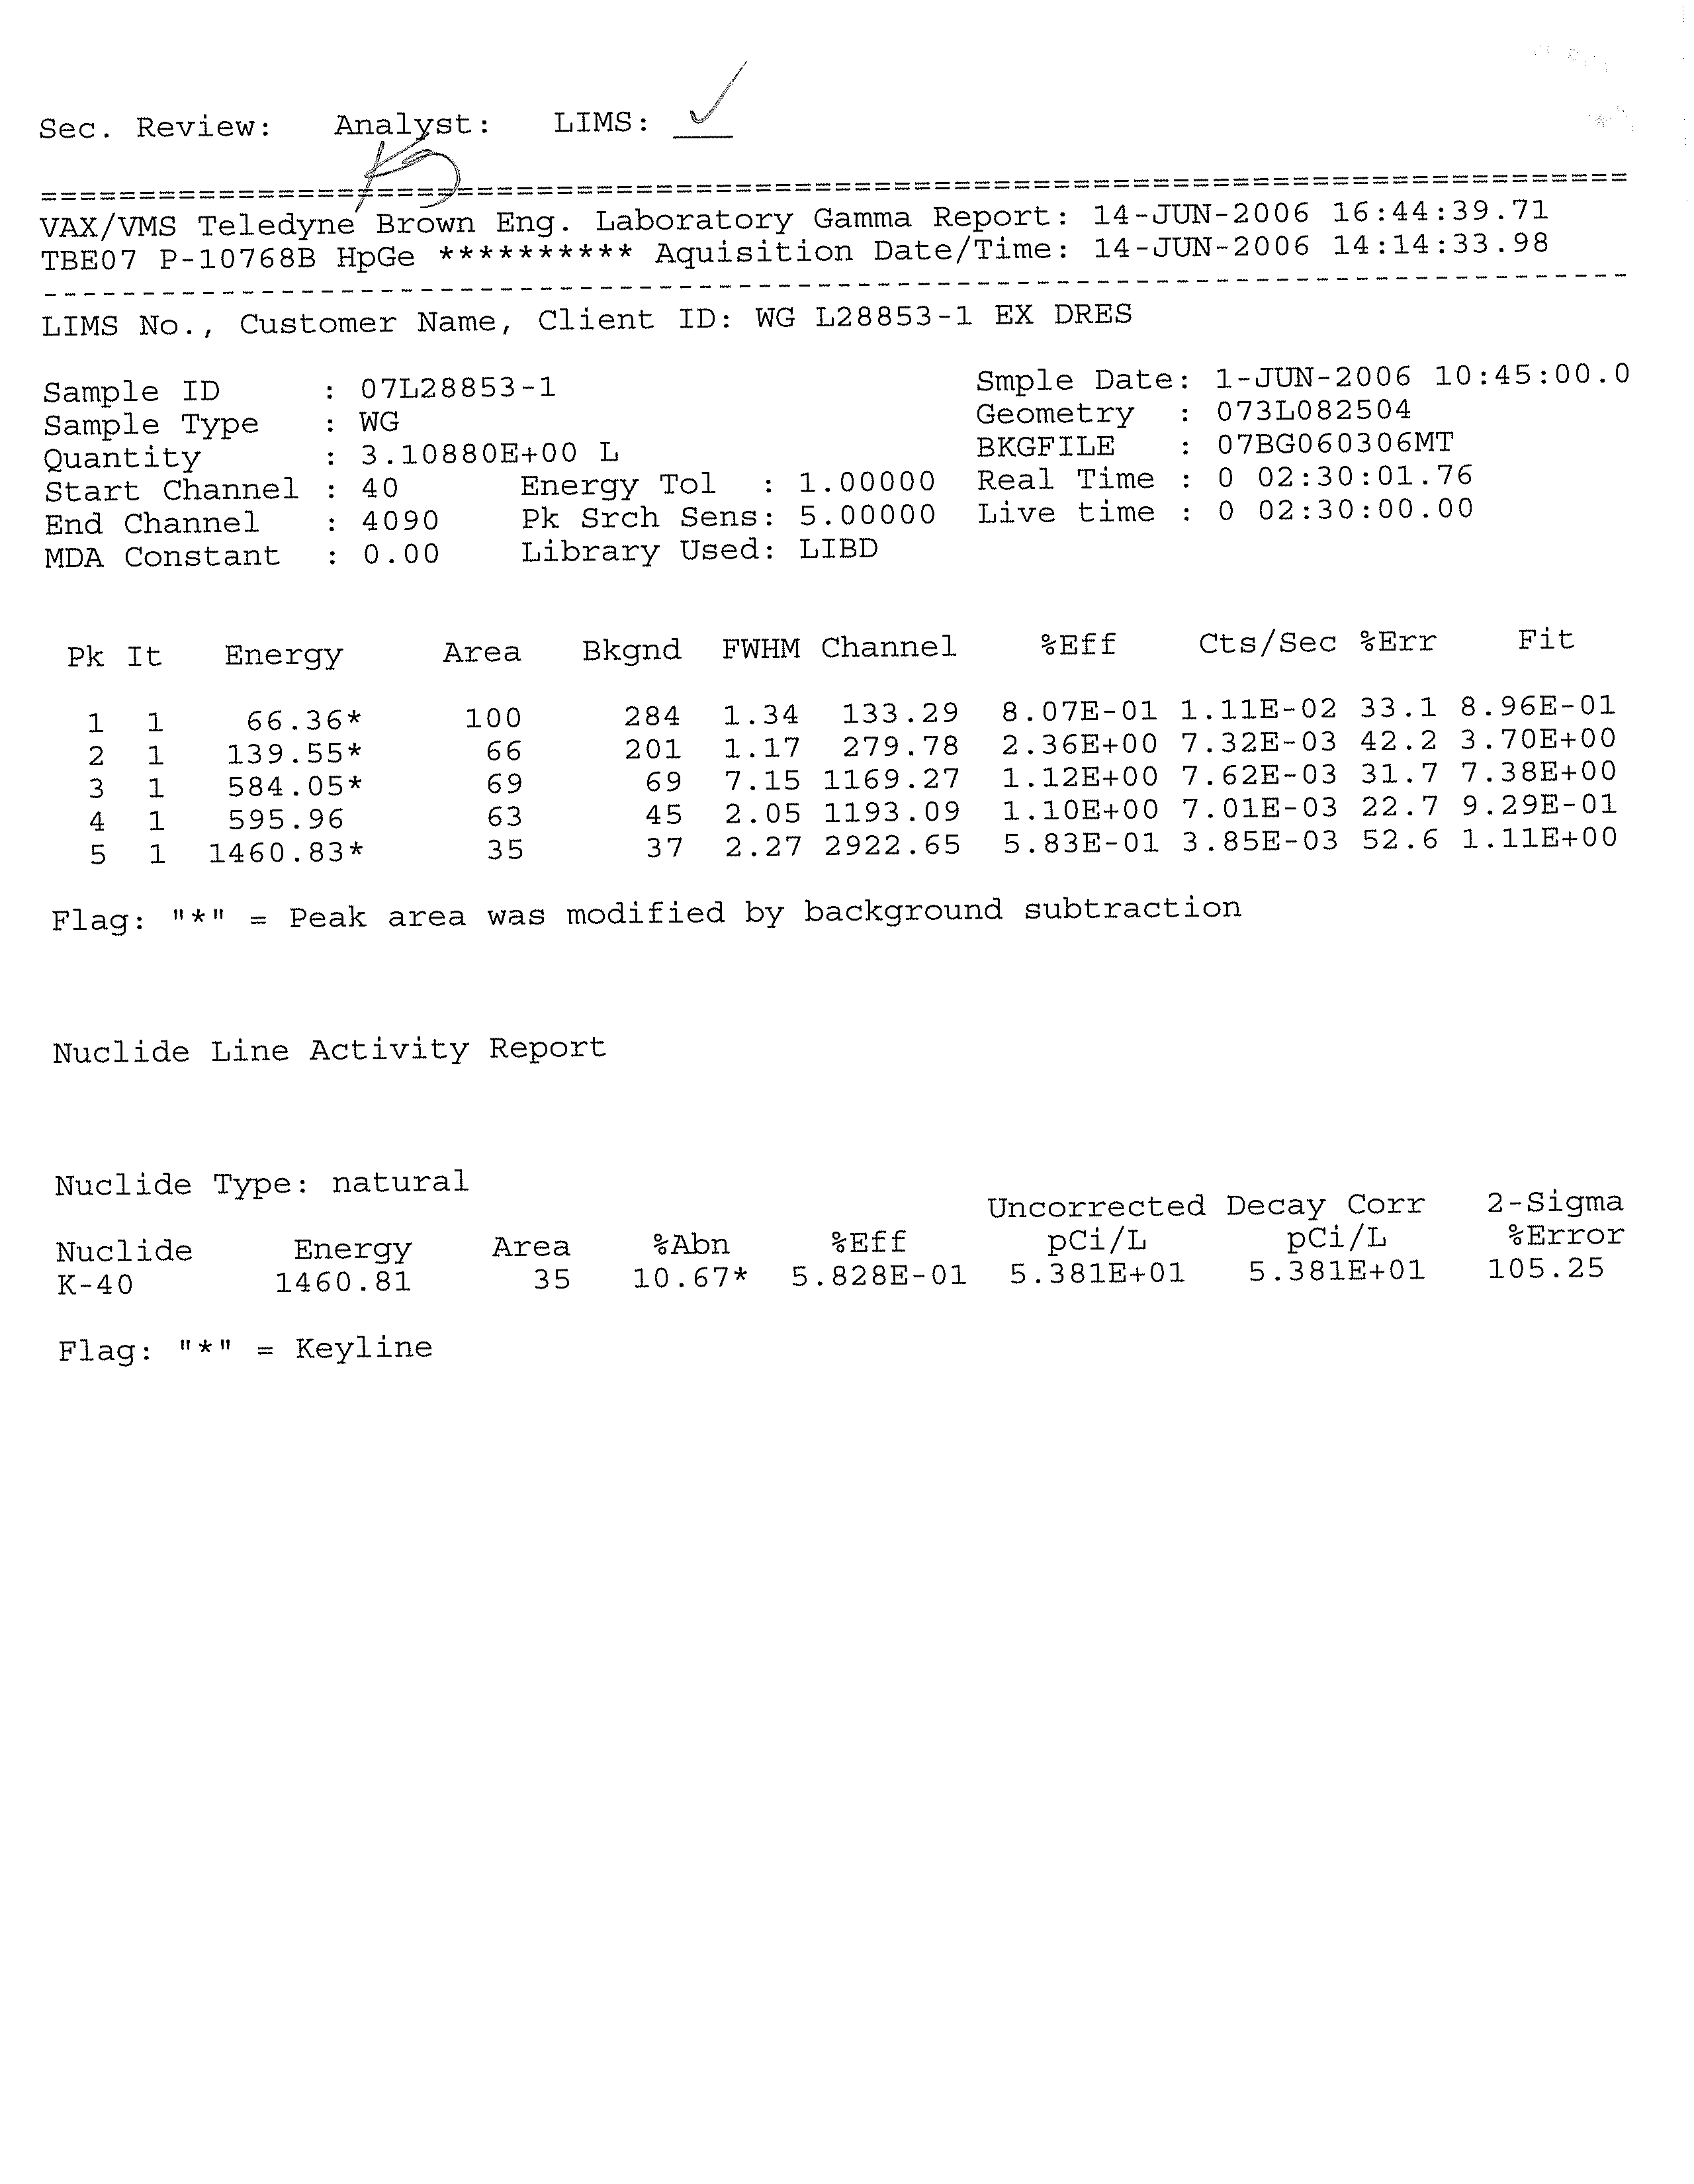
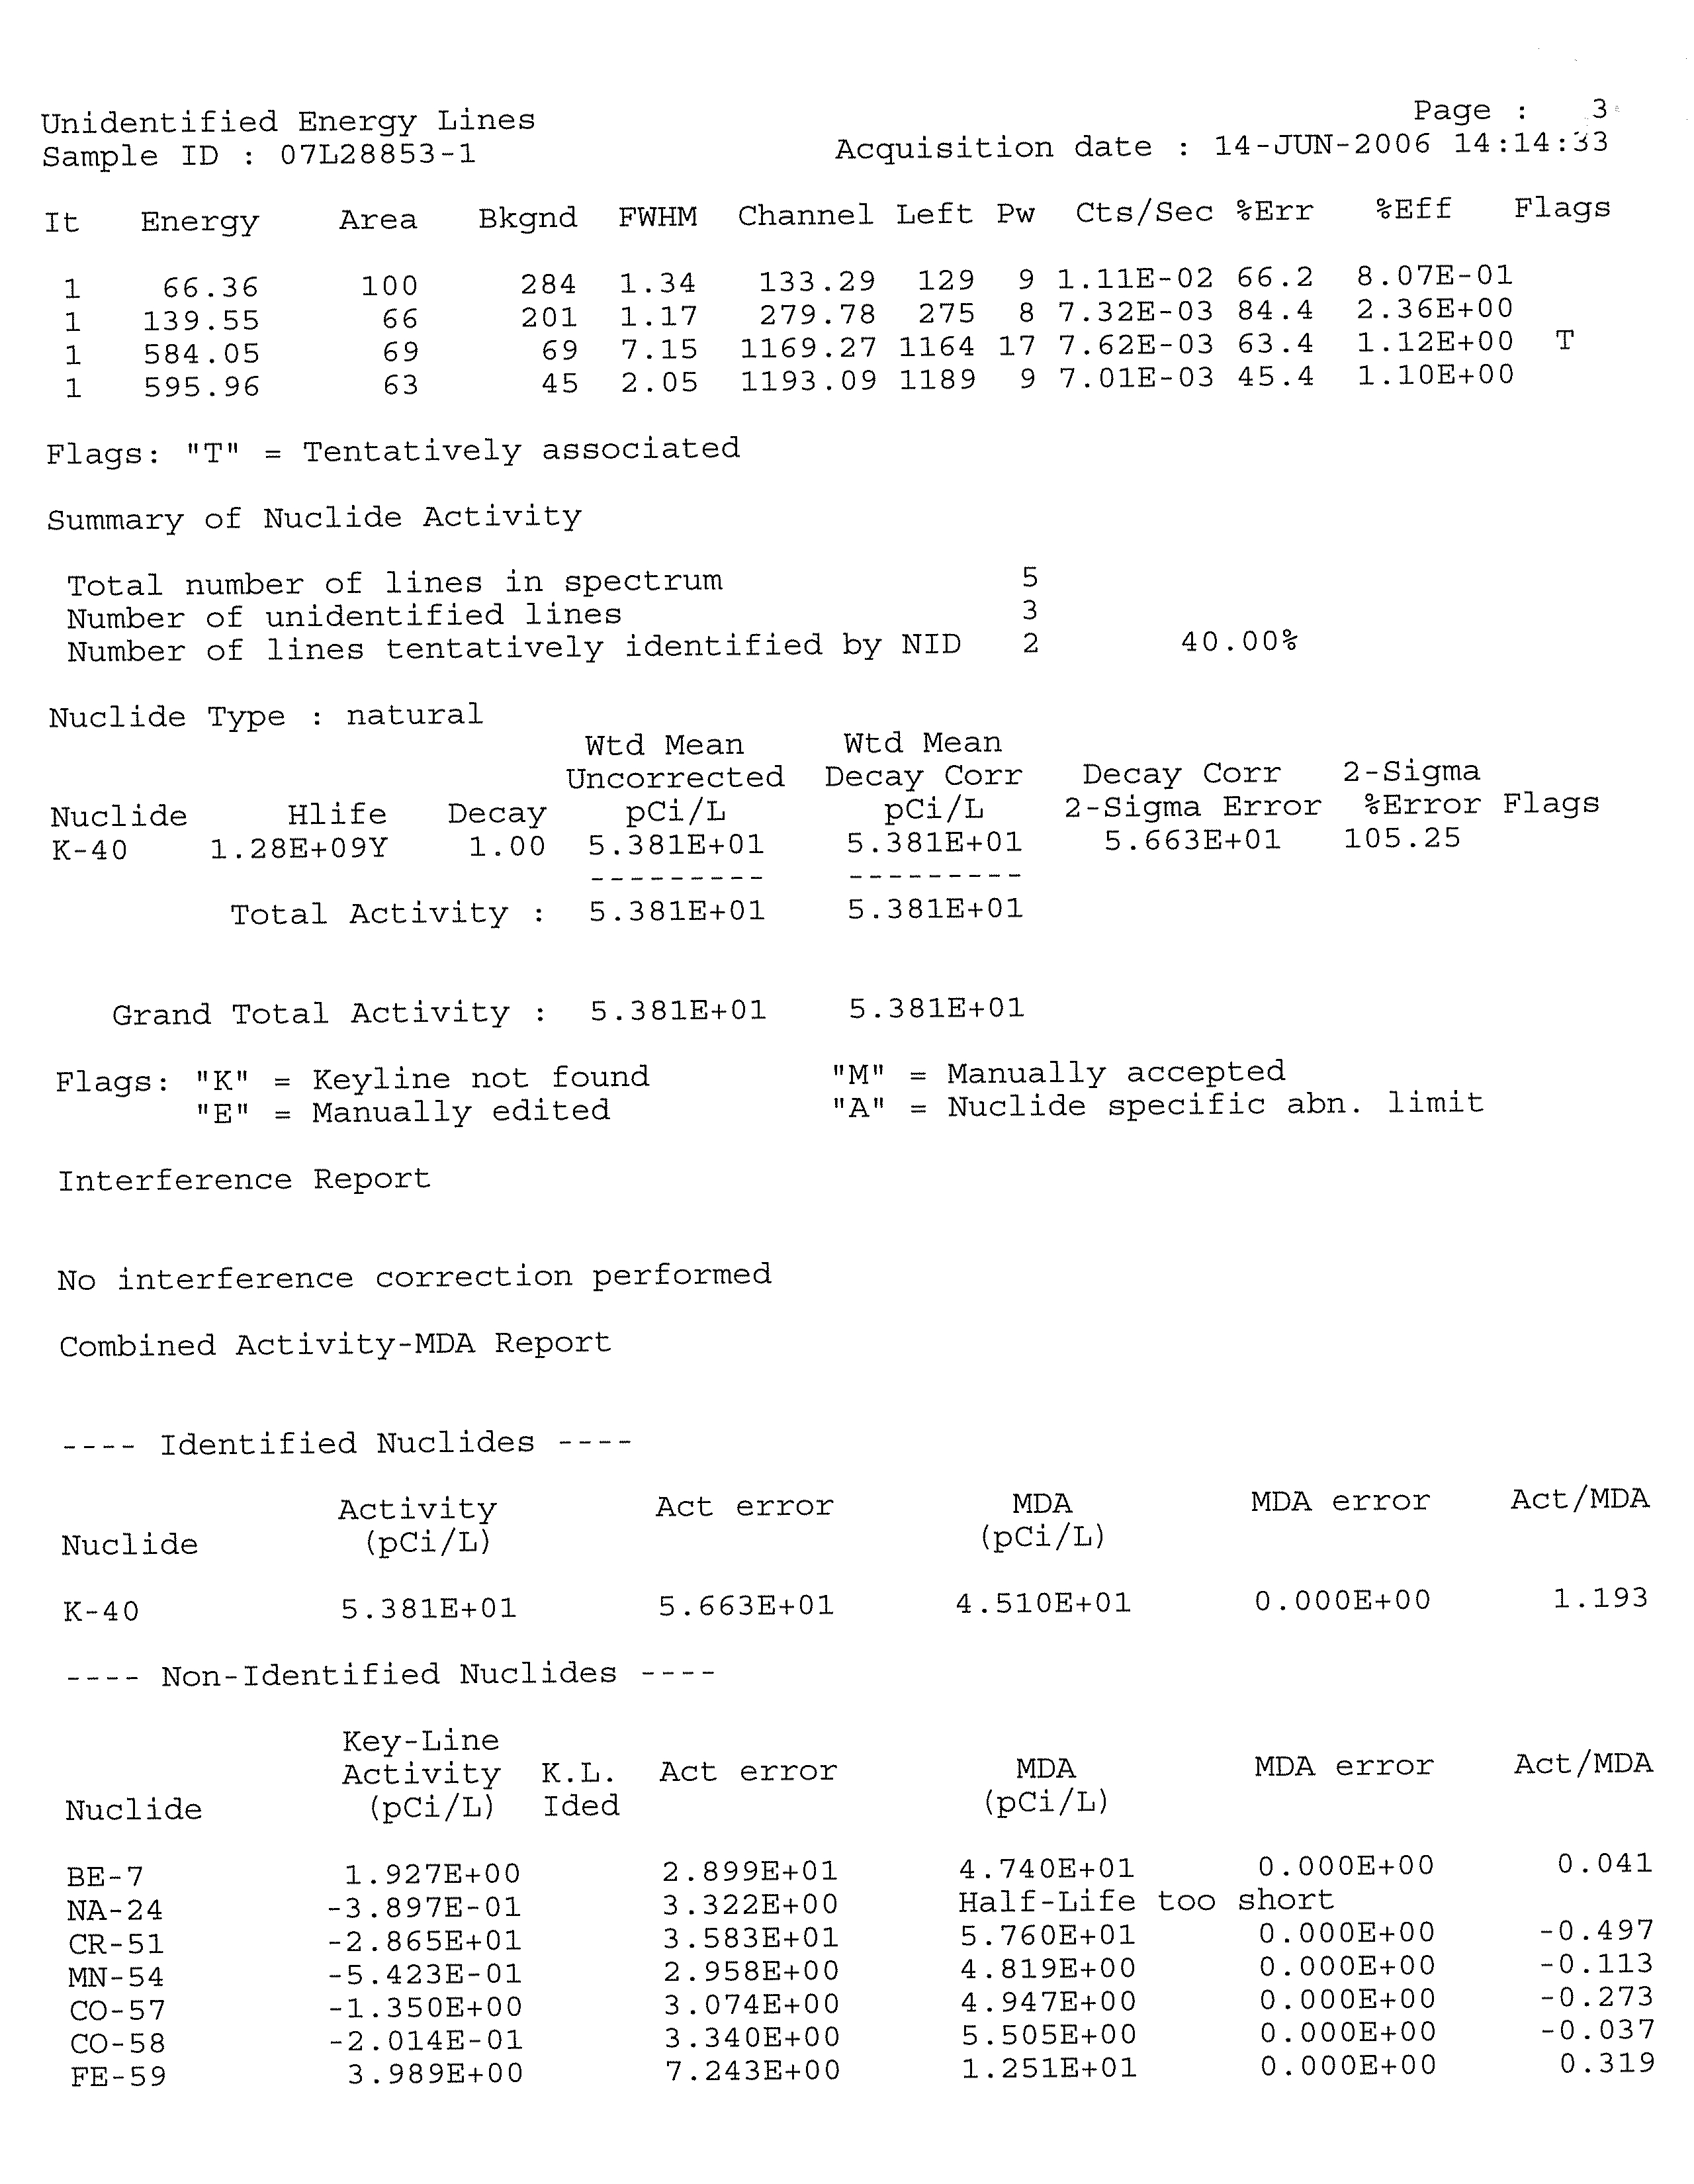
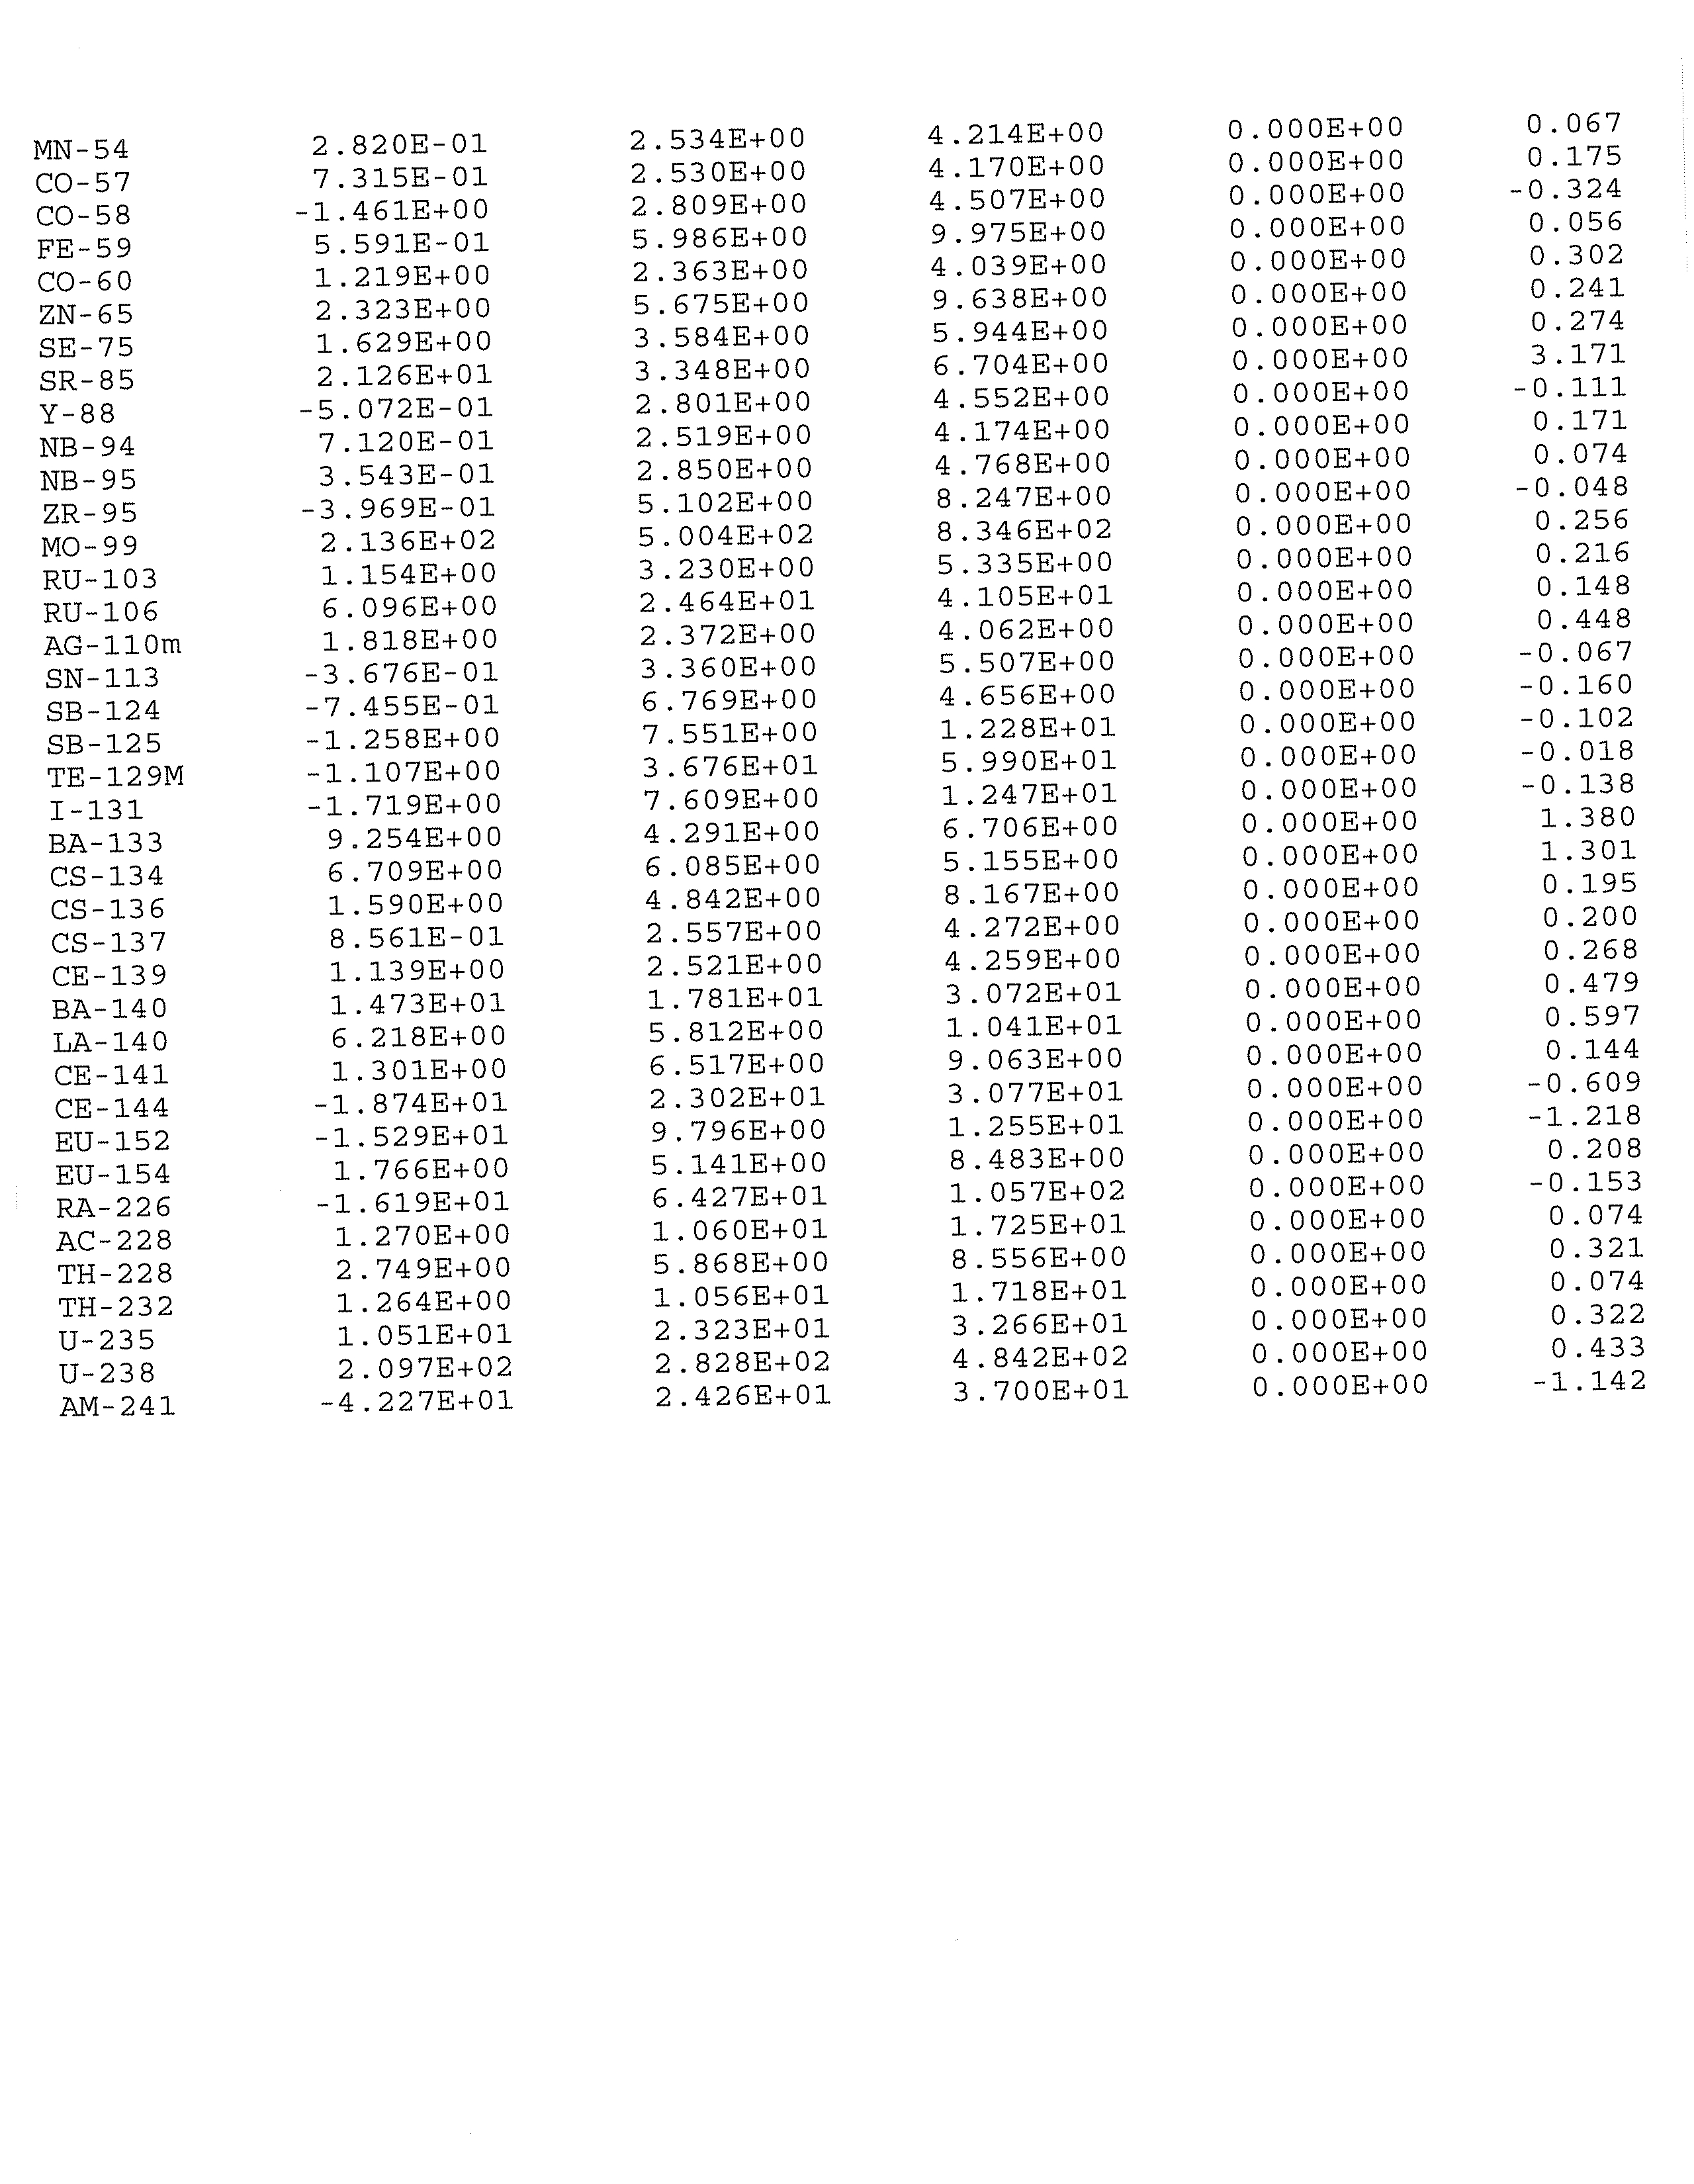
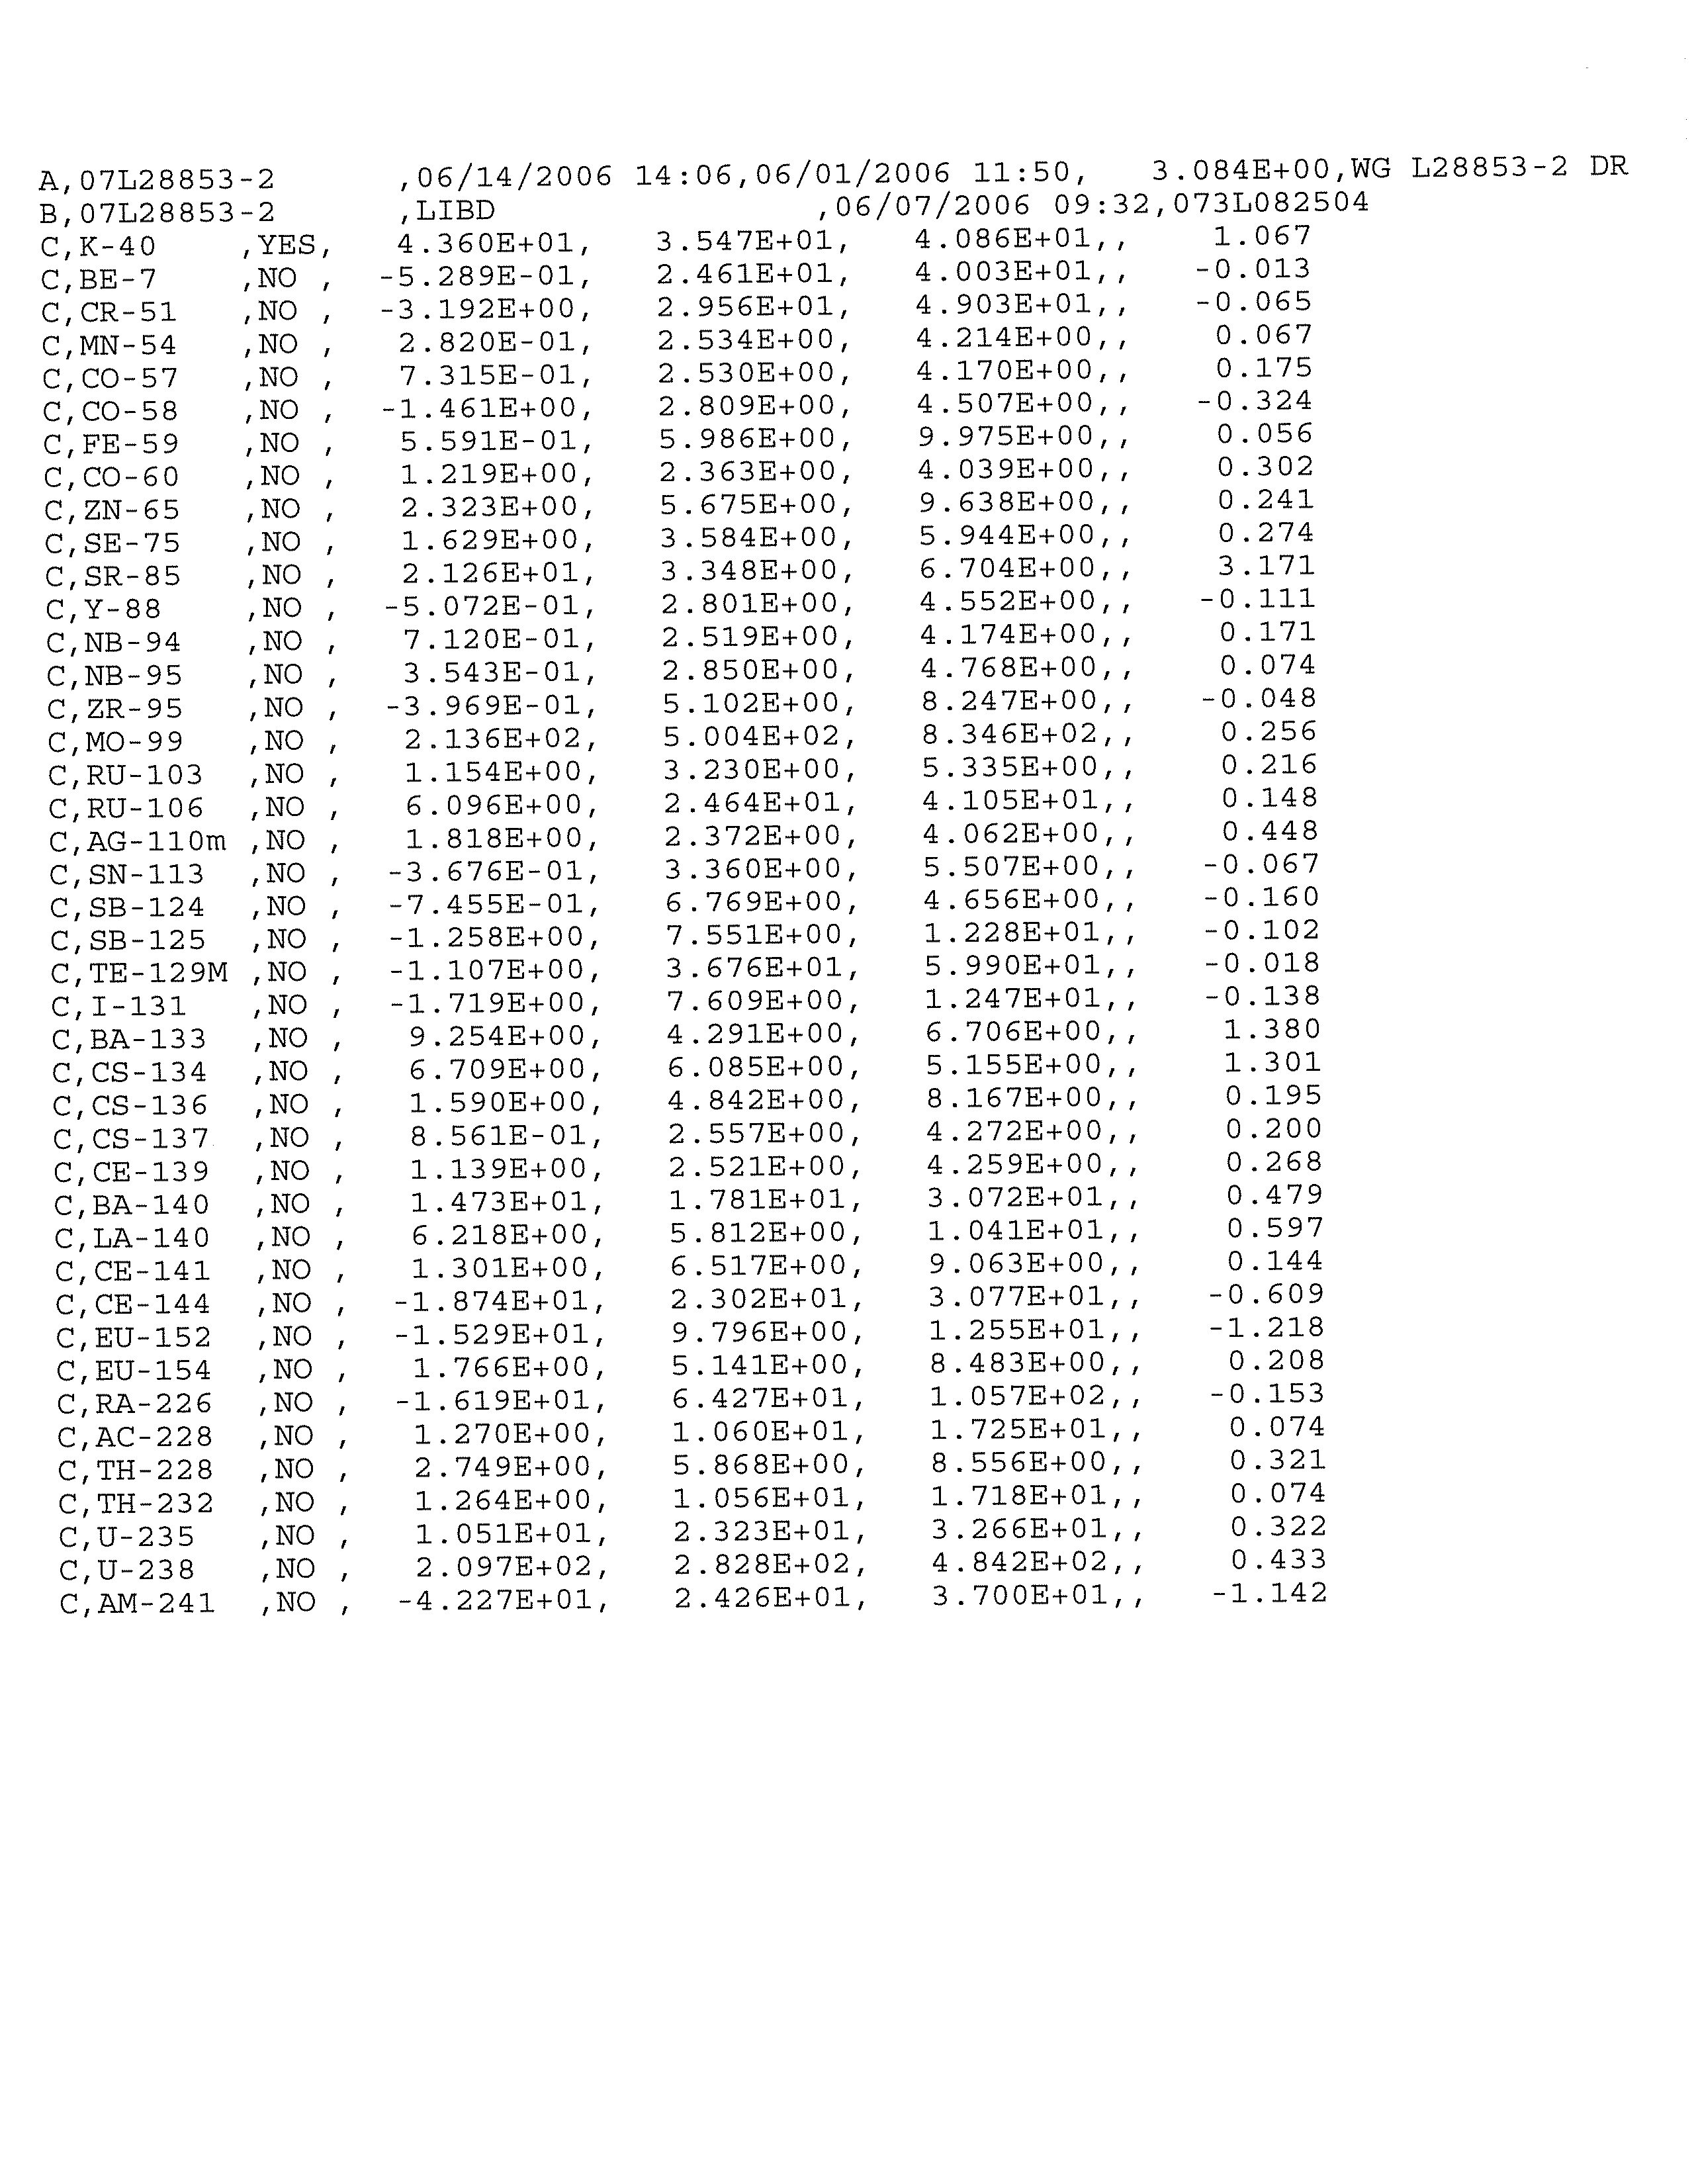
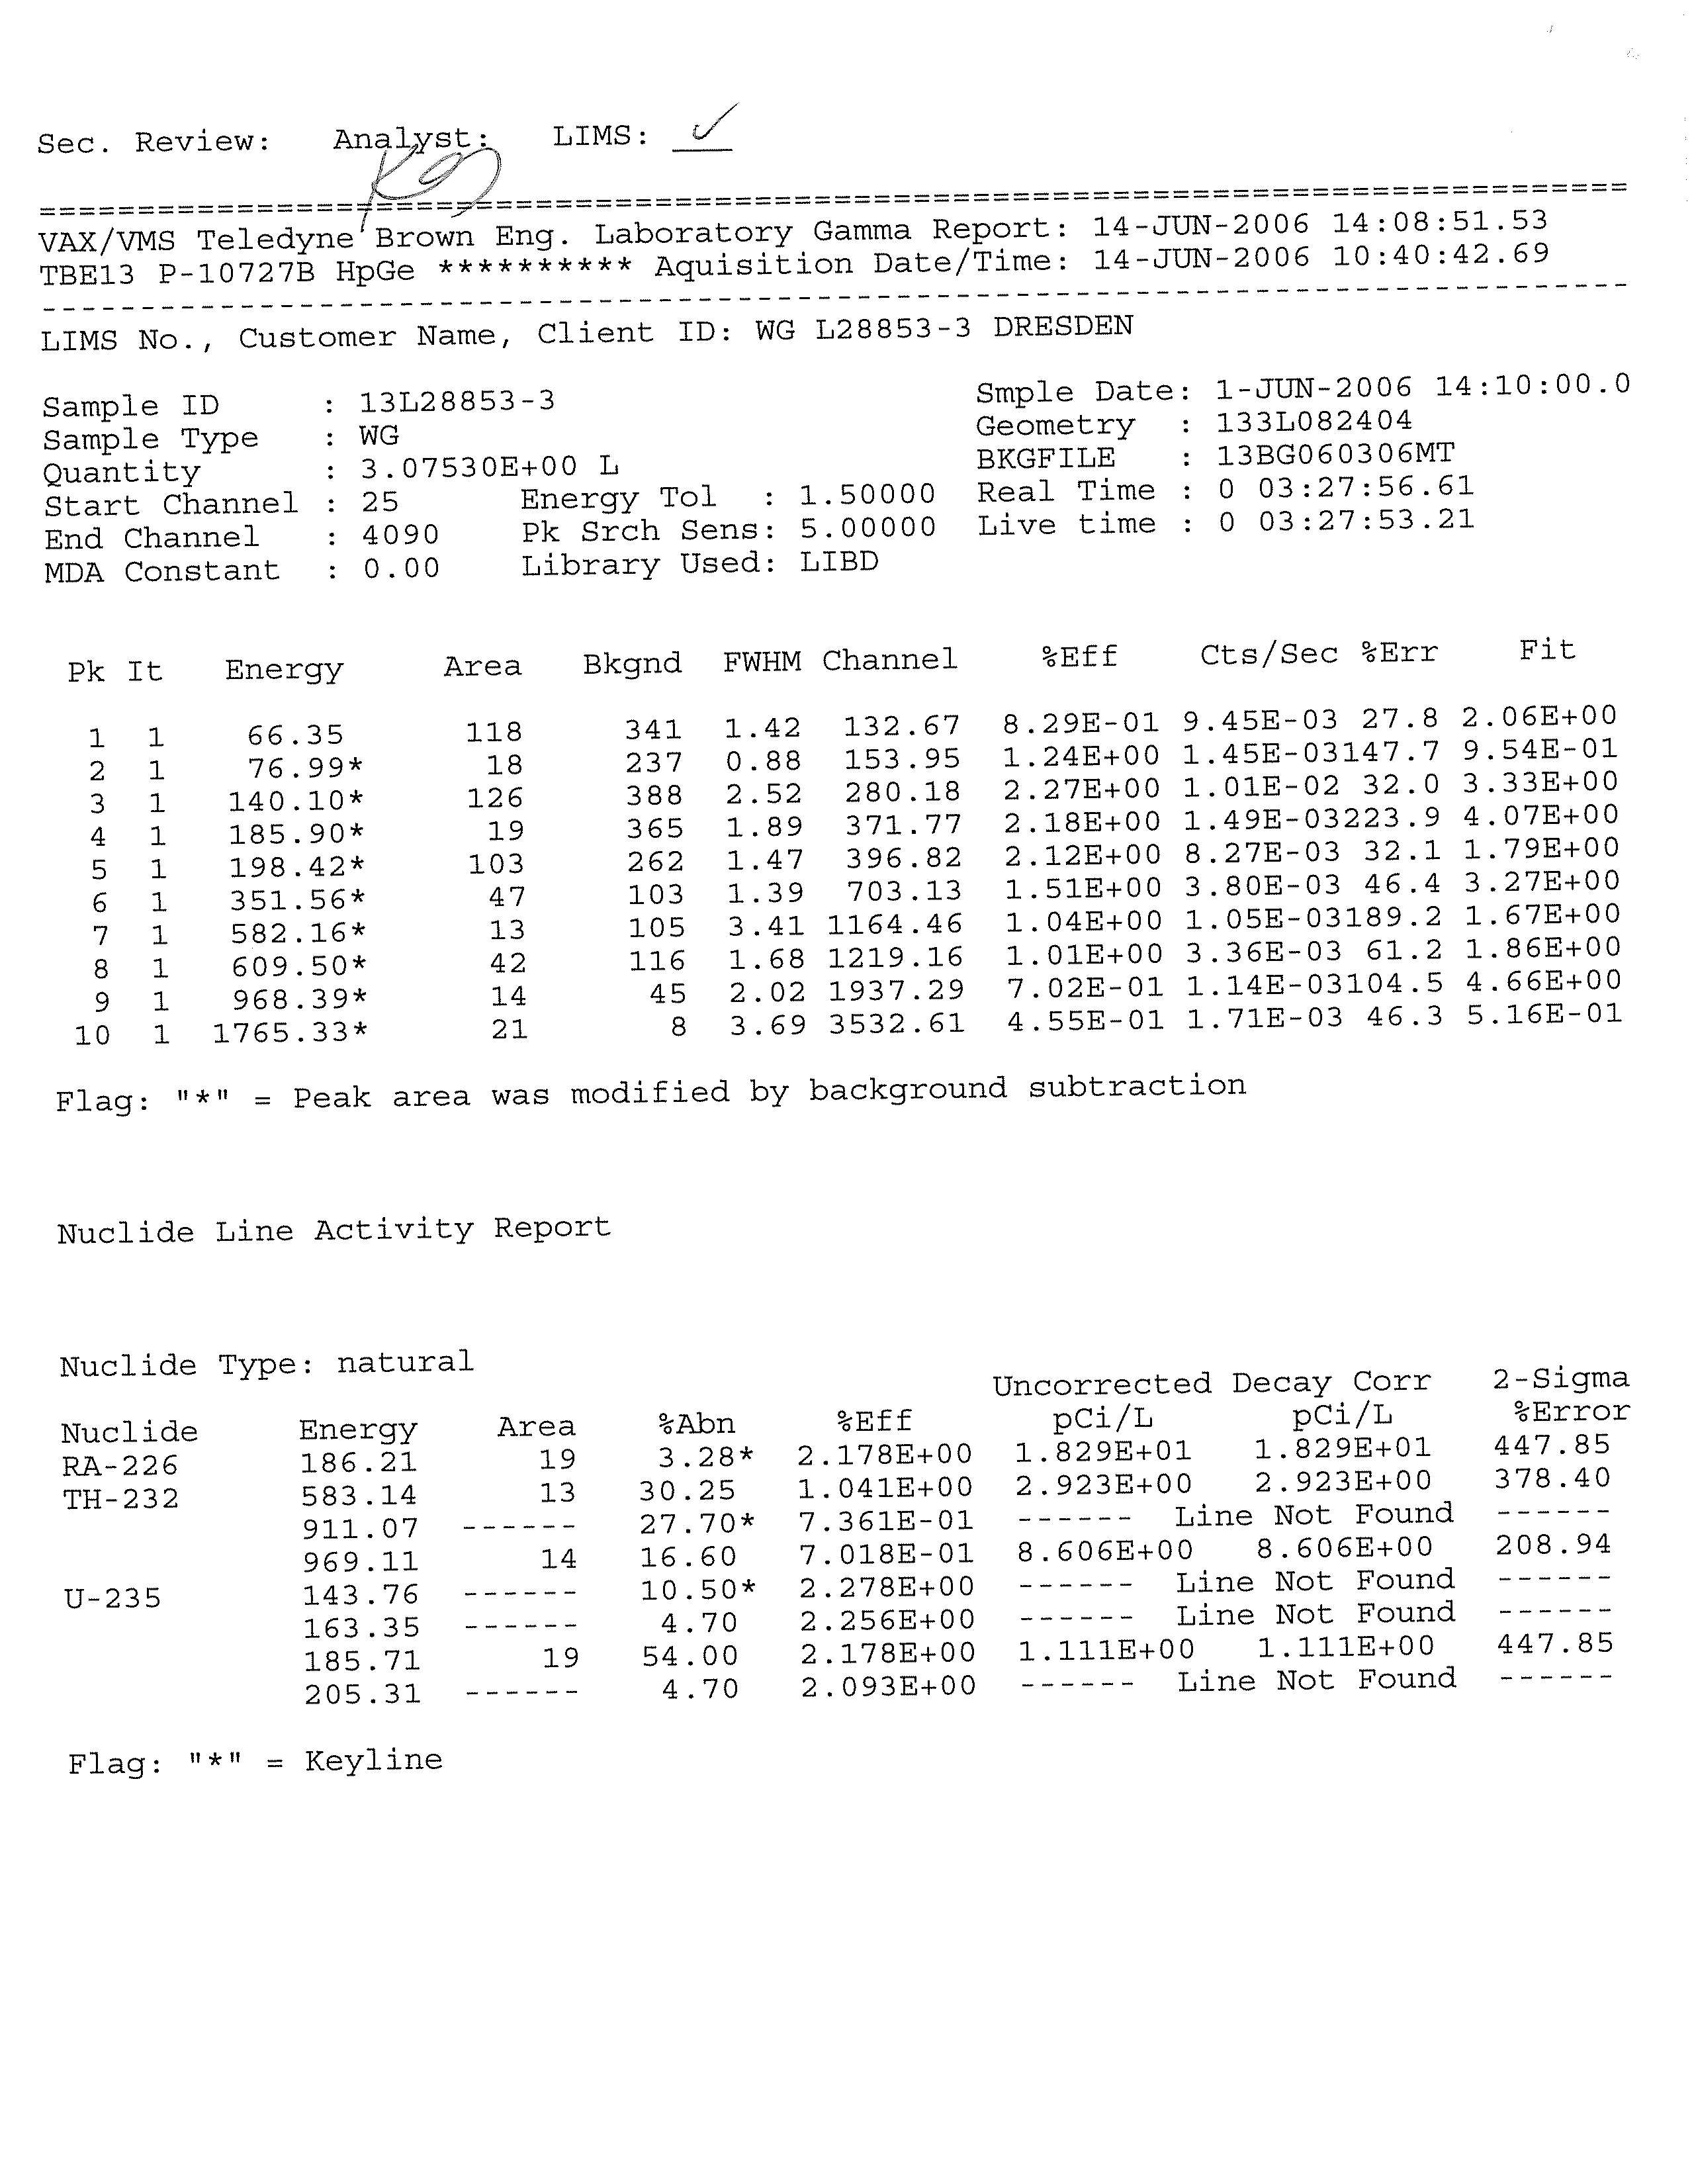
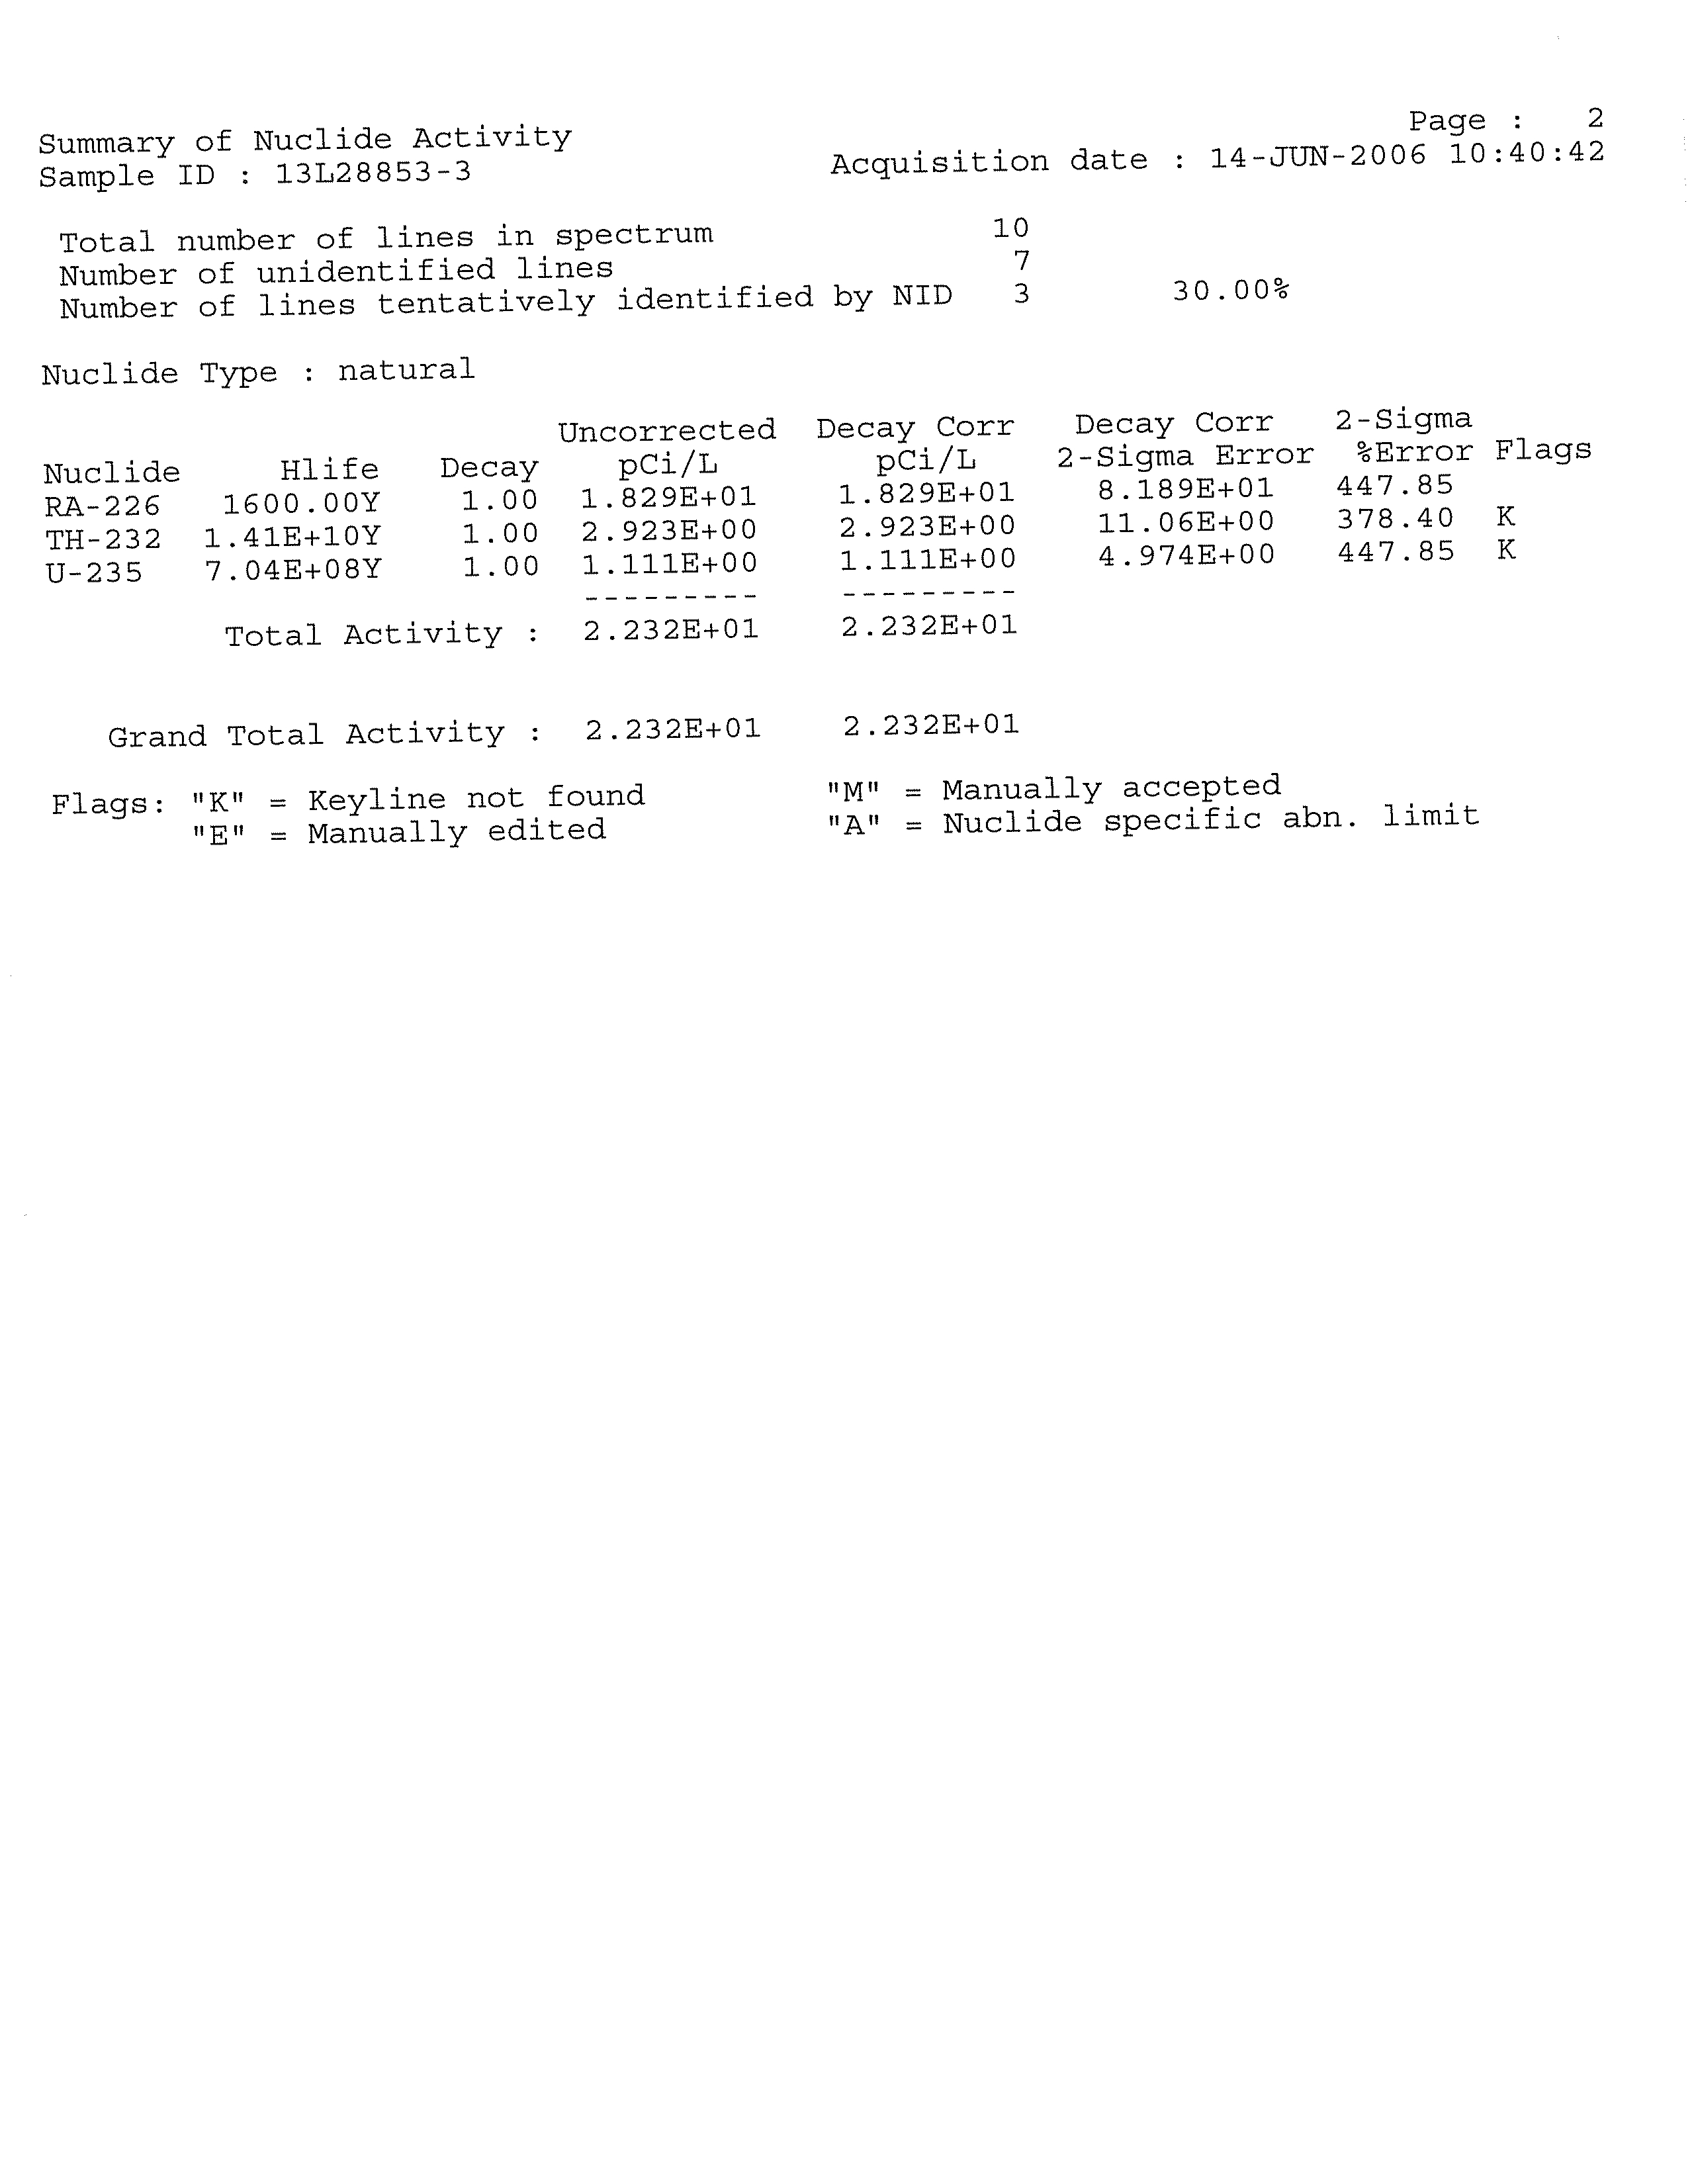
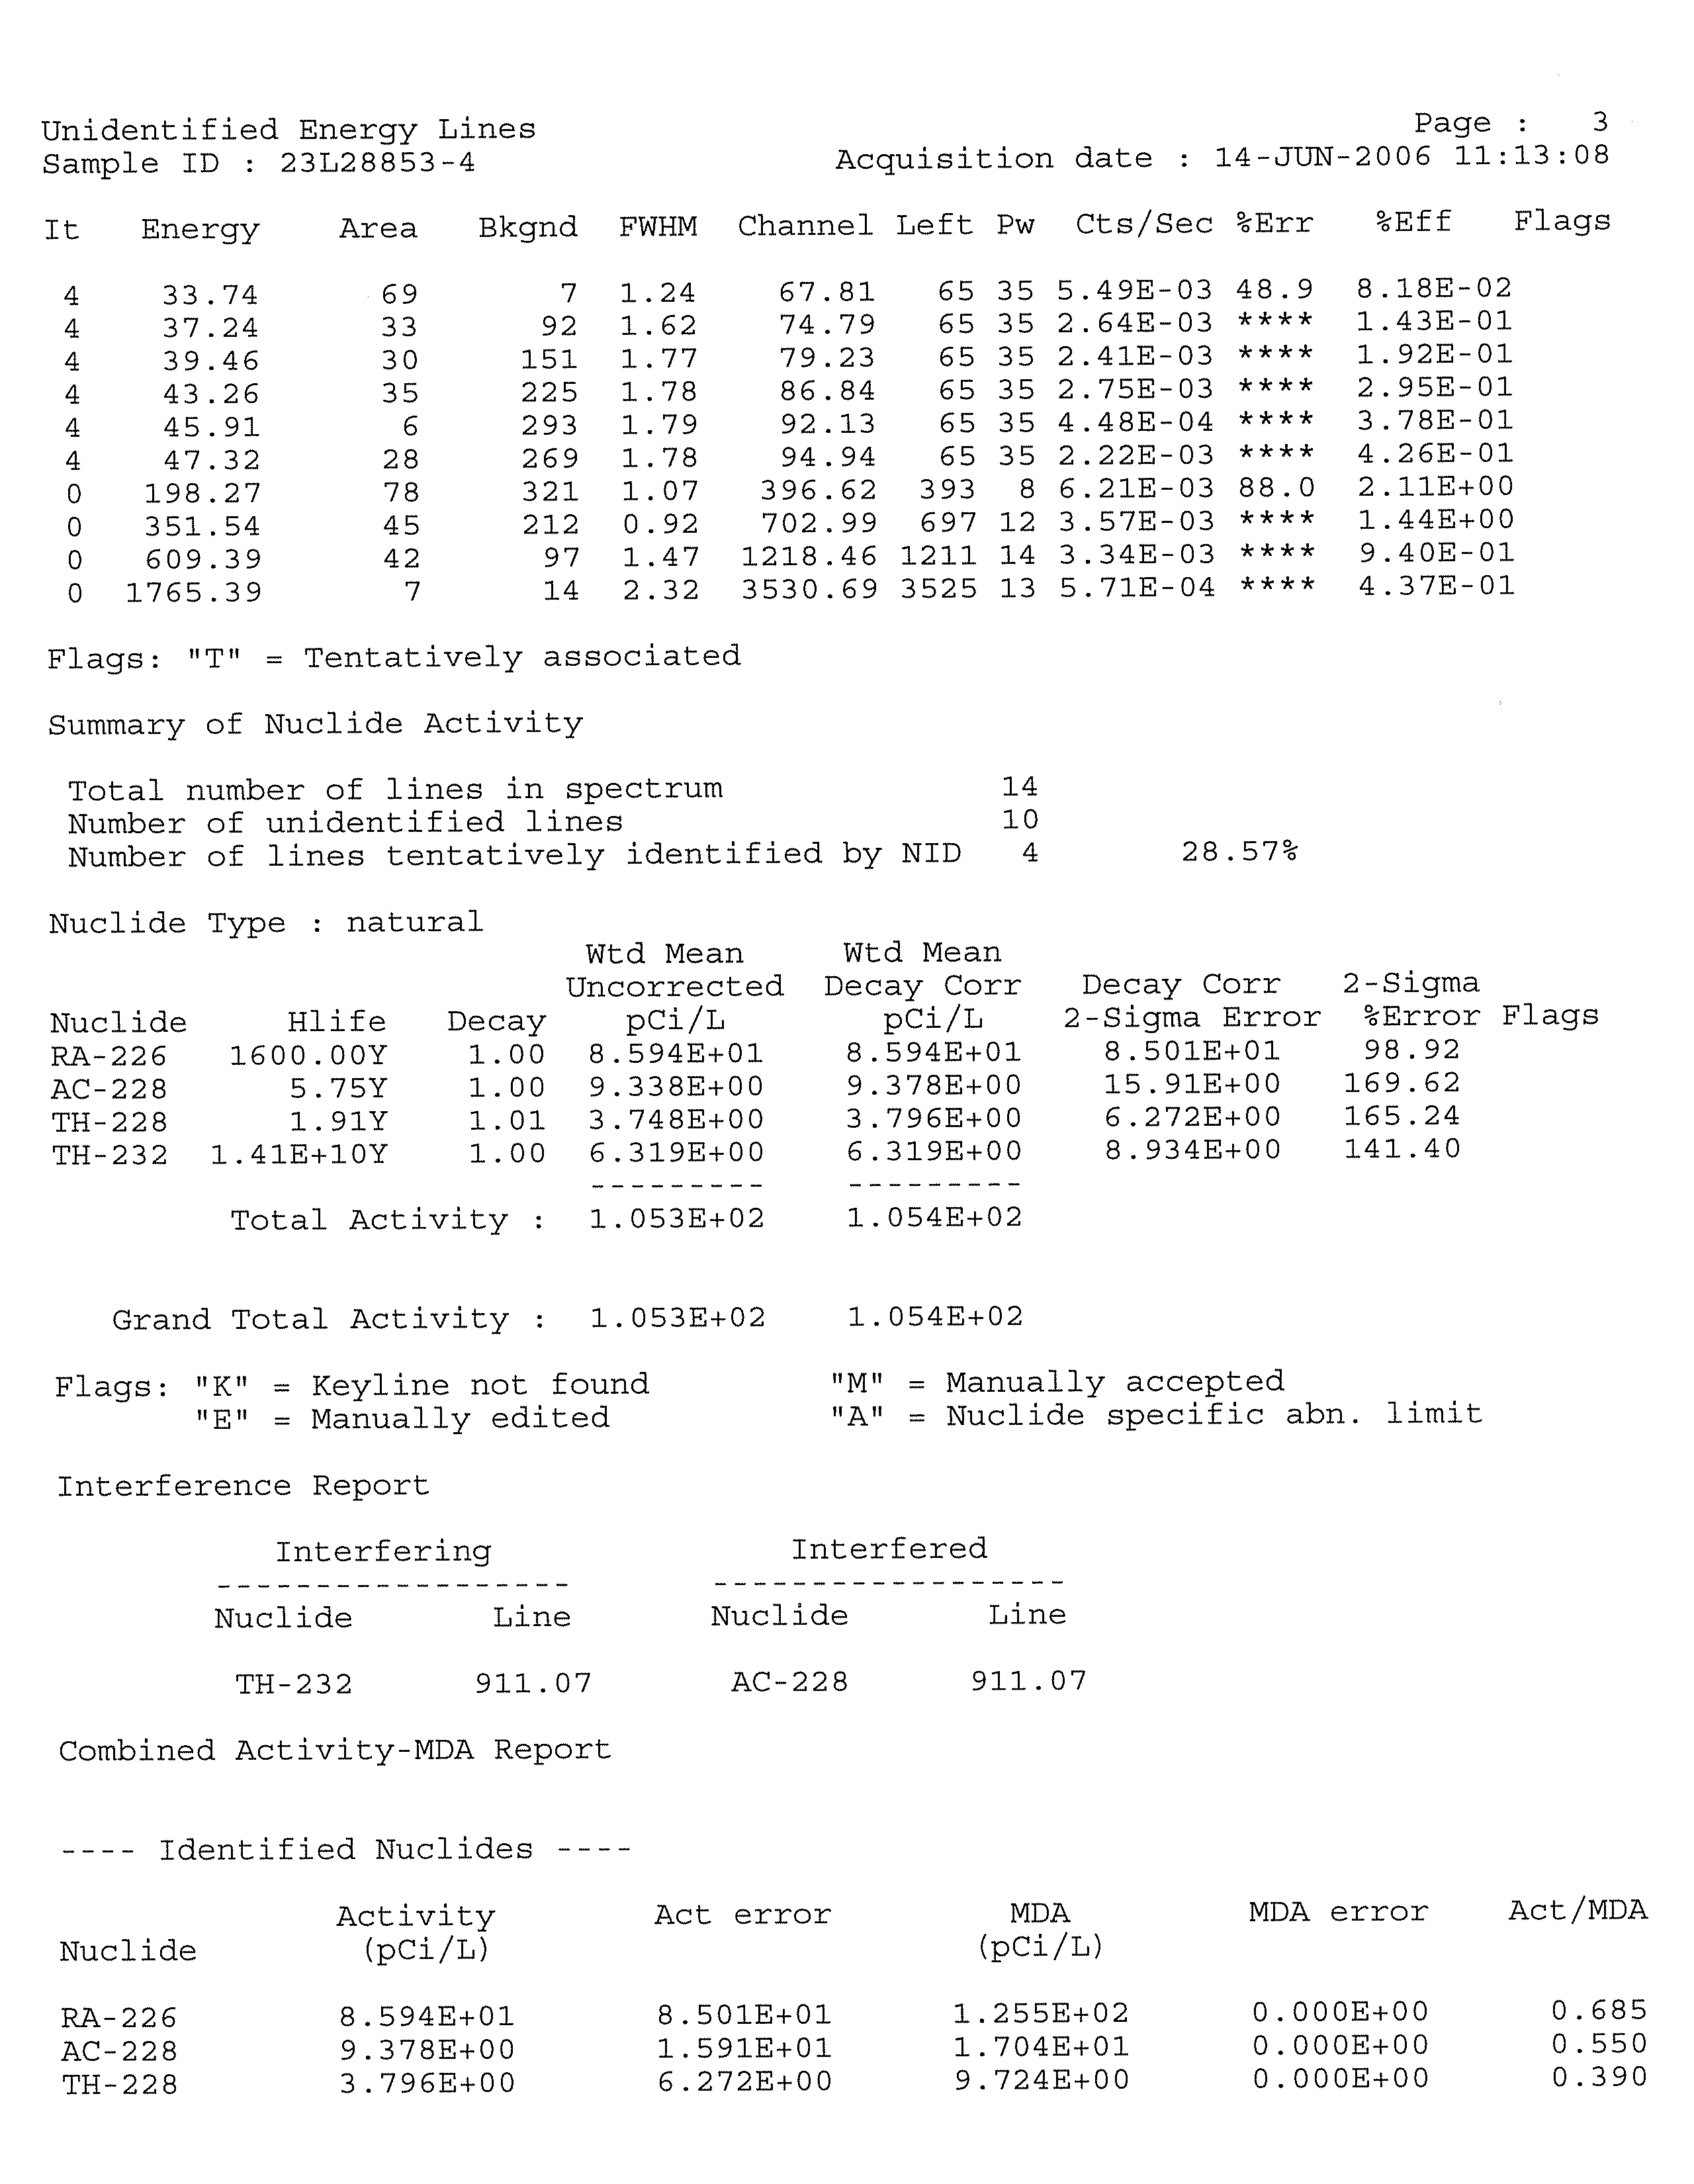
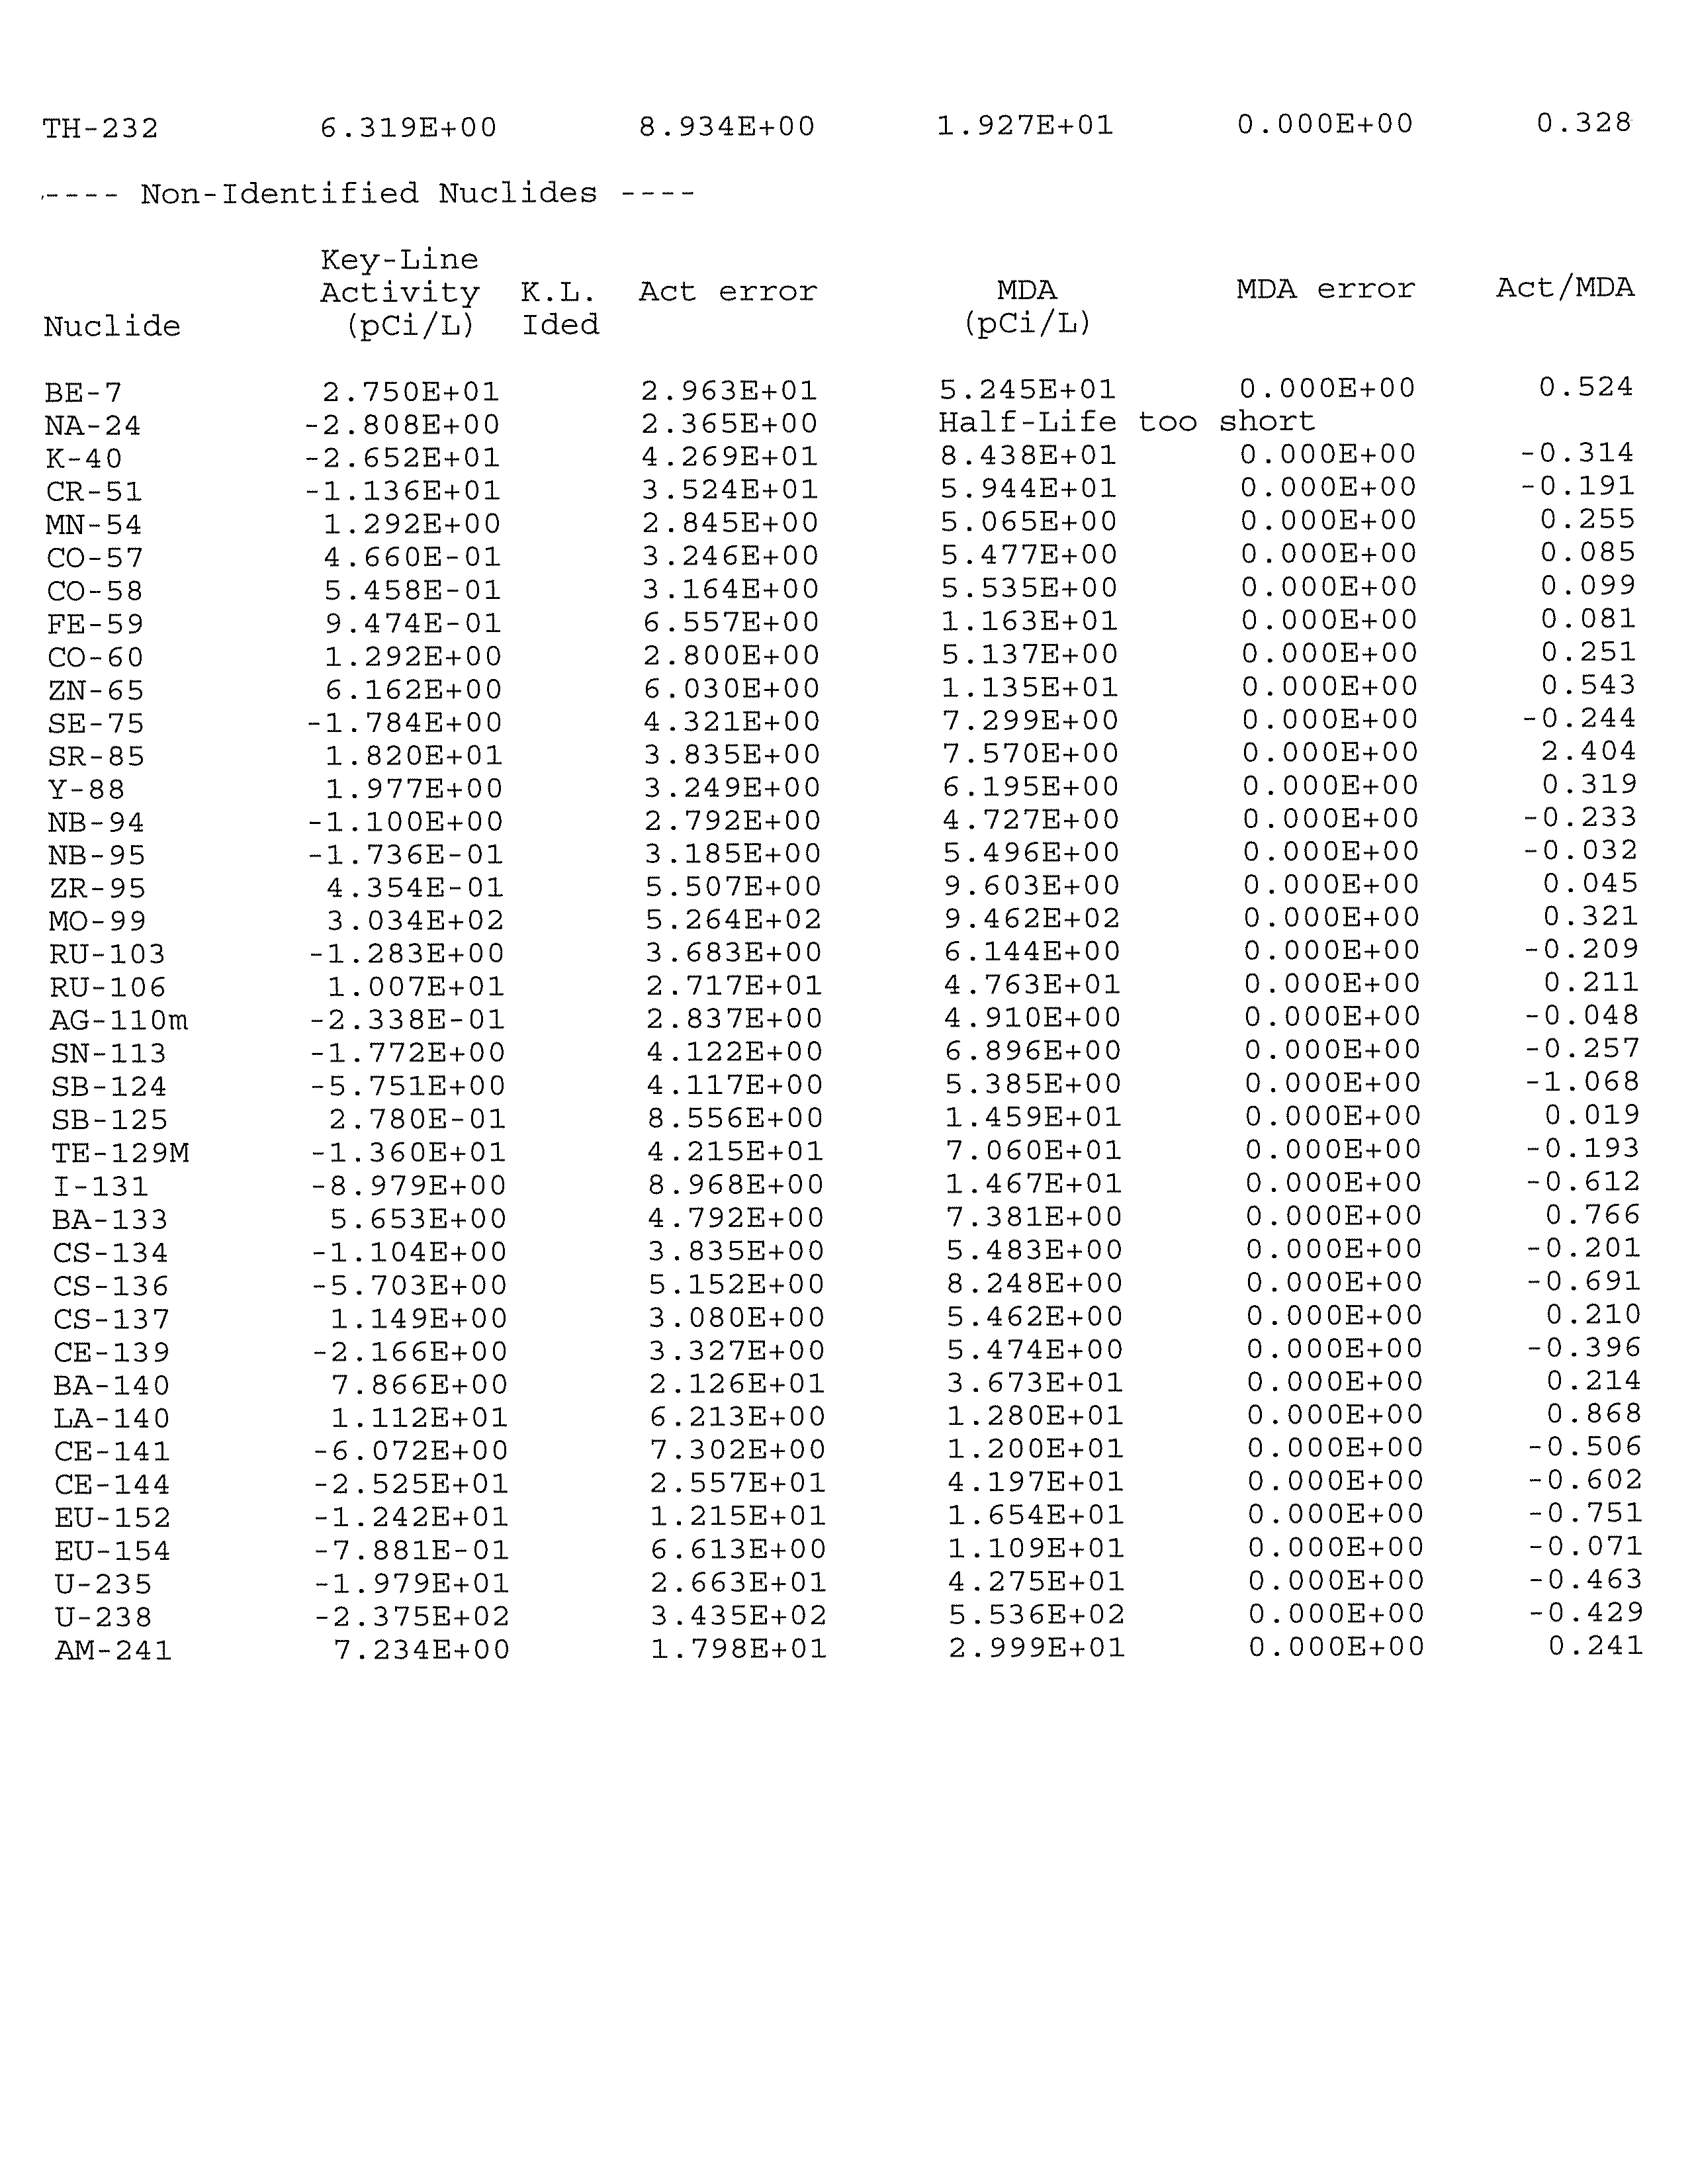
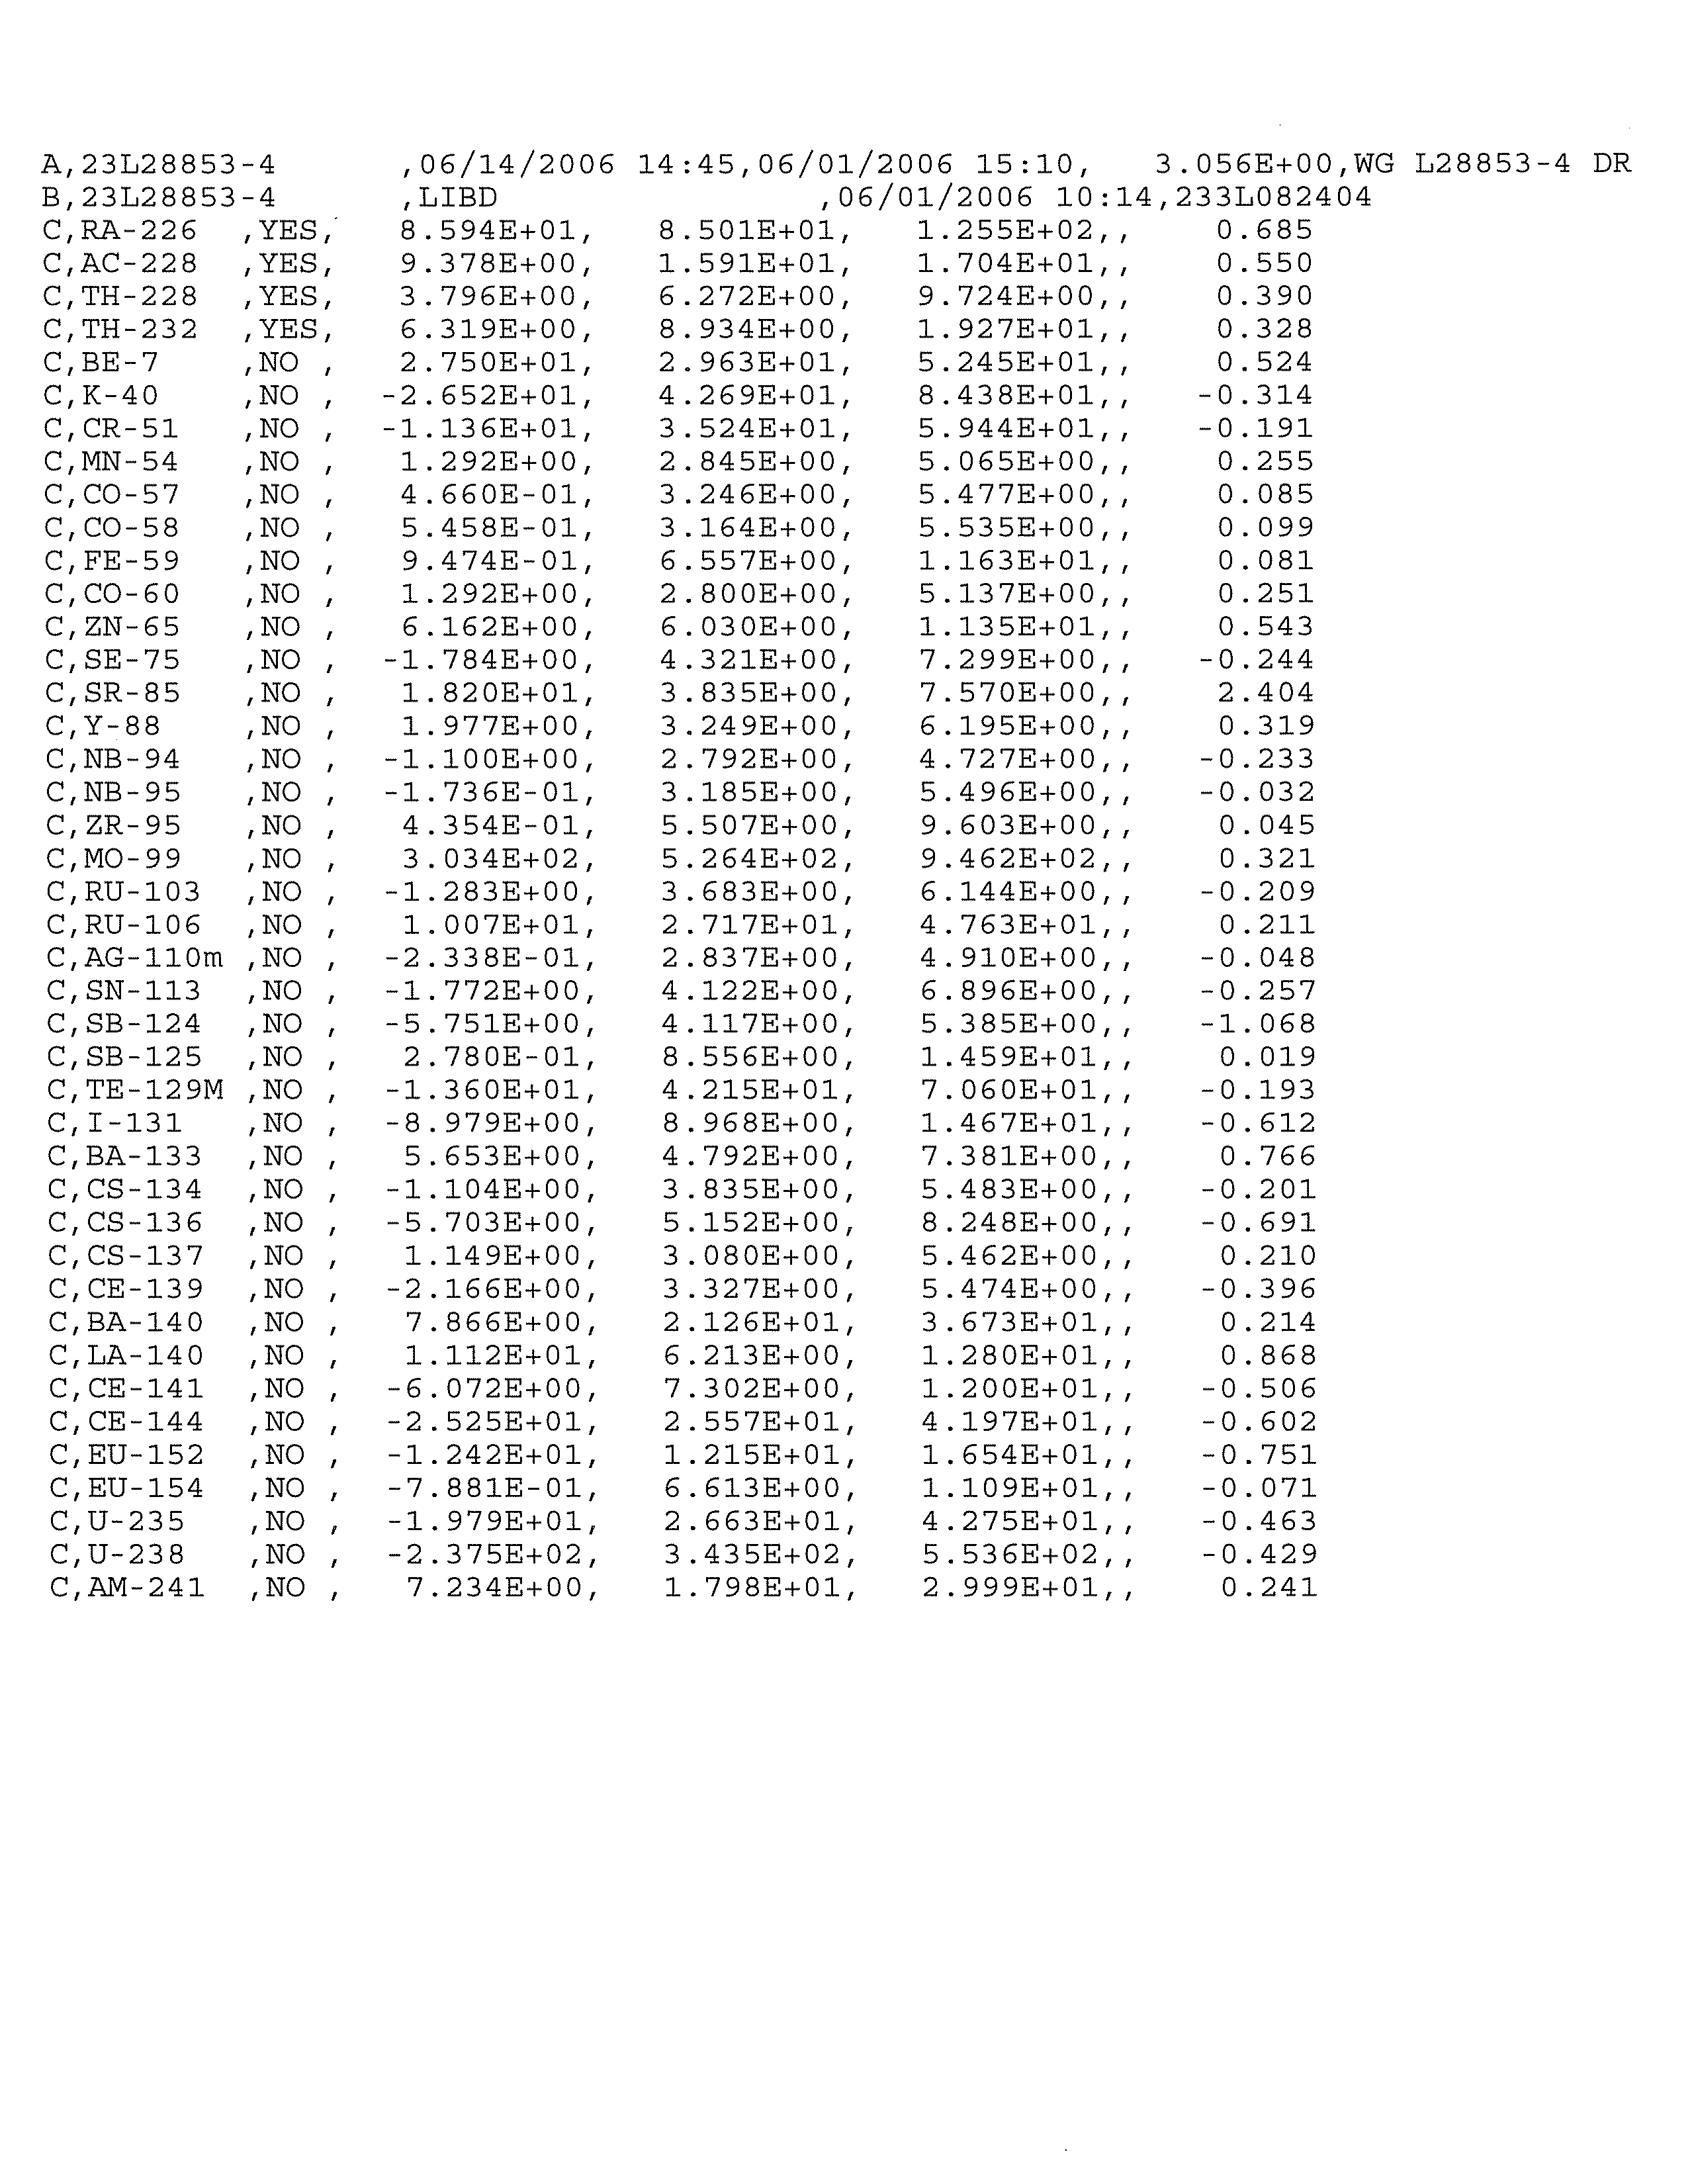
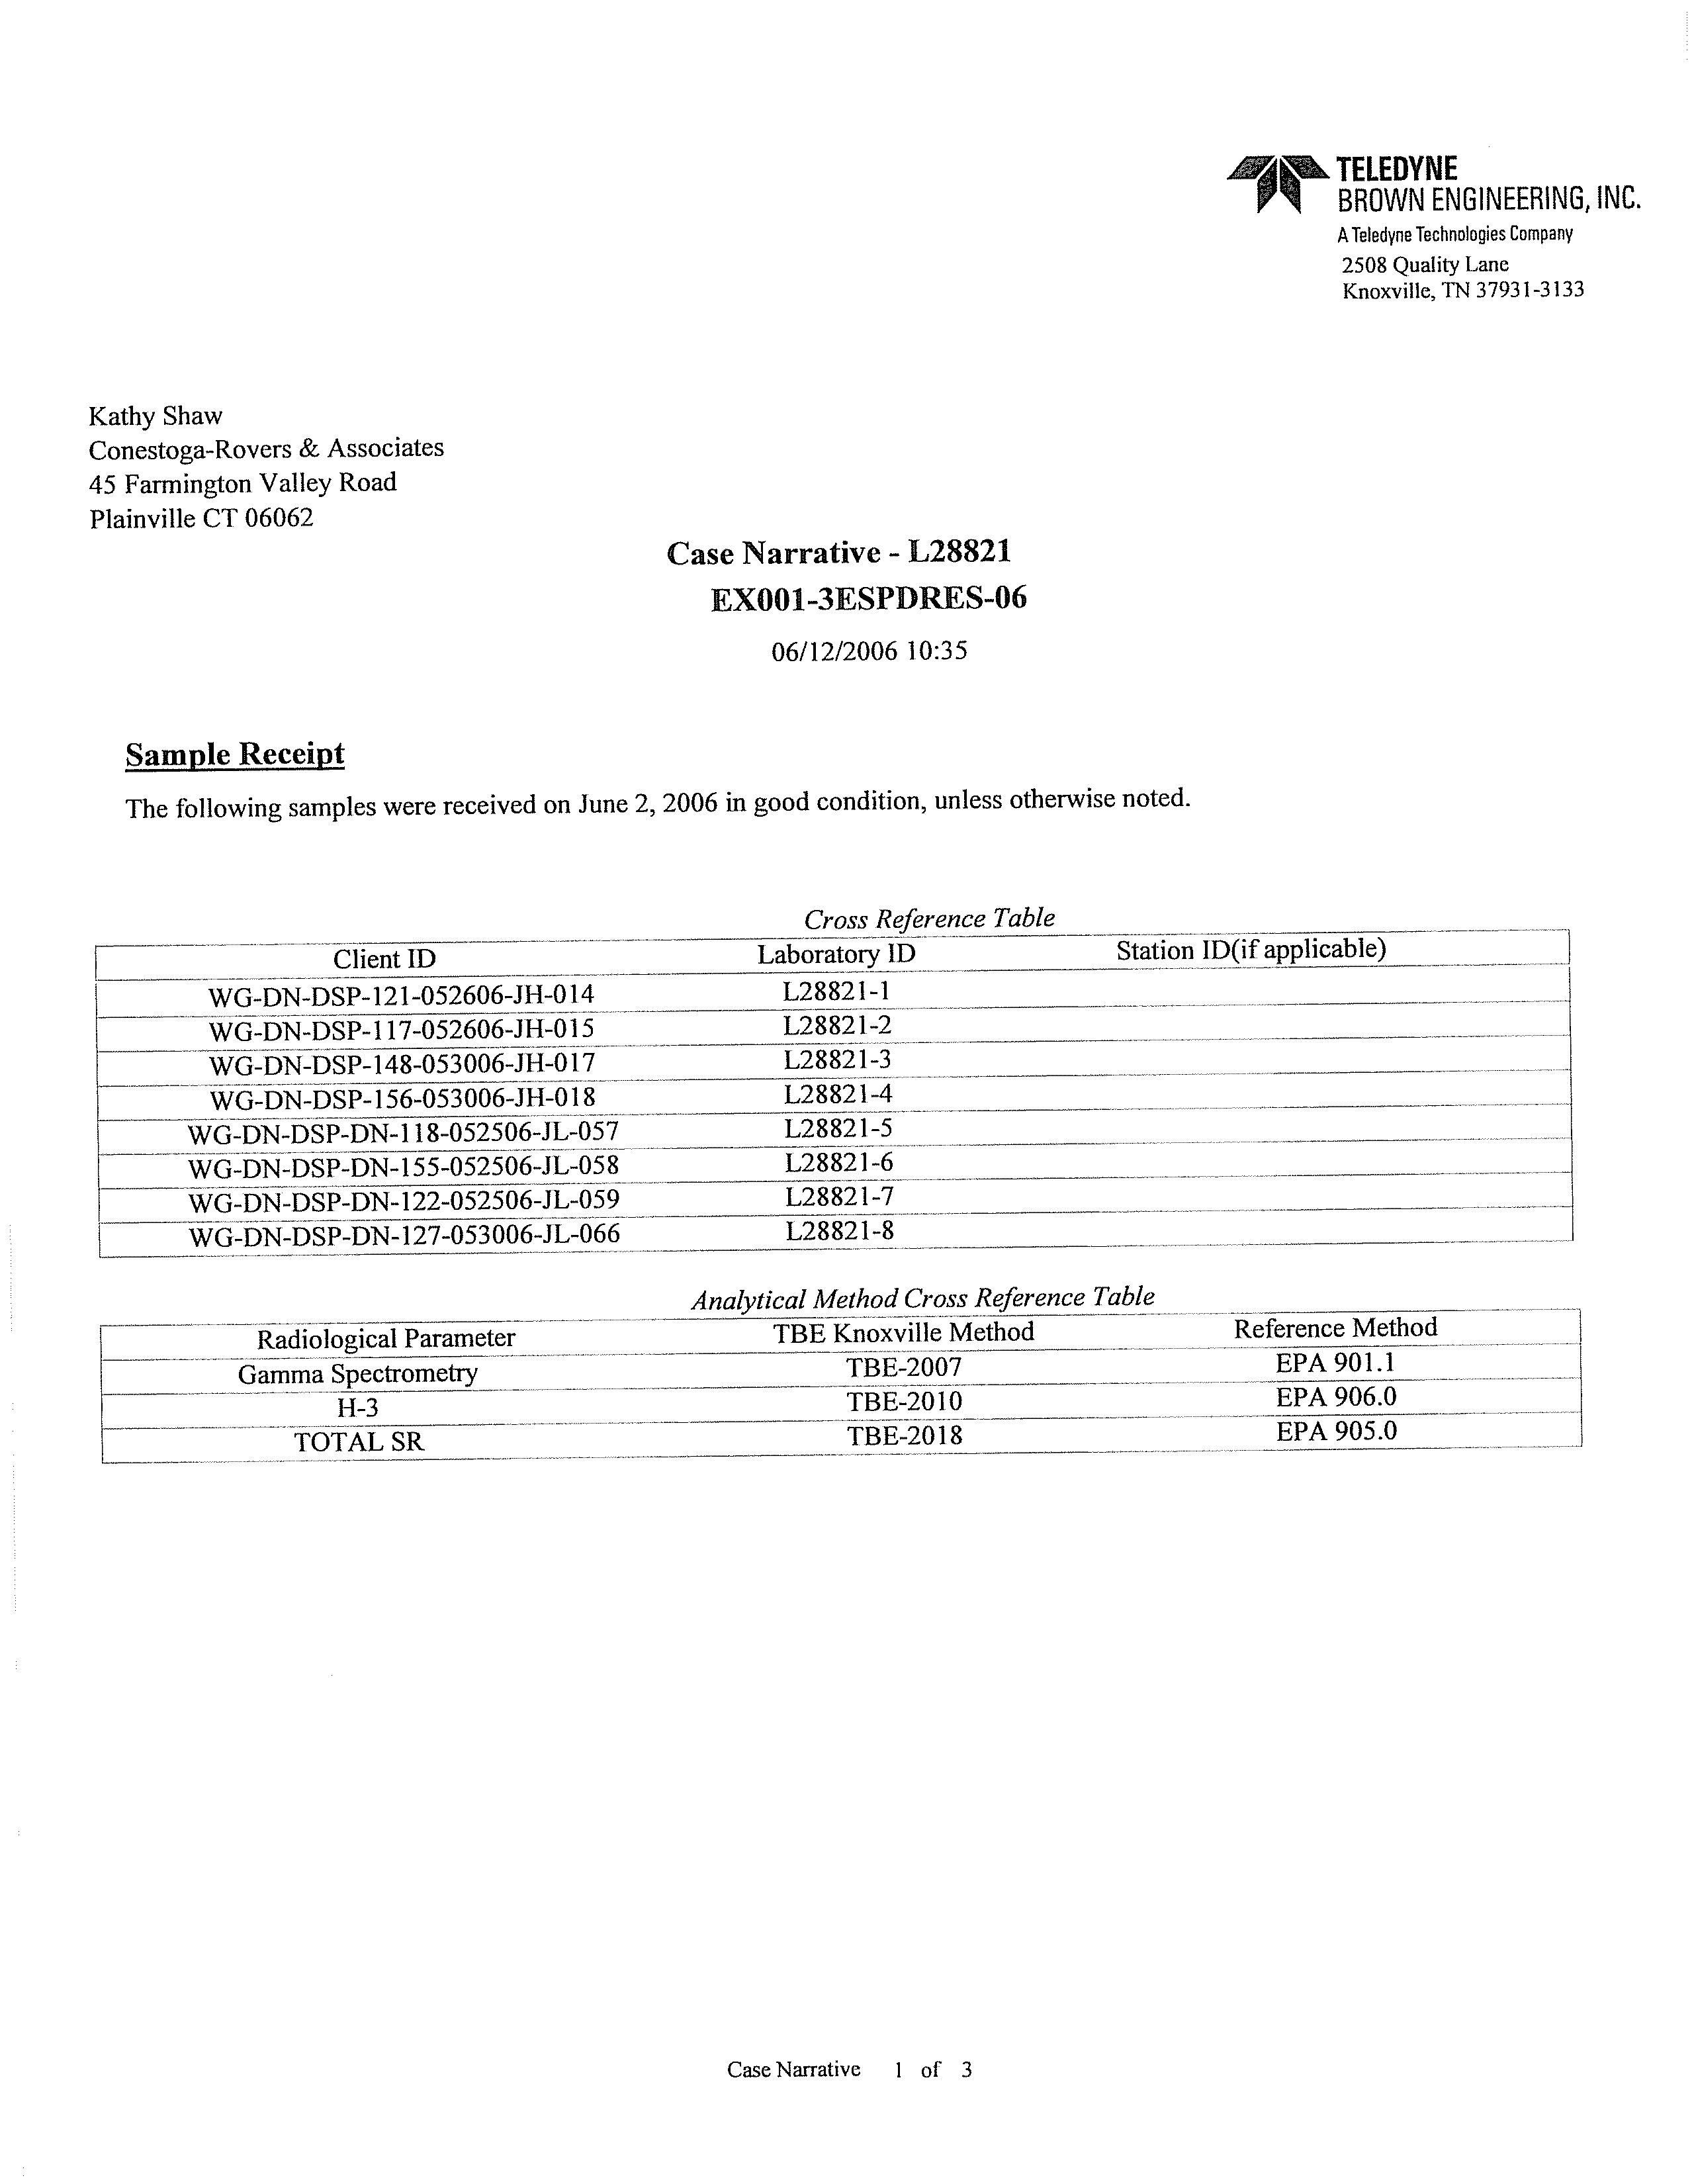
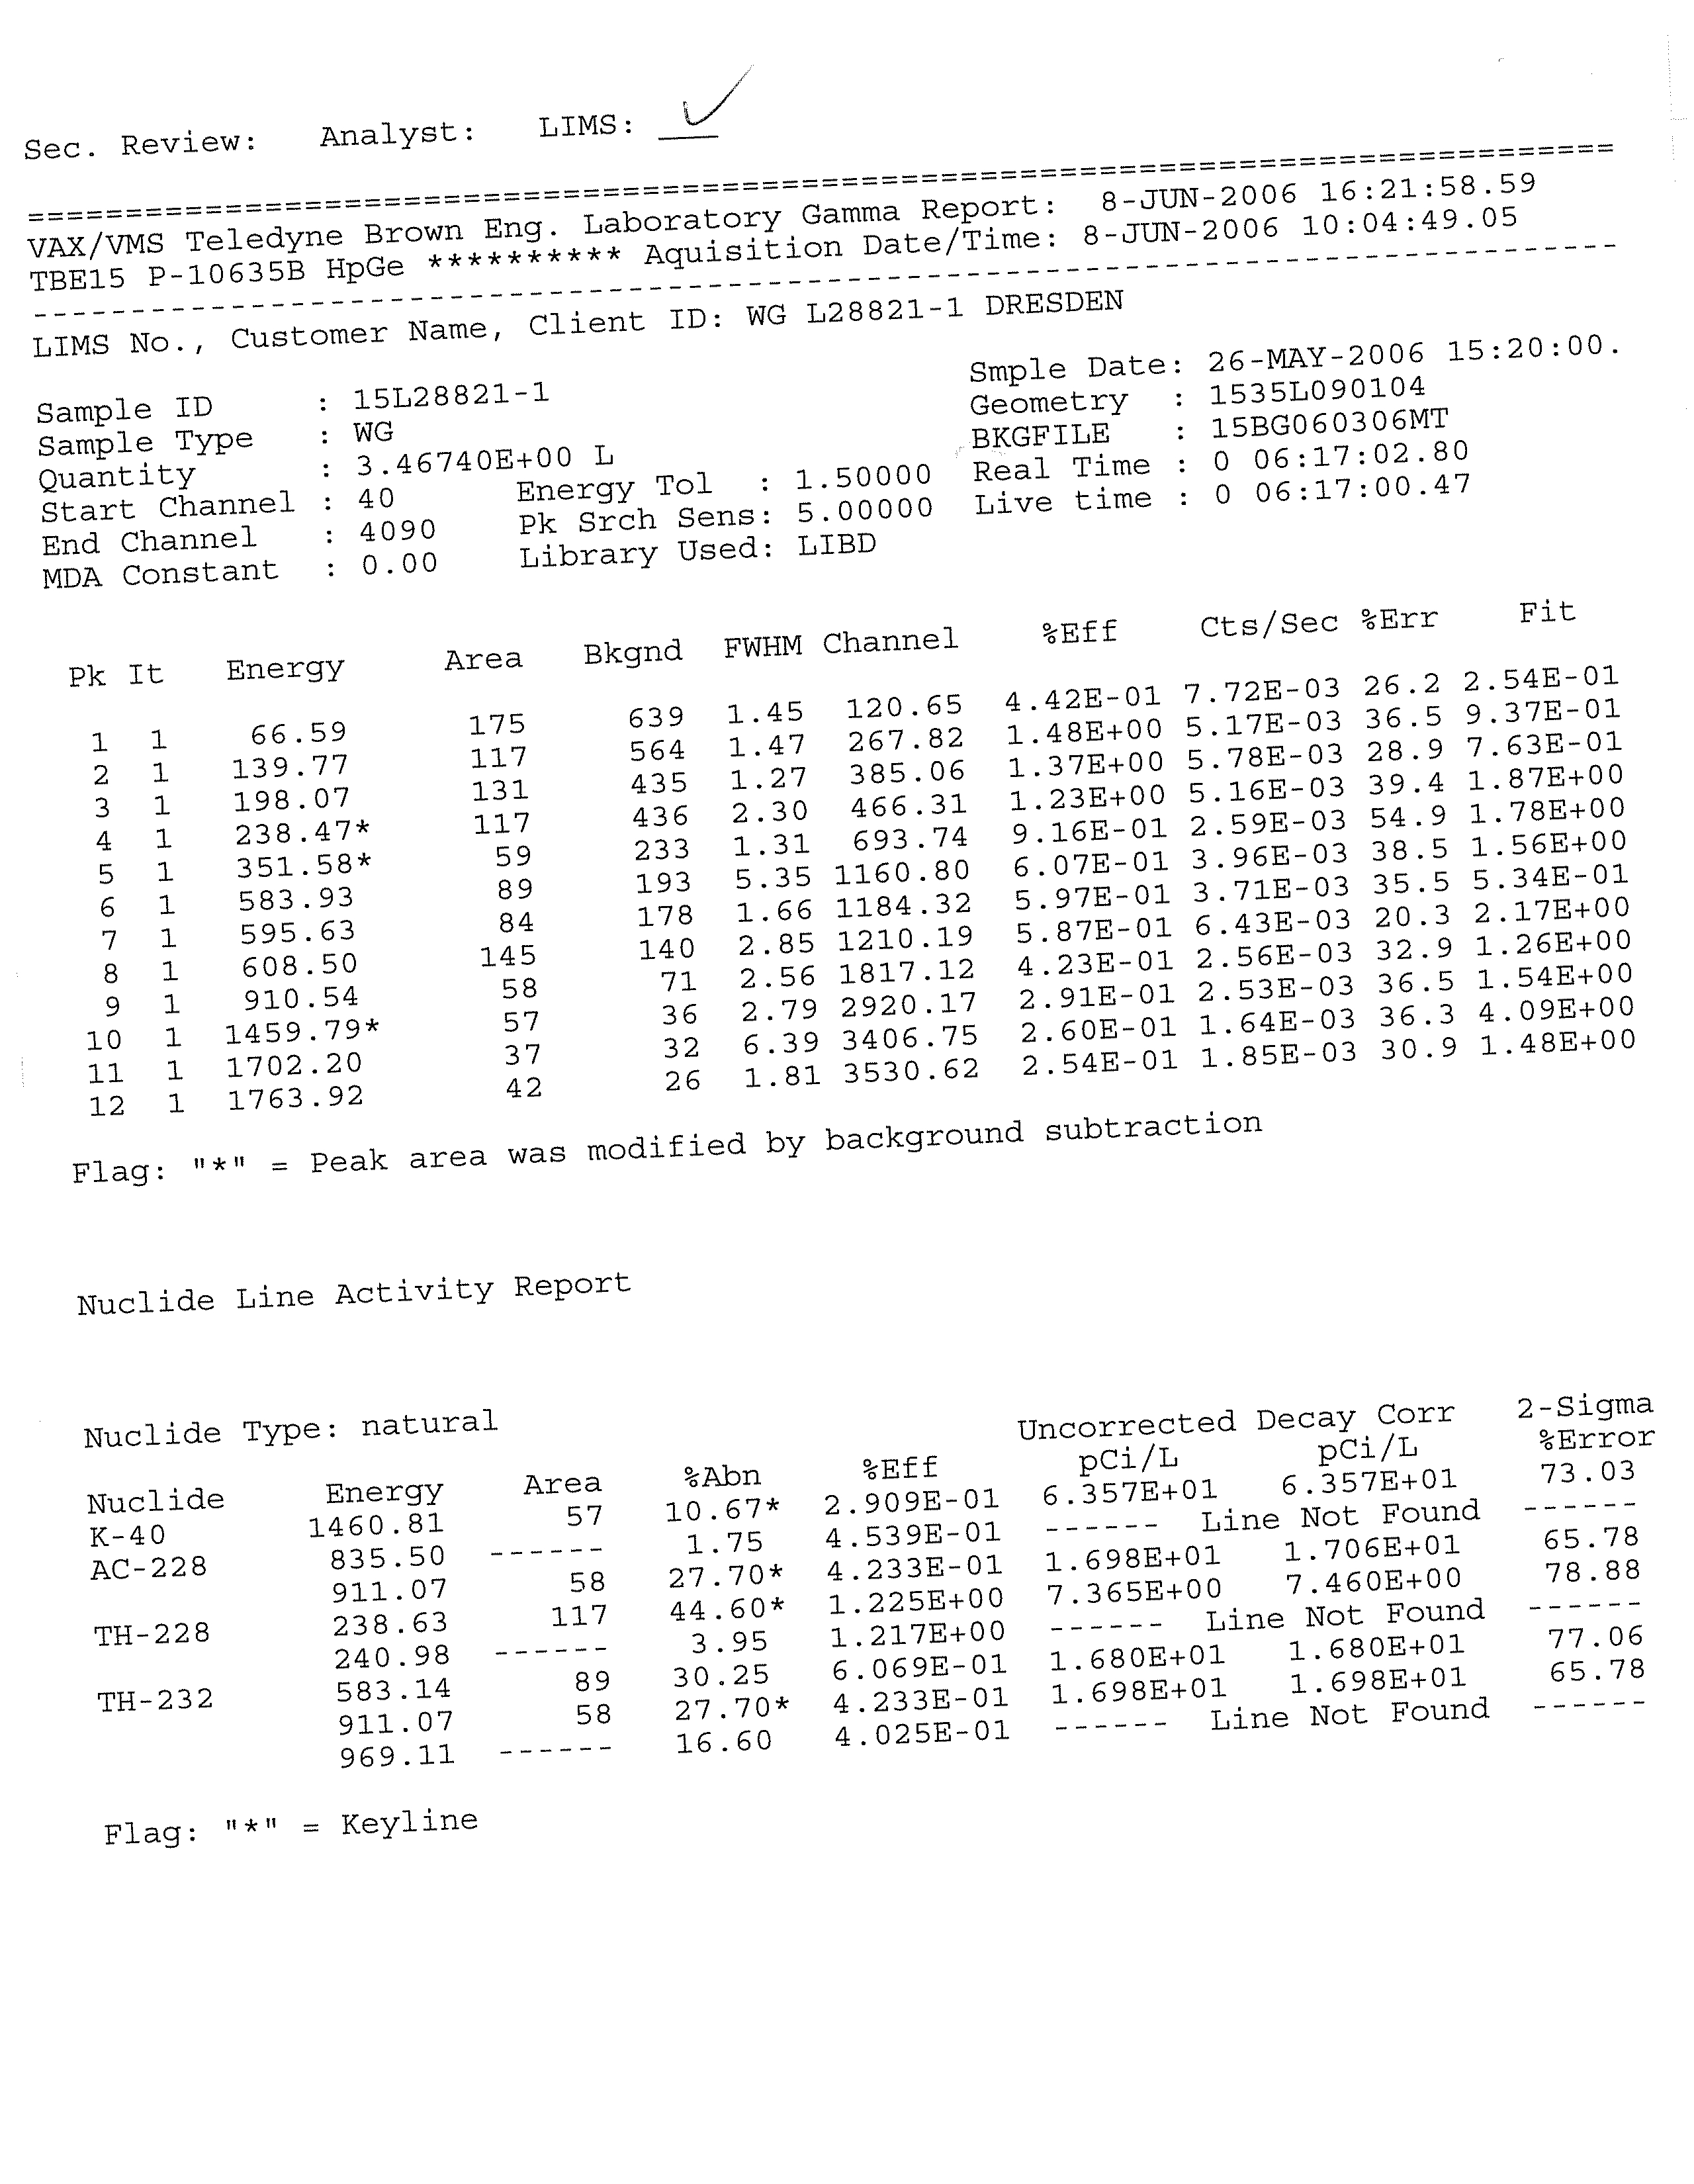
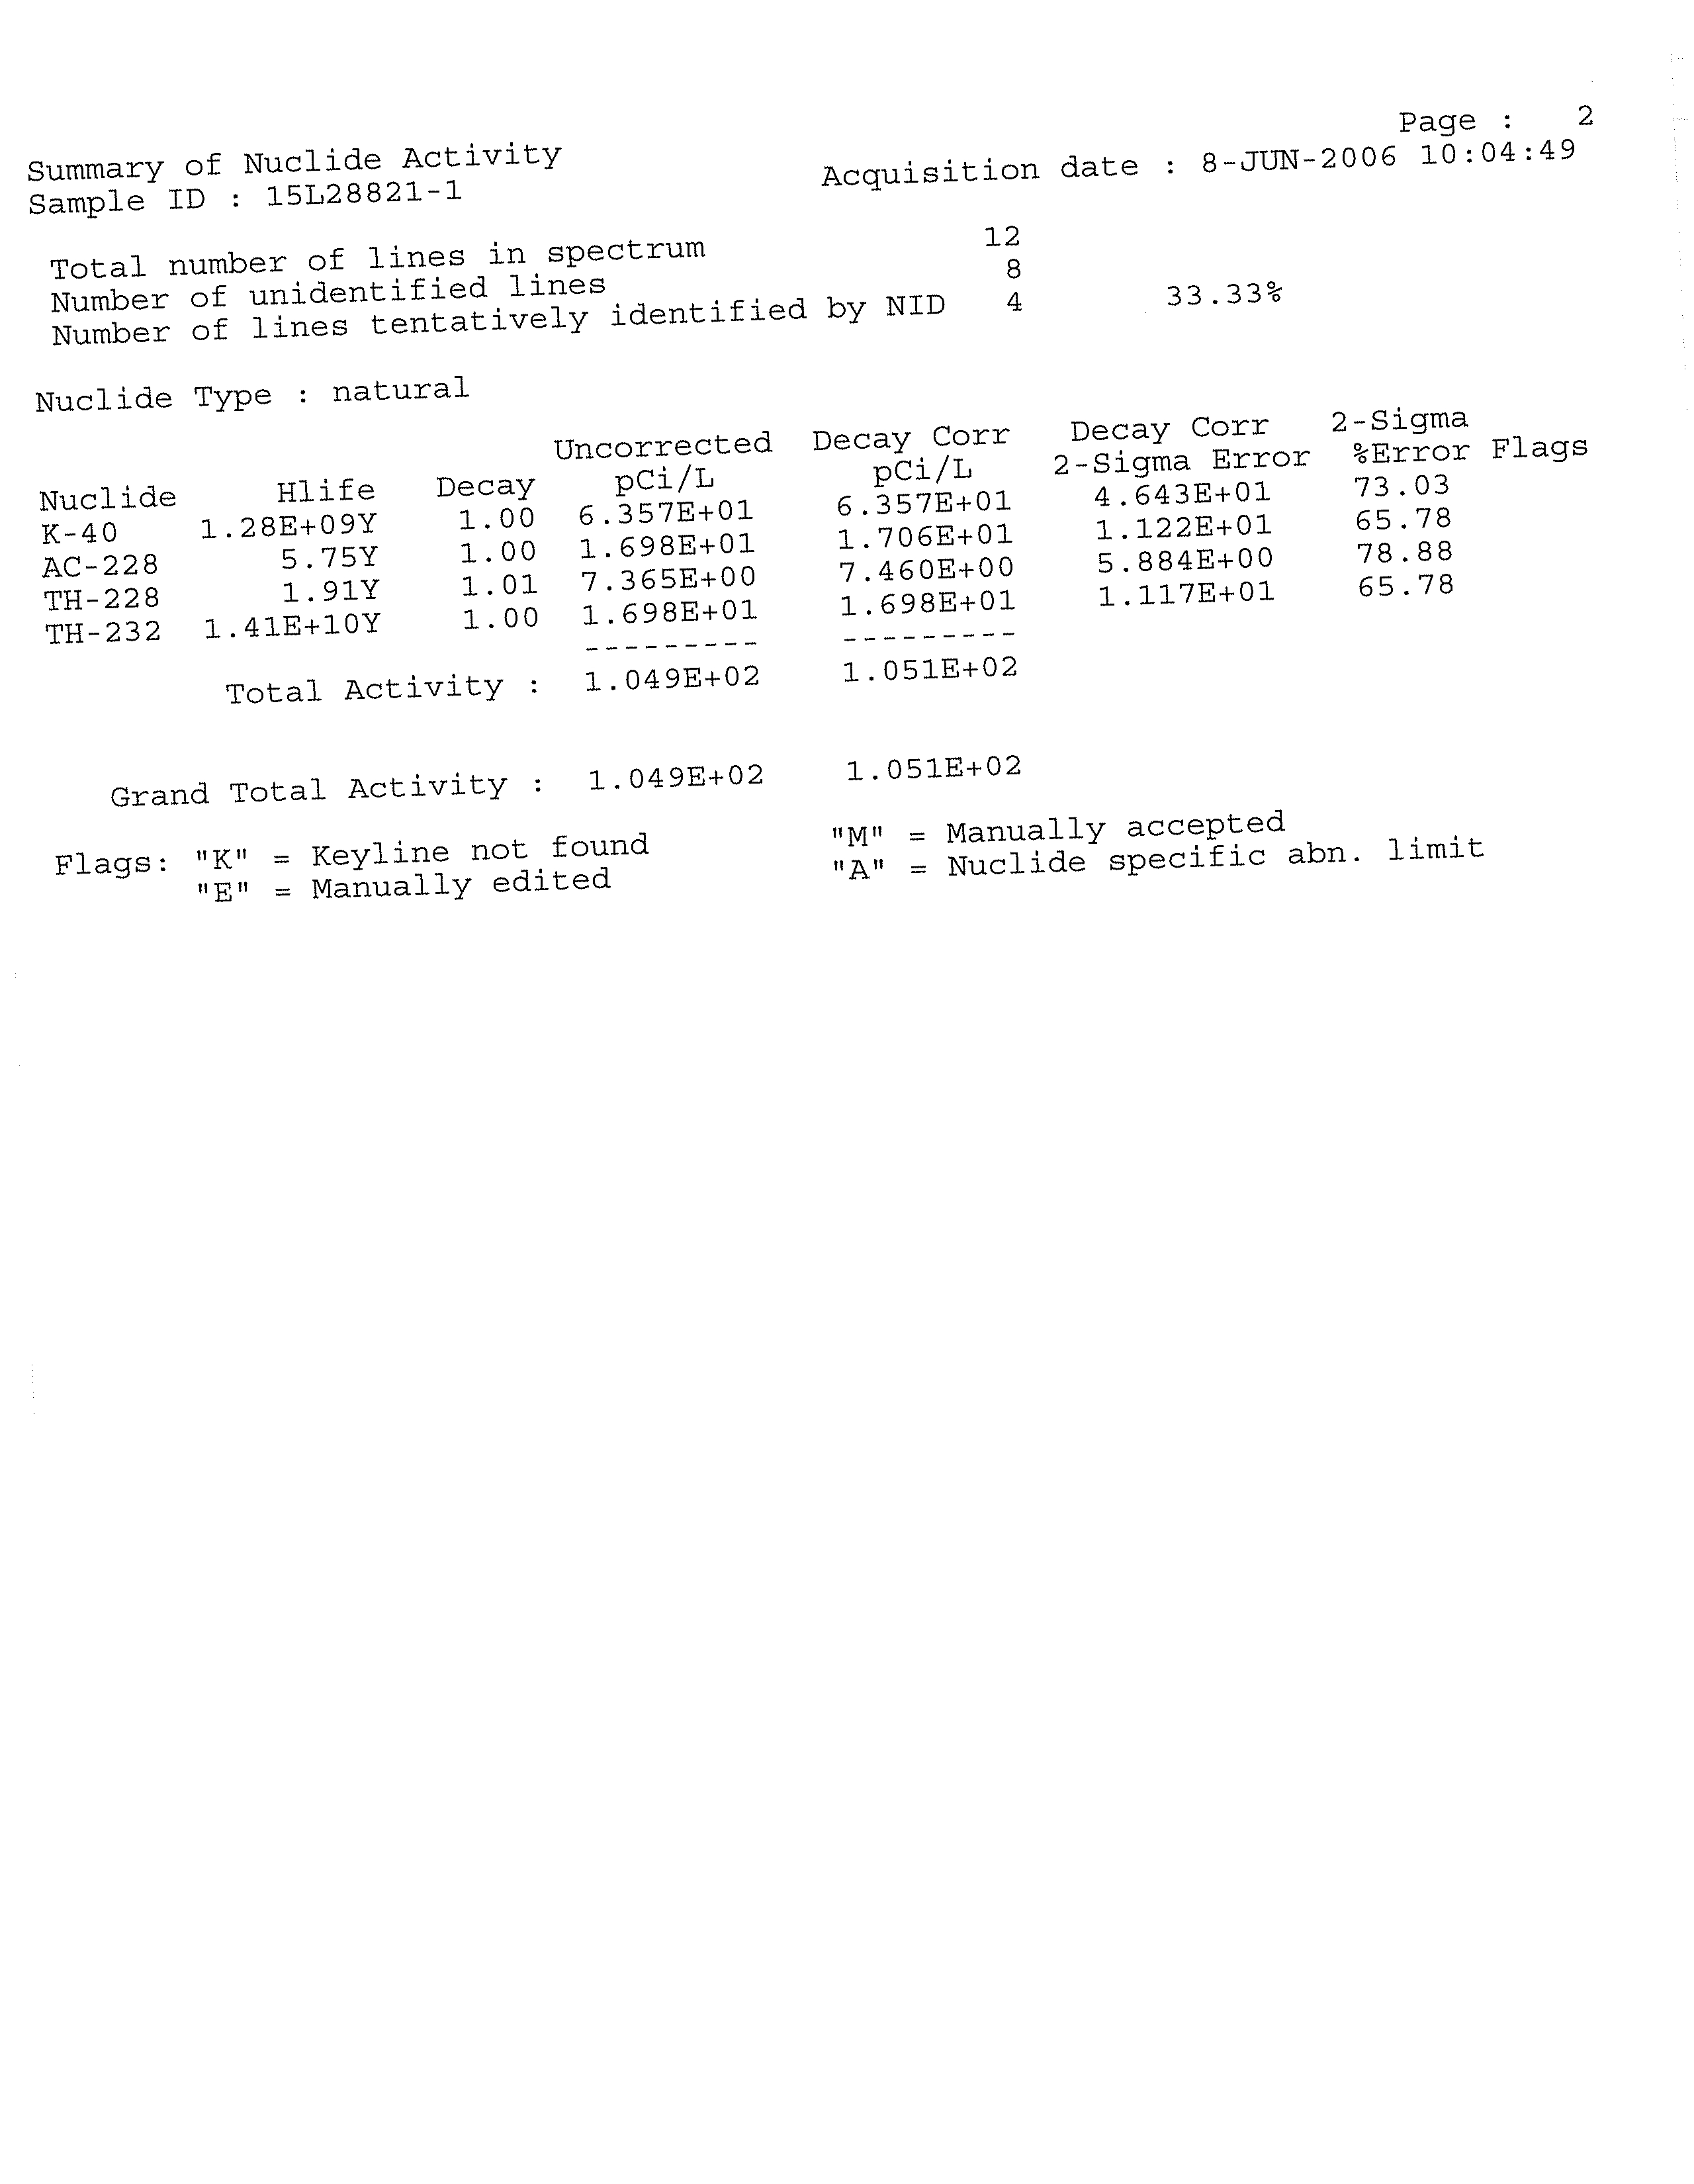
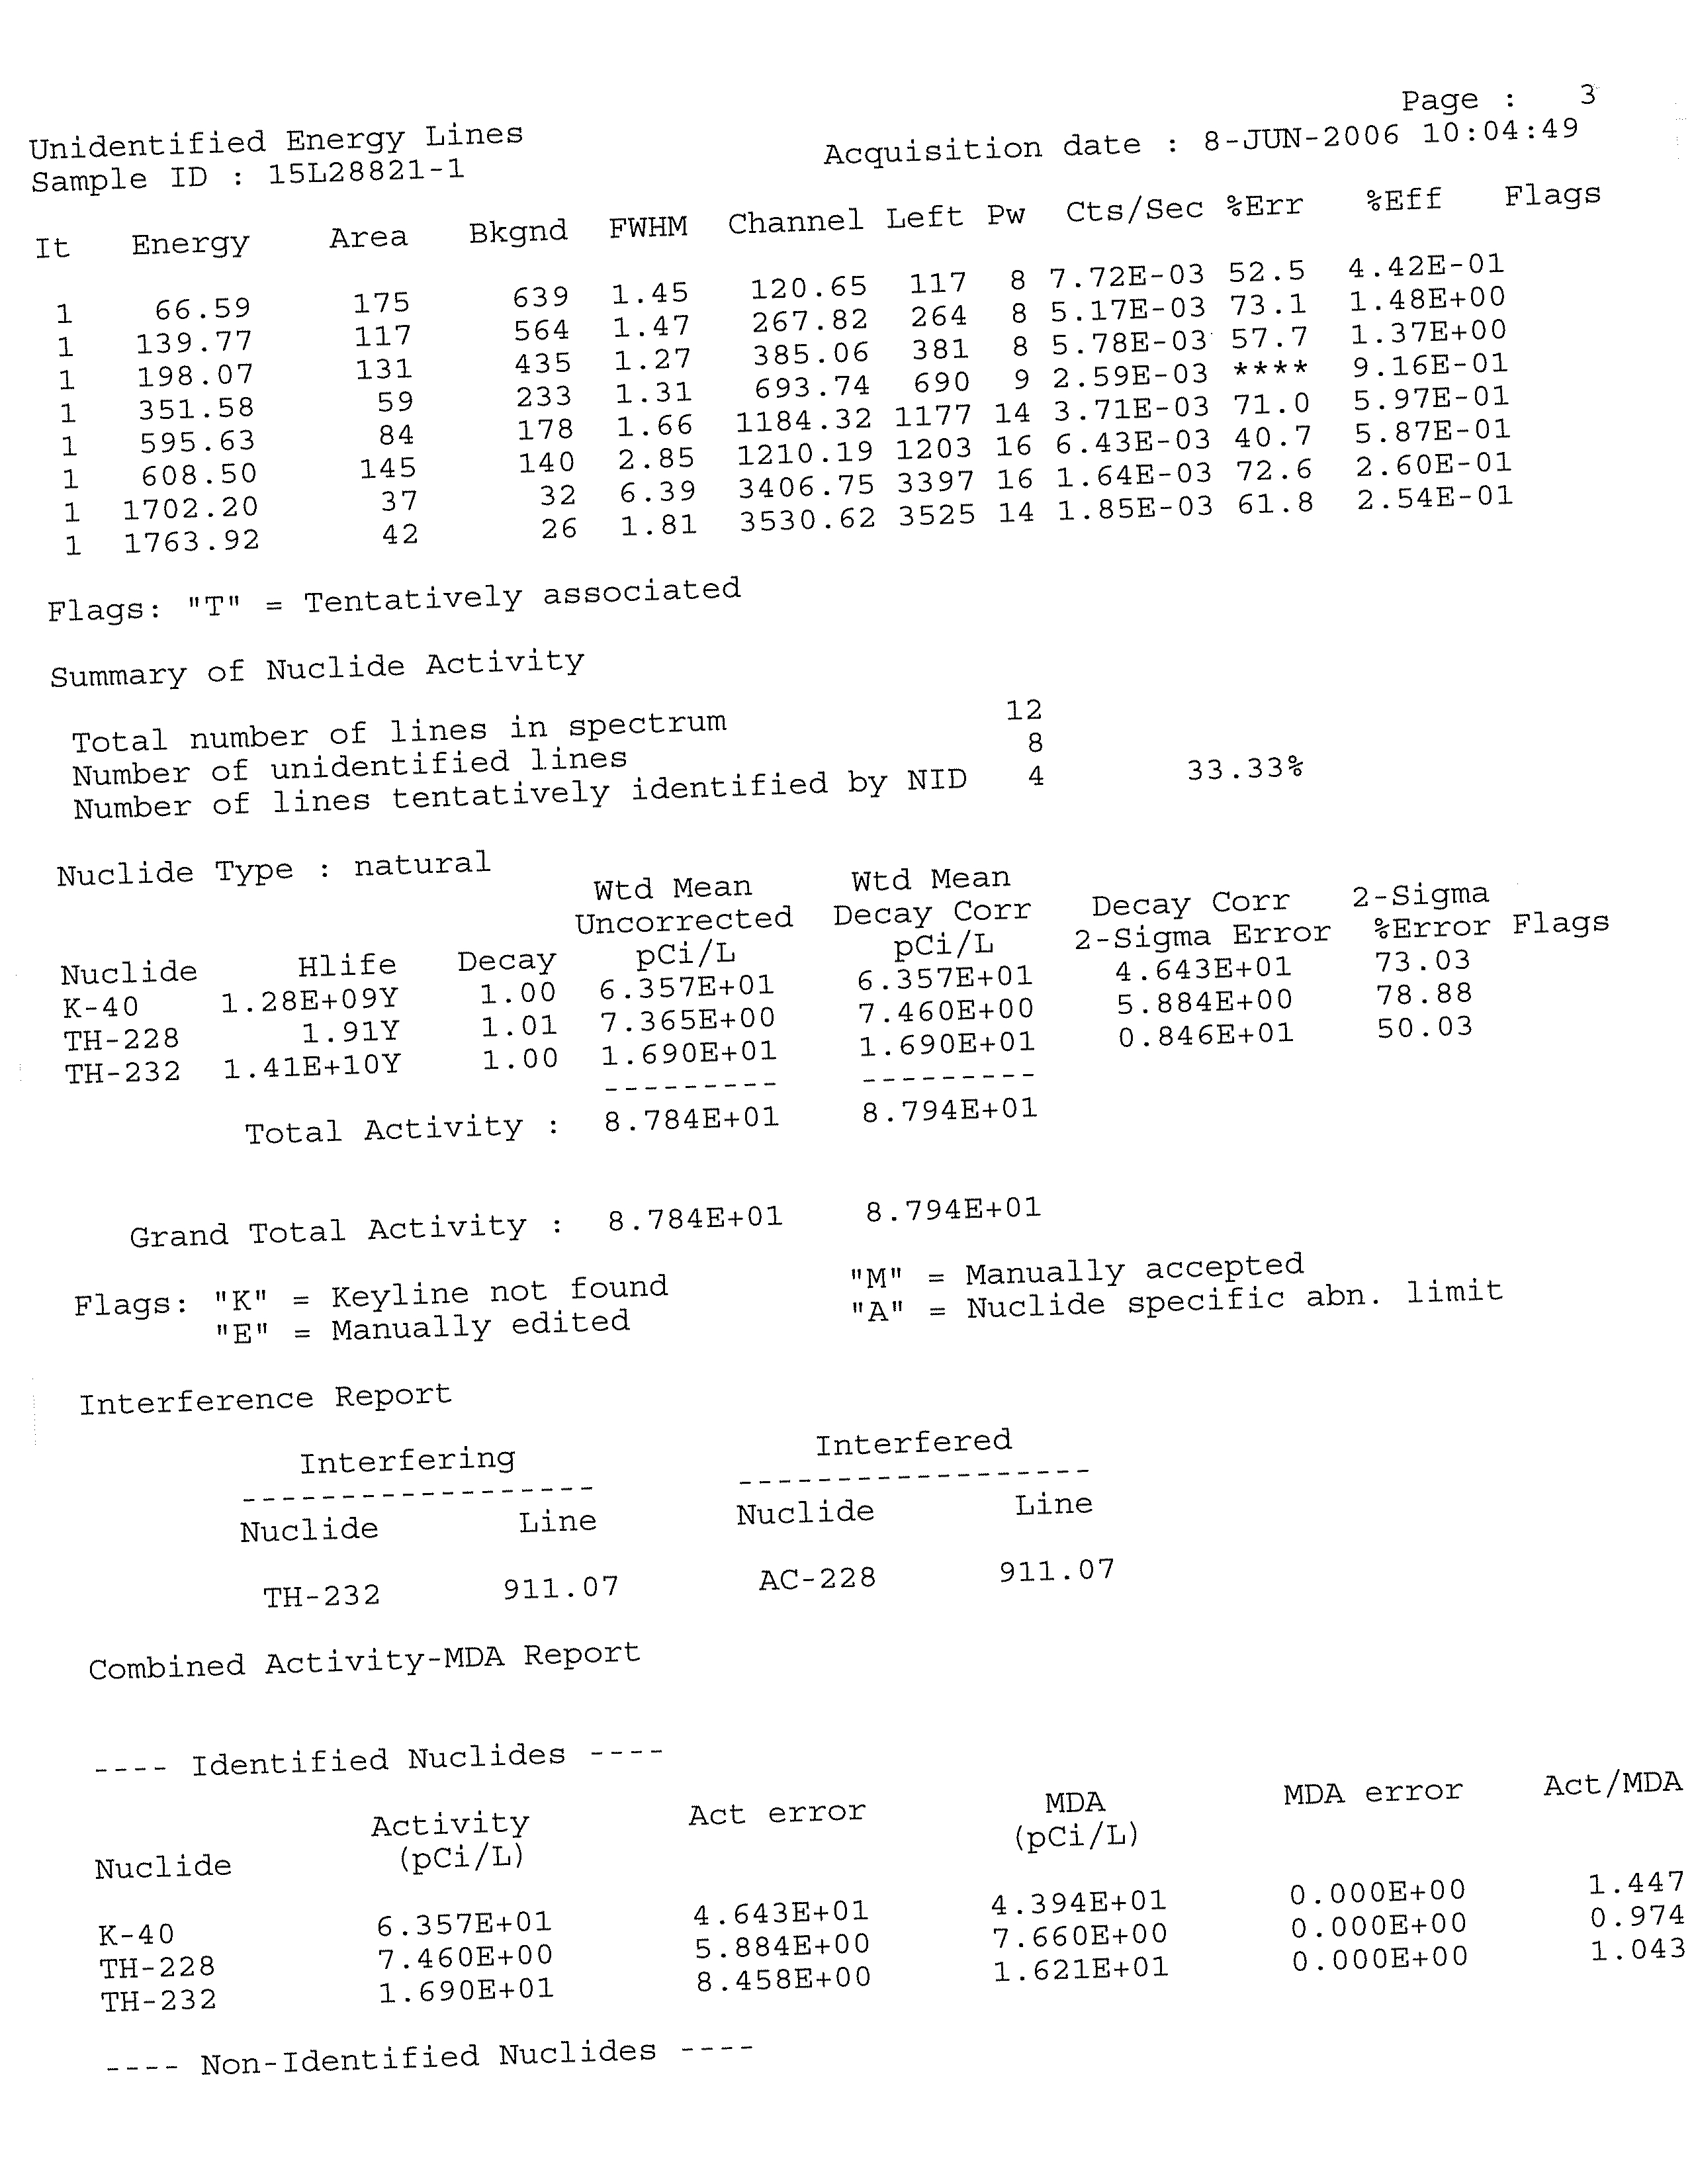
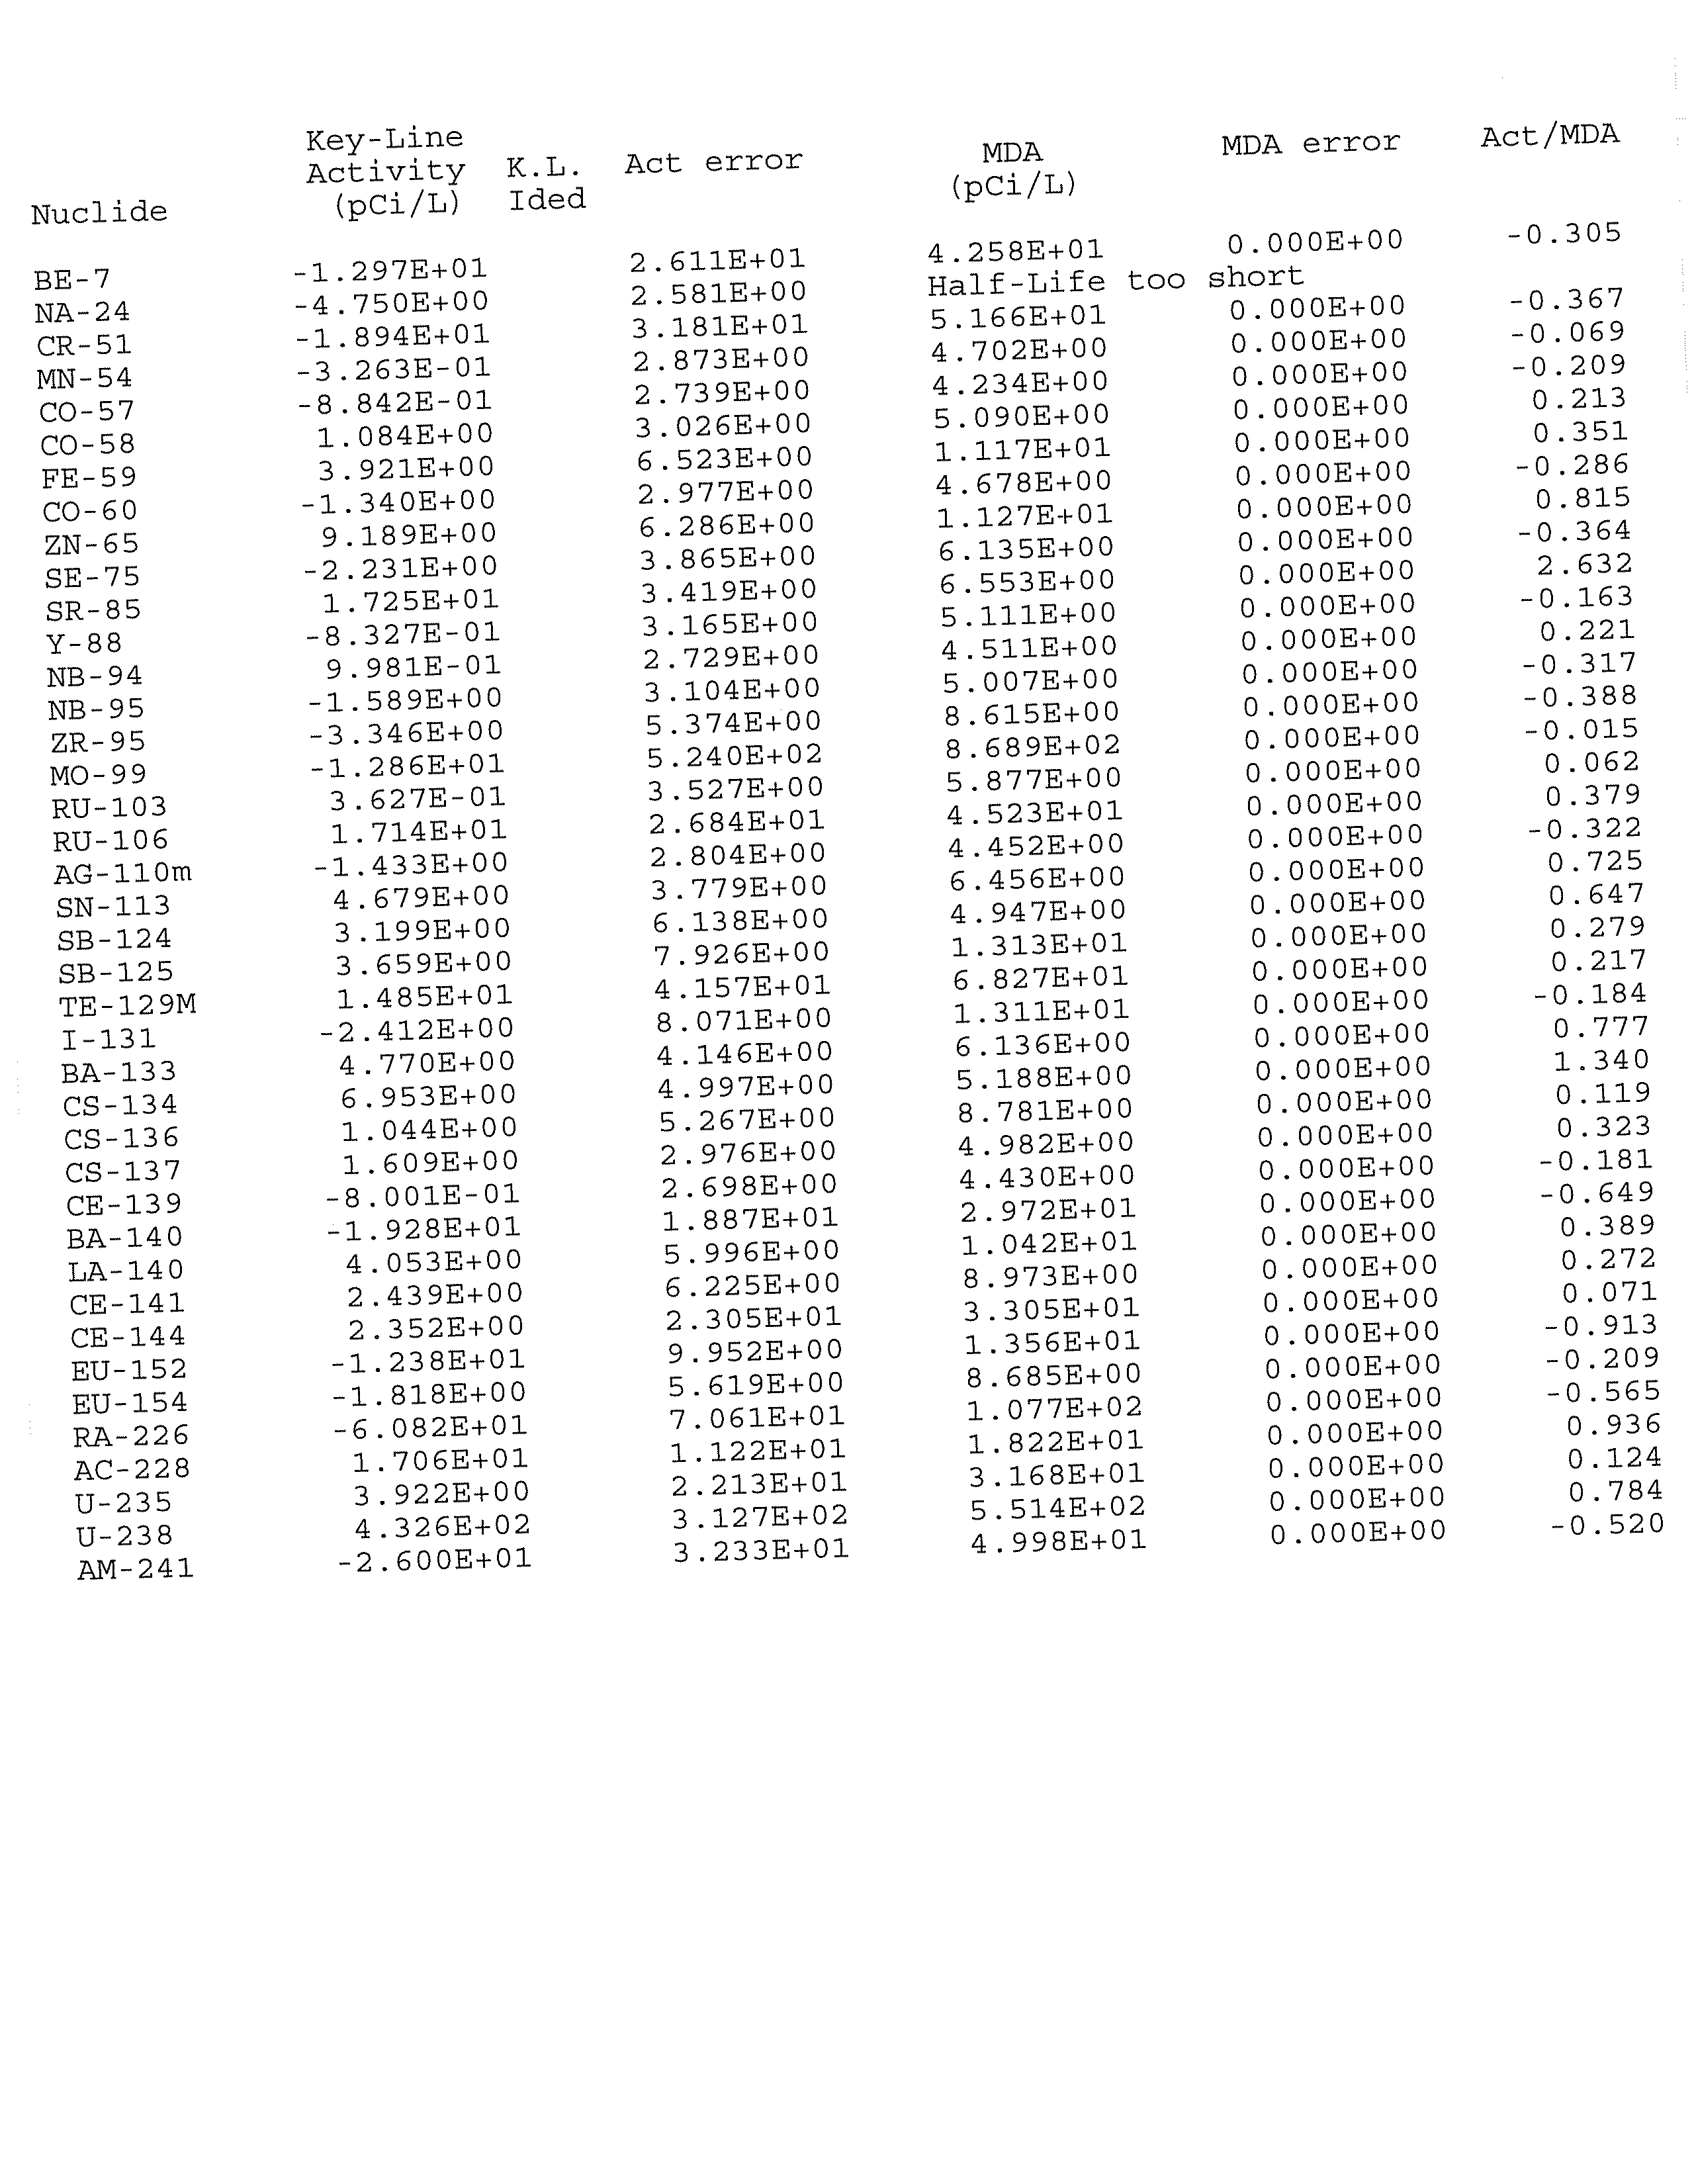
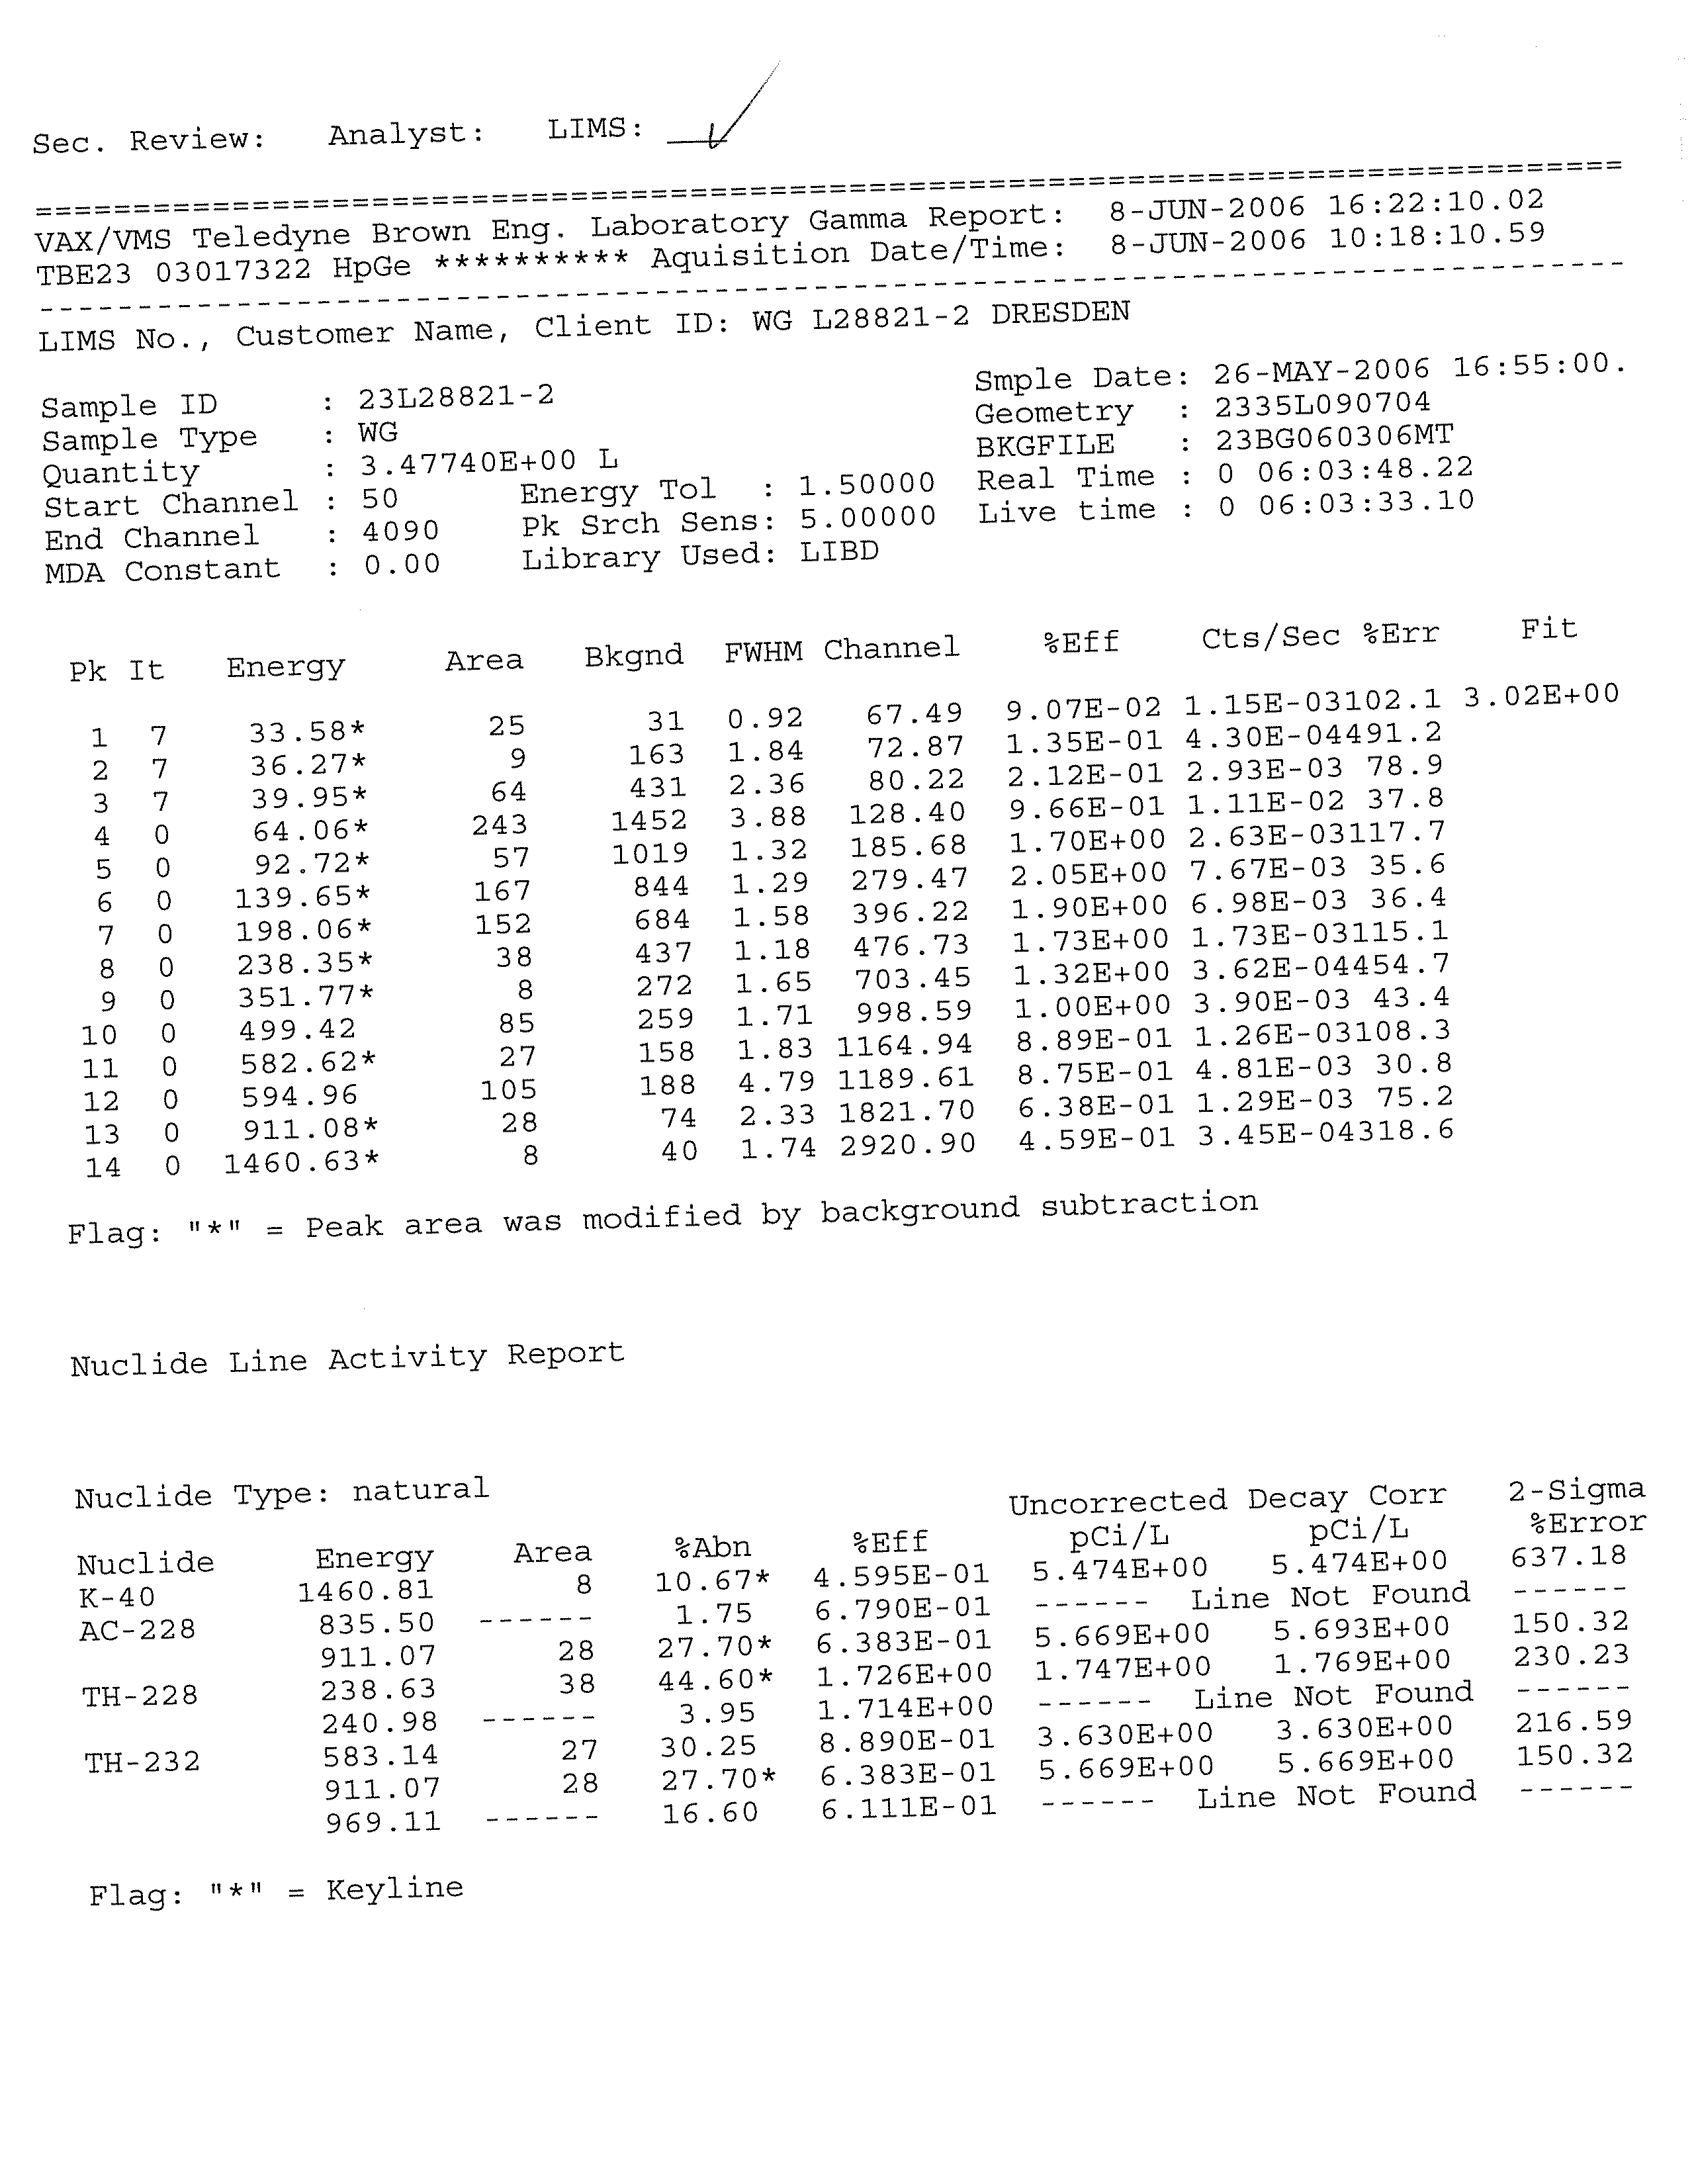
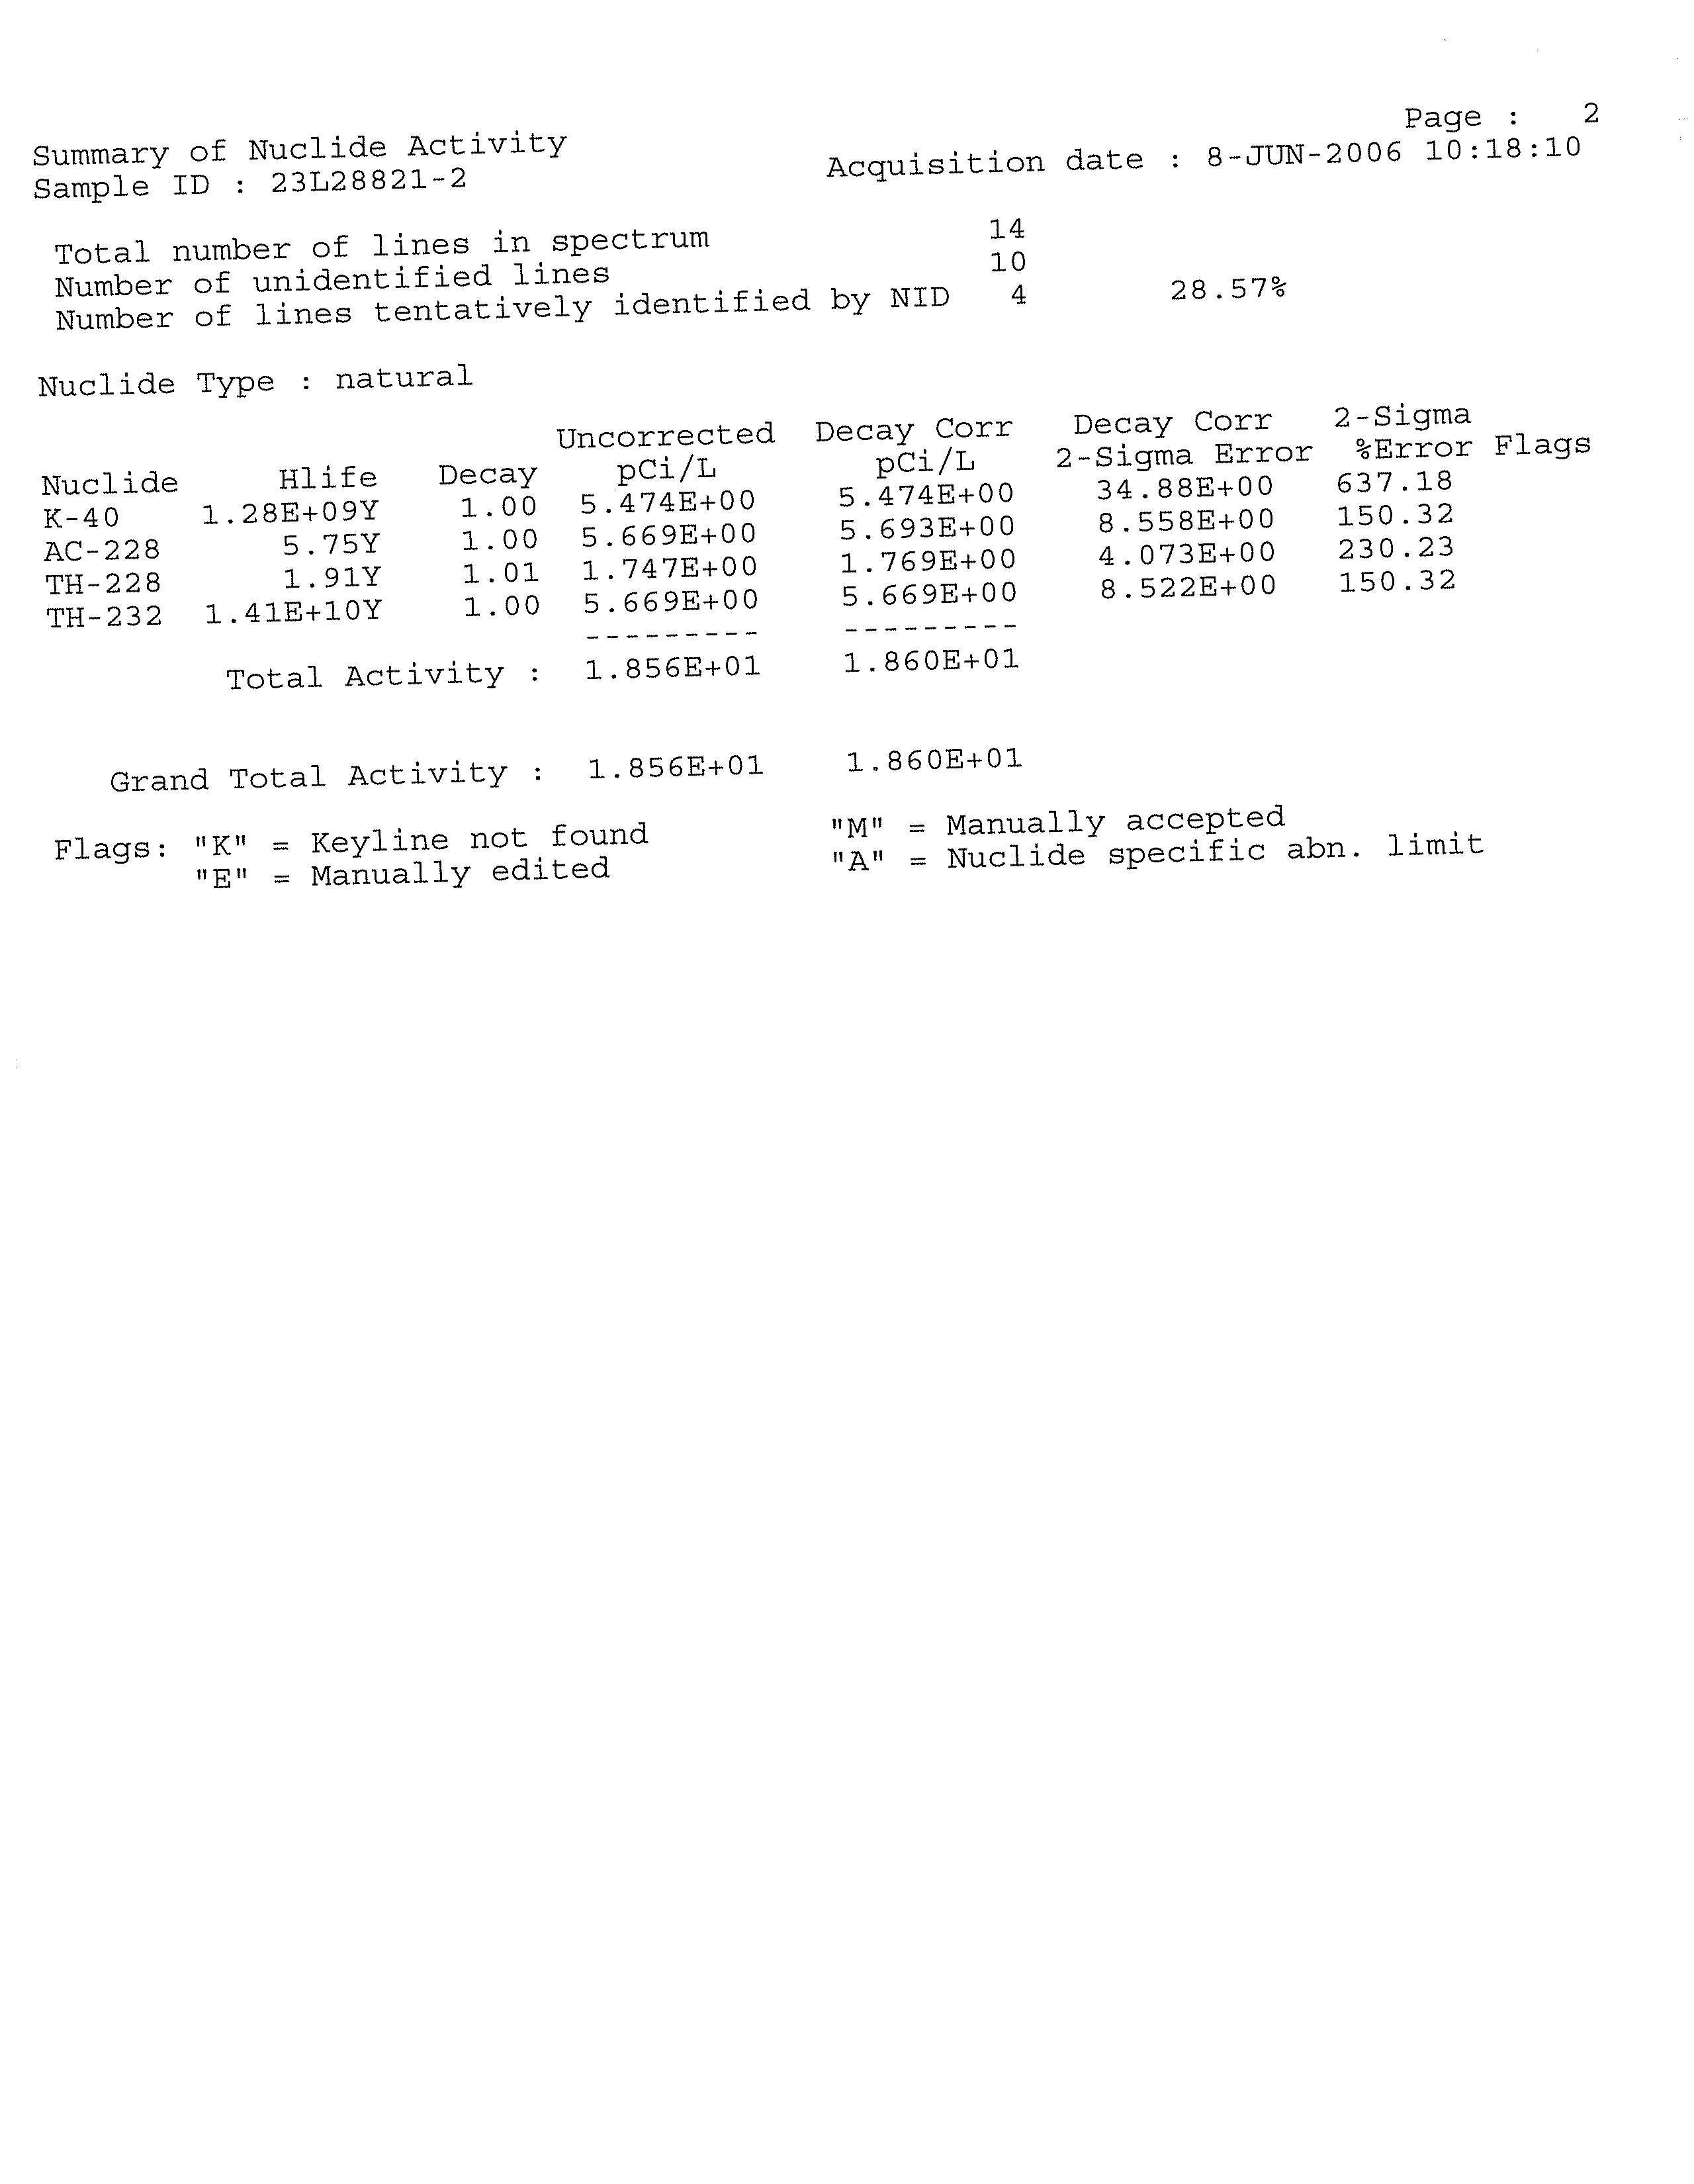
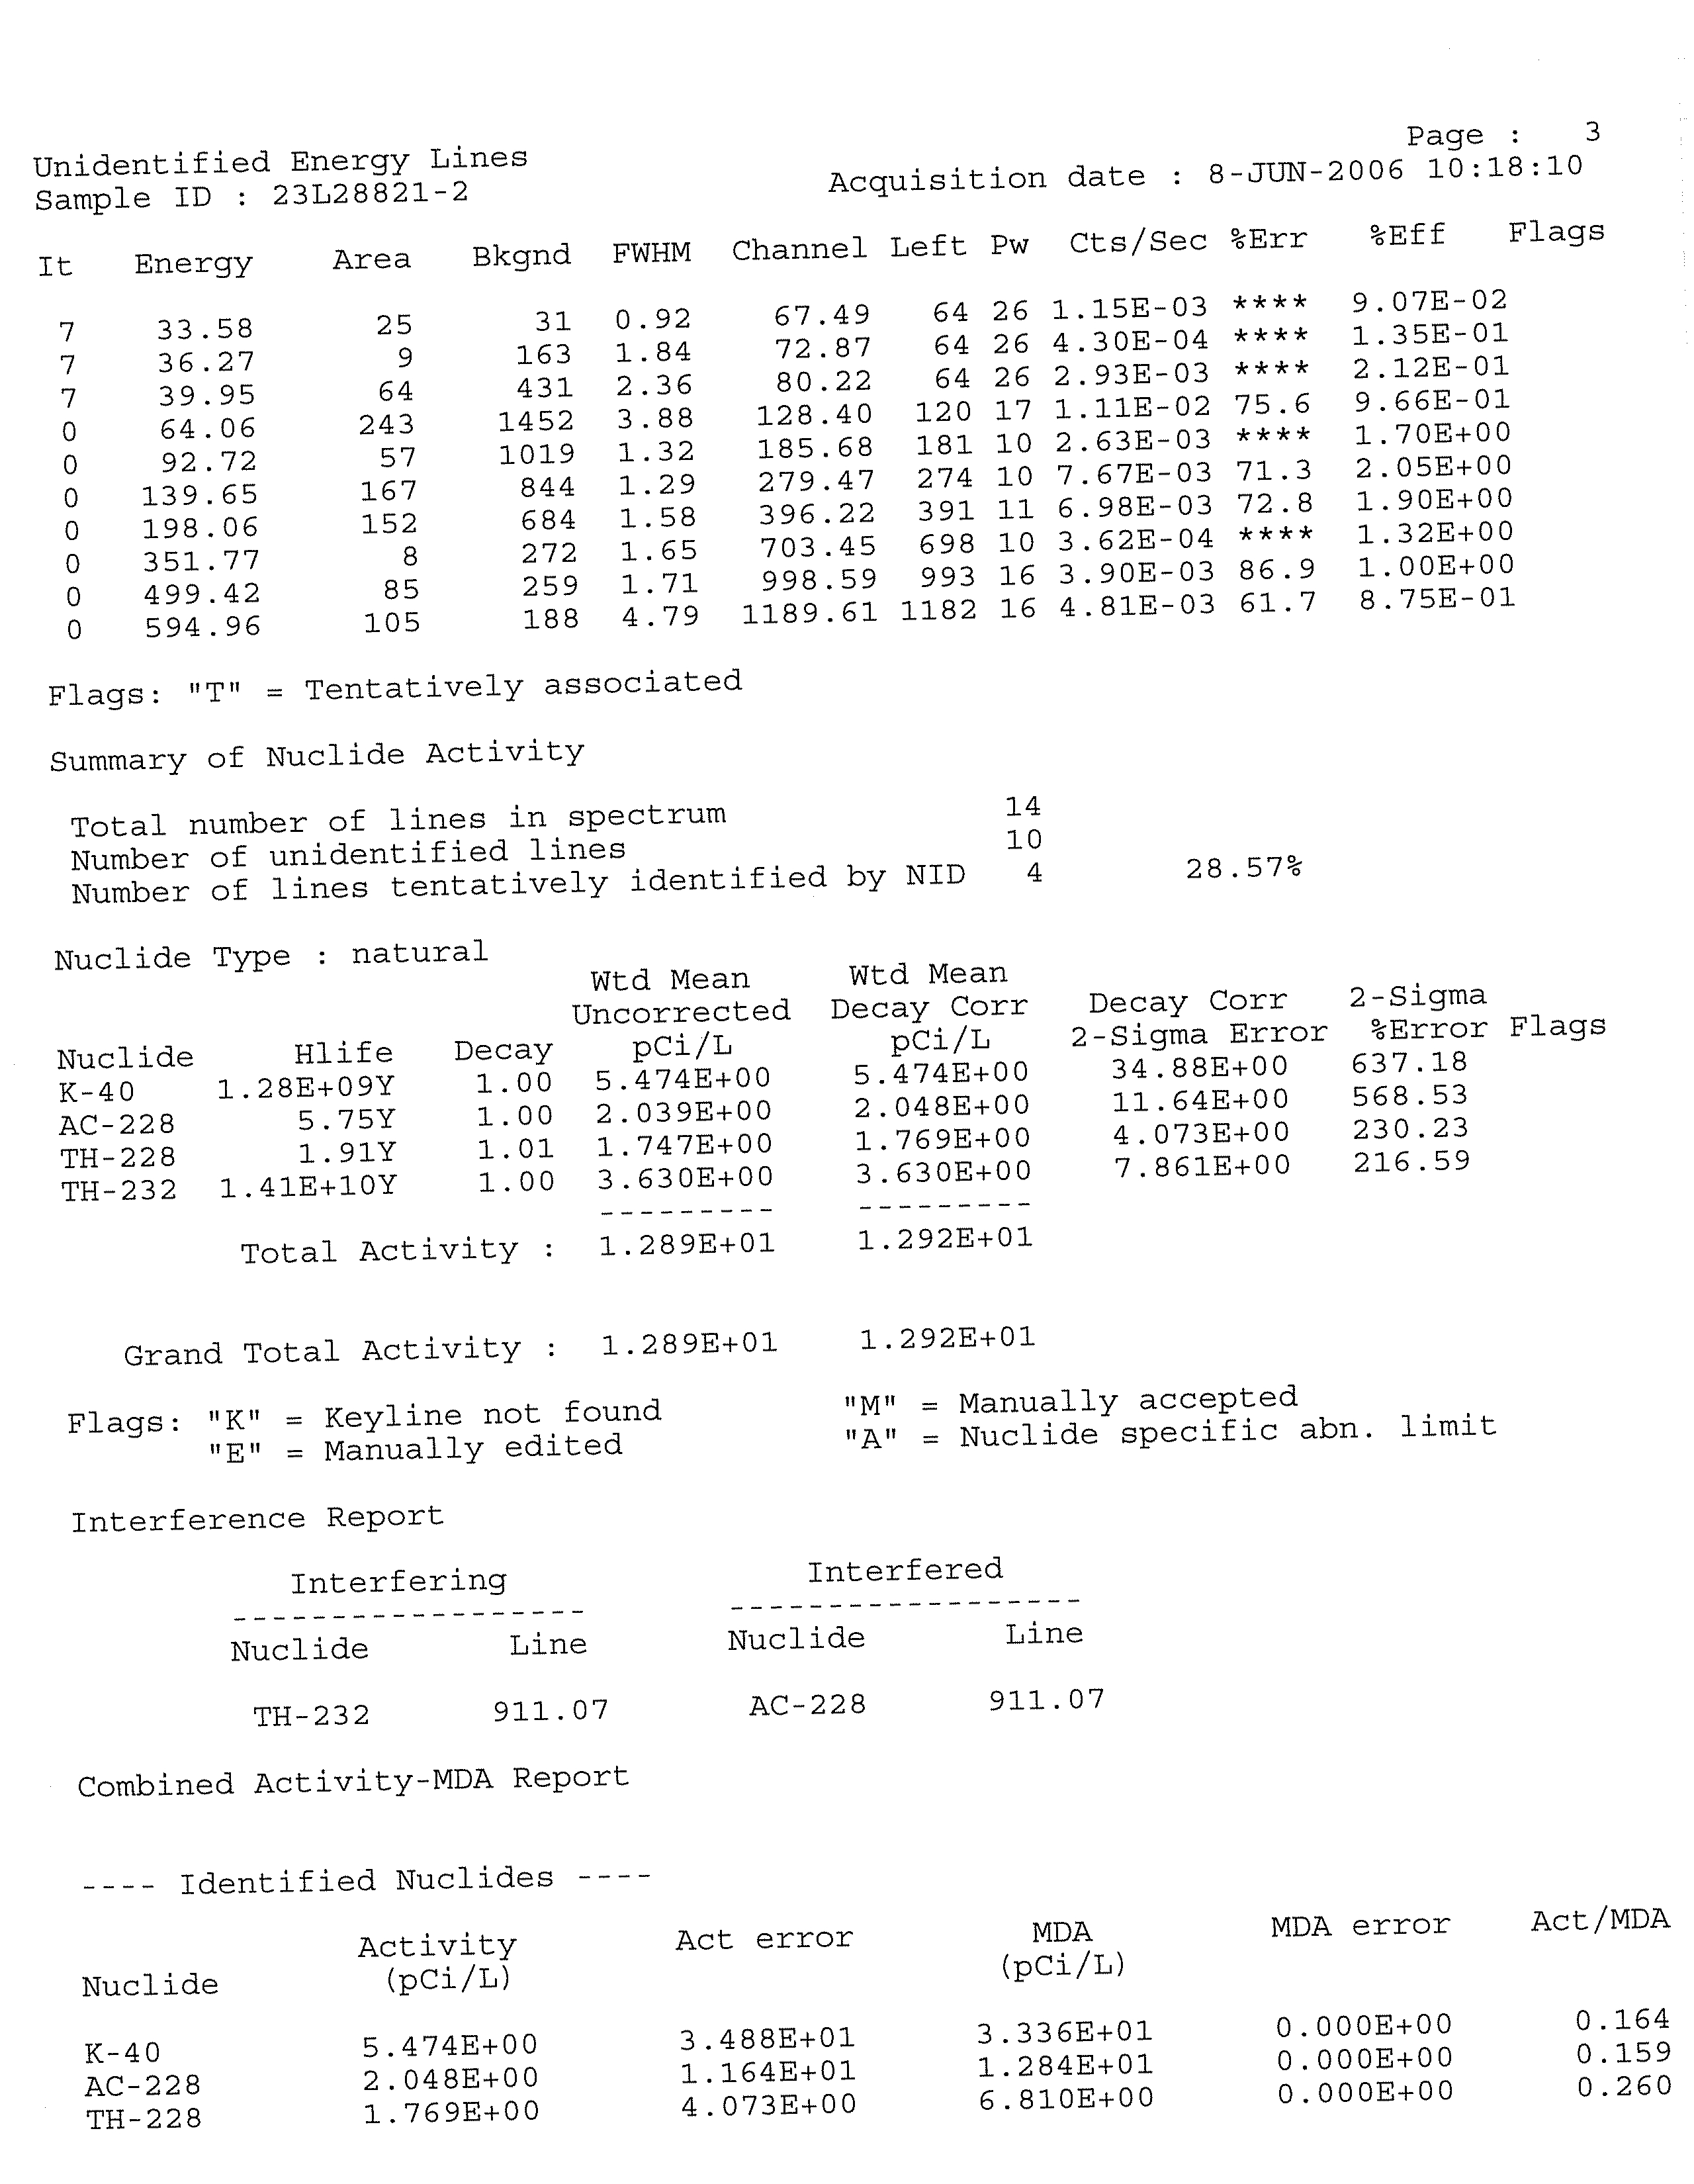
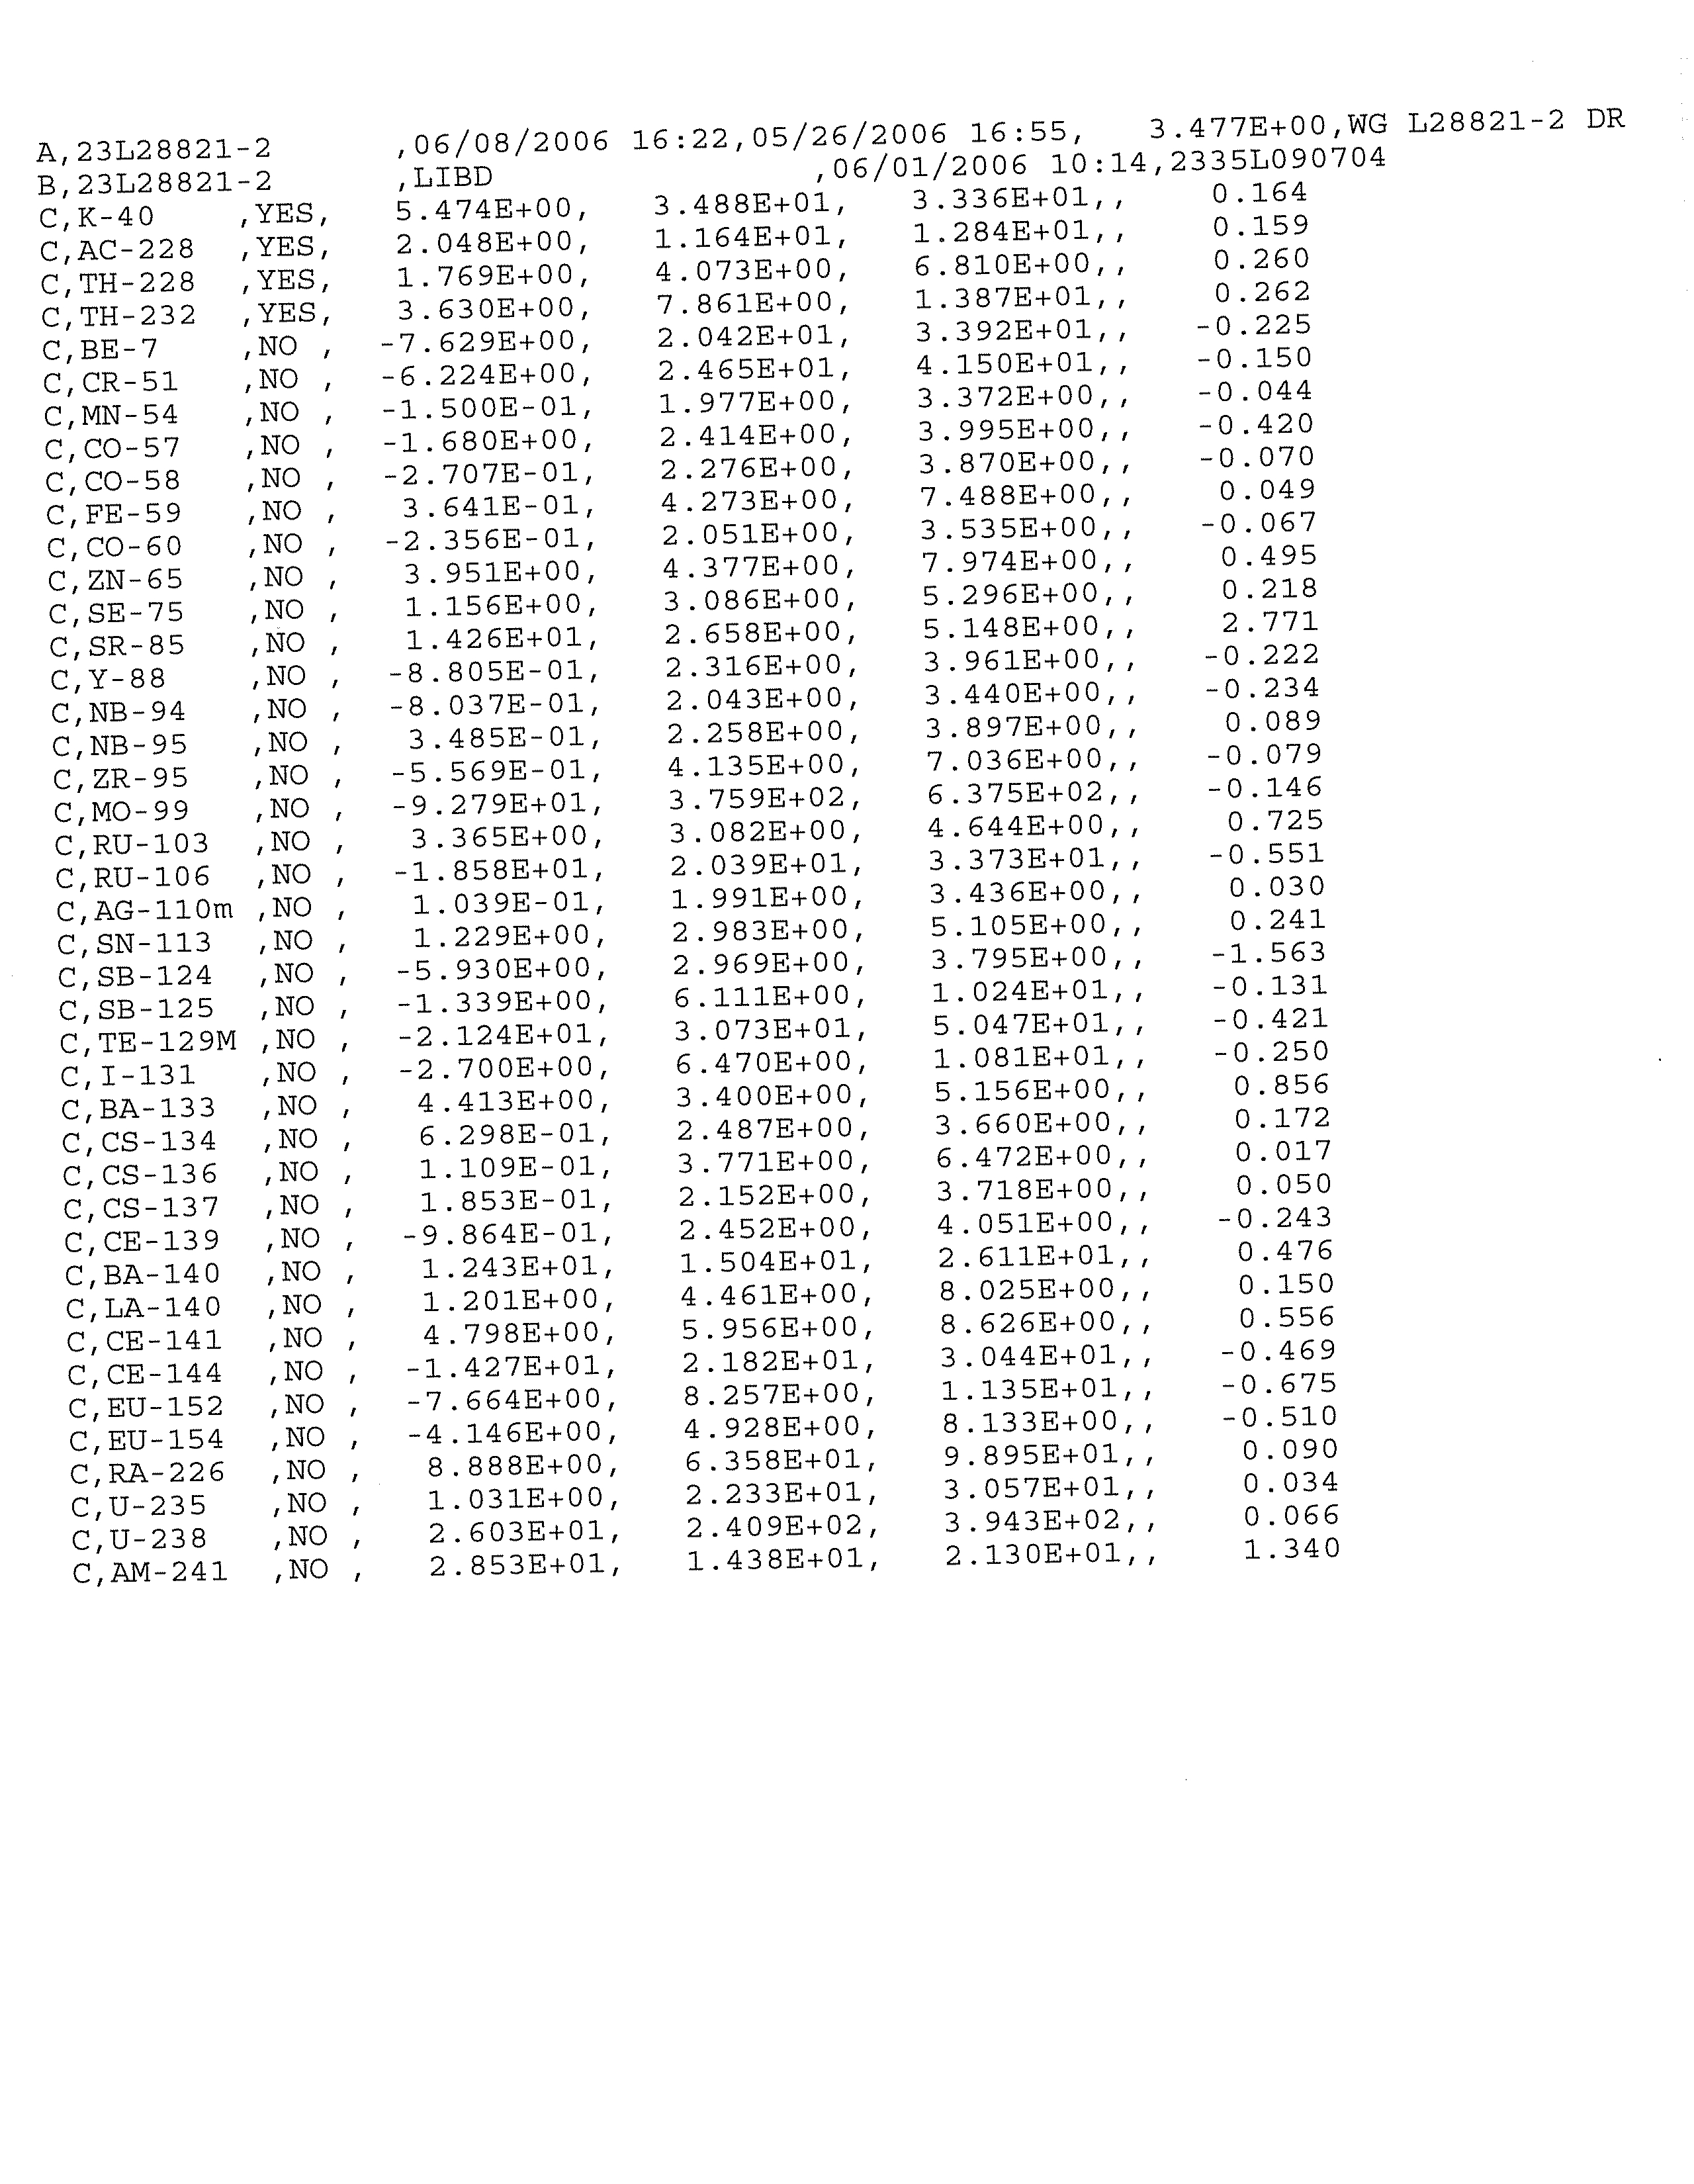
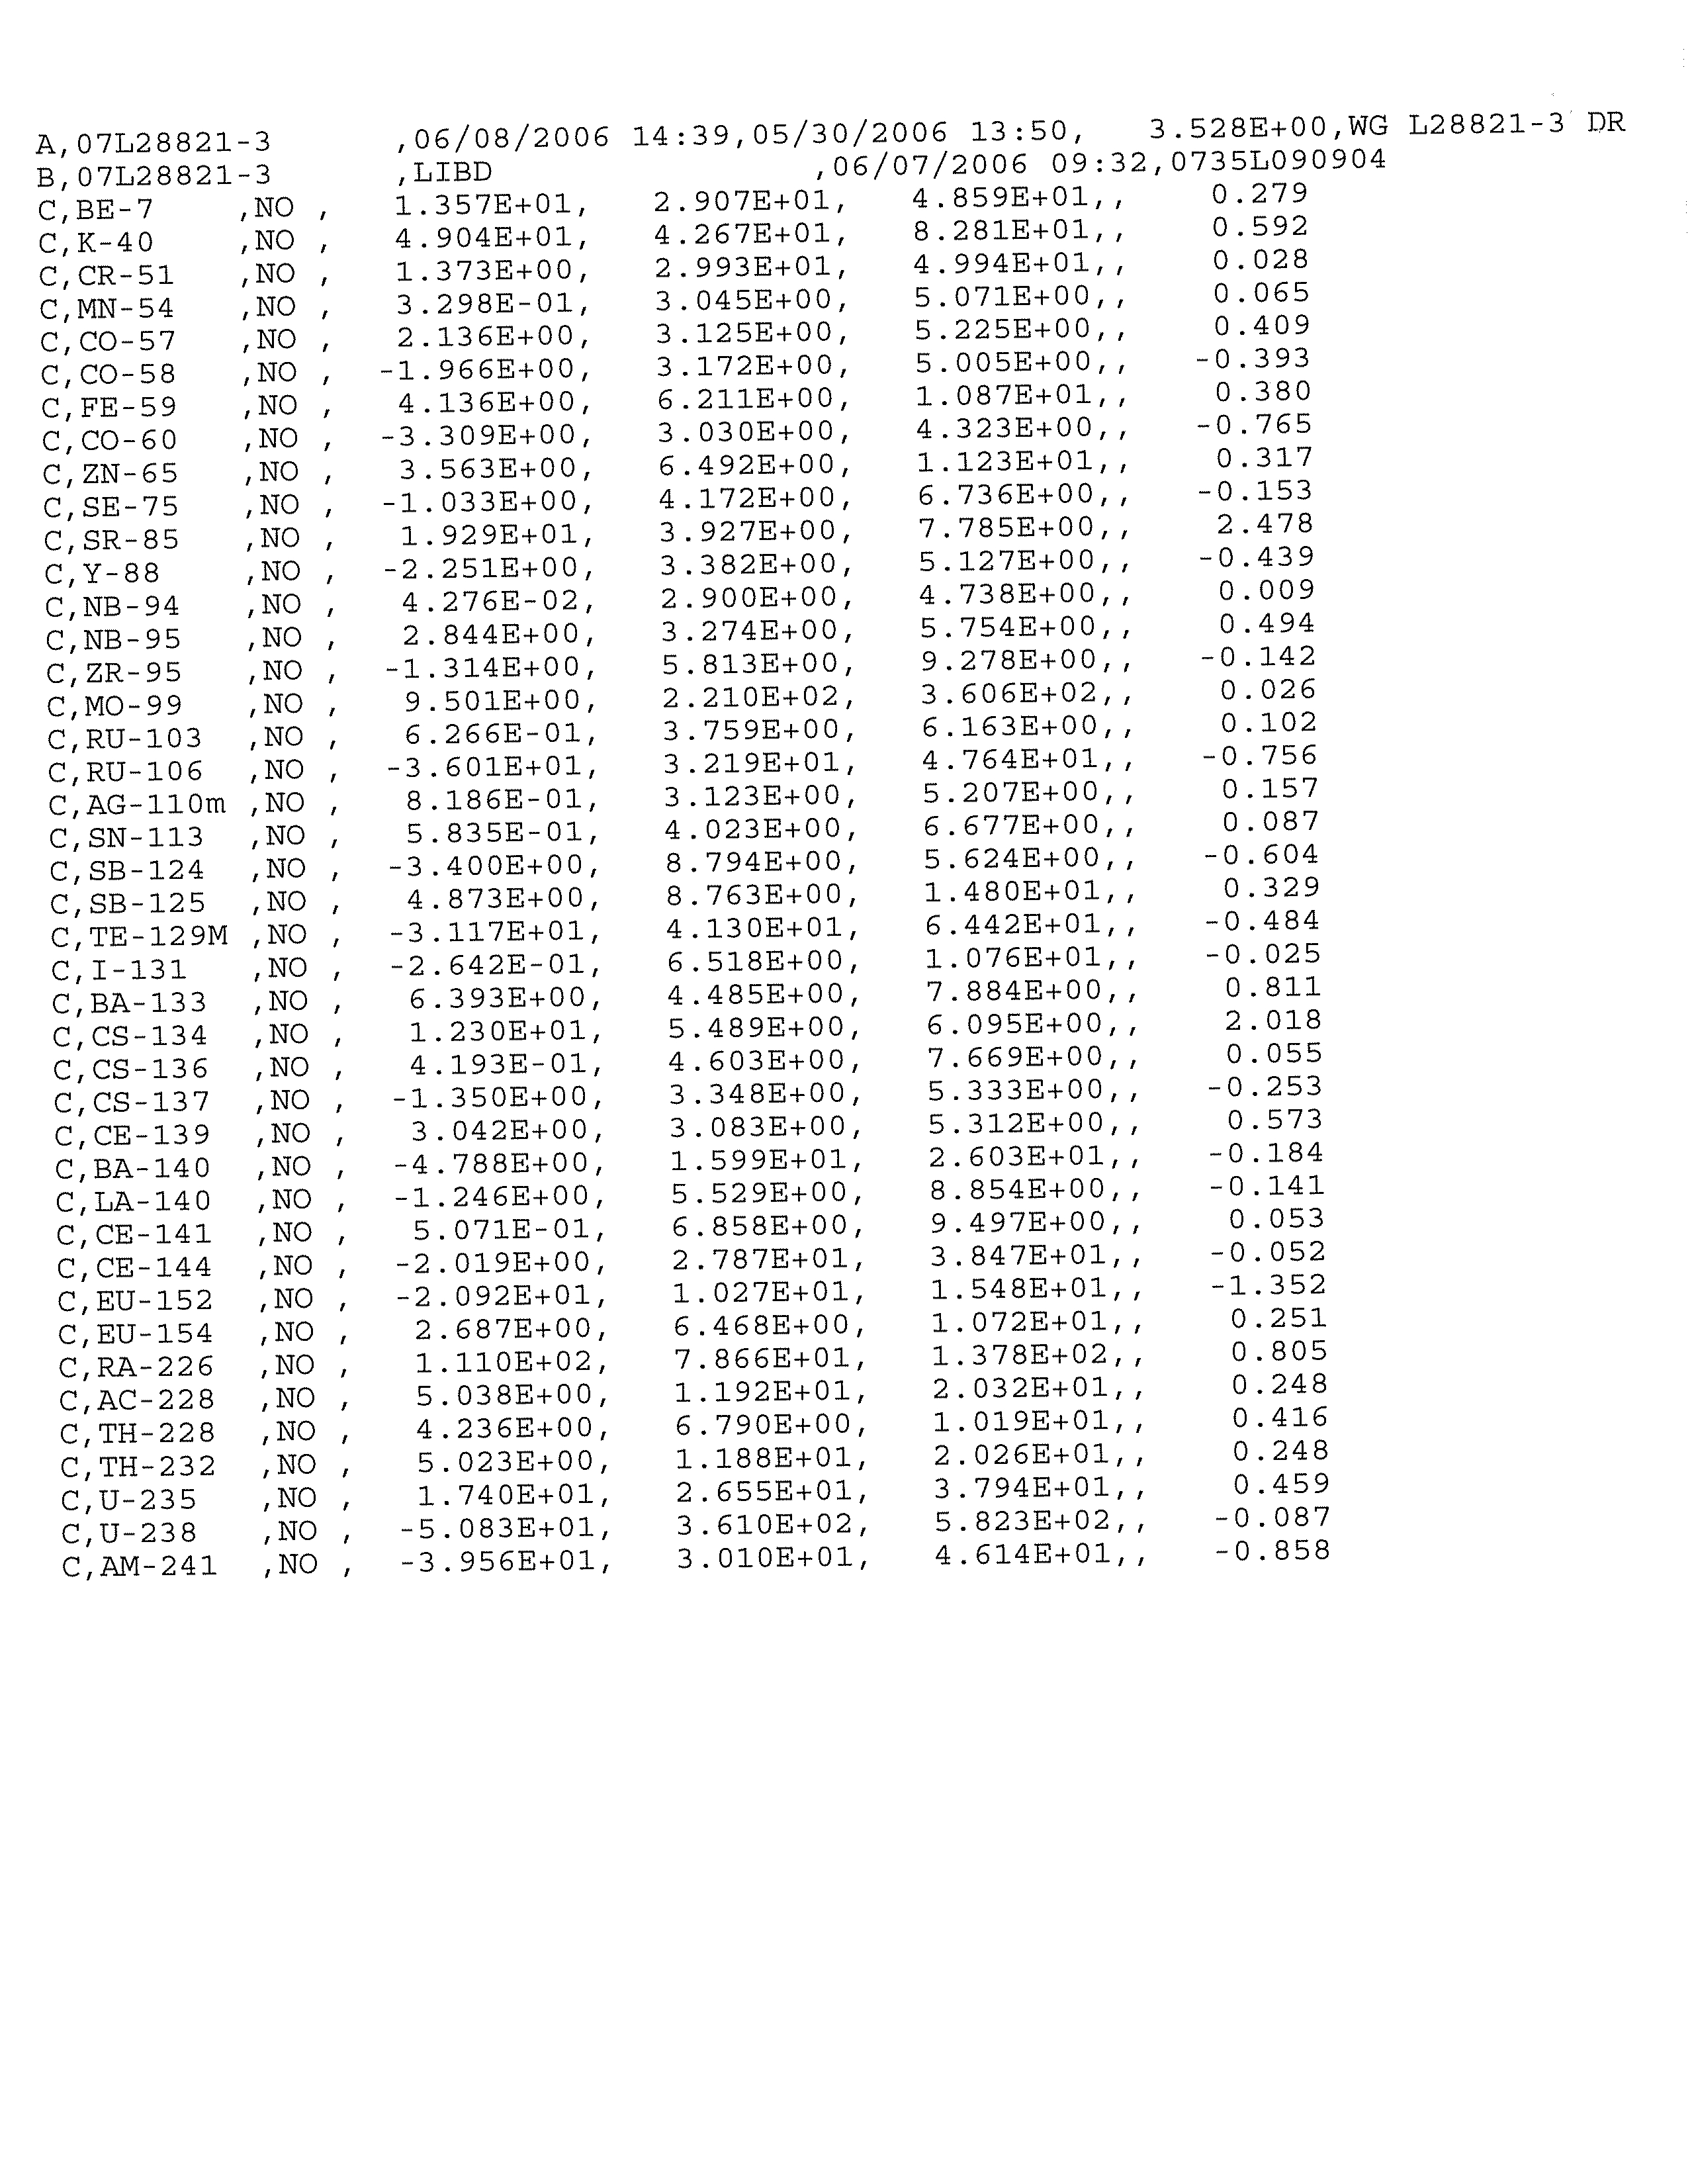
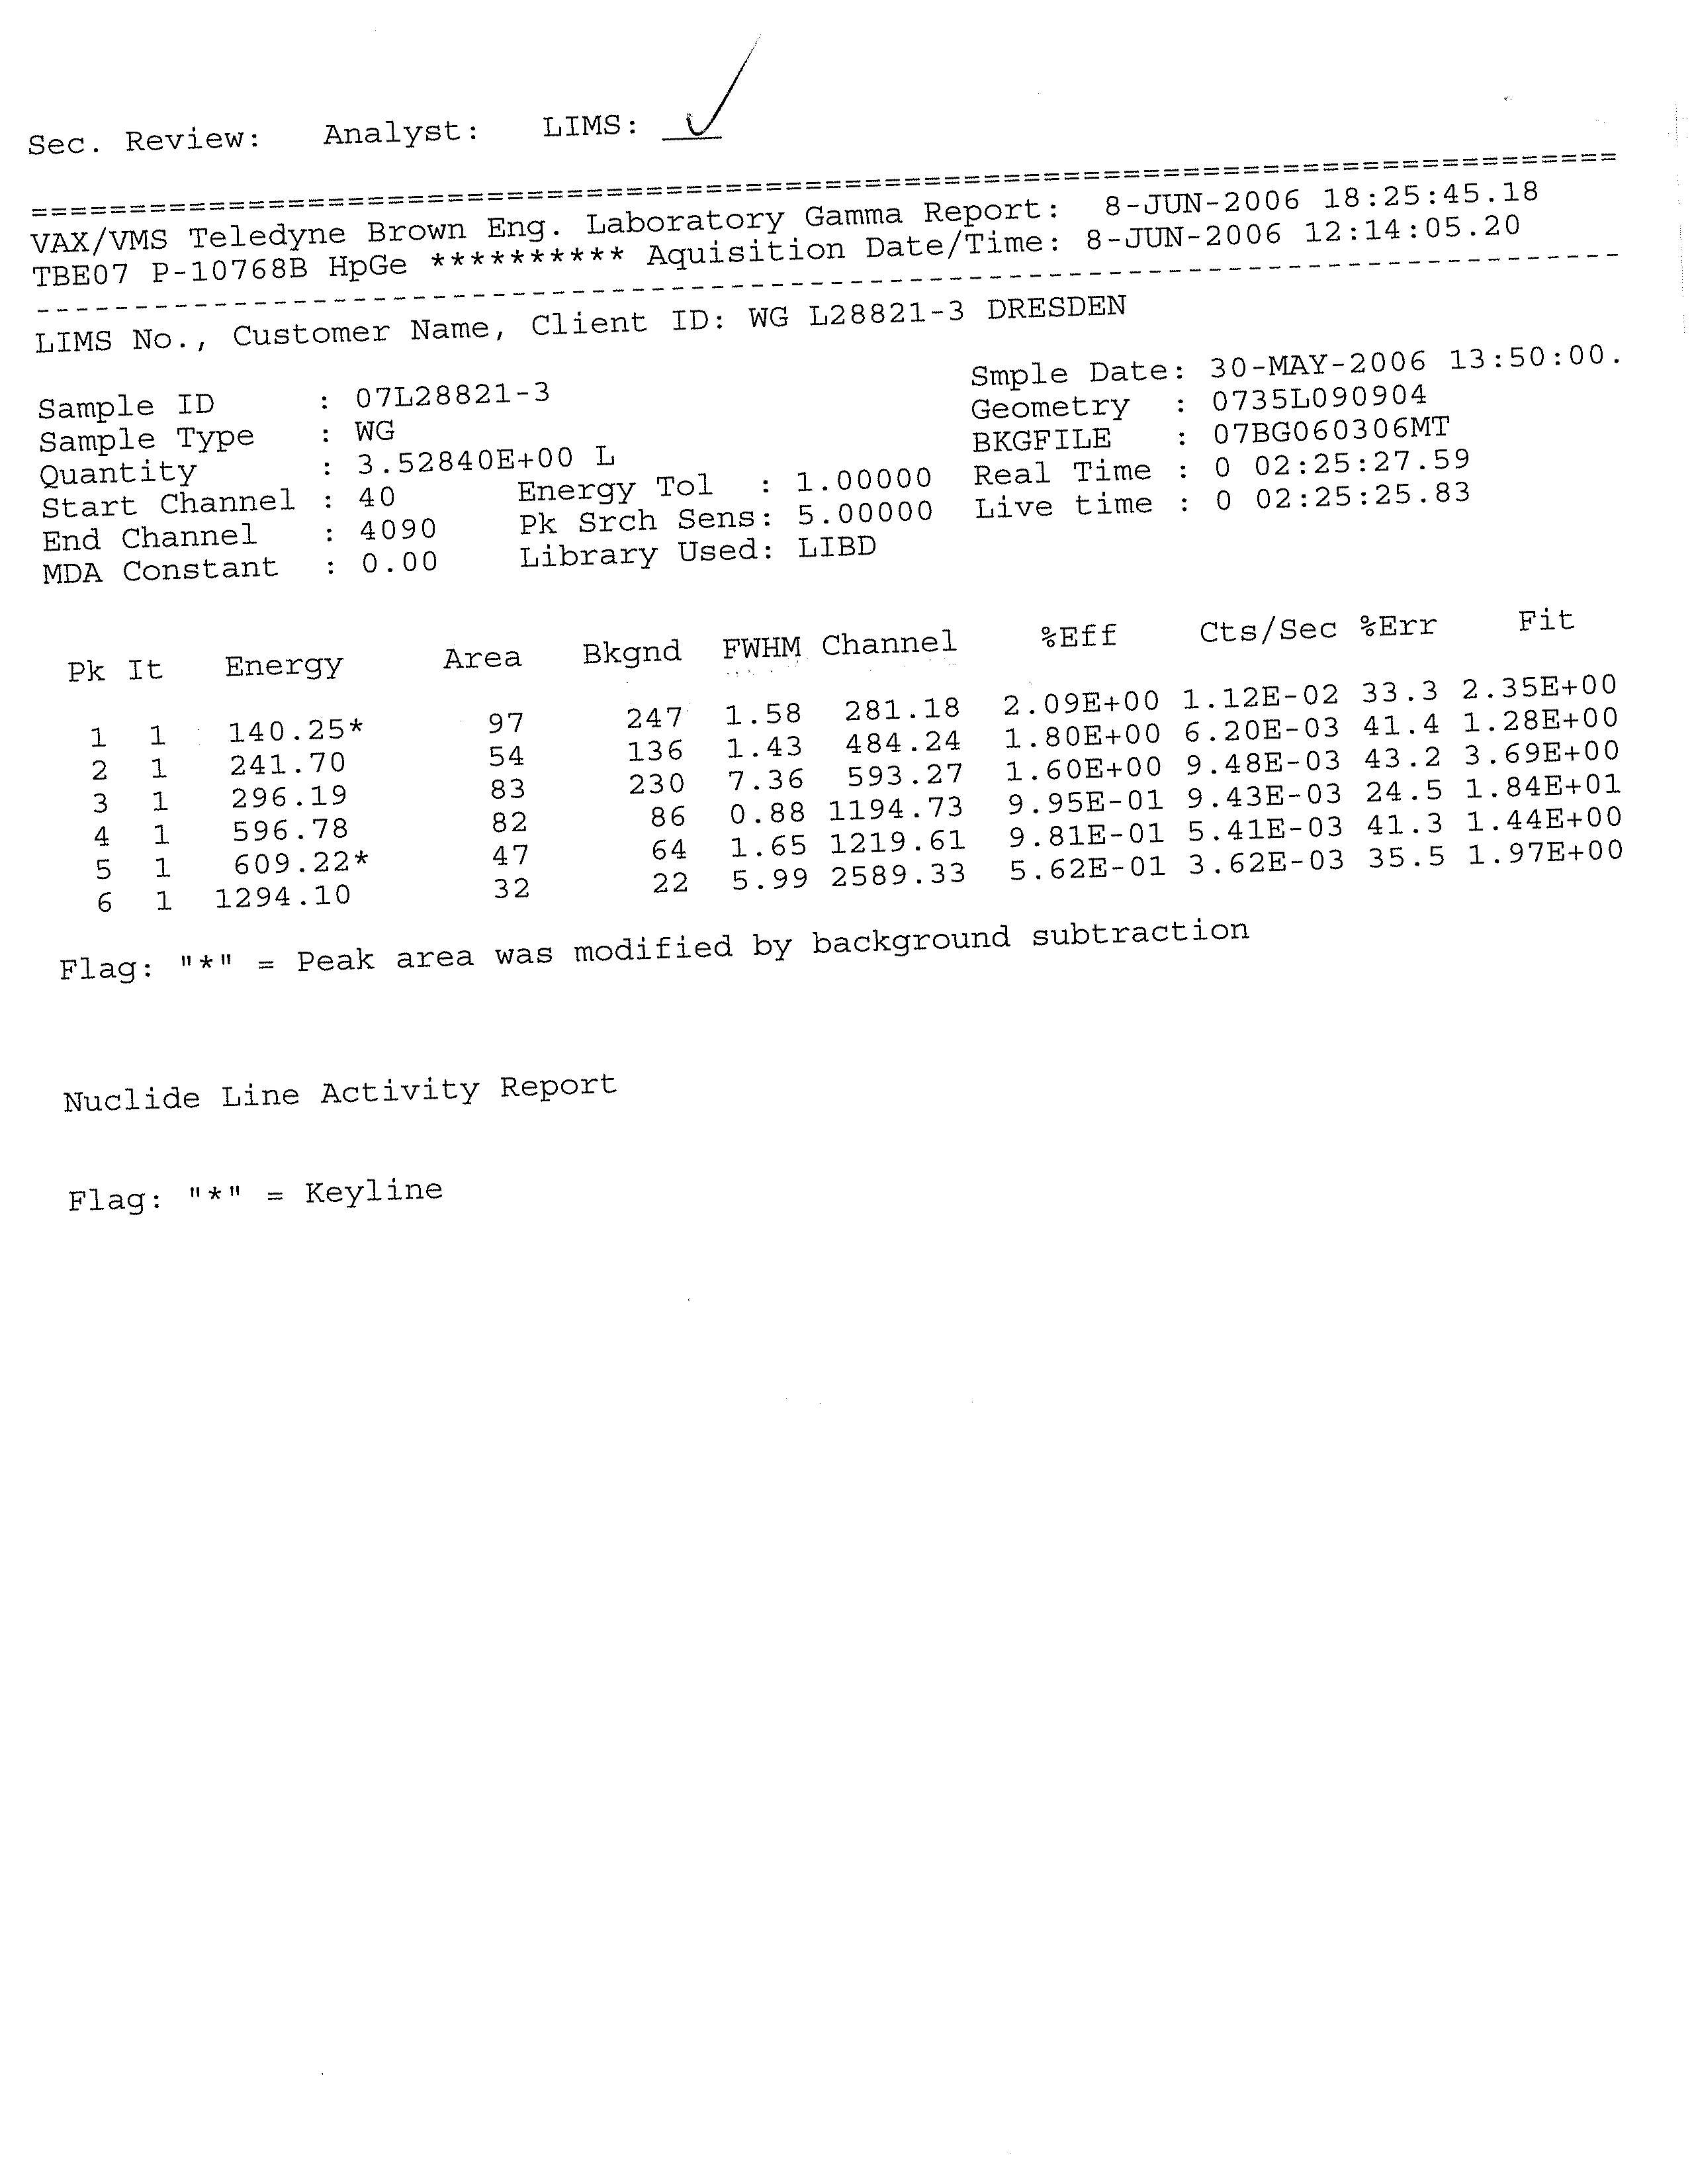
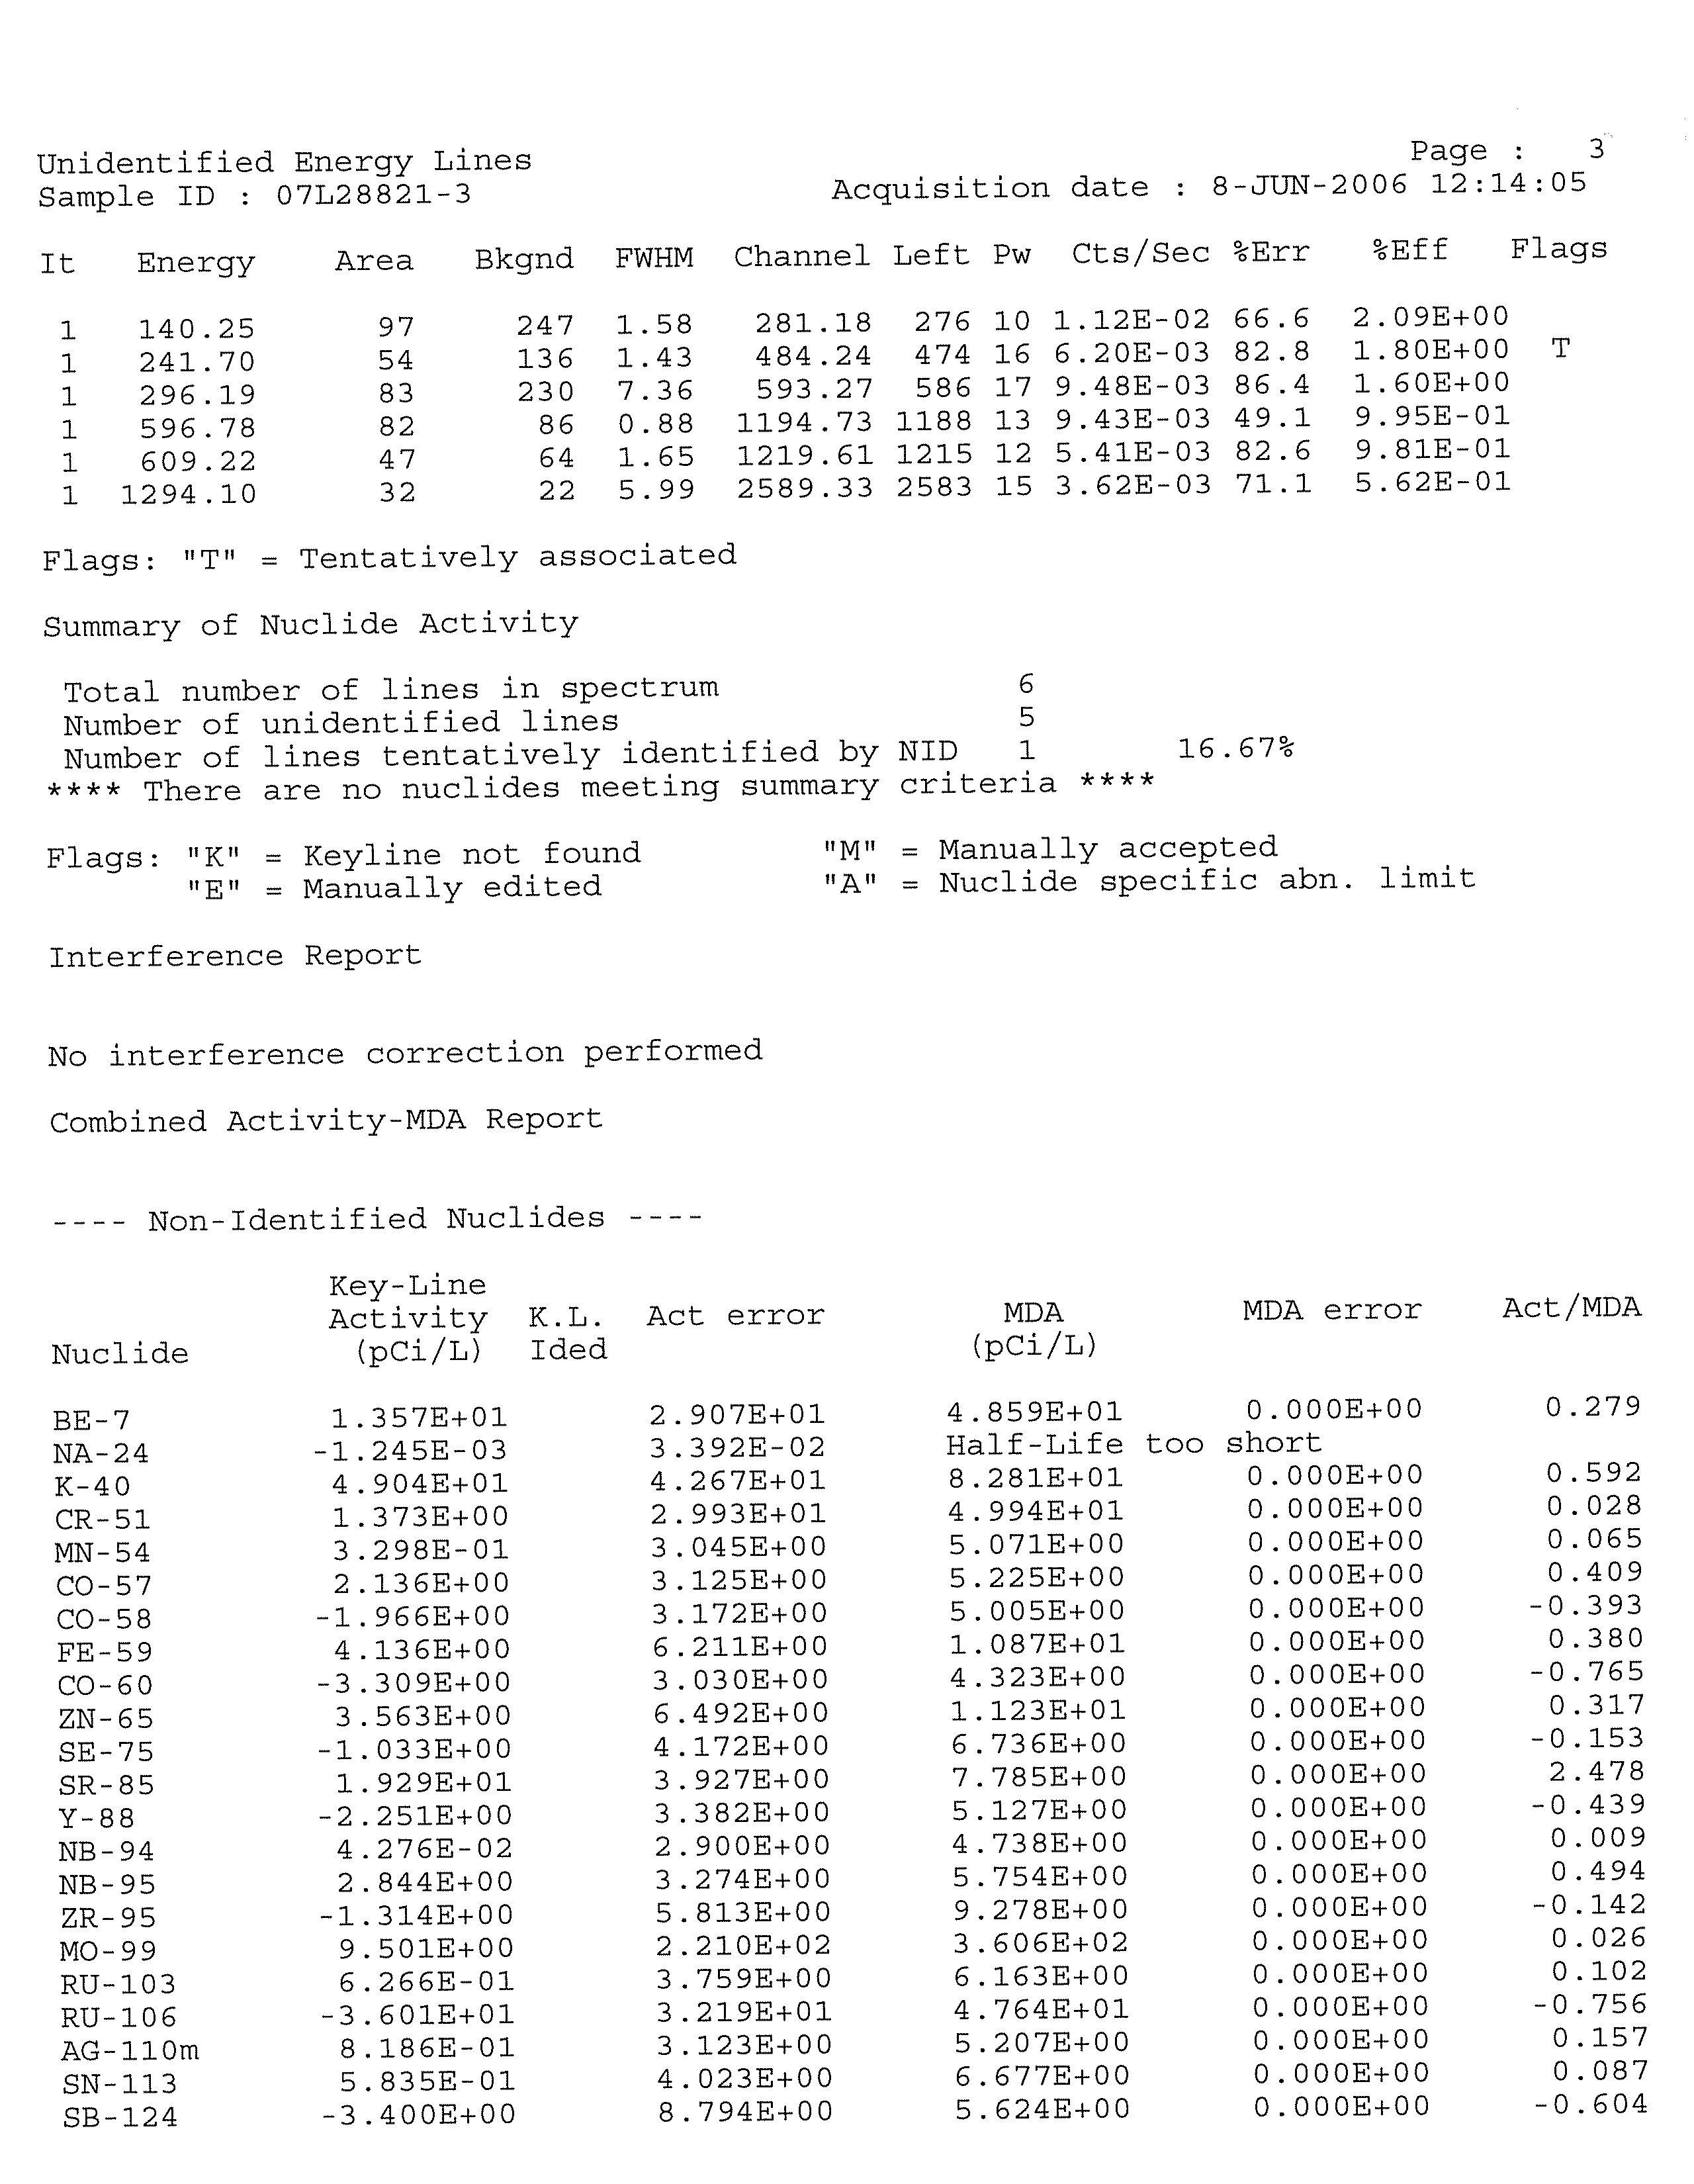
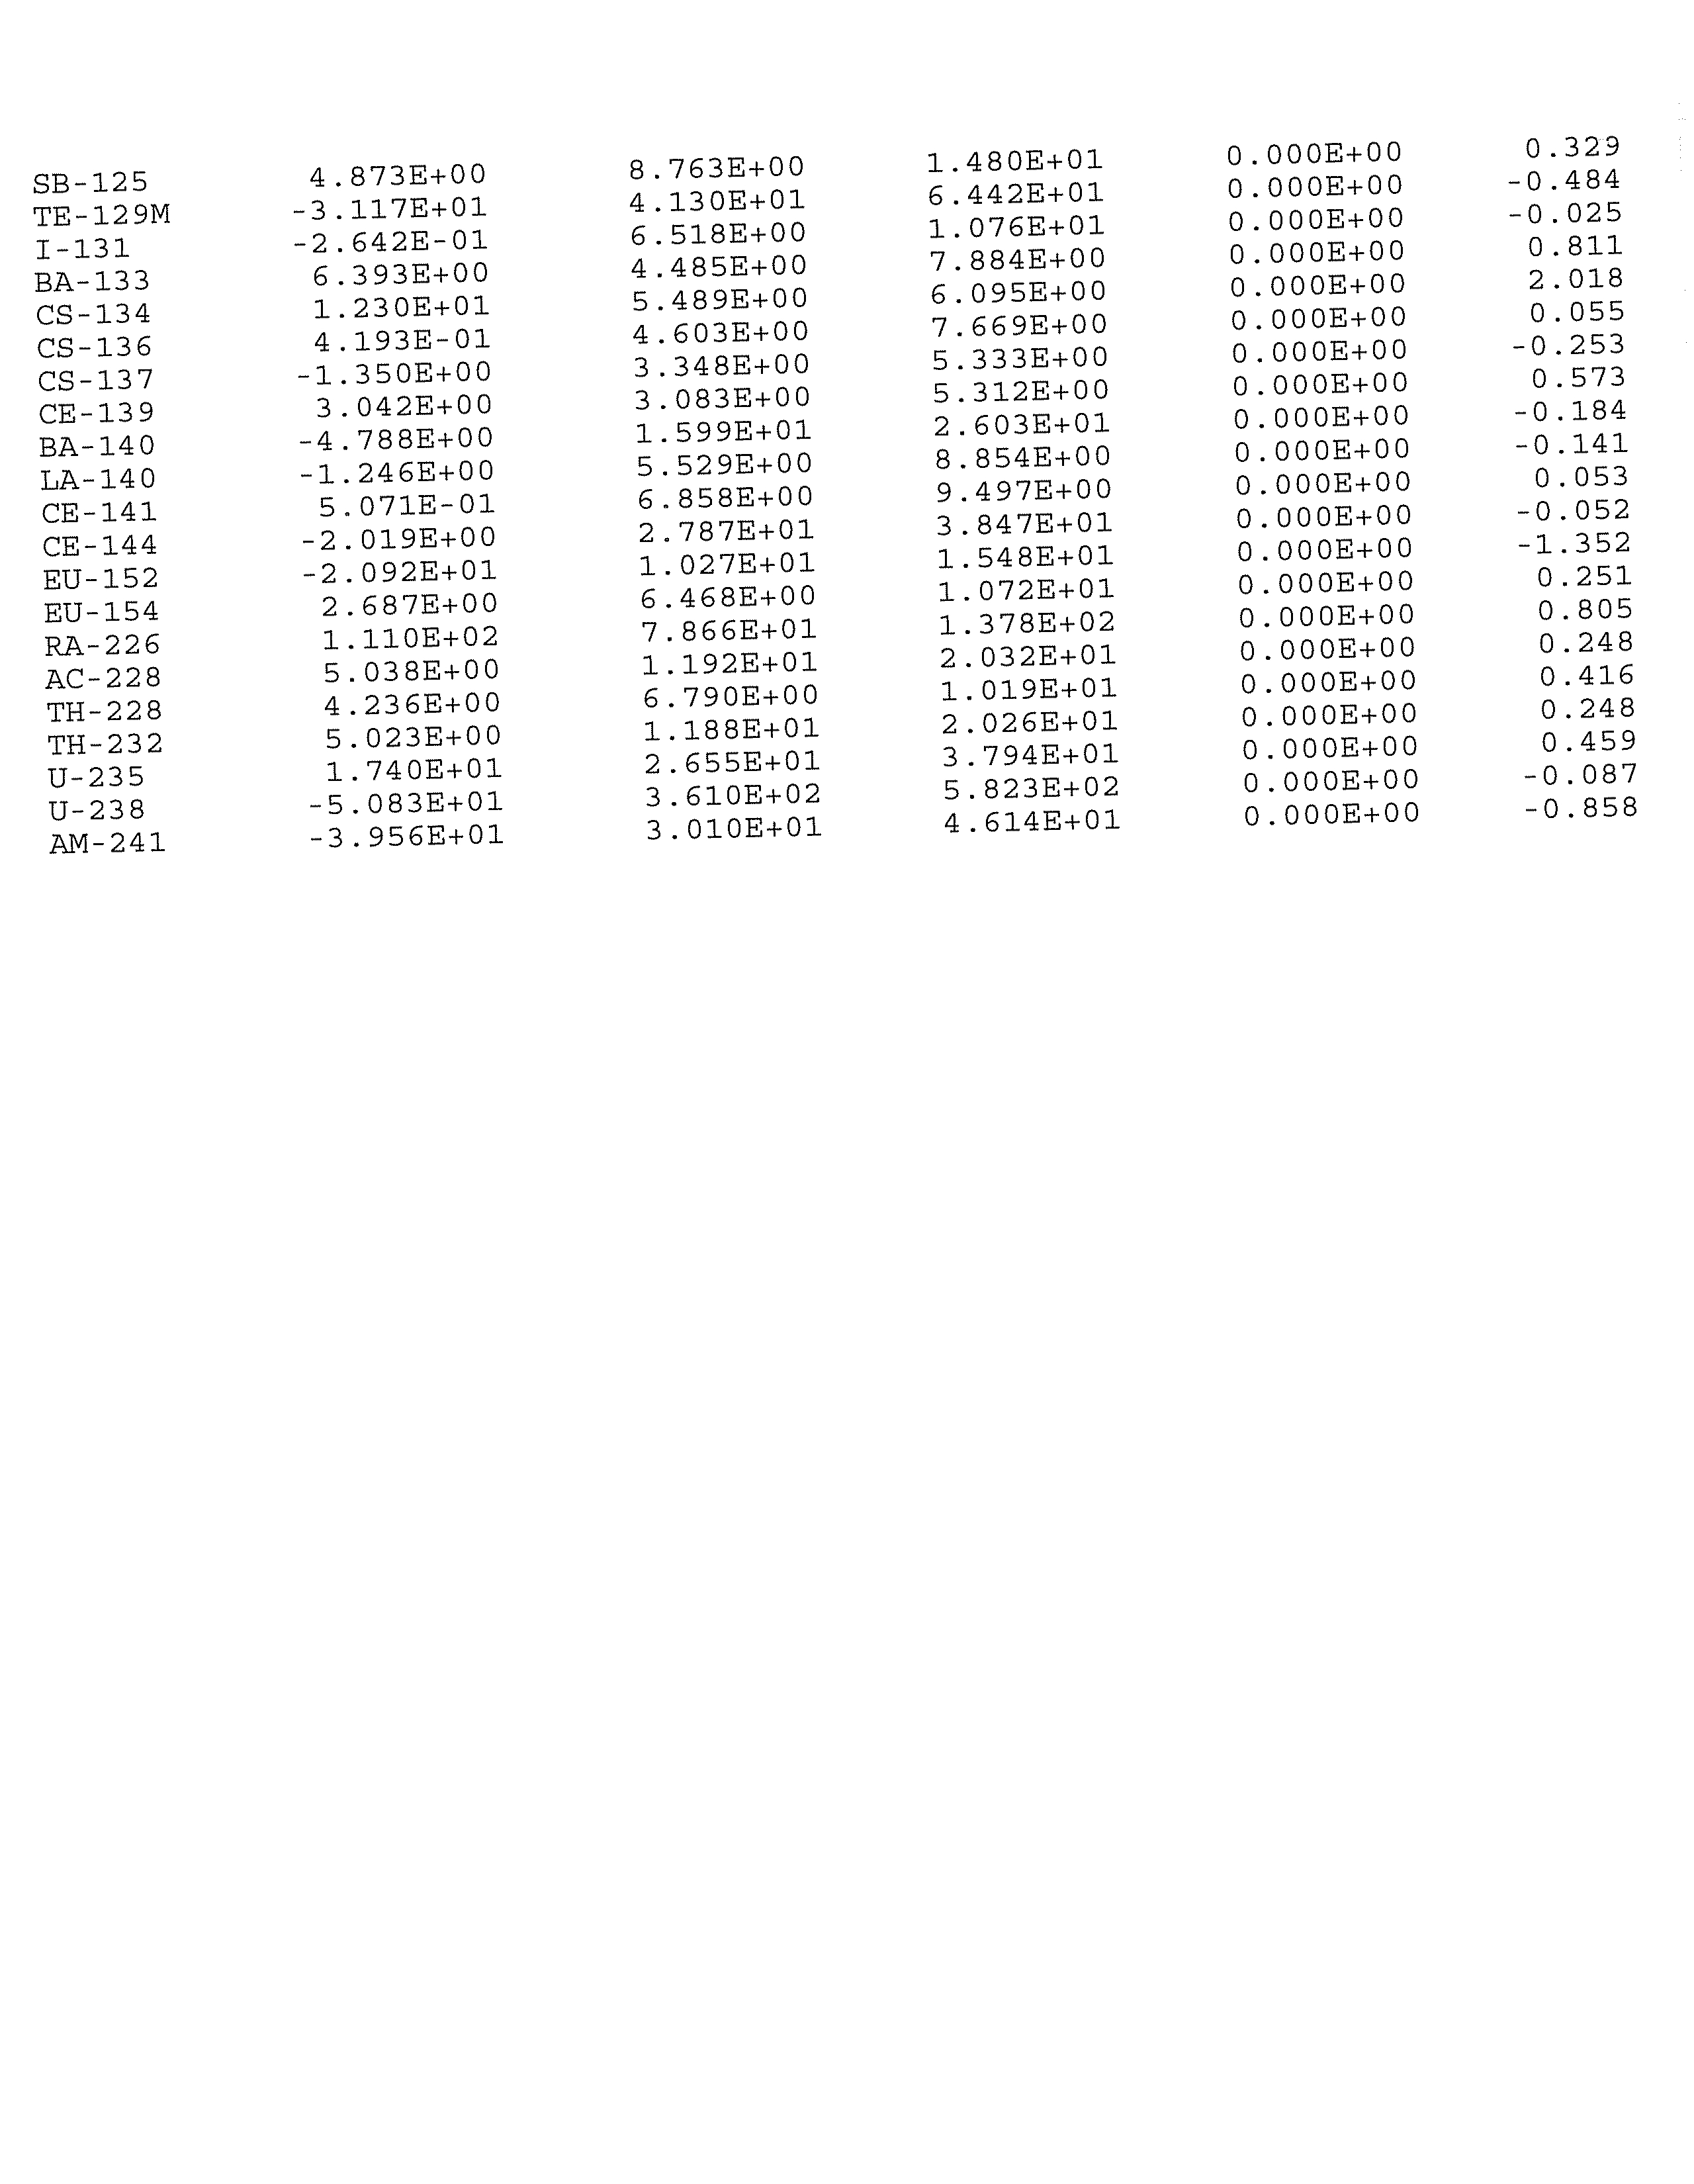
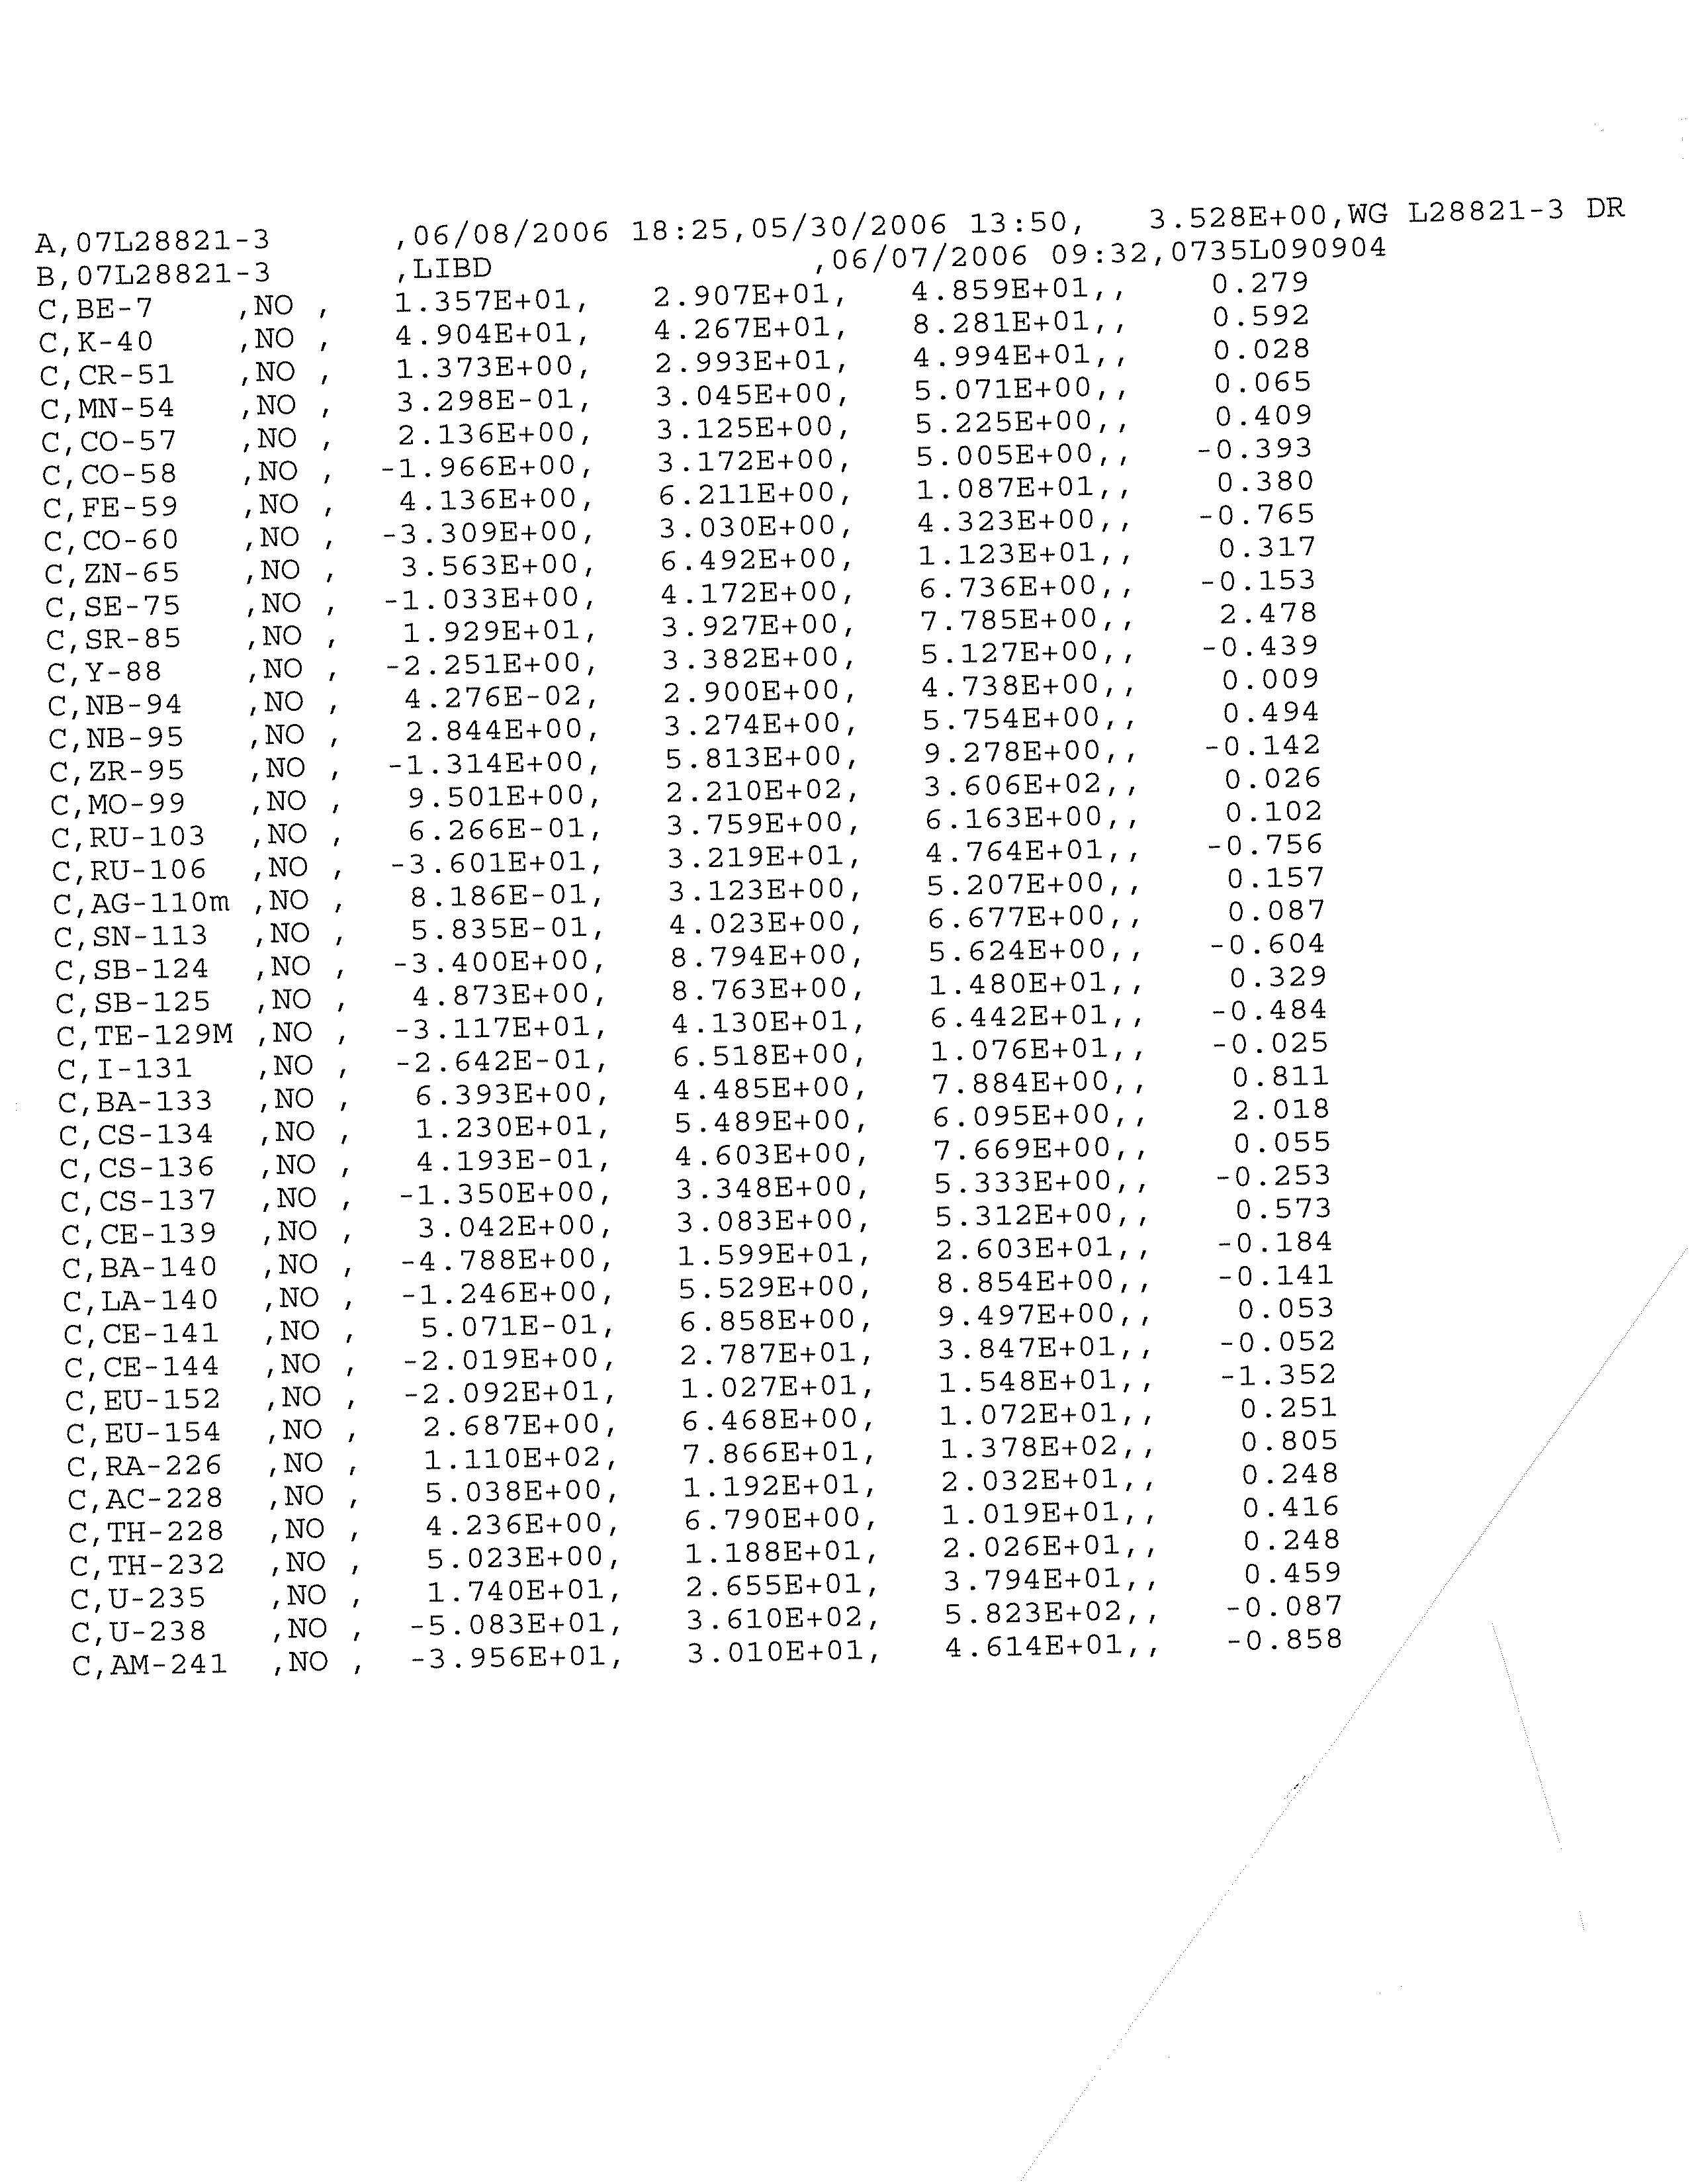
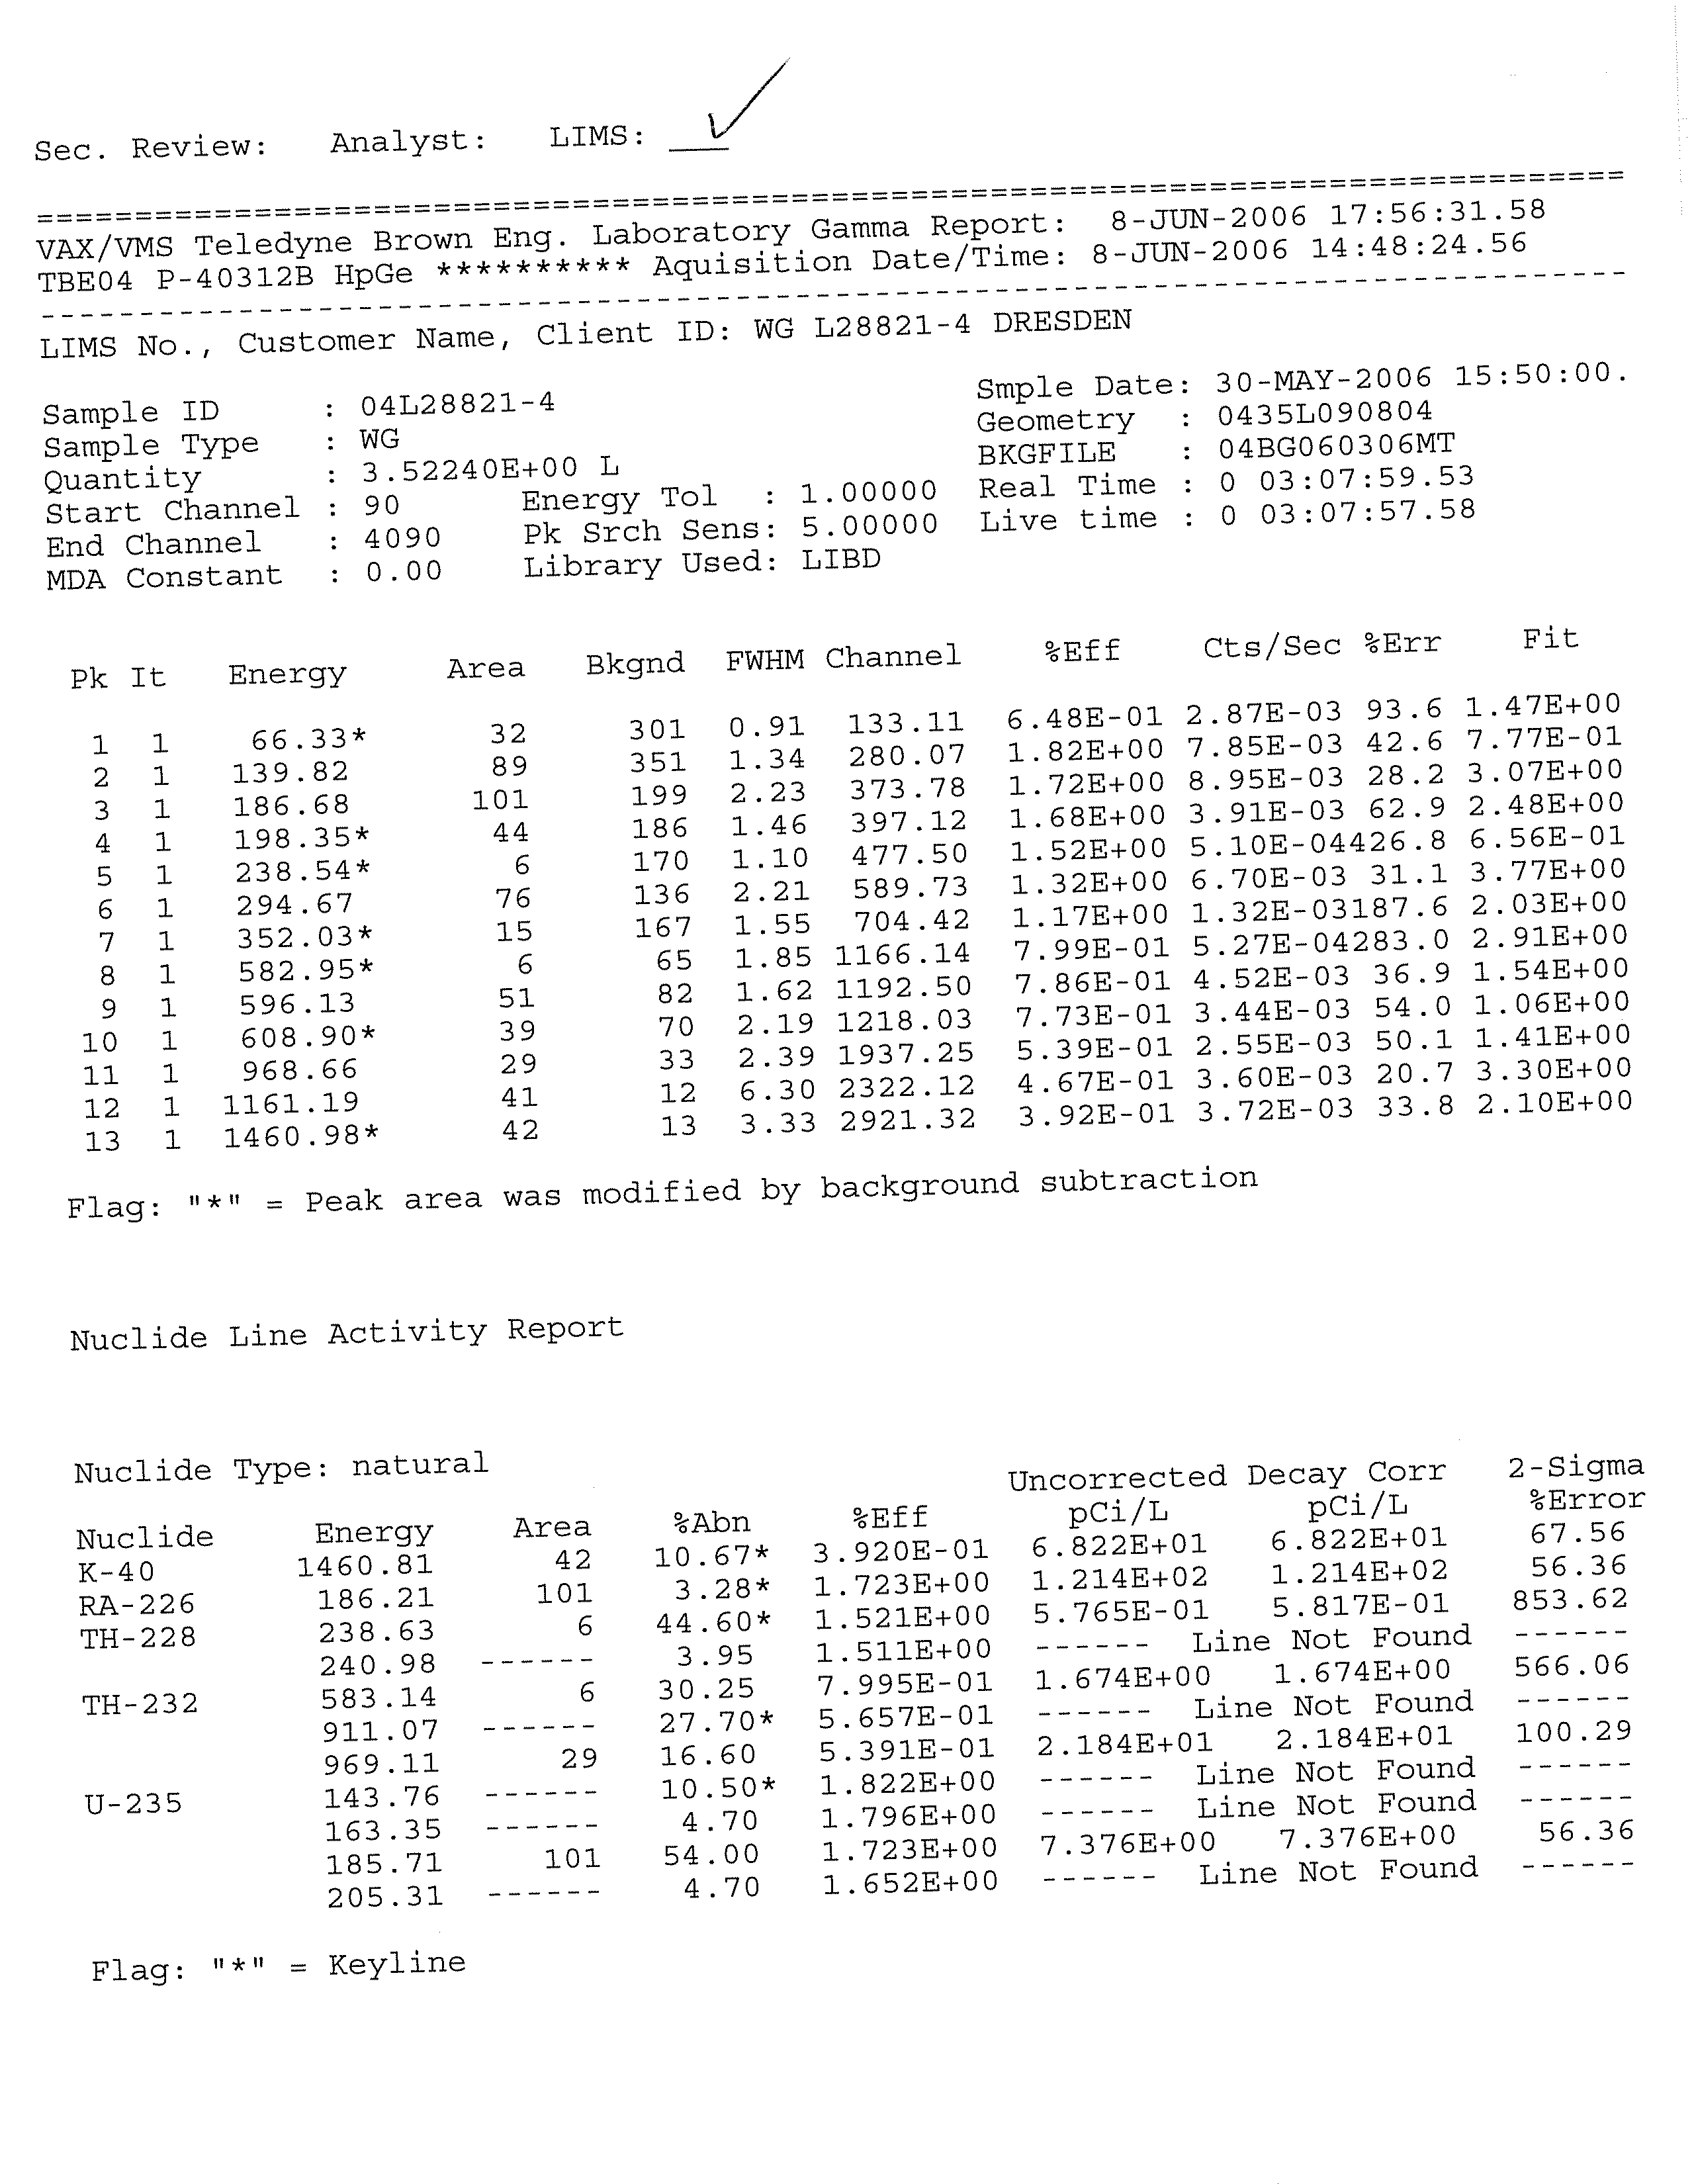
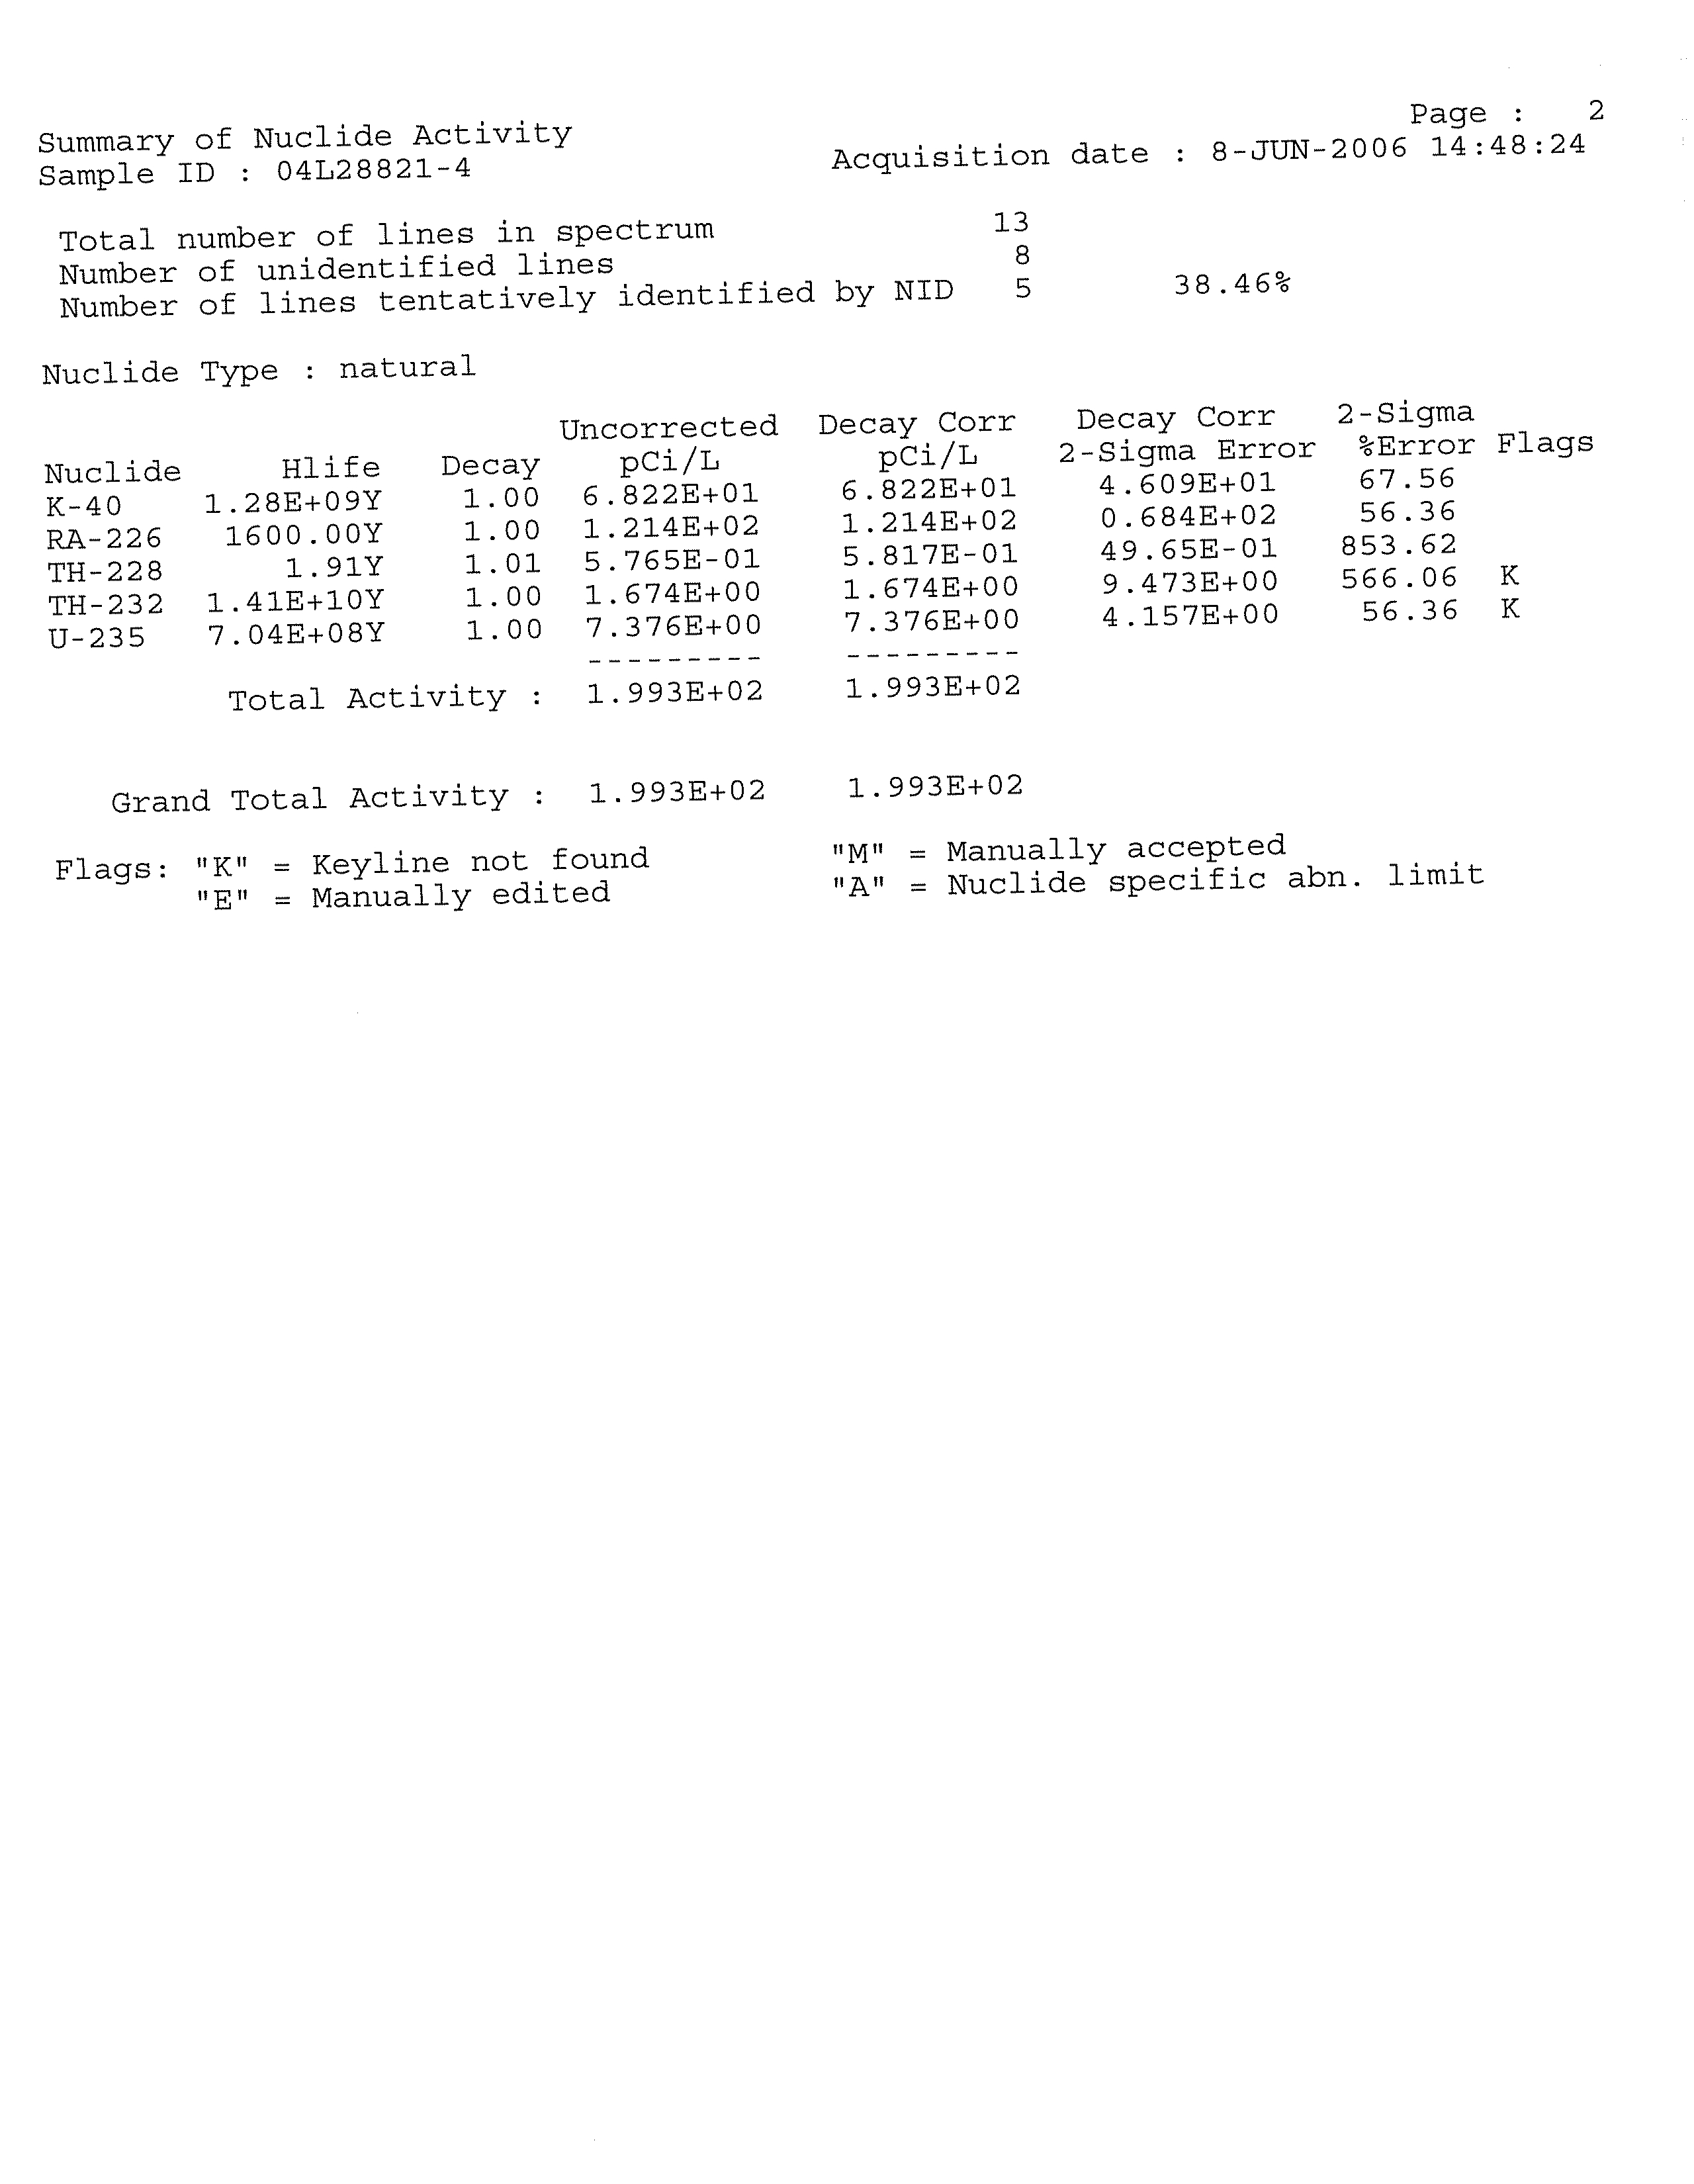
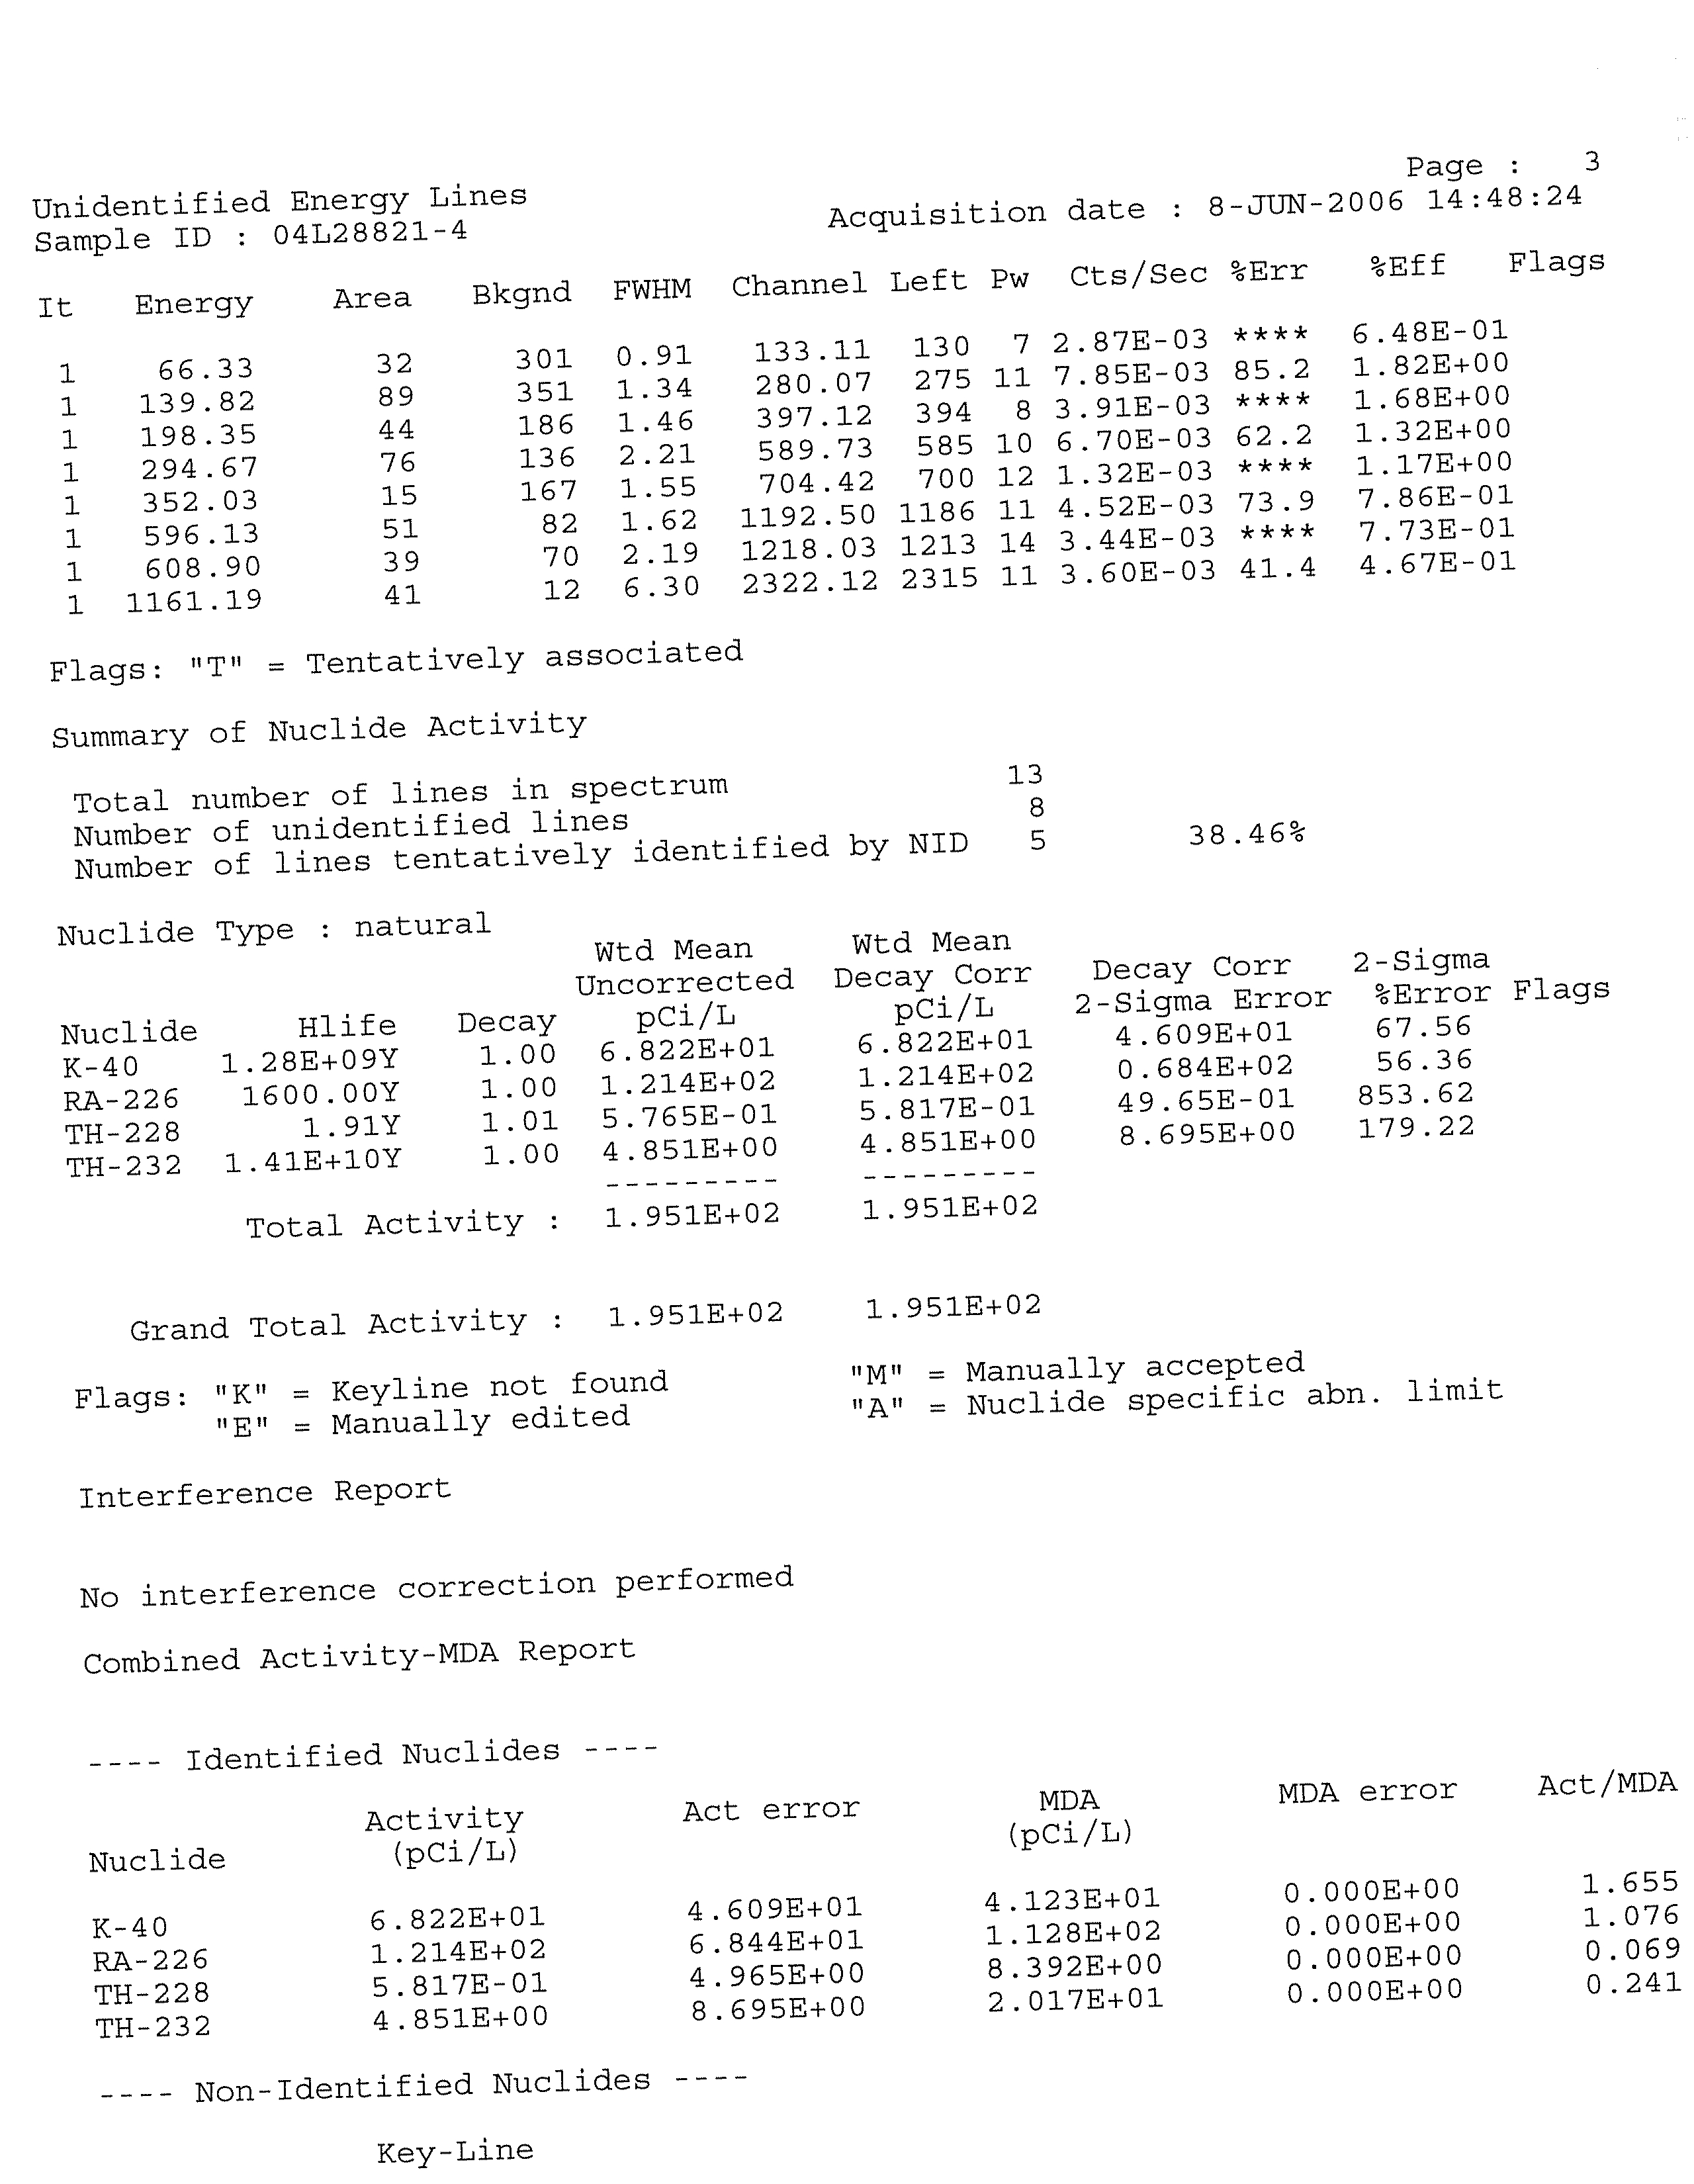
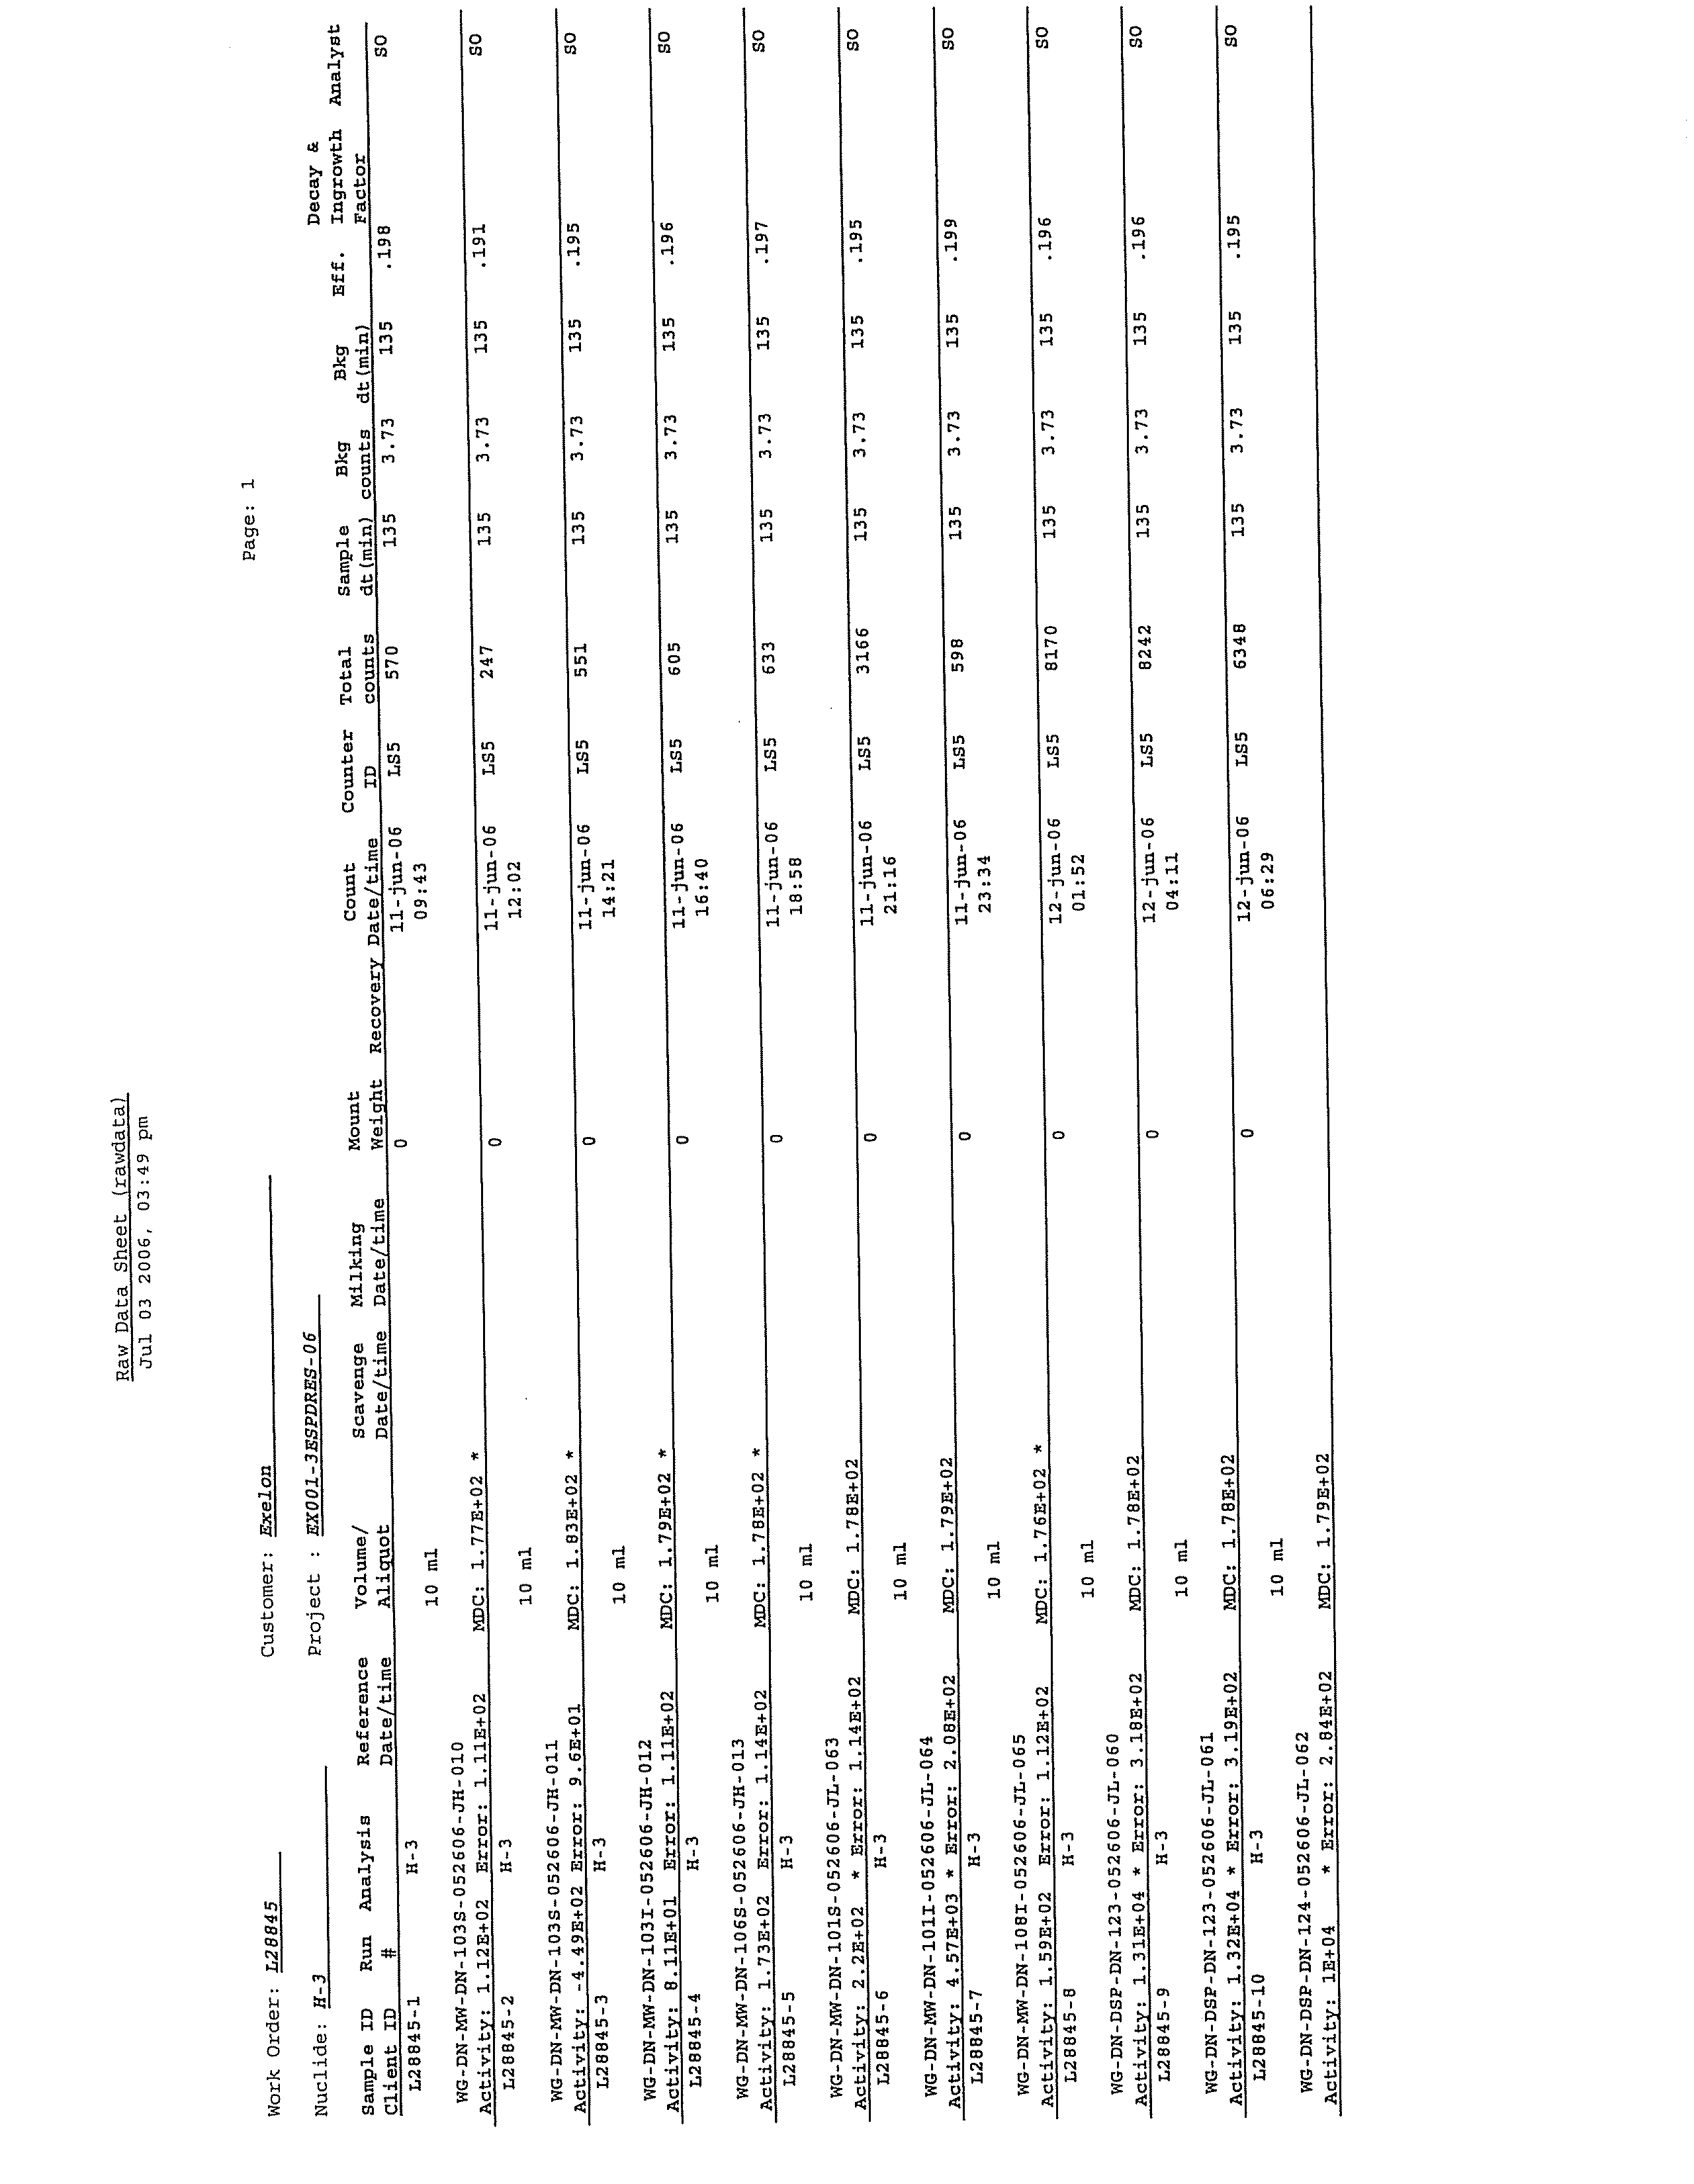
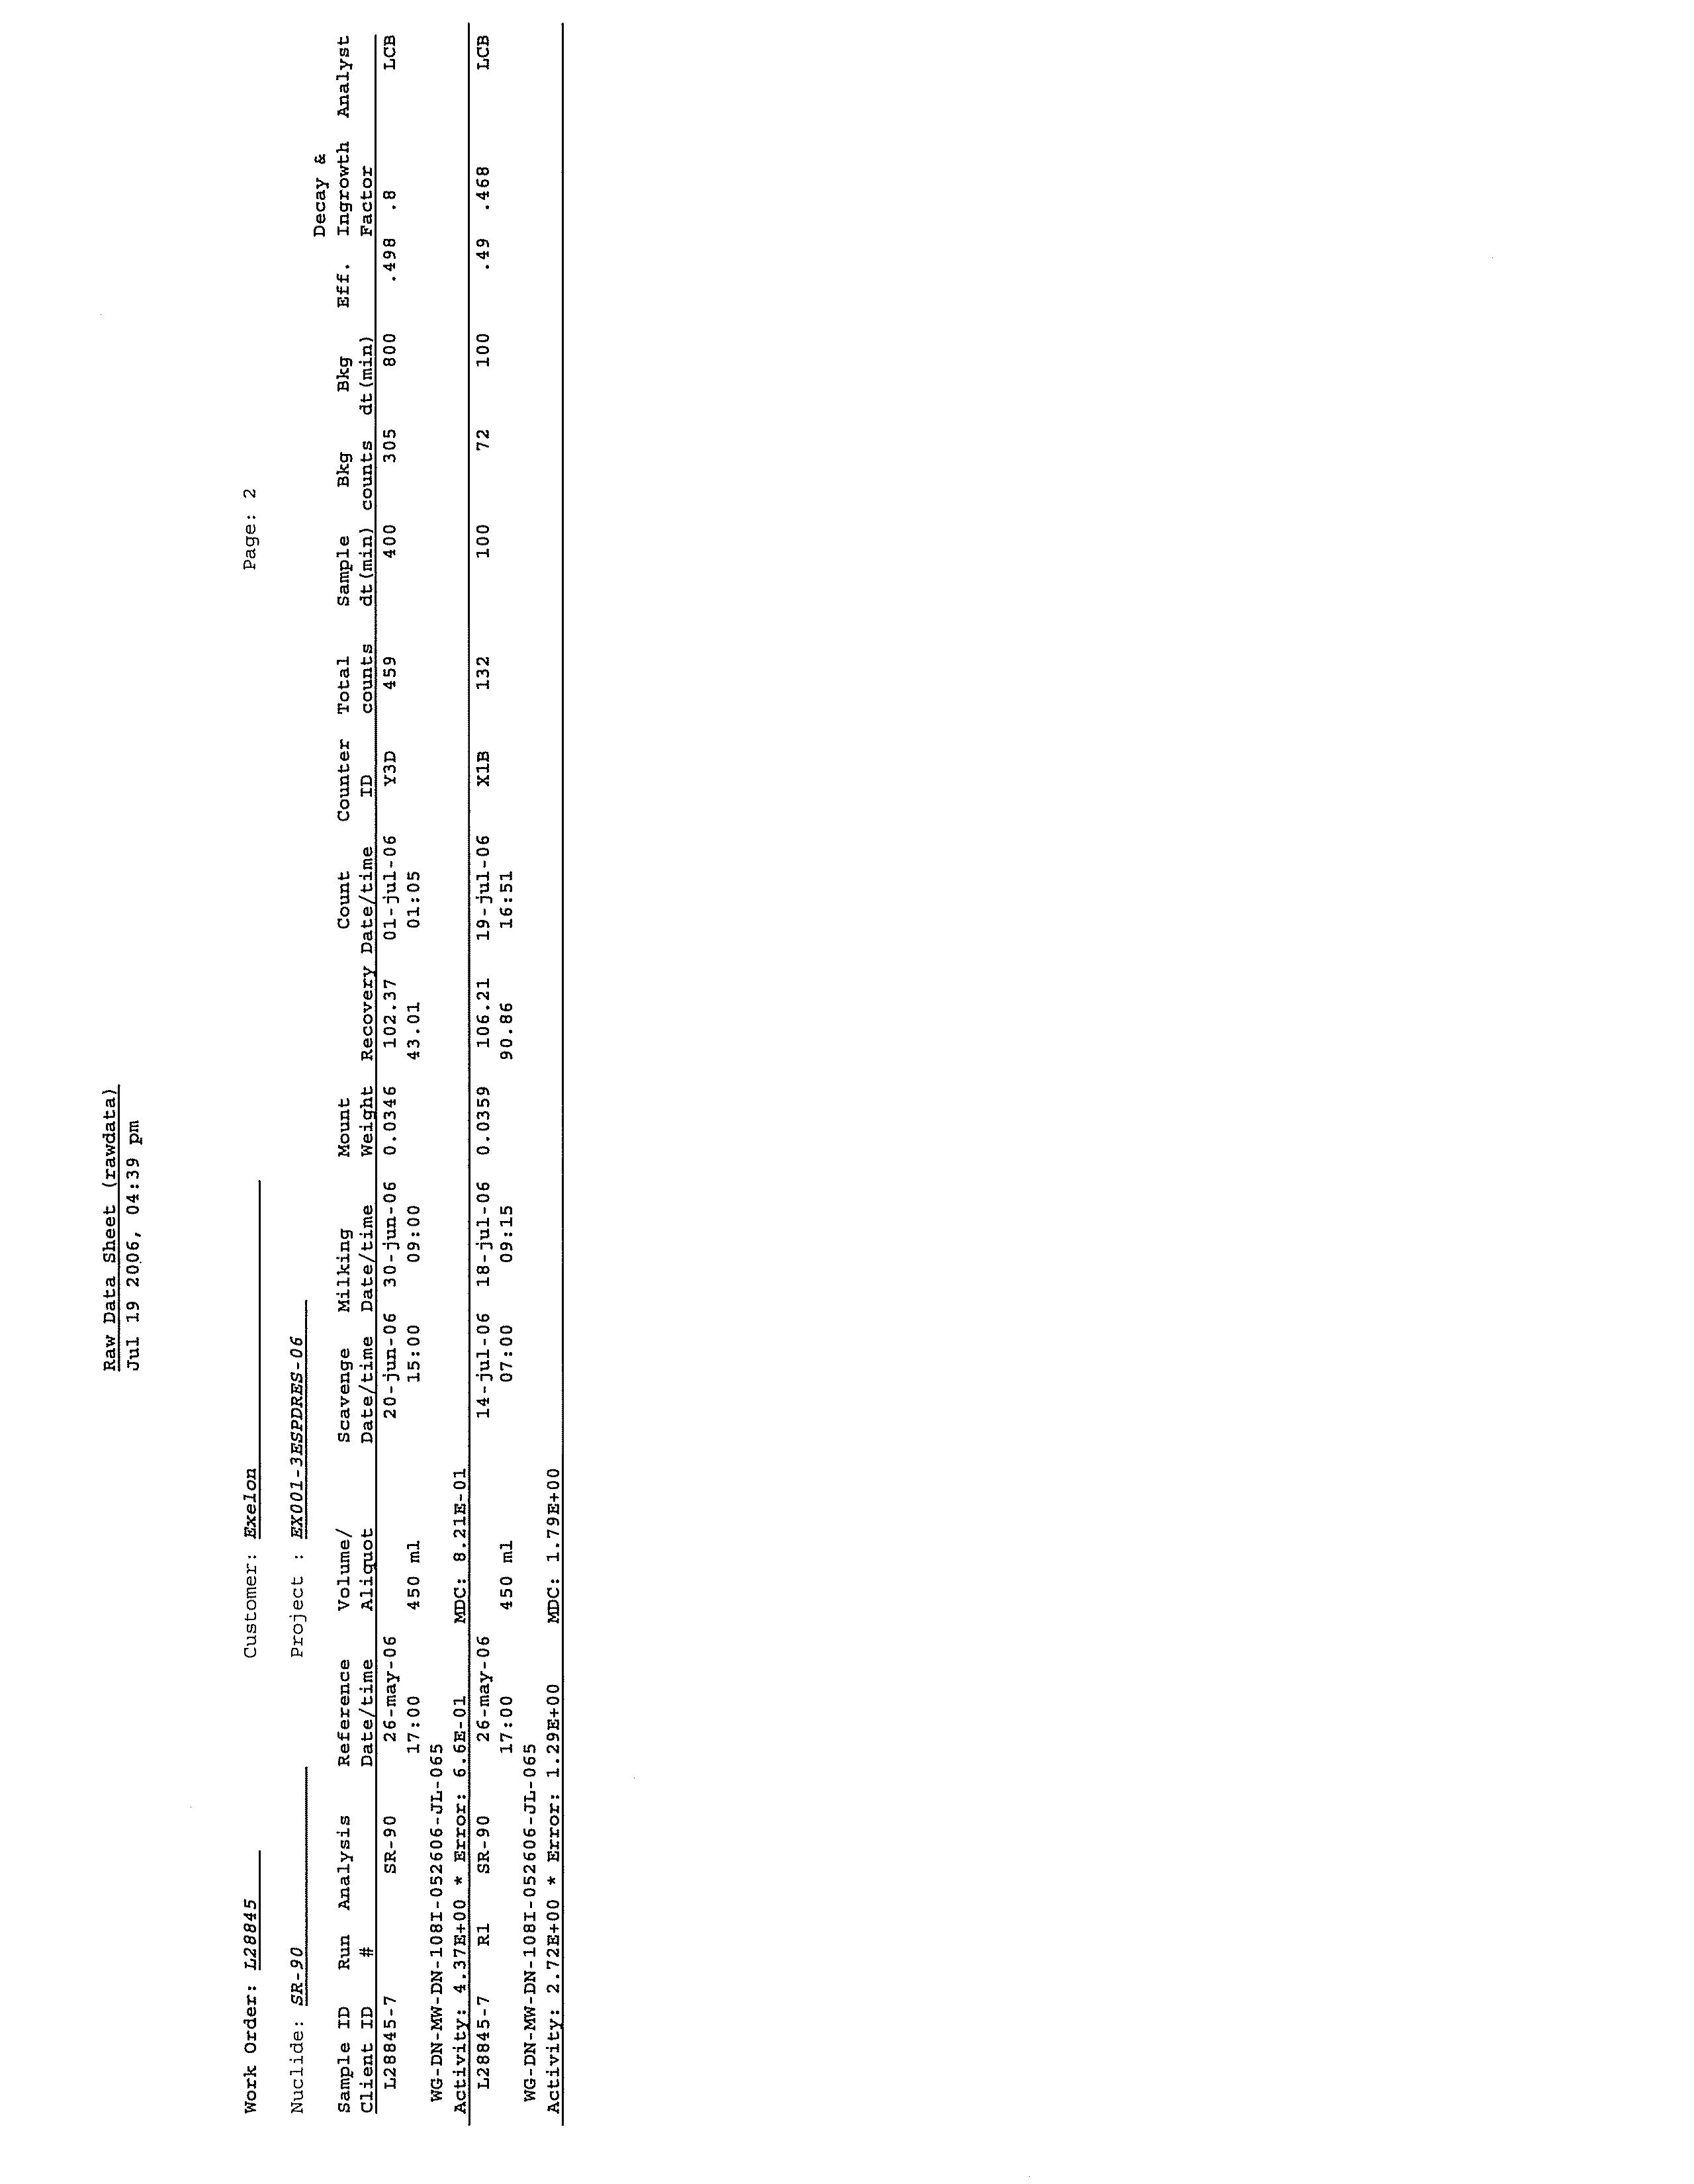
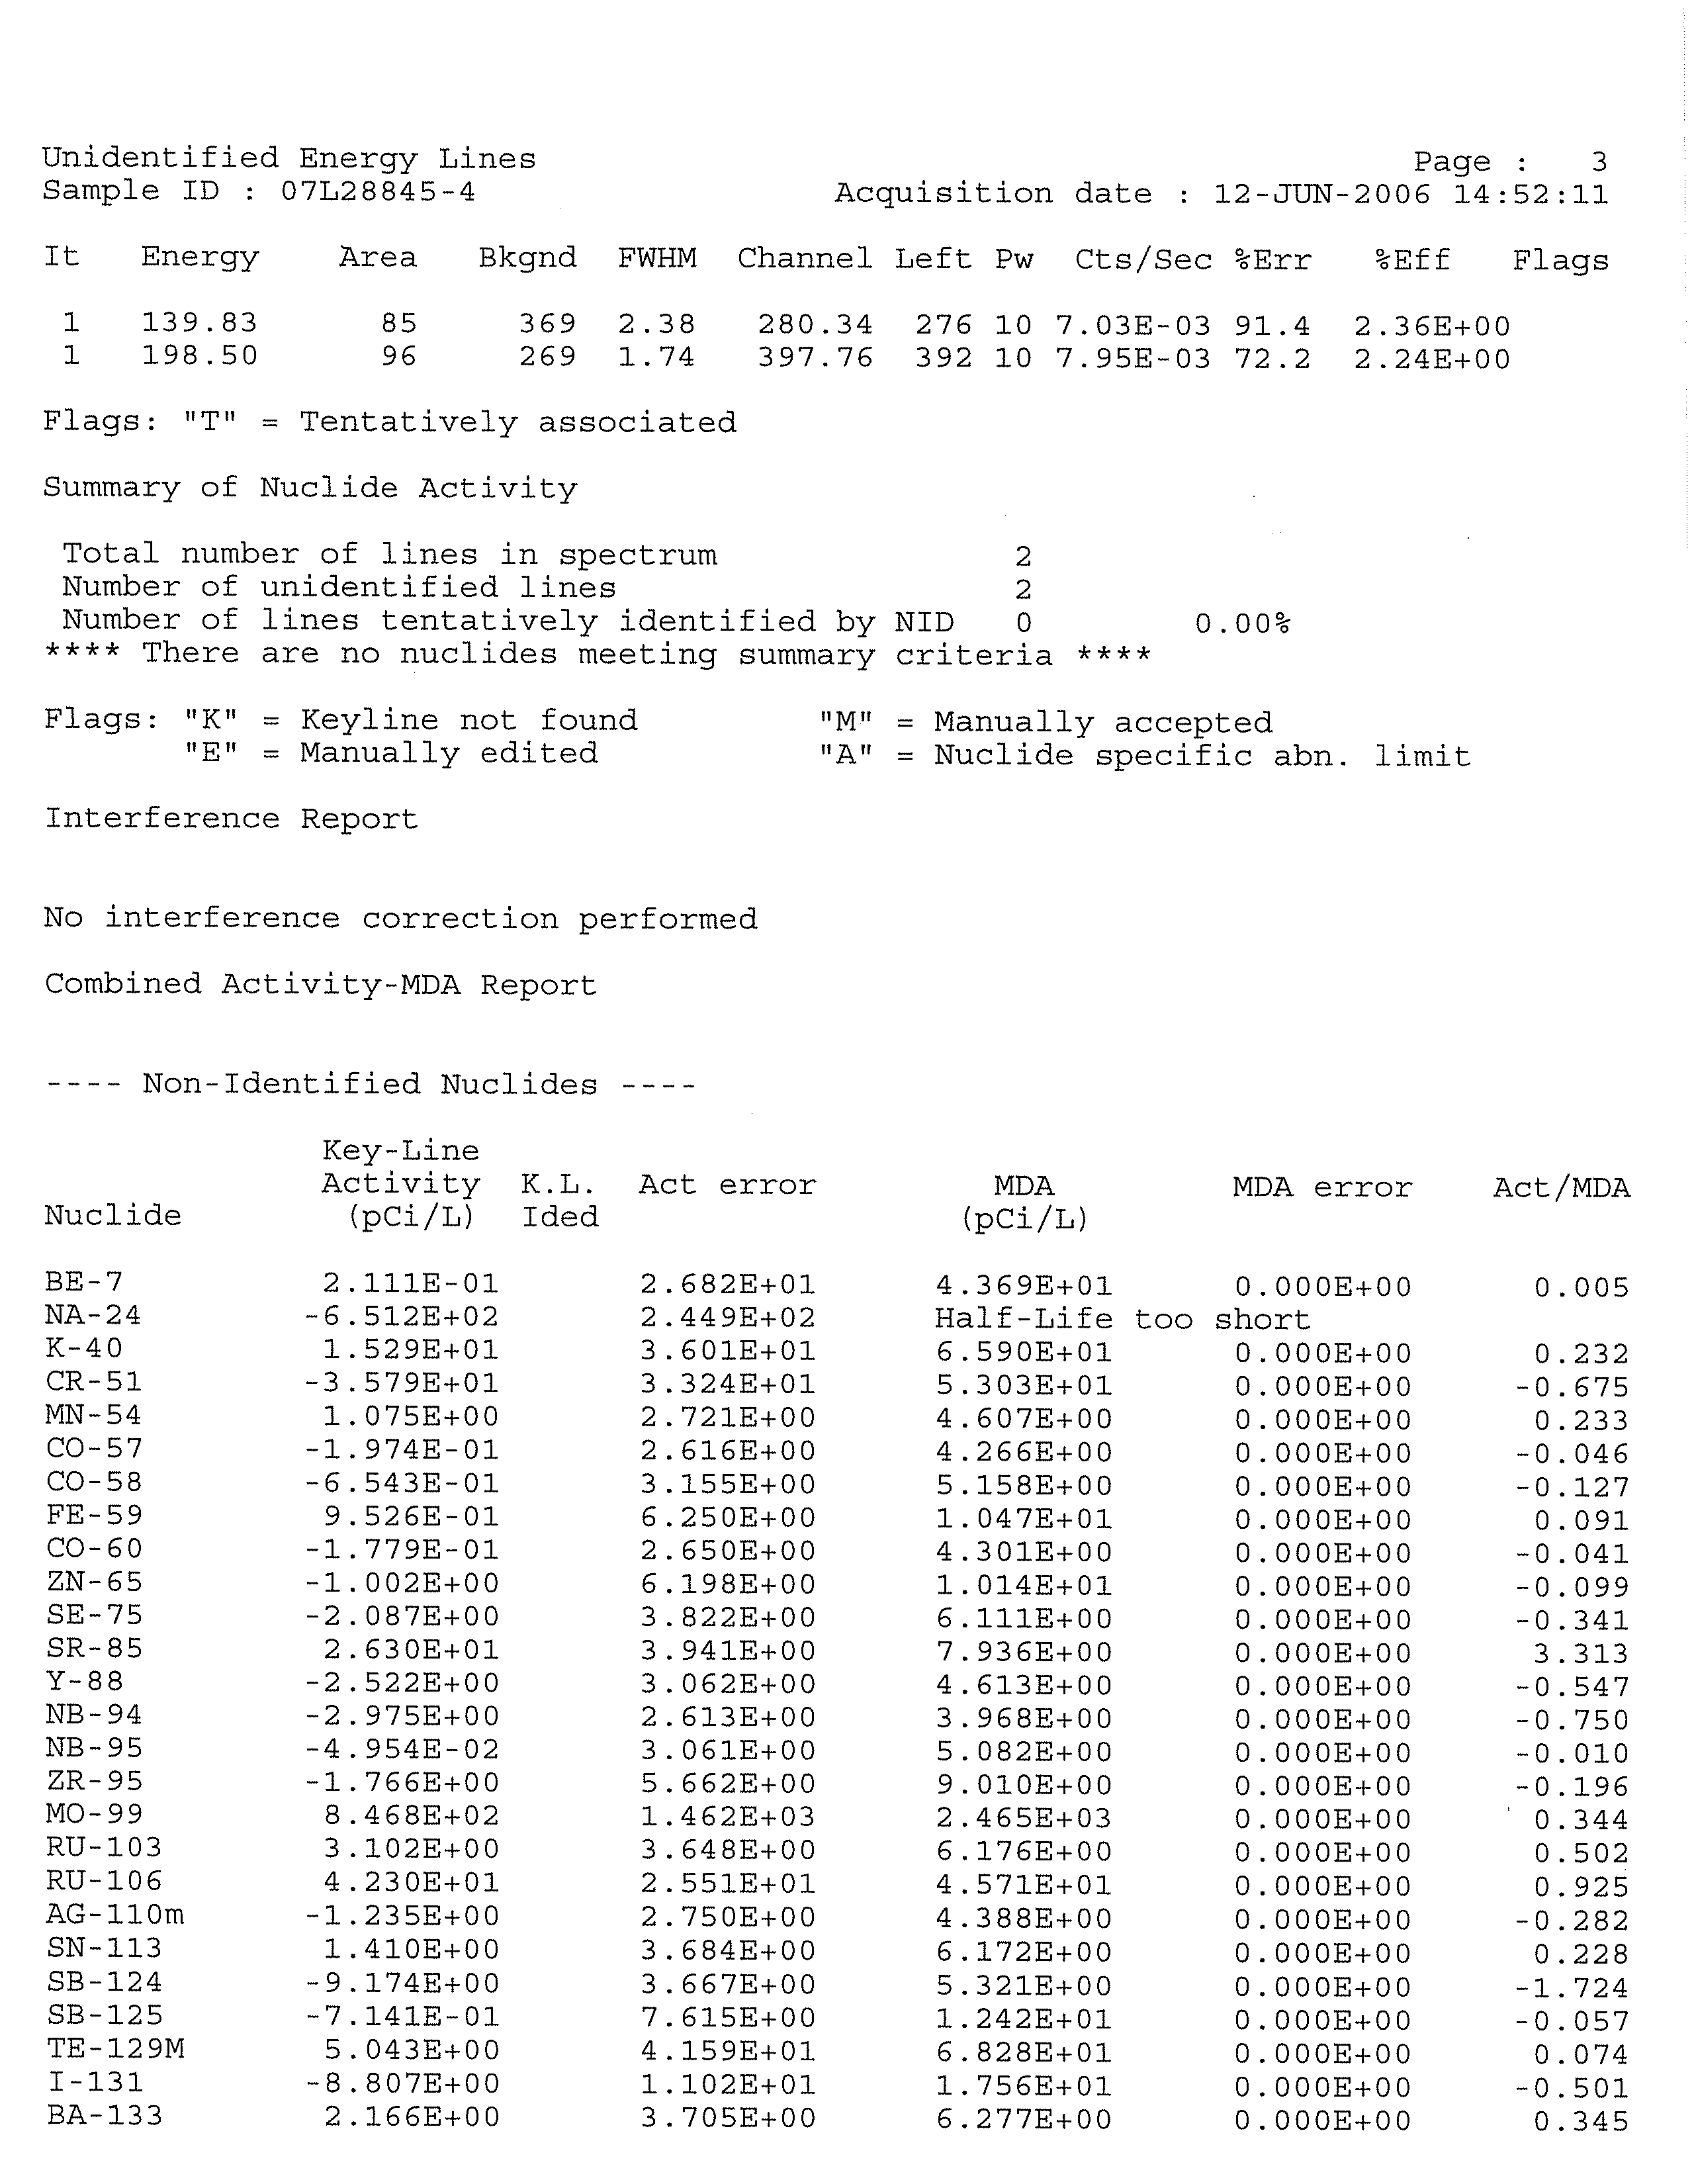
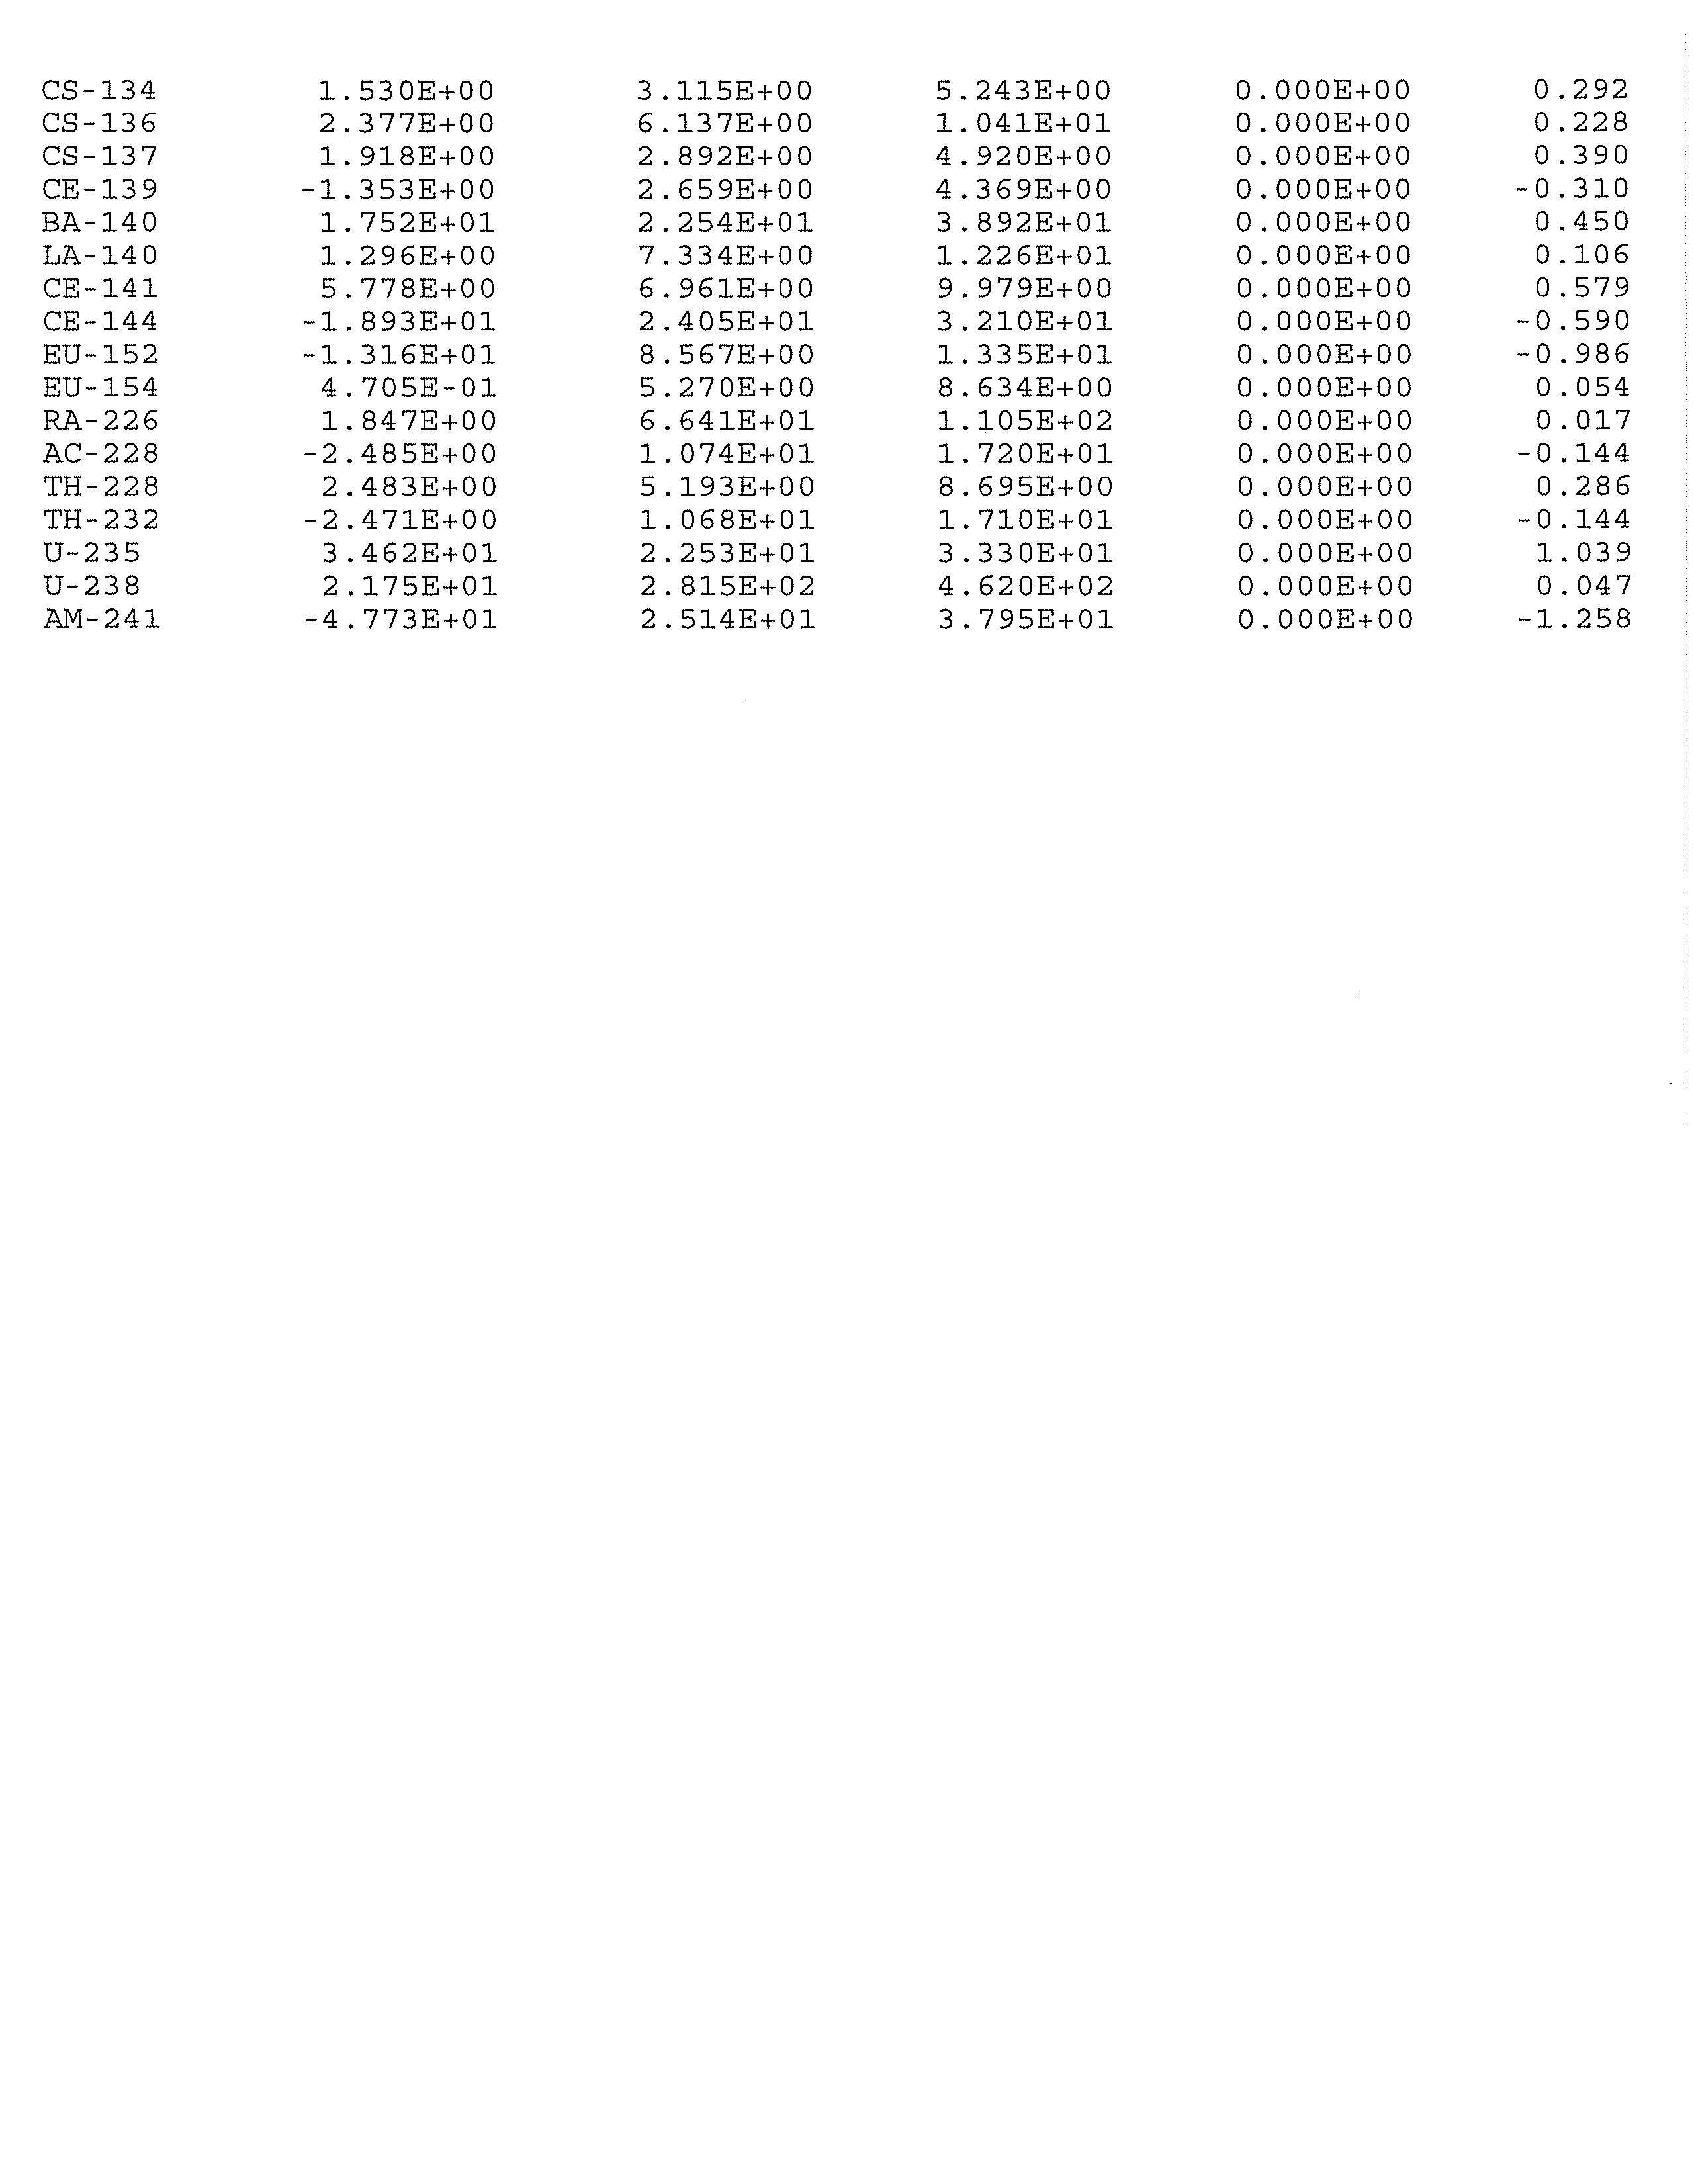
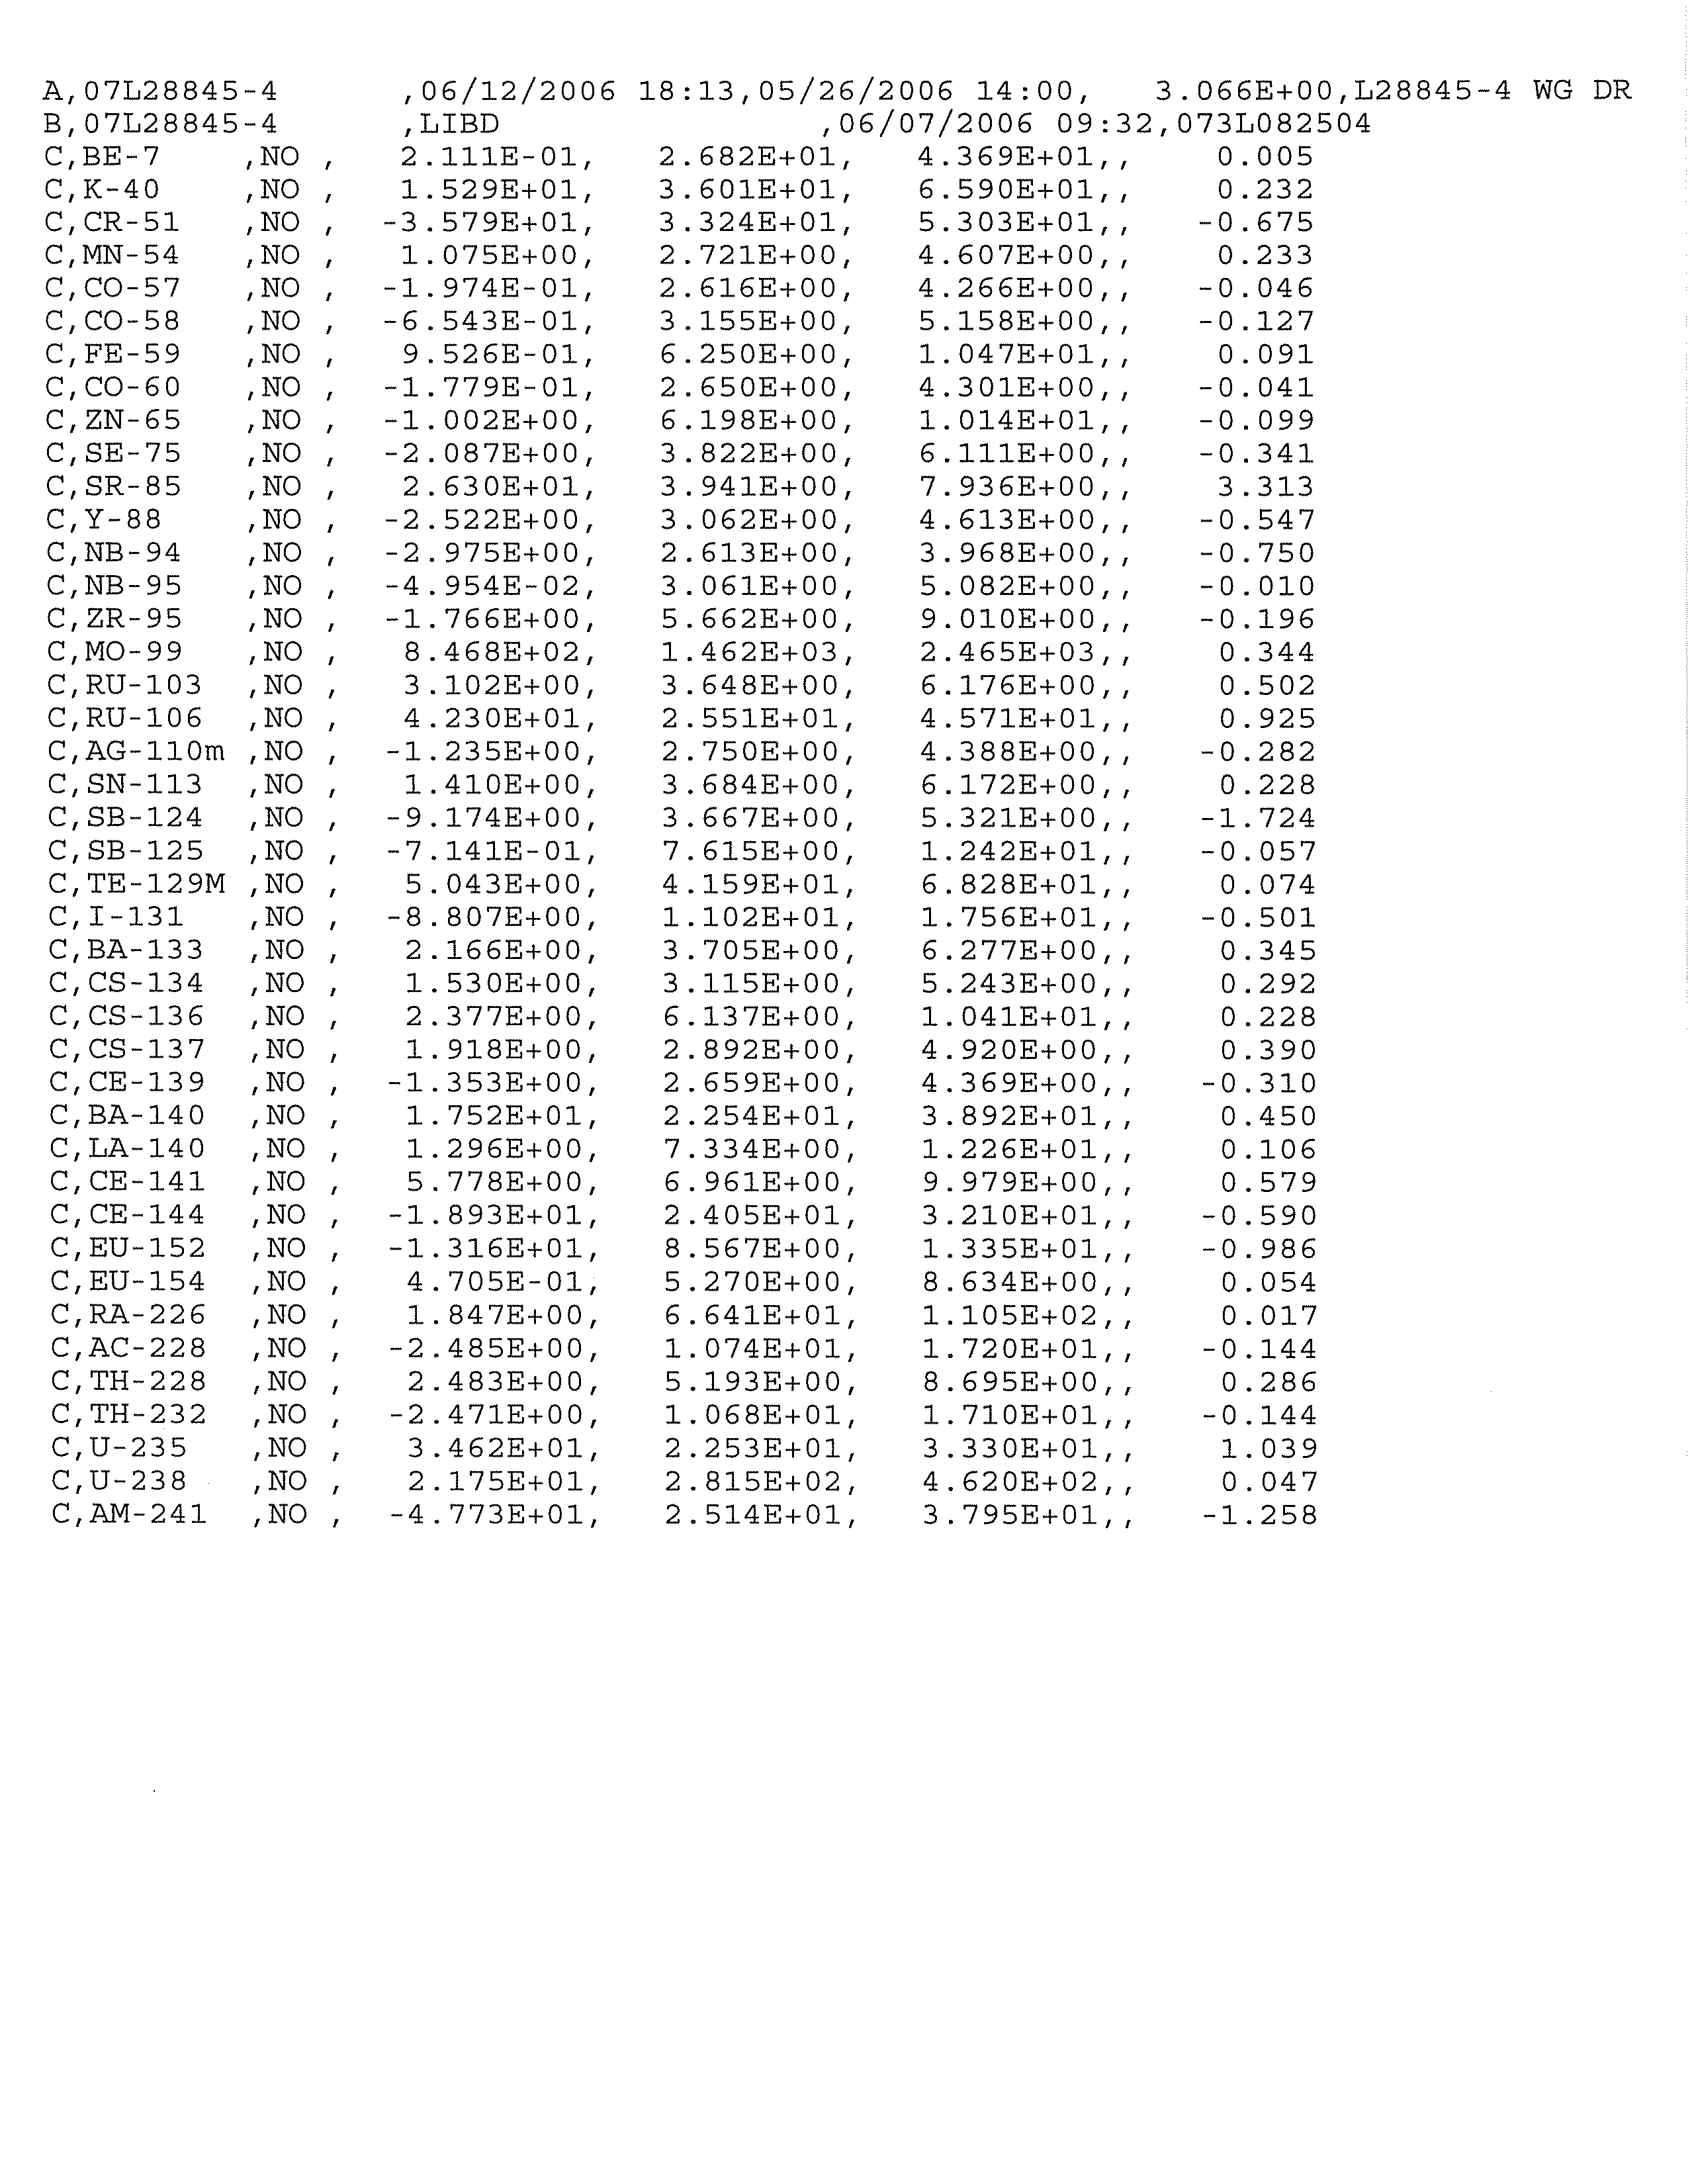
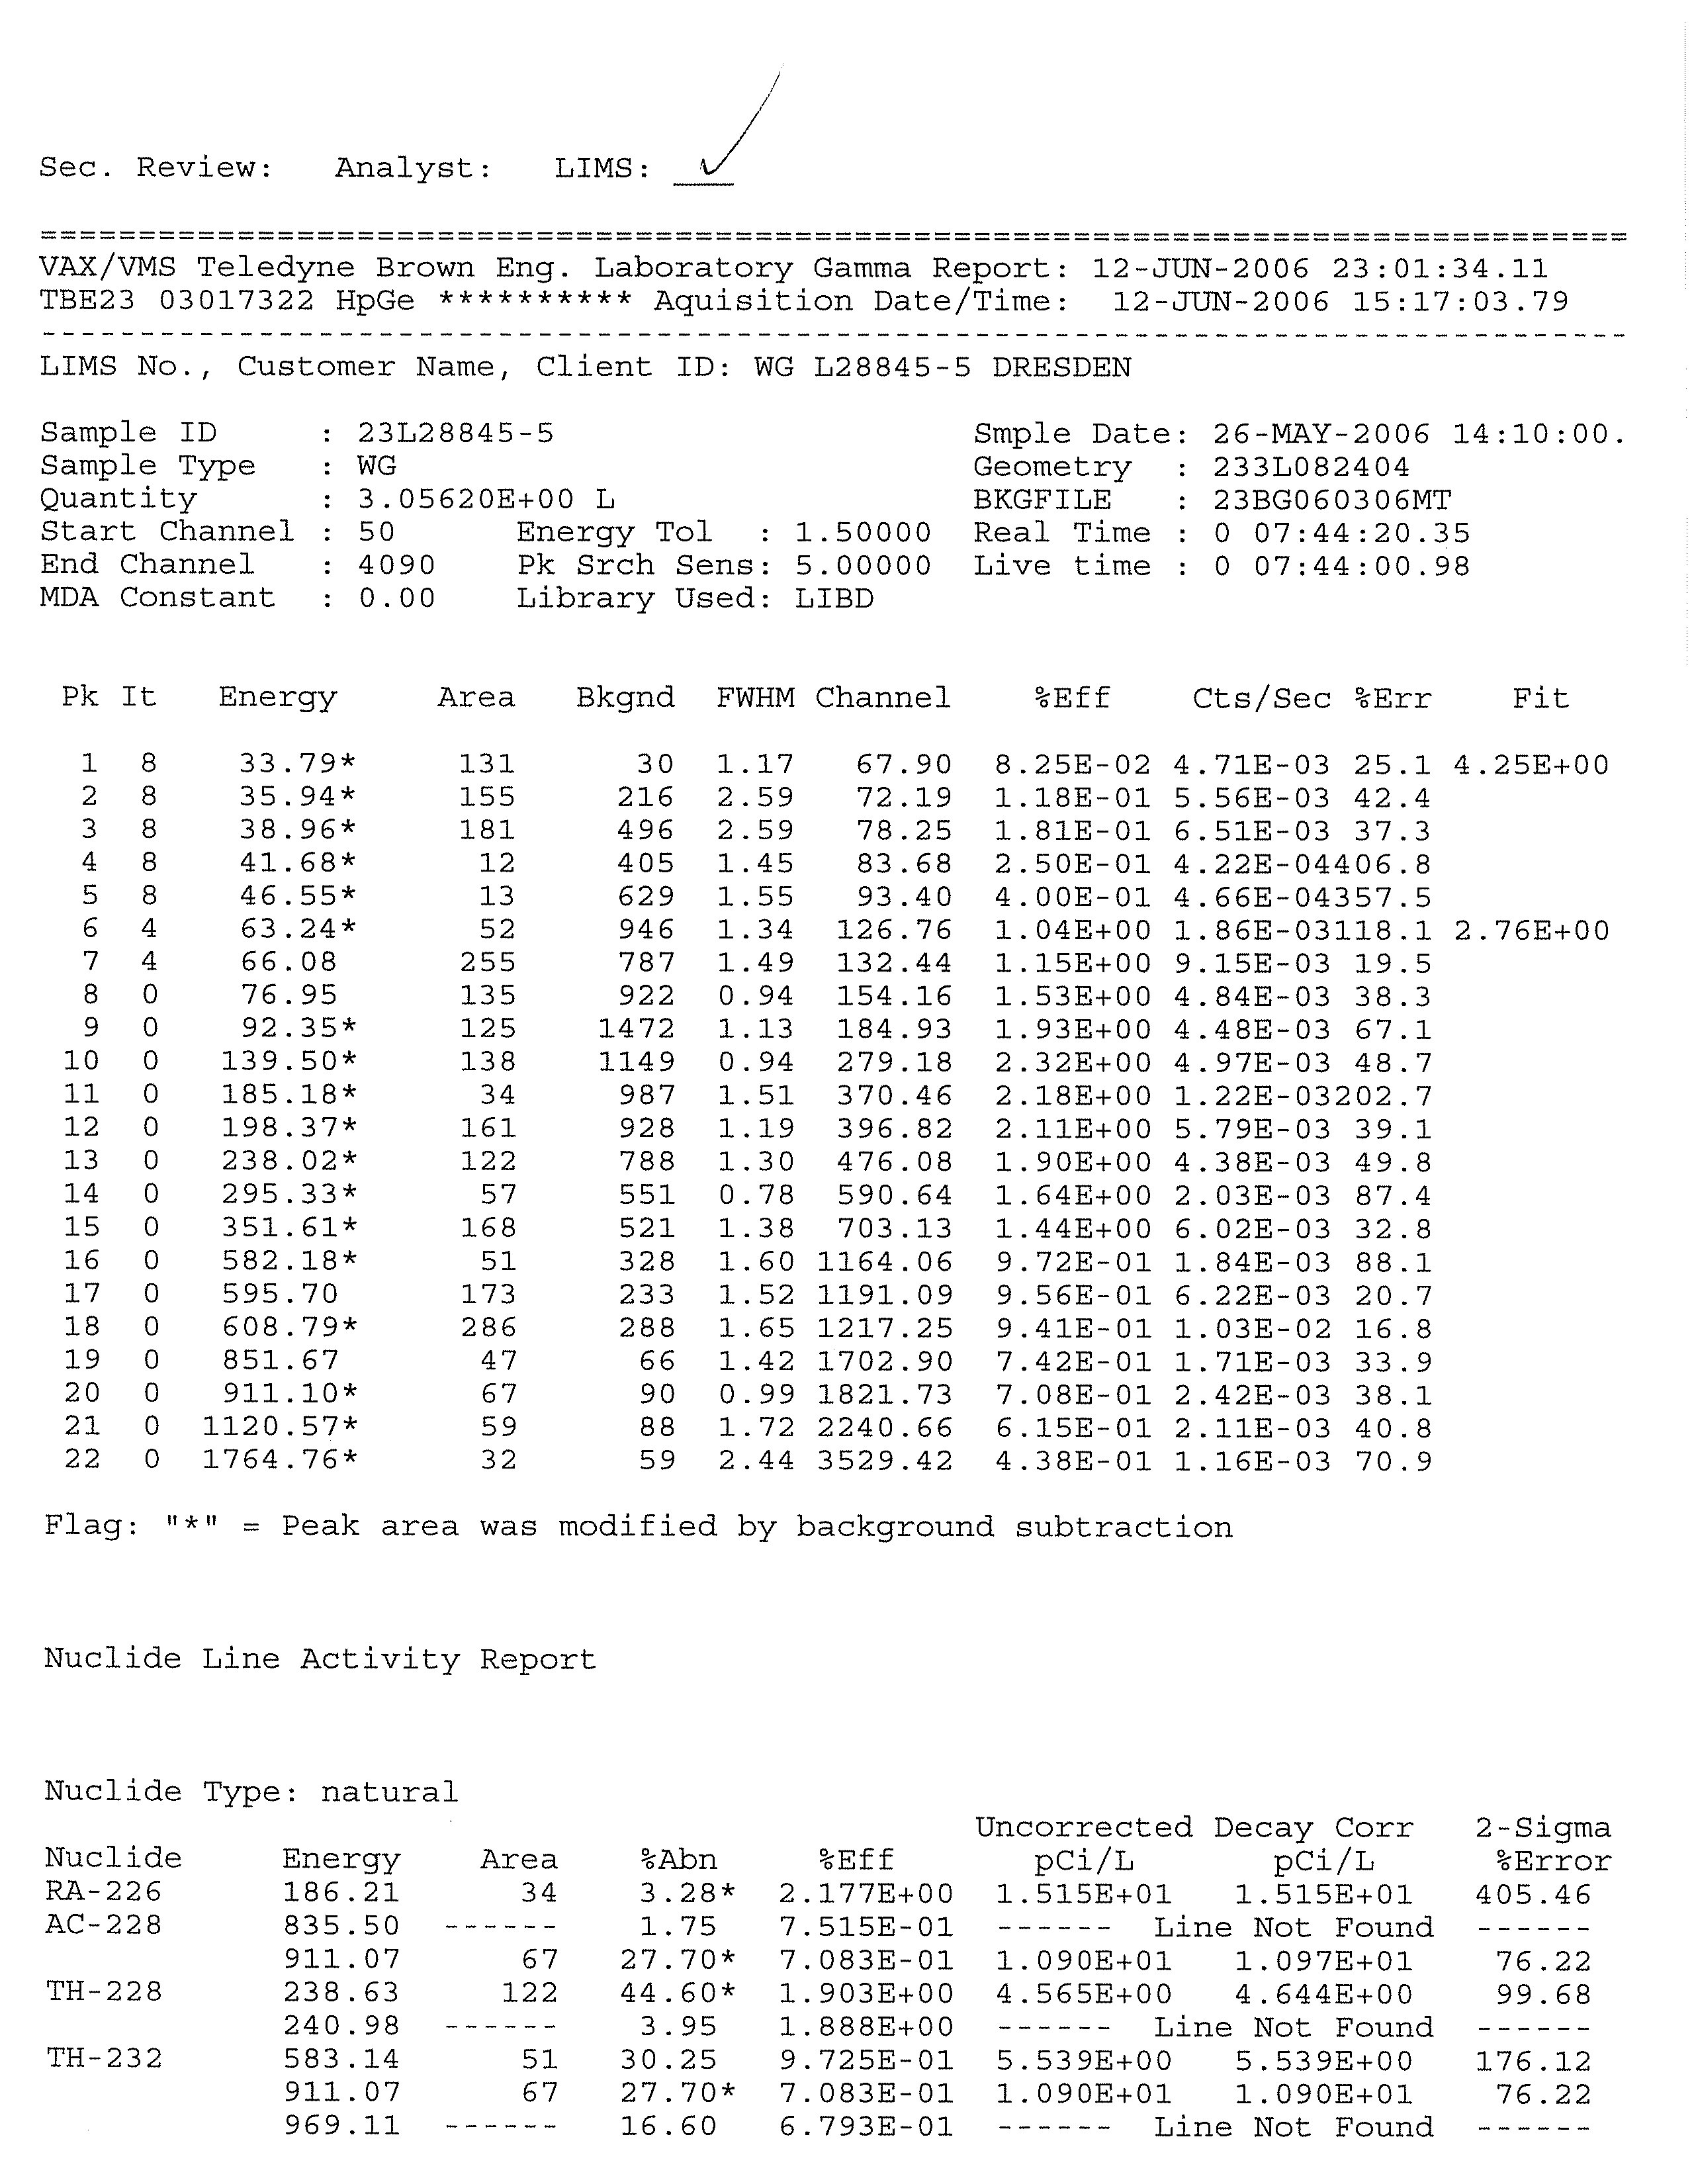
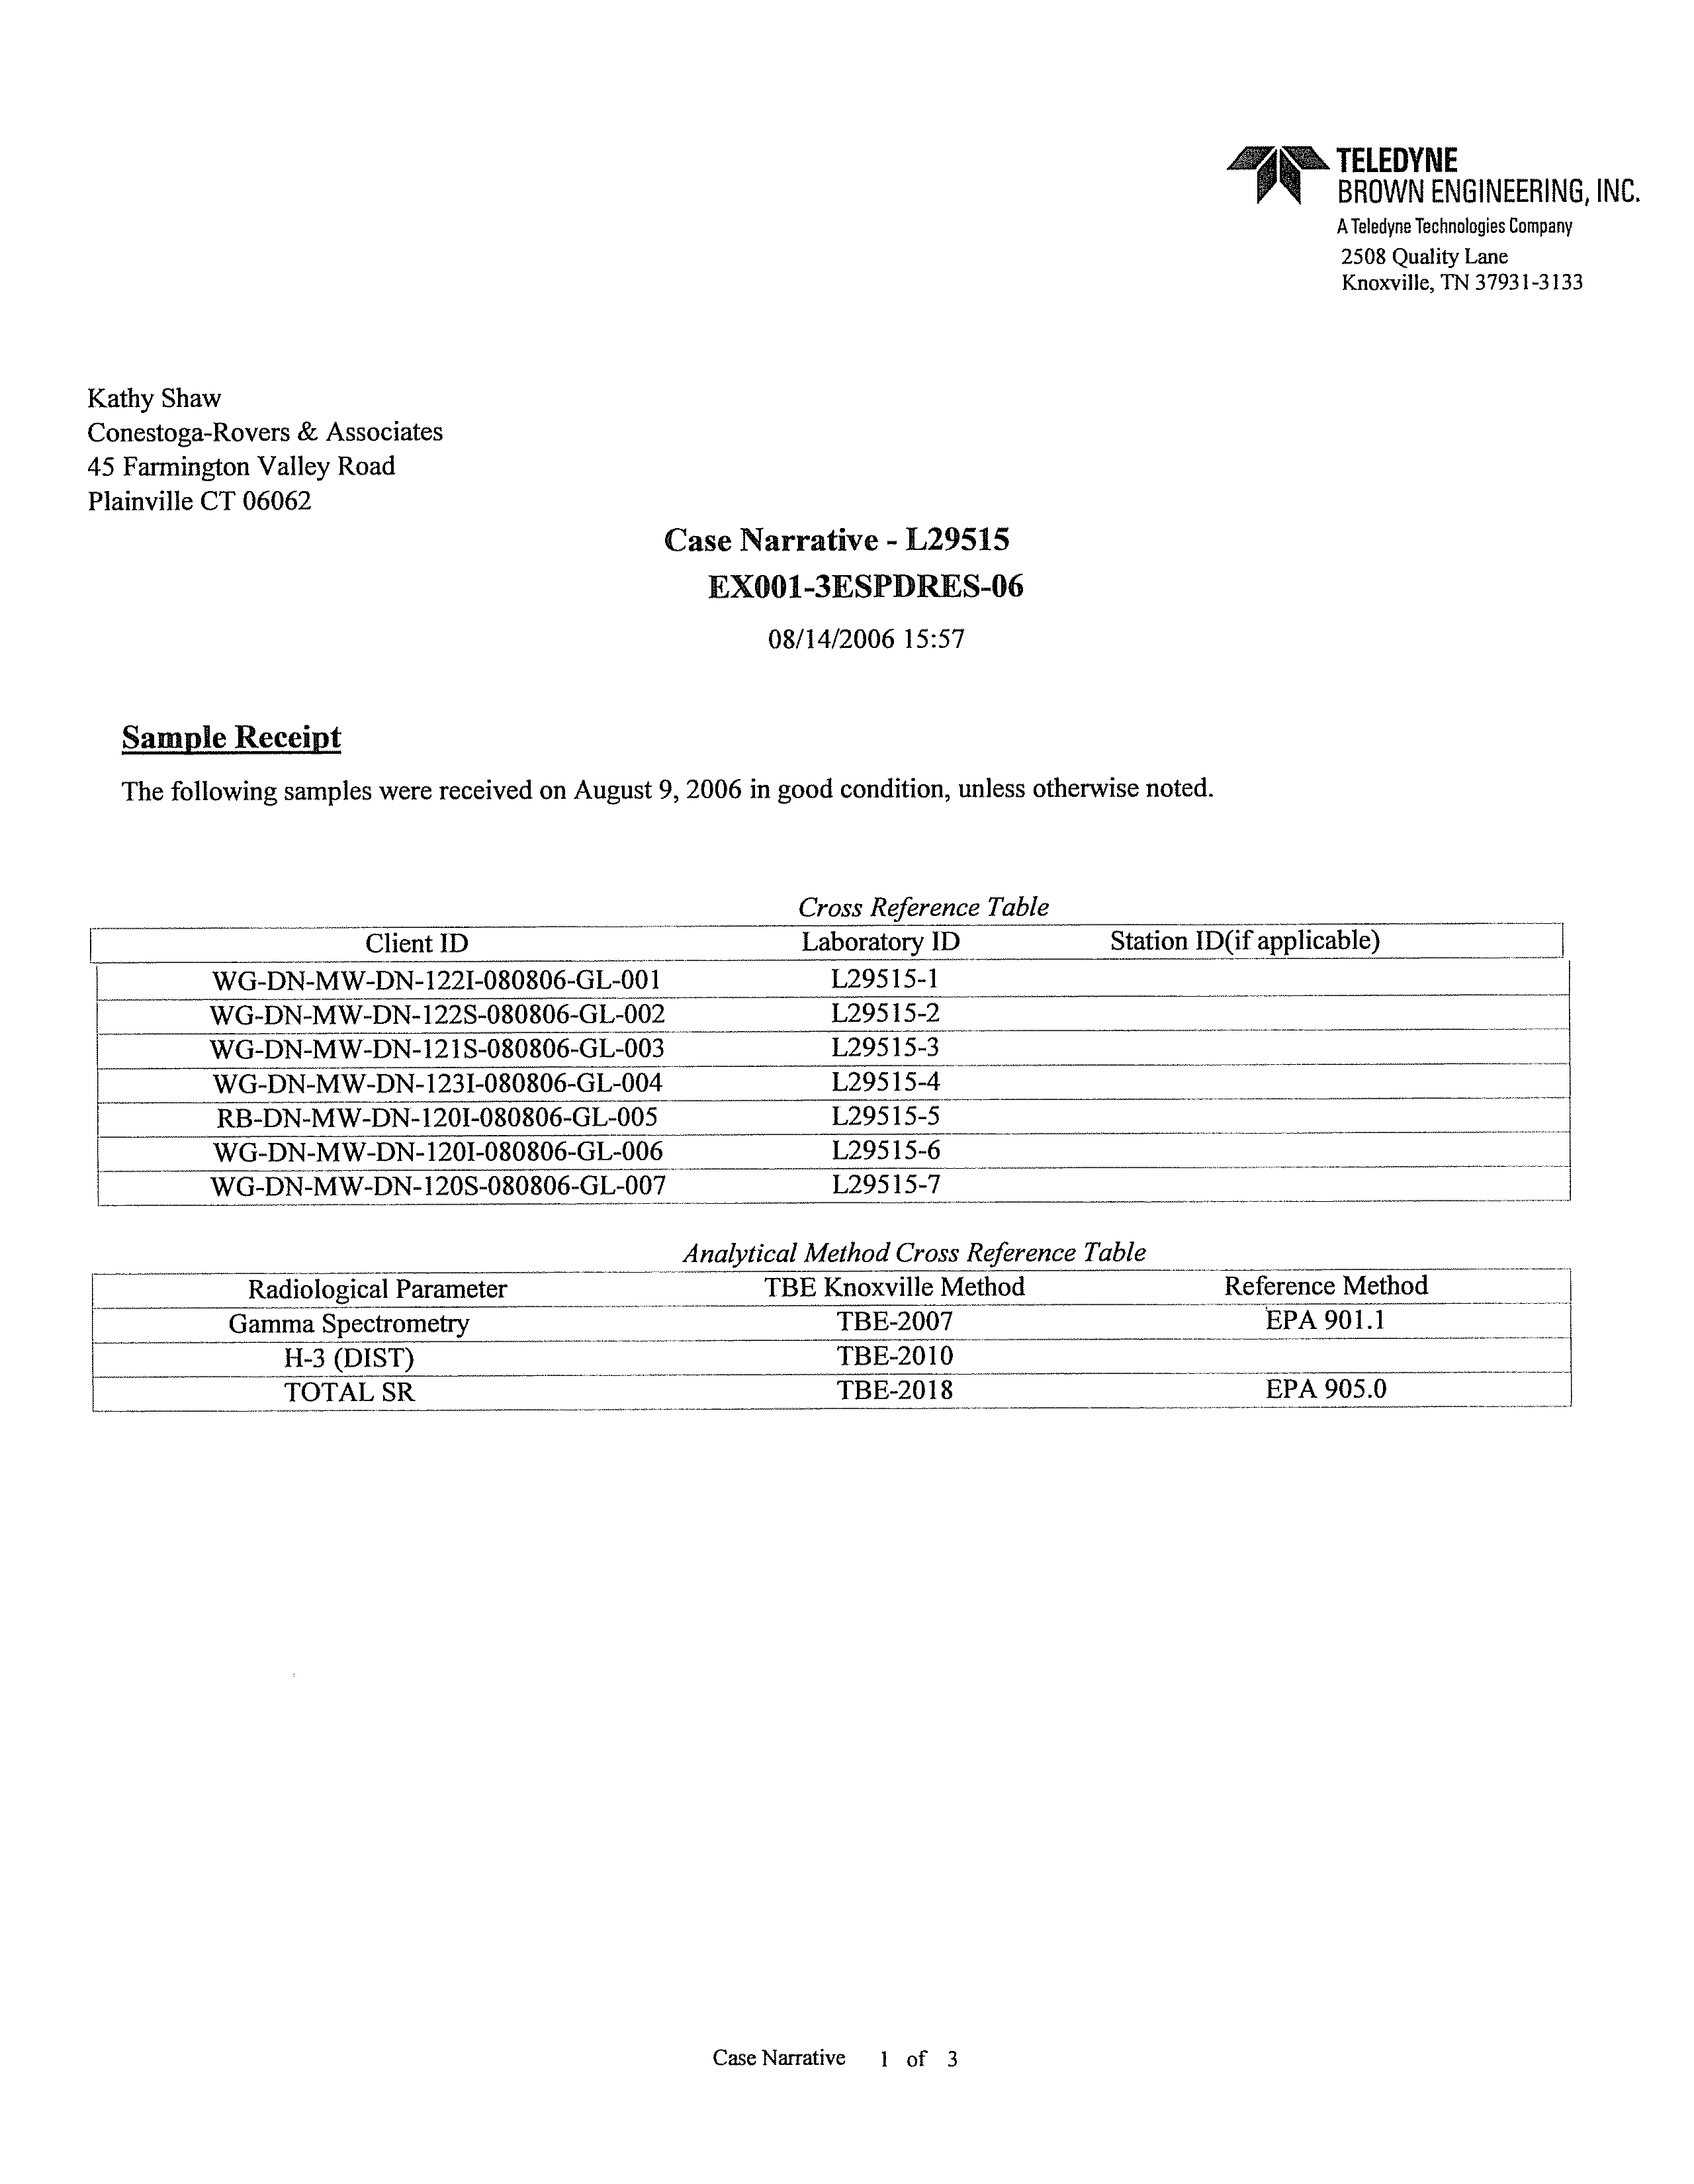
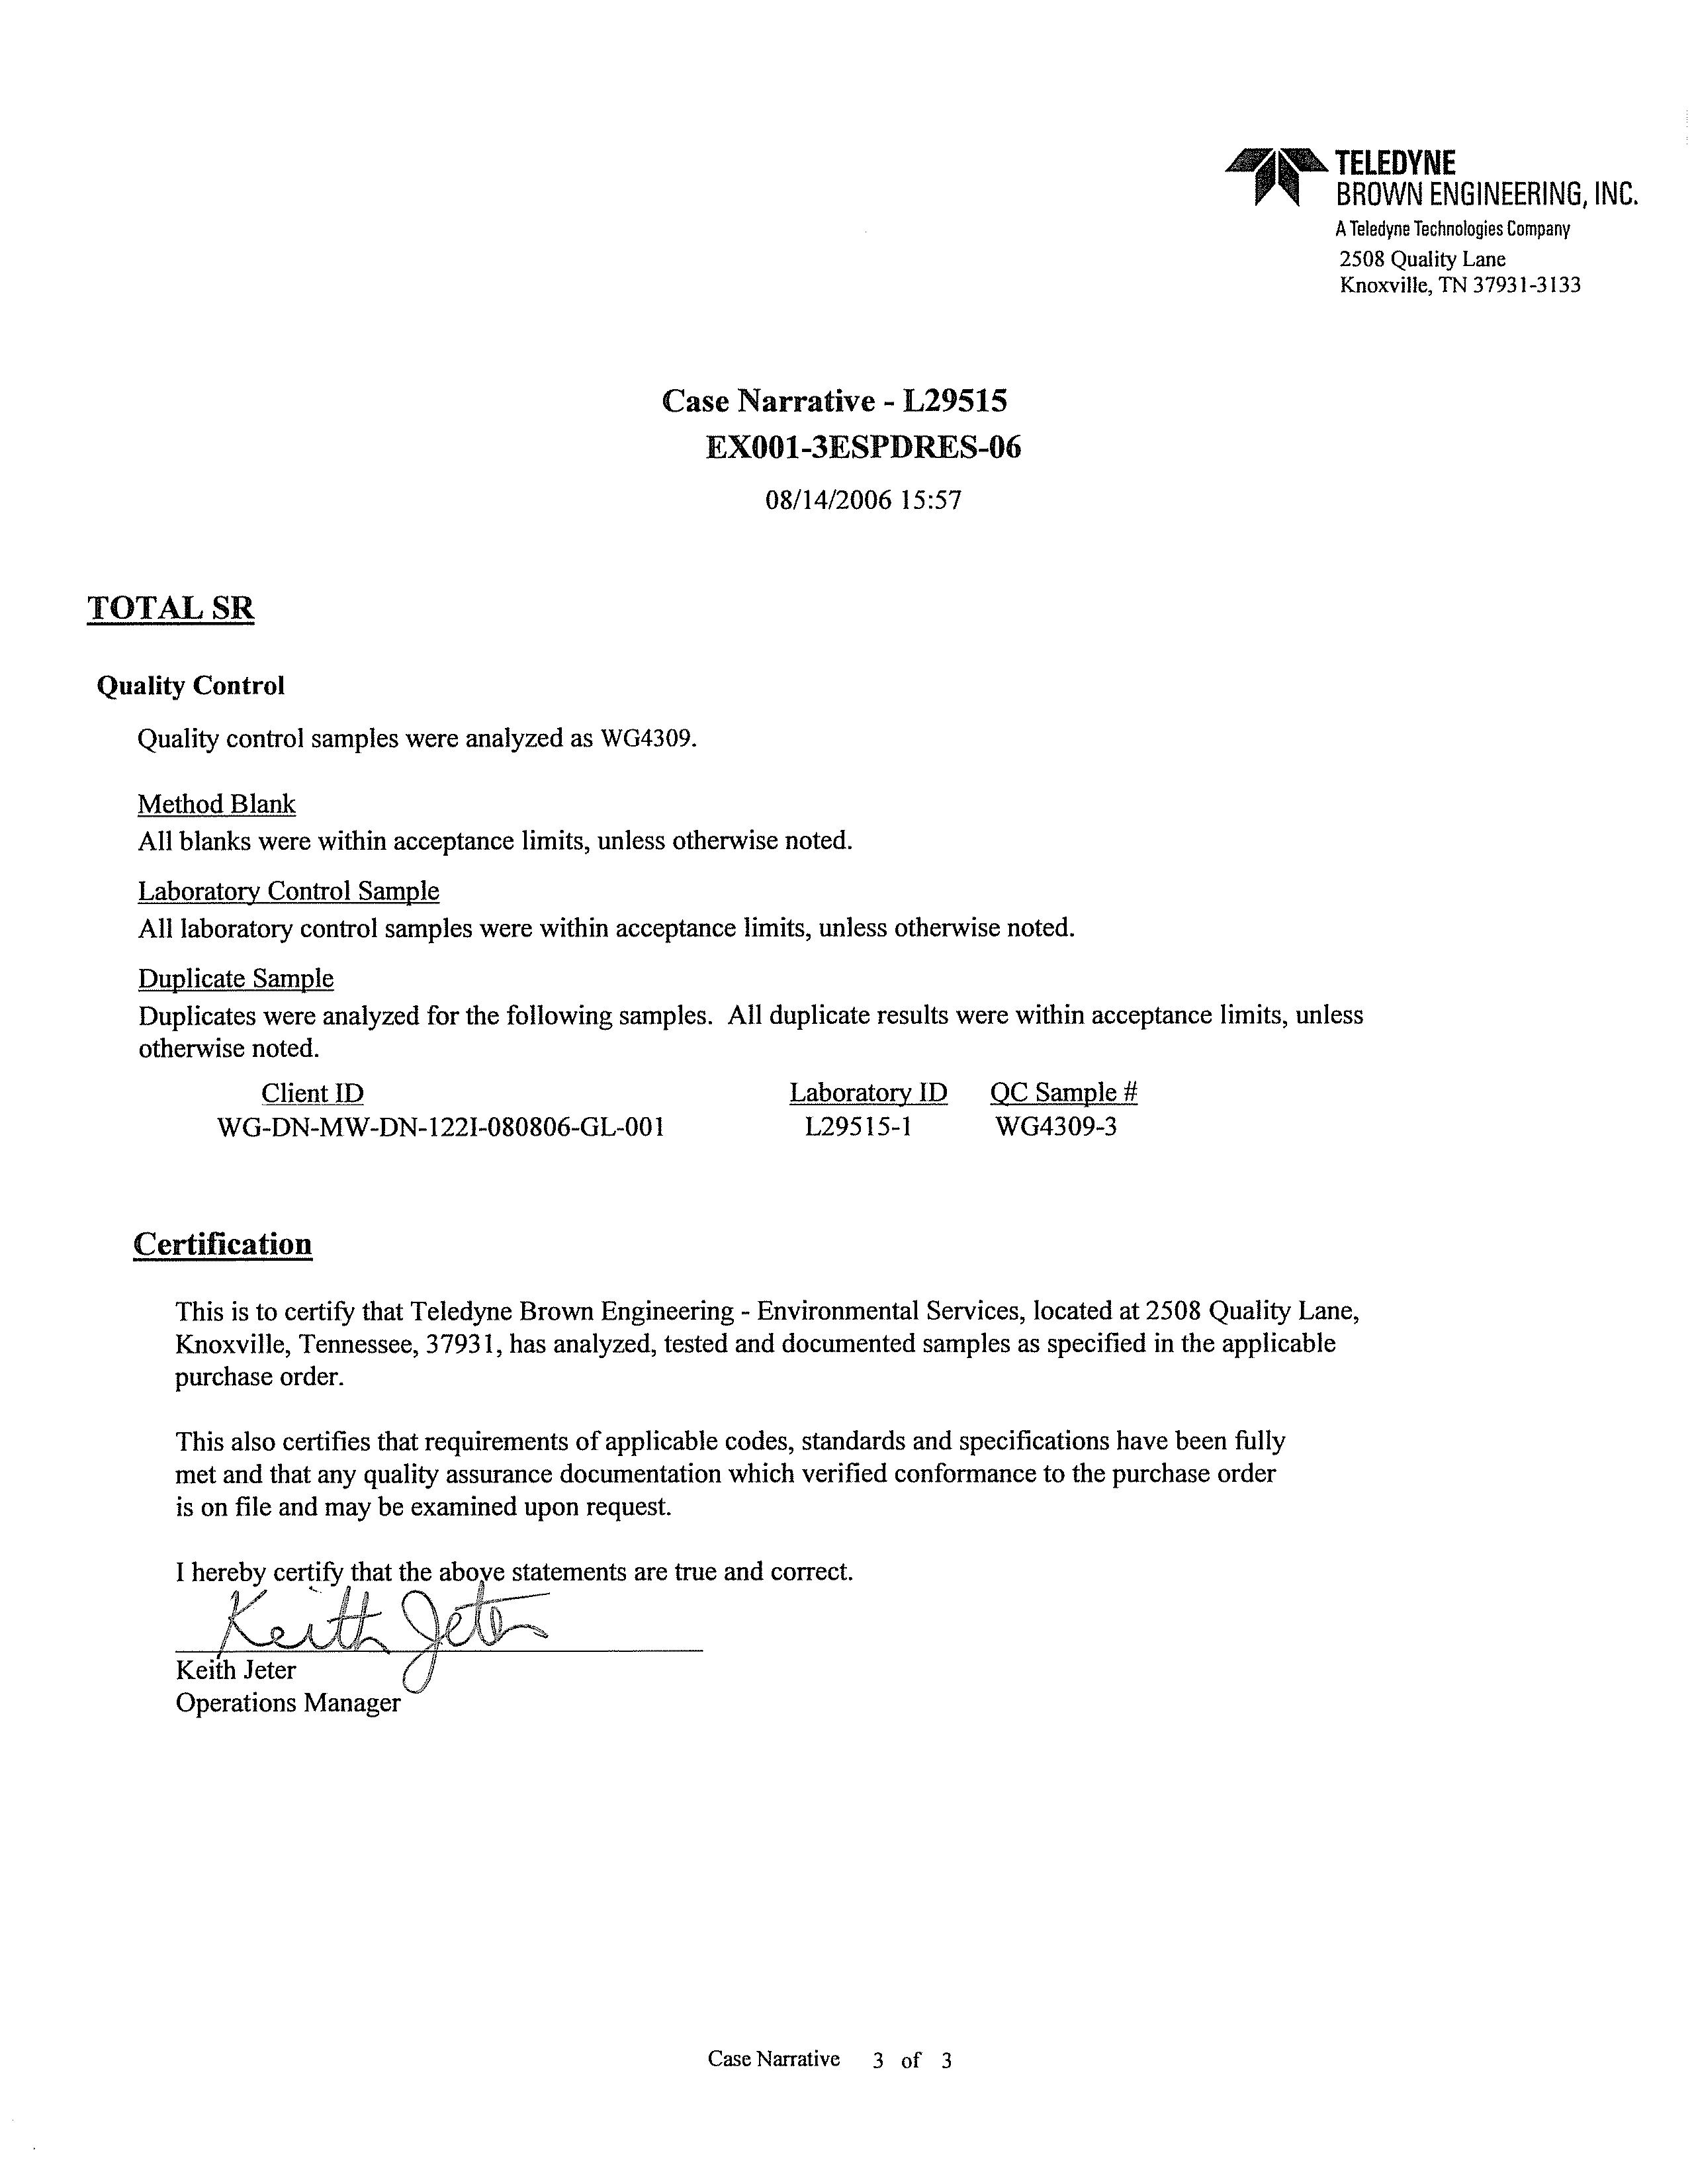
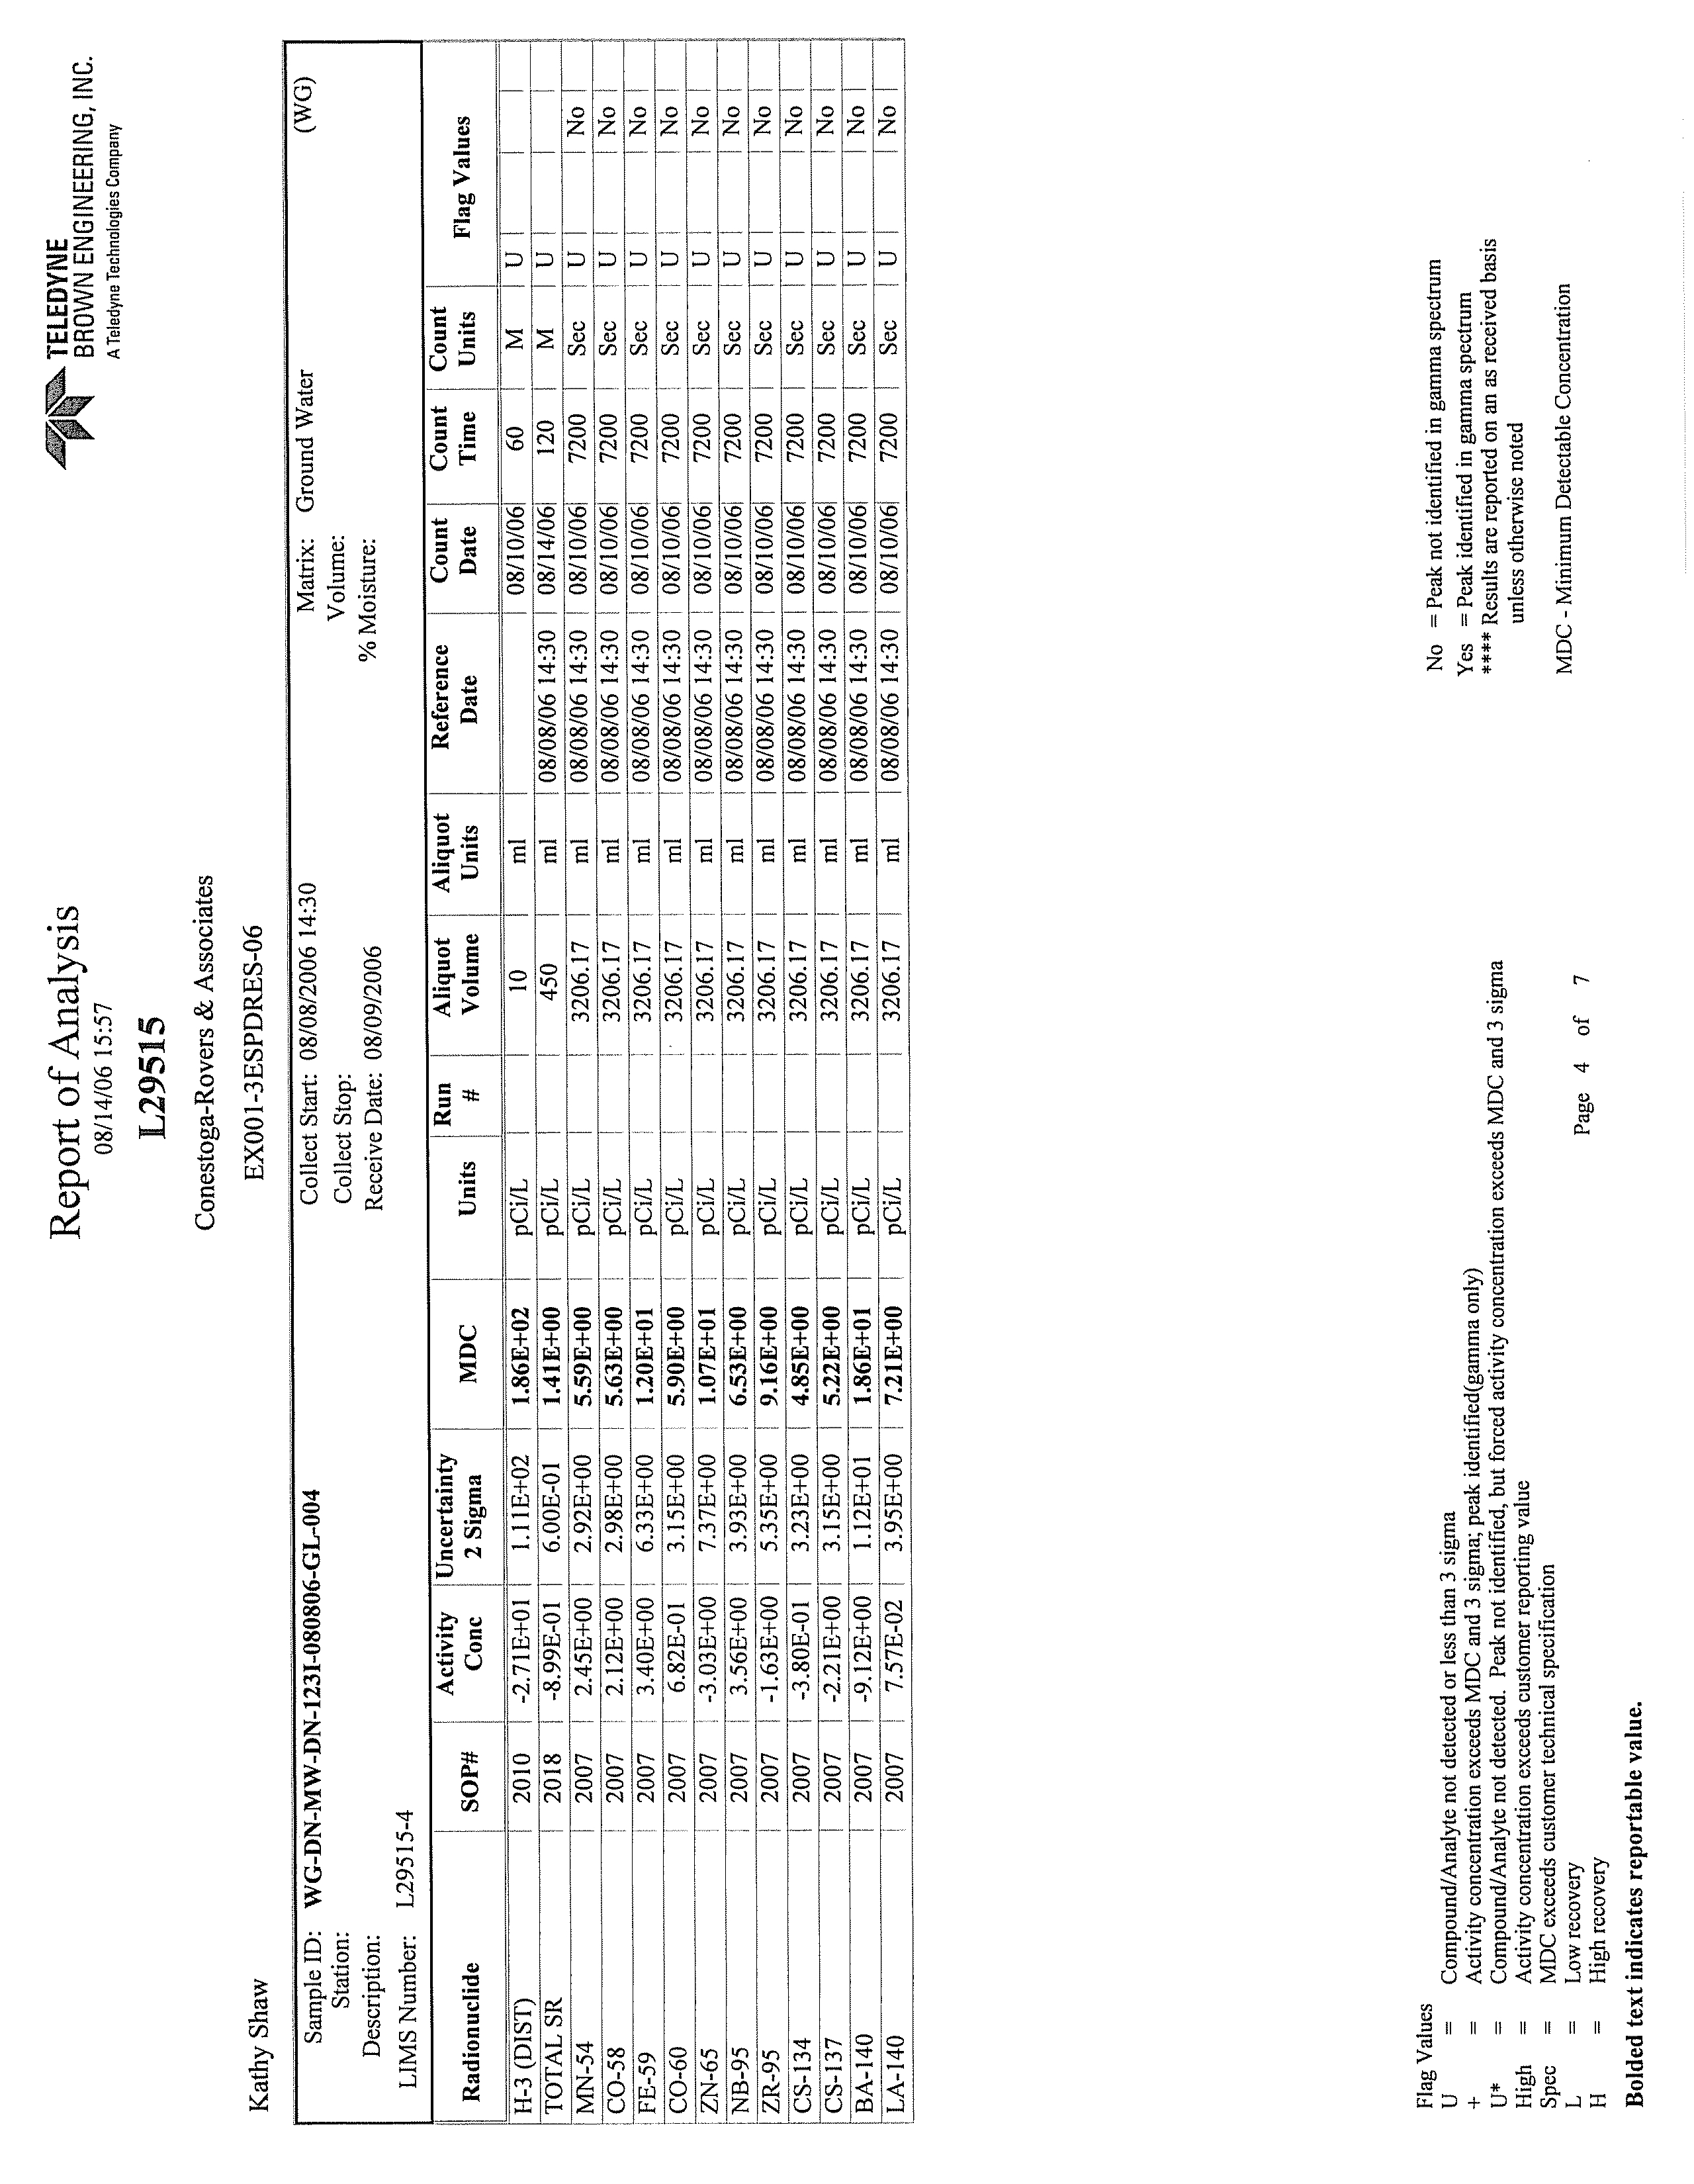
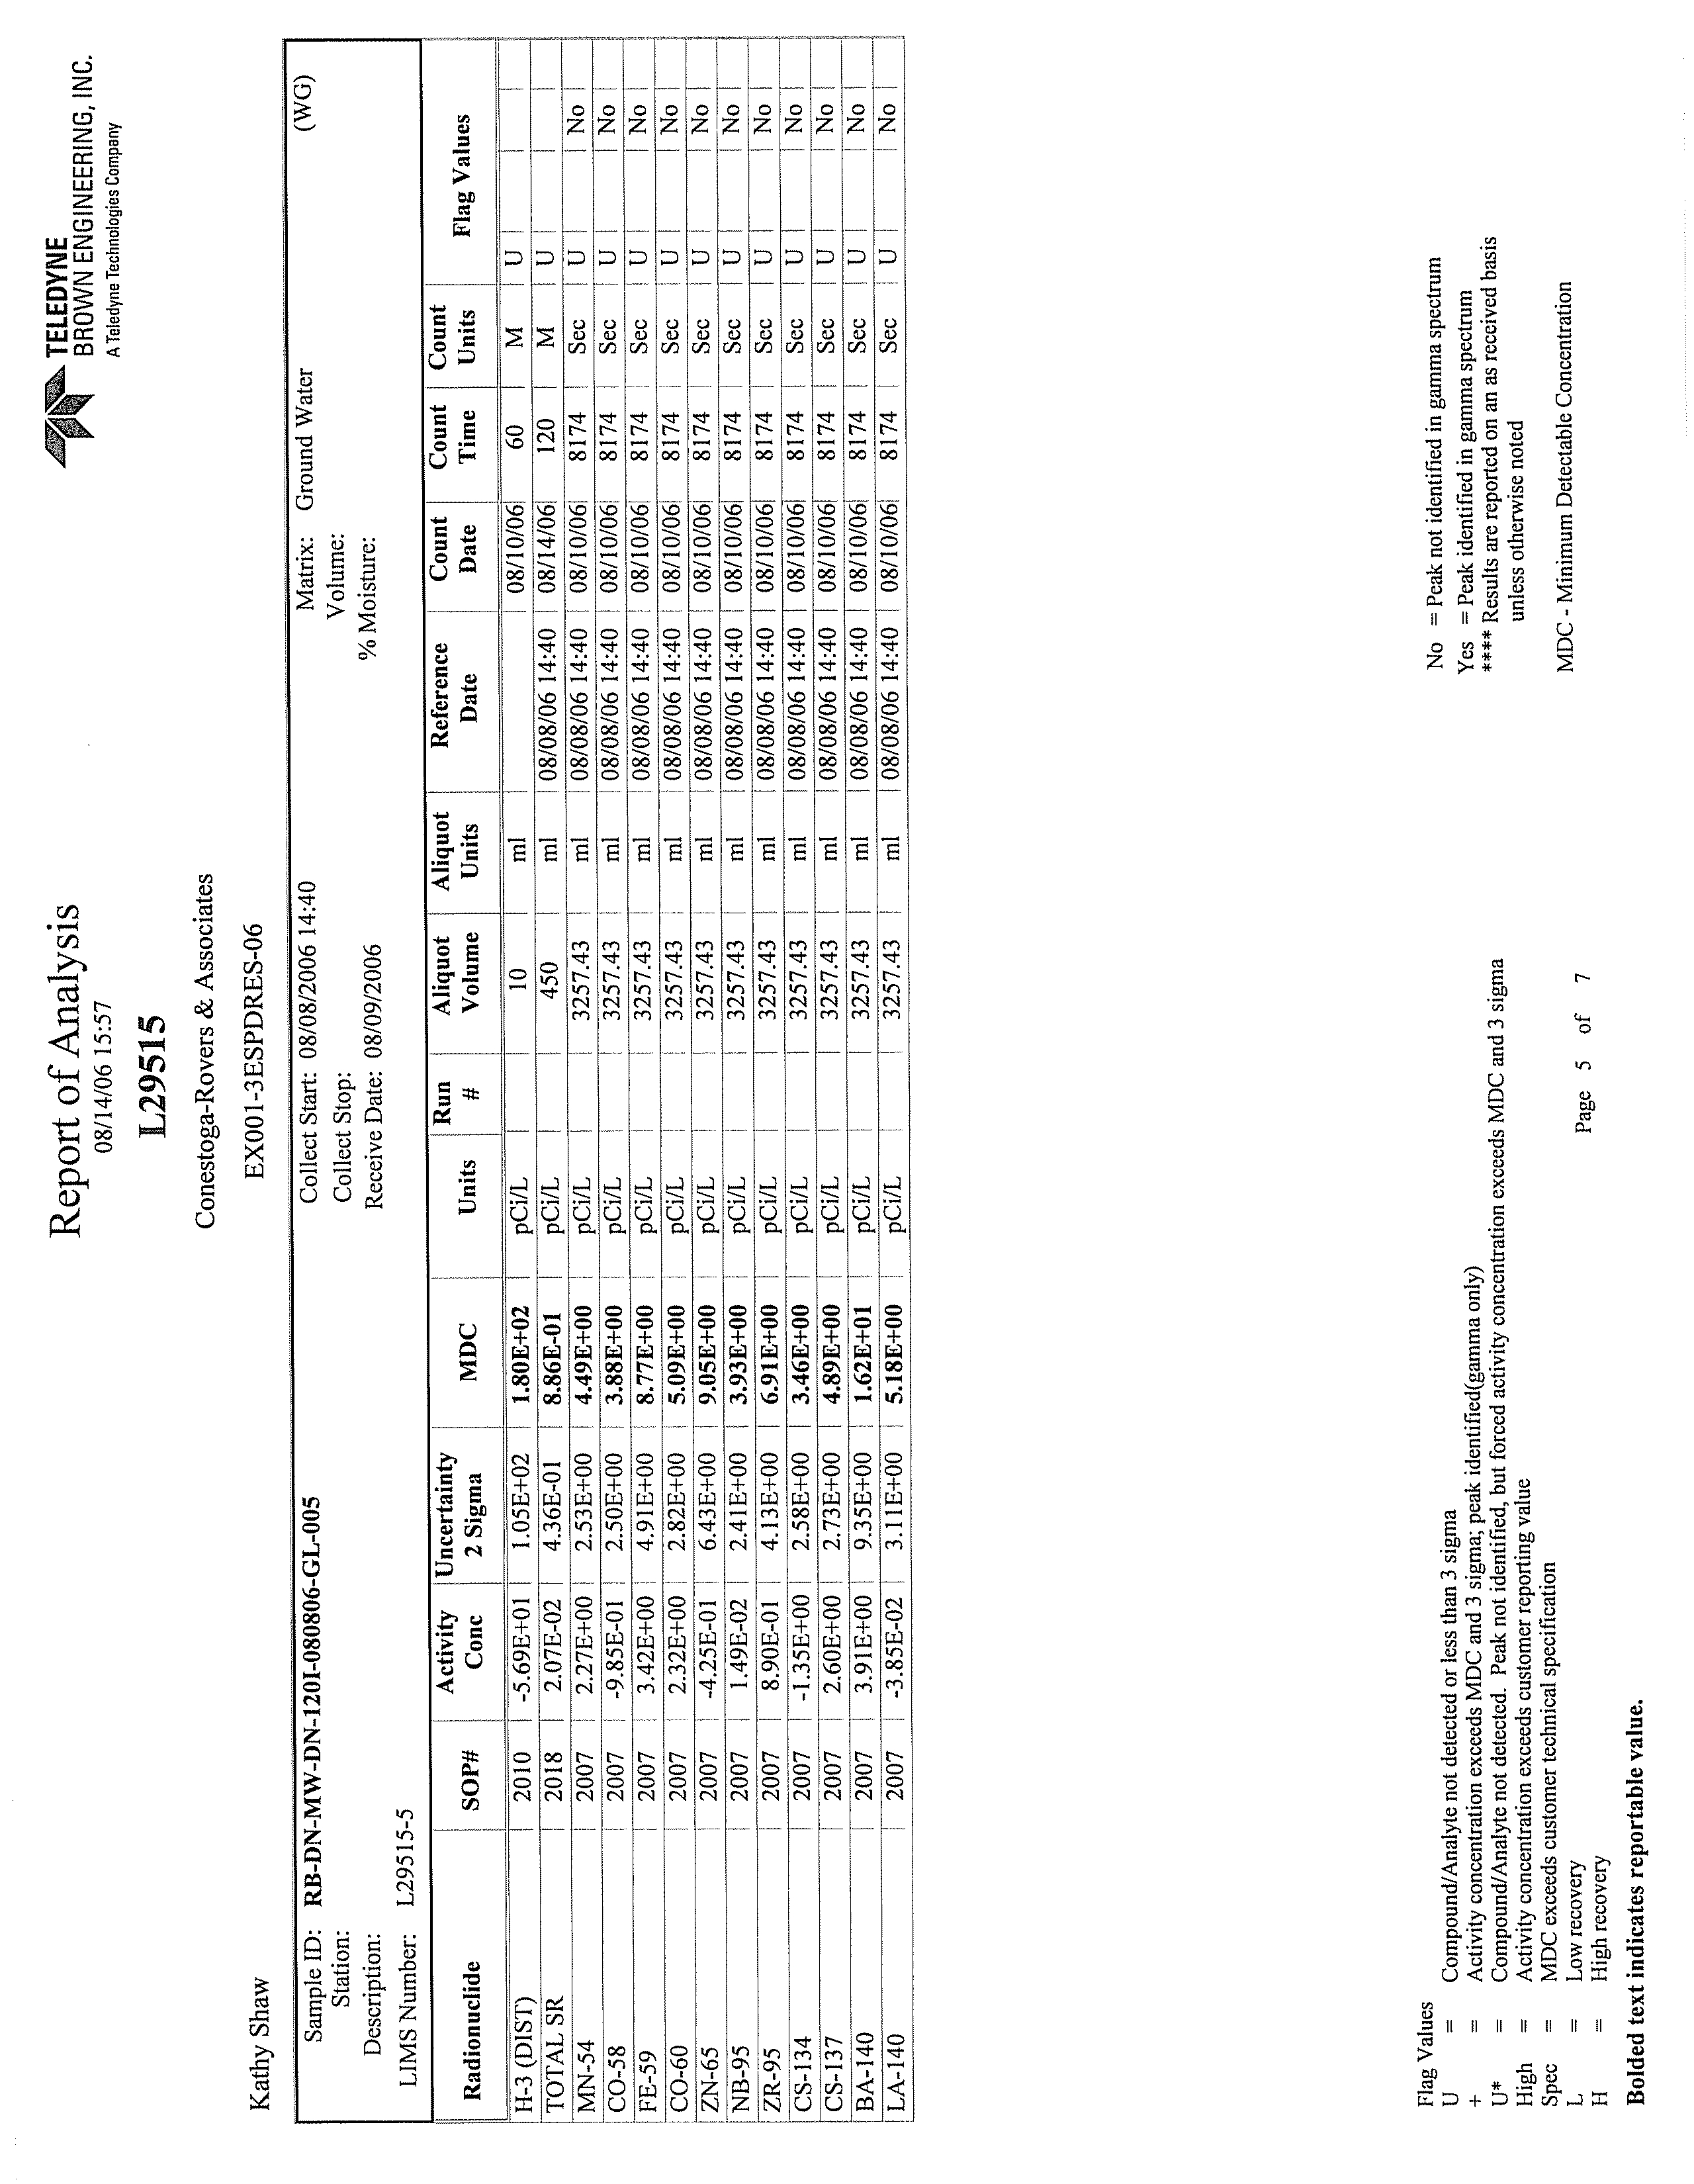
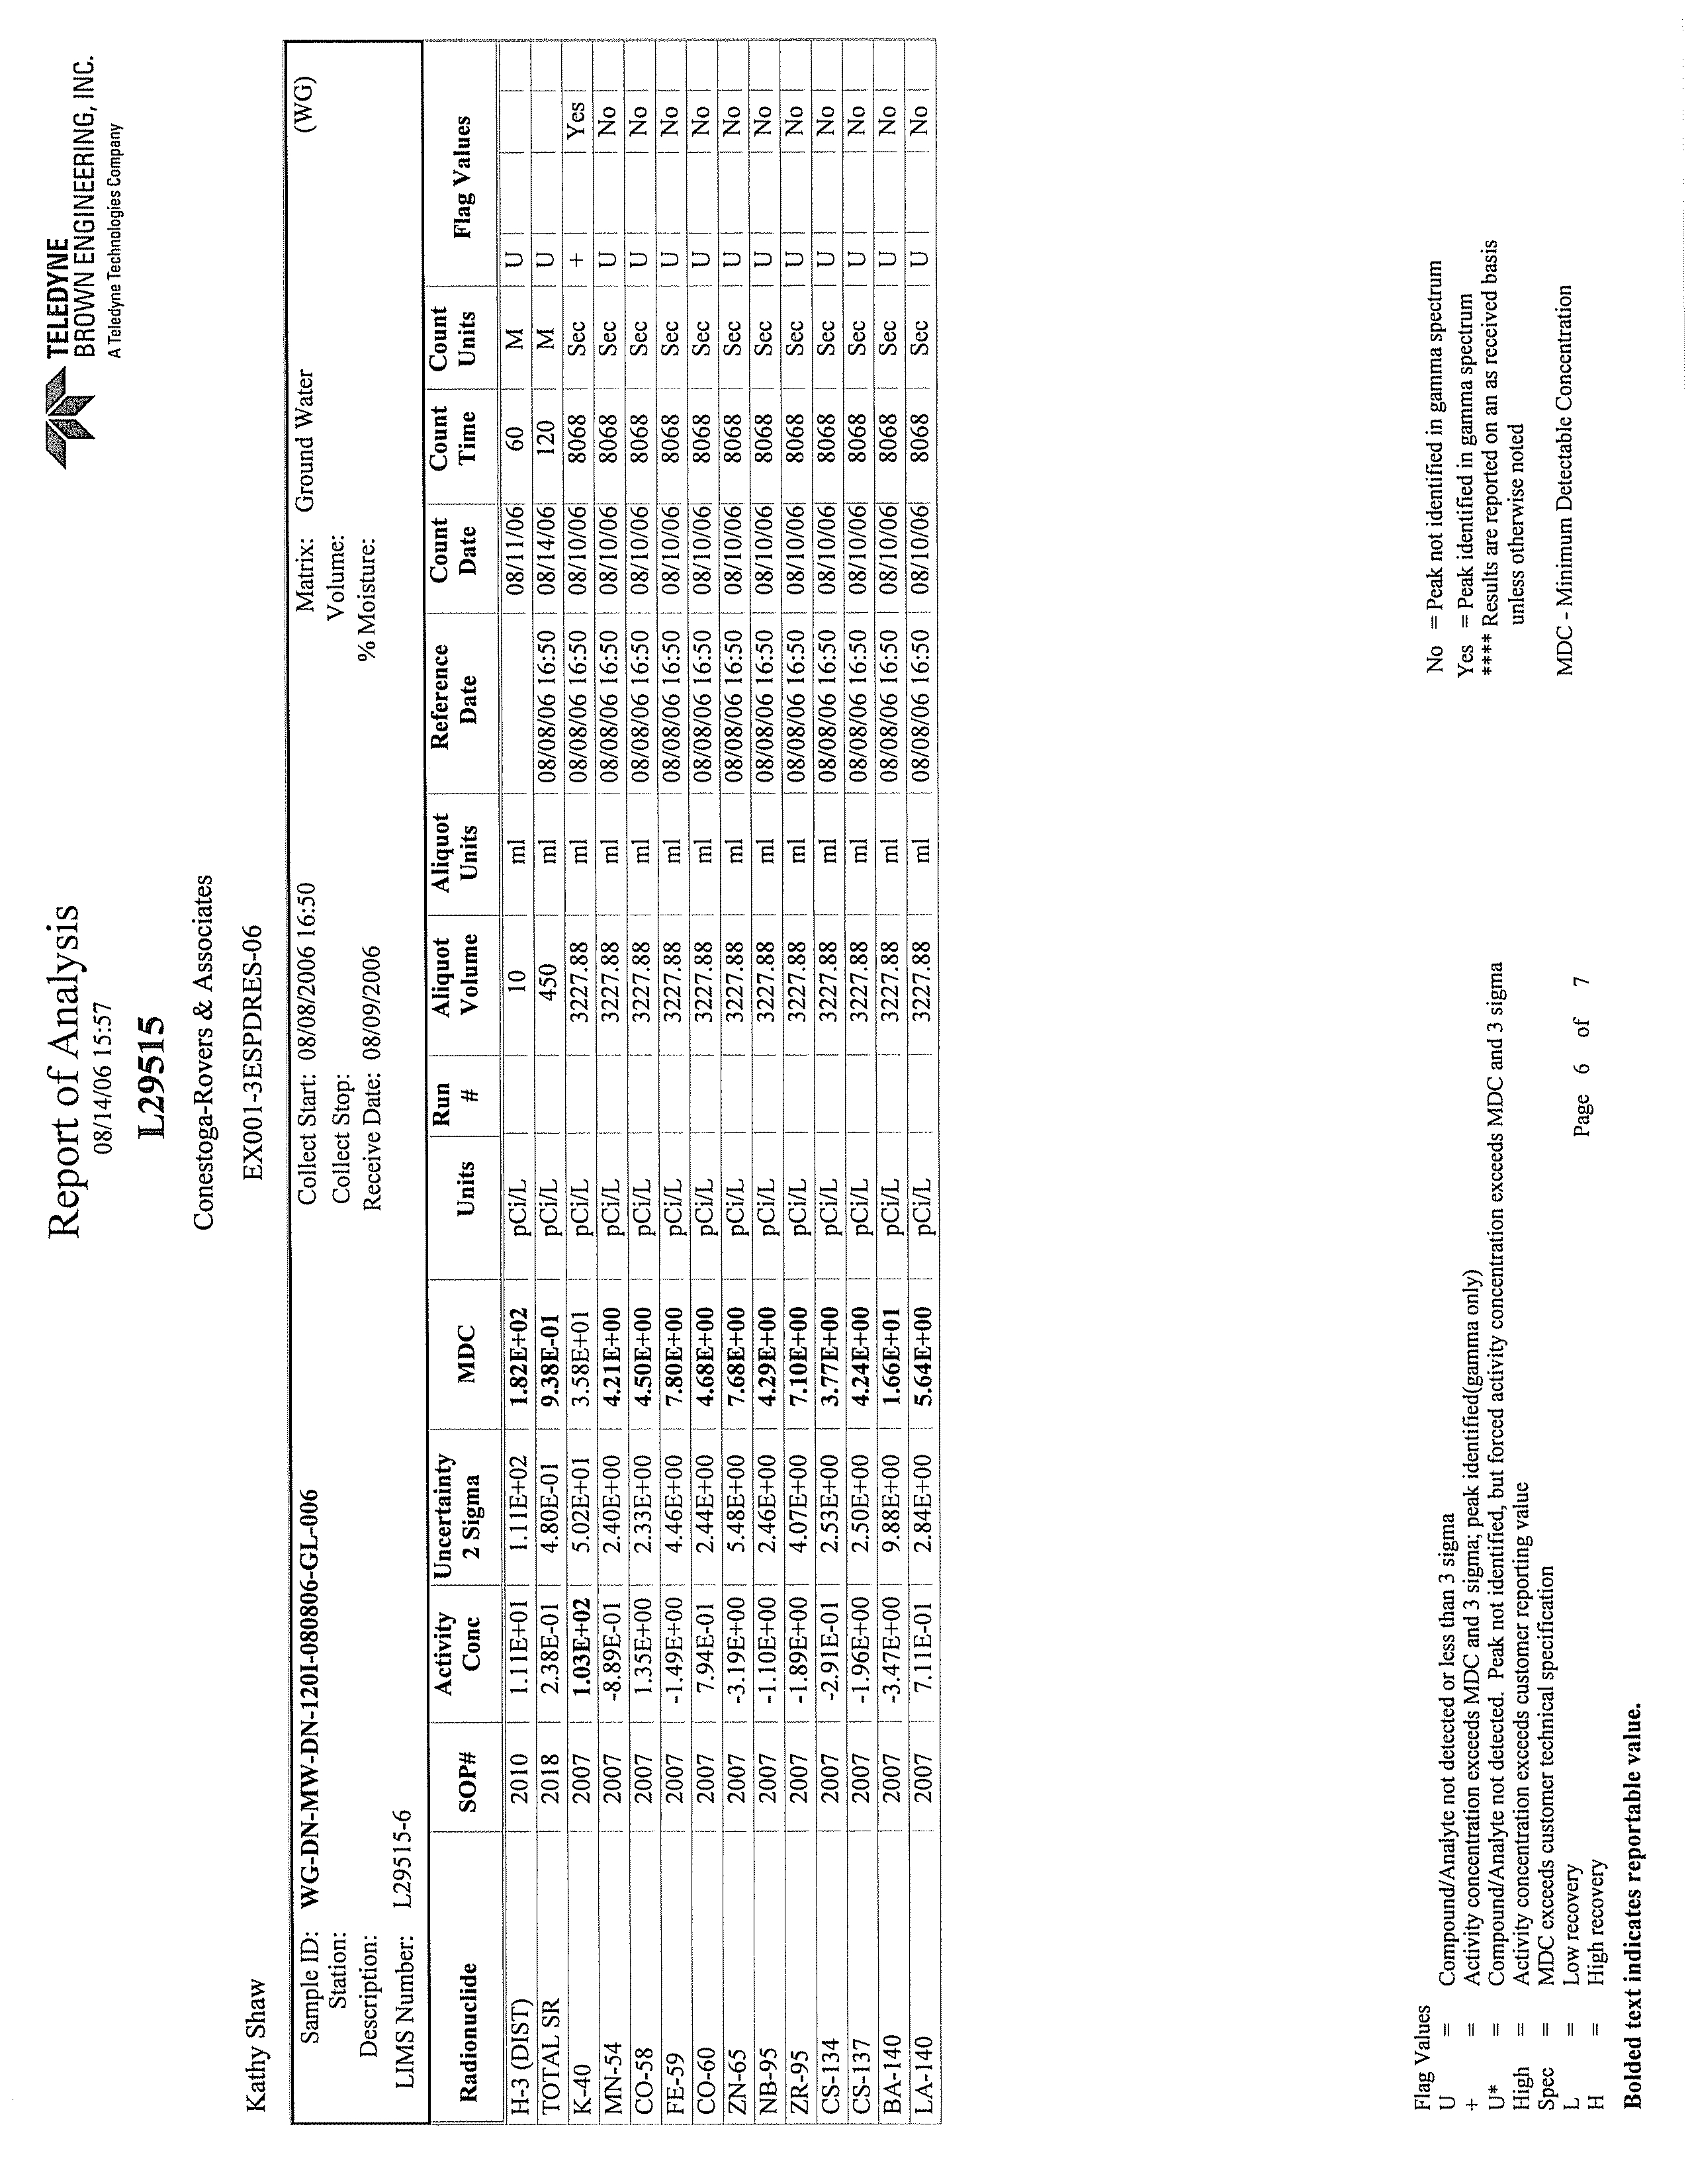
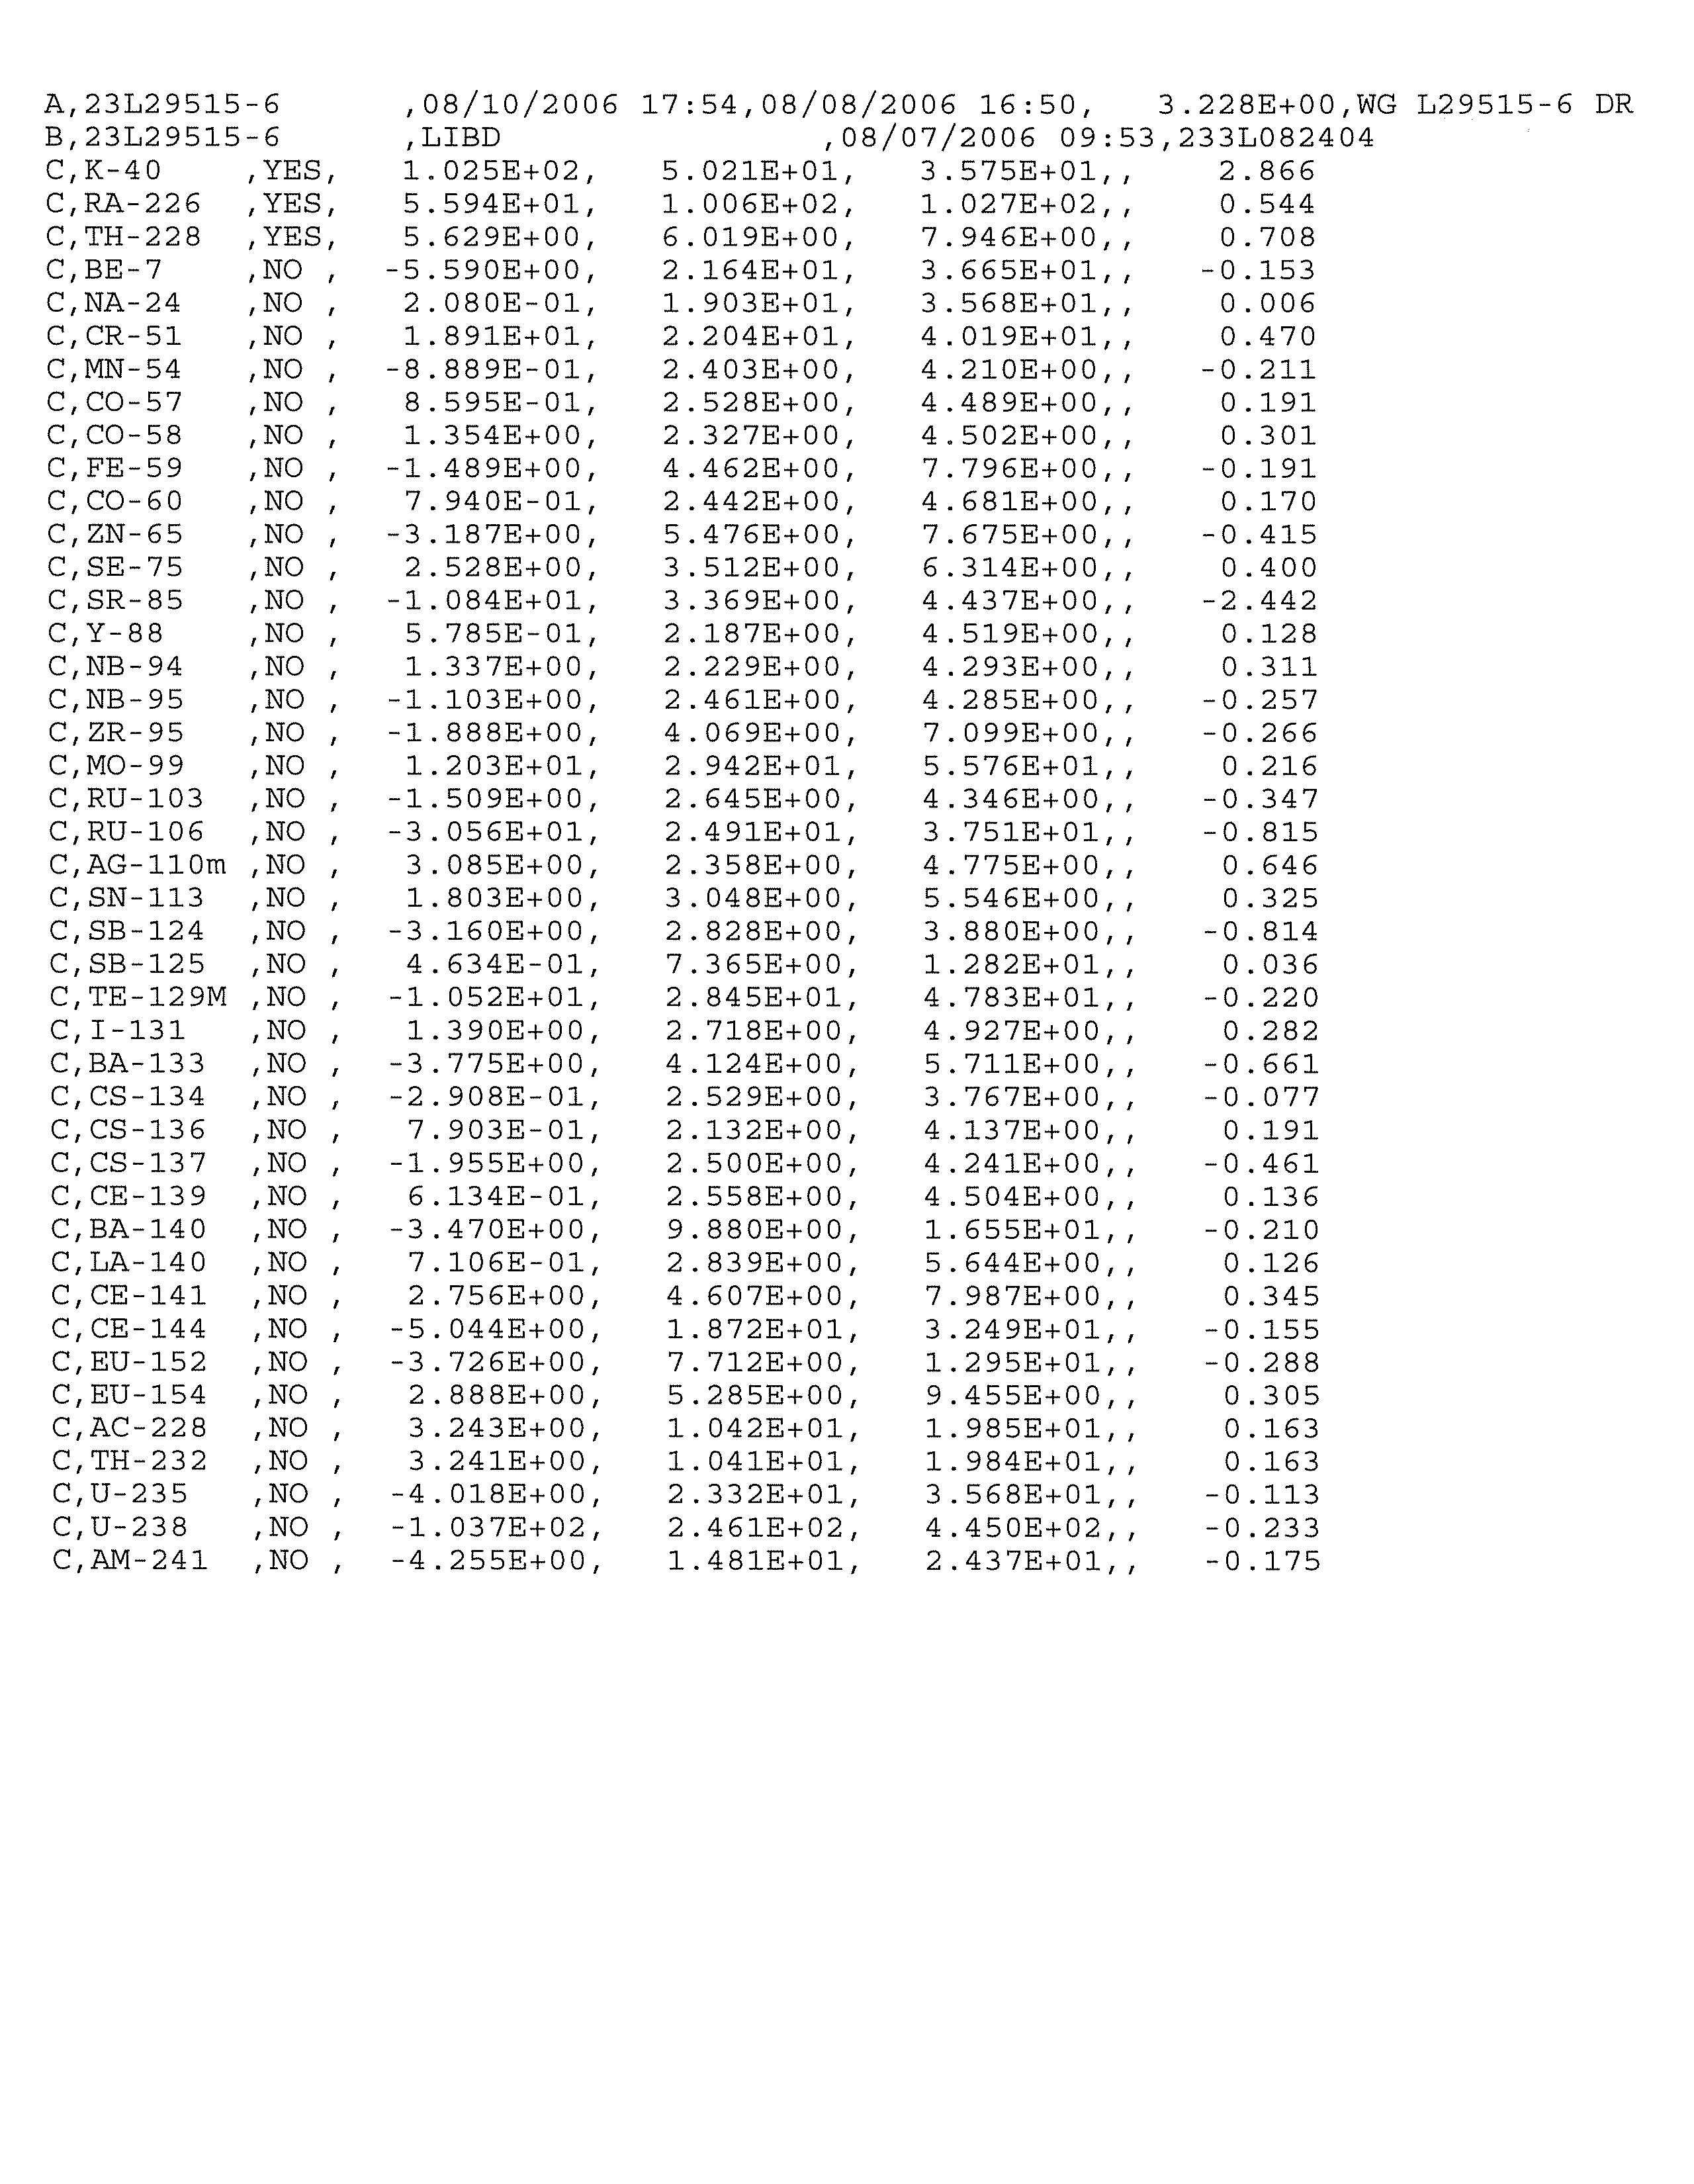
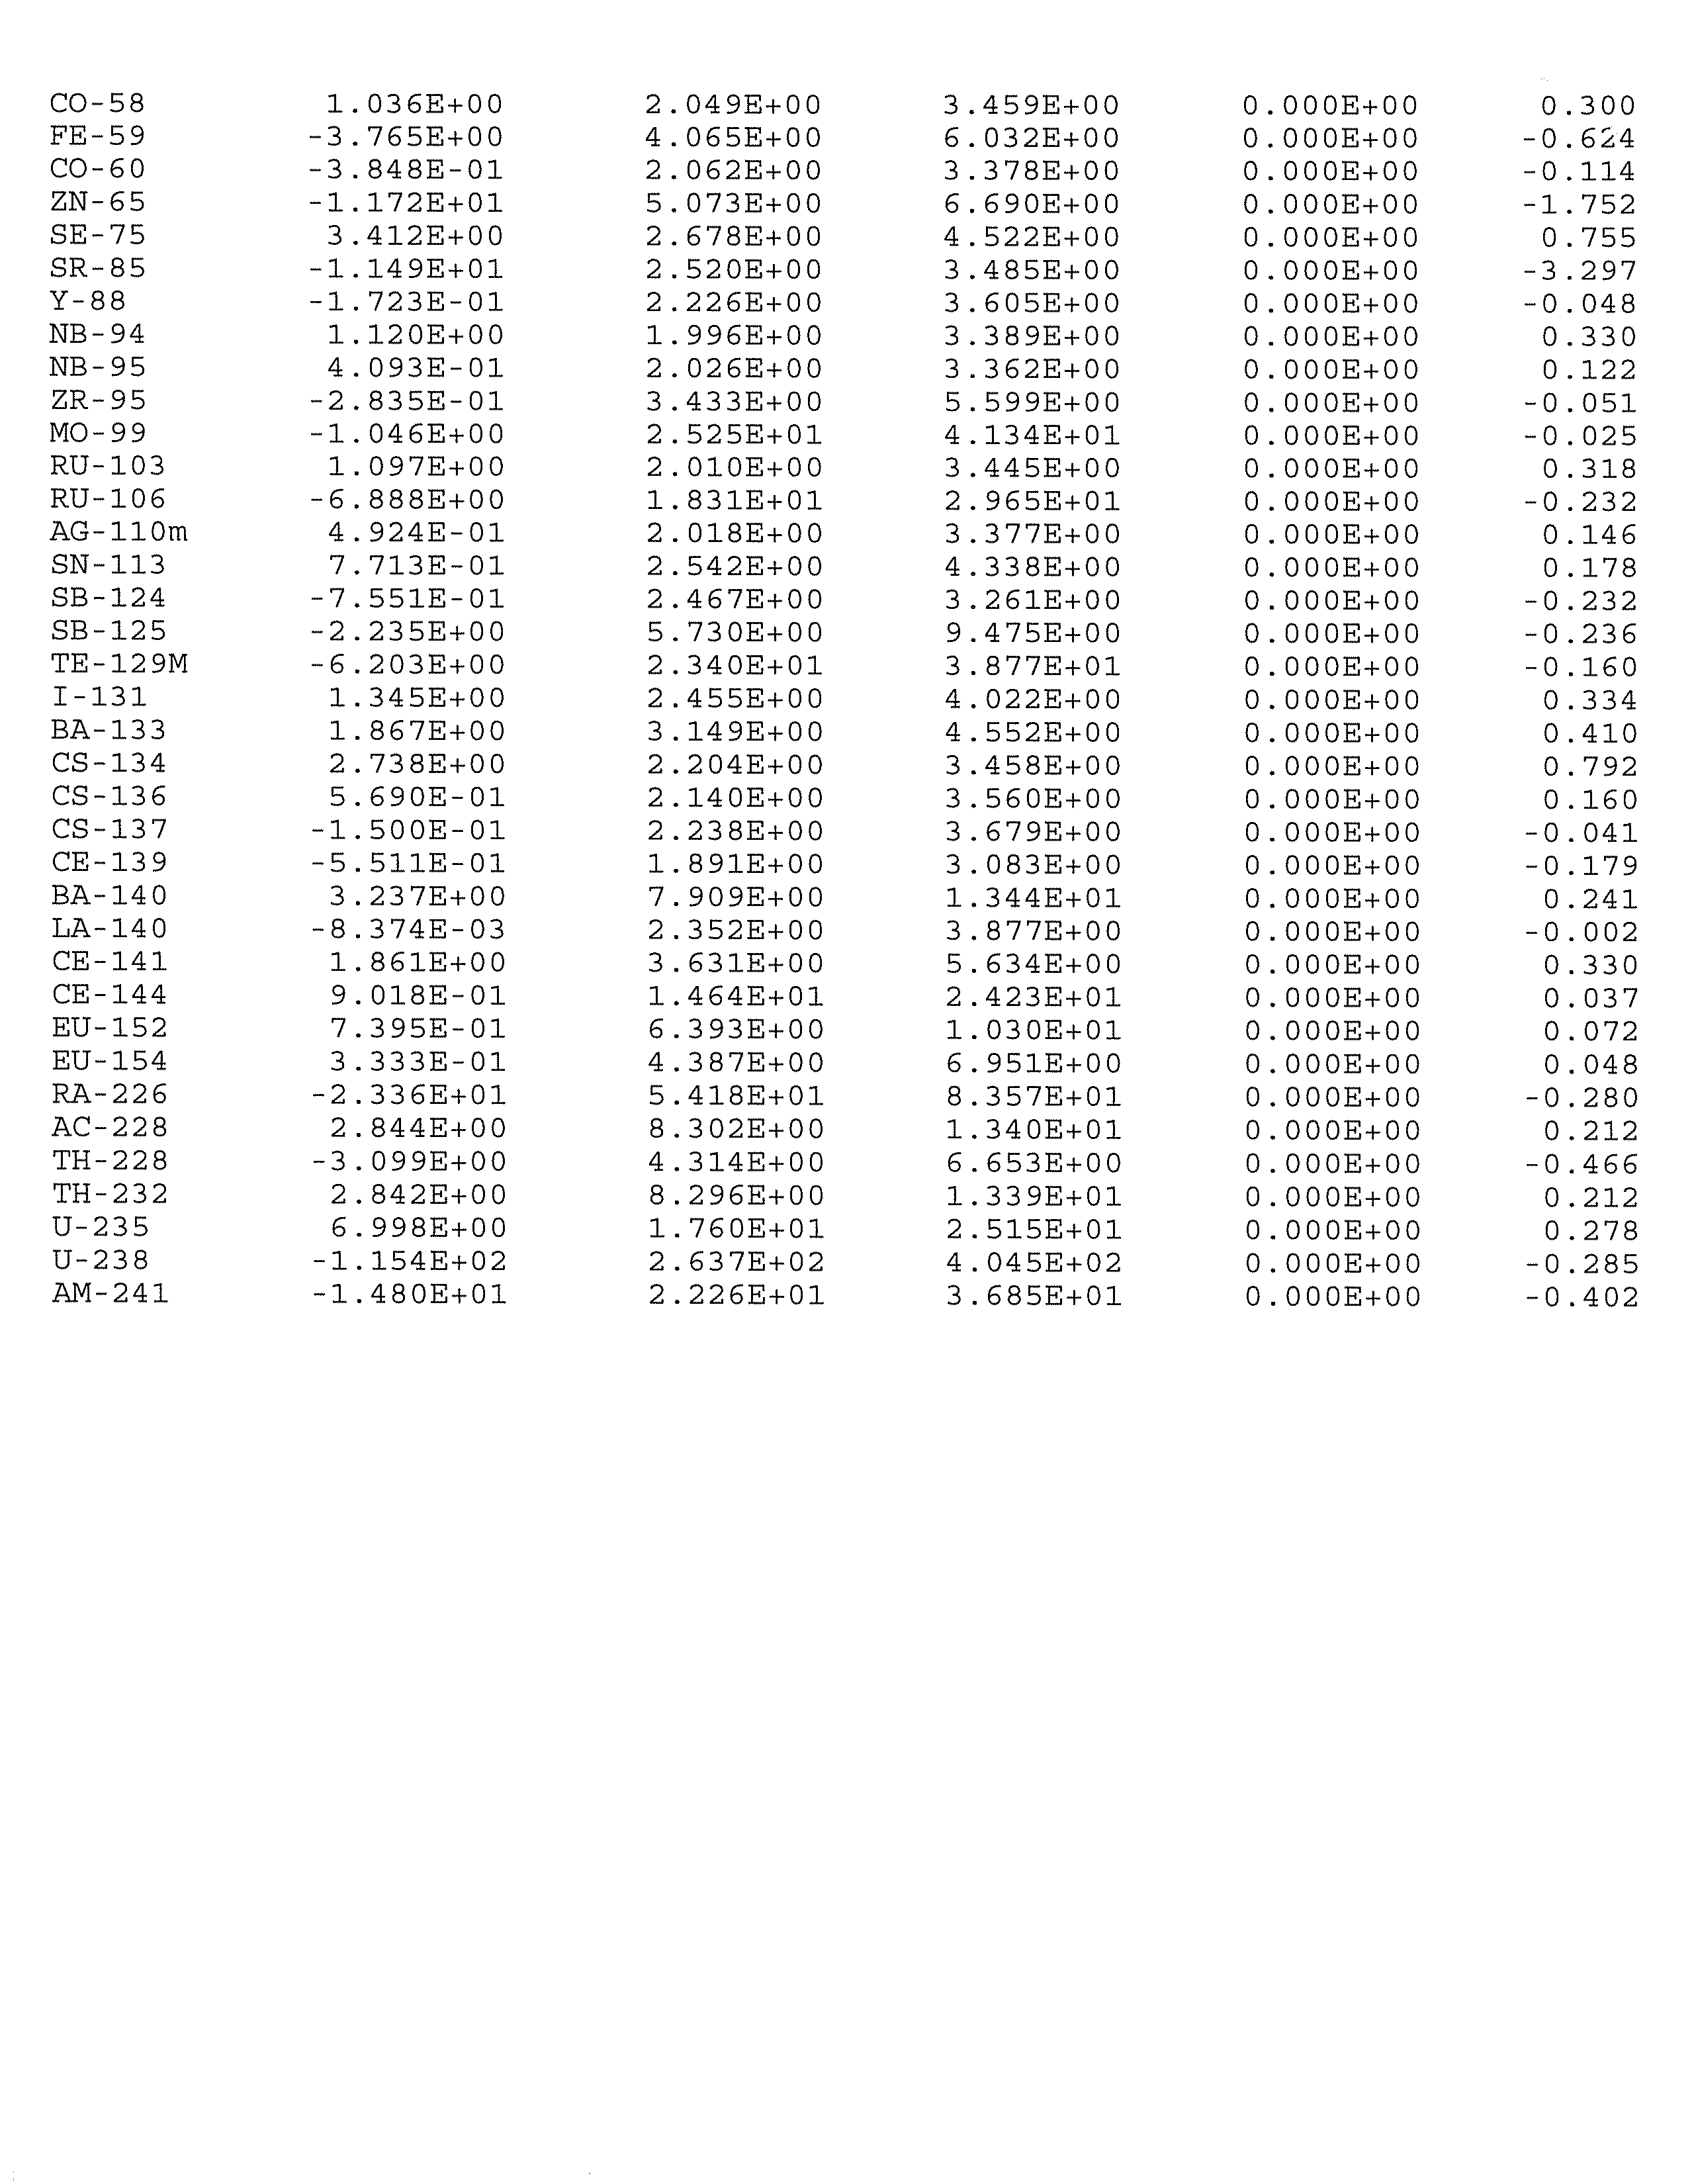
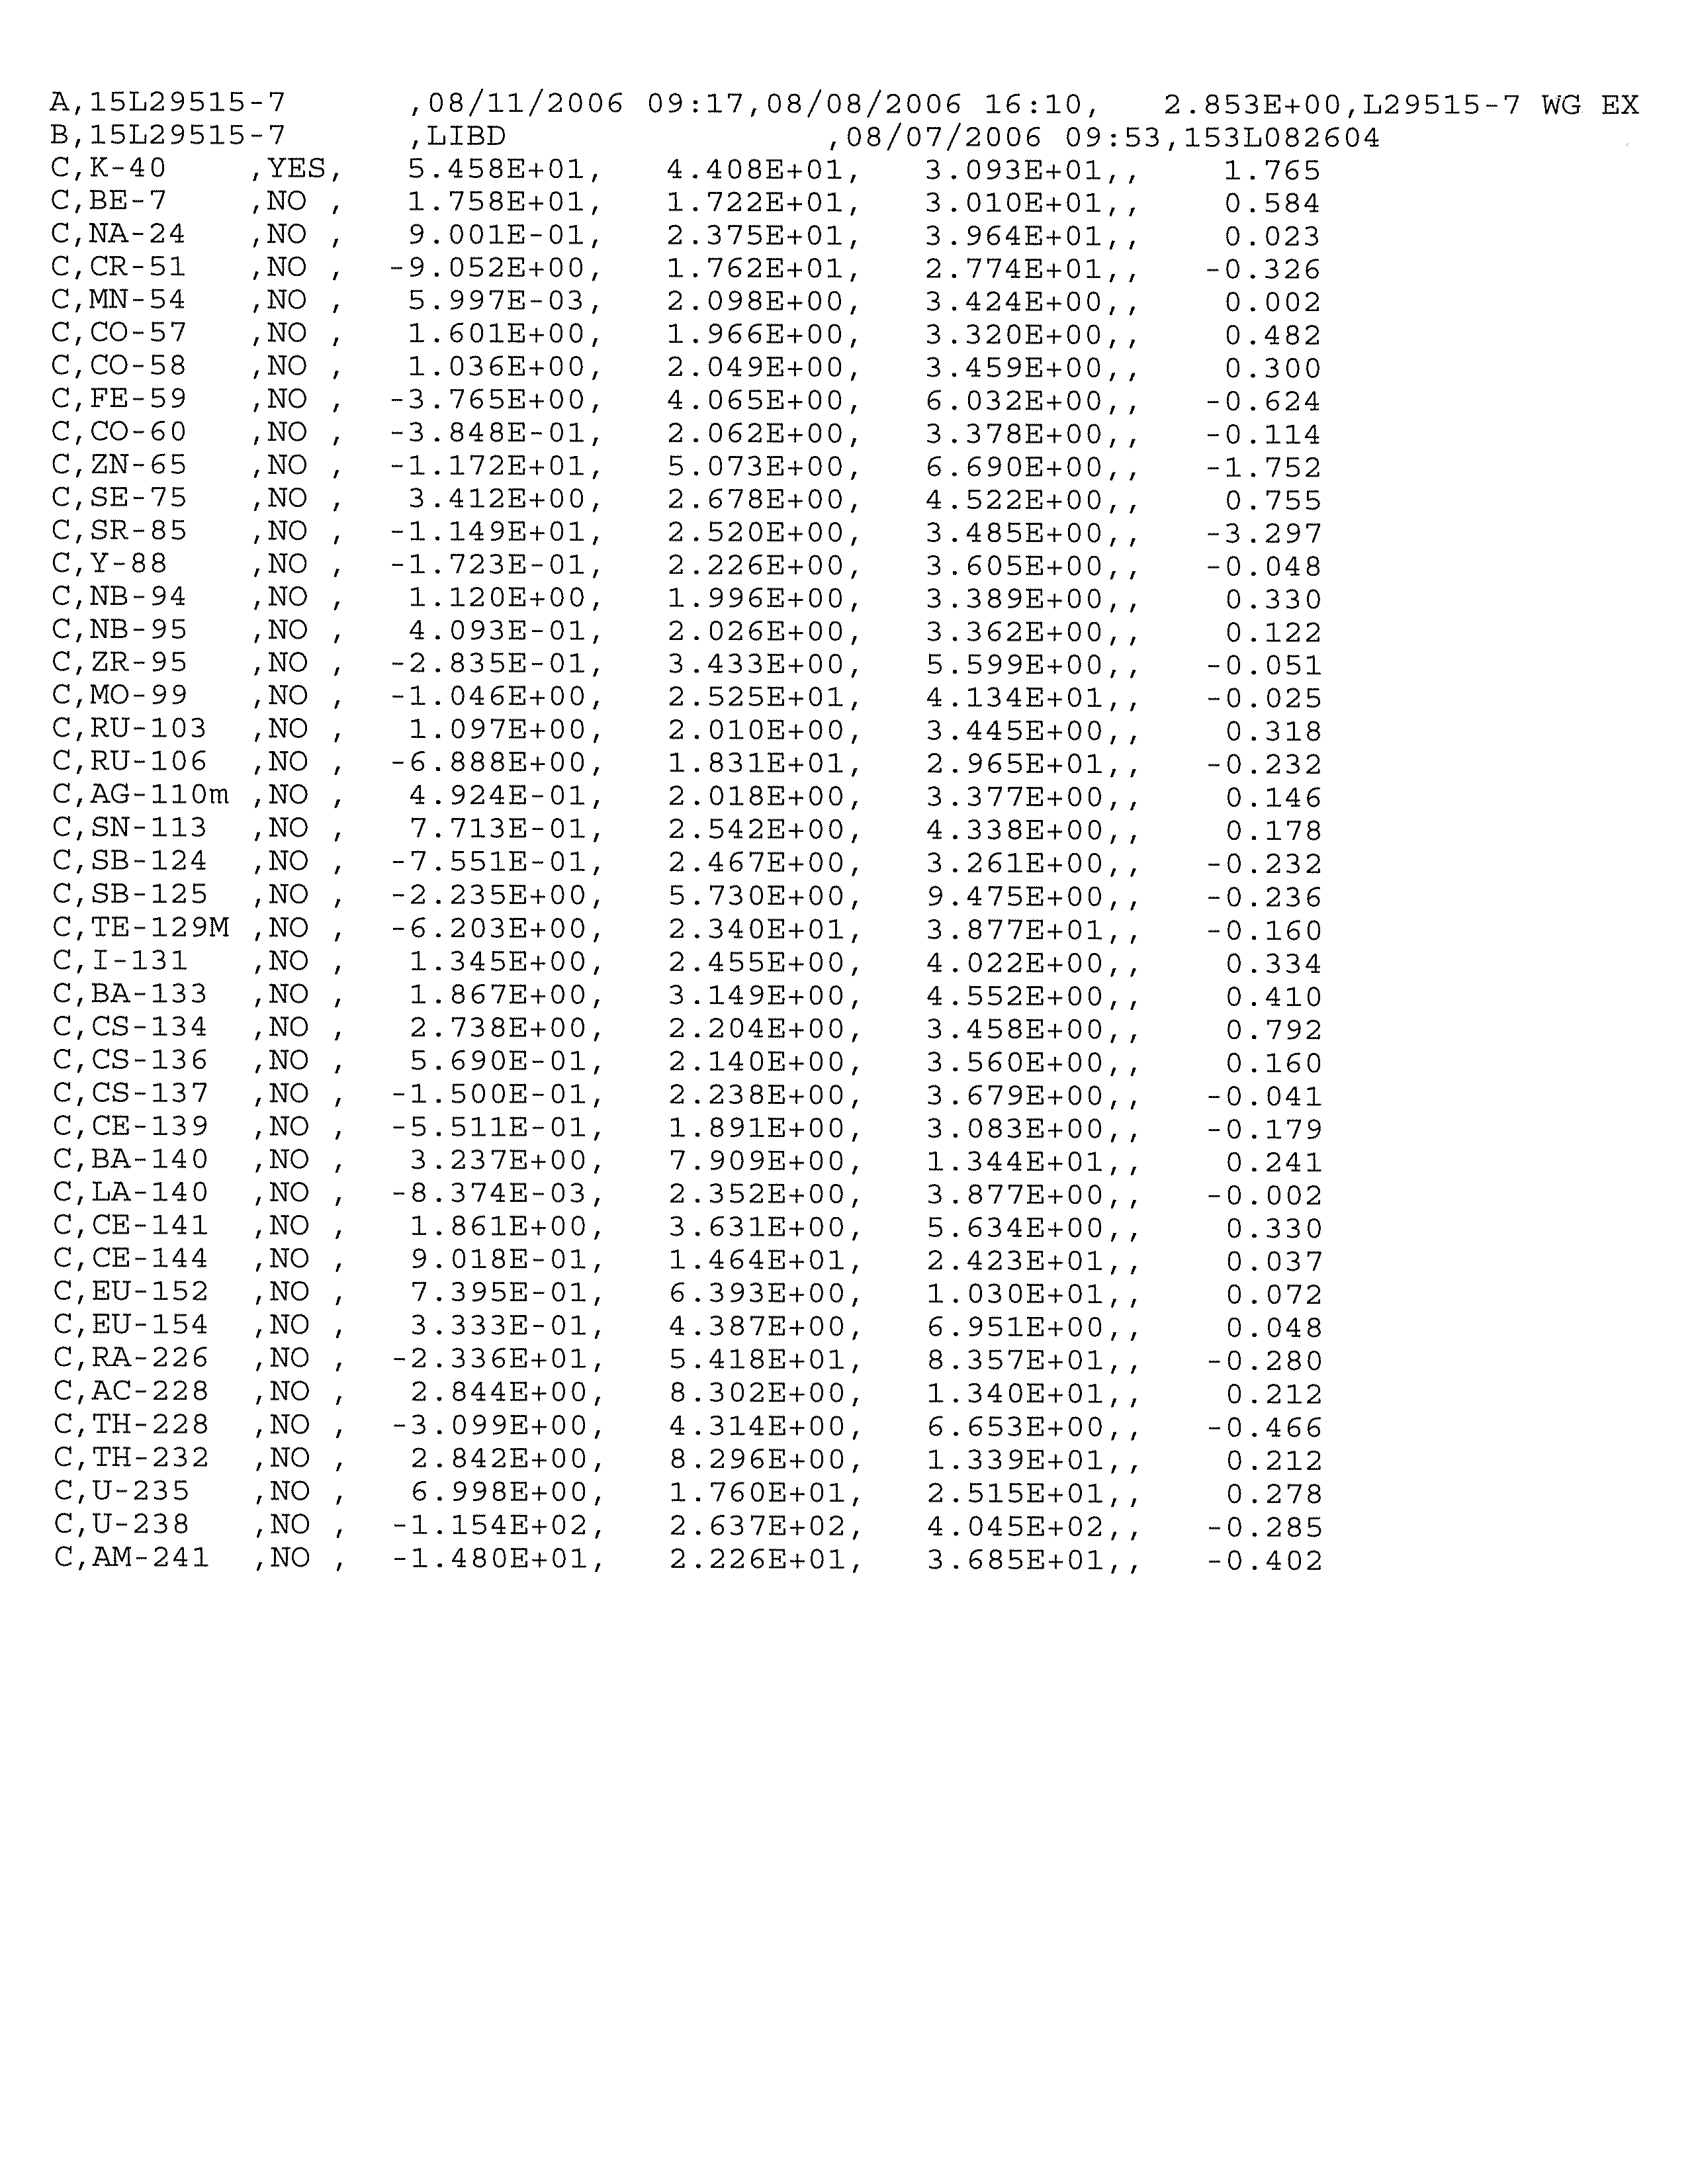
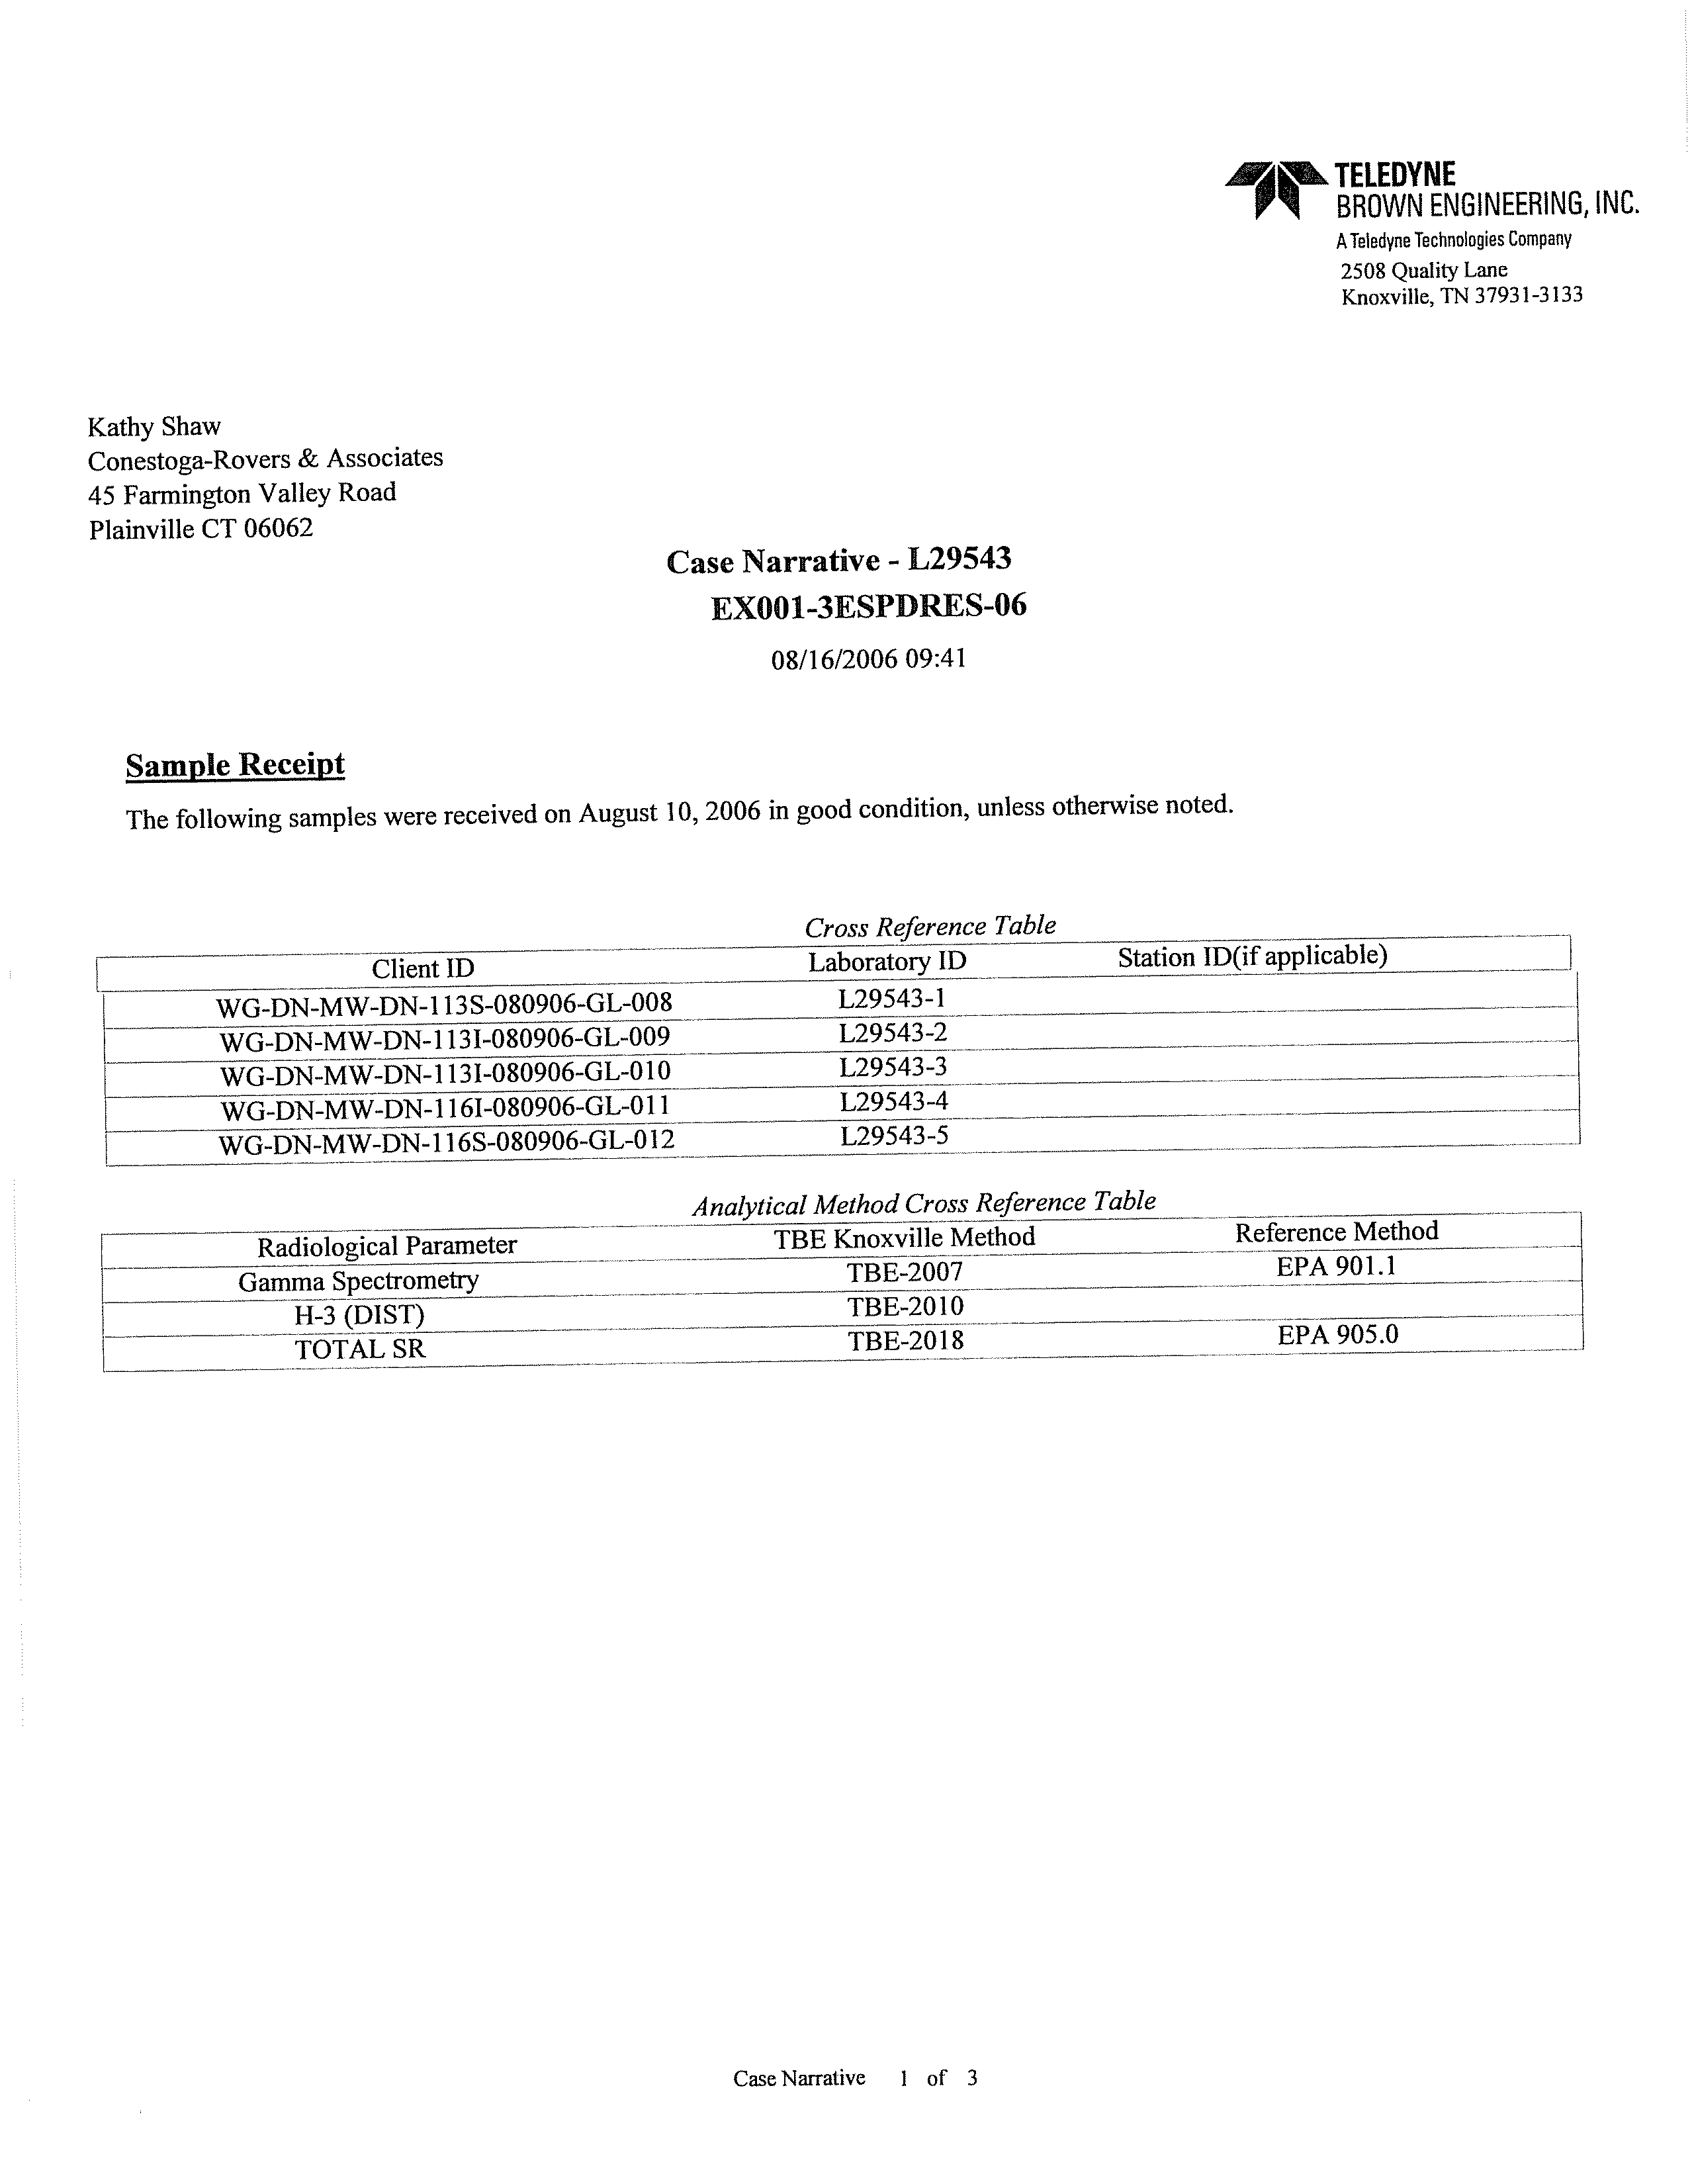
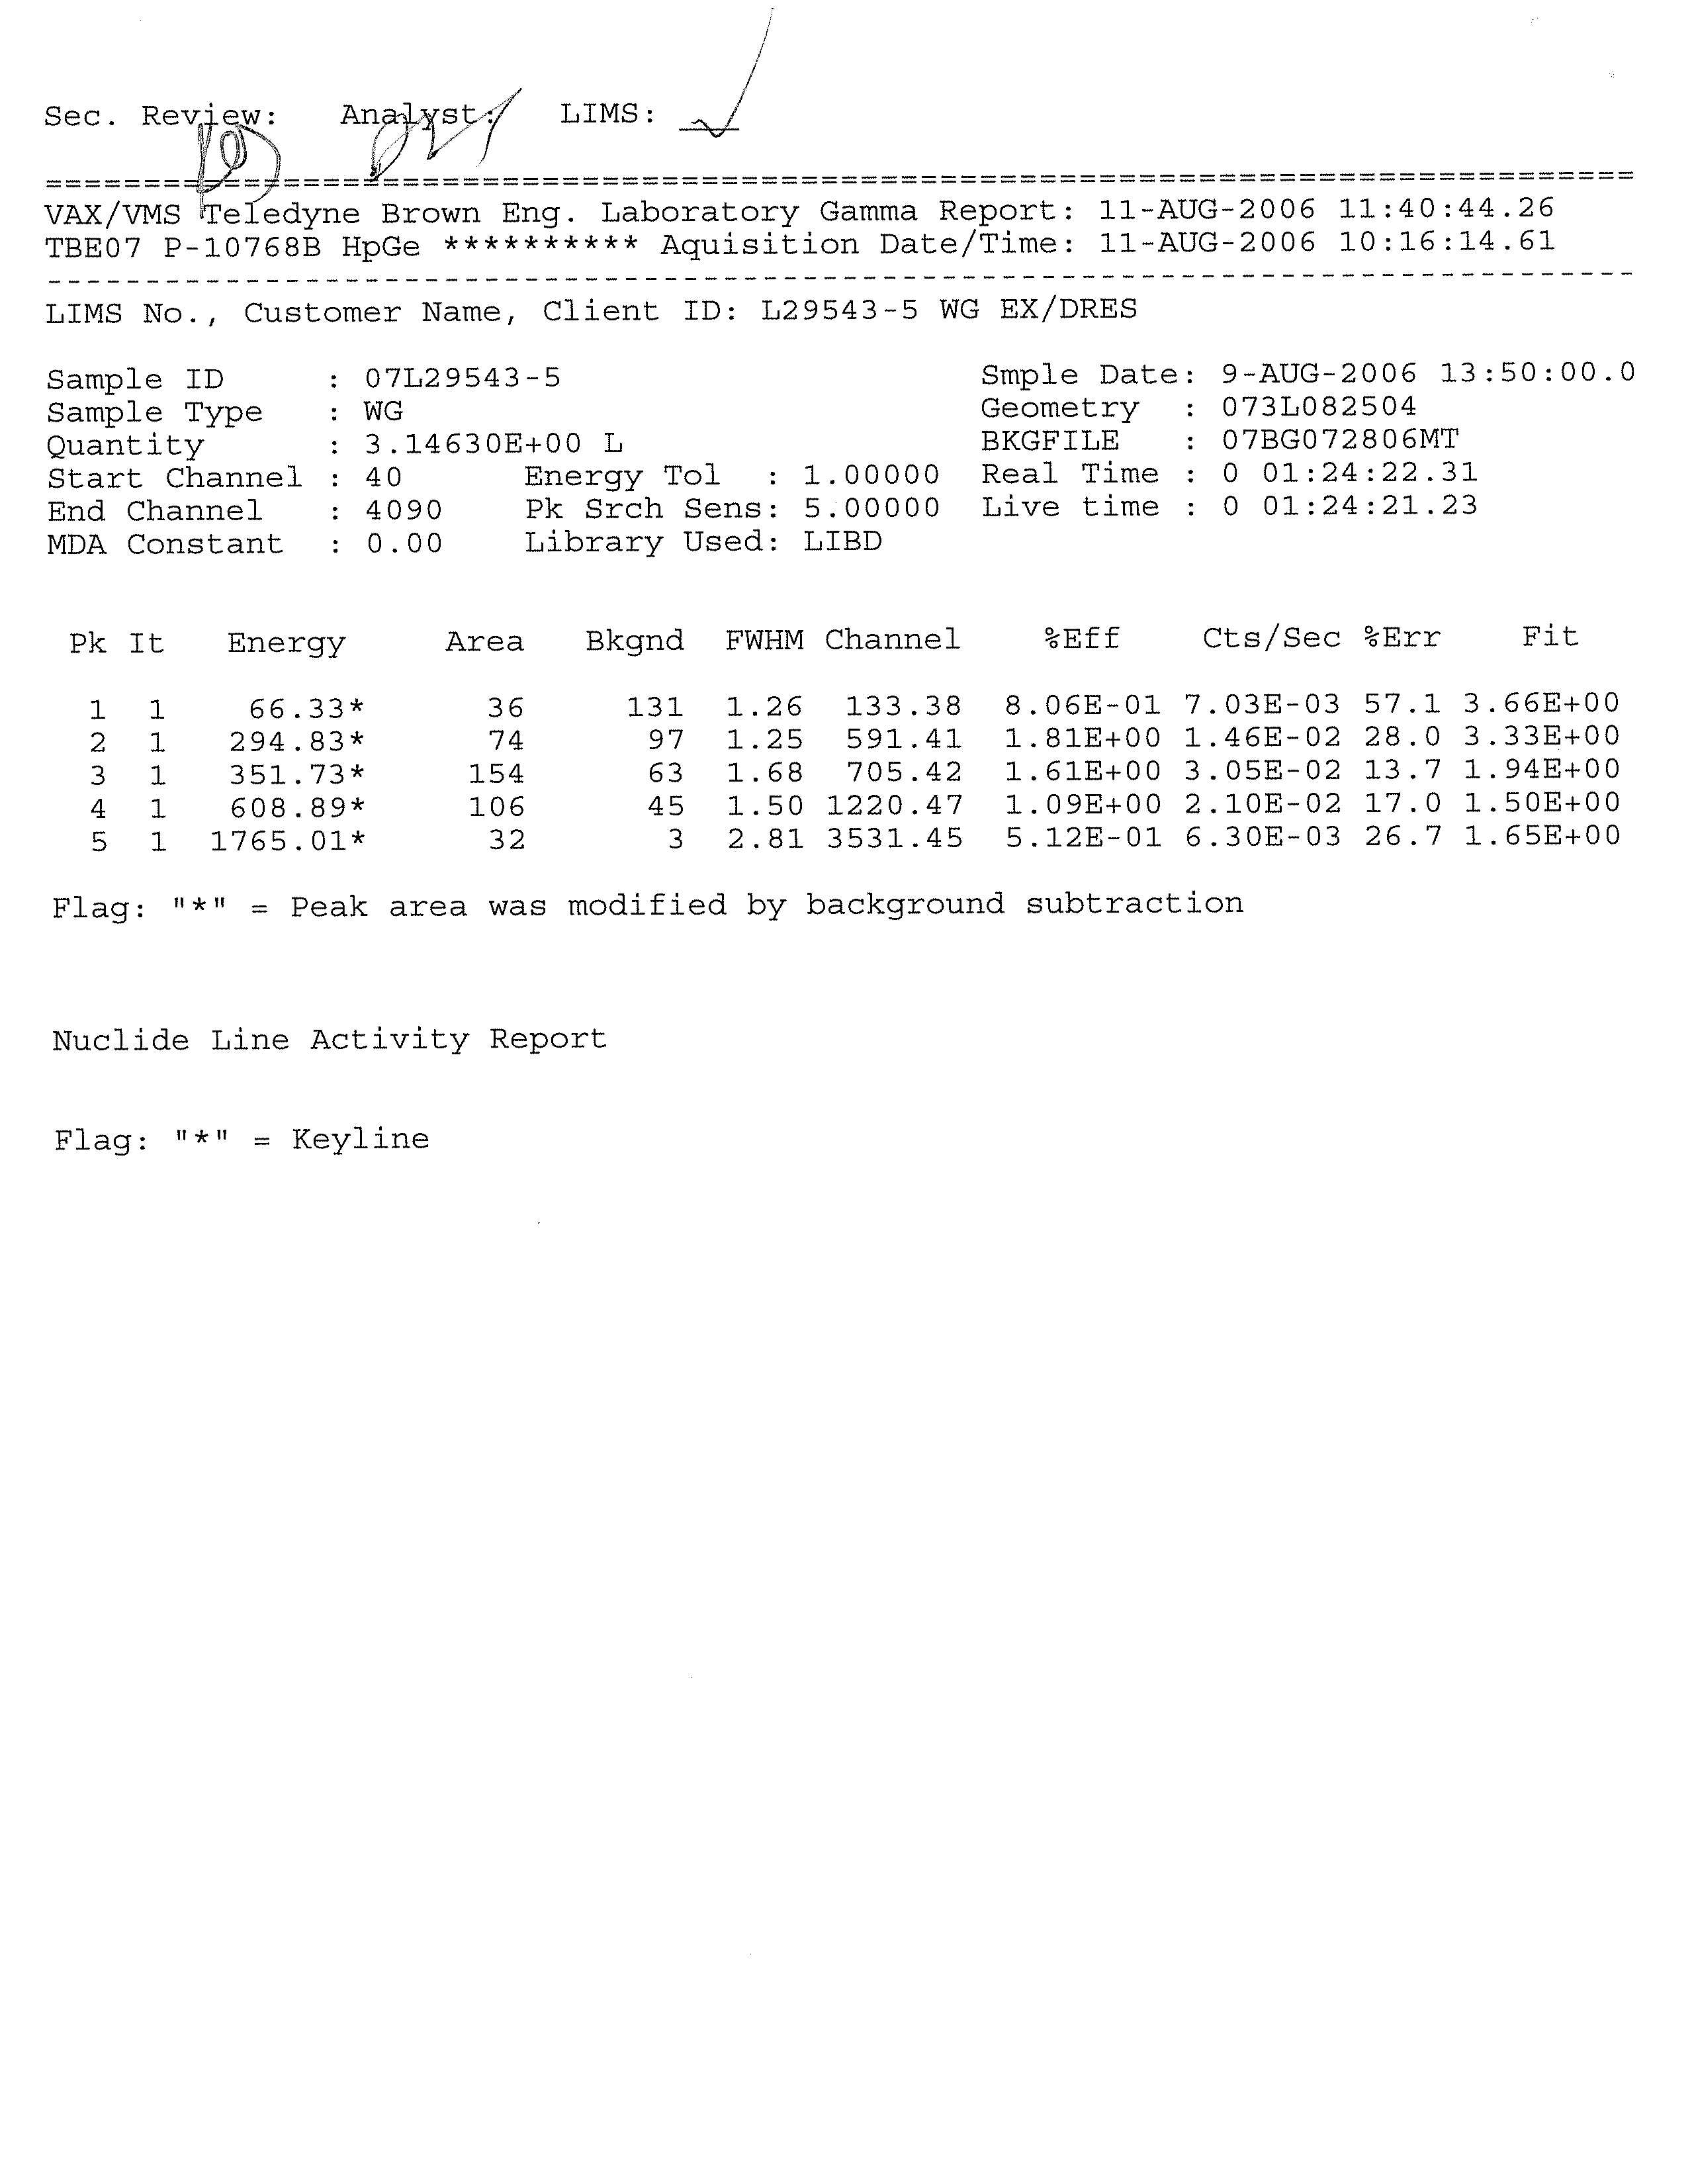
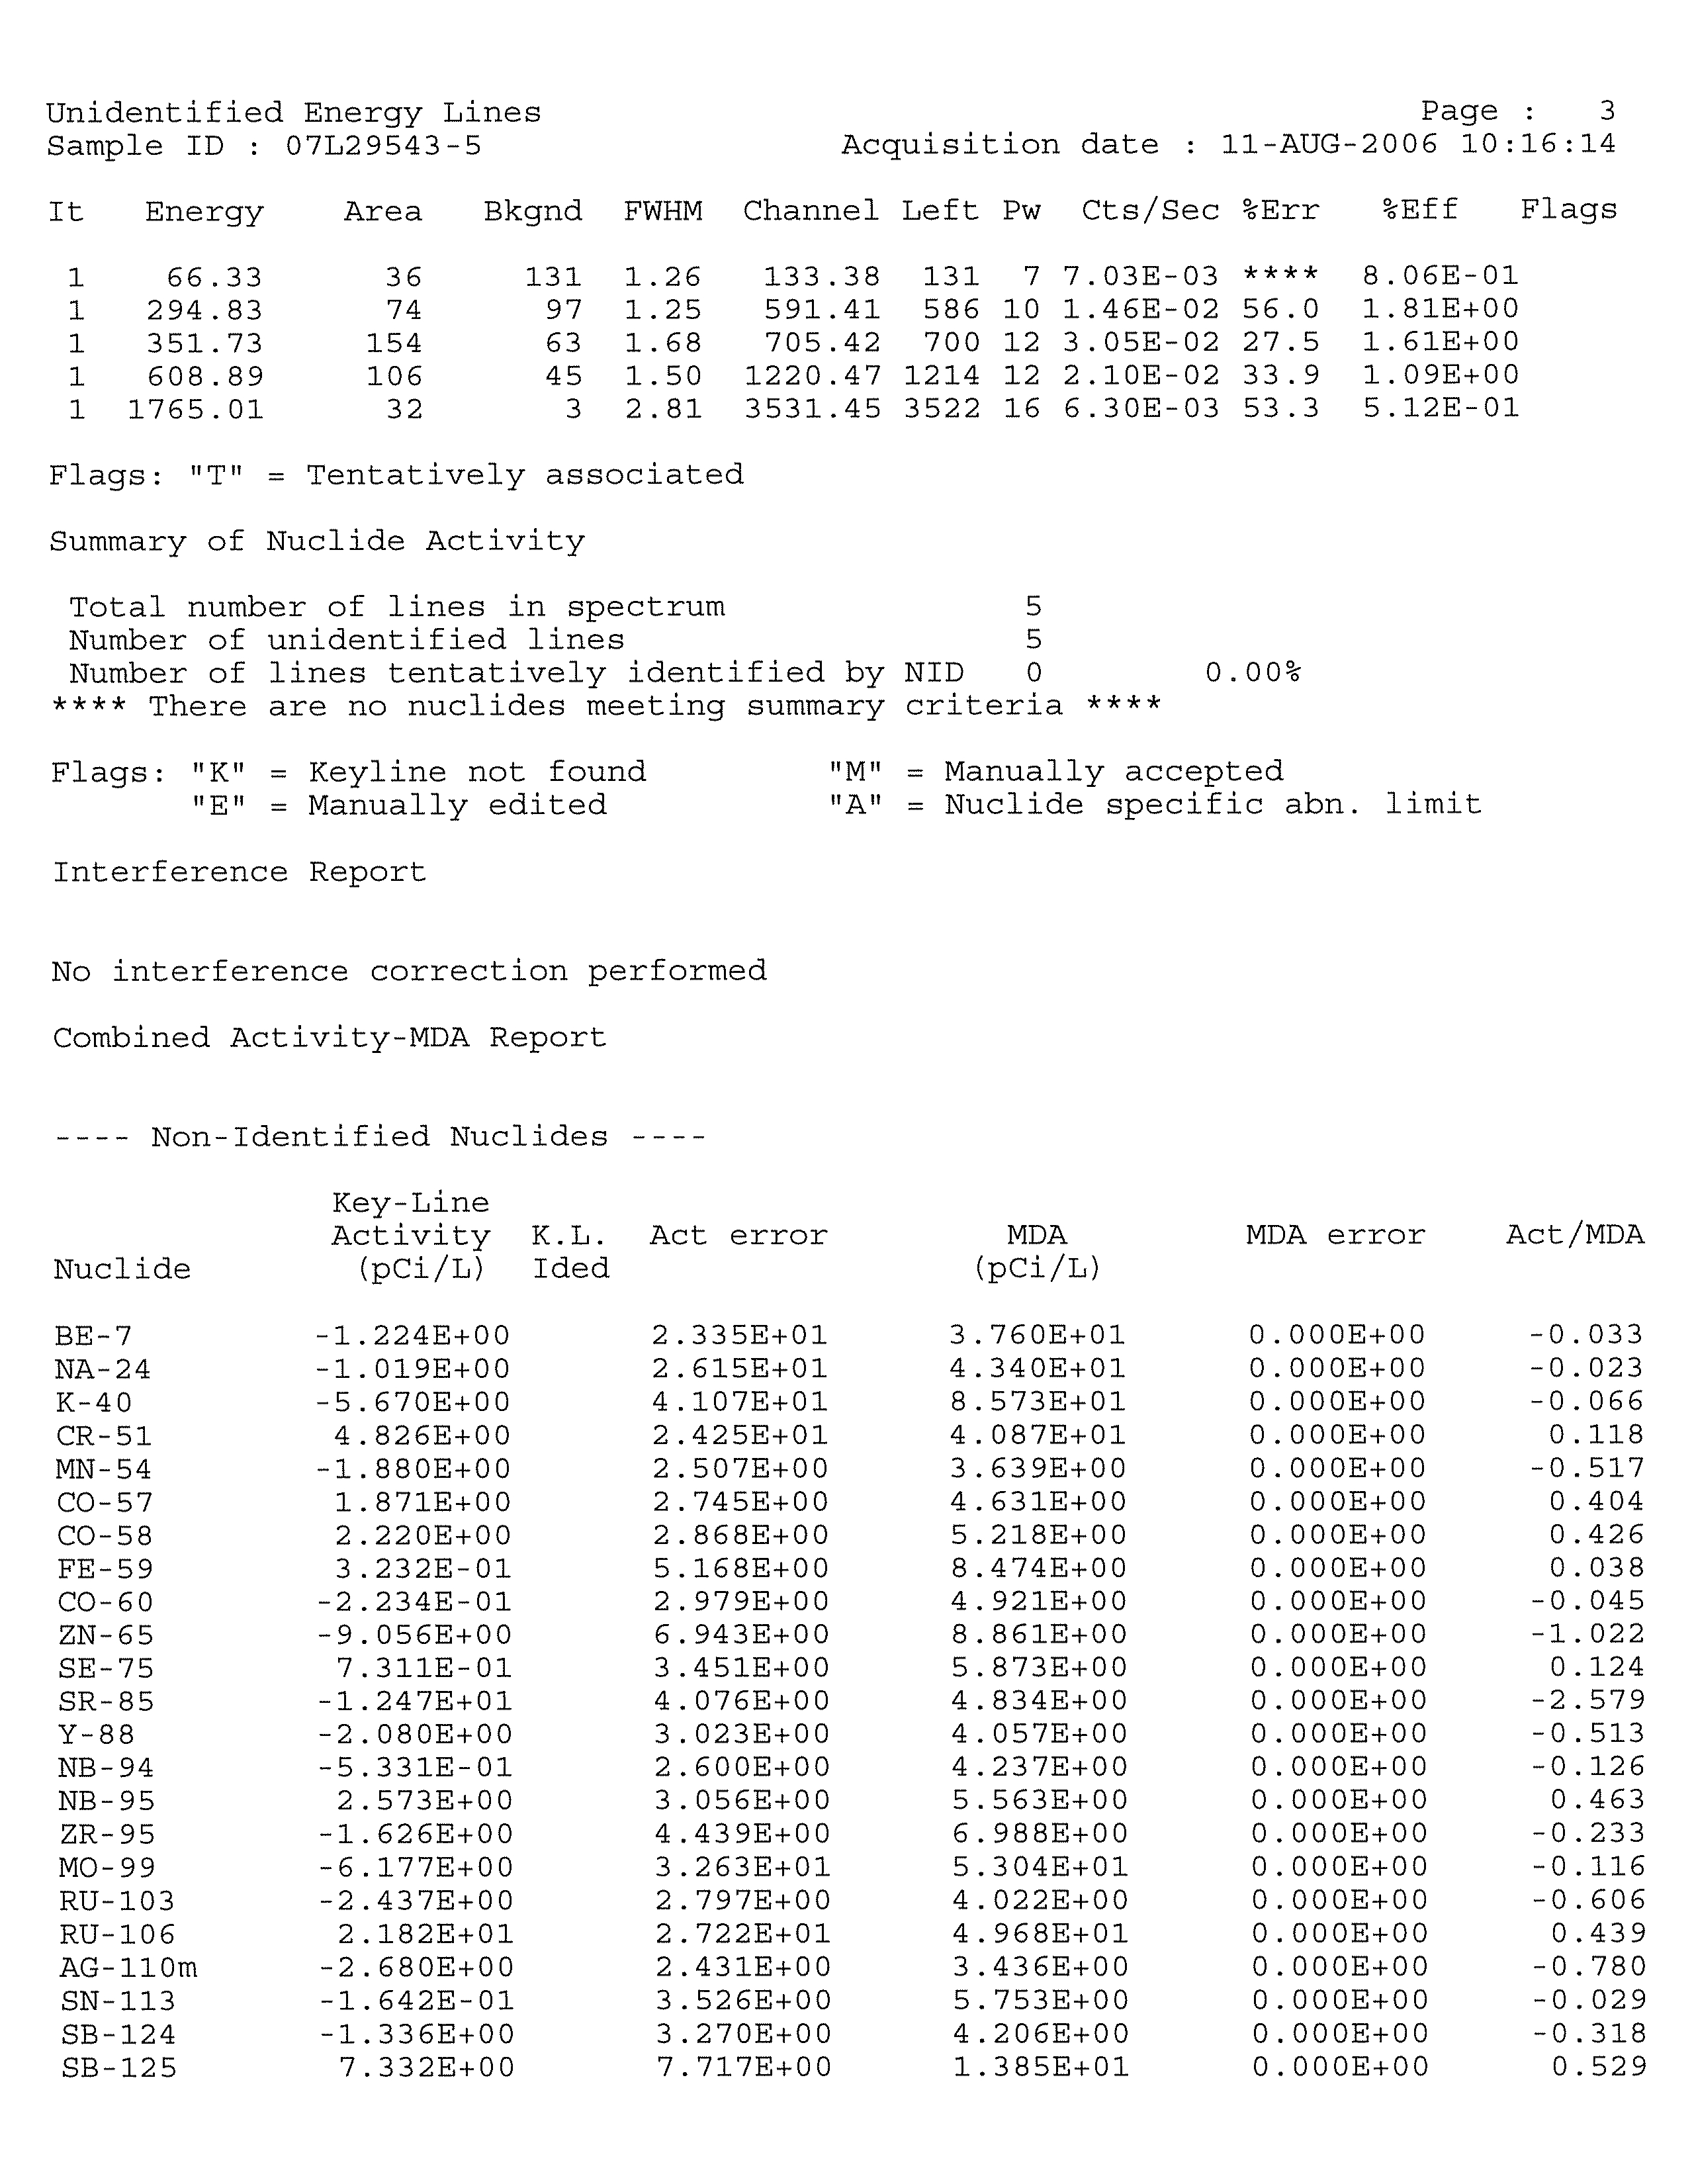
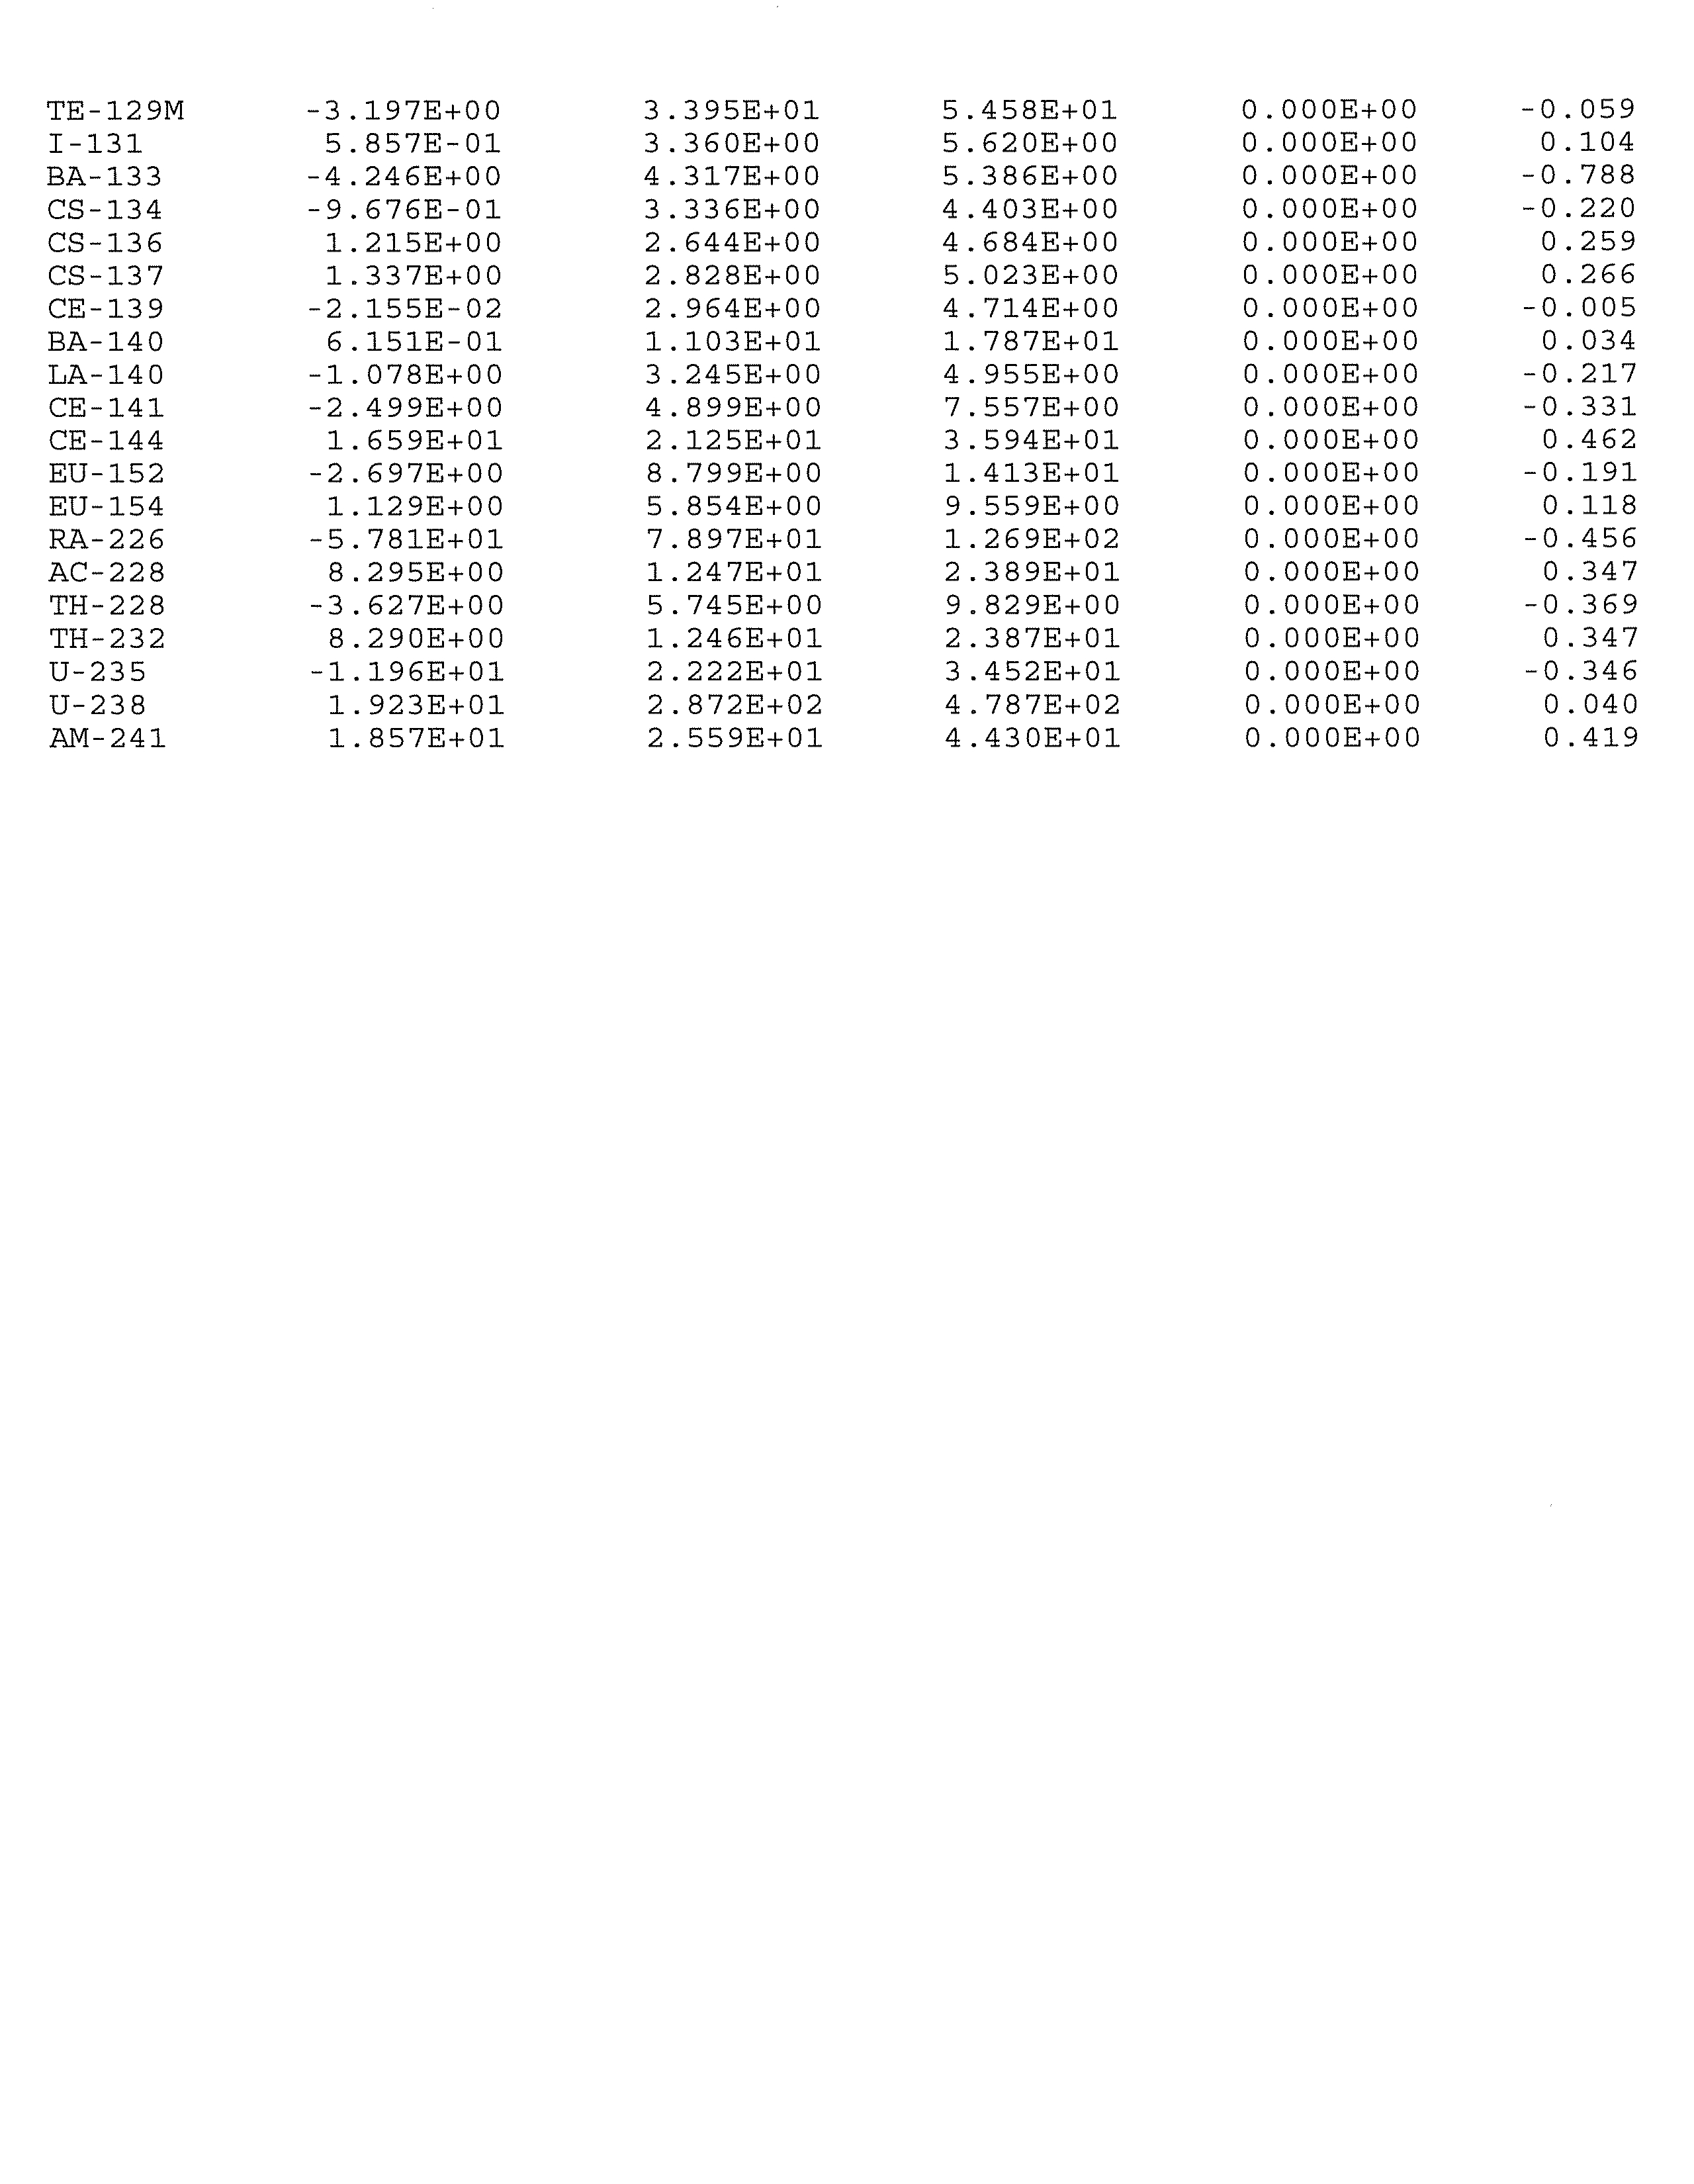
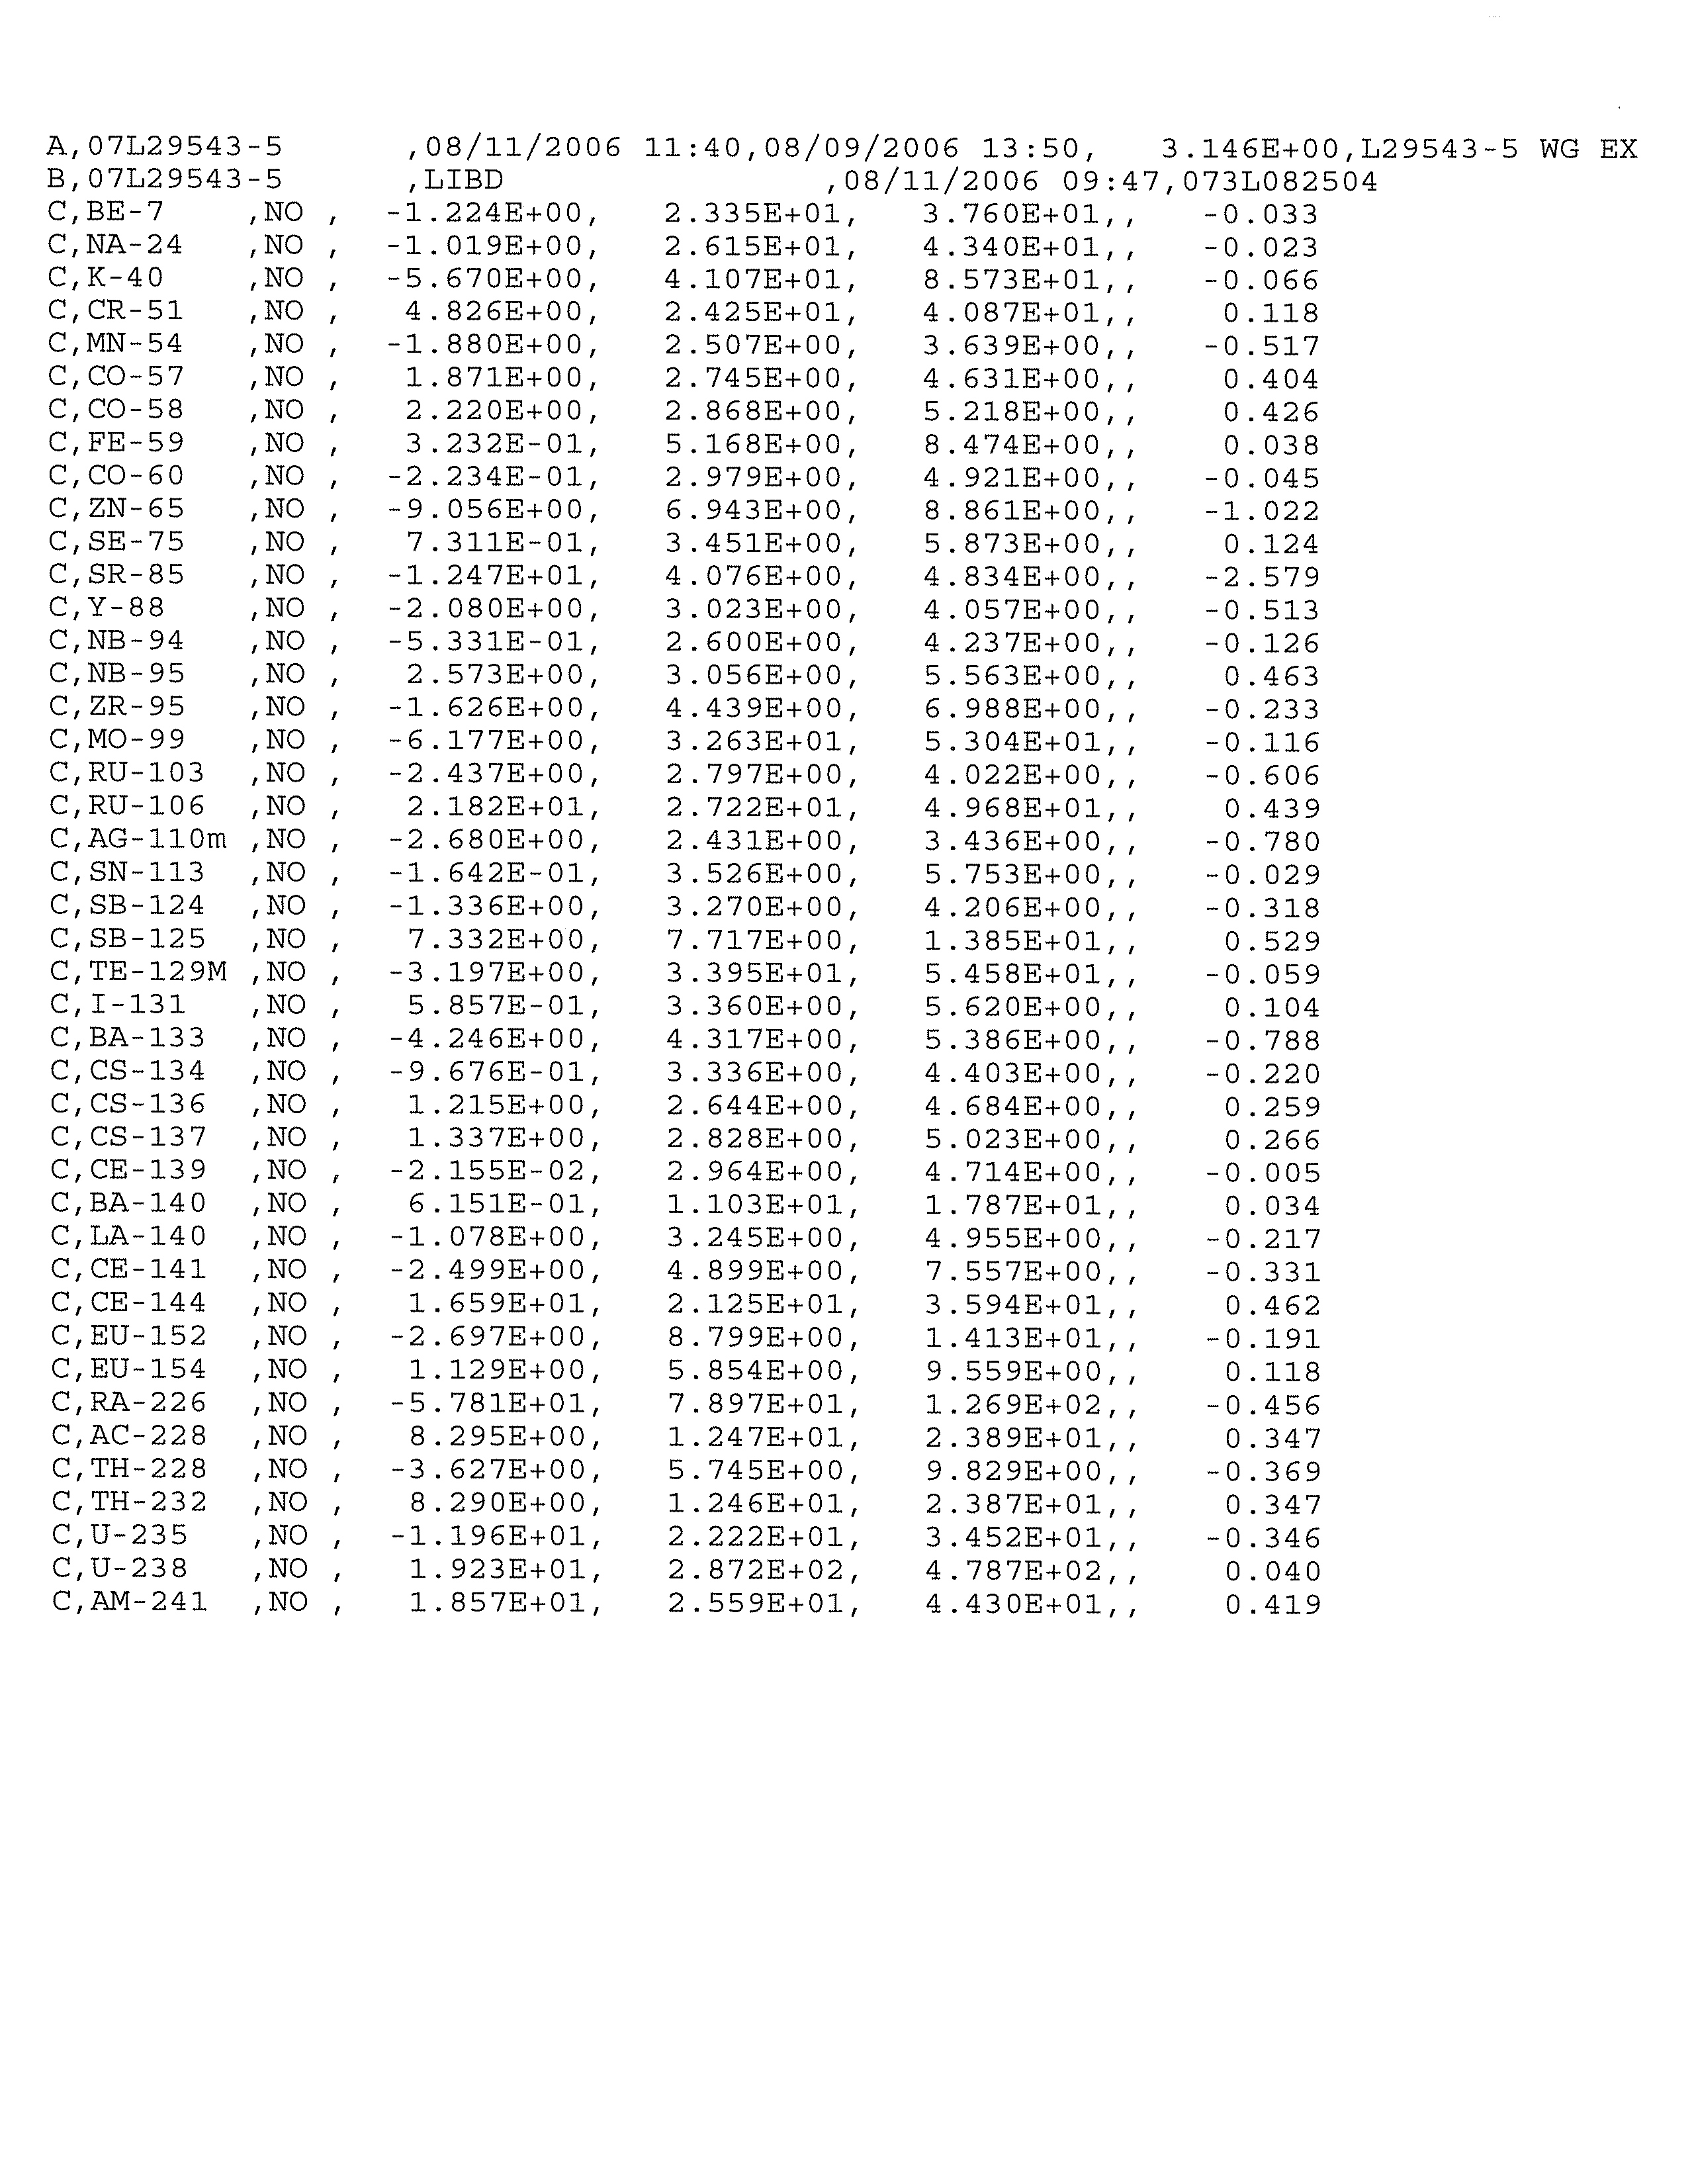
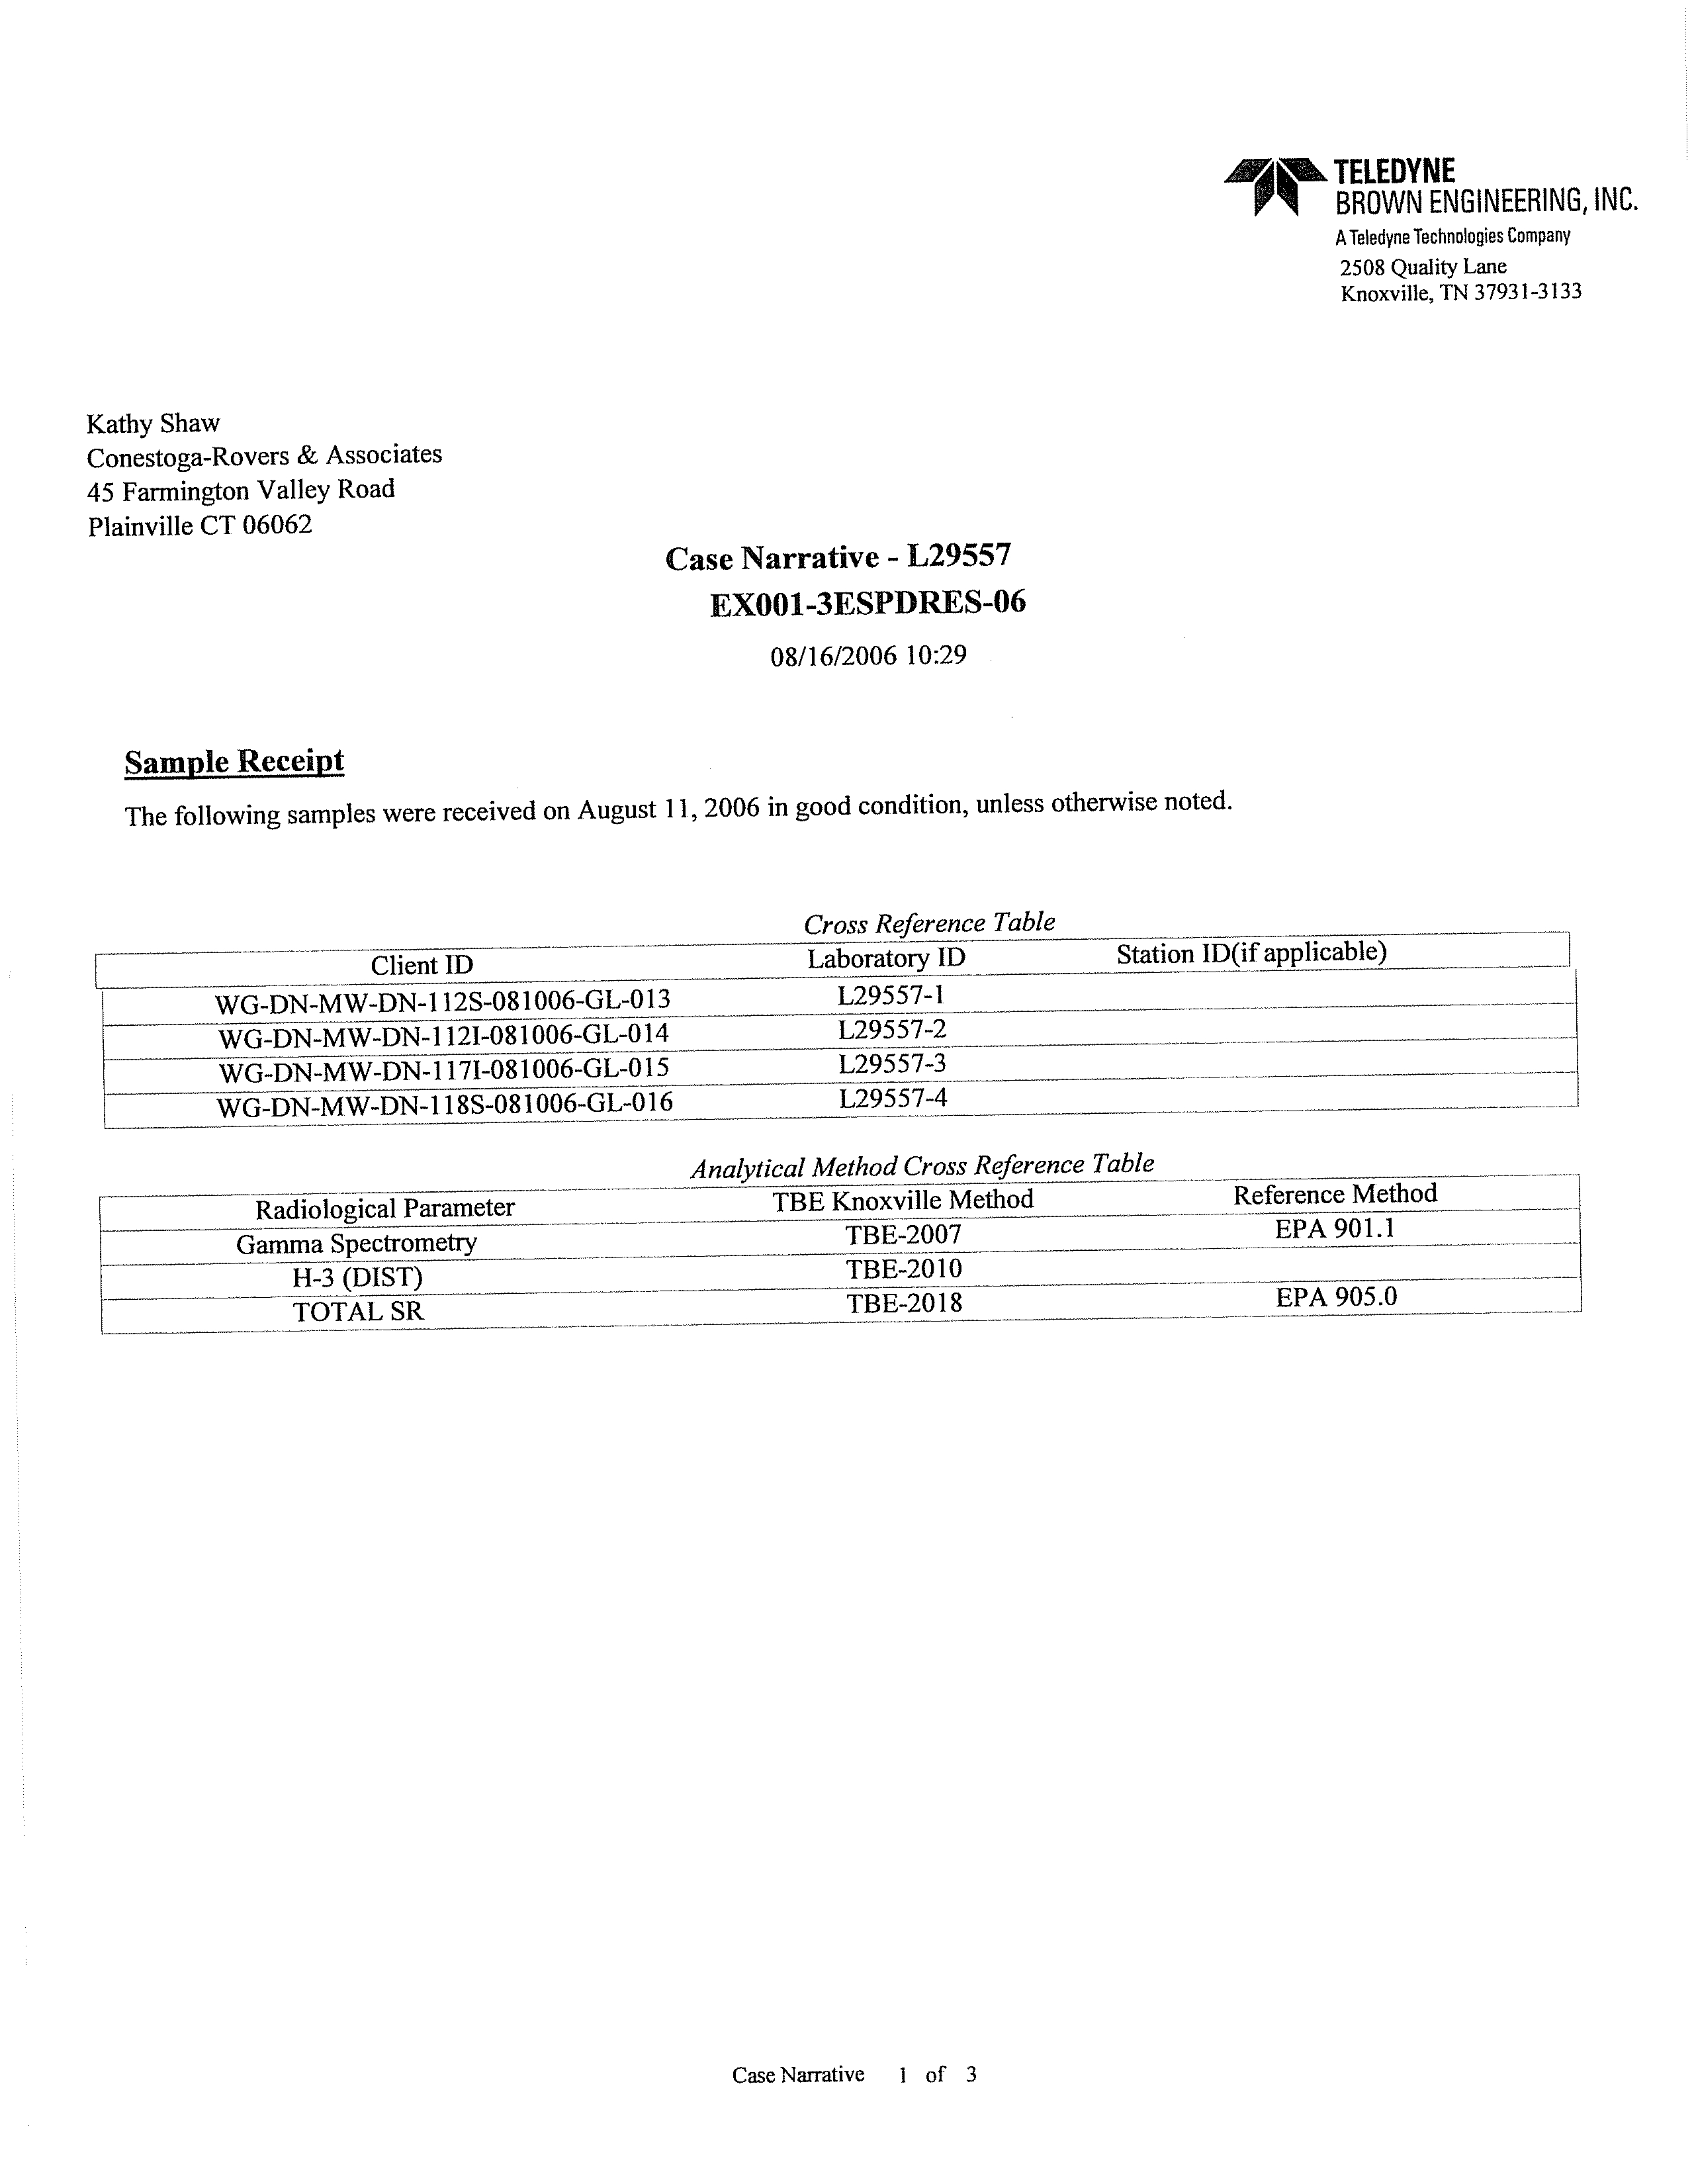
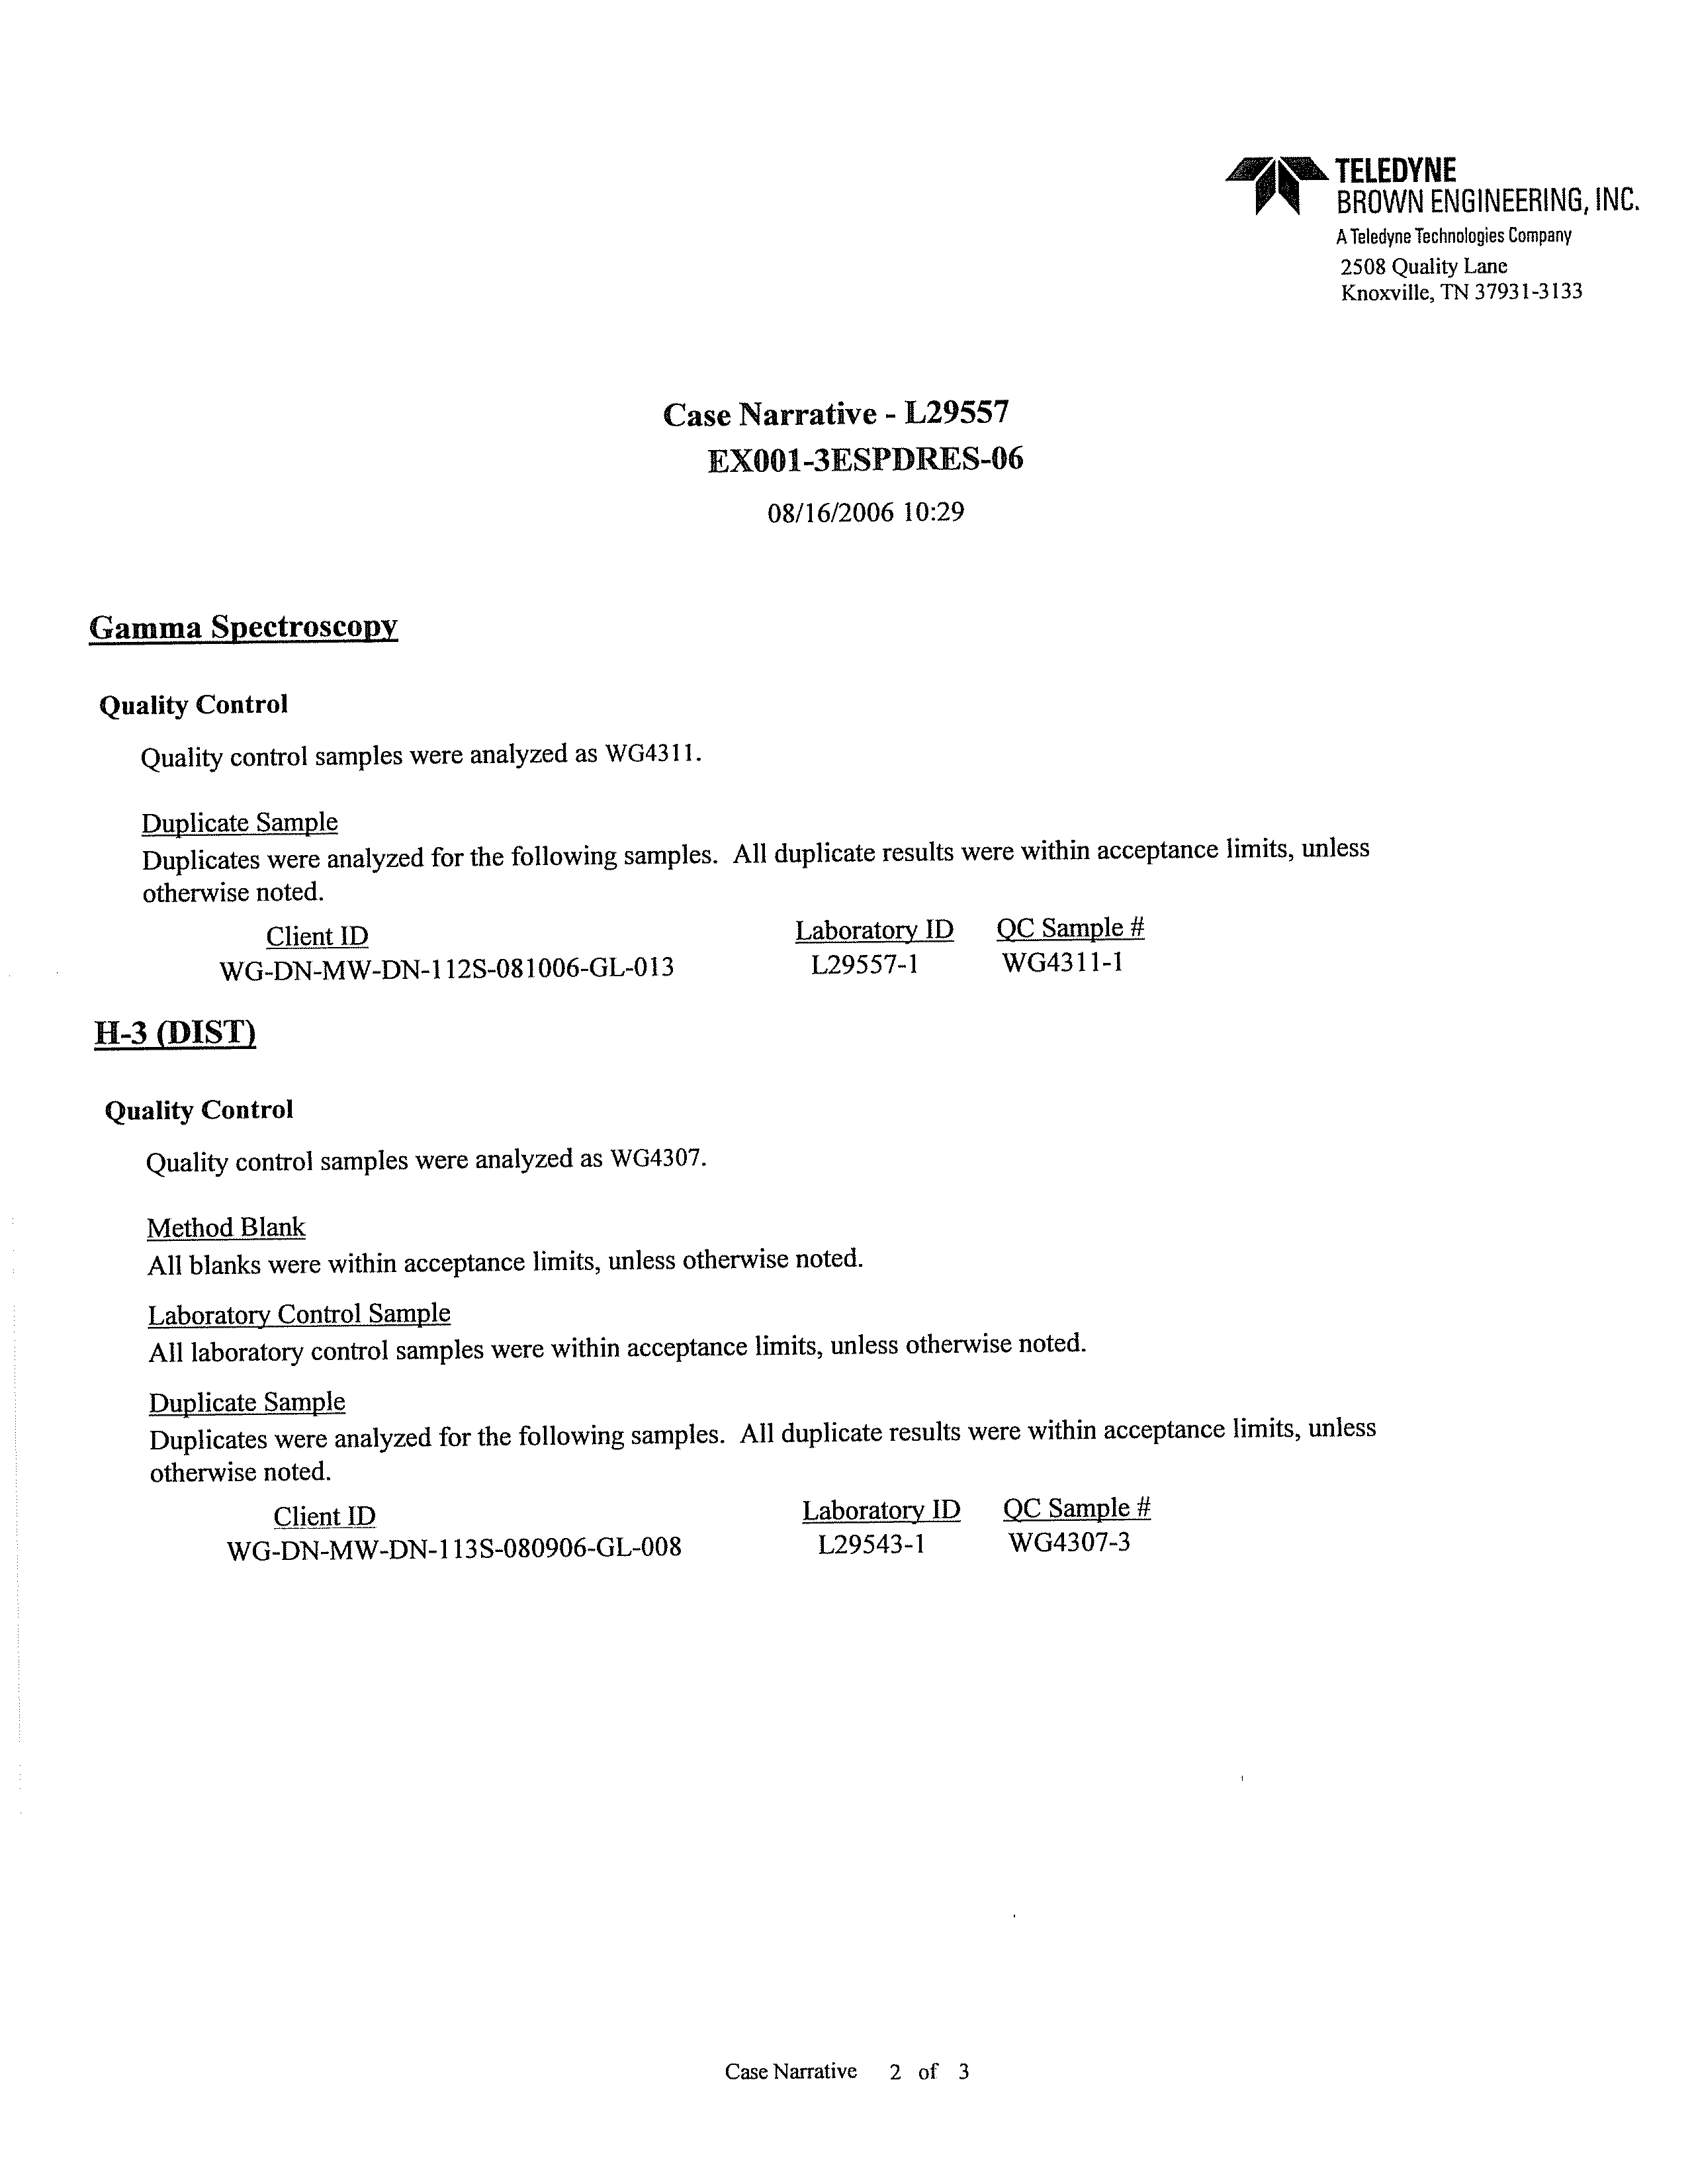
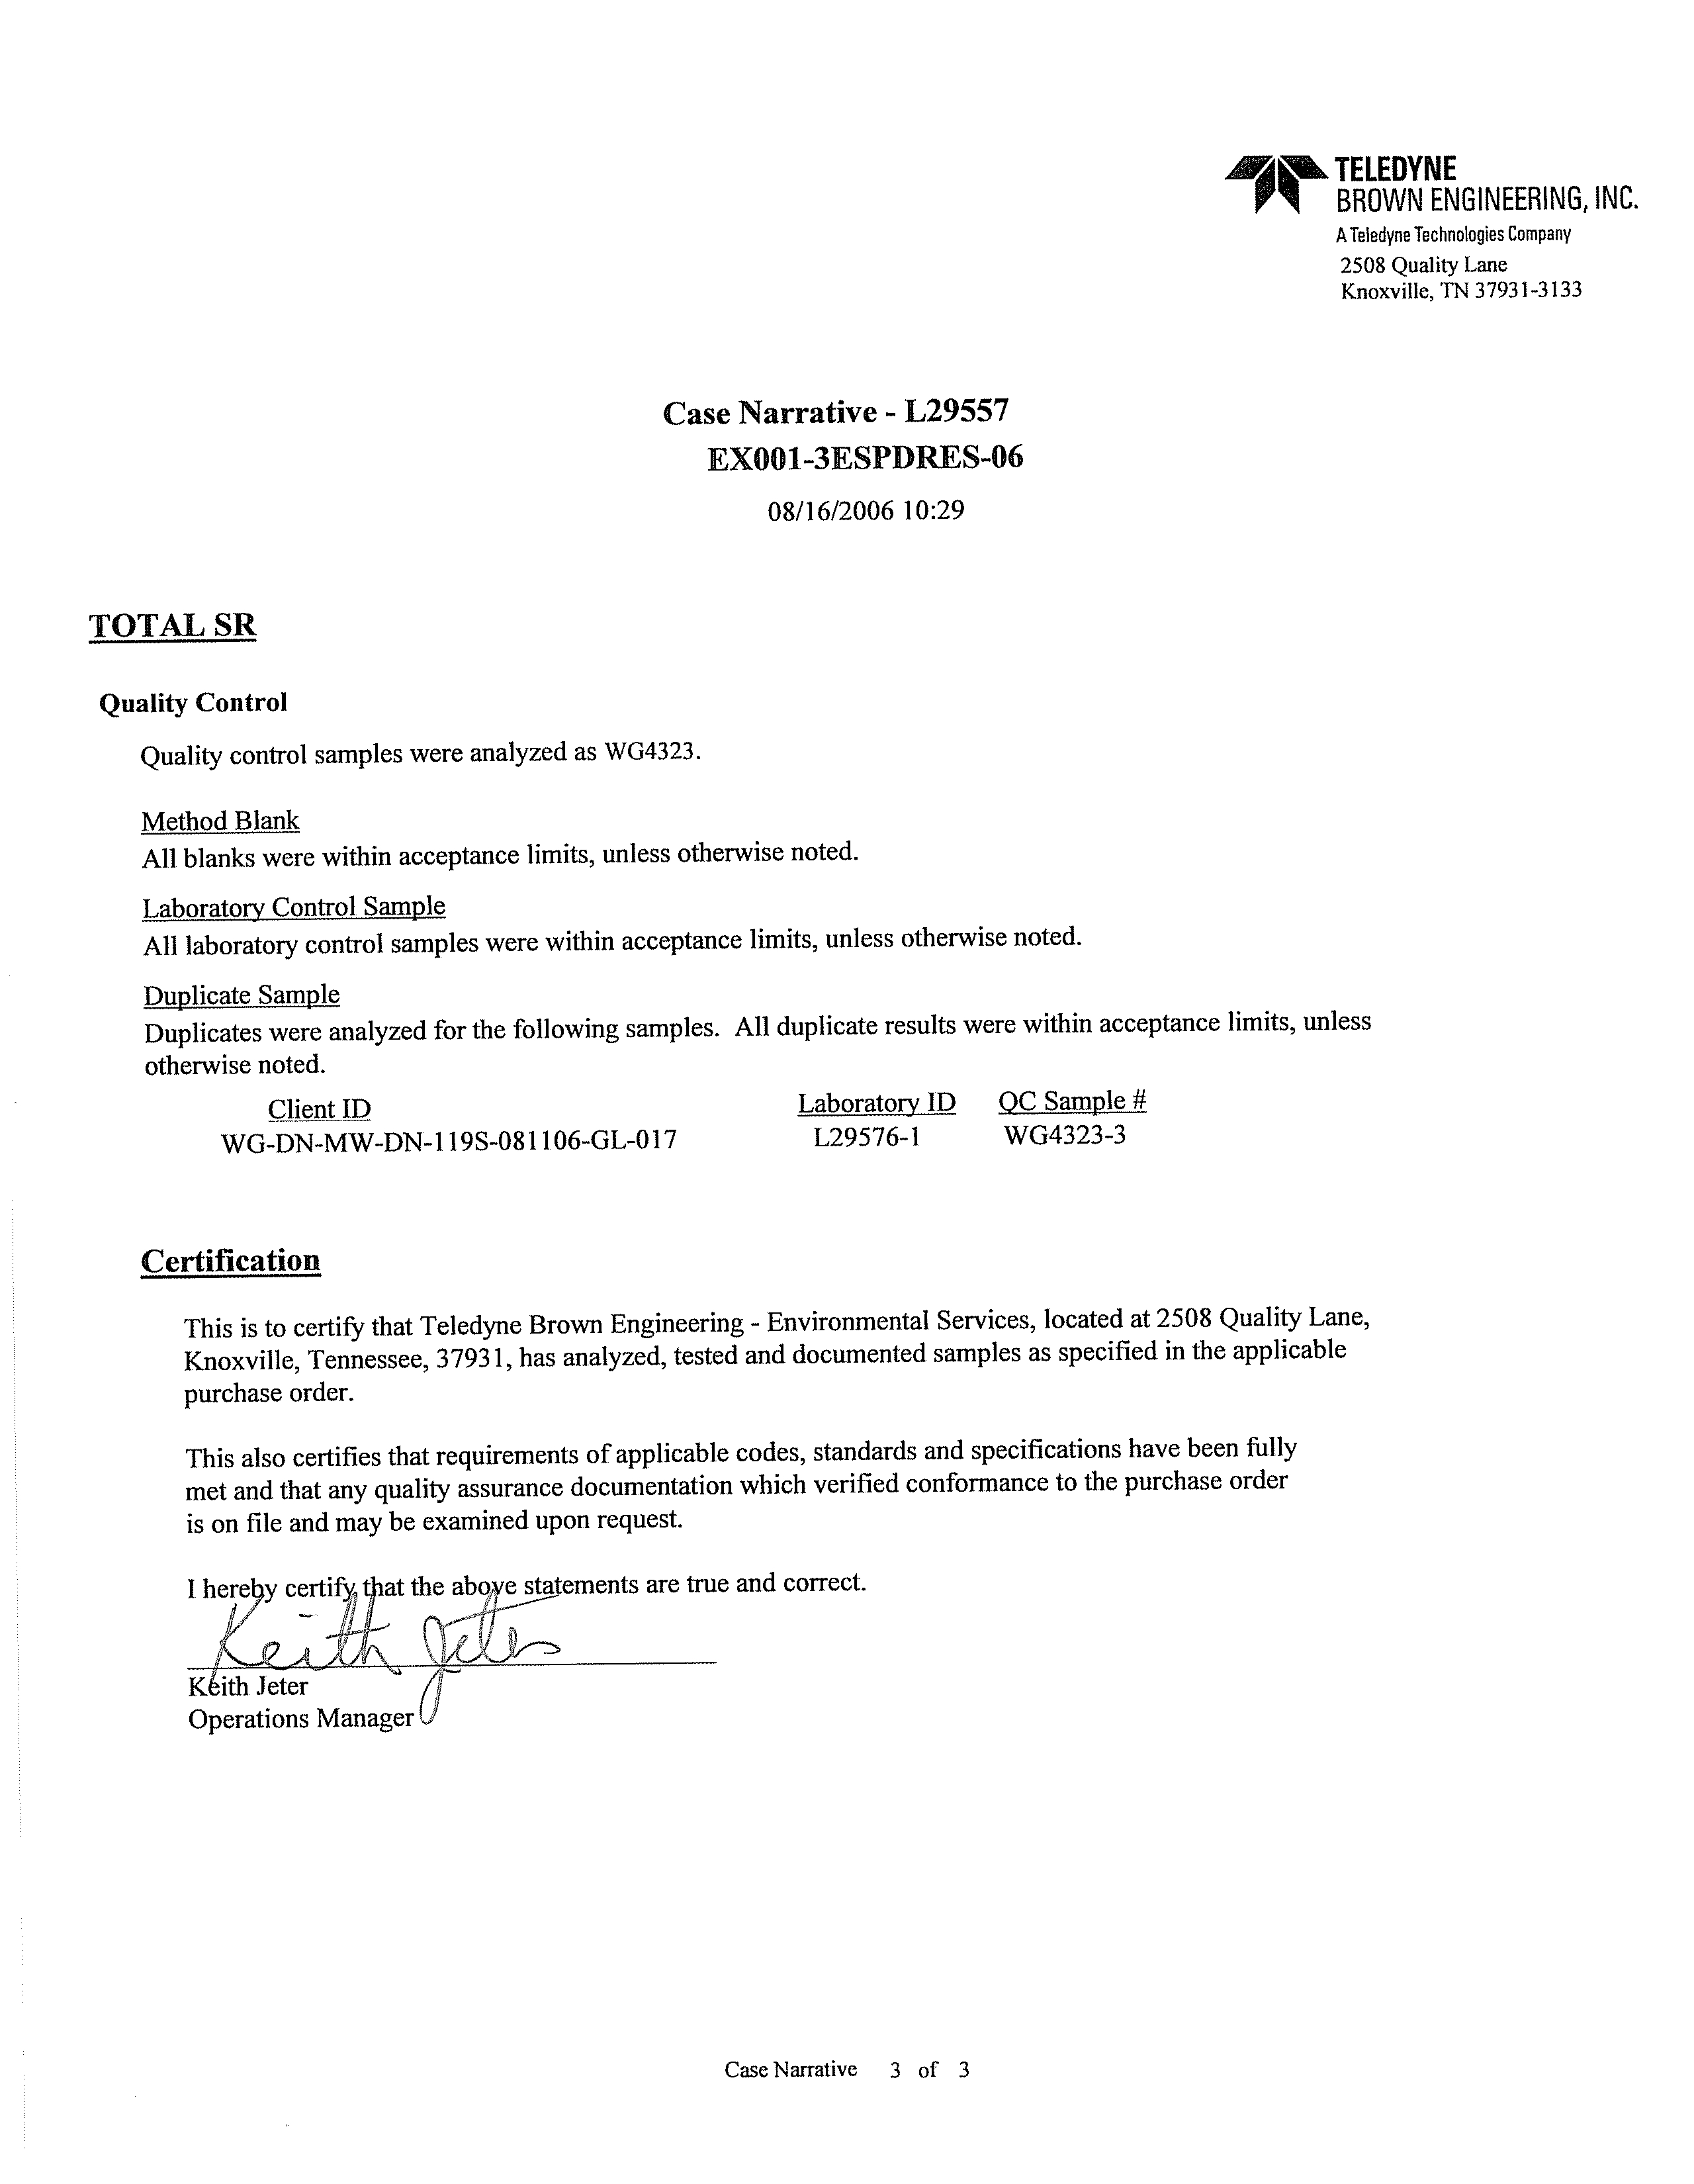
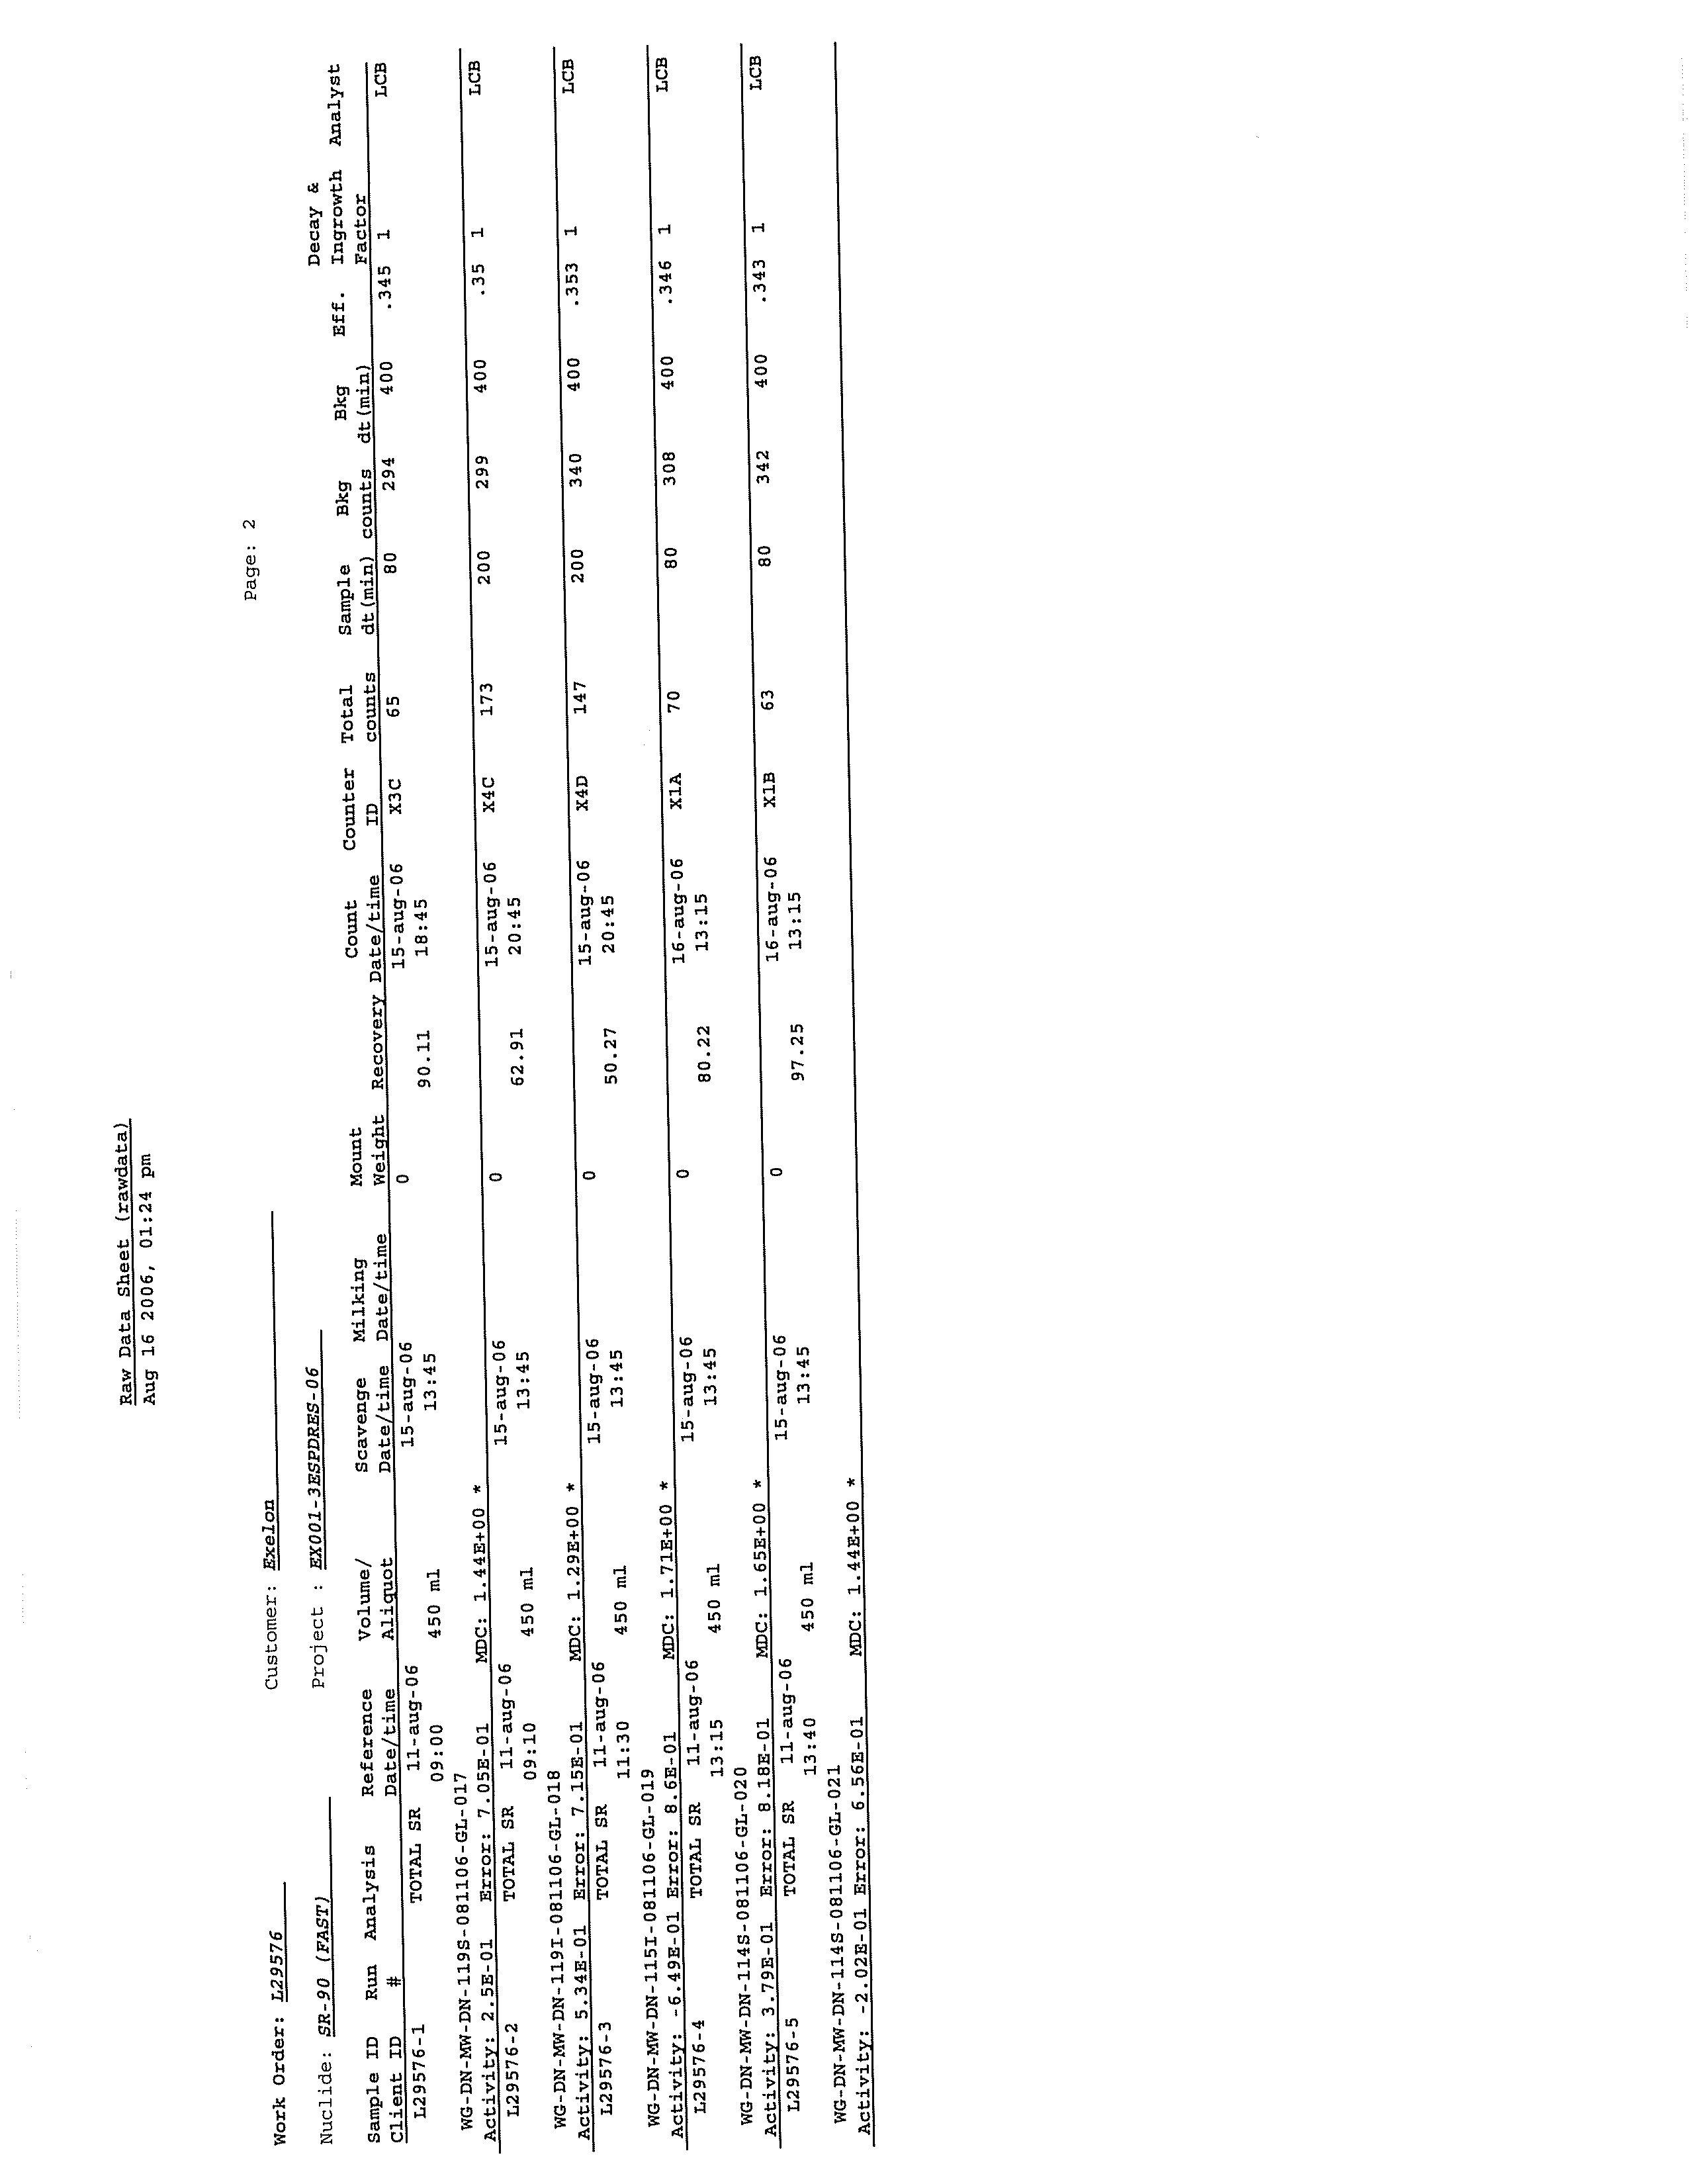
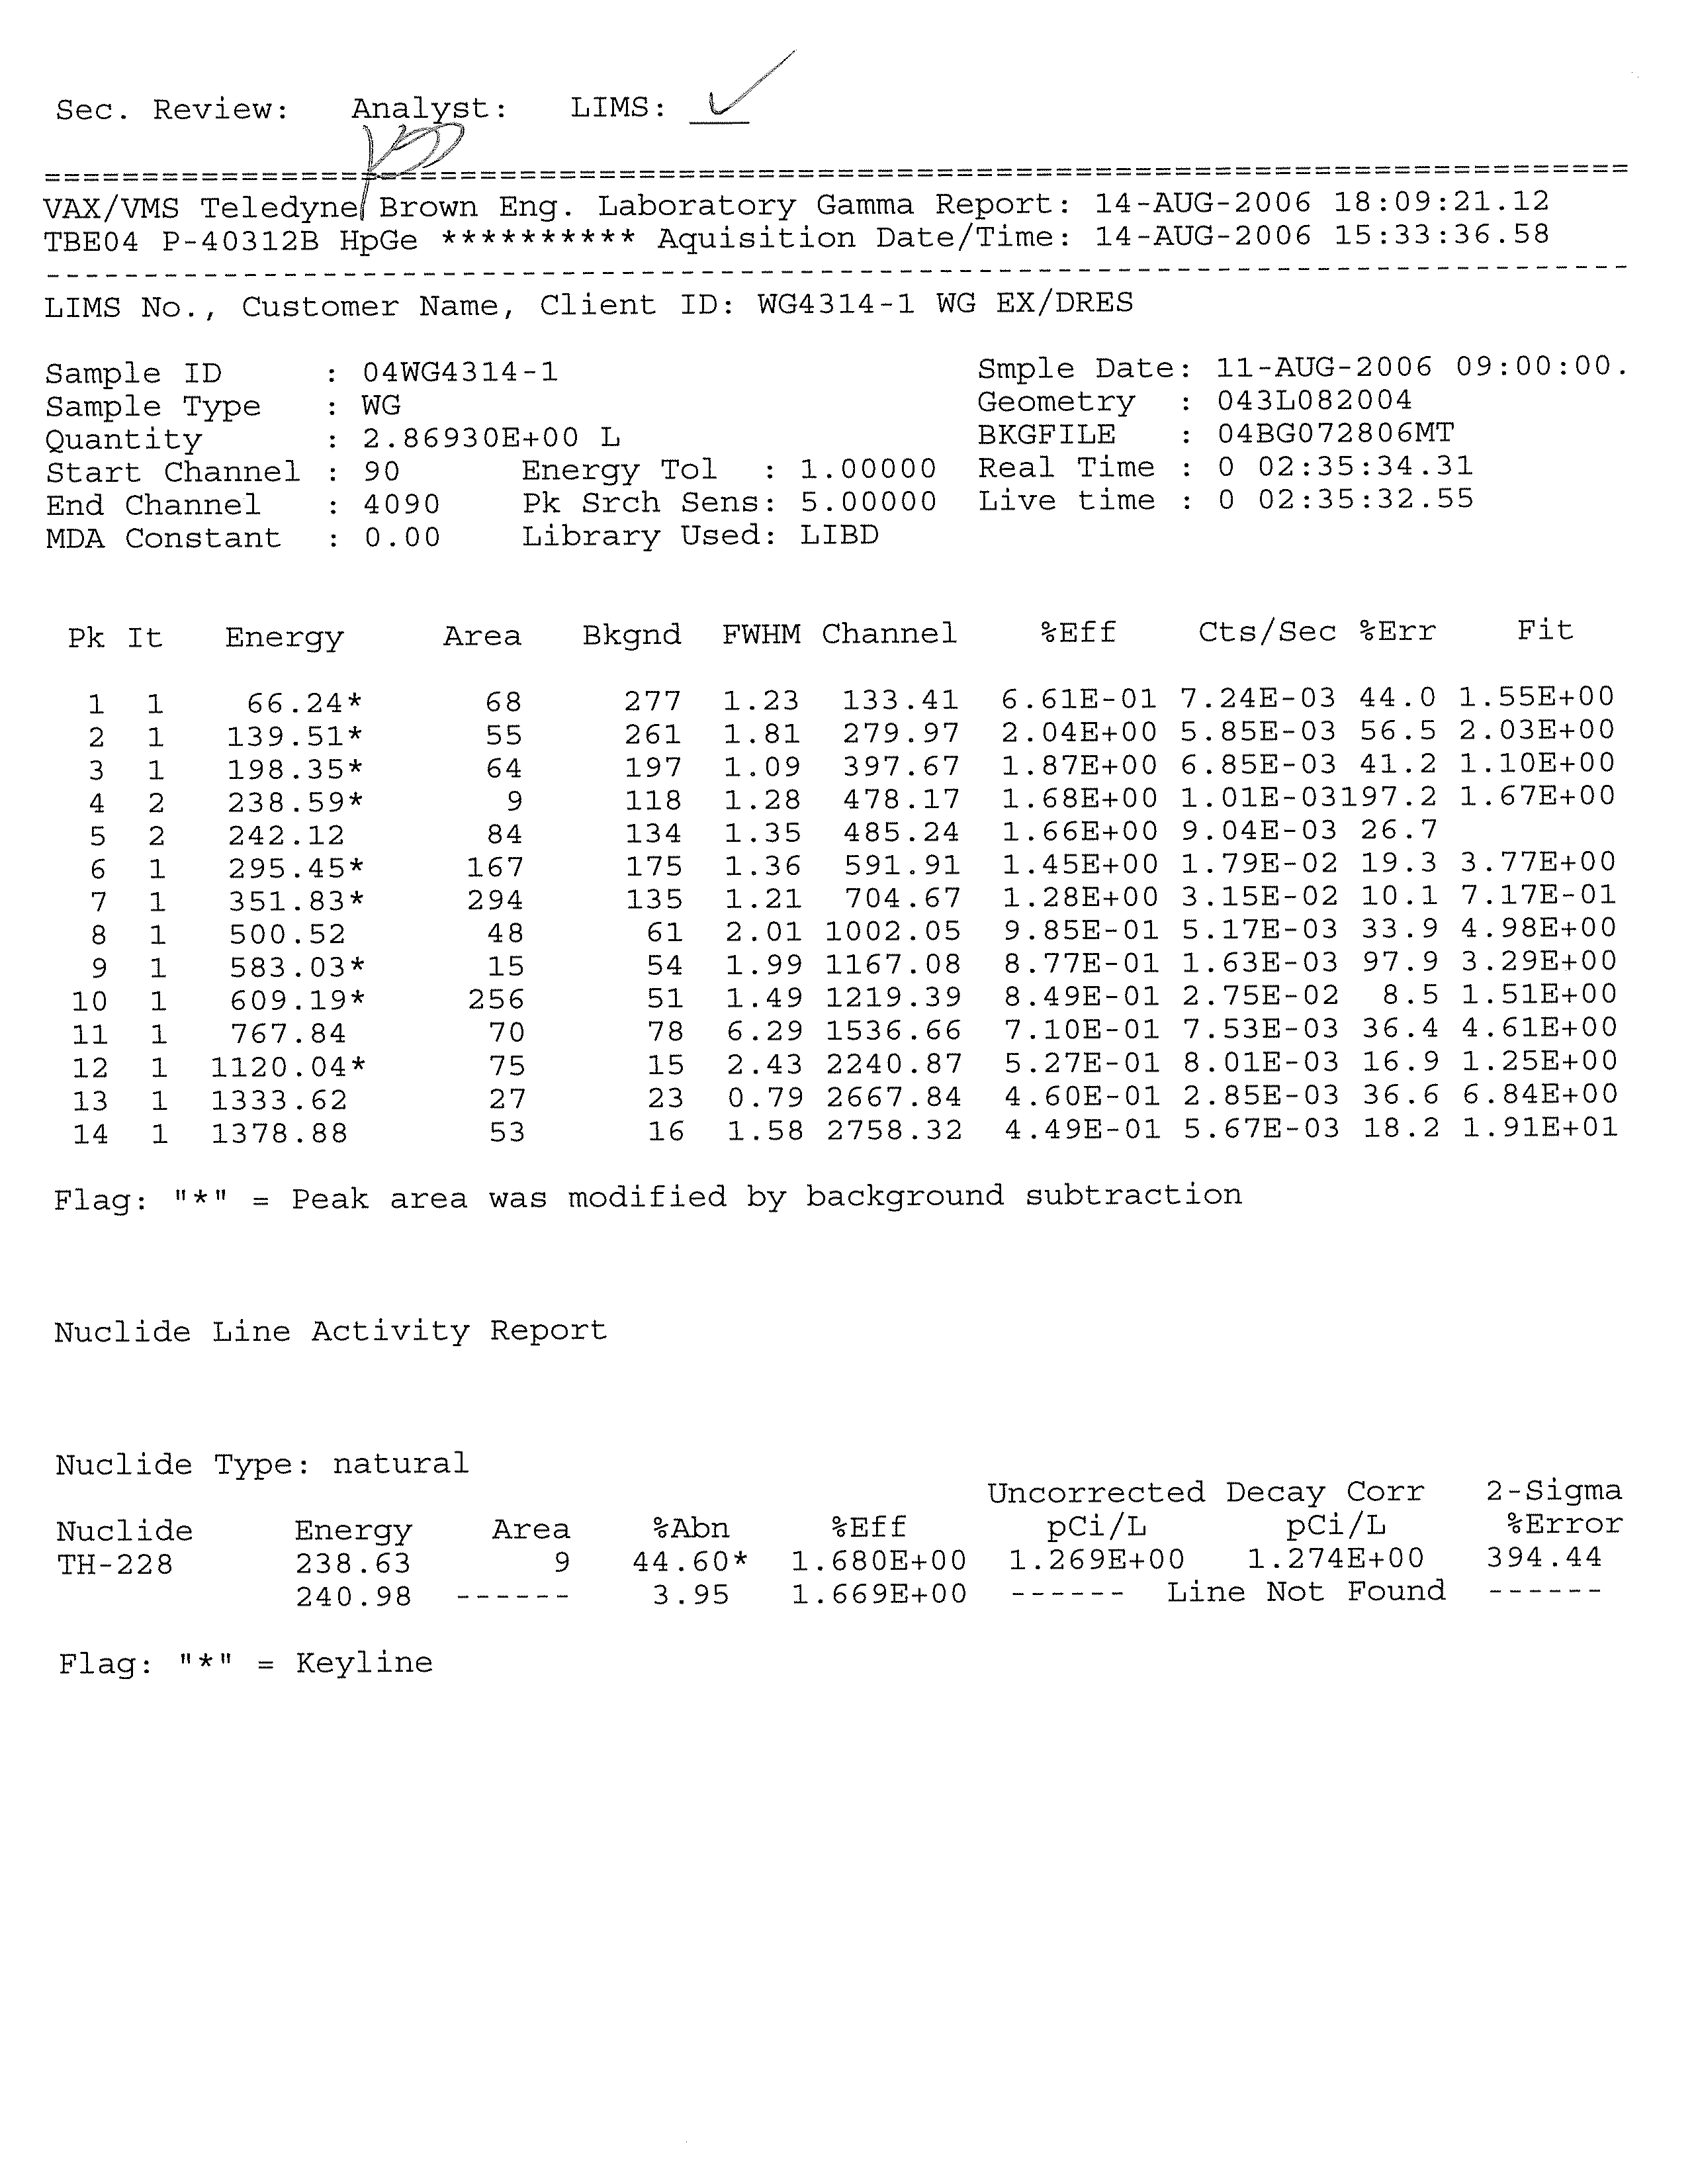
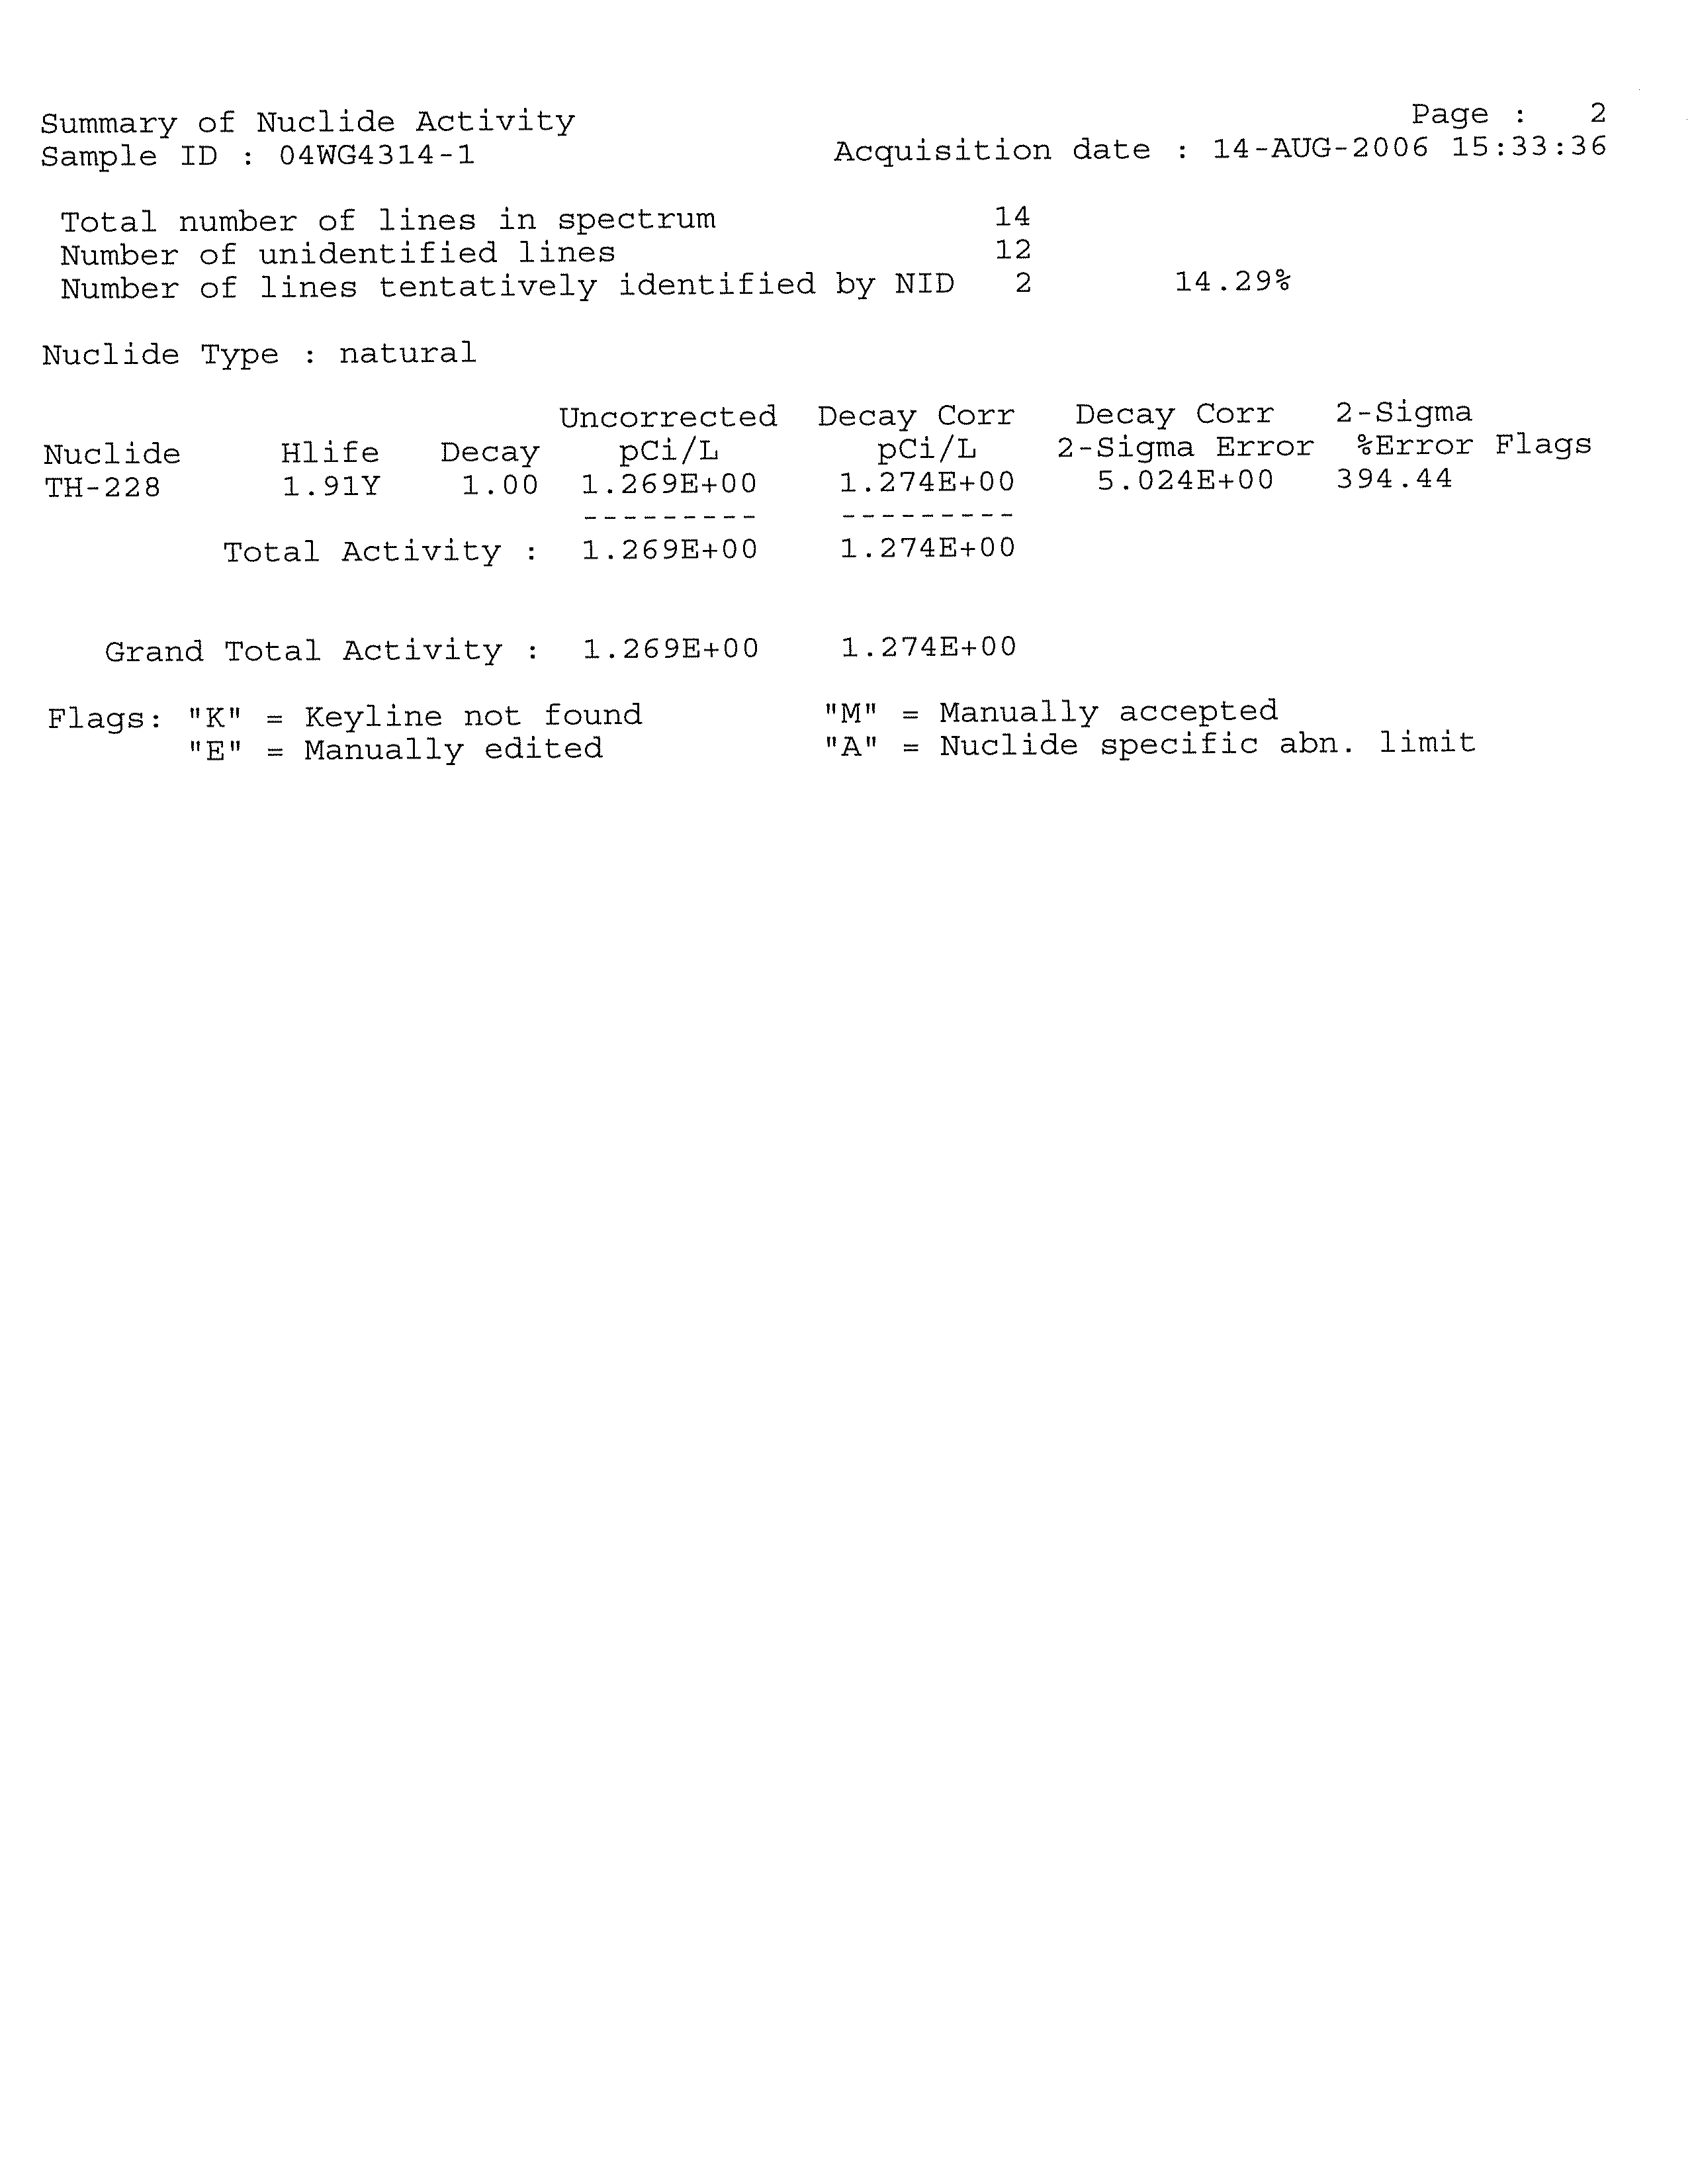
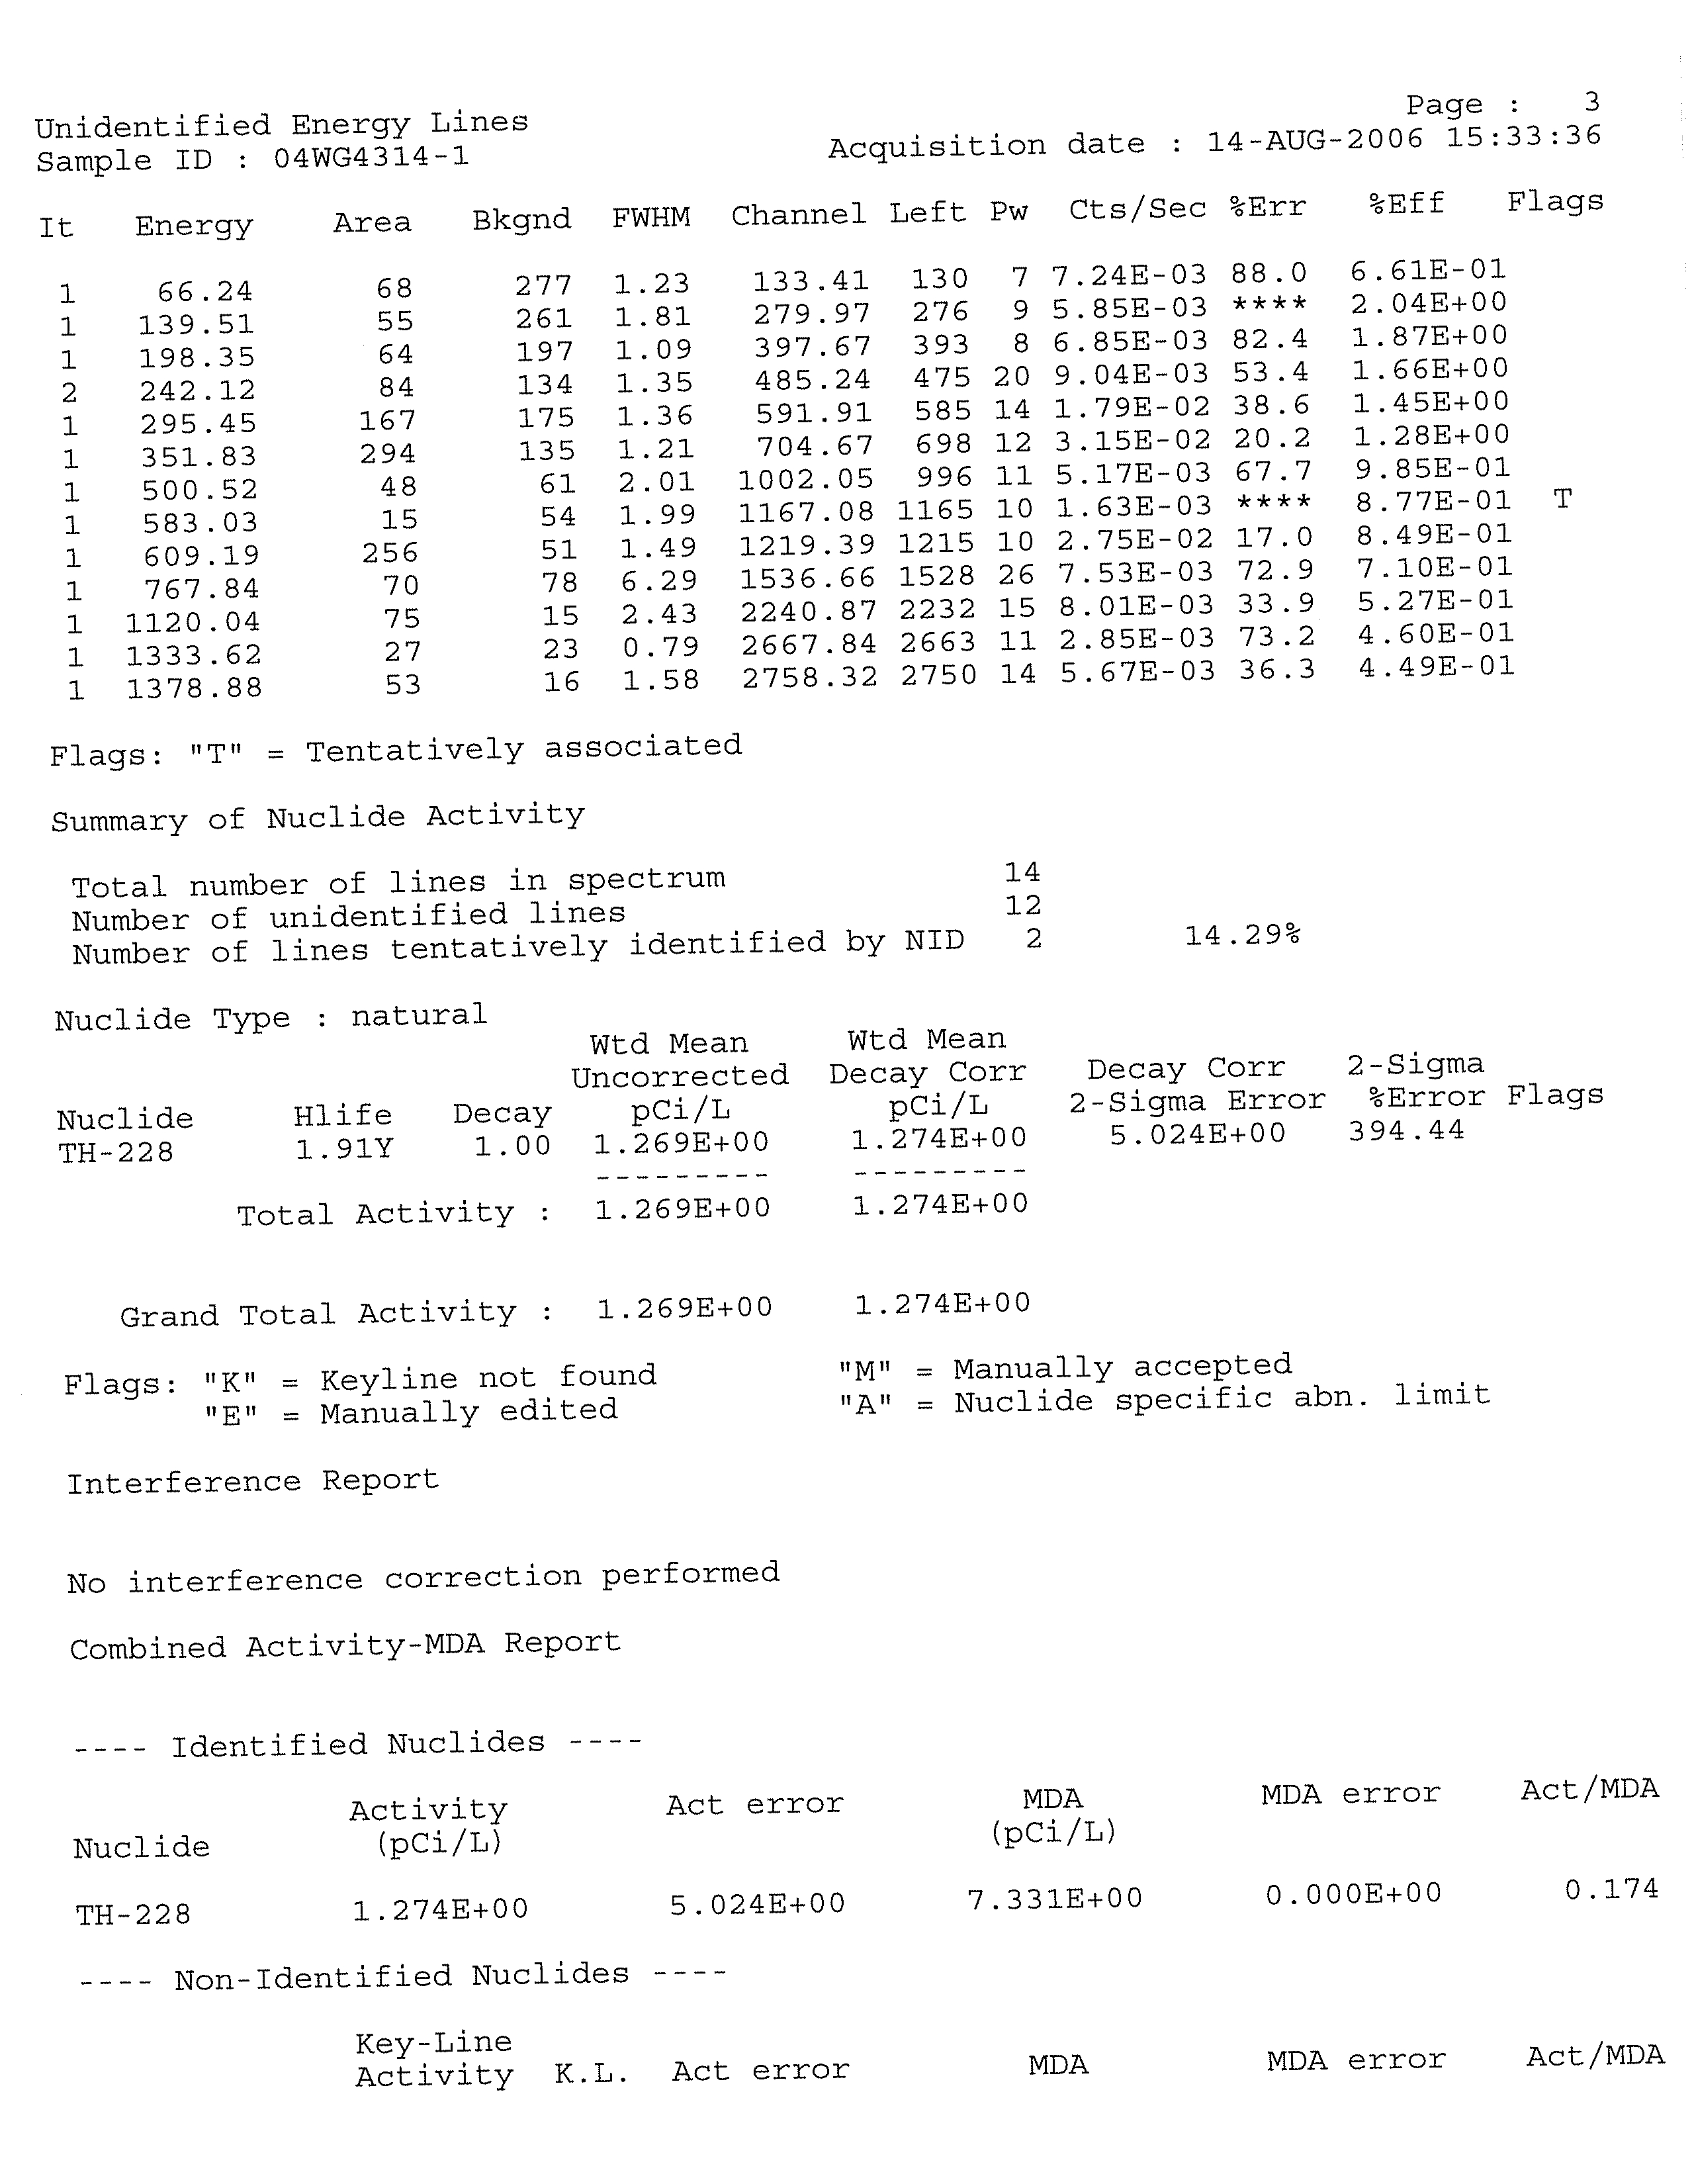
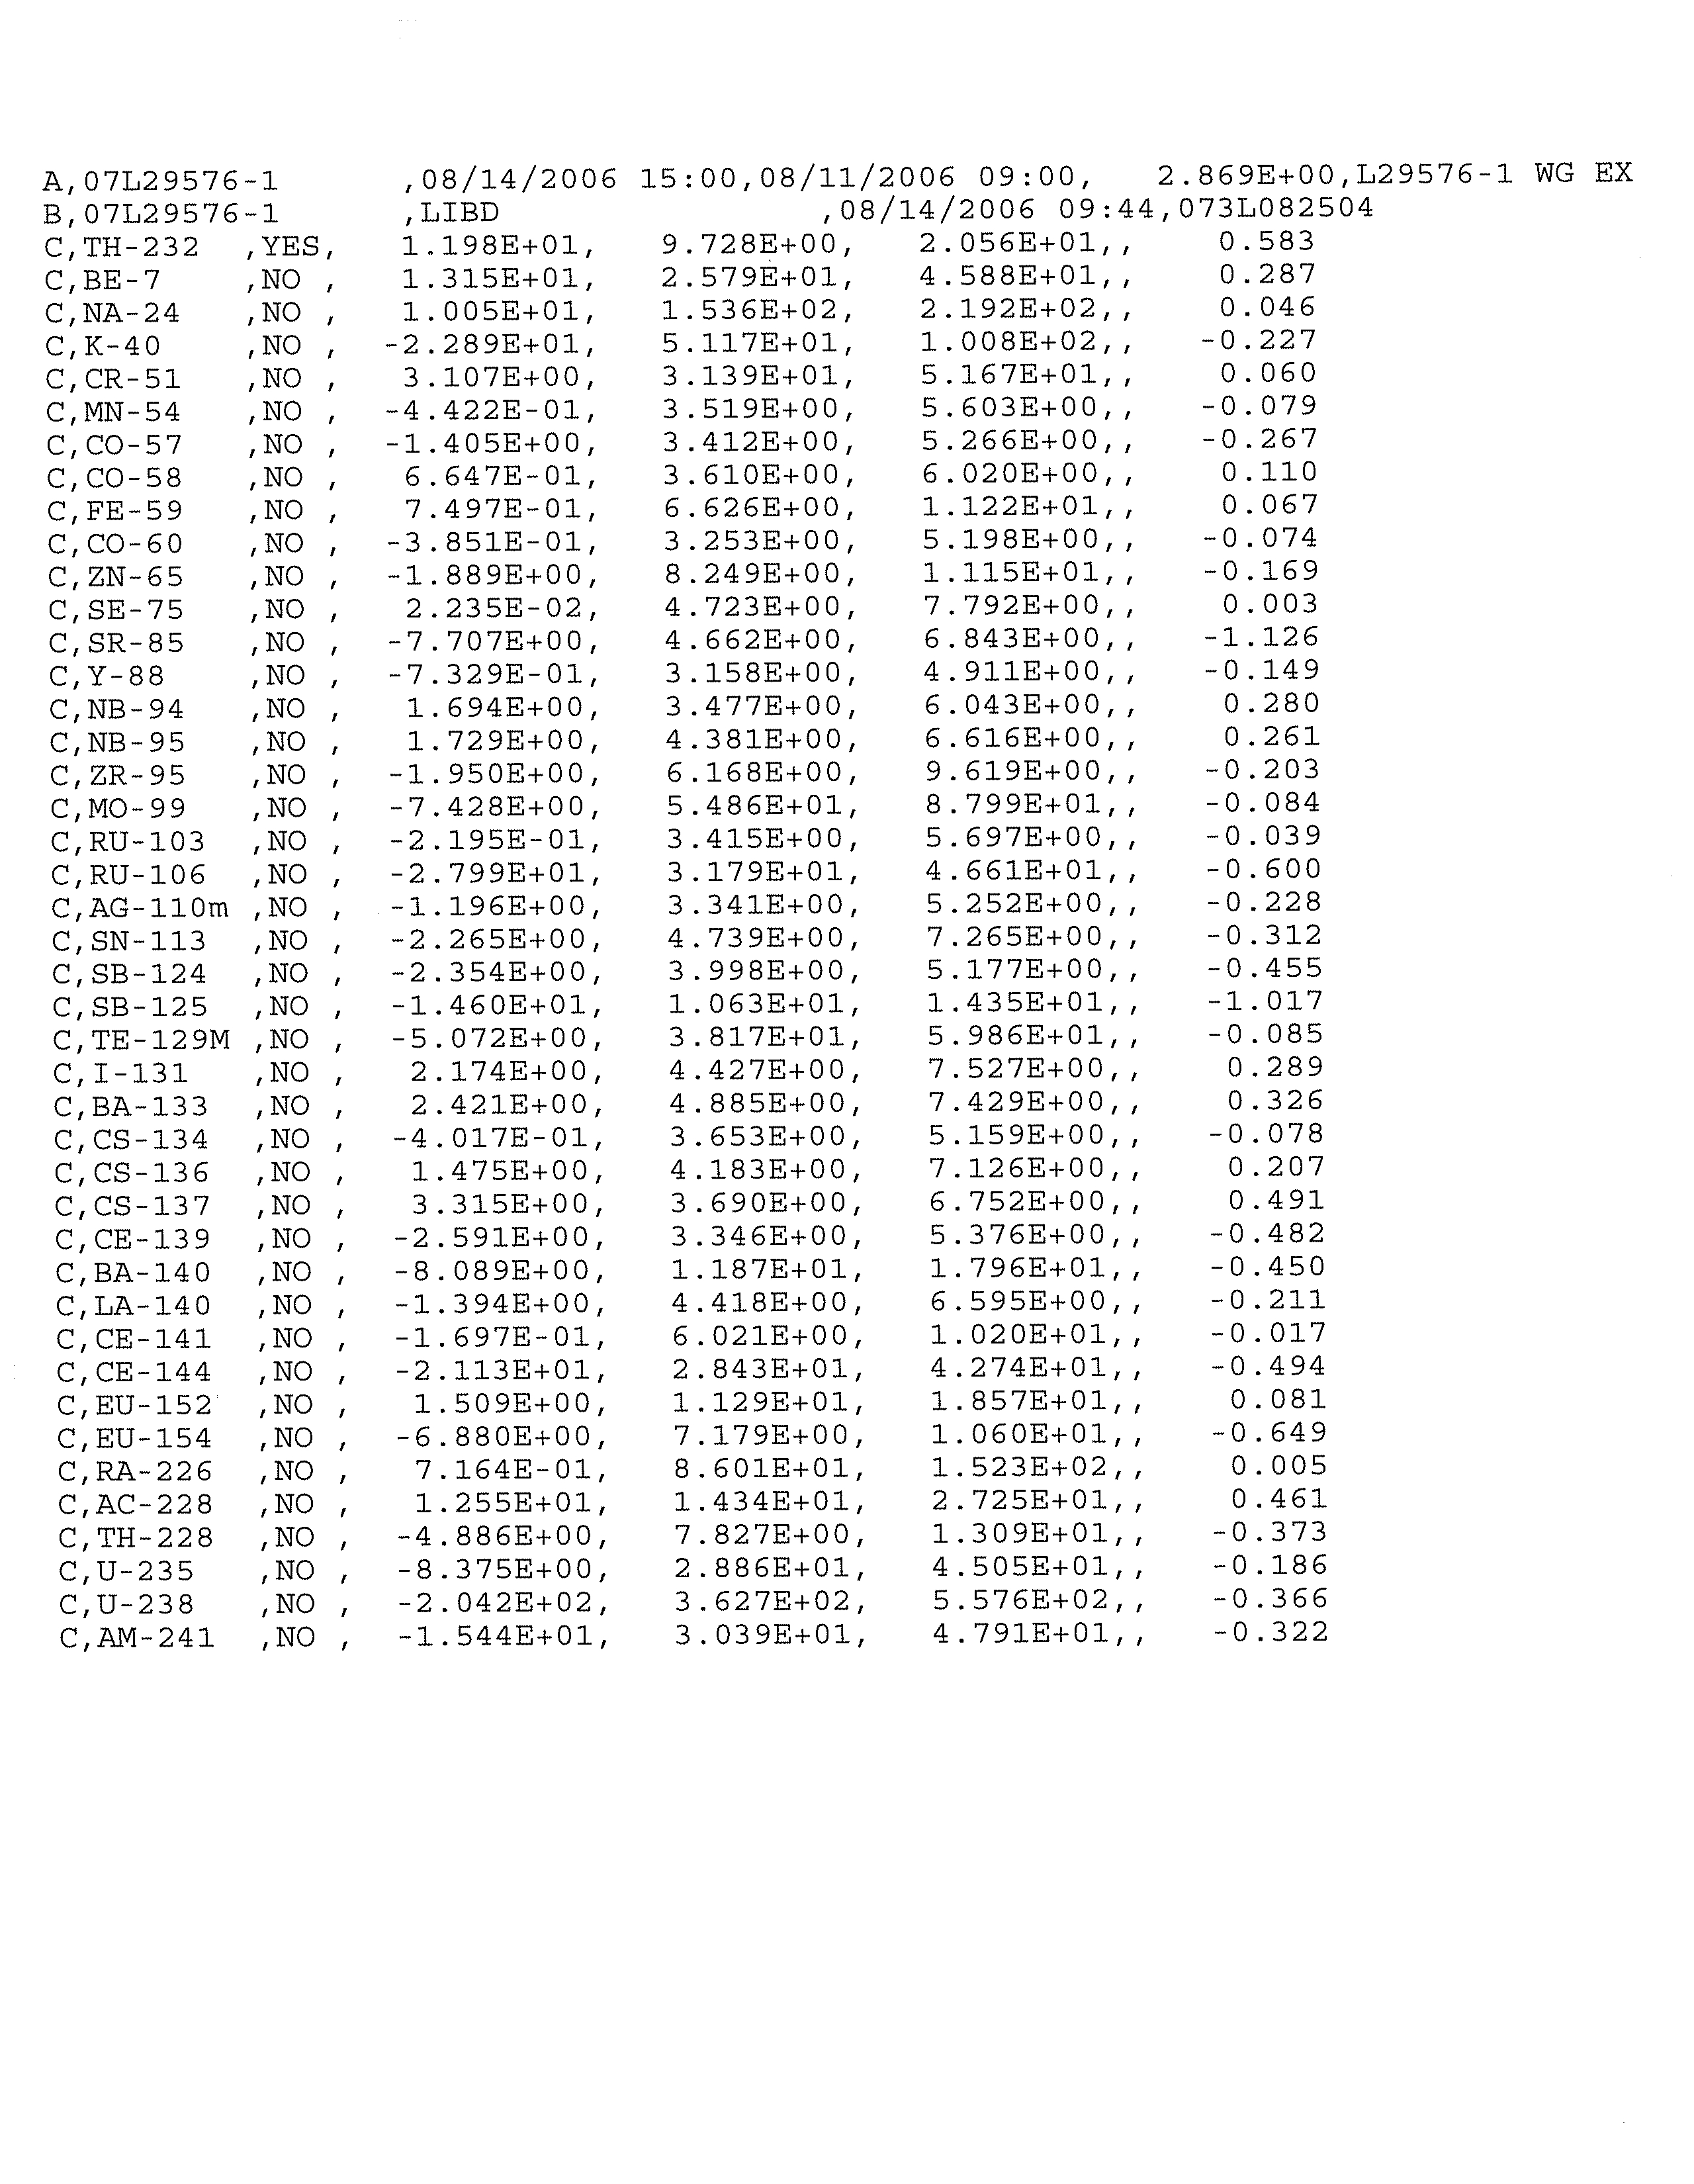
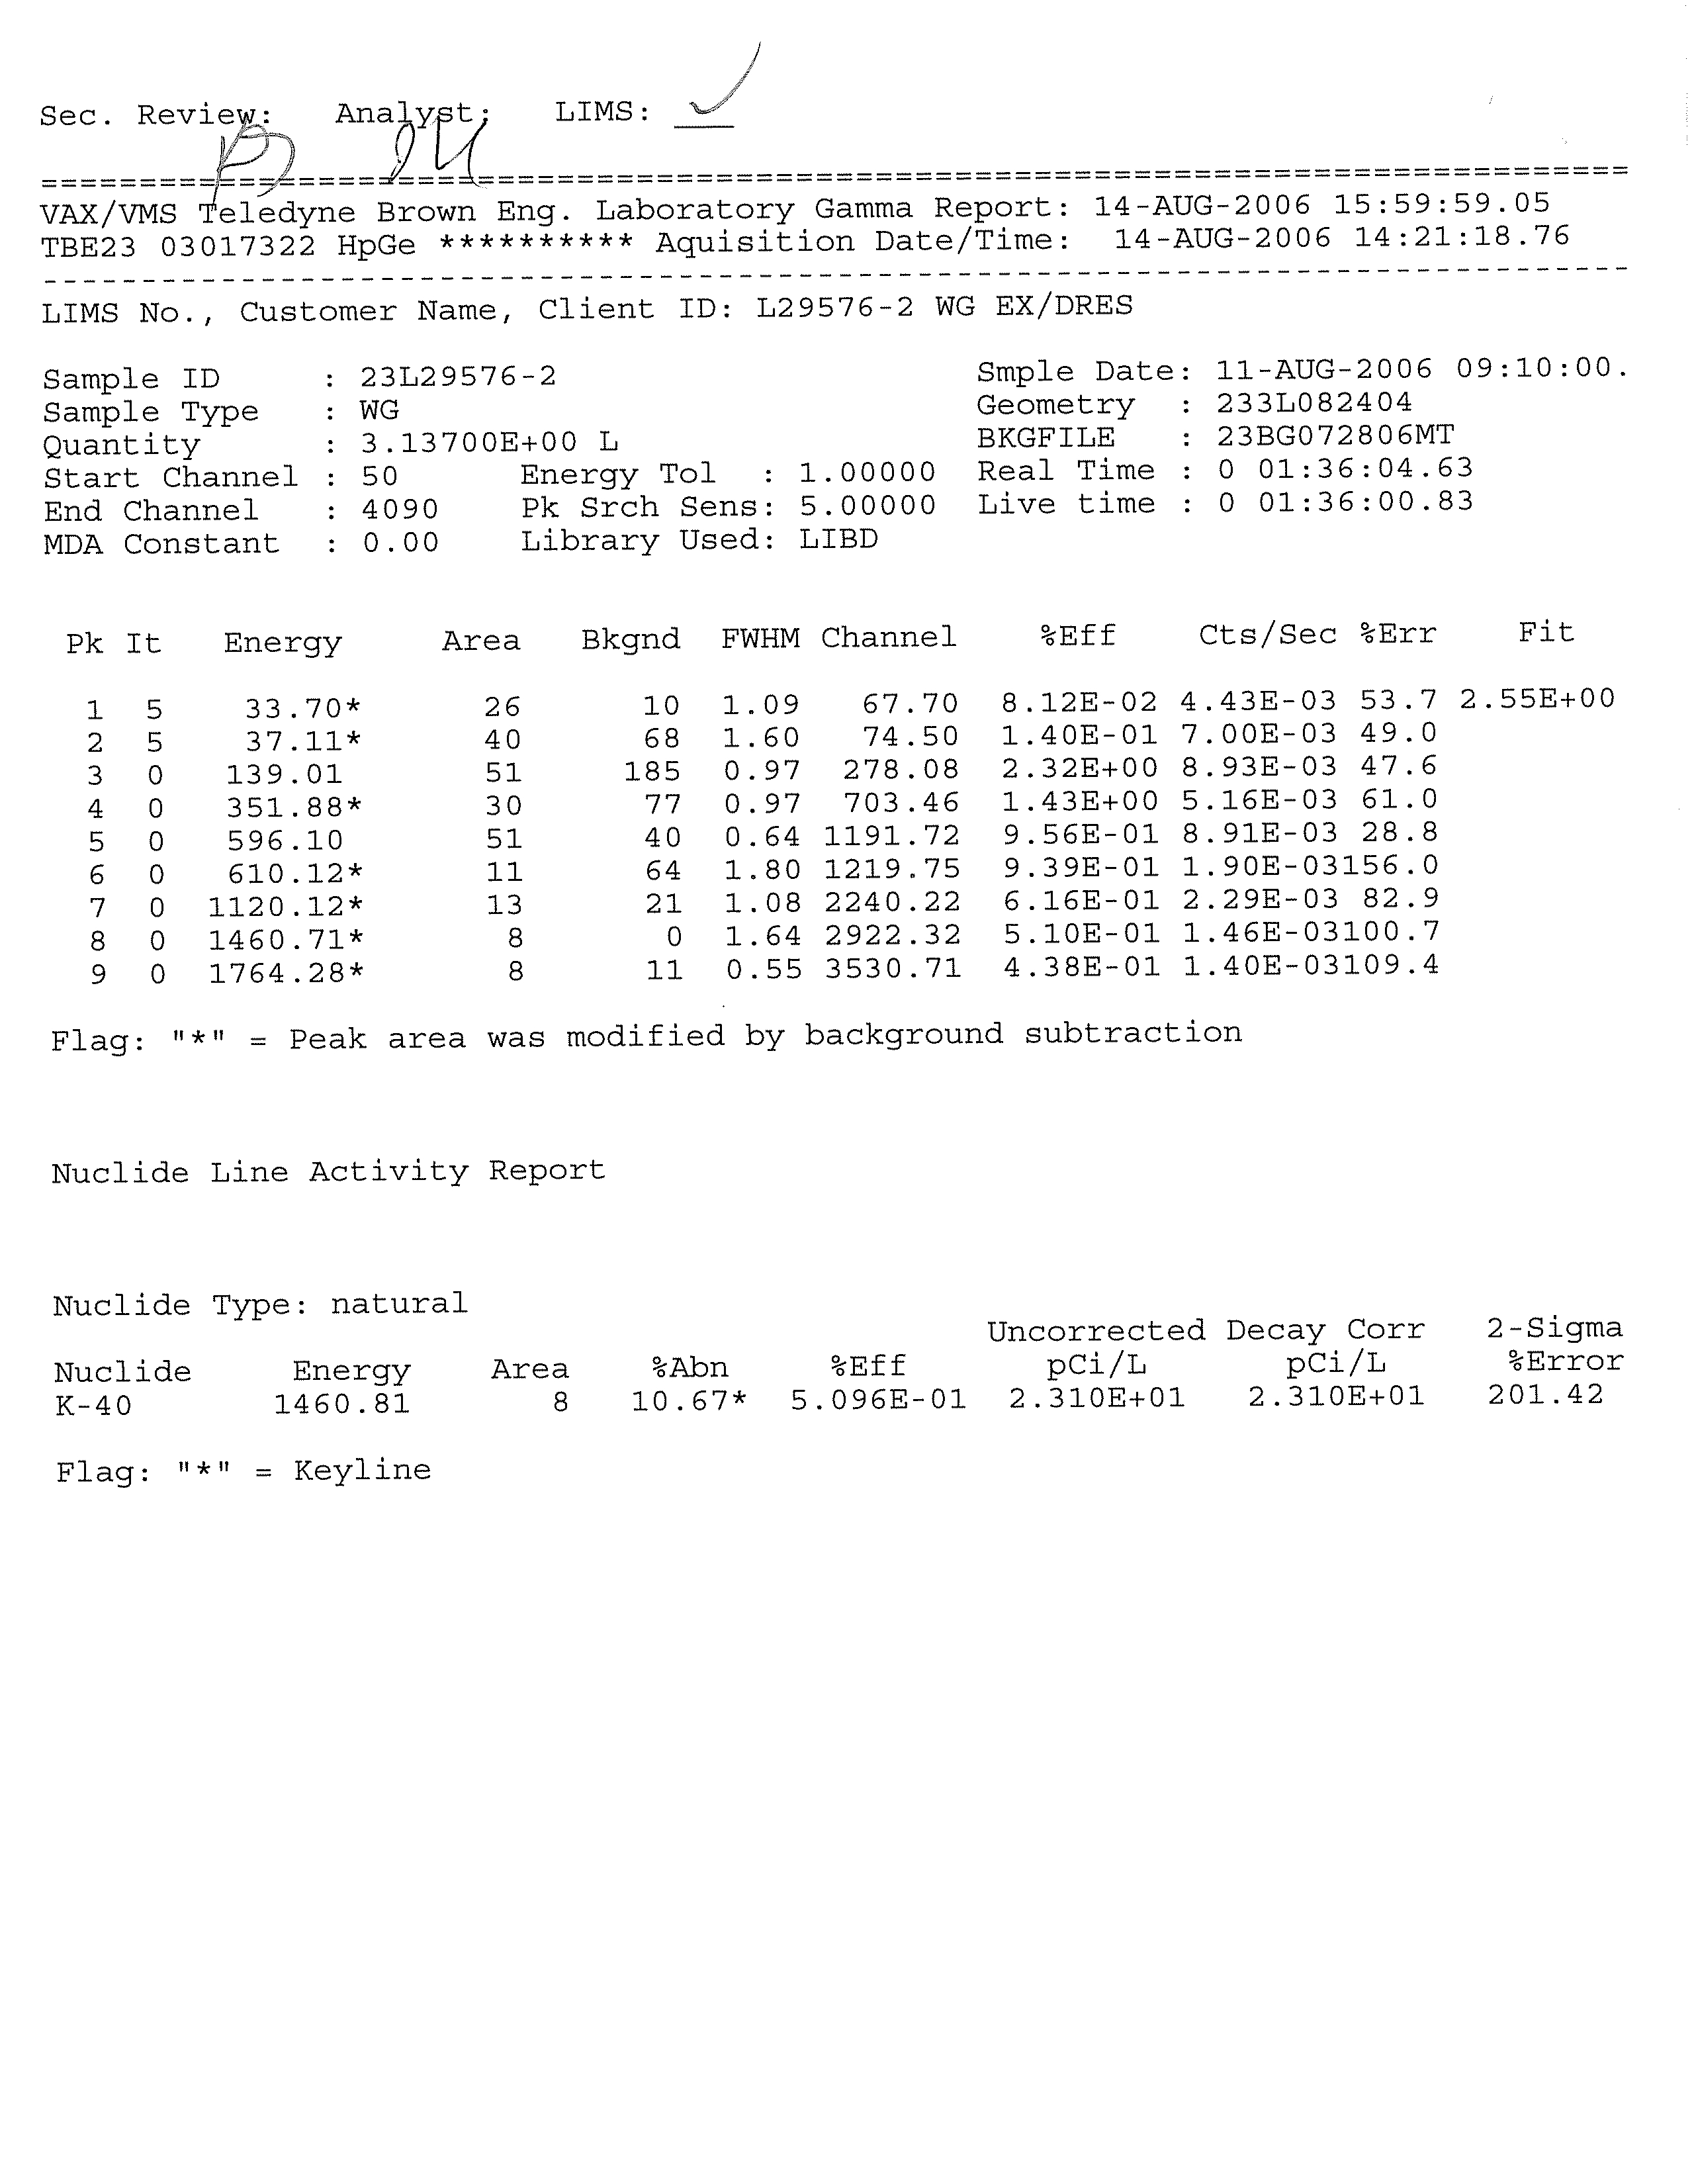
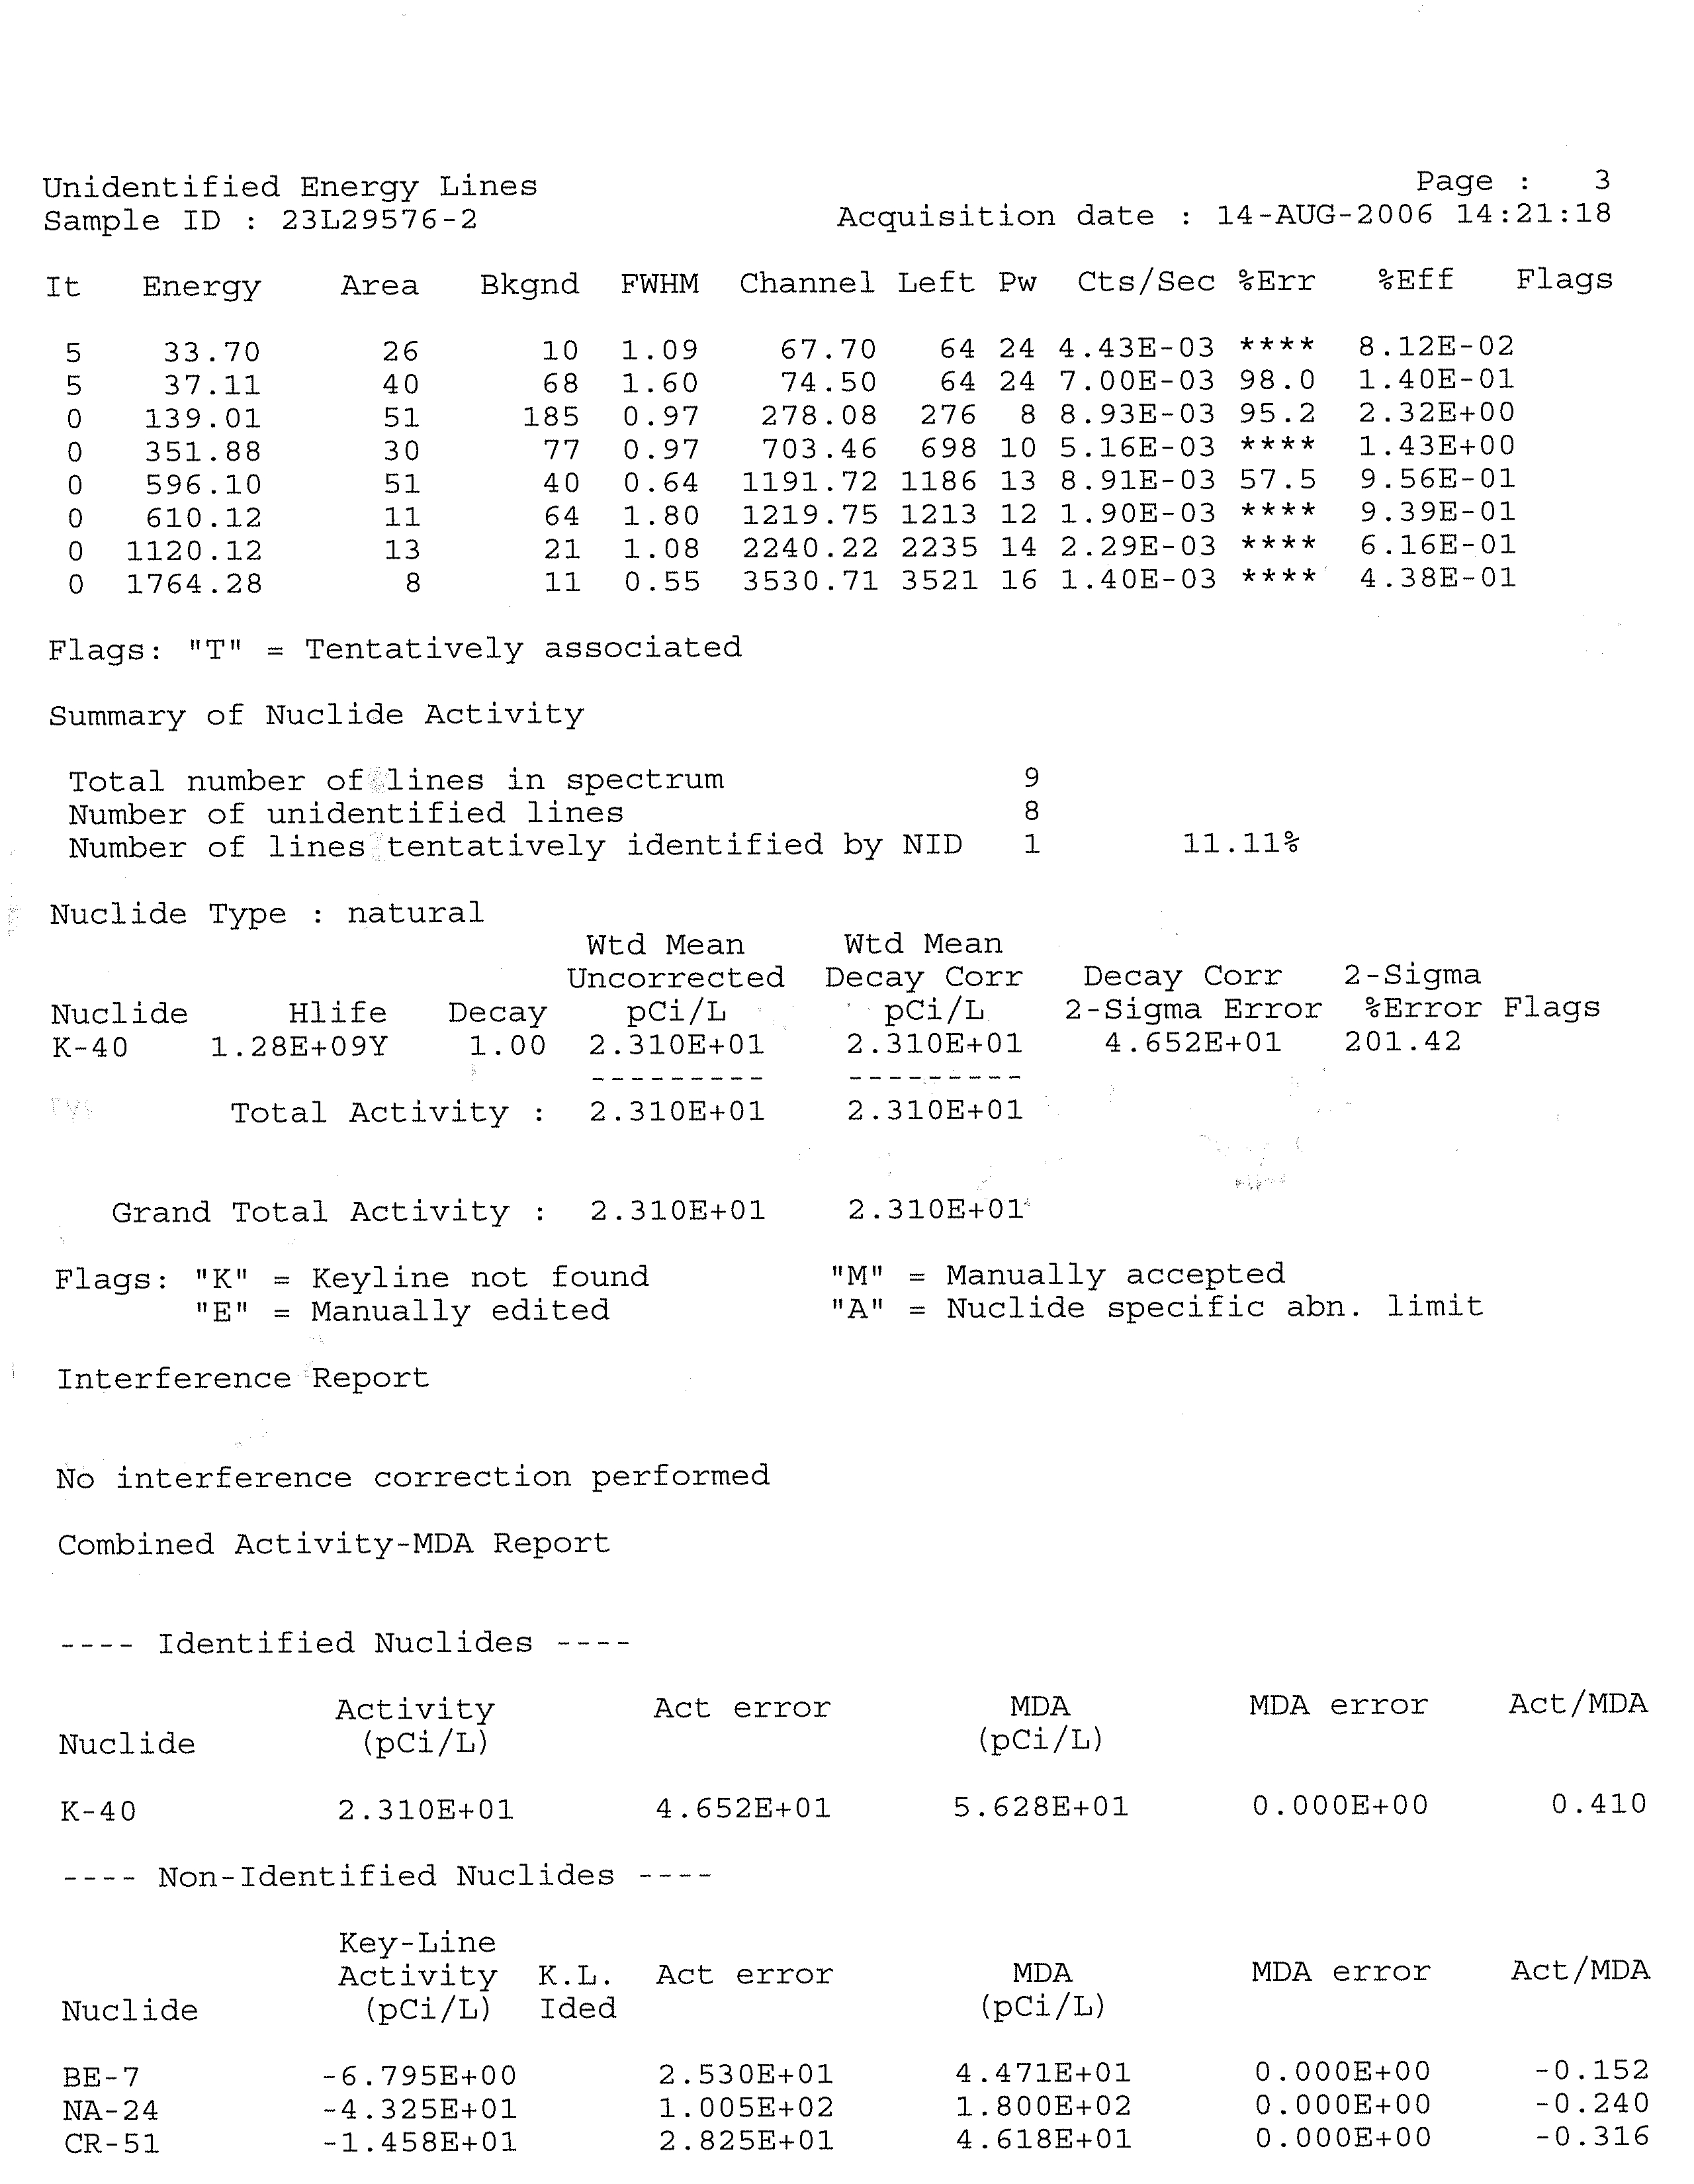
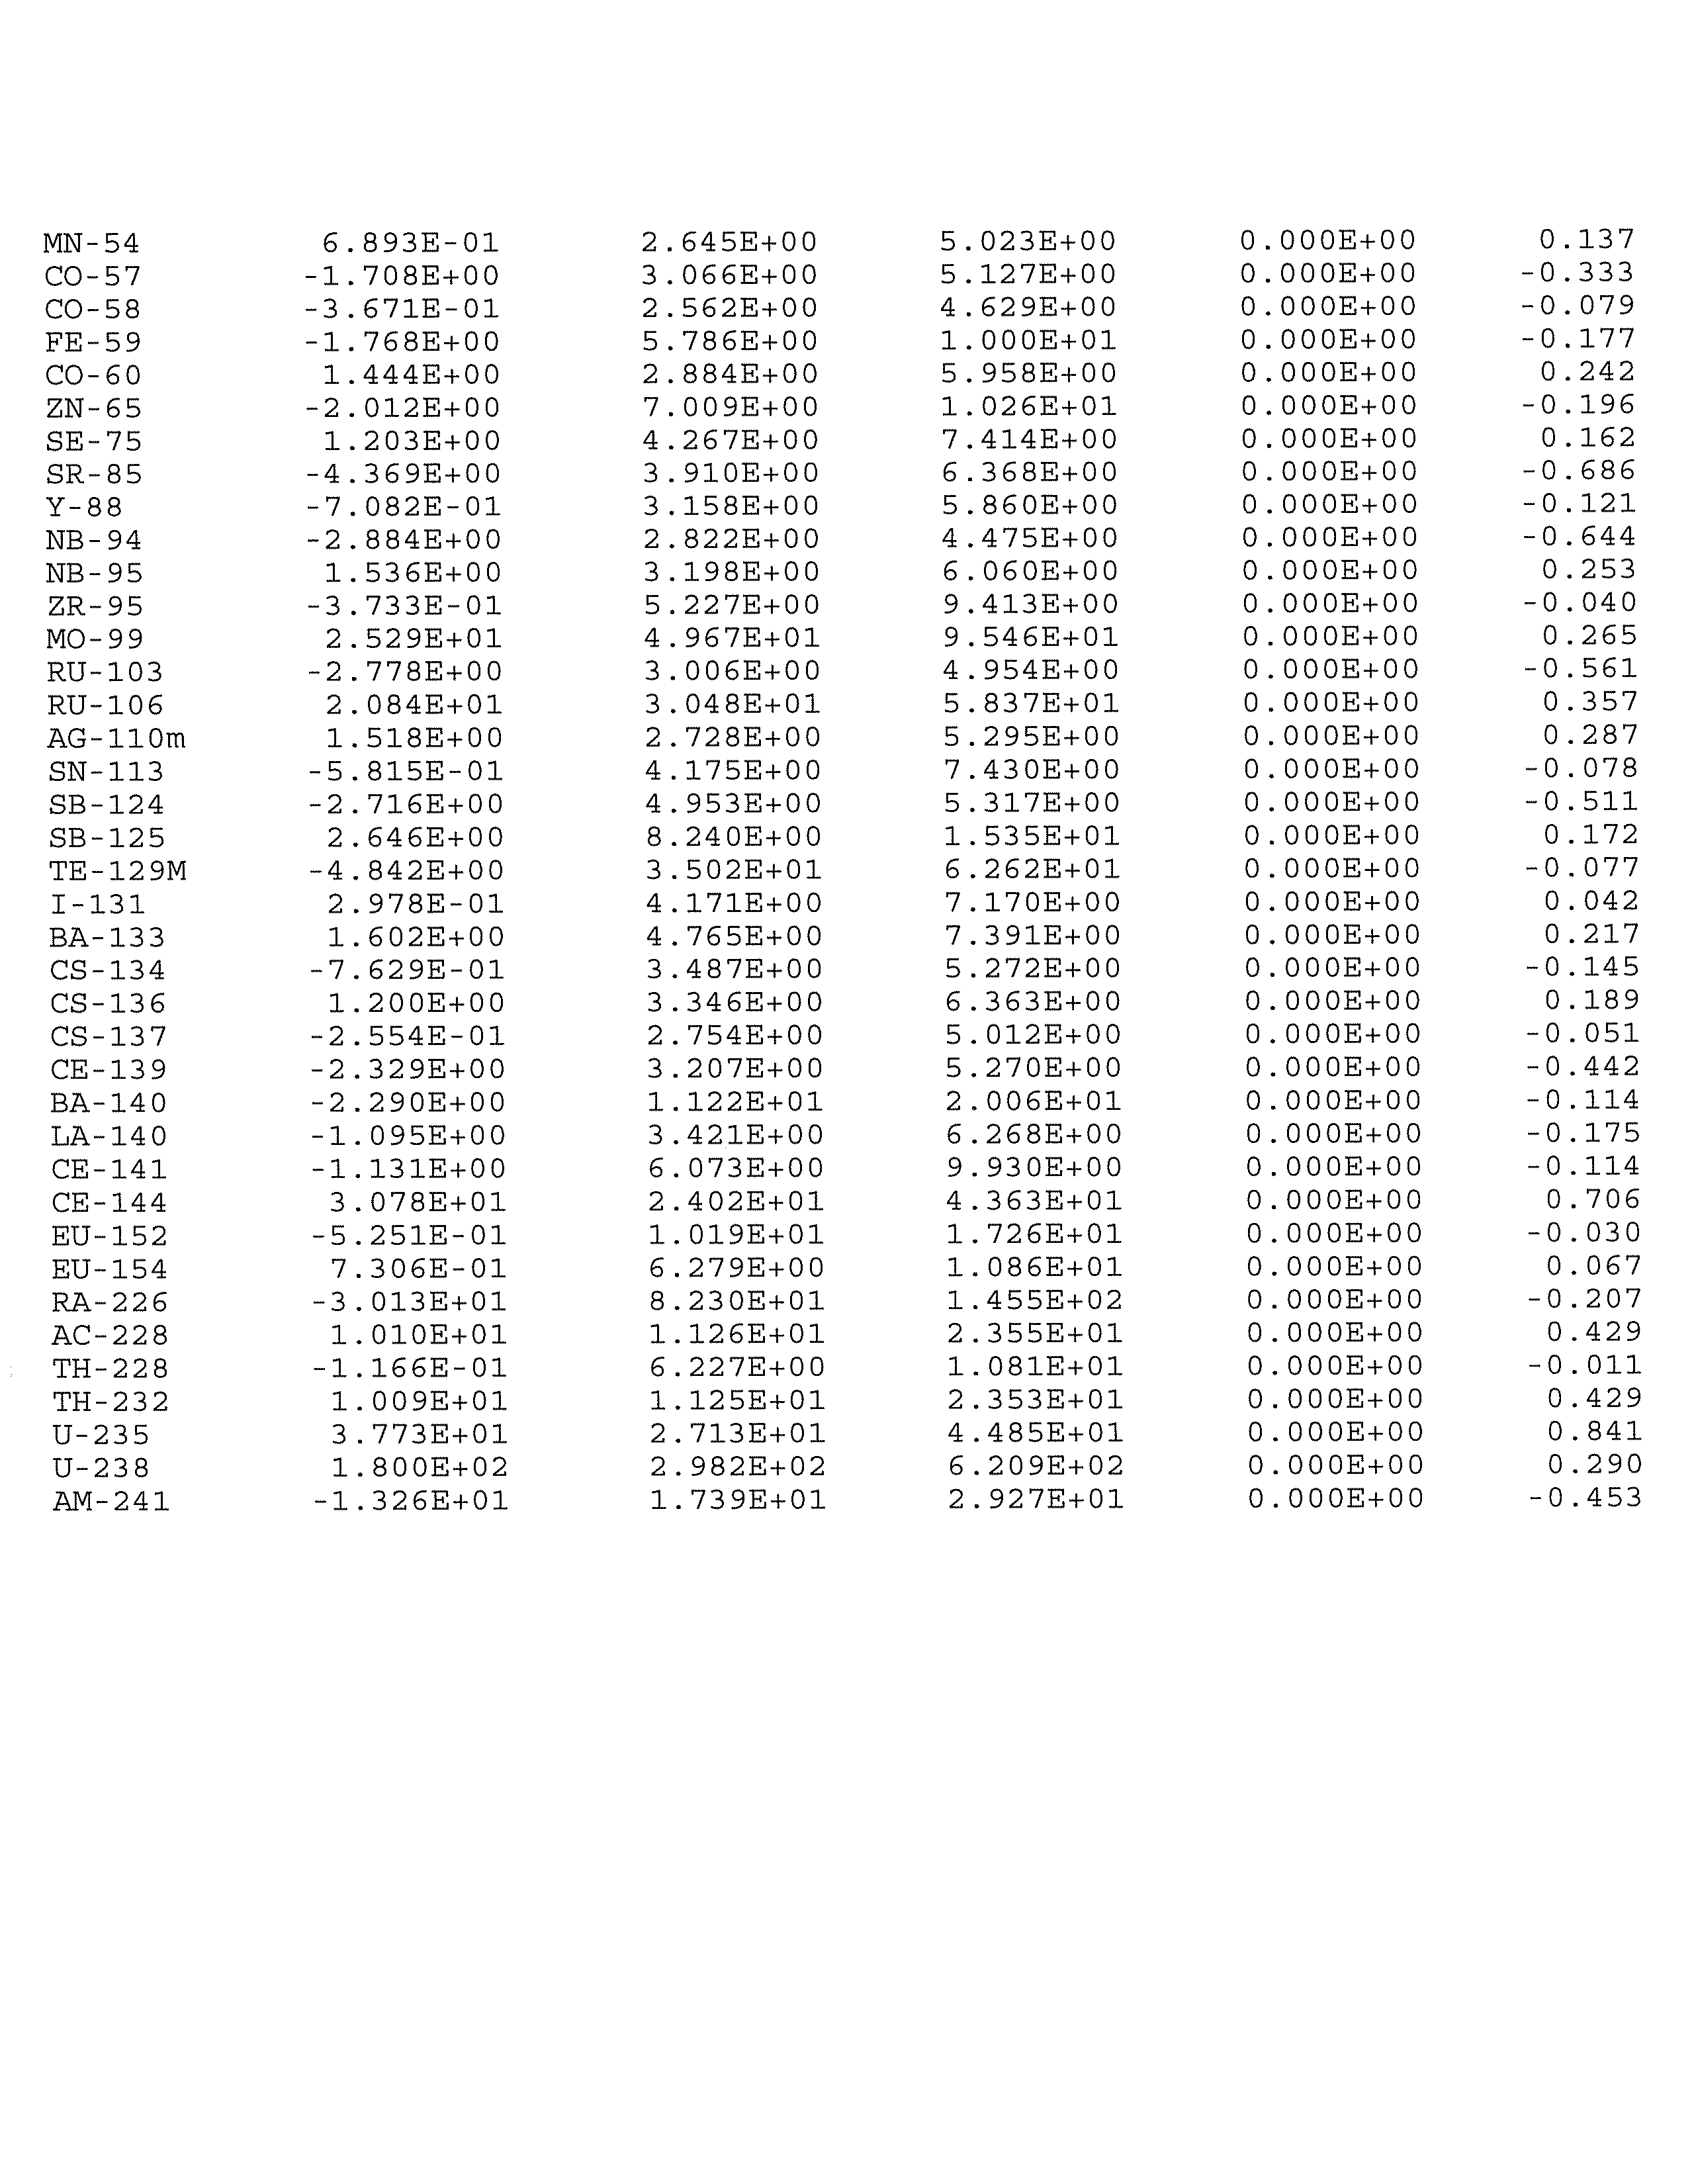
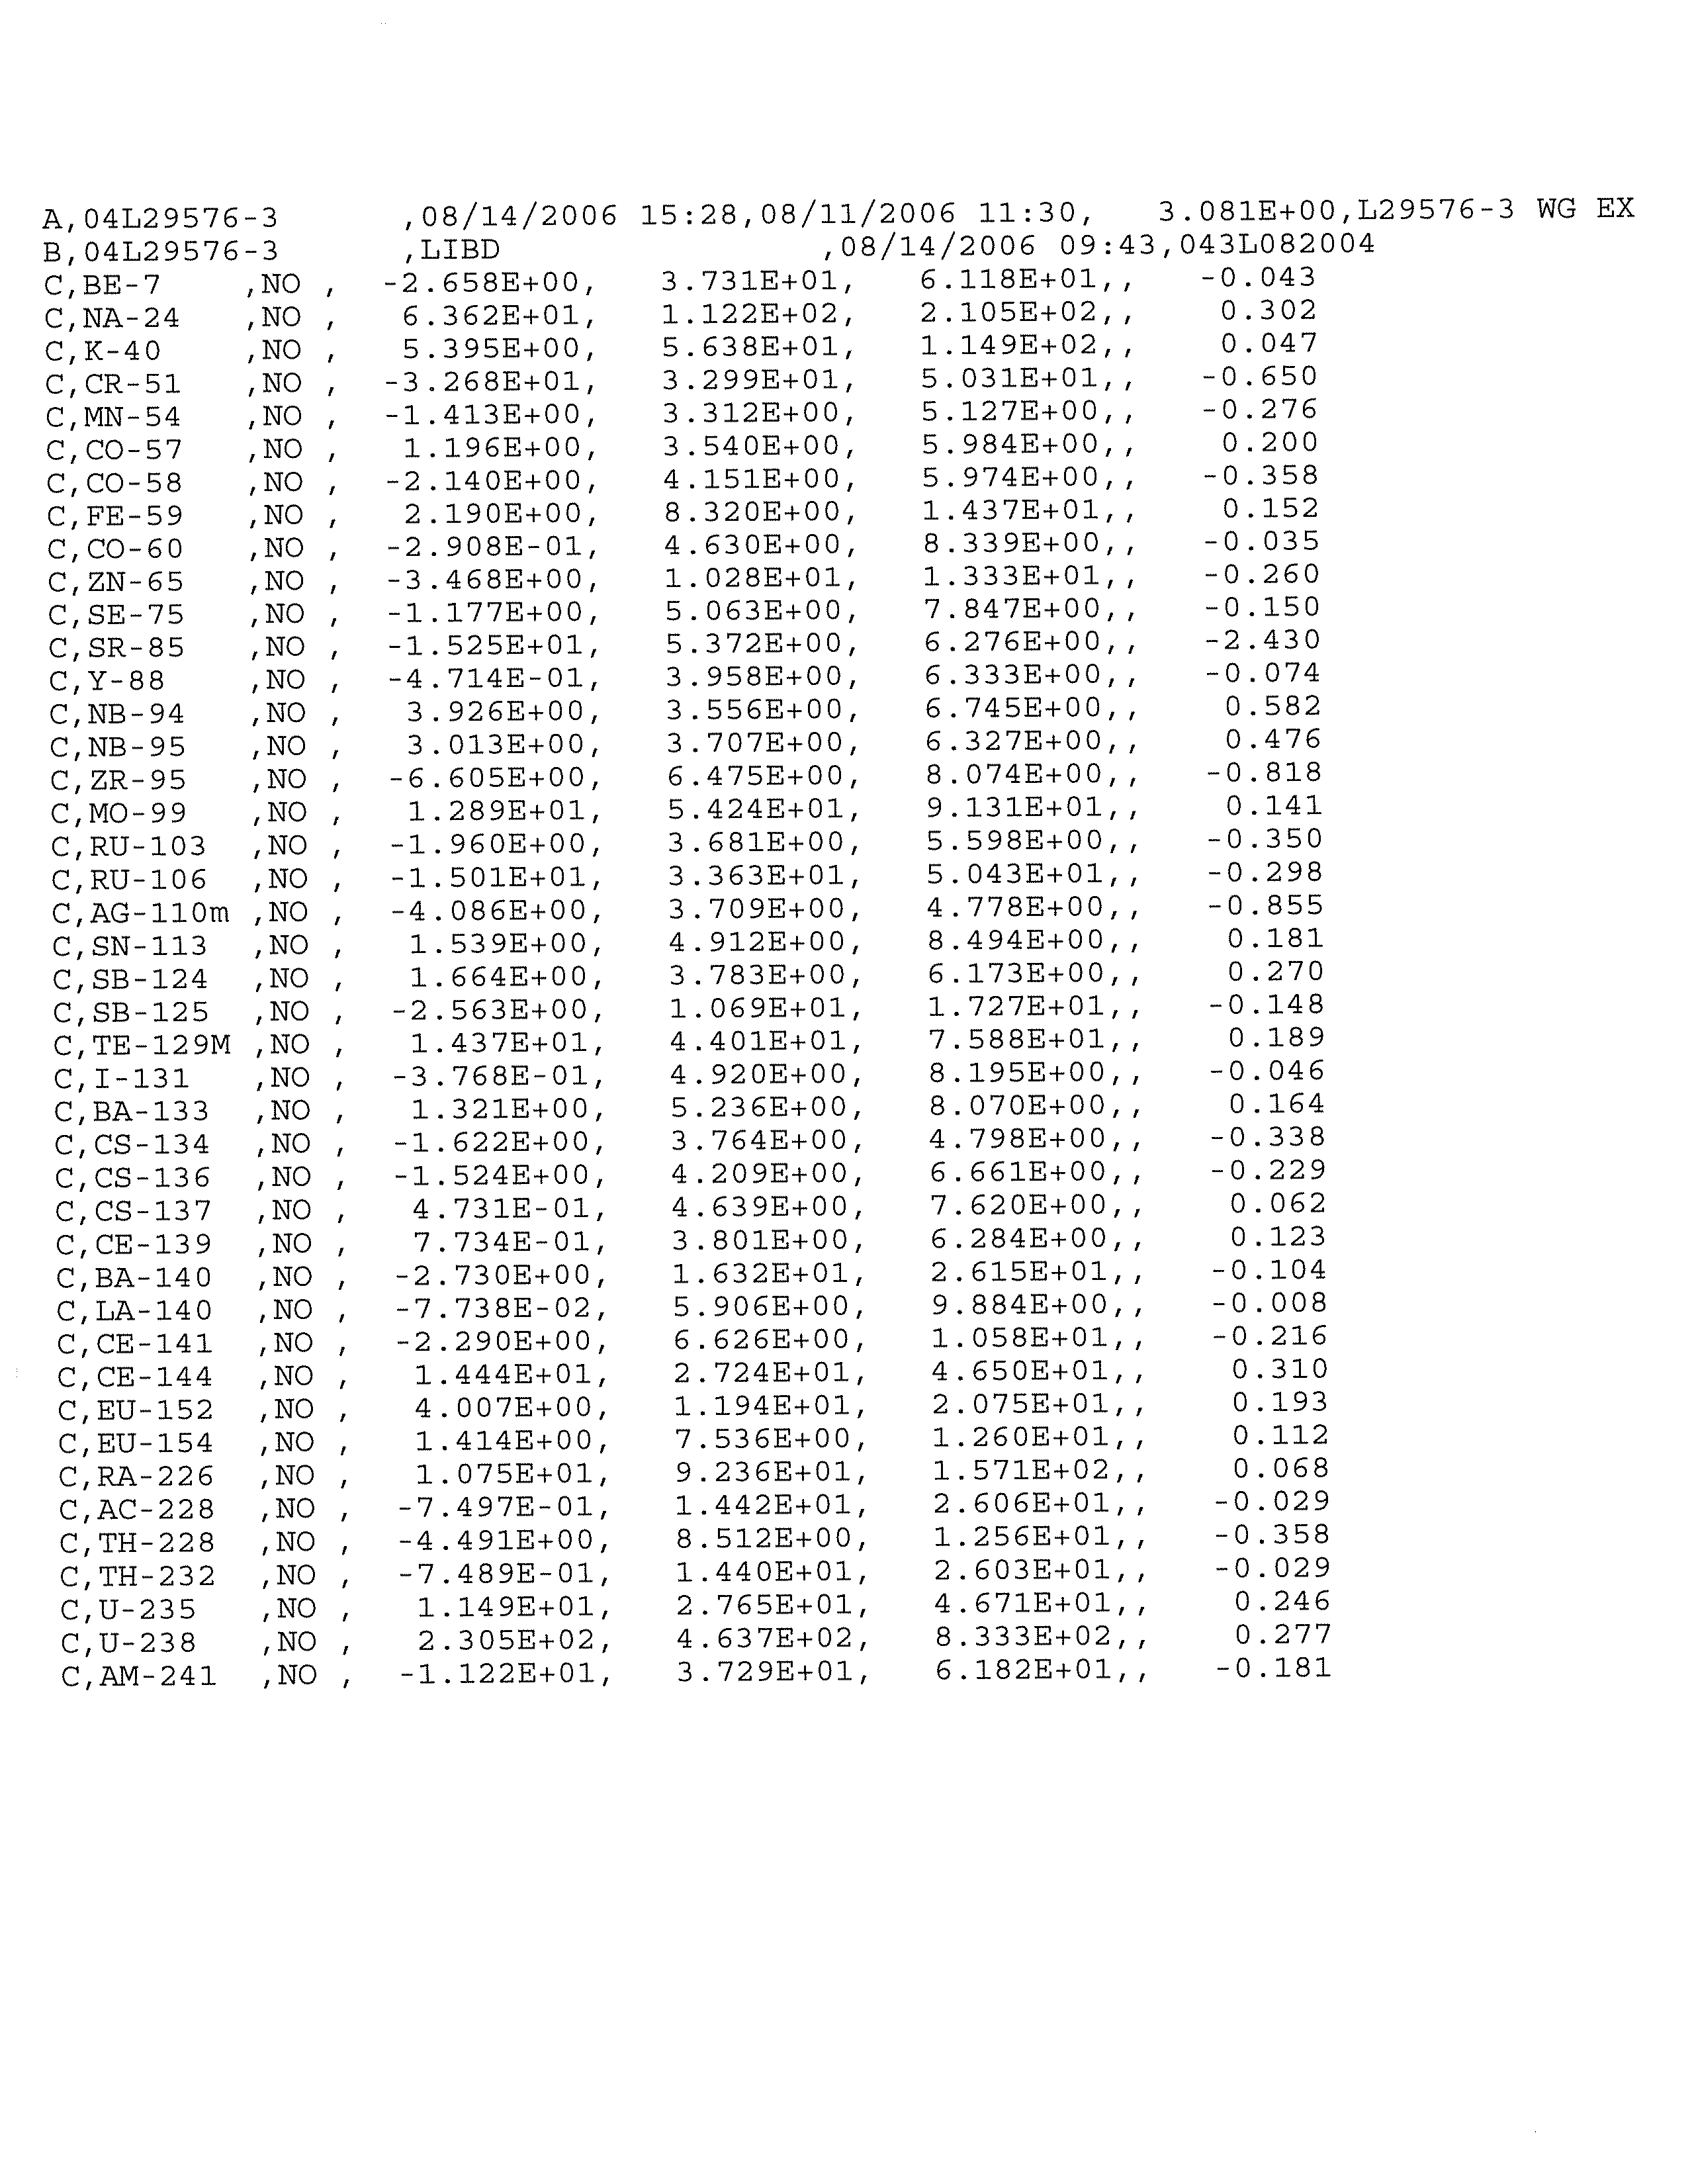
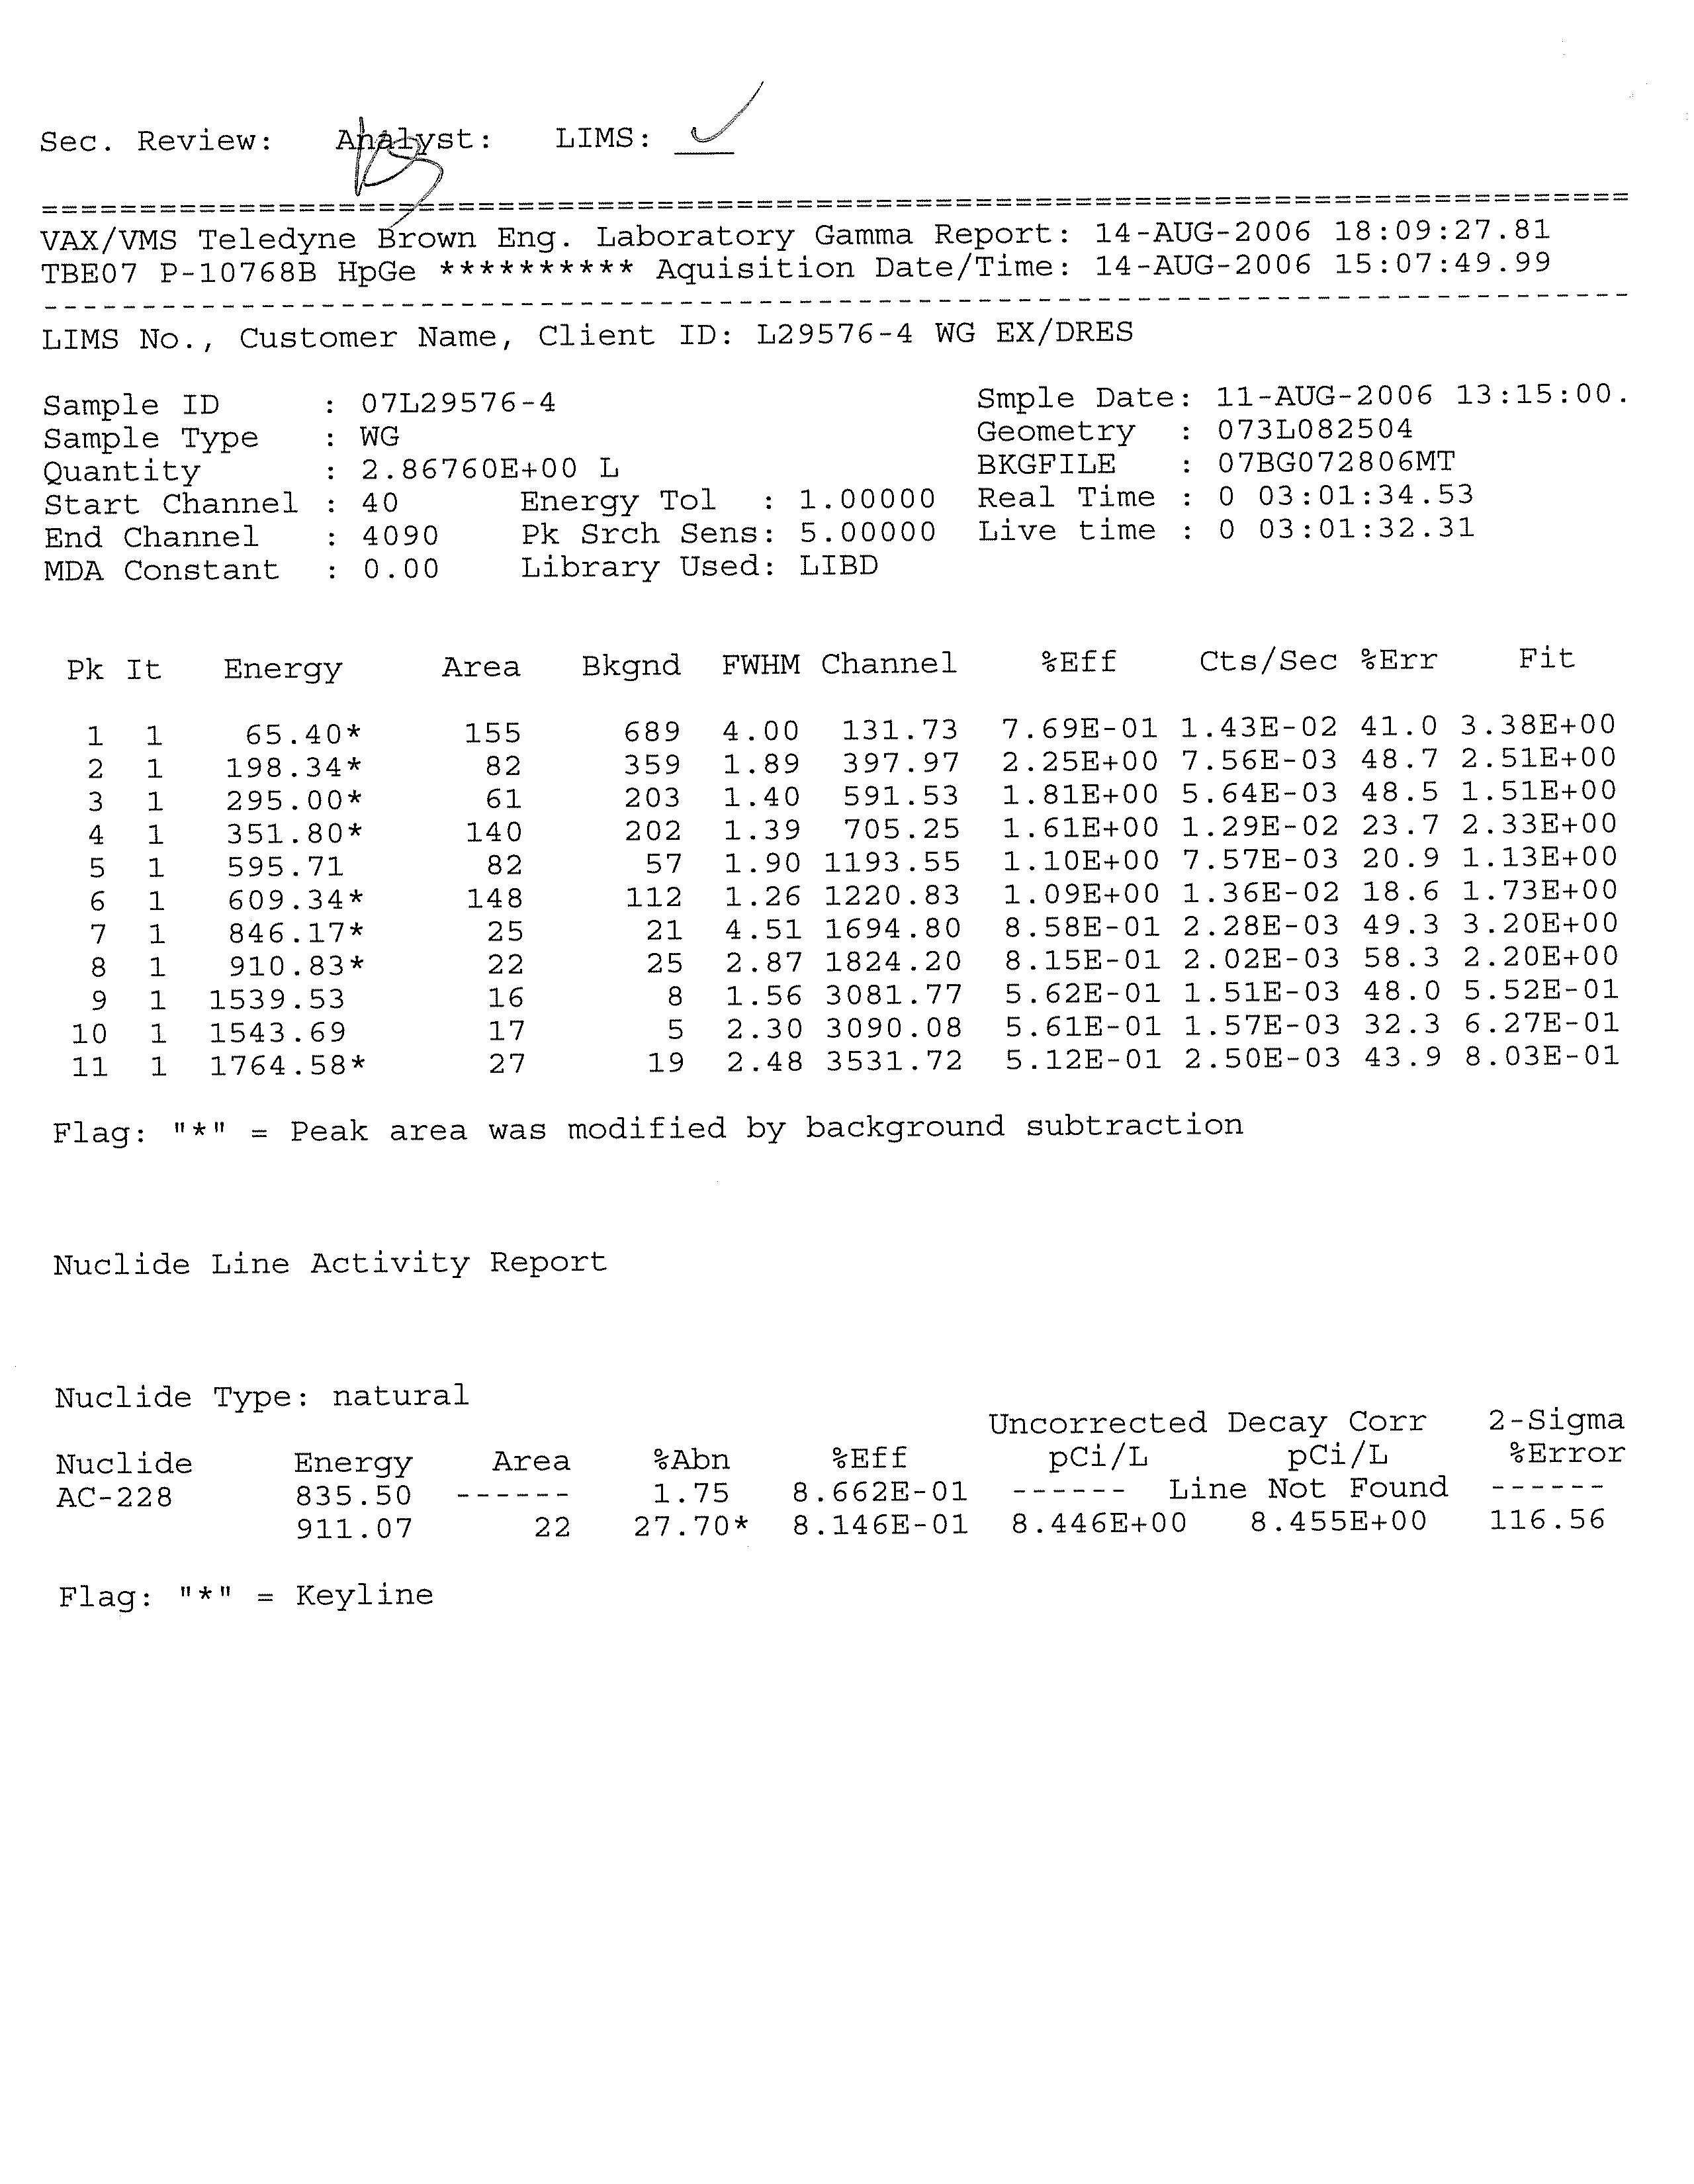
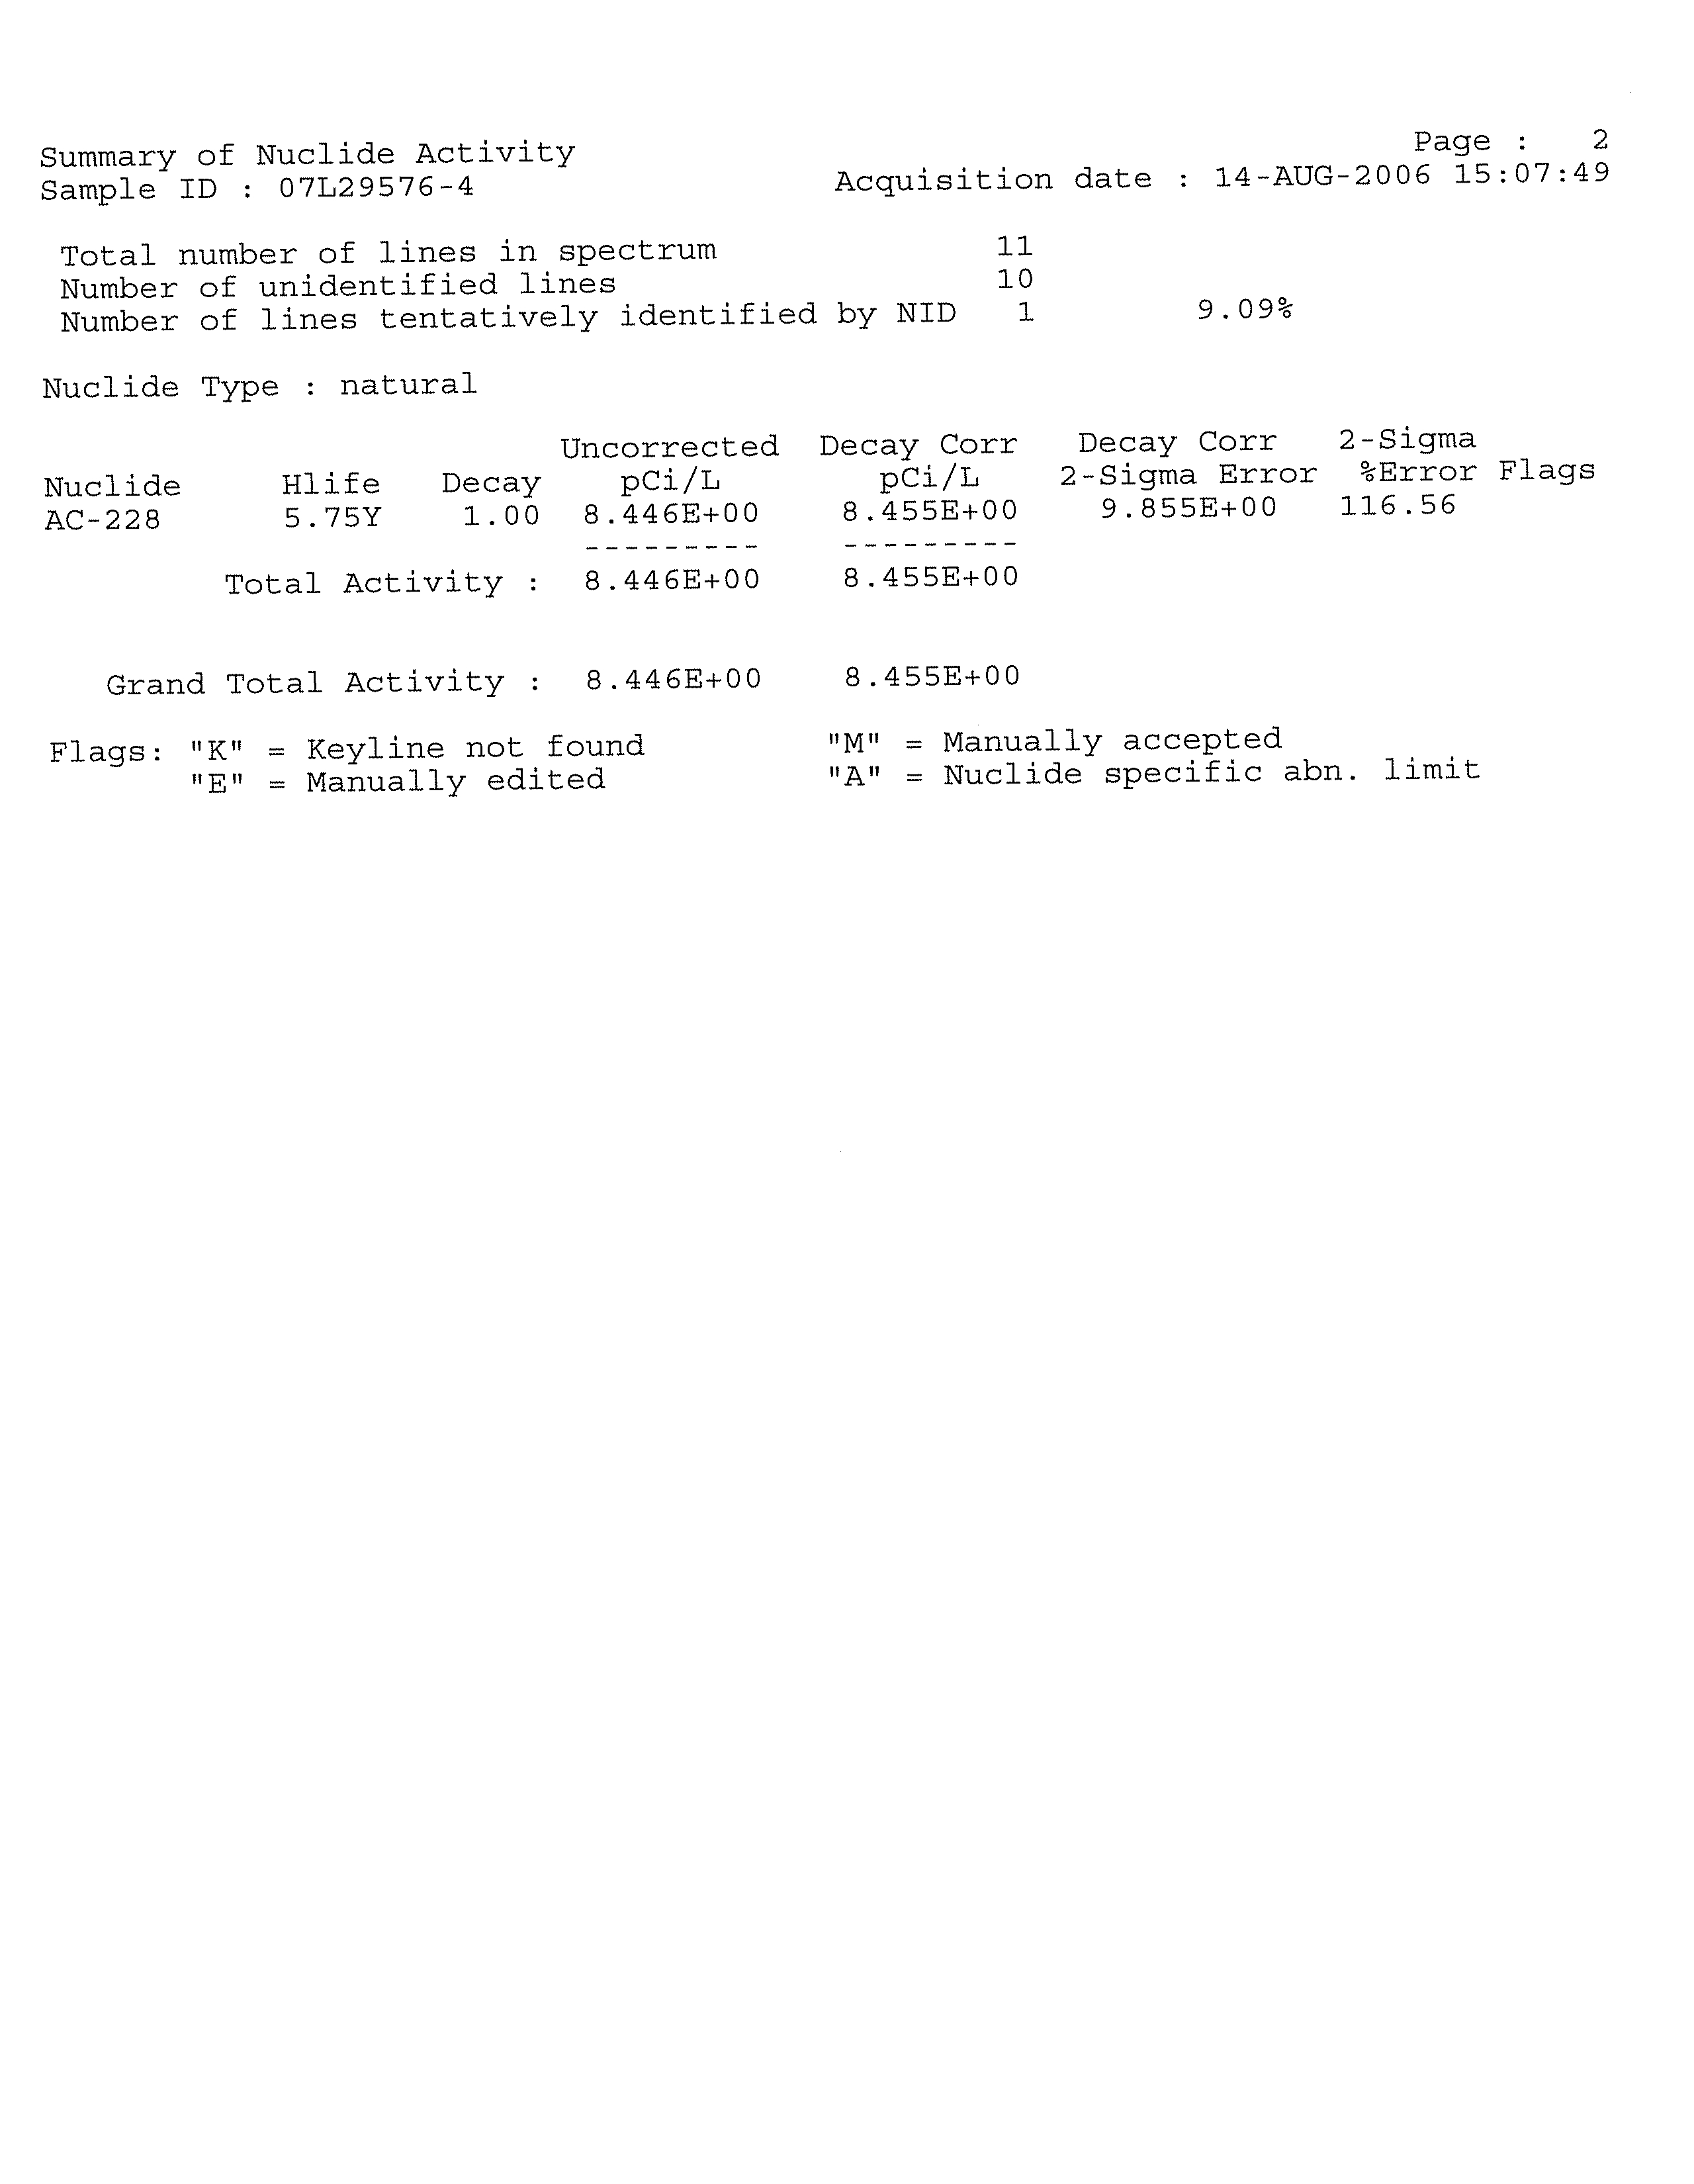
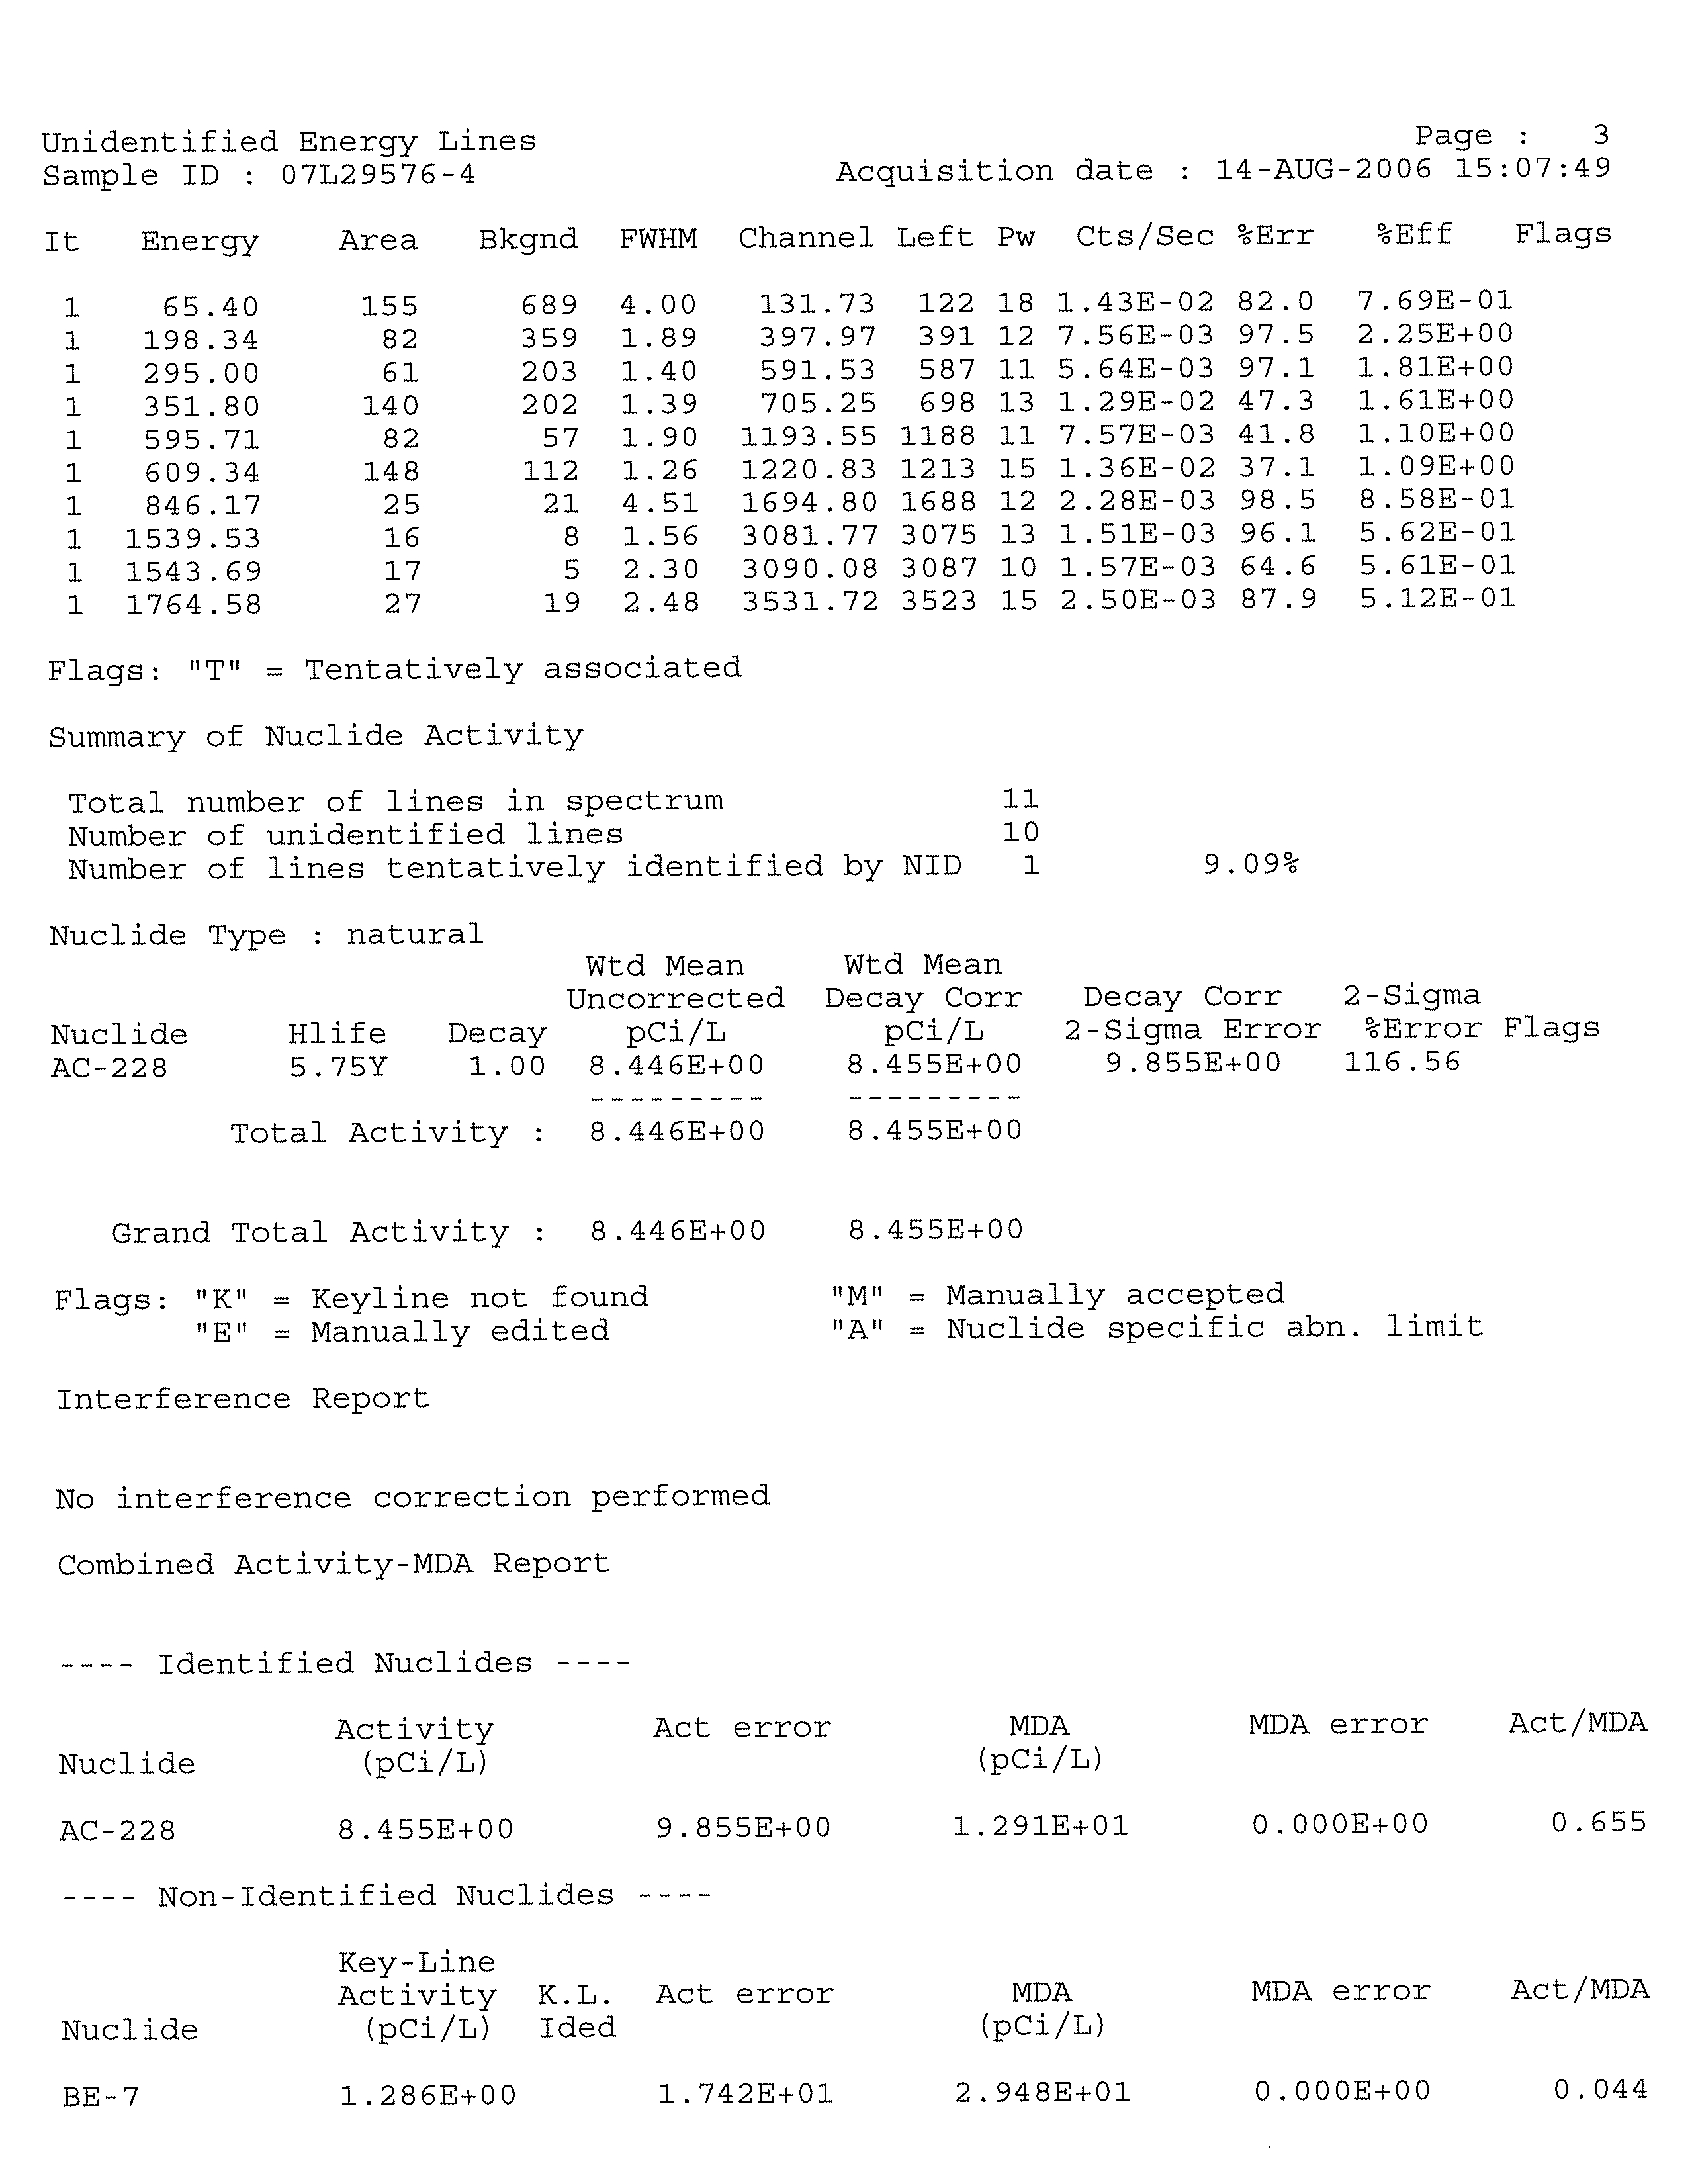
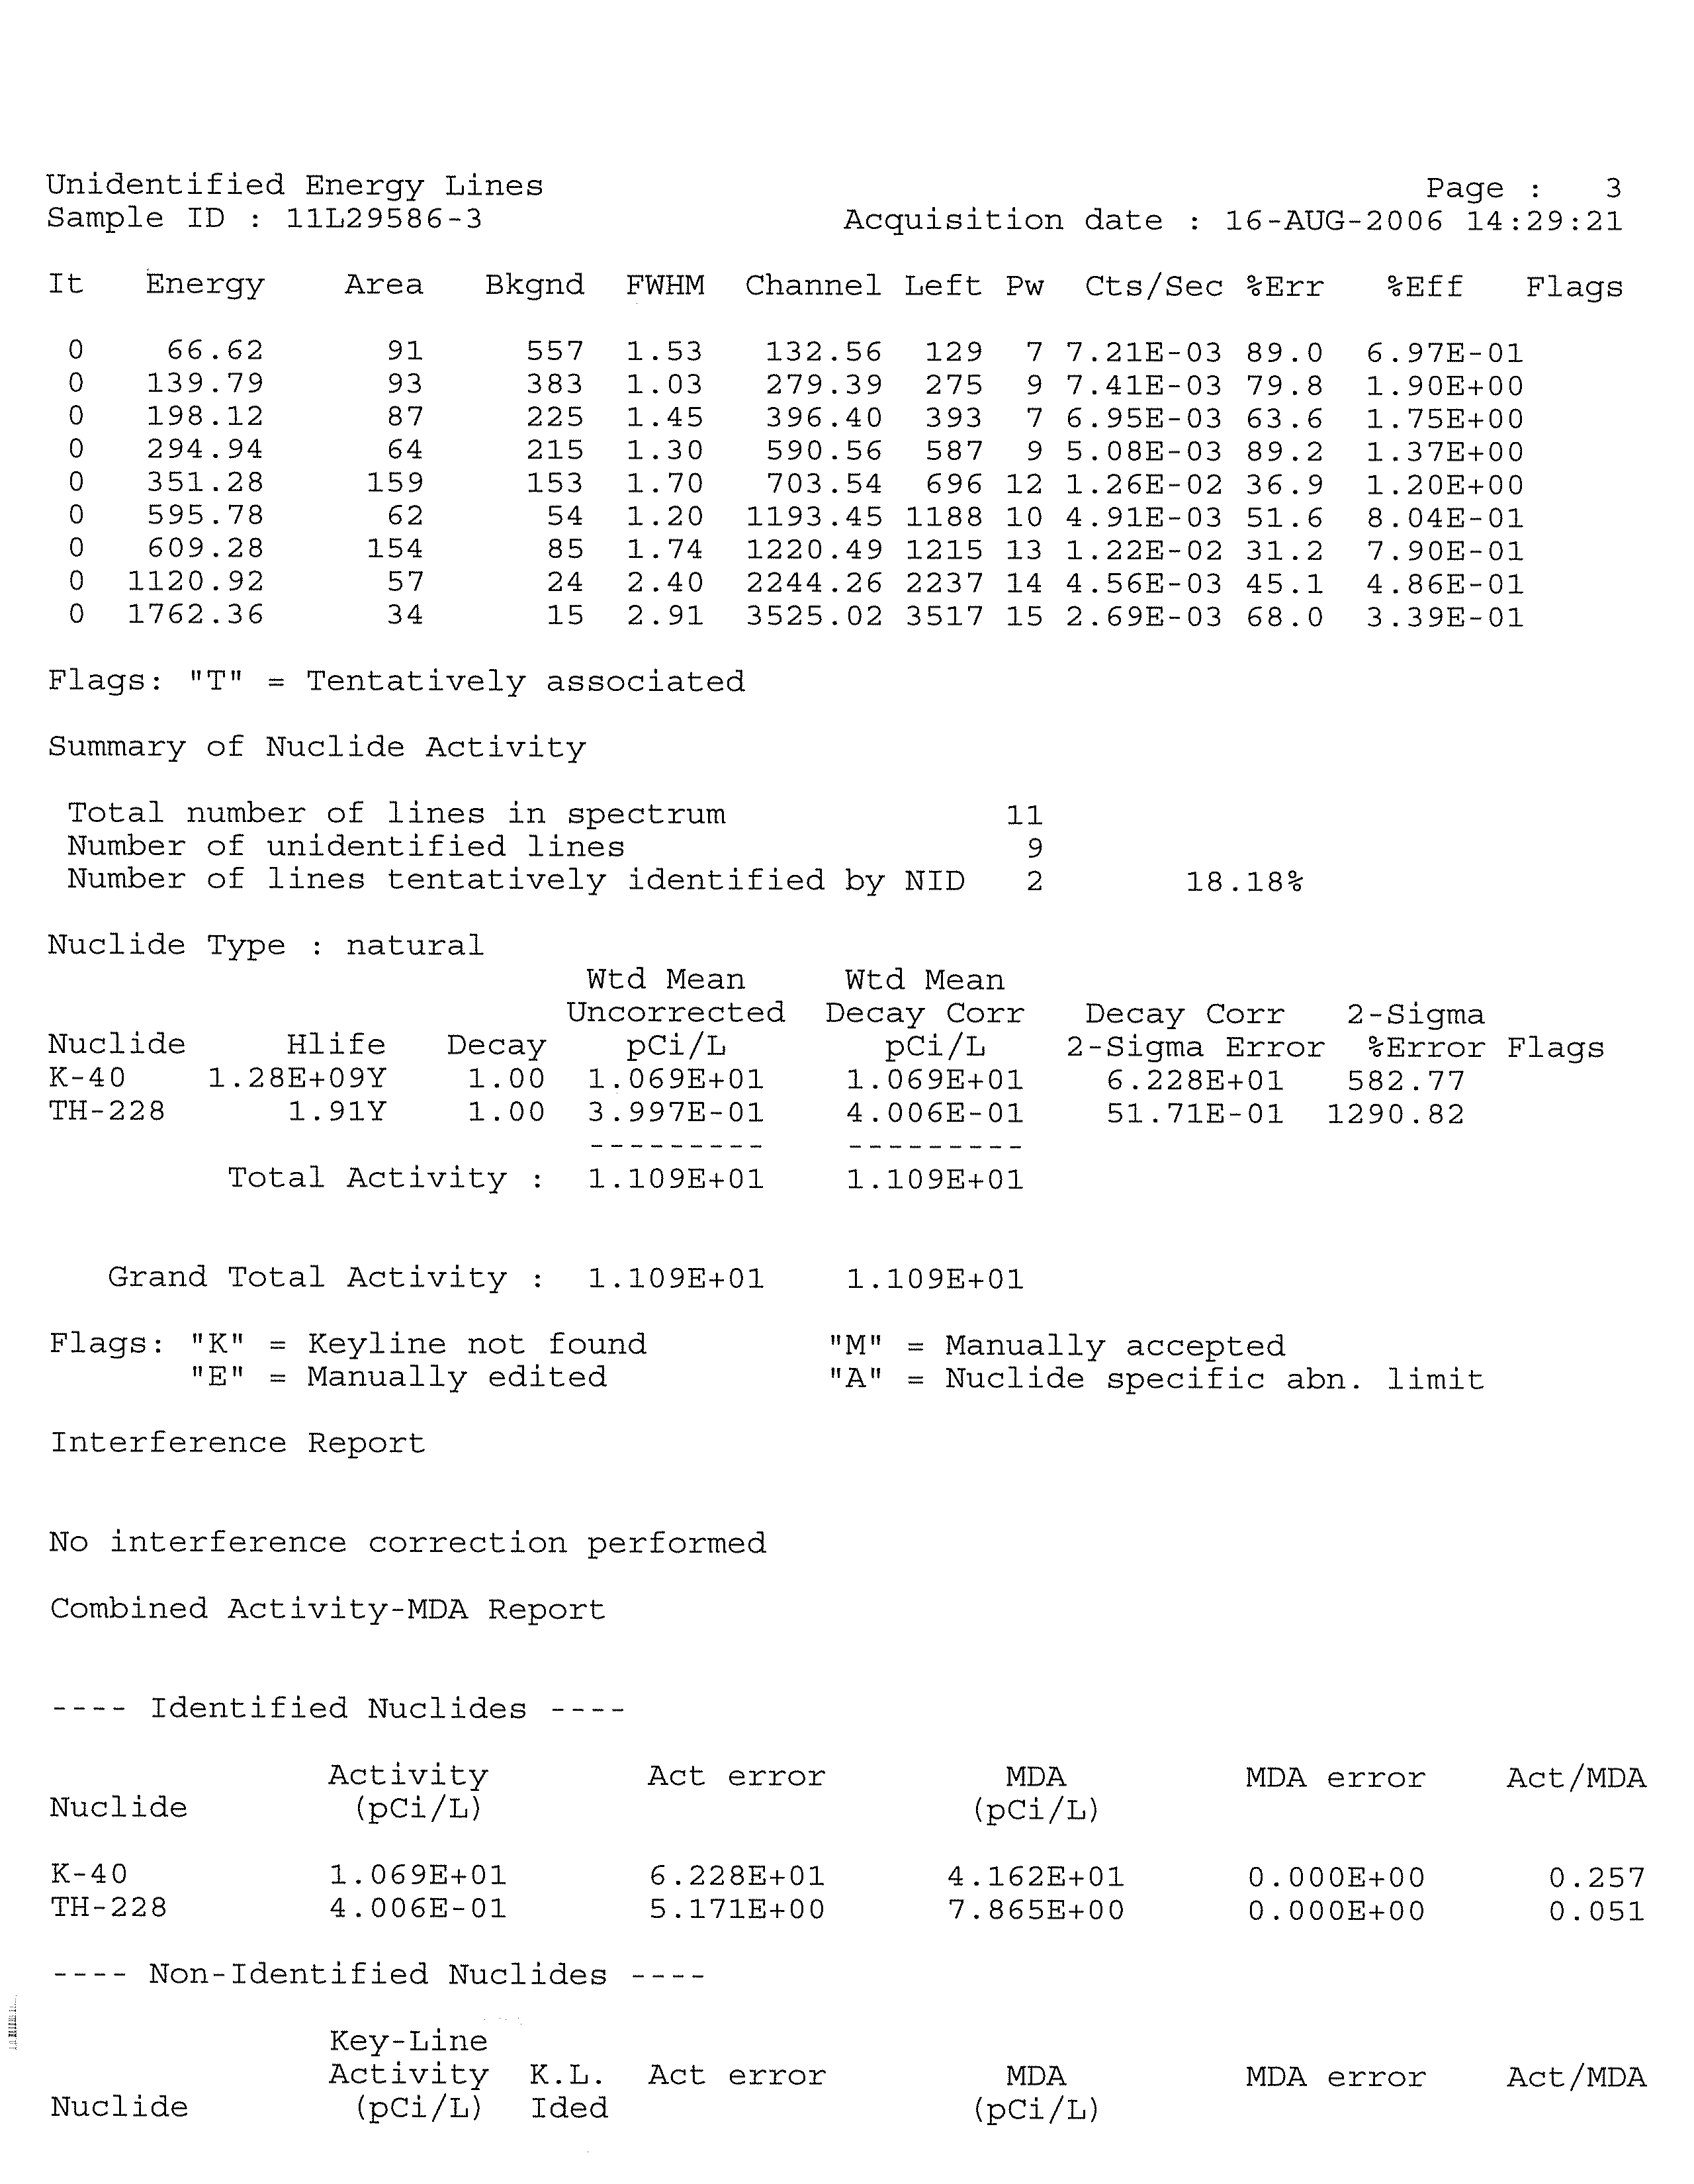
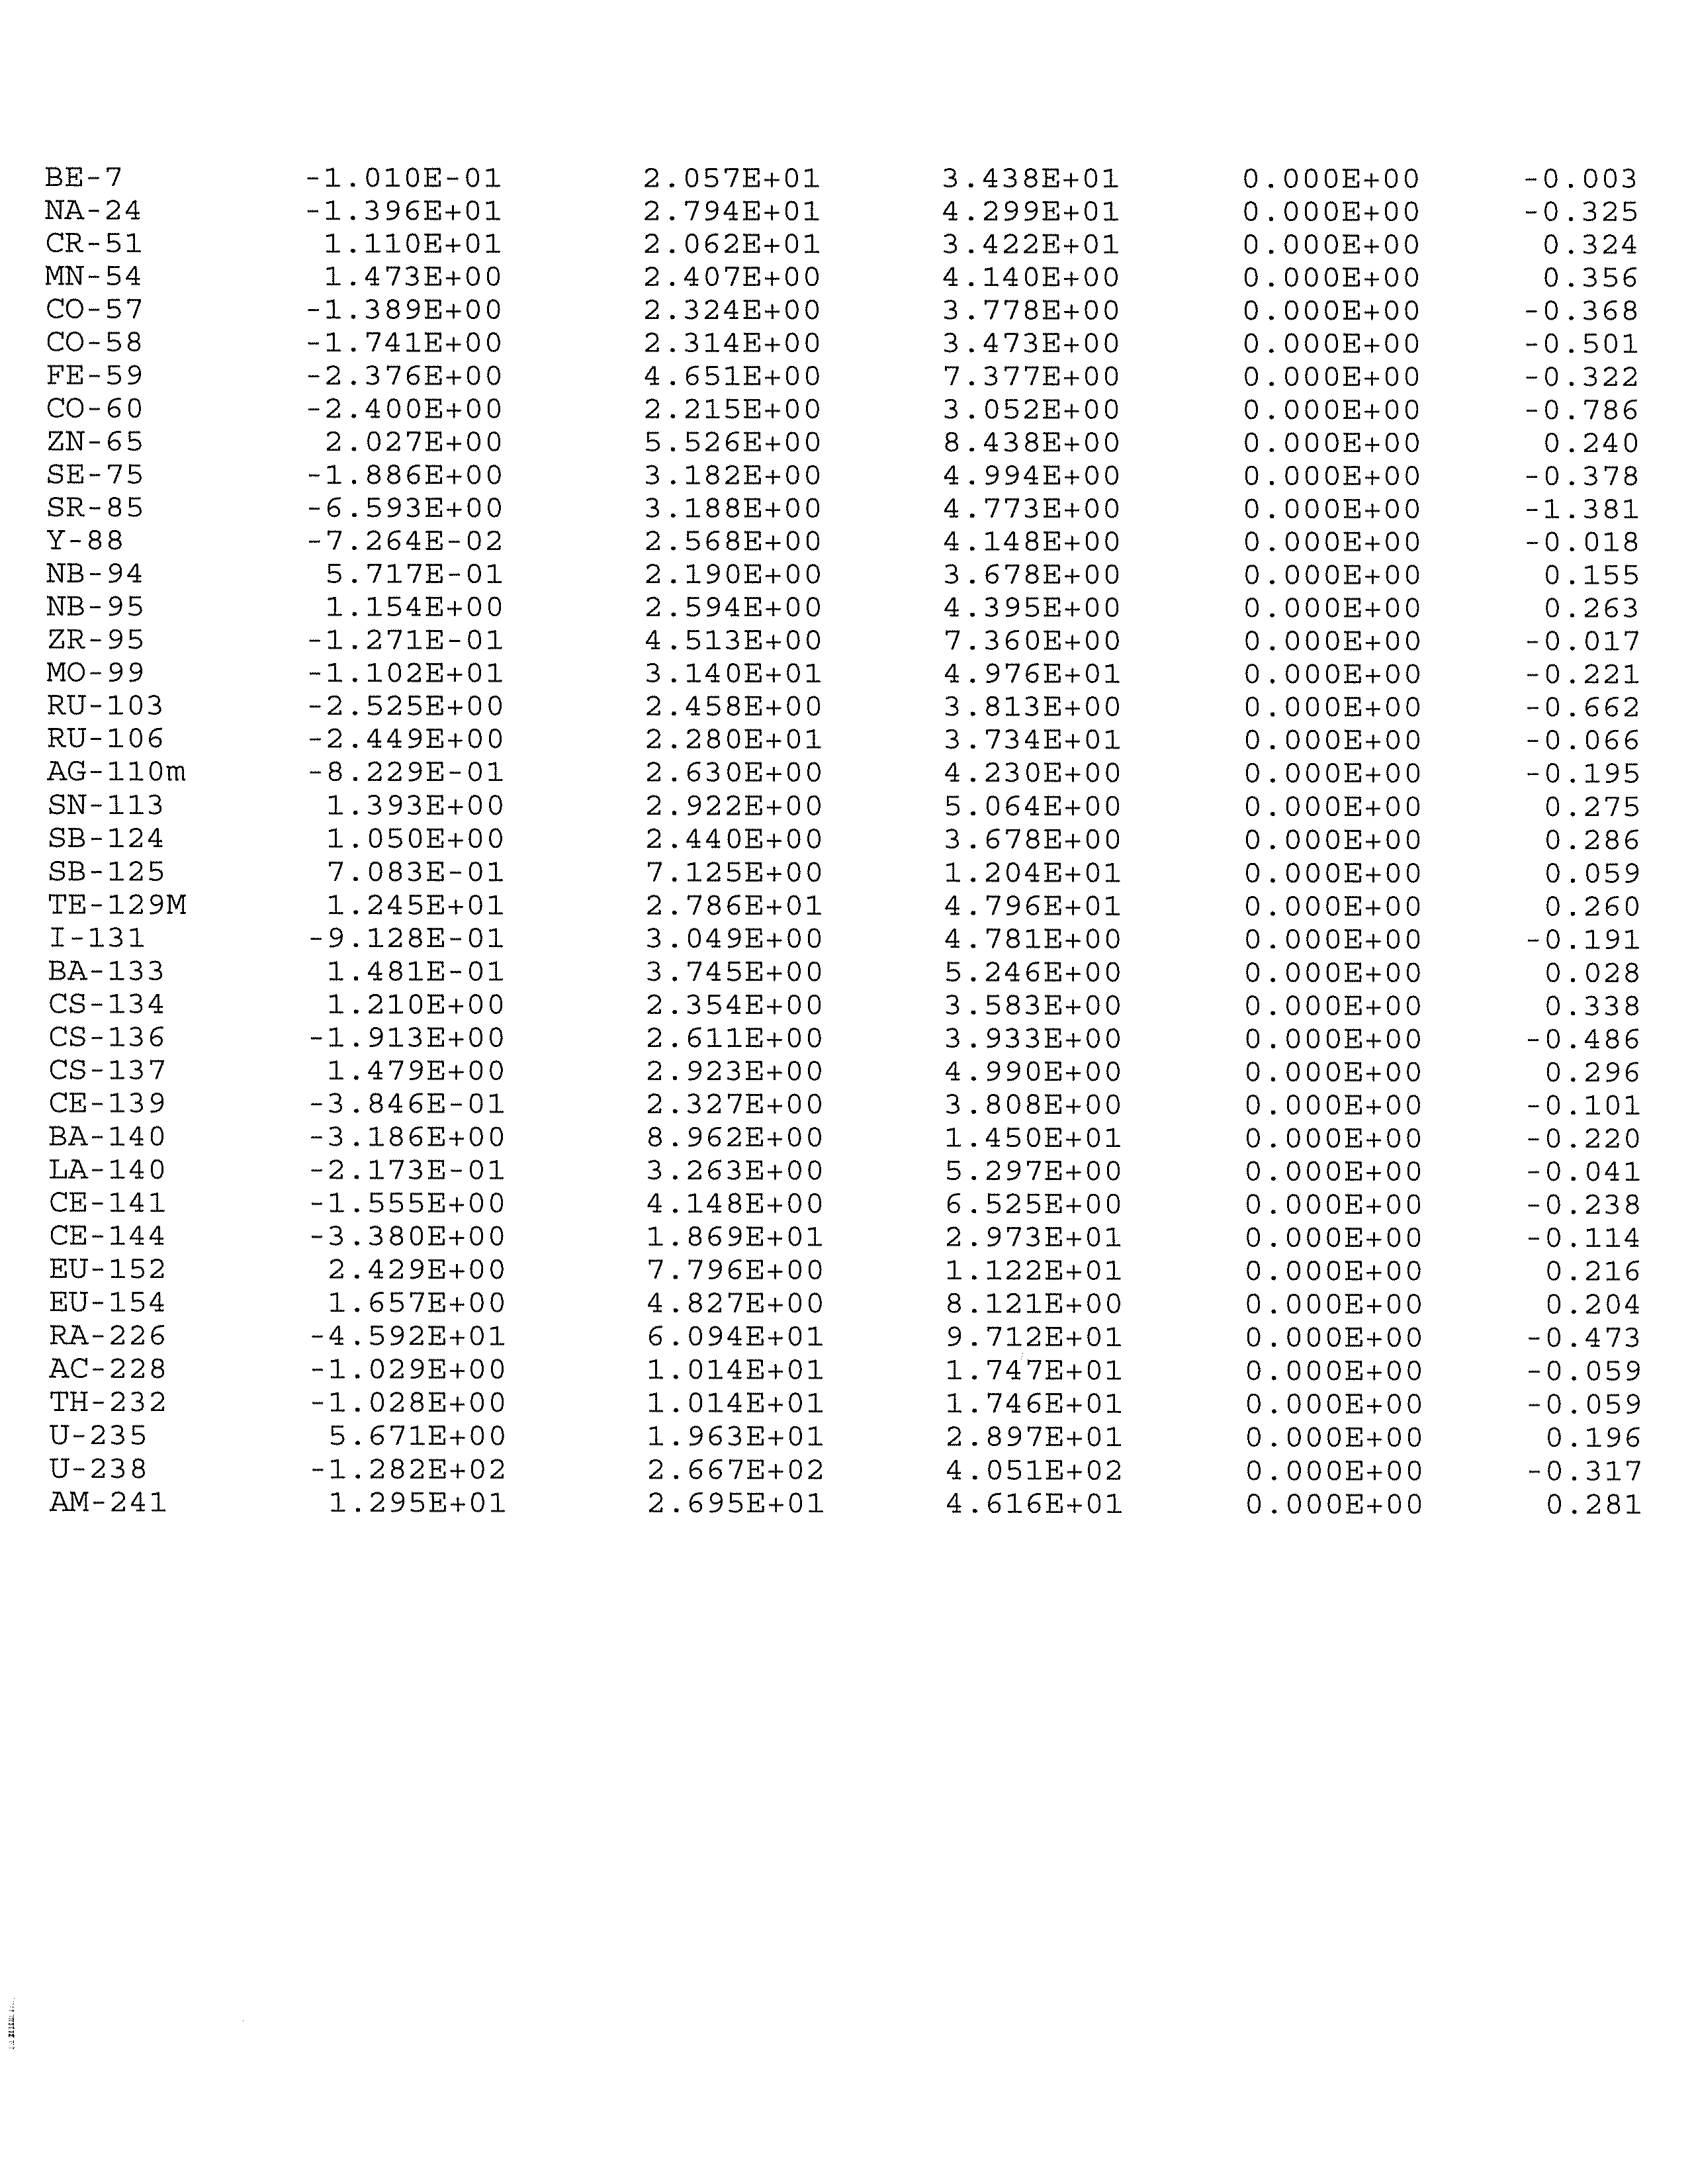
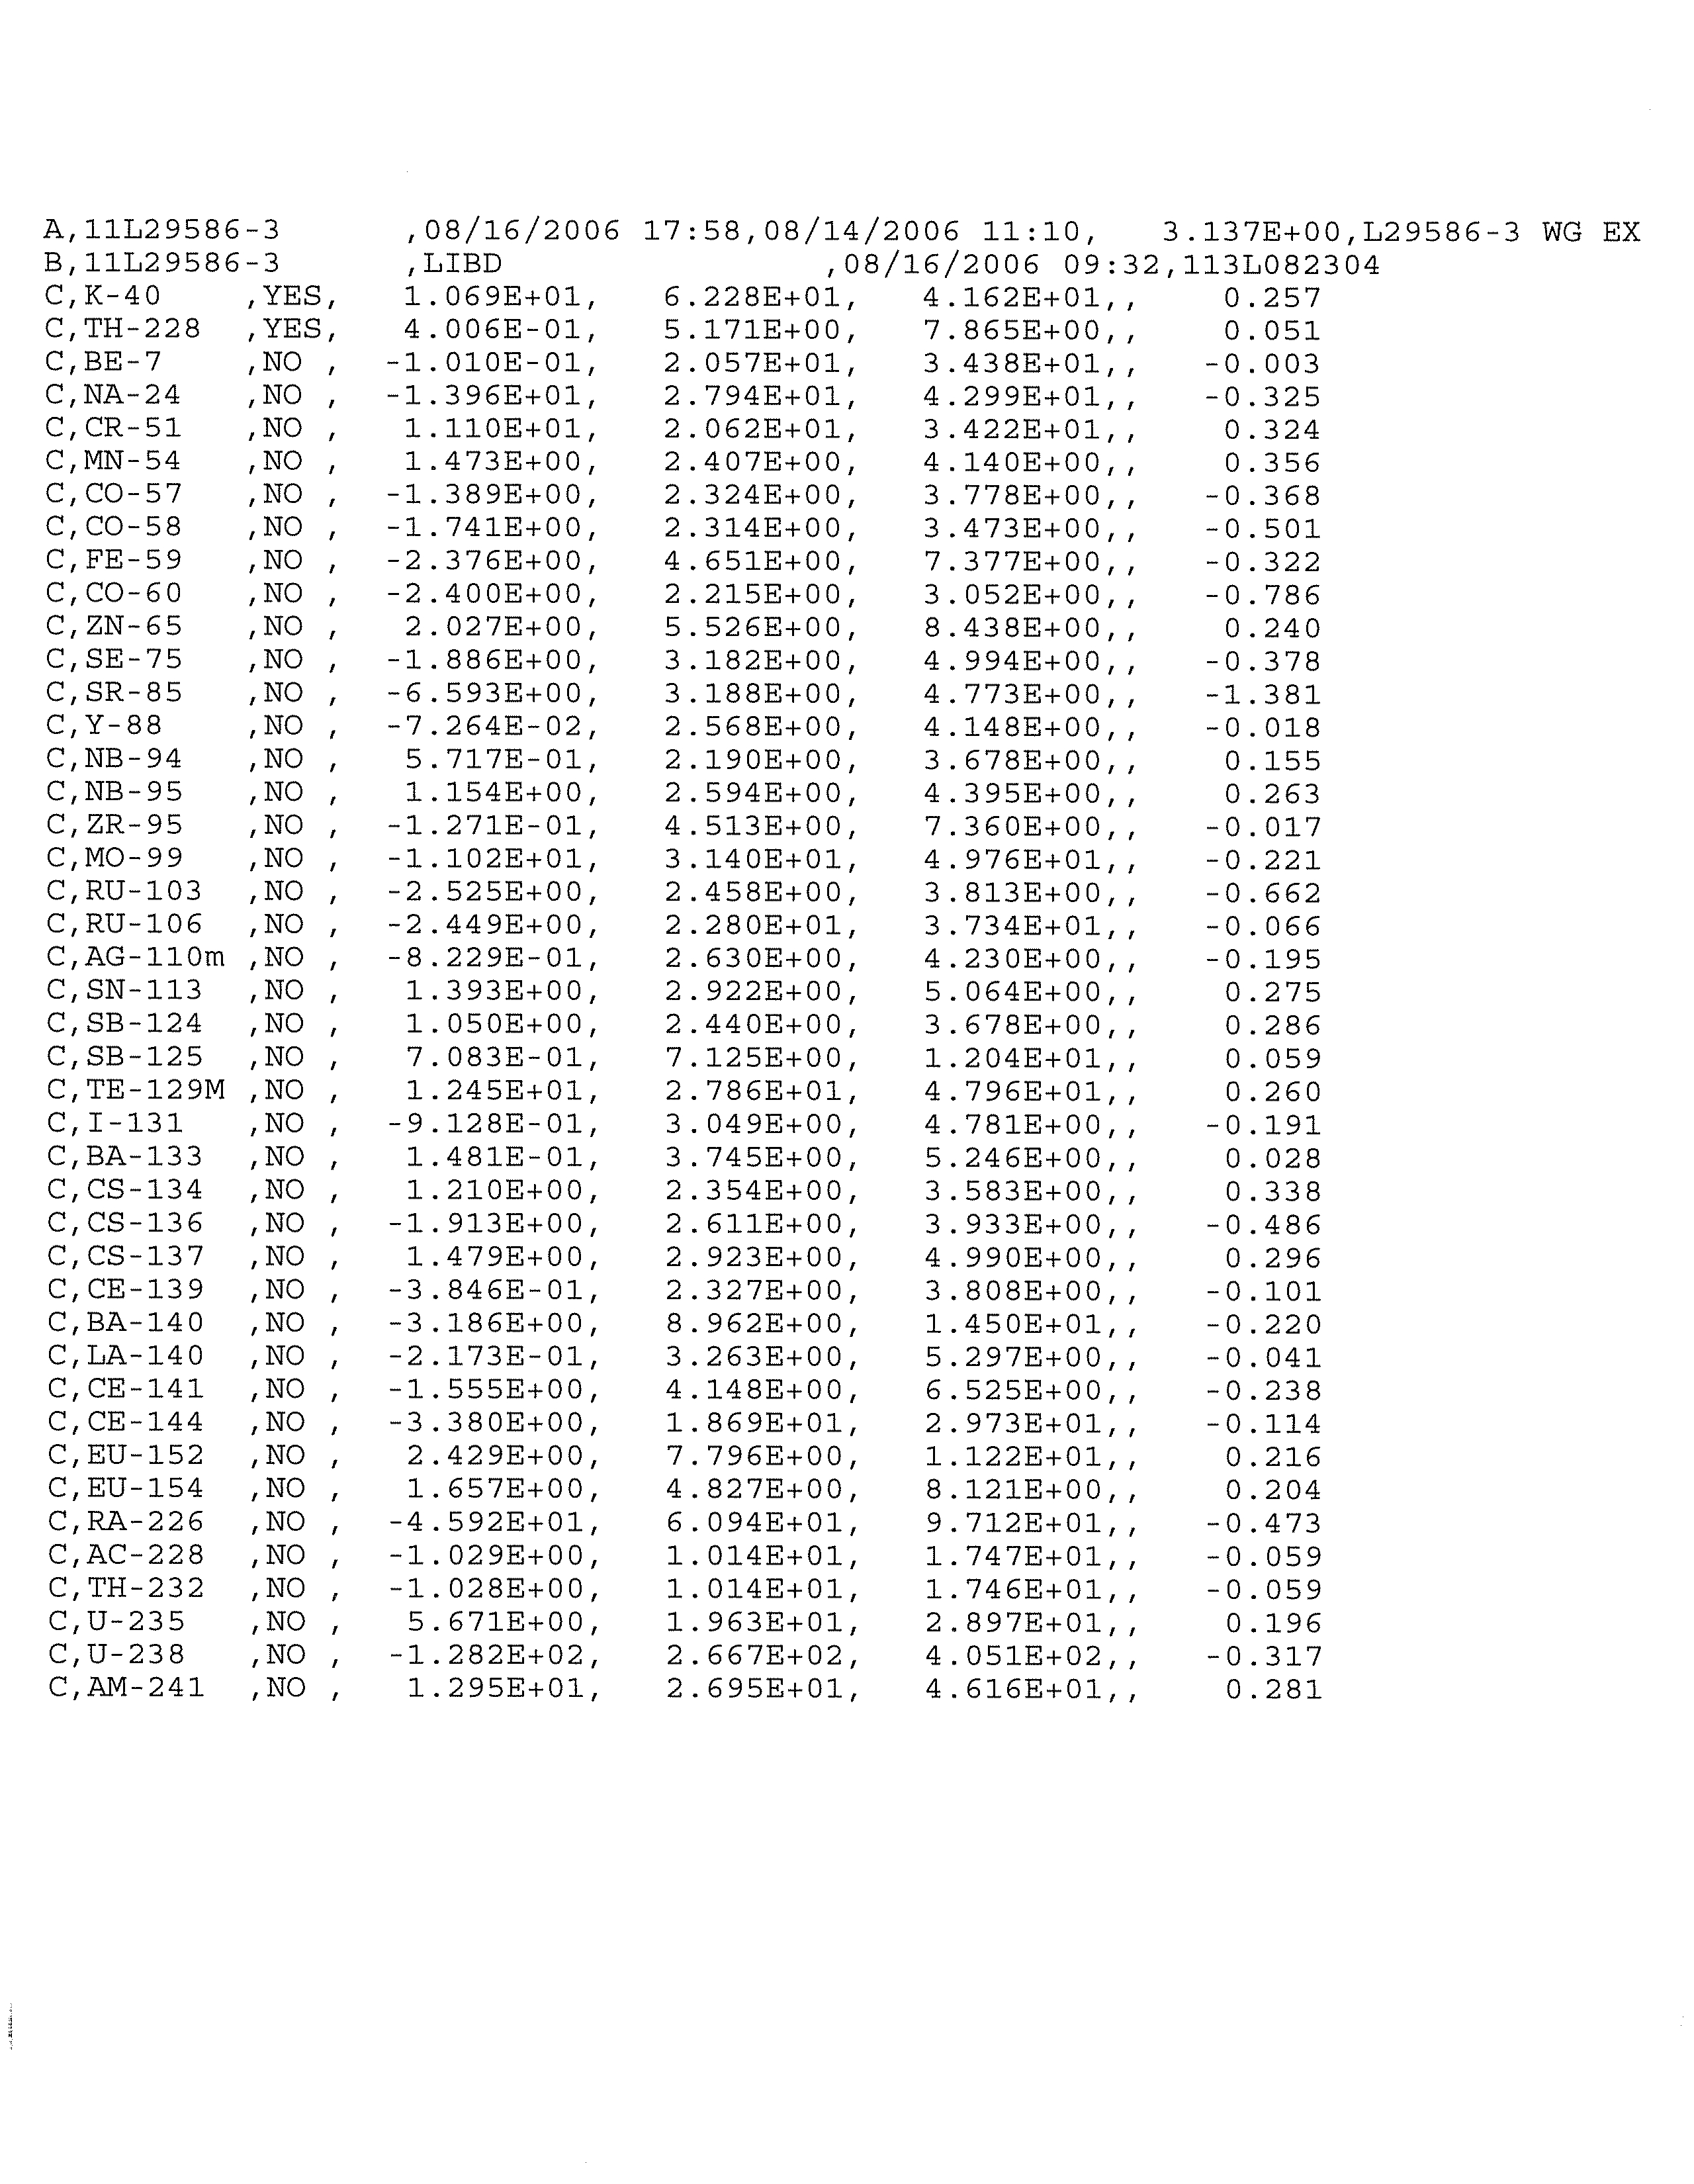
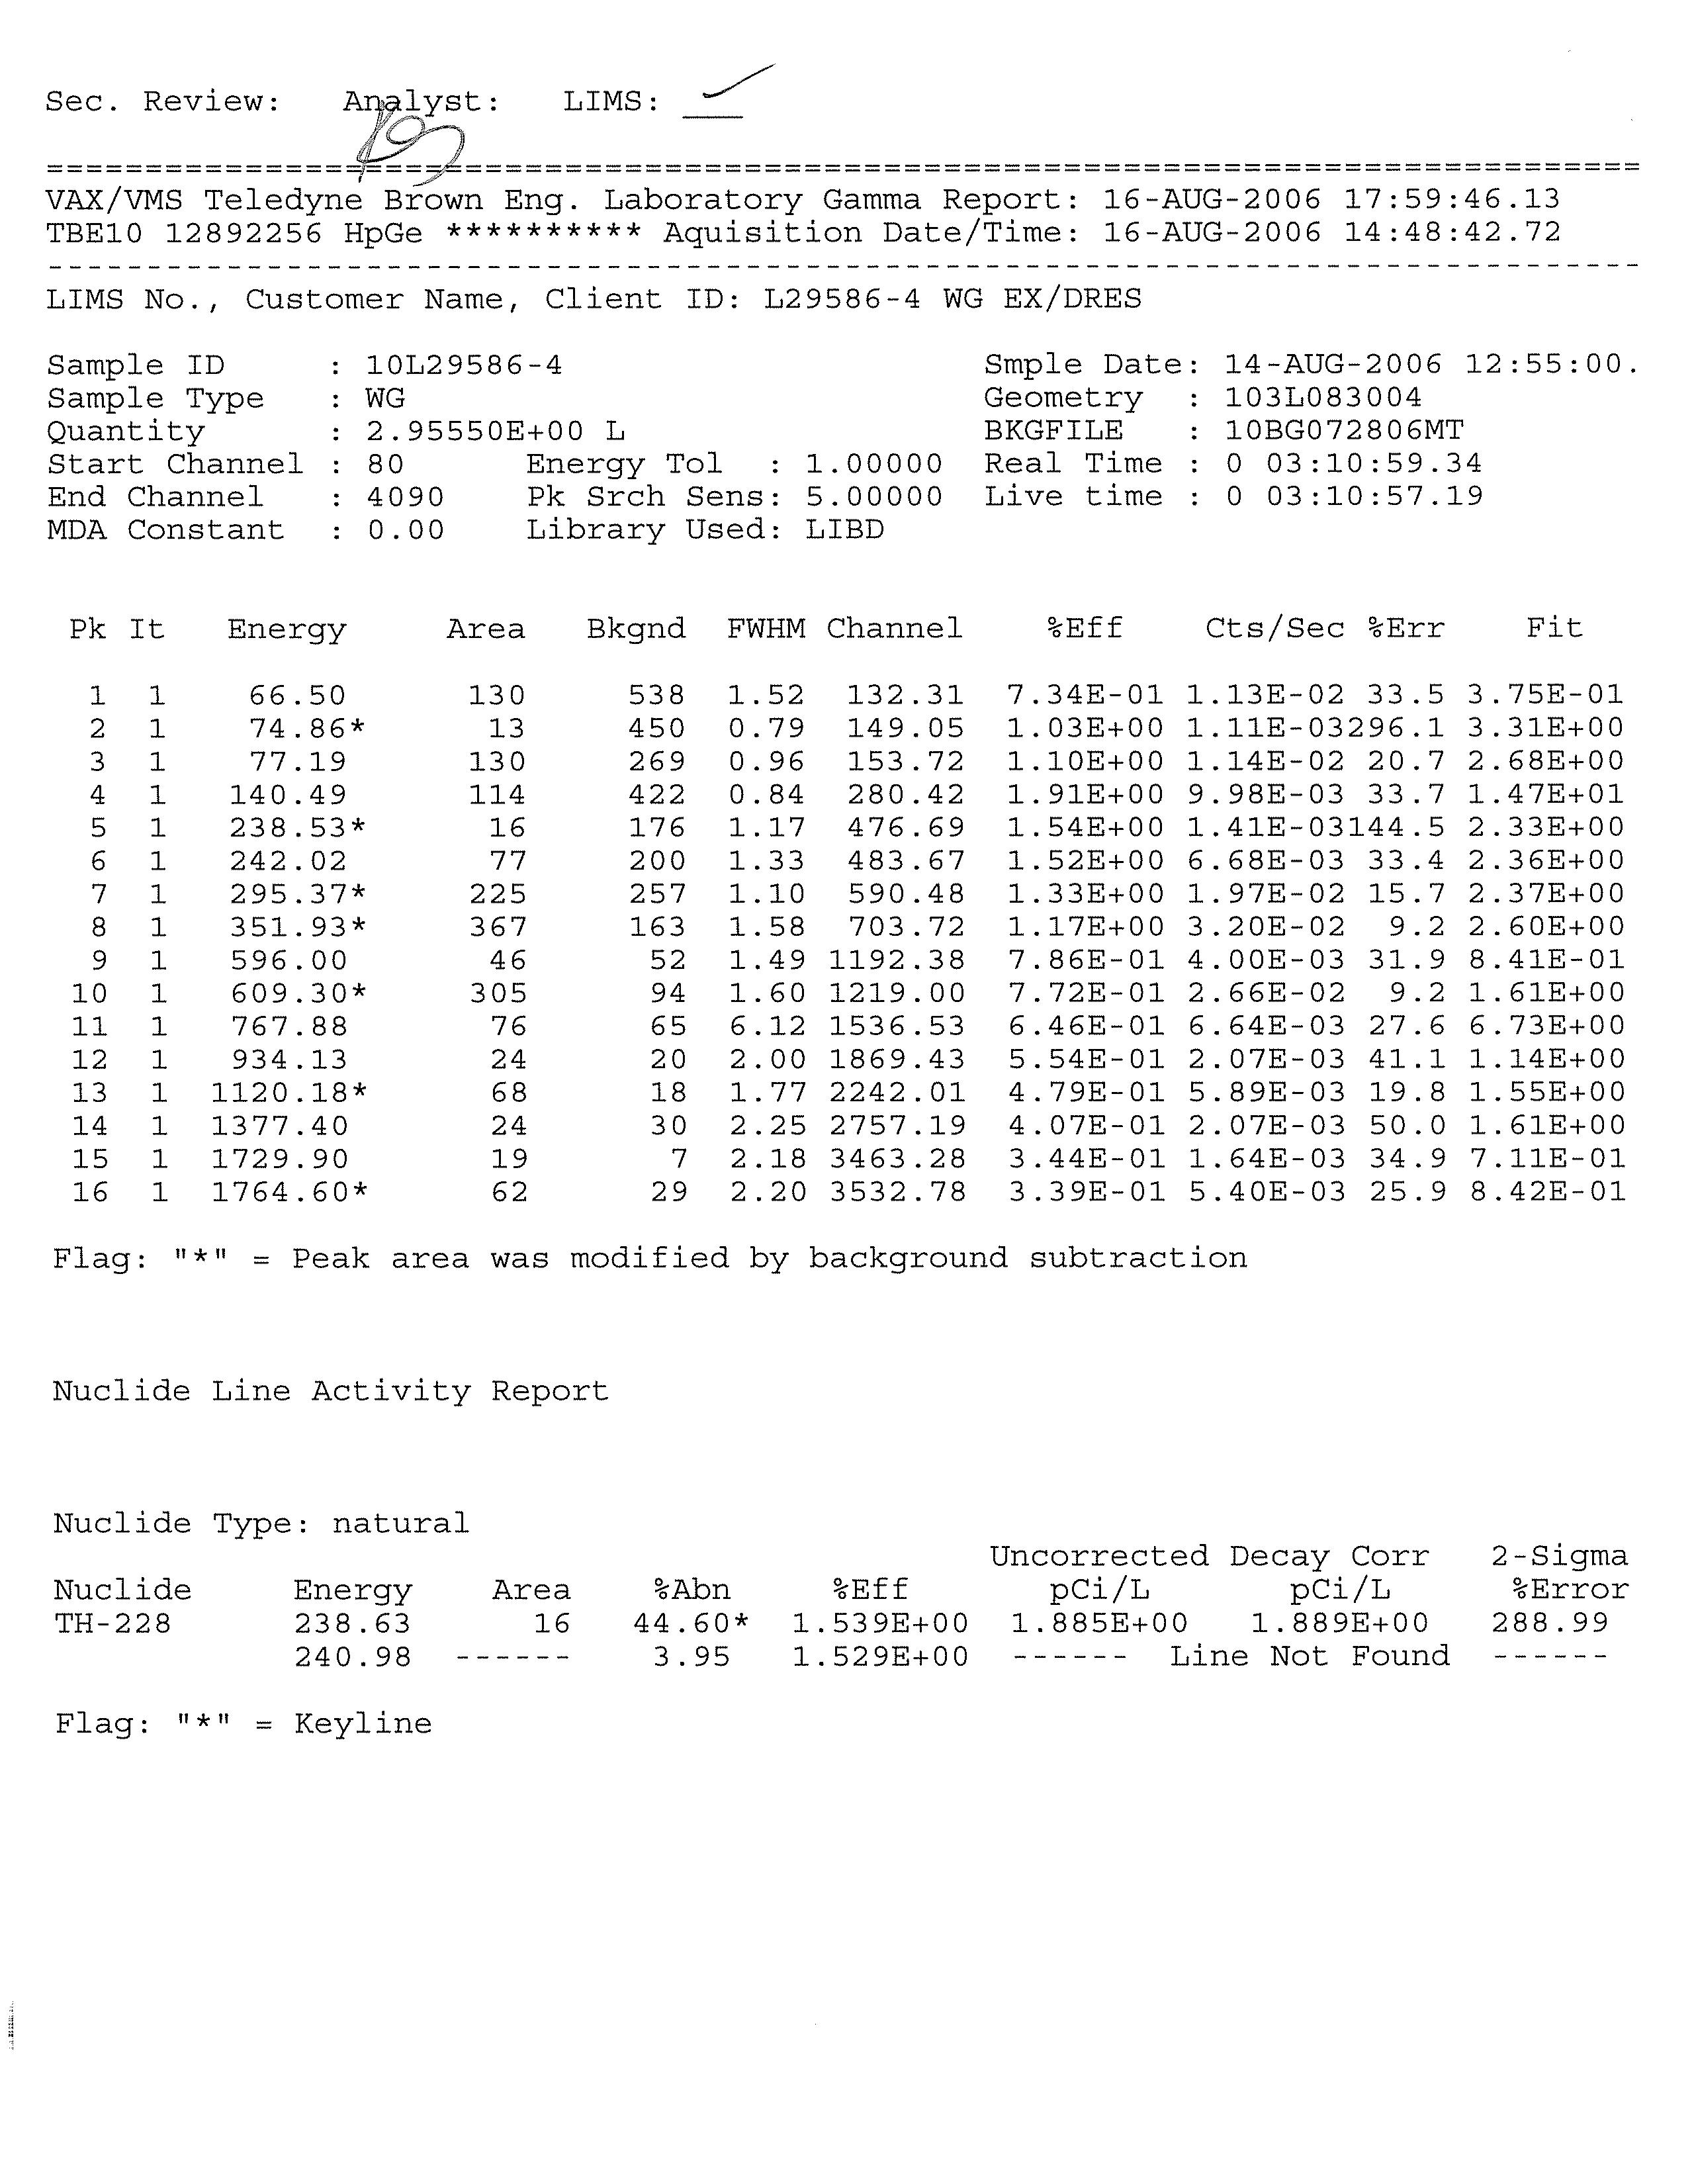
LABORATORY ANALYTICAL REPORTS
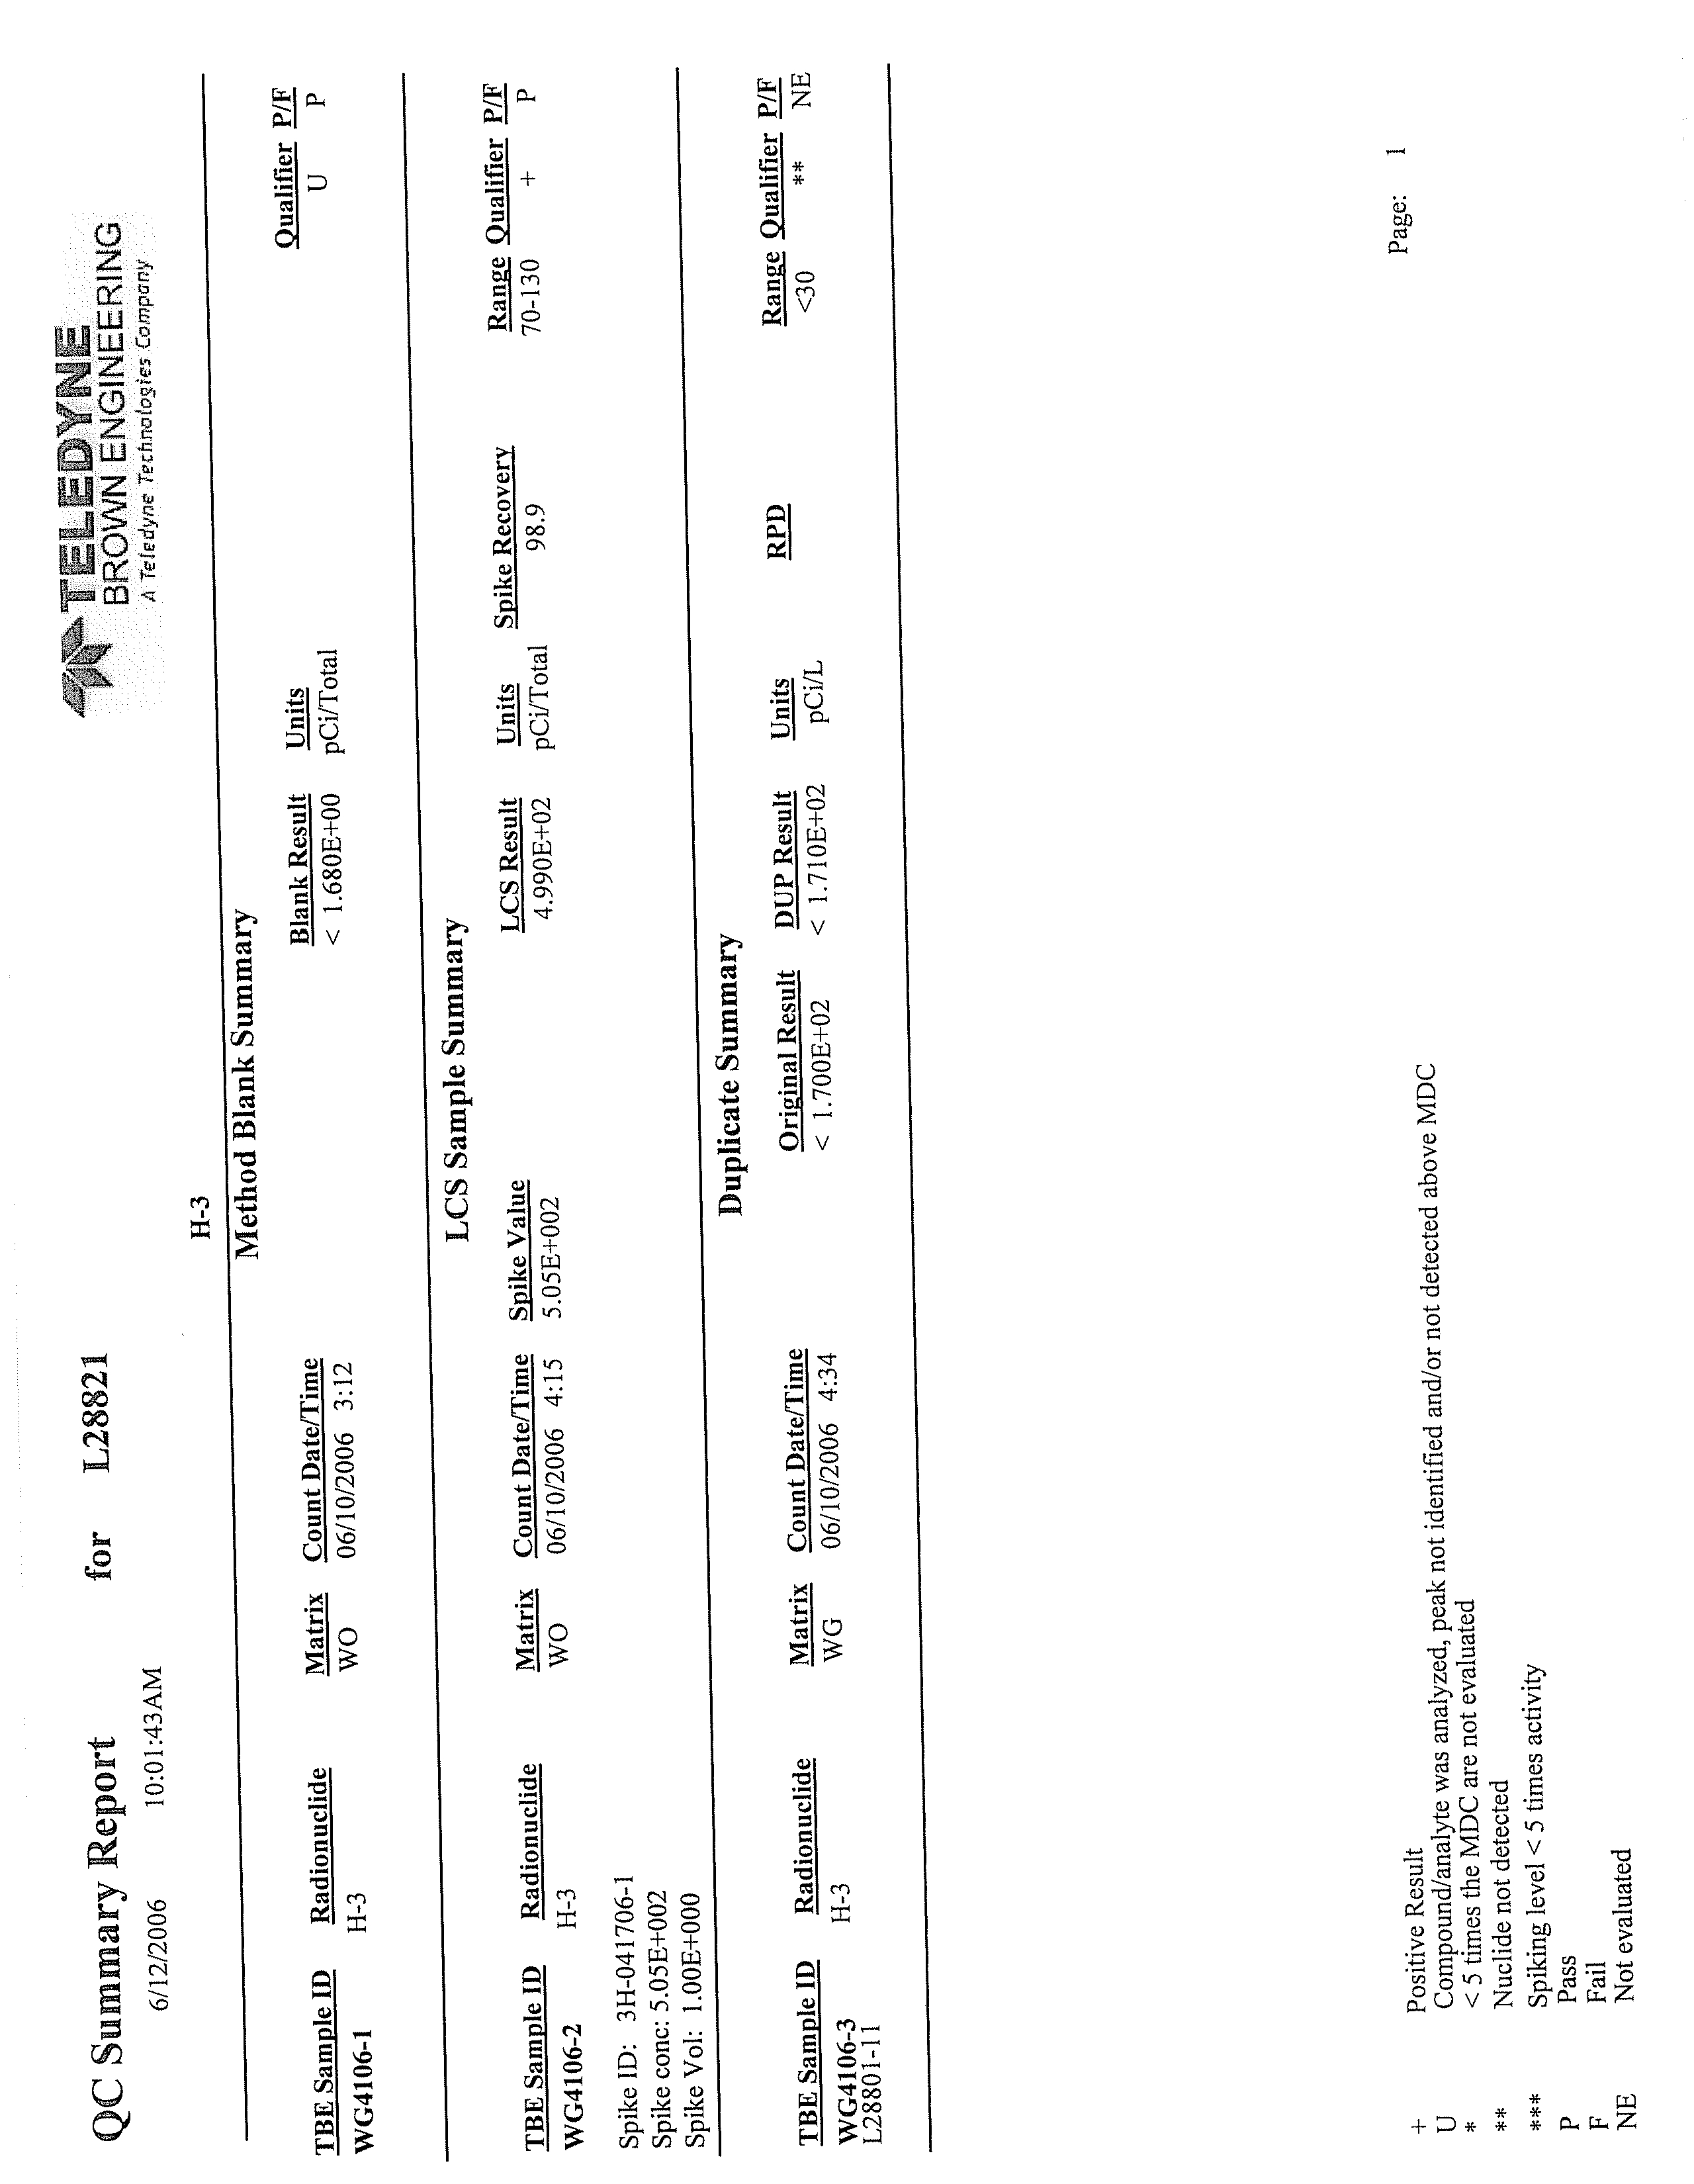
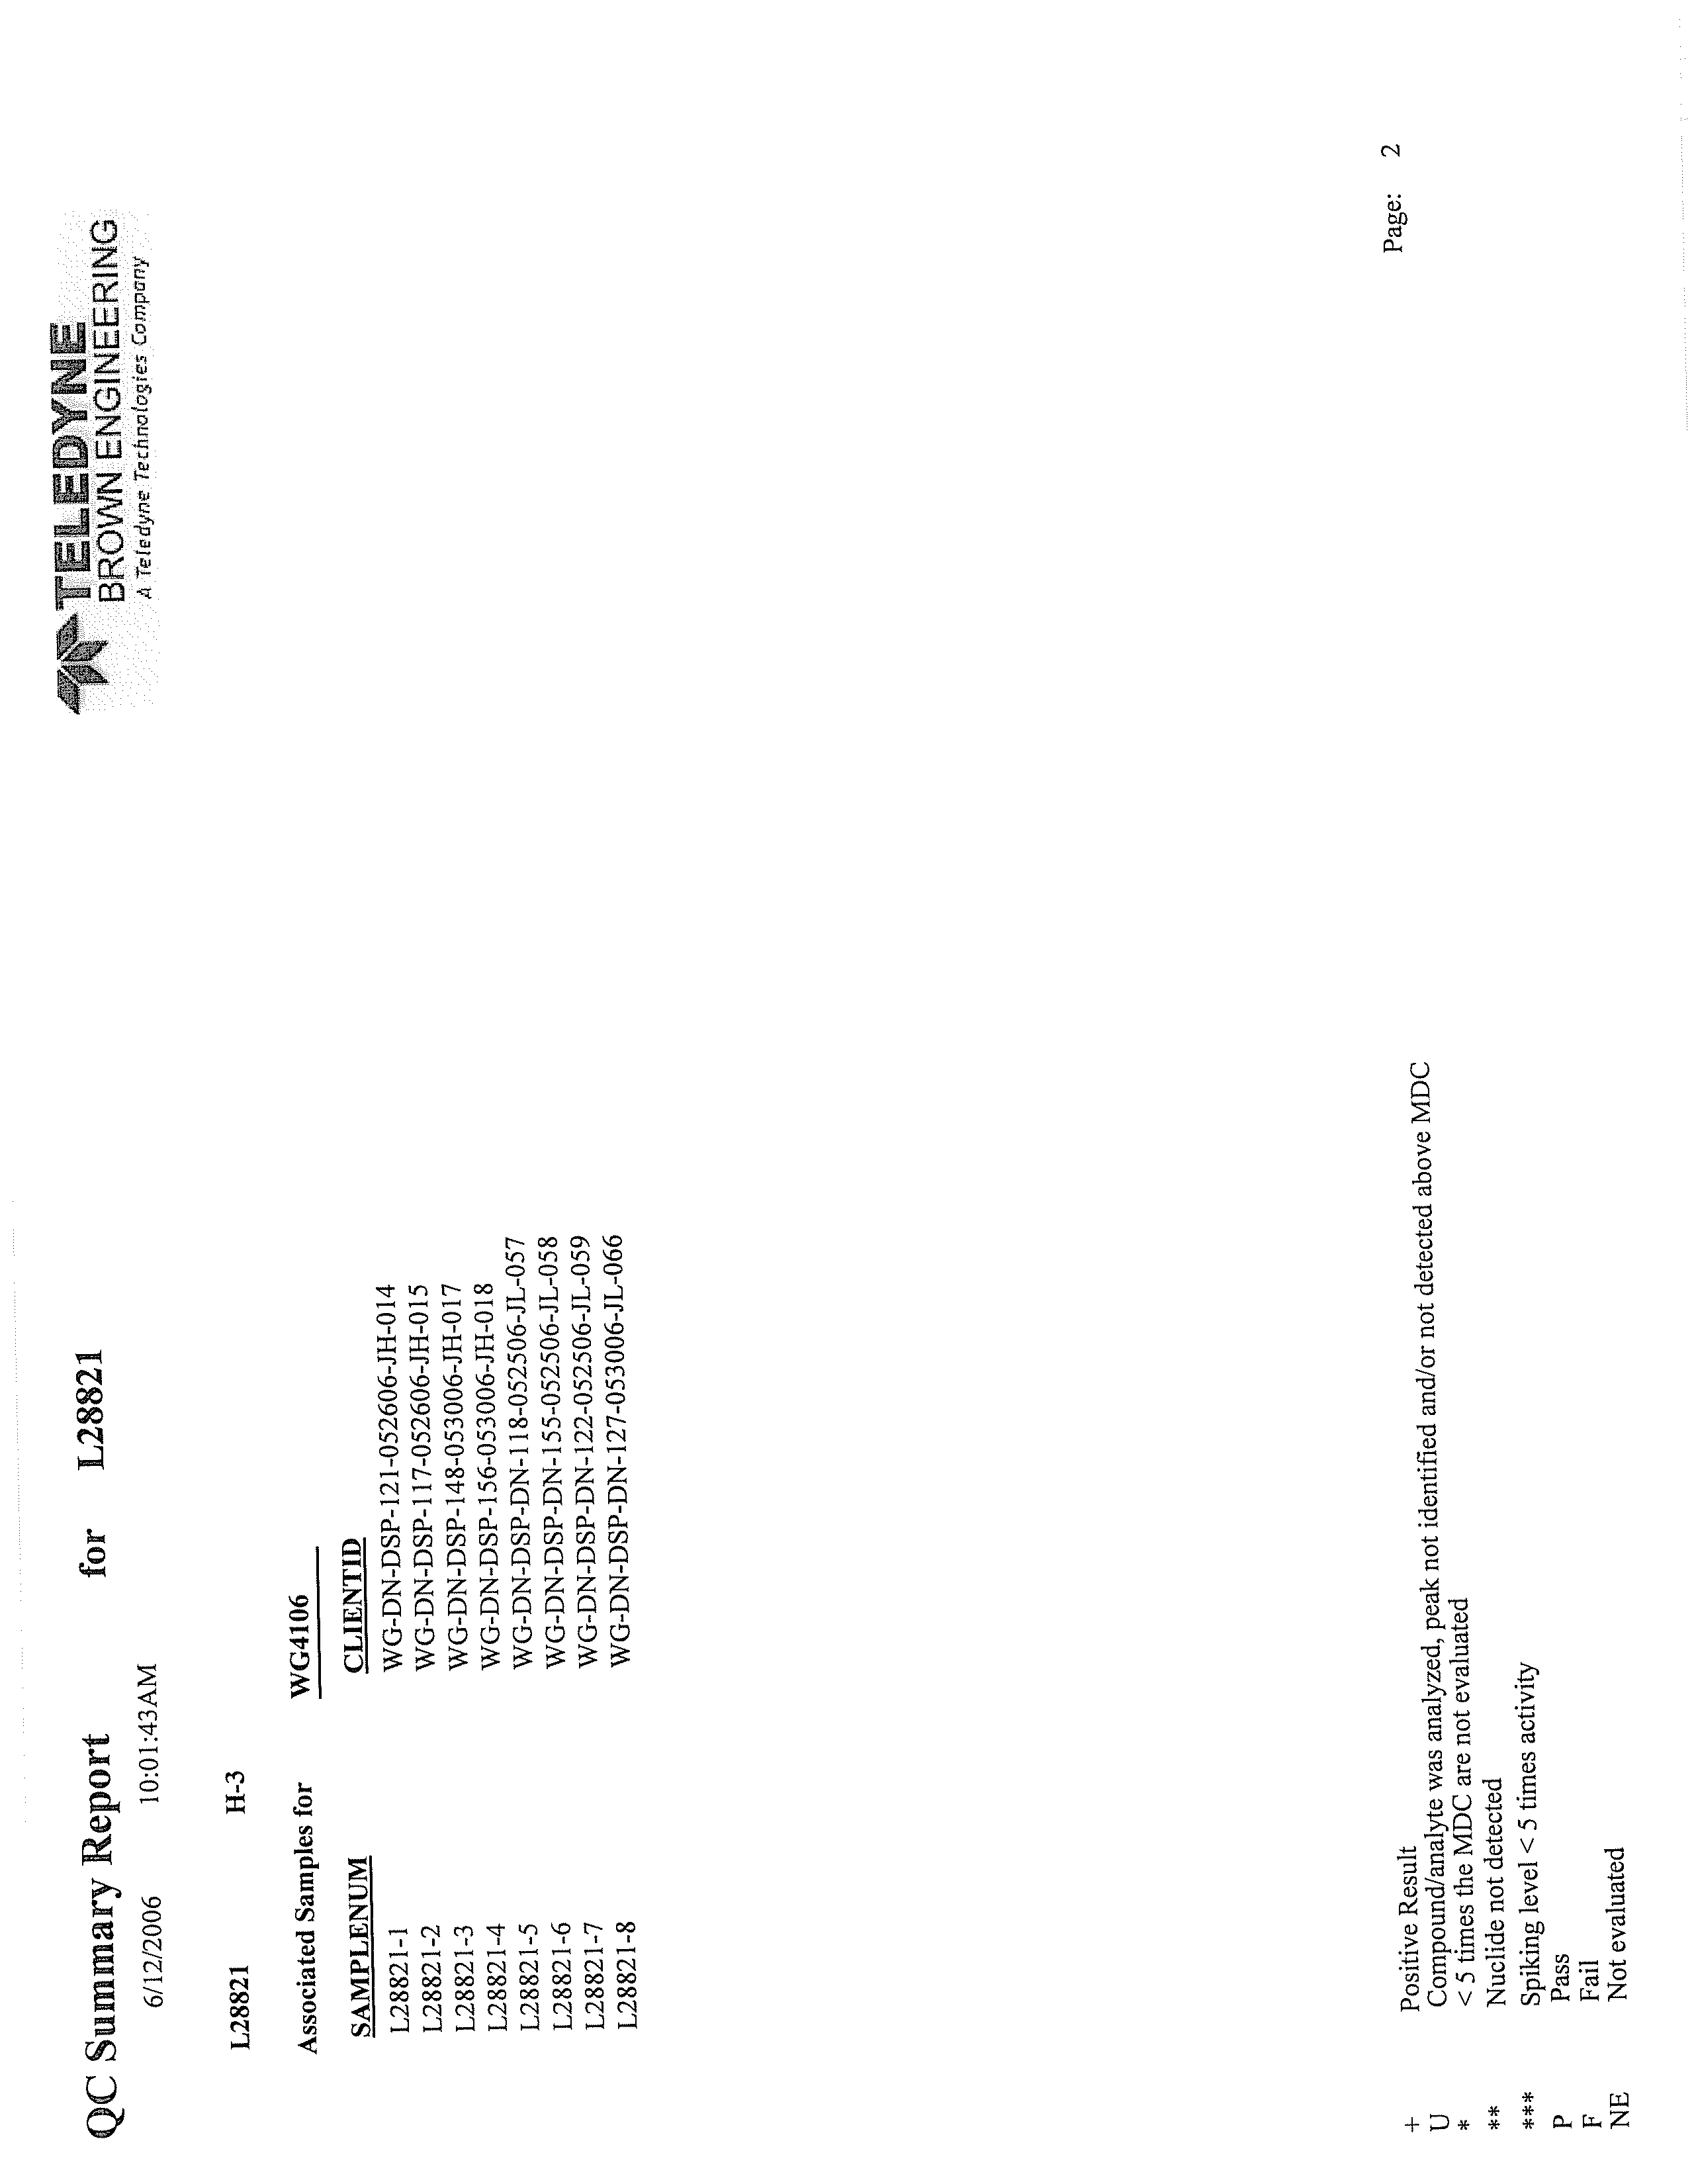
APPENDIX E
DATA VALIDATION MEMORANDUM
045136 (15) Dresden Generating Station
CONESTOGA-ROVERS & ASSOCIATES
Revision 1
EXECUTIVE SUMMARY
This Hydrogeologic Investigation Report (HIR) documents the results of
Conestoga-Rovers & Associates' (CRA's) May to
August 2006 hydrogeologic
investigation pertaining to the Dresden Generating Station (Station). CRA prepared this
HIR for Exelon as part of its Fleetwide Program to determine whether groundwater at
and in the vicinity of its nuclear power generating facilities has been adversely impacted
by any releases of radionuclides.
CRA collected and analyzed information on any historical releases, the structures,
components,
and areas of the Station that have the potential to release tritium or other
radioactive liquids to the environment and past hydrogeologic investigations at the
Station. CRA used this information, combined with its understanding of groundwater
flow at the Station to identify Areas for Further Evaluation (AFEs) for the Station.
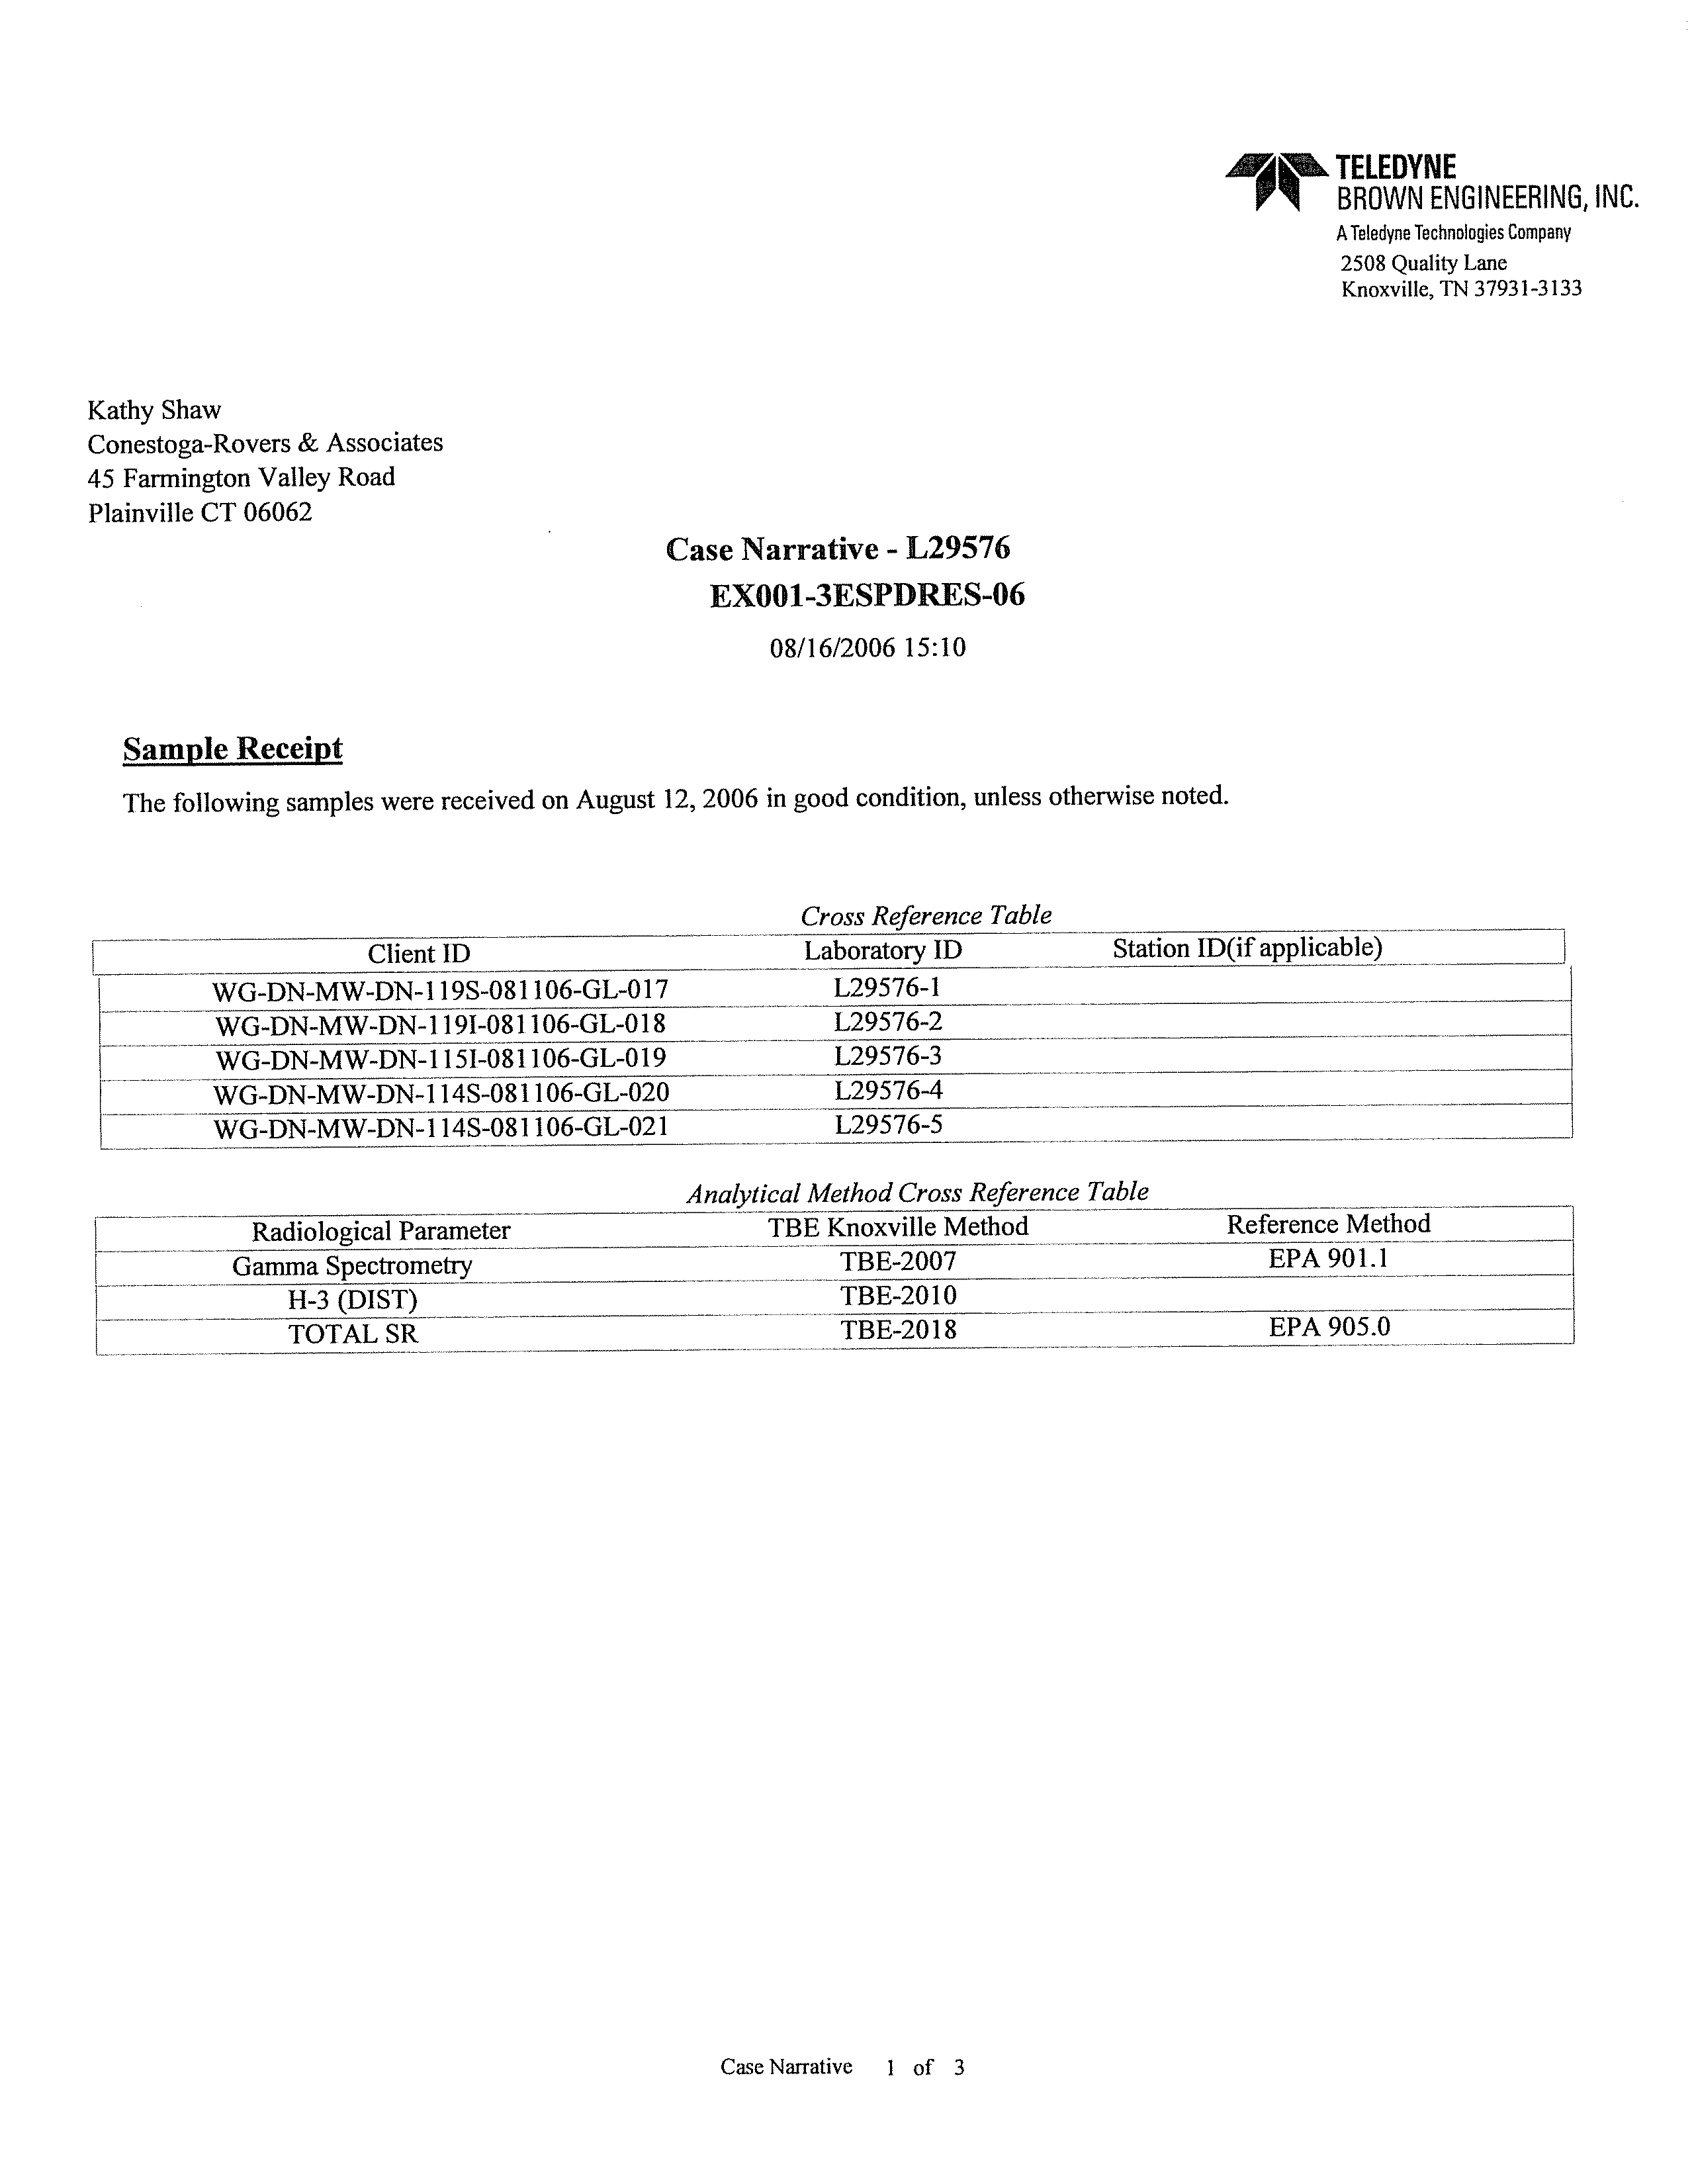
CRA collected 68 groundwater samples and six surface water samples at the Station.
CRA also collected two full rounds
of water levels from the newly installed (with the
exception of the wells installed in August) and existing wells and measured surface
water levels. All groundwater and surface water samples were analyzed for tritium,
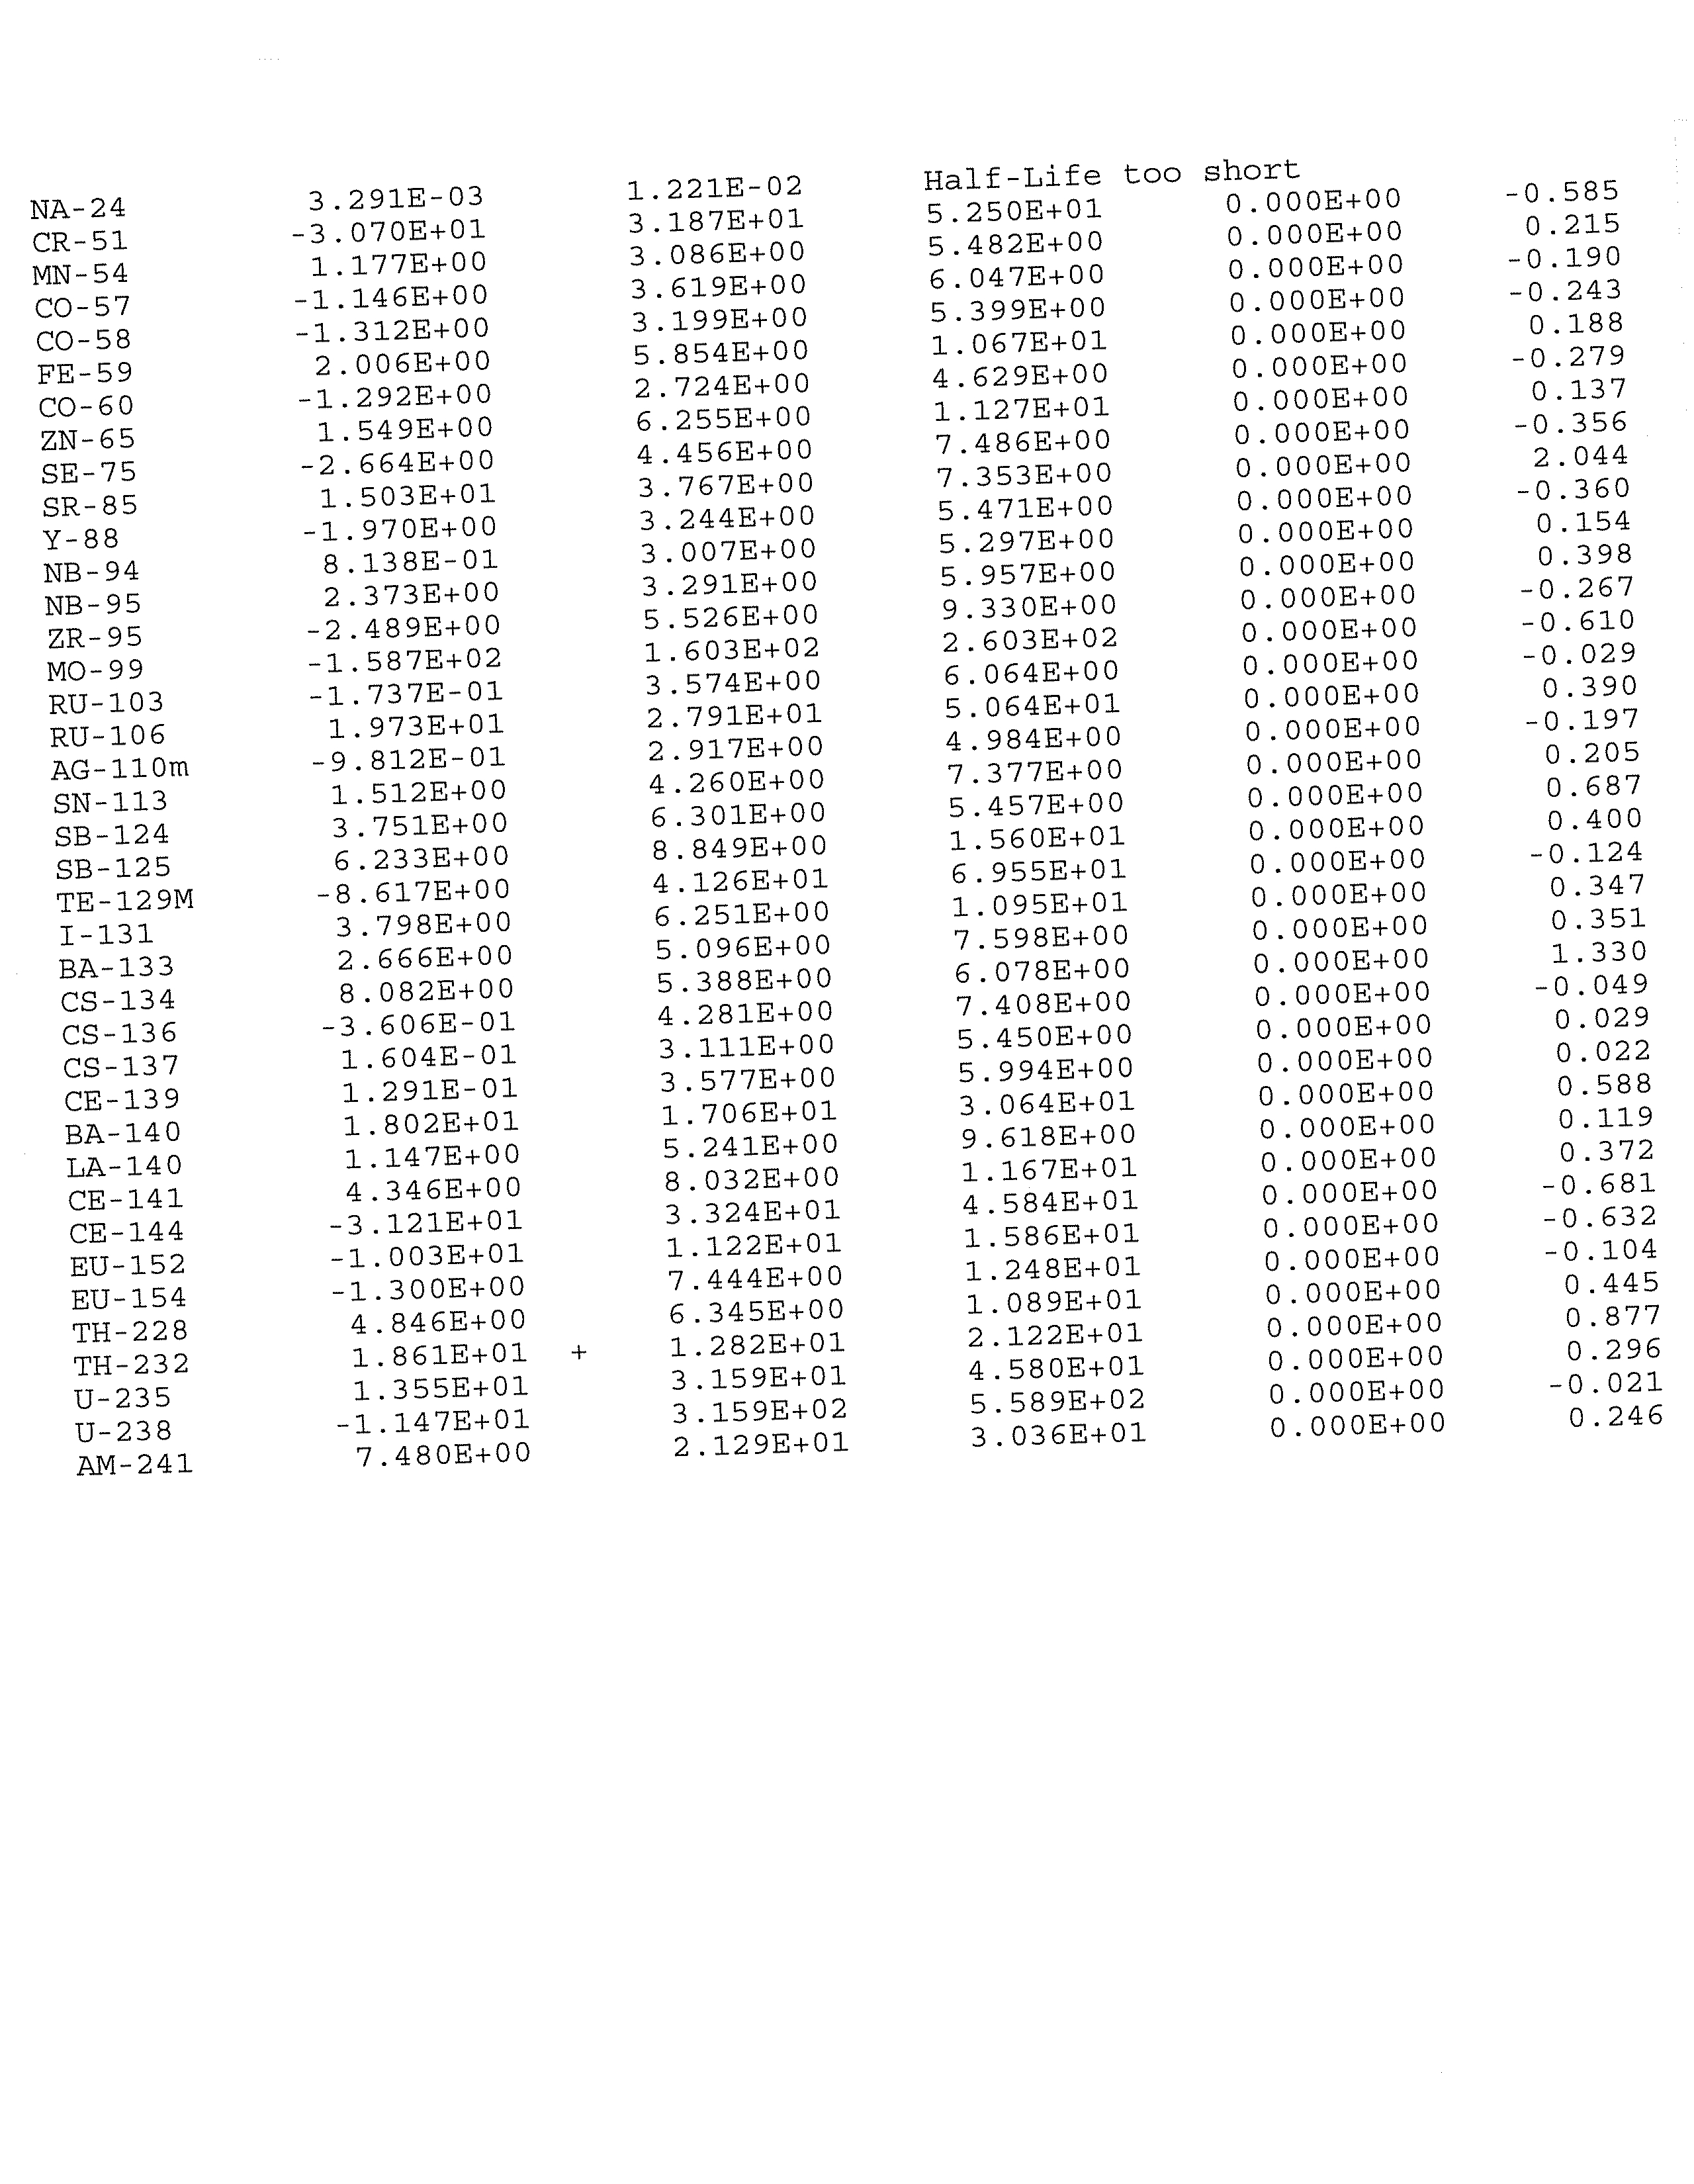
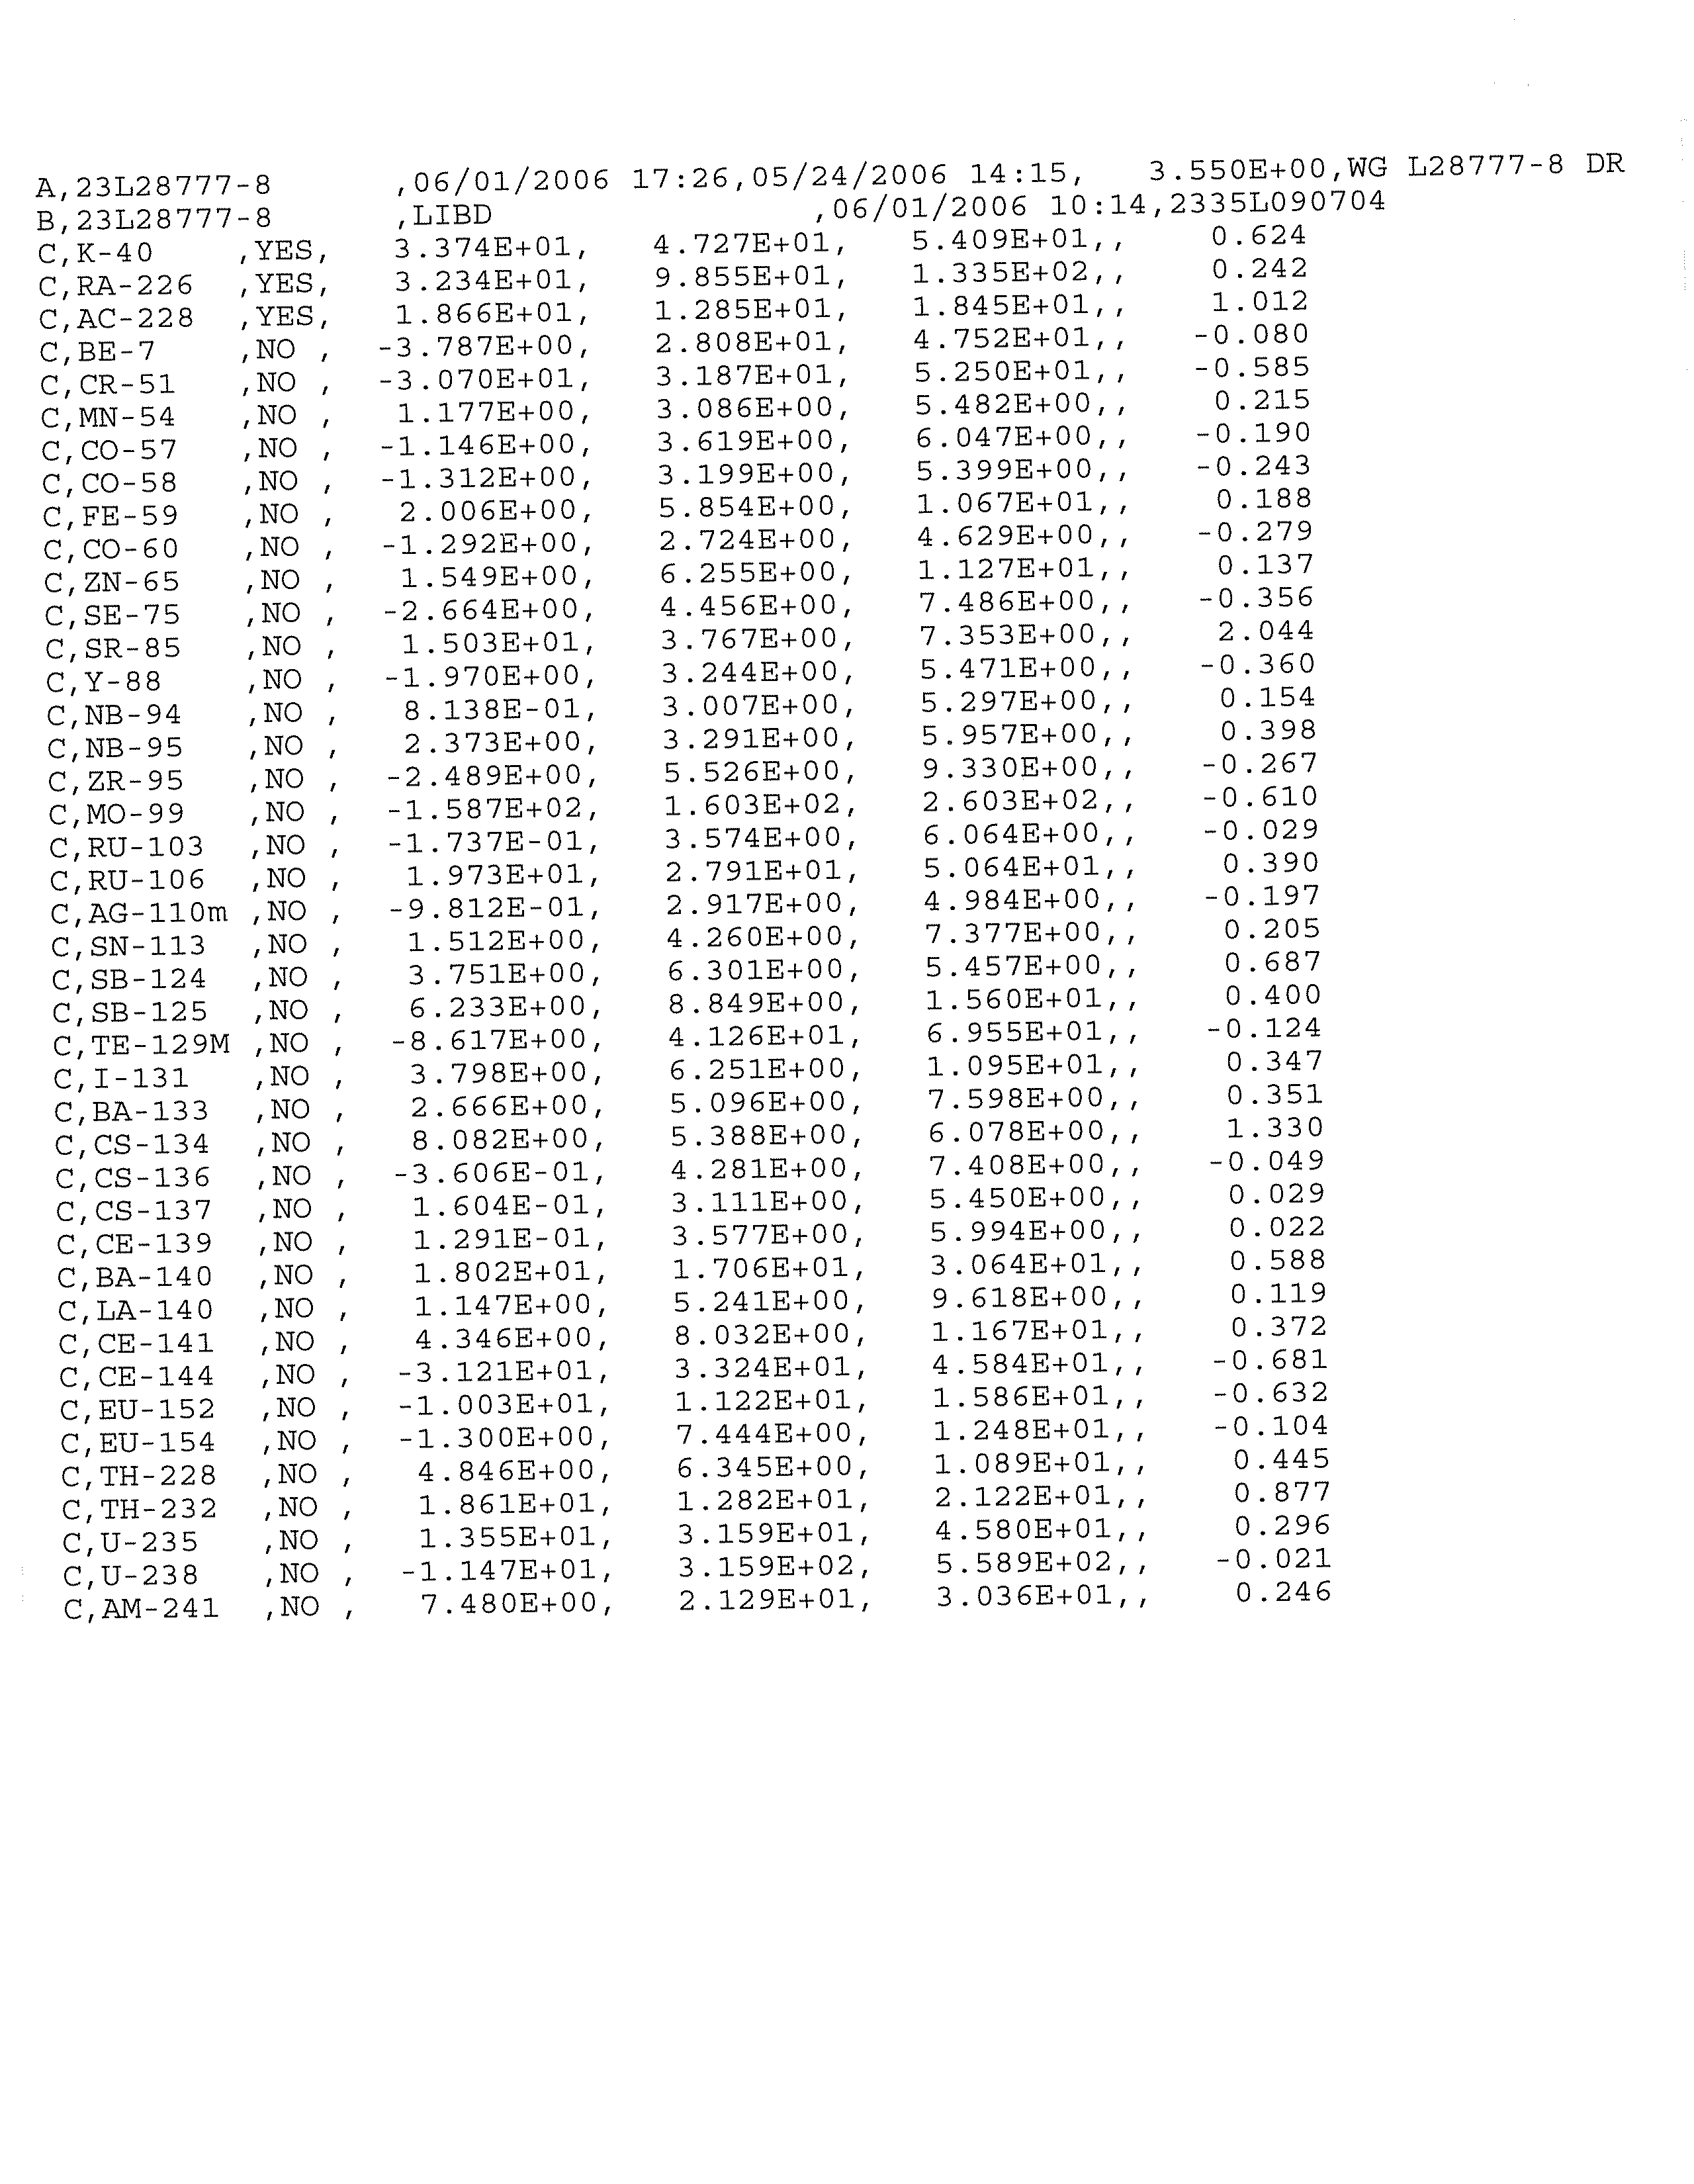
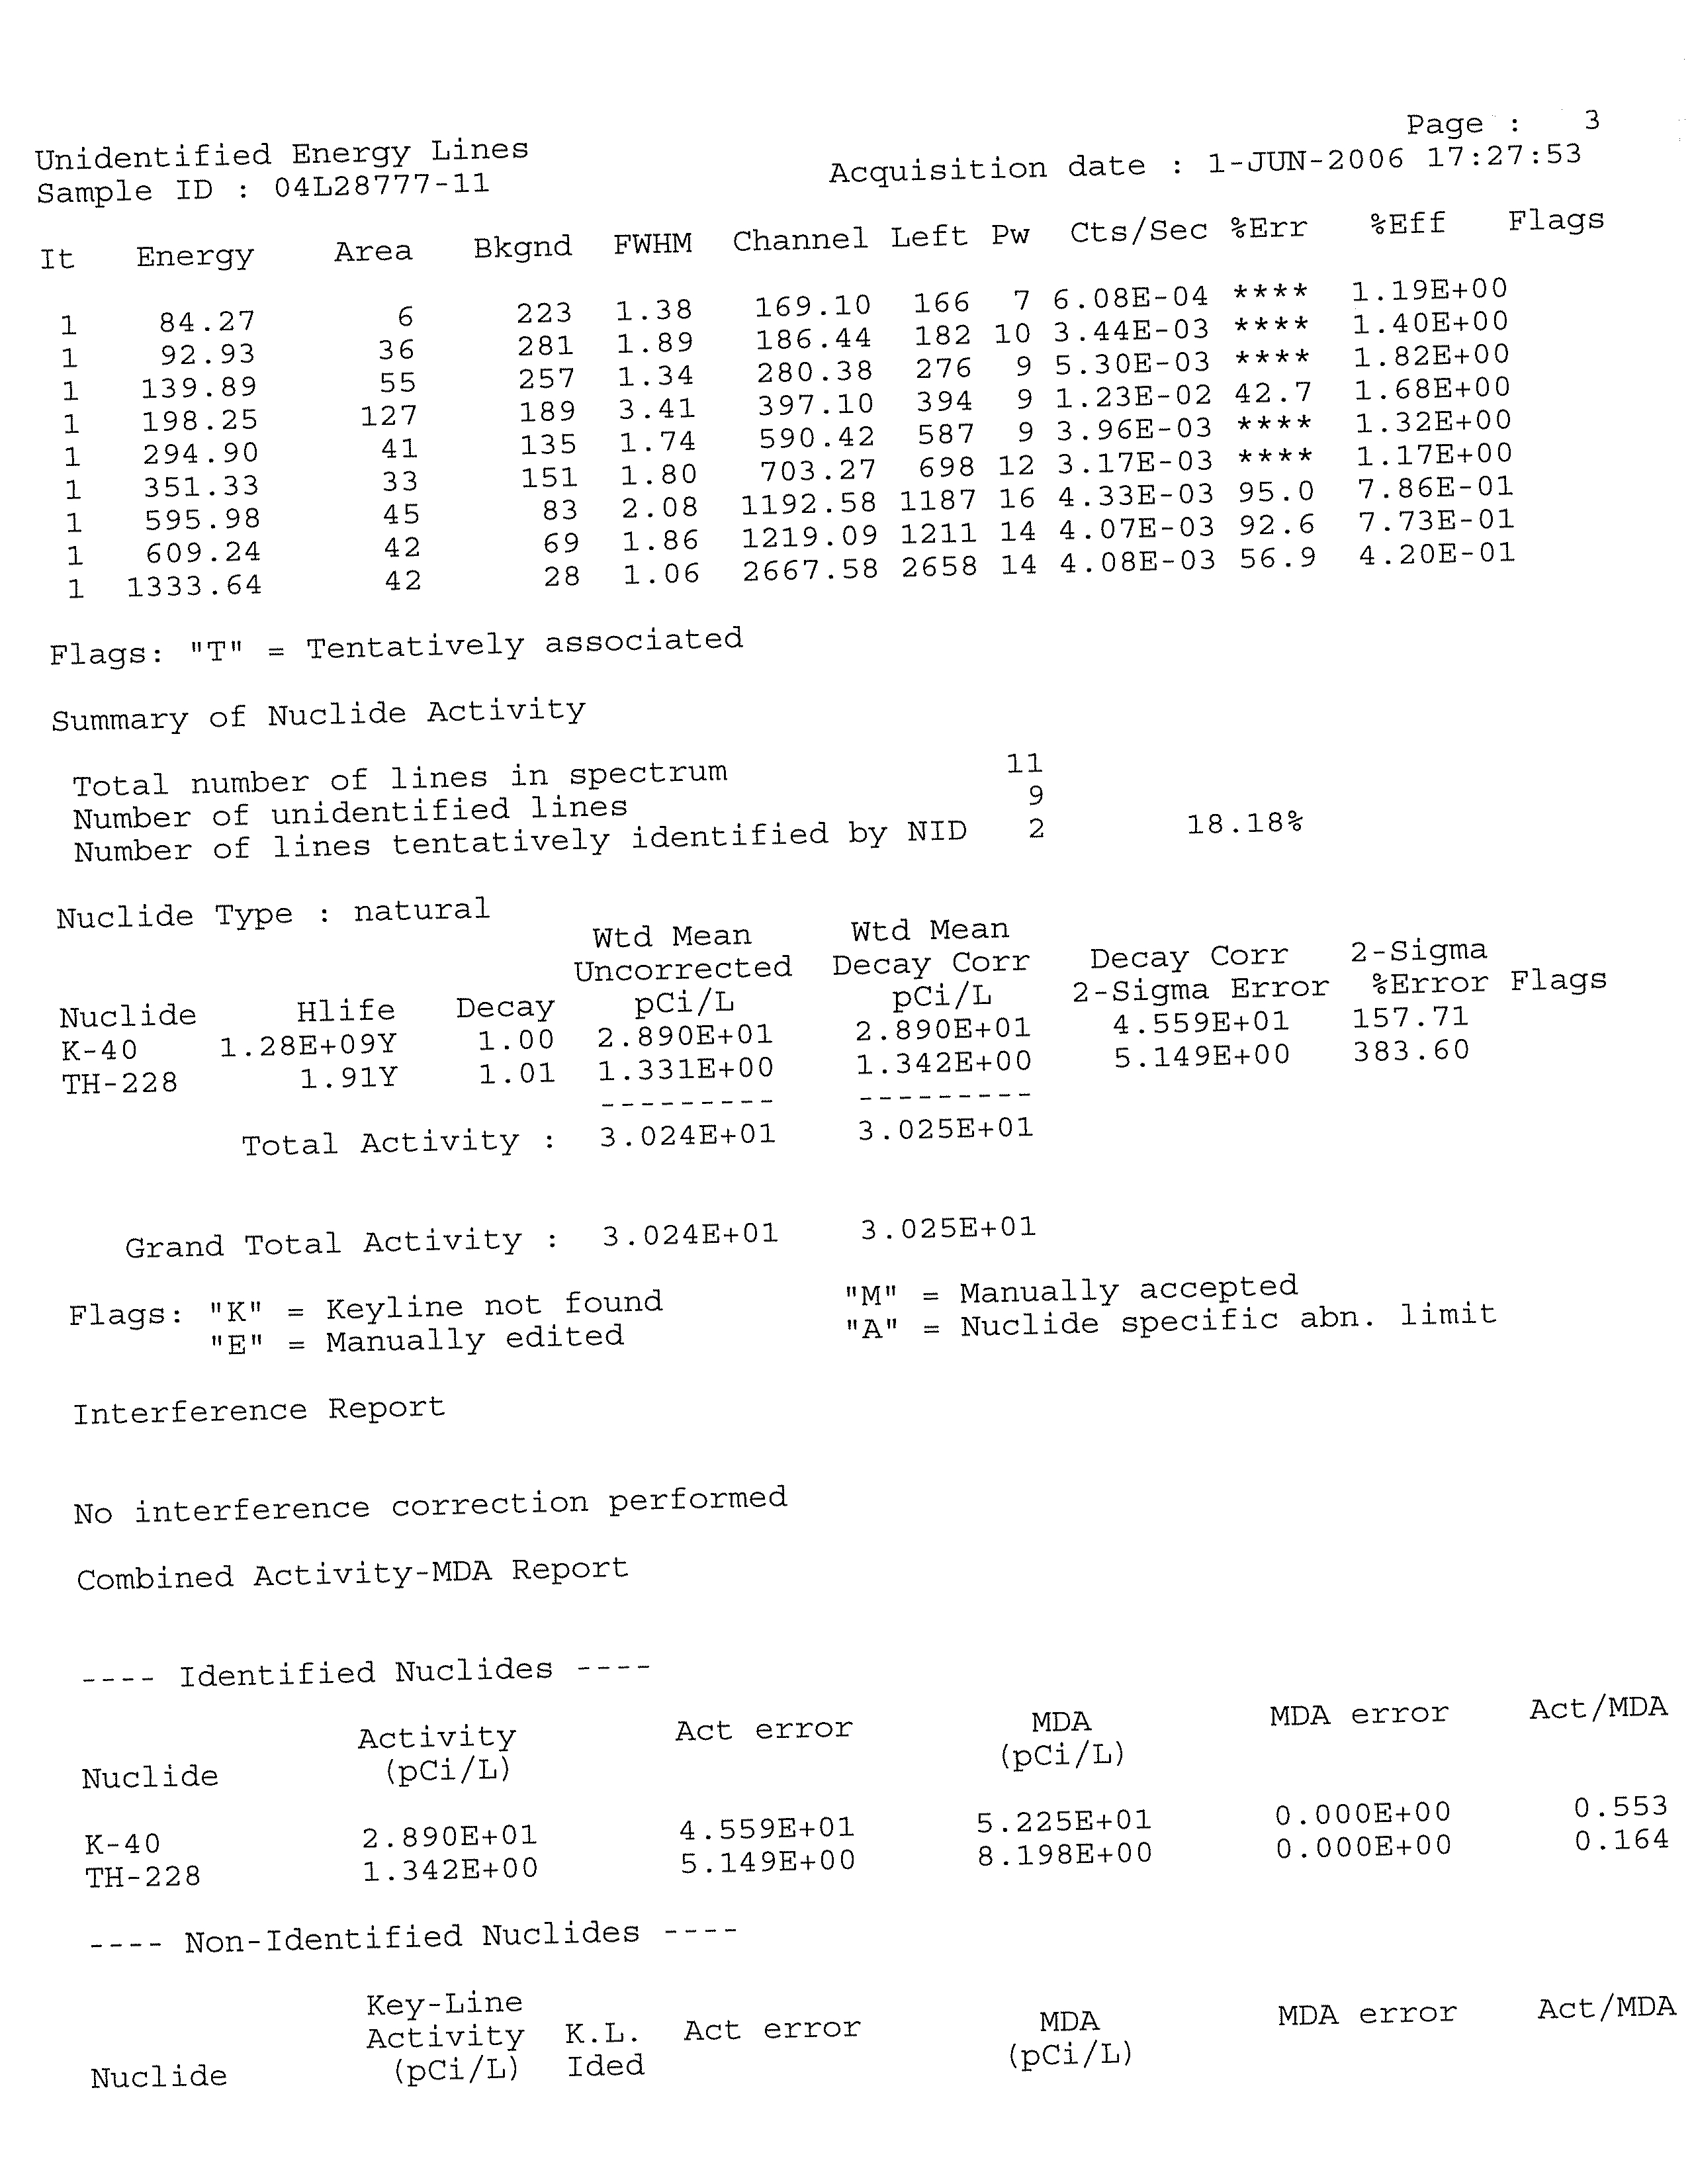
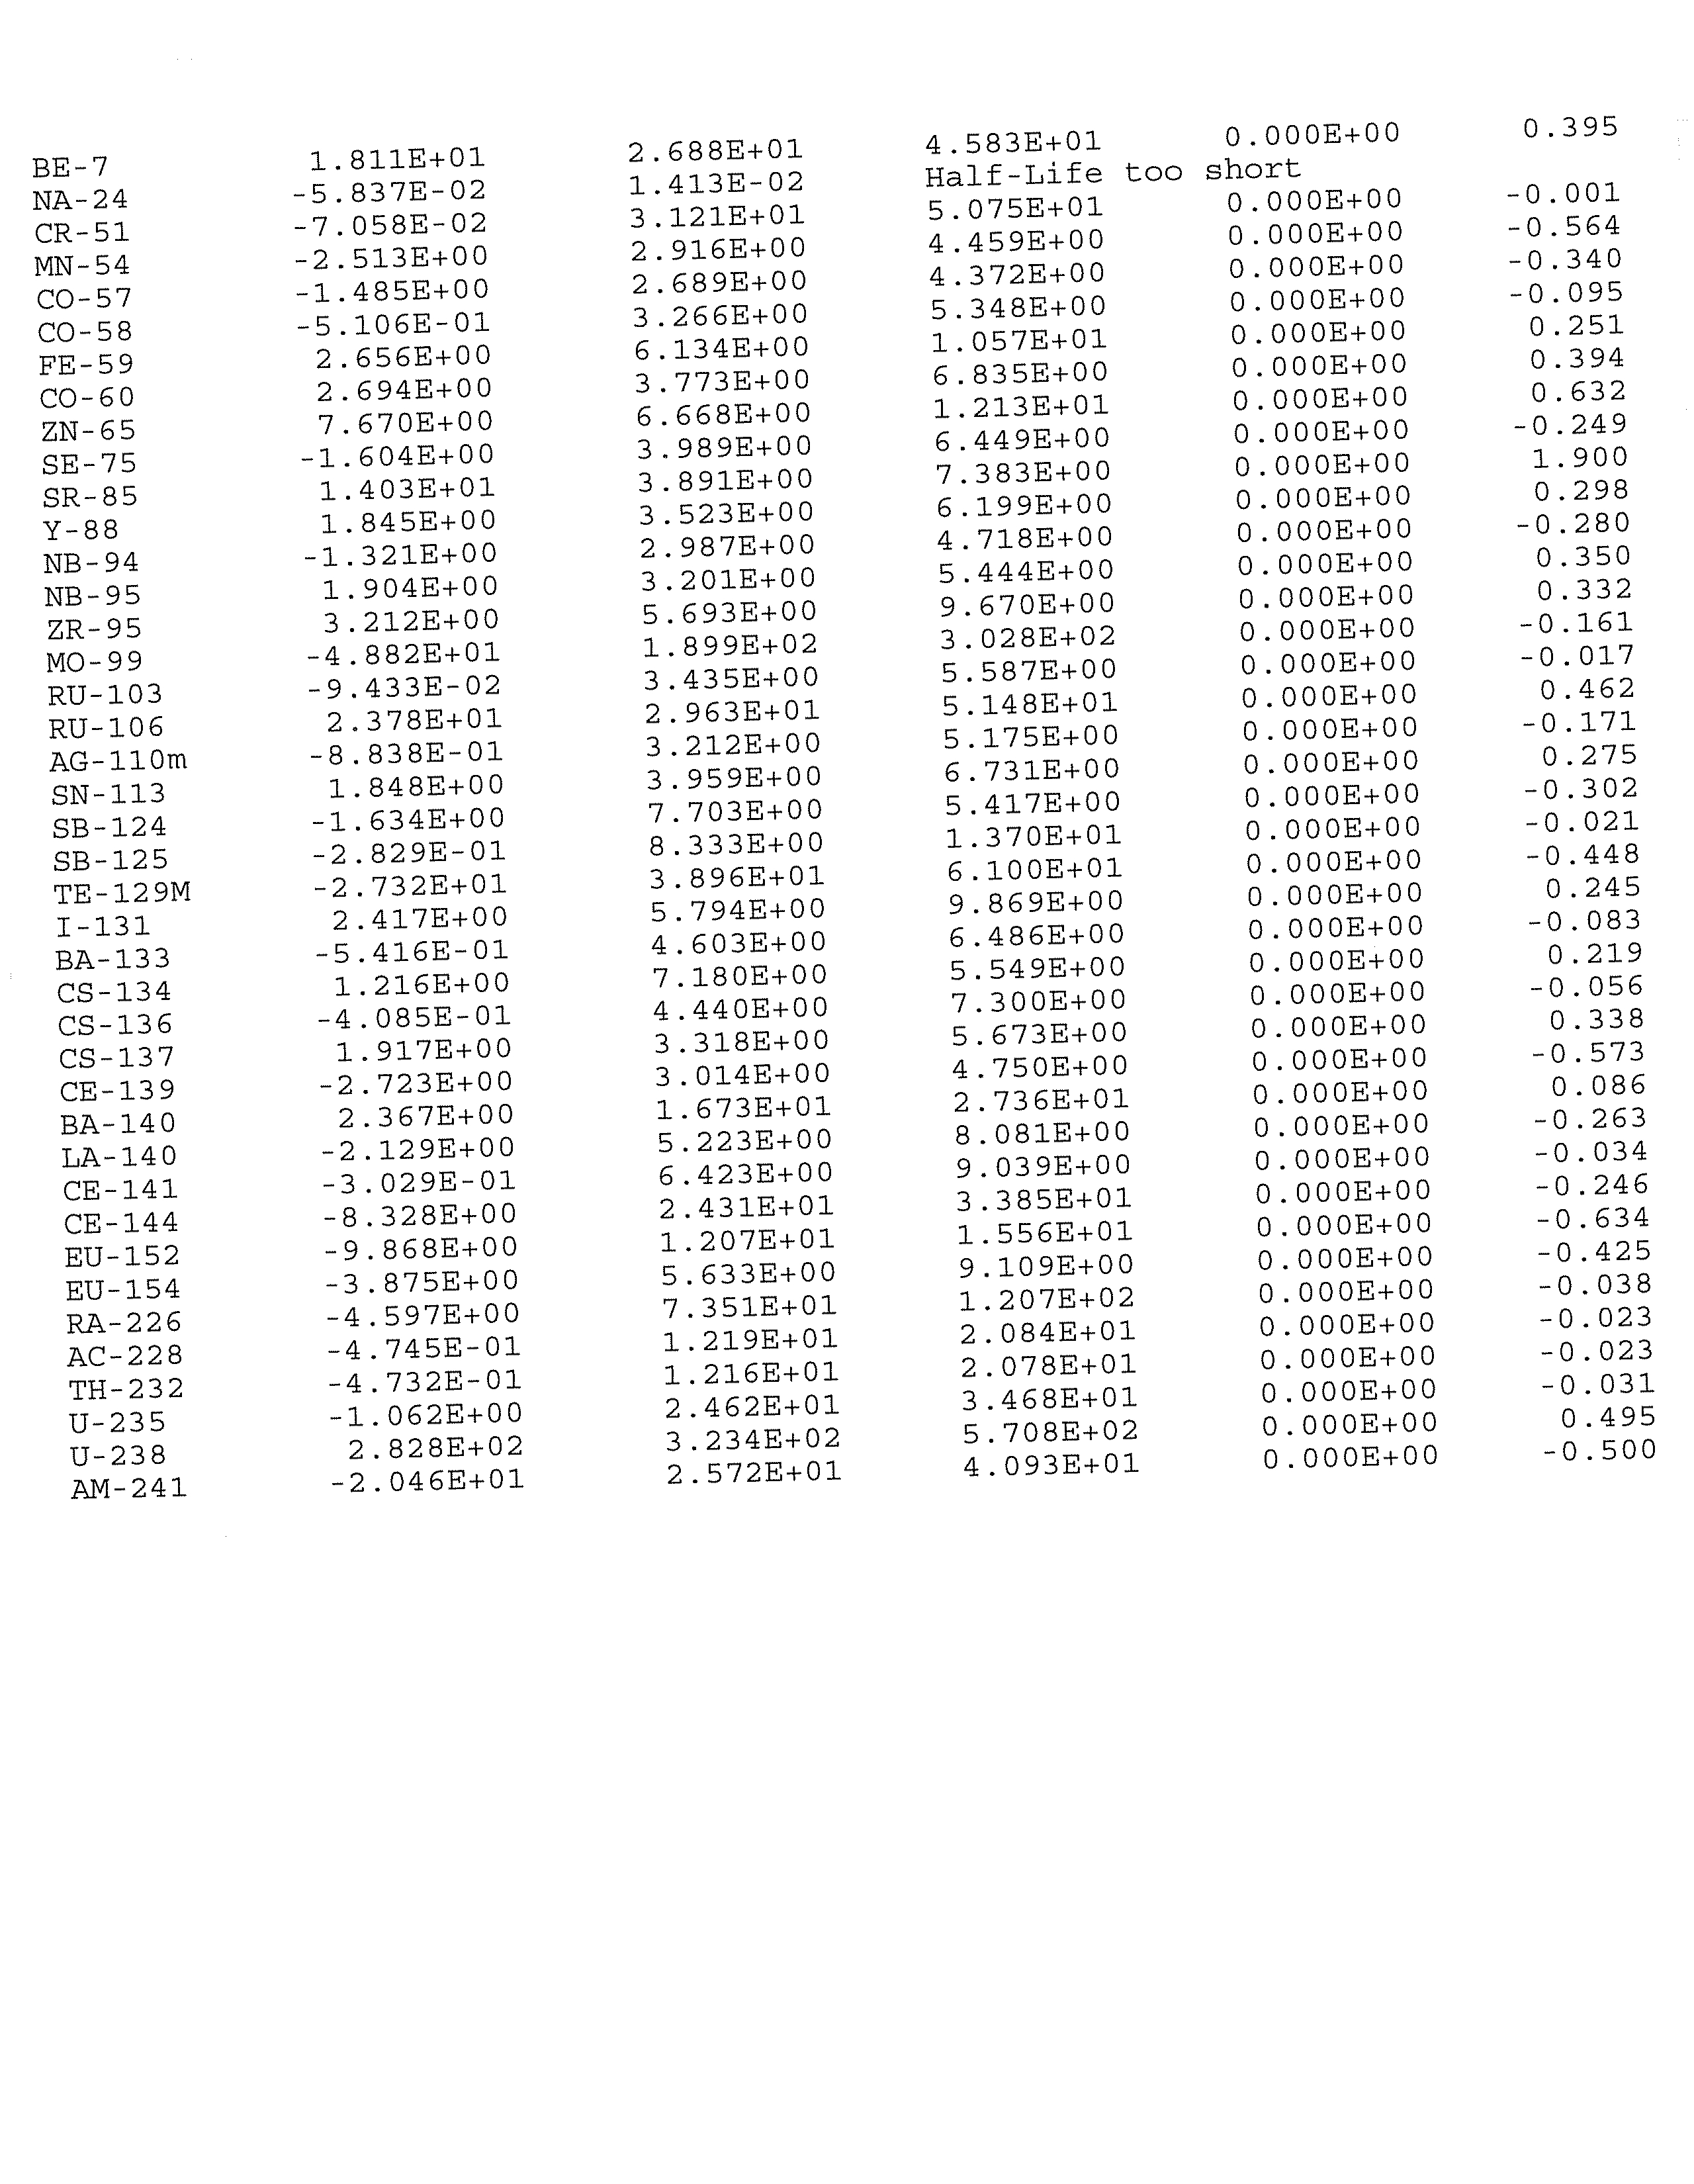
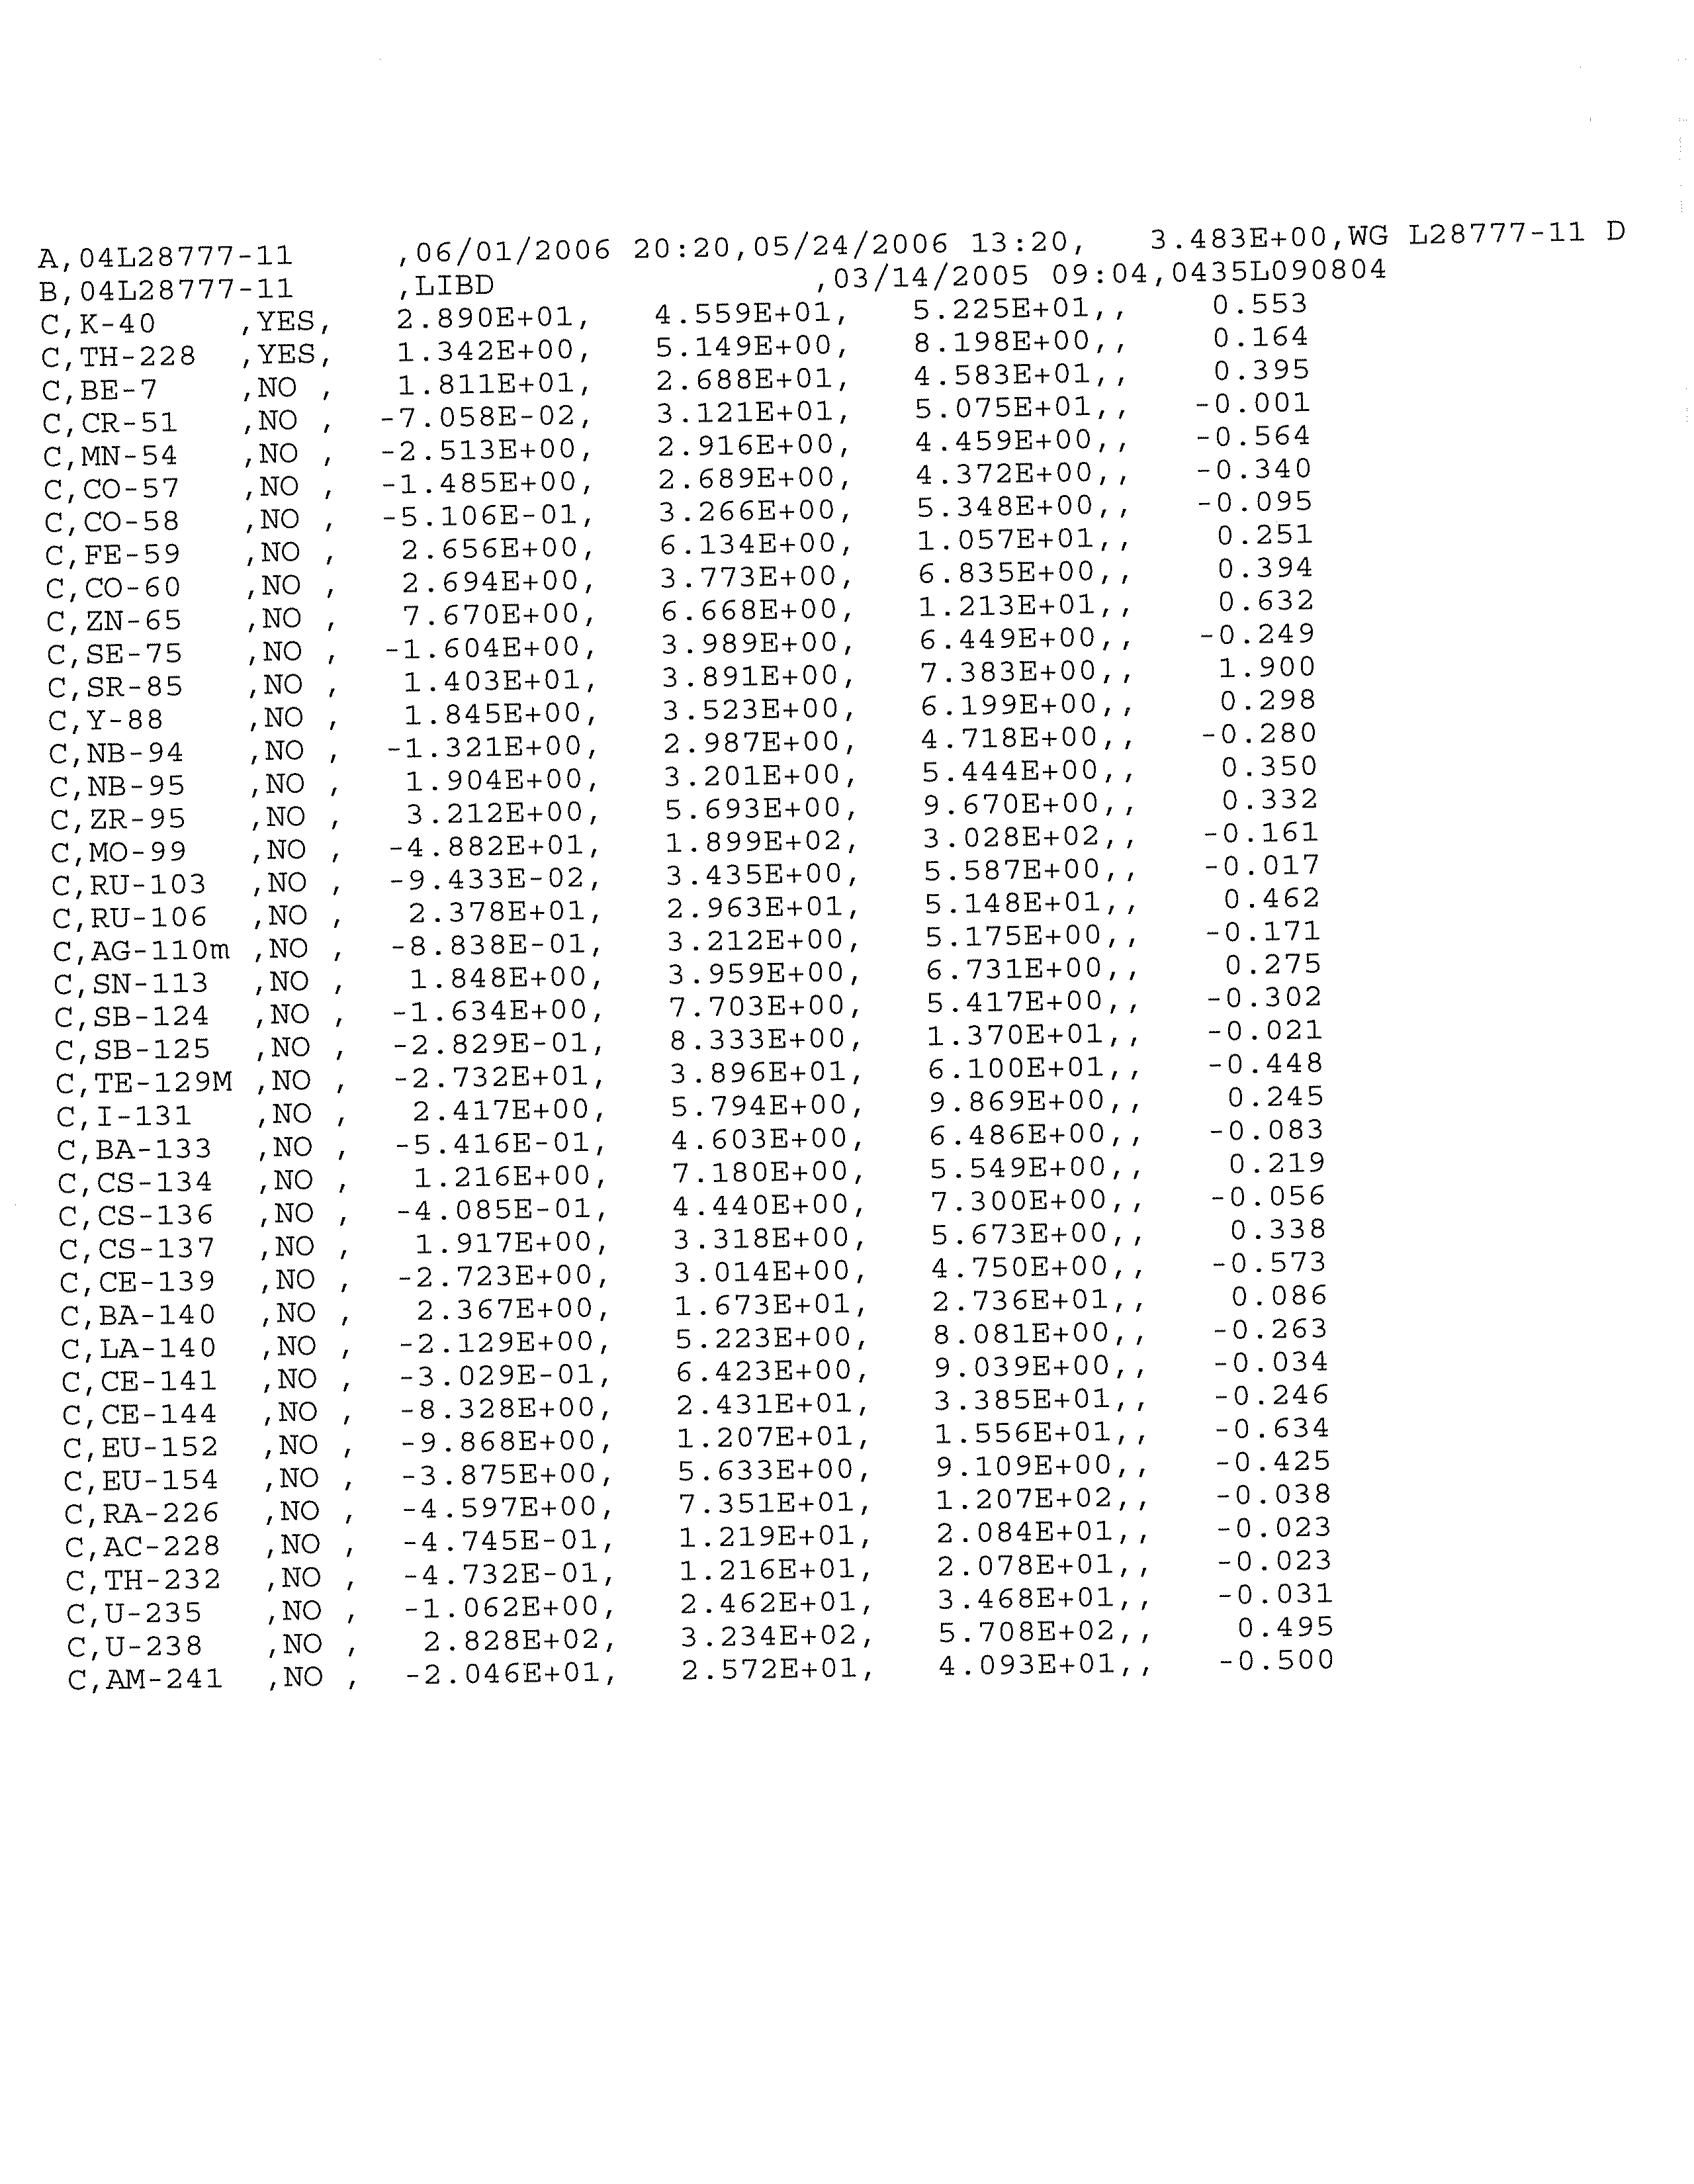
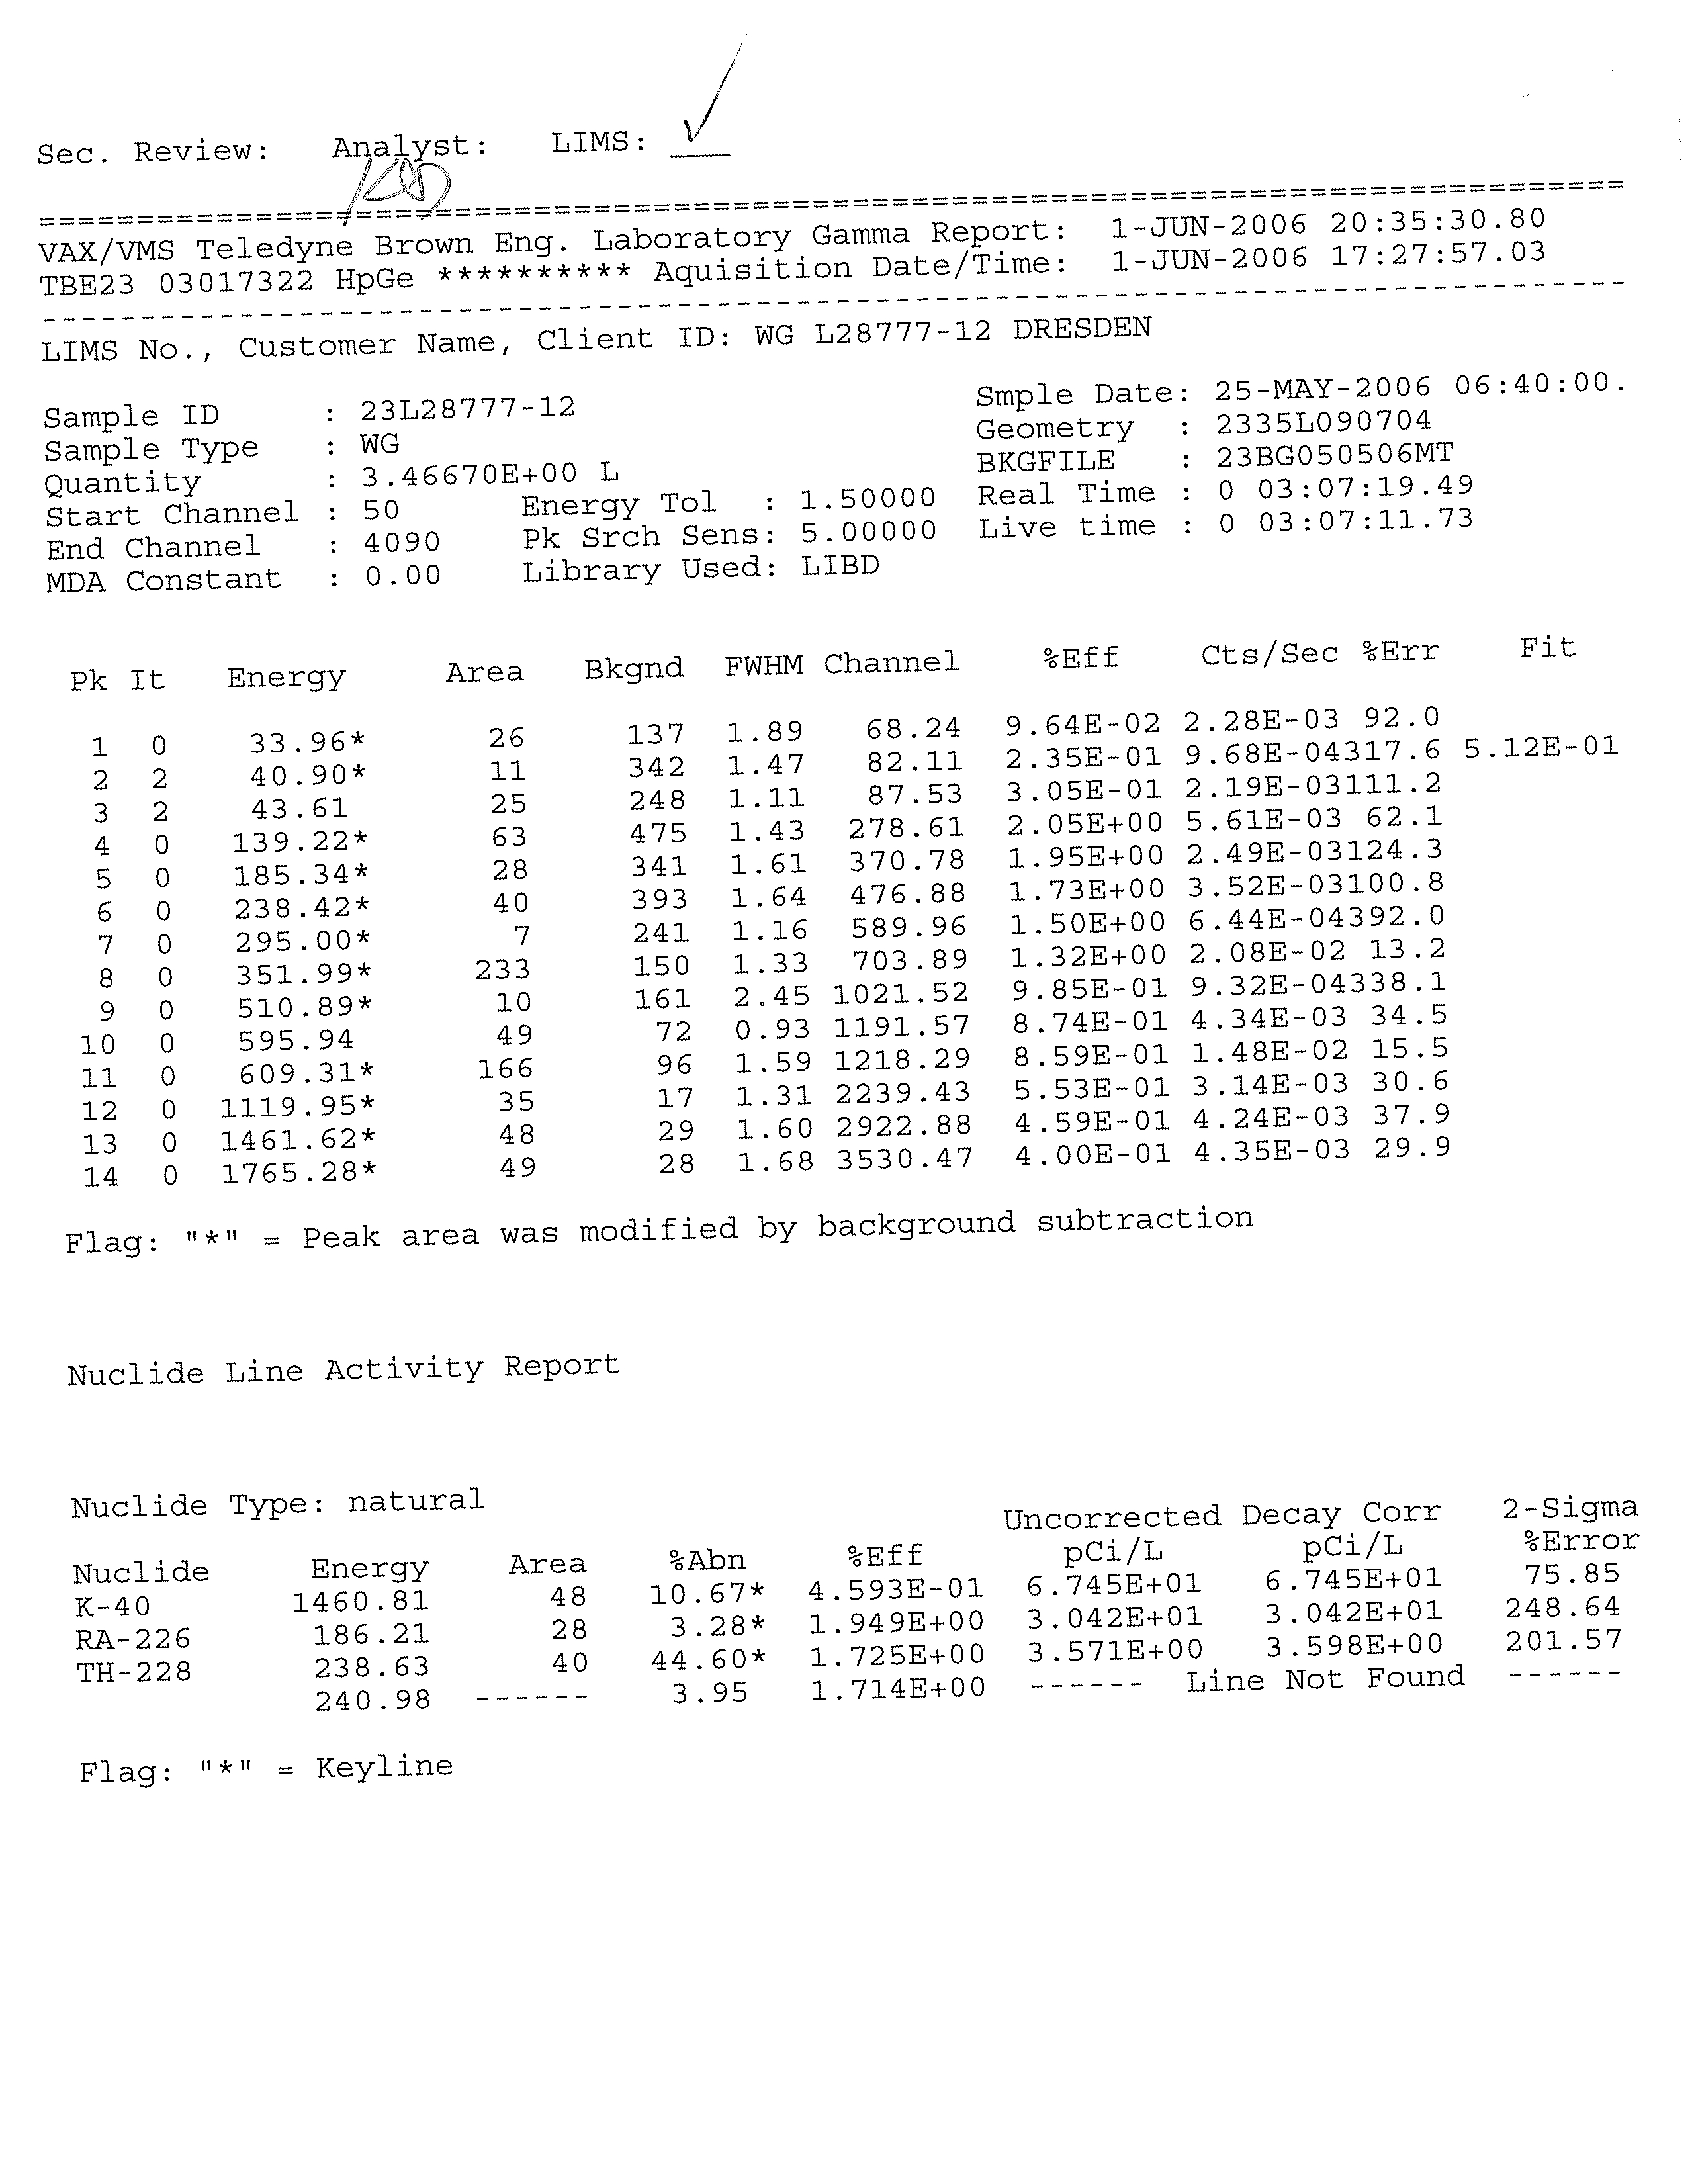
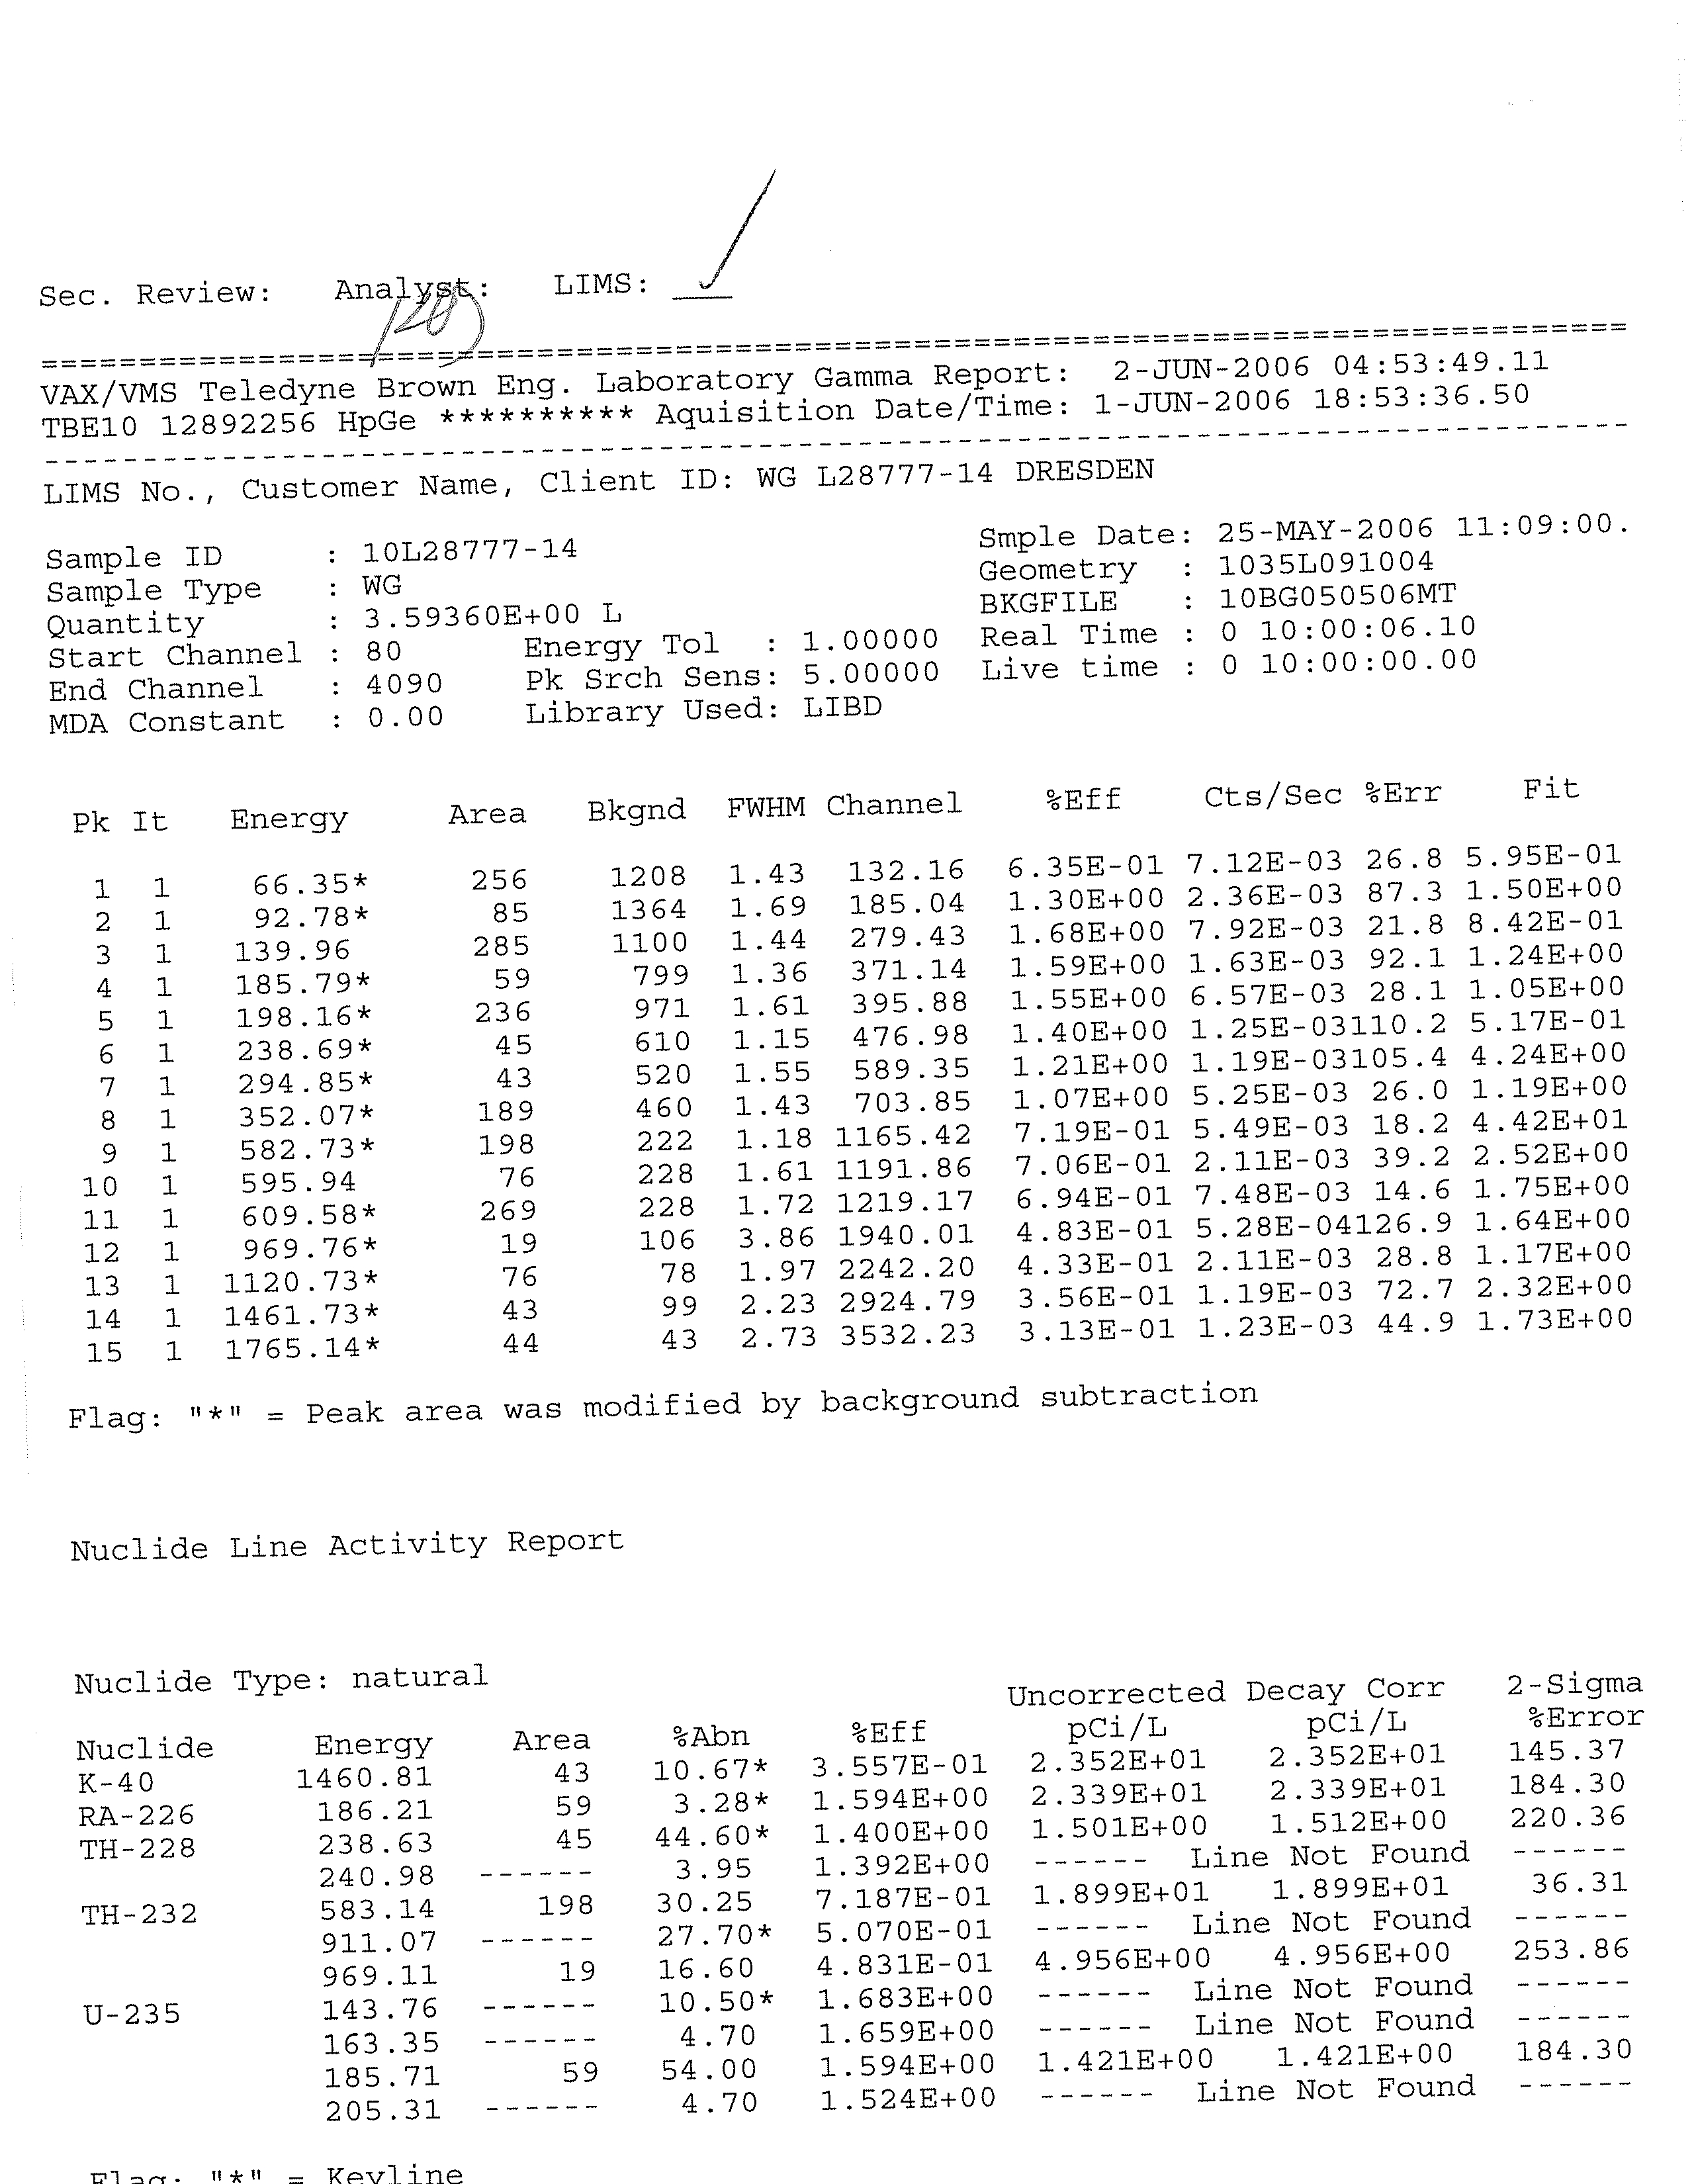
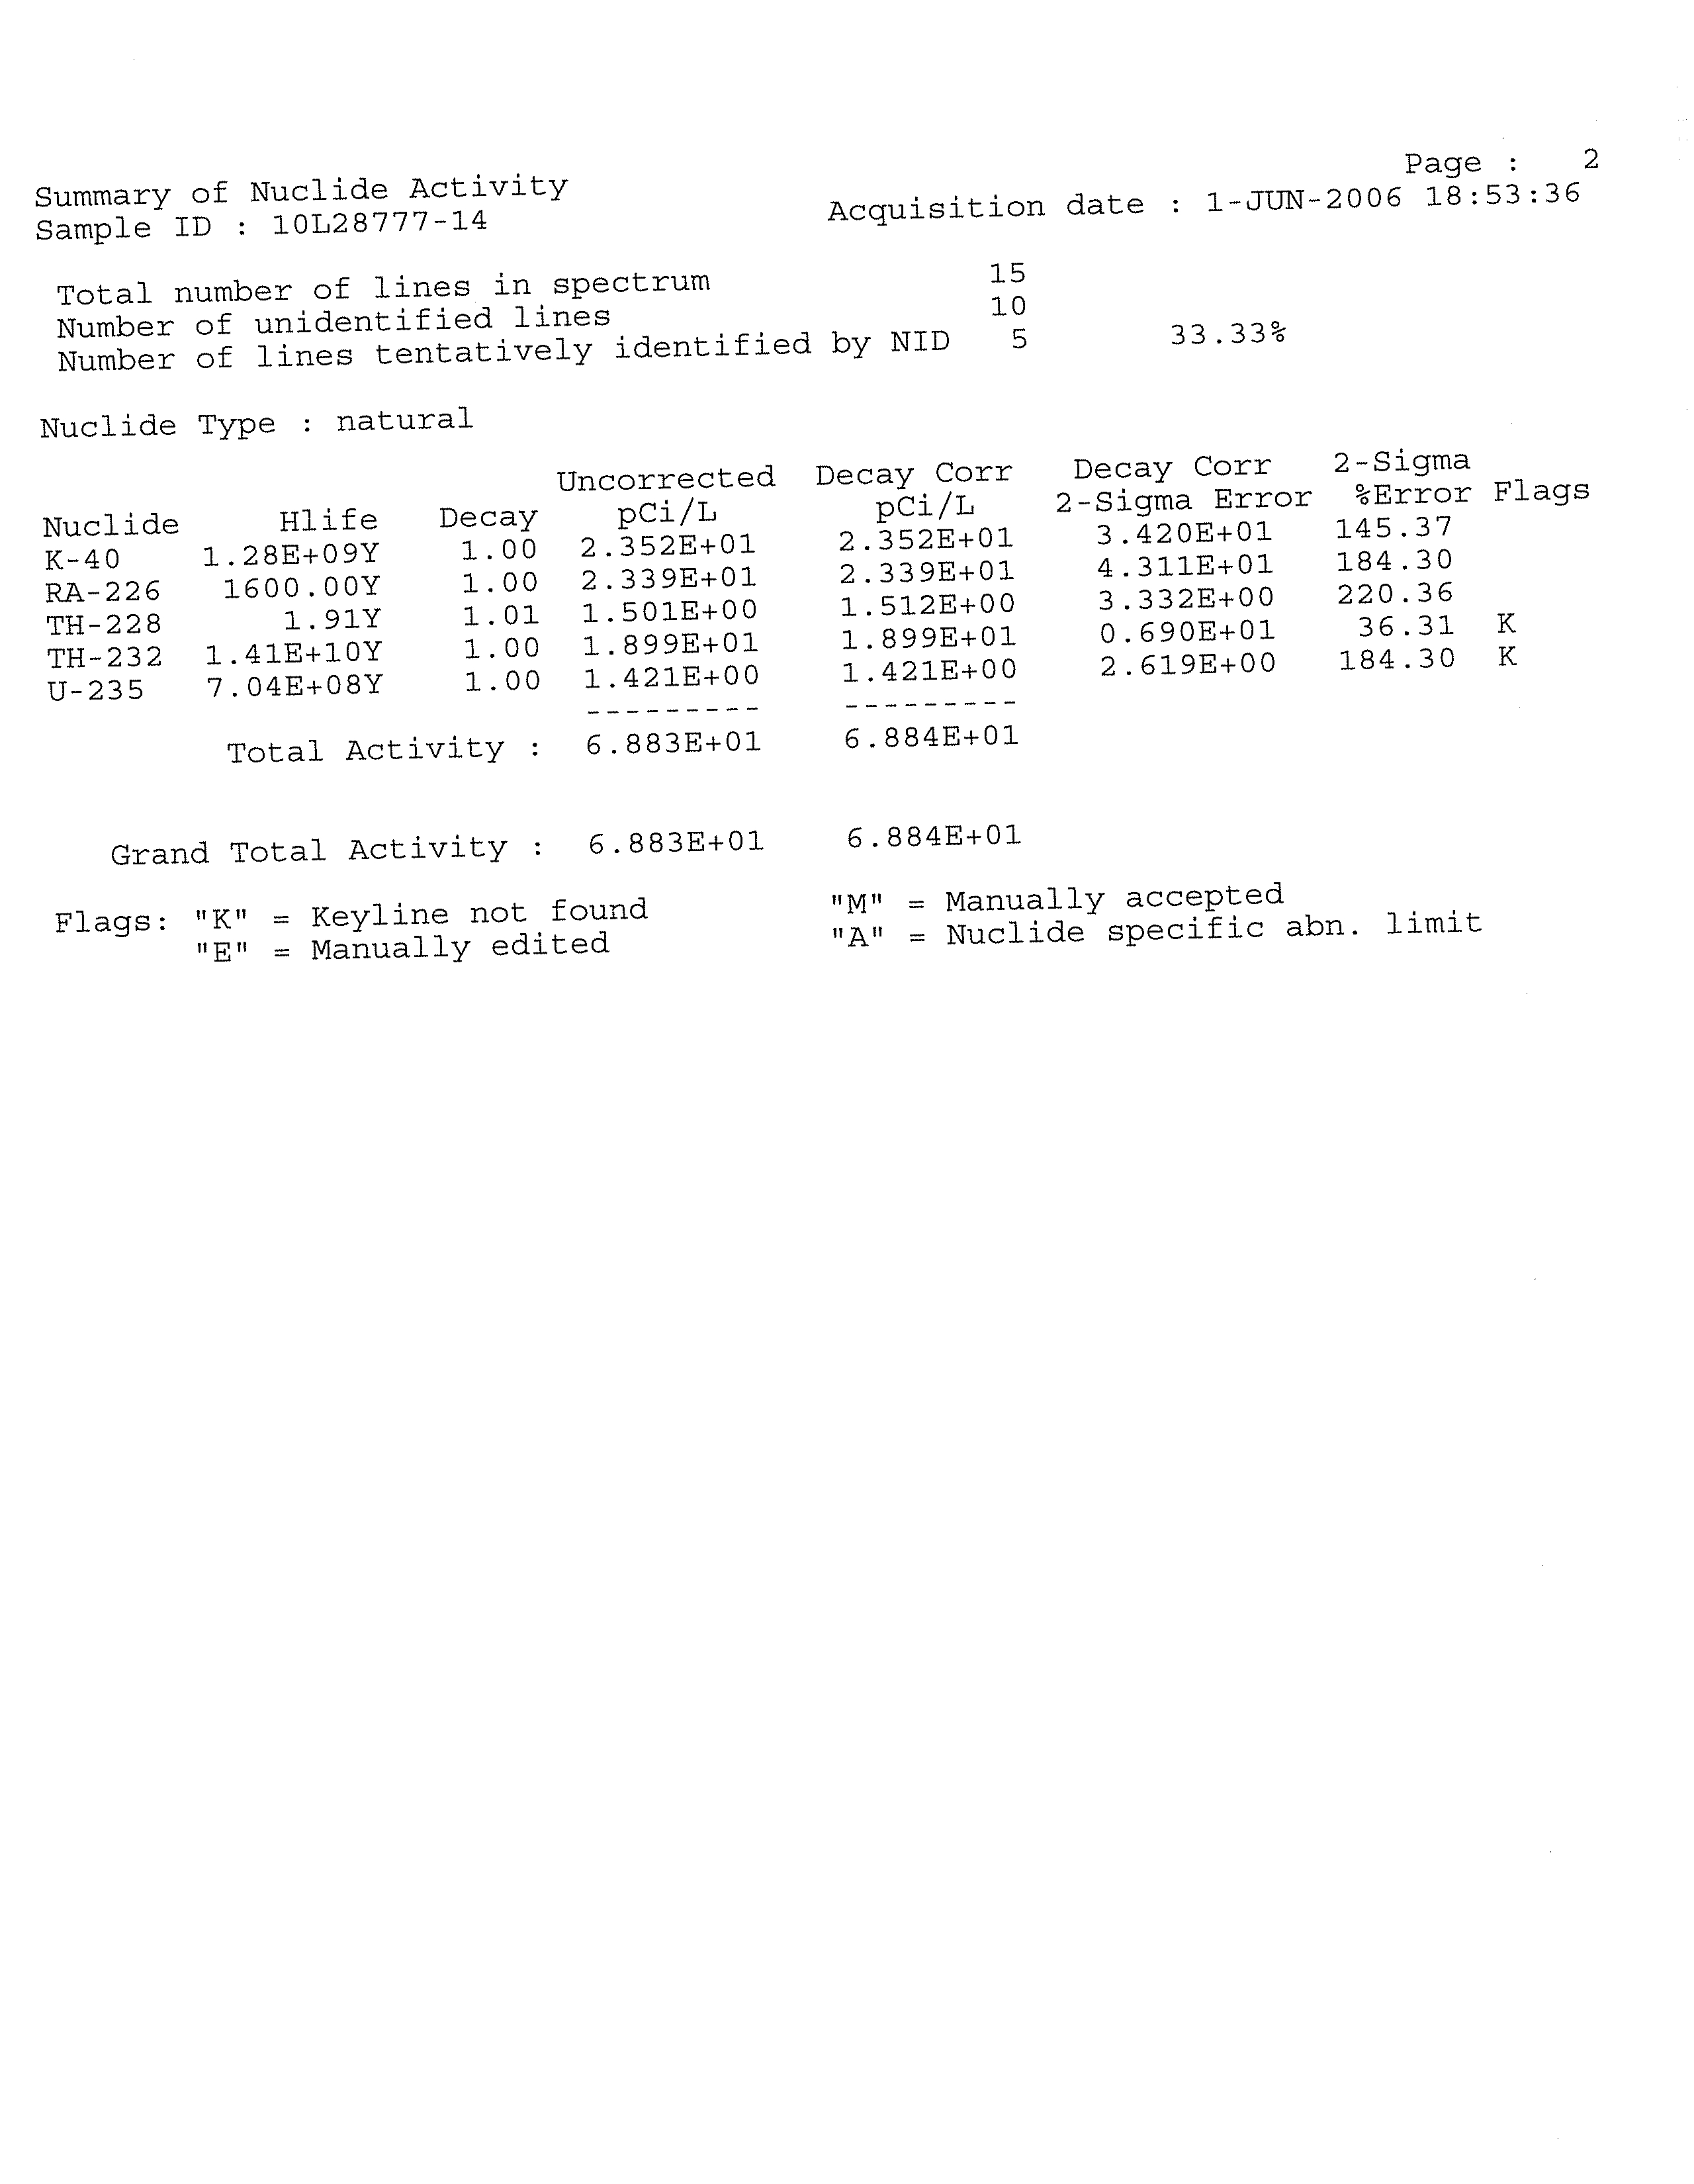
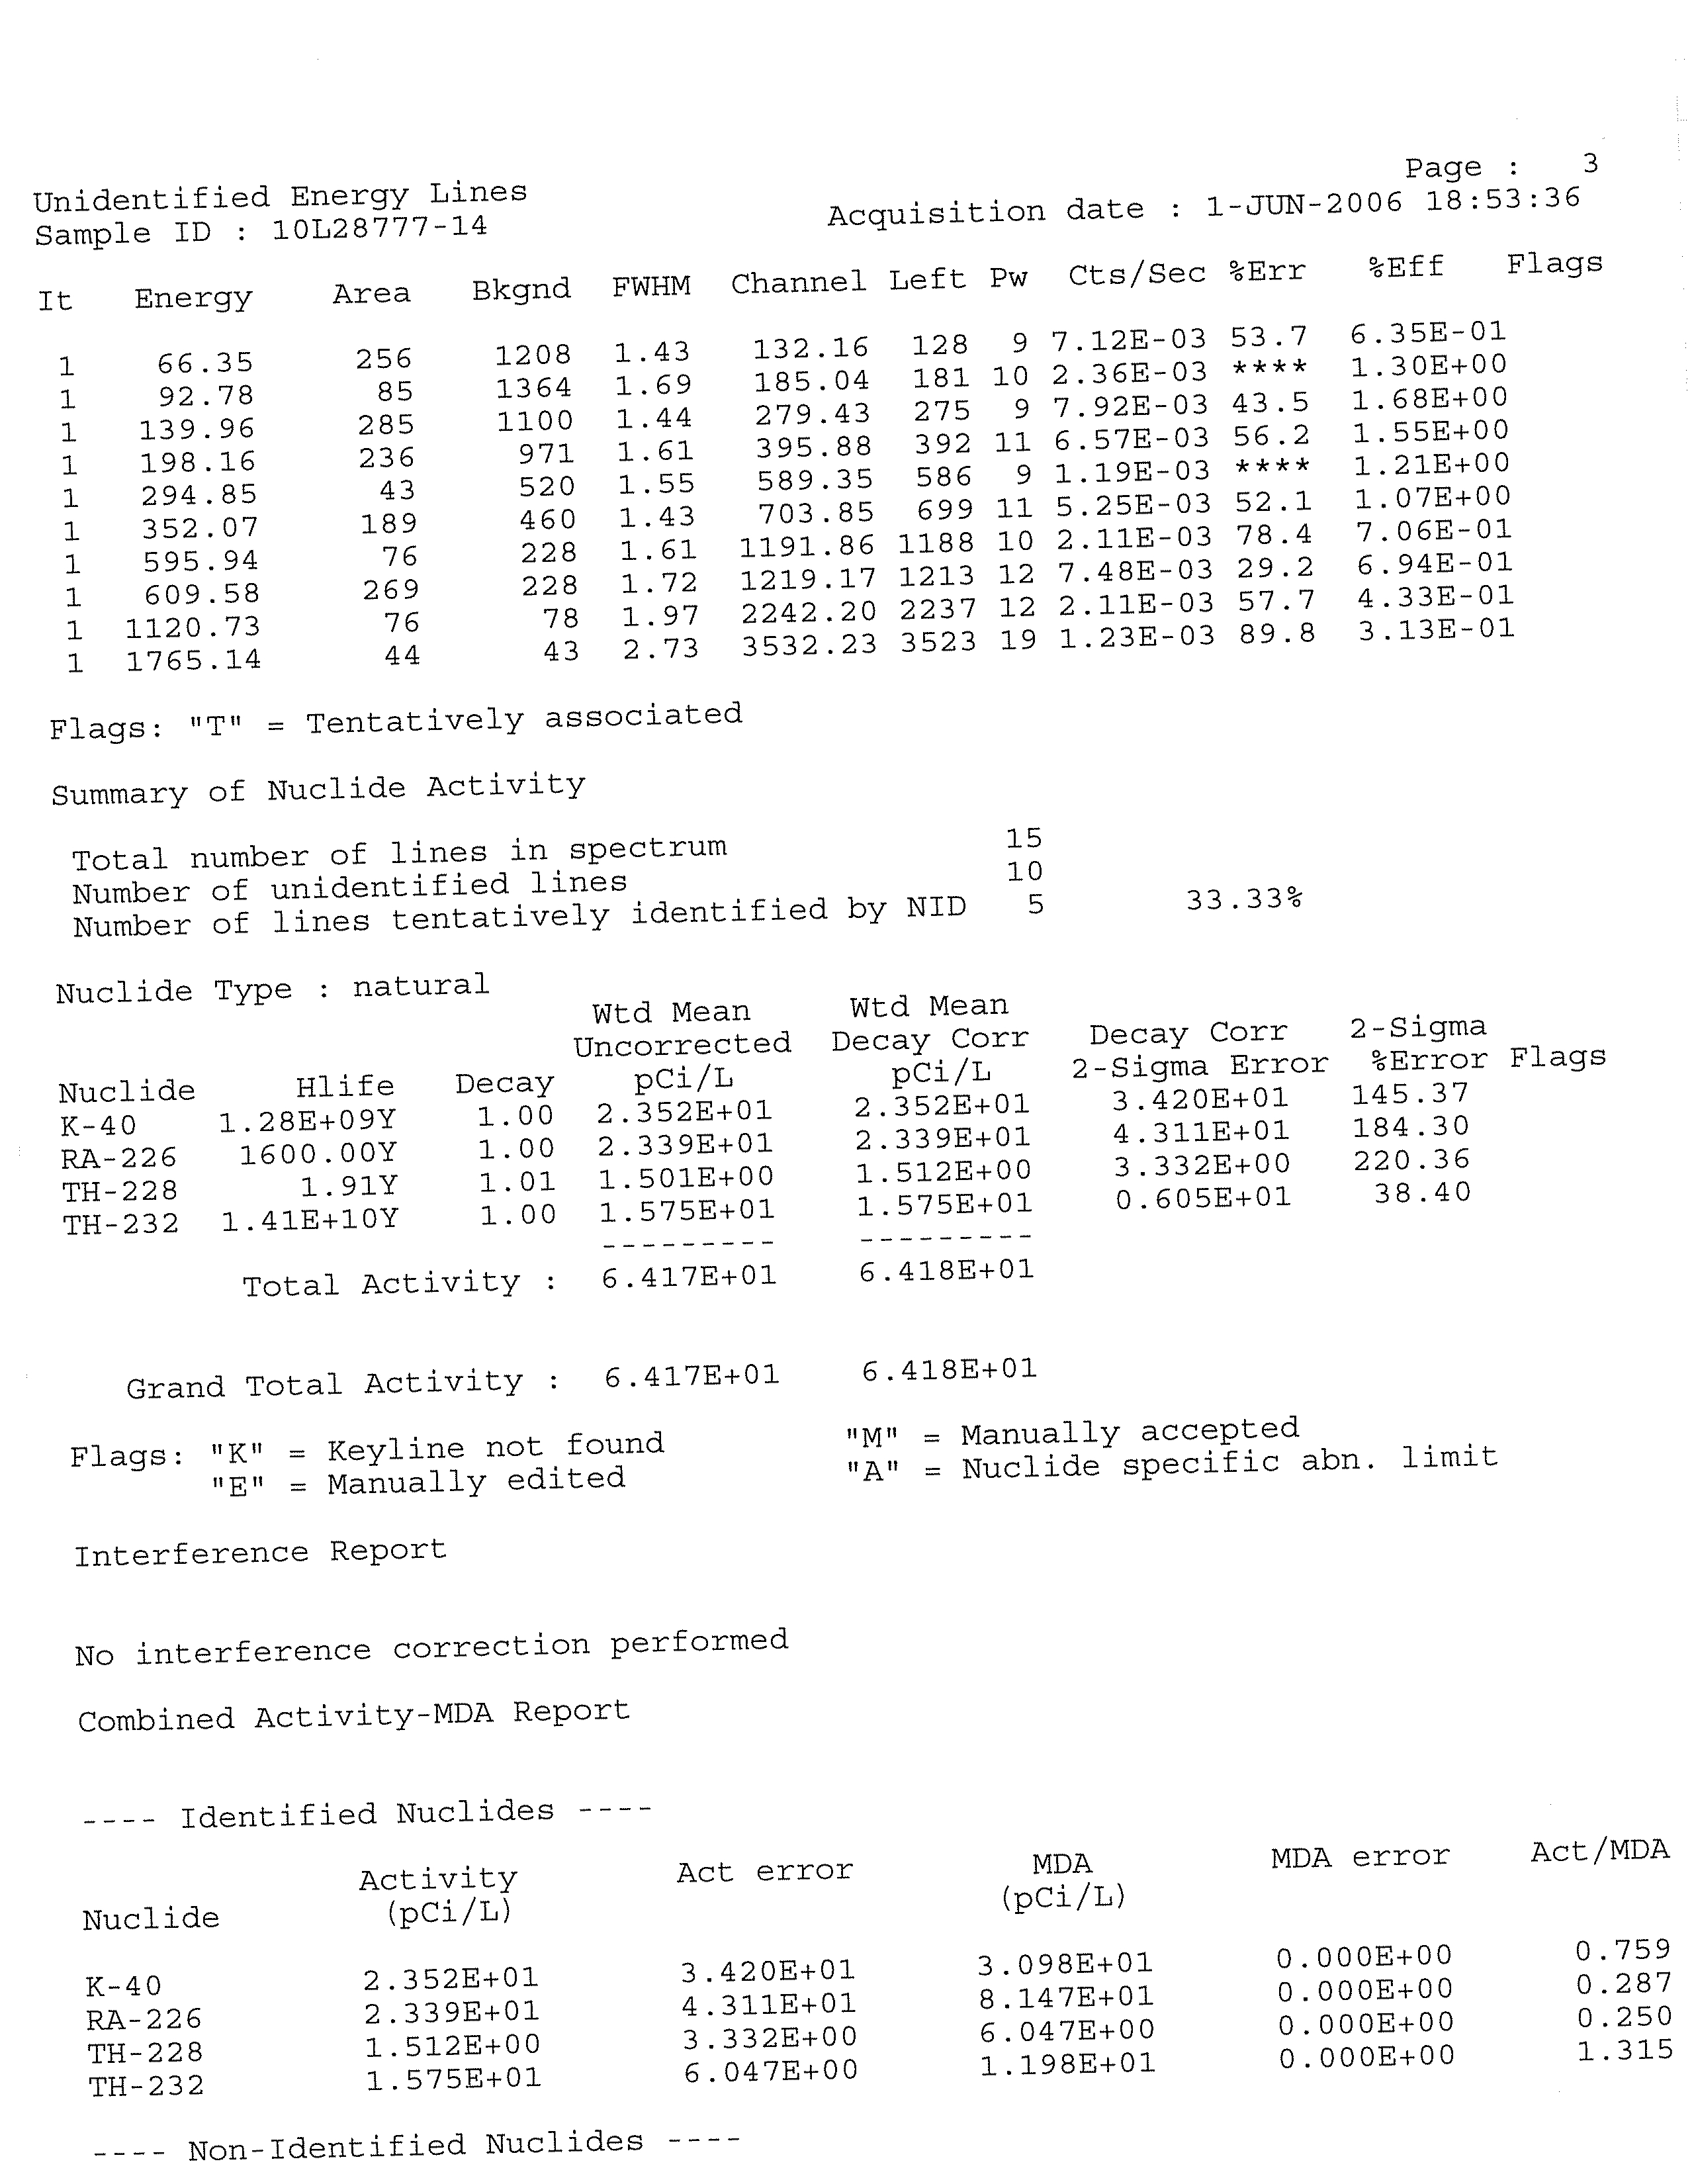
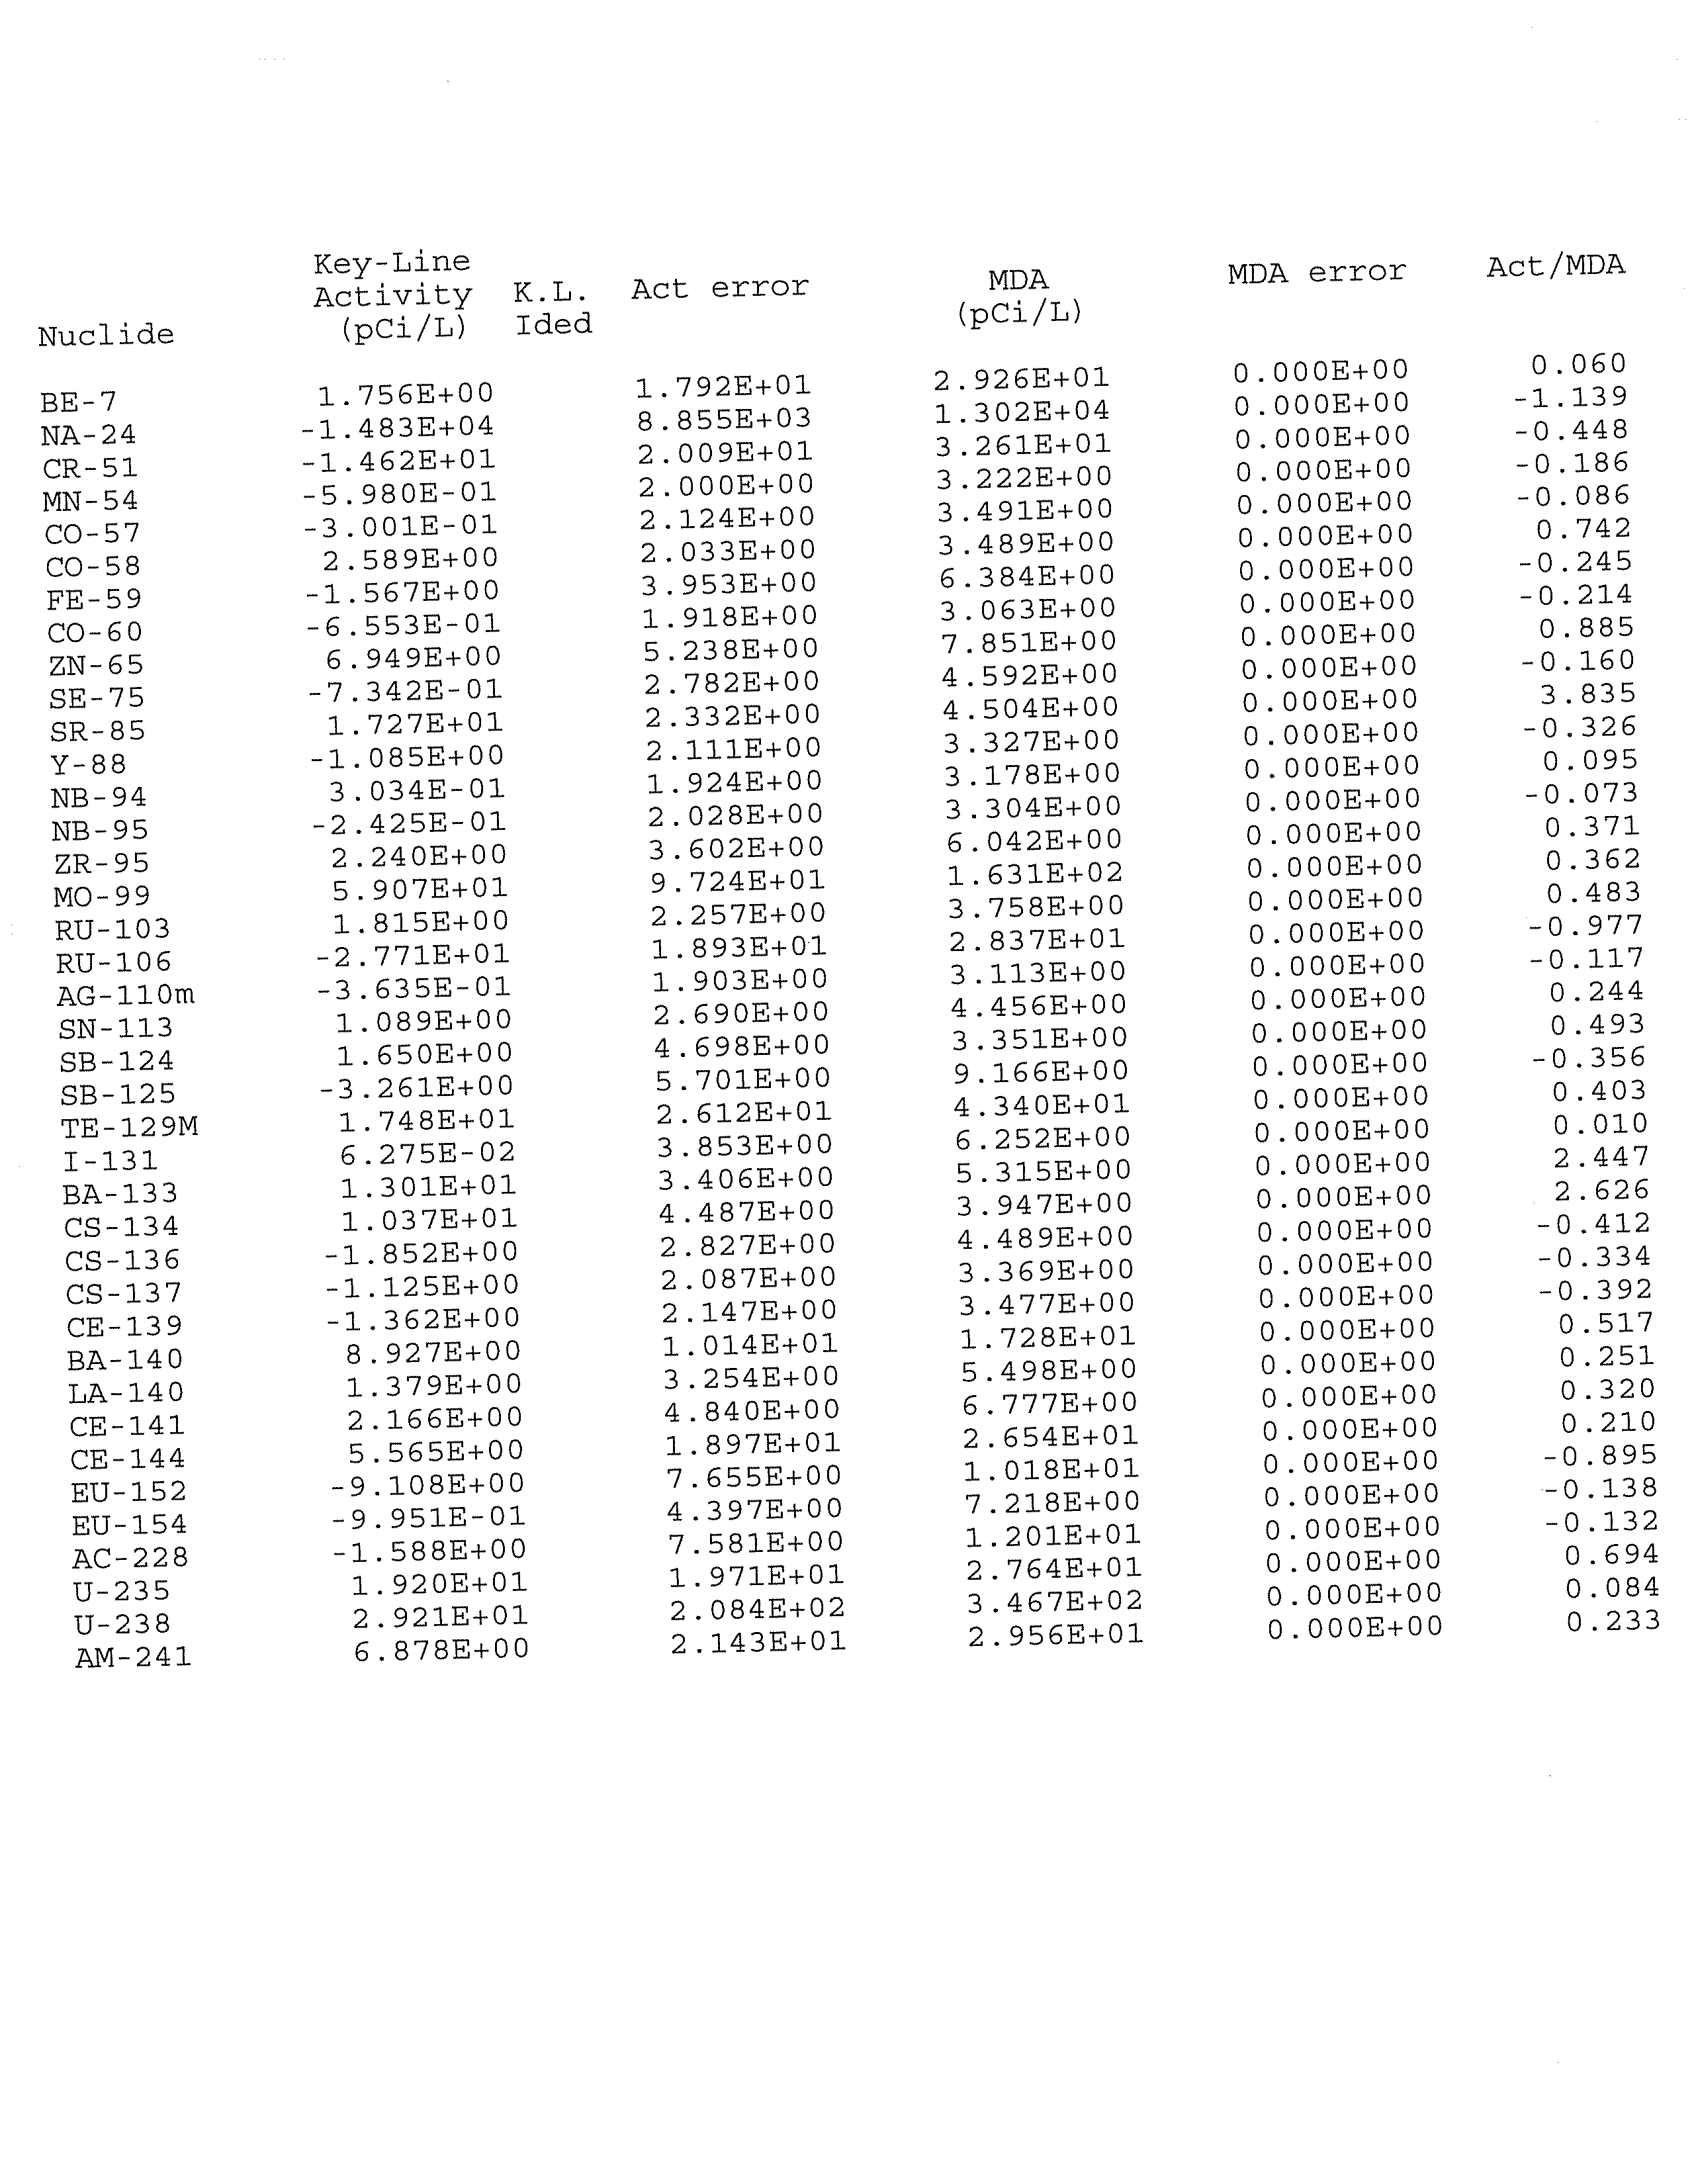
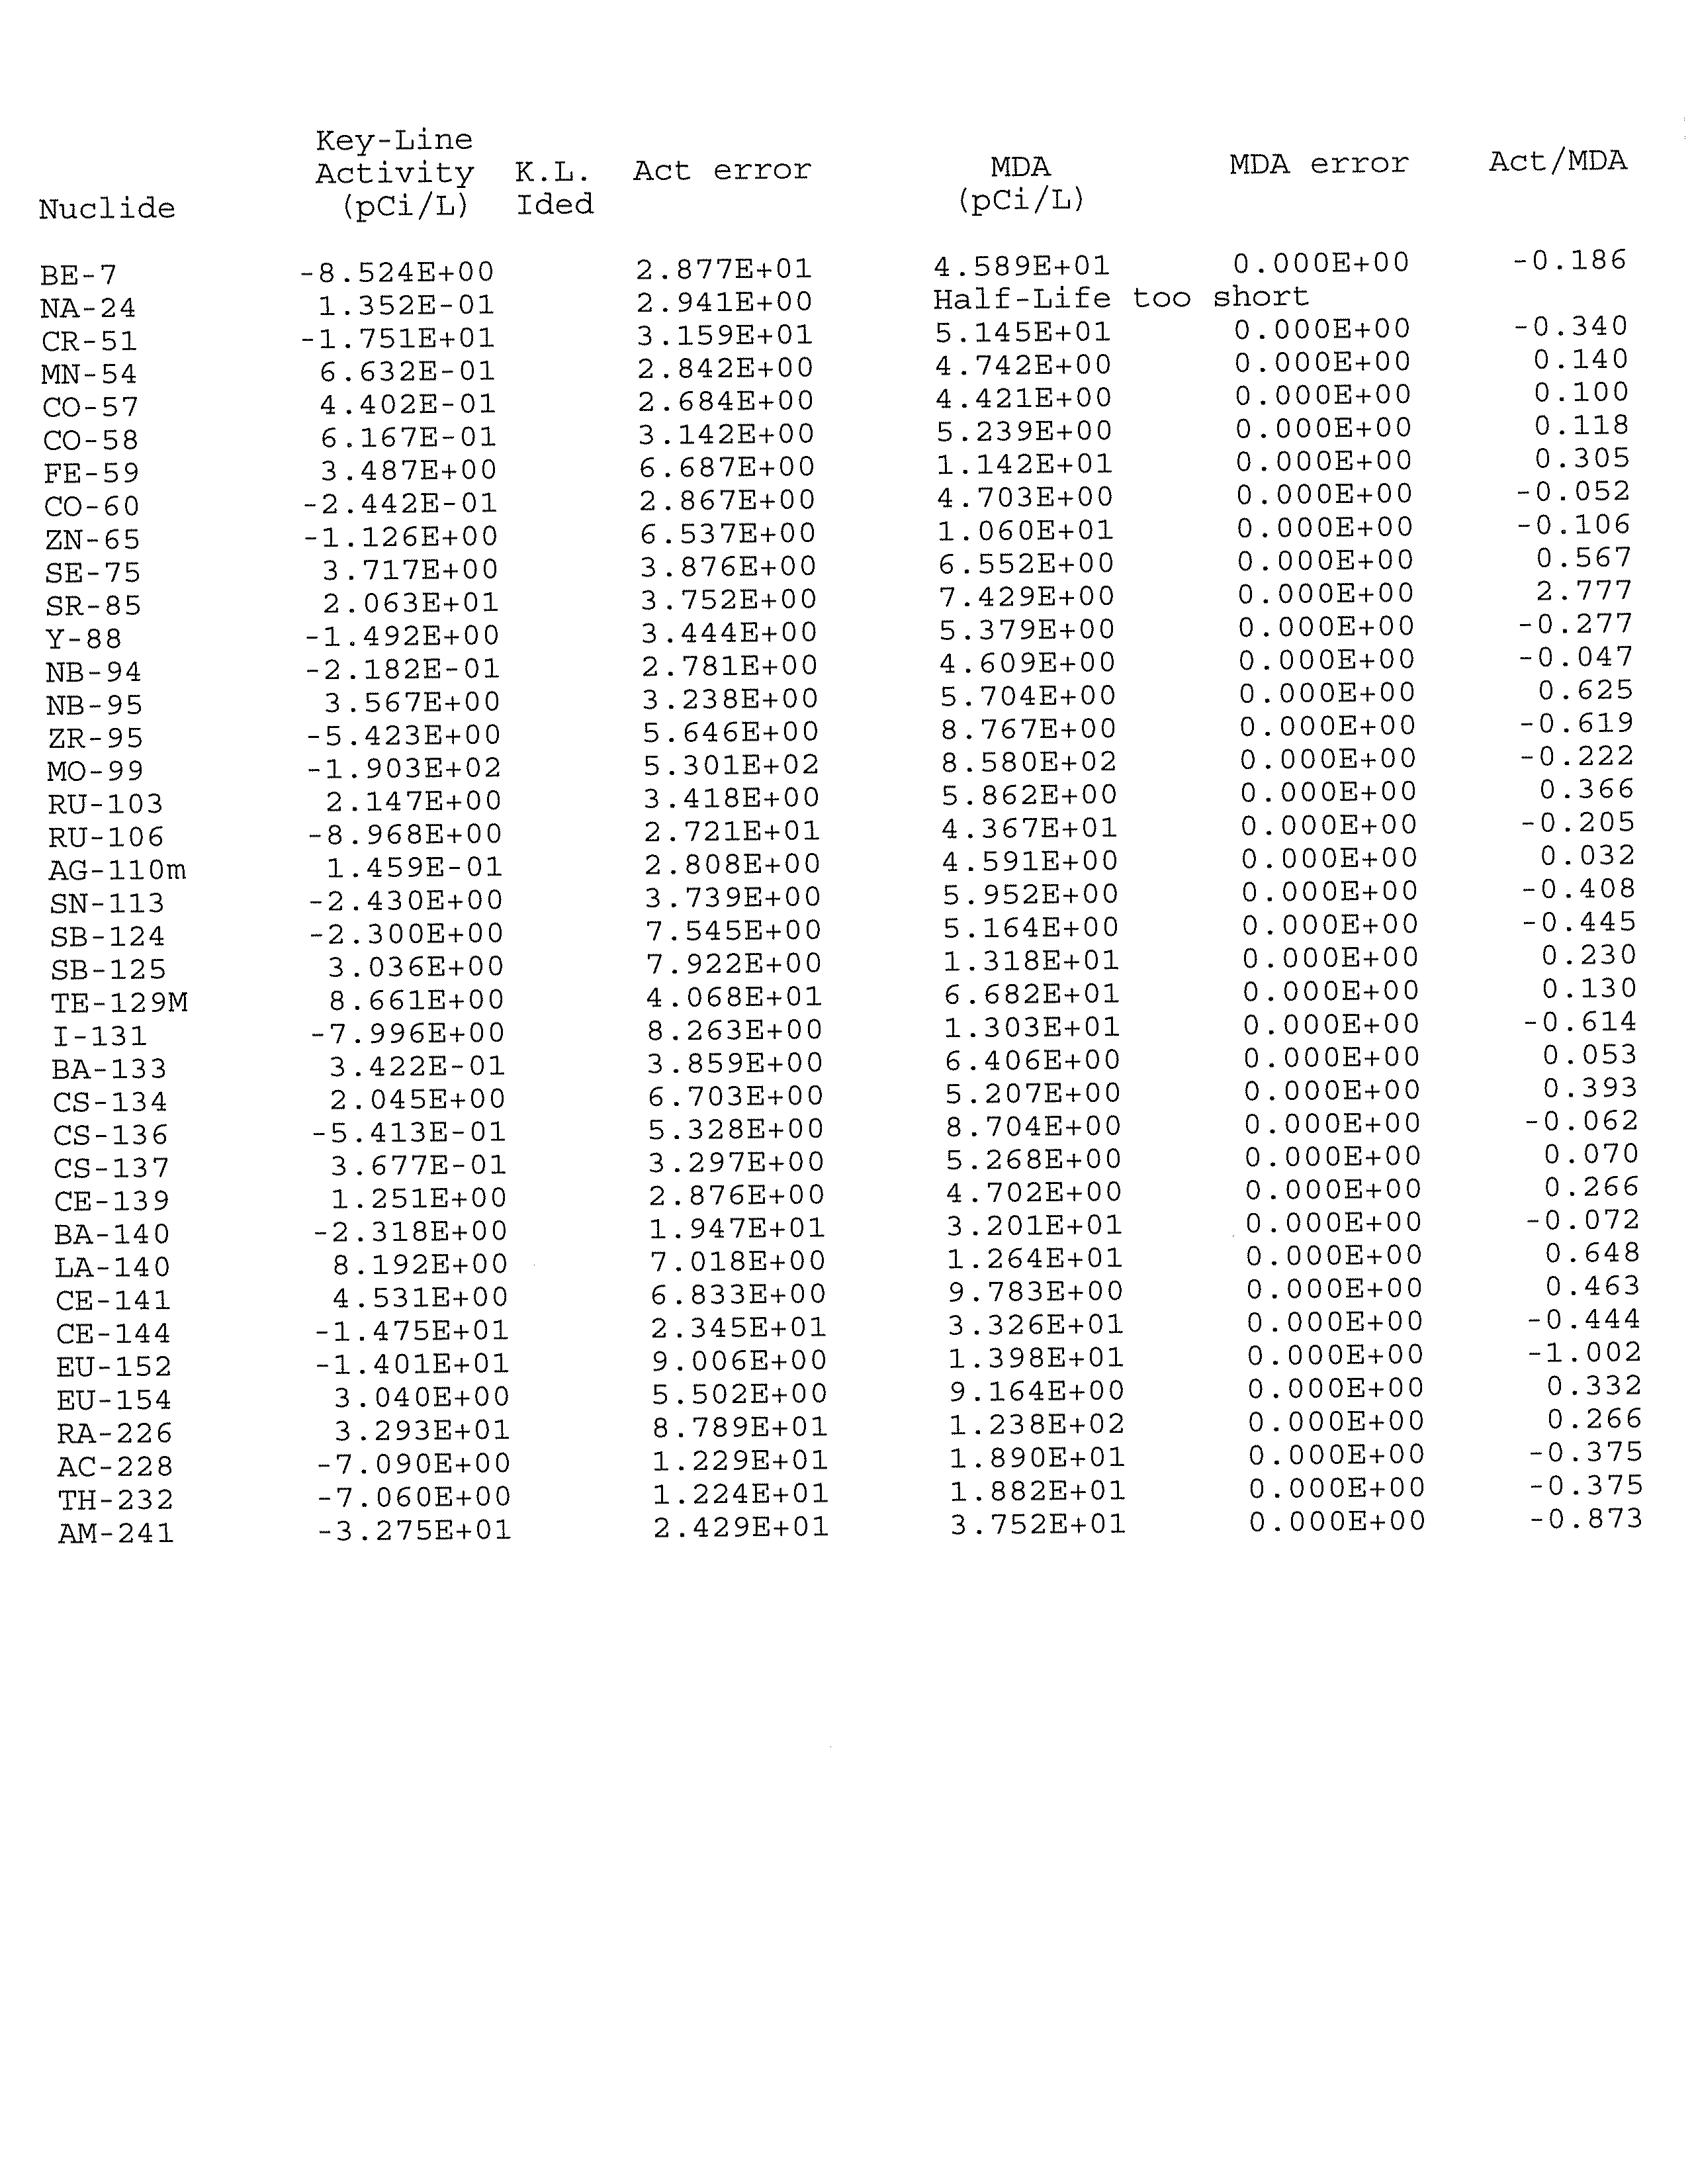
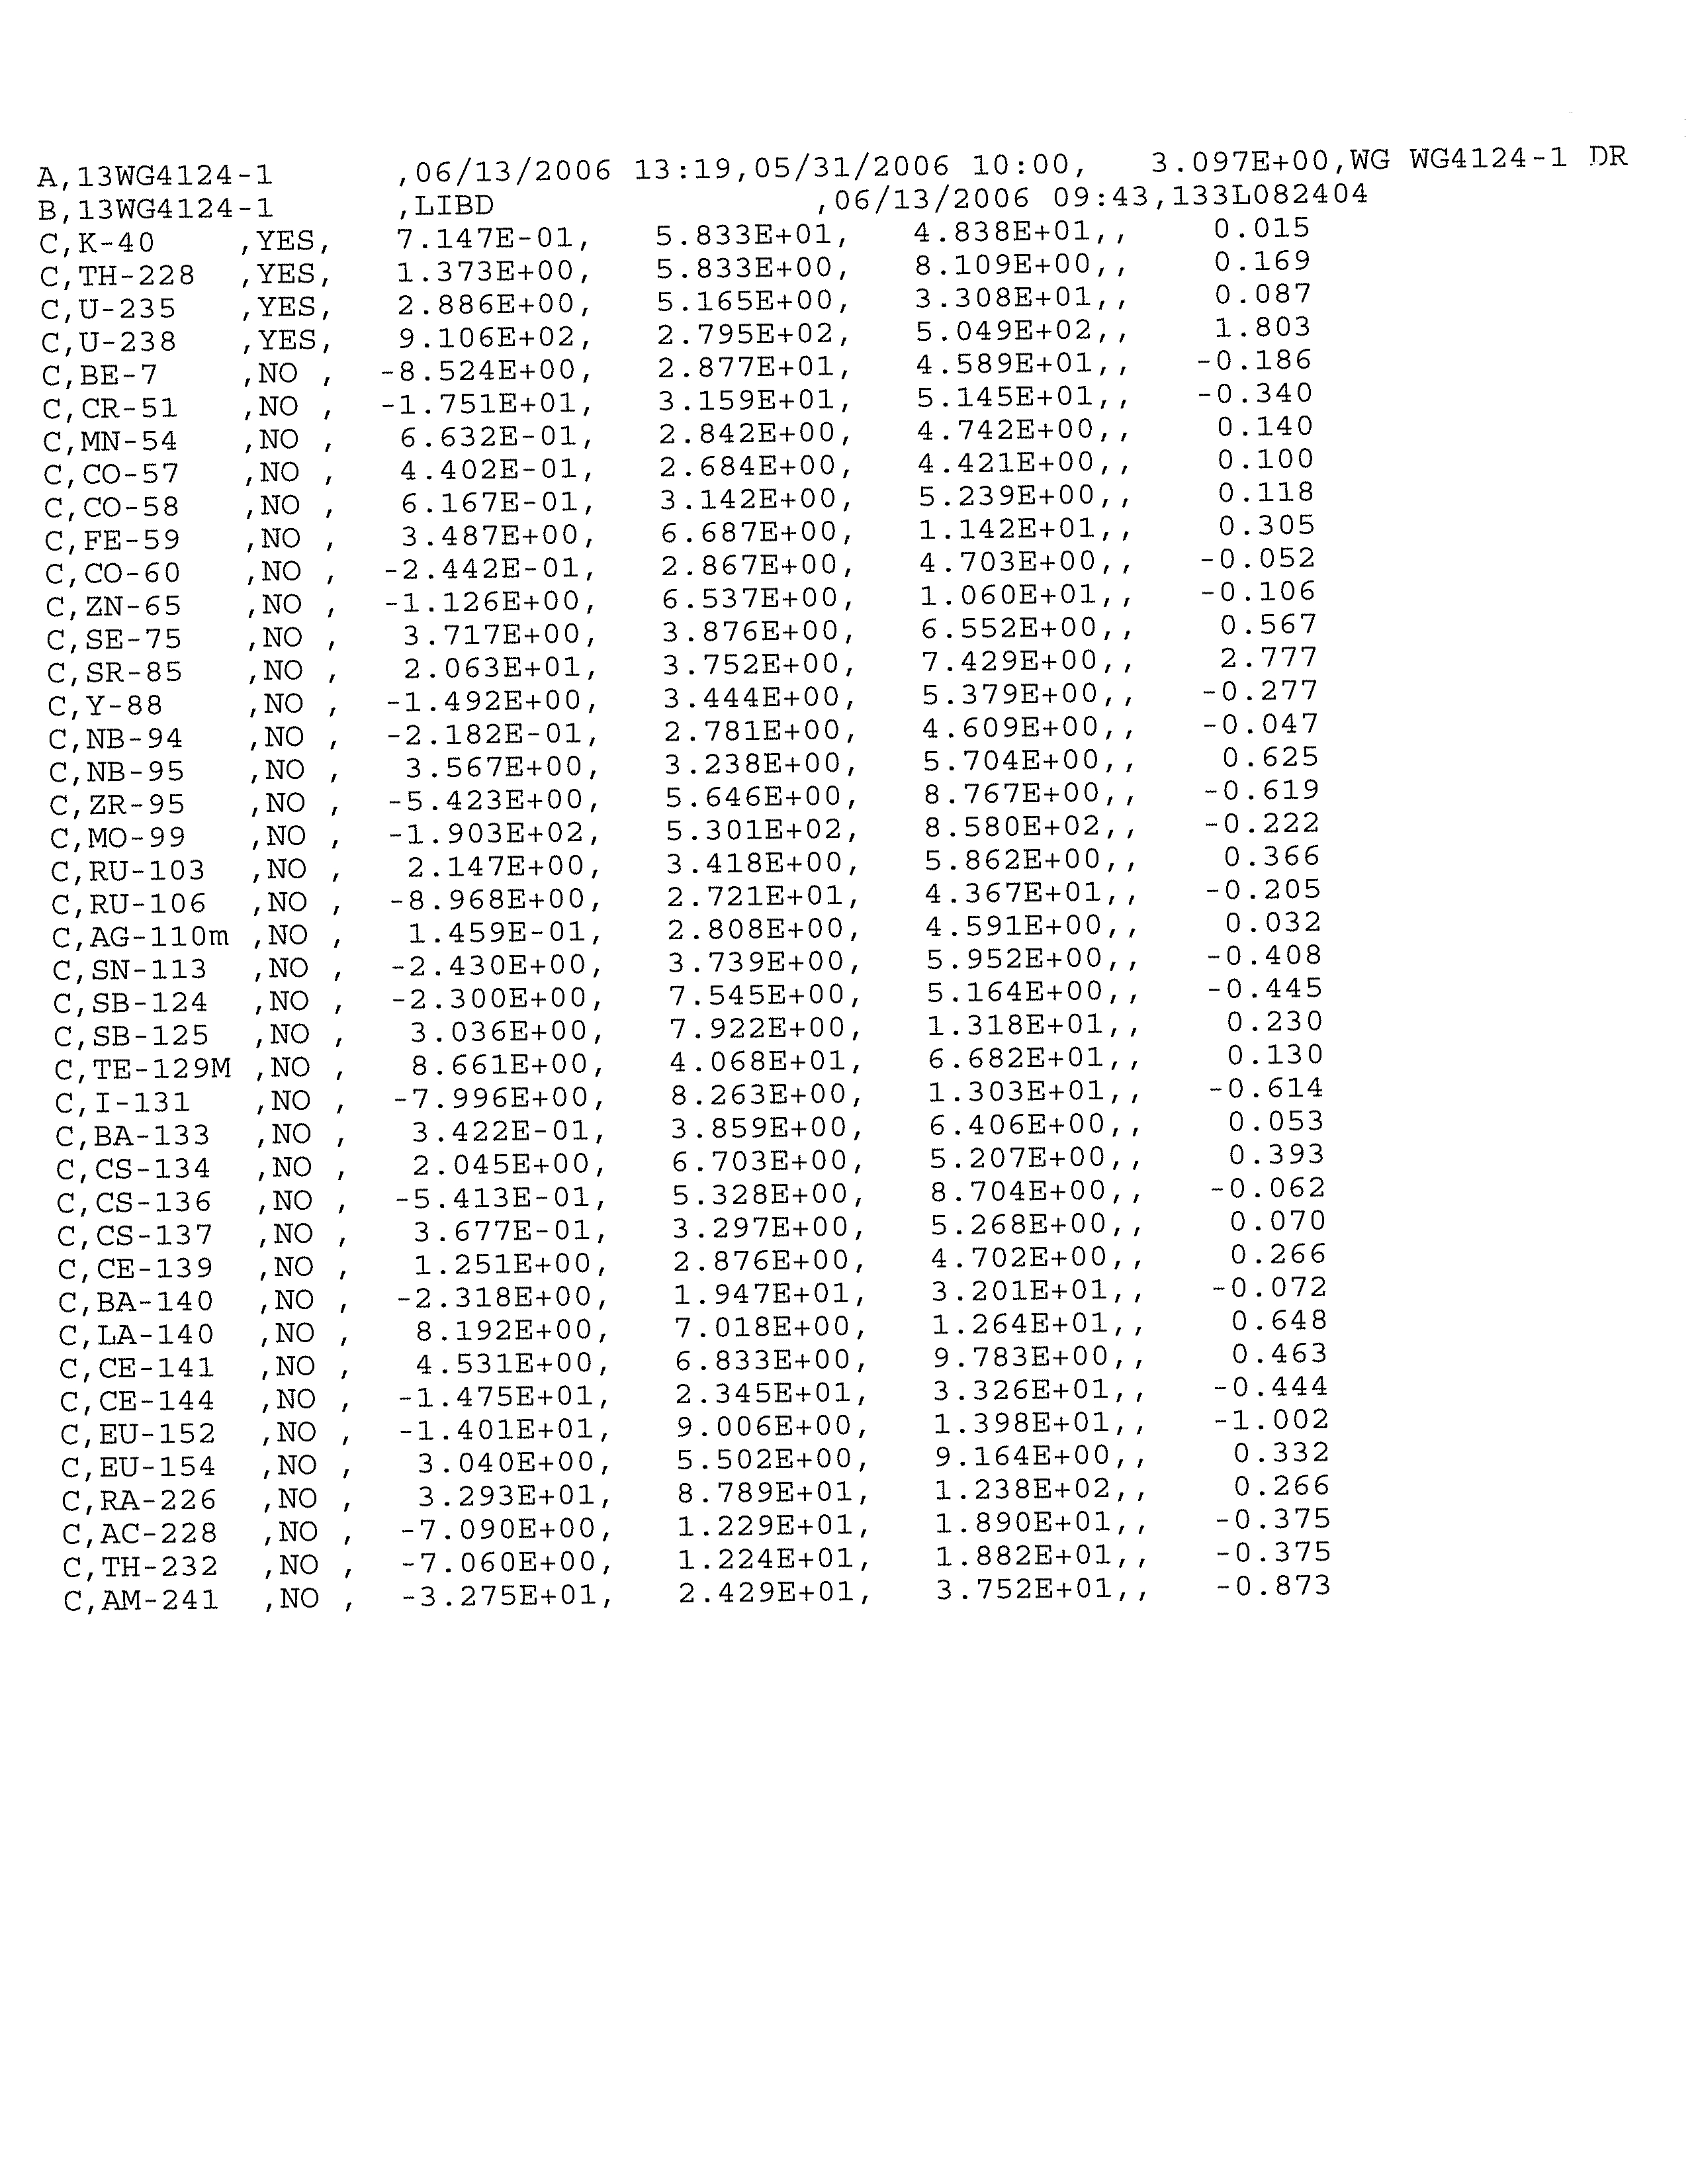
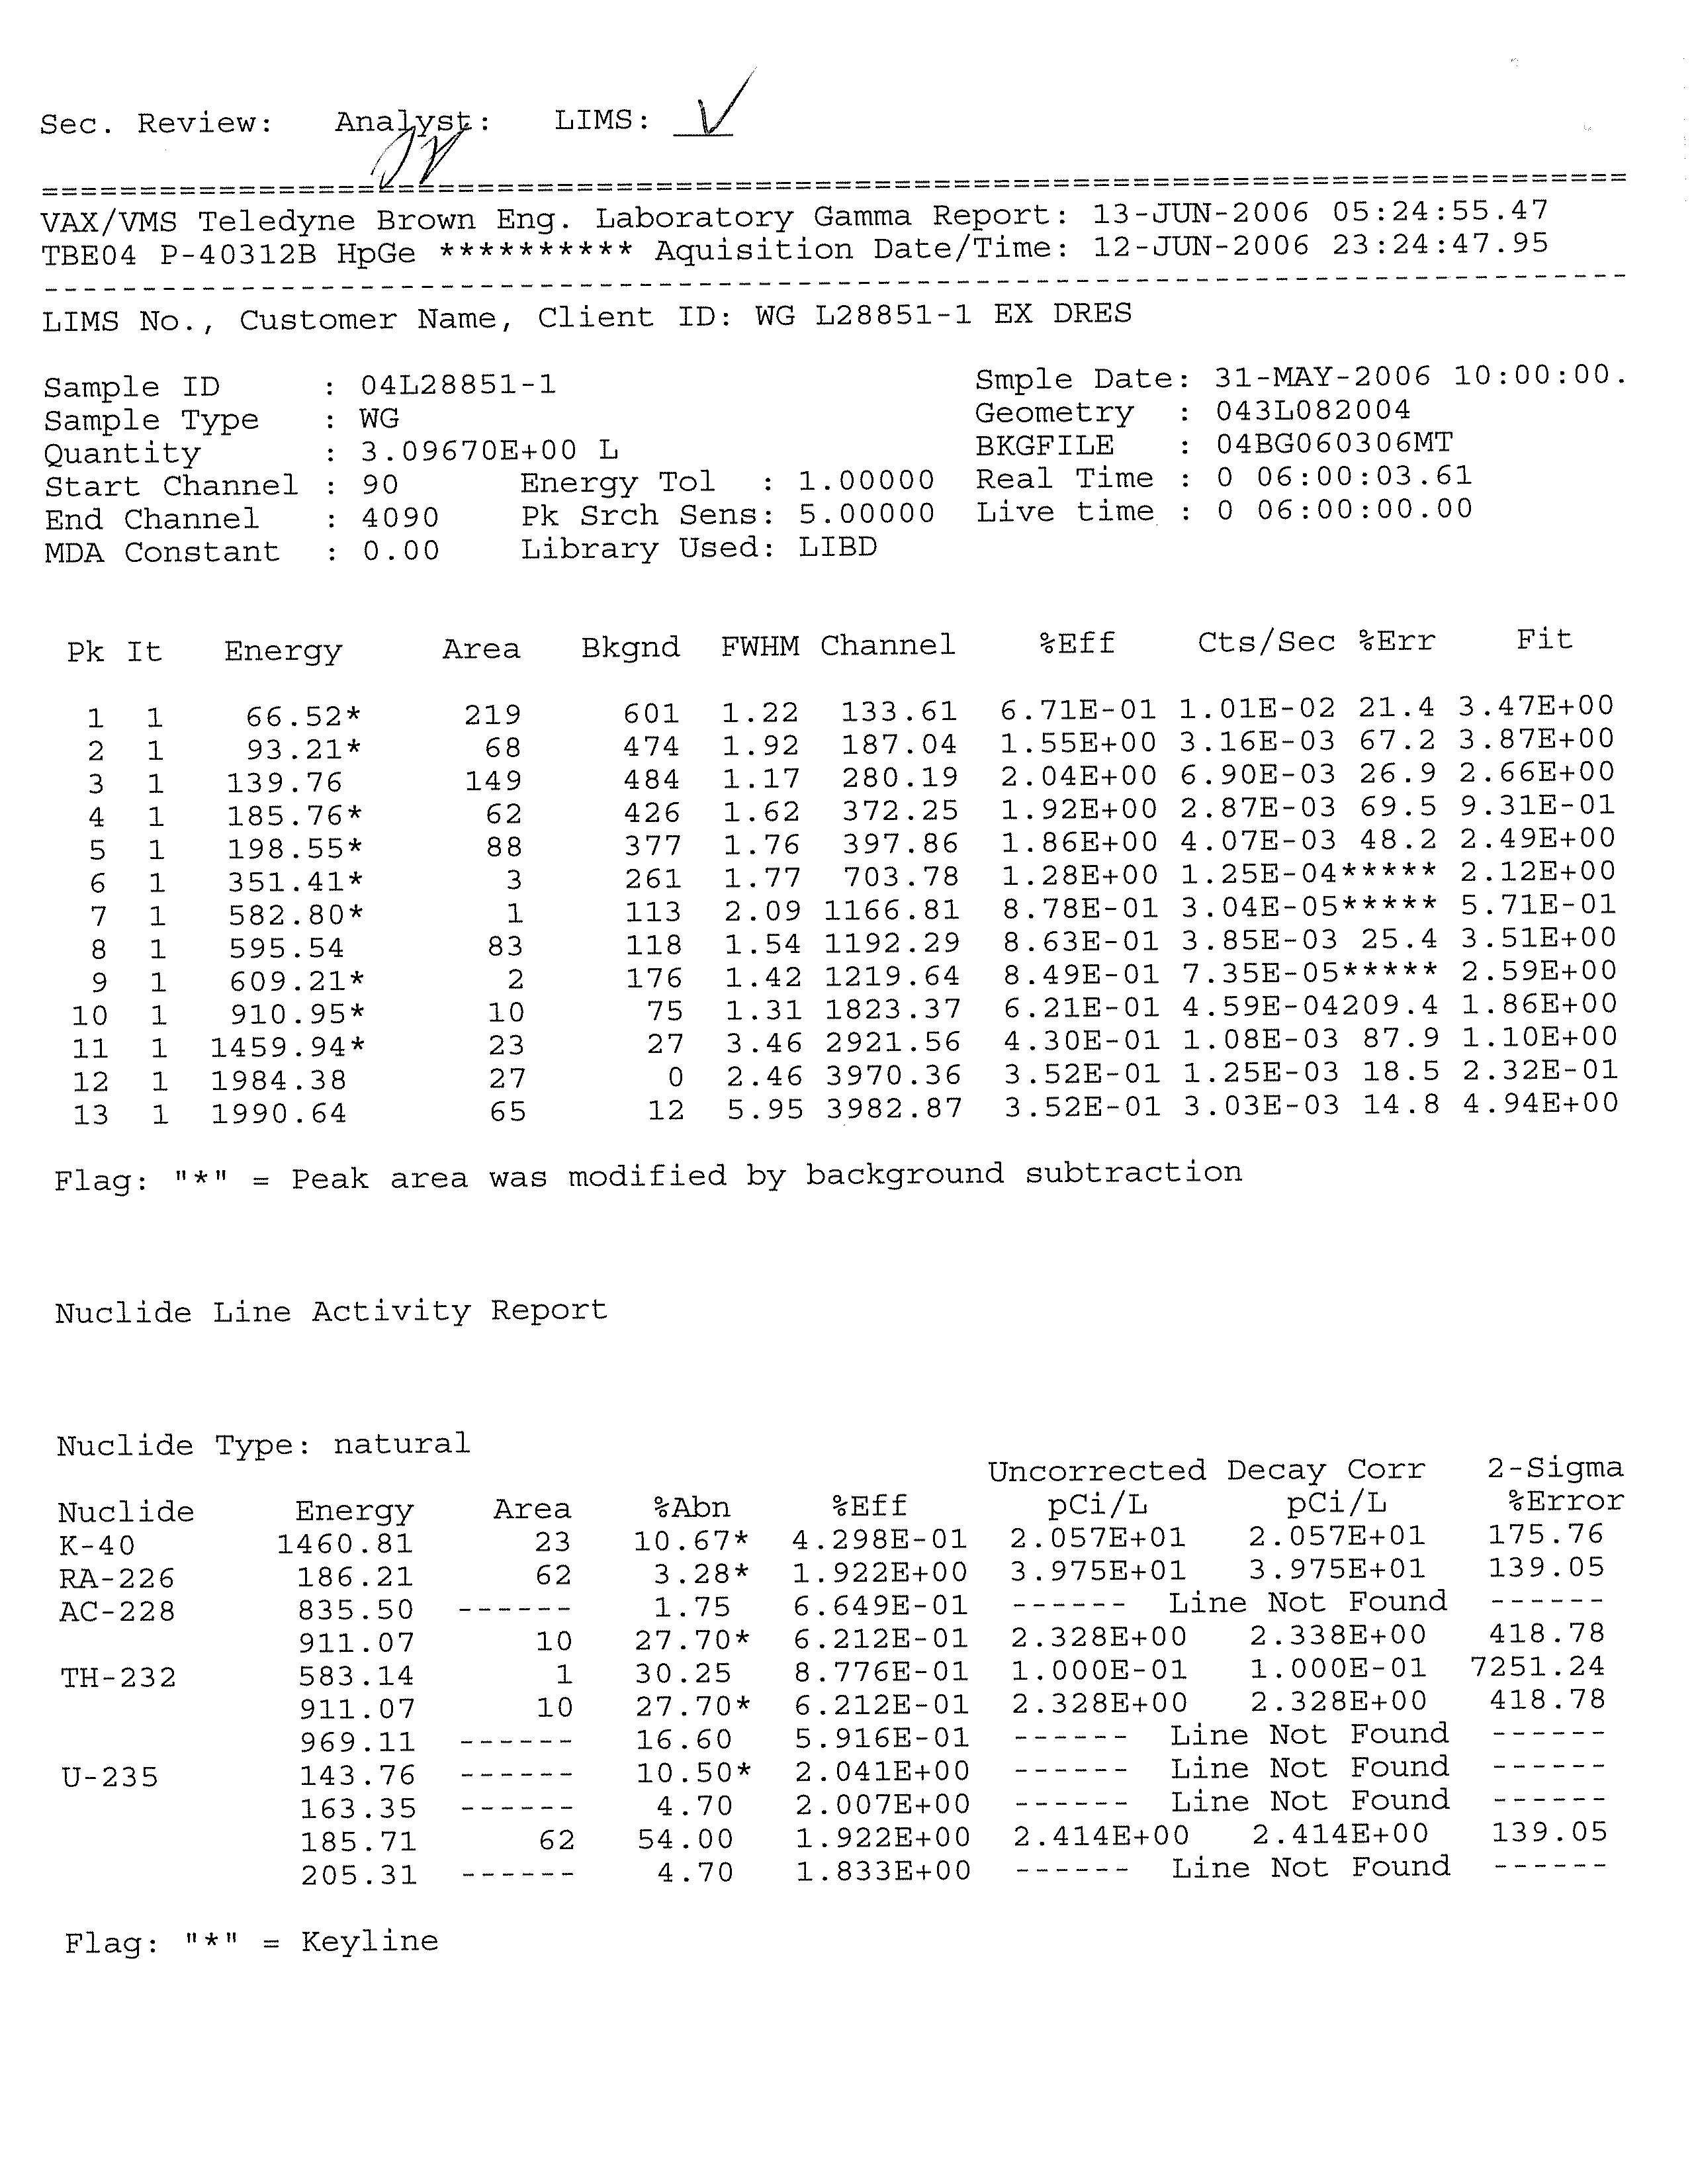
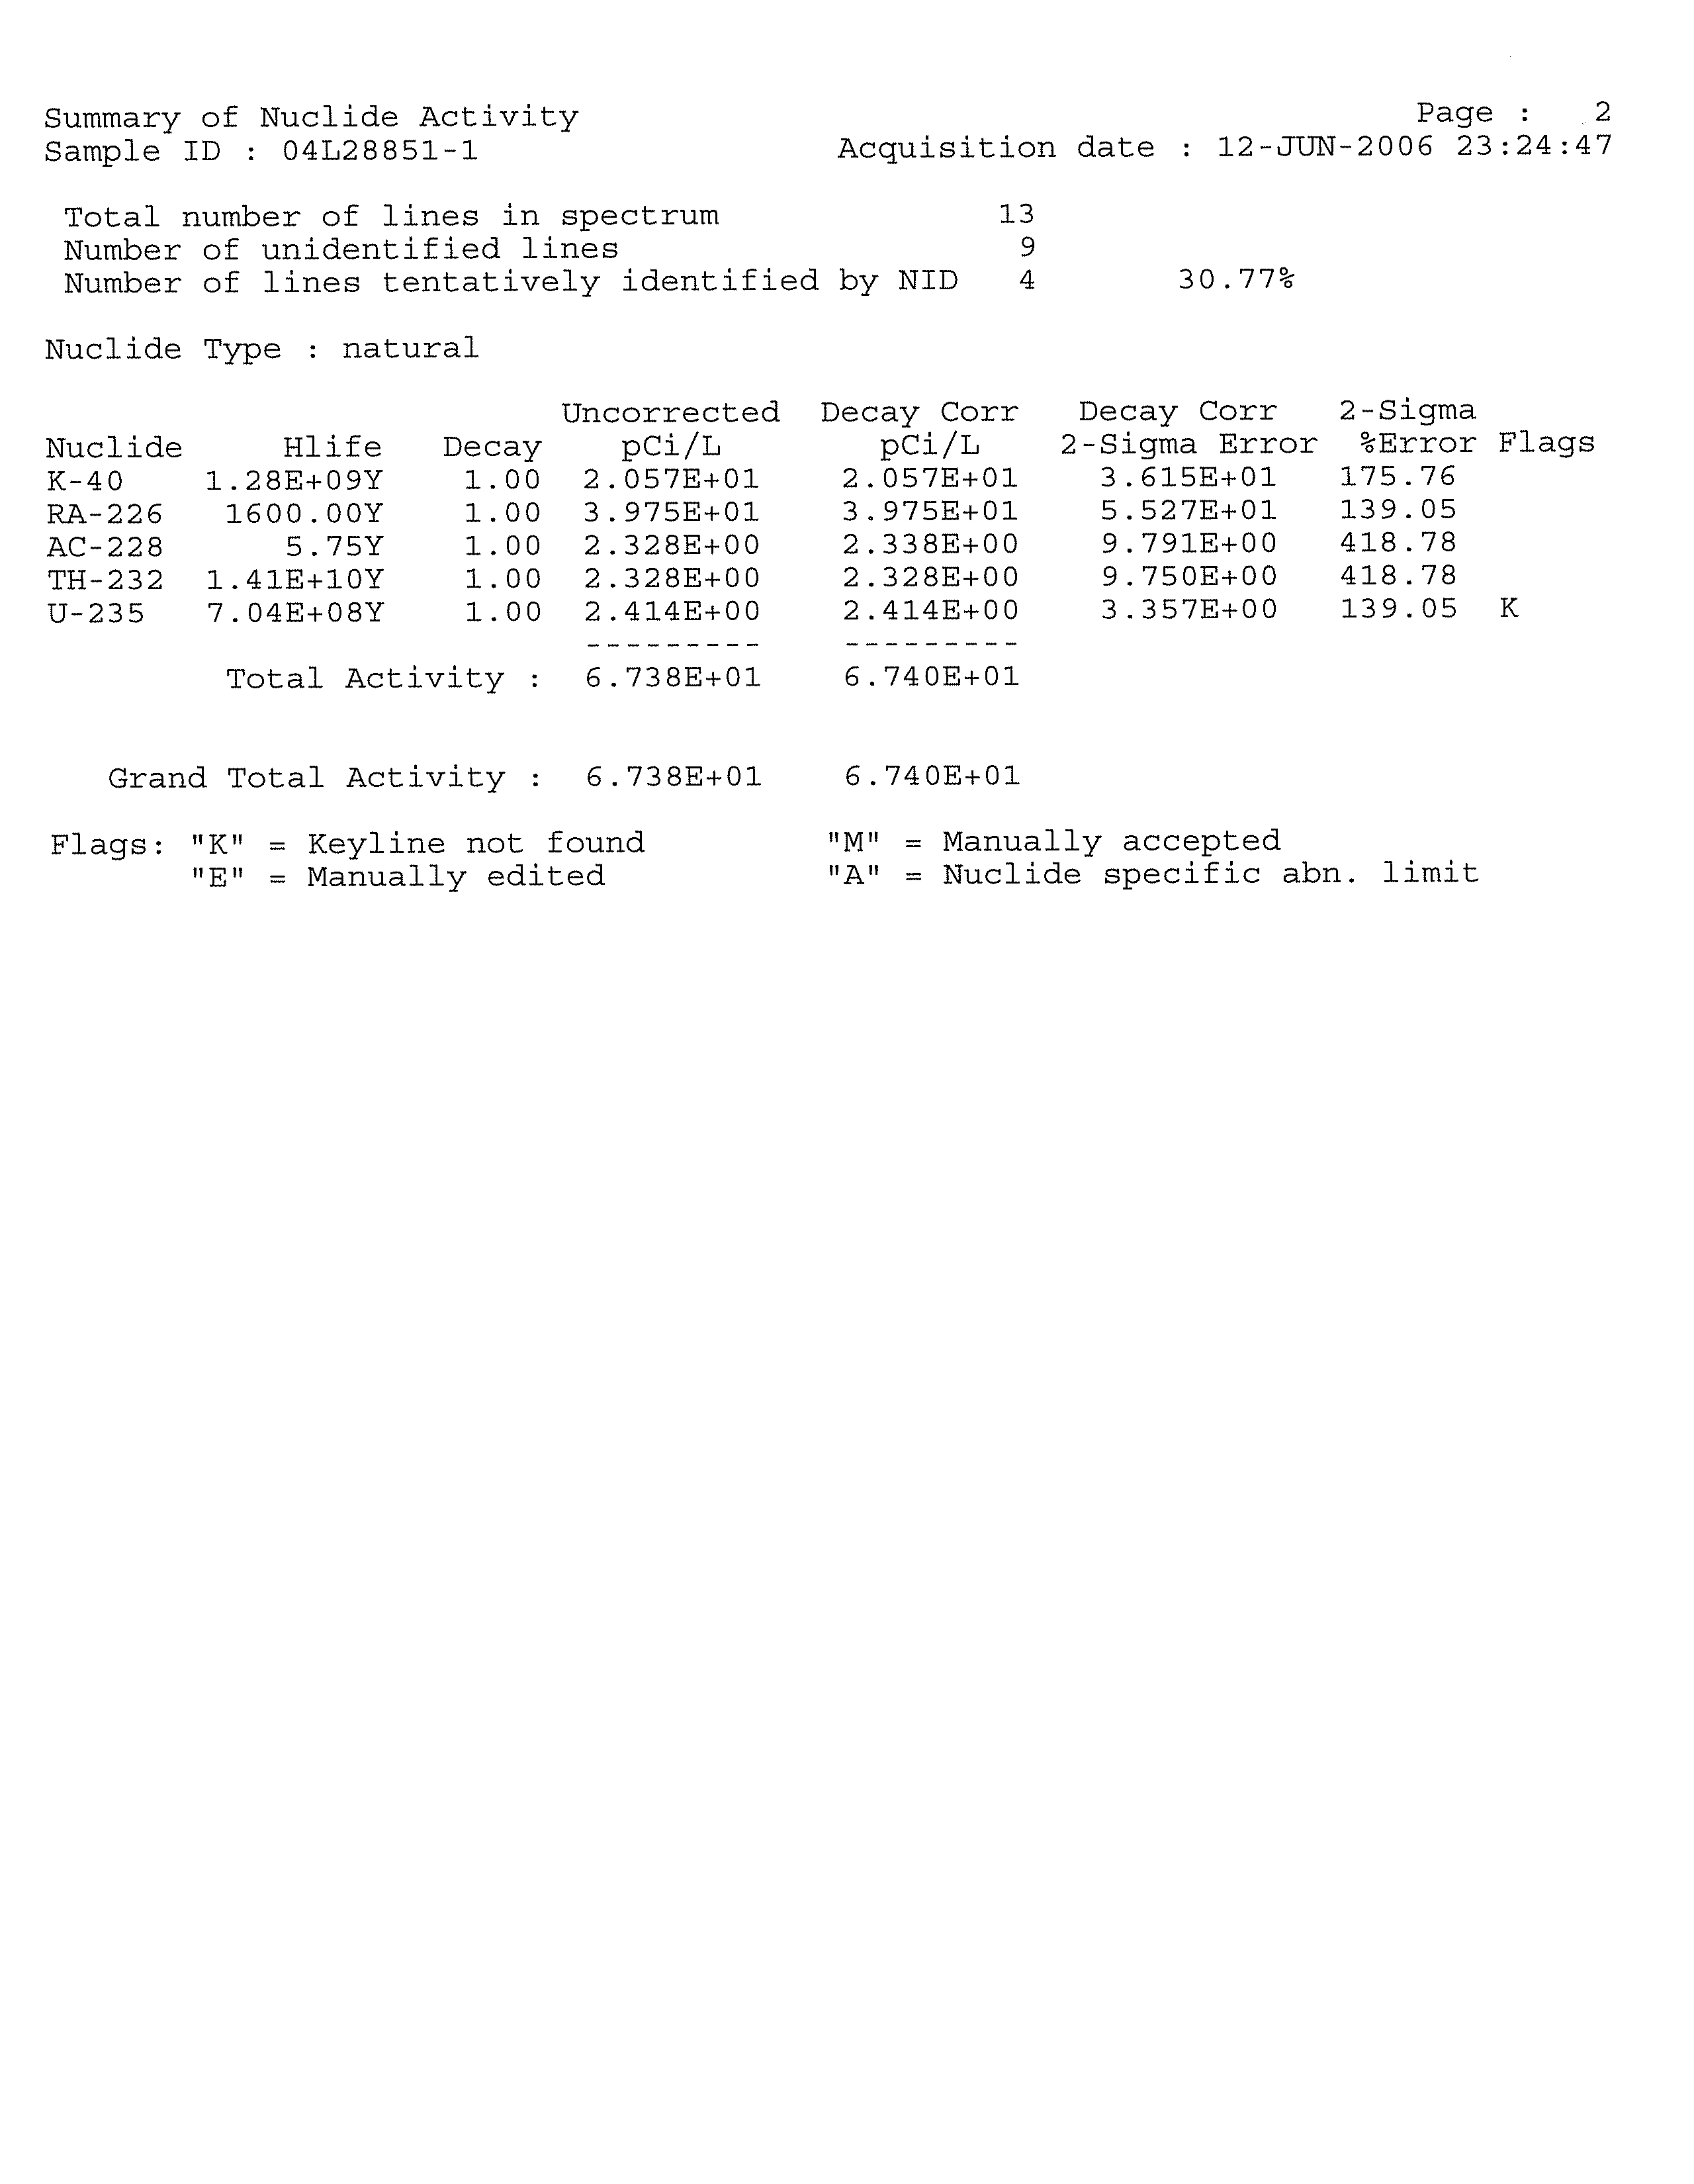
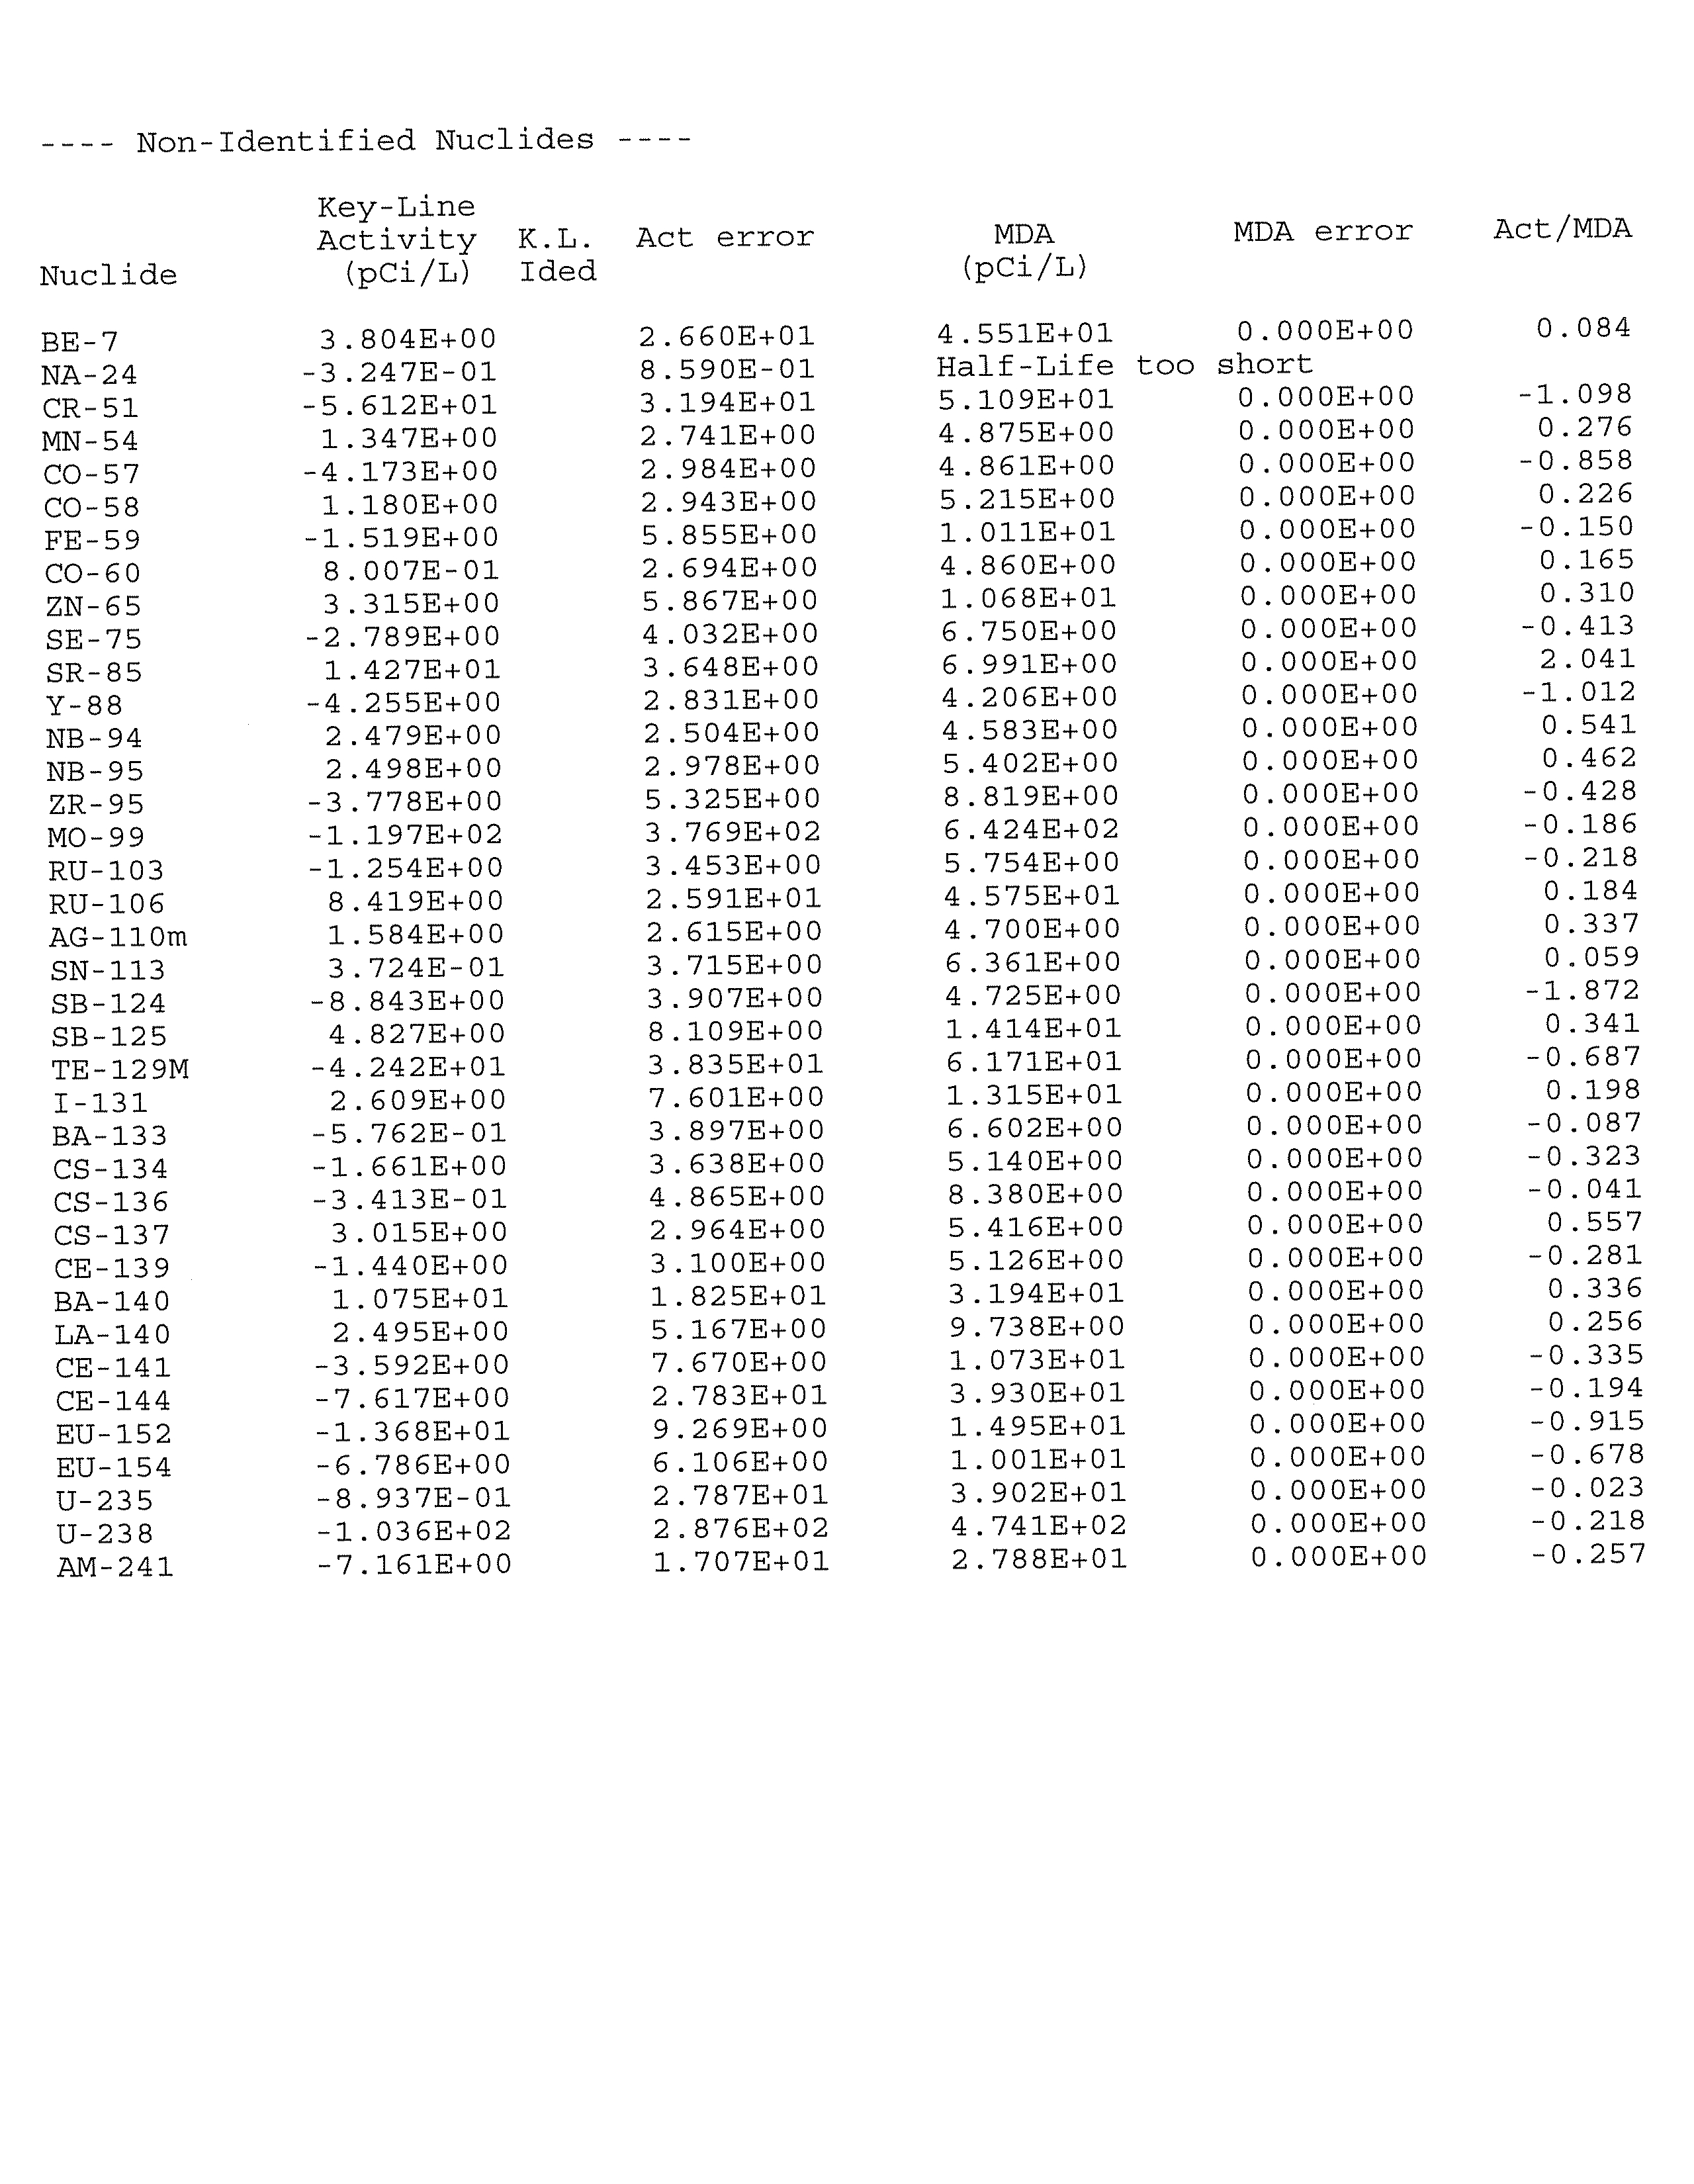
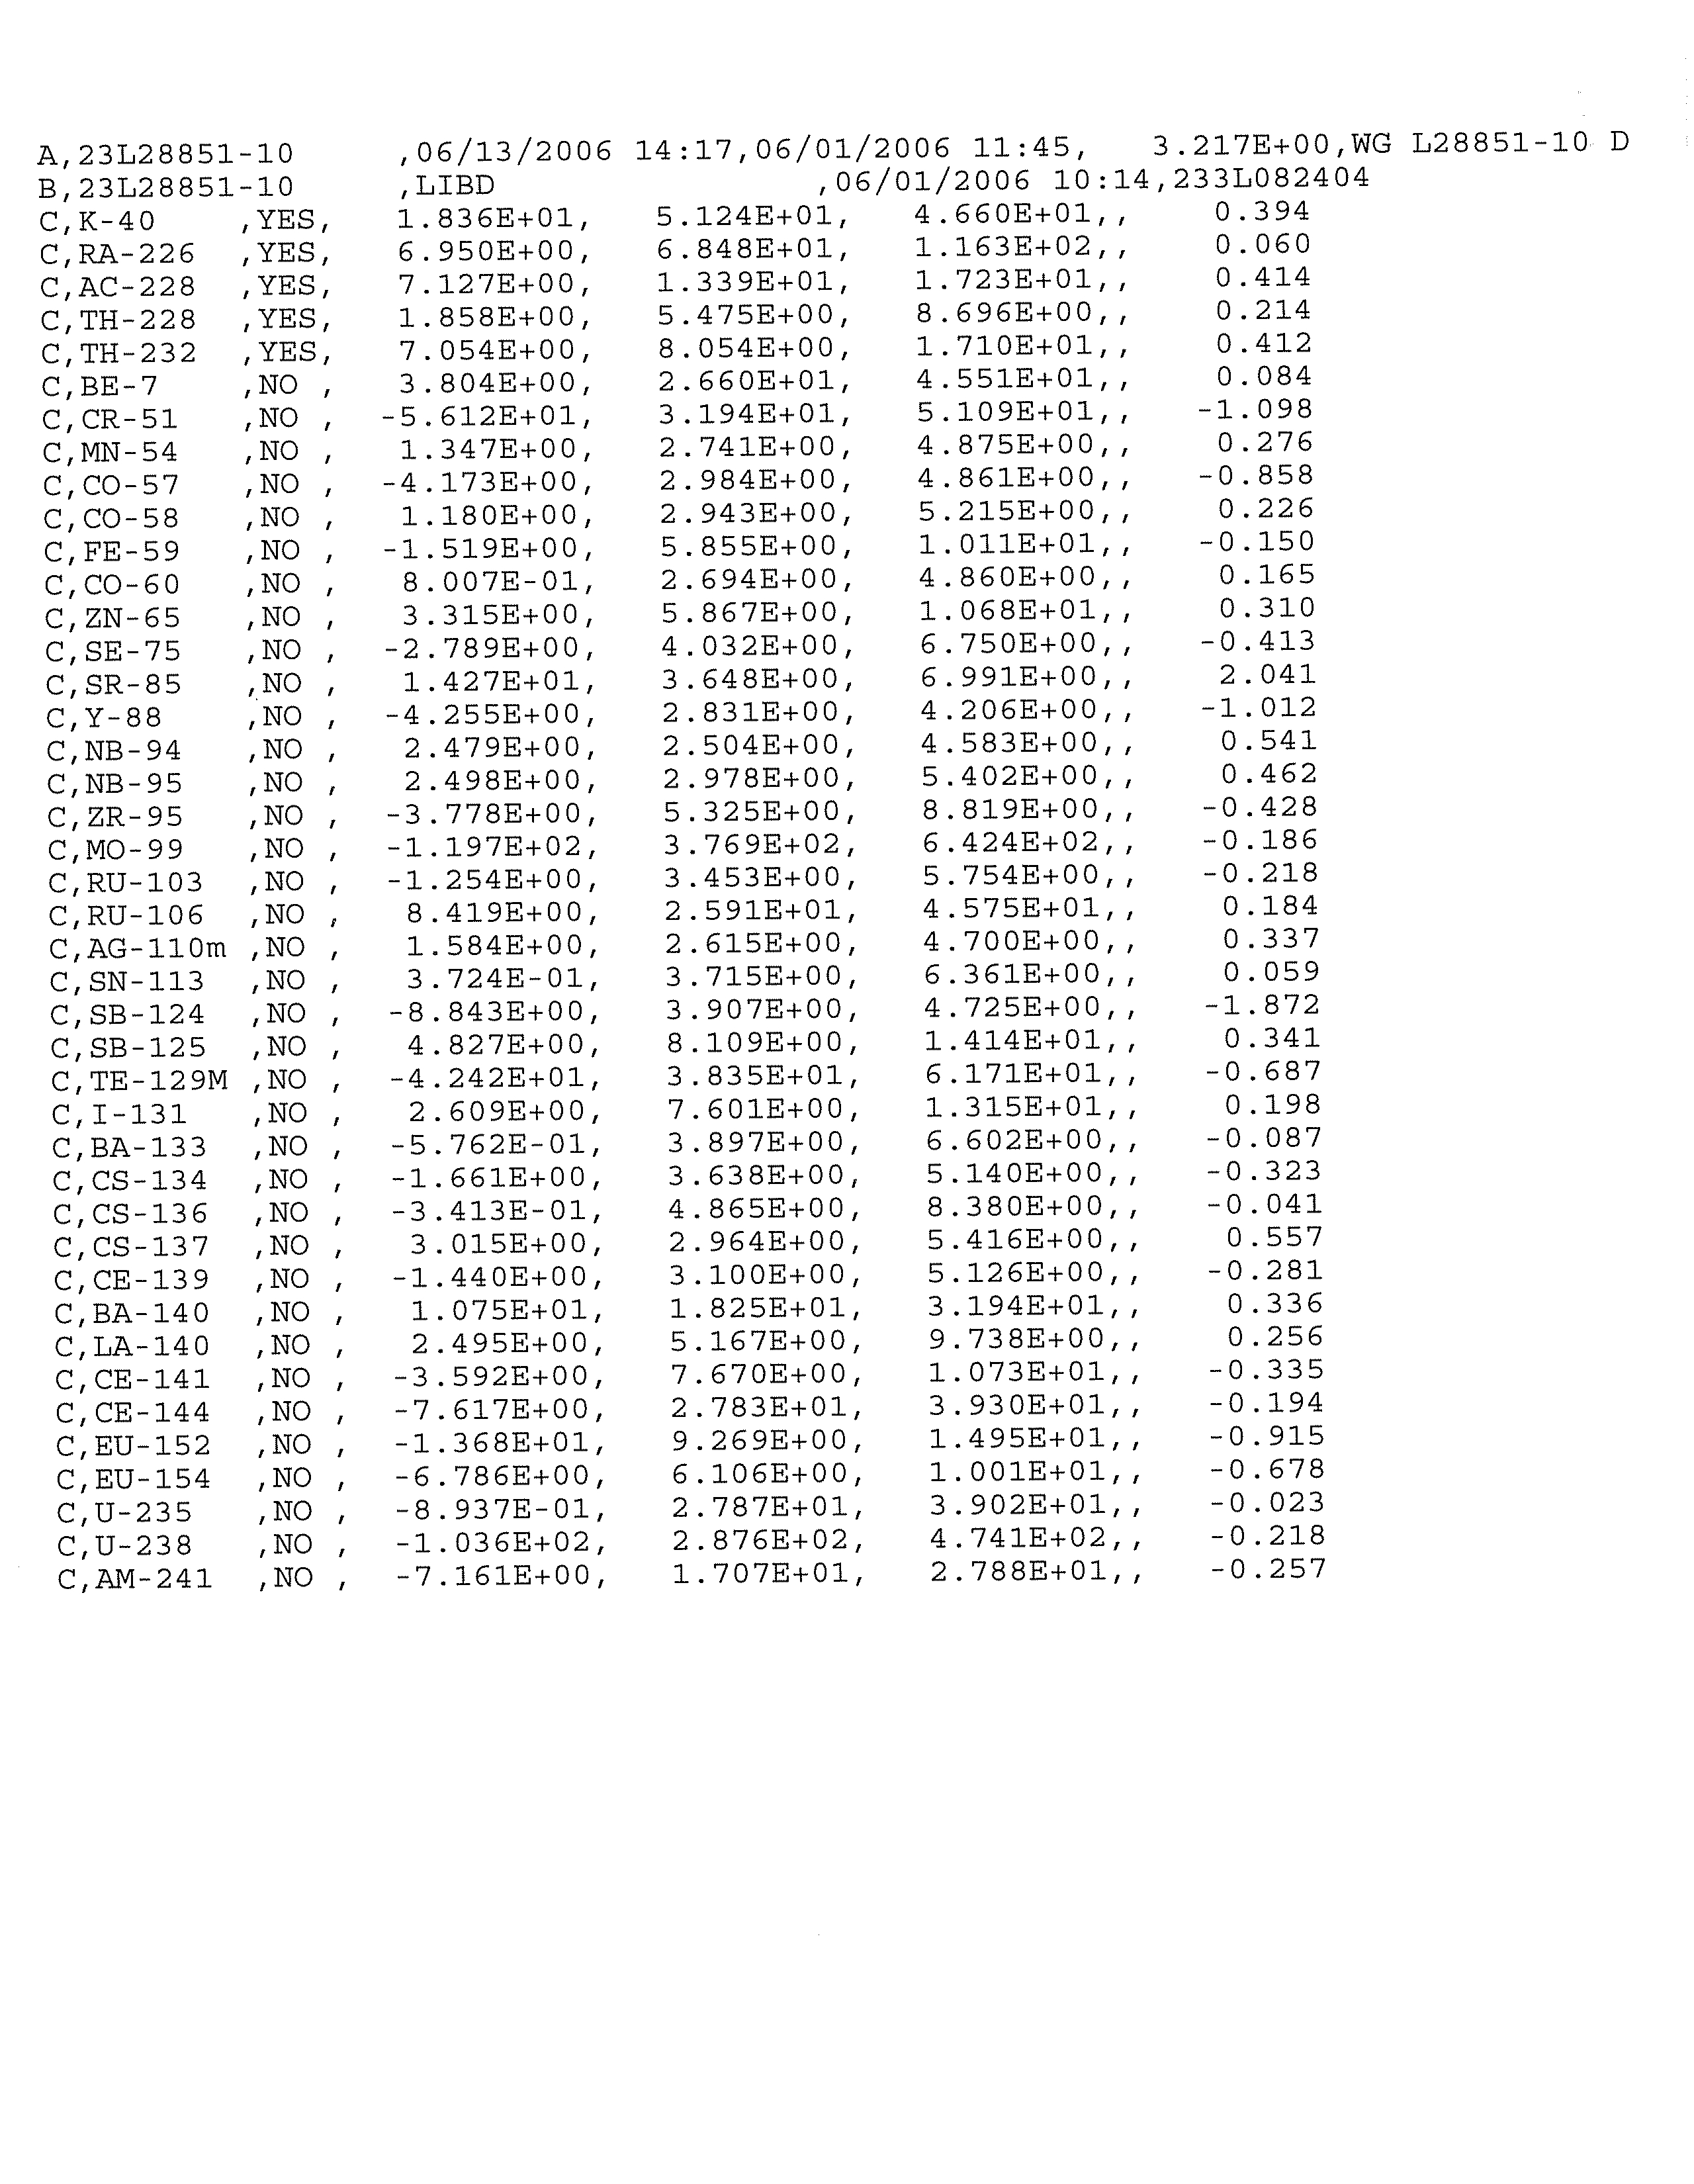
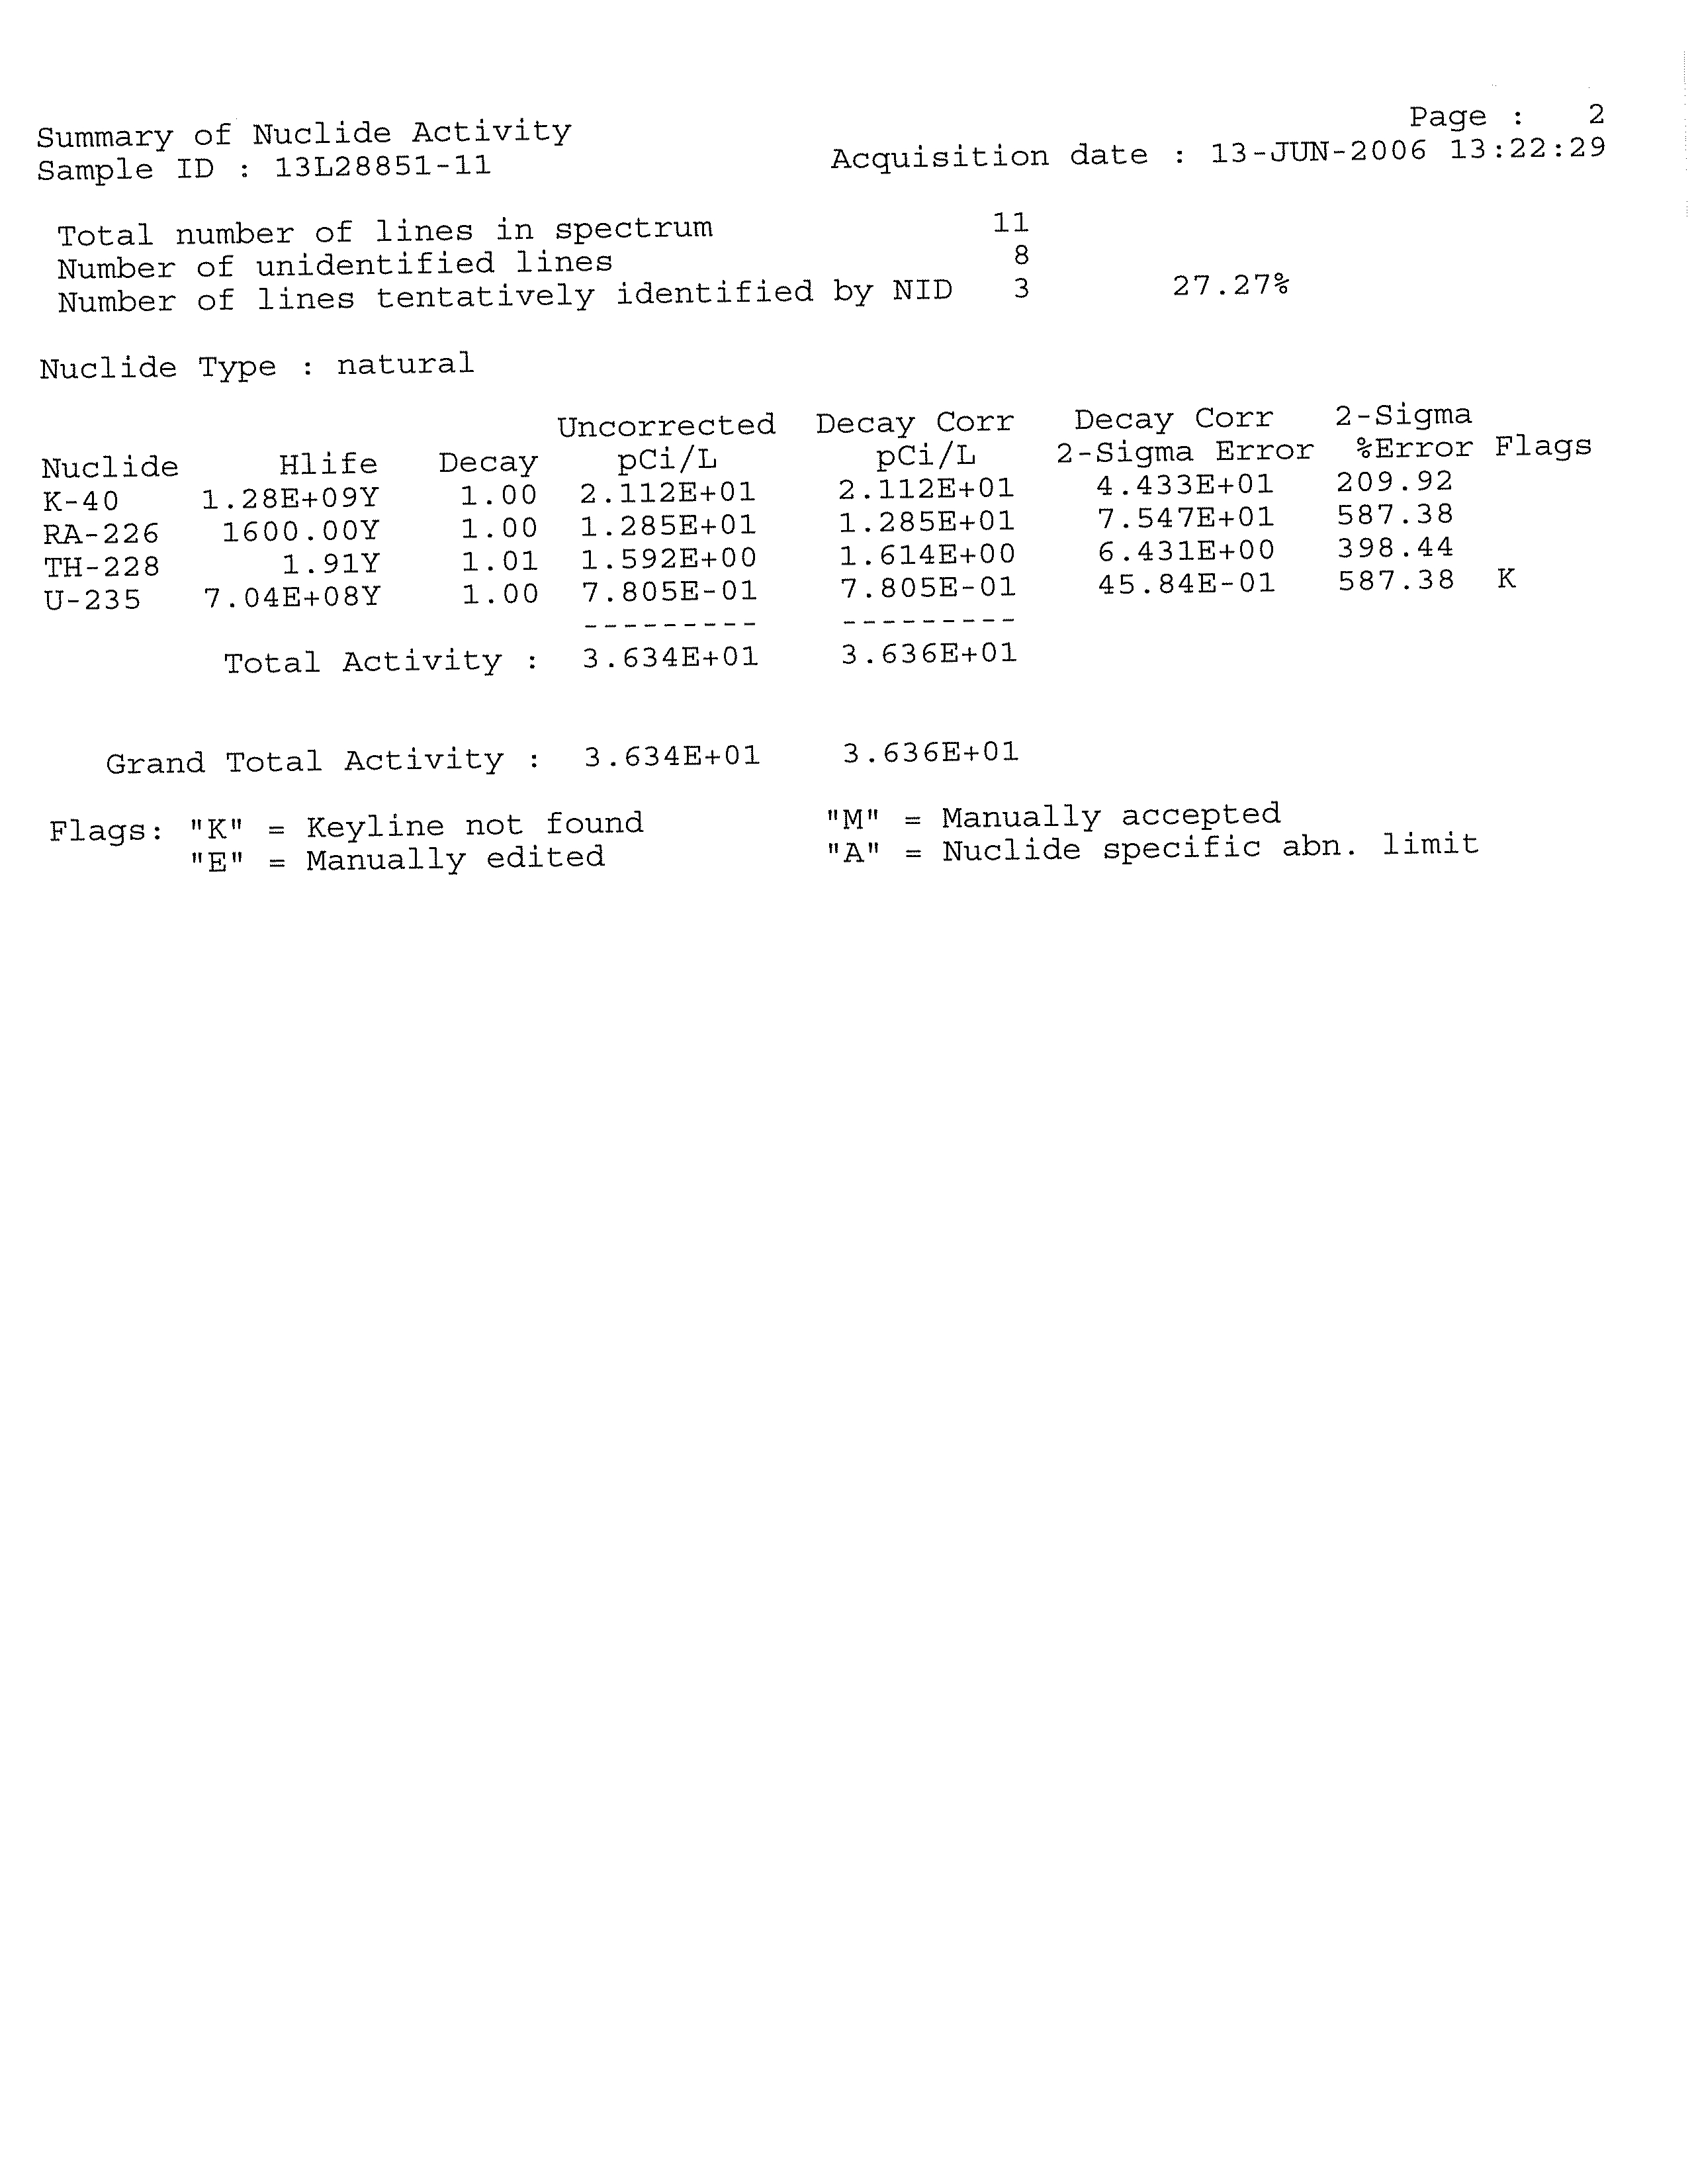
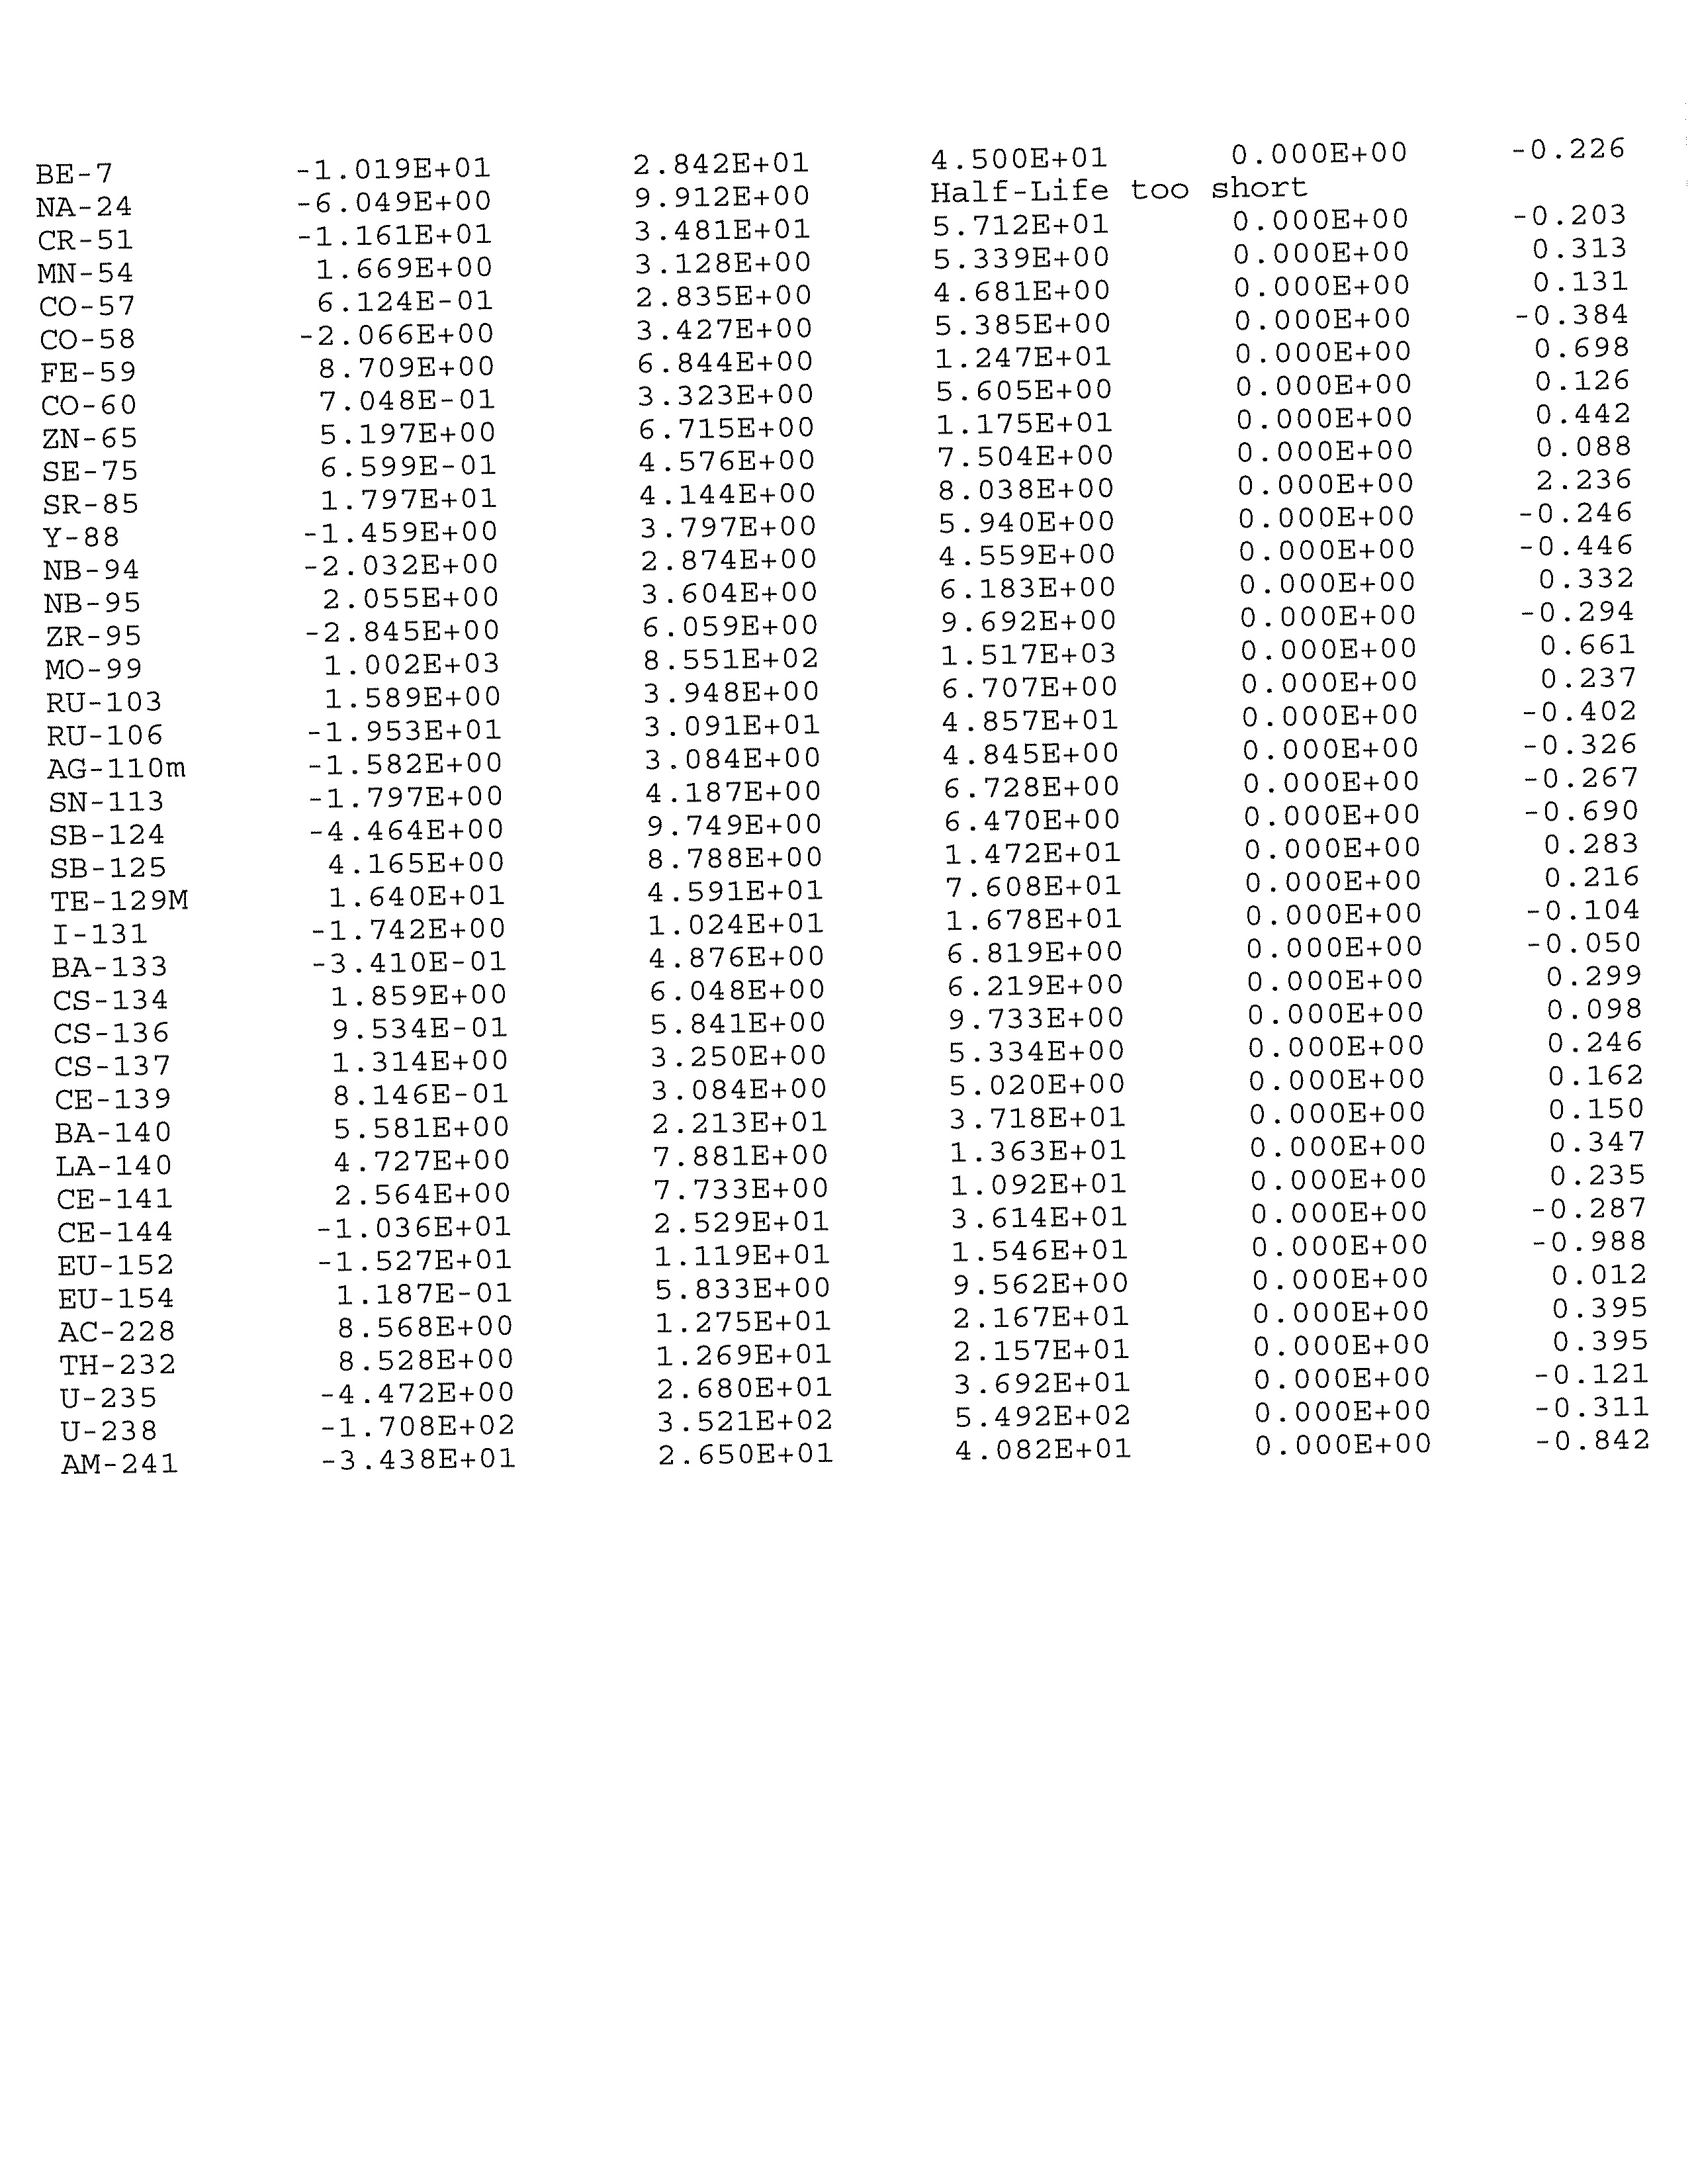
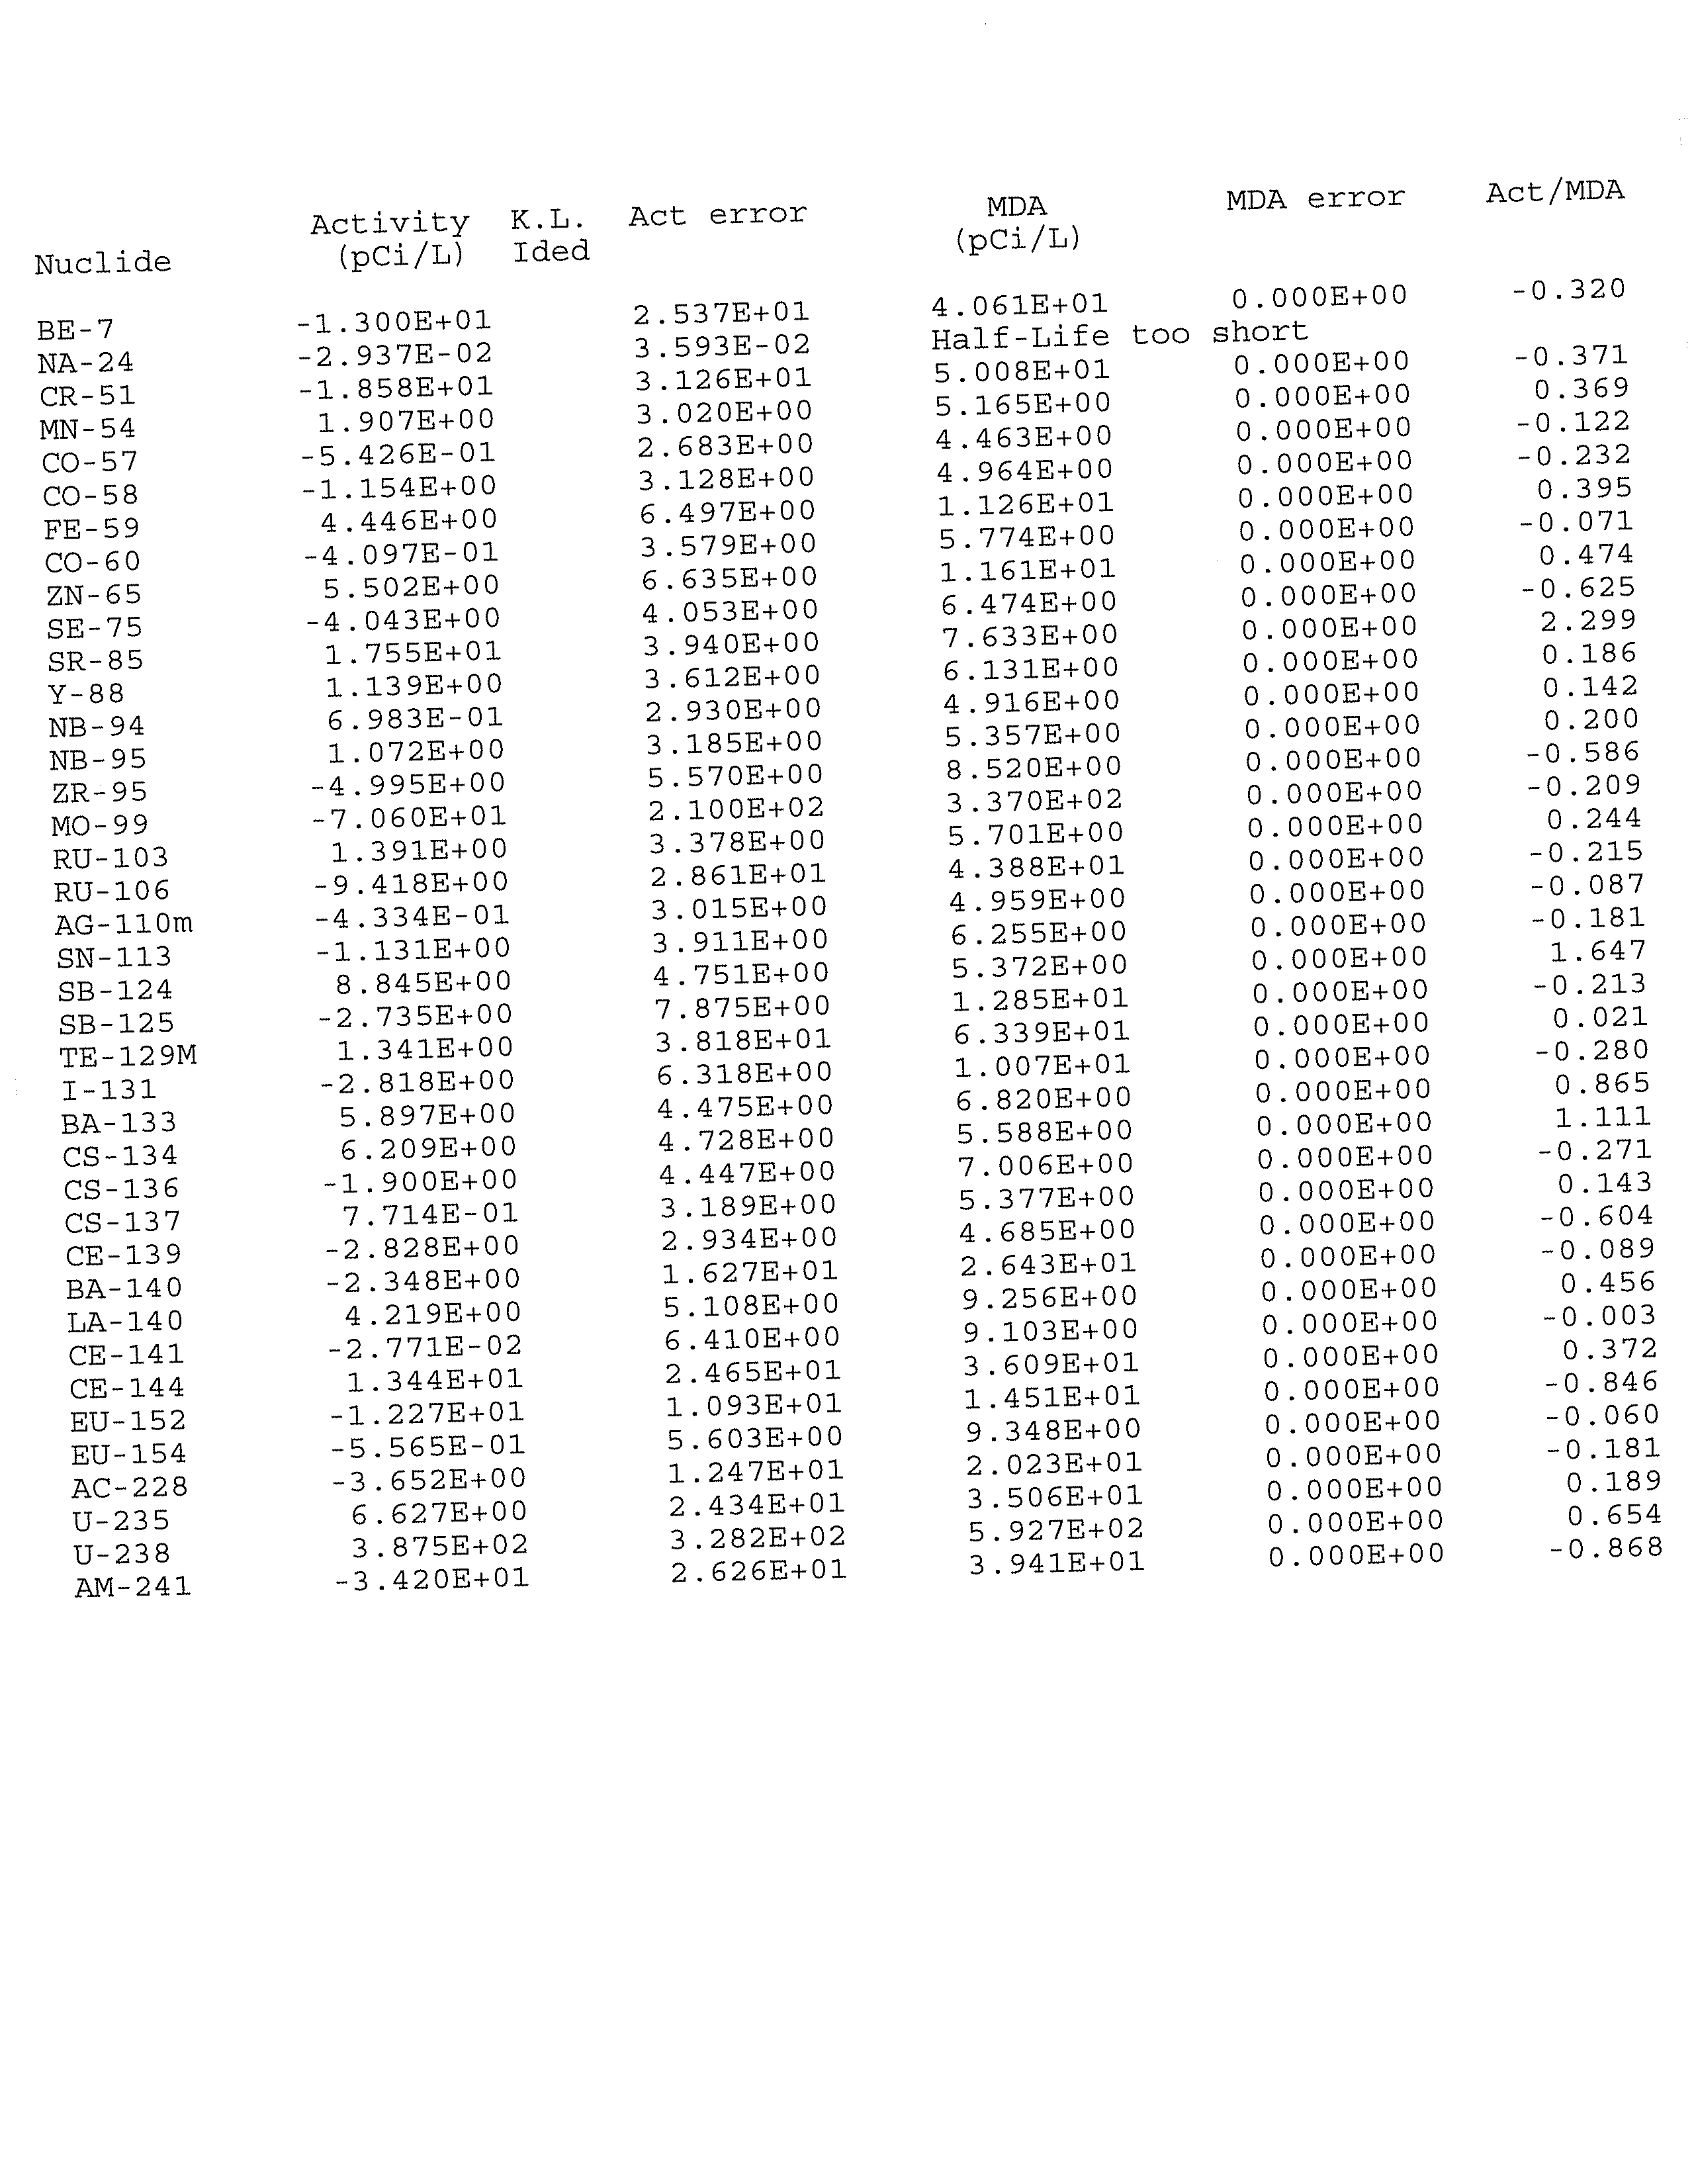
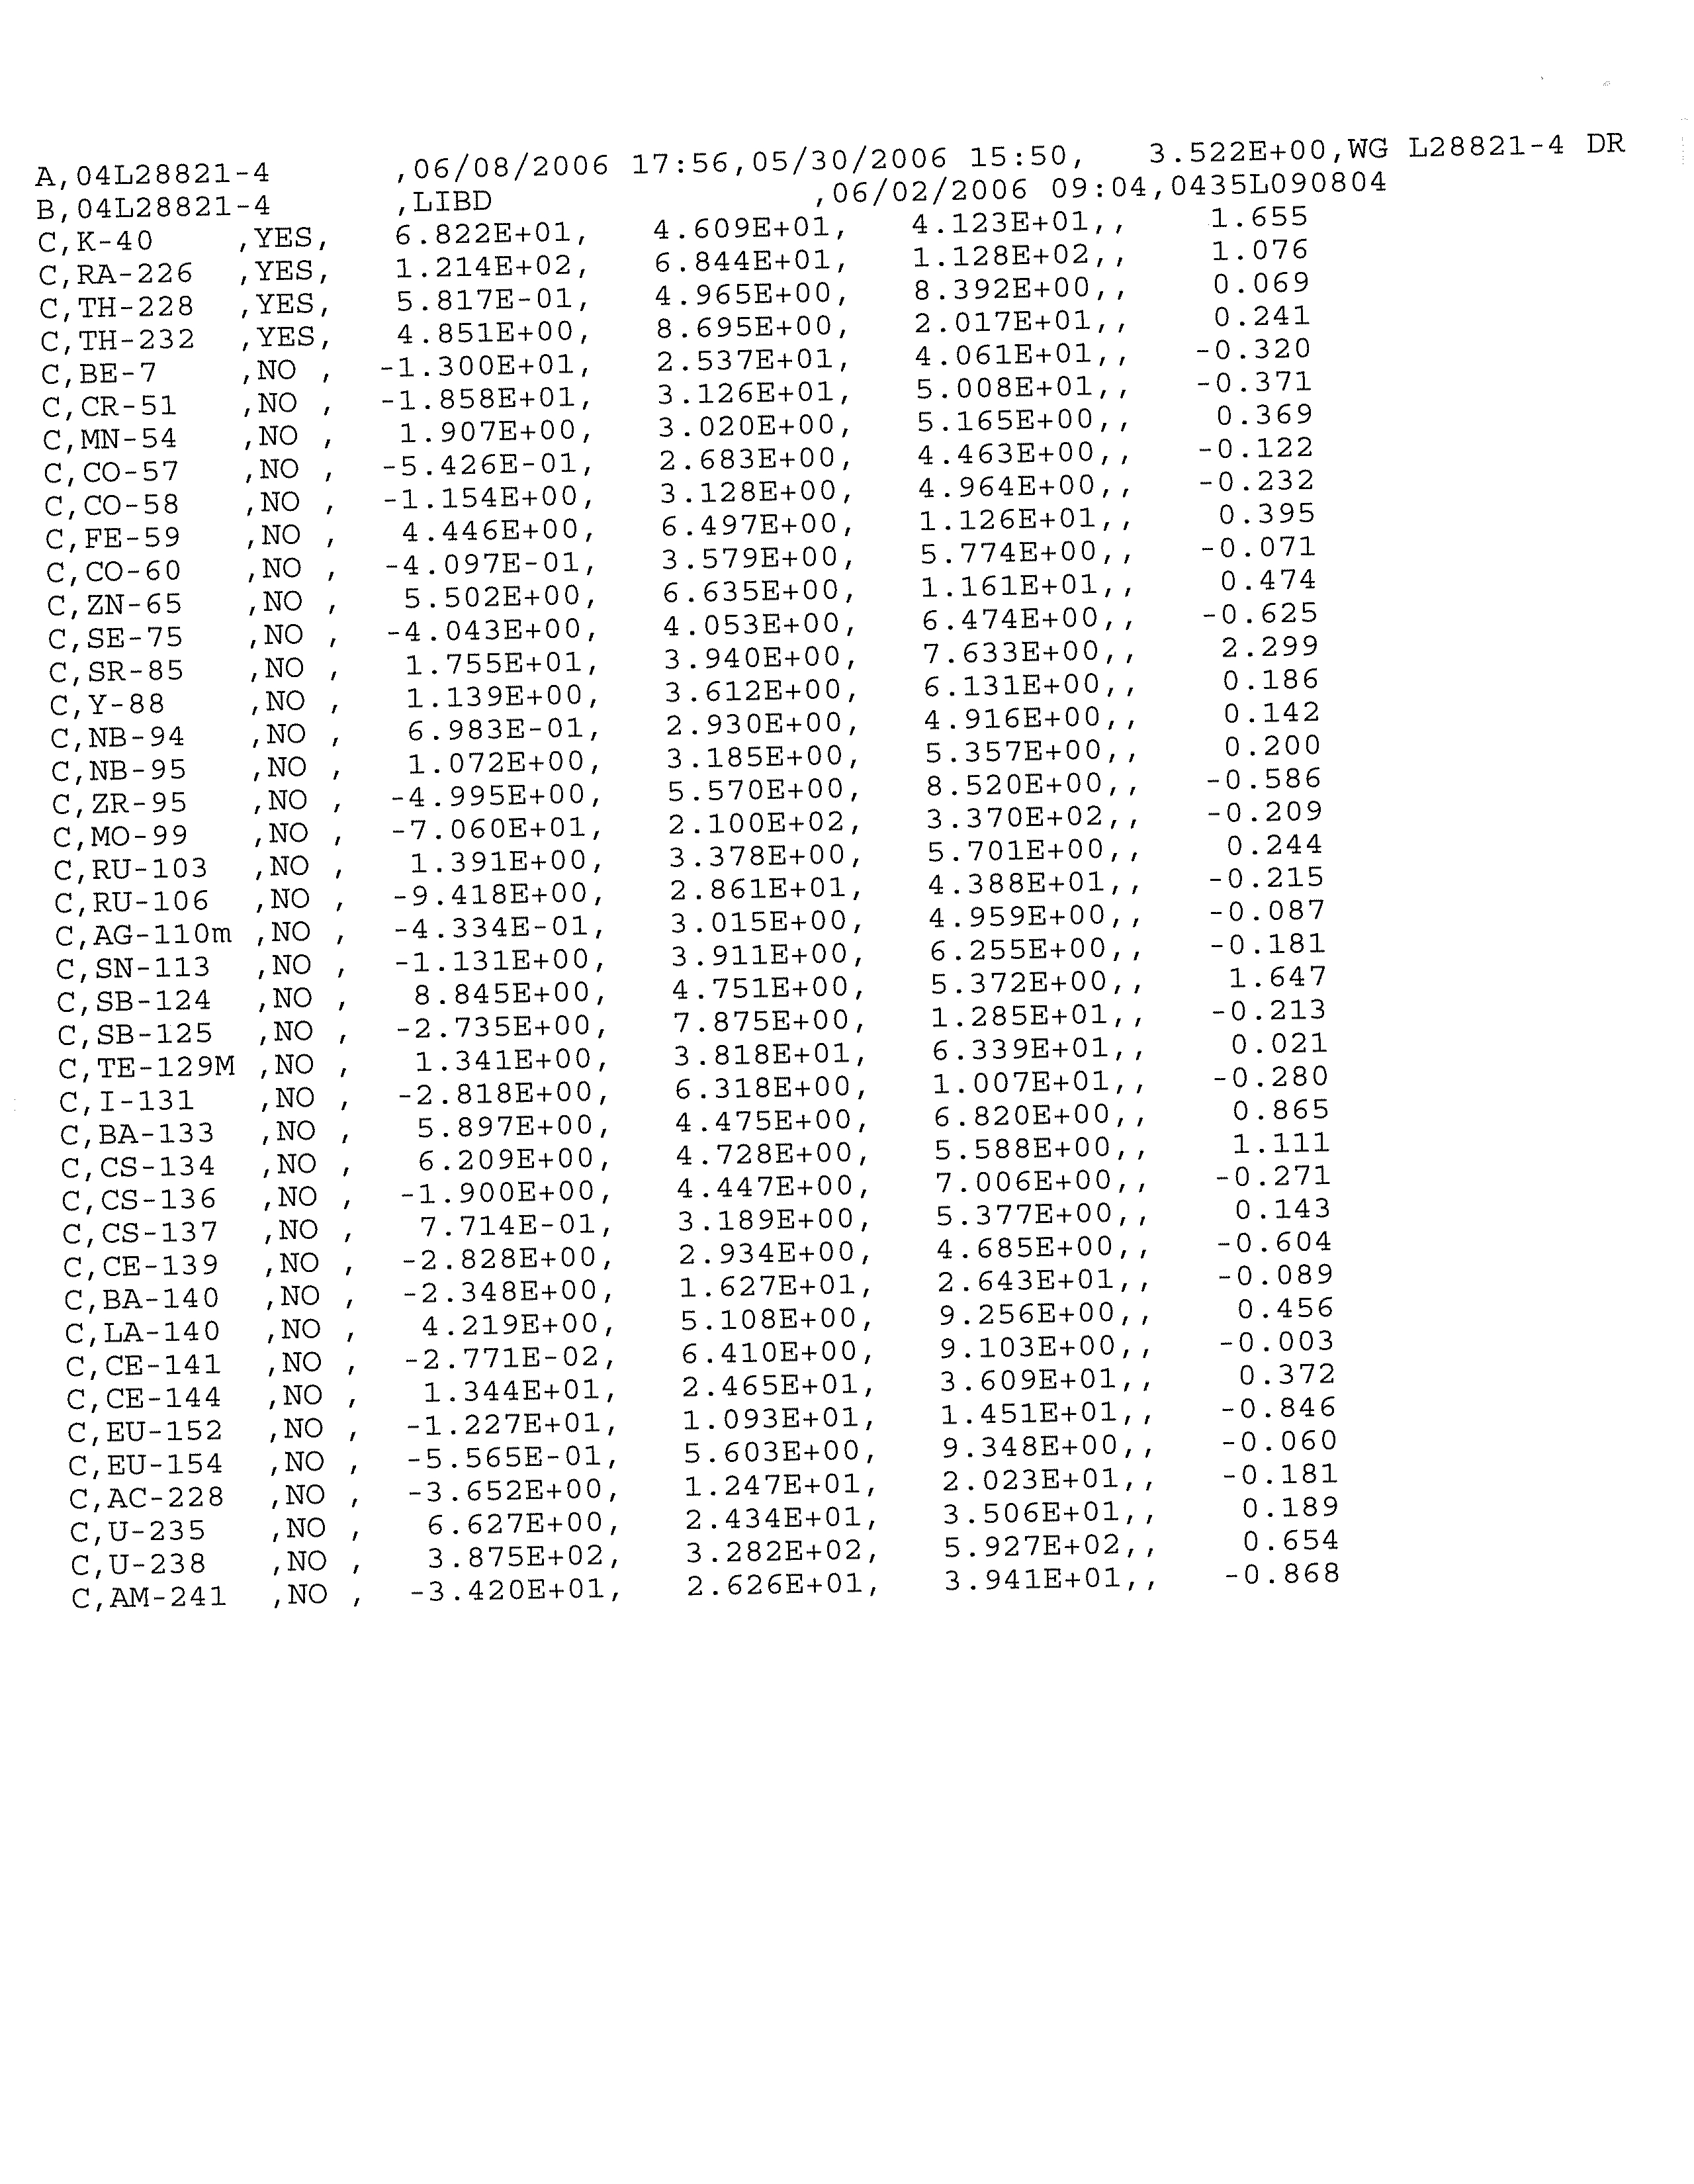
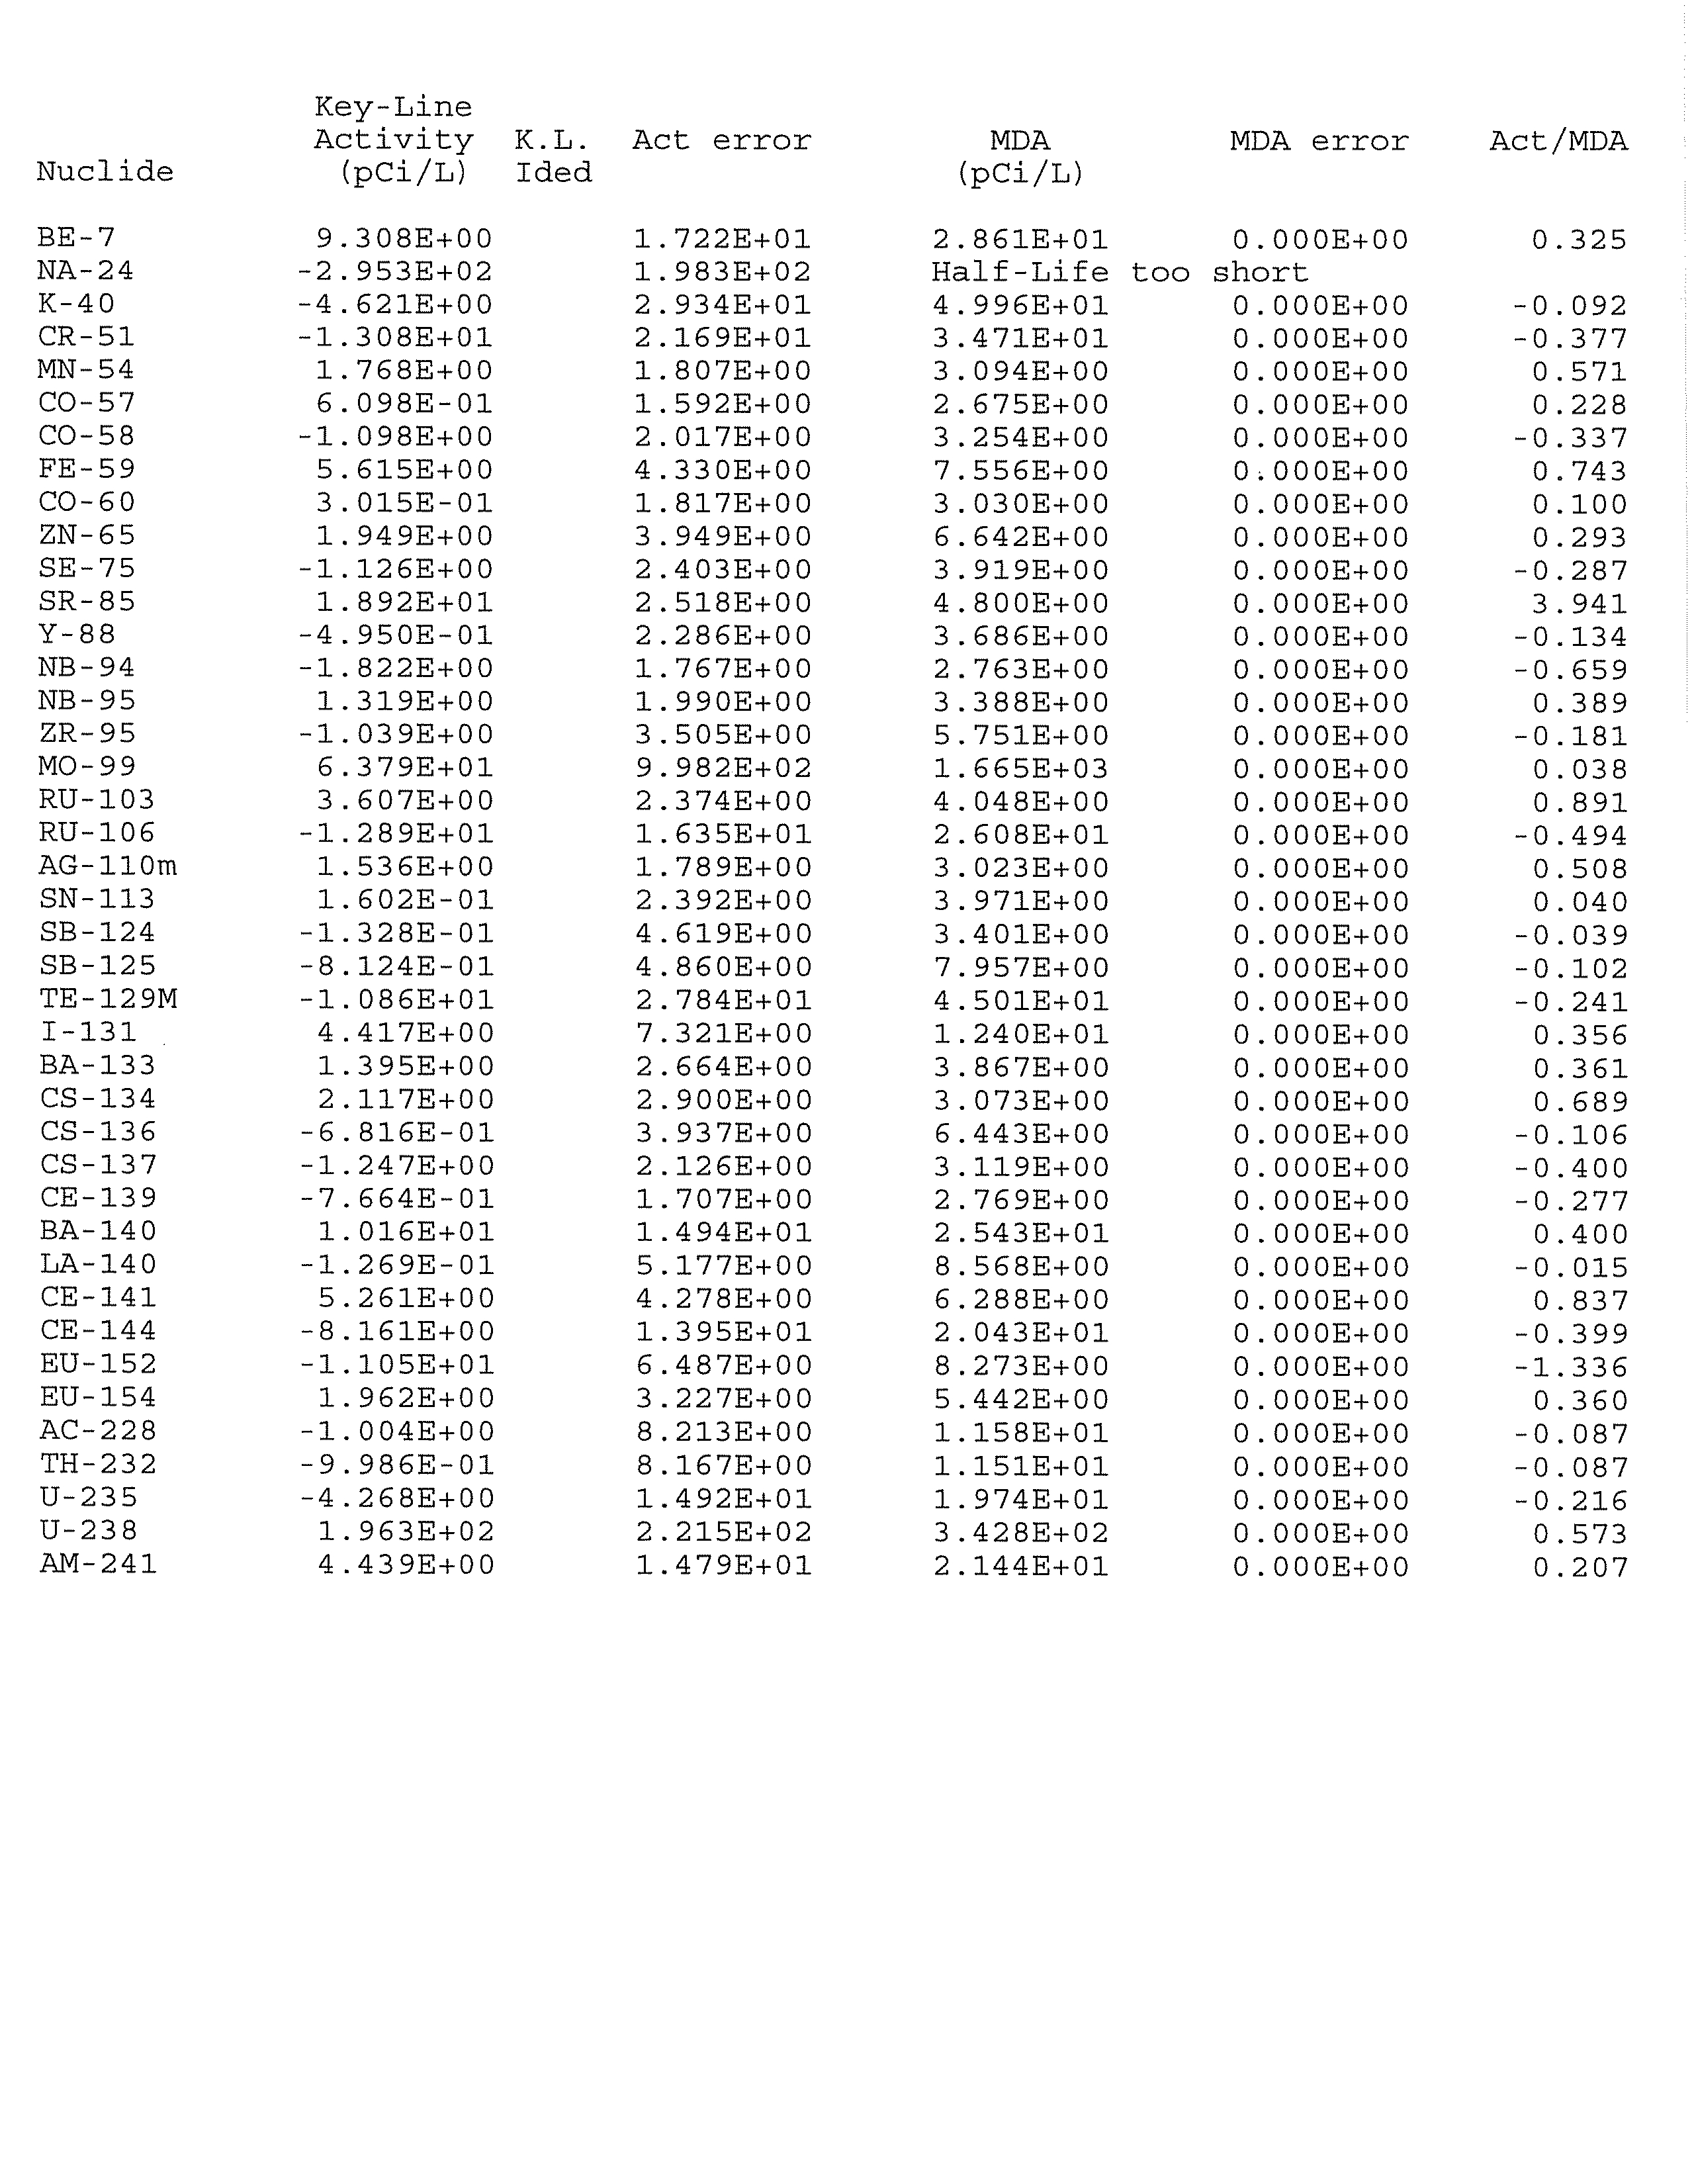
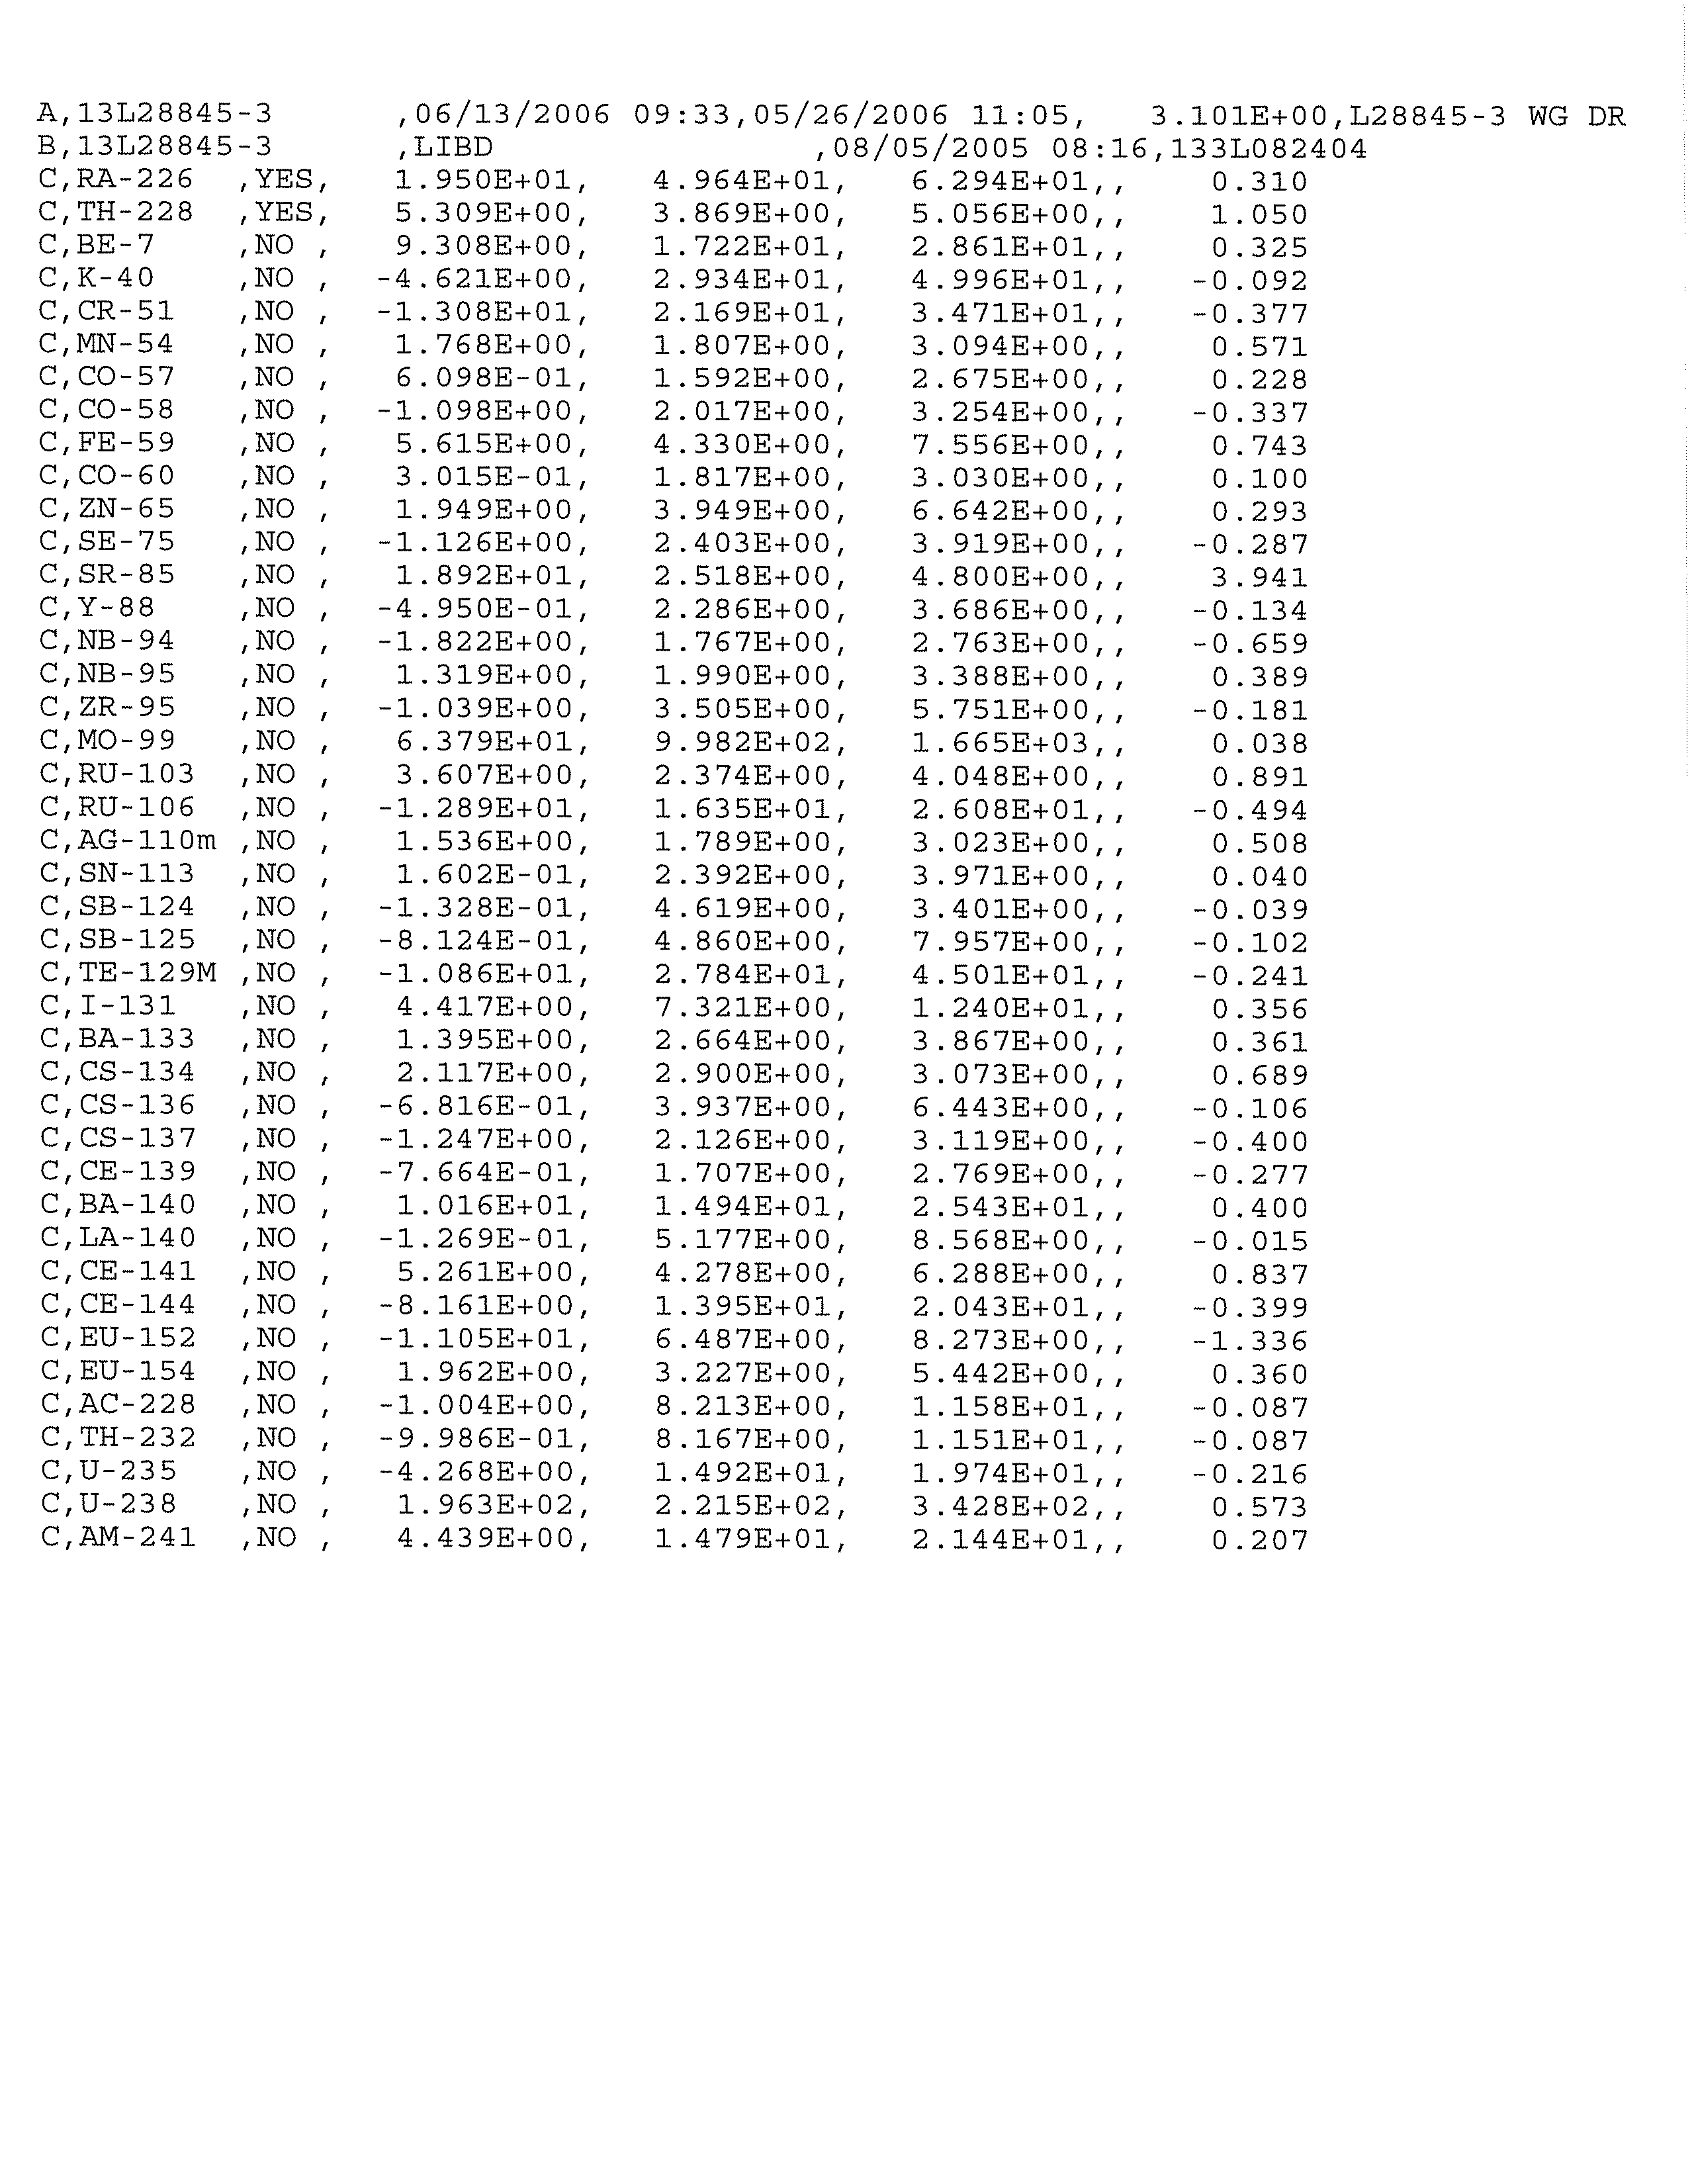
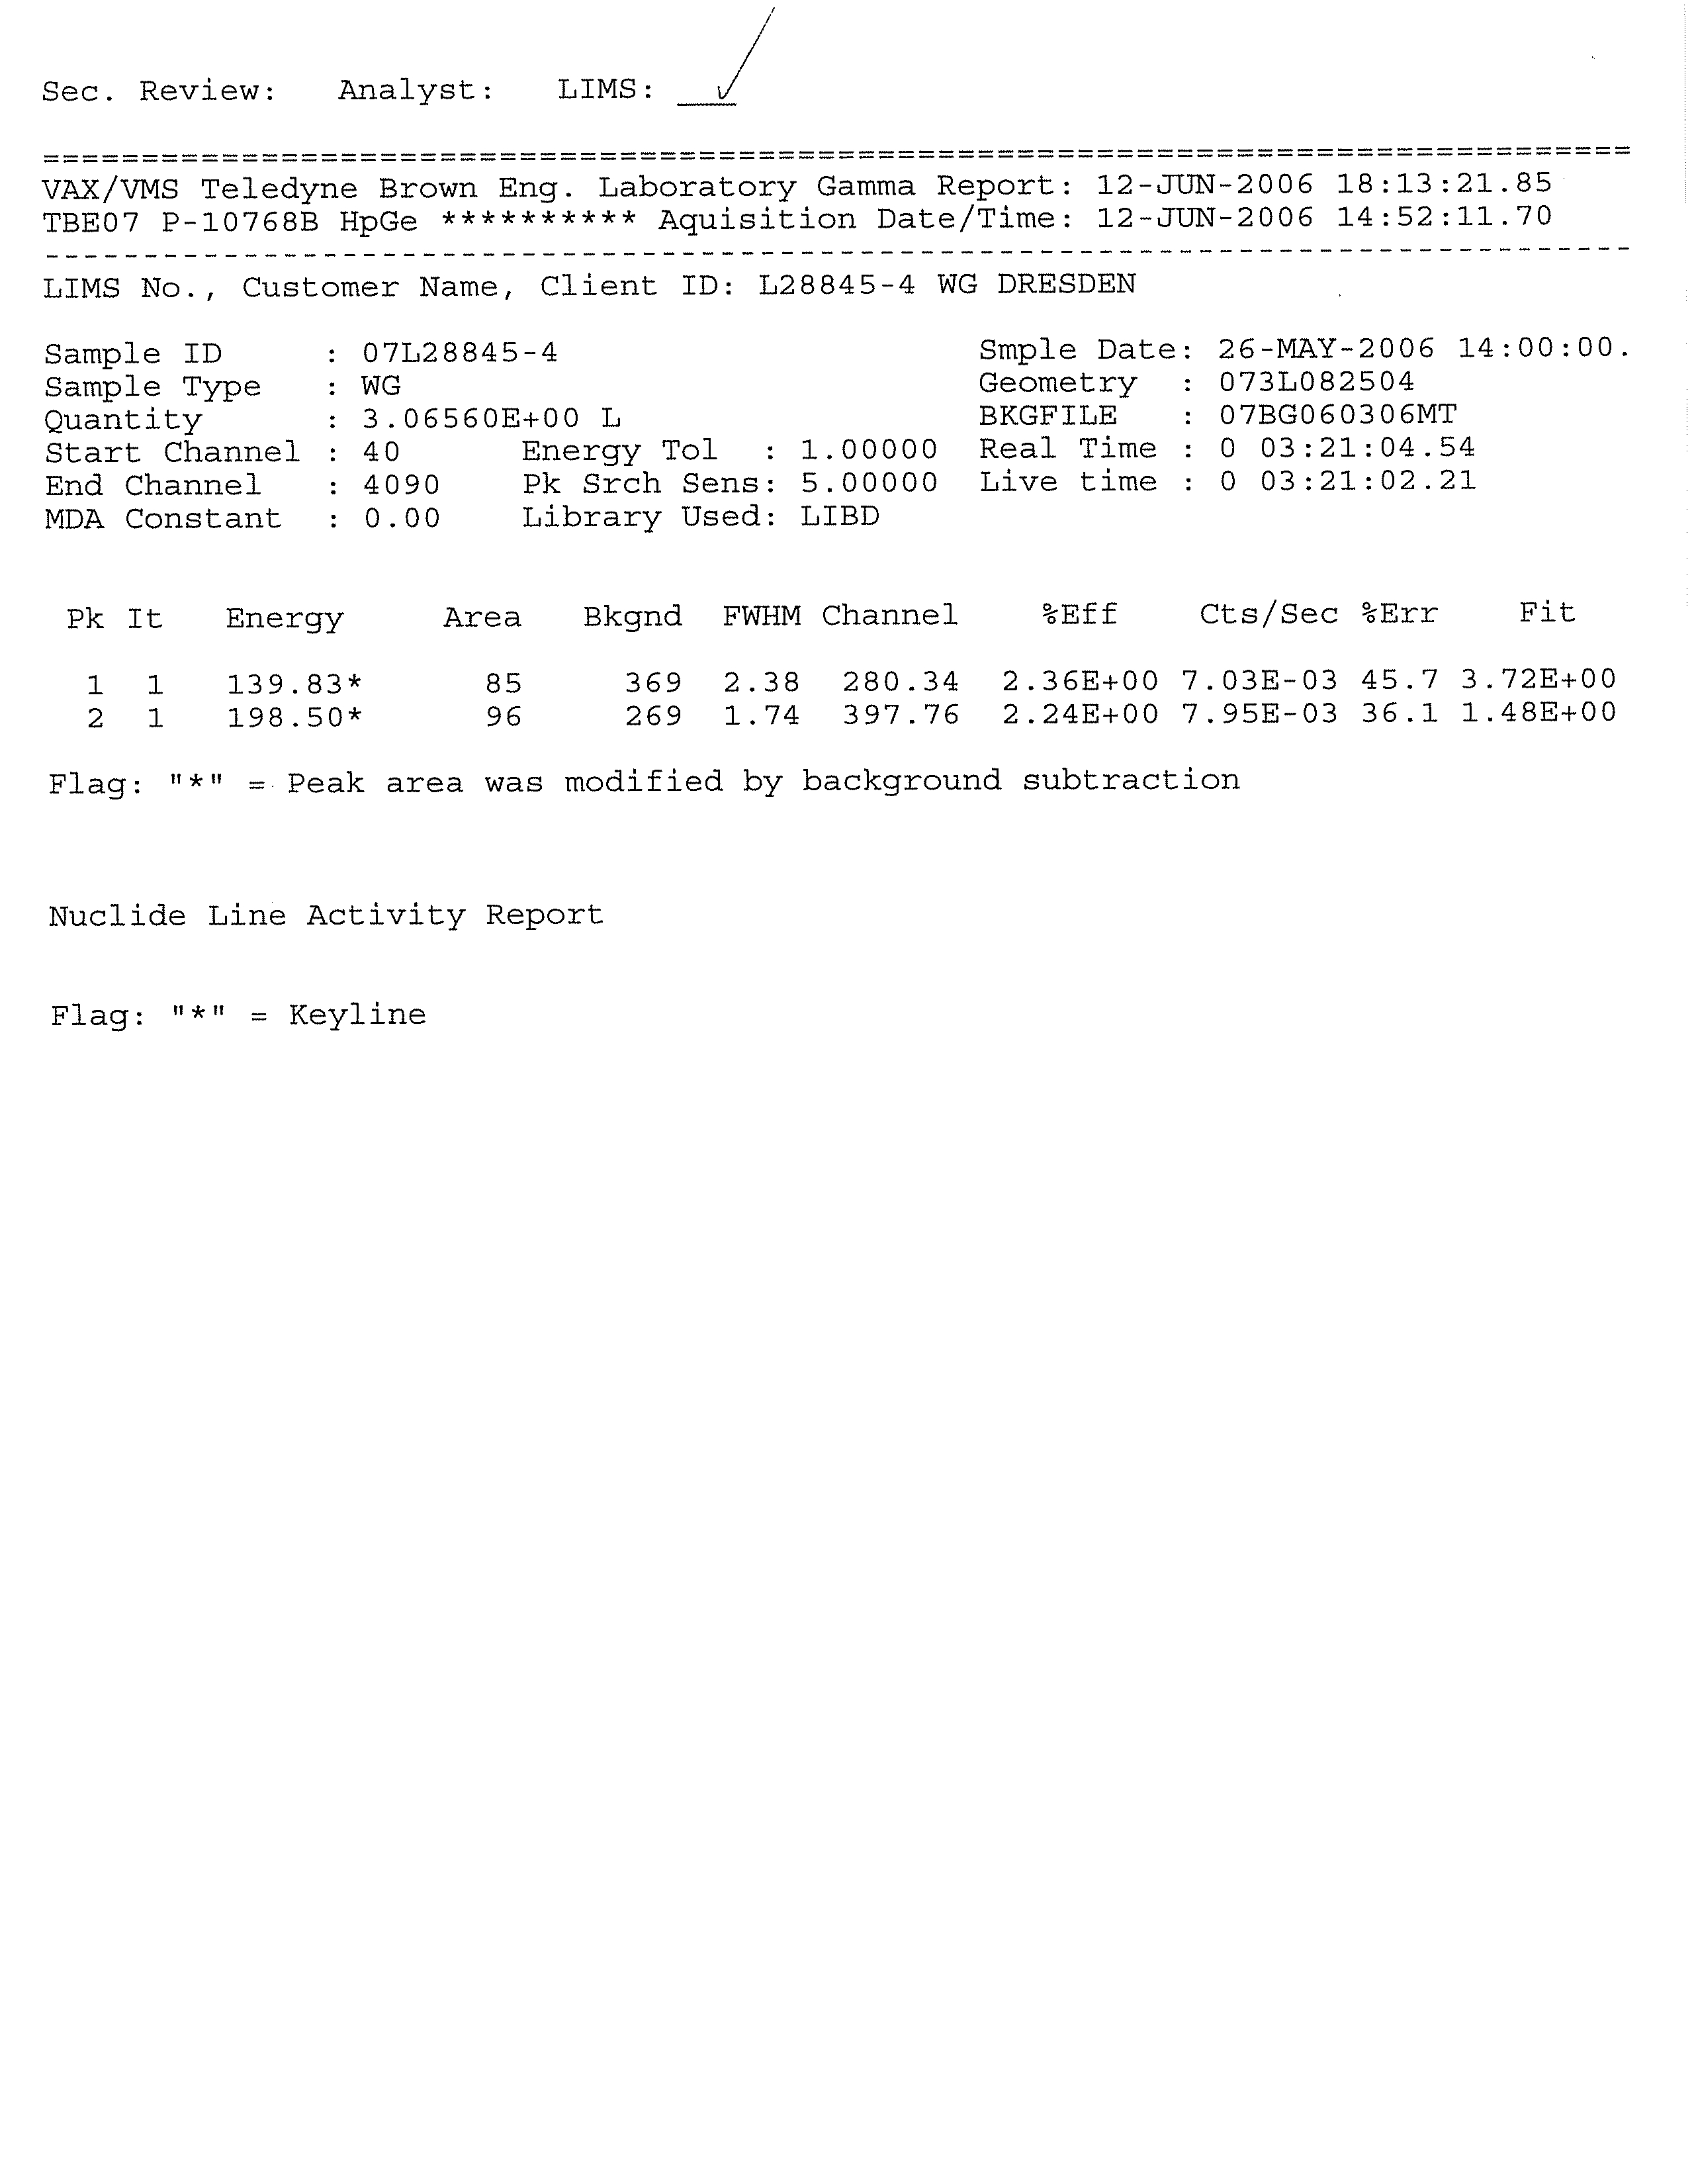
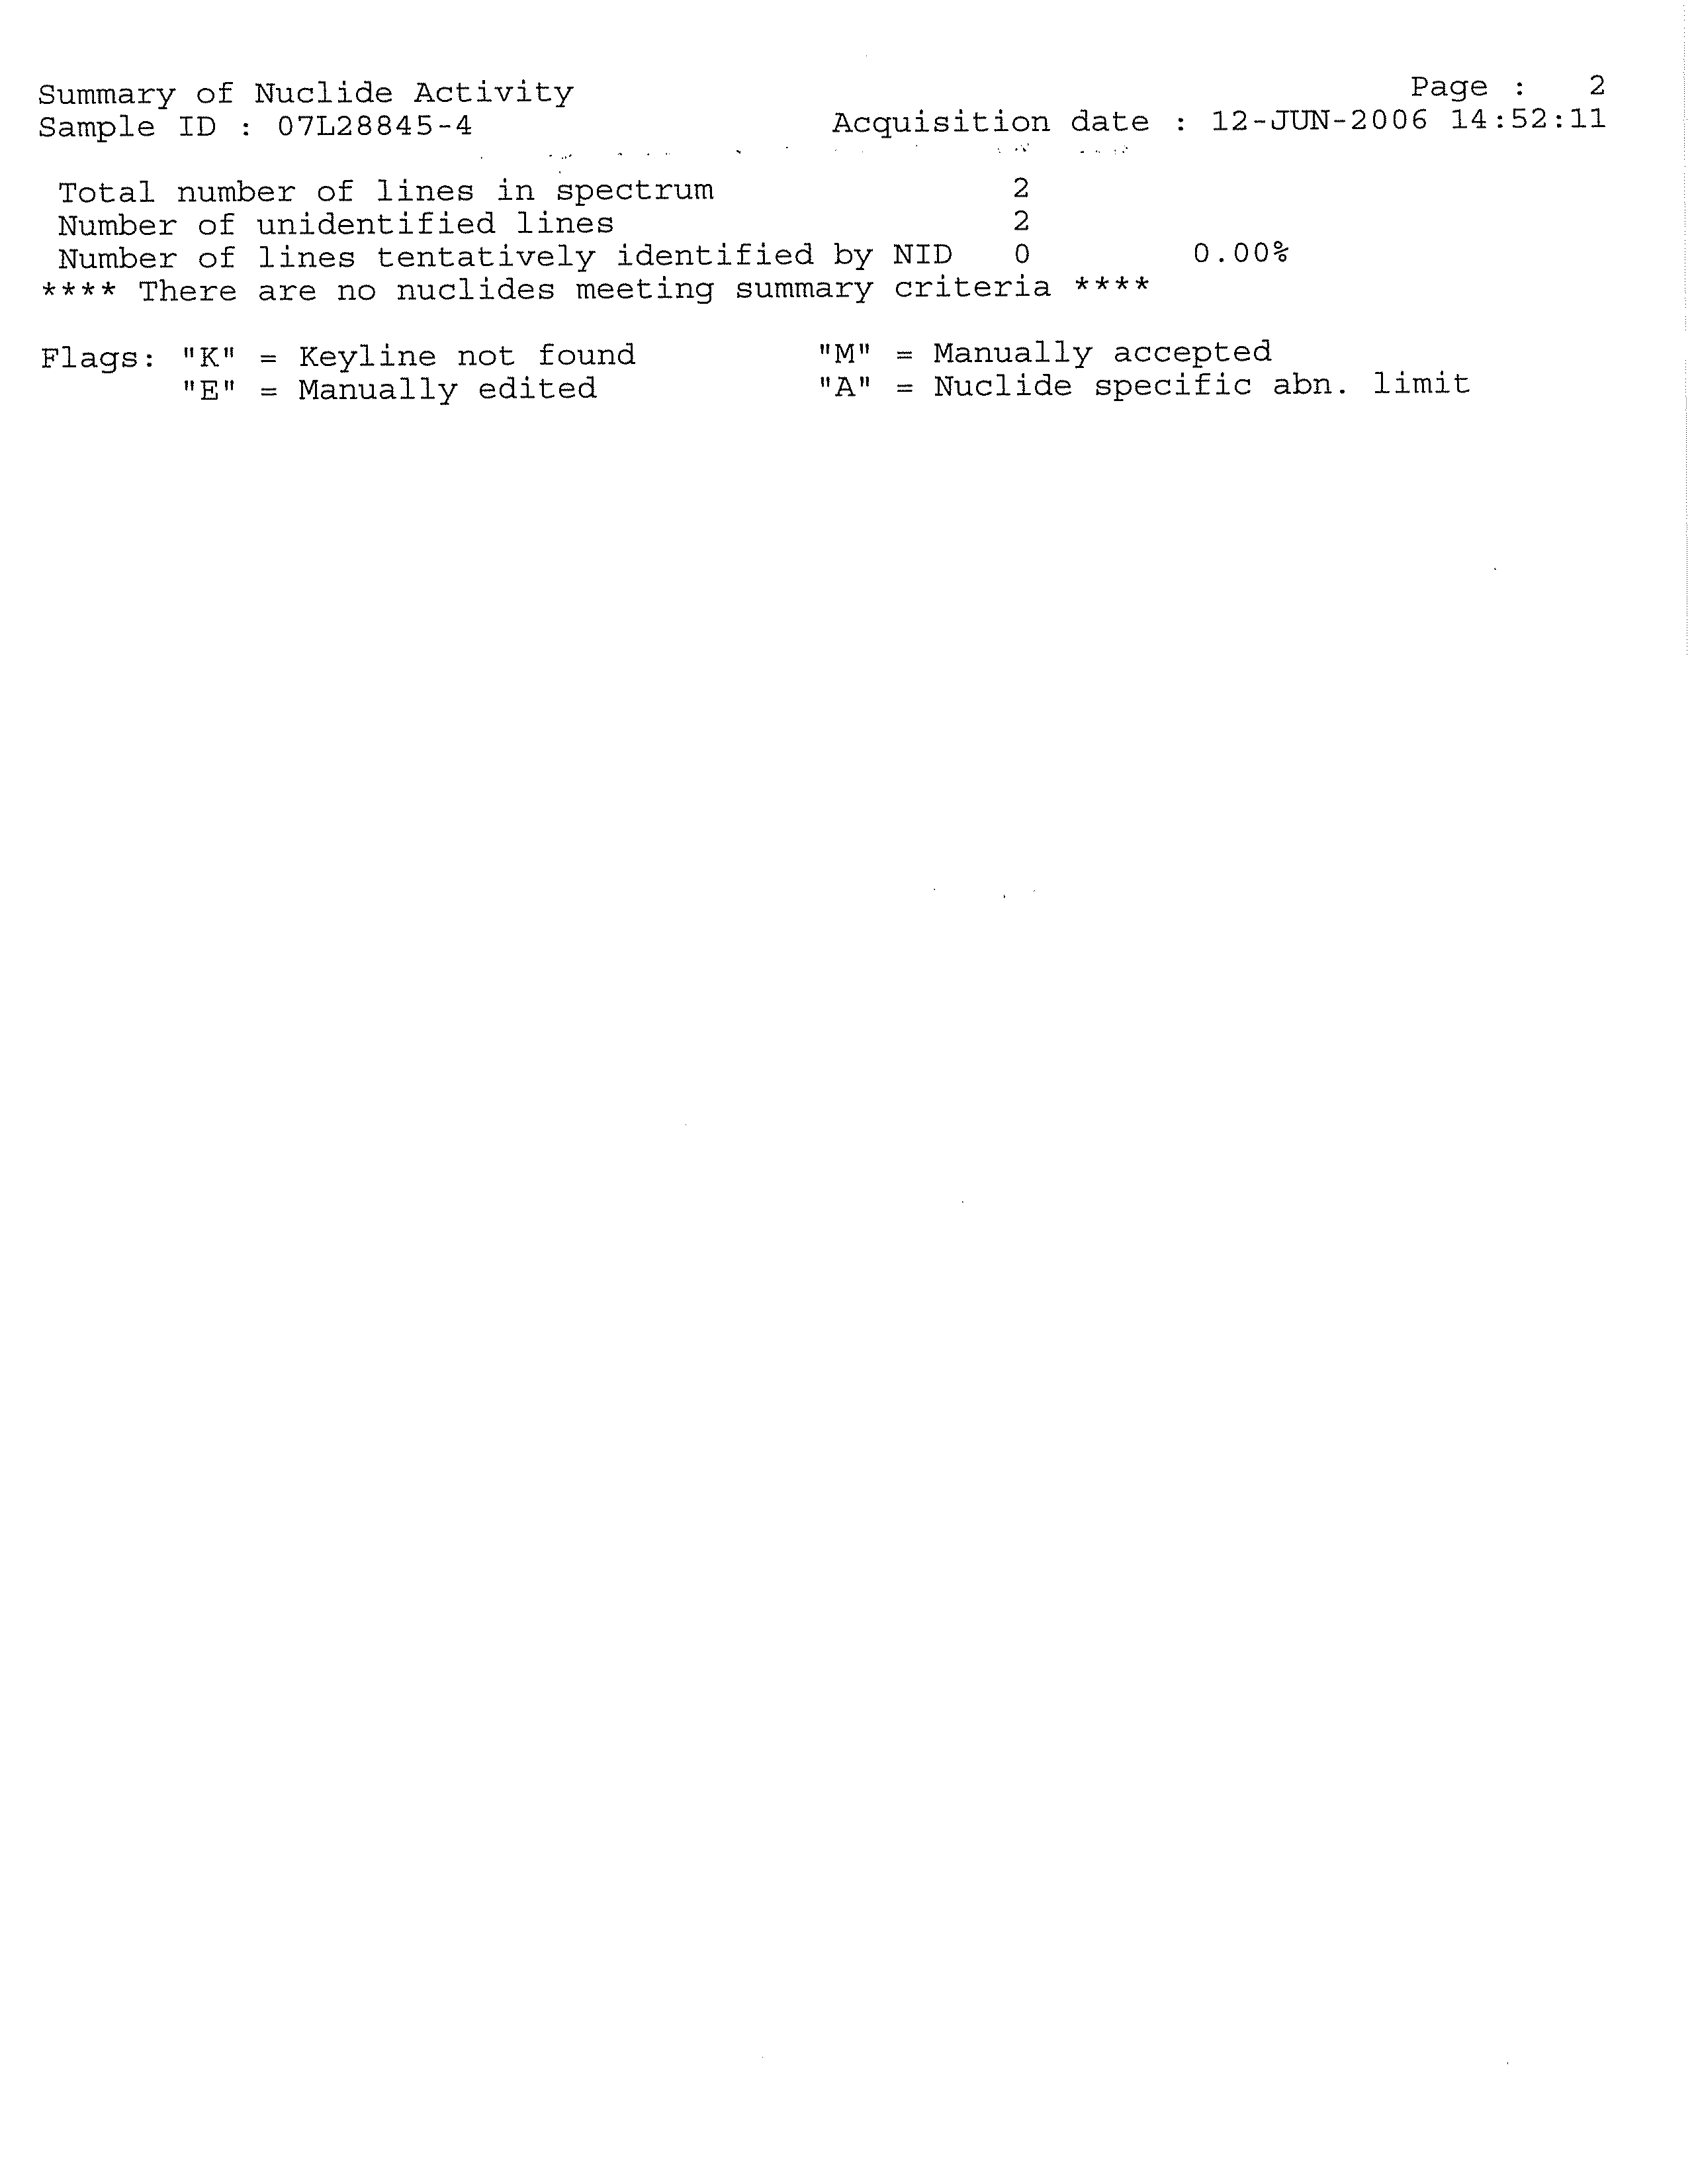
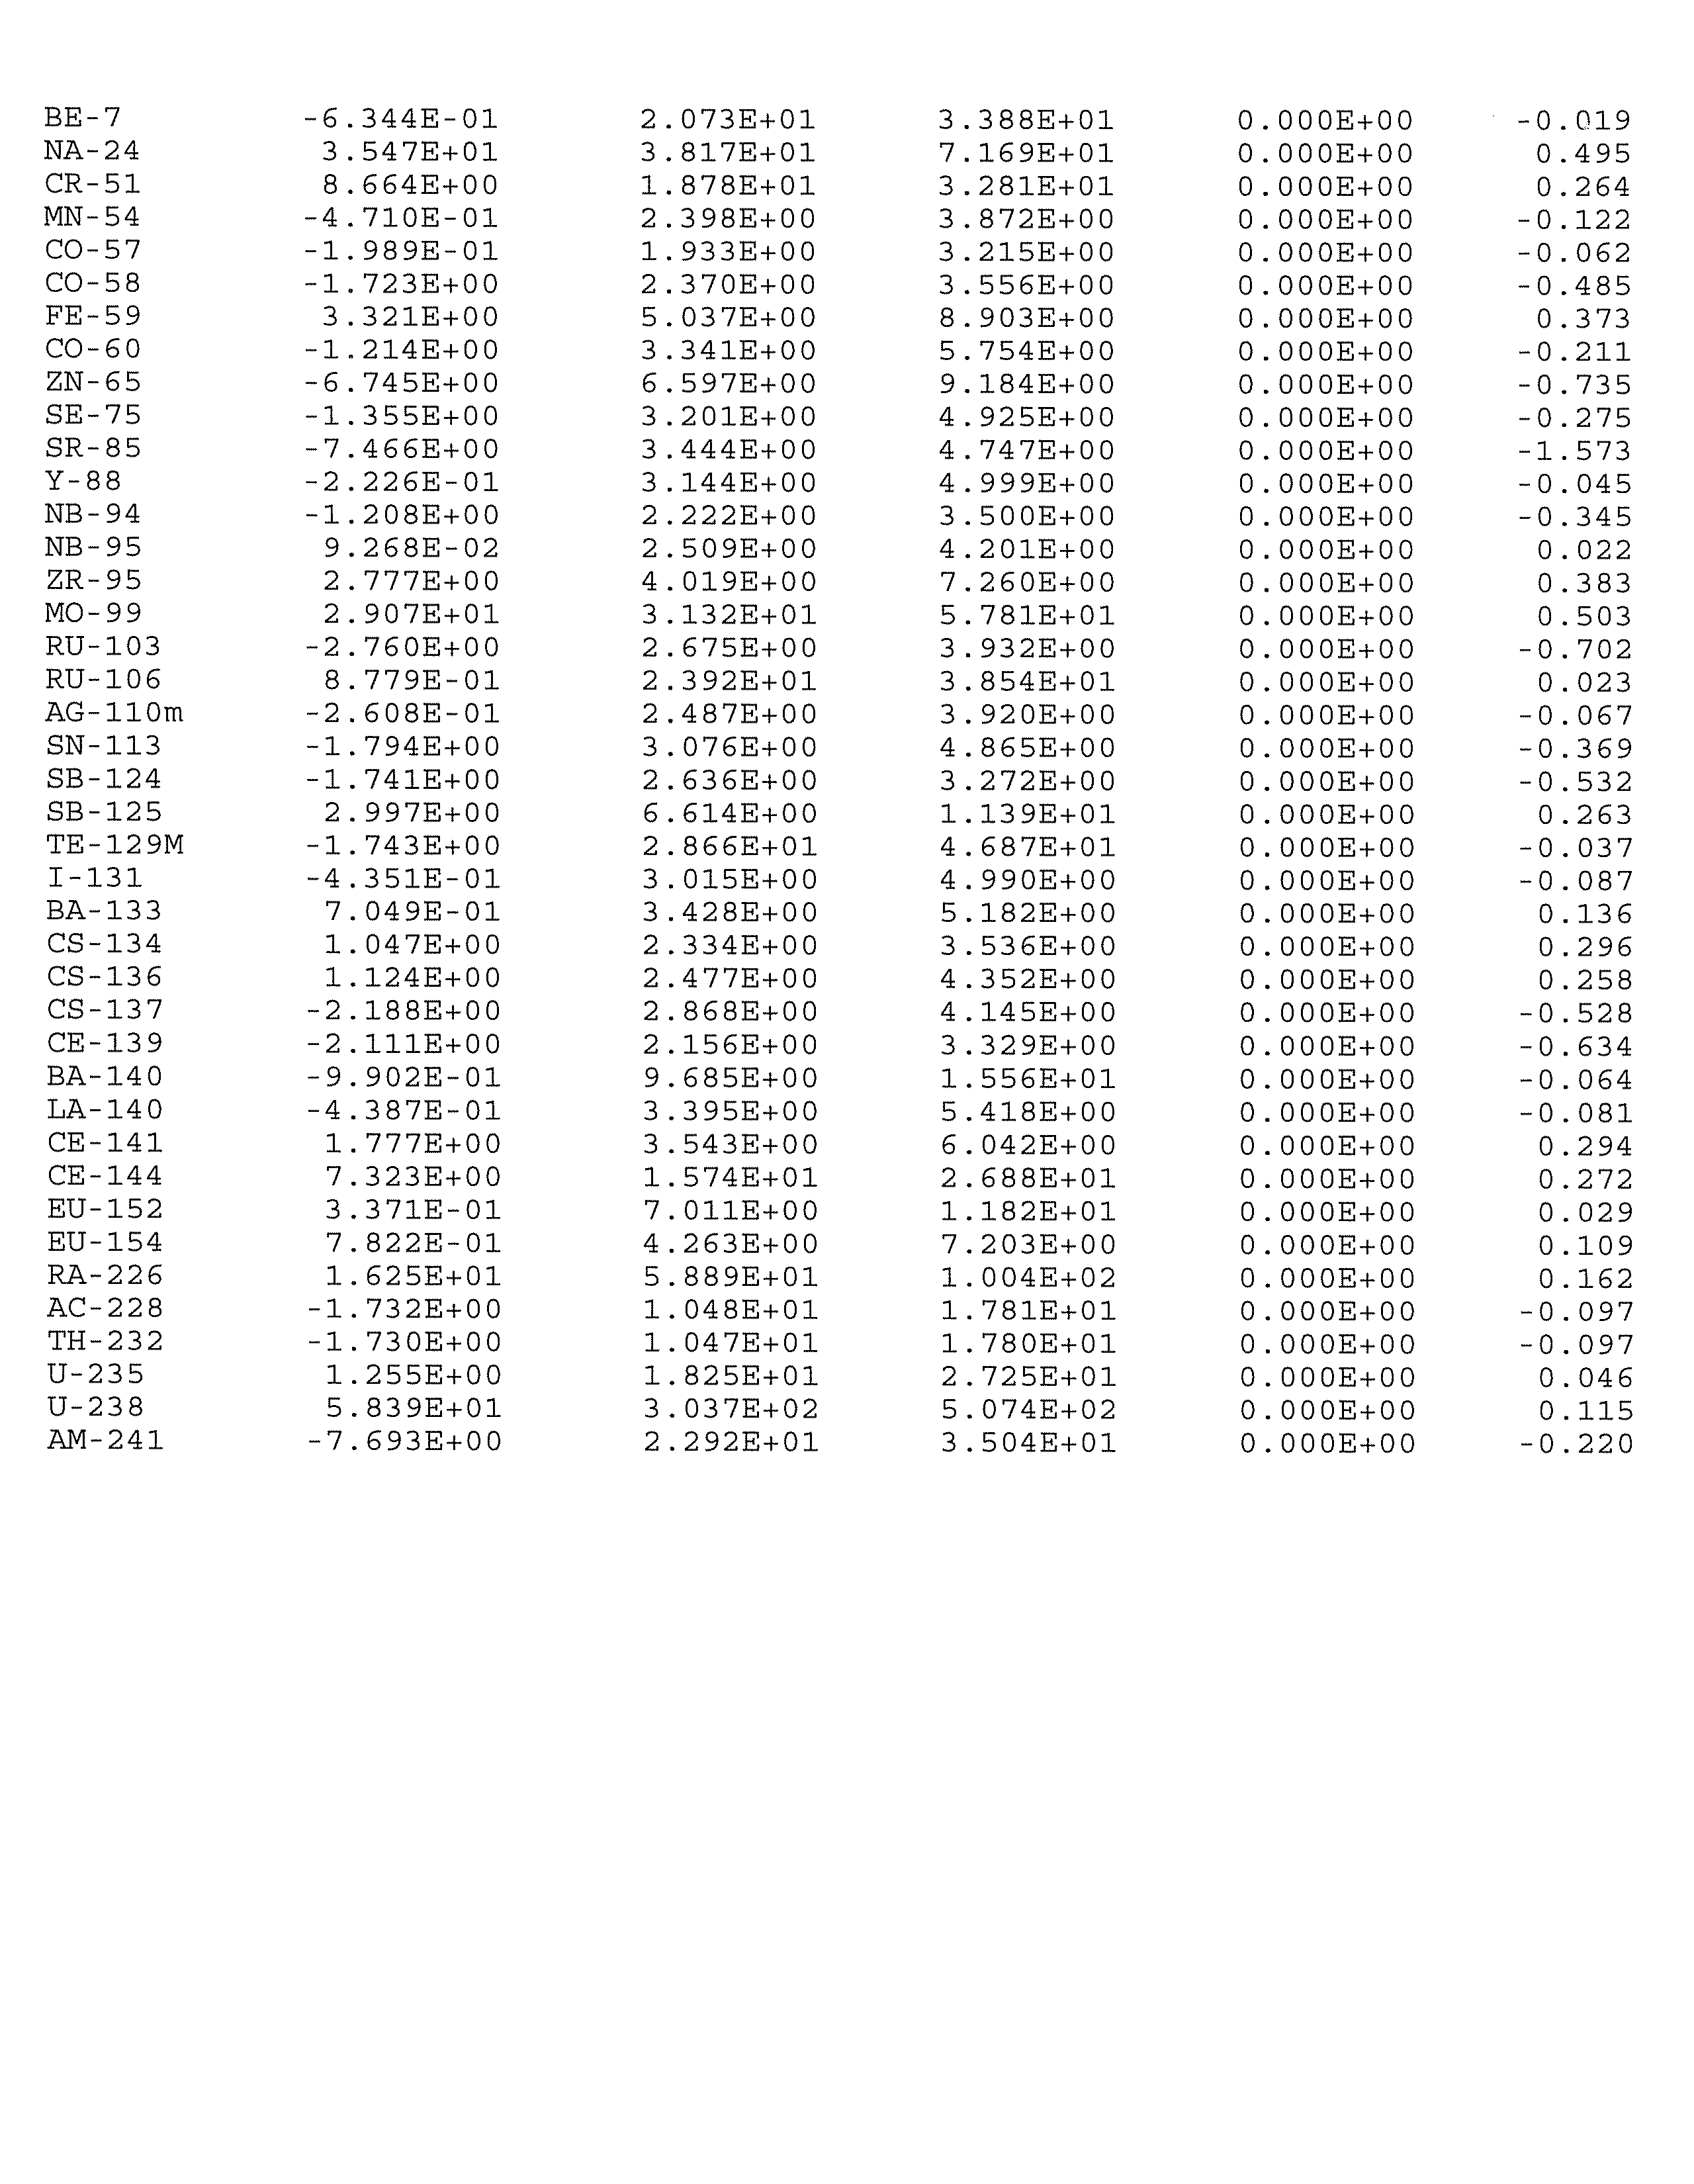
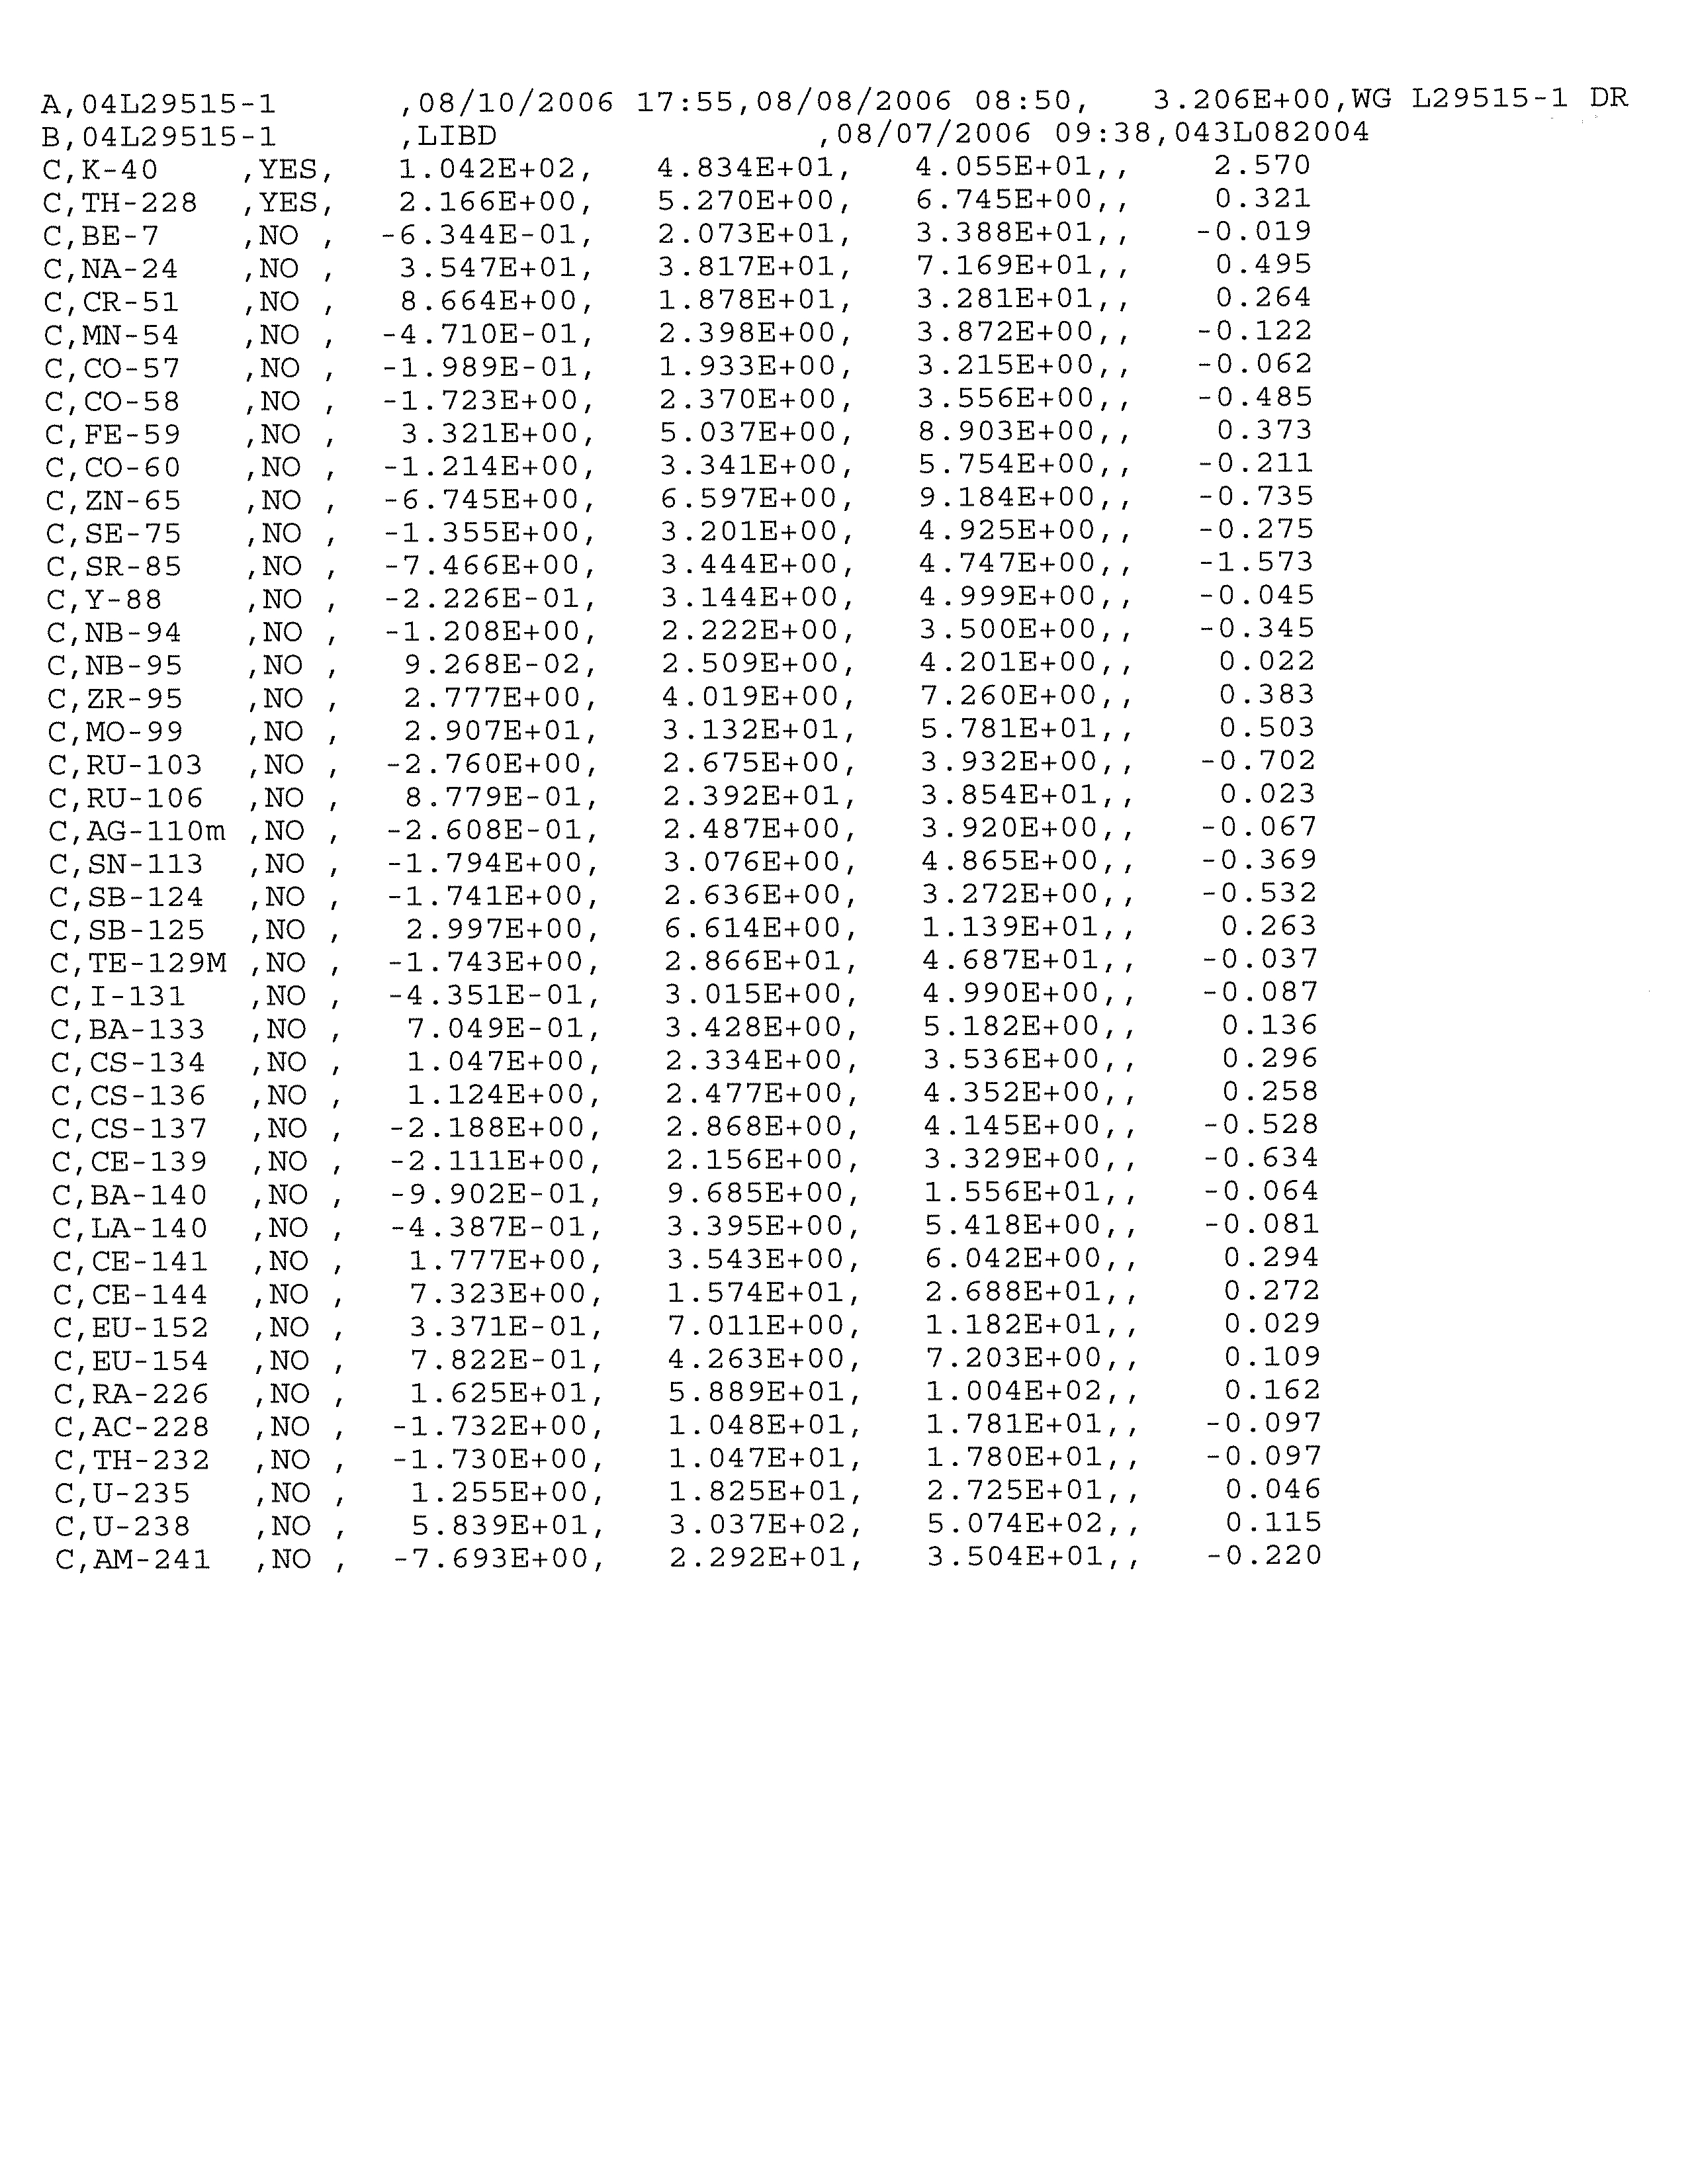
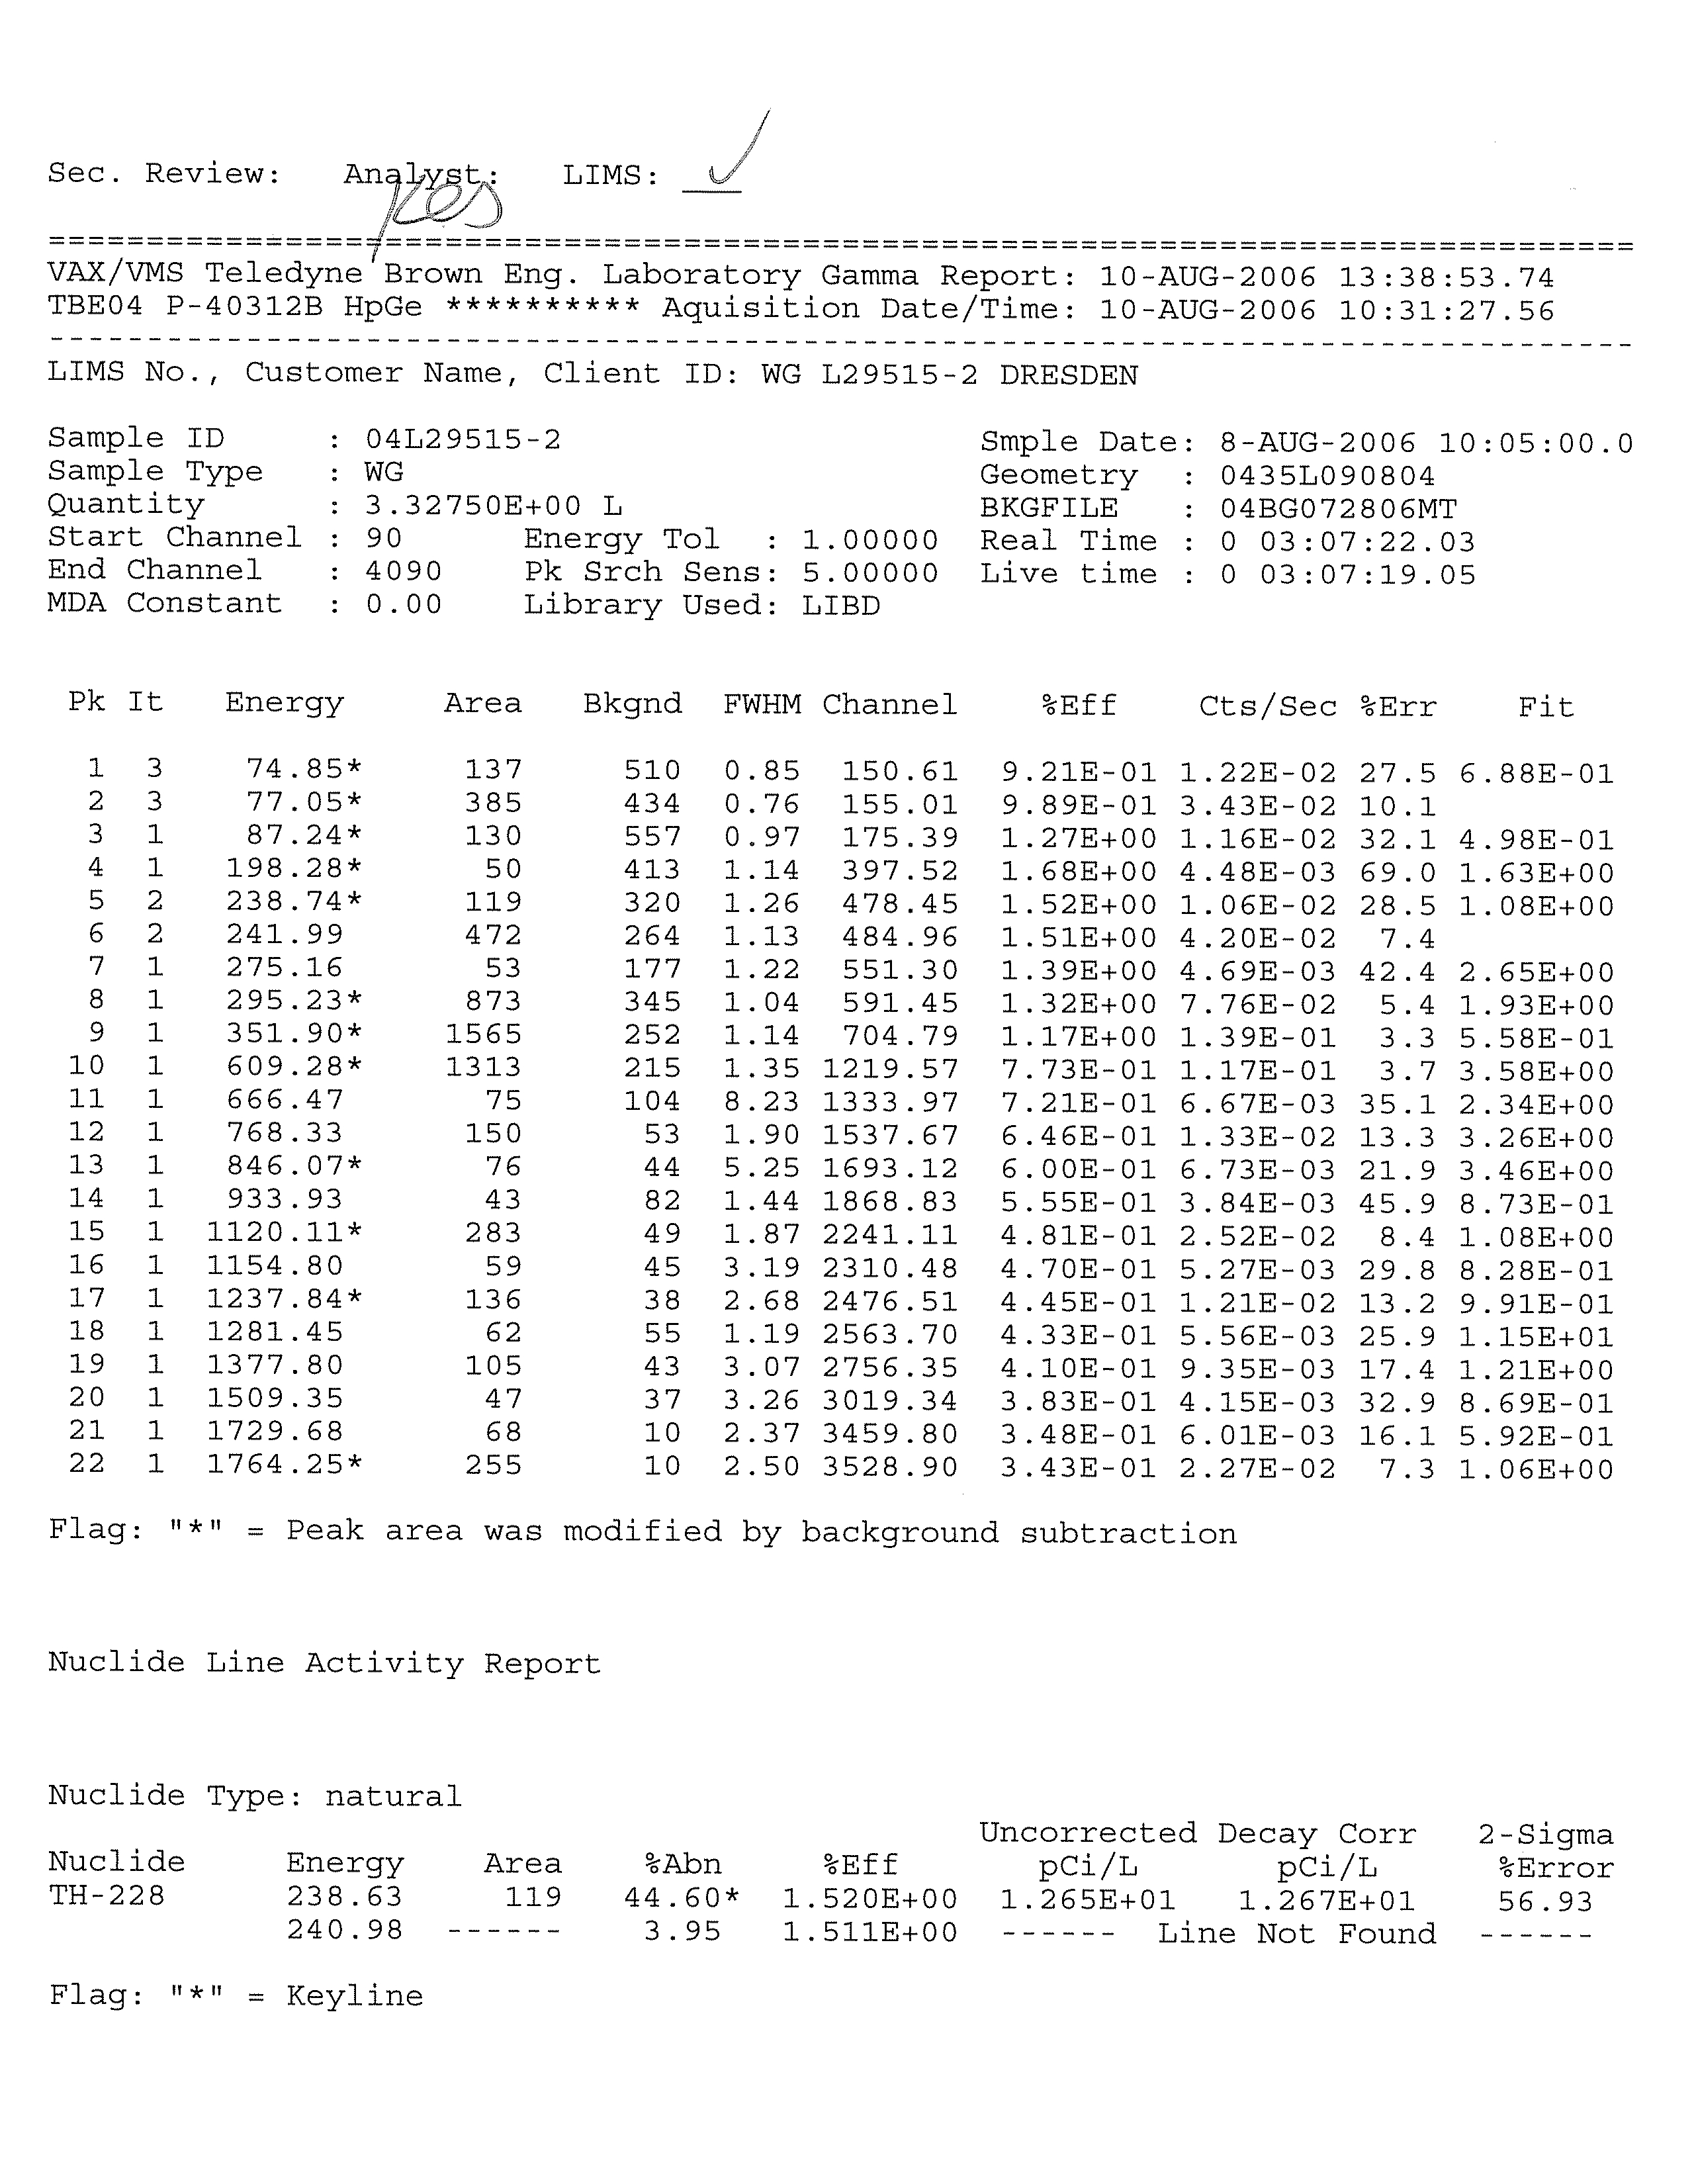
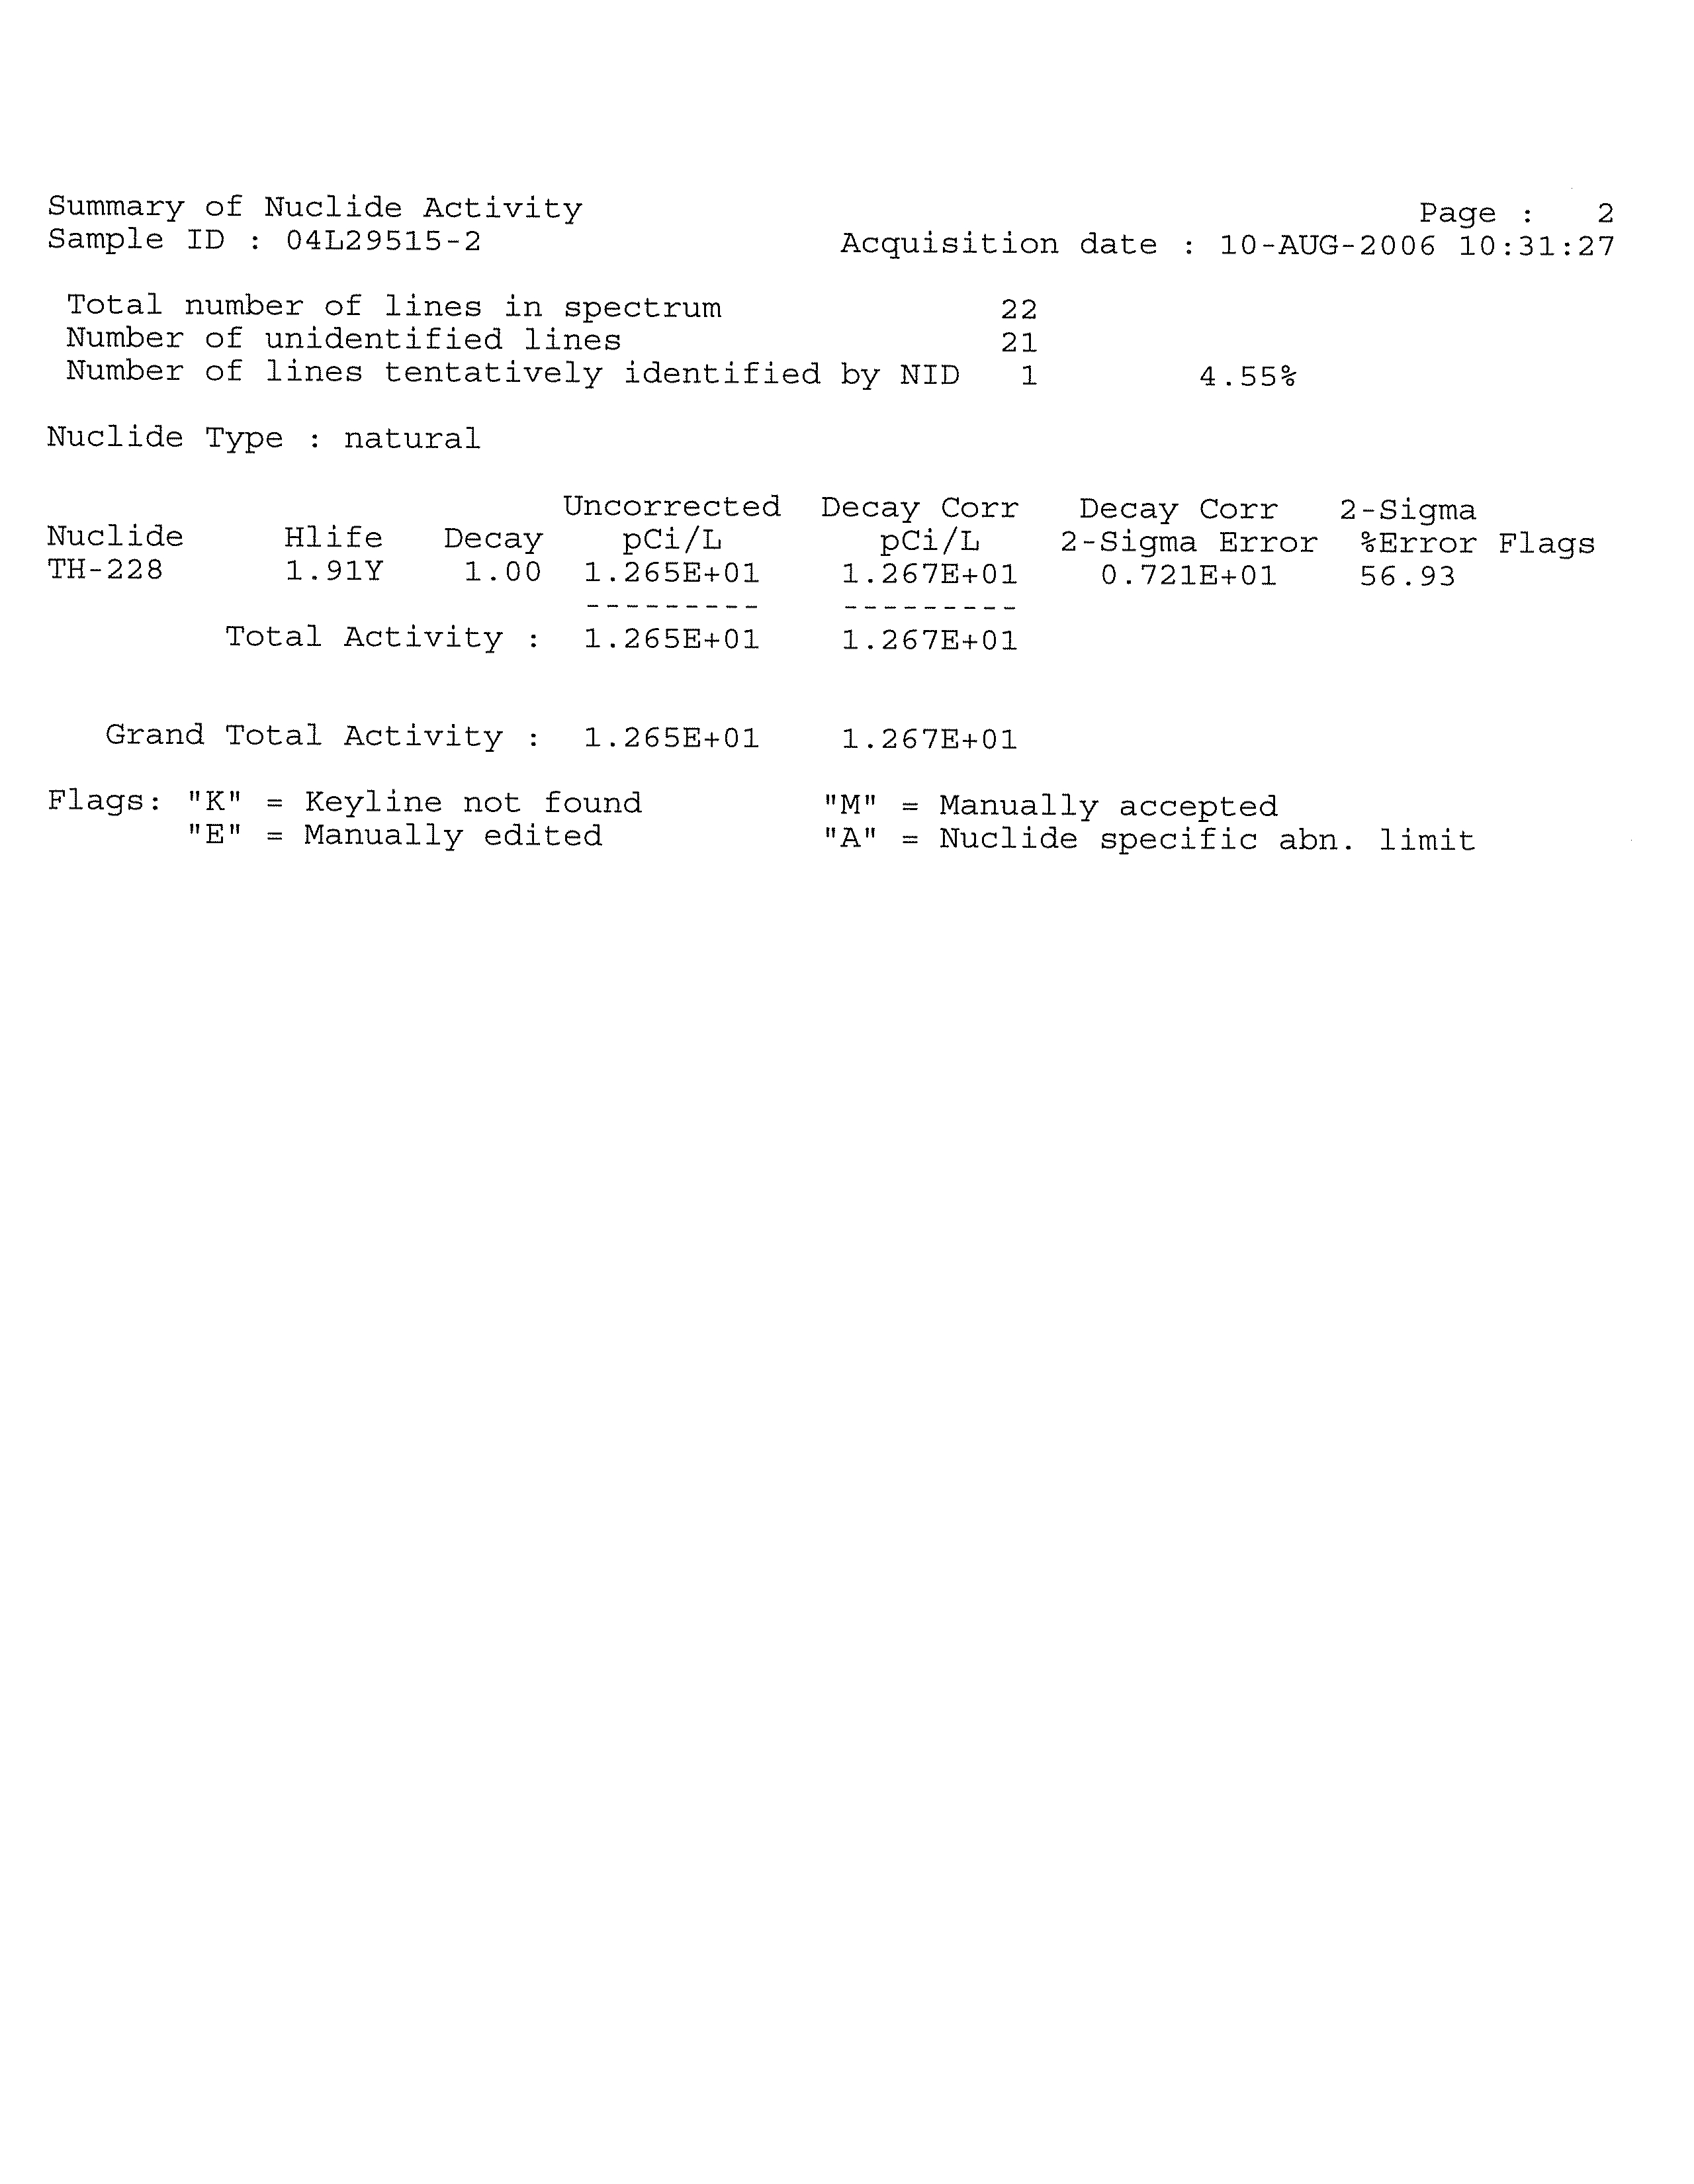
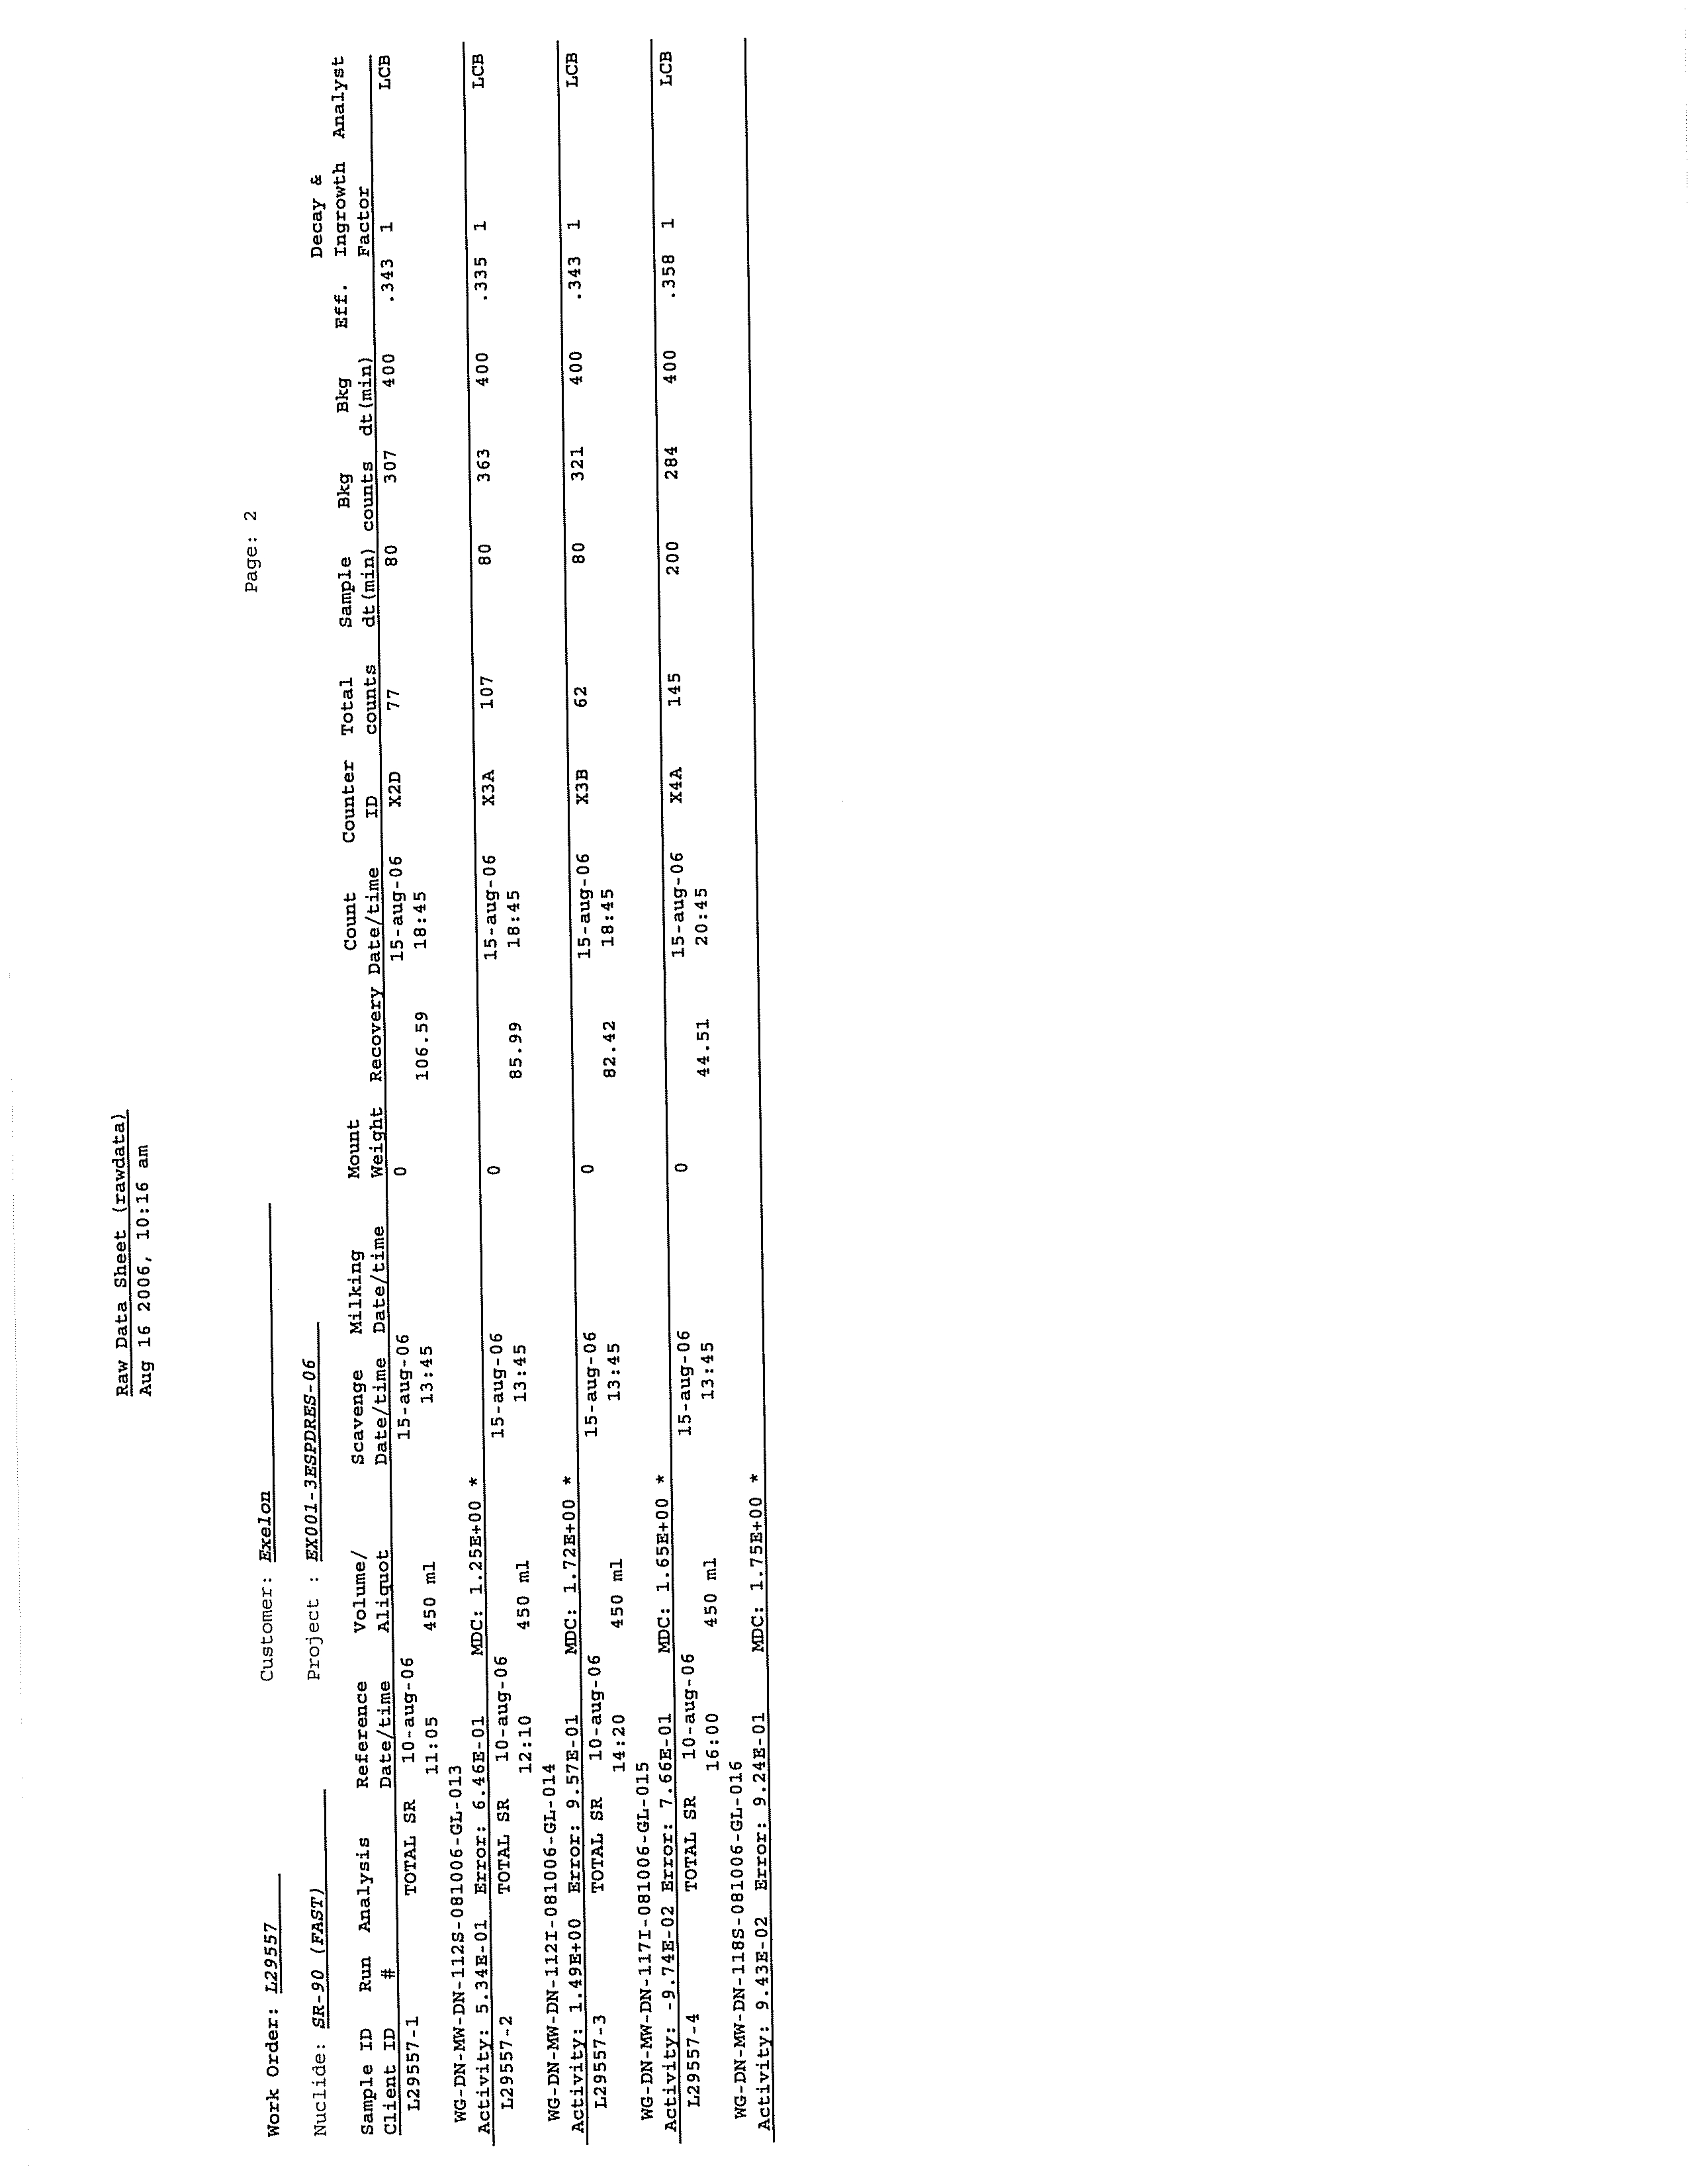
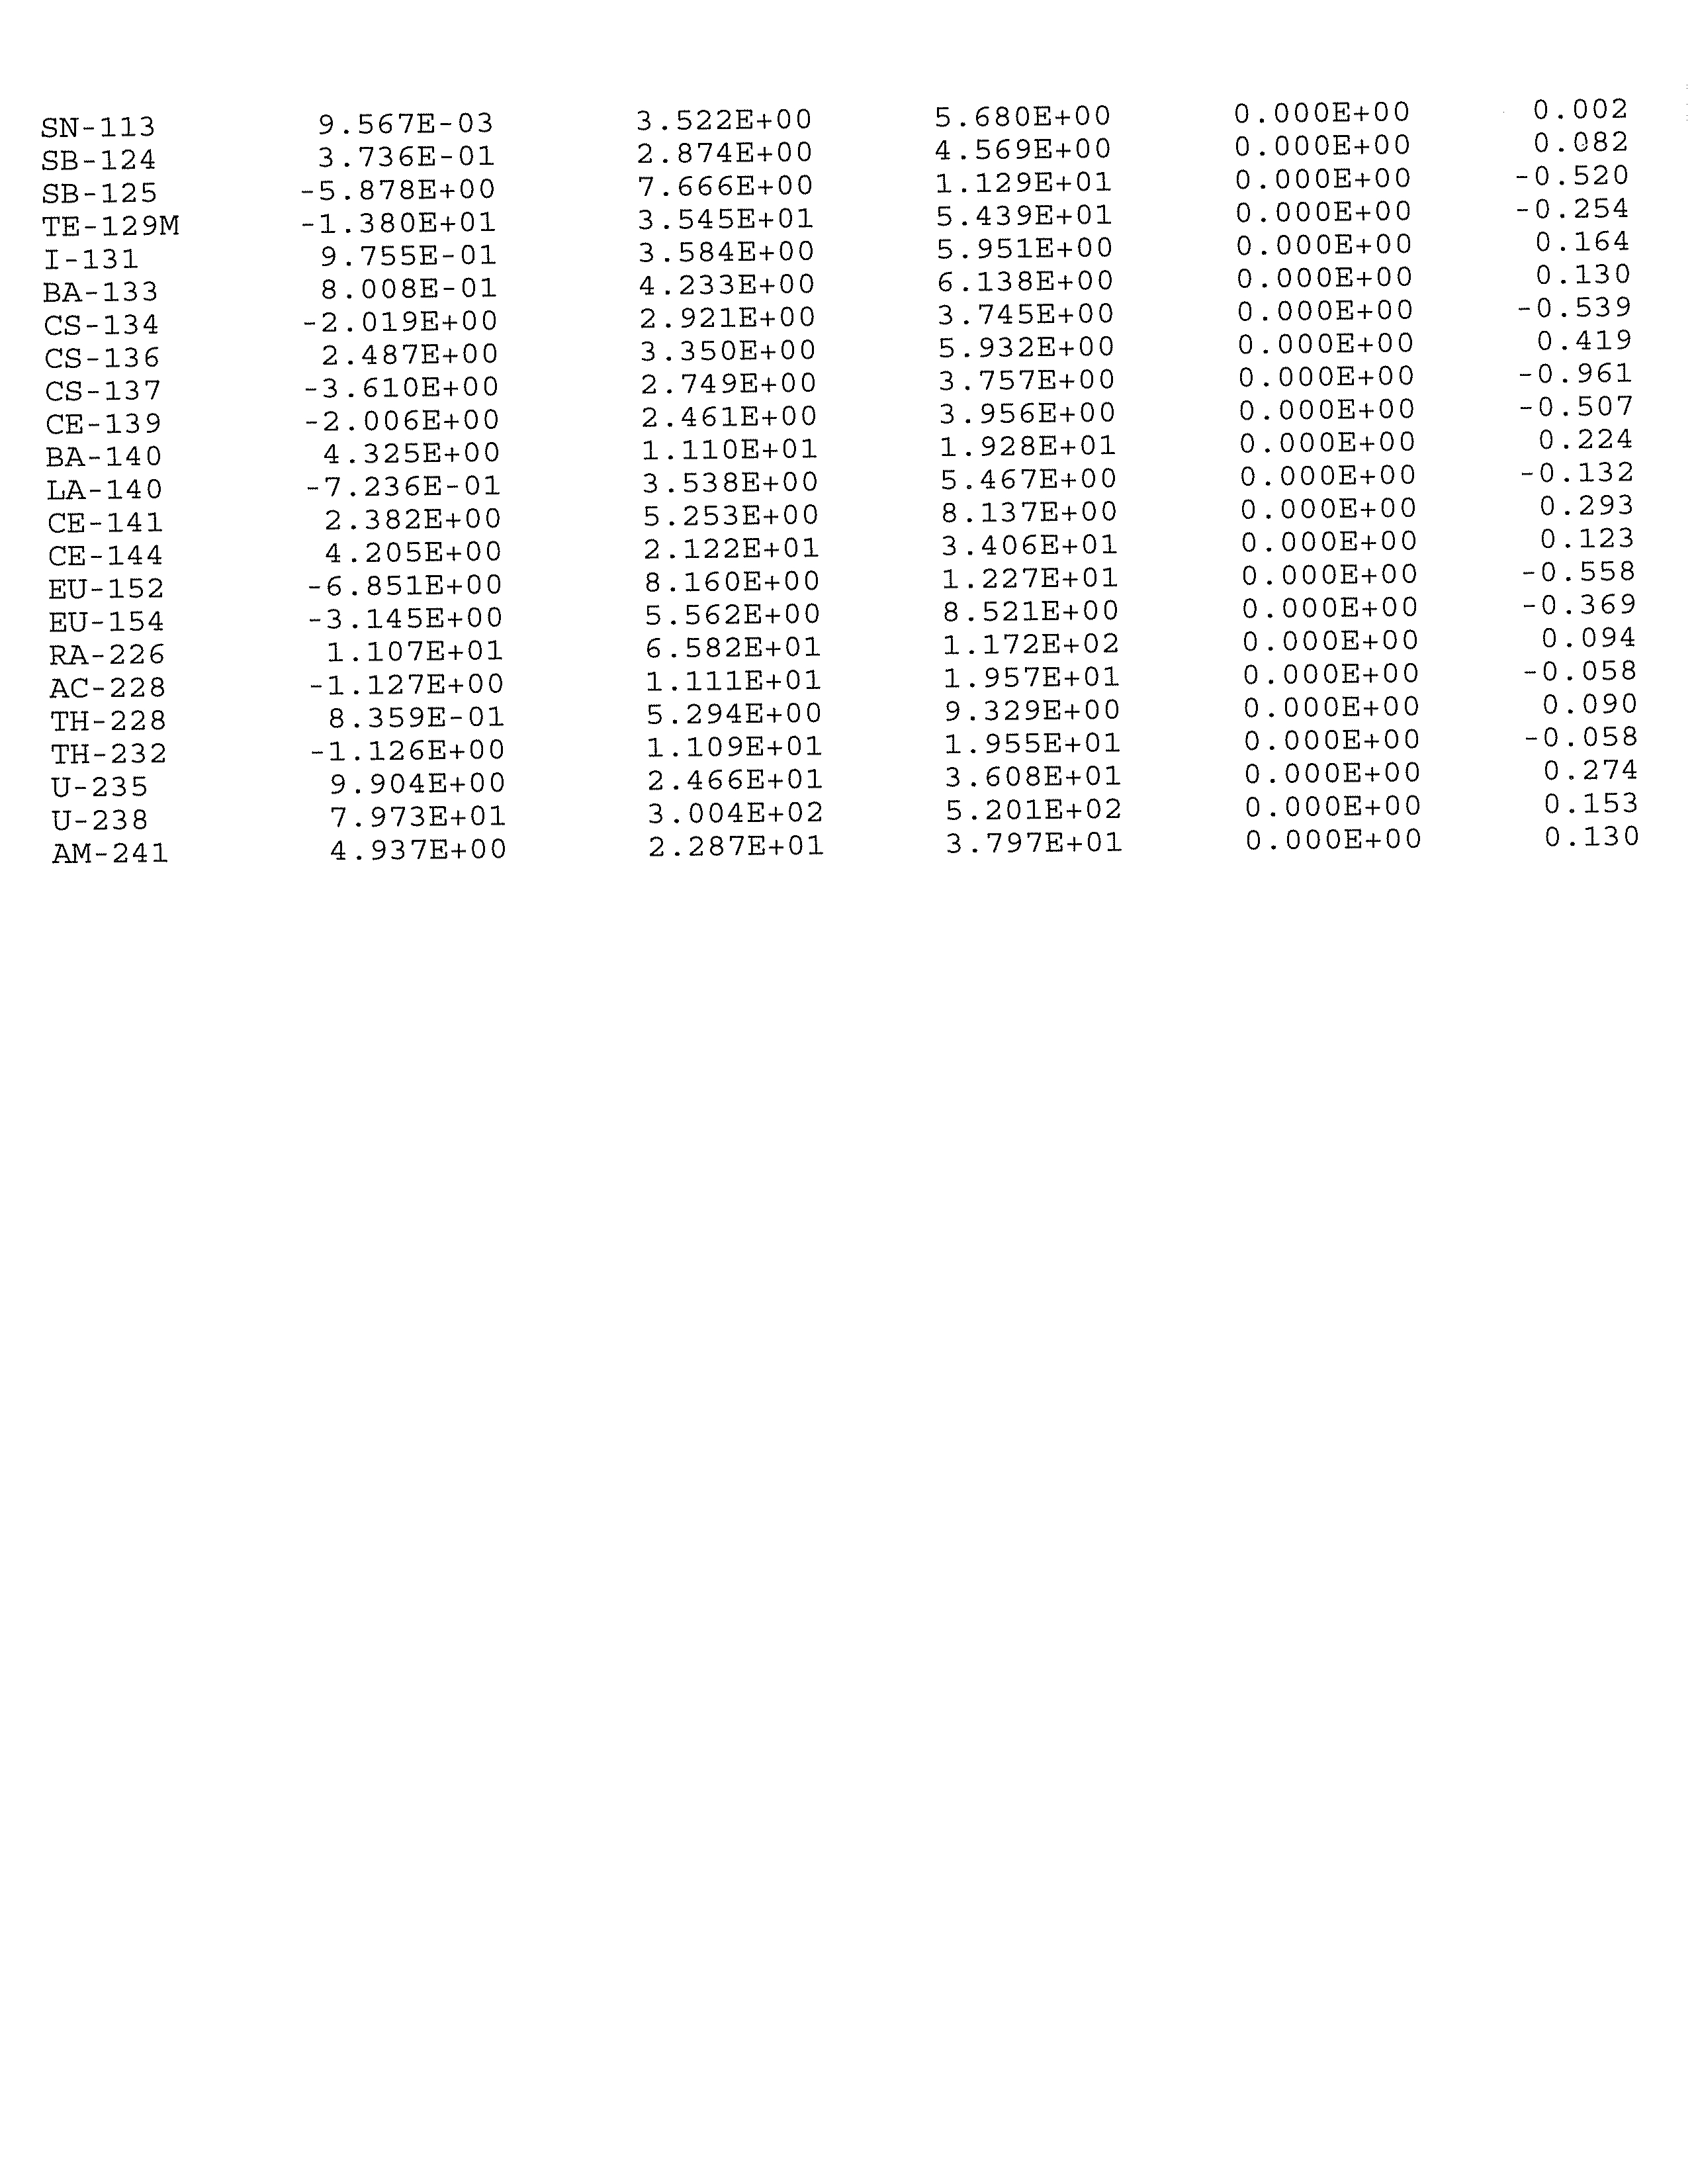
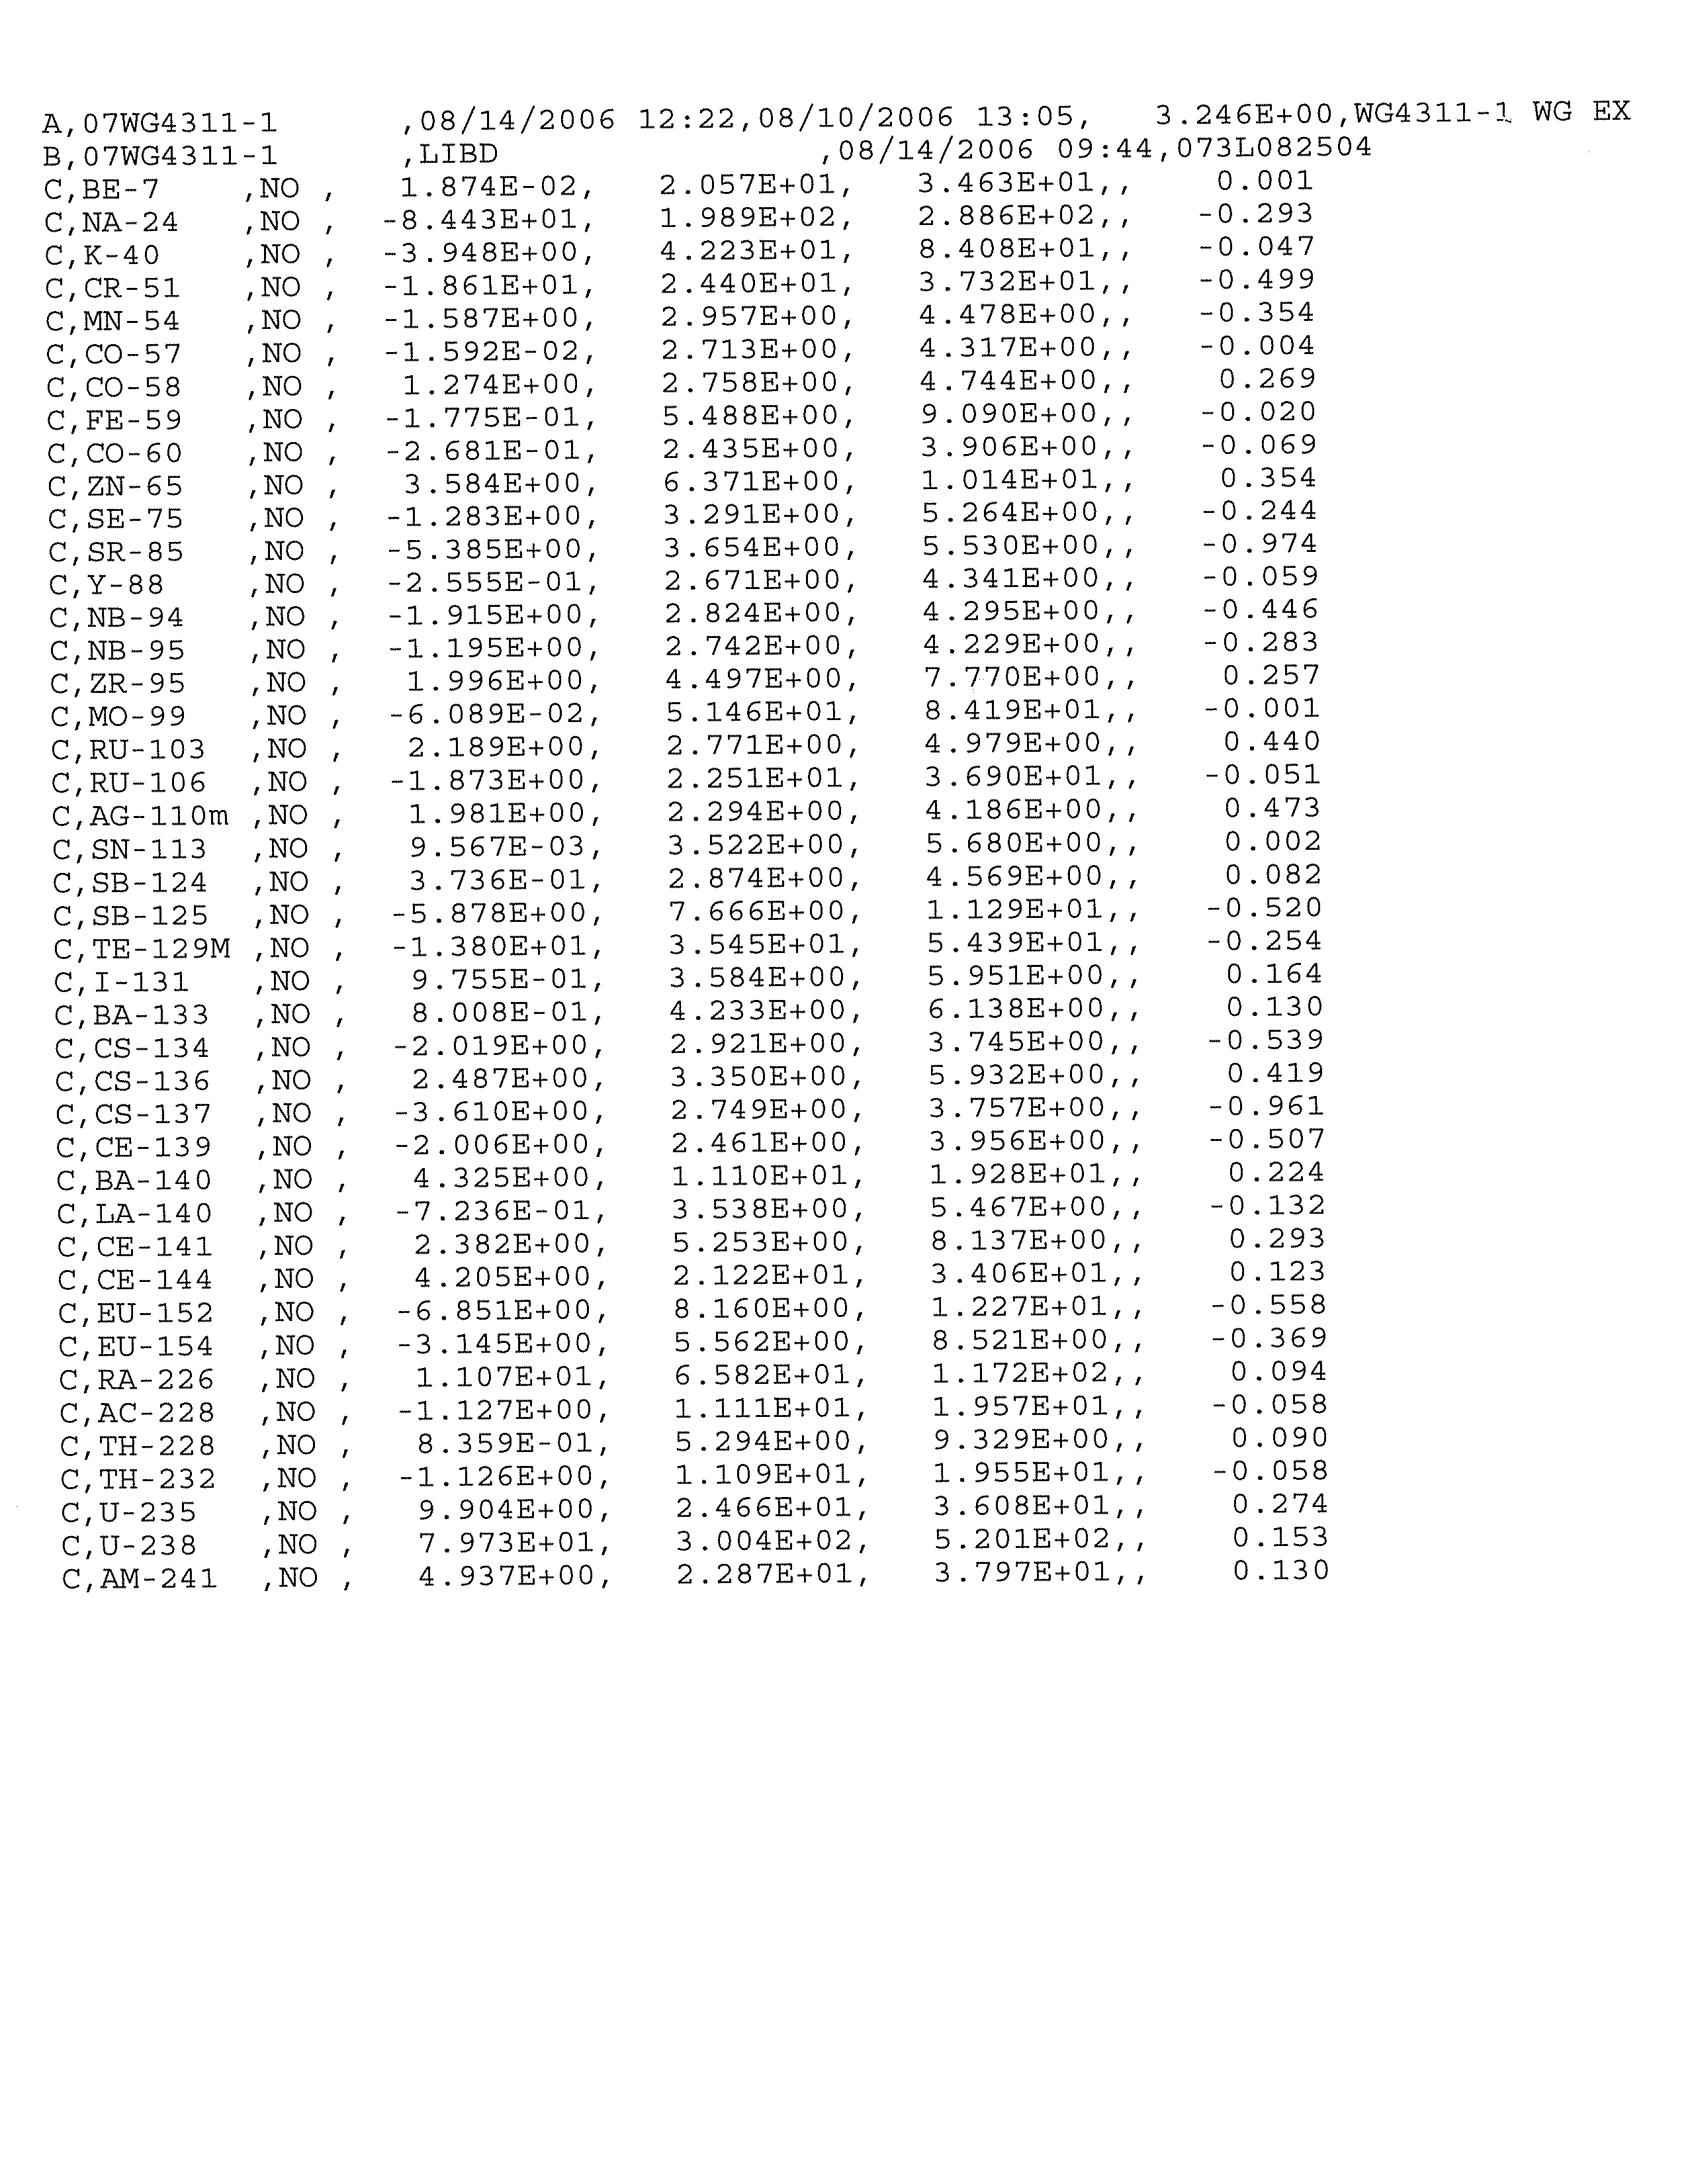
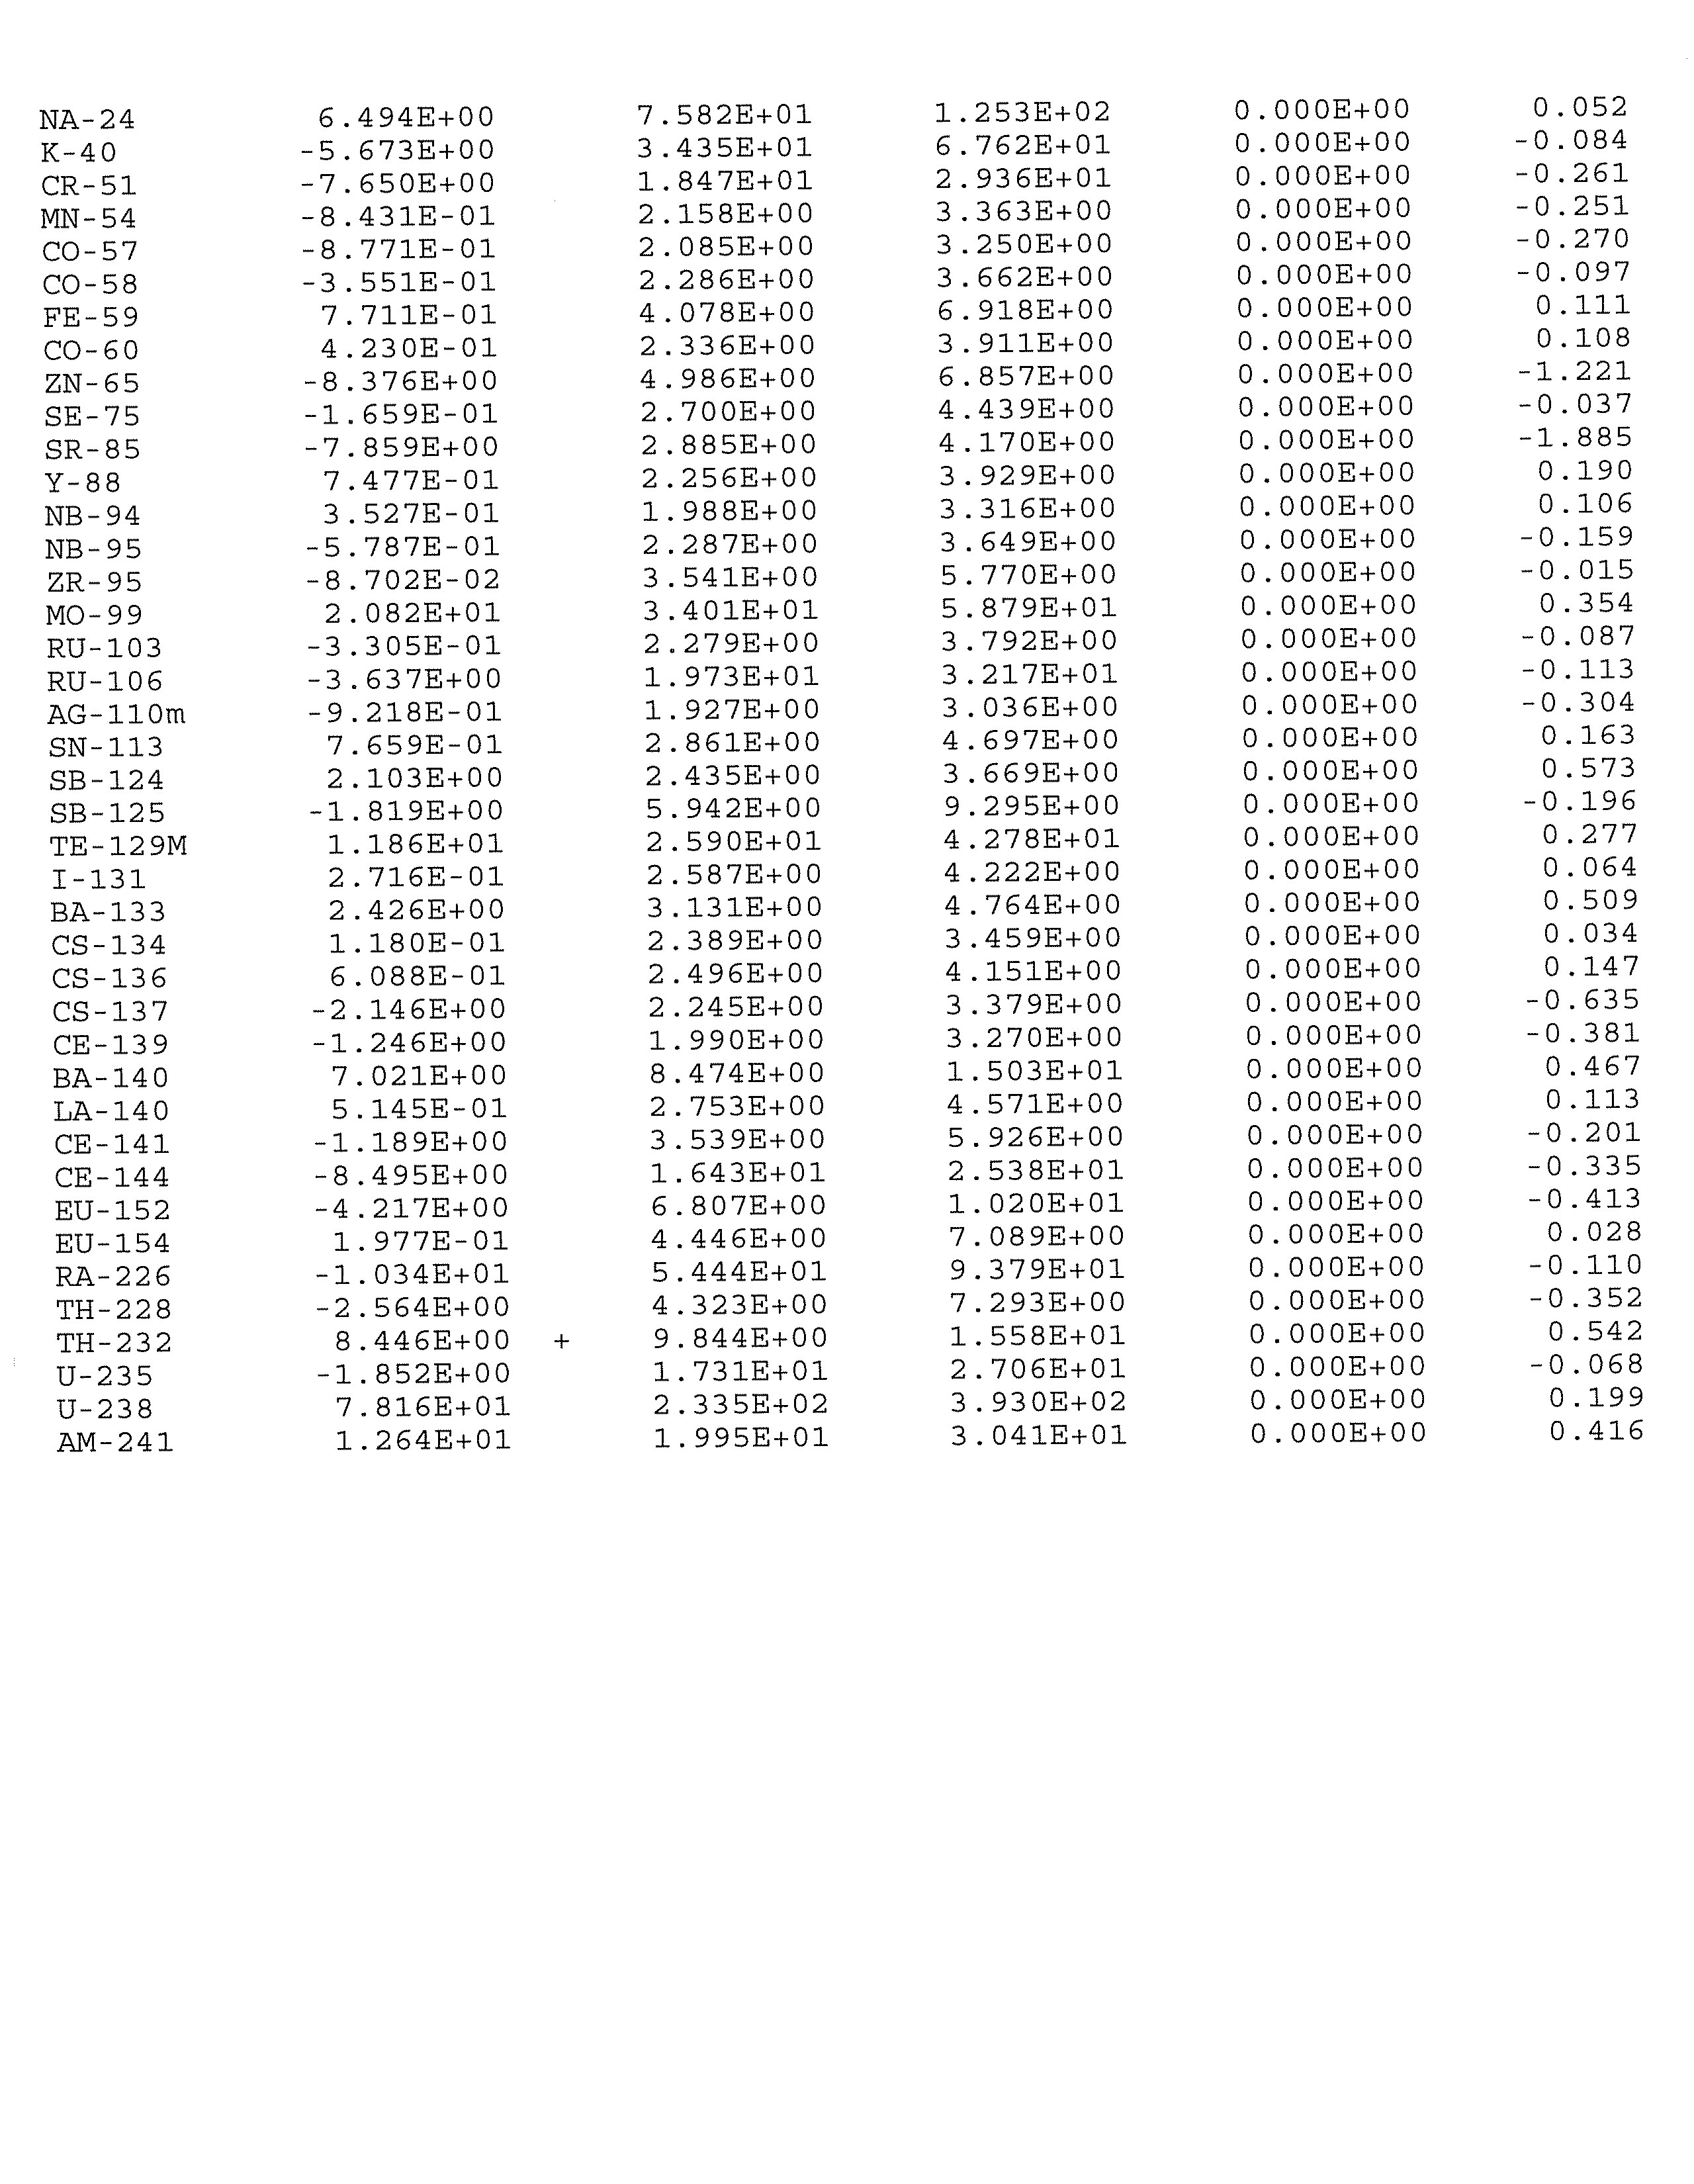
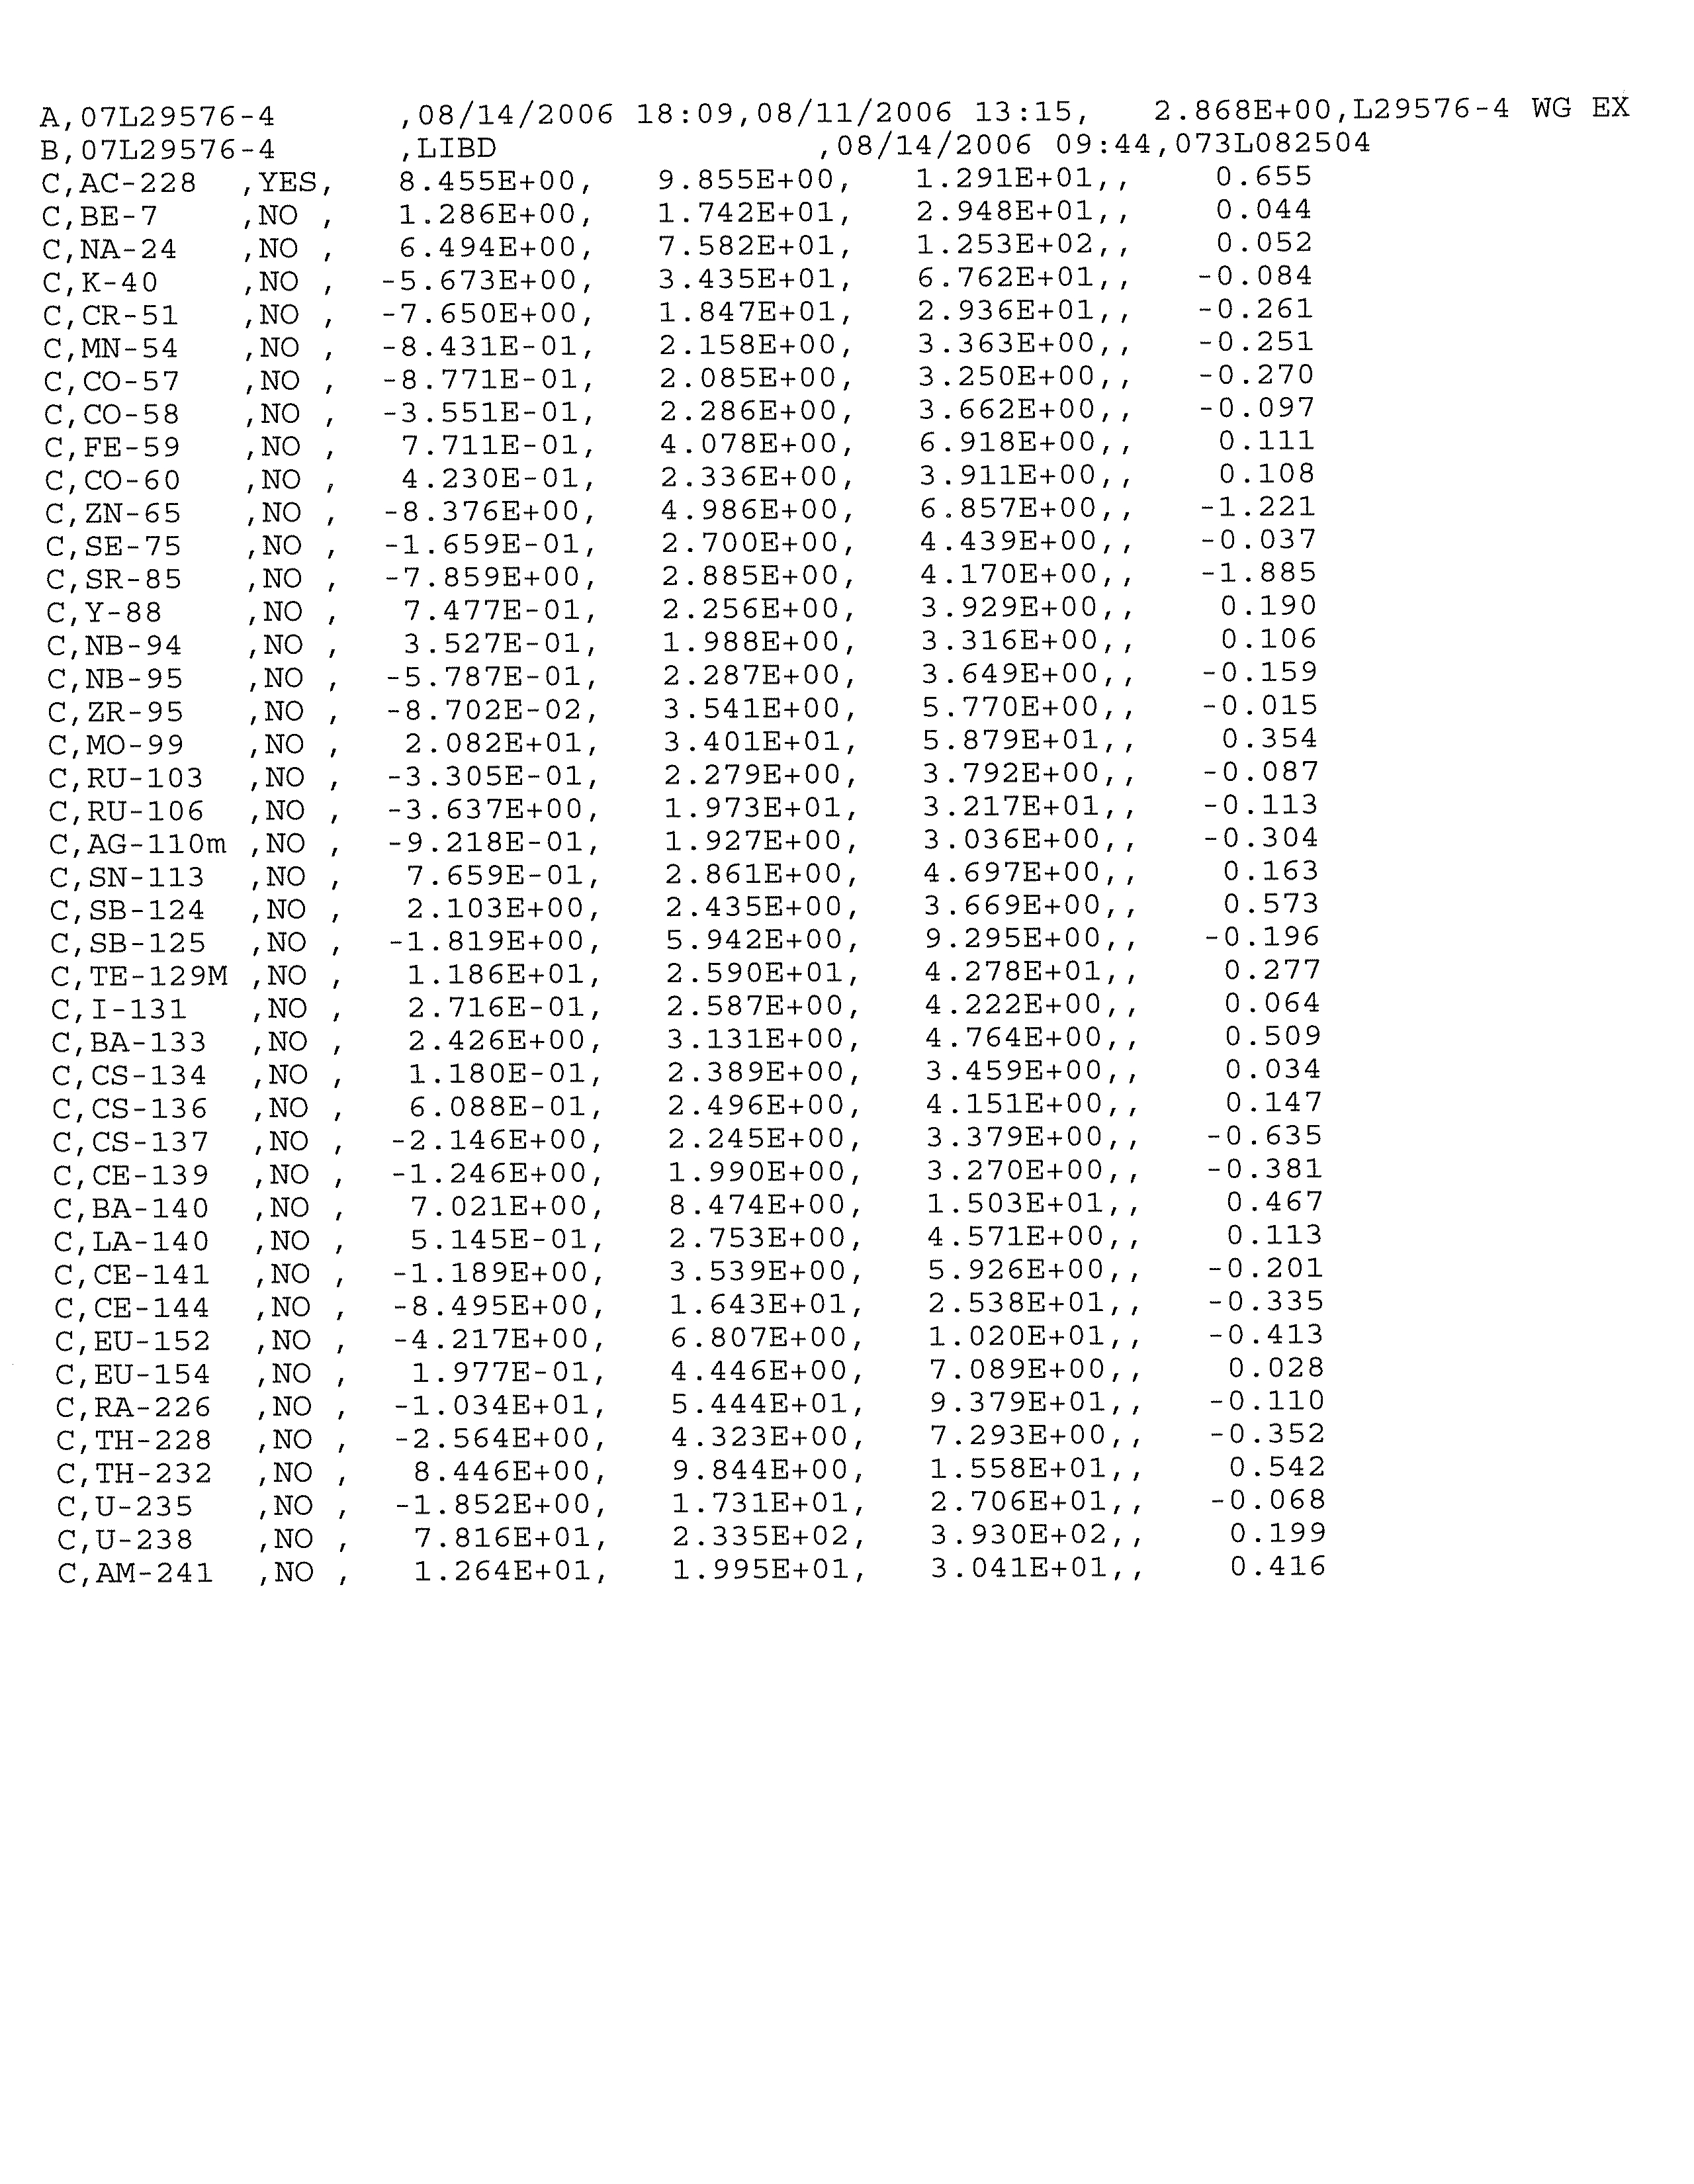
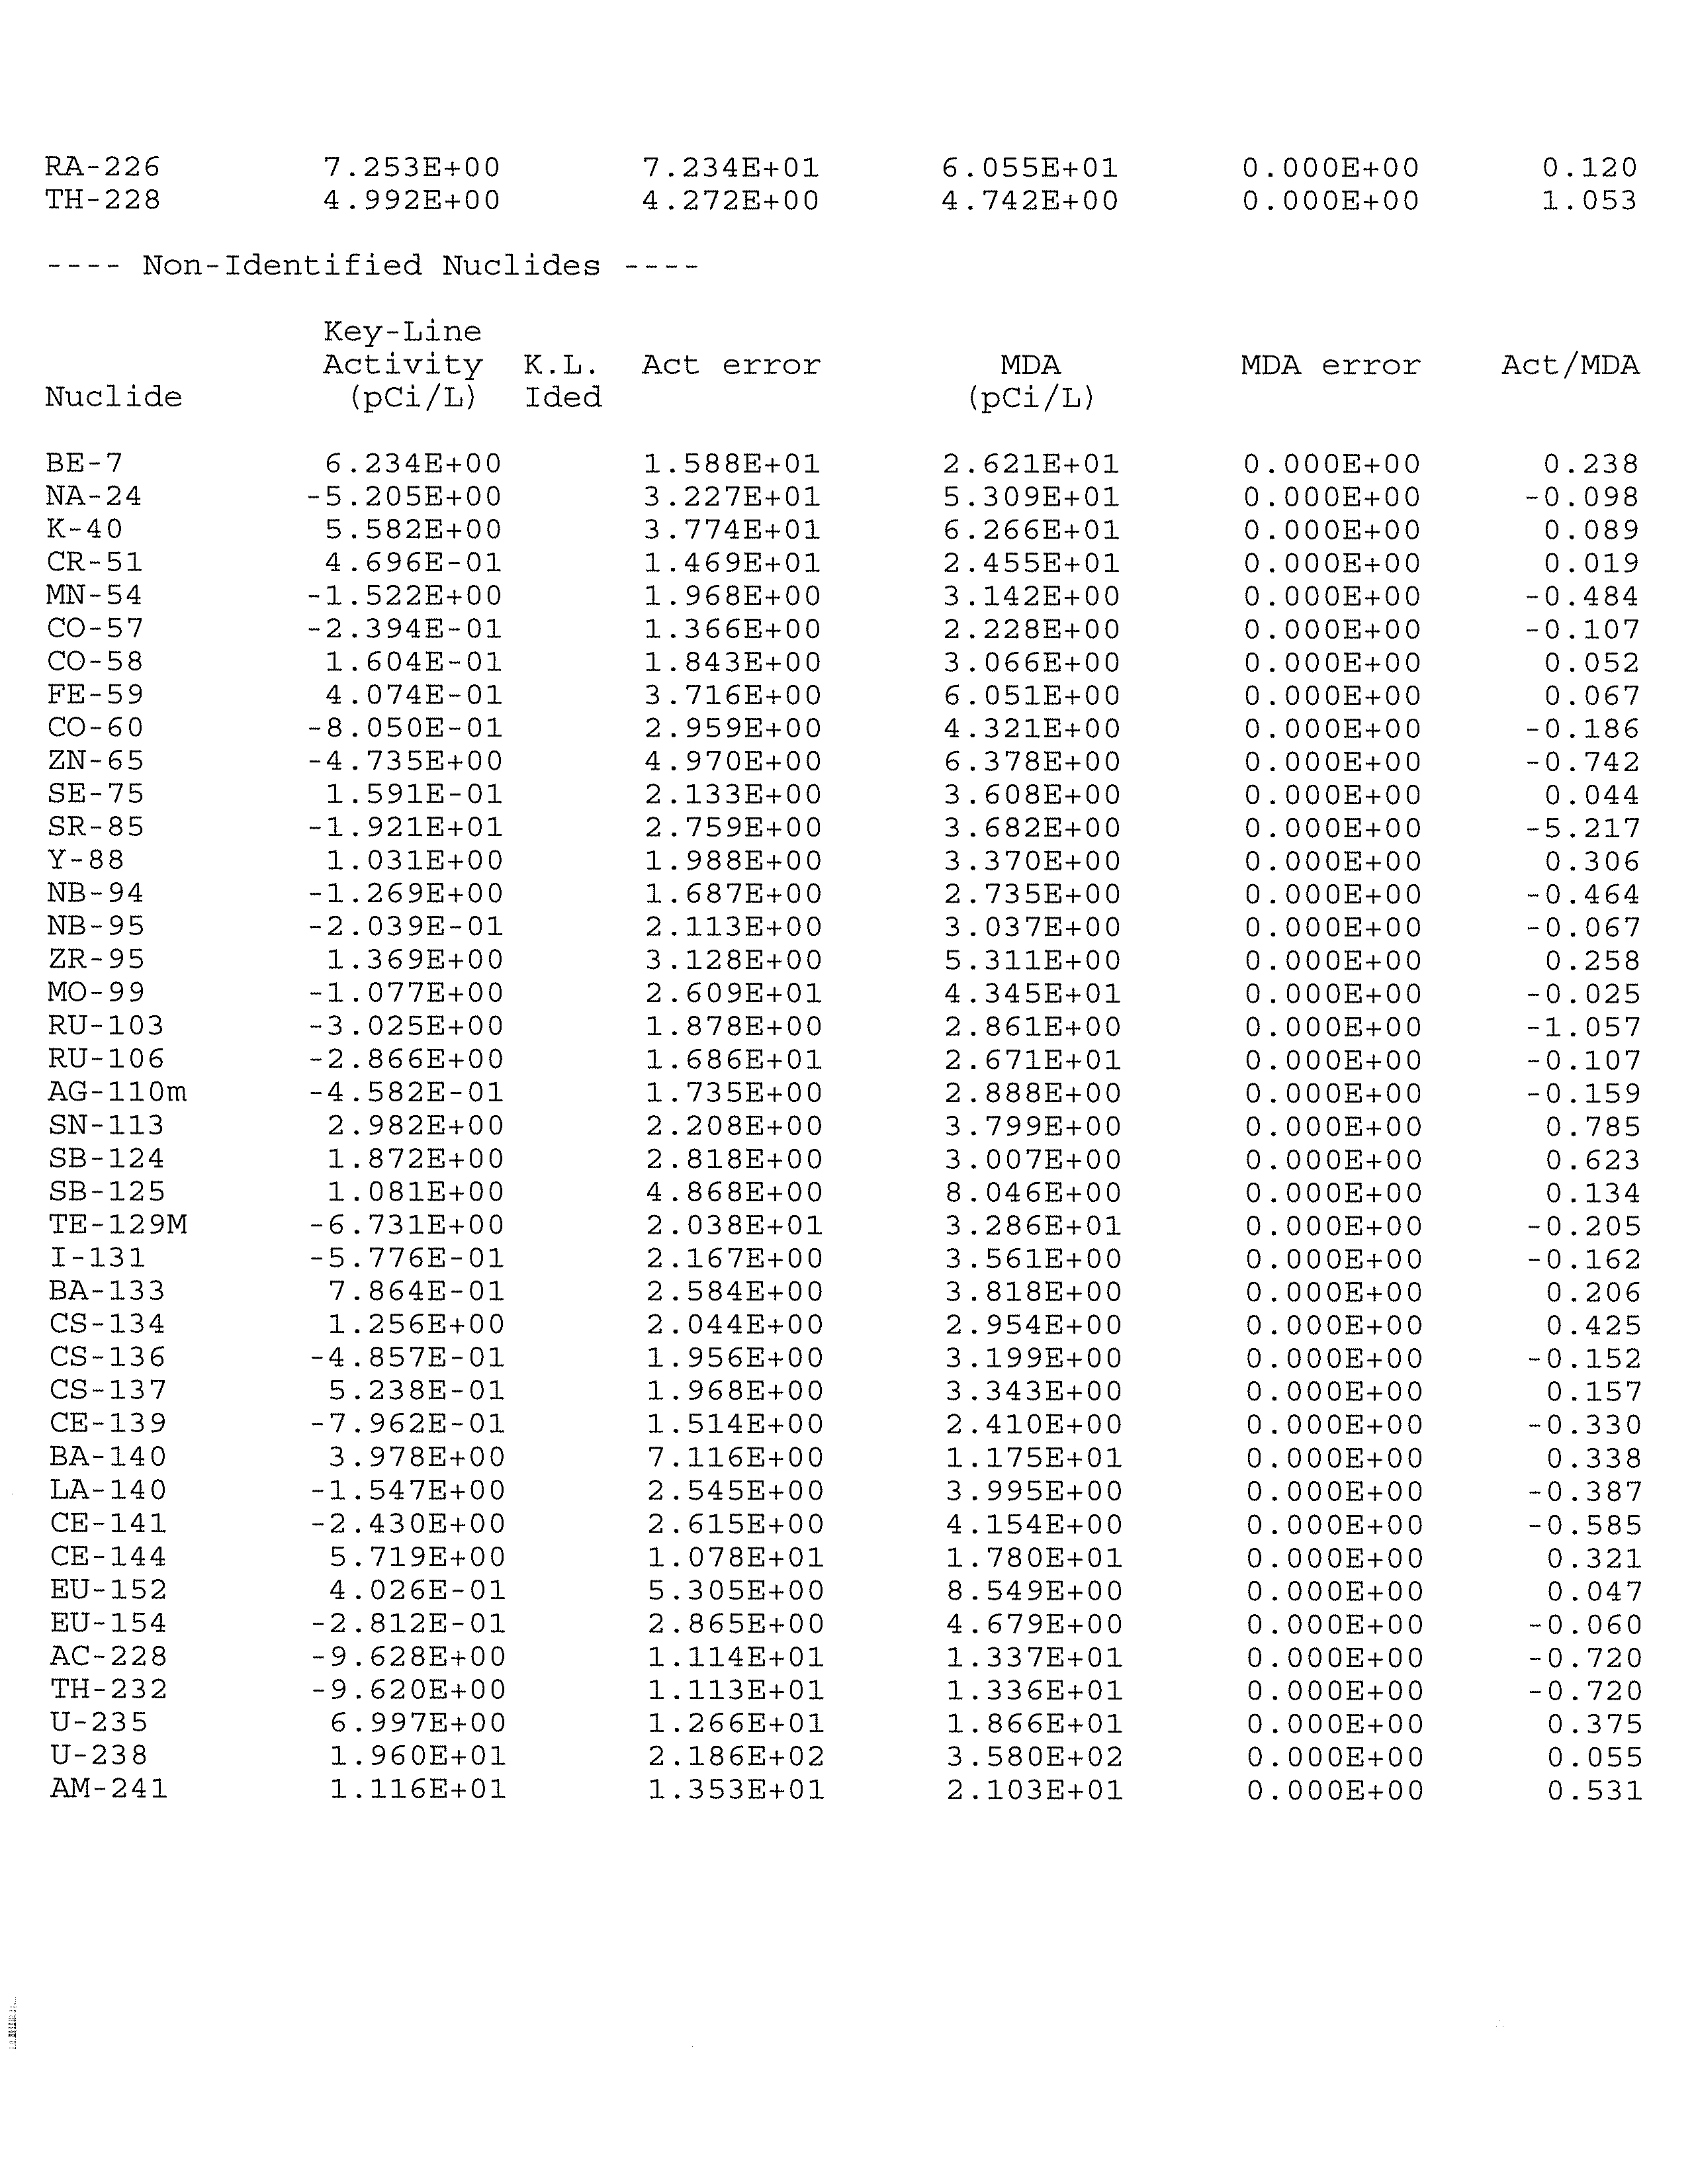
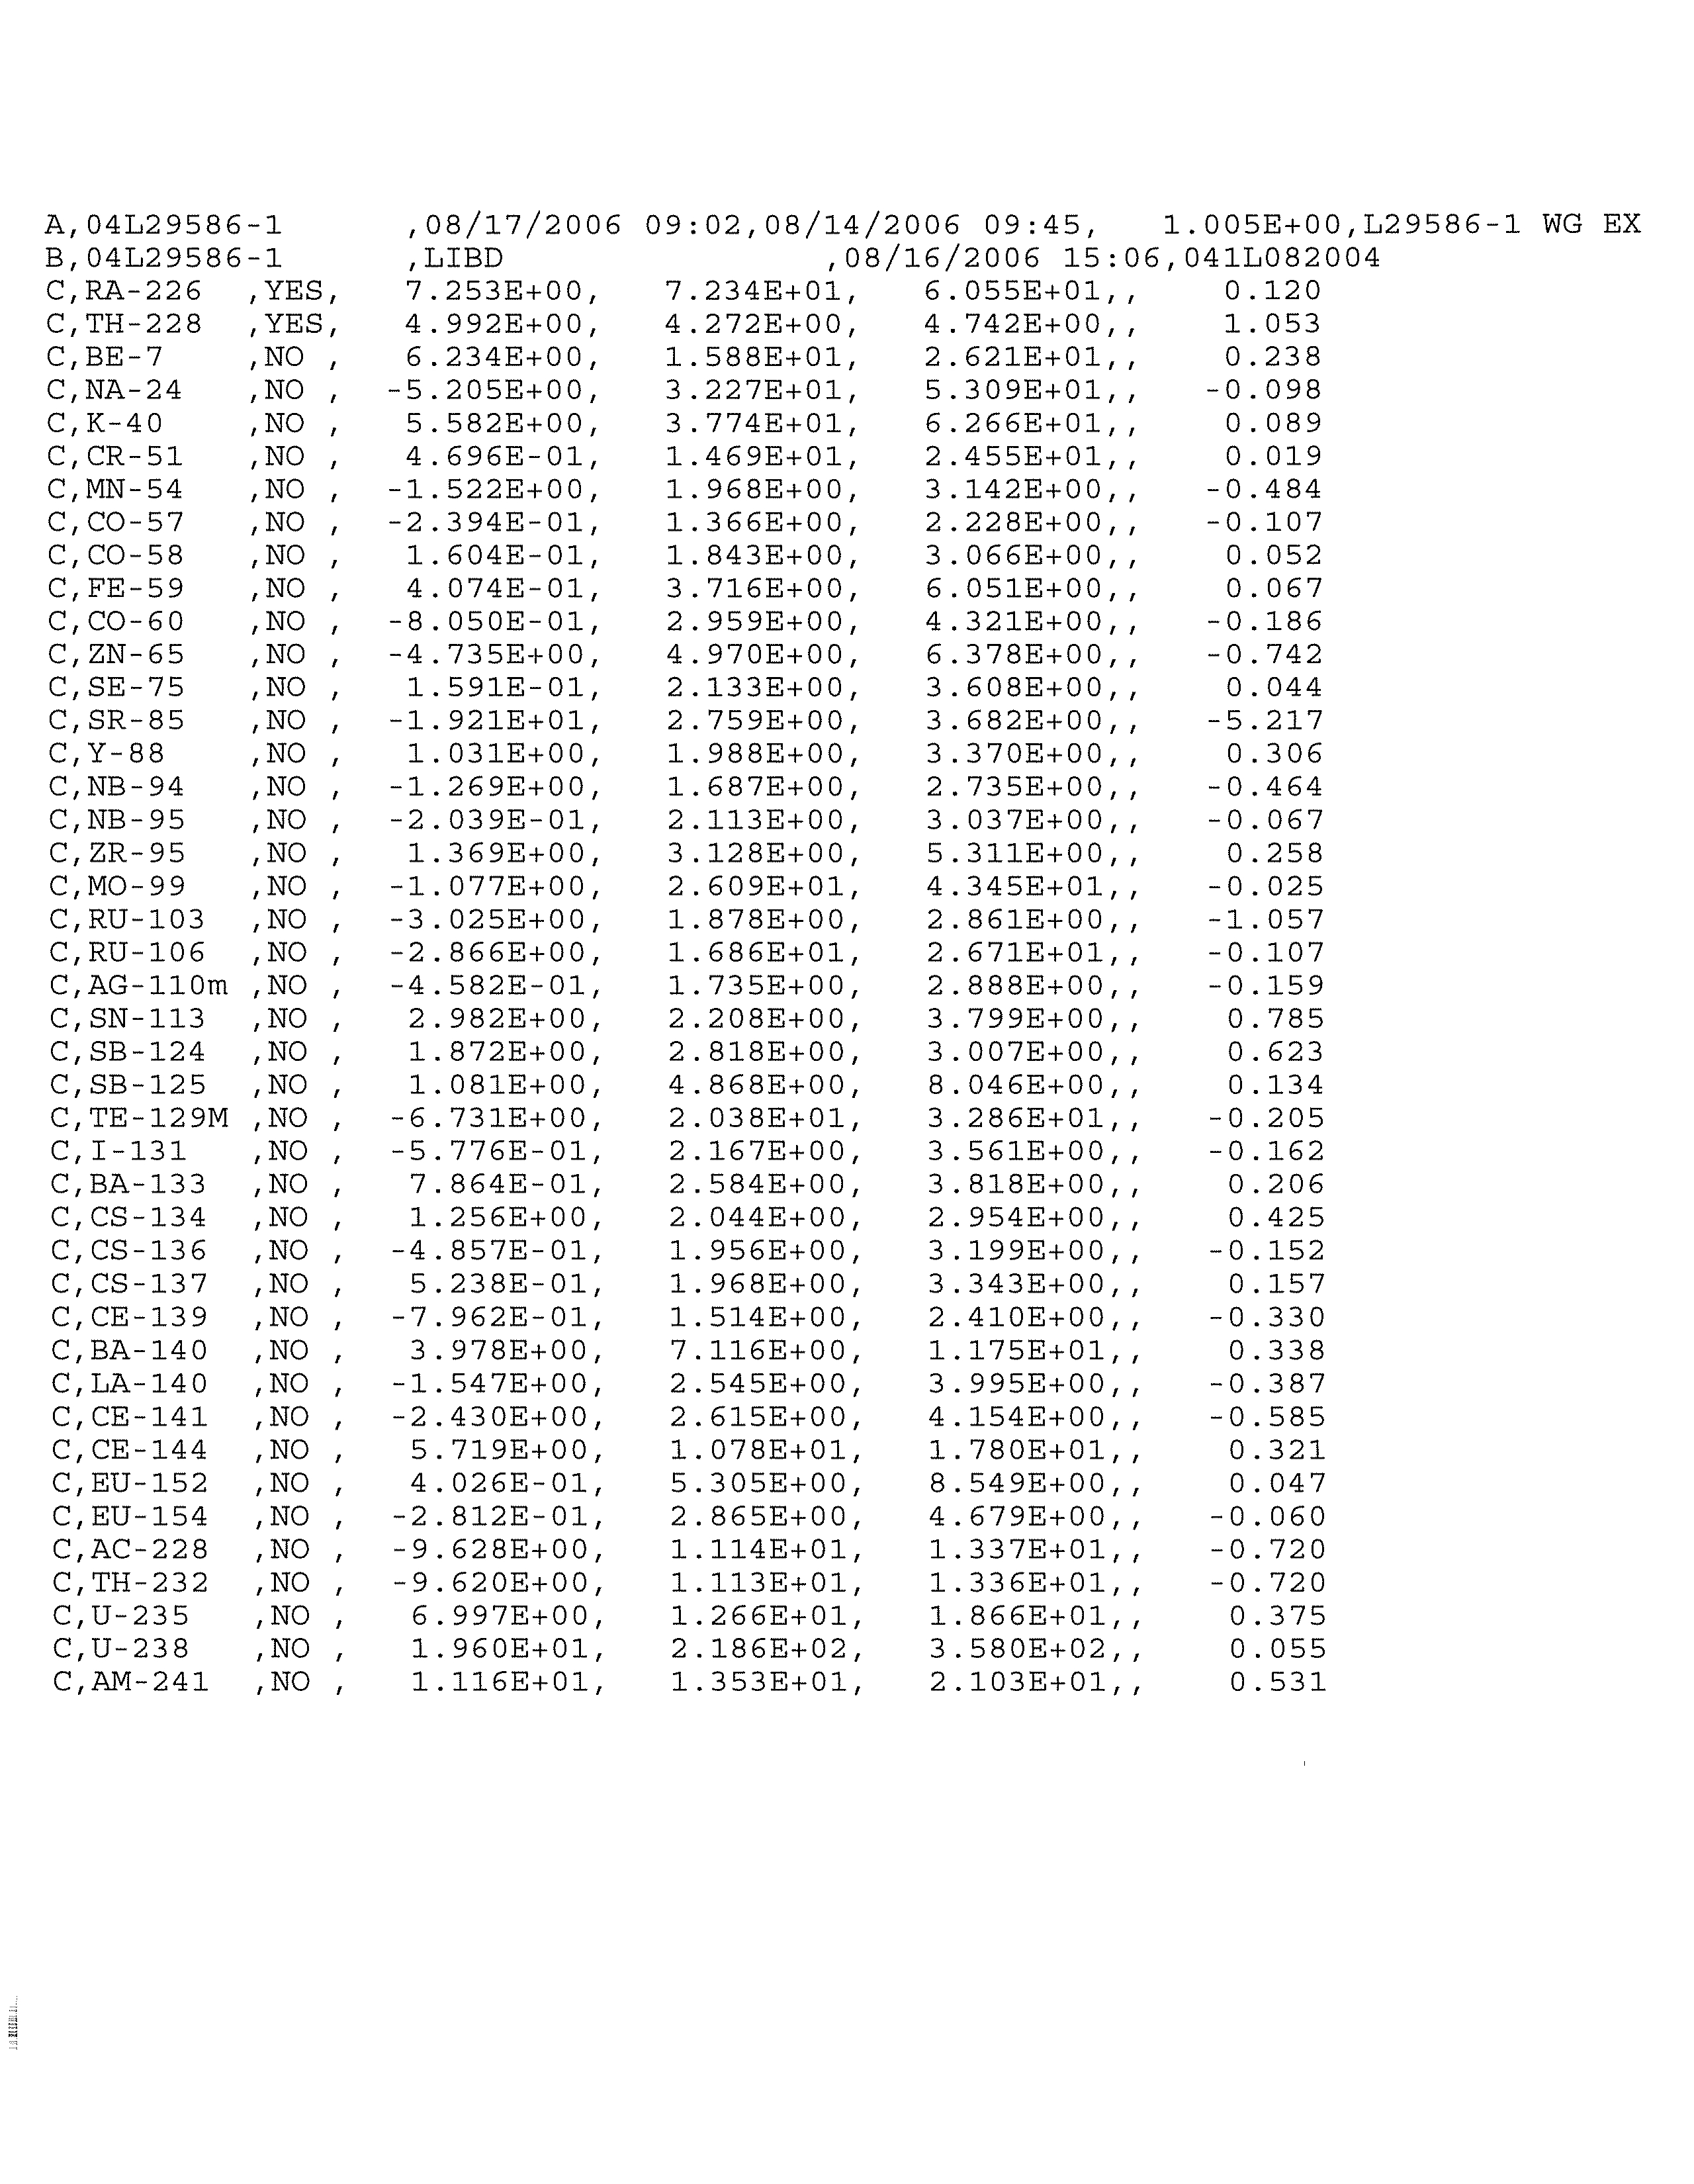
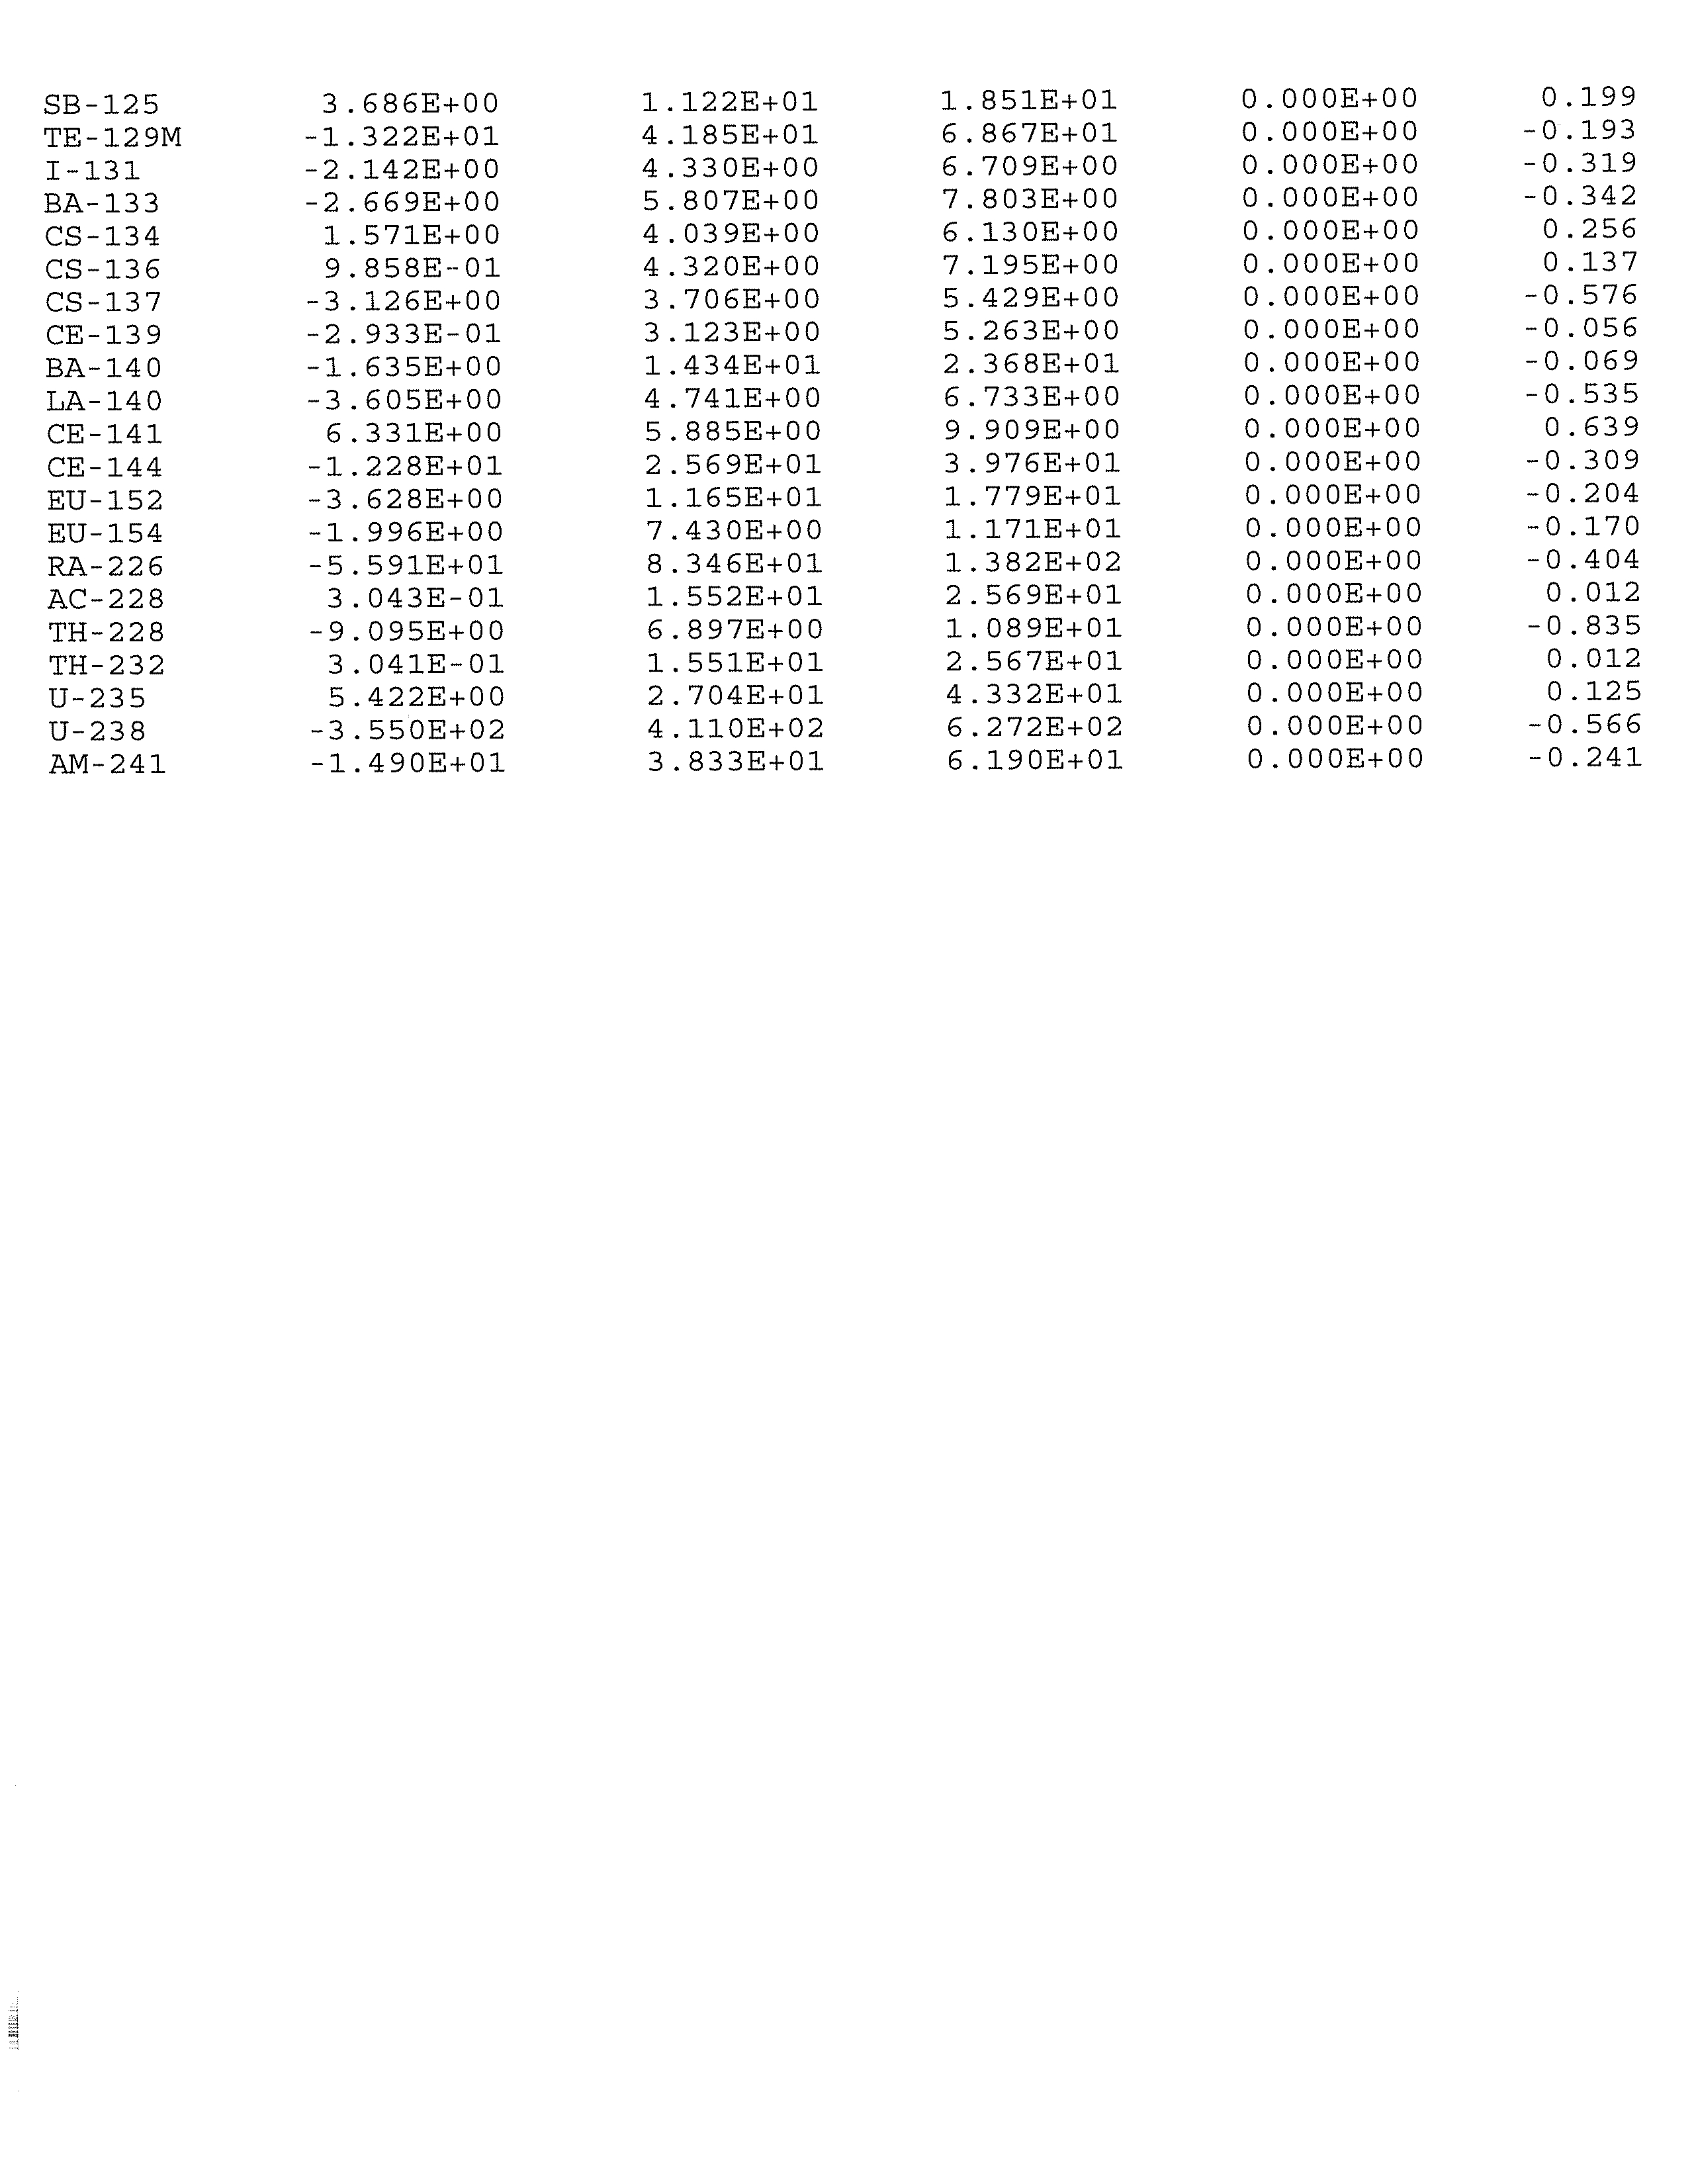
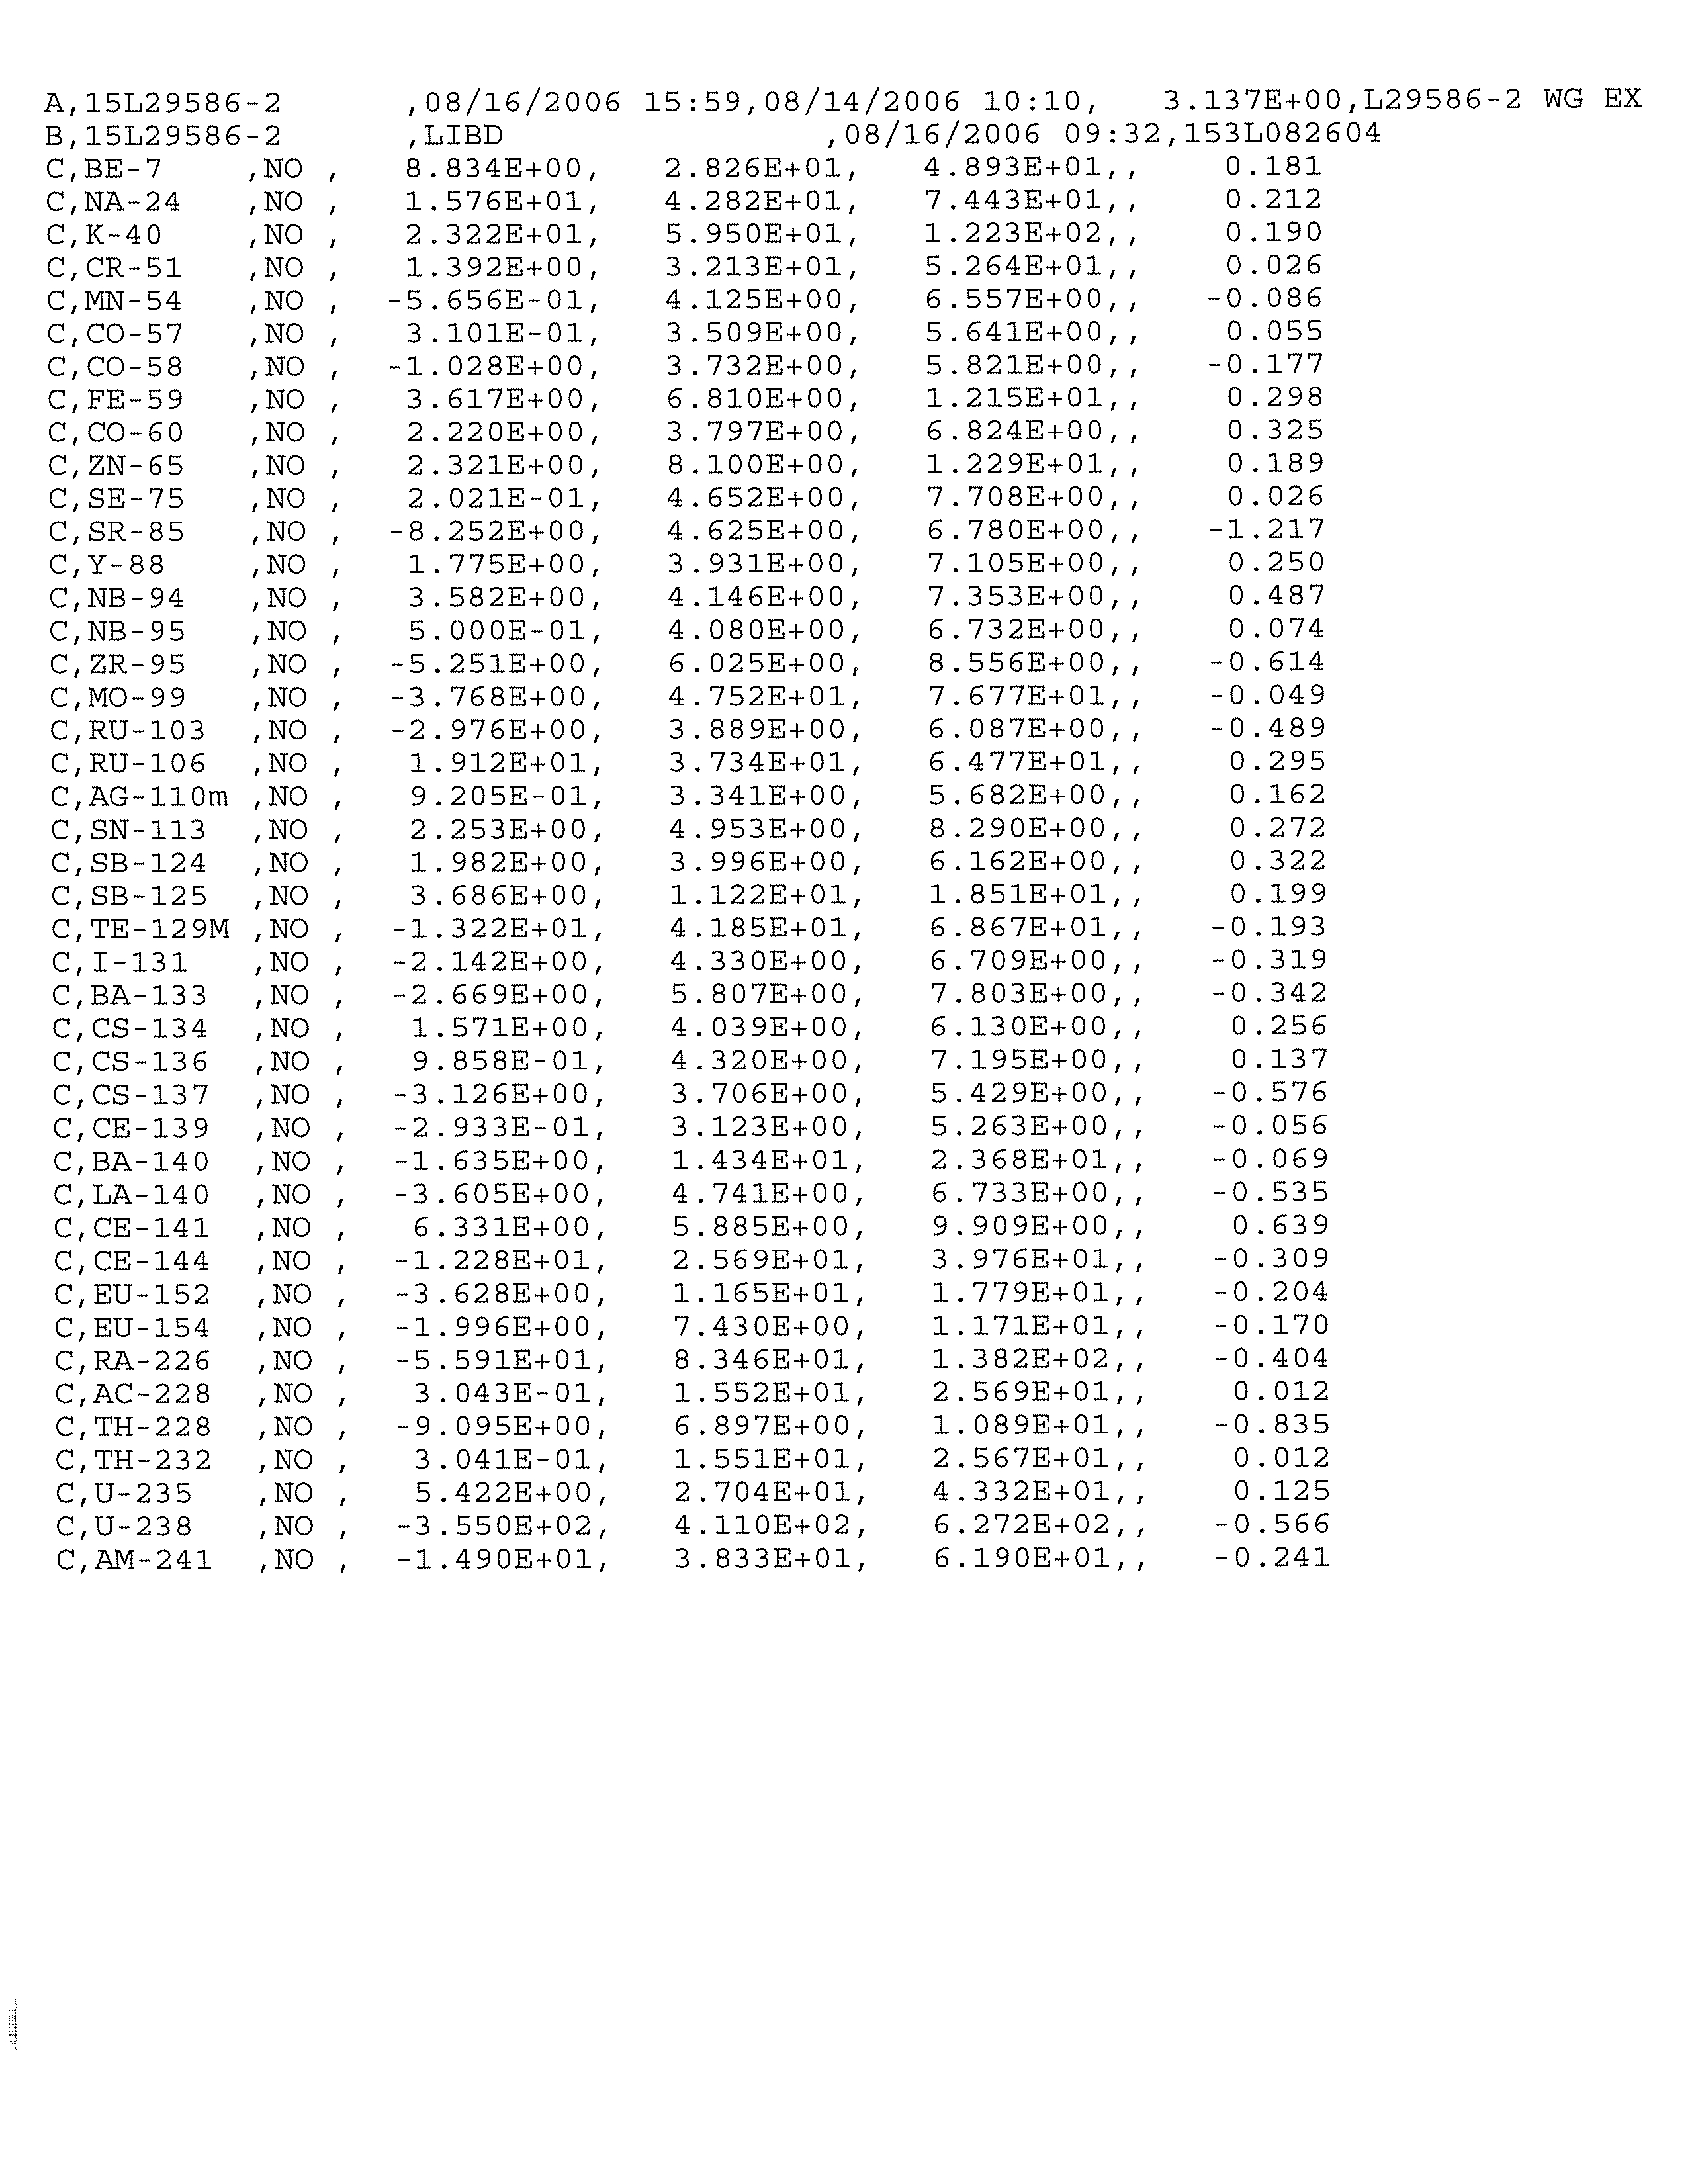
strontium-89/90, and gamma-emitting radionuclides.
The results of the hydrogeologic investigation are:
•
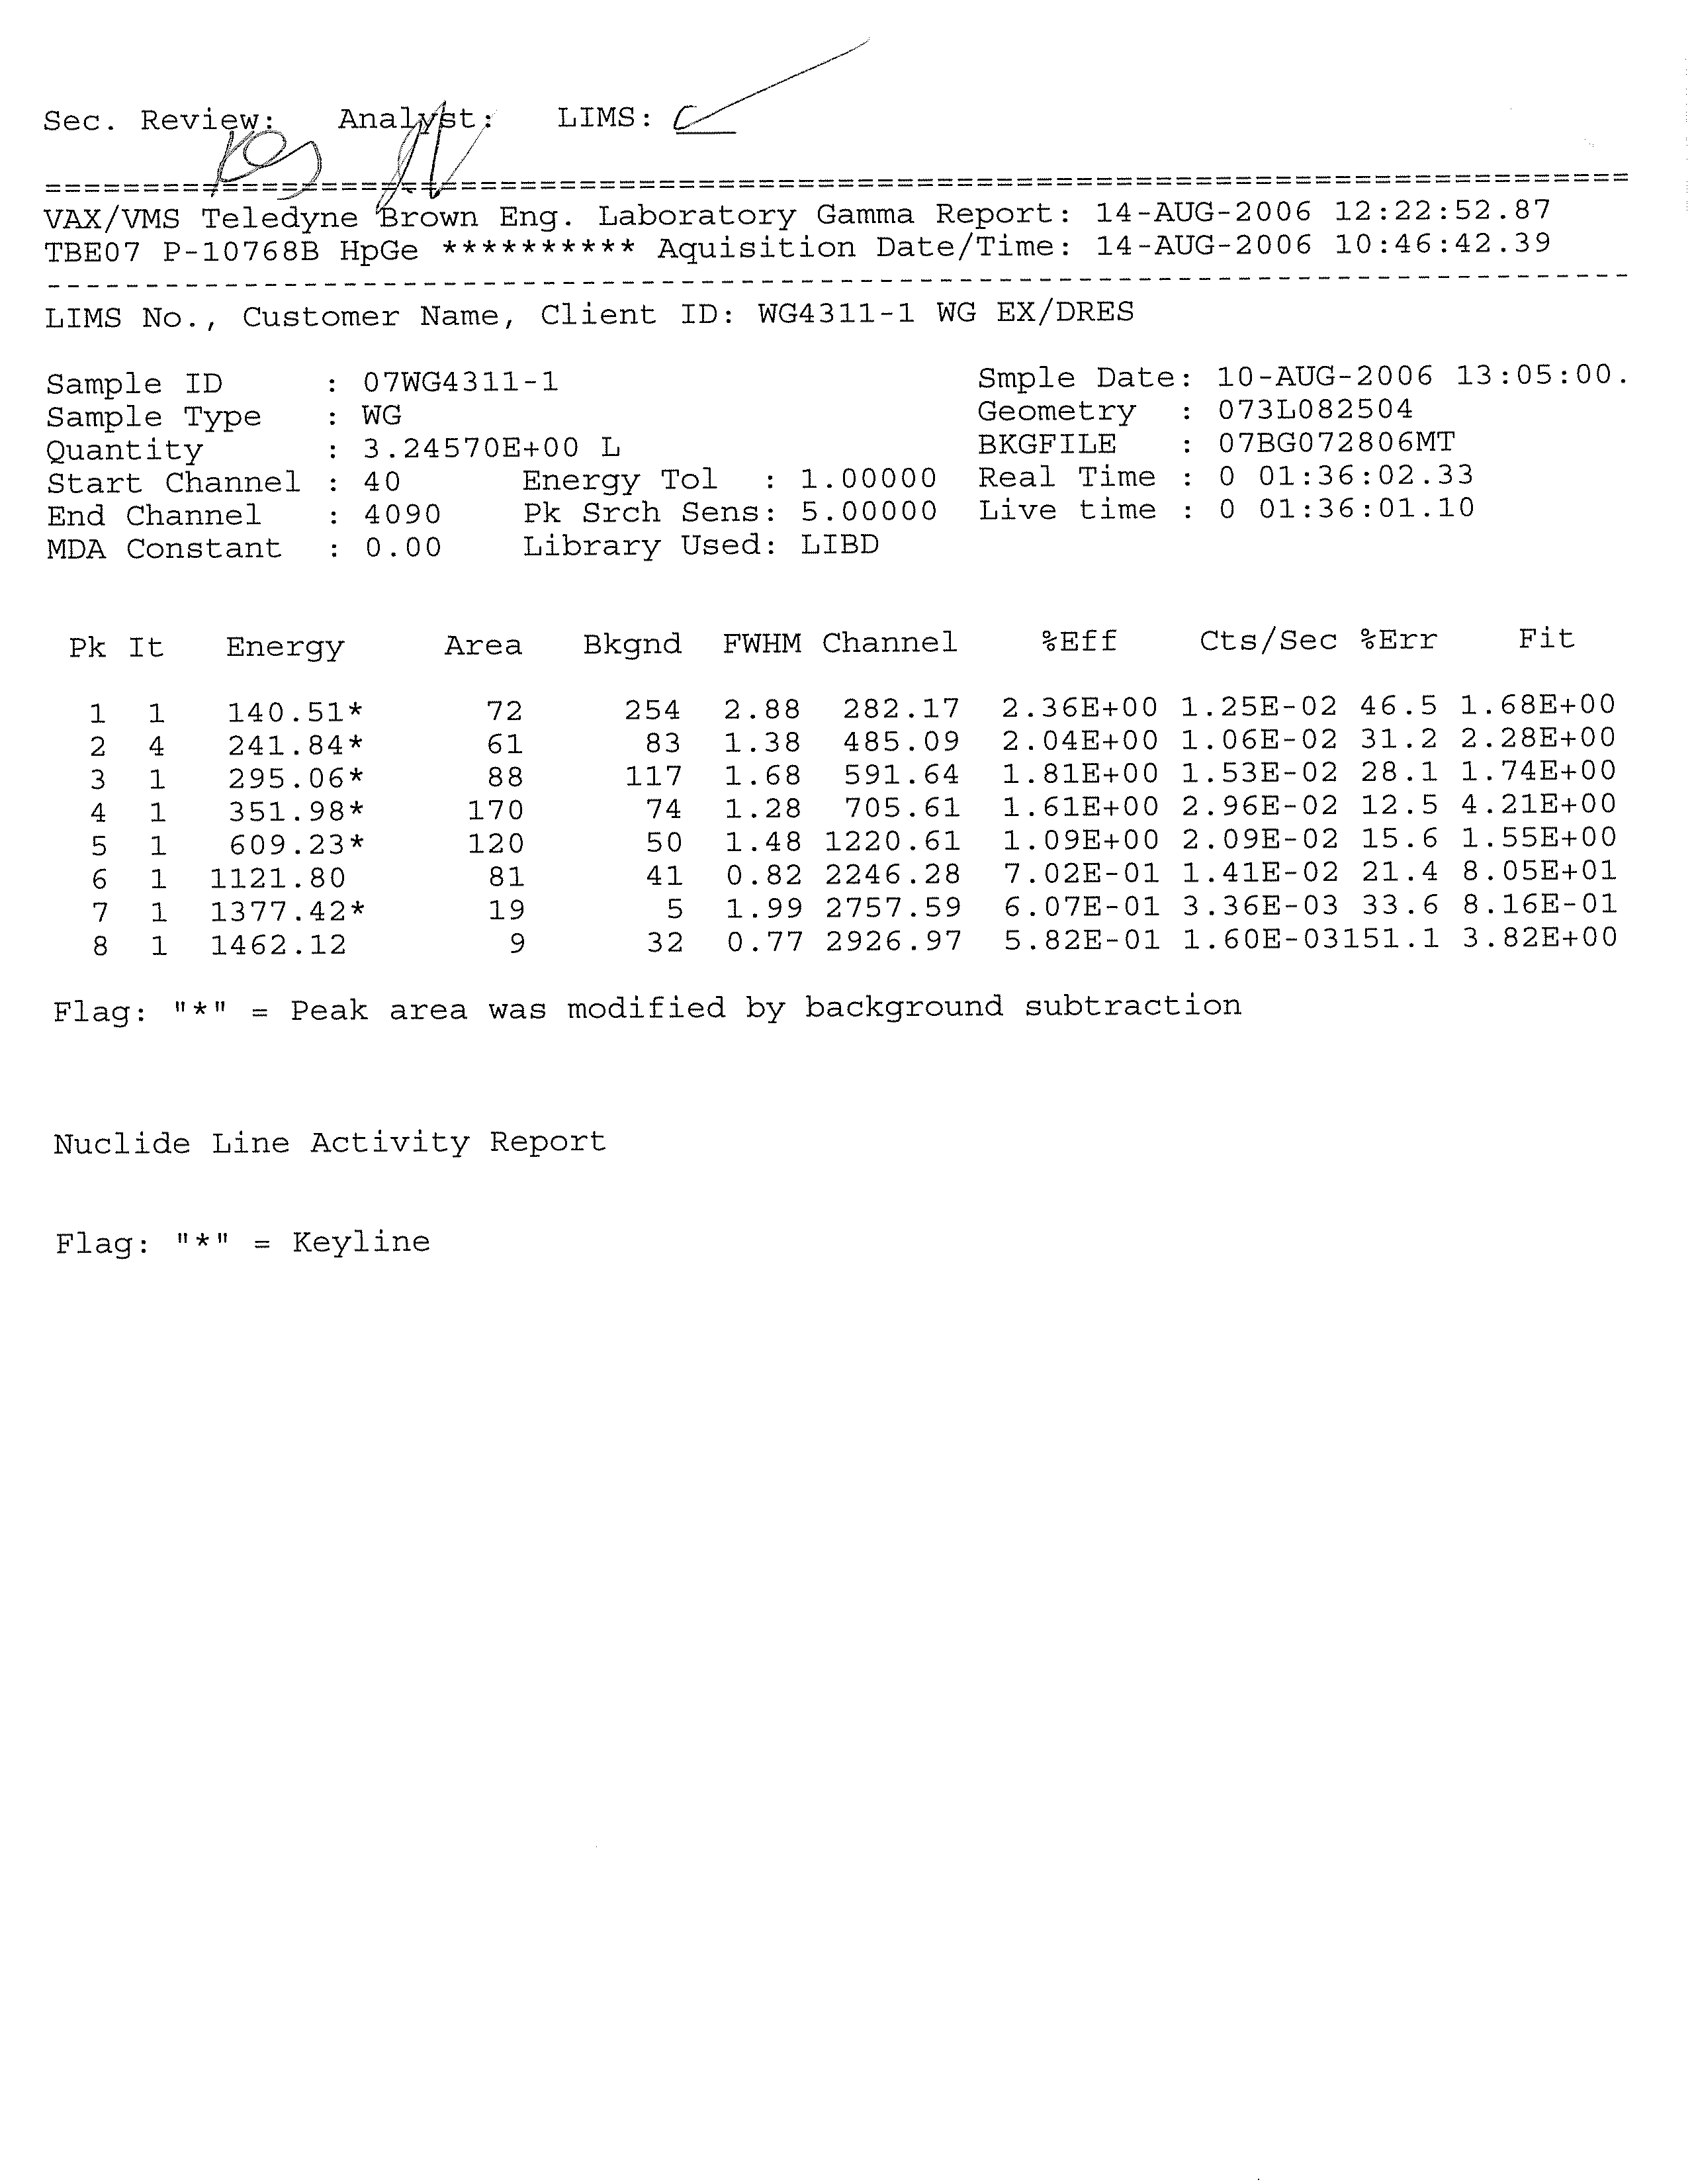
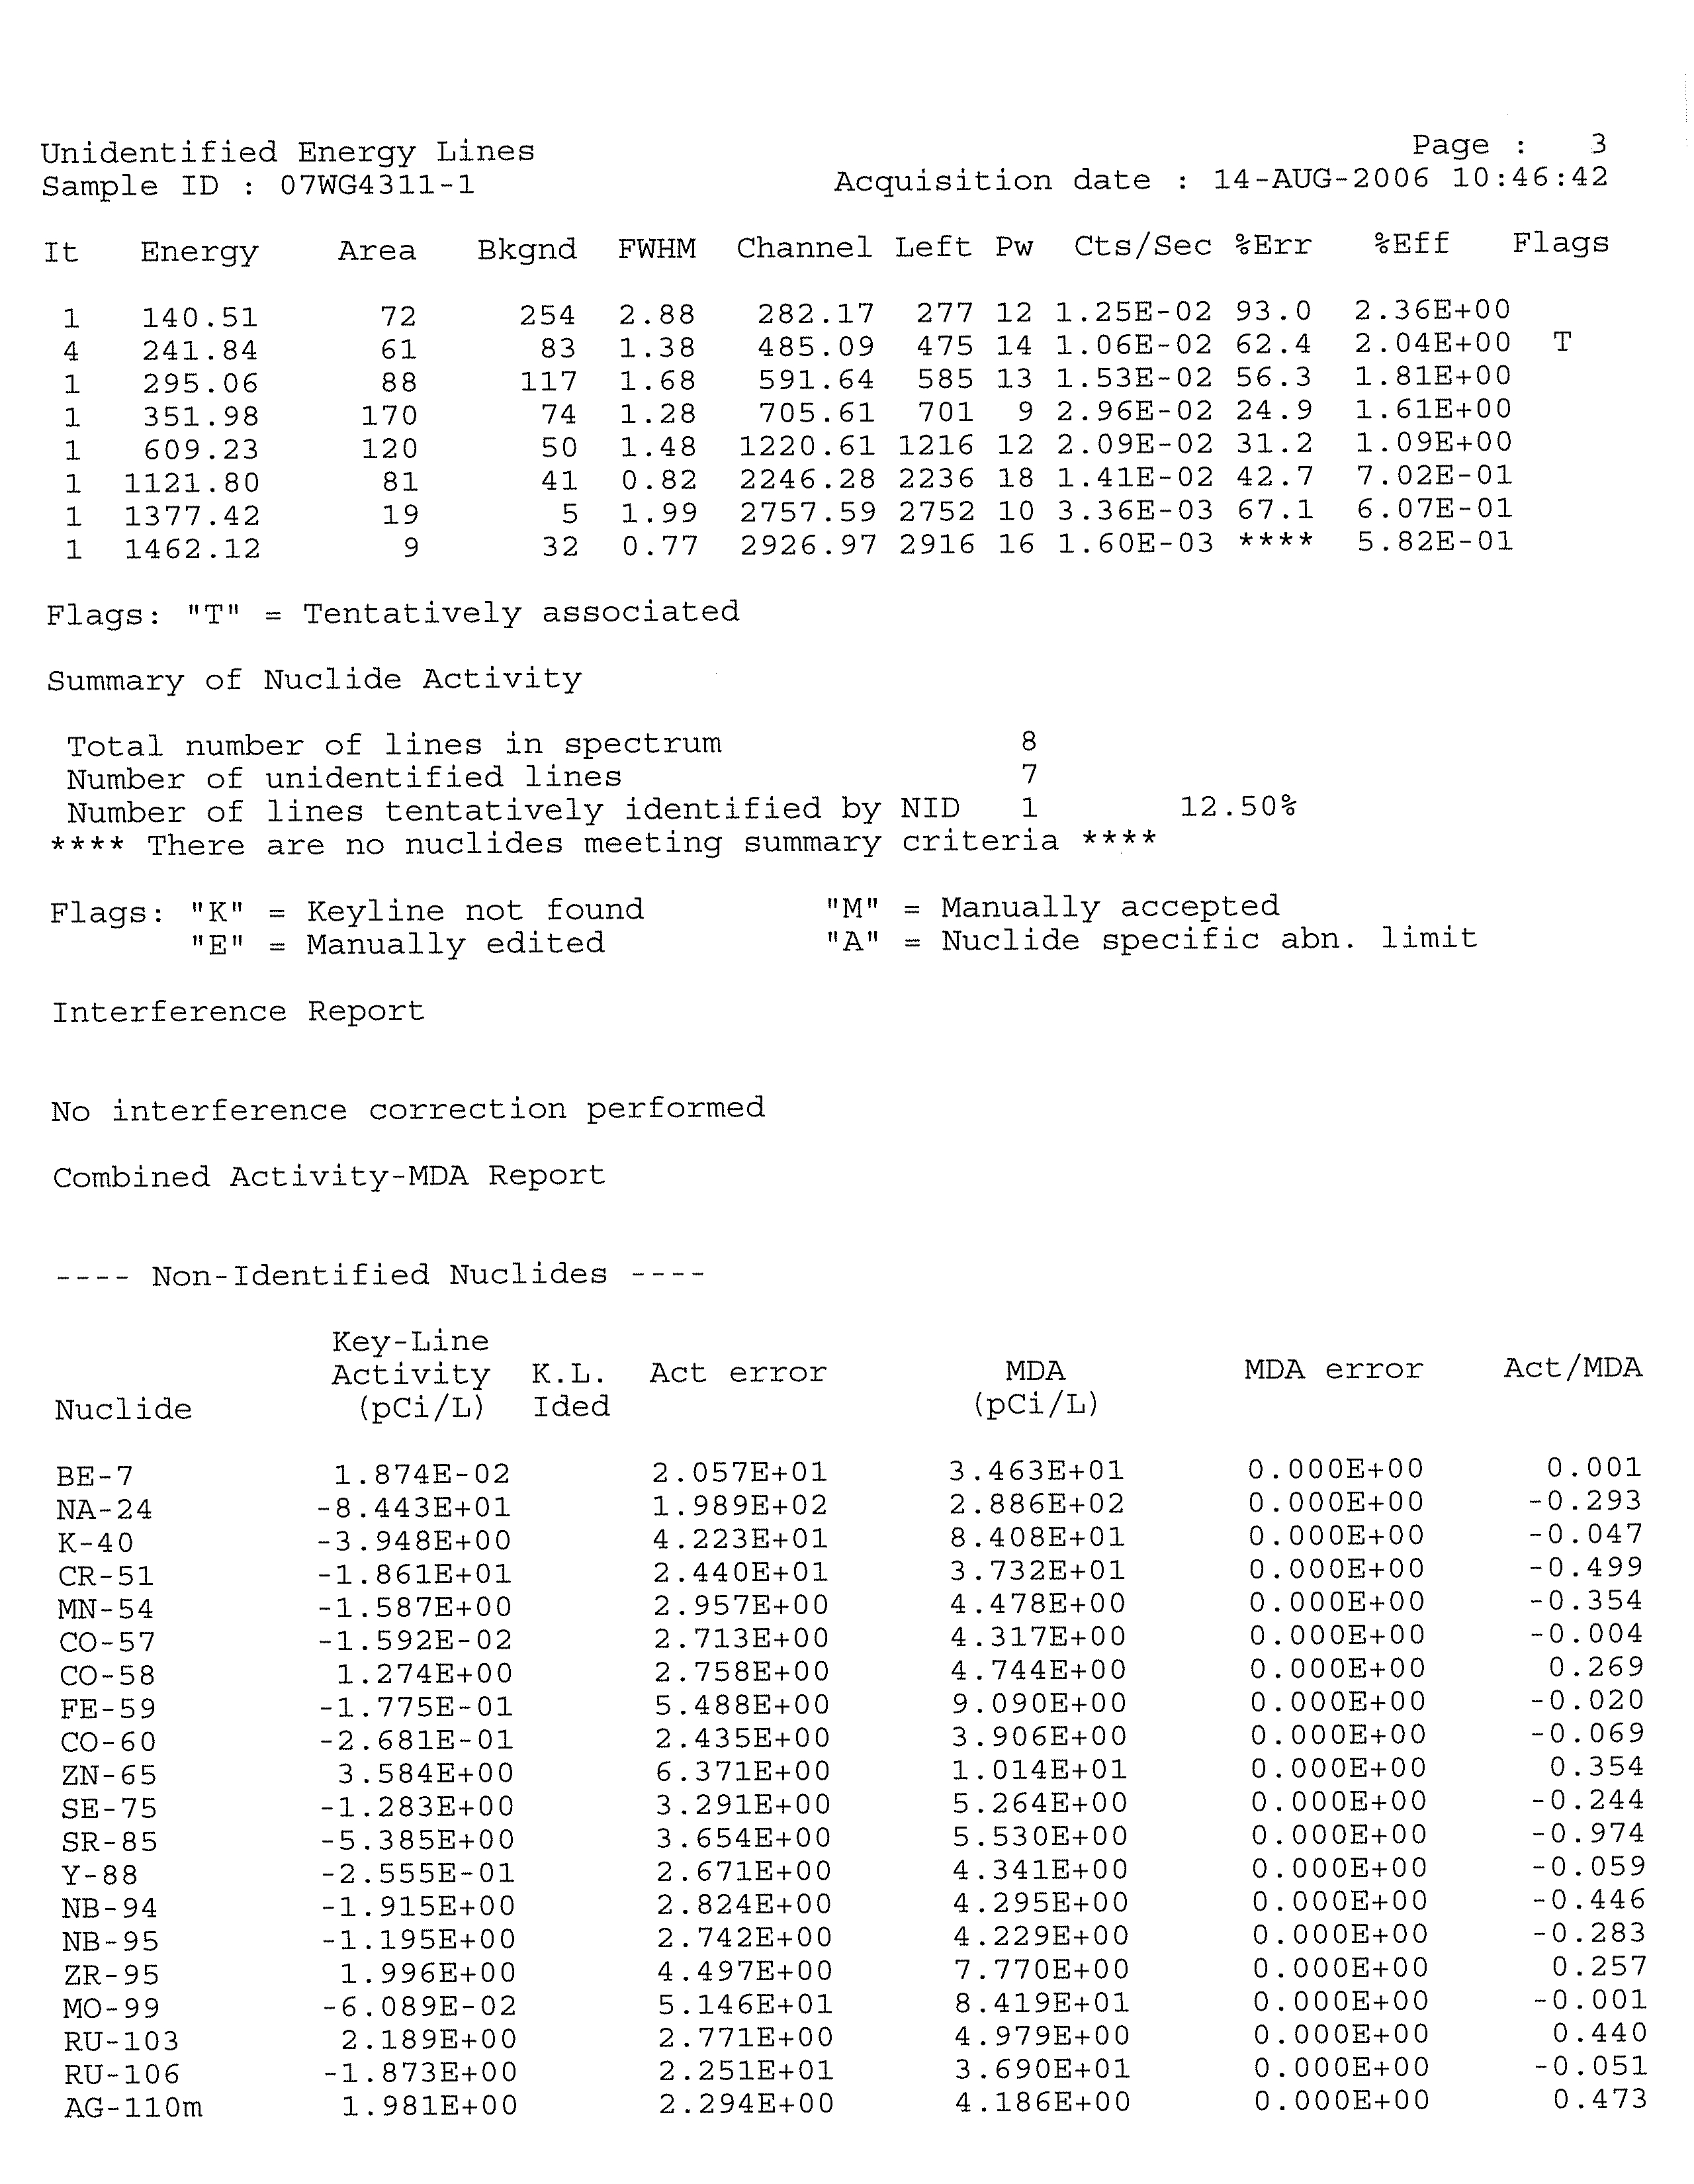
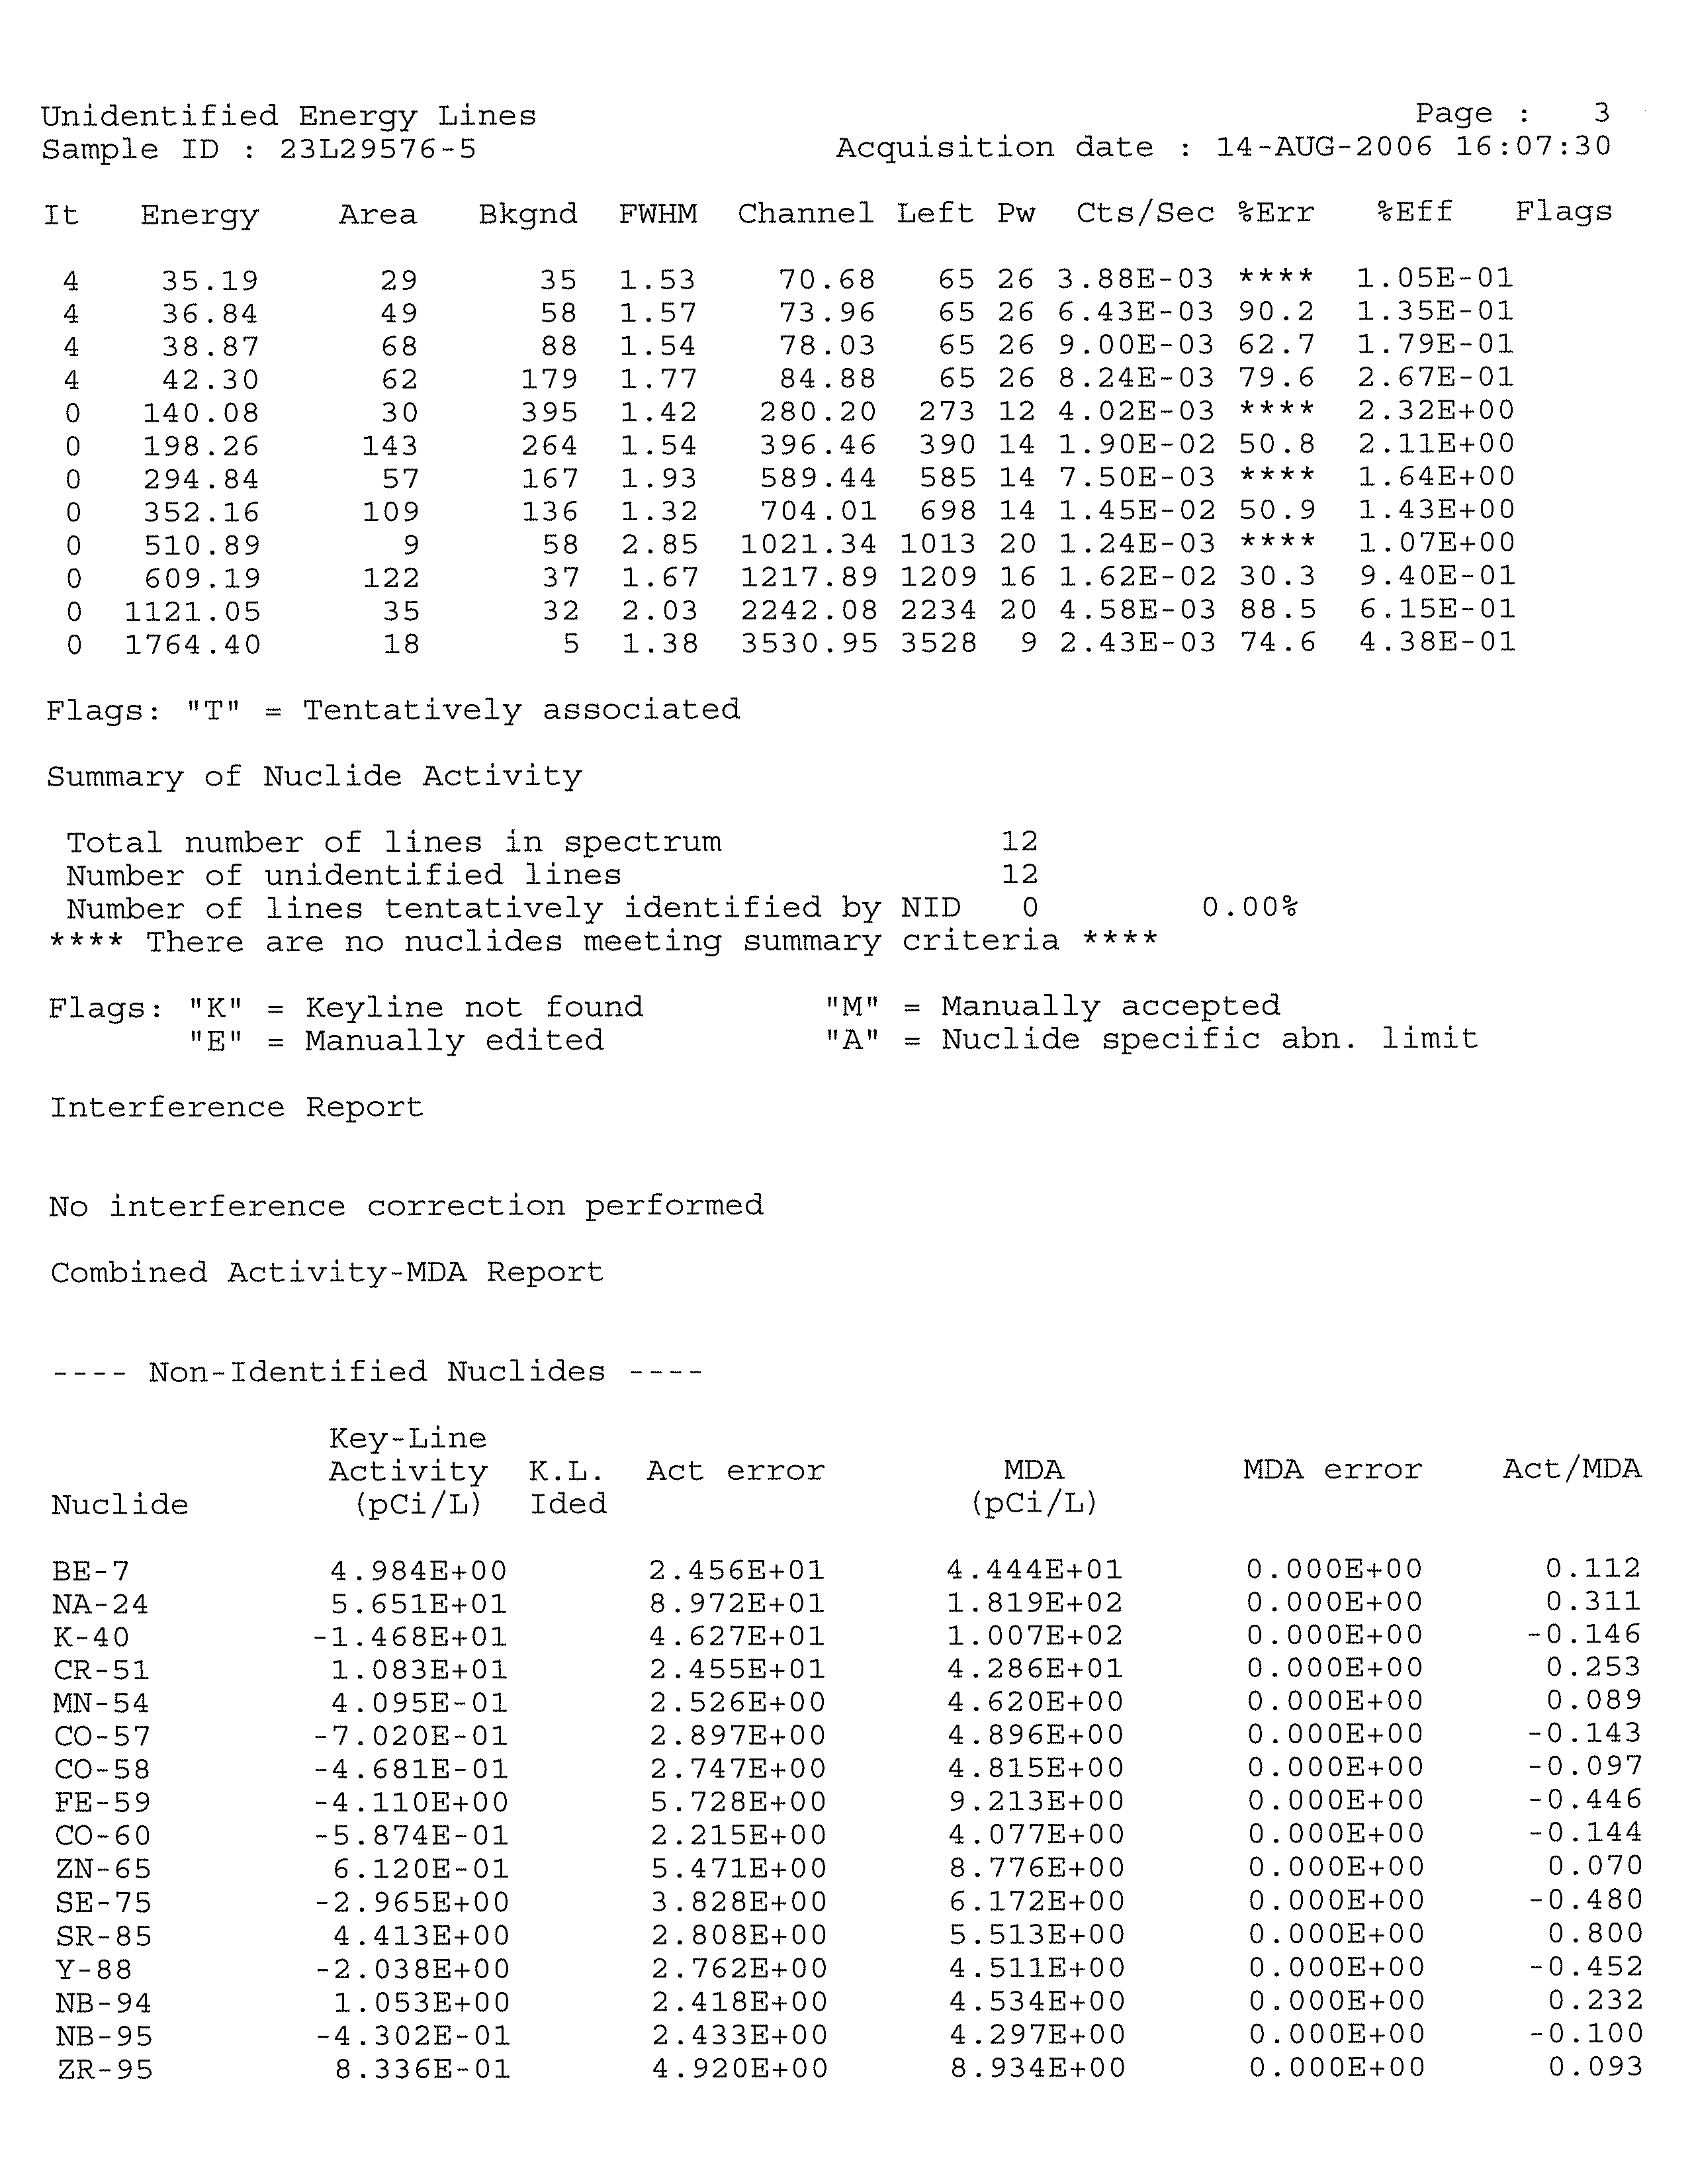
Gamma-emitting radionuclides associated
with licensed plant operations were not
detected at concentrations greater than their respective Lower Limits of Detection
(LLDs) in any of the groundwater or surface water samples obtained and analyzed
during the course of this investigation;
•
Strontium-90 was not detected in groundwater at concentrations greater than the
United States Environmental Protection Agency drinking water standard
of
8.0 pCi/L;
•
Tritium was not detected at concentrations greater than the United States
Environmental Protection Agency drinking water standard of 20,000 pCi/L in any of
the groundwater or surface water samples obtained and analyzed during the course
of this investigation;
•
Tritium was detected in the shallow and intermediate groundwater zones at
concentrations greater than the LLD of 200 pCi/L, which is considered background,
but well below the applicable drinking water standard;
•
These tritium concentrations ranged from 210 ±
124 pCi/L, to 13,200 ± 319 pCi/L;
045136 (15) Dresden Generating Station
i
CONESTOGA-ROVERS & ASSOCIATES
Revision 1
•
Strontium-90 was not detected at concentrations greater than
the United States
Environmental Protection Agency drinking water standard of 8.0 pCi/L in any of
the groundwater or surface water samples obtained and analyzed during the course
of this investigation;
•
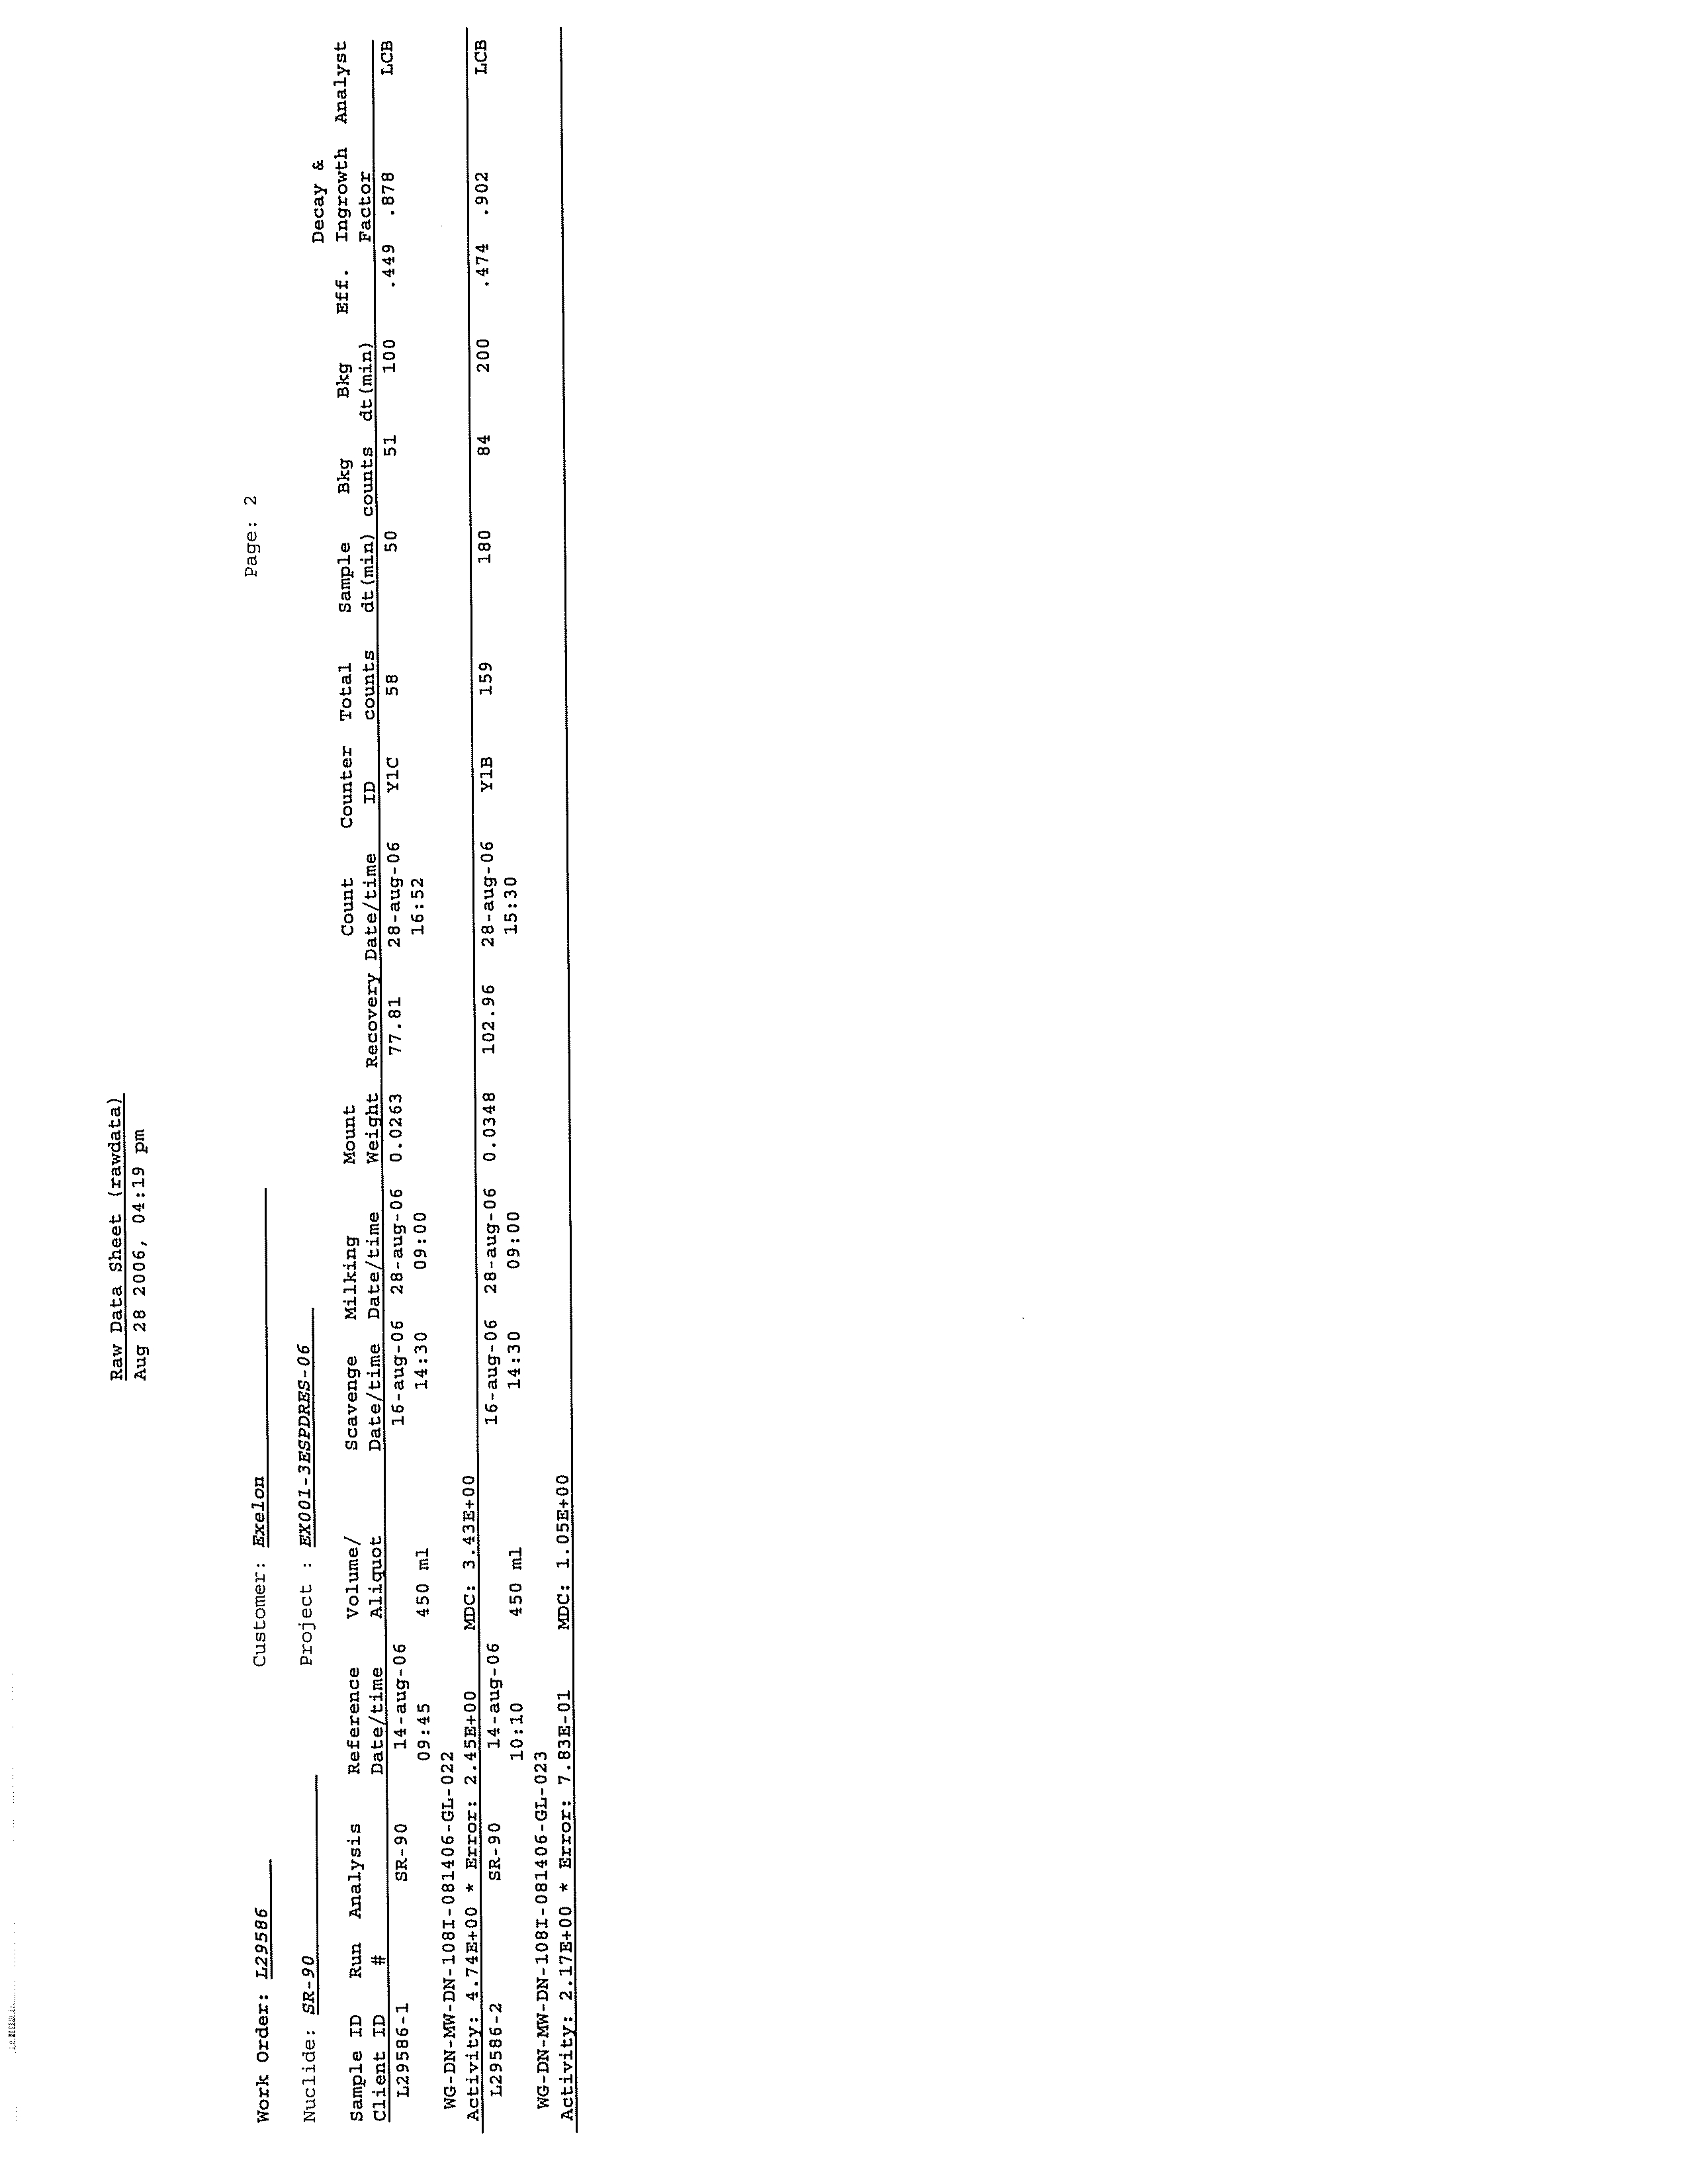
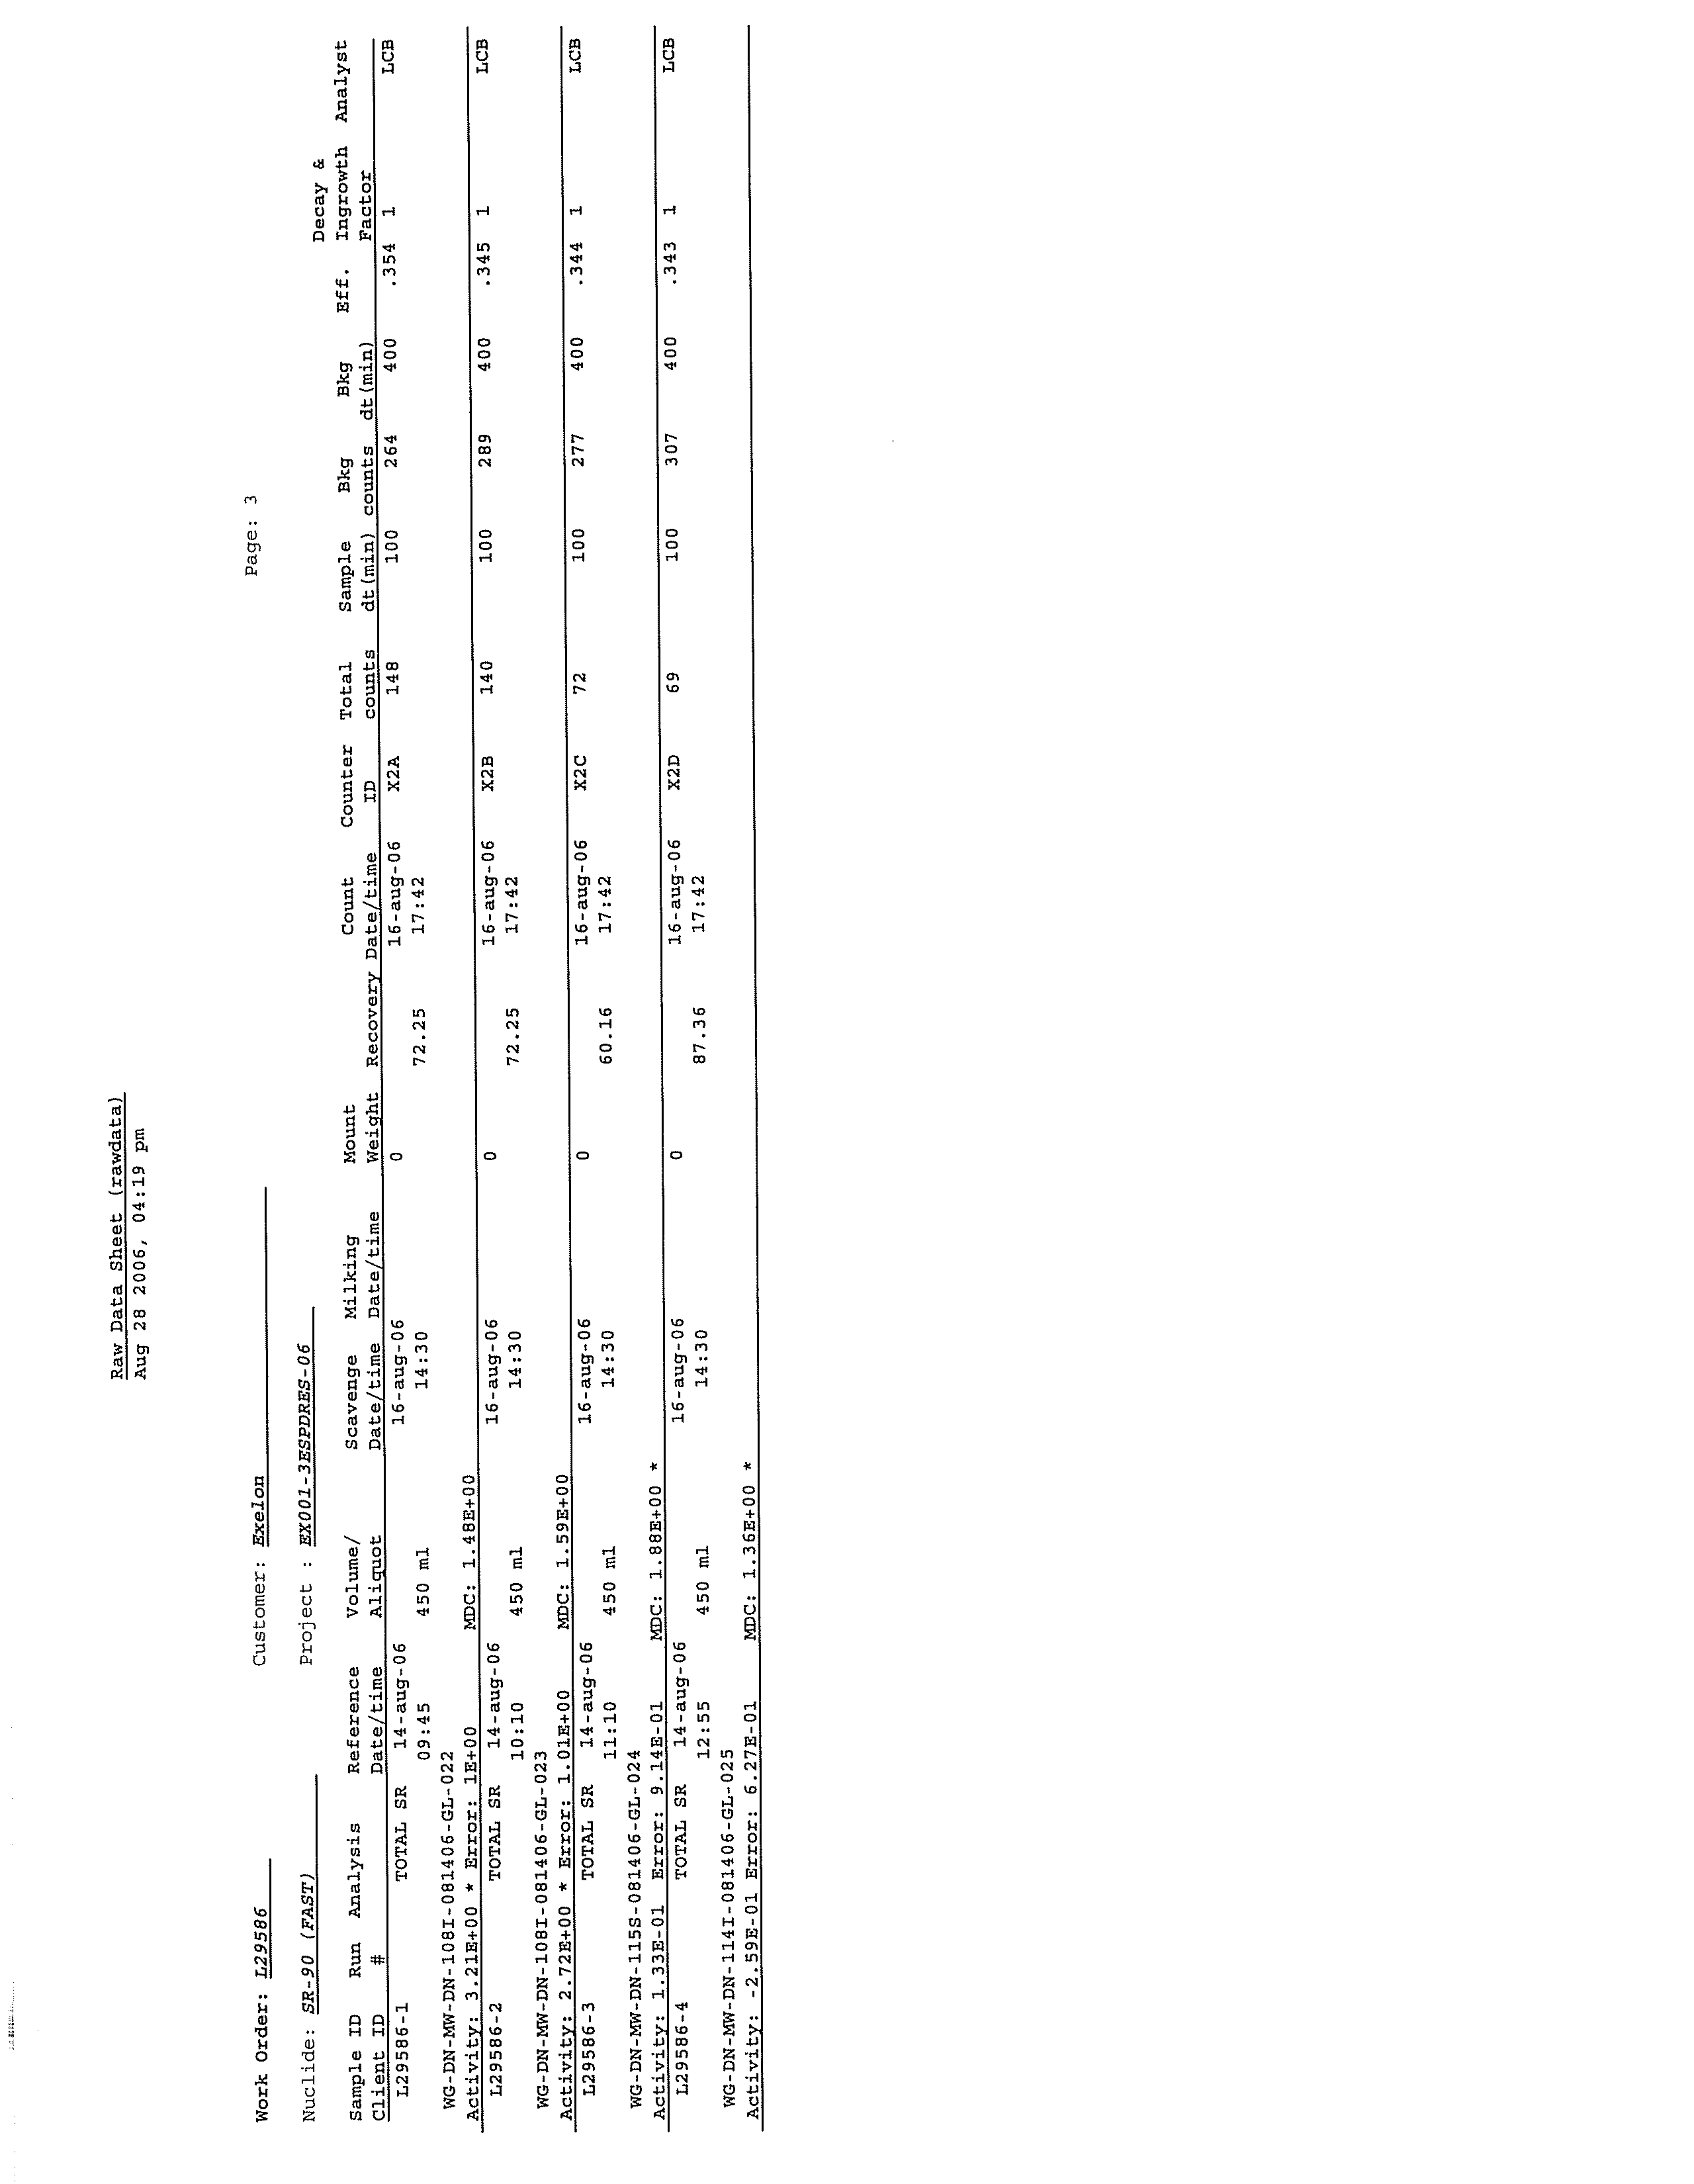
Strontium-90
was detected in a single intermediate well (MW-DN-108I) at
concentrations greater than the Lower Limit of Detection of 2.0 pCi/L, which is well
below the applicable drinking water standard;
•
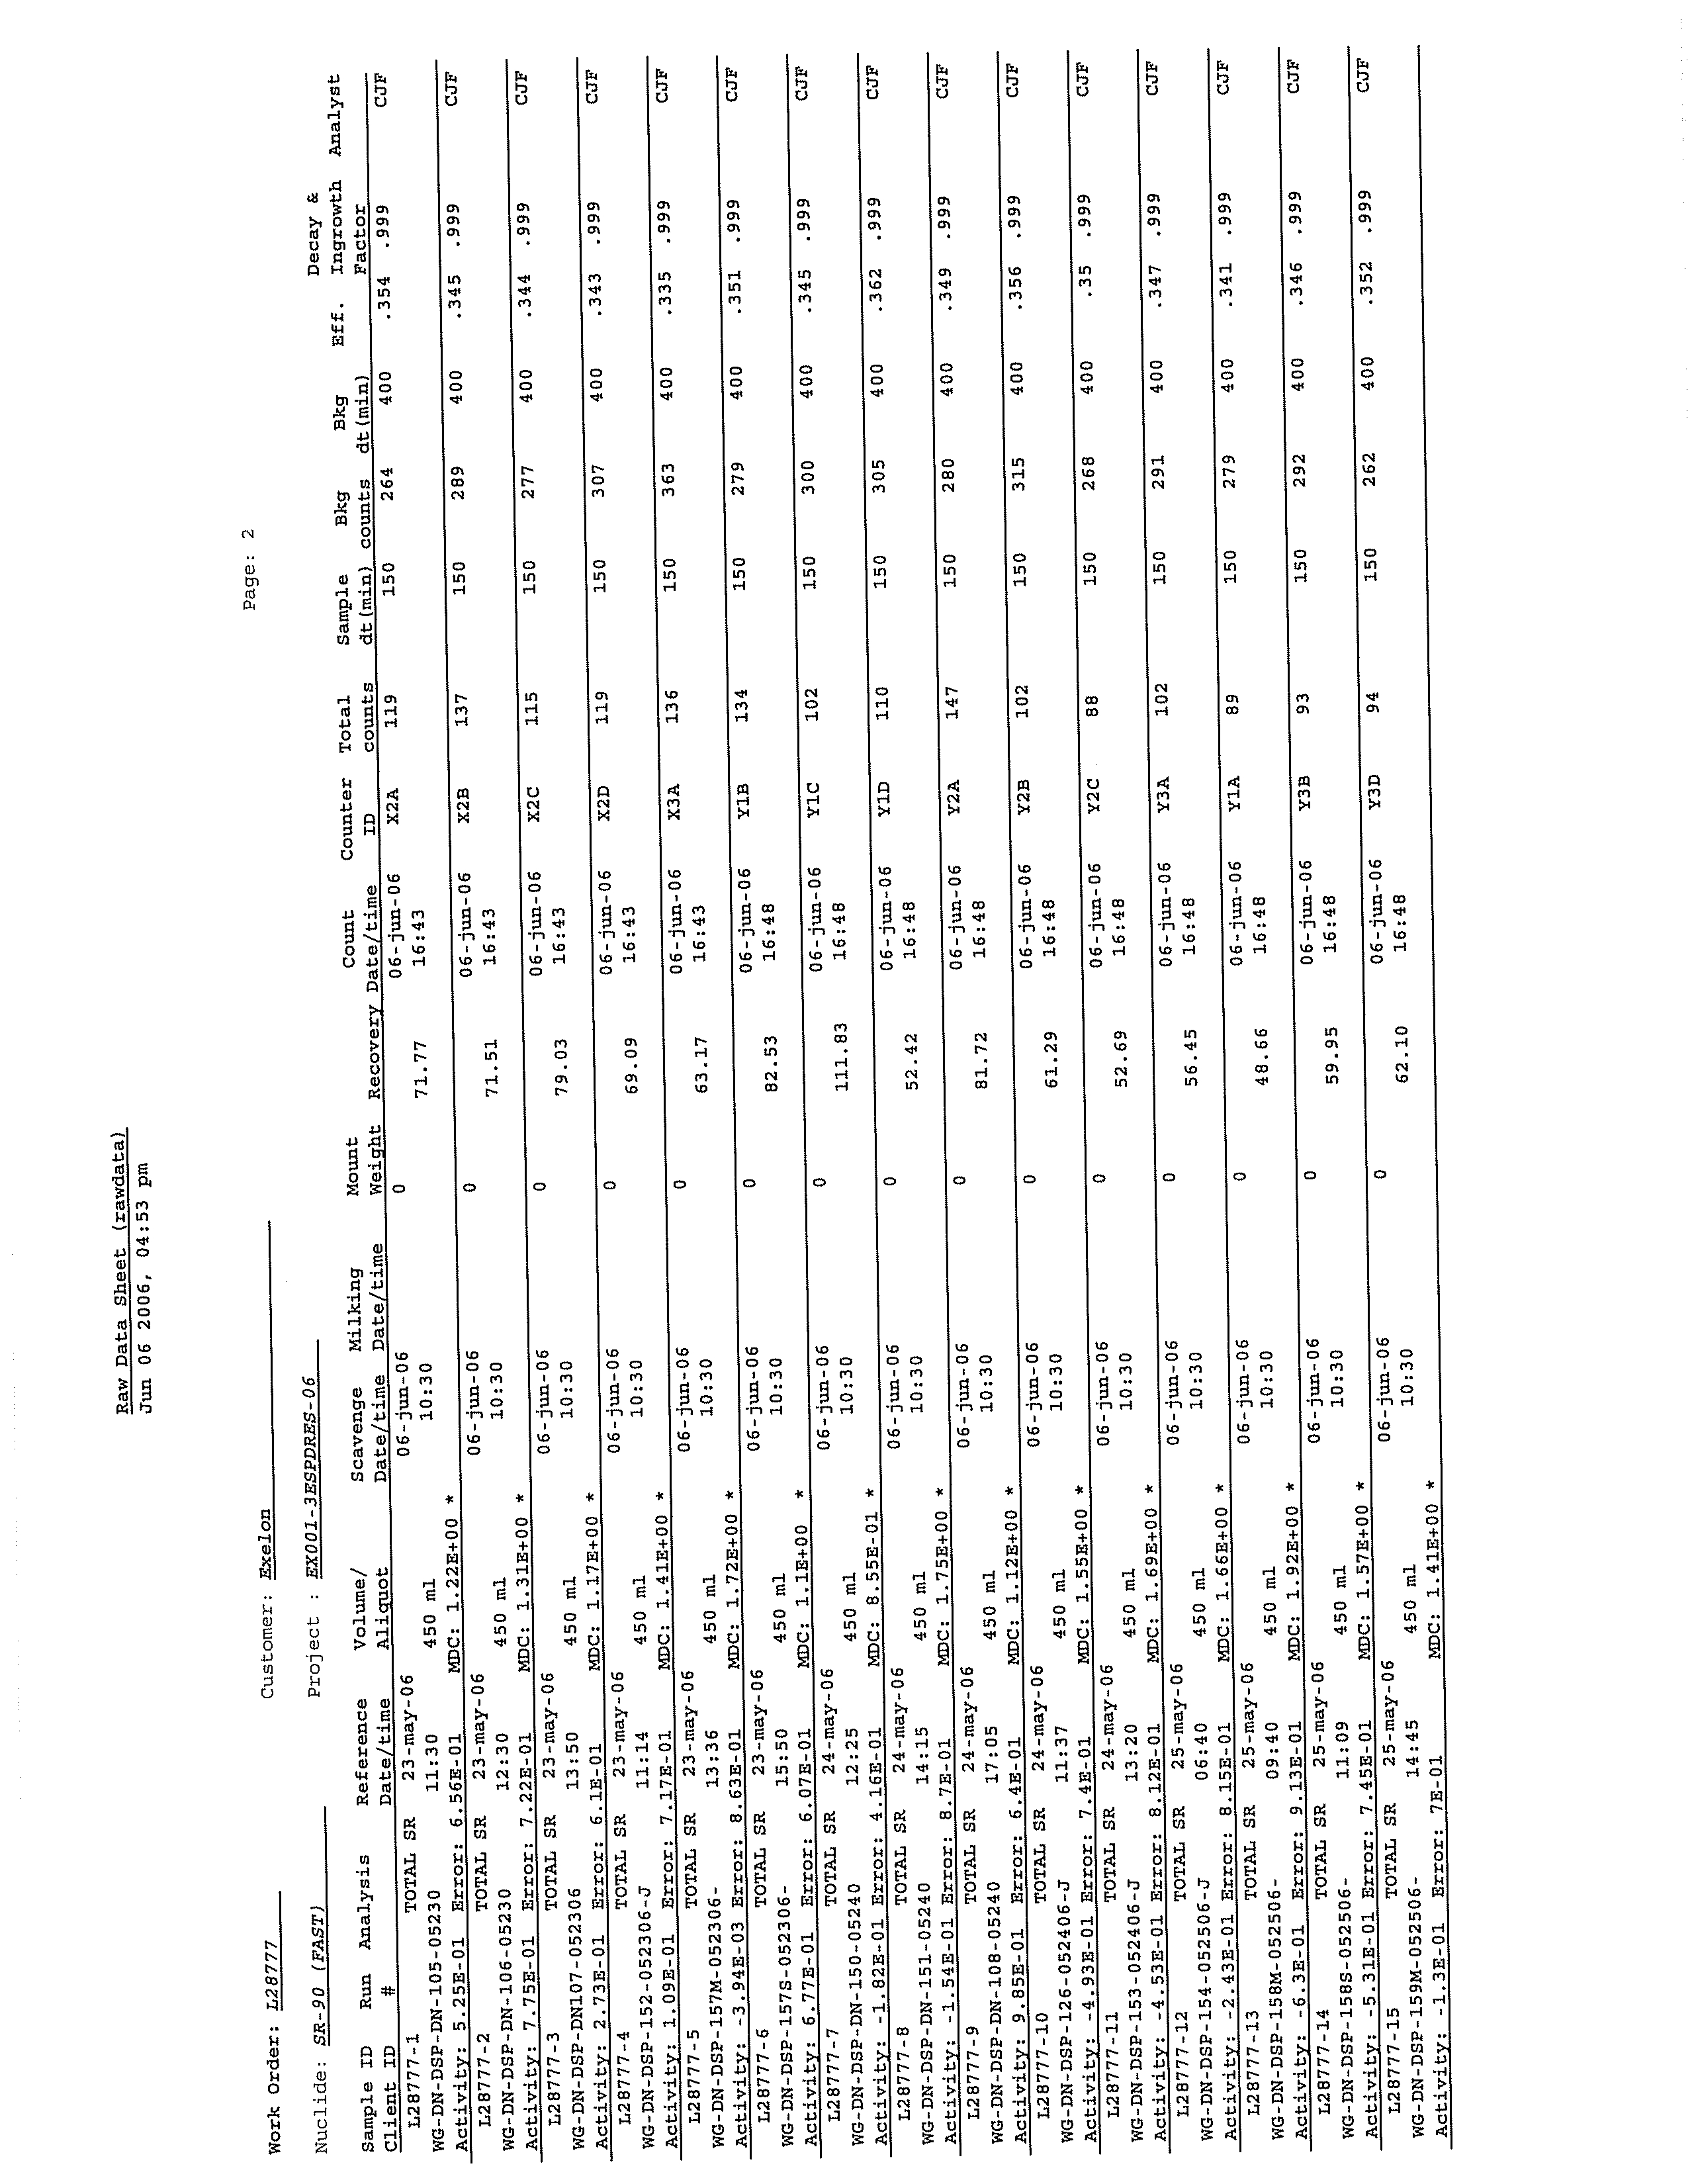
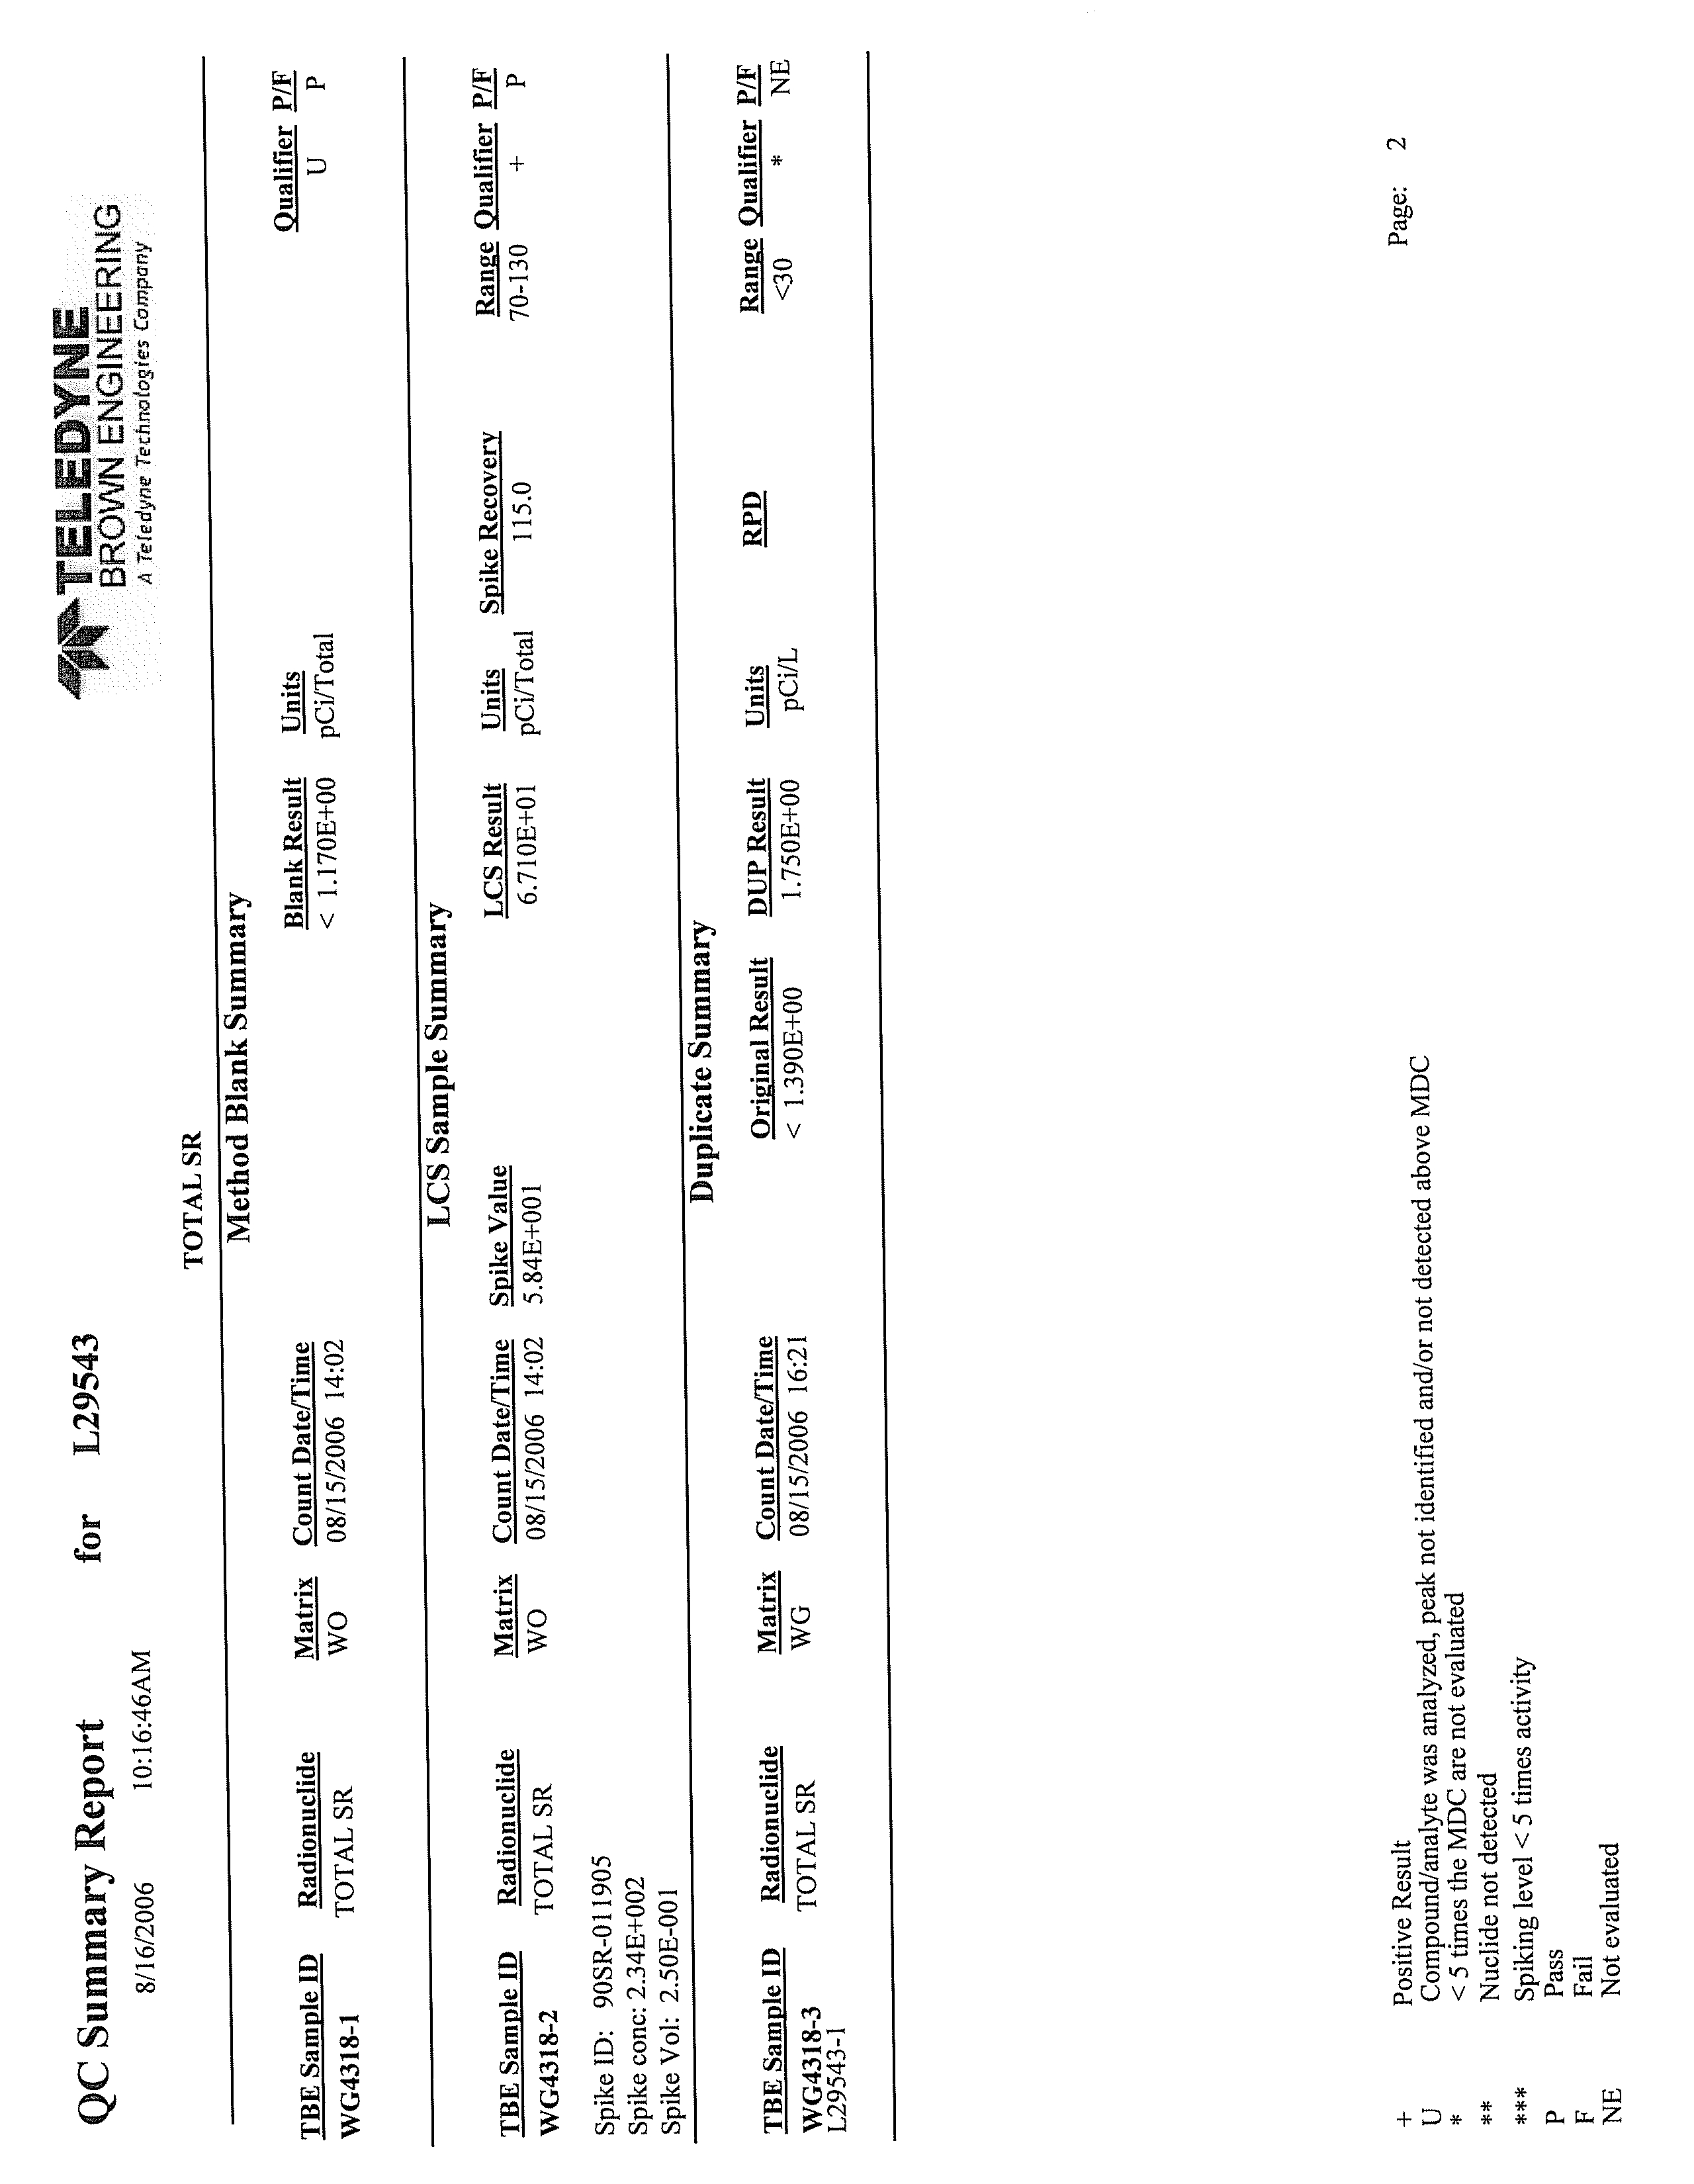
The strontium-90 concentration from MW-DN-108I was 2.17 ±
0.783 pCi/L;
•
Based
on the results of this investigation, tritium originating from the Station is not
migrating off the Station property at detectable concentrations;
•
Based on the results of this investigation, there is no current risk of exposure
to
radionuclides associated with licensed plant operations through any of the identified
potential exposure pathways; and
•
Based upon the results of this
investigation, there are no known active releases into
the groundwater at the Station.
Based on the information collected to date, CRA recommends that Exelon conduct
periodic monitoring of selected sample locations.
045136 (15) Dresden Generating Station
ii
CONESTOGA-ROVERS & ASSOCIATES
Revision 1
1.0
INTRODUCTION
Conestoga-Rovers & Associates (CRA) prepared this Hydrogeologic Investigation
Report (HIR) for Exelon Generation Company, LLC (Exelon) as part of its Fleetwide
Program to determine whether groundwater at and near its nuclear power generating
facilities has been adversely impacted by any releases of radionuclides. This report
documents the results of CRA's May 2006 Hydrogeologic Investigation Work Plan
(Work Plan) as well as several other investigative tasks recommended by CRA during
the course of the investigation. These investigations pertain to Exelon's Dresden
Generating Station in Morris, Illinois (Station) (see Figure 1.1). The Station is defined as
all property, structures, systems, and components owned and operated by Exelon LLC
located at 6500 North Dresden Road in Morris, Illinois.
Pursuant to the Work Plan, CRA assessed groundwater quality at the Station in
locations designated as Areas for
Further Evaluation (AFEs). The process by which CRA
identified AFEs is discussed in Section 3.0 of this report.
The objectives of the Work Plan were to:
•
characterize the geologic and hydrogeologic conditions within the Station, including
subsurface soil types, the presence or absence of confining layers, and the direction
and rate of groundwater flow;
•
characterize the groundwater/surface water interaction at the Station, including a
determination of the surface water flow regime;
•
evaluate groundwater quality at the Station, including the vertical and horizontal
extent, quantity, concentration, and source of tritium and other radionuclides in the
groundwater, if any;
•
define the probable sources of any radionuclides released at the Station;
•
evaluate potential human, ecological, or environmental receptors of any
radionuclides that might have been released to the groundwater; and
•
evaluate whether interim response activities are warranted.
045136 (15) Dresden Generating Station
1
CONESTOGA-ROVERS & ASSOCIATES
Revision 1
2.0
STATION DESCRIPTION
The following section presents a general summary of the Station location and definition,
overview of Station operations, surrounding land use, and an overview of both regional
and Station-specific topography, surface water features, geology, hydrogeology, and
groundwater flow conditions. This section also presents an overview of groundwater
use in the area.
2.1
STATION LOCATION
The Station consists of approximately 1,600 acres, of which approximately 400 acres are
used for the generating facilities. The other approximately 1,284 acres of property
encompass the Industrial Cooling Pond (Pond). The Station is located near the City of
Morris, in Grundy County. The Station is located at the junction of the Kankakee and
Des Plaines Rivers that merge to form the Illinois River. The Station address is
6500 North Dresden Road, Morris, Illinois. The Station is owned and operated by
Exelon. Figure 2.1 presents the Station Boundaries and Features map, which includes
key features. The Protected Area (PA) of the Station is the fenced-in area surrounding
the Reactor and Turbine Buildings and other critical facilities related to the operation of
the Station.
The Pond is located to the south of the Station and serves as the Station's storage and
thermal loss point for cooling water used to
condense the steam generated during
normal operation of the two reactors. Two man-made, unlined canals run between the
power generation buildings within the PA and the Pond and are known respectively as
the Hot and Cold Canals.
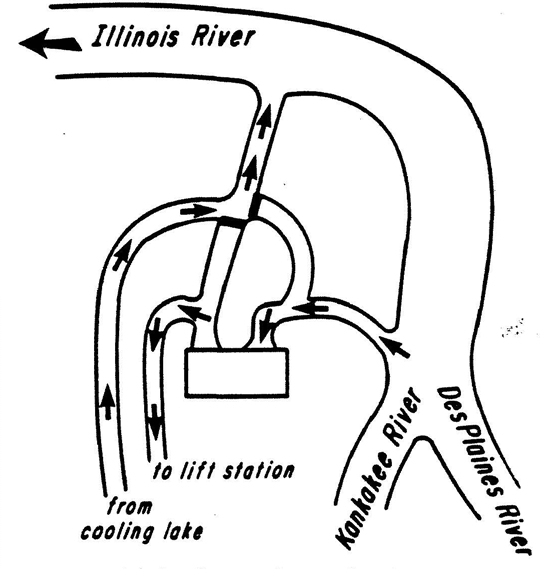
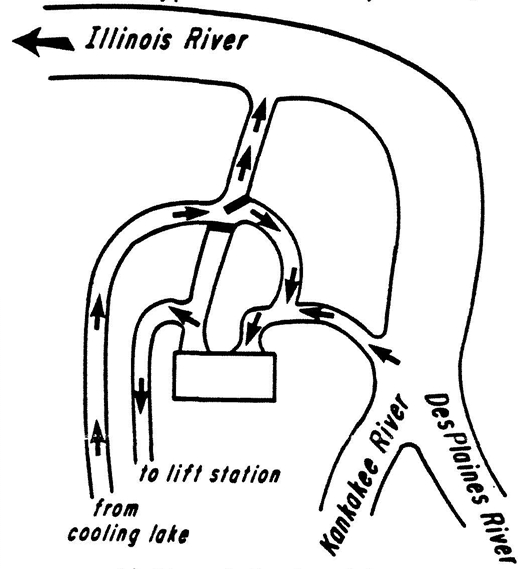
2.2
OVERVIEW OF COOLING WATER OPERATION
The Station's generating system consists of a three-unit nuclear generating facility,
capable of generating 1,824 gross megawatts of electricity. The generating station
consists of one permanently shut down reactor (Unit 1) and two operating reactors
(Units 2/3). Historically, Unit 1 began commercial operation in 1960. Unit 1 was
subsequently shut down in October 1978 and is being decommissioned under the
Nuclear Regulatory Commission's (NRC's) SAFSTOR program. The Station Unit 1
Operating License number is DPR-2. Units 2/3 are boiling water reactors (BWRs) and
began commercial operation in 1970 and 1971, respectively. The Station's Unit 2
045136 (15) Dresden Generating Station
2
CONESTOGA-ROVERS & ASSOCIATES
Revision 1
Operating License number is DPR-19. The Station's Unit
3 Operating License number is
DPR-25.
A BWR plant consists of two separate loops of fluids. Each loop is
designed to avoid
mixing the fluids of one loop with the fluids of another. The loops are called the
primary loop and the secondary loop.
The main purpose of the primary loop is to transfer the energy generated from fission in
the fuel to the turbine to produce electricity.
It is a closed loop system. Nuclear fission
creates heat in the fuel. This heat is removed by the flow of reactor coolant water
through the reactor vessel to the turbine. Steam is generated as a result and is used to
power the turbine, transferring kinetic energy to the generator to produce electricity.
The steam is then condensed on one side of the condenser and the water is pumped back
to the reactor vessel to be heated by the fuel again.
The main purpose of the secondary loop cooling water is to cool the other side of the
condenser, cooling the primary loop steam, and transferring the heat
to the
environment.
Cooling water for the Station is withdrawn from the Kankakee River by way of the
Units
2/3 Intake Canal. Units 2/3 were originally designed to operate in a direct open
cycle. Cooling water was routed from the Kankakee River to the Units 2/3 Cribhouse,
through the condensers, and discharged directly to a canal routed to the Illinois River.
1
Just after initial startup of Units 2/3, the Pond was constructed about 2
miles south of
the Station. The clay dike encloses 1,284 acres. A 'Hot Canal' was cut from the discharge
of Units 2/3 to the Pond Lift Station. Cooling water is lifted 22 feet and routes around
the Pond back to weir gates or a Spillway, constructed just south of the Lift Station. The
Return Canal ('Cold Canal') routes parallel to the Hot Canal back to the plant. The Cold
Canal ends at a Flow Regulating Station with large gates that can divert the cooling
water back to the plant (Closed Cycle operation) or discharge it to the Illinois River
(Indirect Open Cycle). The Pond and both Hot and Cold Canals reduce thermal impact
from dual unit operation.
The cooling water passes through the Units 2/3 Cribhouse and into the condensers.
Once it passes through the condensers it
exits the Turbine Building and is discharged to
the Hot Canal and routes to the Pond. Cooling water is routed through the Pond in such
1
The Kankakee River is where the Intake point is located, whereas, the Illinois River is
where the Discharge point is located (see Figure 2.1).
045136 (15) Dresden Generating Station
3
CONESTOGA-ROVERS & ASSOCIATES
Revision 1
a way as to maximize the heat loss. After passing through the Pond, the cooling water is
routed
back to the Station via the Cold Canal. During the hotter summer months, the
cooling water, from either the Hot or Cold Canals, also passes through a series of
cooling towers. This allows the Station to increase its efficiency in the summer months.
It enables the Station to comply with the thermal limits of its National Pollutant
Discharge Elimination System (NPDES) Permit IL0002224. Due to the Station's differing
demand for cooling water throughout the day, the water levels in the canals fluctuate
markedly on a daily basis. There are two cooling cycles employed at the Station as
discussed below.
From October 1 through June 14 of each year, the Station operates in a Closed Cycle
mode during which a majority of the cooling water is recirculated, and discharge to the
Illinois
River is limited. In this mode, the Flow Regulating Gates divert cooling water
from the Pond back to the Cribhouse Intake structure. In the Closed Cycle mode,
50,000 gallons per minute (gpm) are discharged (blowdown) to the Illinois River
through a permitted outfall.
From June 15 through September 30 of each year, the Dresden NPDES Permit allows the
Station to operate in the
Indirect Open Cycle mode. In this mode, the Flow Regulating
Gates divert all the cooling water flow to the Illinois River through a permitted outfall.
Figure 2.2 provides an overview of the Station's cooling water cycles.
2.3
SURROUNDING LAND USE
Land surrounding the Station is primarily used for residential, agricultural, and limited
industrial purposes. The Illinois River lies to the north of the Station, with residences
located on the northern banks of a bluff on the river, overlooking the Station. To the east
of the Station is the Kankakee River. Residential lots are located immediately south of
the Station along the banks of the Kankakee River. To the west of the Station is vacant
land owned by Exelon, with a General Electric Fuel Processing Facility further beyond.
To the southwest of the Station is Goose Lake Prairie State Park, which is owned and
operated by the Illinois Department of Natural Resources (Illinois DNR). The nearest
urbanized area is the town of Channahon, which is approximately 3 miles to the
northeast of the Station, across the Illinois River. Agricultural land is located further
south and west of the Station.
045136 (15) Dresden Generating Station
4
CONESTOGA-ROVERS & ASSOCIATES
Revision 1
2.4
STATION SETTING
The following section presents a general summary of the topography, surface water
features, geology, hydrogeology, and groundwater flow conditions near the Station.
The information was primarily gathered from the Dresden Station Updated Final Safety
Analysis Report (UFSAR), Revision 6, dated June 2005, and the Final Environmental
Statement (FES), dated November 1973. The main references the UFSAR relies upon are
listed in Section 10.0 of this HIR. CRA checked and verified all UFSAR references that
apply to this HIR.
2.4.1
TOPOGRAPHY AND SURFACE WATER FEATURES
The Station is located within the Kankakee River Basin adjacent to the confluence of the
Kankakee River and Des Plaines River forming the Illinois River (Willman and Frye,
1969; Frye et al., 1969). In general, the topography of the area slopes downward toward
the Kankakee and Illinois Rivers (see Figure 1.1 and United States Geological
Topographic Quadrangle Map—Dresden Mosaic, Illinois dated 1994).
Figure 2.1 presents portions of some of the relevant
surface water features at the Station
such as the Pond, and Hot and Cold Canals. The topography at the Station is generally
flat, with a gentle slope down to the Kankakee and Illinois Rivers. Any surface water
flows via storm drains and man-made ditches.
There are four rock (rip-rap) lined storm drain basins at the Station that originate in the
vicinity of the Units
2/3 Reactor Building. For the purposes of this report, the storm
drain basins are the East Drainage Basin, West Drainage Basin, Southwest Drainage
Basin, and Southeast Drainage Basin.
The East Drainage Basin drains the area around the southeastern and northeastern
perimeter of the Turbine Building, and a portion
of the Station area located between
Unit 1 and the Kankakee River. The East Drainage Basin discharges to the Unit 1 Intake
Canal.
The West Drainage Basin drains the area around the western perimeter of the Turbine
Building, as well as the area to
the northwest. The West Drainage Basin discharges to
the Units 2/3 Discharge Canal through a point located in the west side of the canal.
The Southwest Drainage Basin is located further to the south and west of the Turbine
Building and drains storm water via a drainage ditch located on the
south edge of the
045136 (15) Dresden Generating Station
5
CONESTOGA-ROVERS & ASSOCIATES
Revision 1
PA. The Southwest Drainage Basin, during times of heavy rainfall, discharges to the
Hot Canal.
The Southeast Drainage Basin is located further to the south and east of the Turbine
Building and drains storm water via a drainage ditch located on the
southeast edge of
the PA. The Southeast Drainage Basin, during times of heavy rainfall, discharges to the
Kankakee River (RETEC, 2005).
The primary surface water features within the area of the Station include the
Illinois
River to the north, the Des Plaines River to the east, and the Kankakee River to the
southeast. The Station is located to the south of the intersection of the Kankakee and
Des Plaines River that converge to form the Illinois River. Man-made surface water
features include two Intake Canals (Unit 1 and Units 2/3) leading from the Kankakee
River, two Discharge Canals (Unit 1 and Units 2/3) leading to the Illinois River, the
Pond, and two canals leading to and from the Pond known as the Hot and Cold Canals,
respectively. There are also small lakes and wetlands to the south and southwest of the
Station.
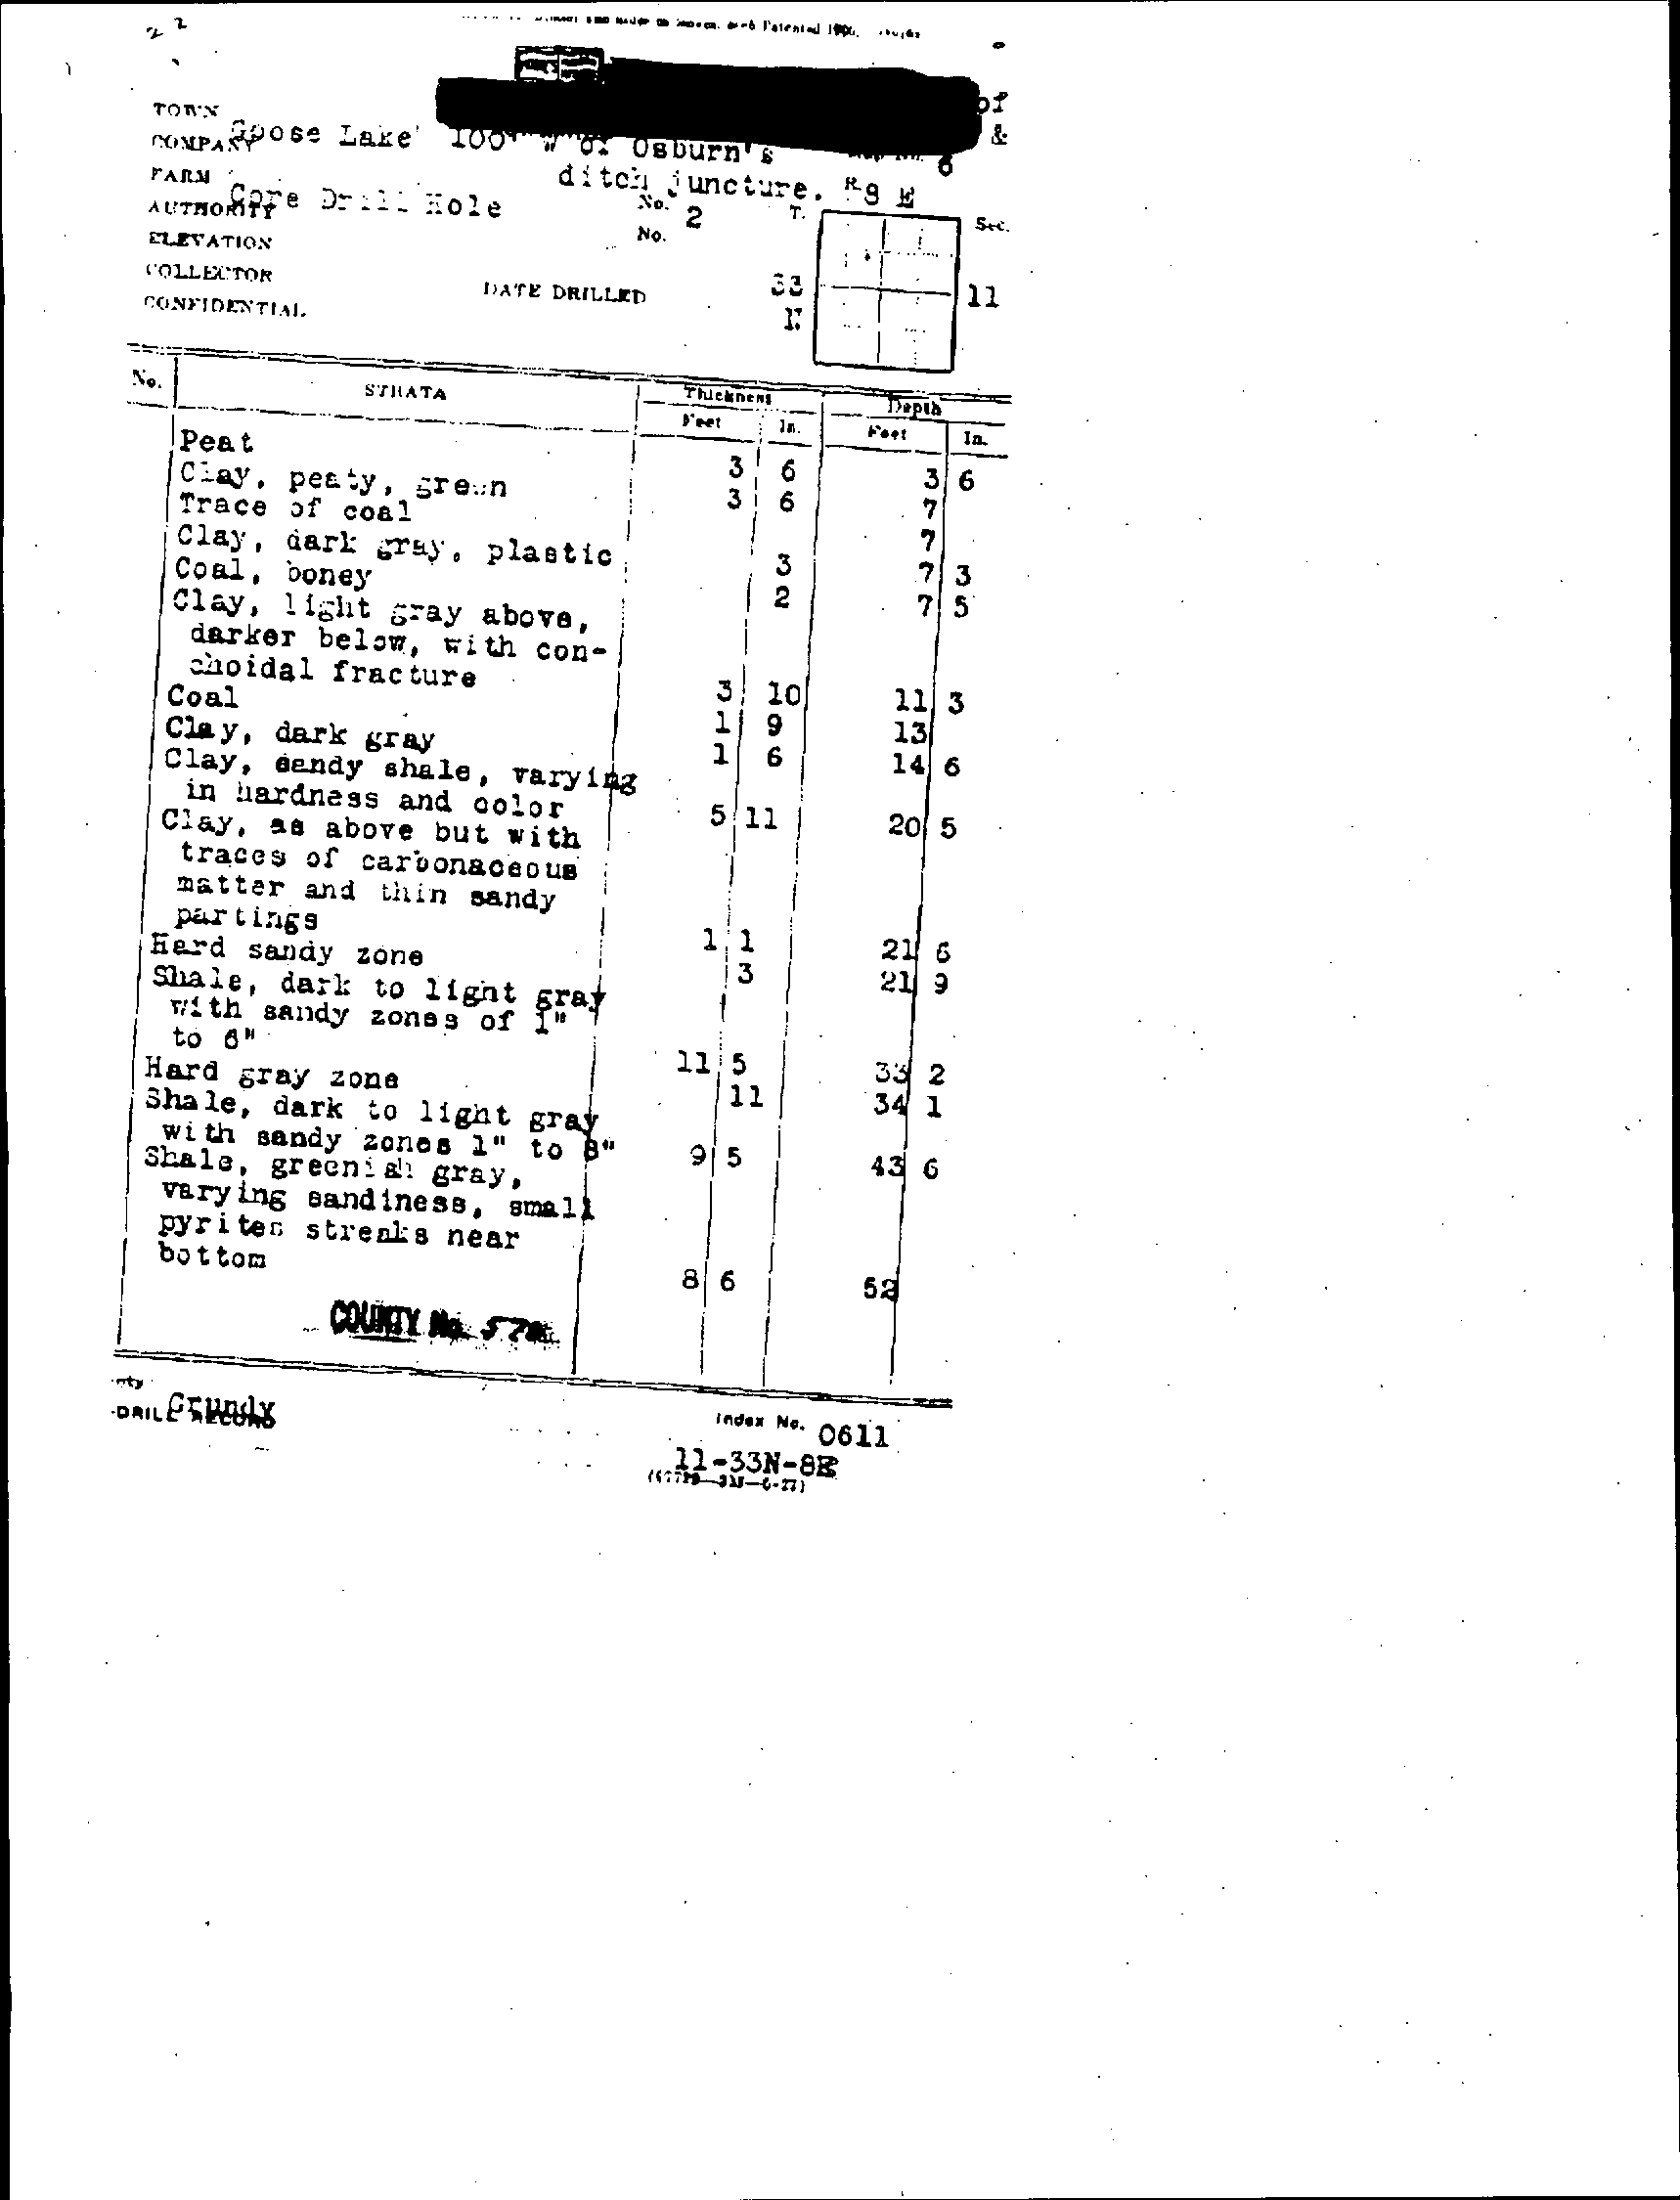
2.4.2
GEOLOGY
Figure 2.3 presents a stratigraphic section of the Station area geology. The geology near
the Station is comprised of these stratigraphic units:
•
Overburden and Fill Material;
•
Pottsville Sandstone;
•
Divine Limestone;
•
Maquoketa Shale; and
•
Galena Dolomite.
Regionally, the overburden typically consists of a Quaternary Age sand
and gravel unit
and a glacial till unit with some lenses of coarse-grained glacial drift (Frye, 1969;
RETEC, 2005). However, in locations bordering major rivers, overburden deposits of
alluvial origin exhibiting variable composition and thickness are expected to be
predominant. At the Station, overburden deposits are of limited areal extent and consist
of highly organic dark brown to black sandy clay with some gravel (RETEC, 2005).
Where present at the Station, the thickness of these deposits is typically less than 5 feet.
Fill material, consisting of gravel and sand, is present to depths of up to 30 feet below
ground surface (bgs) in certain areas within the PA due to construction of the Station.
045136 (15) Dresden Generating Station
6
CONESTOGA-ROVERS & ASSOCIATES
Revision 1
At the Station, the overburden deposits,
where present, are underlain by the
Pennsylvanian-aged Pottsville Sandstone.
The Pottsville Sandstone is exposed at
ground surface in areas where overburden deposits are absent.
Regionally, the
Pottsville Sandstone exhibits prominent cross bedding, which was observed in the
outcrops along the Hot and Cold Canals at the Station (Harza, 1991, 1995; RETEC, 2005).
The sandstone is absent north of the Station, and in areas to the west and southeast of
the Station according to residential and State well logs. The thickness of the sandstone,
where present, near the Station ranges from 25 to 30 feet.
The
Ordovician-aged
Divine
Limestone
unconformably
underlies
the
Pennsylvanian-aged Pottsville Sandstone beneath the Station (i.e.,
intermediary Silurian-
and Devonian-aged units are absent) (Harza, 1991, 1995). Regionally, the Divine
Limestone is considered part of the Maquoketa Shale Group and has a regional dip to
the southeast of approximately 25 feet per mile (Willman, 1975; Harza, 1991, 1995). The
Divine Limestone is widely distributed throughout Illinois; however, in some areas it
becomes interbedded with shale and can be inseparable from the shales below
(Willman, 1975).
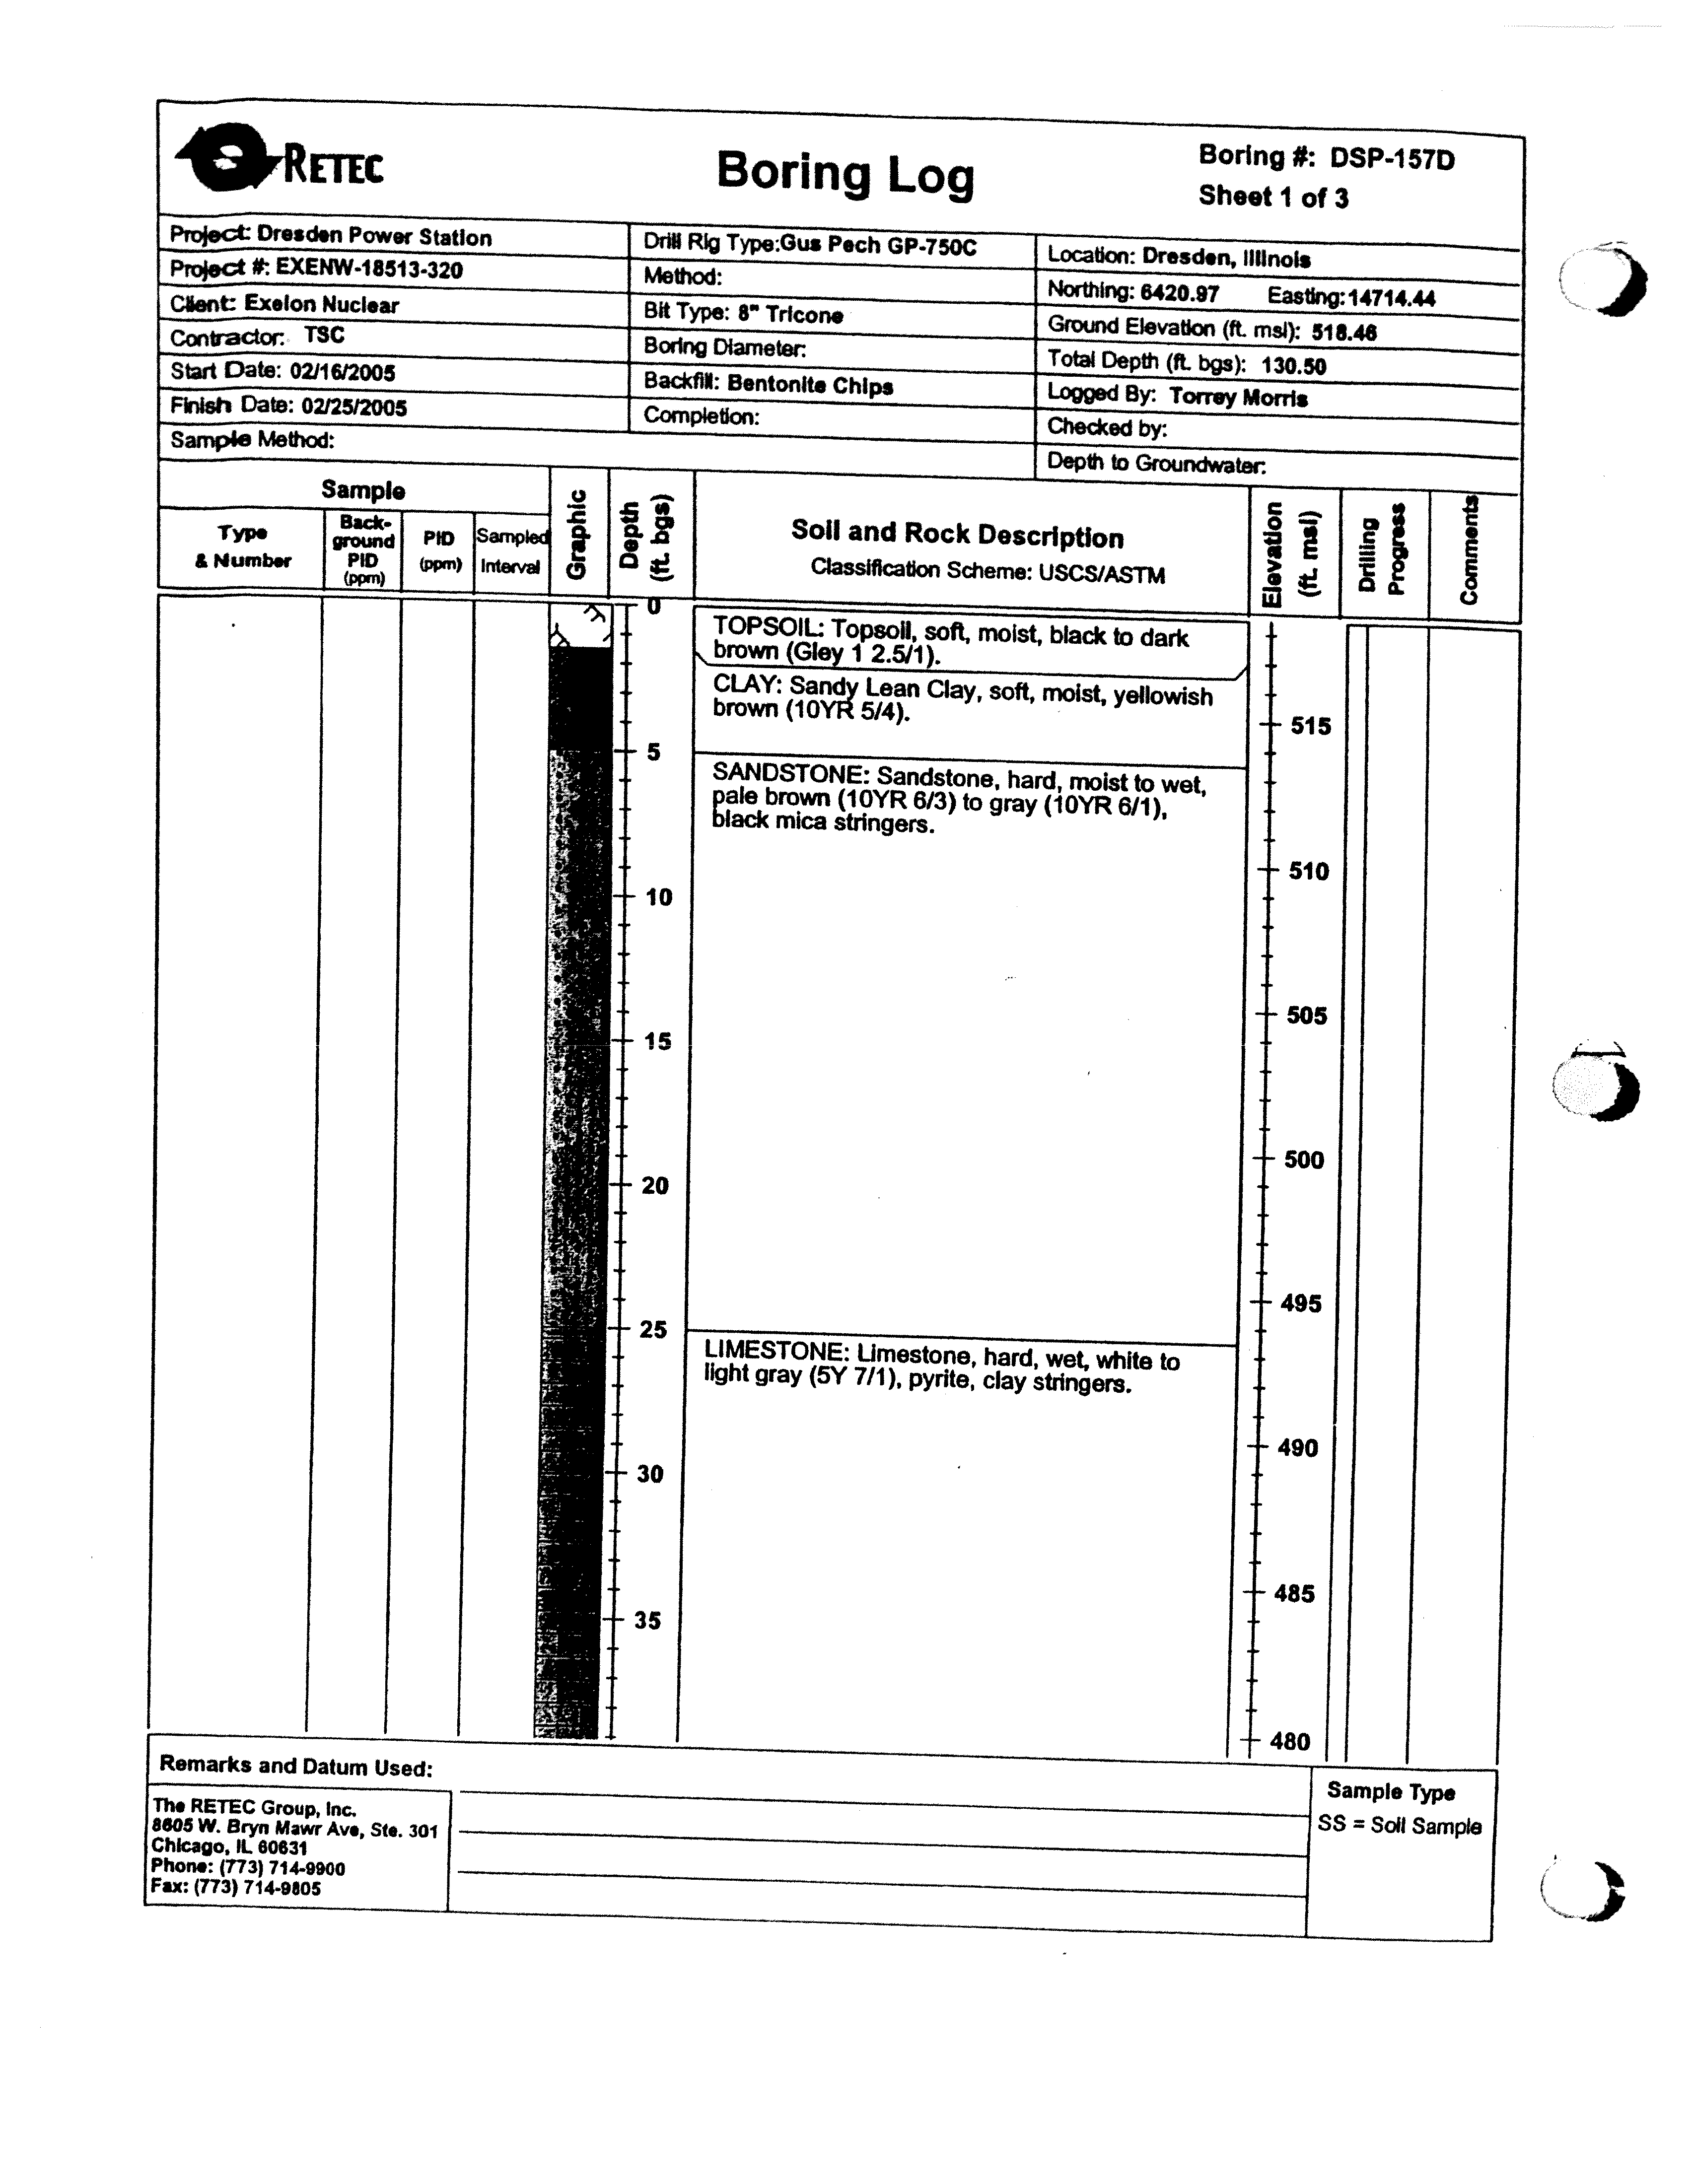
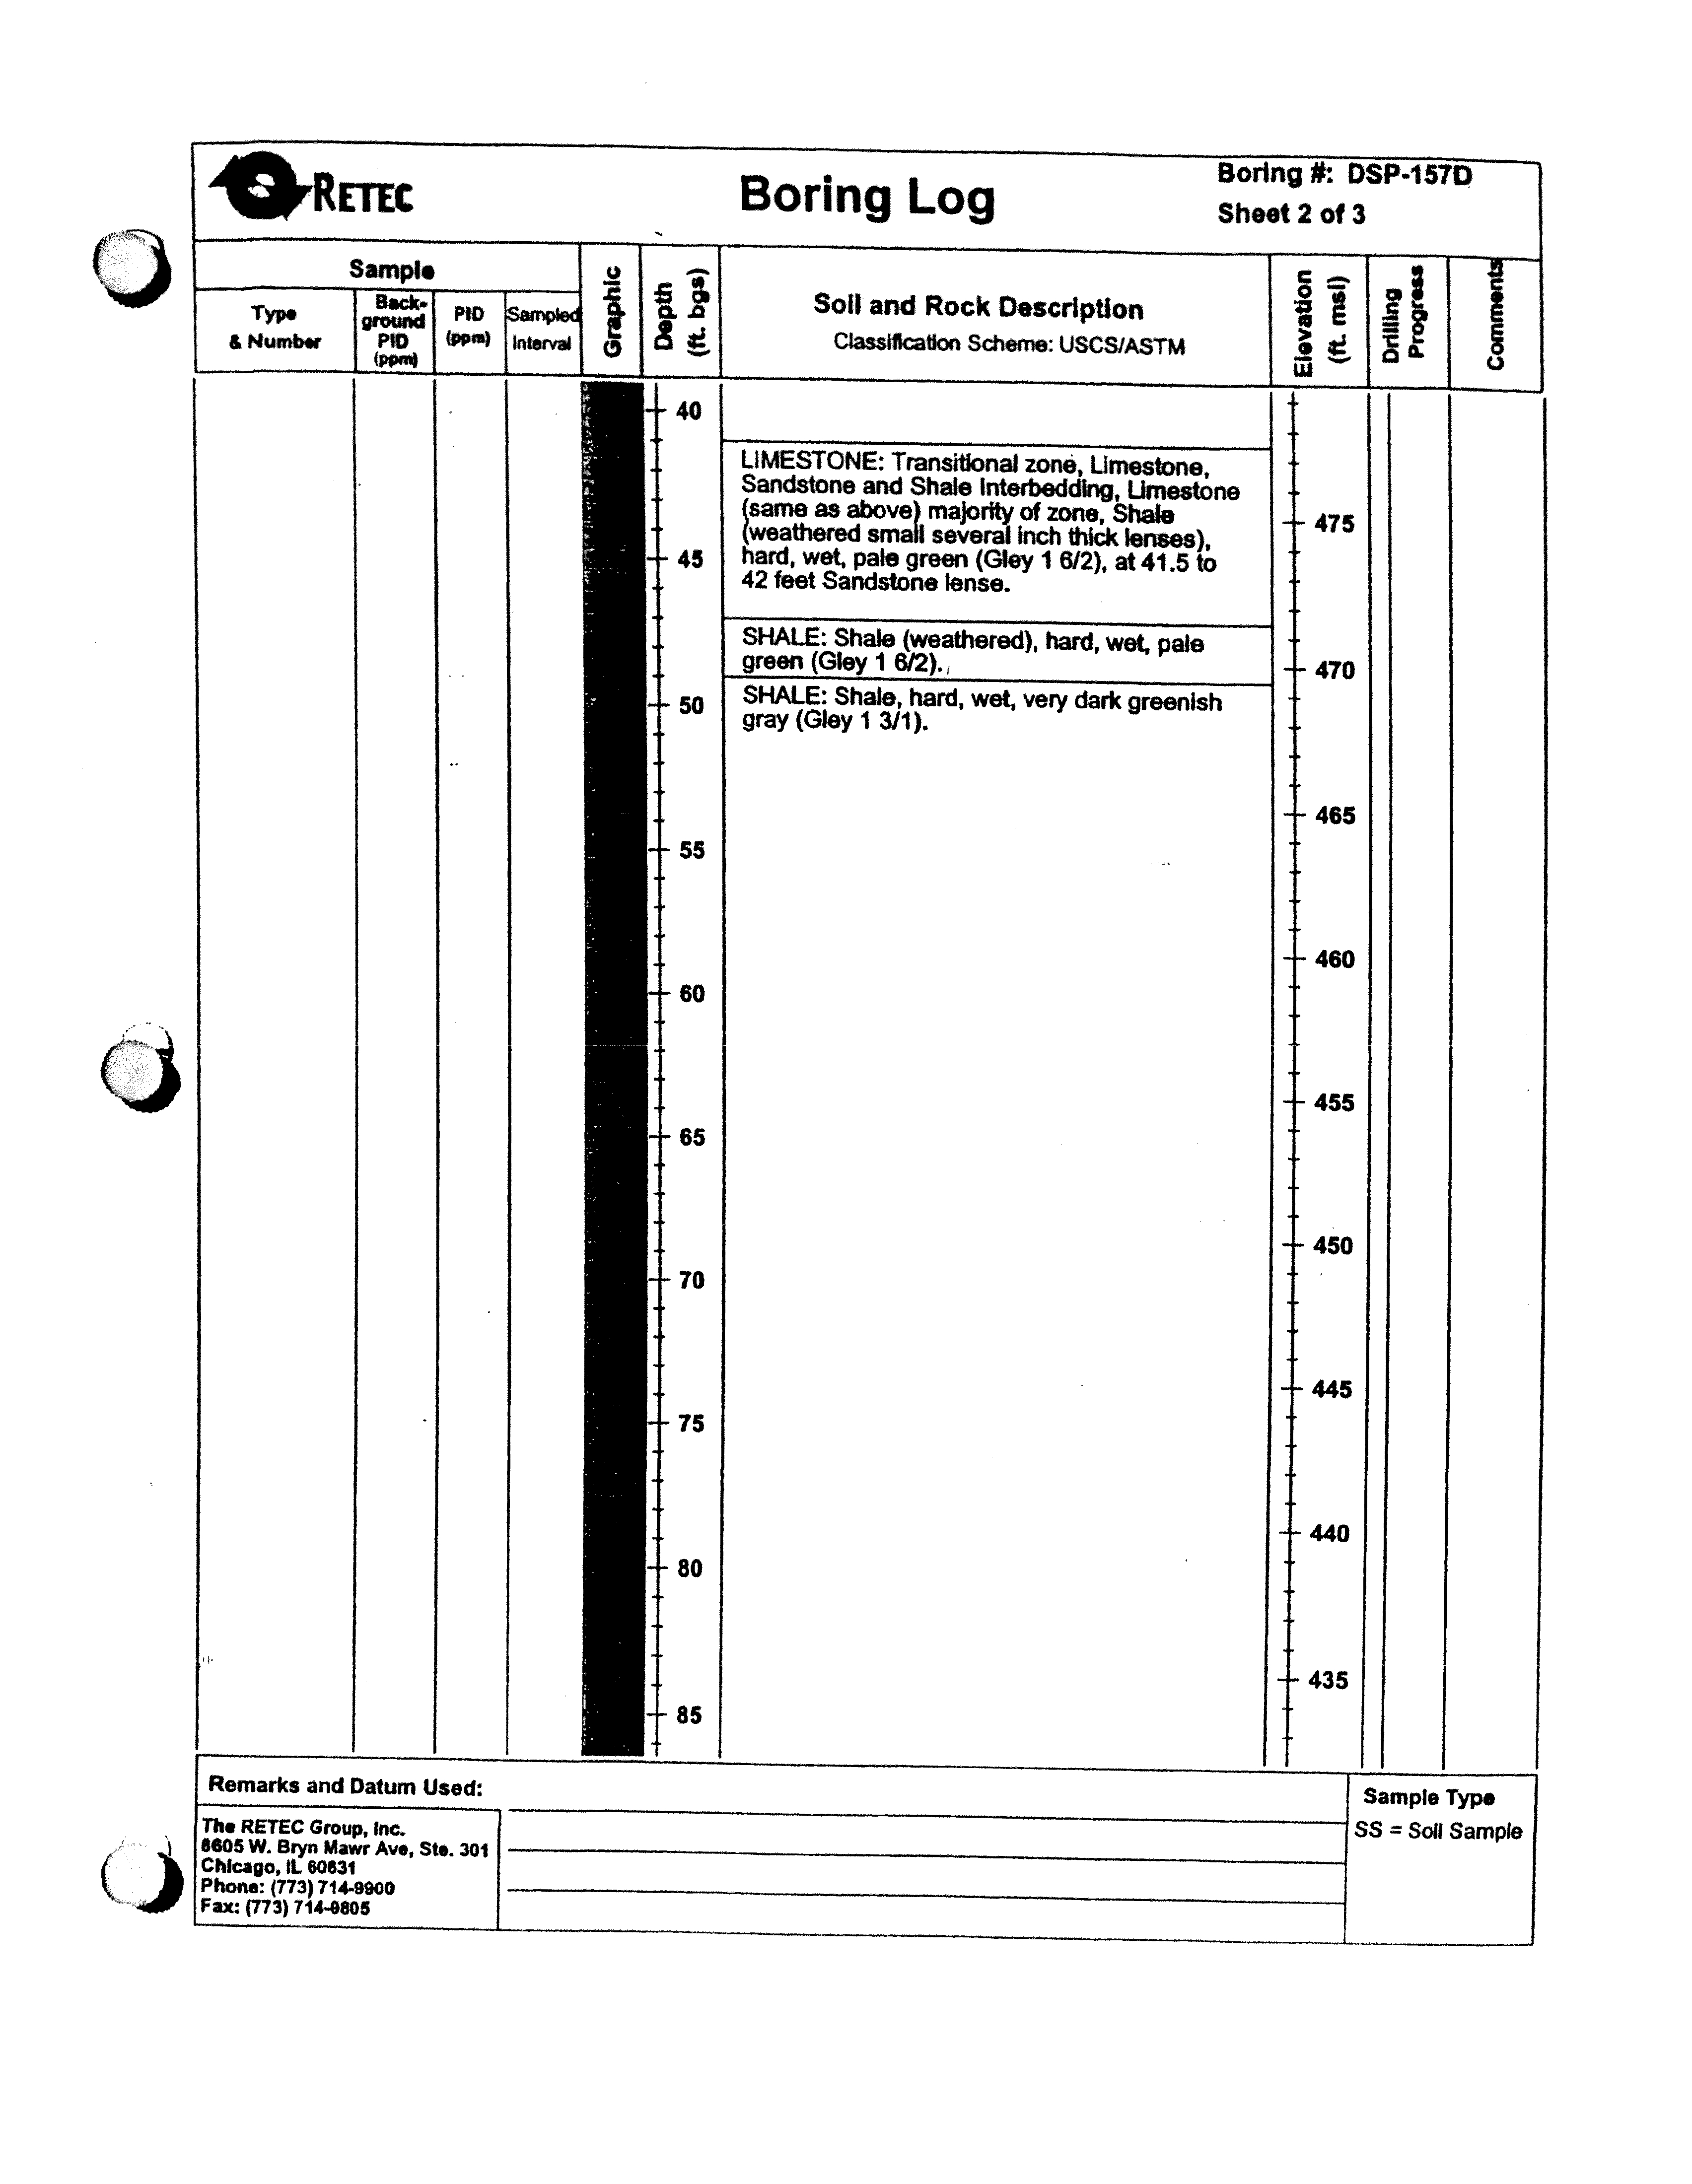
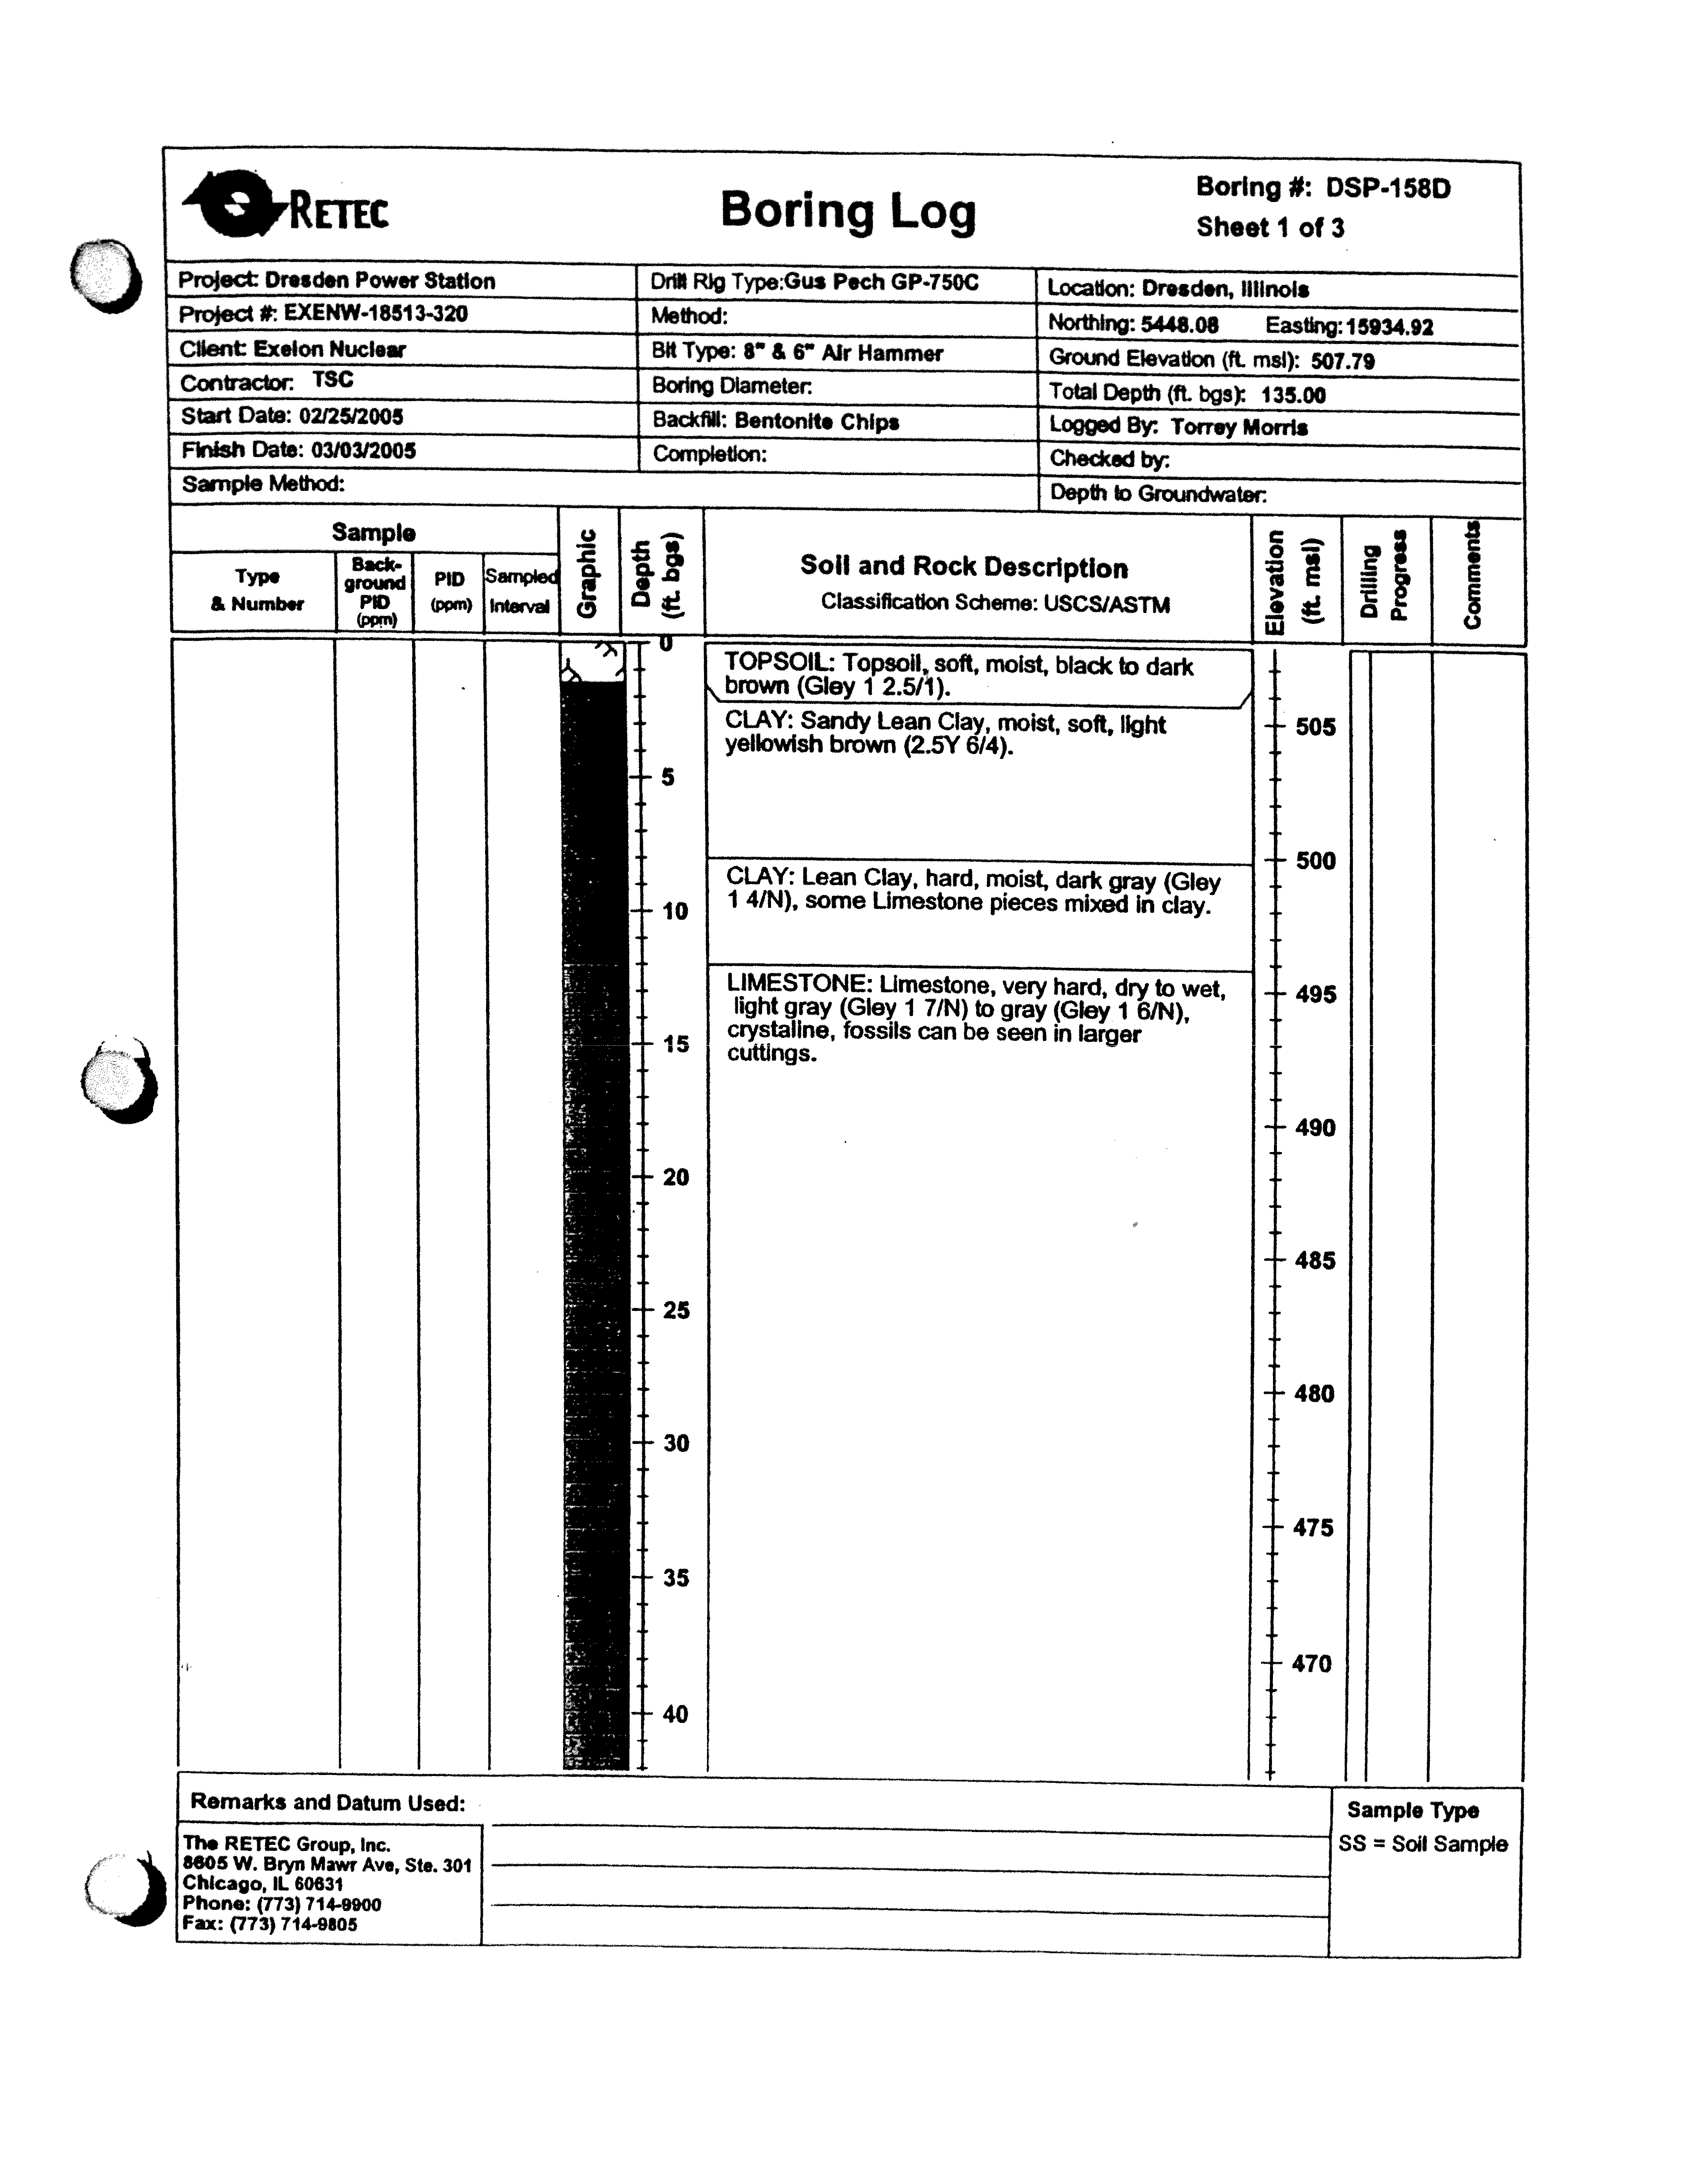
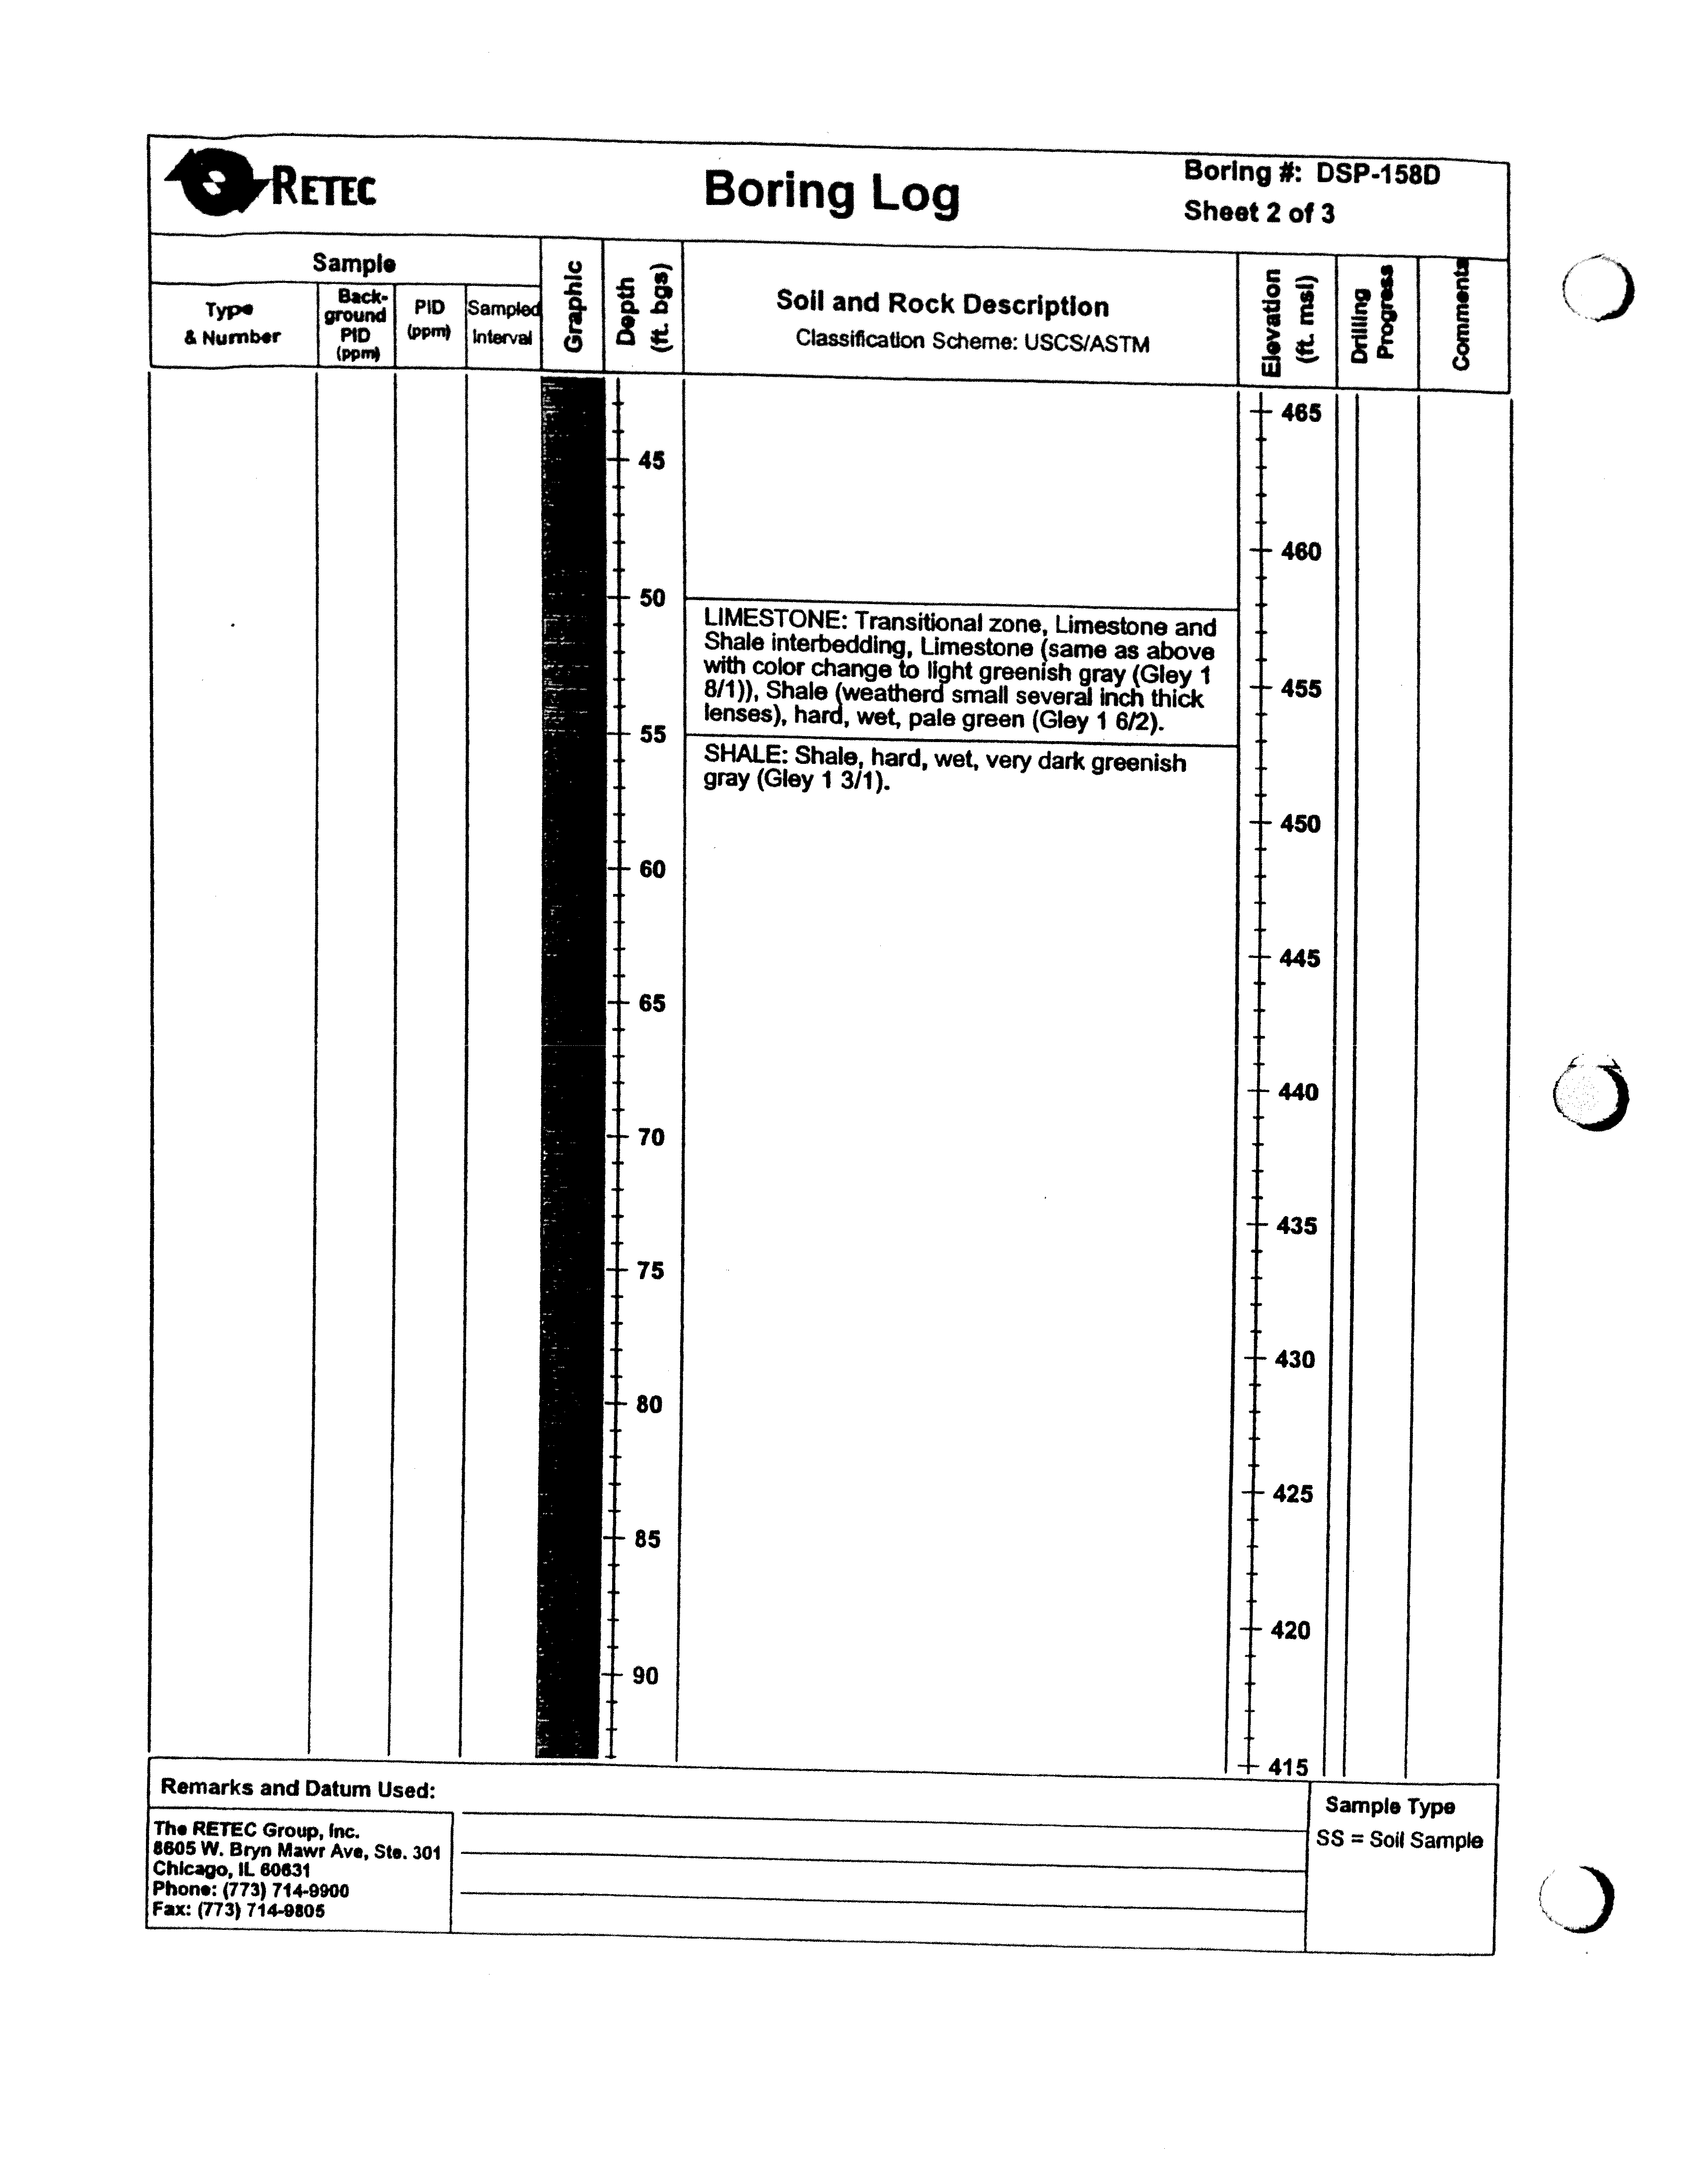
This is depicted in many of the intermediate well boring logs
(Appendix A) at approximately 35 to 40 feet bgs, where a transitional limestone/shale
layer was noted. The thickness of the Divine Limestone varies from 25 to 30 feet thick
across the Station (Harza, 1991, 1995).
The Ordovician-aged Maquoketa Shale is also
part of the Maquoketa Shale Group and
consists of dark gray to dark green dolomitic shale (Willman, 1975). The regional
thickness of the Maquoketa Shale consistently ranges between 65 and 70 feet; however,
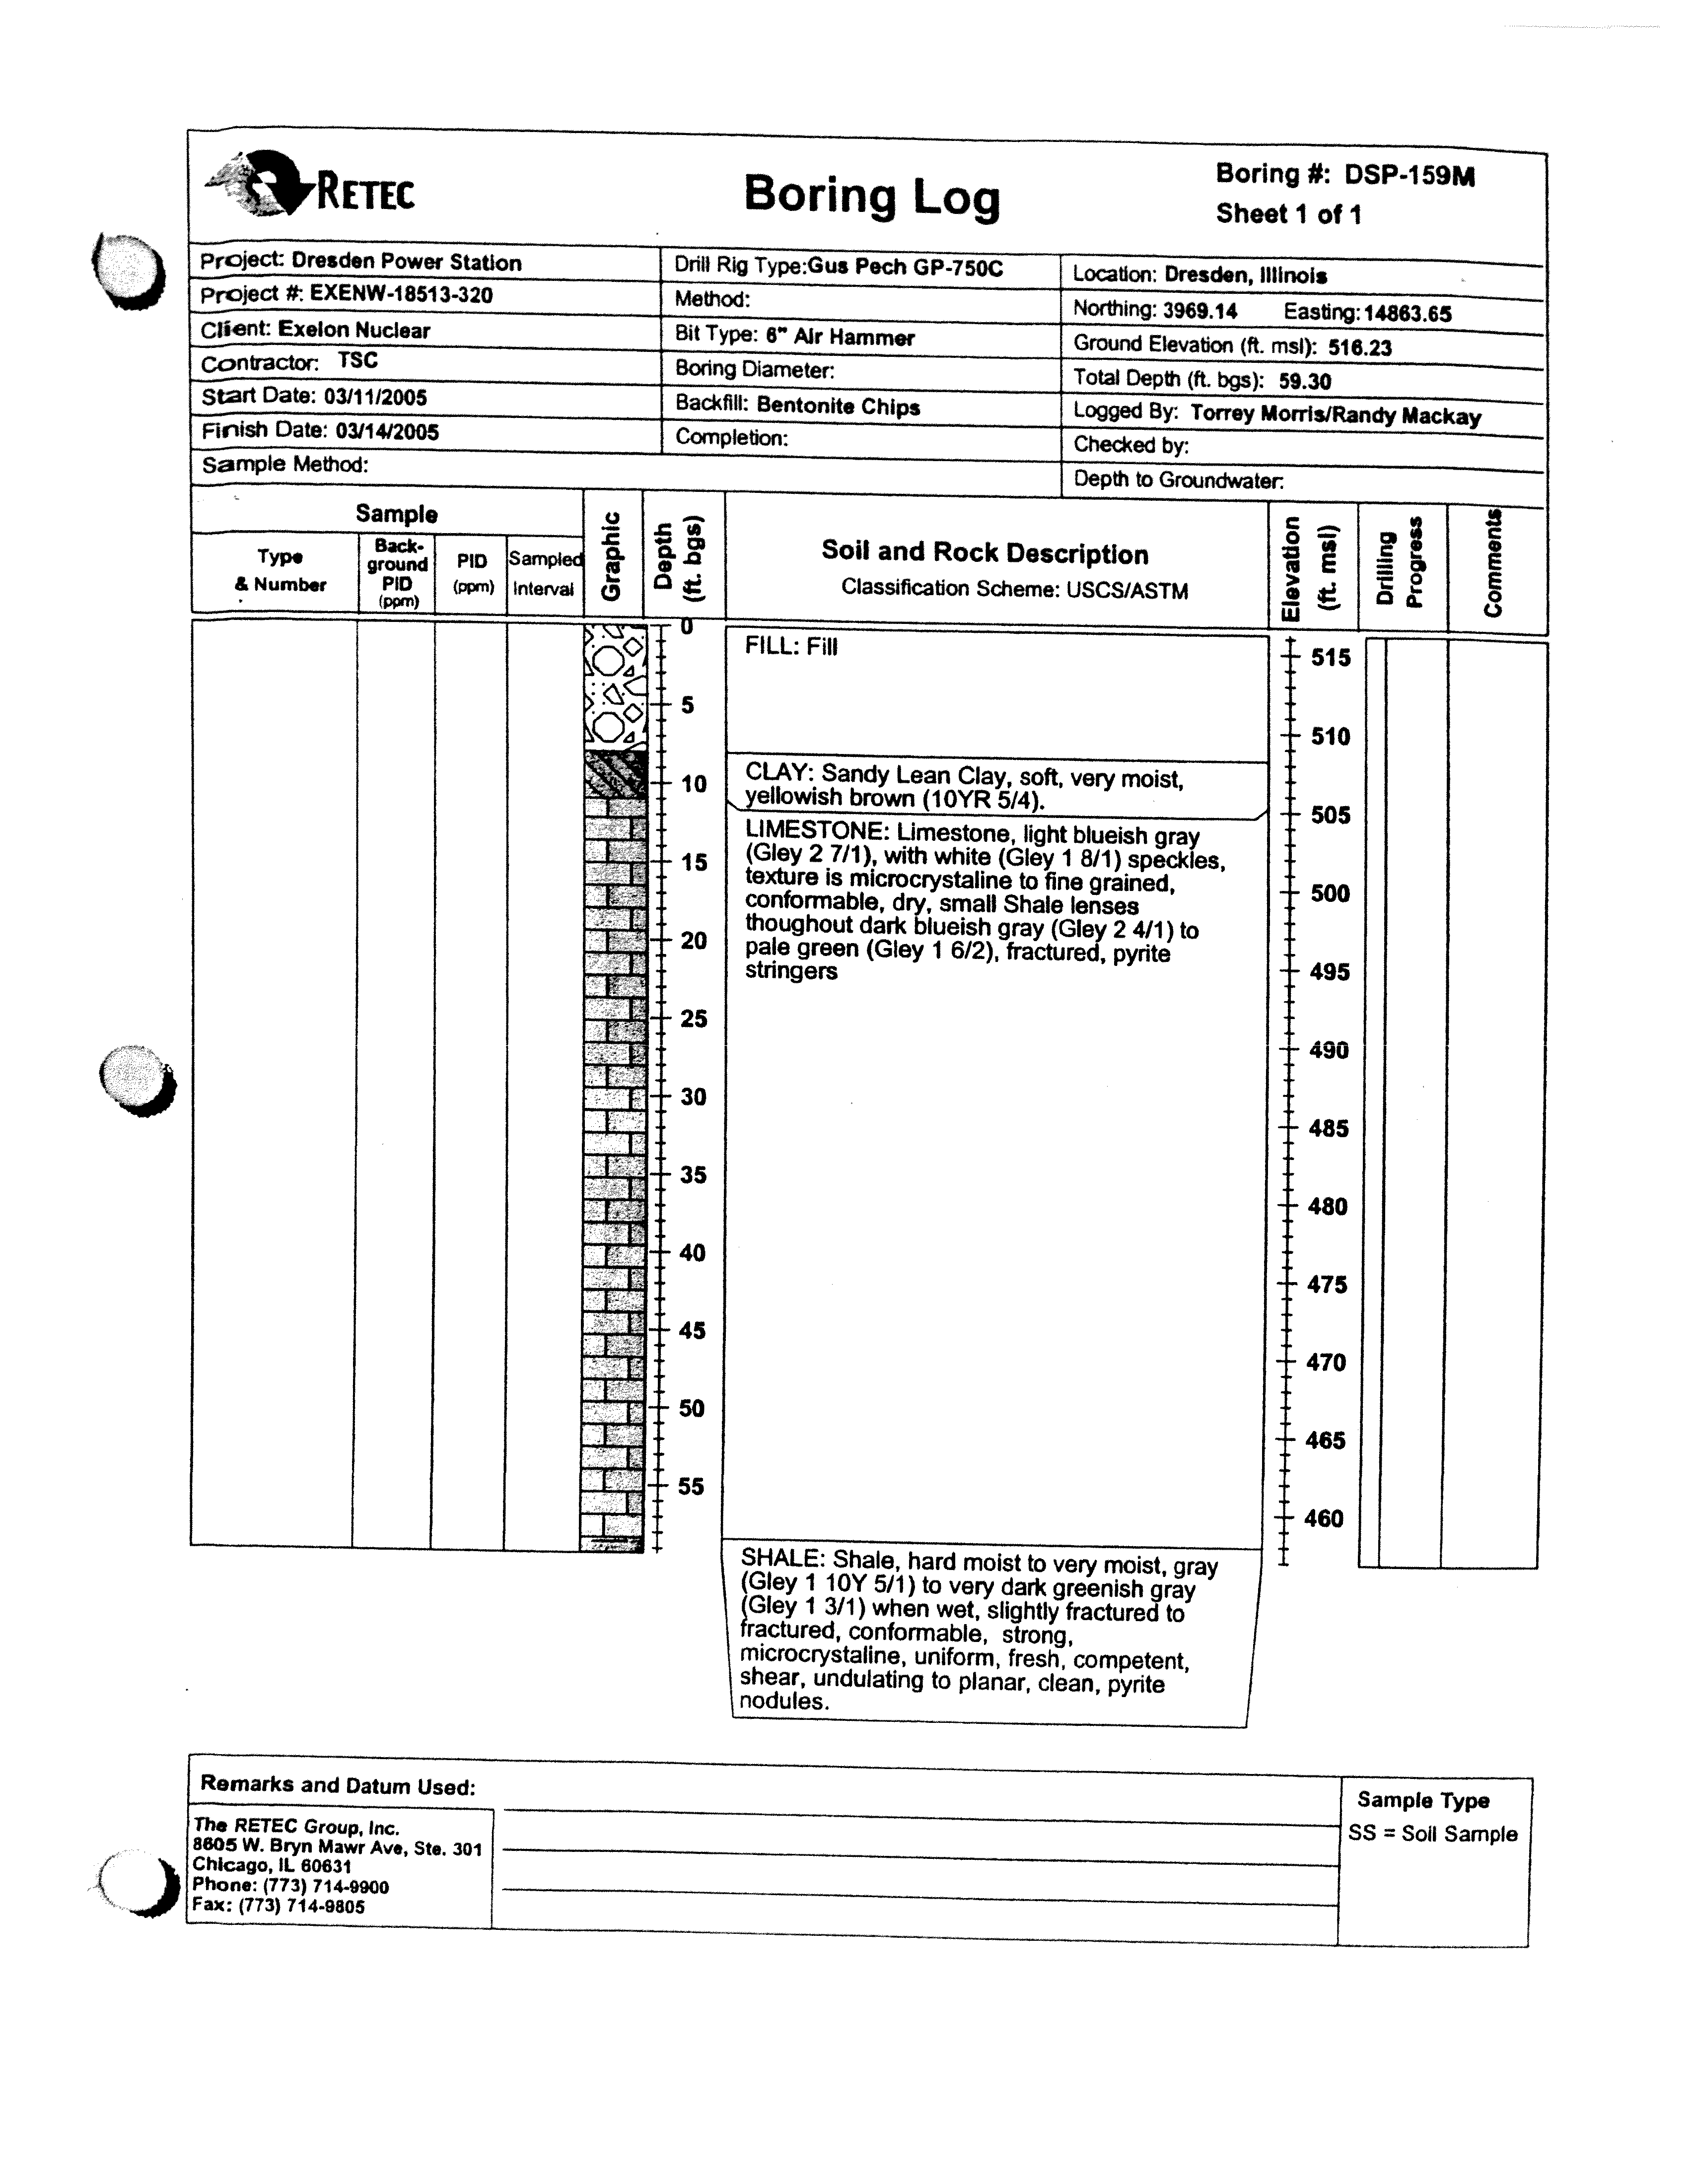
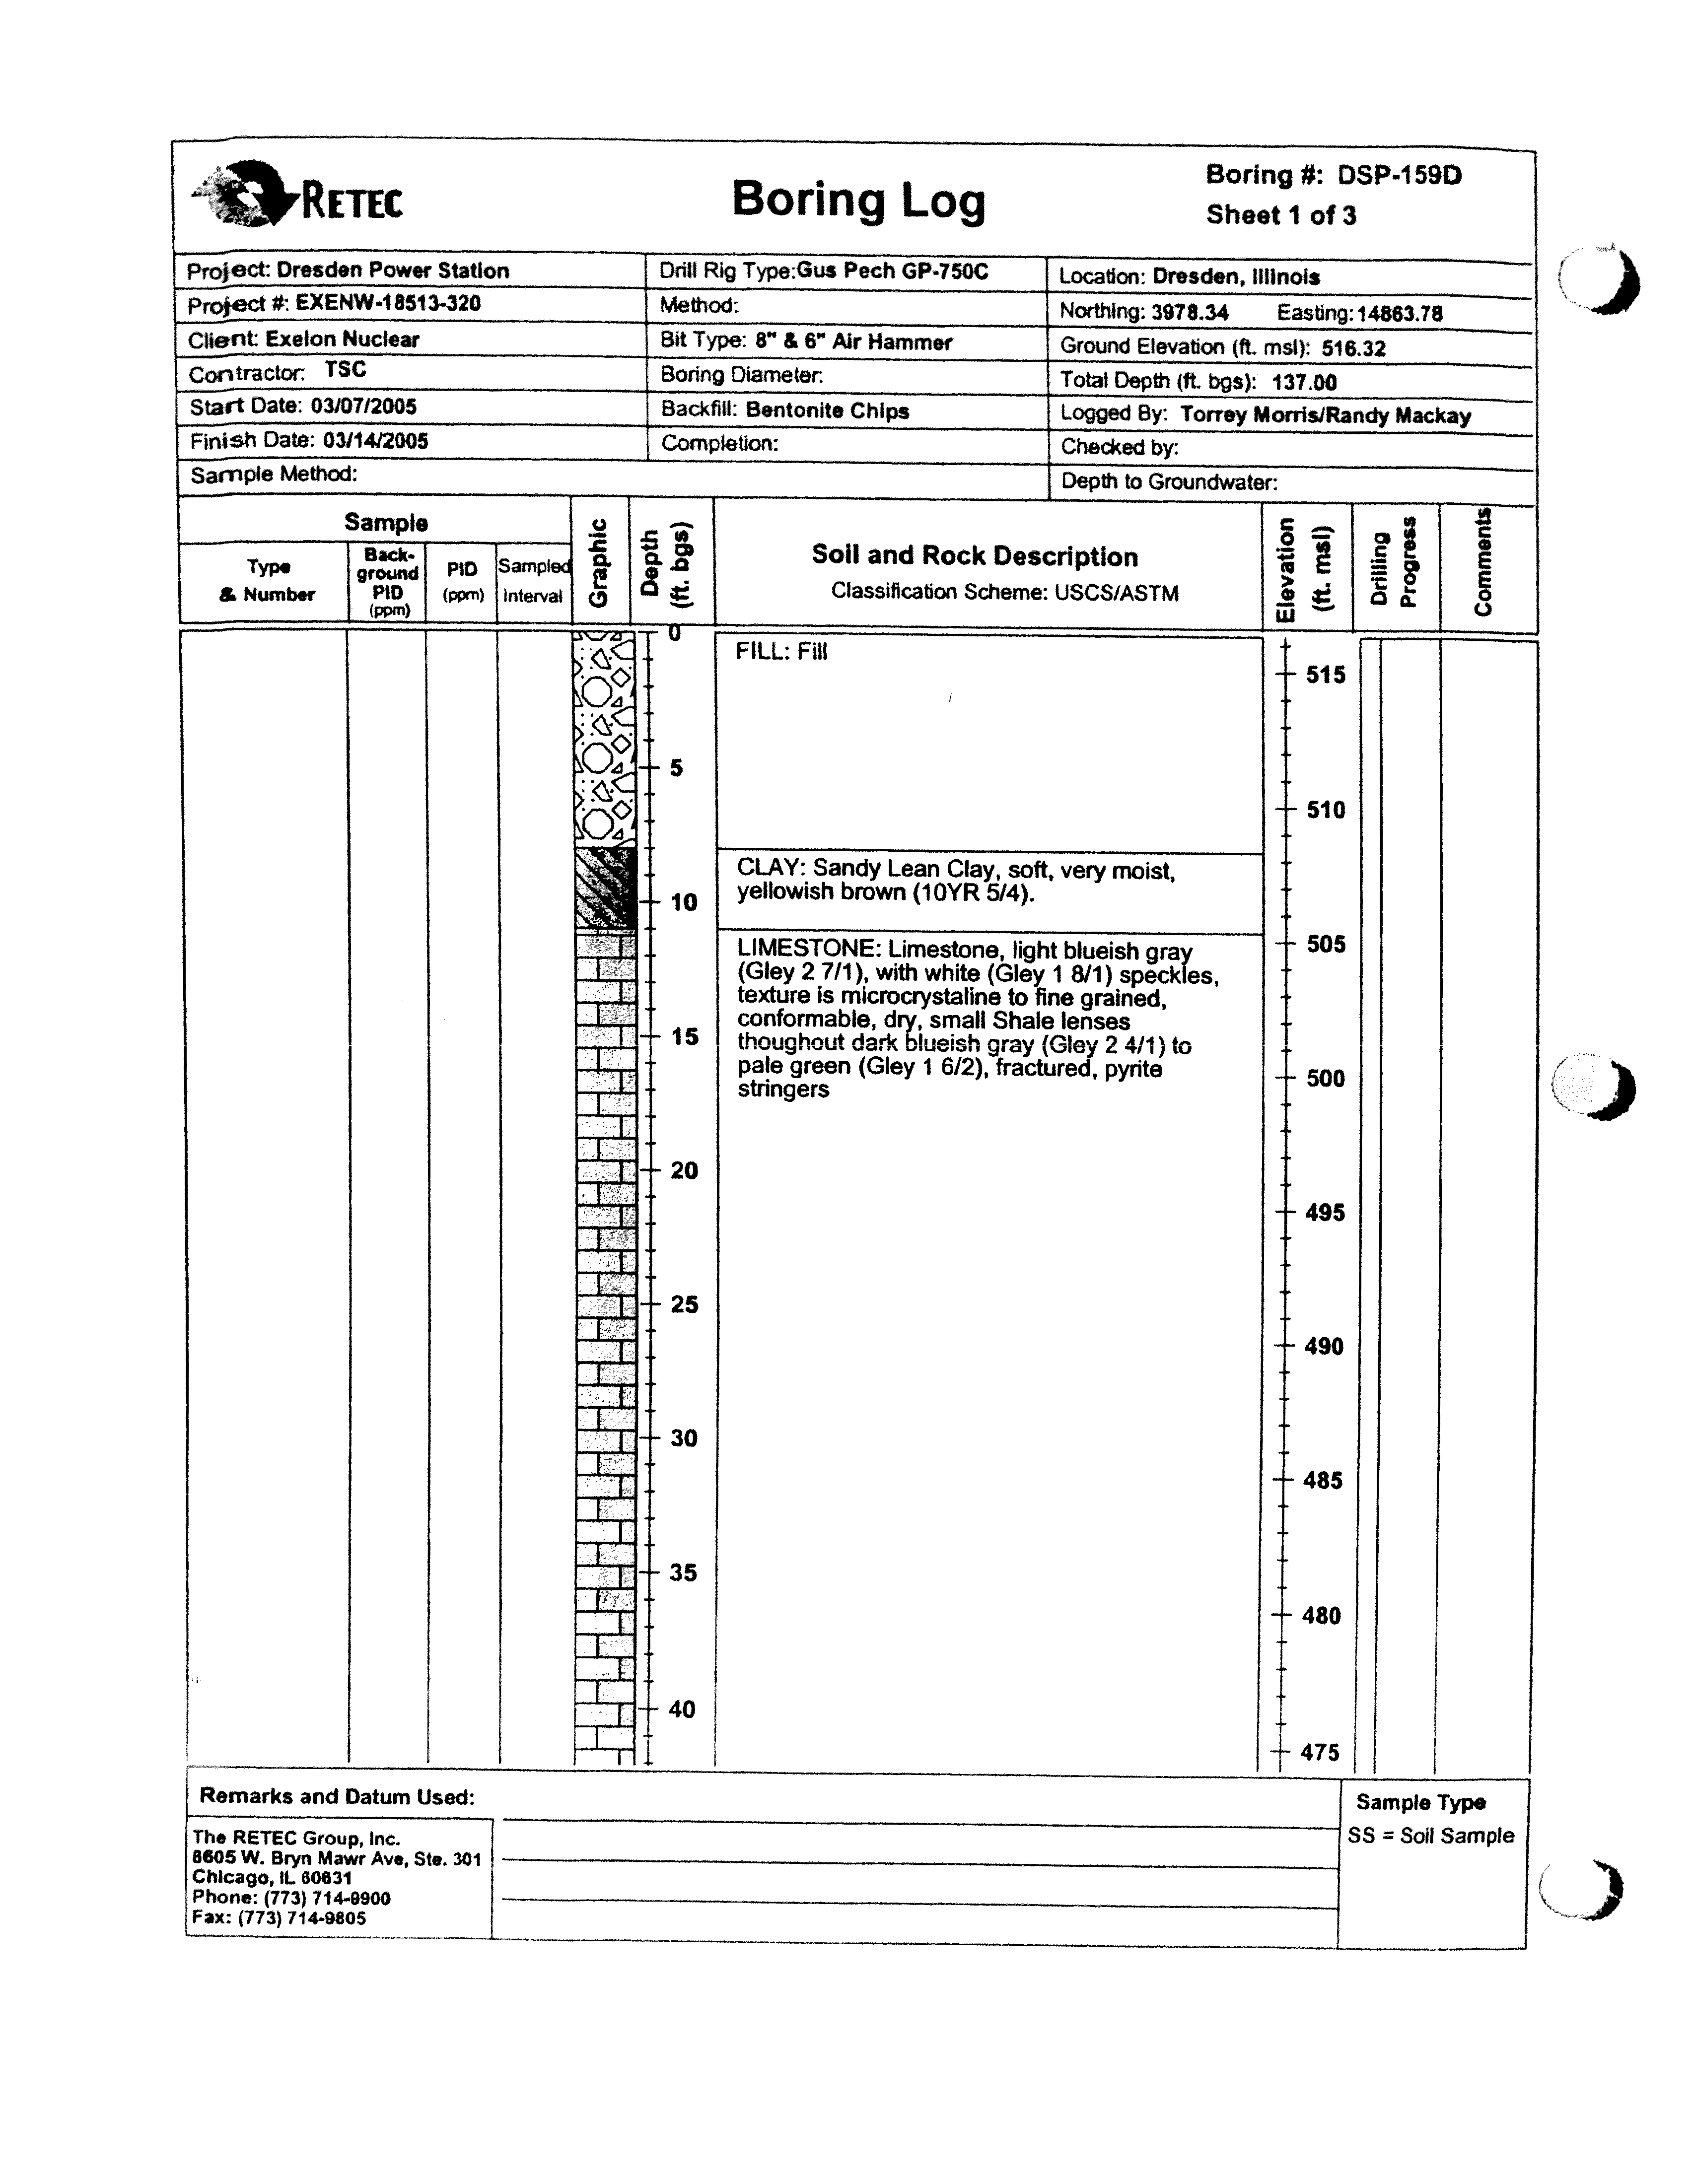
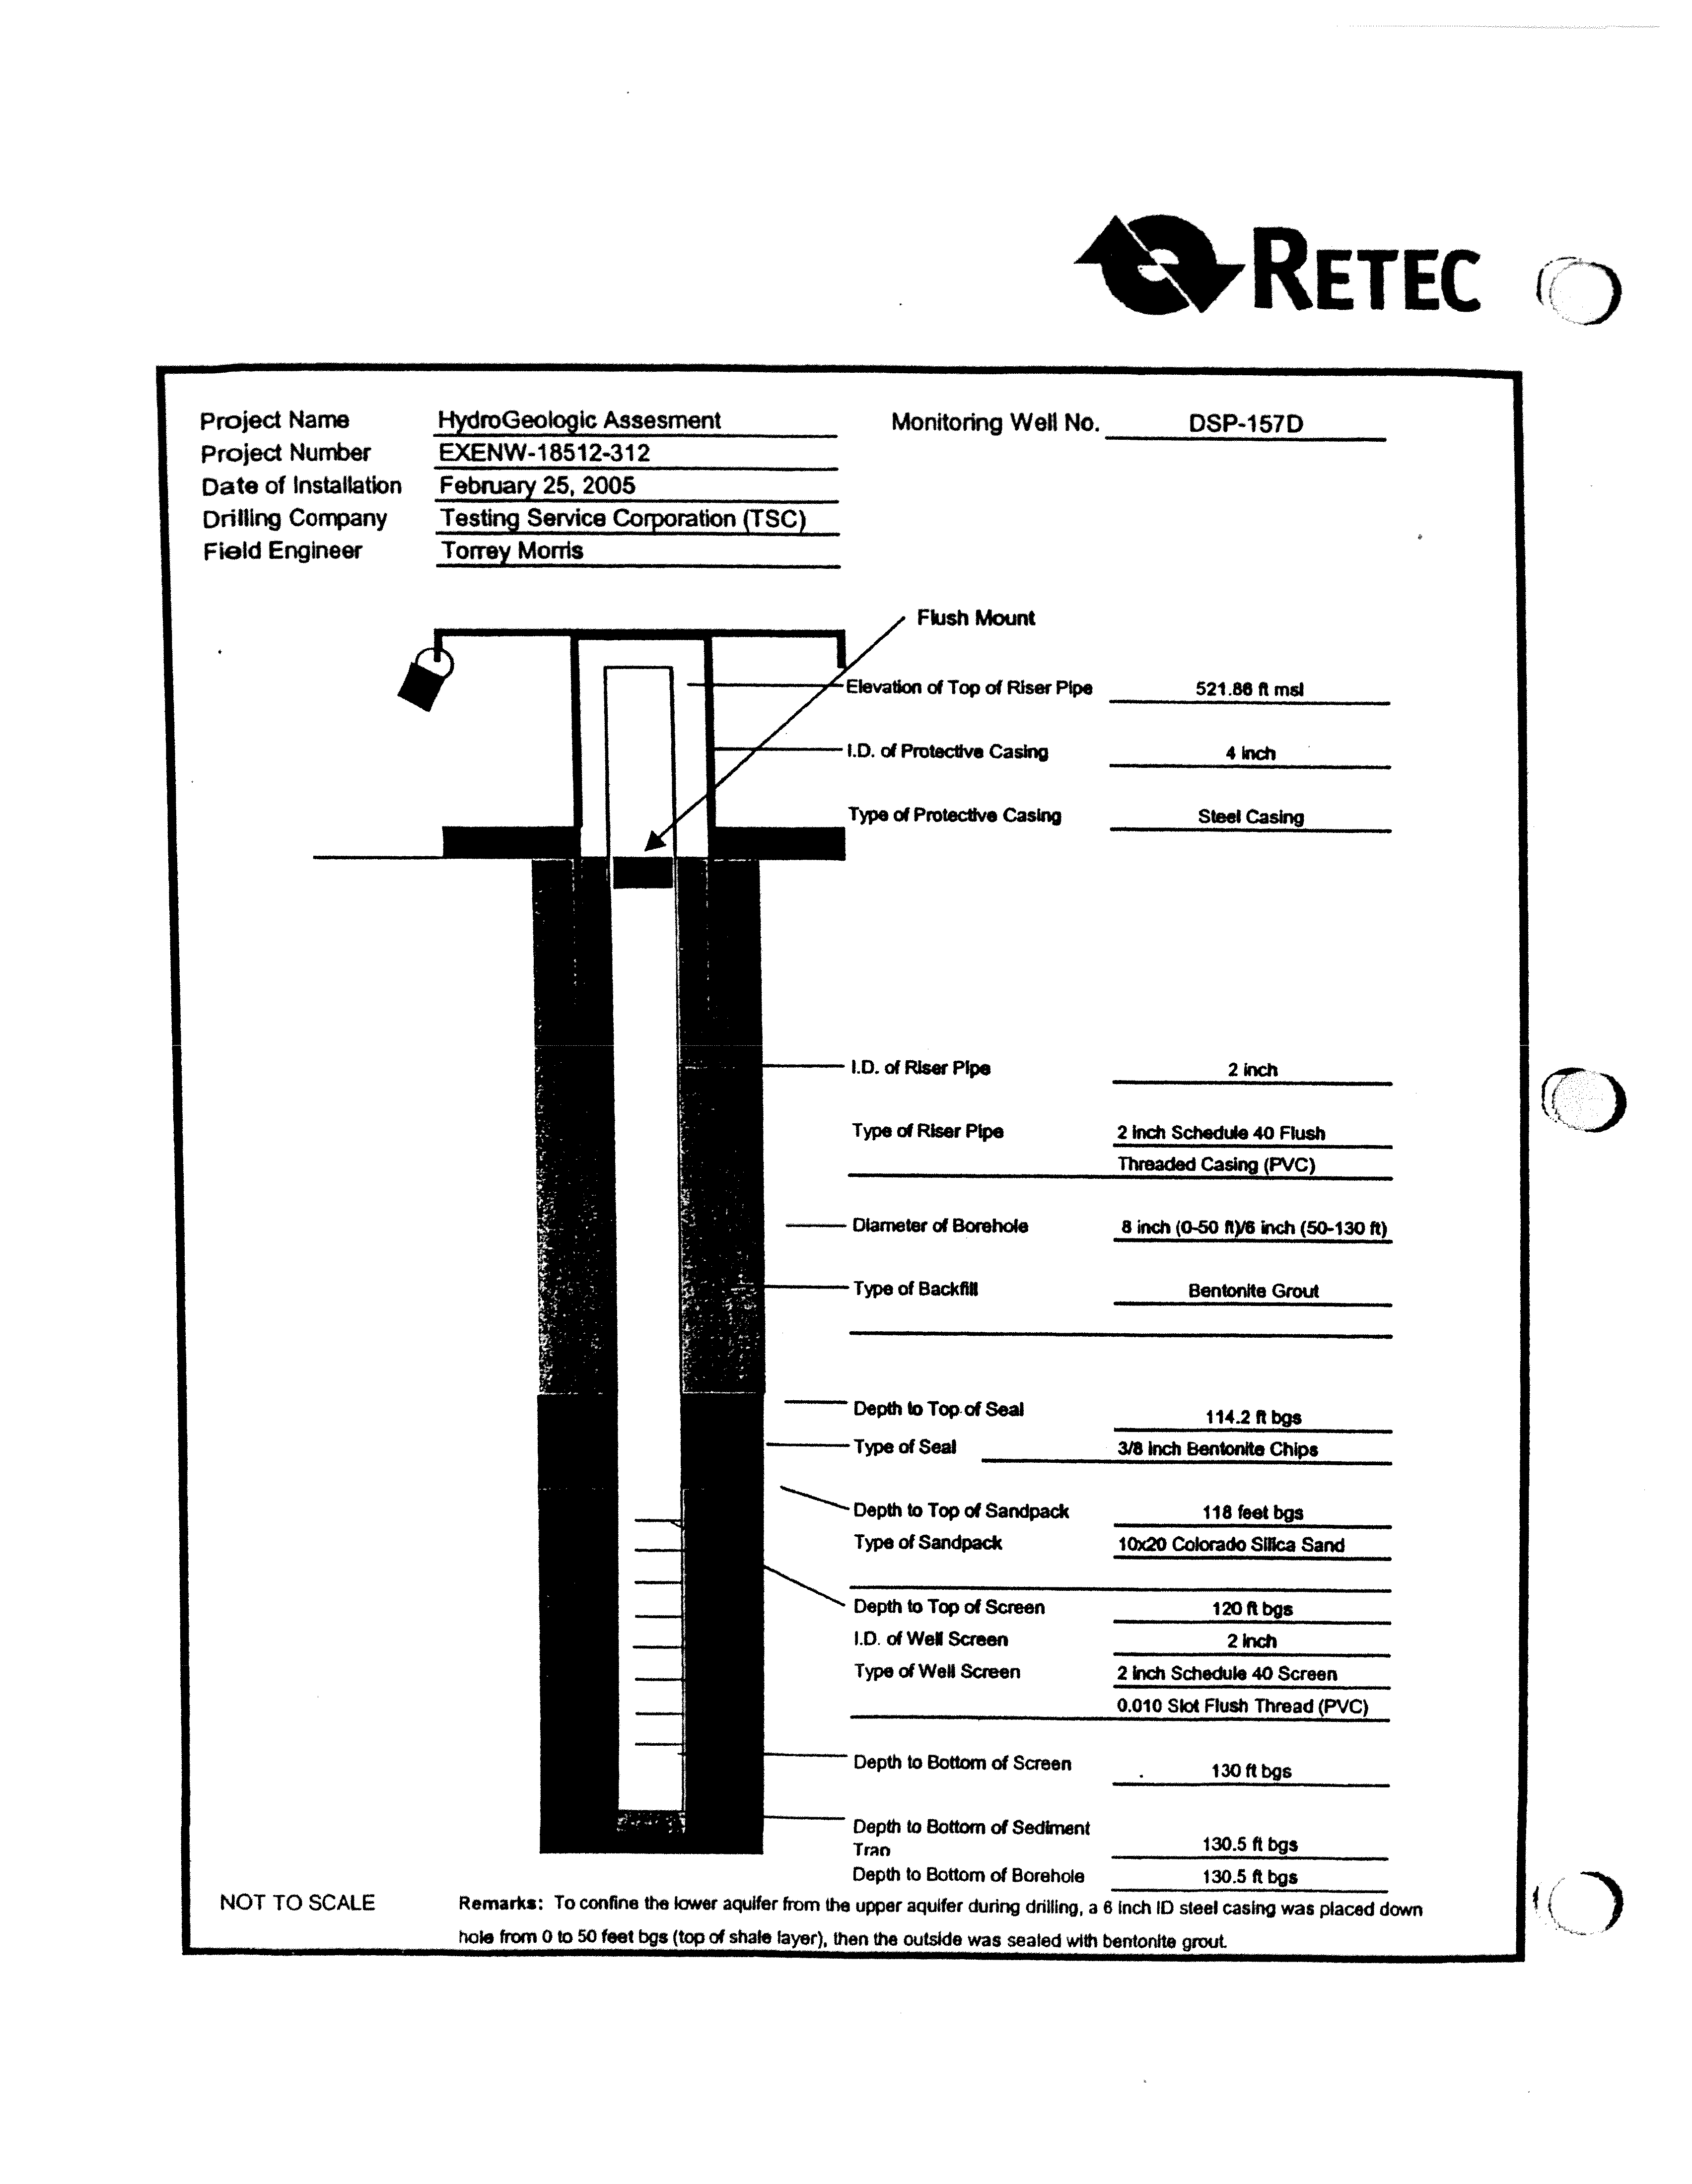
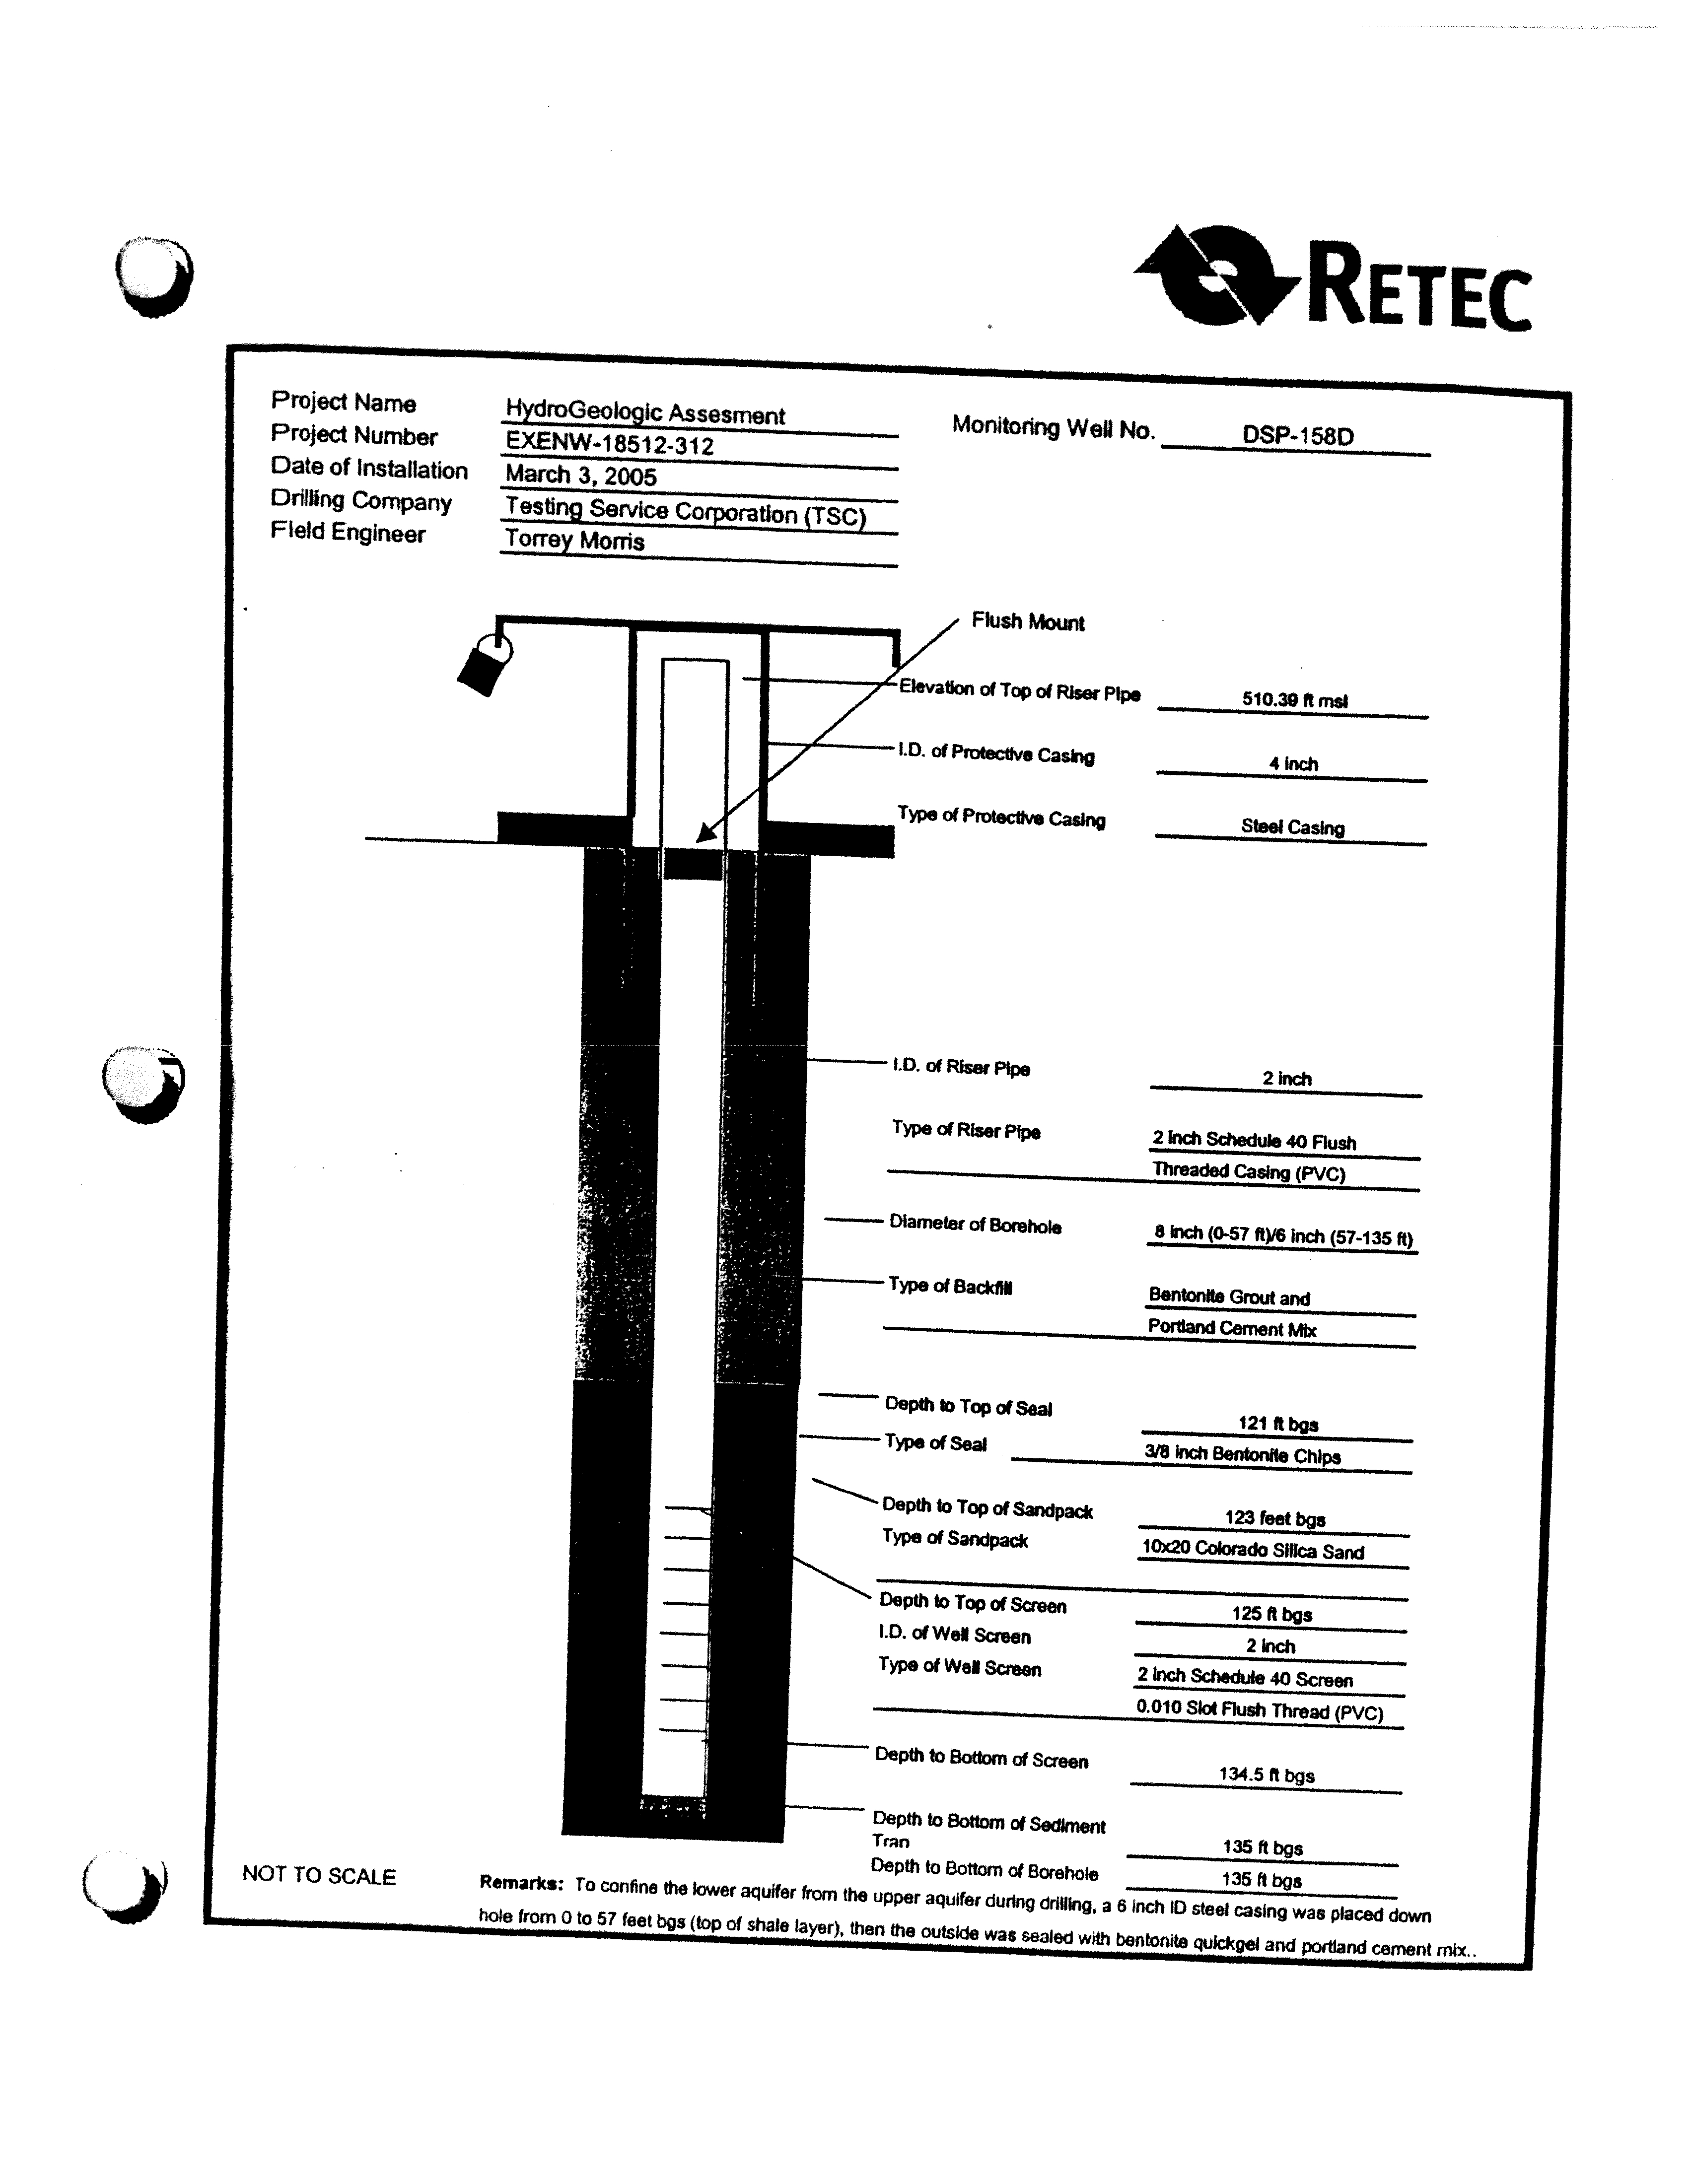
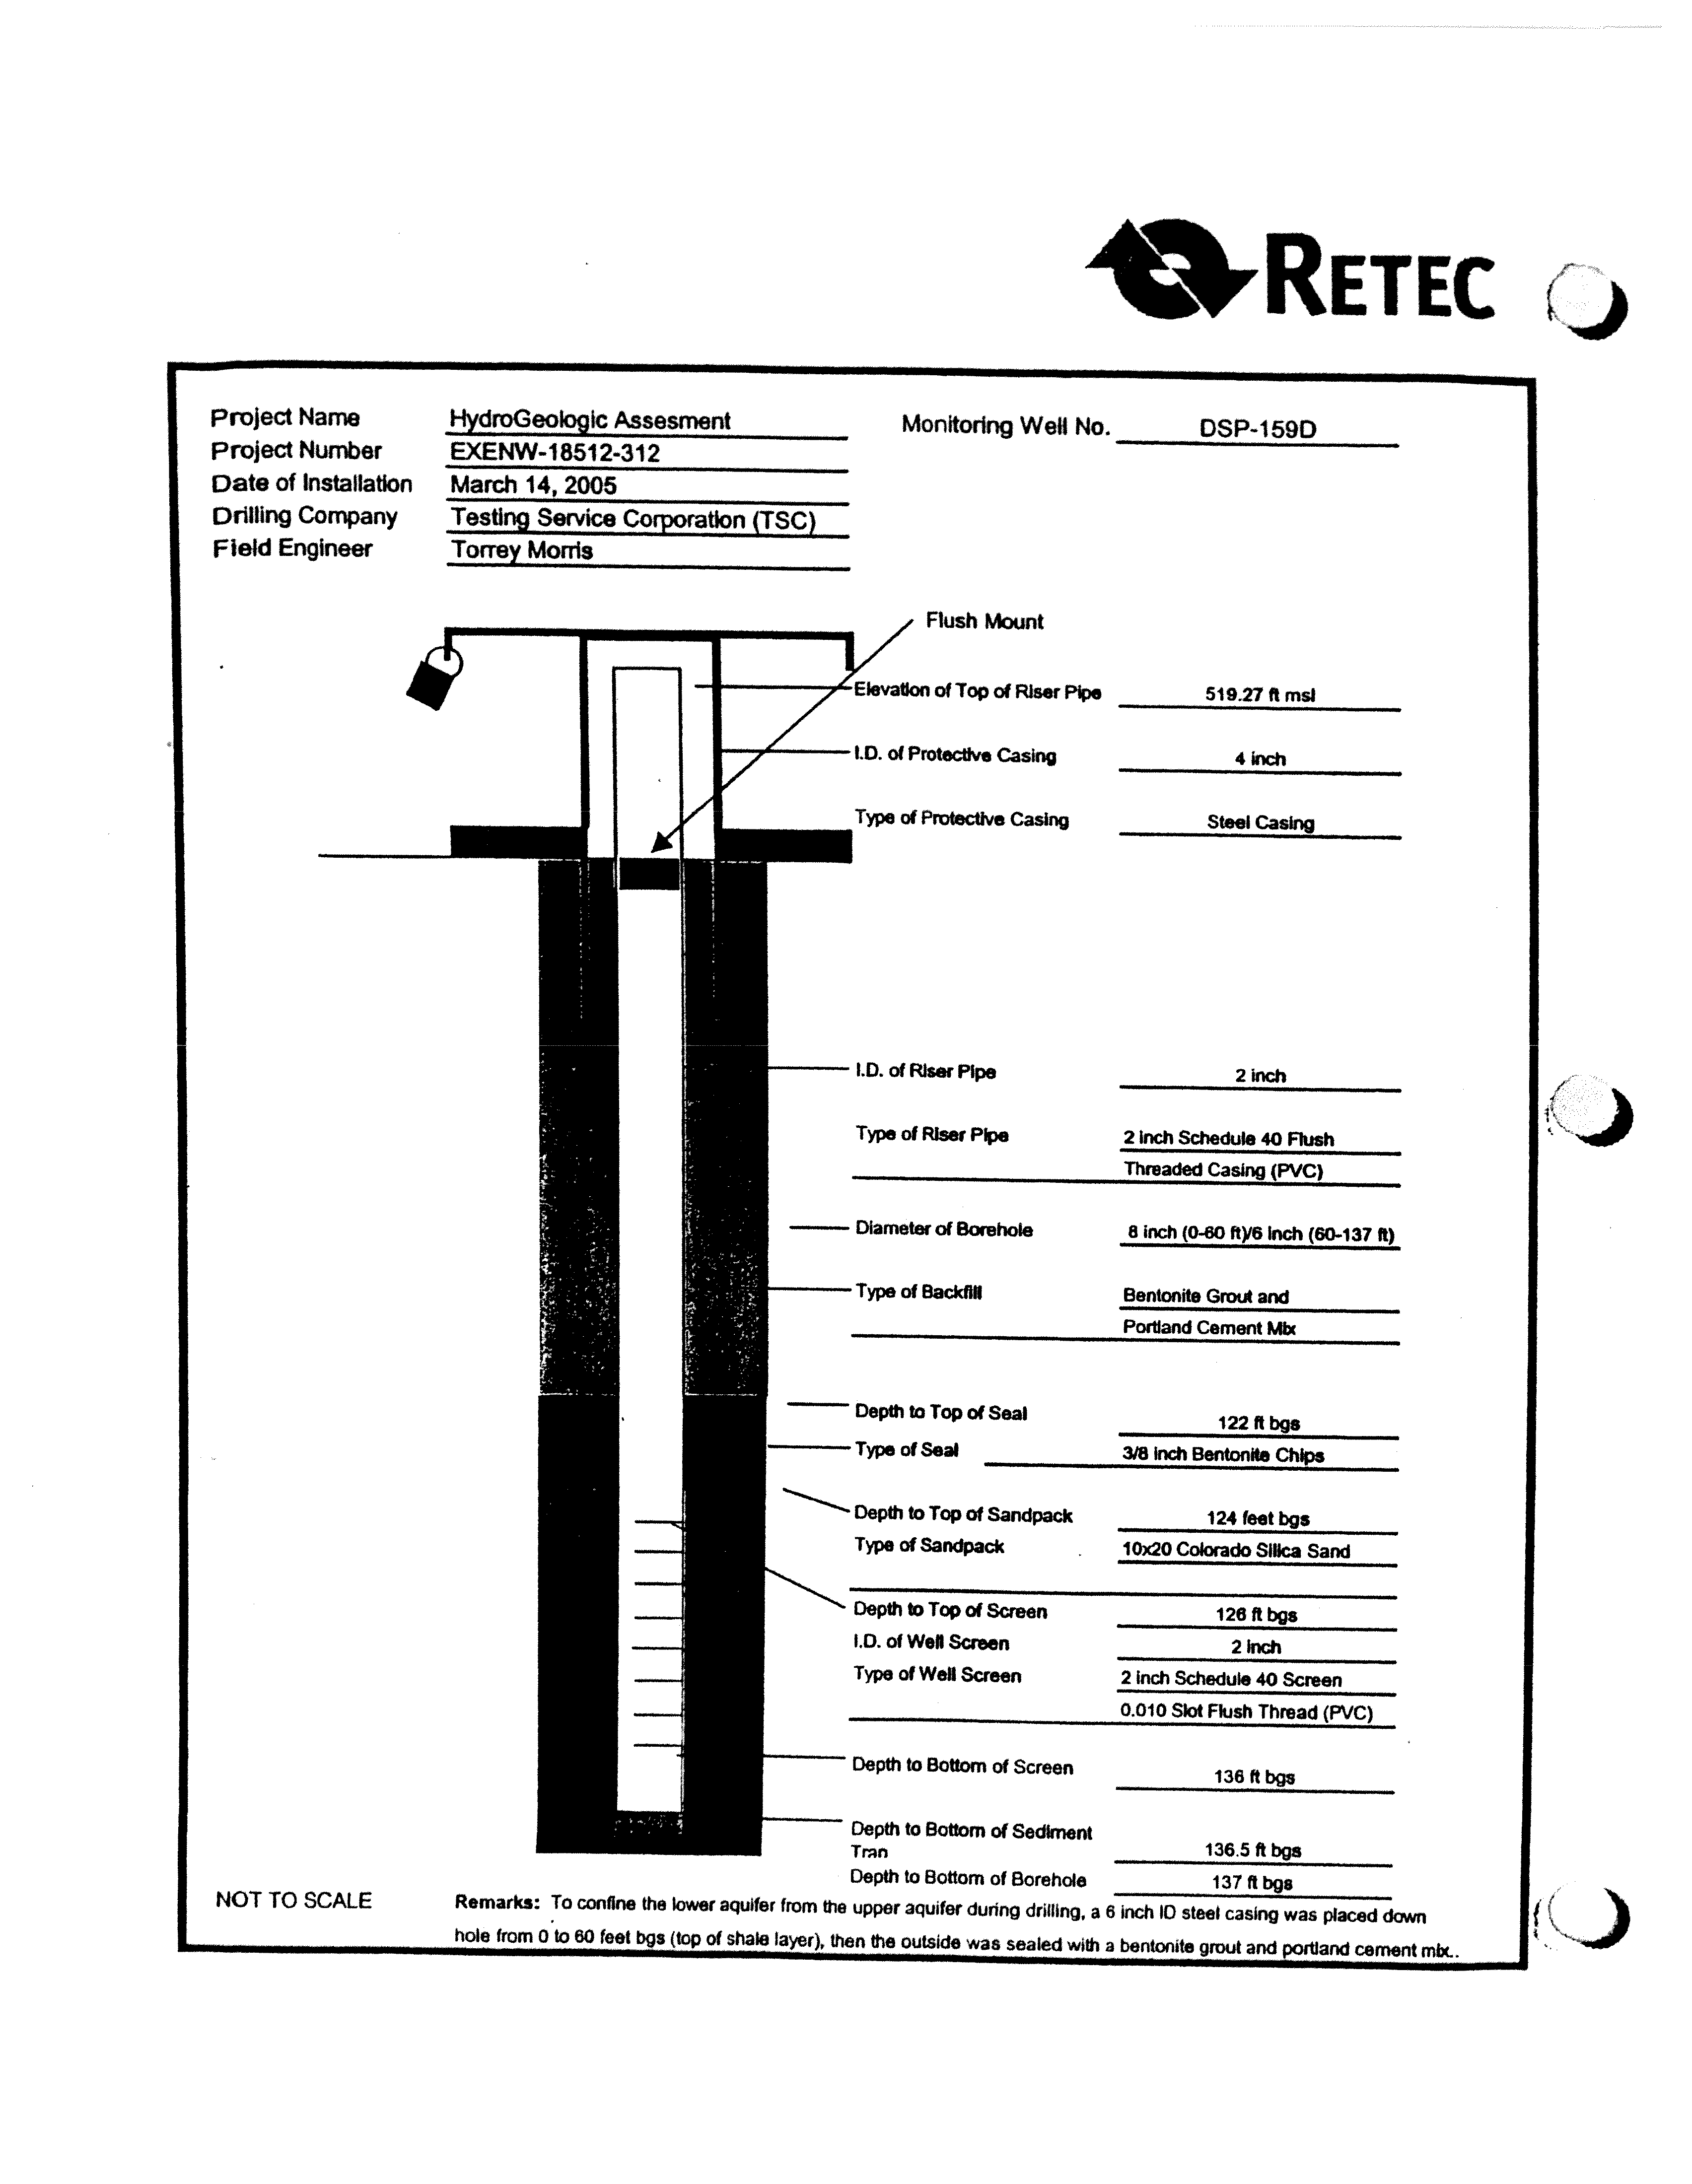
the elevation of the shale surface varies significantly. Based on the three deep wells
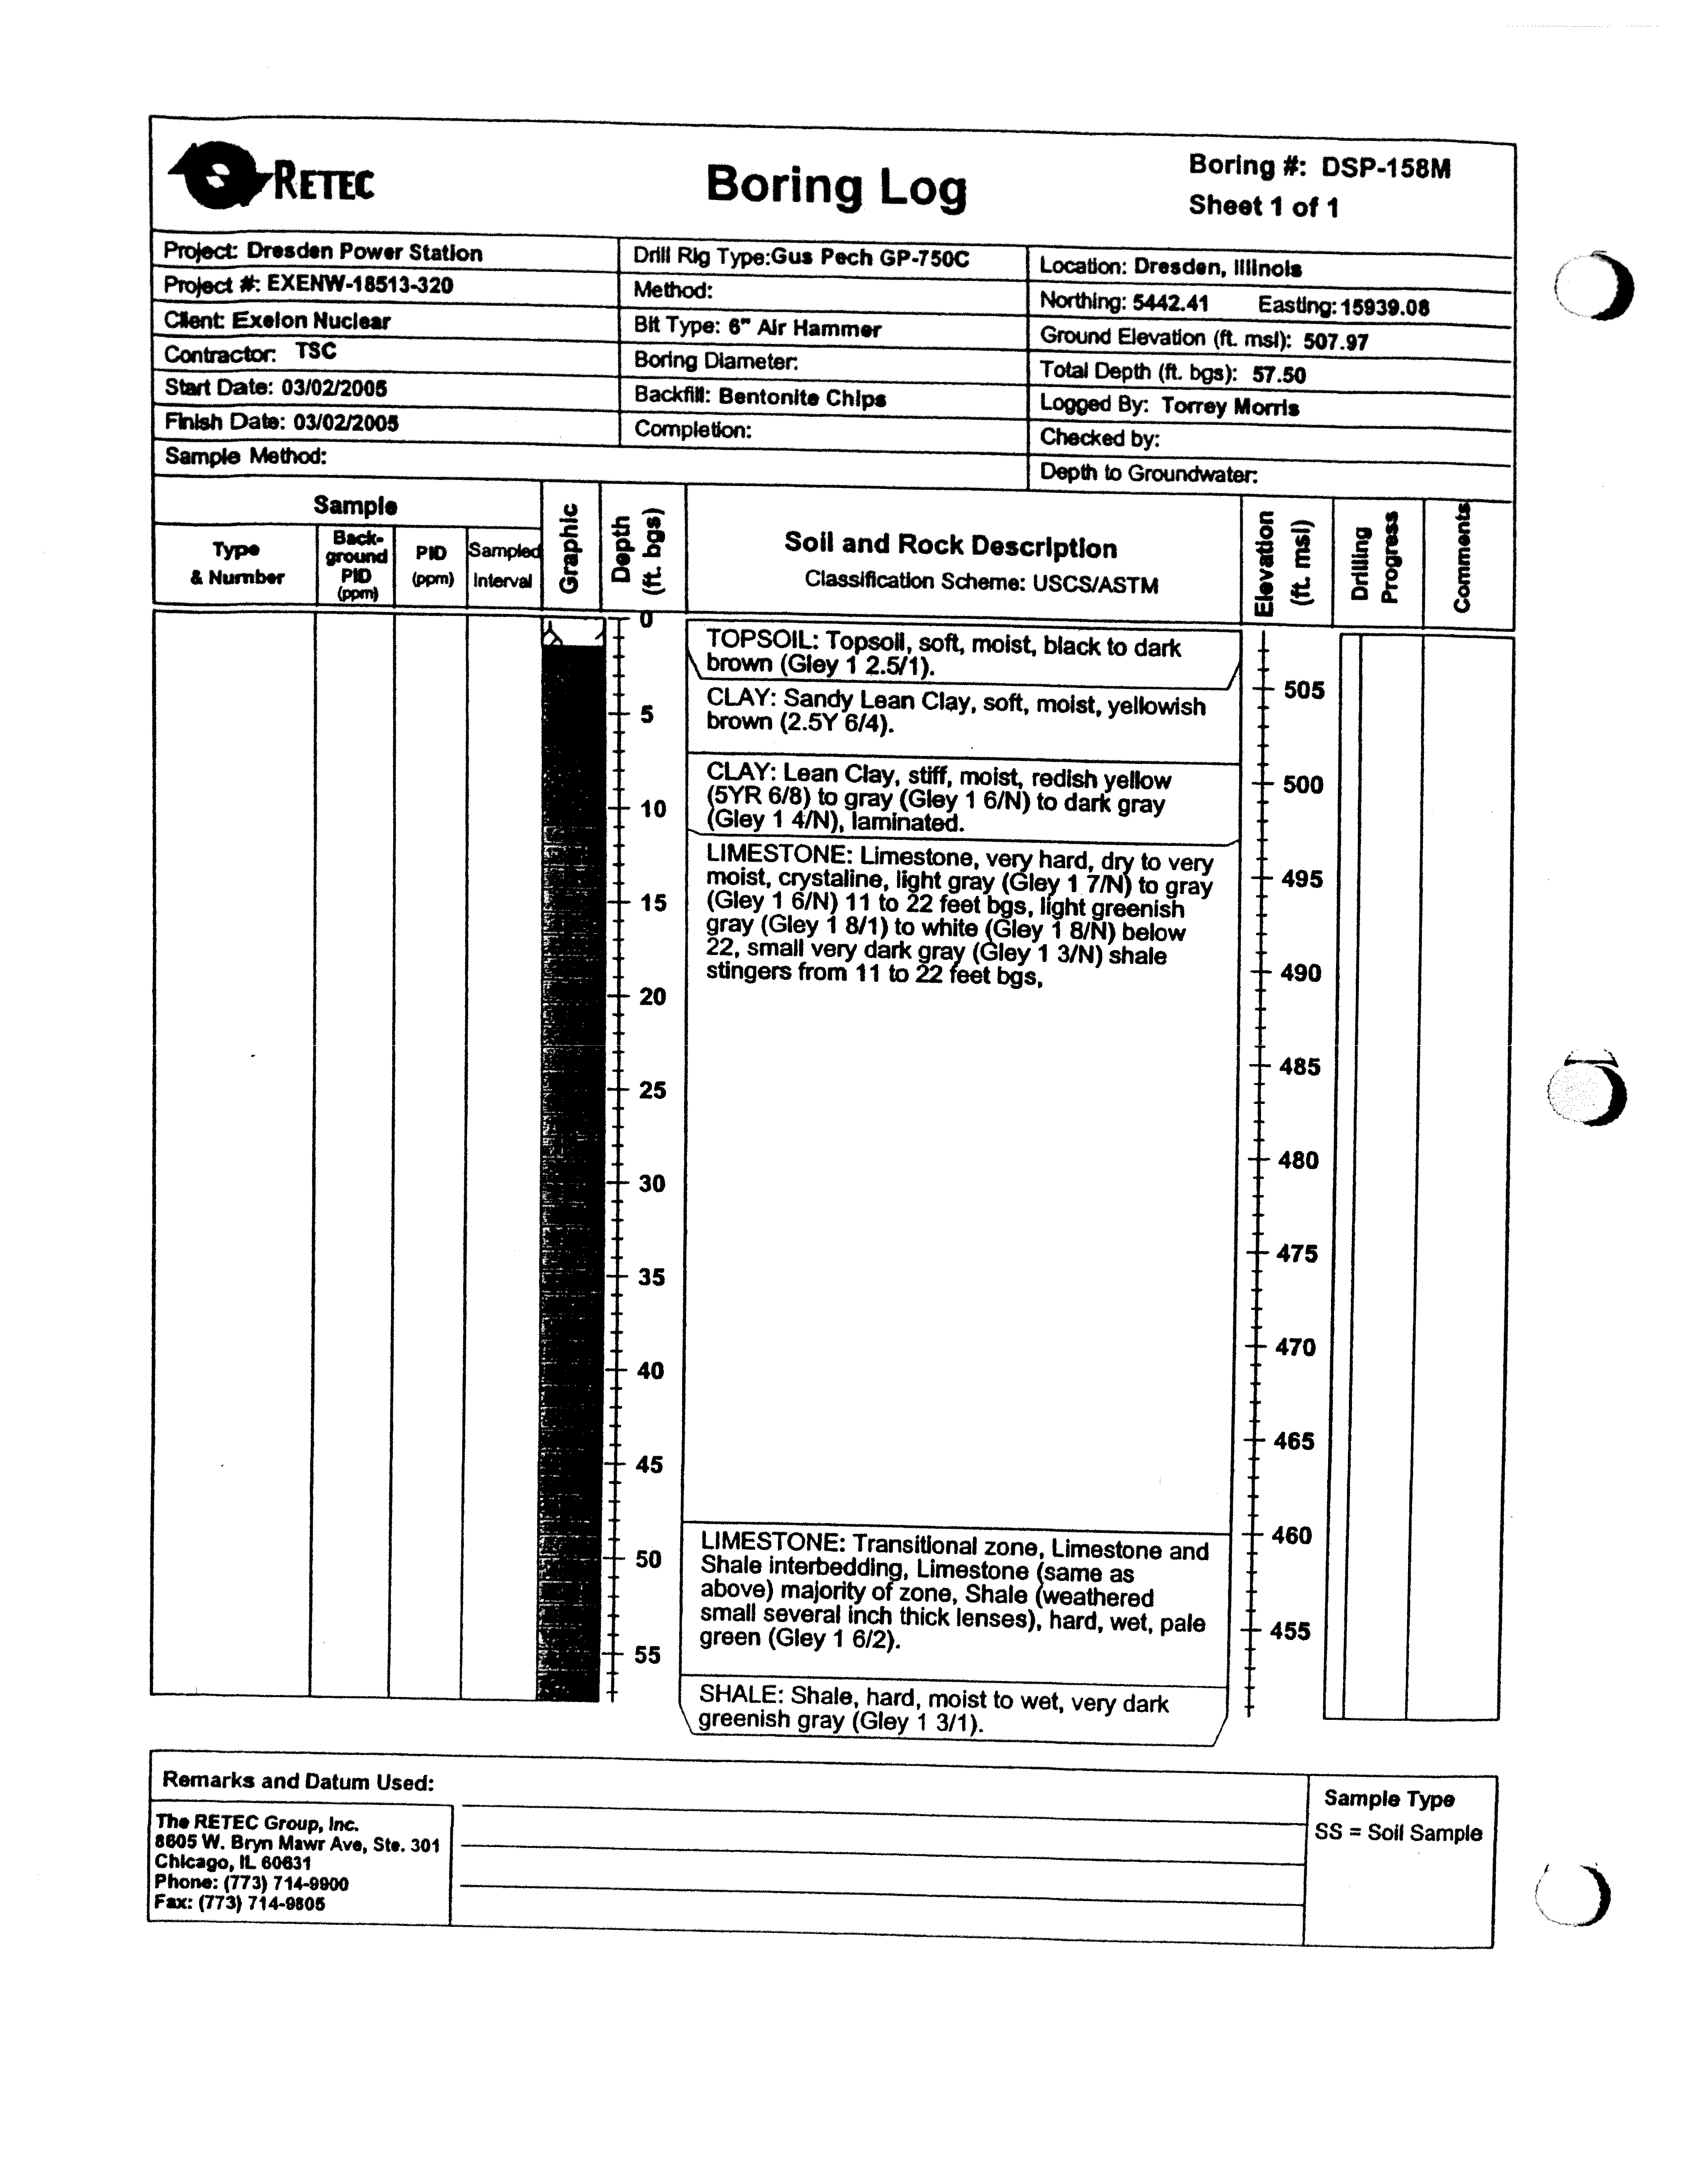
installed by RETEC in March 2005 (DSP-157D, DSP-158D, and DSP-159D), the thickness
of the shale at the Station ranged from 64 to 68 feet. Similar to the Divine Limestone, the
Maquoketa Shale has a regional dip to the southeast of approximately 25 feet per mile
(Willman, 1975; Harza, 1991, 1995).
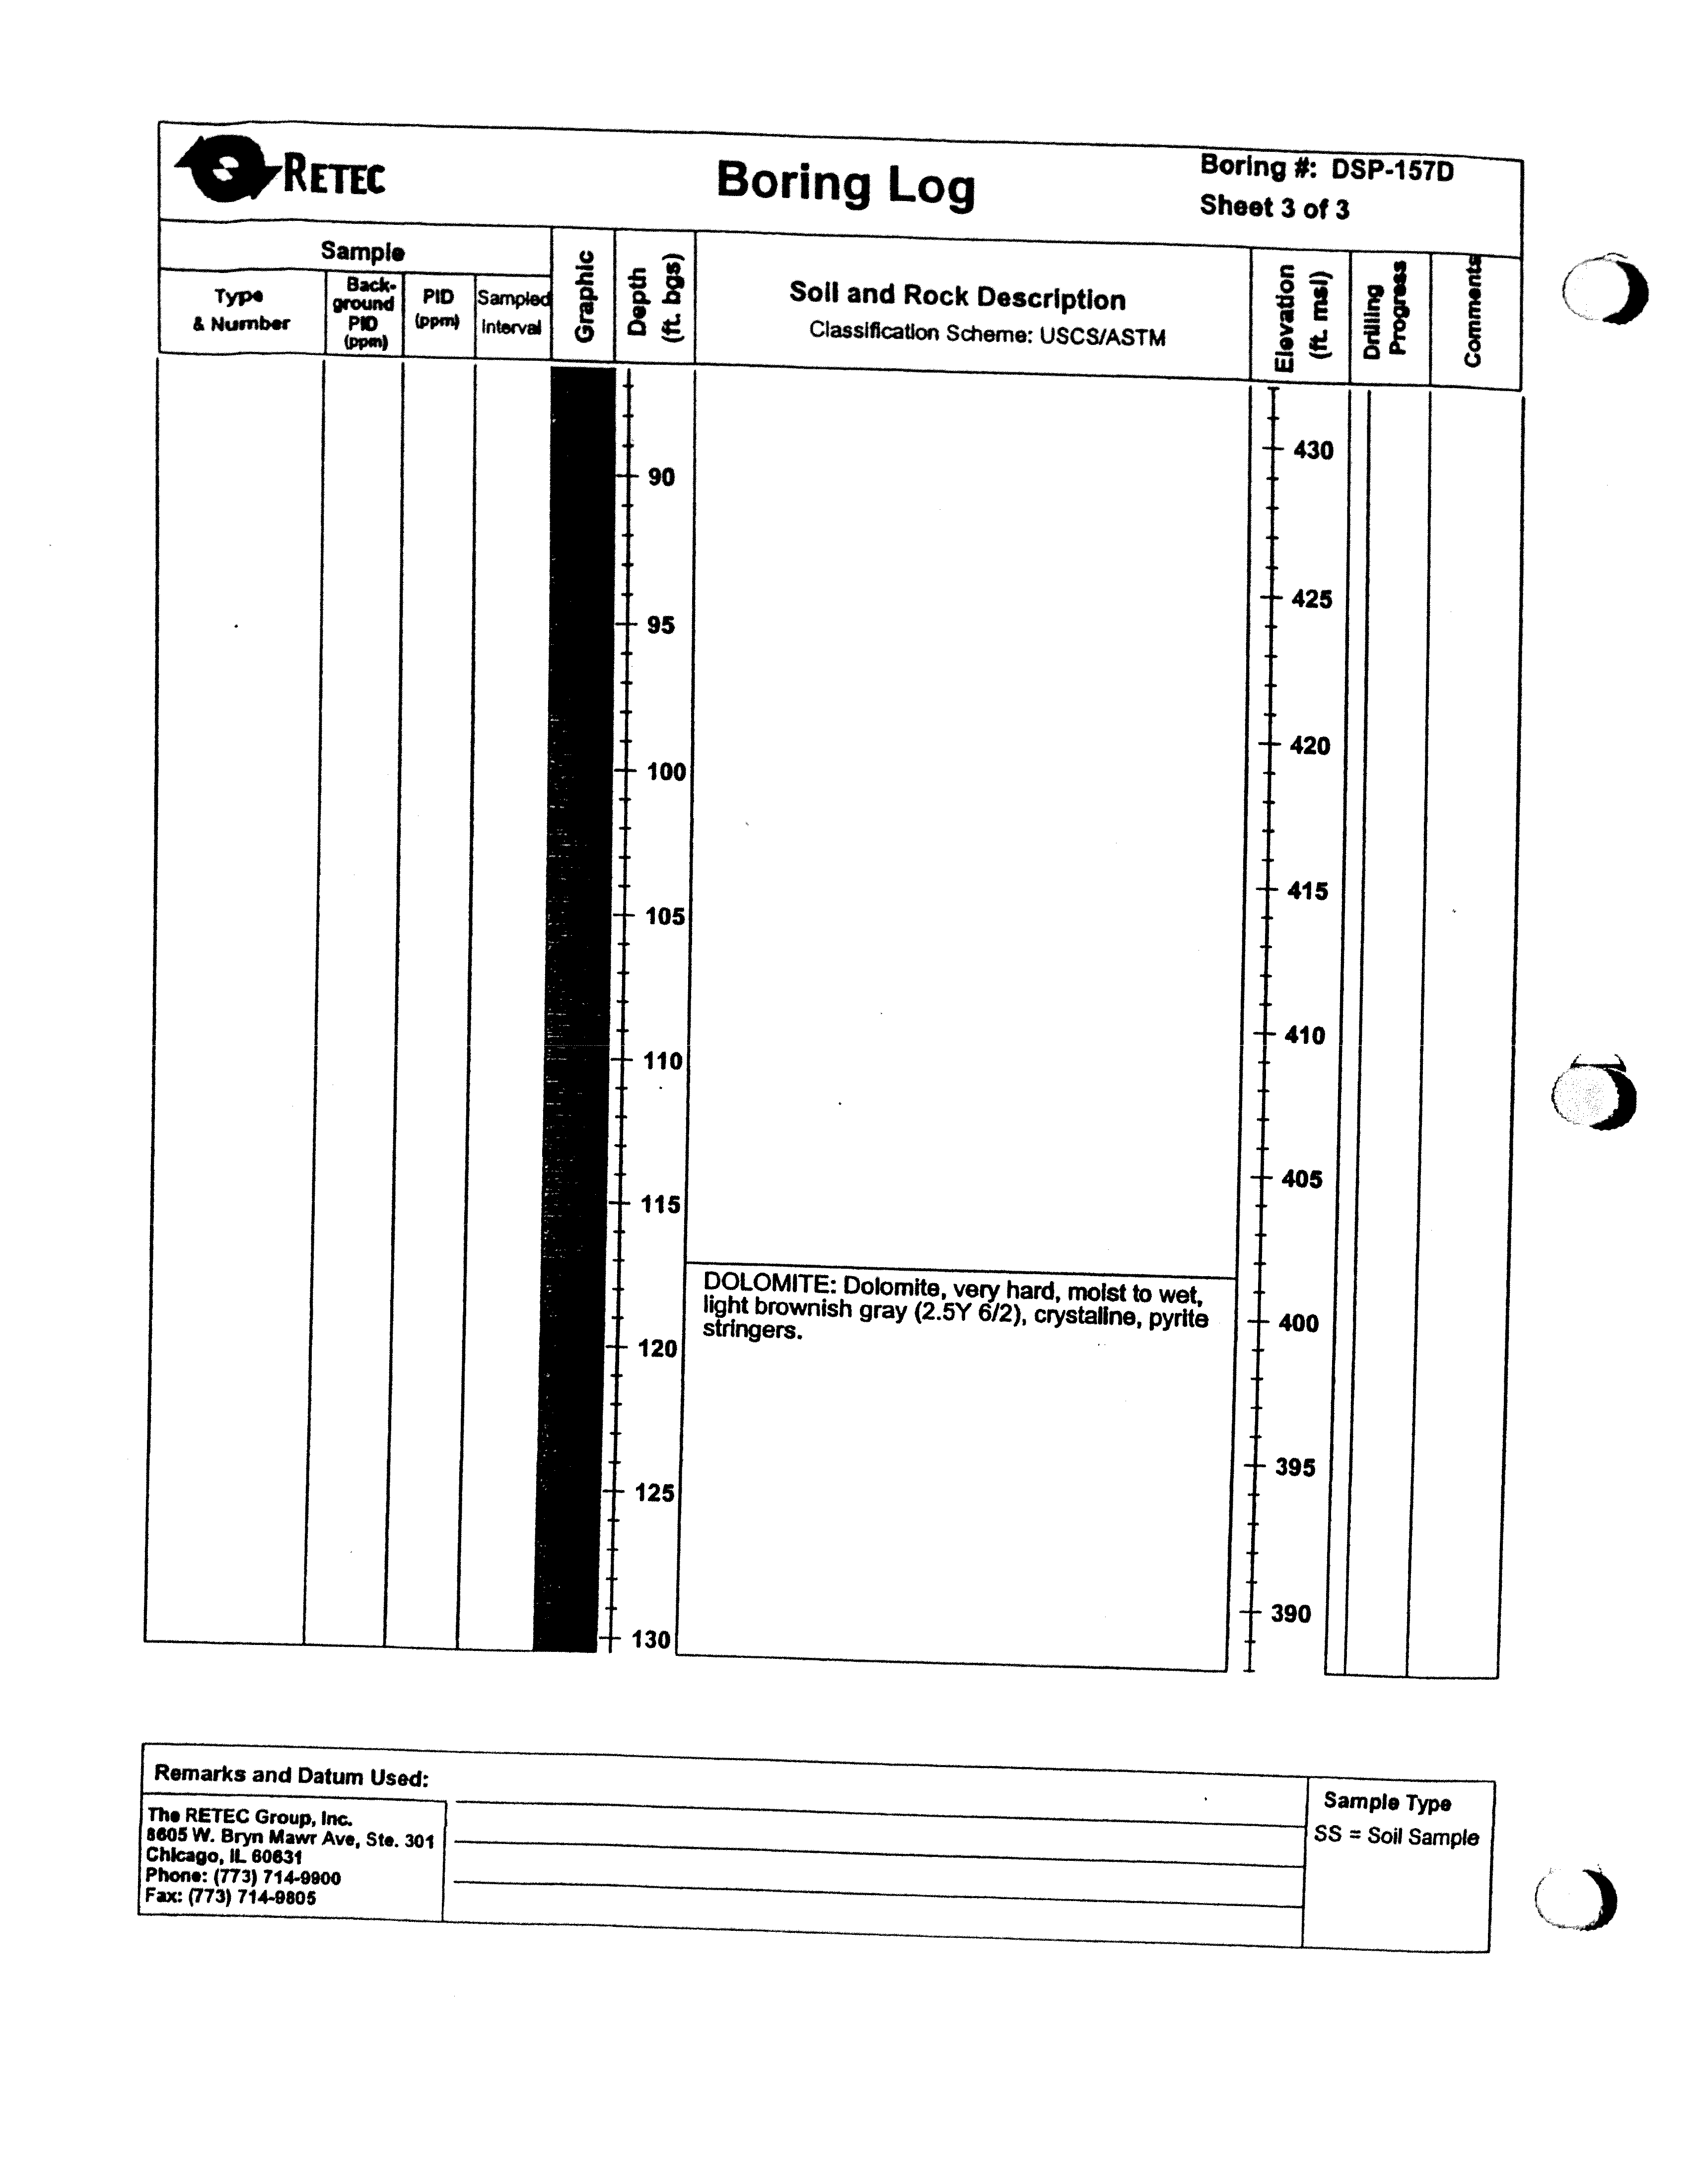
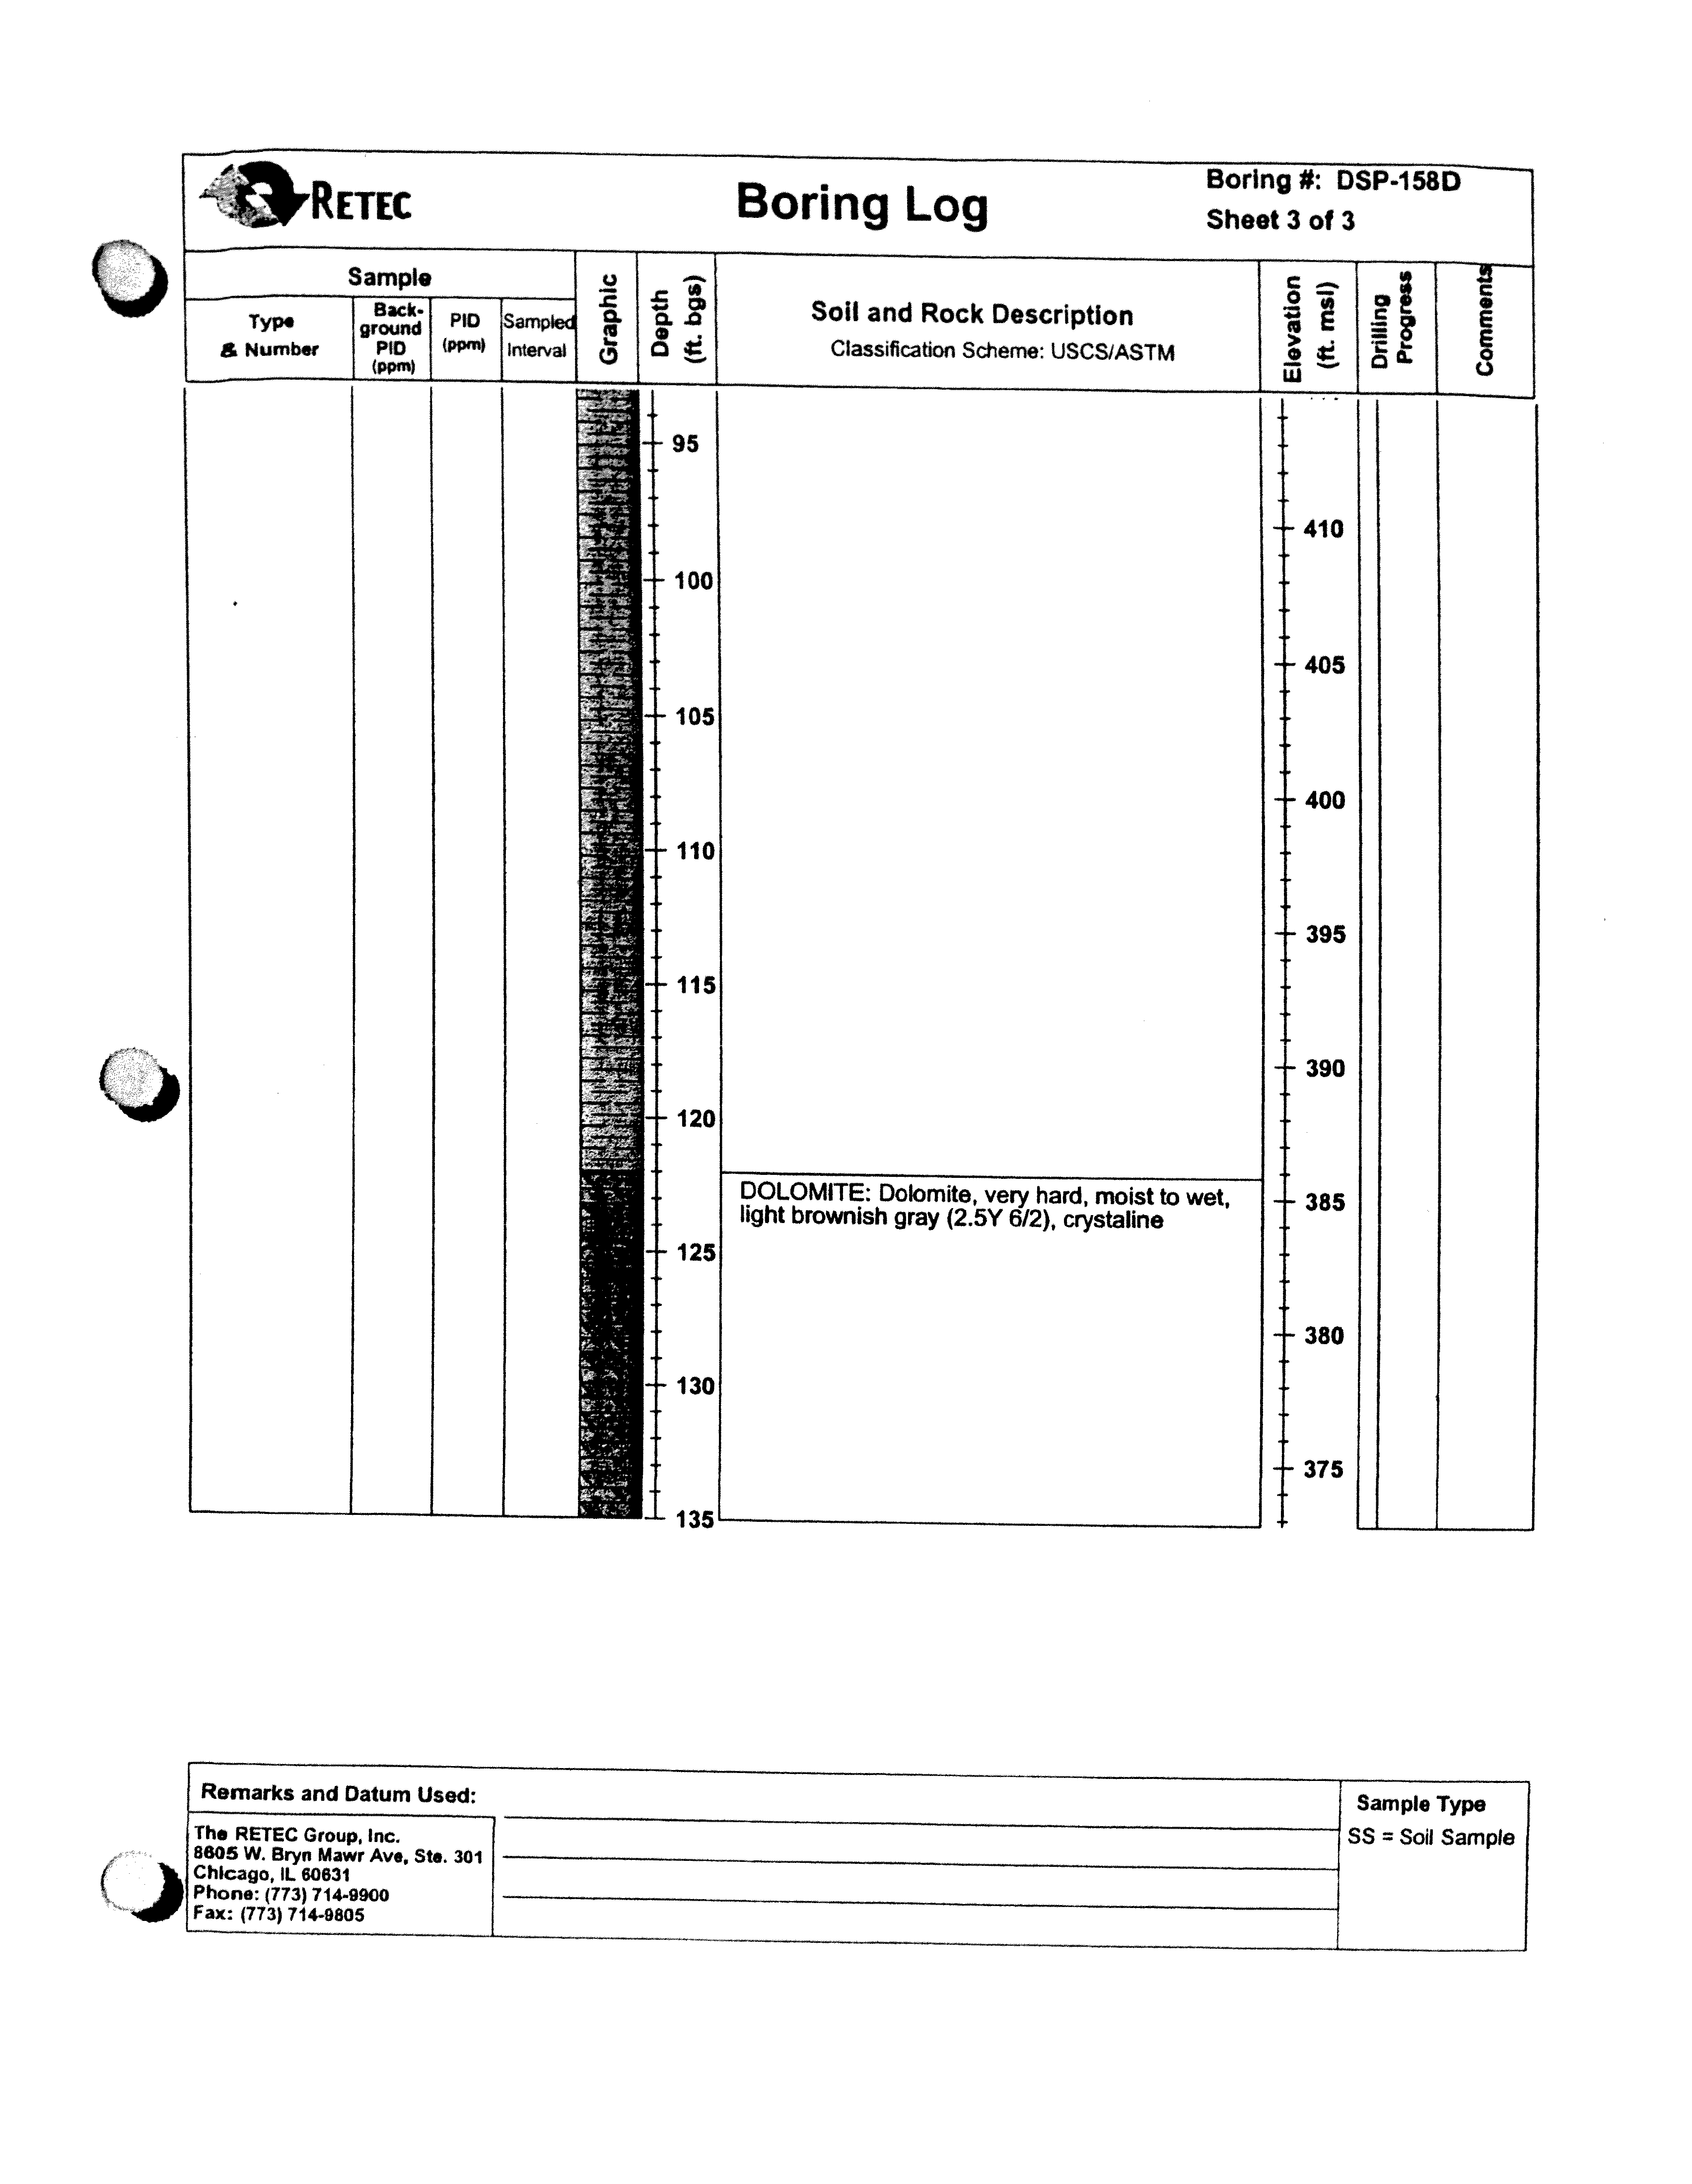
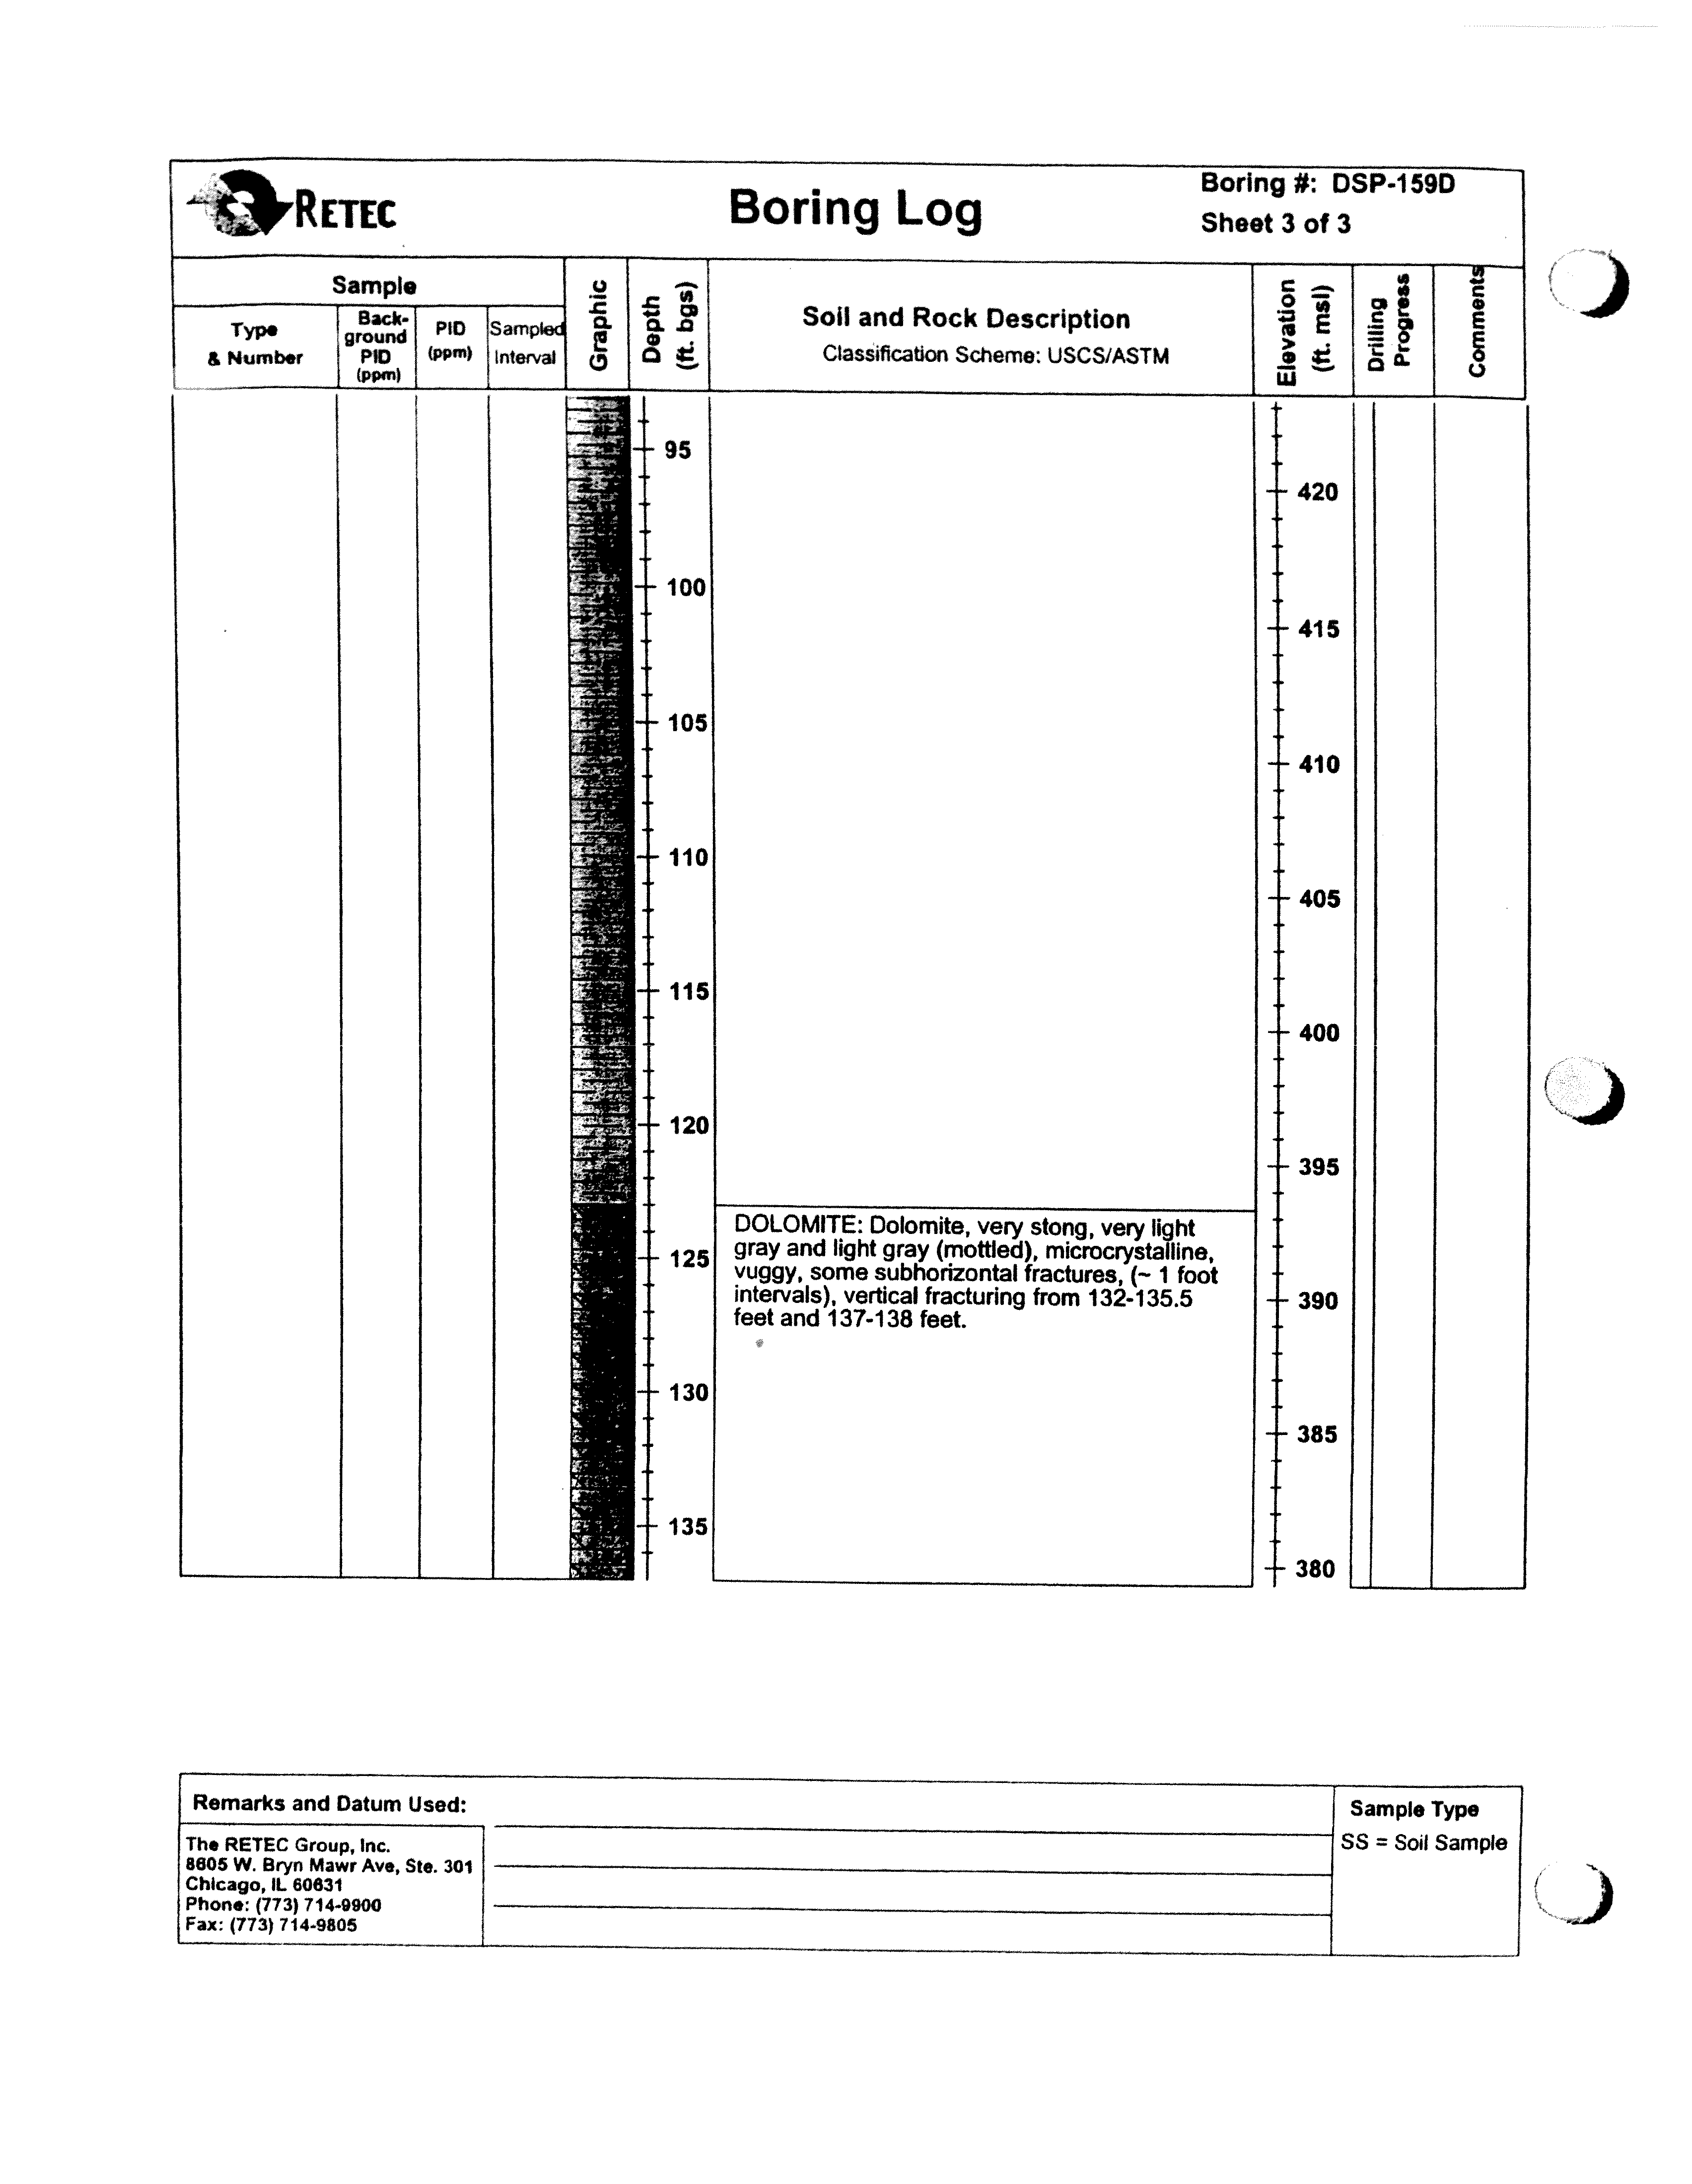
Beneath the Maquoketa Shale Group lies the Ordovician-aged Galena Dolomite.
Regionally, the Galena Dolomite consists of limestone and dolomite formations
(Willman, 1975; Burch, 2002; Buschbach, 1964). At the Station, according to RETEC logs
(Appendix A), this unit consists of a light-brownish gray to pinkish-white crystalline
dolomite.
045136 (15) Dresden Generating Station
7
CONESTOGA-ROVERS & ASSOCIATES
Revision 1
2.4.3
HYDROGEOLOGY
The hydrogeologic units underlying the Station include the:
•
Water table aquifer consisting of the Pottsville Sandstone and Divine Limestone; and
•
Deep Aquifer
consisting of the Galena Dolomite.
The water table is the uppermost groundwater aquifer. Groundwater in
the water table
aquifer occurs under unconfined conditions under the Station, and is found within the
Pottsville Sandstone and Divine Limestone. The upper flow zone of the water table is
defined in the Pottsville Sandstone and the lower flow zone of the water table is defined
in the Divine Limestone. The depth to groundwater varies across the Station, ranging
from approximately 3 feet bgs to 16 feet bgs (Harza, 1991, 1995; RETEC, 2005). The
water table aquifer is monitored by shallow monitoring wells screened within the upper
portion of the water table aquifer in the sandstone (20 to 25 feet deep), and intermediate
wells (35 and 50 feet deep) screened within the water table aquifer in the limestone.
The Maquoketa Shale is the lower confining unit to the water table aquifer and
hydraulically separates the water table aquifer from the lower aquifers
at the Station
(Harza, 1991, 1995). Regional hydrogeologic reports indicate that vertical migration
downward from the water table aquifer is impeded where the Maquoketa Shale is
present due to its low permeability acting as an aquitard (Harza, 1991, 1995;
RETEC, 2005).
Beneath the impermeable Maquoteka Shale, the Galena Dolomite is the next
water-bearing unit and is considered the Deep
Aquifer at the Station. The upper portion
of the Galena Dolomite is unsaturated as indicated by the apparent dry conditions in the
deep wells (RETEC, 2005).
2.5
AREA GROUNDWATER USE
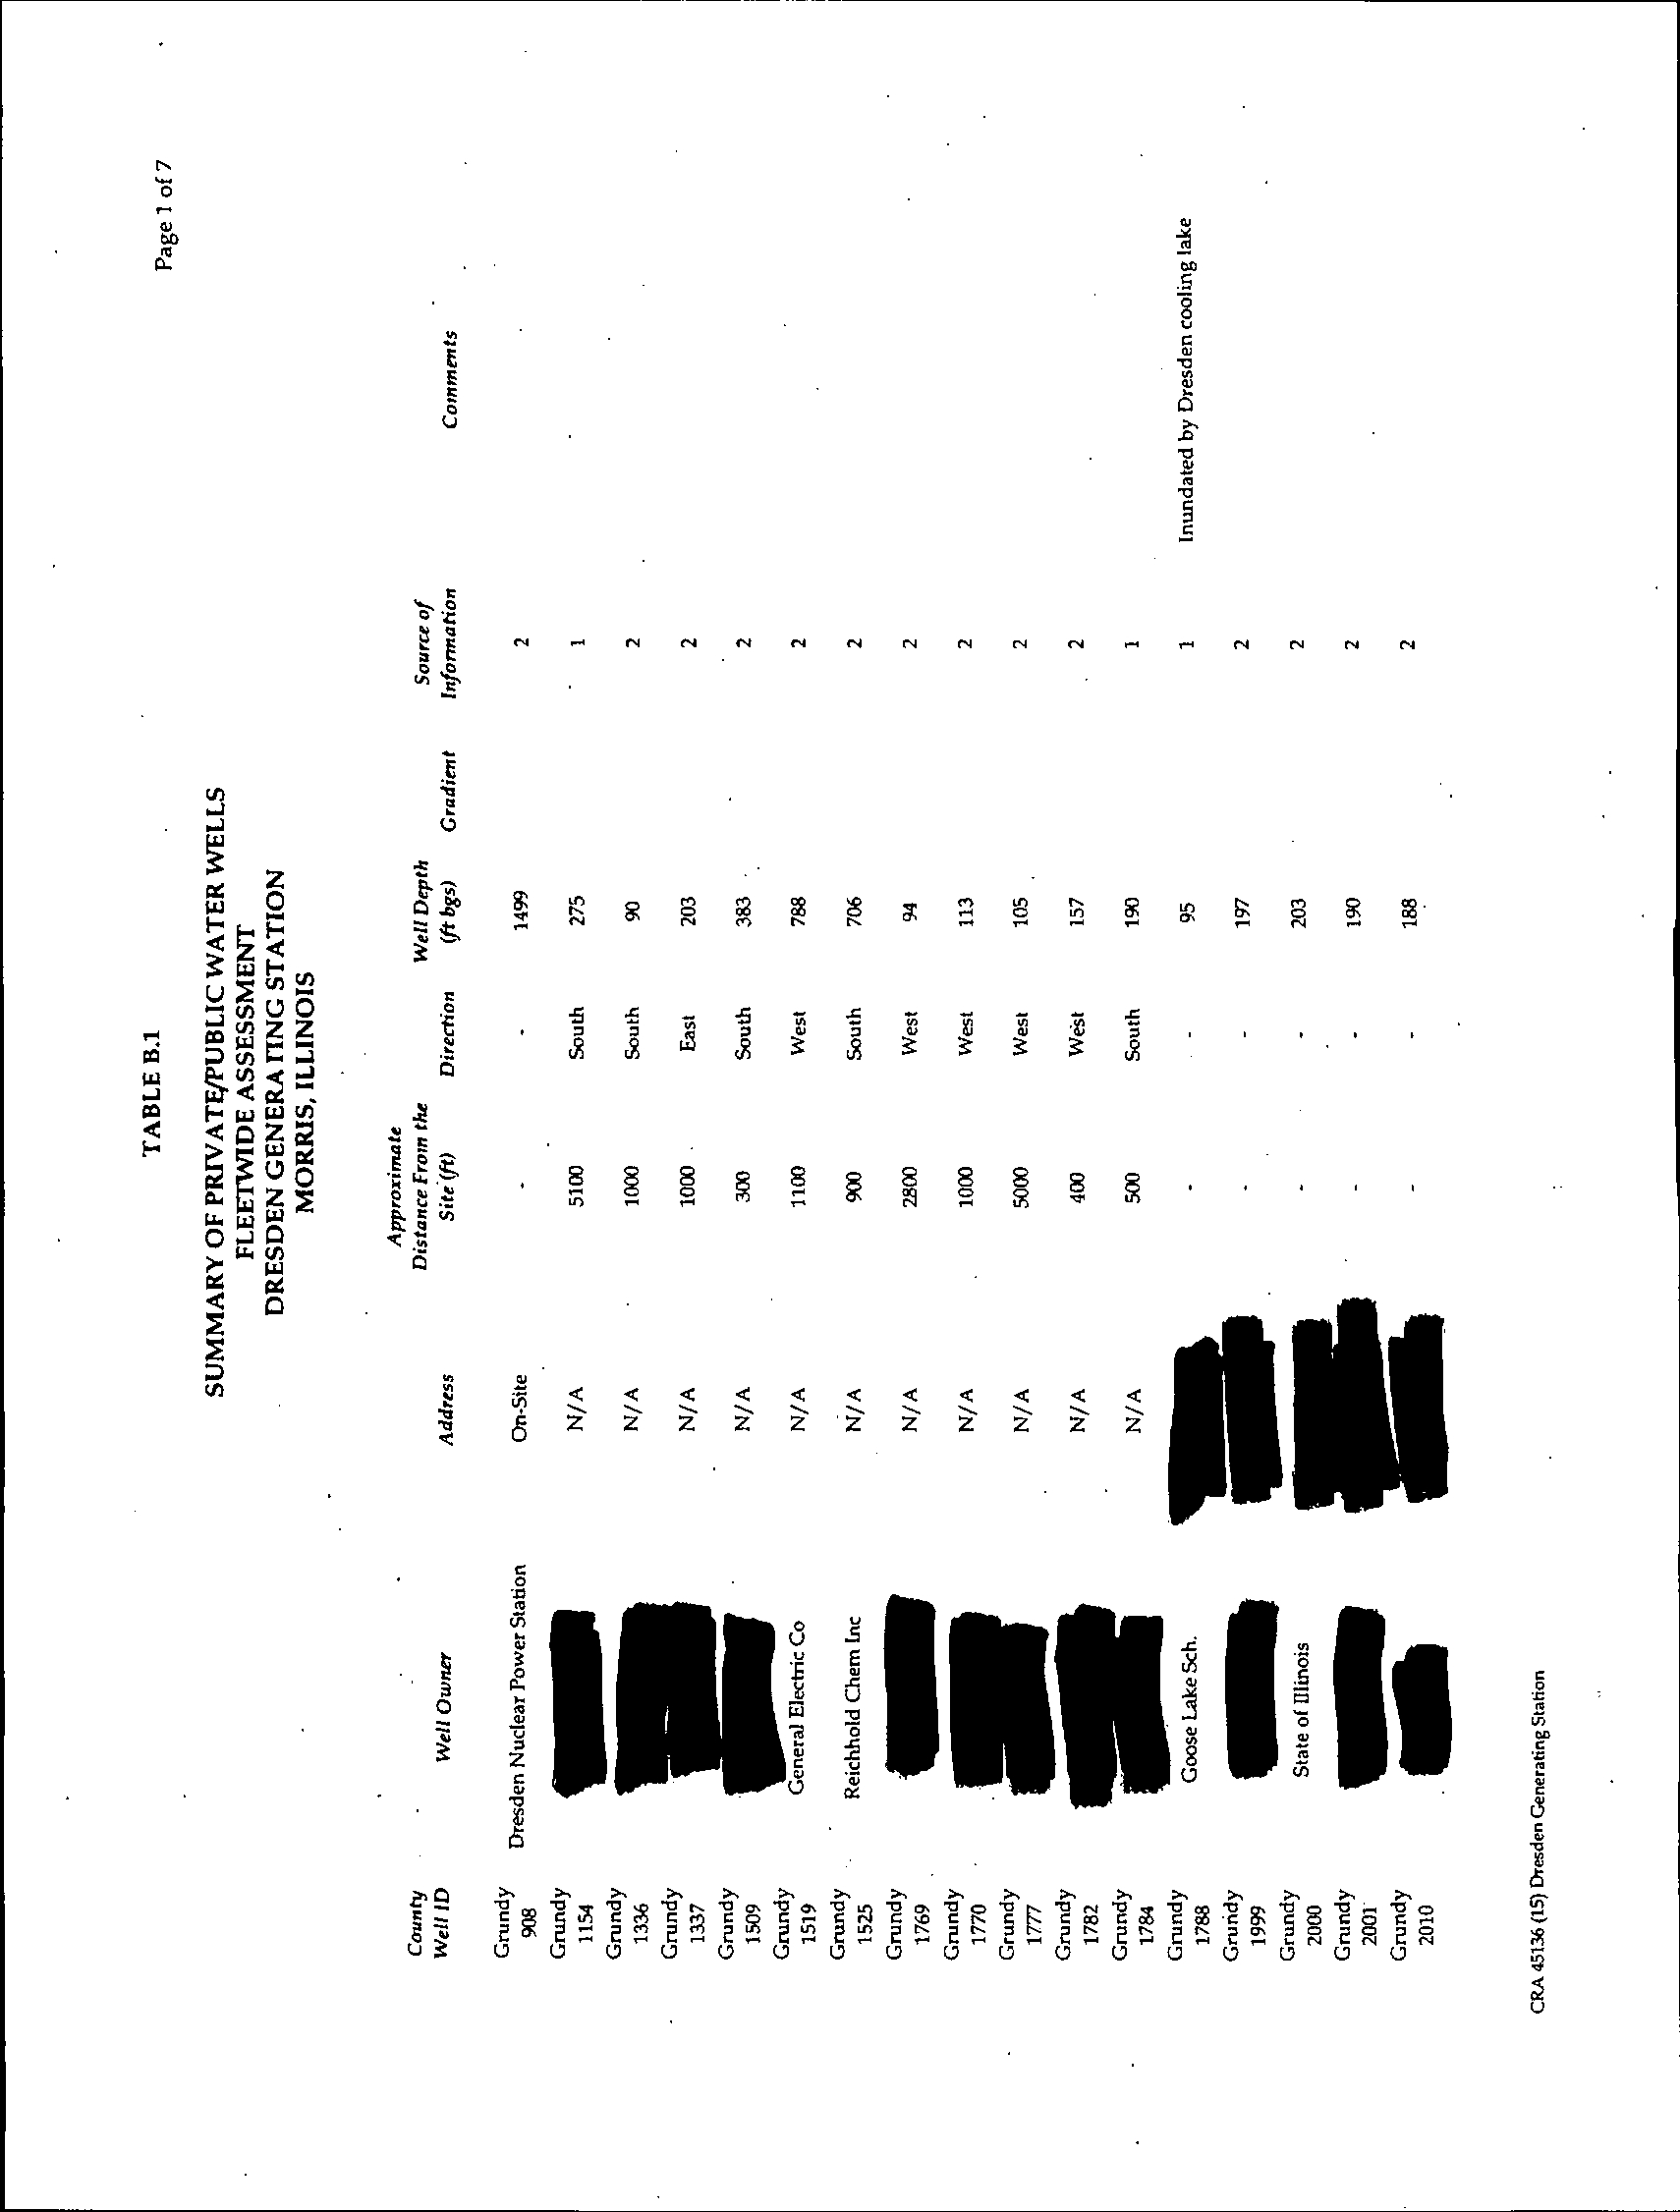
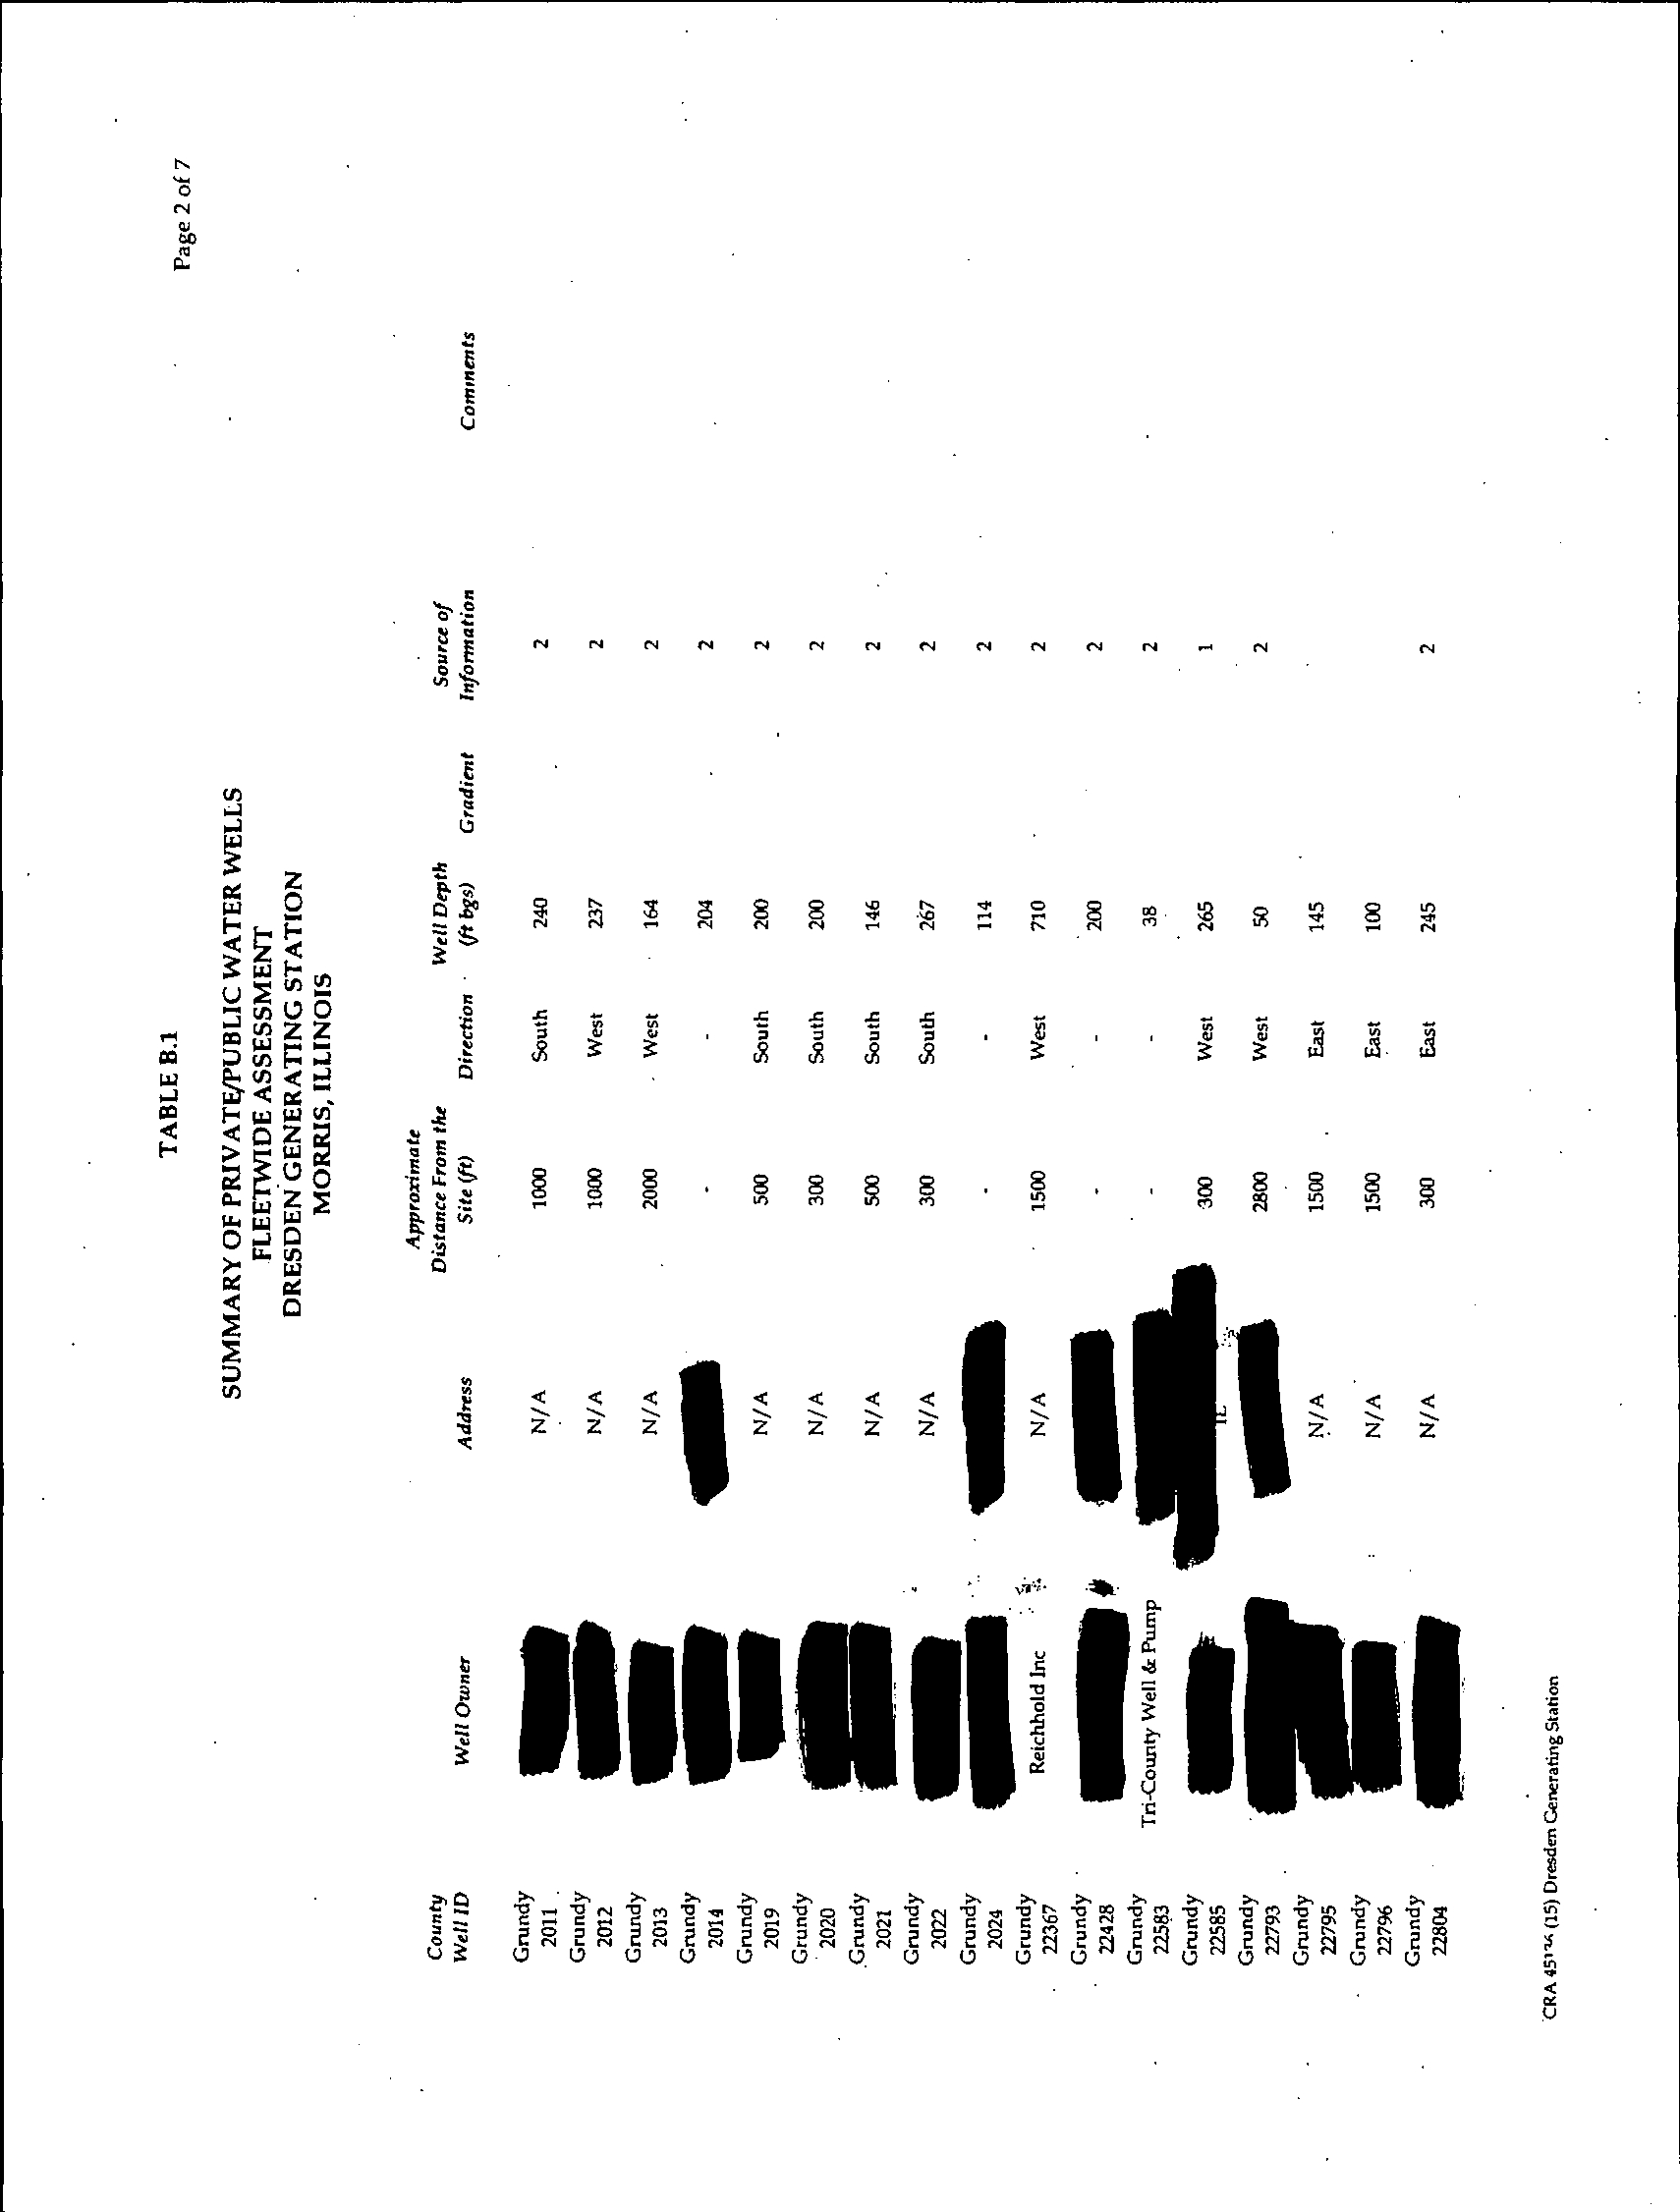
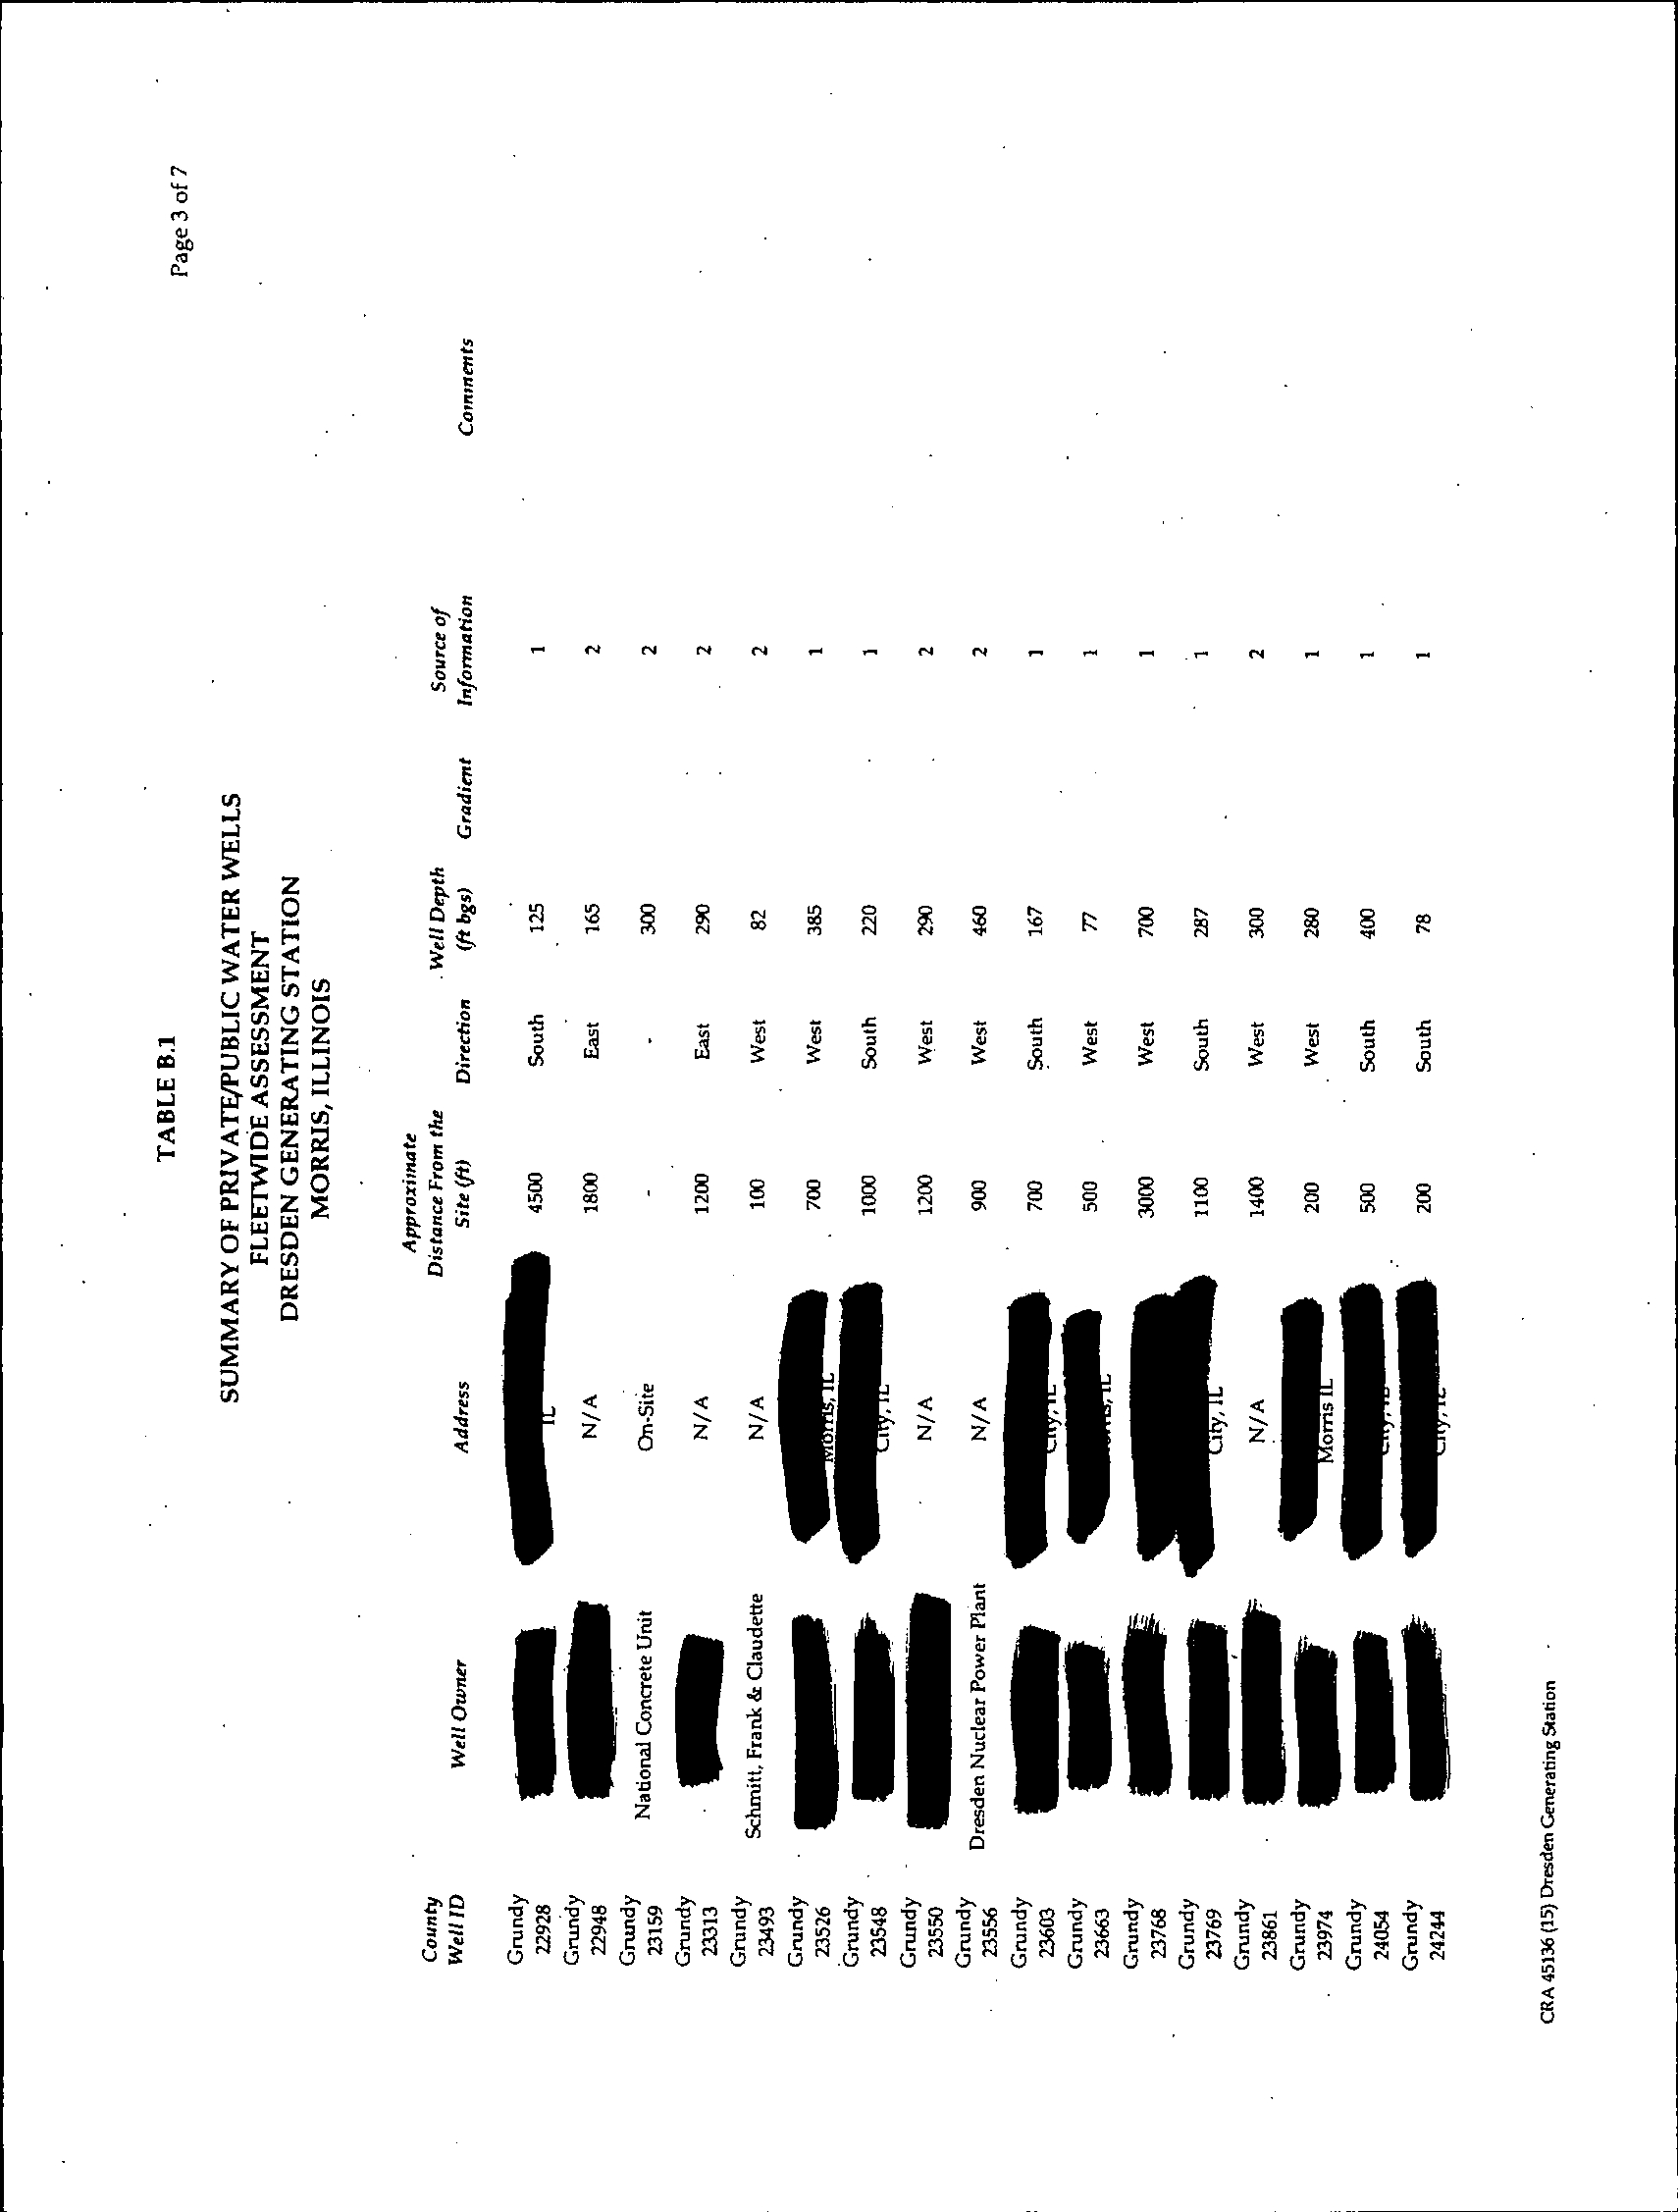
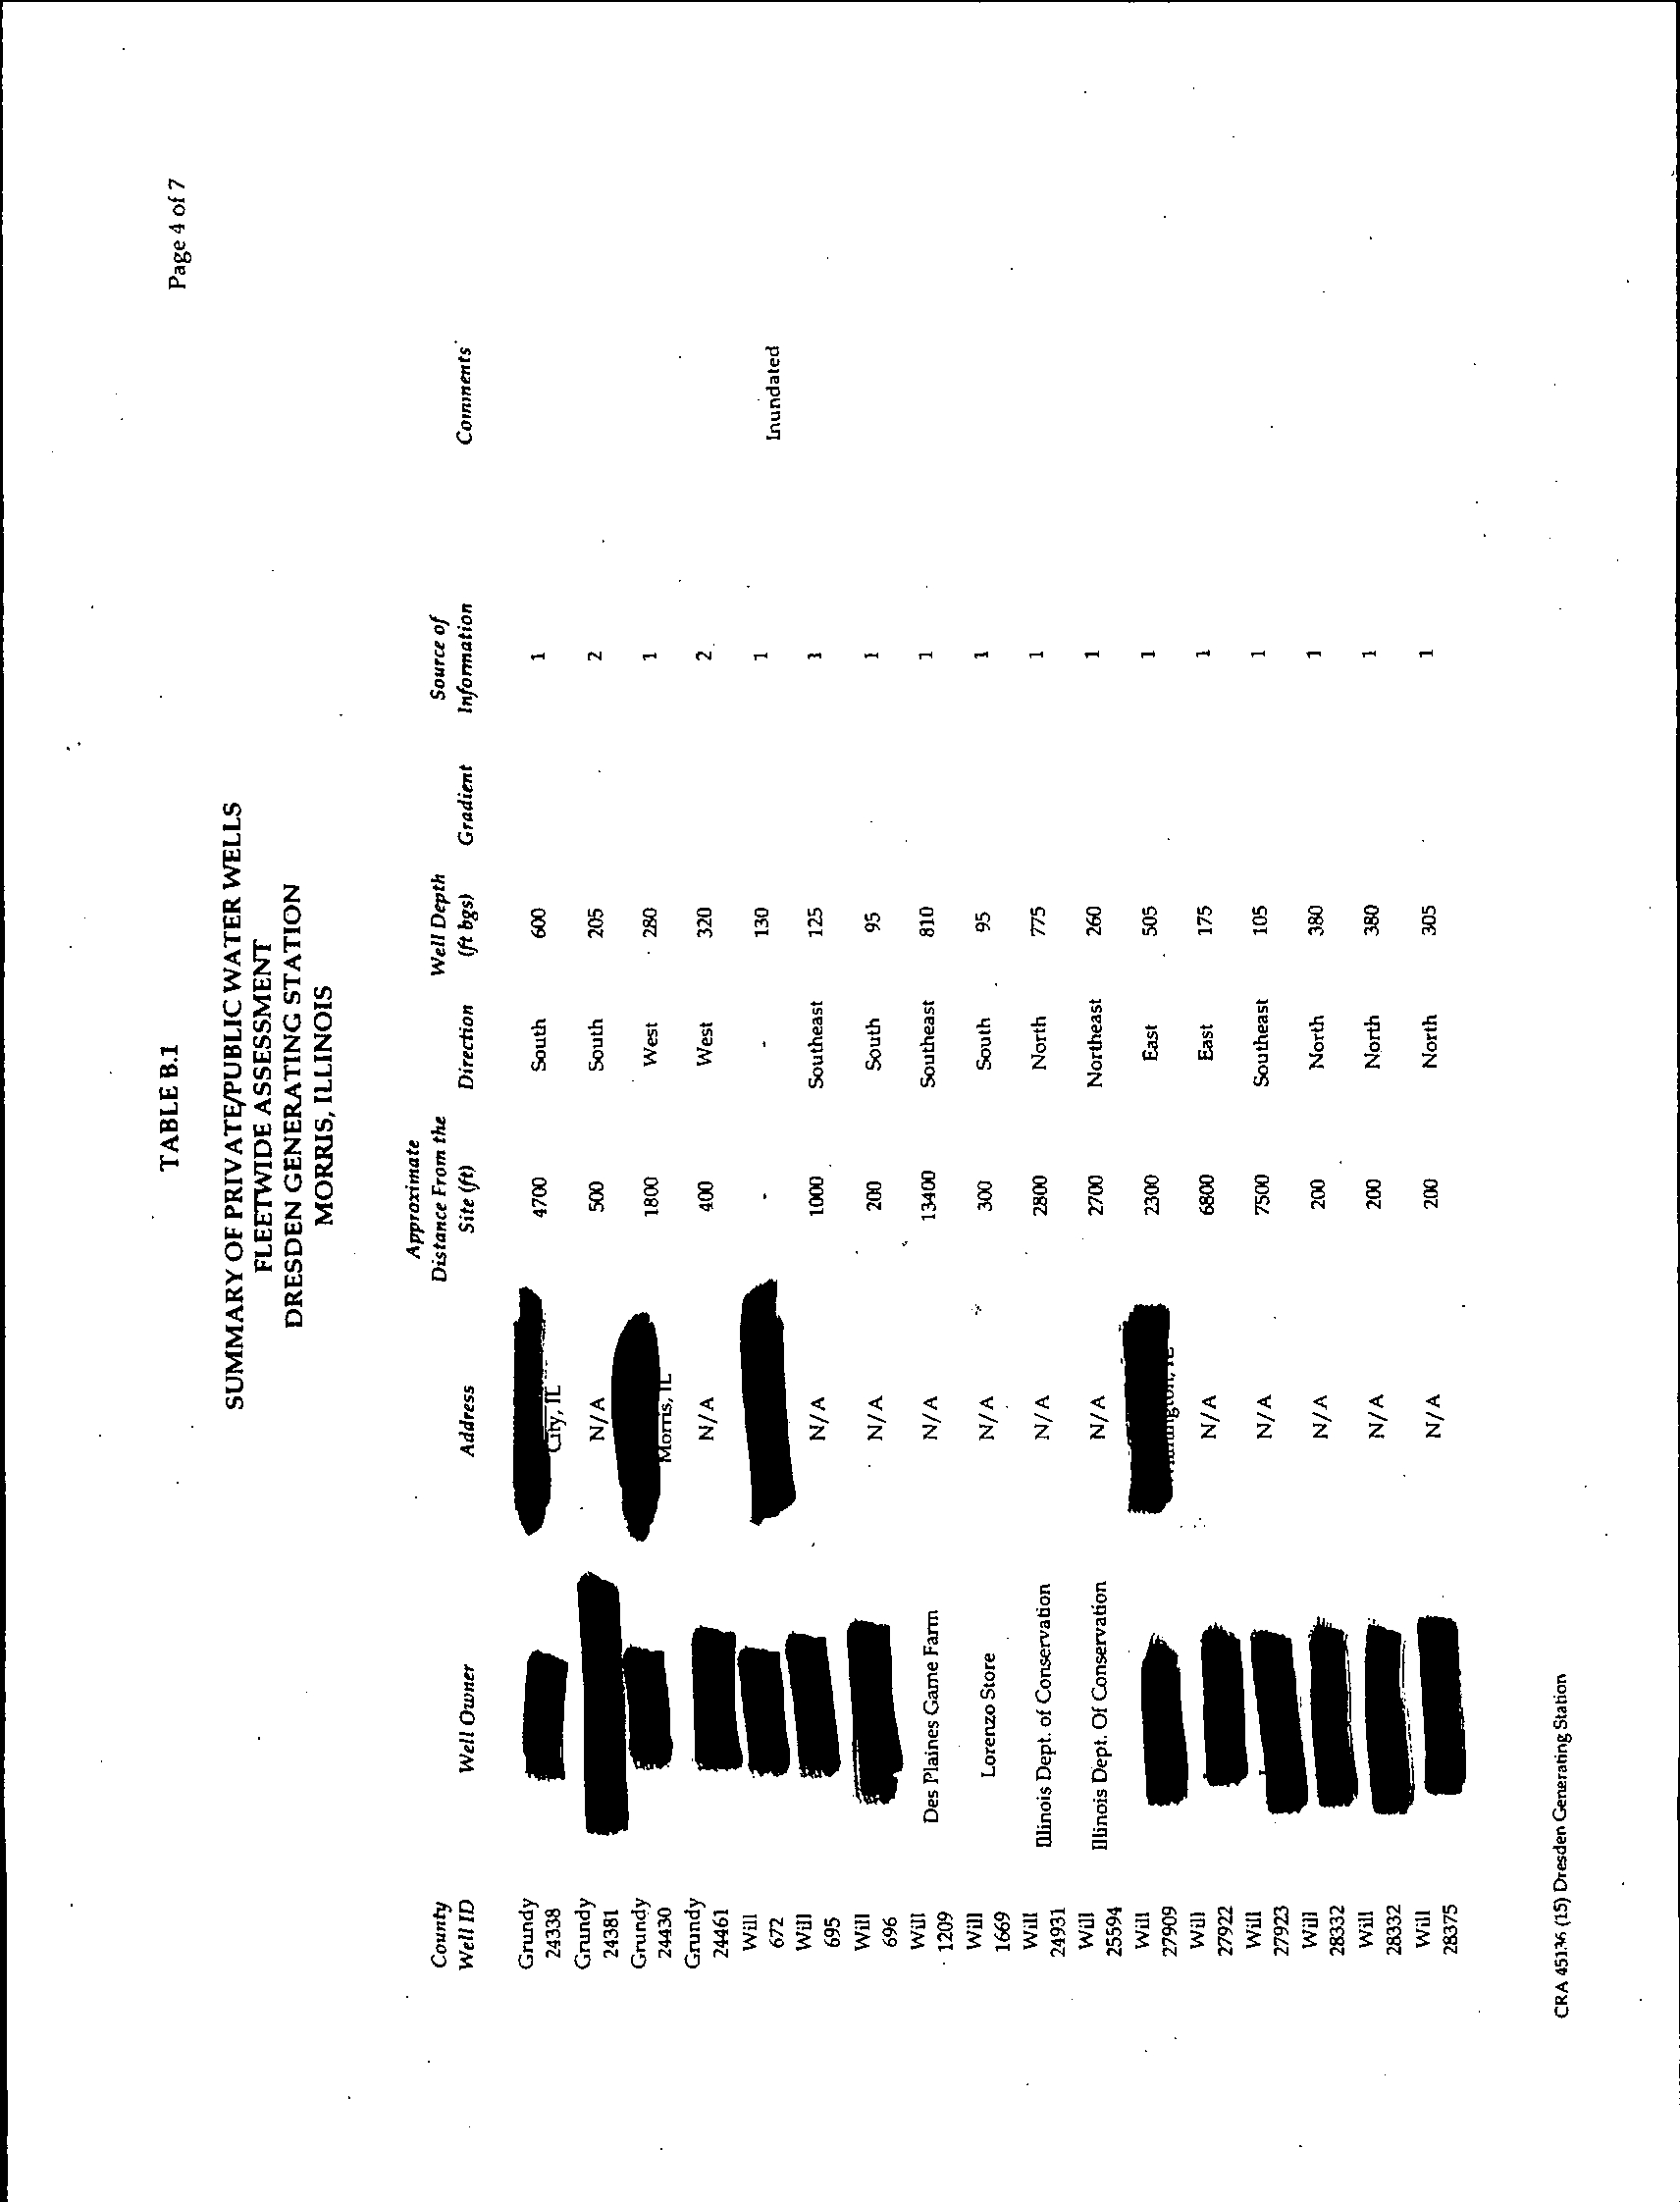
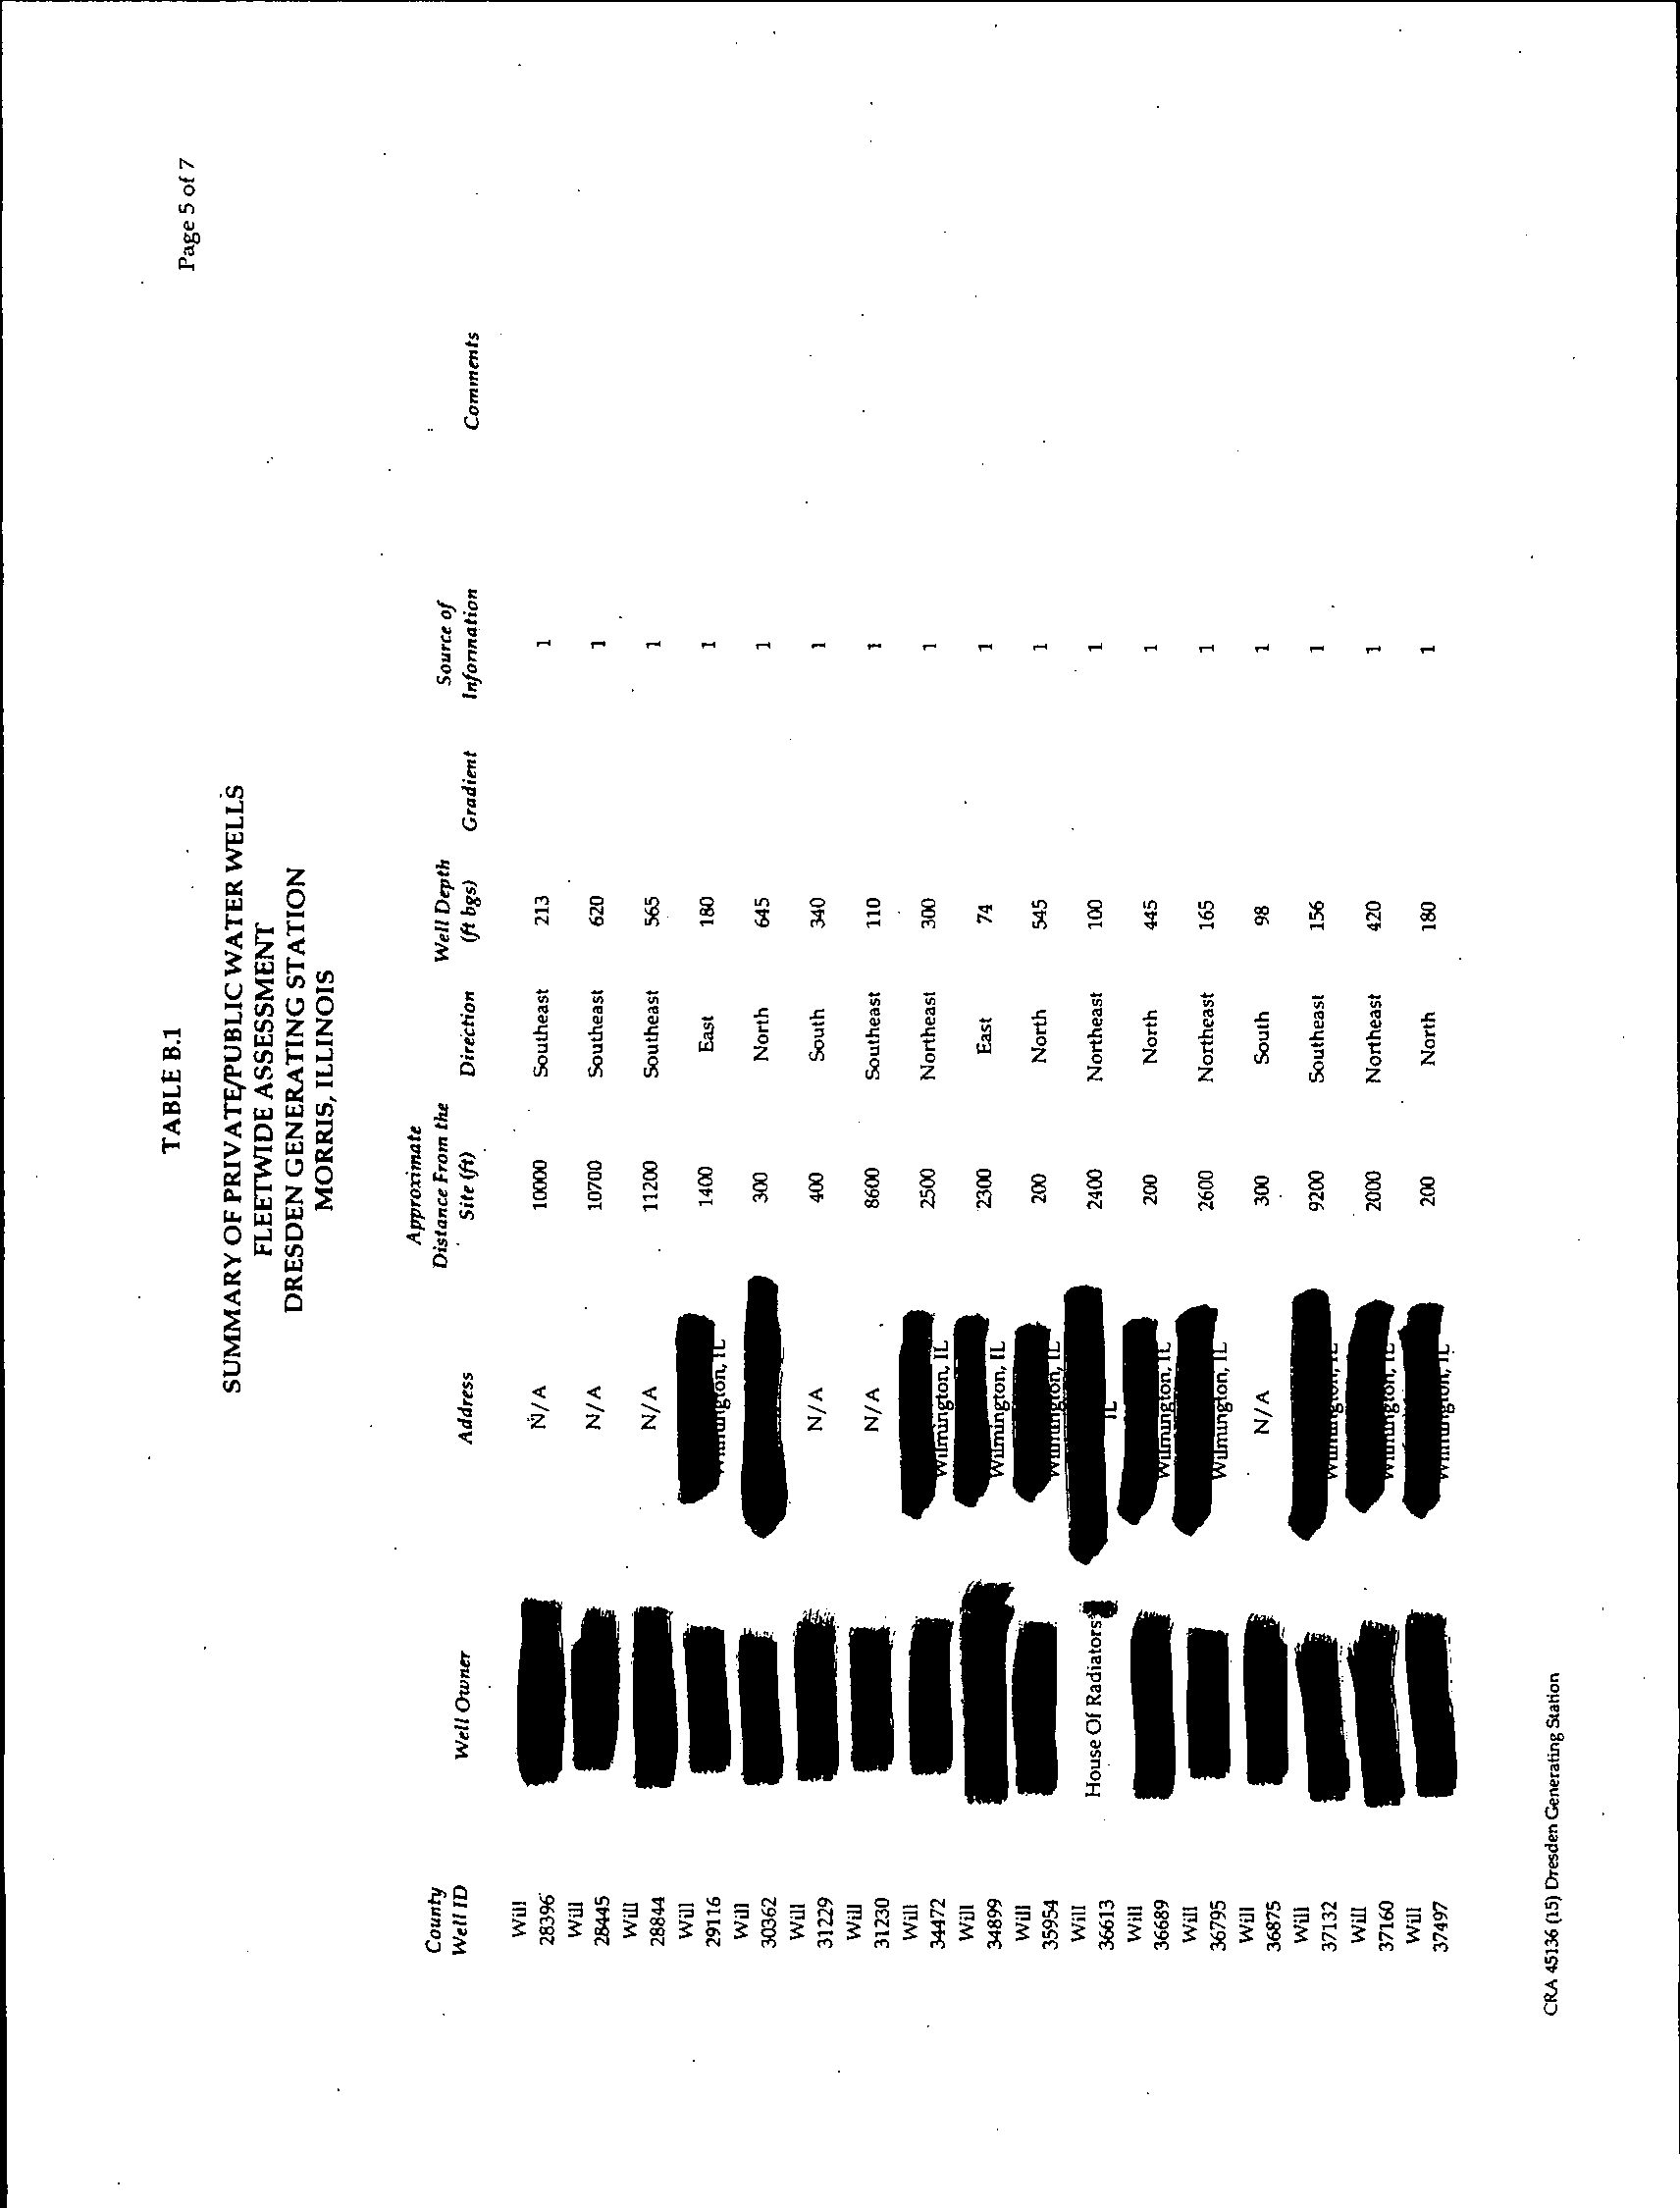
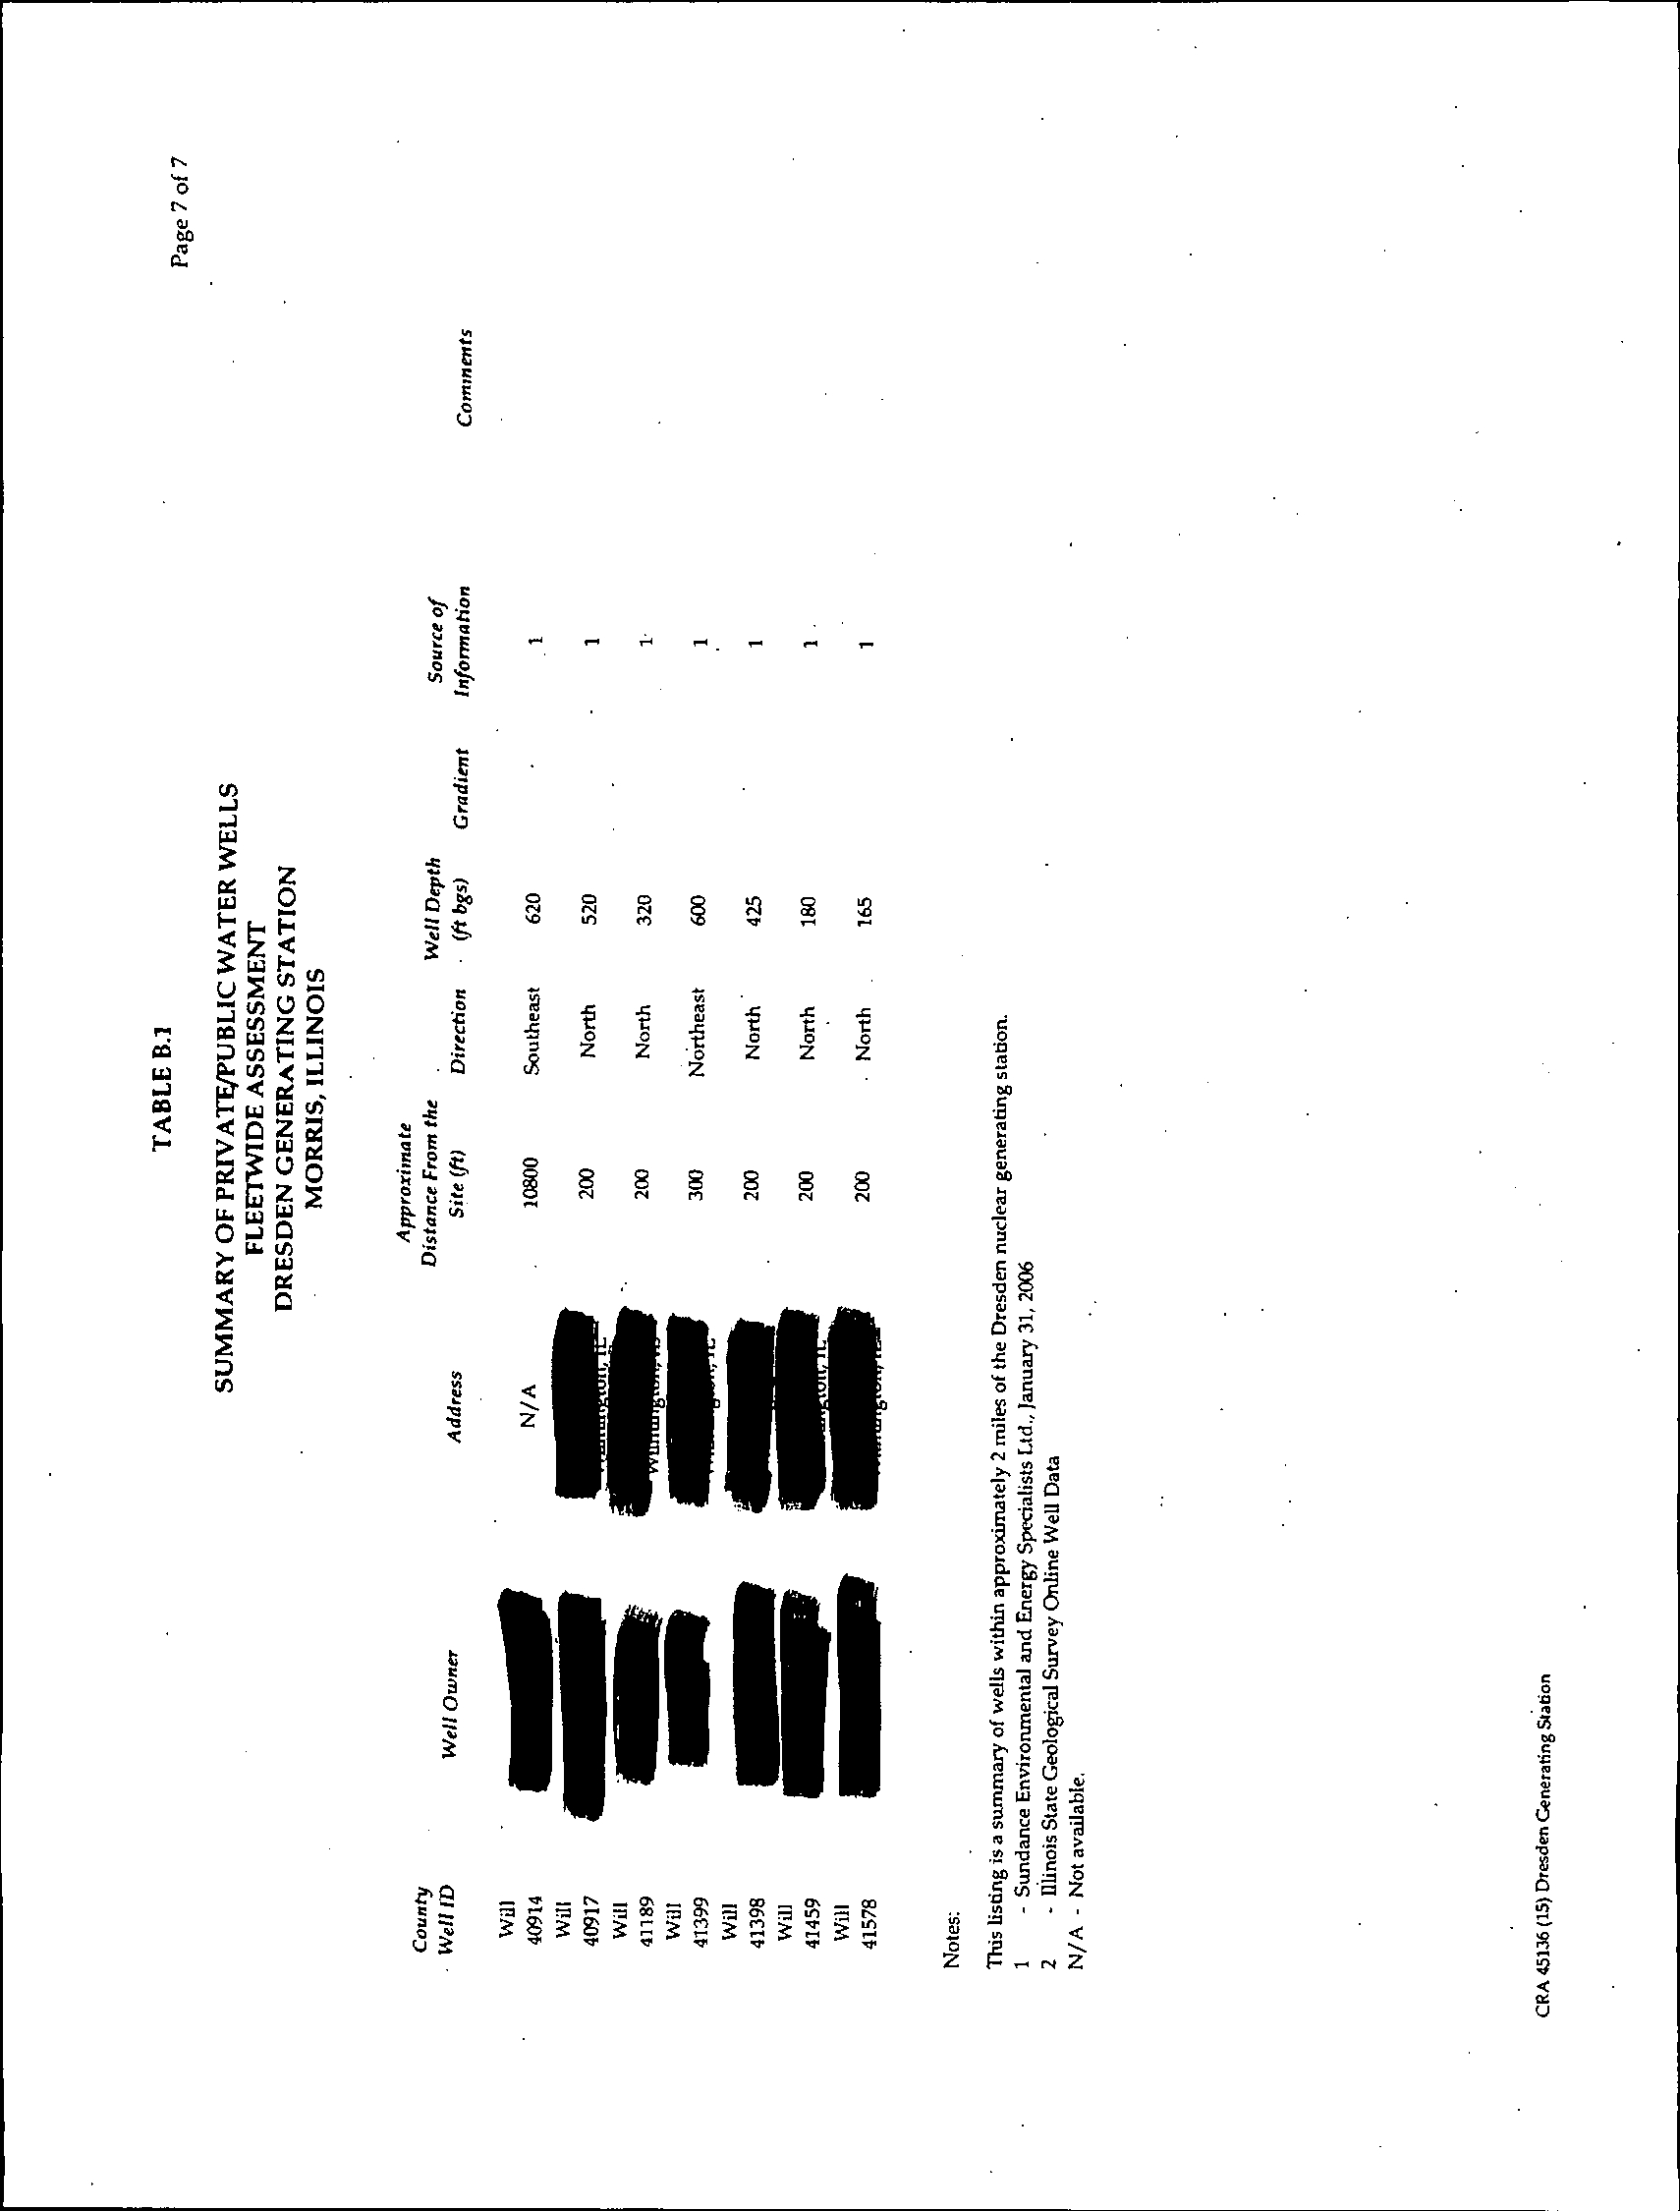
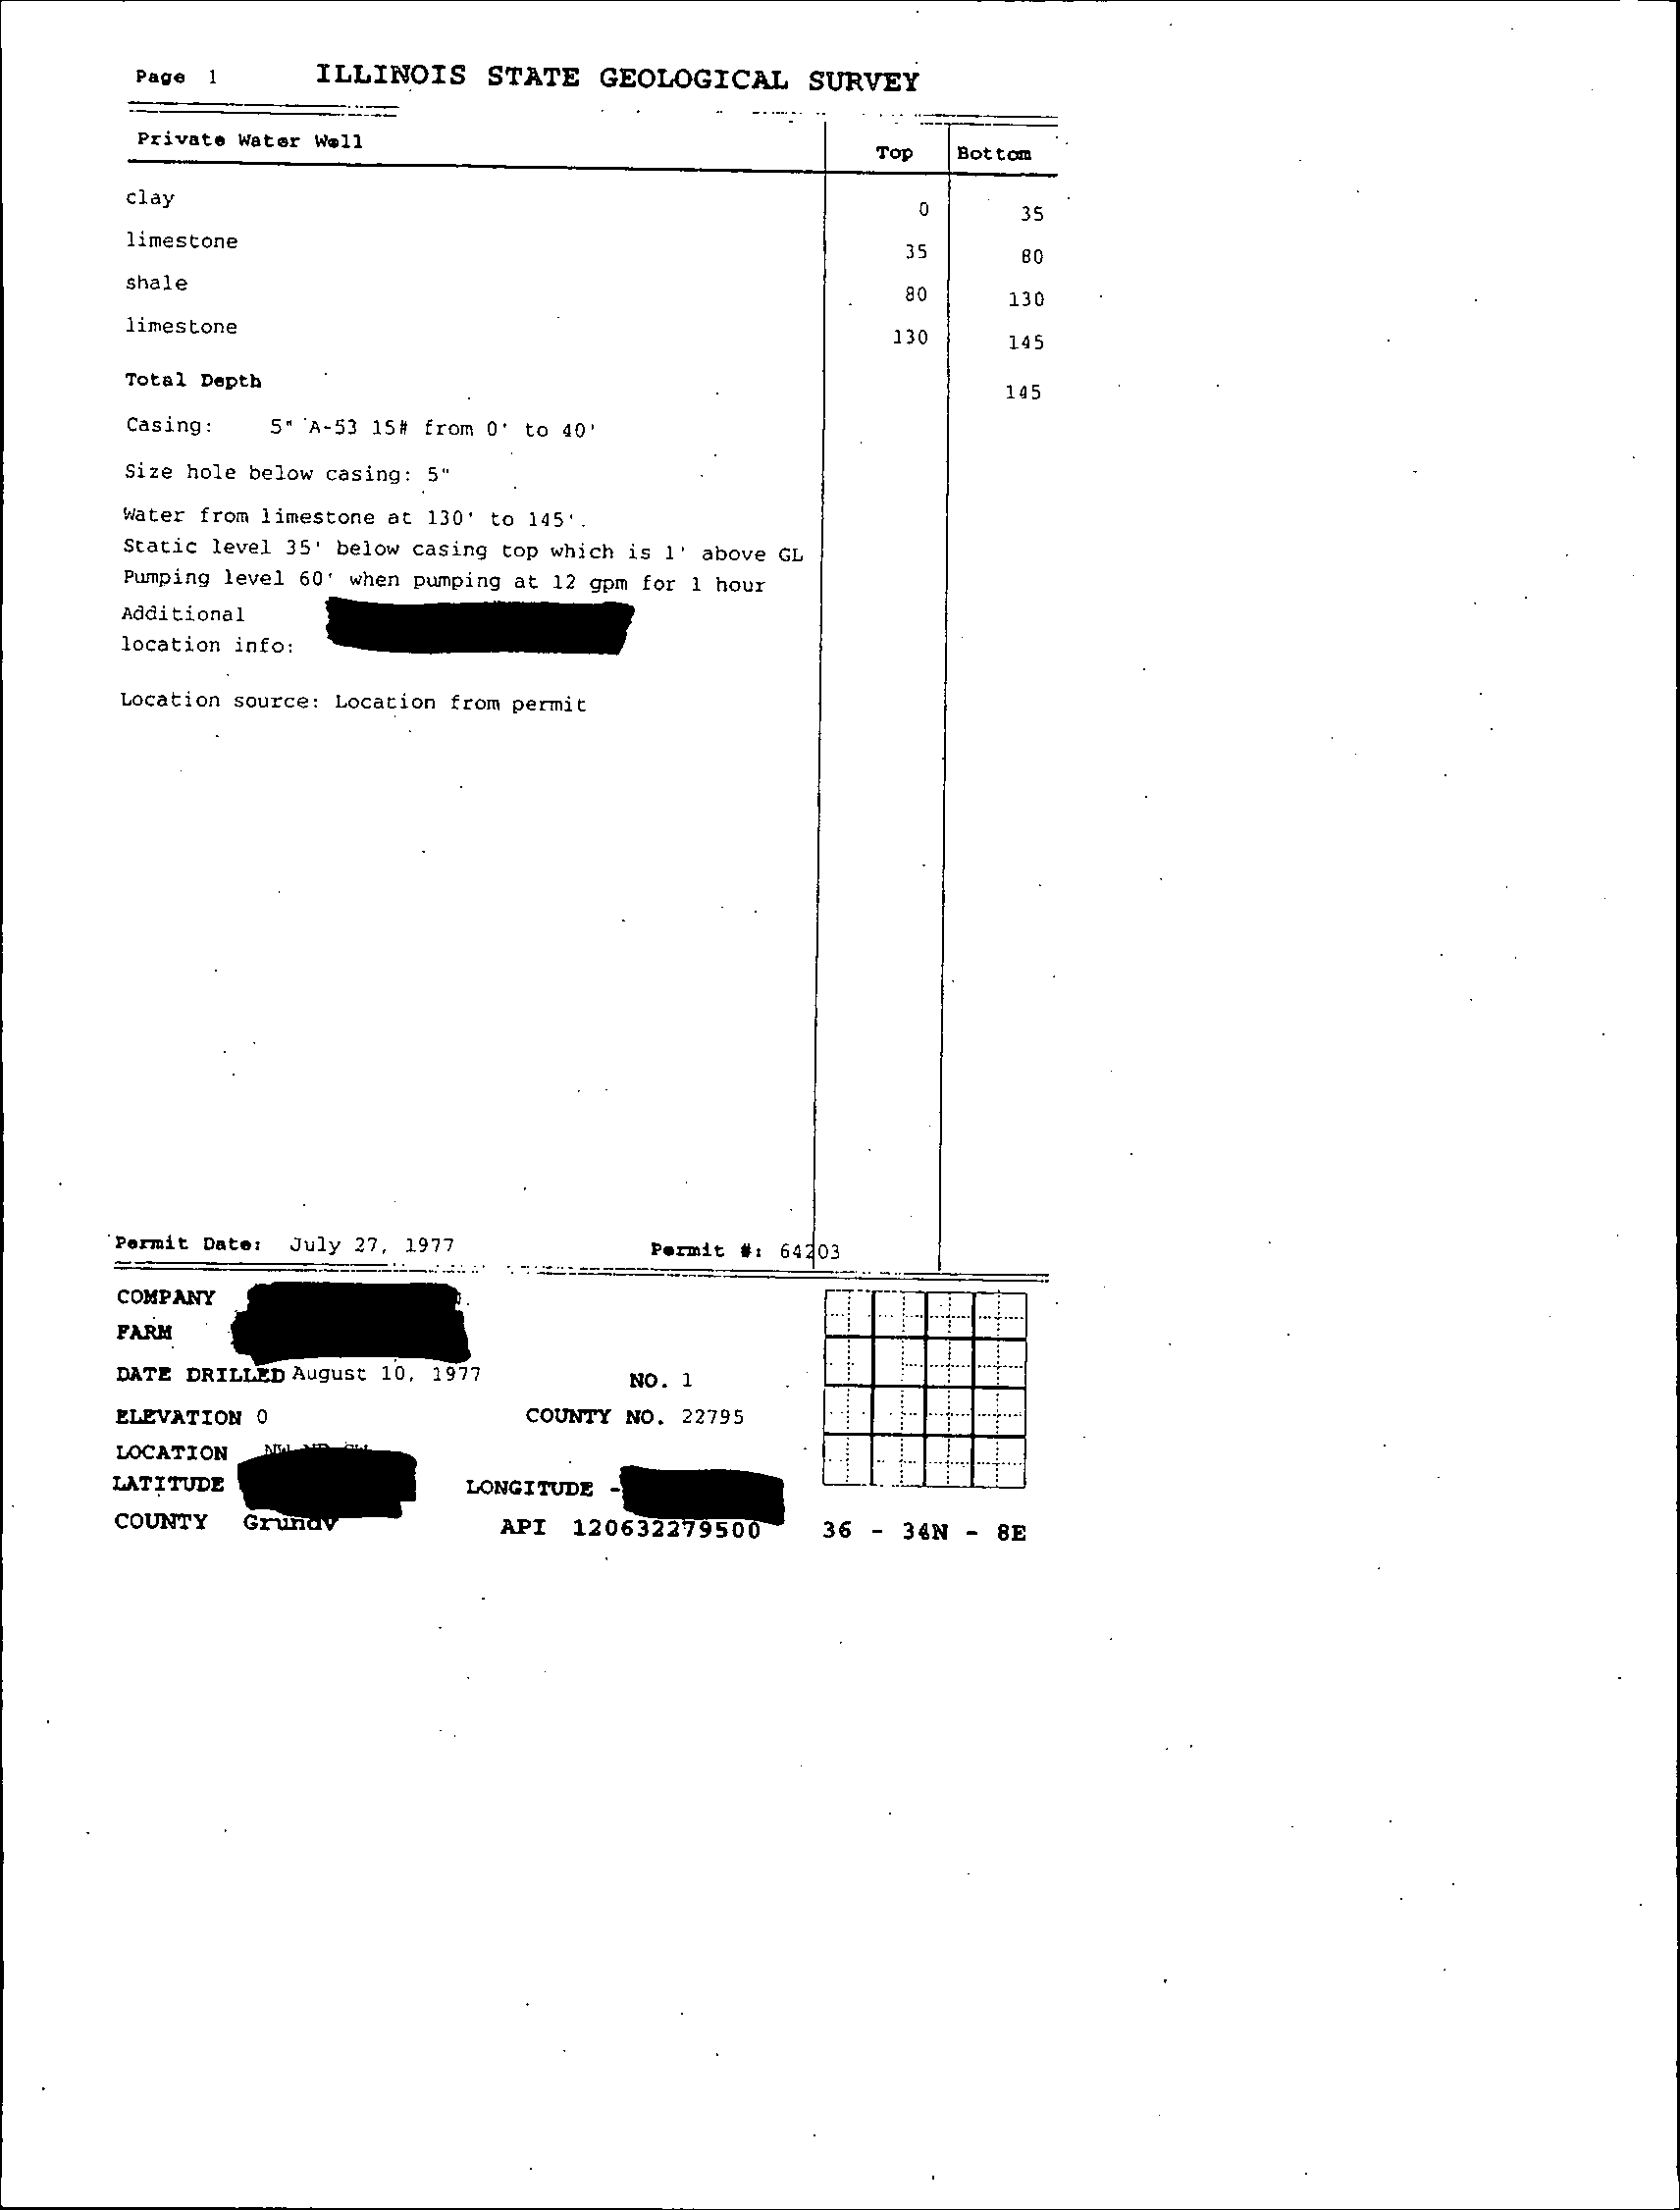
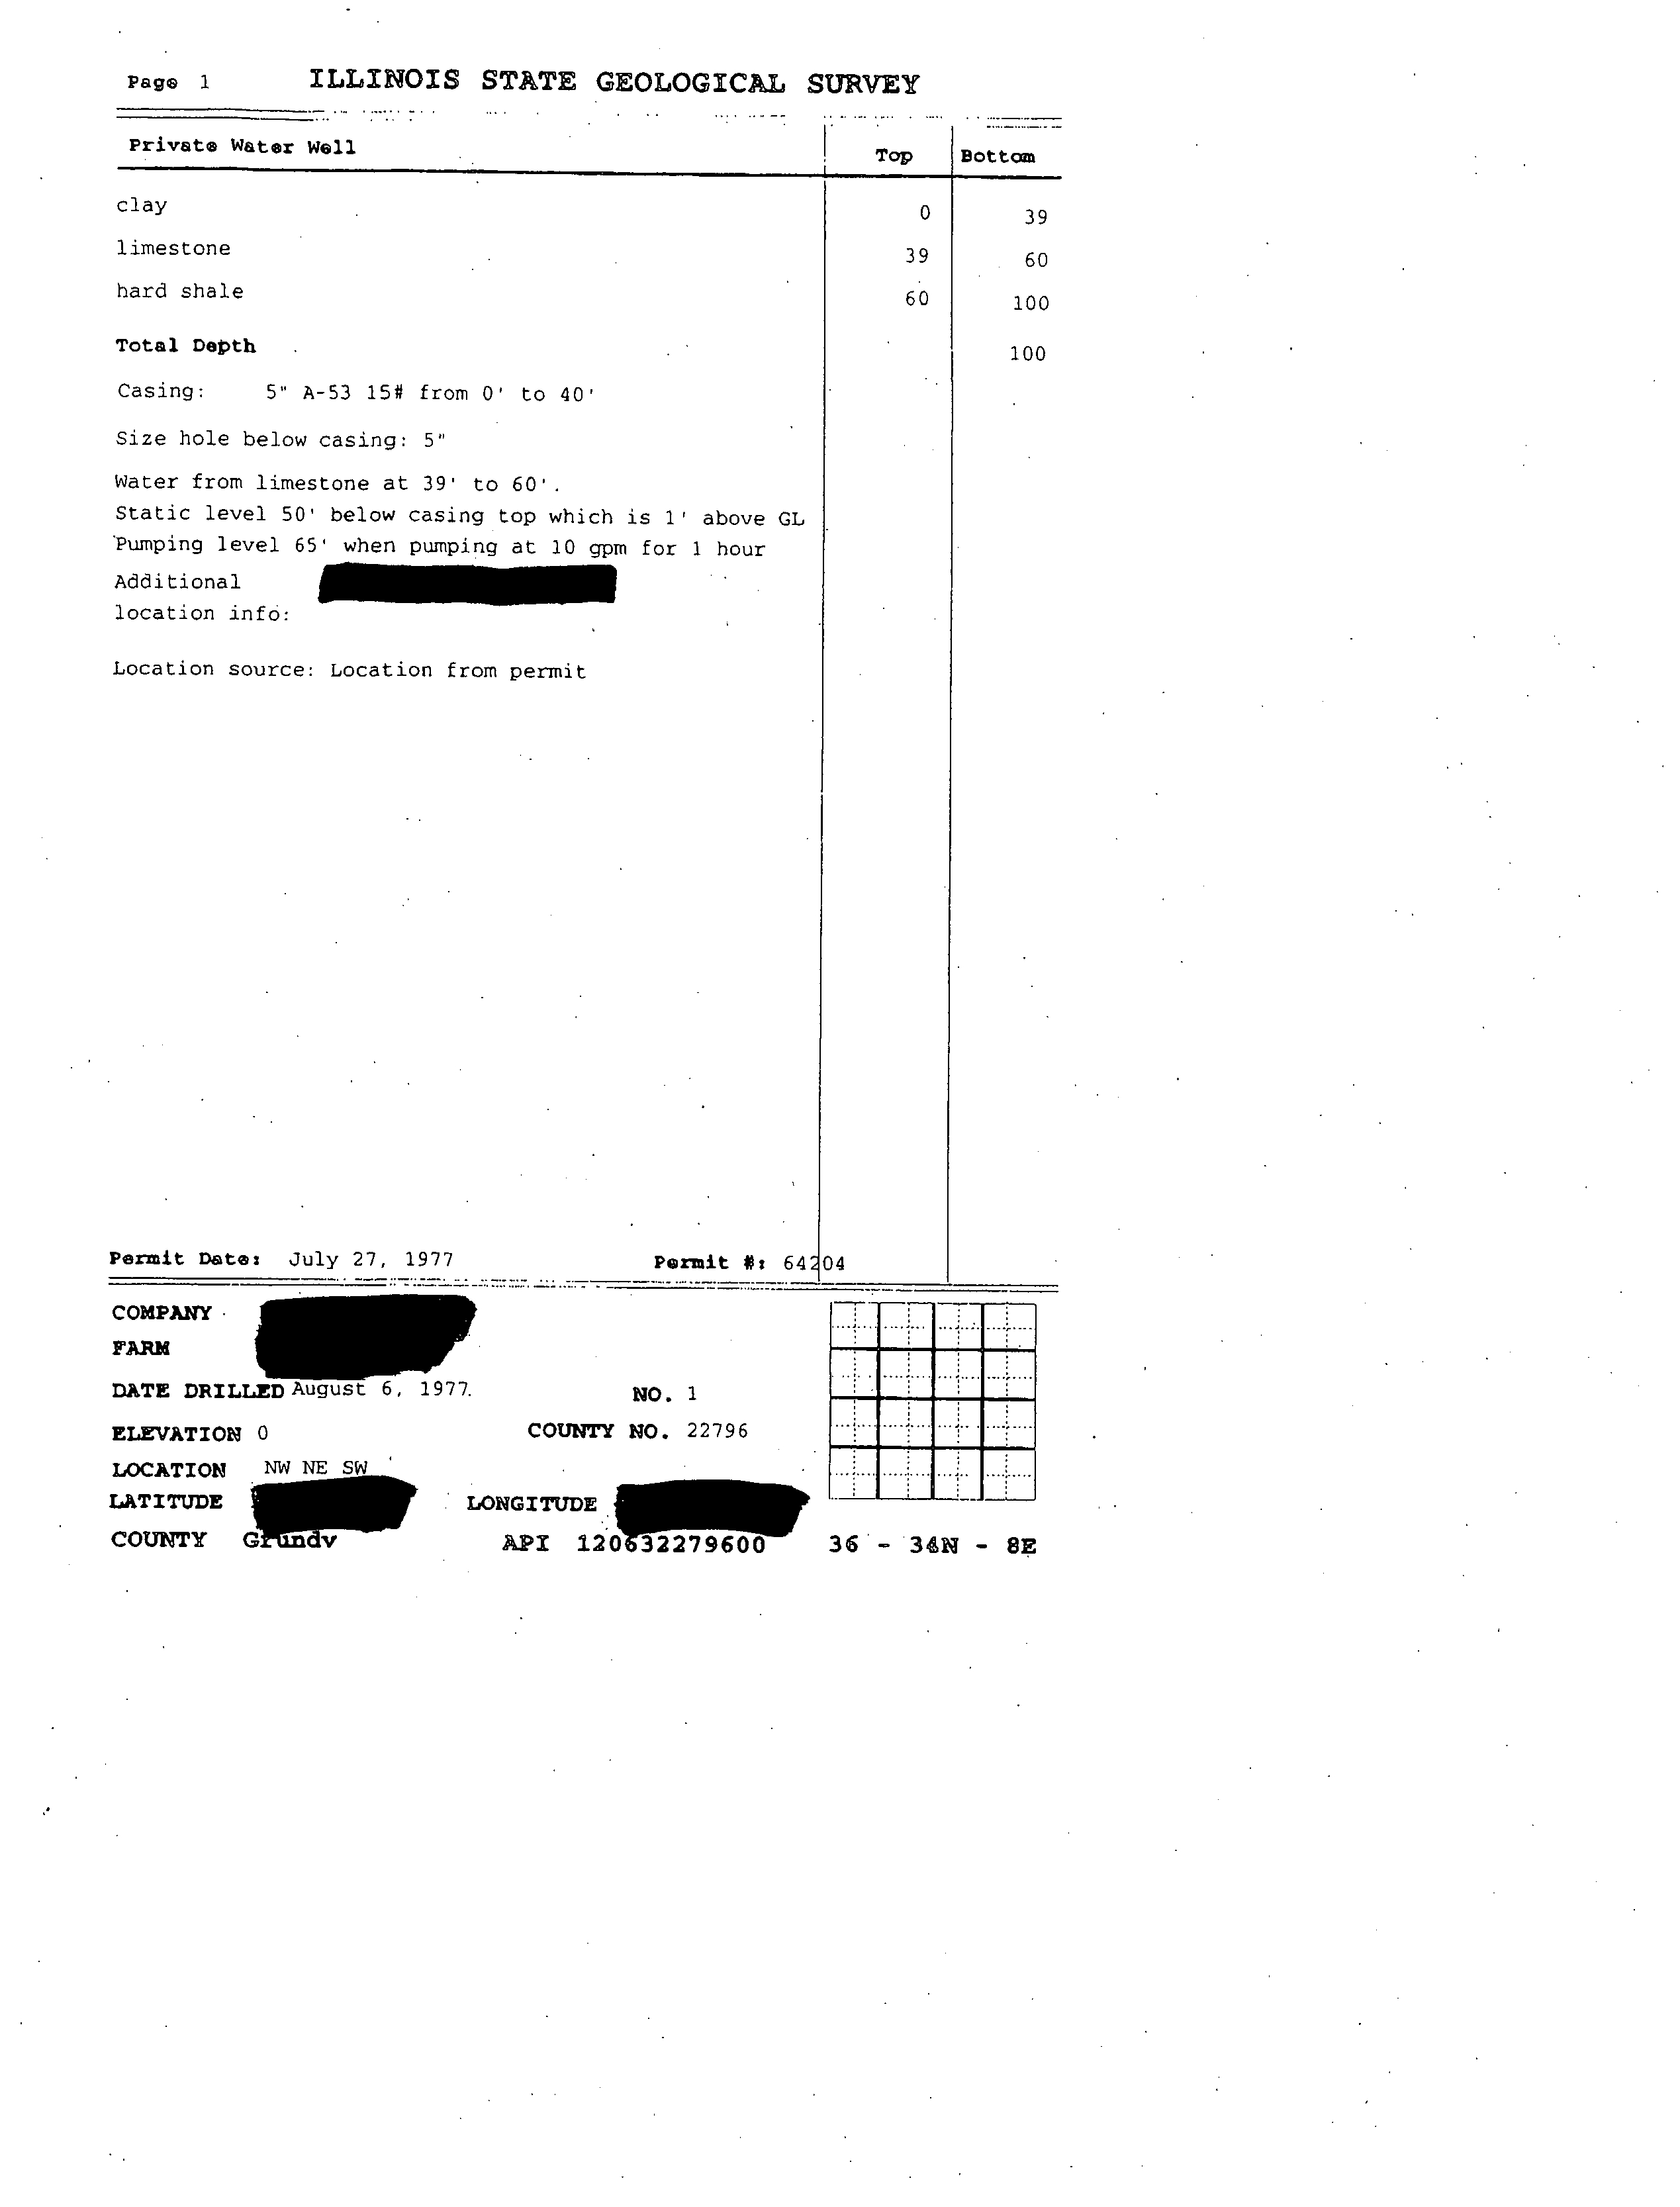
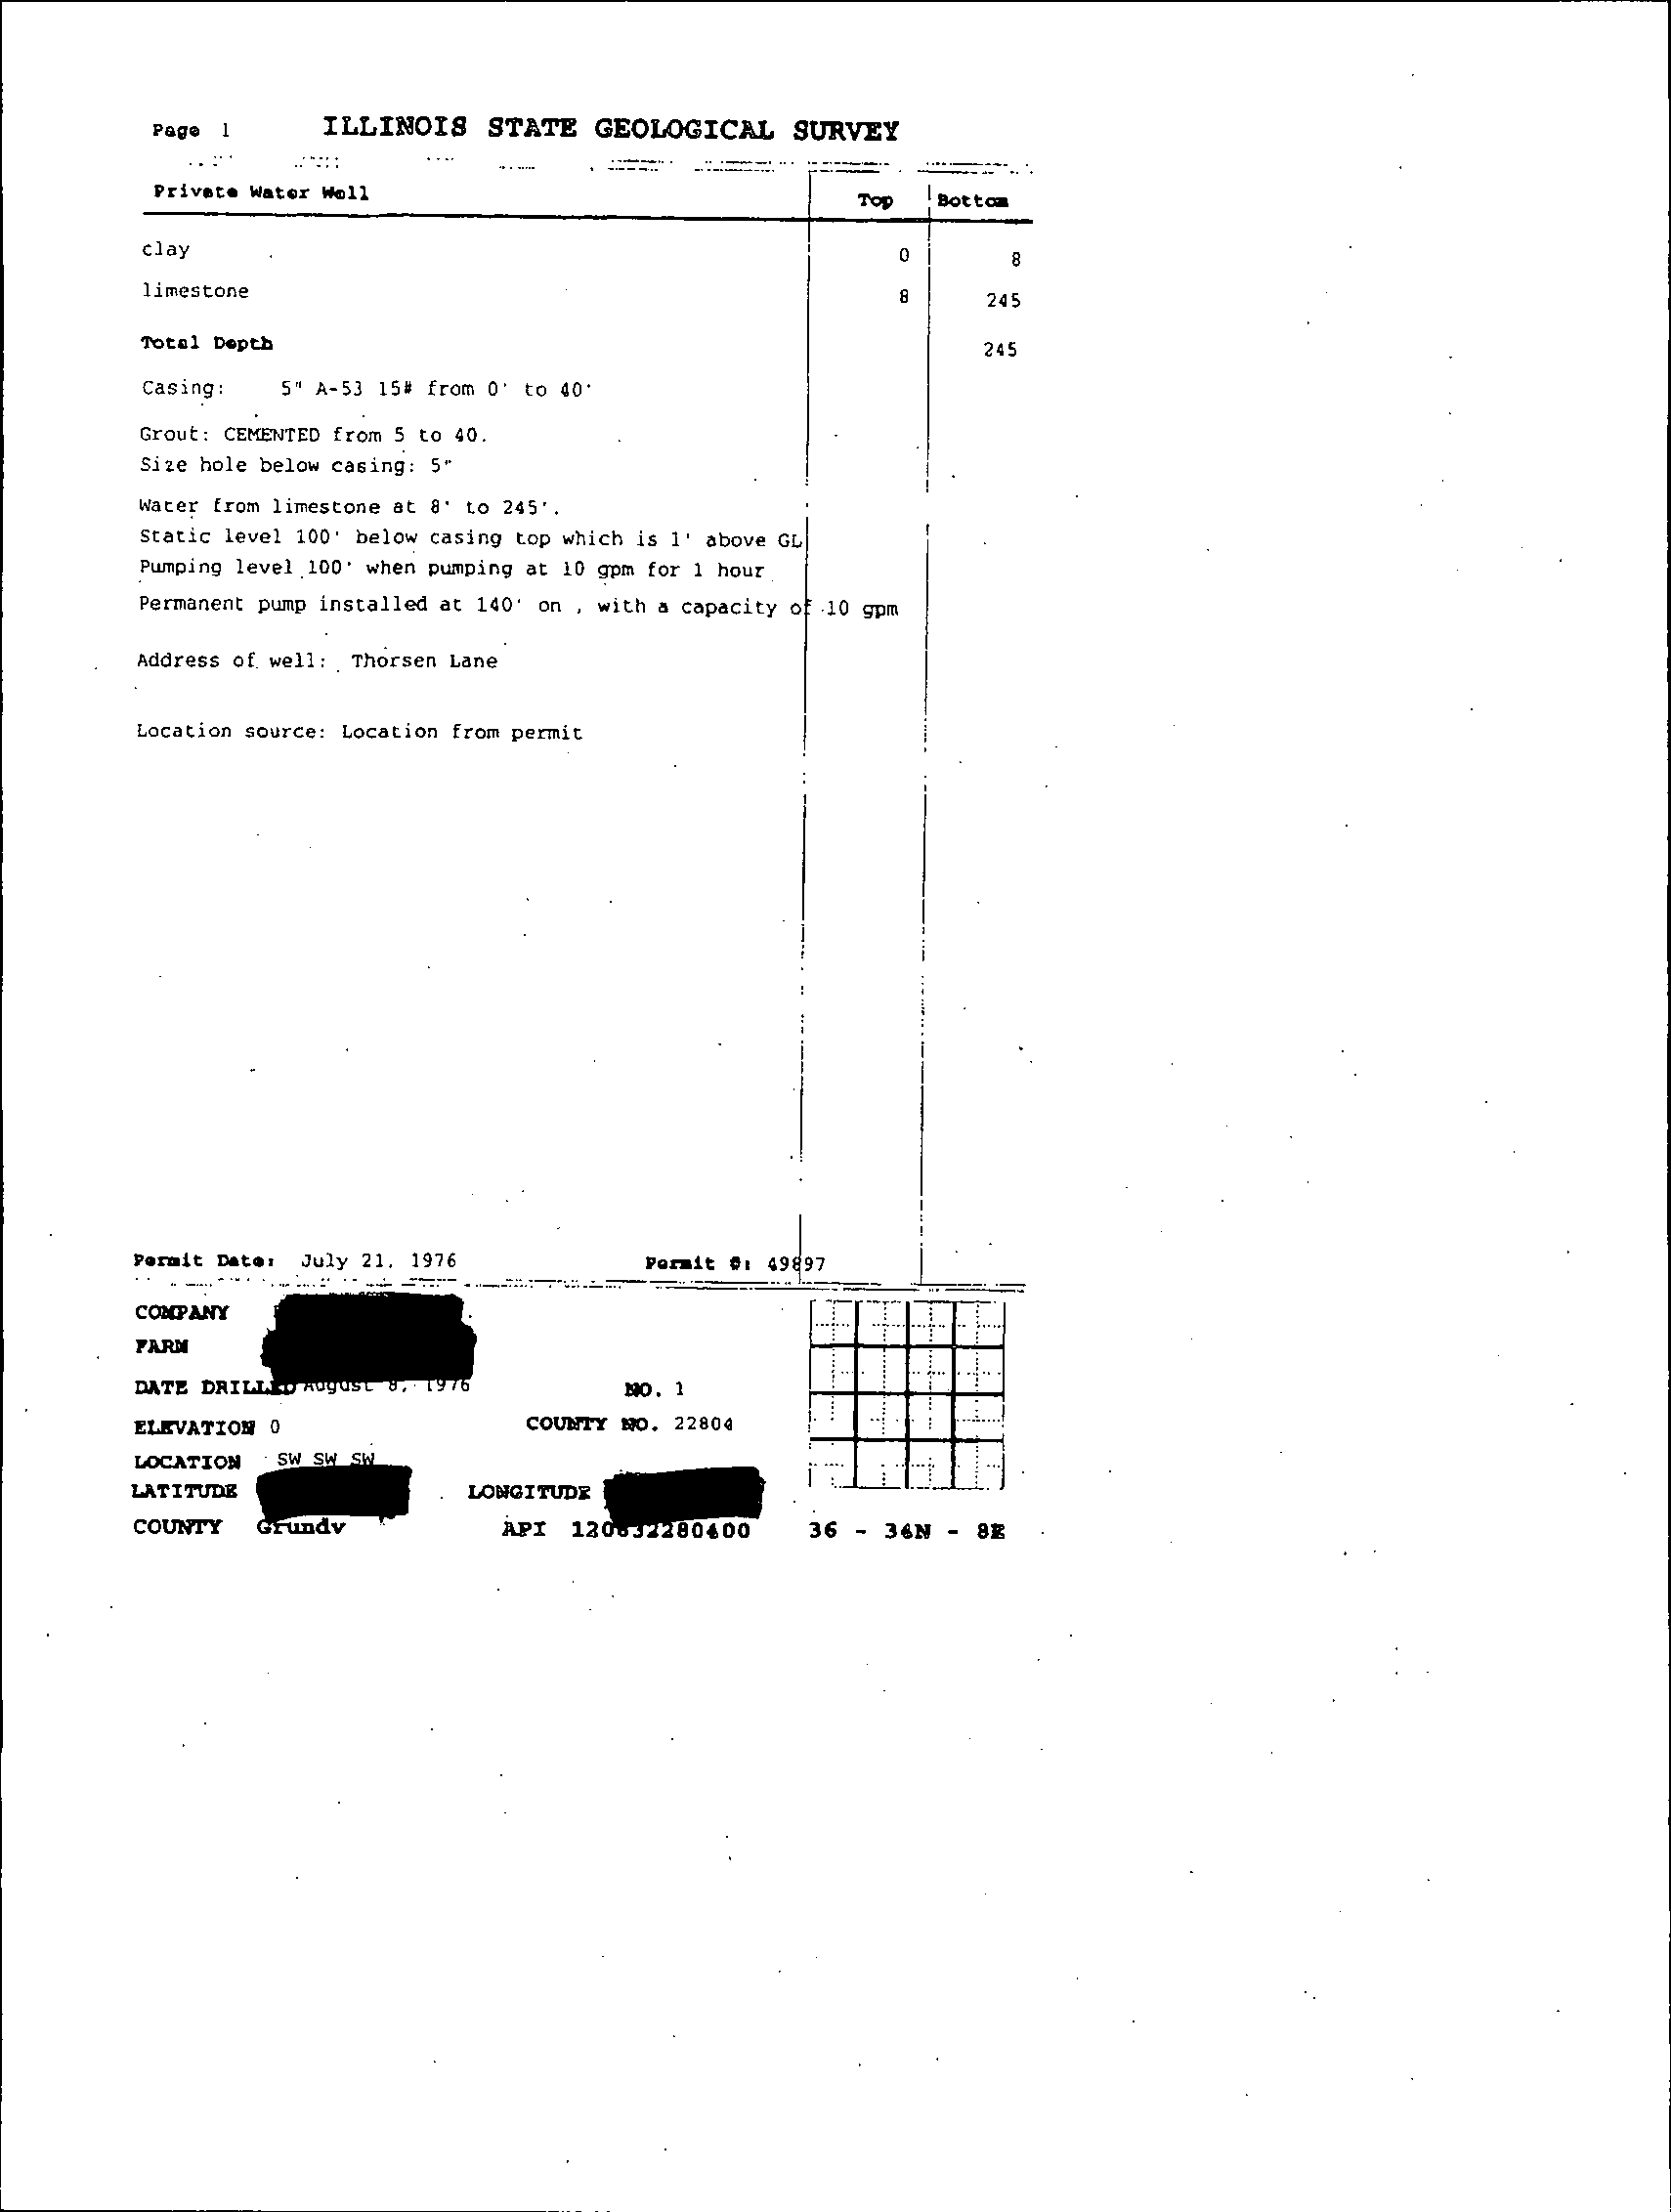
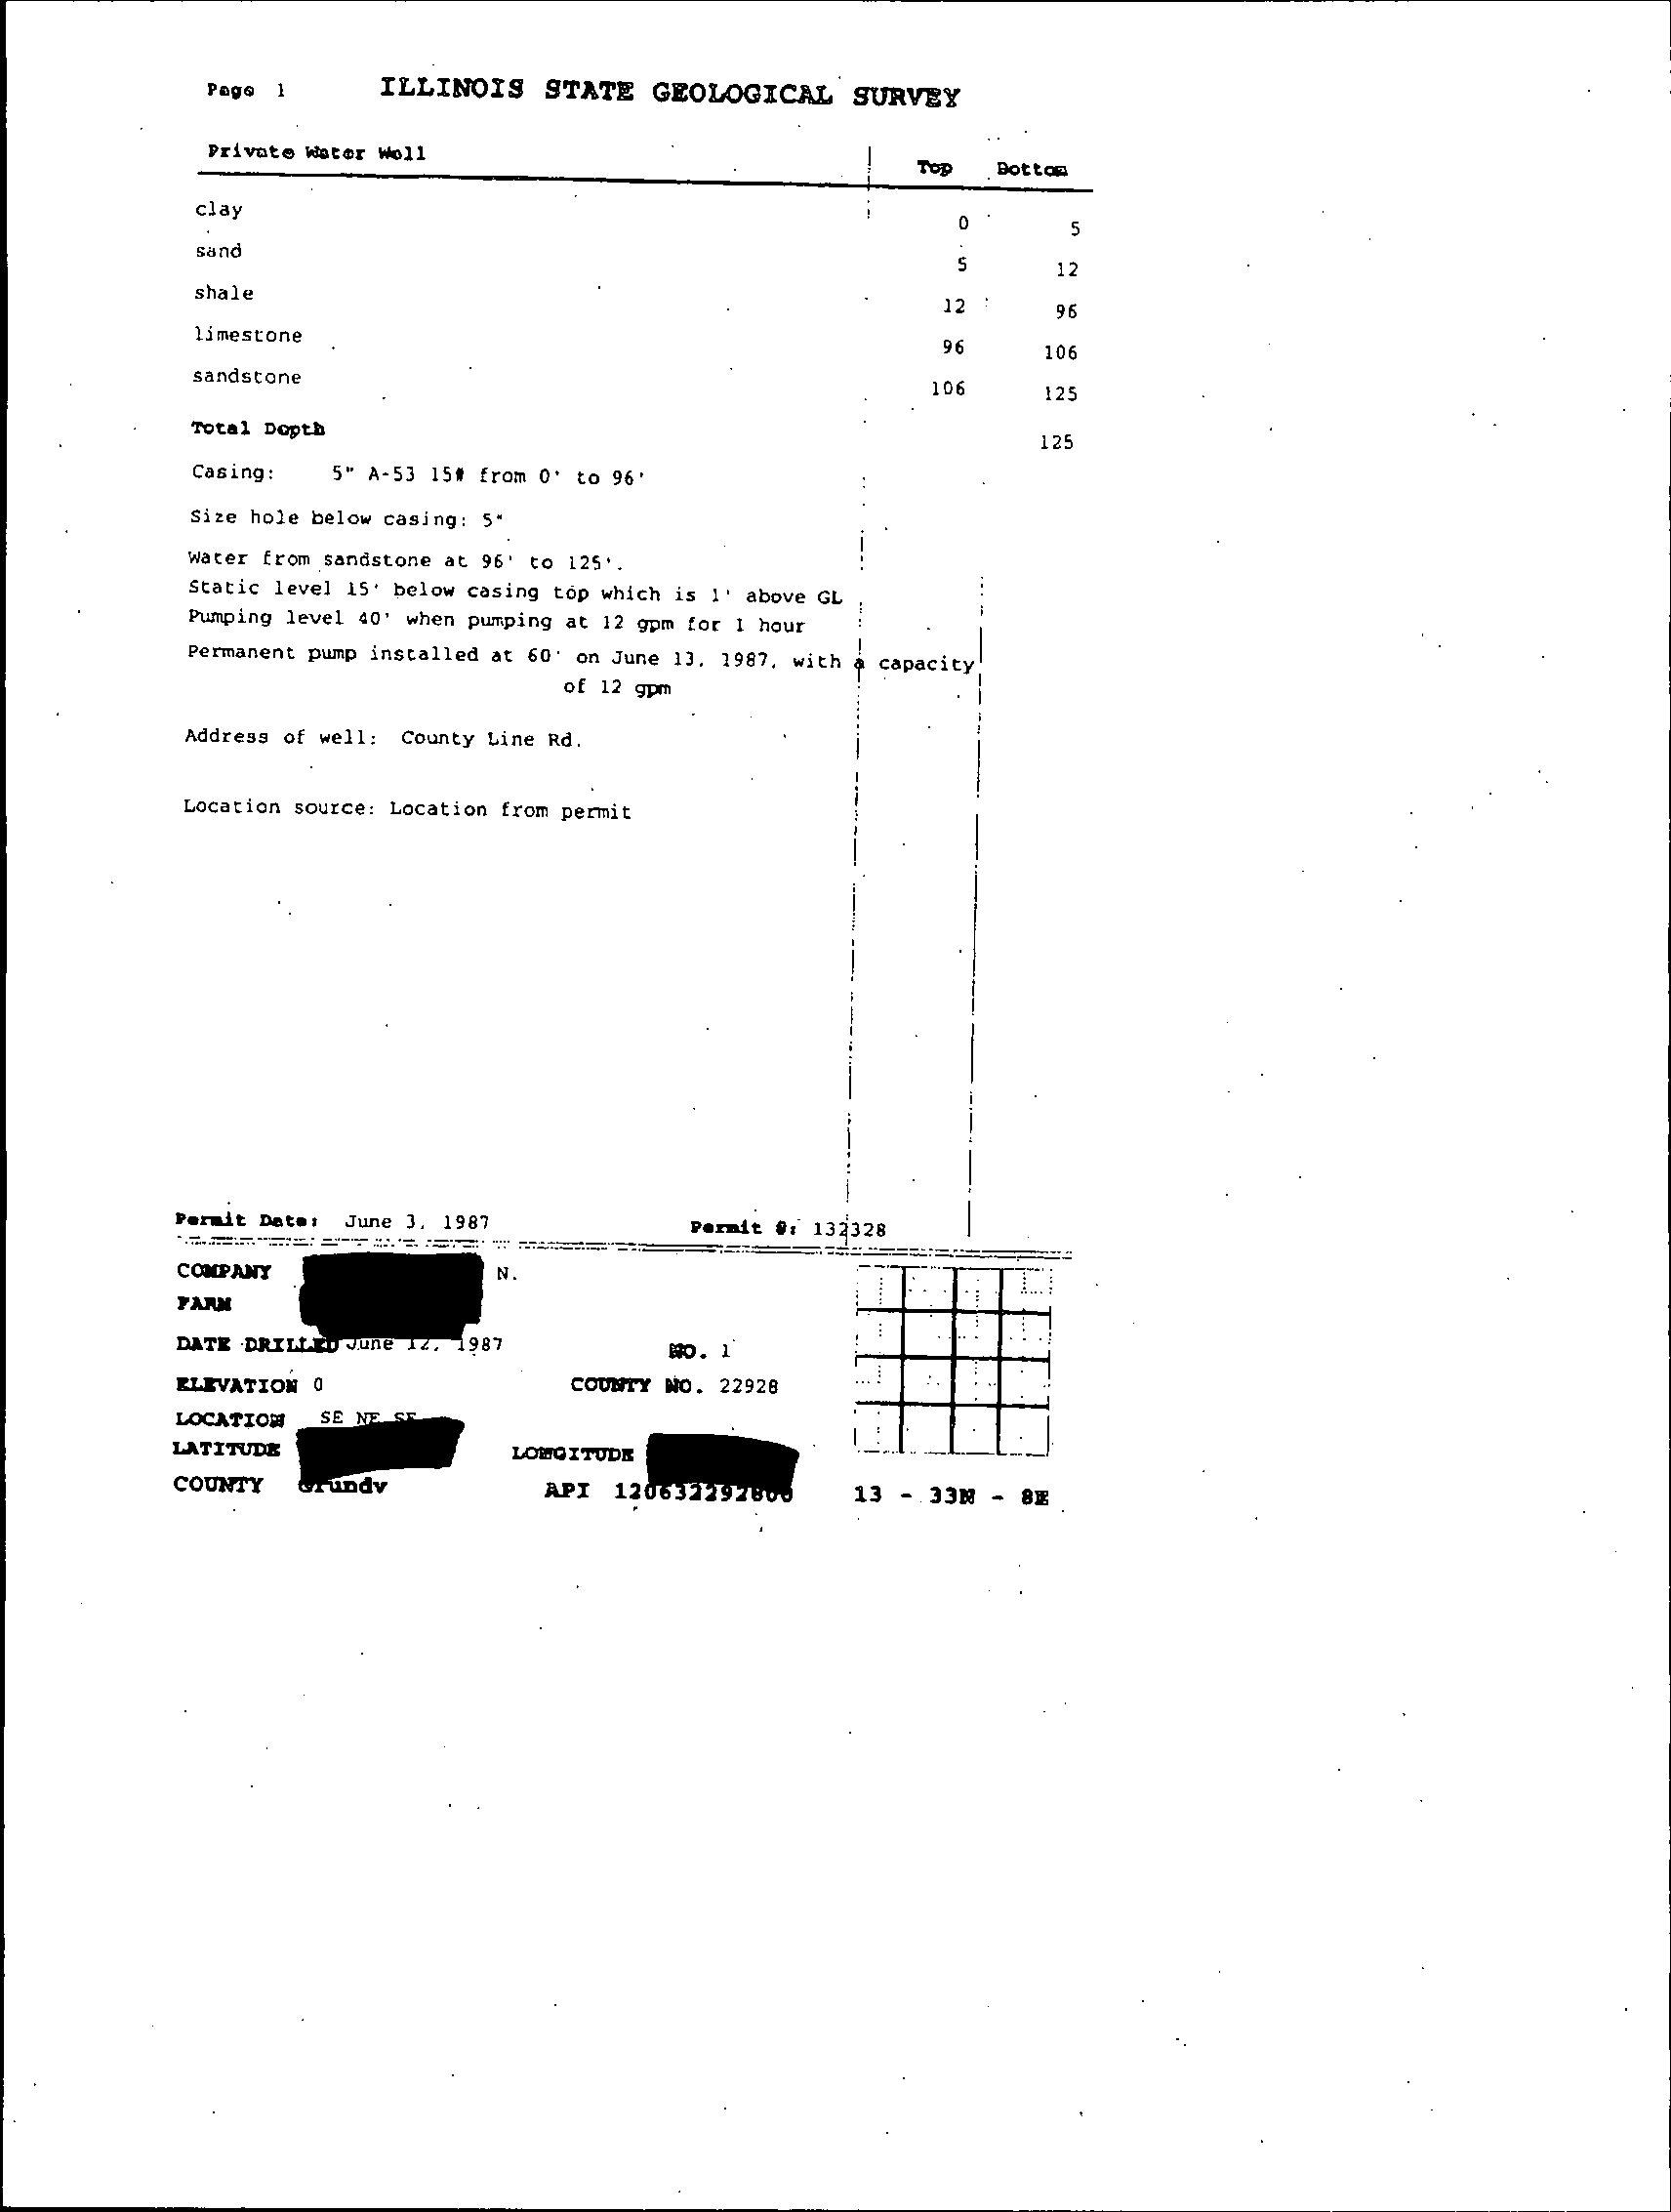
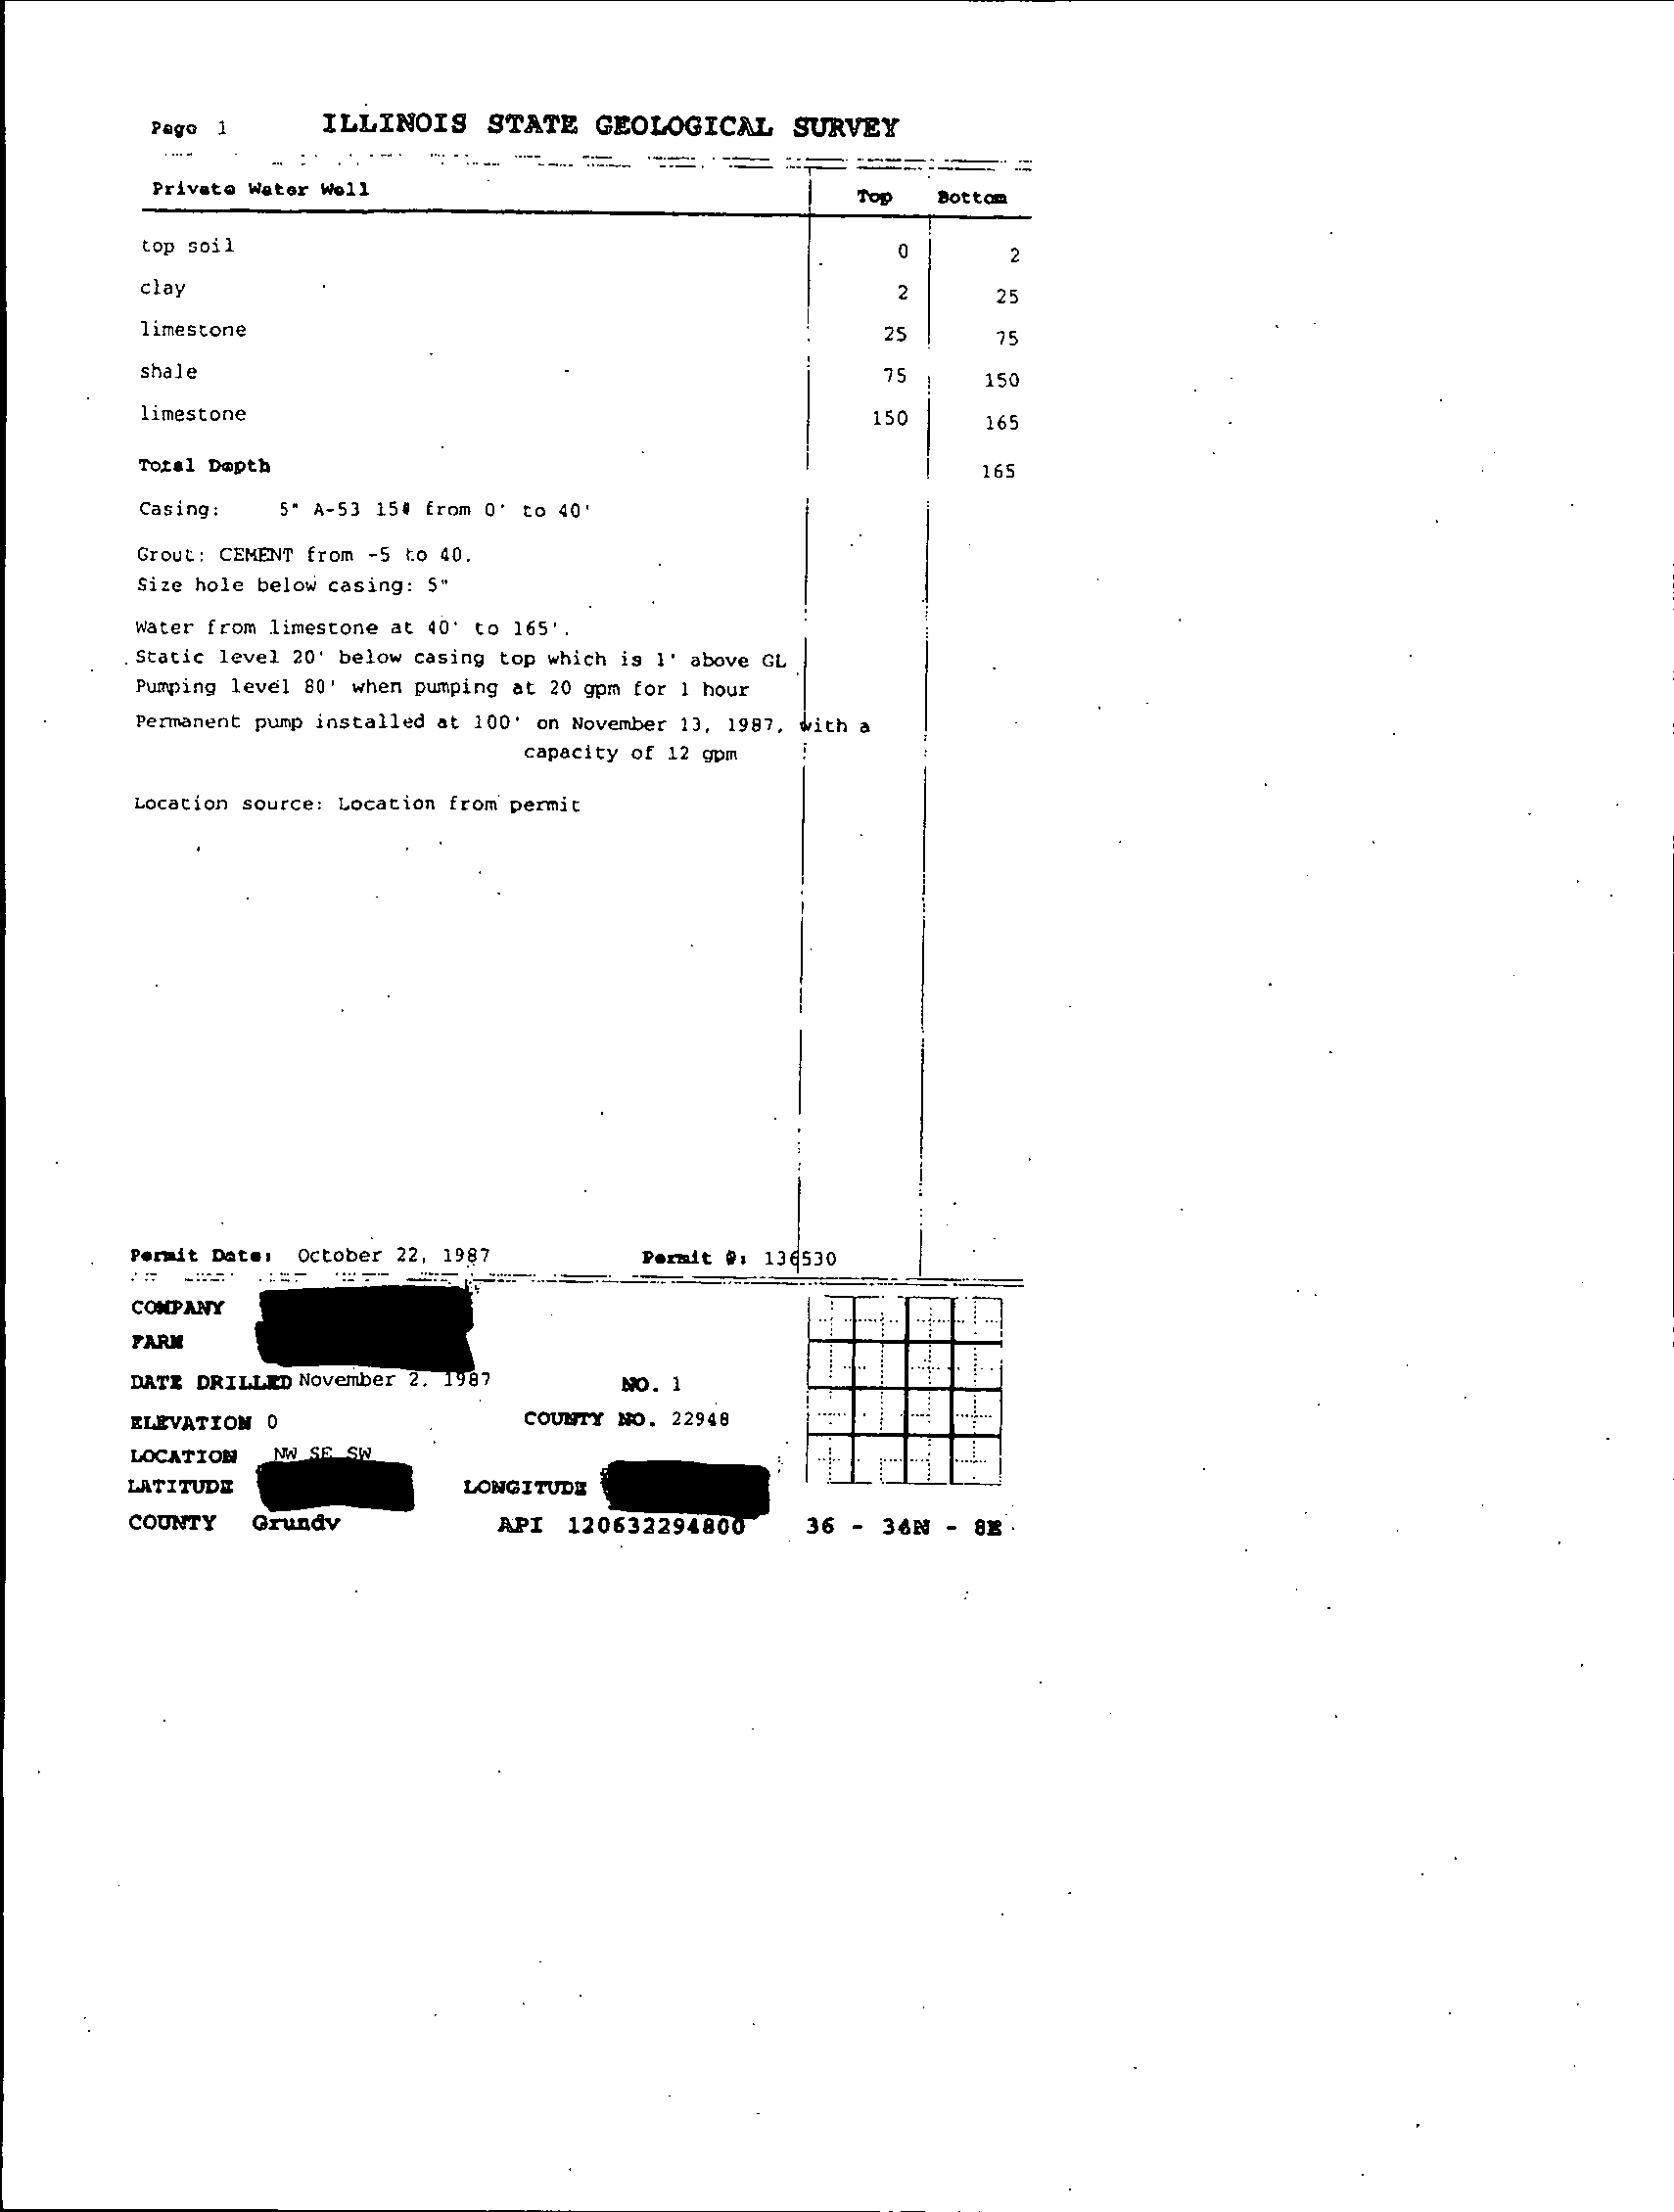
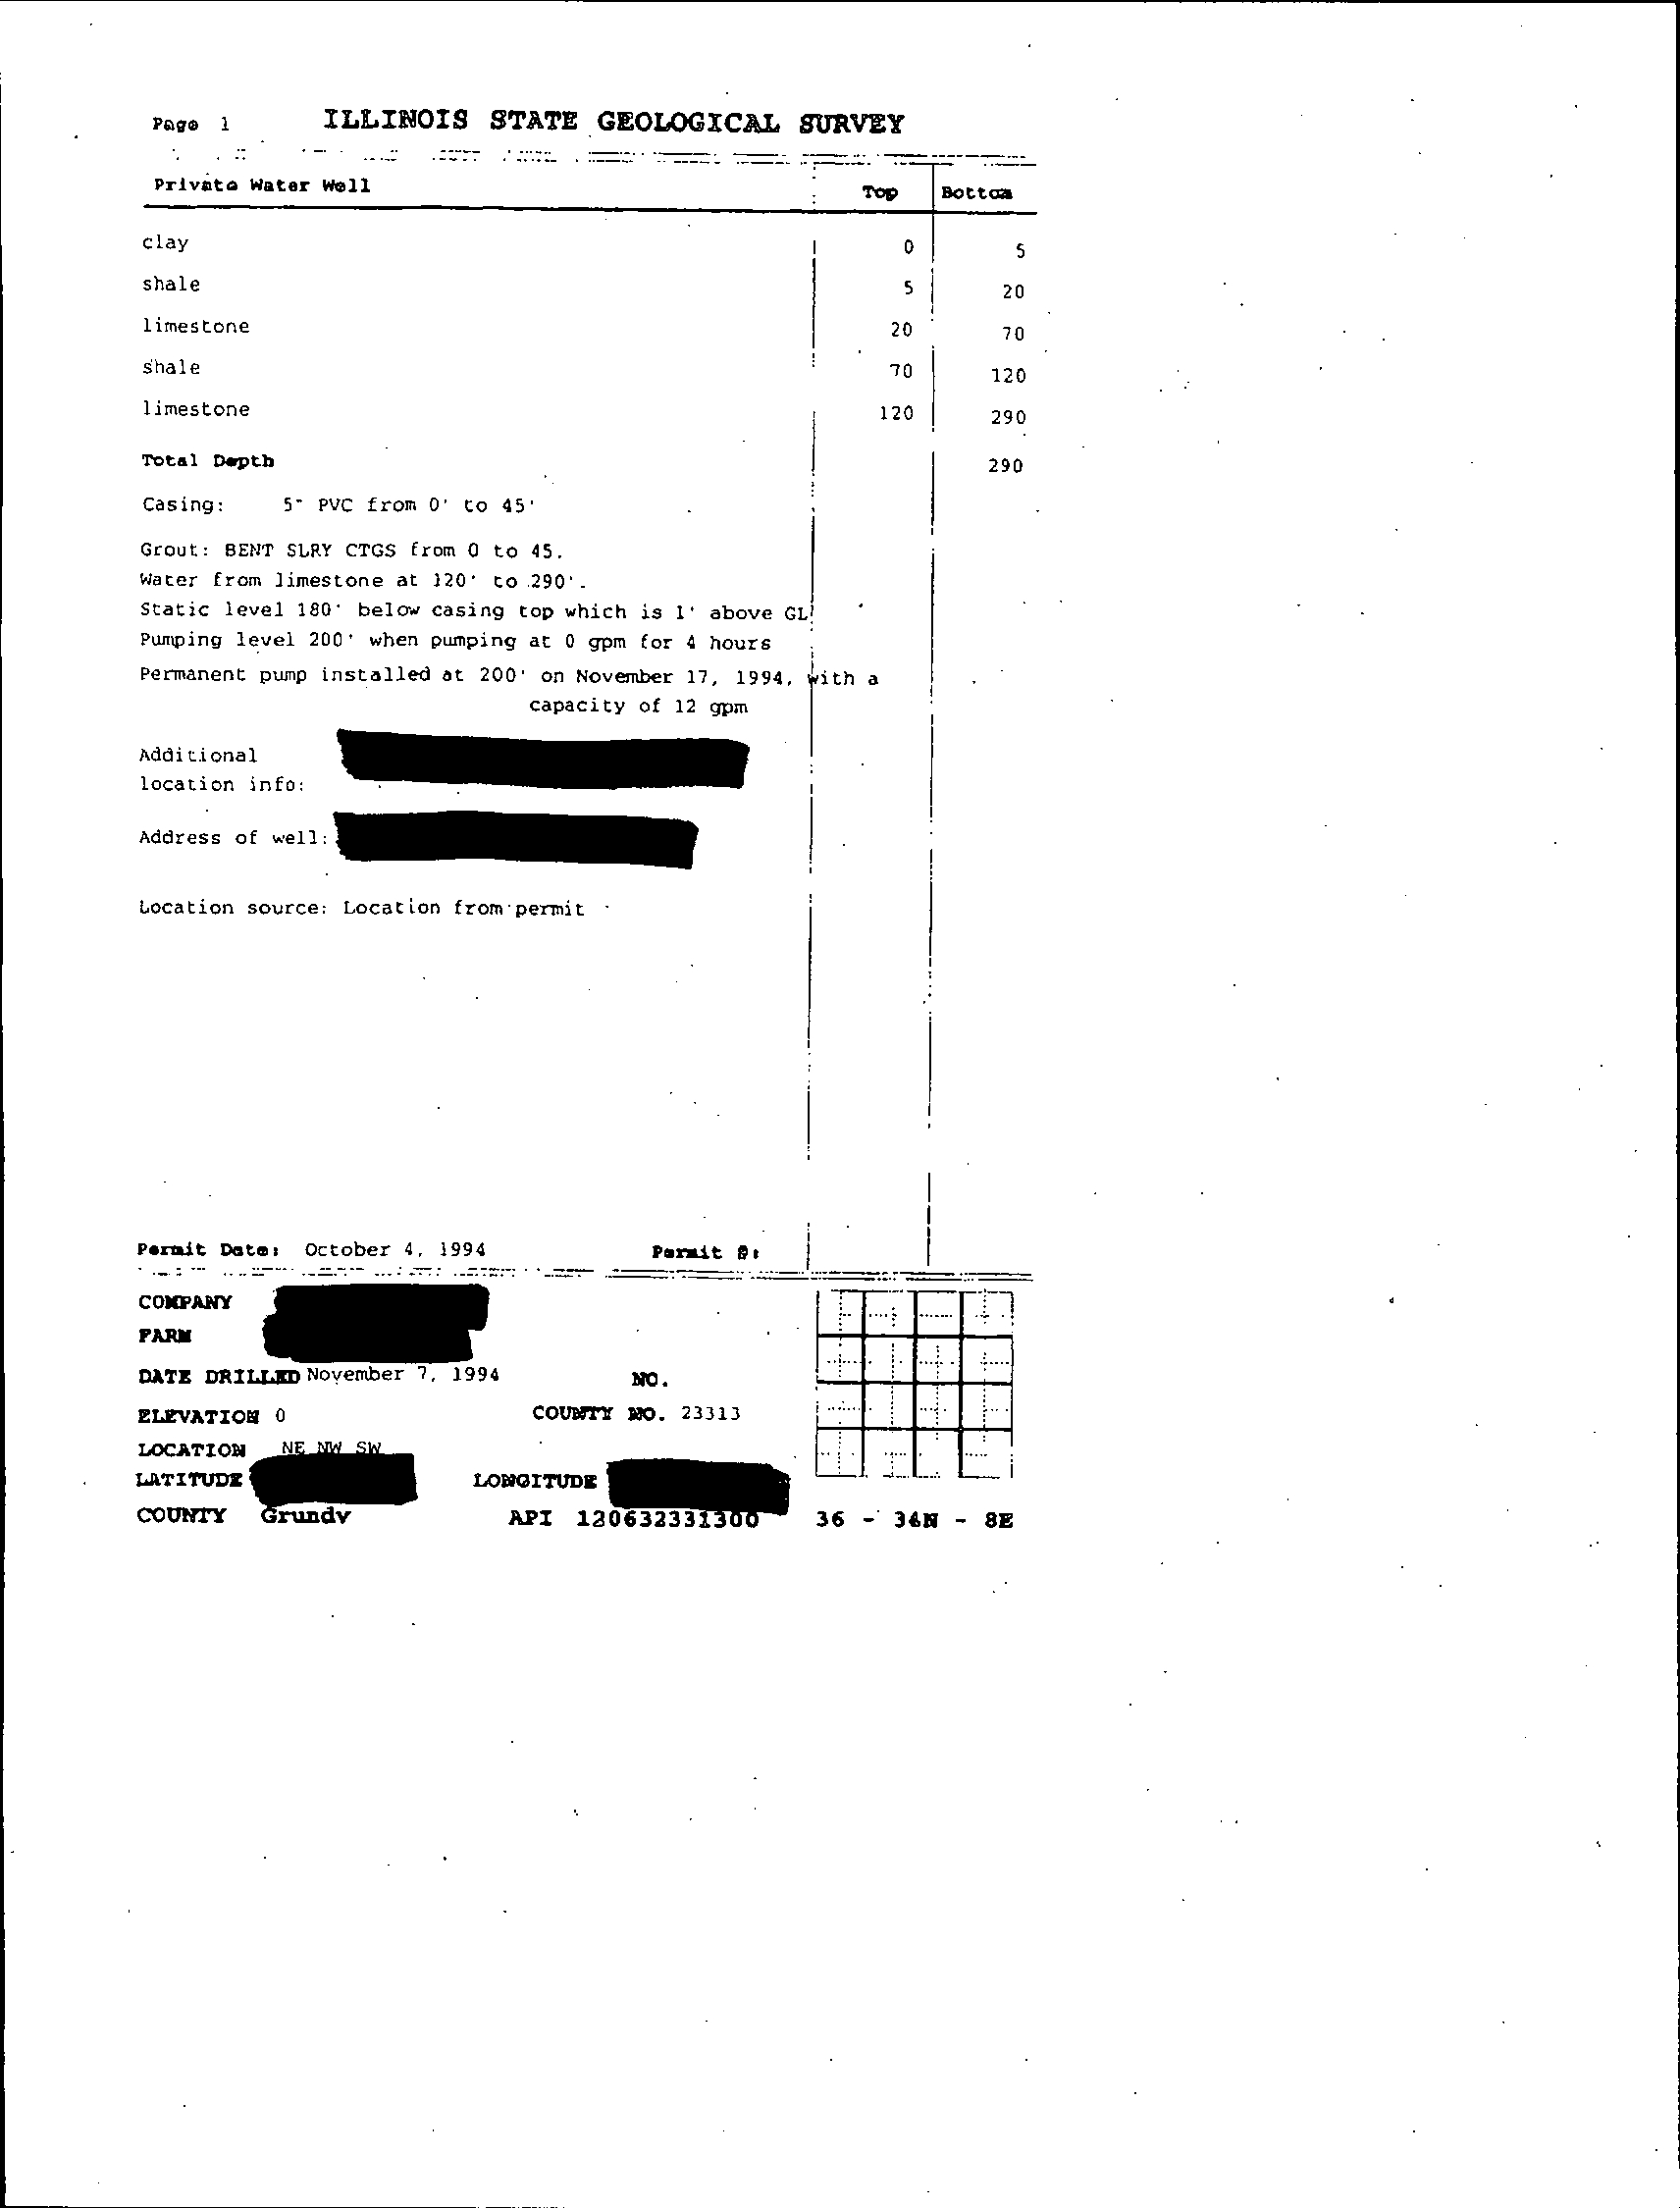
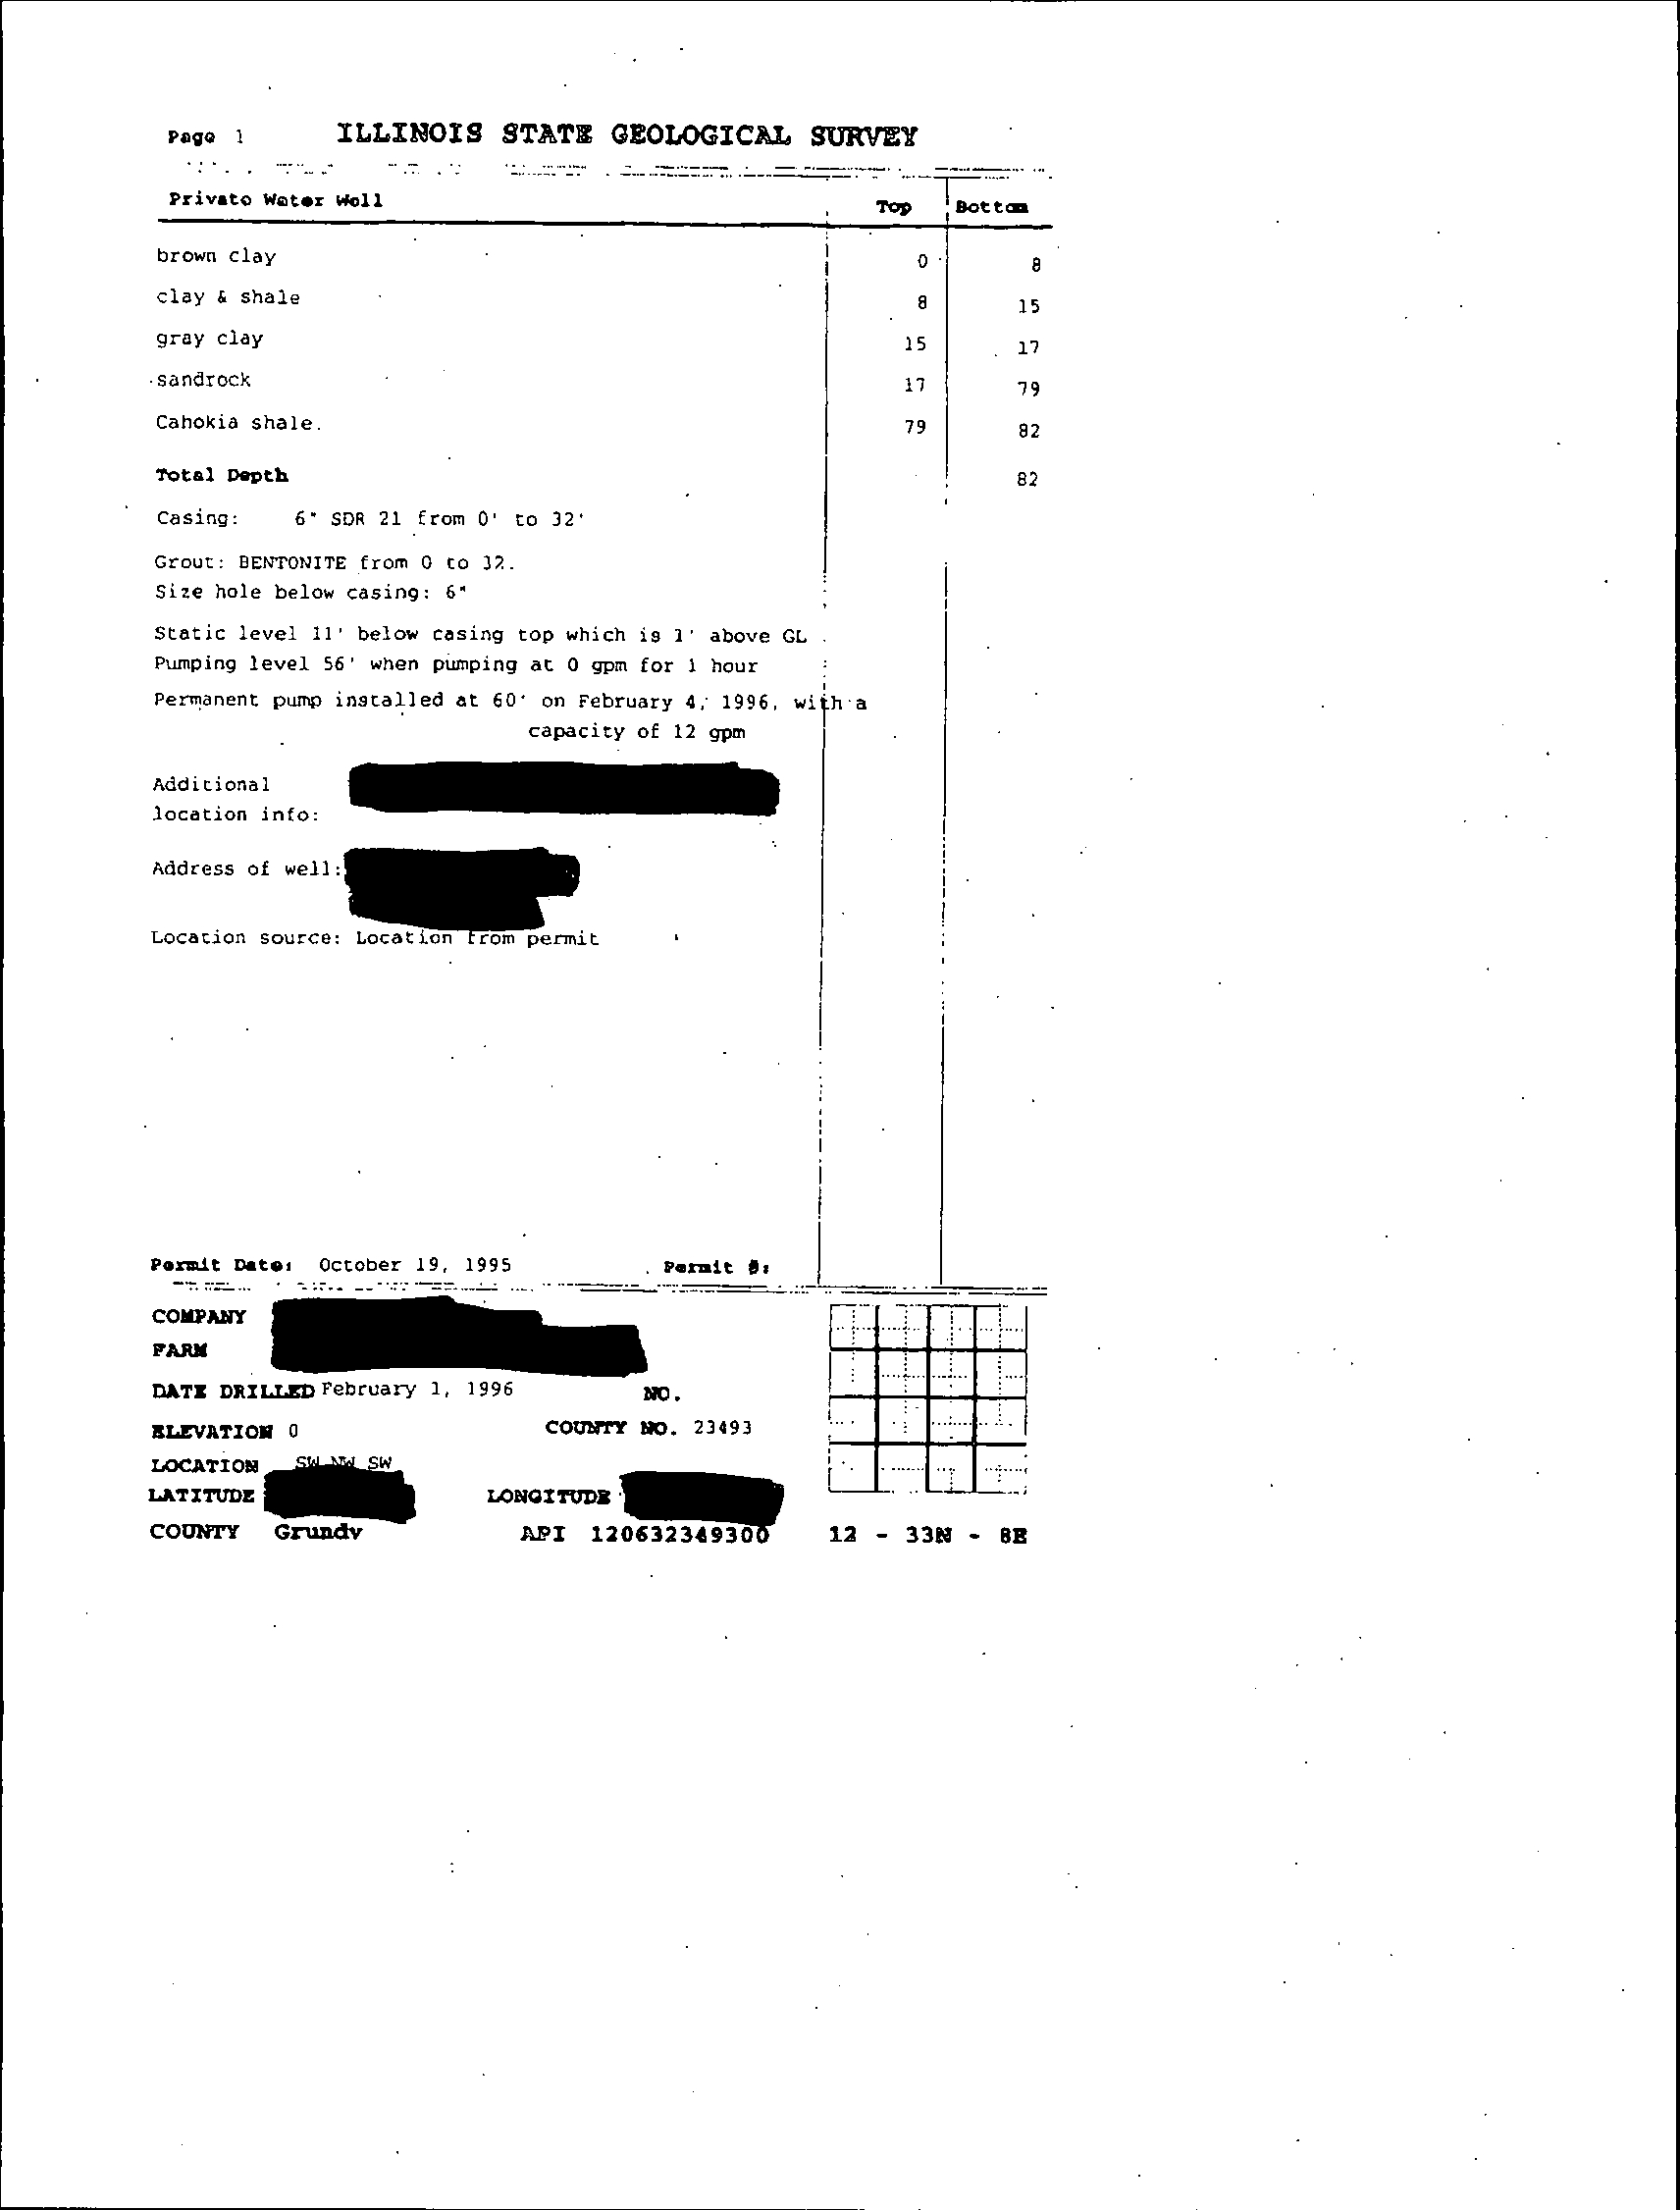
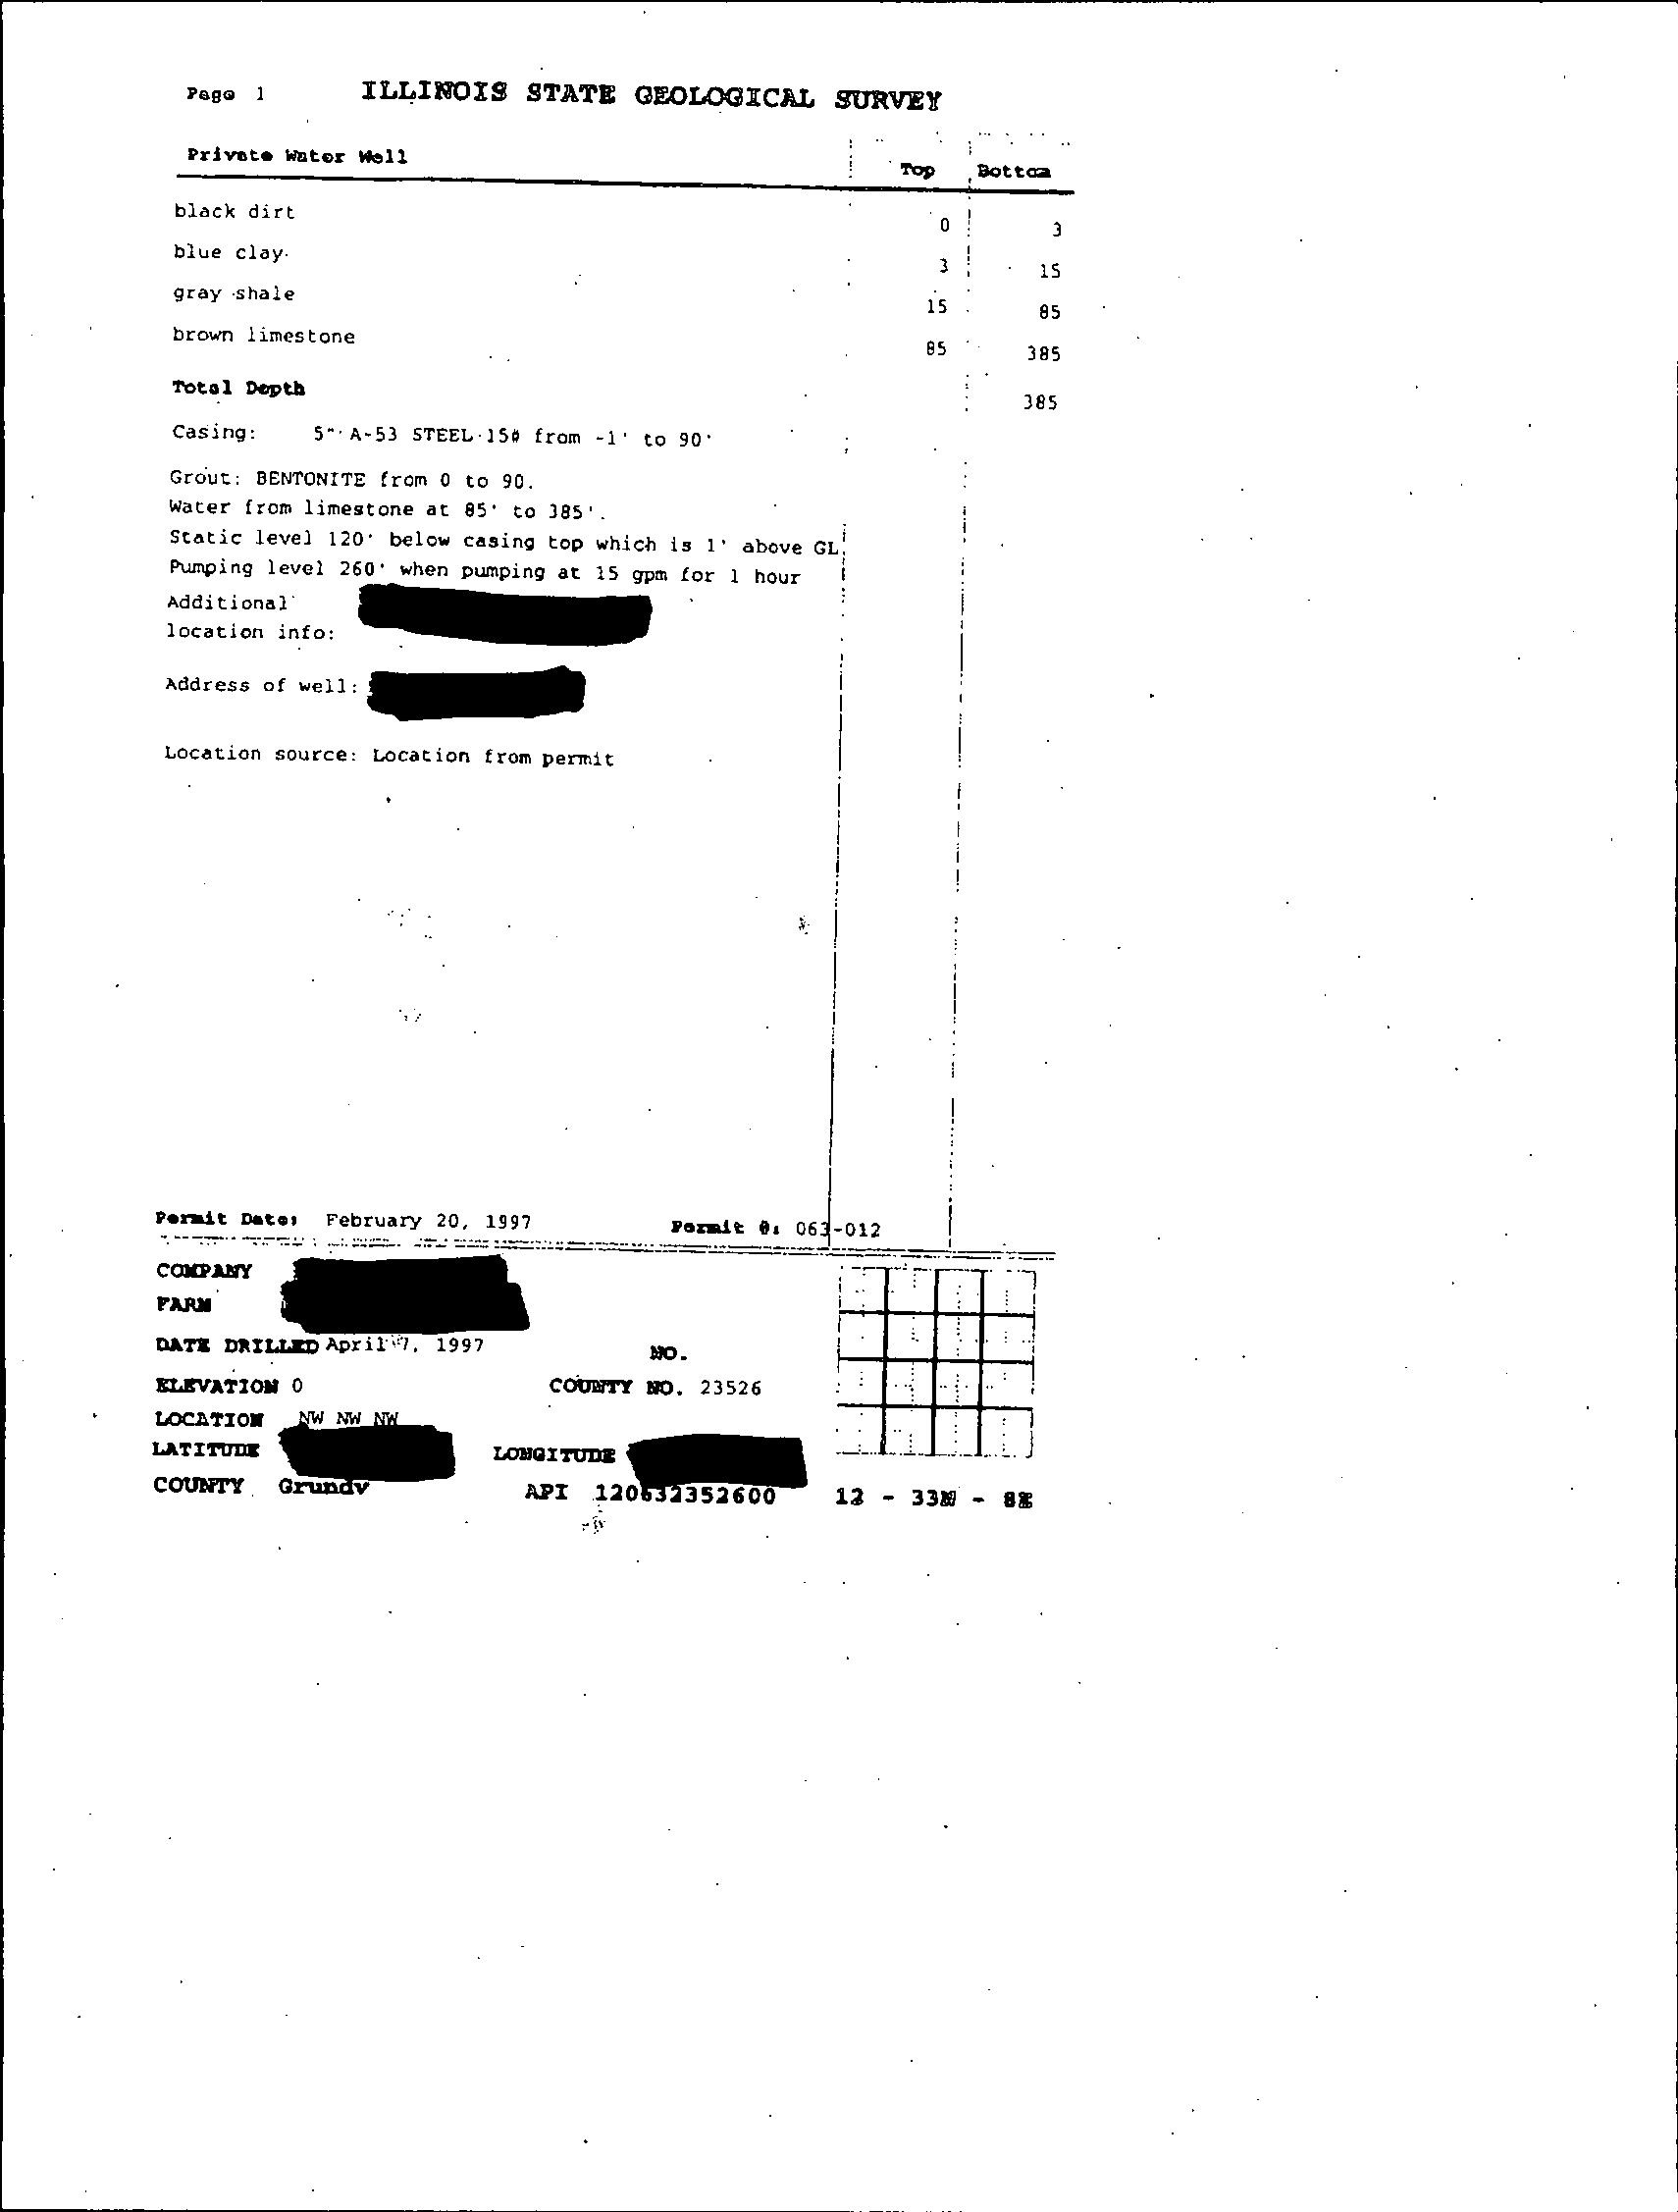
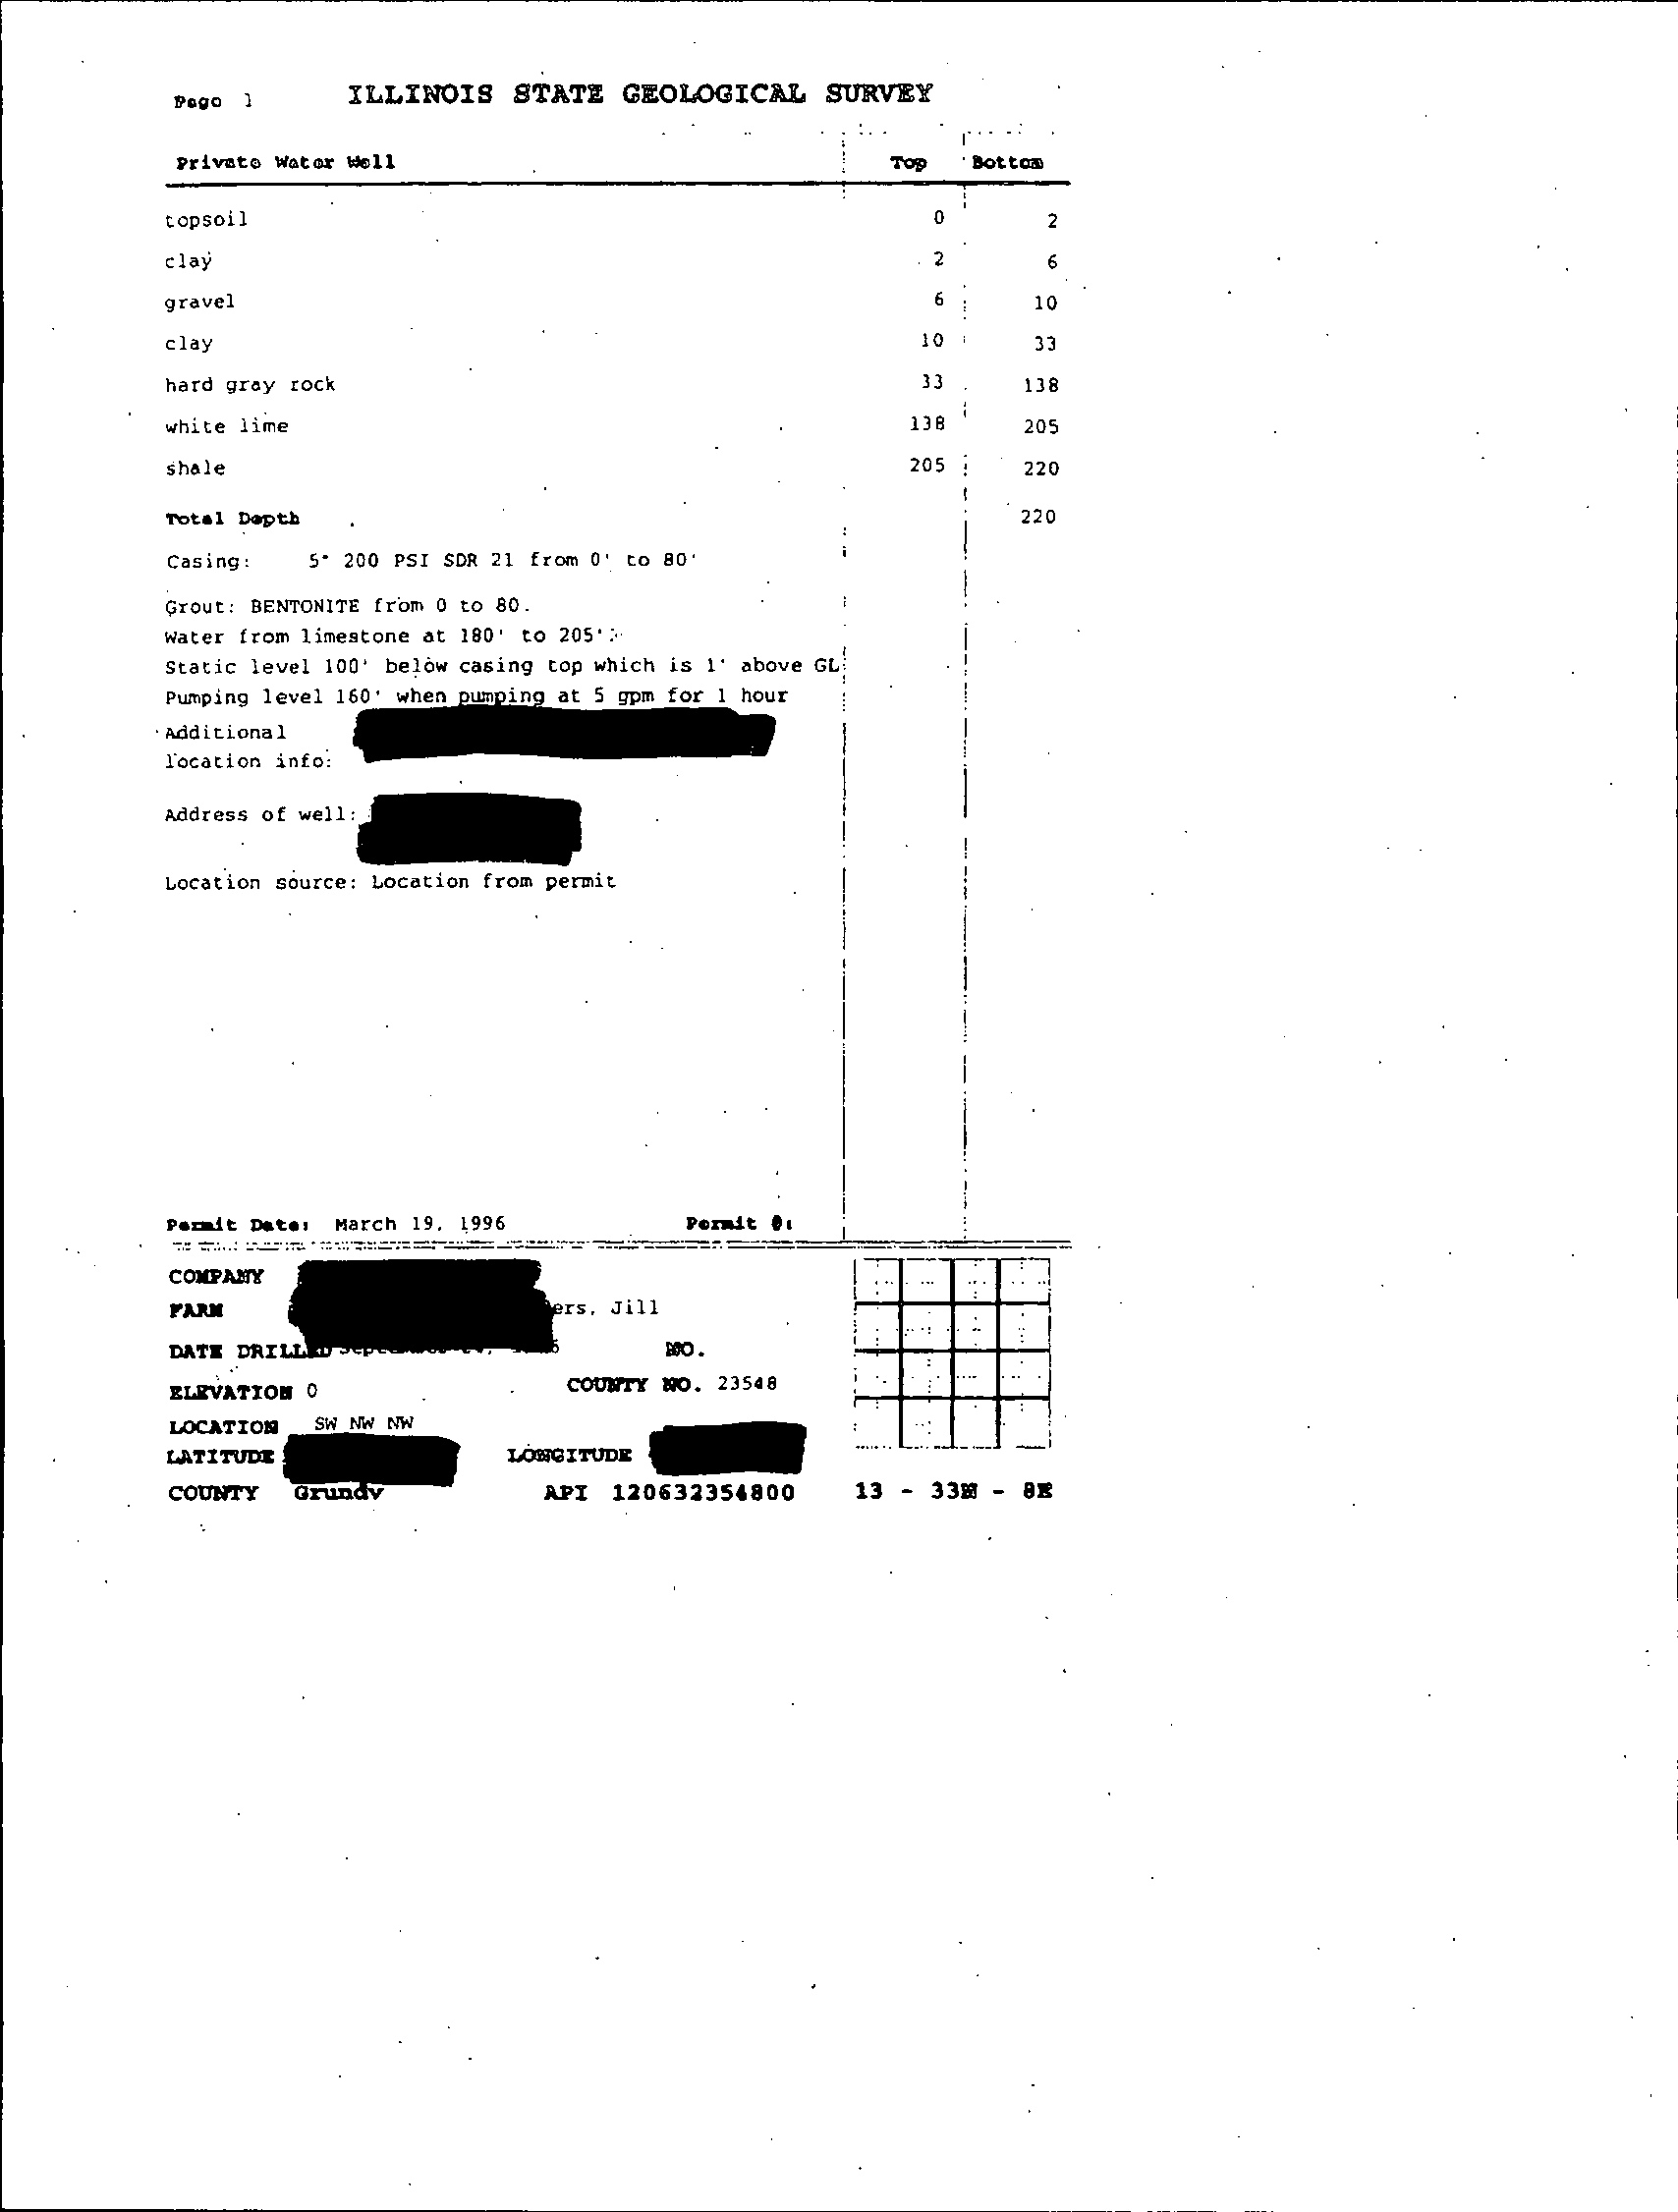
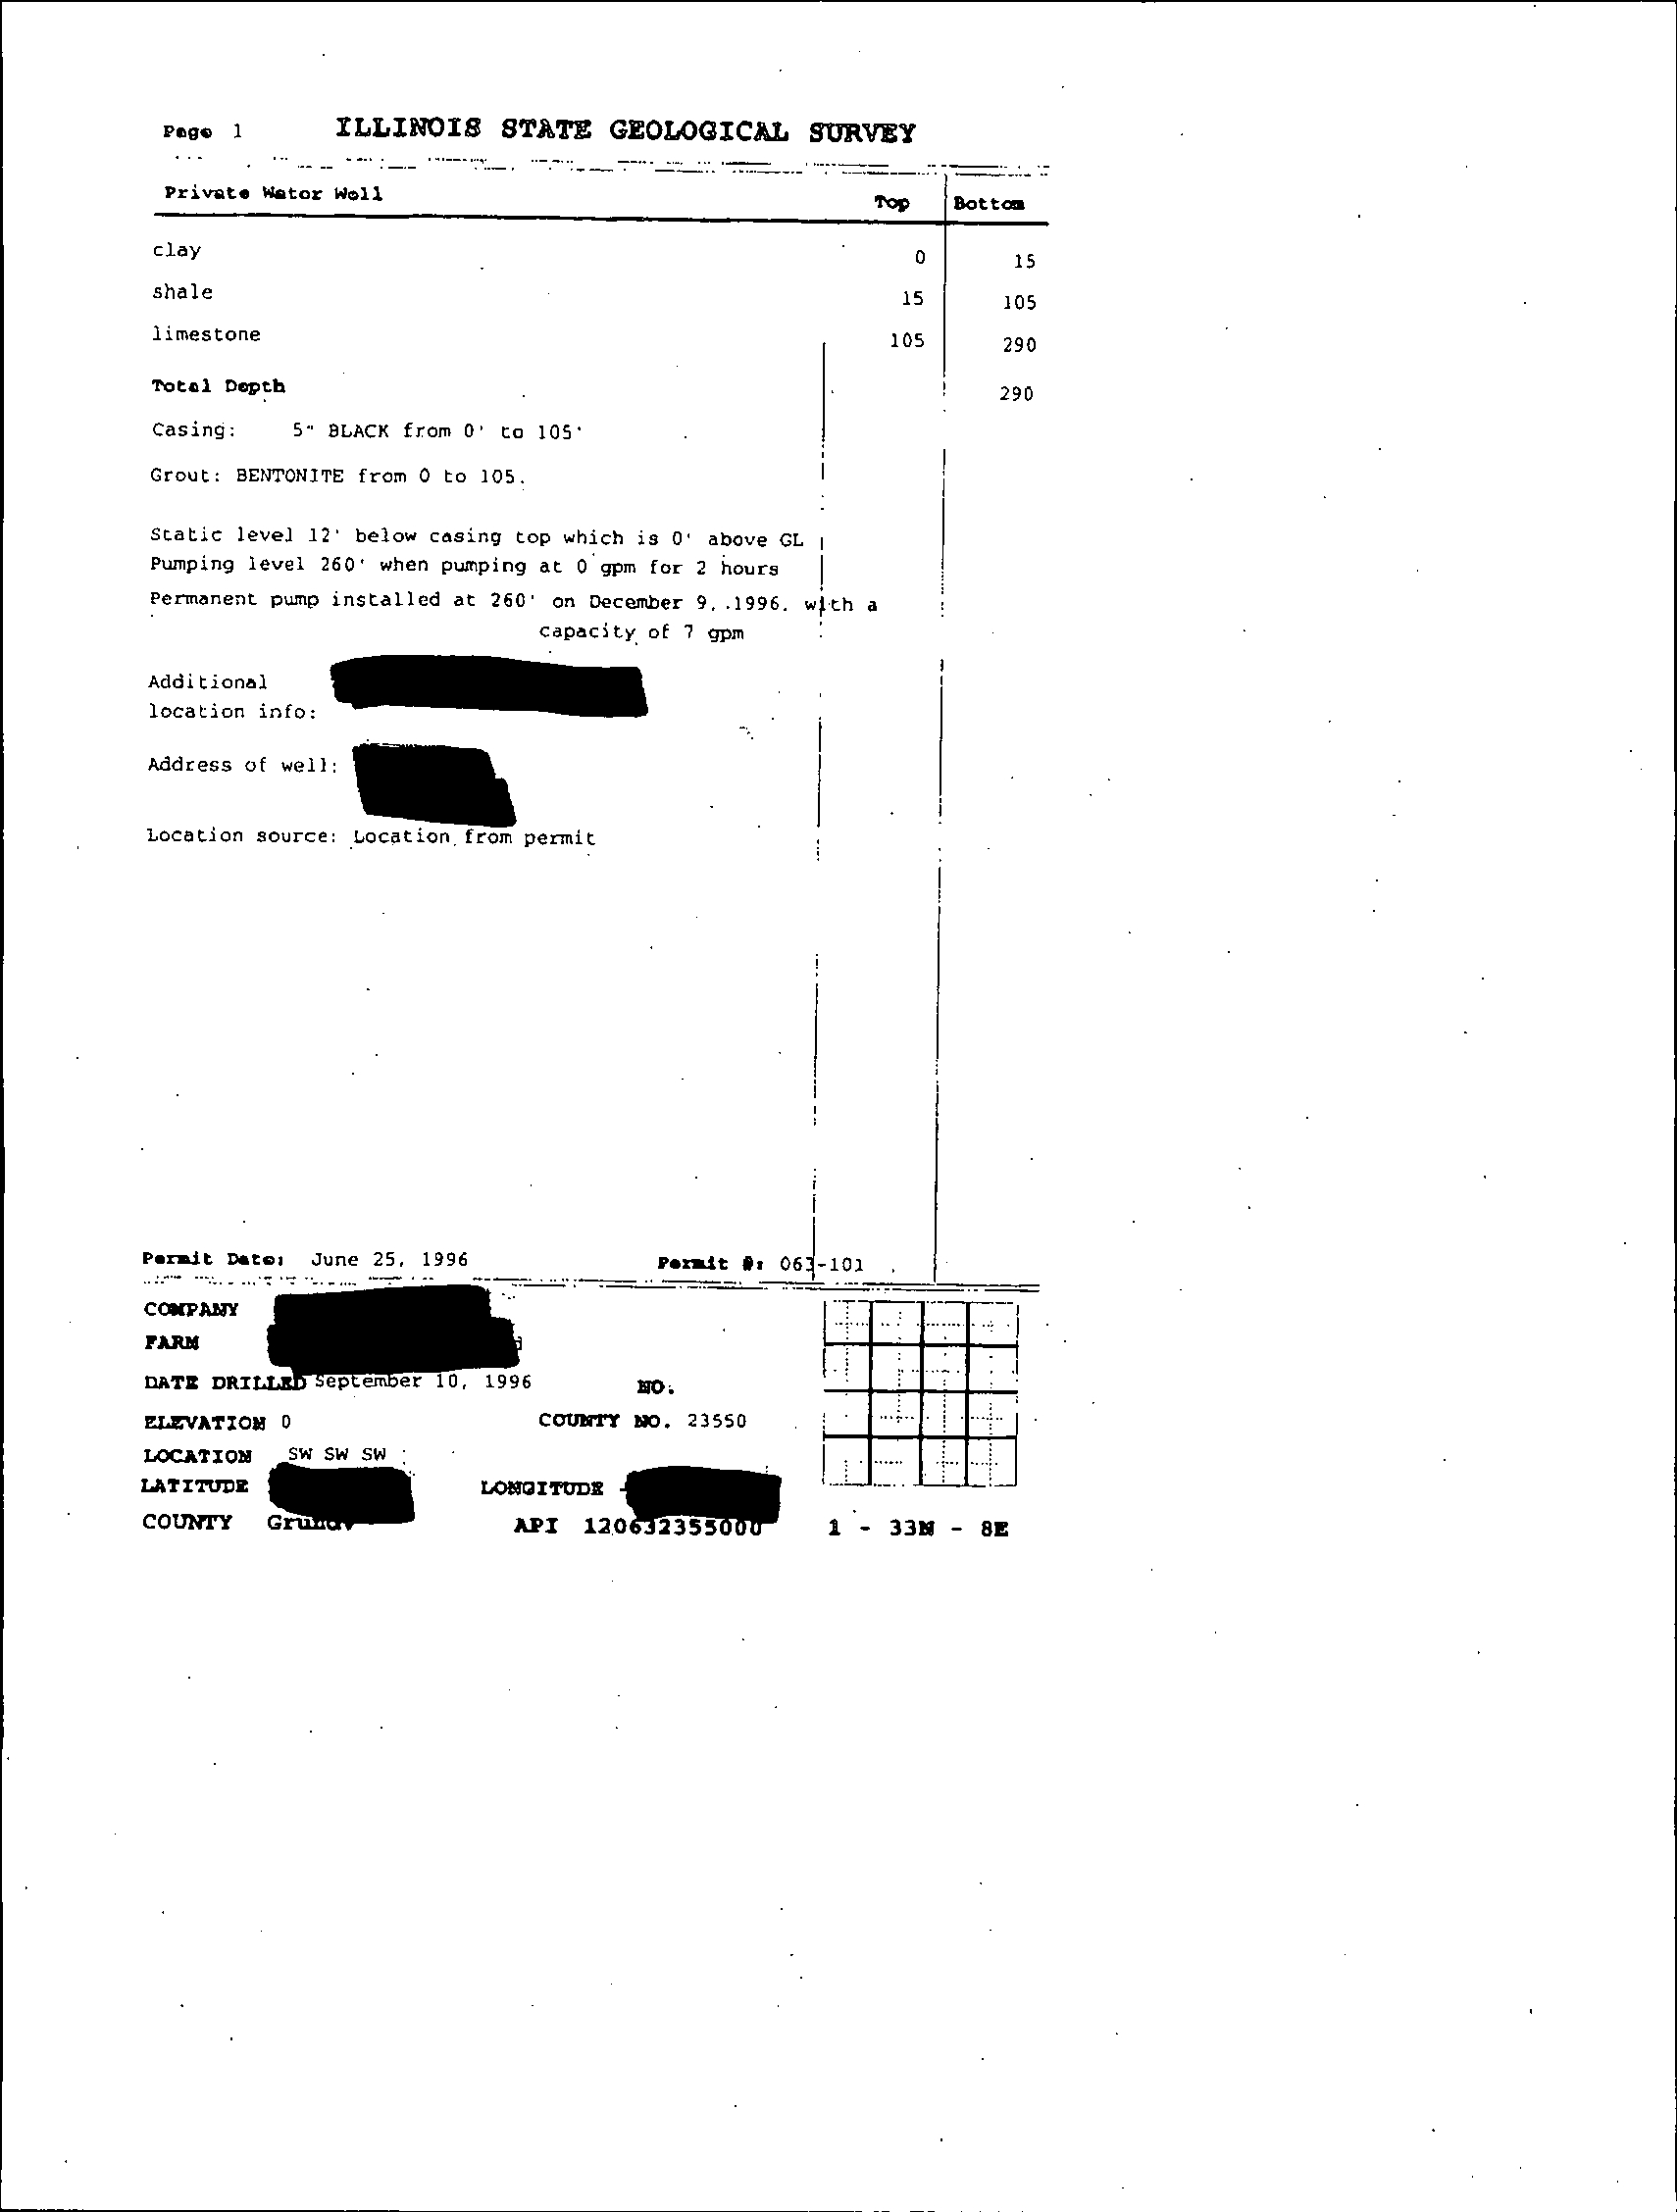
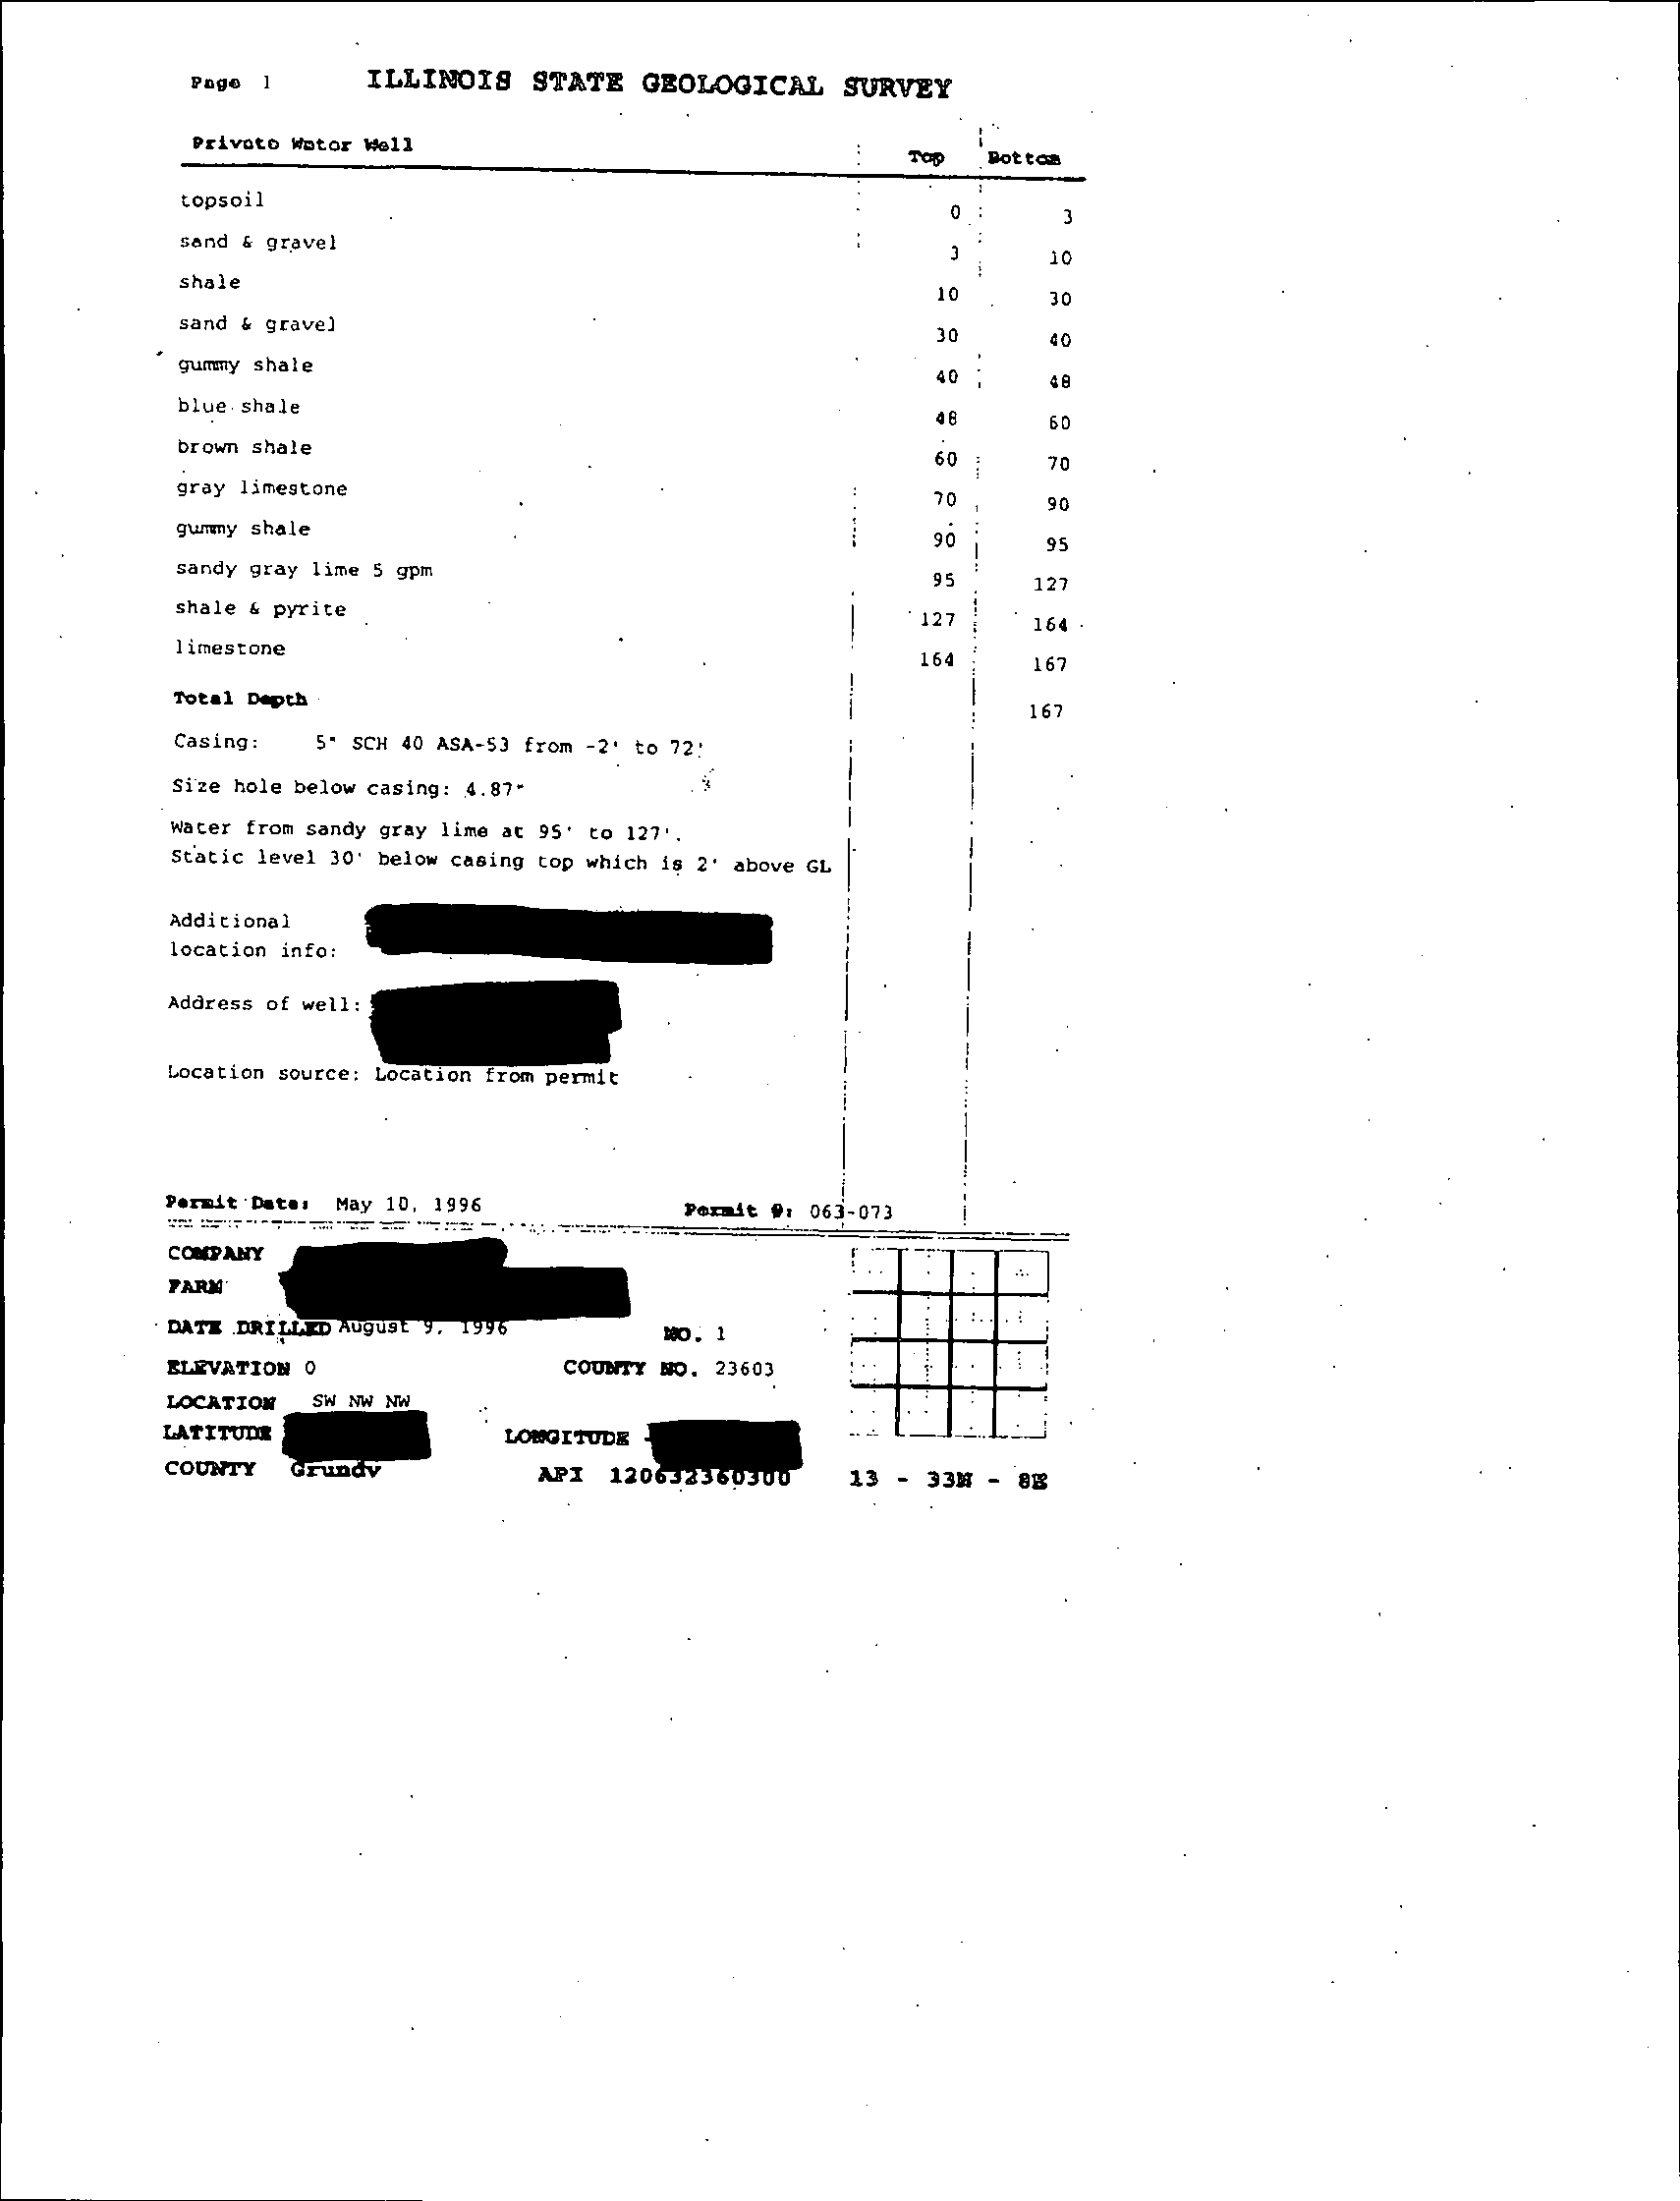
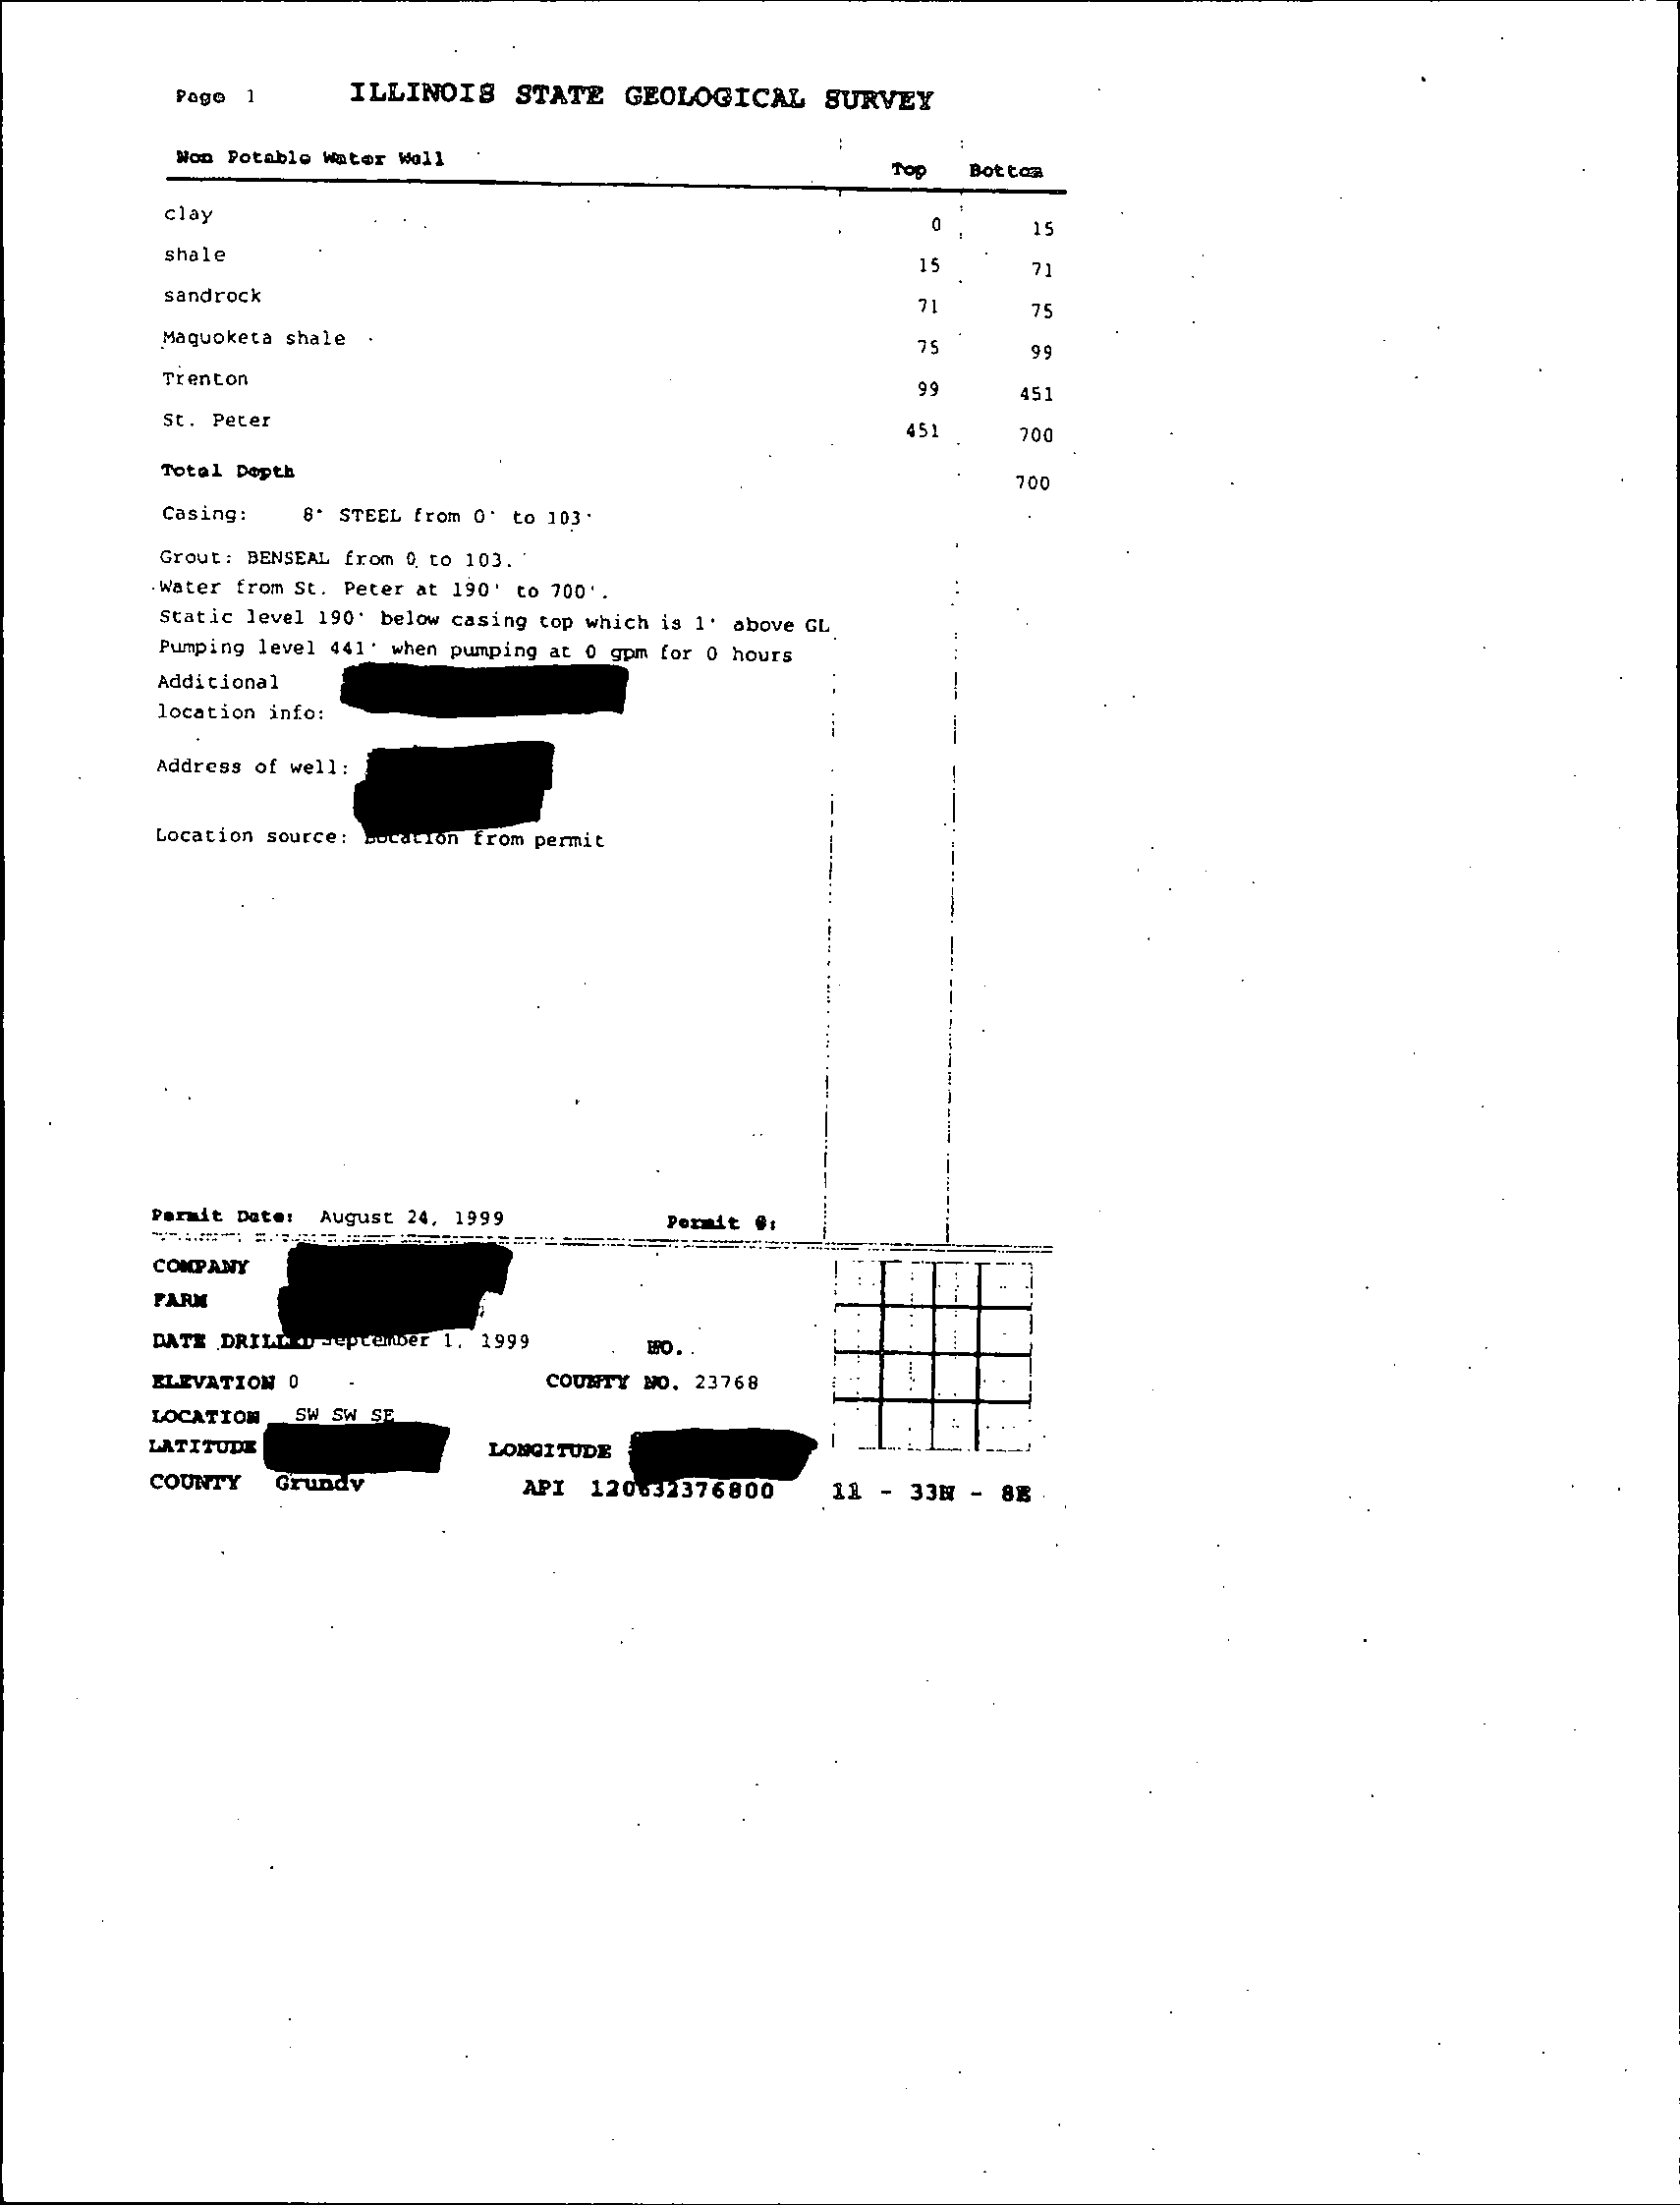
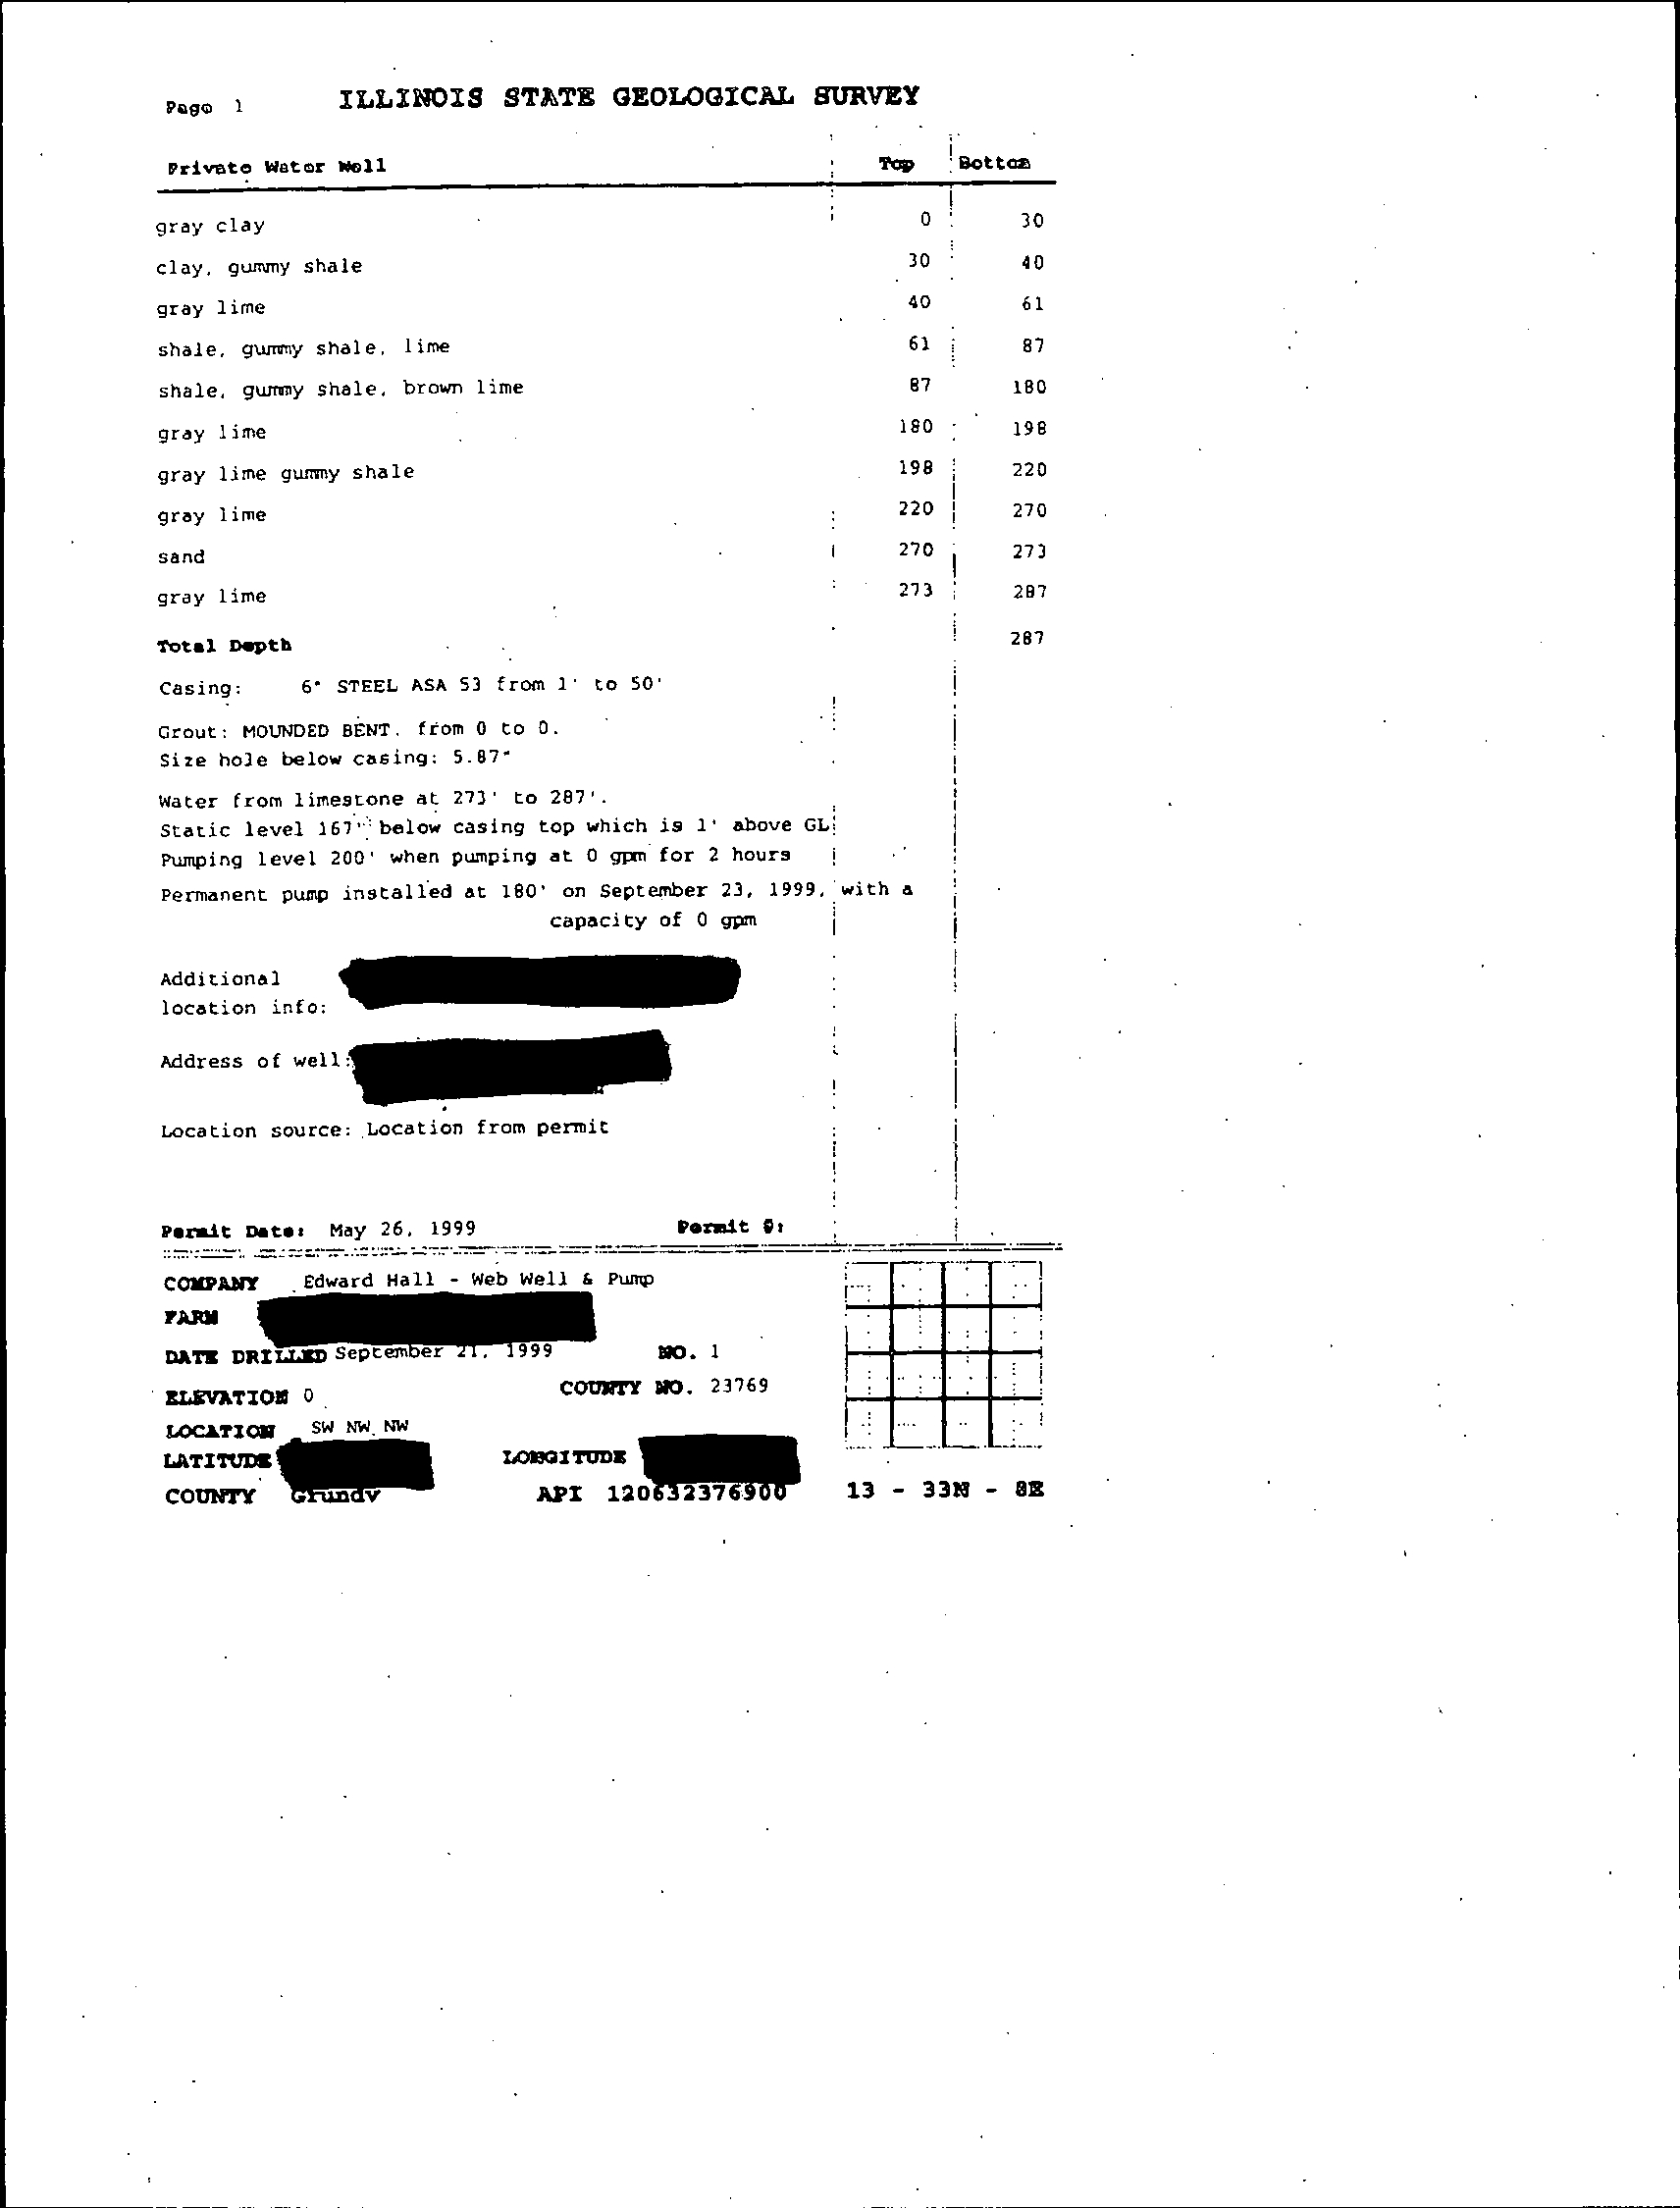
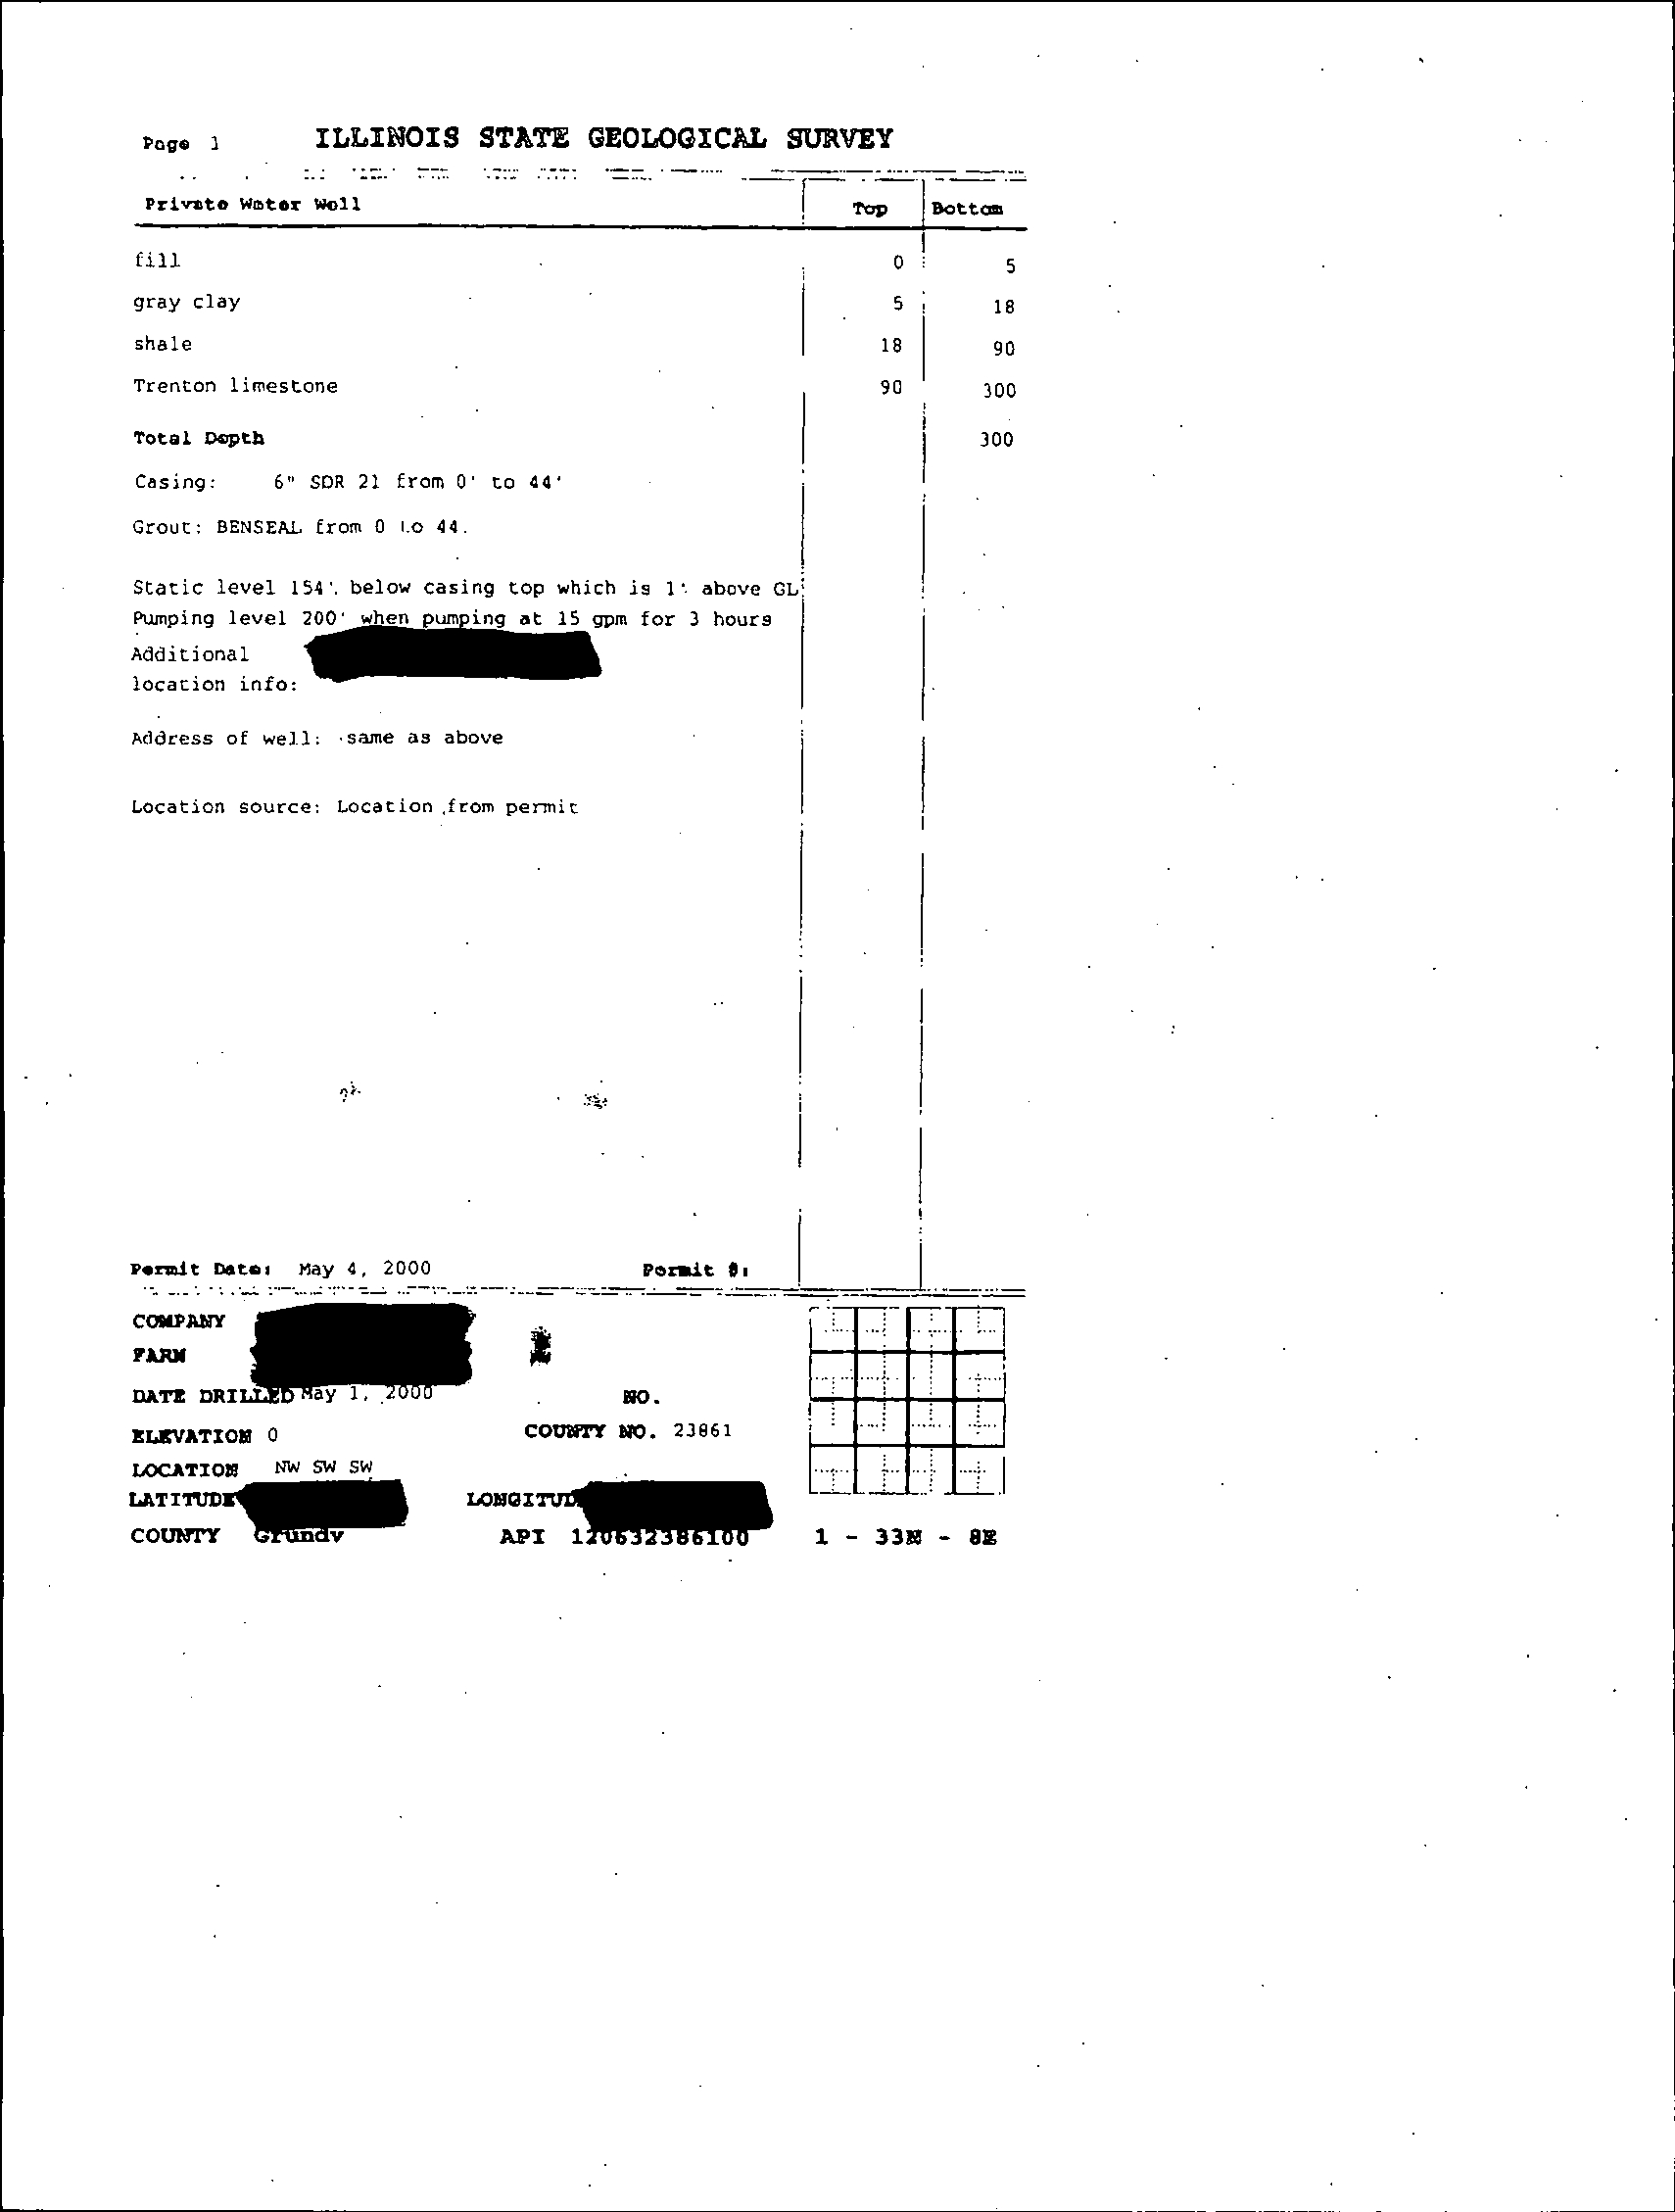
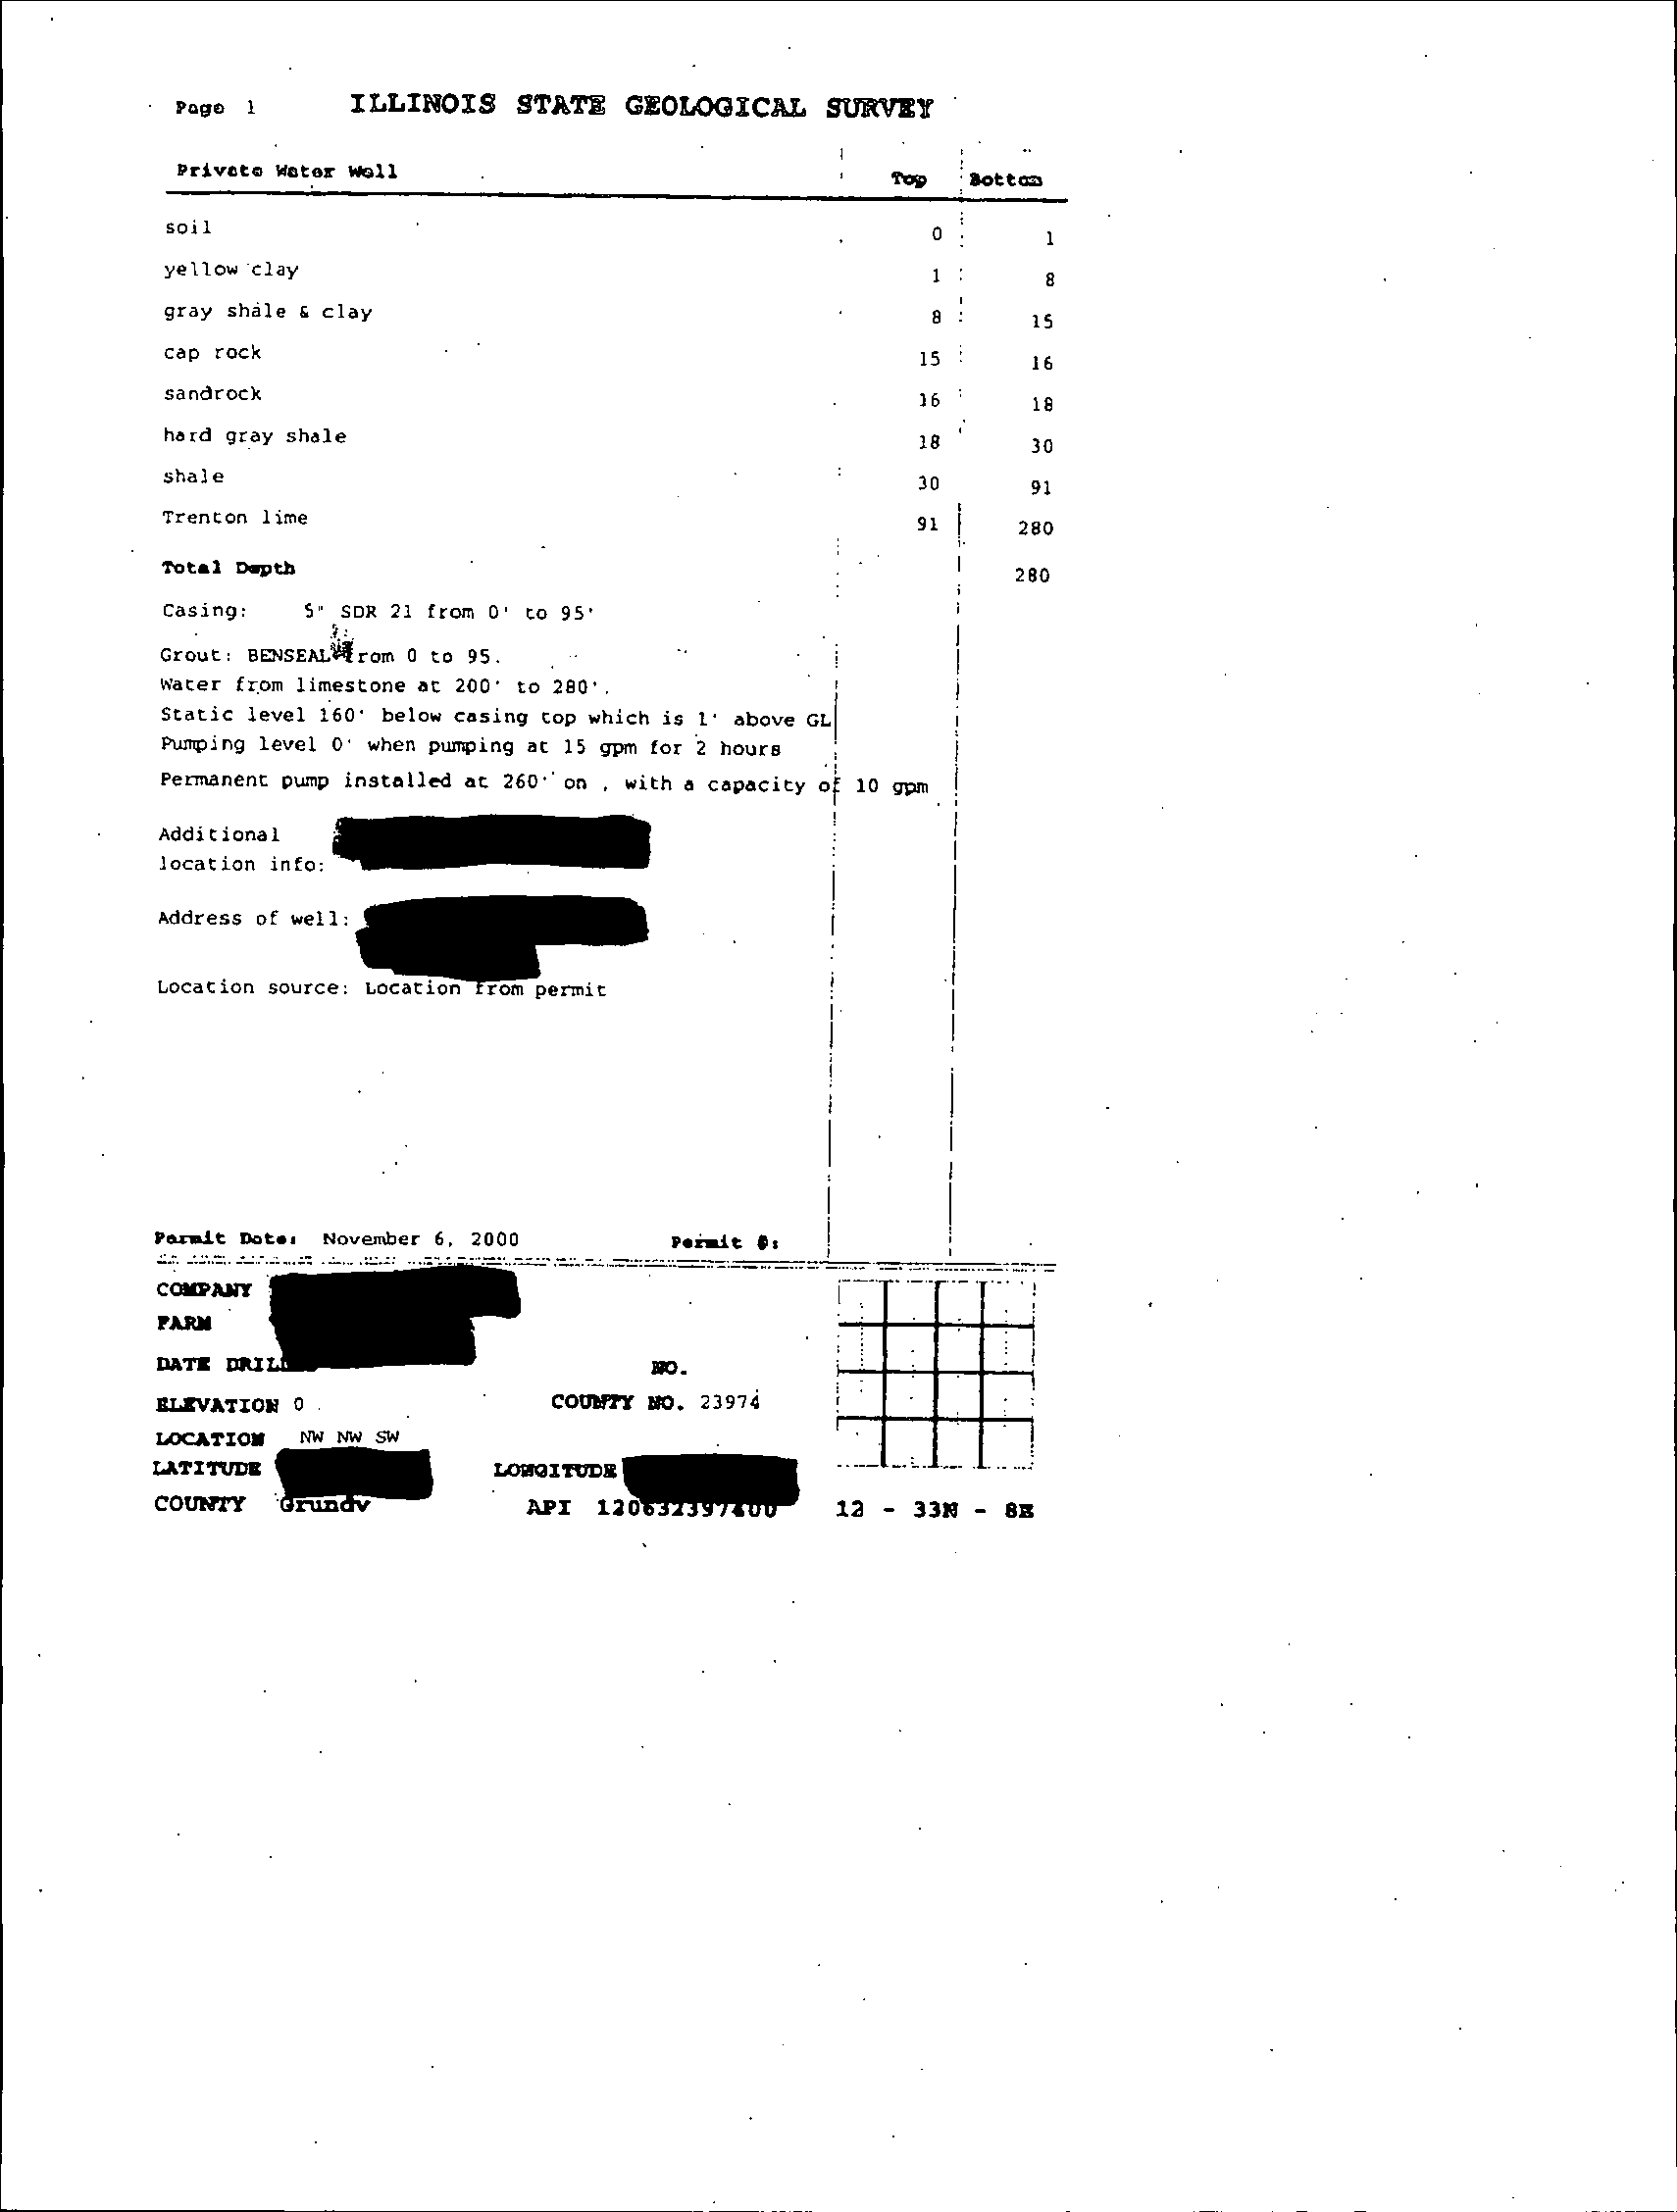
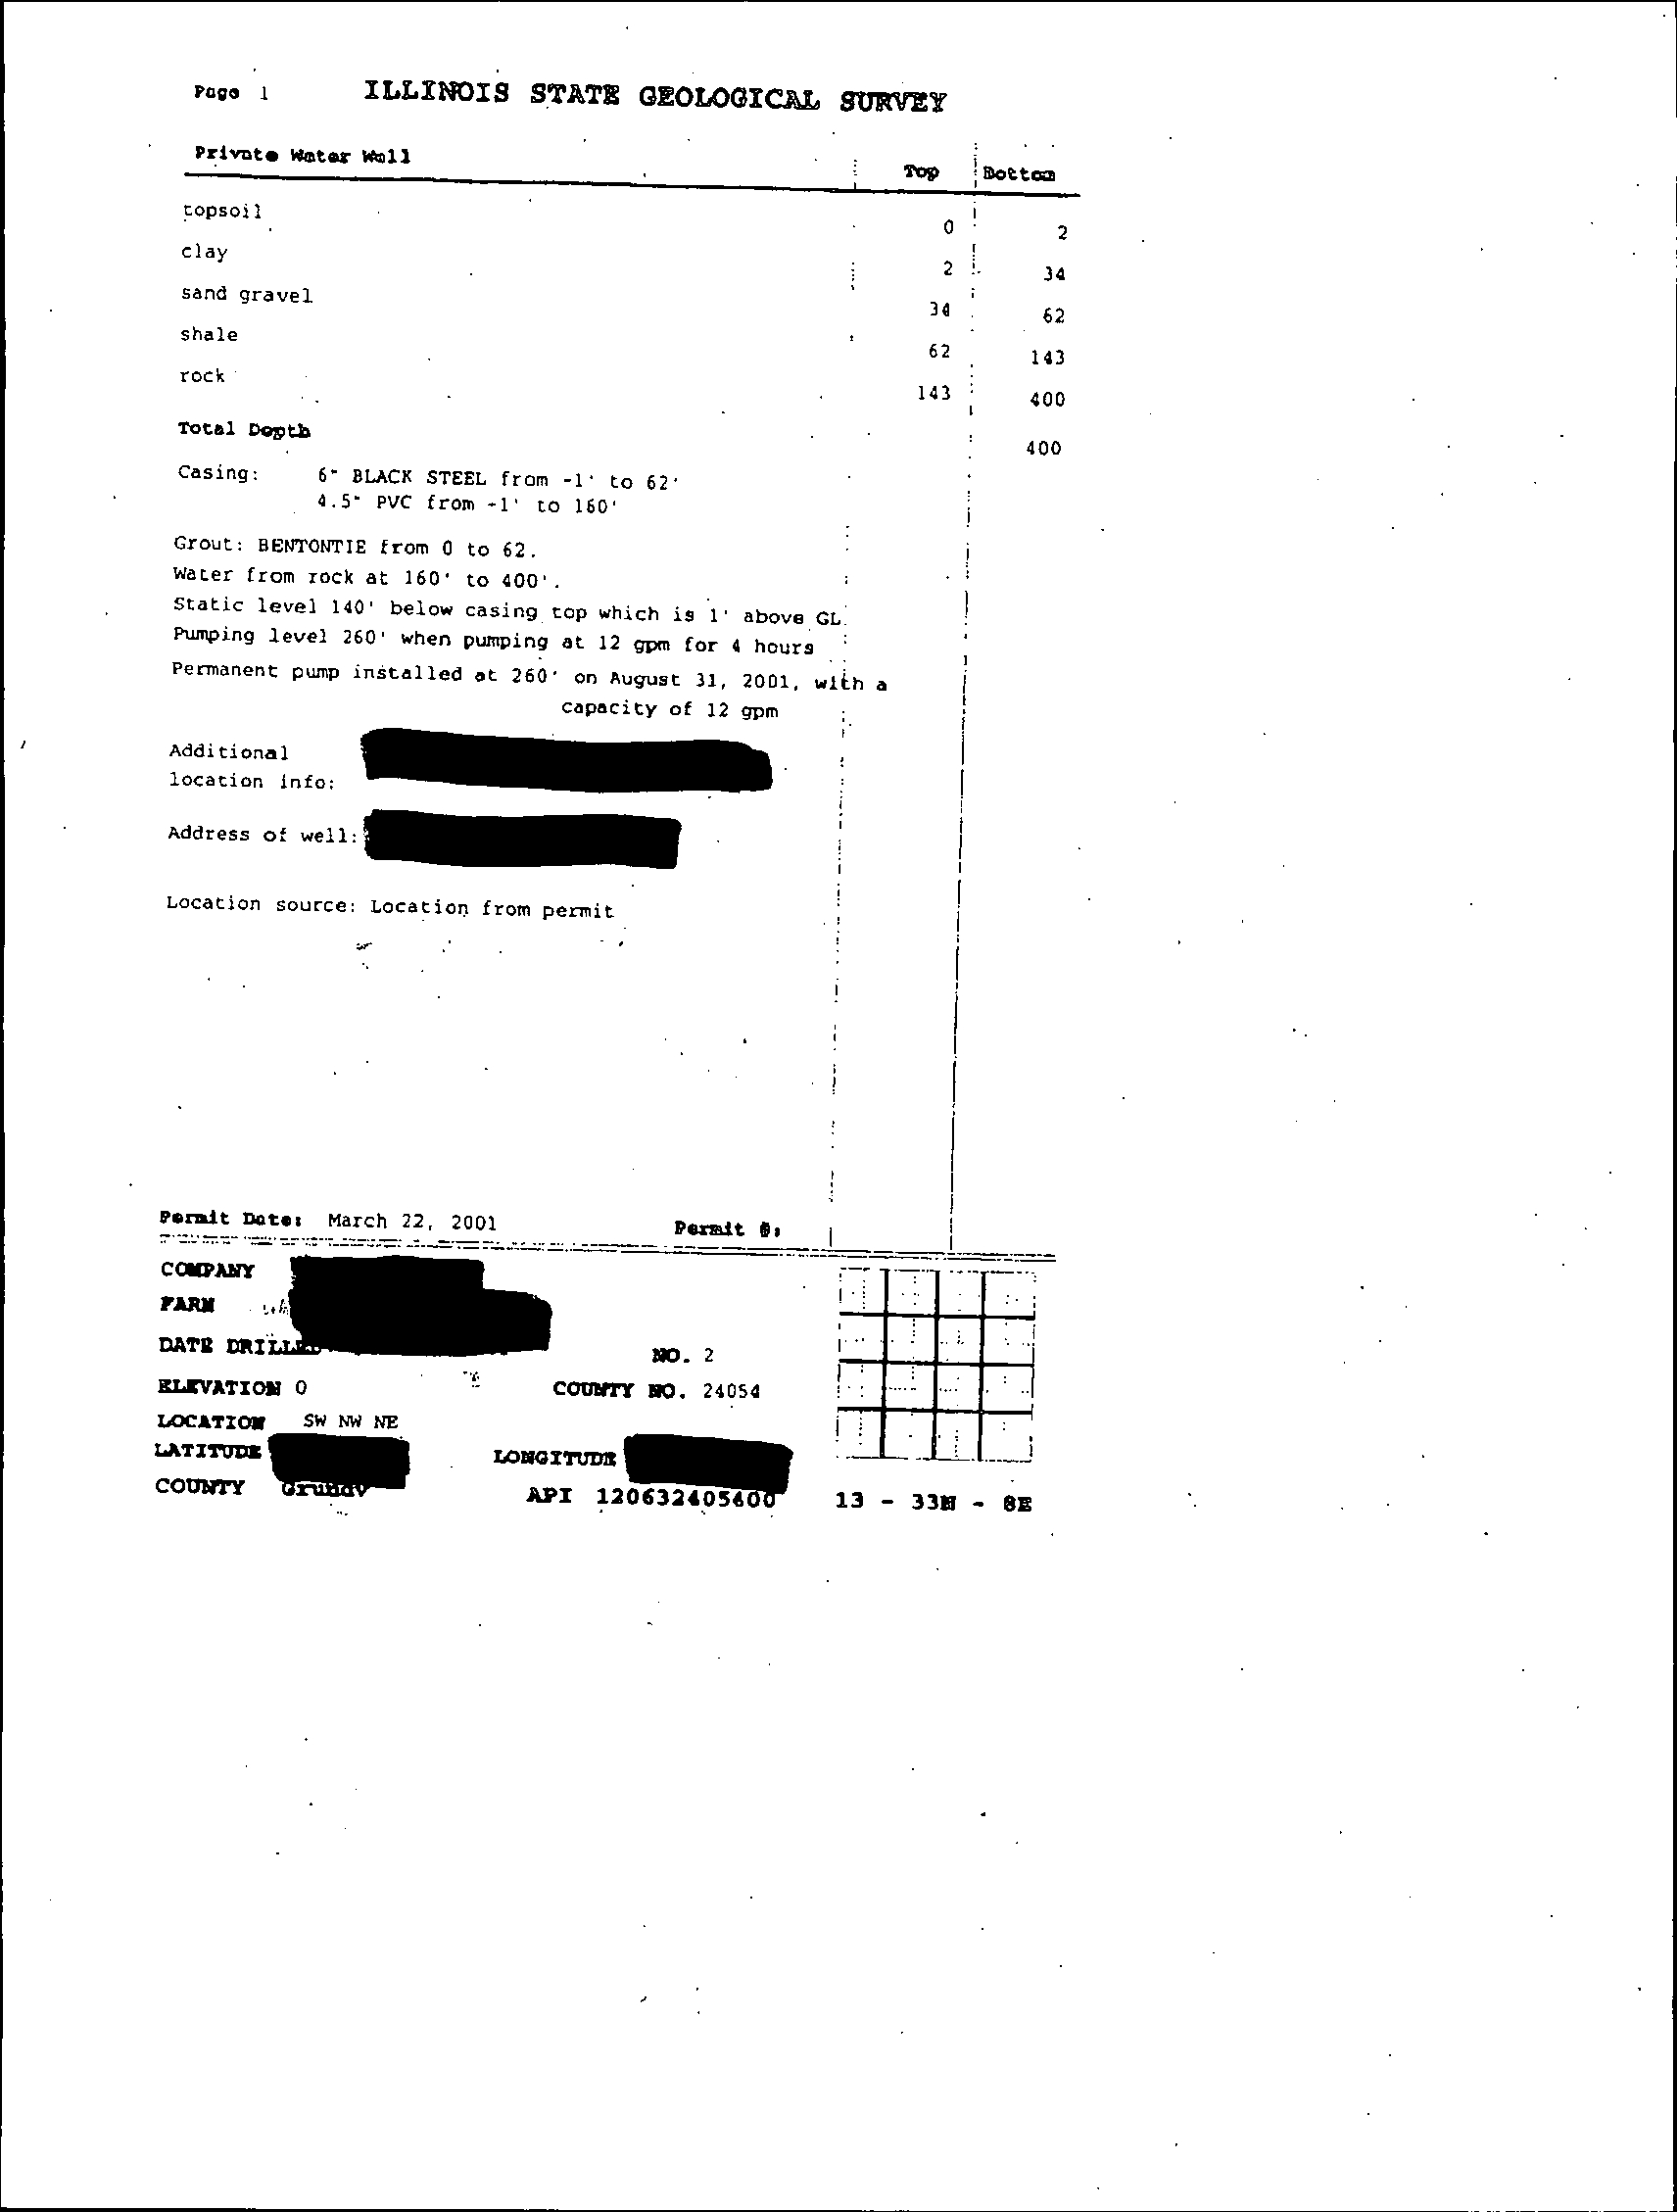
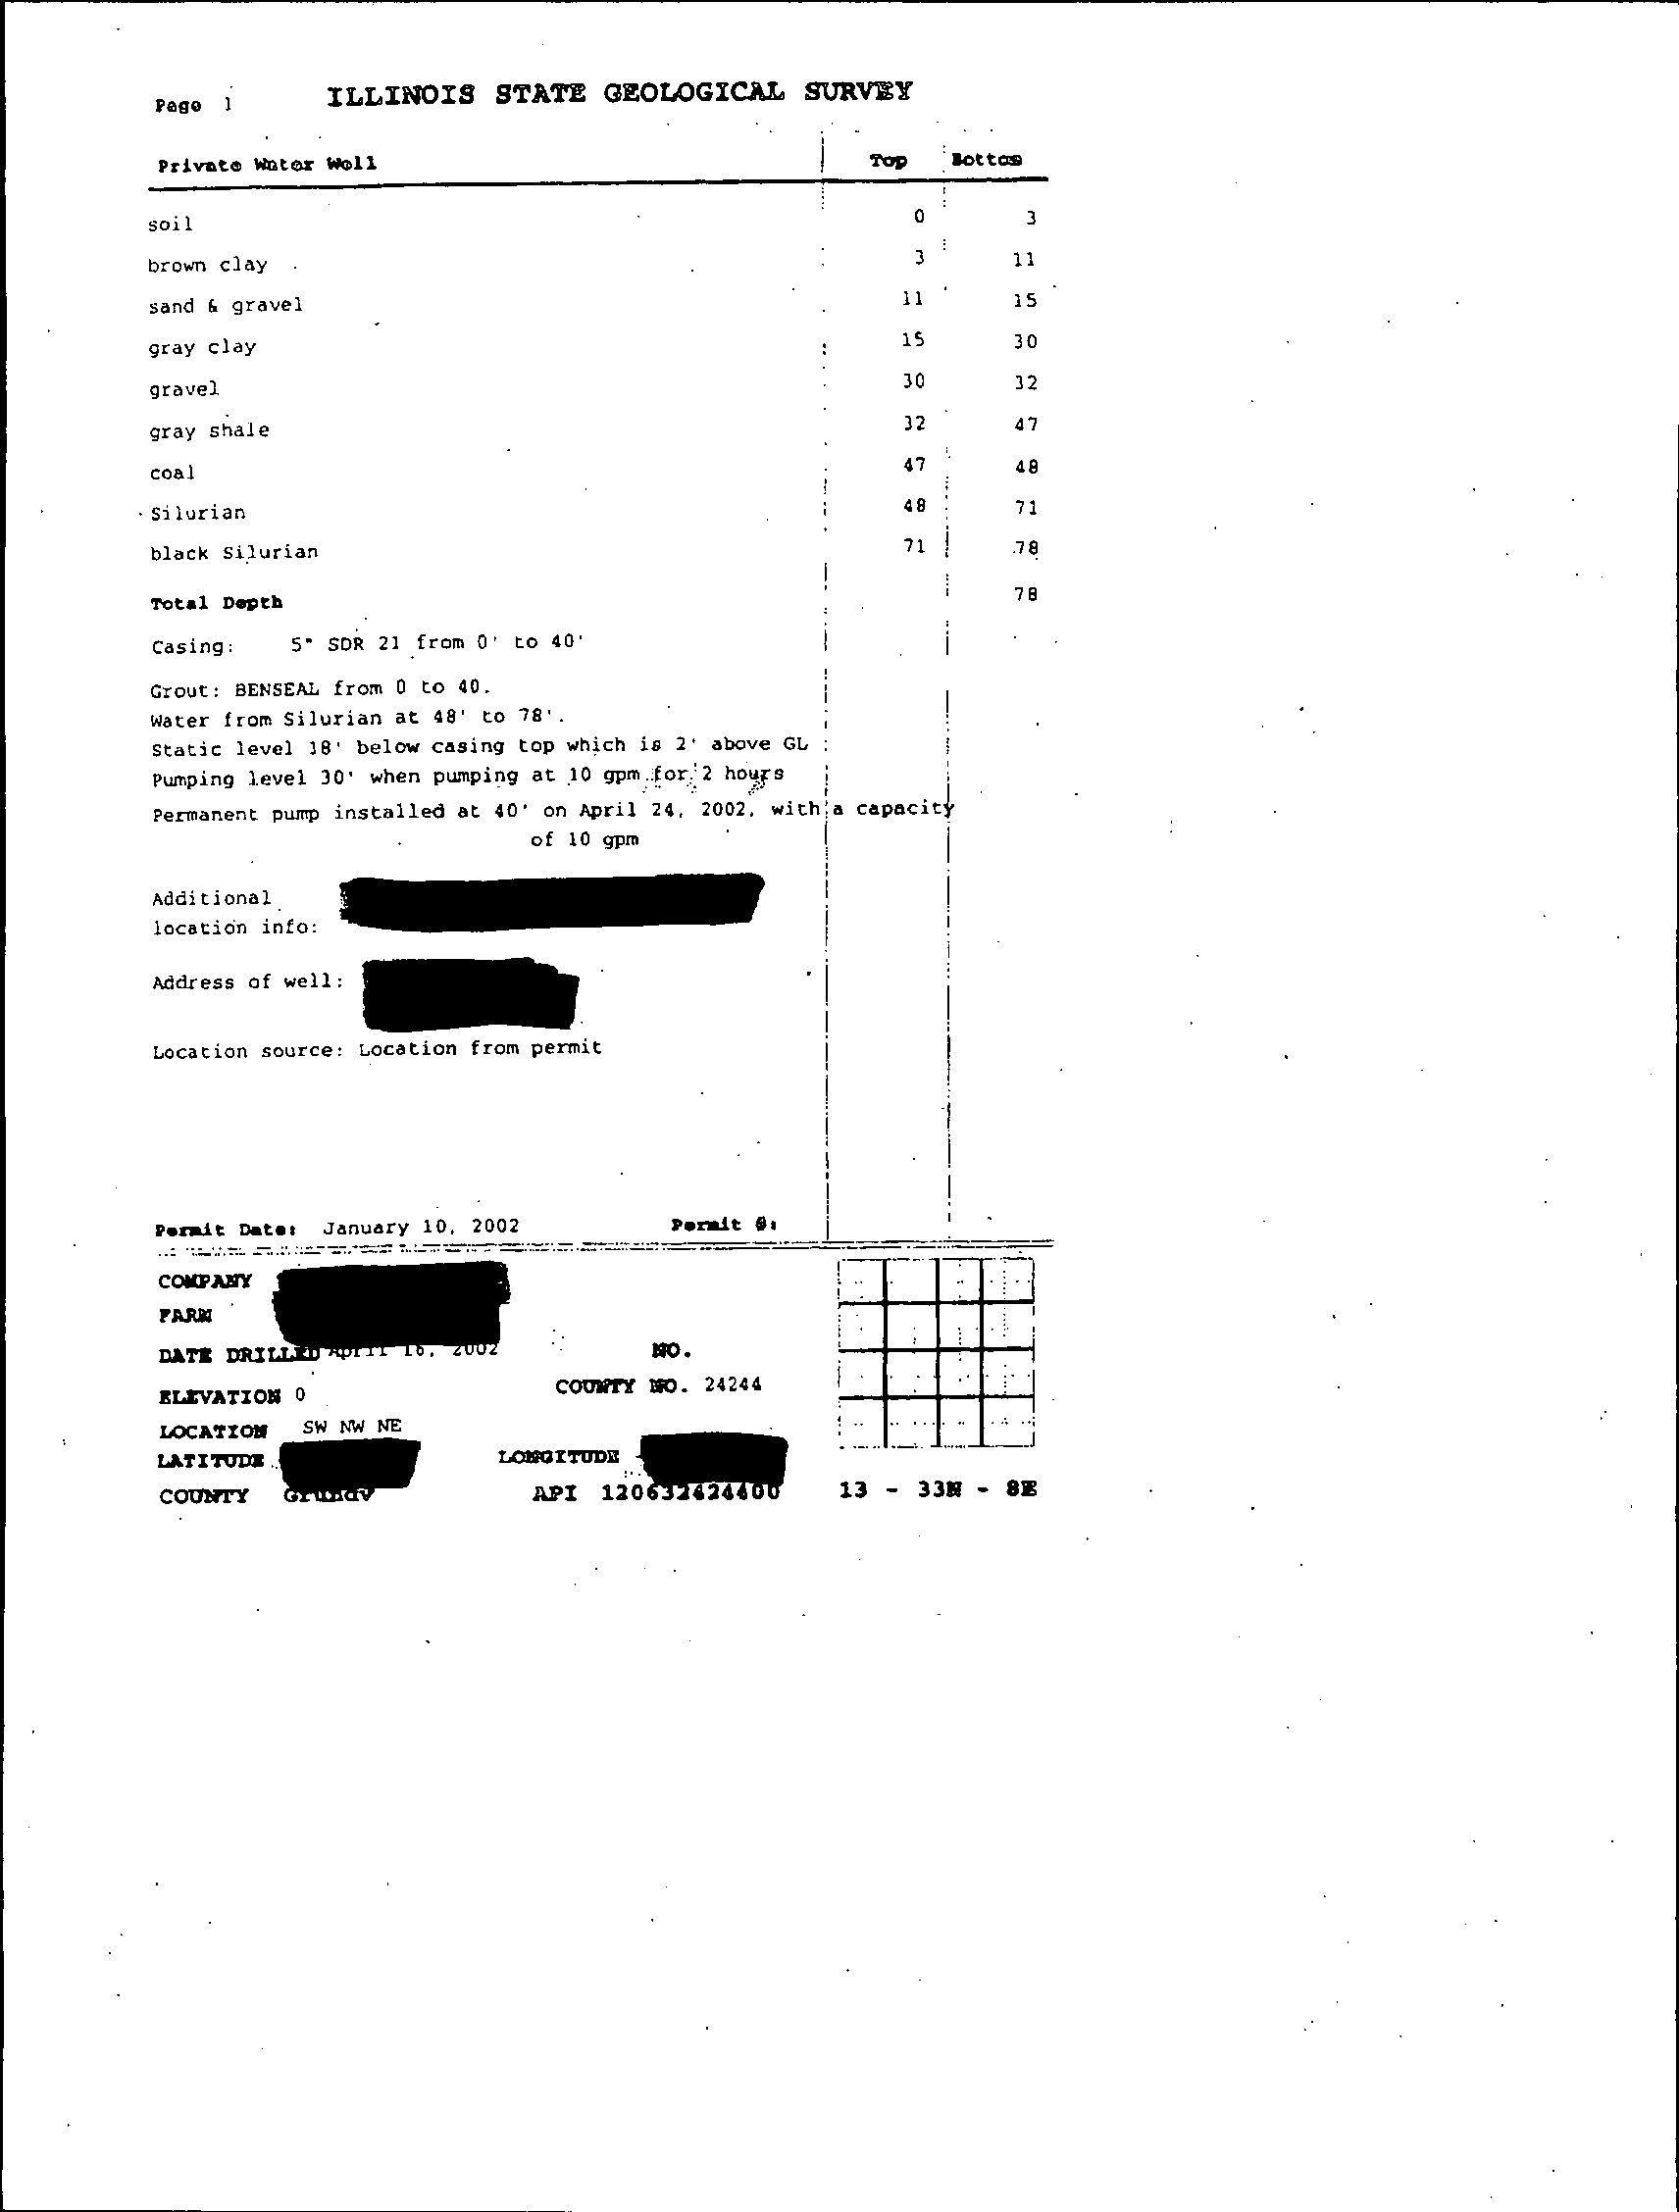
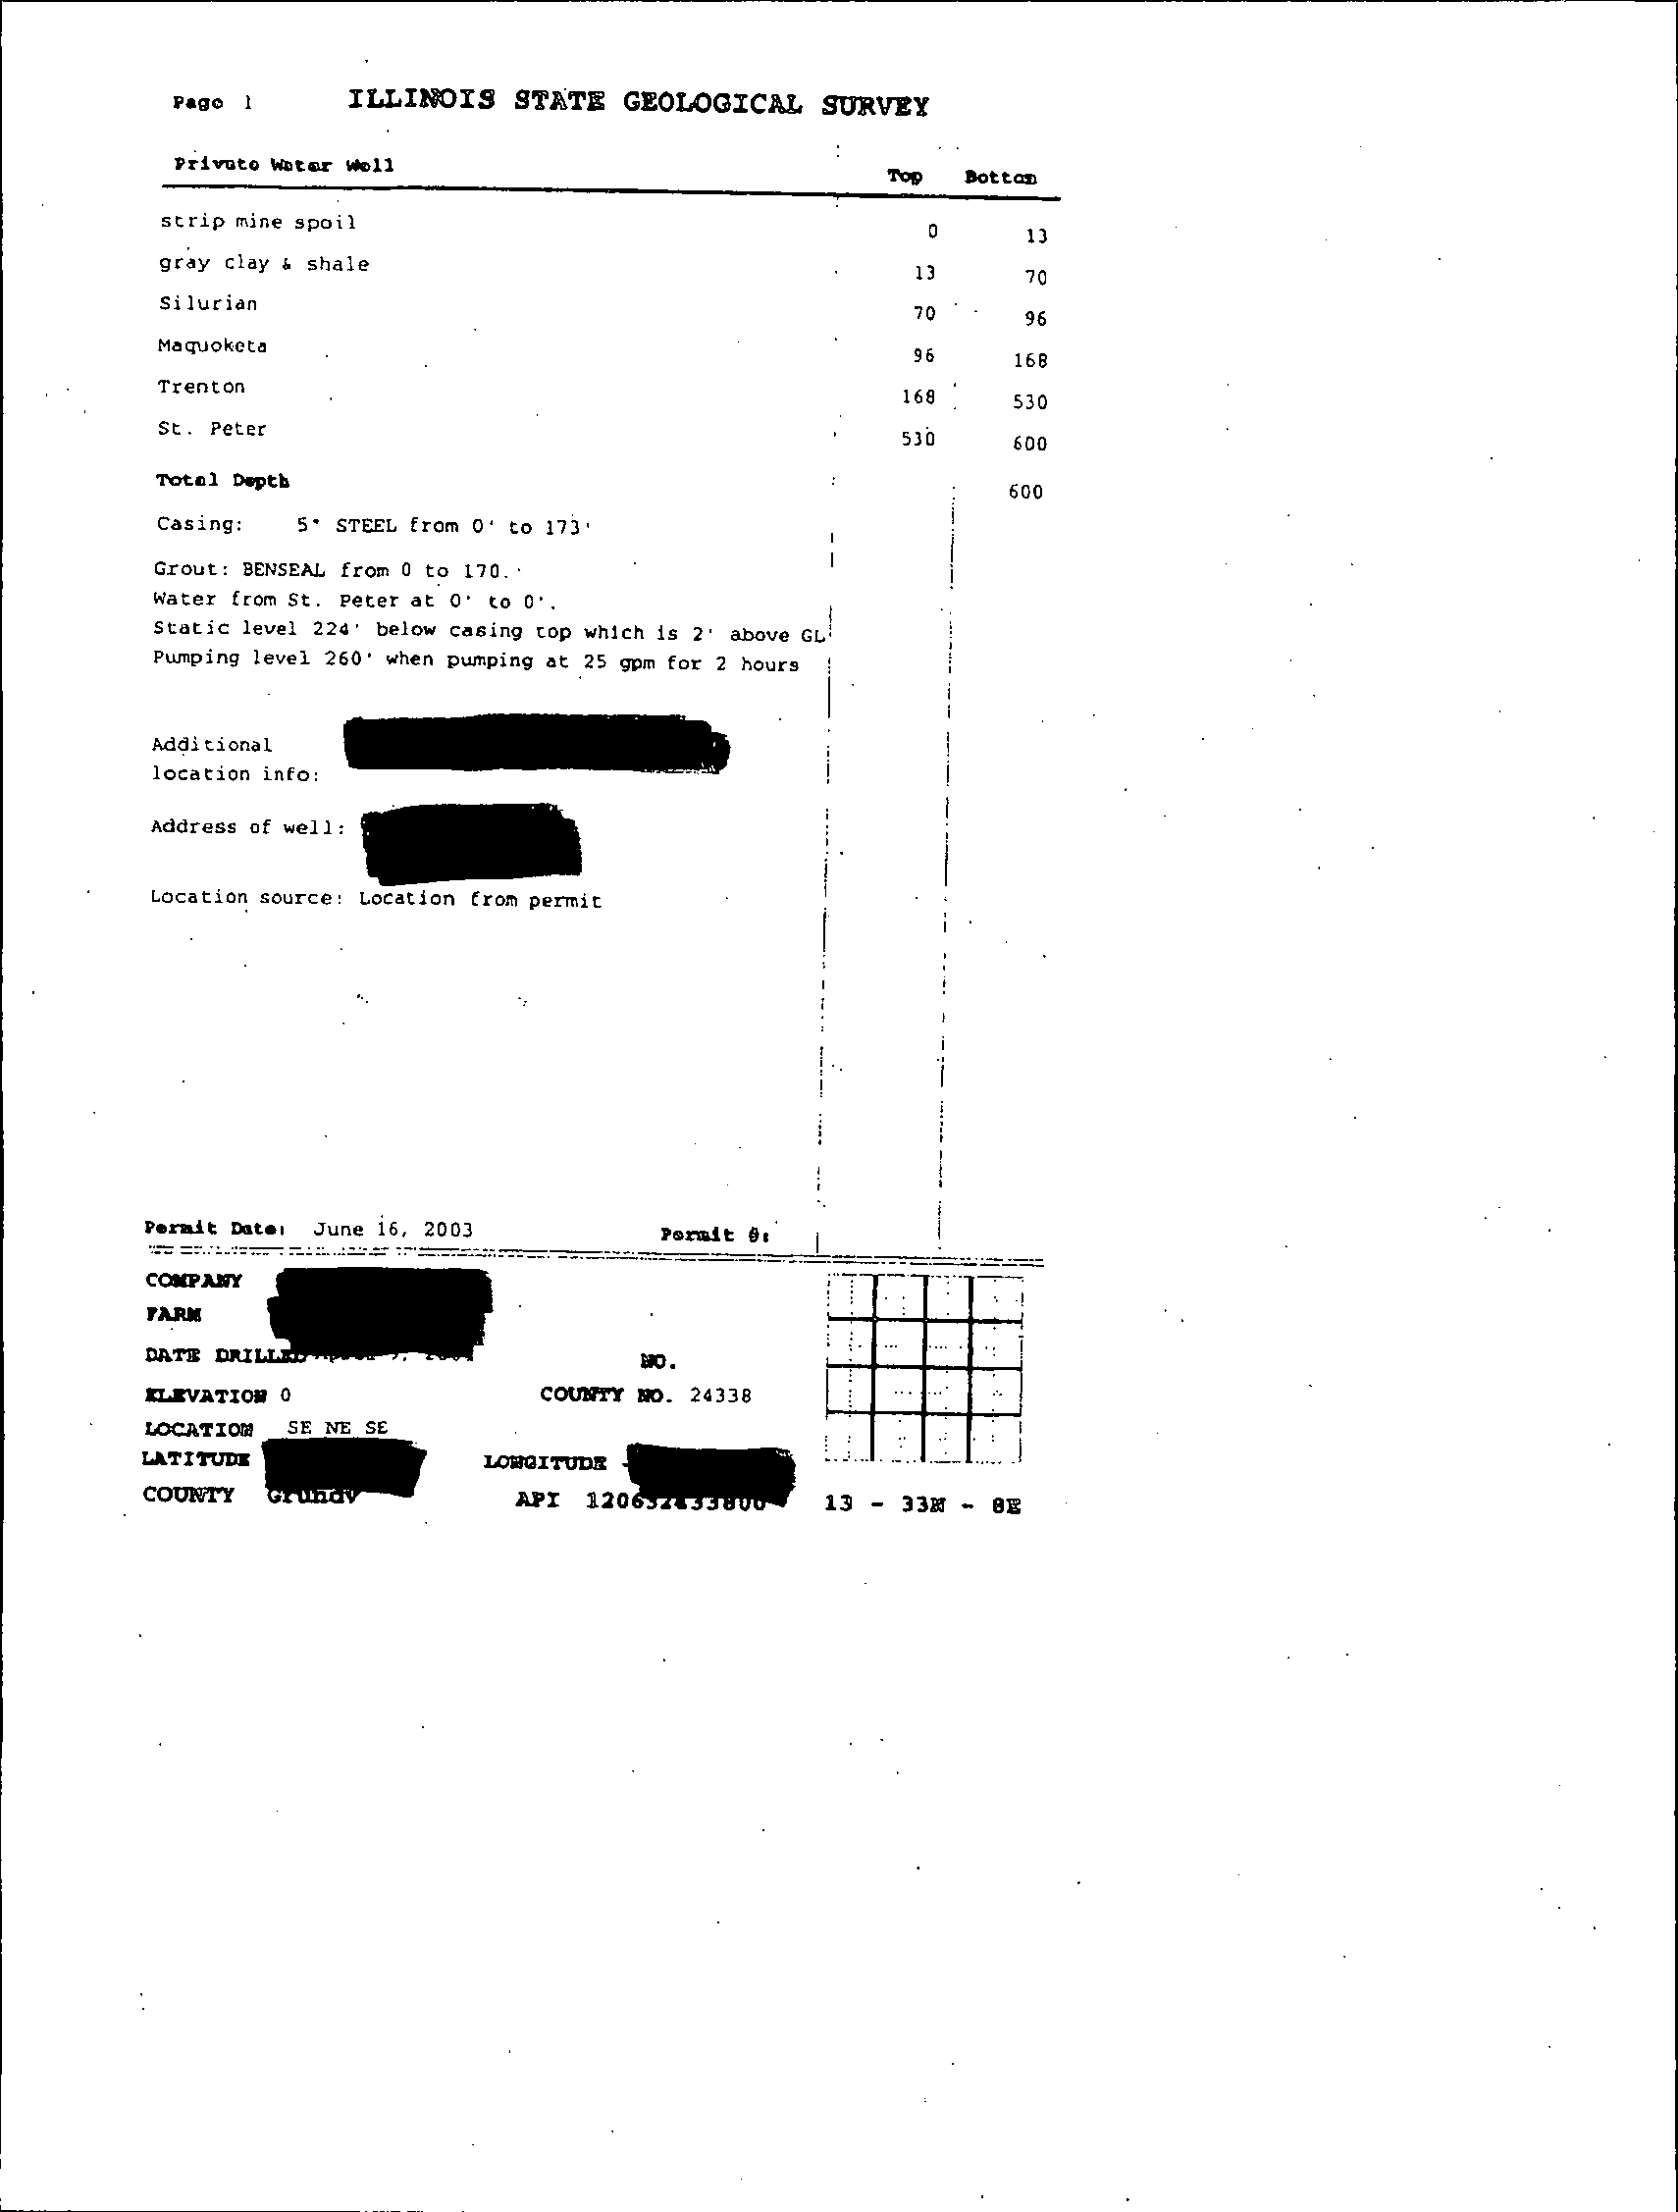
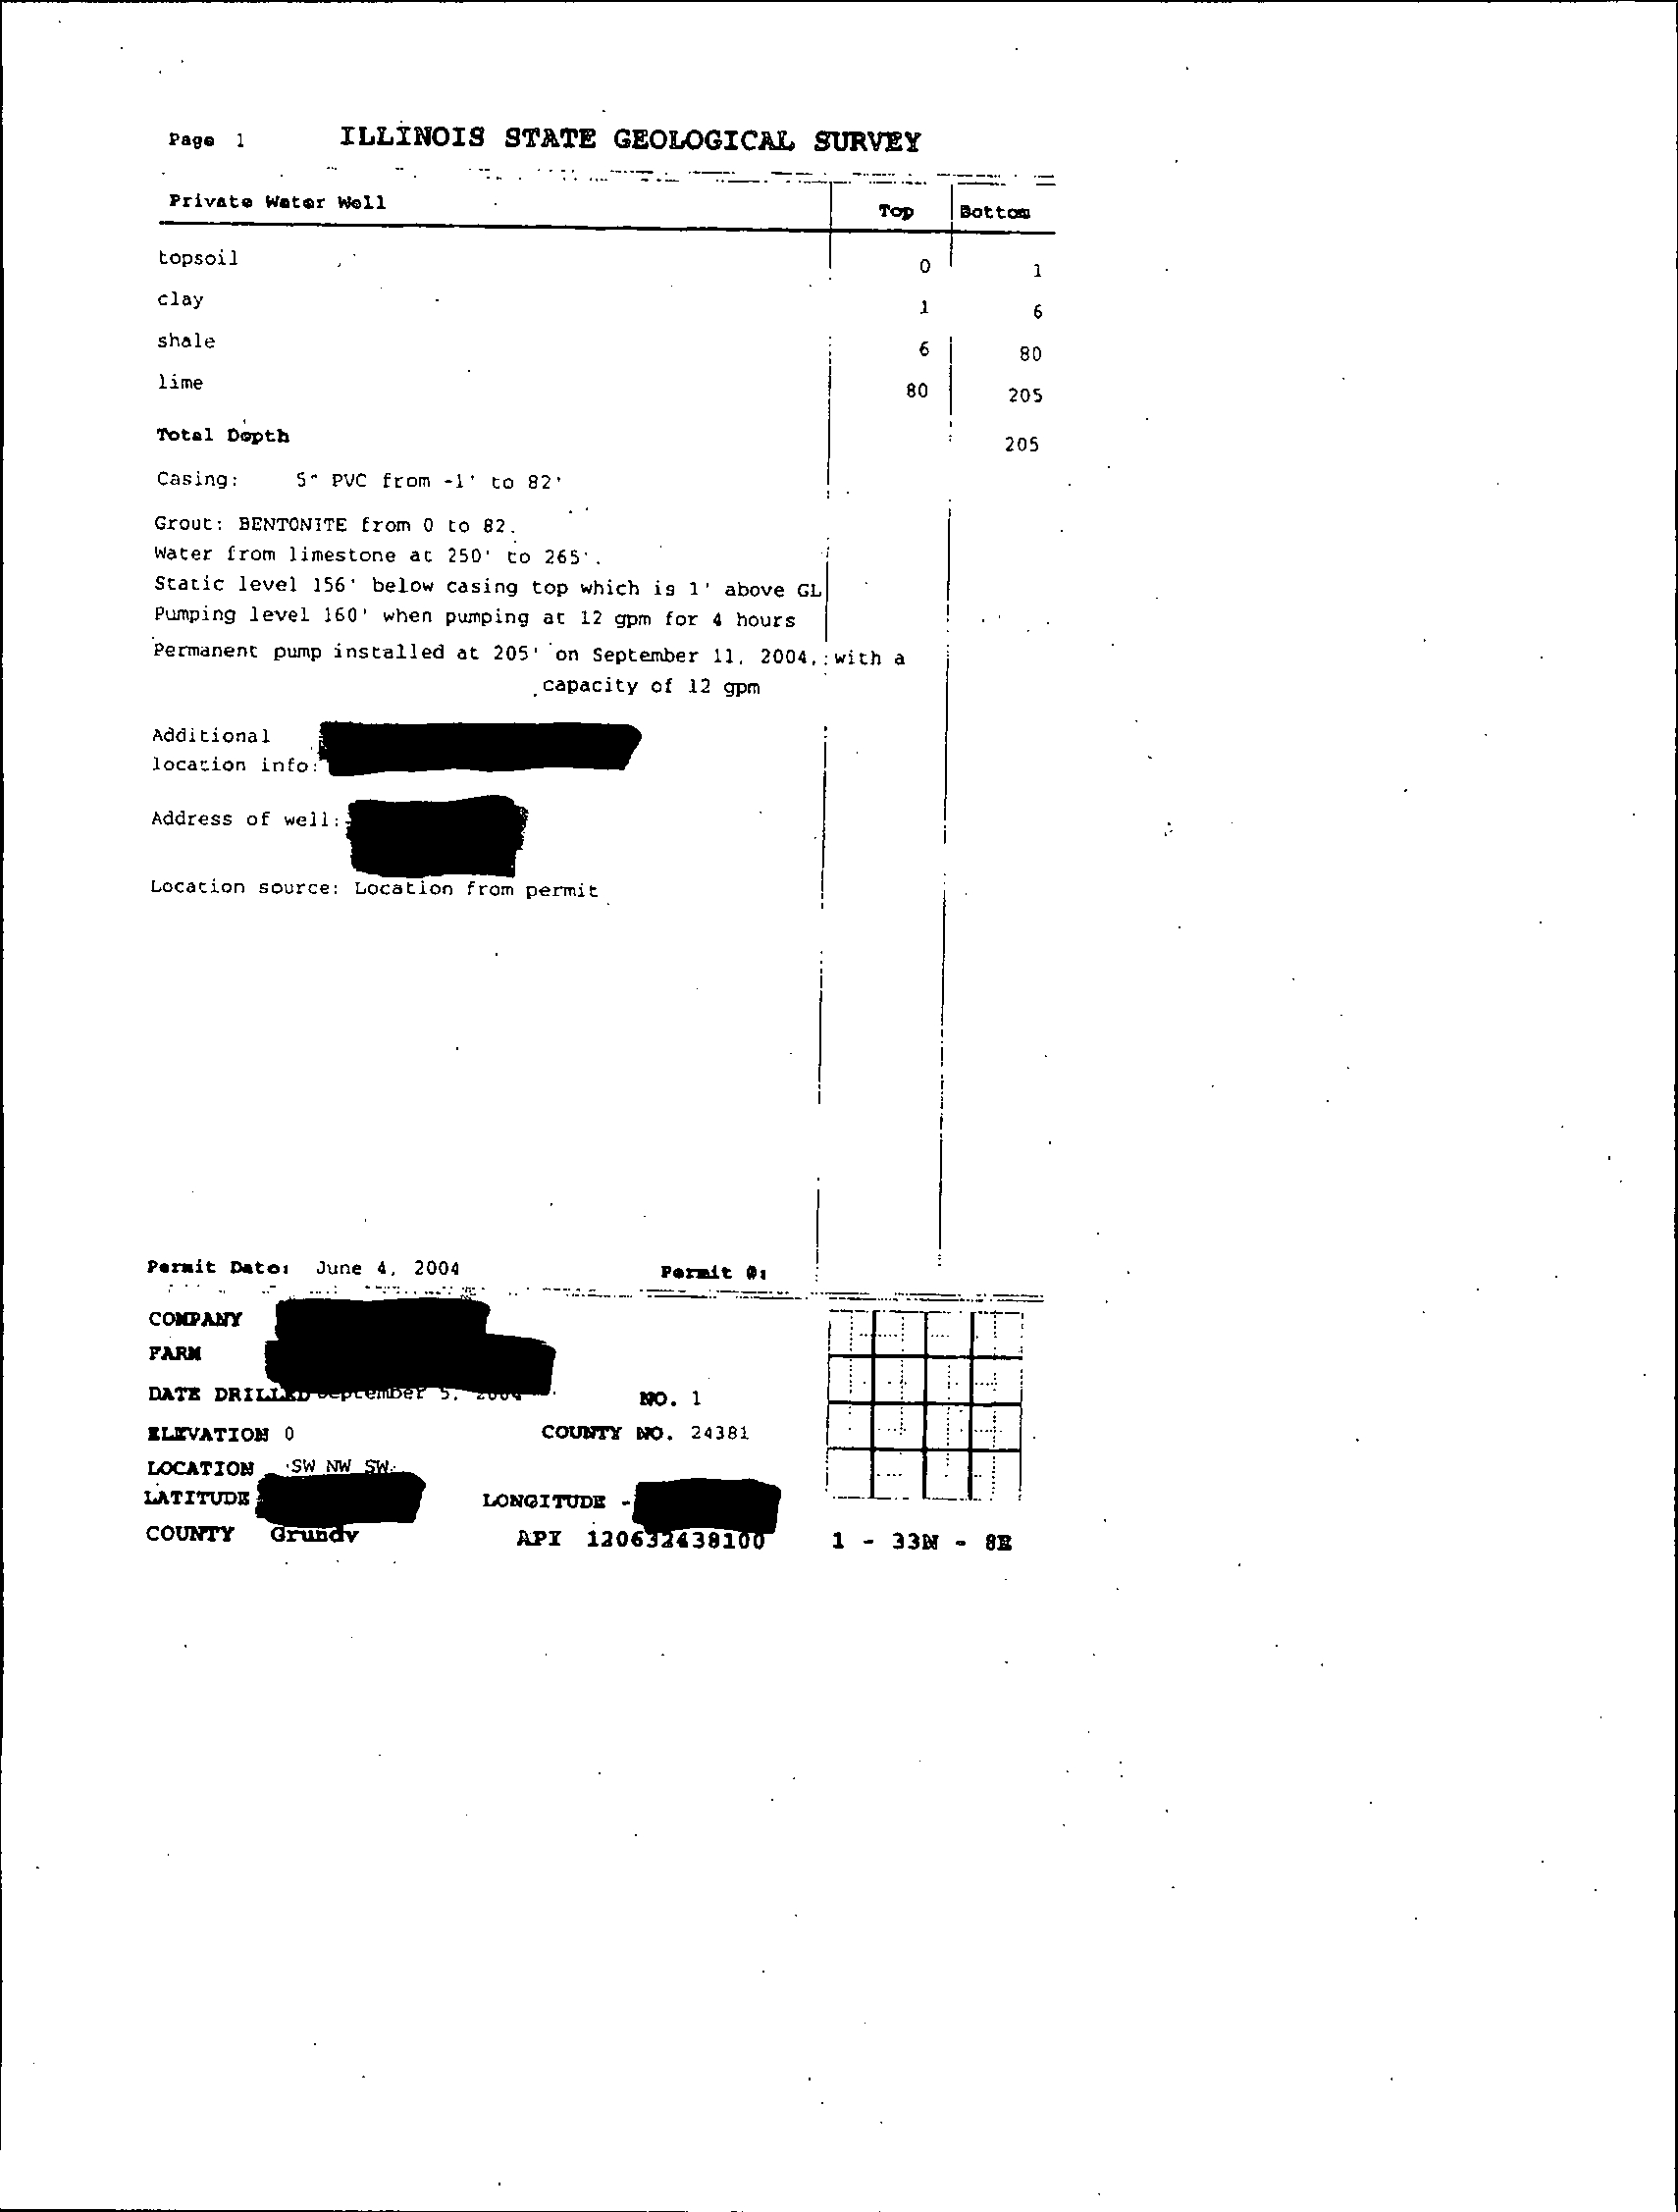
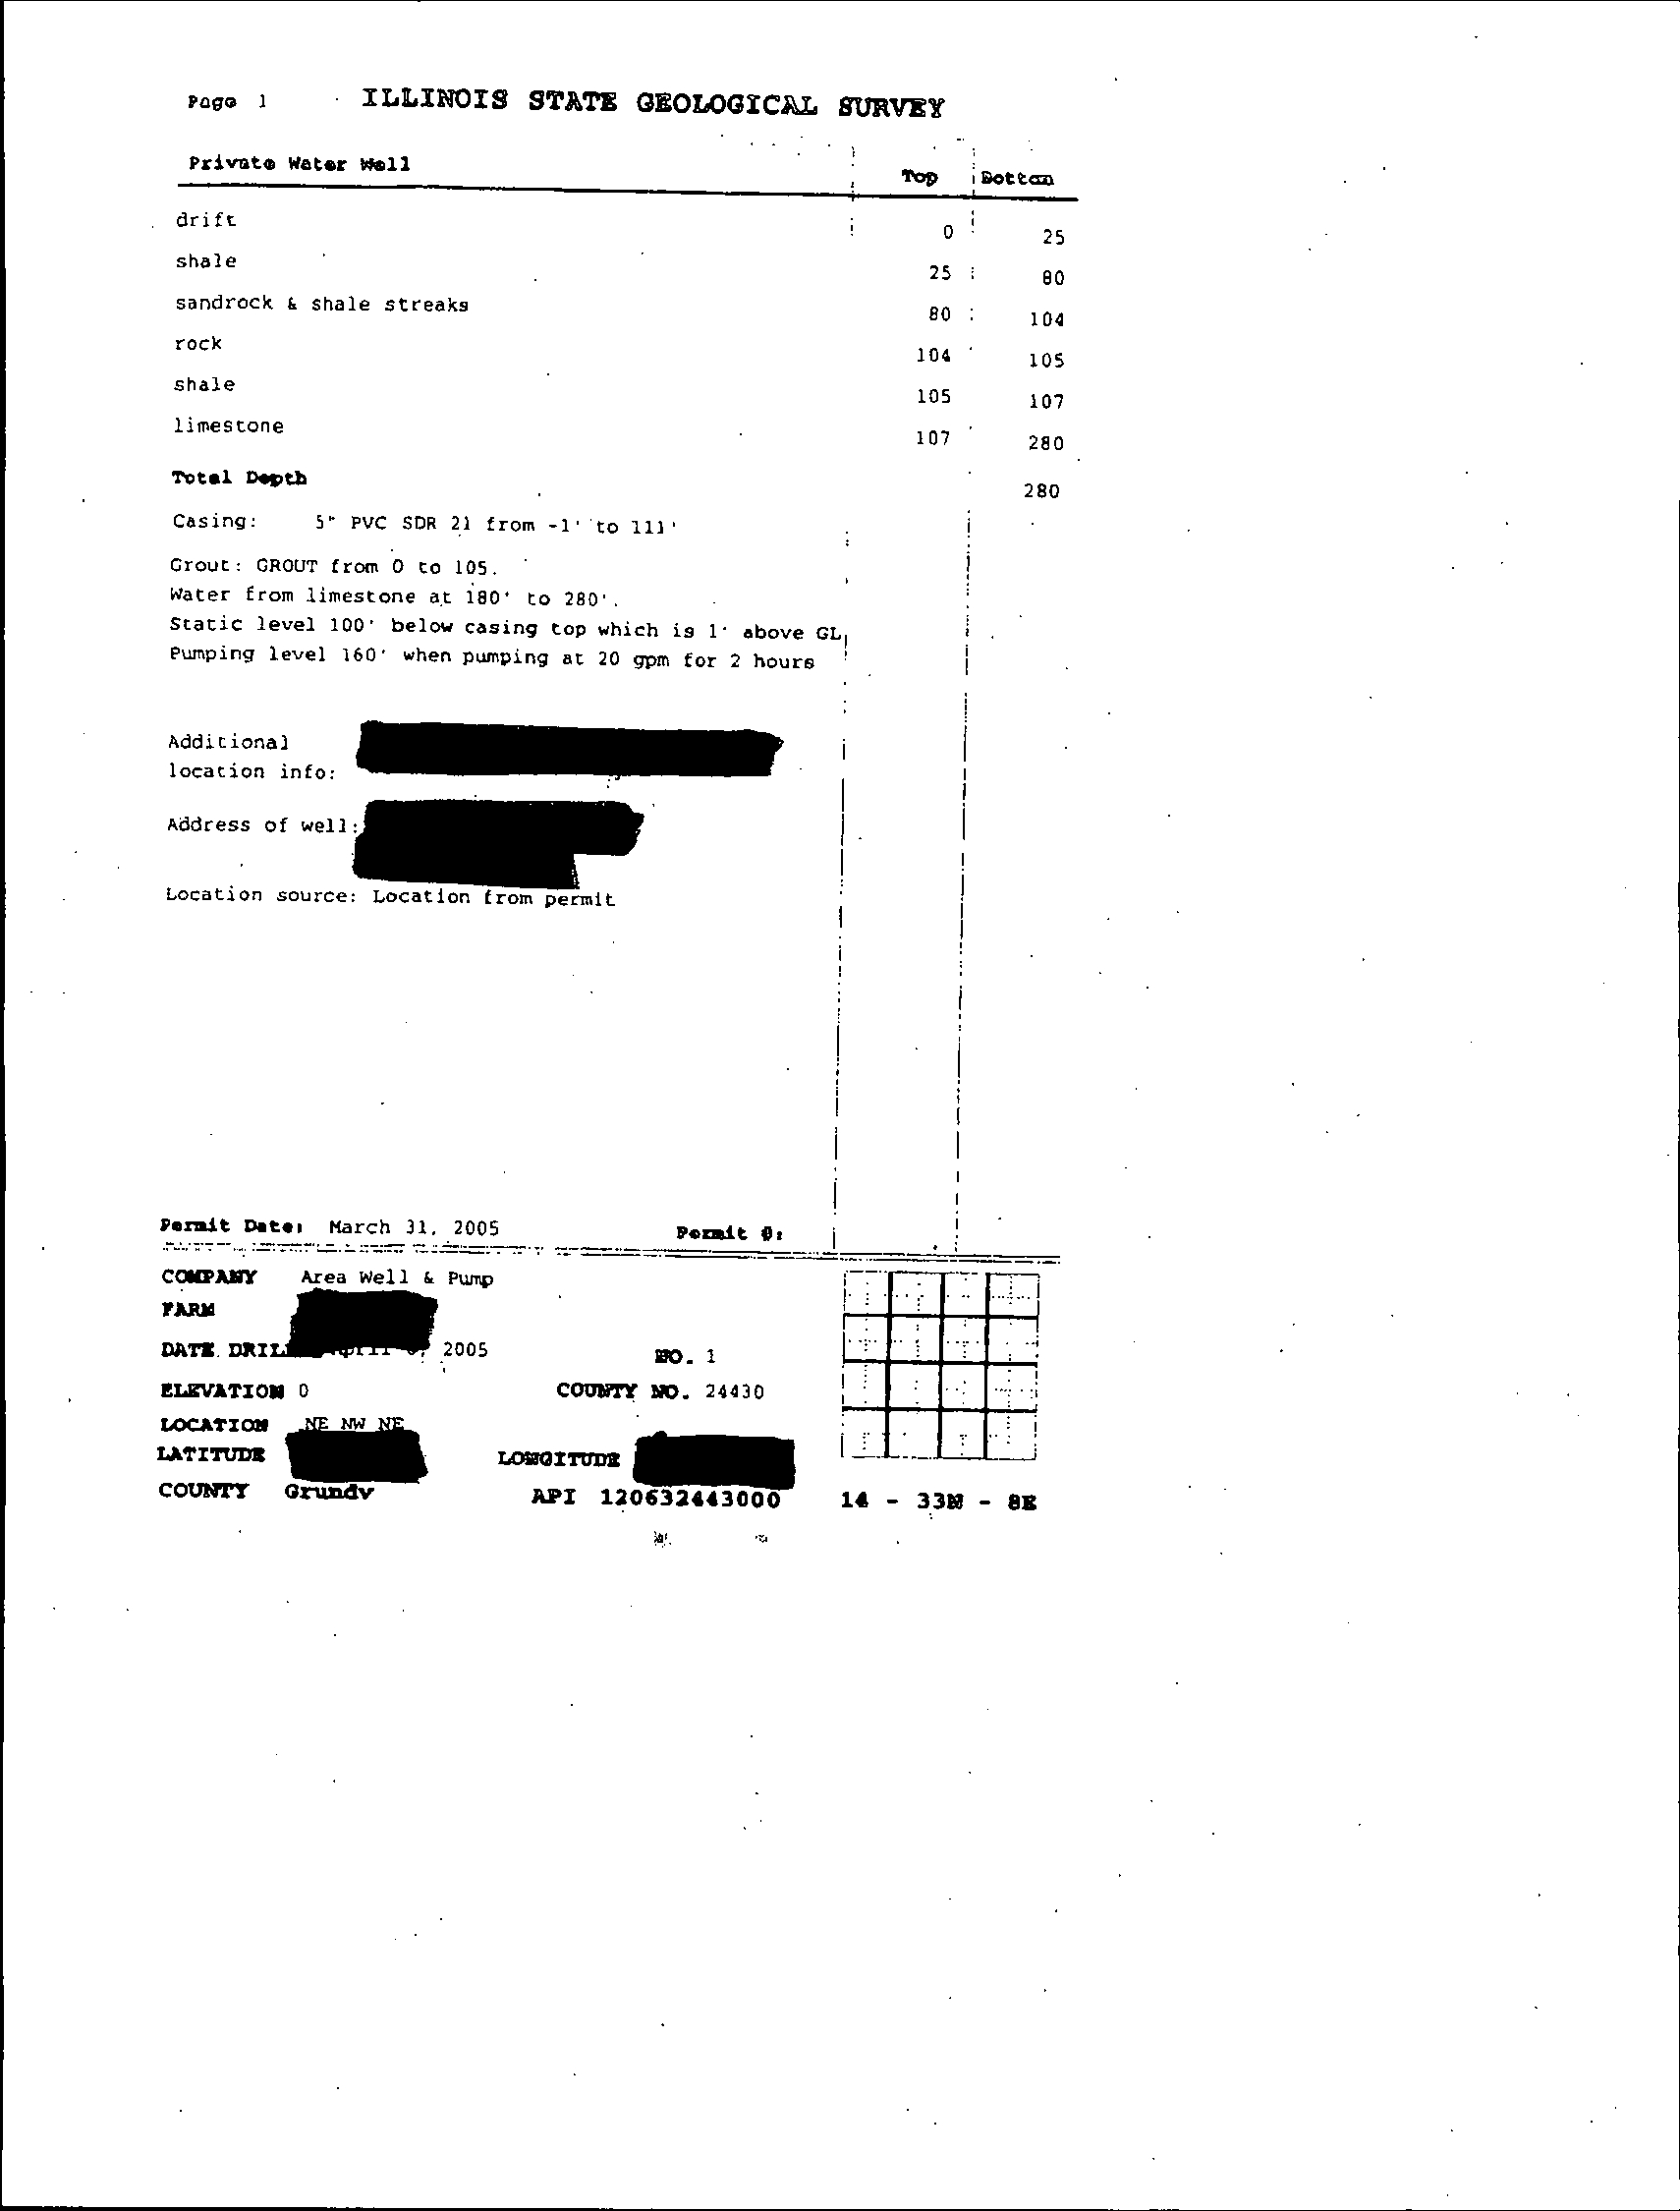
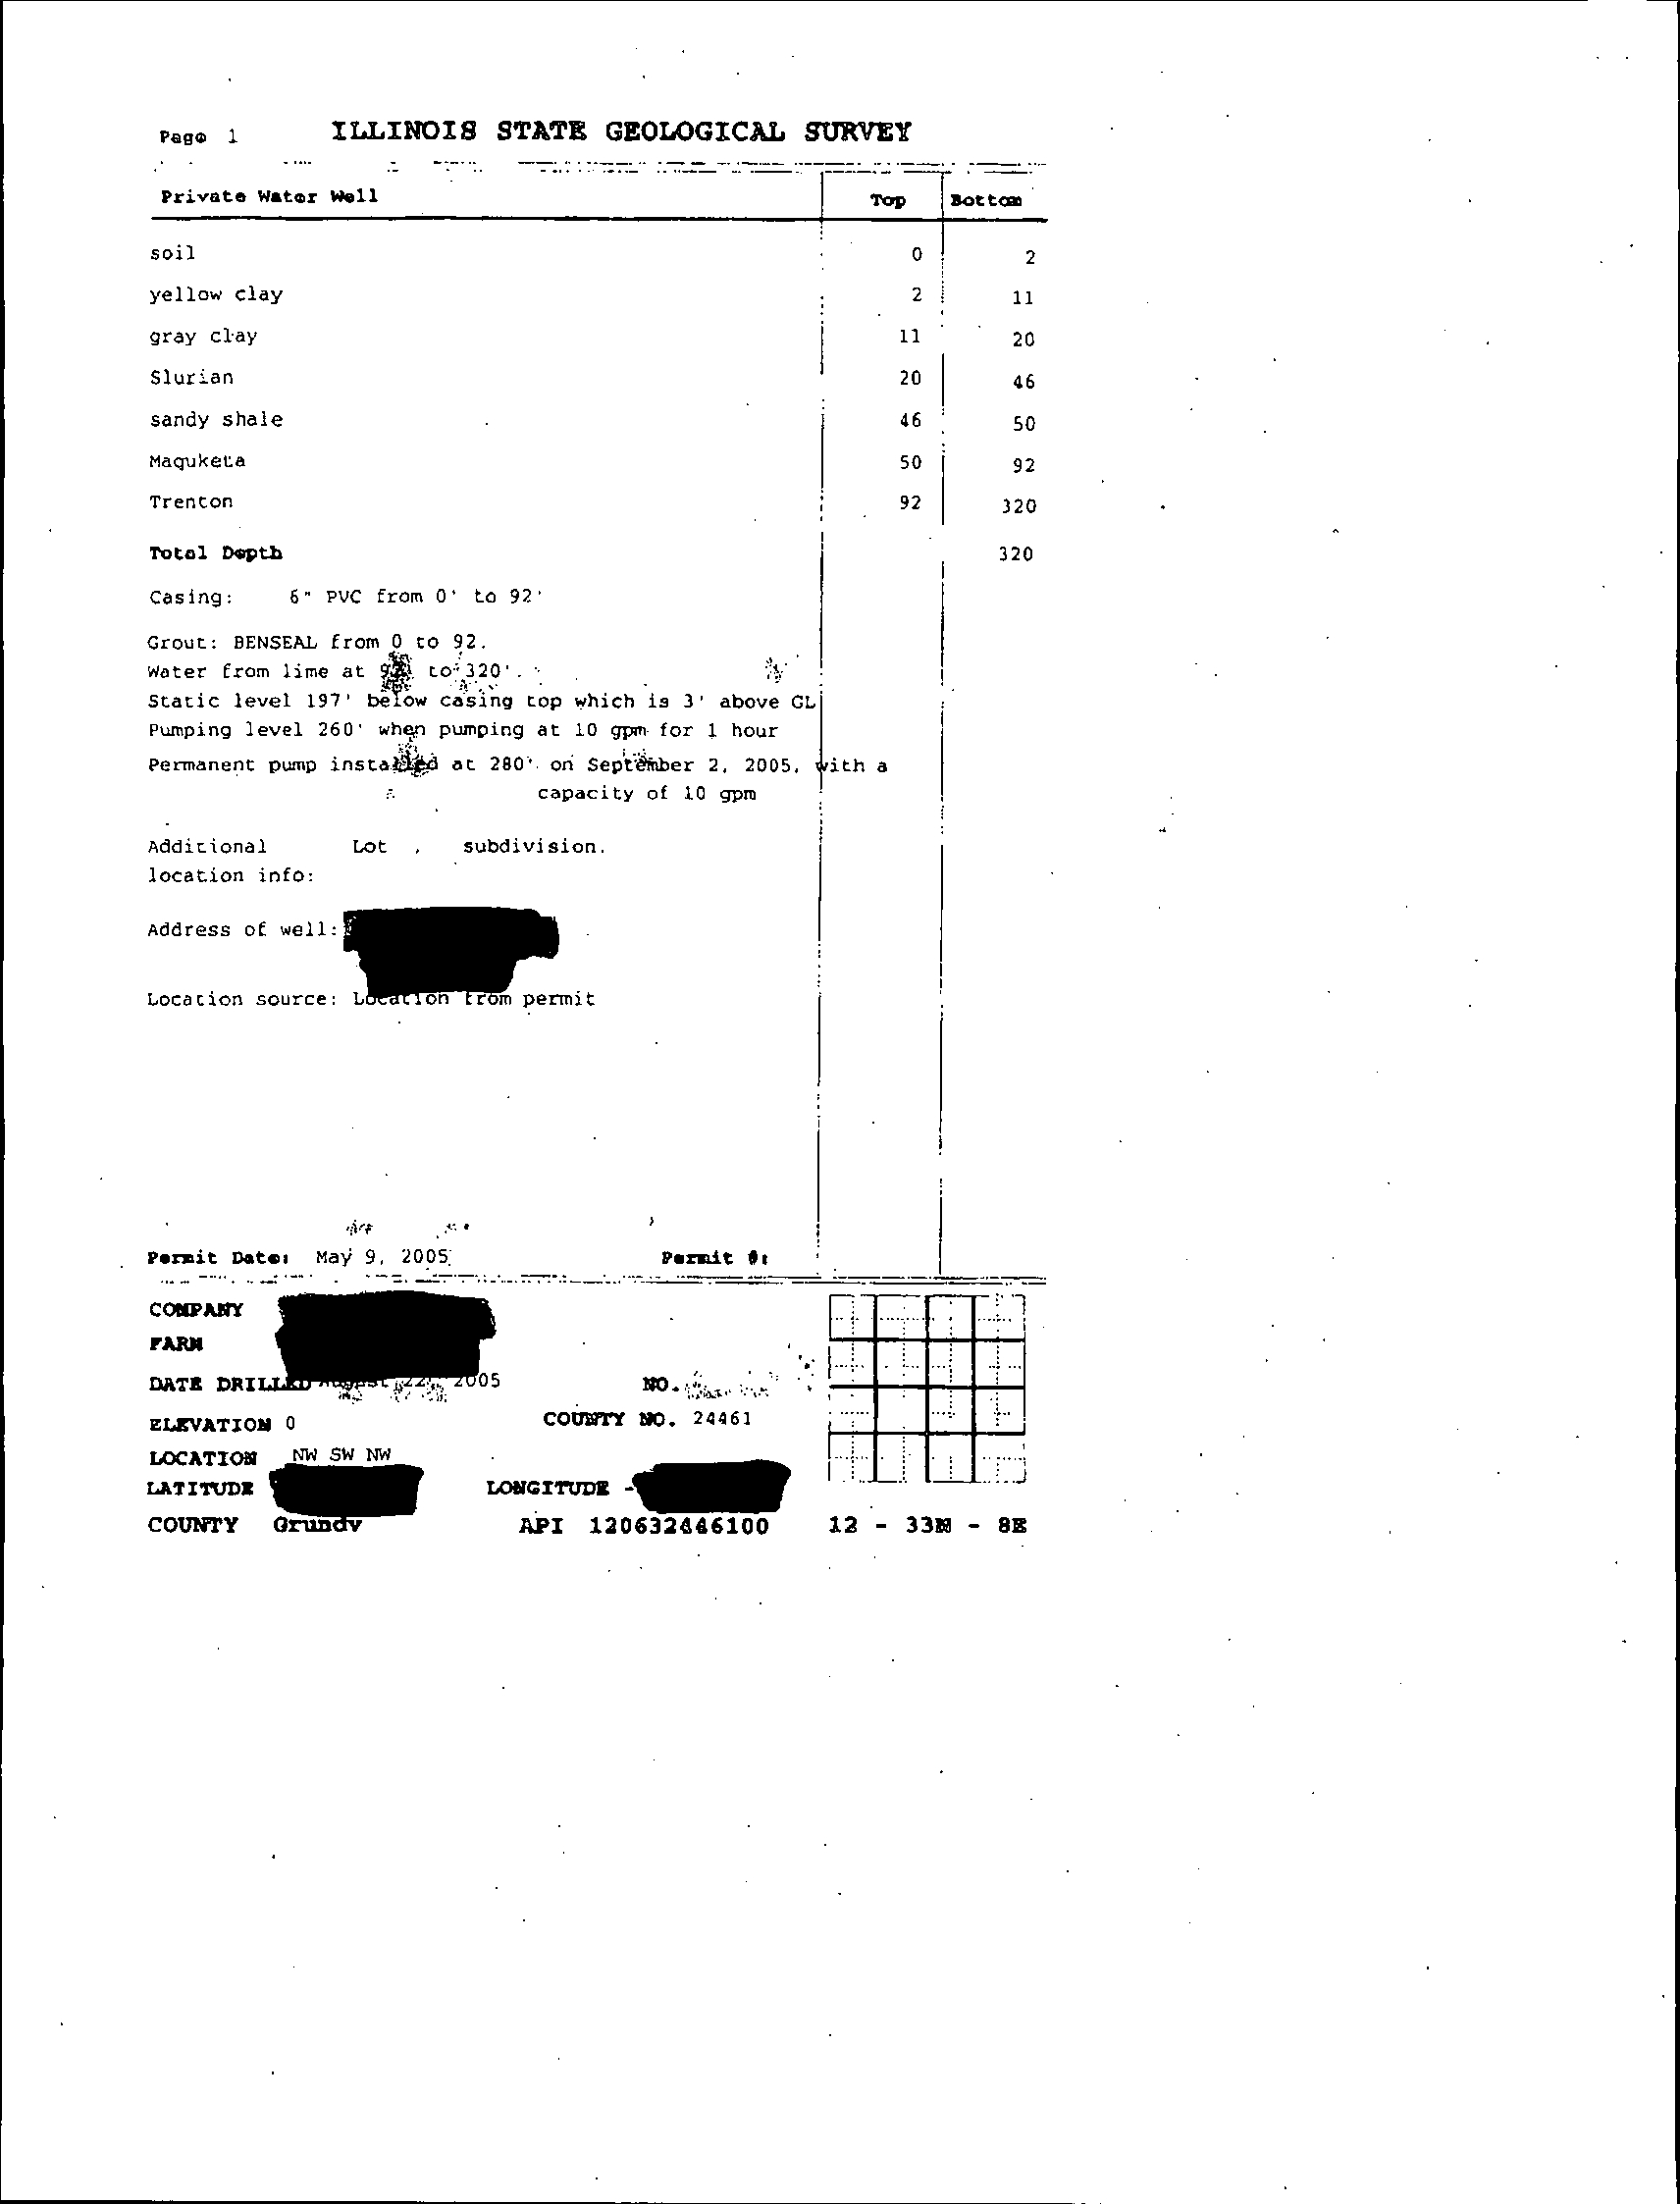
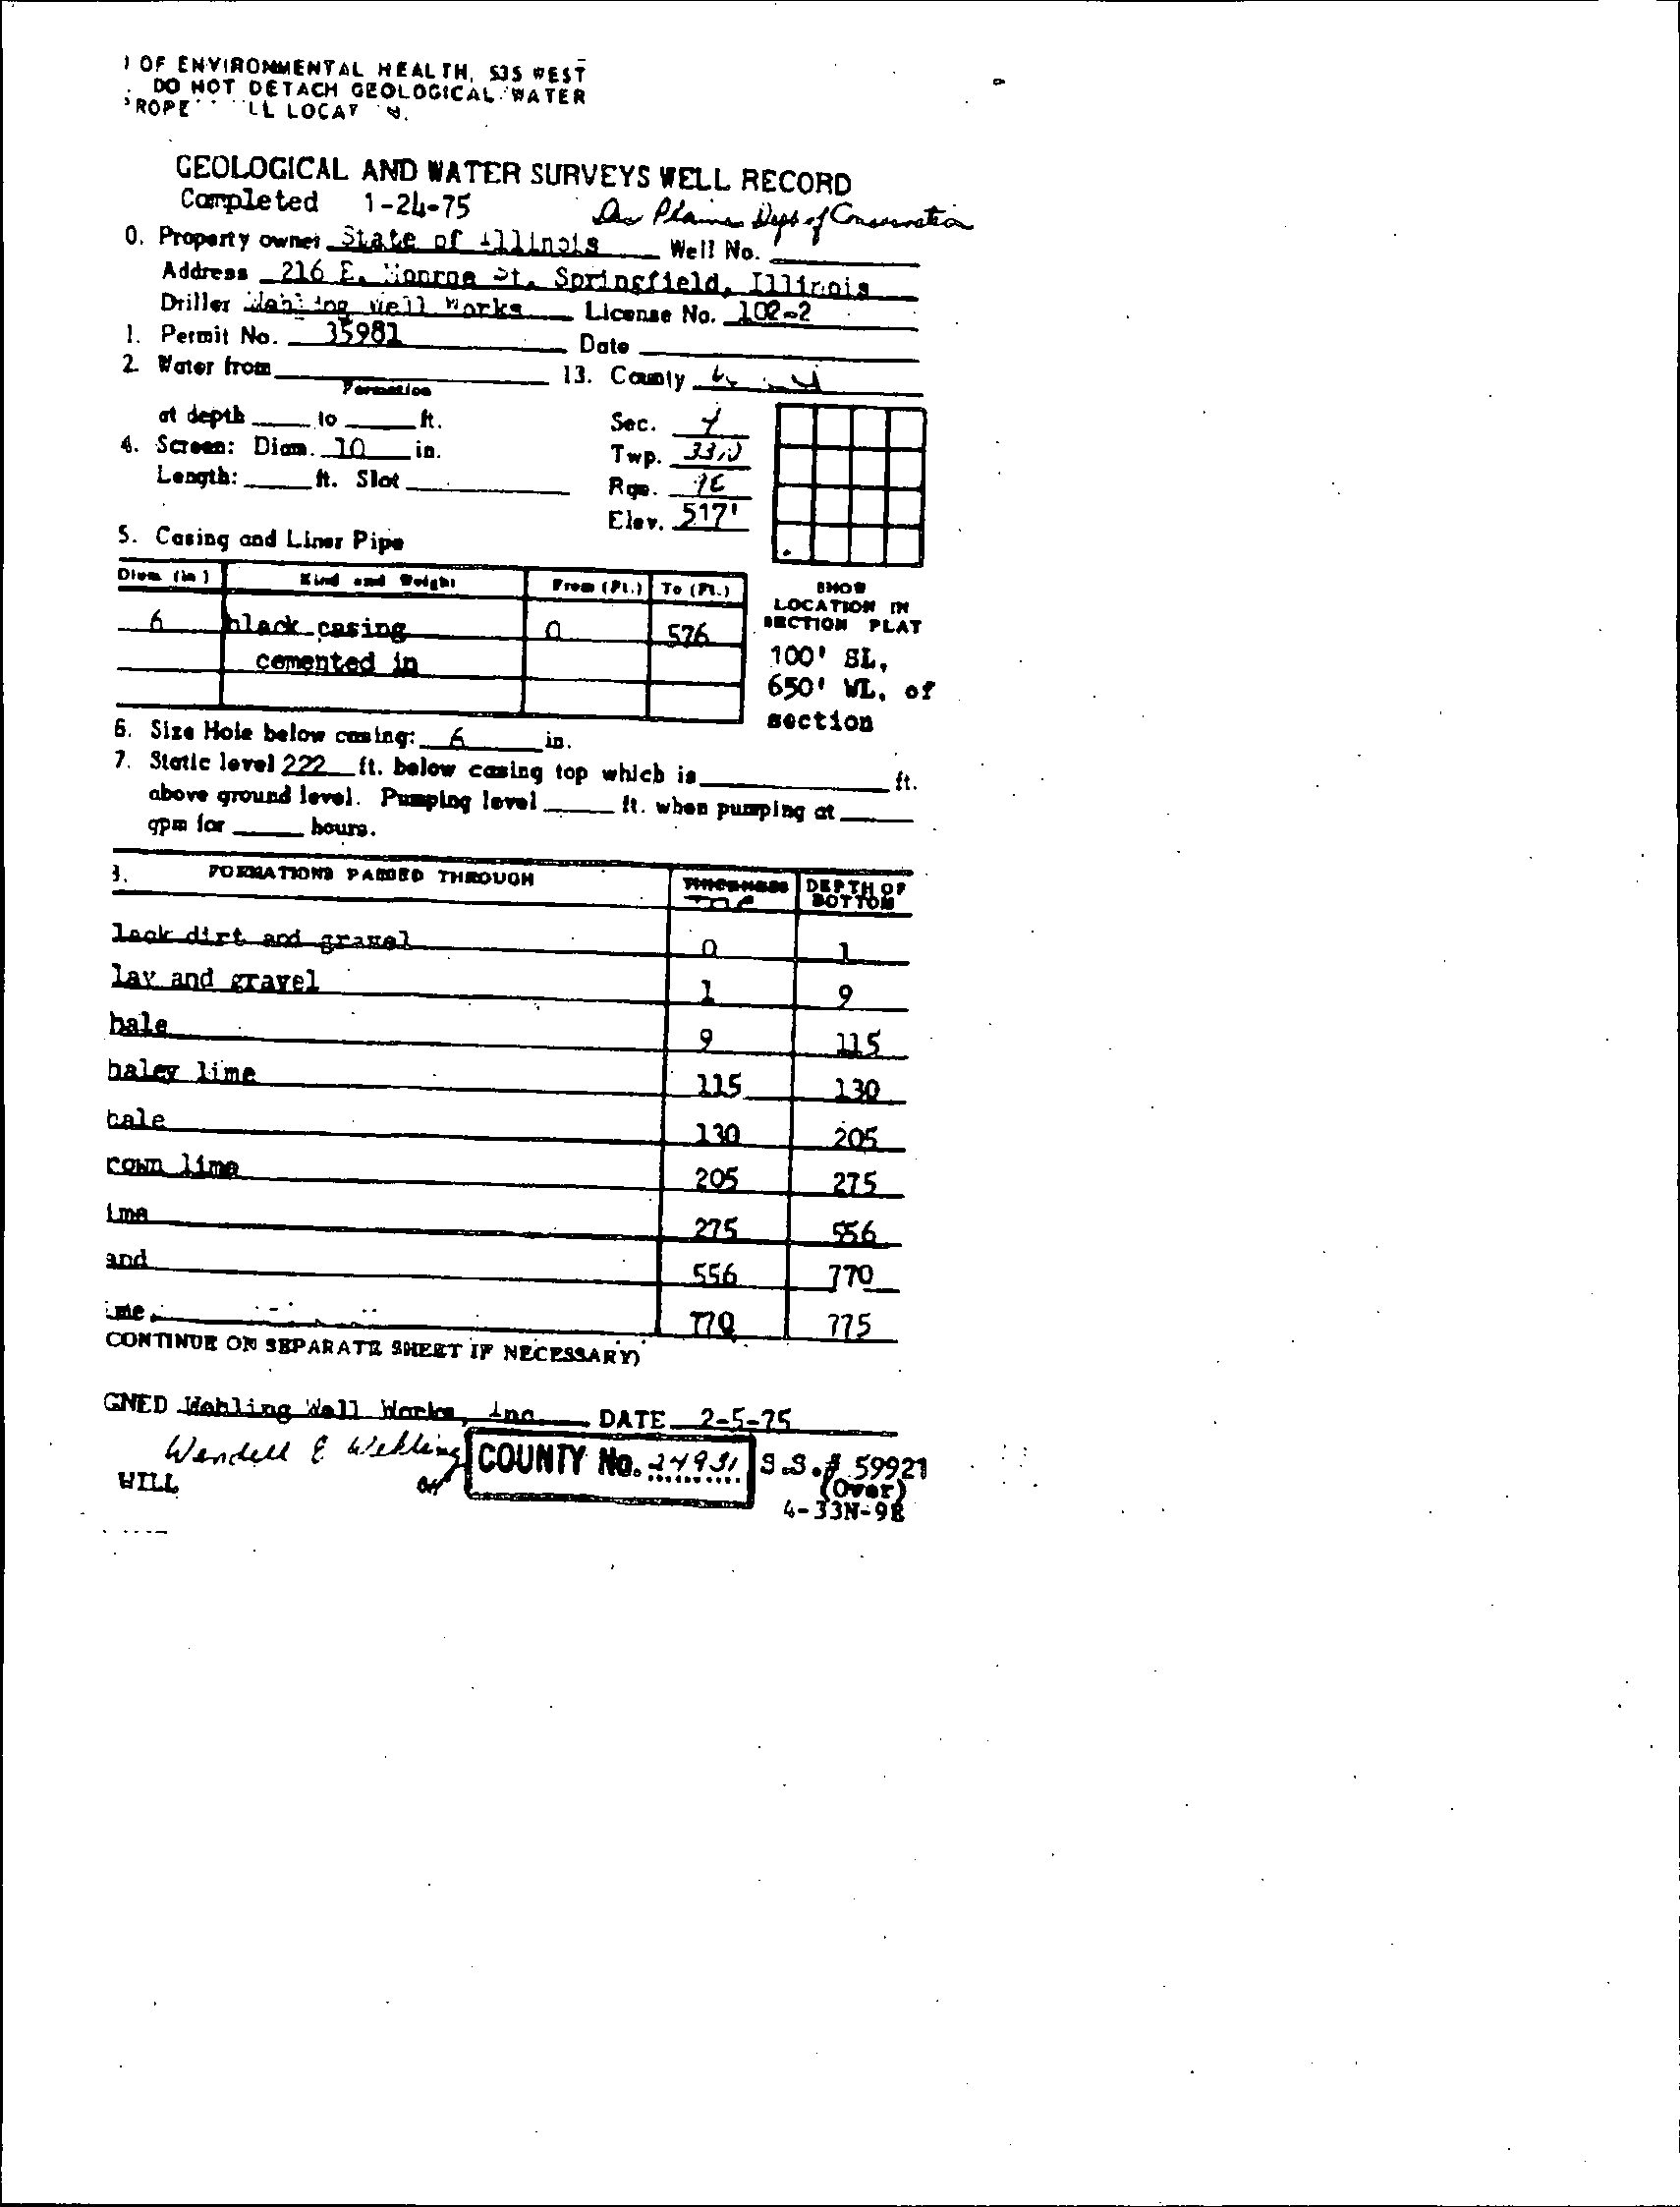
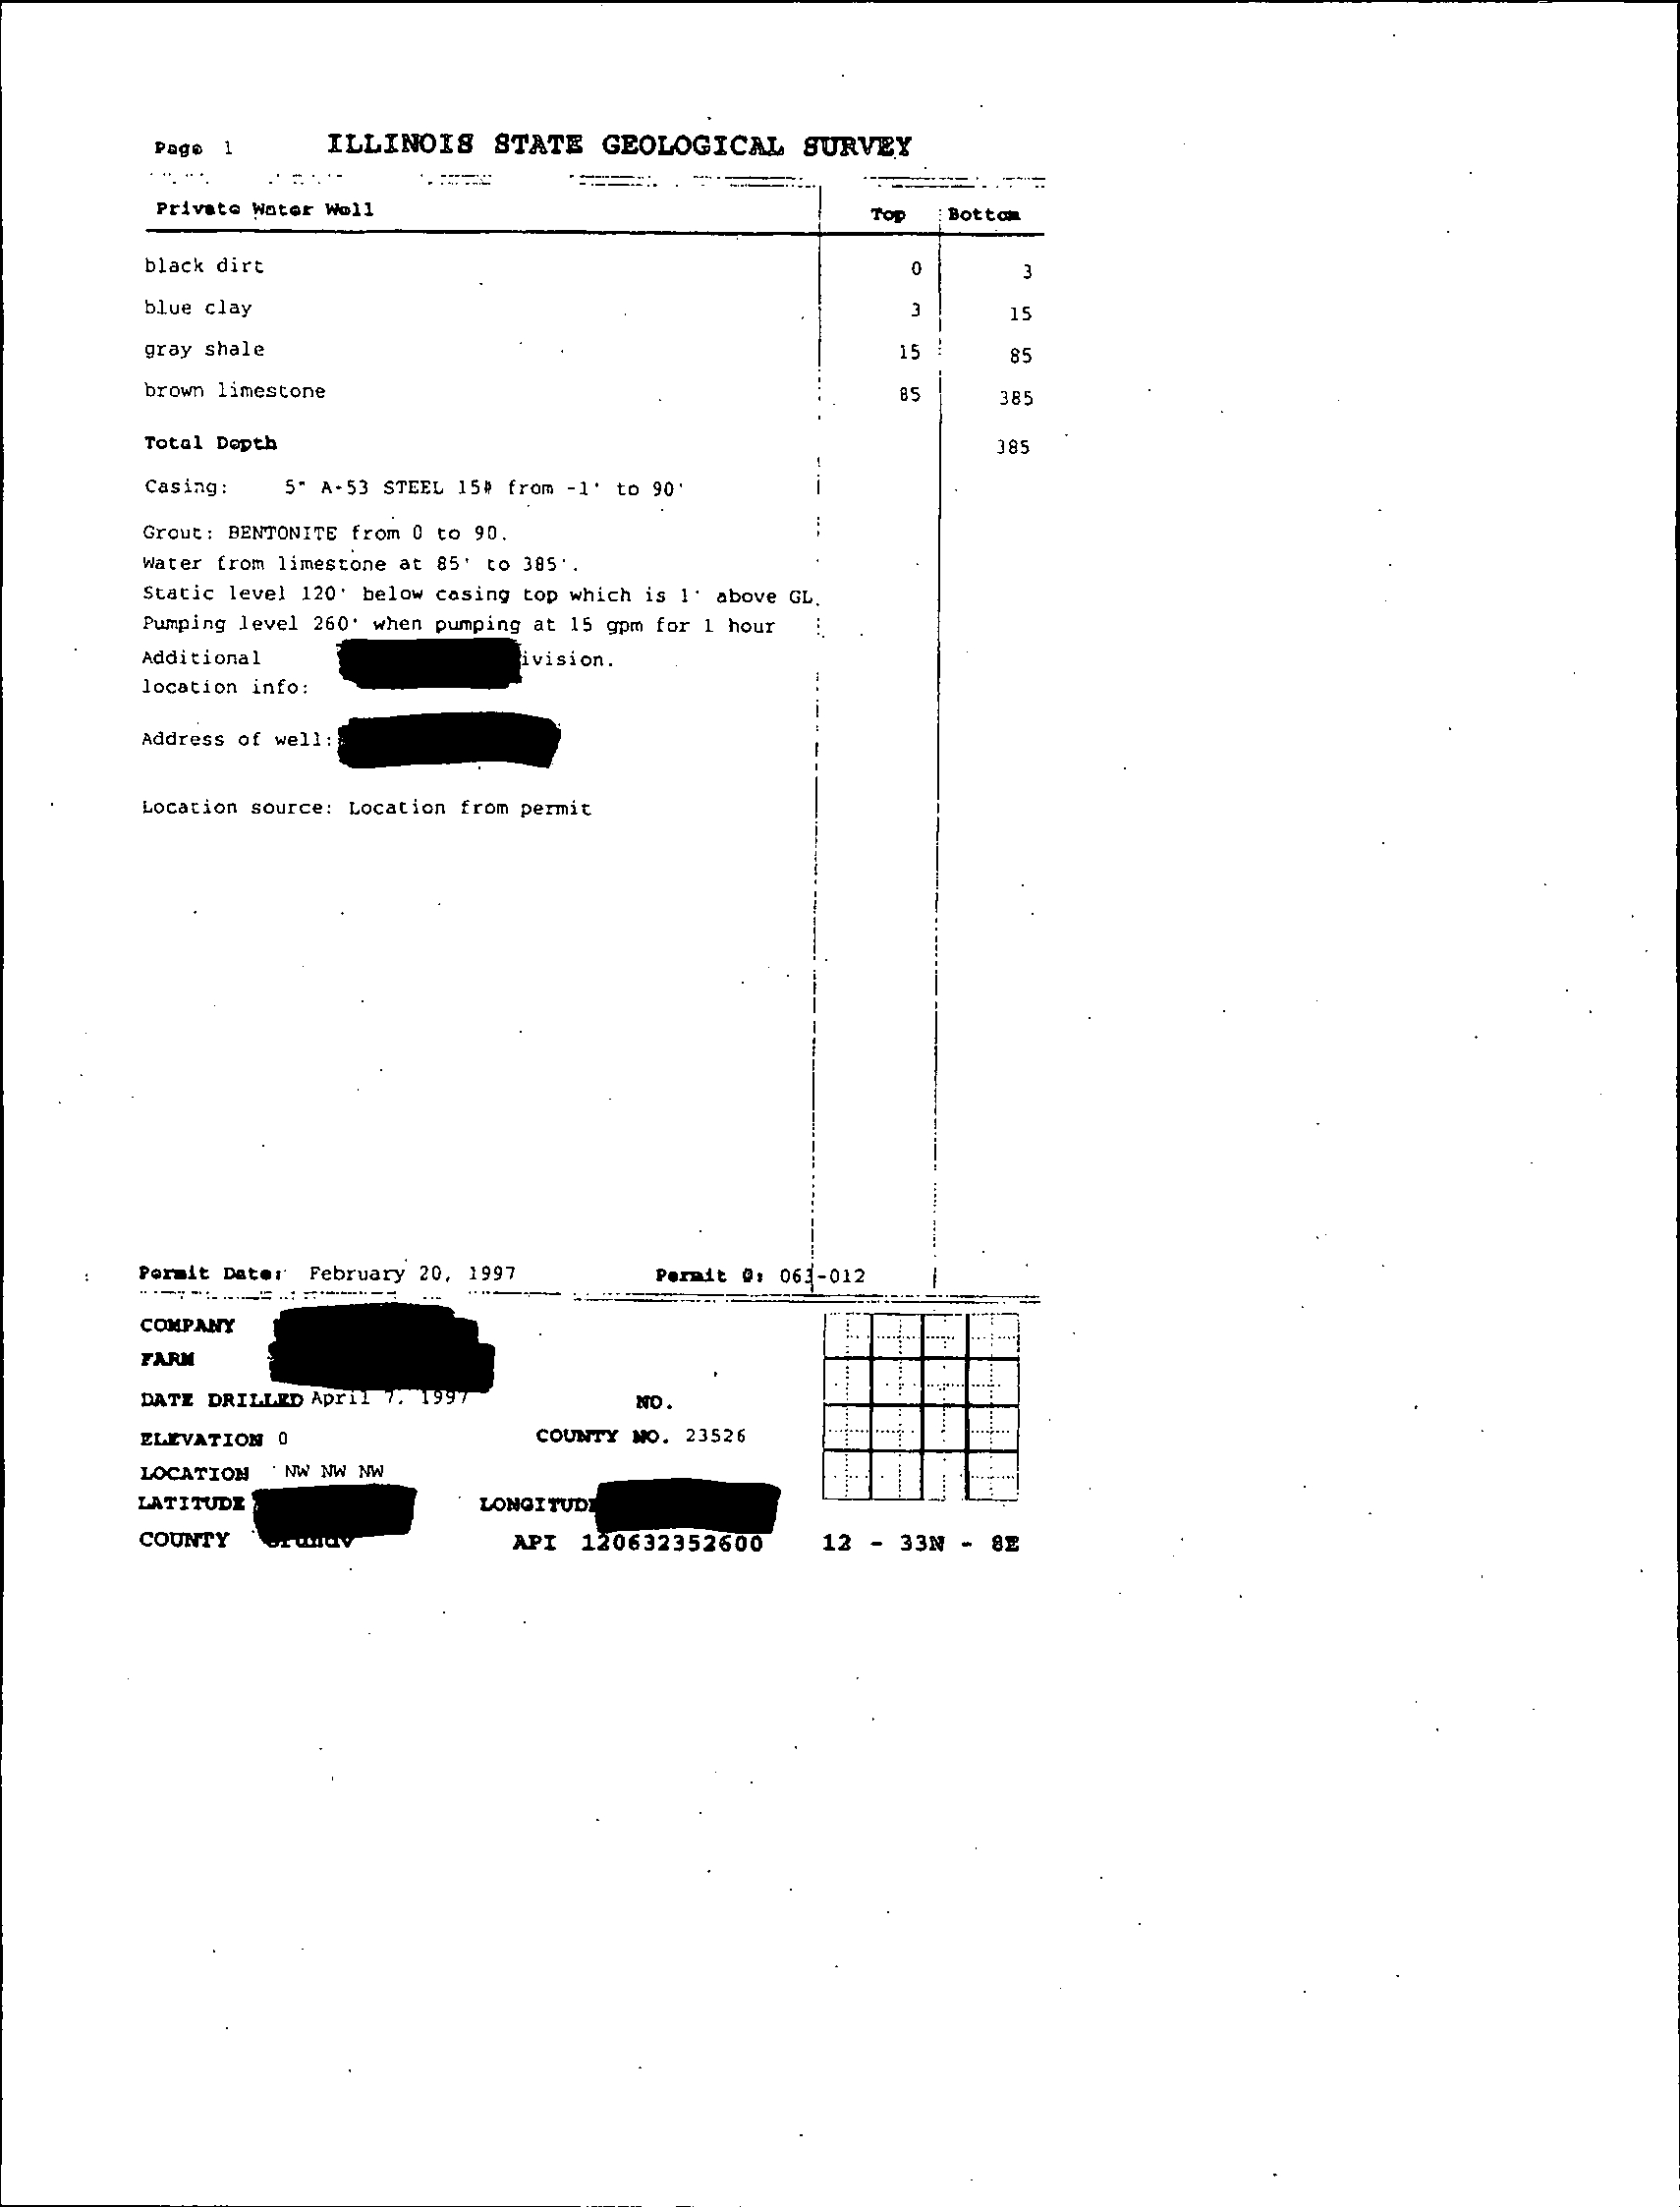
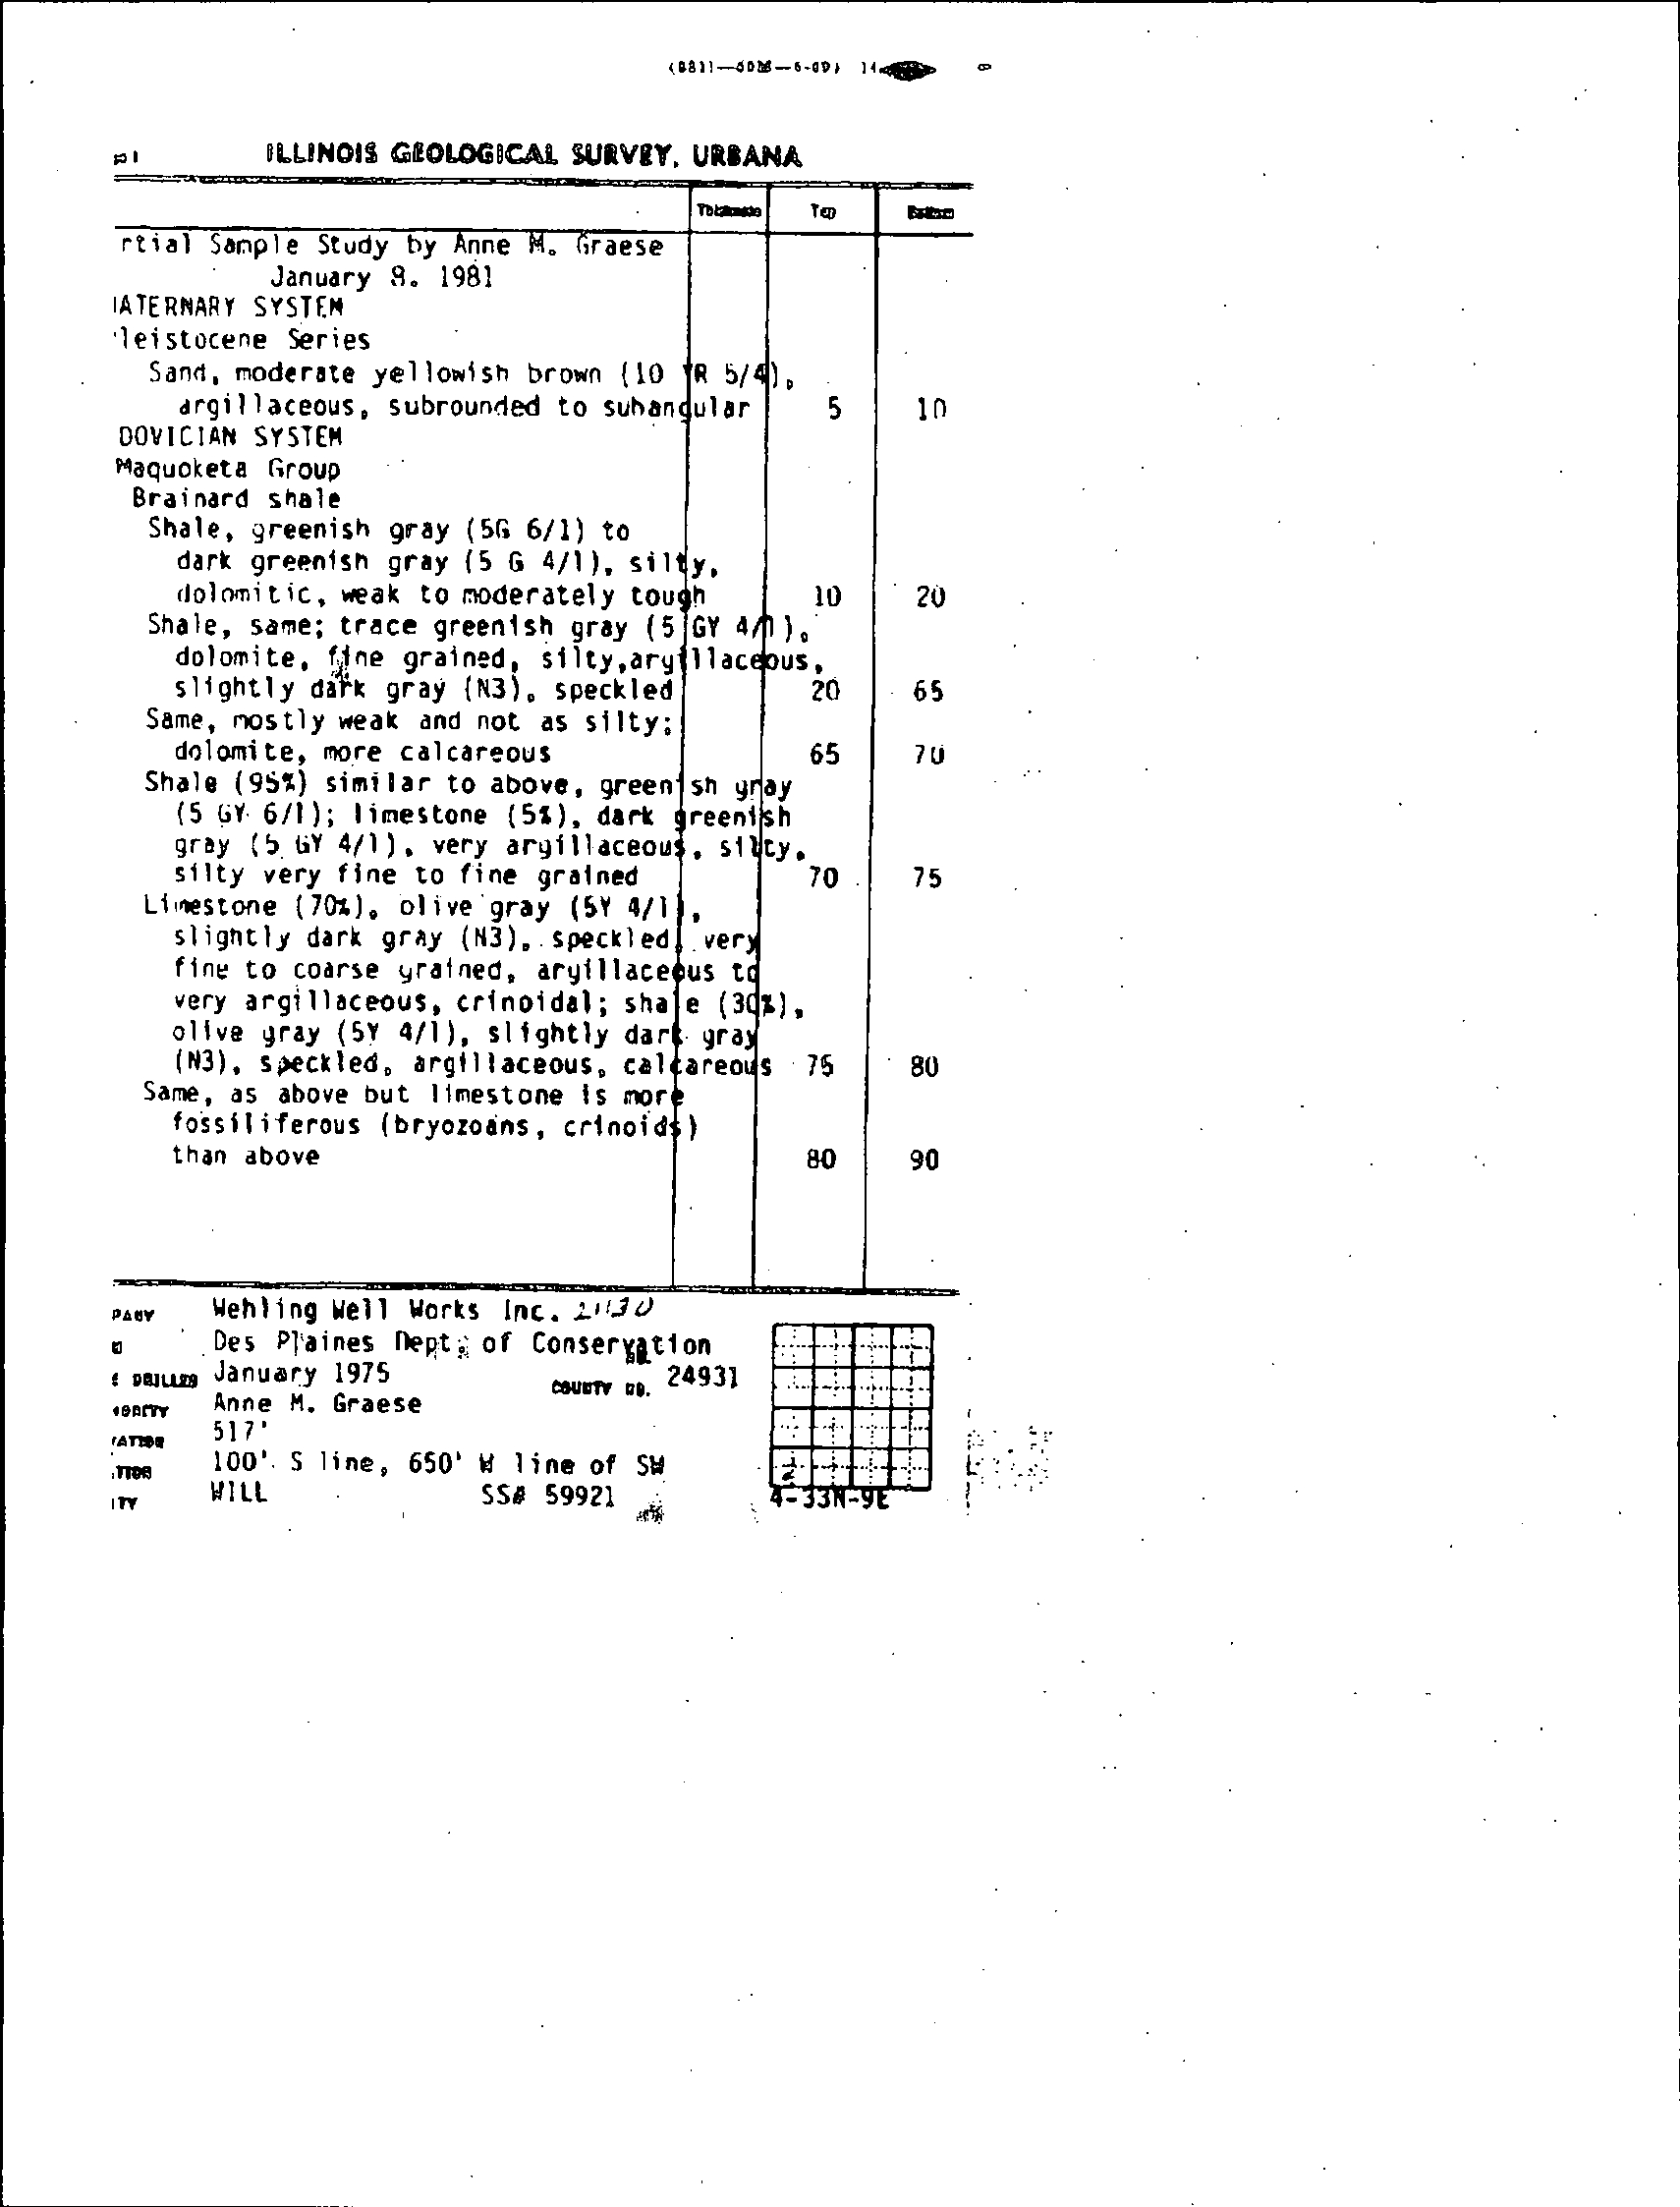
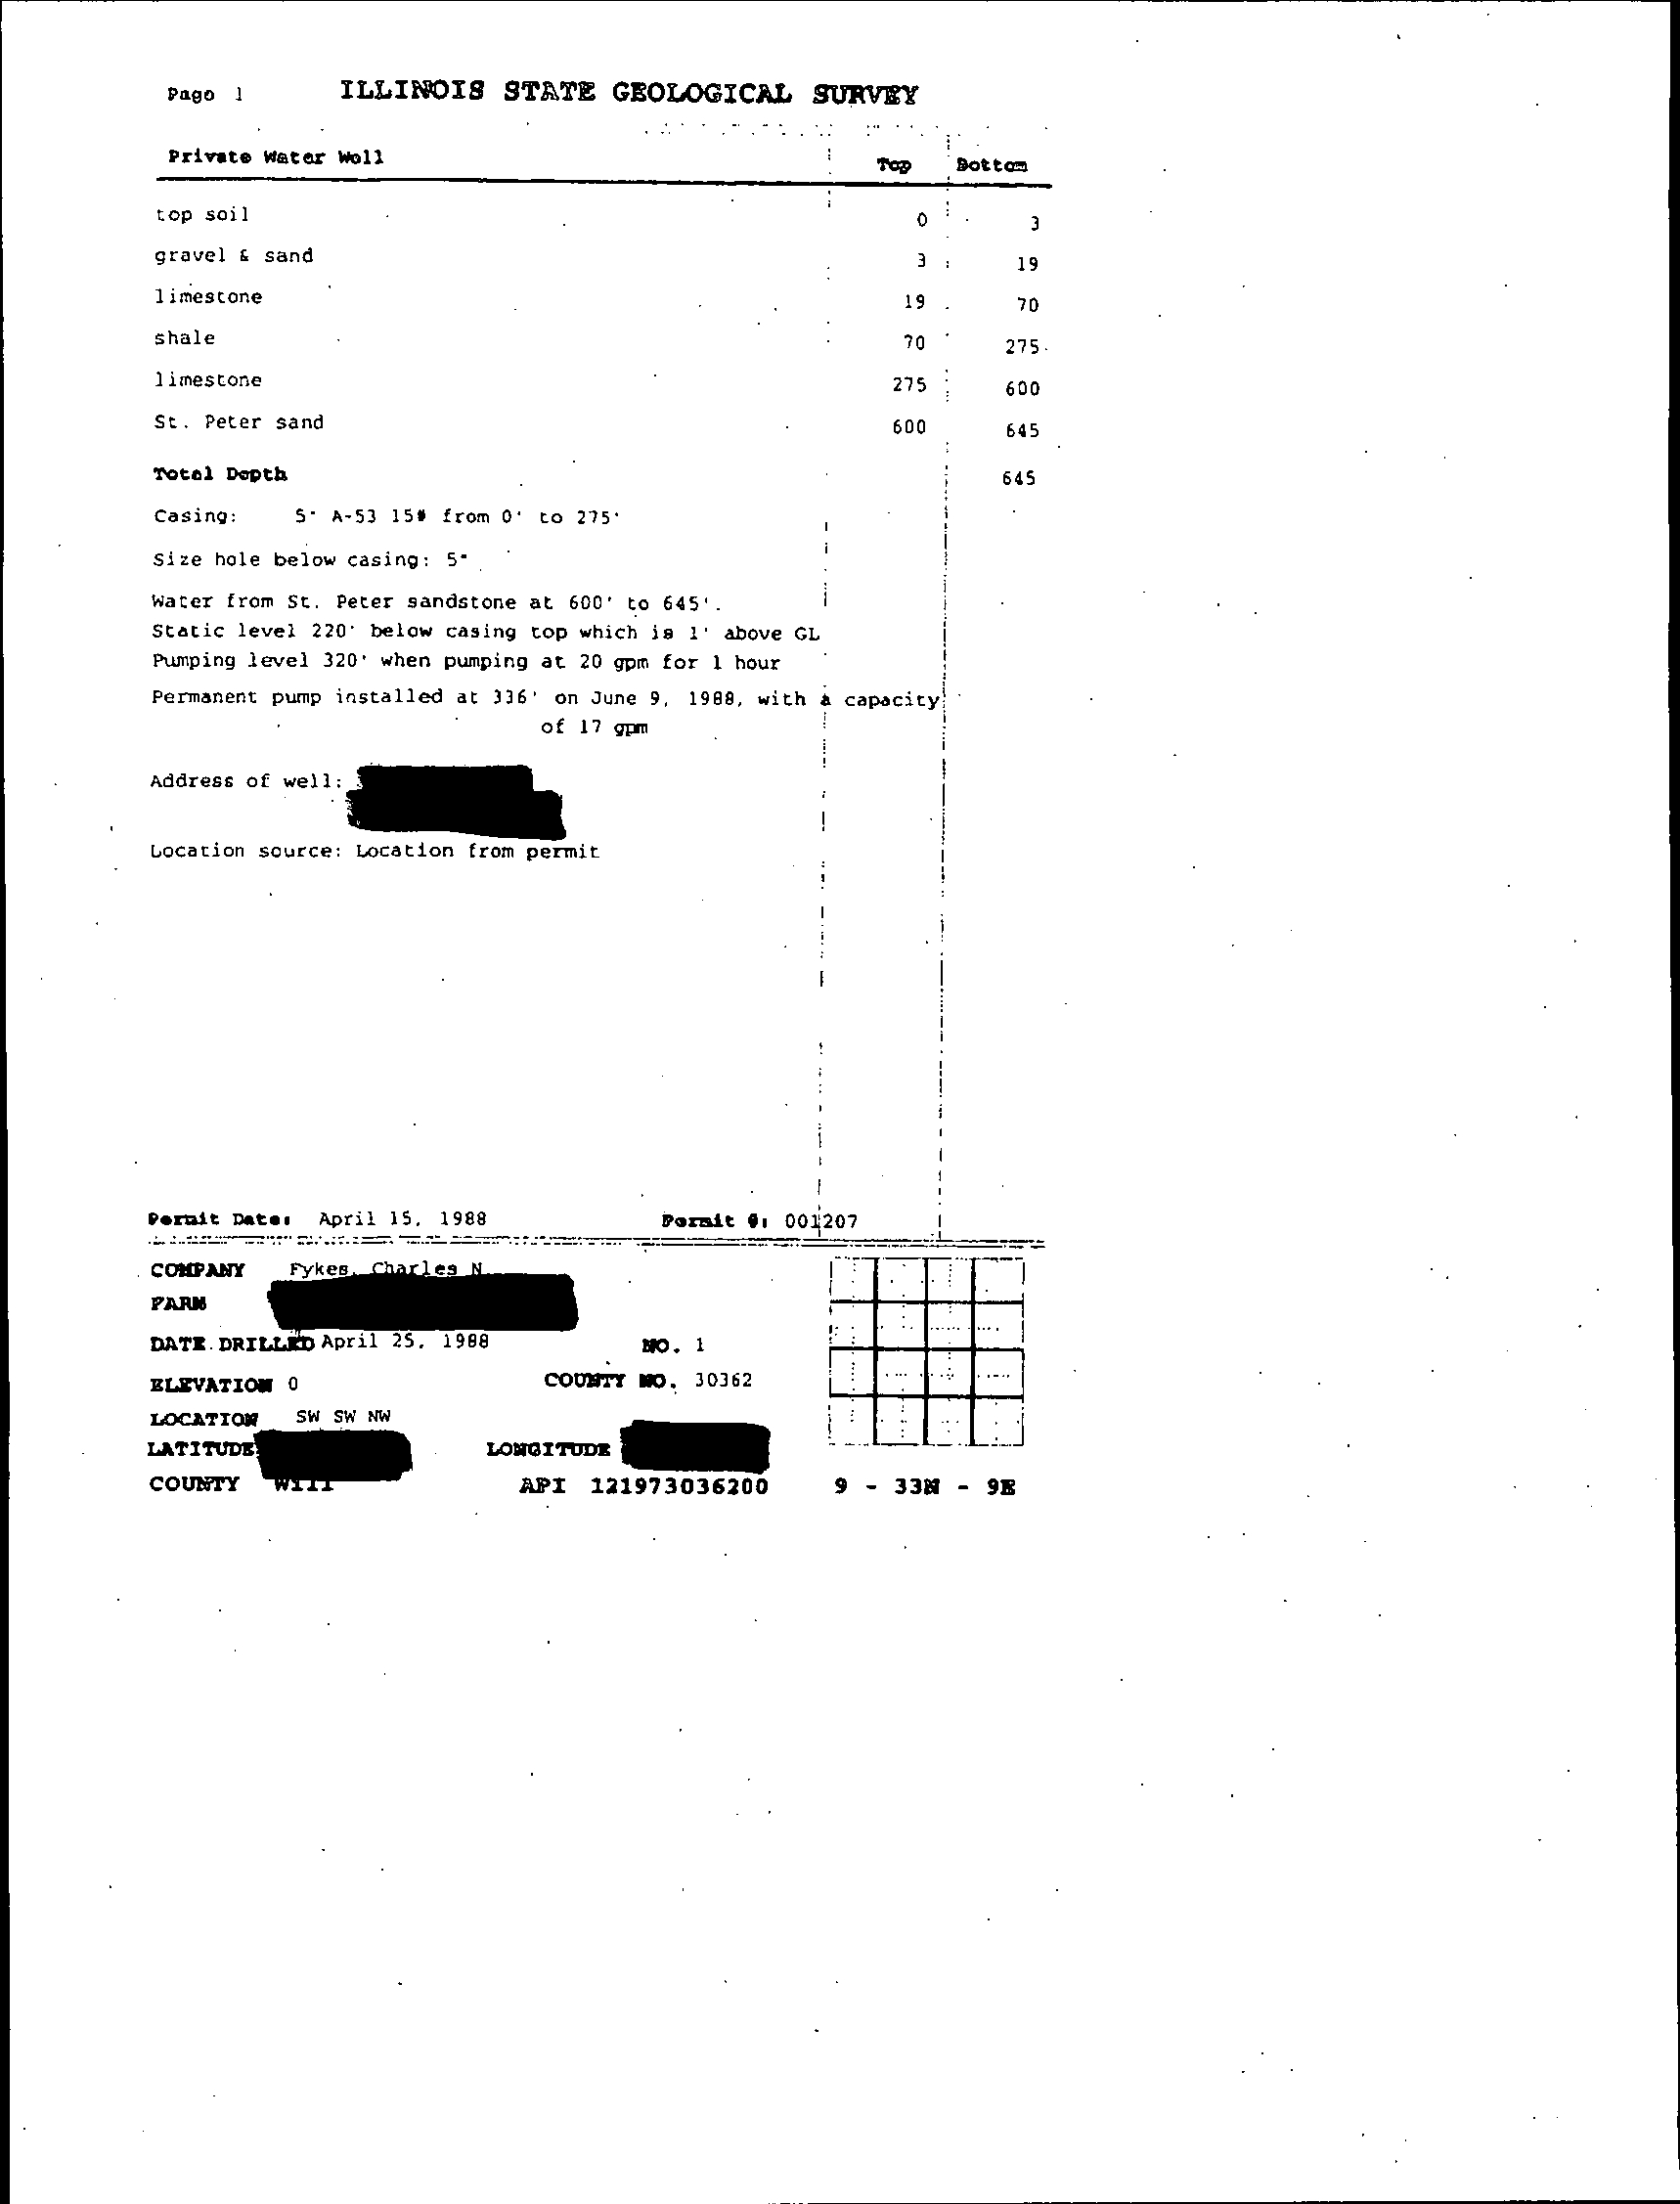
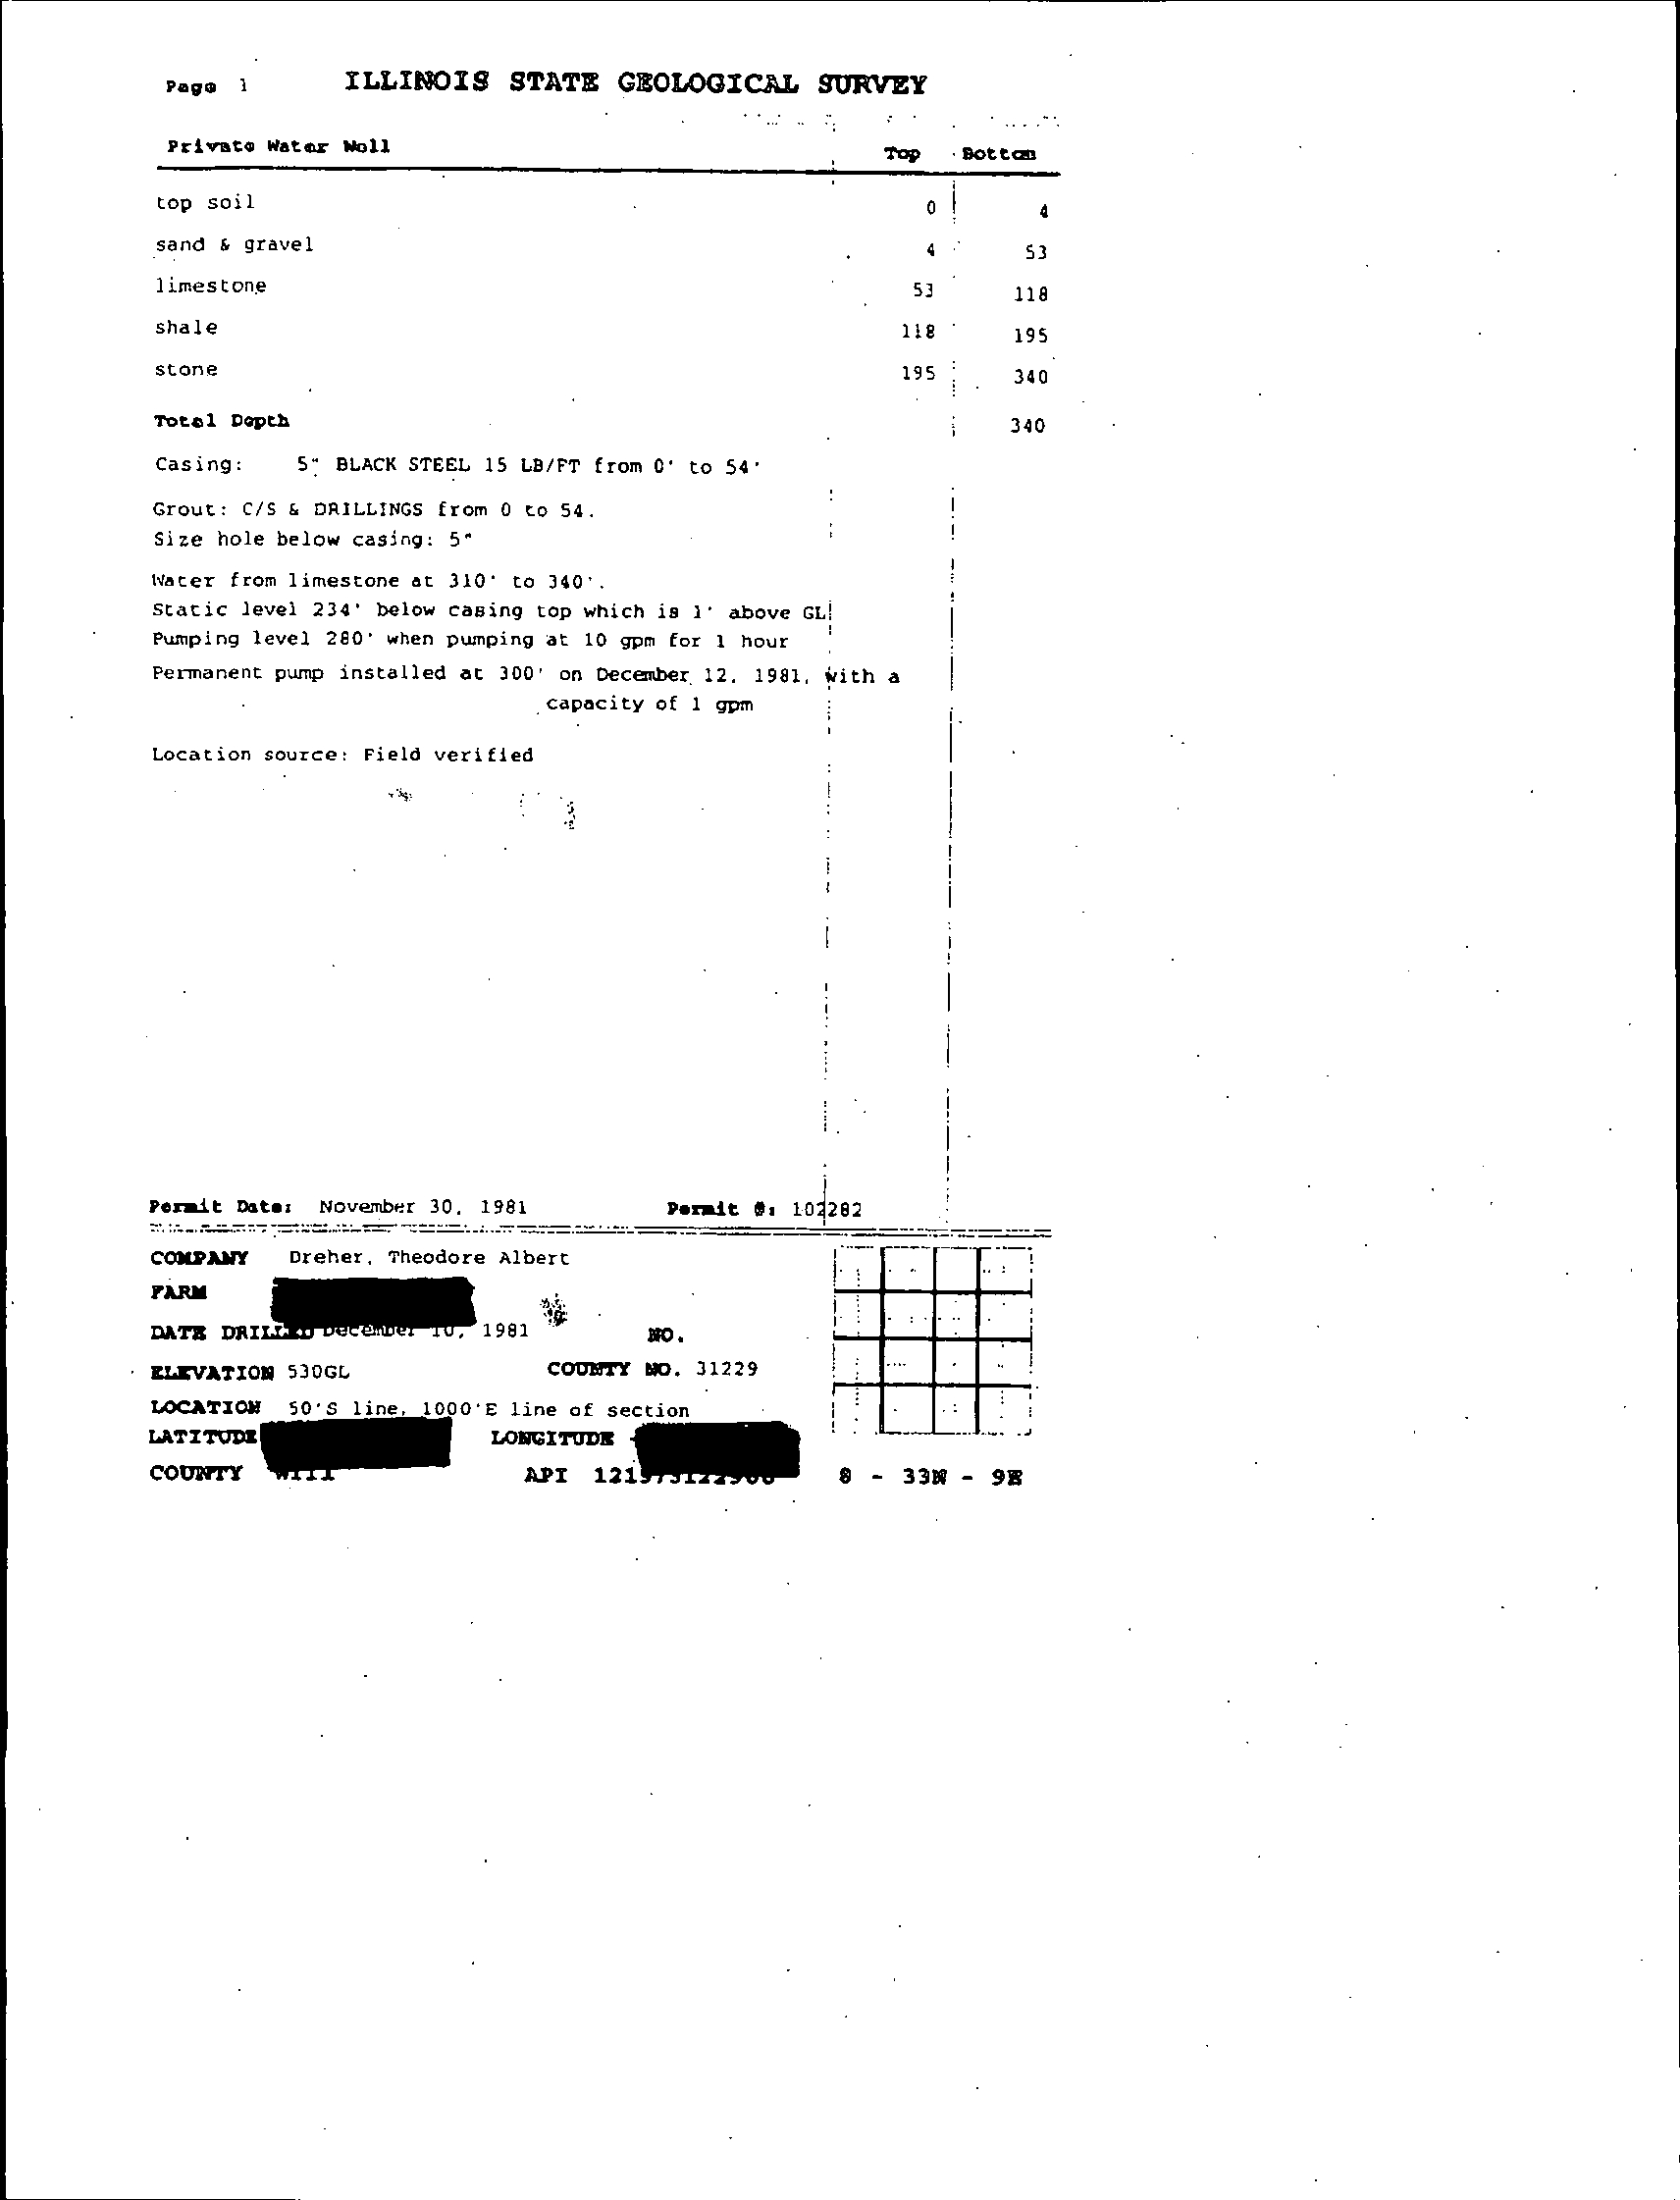
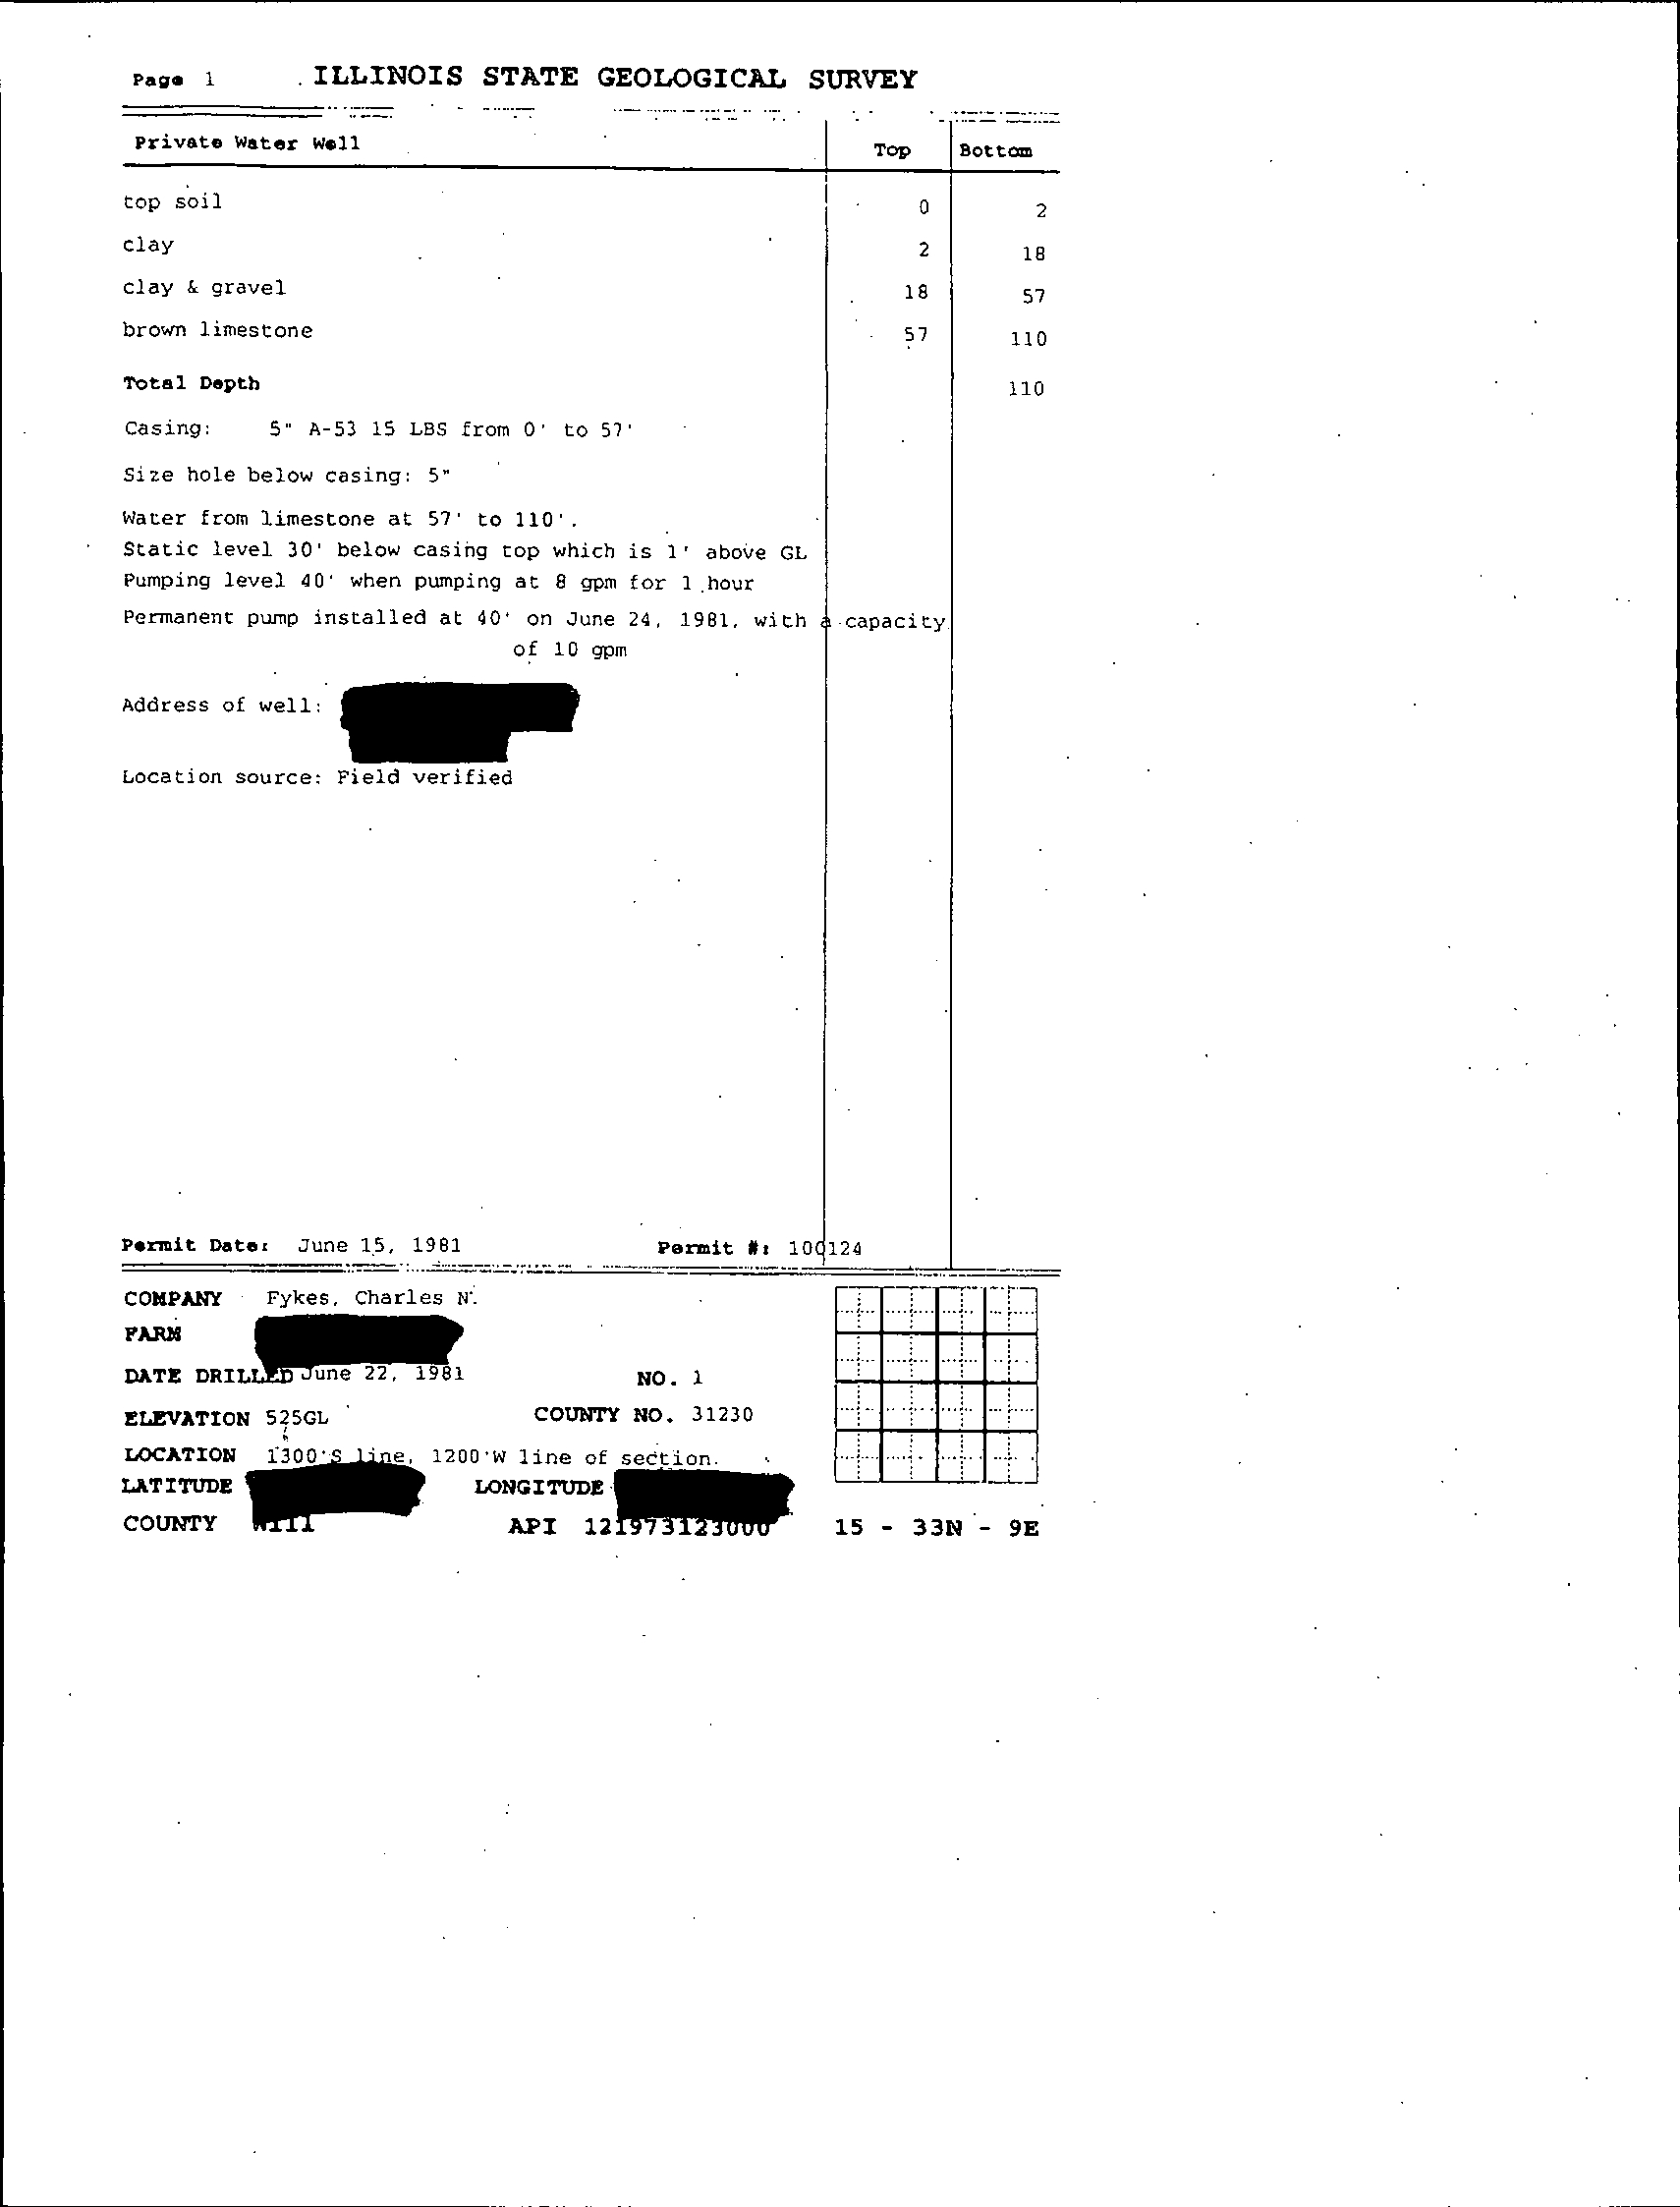
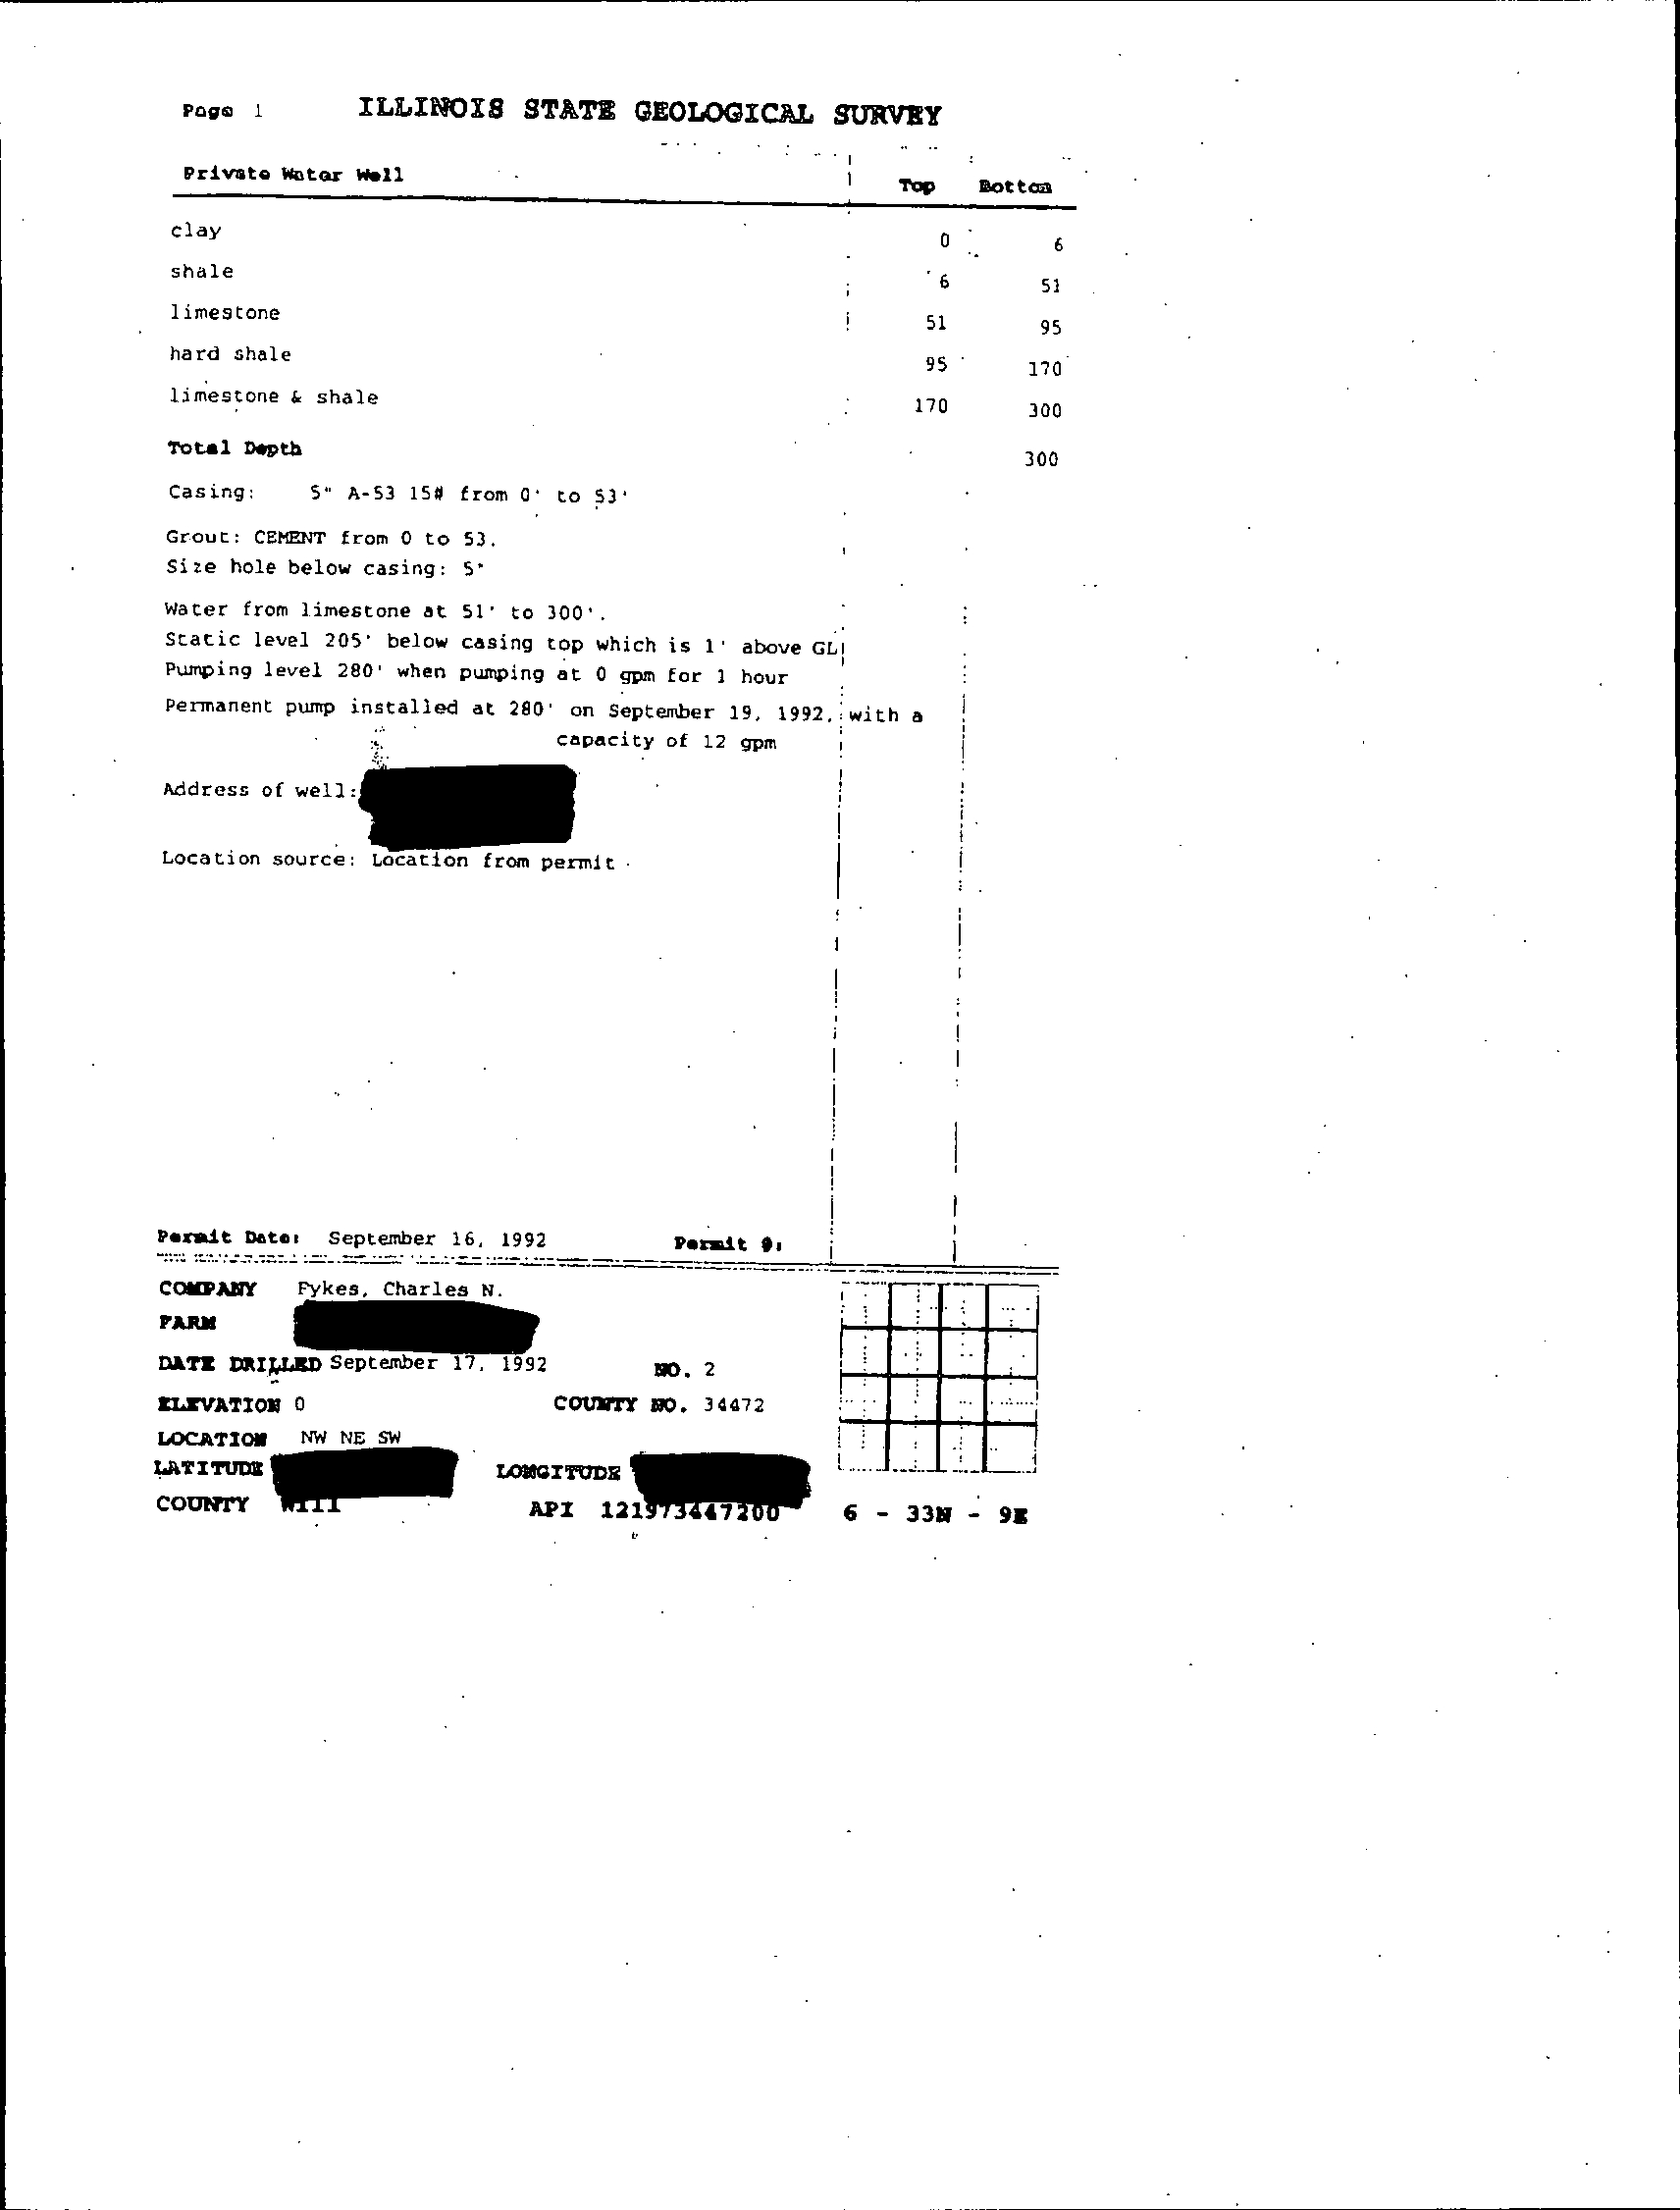
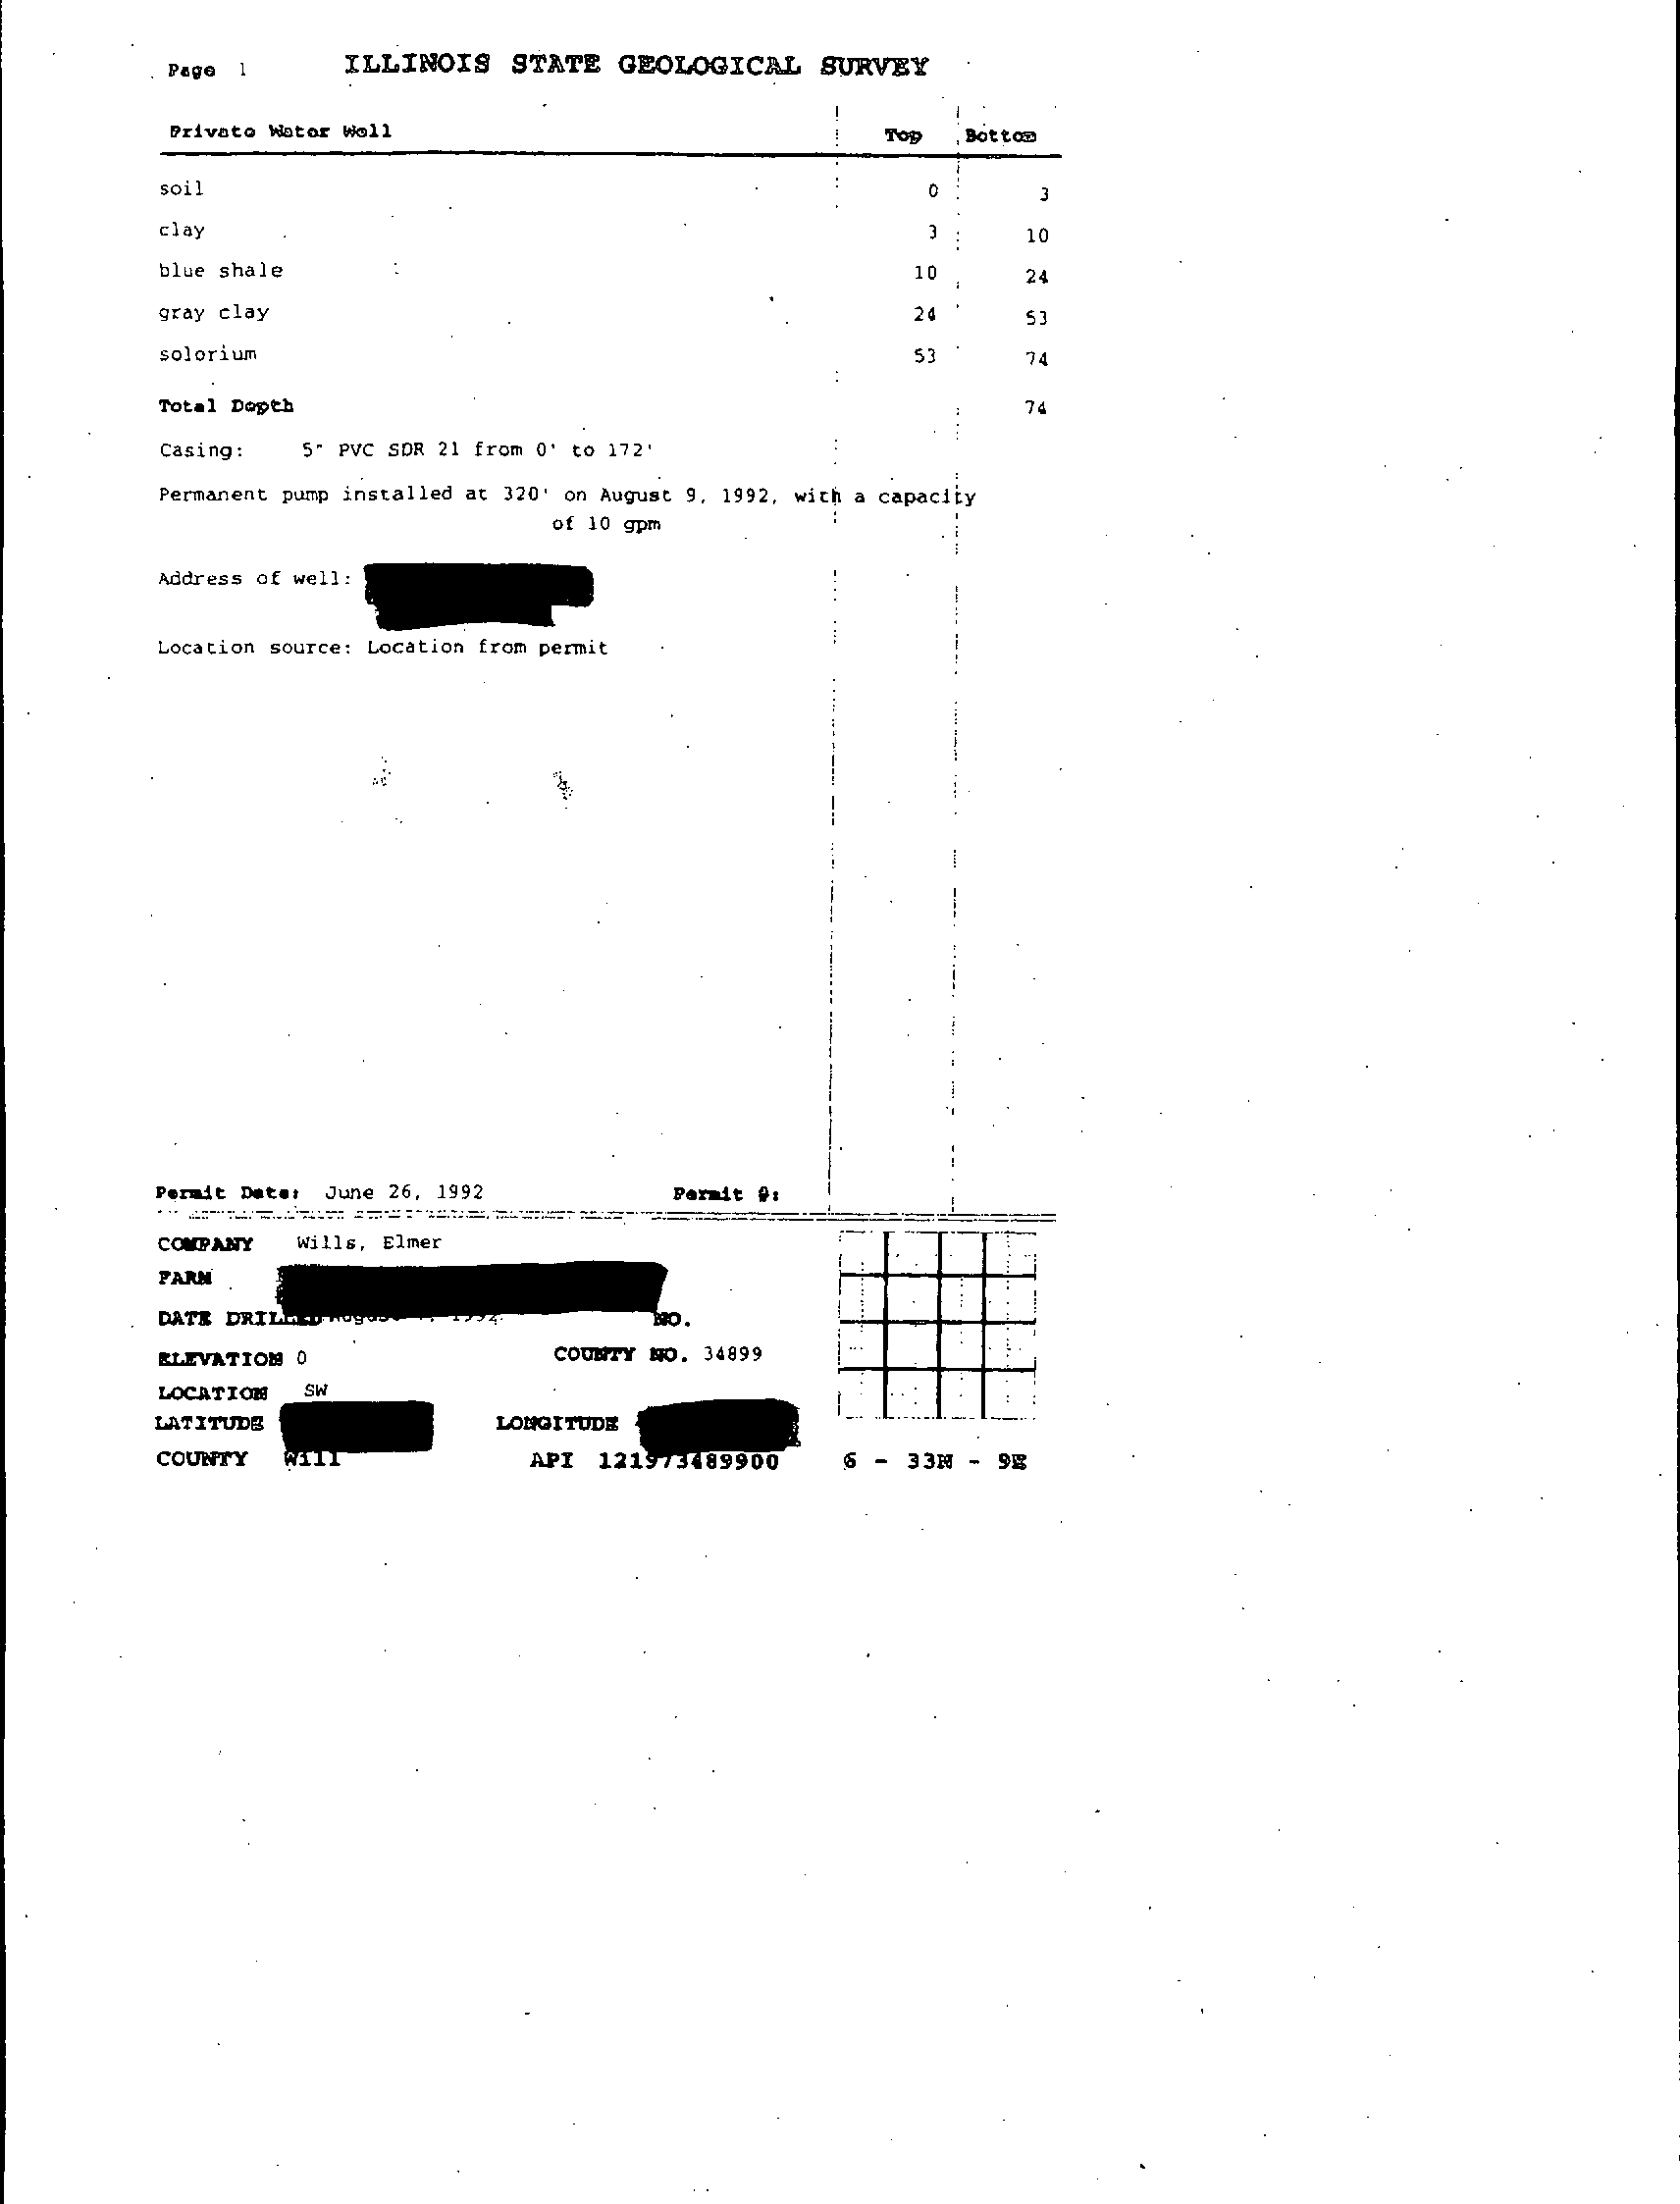
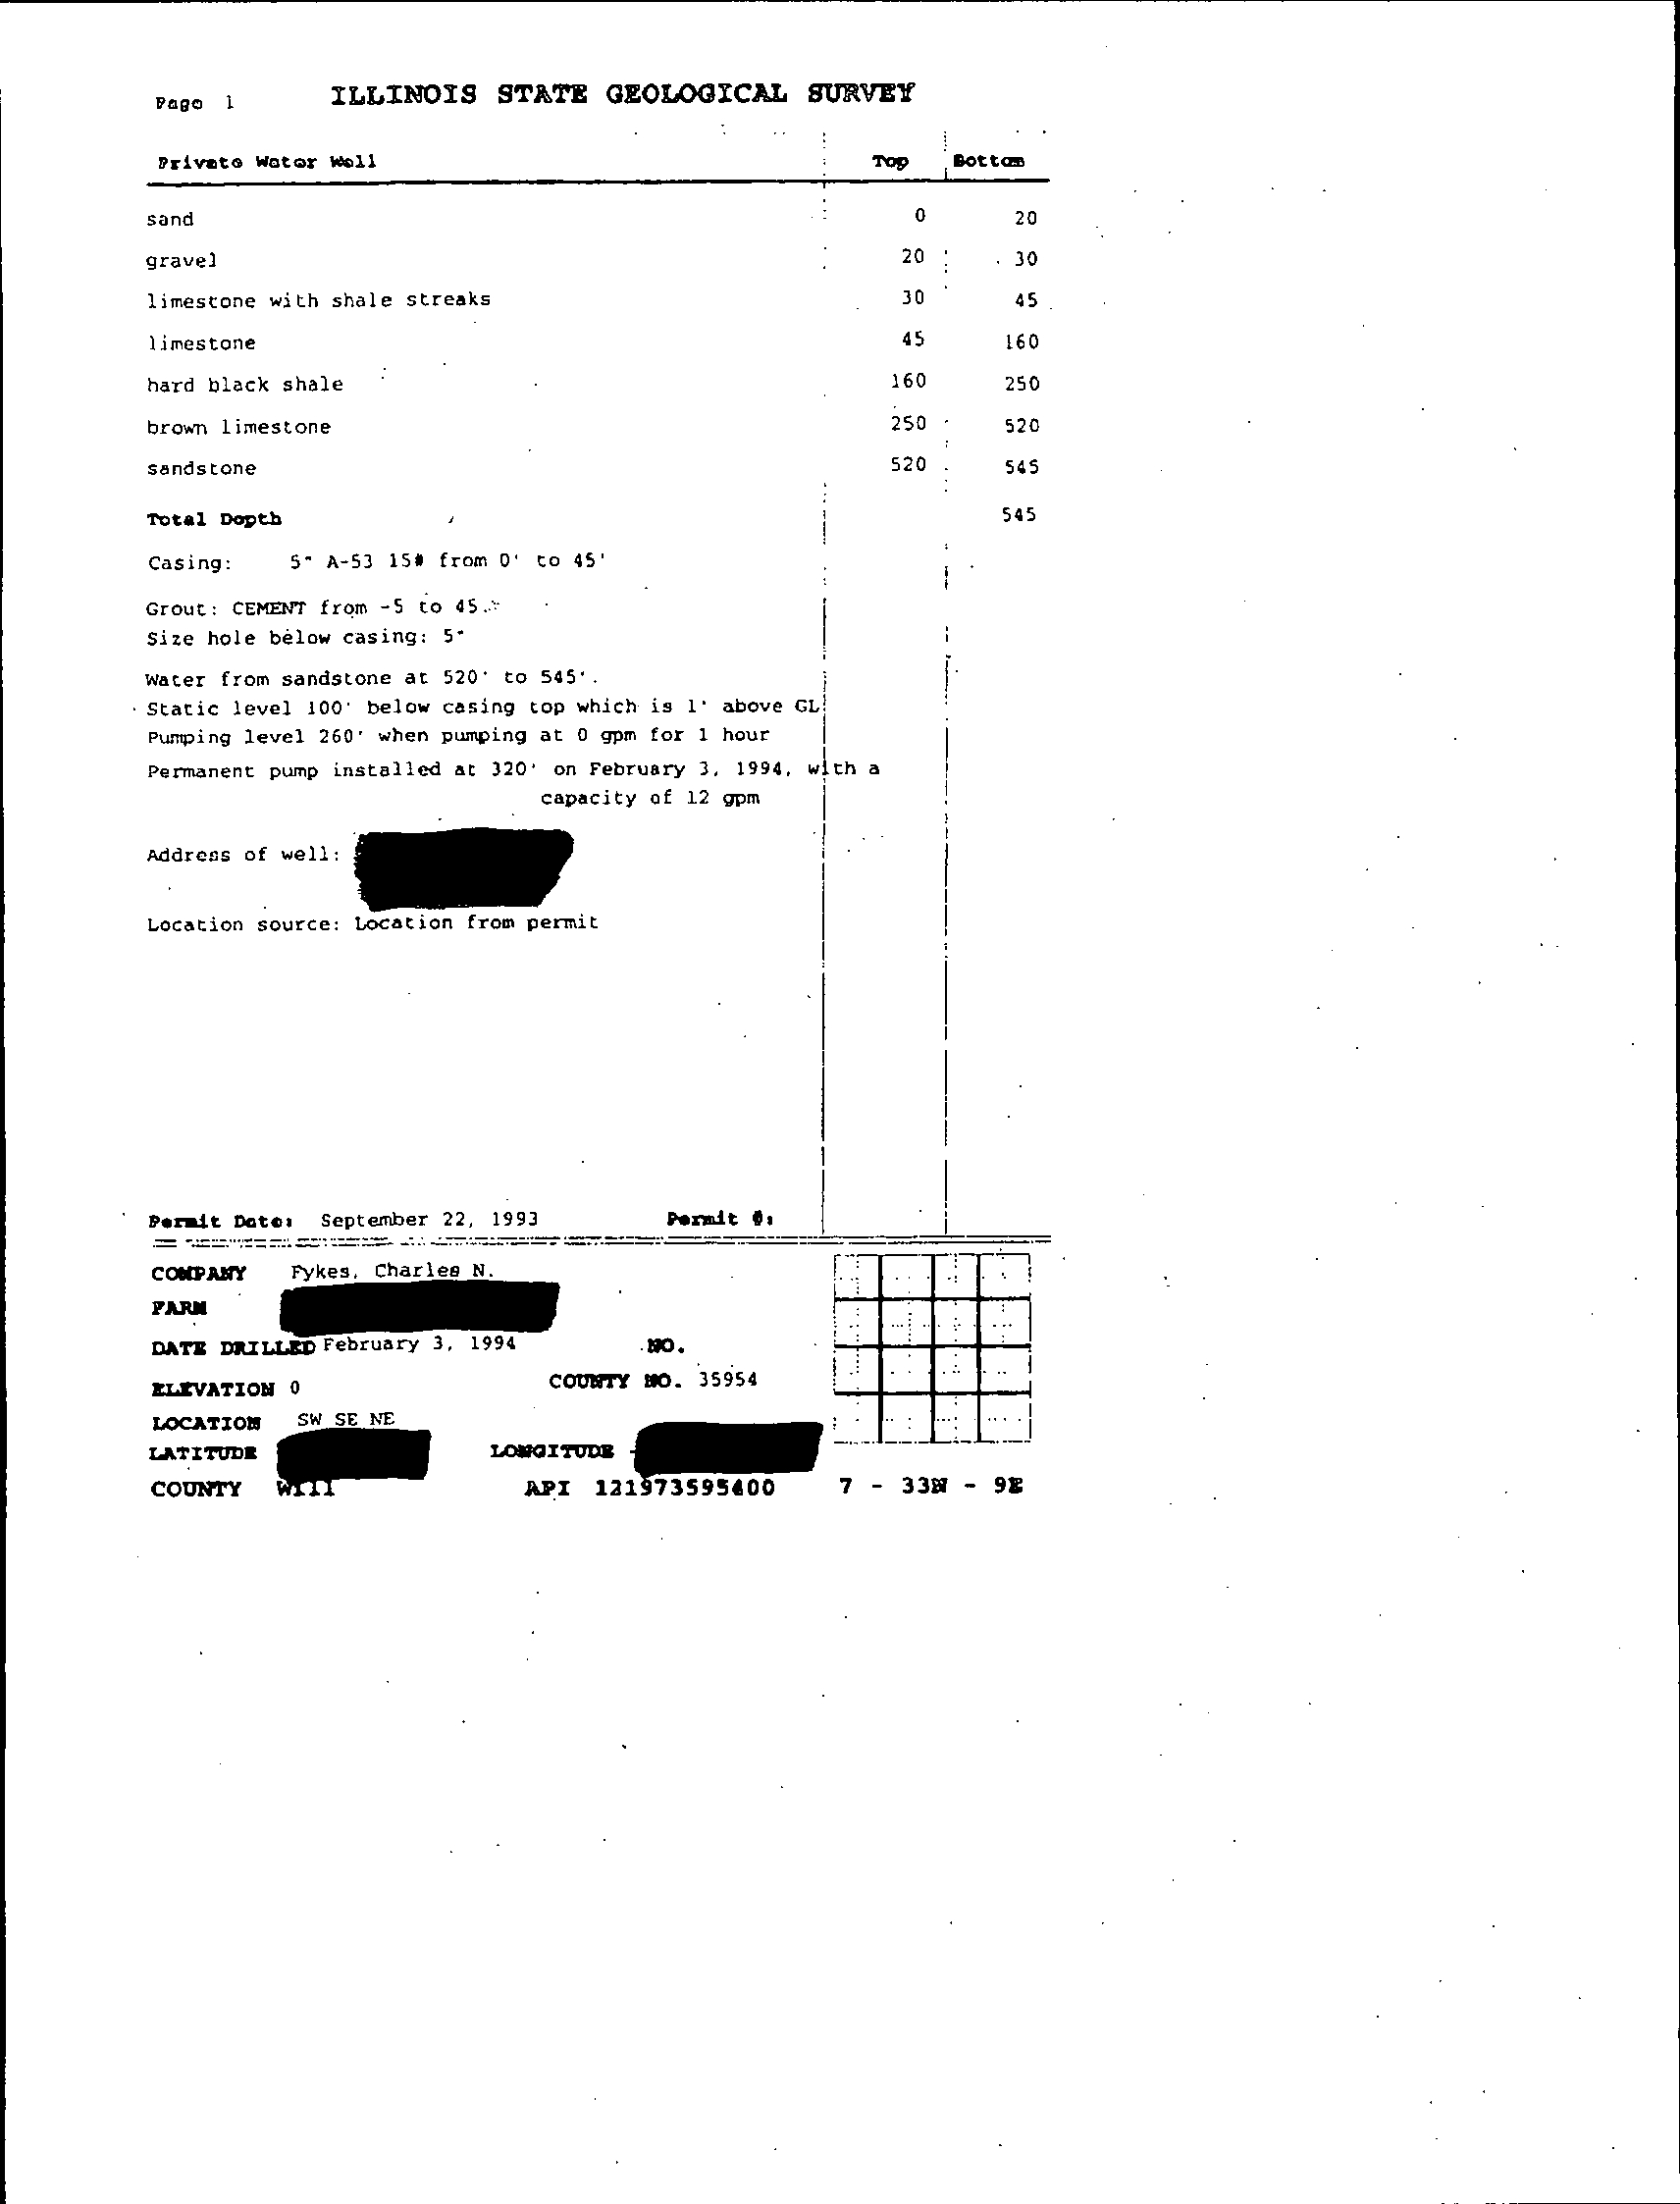
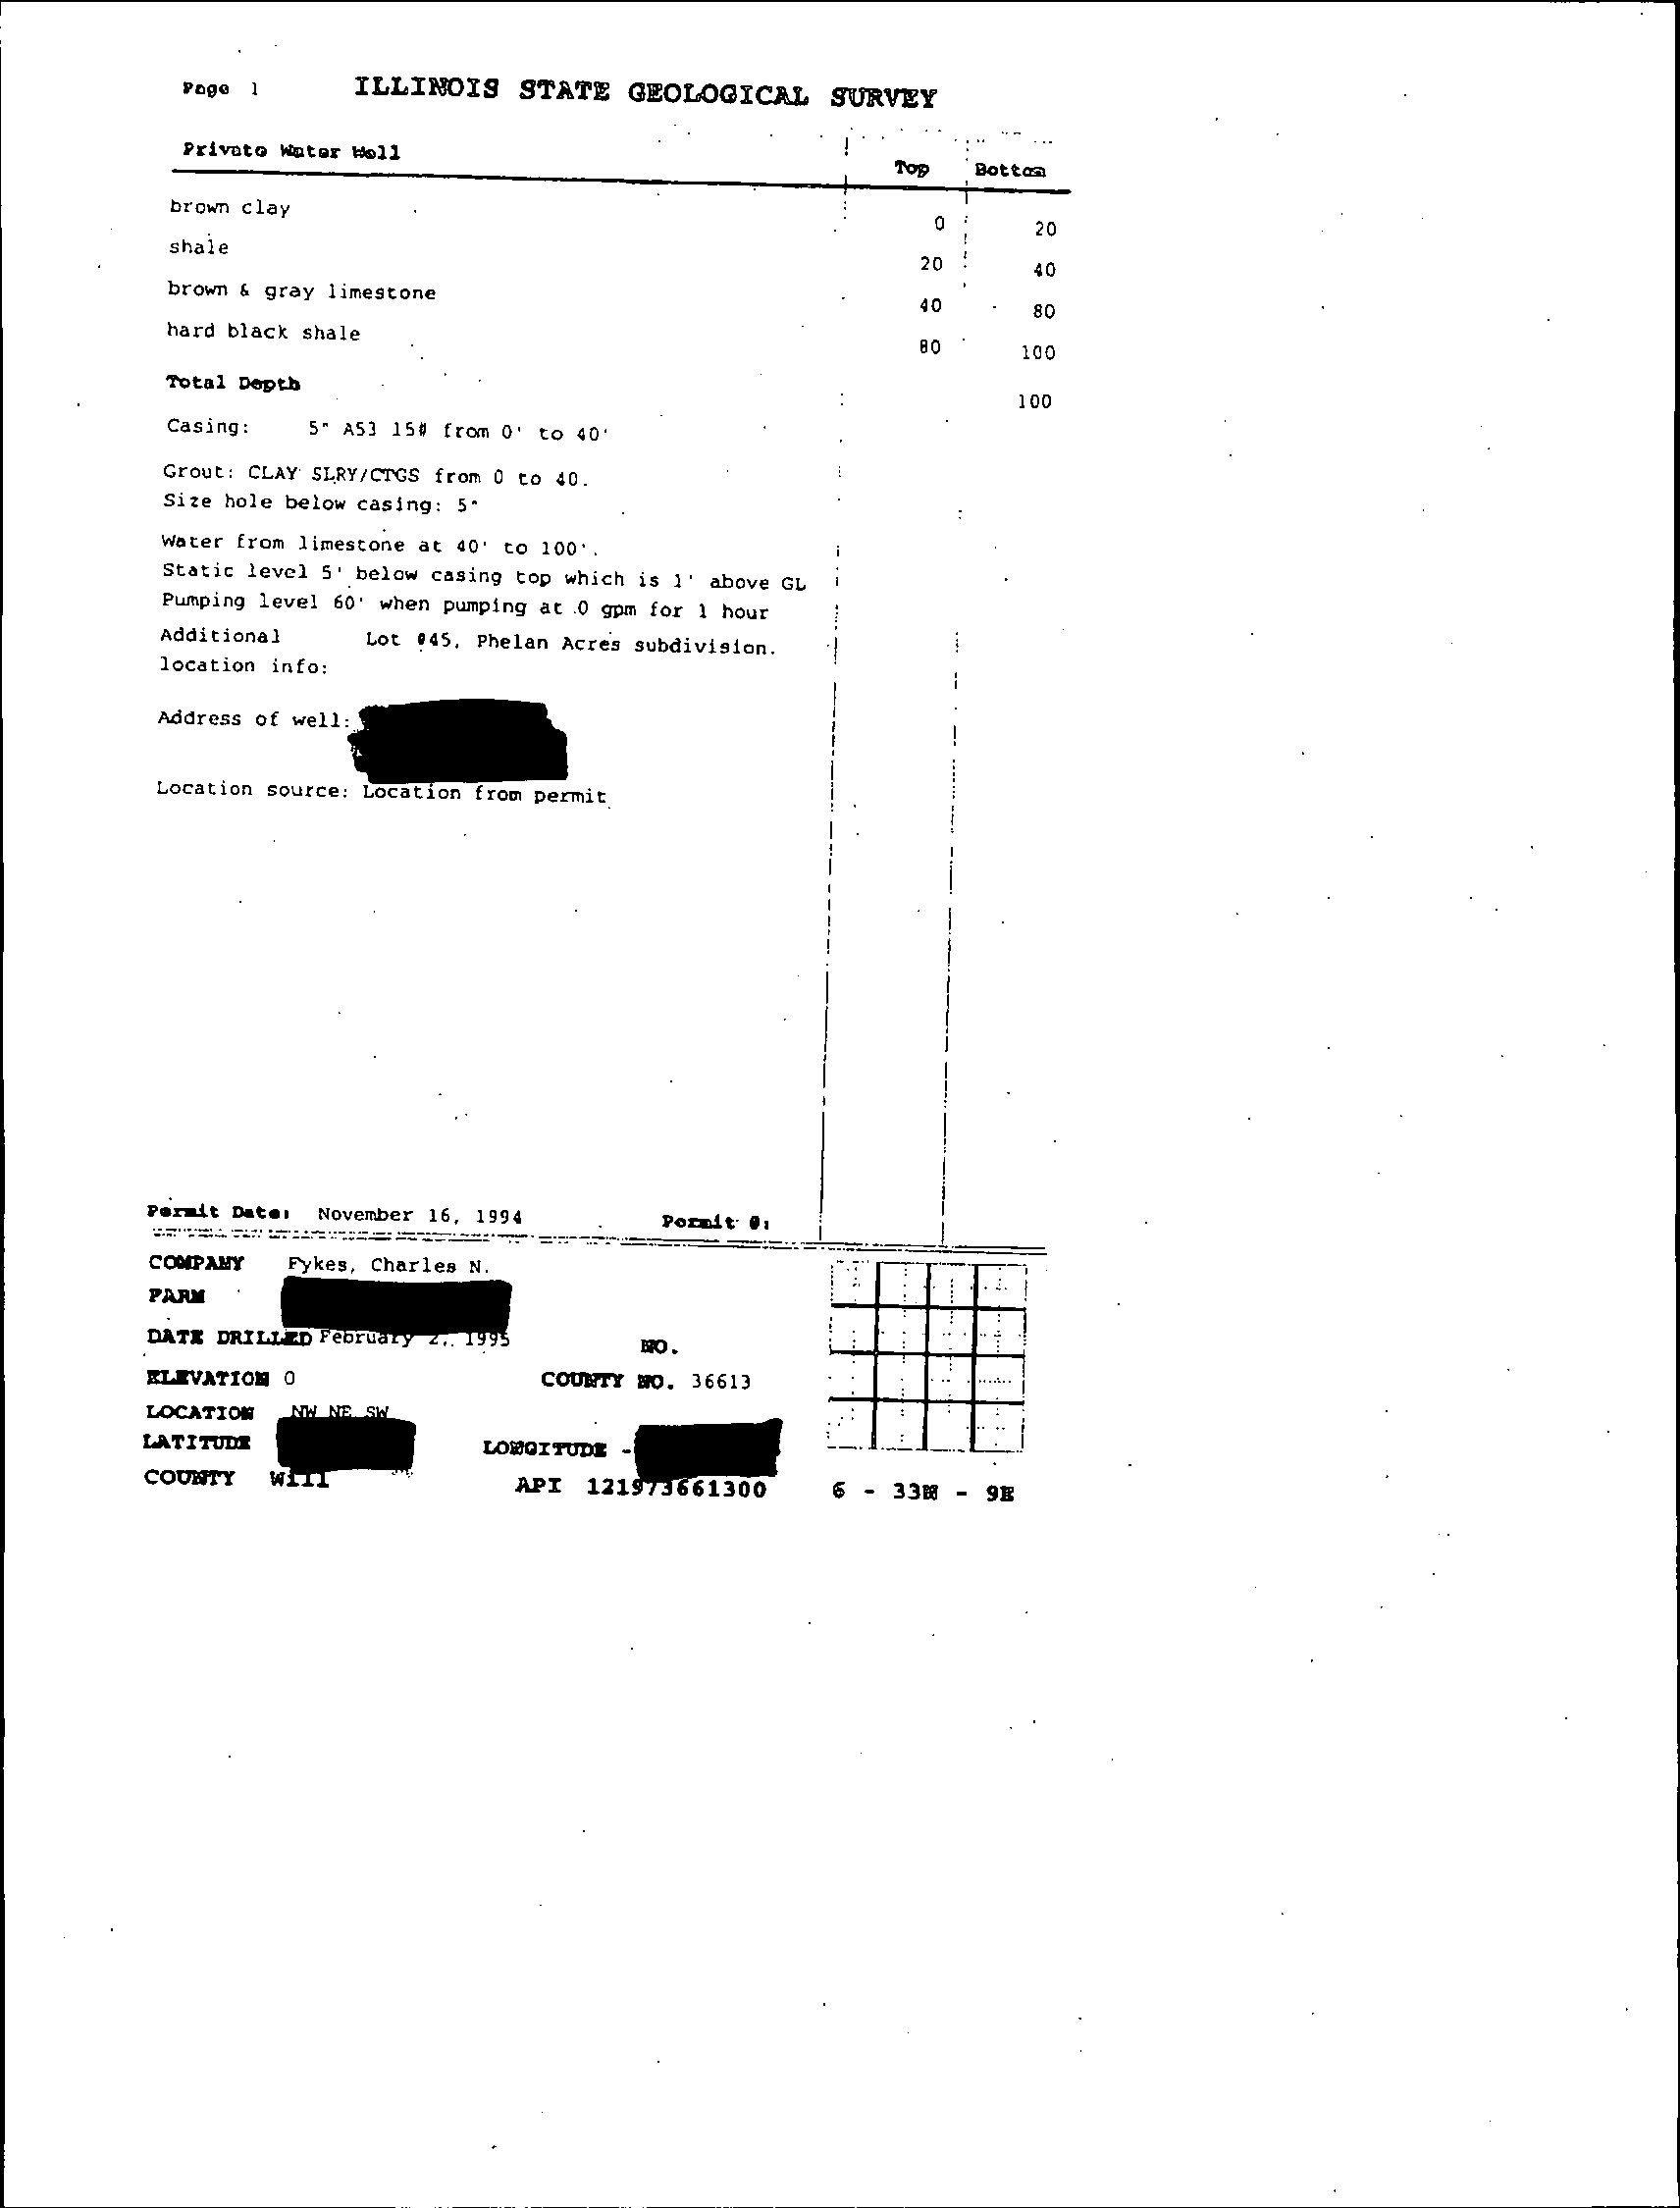
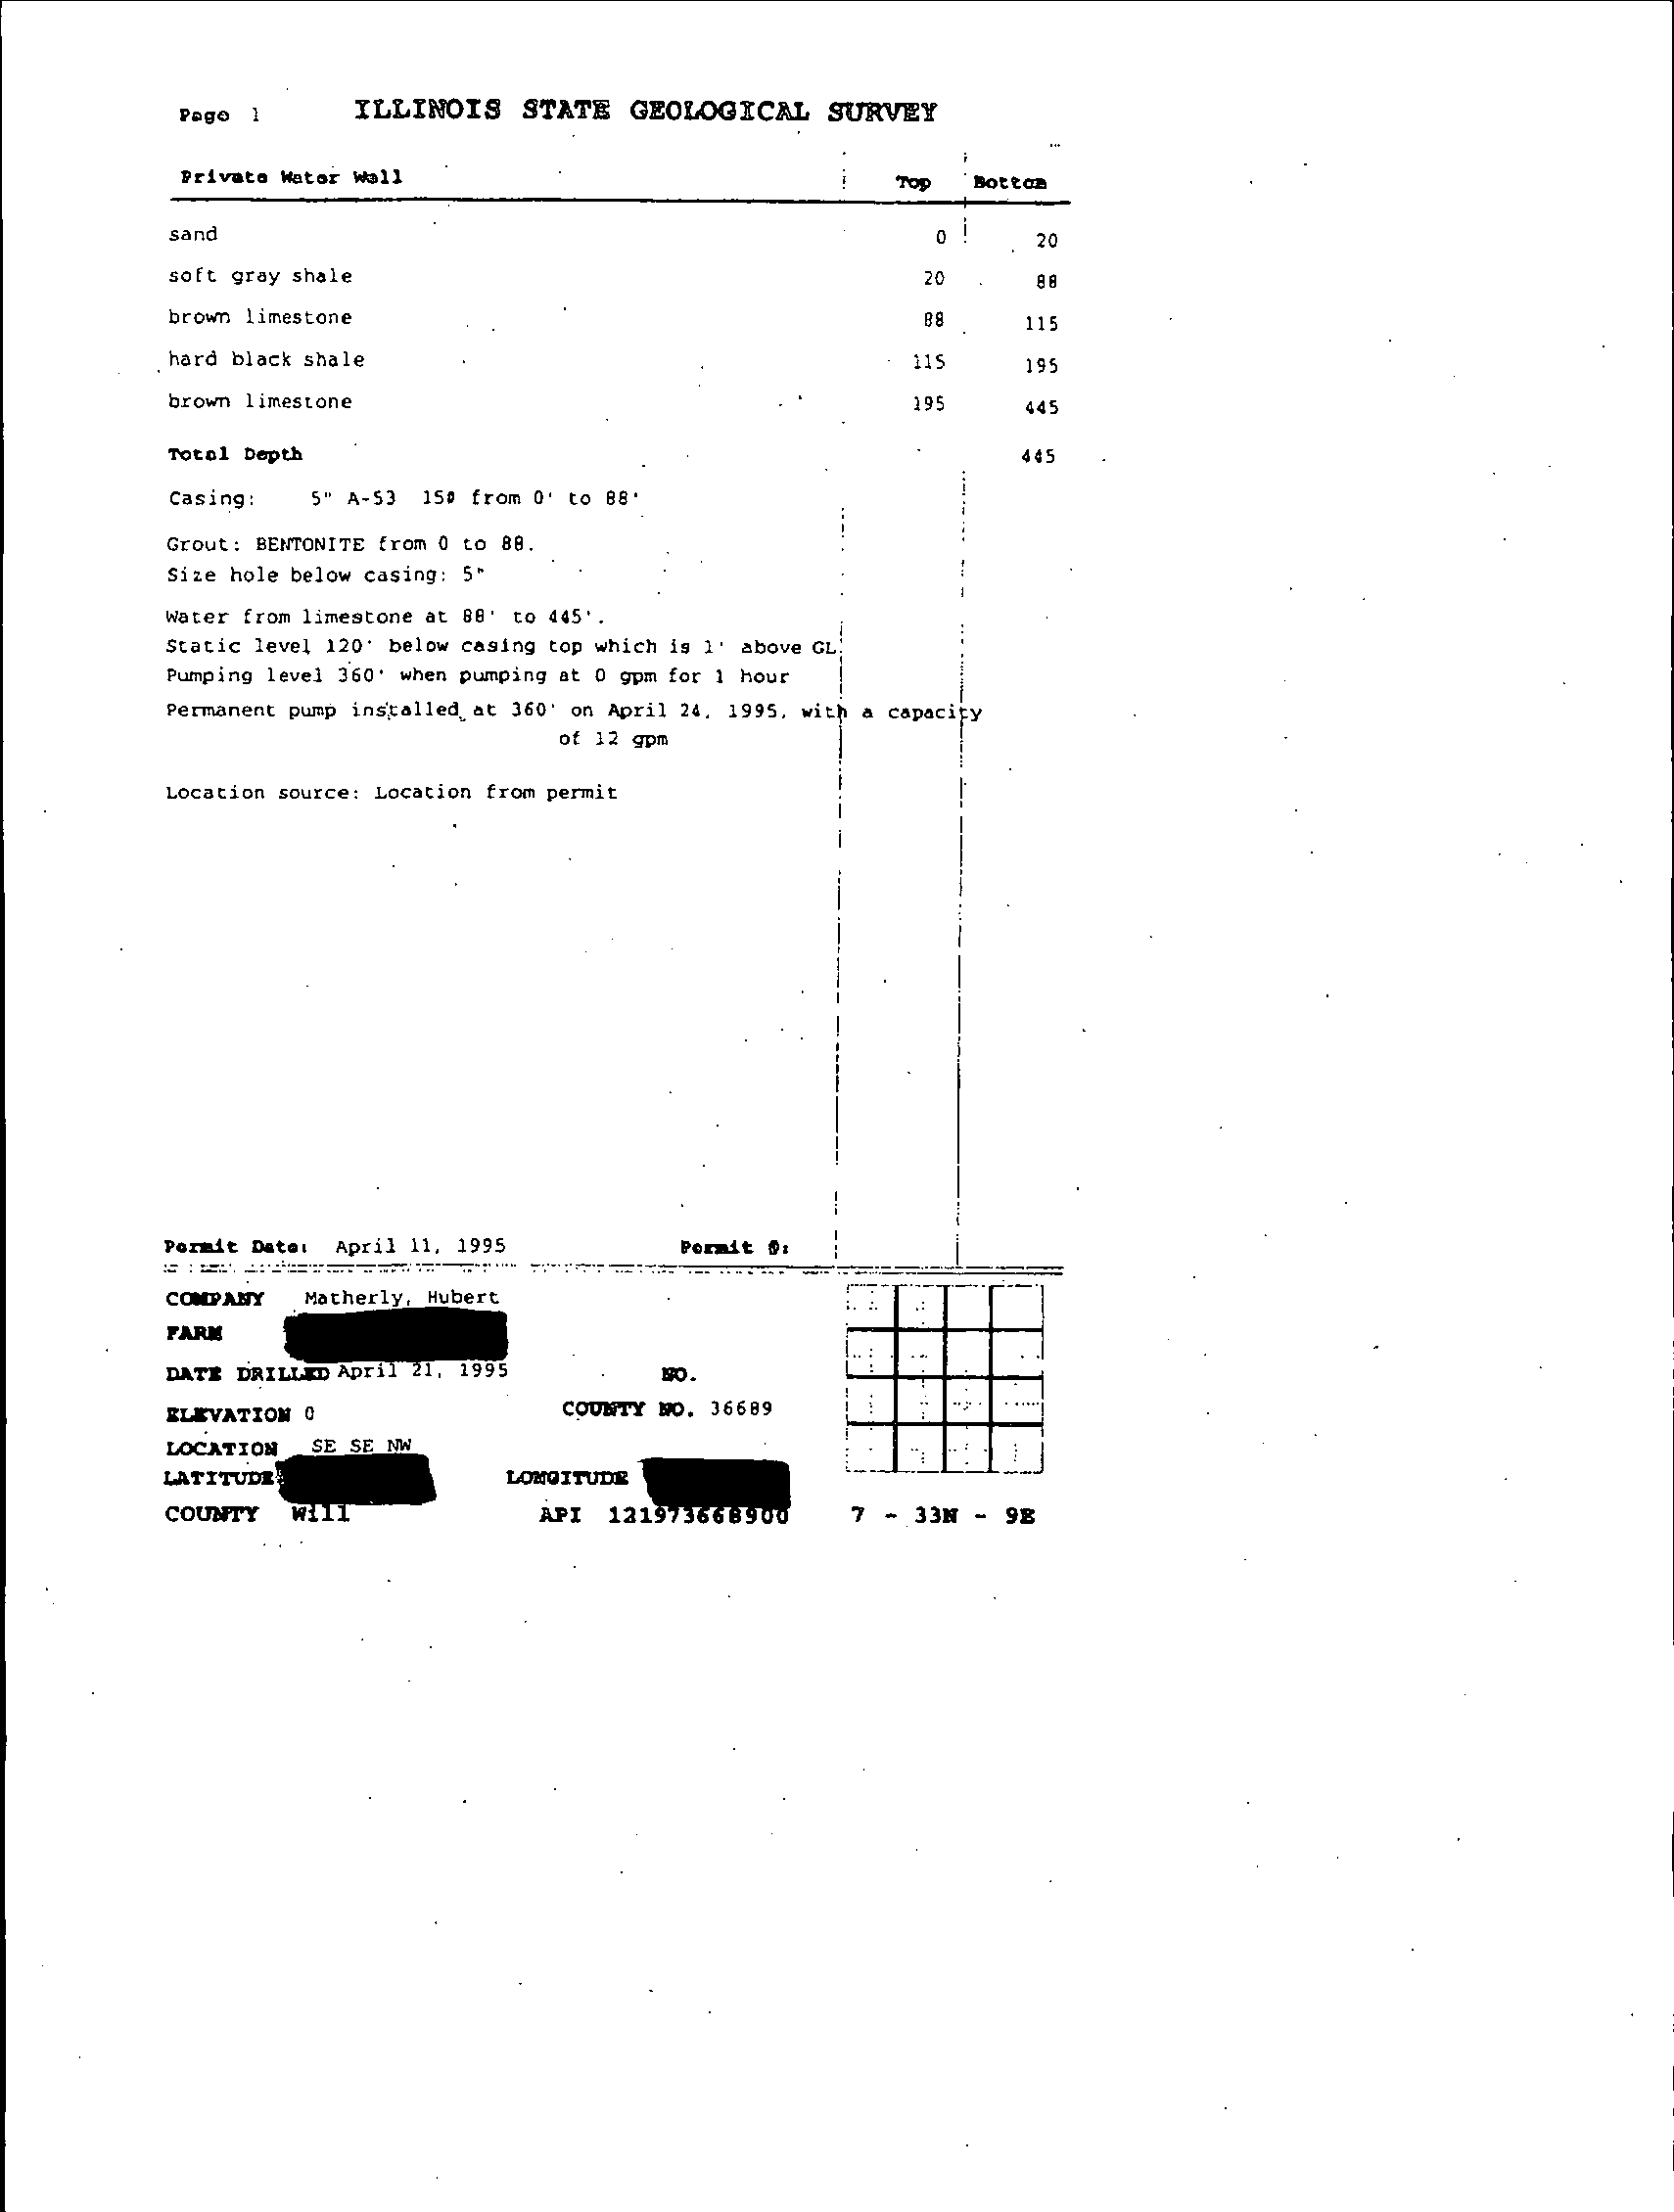
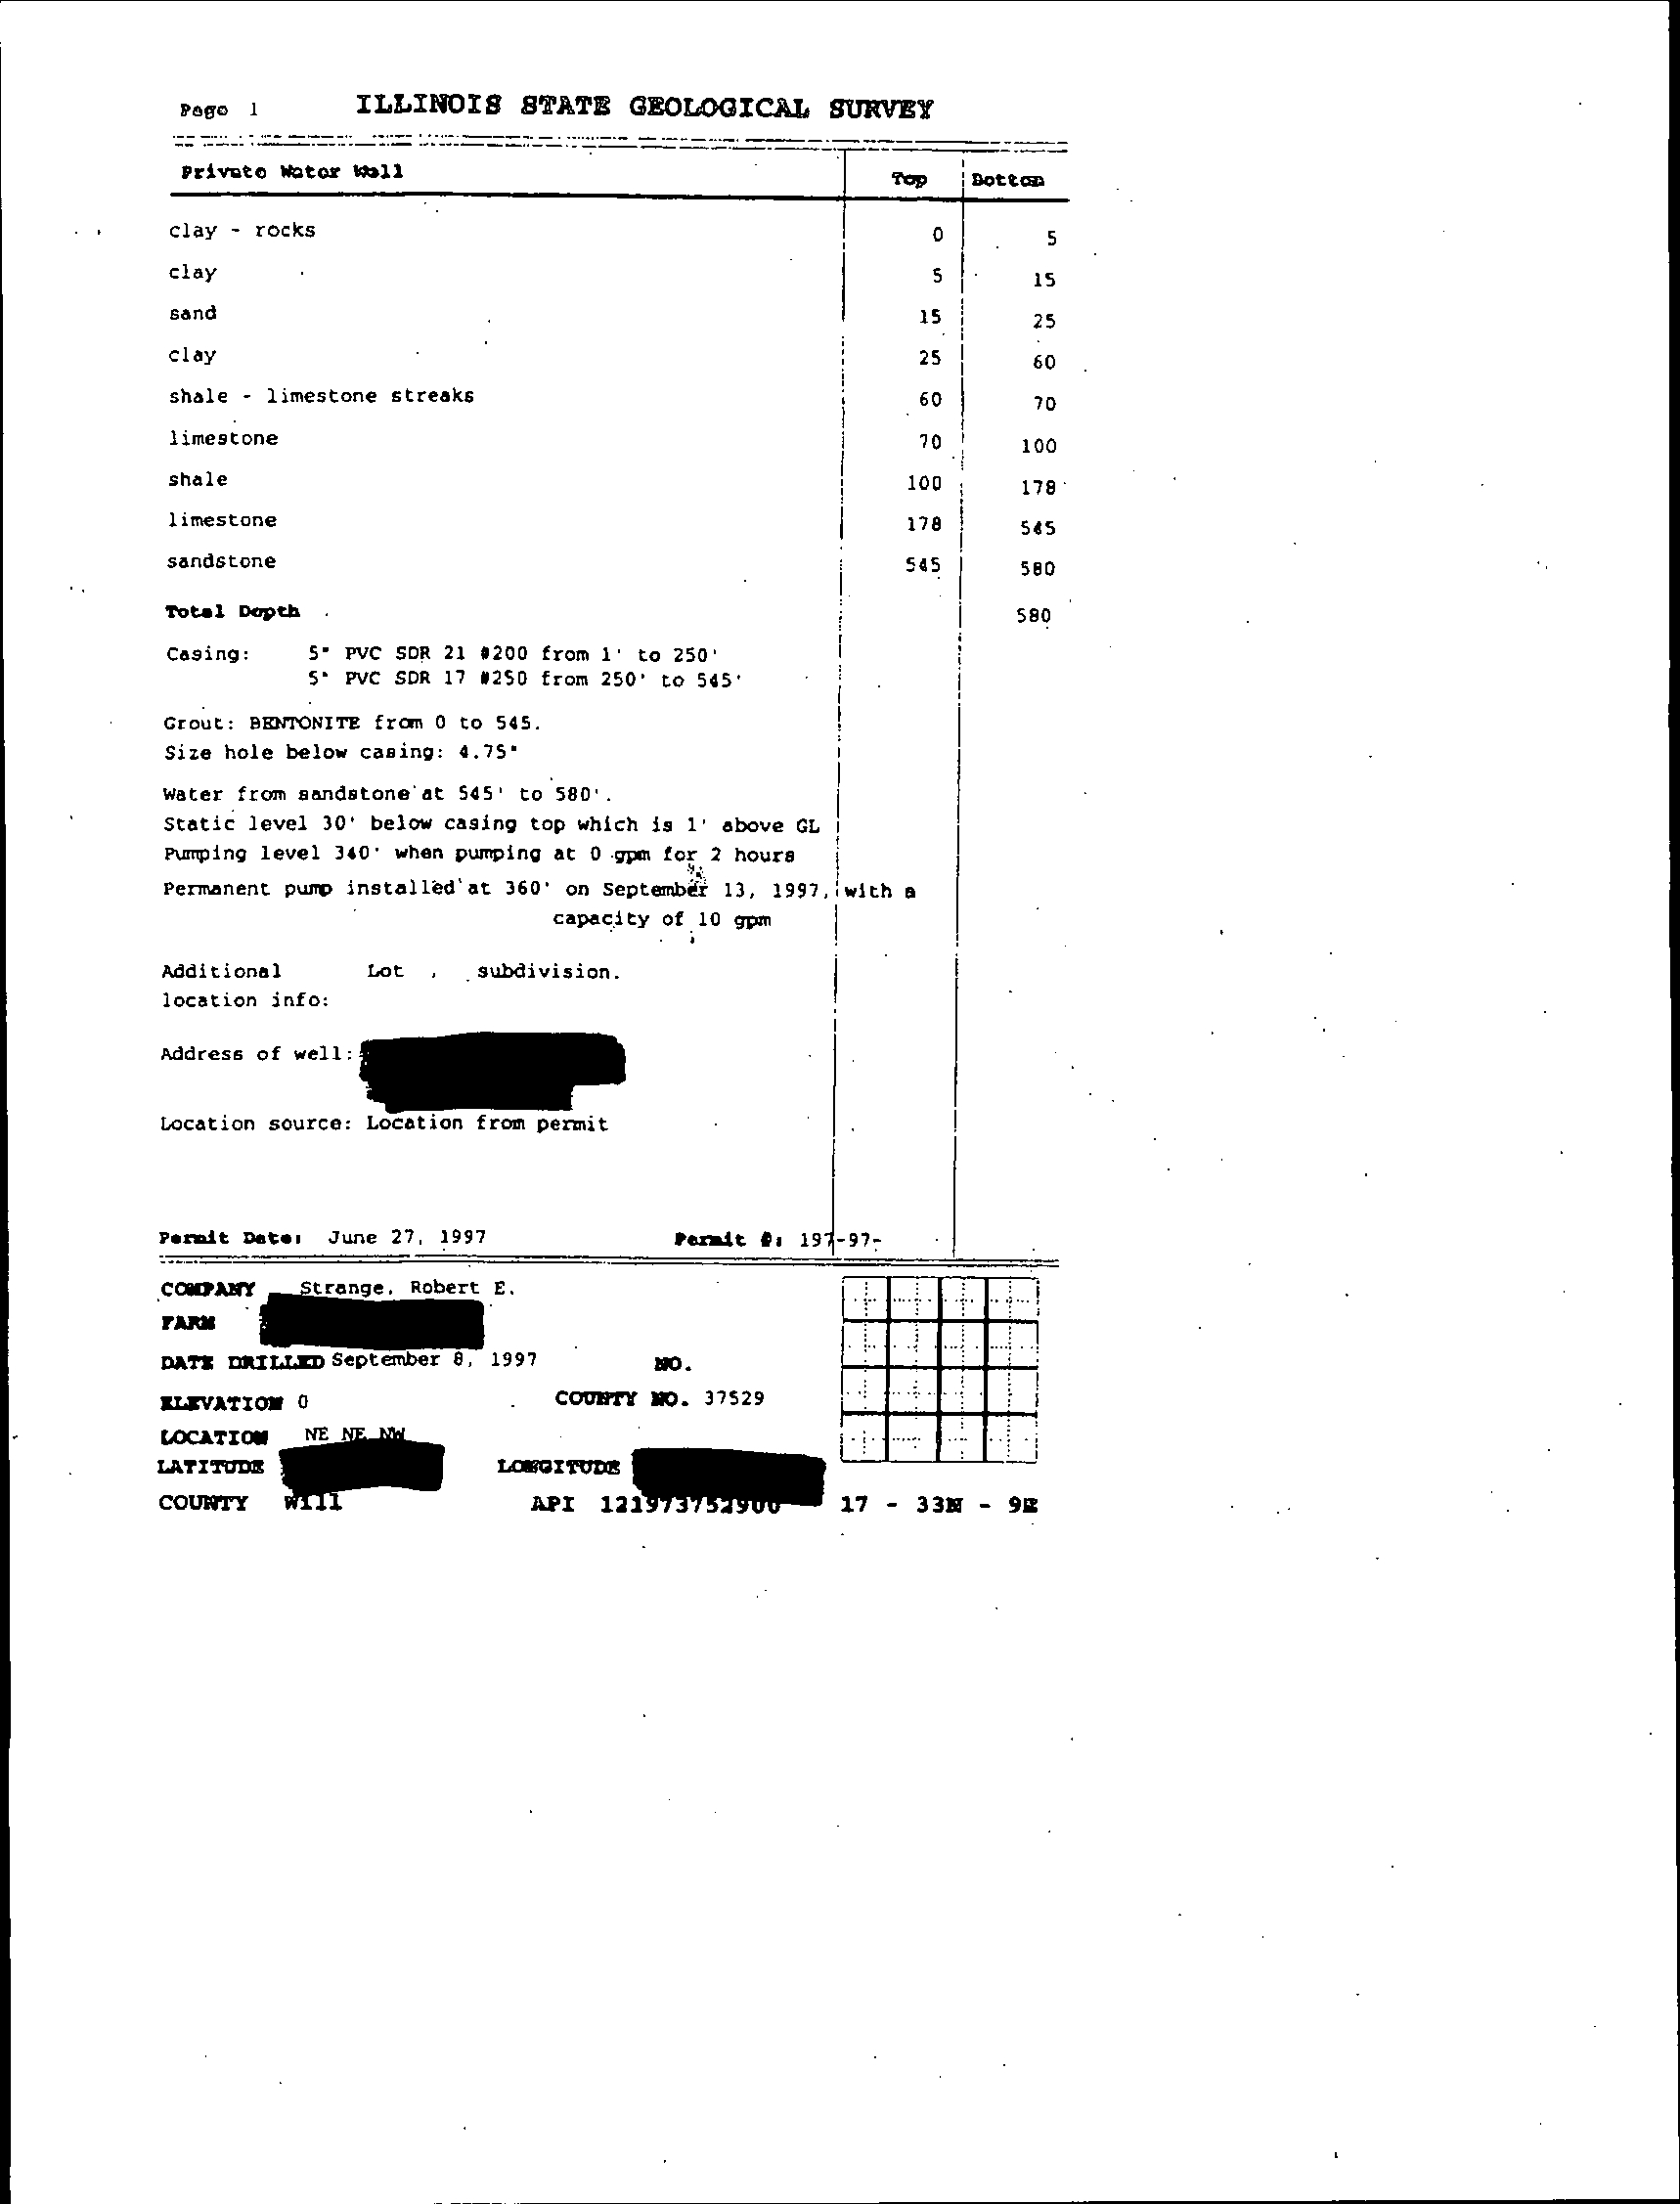
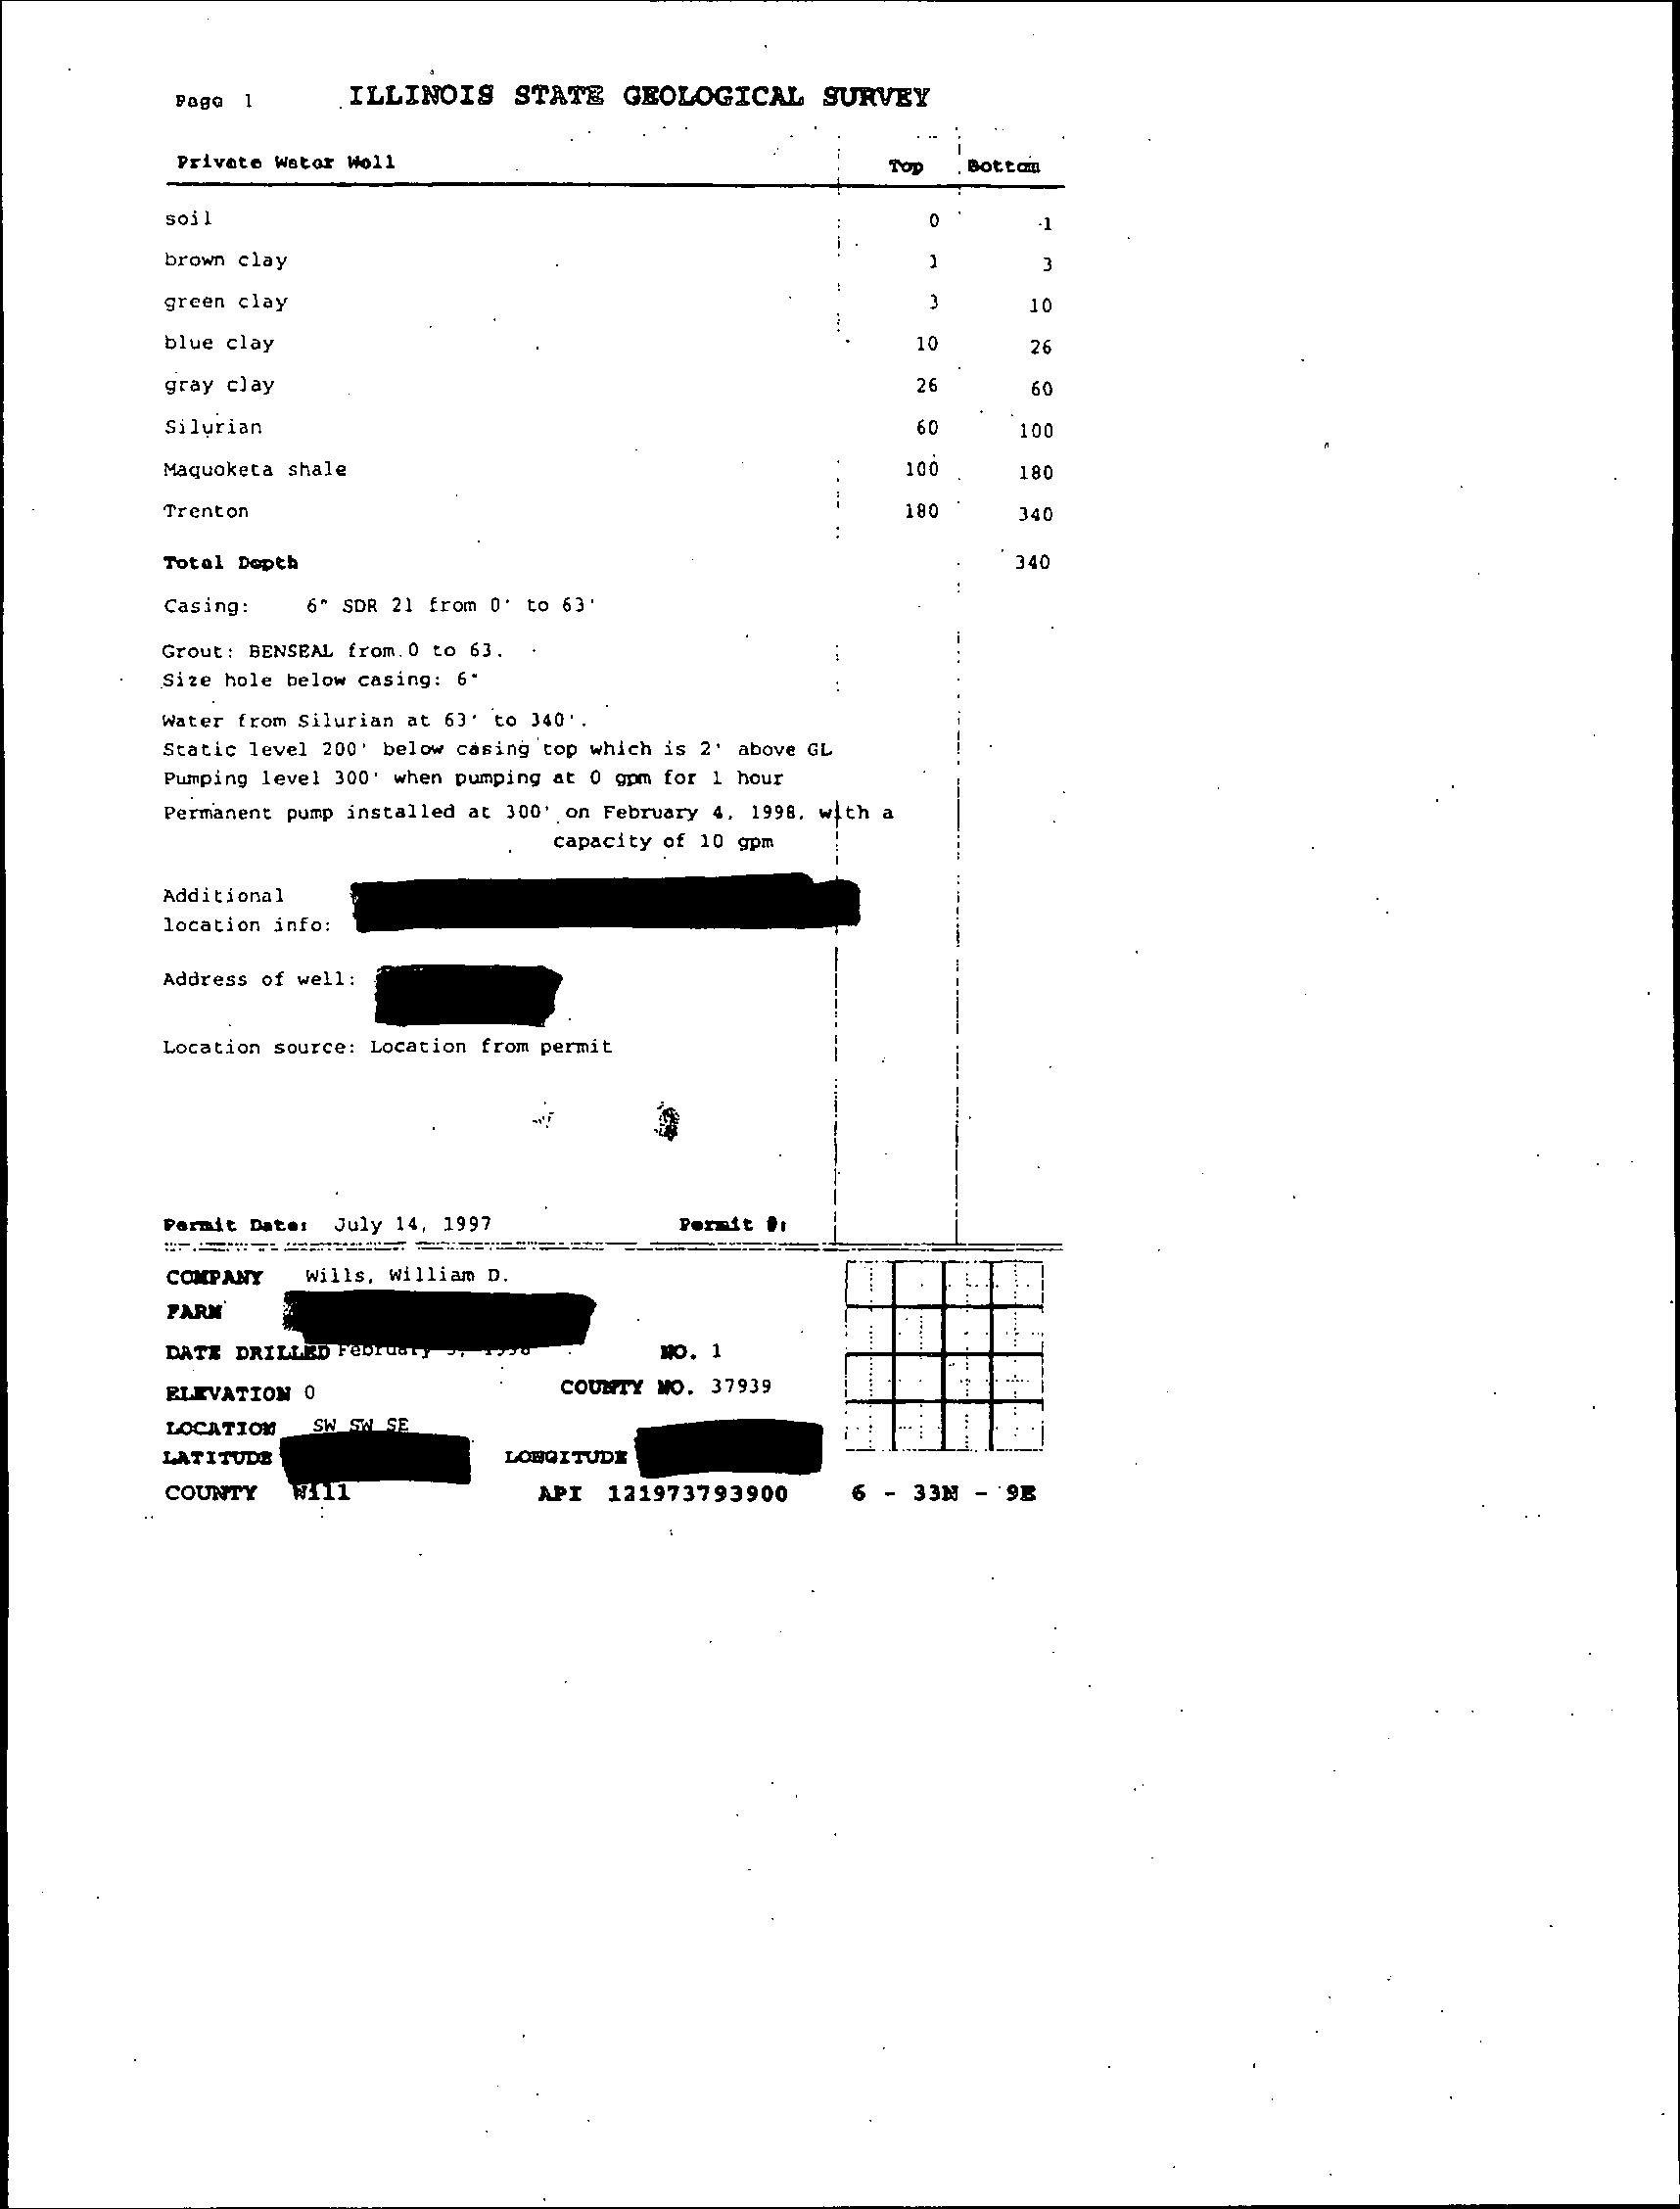
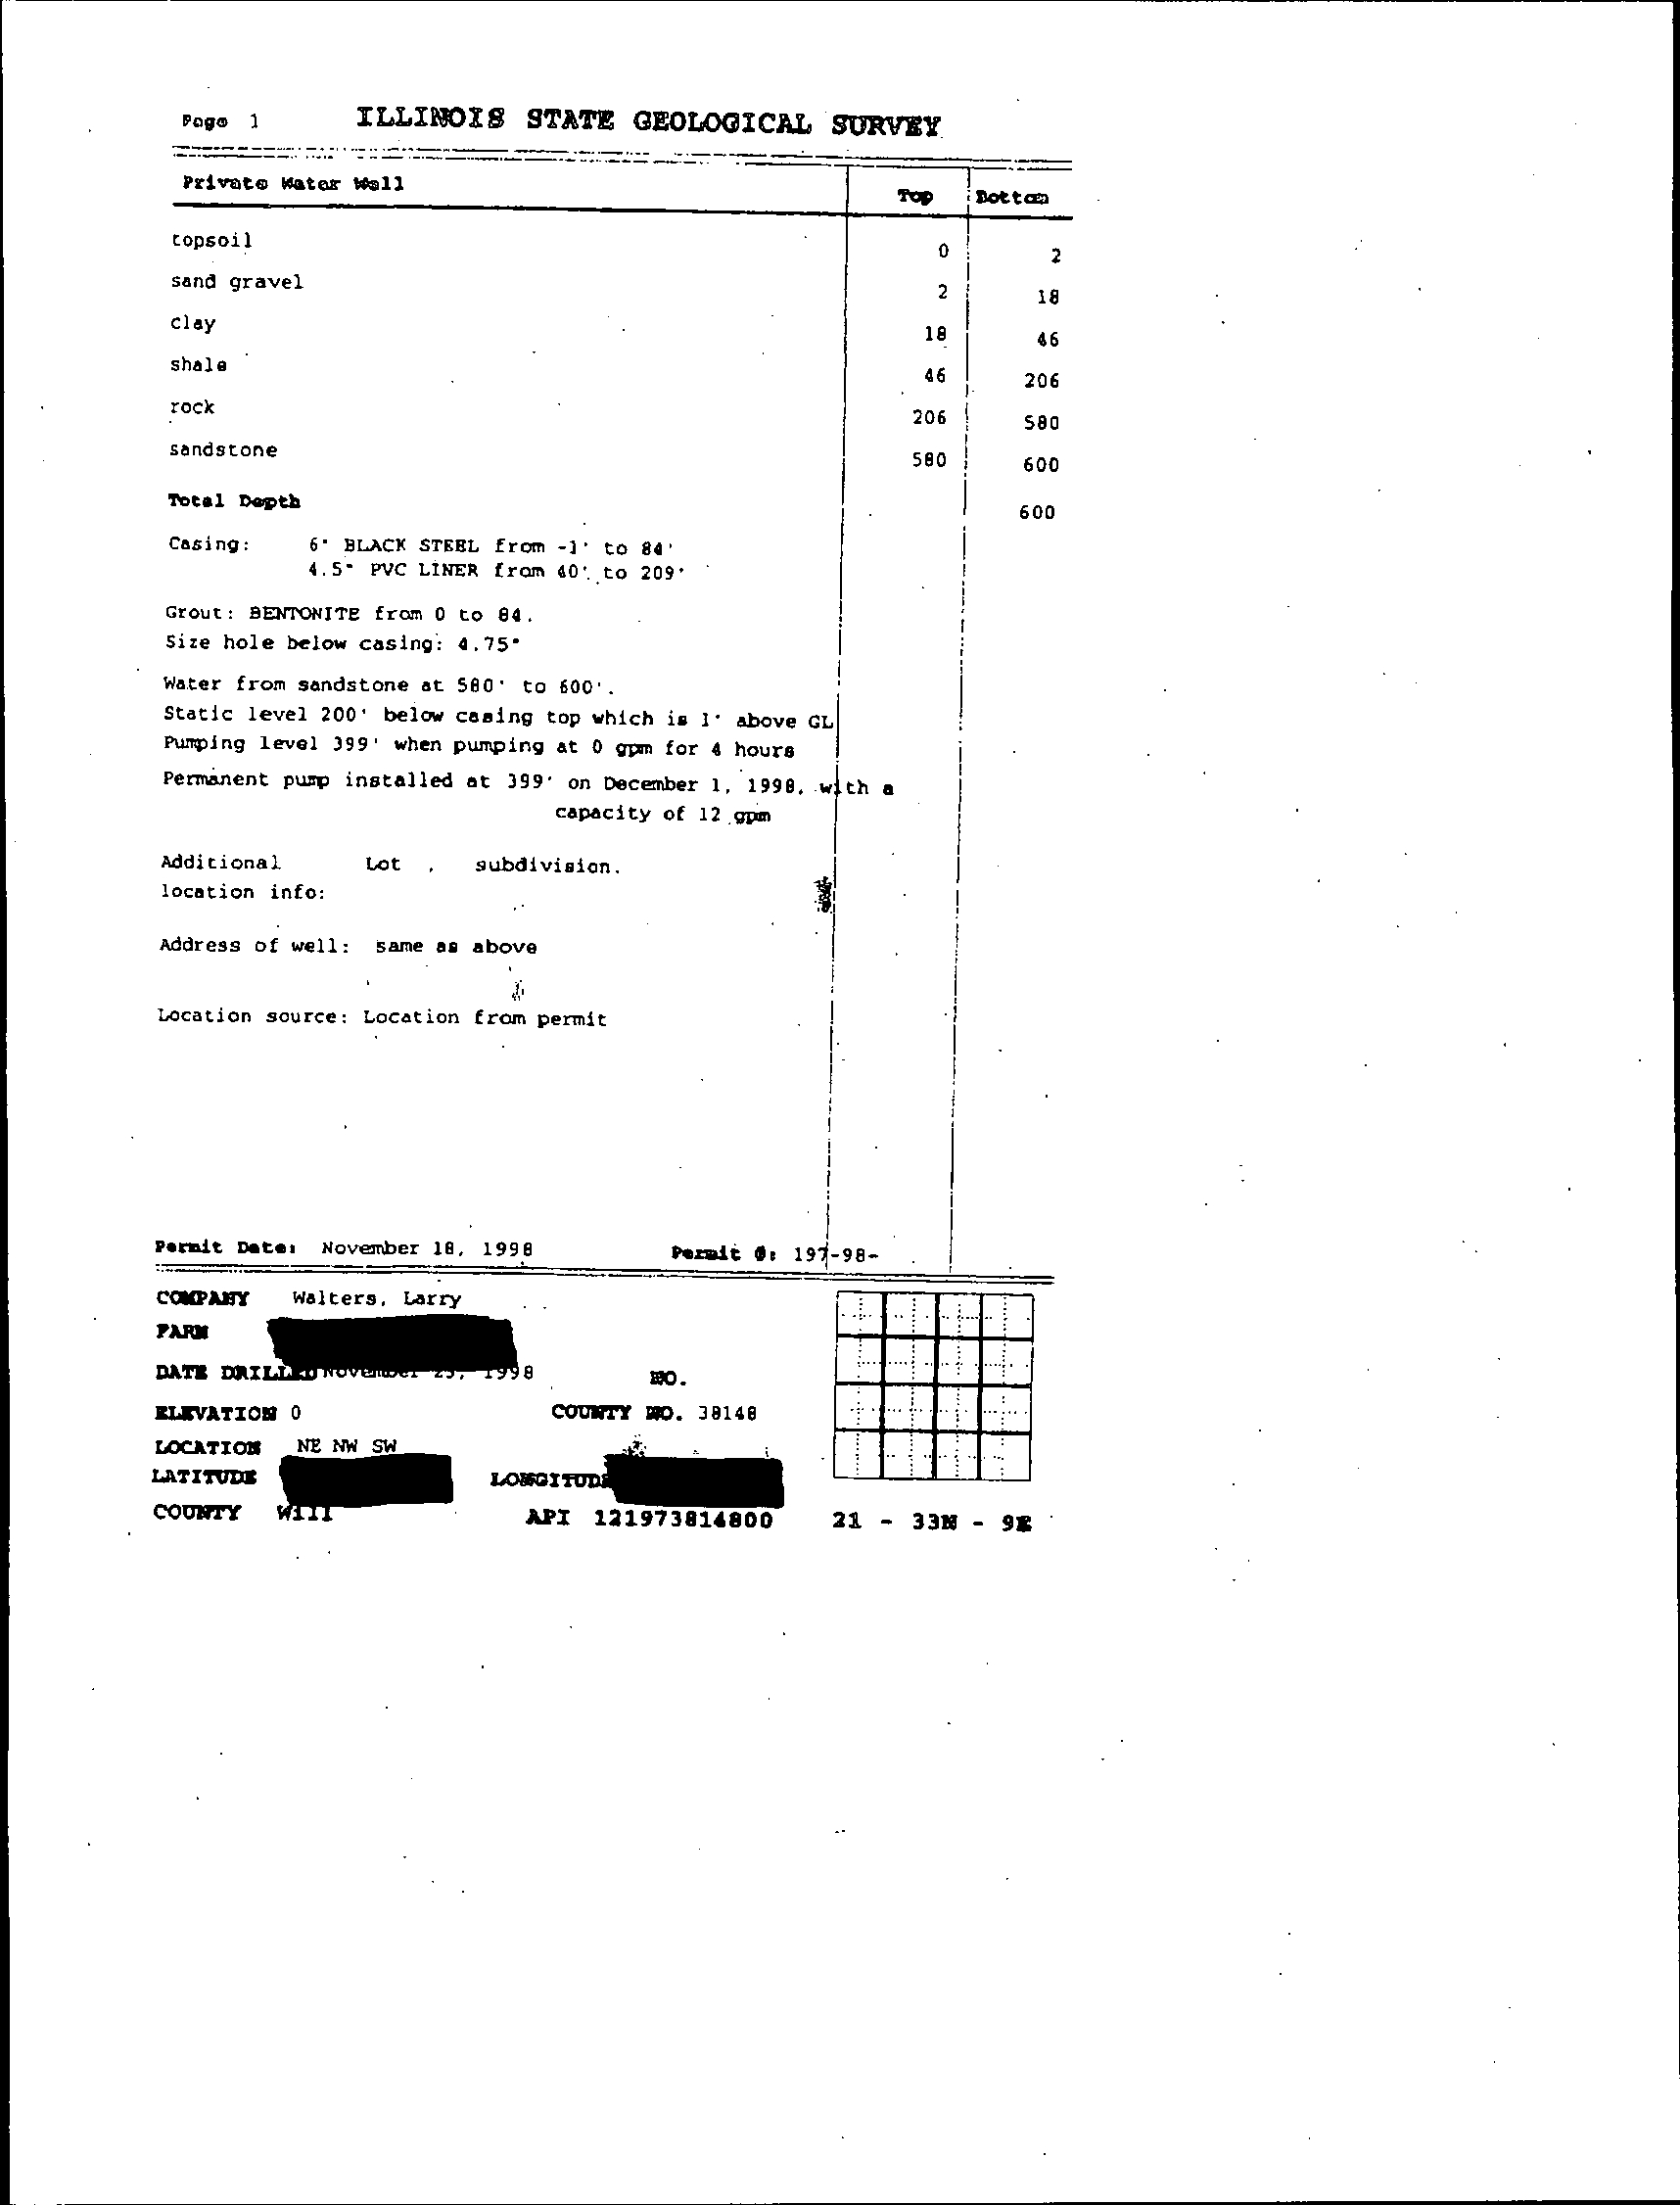
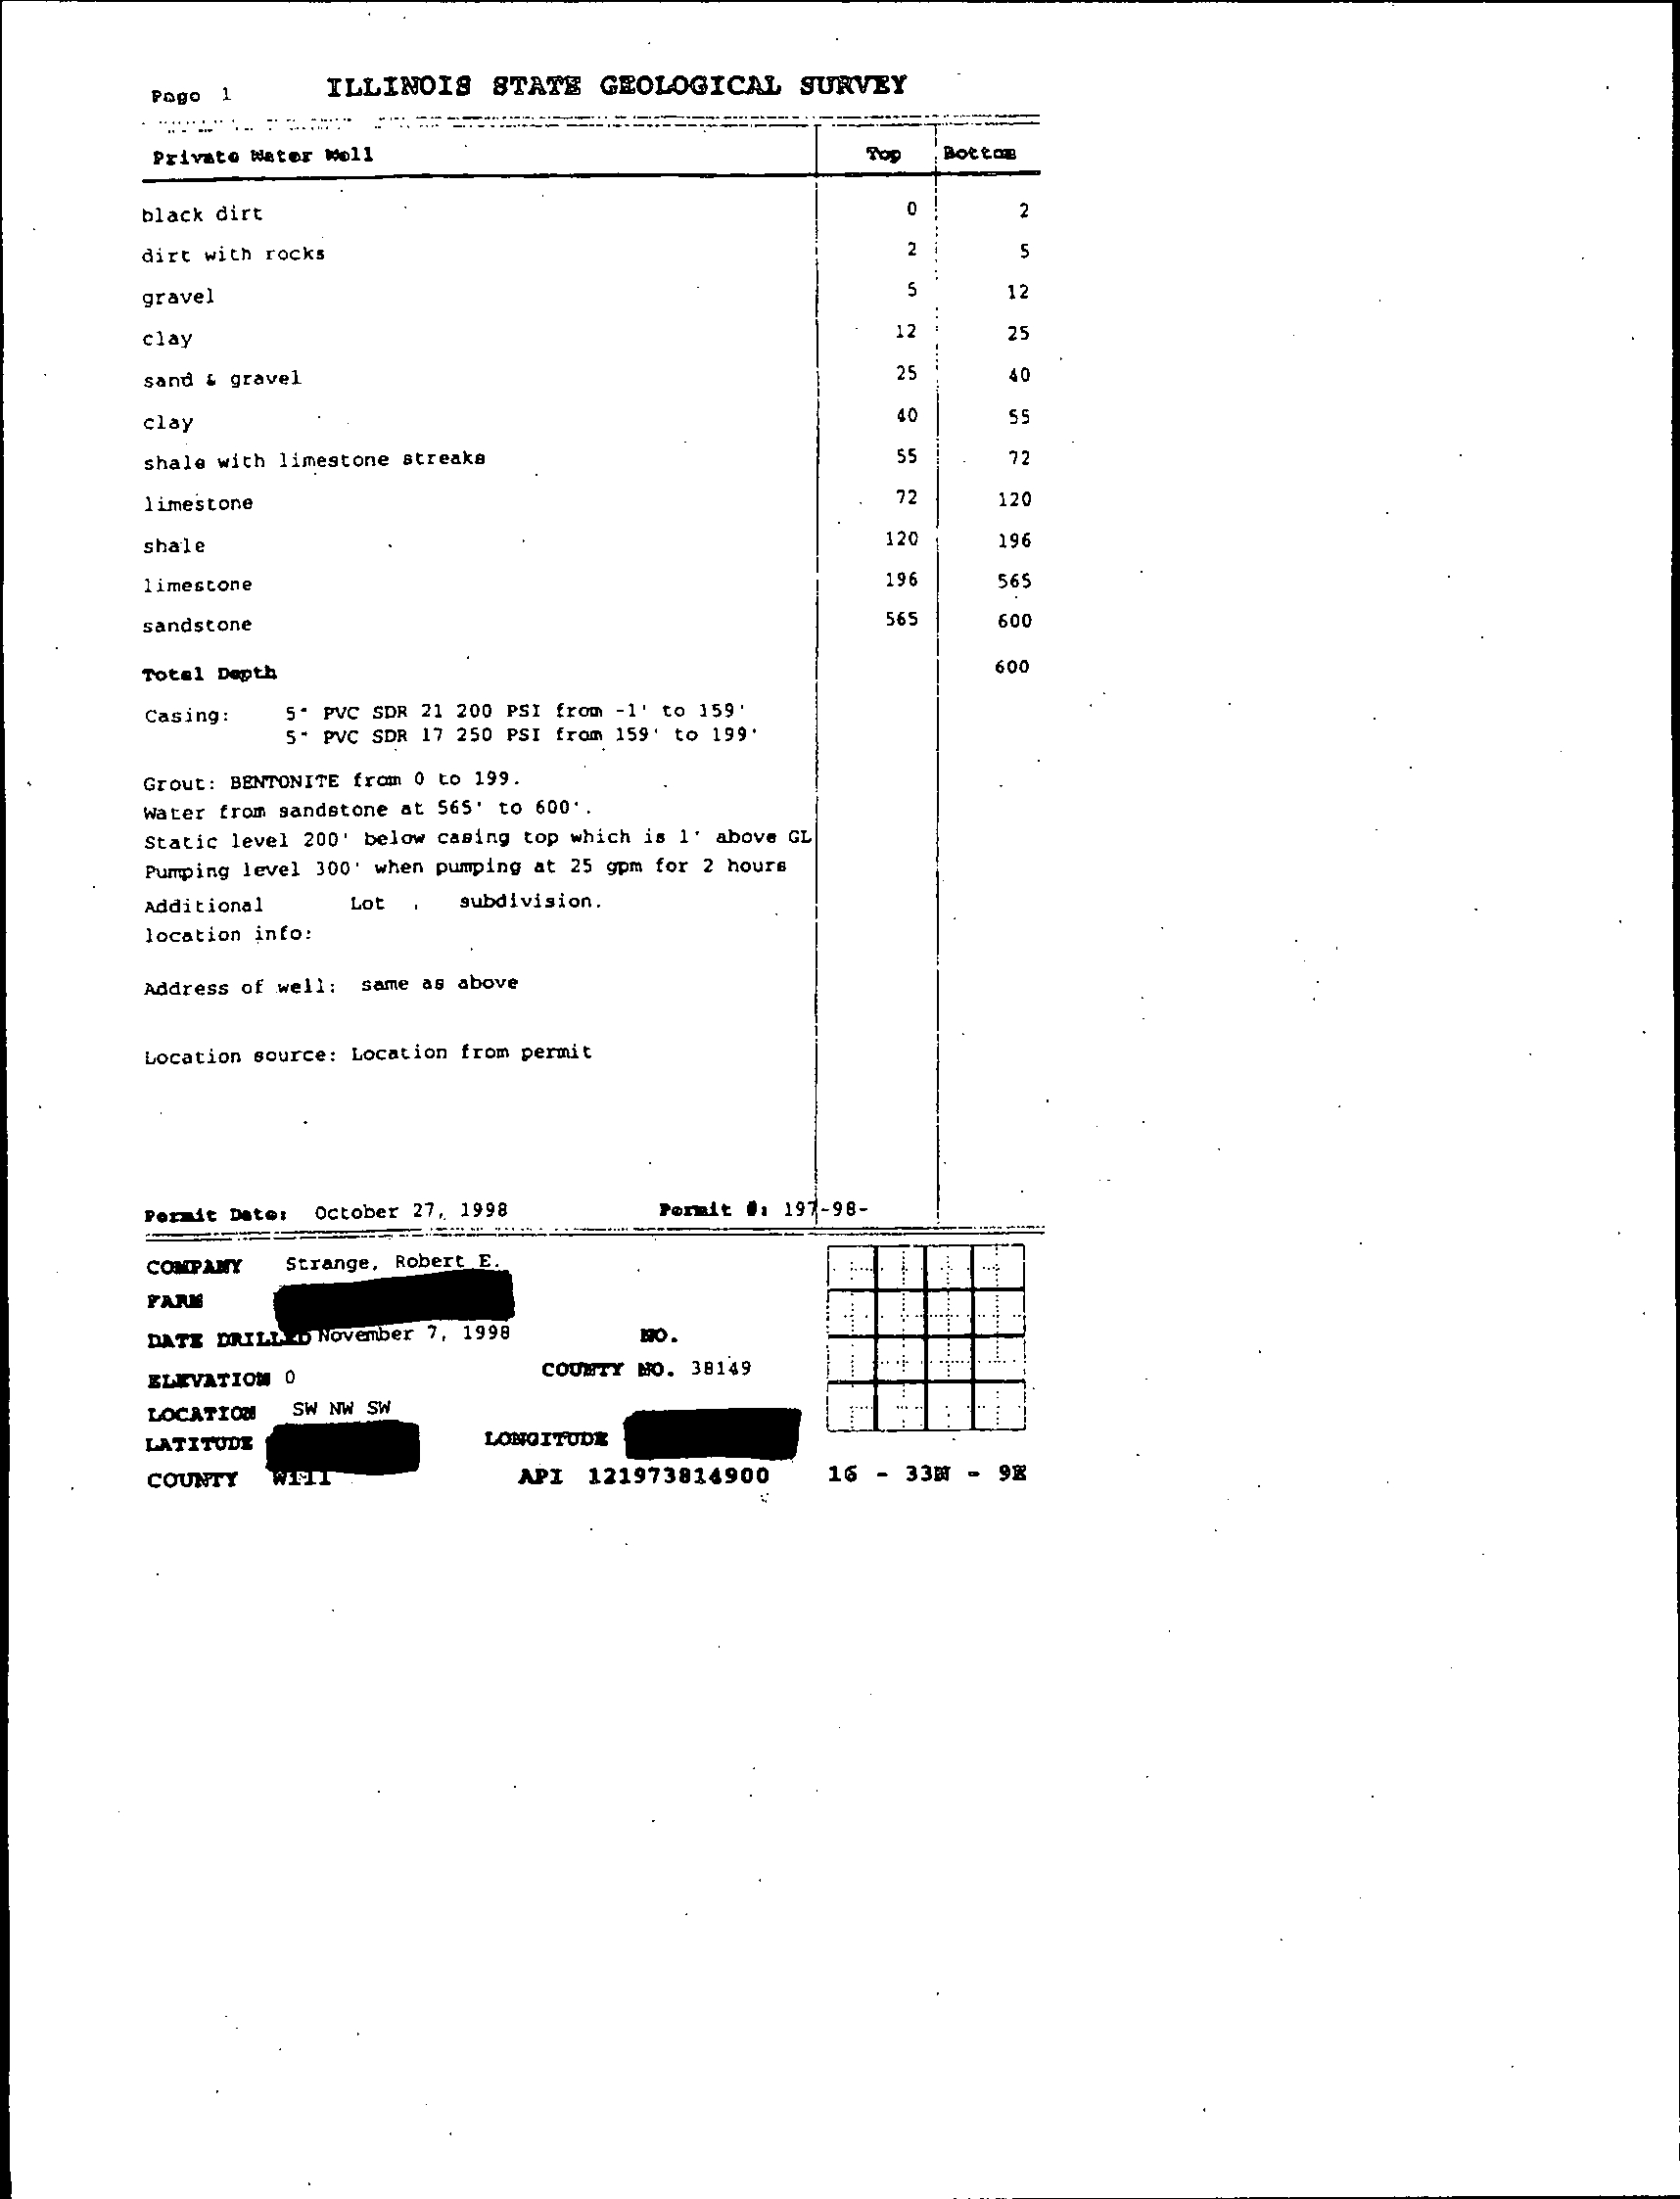
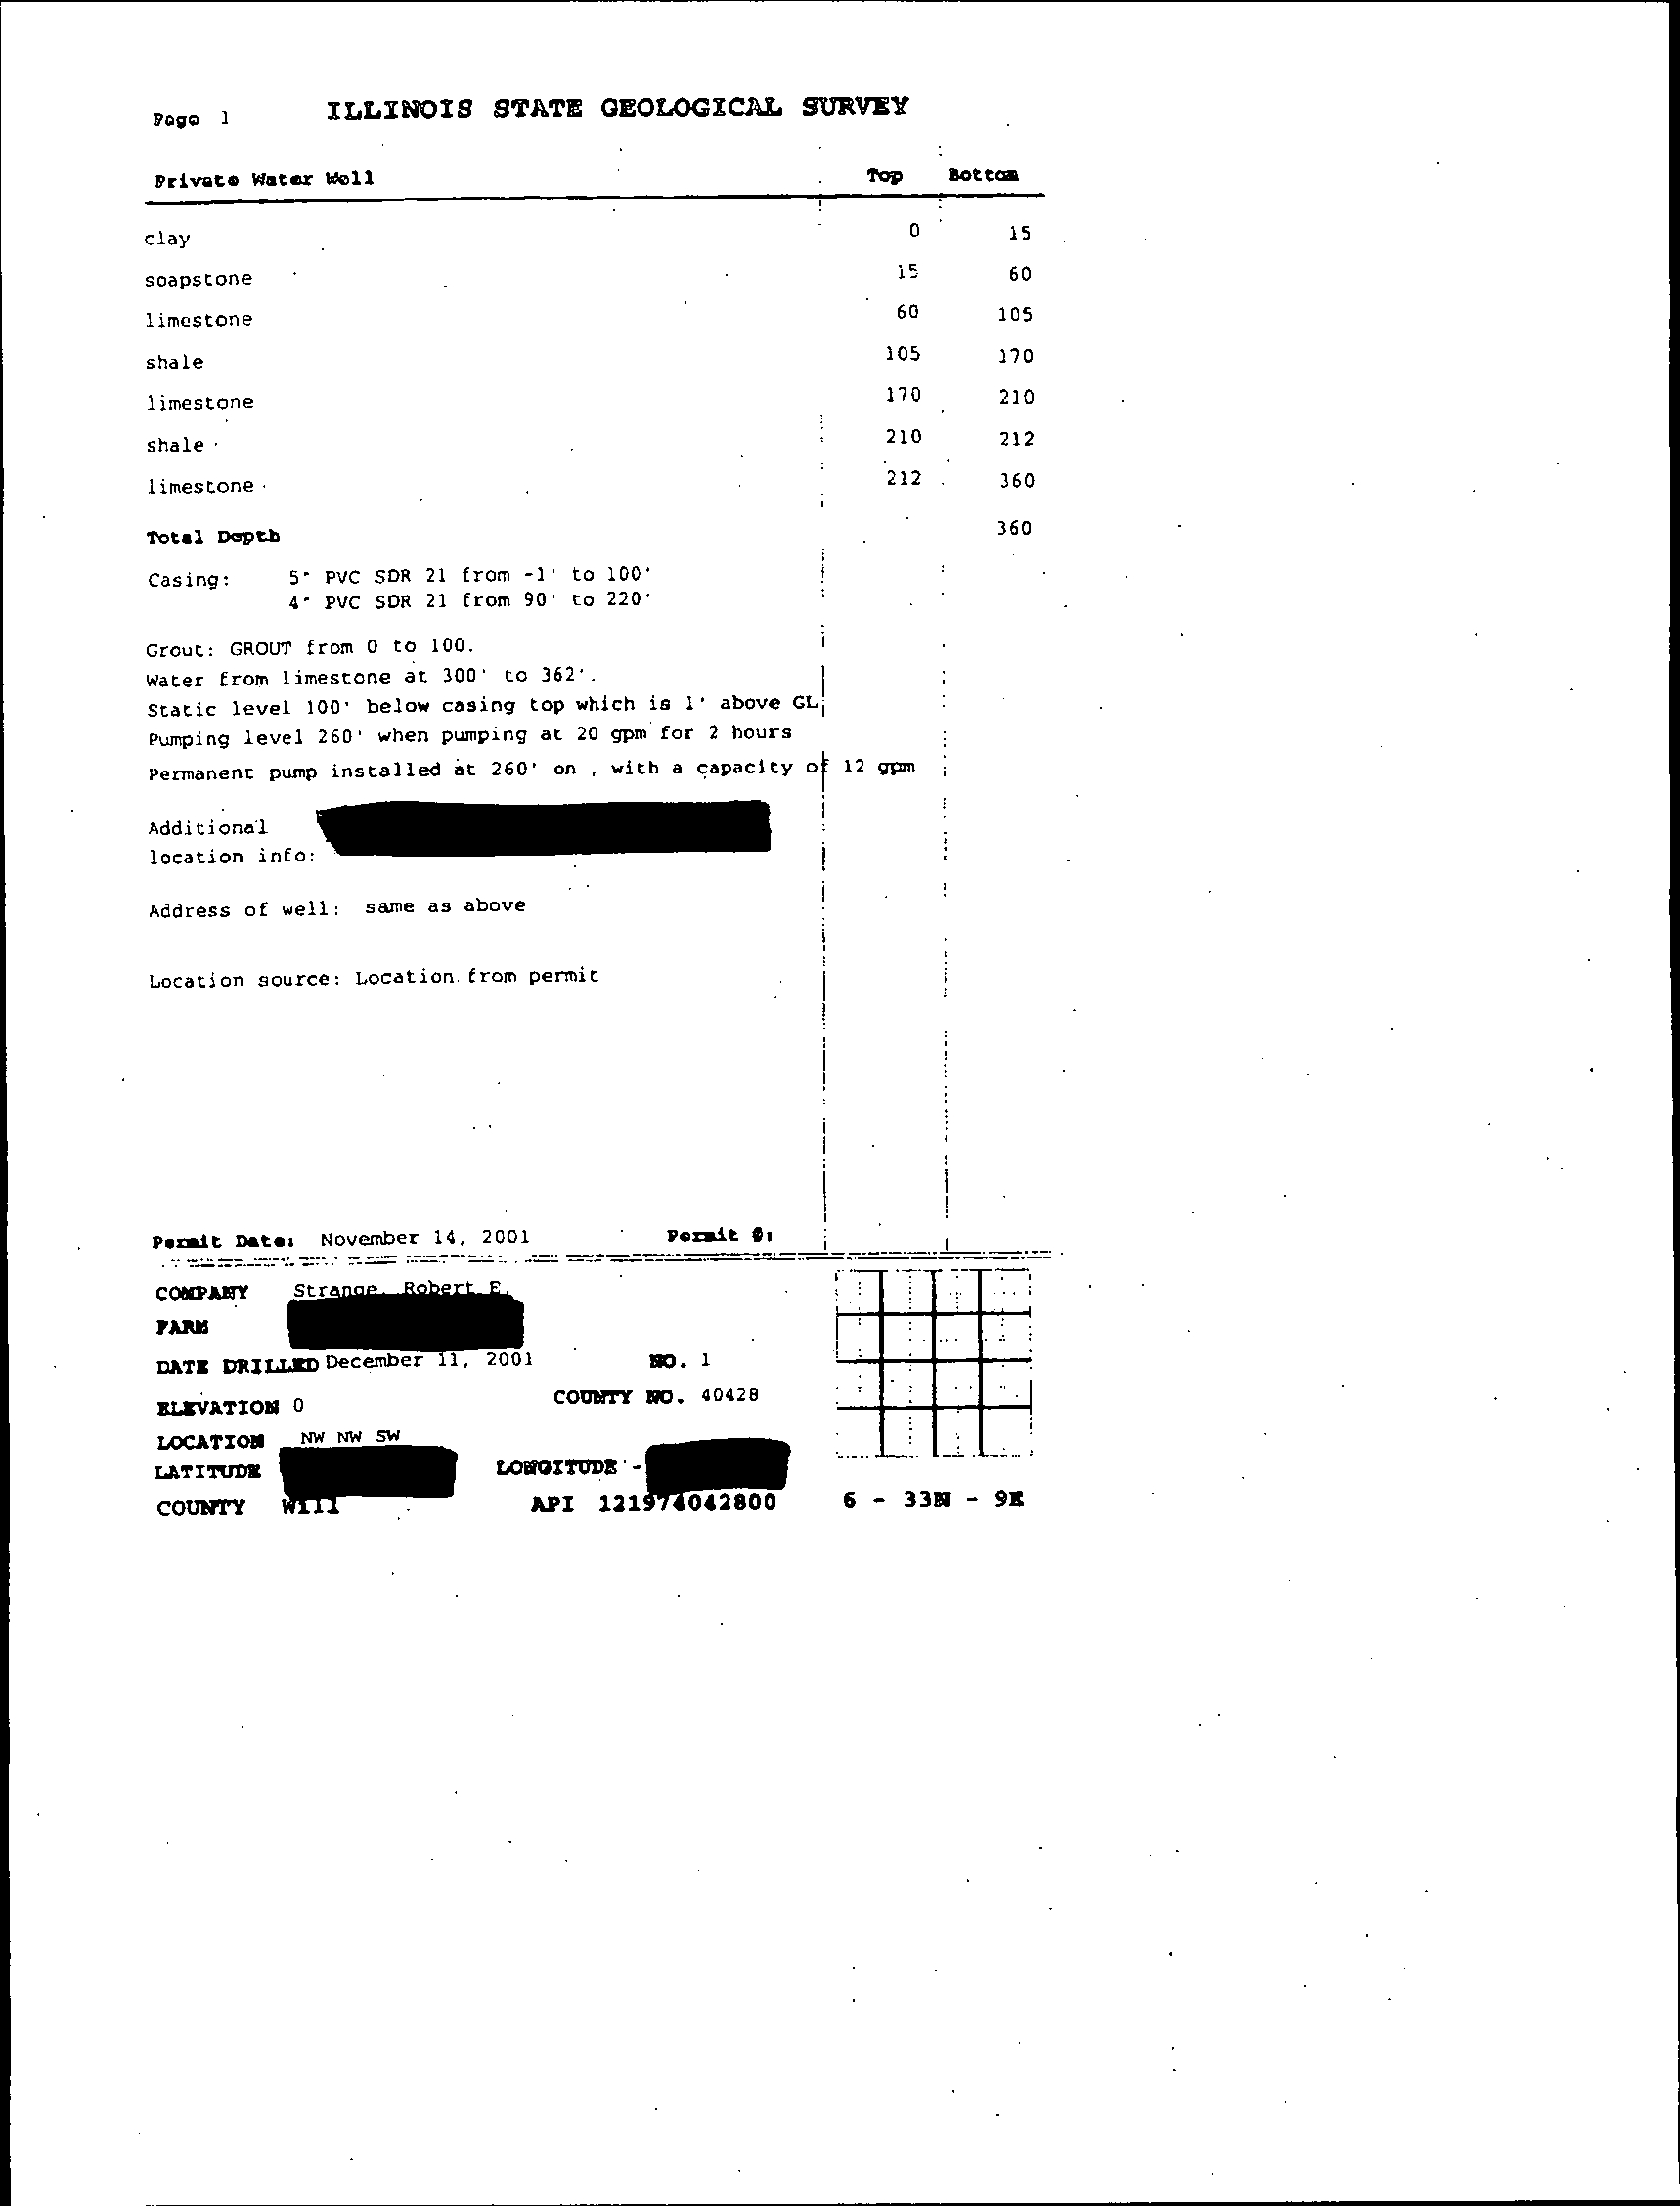
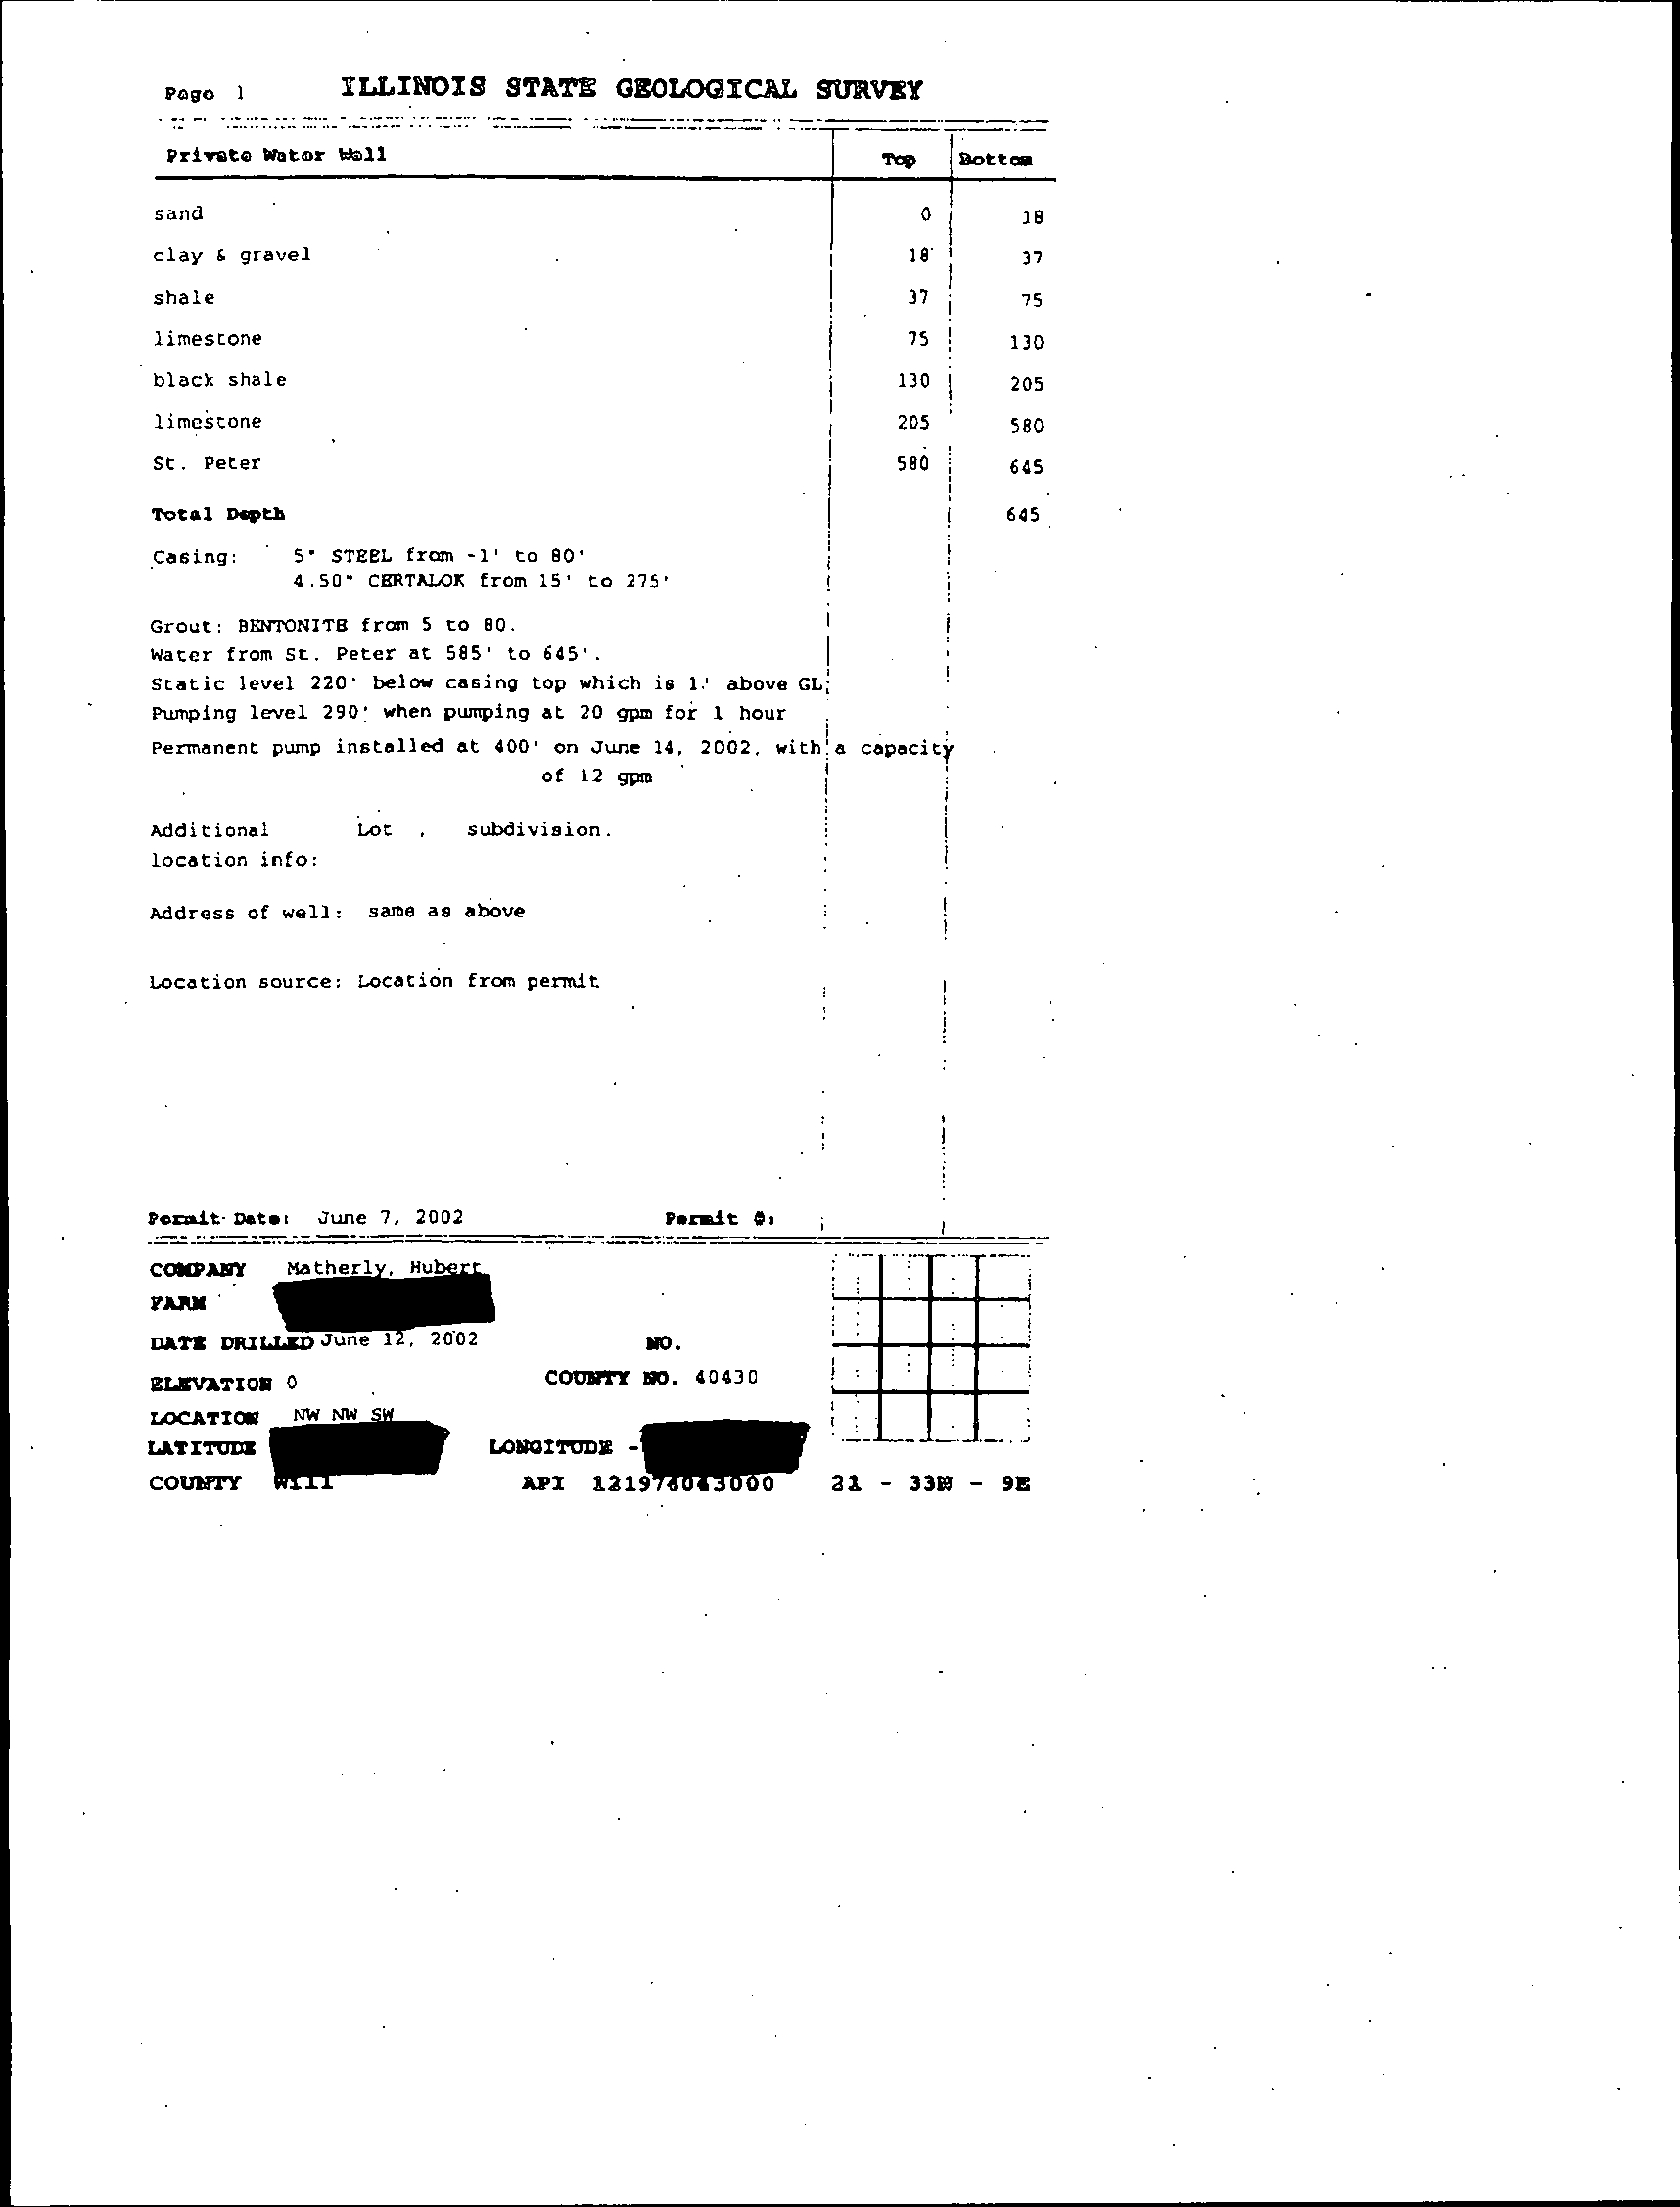
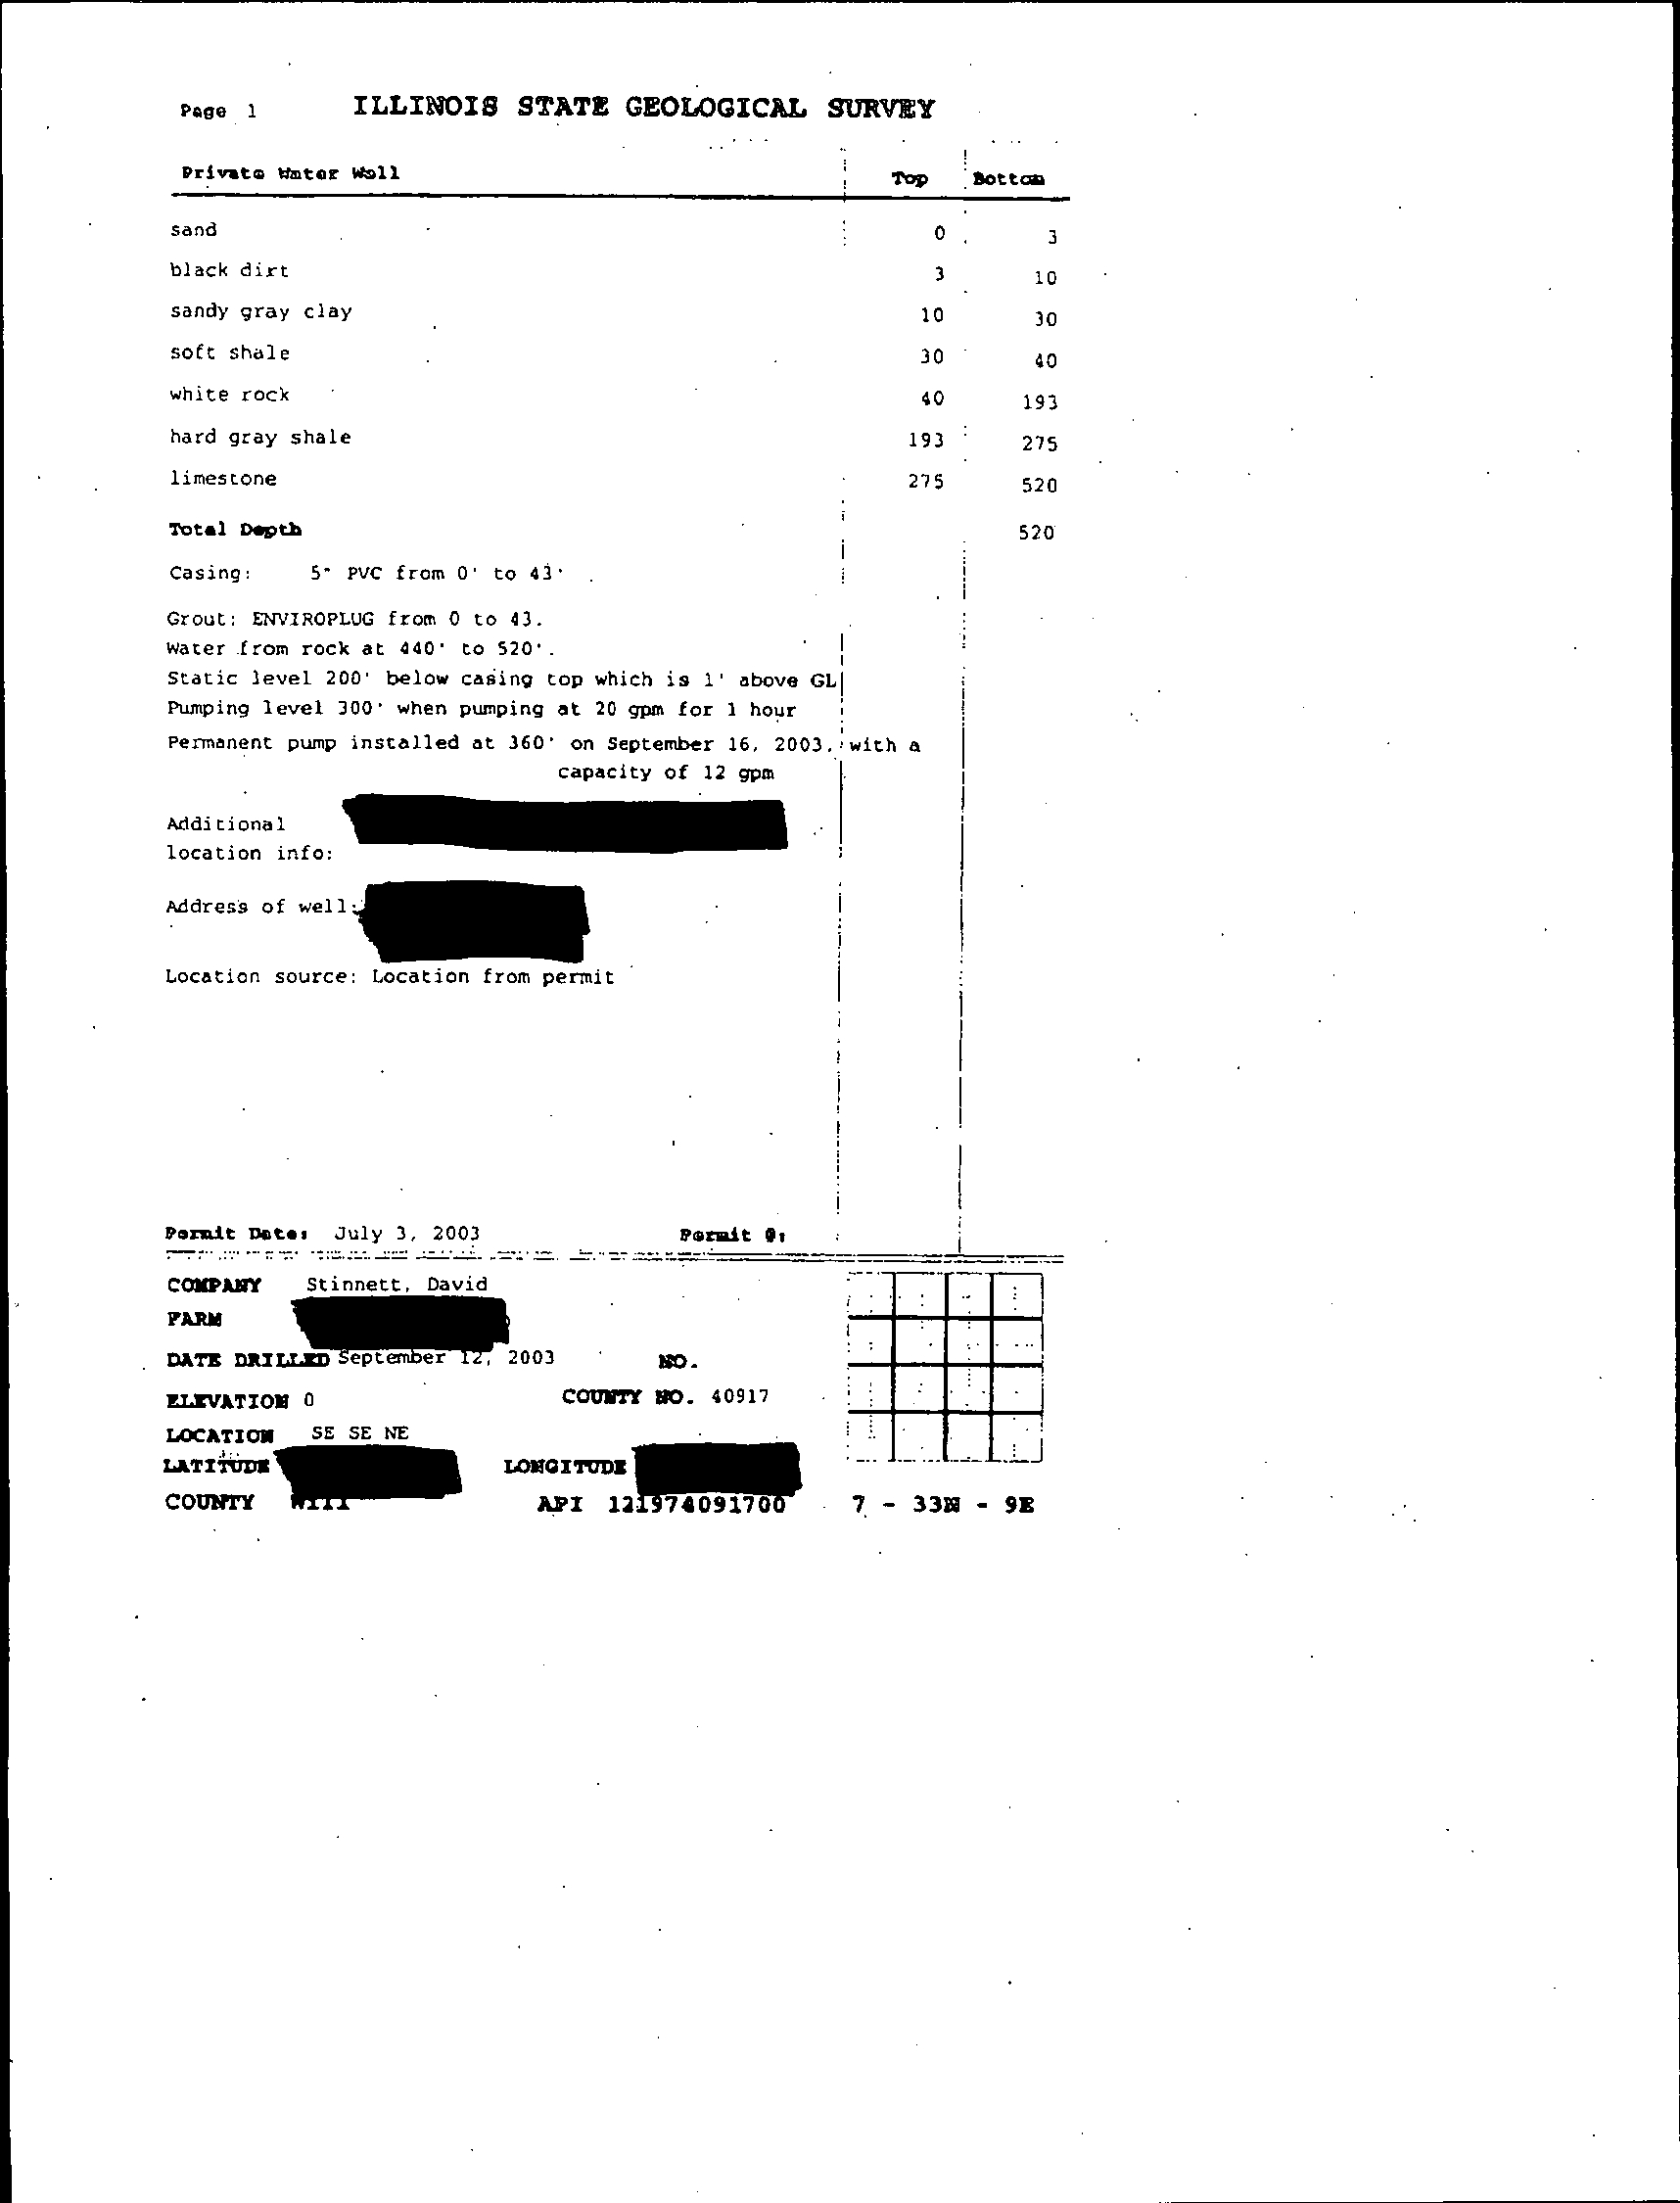
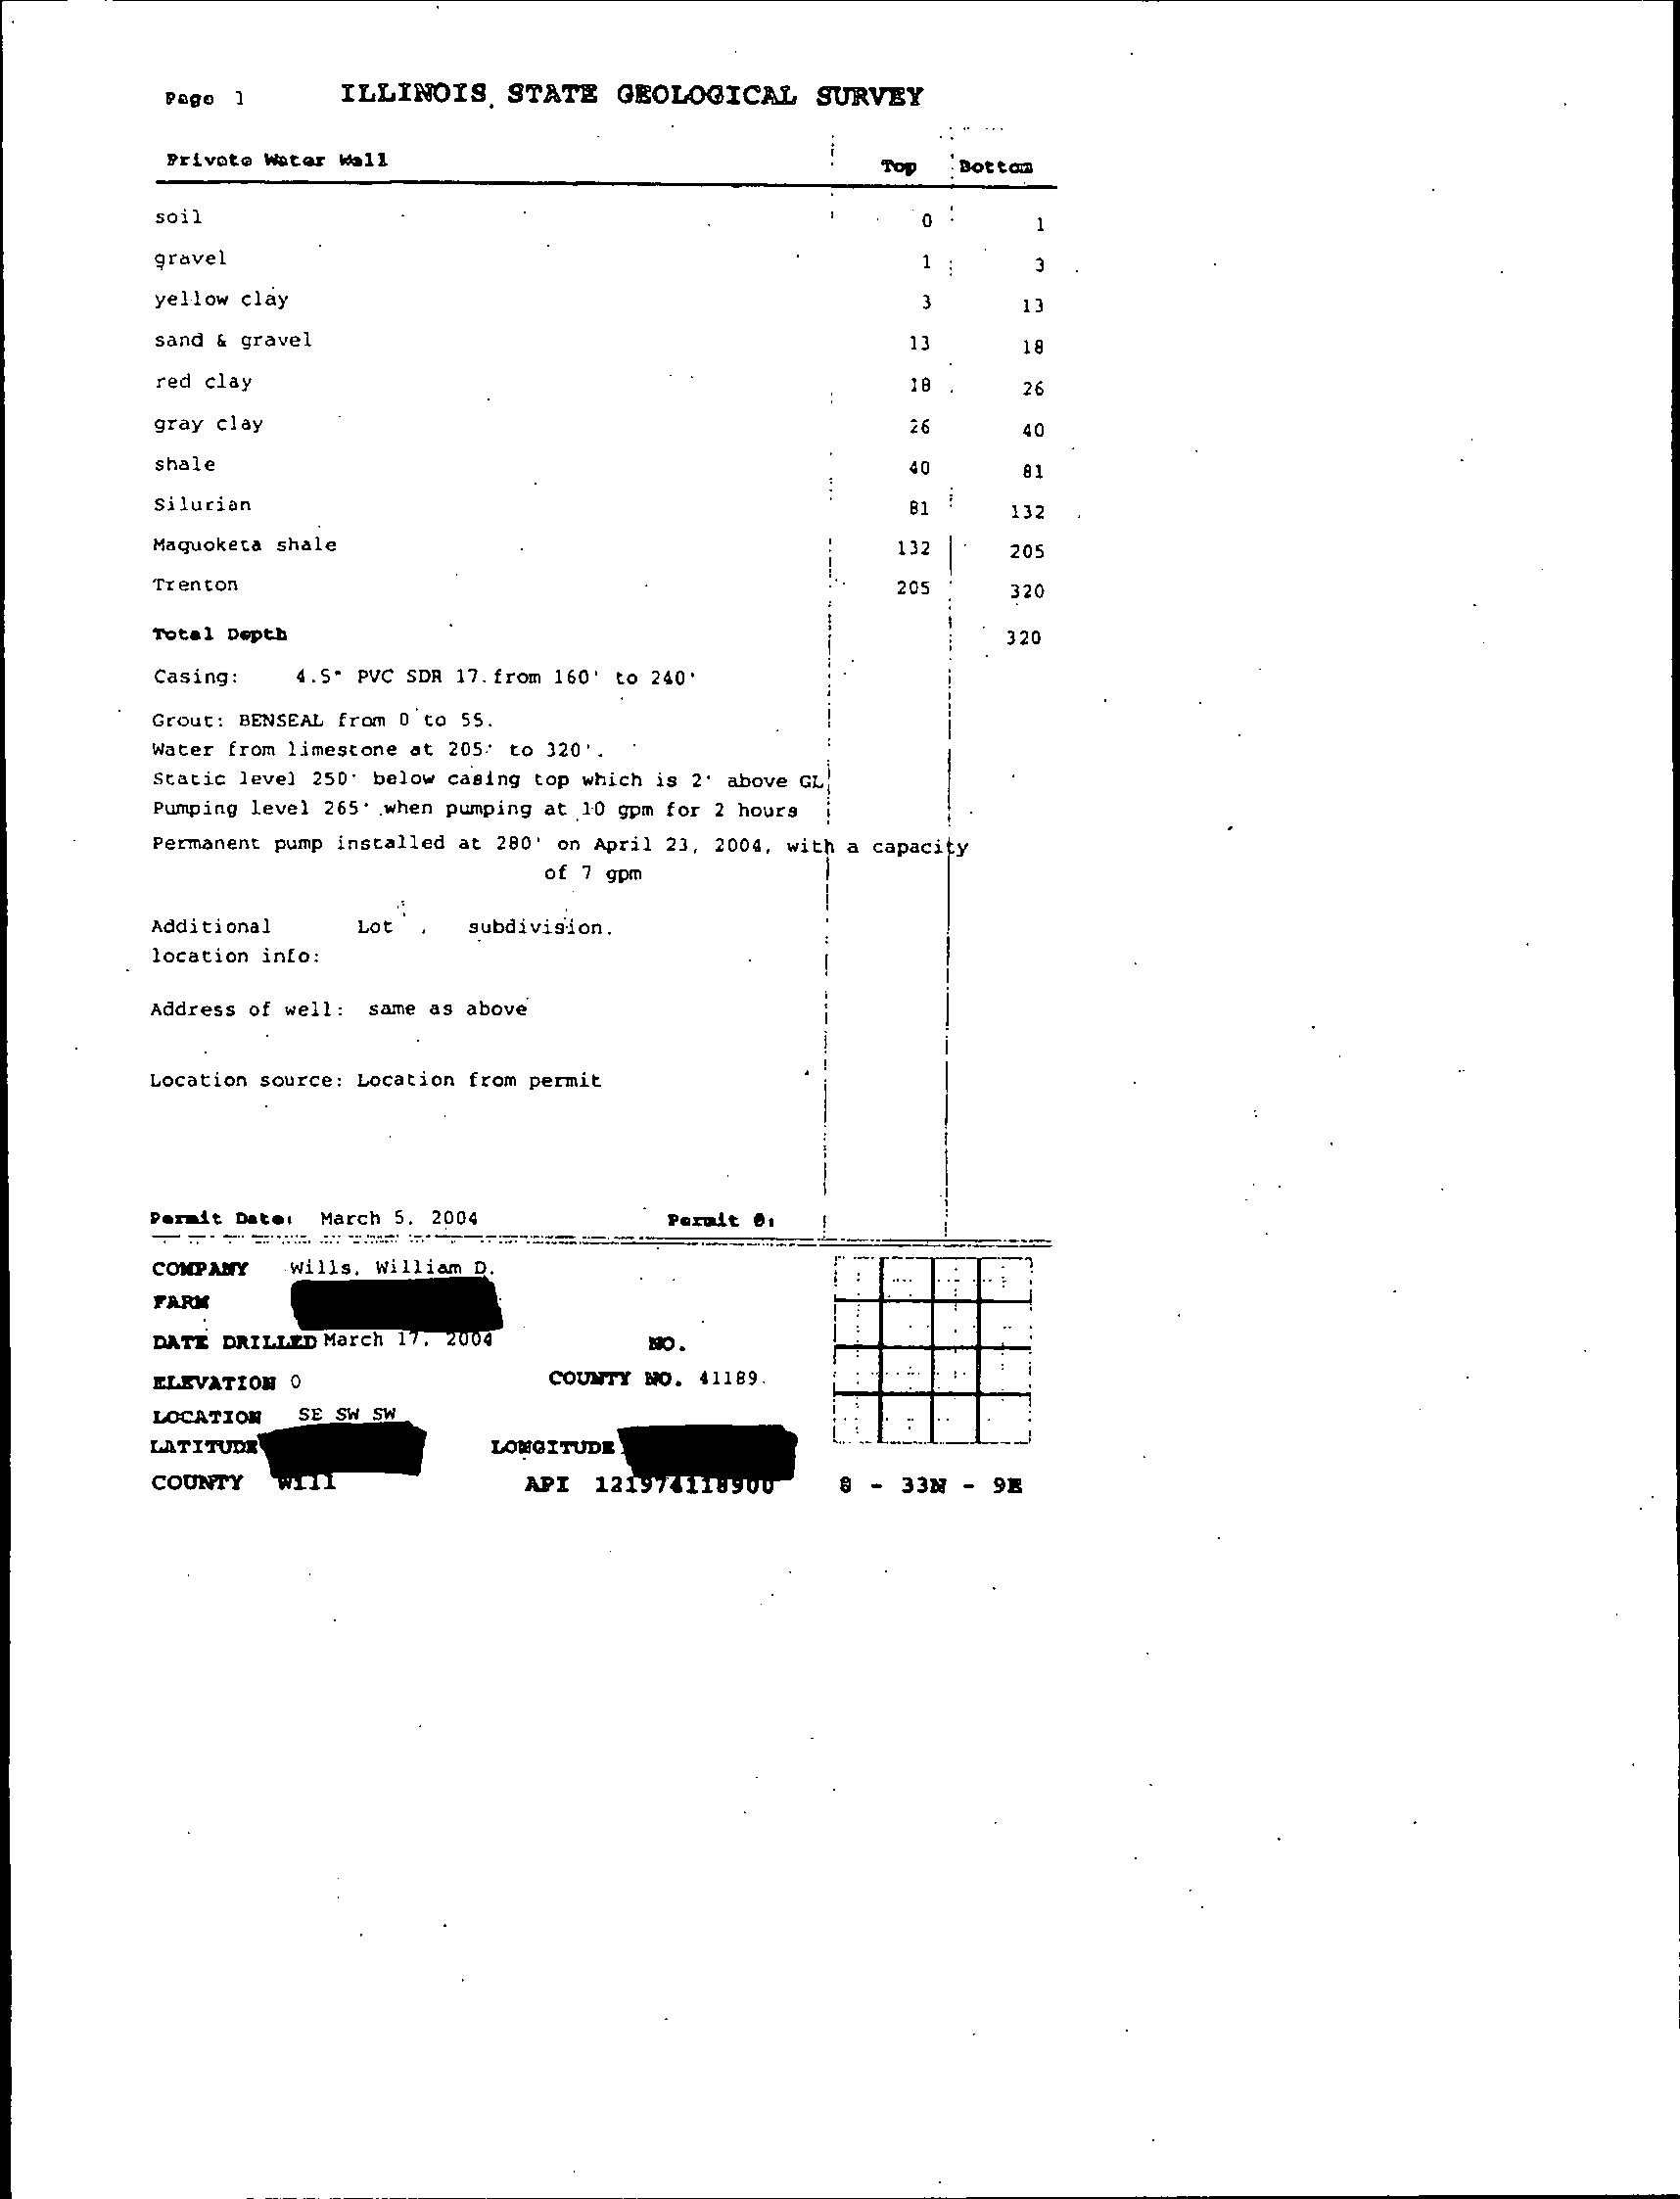
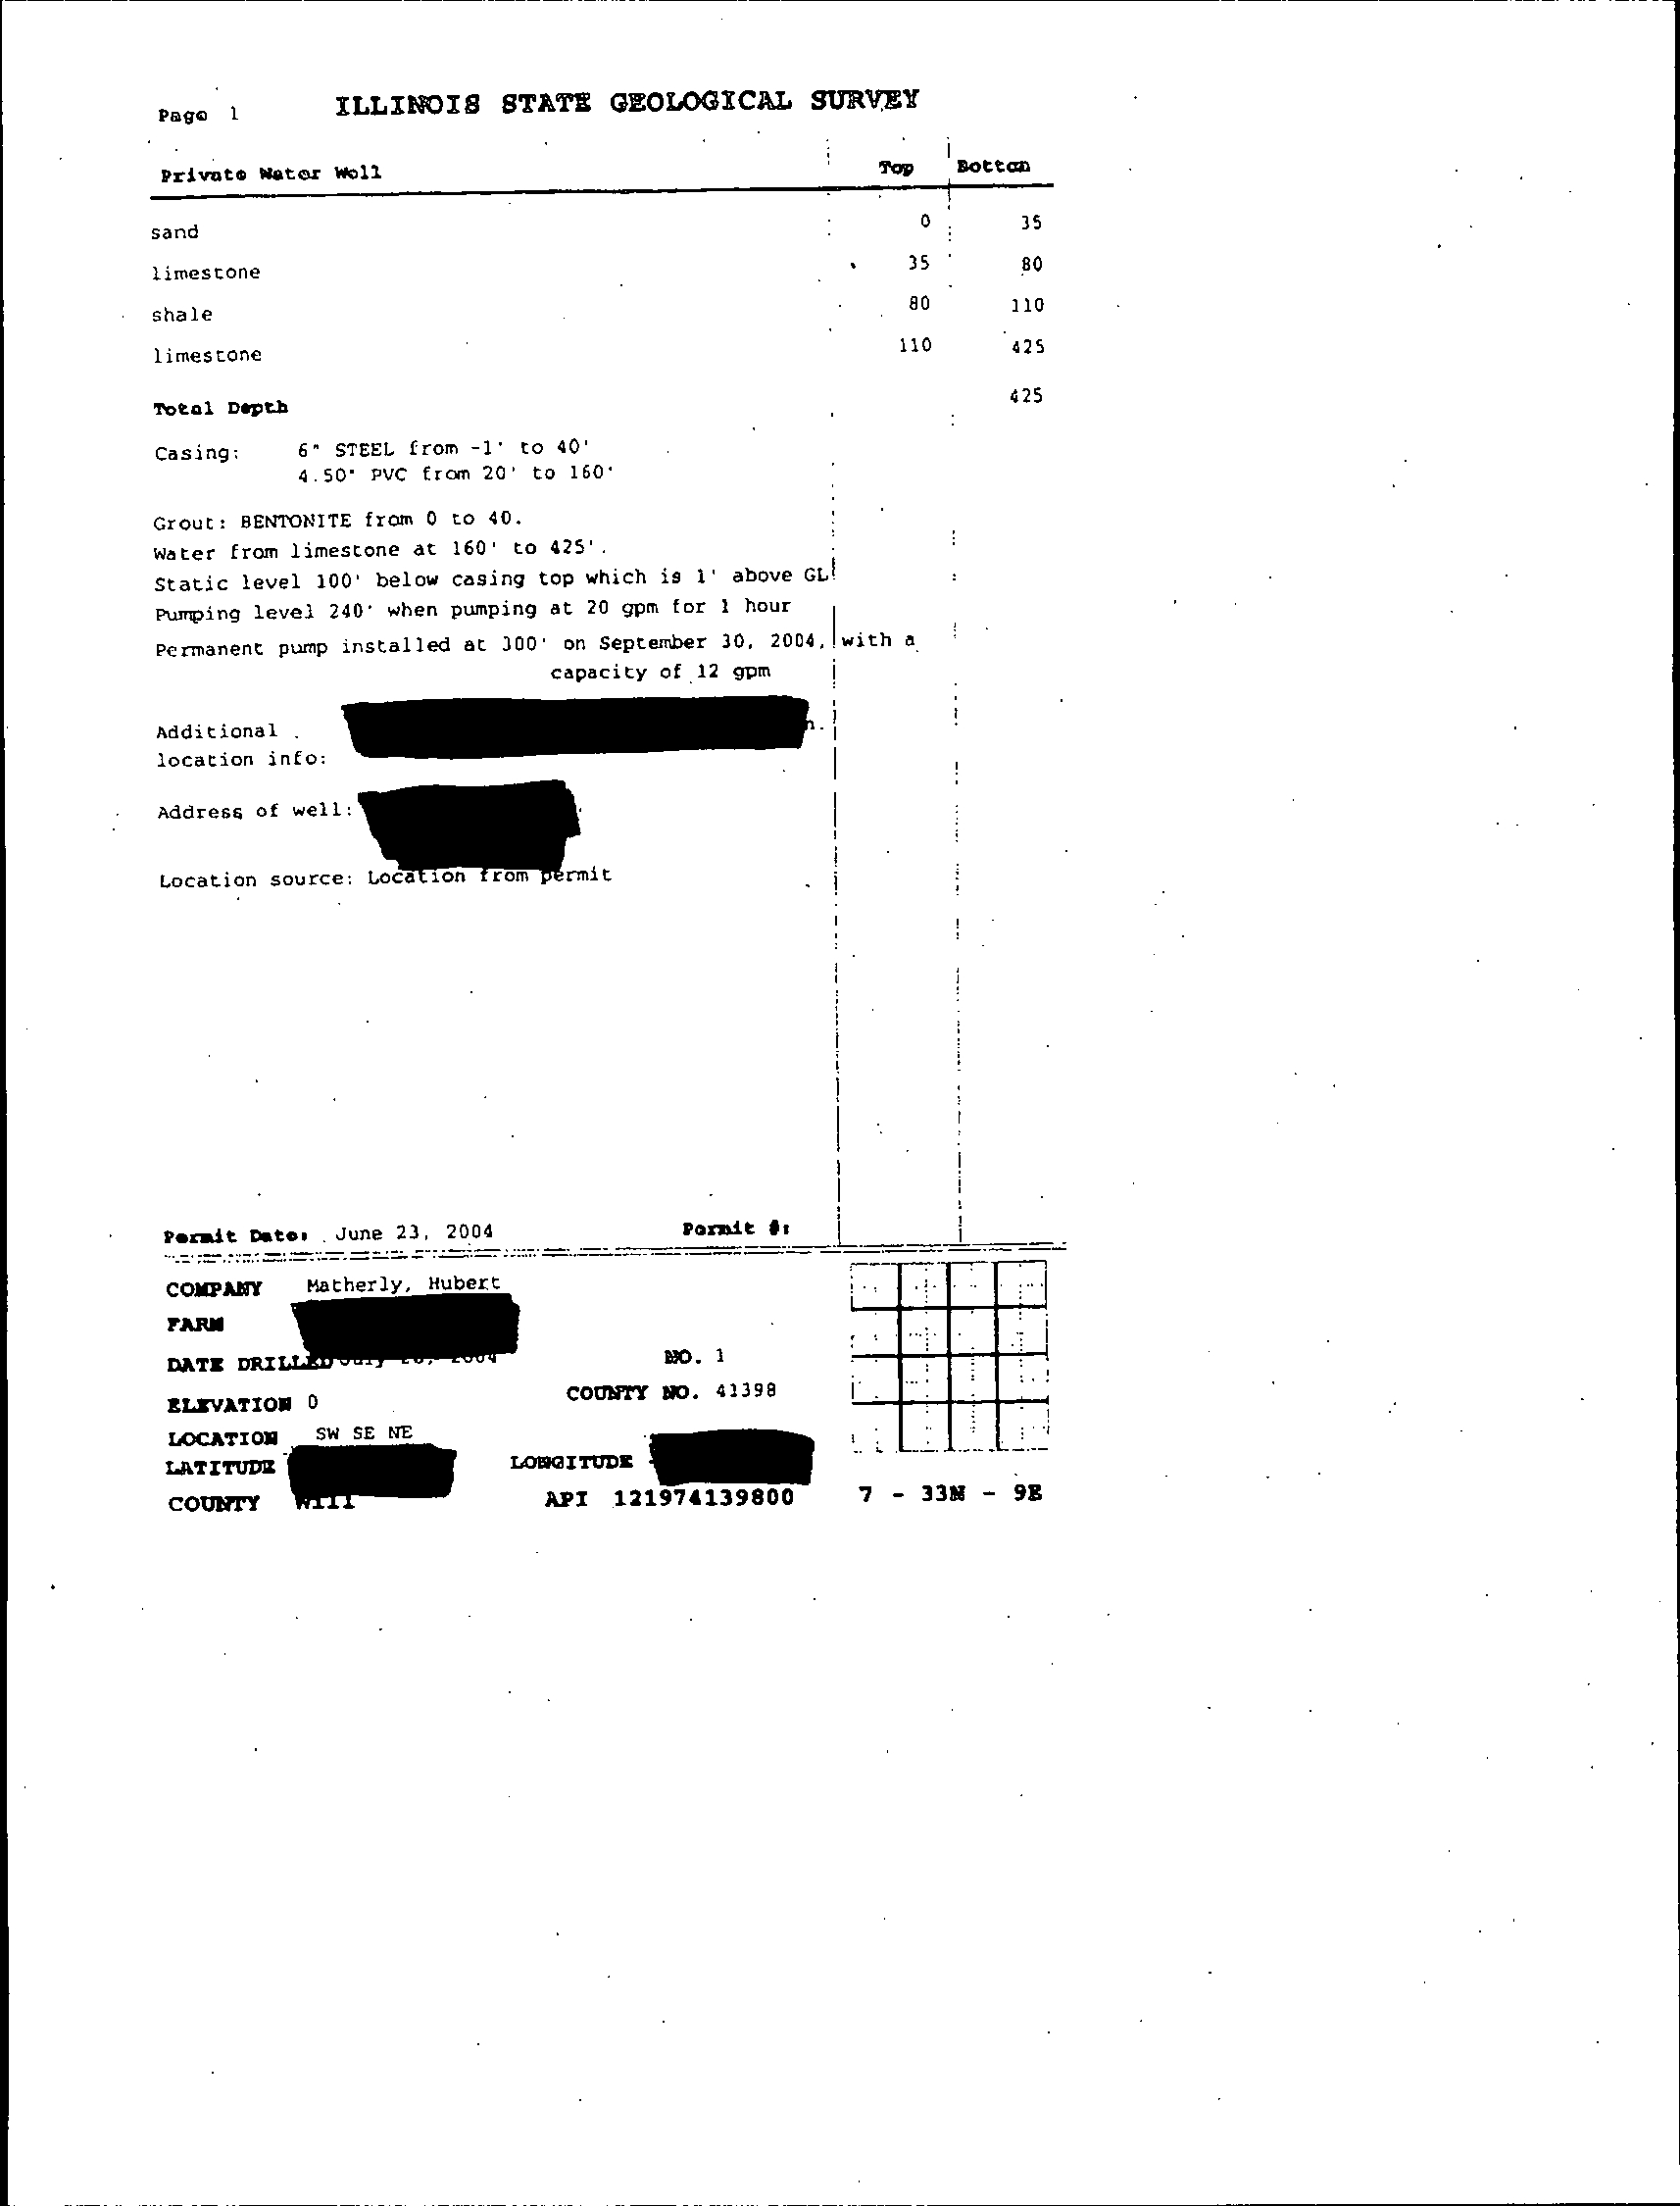
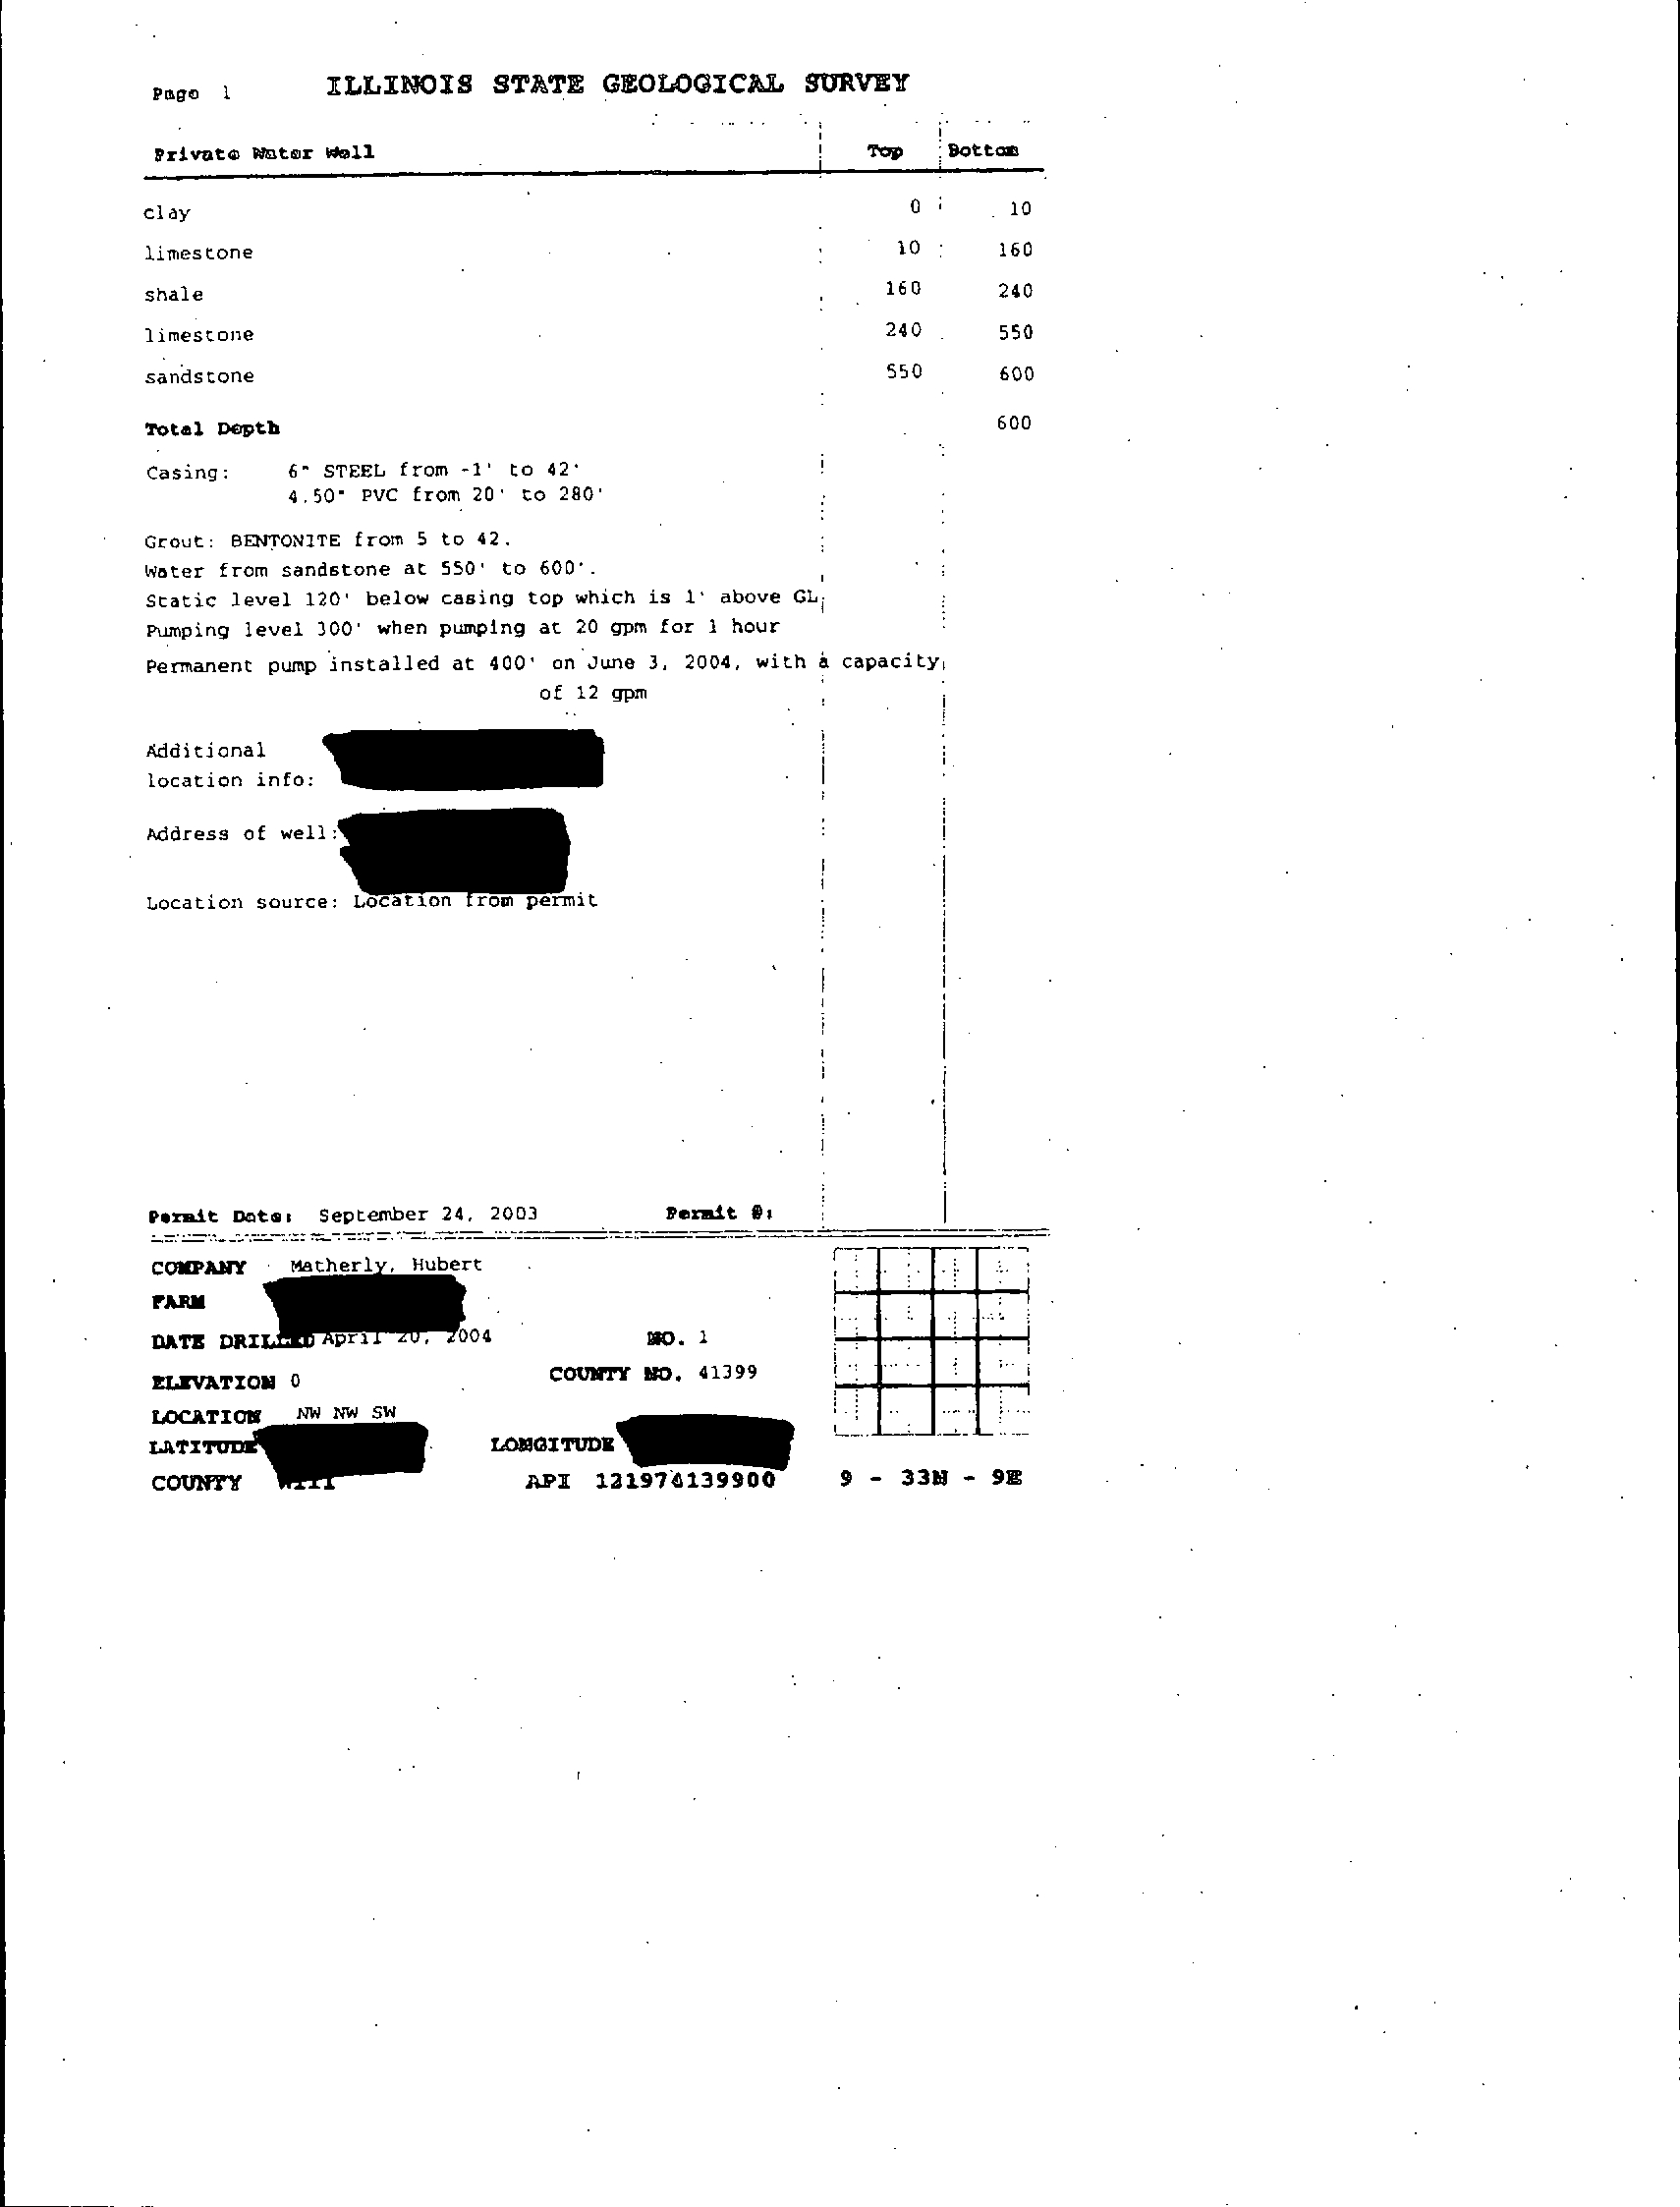
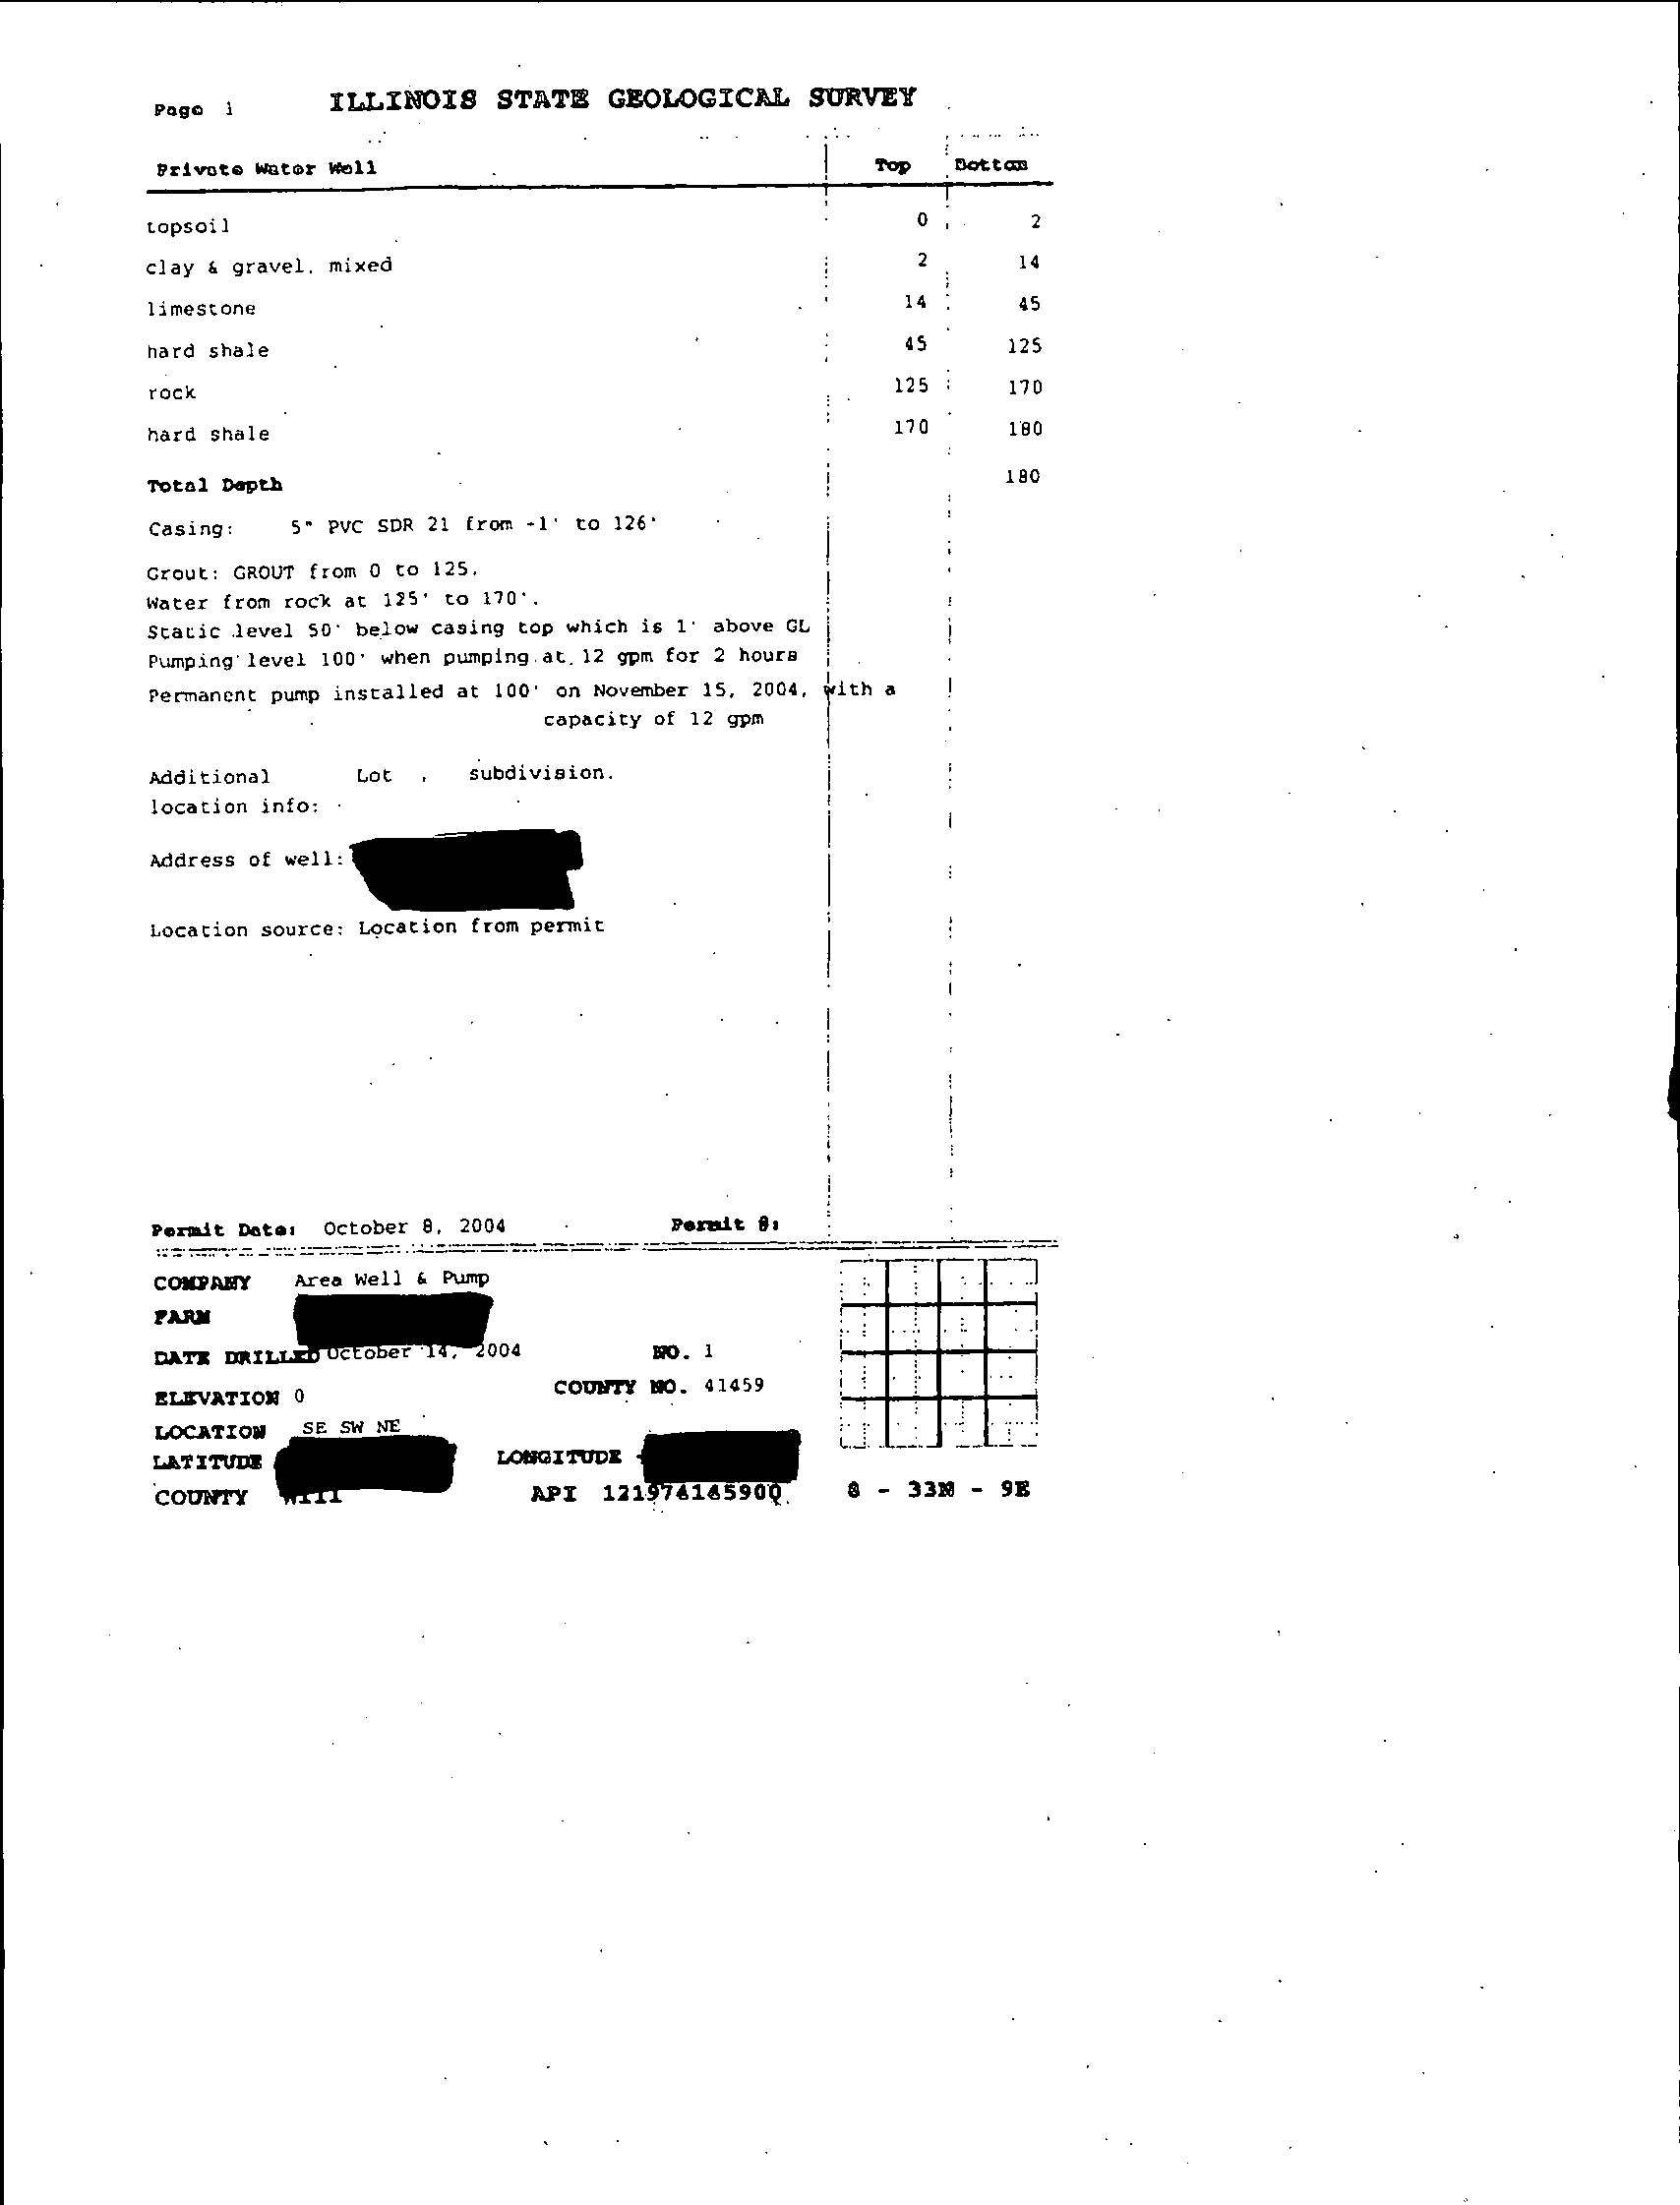
CRA conducted an area wide well inventory of all private, institutional, and public wells
within approximately 2 miles of the Station and a total of 109 wells were identified
(Appendix B).
There are 13 domestic (private) wells, one institutional well, four
unknown usage wells, and one well owned by the Station that obtain their water from
the deeper (i.e., well depth of 600 feet or greater) bedrock aquifers (see Figure B.1). CRA
was unable to confirm all well locations using the Illinois State Geologic Survey's online
well database. Regional water supplies at towns to the west and northeast obtain their
water supplies from deep aquifers at depths over 600 feet below the Maquoketa Shale.
045136 (15) Dresden Generating Station
8
CONESTOGA-ROVERS & ASSOCIATES
Revision 1
This shale aquitard prevents water from
migrating vertically downward to the
production wells.
The groundwater beneath the Station is used for potable purposes. The Station obtains
water
from one 1,500-foot deep well and one 788-foot deep well completed in the deep
bedrock below the Maquoketa Shale. The groundwater withdrawn from these wells is
stored in a 100,000-gallon domestic water tank, and is used for potable purposes and to
produce demineralized water.
045136 (15) Dresden Generating Station
9
CONESTOGA-ROVERS & ASSOCIATES
Revision 1
3.0
AREAS FOR FURTHER EVALUATION
CRA considered all Station operations in assessing groundwater quality
at the Station.
During this process, CRA identified areas at the Station that warranted further
evaluation or "AFEs". This section discusses the process by which AFEs were selected.
CRA's identification of AFEs involved the following components:
•
Station inspection on March 22 and 23, 2006;
•
interviews with Station personnel;
•
evaluation of Station systems;
•
investigation of confirmed and unconfirmed releases of radionuclides; and
•
review of previous Station investigations.
CRA analyzed the information collected from these components combined with
information obtained from CRA's study of hydrogeologic conditions at the
Station to
identify those areas where groundwater potentially could be impacted from operations
at the Station.
CRA then designed an investigation to determine whether any confirmed or potential
releases
or any other release of radionuclides adversely affected groundwater. This
entailed evaluating whether existing Station groundwater monitoring systems were
sufficient to assess the groundwater quality at the AFEs. If the systems were not
sufficient to adequately investigate groundwater quality associated with any AFE,
additional monitoring wells were installed by CRA.
The following sections describe the above considerations and the identification of AFEs.
The results of CRA's investigation are discussed in Section 5.0.
3.1
SYSTEMS EVALUATIONS
Exelon launched an initiative to systematically assess the structures, systems and
components that store, use, or convey potentially radioactively contaminated liquids.
Maps depicting each of these systems were developed and provided to CRA for review.
The locations of these systems are presented on Figure 3.1. The Station identified a total
of 18 systems that contain or could contain potentially radioactively contaminated
liquids. The following presents a list of these systems.
045136 (15) Dresden Generating Station
10
CONESTOGA-ROVERS & ASSOCIATES
Revision 1
System
Identification
Description
Unit 1
13
Emergency Condenser
19
Fuel Pool Cooling
20
Radwaste
33
Condensate
39
Service Water
54
Off Gas
57
Heating Steam
Units 2/3
13
Isolation Condenser
19
Fuel Pool Cooling
20
Radwaste
23
High Pressure Coolant Injection (HPCI) System
33
Condensate
44
Circulating Water
48
Reactor Building Equipment Drains Sumps
49
Turbine Building Equipment Drains Sumps
54
Off Gas
57
Heating Steam
89
High Radiation Sampling System
After these systems were identified, Exelon developed a list of the various structures,
components and areas of the systems (e.g., piping, tanks, process equipment) that
handle or could potentially handle any radioactively contaminated liquid.
The
structures, components, and areas may include:
•
aboveground storage tanks;
•
condensate vents;
•
areas
where confirmed or potential historical releases, spills, or accidental discharges
may have occurred;
•
pipes;
•
pools;
•
sumps;
•
surface water bodies (i.e., basins, pits, ponds, or lagoons);
•
trenches;
•
underground storage tanks; and
•
vaults.
045136 (15) Dresden Generating Station
11
CONESTOGA-ROVERS & ASSOCIATES
Revision 1
The Station then individually evaluated the various system components
to determine
the potential for any release of radioactively contaminated liquid to enter the
environment.
Each structure or identified component was evaluated against the
following seven primary criteria:
•
location of the component (i.e., basement or second floor of building);
•
component construction material (i.e., stainless steel or steel tanks);
•
construction methodologies (i.e., welded or mechanical pipe joints);
•
concentration of radioactively contaminated liquid stored or conveyed;
•
amount of radioactively contaminated
liquid stored or conveyed;
•
existing
controls (i.e., containment and detection); and
•
maintenance history.
System components, which were located inside a building or that otherwise had some
form
of secondary containment, such that a release of radioactively contaminated liquid
would not be discharged directly to the environment, were eliminated from further
evaluation. System components that are not located within buildings or did not have
some other form of secondary containment were retained for further qualitative
evaluation of the risk of a release of radioactively contaminated liquid to the
environment and potential magnitude of any release.
Exelon's risk evaluation took into consideration factors such as:
•
the potential concentration of radionuclides;
•
the volume of liquid
stored or managed;
•
the
probabilities of the systems actually containing radioactively contaminated
liquid; and
•
the potential for a release of radioactively contaminated liquid from the system
component.
These factors were then used to rank the systems and system components according to
the
risk for a potential release of a radioactively contaminated liquid to the environment.
The evaluation process resulted in the identification of structures, components, and
areas to be considered for further evaluation.
045136 (15) Dresden Generating Station
12
CONESTOGA-ROVERS & ASSOCIATES
Revision 1
3.2
HISTORICAL RELEASES
CRA also reviewed information concerning confirmed or potential historical releases of
radionuclides at the Station, including reports and documentation previously prepared
by Exelon and compiled for CRA's review.
CRA evaluated this information in
identifying AFEs.
Any historical releases identified during the course of this
assessment, which may have a current impact on Station conditions, are further
discussed in Section 3.4.
3.3
STATION INVESTIGATIONS
CRA considered previous Station investigations in the process of selecting the AFEs for
the Station.
This section presents a summary of the Station's Radiological
Environmental Monitoring Program (REMP) and past Station investigations.
3.3.1
POWER PLANT DOCUMENTS-UFSAR REPORT
During the construction of the Station, a series of comprehensive investigations of
regional and local geology, surface water, and groundwater conditions were conducted.
These studies were performed for a number of purposes including geotechnical
evaluations of the underlying bedrock, engineering designs for the Station around the
Pond, present and future sources of groundwater, present and future groundwater use,
and other engineering and environmental purposes. These studies are documented in
the UFSAR and FES for the Station.
3.3.2
RETEC GROUNDWATER INVESTIGATION STUDY
In response to tritium detected in July 2004 groundwater samples collected by the
Station, RETEC was contracted to characterize the nature of groundwater
flow at the
facility and to evaluate the extent of the tritium. RETEC reviewed historical data,
installed additional monitoring wells, conducted geophysical logging, completed two
rounds of water level measurements, performed slug tests, and sampled groundwater
for tritium.
RETEC's groundwater investigation report (dated December 7, 2005) concluded that
elevated tritium concentrations were detected
in groundwater samples from wells
located near the Condensate Storage Tank (CST) System, the Unit 1 Spent Fuel Pool,
045136 (15) Dresden Generating Station
13
CONESTOGA-ROVERS & ASSOCIATES
Revision 1
Unit 1 Reactor Building, and the Radwaste discharge piping location
for Units 2/3.
RETEC's investigation revealed that the bulk of the tritium discharged to the
groundwater from the CST system and flowed toward the east and northwest under the
influence of the local hydraulic gradient. The tritium plume was not likely to move in a
southeasterly direction, toward residential wells.
On November 30, 2005, Exelon
submitted this report to Illinois EPA.
3.3.3
GROUNDWATER MONITORING PROGRAM
The Station has a monitoring program that has identified approximately 54 sampling
locations (storm drain system catchbasins, groundwater monitoring wells, and surface
water sampling locations), some of which are sampled as often as every day.
3.3.4
RADIOLOGICAL ENVIRONMENTAL MONITORING PROGRAM
The REMP at the Station was initiated in 1966. The REMP includes the collection of
multi-media samples including air, surface water, groundwater, fish, sediment,
vegetation, local cow milk, and residential potable water. The samples are analyzed for
beta and gamma-emitting radionuclides, tritium, iodine-131, and/or strontium as
established in the procedures developed for the REMP. The samples are collected at
established locations, identified as stations, so that trends in the data can be monitored.
Surface water samples and groundwater samples are collected, as part of REMP at a
total of five locations. Surface water samples are collected at two locations upstream
of
the Station on the Kankakee (D-54) and Des Plaines (D-52) Rivers, and at one location
downstream of the Station on the Illinois River (D-51). Groundwater samples are
collected from a residential well "RW-1" (D-23), and at the Dresden Island Lock and
Dam well (D-35).
In 2005, surface water tritium concentrations in the Kankakee River ranged from the
Lower
Limit of Detection (LLD) of 200 pCi/L to 720 pCi/L and are considered an
upstream source.
An annual report is prepared providing a description of the activities performed and the
results of the analysis of the samples collected from
the various media. The latest report
generated was prepared by Station personnel and is entitled "Dresden Nuclear Power
Station Units 1, 2, and 3 Annual Radiological Environmental Operating Report,
1 January through 31 December 2005". This report concluded that the operation of the
045136 (15) Dresden Generating Station
14
CONESTOGA-ROVERS & ASSOCIATES
Revision 1
Station had no adverse radiological impact on
the environment. The annual report is
submitted to the NRC.
3.4
IDENTIFIED AREAS FOR FURTHER EVALUATION
CRA used the information contained herein along with its understanding of the
hydrogeology at the Station to identify AFEs, which were a primary consideration in the
development of the scope of work in the Work Plan. The establishment of AFEs is a
standard planning practice in hydrogeologic investigations to focus the investigation
activities at areas where there is the greatest potential for impact to groundwater.
Specifically, AFEs were identified based on these six considerations:
•
systems evaluations;
•
risk evaluations;
•
review of confirmed and/or potential releases;
•
review of documents;
•
review of the hydrogeologic conditions; and
•
Station inspection completed on March 22 and 23, 2006.
Prior to CRA completing its analysis and determination of AFEs, Station personnel
completed an exhaustive
review of all historic and current management of systems that
may contain potentially radioactively contaminated liquids.
CRA reviewed the systems identified by the Station, which have the potential for the
release of radioactively contaminated liquids
to the environment, and groundwater flow
at the Station. This evaluation allowed CRA to become familiar with Station operations
and potential systems that may impact groundwater. CRA then evaluated information
concerning historic releases as provided by the Station. This information, along with a
review of the results from historic investigations, was used to refine CRA's
understanding of areas likely to have the highest possibility of impacting groundwater.
Where at-risk systems or identified historical releases were located in close proximity or
were located in areas, which could not be evaluated separately, the systems and
historical releases were combined into a single AFE. At times, during the Station
investigation, separate AFEs were combined into one or were otherwise altered based on
additional information and consideration.
045136 (15) Dresden Generating Station
15
CONESTOGA-ROVERS & ASSOCIATES
Revision 1
Finally, CRA used its understanding of known hydrogeologic conditions (prior to this
investigation)
to identify AFEs. Groundwater flow was an important factor in deciding
whether to combine systems or historical releases into a single AFE or create separate
AFEs.
For example, groundwater flow beneath several systems that contain
radioactively contaminated liquid that flows toward a common discharge point were
likely combined into a single AFE.
Based upon its review of information concerning
confirmed or potential historical
releases, historic investigations, and the systems at the Station that have the potential for
release of radioactively contaminated liquids to the environment combined with its
understanding of groundwater flow at the Station, CRA has identified the following as
the only AFEs (see Figure 3.1).
AFE-Dresden-1: CST System HPCI Piping for Units 2/3
This AFE was established based on information regarding historical releases of tritiated
water in this area. In 1994 there was a leak
from the HPCI return piping to the CST. The
piping was isolated and repaired.
Shallow groundwater monitoring wells were
installed at that time. In August of 2004, the wells outside the Units 2/3 Reactor
Building identified elevated tritium concentrations resulting from a leak in the HPCI
suction piping. The piping was isolated and repaired. In January 2006, the Station
personnel identified higher than expected concentrations of tritium in this area as part of
its groundwater monitoring program. The HPCI piping in this area was suspect and
isolated. The HPCI piping replacement is currently in progress.
AFE-Dresden-2: Unit 1 Spent Fuel Pool
This AFE was established based on information regarding
the historical releases in this
area consisting of a spent fuel pool overflow. Specifically, in 1989, radioactively
contaminated water overflowed from the Unit 1 Fuel Pool. Available data showed soil
was removed from the area.
AFE-Dresden-3: Radwaste Discharge Lines for Units 2/3
This AFE was established based on information regarding historical releases in this area,
including
those in 1984 and 1986. In October 1984 and July 1986 leaks occurred in the
Units 2/3 Radwaste discharge piping. Most notably, in November 1999, a leak occurred
on Units 2/3 Radwaste River Discharge Canal pipe. The piping was excavated and
subsequently replaced.
045136 (15) Dresden Generating Station
16
CONESTOGA-ROVERS & ASSOCIATES
Revision 1
AFE-Dresden-4: Piping from CST System and Storm Drain to Unit 1 Intake Canal
This AFE was established based on information regarding a historical release in this area
due to a leak in
an underground contaminated demineralized water (CDW) pipe. The
water flowed into a storm drain that led to the Unit 1 Intake Canal.
045136 (15) Dresden Generating Station
17
CONESTOGA-ROVERS & ASSOCIATES
Revision 1
4.0
FIELD METHODS
The field investigations completed for this HIR
were completed in May and June 2006.
Supplemental field activities were completed in July and August 2006. CRA supervised
the installation of monitoring wells, collected samples from the newly-installed and
existing monitoring wells, and collected samples from surface water locations. The field
investigations were completed in accordance with the methodologies presented in the
Work Plan (CRA, 2006).
4.1
SURFACE WATER ELEVATION MONITORING POINTS
Water levels in surface water bodies were measured from four surface water elevation
monitoring points (SW-DN-101, SW-DN-102, SW-DN-103, and SW-DN-106) in June 2006
using a portable water level meter from fixed locations on bridges. During the
August 2006 supplemental field activities, surface water elevations were measured from
seven surface water elevation monitoring points (SW-DN-101, -102, -103, -104, -105, -106,
and -107). The surface water elevation monitoring points are presented on Figure 4.1.
Staff gauges were not installed at the Station due to safety concerns. Surface water
elevations at locations SW-DN-104, -105, and –107 were not collected in May 2006 due to
safety concerns at that time.
4.2
GROUNDWATER MONITORING WELL INSTALLATION
Sixteen new monitoring wells were installed for the fleetwide hydrogeologic
investigation in May 2006. An additional 21 new monitoring wells were installed in
July 2006 for the fleetwide hydrogeologic investigation. The additional wells were
installed to further characterize the groundwater flow system and to determine the
impact of surface water in the canals on groundwater flow directions. Monitoring well
construction logs are provided in Appendix A. Figure 4.2 presents the locations of the
37 new monitoring wells and the existing monitoring wells at the Station. These
locations were selected based on a review of all data provided, the hydrogeology at the
Station, the existing well locations, and current understanding of identified AFEs.
Table 4.1 summarizes the well completion details.
The shallow boreholes were
advanced into the bedrock from approximately 20 feet bgs to 42 feet bgs based upon the
depth of the Pottsville Sandstone Formation, with the exception of locations
MW-DN-102S (15 feet bgs) and MW-DN-107S (15 feet bgs). MW-DN-102S could not be
advanced beyond 15 feet bgs due to complications with drilling and MW-DN-107S was
only set on top of the bedrock and screened within the fill material at the Station. The
045136 (15) Dresden Generating Station
18
CONESTOGA-ROVERS & ASSOCIATES
Revision 1
intermediate boreholes were advanced into the bedrock from approximately 50
feet bgs
to 61 feet bgs depending upon the depth to the Maquoketa Shale Formation.
Prior to completing any ground penetration activities, CRA completed subsurface utility
clearance procedures to minimize the potential of injury to
workers and/or damage to
subsurface utility structures.
The subsurface clearance procedures consisted of
completing an electronic survey within a minimum of 10-foot radius of the proposed
location utilizing electromagnetic and ground penetrating radar technology.
Additionally, an air knife was utilized to verify utilities were not present at the proposed
location to a depth to 10 feet bgs.
Specific installation protocols for the shallow and intermediate monitoring wells are
described below:
•
the borehole was advanced to the target depth by an air rotary drill
equipped with a
6-inch outer diameter drill bit;
•
a nominal 2-inch diameter (No.
10 slot) PVC screen, 10 feet in length, attached to a
sufficient length of 2-inch diameter schedule 40 PVC riser pipe to extend to the
surface, was placed into the borehole through the augers;
•
a
filter sand pack consisting of silica sand was installed to a minimum height of
2 feet above the top of the screen as the augers were removed;
•
a minimum 2-foot thick seal consisting of
3/8-inch diameter bentonite pellets or
chips was placed on top of the sand pack and hydrated using potable water;
•
the remaining borehole annulus
was sealed to within 3 feet of the surface using pure
bentonite chips; and
•
the remaining portion of the annulus was filled
with concrete and a 6-inch diameter
protective above-grade casing. The wellhead was fitted with a watertight, lockable
cap.
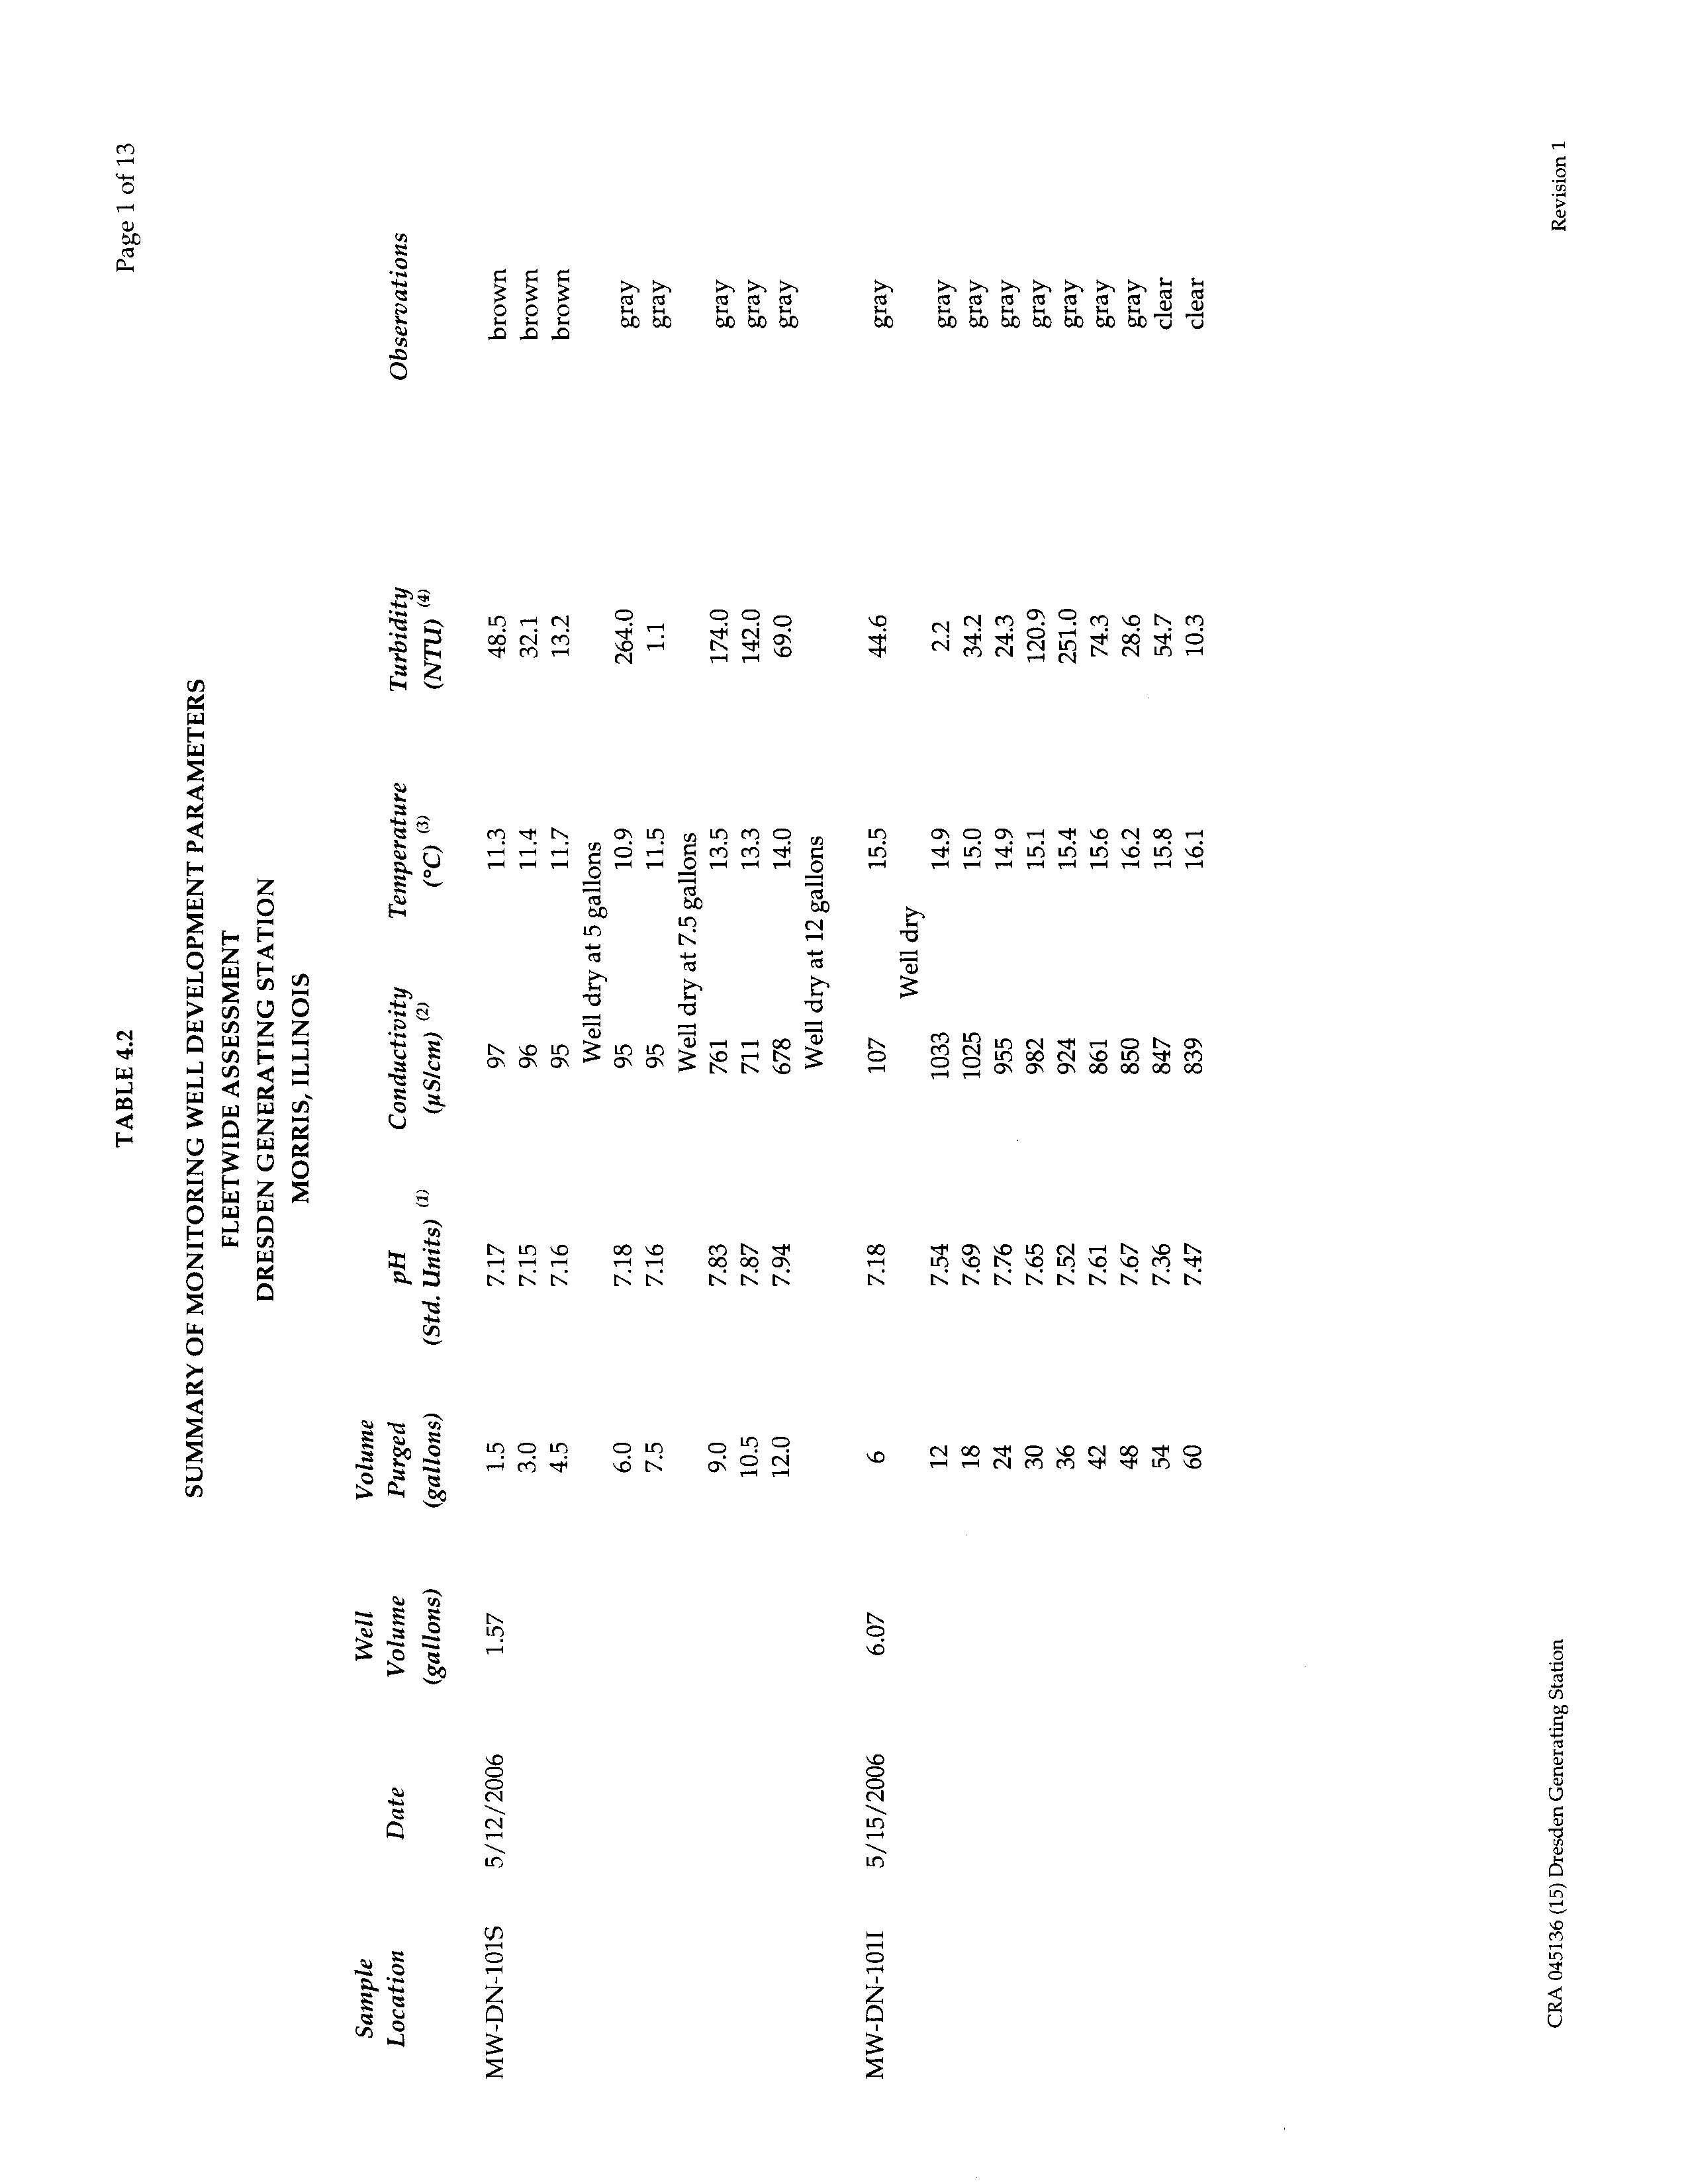
4.3
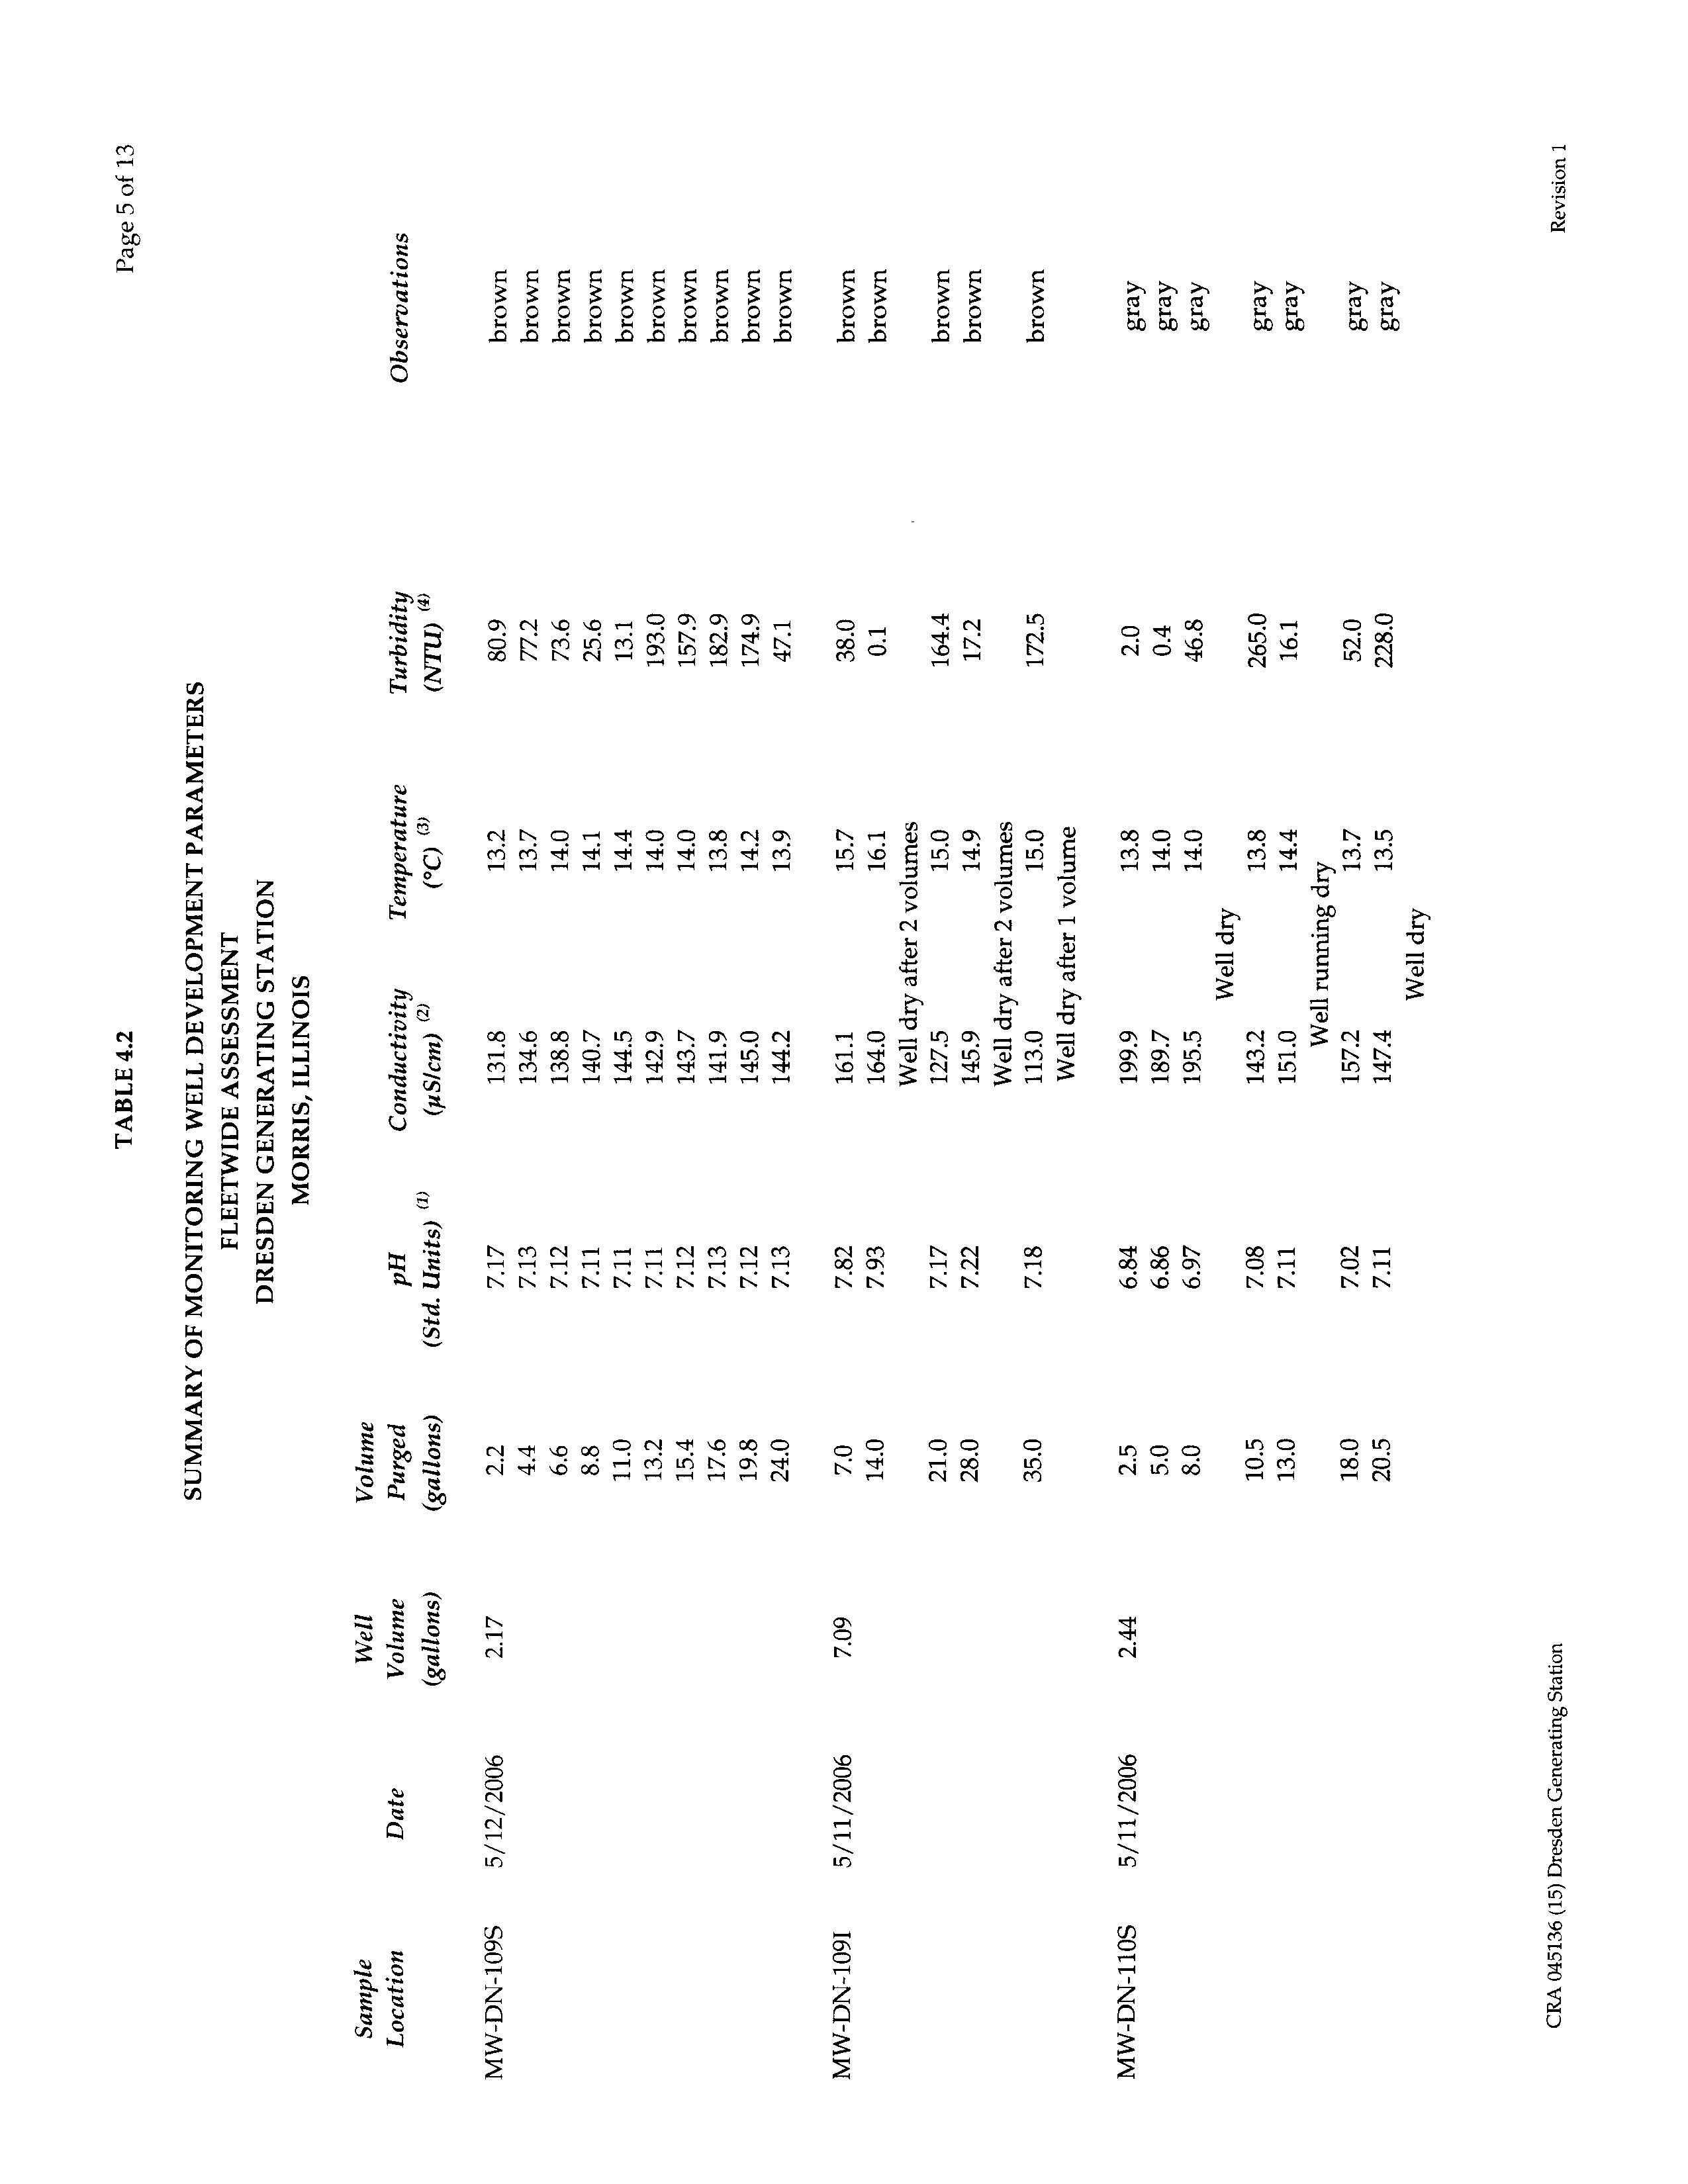
GROUNDWATER MONITORING WELL DEVELOPMENT
In order to establish good hydraulic communication with the aquifer and reduce the
volume of sediment in the newly installed monitoring wells, monitoring well
development was conducted in accordance with the procedure outlined below:
•
monitoring wells were surged using a pre-cleaned
surge block or bailer for a period
of at least 10 minutes;
045136 (15) Dresden Generating Station
19
CONESTOGA-ROVERS & ASSOCIATES
Revision 1
•
water was purged from
the monitoring well using an electric submersible or
peristaltic pump;
•
groundwater was collected at
regular intervals and the pH, temperature, and
conductivity were measured using field instruments. These instruments were
calibrated daily according to the manufacturer's specifications.
Additionally,
observations such as color, odor, and turbidity of the purged water were recorded;
and
•
development continued until the turbidity and silt content of the
monitoring wells
were significantly reduced and three consistent readings of pH, temperature, and
conductivity were recorded, or a maximum of ten well volumes were purged.
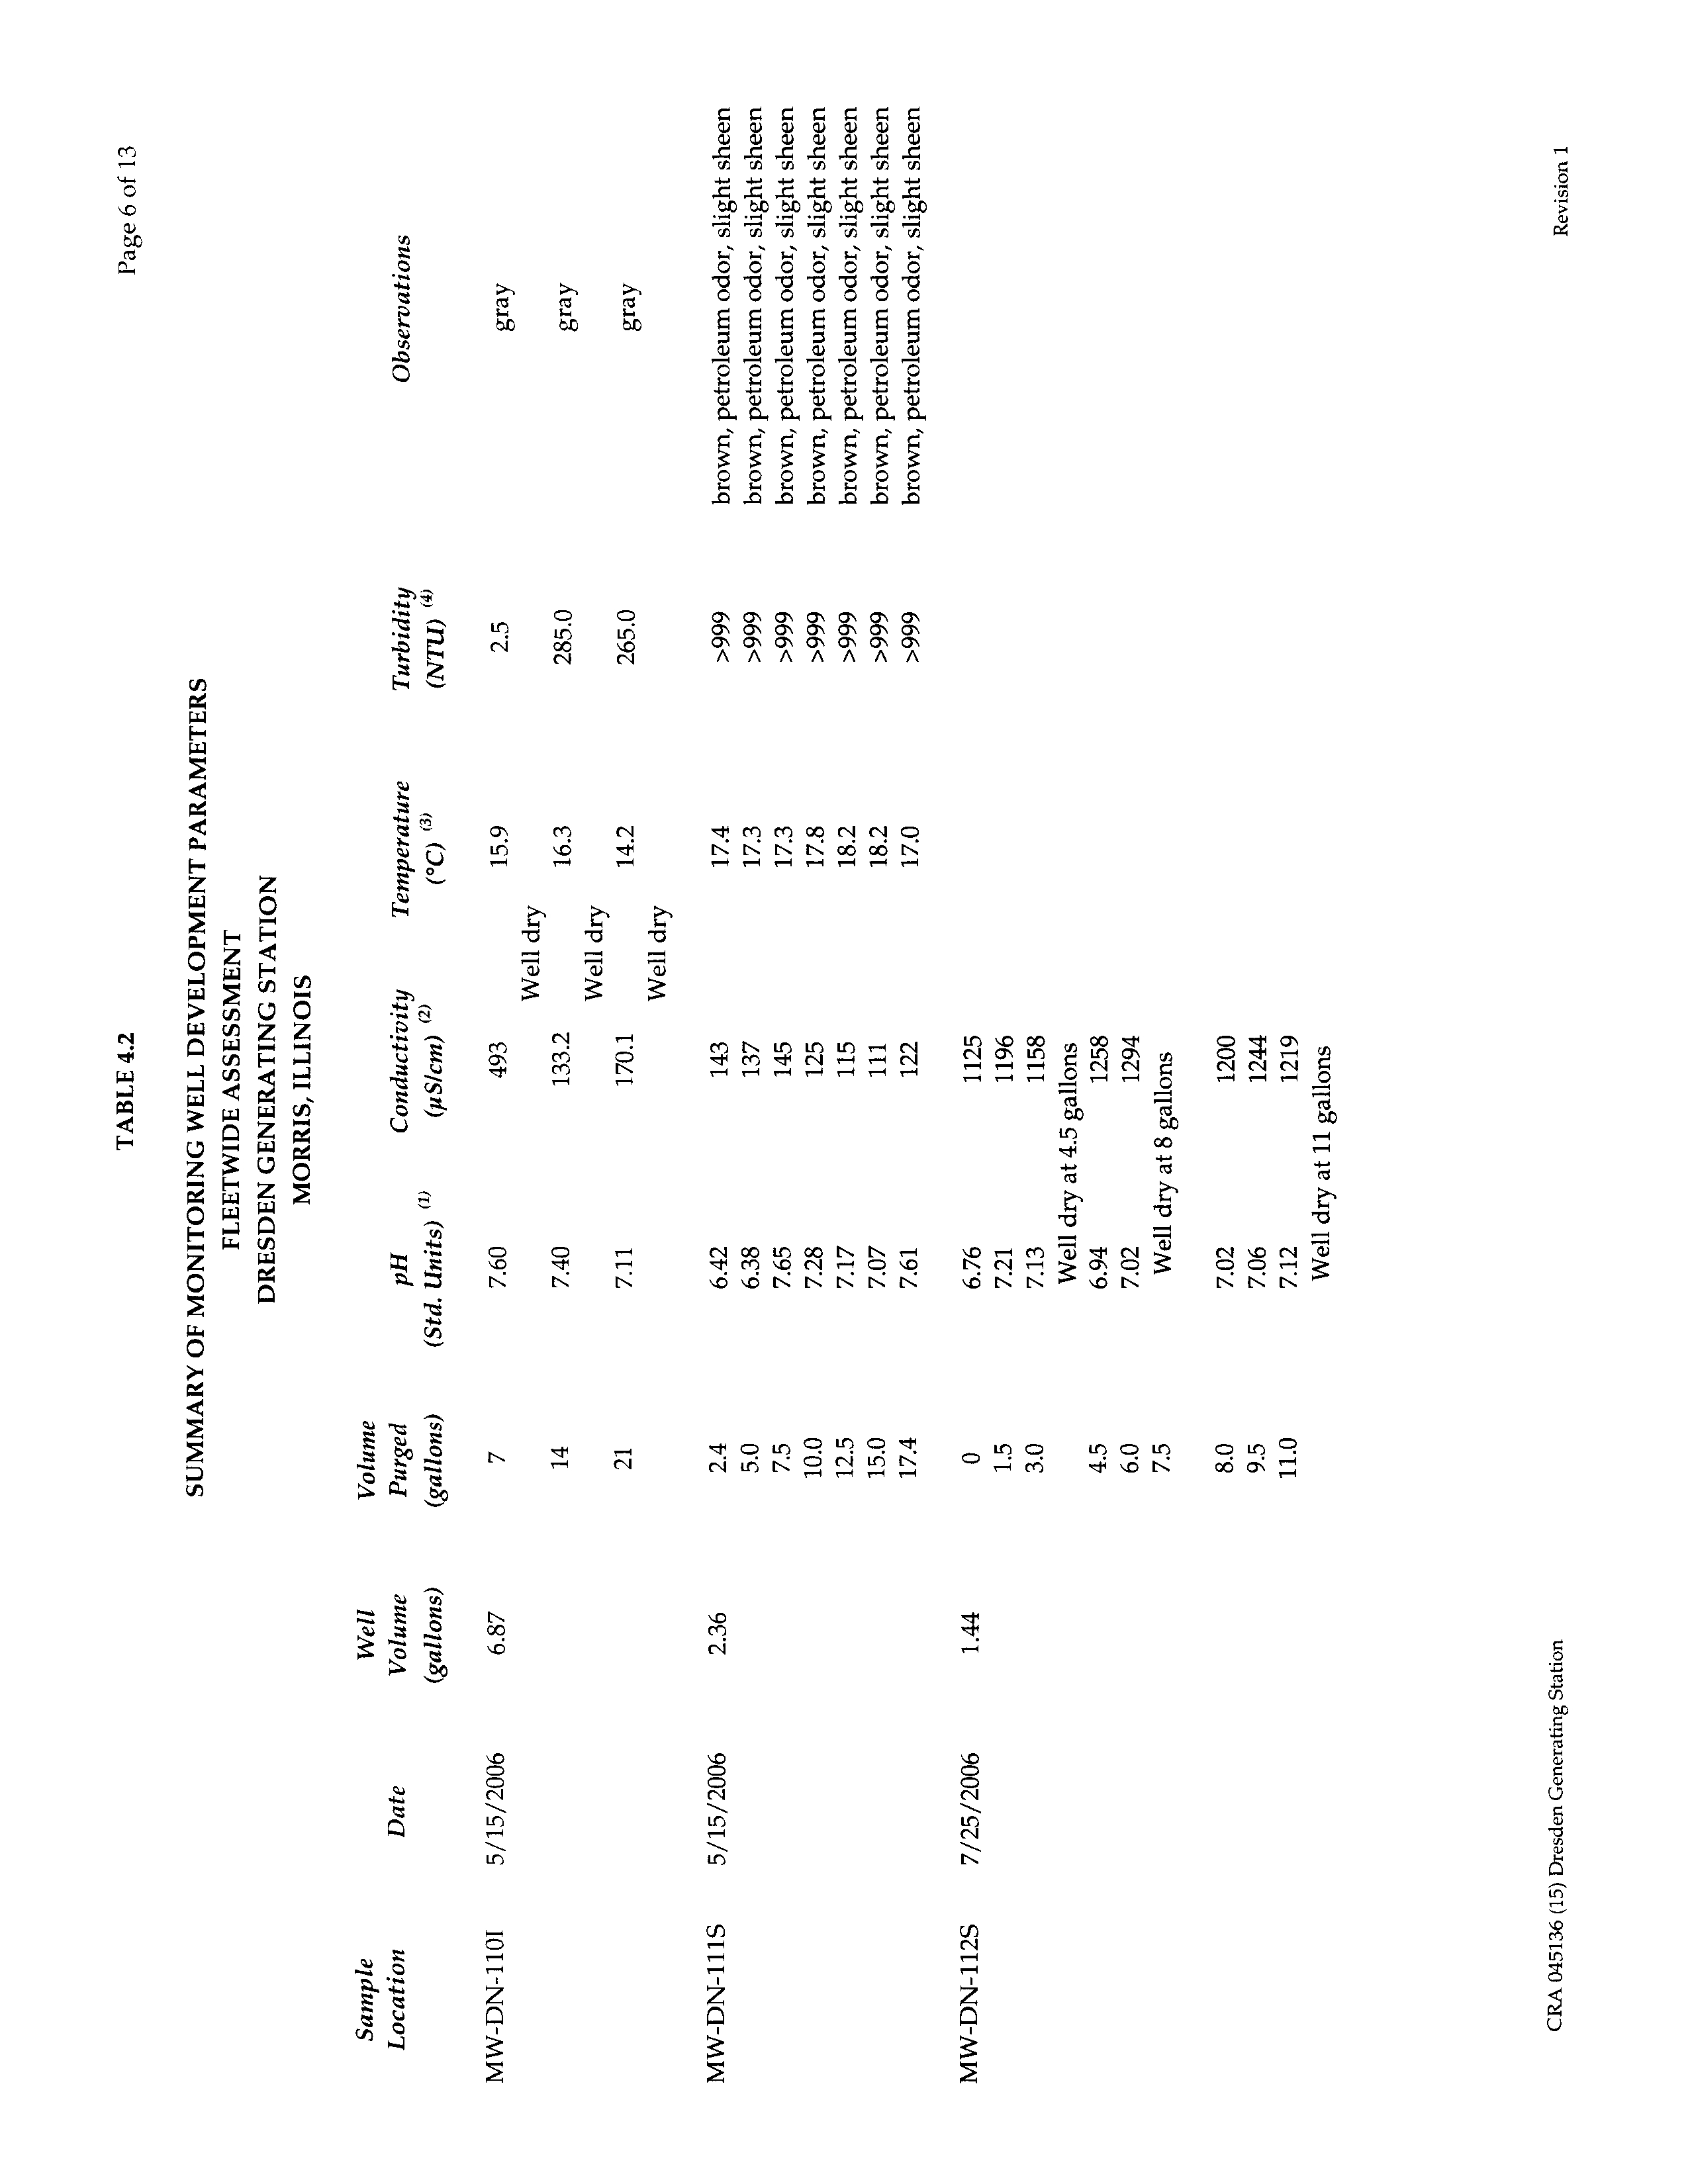
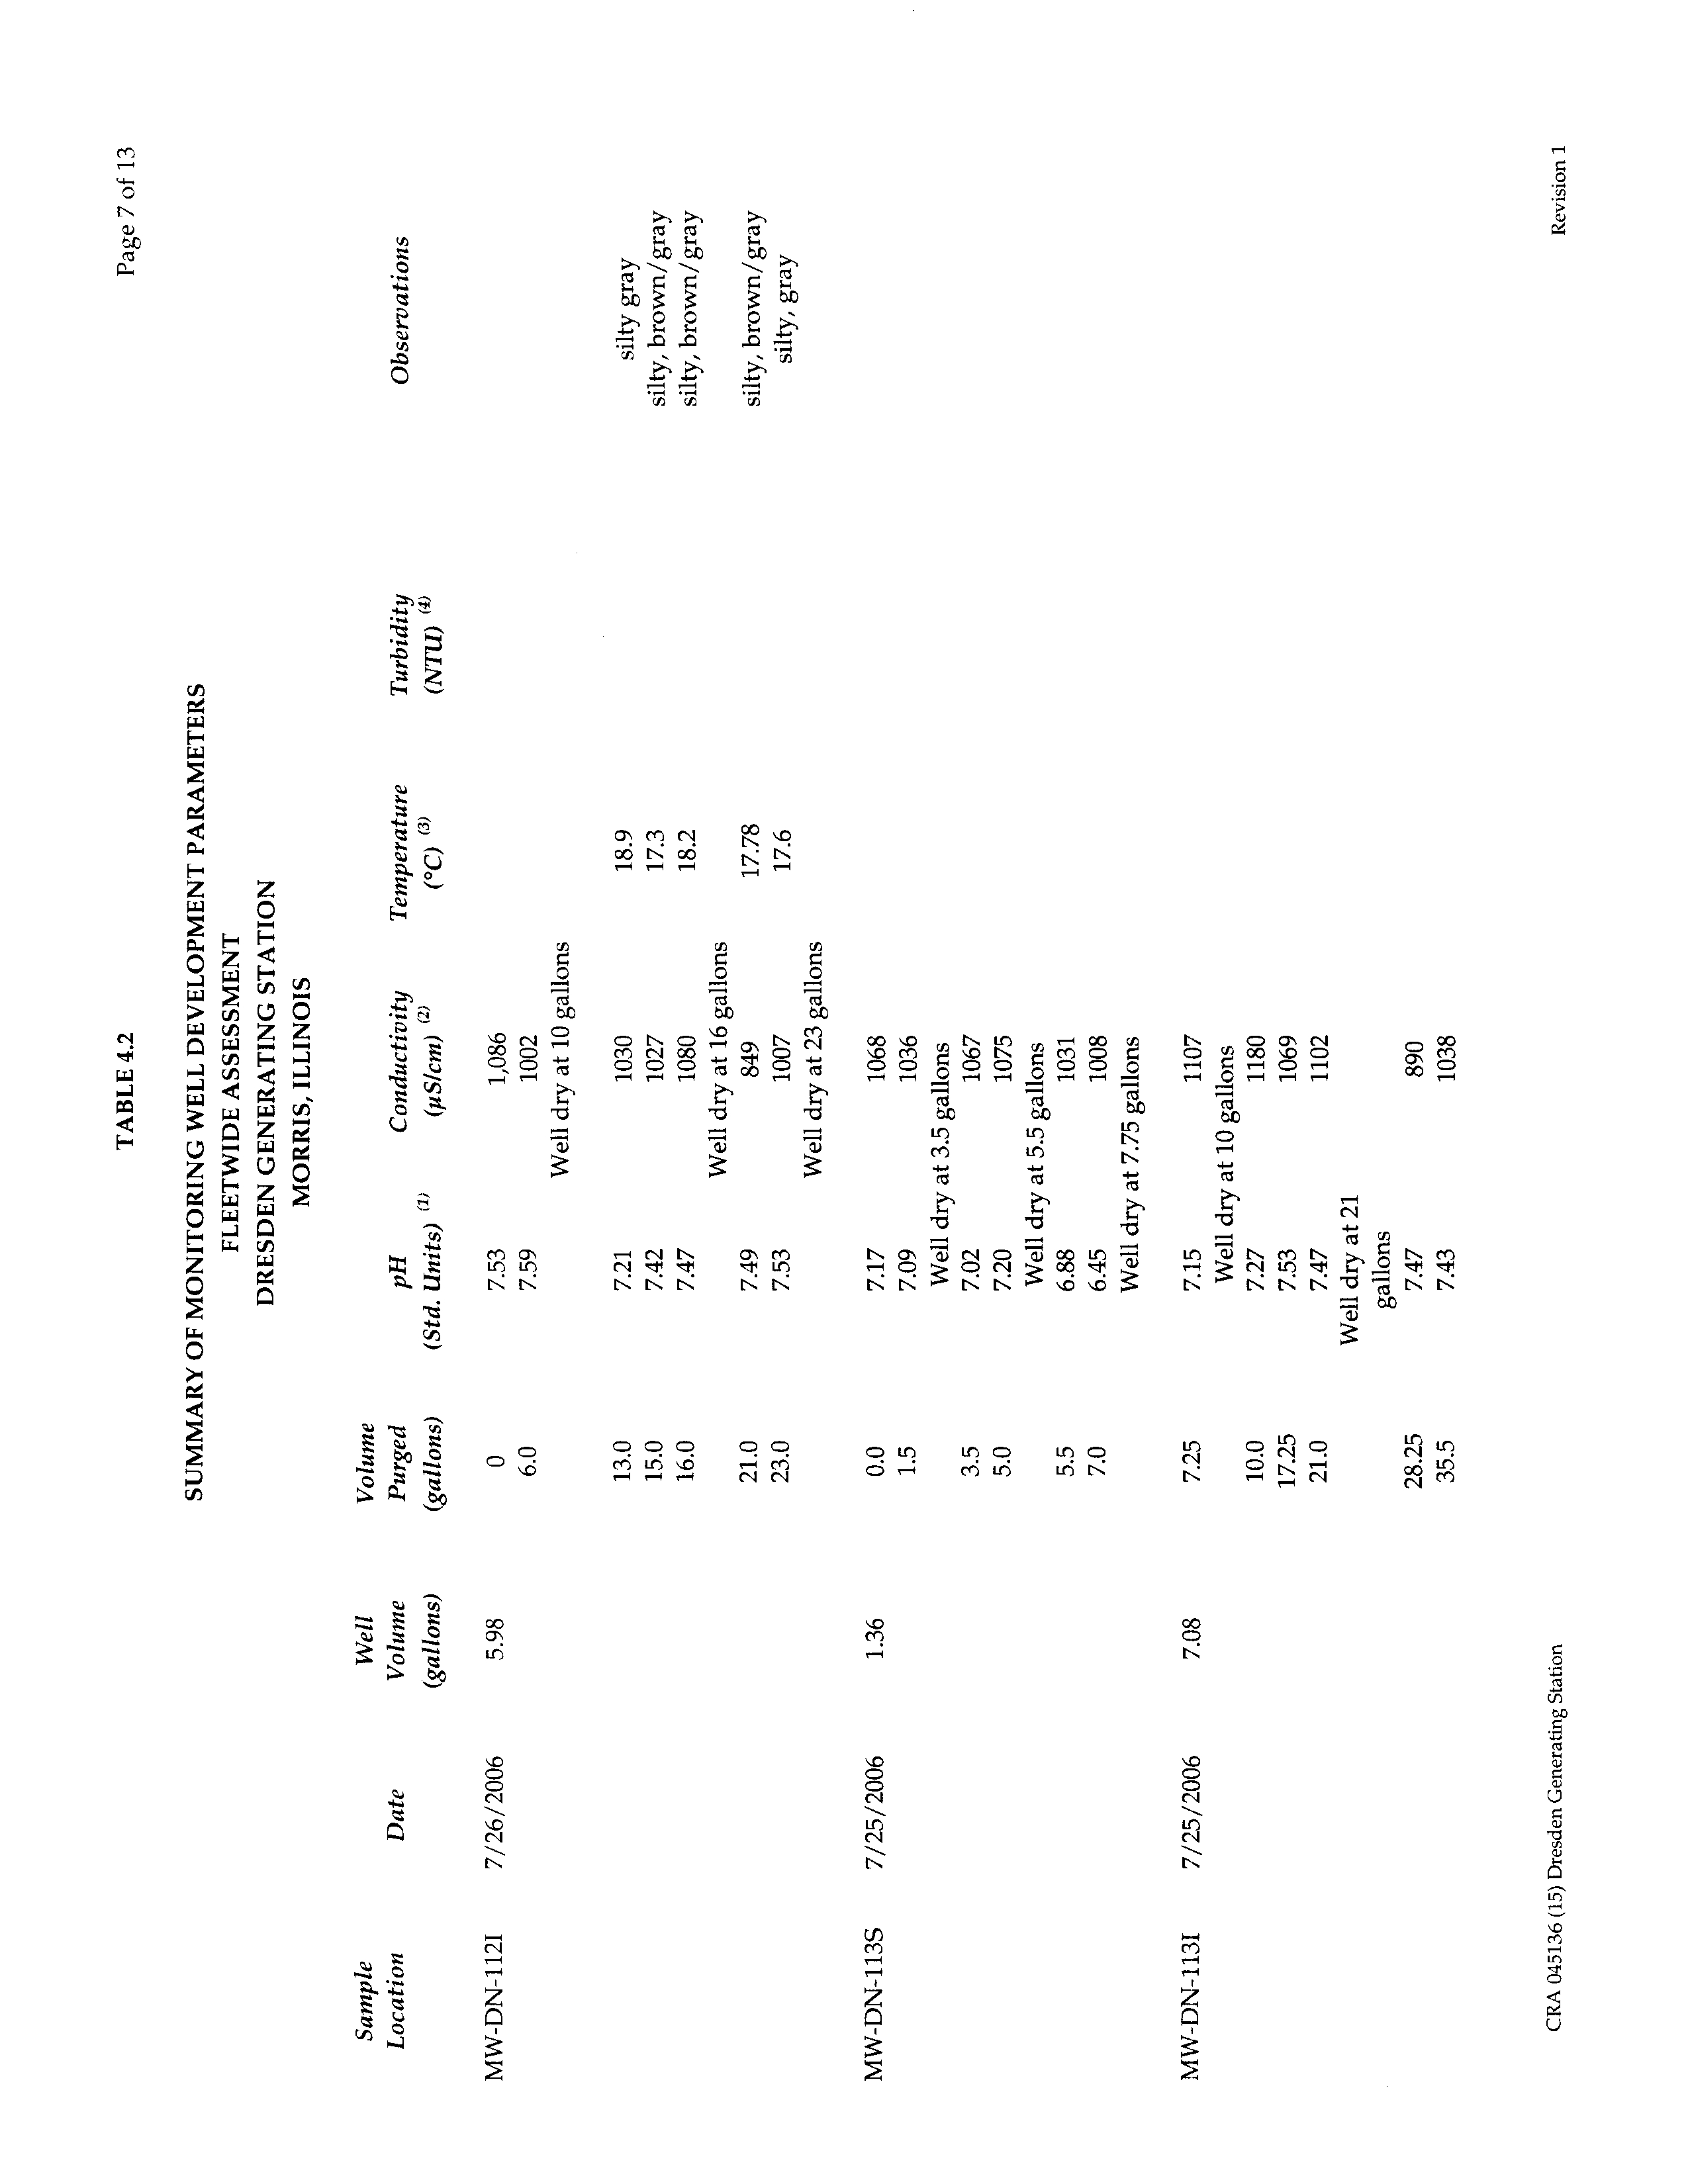
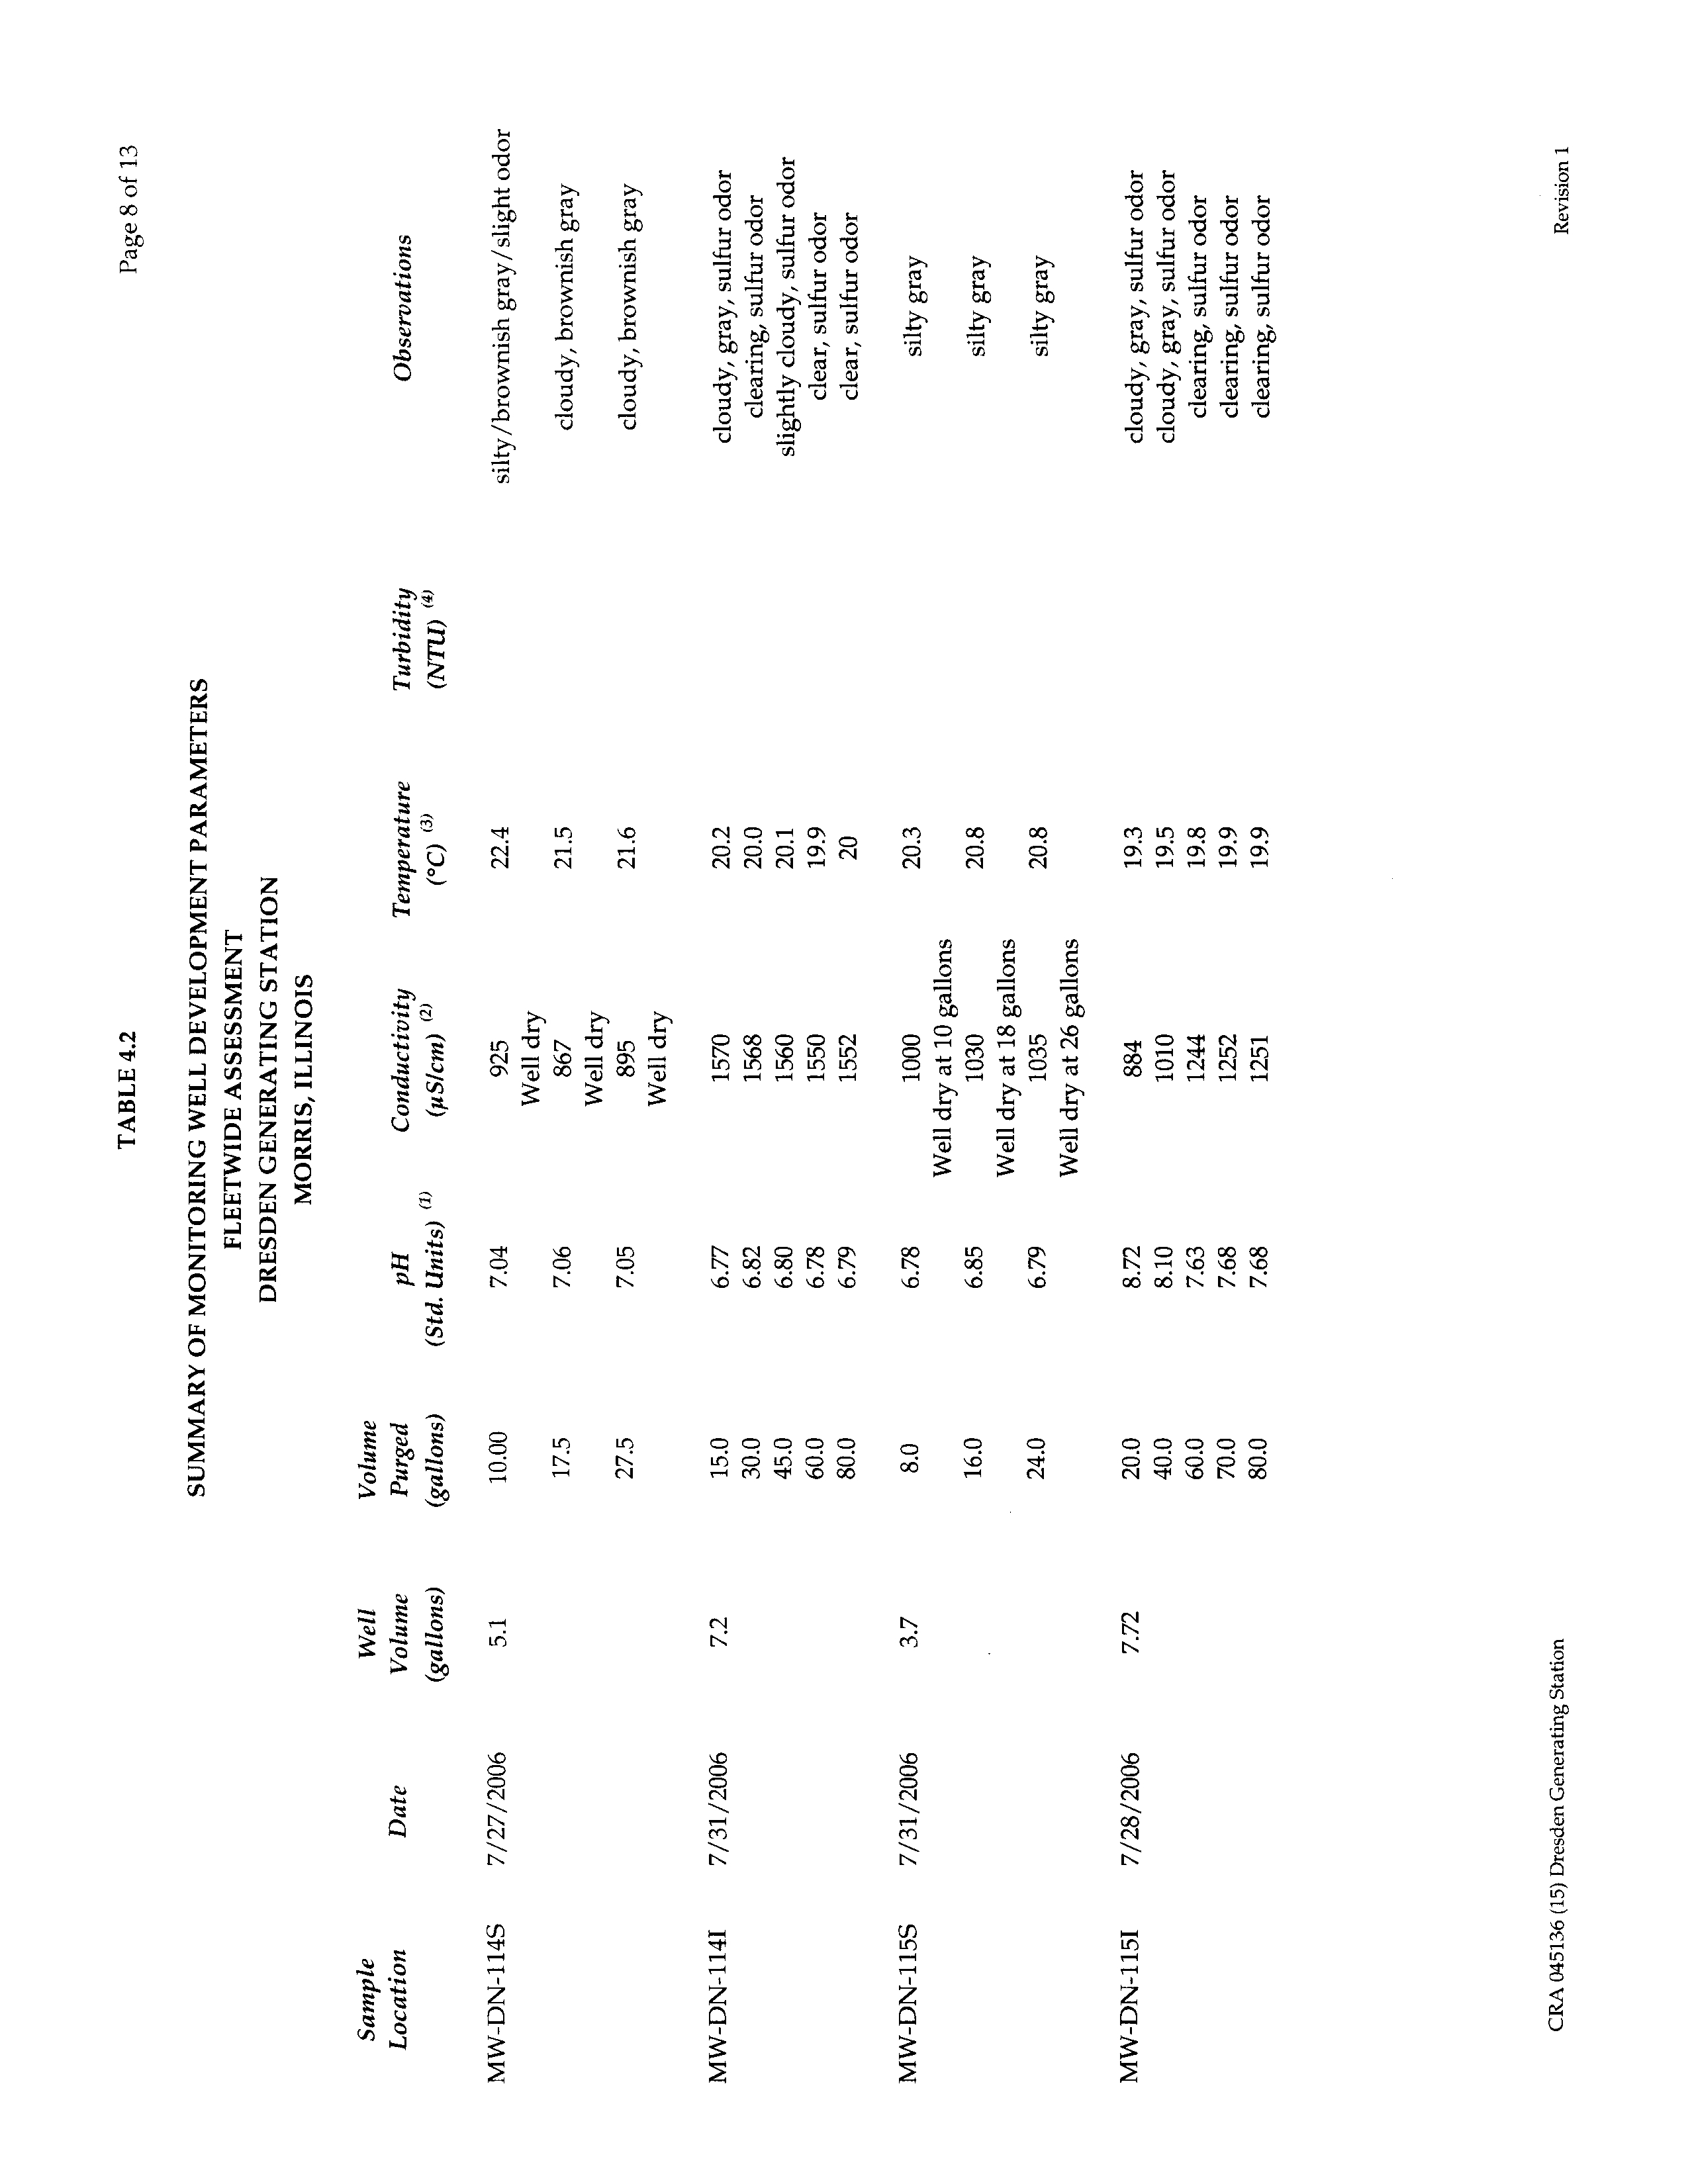
Thirty-six of 37 newly installed monitoring wells were developed in accordance with
this monitoring well
development procedure. Monitoring well MW-DN-123S was dry
upon installation and was therefore not developed.
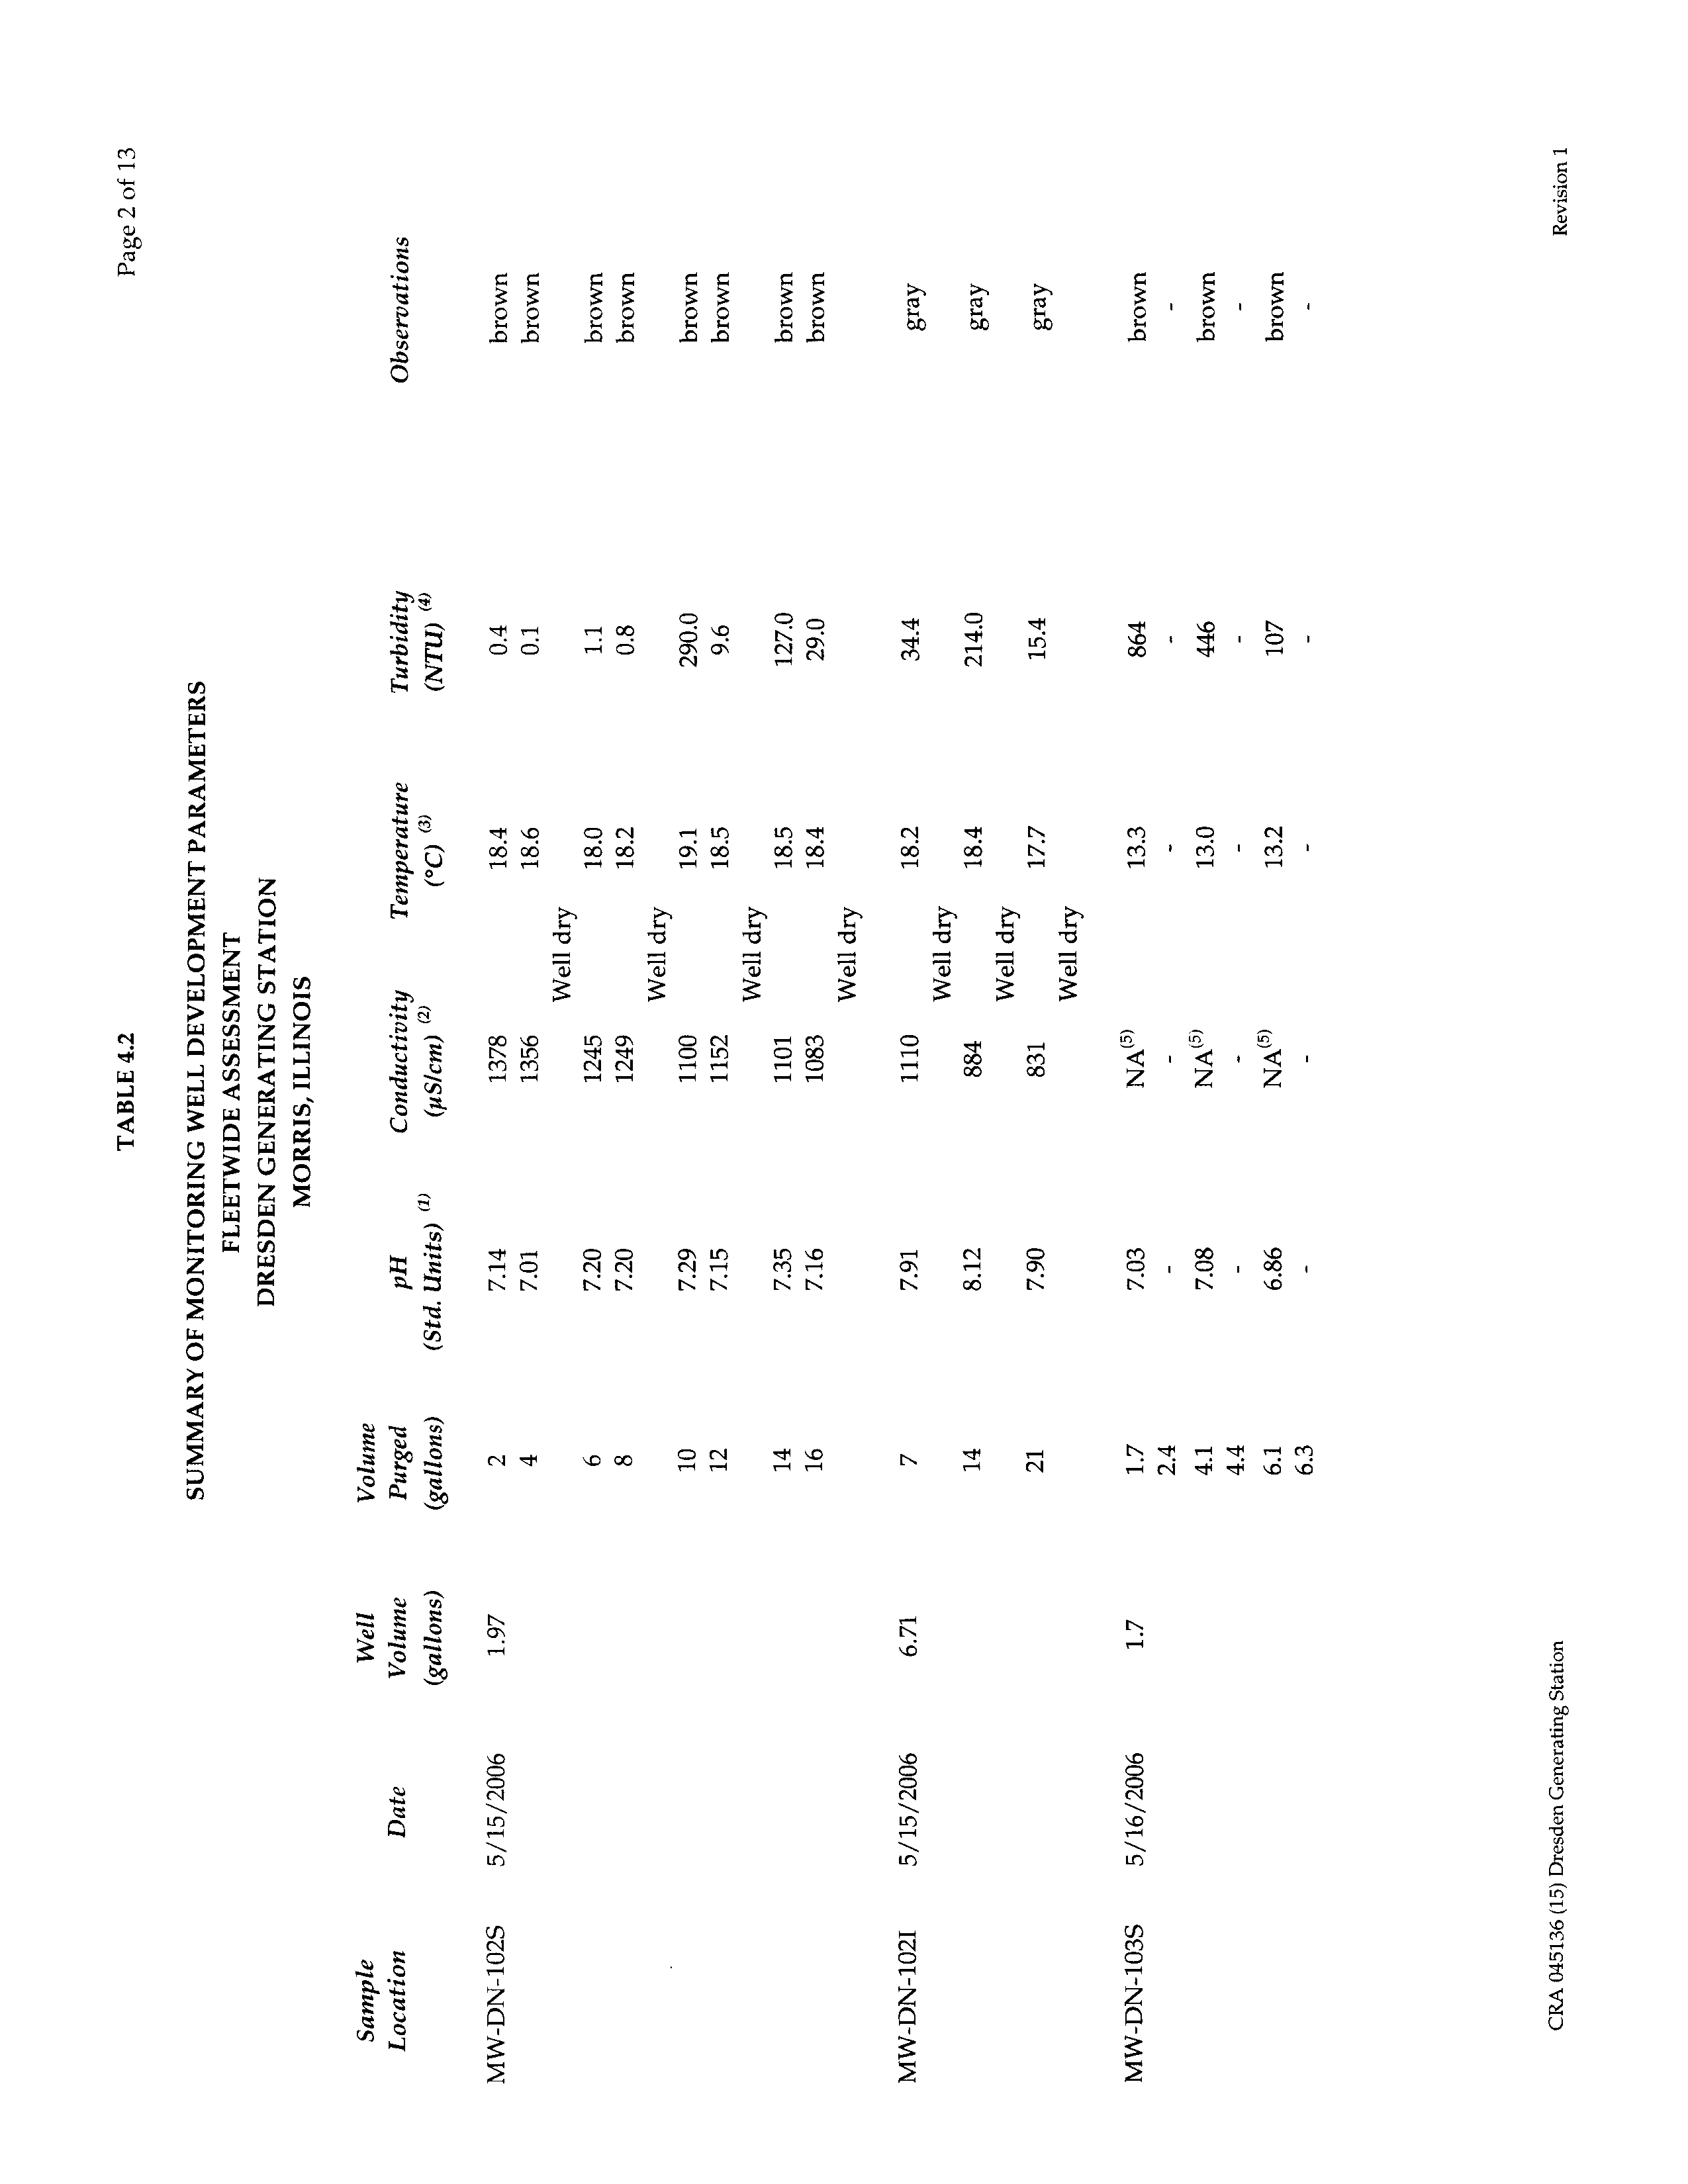
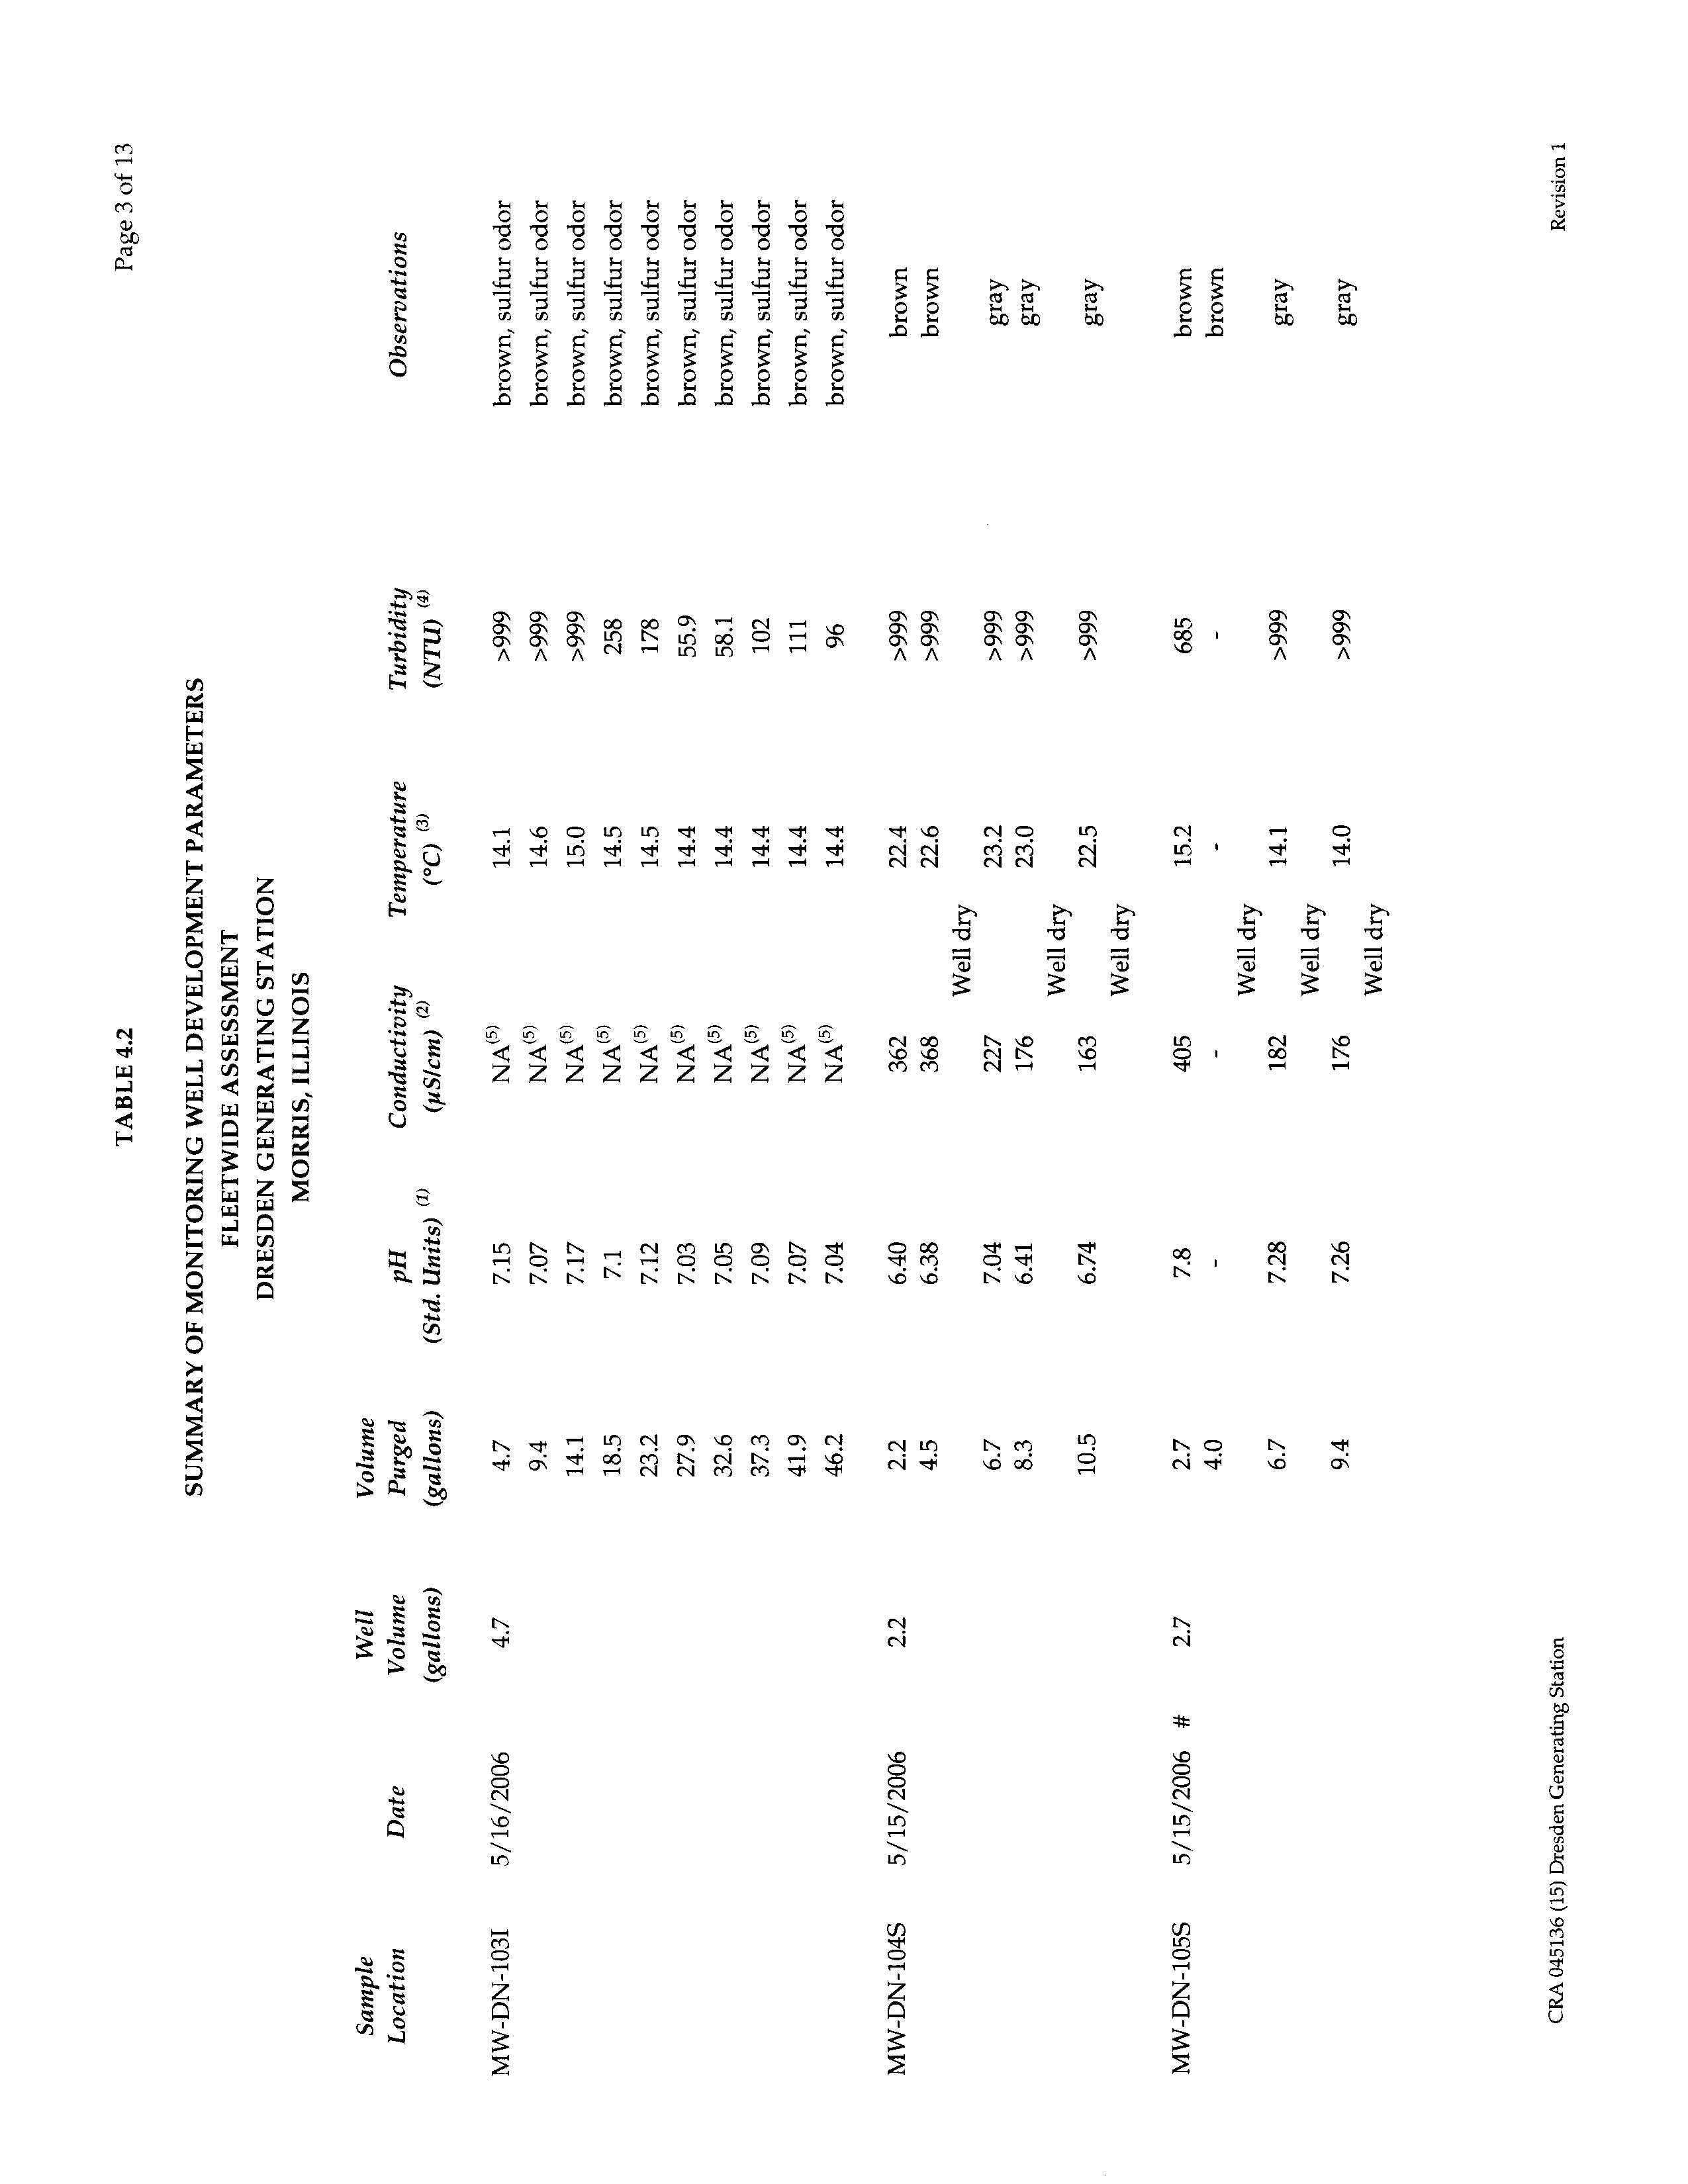
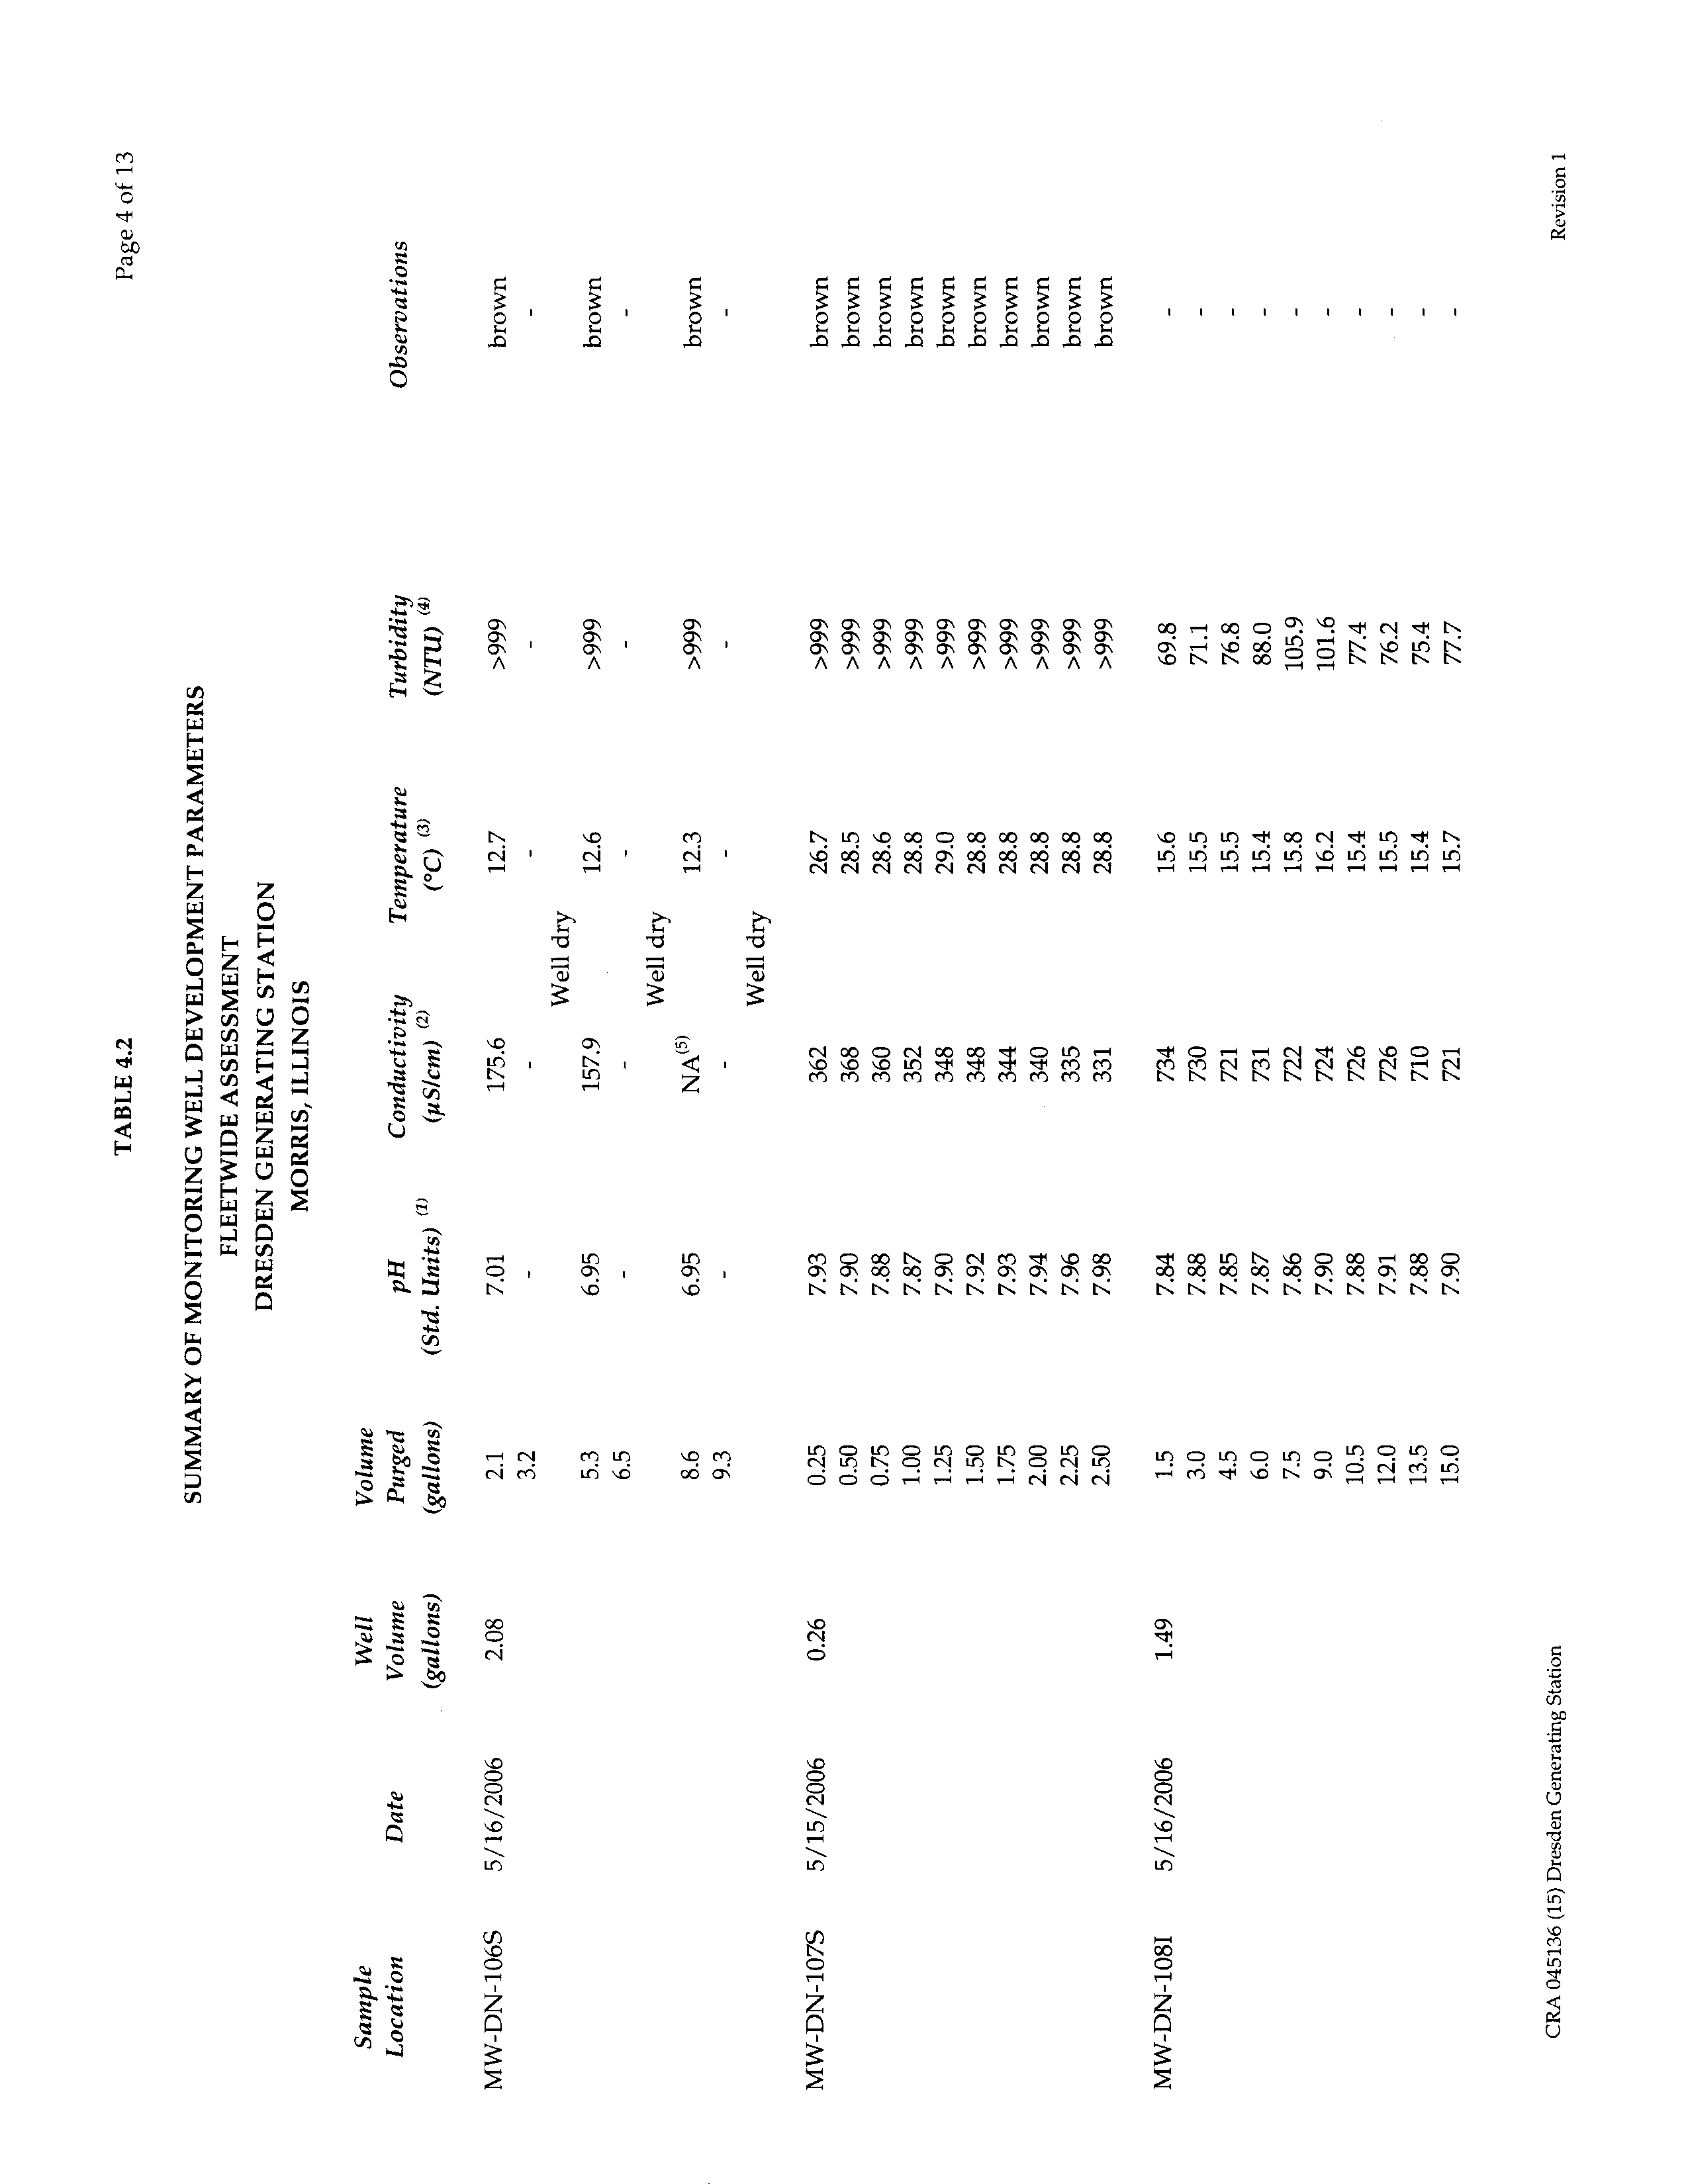
A summary of monitoring well development parameters is provided in Table 4.2.
4.4
SURVEY
The new monitoring wells and surface water sampling locations were surveyed to
establish reference elevations relative to mean sea level. The top of each well casing was
surveyed to the nearest 0.01 foot relative to the North American Vertical Datum, 1988
(NAVD 88), and the survey point was marked on the well casing. The survey included
the ground elevation at each well to the nearest 0.10 foot relative to the NAVD 88, and
the well location to the nearest 1.0 foot. A reference point was also marked on the
bridge surface or railing.
4.5
GROUNDWATER AND SURFACE WATER ELEVATION
MEASUREMENTS
On May 22, 2006 and again on August 7, 2006, CRA collected a round of water level
measurements from the monitoring wells and surface water elevation
monitoring points
at the Station in accordance with the Work Plan. Based on the measured depth to water
from the reference point and the surveyed elevation of the reference point, the
groundwater or surface water elevation was calculated. A summary of groundwater
elevations for the event is provided in Table 4.3. A summary of surface water elevations
for the event is provided in Table 4.4.
045136 (15) Dresden Generating Station
20
CONESTOGA-ROVERS & ASSOCIATES
Revision 1
Prior to the water level measurements, the wells were identified and located.
Once the
wells were identified, CRA completed a thorough inspection of each well and noted any
deficiencies.
Water level measurements were collected using an electronic
depth-to-water probe accurate to ± 0.01 foot. The measurements were made from the
designated location on the inner riser or steel casing of each monitoring well, and on the
reference point for each surface water elevation monitoring point. The water level
measurements were obtained using the following procedures:
•
the proper elevation of the
meter was checked by inserting the tip into water and
noting if the contact was registering correctly;
•
the tip was dried, and then slowly lowered into
the well until contact with the water
was indicated;
•
the tip was slowly raised until the light
and/or buzzer just began to activate. This
indicated the static water level;
•
the reading at the reference point was noted to the nearest hundredth of a foot;
•
the reading was then re-checked; and
•
the water level was then recorded, and the water level meter decontaminated prior
to use at the next well location.
4.6
GROUNDWATER AND SURFACE WATER SAMPLE COLLECTION
CRA conducted one round of groundwater sampling during the completion of the Work
Plan for these hydrogeologic investigations. A total of 45 monitoring wells were
sampled between May 23 and June 2, 2006. Of the 45 monitoring wells sampled, 16 were
newly installed.
In addition, between August 7, 2006 to August 14, 2006, CRA
conducted a supplemental round of groundwater sampling of 21 newly installed wells
(installed in July 2006) and one previously installed groundwater well. The sampling for
each event was scheduled to allow for 2 weeks to elapse between well development and
groundwater sample collection. The existing wells were selected for inclusion in this
investigation based on their proximity to AFEs.
At the monitoring well locations, CRA conducted the sampling using pneumatic bladder
pumps or peristaltic pumps and dedicated
polyethylene tubing to employ low flow
purging techniques as described in Puls and Barcelona (1996).
045136 (15) Dresden Generating Station
21
CONESTOGA-ROVERS & ASSOCIATES
Revision 1
The groundwater in the monitoring wells was sampled by the following
low-flow
procedures:
•
the wells were located and the well identification numbers were verified;
•
a water level measurement was taken;
•
the well was sounded by carefully lowering the water level tape to the bottom of the
well (so as to minimize penetration and disturbance of the well bottom sediment),
and comparing the sounded depth to the
installed depth to assess the presence of
any excess sediment or drill cuttings;
•
the pump or tubing was lowered slowly into the well and fixed
into place such that
the Intake was located at the mid-point of the well screen, or a minimum of 2 feet
above the well bottom/sediment level;
•
the purging was conducted using
a pumping rate between 100 to 500 milliliters per
minute. Initial purging began using the lower end of this range. The groundwater
level was monitored to ensure that a drawdown of less than 0.3 foot occurred. If this
criterion was met, the pumping rate was increased dependent on the behavior of the
well. During purging, the pumping rate and groundwater level were measured and
recorded approximately every 10 minutes;
•
the
field parameters [pH, temperature, conductivity, oxidation-reduction potential
(ORP), dissolved oxygen (DO), and turbidity] were monitored during the purging to
evaluate the stabilization of the purged groundwater. Stabilization was considered
to be achieved when three consecutive readings for each parameter, taken at
5-minute intervals, were within the following limits:
pH
± 0.1 pH units of the average value of the three readings,
Temperature
± 3 percent of the average value of the three readings,
Conductivity
± 0.005 milliSiemen per centimeter (mS/cm) of the average value
of
the three readings for conductivity <1 mS/cm and
± 0.01 mS/cm of the average value of the three readings for
conductivity >1 mS/cm,
ORP
± 10 millivolts (mV) of the average value of the three readings,
DO
± 10 percent of the average value of the three readings, and
Turbidity
± 10 percent of the average value of the three readings, or a final
value of less than 5 nephelometric turbidity units (NTUs);
•
once purging was complete, the groundwater samples were collected directly from
the pump/tubing directly into the sample containers; and
045136 (15) Dresden Generating Station
22
CONESTOGA-ROVERS & ASSOCIATES
Revision 1
•
in the event that the groundwater recharge to the monitoring well was
insufficient to
conduct the low-flow procedure, the well was pumped dry and allowed to
sufficiently recharge prior to sampling.
All groundwater samples were labeled with a unique
sample number, the date and time,
the parameters to be analyzed, the job number, and the sampler's initials. For the May
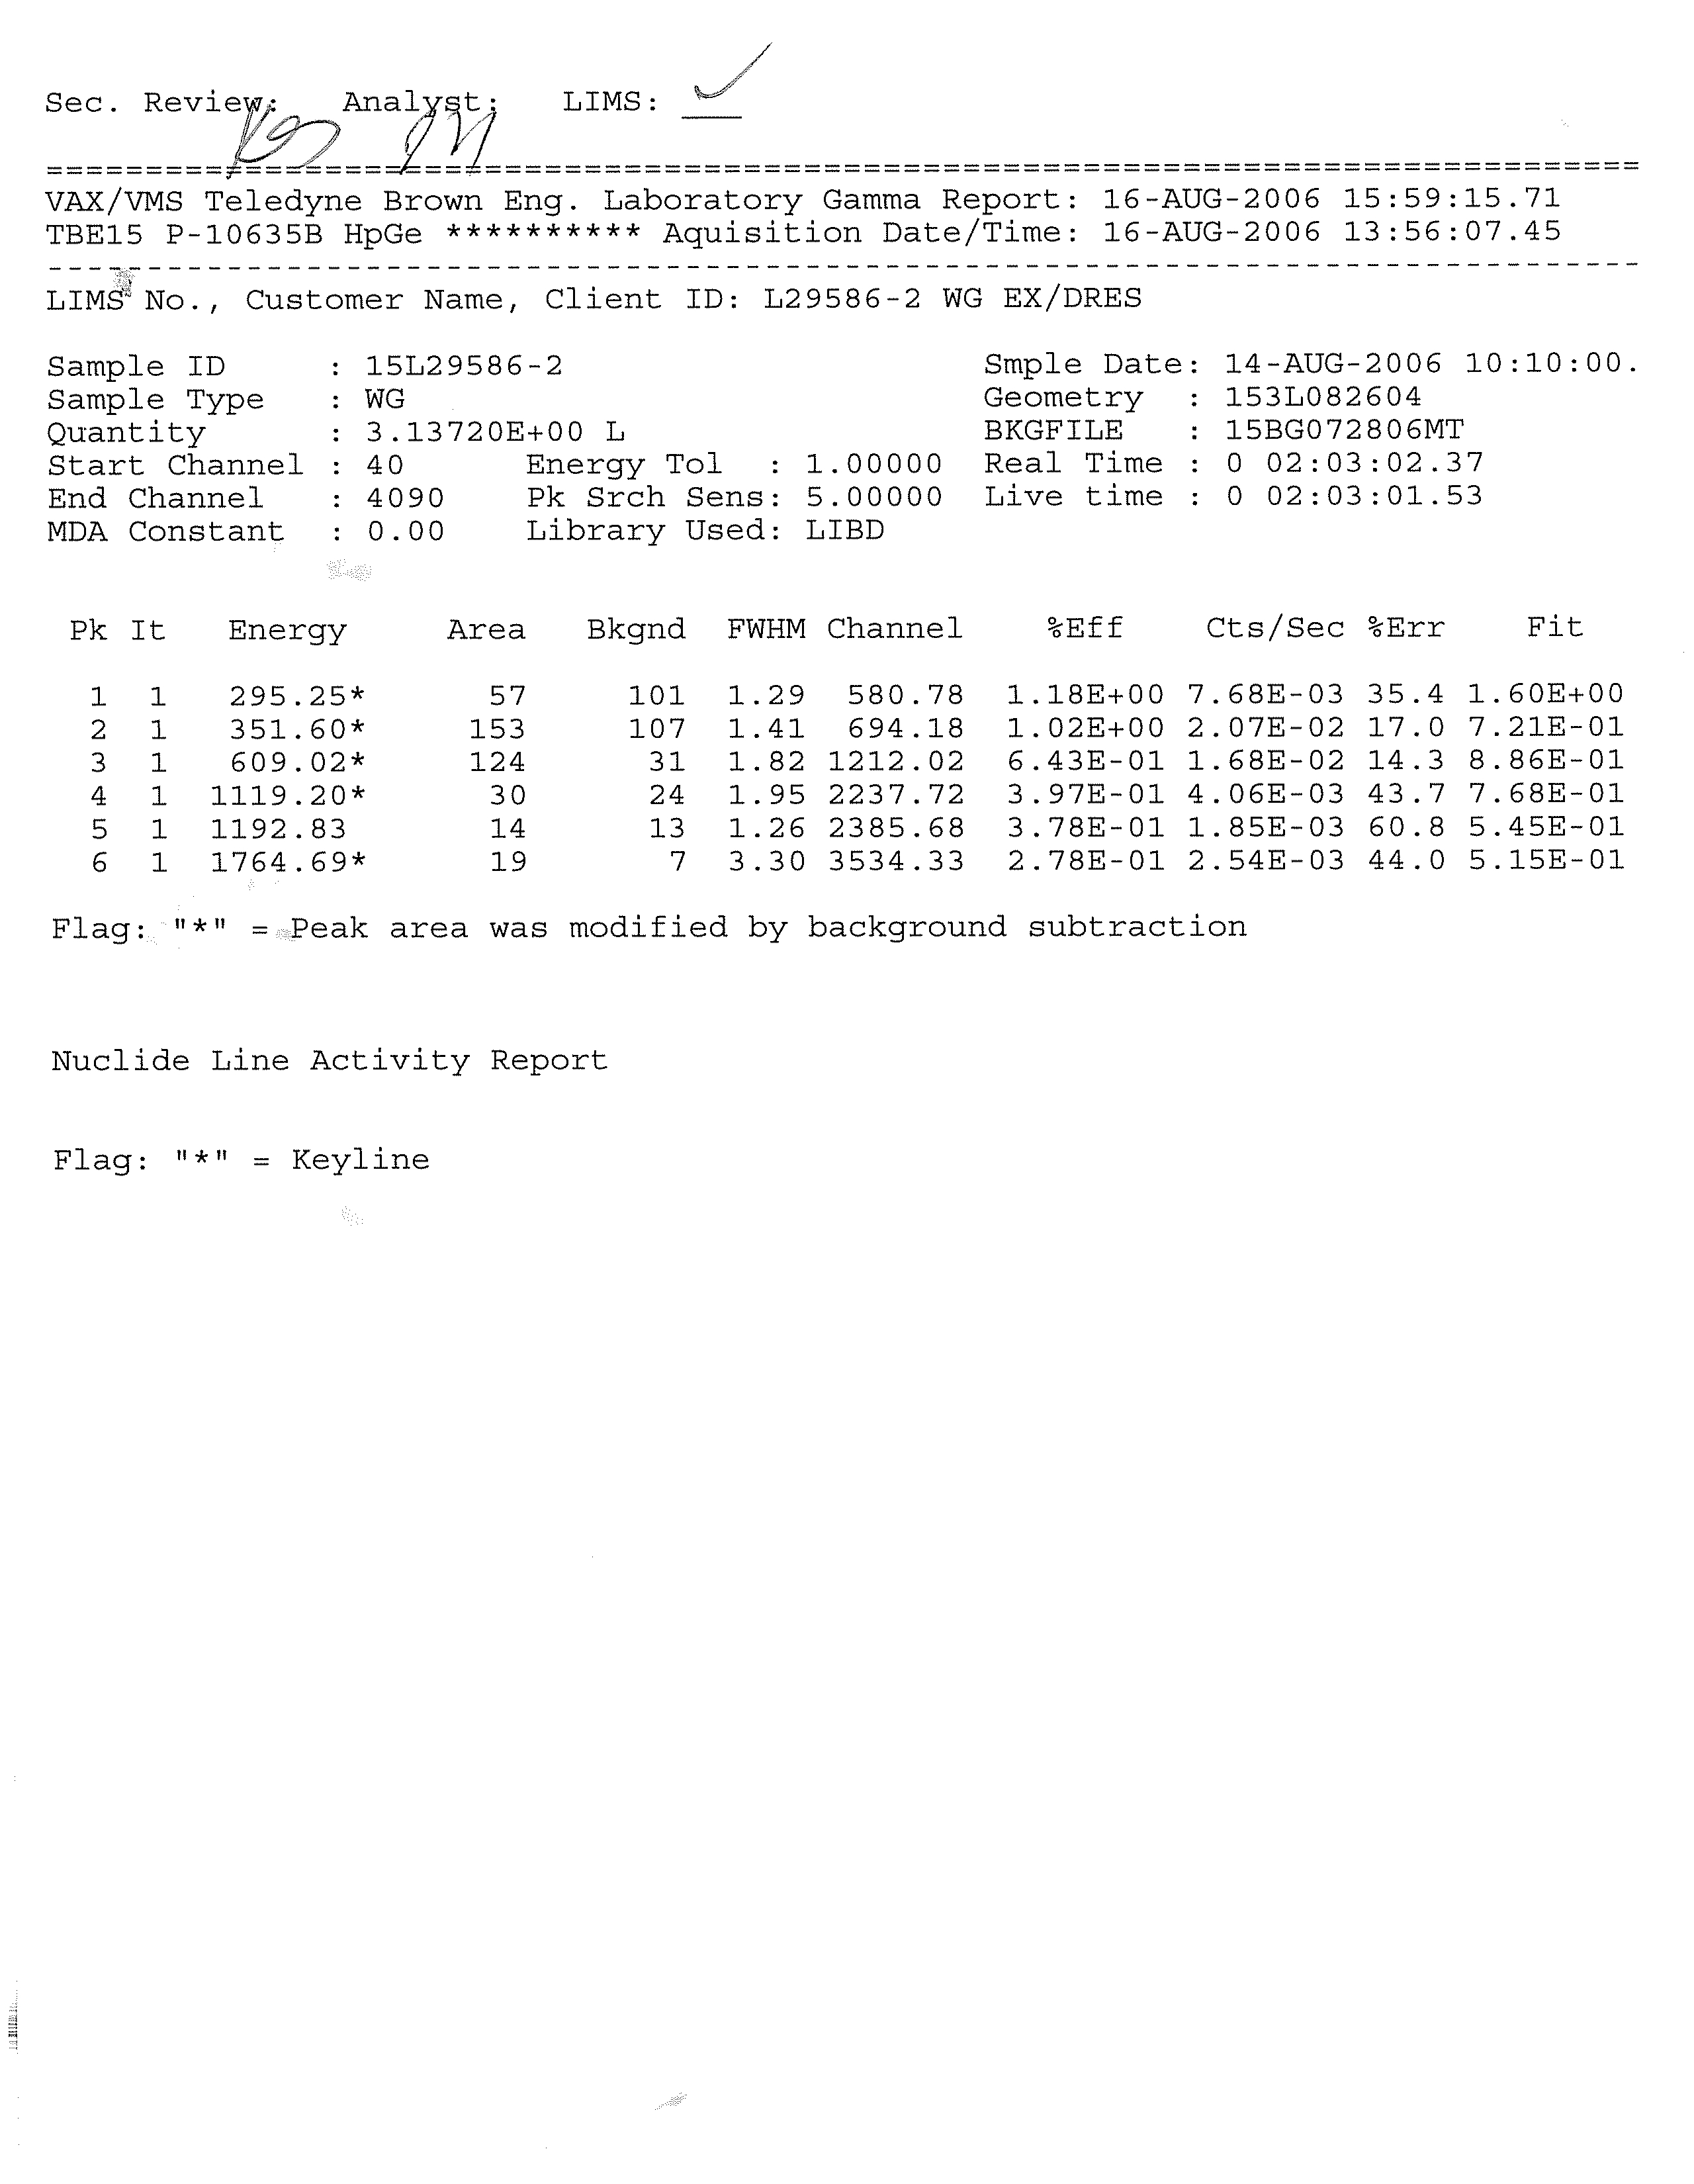
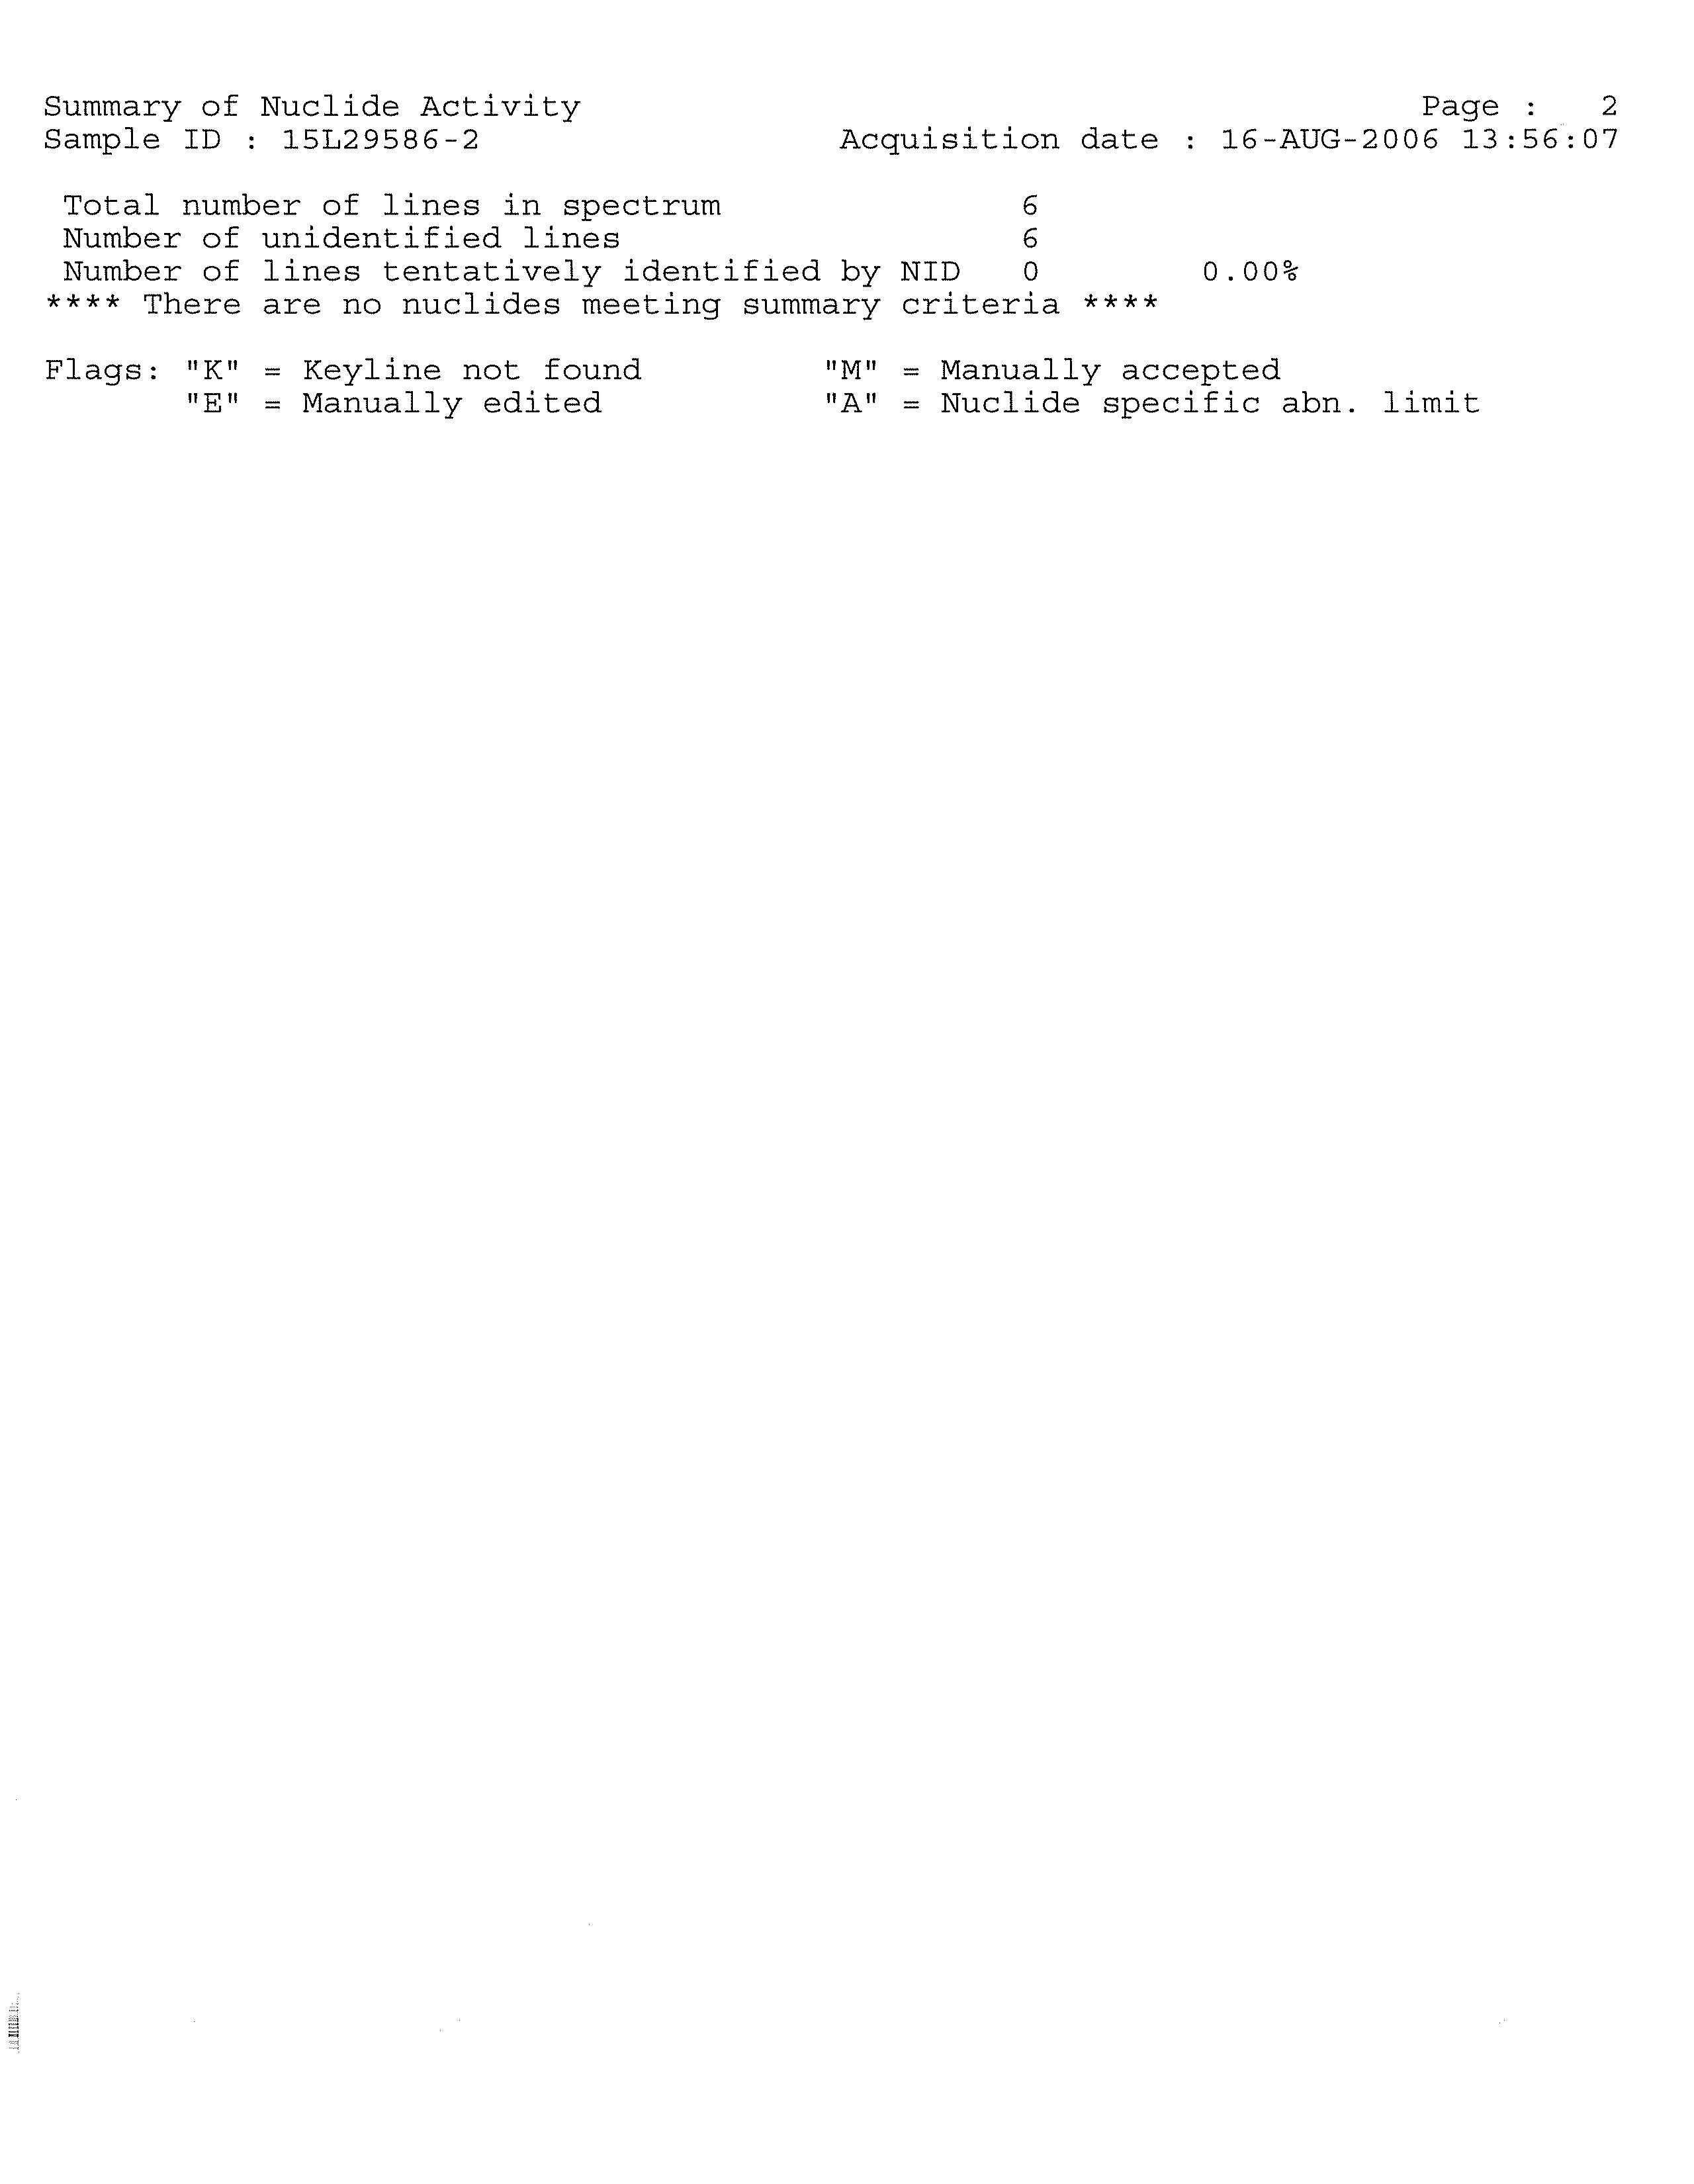
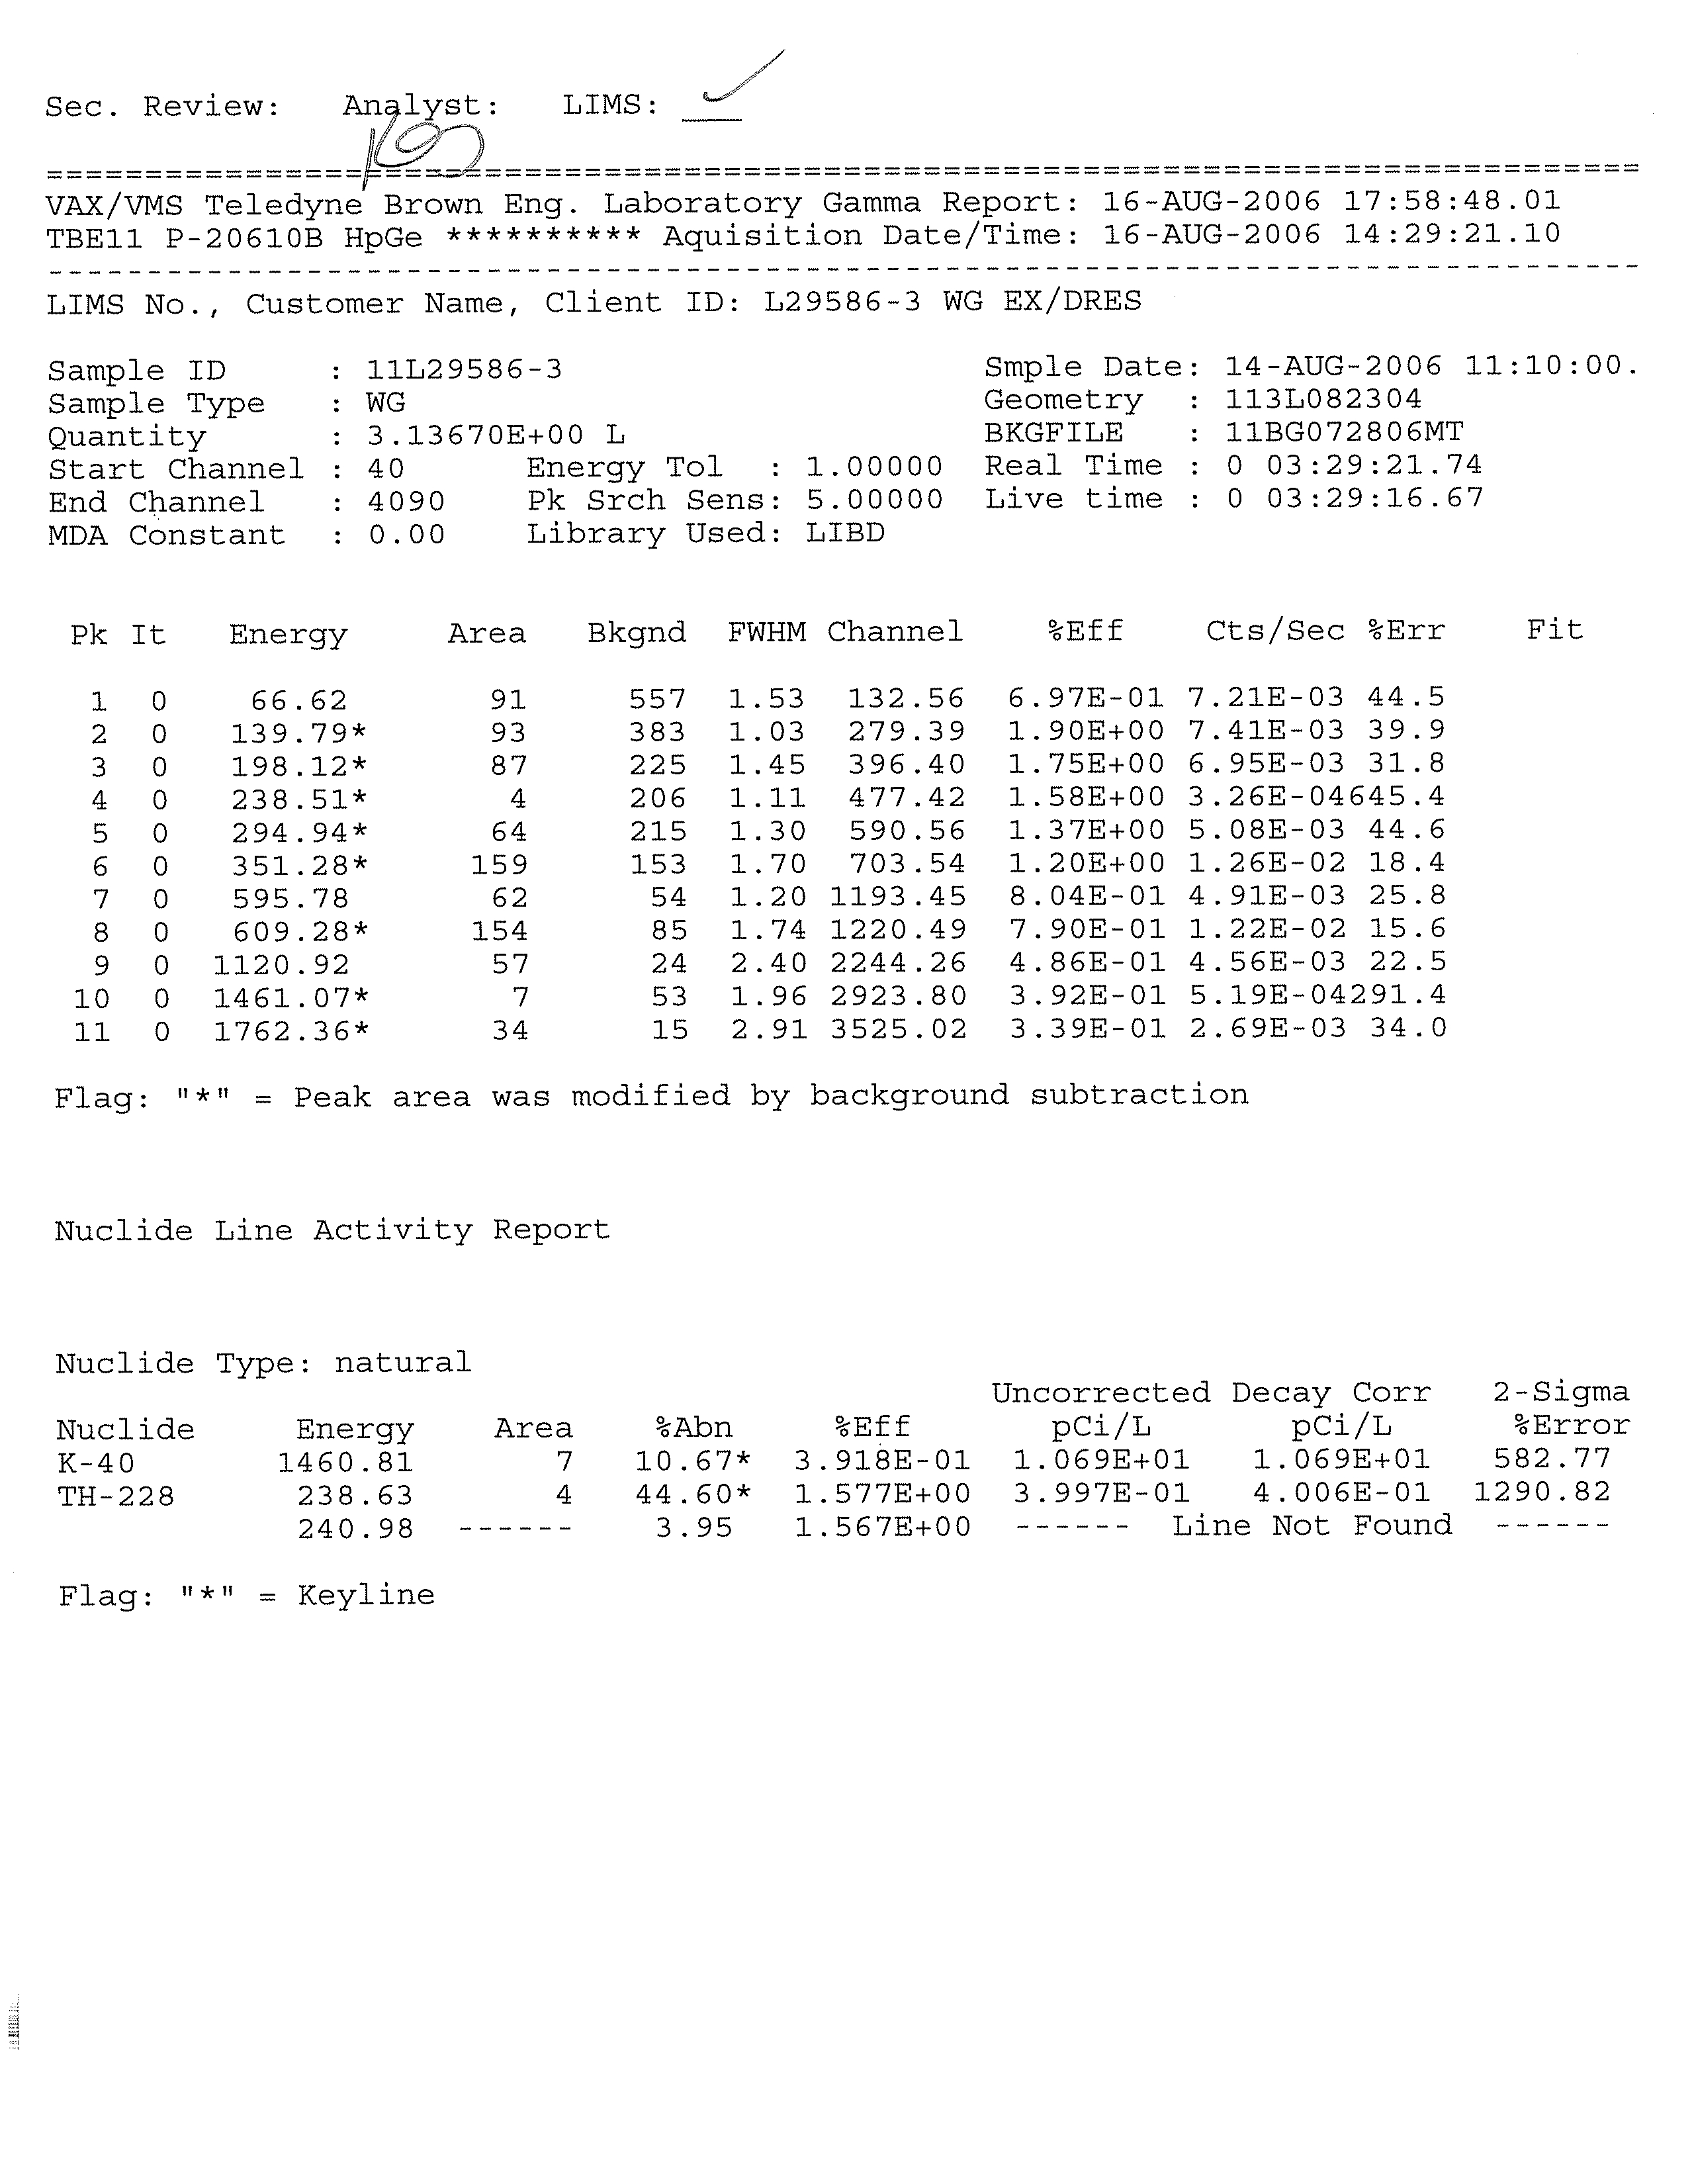
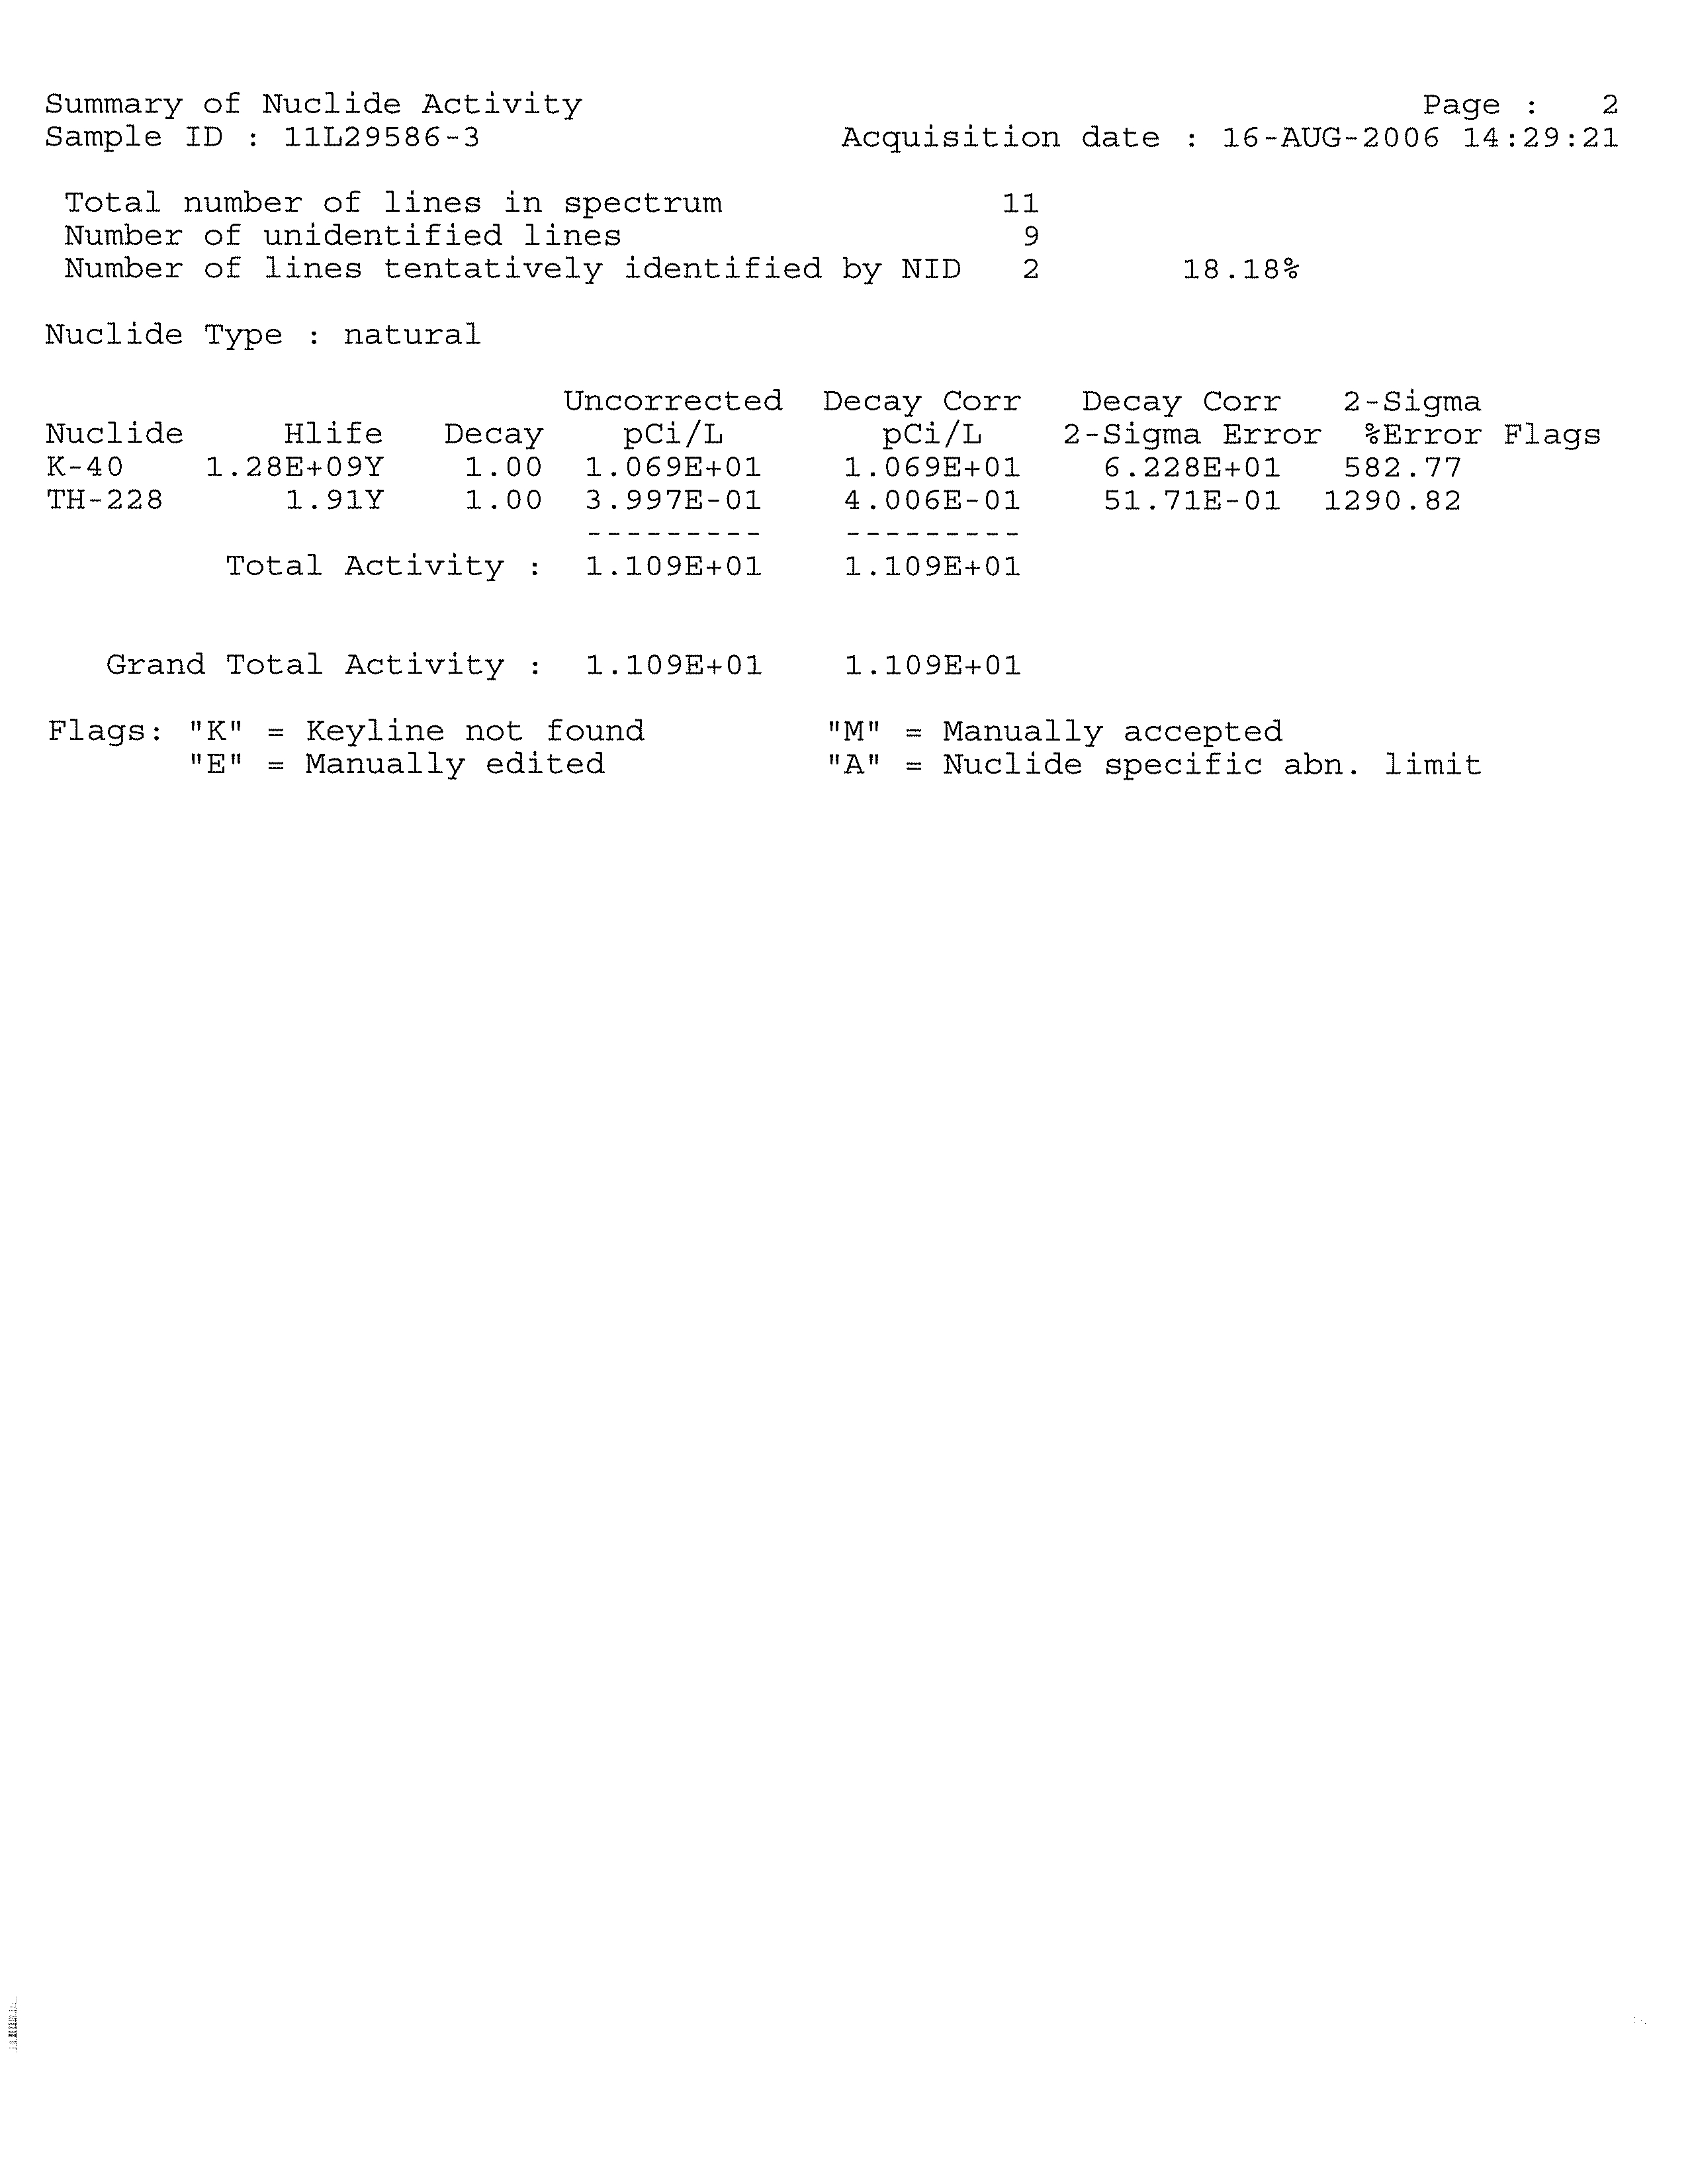
and June 2006 sampling event, the samples were screened by the Station for shipment to
Teledyne Brown Engineering Inc. (Teledyne Brown). For the August 2006 sampling
event, groundwater samples were shipped to Teledyne Brown based on screening
results obtained during well development activities.
Due to the limited volume of water available for collection in monitoring
well
MW-DN-123S, the monitoring well was not purged and a bailer was used to collect a
groundwater sample for tritium only (insufficient volume of groundwater remained to
sample for strontium-89/90 or gamma-emitting radionuclides).
Field measurements for the hydrogeologic investigation are presented in Table 4.5 and a
sample key is provided in Table 4.6.
CRA containerized the water purged from the monitoring wells during the sampling, as
well as the water purged from
all of the wells during the hydrogeologic investigation.
The water was placed into 55-gallon drums, which will be processed by the Station in
accordance with its NPDES permit.
Surface water samples were collected from May 23 to June 2, 2006 at the Units 2/3
Intake Canal (SW-DN-101), Units
2/3 Discharge Canal (SW-DN-102), Recycling Canal
(SW-DN-103), Hot Canal (SW-DN-104), Cold Canal (SW-DN-105) and the Pond
(SW-DN-106). The surface water sampling locations are presented on Figure 4.1.
The surface water samples were collected by directly filling the sample container from
the composite samplers at the determined locations
until completely filled. A sample
key is presented in Table 4.6.
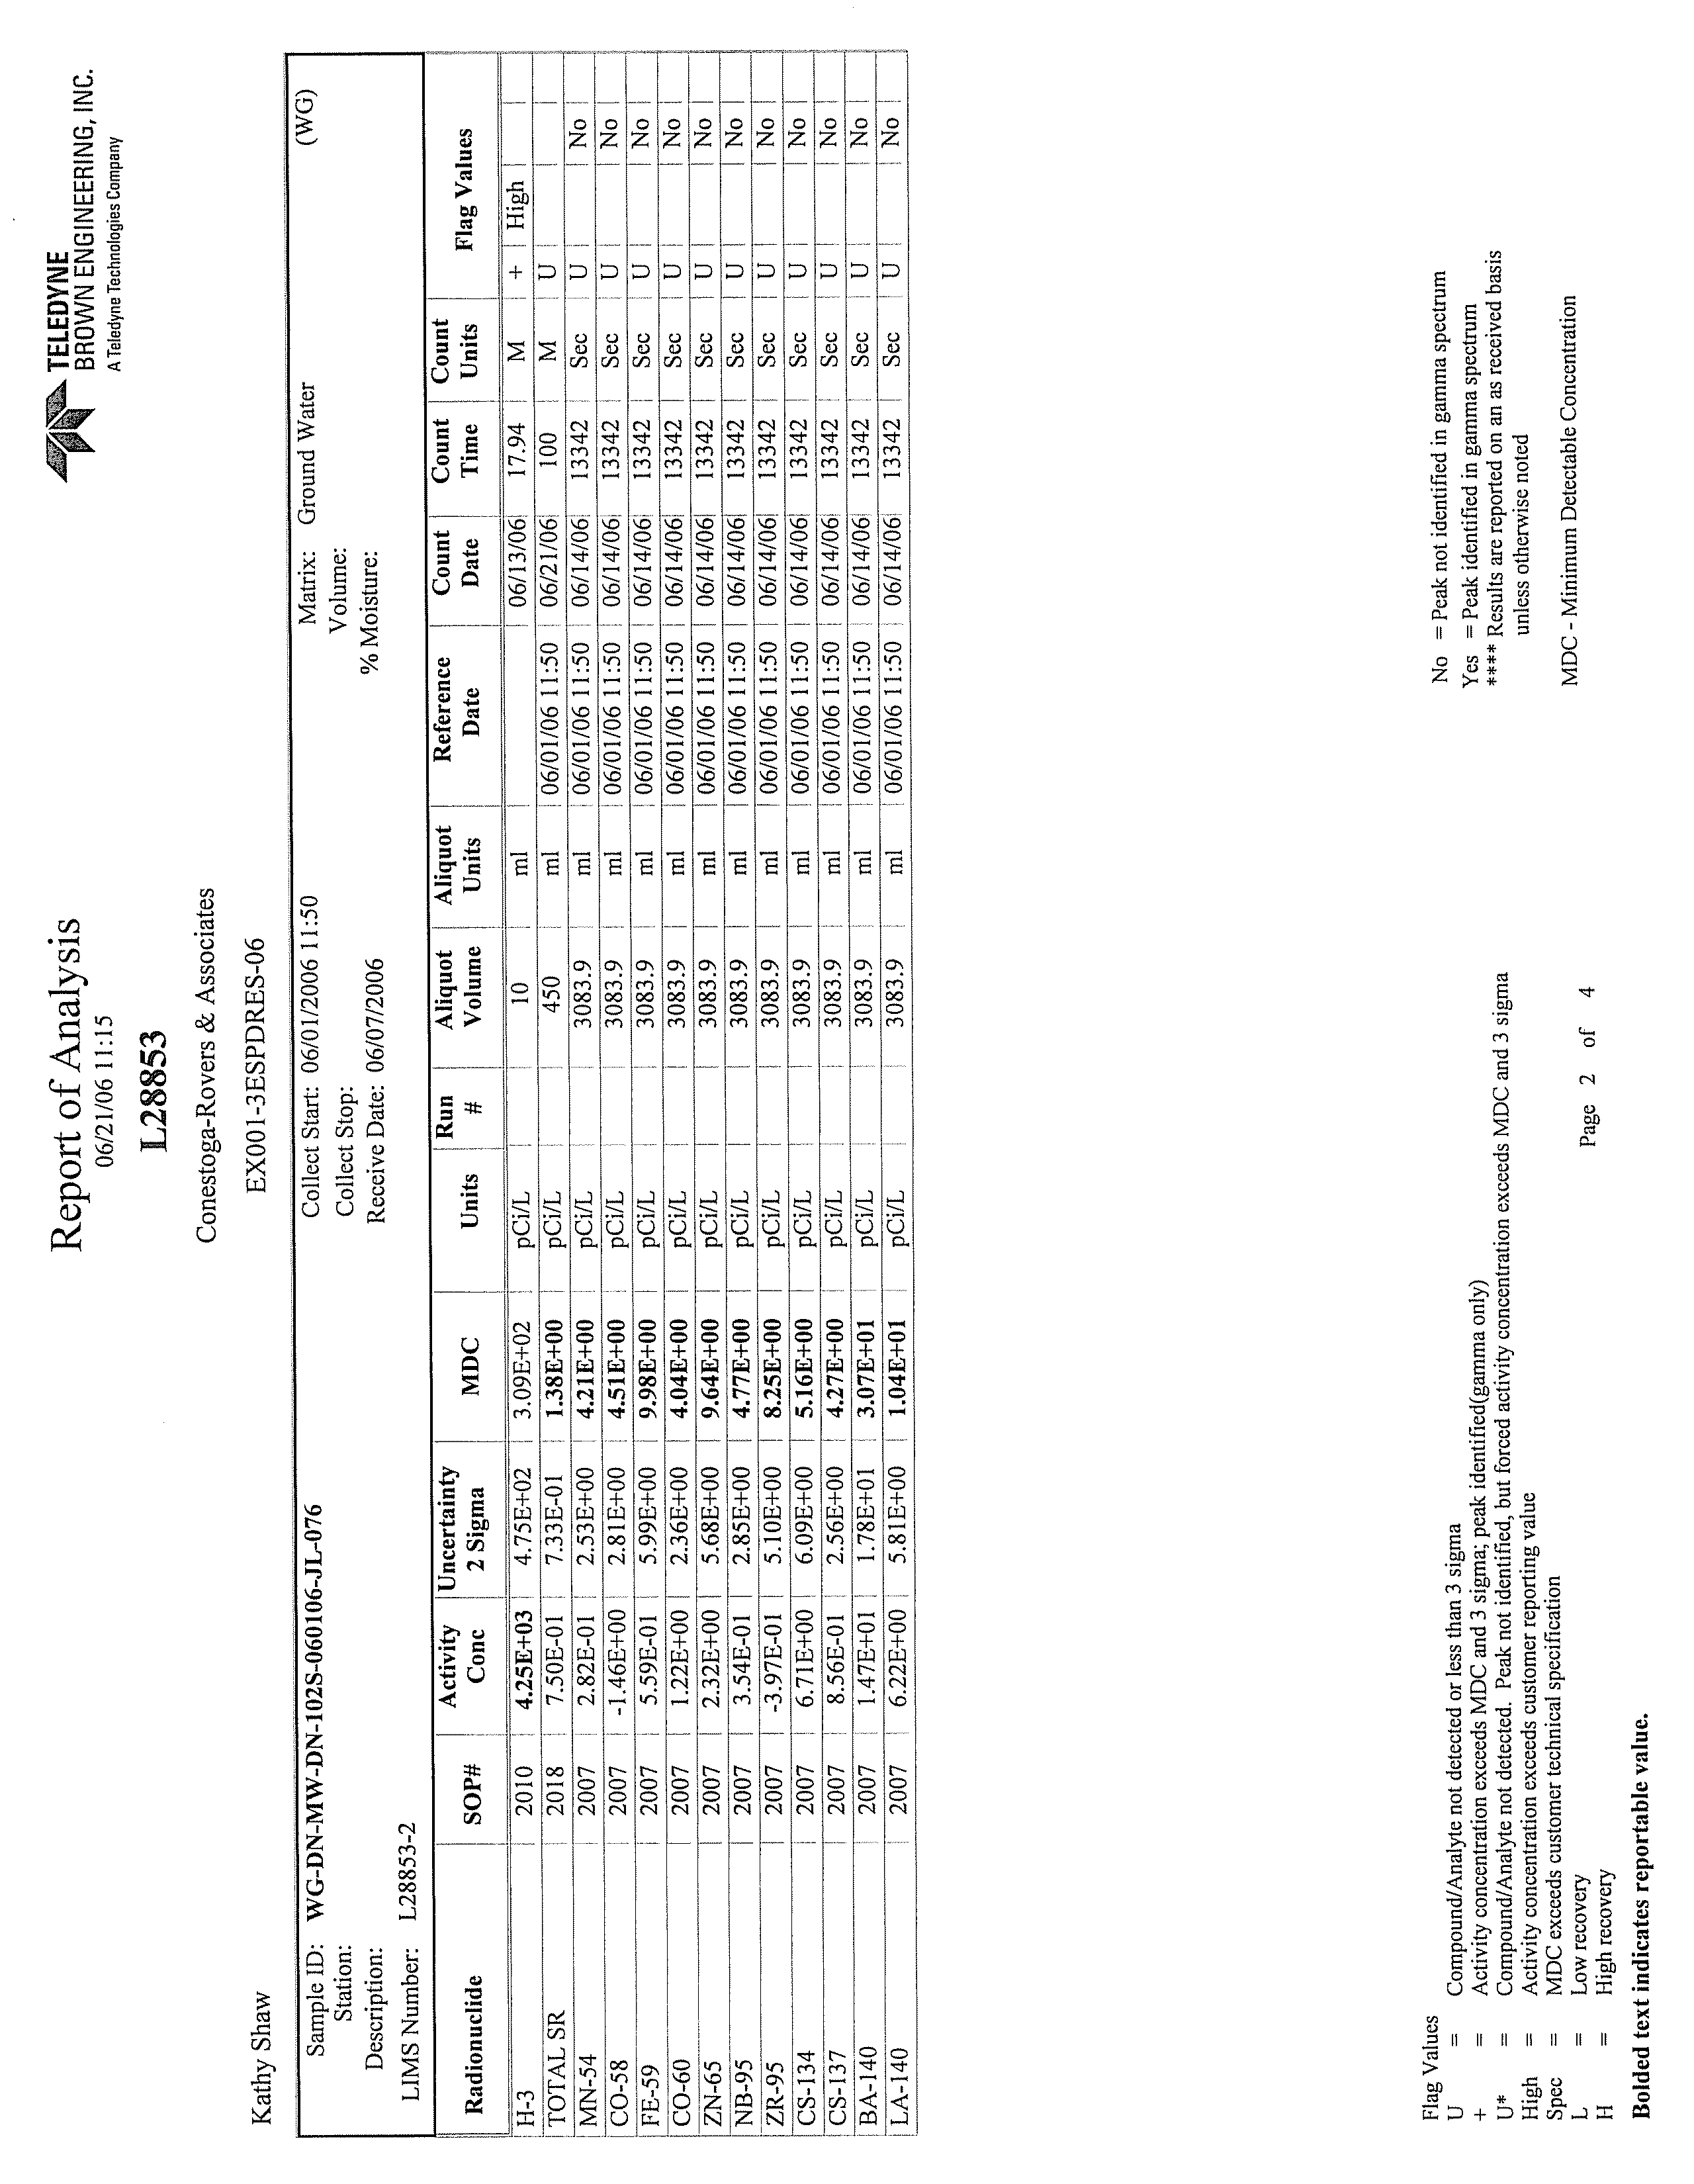
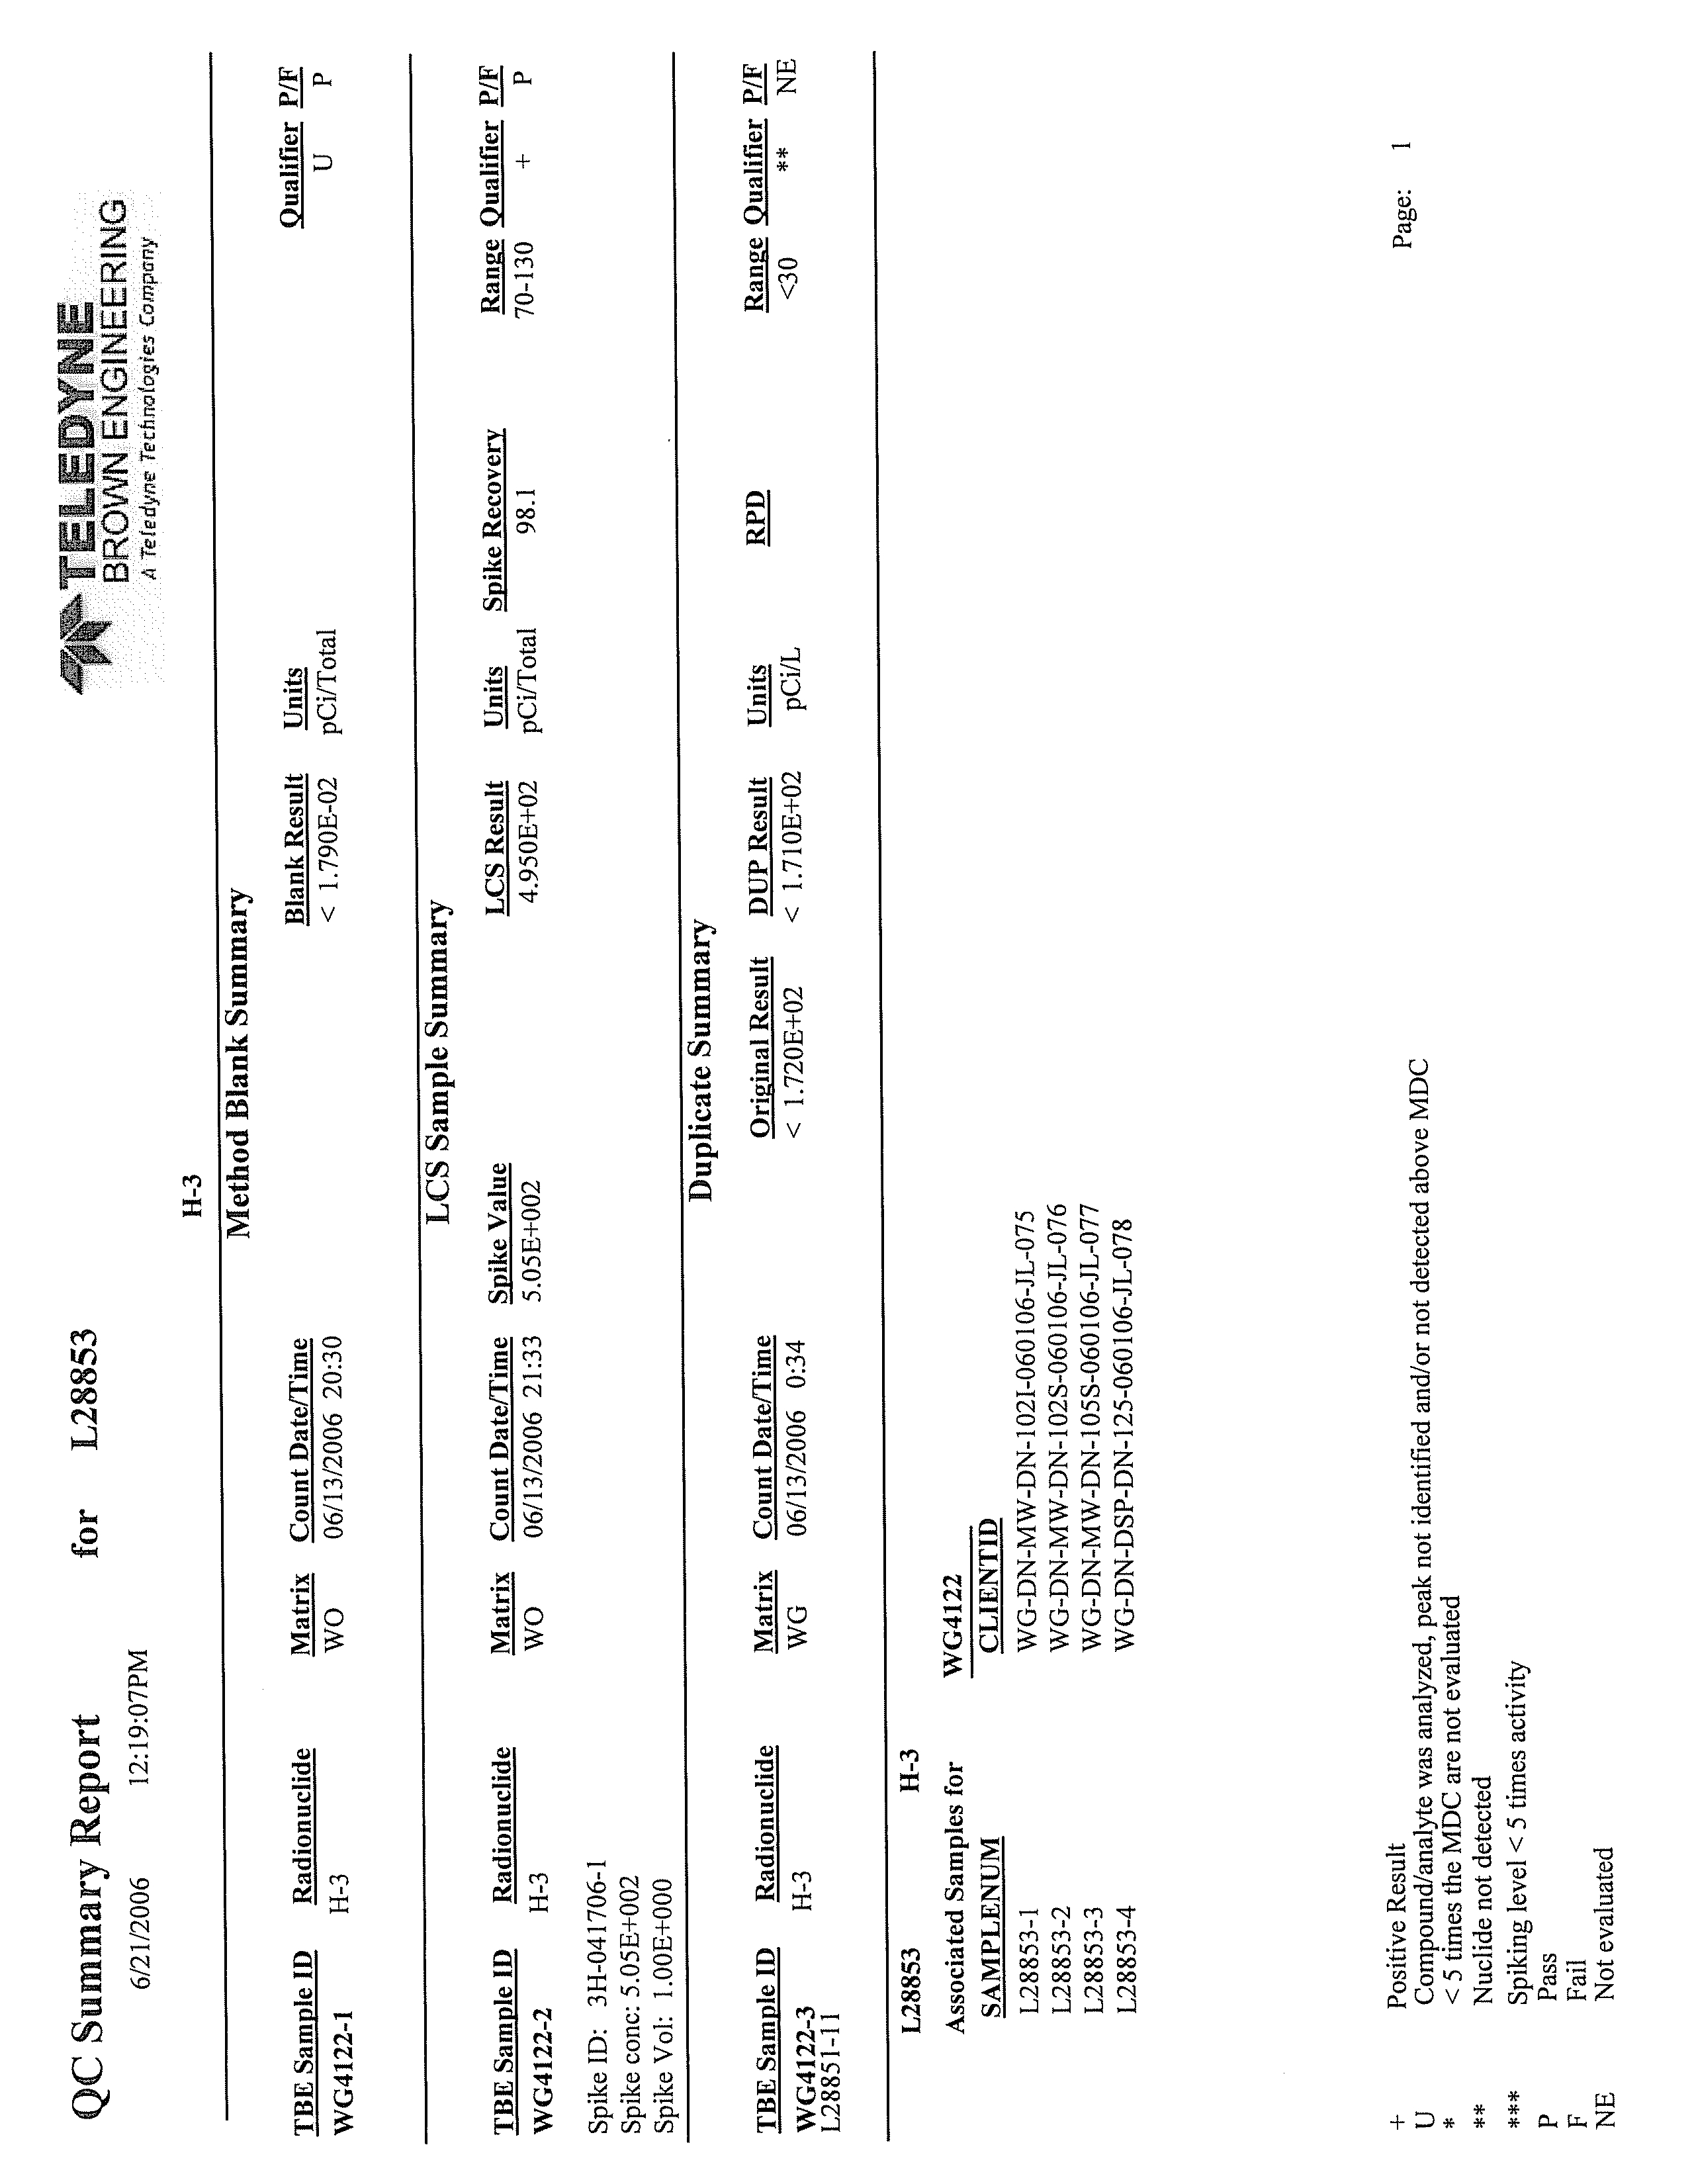
4.7
DATA QUALITY OBJECTIVES
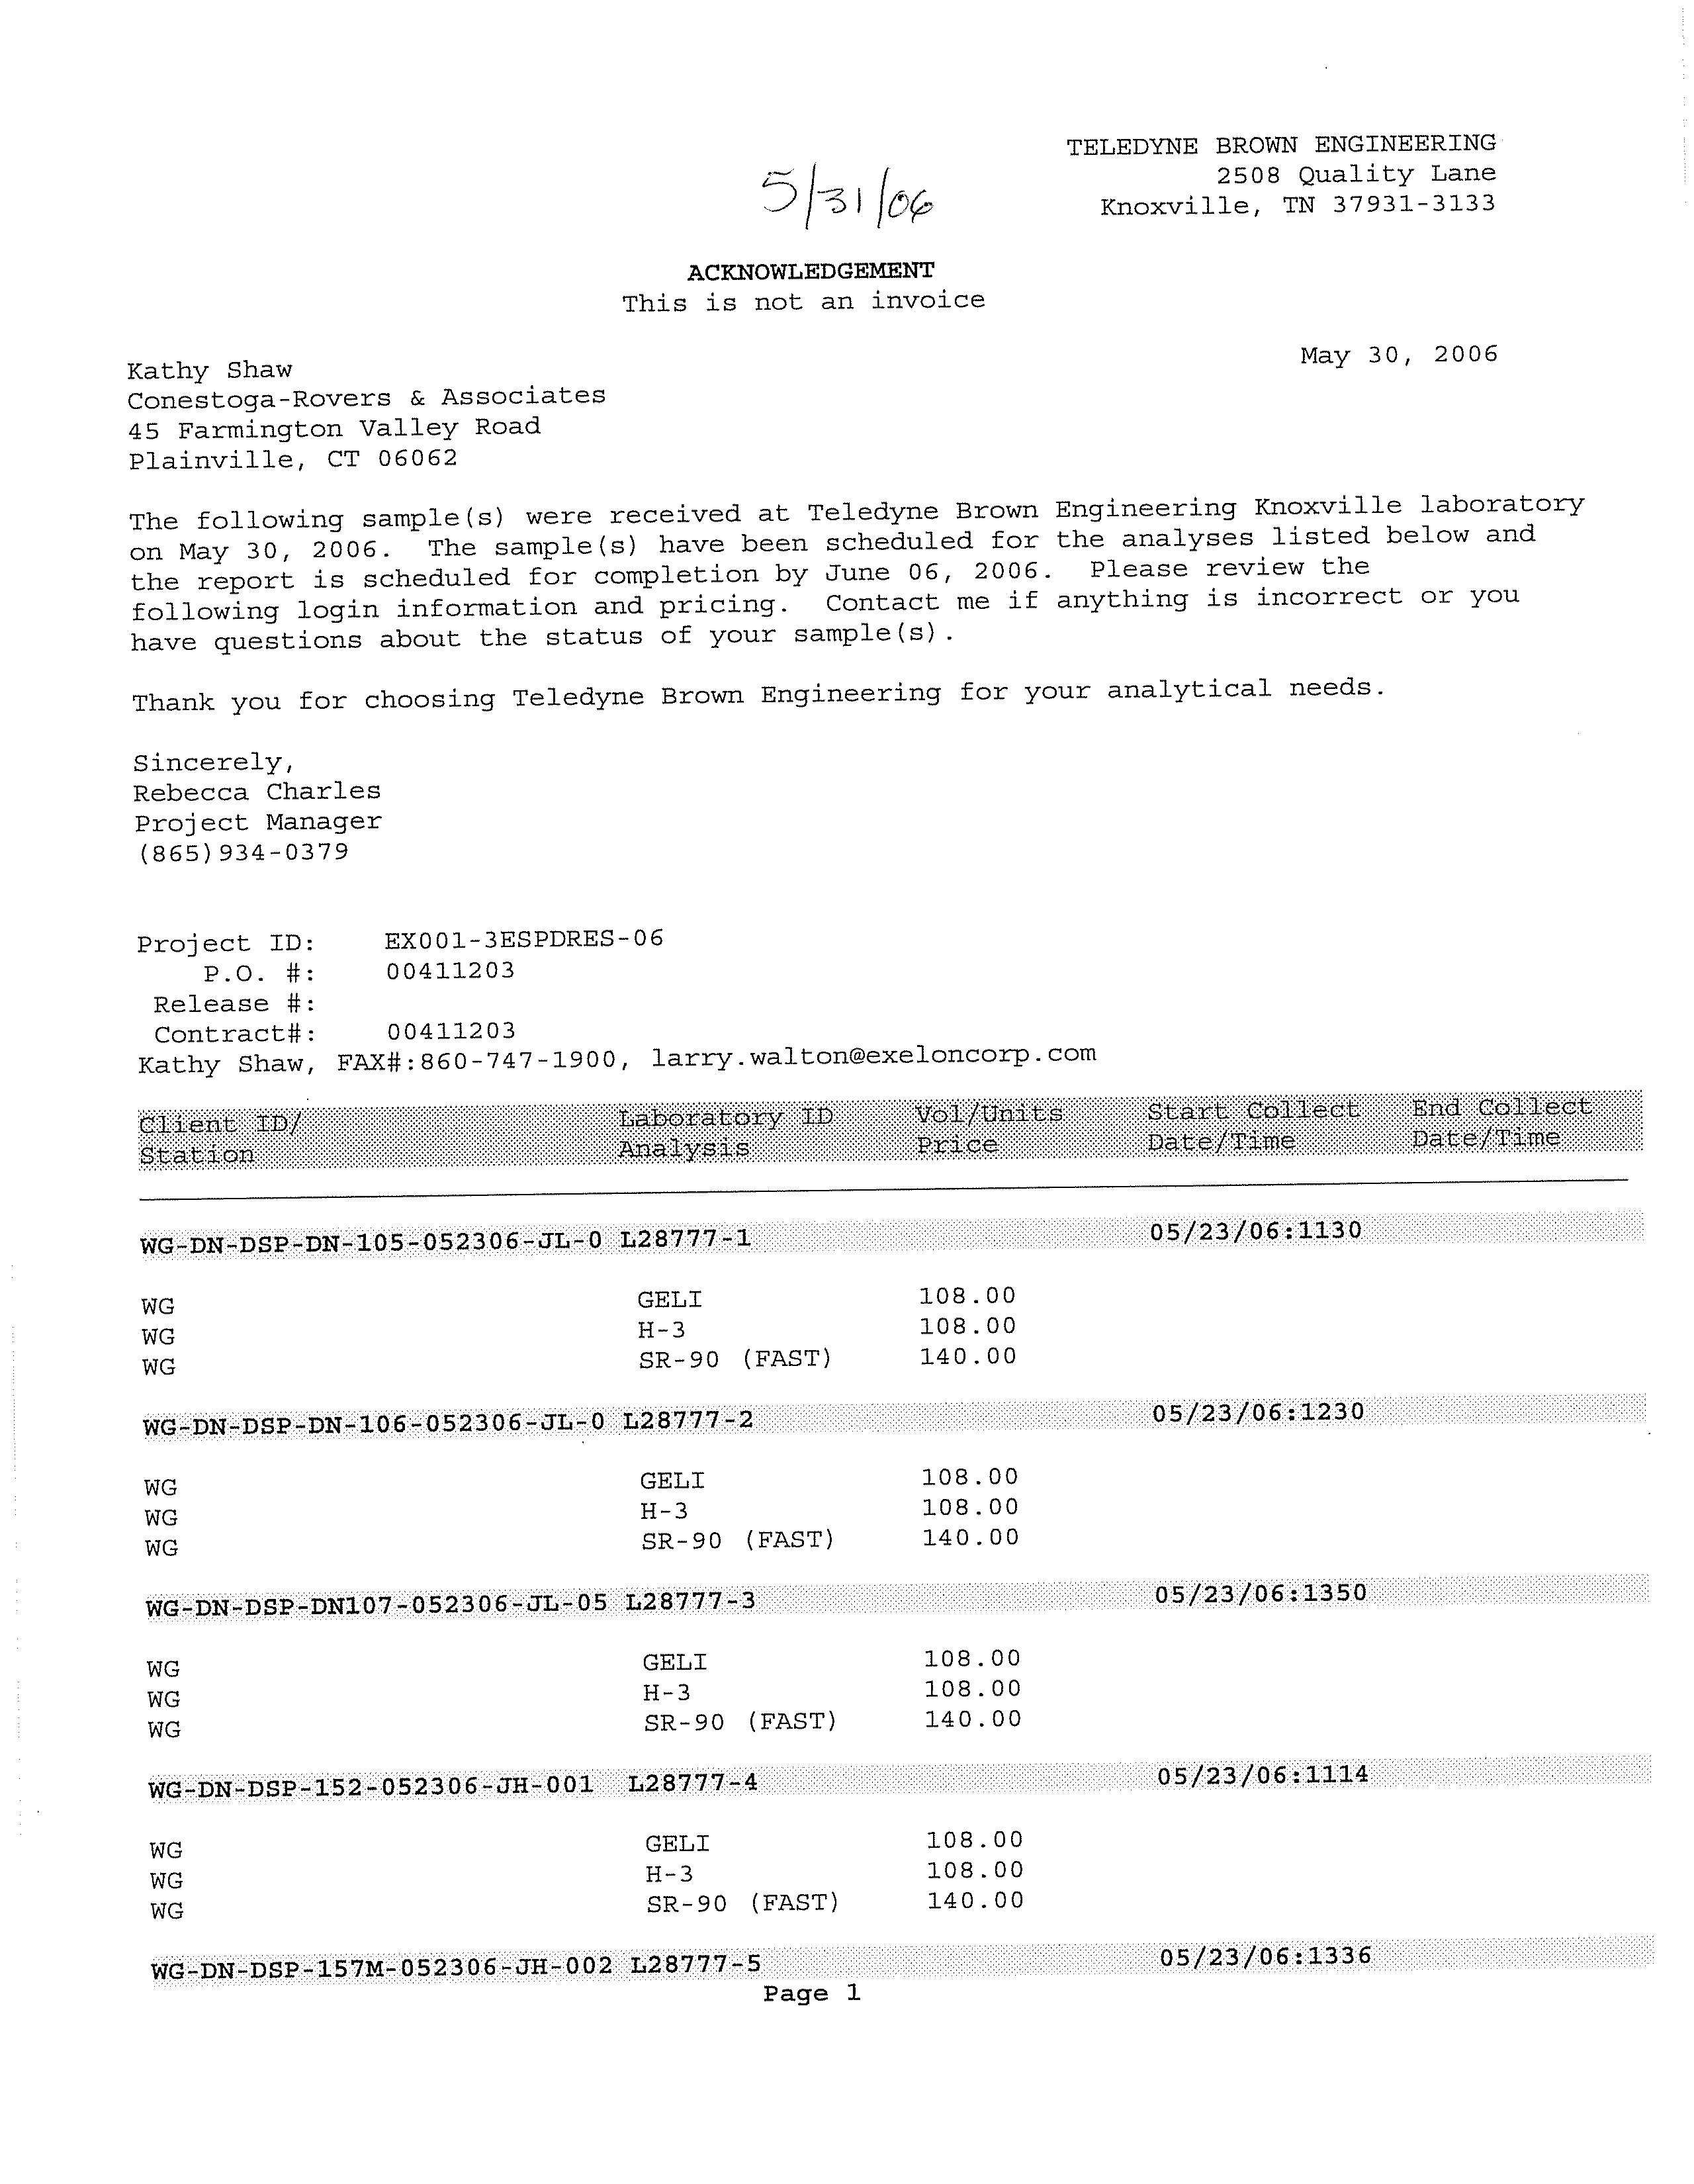
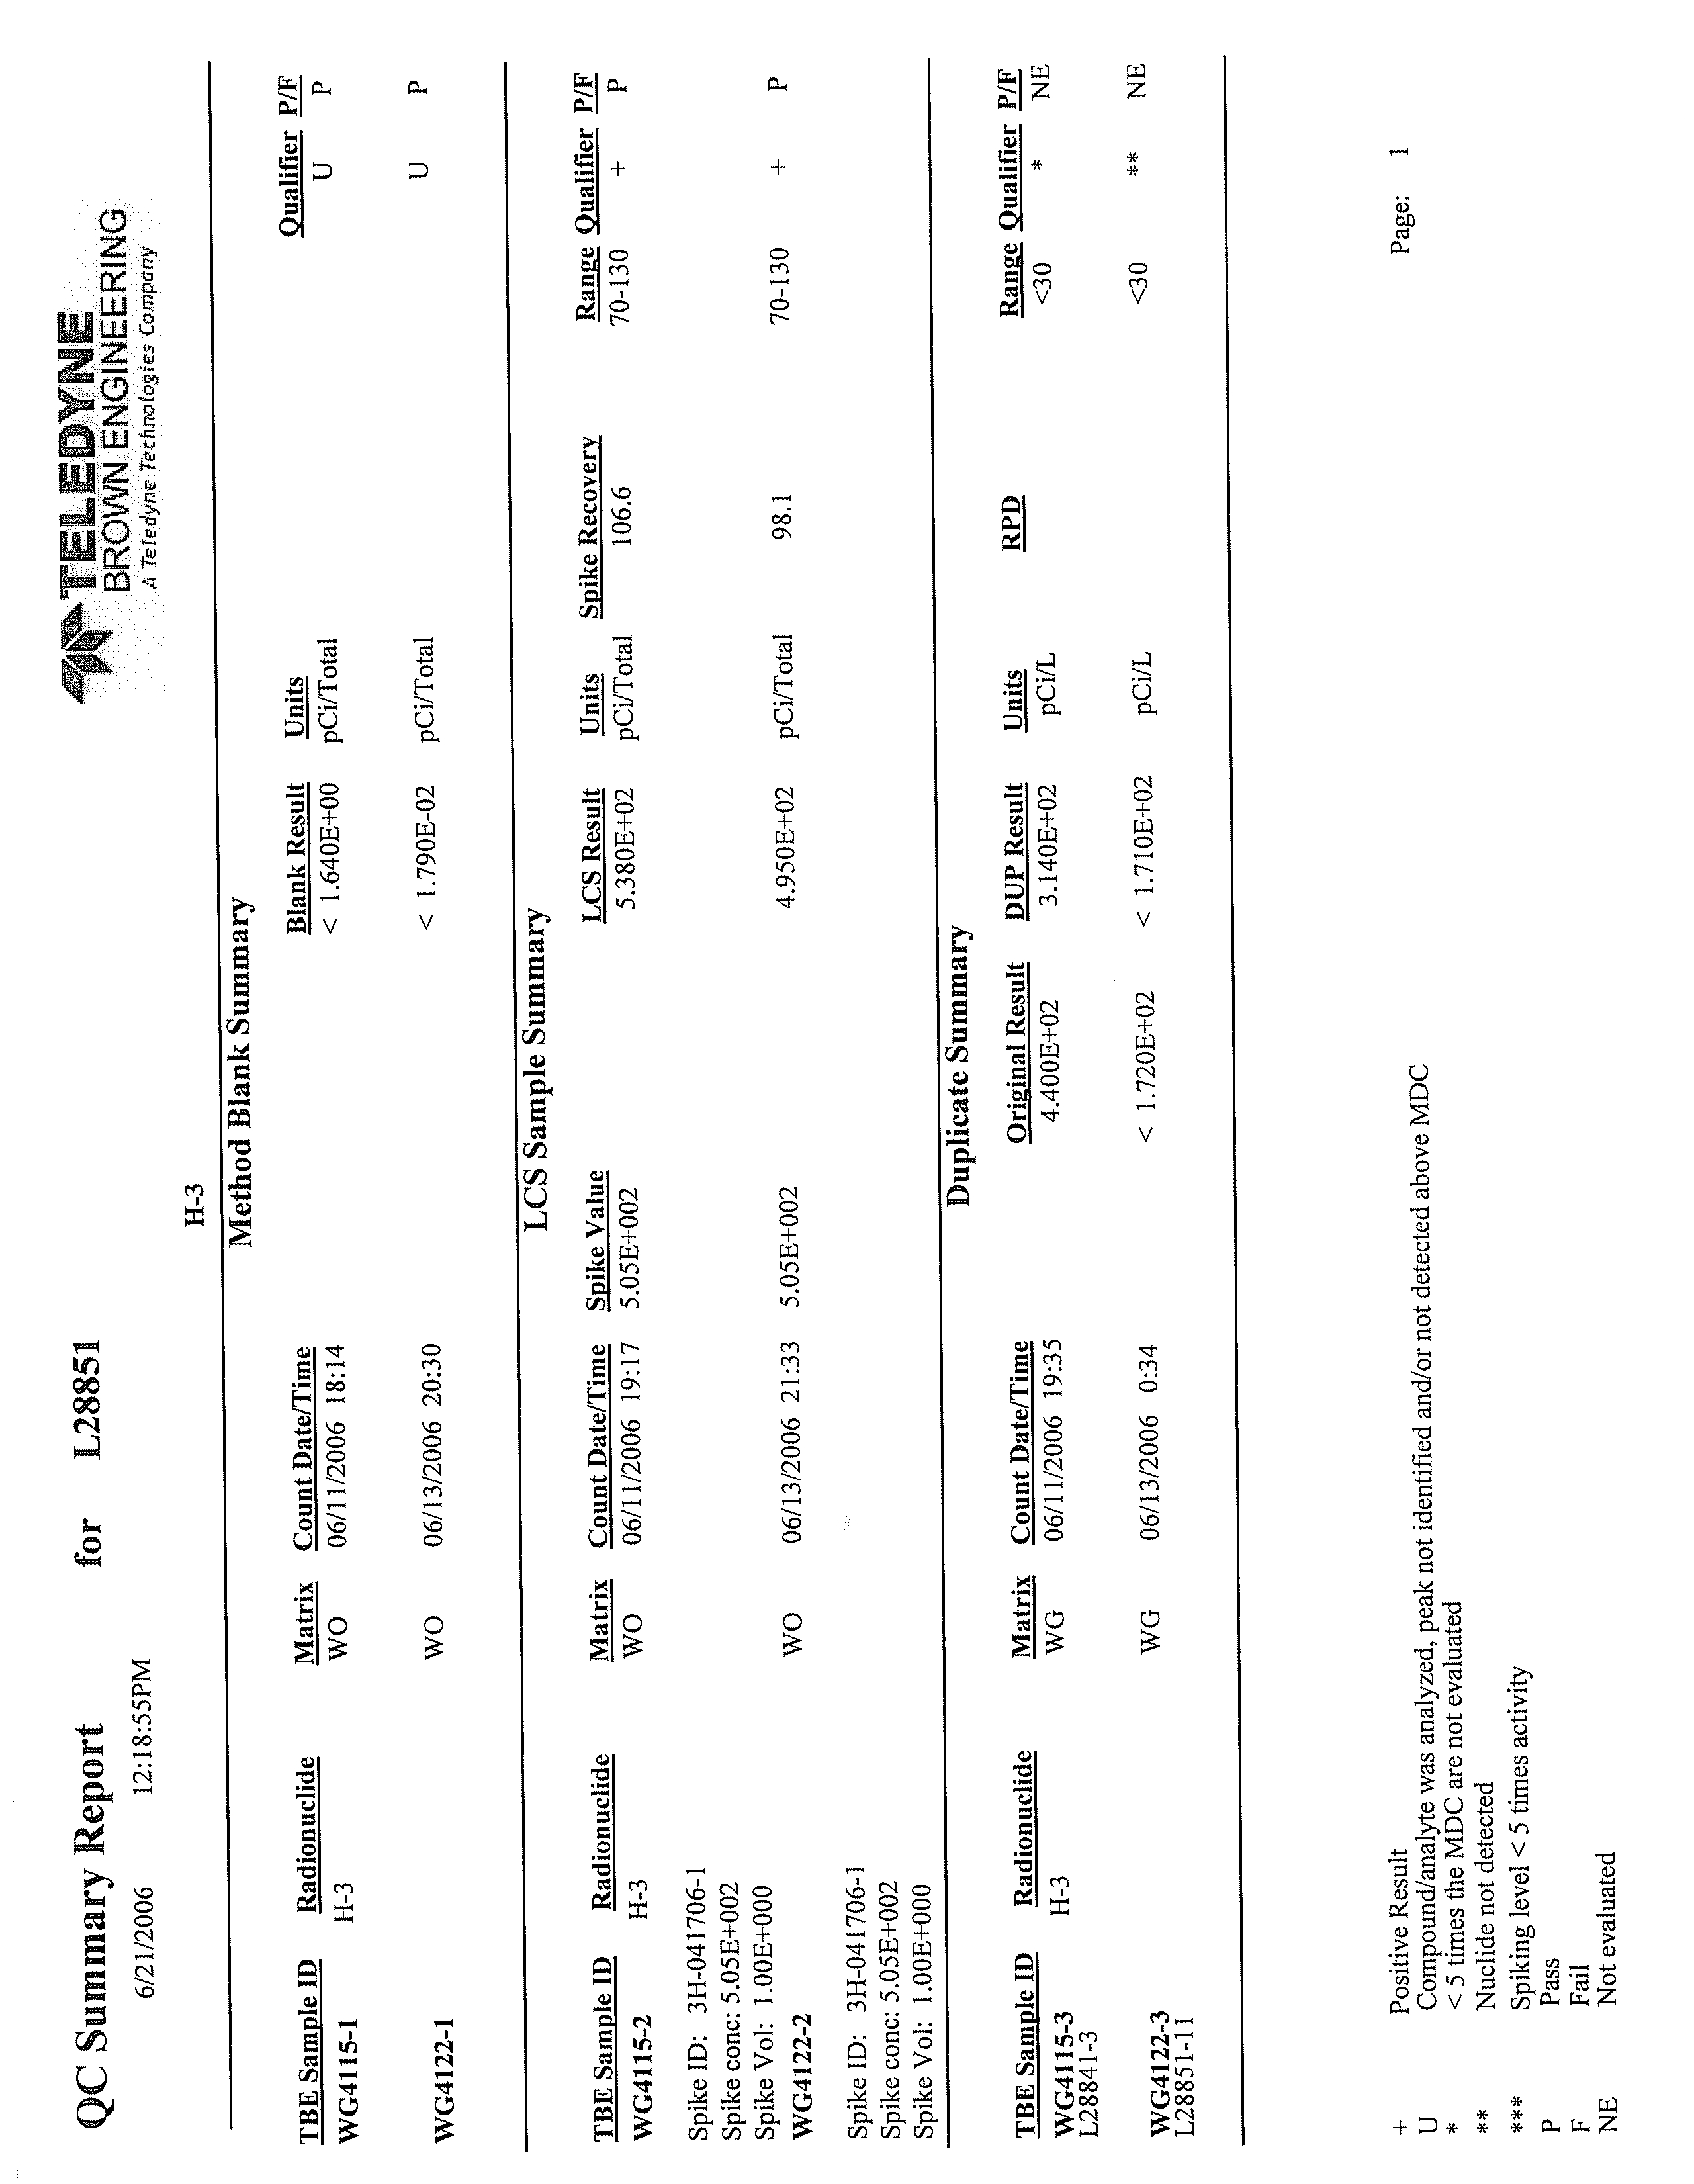
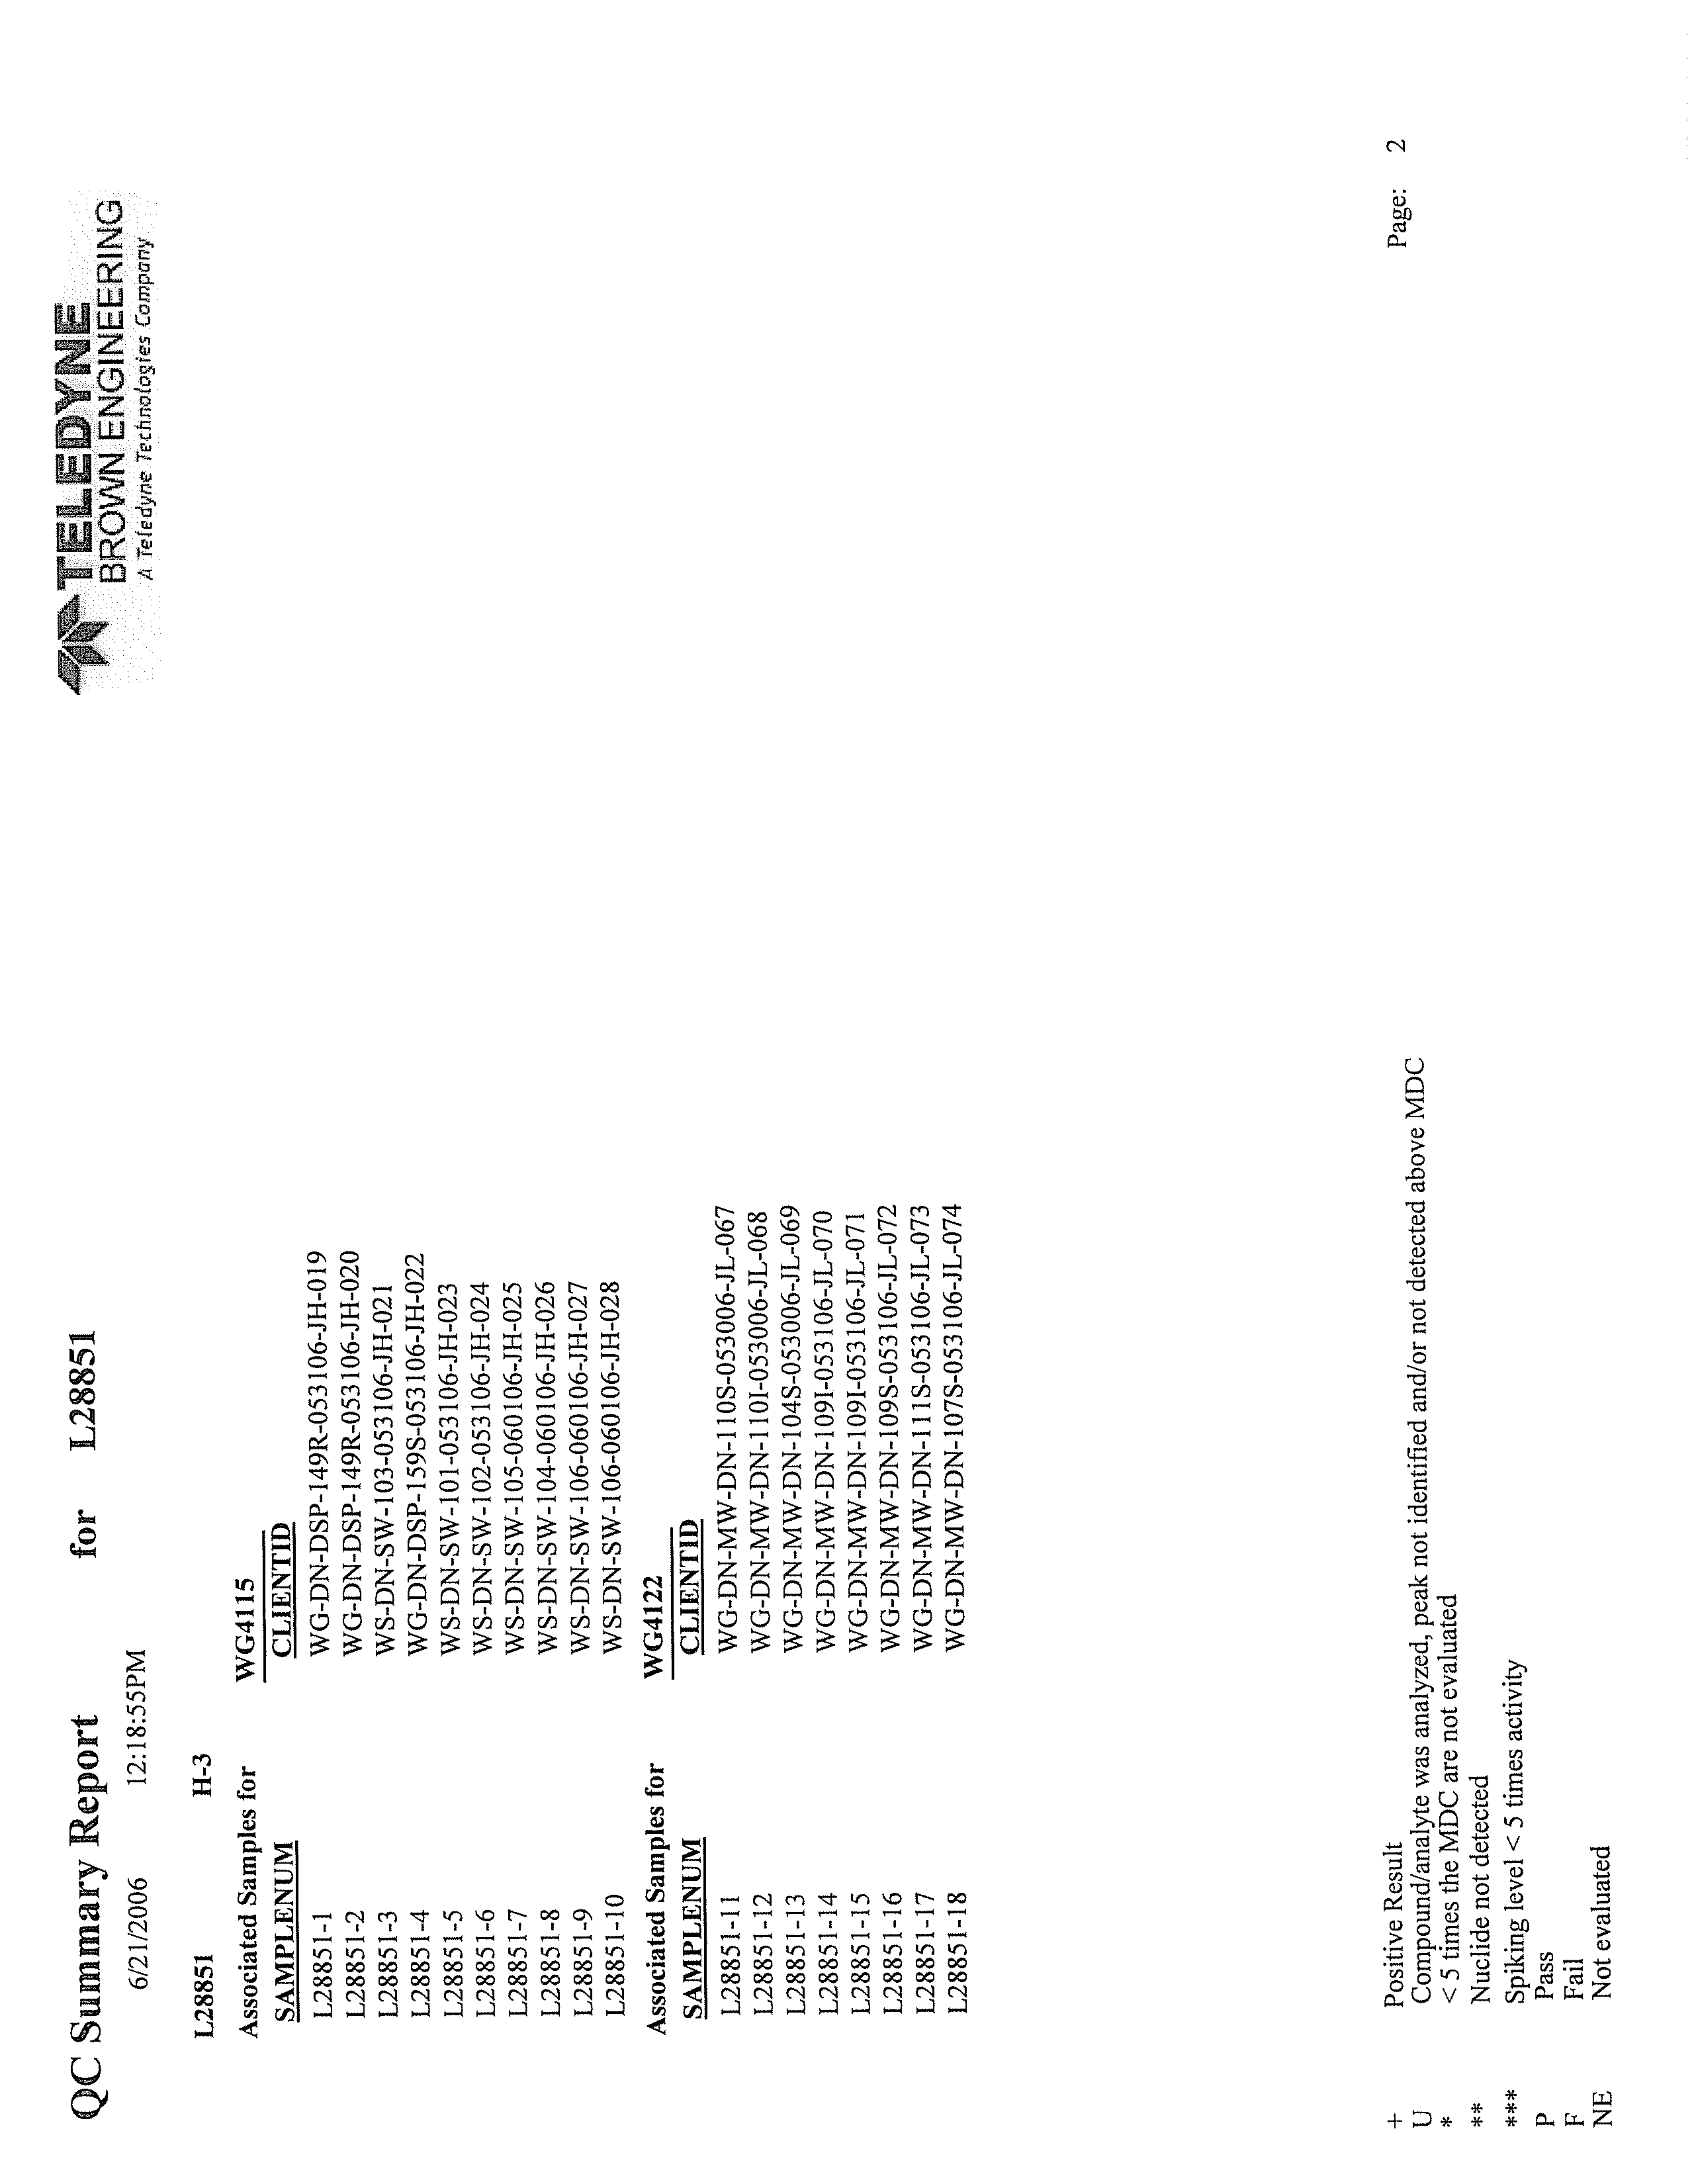
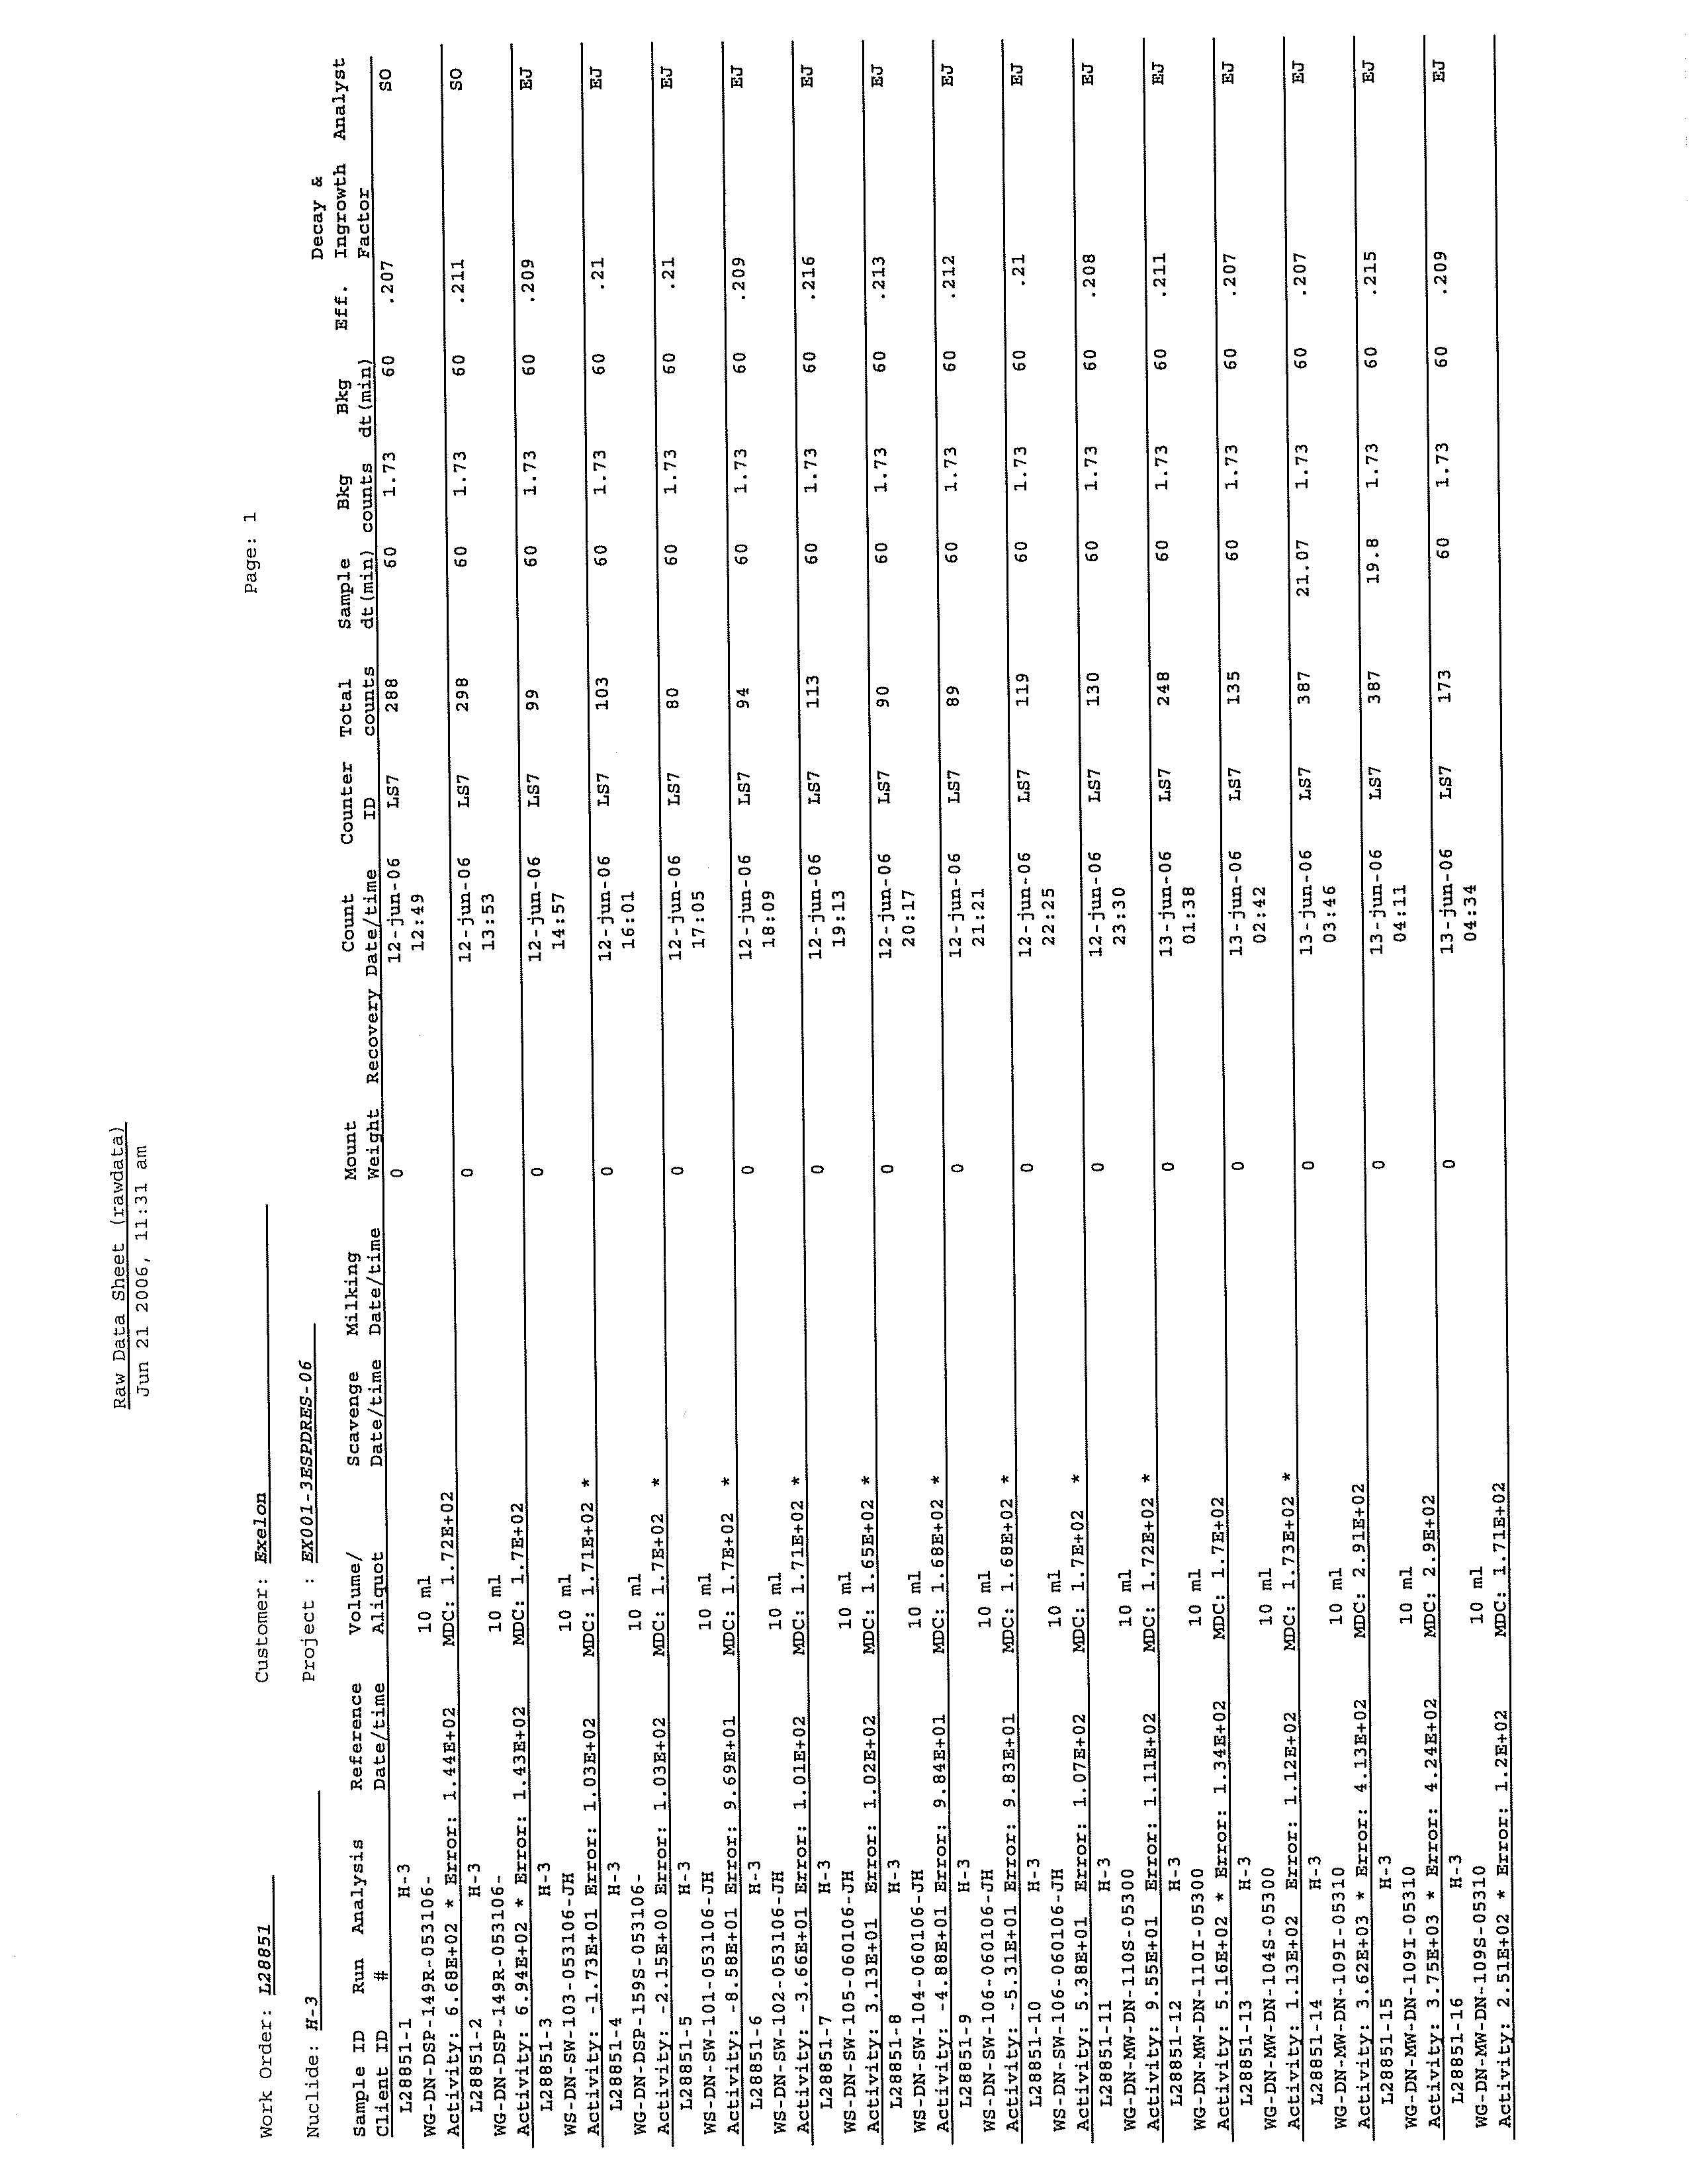
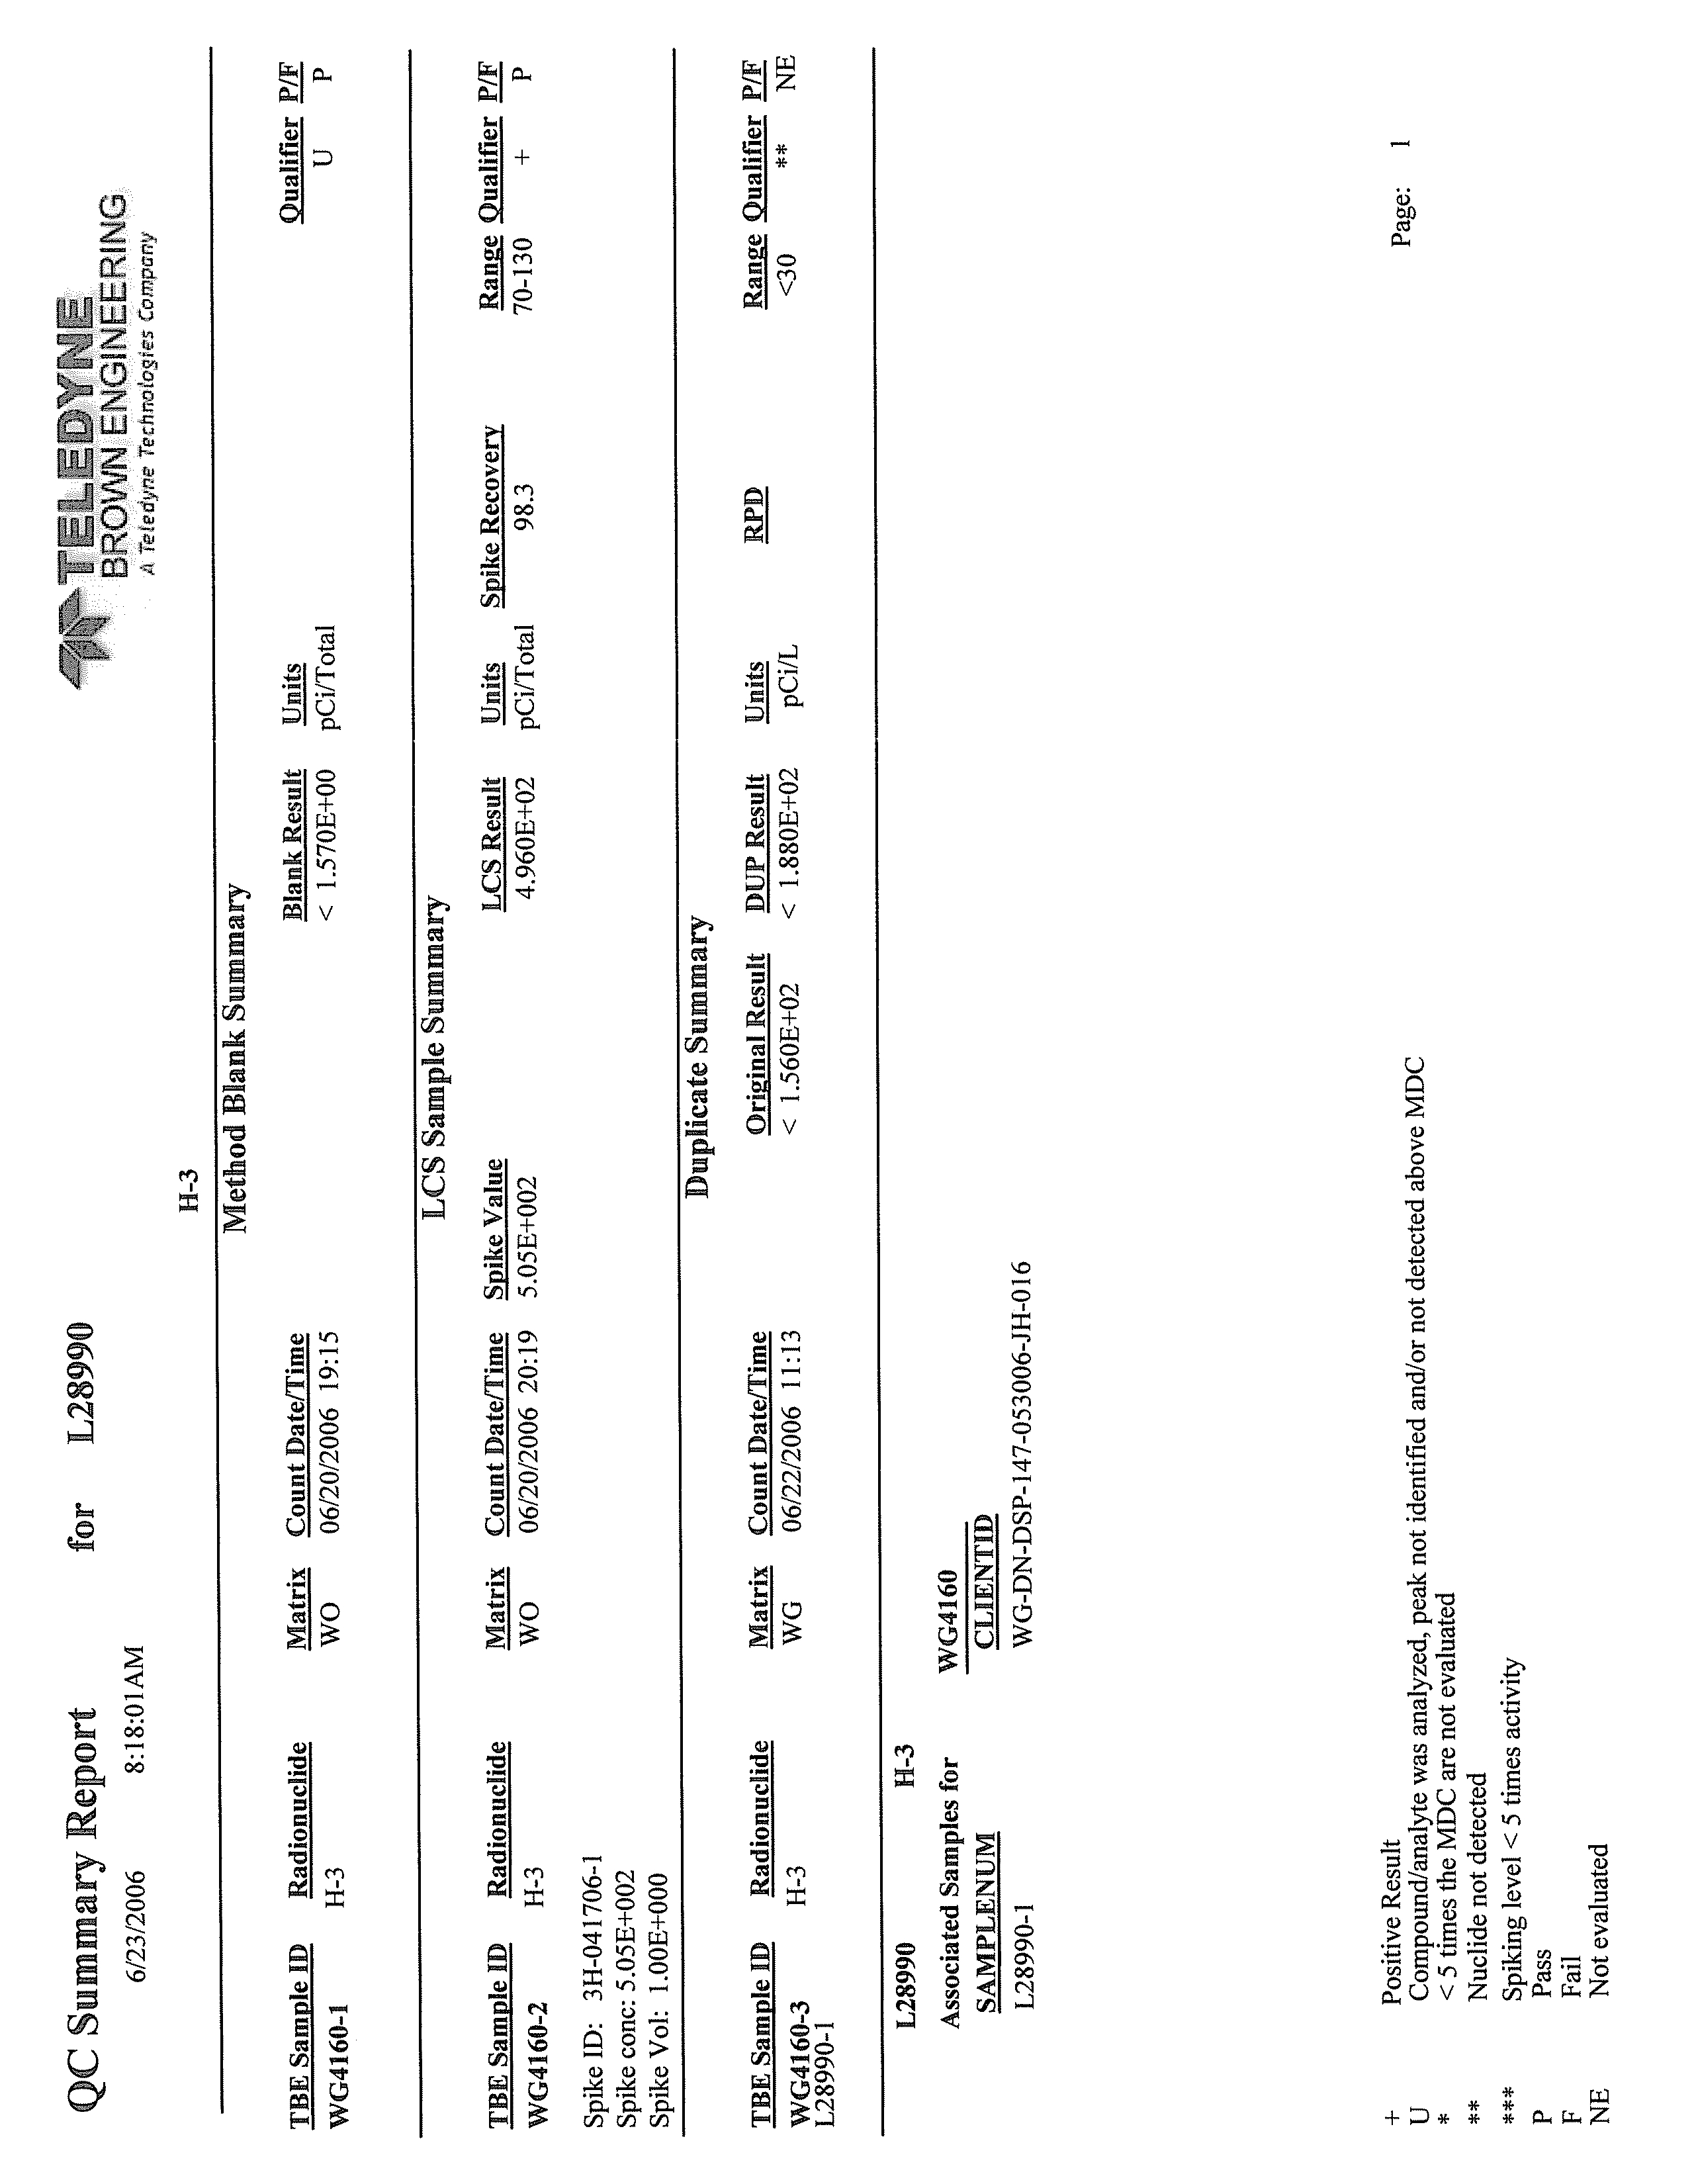
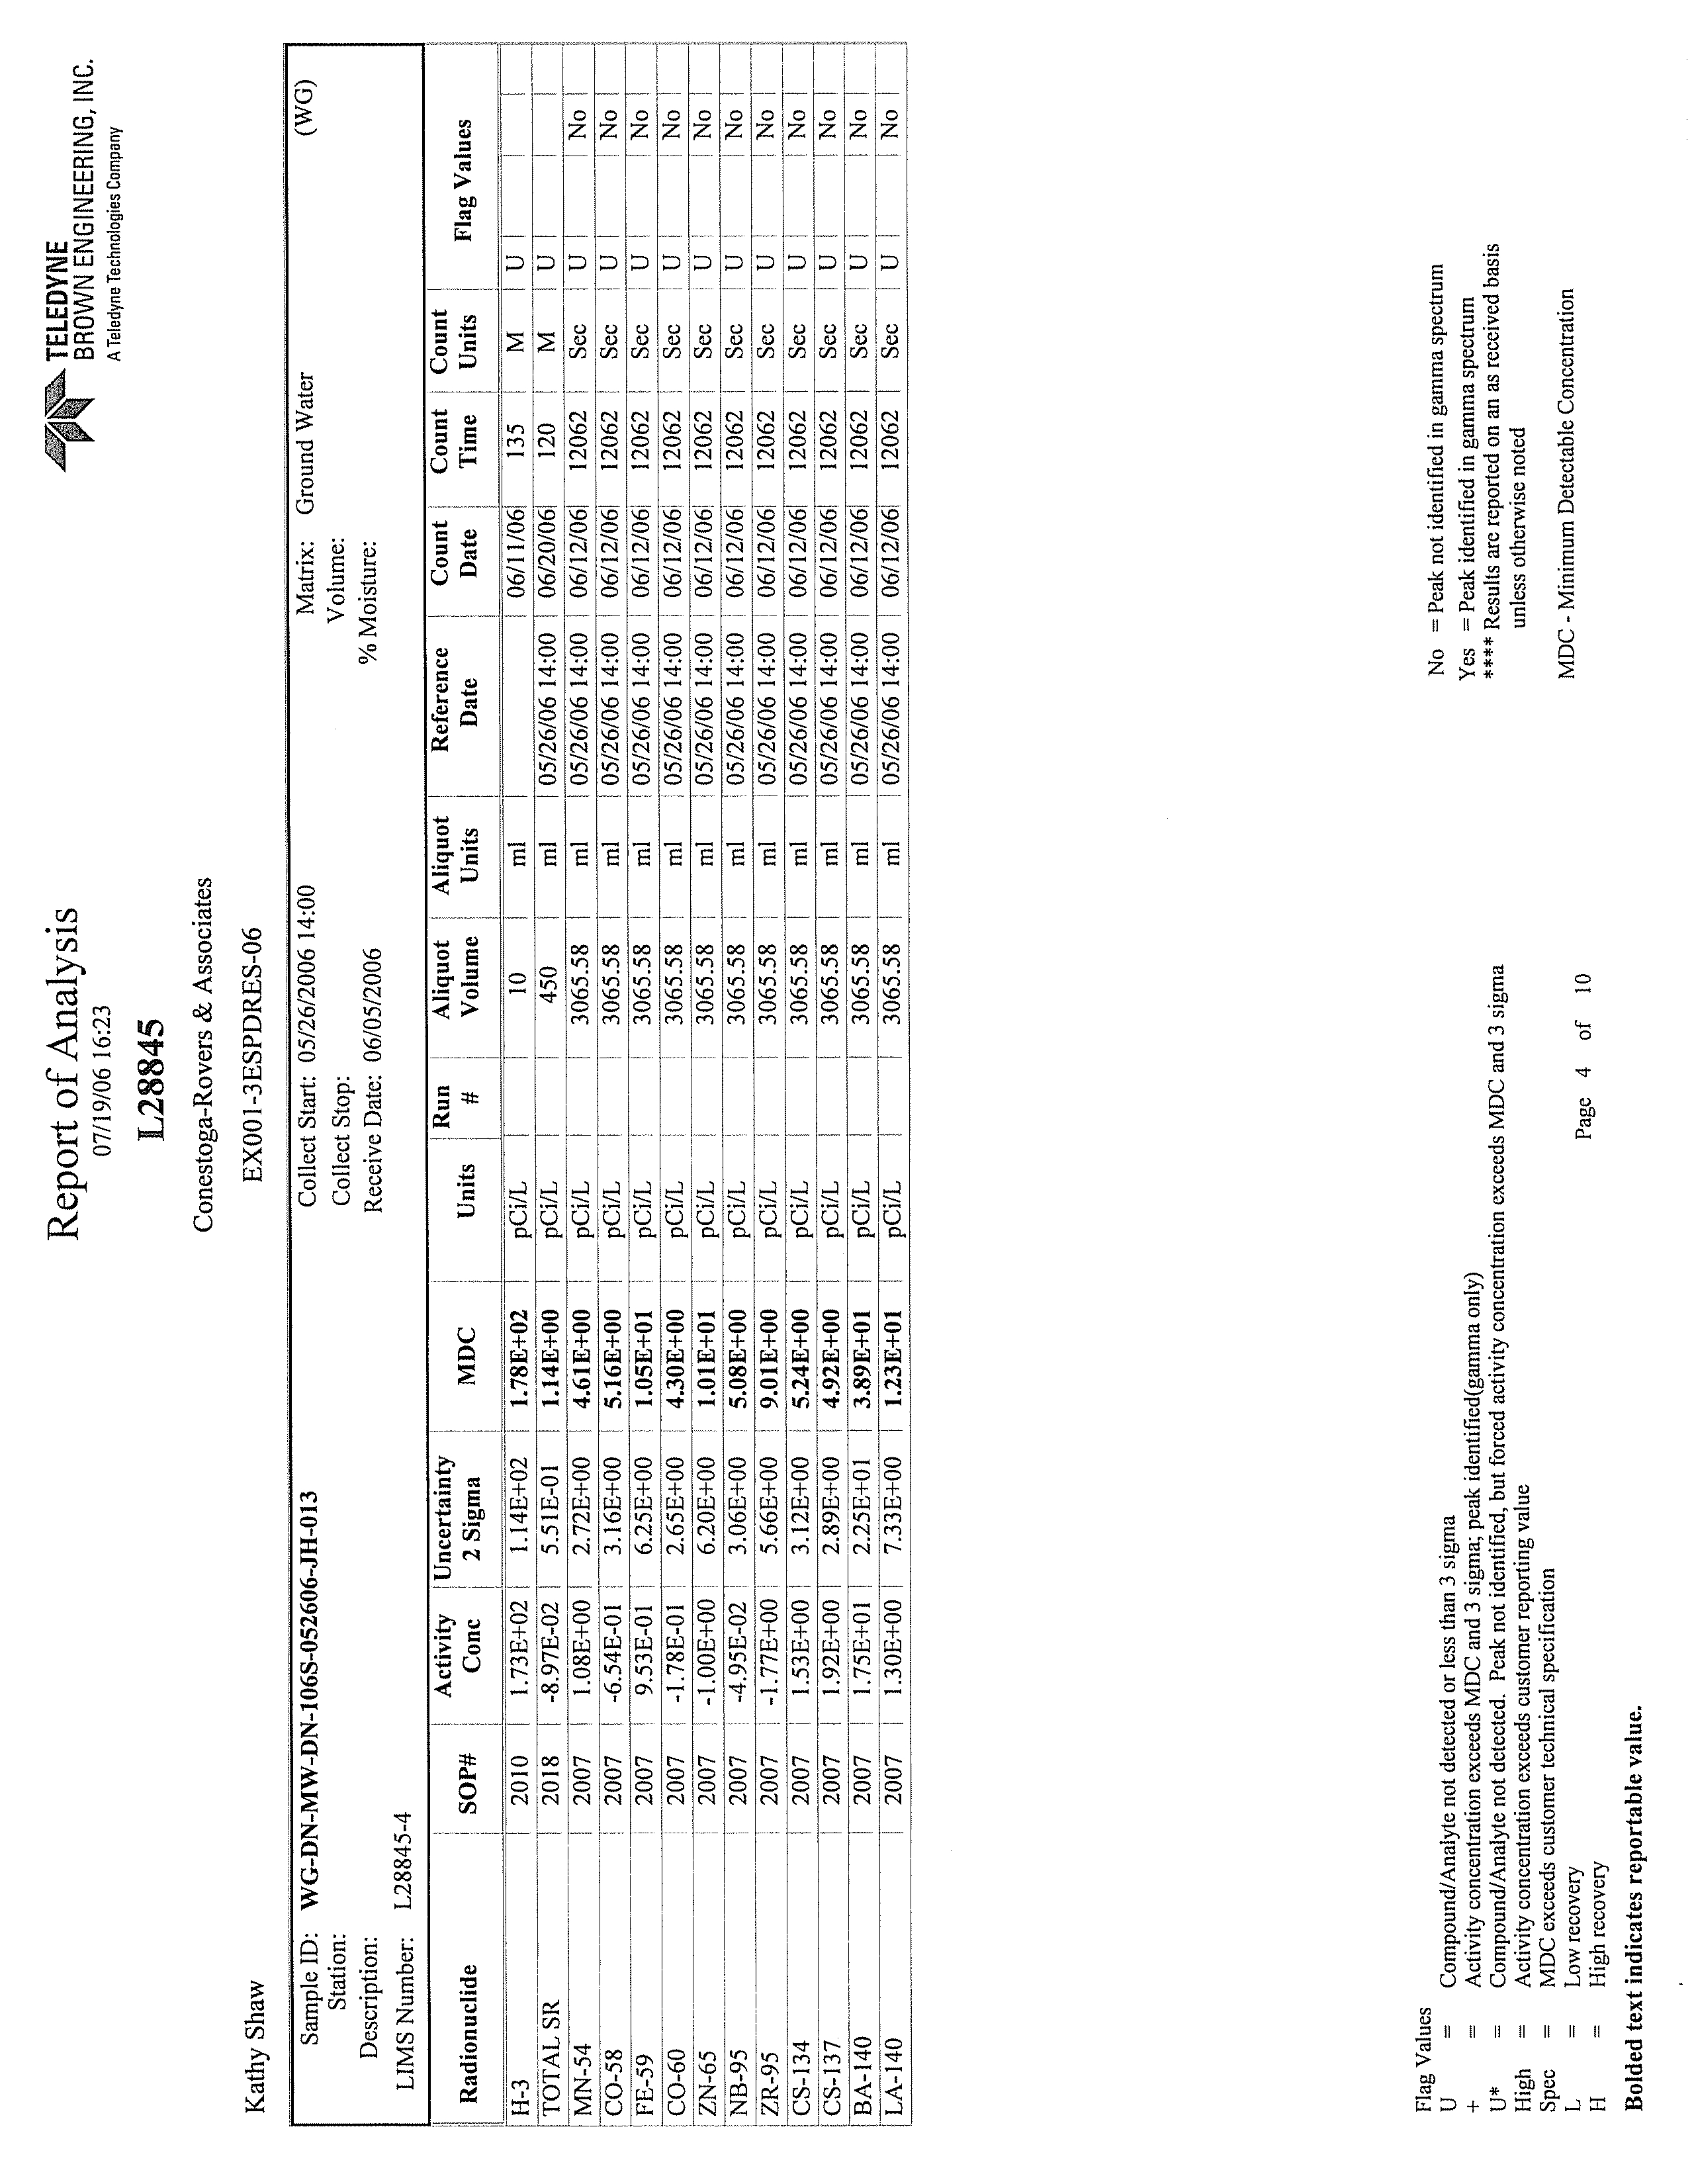
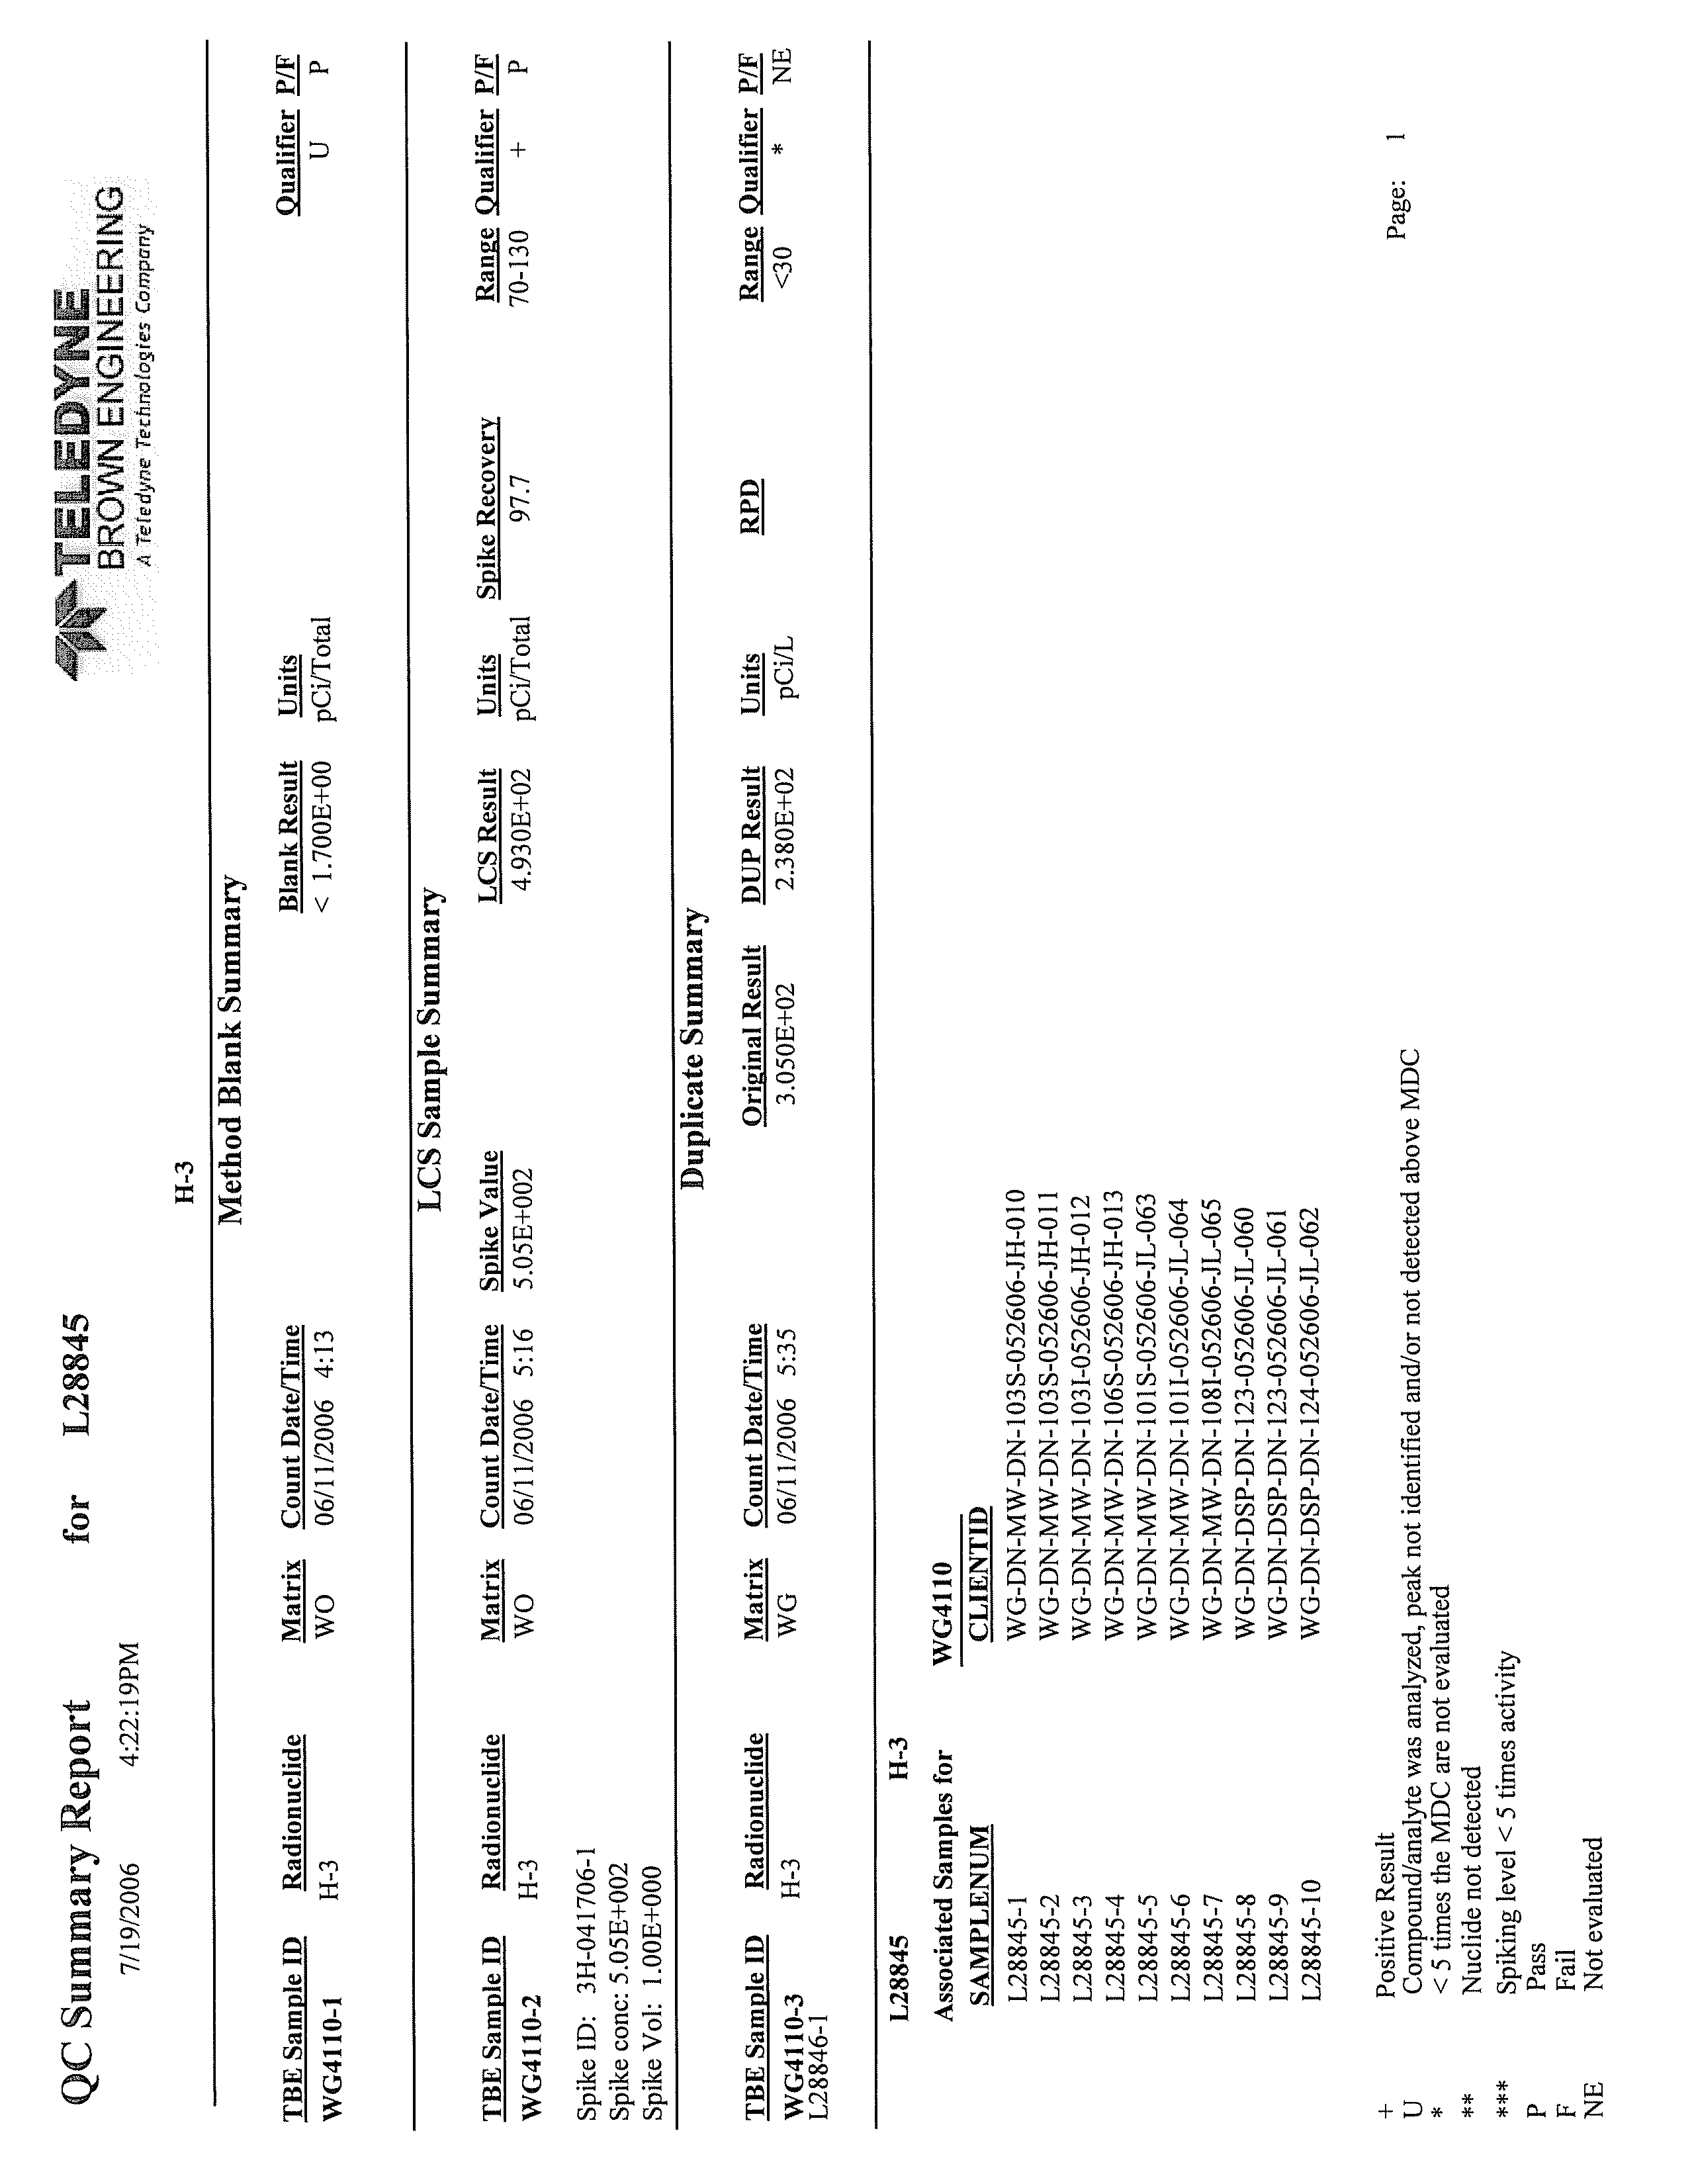
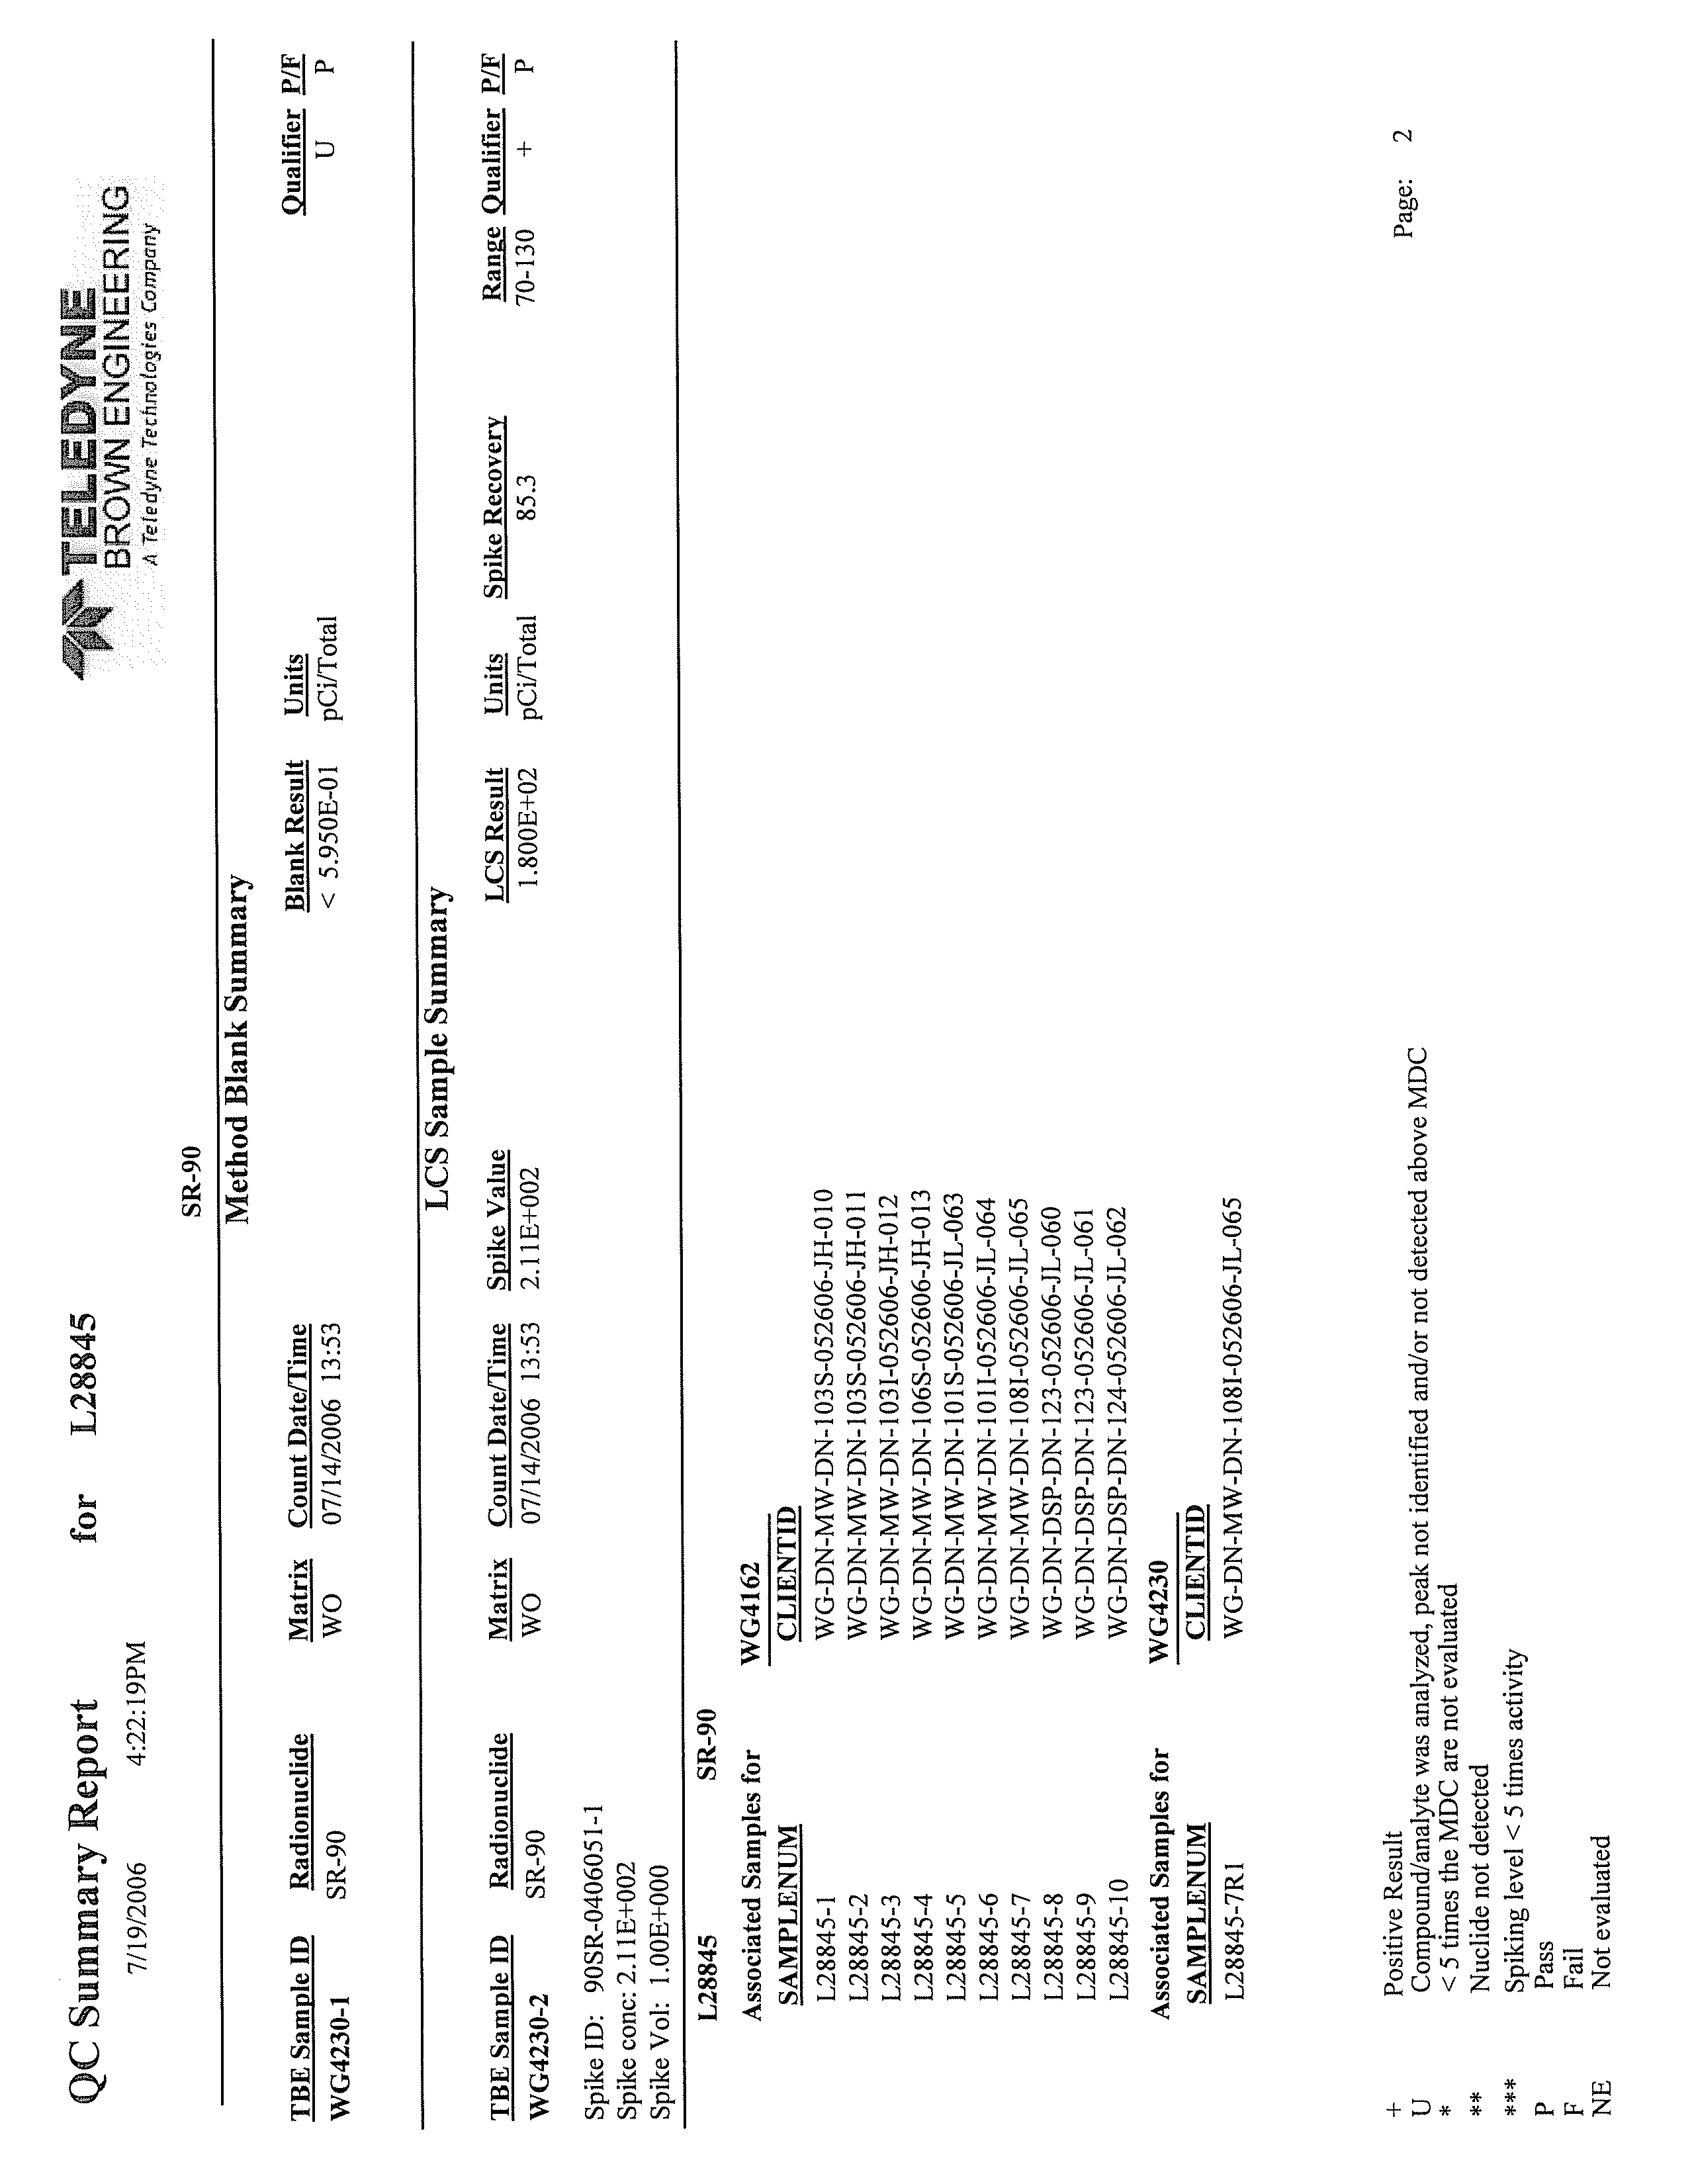
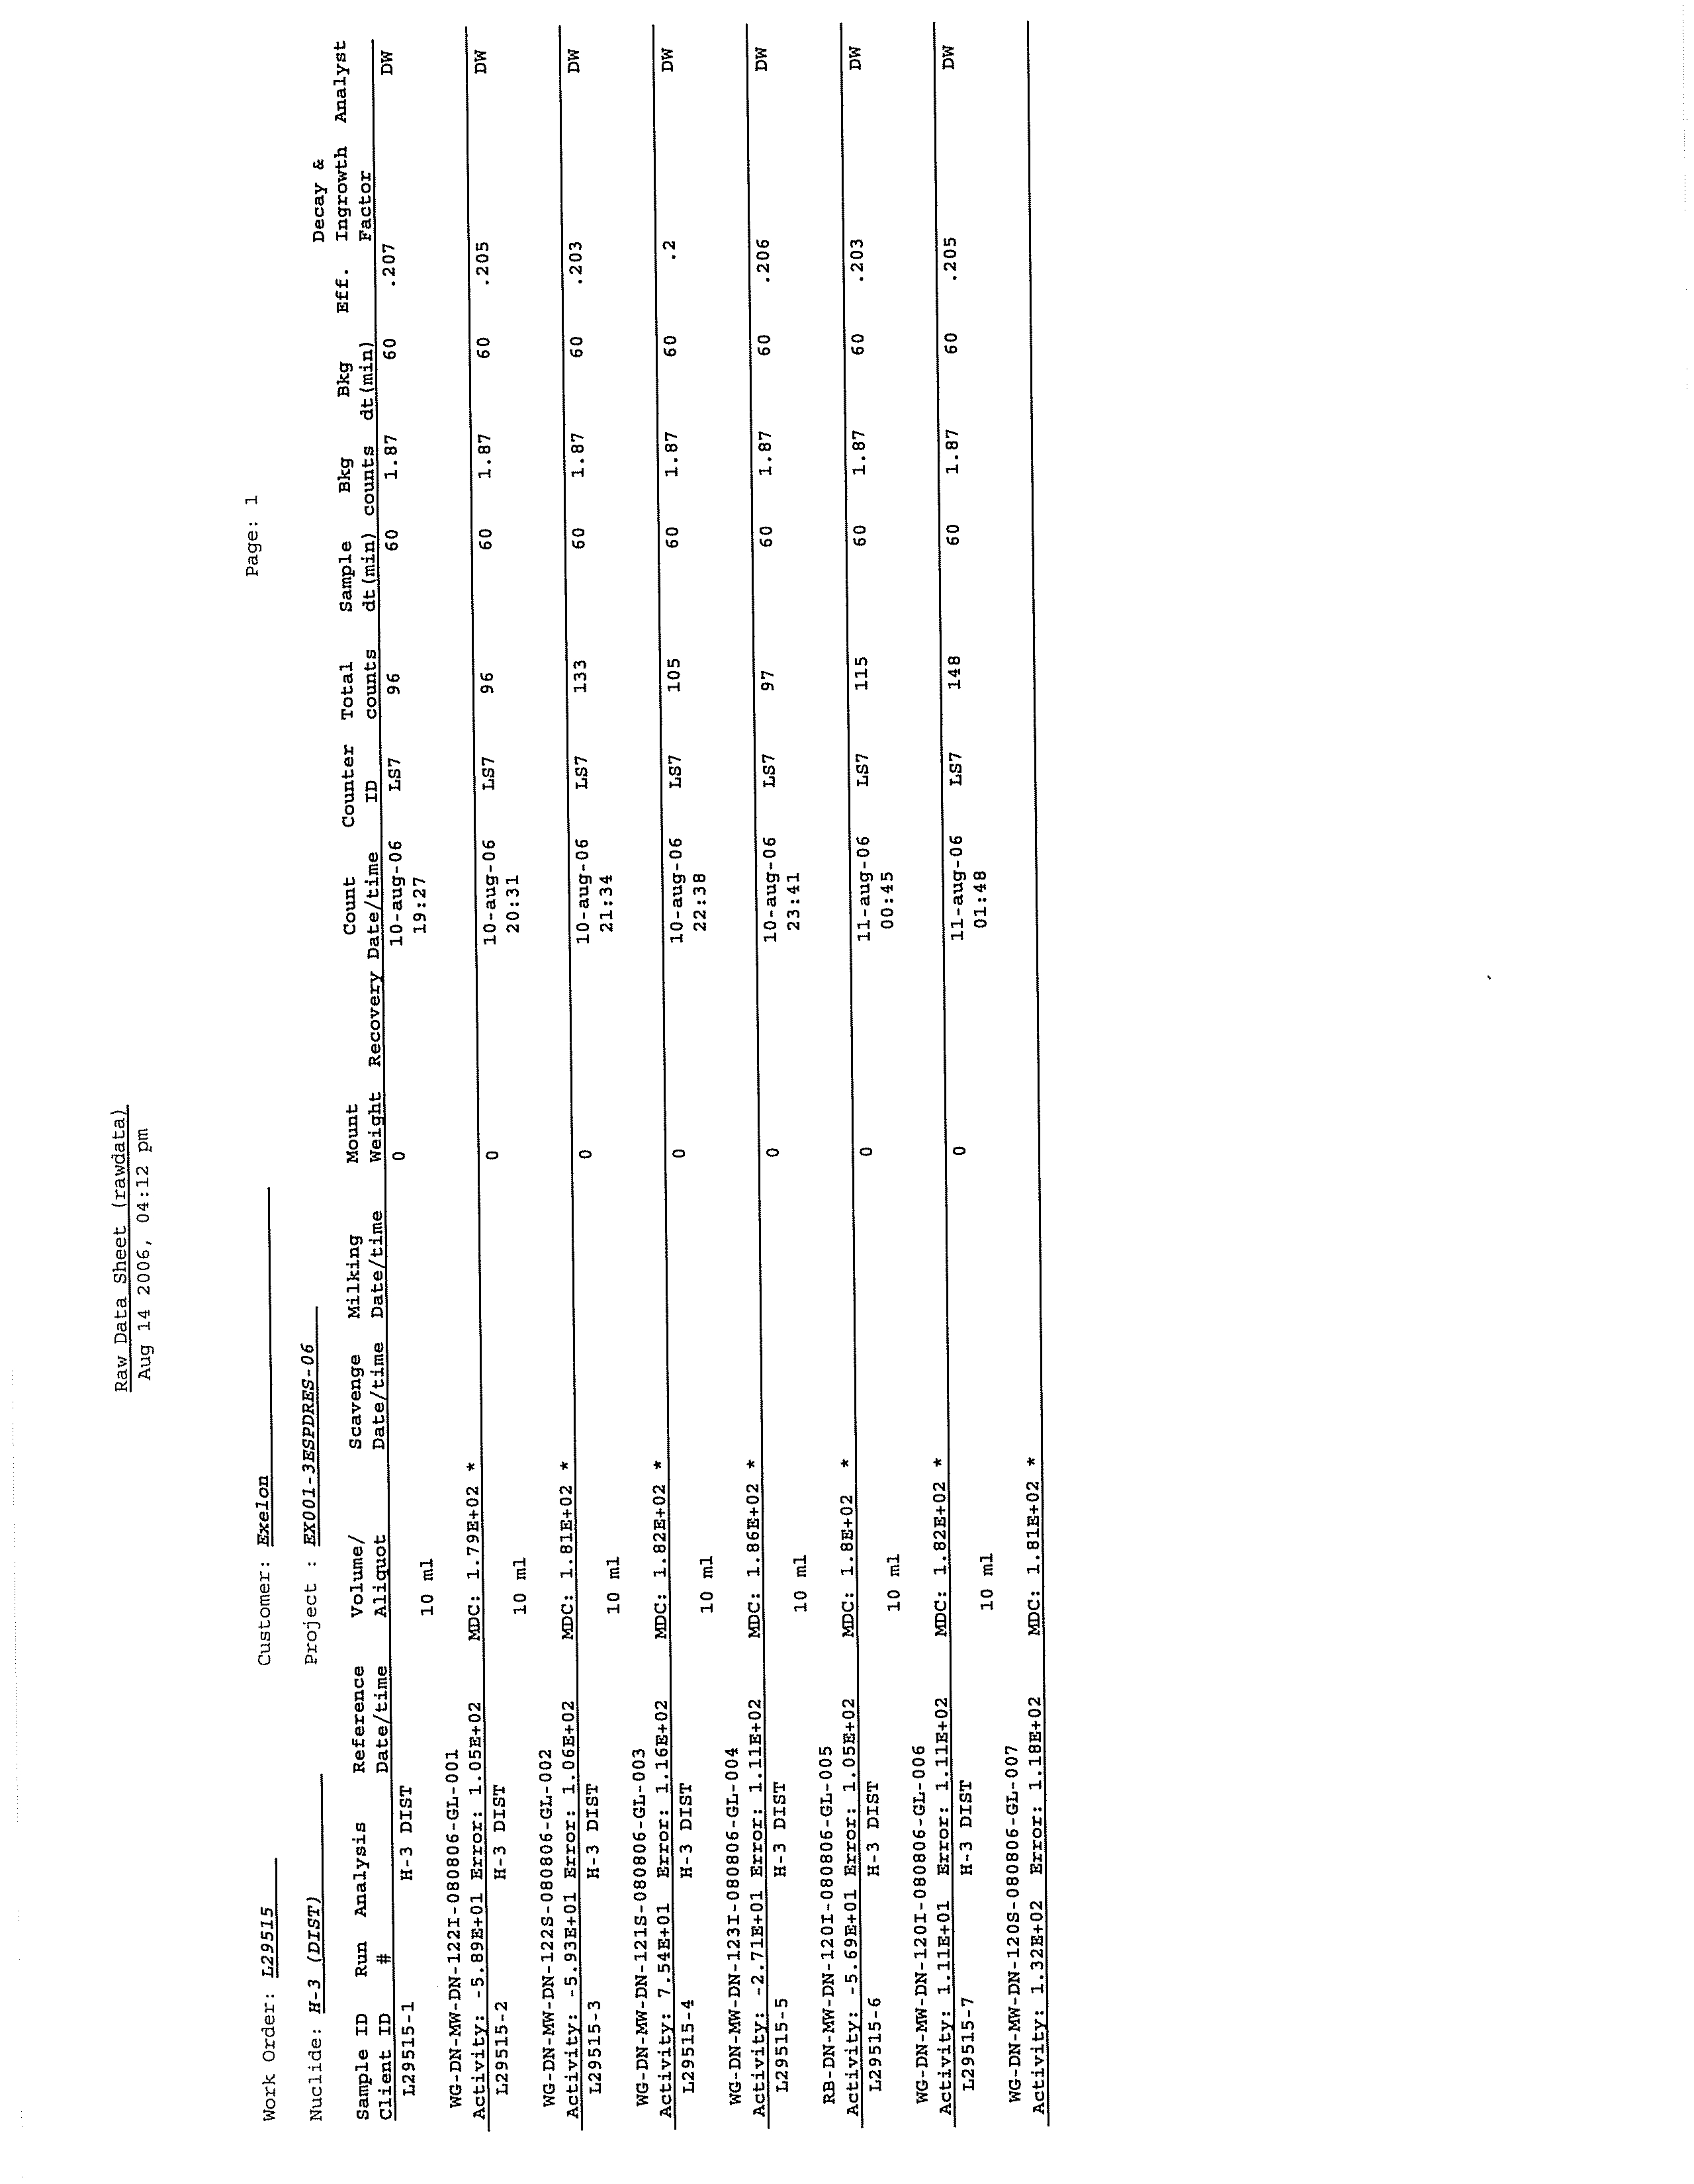
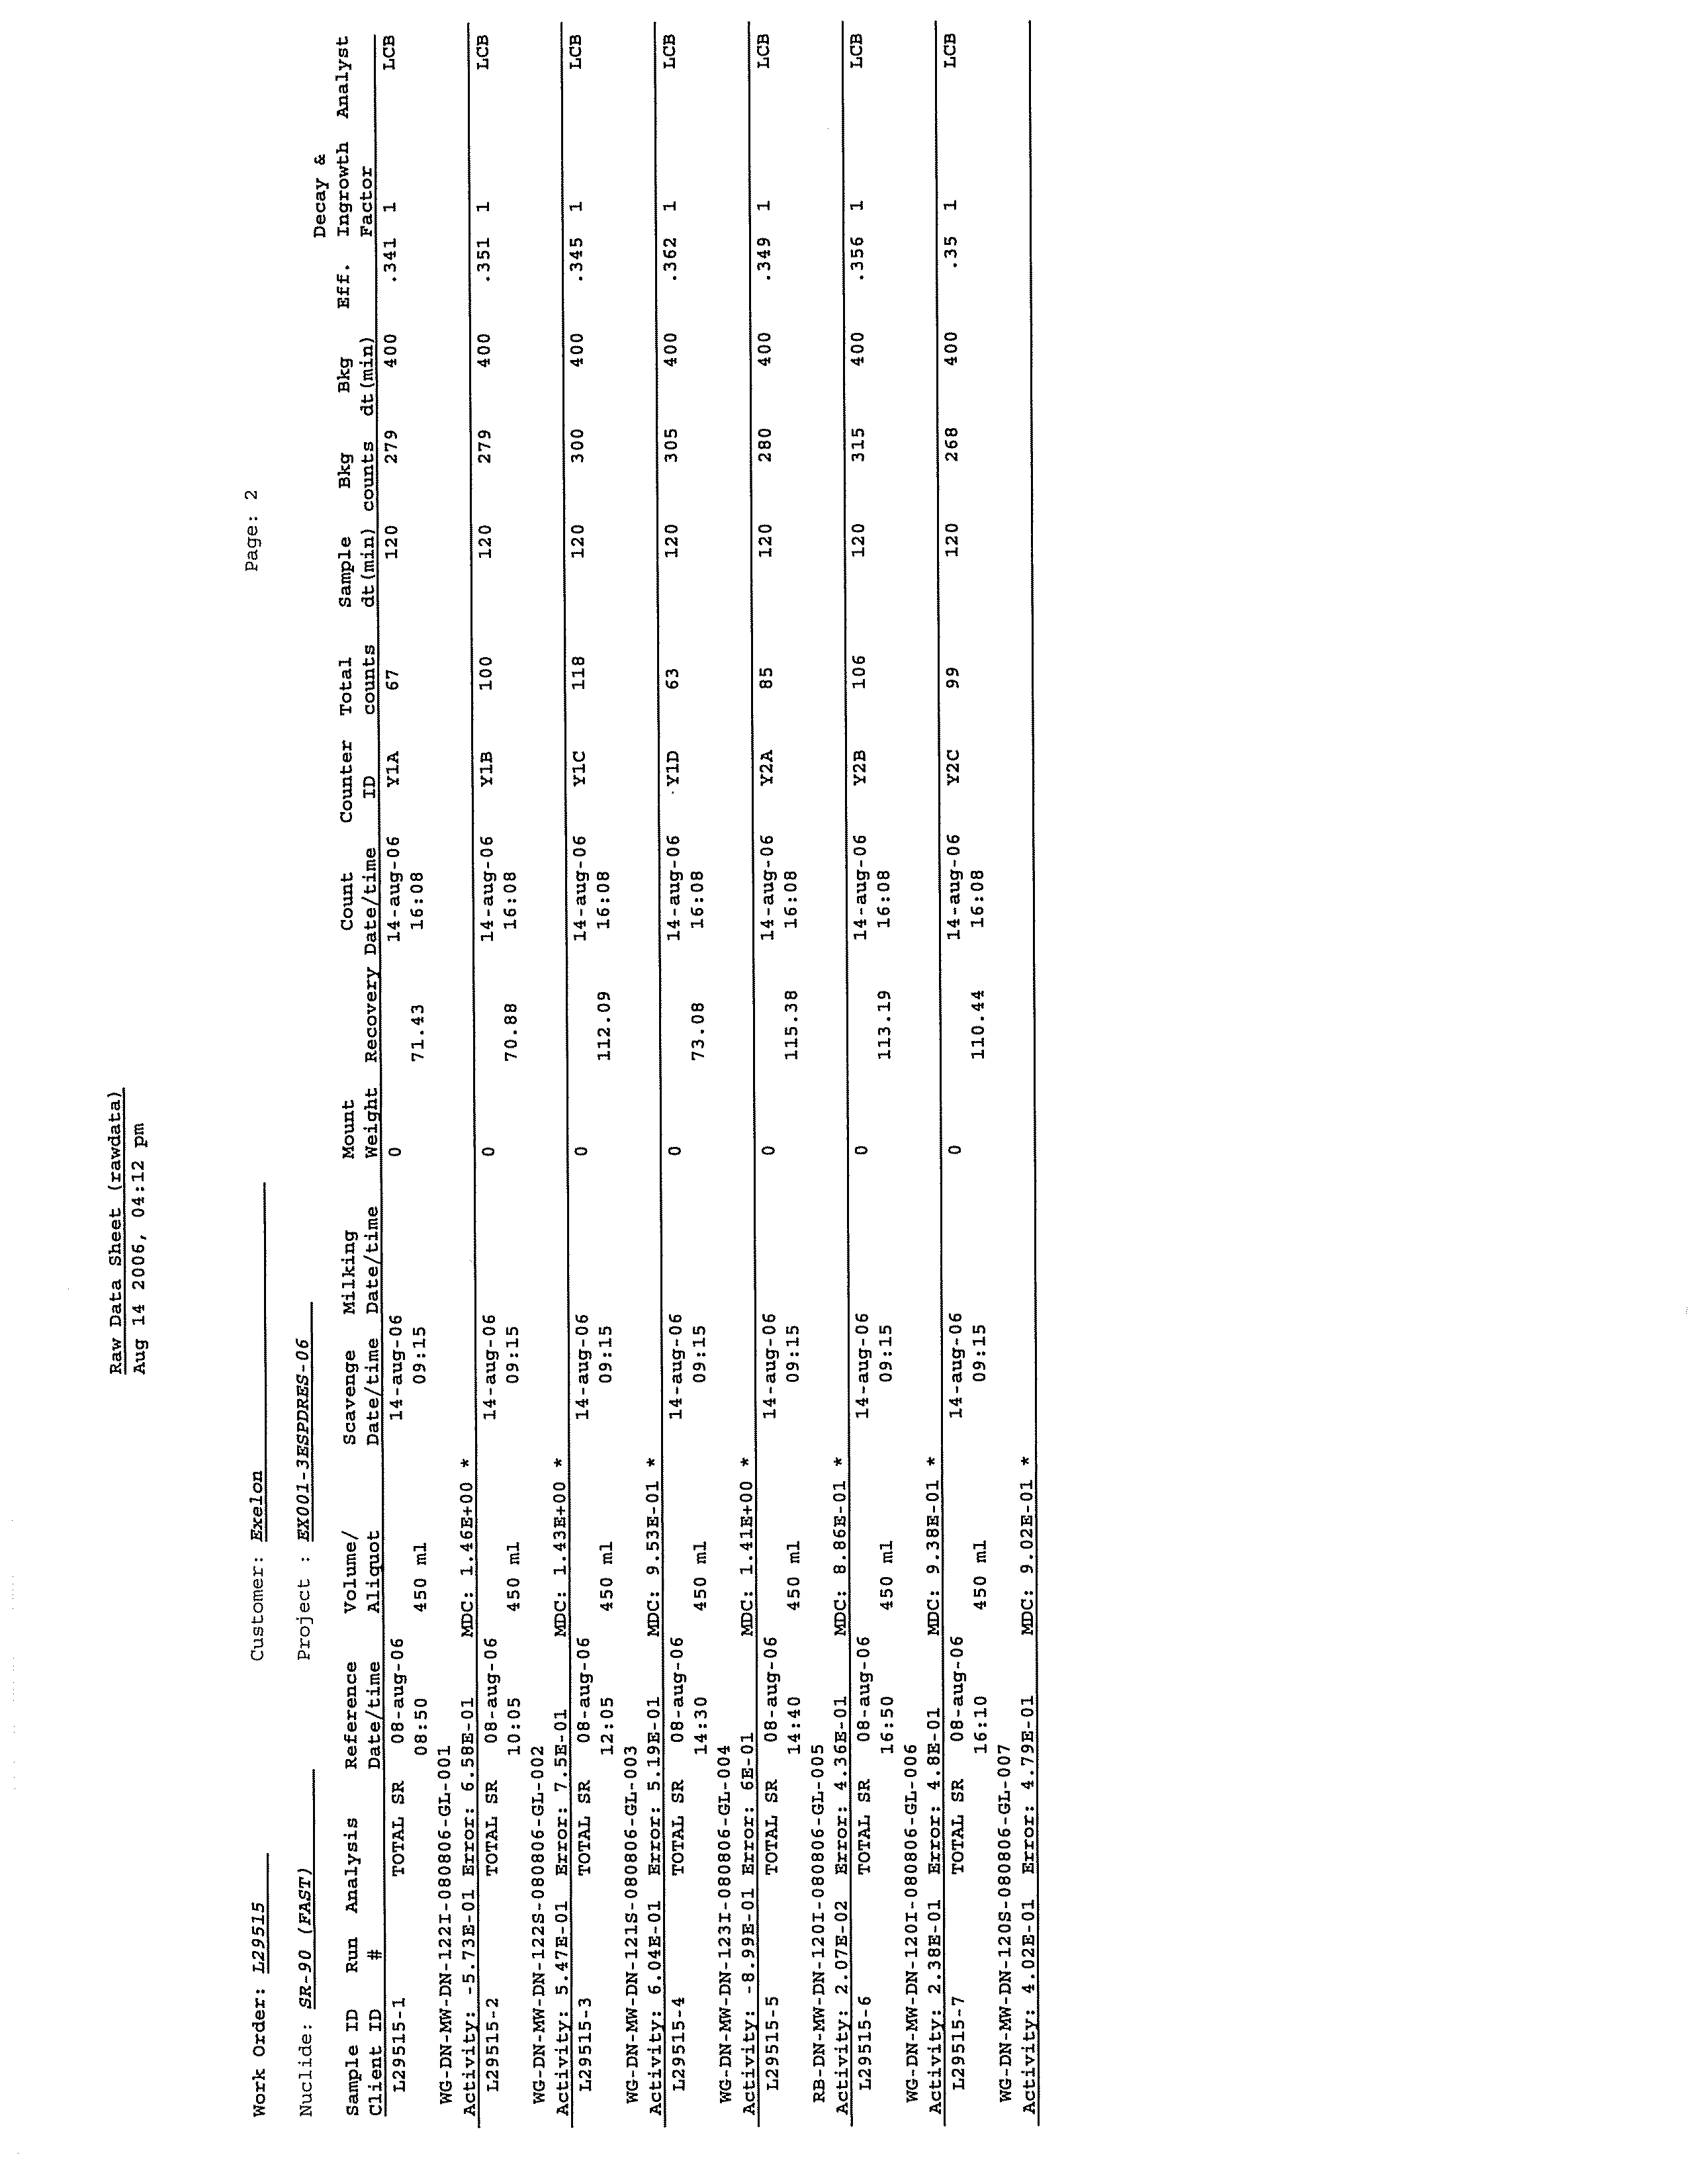
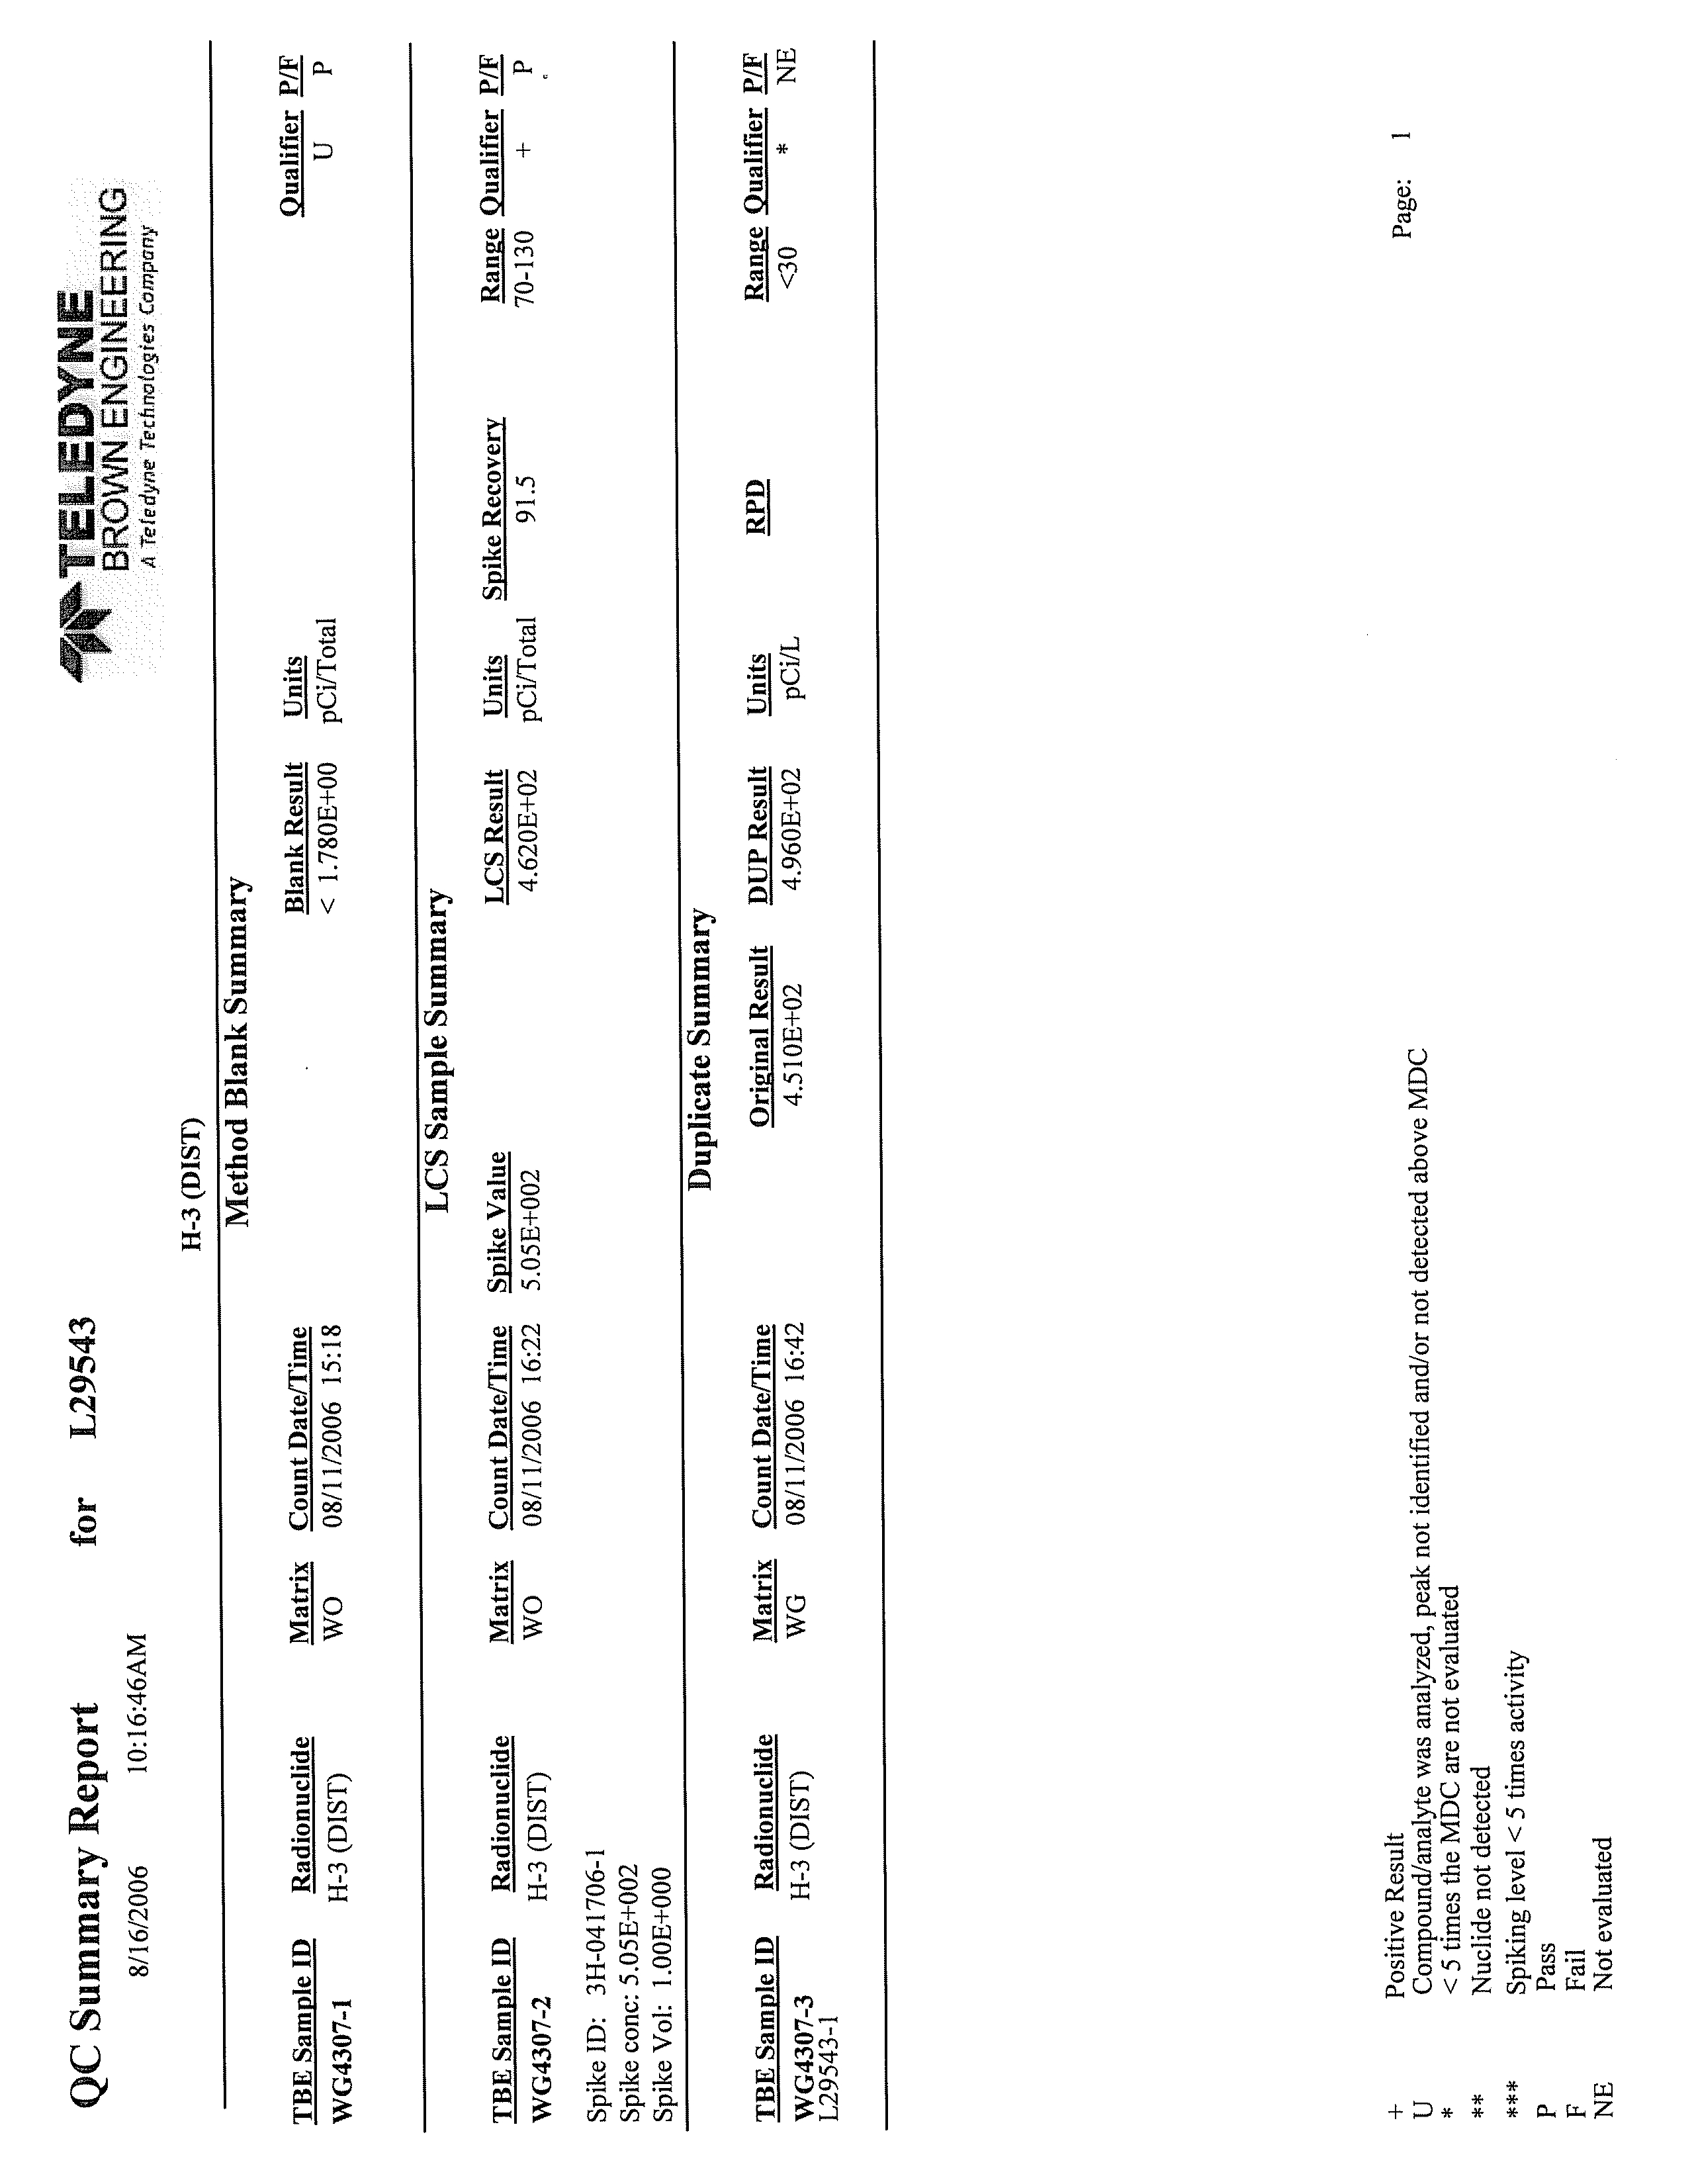
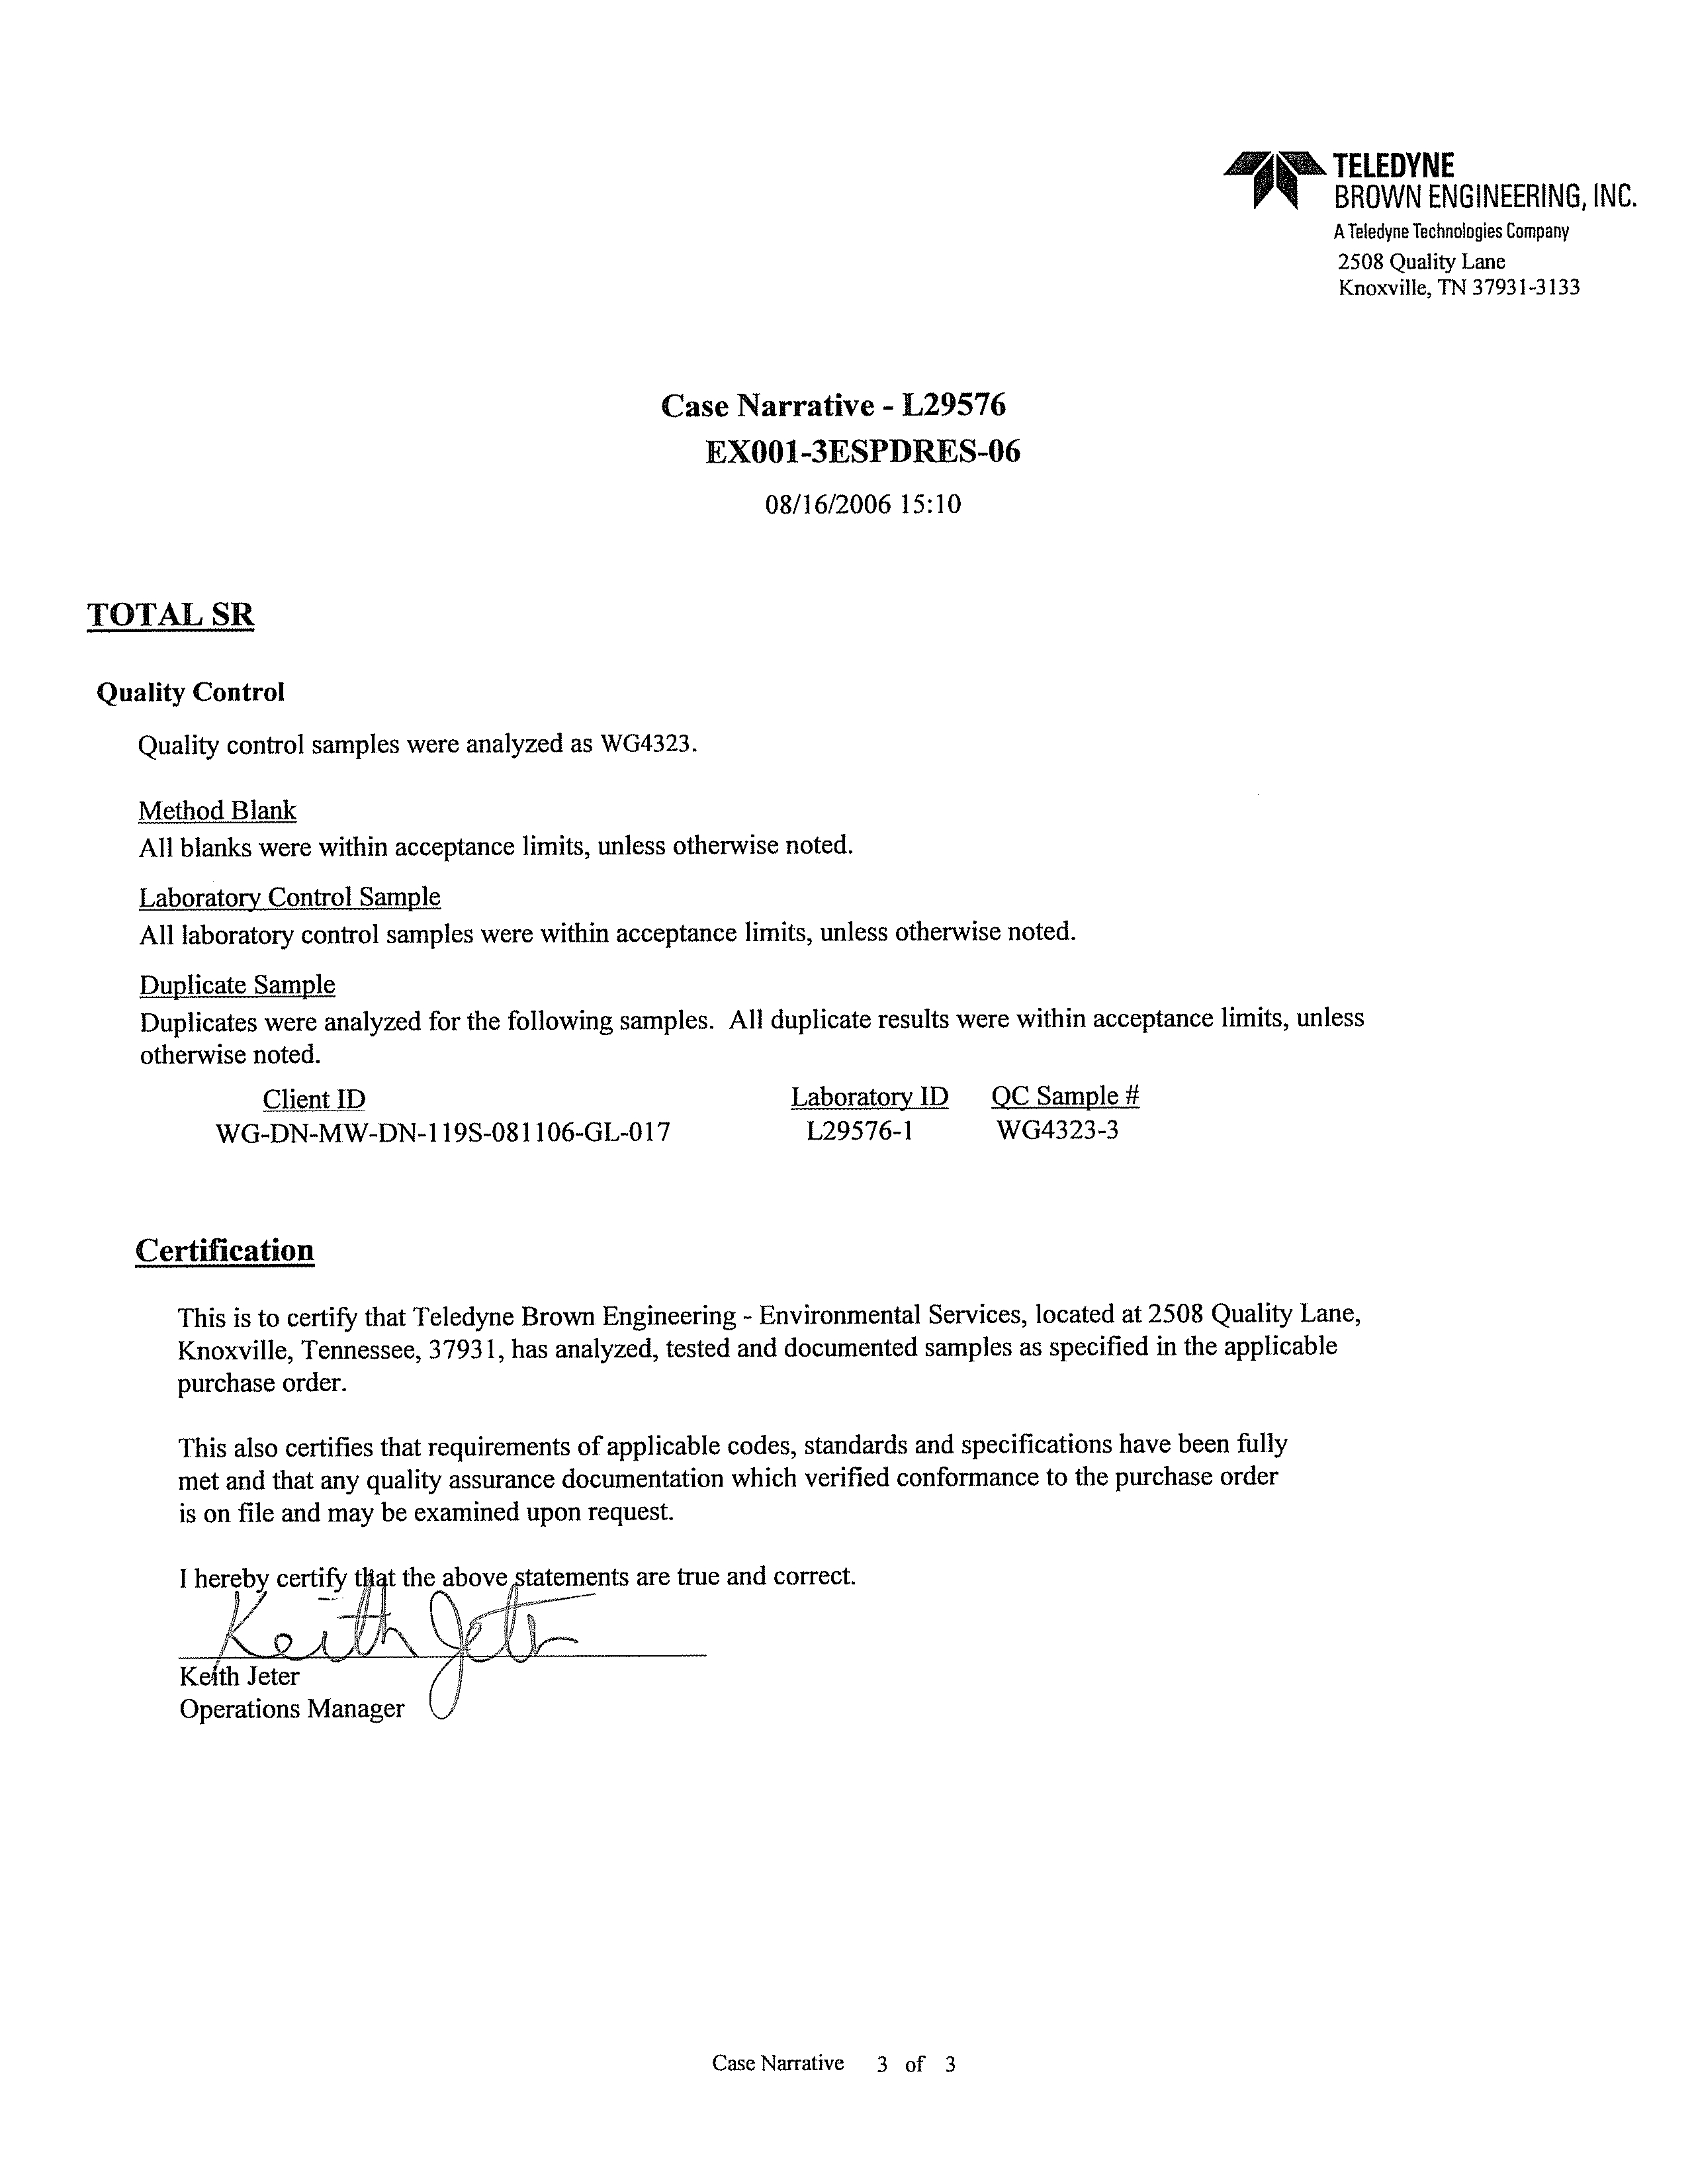
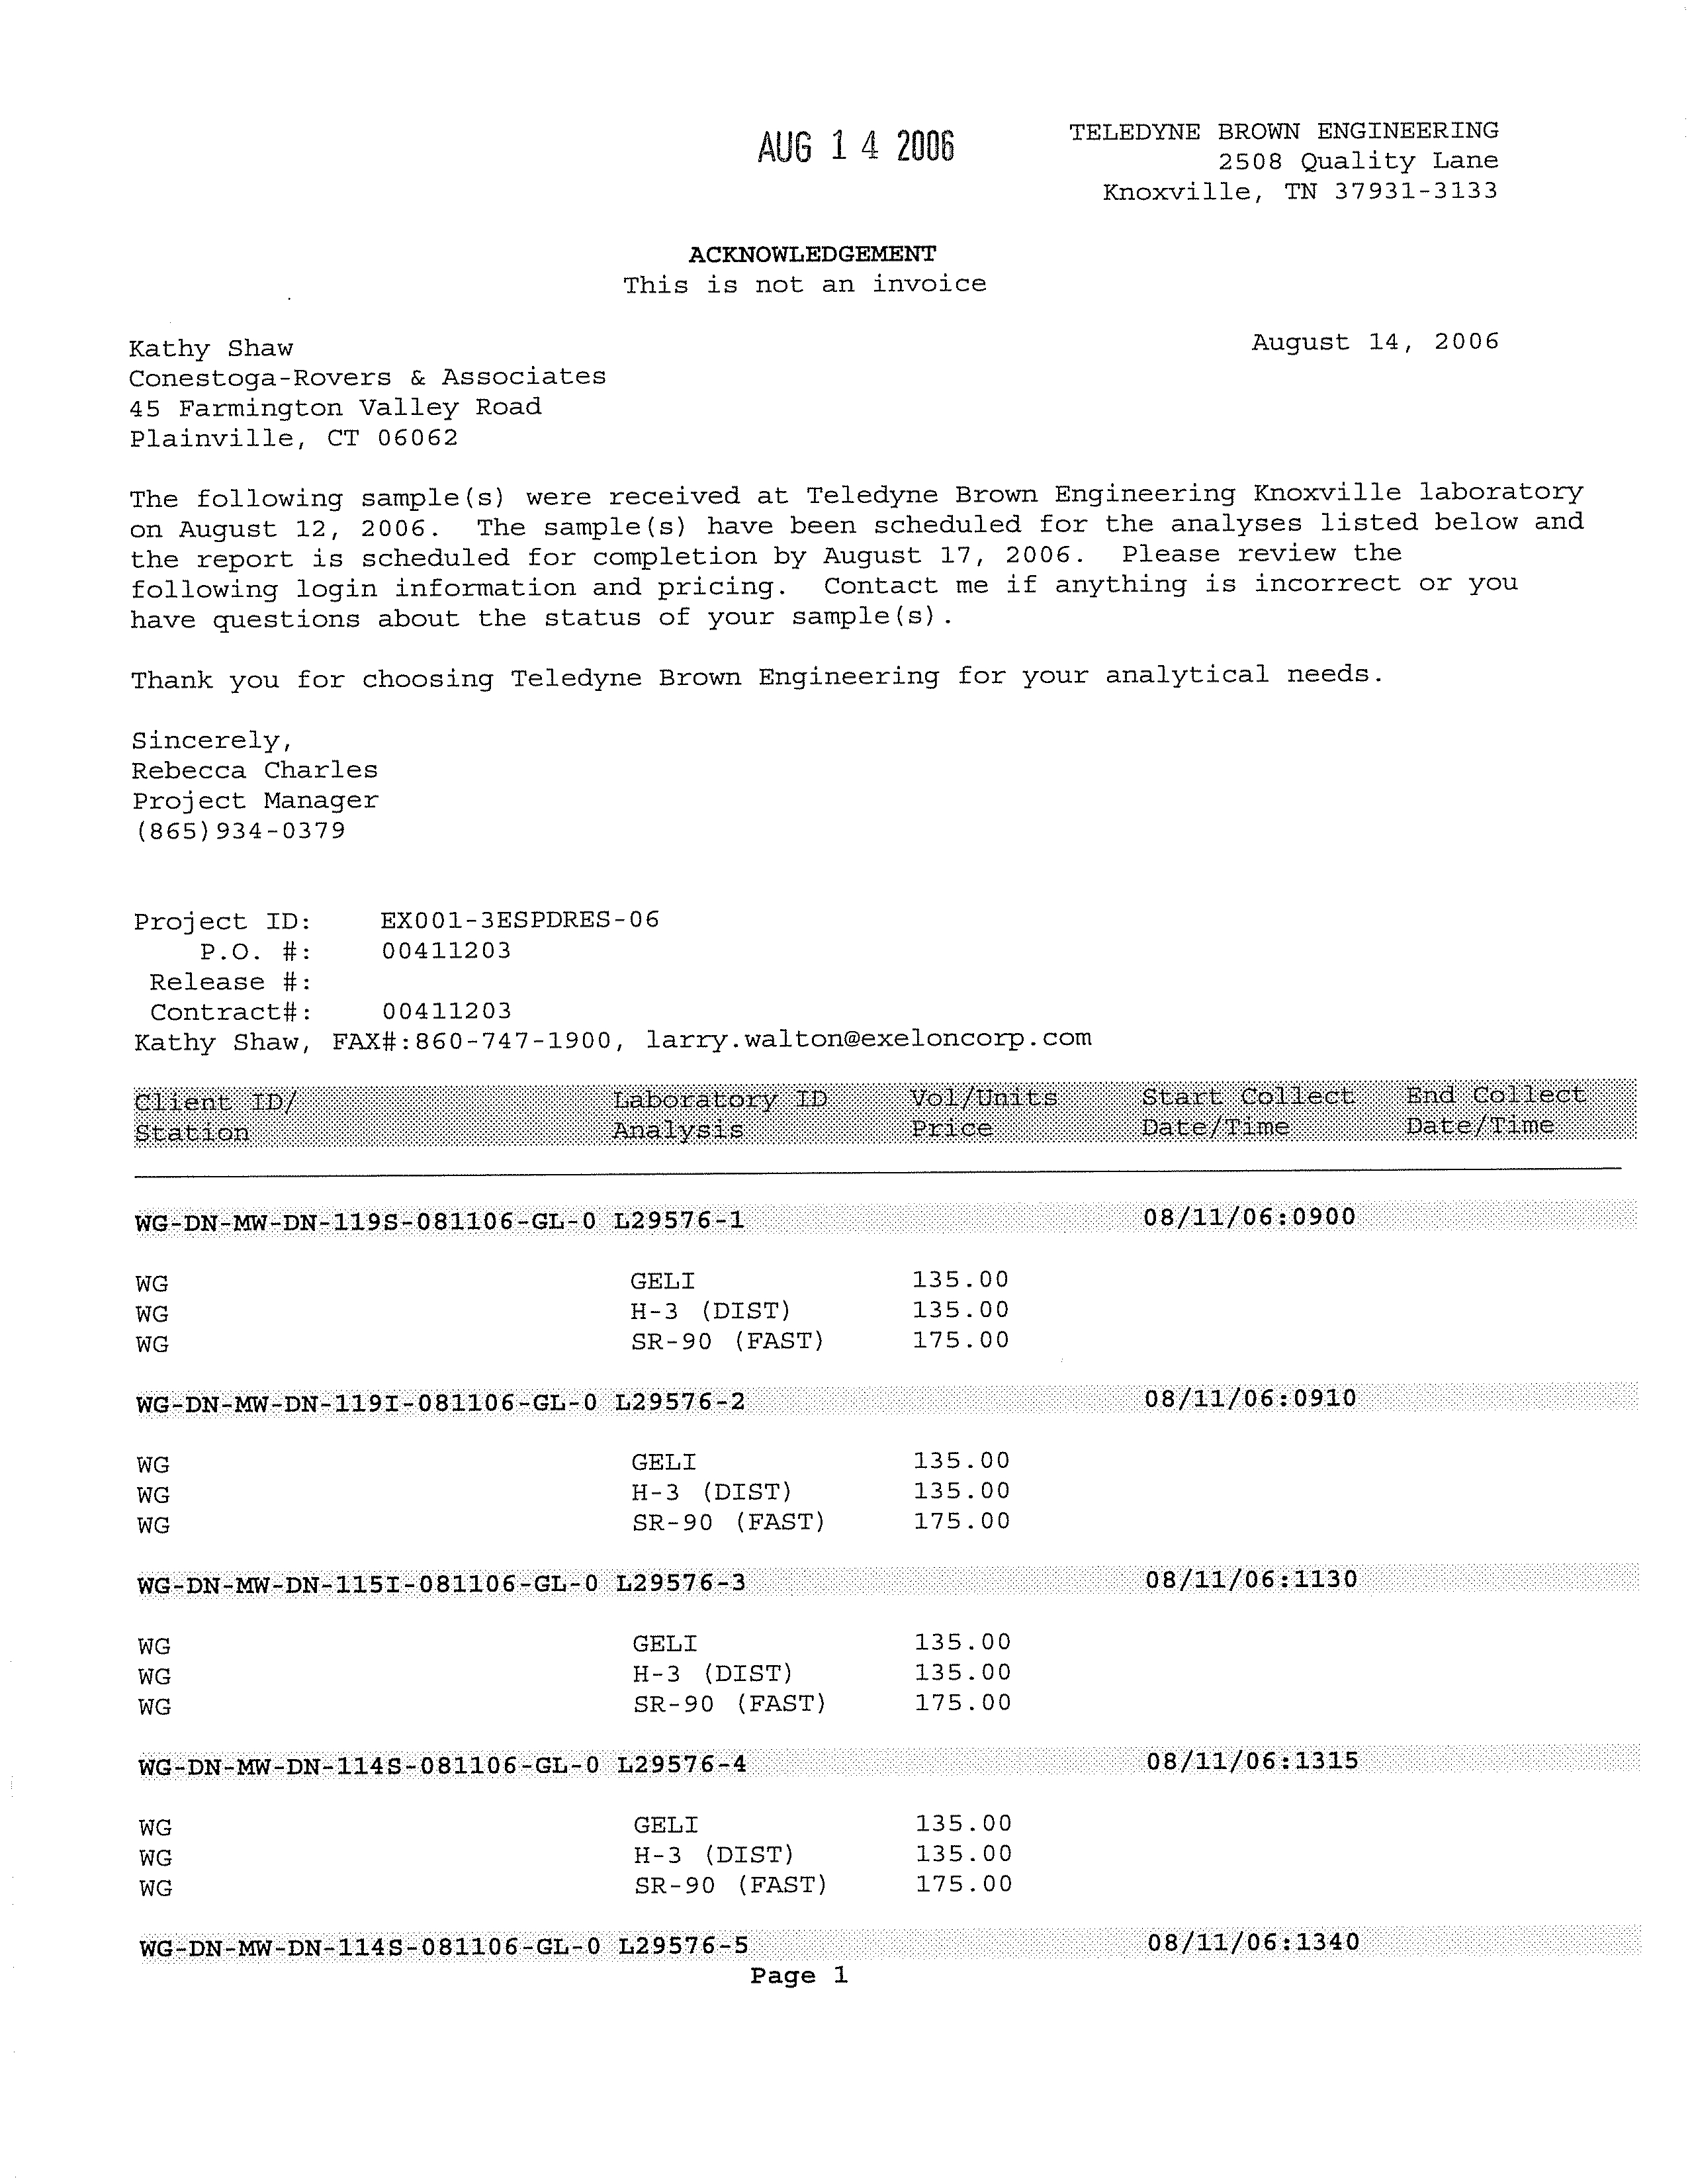
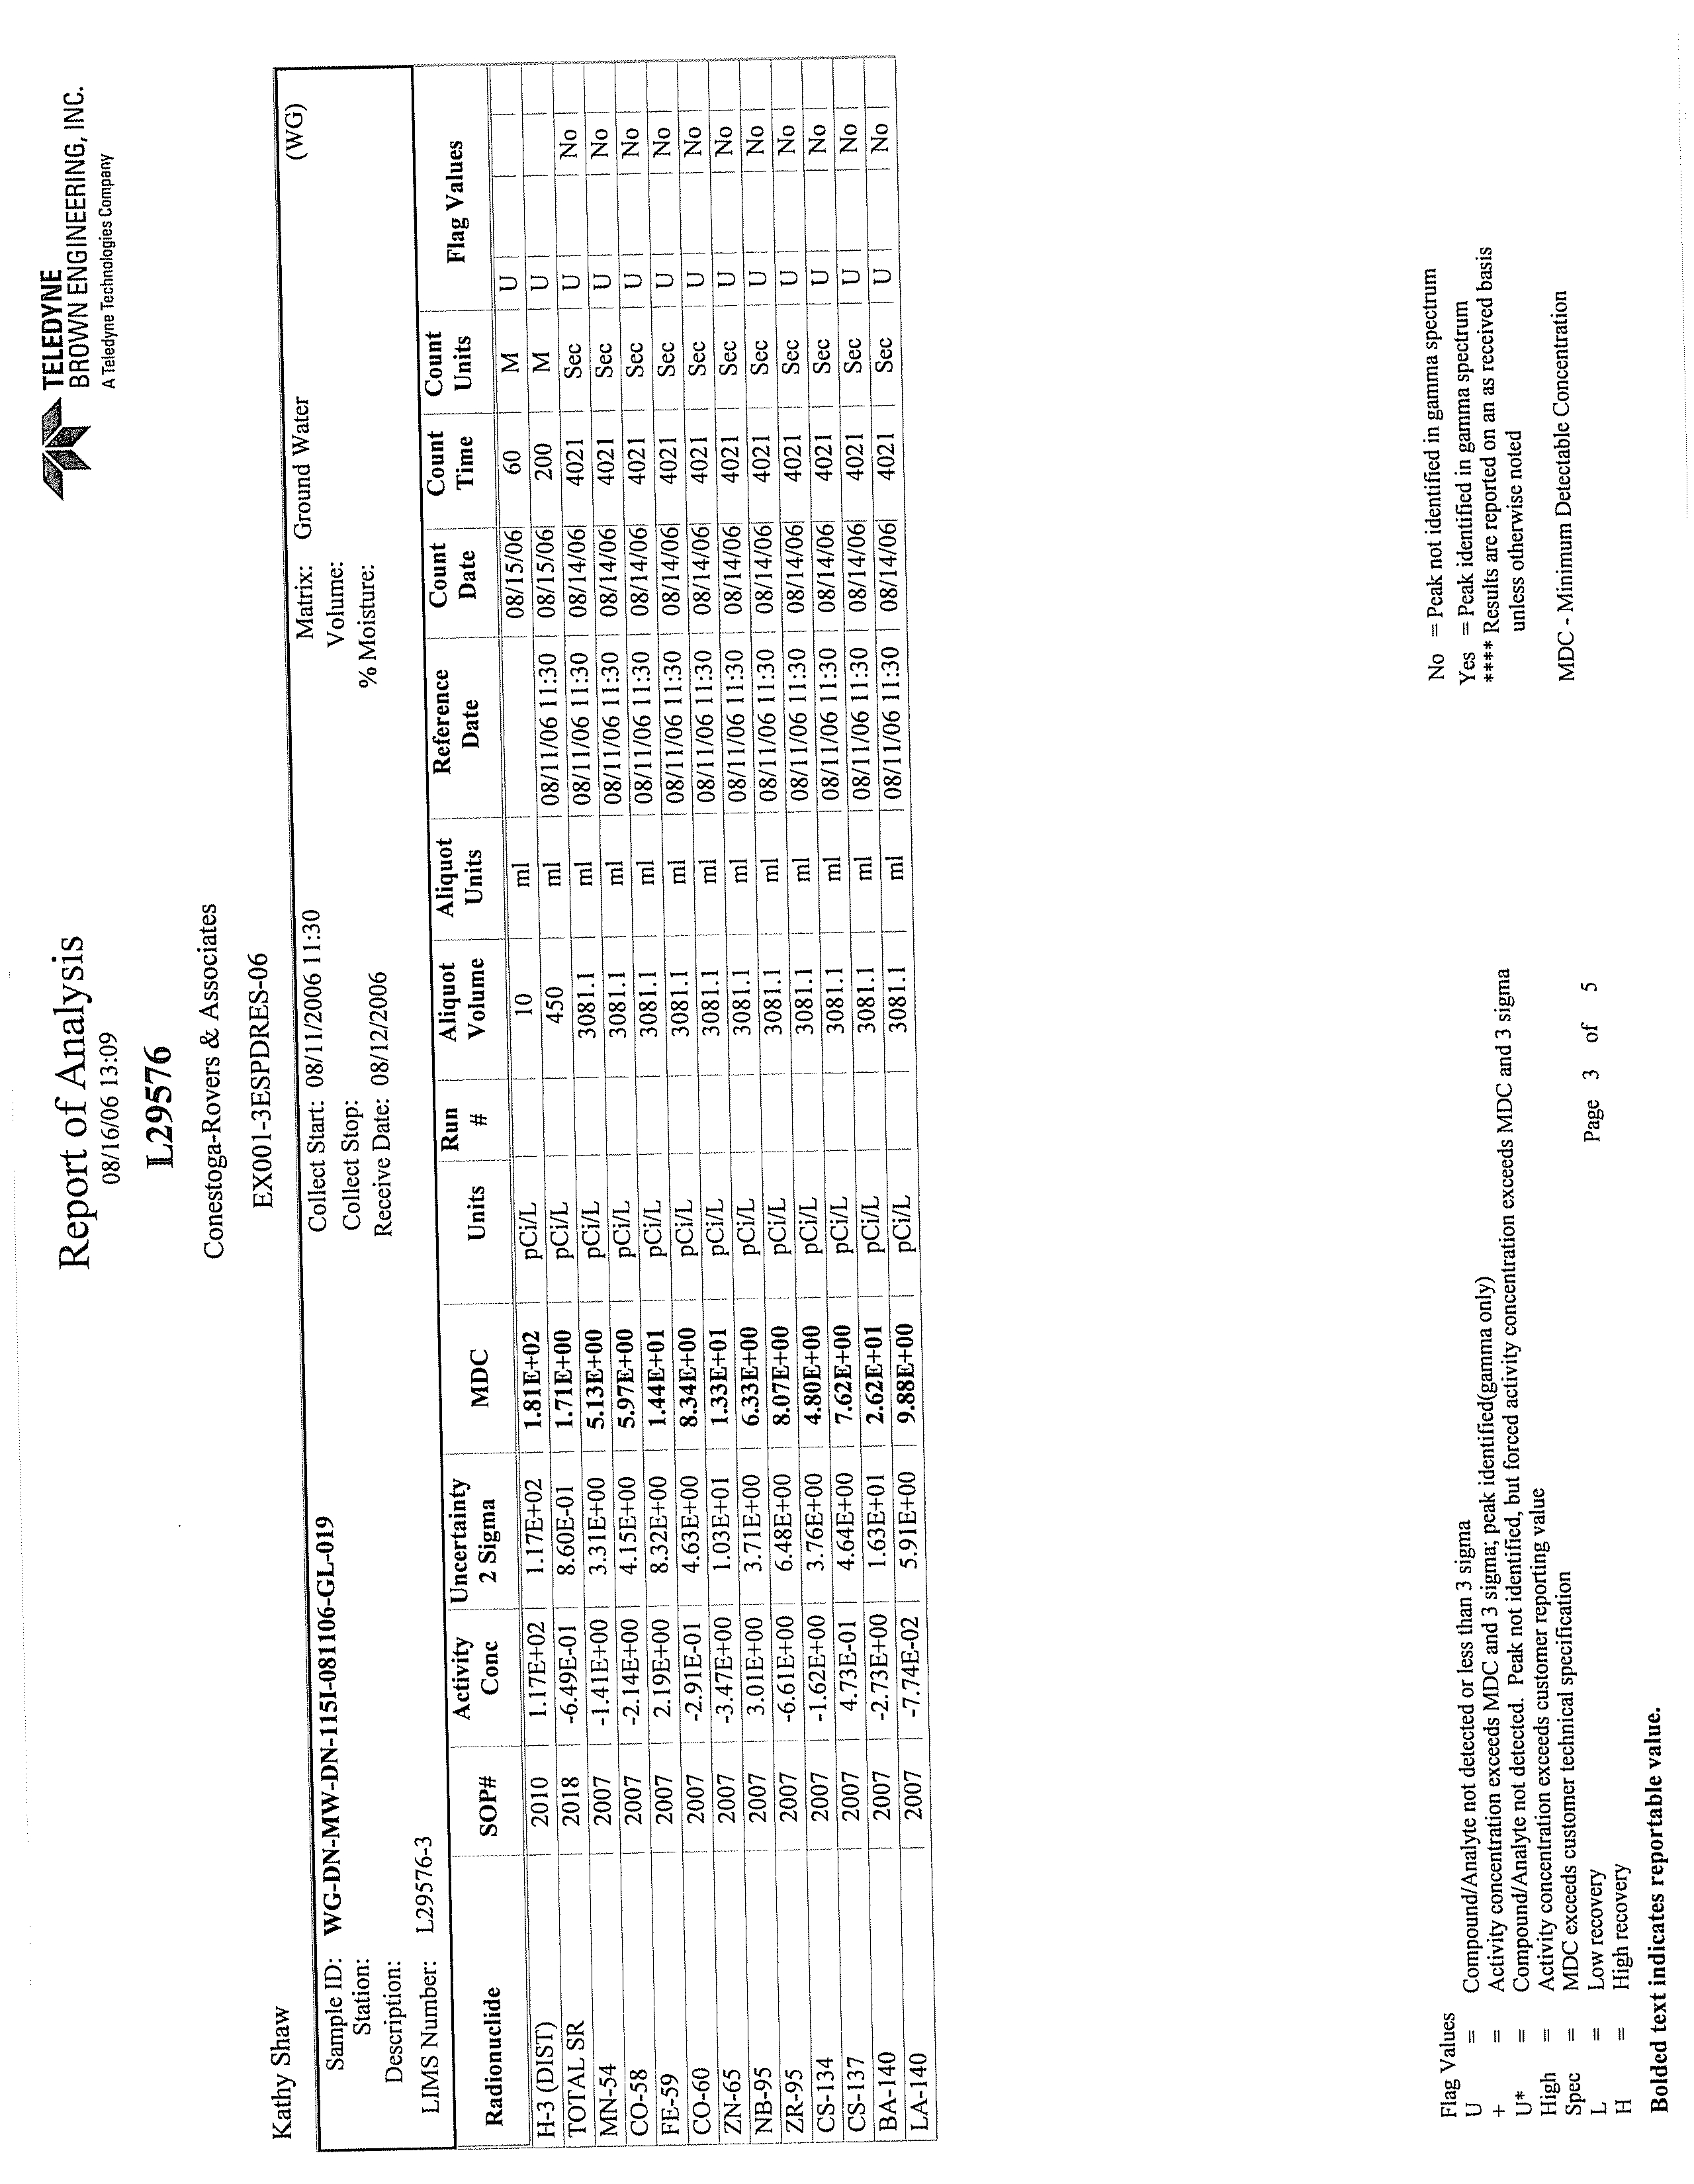
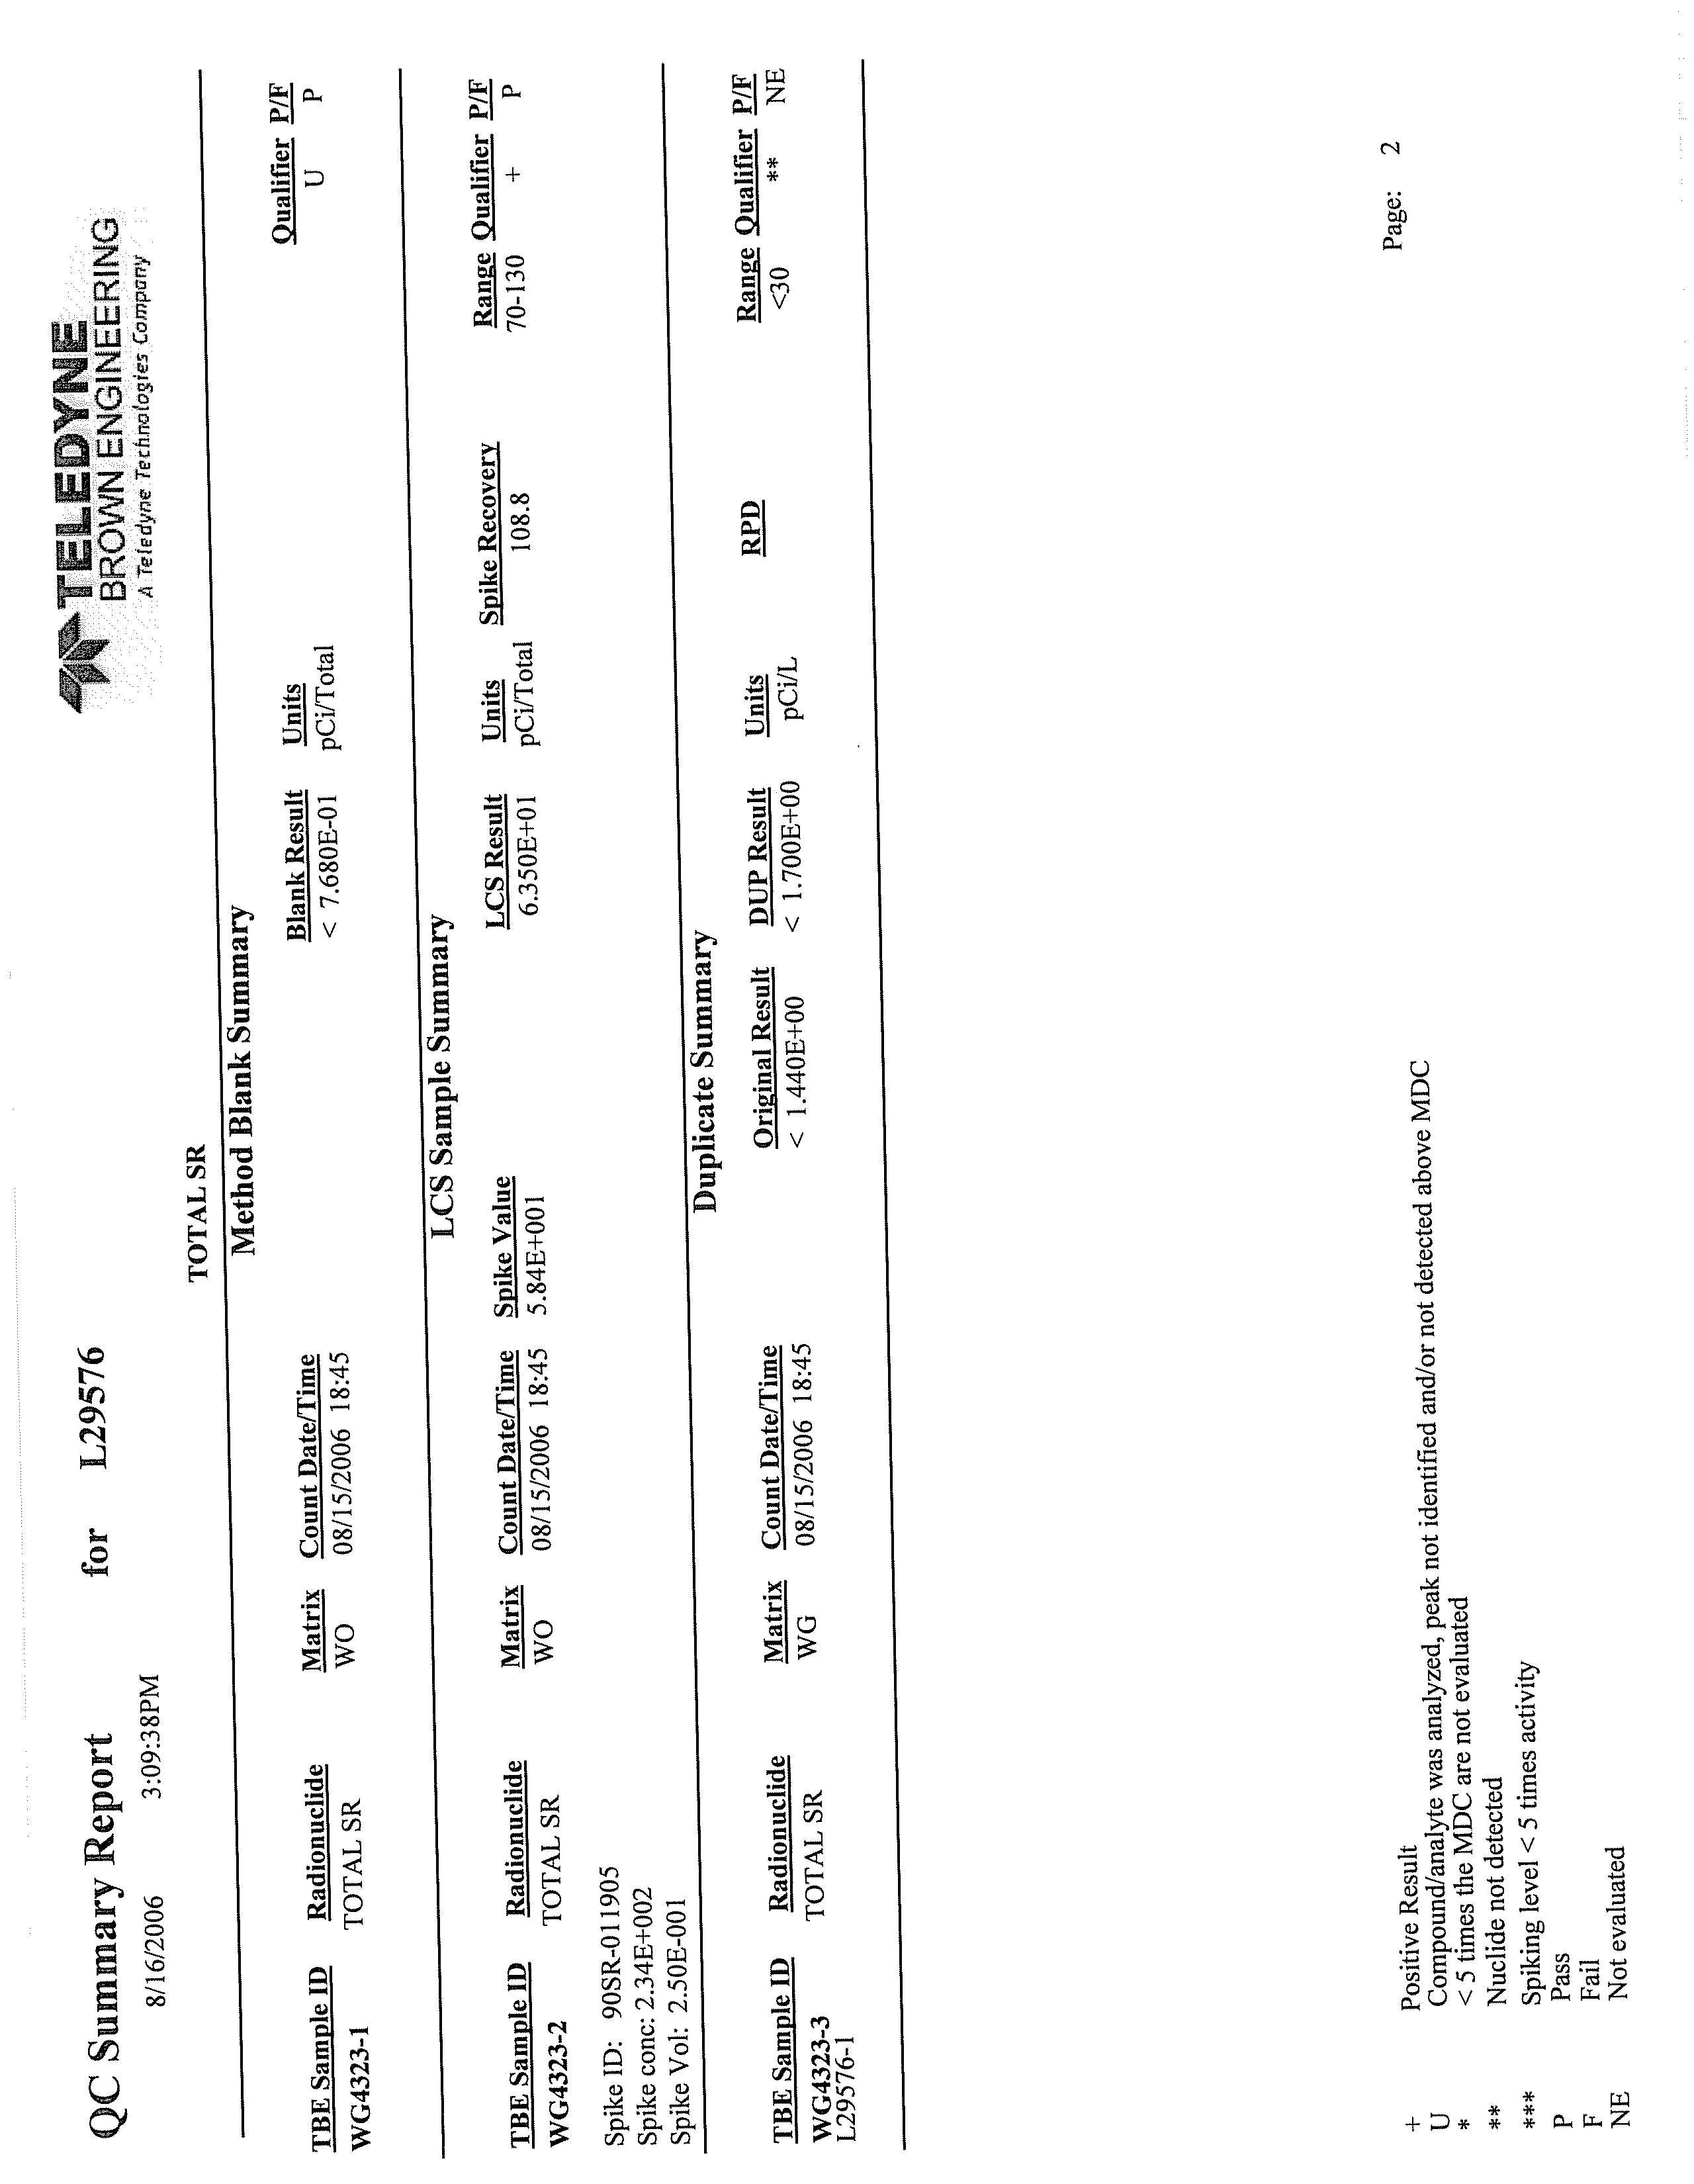
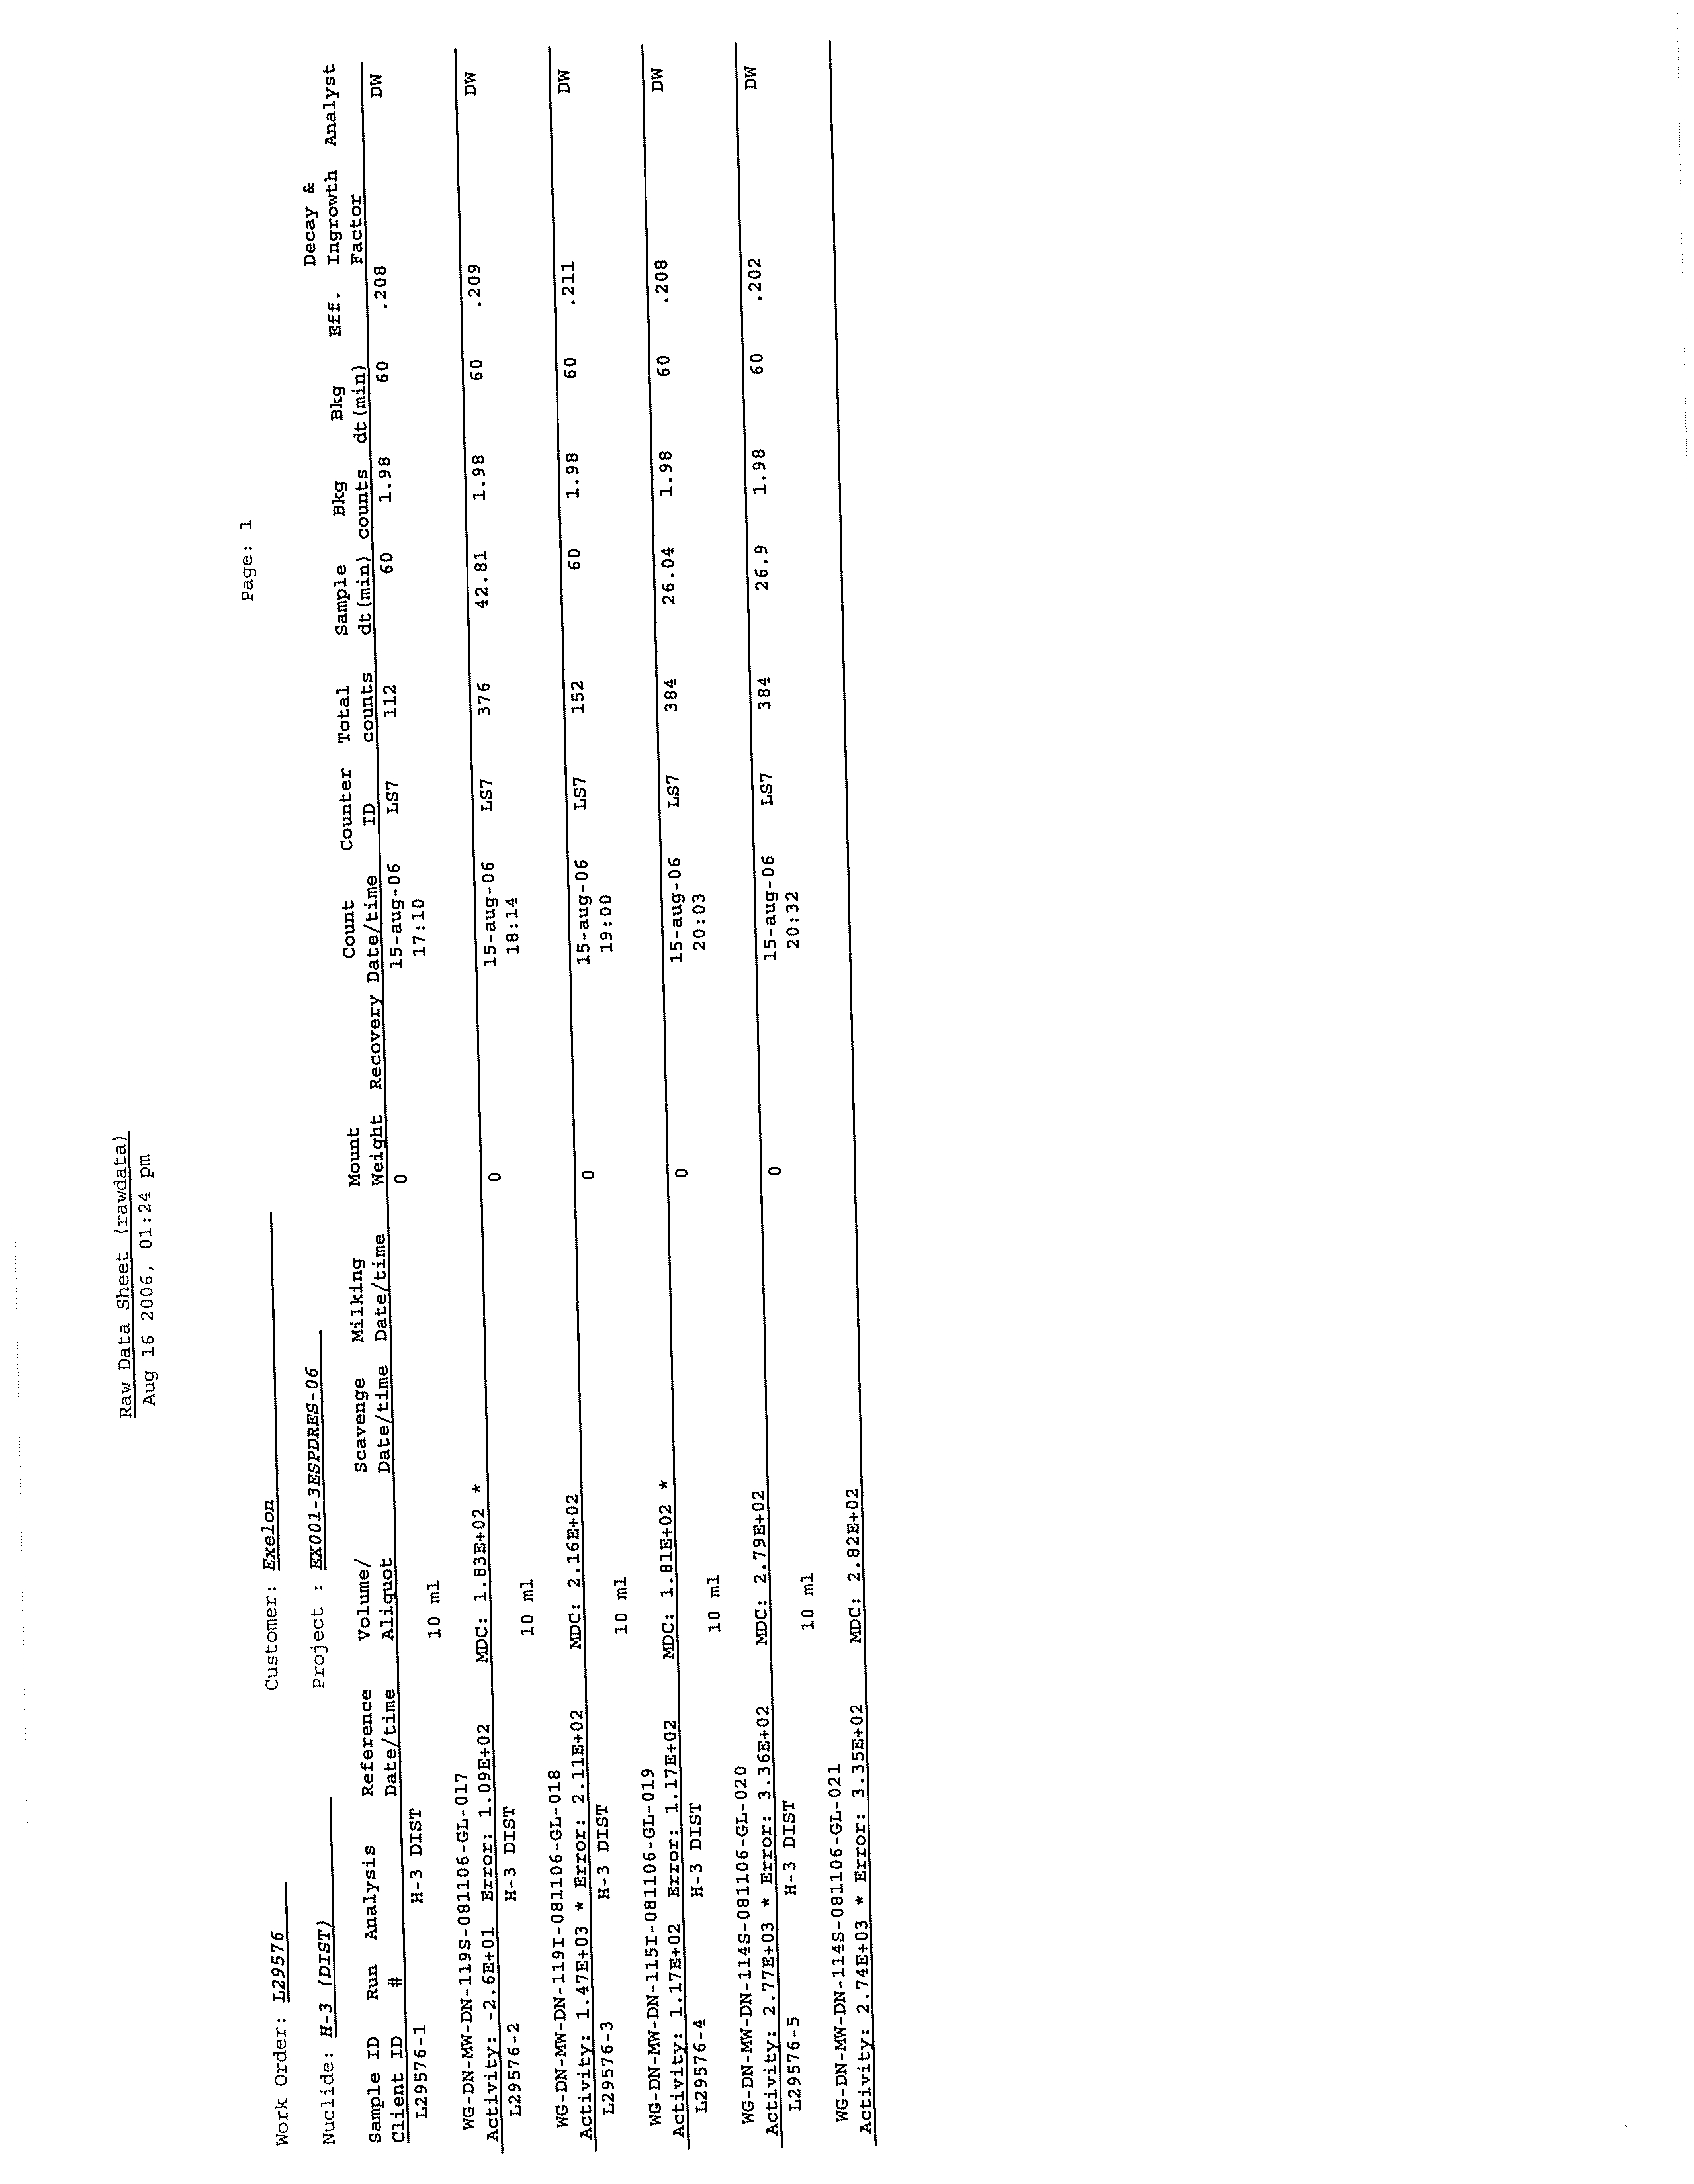
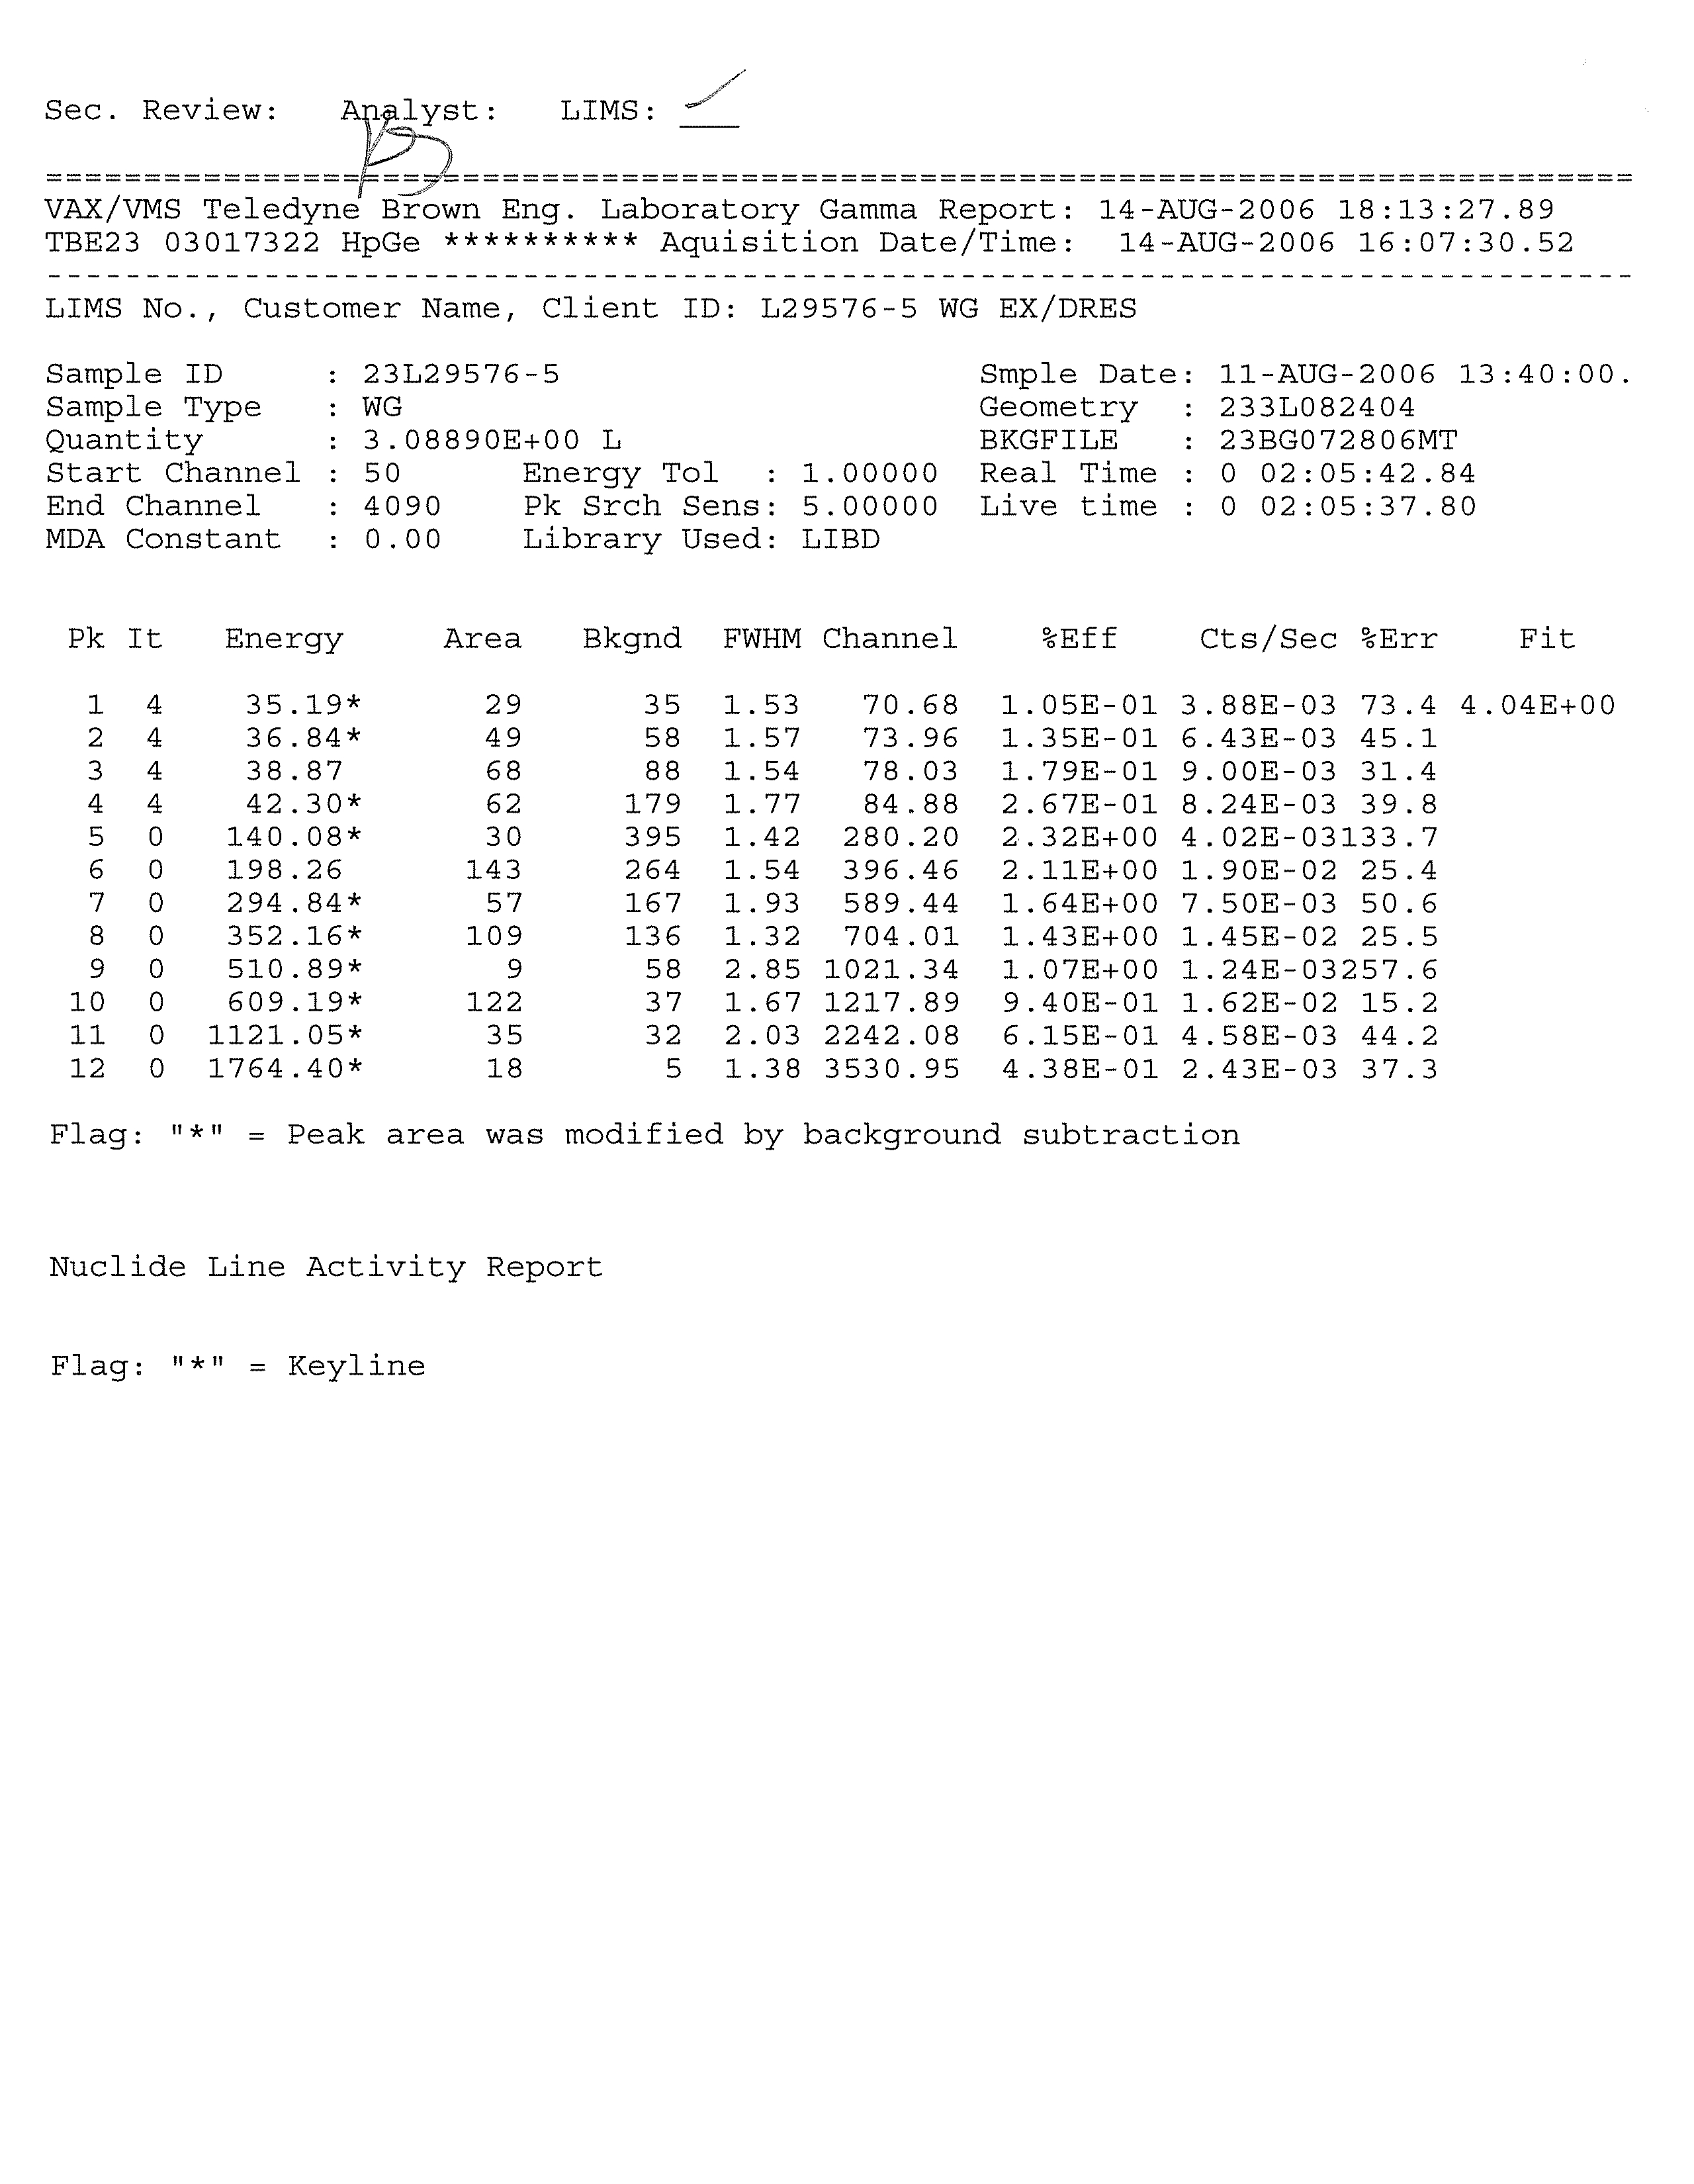
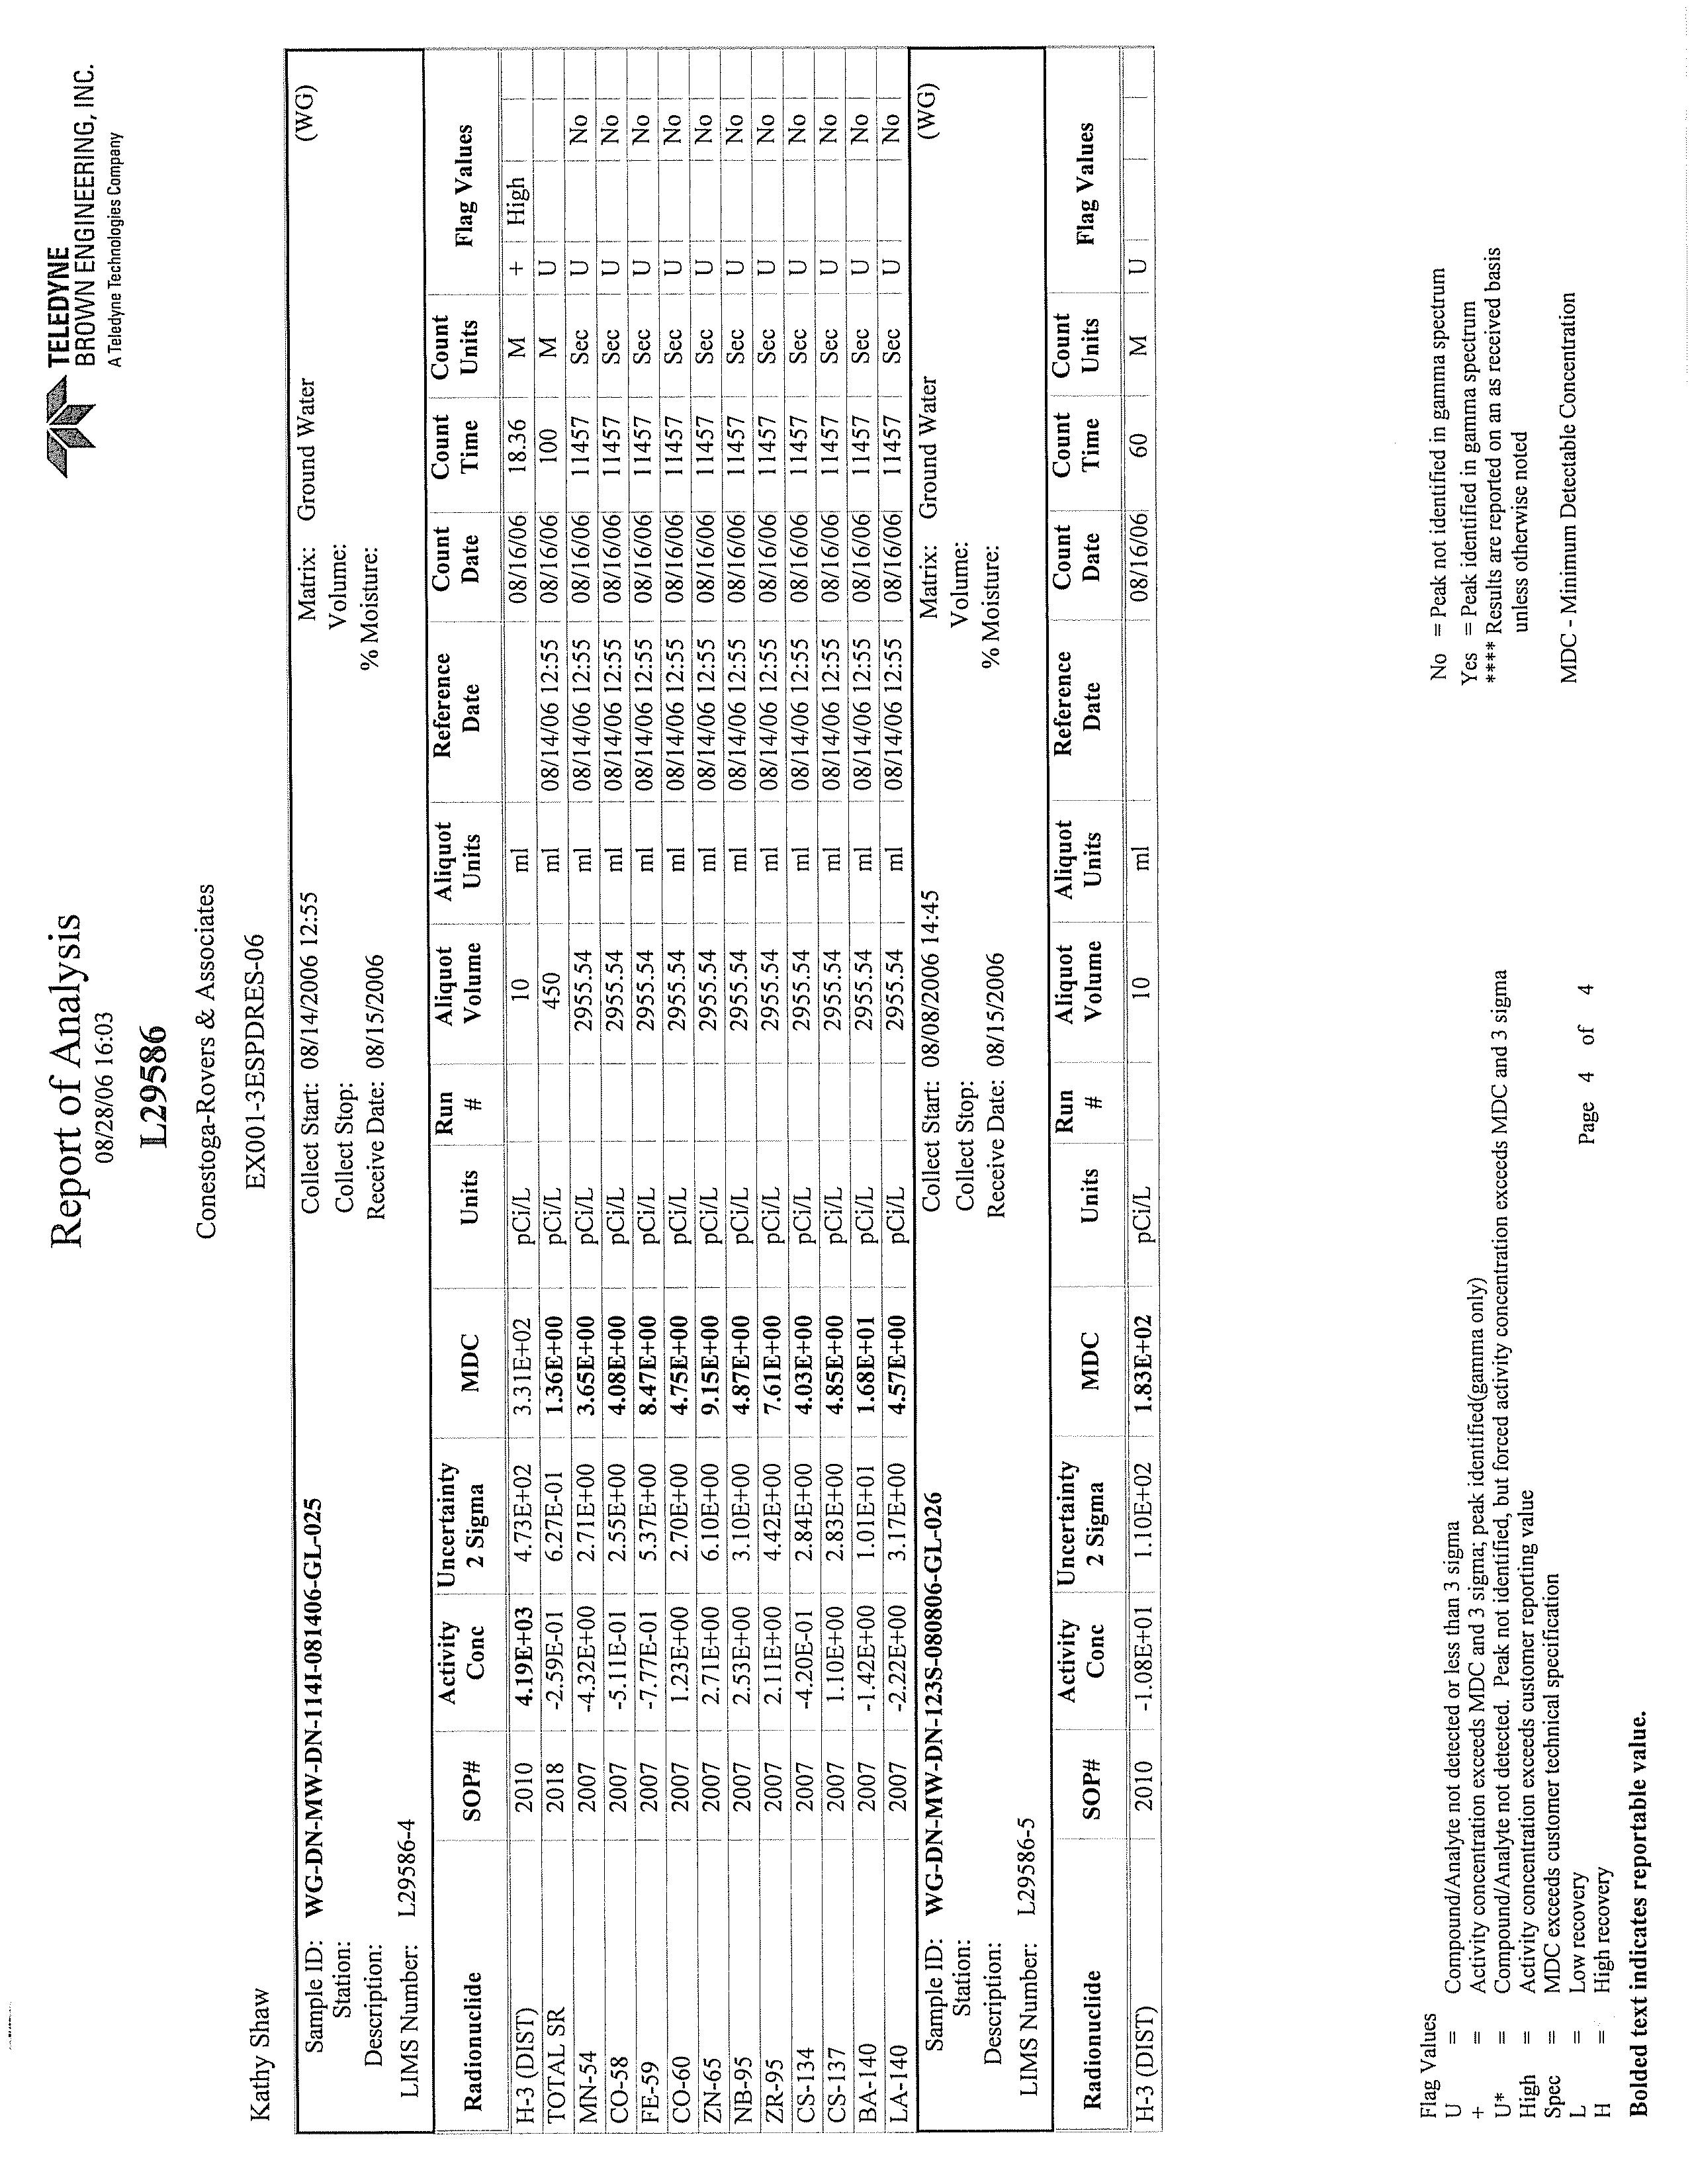
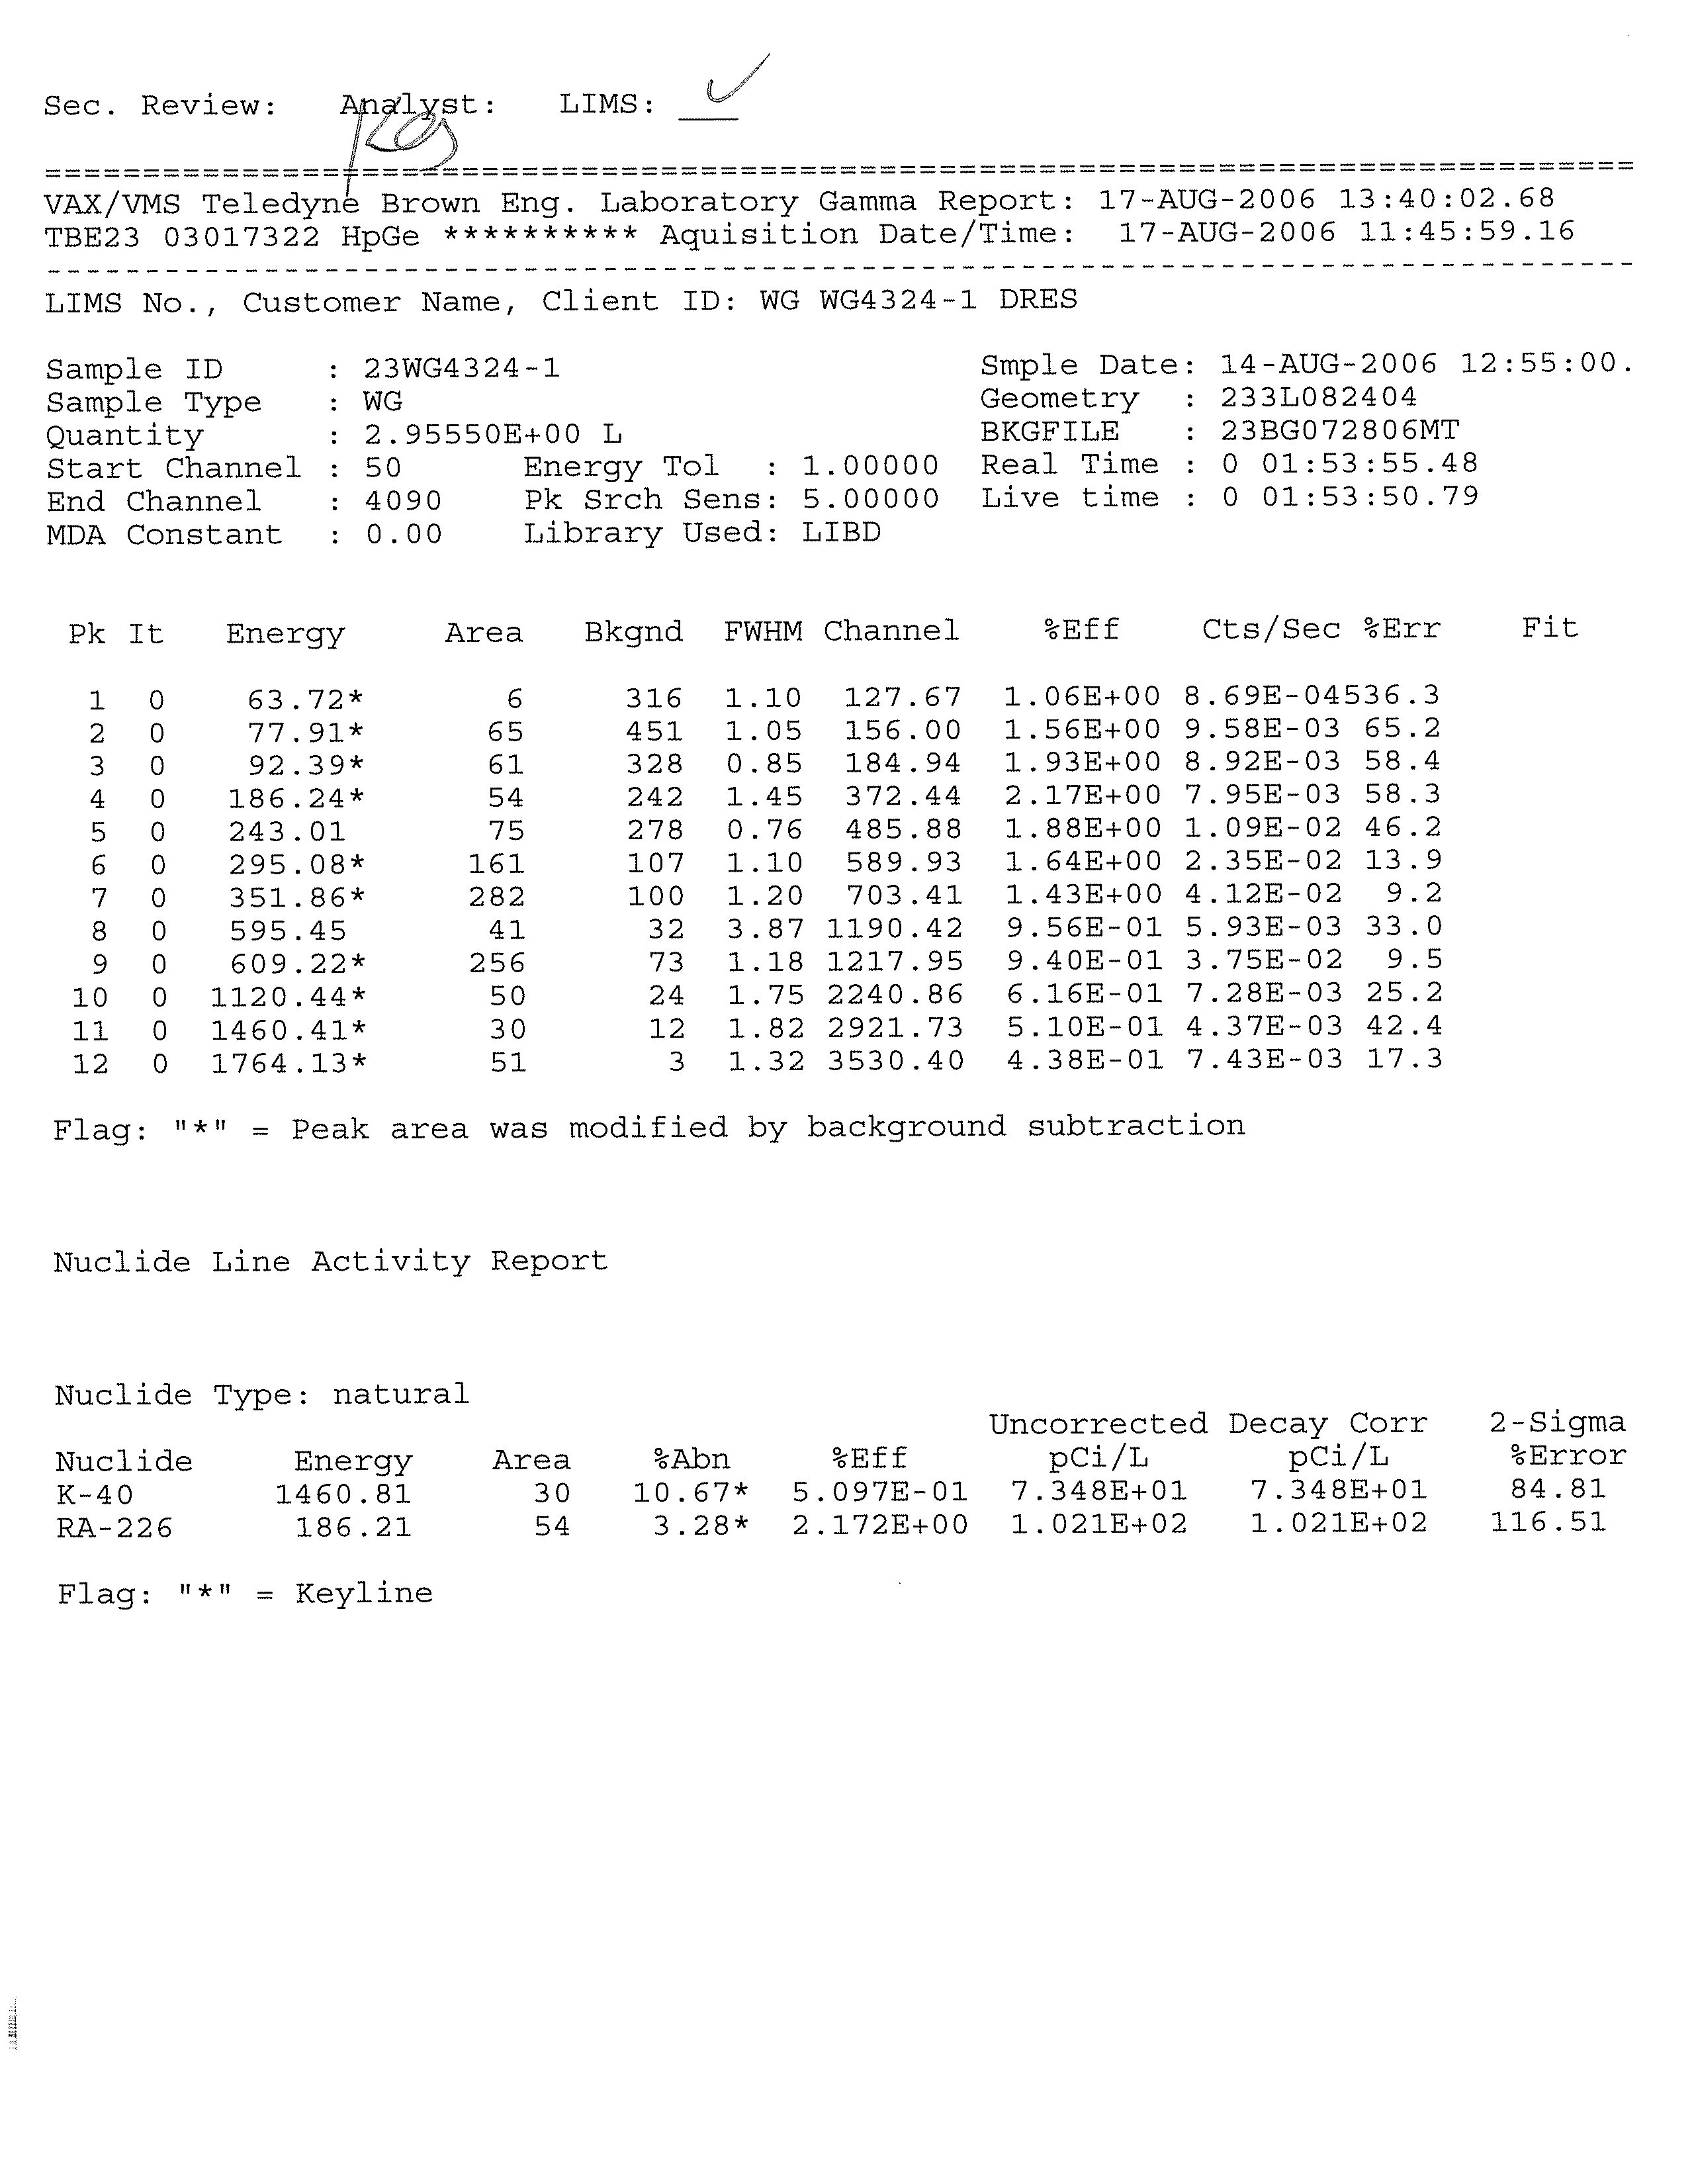
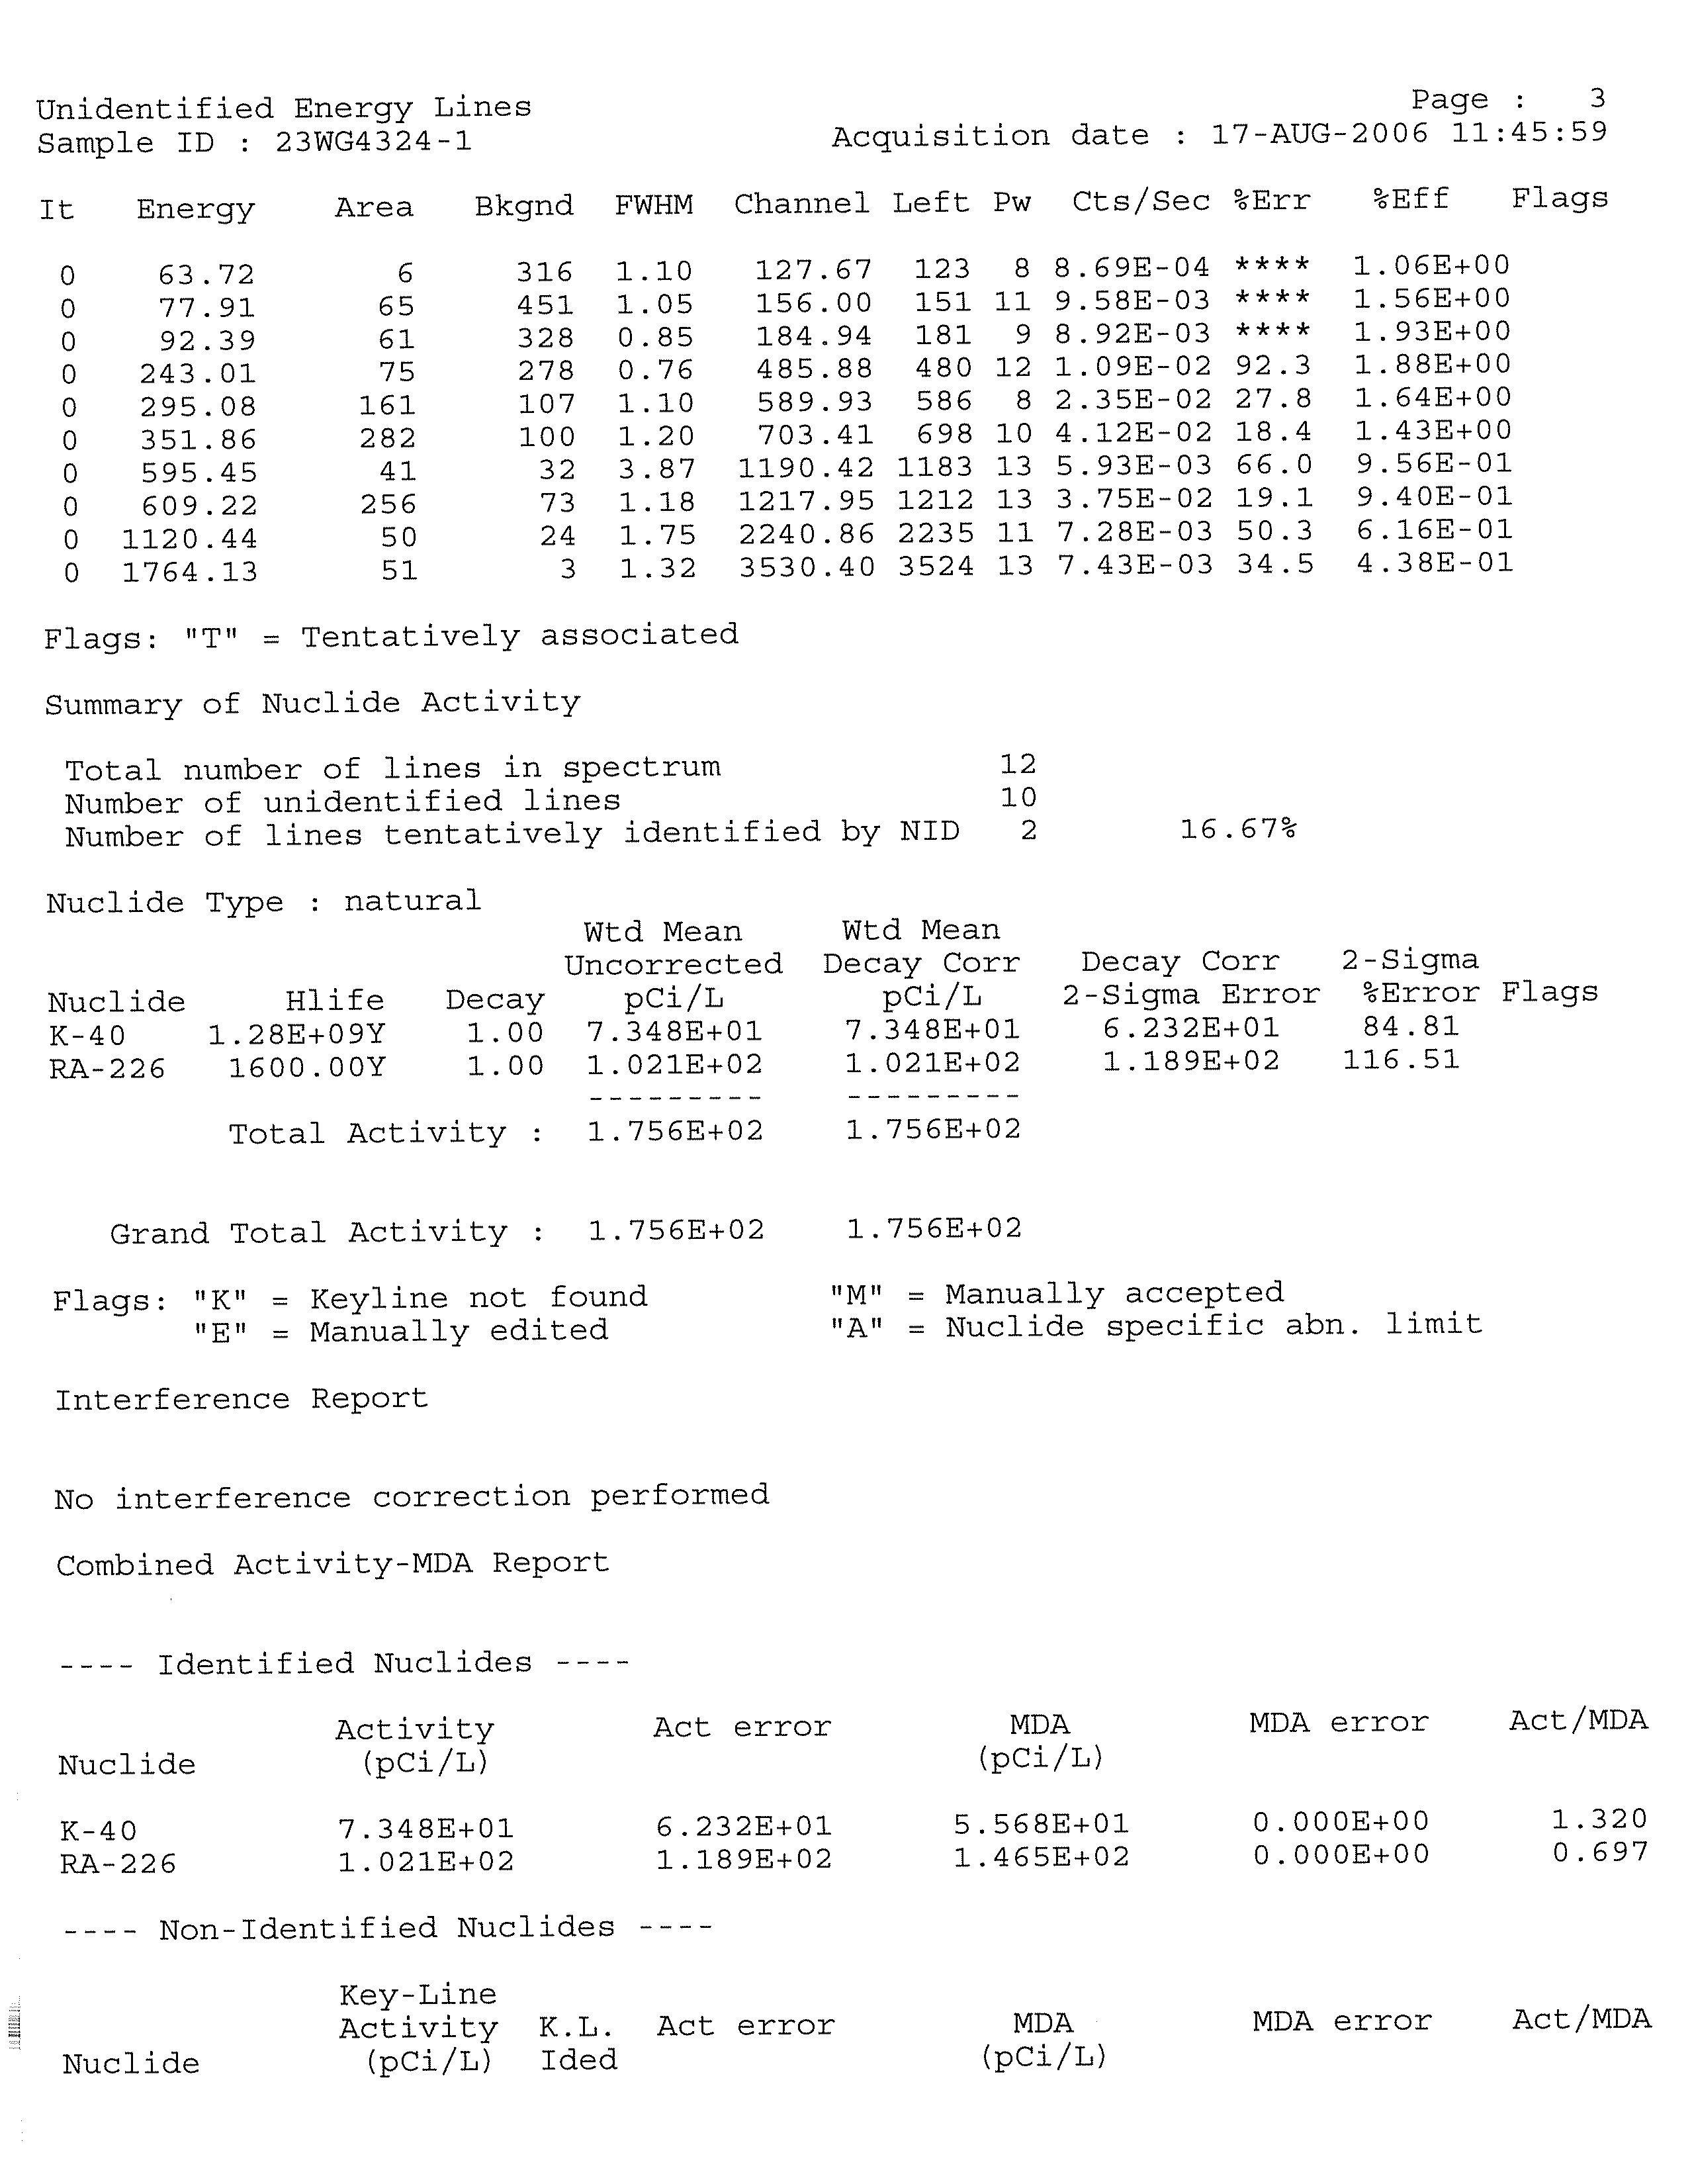
CRA has validated the analytical data to establish the accuracy and completeness of the
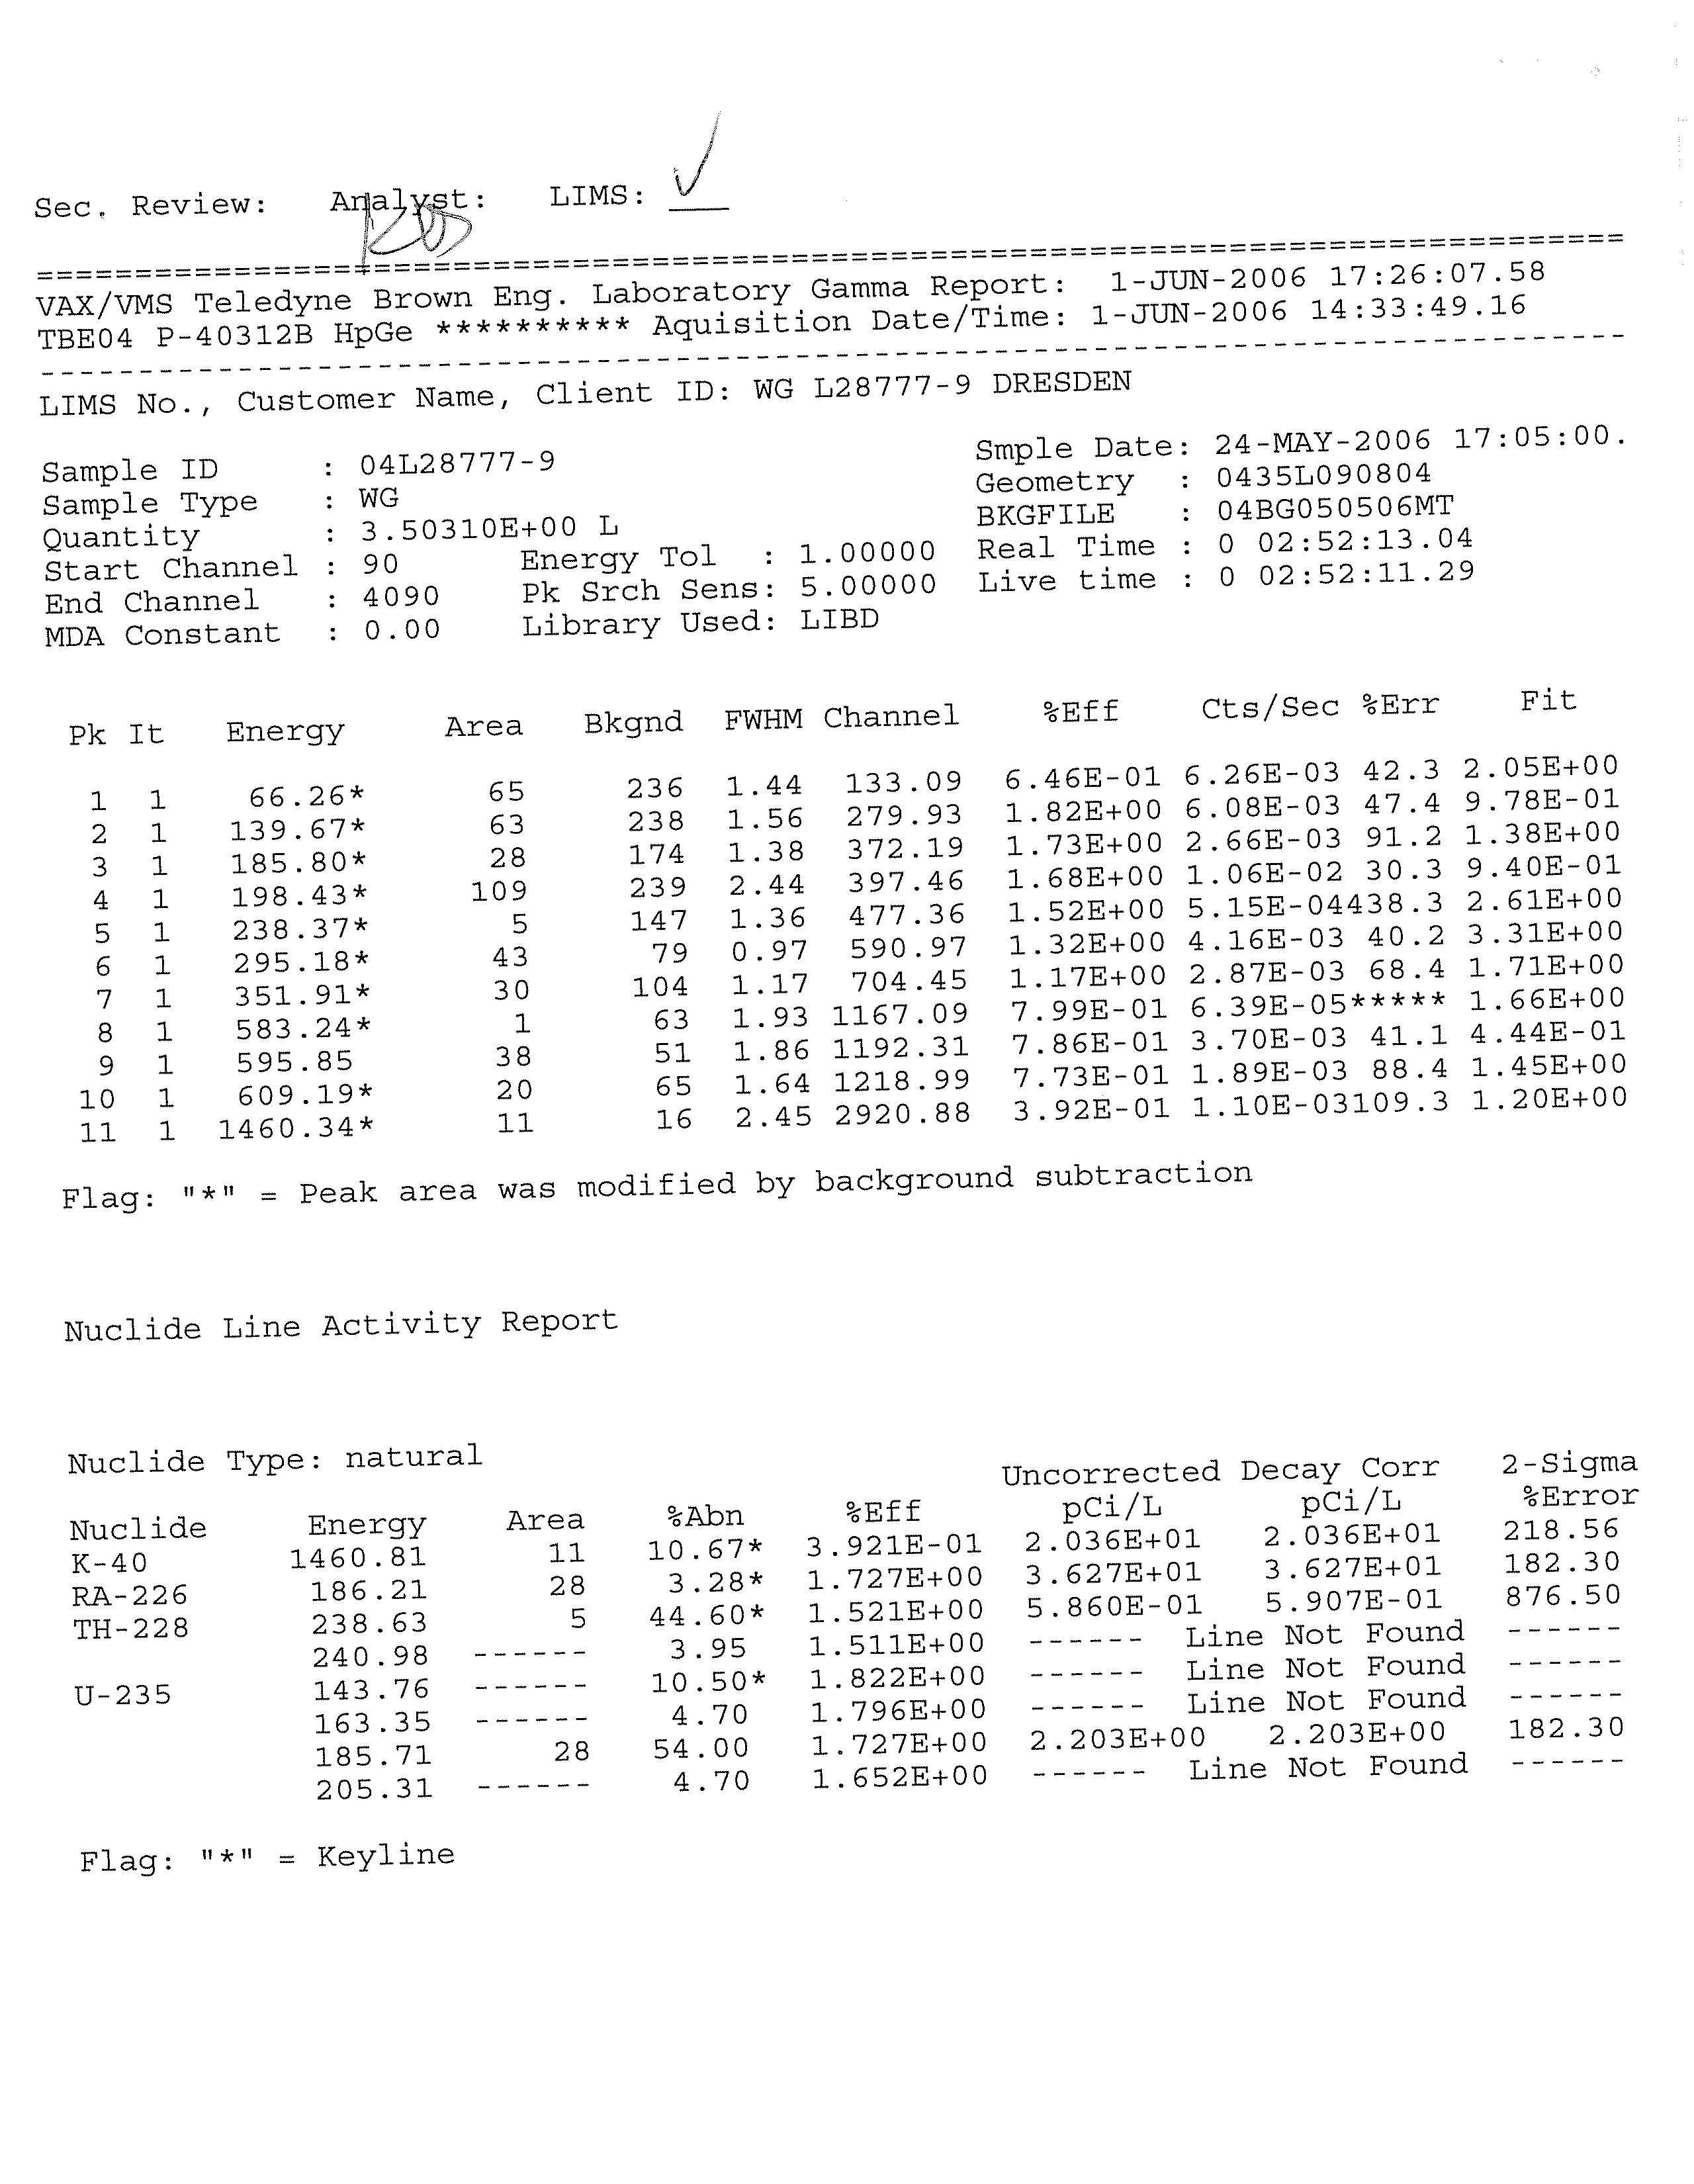
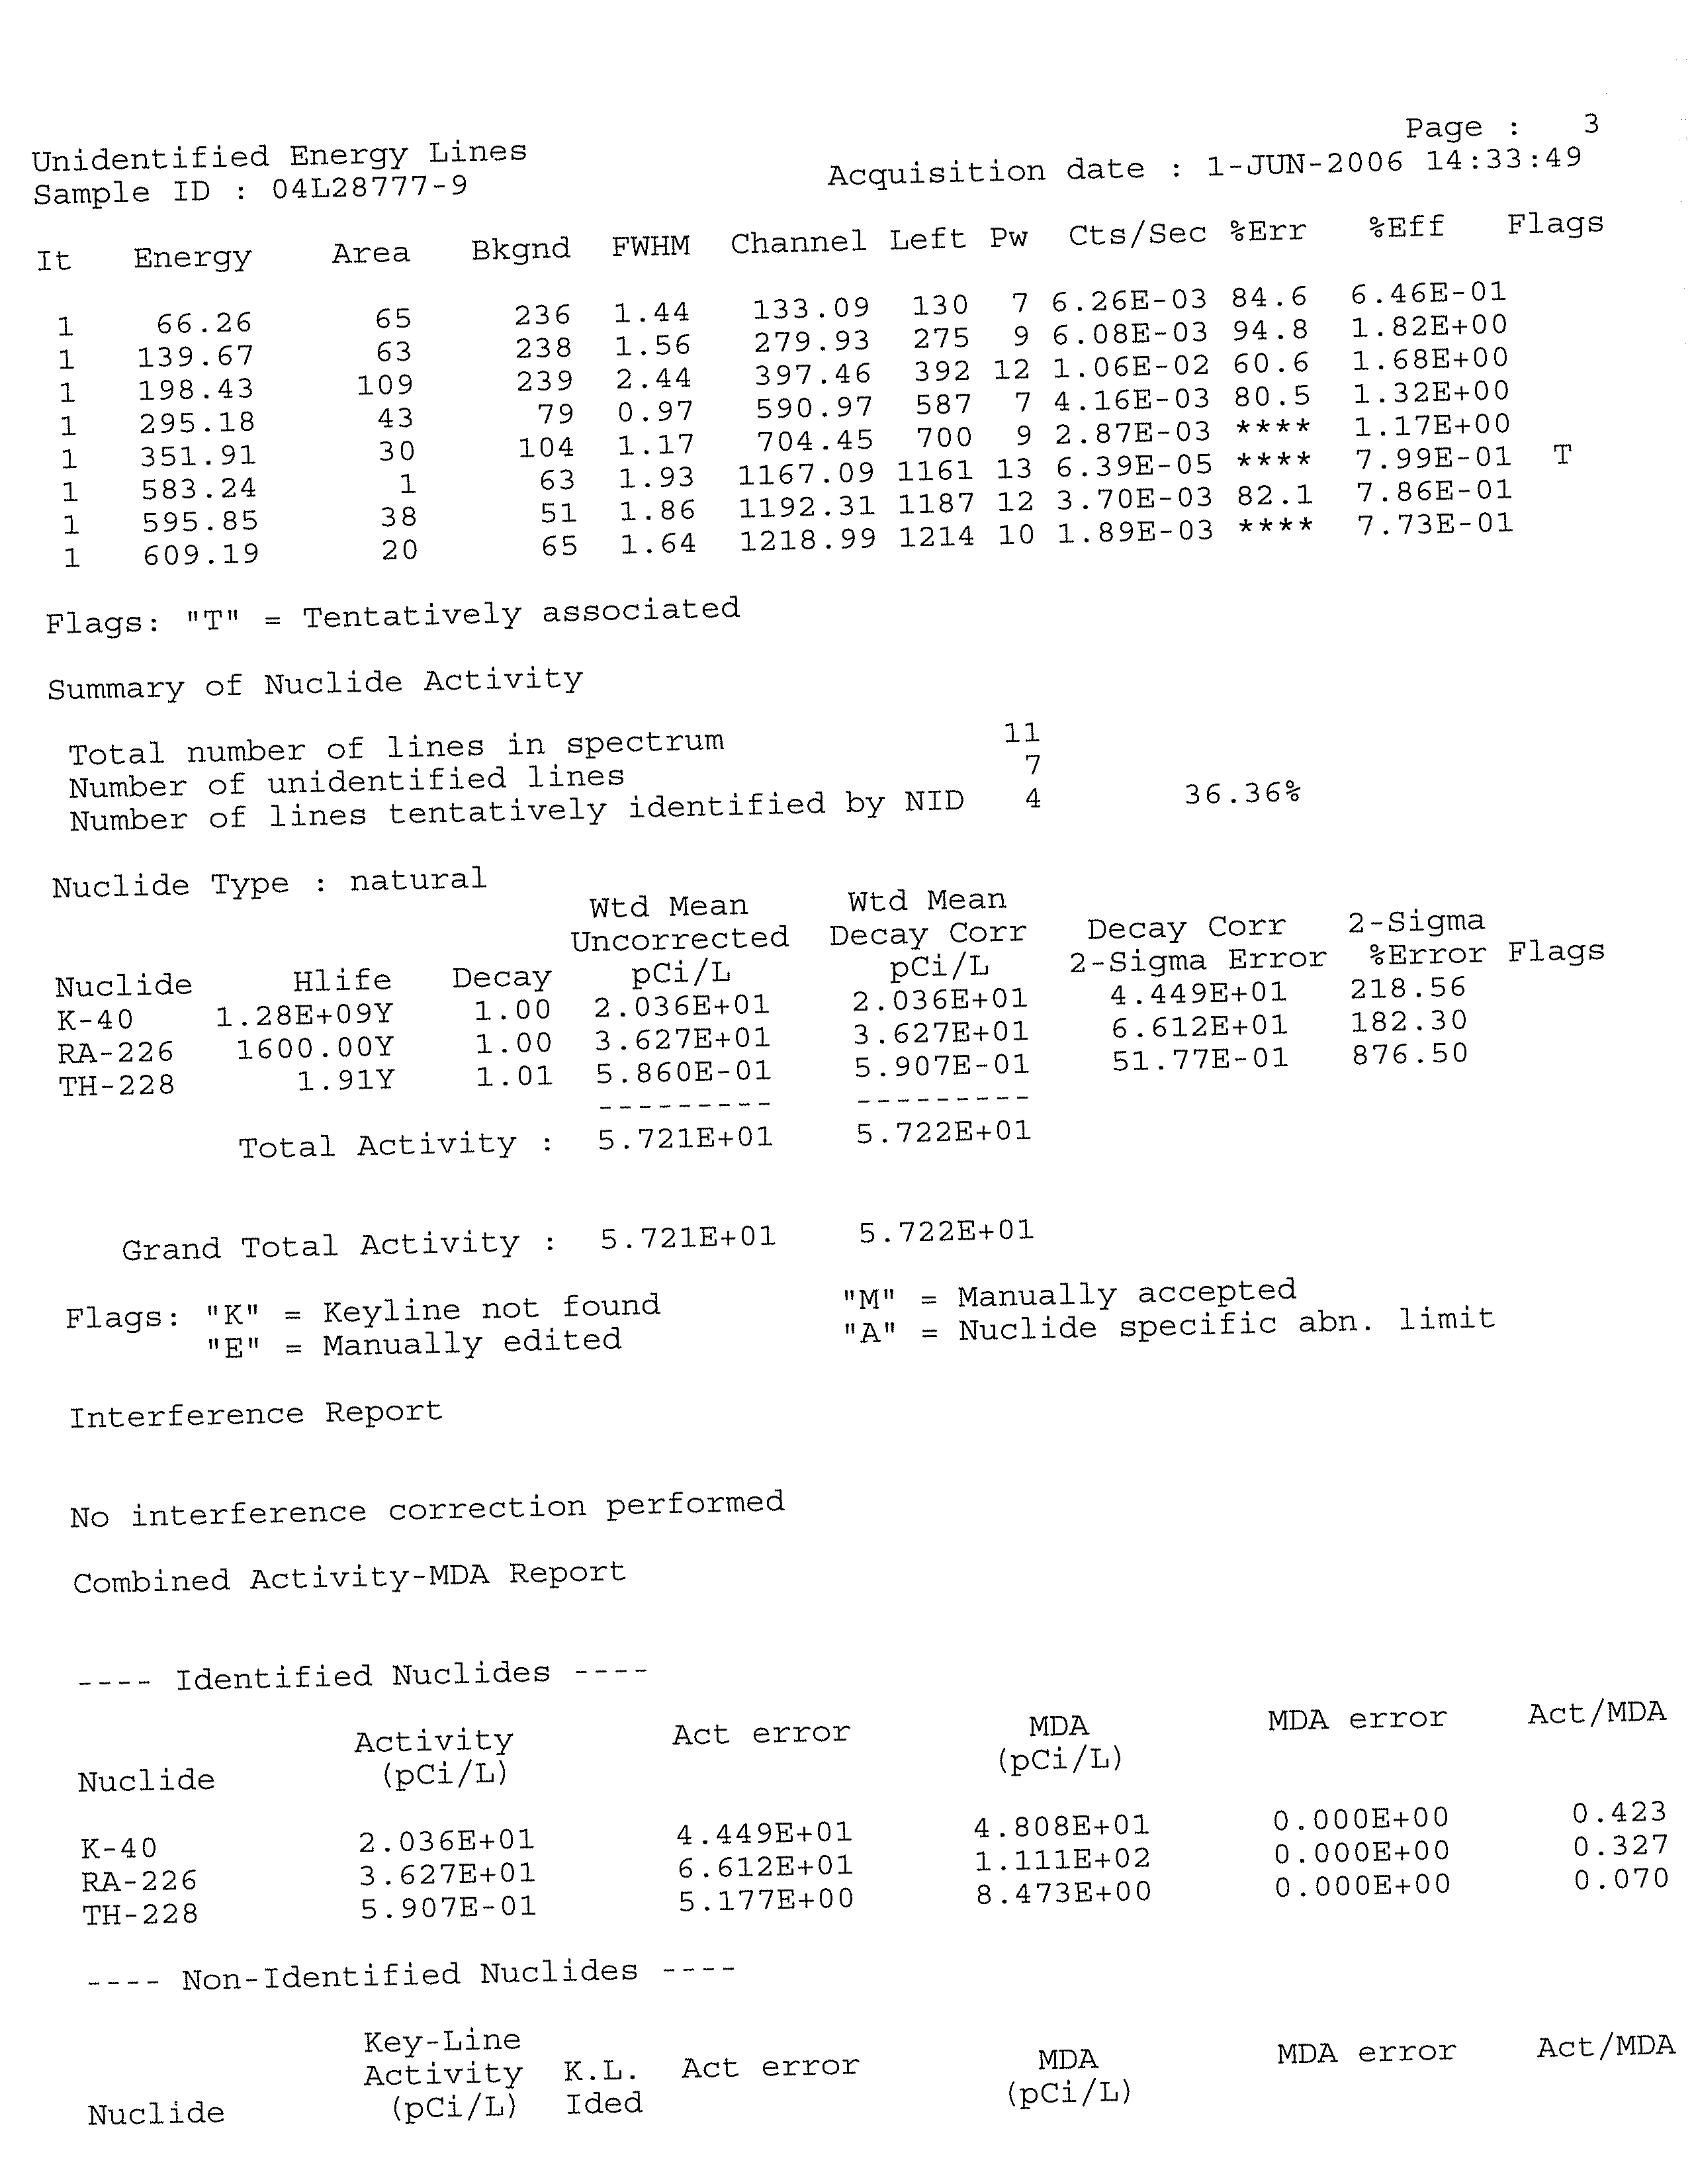
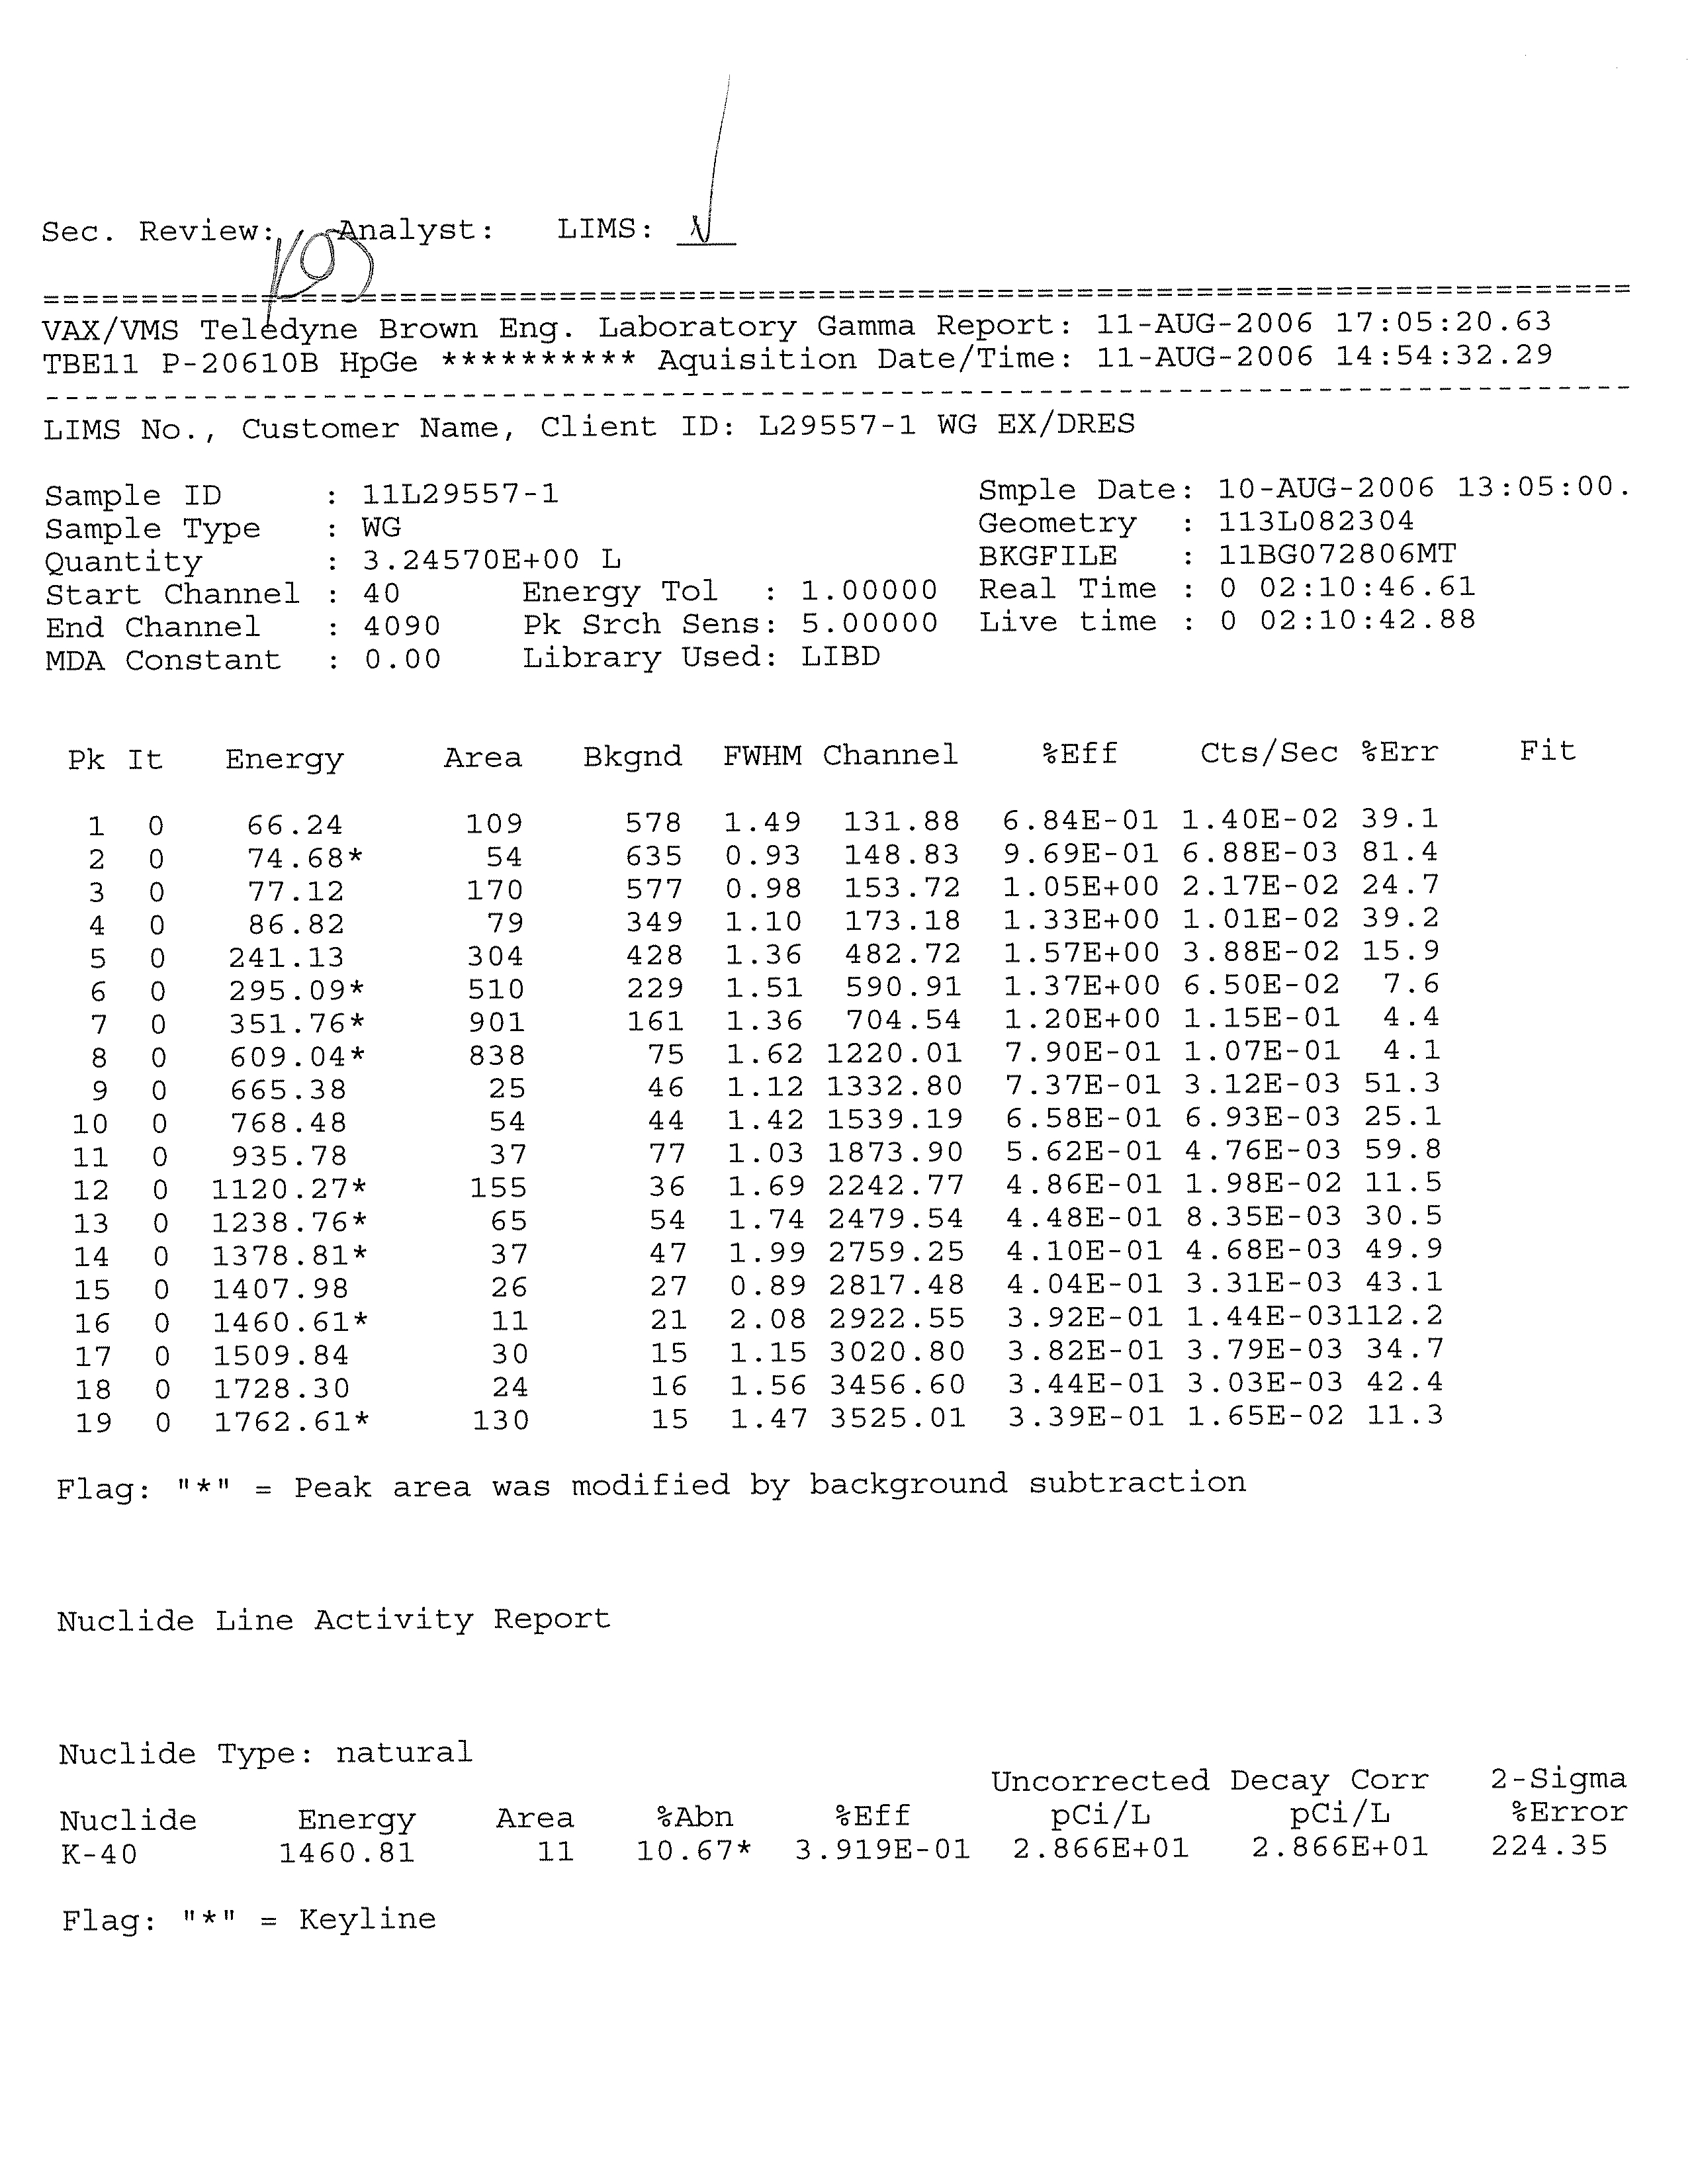
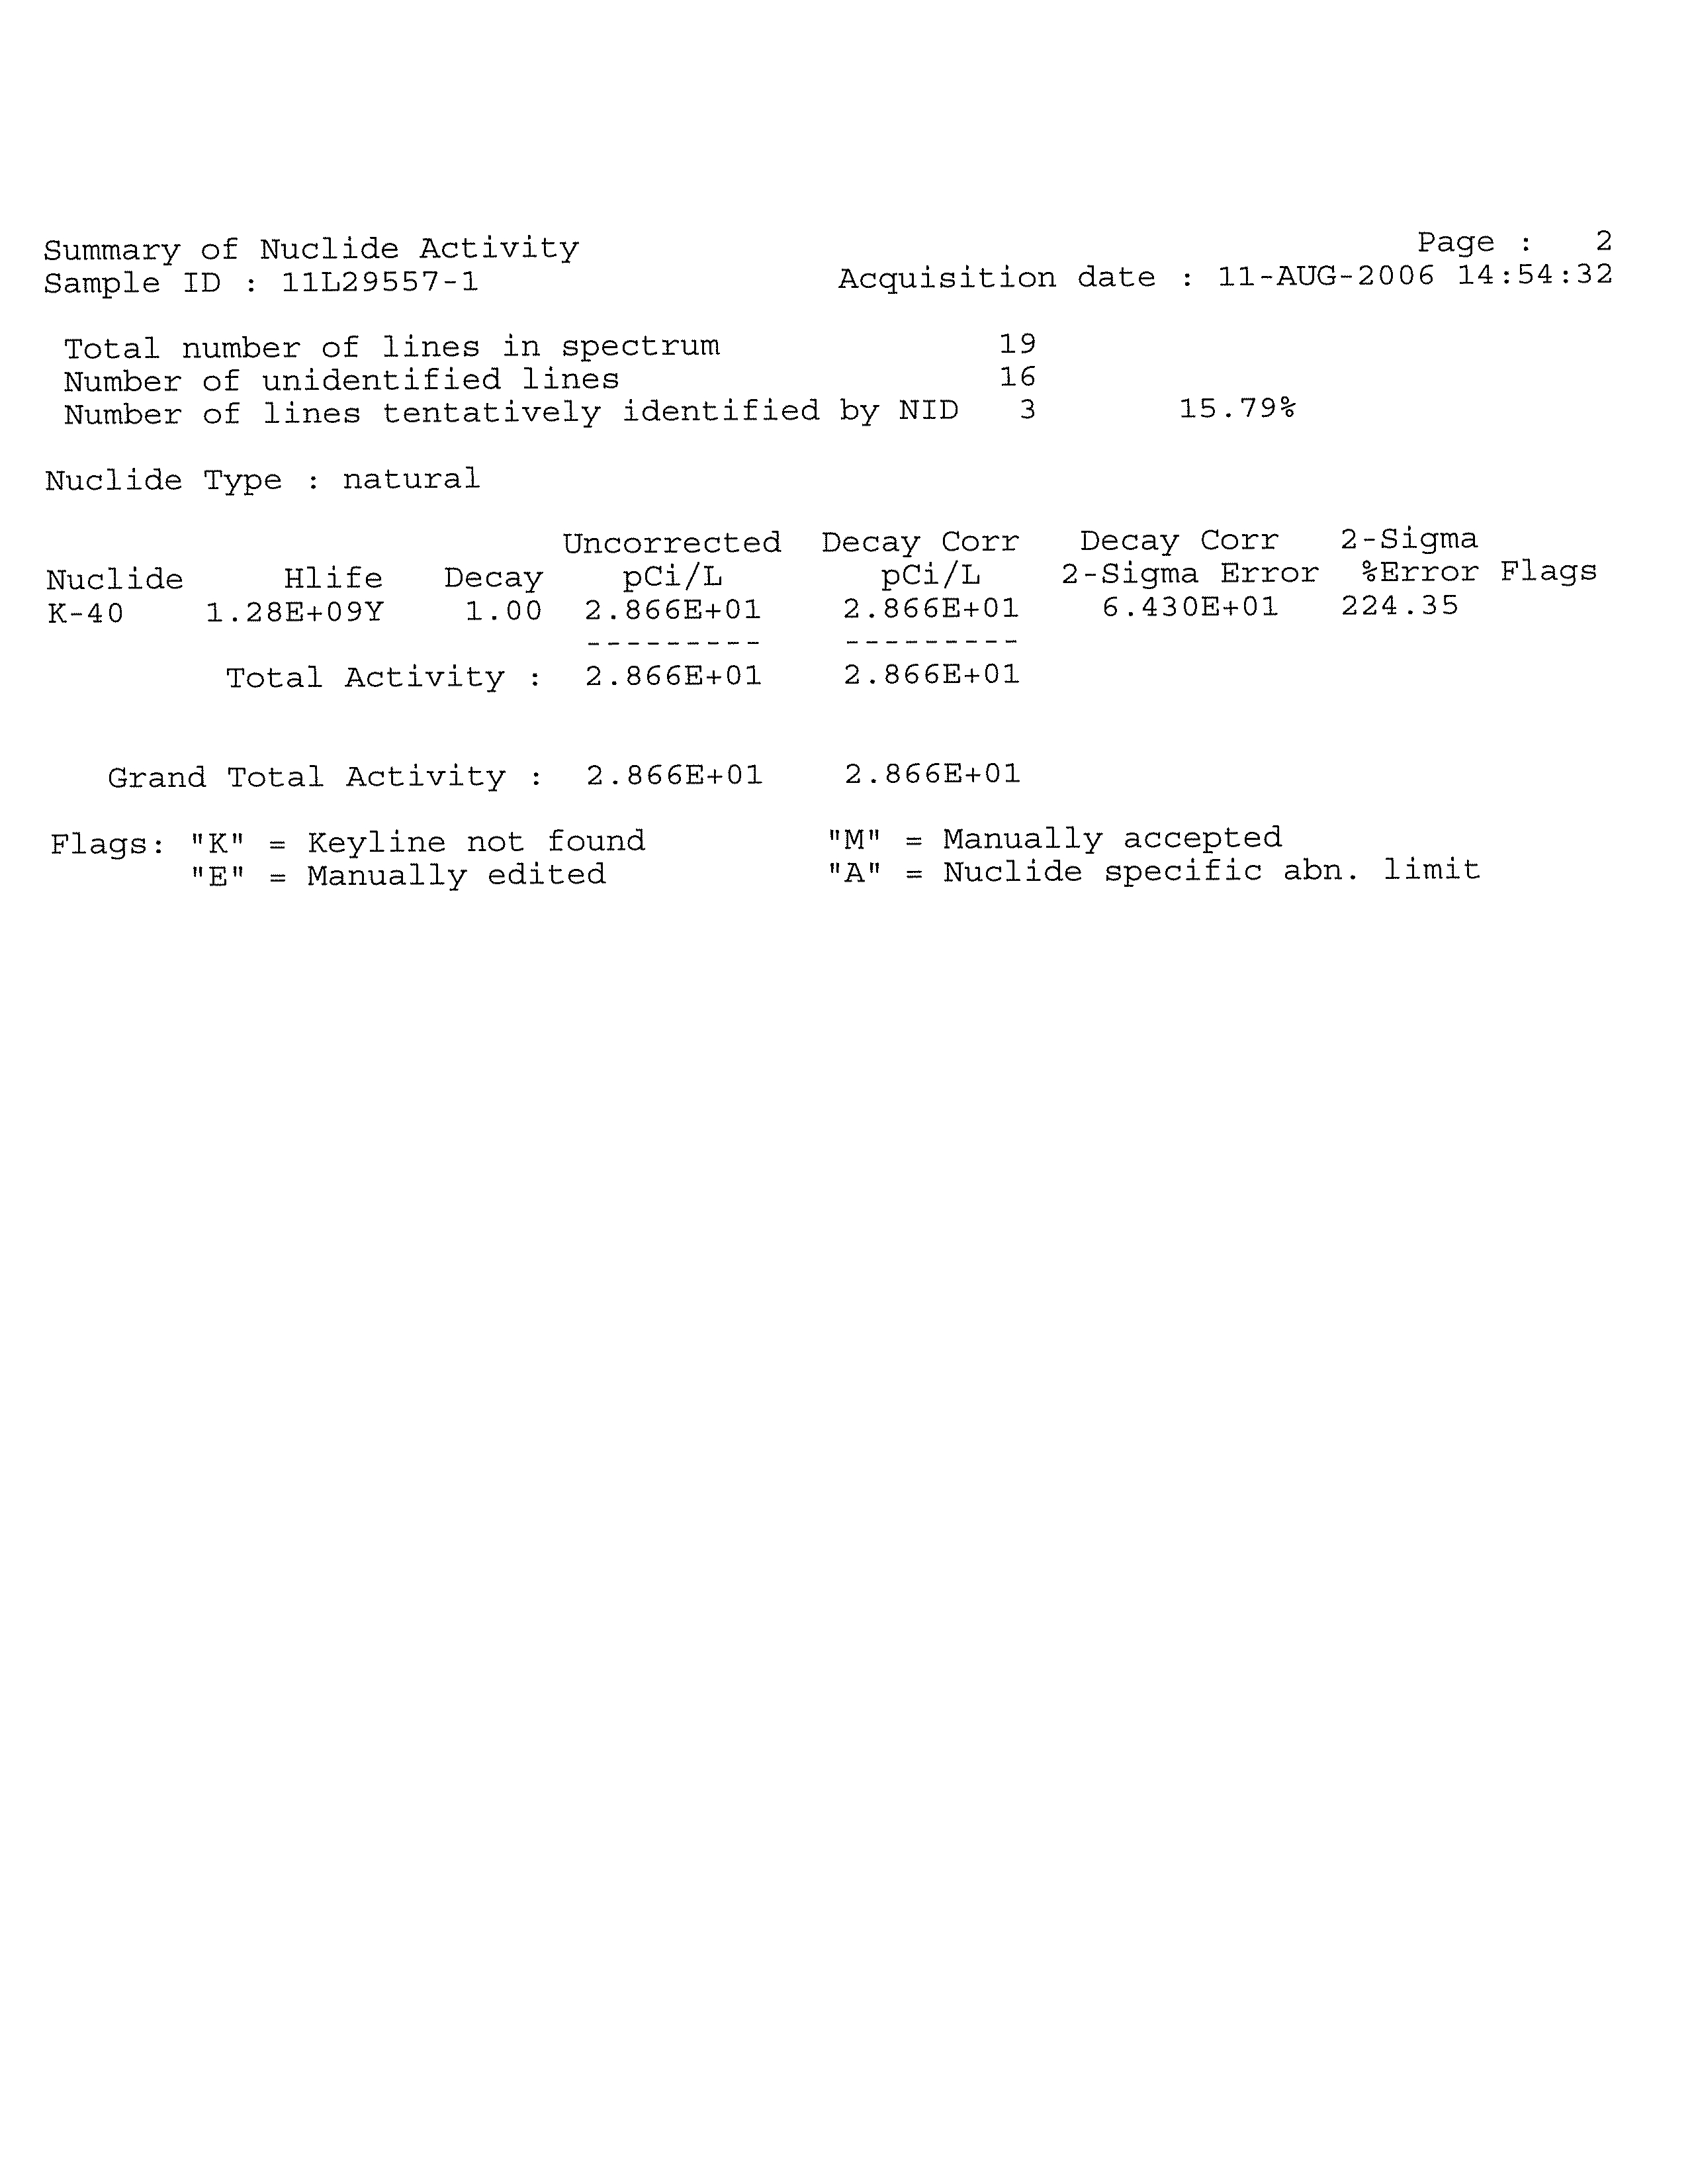
data reported. Teledyne Brown
provided the analytical services. The Quality Assurance
Program for the laboratory is described in Appendix C.
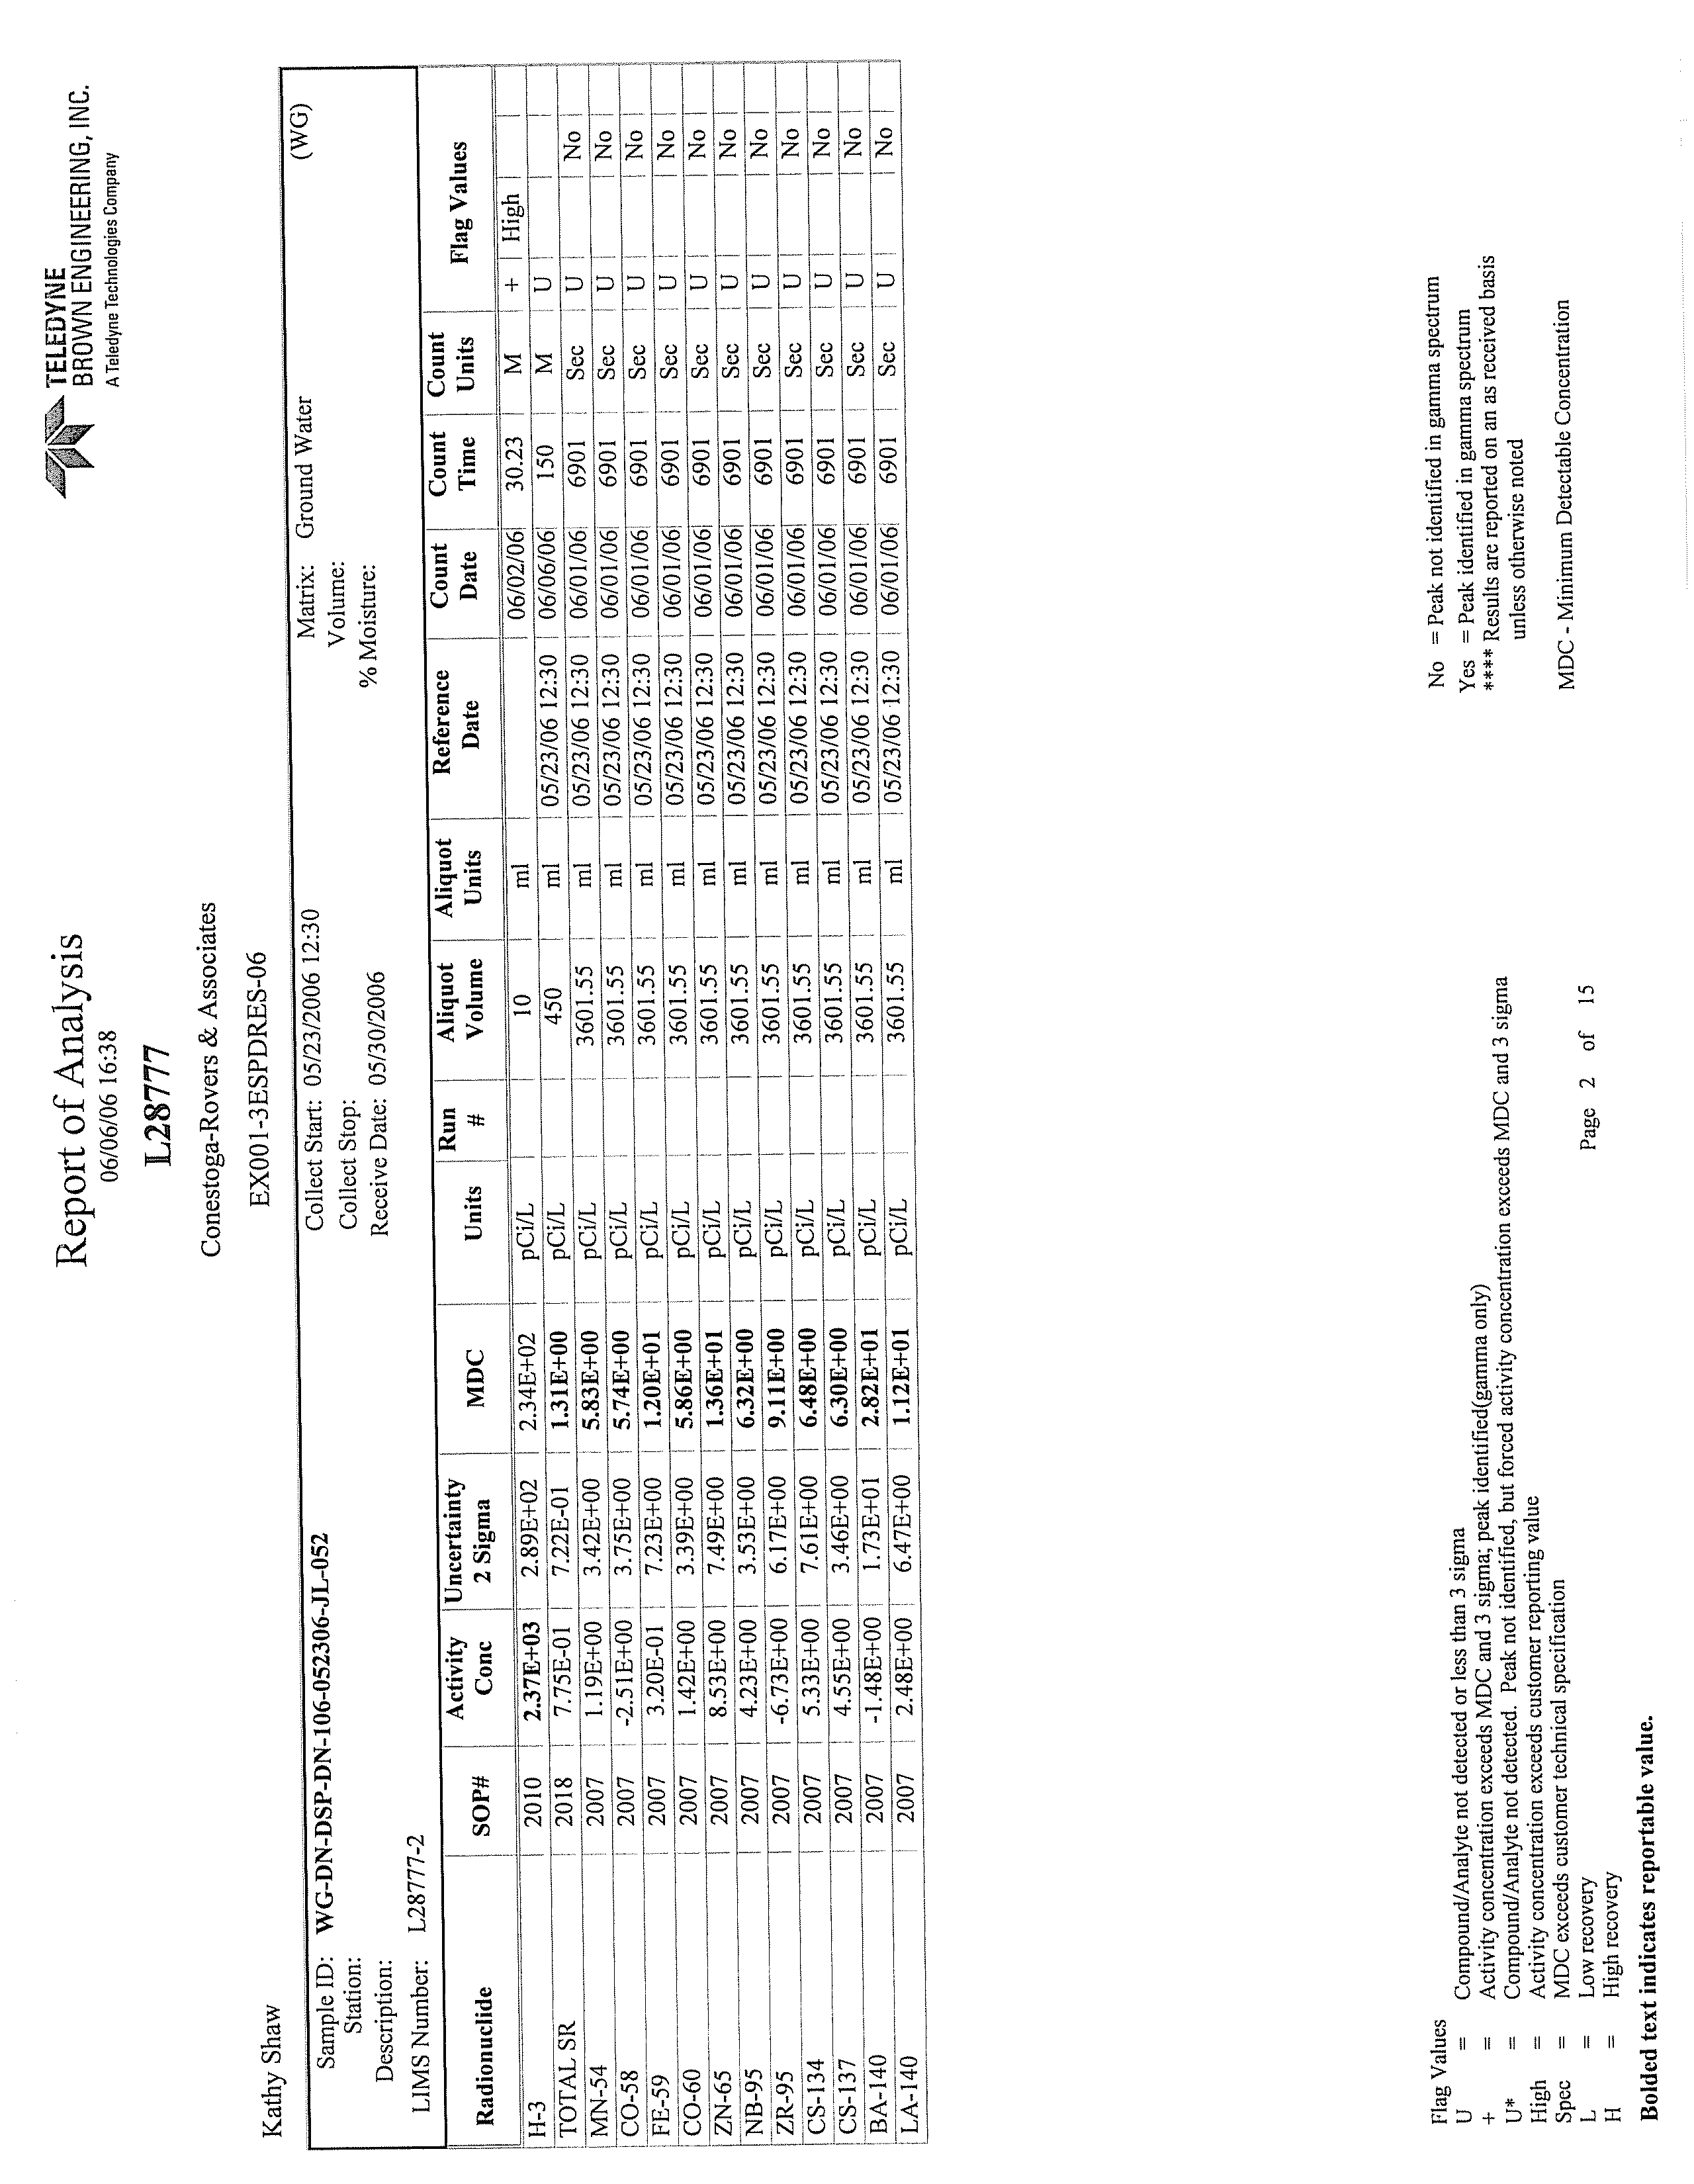
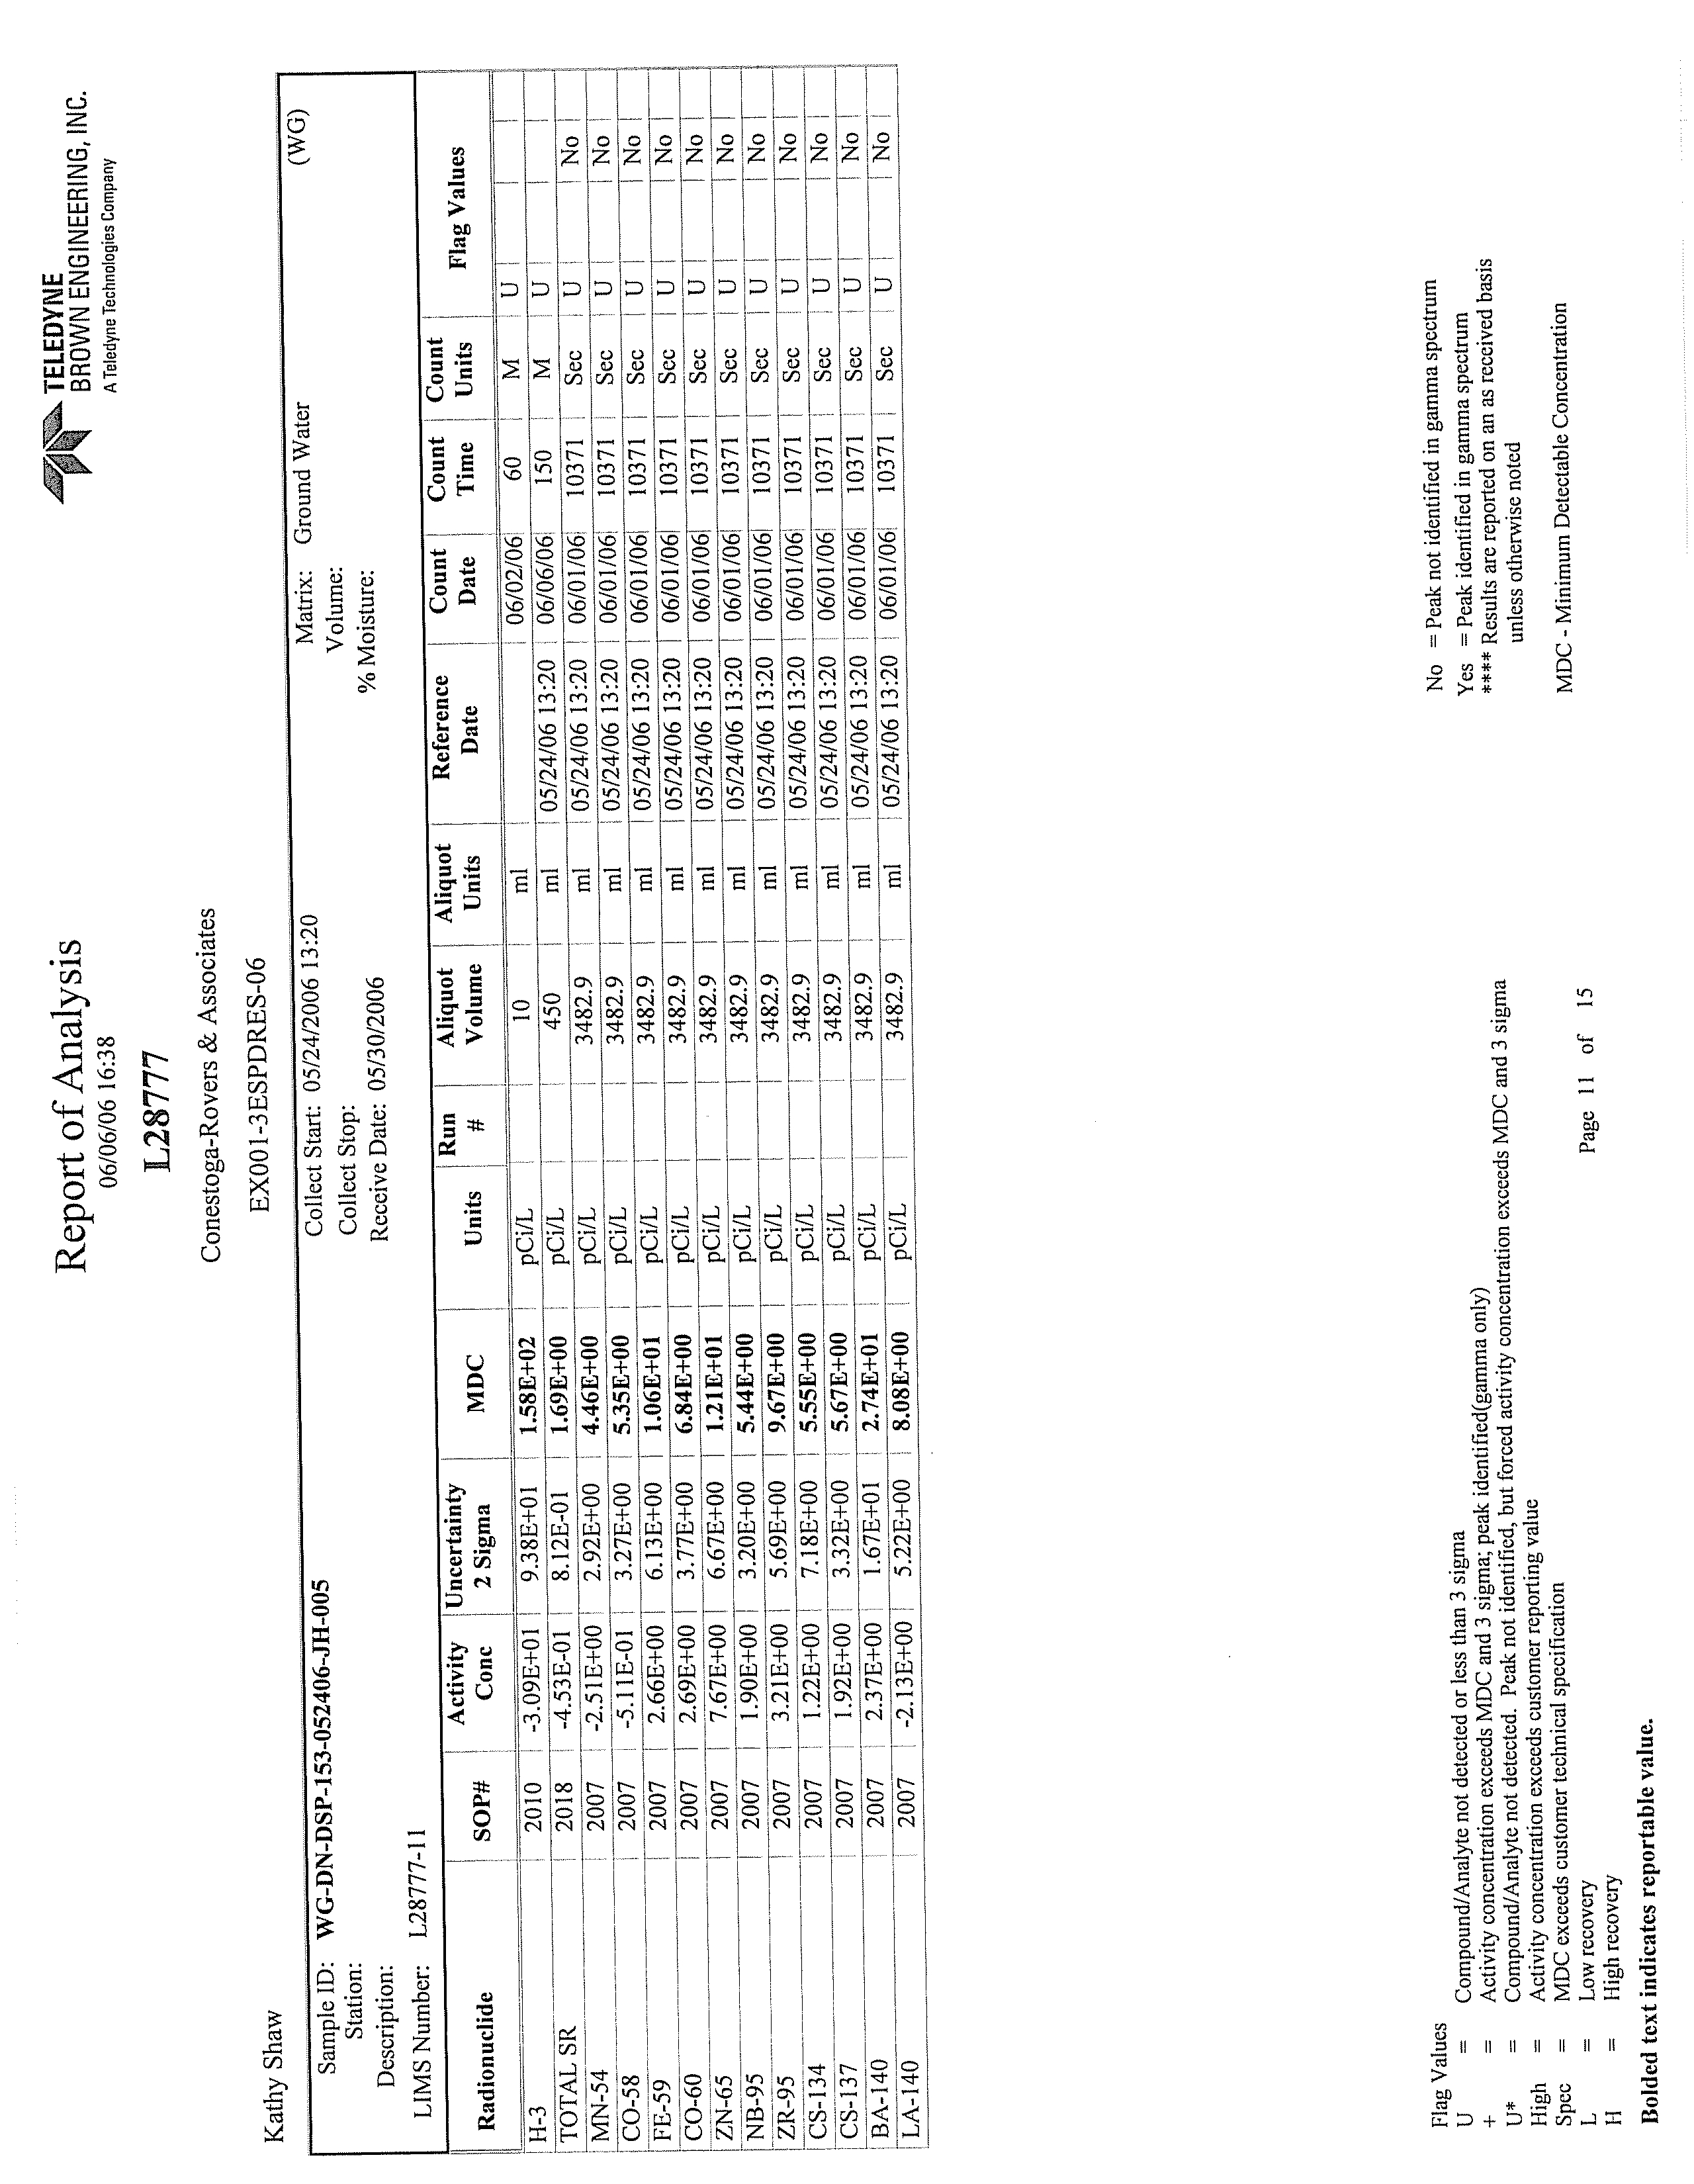
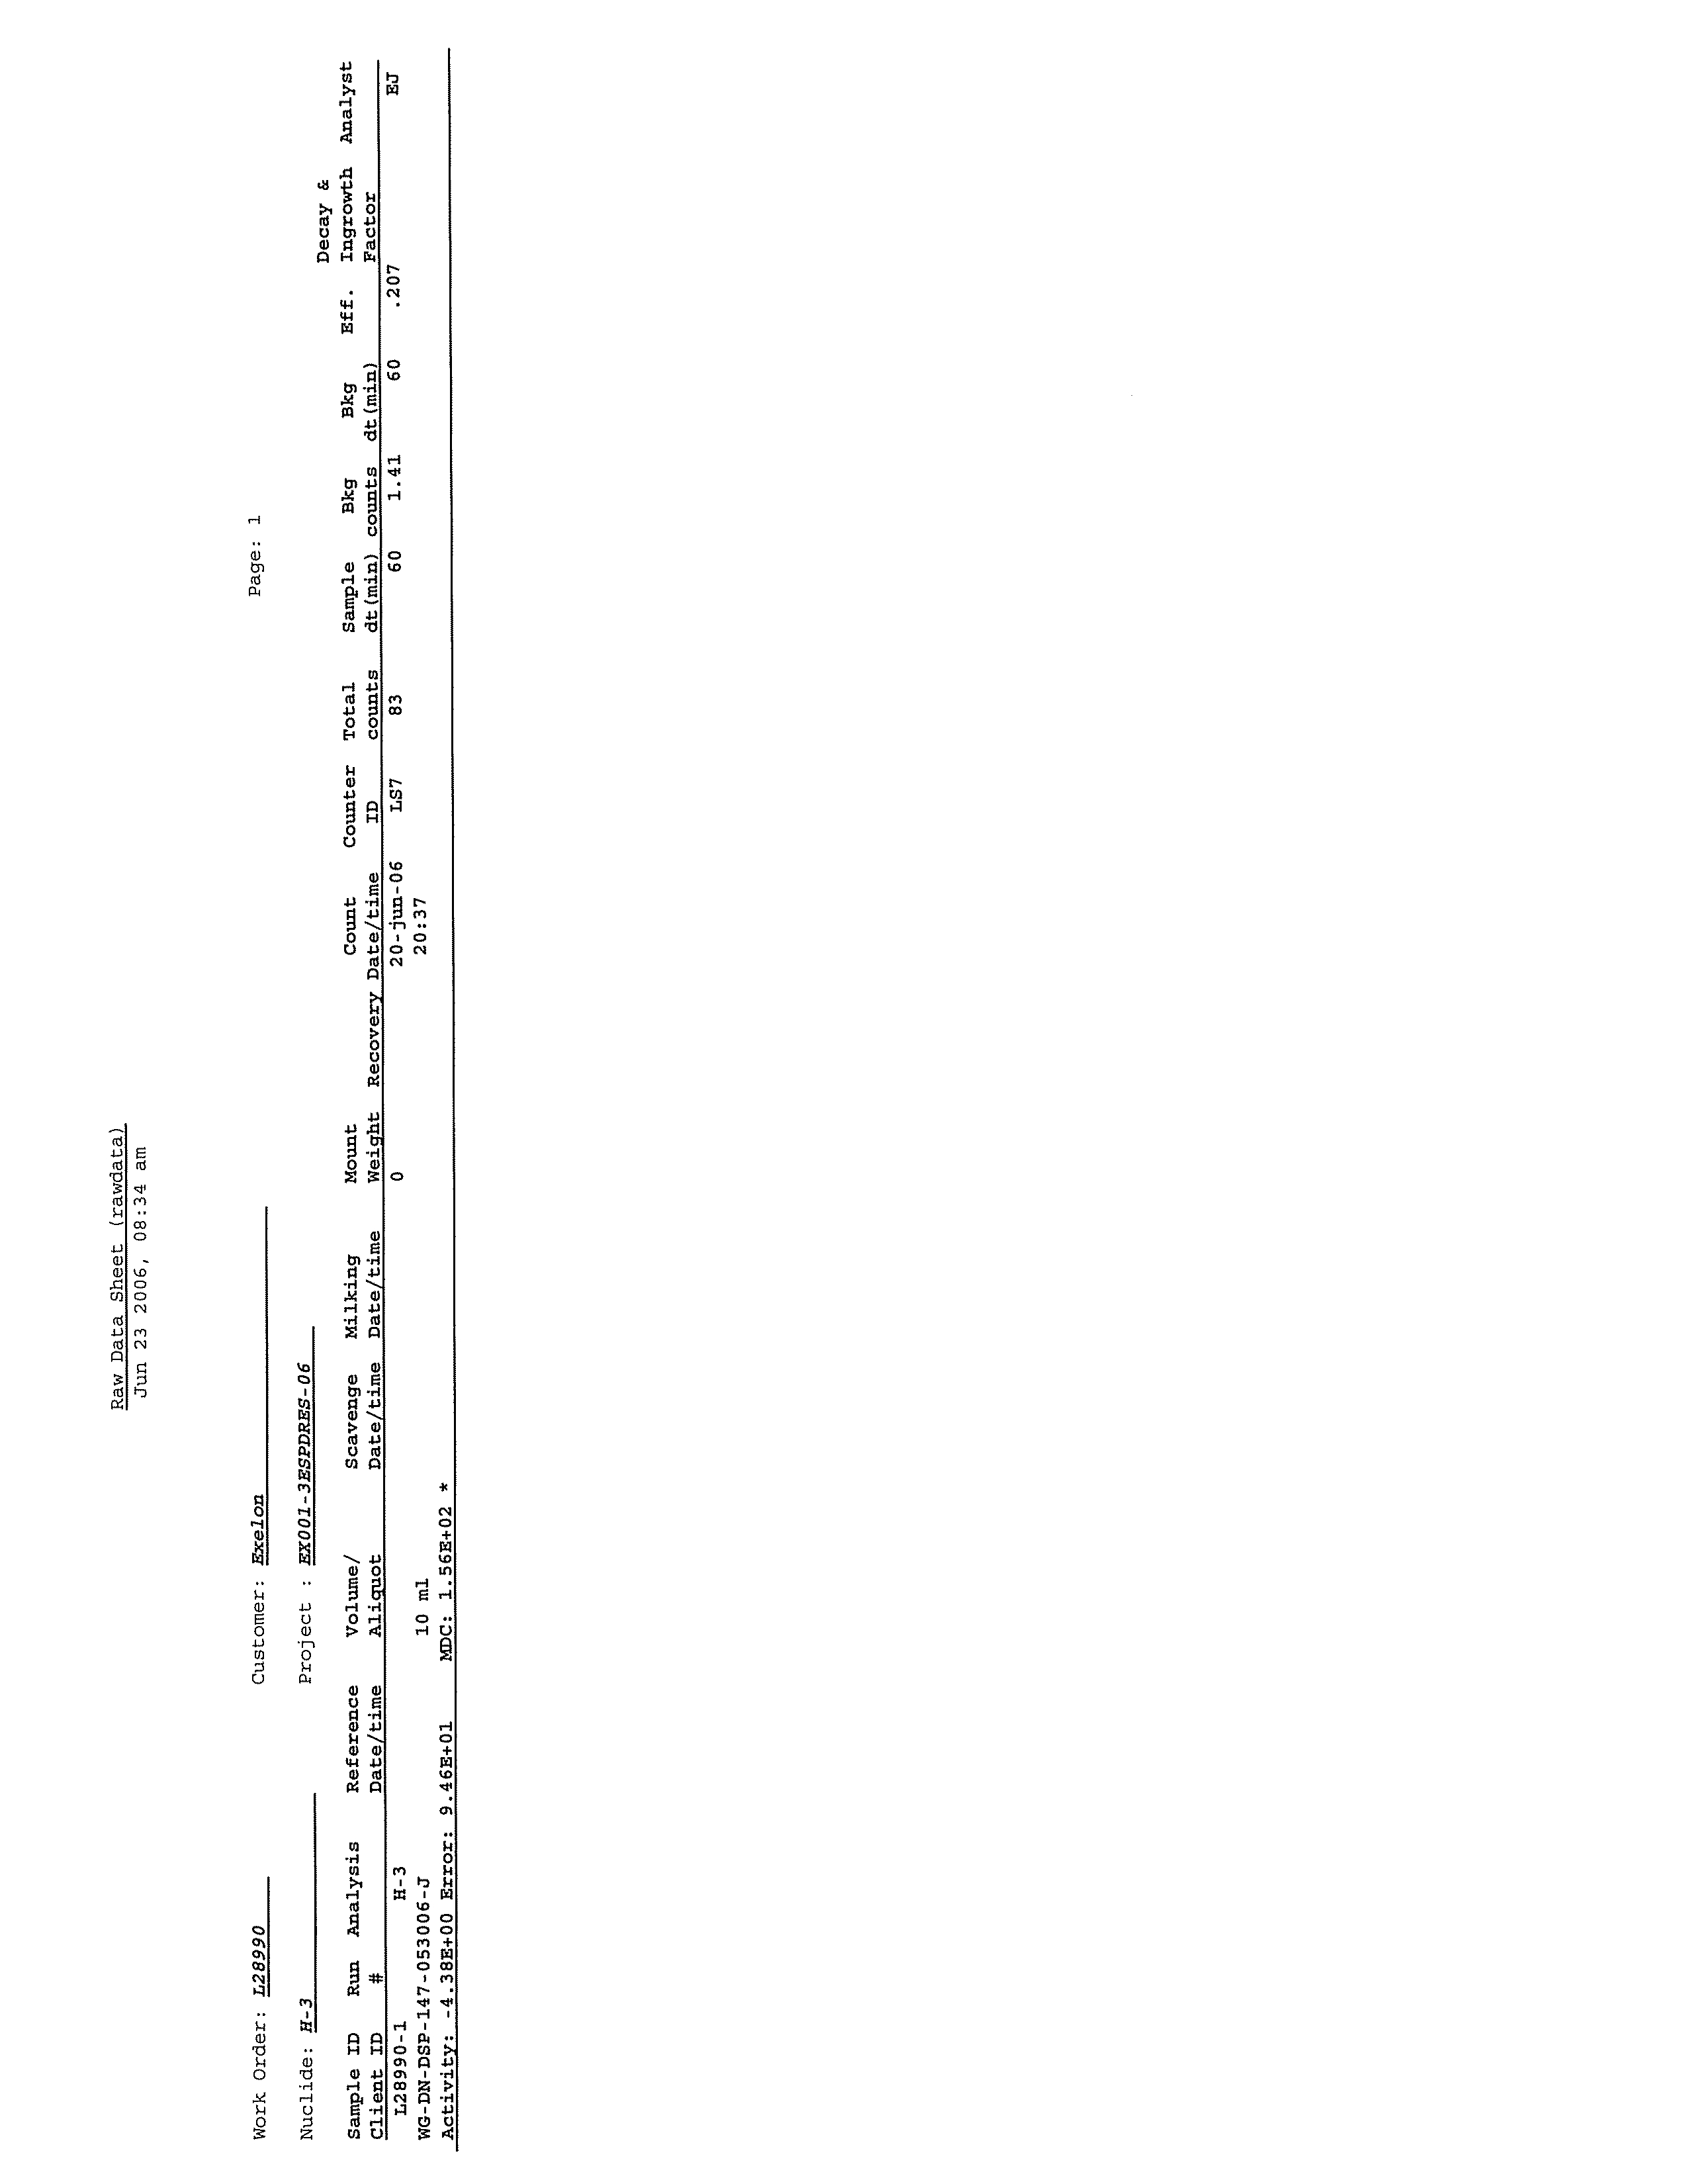
Analytical data for
groundwater and surface water samples collected in accordance with the Work Plan are
045136 (15) Dresden Generating Station
23
CONESTOGA-ROVERS & ASSOCIATES
Revision 1
presented in Appendix D. Data validation reports are presented in Appendix
E. The
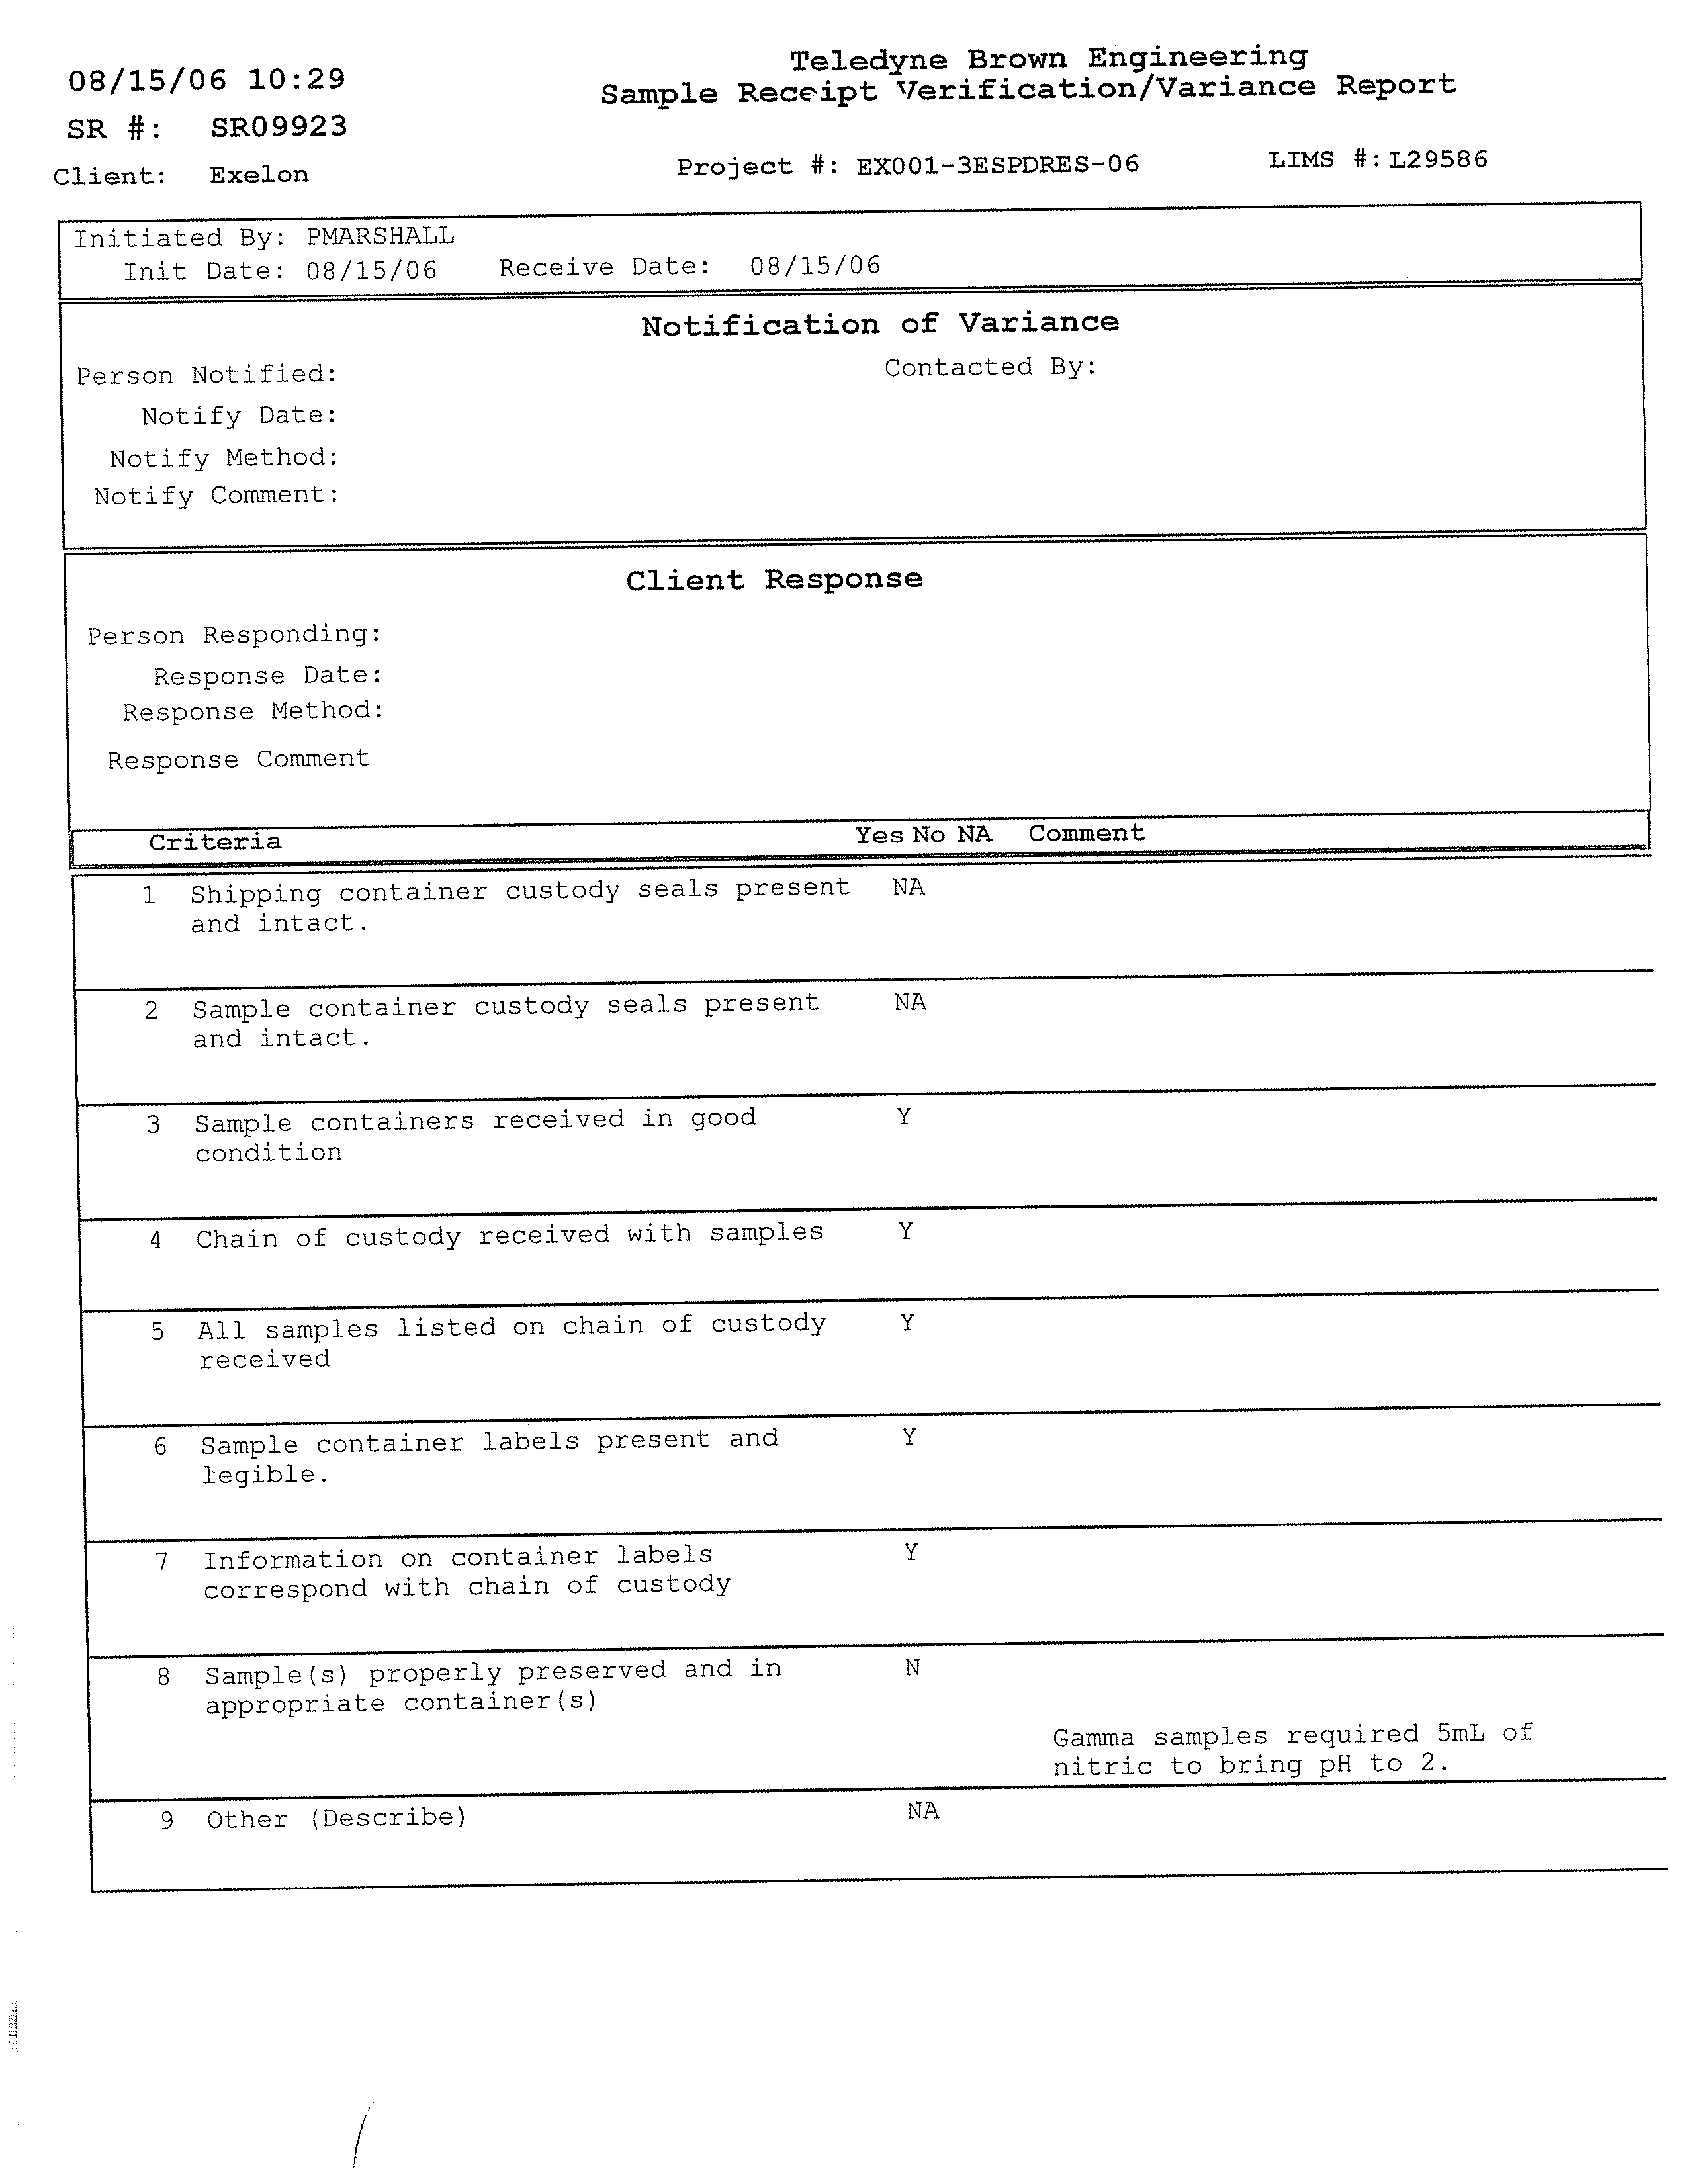
data validation included the following information and evaluations:
•
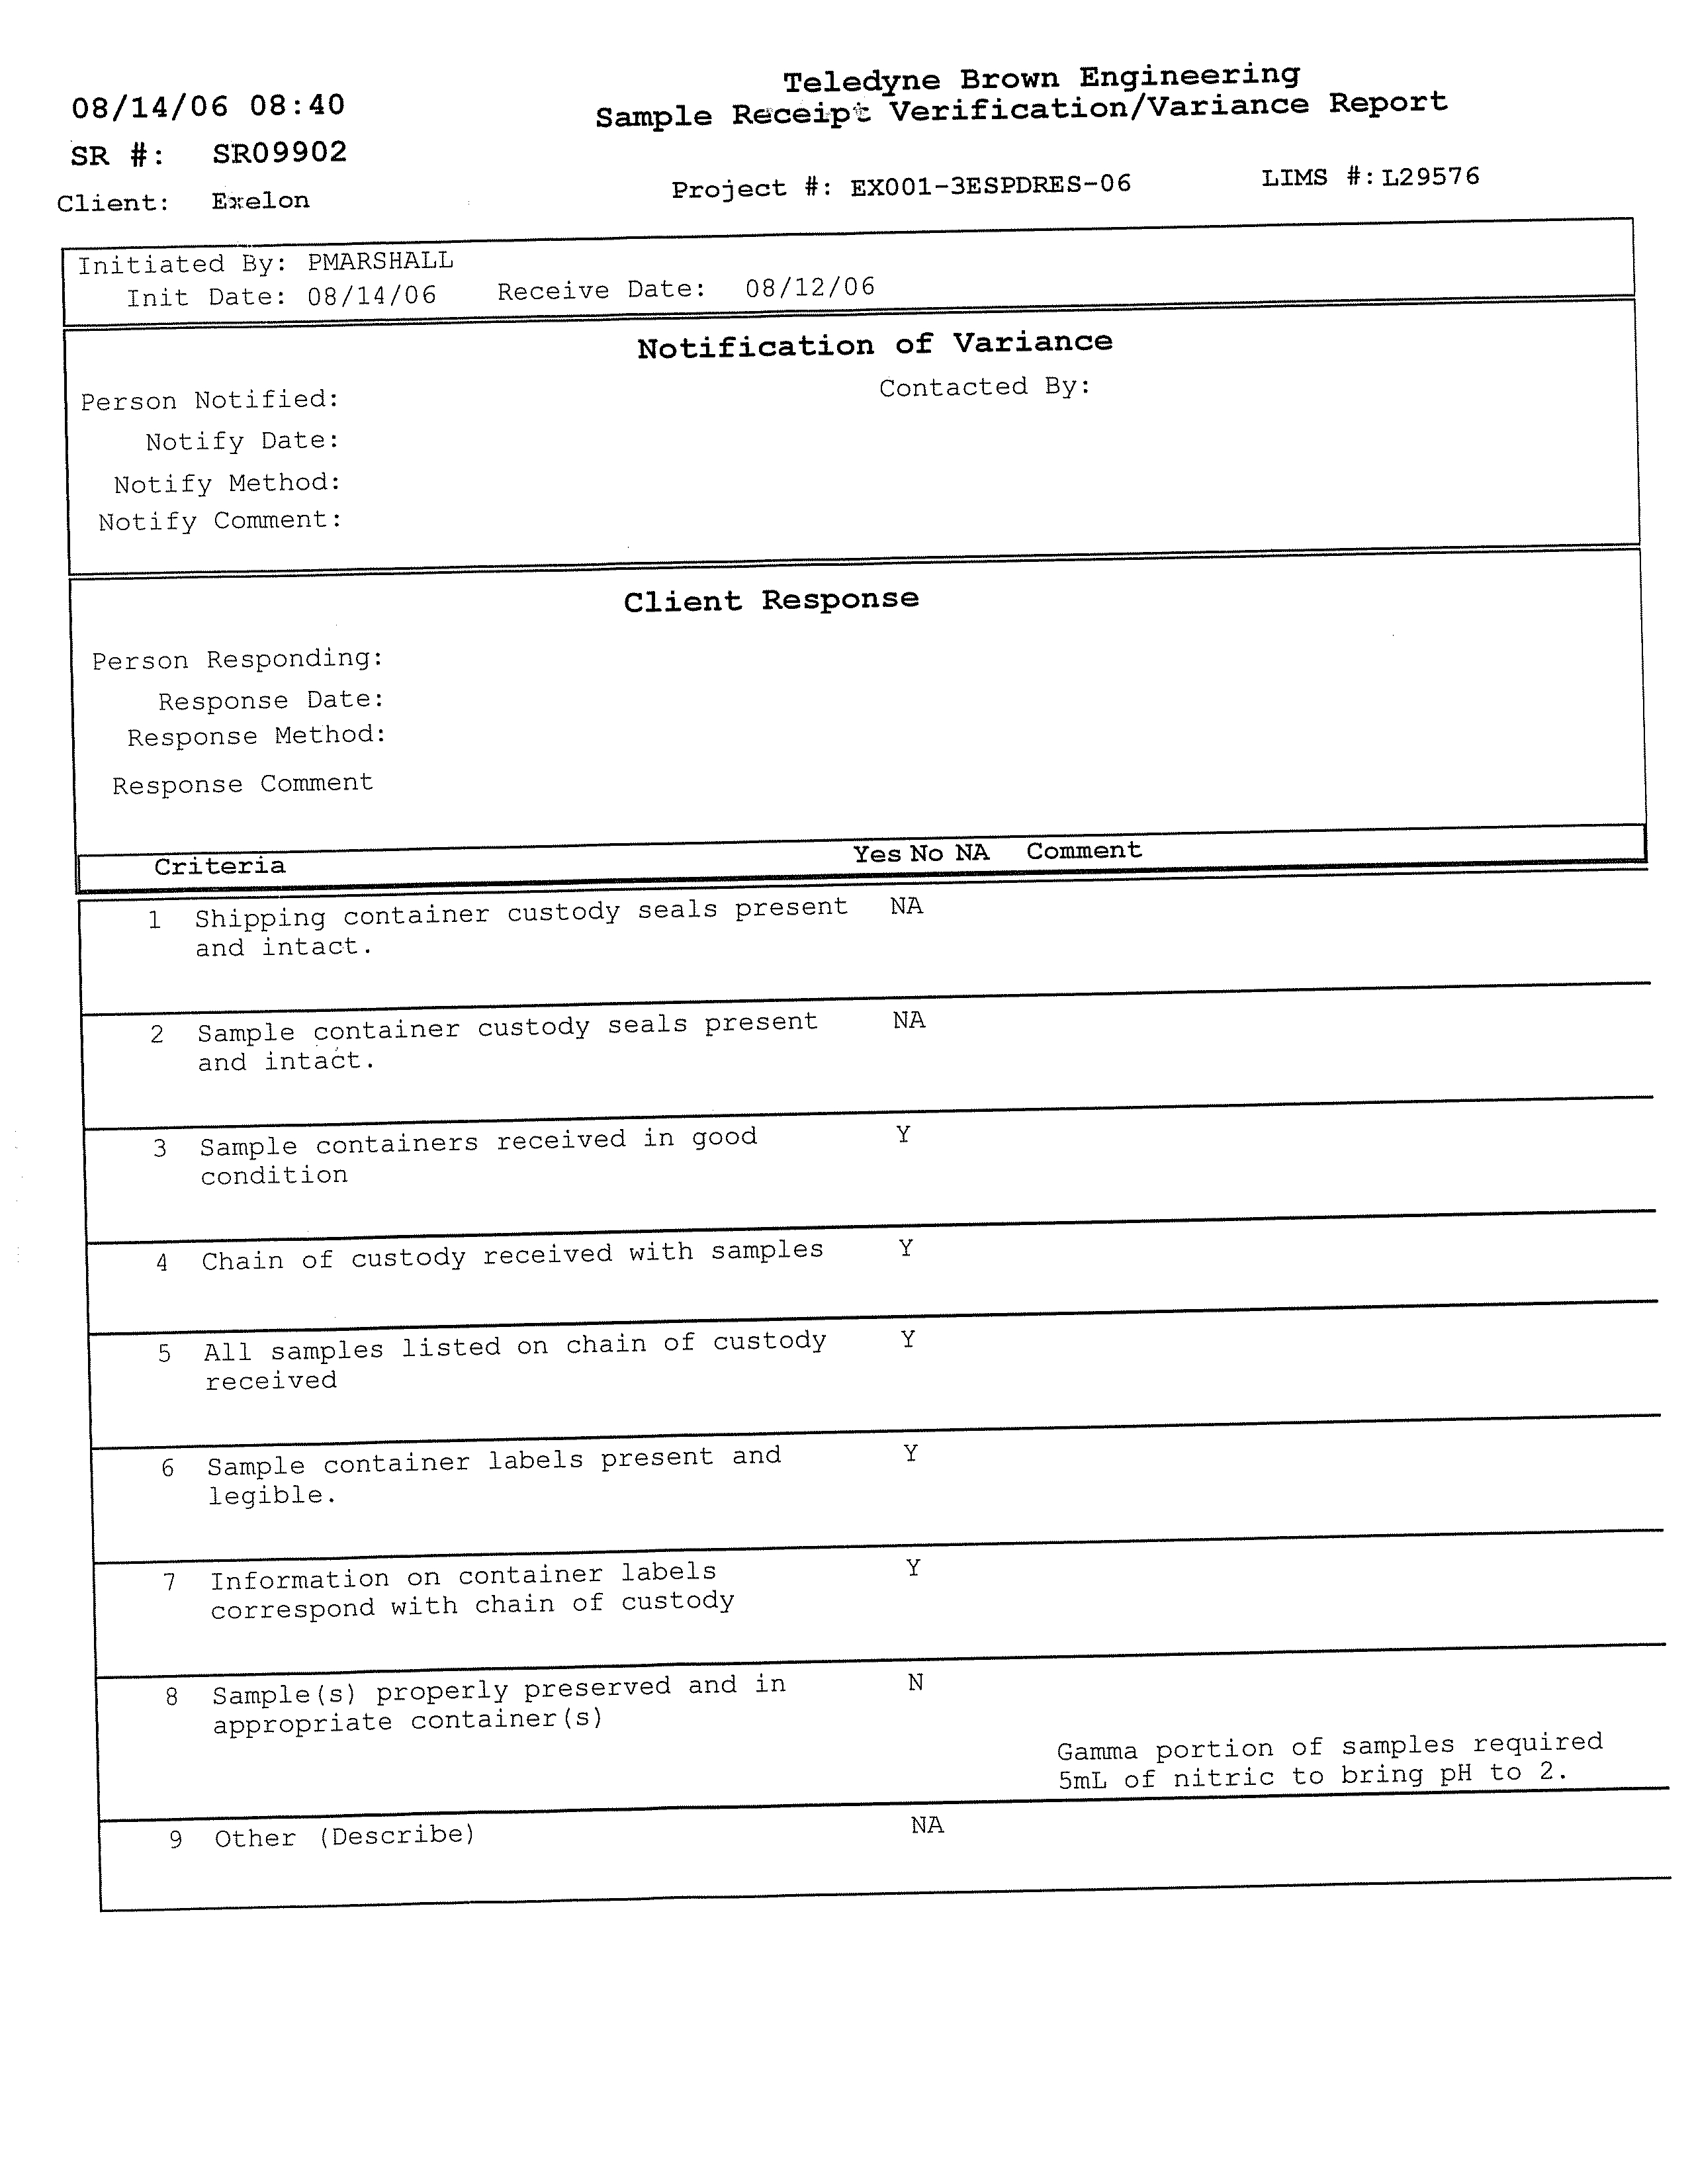
sample preservation;
•
sample holding times;
•
laboratory method blanks;
•
laboratory control samples;
•
laboratory duplicates;
•
verification of laboratory qualifiers; and
•
field quality
control (field blanks and duplicates).
Following the completion of field activities, CRA compiled and reviewed the geologic,
hydrogeologic, and analytical data.
The data were reviewed using the following techniques:
•
data tables and databox figures;
•
hydrogeologic cross-sections; and
•
hydraulic analyses.
4.8
SAMPLE IDENTIFICATION
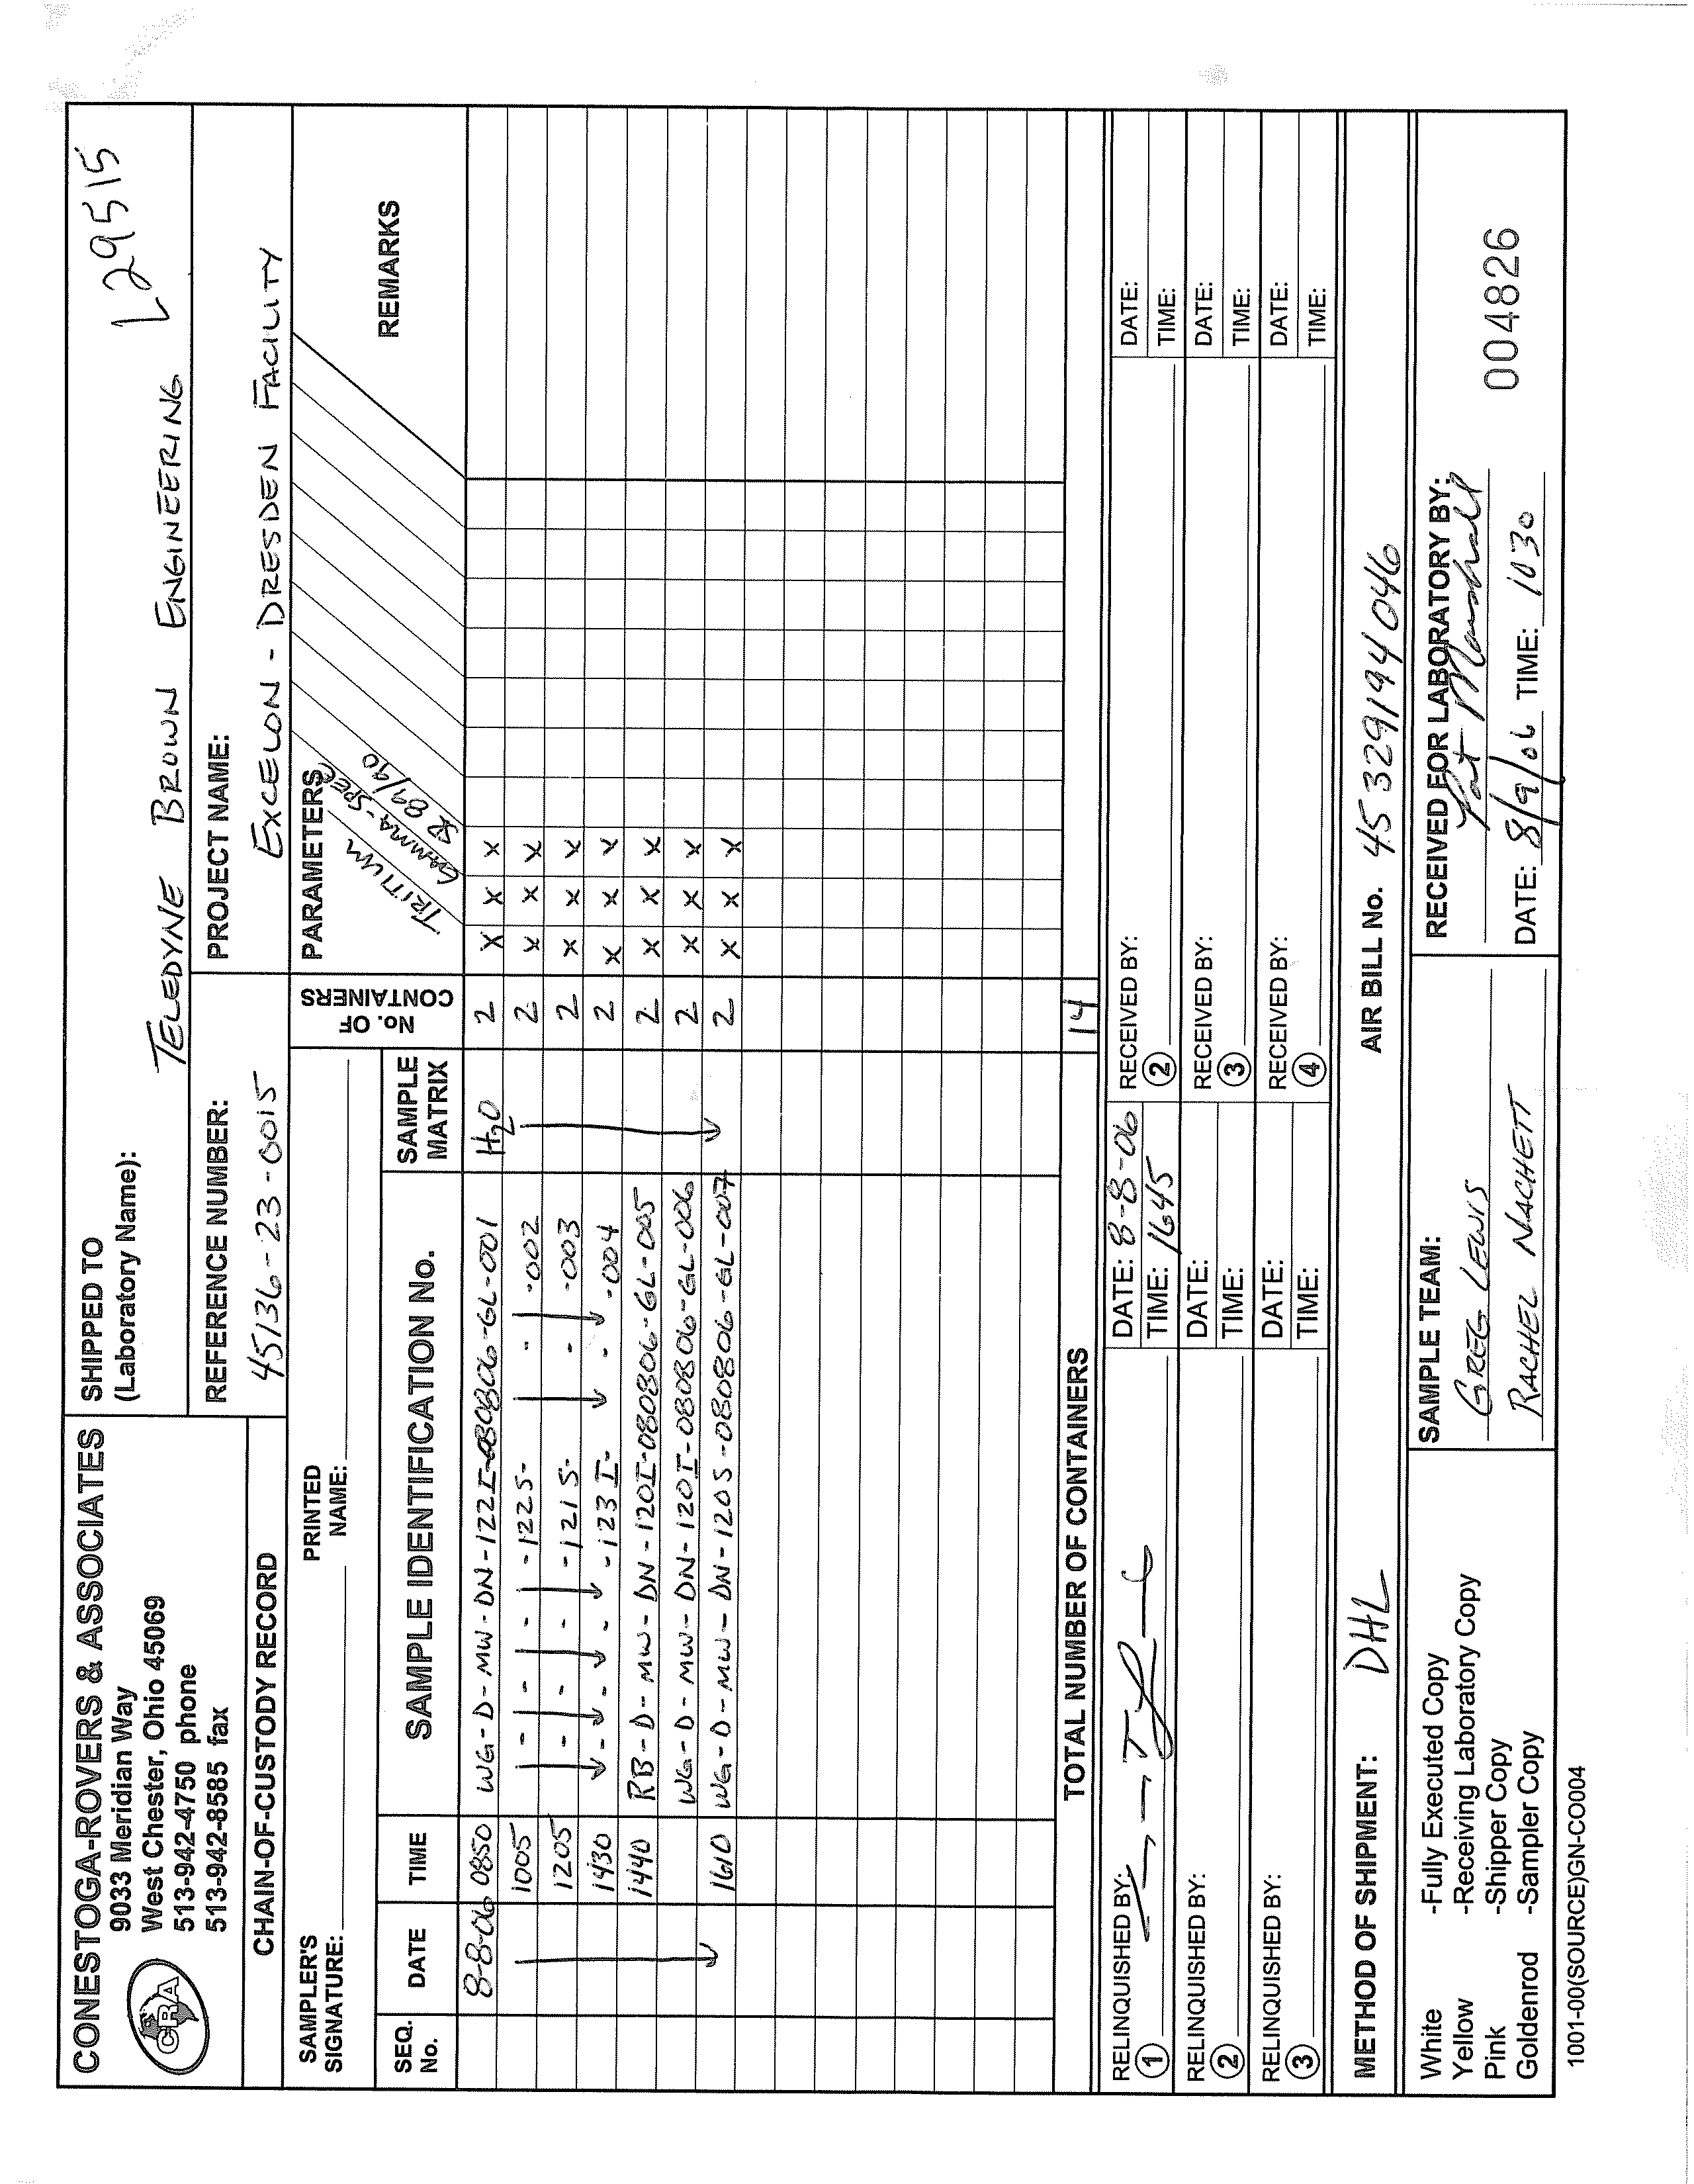
Systematic sample identification codes were used to uniquely identify all samples. The
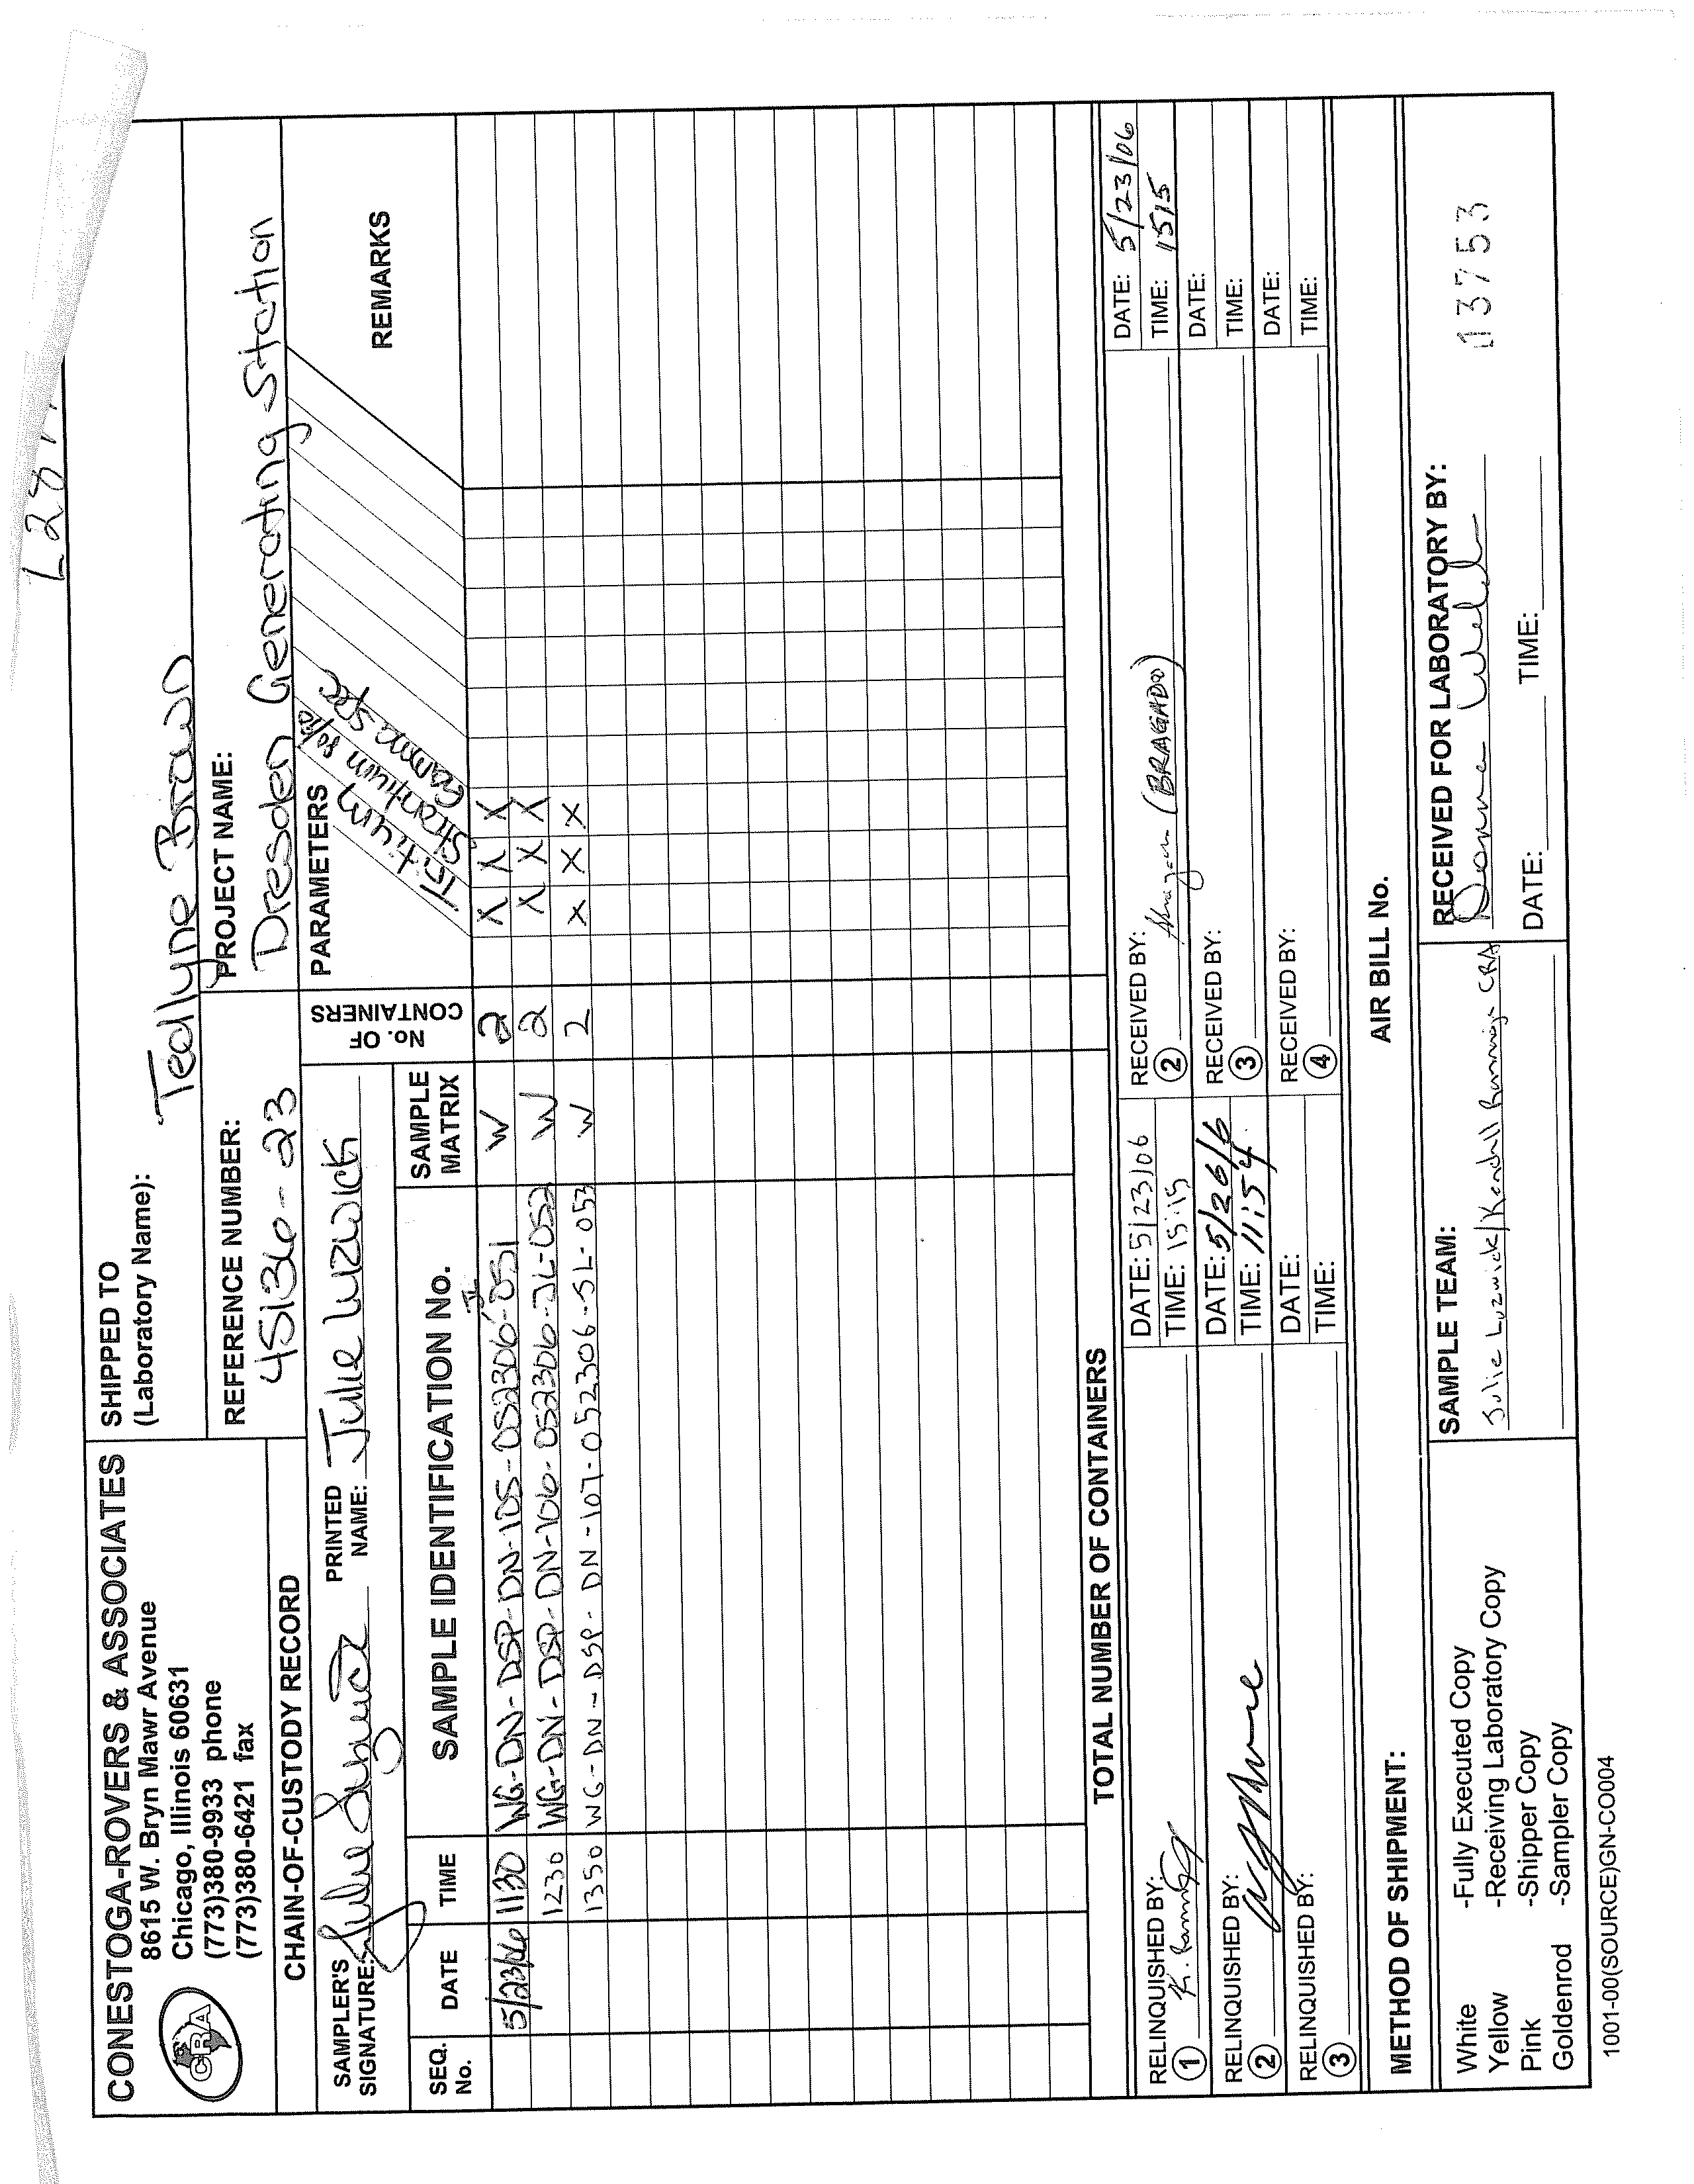
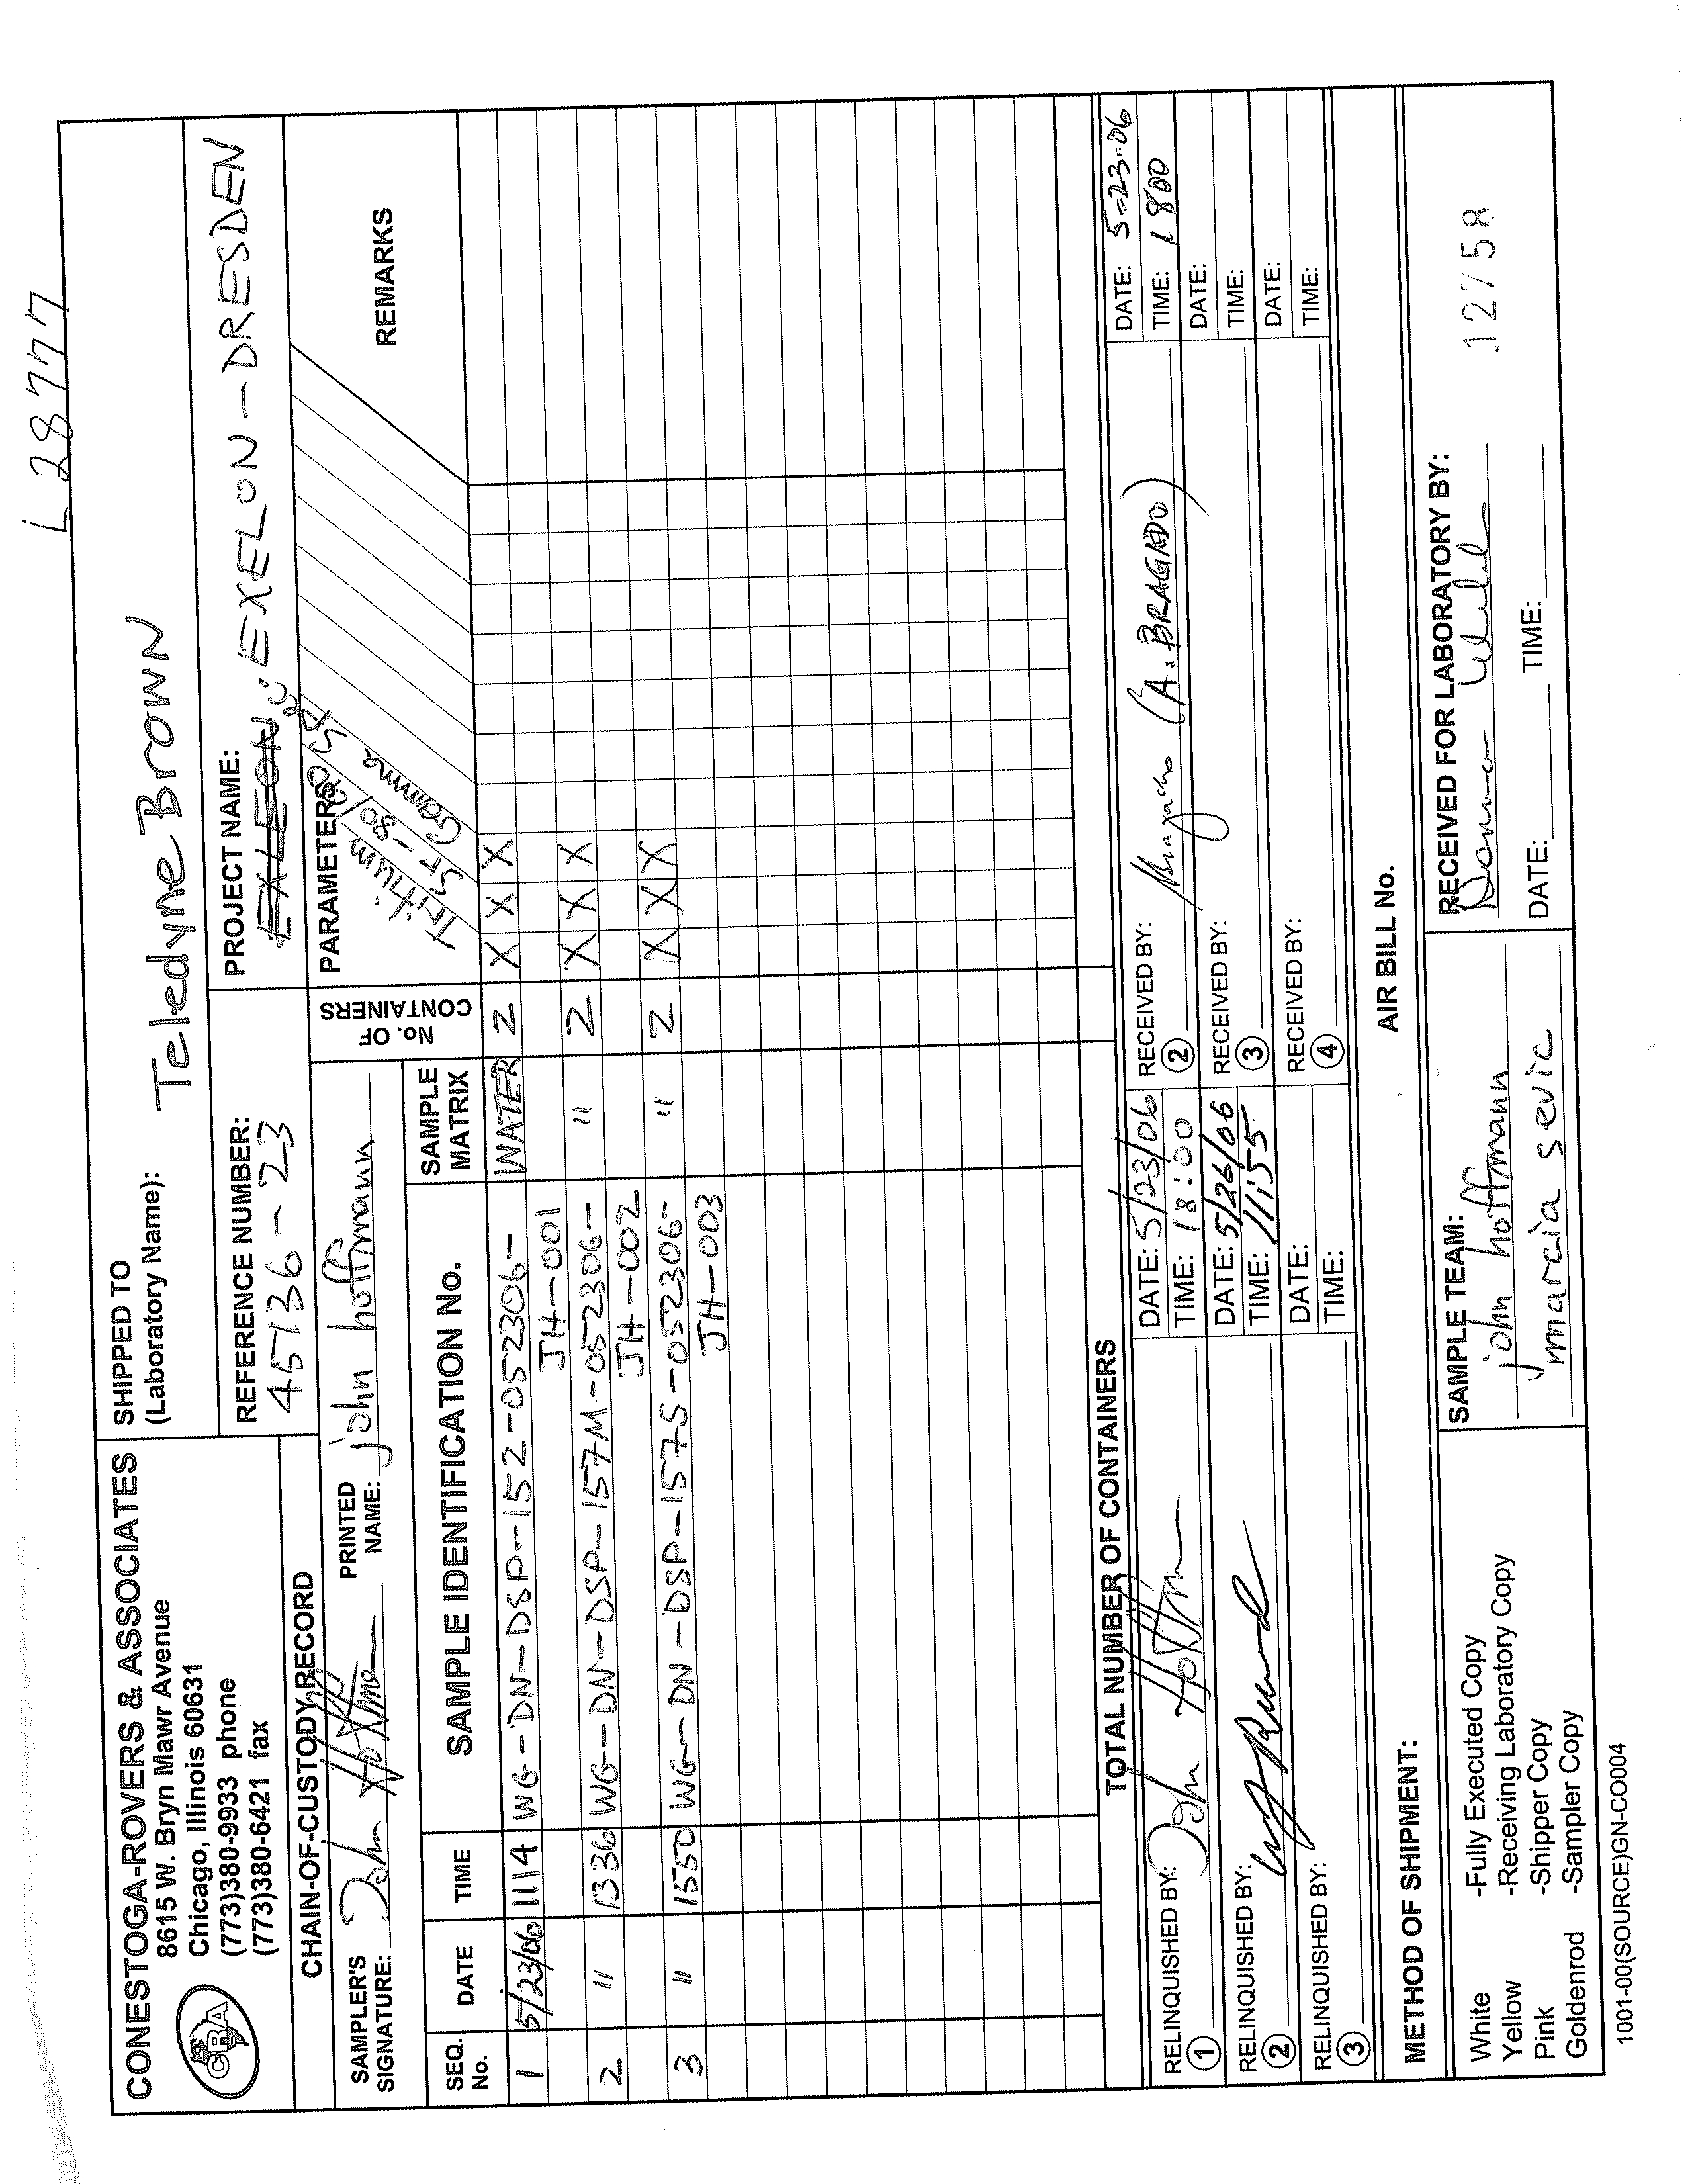
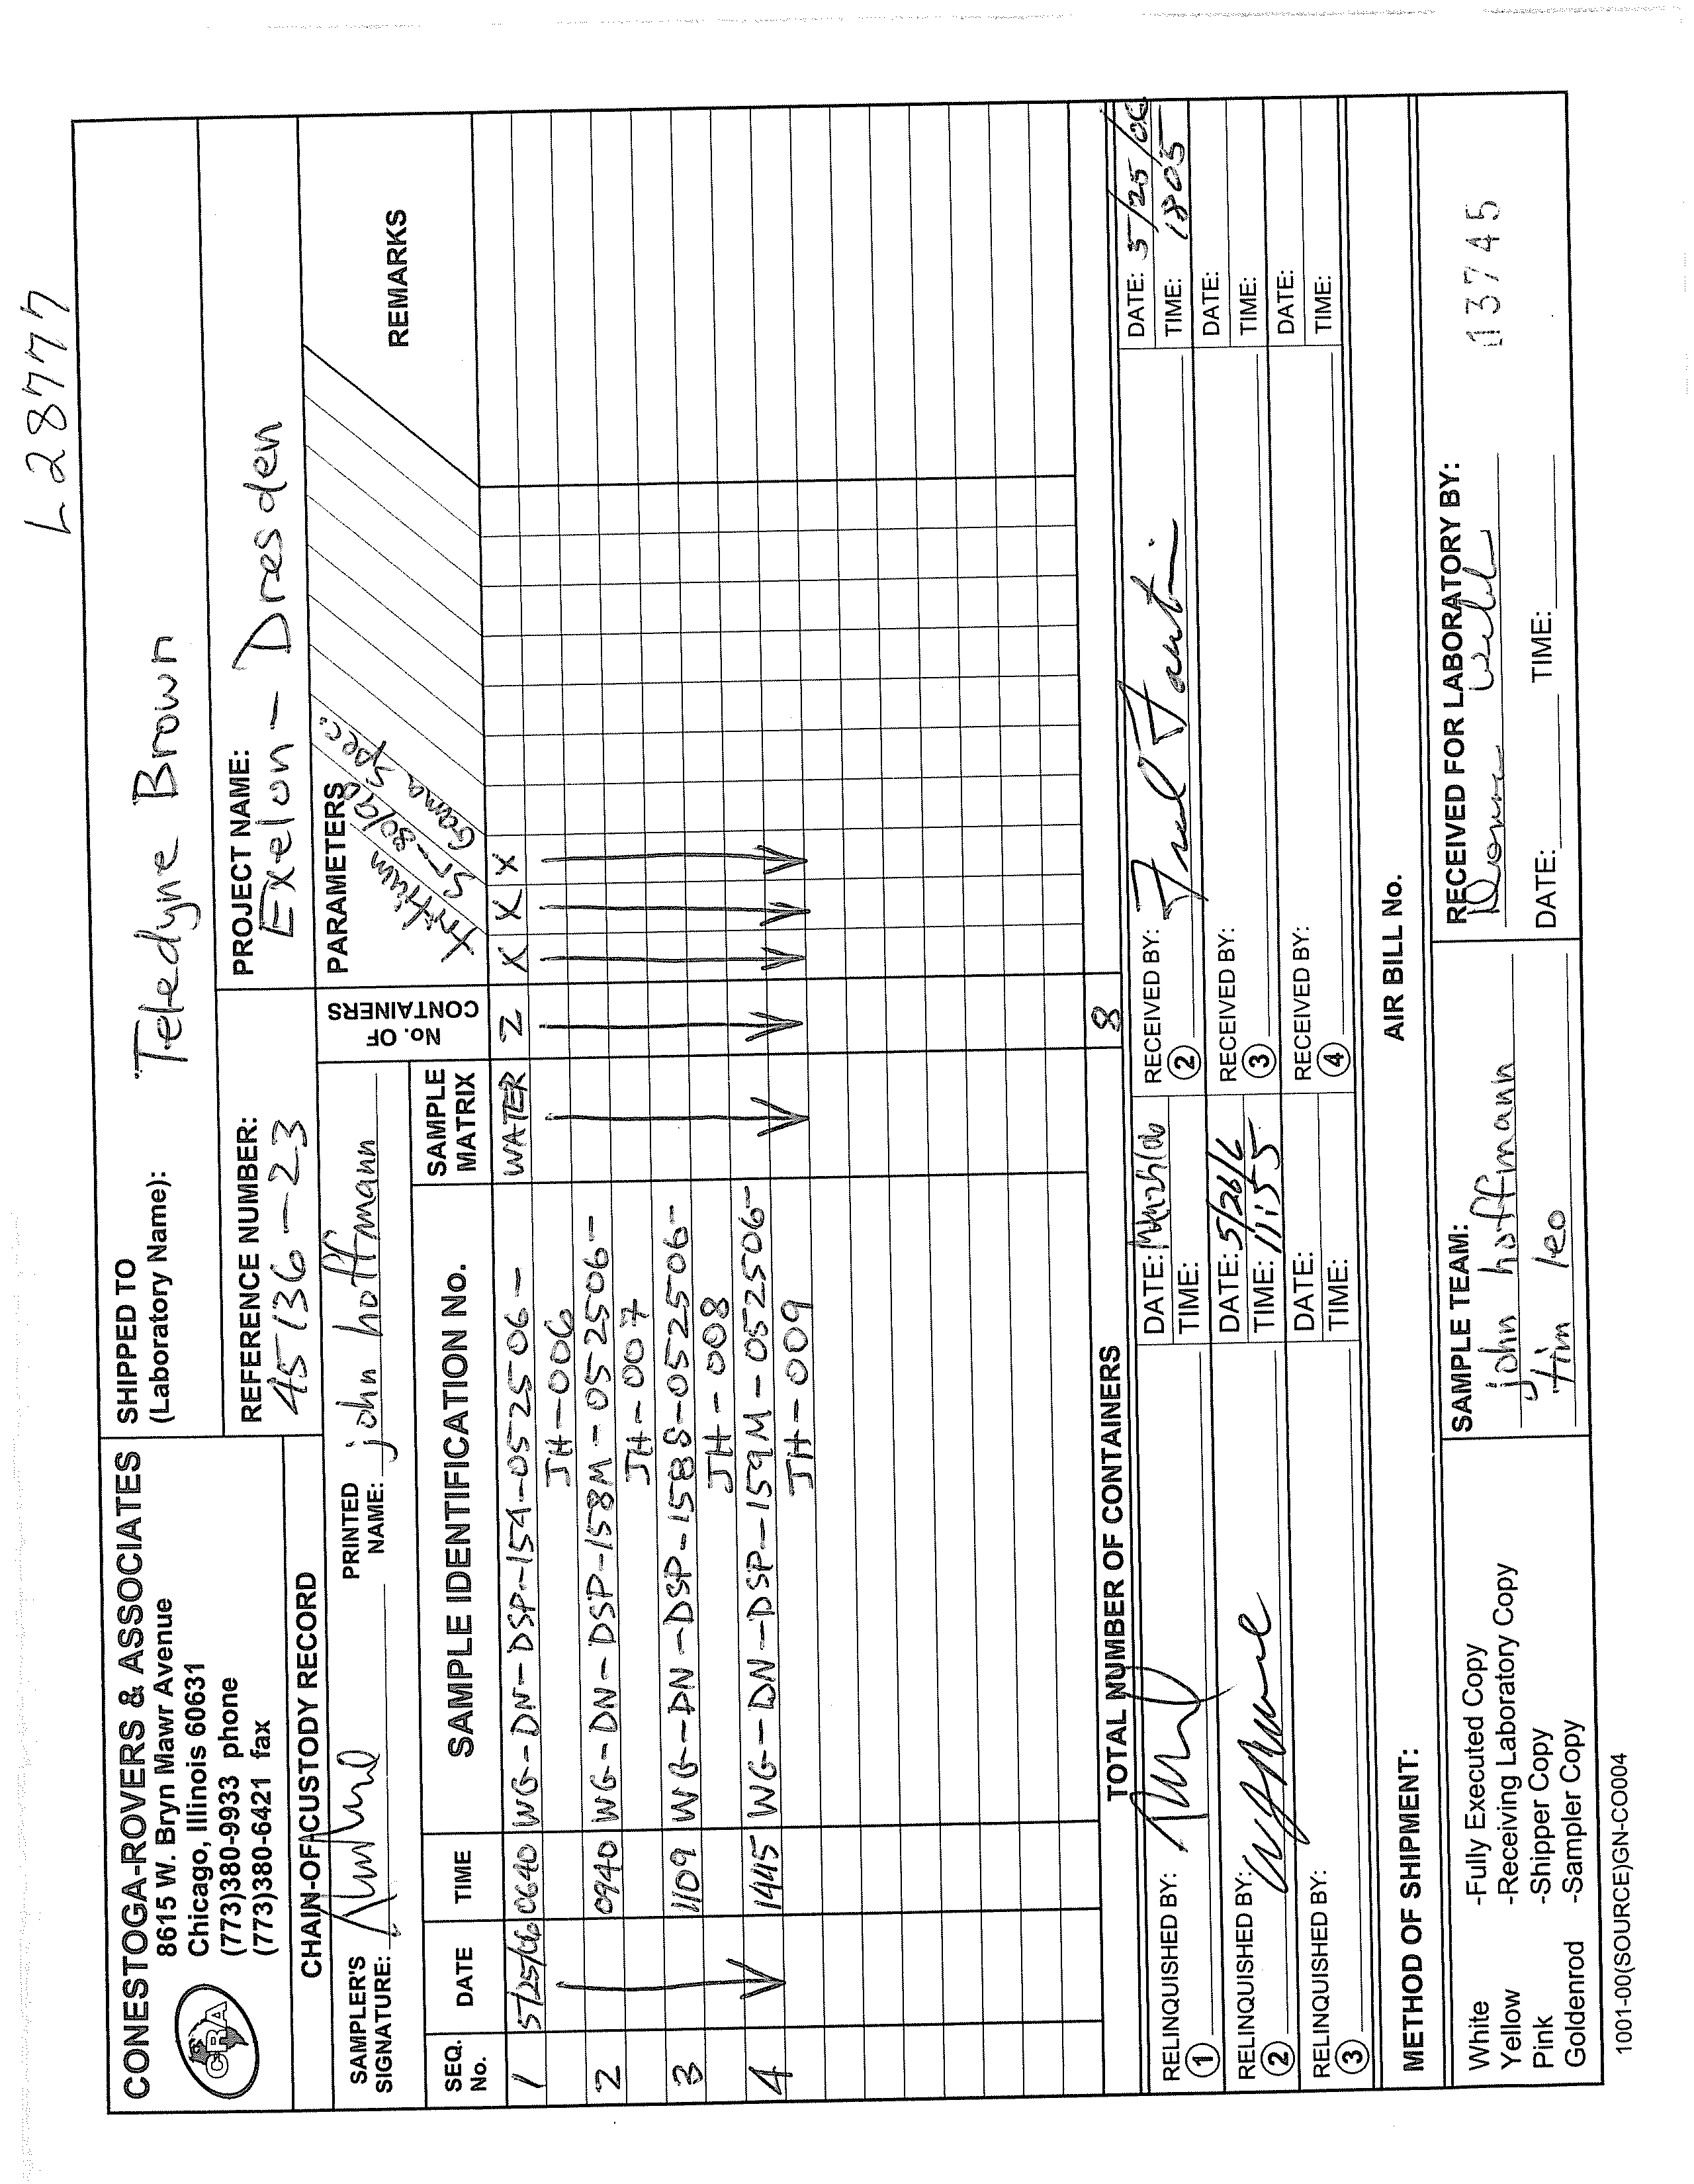
identification code format used in the field was: WG - DN – DSP-152 - 052306 – JH - 001.
A summary of sample identification numbers is presented in Table 4.6.
WG
-
Sample matrix -groundwater
WS
-
Sample matrix - surface water
RB
-
Sample matrix – rinse blank
DN
-
Station code
DSP-152 -
Well location
052306
-
Date
JH
-
Sampler initial
001
-
Sample number
045136 (15) Dresden Generating Station
24
CONESTOGA-ROVERS & ASSOCIATES
Revision 1
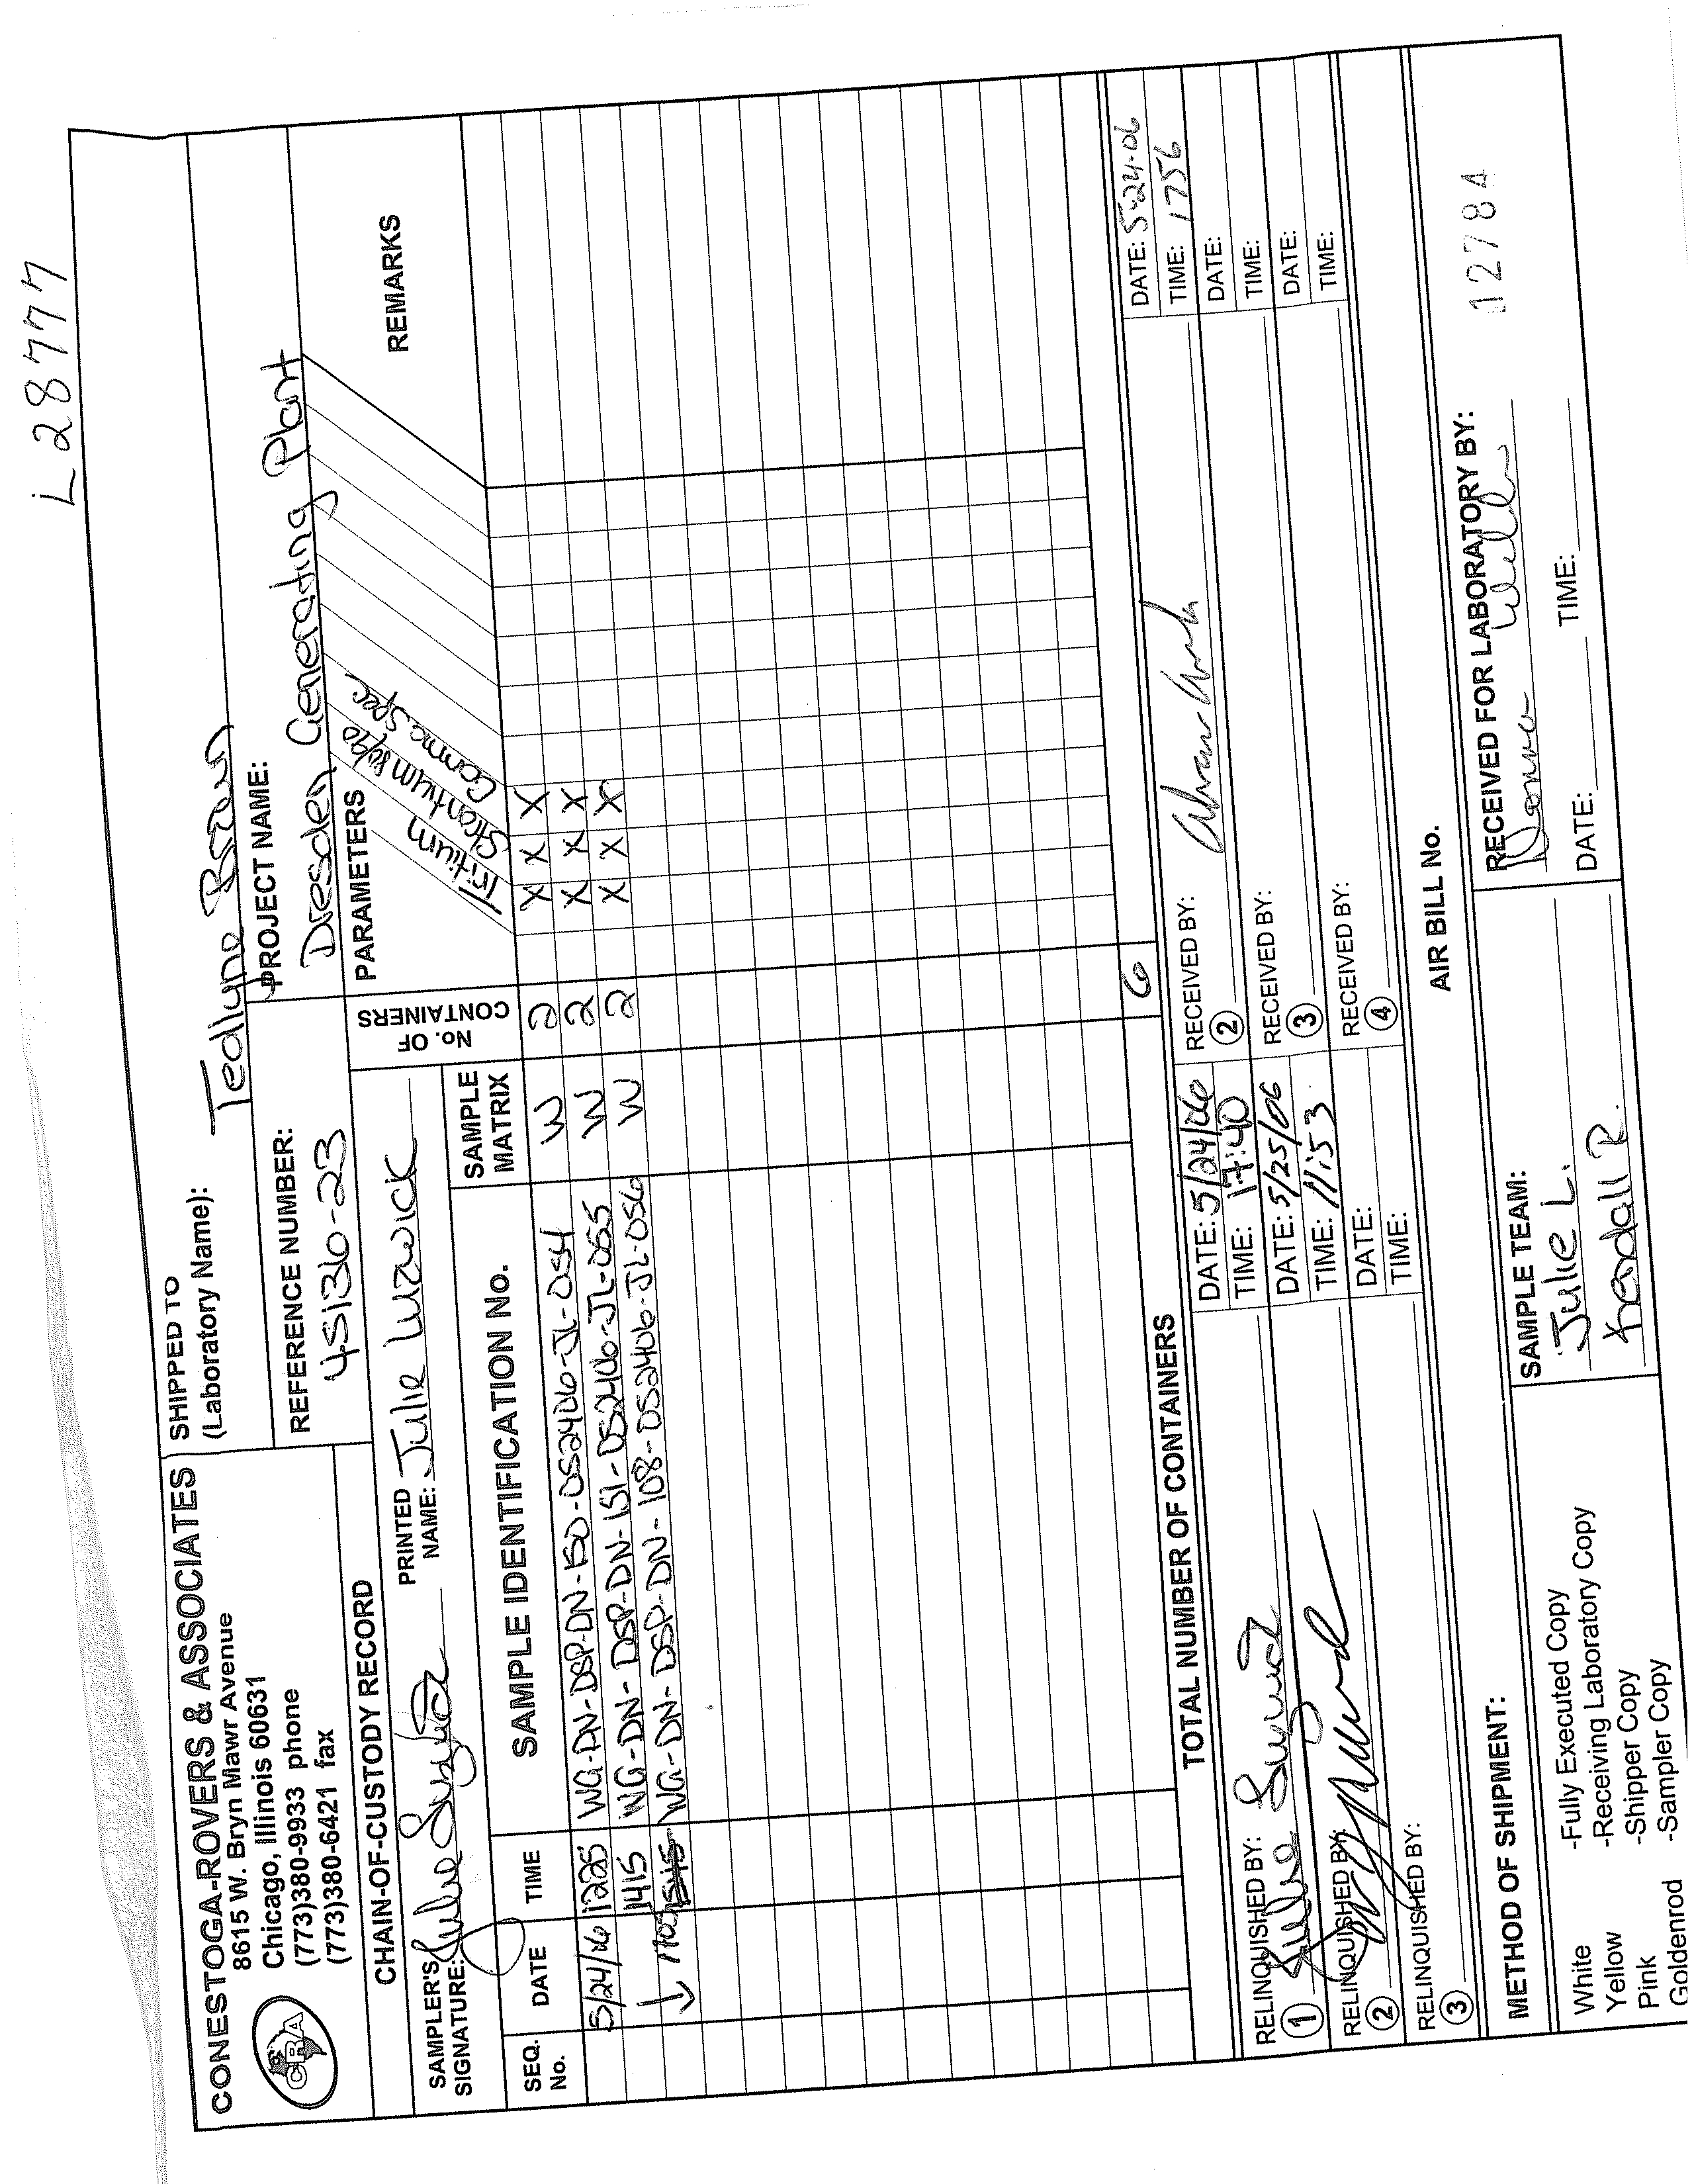
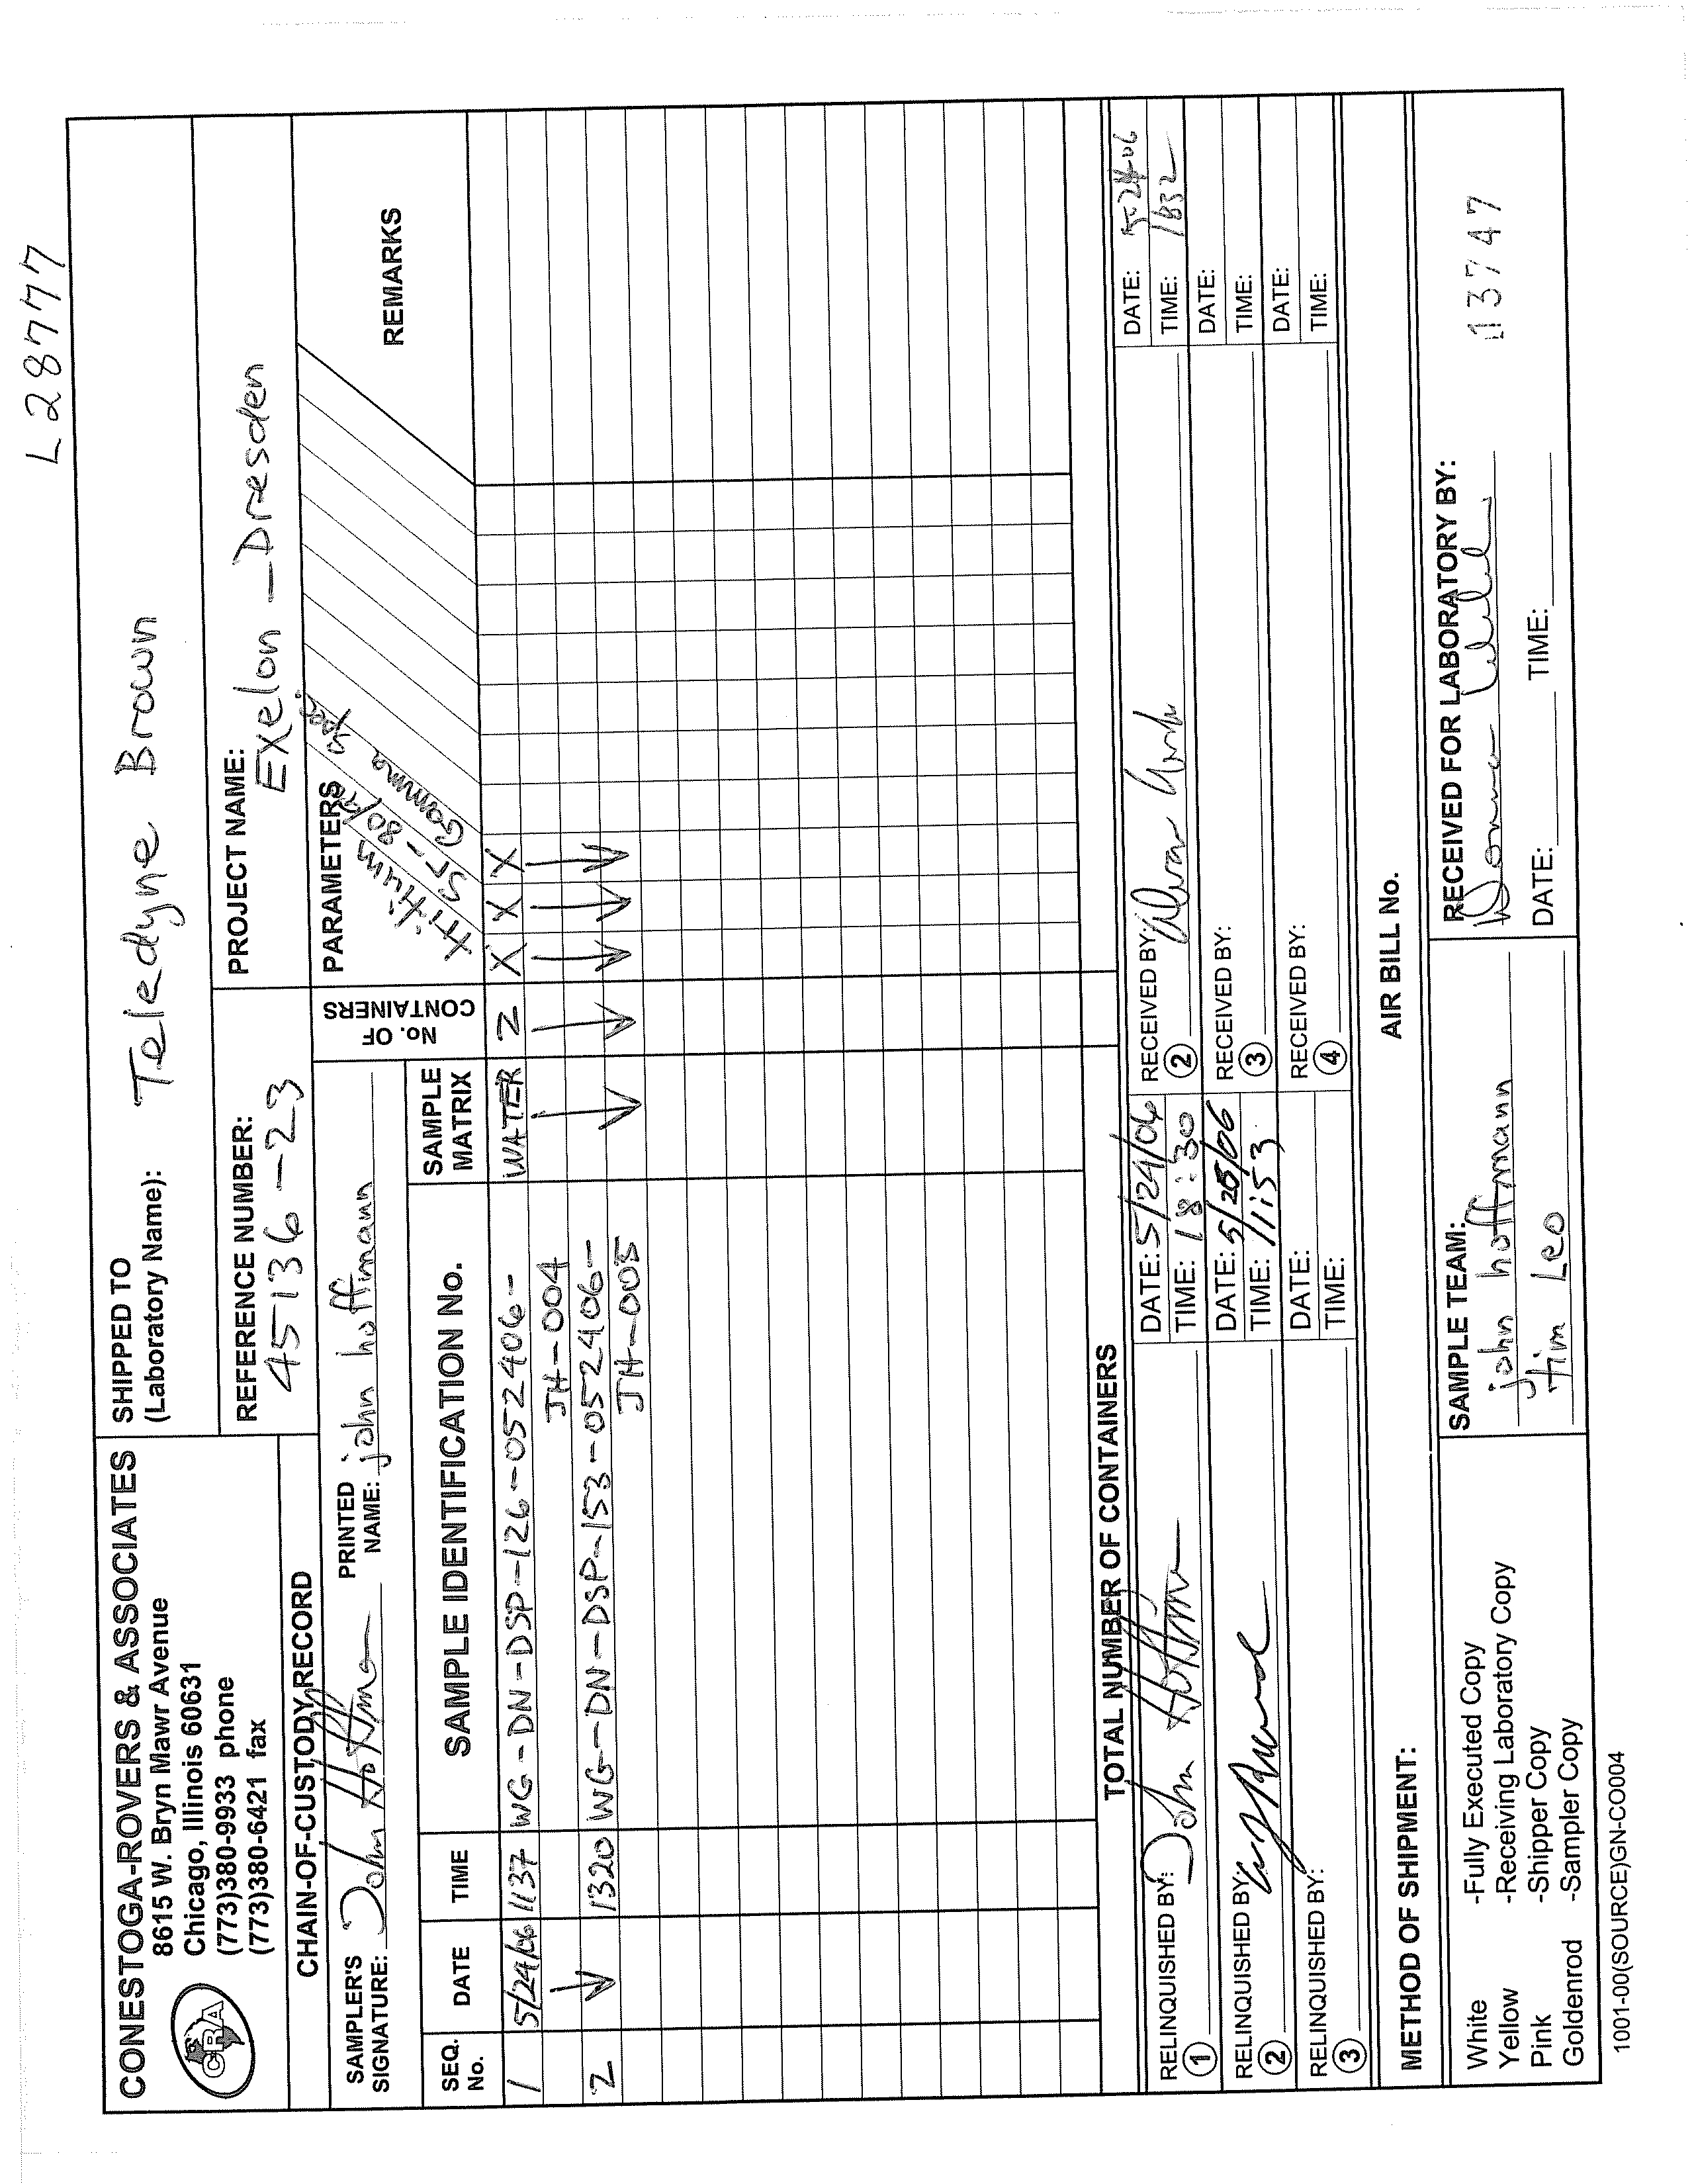
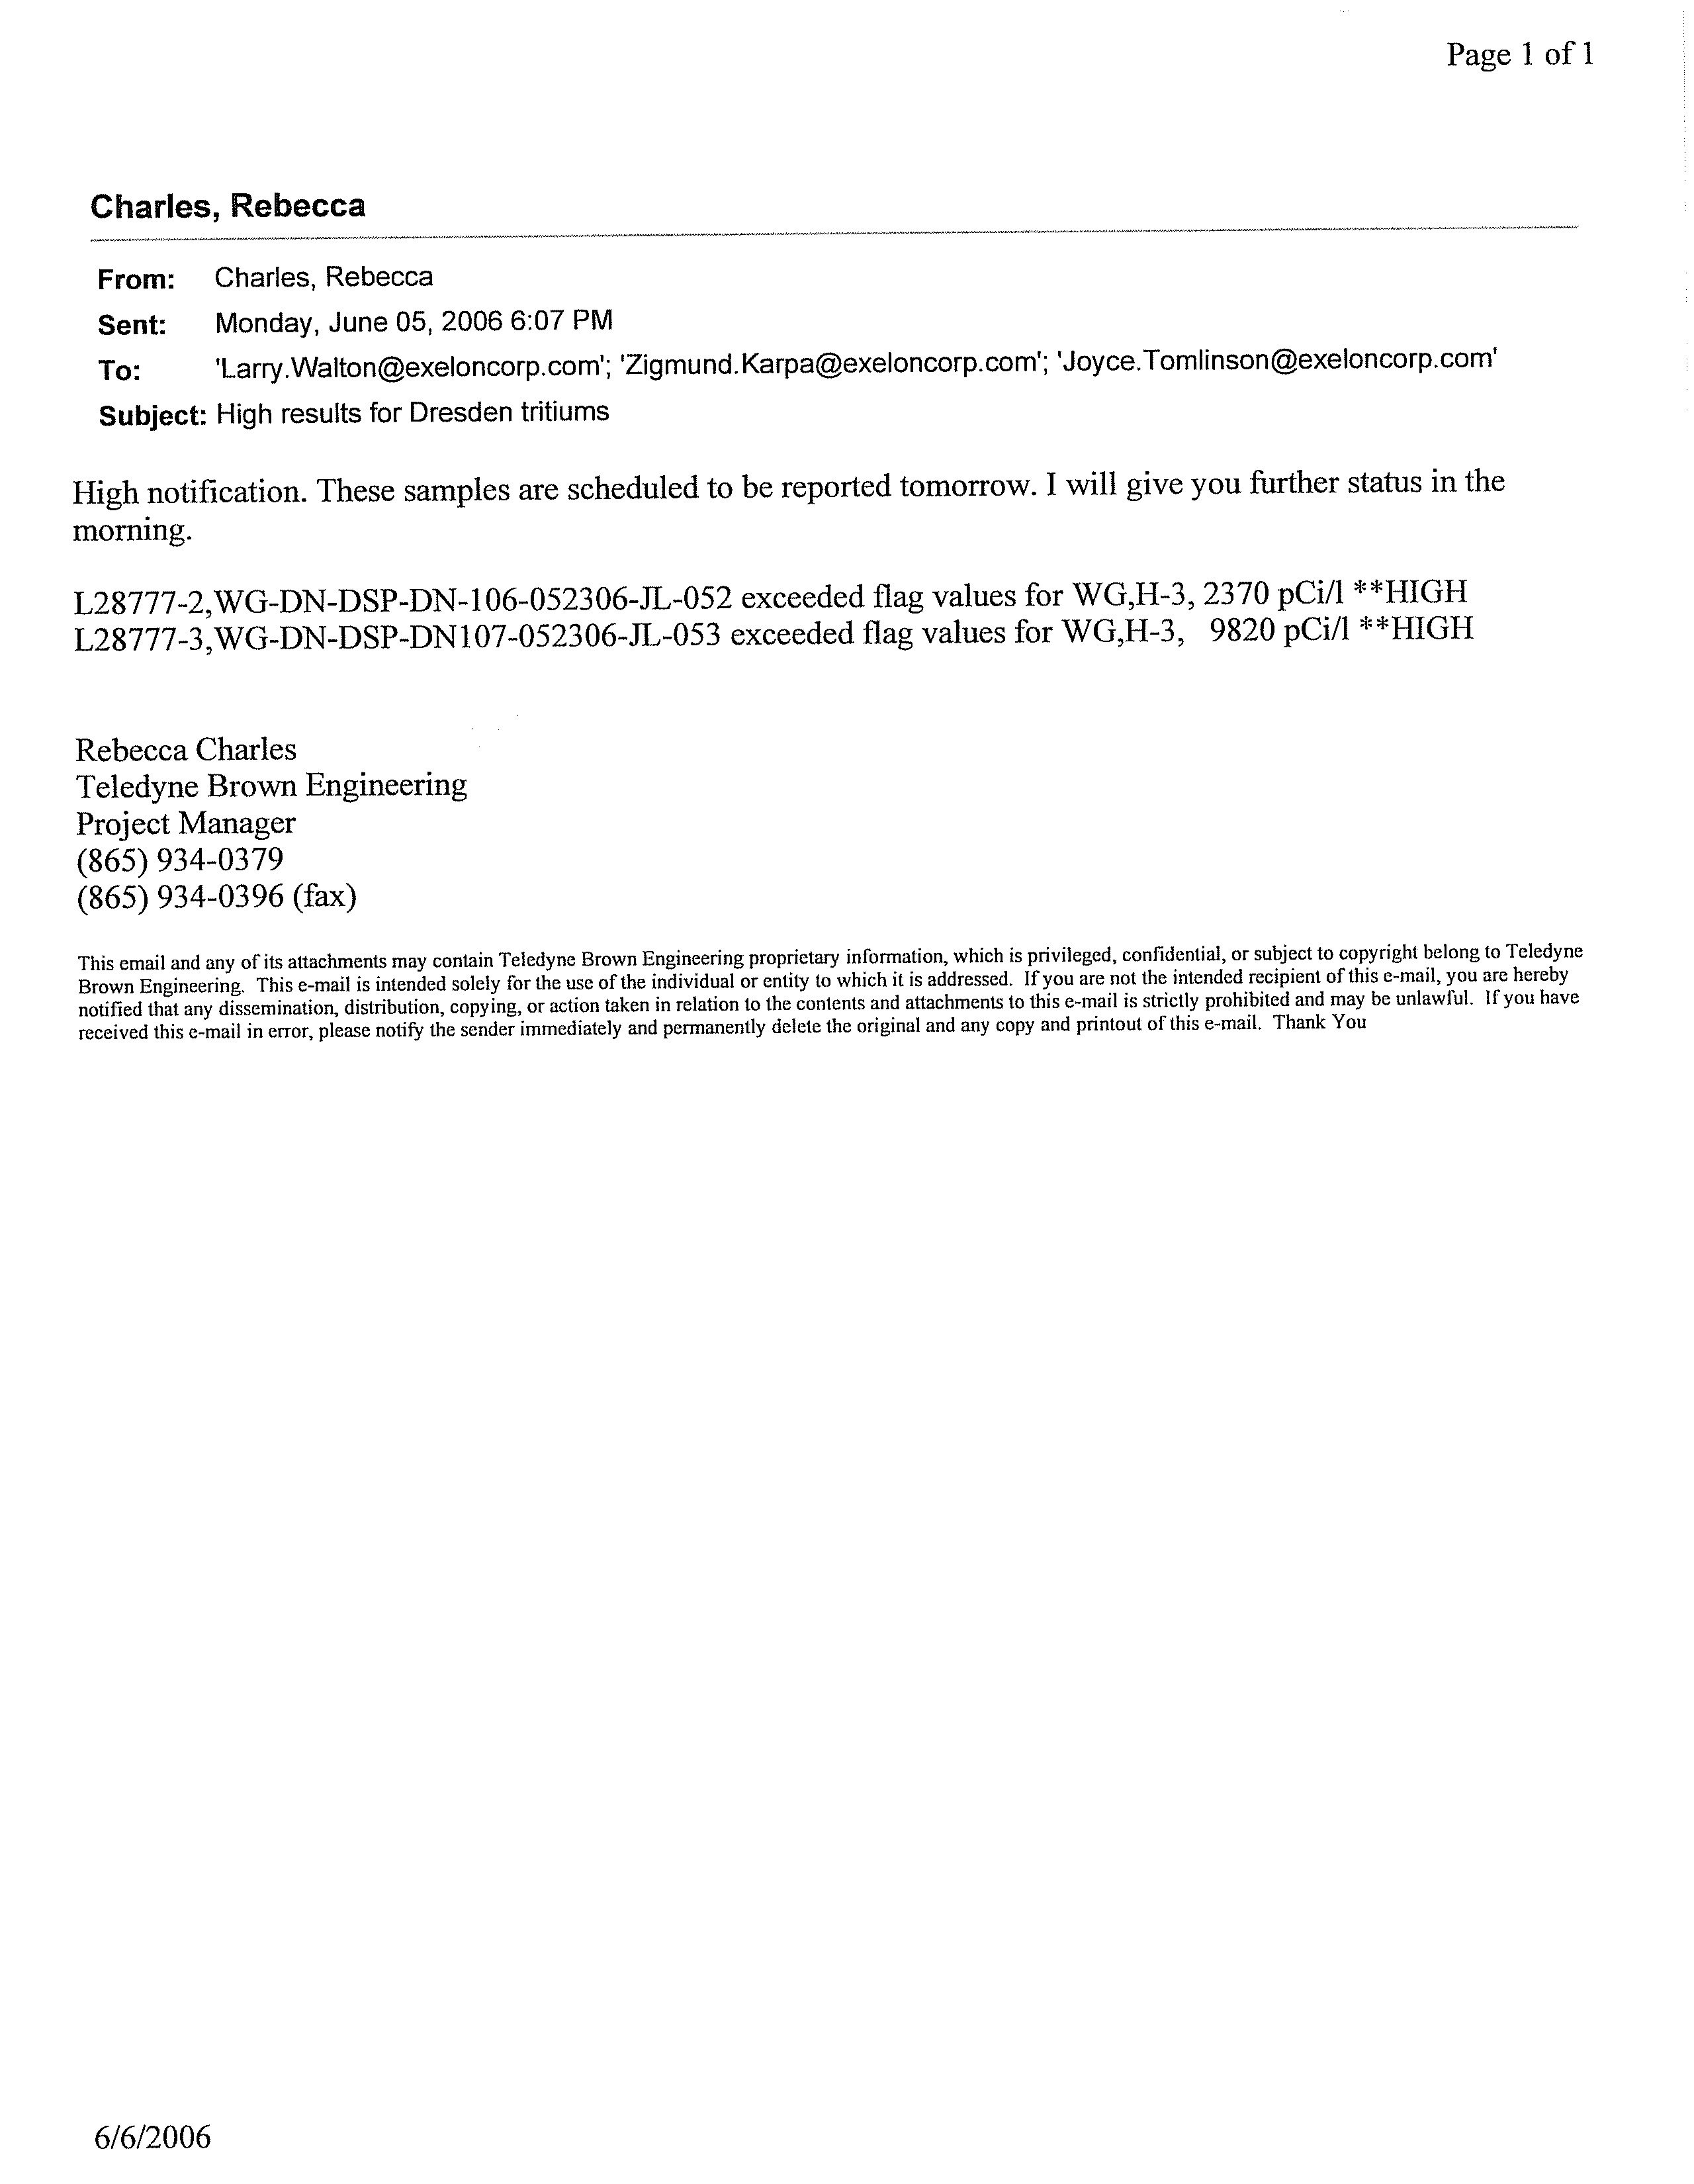
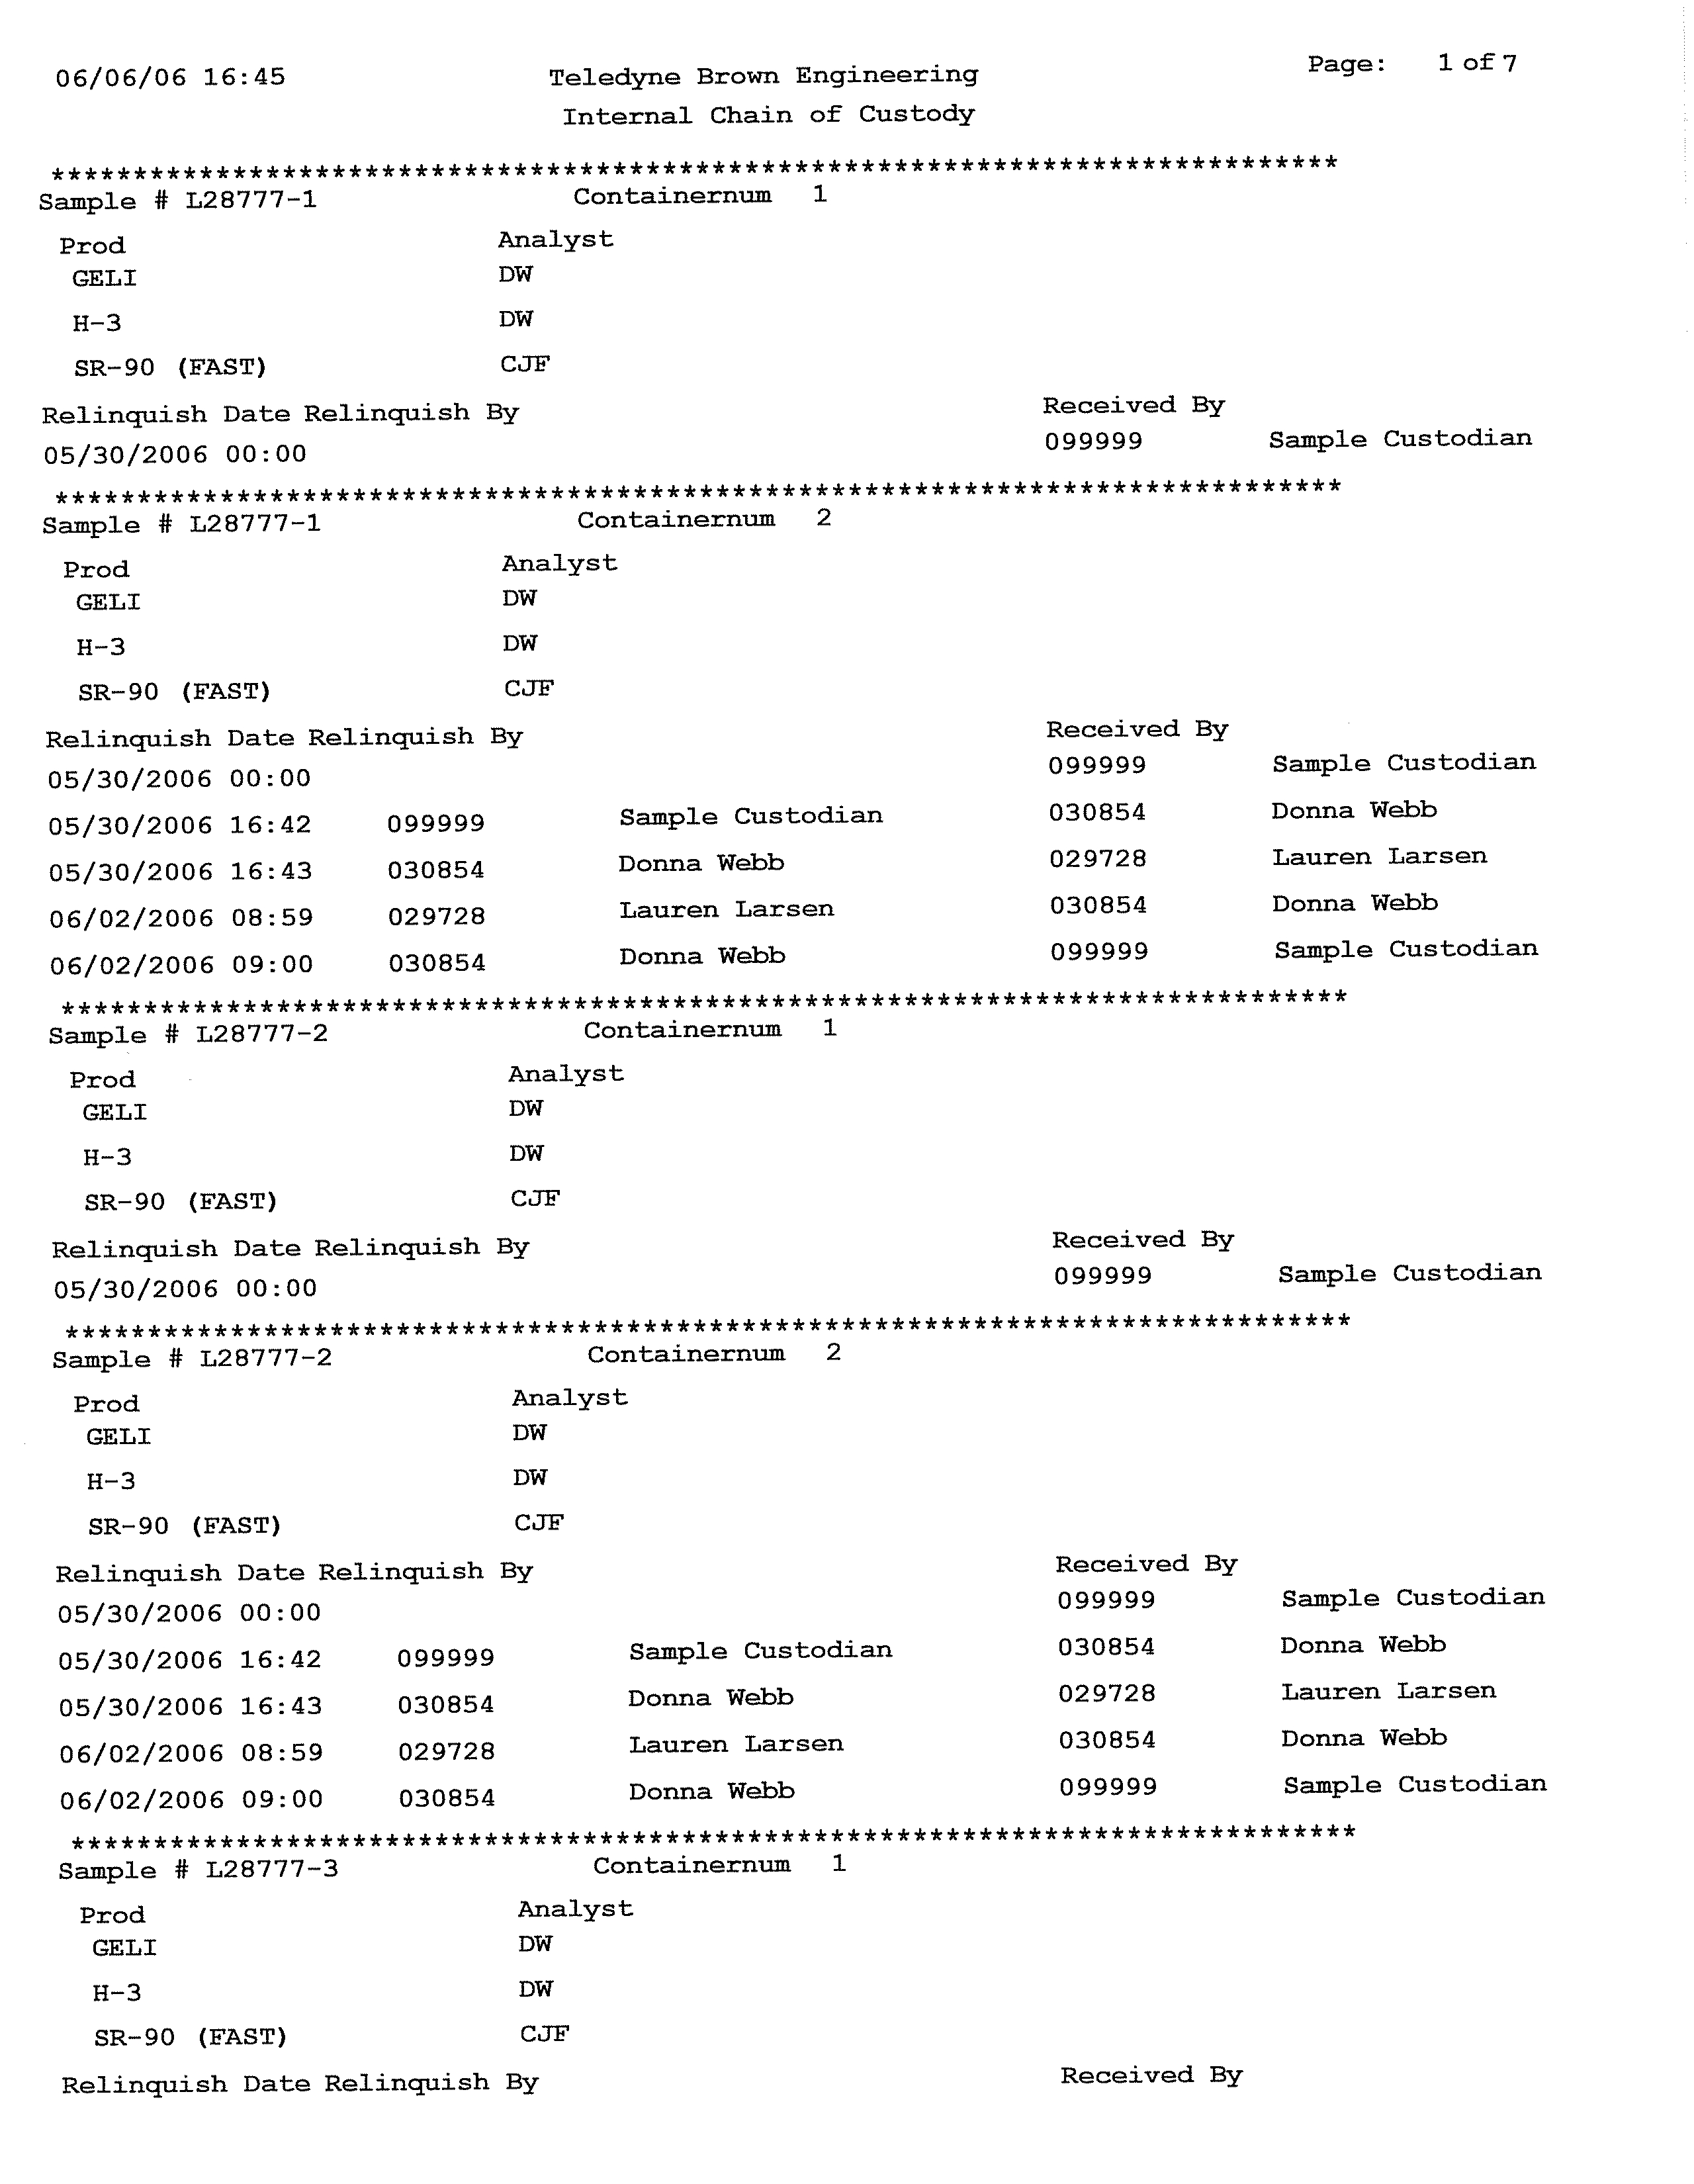
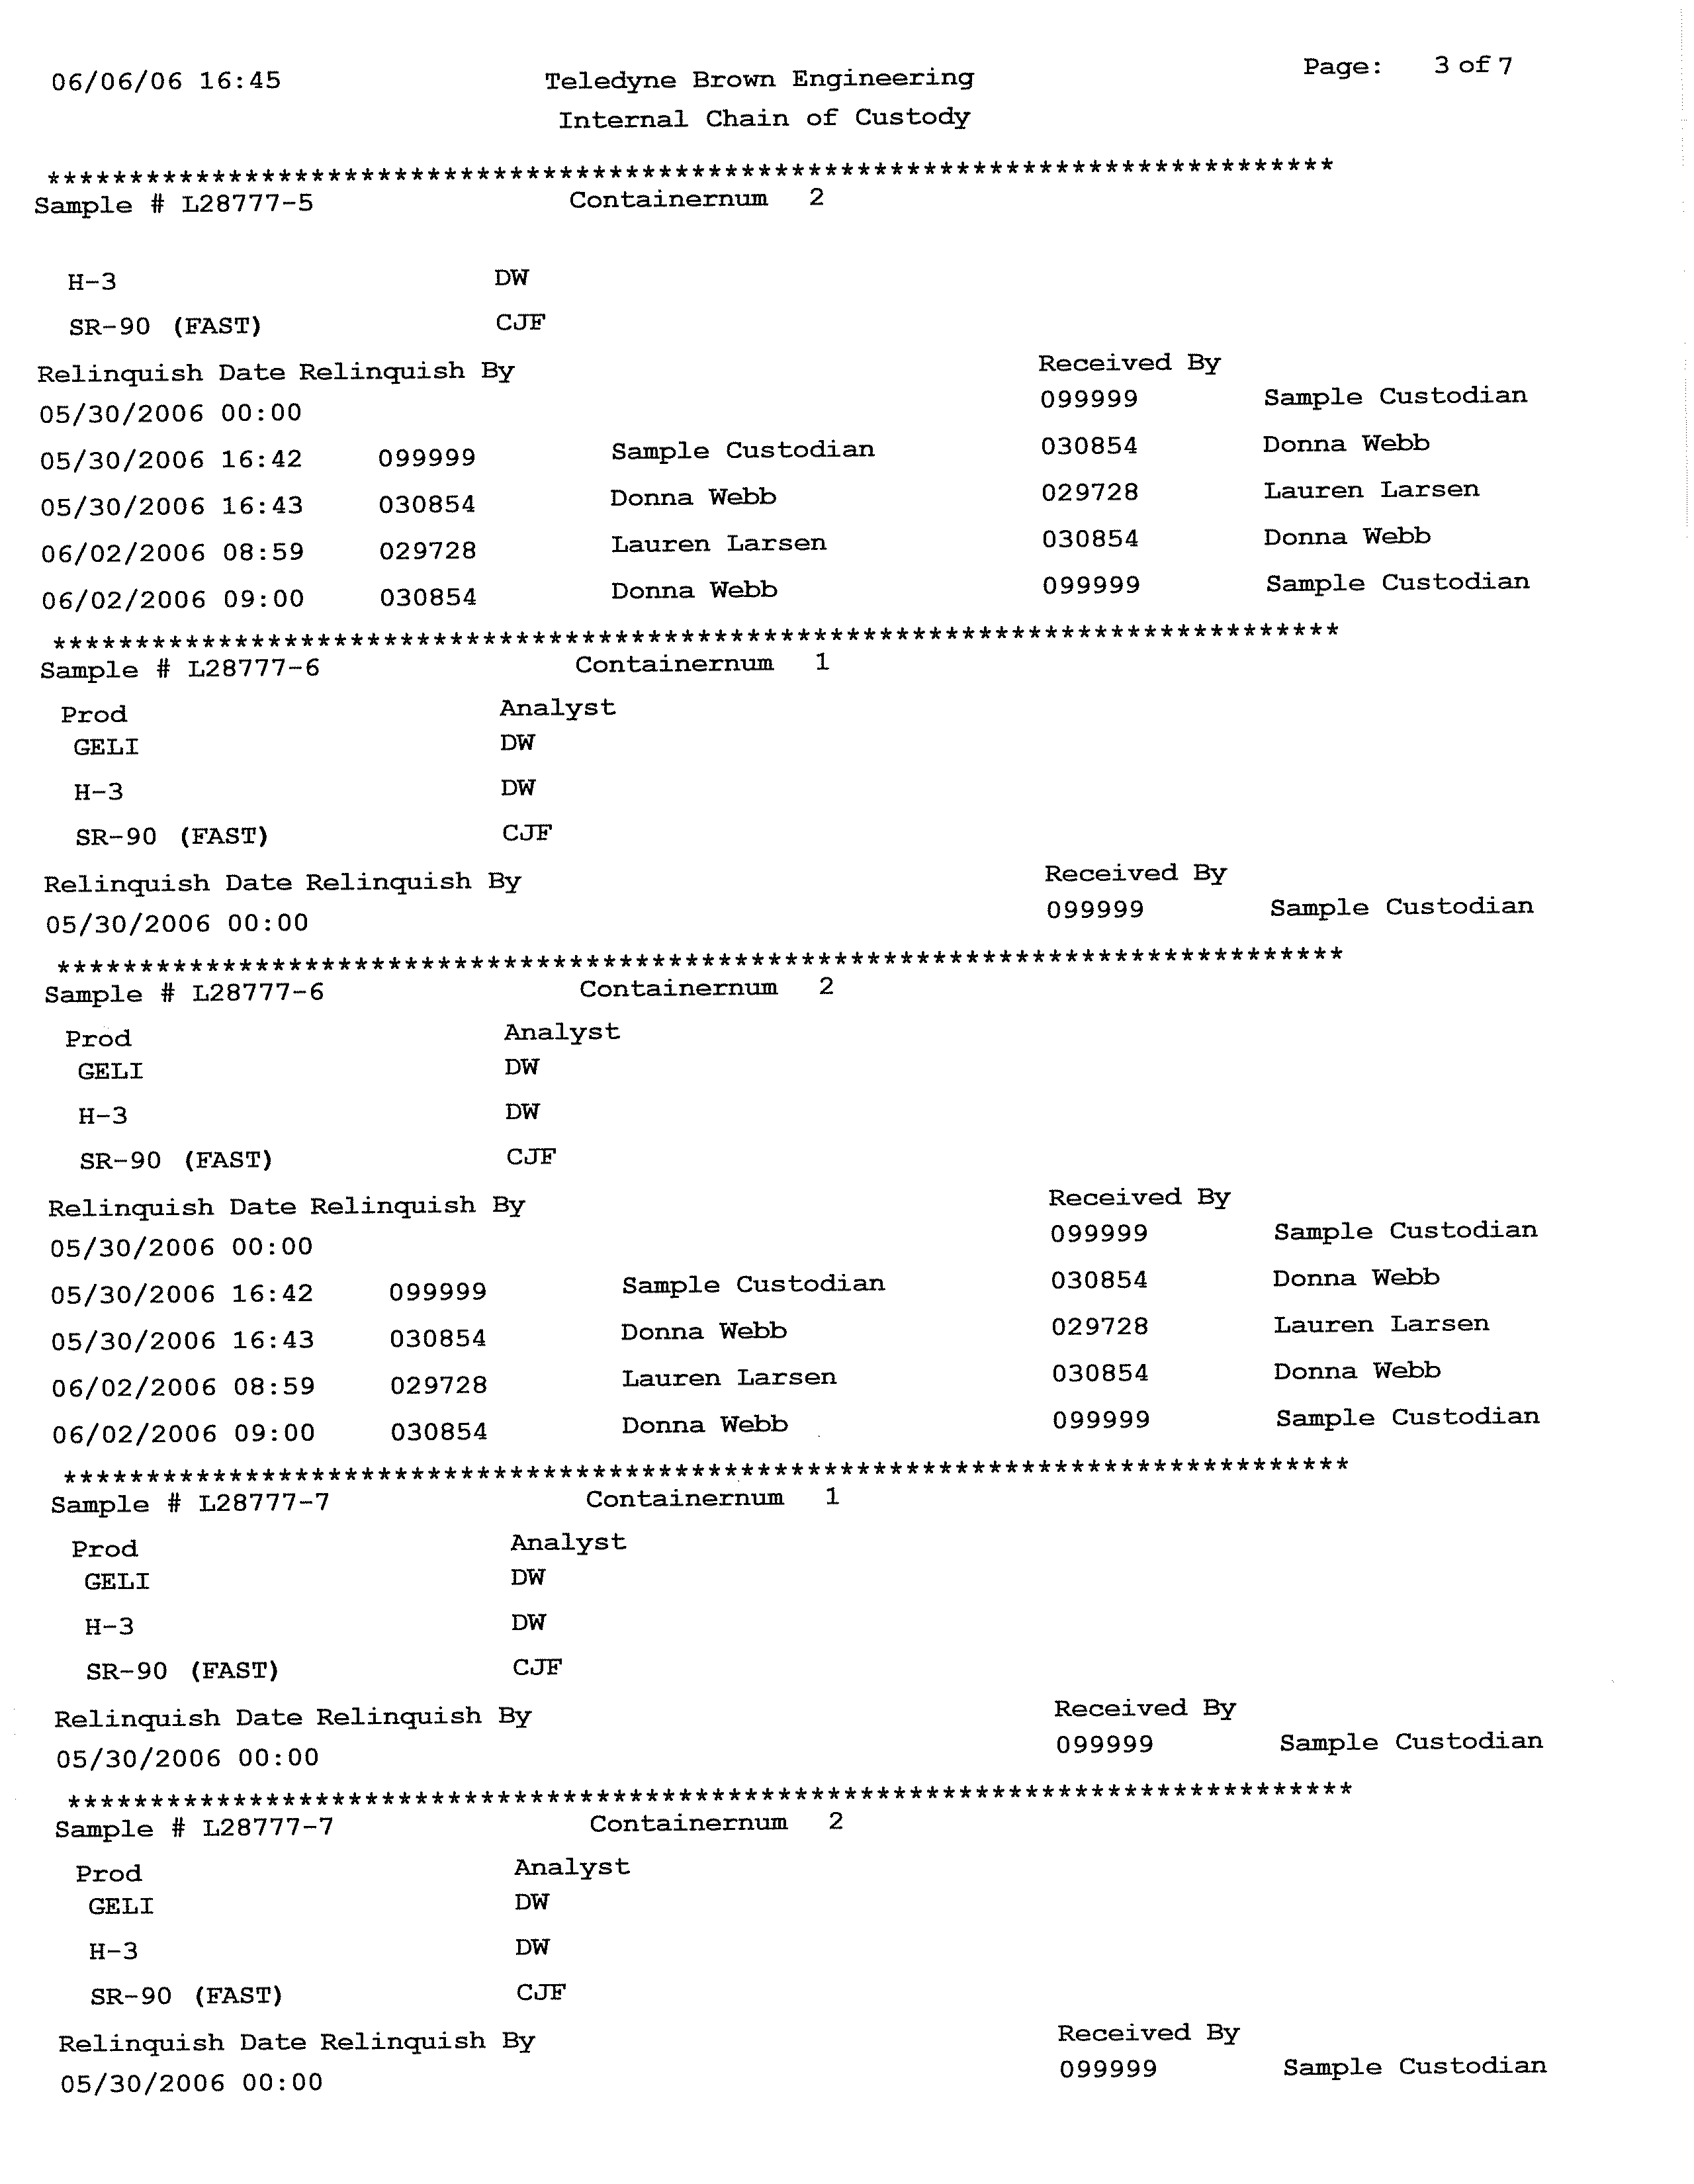
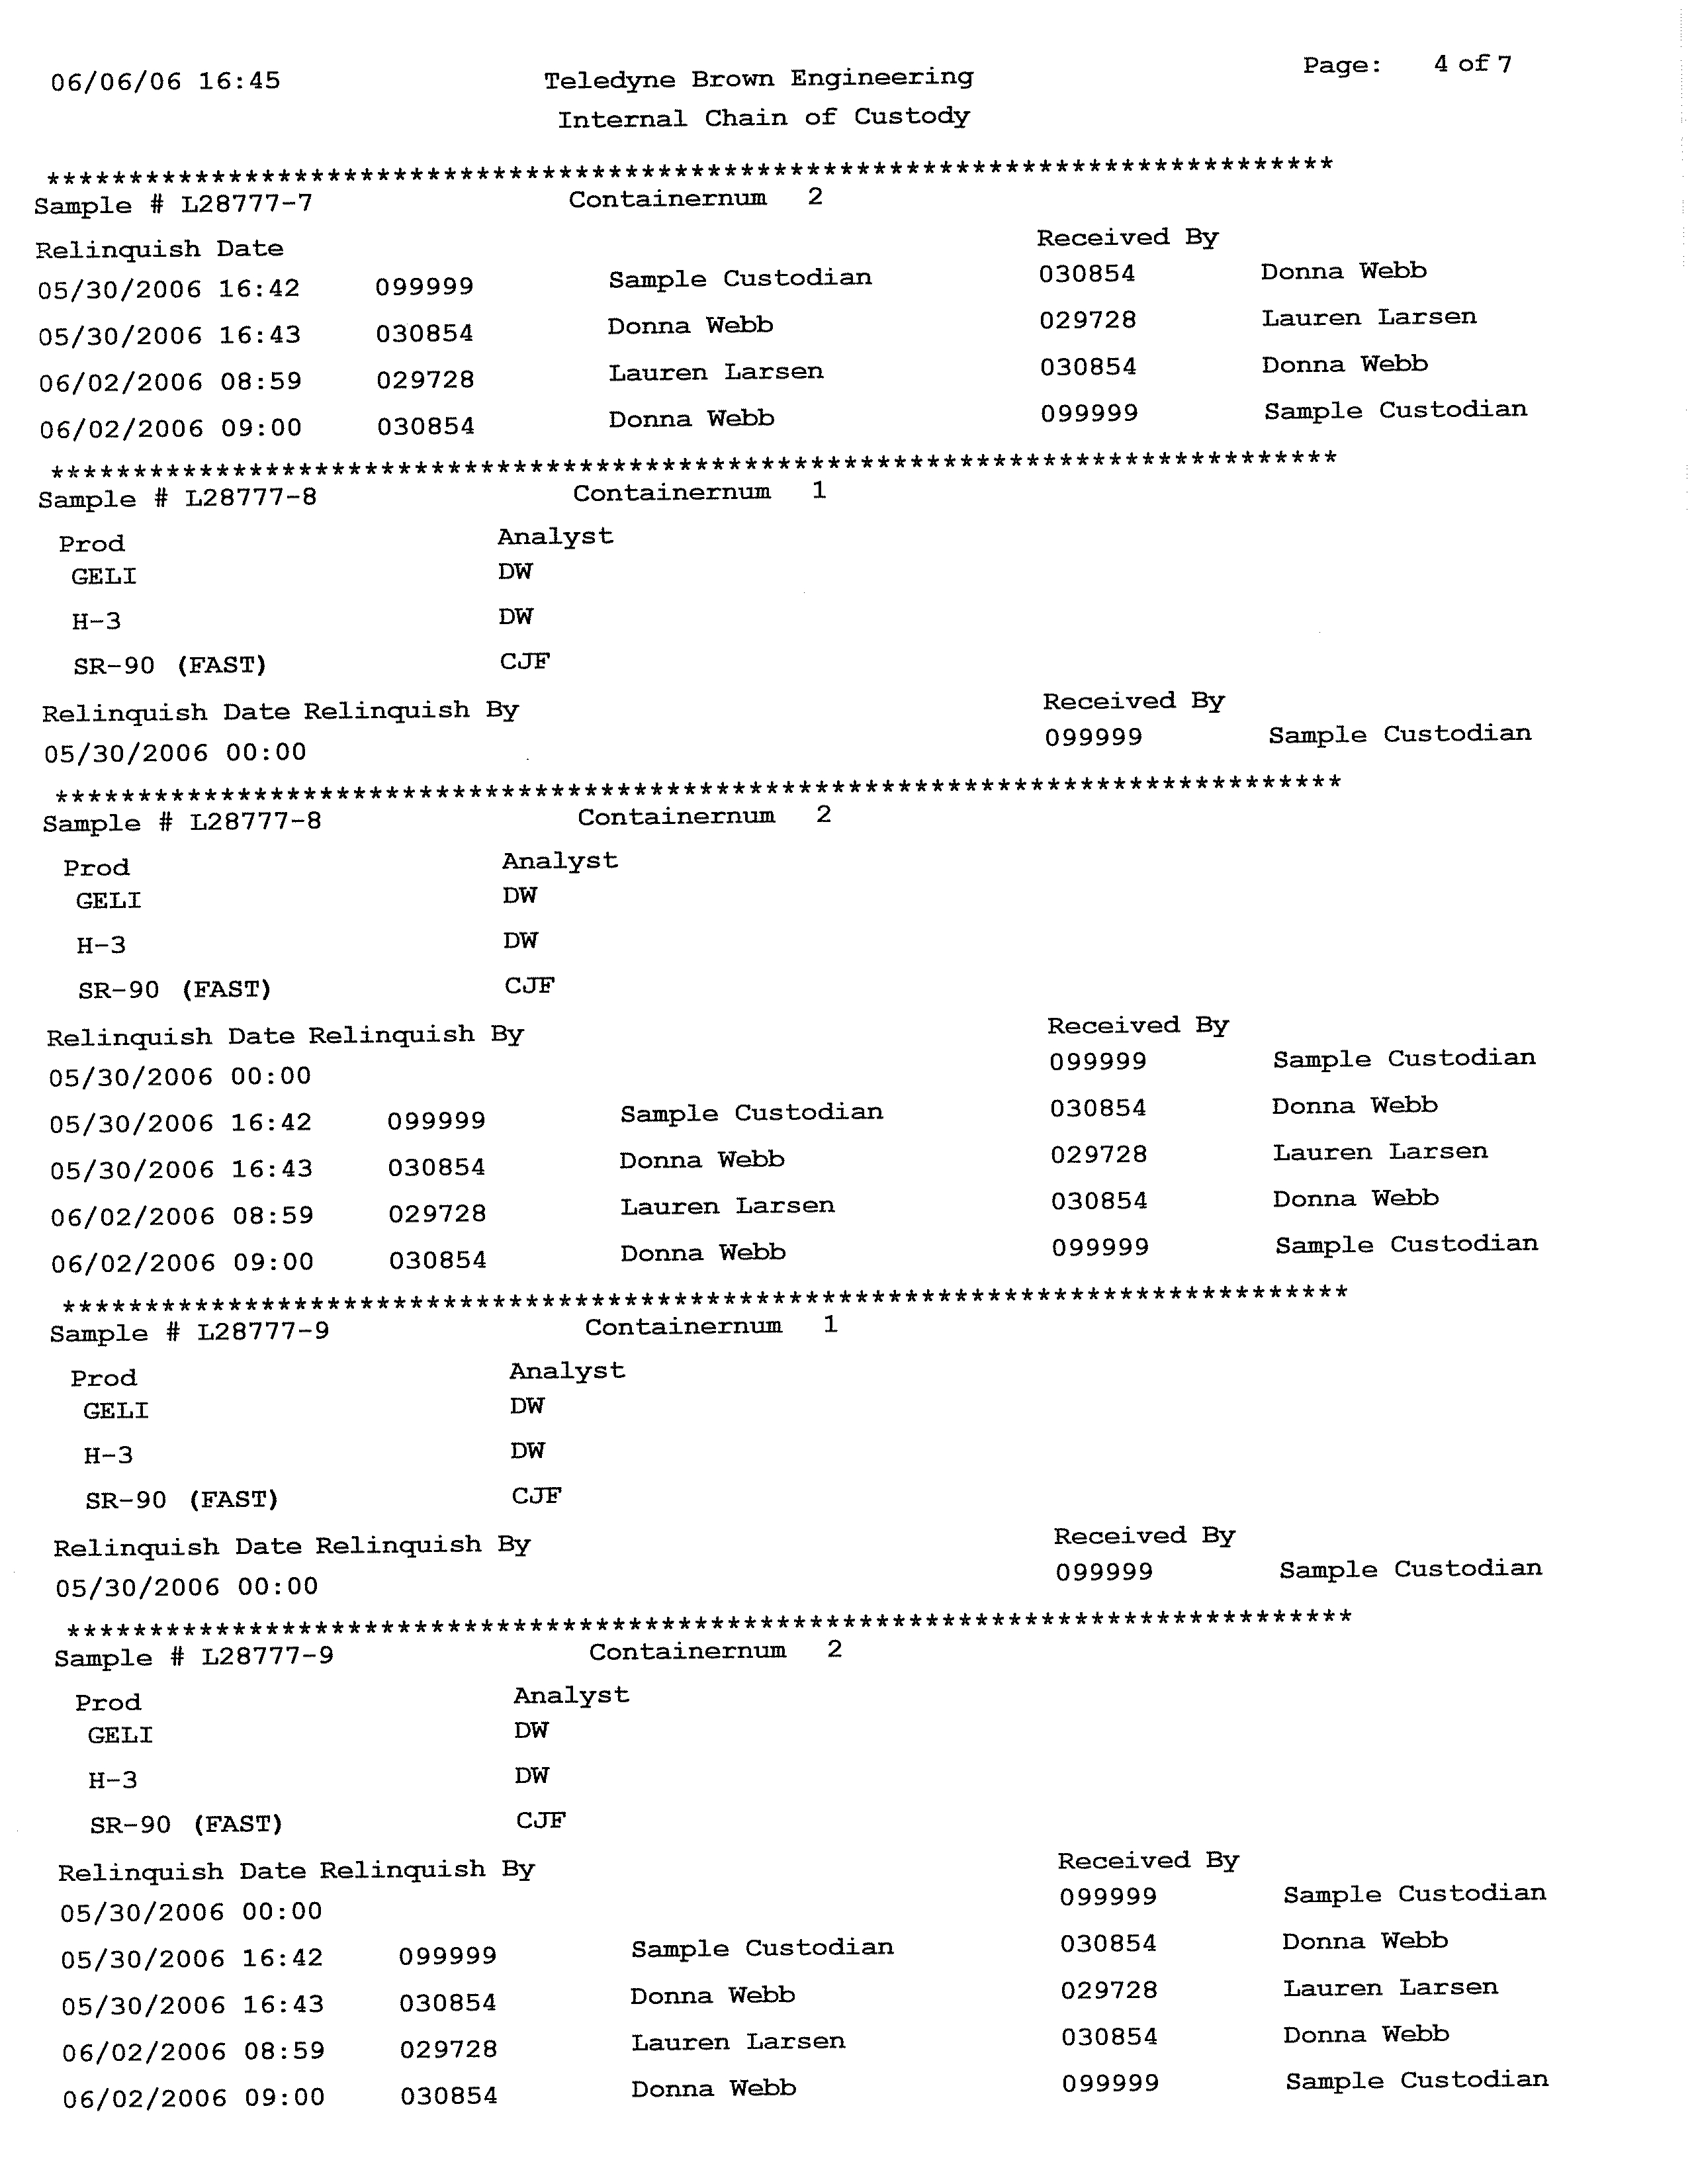
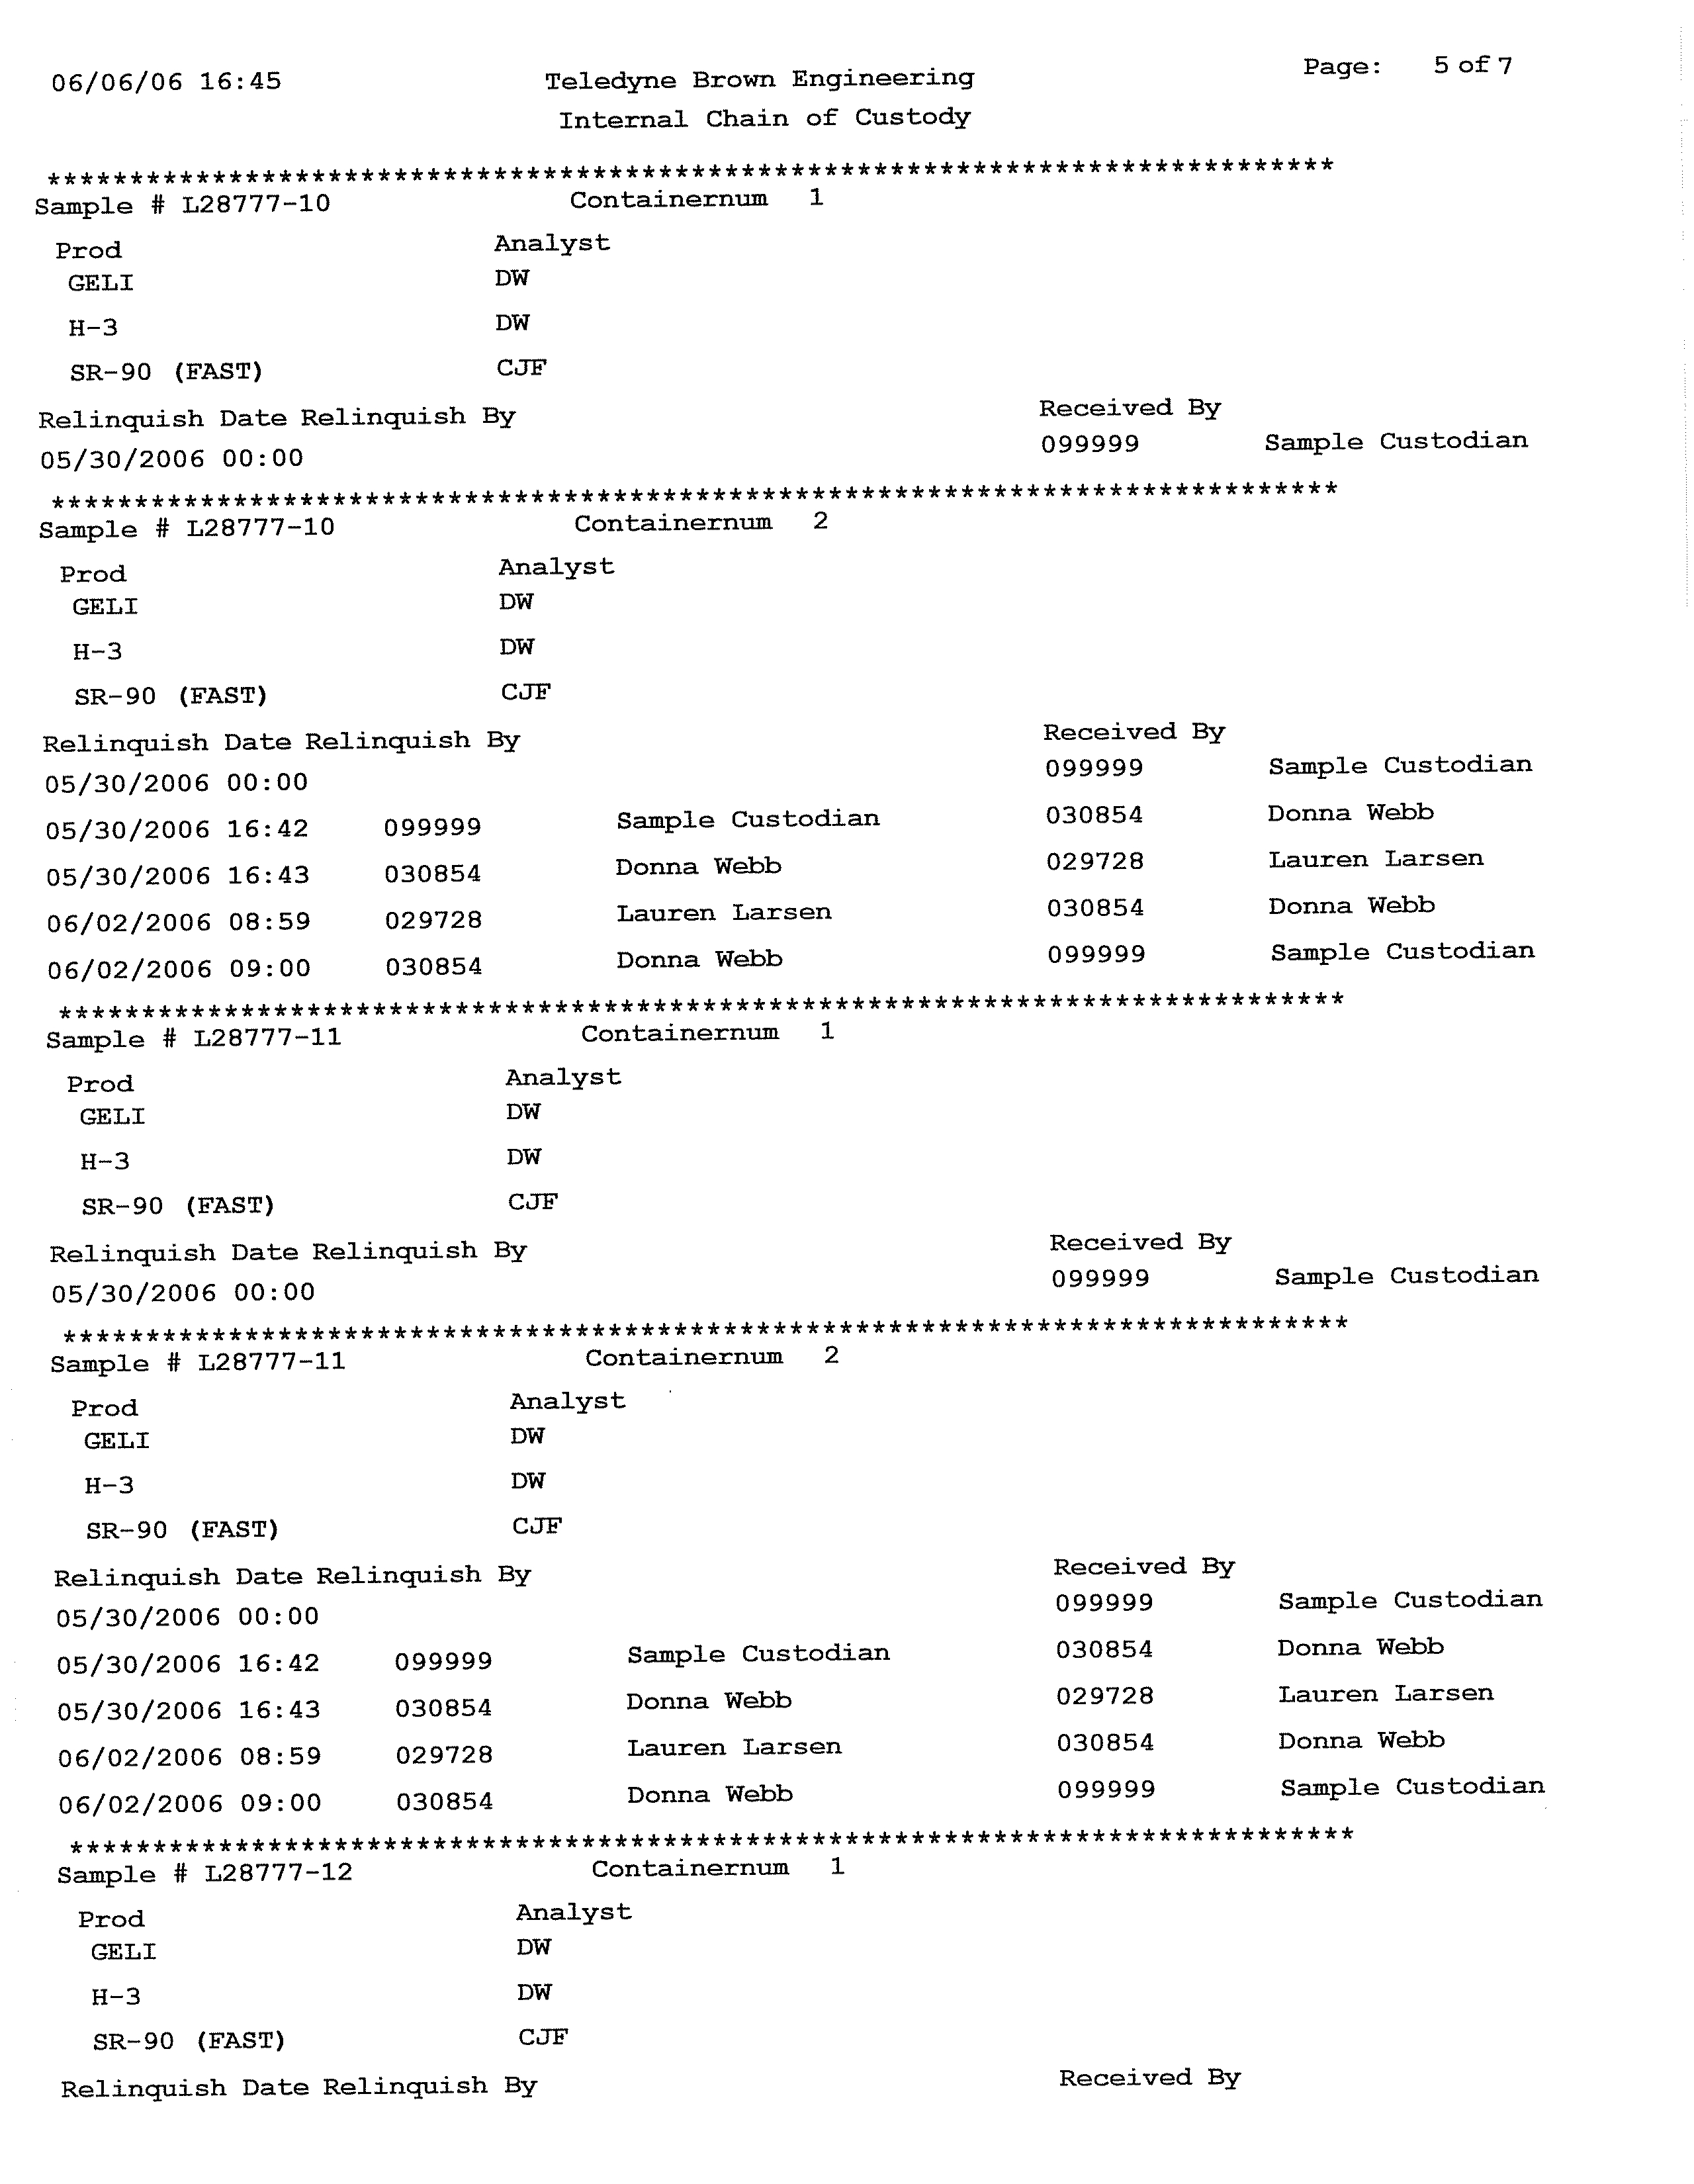
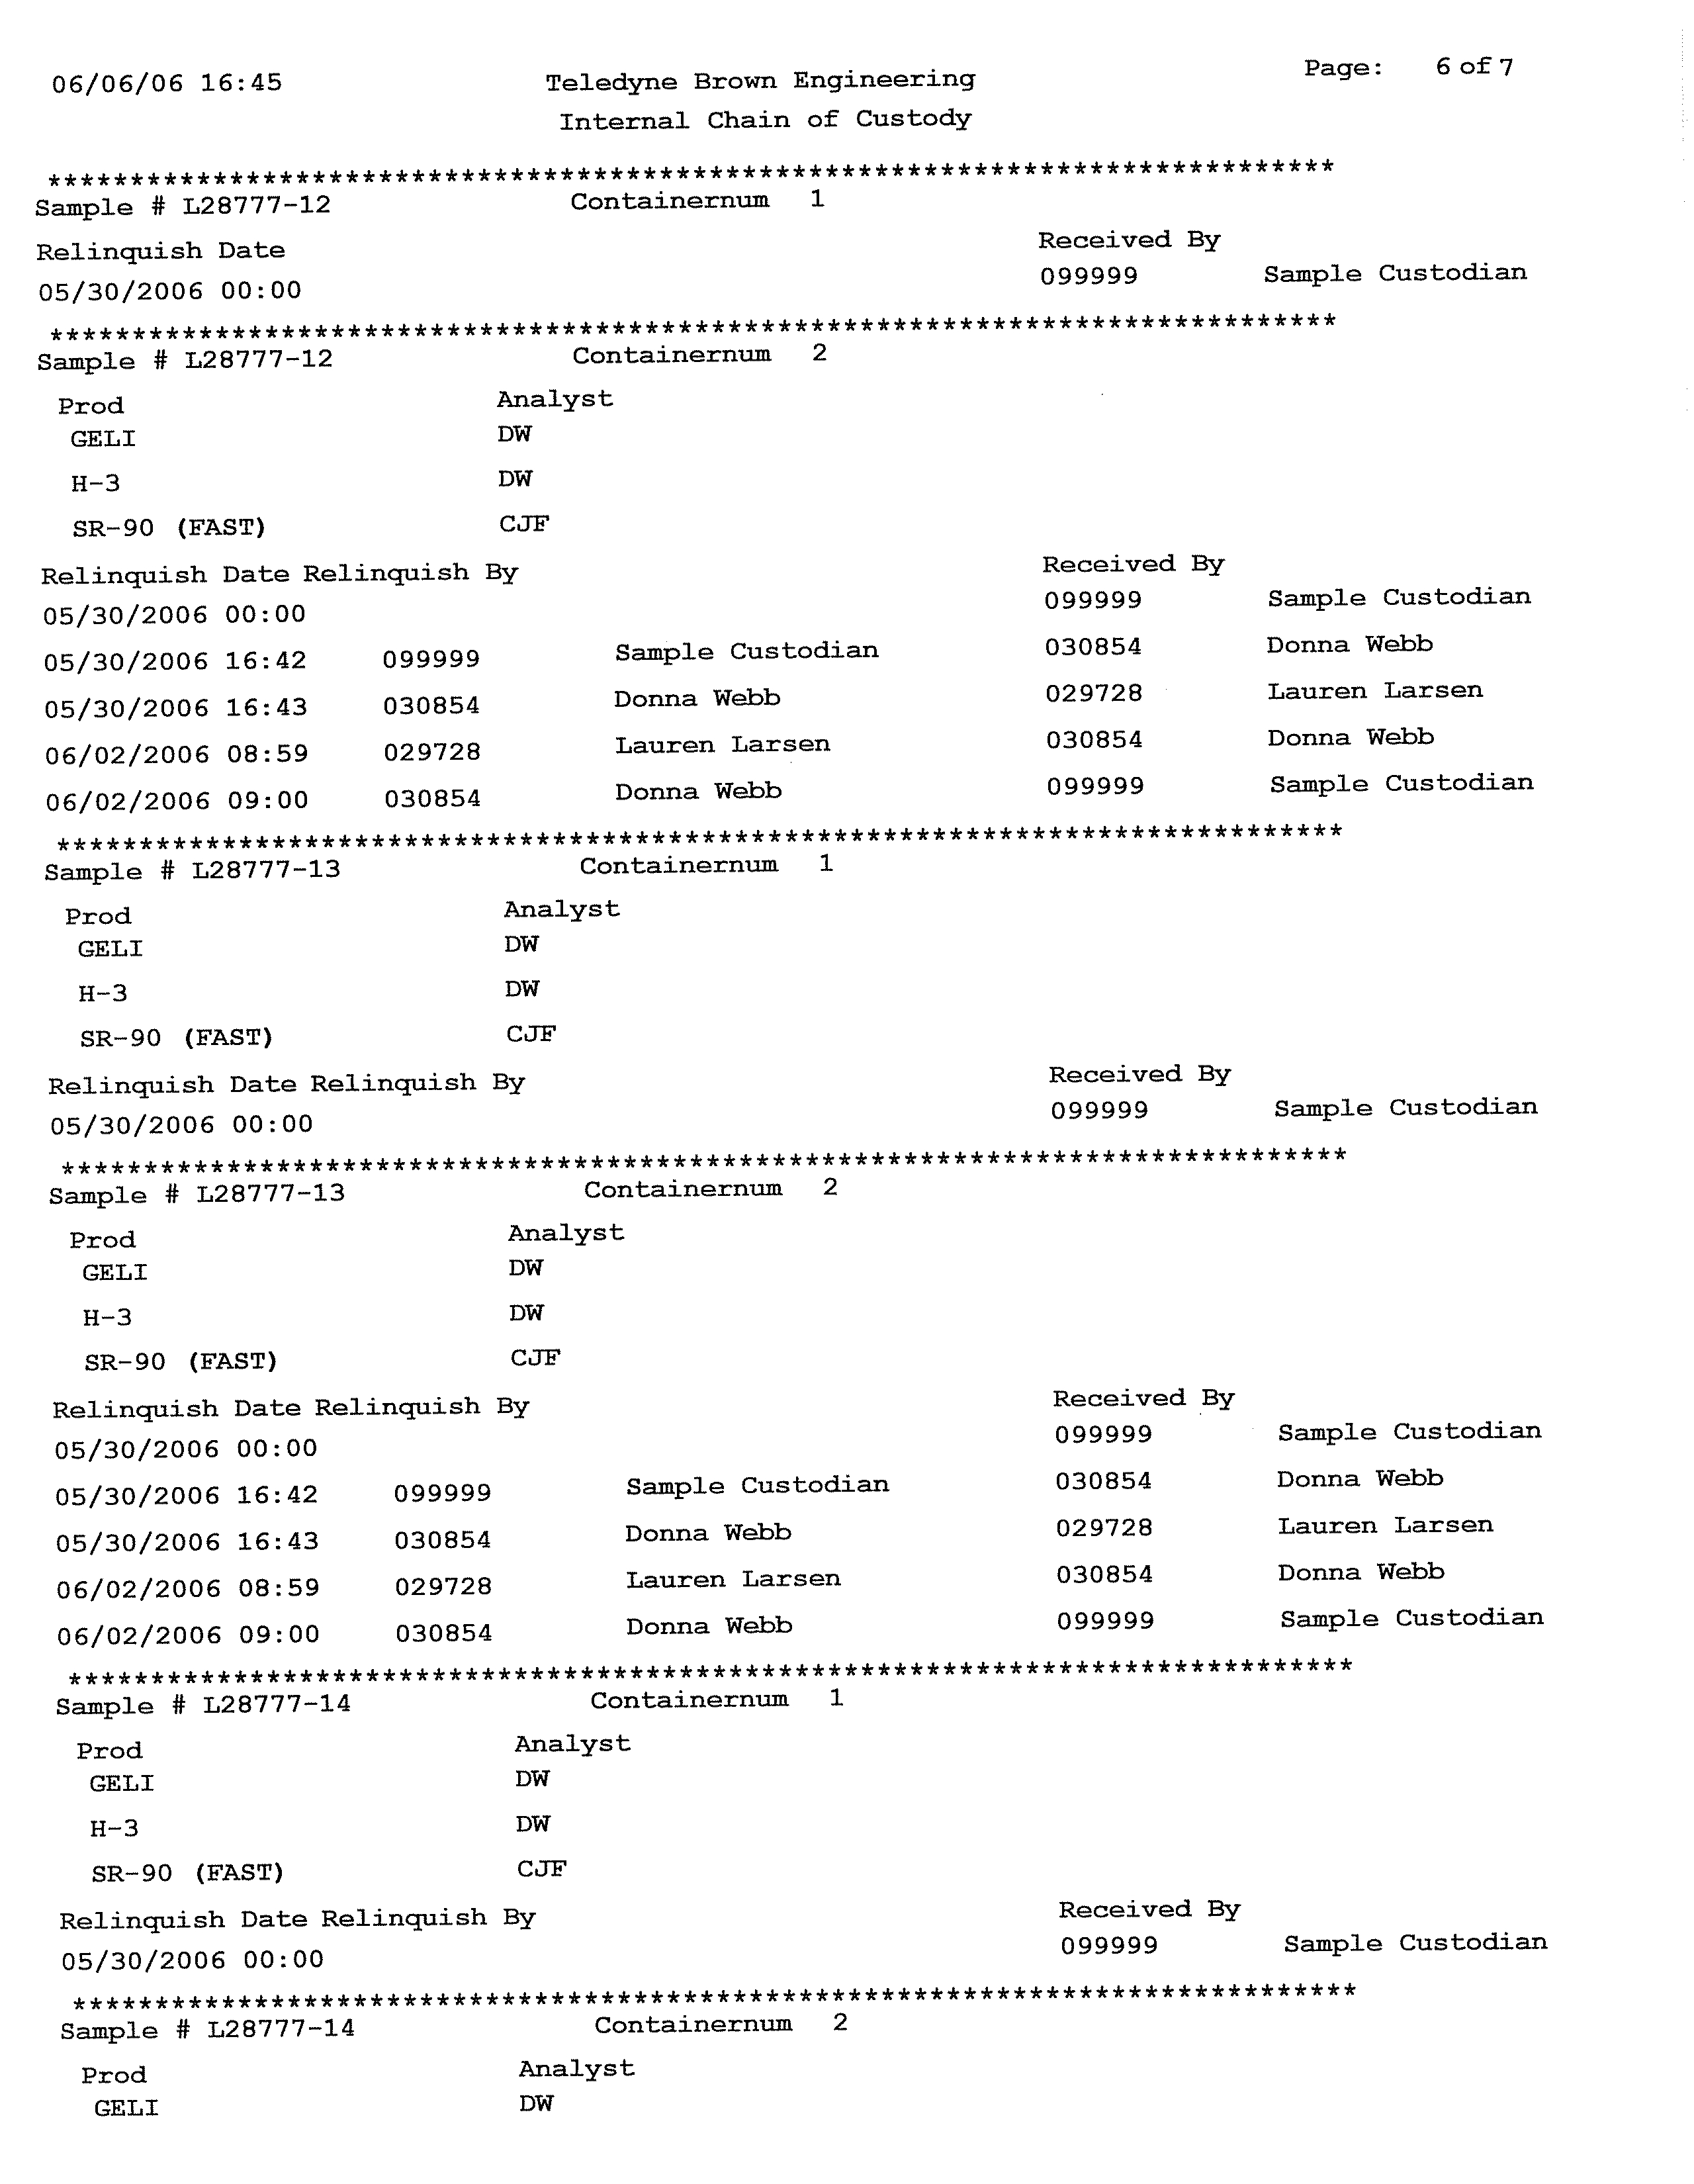
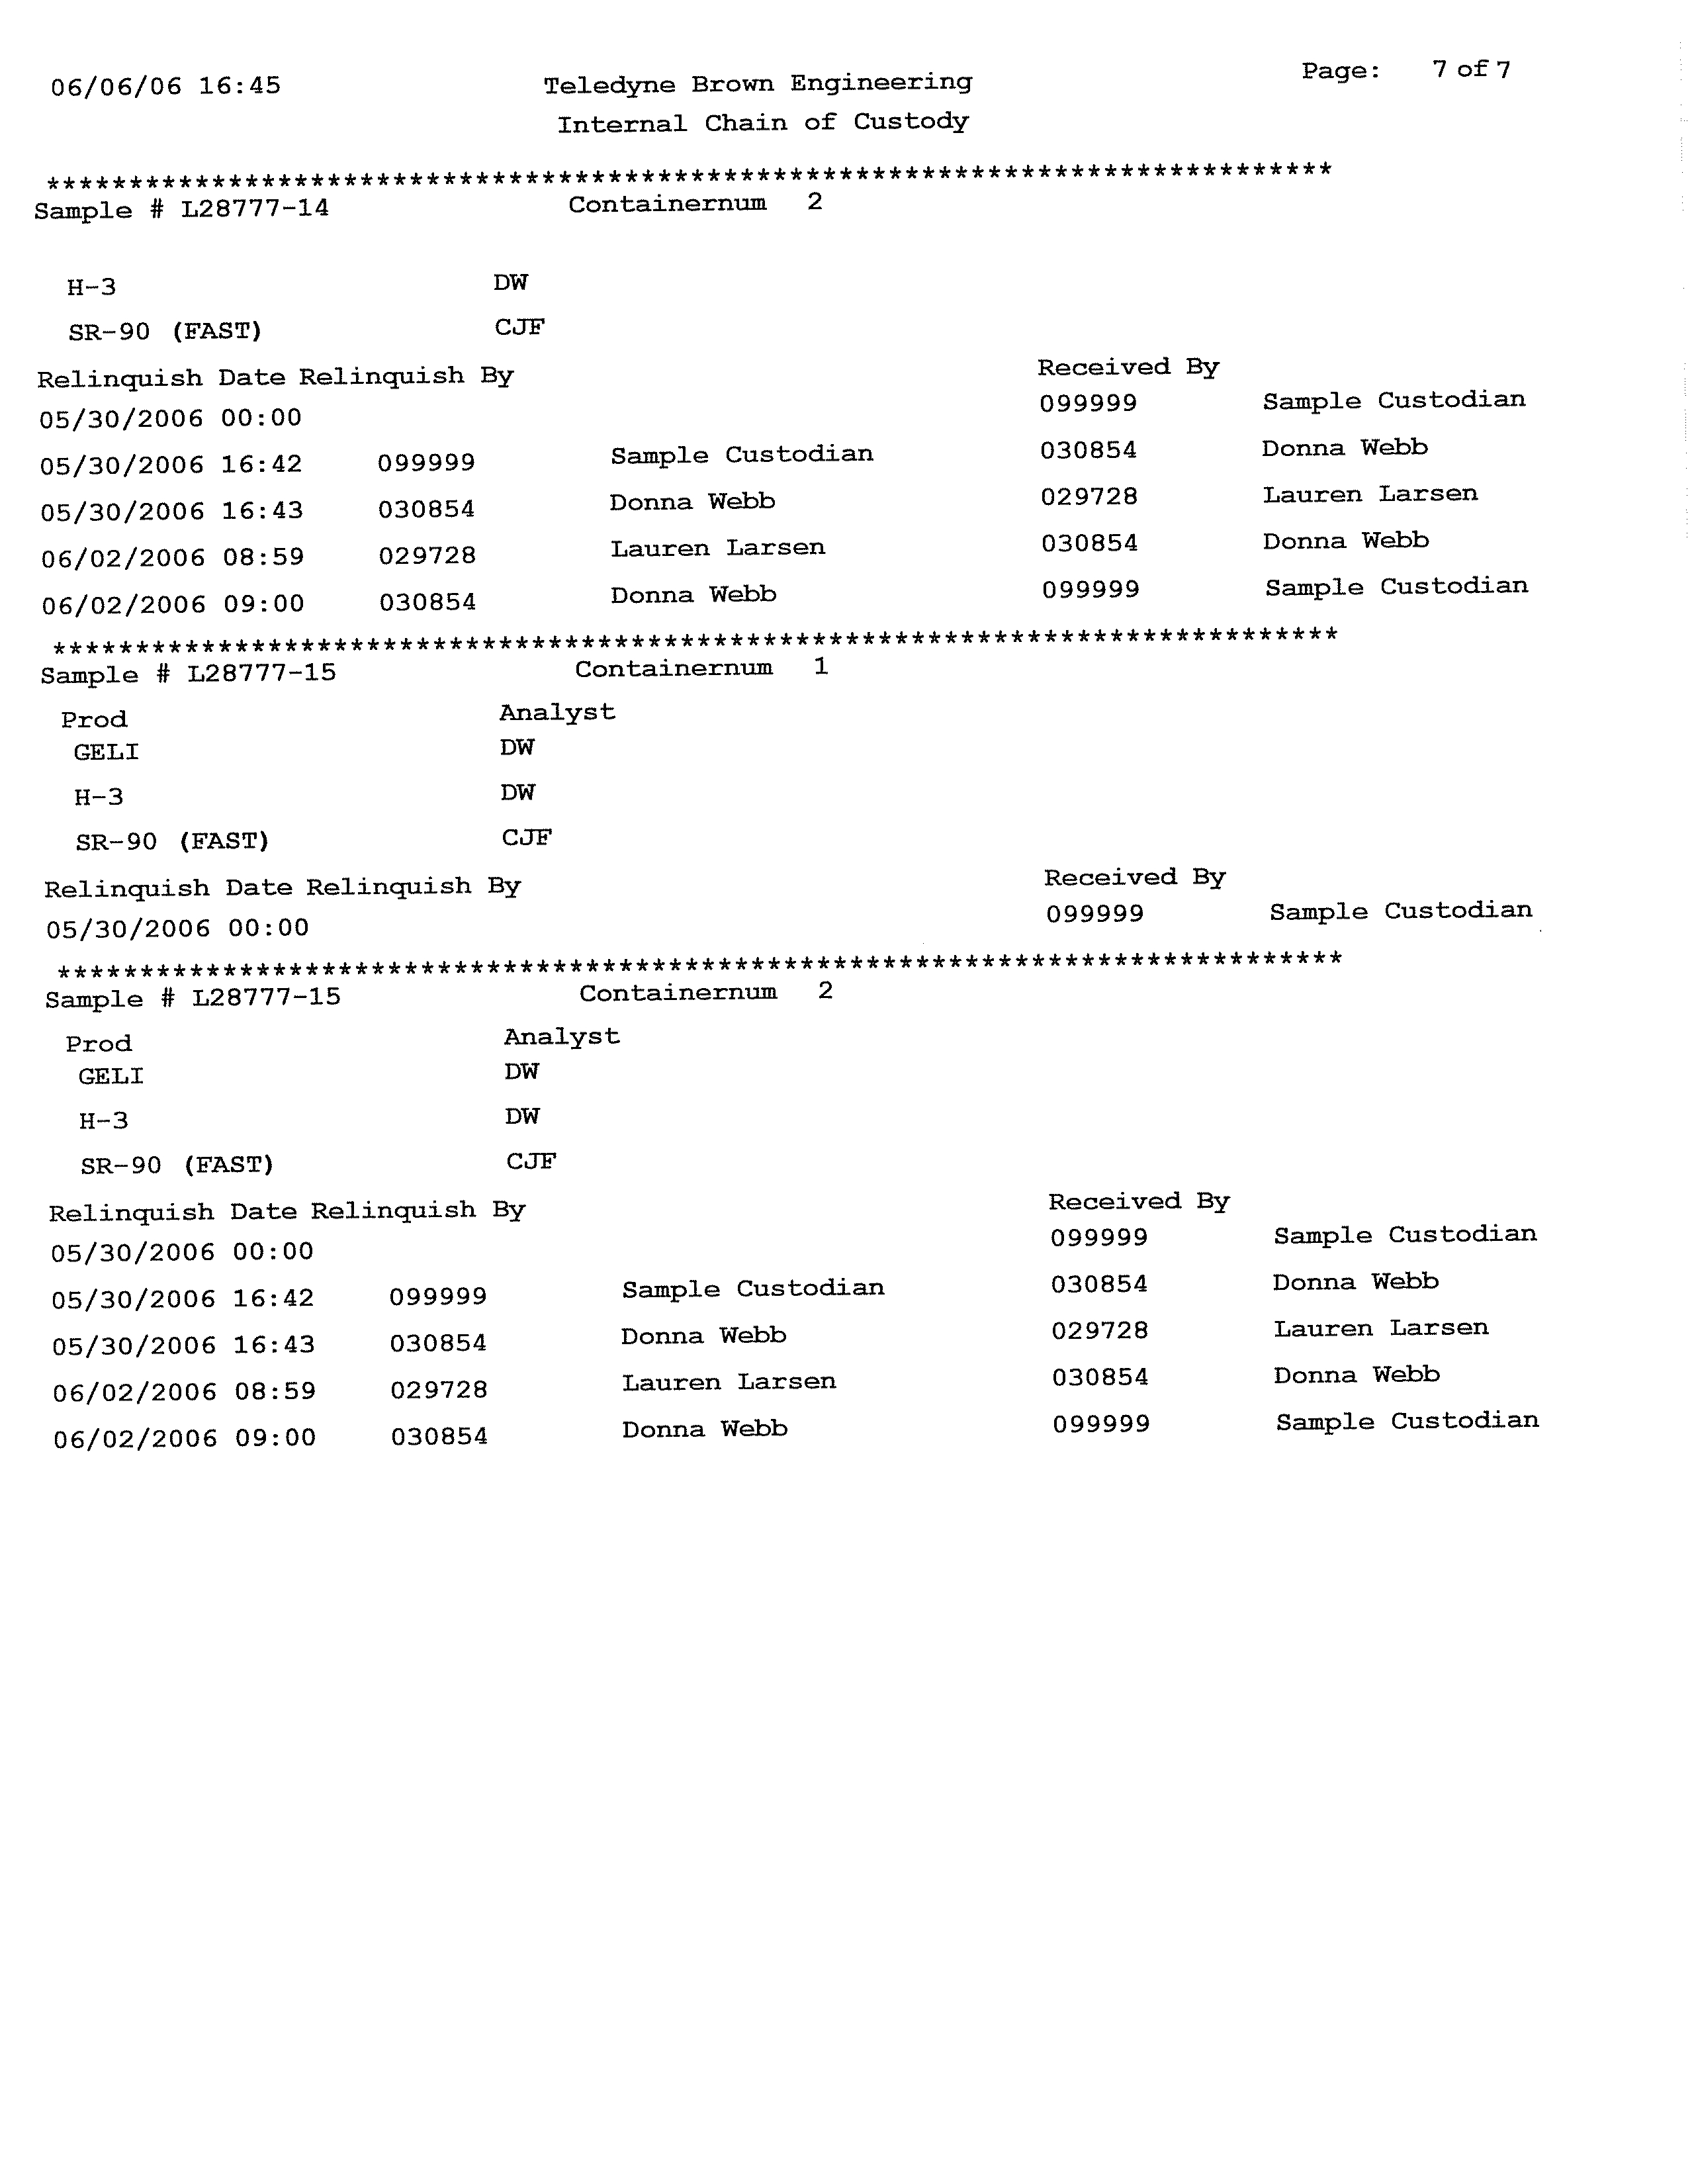
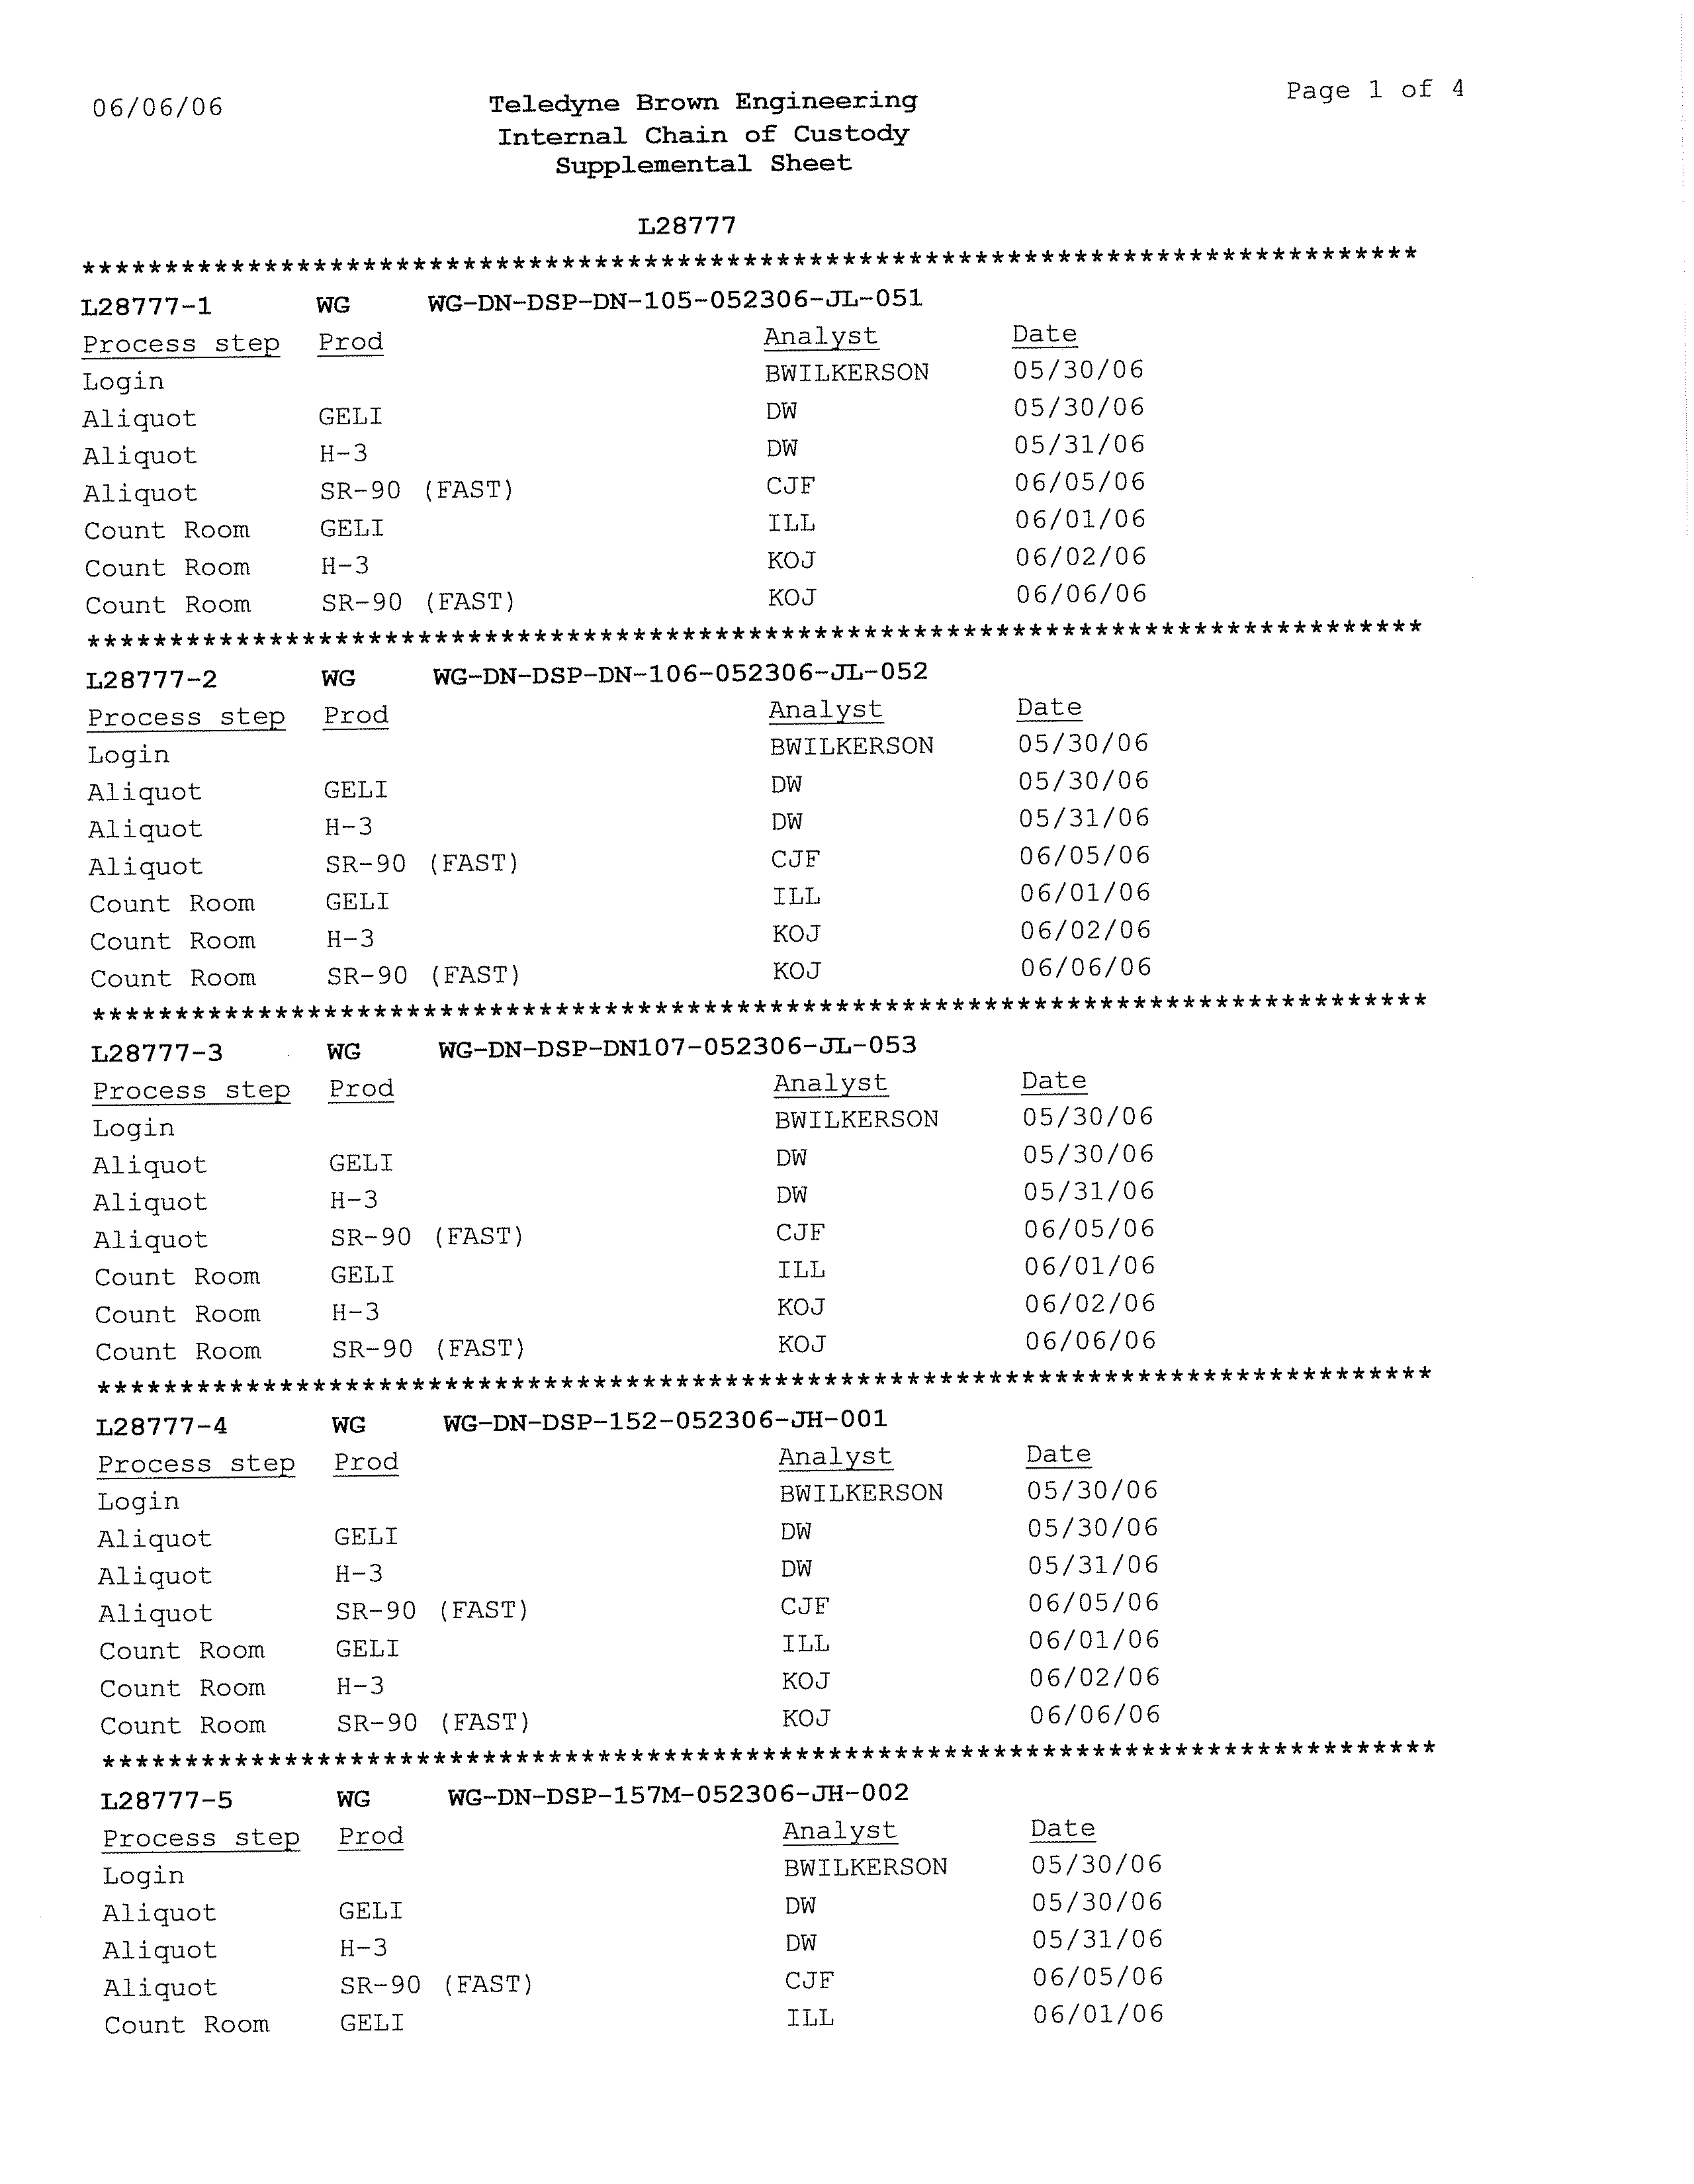
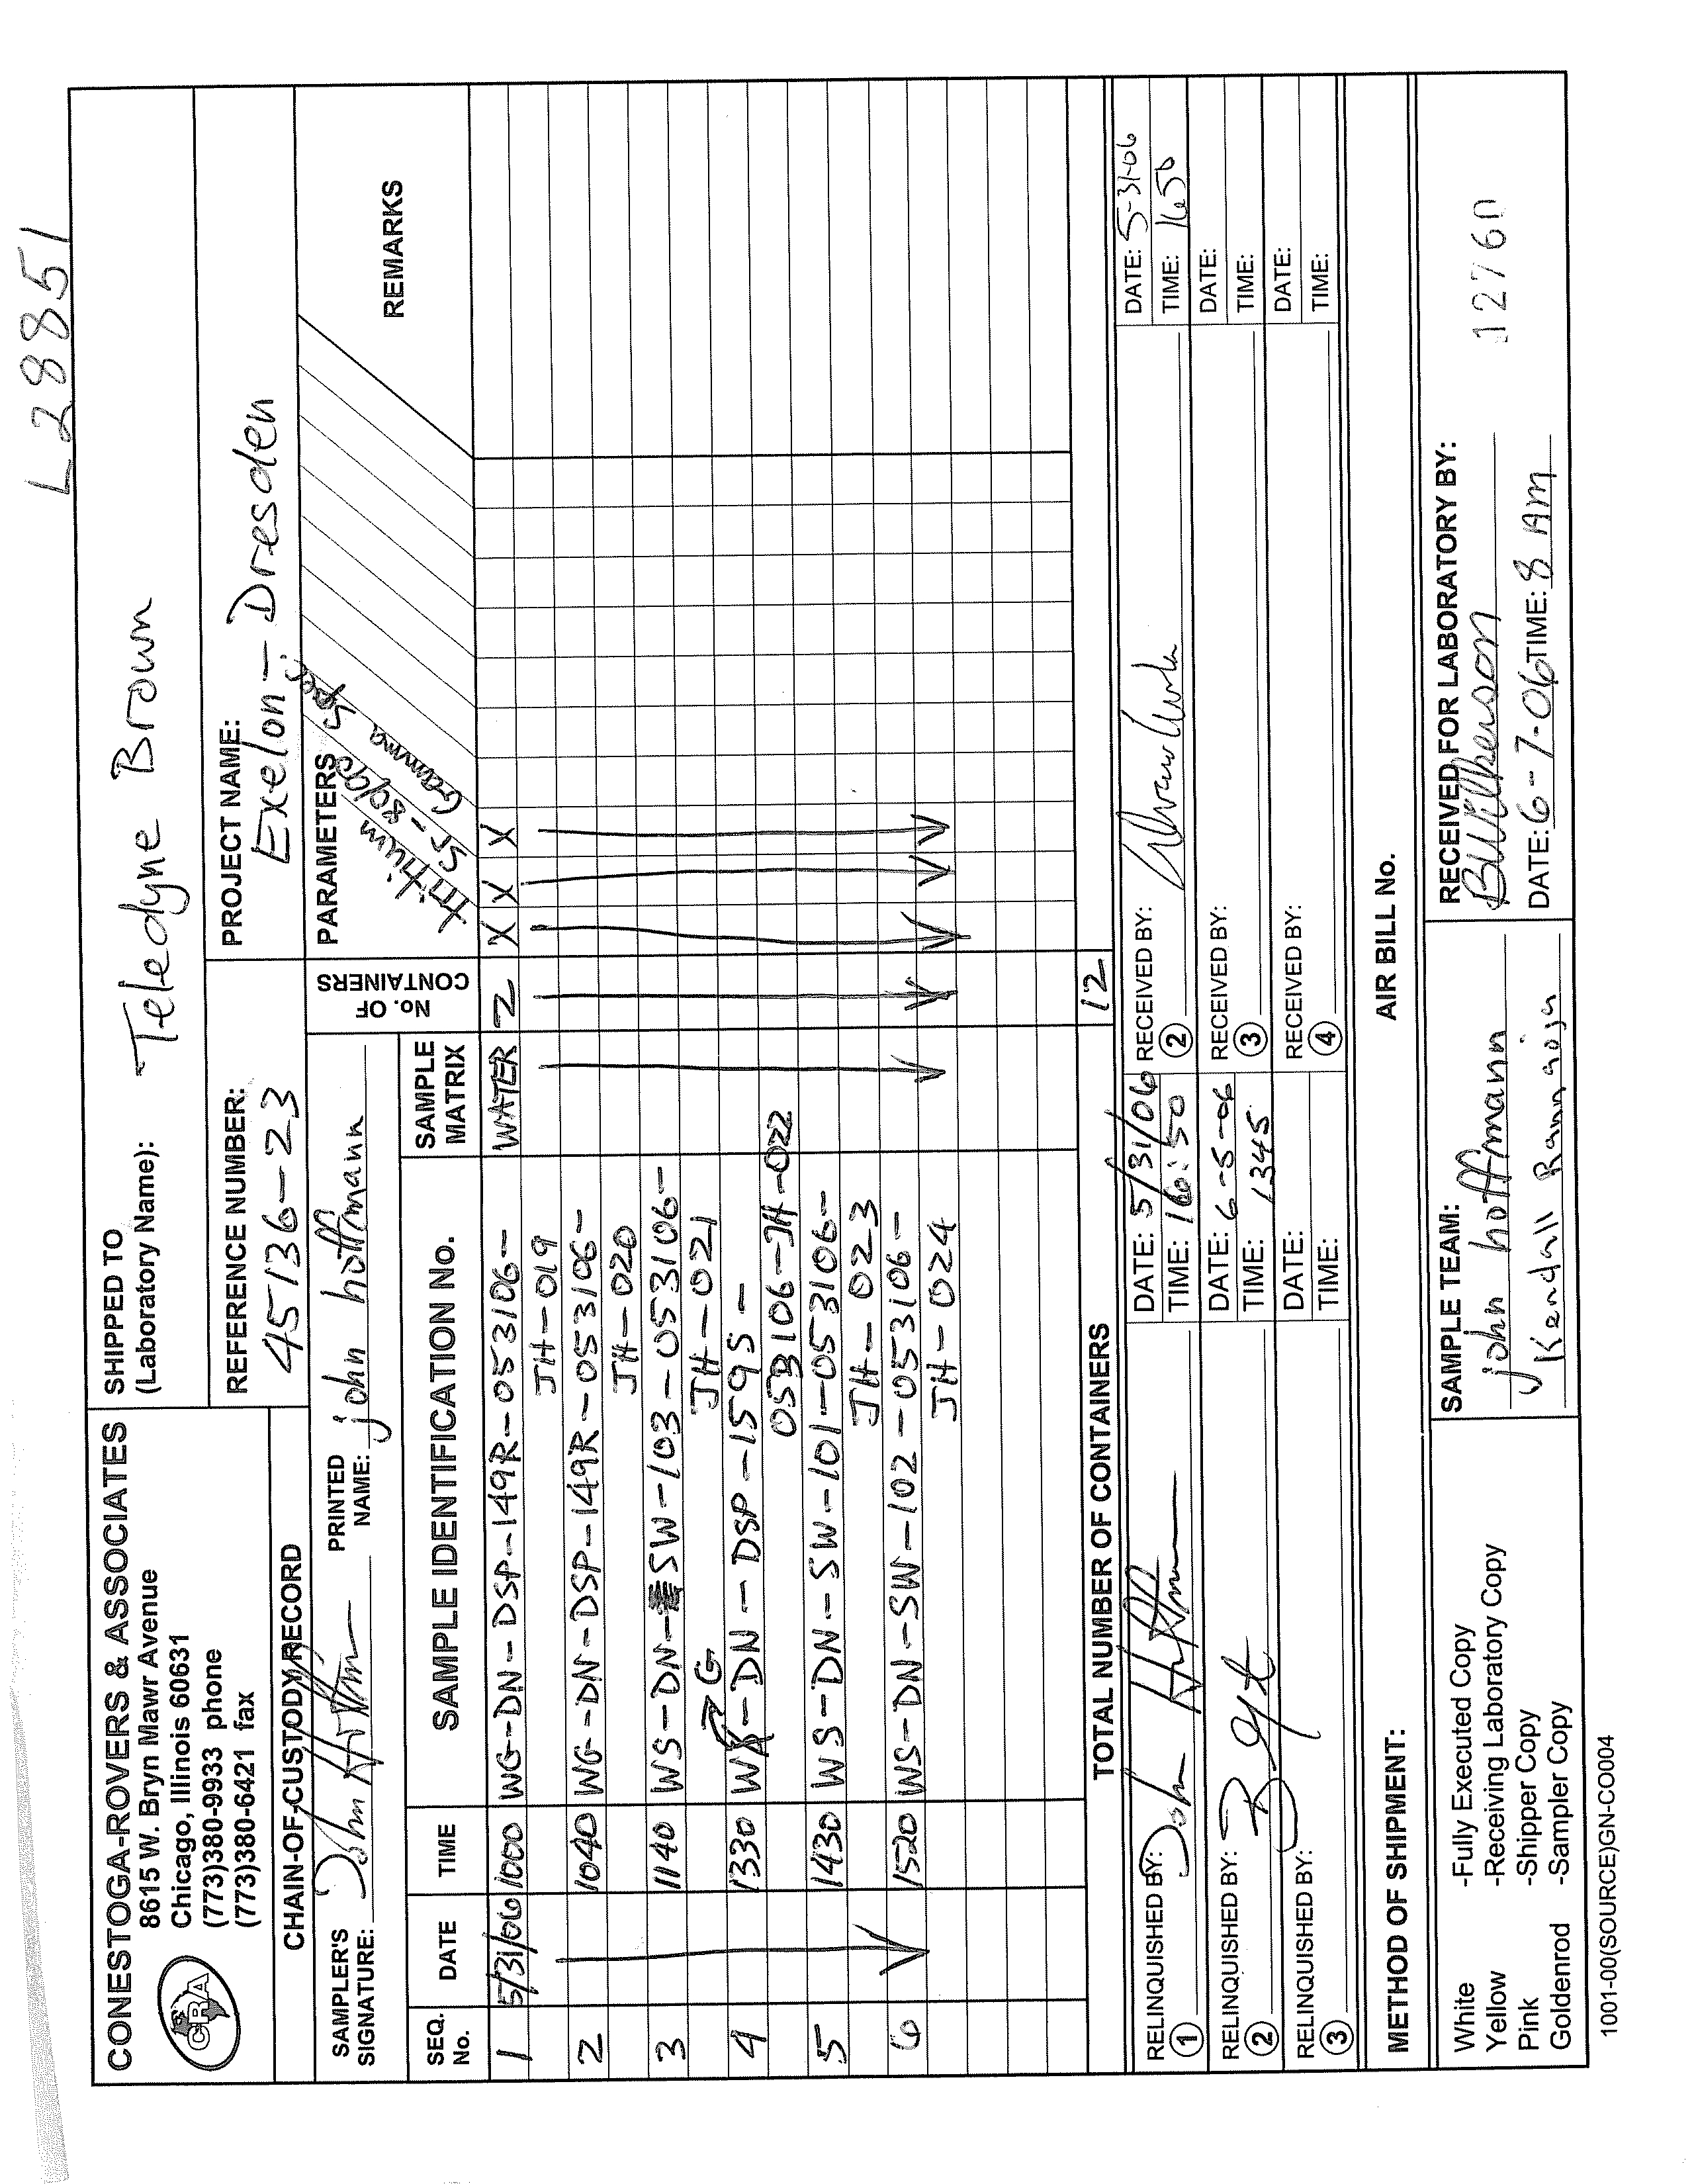
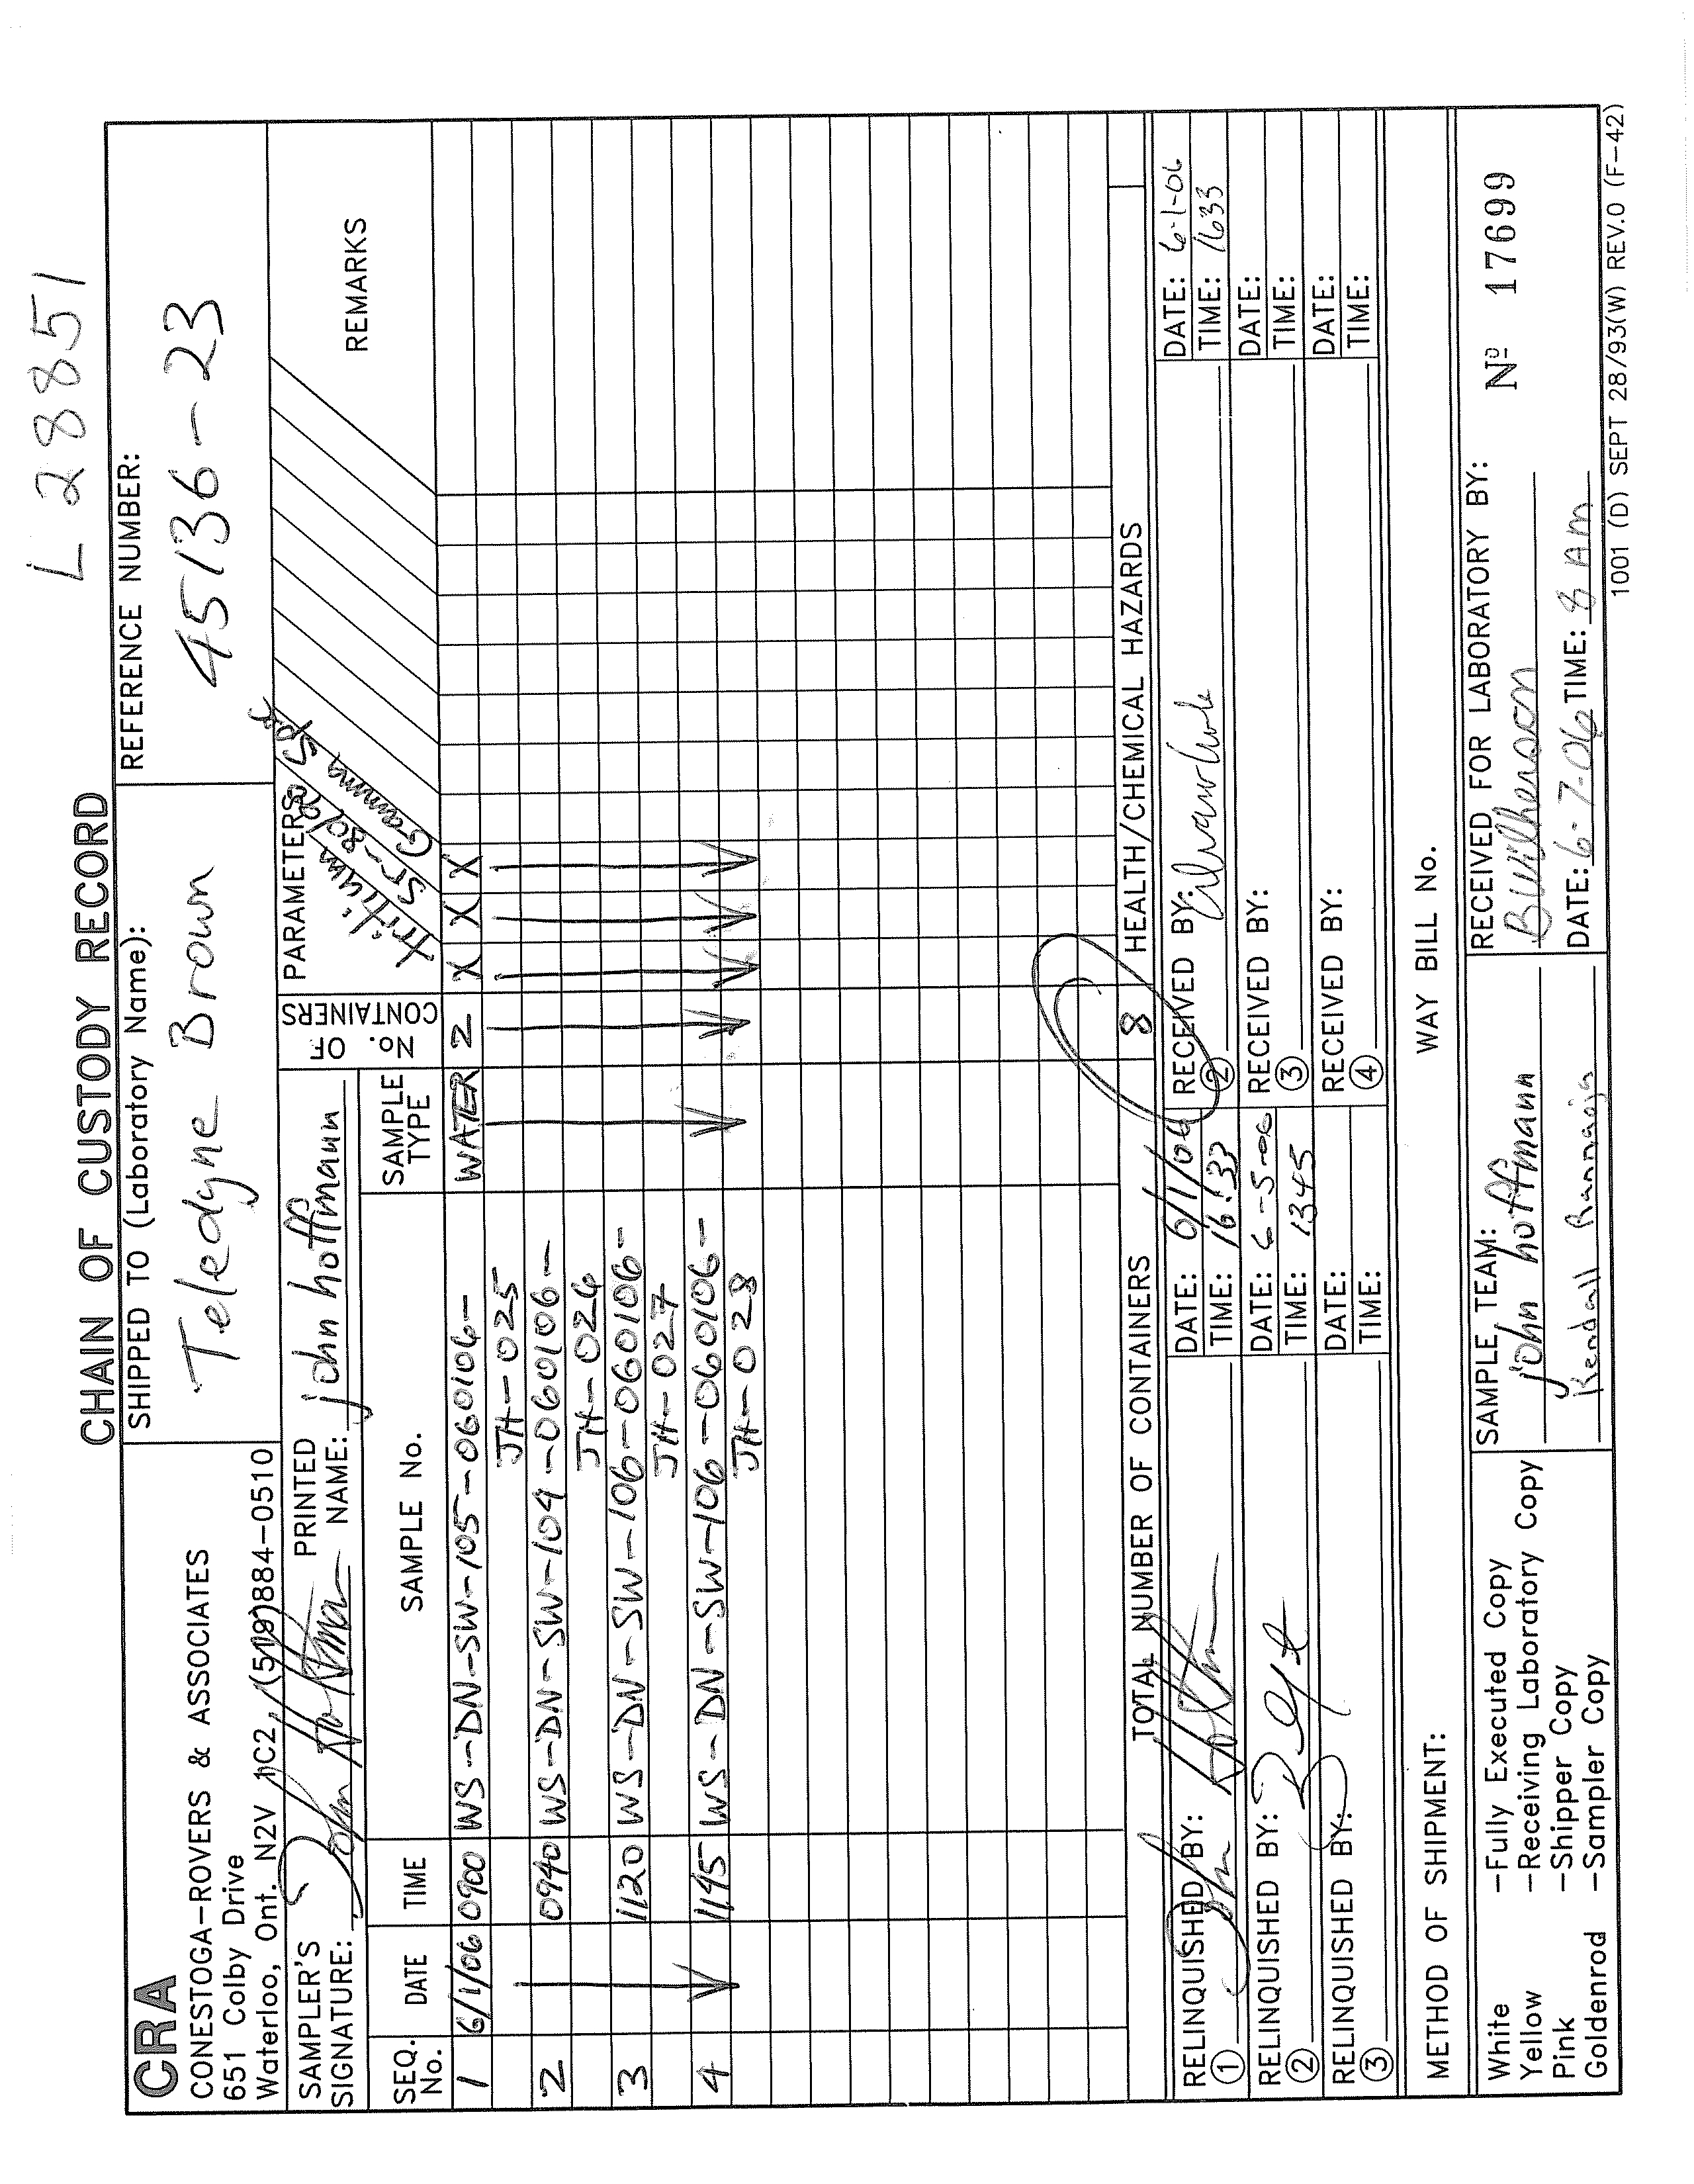
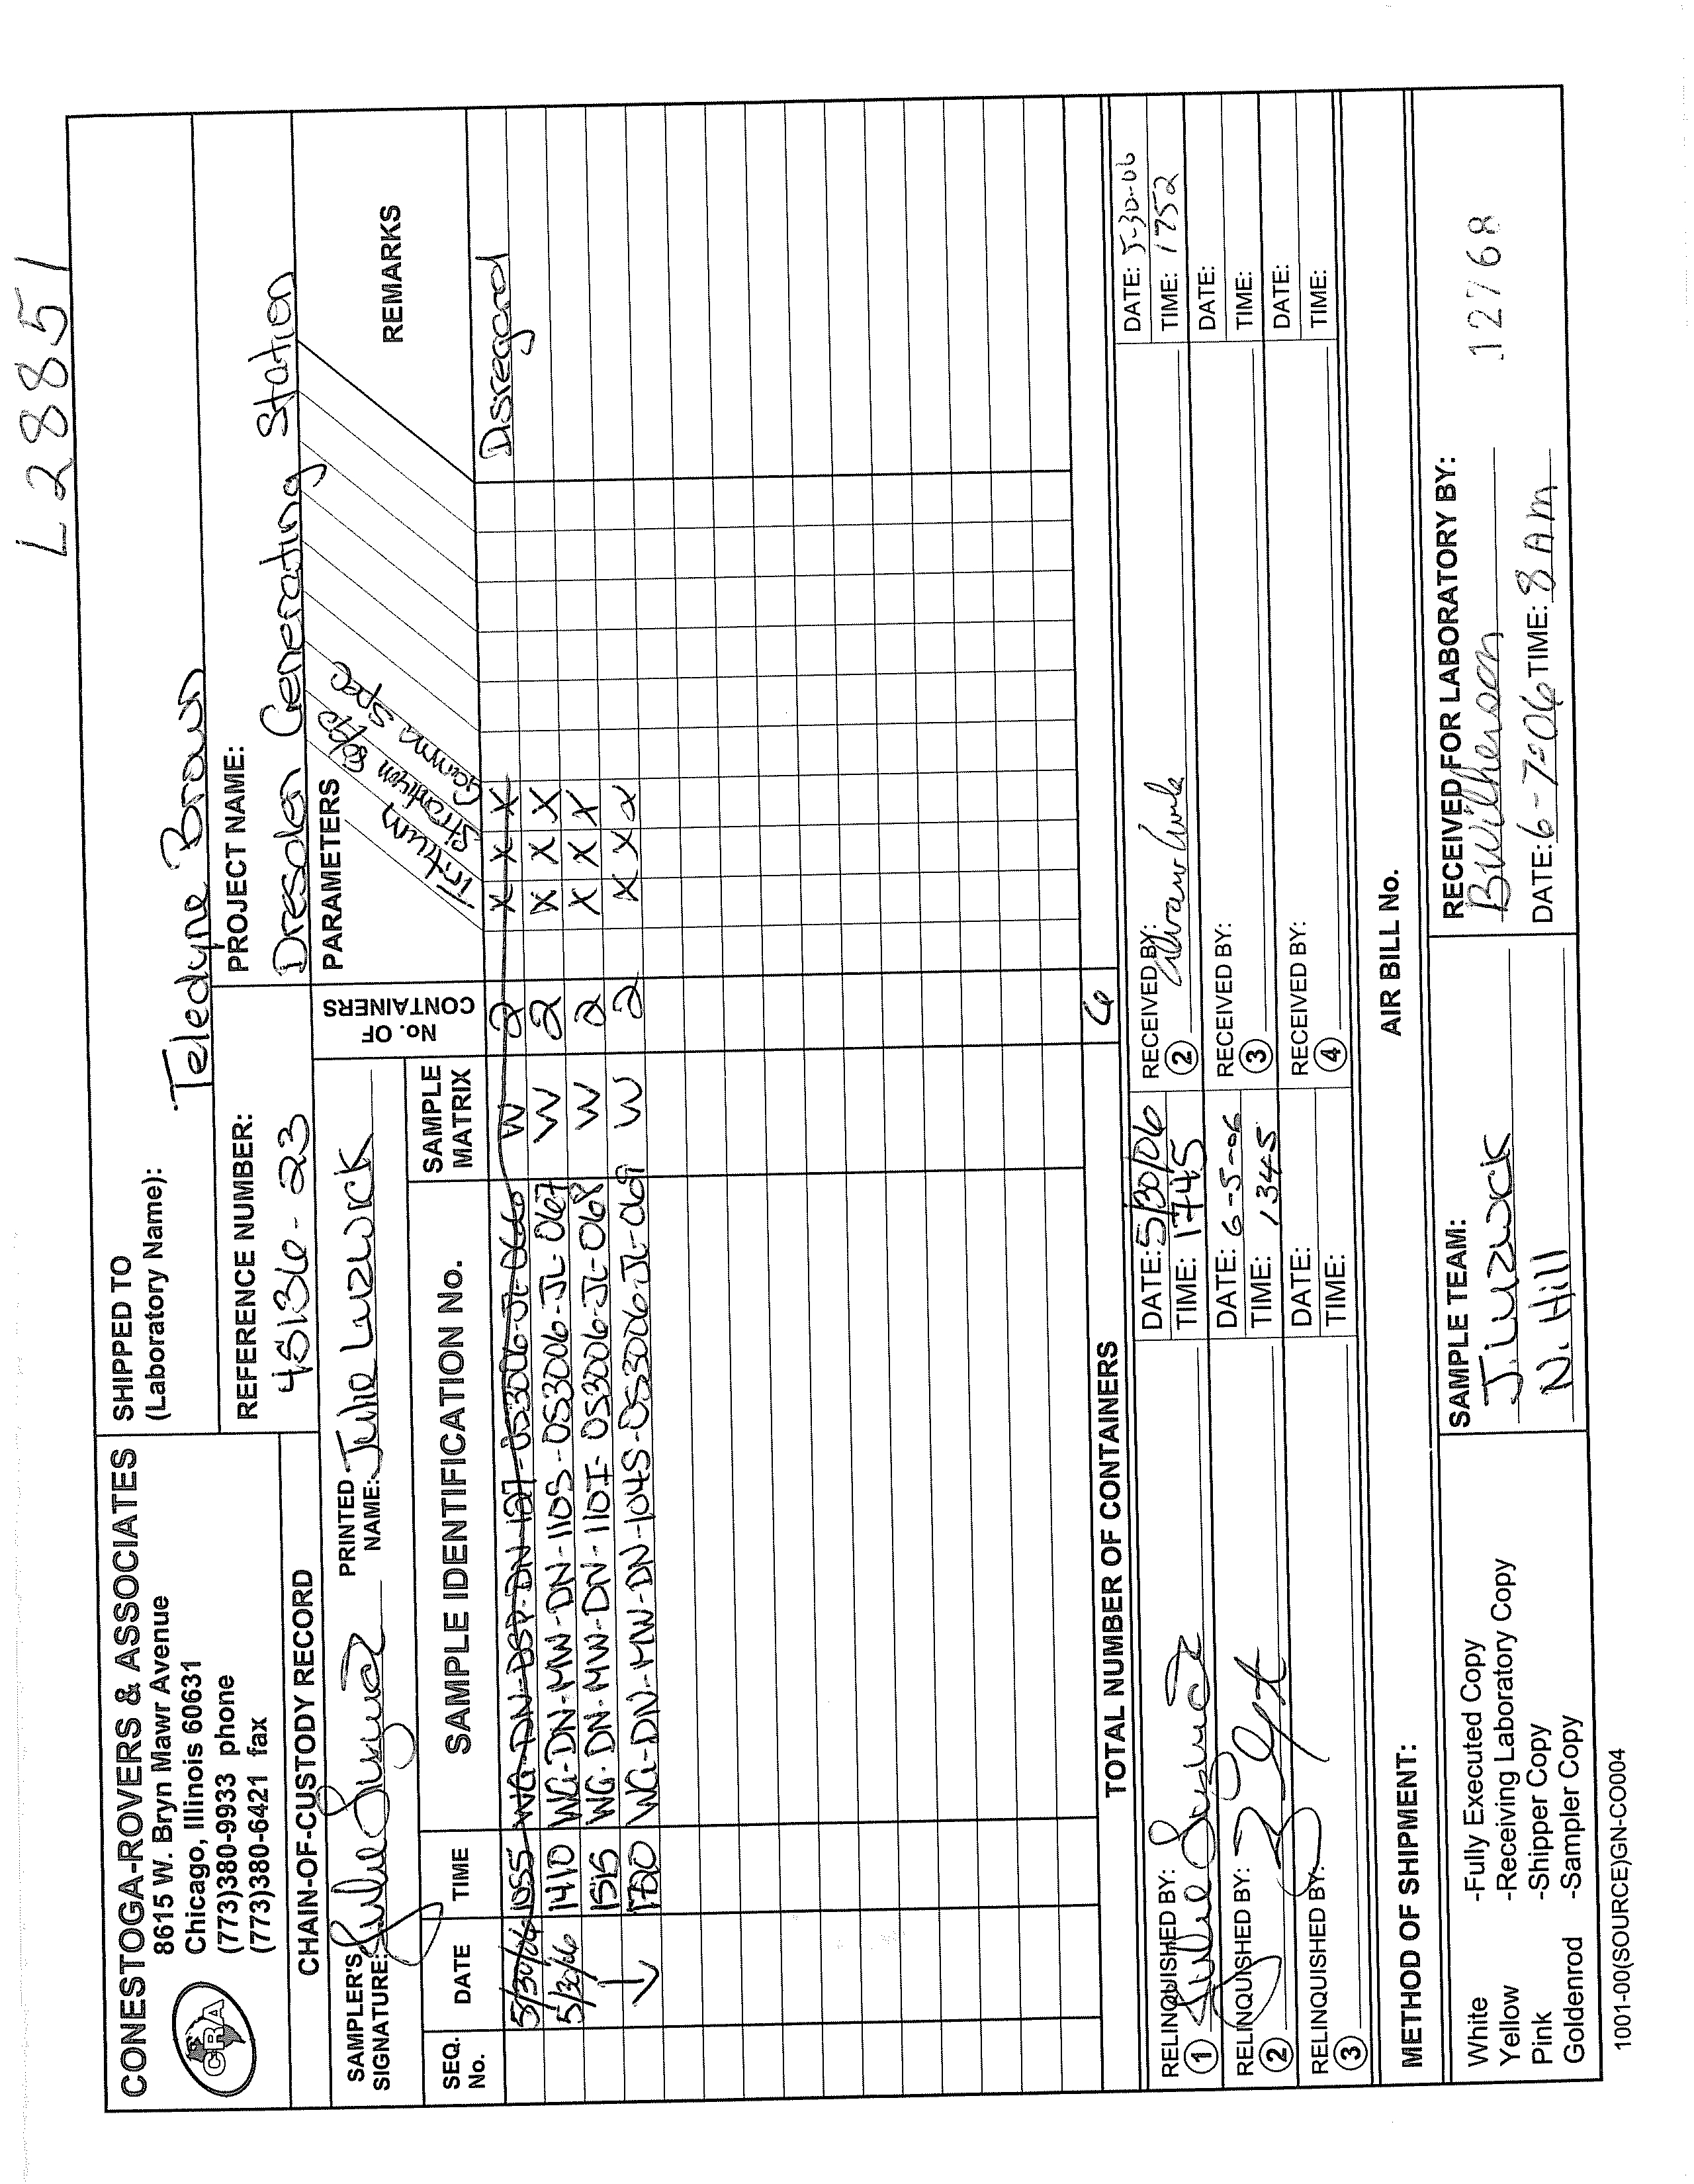
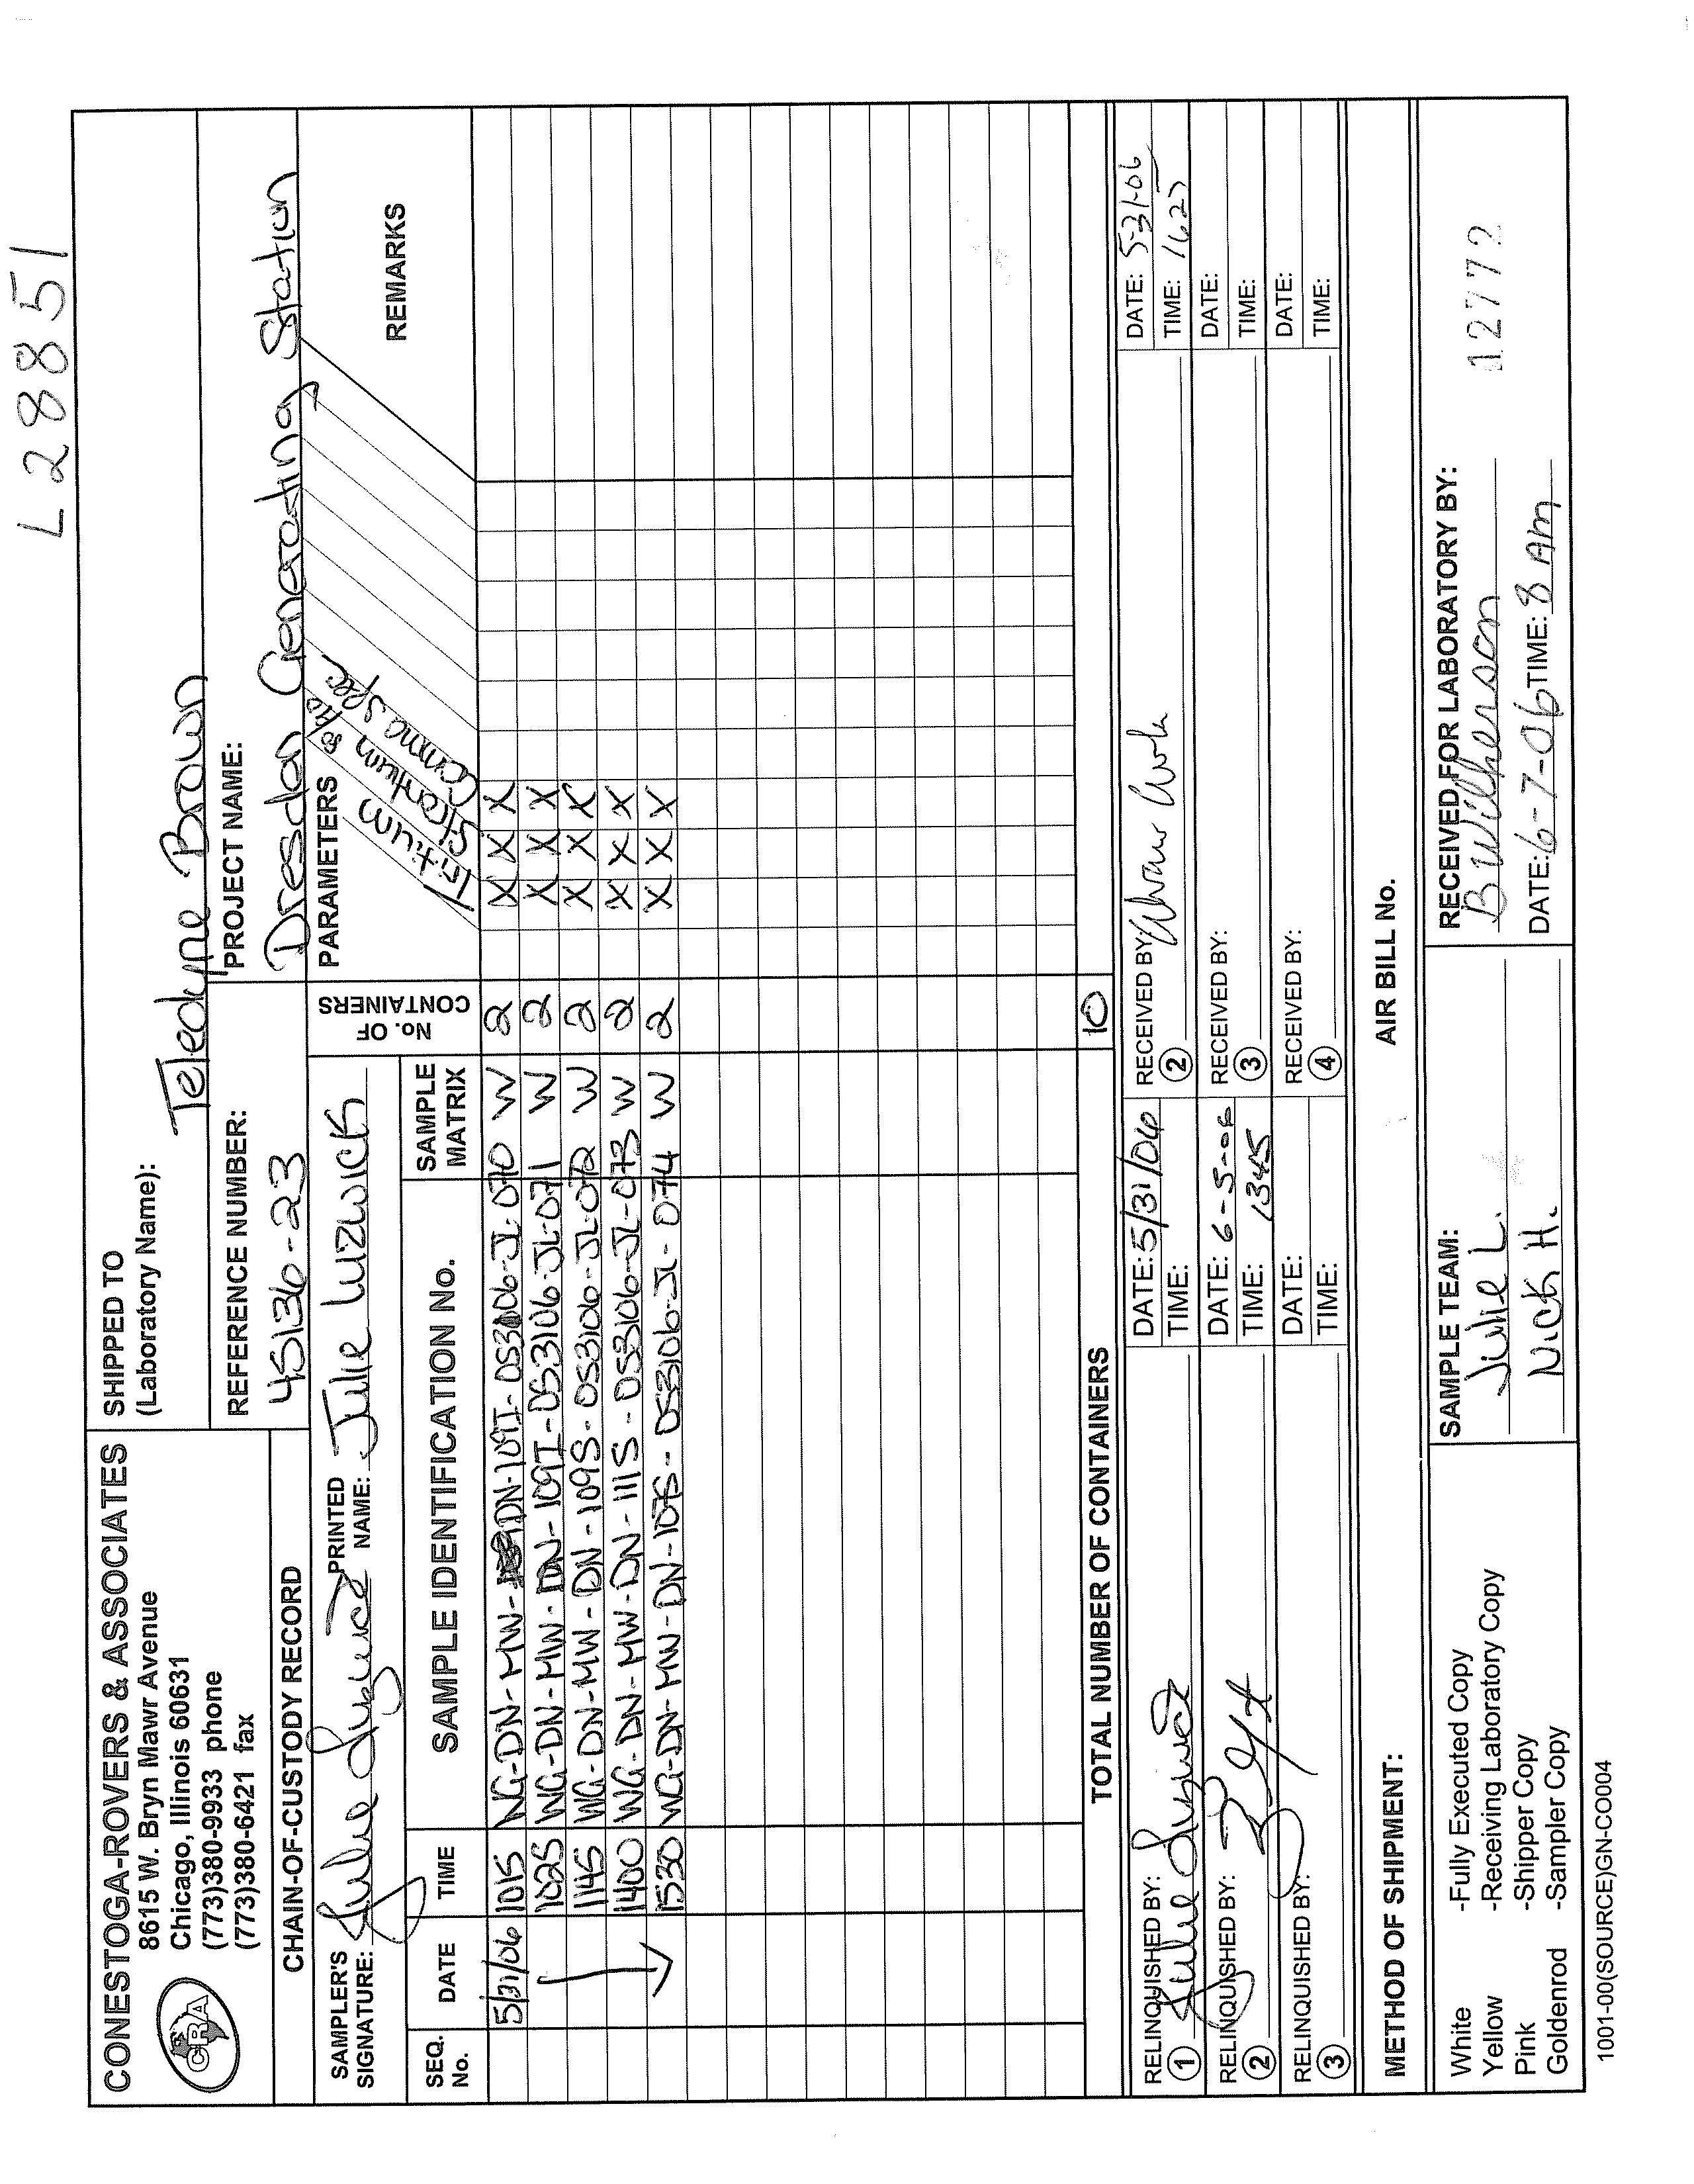
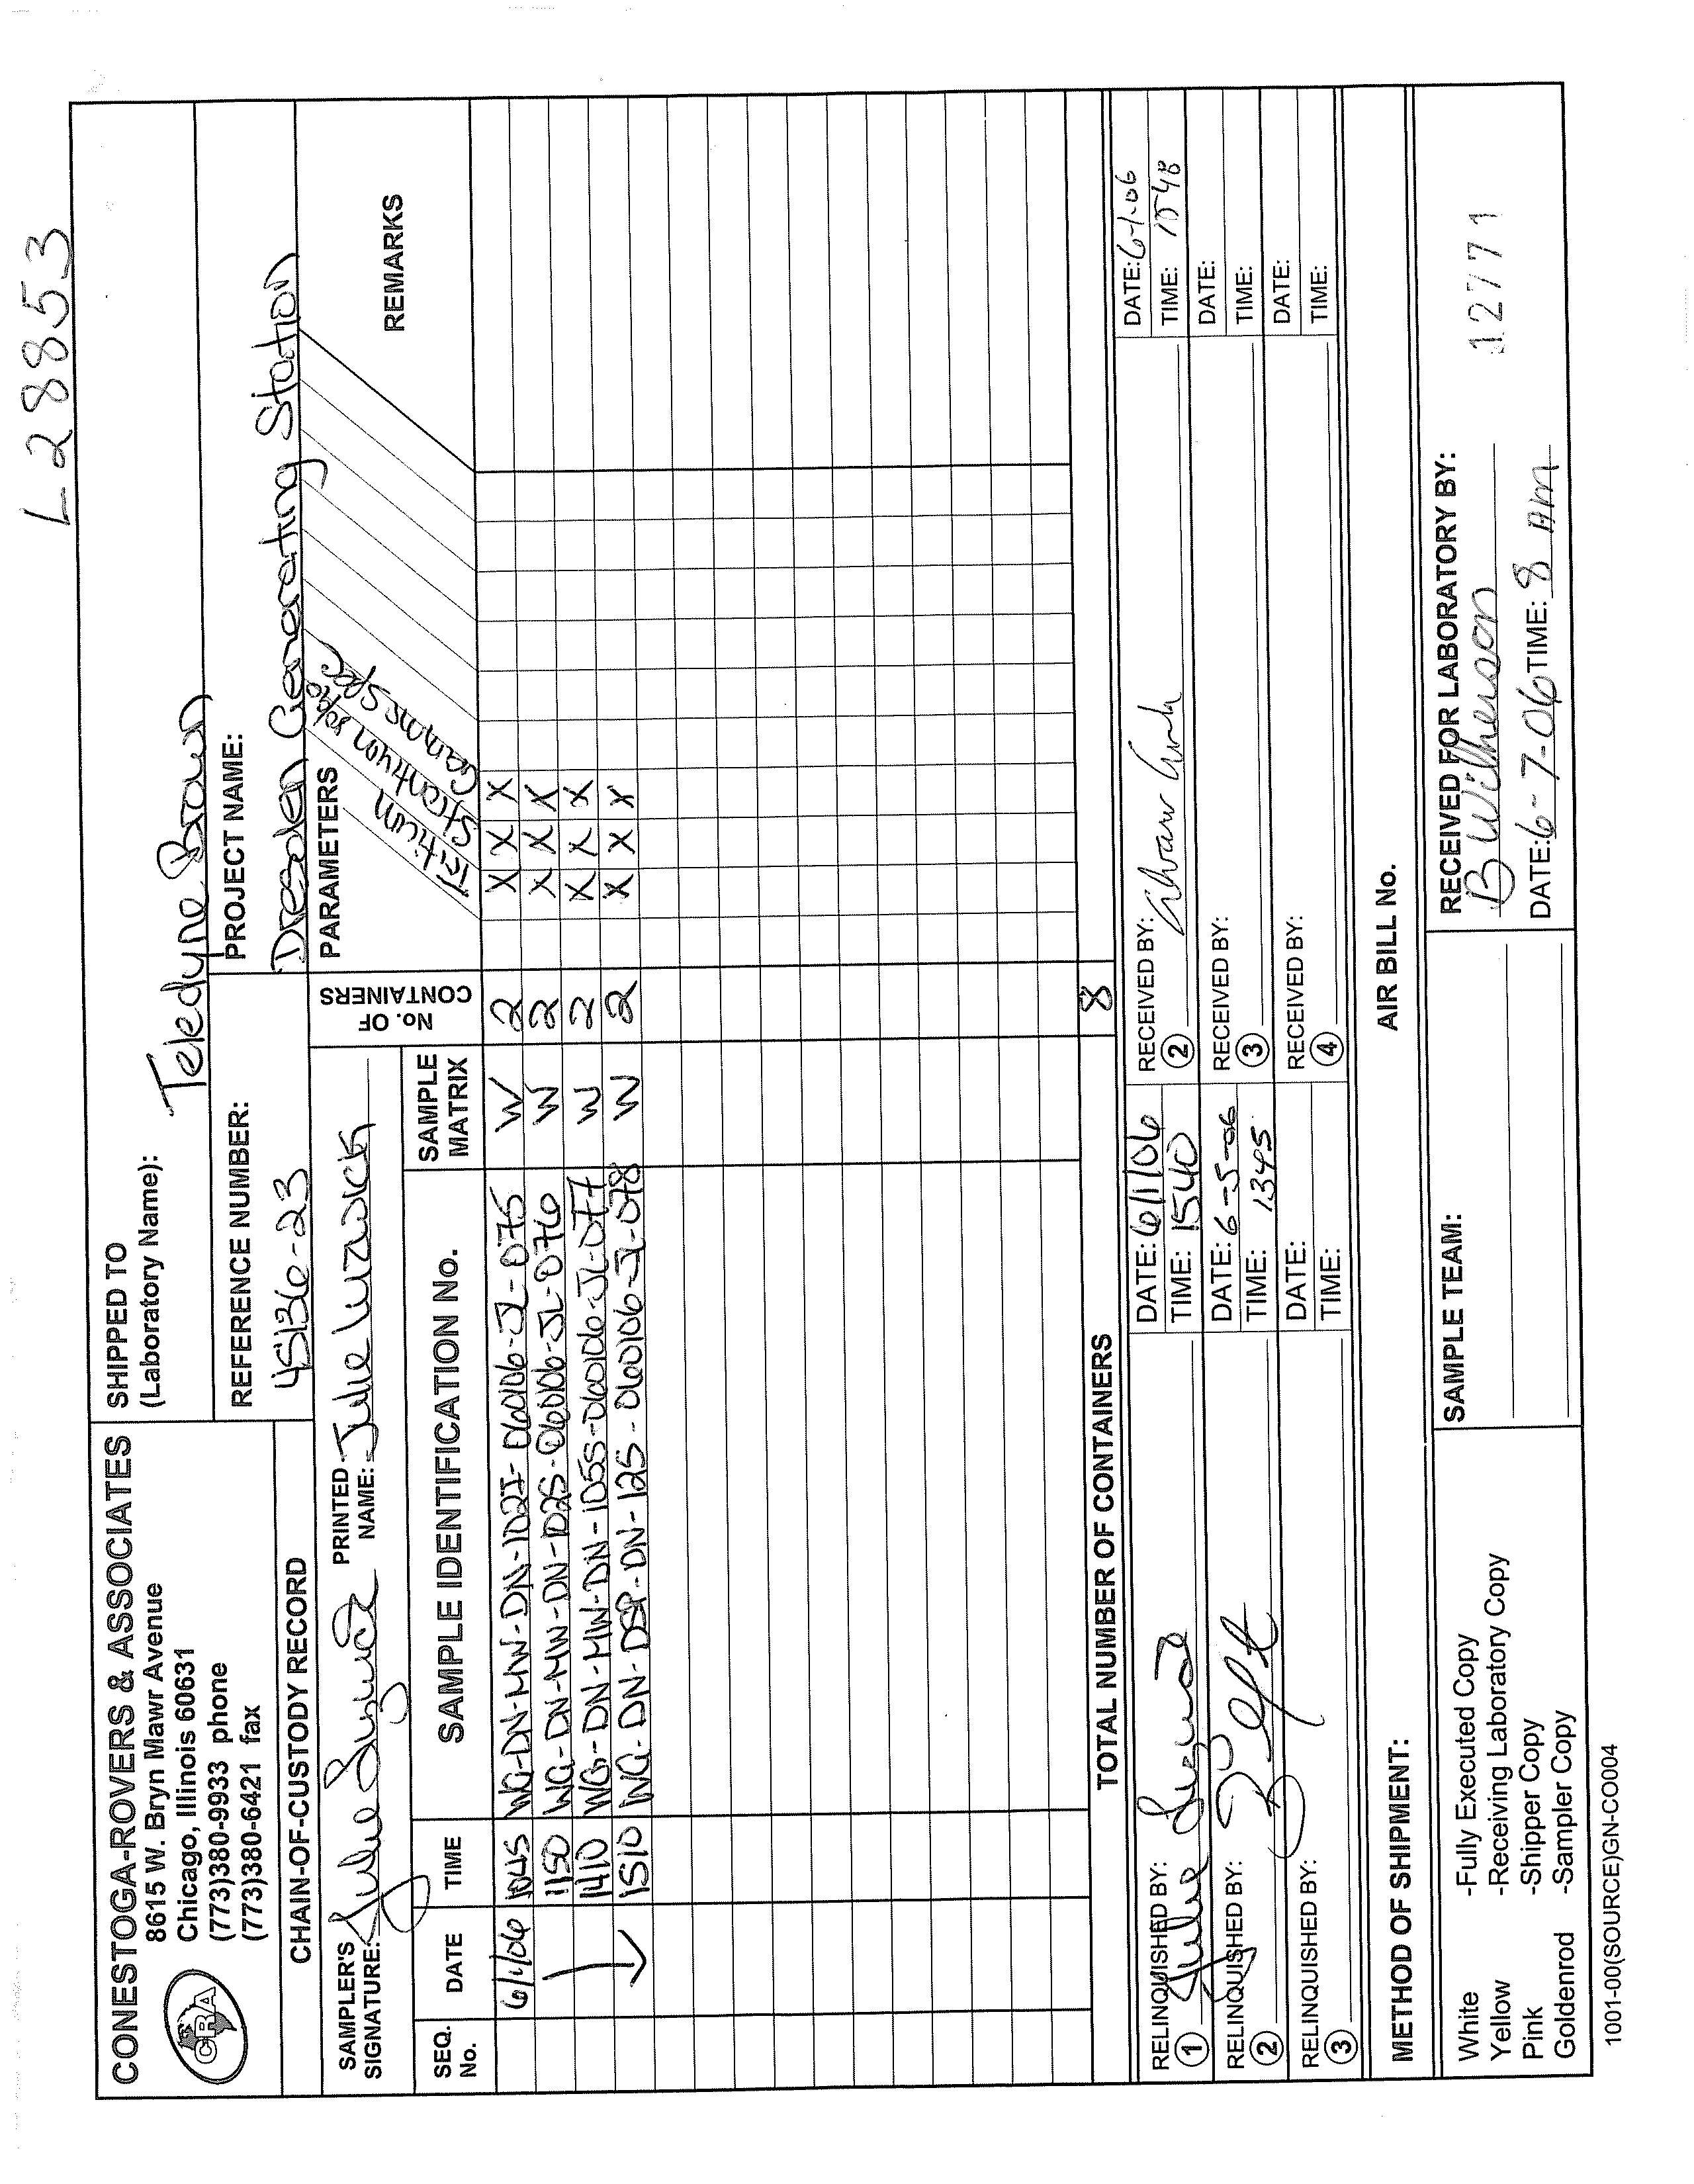
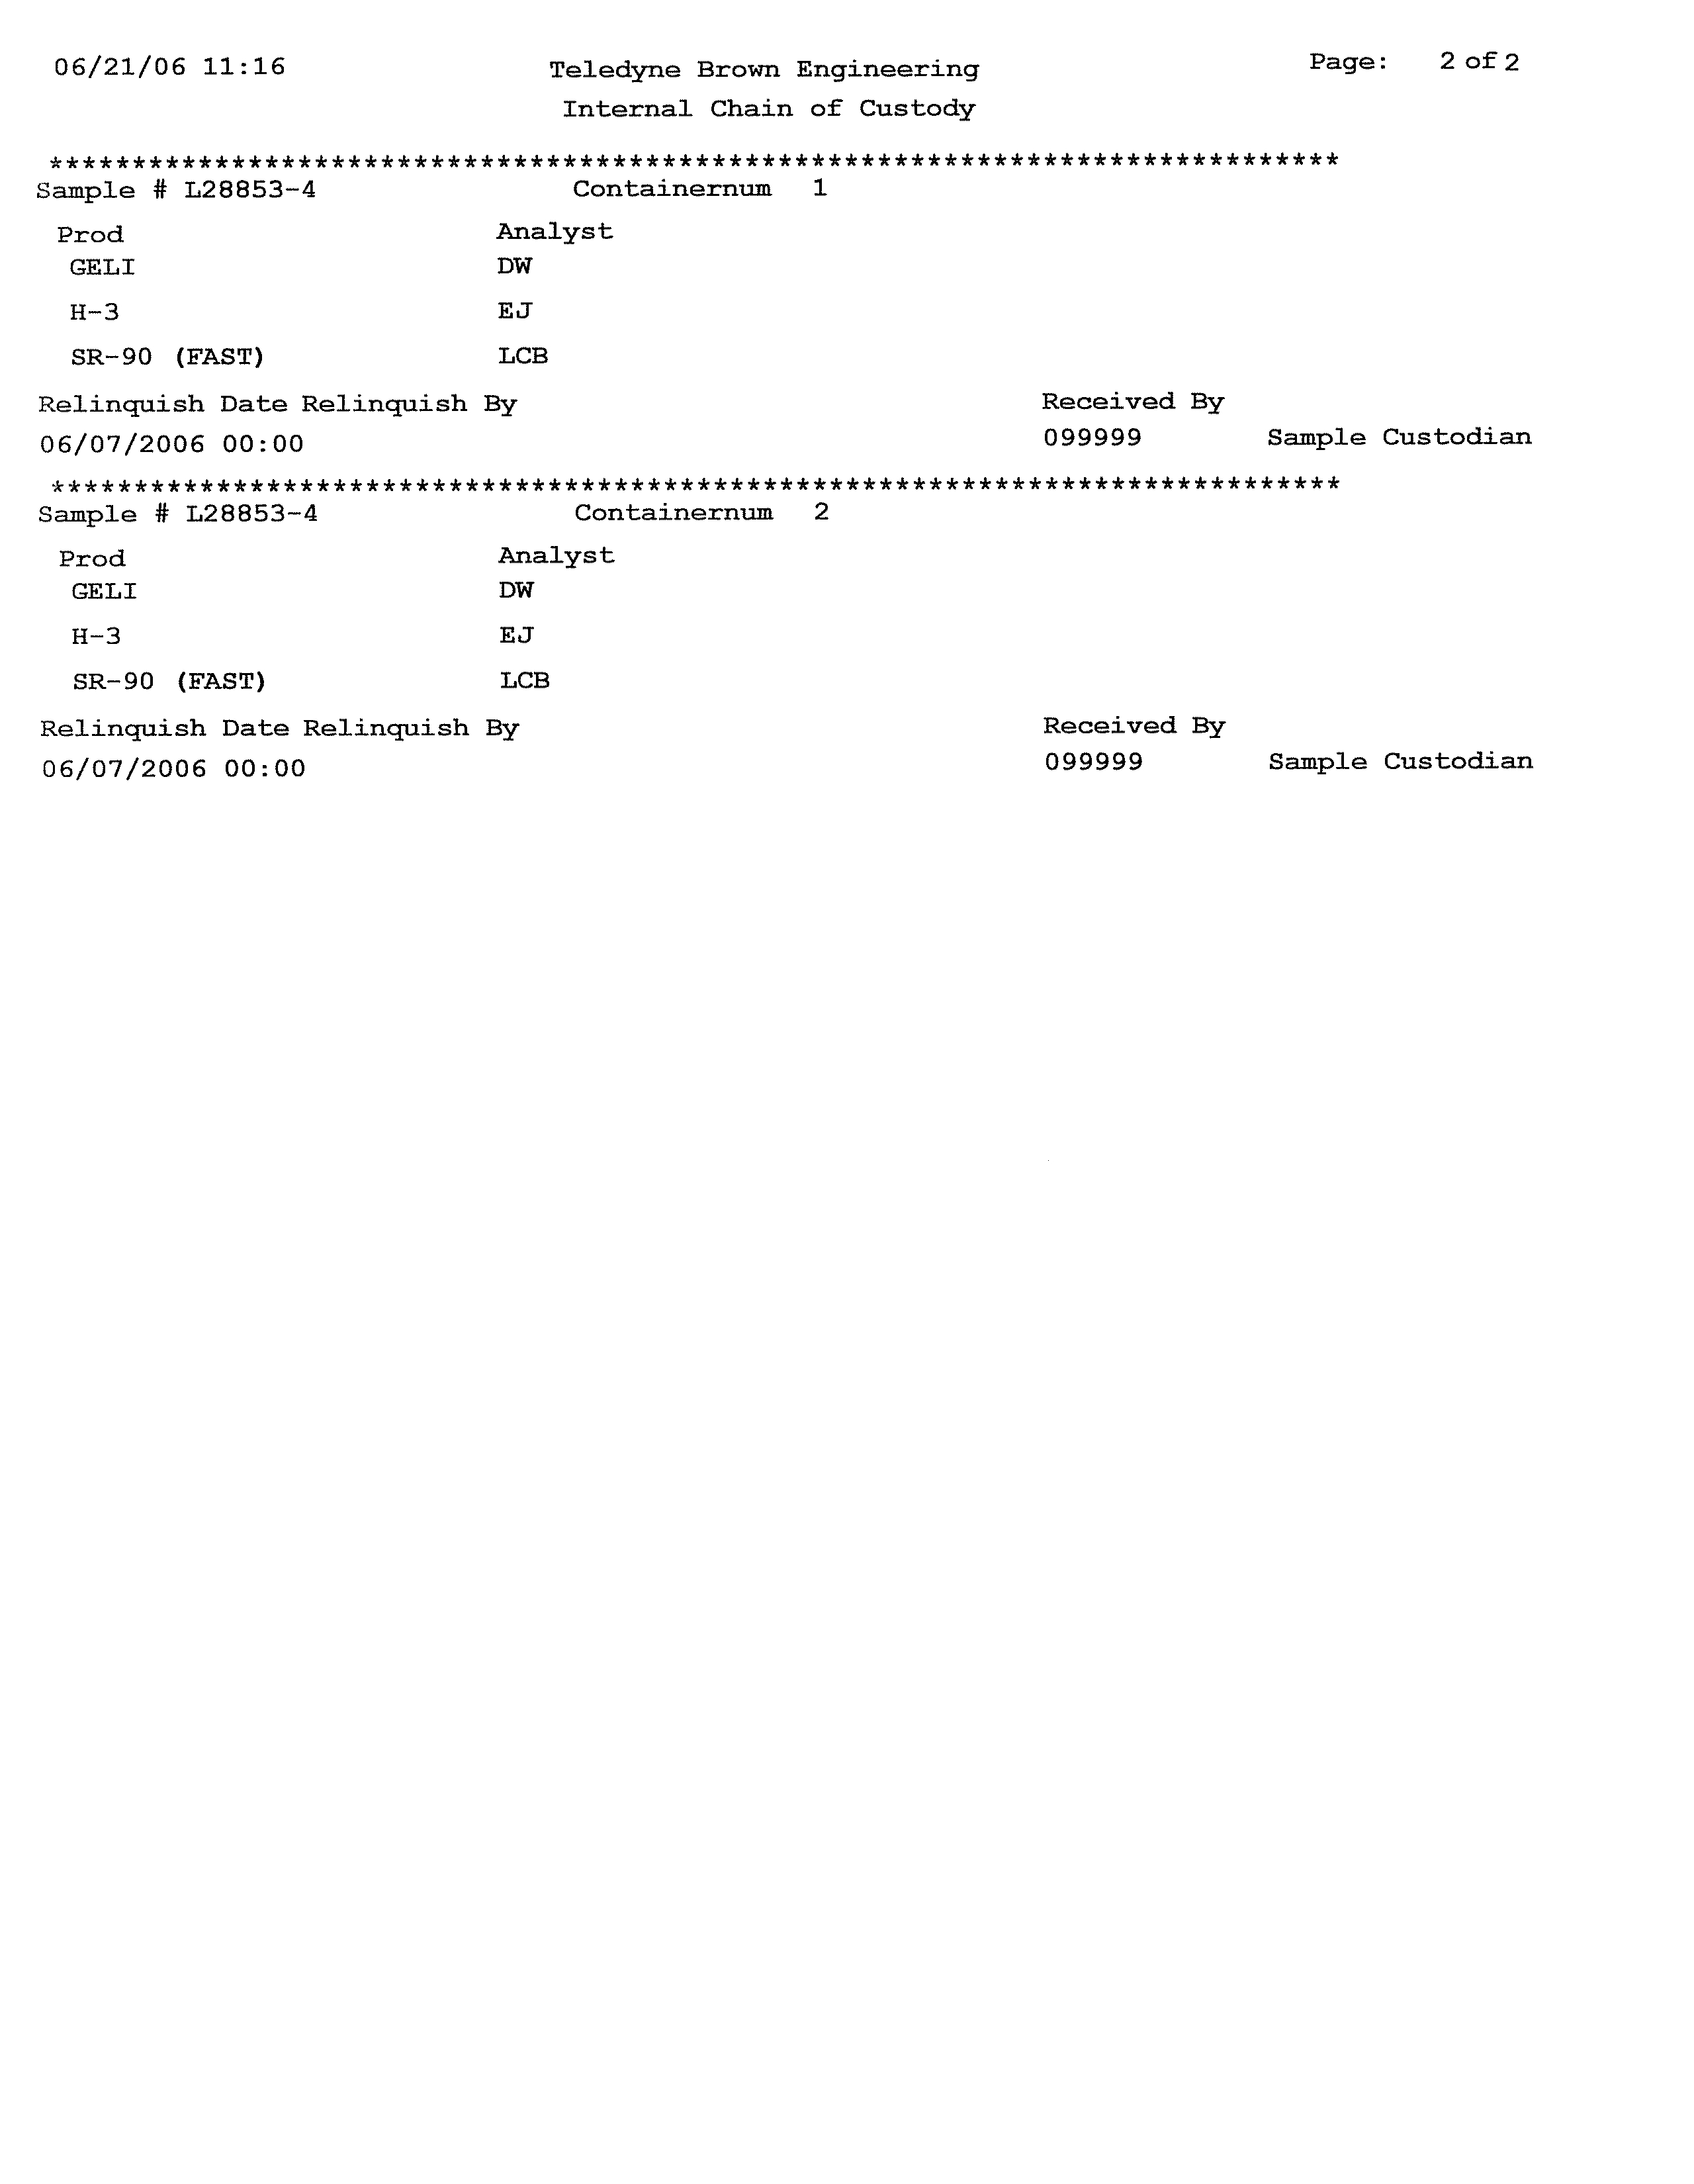
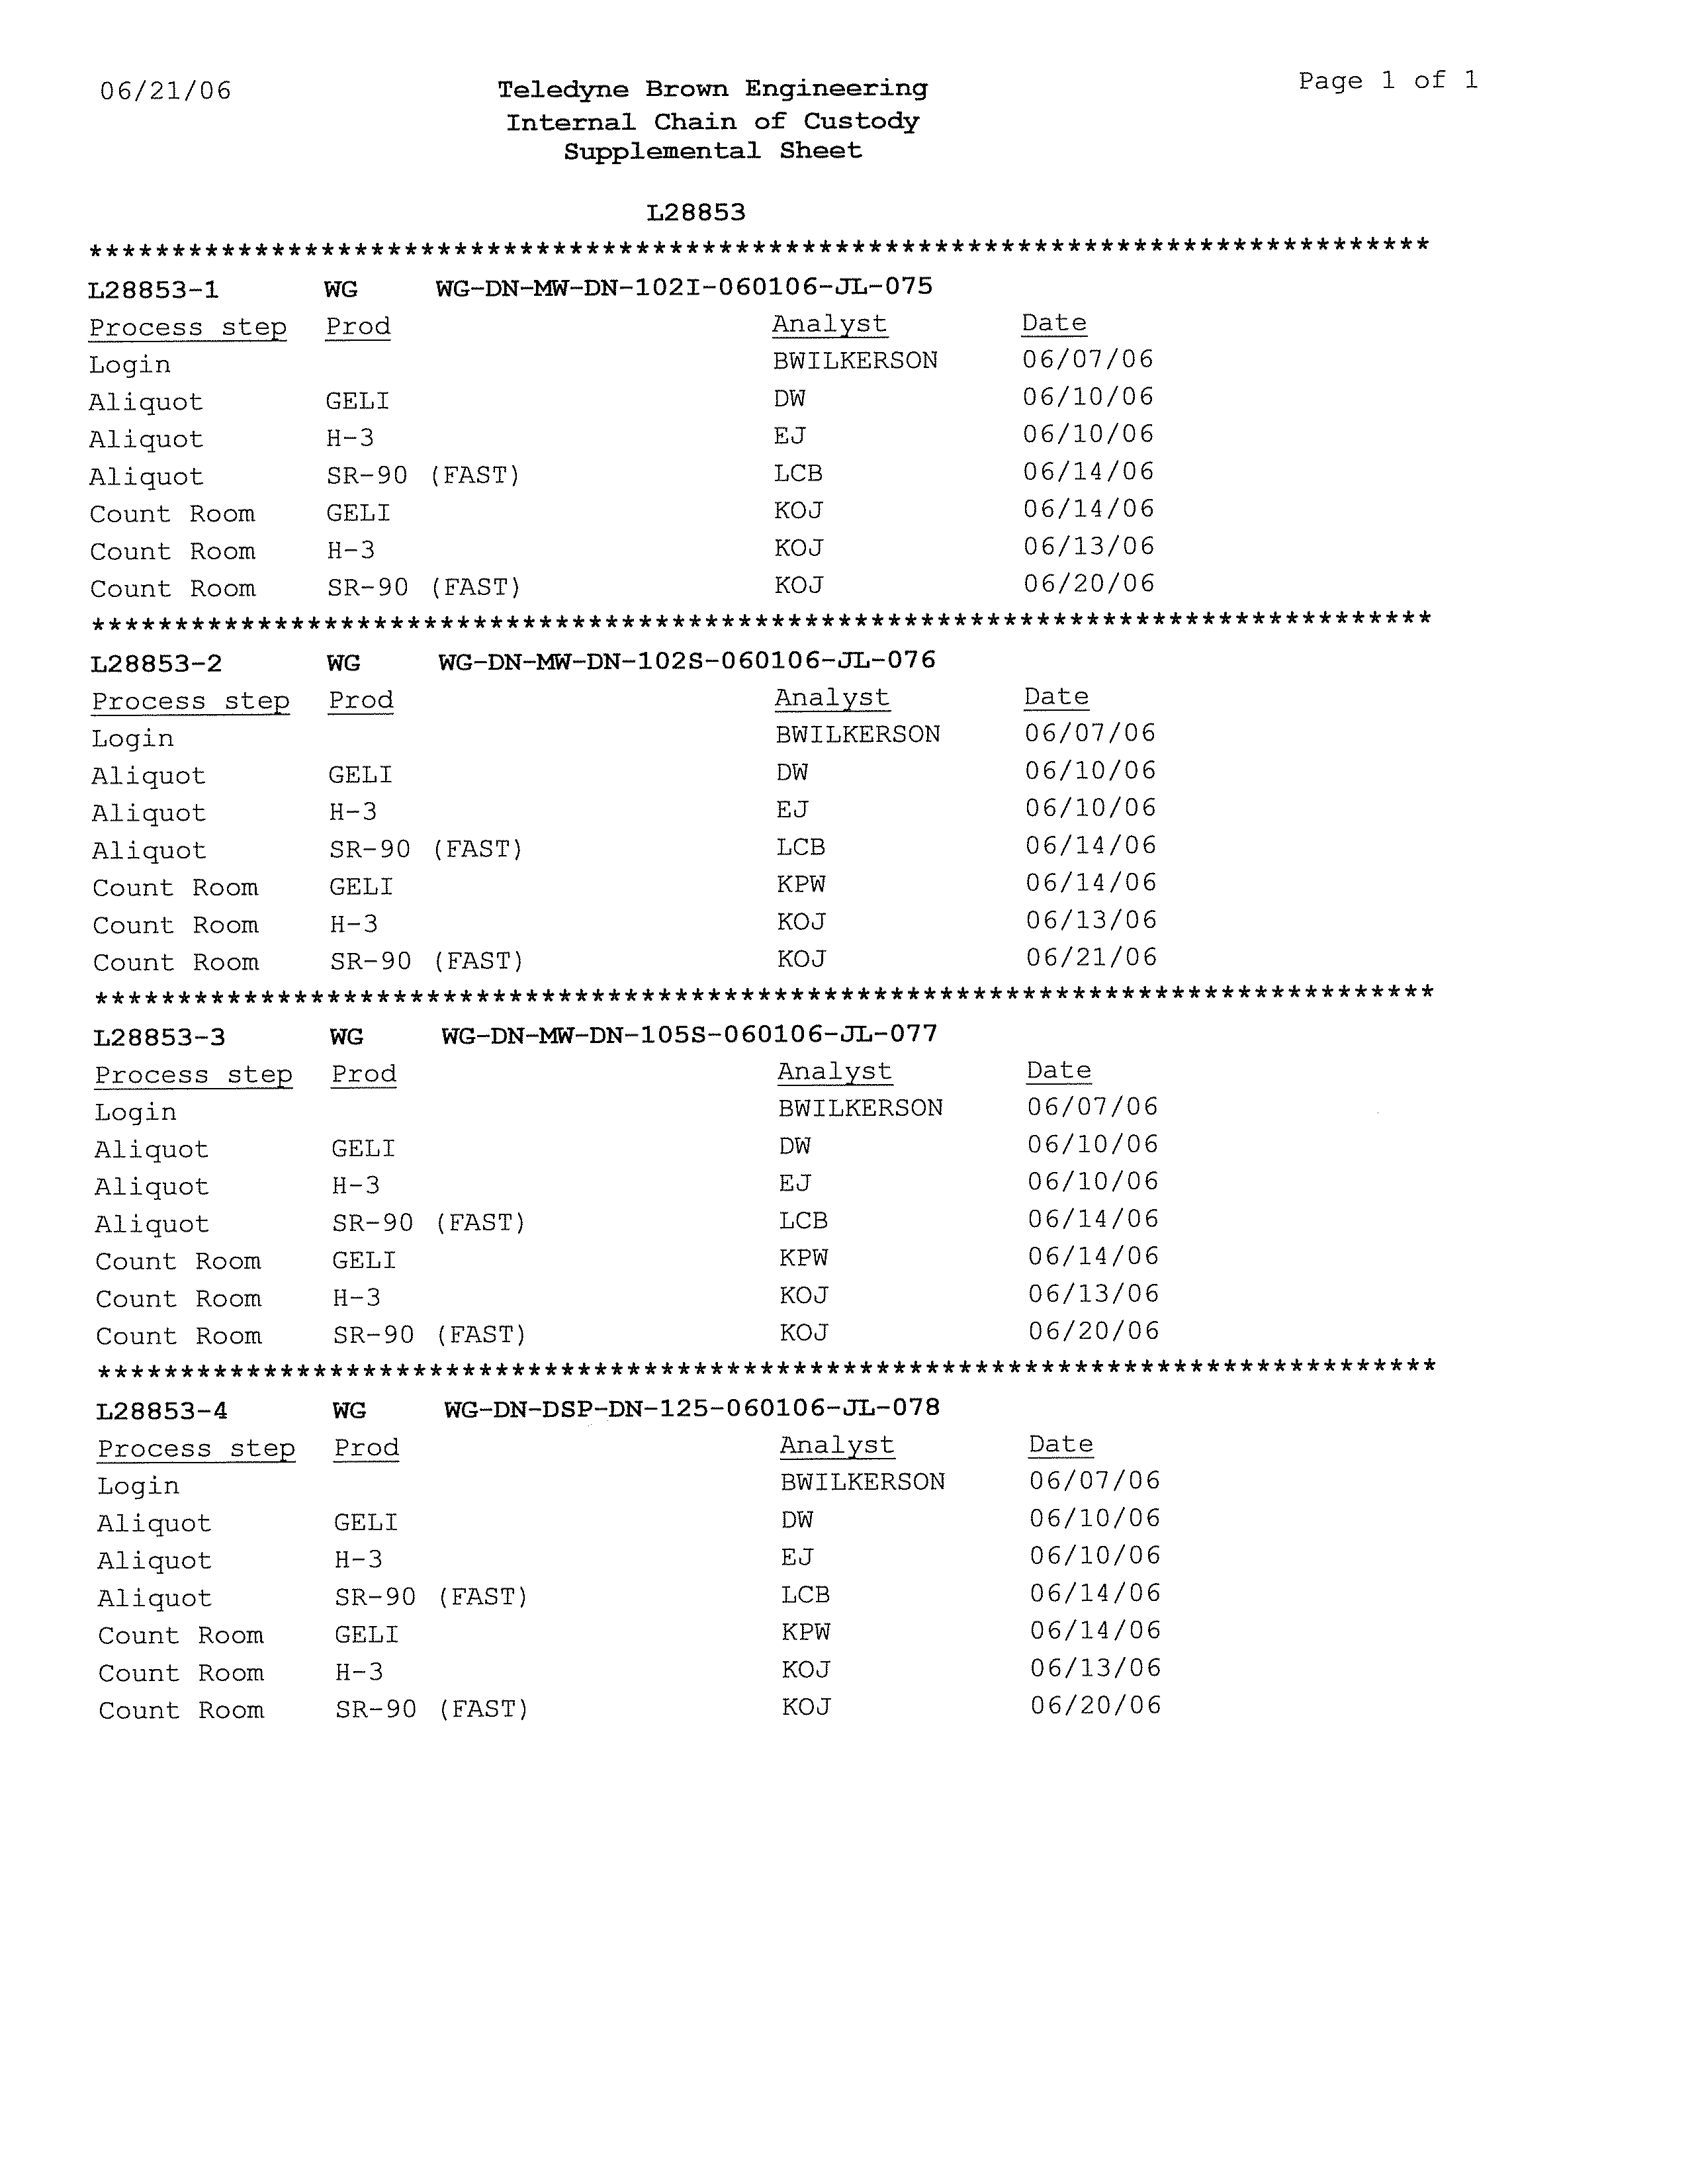
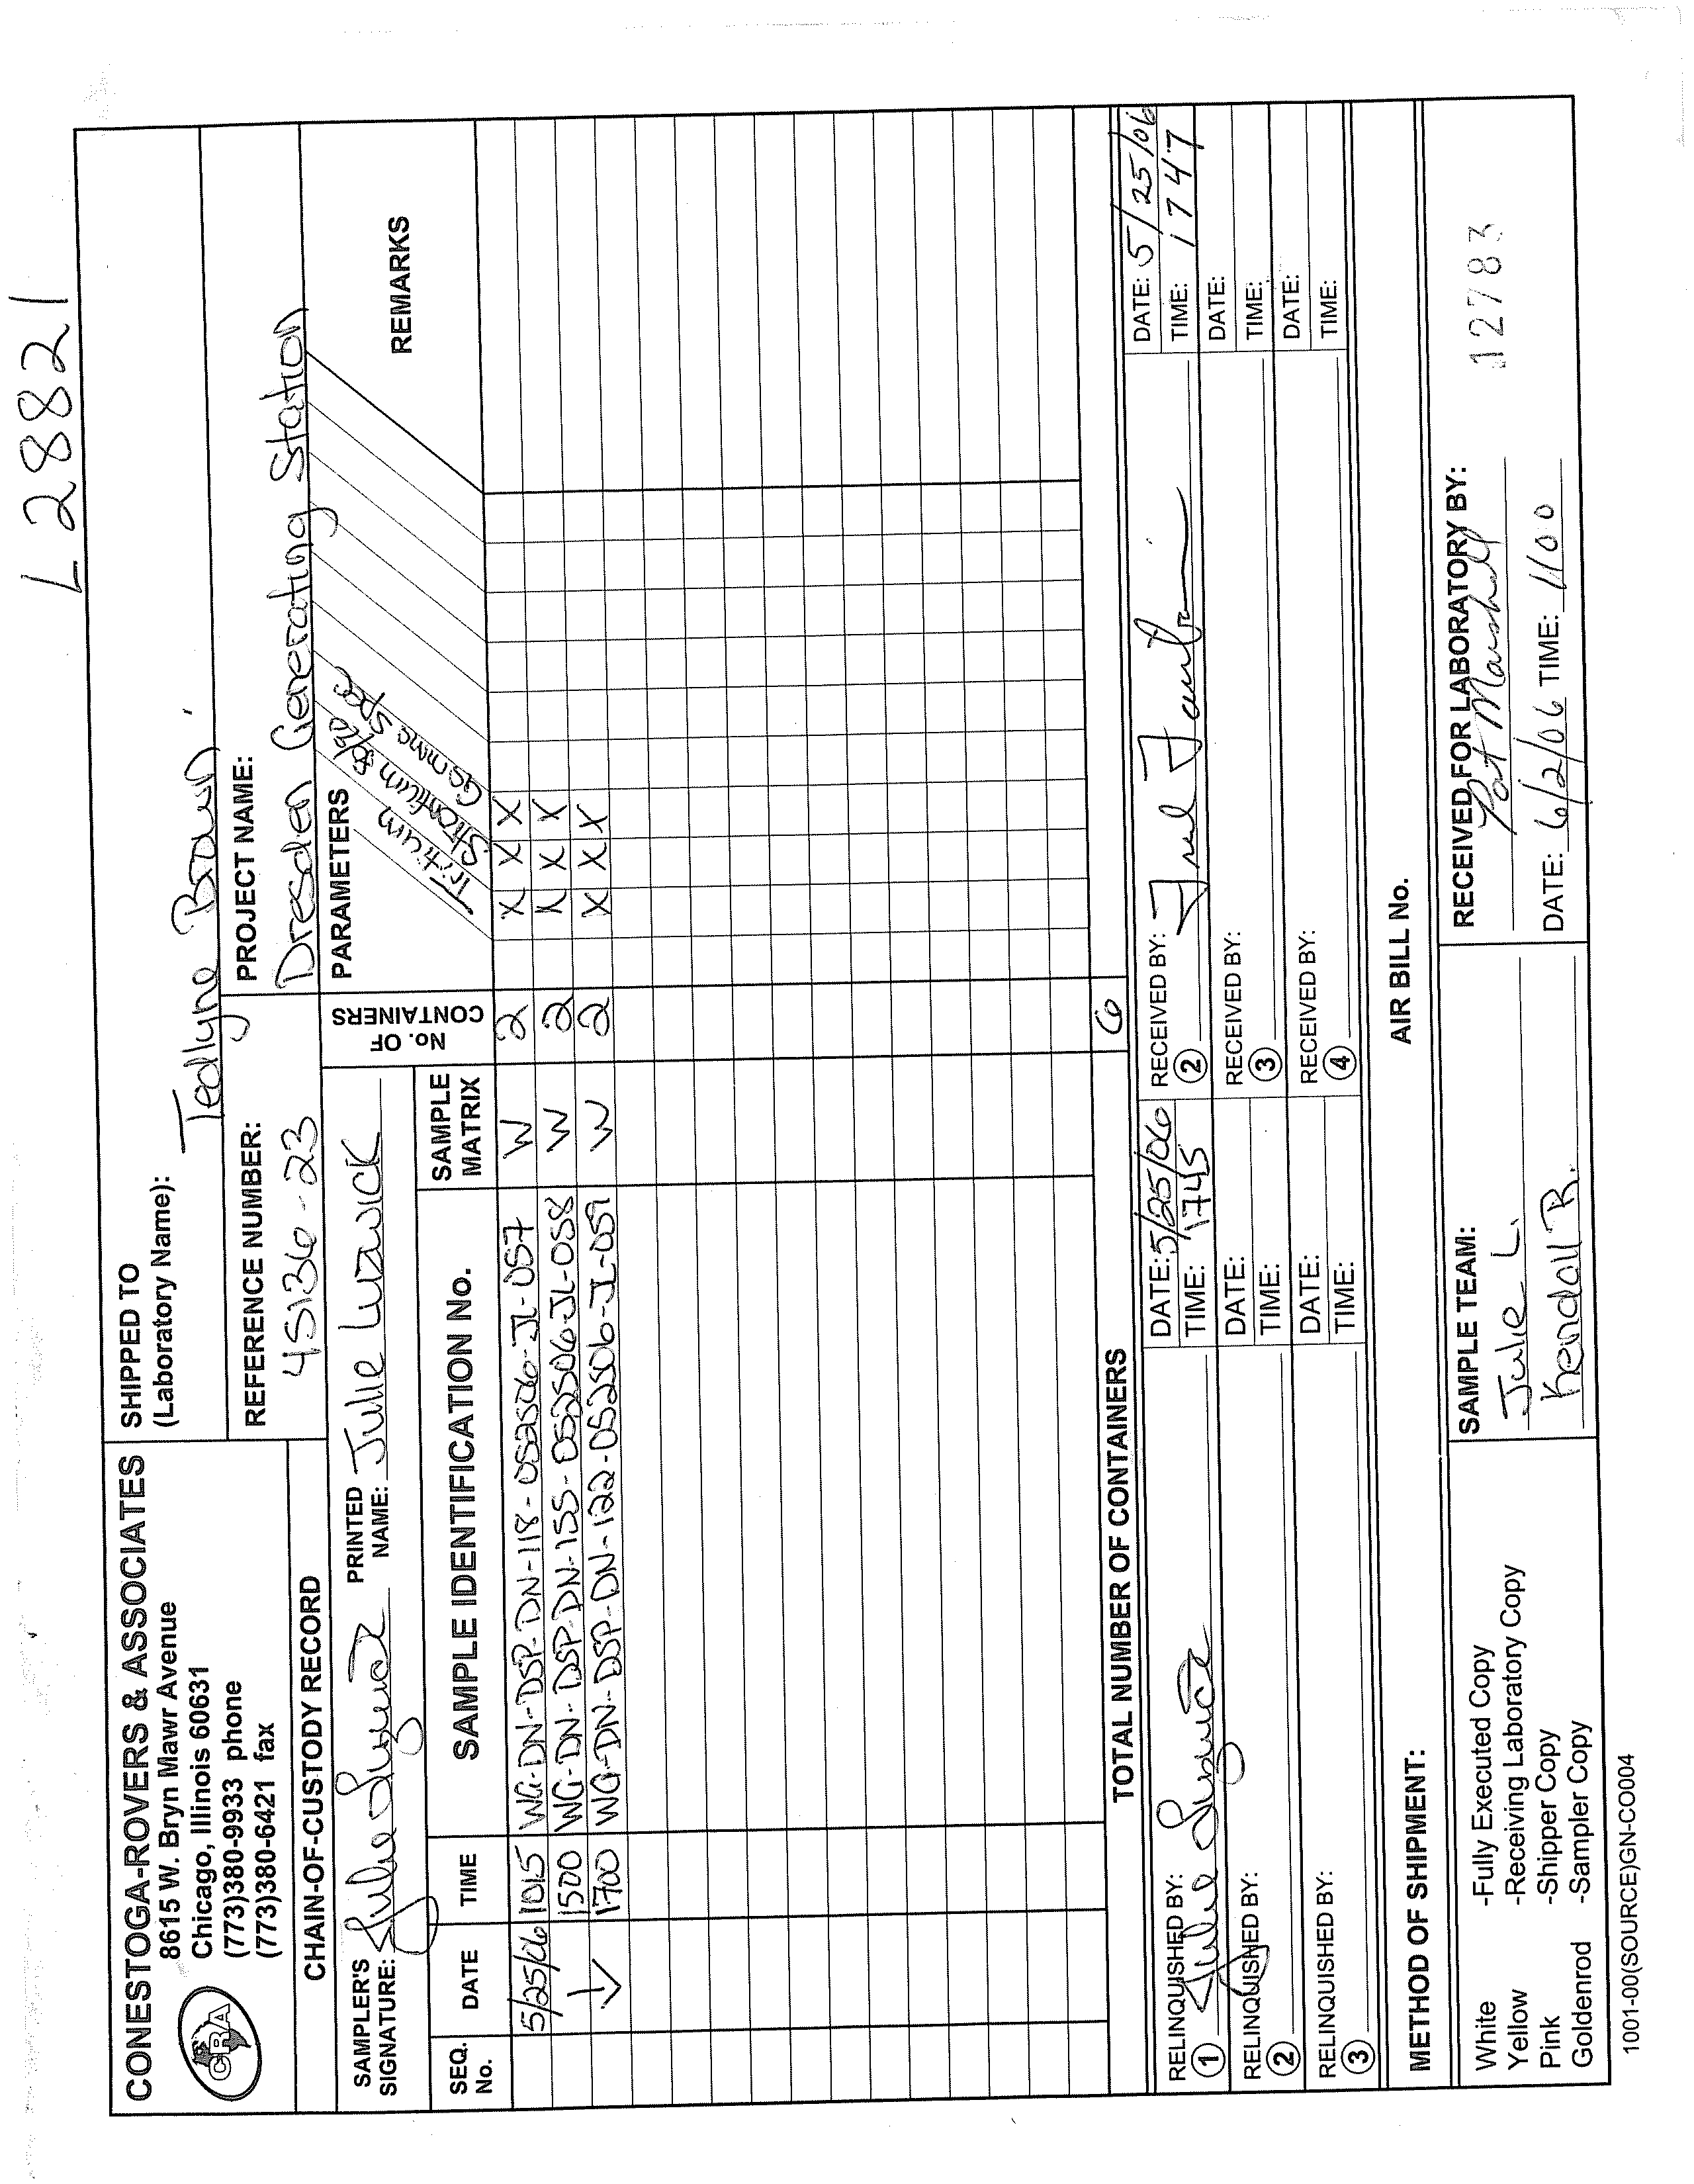
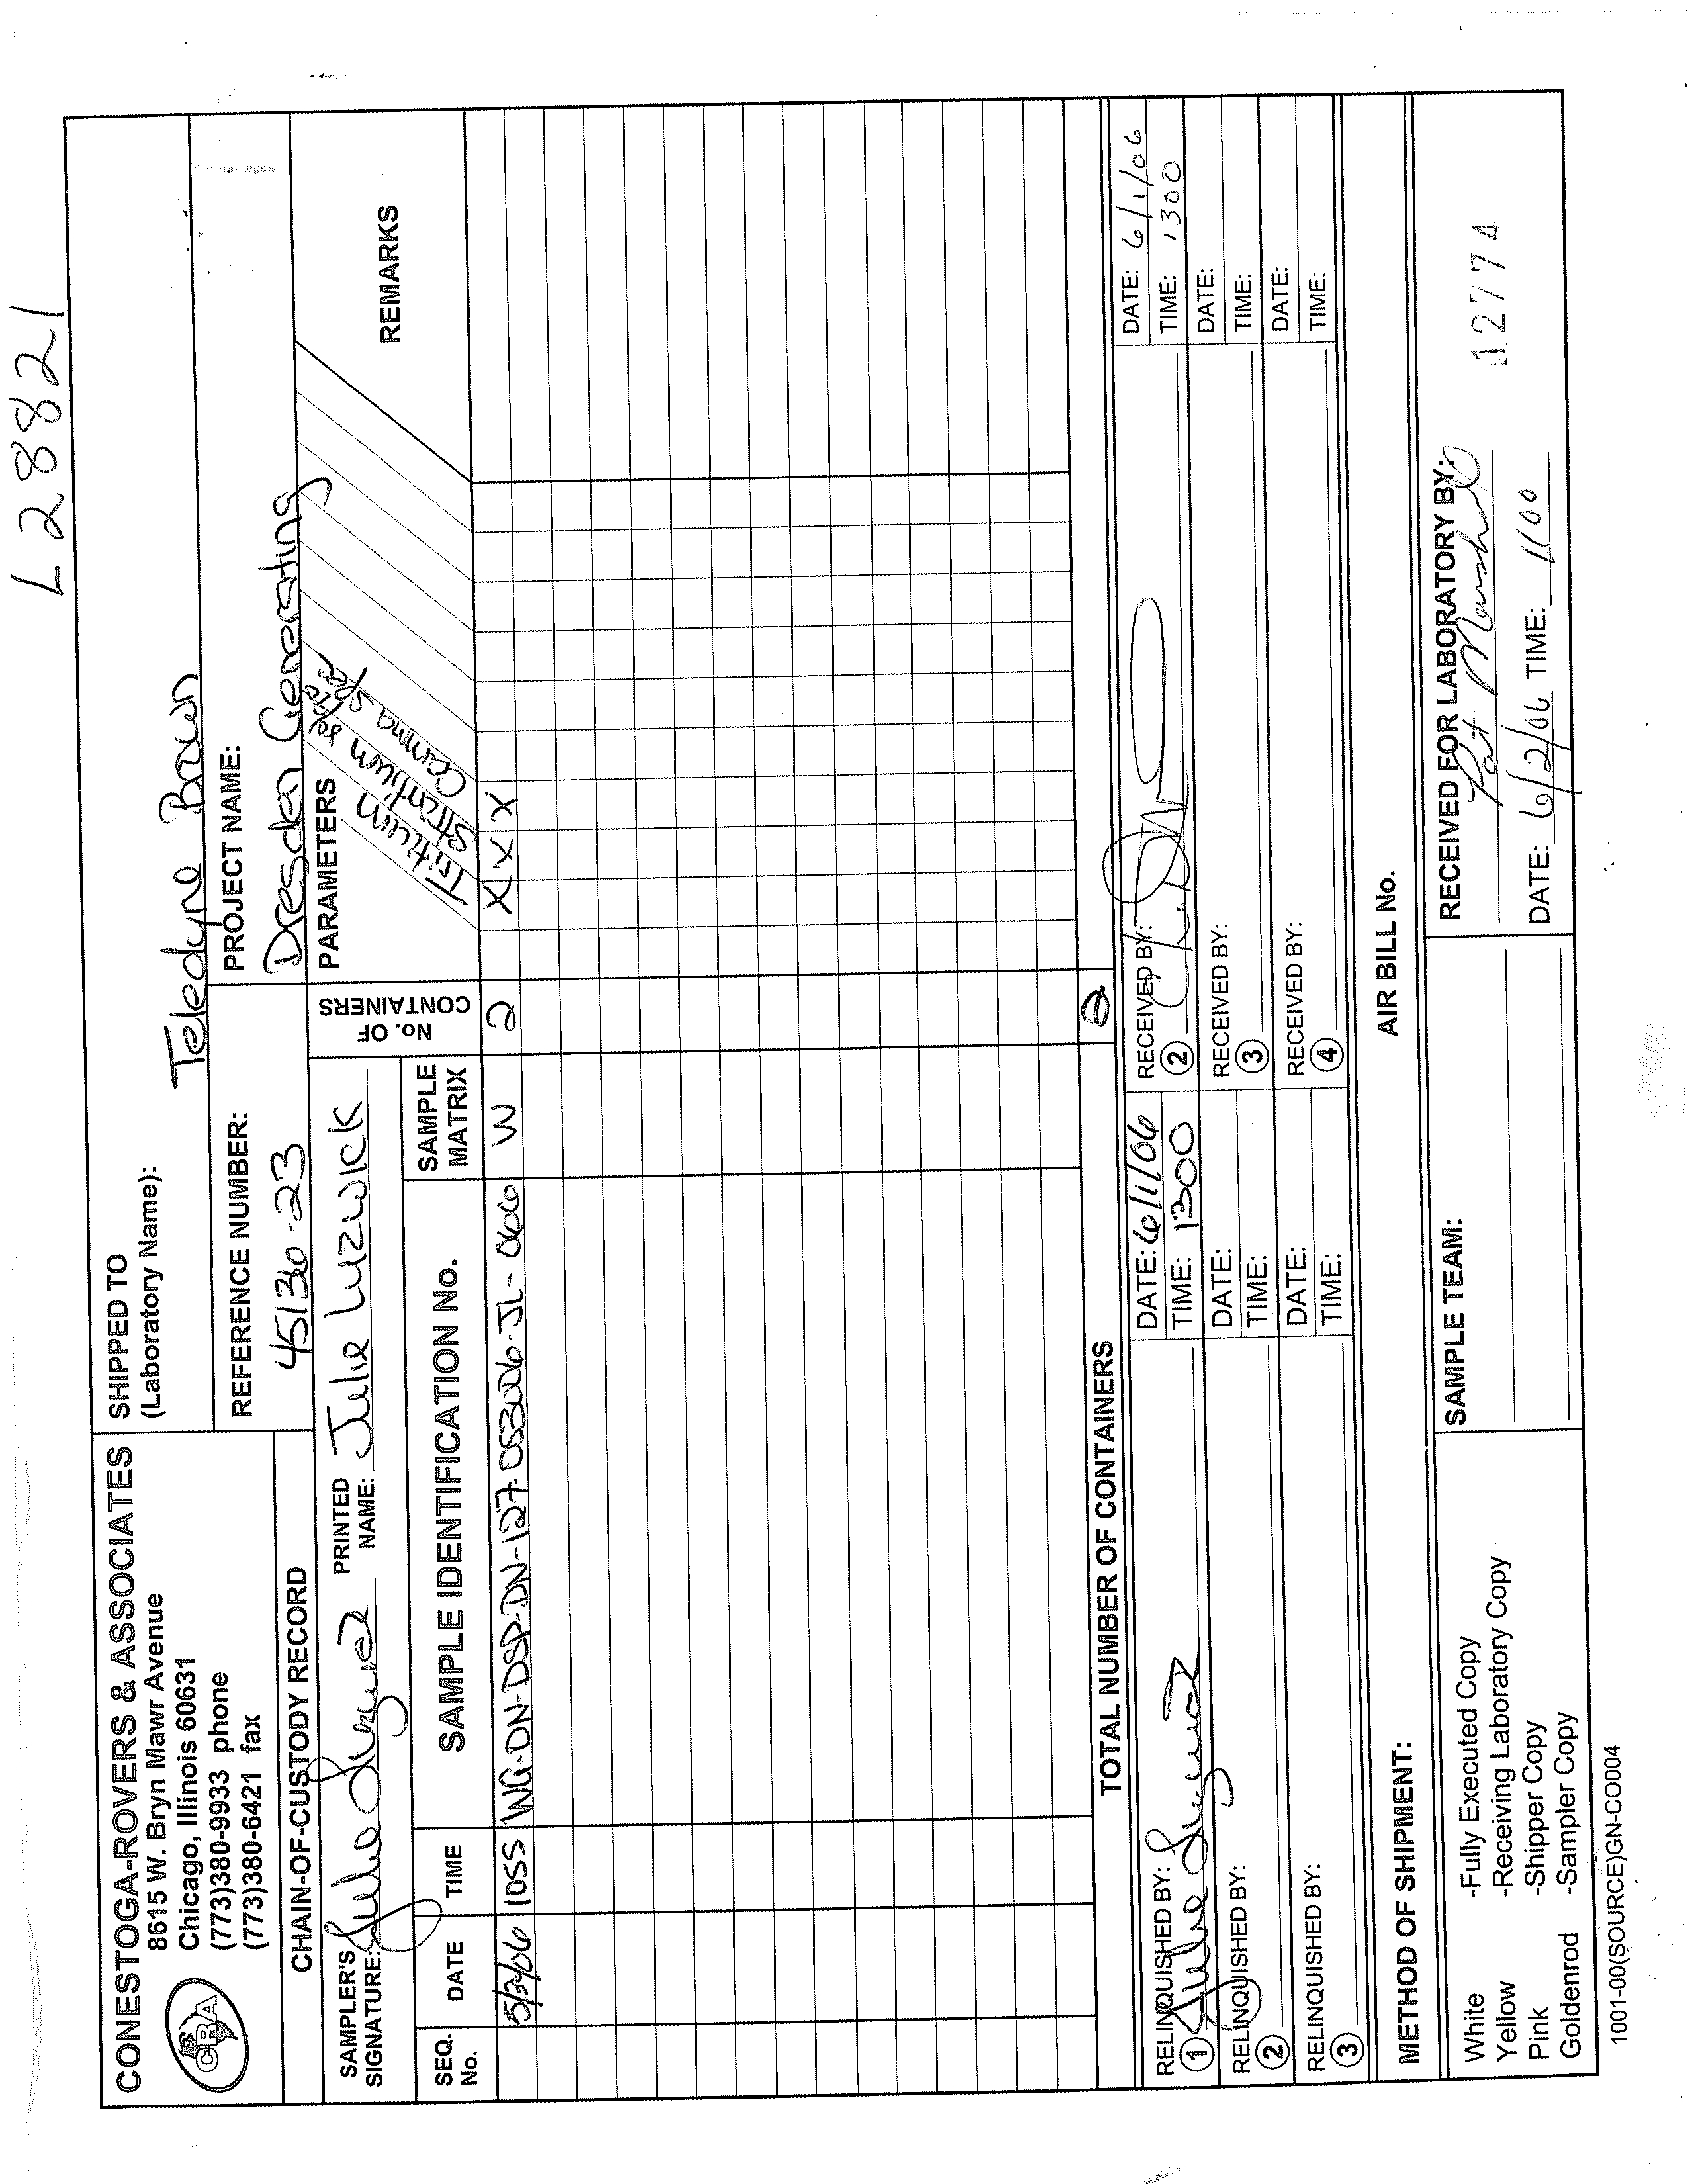
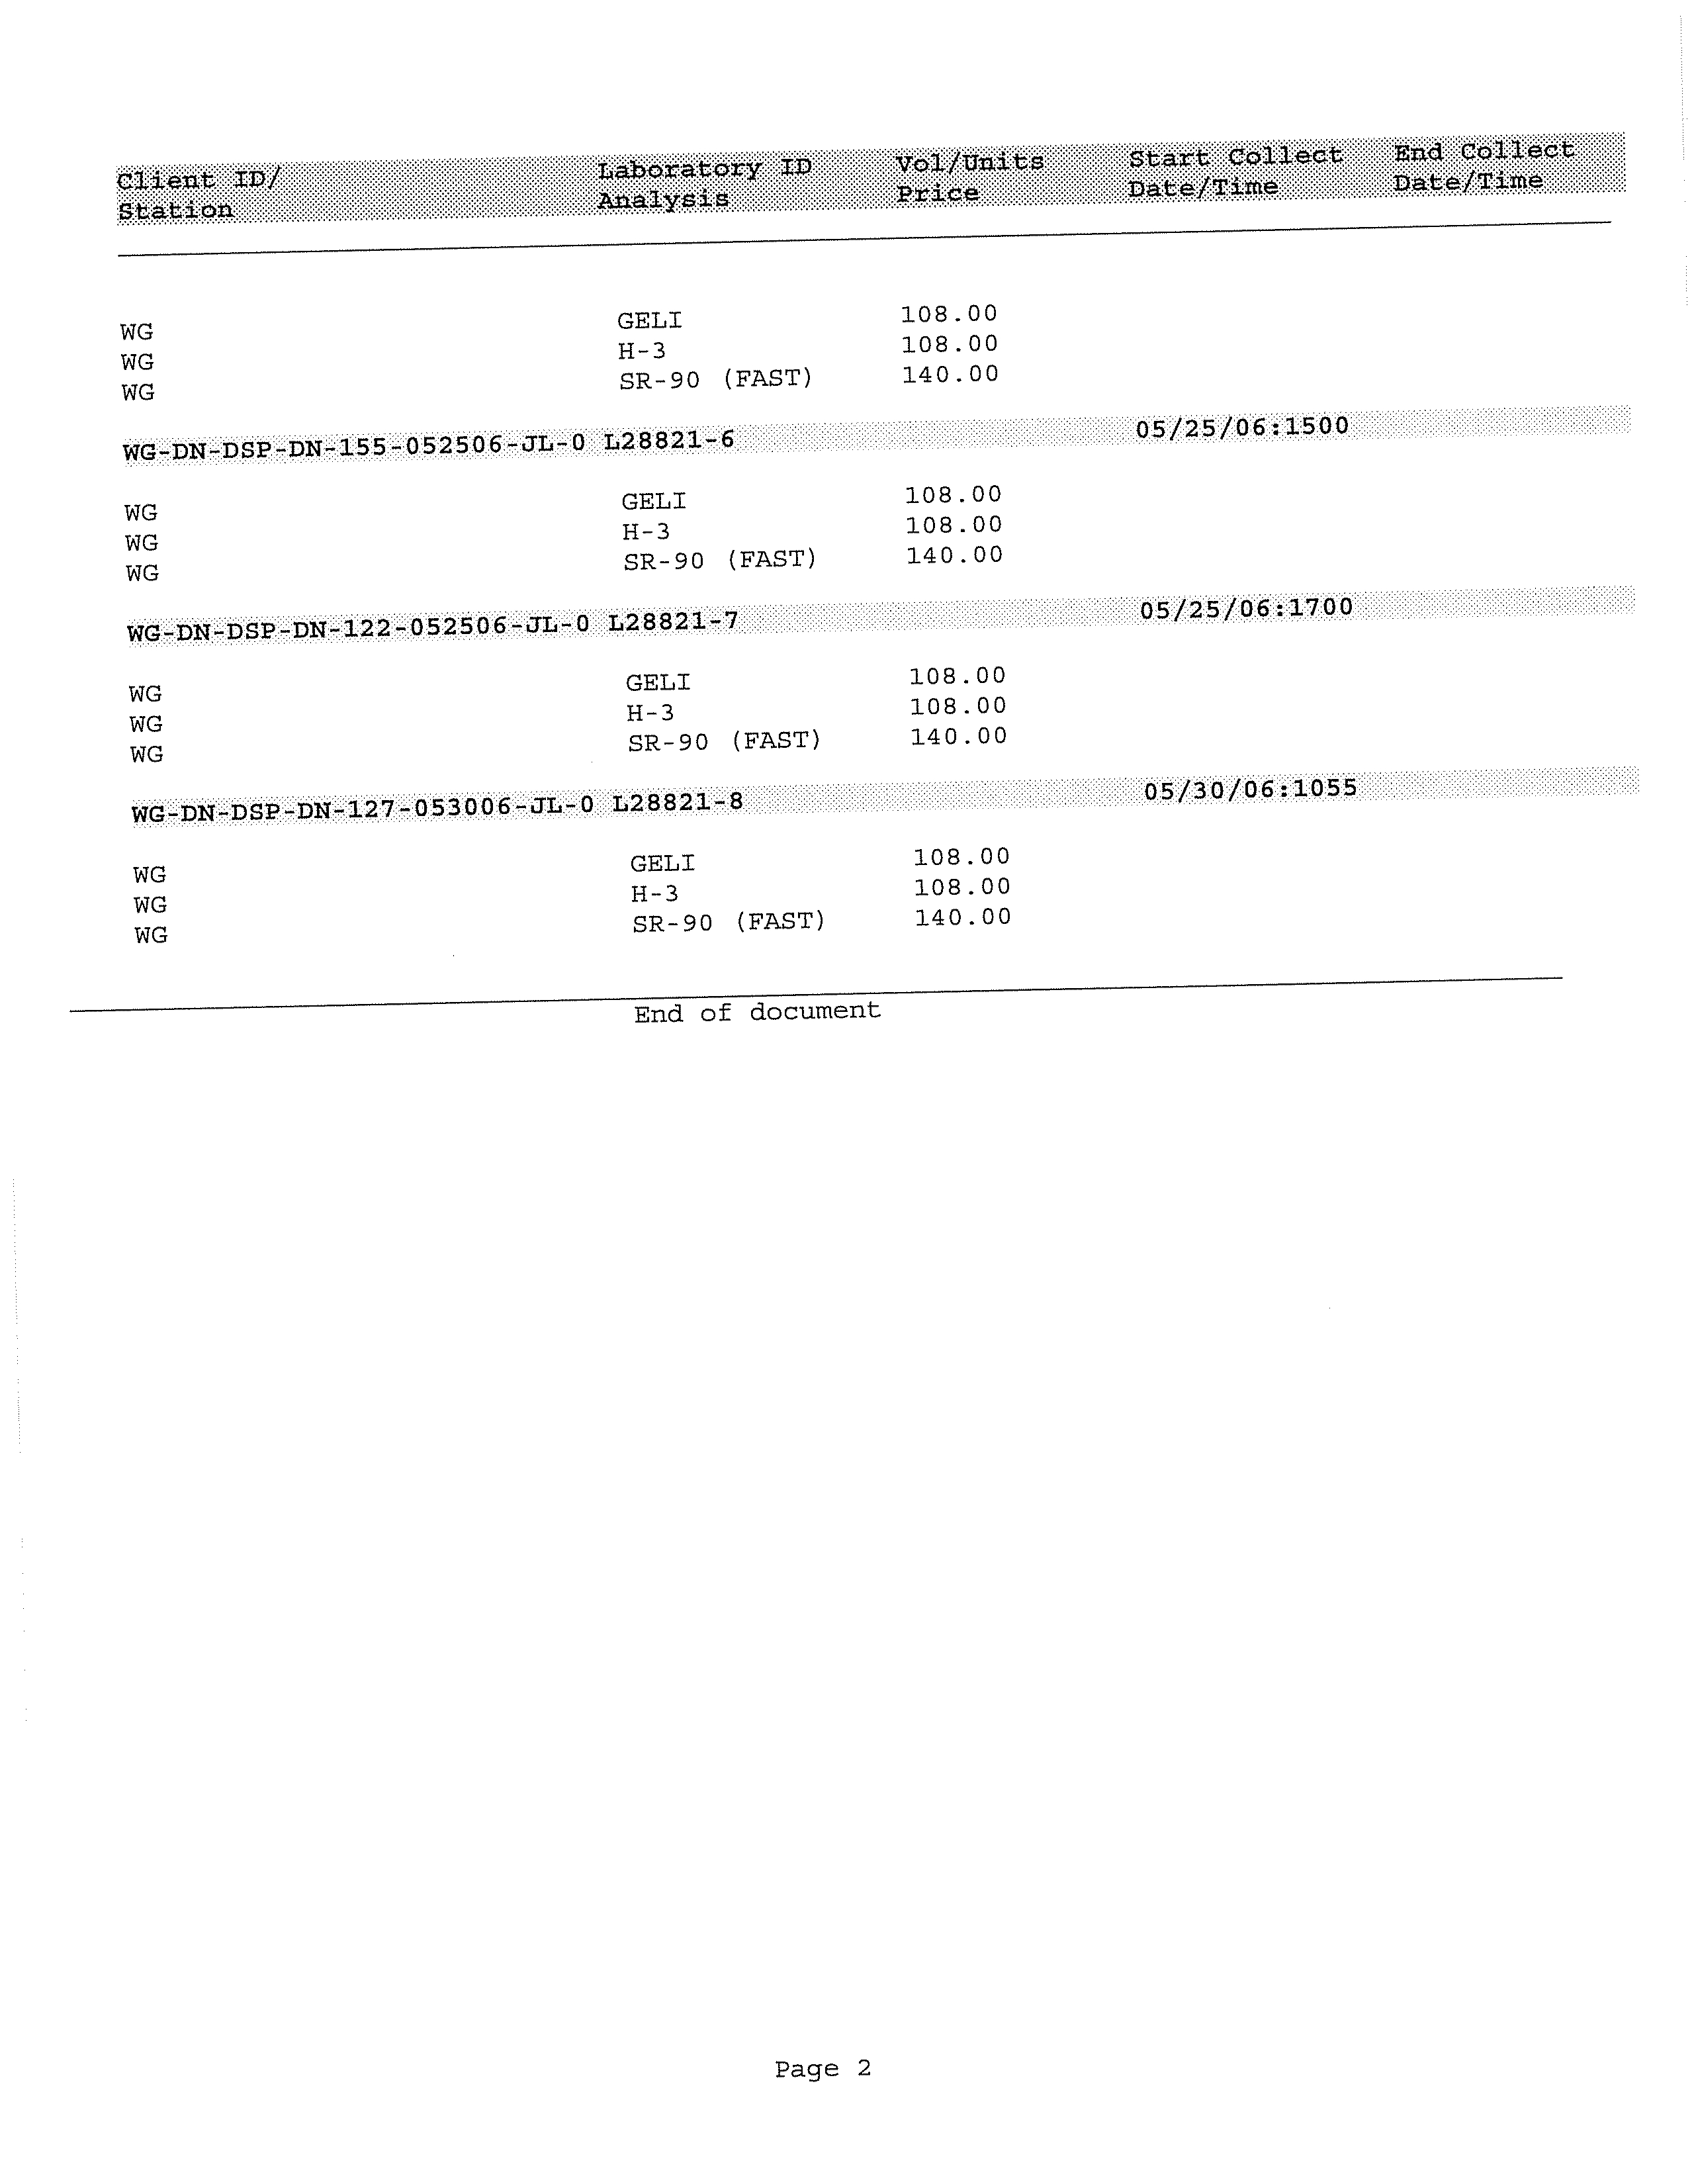
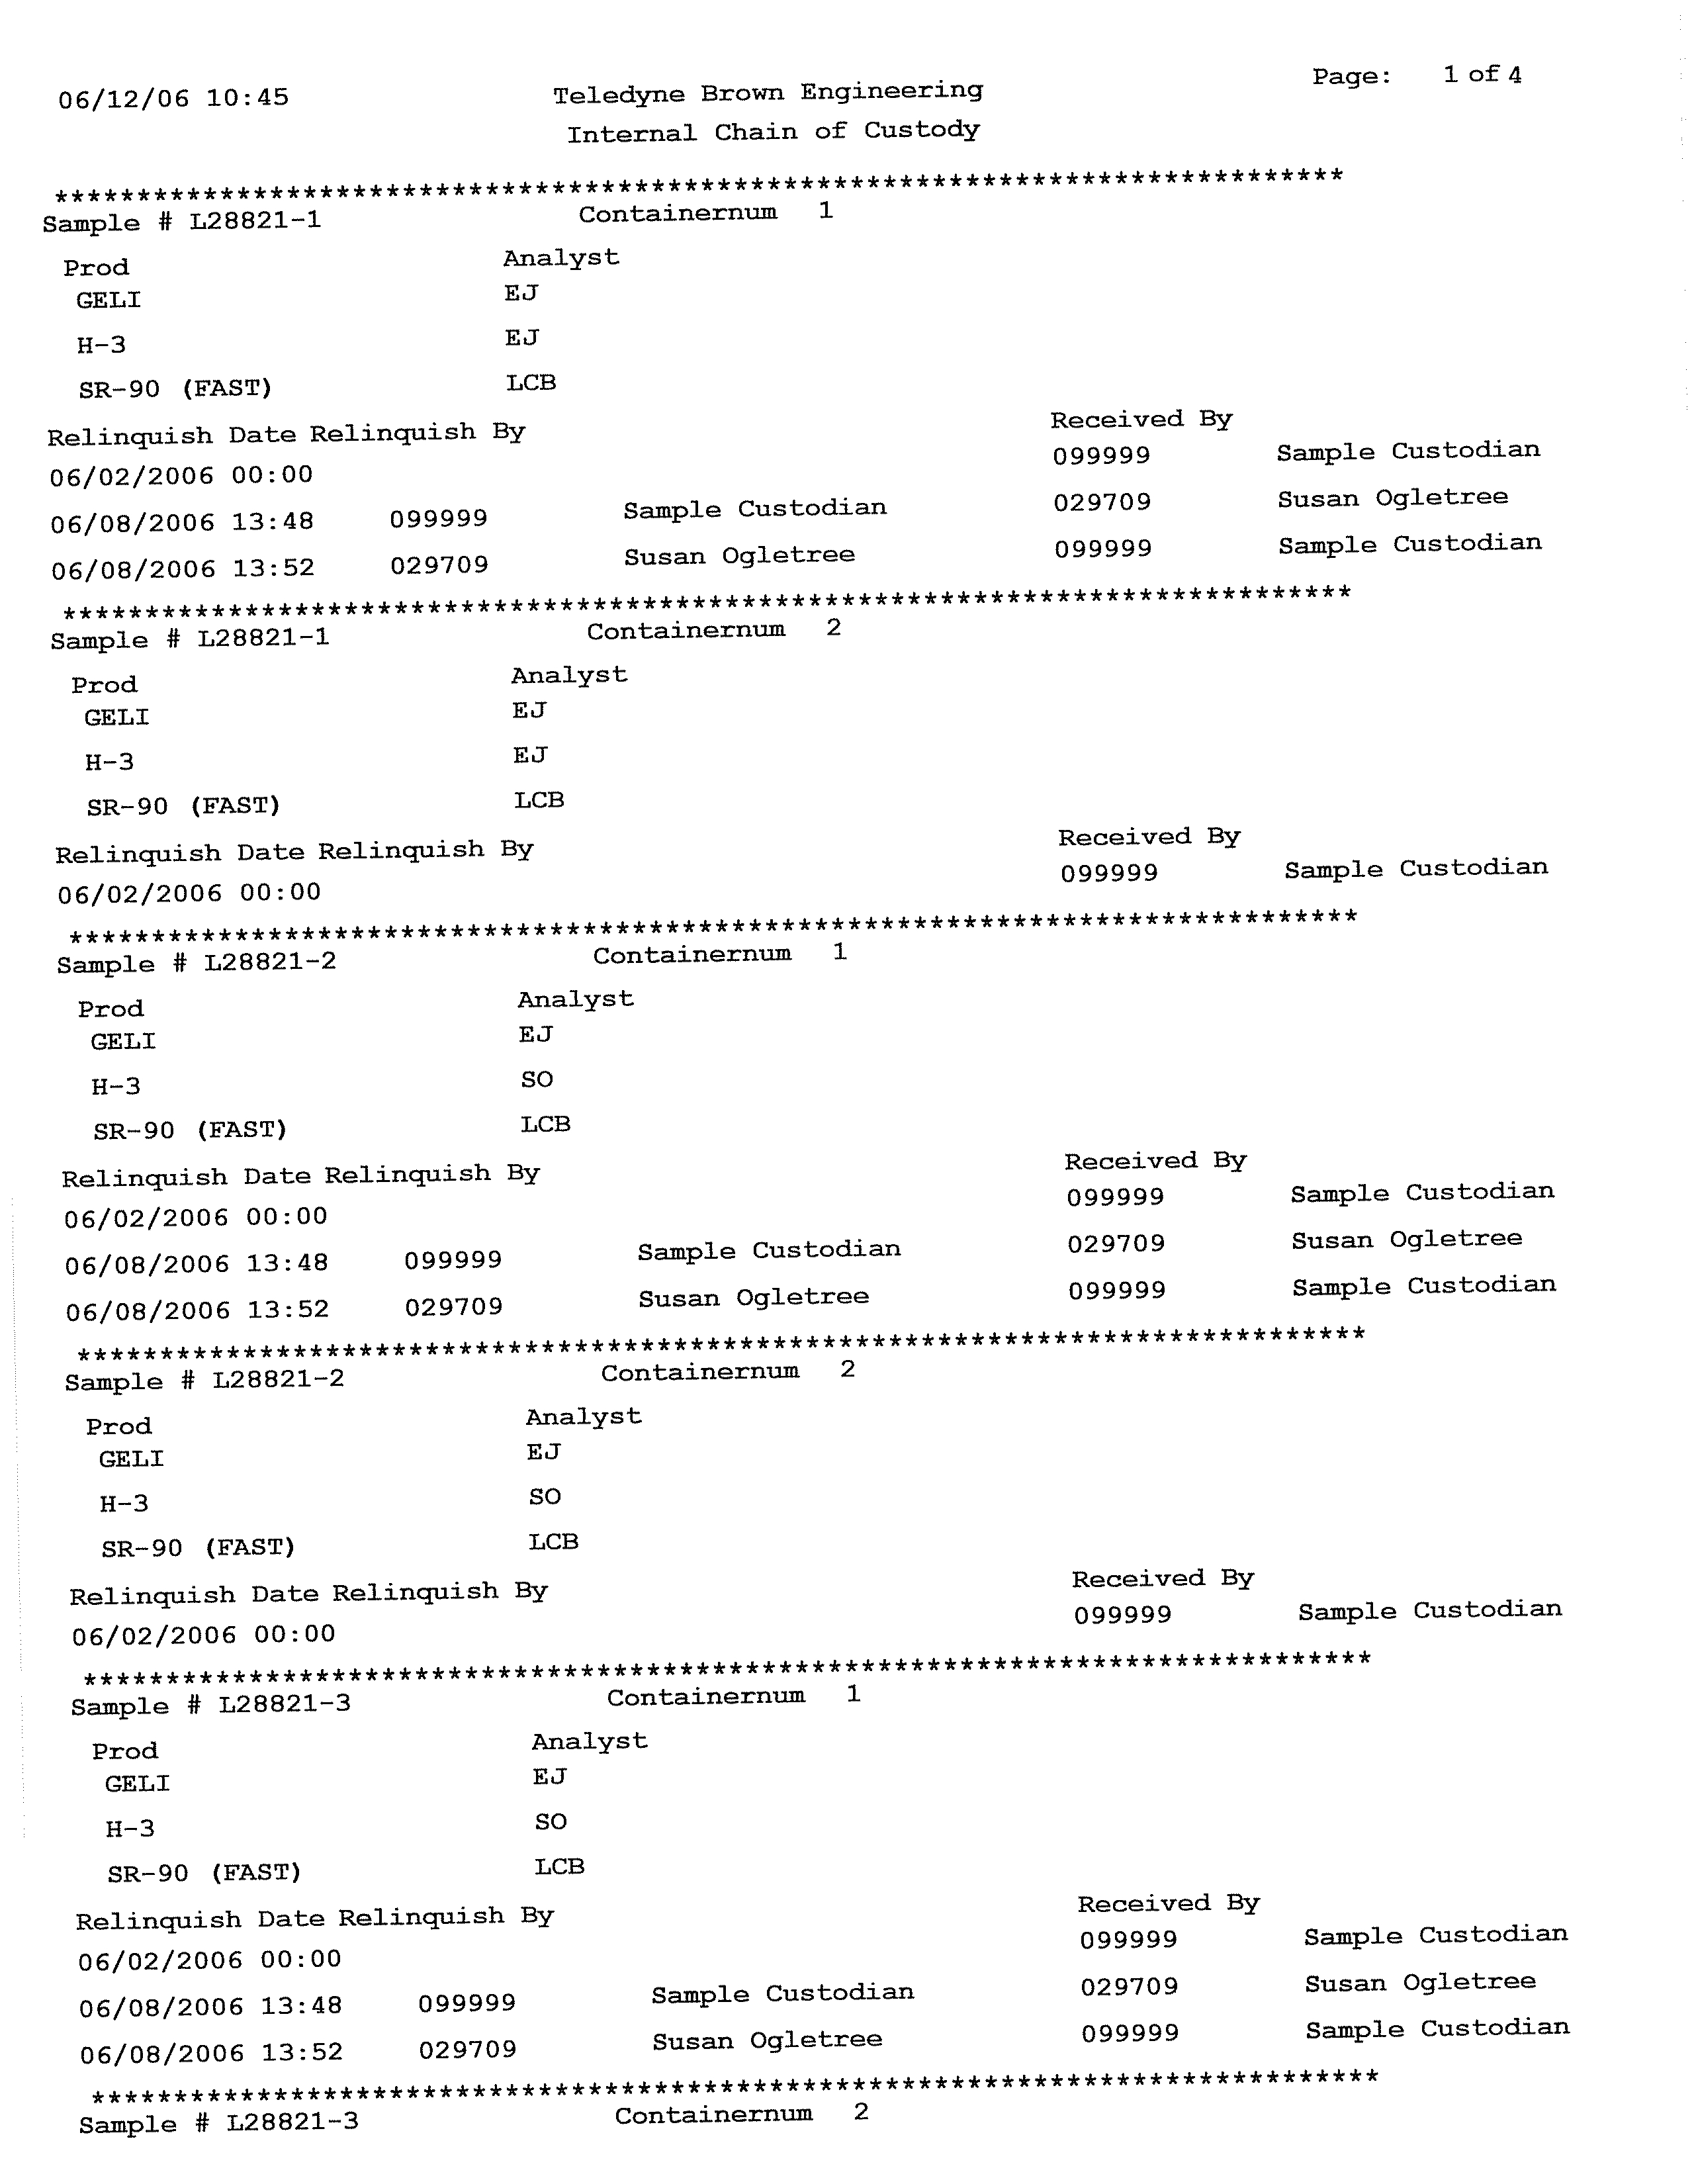
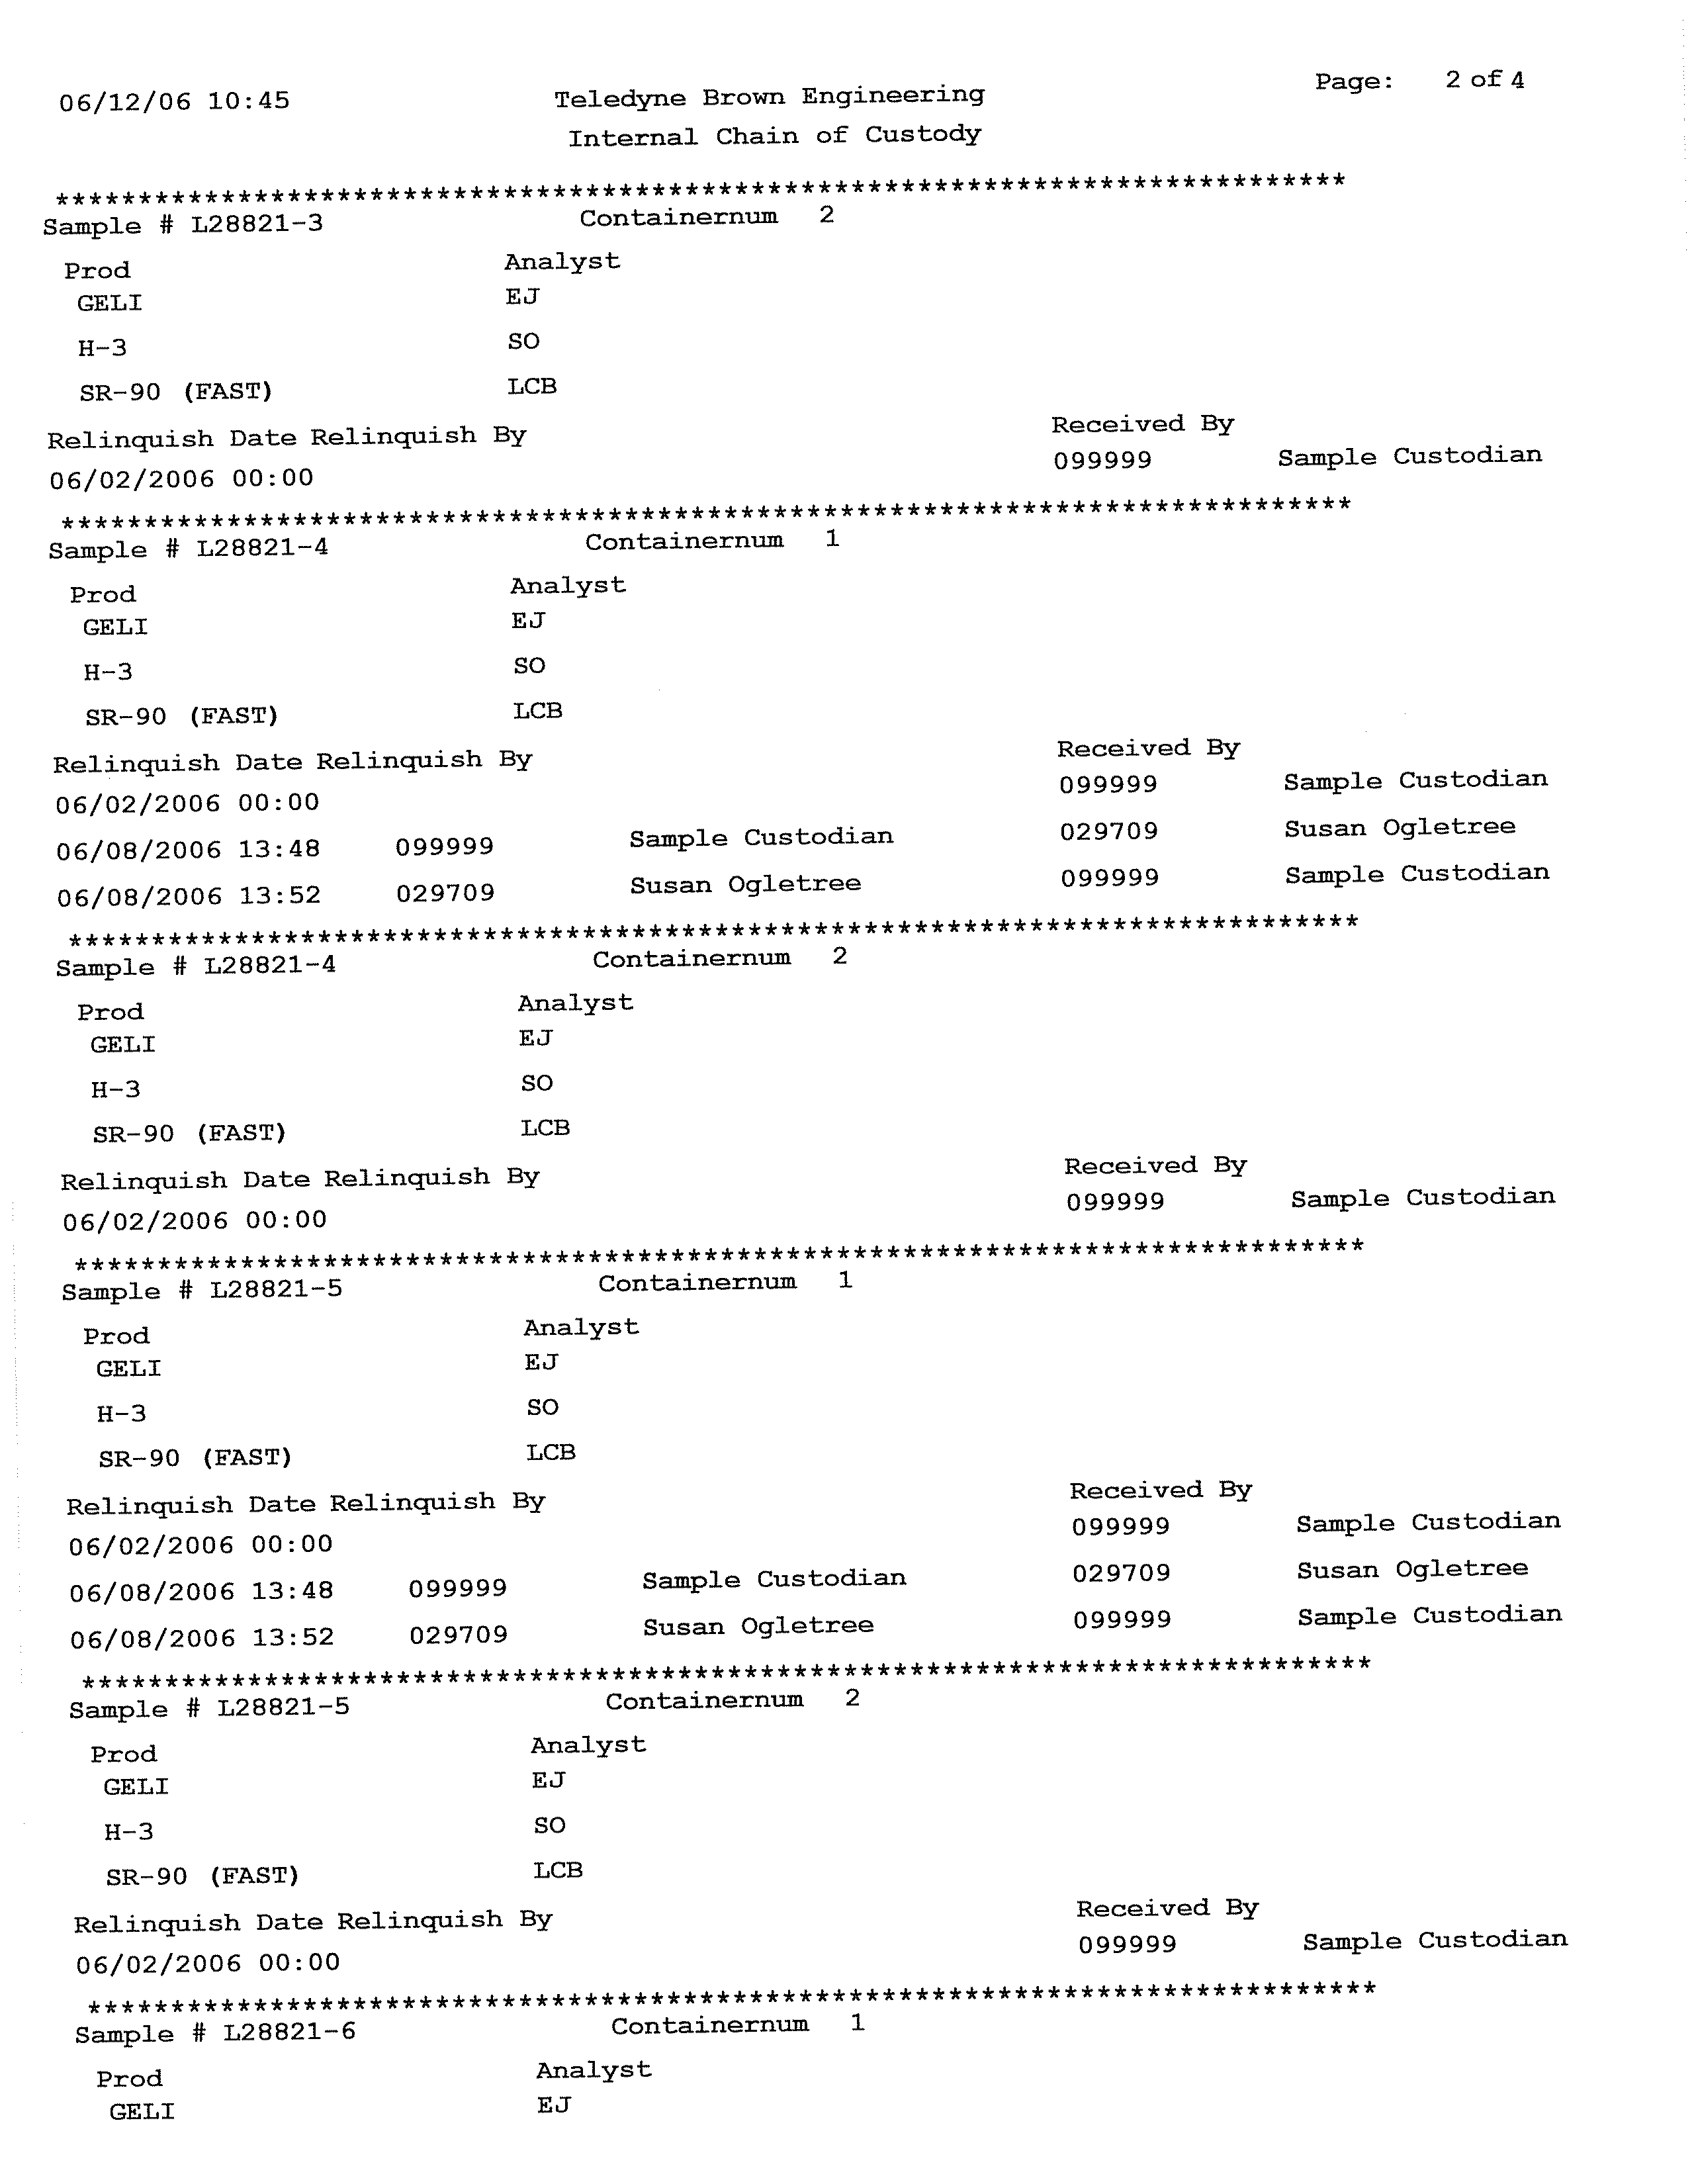
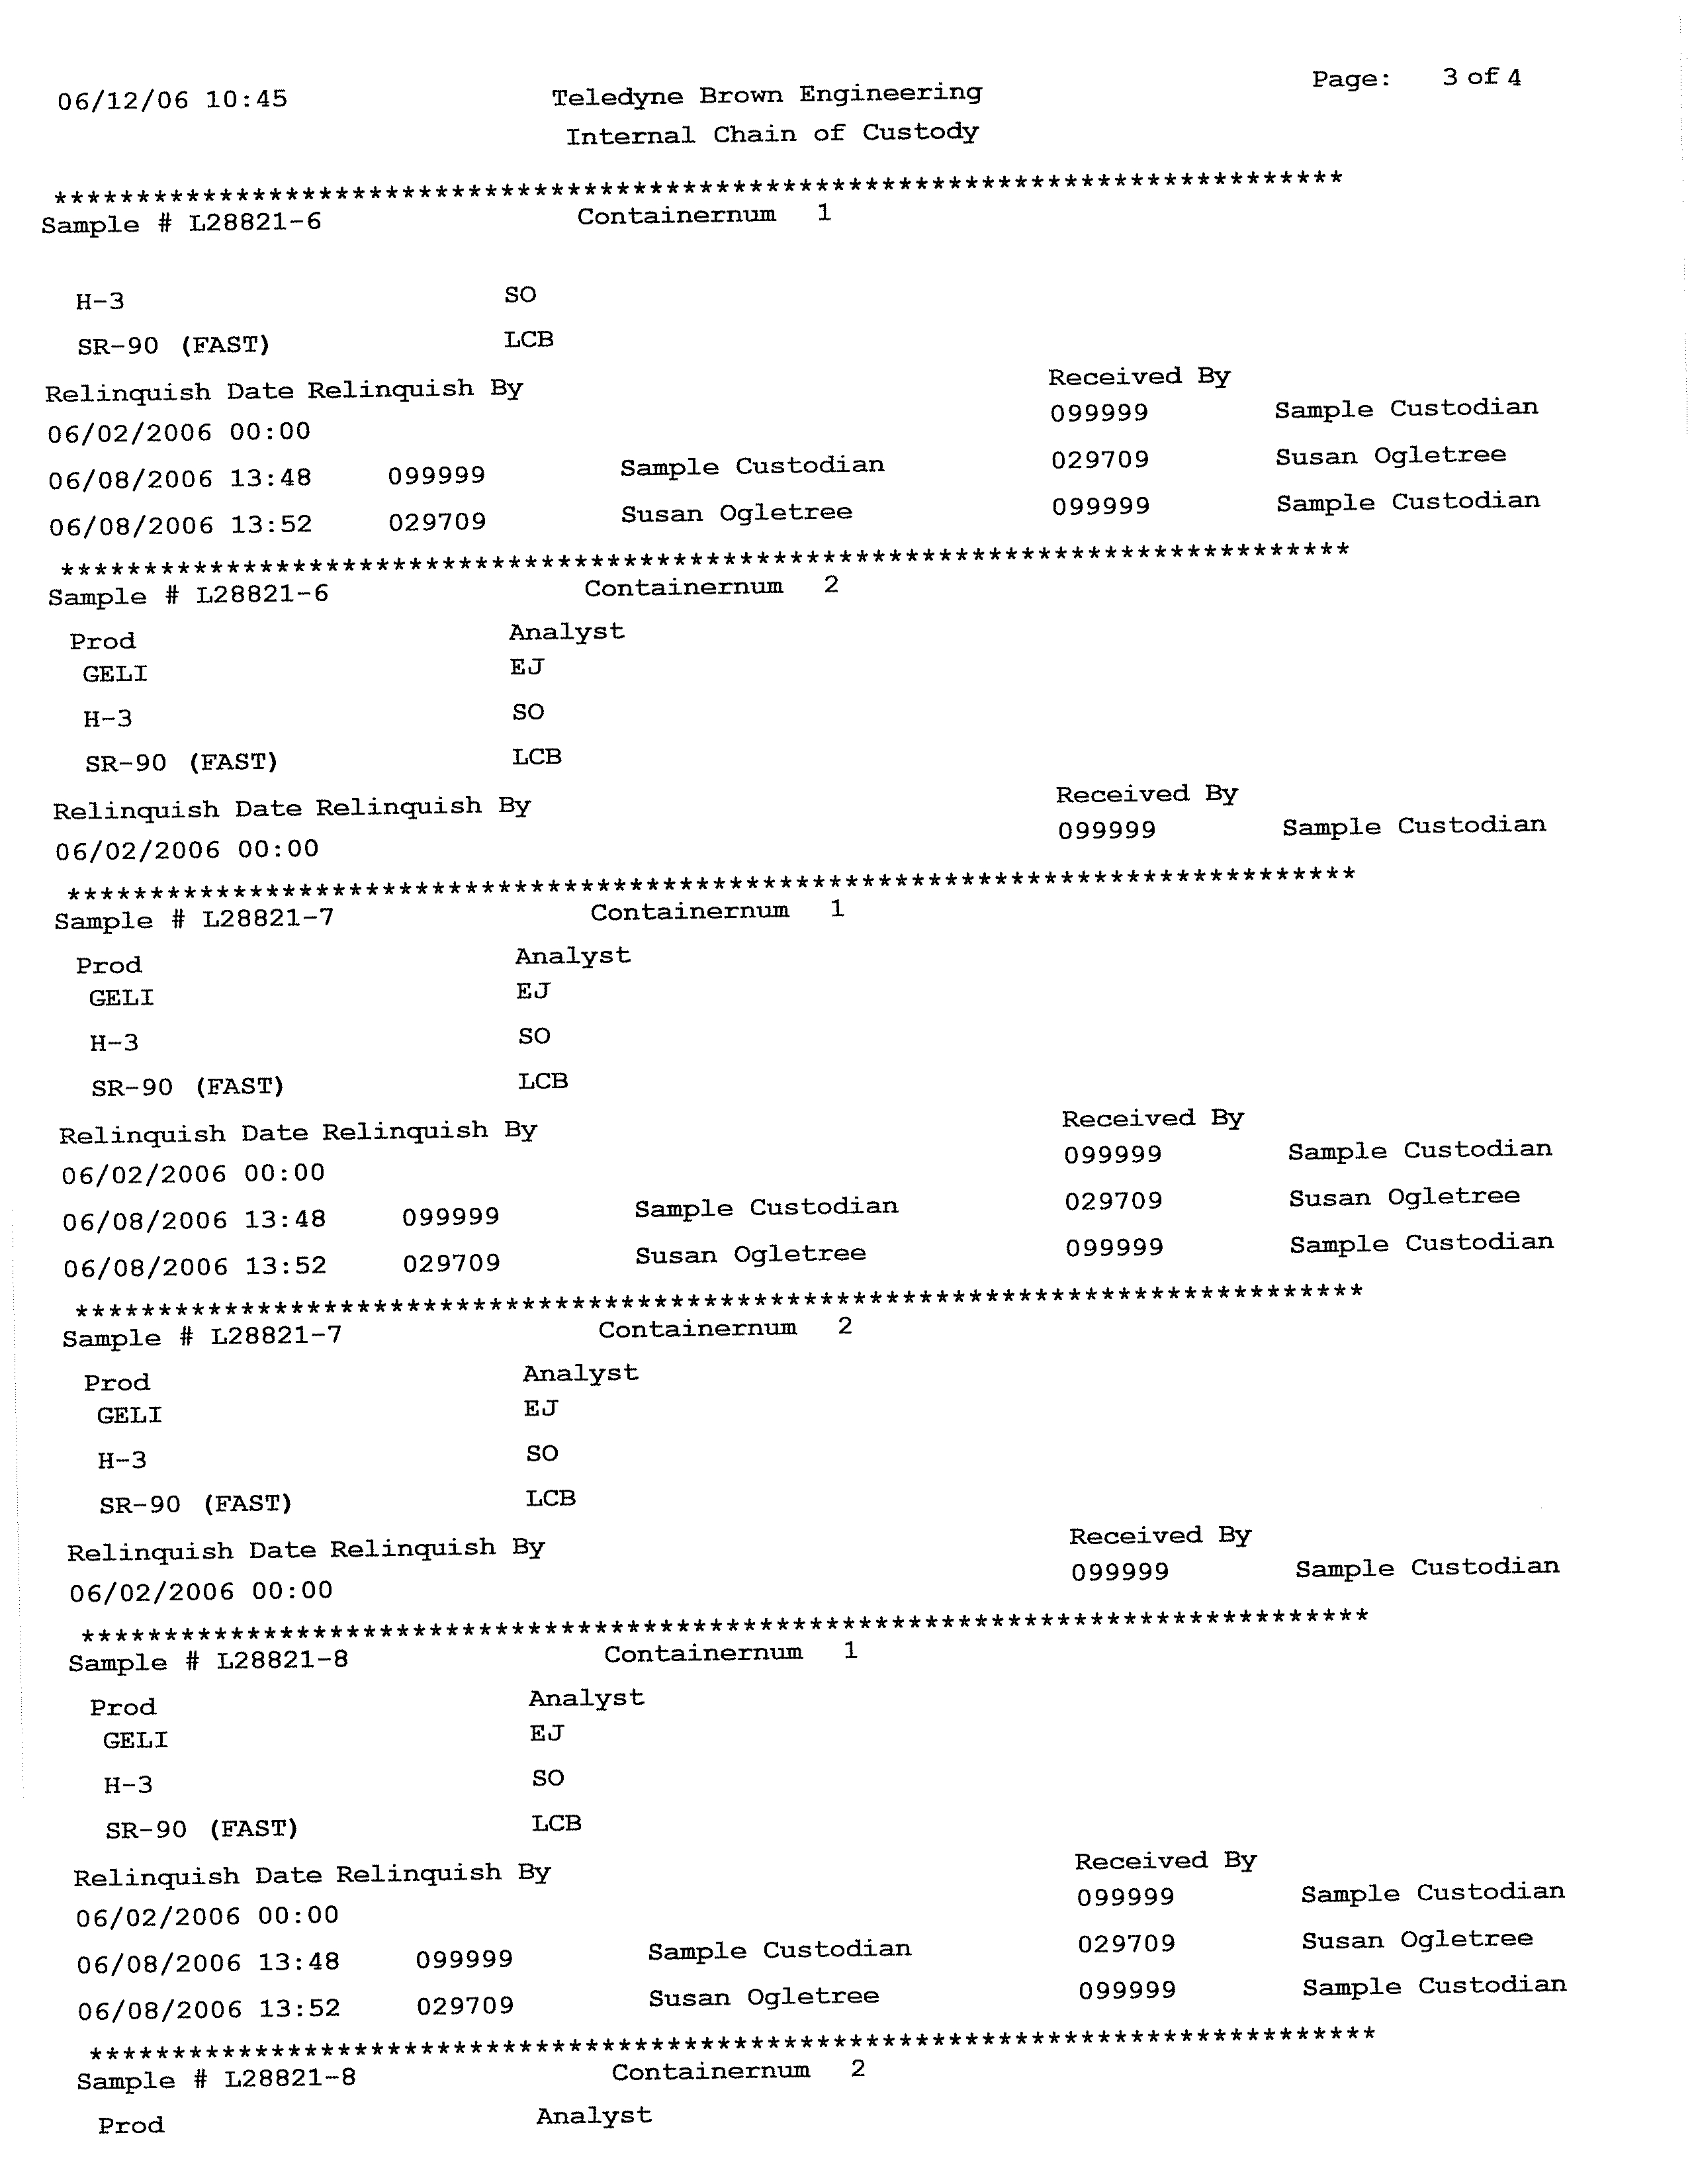
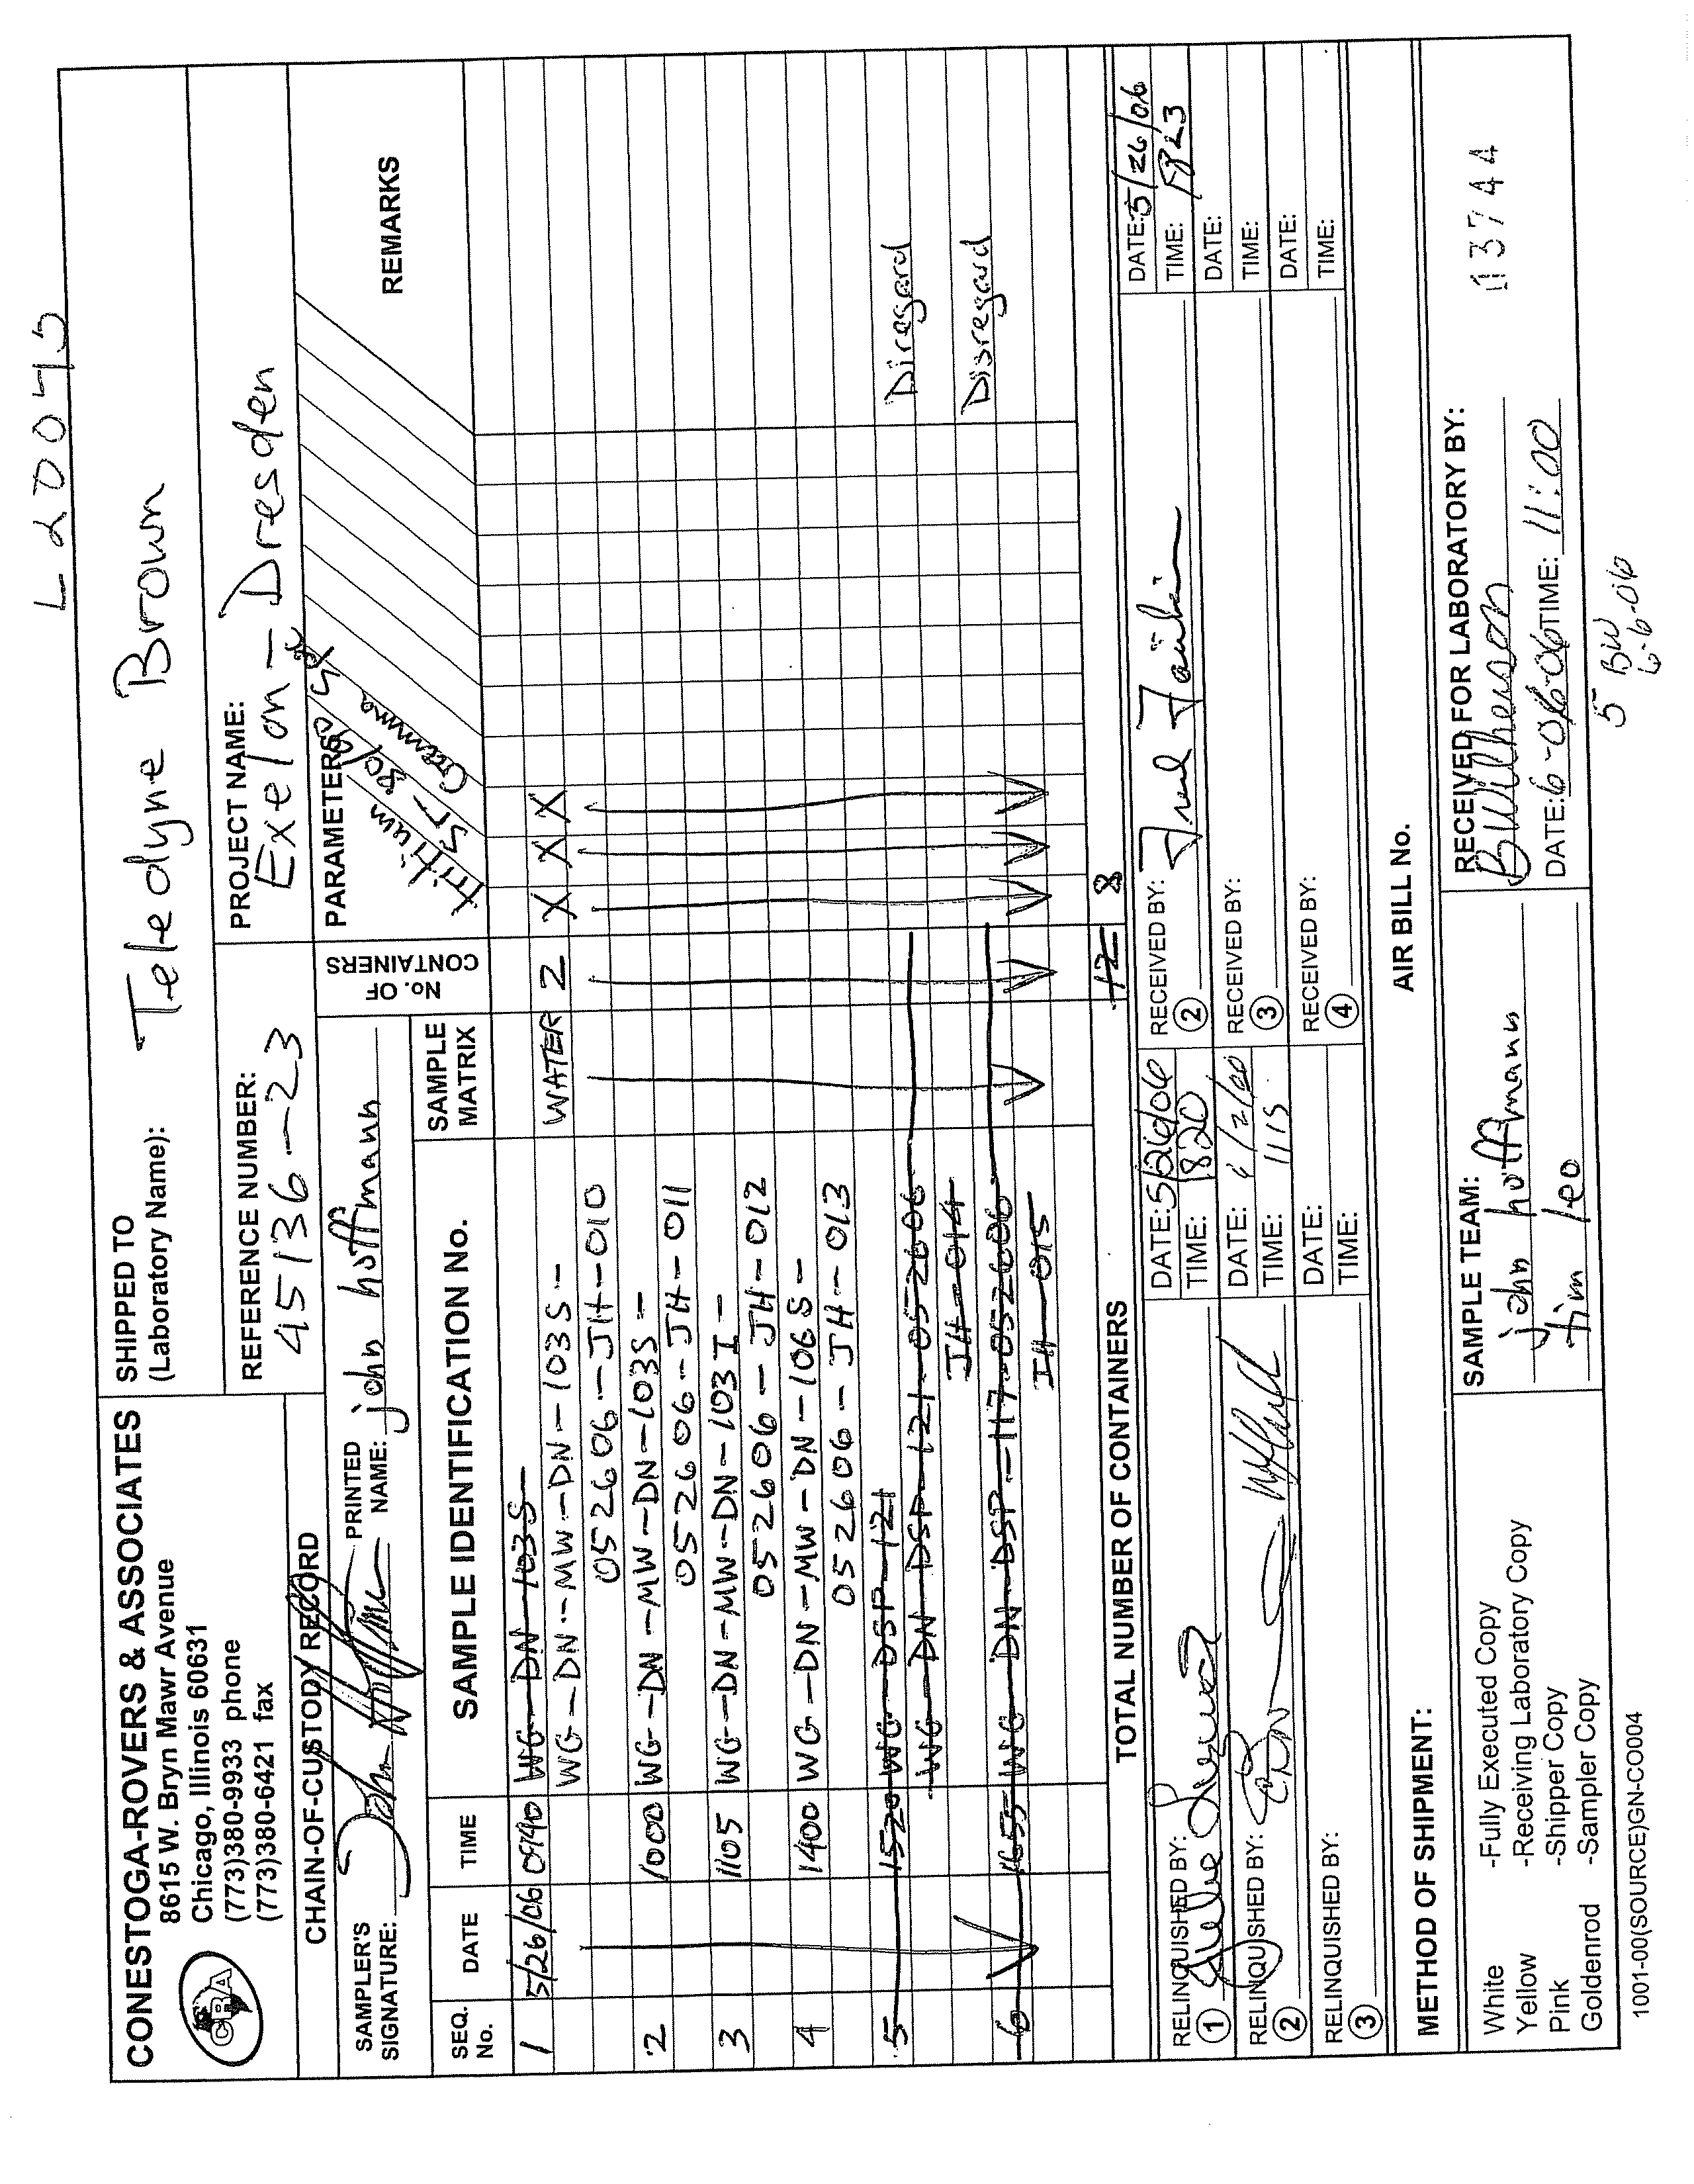
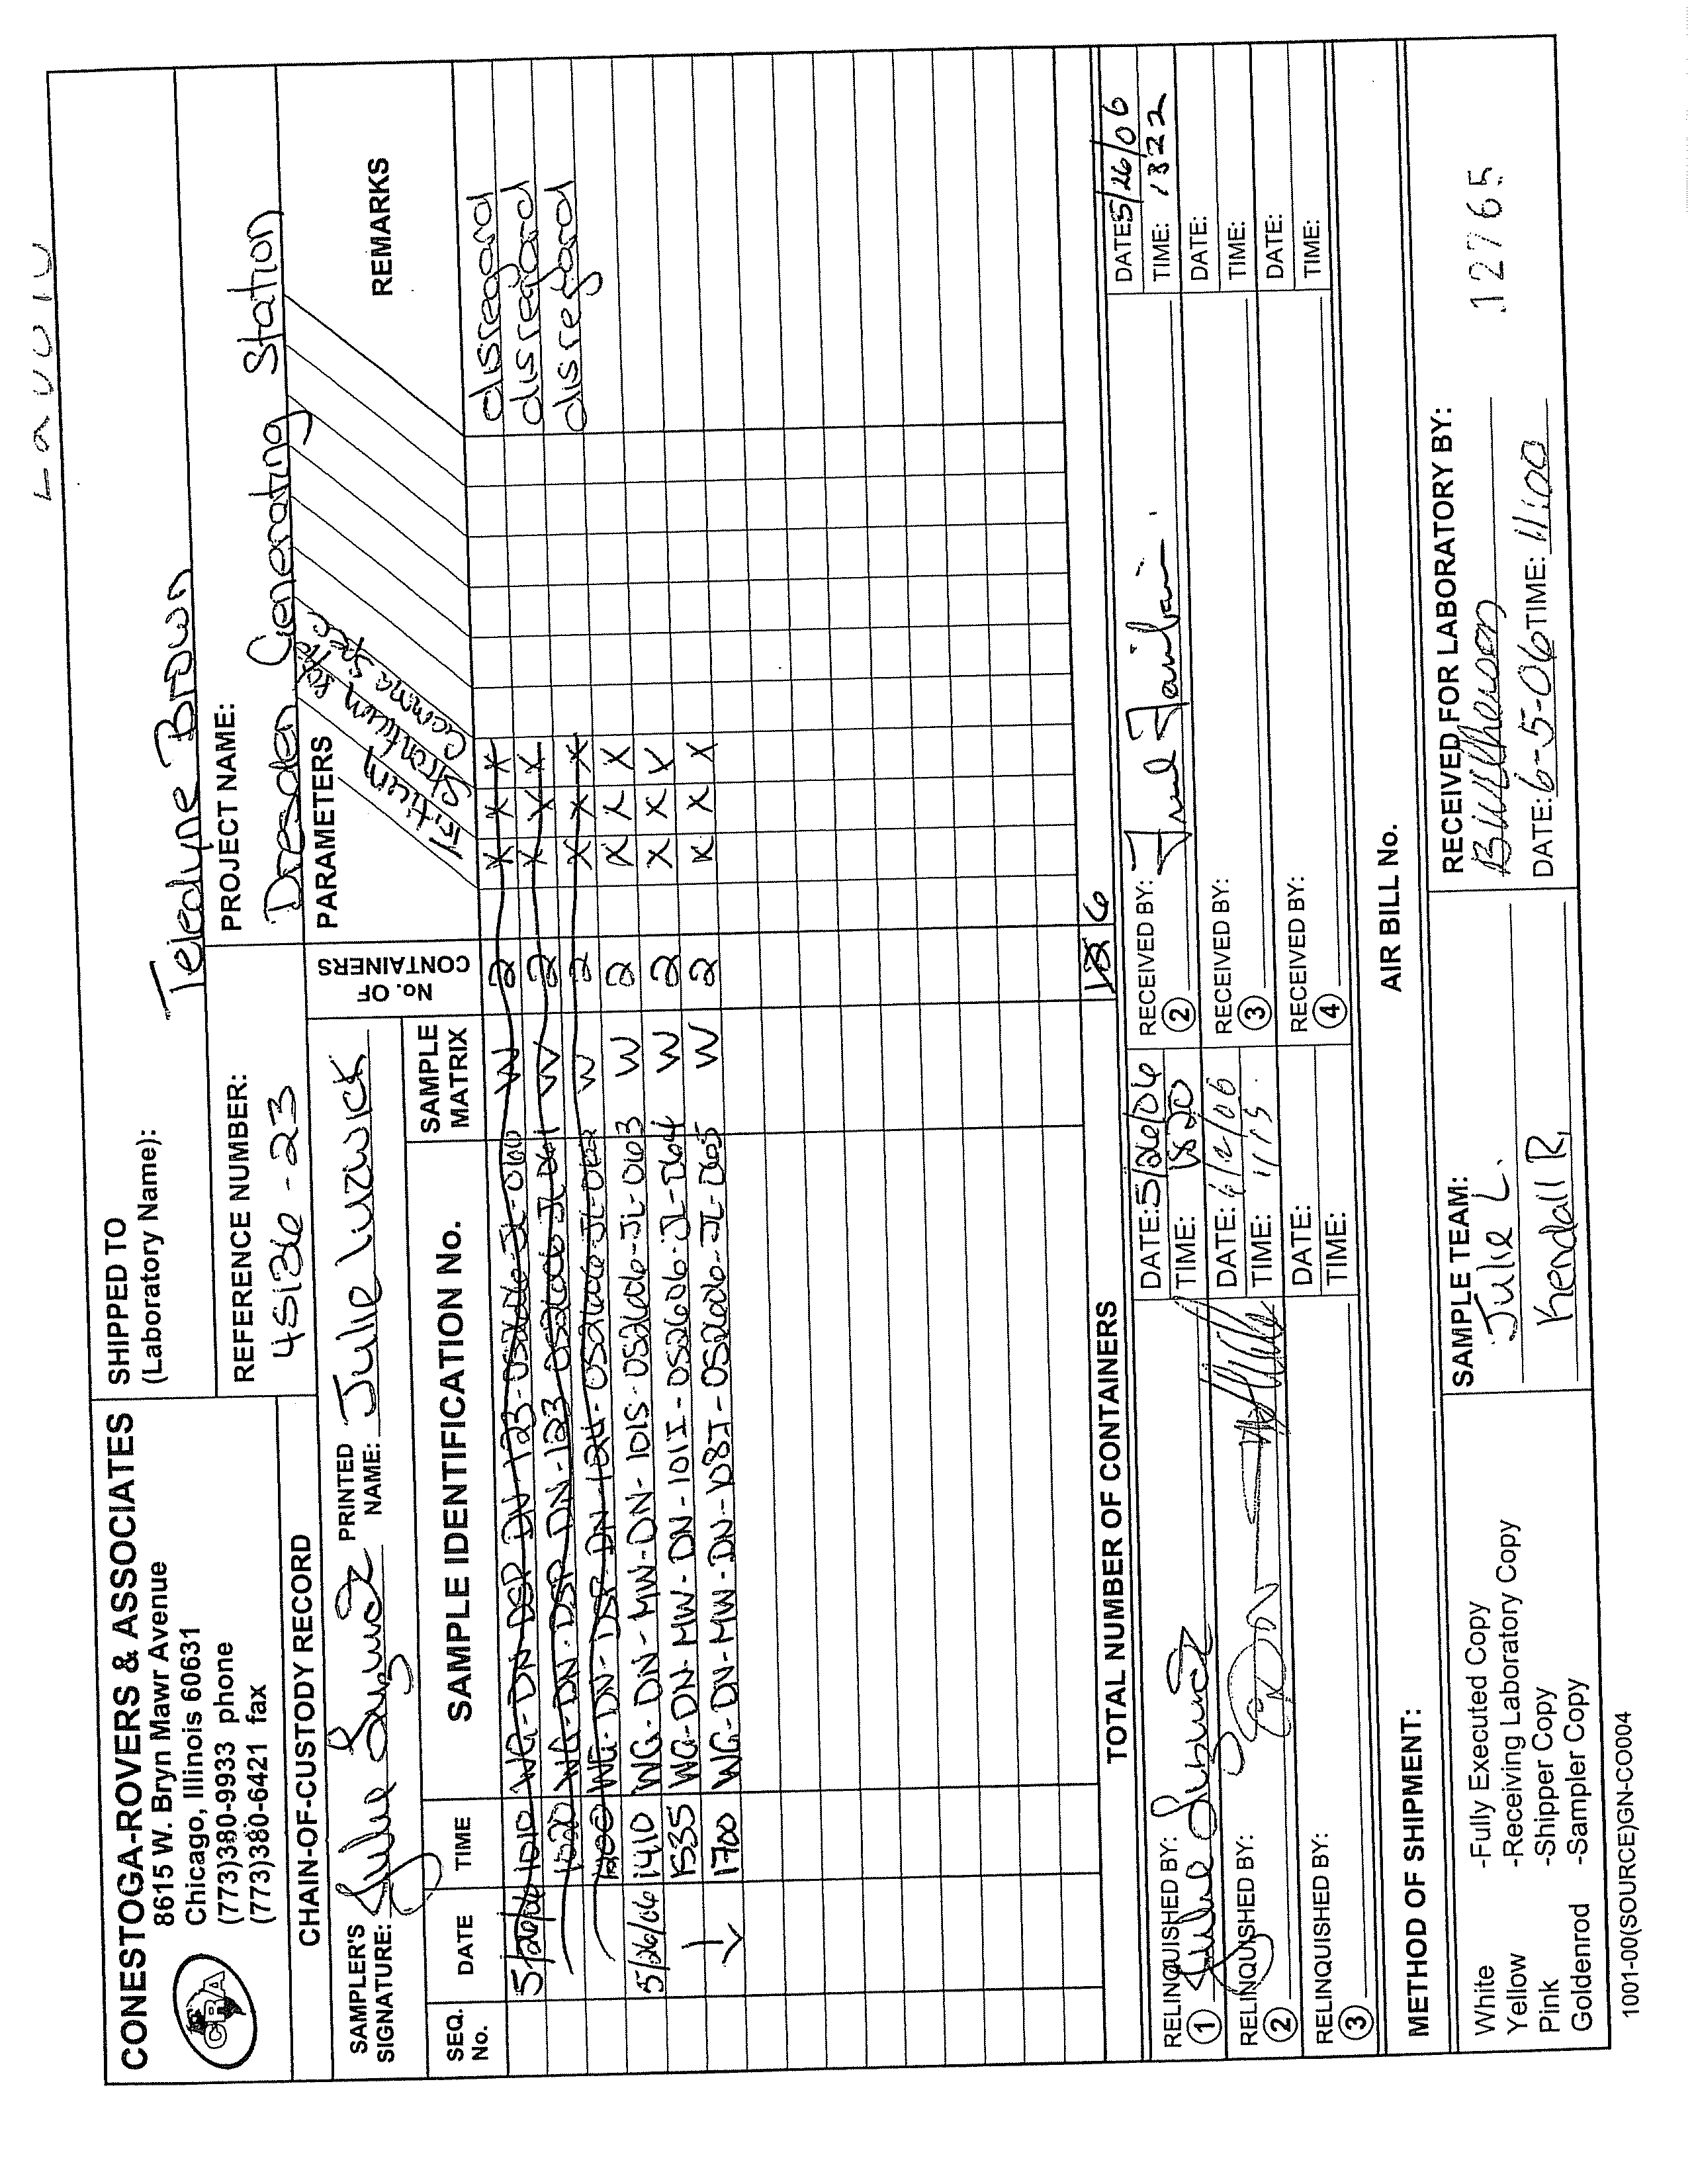
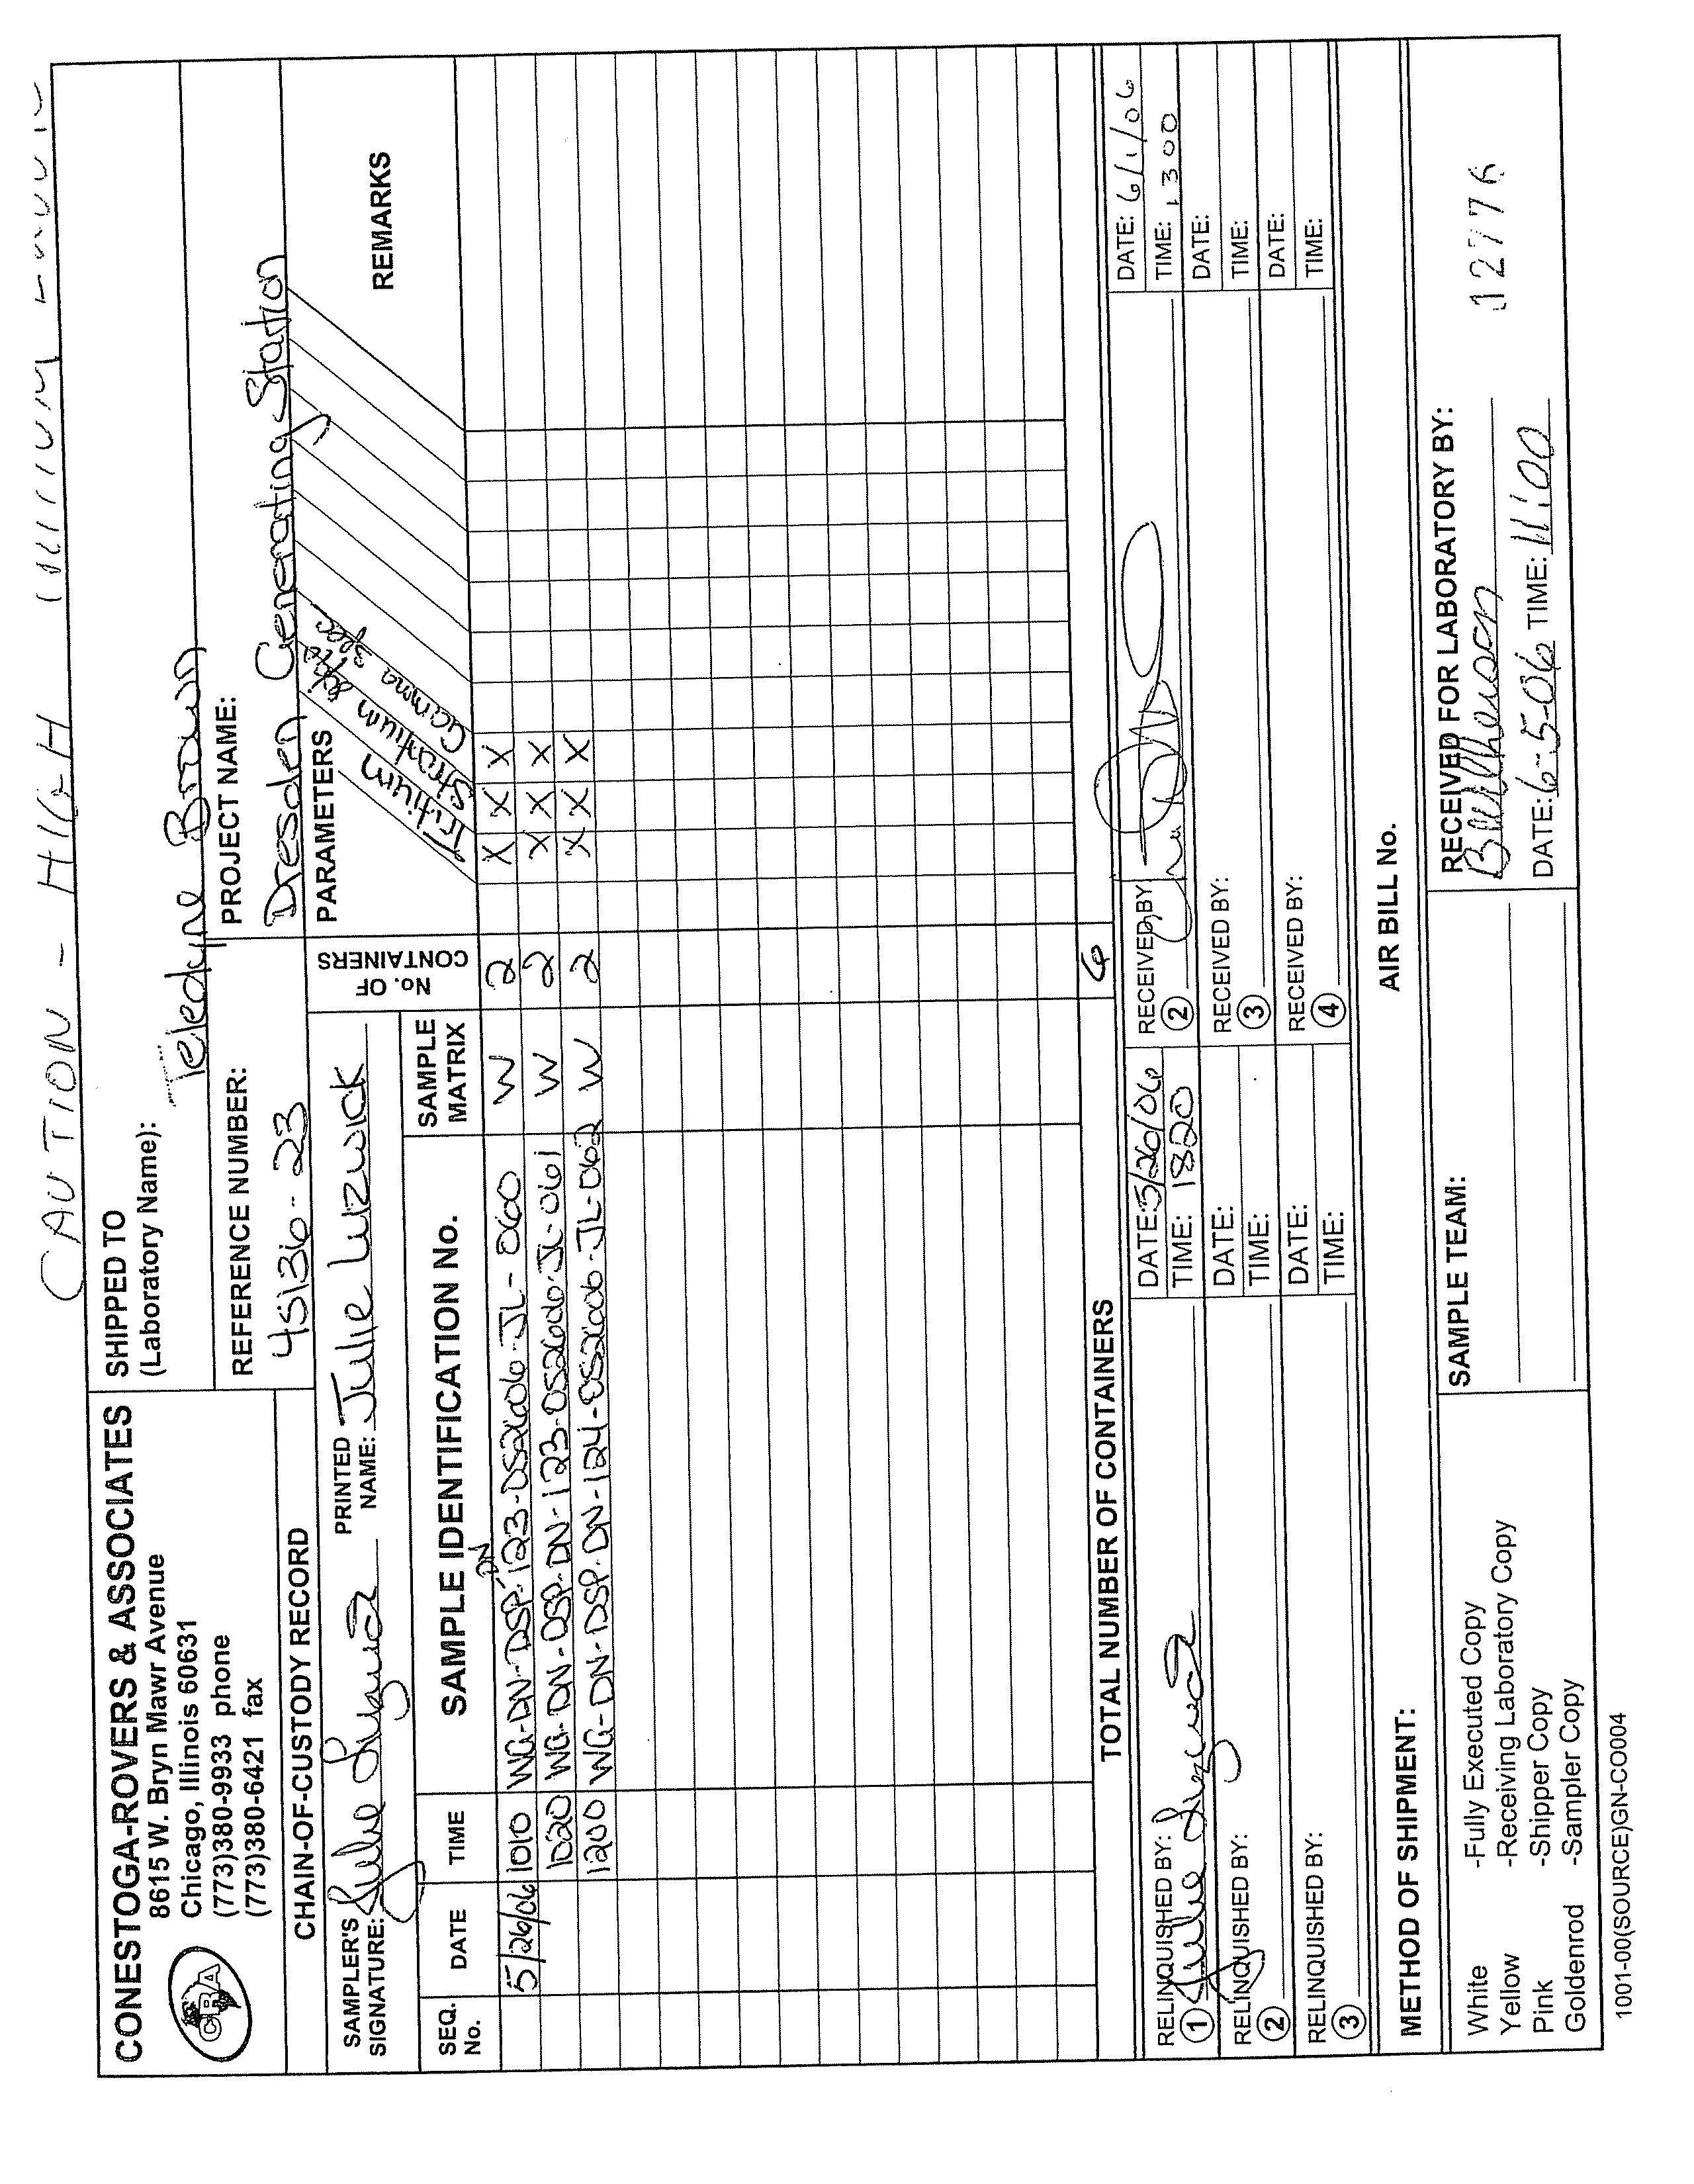
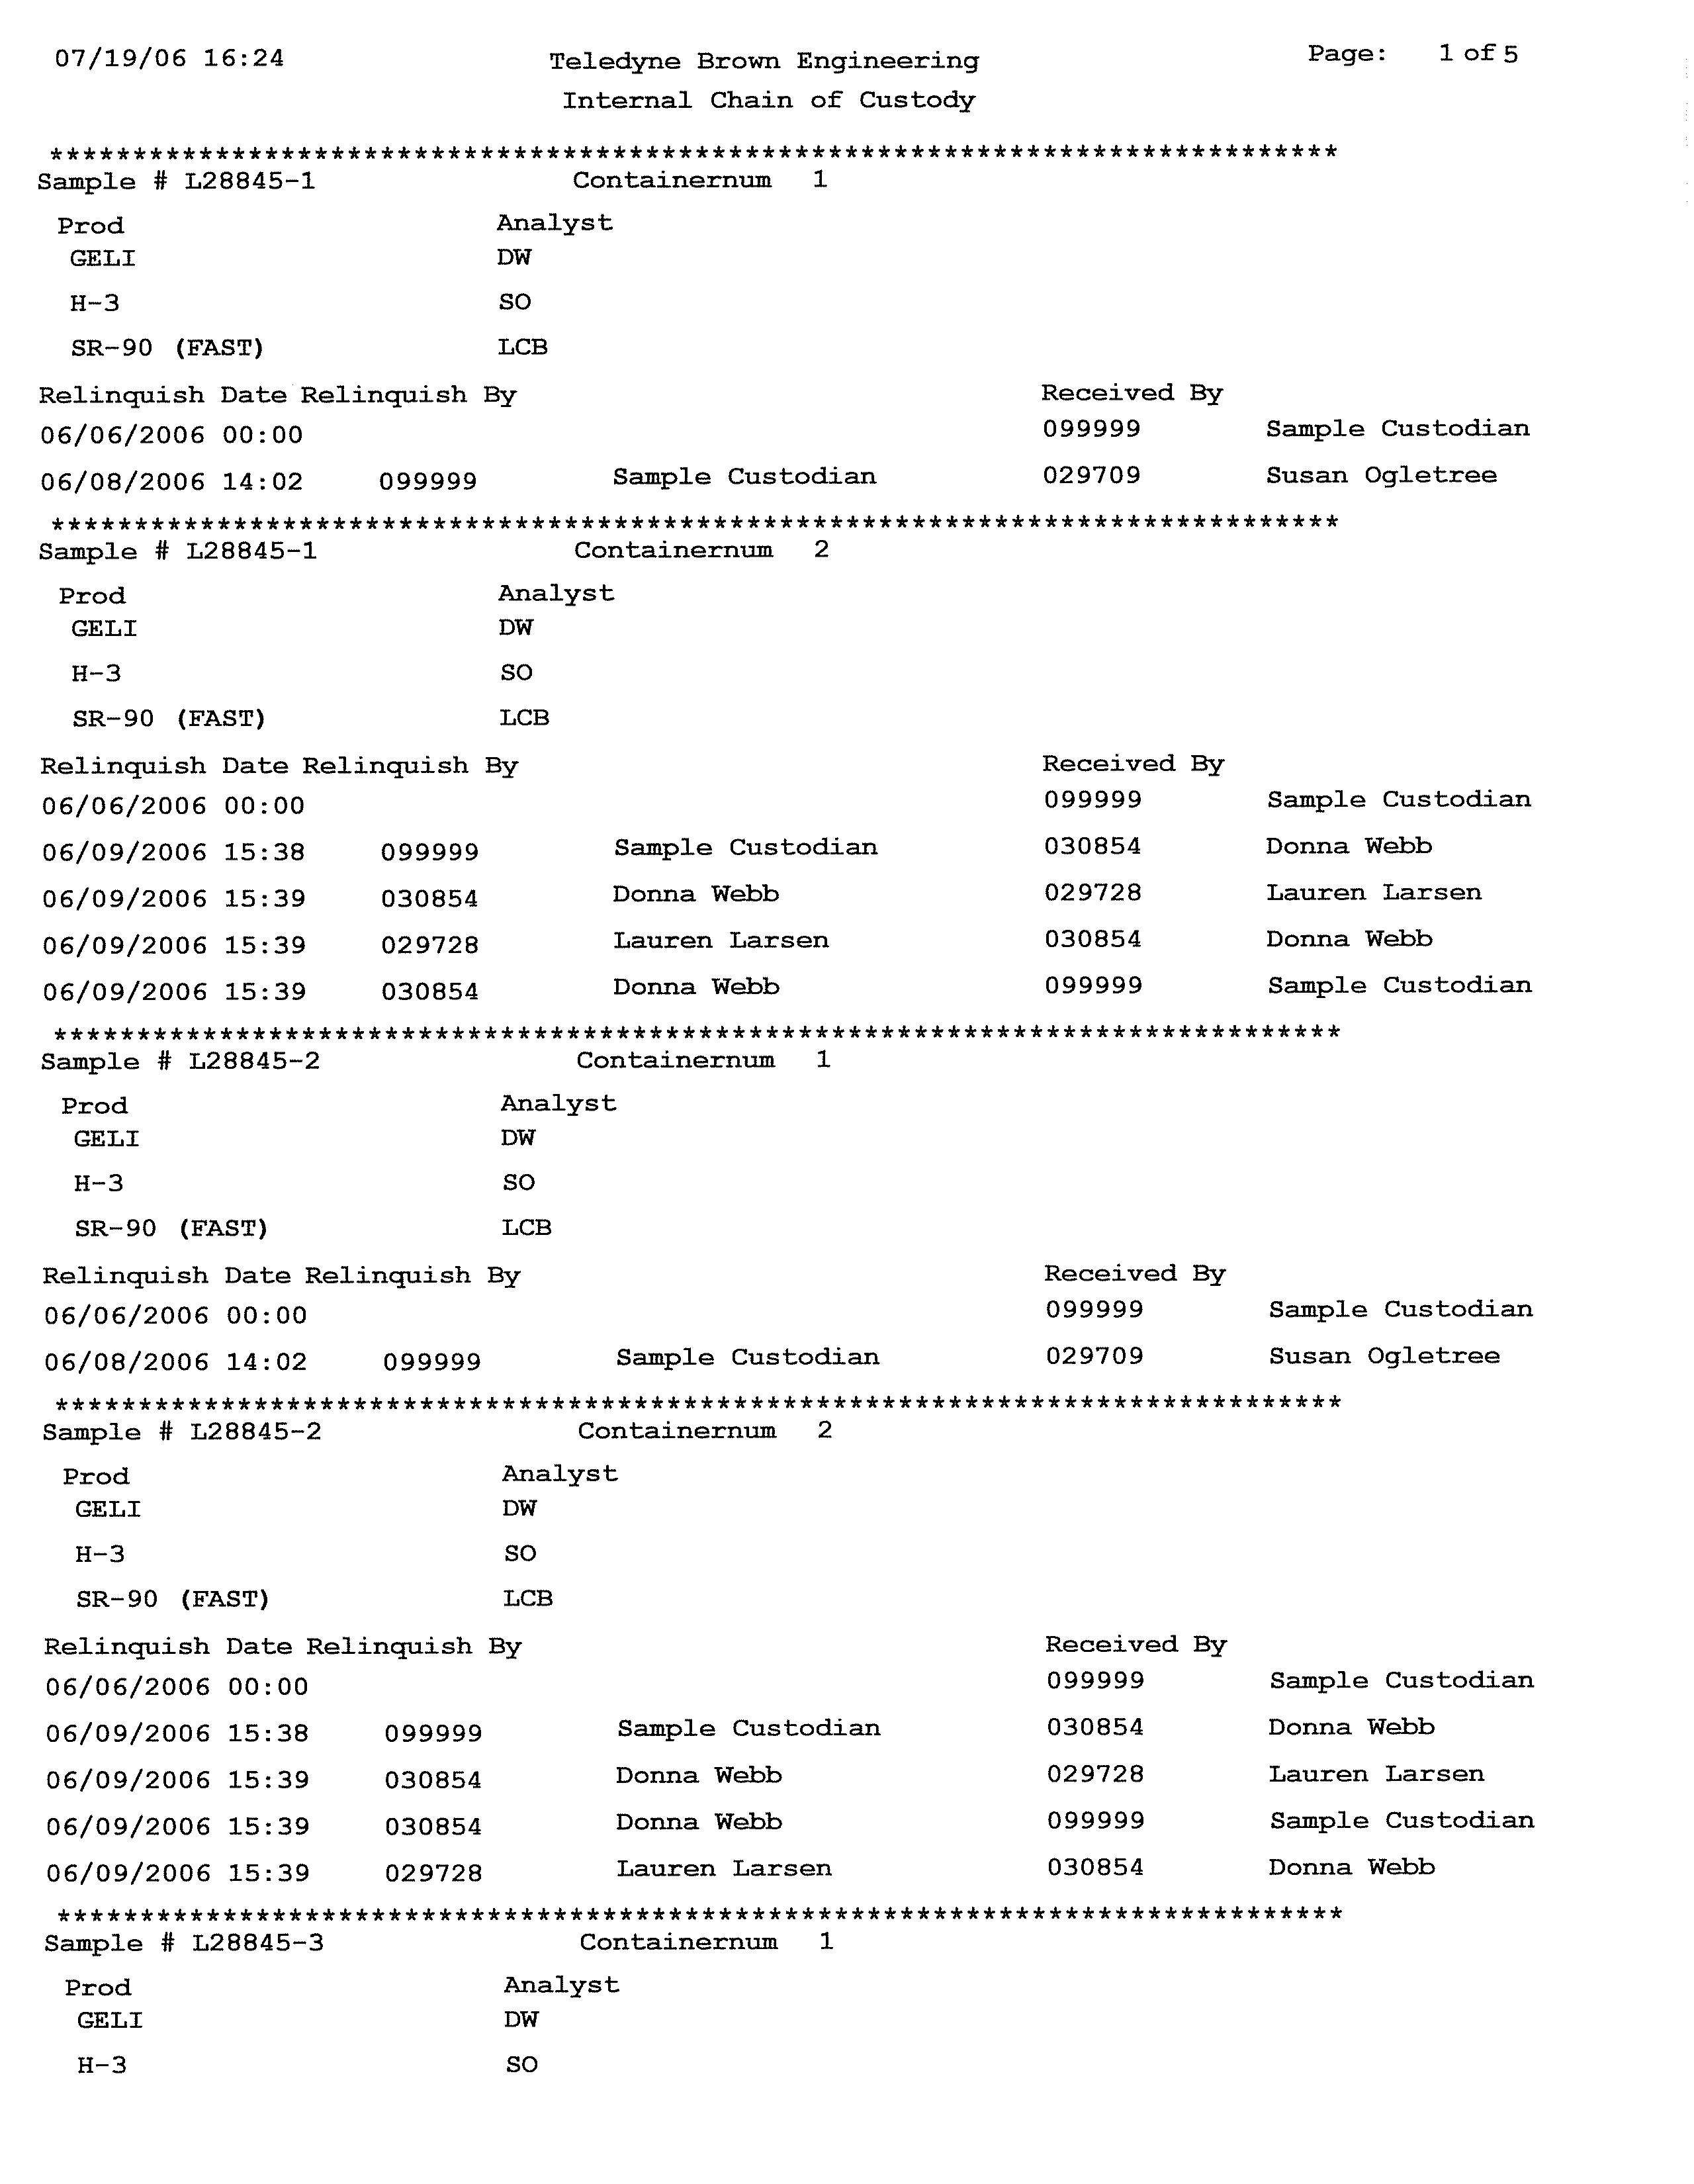
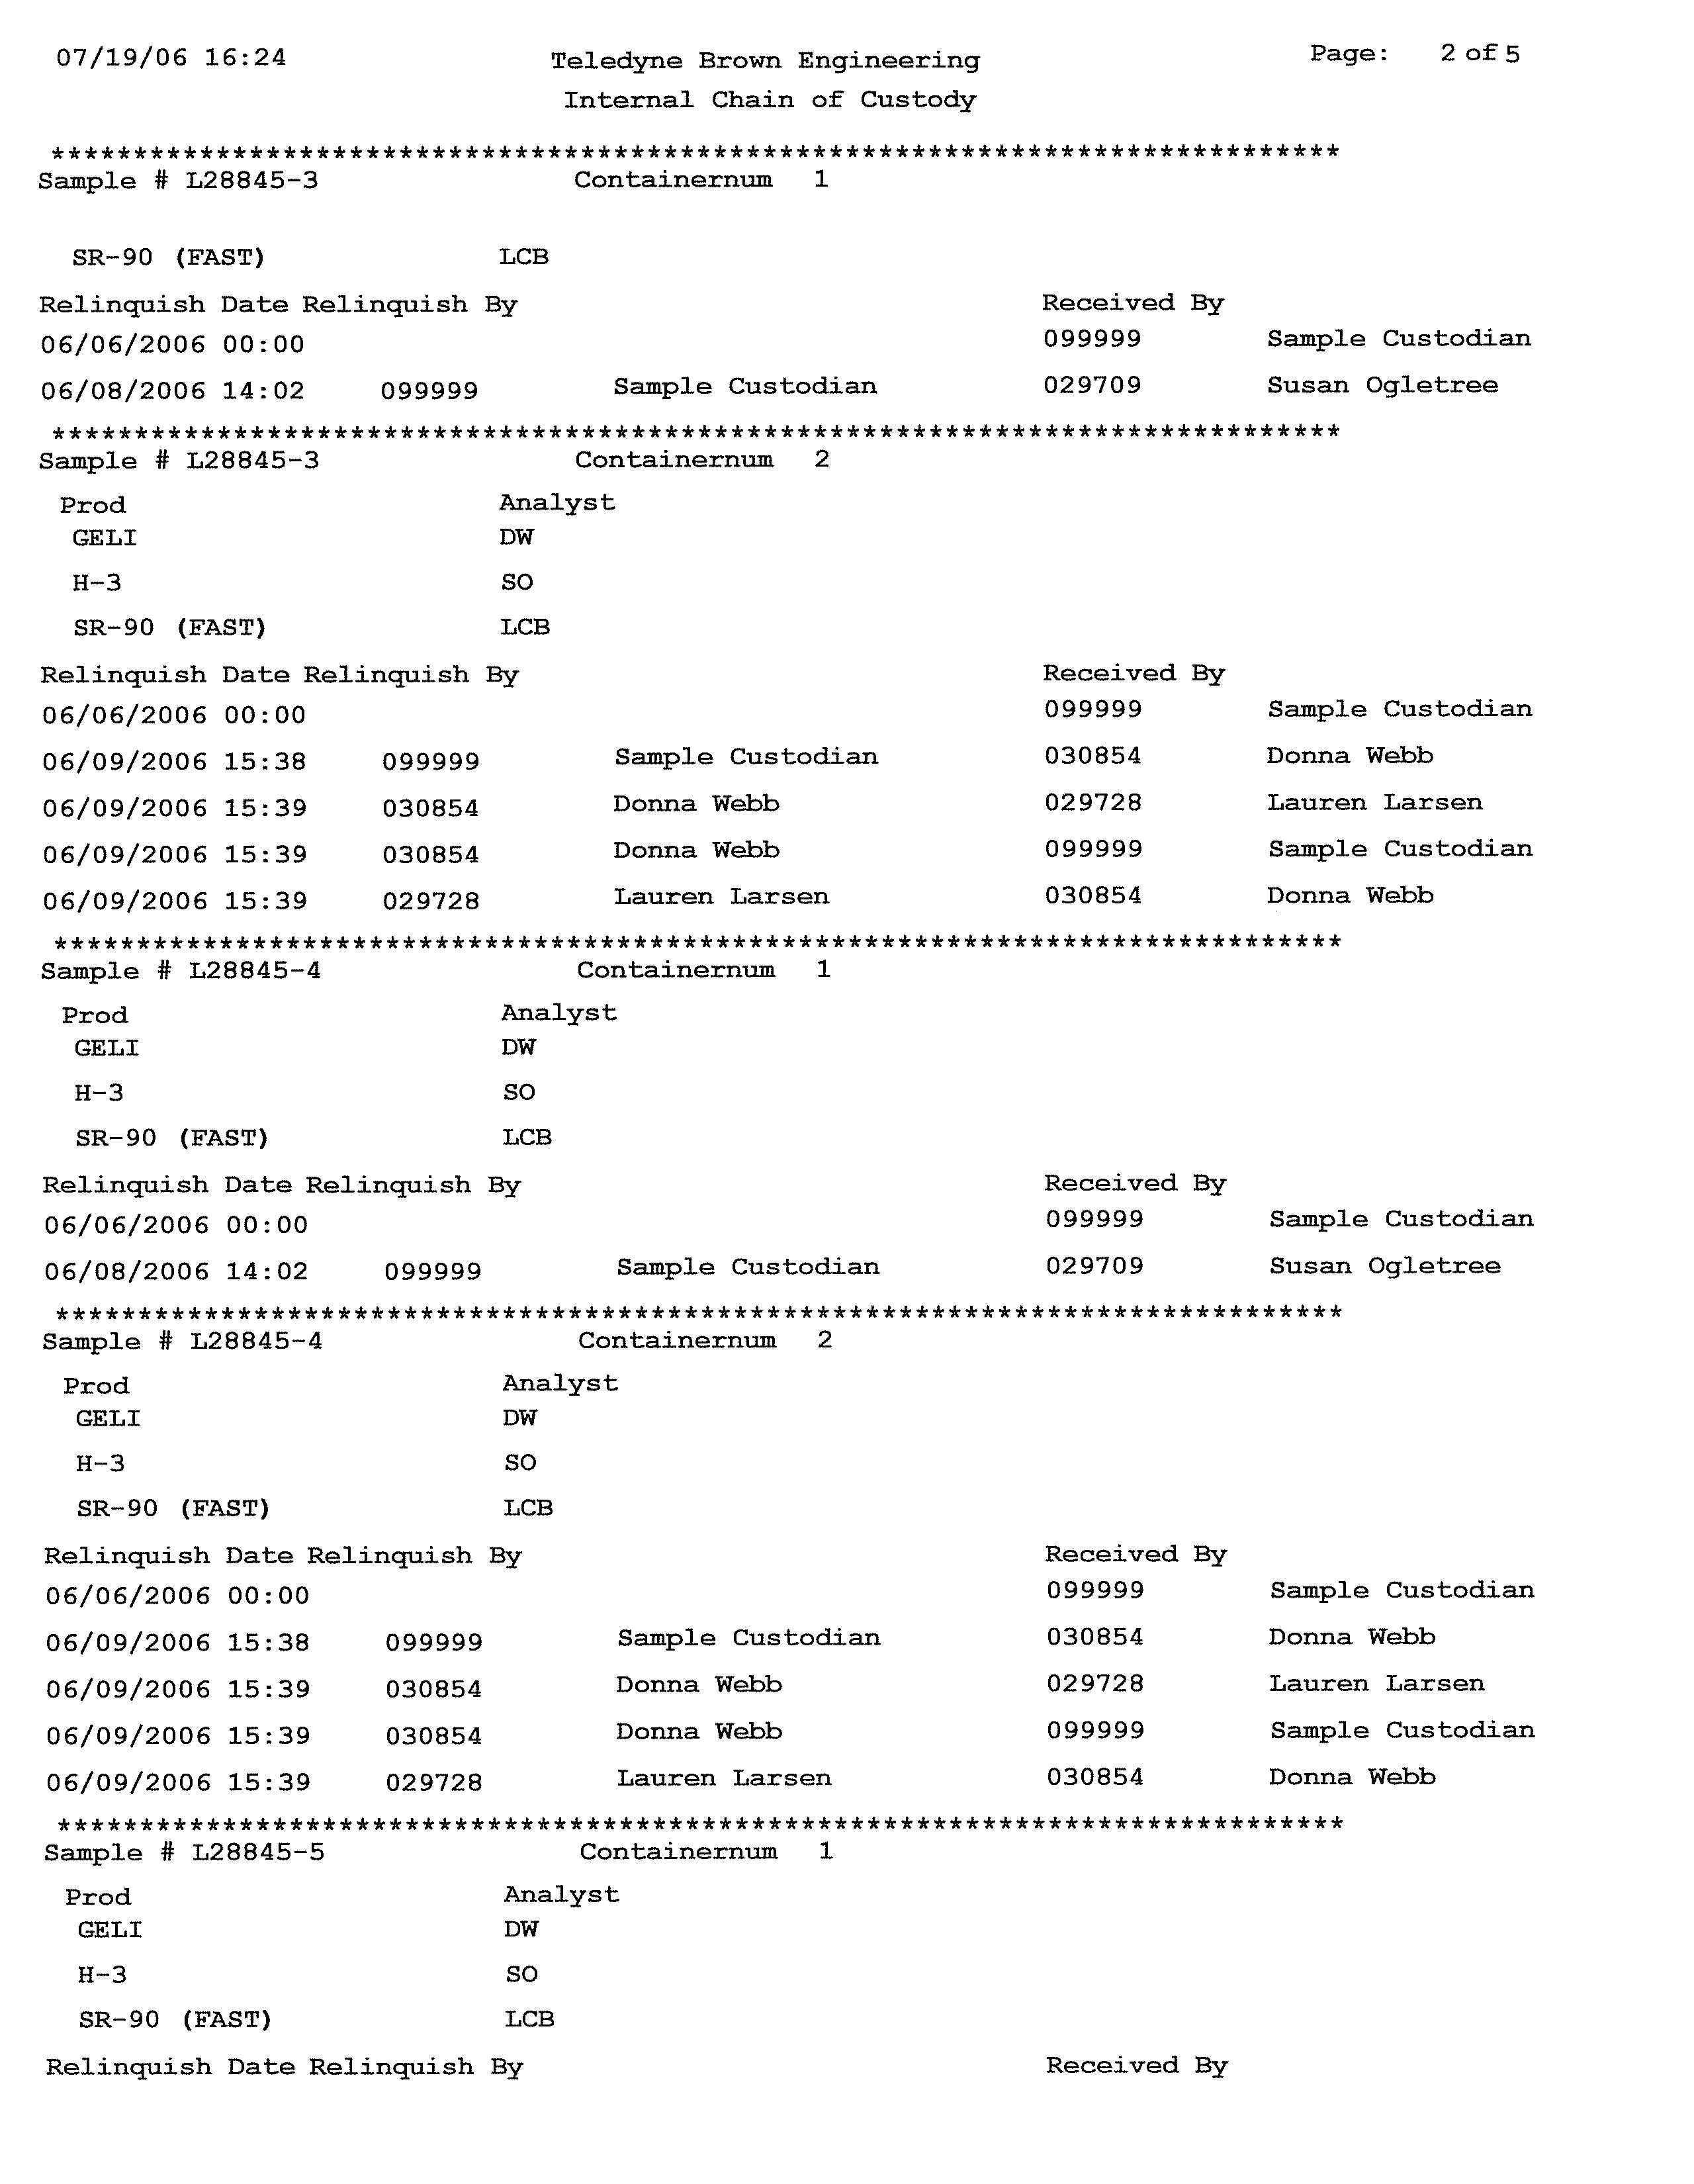
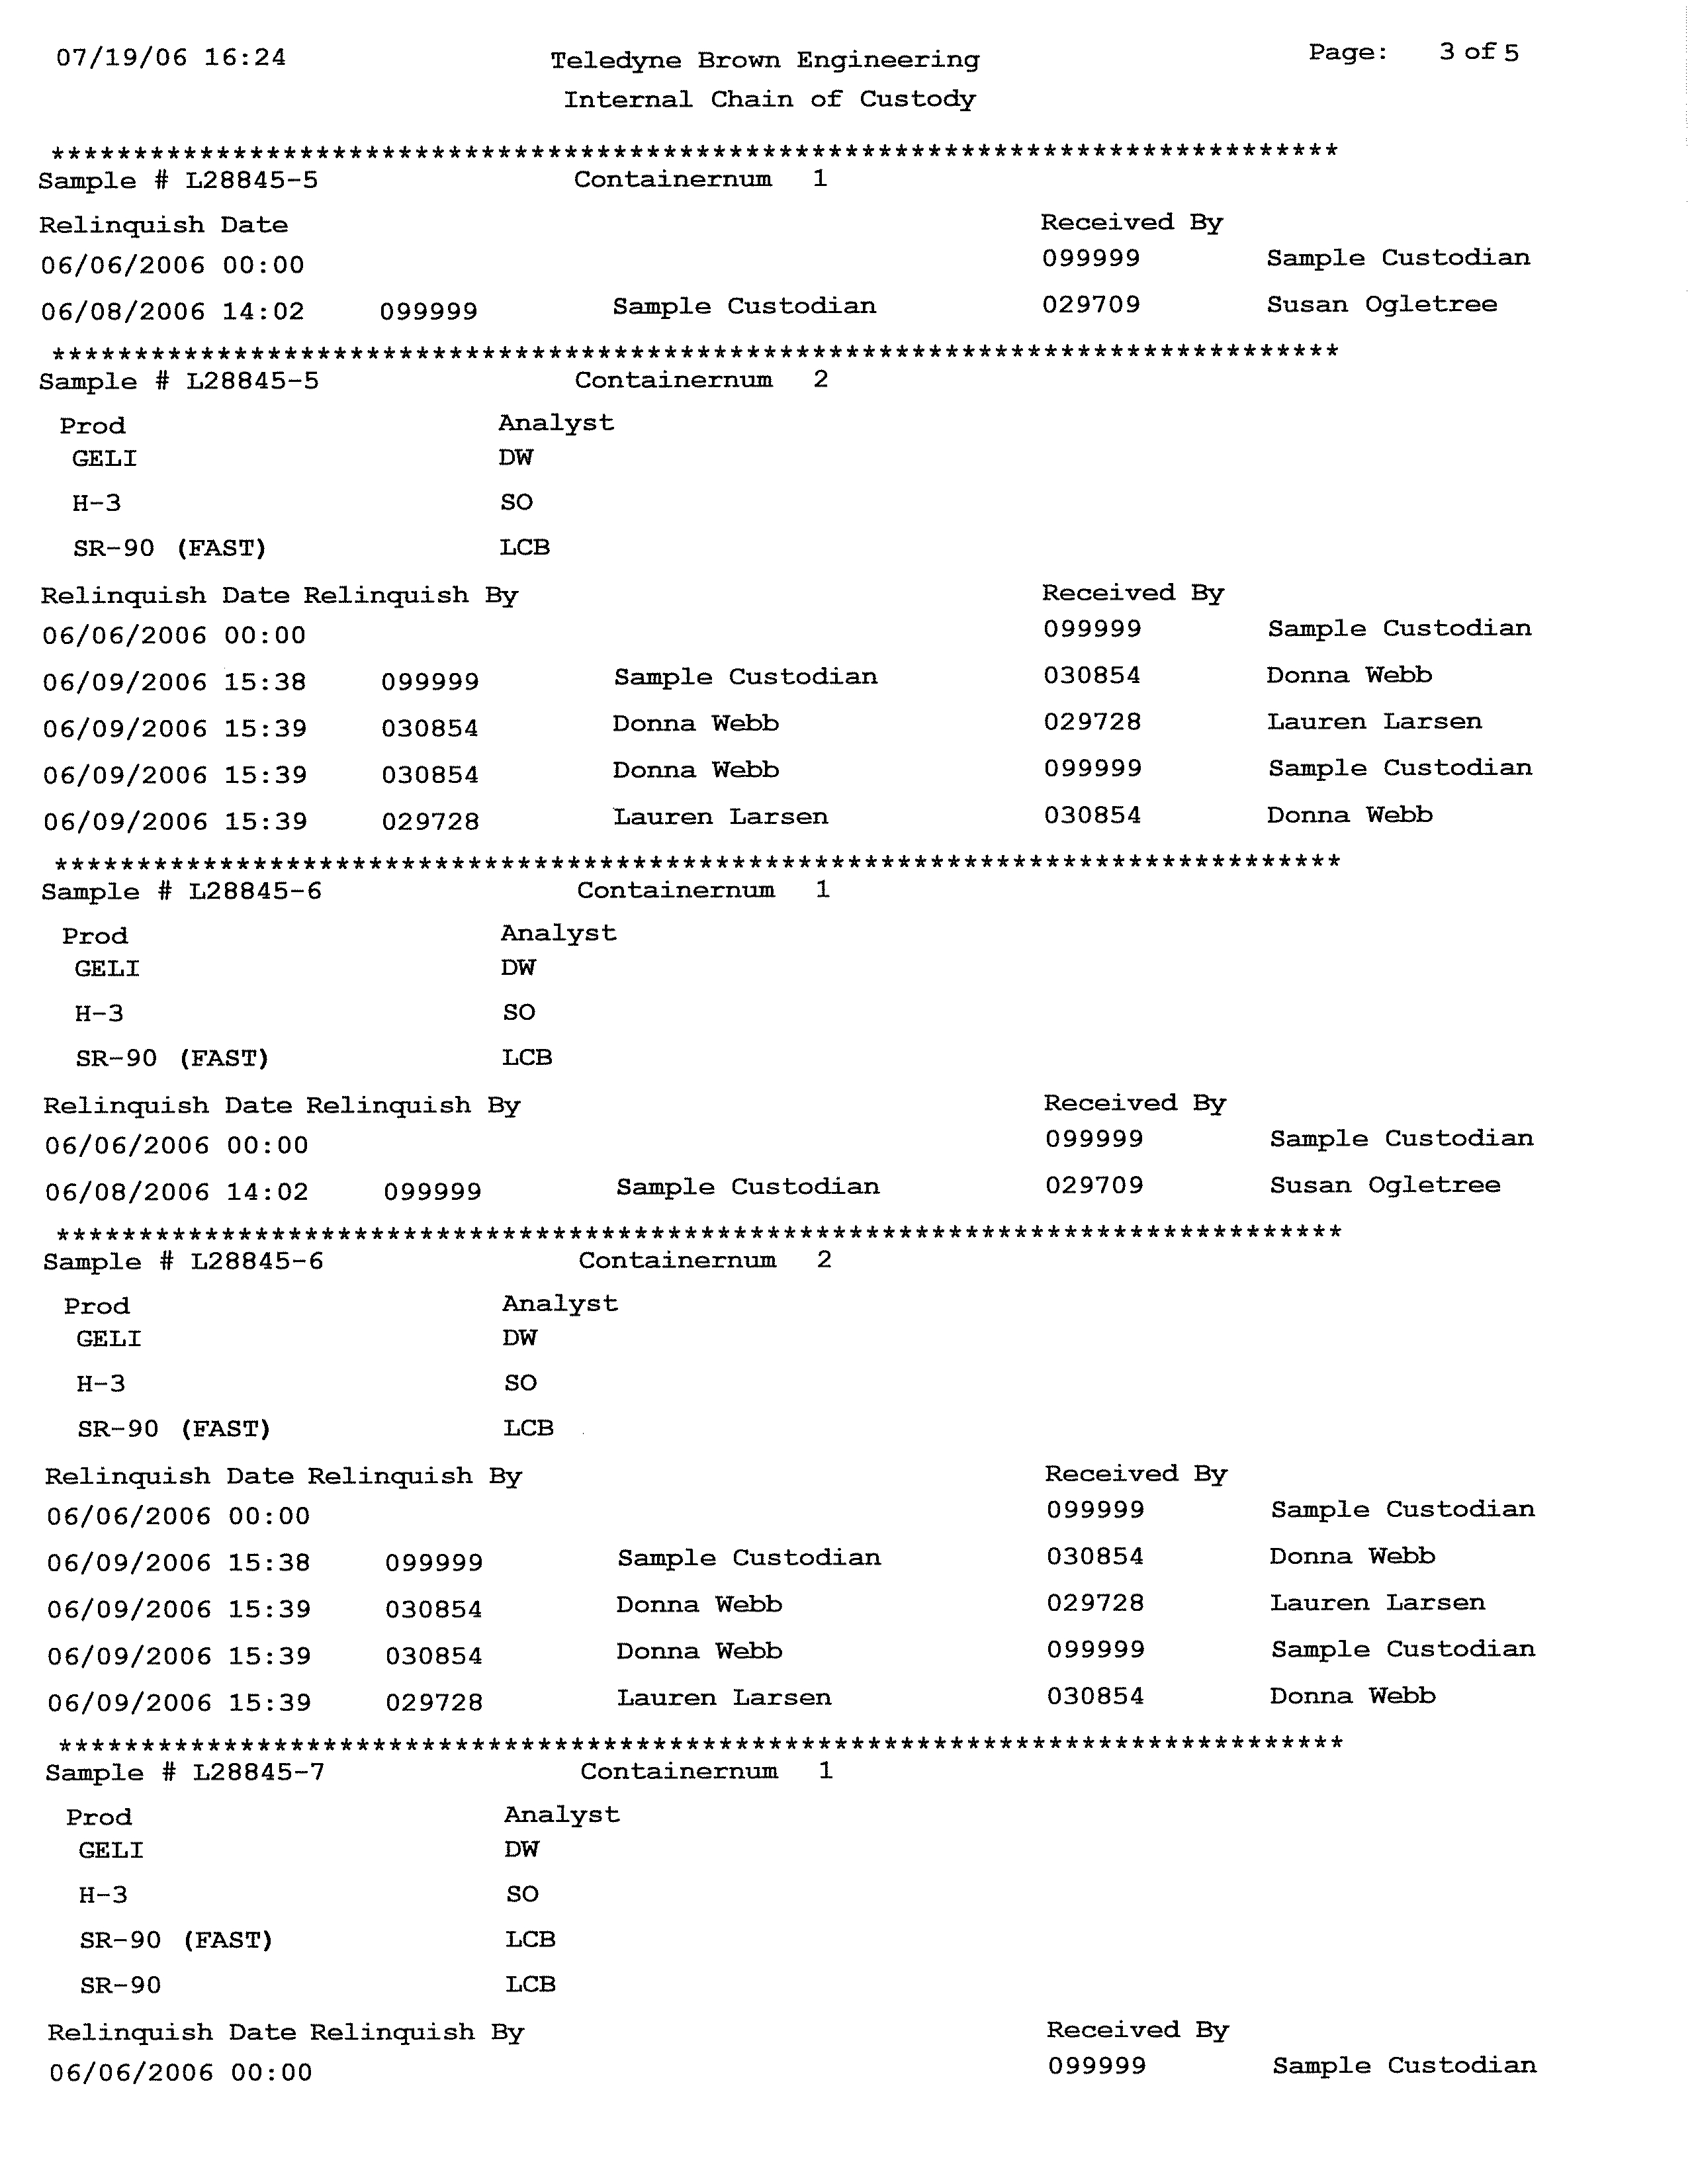
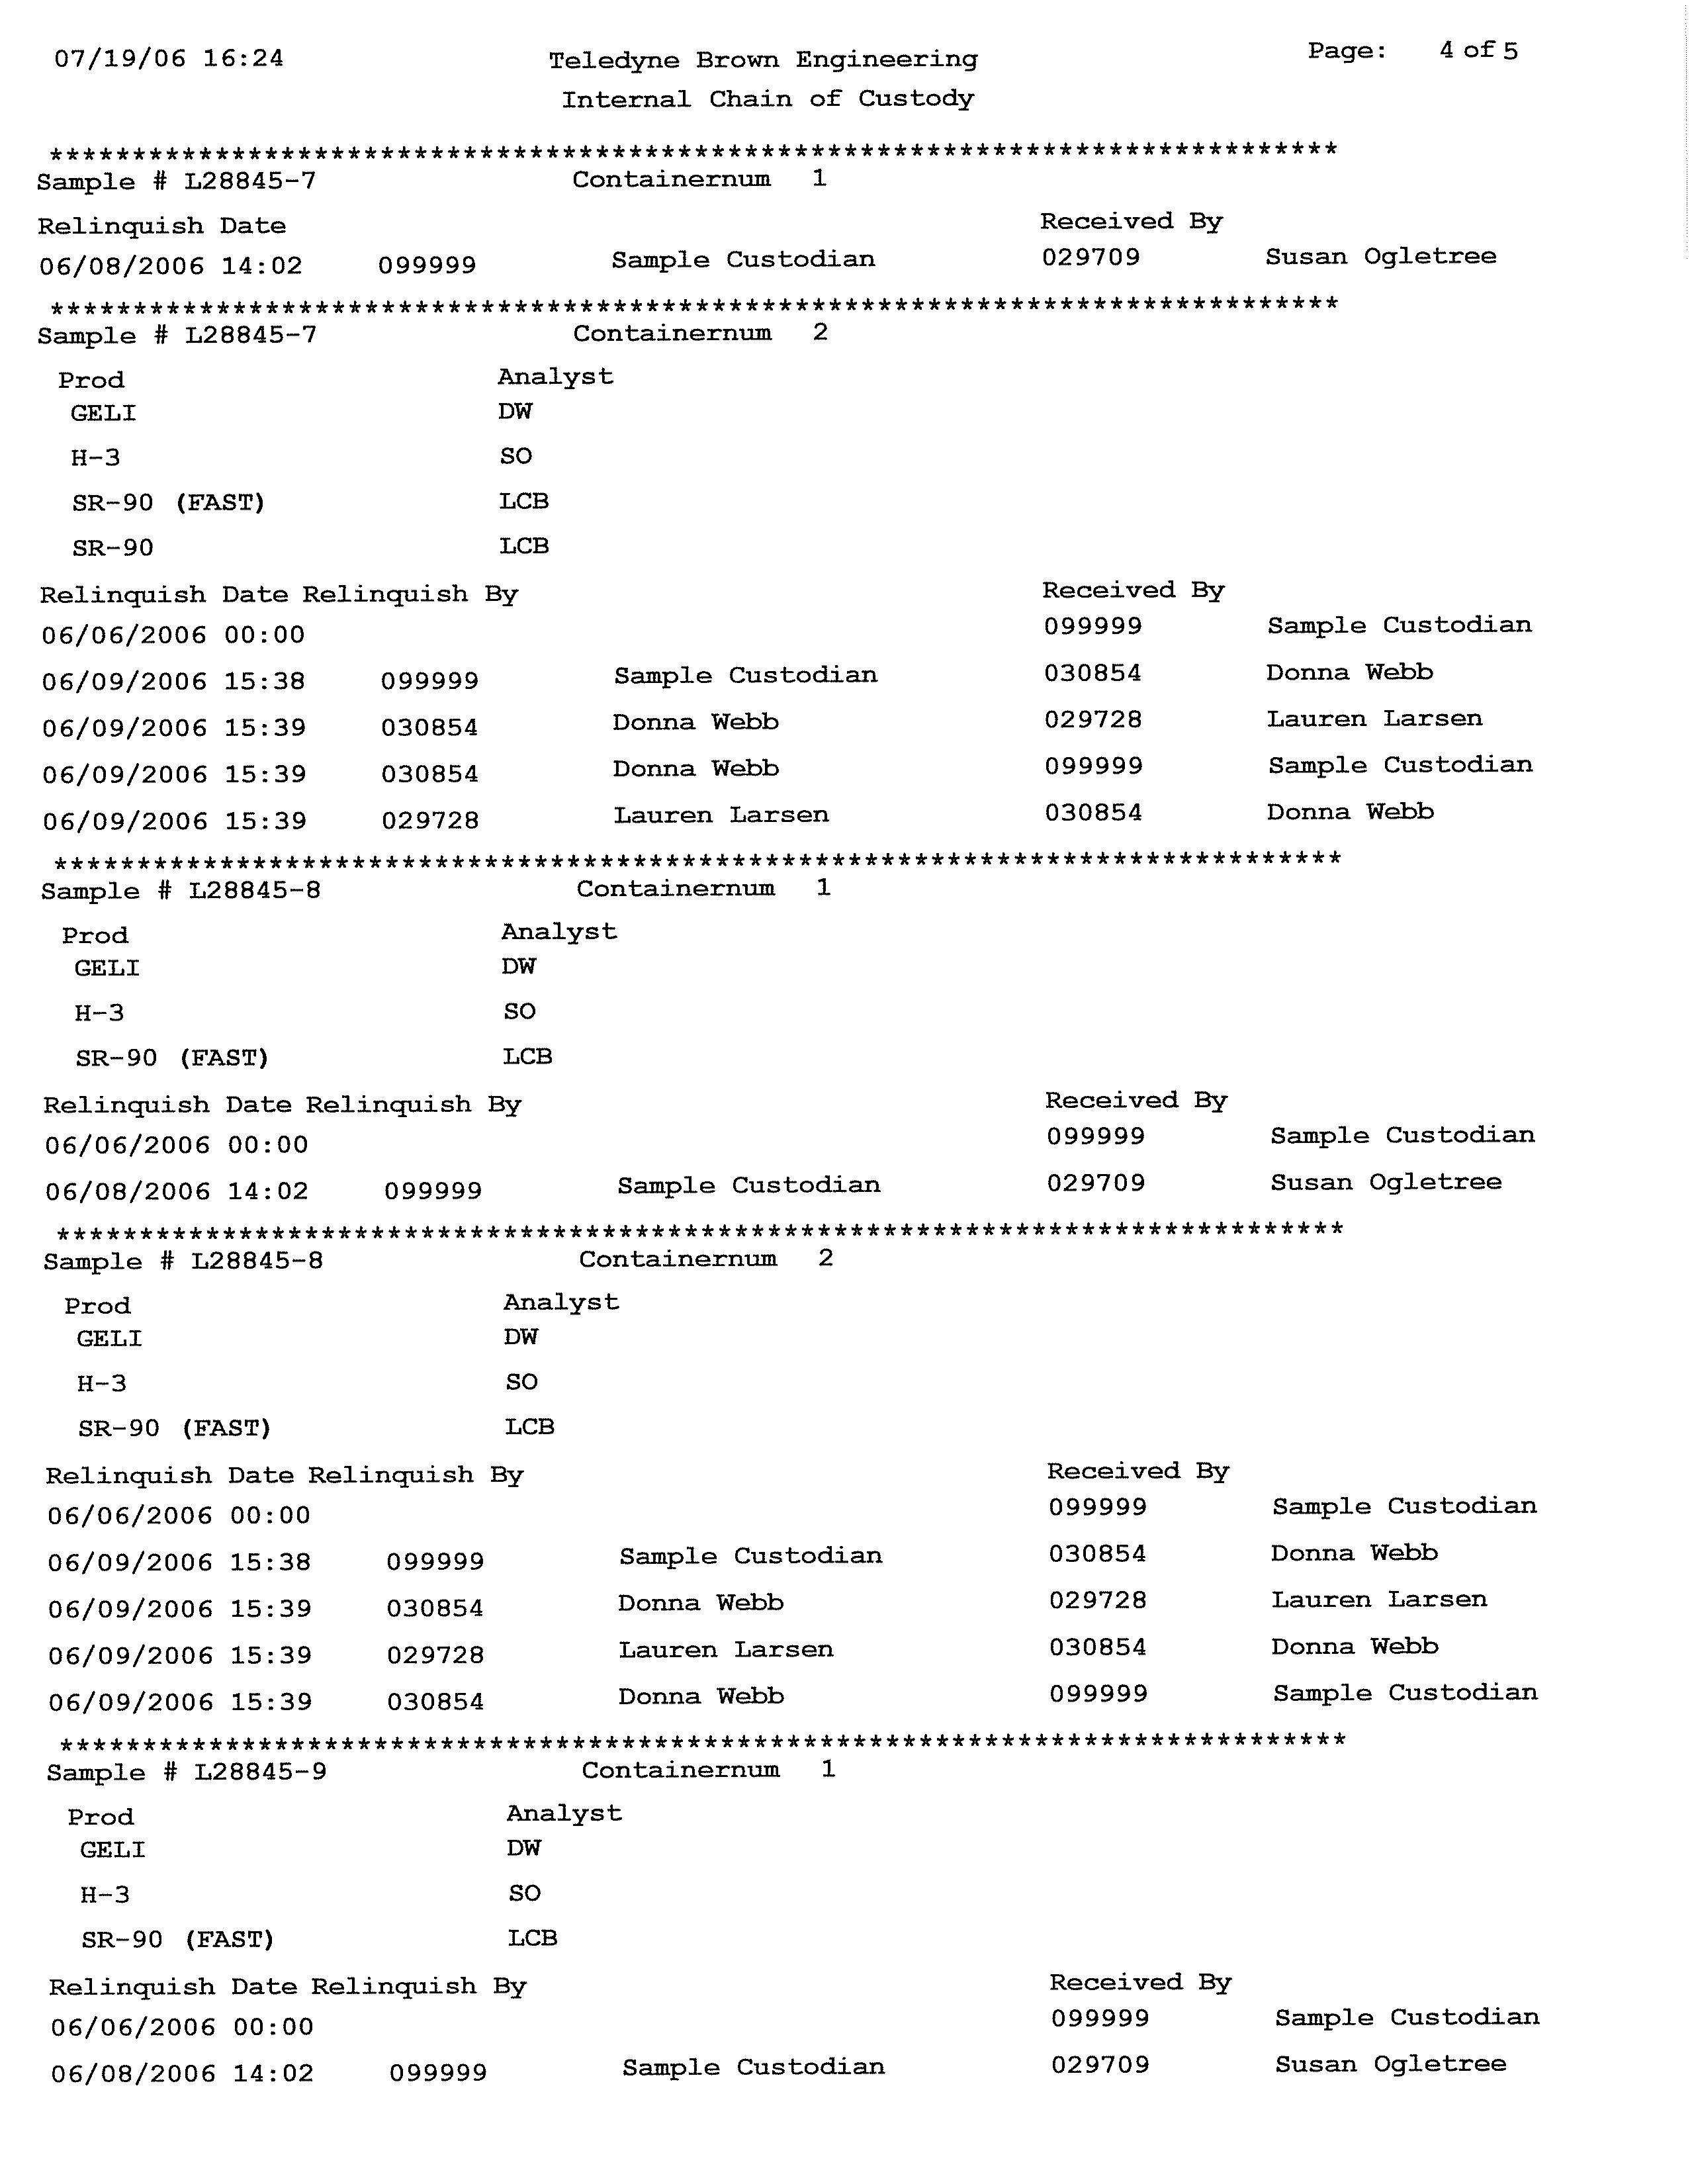
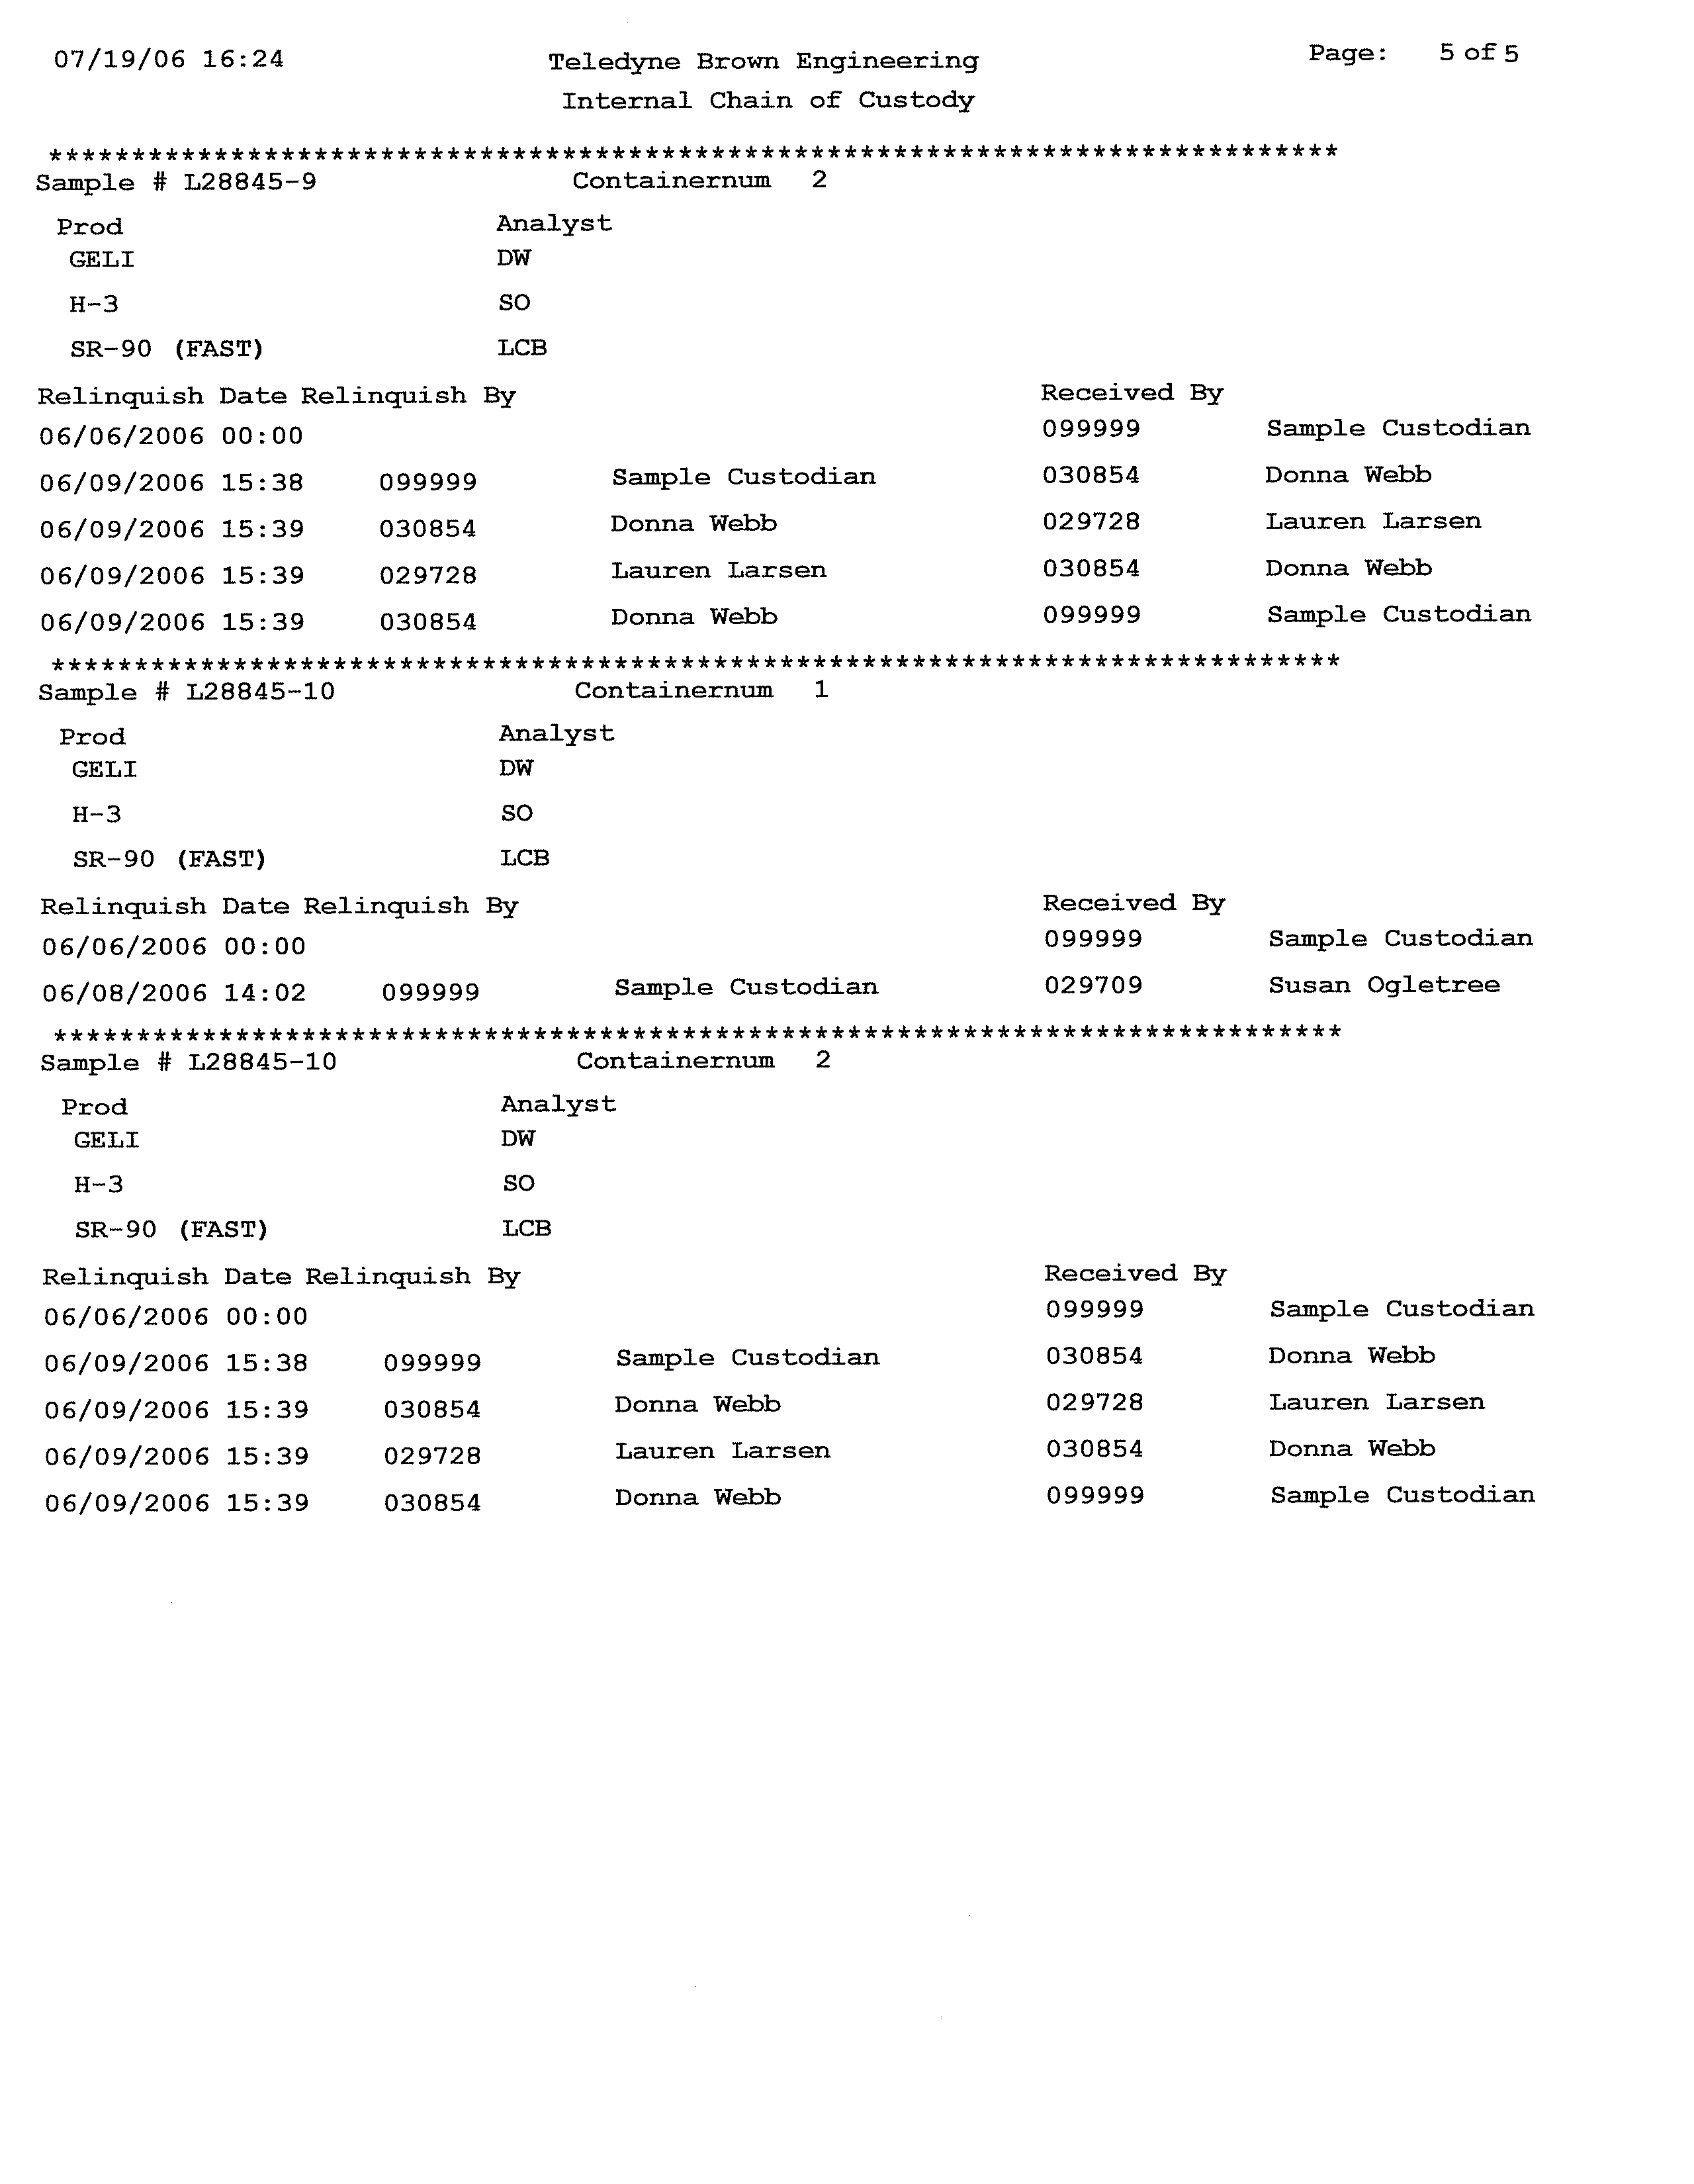
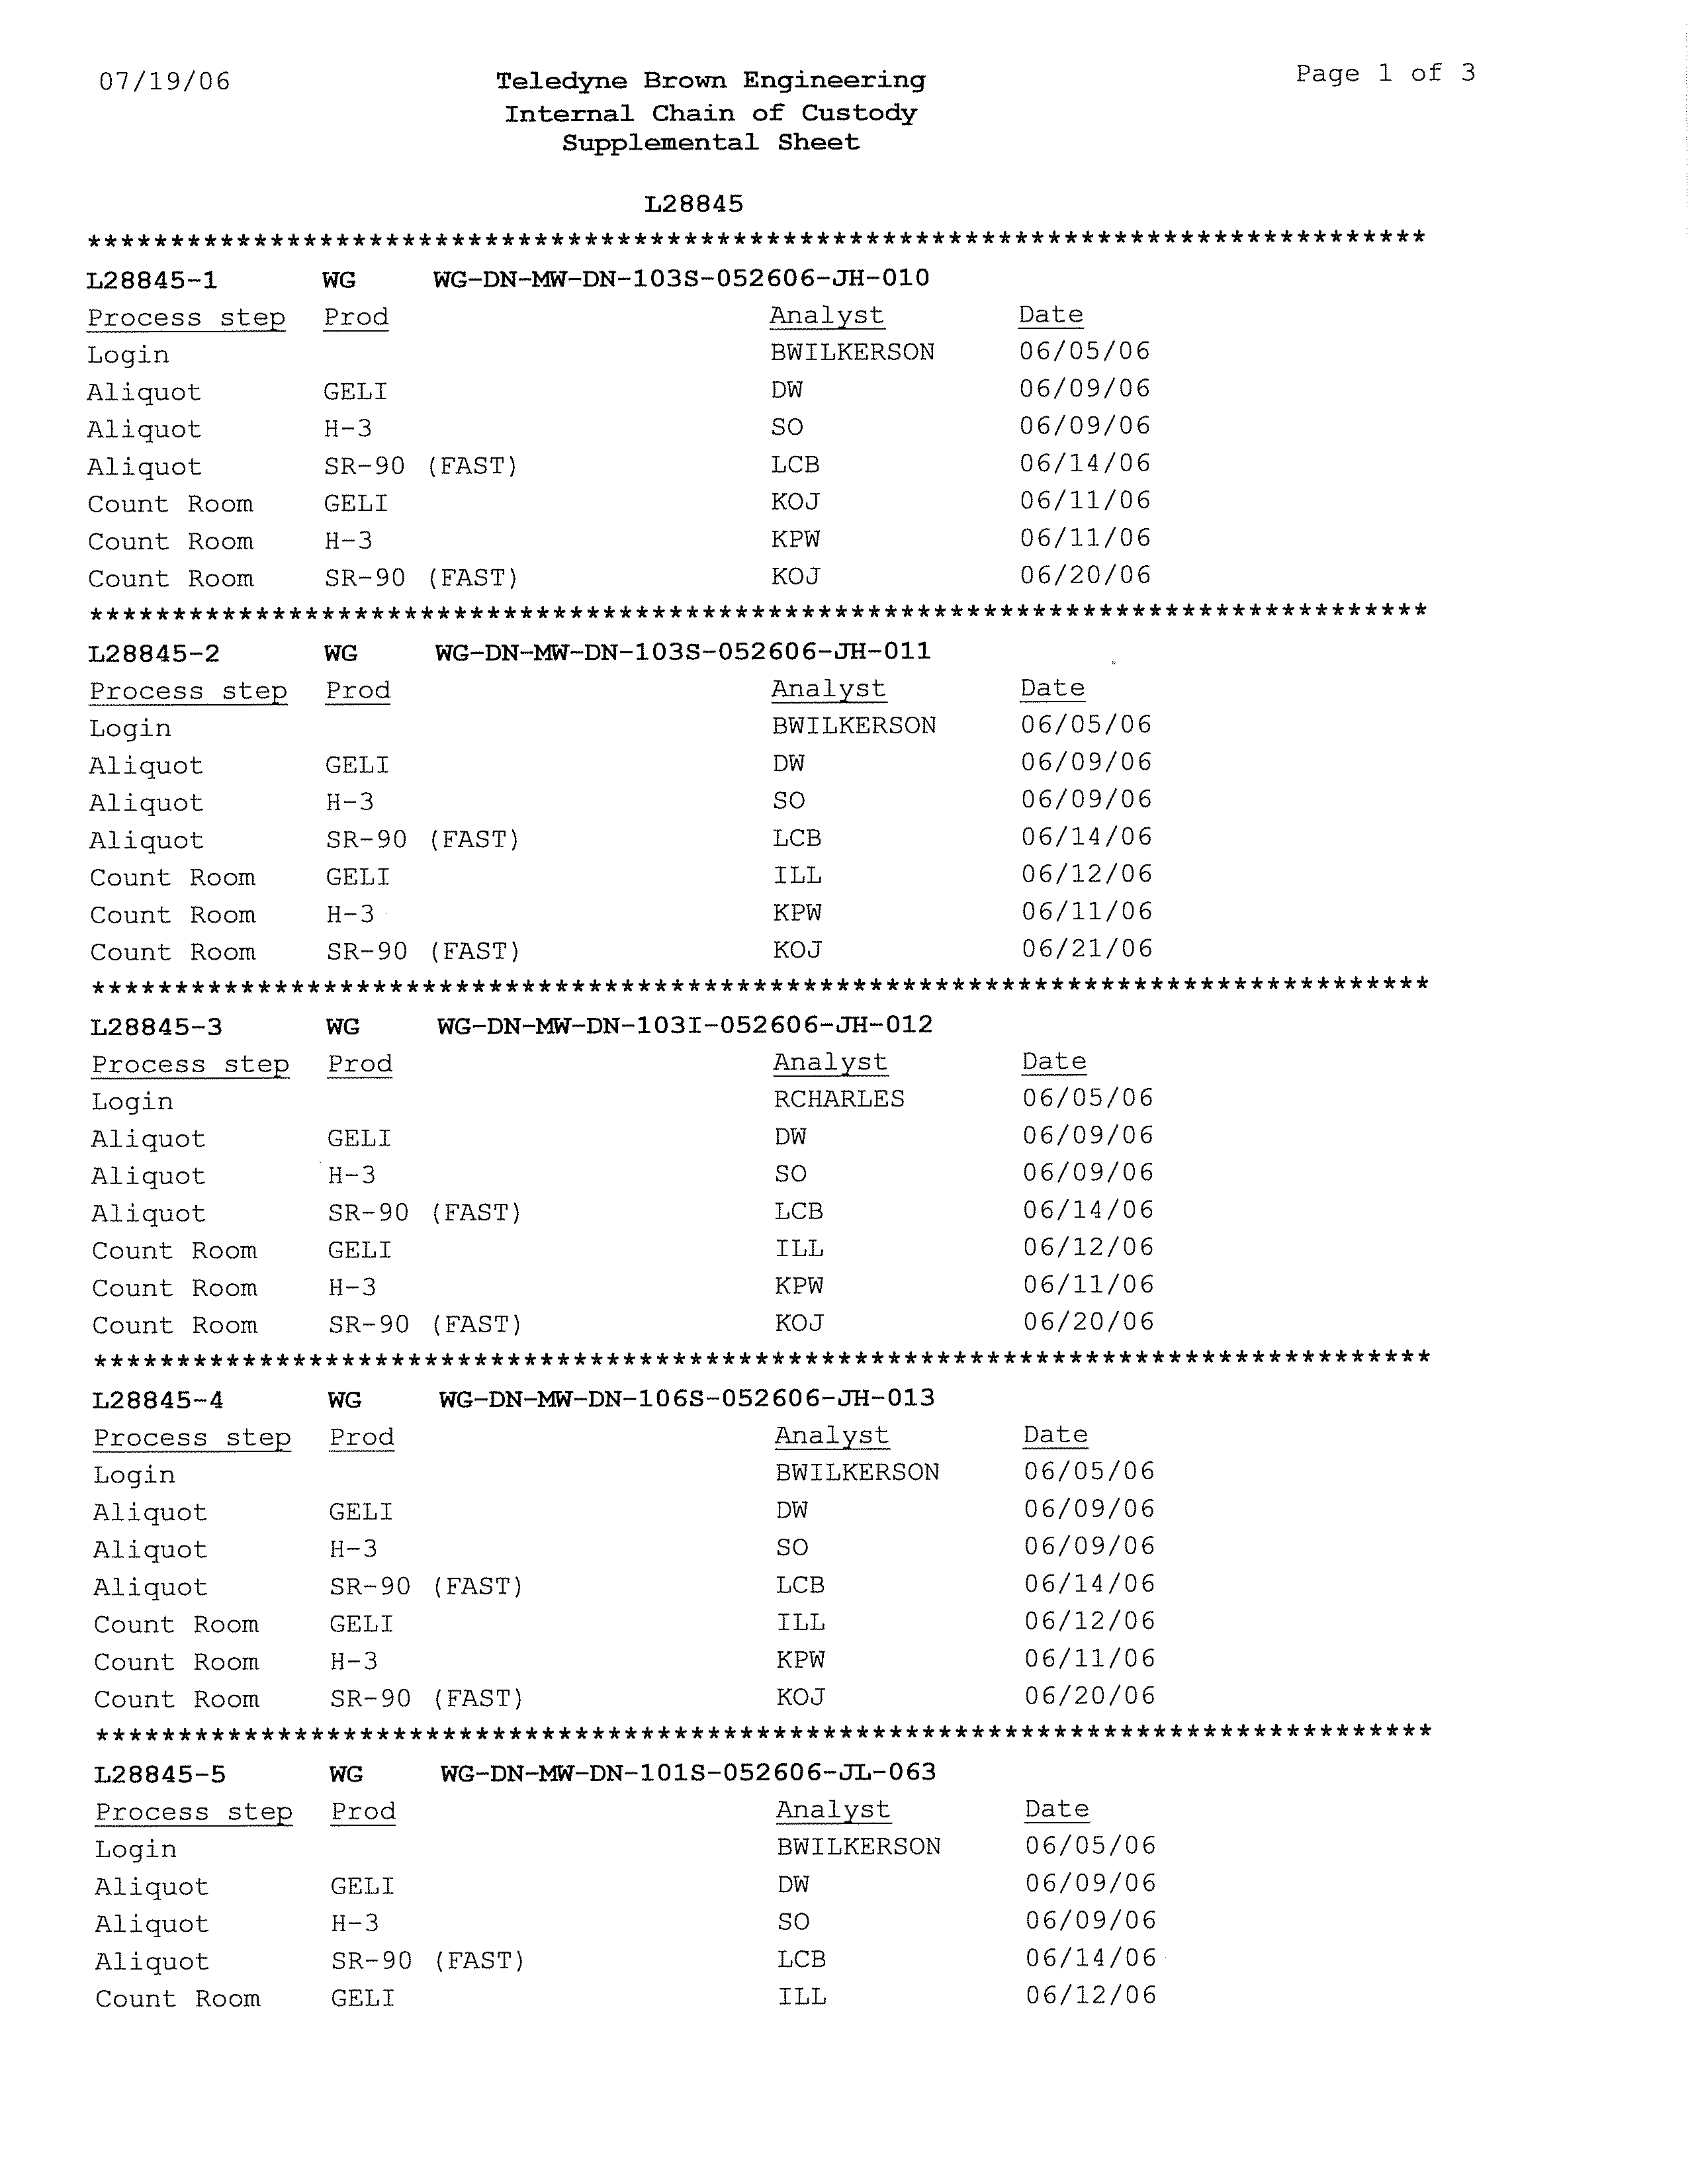
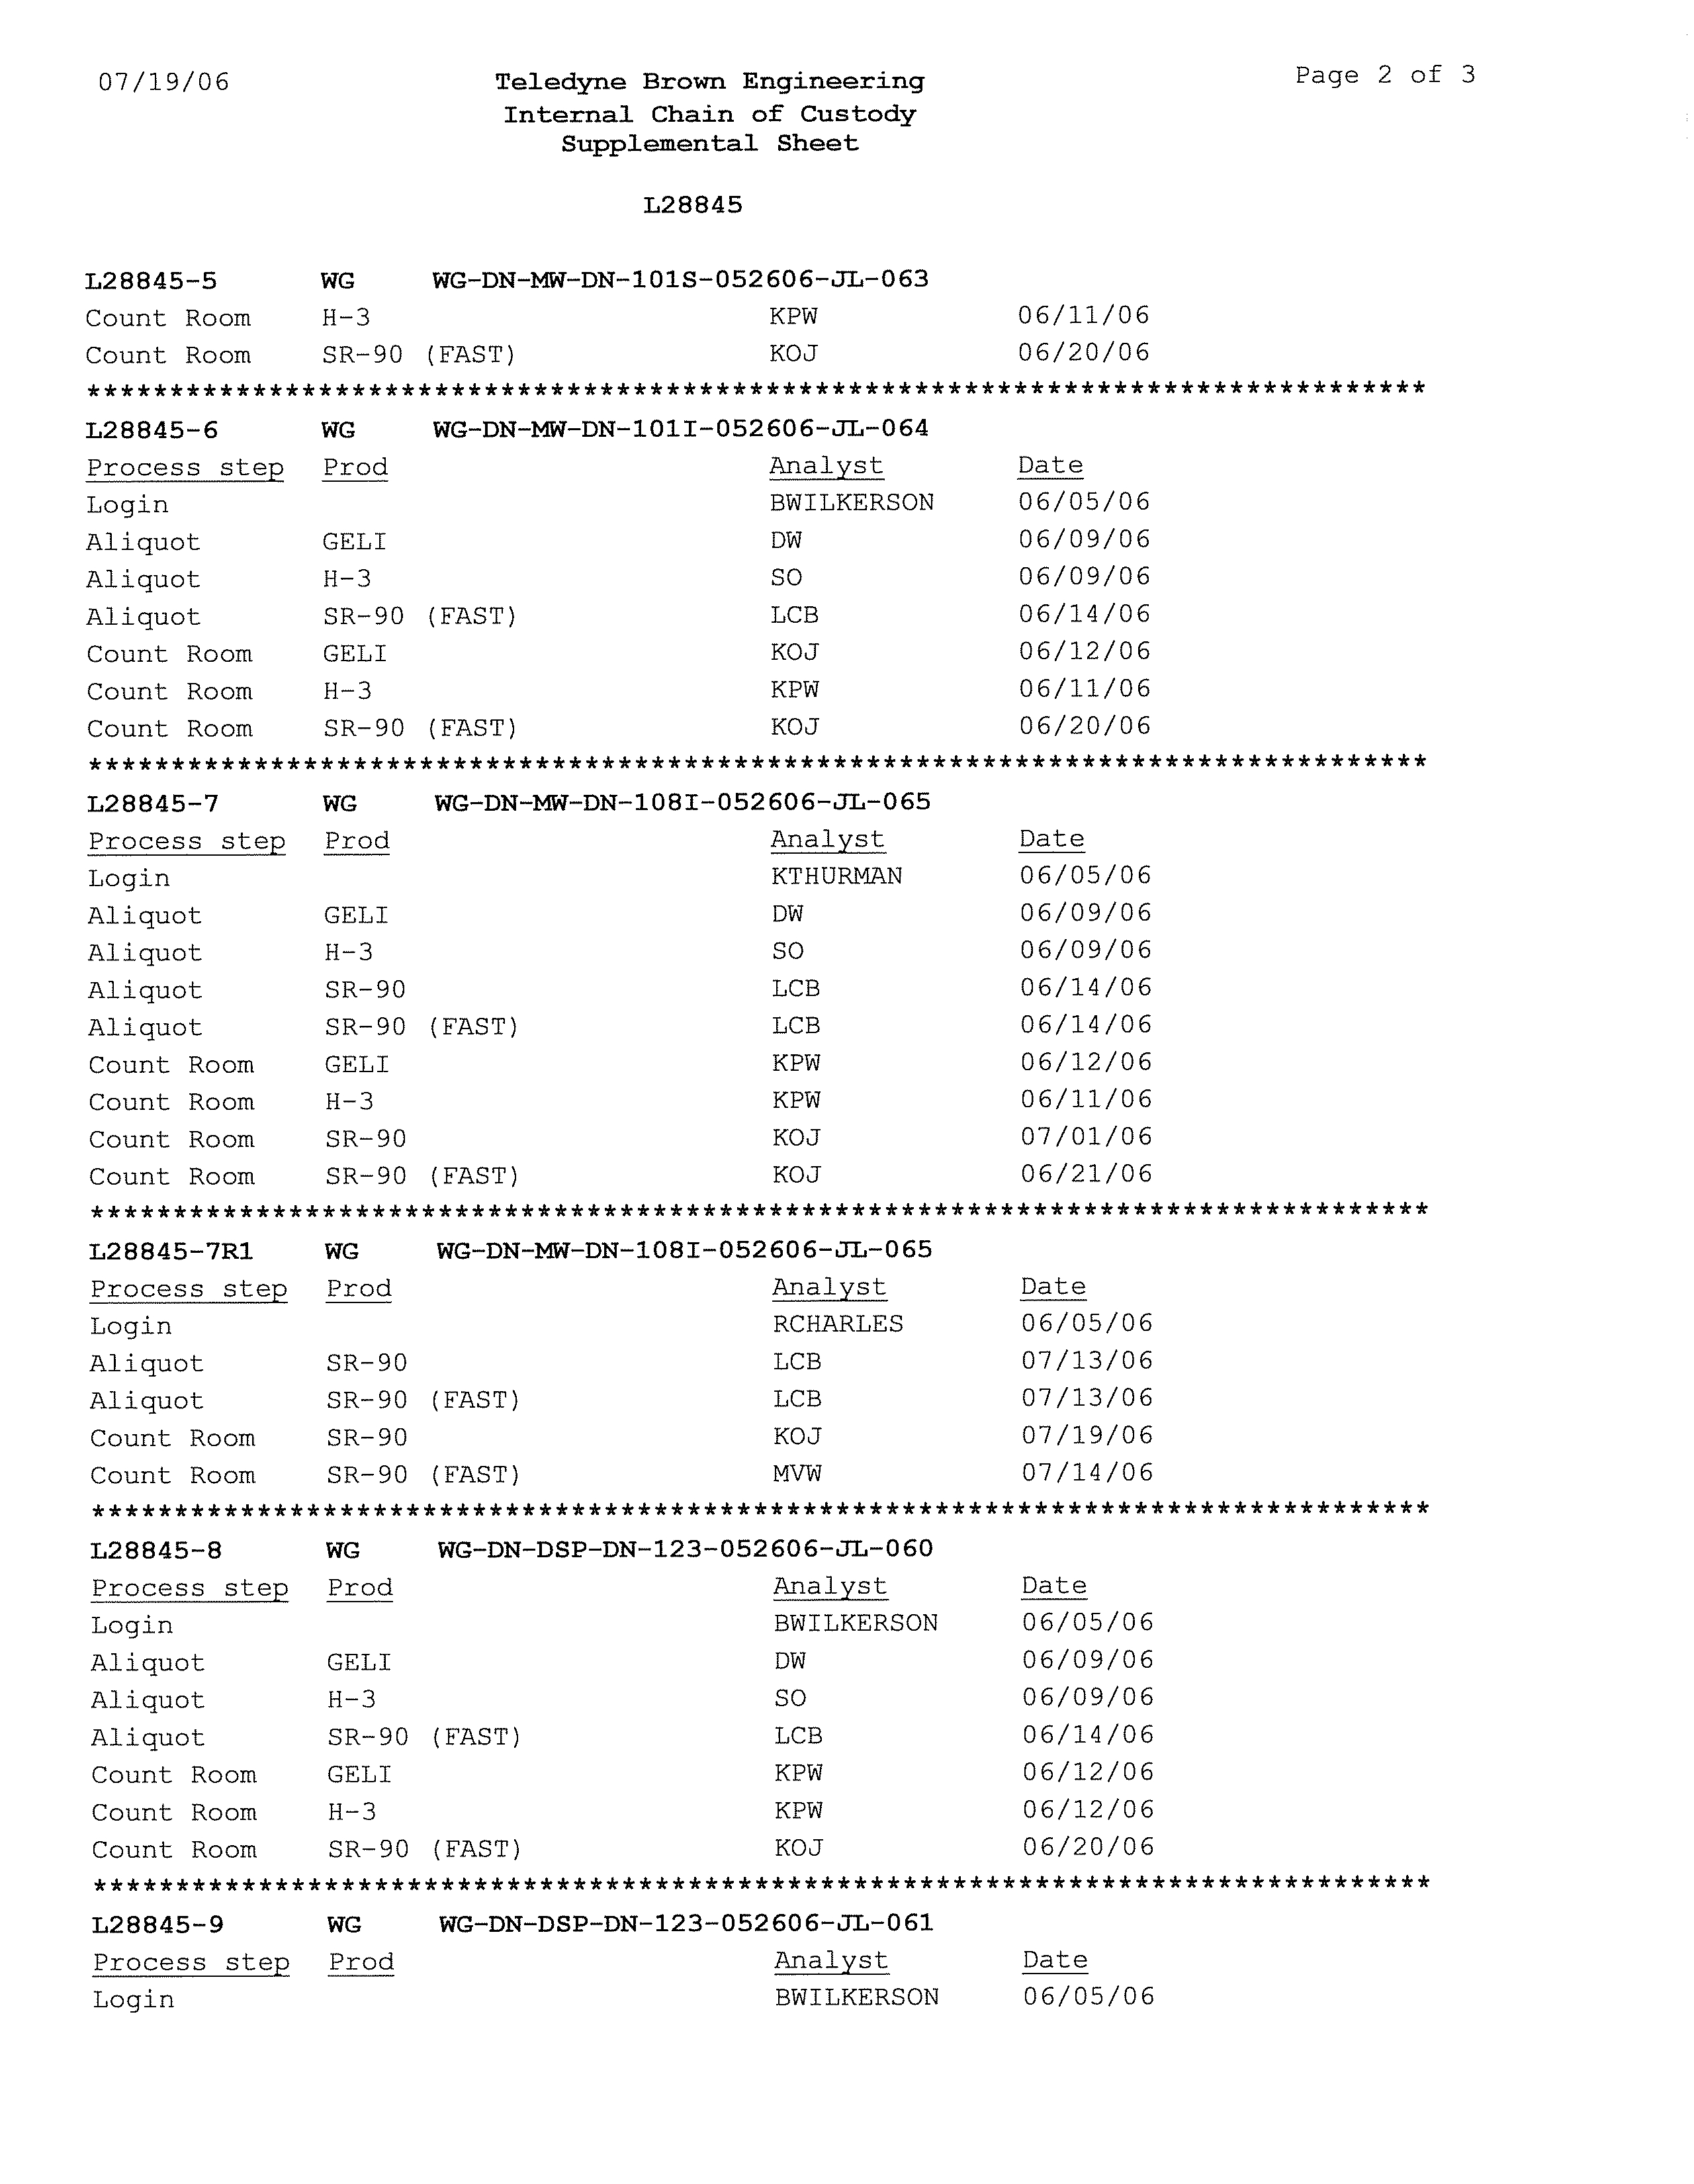
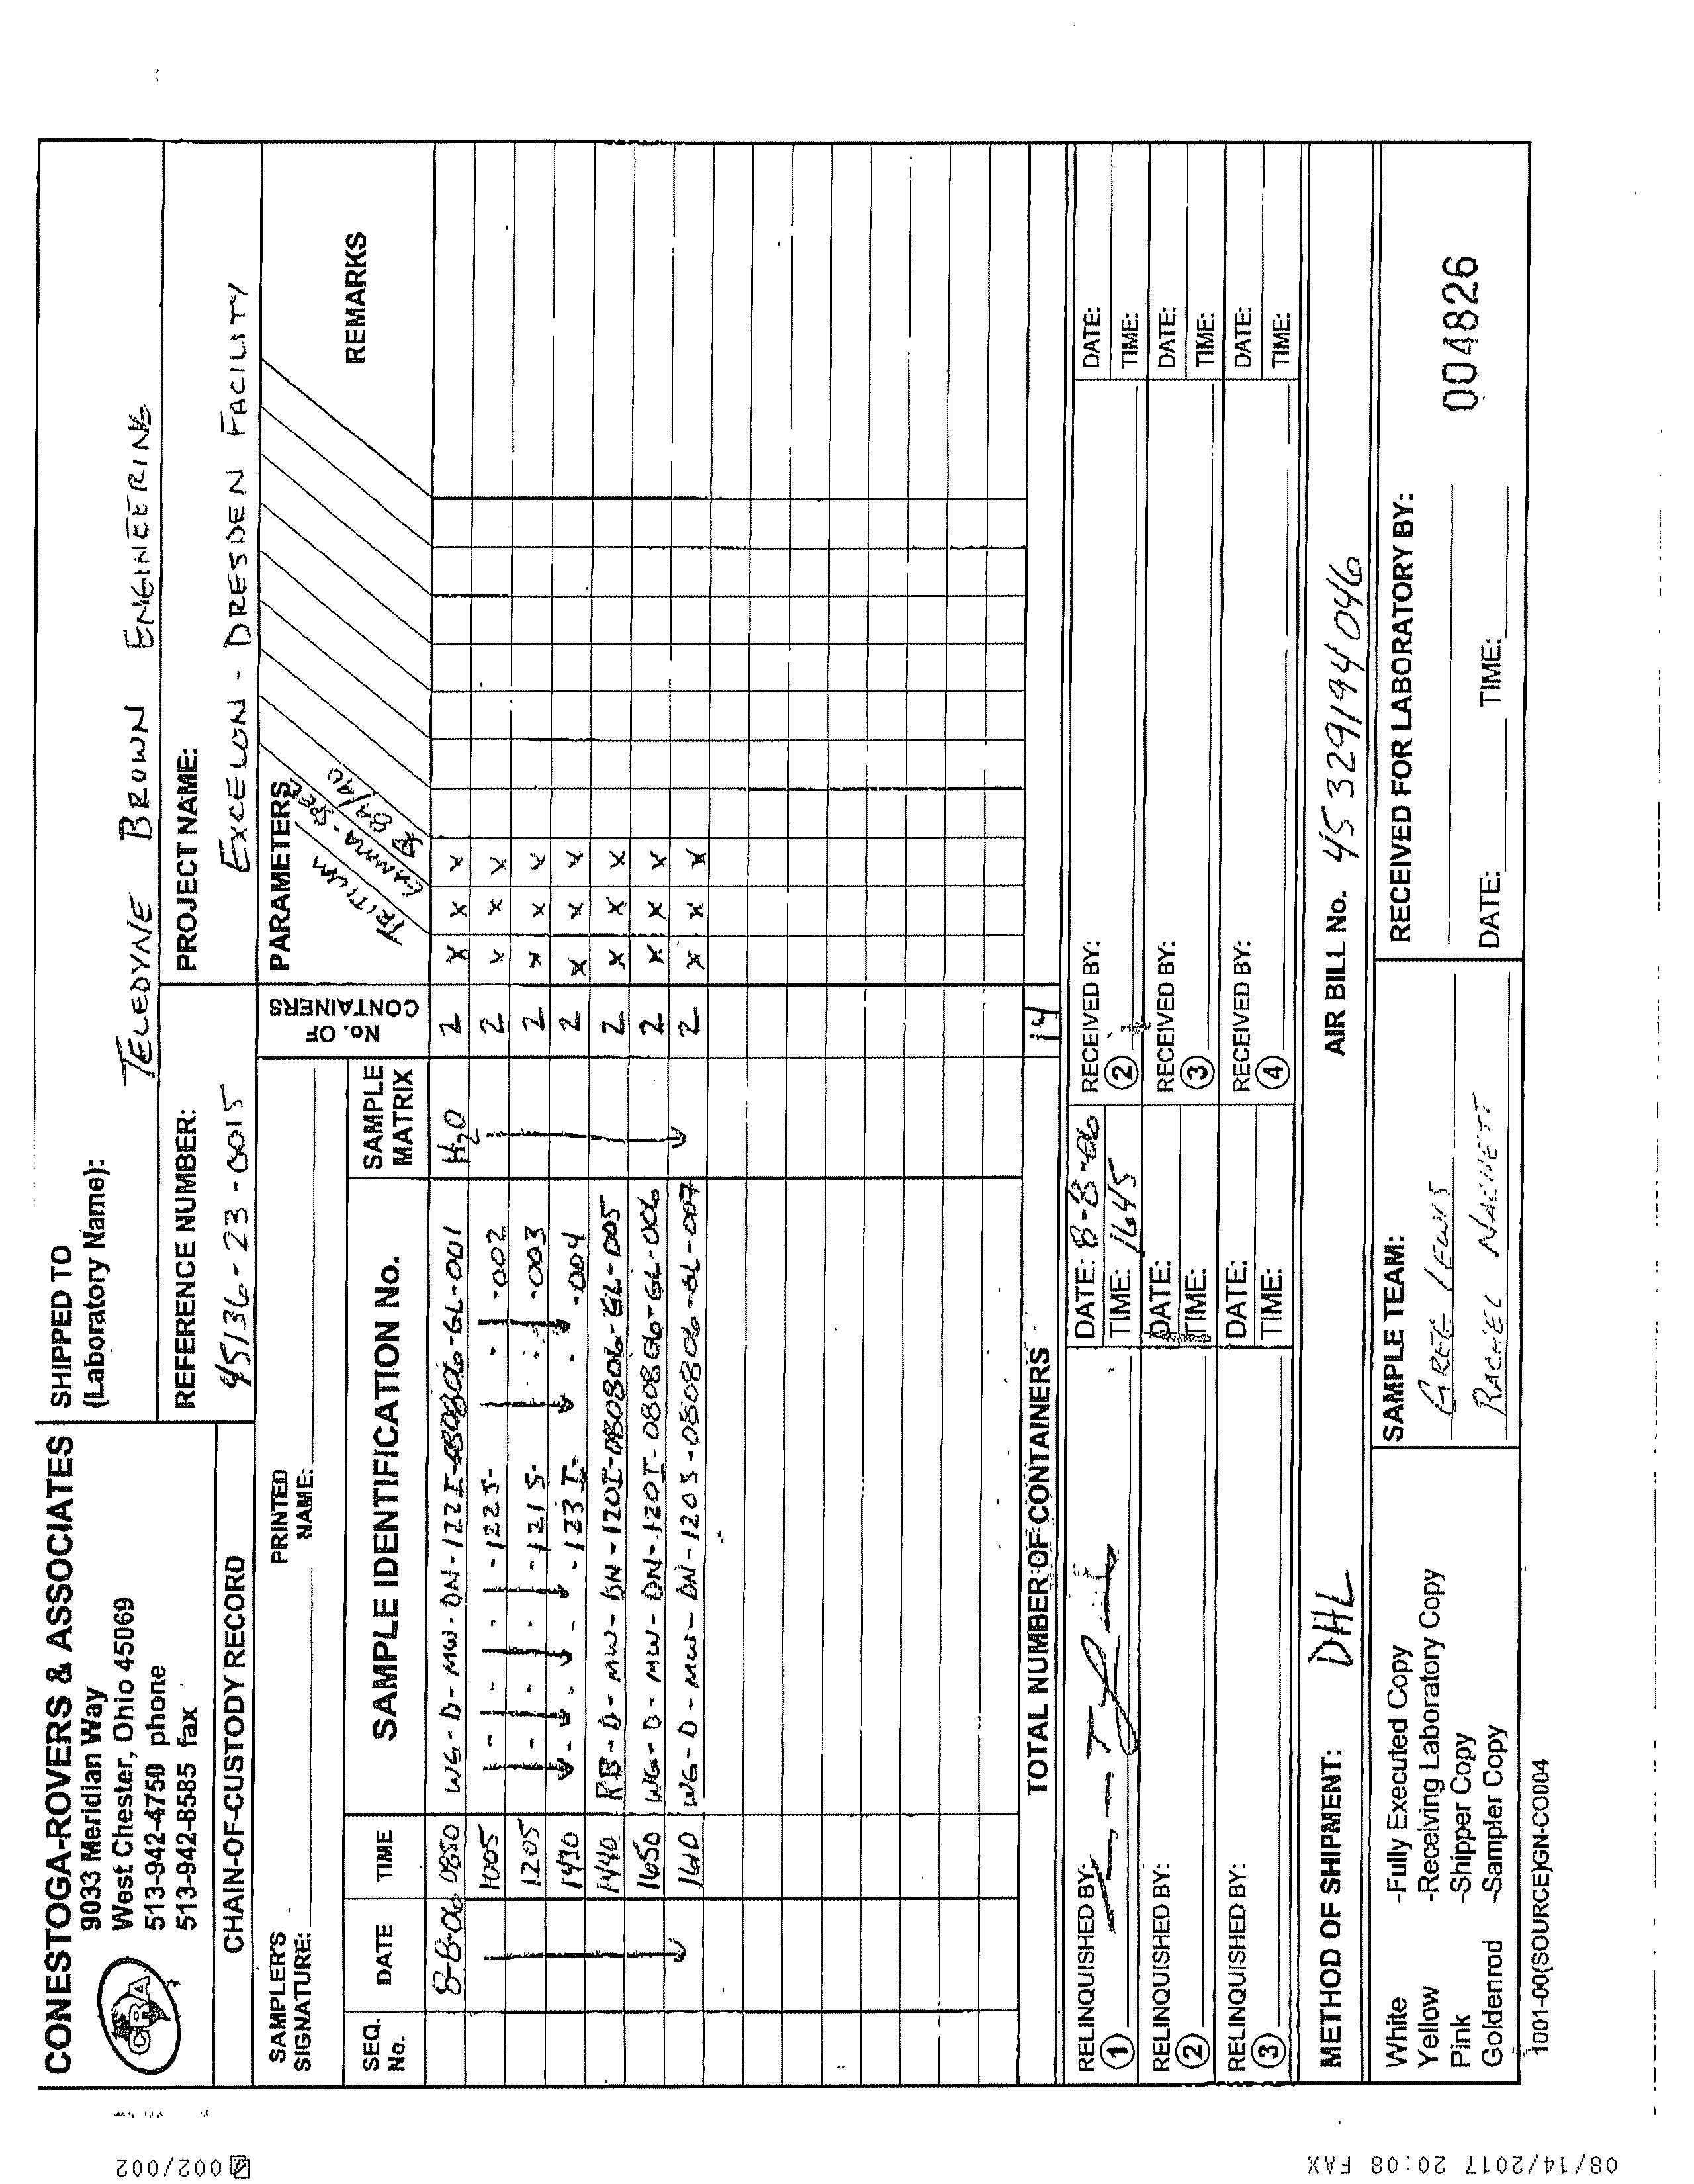
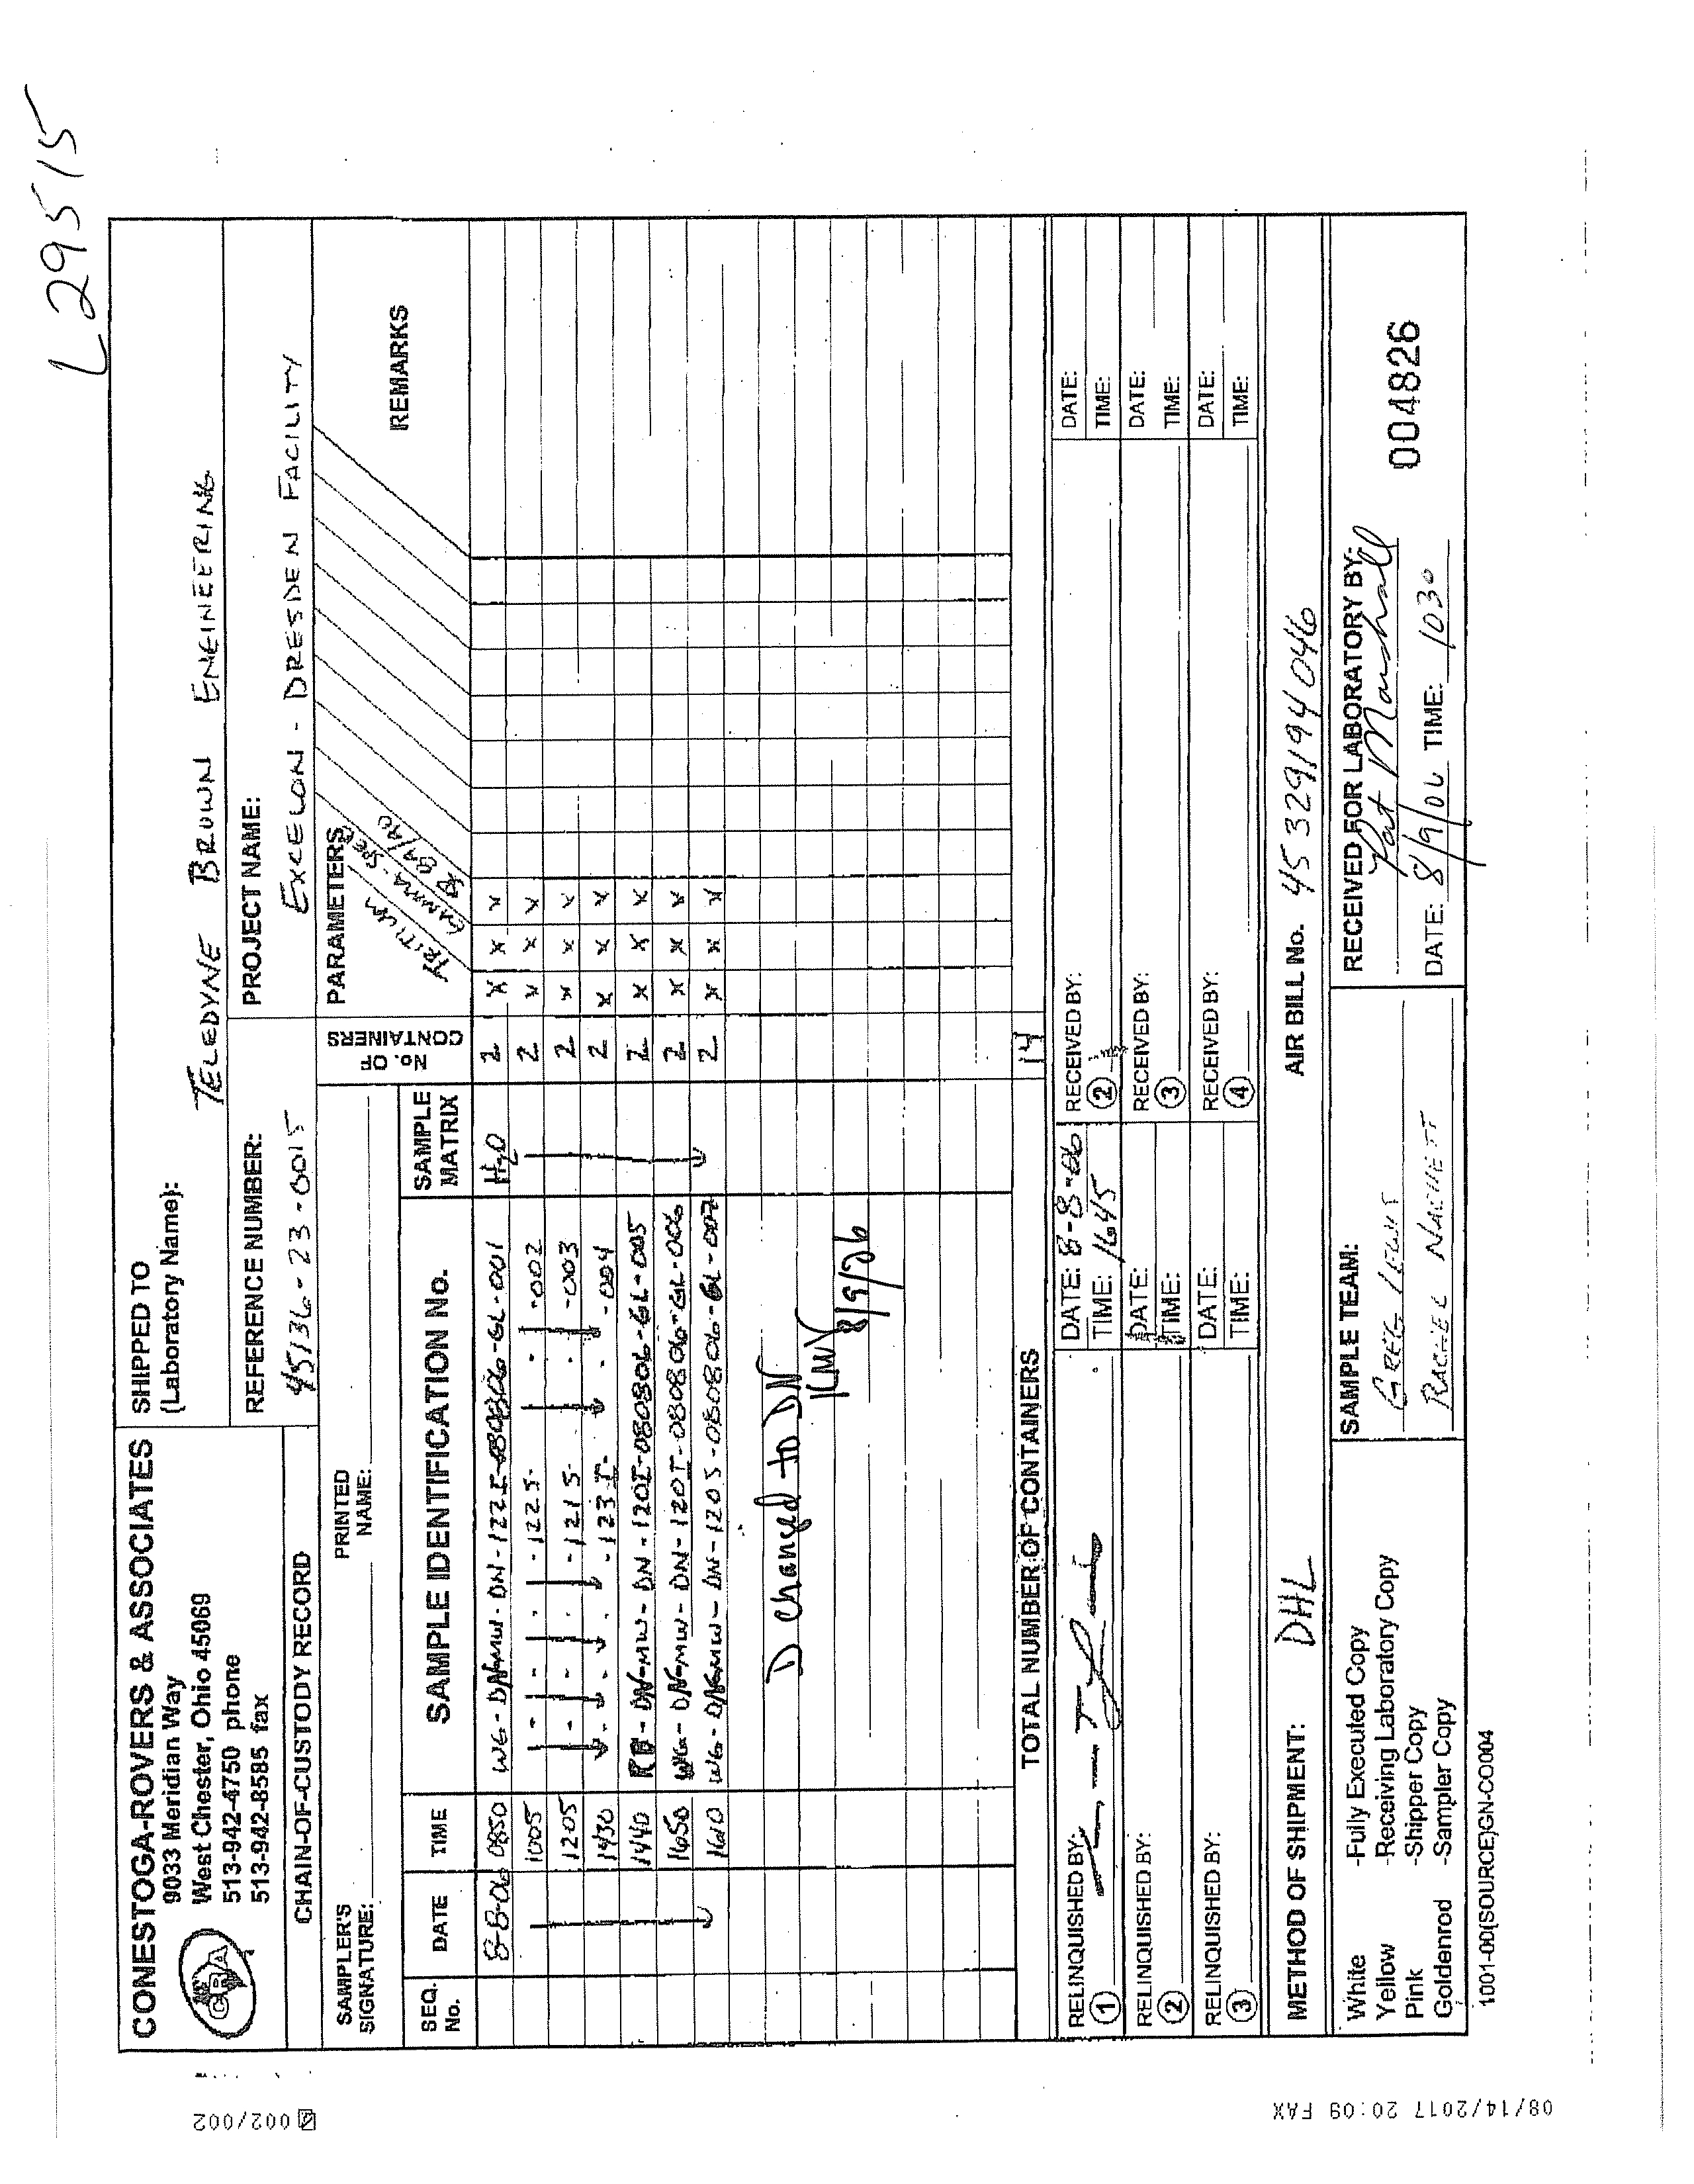
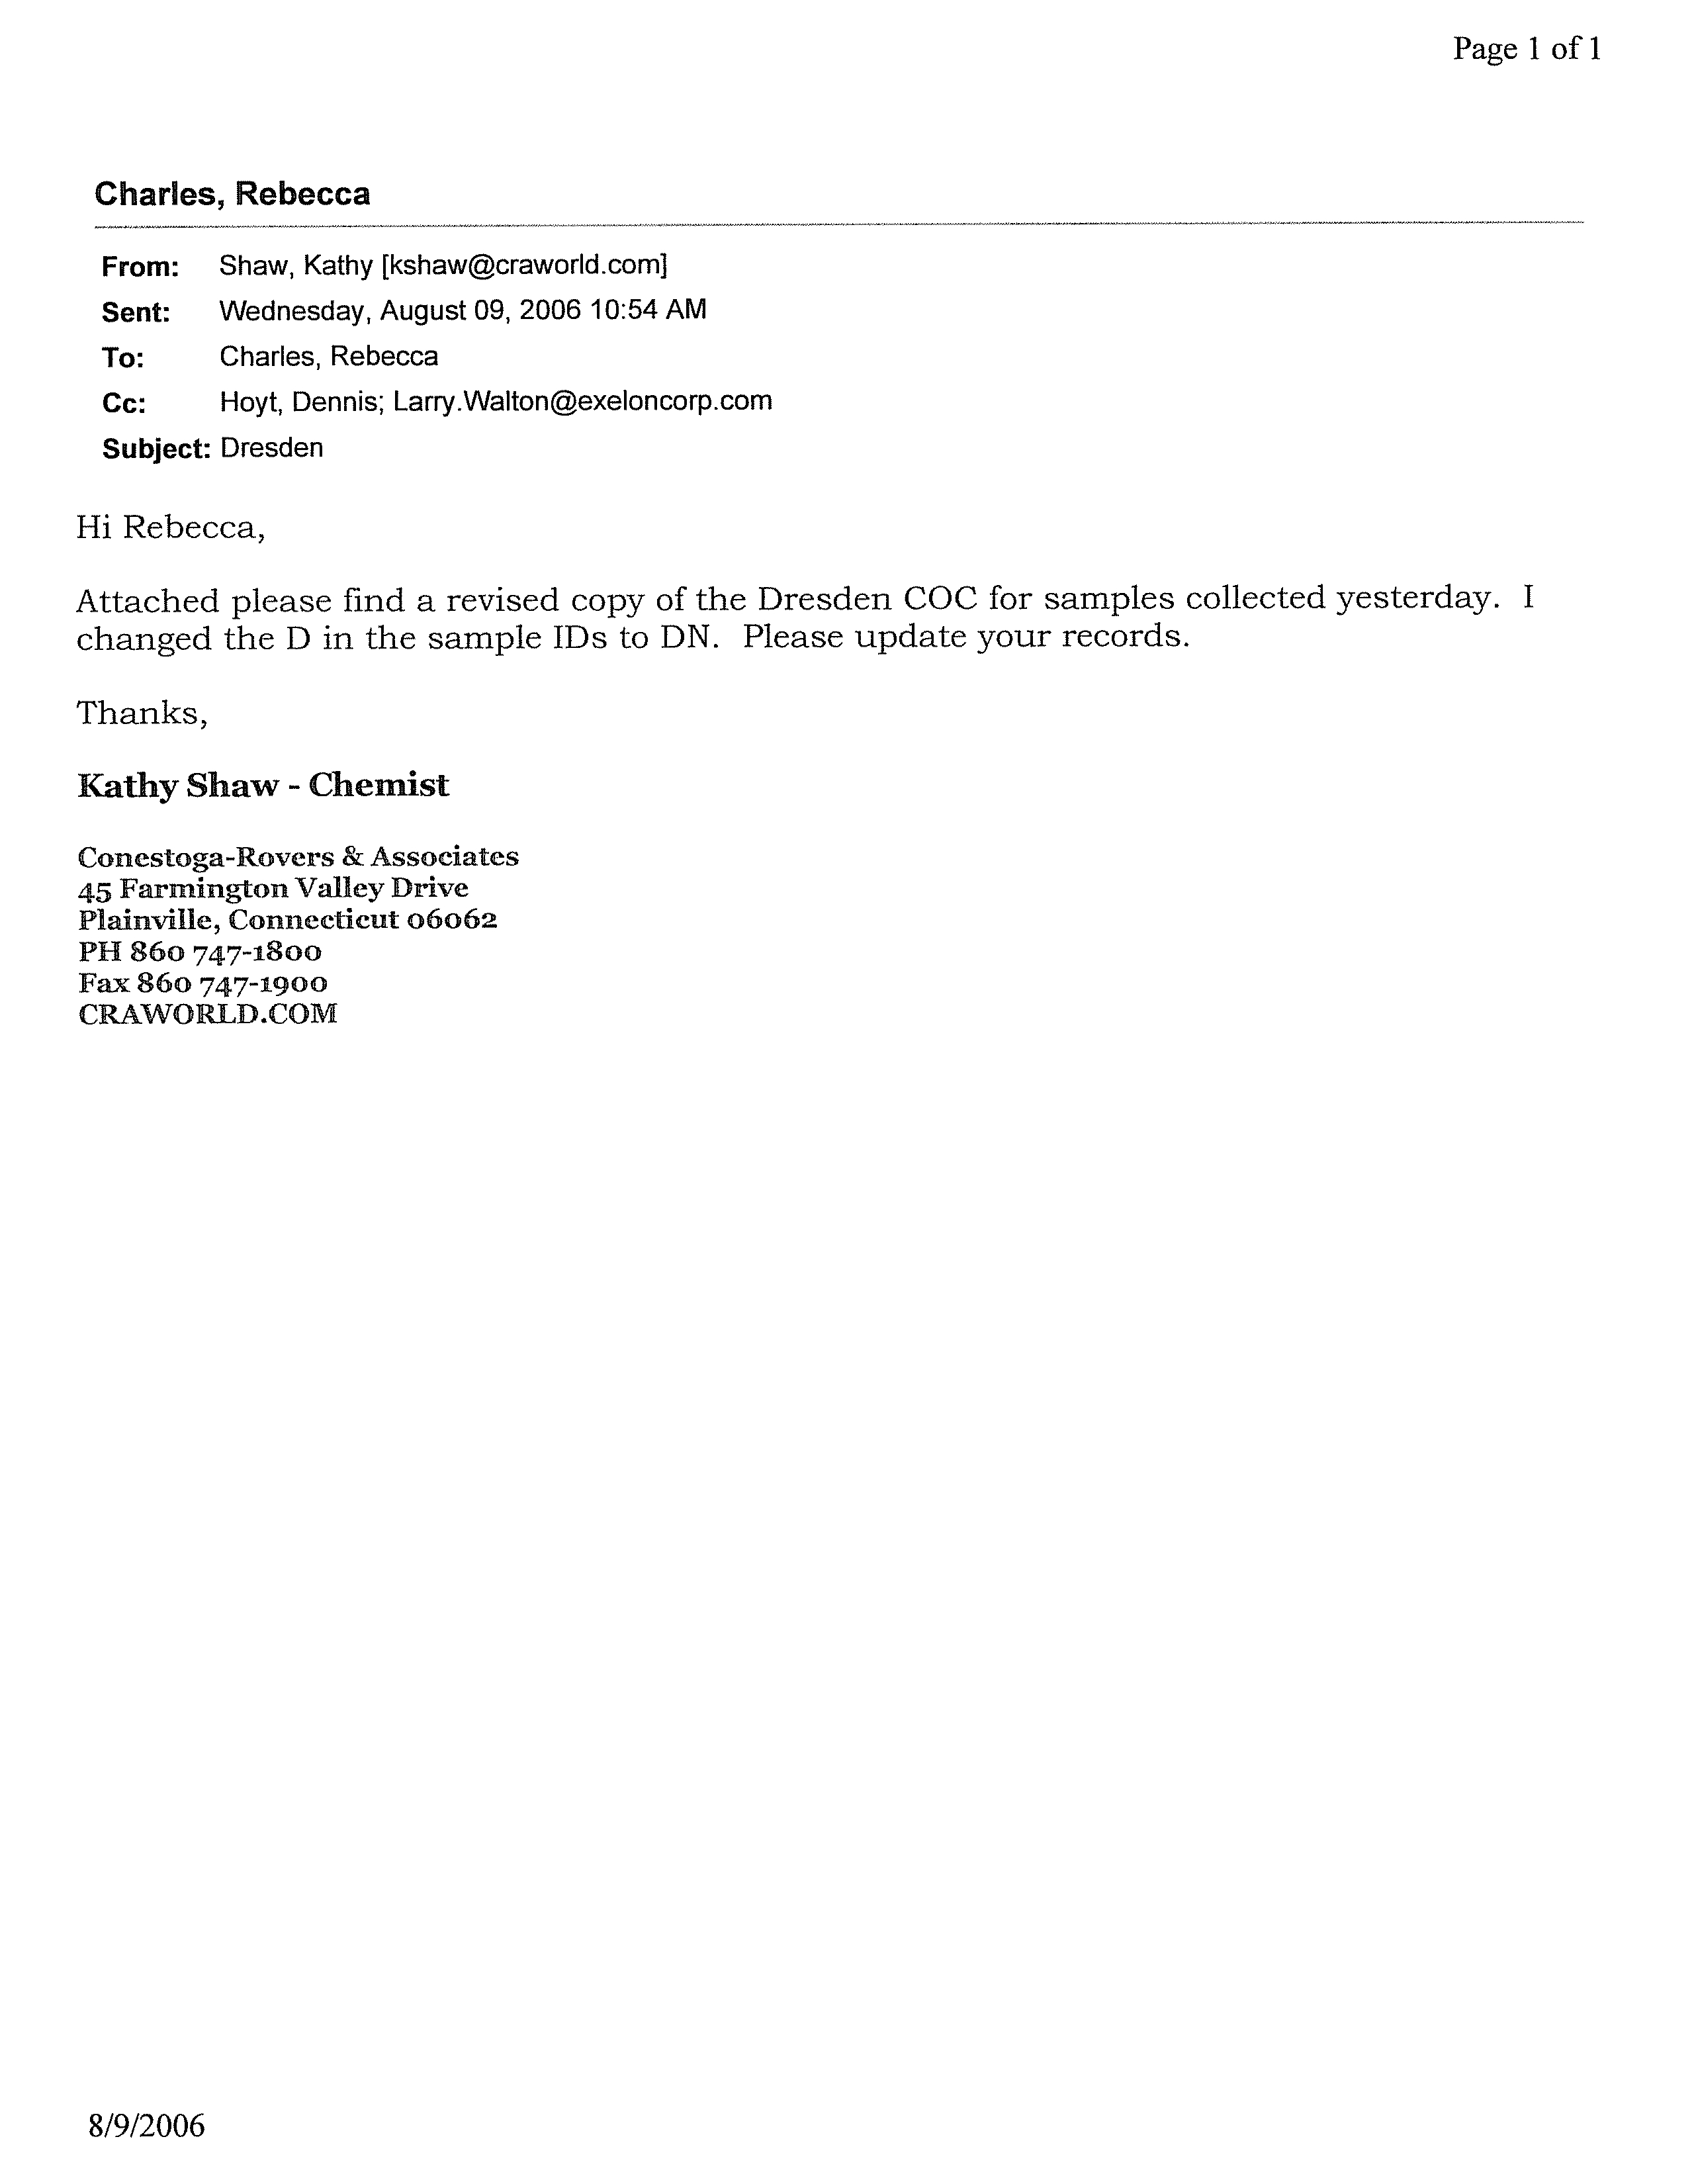
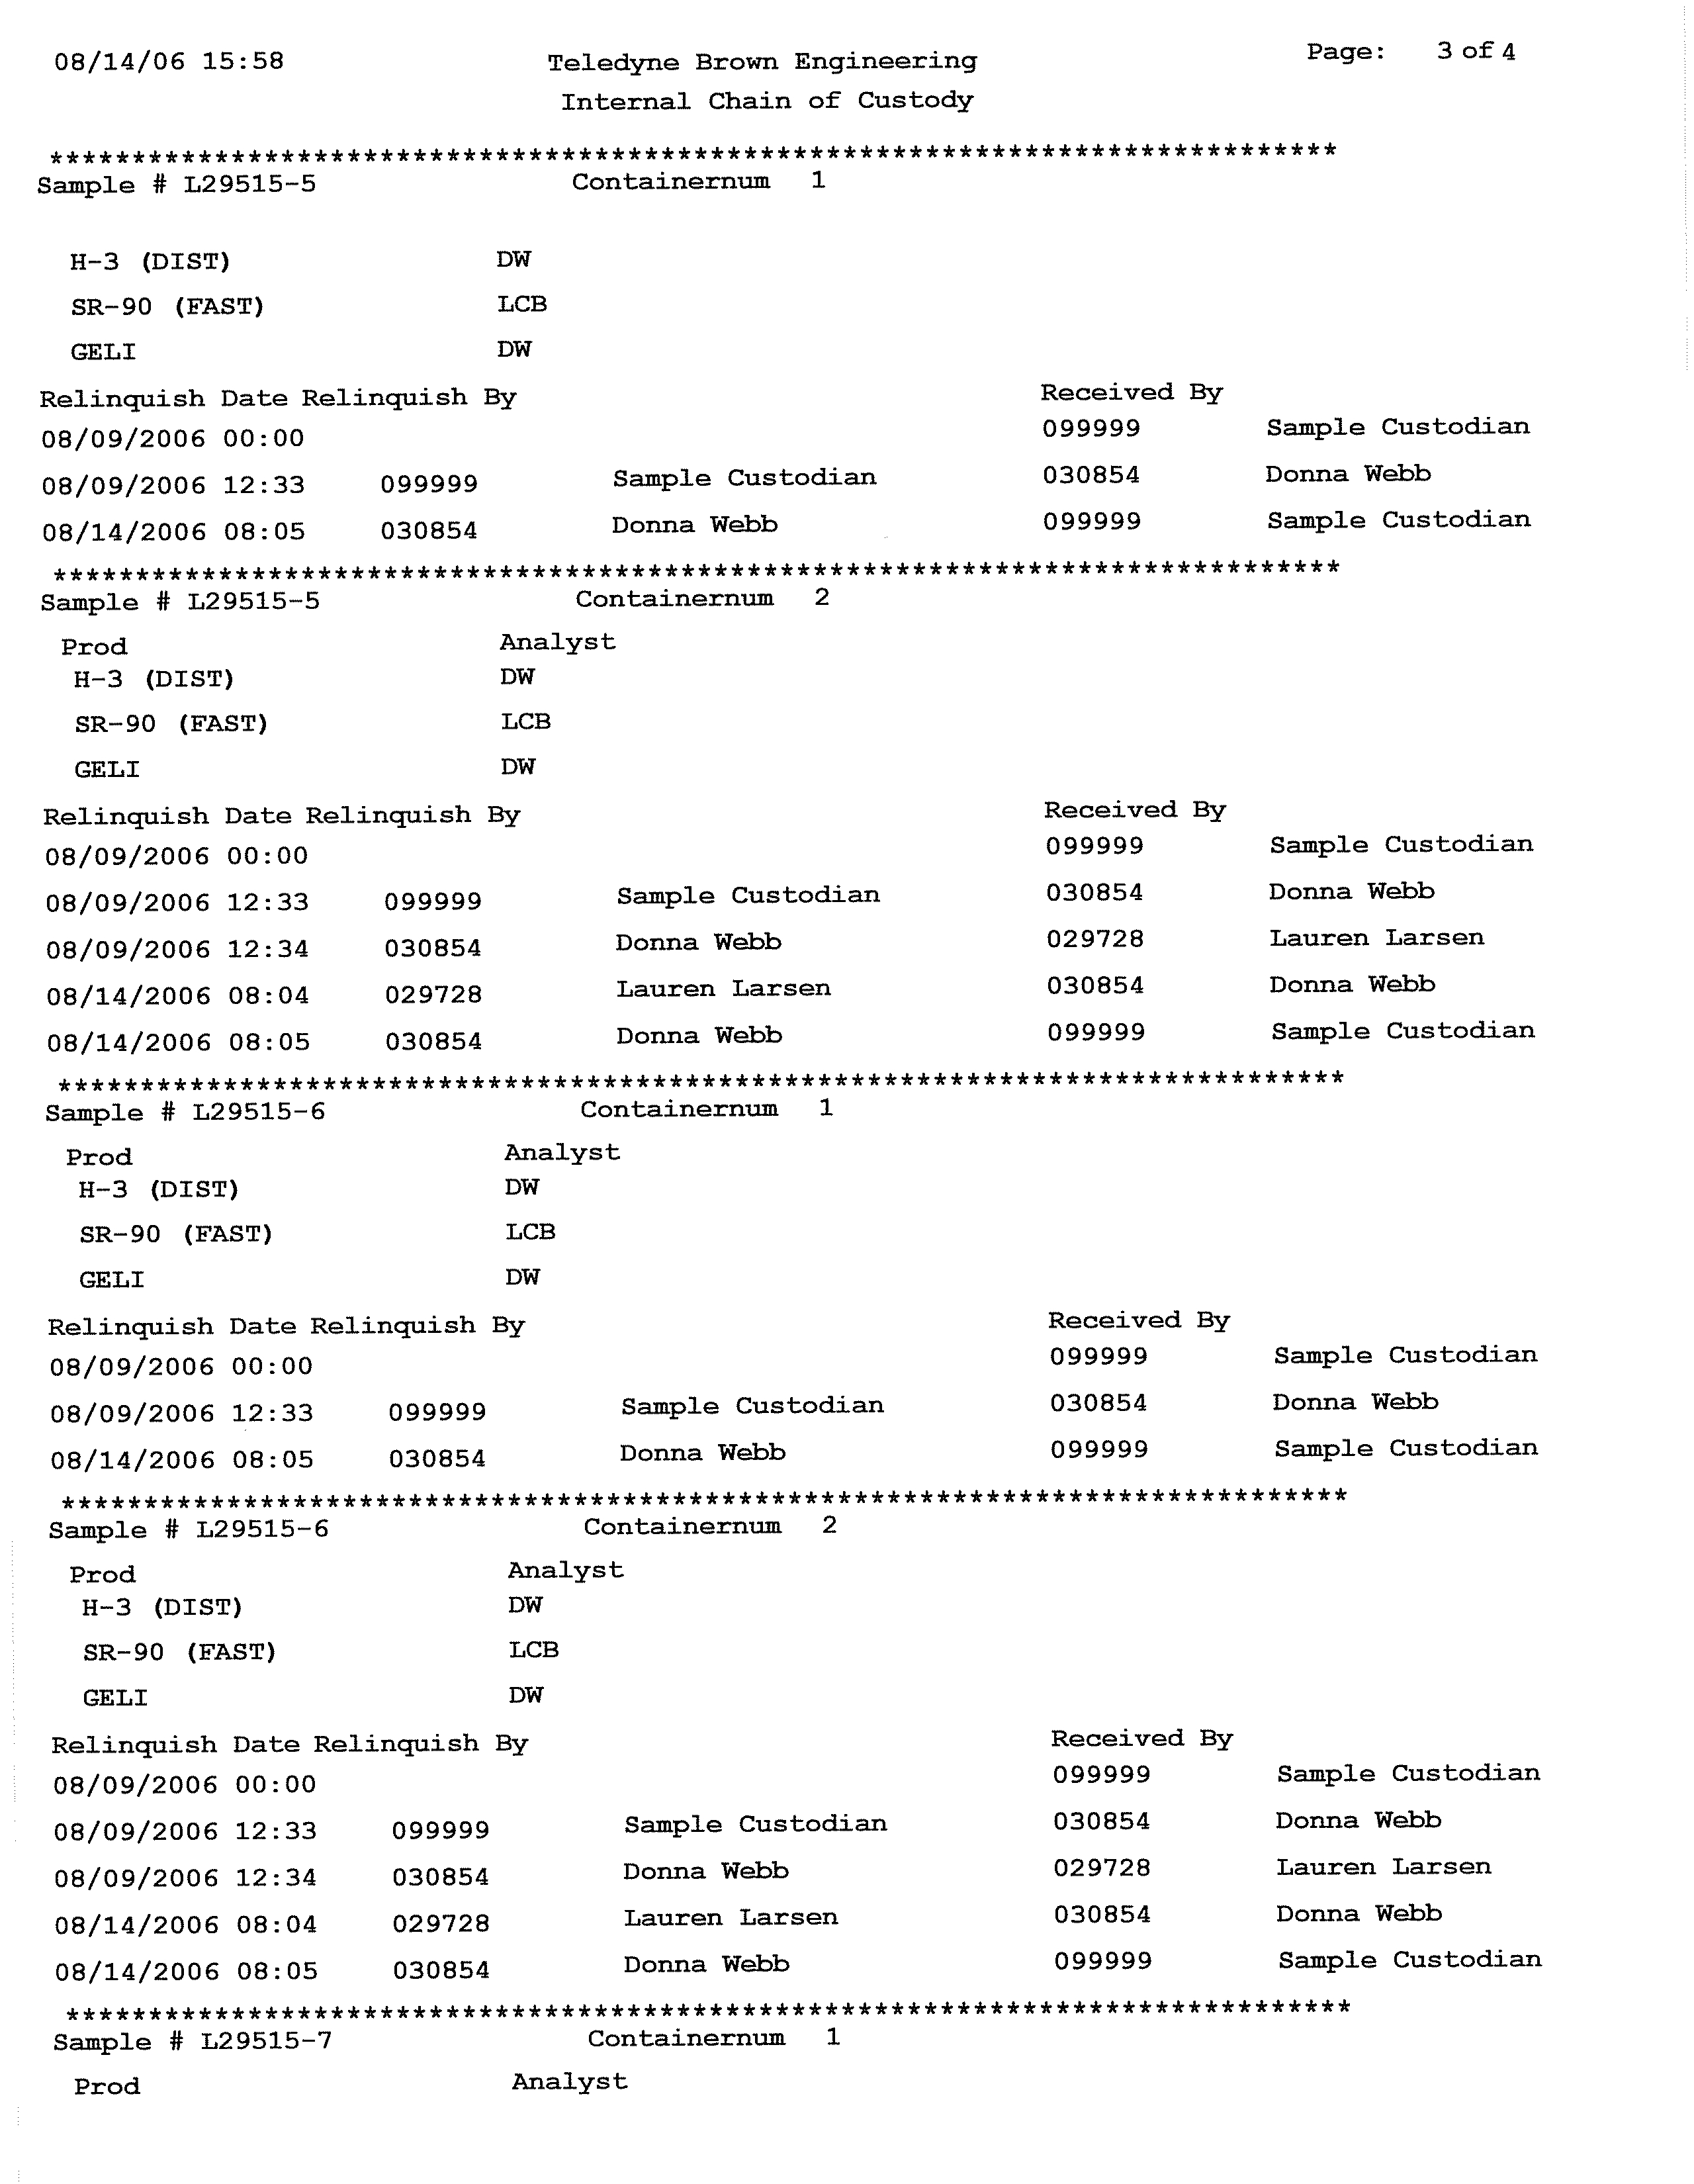
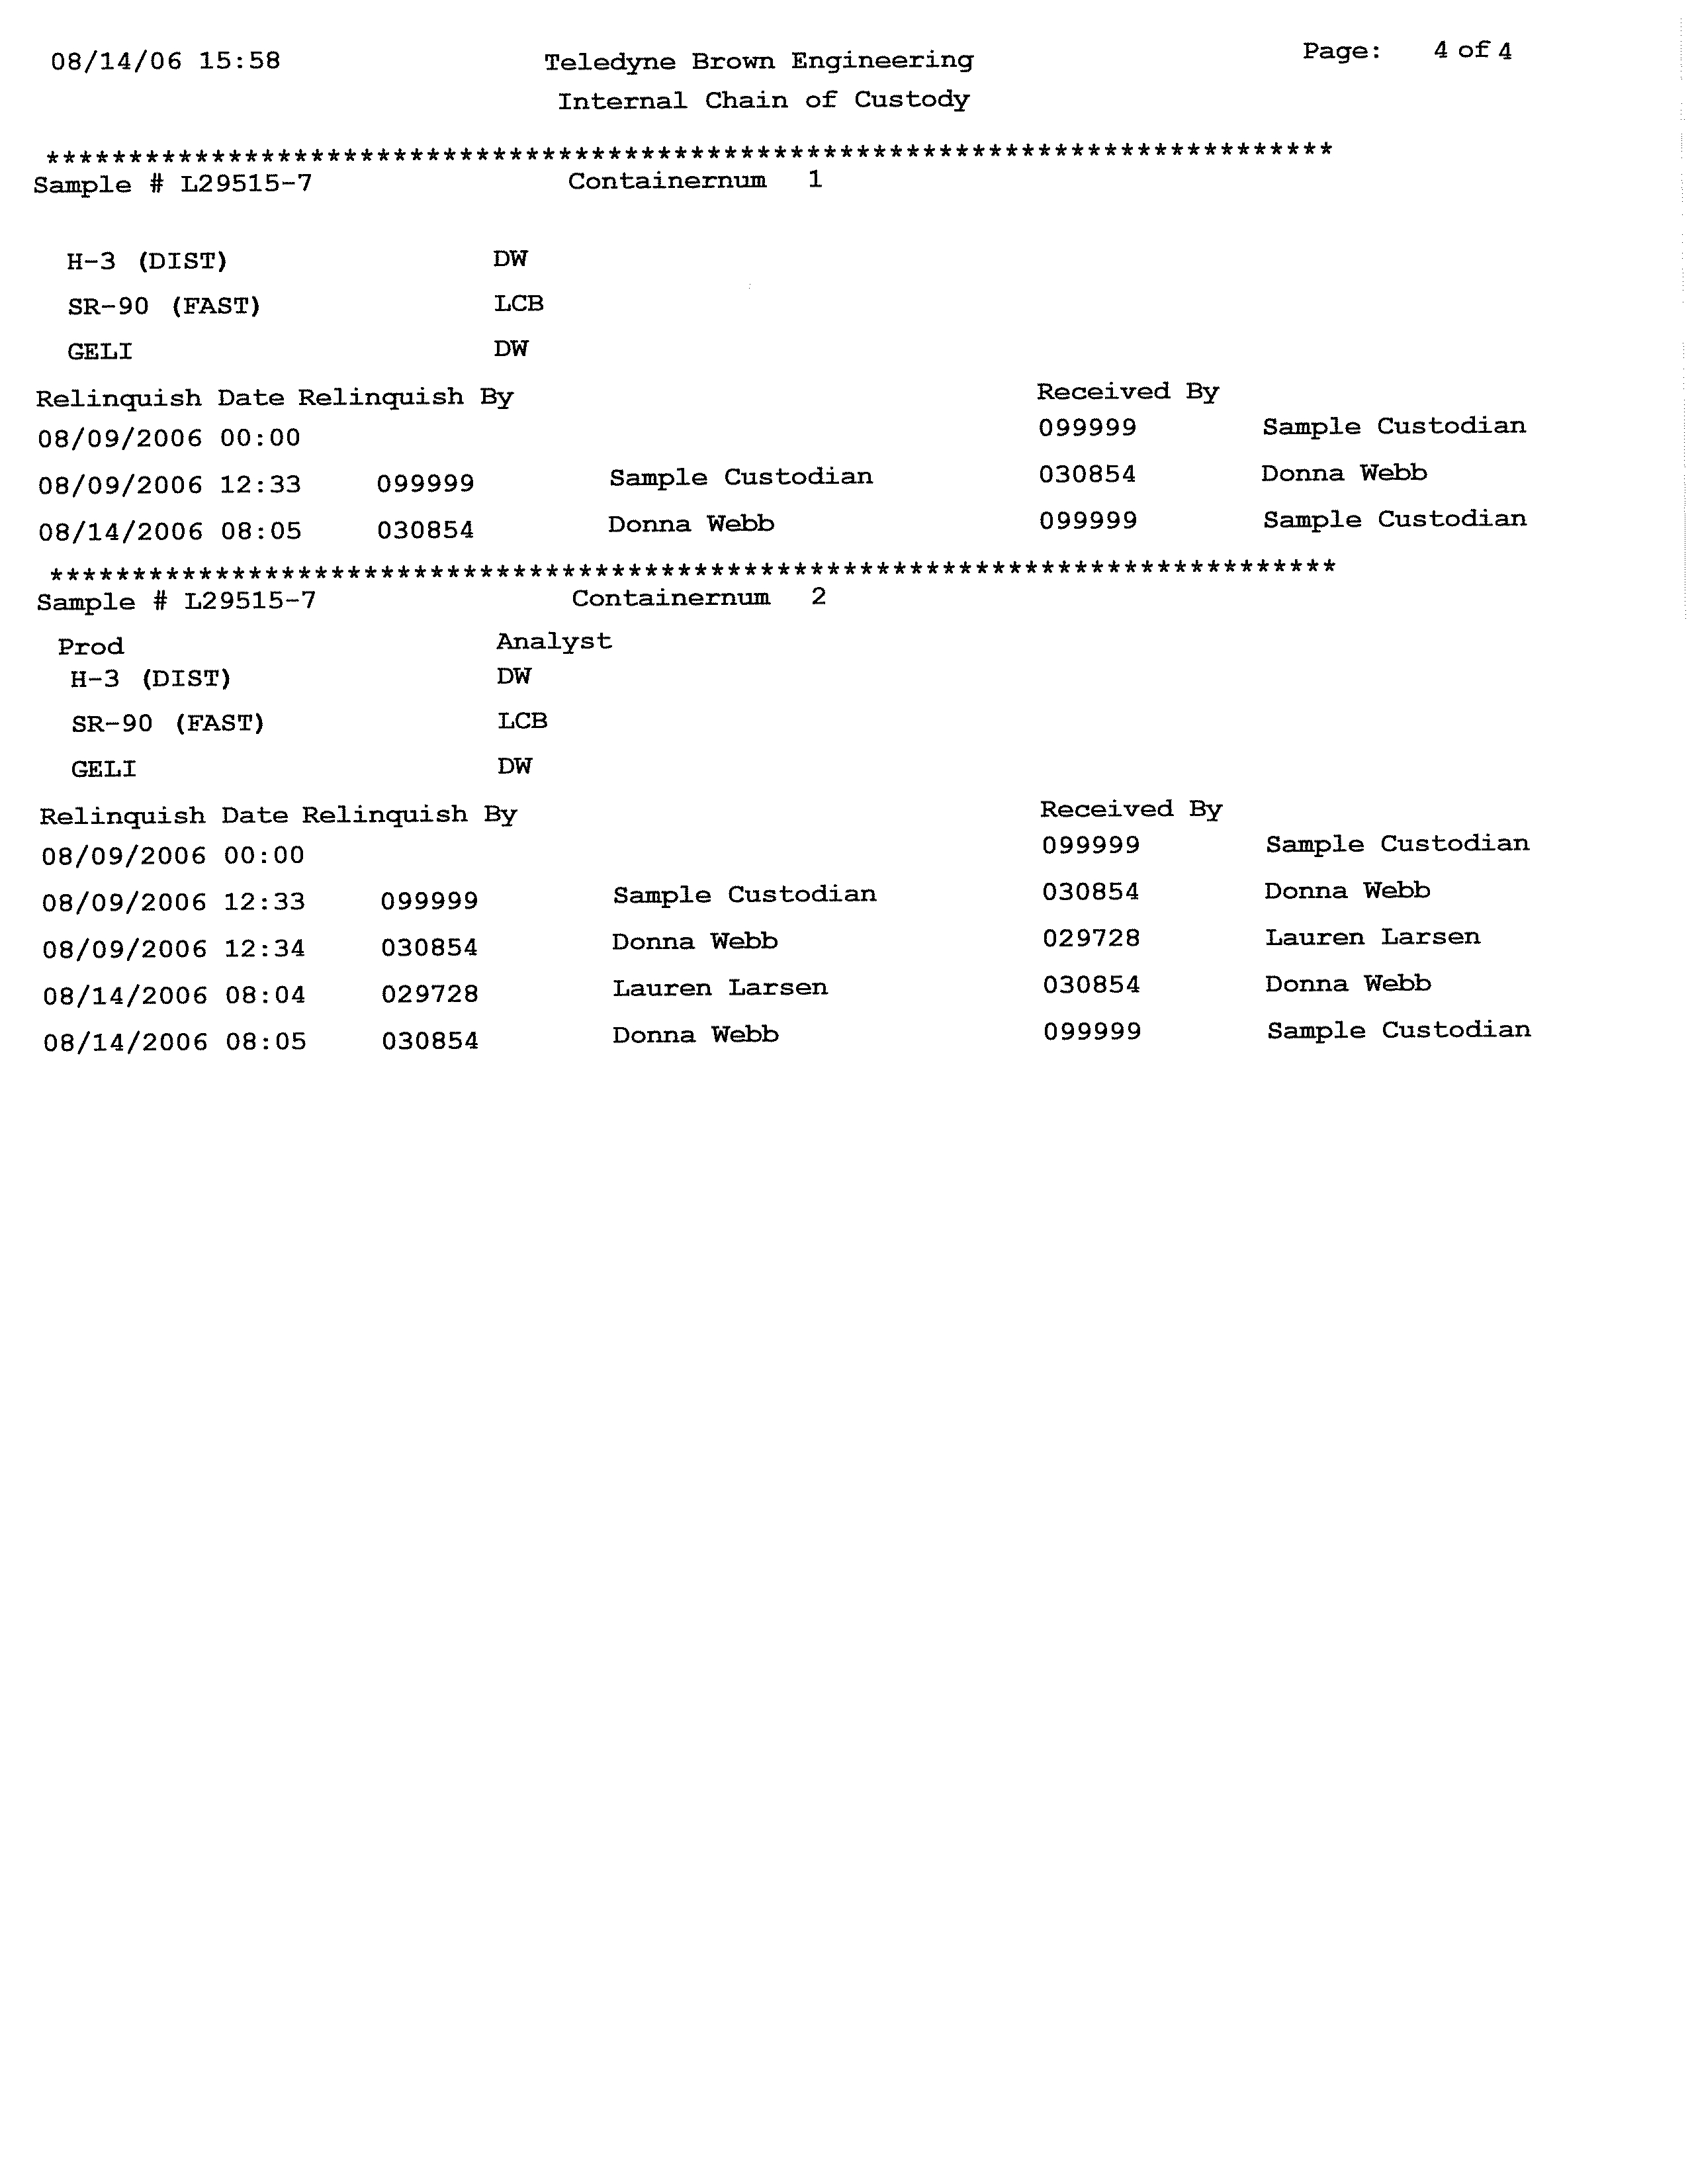
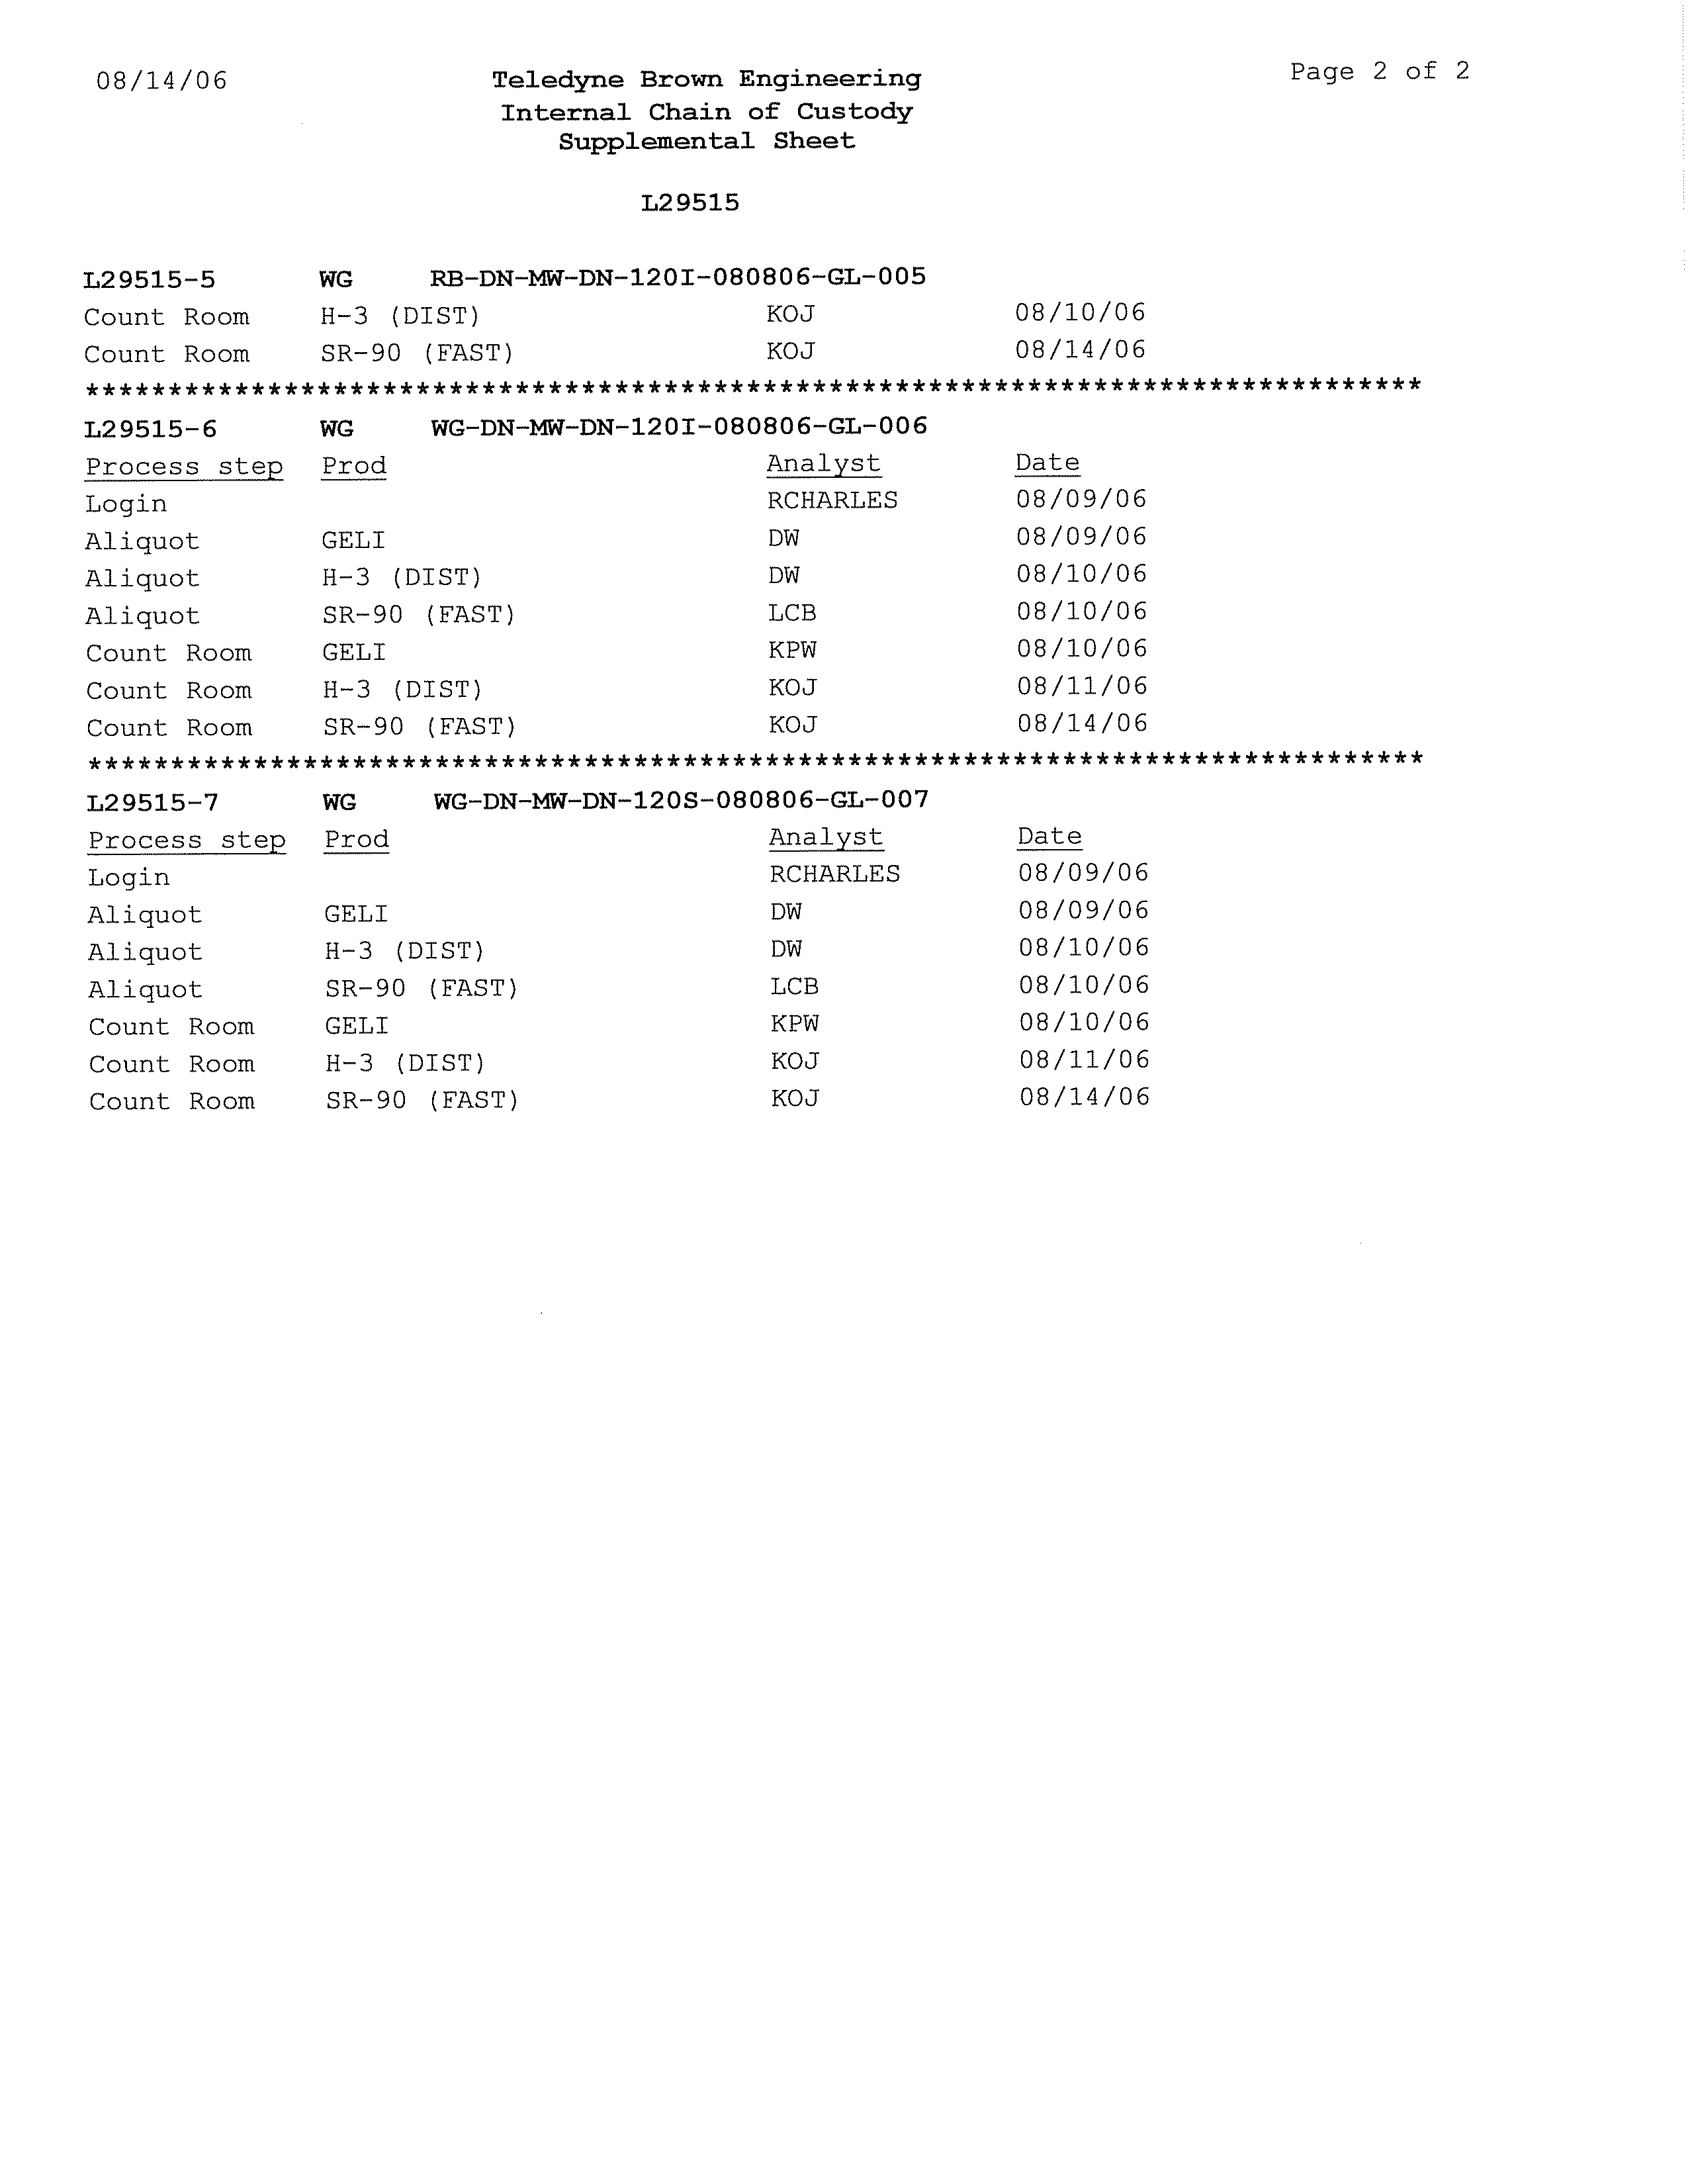
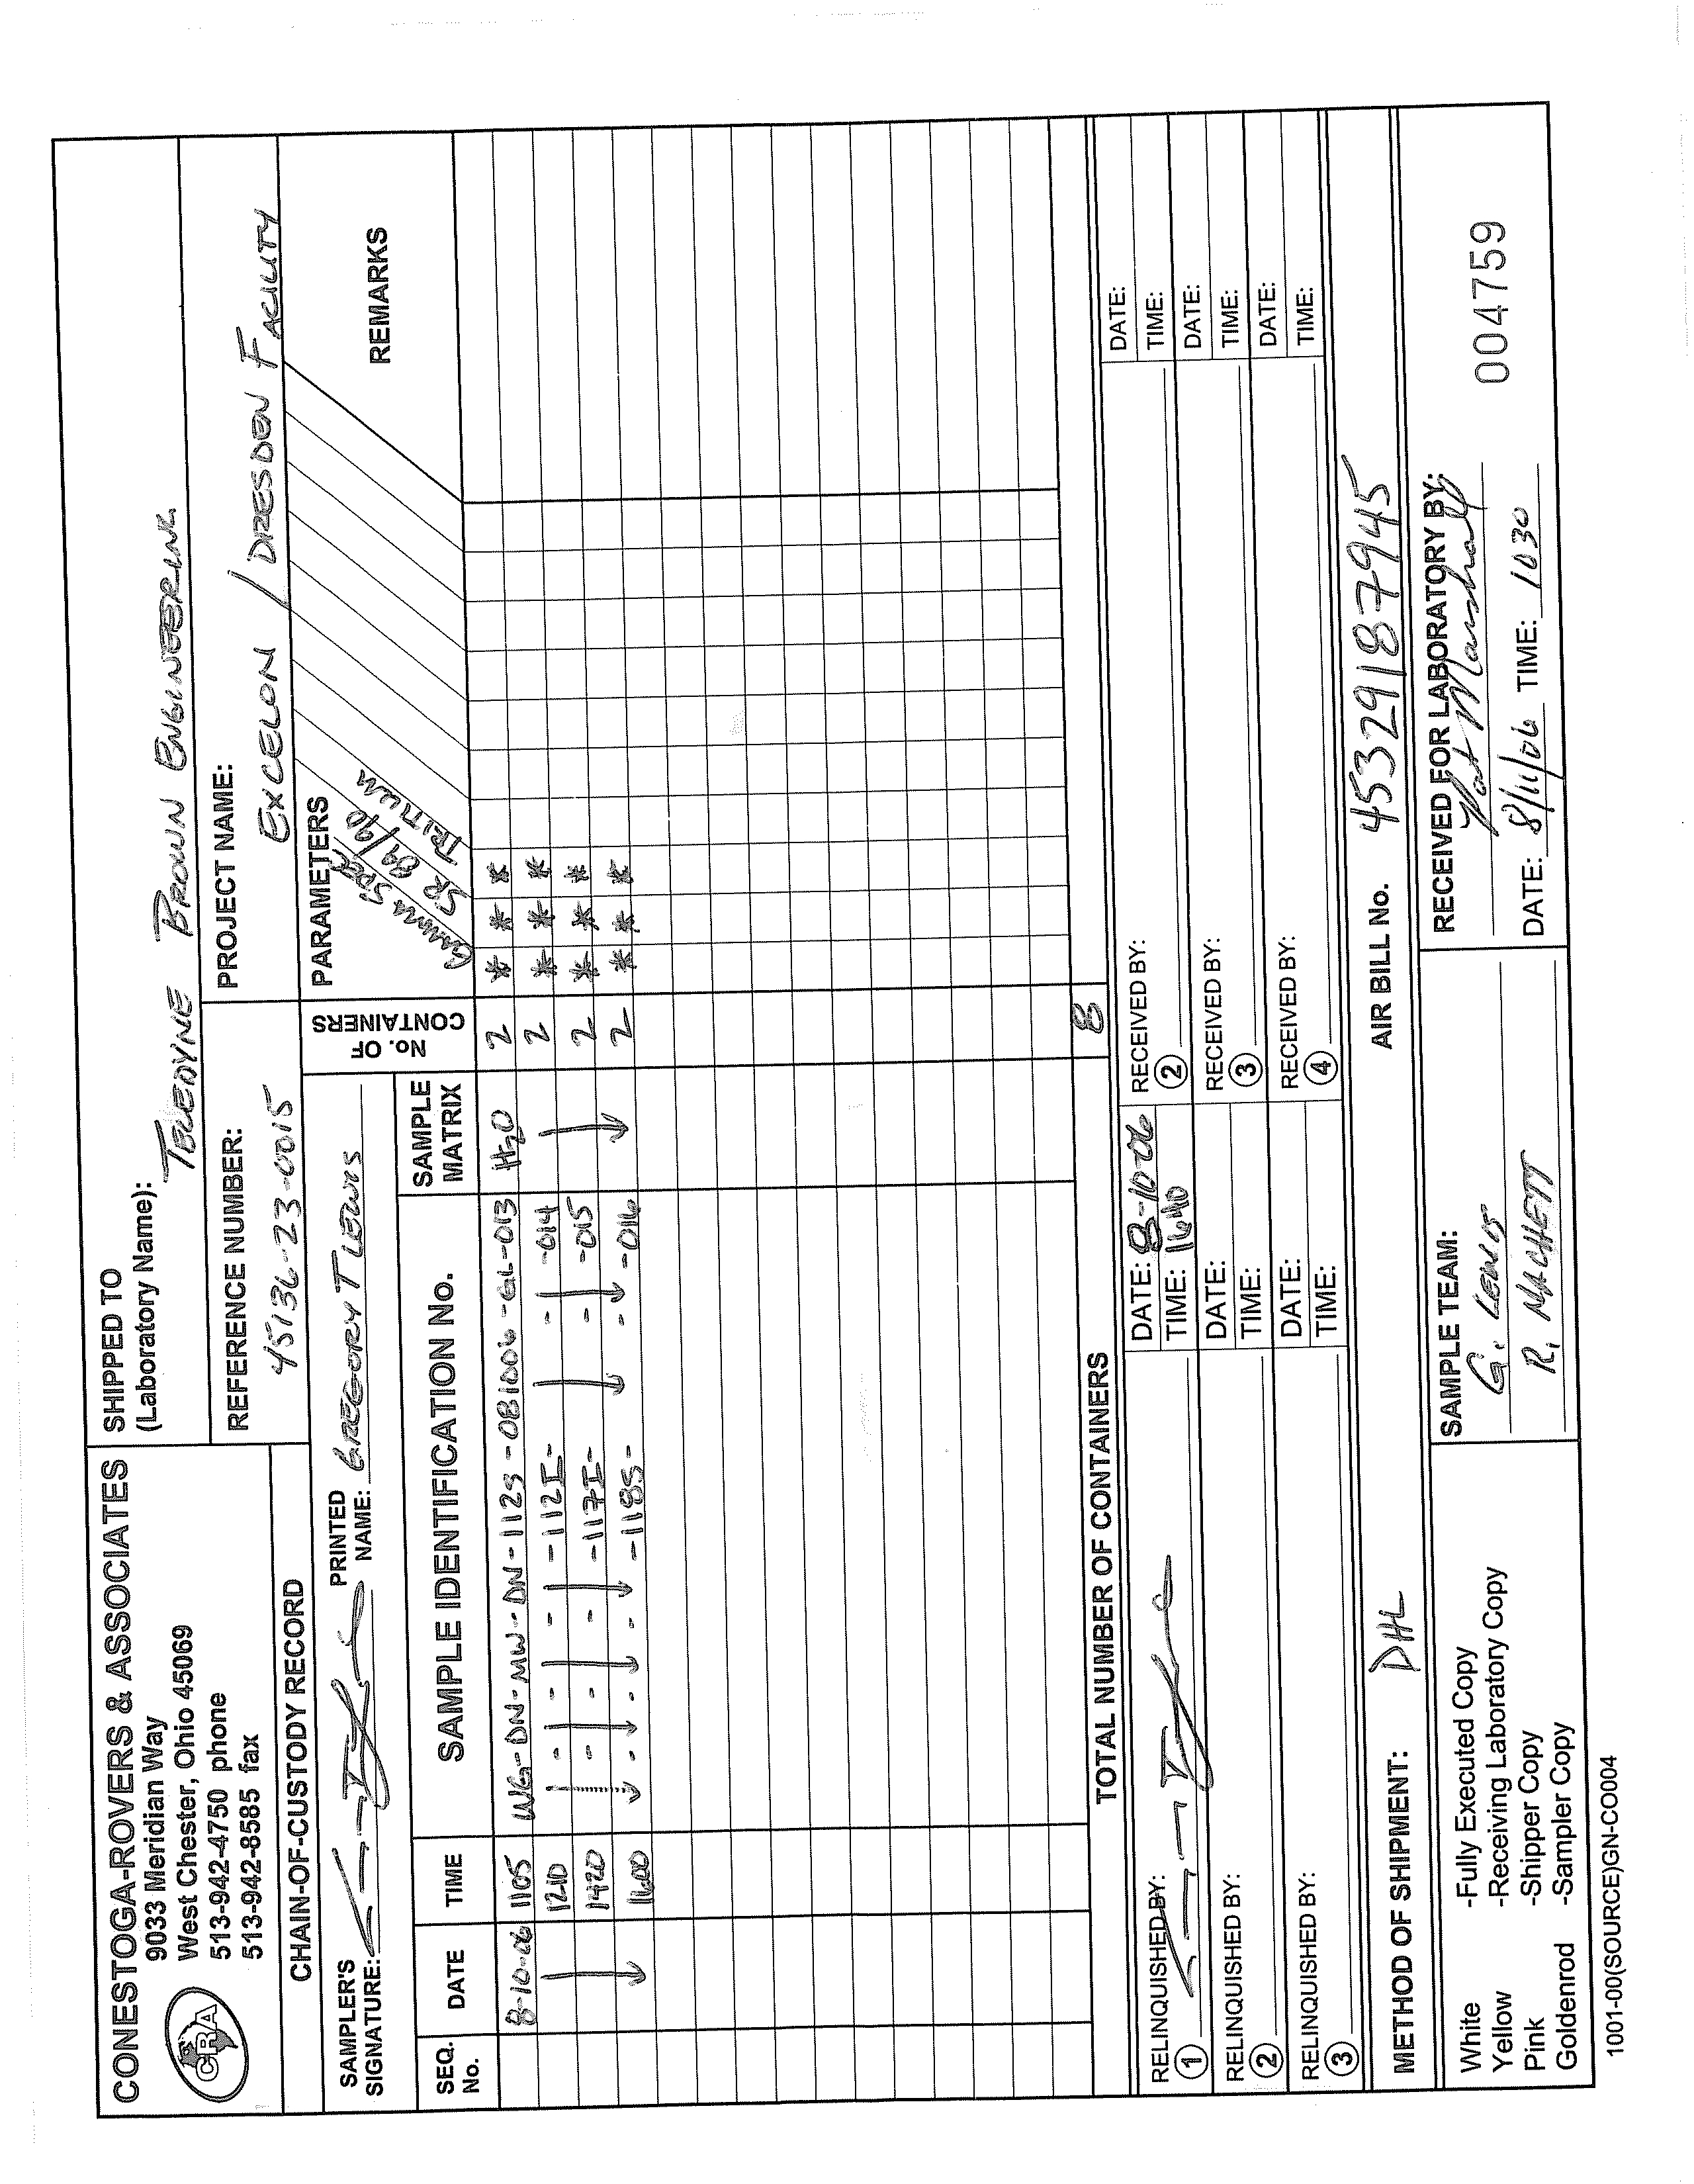
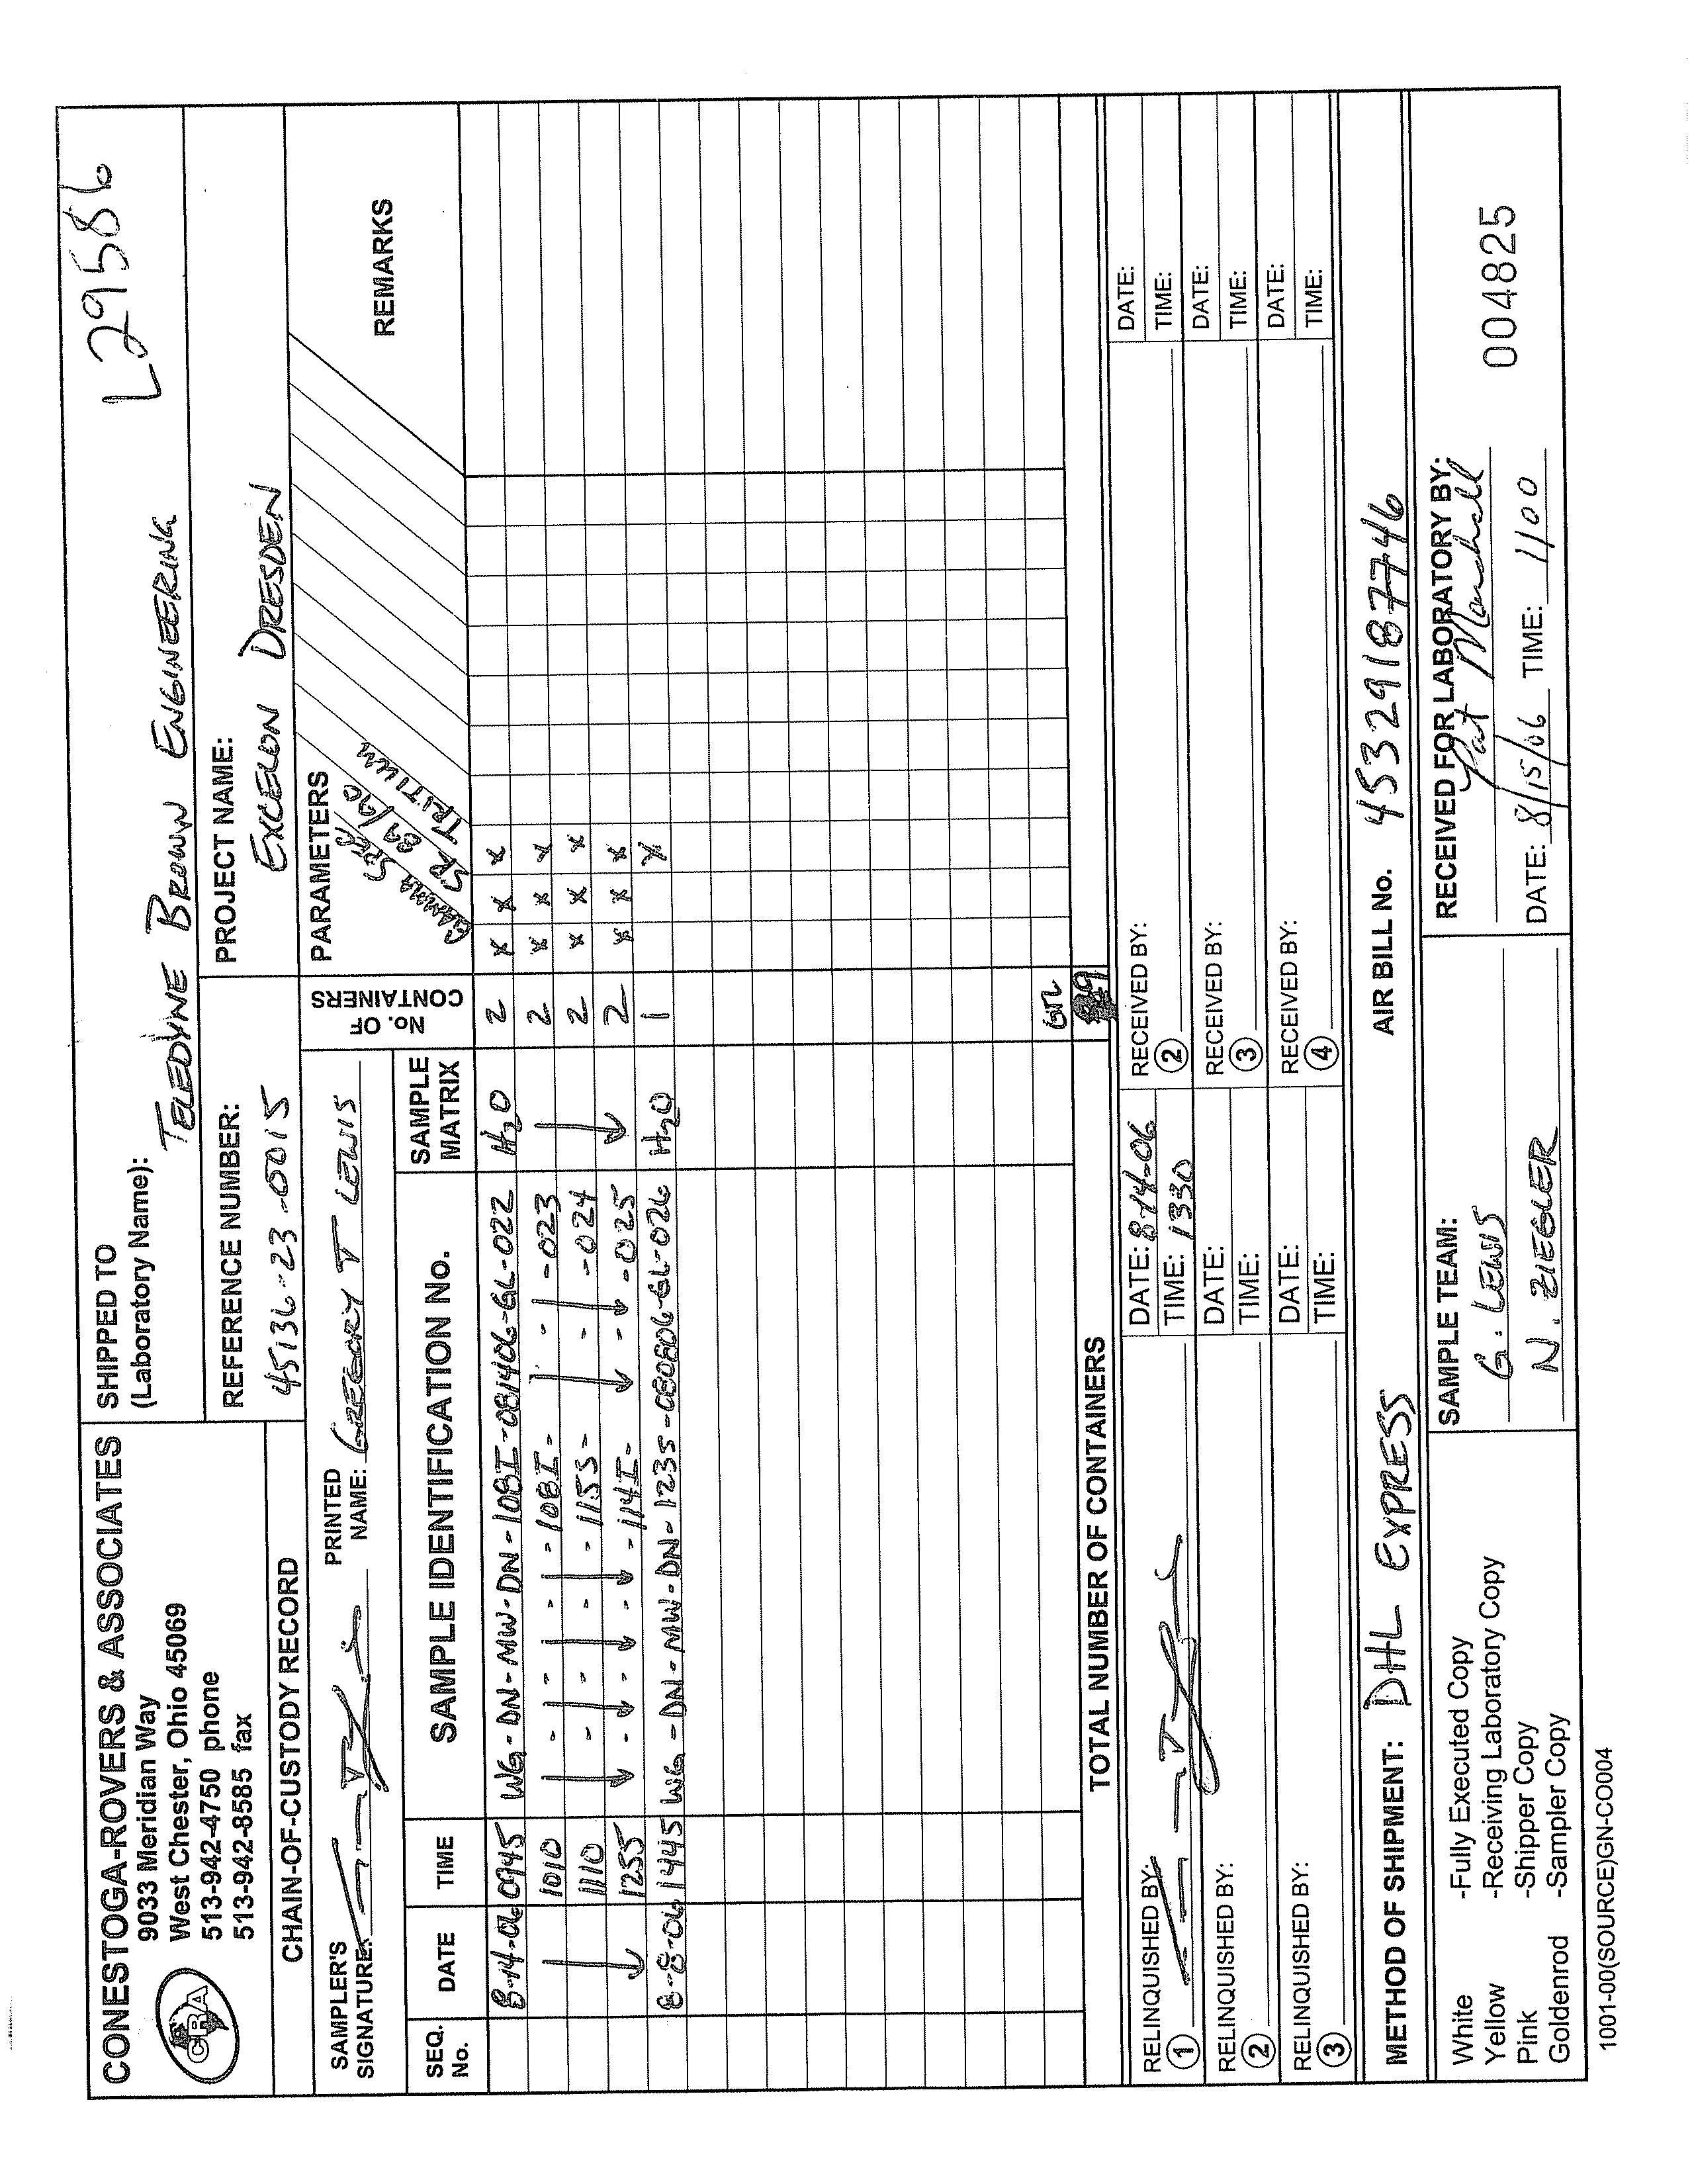
4.9
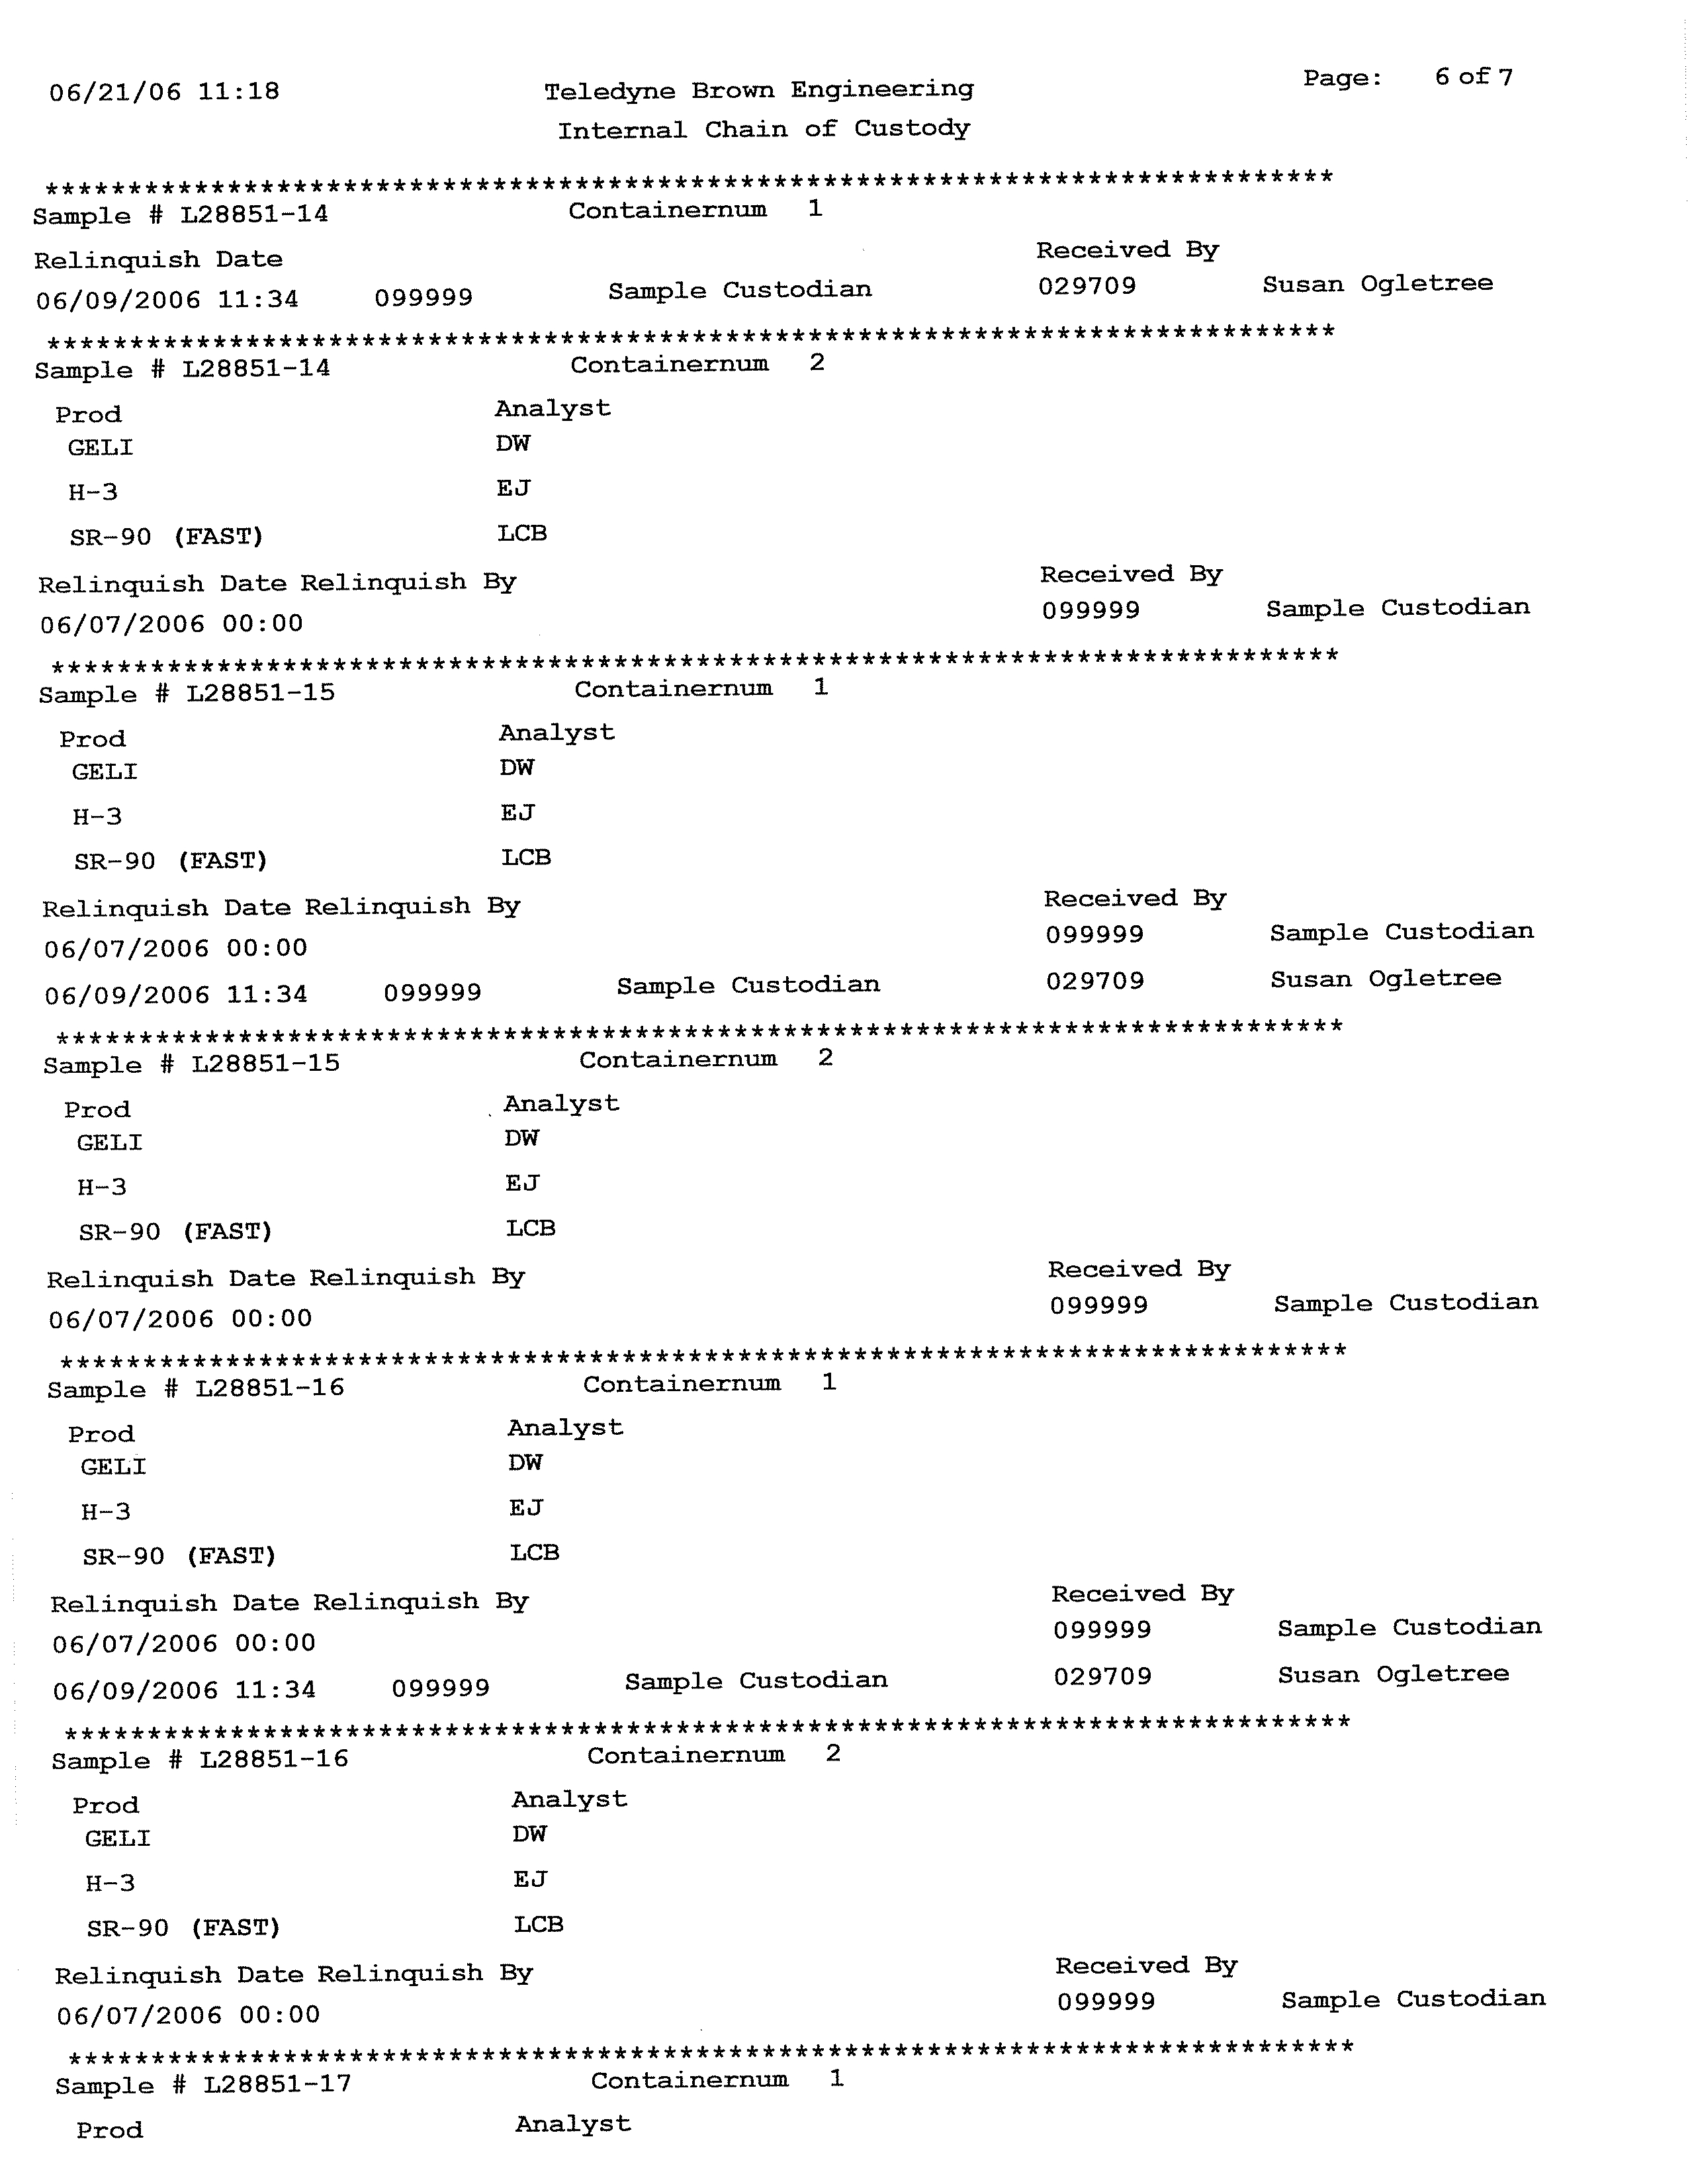
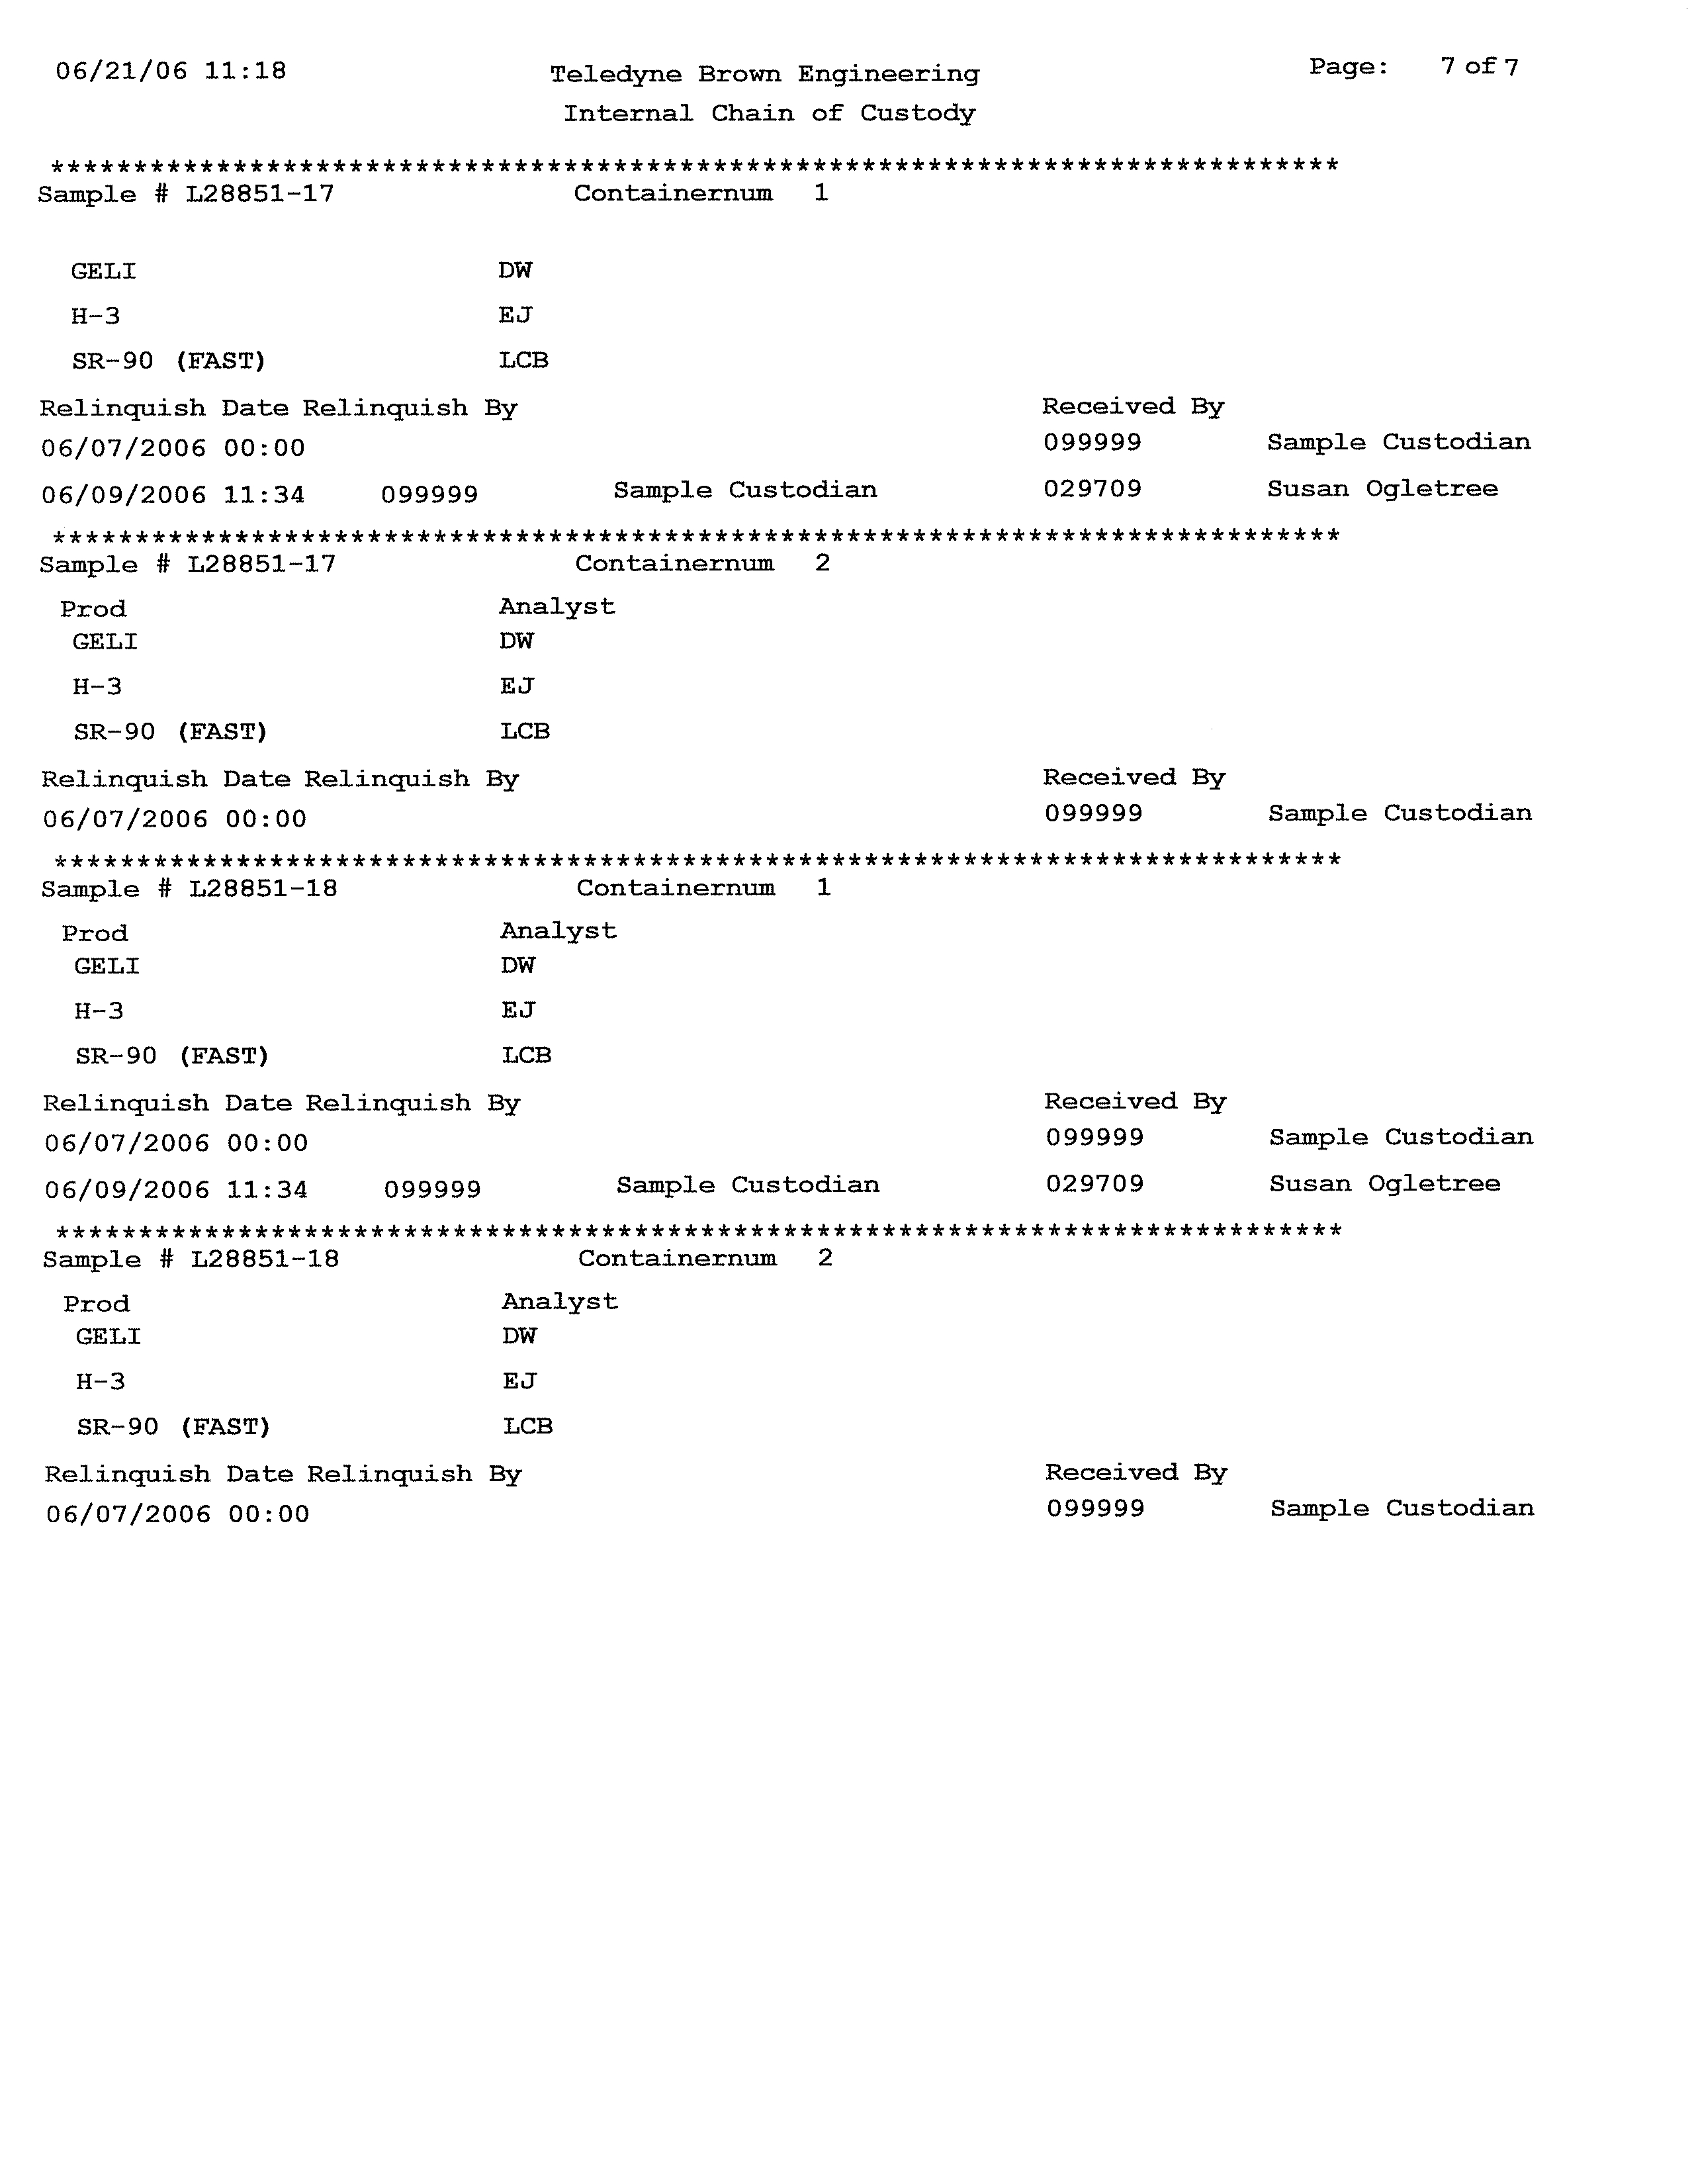
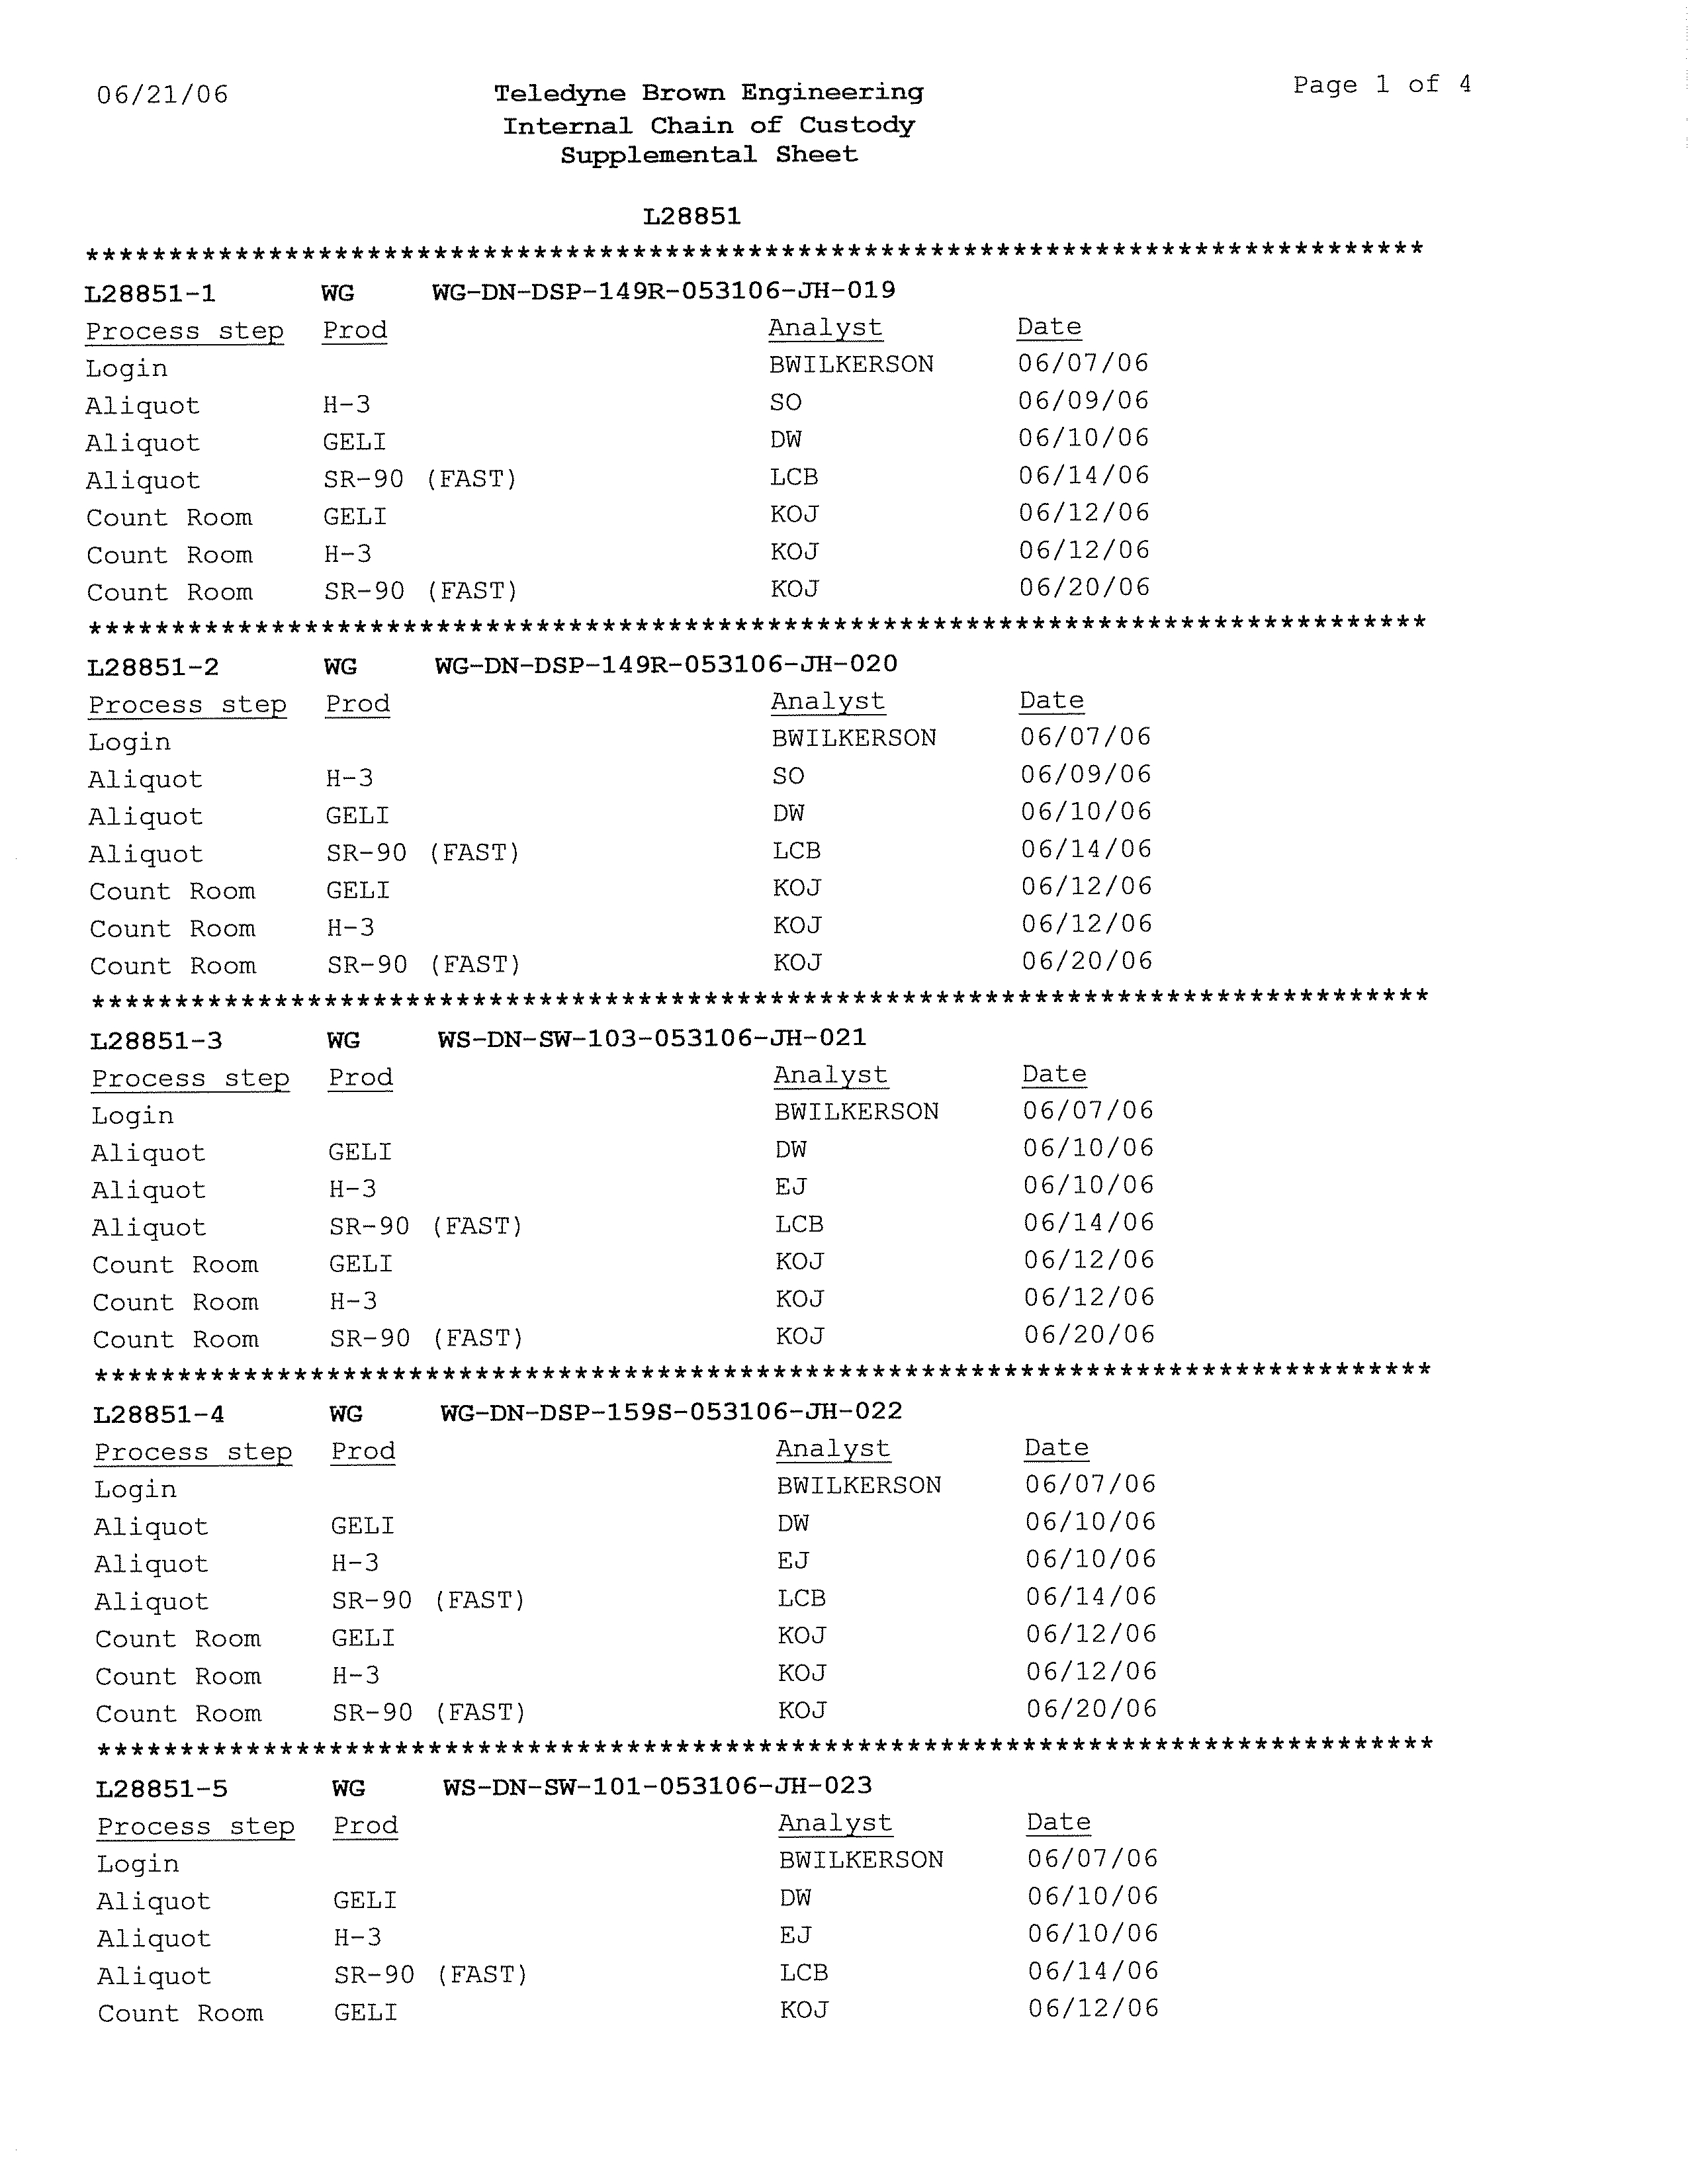
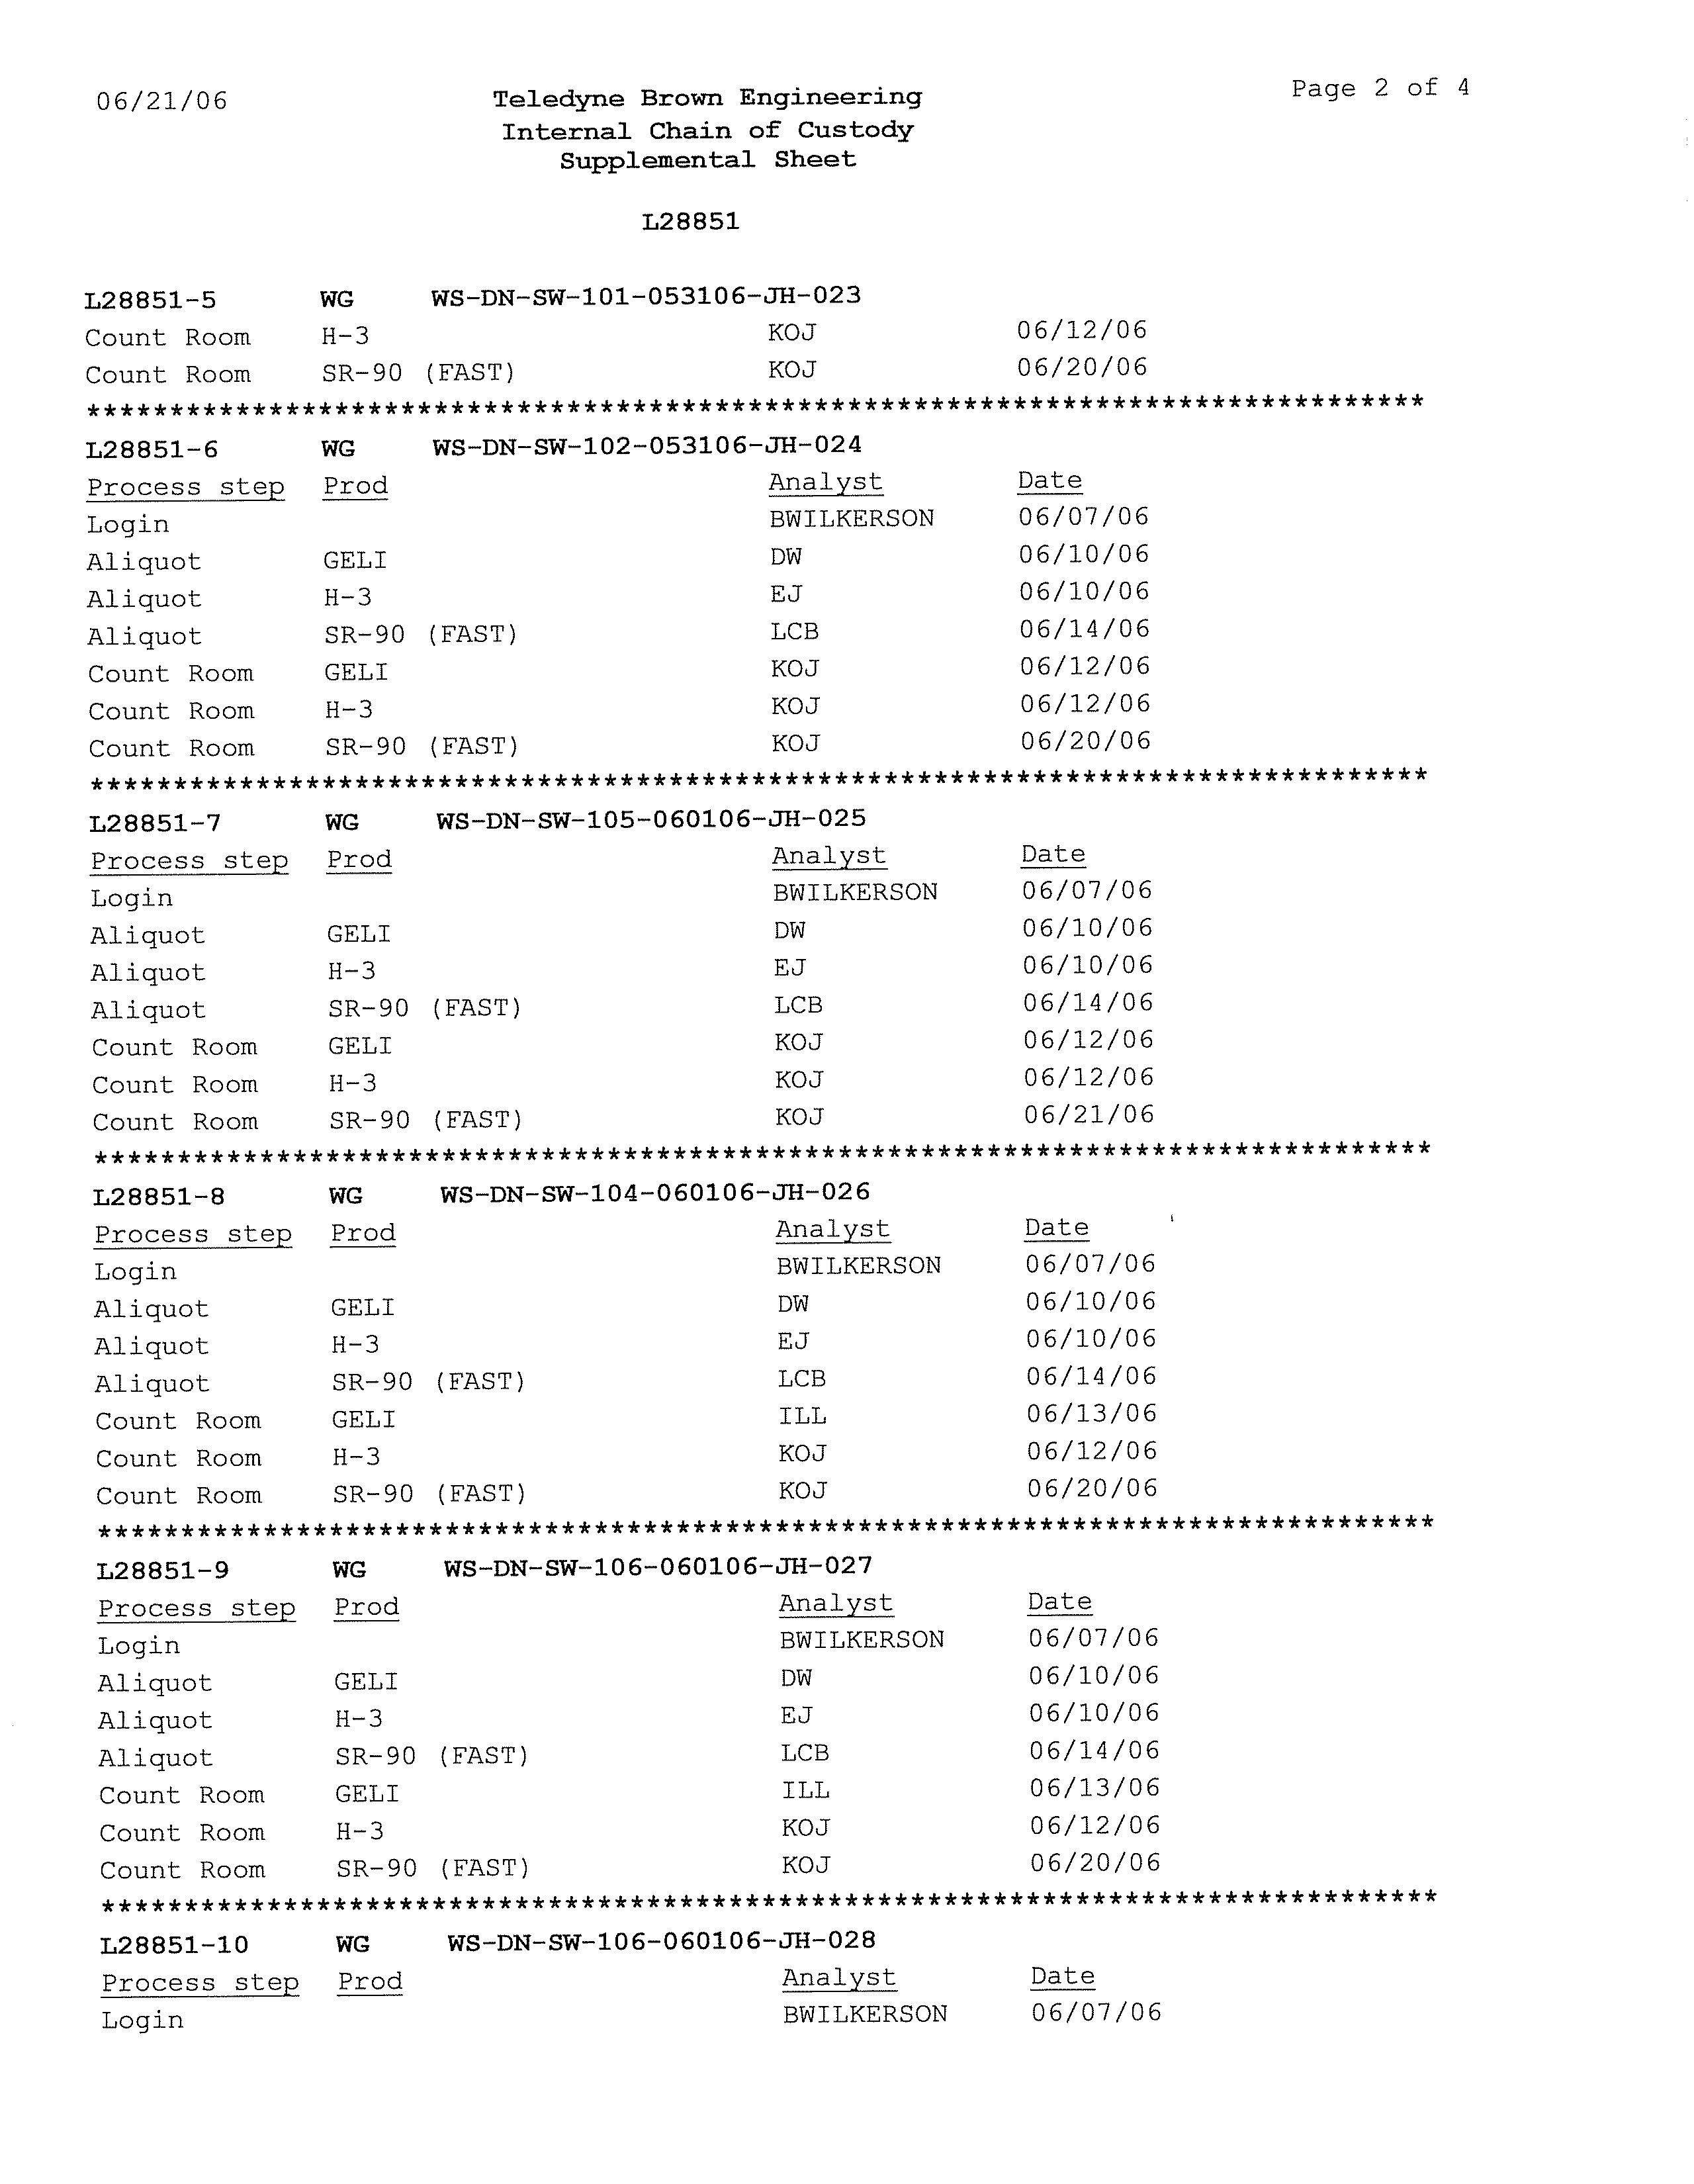
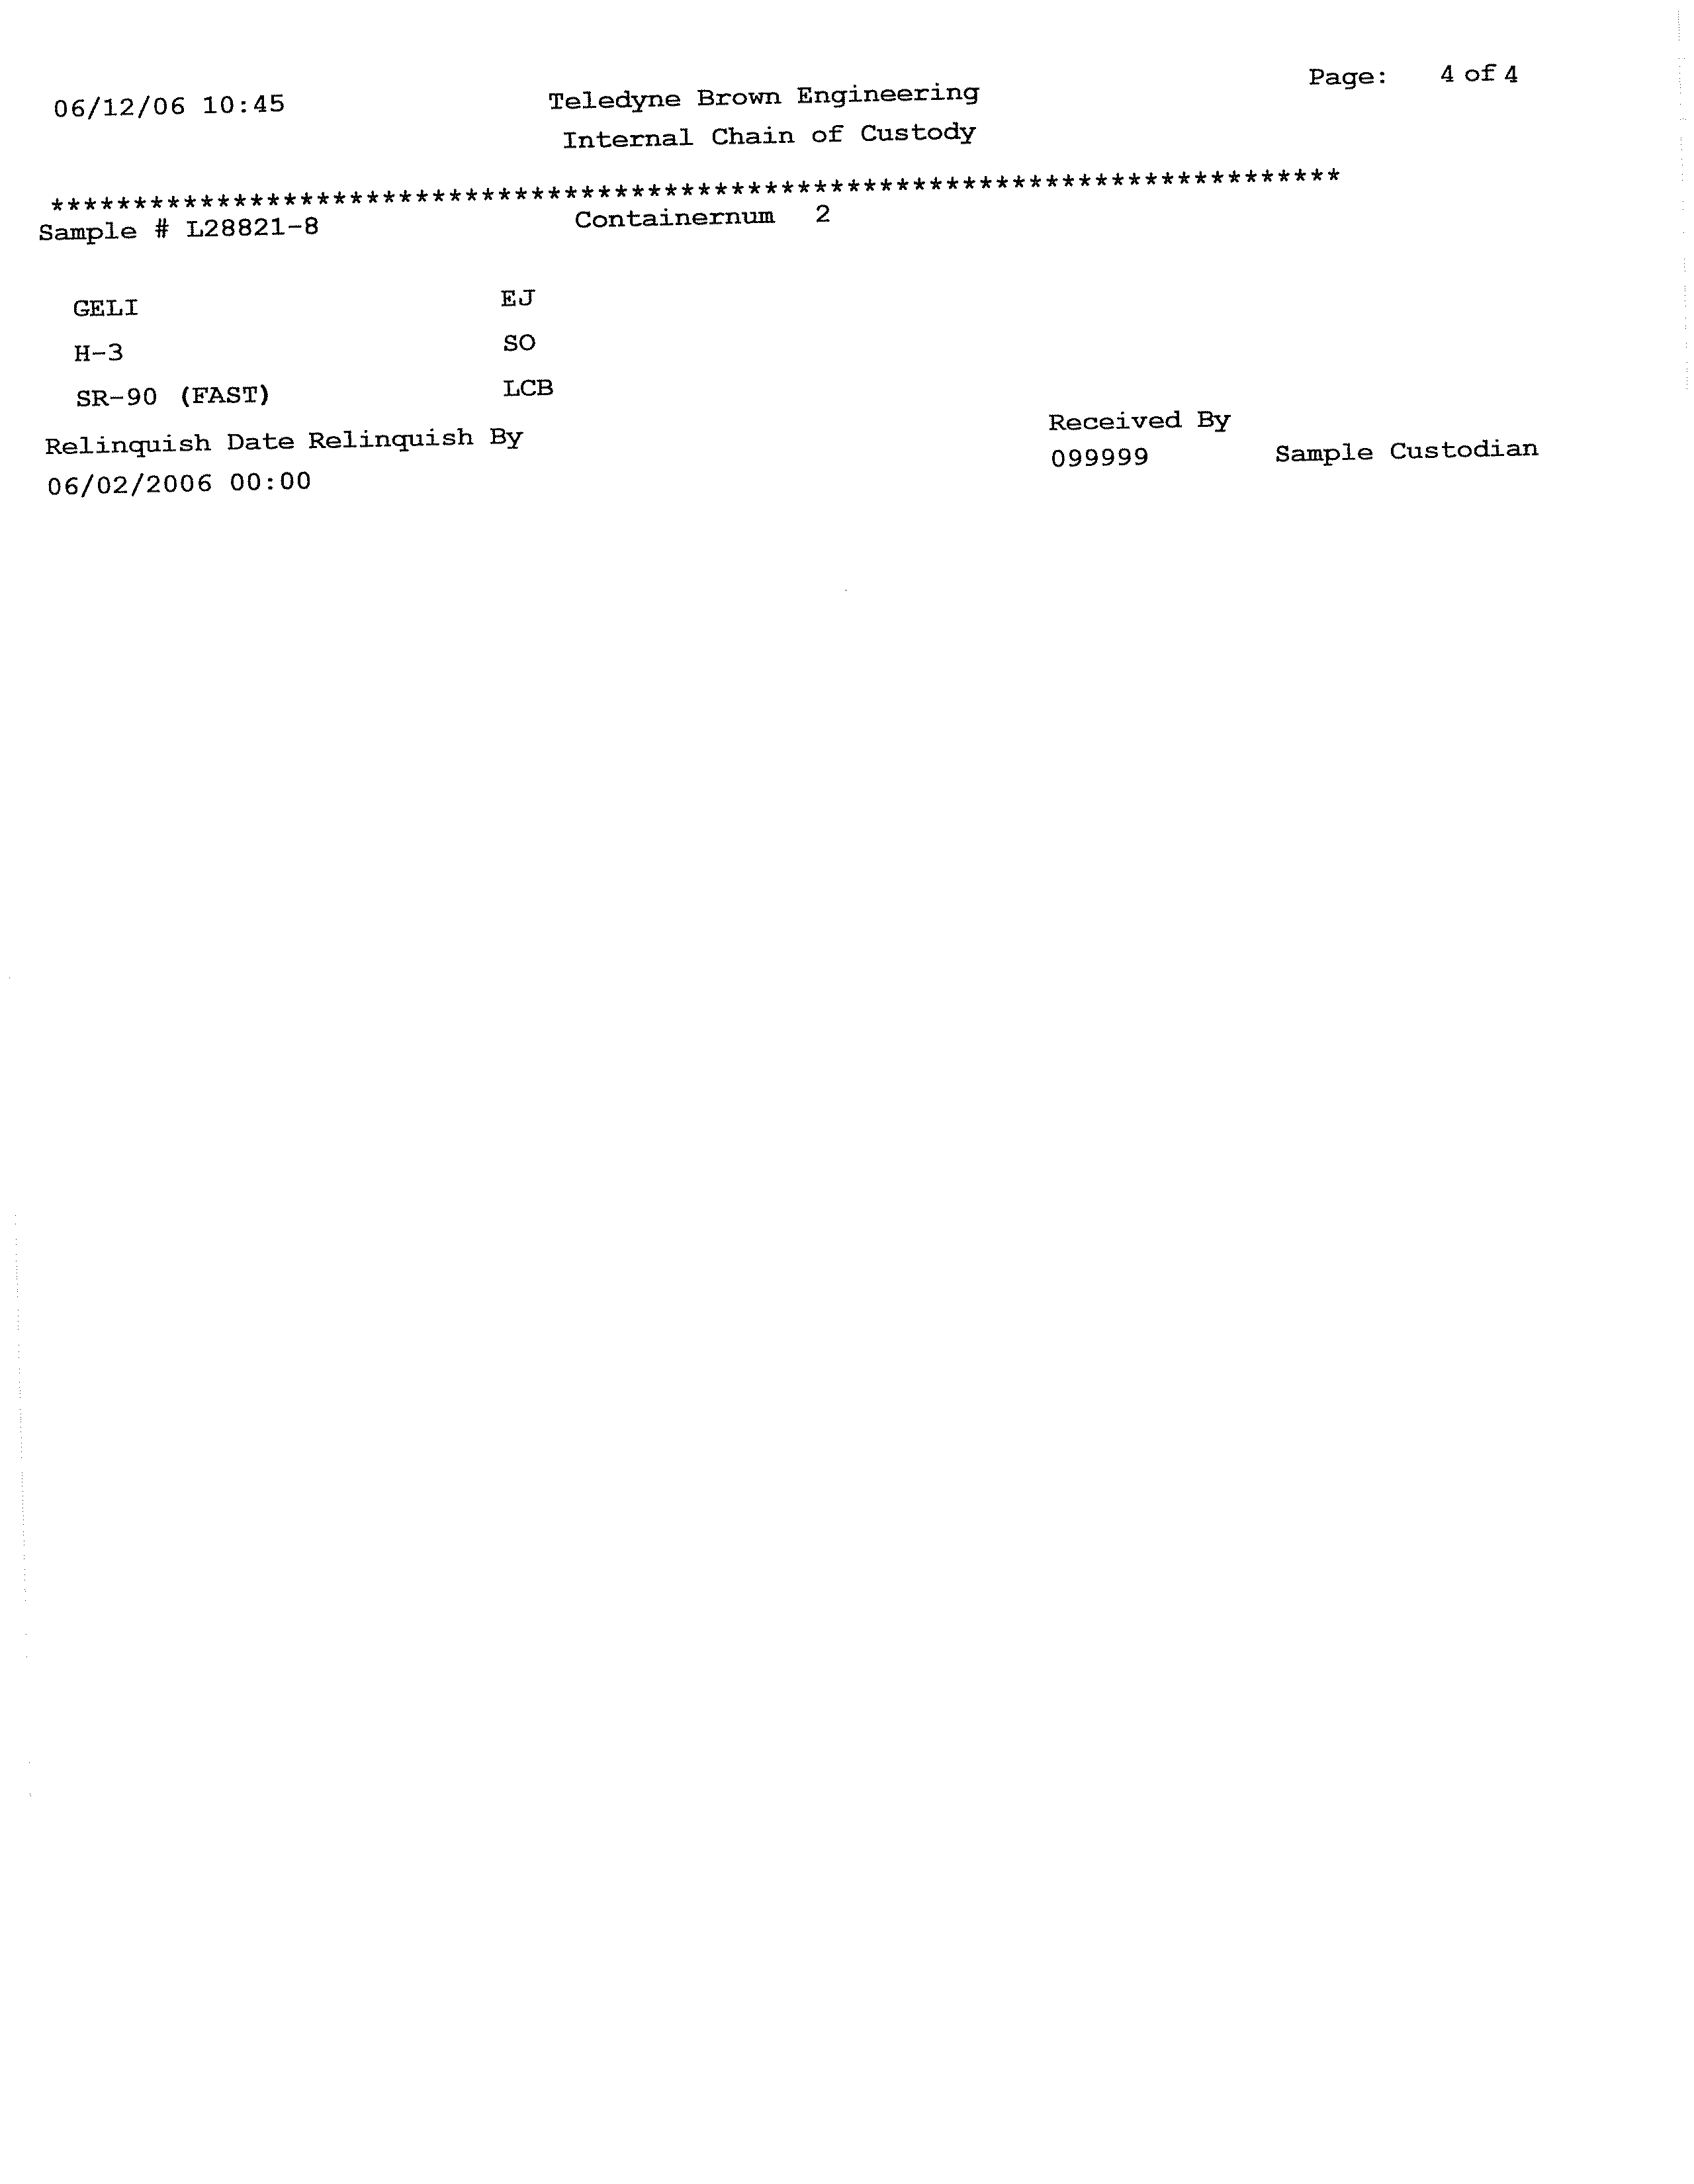
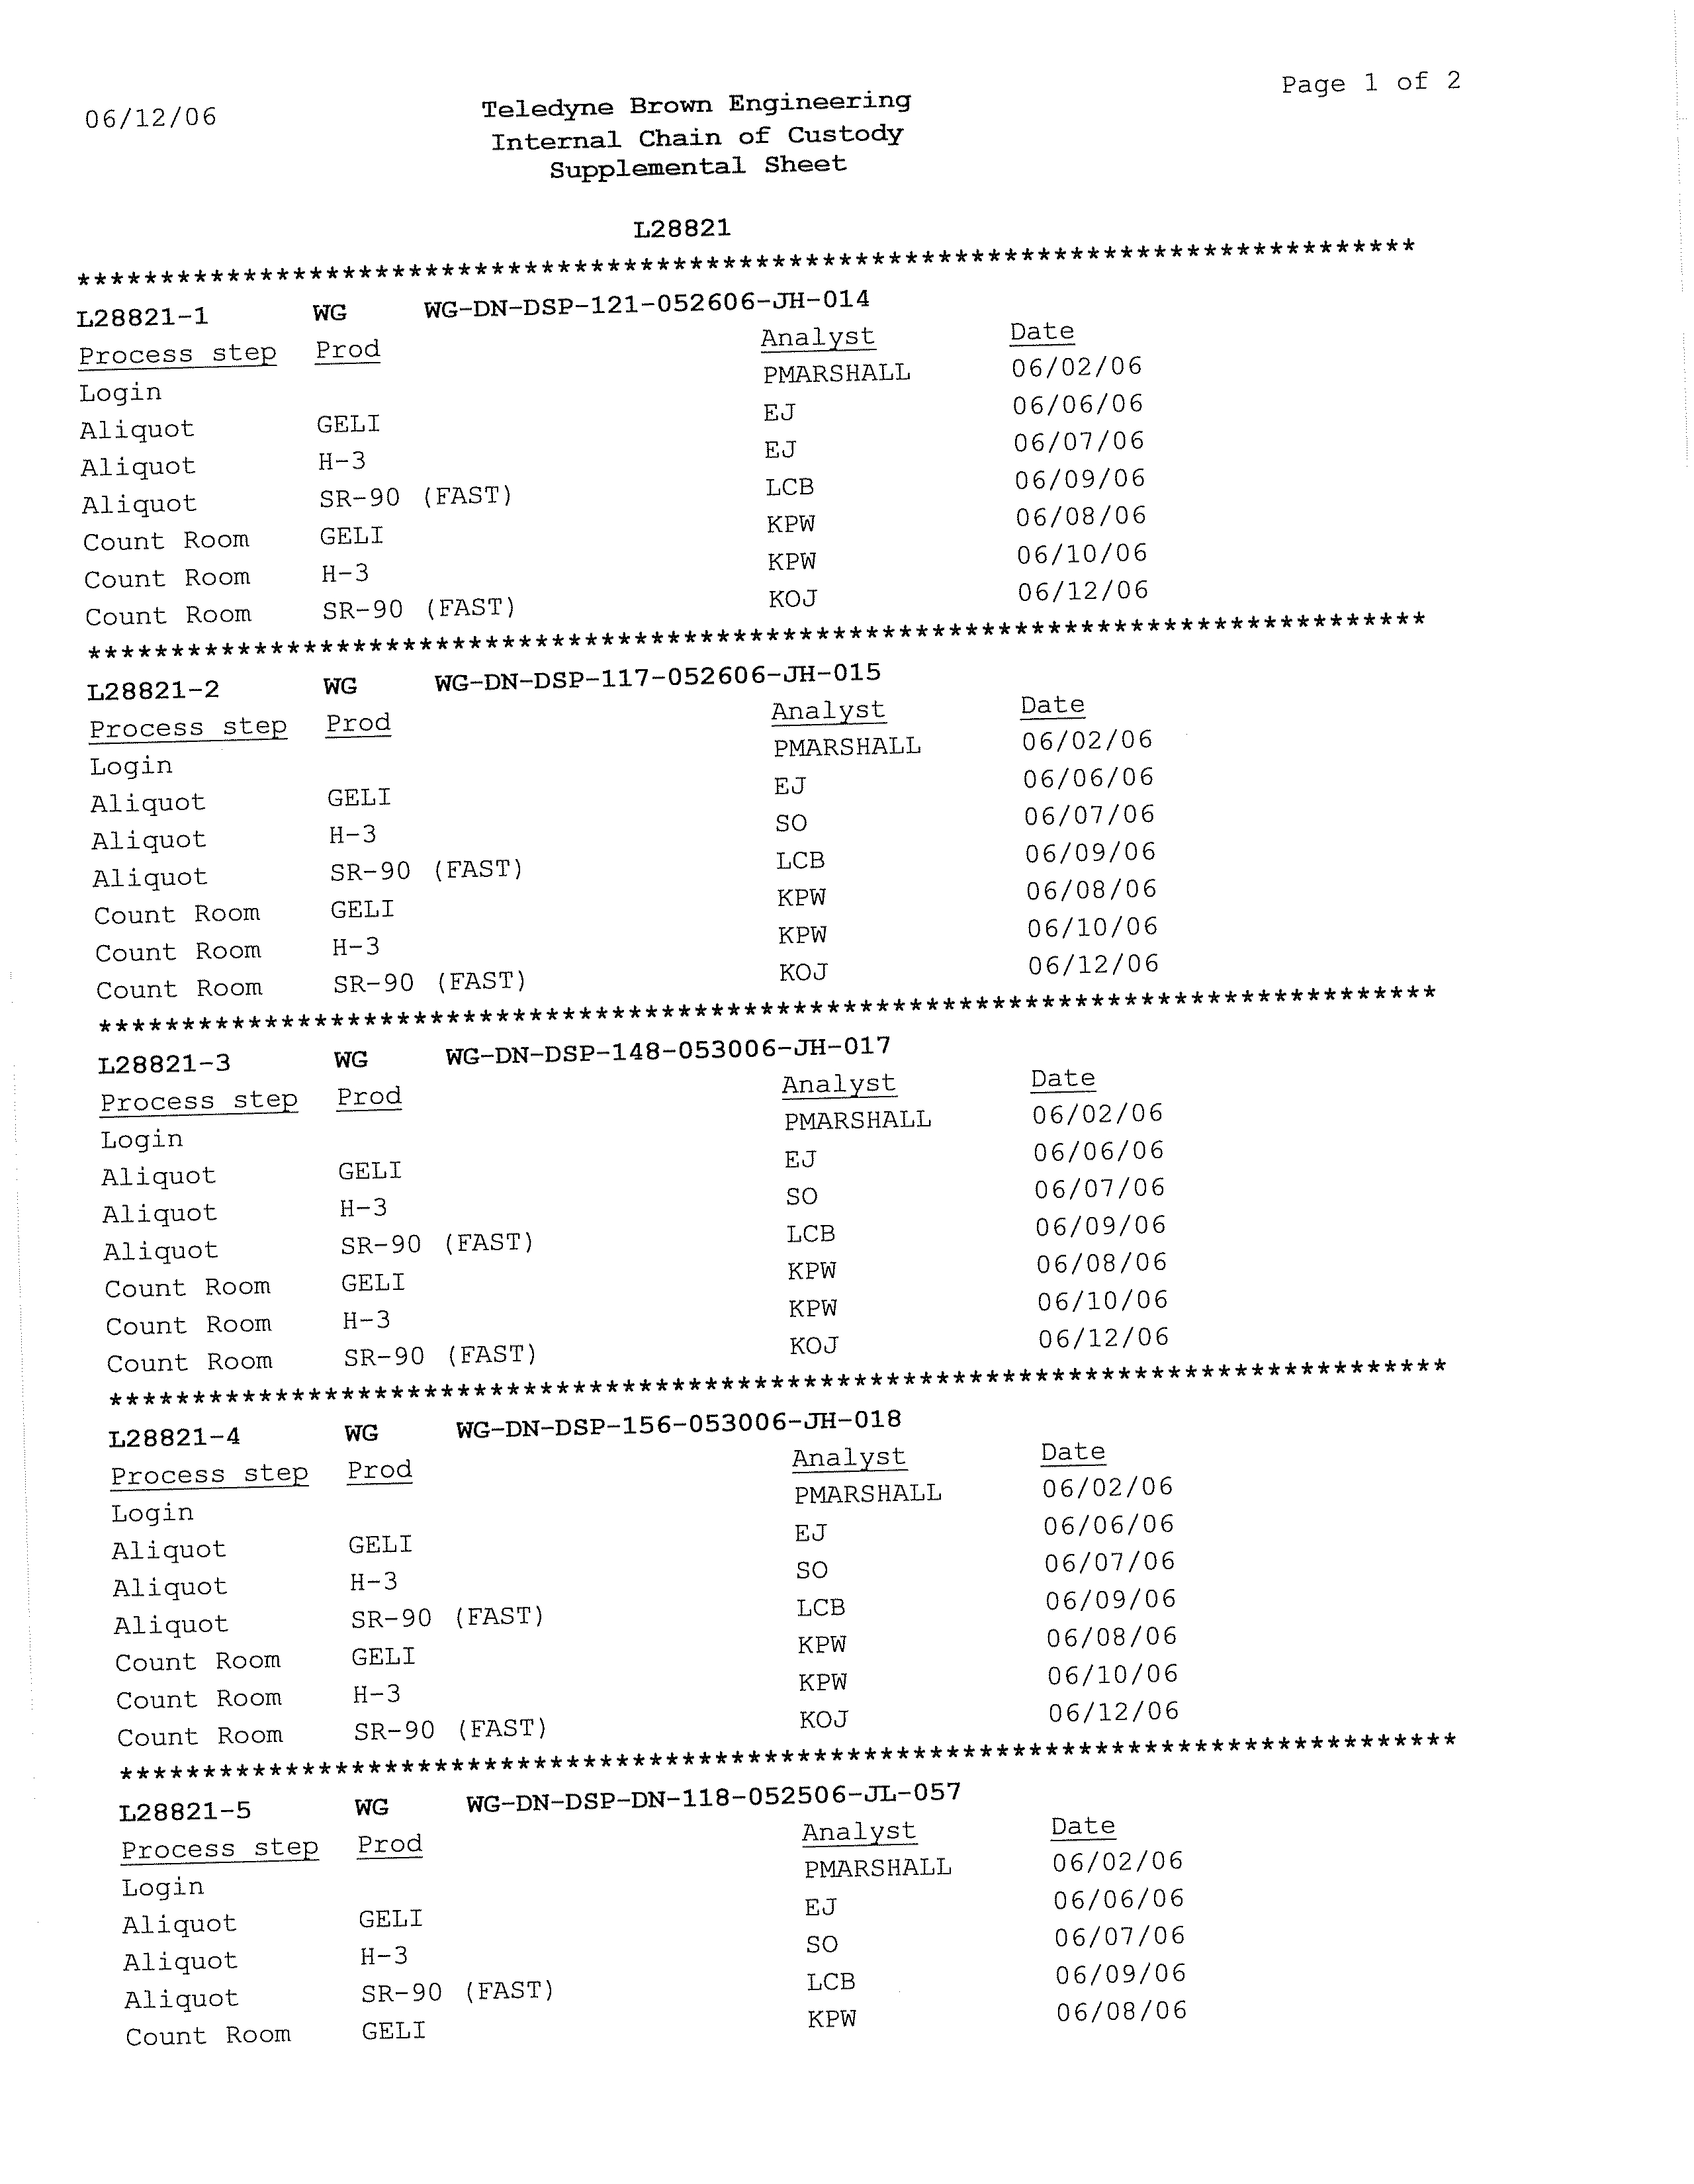
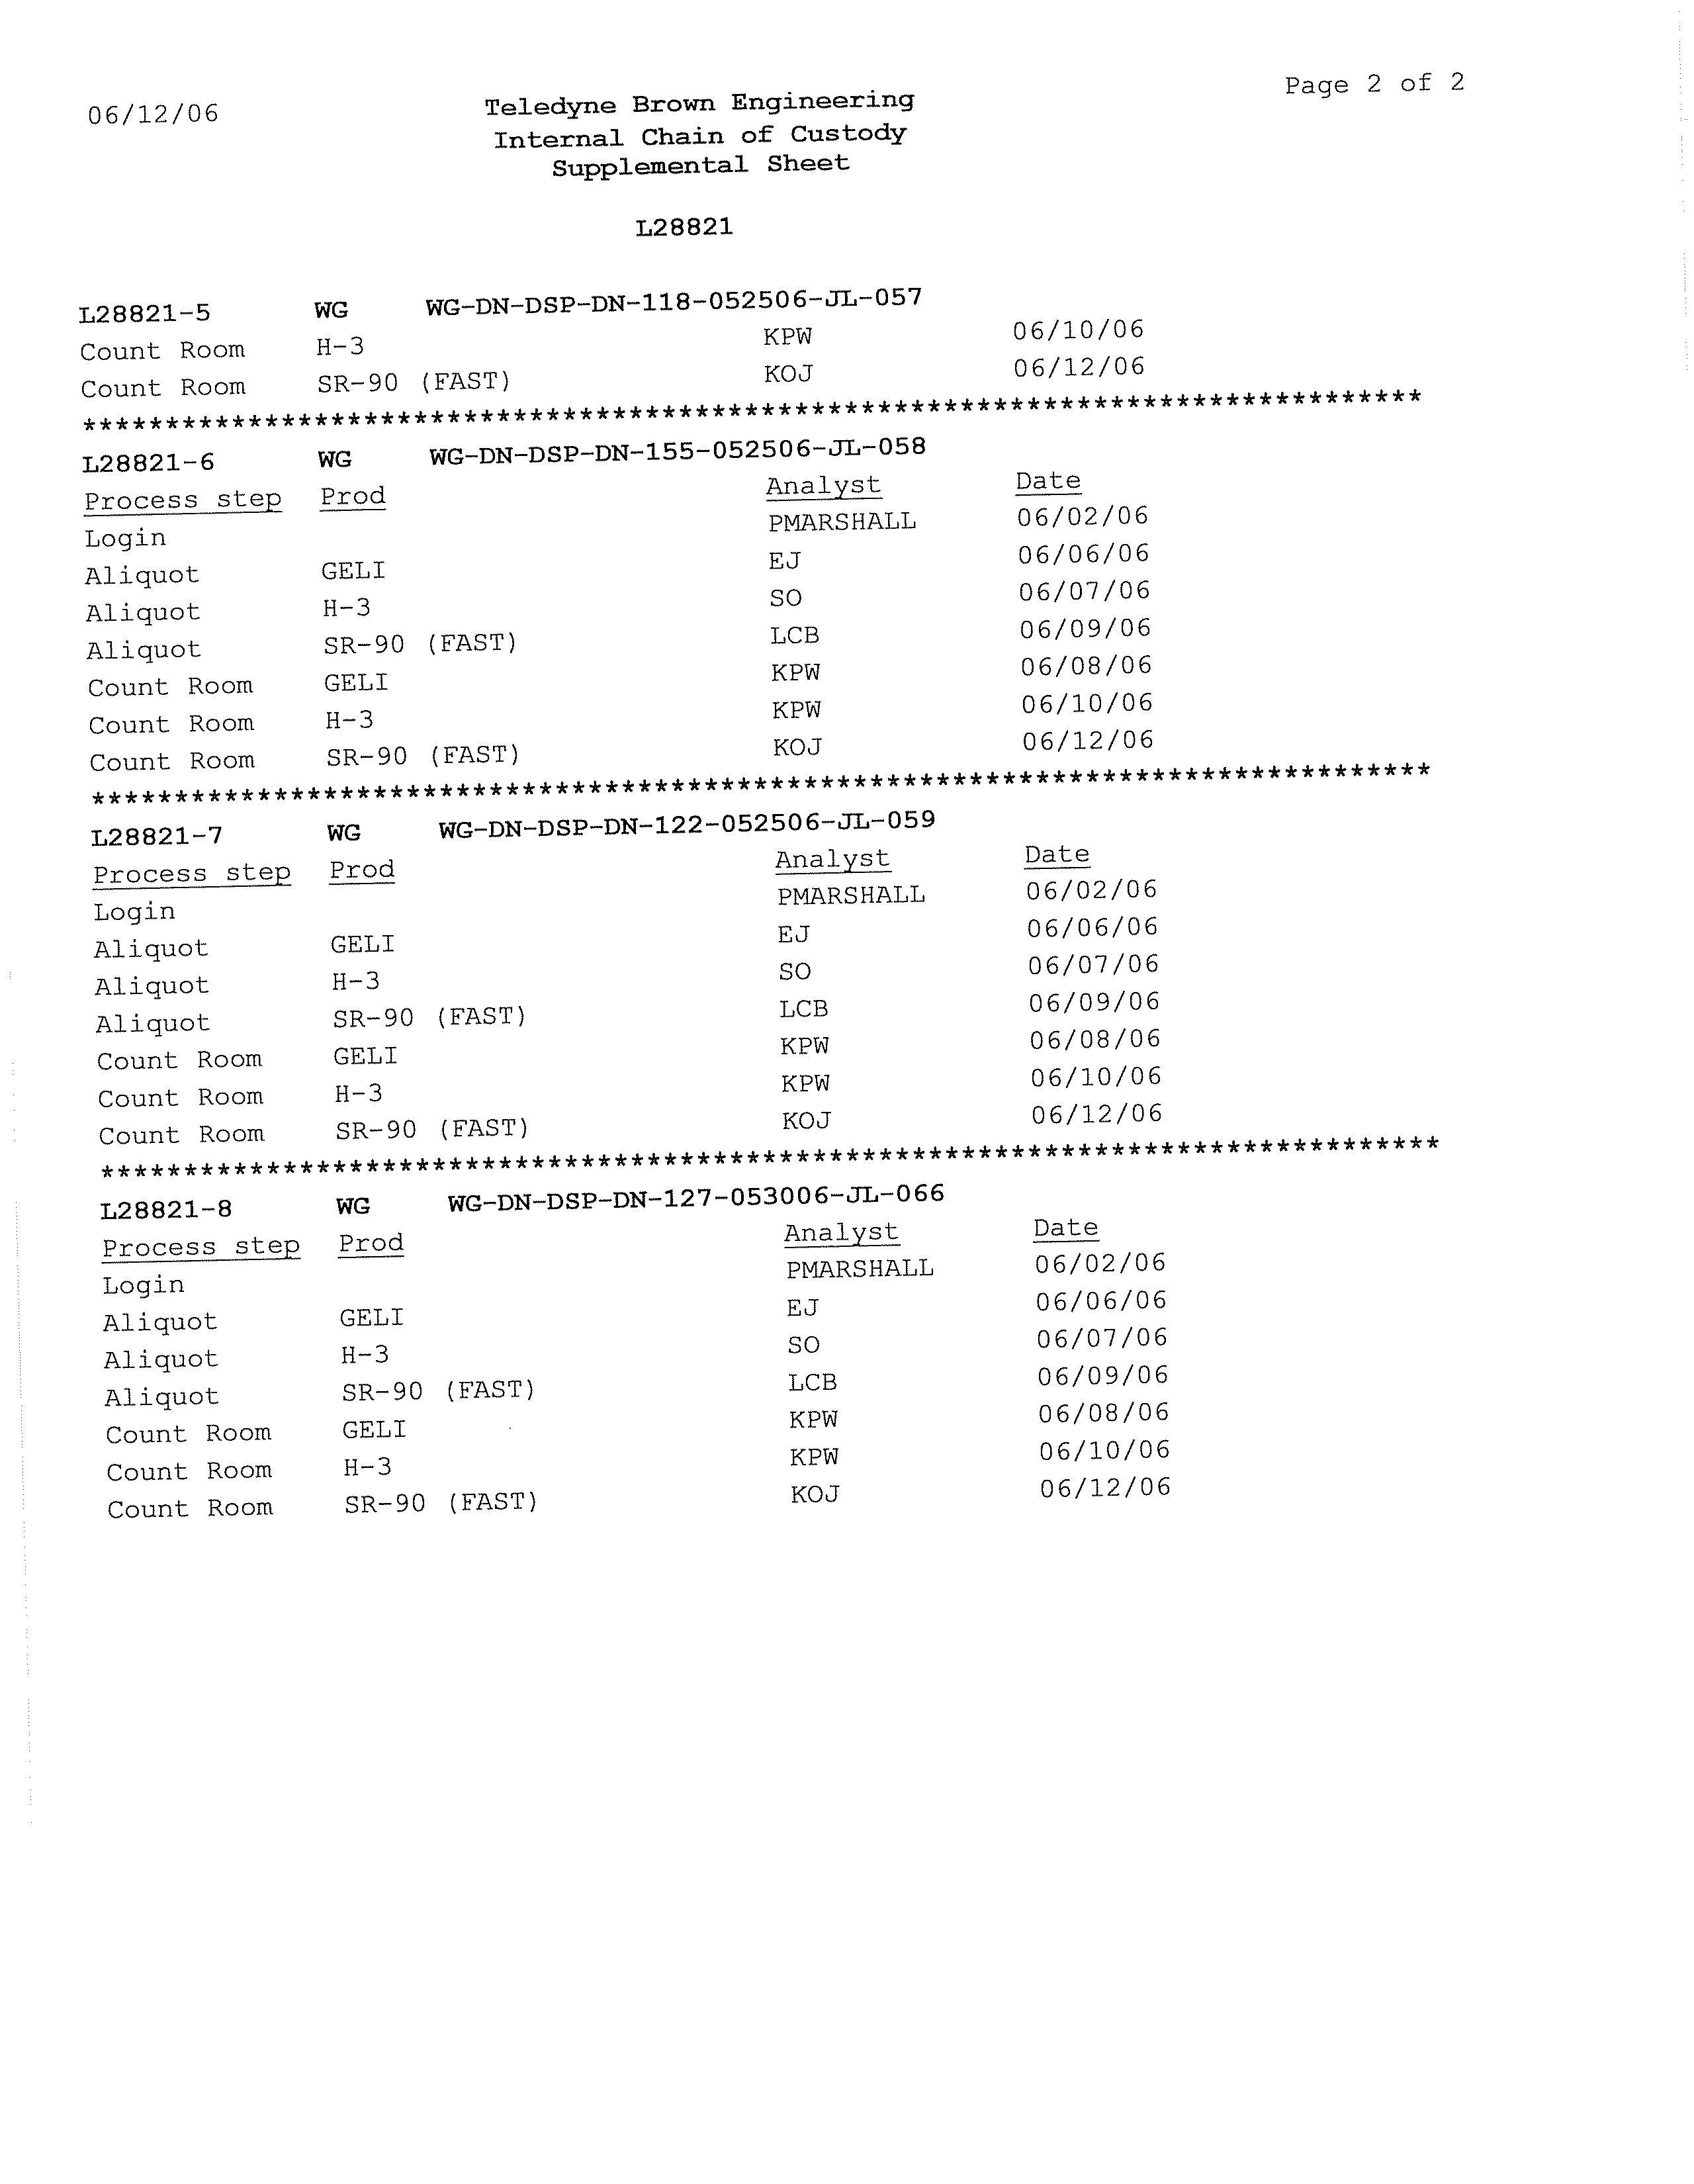
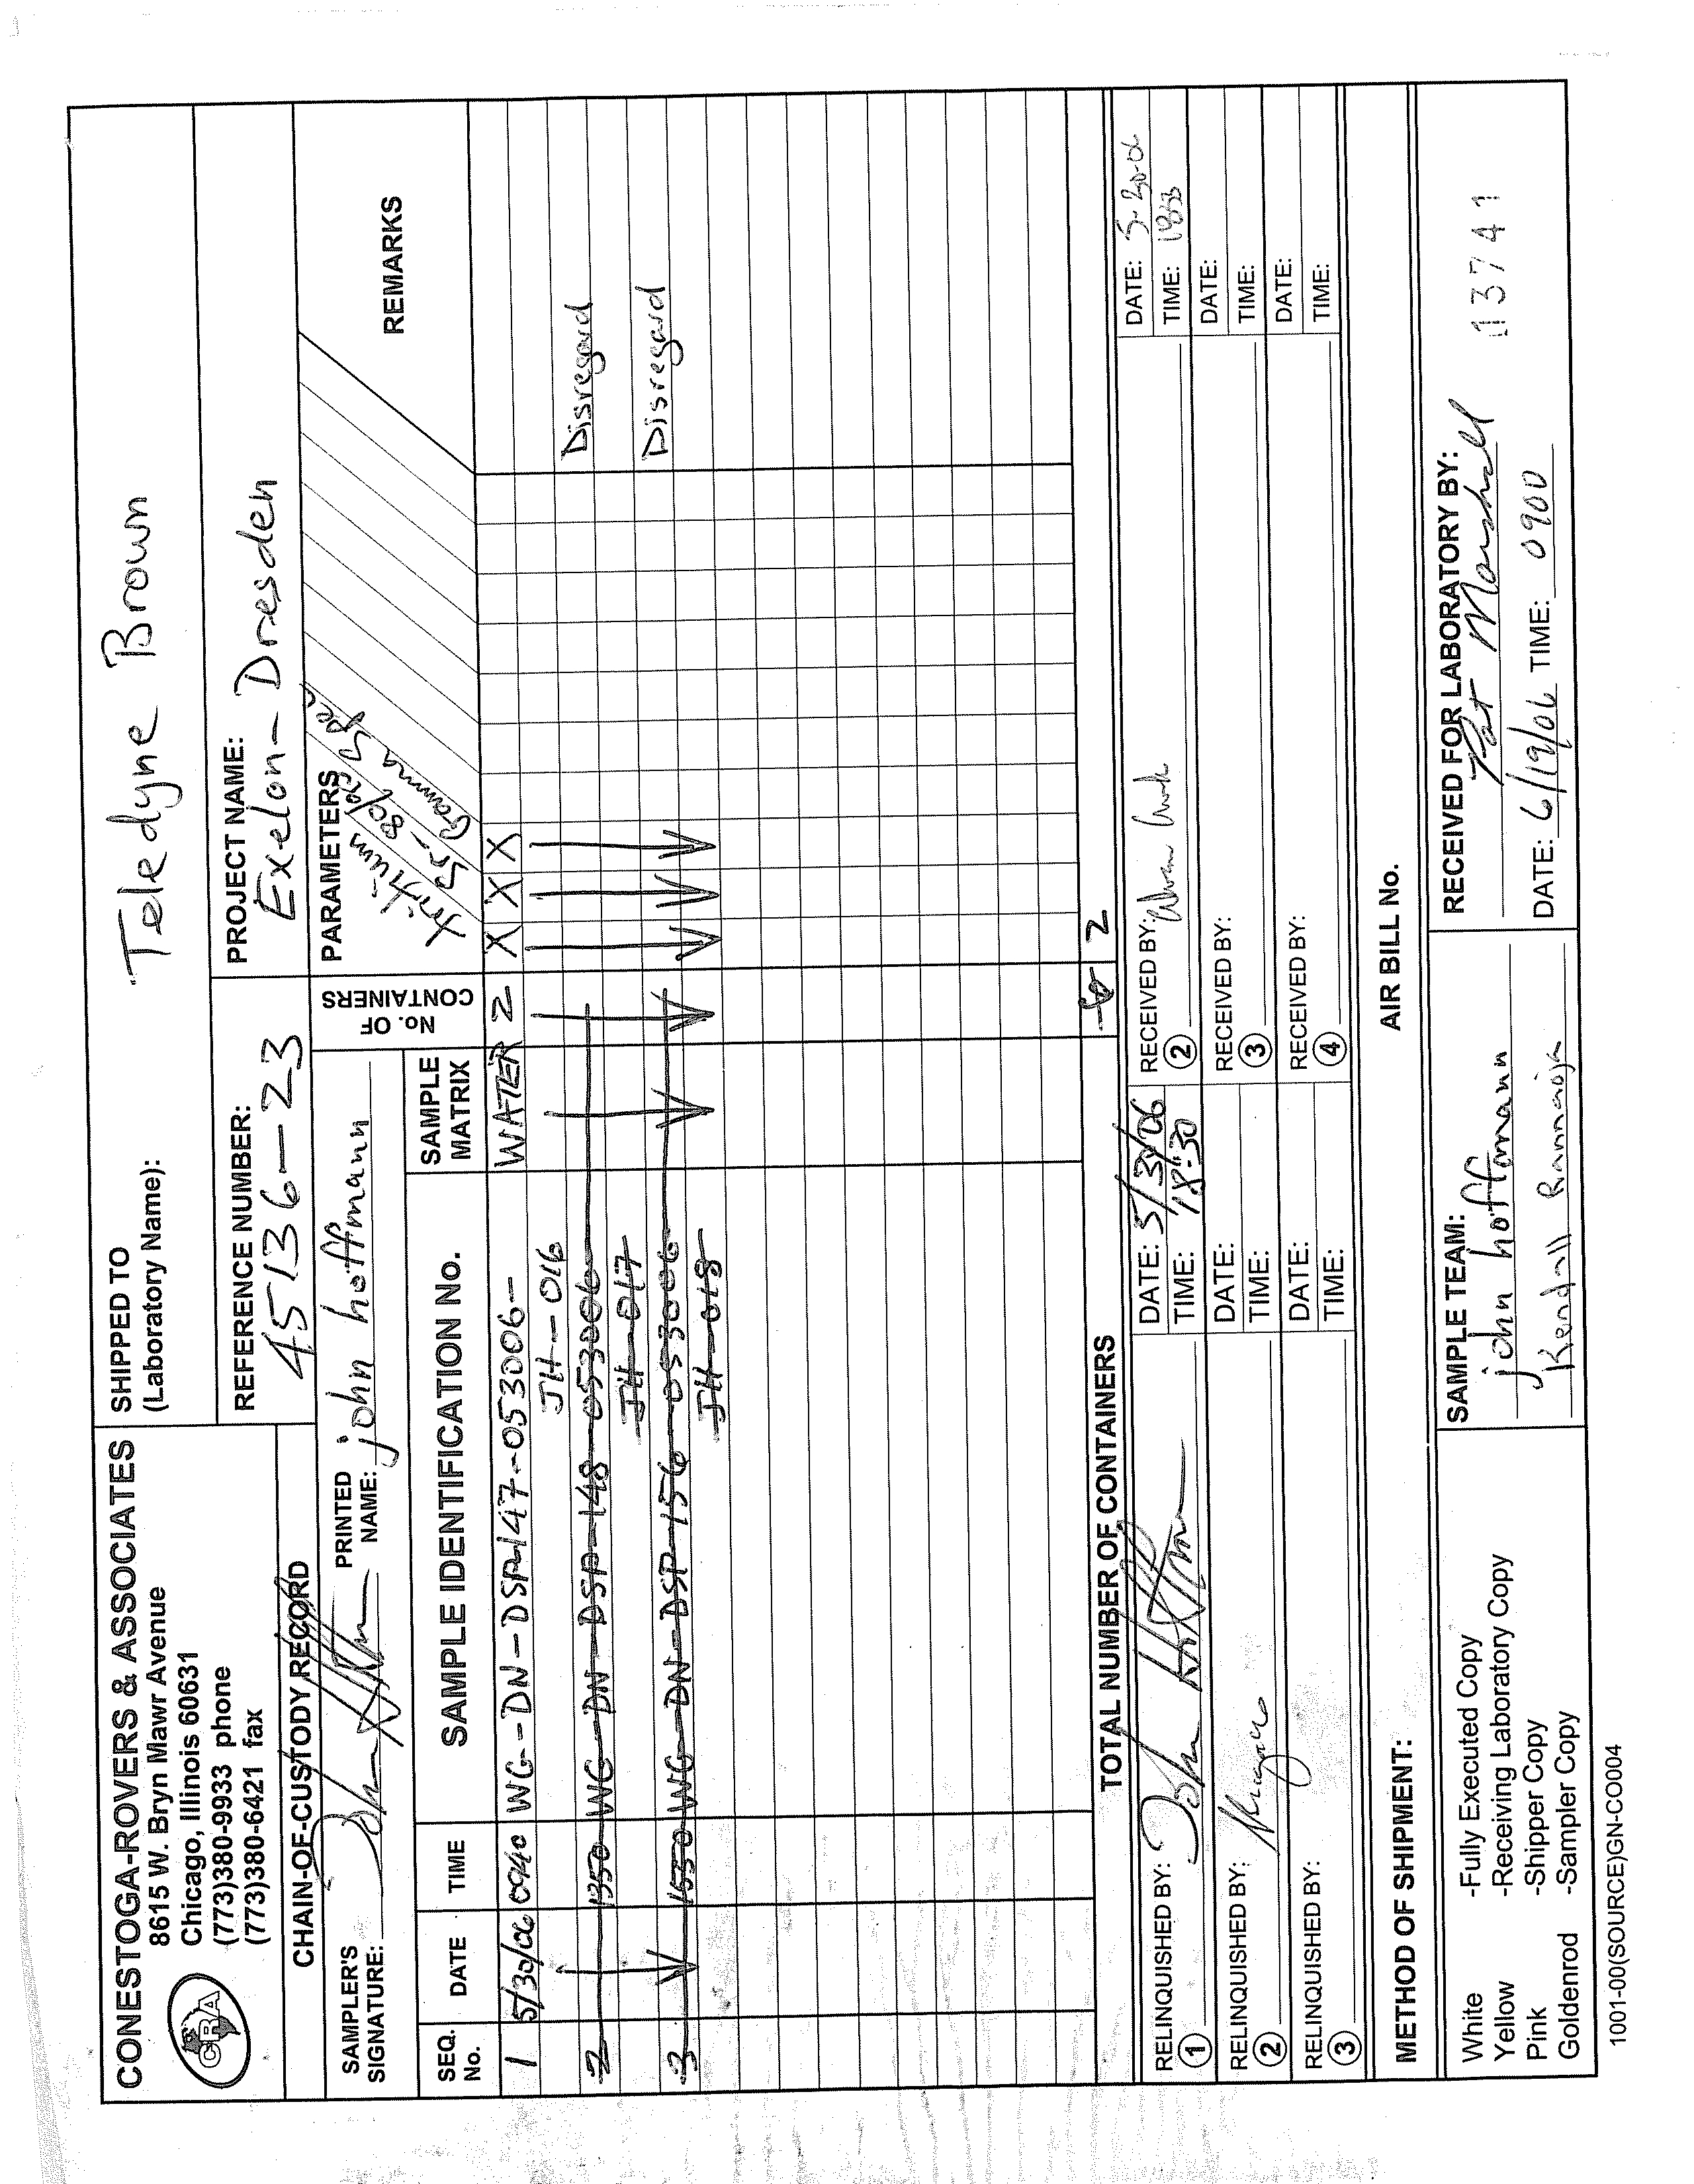
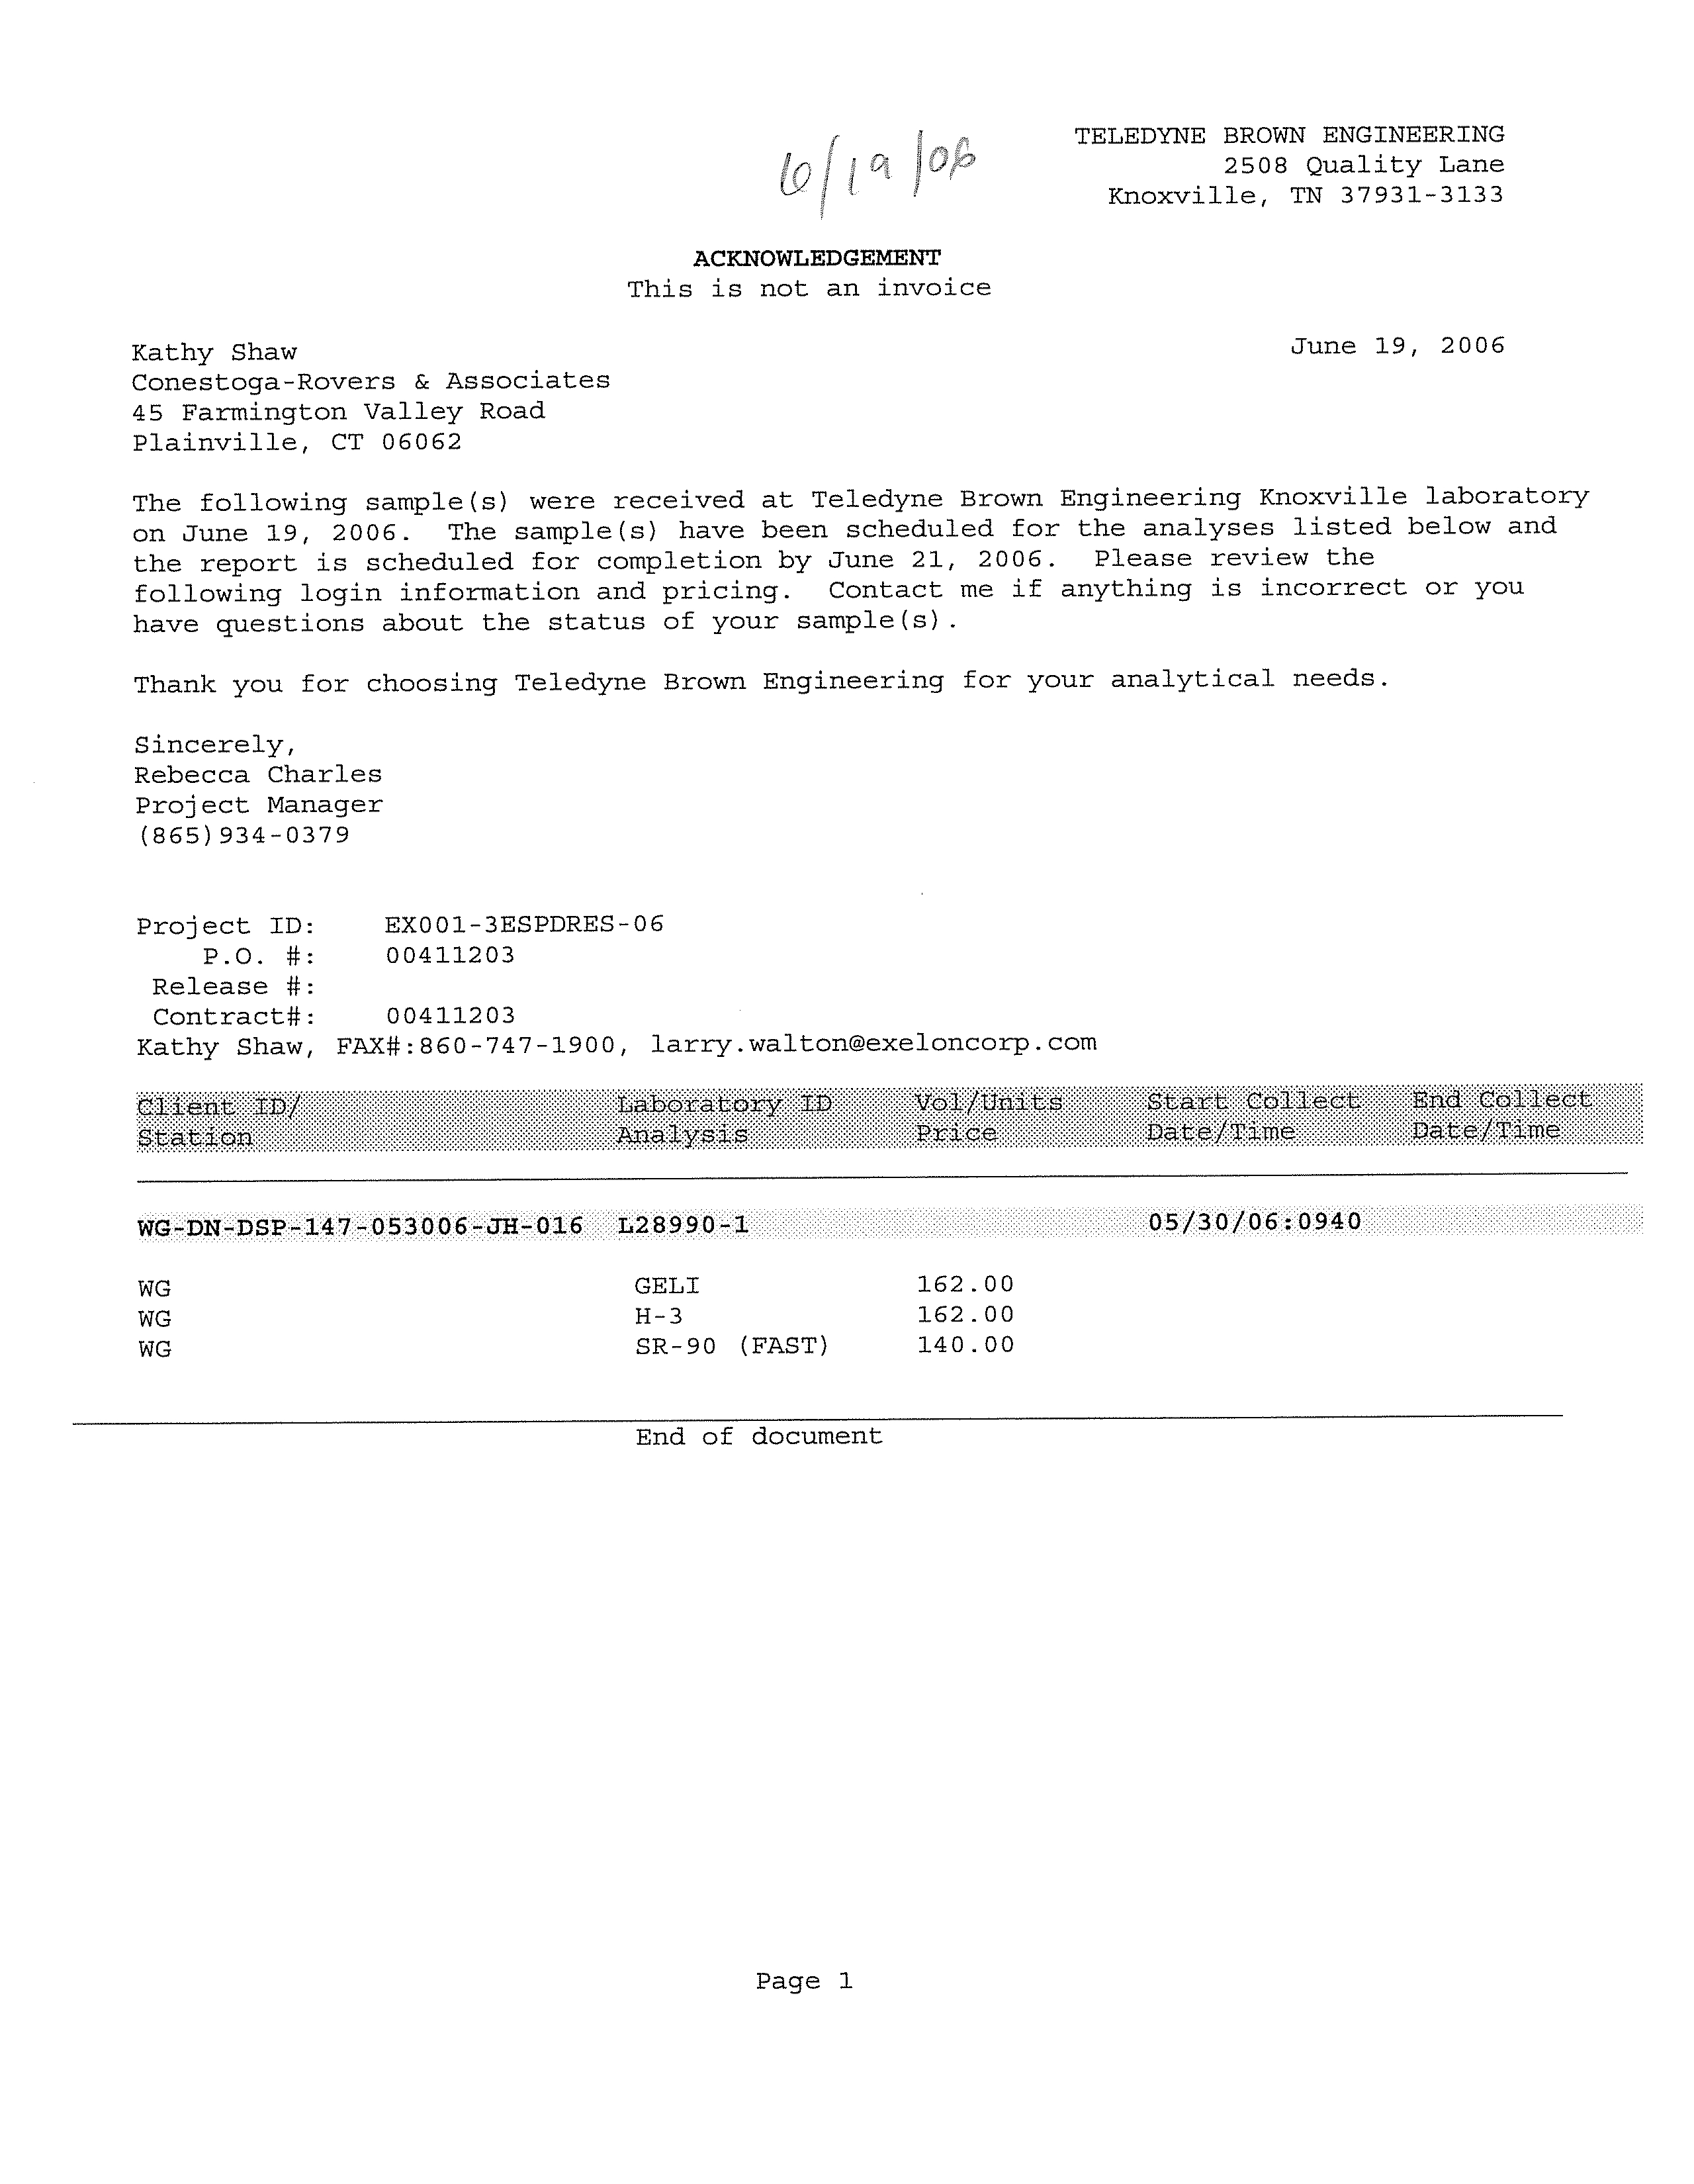
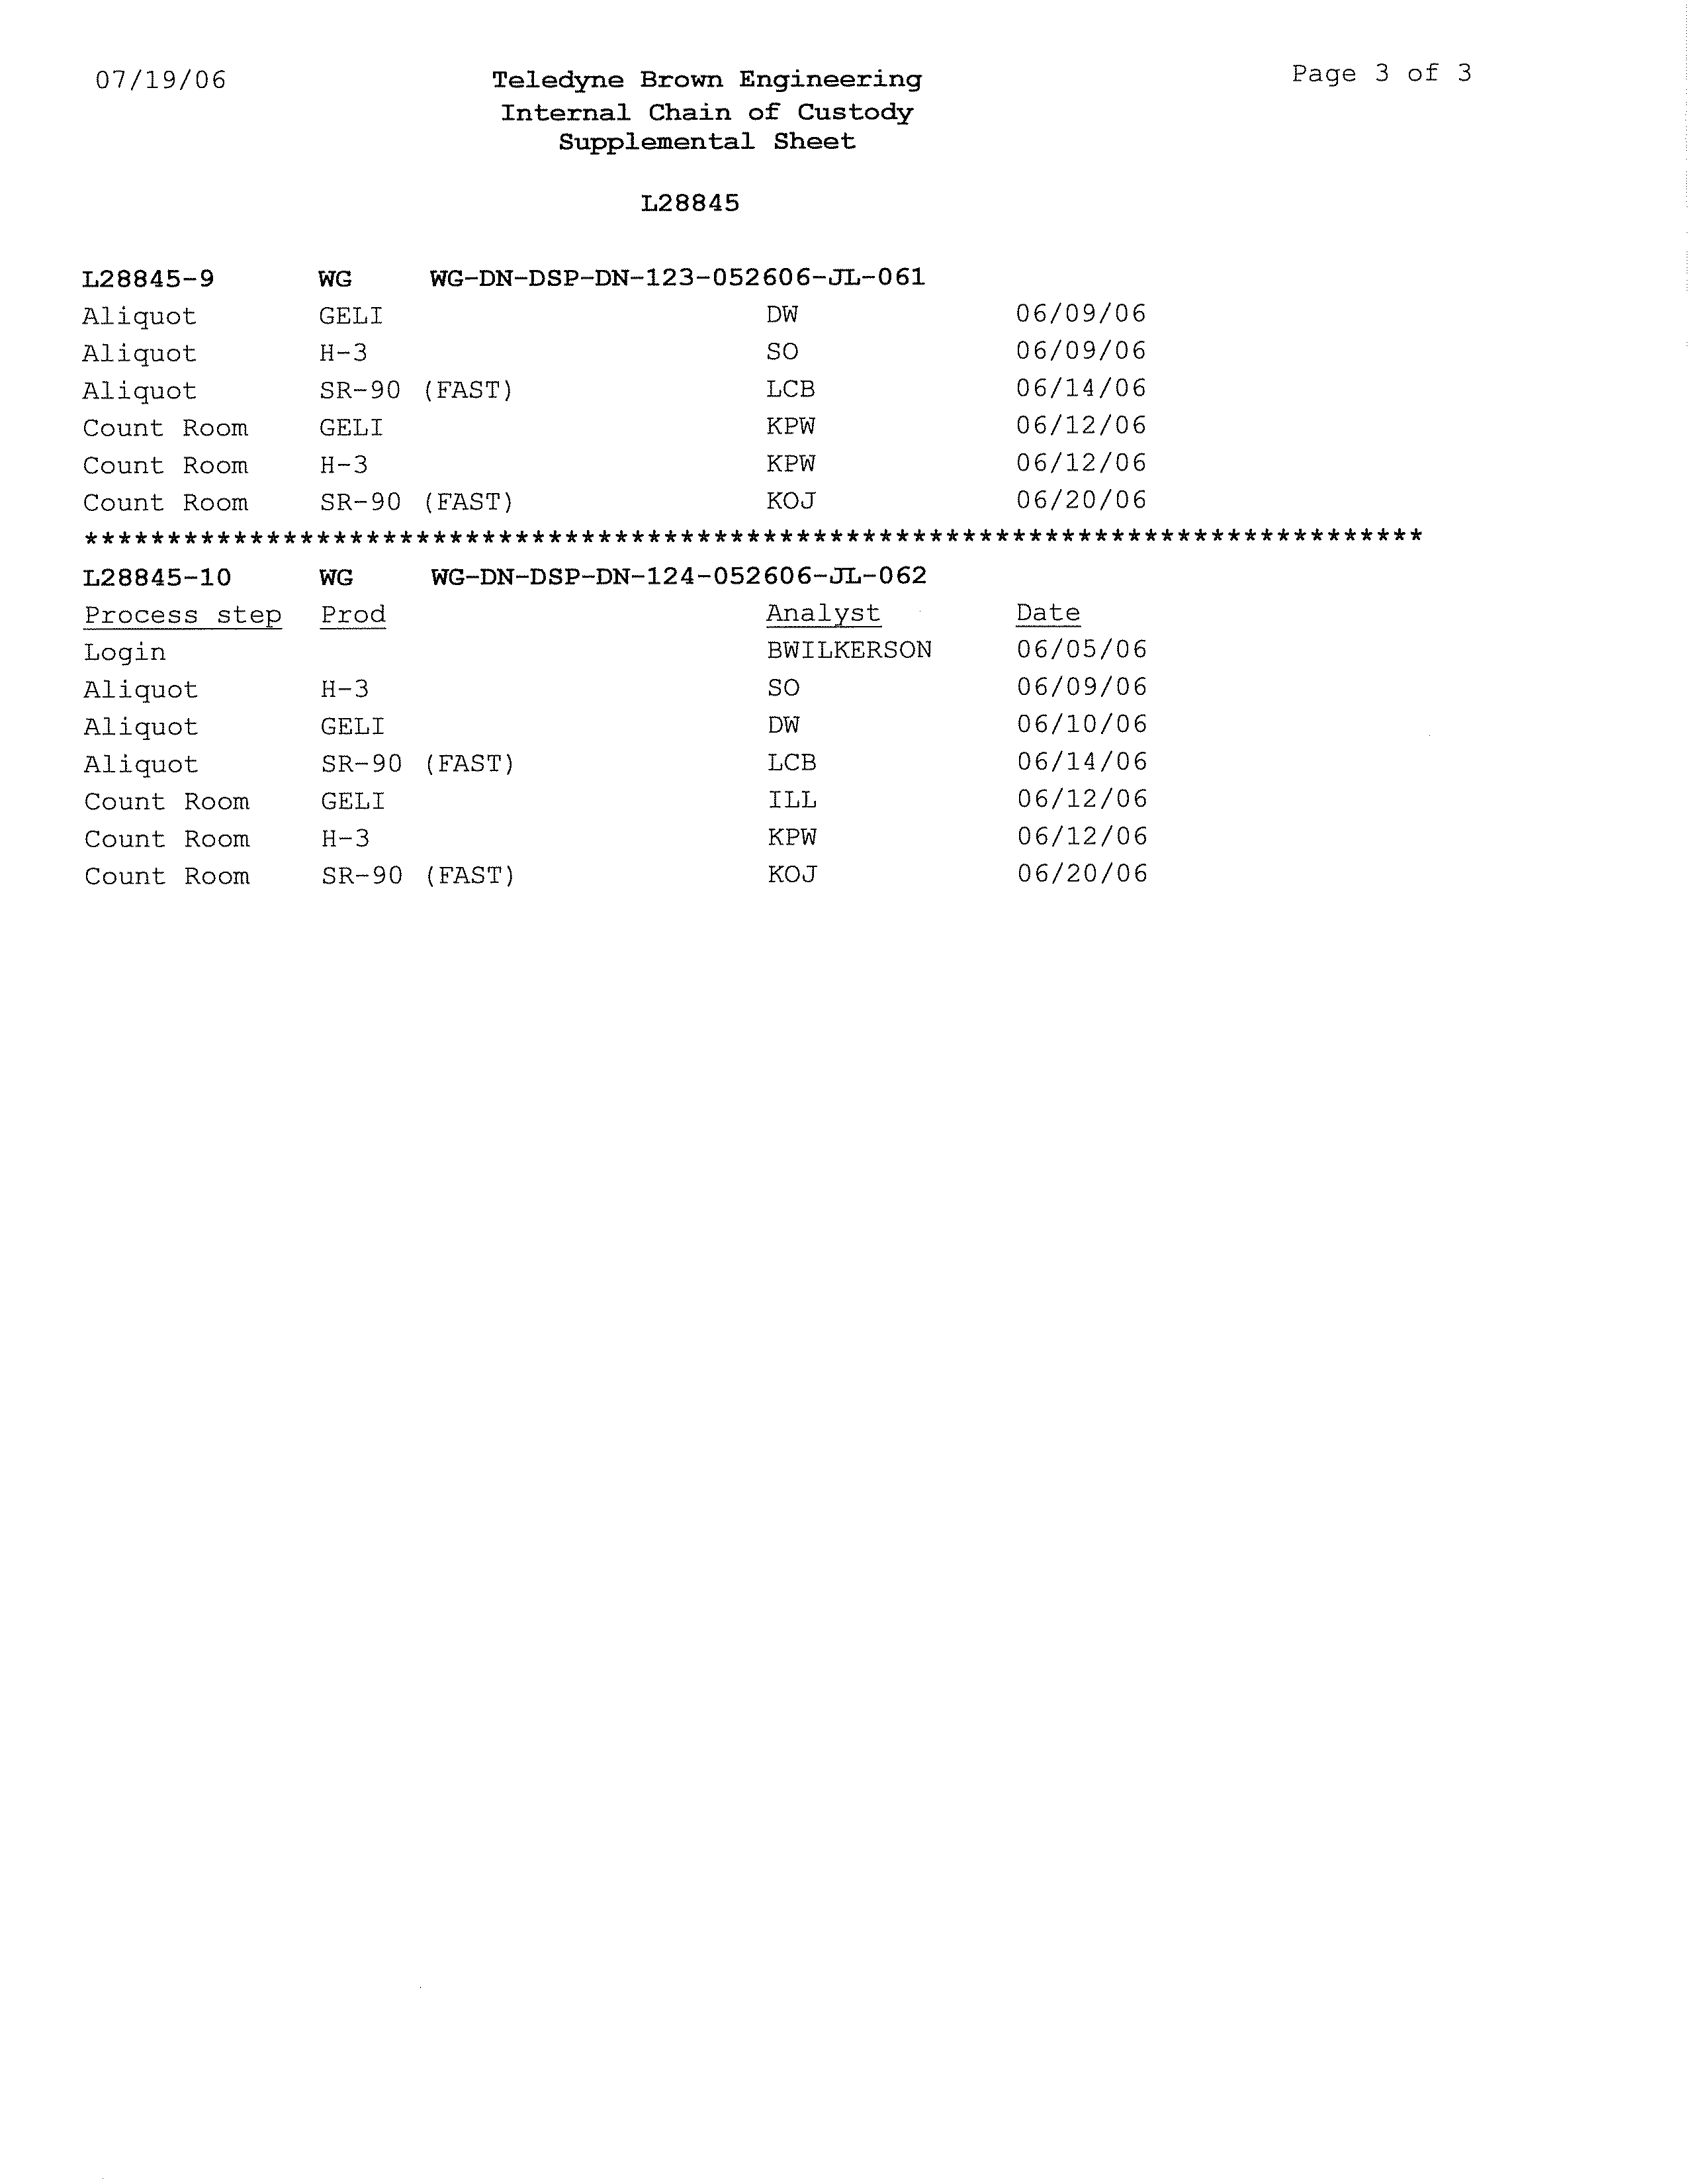
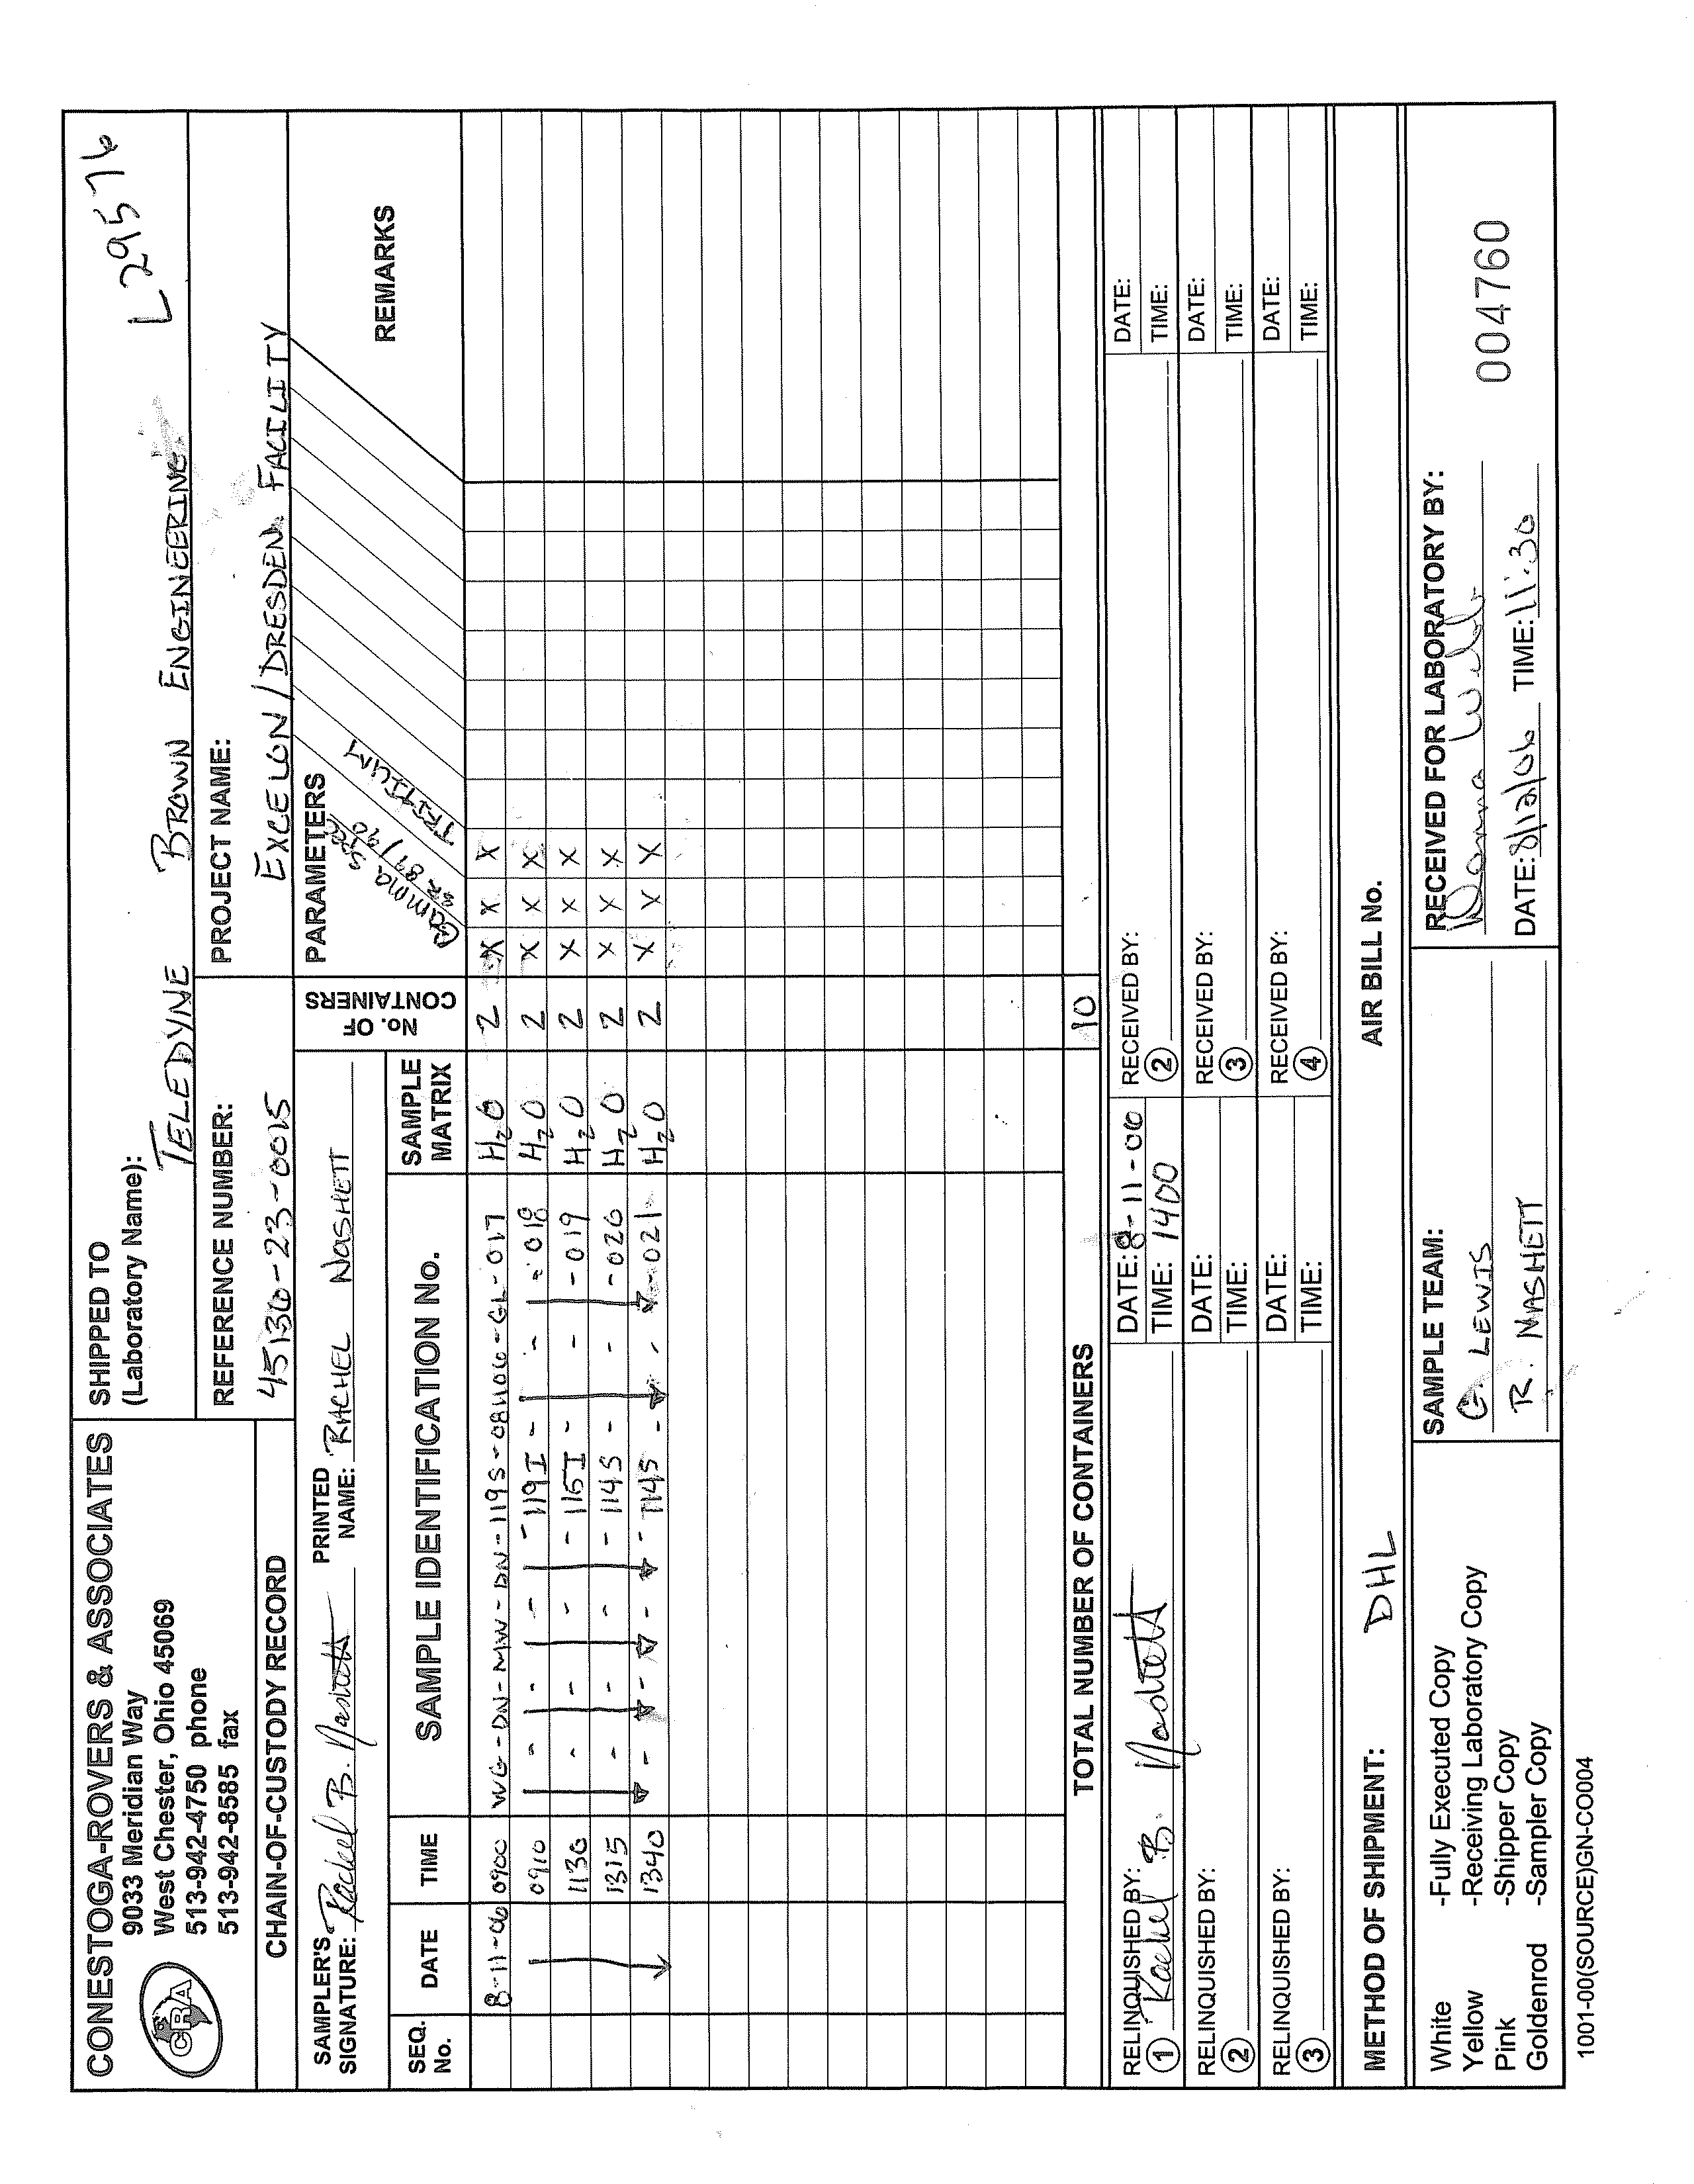
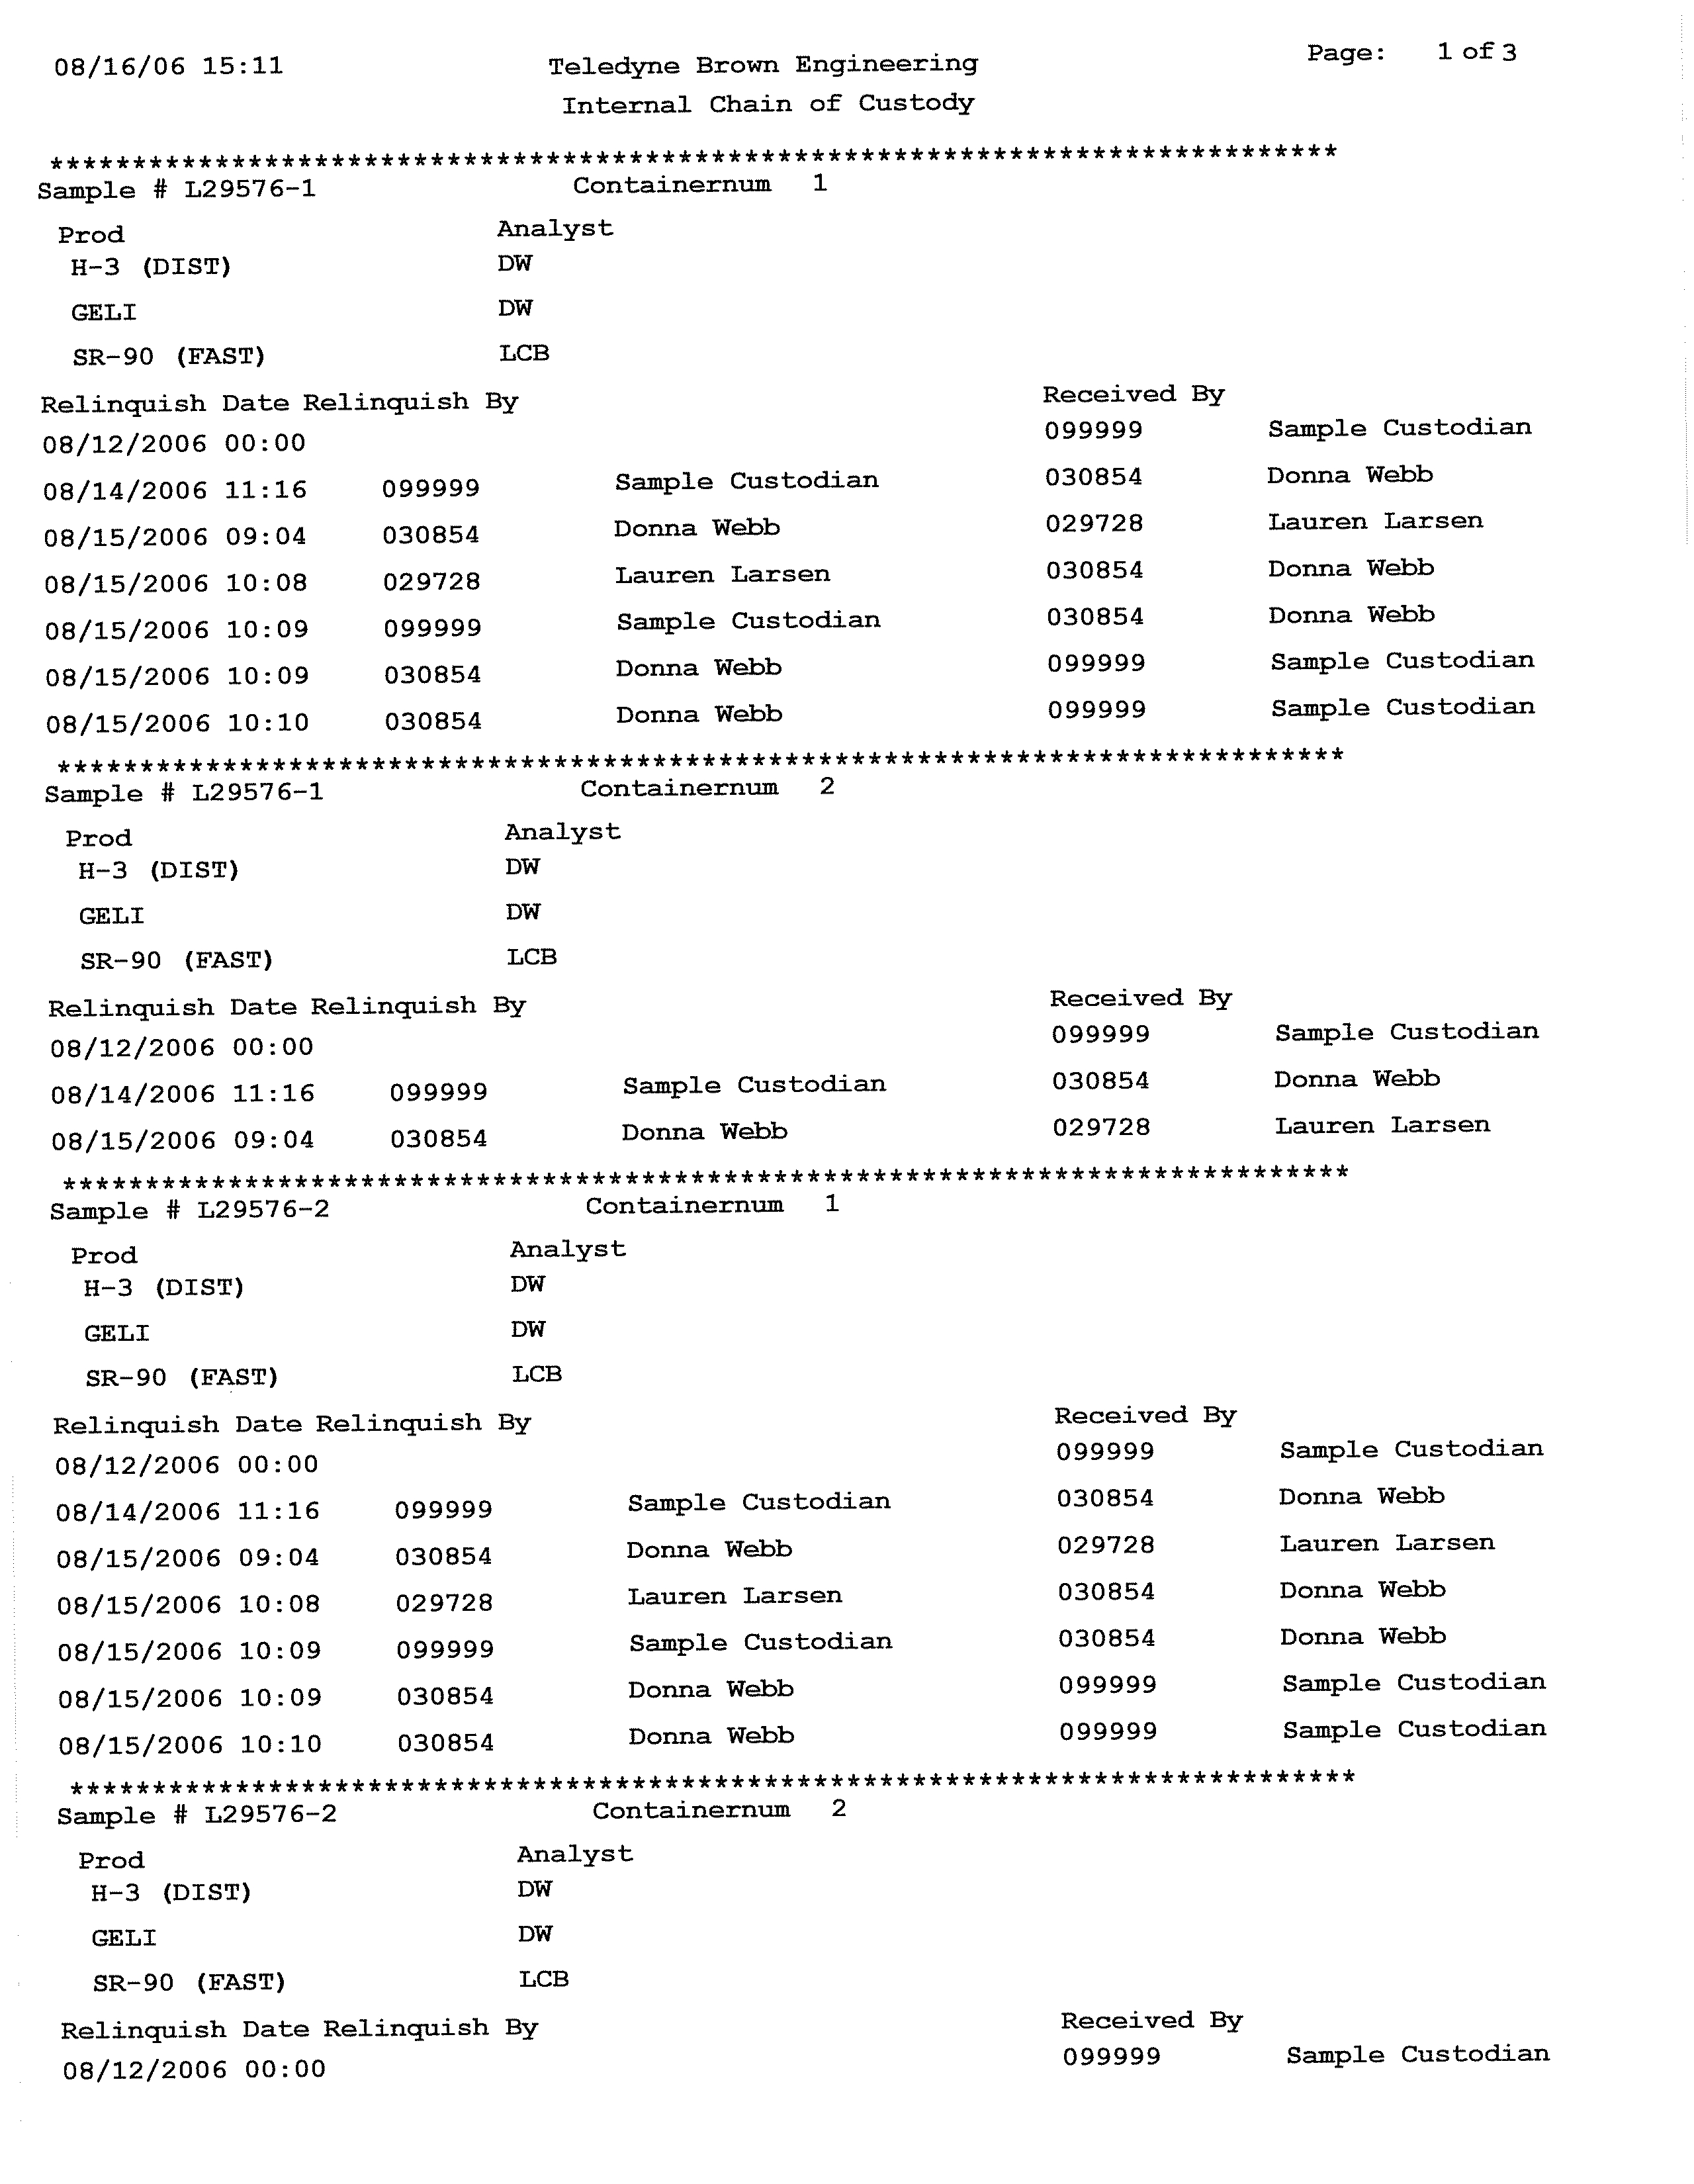
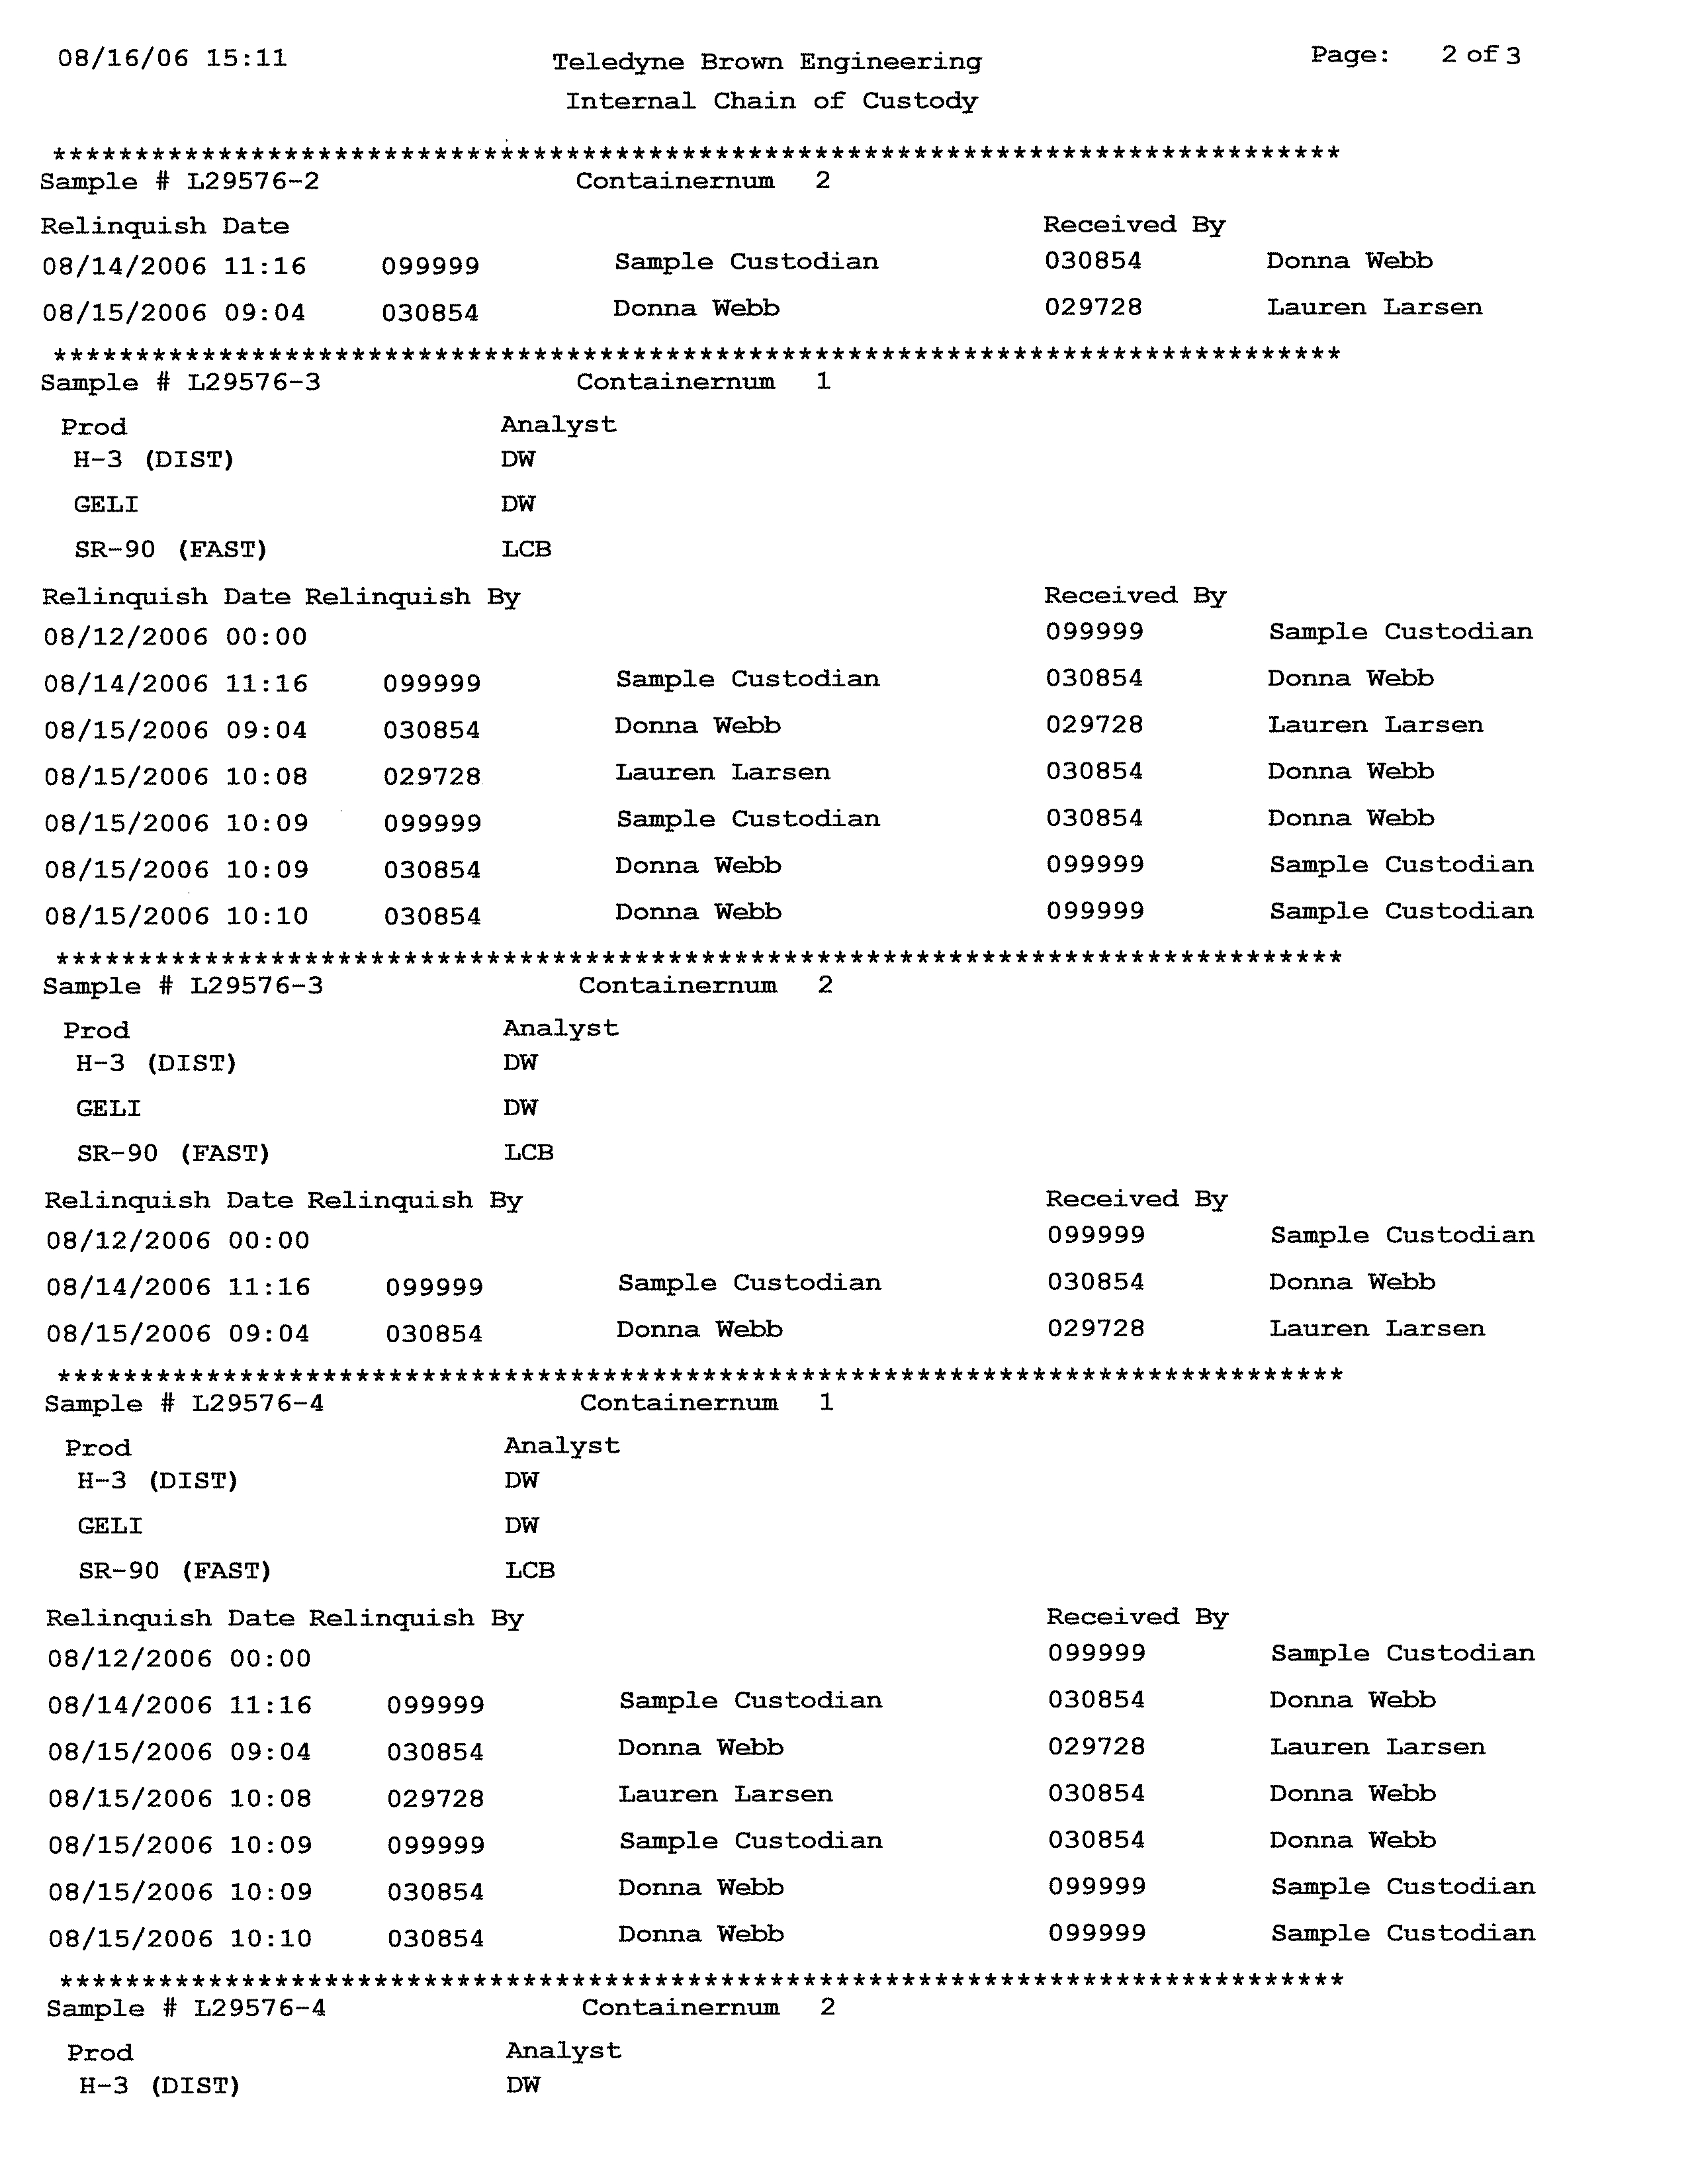
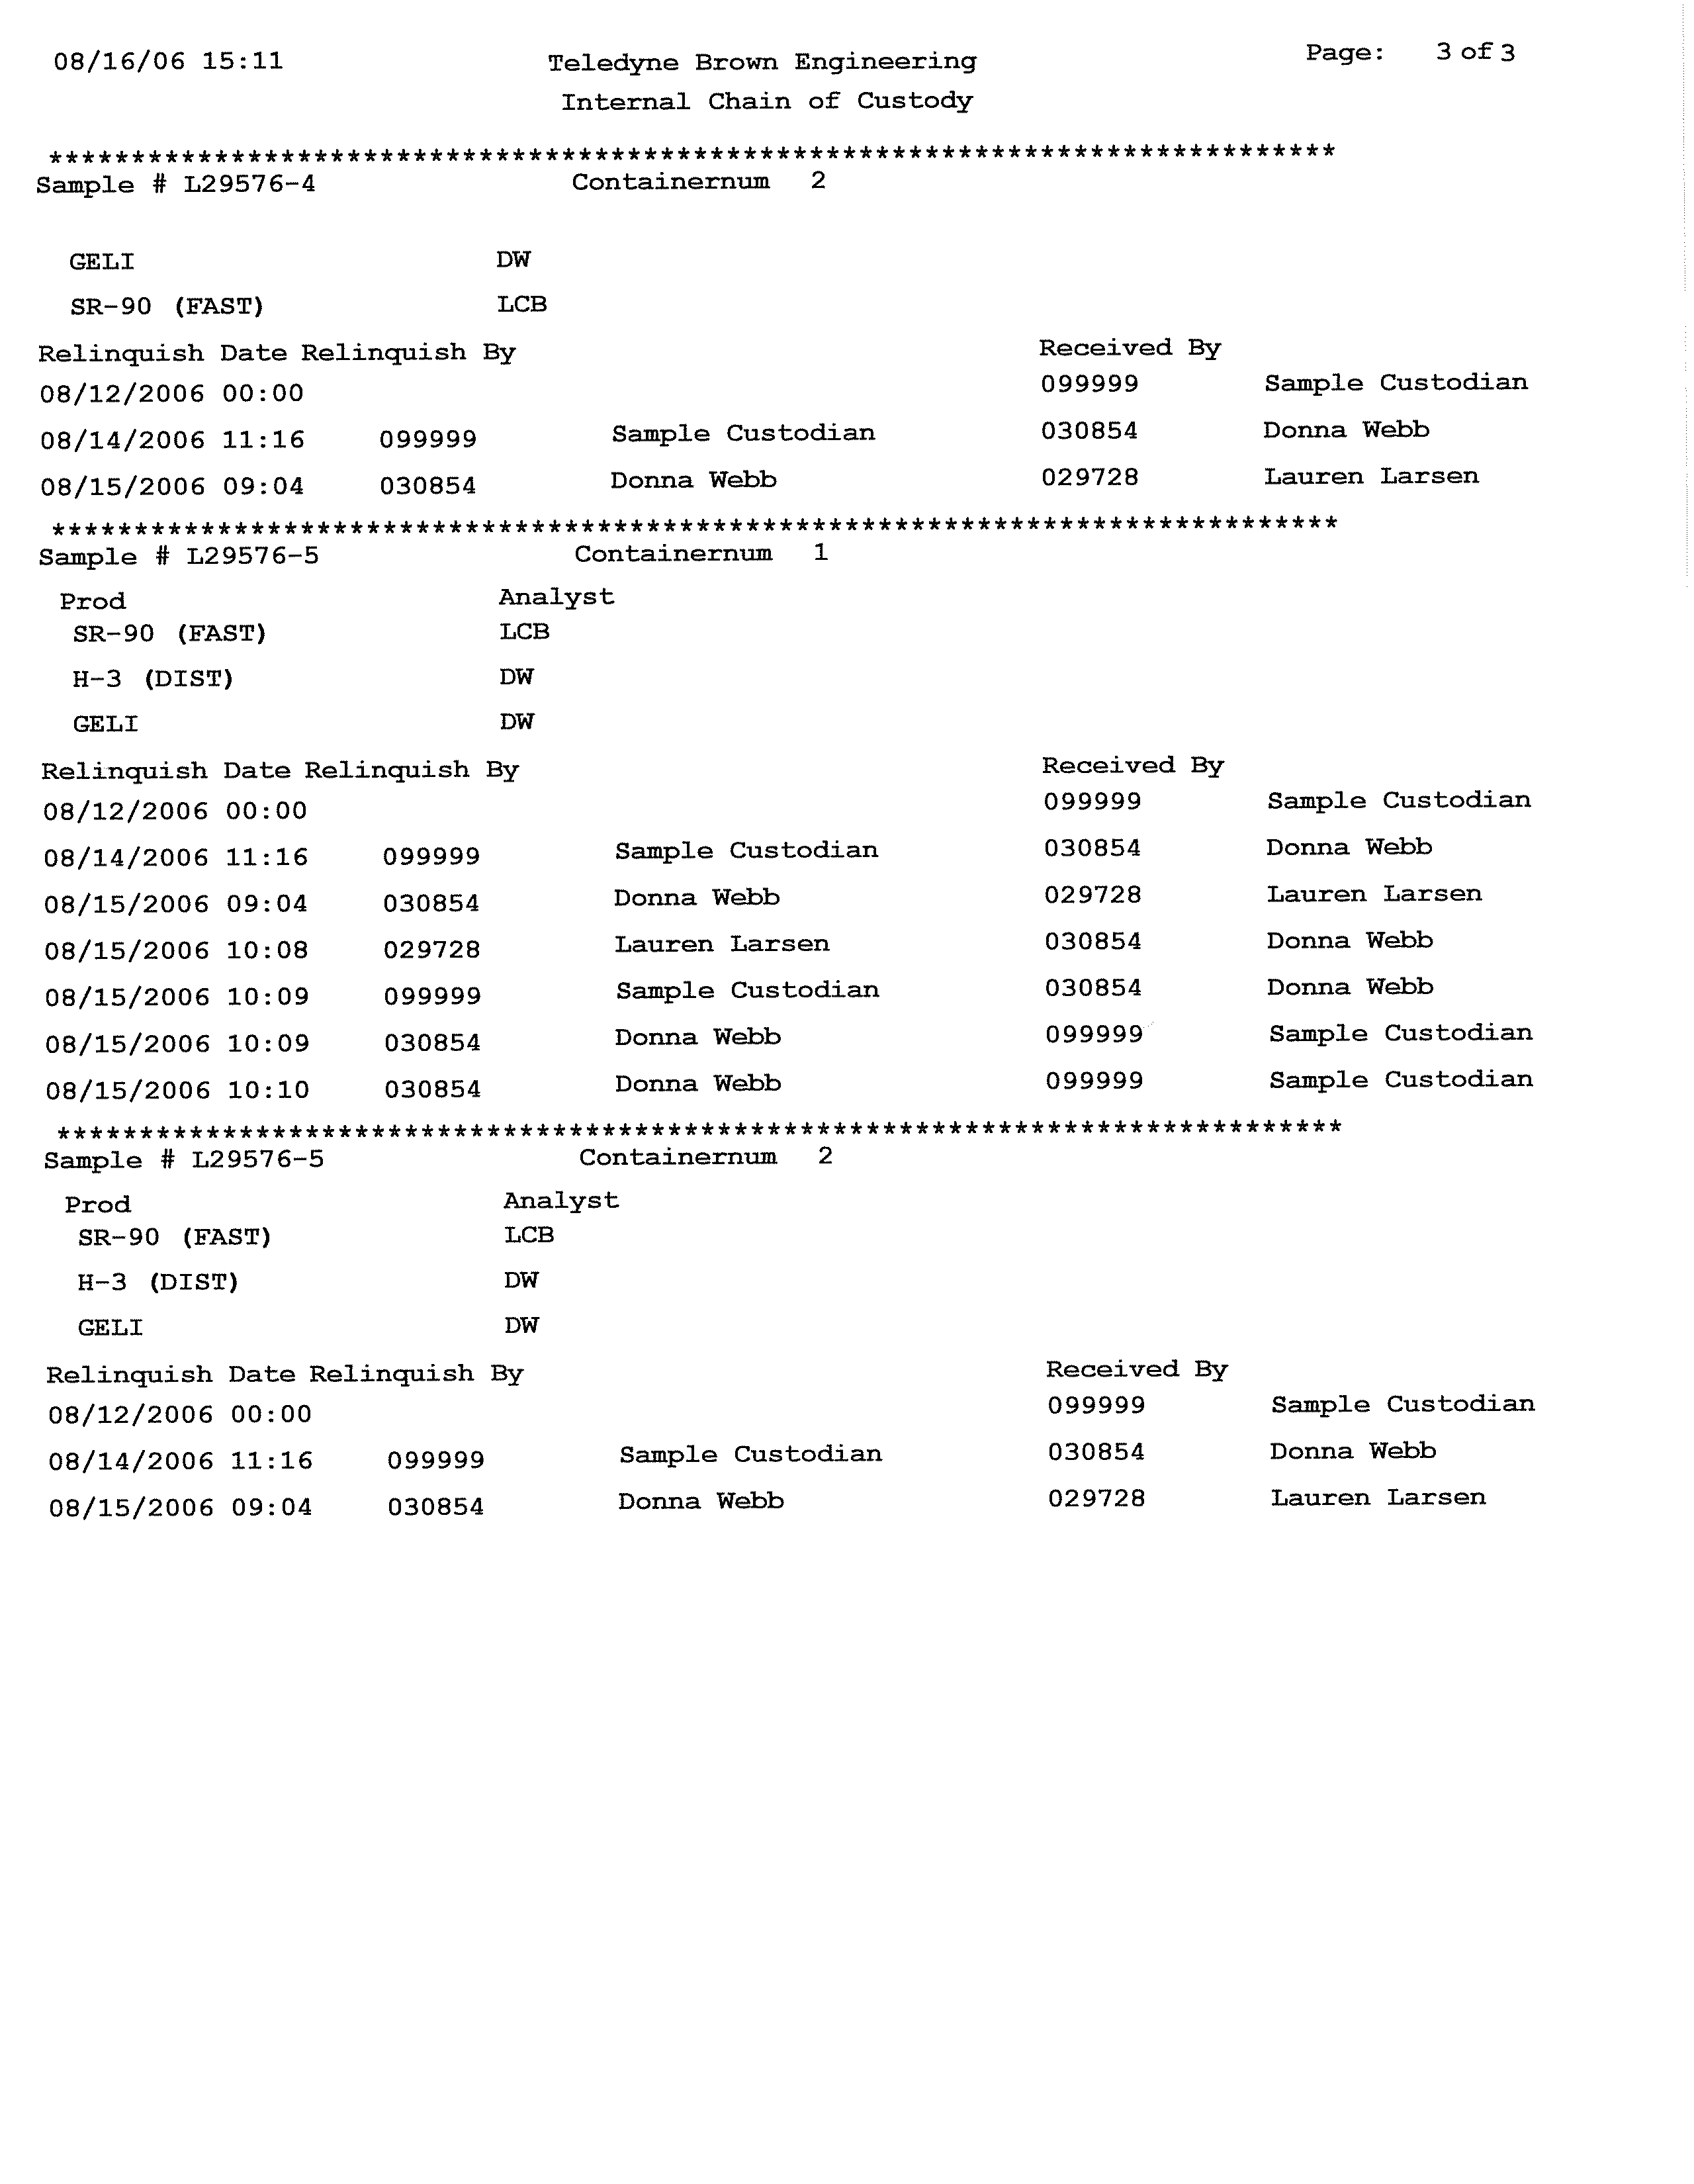
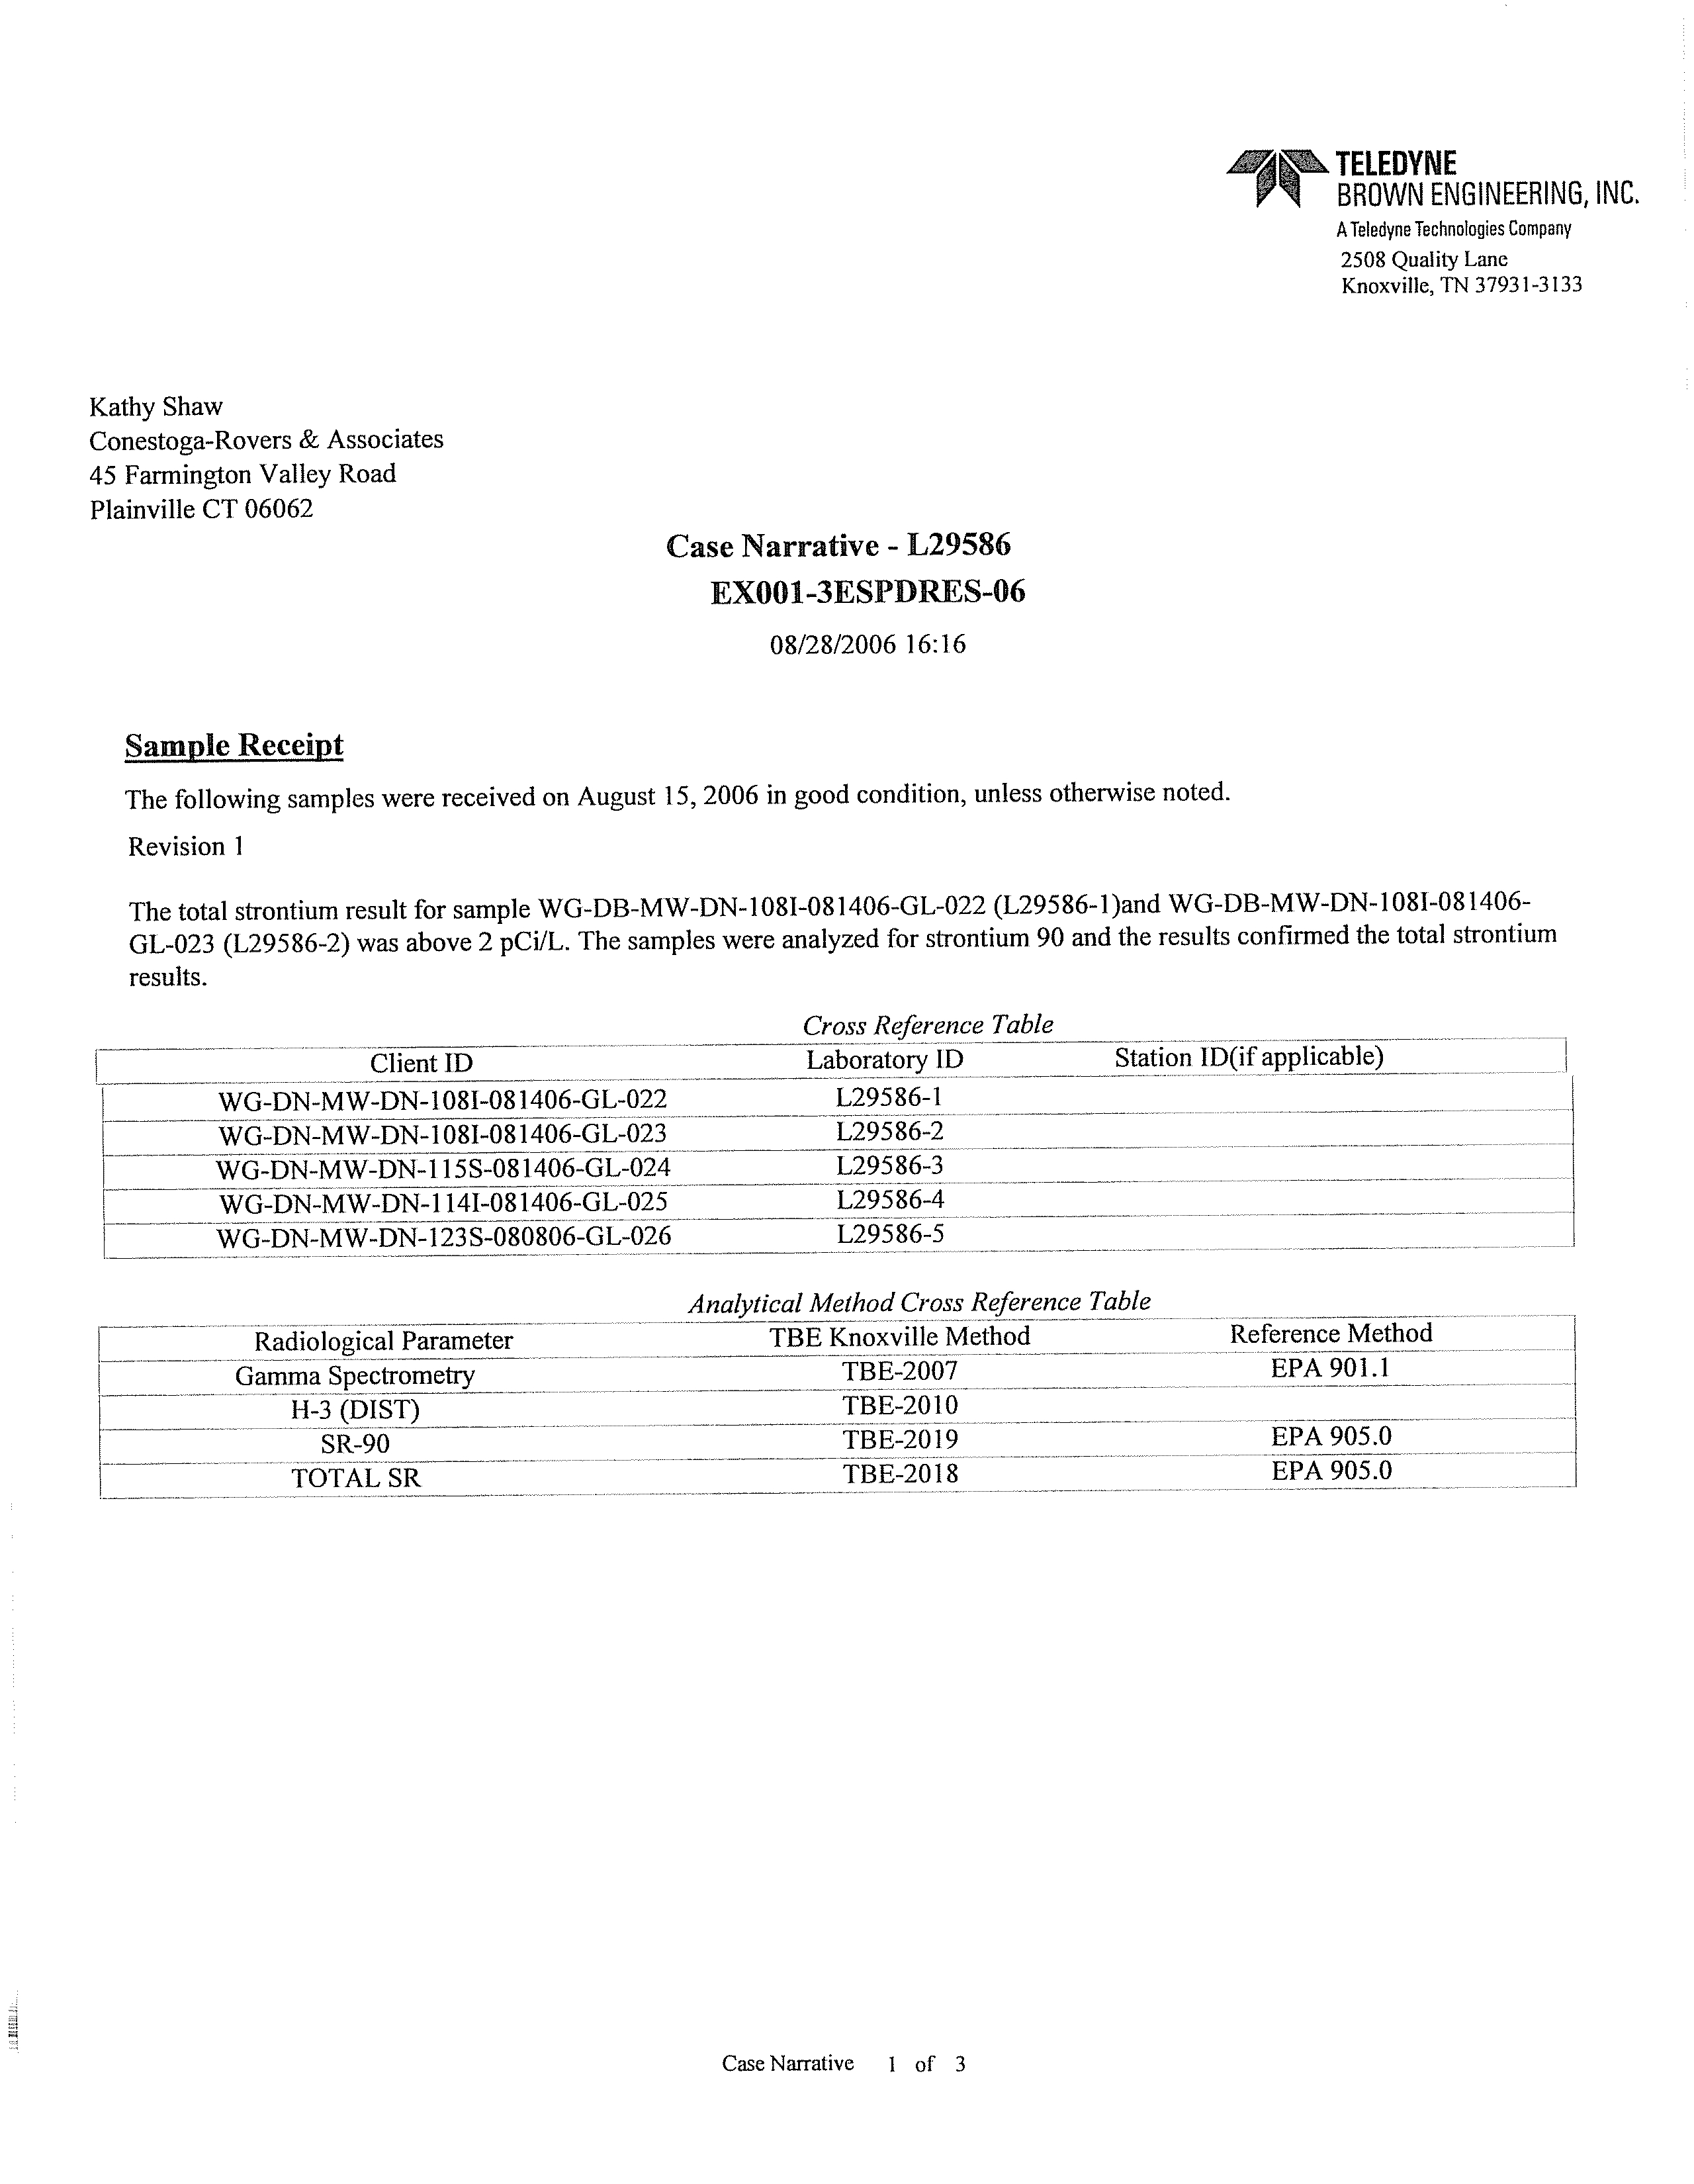
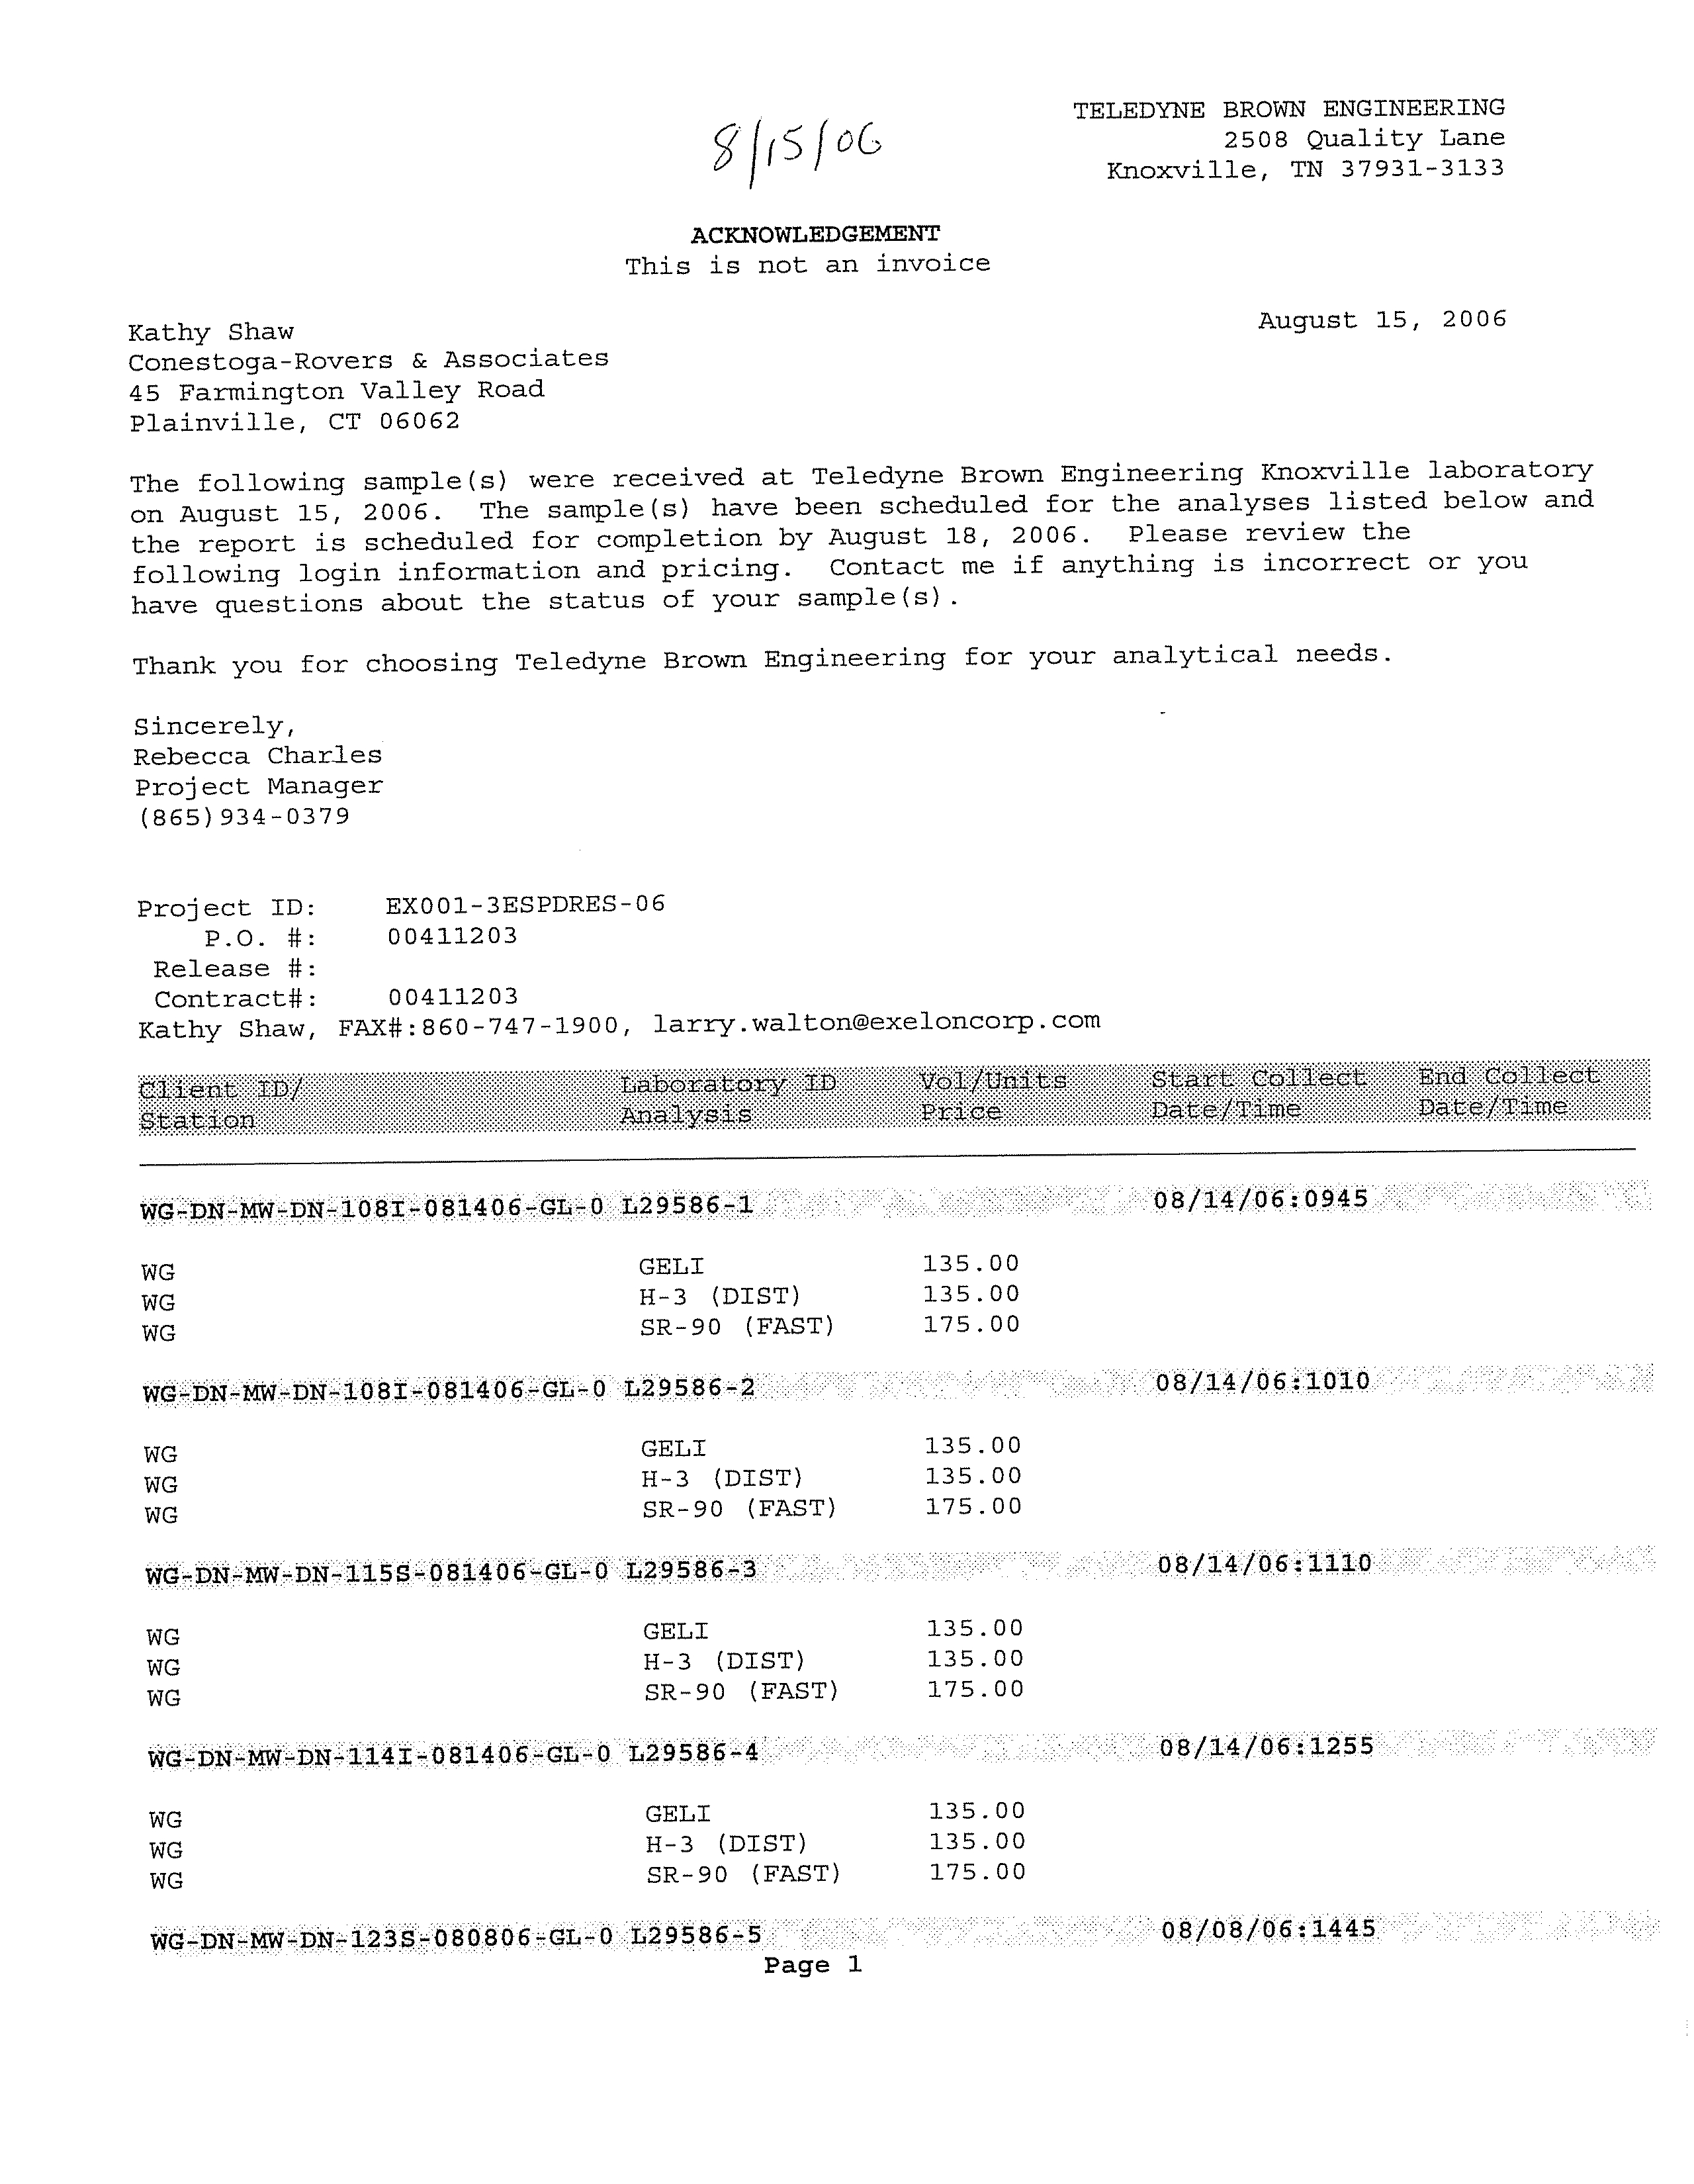
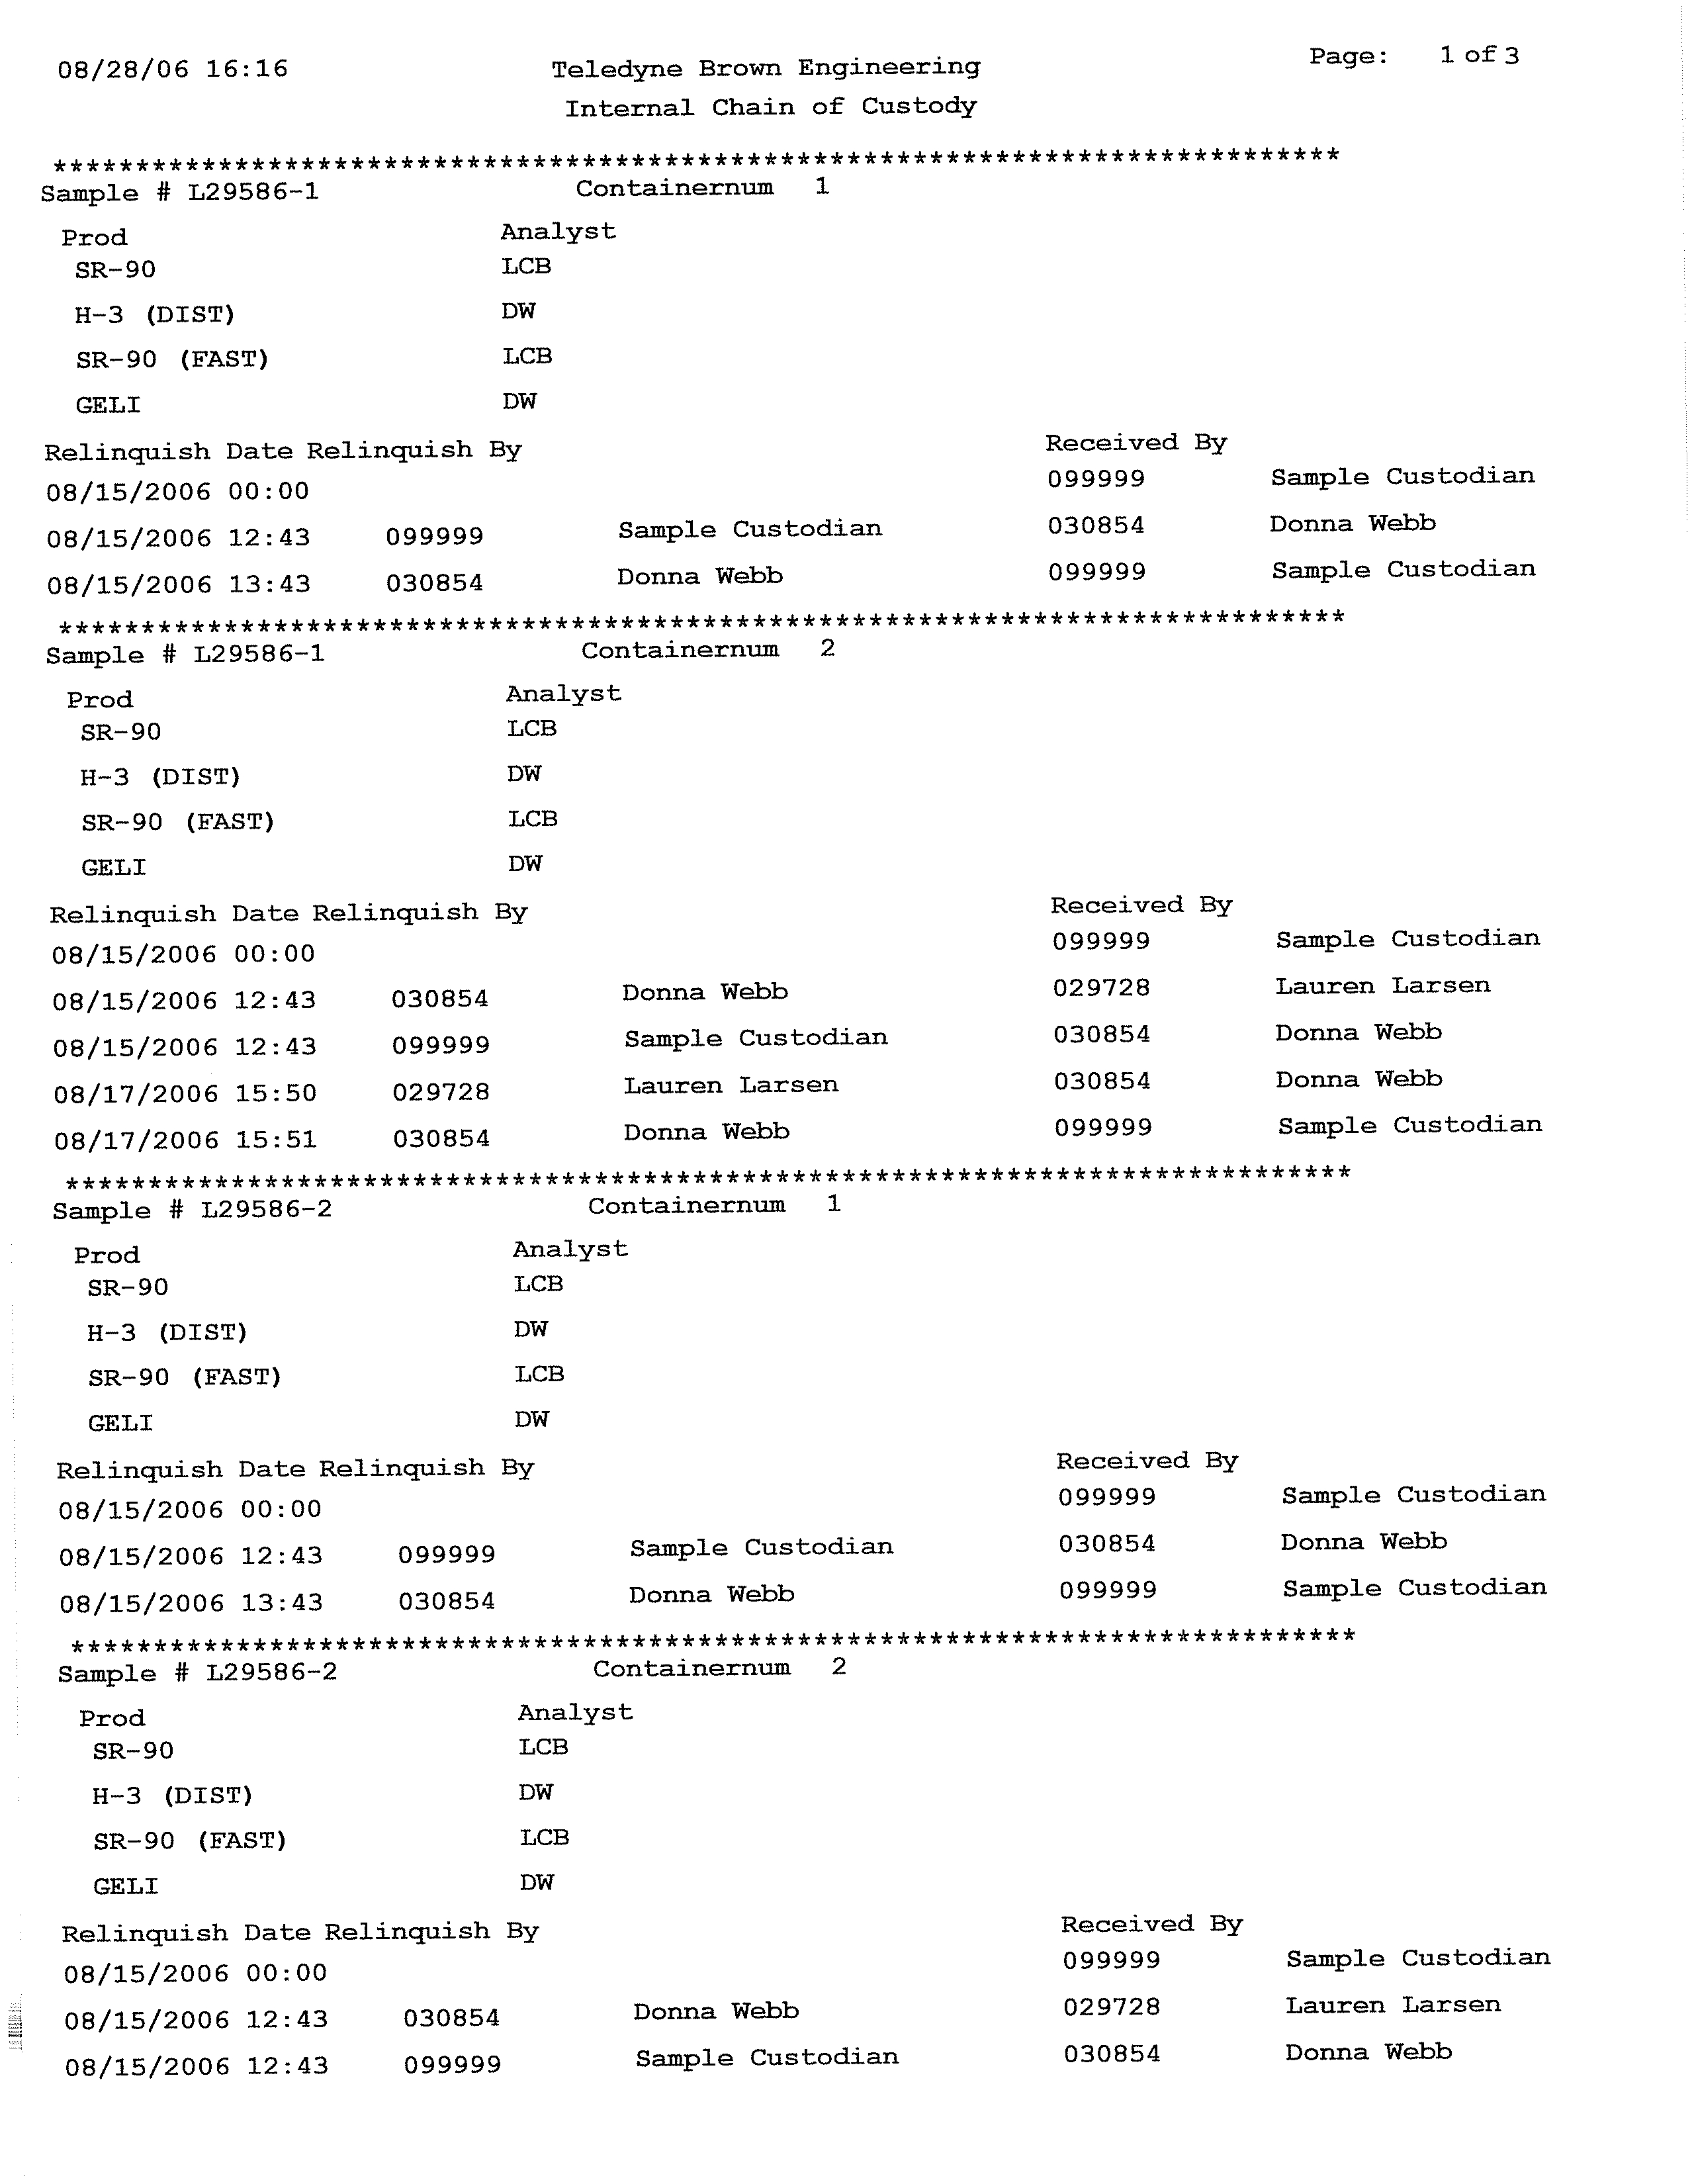
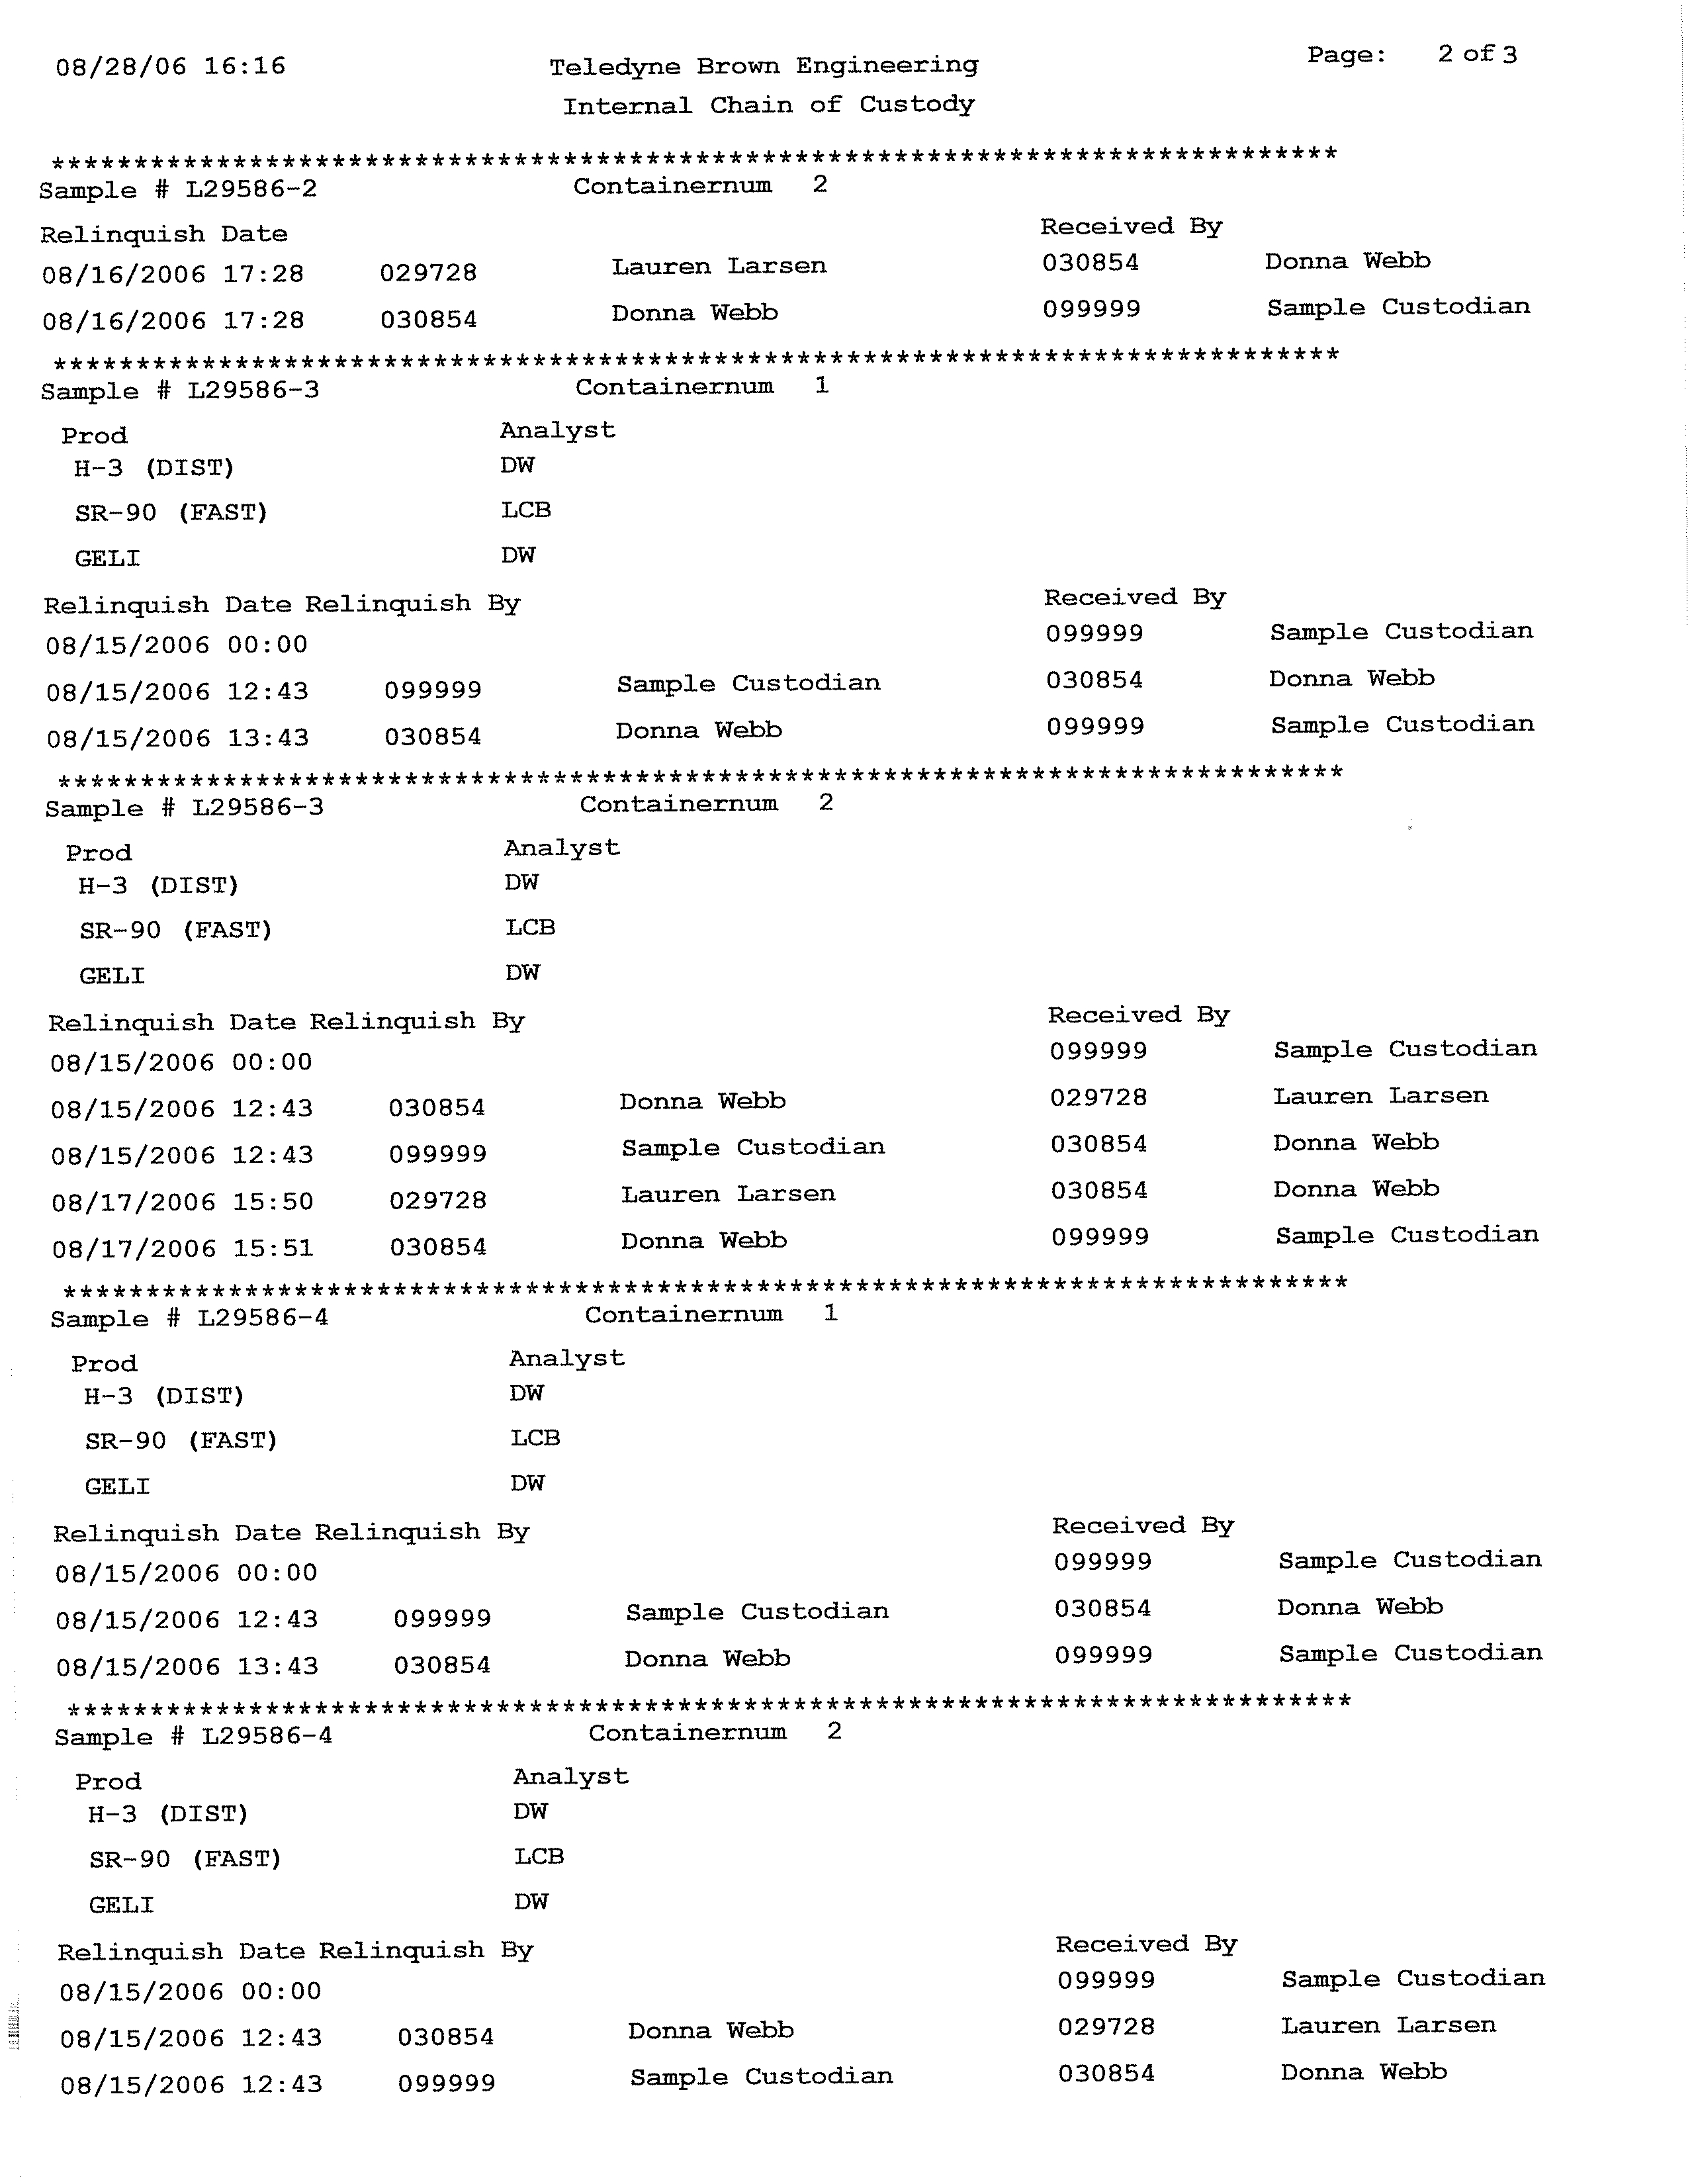
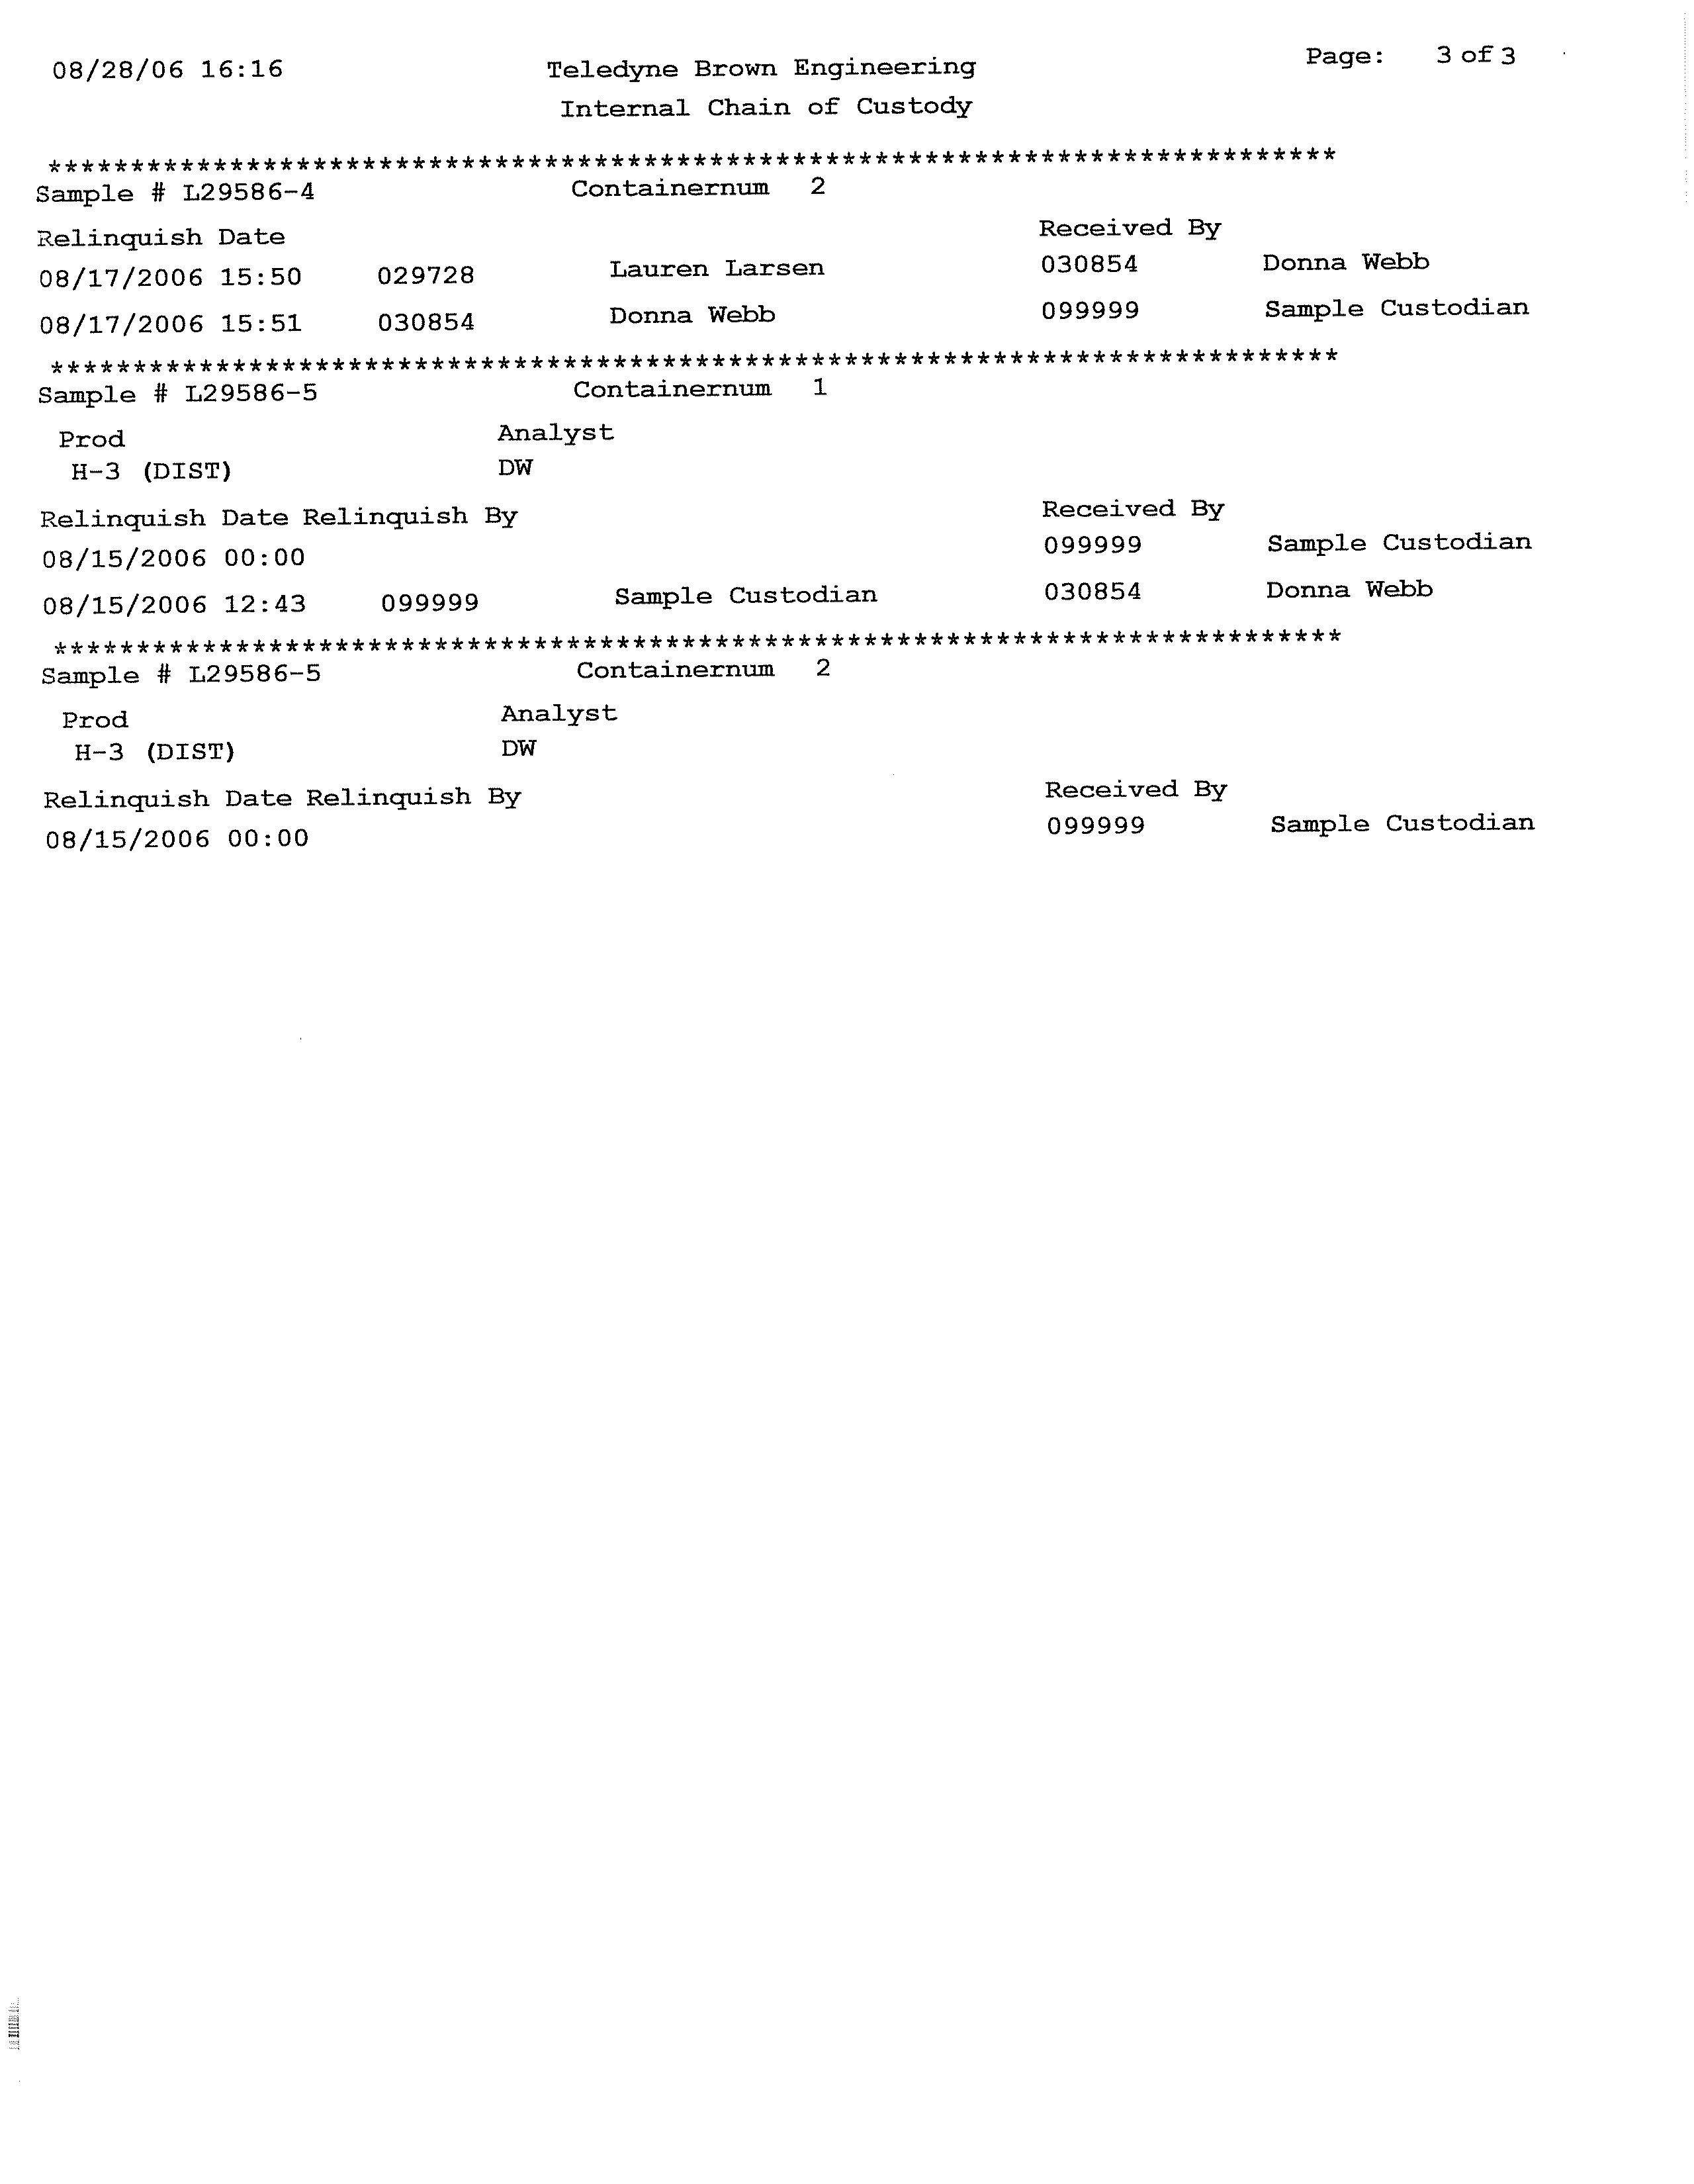
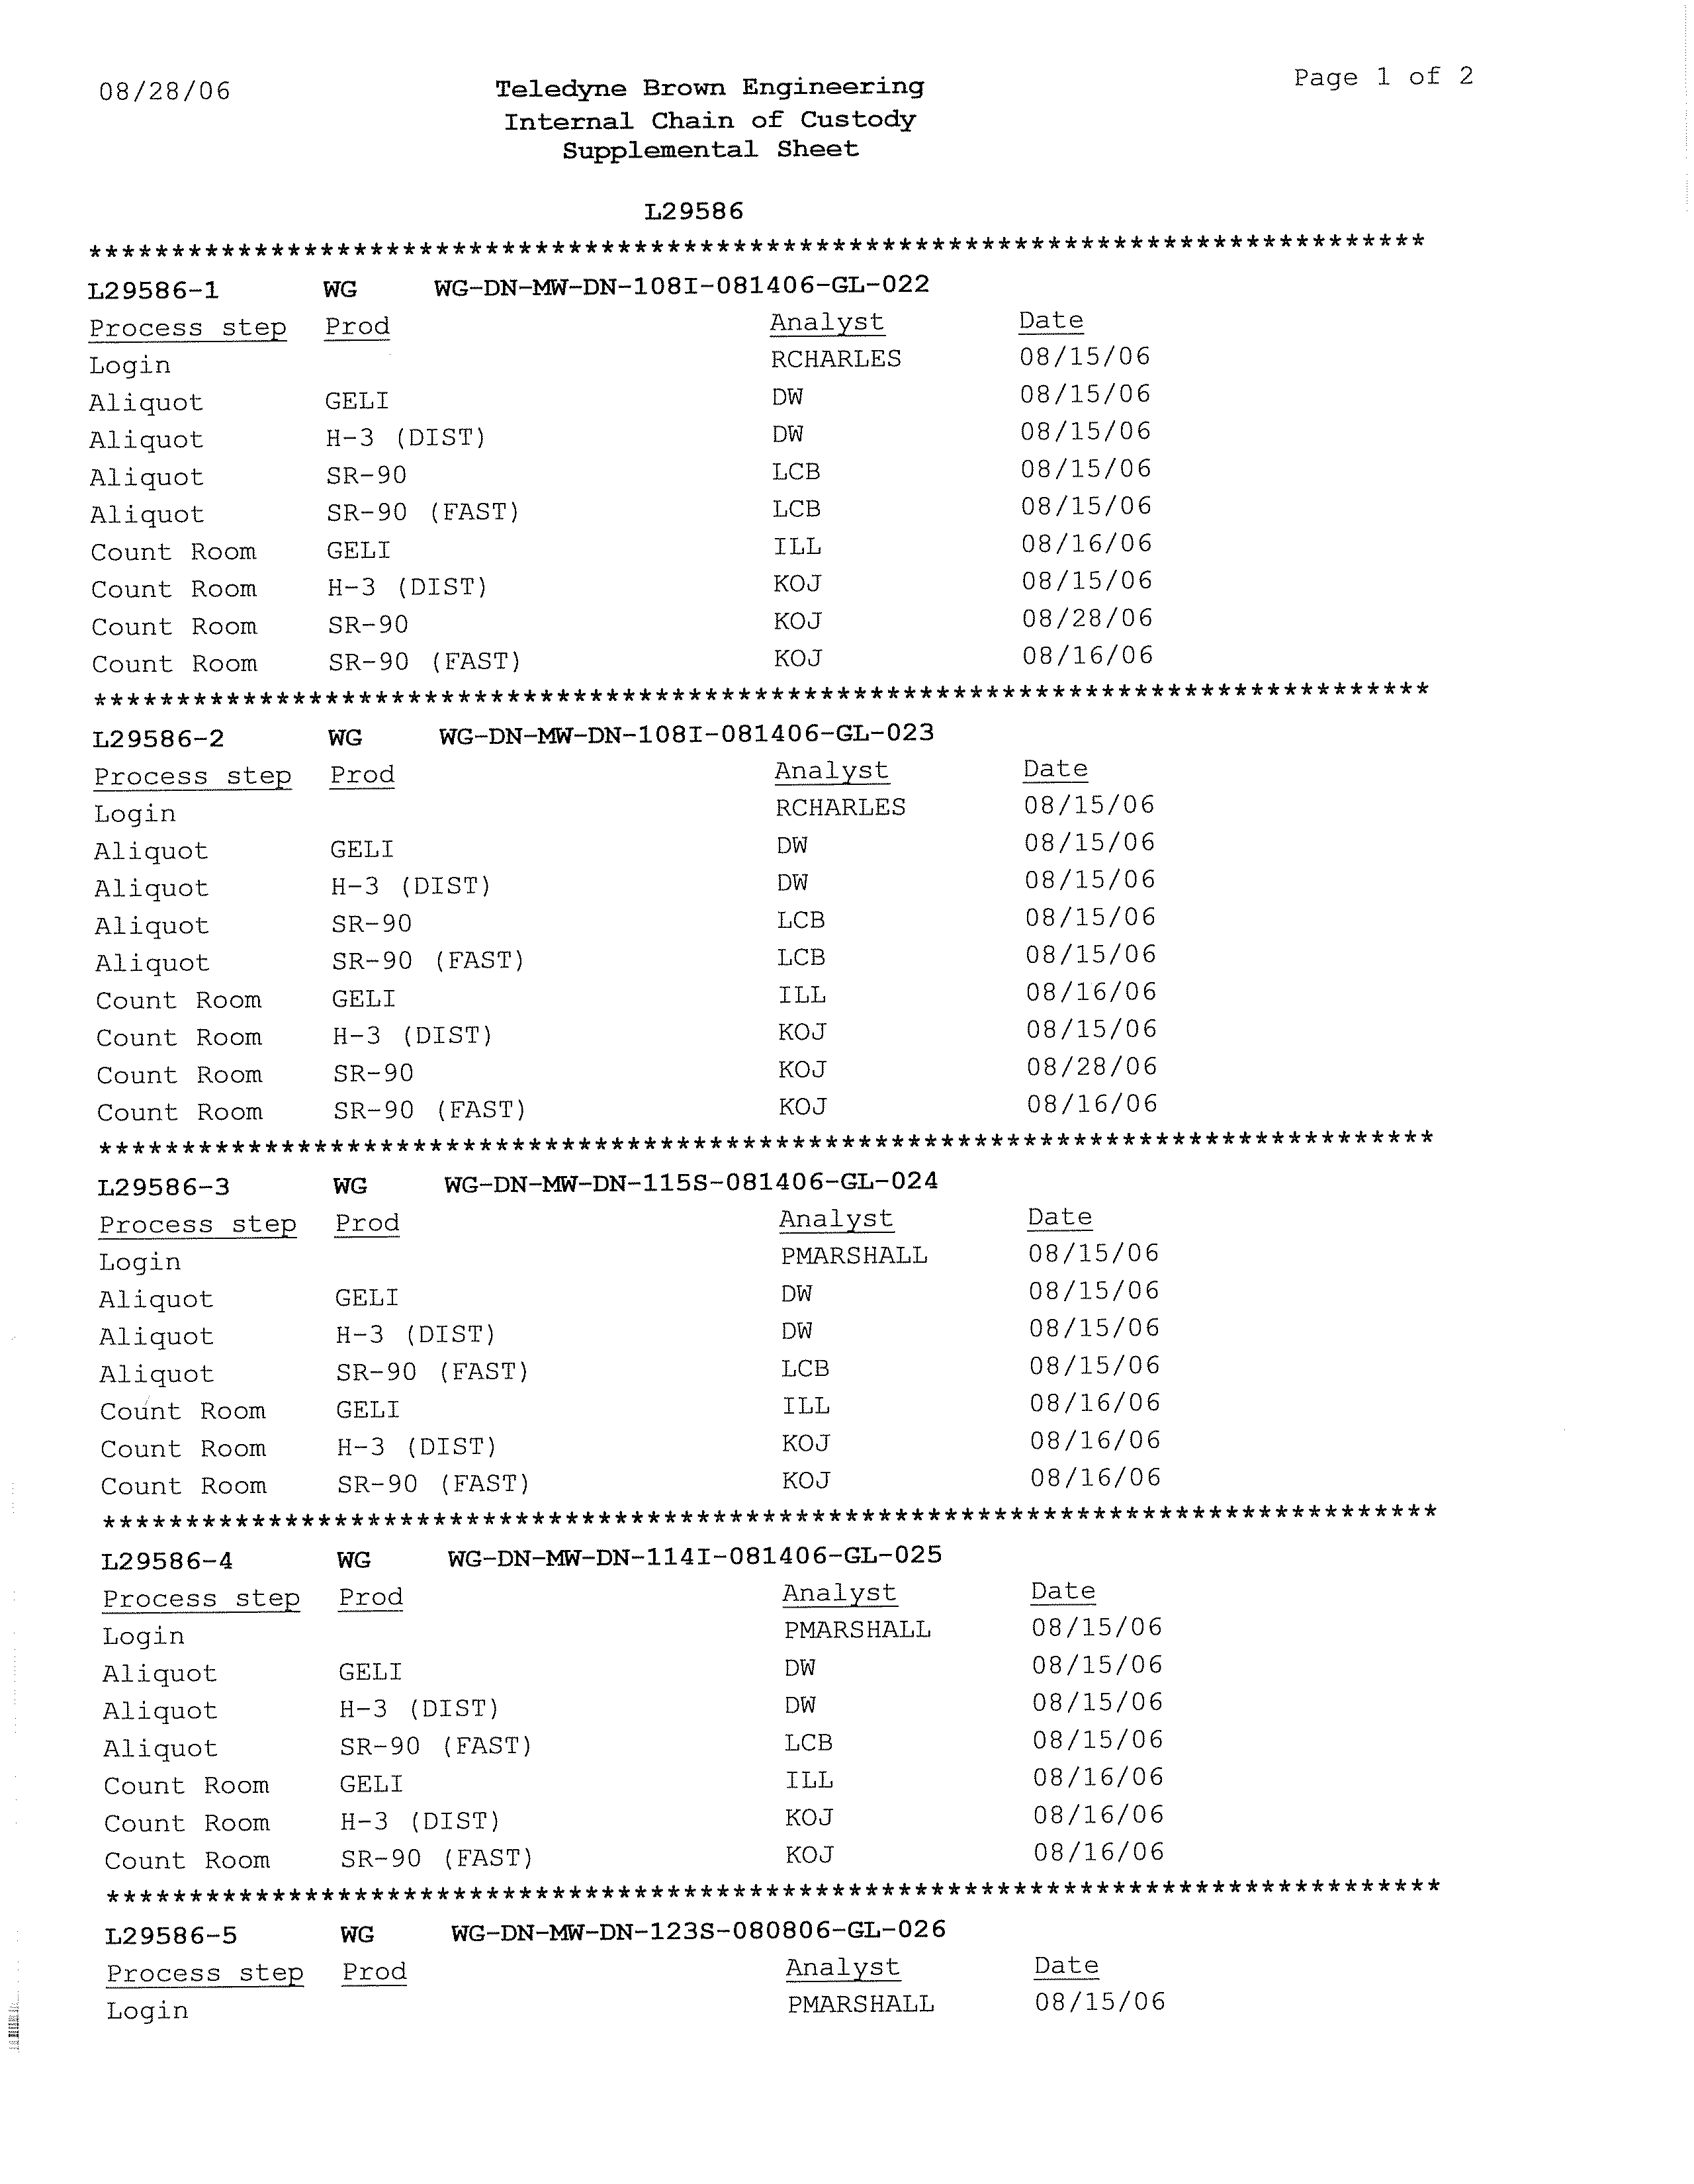
CHAIN-OF-CUSTODY RECORD
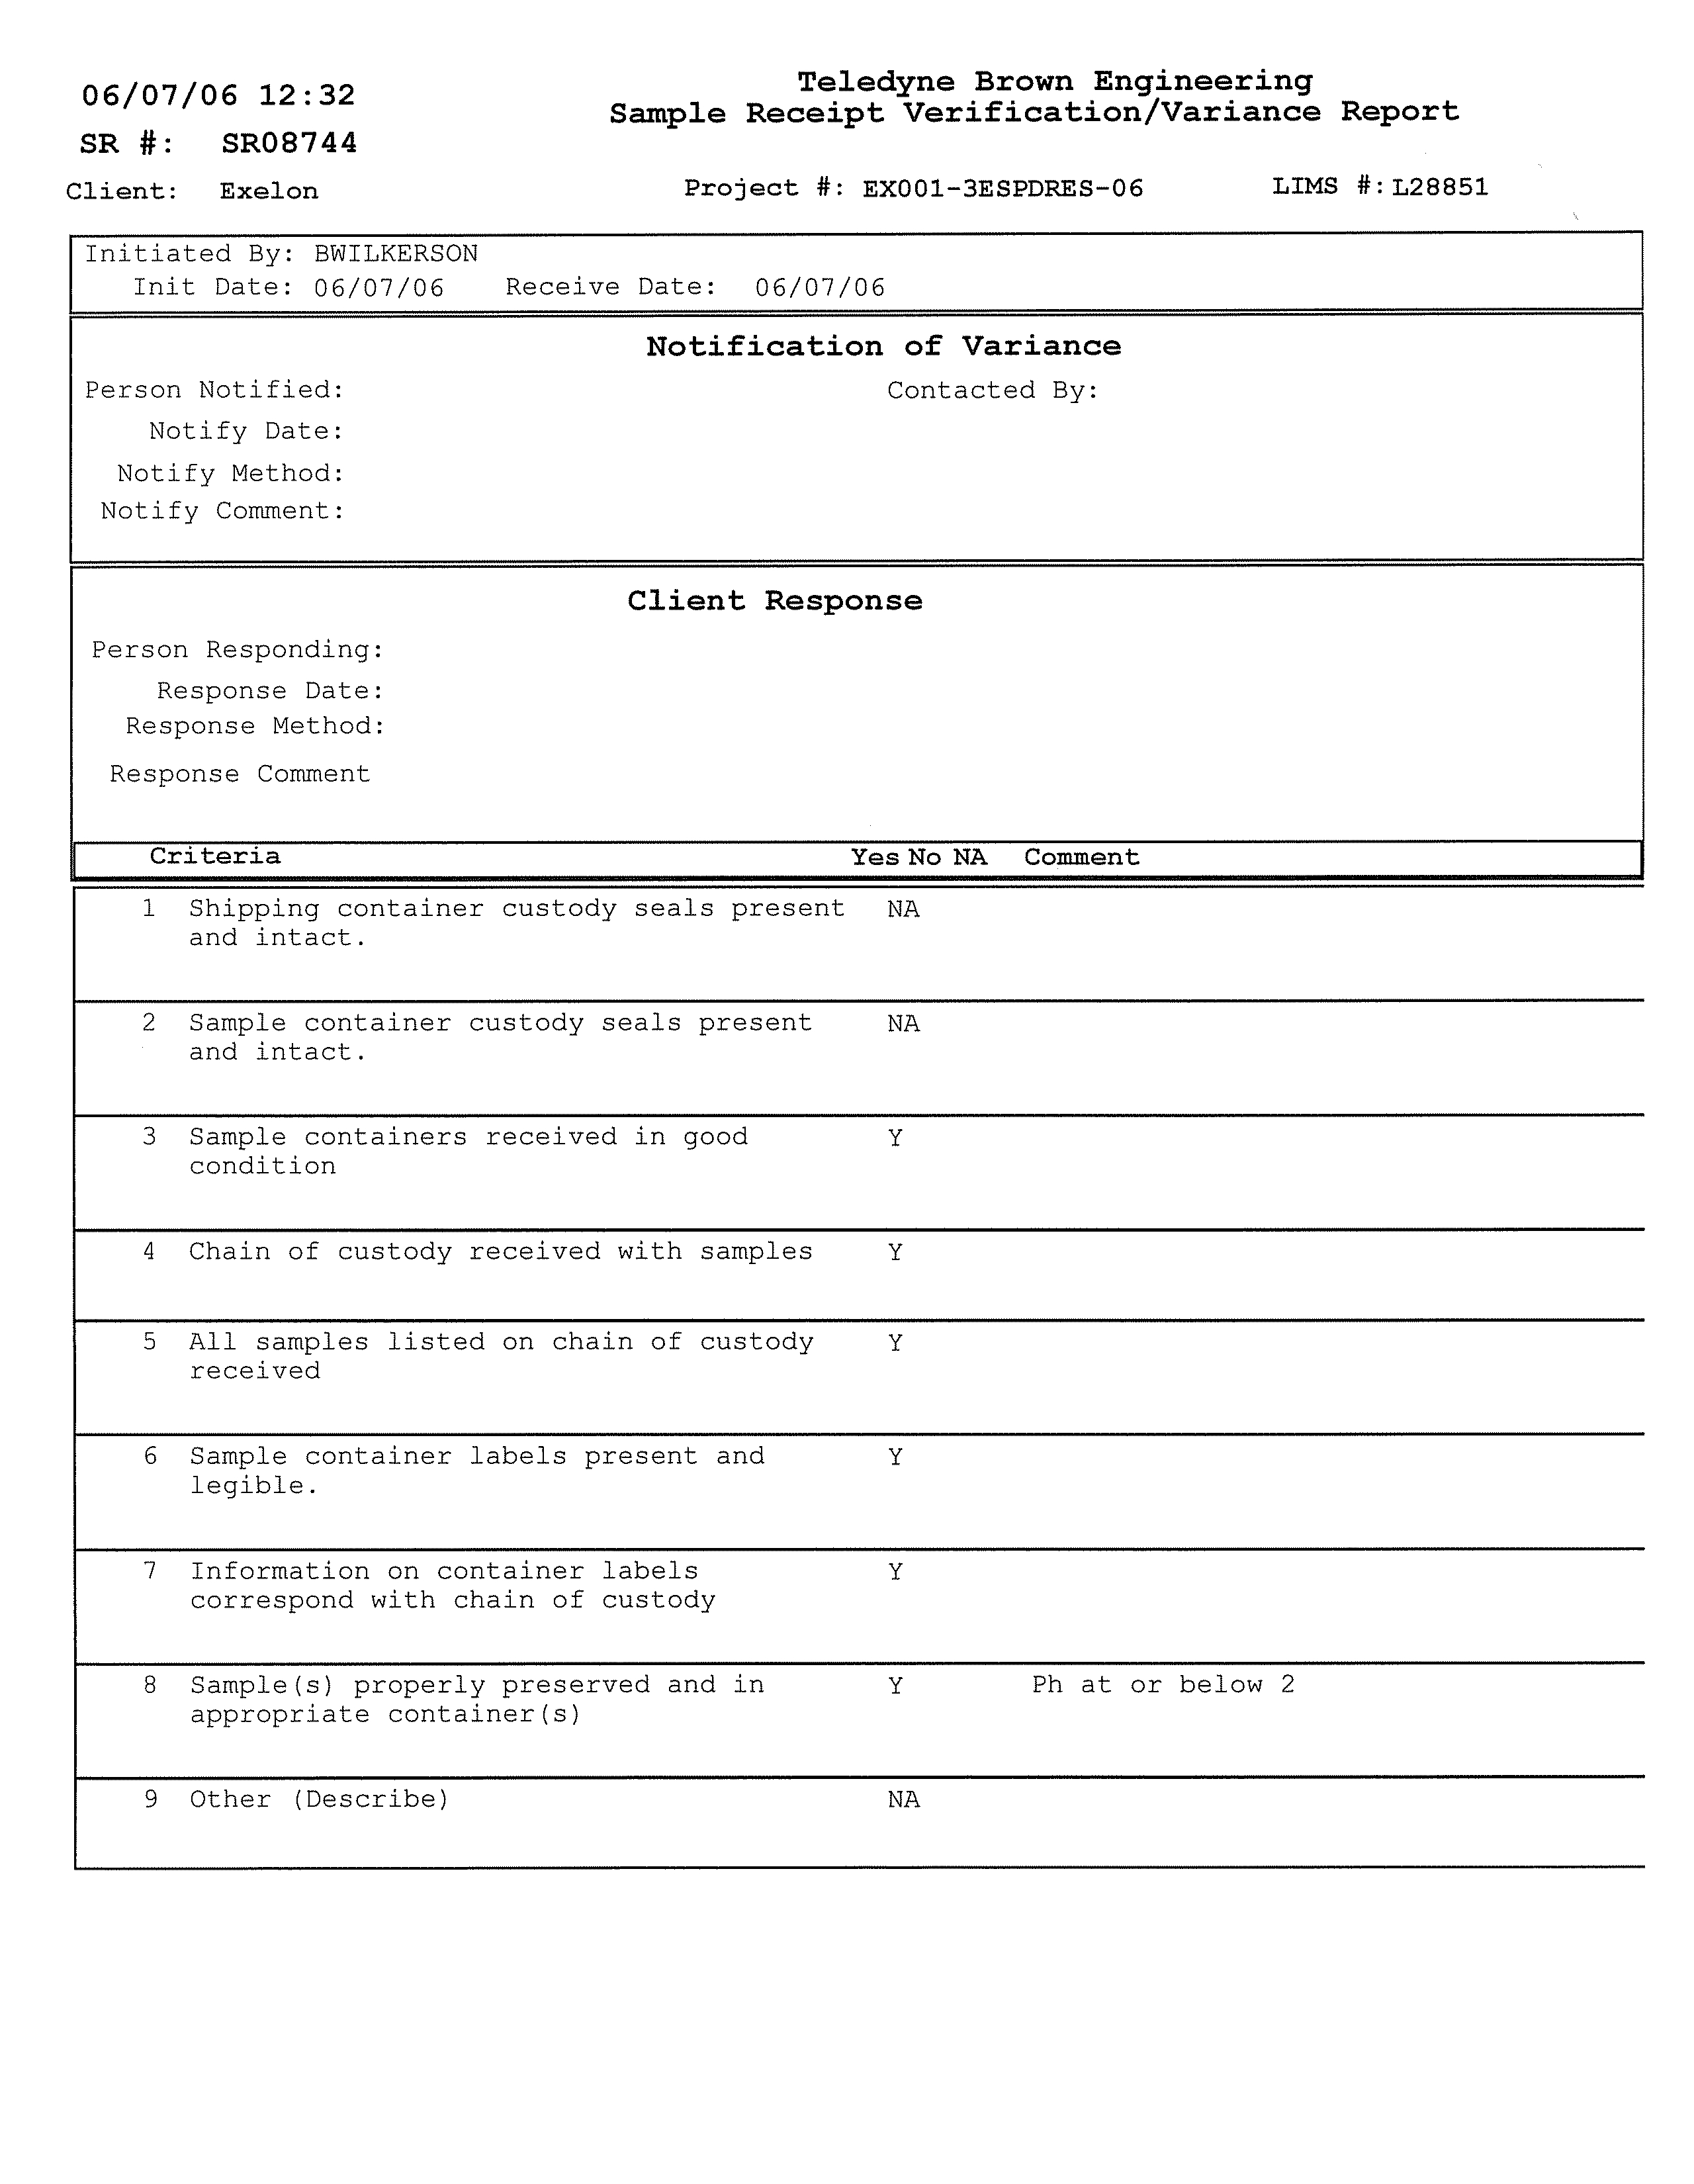
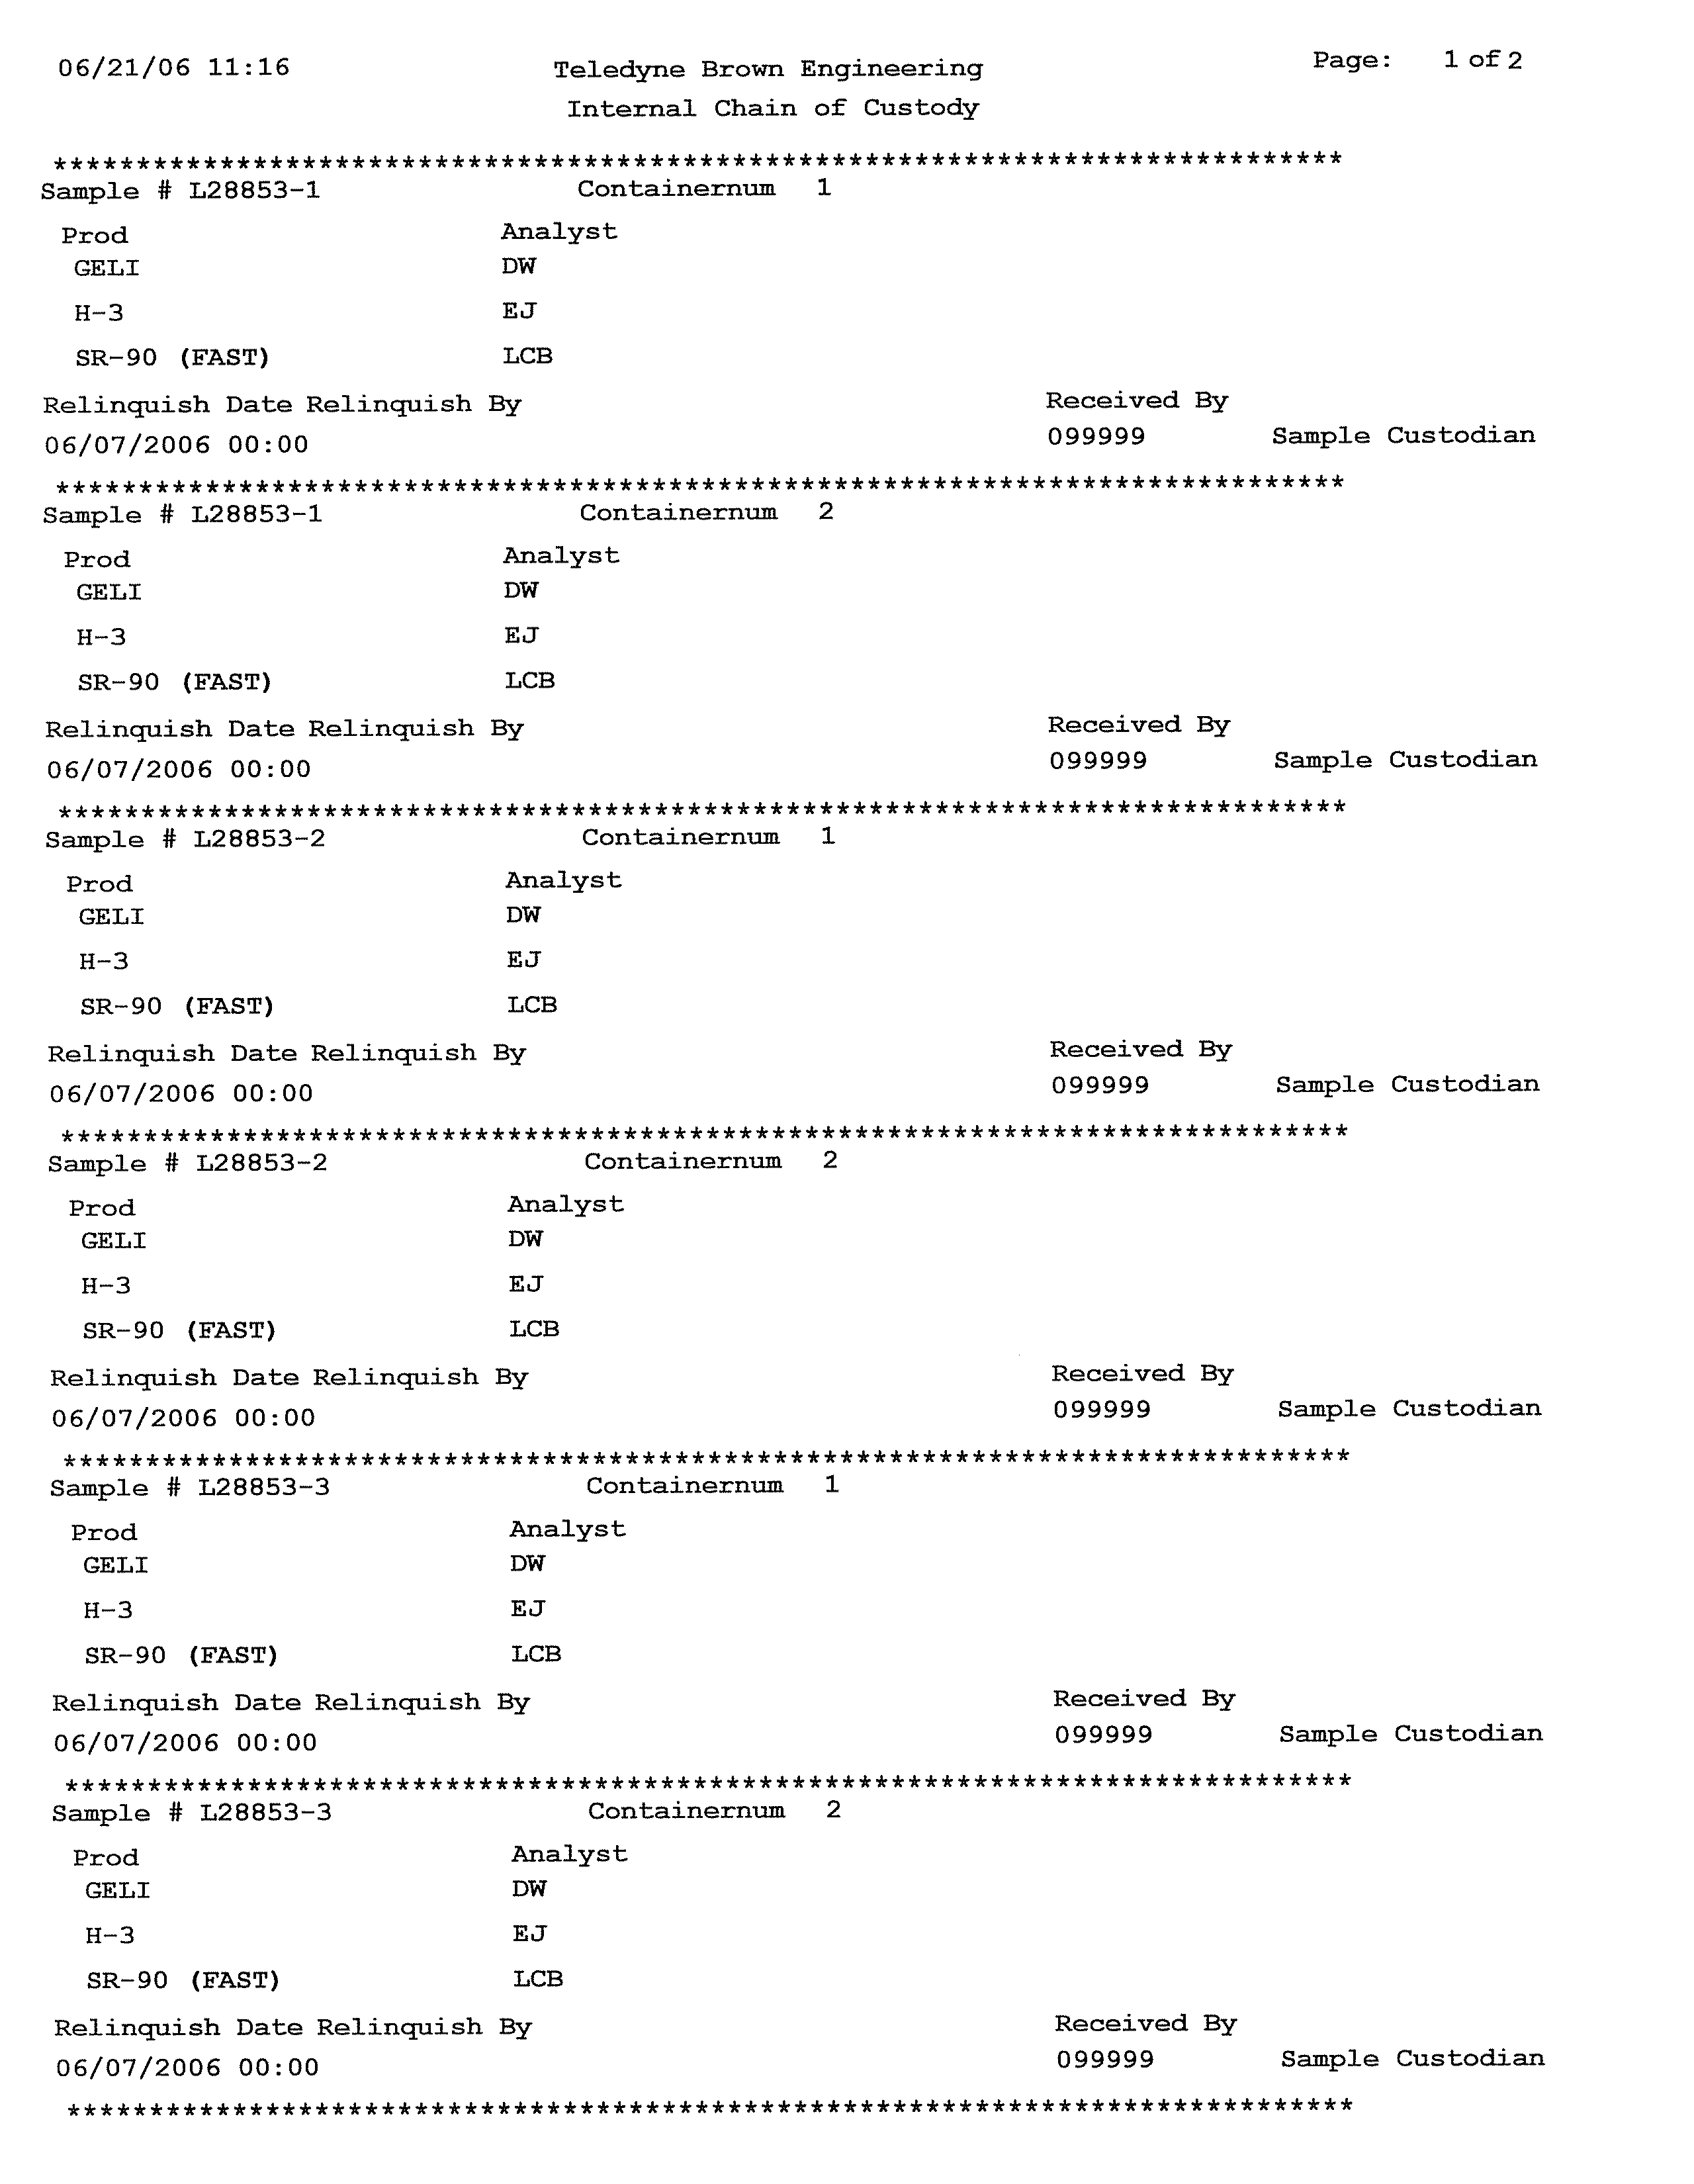
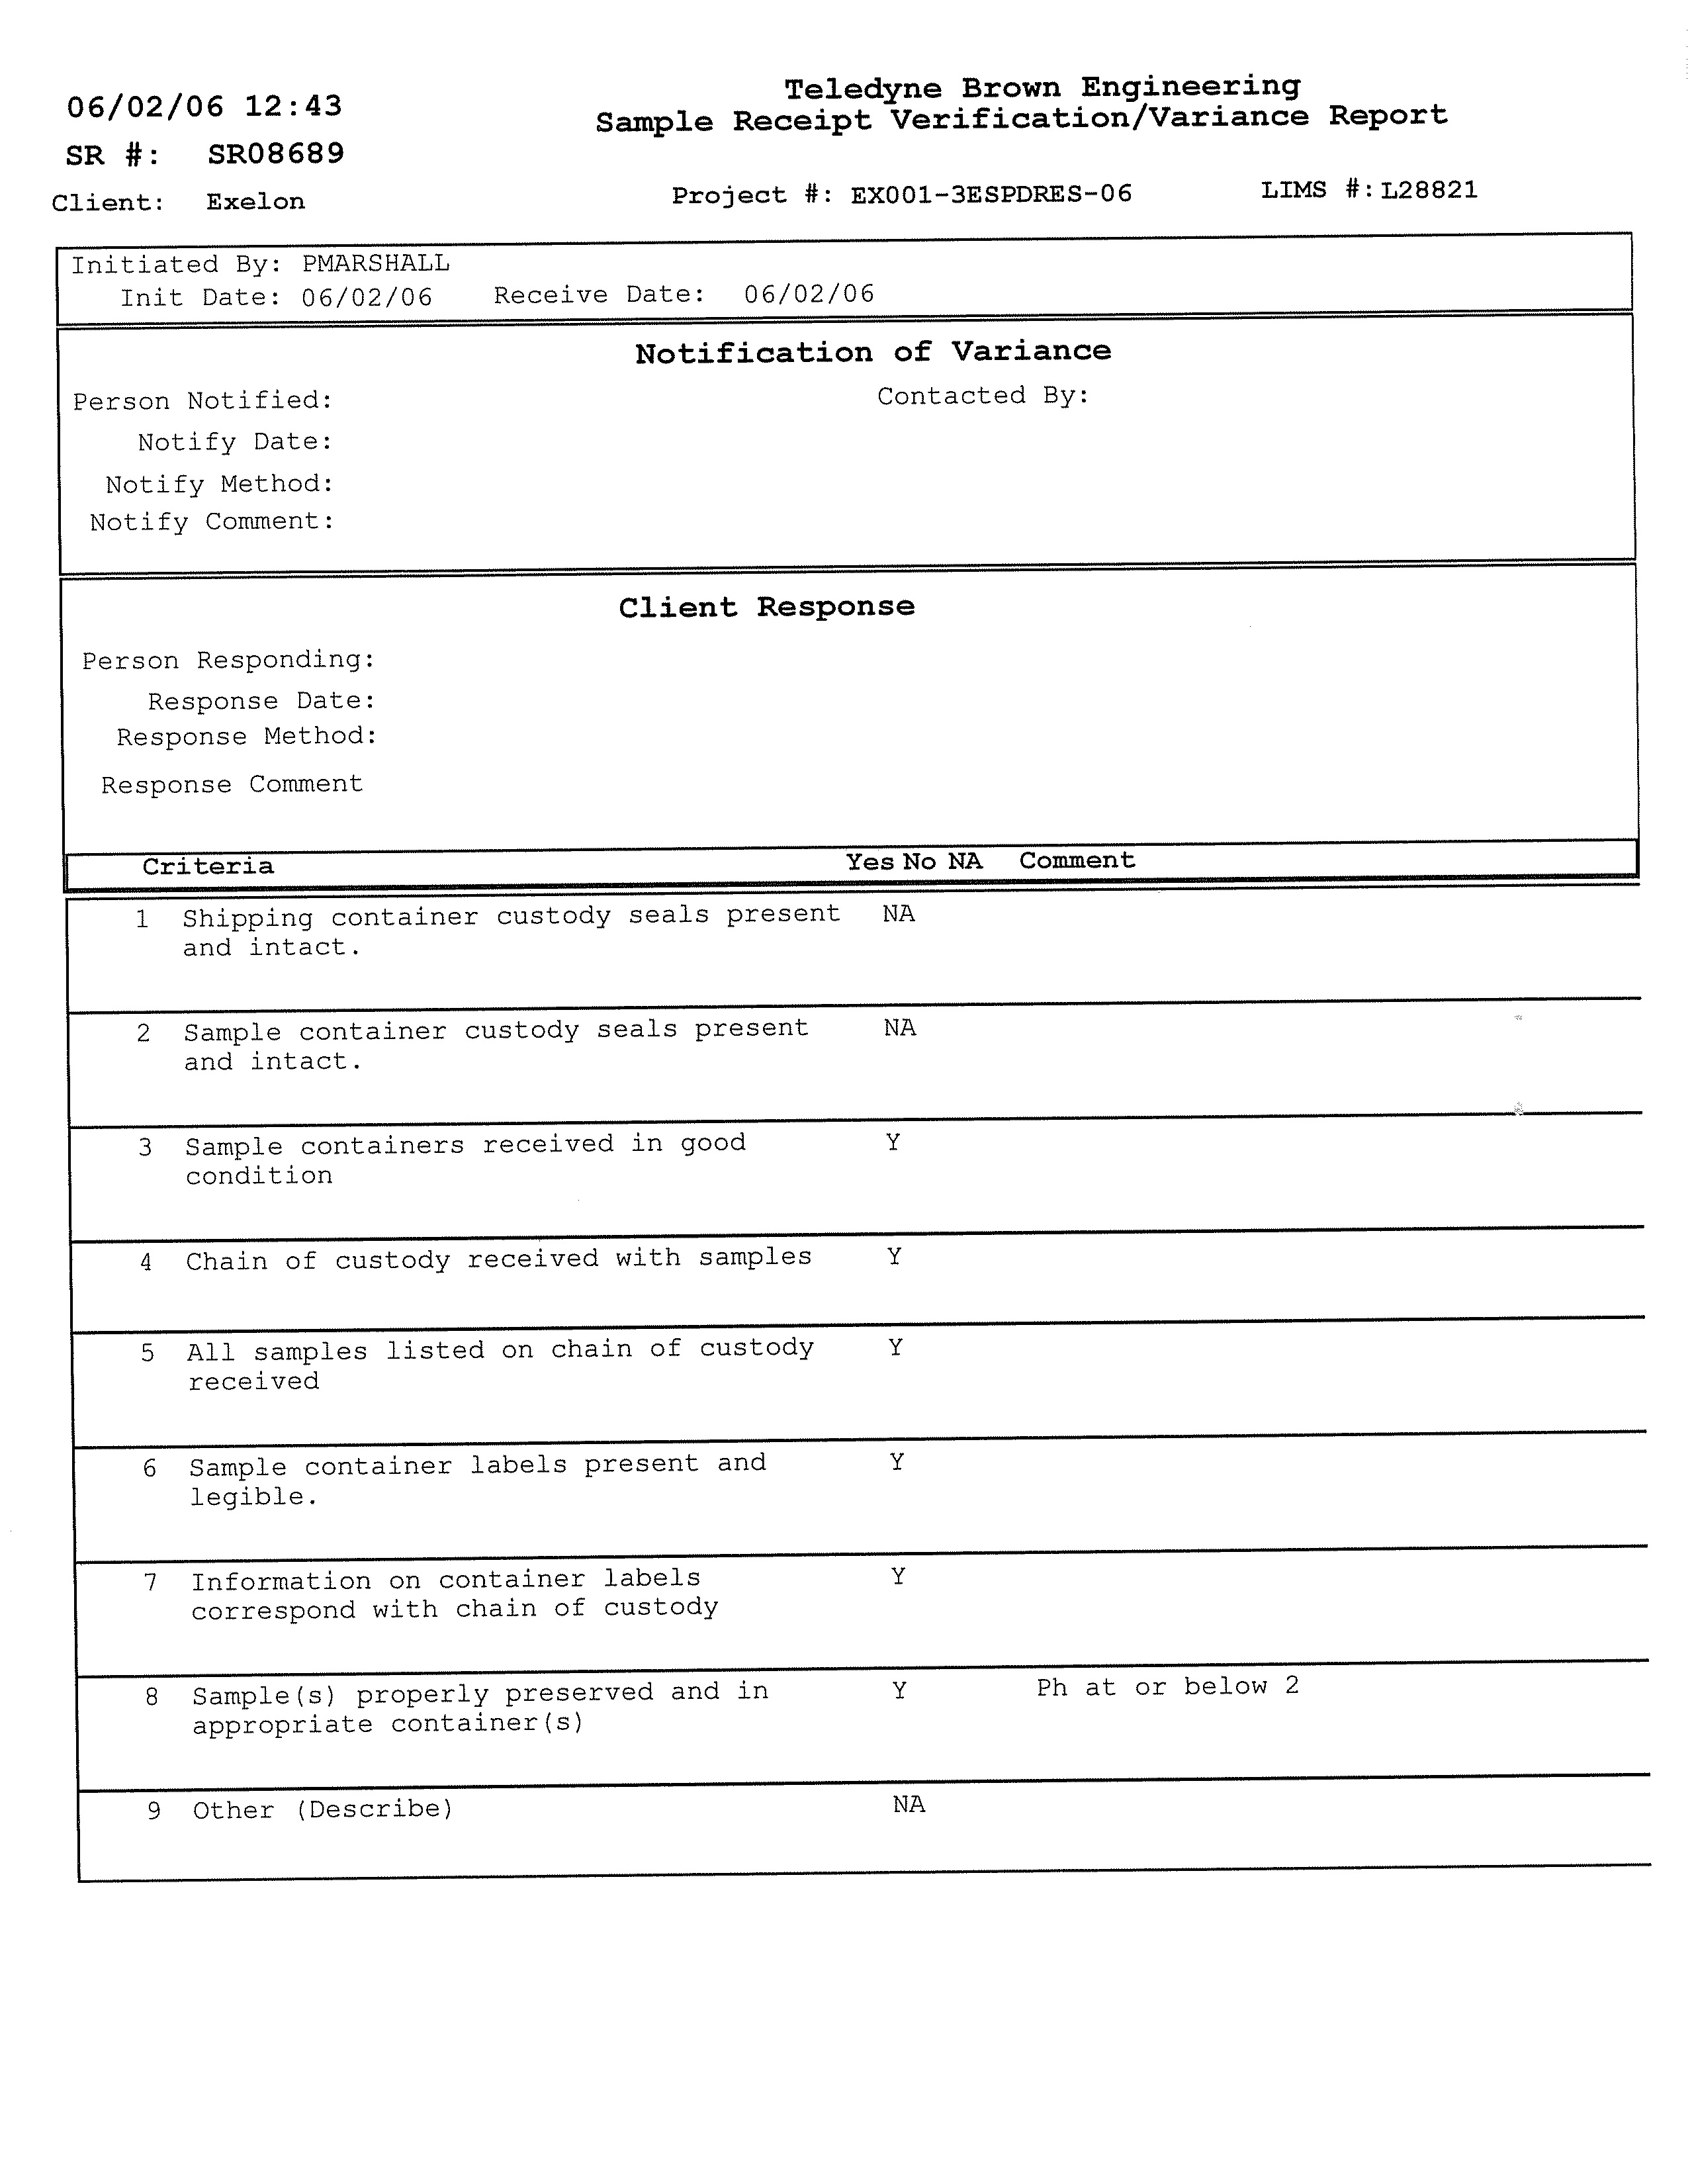
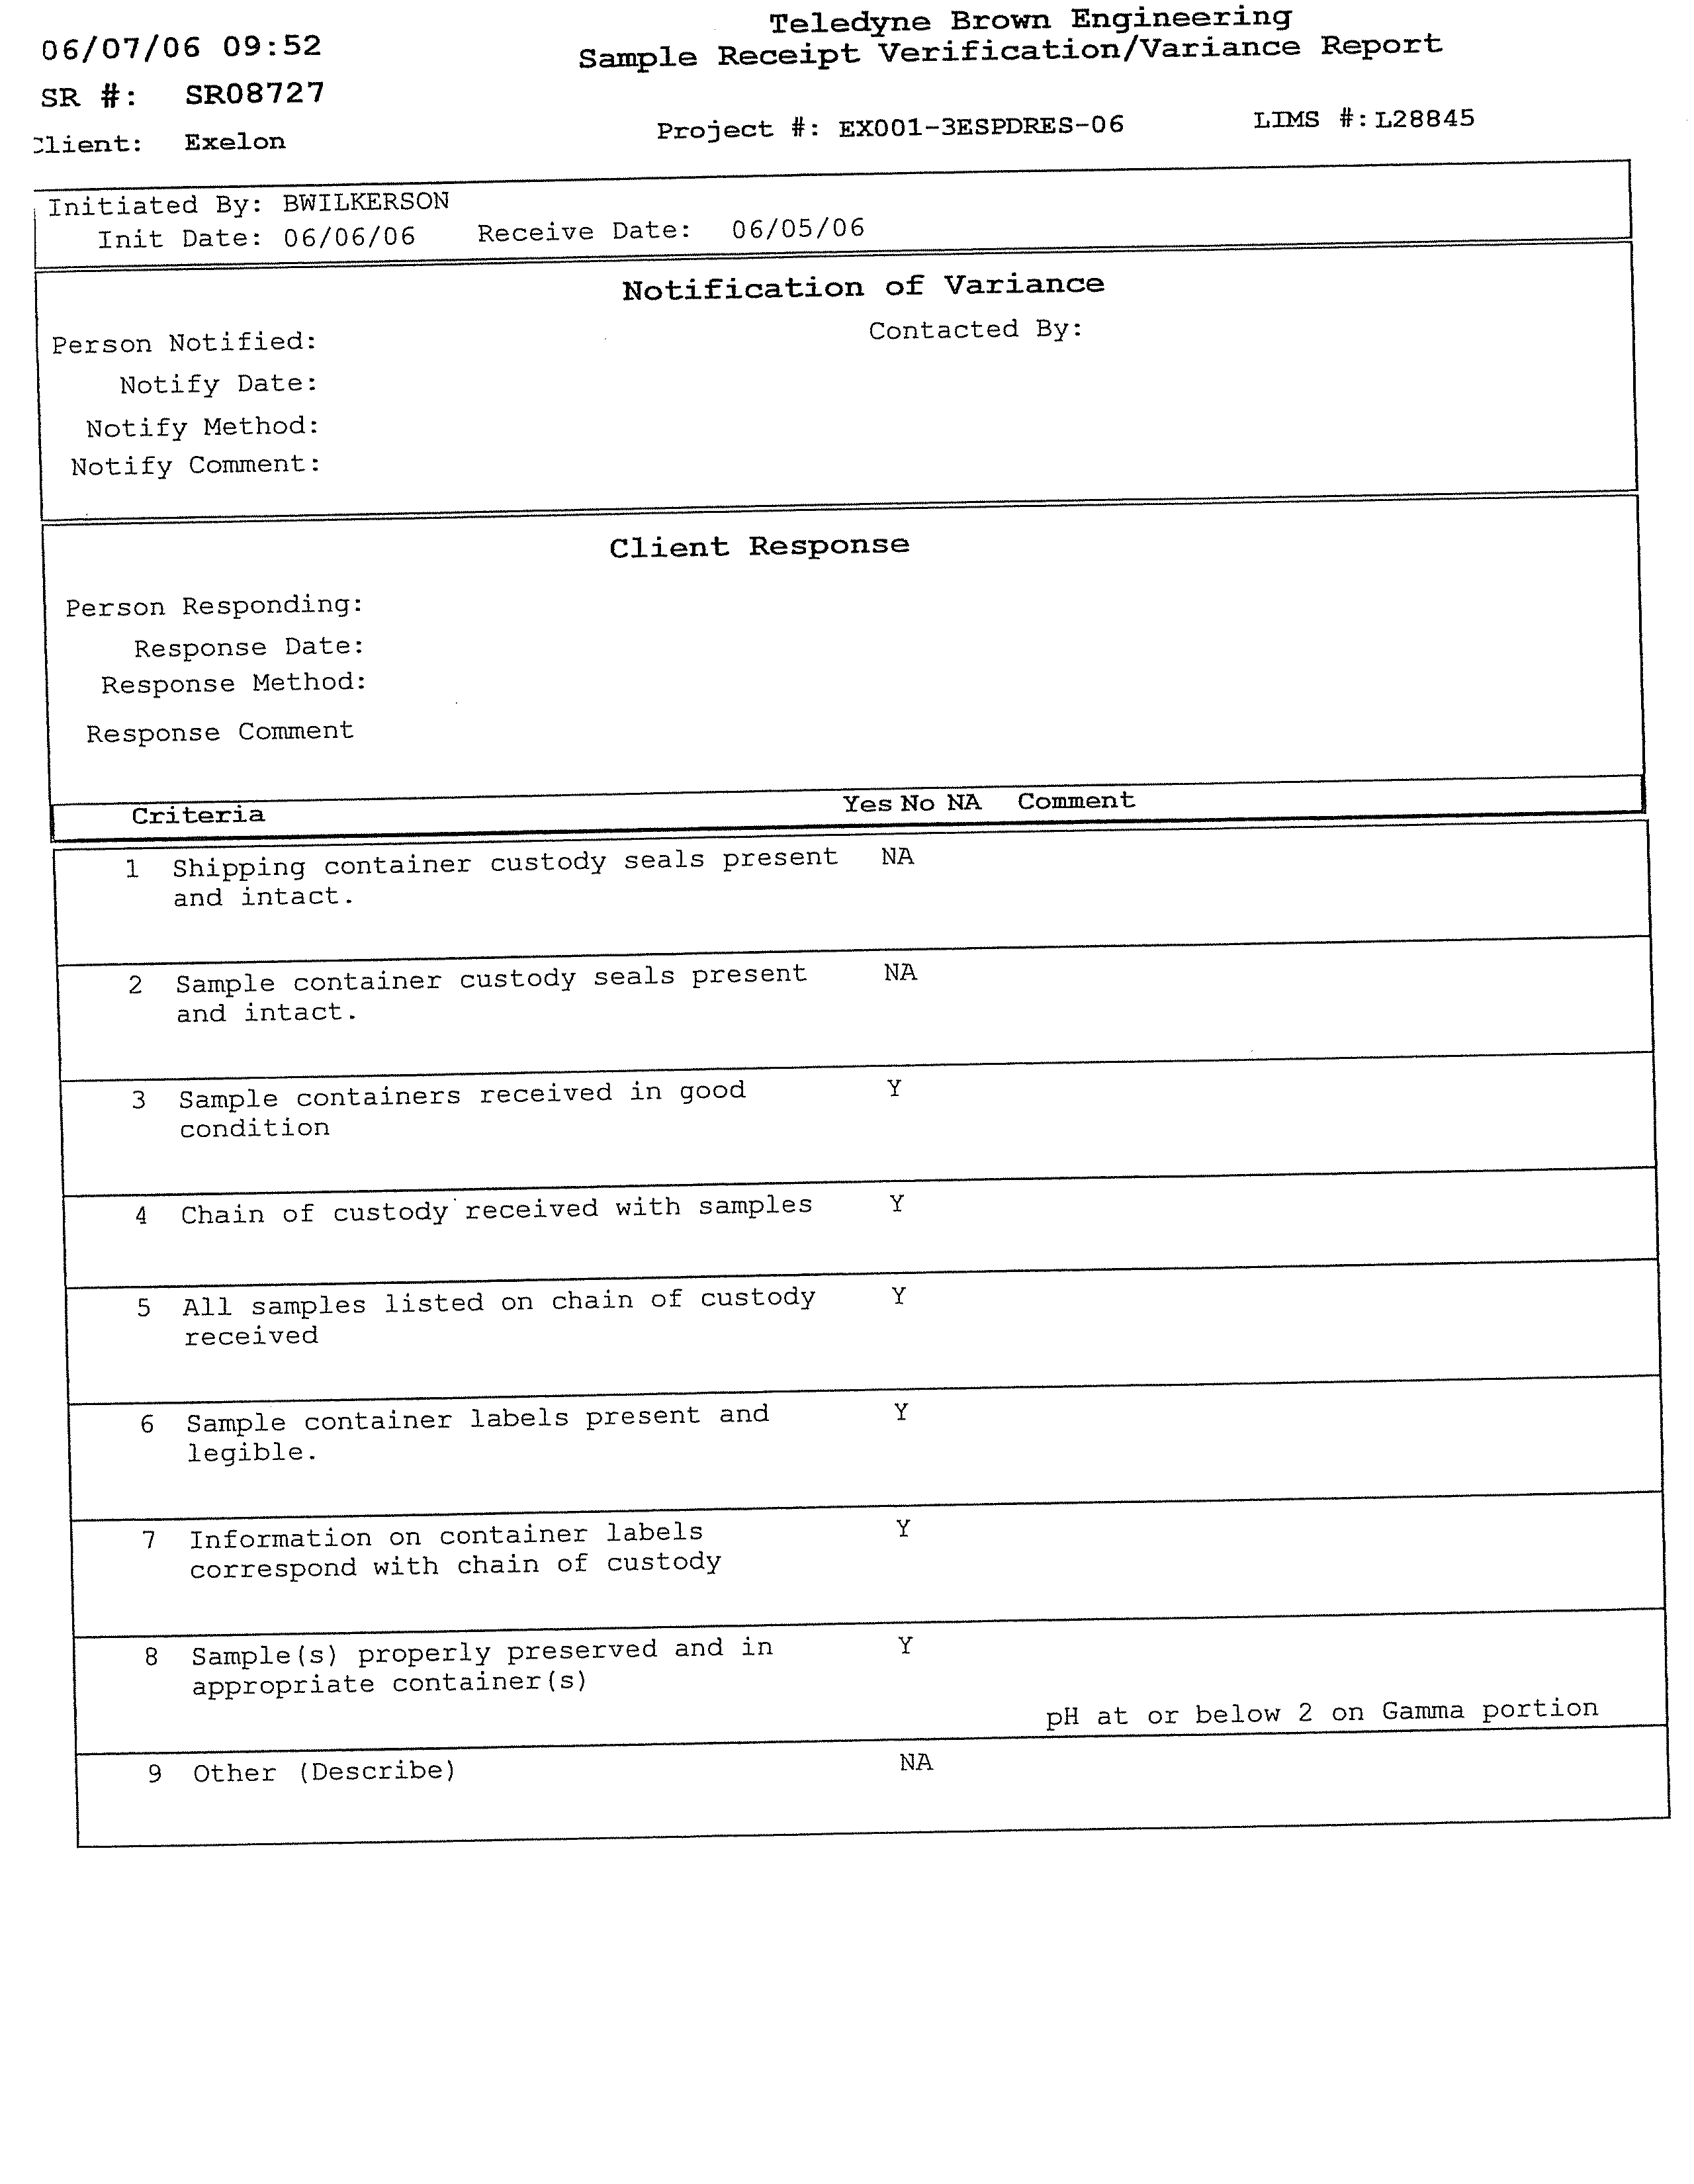
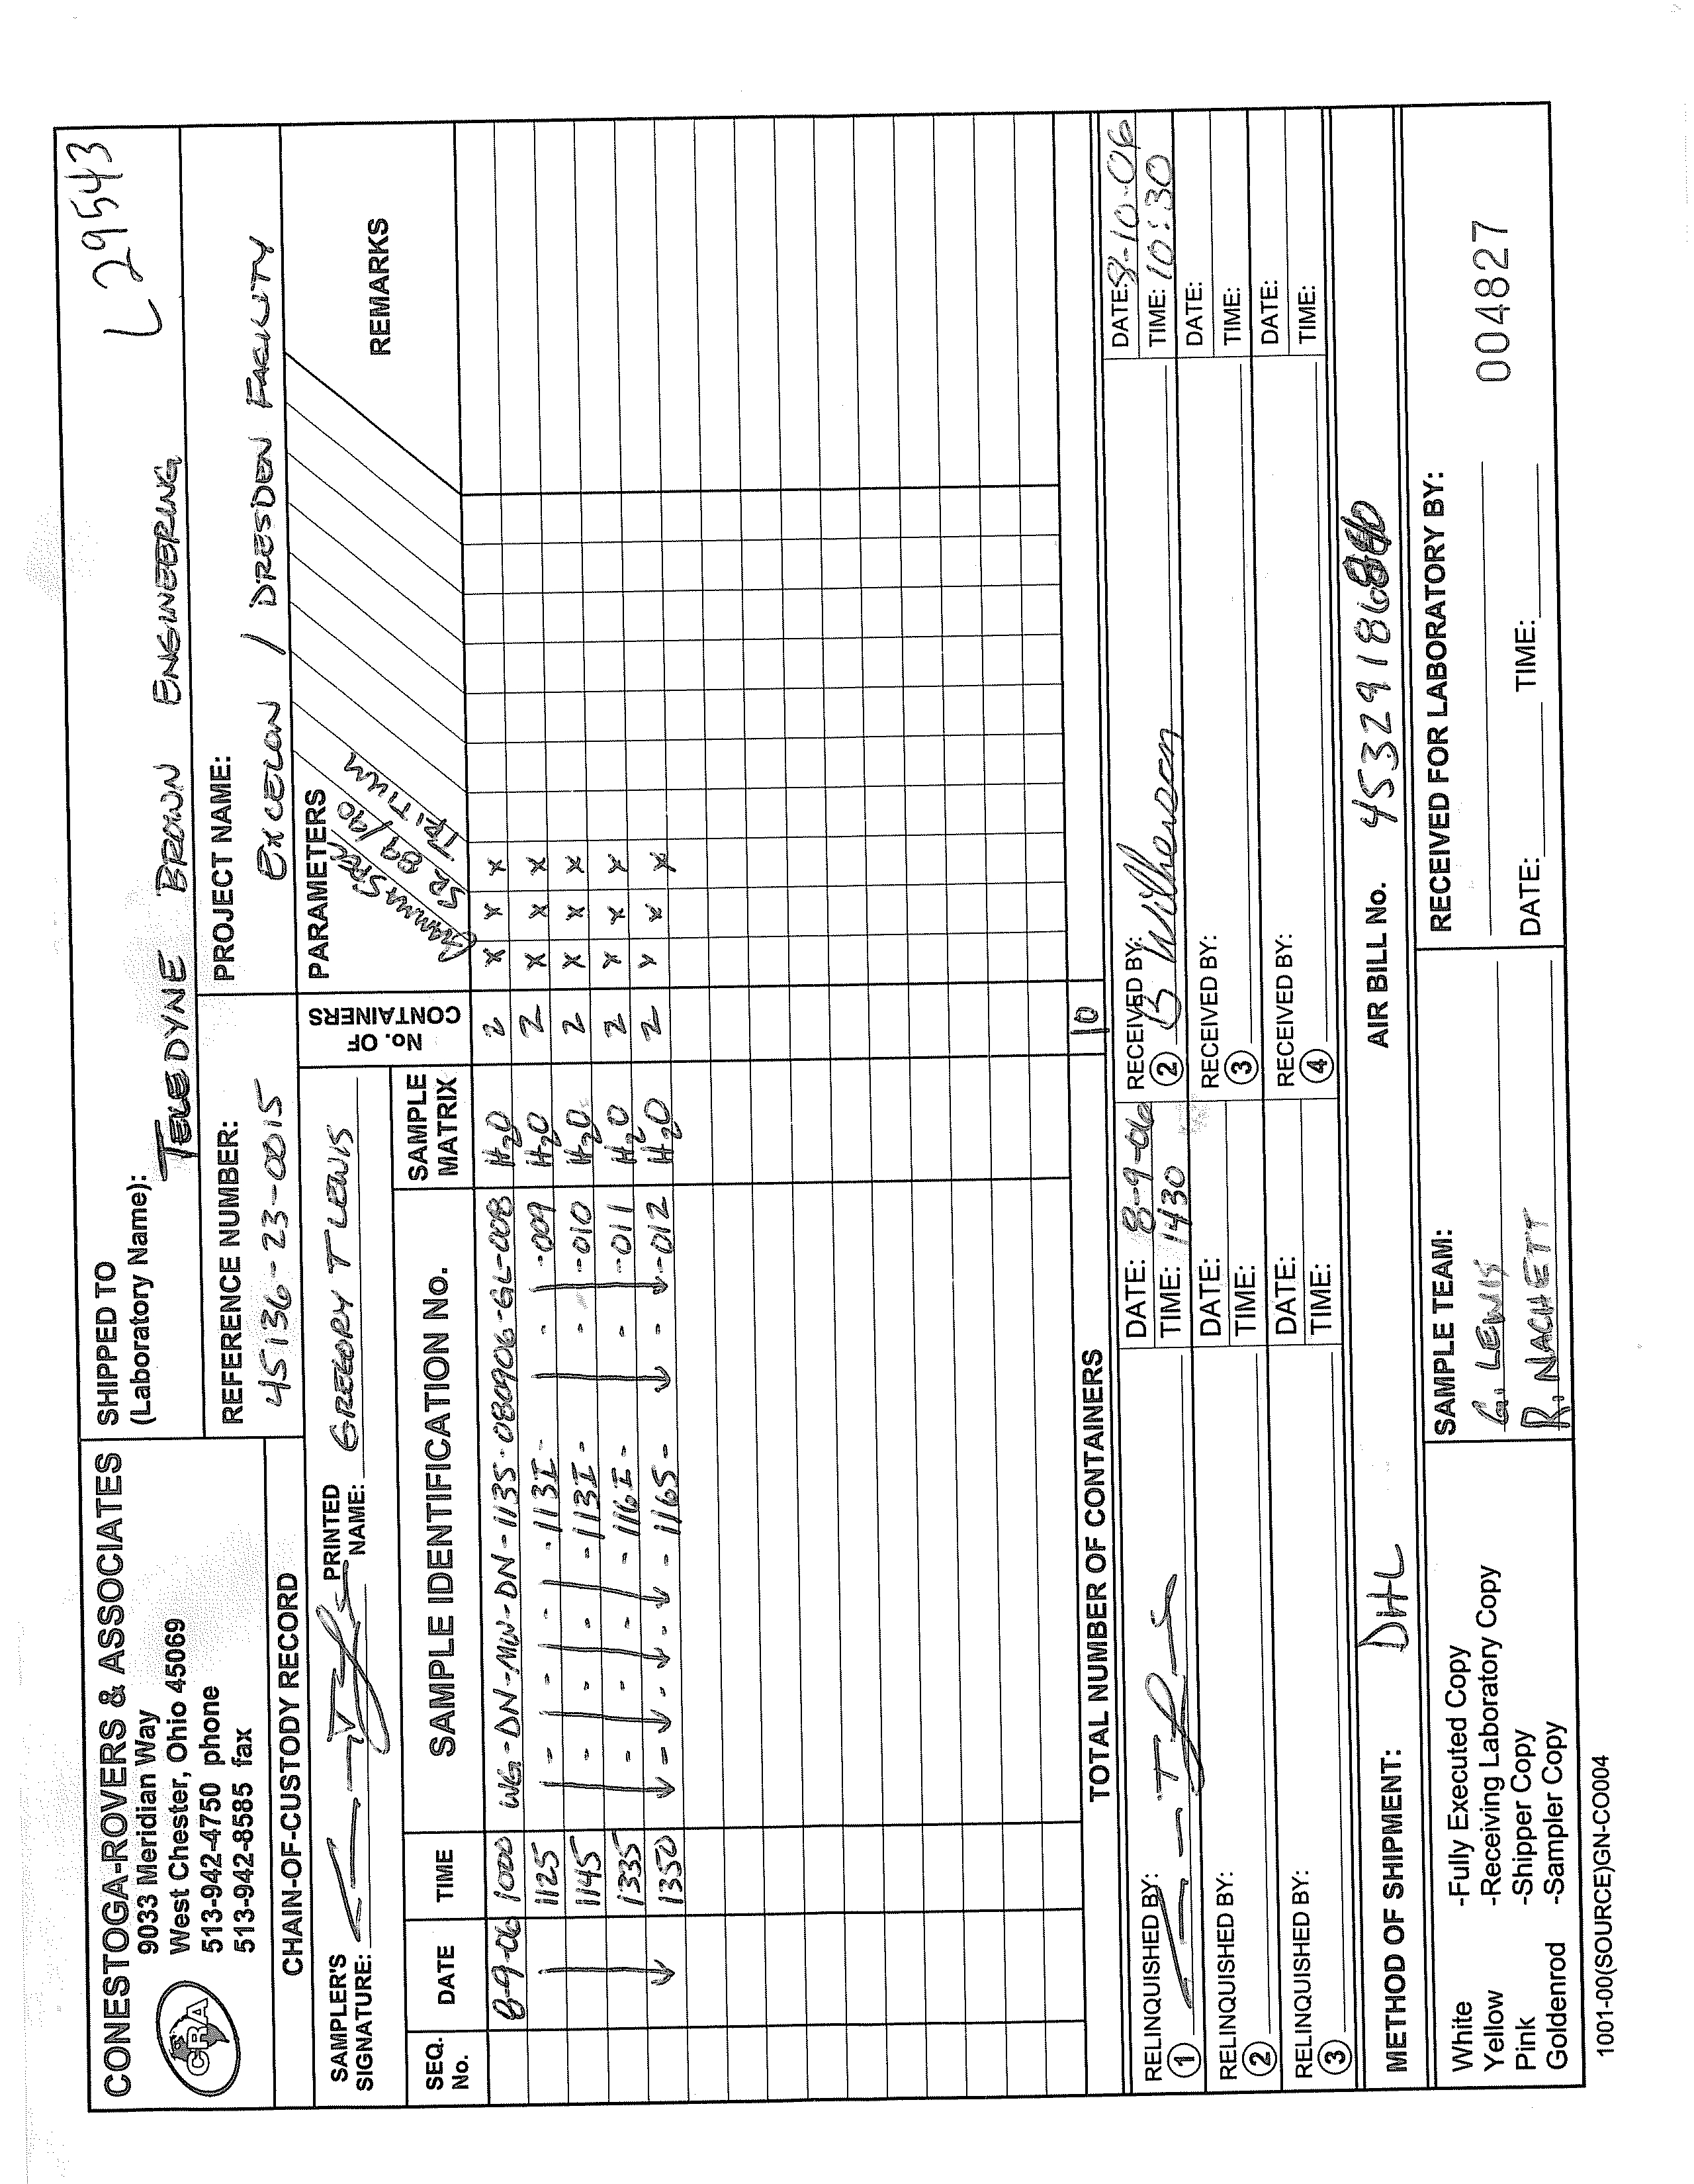
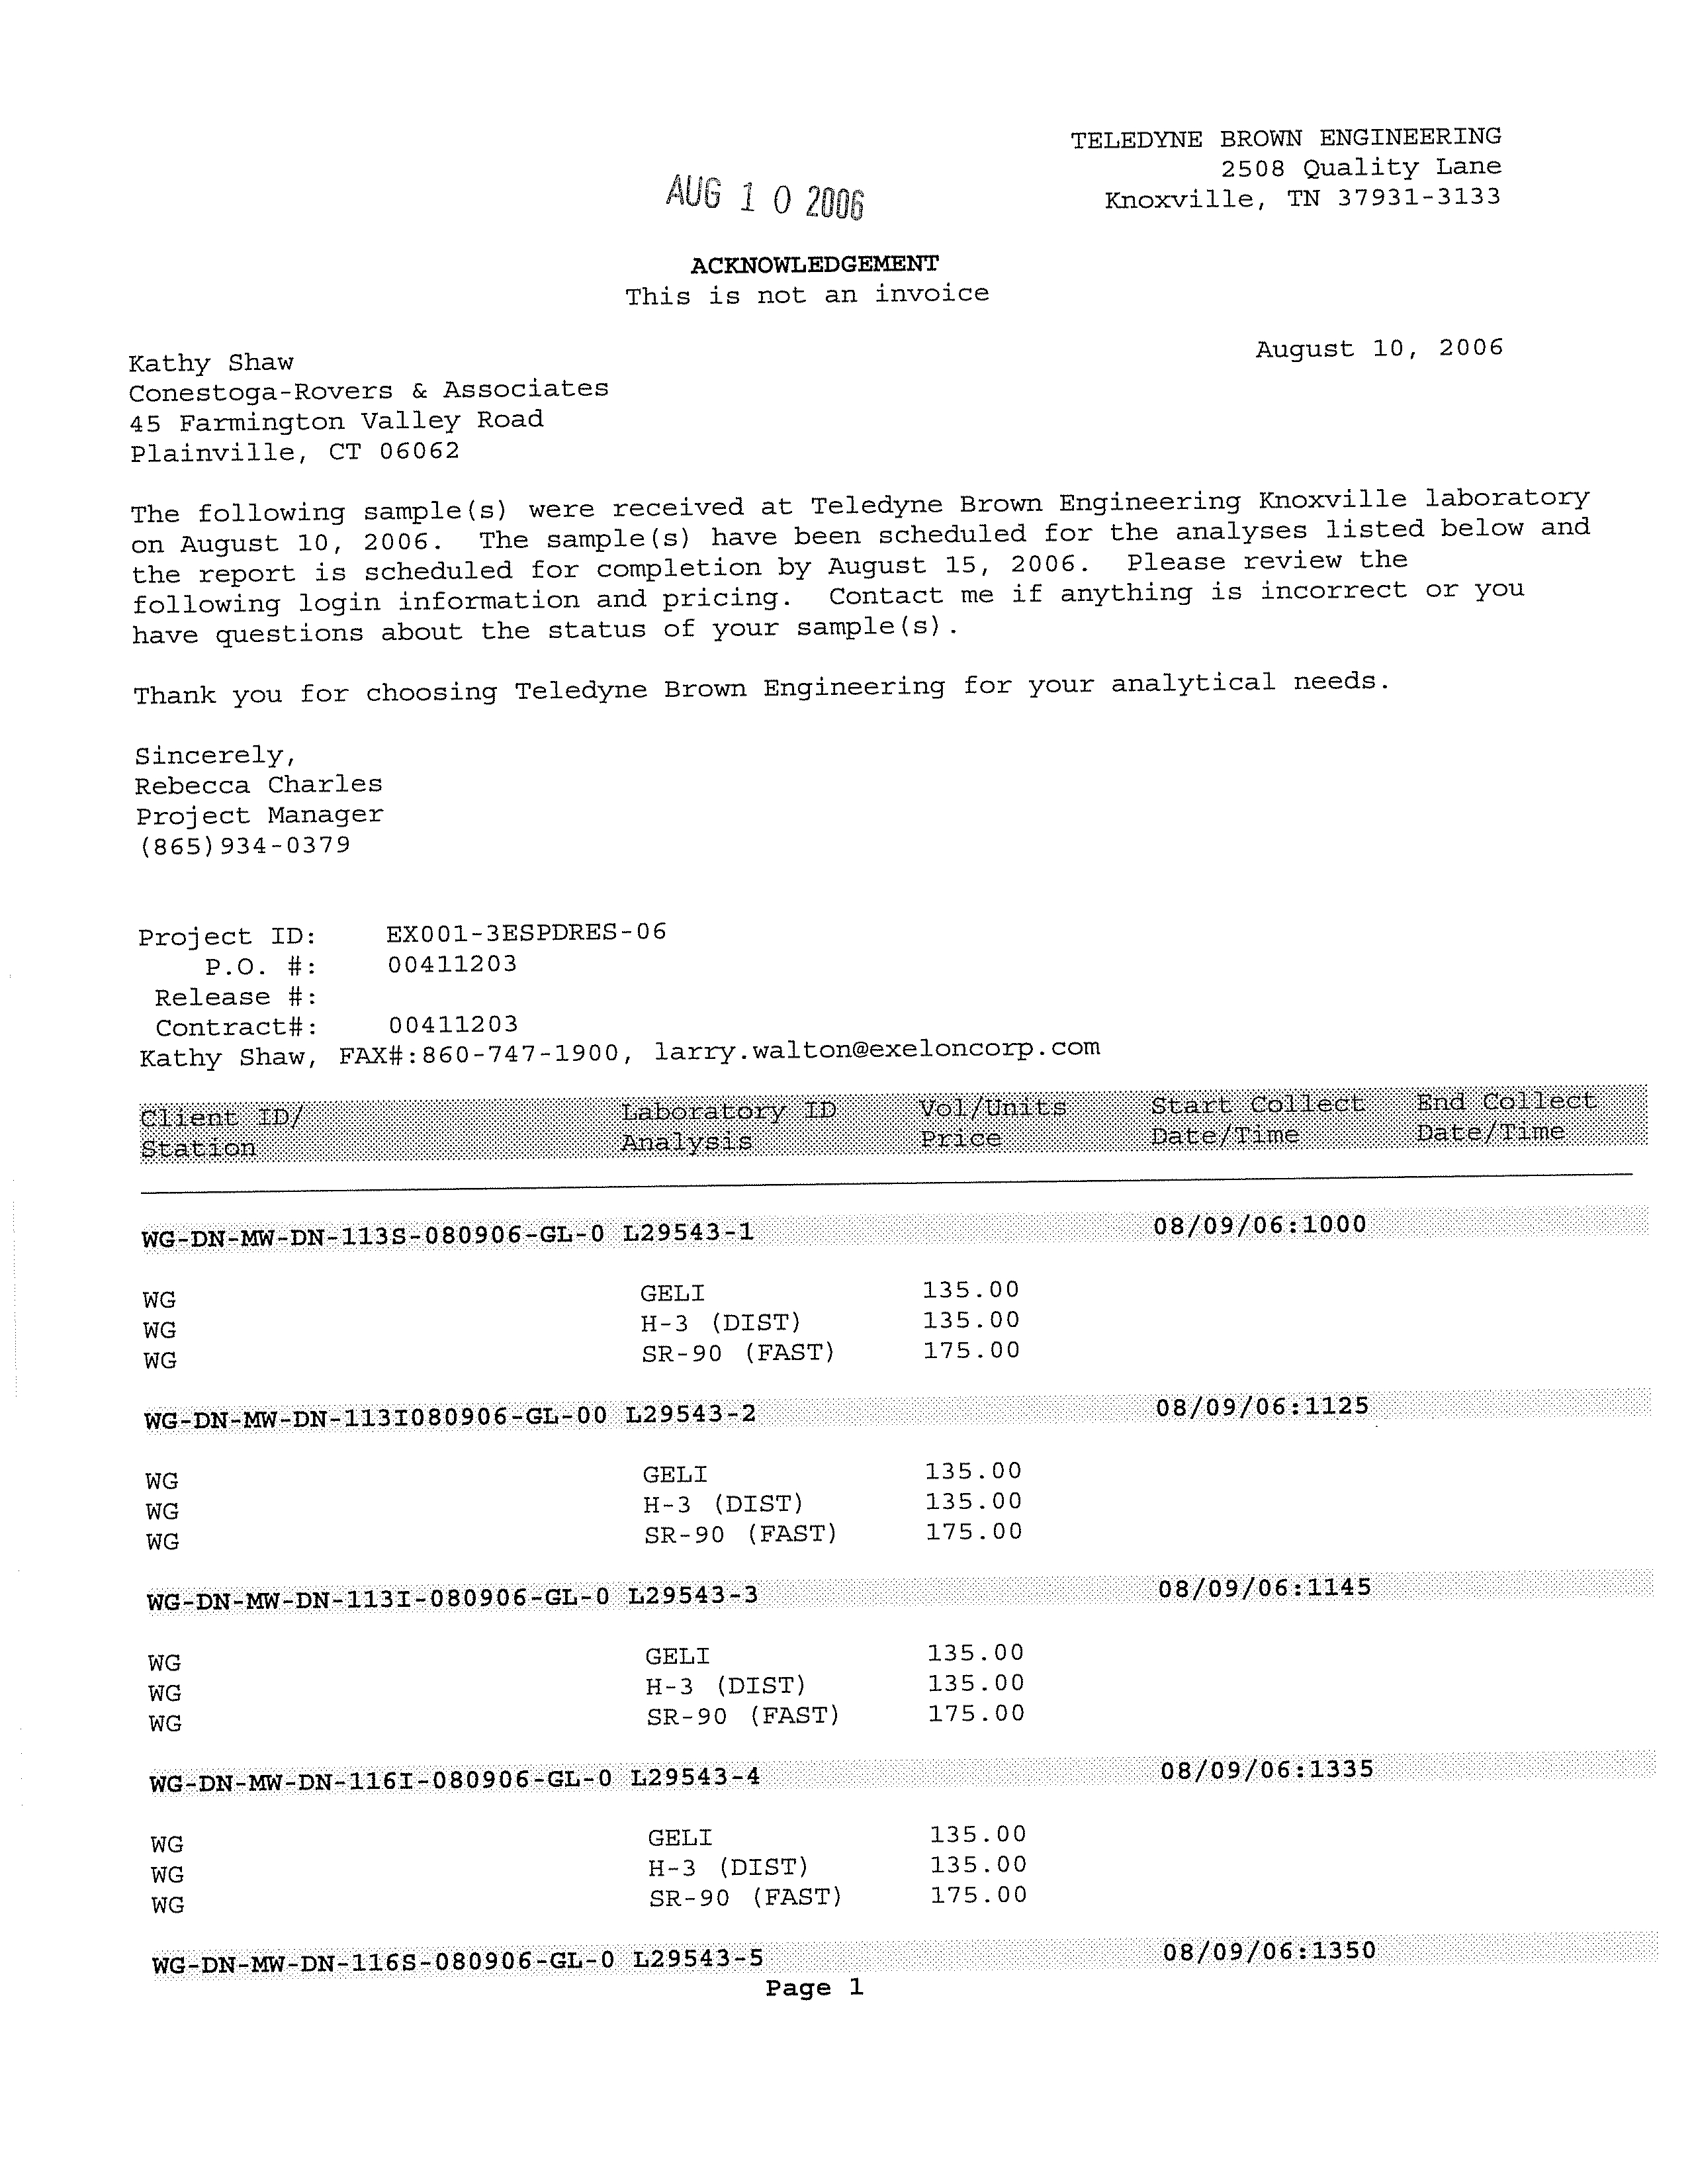
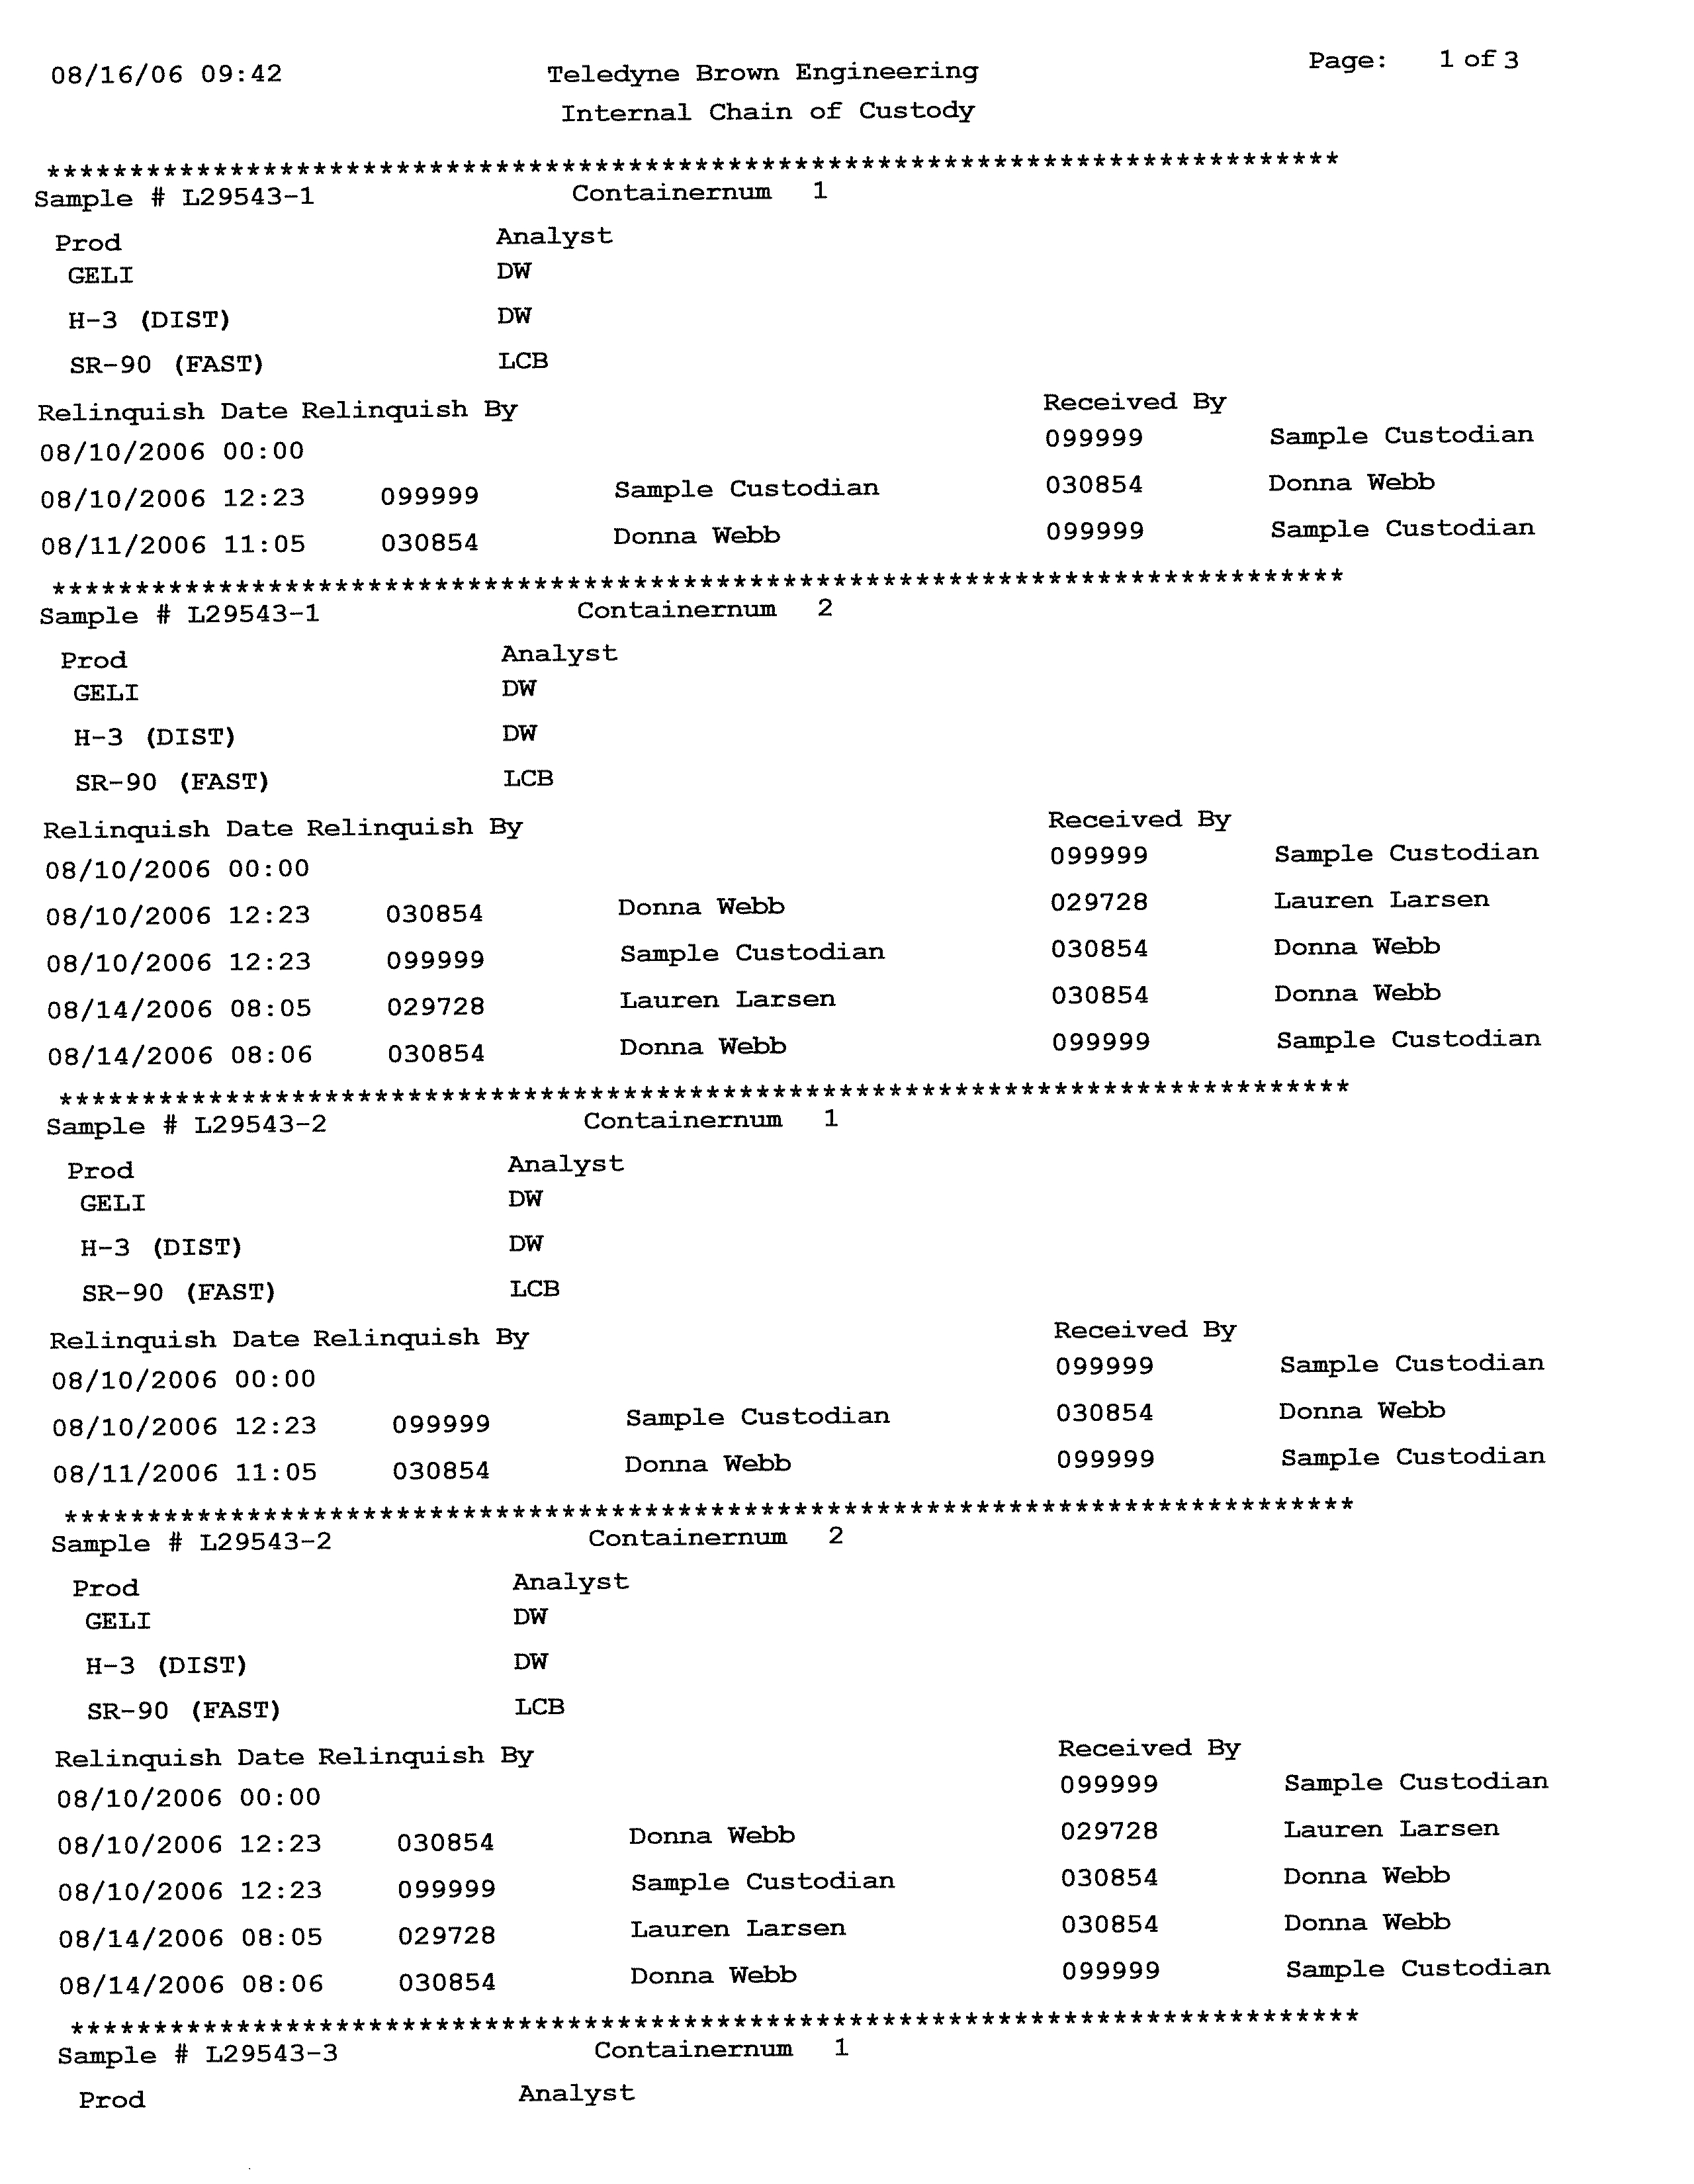
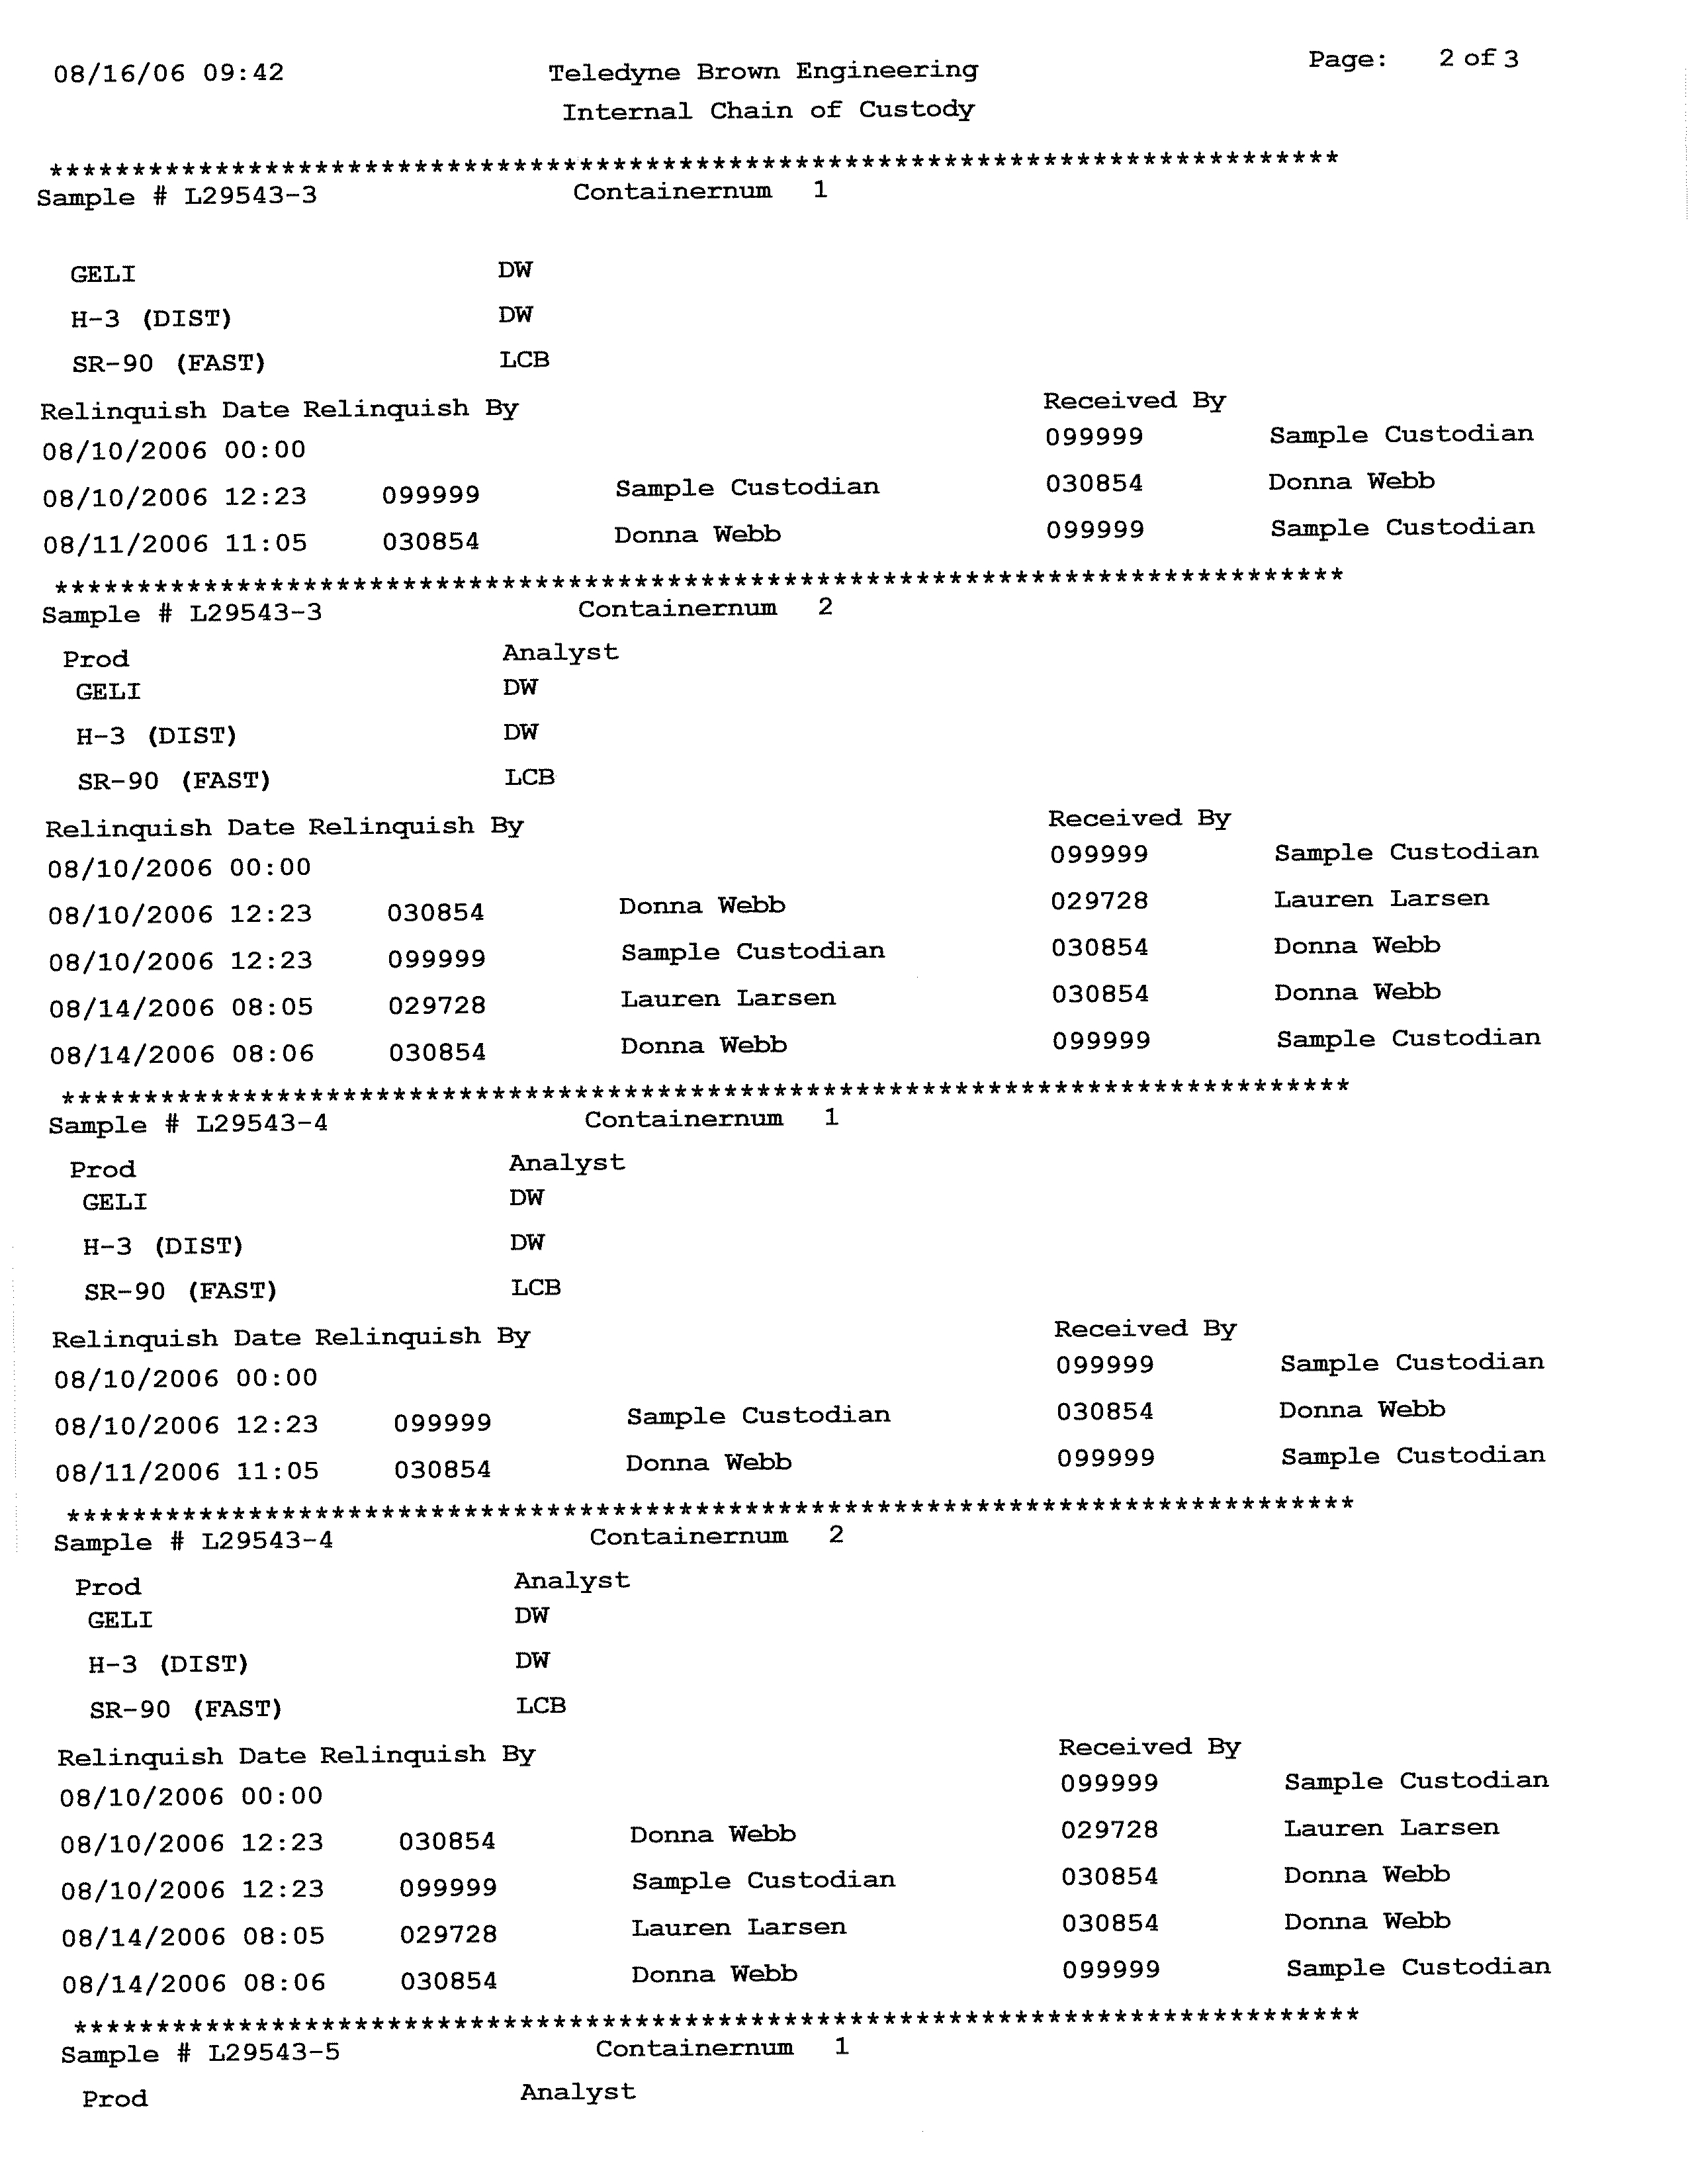
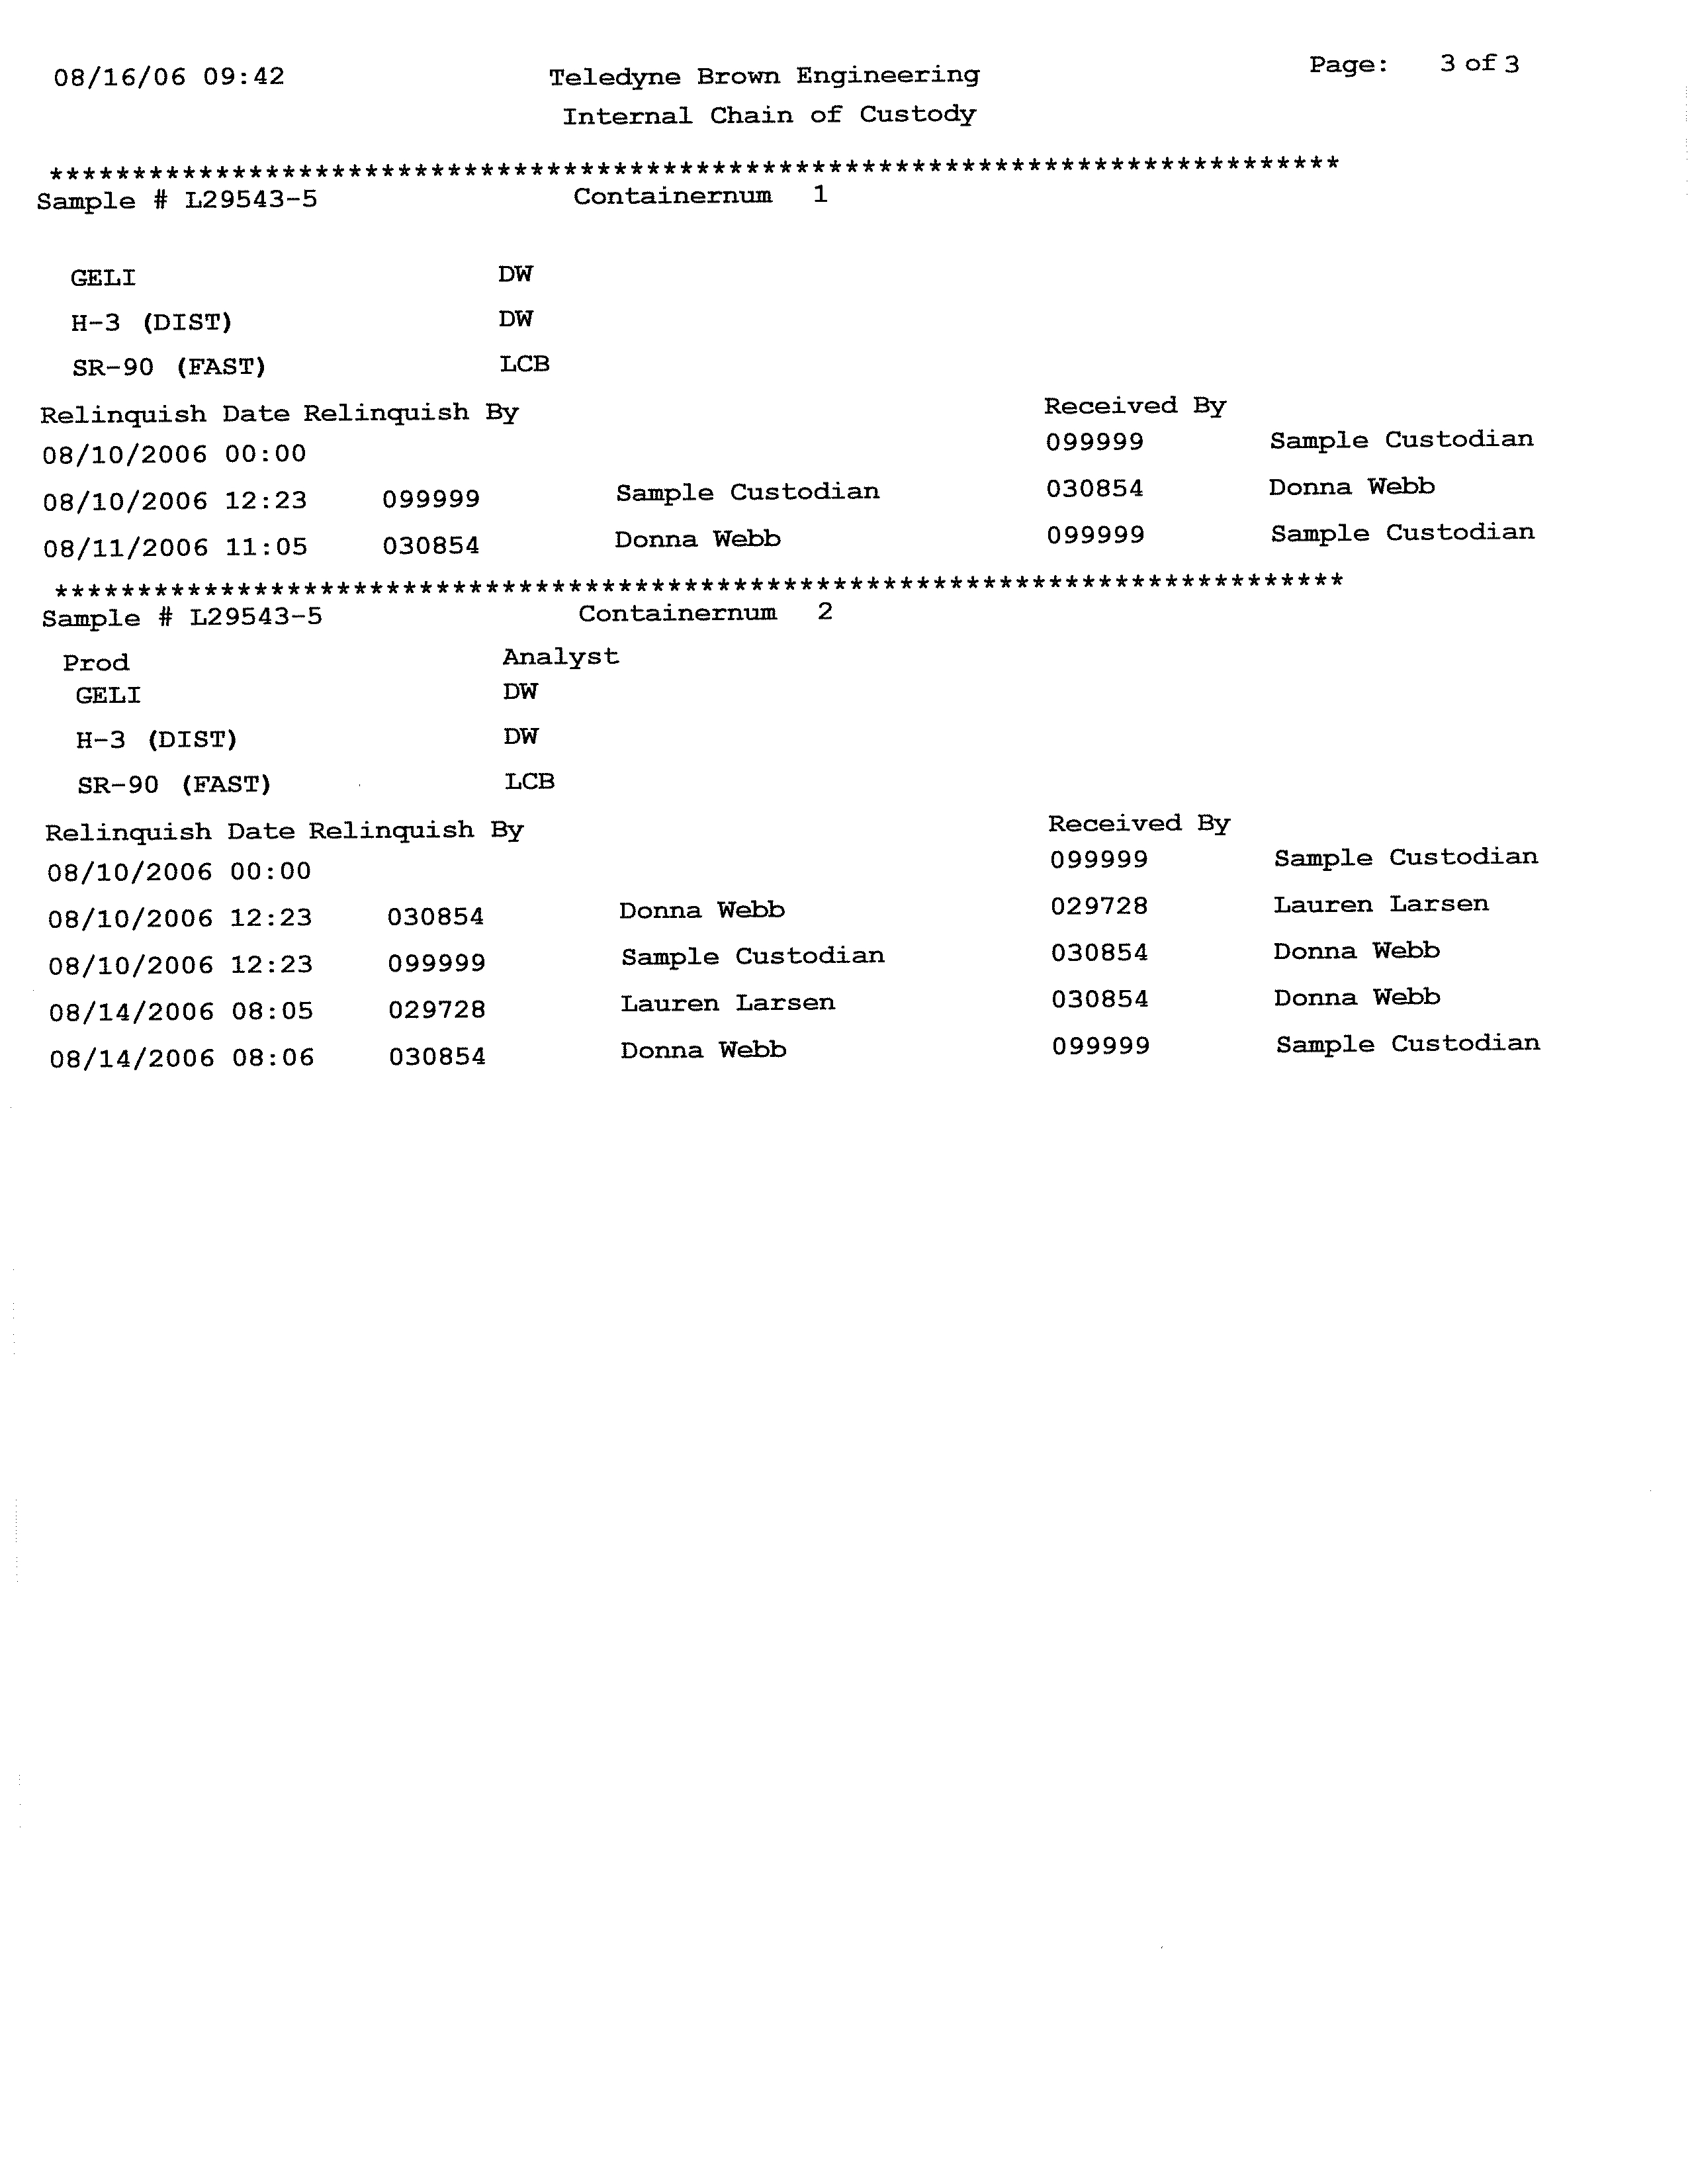
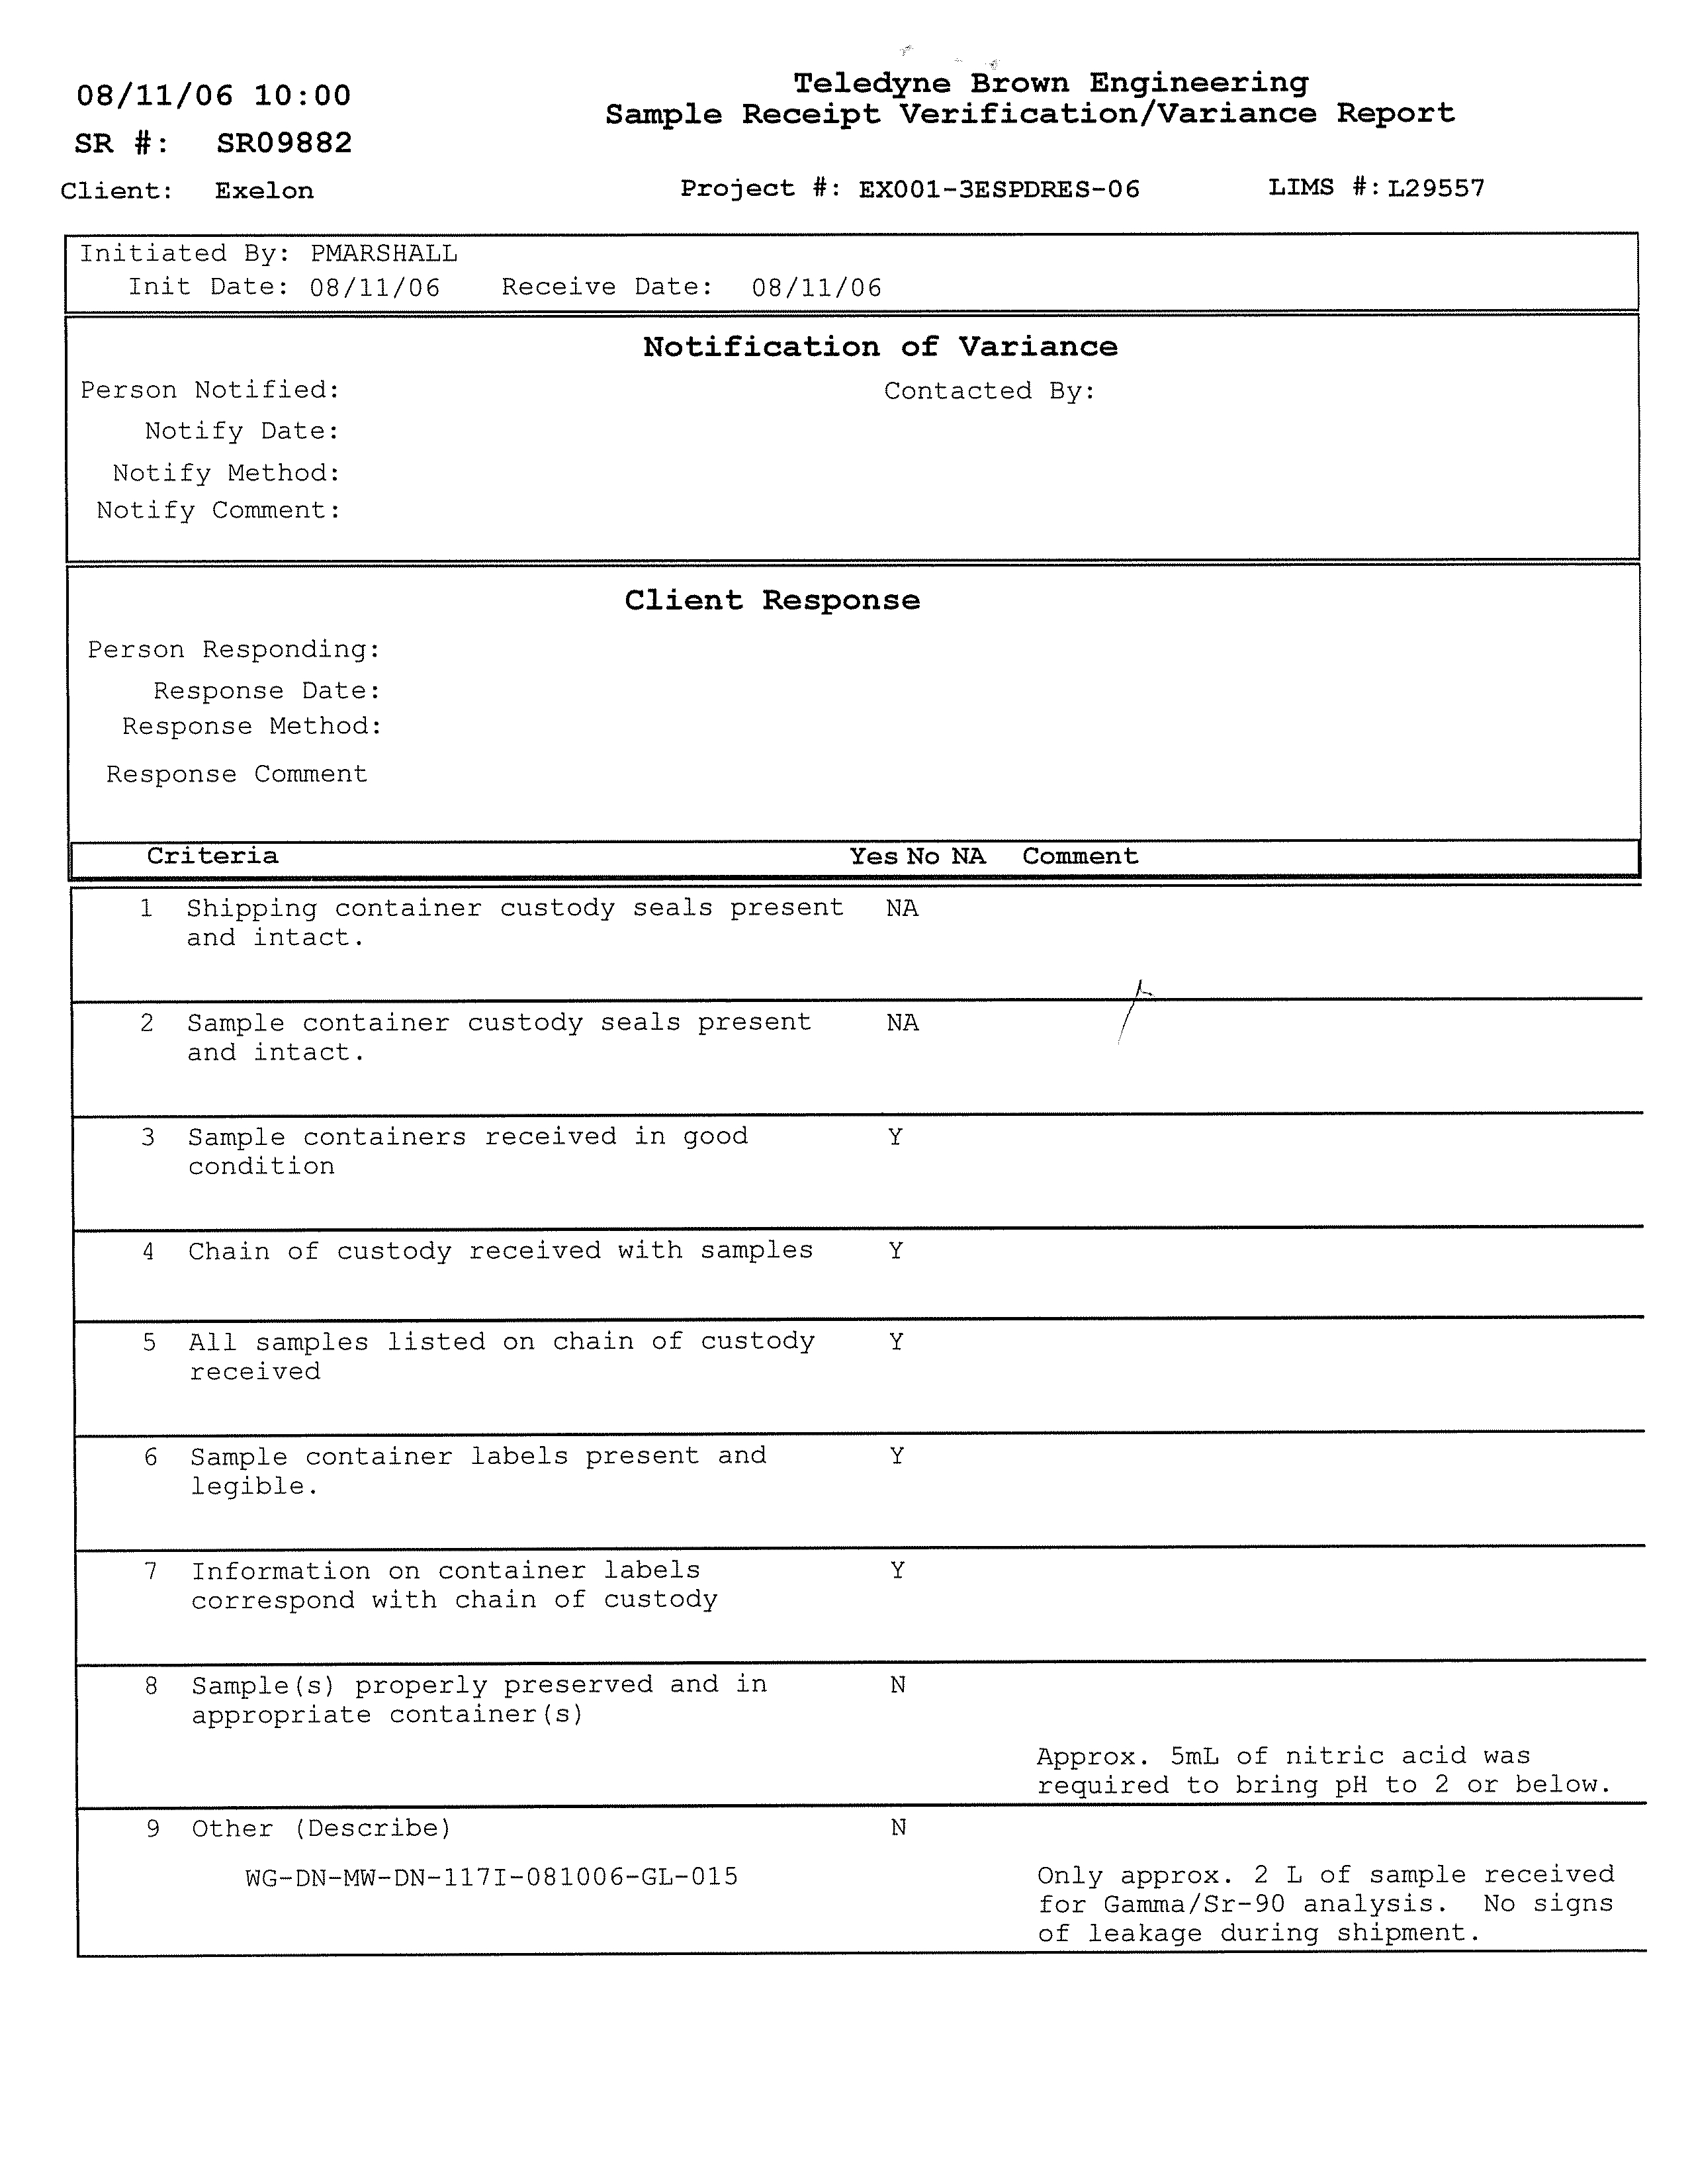
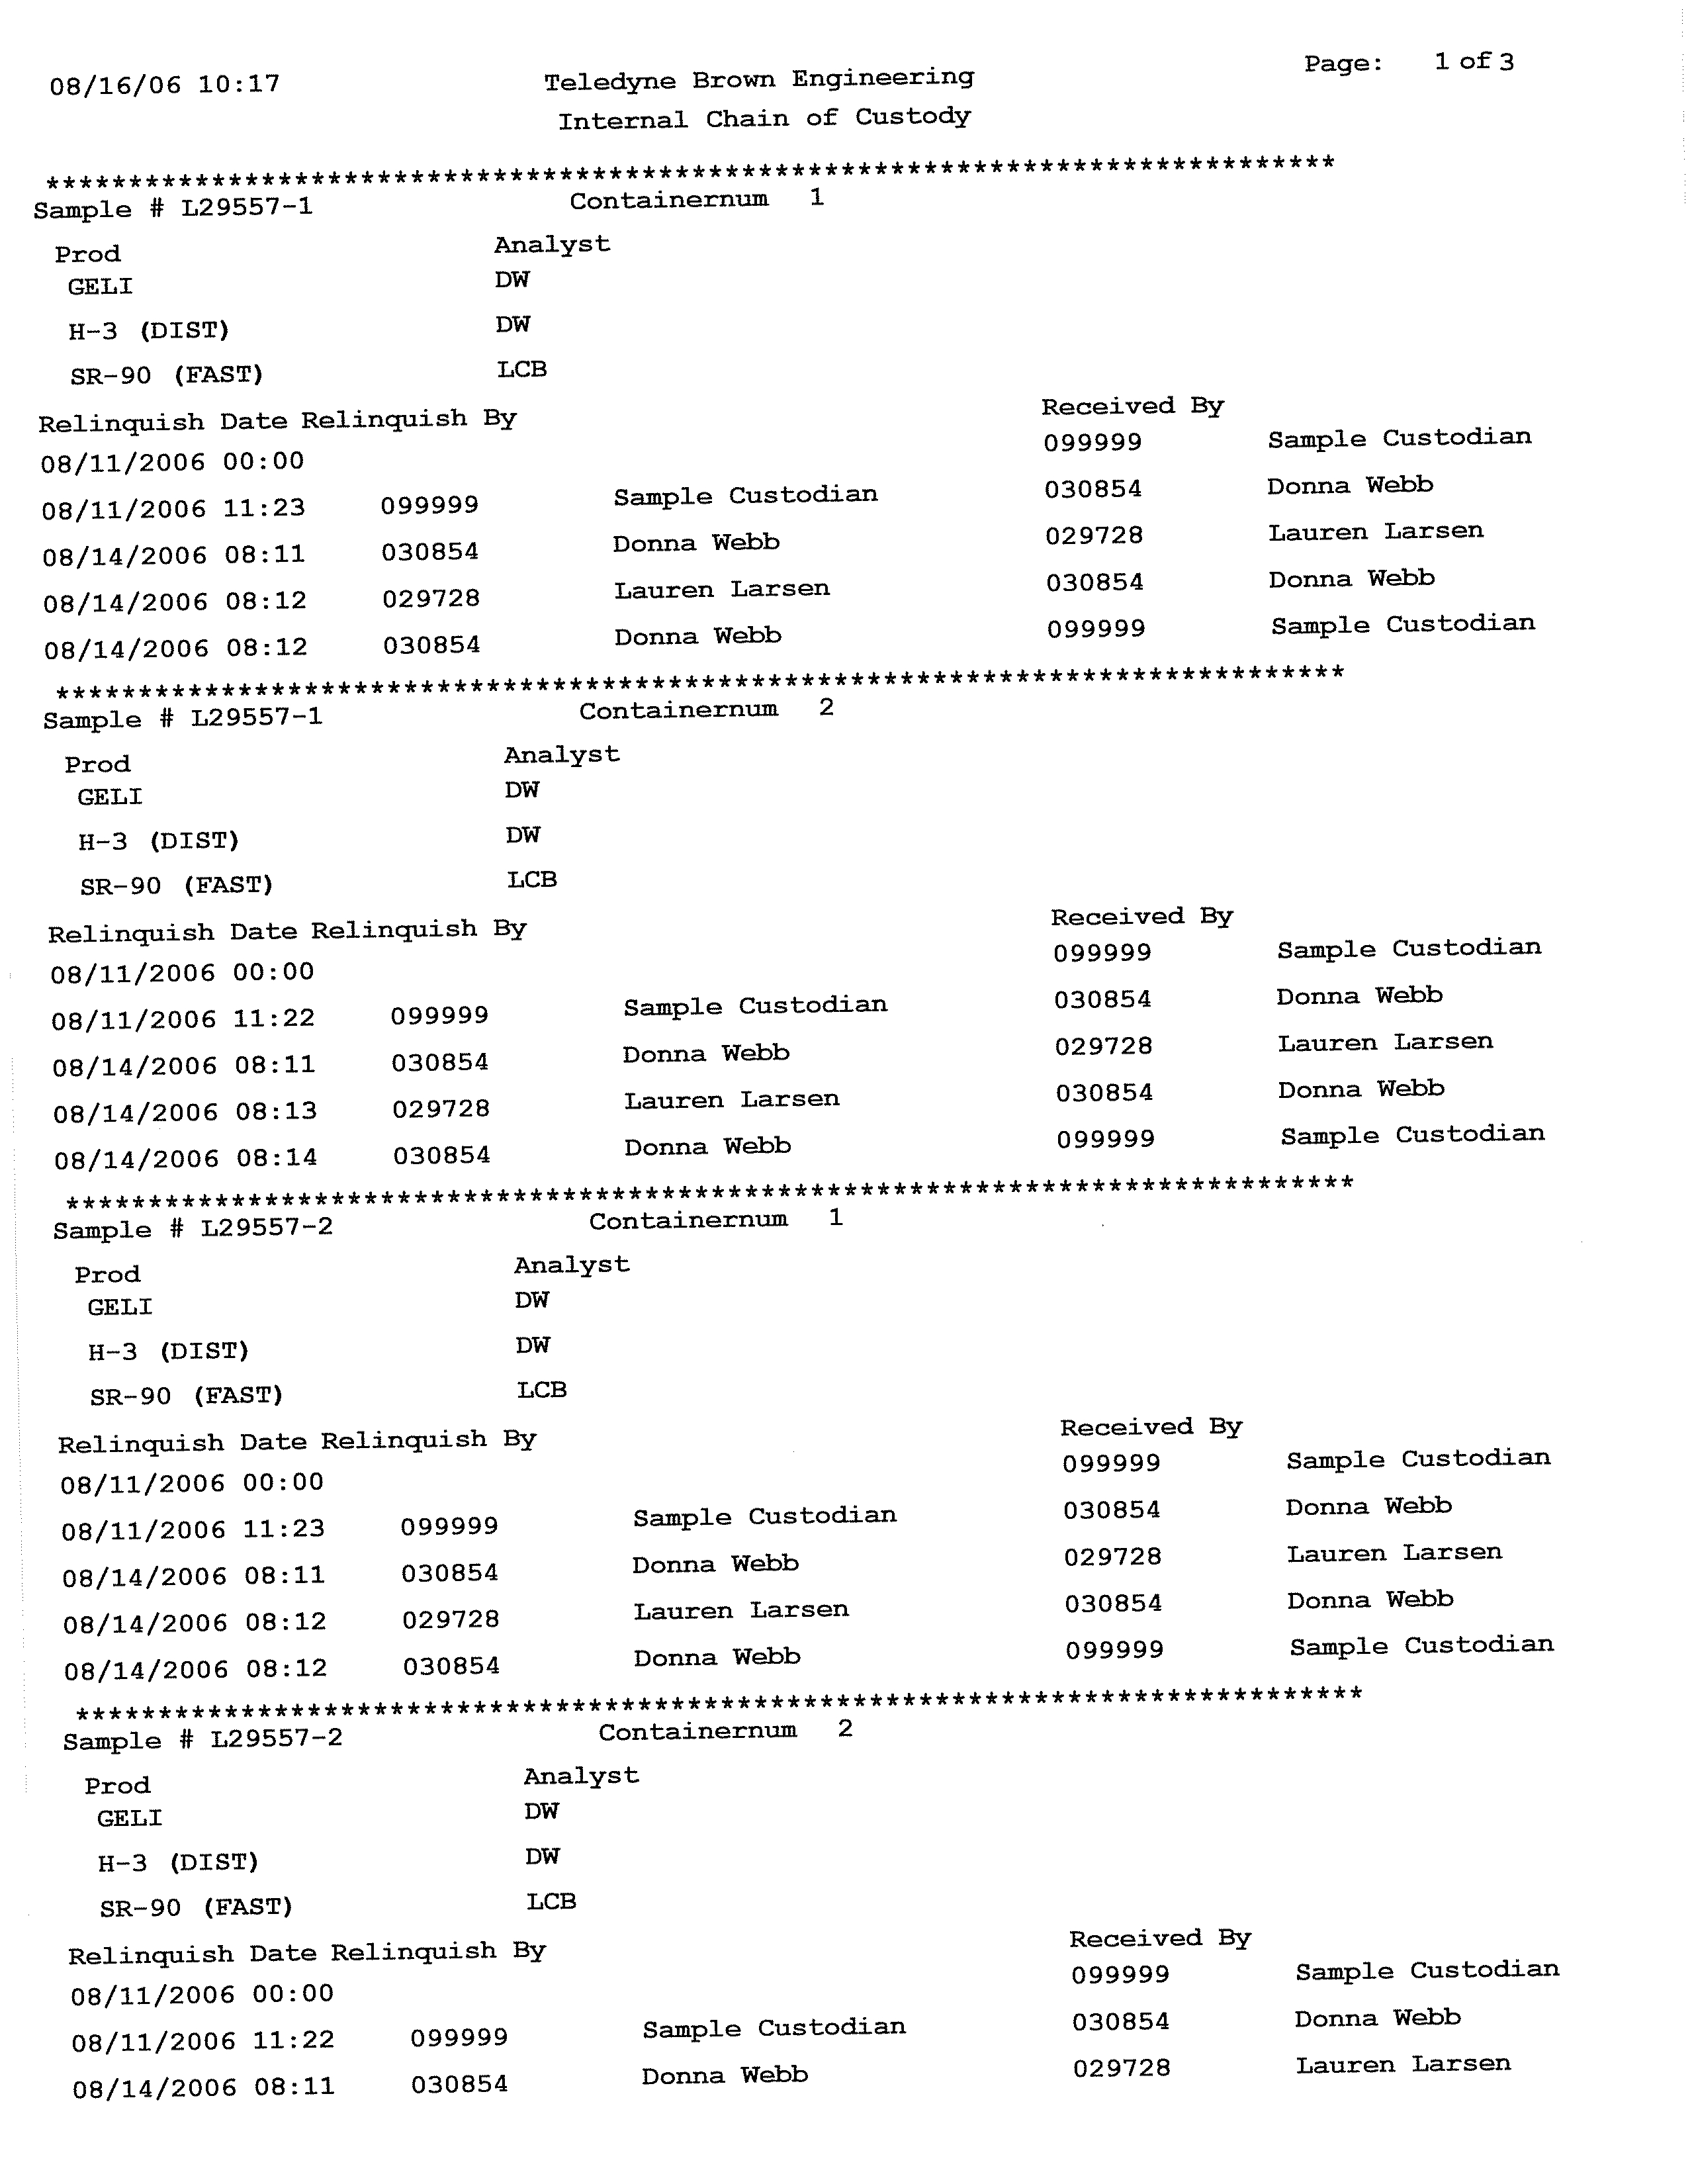
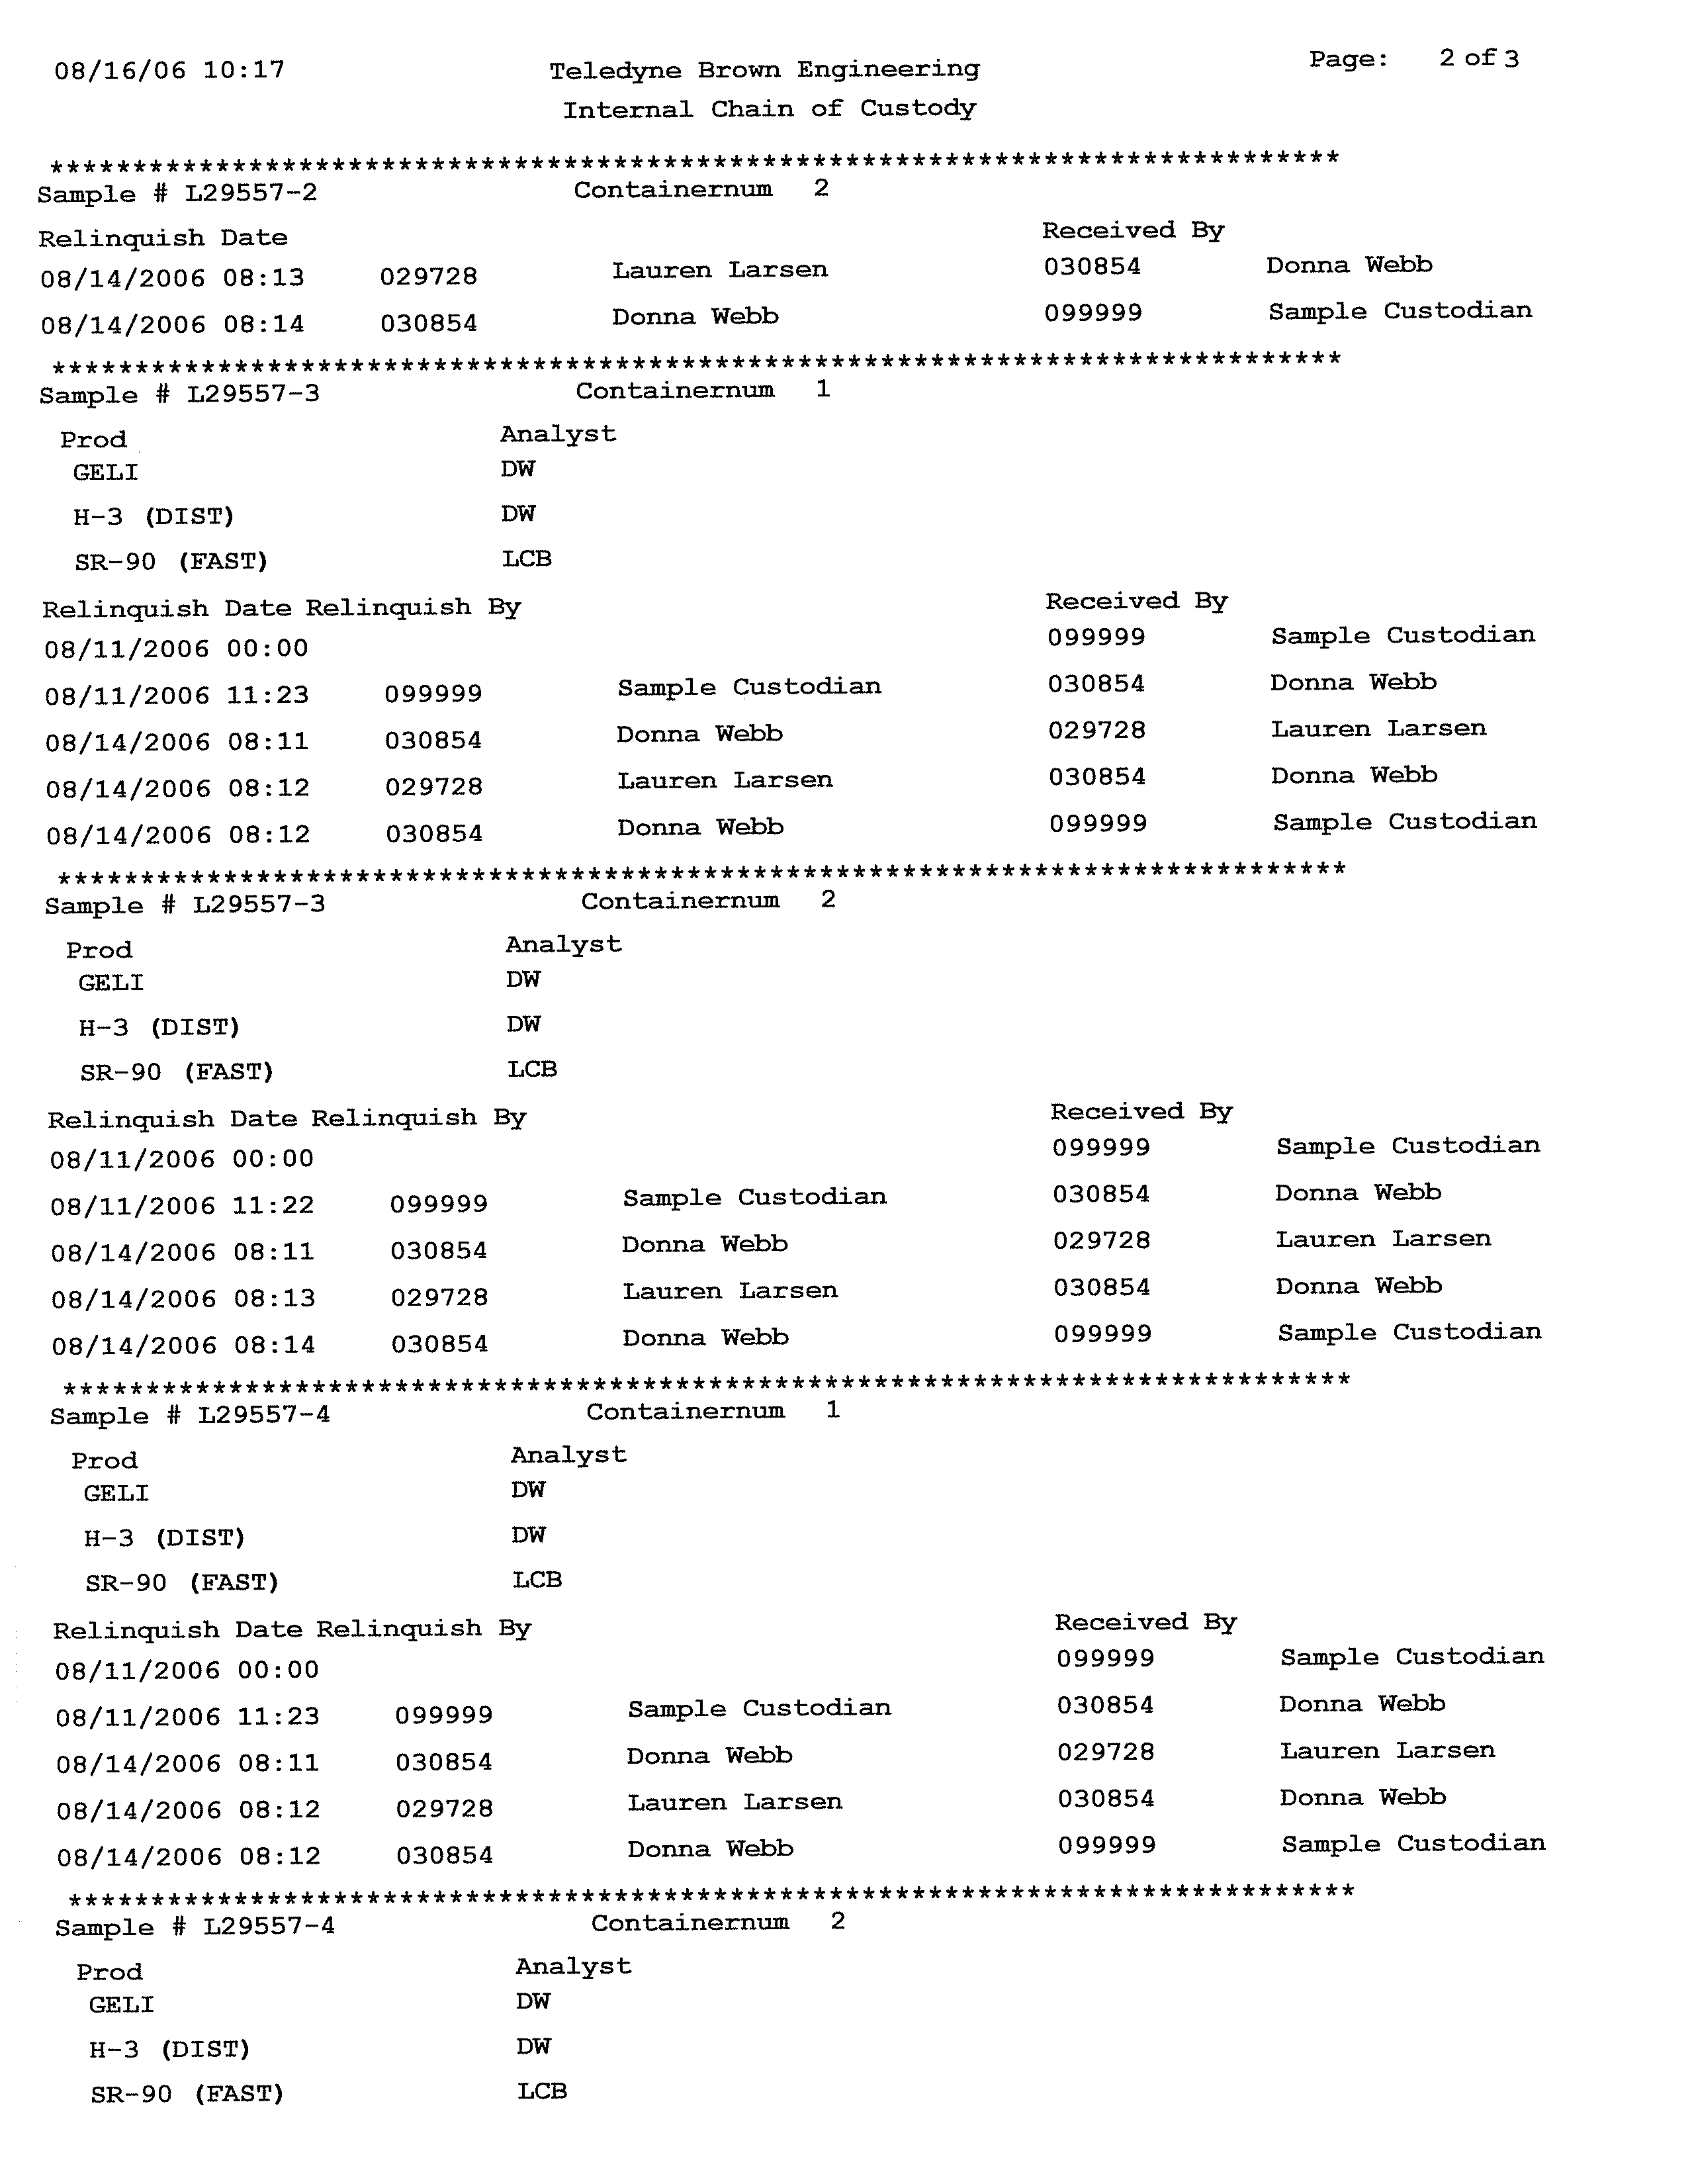
The samples were delivered to Station personnel under chain-of-custody protocol.
Subsequently, the Station shipped the samples under chain-of-custody protocol to
Teledyne Brown for analyses.
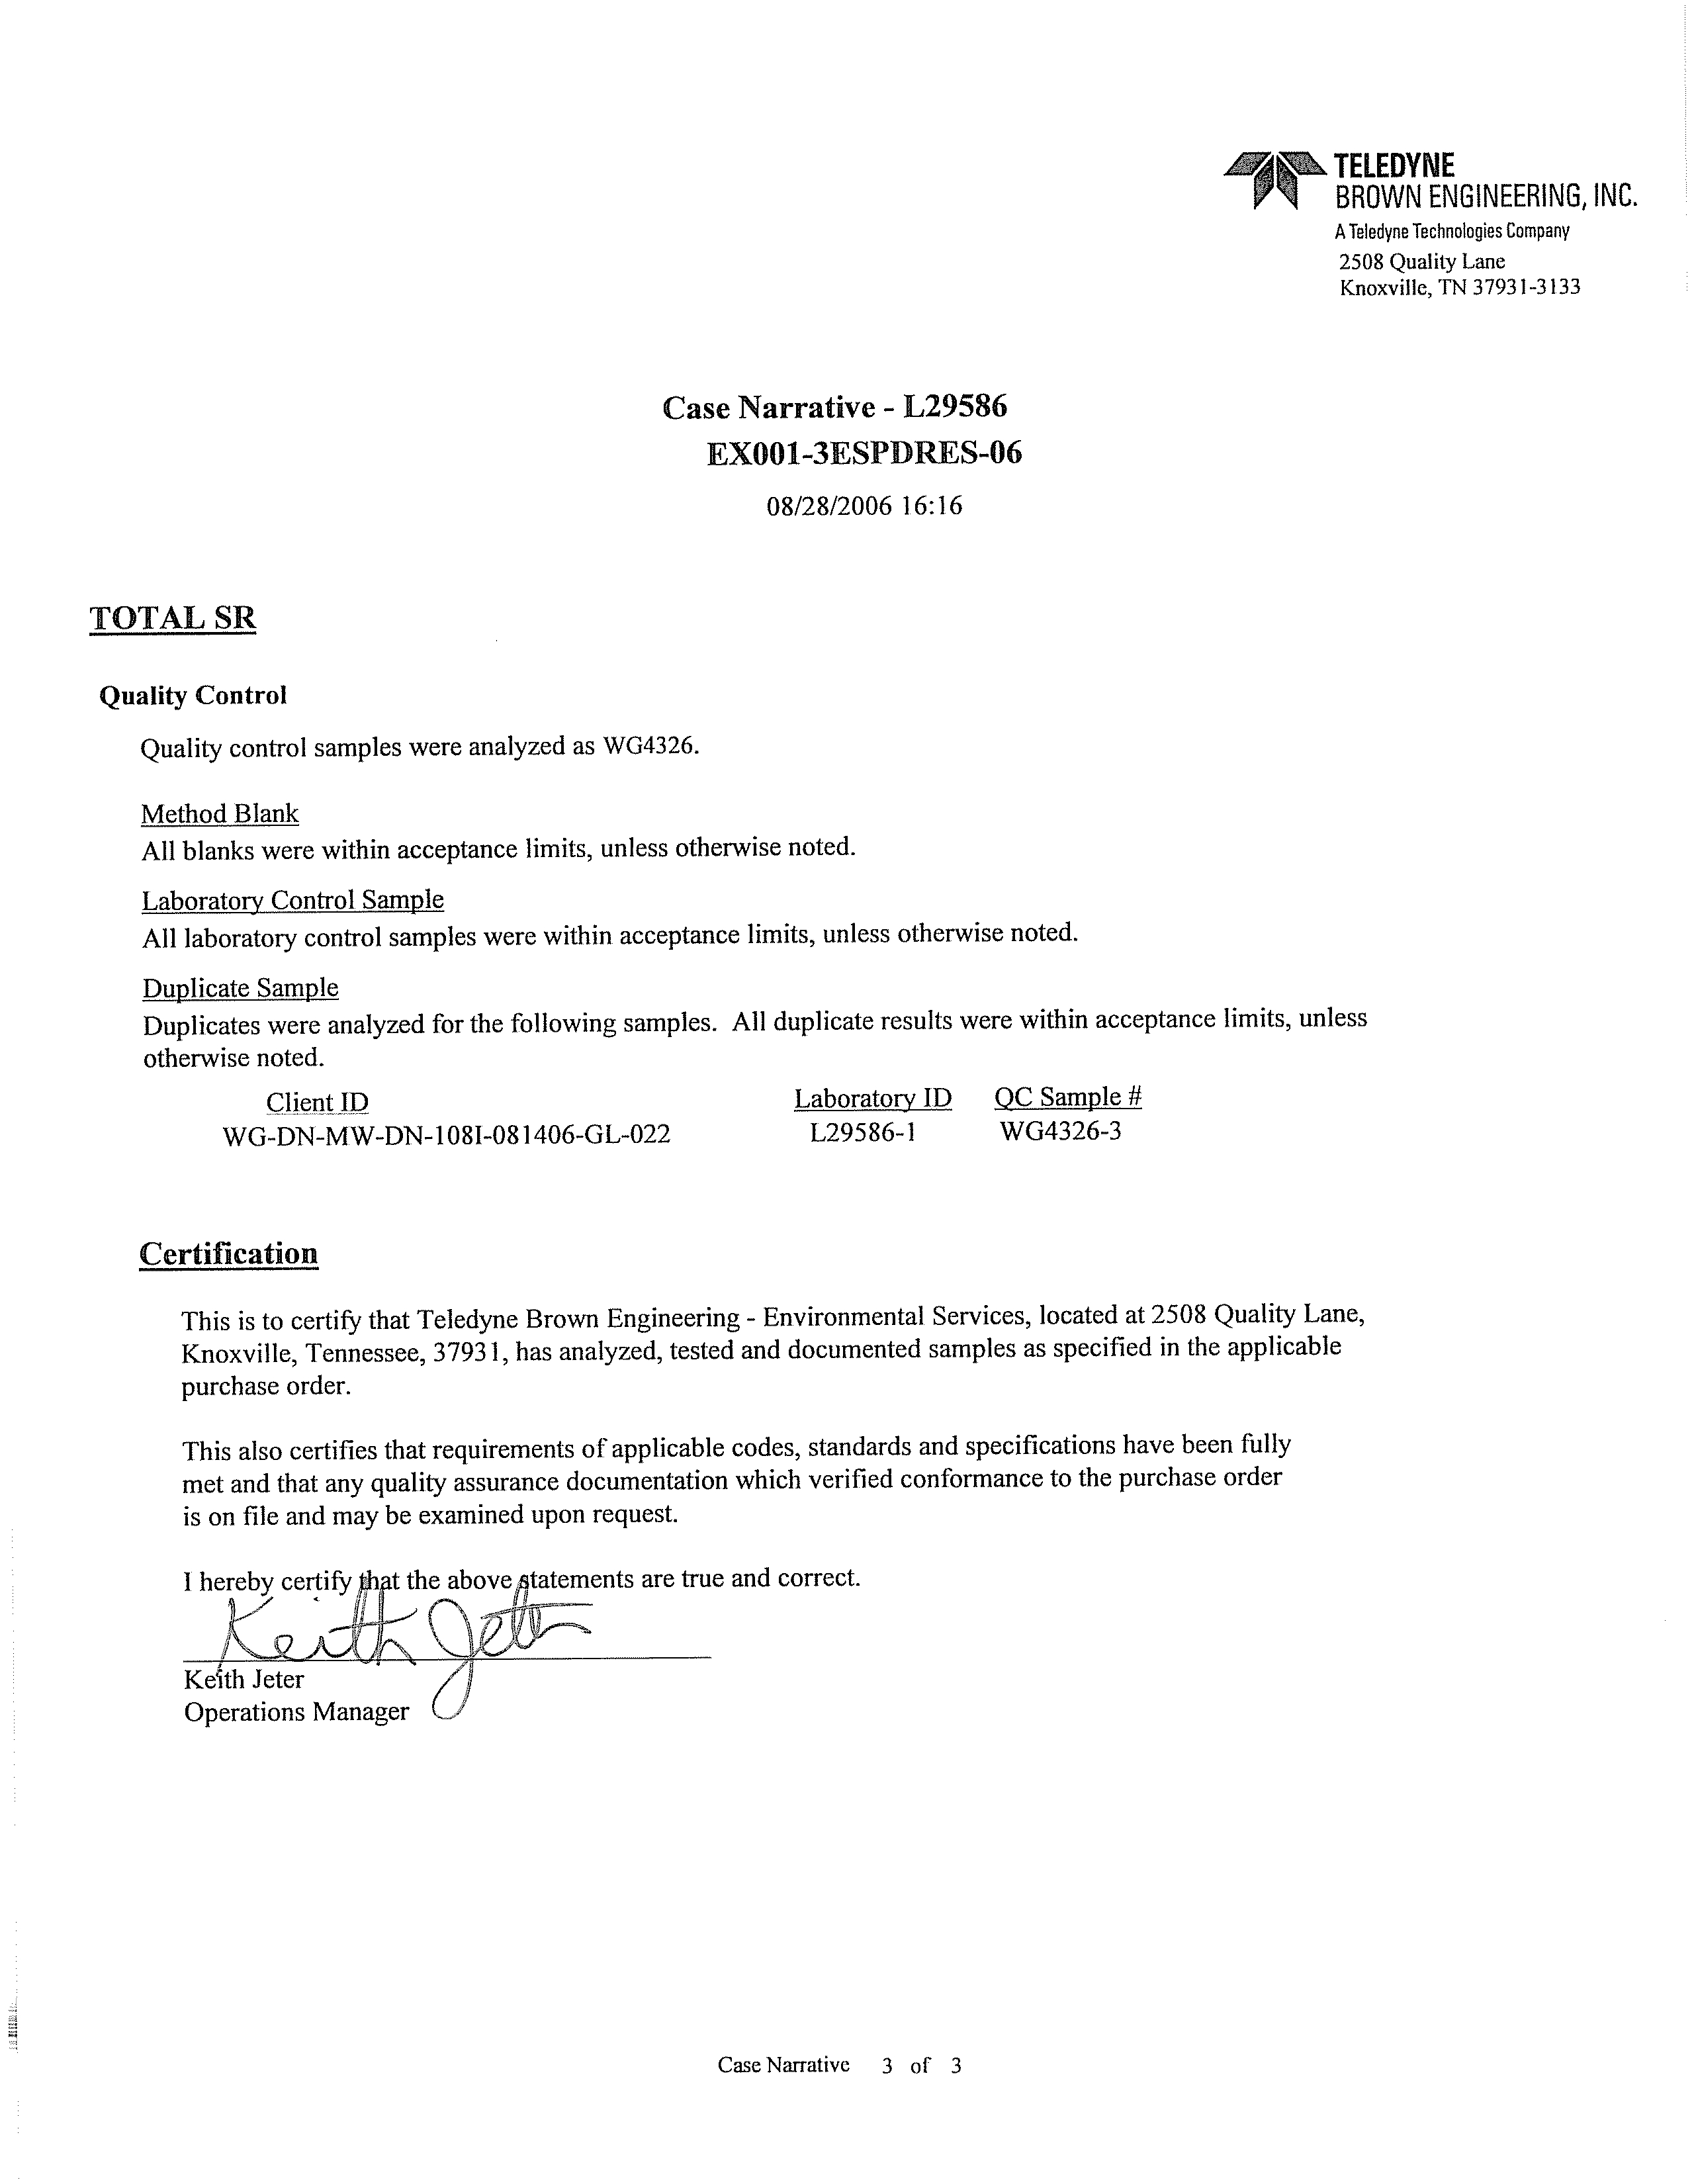
4.10
QUALITY CONTROL SAMPLES
Quality control samples were collected to evaluate the sampling and analysis process.
Field Duplicates
Field duplicates were collected to verify the accuracy of the analytical laboratory by
providing two samples collected at the same location and then
comparing the analytical
results for consistency. Field duplicate samples were collected at a frequency of one
duplicate for every ten samples collected. A total of four duplicate samples were
collected. The locations of duplicate samples were selected in the field during the
performance of sample collection activities. The duplicate samples were collected
simultaneously with the actual sample and were analyzed for the same parameters as
the actual samples.
Split Samples
During the May/June 2006 sampling event, split
samples were collected for the NRC for
tritium simultaneously with the actual sample at every sample location. Split samples
were delivered to the Station personnel and made available to the NRC and Illinois
Environmental Protection Agency (EPA).
During the August 2006 sampling event, split samples were collected for the NRC and
for the Illinois Emergency
Management Agency (IEMA) for tritium simultaneously with
the actual sample at every sample location. Split samples were delivered to the Station
personnel and made available to the NRC, IEMA, and Illinois EPA.
4.11
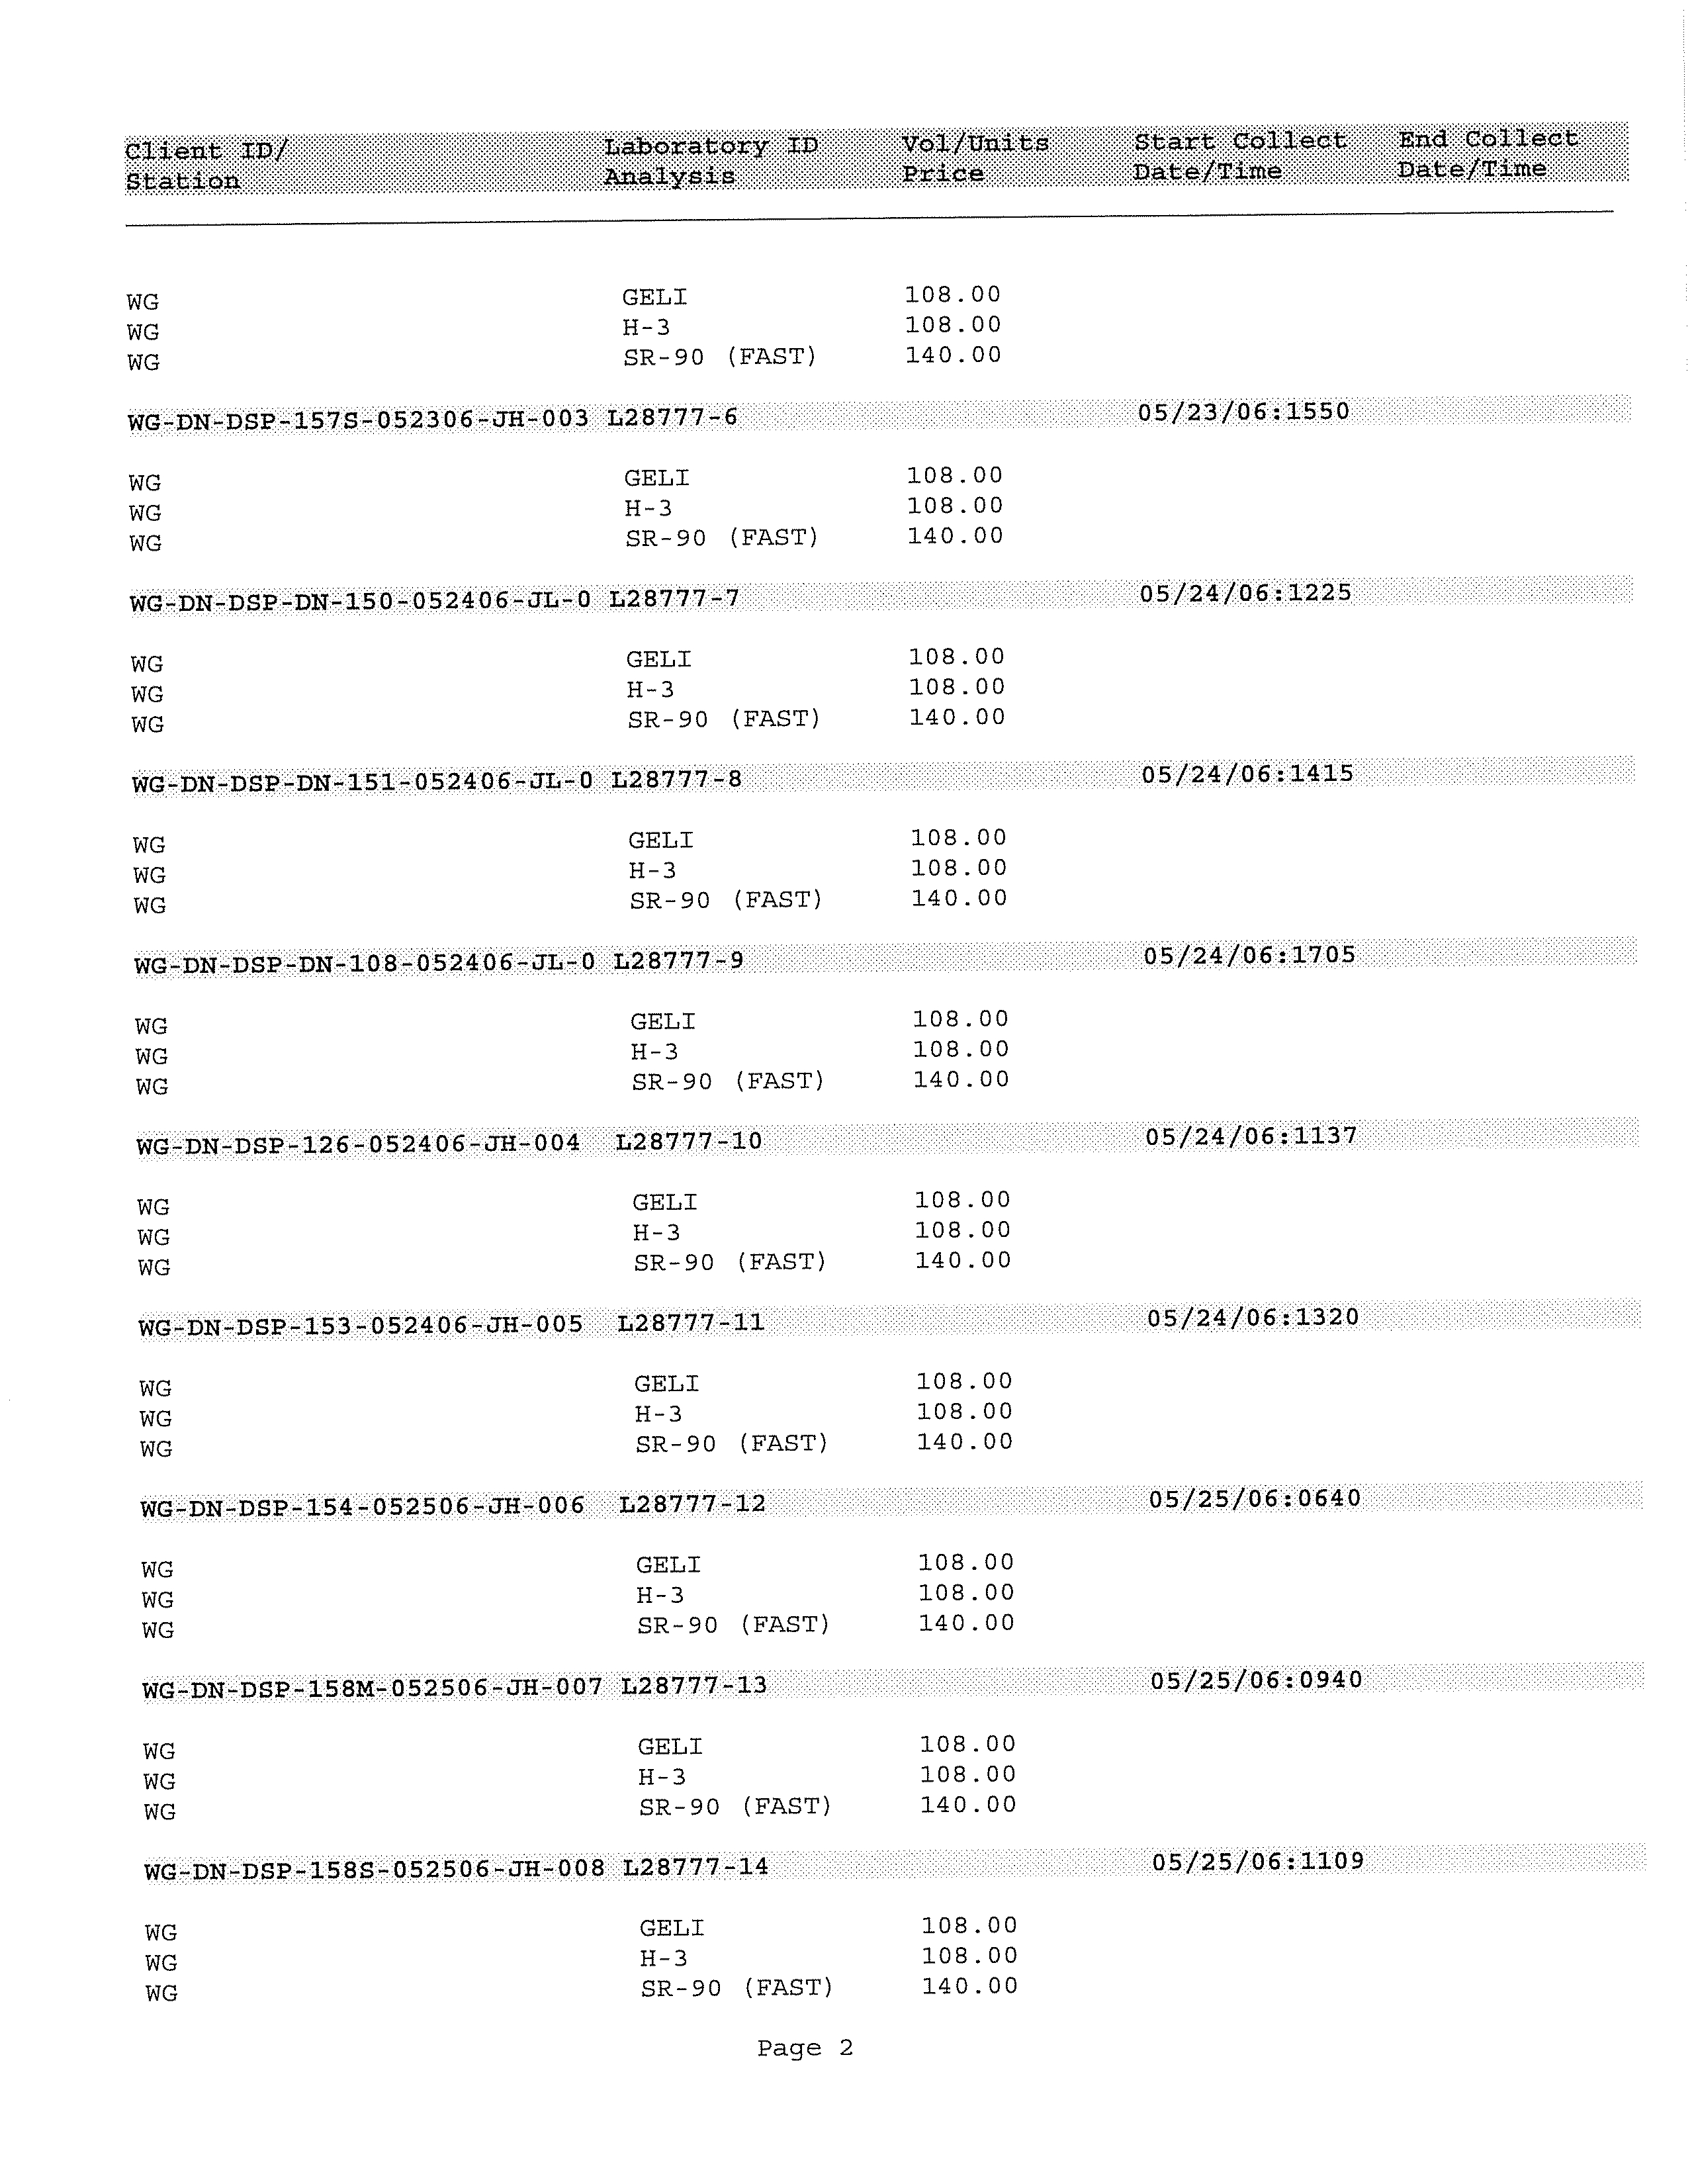
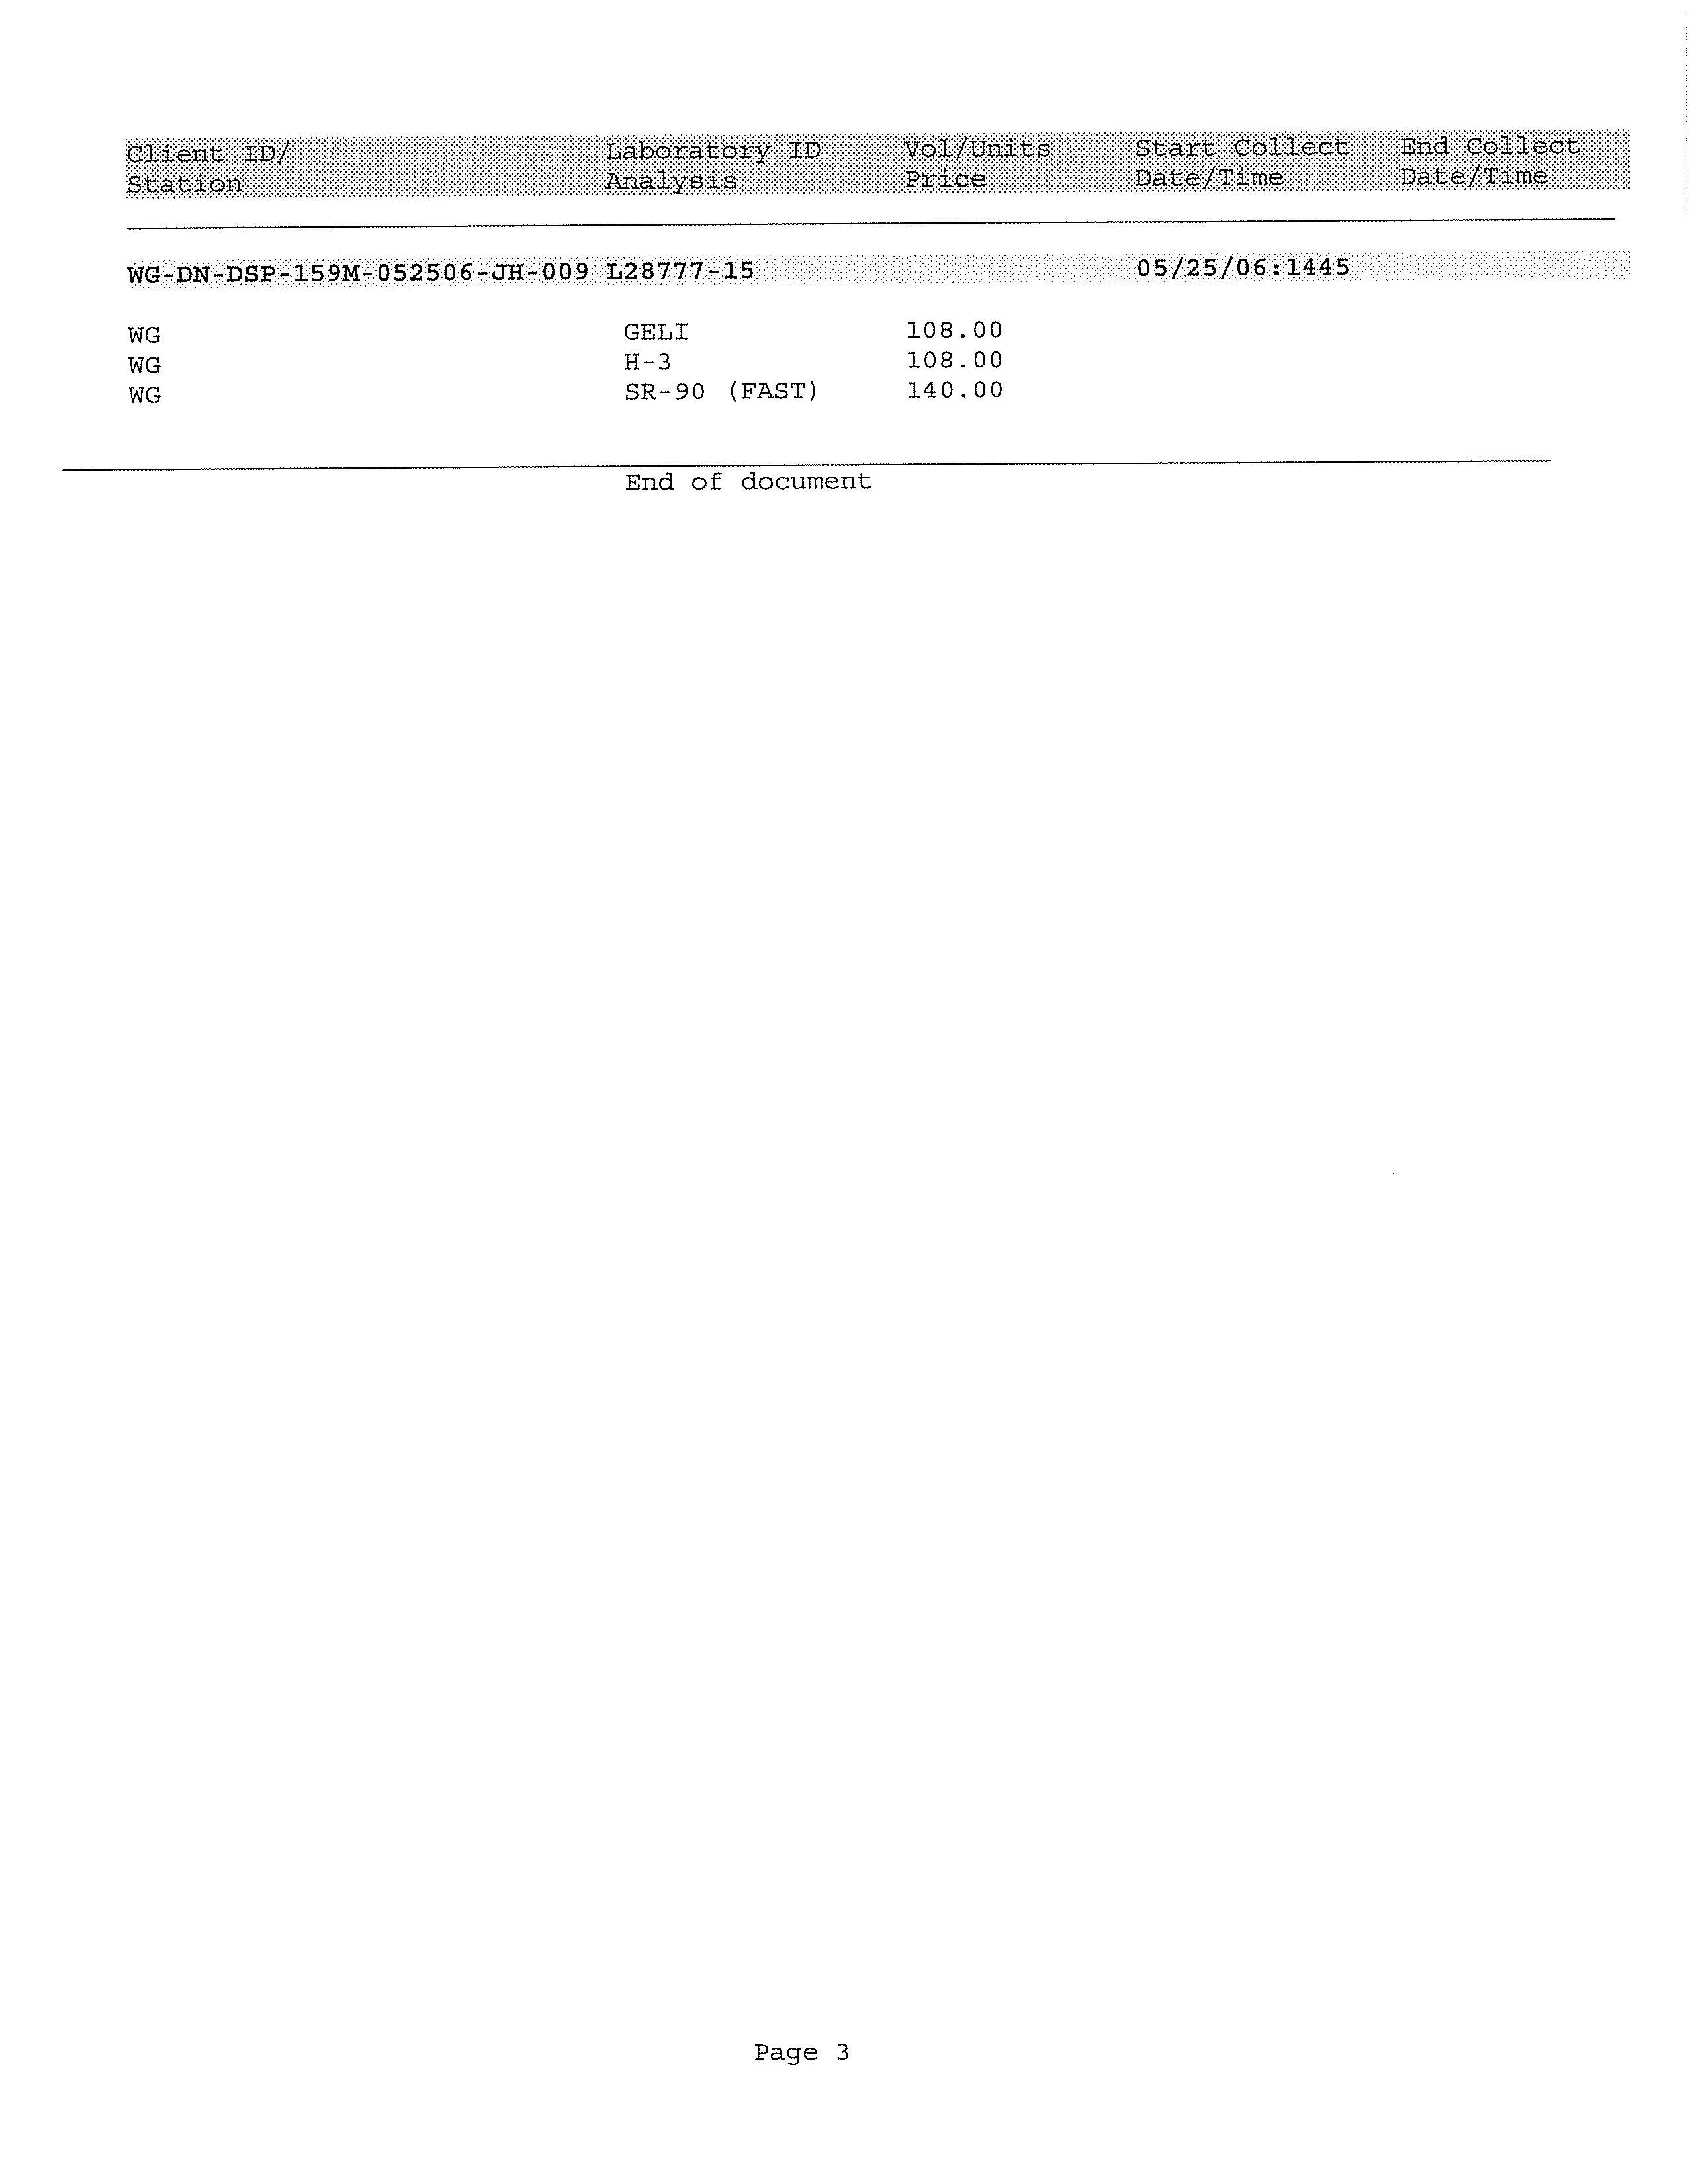
ANALYSES
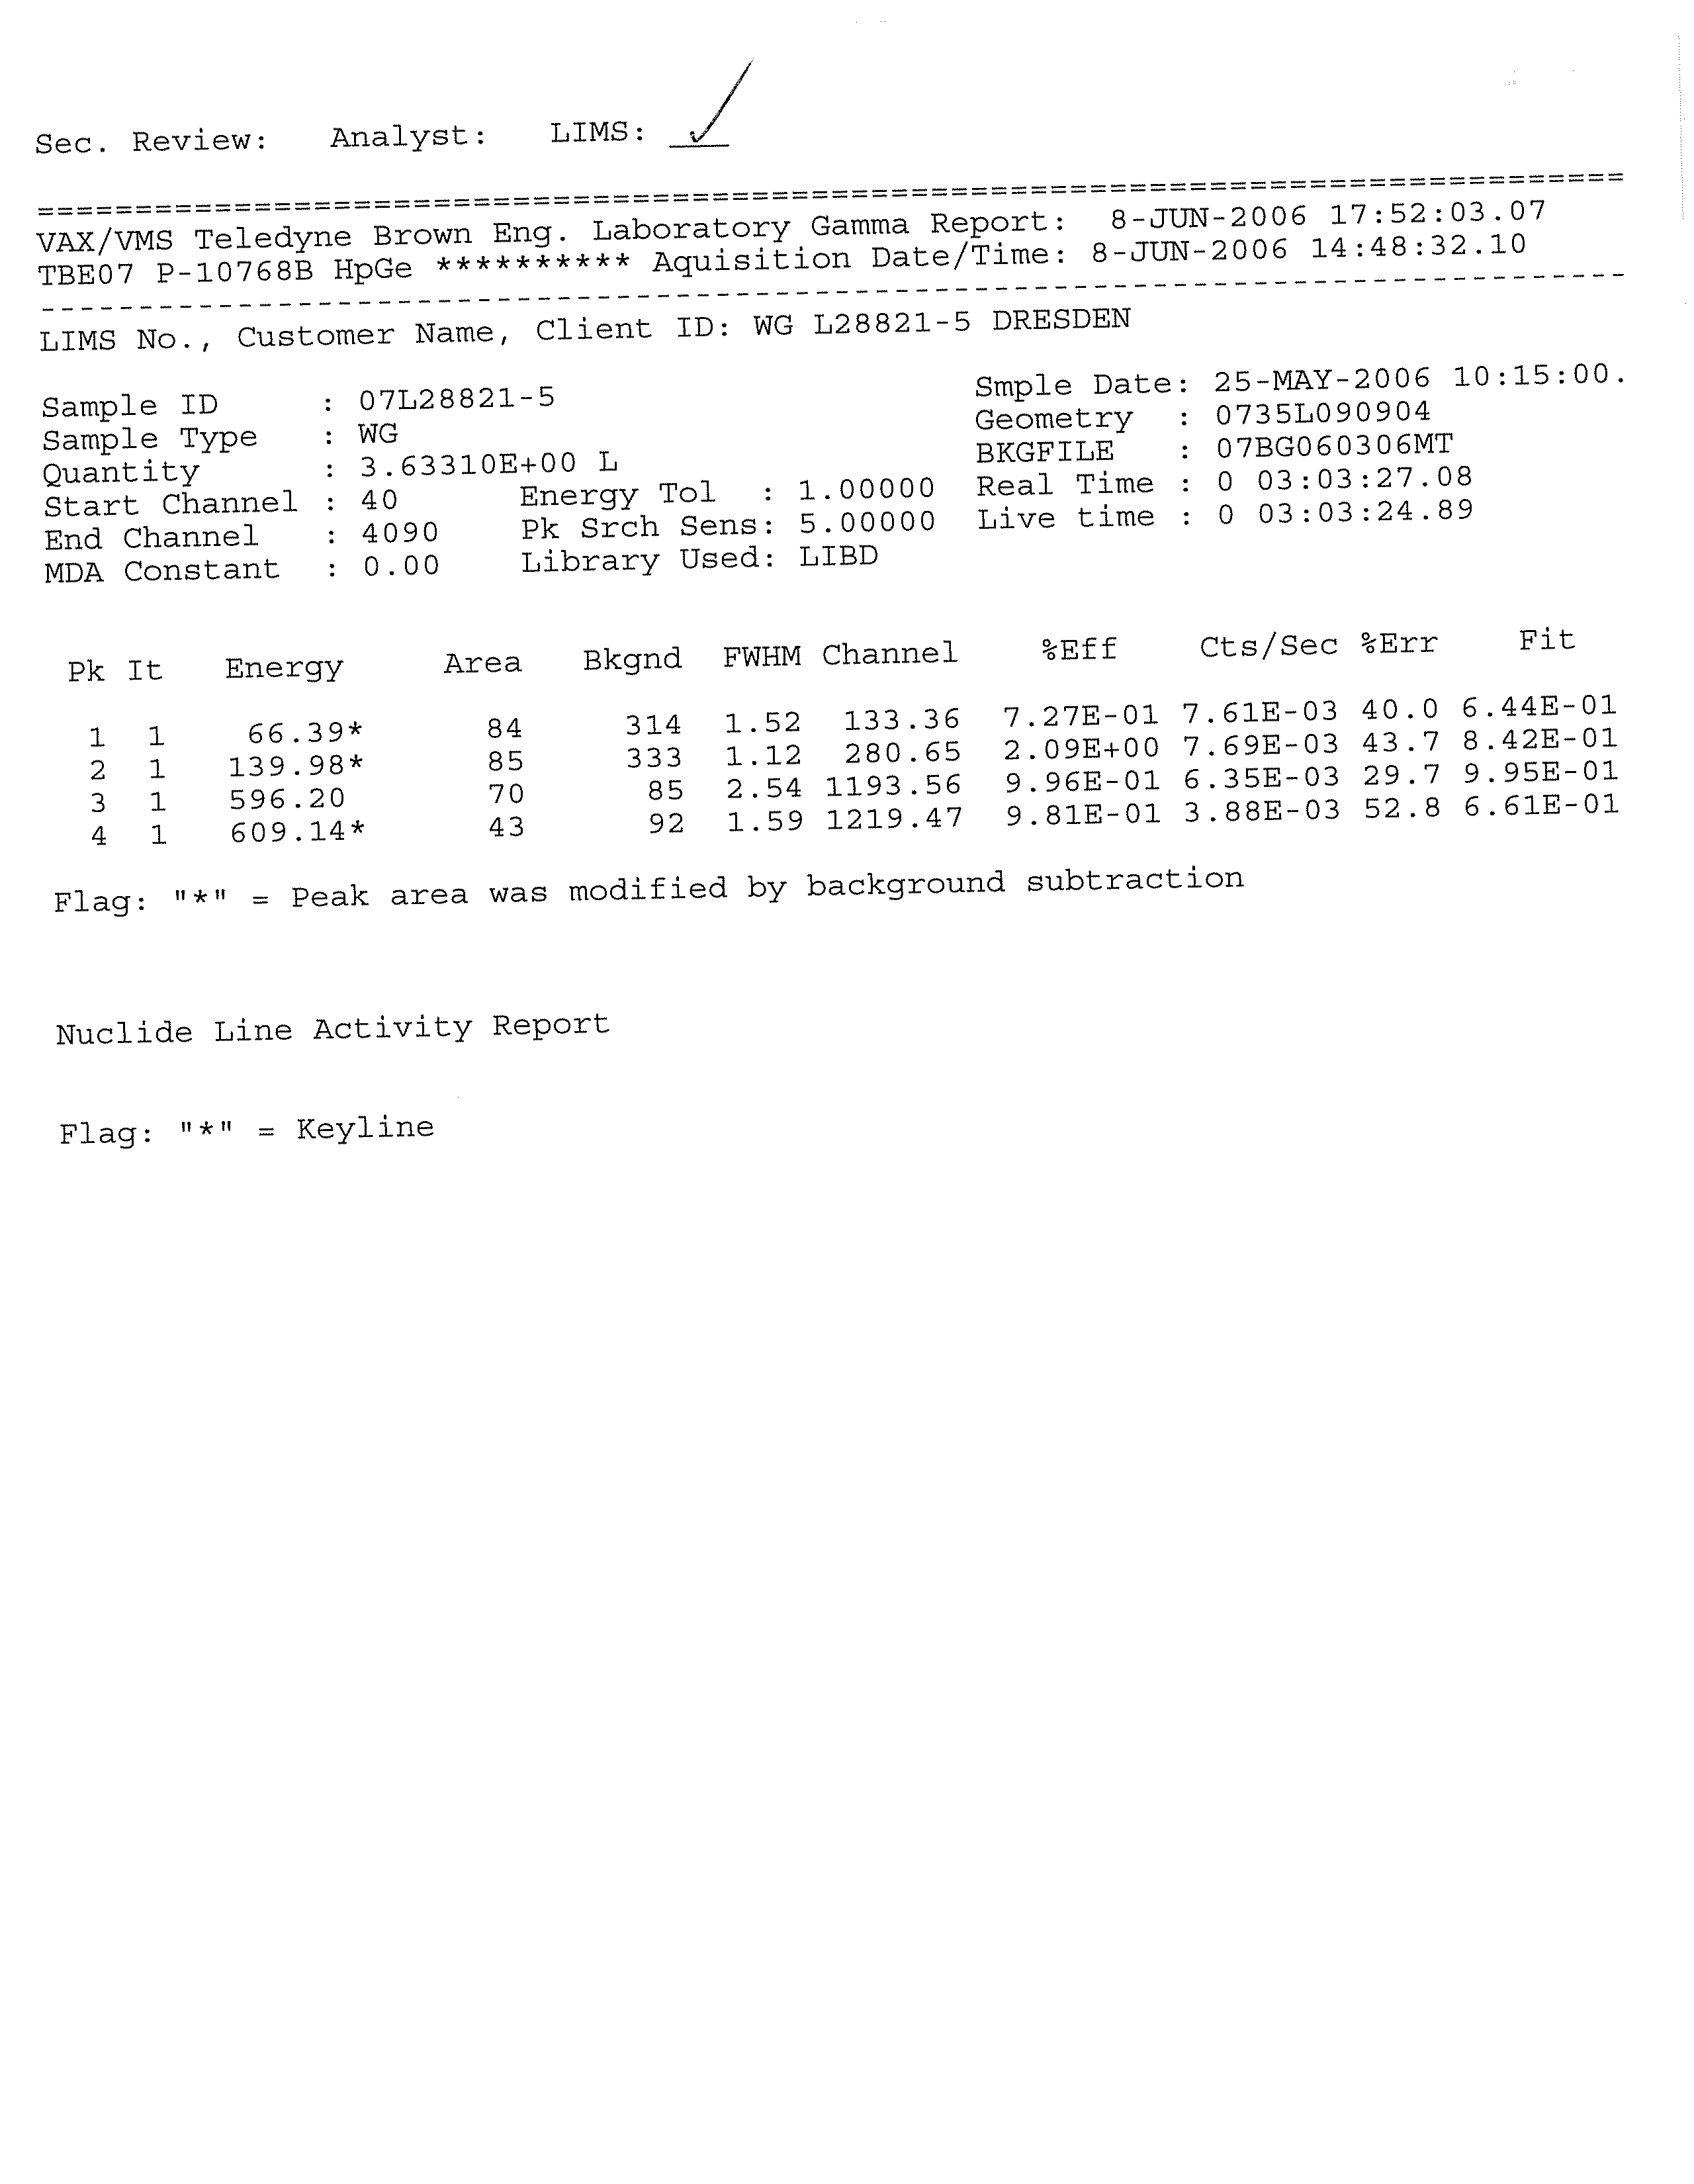
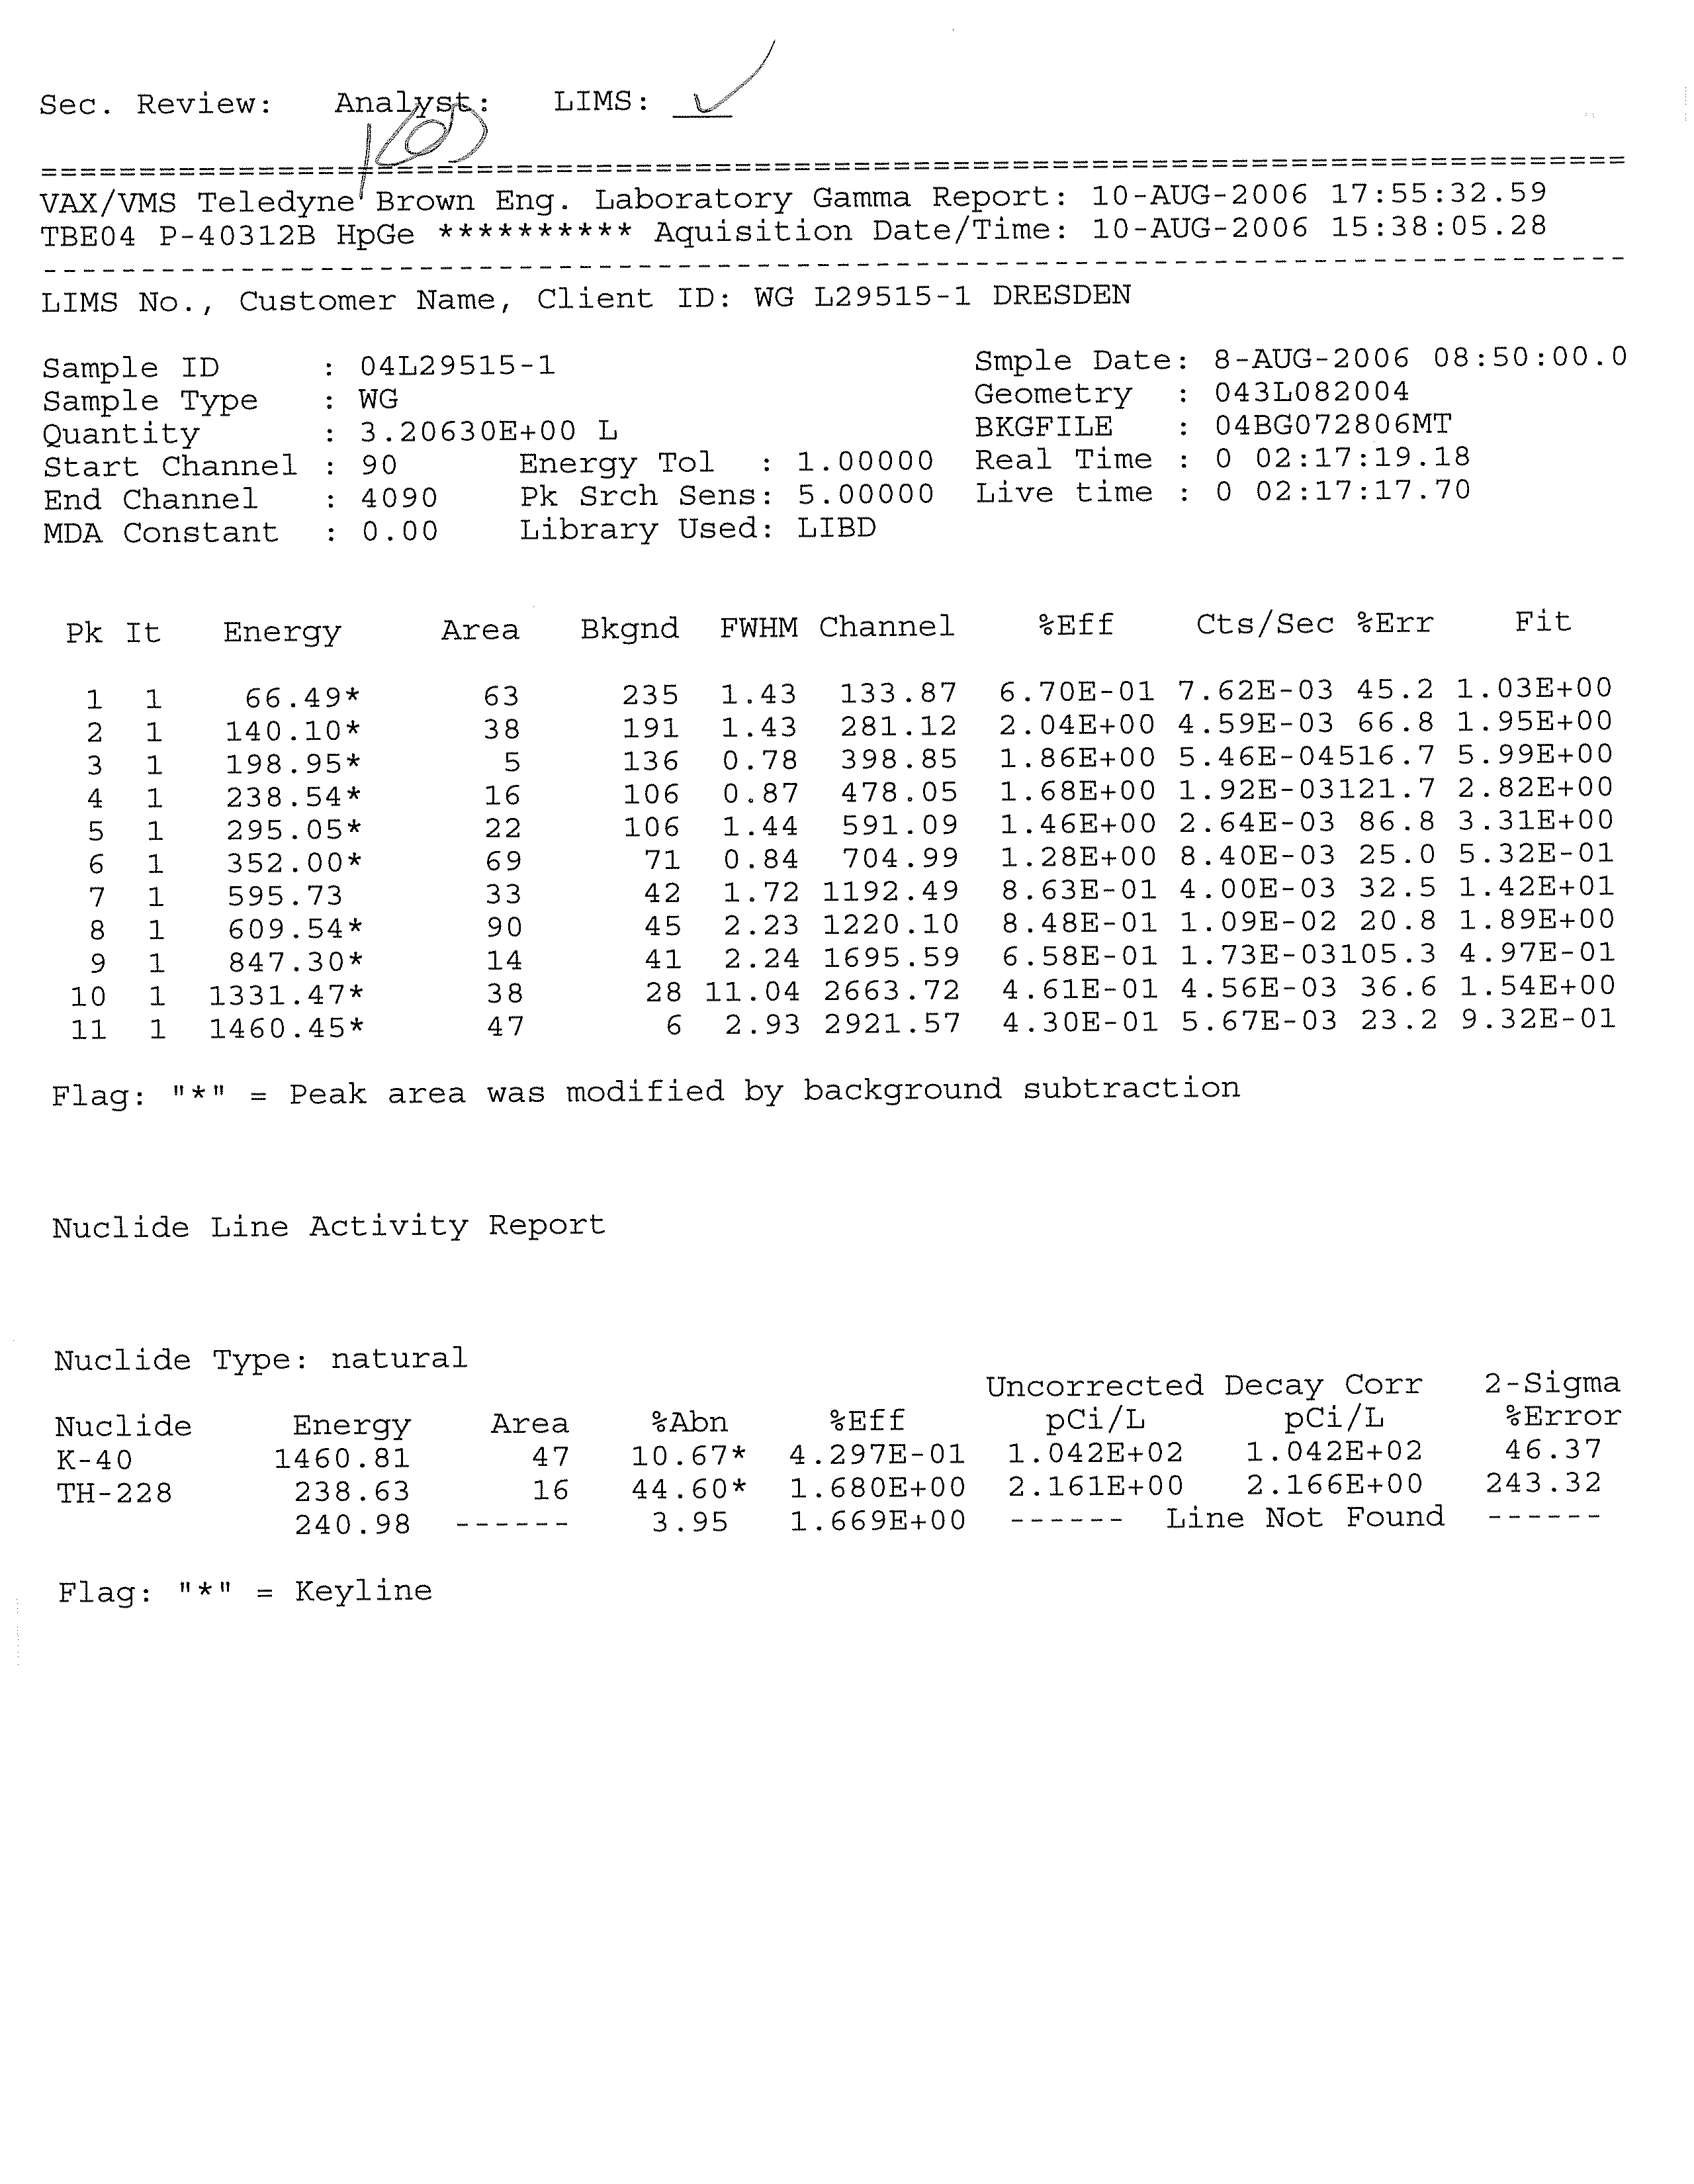
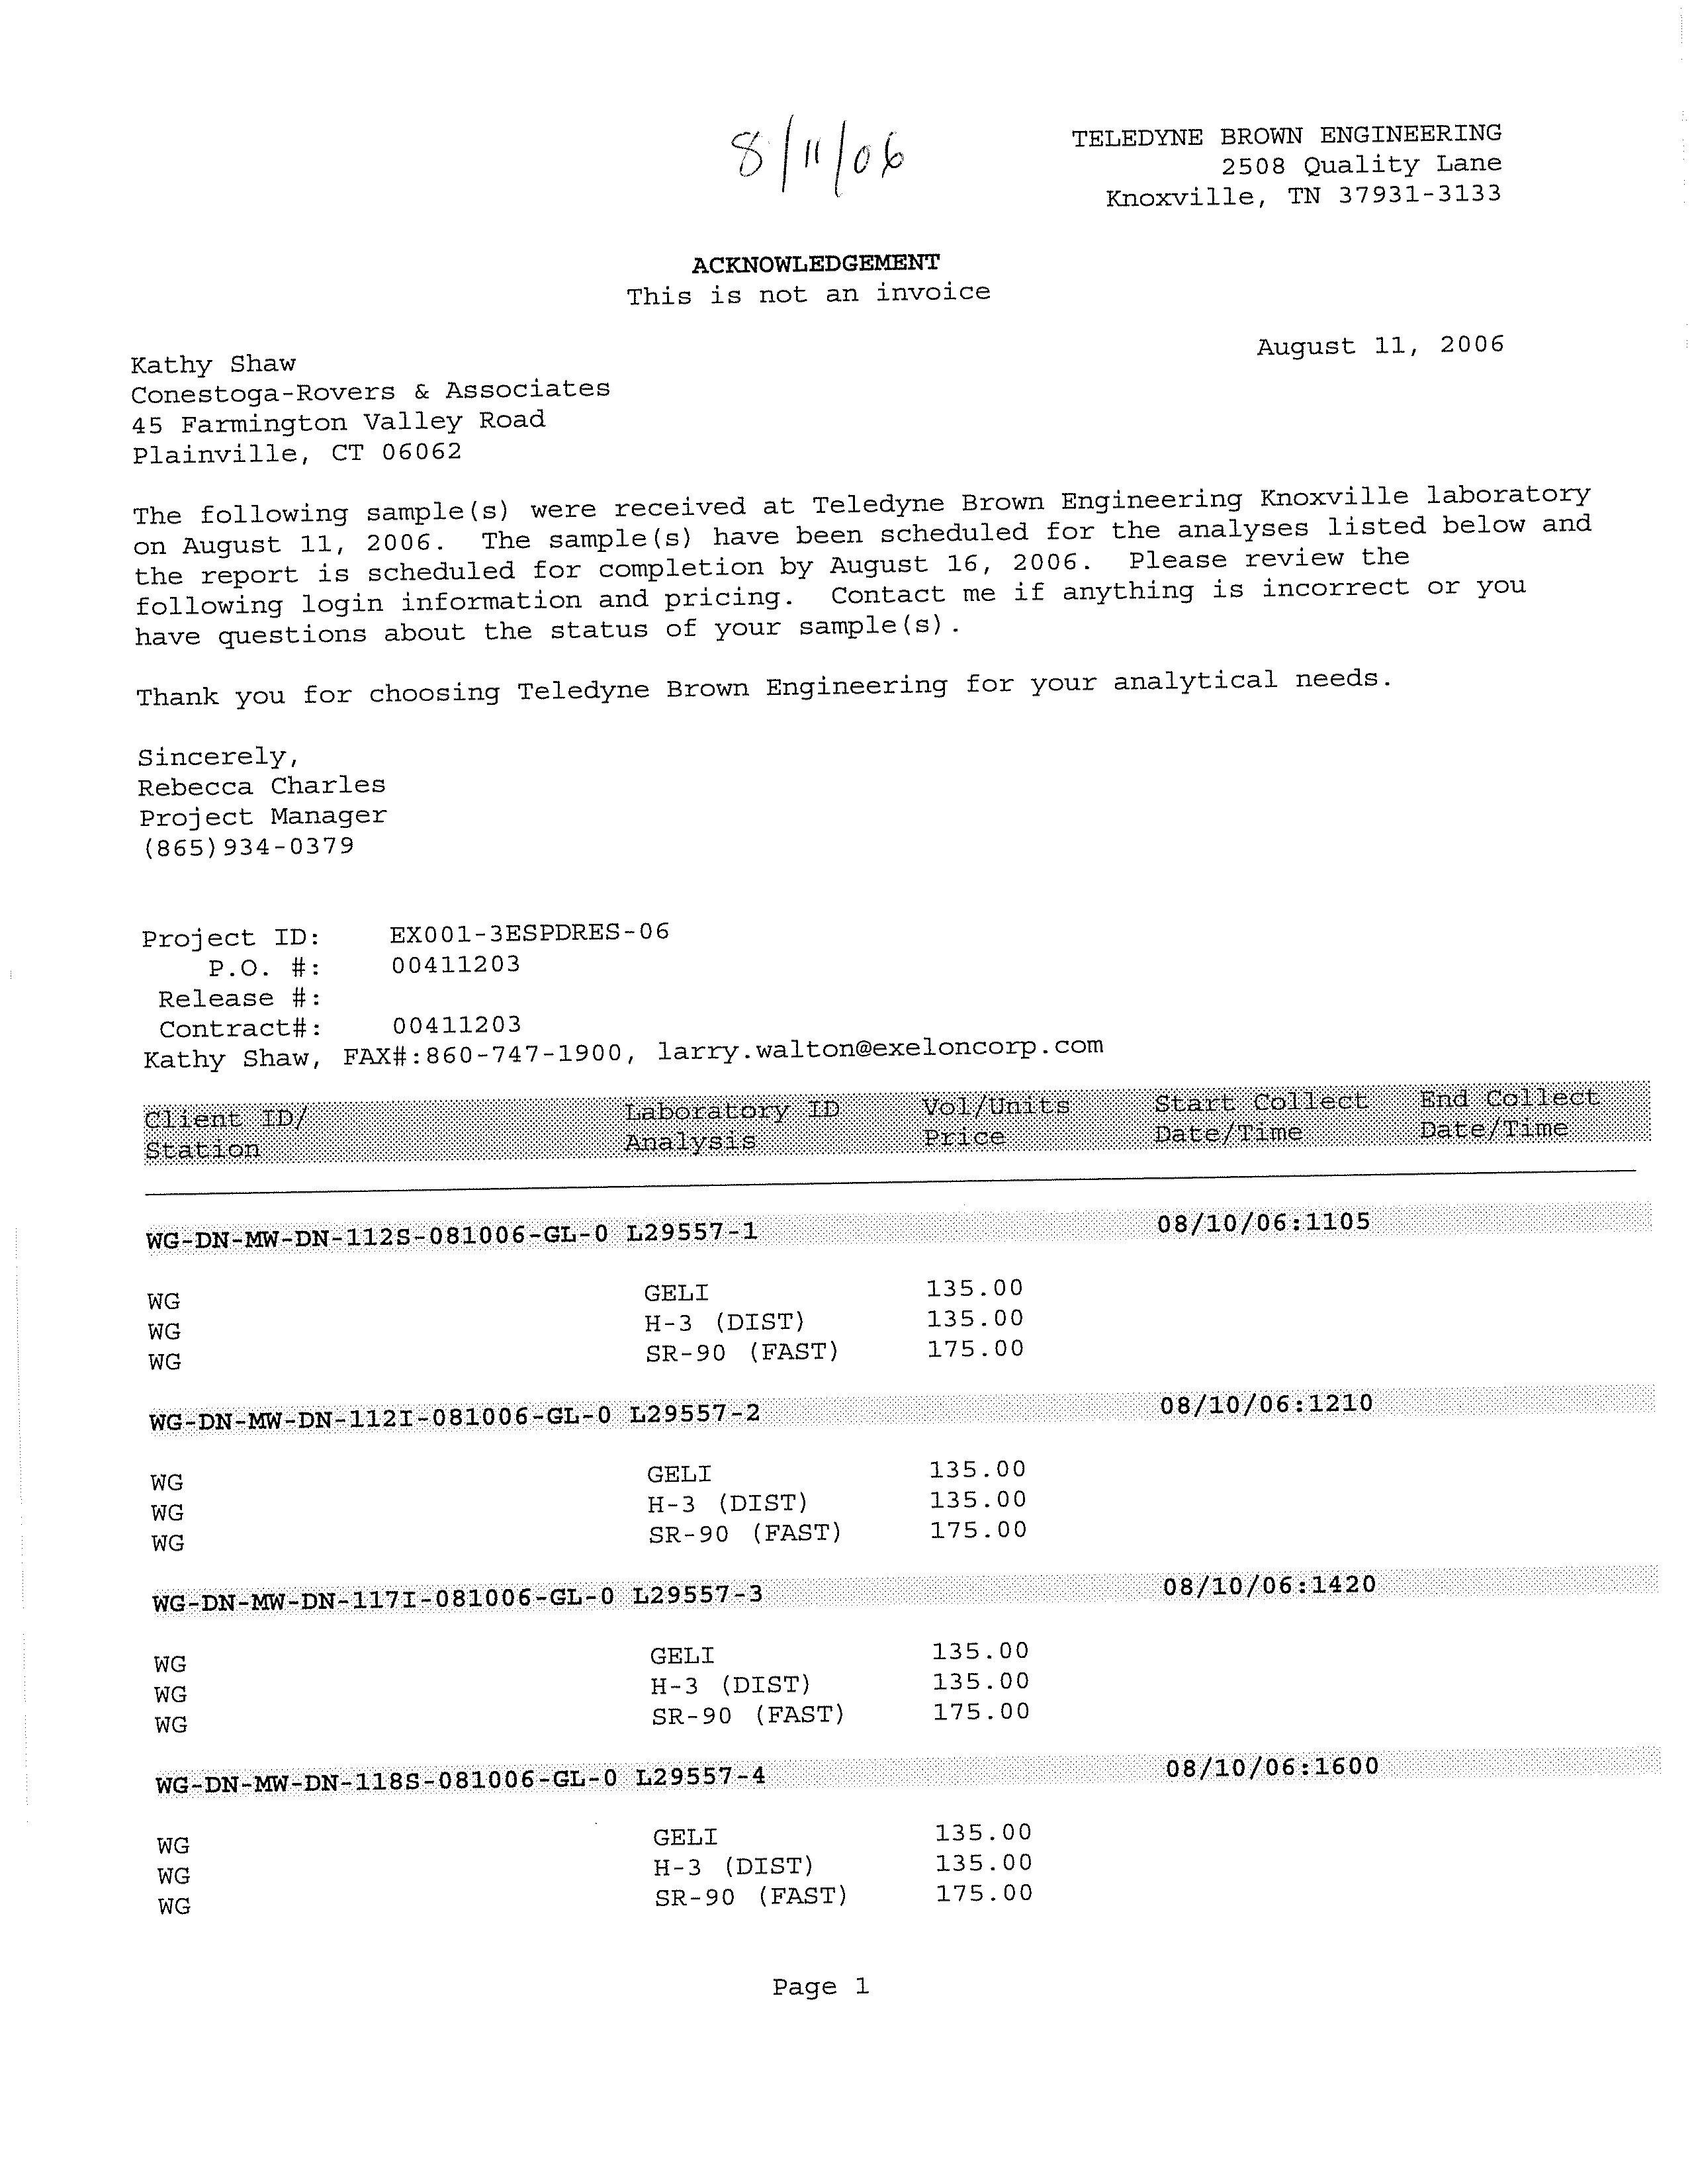
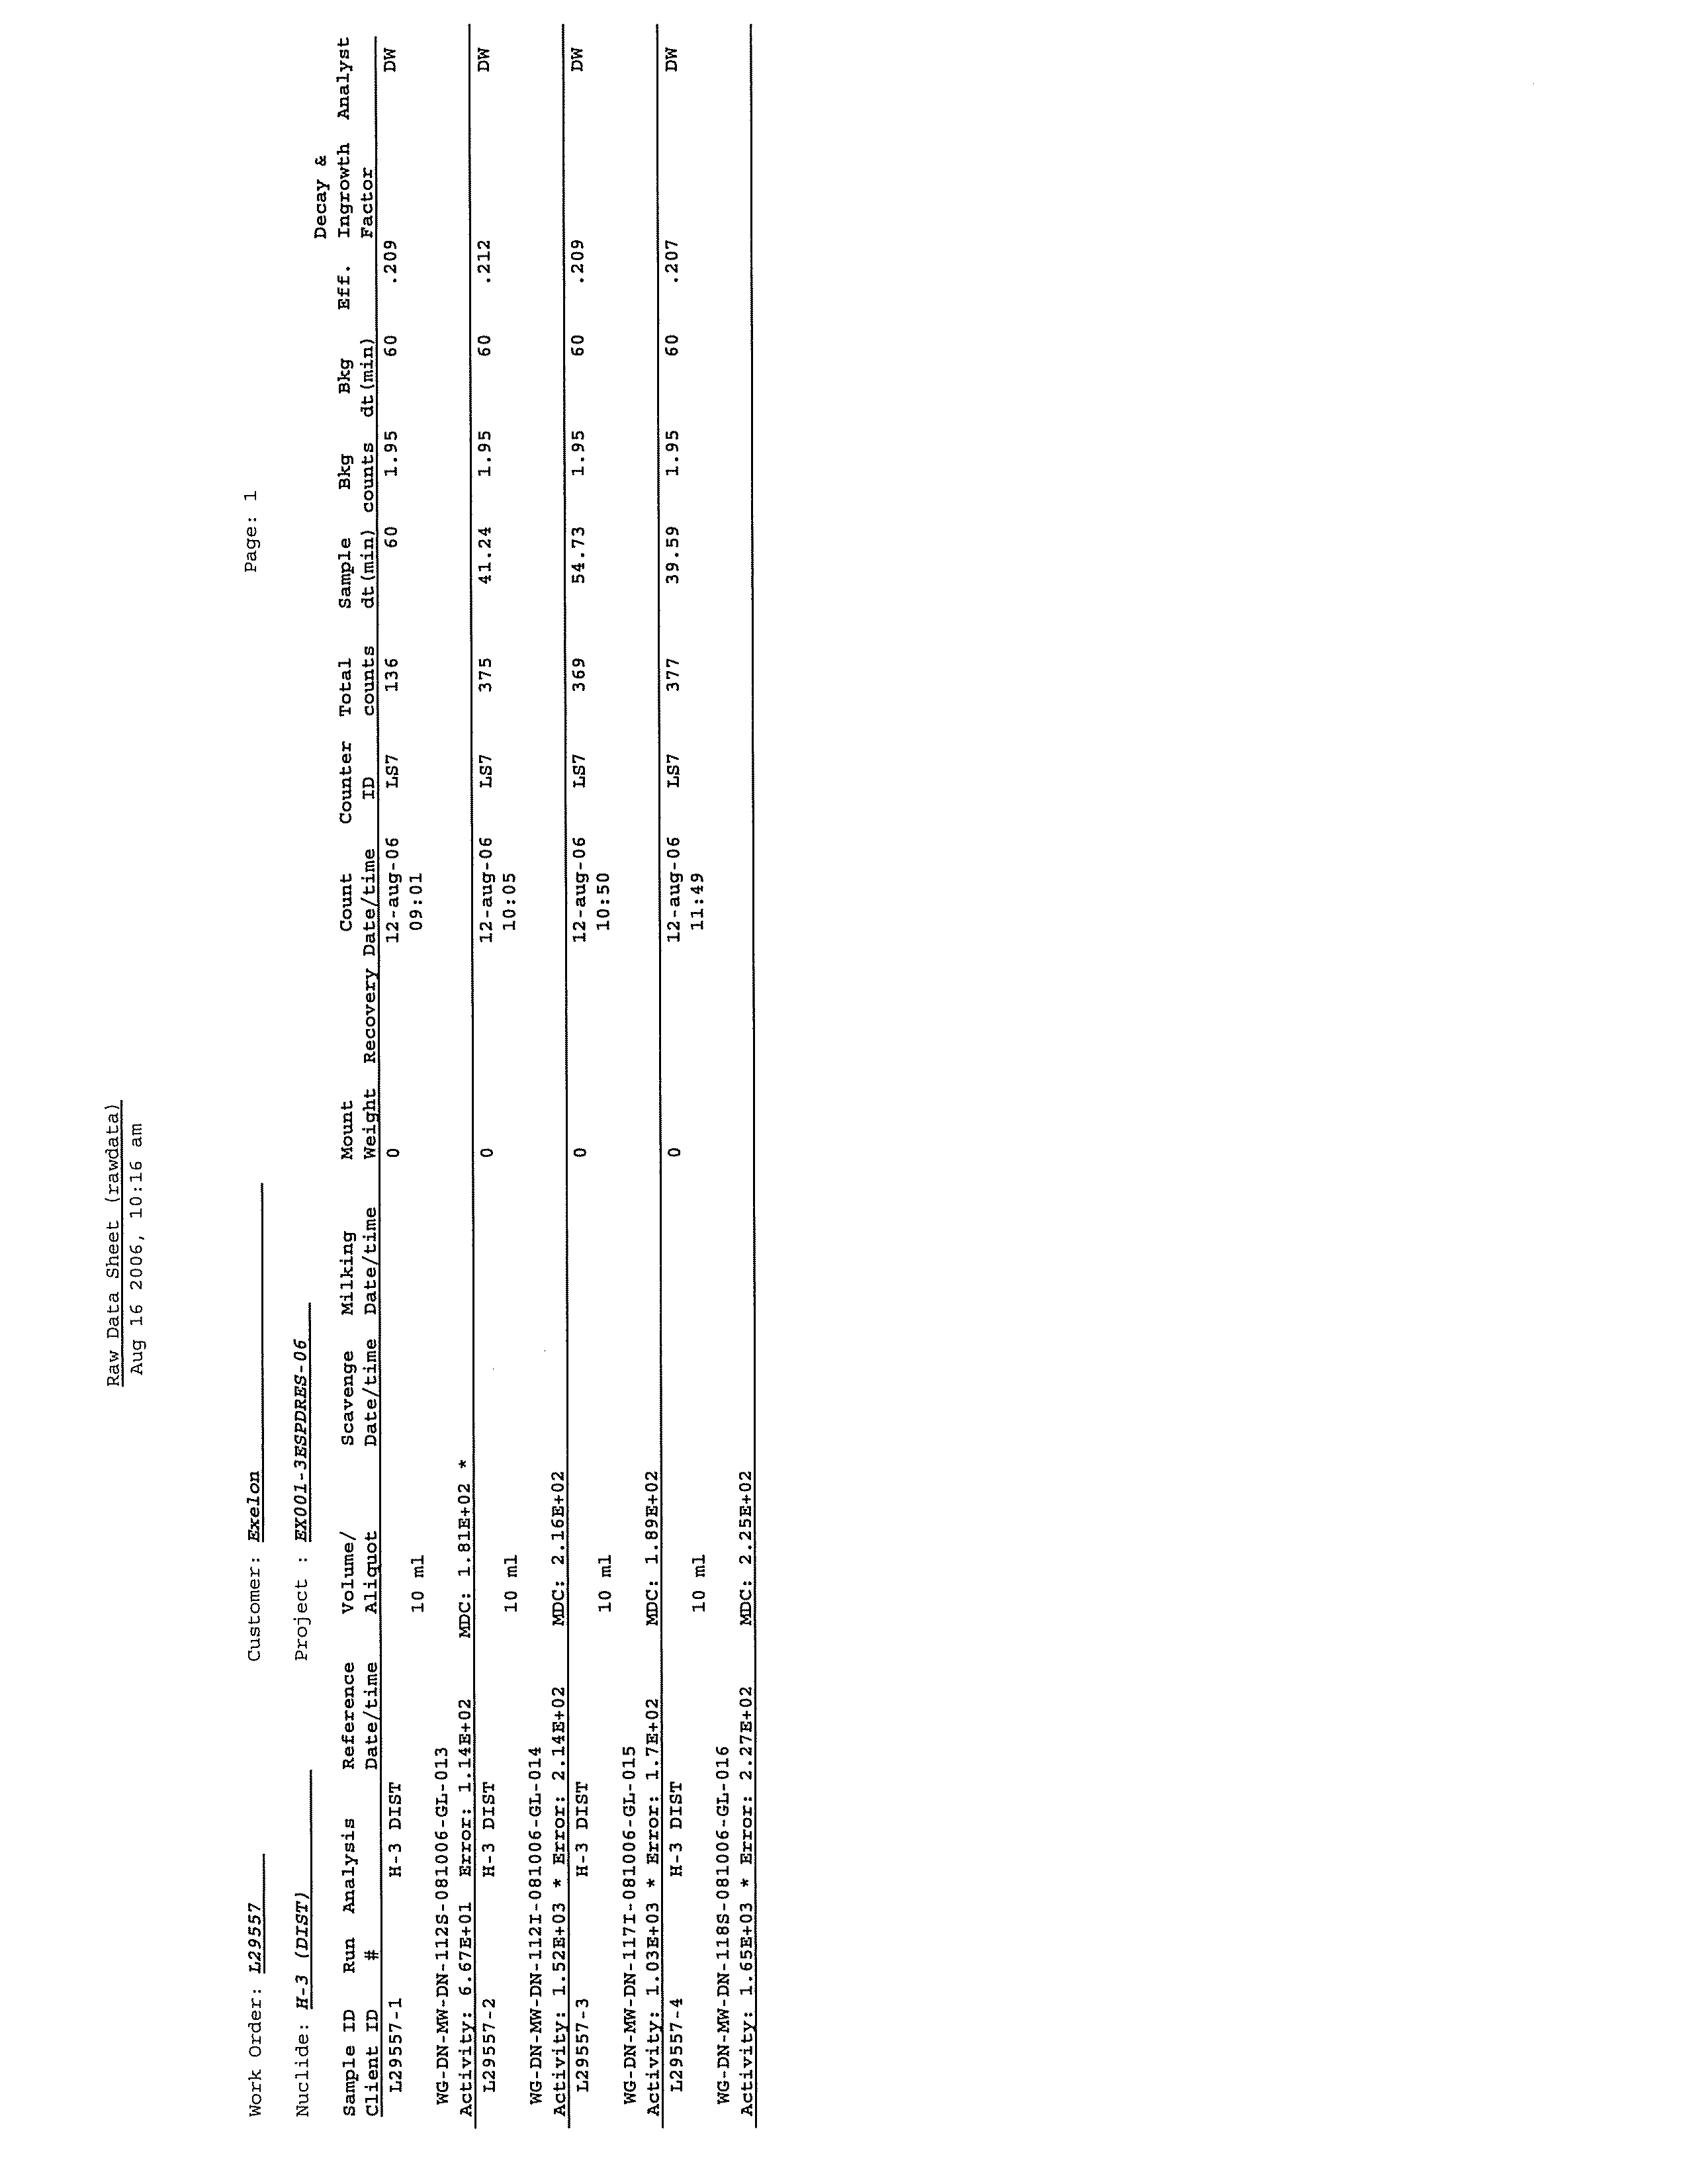
Groundwater and surface water samples were
analyzed for tritium and gamma-emitting
radionuclides as listed in NUREG-1302 and strontium-89/90 as listed in 40 CFR 141.25.
045136 (15) Dresden Generating Station
25
CONESTOGA-ROVERS & ASSOCIATES
Revision 1
5.0
RESULTS SUMMARY
This section provides a summary of Station-specific geology and hydrogeology, along
with a discussion of hydraulic gradients, groundwater elevations, and flow directions in
the vicinity of the Station. This section also presents and evaluates the analytical results
obtained from activities performed in accordance with the Work Plan.
5.1
STATION GEOLOGY
The geology encountered during the monitoring well installation activities is consistent
with the geology described in Section 2.4.2 and the geology described by RETEC
(RETEC, 2005
)
. The geology beneath the Station consists of a relatively thin overburden
deposit that overlies layers of sandstone, limestone, shale, and dolomite
.
Geologic
cross-section locations are shown on Figure 5.1 and the geologic lines of sections are
shown on Figures 5.2 and 5.3, respectively. Geological units at the Station consist of the
following:
•
Thin layer of overburden and fill;
•
Pottsville Sandstone Formation;
•
Divine Limestone Formation;
•
Maquoketa
Shale; and
•
Galena Dolomite Formation.
Where present, the overburden ranges between 0
and 5 feet thick at the Station and
consists of highly organic dark brown to black sandy clay with some gravel. During
construction of the Station, fill consisting of gravel and sand was used to replace the
overburden within the PA. At monitoring well MW-DN-108I, fill was encountered to a
depth of approximately 26 feet bgs. According to Station personnel, MW-DN-108I was
drilled over the abandoned intake trough for the Unit 1 cooling water from the Unit 1
Cribhouse. There is approximately 12 feet of fill along the east bank of the Hot Canal
near well cluster DSP-159; the fill was placed several years ago during construction.
Monitoring well MW-DN-107S was also installed in the fill in the PA.
The Pottsville Sandstone Formation is a hard, gray to yellowish-brown, medium- to
coarse-grained sandstone. The Pottsville Sandstone Formation is prevalent
beneath the
entire area of the Station as shown on Figures 5.2 and 5.3. The thickness of the
sandstone near the Station ranges from 25 to 30 feet. Monitoring wells MW-DN-101S to
-106S, -109S to –116S, and –118S to –123S are all screened within the Pottsville Sandstone
045136 (15) Dresden Generating Station
26
CONESTOGA-ROVERS & ASSOCIATES
Revision 1
Formation.
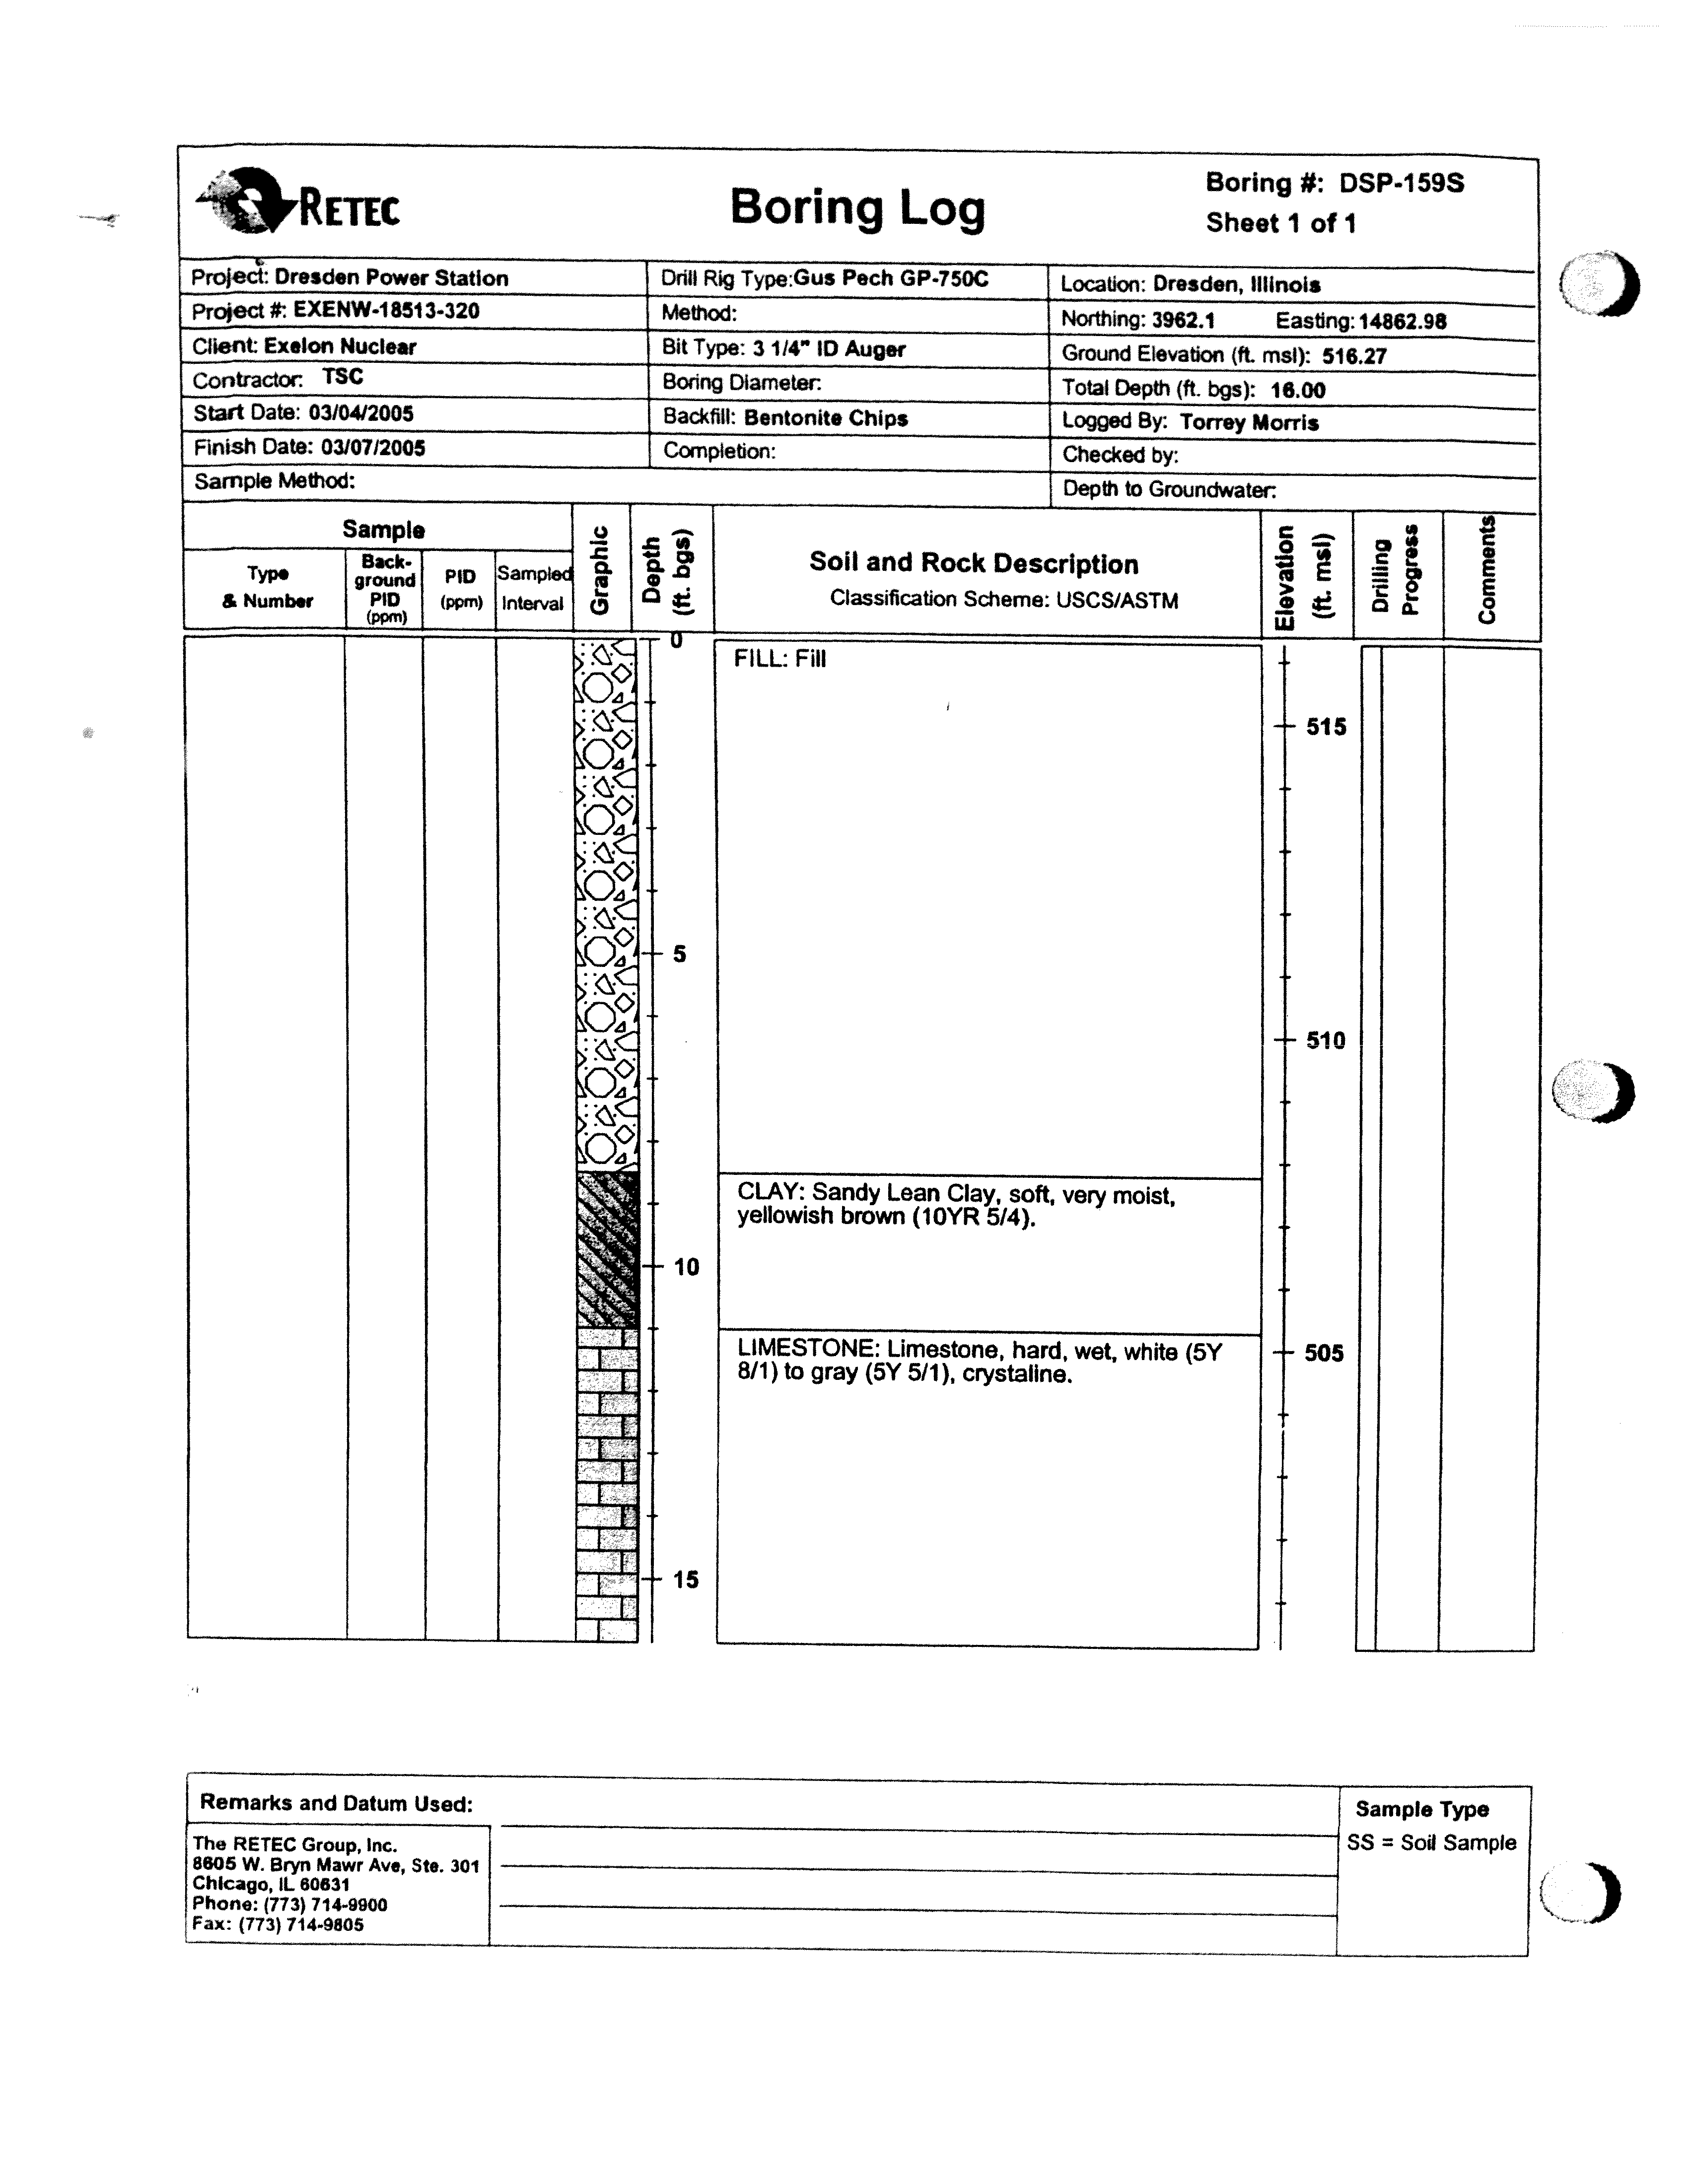
According to RETEC, the Pottsville Sandstone Formation was not
encountered during drilling activities to the south
of the Station at well clusters DSP-158
or DSP-159.
The Divine Limestone Formation is below the Pottsville Sandstone Formation and is a
hard, light-gray crystalline limestone. A transitional
zone was noted between the Divine
Limestone and the underlying Maquoketa Shale at approximately 40 to 55 feet bgs
where the Divine Limestone Formation had interbedded layers of shale and traces of
chert present. The thickness of the Divine Limestone Formation across the Station is
approximately 15 to 30 feet. Monitoring wells MW-DN-101I, -102I, -103I, -108I to -117I,
and -119I to –123I are all screened within the Divine Limestone Formation.
The Maquoketa Shale is below the Divine Limestone Formation and is a hard,
pale-green to gray shale with some locations
having trace amounts of sandstone and
limestone. The Maquoketa Shale acts as a confining layer and aquitard at the Station,
separating the water table aquifer from the Deep Aquifer below. To identify the bottom
of the water table aquifer, the boring was advanced approximately 2 feet into the top of
the Maquoketa Shale during installation of intermediate monitoring wells. The depth to
the top of the shale ranged from 45 to 55 feet.
Underneath the Maquoketa Shale is the Galena Dolomite Formation; however, it was
not encountered during the HIR drilling because
none of the newly installed wells
penetrated the overlying Maquoketa Shale. The existing monitoring wells at the Station
that are set into the upper portion of the Galena Dolomite Formation (DSP-157D,
DSP-158D, and DSP-159D) were dry when monitored during the HIR.
Two geologic cross-sections were generated employing the stratigraphic data collected
during this investigation. The geologic cross-section
locations are shown on Figure 5.1
and the geologic lines-of-sections trending north-south and east-west are shown on
Figures 5.2 and 5.3, respectively.
Geologic cross-section A-A' (Figure 5.2) is a north-south section running through the
center
of the Units 2/3 Reactor and Turbine Building and depicts the approximate depth
and location of the buildings with respect to the surrounding wells. This cross-section
begins to the north of the PA (DSP-149) and terminates to the south of the PA
(DSP-157M). This cross-section transects through the middle of the Radwaste Discharge
Piping for Units 2/3 and portions of the CST System HPCI Piping.
Geologic cross-section B-B' (Figure 5.3) is a west-east section through the northern
section
of the Station.
This cross-section begins at the western end of the PA
045136 (15) Dresden Generating Station
27
CONESTOGA-ROVERS & ASSOCIATES
Revision 1
(MW-DN-110I) at the Station and terminates near the northeastern end of the Station
close to the fence line bordering the Unit
1 Intake Canal (MW-DN-101I).
This
cross-section transects through the Radwaste Discharge Piping for Units 2/3 and the
northern portions of the Unit 1 Spent Fuel Pool and the CDW Piping from the CST
System.
5.2
STATION HYDROGEOLOGY
The water table aquifer at the Station has been divided into two zones, shallow and
intermediate. Groundwater contour maps for shallow and intermediate groundwater
zones at the Station are illustrated on Figures 5.4 and 5.5, respectively. These figures are
discussed further in the section below.
The shallow groundwater zone at the Station represents the saturated portion of the
Pottsville Sandstone Formation and extends to the top of the Divine Limestone
Formation.
The intermediate groundwater zone at the Station represents the Divine Limestone
Formation and extends
to the top of the Maquoketa Shale.
The Maquoketa Shale acts as an aquitard, impeding the vertical movement of
groundwater and preventing
the migration of groundwater downward to the deeper
aquifers.
5.2.1
GROUNDWATER FLOW DIRECTIONS
Generally, groundwater flow in both the shallow and intermediate zones at the Station
is radially outward from the Station, and is influenced by the Kankakee River, the
Illinois River, and the canal network.
The direction of groundwater flow towards the Kankakee and Illinois Rivers is
consistent with the description of regional
groundwater flow in Section 2.4.3. Both
shallow and intermediate groundwater flow have been influenced by the Station's
construction, which includes features such as the Unit 1 and Units 2/3 Buildings and the
canal network, as discussed in Section 5.2.2.
As indicated in the preceding discussion, the hydrogeologic framework at the Station is
influenced by zones of recharge
(i.e., area between the canal network and Kankakee
045136 (15) Dresden Generating Station
28
CONESTOGA-ROVERS & ASSOCIATES
Revision 1
River) and discharge (i.e., Kankakee River and canal network), fracturing (both natural
and man-made during Station
construction), building foundations, and the canal
network.
Shallow Groundwater Zone
The groundwater flow contours on Figure
5.4 were generated using groundwater
elevation data from monitoring wells completed in the Pottsville Sandstone Formation
and from water levels in the canals. The groundwater flow pattern and water levels in
the canal network in the shallow groundwater flow zone are primarily controlled by the
location of recharge and discharge zones, and secondarily by man-made structures and
fracture distribution and orientation. The shallow groundwater contours parallel the
surface water bodies, indicating that the surface water bodies control the groundwater
flow patterns in this zone.
A groundwater mound exists to the south of the Units
2/3 Buildings with a high point
located at DSP-157S (515.84 feet AMSL) as shown on Figure 5.4.
Intermediate Groundwater Zone
The groundwater flow contours shown on Figure 5.5
were generated using groundwater
elevation data from monitoring wells completed in the Divine Limestone Formation.
The groundwater flow patterns in the Divine Limestone Formation are primarily
controlled by fracture distribution and orientation, and the location of recharge and
discharge zones. Secondary influences include man-made structures such as the
Station's foundations.
As in the shallow groundwater zone, groundwater in the intermediate zone flows
radially outward from the center of
the Station. A northwest-southeast oriented
groundwater divide is evident and is defined by the groundwater elevation in
monitoring wells DSP-125 (513.11 feet AMSL) and DSP-152 (513.02 feet AMSL), which
are located south of the PA.
5.2.2
MAN-MADE INFLUENCE ON GROUNDWATER FLOW
Station Structures
Groundwater flow in the shallow zone is generally radially outward from the center
of
the Station. The groundwater flow is influenced by the presence of the Unit 1 Sphere,
045136 (15) Dresden Generating Station
29
CONESTOGA-ROVERS & ASSOCIATES
Revision 1
Units 2/3 Reactor and Turbine Buildings, and associated structures including the Unit
1
and Units 2/3 Radwaste Buildings, the Units 2/3 Off-gas Filter Building, the Unit 1 and
Units 2/3 Cribhouses, and the Unit 1 Fuel Pool and Fuel Handling Buildings.
Worksheets depicting building depths were provided by Station personnel during the
completion of this HIR. These buildings were constructed through bedrock (sandstone
and limestone) to a depth of approximately 45 to 50 feet bgs and were cast on top of the
confining shale layer (Maquoketa Shale) (see Figure 5.2).
As a result, groundwater flows laterally around these structures. There is little variation
in geology around the Unit
1 Sphere; however, the groundwater contours for both
shallow and intermediate groundwater zones show a slight deflection to the north on
the eastern side of the Unit 1 Sphere. The Unit 1 Turbine Building was also constructed
through bedrock, but not cast on top of Maquoketa Shale. The depth of its foundations
is approximately 26 feet bgs. Therefore, groundwater in the intermediate zone of the
water table aquifer flows beneath the Unit 1 Turbine Building.
Canal System
The Canal System at the Station also influences groundwater flow. Both the Hot and
Cold Canals are unlined flumes, 8
feet deep and 55 feet wide, which were blasted into
the bedrock. Therefore, the base of the canals, especially at the northern end, is within
the Pottsville Sandstone.
The canal system flow regimes are controlled by Flow Regulating Gates. Water levels
within the canals, especially the Hot Canal, may
vary as much as 1 to 2 feet during the
day based on the Station's need for cooling water. Water levels in the canals are also
influenced by the operation of the cooling towers located along their banks and to the
southwest of the PA. The pumps and discharge flumes that are associated with these
systems are cycled on and off as needed. Monitoring wells located near the canal and
the Cooling Tower Pumps and Discharge Flumes include DSP-127, MW-DN-110S/I,
MW-DN-103S/I, MW-DN-121S, MW-DN-123S/I, DSP-159S/M, and DSP-126. These
wells will be influenced by the varying water levels in the canals and the accompanying
surface water discharge to groundwater.
The Units 2/3 Intake Canal also has an effect on the groundwater levels at the Station as
shown on Figure
5.5. There is a groundwater low point to the north of the PA in this
area. This low point is attributable to the fact that surface water from the Kankakee
River is being pumped into the Units 2/3 Cribhouse within the unlined Units 2/3 Intake
Canal, and groundwater is being influenced by the pumping of surface water in this
area.
045136 (15) Dresden Generating Station
30
CONESTOGA-ROVERS & ASSOCIATES
Revision 1
Industrial Cooling Pond
The Hot and Cold Canals run generally north–south to the Industrial Cooling Pond
(Pond). The Pond, which covers approximately
1,284 acres, is over 8,700 feet south of
the PA (Figure 2.1). The Pond was formed by constructing a clay dike around a low
lying area. Approximately 100 drain tiles were installed to drain water from the low
lying areas to the Kankakee River. When the pond was constructed these drain tiles
were filled with concrete.
The Pond is not lined and is located along the west bank of the Kankakee River. The
surface water in the Hot Canal flows south to the Pond and then water
from the Pond
flows back to the north through the Cold Canal.
Dresden Island Lock and Dam
The normal pool elevation for the Kankakee and Des Plaines Rivers, which join to form
the
Illinois River, is 505 feet AMSL.
Dresden Island Lock and Dam, located
approximately 3,000 feet northwest of the Station, control the pool elevation. This lock
and dam (which is controlled by the Army Corps of Engineers) also controls the surface
water elevations in the Unit 1 and Units 2/3 Intake Canals and the Unit 1 Discharge
Canal.
5.2.3
VERTICAL HYDRAULIC GRADIENTS
Groundwater elevation data from several monitoring well nests installed at the Station
have been used to calculate the vertical hydraulic gradient between the shallow and
intermediate groundwater zones. The calculated hydraulic gradients for the Station are
provided in Table 5.1. A moderate downward vertical gradient (0.062 feet/foot) was
calculated to the west of the Units 2/3 Building. A moderate downward vertical
gradient (0.0215 feet/foot) was also calculated for the well clusters east of the Unit 1
Turbine Building. At the MW-DN-114 well cluster, which is located south of the turbine
buildings in a cove between the Unit 2/3 and Unit 1 Turbine Buildings, a strong upward
gradient (-0.332 feet/foot) was calculated.
A strong upward gradient was also
calculated for well cluster MW-DN-123 (-0.566 feet/foot). The average calculated
vertical gradient at the Station is approximately -0.02 feet/foot, which indicates that
there is an upward gradient across the Station.
045136 (15) Dresden Generating Station
31
CONESTOGA-ROVERS & ASSOCIATES
Revision 1
5.2.4
LATERAL GROUNDWATER FLOW AND VELOCITY
Shallow Groundwater Zone
Groundwater flow velocity for the shallow
zone was calculated using a hydraulic
conductivity (slug test methodology) of 34.3 feet per day (RETEC, 2005), a porosity of
30 percent for the Pottsville Sandstone, and a hydraulic gradient of 0.002 to 0.009 foot
per foot (based on August 2006 water elevations). The groundwater flow velocity for
the shallow zone was calculated to range from 87 to 355 feet per year (ft/yr).
Intermediate Groundwater Zone
Groundwater flow velocity for the intermediate zone was calculated using a hydraulic
conductivity (slug test methodology) of 0.67
feet per day (RETEC 2005), a porosity of
10 percent for the Divine Limestone, and a hydraulic gradient of 0.007 to 0.09 foot per
foot (based on August 2006 water elevations). The groundwater flow velocity for the
intermediate zone was calculated to range from 17 to 225 ft/yr.
The horizontal velocities are representative of
the area south of the Units 2/3 Turbine
Building since the wells used by RETEC to develop the hydraulic conductivities are
located in that area.
5.3
GROUNDWATER QUALITY
CRA personnel collected groundwater samples from 66
monitoring wells at the Station.
The samples were analyzed for tritium and additional radionuclides. Teledyne Brown
provided the analytical services. The Quality Assurance Program for the laboratory is
described in Appendix C. The analytical data reports are provided in Appendix D.
The analytical data presented herein has been subjected to CRA's data validation
process. CRA has used the data with appropriate qualifiers where necessary.
The data reported in the figures and tables does not include the results of recounts that
the laboratory completed, except if those results ultimately replaced an initial report.
The tables and figures, therefore, include only the first analysis reported by the
laboratory. Where multiple samples were collected over time, then the most recent
result has been used in the discussion, below.
045136 (15) Dresden Generating Station
32
CONESTOGA-ROVERS & ASSOCIATES
Revision 1
5.3.1
SUMMARY OF BETA-EMITTING RADIONUCLIDES
ANALYTICAL RESULTS
A summary of the tritium results for the groundwater samples collected during this
investigation is provided in Table 5.2 and shown on Figures 5.6 and 5.7.
All tritium concentrations were less than the United States Environmental Protection
Agency
(USEPA) drinking water standard of 20,000 pCi/L. Tritium was detected at
concentrations greater than the LLD of 200 pCi/L.
All strontium-90 concentrations were less than the USEPA drinking water standard of
8.0 pCi/L.
Tritium was detected in groundwater samples from nine locations
in the shallow
groundwater zone at concentrations ranging from 220 ± 114 pCi/L to 4,250 ± 475 pCi/L.
Tritium was detected in groundwater samples from twenty-one wells in the
intermediate groundwater zone at concentrations
ranging from 210 ± 124 pCi/L to
13,200 ± 319 pCi/L. The highest concentration was detected in the groundwater sample
collected from DSP-123, which was installed in the intermediate groundwater zone to
the north of the Unit 1 Sphere.
A summary of the strontium-89/90 results for the groundwater samples collected as
part of the investigation that is the subject of this HIR is provided in Table
5.3 and
shown on Figures 5.8 and 5.9. Strontium-89/90 was detected in one monitoring well
(MW-DN-108I) at a concentration greater than the LLD of 2.0 pCi/L. In August 2006, a
sample was collected from this well, and strontium-89/90 was detected at a
concentration of 2.72 ± 1.01 pCi/L. This sample was further analyzed for strontium-90,
which was detected at a concentration of 2.17 ± 0.783 pCi/L. Furthermore, a duplicate
of this sample was analyzed for total strontium and strontium-90.
Since the
strontium-90 results exceeded the sum of the total strontium in the duplicate sample, it
has been concluded that the results of this sample are invalid.
In May 2006, a sample was collected from this monitoring well (MW-DN-108I).
Analyses in July
2006 detected strontium-89/90 at a concentration of 4.42 ± 1.23 pCi/L.
In July 2006, this sample was further analyzed for strontium-90, which was detected at a
concentration of 4.37 ± 0.66 pCi/L. In July 2006, the sample was re-analyzed and
strontium-89/90 was detected at a concentration of 3.39 ± 0.774 pCi/L. In July 2006, this
sample was further analyzed for strontium-90, which was detected at a
concentration of
2.72 ± 1.29 pCi/L. Because the total strontium from these two samples varied by almost
045136 (15) Dresden Generating Station
33
CONESTOGA-ROVERS & ASSOCIATES
Revision 1
40 percent and the margin of error was nearly 50 percent, it became necessary to run a
third analysis
to verify what, if any, detectable concentration existed. This could not be
completed for the May
2006 samples due to the samples becoming contaminated at the
analytical laboratory. Normal protocol for an anomalous positive result is to perform a
confirmatory sampling and analysis of the respective well. Consequently, the well
MW-DN-108I was re-sampled in August 2006, as discussed above.
5.3.2
SUMMARY OF GAMMA-EMITTING RADIONUCLIDES
ANALYTICAL RESULTS
Gamma-emitting target radionuclides were not detected at concentrations greater than
their respective LLDs. A summary of the gamma-emitting radionuclides results for the
groundwater samples collected as part of the investigation that is the subject of this HIR
is provided in Table 5.3 and shown on Figures 5.8 and 5.9.
Other non-targeted radionuclides were also included in the tables but excluded from
discussion in this report.
These radionuclides were either a) naturally occurring and
thus not produced by the Station, or b) could be definitively evaluated as being naturally
occurring due to the lack of presence of other radionuclides which would otherwise
indicate the potential of production from the Station.
5.3.3
SUMMARY OF FIELD MEASUREMENTS
Table 4.5 presents of a summary of field measurements collected during the well
purging and sampling activities. These field measurements included pH, dissolved
oxygen, conductivity, turbidity and temperature. The field parameters were typical of a
shallow aquifer with carbonate source rock (i.e., the underlying Divine Limestone
Formation and Maquoketa Shale). As such, the pH values were found to be above 7.0
and the conductivity was indicative of a shallow water table system subject to surface
water recharge.
5.4
SURFACE WATER QUALITY
Six surface water samples were collected from the locations shown on Figure 4.1. The
samples
were
analyzed
for
tritium,
gamma-emitting
radionuclides,
and
strontium-89/90. Teledyne Brown provided the analytical services. The Quality
045136 (15) Dresden Generating Station
34
CONESTOGA-ROVERS & ASSOCIATES
Revision 1
Assurance Program for the laboratory is described in Appendix
C. The analytical data
reports are provided in Appendix D.
5.4.1
SUMMARY OF BETA-EMITTING RADIONUCLIDES
ANALYTICAL RESULTS
Tritium was not detected at concentrations greater than the LLD of 200 pCi/L. A
summary
of the tritium results for the surface water samples collected in this
investigation is provided in Table 5.4 and shown on Figure 5.6.
Strontium-89/90 was not detected at concentrations greater than the LLD of 2.0 pCi/L.
A
summary of the strontium-89/90 analytical results for the surface water samples
collected in this investigation is provided in Table 5.5 and shown on Figure 5.8.
5.4.2
SUMMARY OF GAMMA-EMITTING RADIONUCLIDES
ANALYTICAL RESULTS
Gamma-emitting target radionuclides were not detected at concentrations greater than
their respective LLDs. A summary of the gamma-emitting radionuclides results for the
surface water samples collected in this investigation is provided in Table 5.5 and shown
on Figure 5.8.
Other non-targeted radionuclides were also included in the tables but excluded from
discussion in this report.
These radionuclides were either a) naturally occurring and
thus not produced by the Station, or b) could be definitively evaluated as being naturally
occurring due to the lack of presence of other radionuclides which would otherwise
indicate the potential of production from the Station.
045136 (15) Dresden Generating Station
35
CONESTOGA-ROVERS & ASSOCIATES
Revision 1
6.0
RADIONUCLIDES OF CONCERN AND SOURCE AREAS
This section discusses radionuclides evaluated in
this investigation, potential sources of
the radionuclides detected, and their distribution.
6.1
GAMMA-EMITTING RADIONUCLIDES
Gamma-emitting target radionuclides were not detected at concentrations greater than
their respective LLDs. Other non-targeted radionuclides were also included in the
tables
but excluded from the discussion in this report. These radionuclides were either
a) naturally occurring and thus not produced by the Station, or b) could be definitively
evaluated as being naturally occurring due to the lack of presence of other radionuclides
which would otherwise indicate the potential of production from the Station.
6.2
BETA-EMITTING RADIONUCLIDES
Strontium-89/90 was detected in one monitoring
well (MW-DN-108I) at a concentration
greater than the LLD of 2.0 pCi/L. In August 2006, a sample was collected from this
well, and strontium-89/90 was detected at a concentration of 2.72 ± 1.01 pCi/L. This
sample was further analyzed for strontium-90, which was detected at a concentration of
2.17 ± 0.783 pCi/L. Furthermore, a duplicate of this sample was analyzed for total
strontium and strontium-90. Since the strontium-90 results exceeded the sum of the
total strontium in the duplicate sample, it has been concluded that the results of this
sample are invalid.
In May 2006, a sample was collected from this monitoring well (MW-DN-108I).
Analyses in July
2006 detected strontium-89/90 at a concentration of 4.42 ± 1.23 pCi/L.
In July 2006, this sample was further analyzed for strontium-90, which was detected at a
concentration of 4.37 ± 0.66 pCi/L. In July 2006, the sample was re-analyzed and
strontium-89/90 was detected at a concentration of 3.39 ± 0.774 pCi/L. In July 2006, this
sample was further analyzed for strontium-90, which was detected at a
concentration of
2.72 ± 1.29 pCi/L. Because the total strontium from these two samples varied by almost
40
percent and the margin of error was nearly 50 percent, it became necessary to run a
third analysis to verify what, if any, detectable concentration existed. This could not be
completed for the May
2006 samples due to the samples becoming contaminated at the
analytical laboratory. Normal protocol for an anomalous positive result is to perform a
confirmatory sampling and analysis of the respective well. Consequently, the well
MW-DN-108I was re-sampled in August 2006, as discussed above.
045136 (15) Dresden Generating Station
36
CONESTOGA-ROVERS & ASSOCIATES
Revision 1
Tritium was detected at concentrations greater than the LLD of 200 pCi/L. Detectable
concentrations of tritium ranged from
210 ± 124 pCi/L to 13,200 ± 319 pCi/L. The
following sections focus on tritium and strontium; specifically, providing general
characteristics of tritium and strontium, potential sources, distribution in groundwater,
and a conceptual model for migration.
6.3
TRITIUM
6.3.1
GENERAL CHARACTERISTICS
Tritium (chemical symbol H-3) is a radioactive isotope of hydrogen. The most common
forms of tritium are tritium gas
and tritium oxide, which is also called "tritiated water."
The chemical properties of tritium are essentially those of ordinary hydrogen. Tritiated
water behaves the same as ordinary water in both the environment and the body.
Tritium can be taken into the body by drinking water, breathing air, eating food, or
absorption through skin. Once tritium enters the body, it disperses quickly and is
uniformly distributed throughout the body. Tritium is excreted primarily through urine
within a month or so after ingestion. Organically bound tritium (tritium that is
incorporated in organic compounds) can remain in the body for a longer period.
Tritium is produced naturally in the upper atmosphere when cosmic rays strike air
molecules.
Tritium is also produced during nuclear weapons explosions,
as a
by-product in reactors producing electricity, and in special production reactors, where
the isotopes lithium-7 and/or boron-10 are bombarded to produce tritium.
Although tritium can be a gas, its most
common form is in water because, like
non-radioactive hydrogen, radioactive tritium reacts with oxygen to form water.
Tritium replaces one of the stable hydrogen atoms in the water molecule and is called
tritiated water. Like normal water, tritiated water is colorless and odorless. Tritiated
water behaves chemically and physically like non-tritiated water in the subsurface, and
therefore tritiated water will travel at the same velocity as the average groundwater
velocity.
Tritium has a half-life of approximately 12.3 years. It decays spontaneously to helium-3
(
3
He). This radioactive decay releases a beta particle (low-energy electron). The
radioactivity of tritium is the source of the risk of exposure.
045136 (15) Dresden Generating Station
37
CONESTOGA-ROVERS & ASSOCIATES
Revision 1
Tritium is one of the least dangerous radionuclides because it emits
very weak radiation
and leaves the body relatively quickly. Since tritium is almost always found as water, it
goes directly into soft tissues and organs. The associated dose to these tissues is
generally uniform and is dependent on the water content of the specific tissue.
6.3.2
DISTRIBUTION IN STATION GROUNDWATER
This section provides an overview of the lateral and vertical distribution of tritium
detected in groundwater at the Station. Tritium was detected in groundwater at
concentrations greater than the LLD of 200 pCi/L in both the shallow and intermediate
groundwater zones.
Hydrogeologic profiles were created across the Station at locations shown on Figure
5.1.
Hydrogeologic profiles of the tritium concentrations in groundwater are presented on
Figures 6.1, 6.2, and 6.3. The following discussion presents the distribution of tritium
concentrations in Station groundwater with respect to the location of a particular AFE.
The distribution of tritium in the shallow groundwater zone is shown on Figure
5.6, and
the distribution of tritium in the intermediate groundwater zone is shown on Figure 5.7.
As shown in Figures 5.6 and 5.7, there appear to be two primary sources of tritium
beneath the Station. One is from the HPCI Piping leaks and the other is from the Unit 1
Fuel Pool overflow. The remainder of this section provides further details on the
distribution of the tritium related to the four AFEs.
AFE-Dresden-1: CST System HPCI Piping Leak
The most frequent detections of tritium in the shallow and intermediate groundwater
zones
were identified near the Units 2/3 Turbine Building on its south, east and west
sides. As demonstrated in the following paragraphs, the source of the tritium in this
area is historical tritium releases from the CST System HPCI Piping.
The highest concentrations of tritium in the shallow groundwater zone were detected
within the area surrounding CST System
HPCI Piping at monitoring wells
MW-DN-102S (4,250 ± 475 pCi/L), MW-DN-114S (2,770 ± 336 pCi/L), and MW-DN-107S
(1,040 ± 165 pCi/L). MW-DN-102S is located approximately 600 feet southwest of CST
System HPCI Piping. MW-DN-114S is located approximately 450 feet northeast of CST
System HPCI Piping. MW-DN-107S is located approximately 300 feet northeast of CST
System HPCI Piping.
045136 (15) Dresden Generating Station
38
CONESTOGA-ROVERS & ASSOCIATES
Revision 1
Groundwater flows radially outward beneath
the PA. Near the CST System HPCI
Piping, the flow is to the northwest, west and south-southwest with minimal flow also
to the northeast. Tritium detected in groundwater follows this flow path as it moves
from the HPCI Piping around the buildings to the northwest (Figure 5.4). Tritium was
also detected at concentrations greater than the LLD of 200 pCi/L in groundwater
samples collected from monitoring wells MW-DN-111S (638 ± 140 pCi/L) and MW-109S
(251 ± 120 pCi/L), located to the west-northwest, hydraulically downgradient of CST
System HPCI Piping. In addition, tritium was also detected greater than the LLD of
200 pCi/L in groundwater samples collected from MW-DN-113S (451 ± 136 pCi/L),
located to the south of the CST System HPCI Piping. Although MW-DN-113S is not
presently downgradient of AFE-Dresden-1, seasonal fluctuations in groundwater
elevations could result in this well being downgradient to the AFE.
Within the intermediate groundwater zone, tritium was detected in groundwater
samples
from
monitoring
wells
DSP-125
(320 ± 127 pCi/L),
MW-DN-102I
(1,380 ± 195 pCi/L),
DSP-124
(10,000 ± 284 pCi/L),
MW-DN-109I
(3,620 ± 413/3,750 ± 424 pCi/L), MW-DN-112I (1,520 ± 214 pCi/L), and MW-DN-110I
(516 ± 134 pCi/L), within the area surrounding CST System HPCI Piping for Units 2/3.
DSP-125 is located approximately 100 feet east of the area of the release at the CST
System HPCI Piping for Units 2/3. MW-DN-102I is located approximately 600 feet
southwest of the CST System HPCI Piping. DSP-124, MW-DN-109I, MW-DN-112I, and
MW-DN-110I are all located to the northwest and are located hydraulically
downgradient of the release at the CST System HPCI Piping. These tritium levels
demonstrate declining (10,000 ± 284 pCi/L to 516 ± 134 pCi/L) concentrations with
increased distance from the CST System Piping.
Groundwater flow in and around the Units 2/3 Turbine Building is
radially outward
from the center of the PA as depicted for the shallow and intermediate groundwater
zones on Figures 5.4 and 5.5. This flow pattern provides a potential explanation for the
detection of tritium greater than the LLD of 200 pCi/L in the groundwater samples from
monitoring wells MW-DN-102S and MW-DN-102I, which are located southwest of the
CST. Groundwater containing tritium that has originated in the area of the HPCI Piping
for Units 2/3 also migrates to the northeast underneath the Unit 1 Turbine Building
within the intermediate zone of the water table aquifer.
AFE-Dresden-2: Unit 1 Spent Fuel Pool
Groundwater flow within the shallow groundwater zone in the area of
the Unit 1 Spent
Fuel Pool is consistent with the general flow direction across the Station. However,
there is a slight deflection of groundwater flow east of the Unit 1 Turbine Building due
045136 (15) Dresden Generating Station
39
CONESTOGA-ROVERS & ASSOCIATES
Revision 1
to the influence of the structure at that location. The closest shallow monitoring well to
the Unit
1 Spent Fuel Pool is MW-DN-118S. The groundwater sample from this well
contained tritium at a concentration of 1,650 ± 227 pCi/L while the sample from
MW-DN-105S, located upgradient of the Unit 1 Spent Fuel Pool, did not contain tritium
at concentrations greater than the LLD of 200 pCi/L. MW-DN-101S is located to the
north of the Unit 1 Spent Fuel Pool along the banks of the Unit 1 Intake Canal. The
groundwater sample from MW-DN-101S had a tritium concentration of 220 ± 114 pCi/L,
only slightly greater than the LLD of 200 pCi/L.
The highest concentration of tritium in the intermediate groundwater zone across the
Station
was
detected
in
a
groundwater
sample
from
DSP-123
(13,100 ± 318/13,200 ± 319 pCi/L), which is directly north of the Unit 1 Spent Fuel Pool
and also to the north of the Unit 1 Sphere, but along the groundwater flow path
originating south of the Turbine Building. MW-DN-119I (1,470 ± 211 pCi/L) is also
located along the flow path originating from the Fuel Pool. DSP-105, DSP-106, DSP-107,
and DSP-108 are located to the south and east of the Unit 1 Turbine Building and Sphere.
Within the intermediate groundwater zone tritium was detected in groundwater
samples from monitoring wells DSP-105 (319 ± 117 pCi/L), DSP-106 (2,370 ± 289 pCi/L),
DSP-107
(9,820 ± 1,030 pCi/L),
DSP-108
(1,930 ± 244 pCi/L),
DSP-123
(13,200 ± 319 pCi/L), and MW-DN-101I (4,570 ± 208 pCi/L).
Tritium detected in the groundwater samples from shallow and intermediate
monitoring wells in this
area is primarily the result of the Unit 1 Spent Fuel Pool
historical release.
AFE-Dresden-3: Radwaste Discharge Piping for Units 2/3
There are six wells that are used to evaluate
the water quality near this AFE.
Groundwater samples from three of these wells contained less than detectable
concentrations of tritium. The other three monitoring wells had tritium concentrations
ranging from 356 to 1,440 pCi/L.
The groundwater quality downgradient of Radwaste Discharge lines for
Units 2/3 is
characterized by the analysis of groundwater samples from MW-DN-104S, installed
along the Radwaste Discharge Lines for Units 2/3. MW-DN-104S is hydraulically
downgradient of the Radwaste Surge Tank and the point at which the discharge piping
penetrates the structure. The groundwater sample from this well did not contain tritium
at a concentration greater than the LLD of 200 pCi/L. Groundwater flow near the
Radwaste Discharge Lines for Units 2/3 is to the north-northeast, consistent with the
general groundwater flow direction in the shallow groundwater zone at the Station.
045136 (15) Dresden Generating Station
40
CONESTOGA-ROVERS & ASSOCIATES
Revision 1
Within the intermediate groundwater zone, tritium was detected in groundwater
samples
from
monitoring
wells
DSP-122
(1,440 ± 139 pCi/L),
DSP-149R
(668 ± 144/694 ± 143 pCi/L), and DSP-148 (356 ± 111 pCi/L). These wells are located
near the Radwaste Discharge Piping and downgradient of the 77,000-gallon Radwaste
Surge Tank where historical releases have been identified.
The low concentrations of tritium detected in
the shallow and intermediate monitoring
wells discussed above is likely associated with historical releases from the Radwaste
Discharge Piping for Units 2/3, influence from the canal, or both.
AFE-Dresden-4: Piping from CST System and Storm Drain to Unit 1 Intake Canal
The footprint of AFE-Dresden-4 includes the area occupied by the CST System piping
and the storm drains that discharge to the Unit 1 Intake Canal. The shallow wells,
MW-DN-105S, MW-DN-101S MW-DN-115S, MW-DN-118S, are located in close
proximity to the East Drainage Basin storm drain that discharges to the Unit 1 Intake
Canal.
The groundwater sample from MW-DN-101S contained tritium at a
concentration slightly greater than the LLD of 200 pCi/L (220 ± 114 pCi/L) while the
upgradient location of MW-DN-118S had tritium detected at 1,650 ± 227 pCi/L. The
groundwater samples from MW-DN-105S and MW-DN-115S were non-detect for
tritium at the LLD of 200 pCi/L. In the shallow groundwater zone, two shallow wells,
MW-DN-107S and MW-DN-114S, are located near the CST System HPCI Piping leak
and had tritium concentrations in groundwater samples of 1,040 ± 165 pCi/L and
2,770 ± 336 pCi/L, respectively. Groundwater flow within the area surrounding the CST
System HPCI Piping and Storm Drain to Unit 1 Intake Canal is also locally to the
north-northeast, consistent with the general radial flow direction at the Station and with
the flow moving around the buildings.
Within the intermediate groundwater zone, tritium was detected in groundwater
samples from monitoring wells DSP-125 (320 ±
127 pCi/L), DSP-105 (319 ± 117 pCi/L),
DSP-106
(2,370 ± 289 pCi/L),
DSP-107
(9,820 ± 1,030 pCi/L),
DSP-108
(1,930 ± 244 pCi/L),
MW-DN-101I
(4,570 ± 208 pCi/L),
MW-DN-114I
(4,190 ± 473 pCi/L), and MW-DN-119I (1,470 ± 211 pCi/L). DSP-105, DSP-106, DSP-107,
DSP-108, and MW-DN-119I are all located in close proximity to the storm drain
servicing the Unit 1 Intake Canal. The detections of tritium in these wells may be the
result of a combination of releases from AFE–Dresden-1 and AFE-Dresden-4.
Most of the storm drainage system adjacent to the Turbine Buildings is constructed
below
the water table. Portions of the storm drainage system lie below the water table
045136 (15) Dresden Generating Station
41
CONESTOGA-ROVERS & ASSOCIATES
Revision 1
by as much as 3 feet. As such, infiltration of groundwater into the storm drainage
system that extends
from AFE-Dresden-1 to AFE-Dresden-4 is contributing to the
movement of tritiated water along southern, eastern and western sides of the Turbine
Buildings. This is consistent with groundwater movement in this area. Therefore, the
majority of the groundwater that enters the storm drains or surrounding fill would
eventually discharge into the Canal System.
The Station currently performs weekly monitoring of two manhole locations that are
located upstream from the discharge points
for the East Drainage Basin and the West
Drainage Basin. Manhole DSP-131 is the final manhole on the West Drainage Basin
system prior to discharge into the Unit 2&3 Discharge Canal. The August 2006 tritium
concentration at DSP-131 was 600 pCi/L. Manhole DSP-132 is the final manhole on the
East Drainage Basin system prior to discharge into the Unit 1 Intake Canal. The
August 2006 tritium concentration at DSP-132 was 700 pCi/L.
6.3.3
DISTRIBUTION IN STATION SURFACE WATER
Tritium was not detected in the six surface water samples at concentrations greater than
the LLD of 200 pCi/L. The surface water sample locations are shown on Figure 4.1.
6.3.4
CONCEPTUAL MODEL OF TRITIUM RELEASE
AND MIGRATION
This section presents CRA's conceptual model of groundwater and tritium migration at
the Station.
Hydrogeologic Framework
Based upon existing Station data from boring
logs and water level data, the
groundwater flow in the water table aquifer is expected to move under conditions
equivalent to porous media flow. The sandstone and the limestone bedrock have
characteristics that are equivalent to a porous medium at the scale of this investigation.
Therefore, discussions of groundwater flow within the shallow and intermediate zones
of the water table aquifer are assumed to be under porous media conditions.
Groundwater flow within the water table aquifer at the Station generally moves from
southwest to the northeast to the regional
discharge points in the Kankakee and Illinois
Rivers. Structures and operations at the Station have modified the flow within the water
045136 (15) Dresden Generating Station
42
CONESTOGA-ROVERS & ASSOCIATES
Revision 1
table aquifer before it reaches the river systems. The canals act like partially
penetrating
streams, and may receive water from or discharge water to the groundwater system.
The locations of the canals and the rivers with respect to the Station result in radial
groundwater
flow from the center of the PA. The potentiometric surface represented on
Figures 5.4 and 5.5 demonstrate the multiple groundwater discharge locations and the
resultant radial pattern to those locations.
Building foundations and fill also influence groundwater flow by redirecting
groundwater flow. For example,
as groundwater flows toward the rivers and canals, it
encounters the basements and backfill around the Turbine Buildings and other
buildings.
The operation of the intake structure near
the north side of the Units 2/3 Turbine
Building appears to have some localized influence on groundwater flow as is evident by
the potentiometric surface shown on Figure 5.4. This figure suggests that the pumping
of water into this structure creates a capture zone of groundwater.
Groundwater flow at the Station is limited in the vertical direction by the presence of the
Maquoketa
Shale.
The hydrogeologic profiles presented on Figures 6.1 to 6.3
demonstrate that tritium has not migrated deeper than the base of the Divine
Limestone/top of the Maquoketa Shale.
The following presents the tritiated water migration pathways:
•
Historic data shows that tritiated water has entered the Station Canal System via the
Intake Canal from the Kankakee River.
•
Tritiated groundwater flows beneath and around the structures and enters the Canal
System via the Intake Canal at the intake structure.
•
Surface water in the Canal System can migrate both vertically and laterally into
groundwater.
•
Tritiated groundwater appears to infiltrate into storm drains, which are submerged
below the water table, and enter the Canal System when the storm drains discharge
to the Canal System, including the Intake Canal.
•
Tritiated Kankakee River water in the canal systems can discharge to groundwater,
under certain conditions, and then migrate back toward Kankakee River and some
residential wells.
045136 (15) Dresden Generating Station
43
CONESTOGA-ROVERS & ASSOCIATES
Revision 1
6.4
STRONTIUM
6.4.1
GENERAL CHARACTERISTICS
Elemental strontium occurs naturally in the earth's
mantle as a mixture of four stable
isotopes (strontium-88, strontium-86, strontium-87, and strontium-84), and is present
everywhere in very dilute concentrations.
It is very similar to calcium in its
environmental and physiological behavior.
All four isotopes behave the same
chemically, so any combination of the four would have the same chemical effect on the
body.
The radioactive isotopes of strontium do not occur naturally but are produced as a
by-product of nuclear fission
of uranium-235, uranium-238, or plutonium-239. The most
significant isotopes are strontium-90 (half-life of 29 years), strontium-89 (half-life of
51 days), and strontium-85 (half-life of 65 days), which decay by the emission of beta
particles. Strontium-90 releases beta particles and decays into yttrium-90. Yttrium-90
decays to the stable isotope zirconium-90.
The Agency for Toxic Substances and Disease Registry (ATSDR) provides a toxicological
profile for strontium (ATSDR,
2004). According to this profile, strontium behaves
similar to calcium and is absorbed by the body and deposited in bone and
blood-forming tissue (bone marrow) when food and water products containing trace
amounts are ingested. Strontium-90 has a relatively long half-life of 29 years. The most
serious effects of oral exposure to absorbed radioactive strontium are necrotic lesions
and cancers of bone and the adjacent tissues. High-level acute exposures can destroy
bone marrow, leading to acute radiation syndrome. At lower doses, irradiation of bone
marrow may lead to chronic suppression of immune functions.
6.4.2
DISTRIBUTION IN STATION GROUNDWATER
This section provides an overview of the lateral and vertical distribution of strontium-90
detected in groundwater at the Station. Strontium-90 was detected in groundwater at
concentrations exceeding the LLD of 2 pCi/L in the intermediate groundwater zone.
Since strontium-90 was detected at only one groundwater monitoring location
(well
MW-DN-108I), the following discussion presents the distribution of strontium-90
concentrations in Station groundwater with respect to monitoring well MW-DN-108I.
045136 (15) Dresden Generating Station
44
CONESTOGA-ROVERS & ASSOCIATES
Revision 1
Groundwater Monitoring Well MW-DN-108I
Strontium-89/90 was detected in one monitoring
well (MW-DN-108I) at a concentration
greater than the LLD of 2.0 pCi/L. In August 2006, a sample was collected from this
well, and strontium-89/90 was detected at a concentration of 2.72 ± 1.01 pCi/L. This
sample was further analyzed for strontium-90, which was detected at a concentration of
2.17 ± 0.783 pCi/L. Furthermore, a duplicate of this sample was analyzed for total
strontium and strontium-90. Since the strontium-90 results exceeded the sum of the
total strontium in the duplicate sample, it has been concluded that the results of this
sample are invalid.
In May 2006, a sample was collected from this monitoring well (MW-DN-108I).
Analyses in July
2006 detected strontium-89/90 at a concentration of 4.42 ± 1.23 pCi/L.
In July 2006, this sample was further analyzed for strontium-90, which was detected at a
concentration of 4.37 ± 0.66 pCi/L. In July 2006, the sample was re-analyzed and
strontium-89/90 was detected at a concentration of 3.39 ± 0.774 pCi/L. In July 2006, this
sample was further analyzed for strontium-90, which was detected at a
concentration of
2.72 ± 1.29 pCi/L. Because the total strontium from these two samples varied by almost
40
percent and the margin of error was nearly 50 percent, it became necessary to run a
third analysis to verify what, if any, detectable concentration existed. This could not be
completed for the May
2006 samples due to the samples becoming contaminated at the
analytical laboratory. Normal protocol for an anomalous positive result is to perform a
confirmatory sampling and analysis of the respective well. Consequently, the well
MW-DN-108I was re-sampled in August 2006, as discussed above.
This well is located in the vicinity of the Unit
1 Off-Gas Hold-up Piping to the Unit 1
Off-Gas Suppression System. In
November 1975, a ditch which had been dug to connect
piping between the Unit 1 Off-Gas Hold-up Piping and the newly constructed Unit 1
Off-Gas Suppression System, began to fill with rainwater which flowed along the ditch
towards the Unit 1 Circulating Water Intake Canal. The off-gas pipe was breached at the
time allowing contaminants from inside the pipe to be flushed out into the ditch
(surrounding soil). This release is the likely source of the strontium-89/90 detected in
groundwater samples collected from well MW-DN-108I.
Since strontium-89/90 was not detected at concentrations above the LLD of
2.0 pCi/L in
groundwater samples from any of the other groundwater monitoring wells throughout
the Station property and adjacent to well MW-DN-108I, it is assumed that the detection
of strontium-89/90 is localized to this area.
045136 (15) Dresden Generating Station
45
CONESTOGA-ROVERS & ASSOCIATES
Revision 1
6.4.3
DISTRIBUTION IN STATION SURFACE WATER
Strontium was not detected in the six surface water samples at concentrations greater
than the LLD of 2.0 pCi/L.
045136 (15) Dresden Generating Station
46
CONESTOGA-ROVERS & ASSOCIATES
Revision 1
7.0
EXPOSURE PATHWAY ASSESSMENT
This section addresses the groundwater impacts from tritium at the Station and potential
risks to human health and the environment.
Based upon historical knowledge and data related to the Station operations, and based
upon radionuclide analyses of groundwater
samples and the isolated detection of
strontium-90 in the groundwater sample from MW-DN-108I, the primary constituent of
concern (COC) is tritium. The discussions that follow are restricted to the exposure
pathways related to tritium.
Teledyne Brown reports all samples to their statistically derived minimum detectable
concentrations (MDC) approximately
150 to 170 pCi/L, which is associated with
95 percent confidence interval on their hard-copy reports. However, the laboratory uses
a 99 percent confidence range (± 3-sigma) for determining whether to report the sample
activity concentration as detected or not. This 3-sigma confidence typically equates to
150 (± 135.75) pCi/L.
Exelon has specified a LLD of 200 pCi/L for the Fleetwide Assessment. Exelon
has also
required the laboratory to report related peaks identified at the 95 percent confidence
level (2-sigma).
This HIR, therefore, screens and assesses data using Exelon's
LLD of 200 pCi/L. As is
outlined below, this concentration is also a reasonable approximation of the background
concentration of tritium in groundwater at the Station.
7.1
HEALTH EFFECTS OF TRITIUM
Tritium is a radionuclide that decays by emitting a low-energy beta particle that cannot
penetrate deeply into tissue or travel far in air. A person's exposure to
tritium is
primarily through the ingestion of water (drinking water) or through ingestion of water
bearing food products. Inhalation of tritium requires the water to be in a vapor form
(i.e., through evaporation or vaporization due to heating). Inhalation is a minor
exposure route when compared to direct ingestion or drinking of tritiated water.
Absorption of tritium through skin is possible, but tritium exposure is more limited here
versus direct ingestion or drinking of tritiated water.
045136 (15) Dresden Generating Station
47
CONESTOGA-ROVERS & ASSOCIATES
Revision 1
7.2
BACKGROUND CONCENTRATIONS OF TRITIUM
The purpose of the following paragraphs is
to establish a background concentration
through review of various media.
7.2.1
GROUNDWATER
Tritium is created in the environment from naturally occurring processes both cosmic
and
subterranean, as well as from anthropogenic (i.e., man-made) sources. In the upper
atmosphere, "cosmogenic" tritium is produced from the bombardment of stable nuclides
and combines with oxygen to form tritiated water, which will then enter the hydrologic
cycle. Below ground, "lithogenic" tritium is produced by the bombardment of natural
lithium isotopes
6
Li (92.5% abundance)
and
7
Li (7.5% abundance)
present in crystalline
rocks by neutrons produced by the radioactive decay of uranium and thorium.
Lithogenic production of tritium is usually negligible compared to other sources due to
the limited abundance of lithium in rock. The lithogenic tritium is introduced directly to
groundwater.
A major anthropogenic source of tritium comes from the former atmospheric testing of
thermonuclear weapons. Levels of tritium in precipitation increased during the 1950s
and early 1960s, coinciding with the release of significant amounts of tritium to
the
atmosphere during nuclear weapons testing prior to the signing of the Limited Test Ban
Treaty in 1963, which prohibited atmospheric nuclear tests.
7.2.2
PRECIPITATION DATA
Precipitation samples are routinely collected at stations around the world for the
analysis of tritium and other radionuclides. Two publicly available databases that
provide tritium concentrations in precipitation are Global Network of Isotopes in
Precipitation (GNIP) and USEPA's RadNet database.
GNIP provides tritium
precipitation concentration data for samples collected world wide from 1960 to 2006.
RadNet provides tritium precipitation concentration data for samples collected at
Stations through the U.S. from 1960 up to and including 2006.
Based on GNIP data for sample stations located in the U.S. Midwest including Chicago,
St.
Louis and Madison, Wisconsin, as well as Ottawa Ontario, and data from the
University of Chicago, tritium concentrations peaked around 1963. This peak, which
approached 10,000 pCi/L for some stations, coincided with the atmospheric testing of
045136 (15) Dresden Generating Station
48
CONESTOGA-ROVERS & ASSOCIATES
Revision 1
thermonuclear weapons. Tritium concentrations showed a sharp decline up until 1975
followed by a gradual decline since that time.
Tritium concentrations in Midwest
precipitation have typically been below 100 pCi/L since around 1980.
The RadNet database for several stations in
the U.S. Midwest (Chicago, Columbus,
Indianapolis, Lansing, Madison, Minneapolis, Painesville, Toledo, and Welsch, MN) did
not show the same trend, which can attributed to pre-1995 data handling procedures.
The pre-1995 data were rounded to the nearest 100 pCi/L, which damped out variances
in the data. The post-1995 RadNet data, where rounding was not applied, exhibit much
more scatter, and similar to the GNIP data, the vast majority of the data were less than
100 pCi/L.
CRA constructed a non-parametric upper tolerance
limit with a confidence of 95 percent
and a coverage of 95 percent based on RadNet data for USEPA Region 5 from 2004 to
2005. The resulting upper tolerance limit is 133 pCi/L, which indicates that CRA is
95 percent confident that 95 percent of the ambient precipitation concentration results
are below 133 pCi/L. The statistical confidence, however, must be compared with the
limitations of the underlying RadNet data, which does not include the minimum
detectable concentration for a majority of the measurements. Some of the RadNet values
below 200 pCi/L may be approximated. Nevertheless, these results show a background
contribution for precipitation of up to 133 pCi/L.
7.2.3
SURFACE WATER DATA
Tritium concentrations are routinely measured in large surface water bodies, including
Lake Michigan and the Mississippi River. Surface
water data from the RadNet database
for Illinois sampling stations include East Moline (Mississippi River), Moline
(Mississippi River), Marseilles (Illinois River), Morris (Illinois River), Oregon (Rock
River), and Zion (Lake Michigan). As is the case for the RadNet precipitation data, the
pre-September 1995 Illinois surface water data was rounded to the nearest 100 pCi/L,
creating a dampening of variances in the data. The post-1995 Illinois surface water data,
similar to the post-1995 Midwest precipitation data, were less than 100 pCi/L with the
exception of the Moline (Mississippi River) station.
Tritium surface water
concentrations at this location varied between 100 and 800 pCi/L, which may reflect
local natural or anthropogenic inputs.
The USEPA RadNet surface water data typically has a reported 'Combined Standard
Uncertainty'
of 35 to 50 pCi/L.
According to USEPA, this corresponds to a
±
70 to 100 pCi/L 95 percent confidence bound on each given measurement. Therefore,
045136 (15) Dresden Generating Station
49
CONESTOGA-ROVERS & ASSOCIATES
Revision 1
the typical background data provided may be
subject to measurement uncertainty of
approximately
±
70 to 100 pCi/L.
As part of the REMP, tritium concentrations are measured in the Kankakee, Des
Plaines
and Illinois Rivers as well as within the canal network at the Station.
Surface water samples are collected as part of REMP at a total of three locations.
Samples
are collected at two locations upstream of the Station on the Kankakee (D-54)
and Des Plaines (D-52) Rivers, and at one location downstream of the Station on the
Illinois River (D-51). The concentration of tritium within the Kankakee River (D-54) was
not greater than the LLD of 200 pCi/L since 2003 but increased to 720 pCi/L in 2005 and
is attributable to an upstream source. The concentration of tritium within the Des
Plaines River (D-52) has not been greater than the LLD of 200 pCi/L since 2000 except
for one sample at 230 pCi/L in 2003. The concentration of tritium within the Illinois
River (D-51) has fluctuated from less than the LLD of 200 pCi/L since 2000 to a
maximum concentration of 1,974 pCi/L in 2002.
Since January 2005, the concentration of tritium in the Station intake has ranged from the
LLD of 200
pCi/L to greater than 2,500 pCi/L. In addition, available data indicates that
upstream background concentrations in the Kankakee River have ranged from LLD of
200 pCi/L to greater than 6,900 pCi/L (RETEC, 2004). The intake canal sample is a
direct representation of tritium concentrations in the Kankakee River.
7.2.4
DRINKING WATER DATA
Tritium concentrations in drinking water from the RadNet database for three Illinois
sampling stations (Chicago, Morris, and East Chicago) exhibit similar trends to the
precipitation and surface water data. As with the precipitation and surface water data,
the pre-1995 data has dampened out variances due to rounding the data to the nearest
100 pCi/L. The post-1995 results show tritium concentrations in samples of drinking
water were less than 100 pCi/L and less than the tritium concentrations found in
precipitation and surface water.
A residential well, designated RW-1, has been
sampled for tritium for over 10 years as
part of the Offsite Dose Calculation Manual (ODCM) and is located approximately
0.7 miles south of the plant. Prior to 1995, the groundwater samples from this well
consistently contained tritium concentrations less than 300 pCi/L.
From 1995 to
April 2005, tritium concentrations increased from 232 to 940 pCi/L.
045136 (15) Dresden Generating Station
50
CONESTOGA-ROVERS & ASSOCIATES
Revision 1
Based on the tritium found in RW-1, in December 2004, Exelon
sampled 34 additional
residential wells in the same neighborhood. Tritium was detected in groundwater
samples from three of the 34 residential wells, designated RW-2, RW-3, and RW-4.
These wells are all located beside the Kankakee River to the south of the Station. The
locations of these wells are shown on Figure B.1 in Appendix B.
A groundwater sample was collected from the RW-2 well on December
2, 2004, and the
sample was split for analysis by two independent laboratories. Due to the discrepancy
in the results (366 pCi/L versus 114 pCi/L), another sample was collected on January 13,
2005, and four aliquots were reported ranging in concentration from 360 to 480 pCi/L.
Another sample was collected on April 15, 2005, and the reported tritium concentration
was 542 pCi/L.
Groundwater samples were collected from the
RW-3 well on September 21, 2005 with a
concentration of 369 pCi/L and the RW-4 well on August 29, 2005 with a concentration
of 468 pCi/L.
A water sample collected from the RW-1 well on April
15, 2005 contained tritium at a
concentration of 653 pCi/L. A sample collected from the RW-2 well on the same date
contained 542 pCi/L of tritium.
Based on the results of this investigation, the low tritium concentration impact observed
in the residential wells to the south of the Station is principally, if not
entirely, due to the
discharge of tritiated Kankakee River water to groundwater. In addition, the HIR data
demonstrate that there is no measurable tritium impact in the canal network from
current groundwater migration to the canal network in the vicinity of the PA.
7.2.5
EXPECTED TRITIUM BACKGROUND FOR THE STATION
As reported in the GNIP and RadNet databases, tritium concentrations in U.S. Midwest
precipitation has typically been less than 100 pCi/L since 1980. Tritium concentrations
reported in the RadNet database for Illinois surface water and groundwater, at least
since 1995, has typically been less than 100 pCi/L. Based on the USEPA Region 5 2004
to 2005 RadNet precipitation data, 95 percent of the ambient concentrations of tritiated
water in Illinois are expected to be less than 133 pCi/L, based on a 95 percent confidence
limit. Tritium concentrations in surface water and drinking water are expected to be
comparable or less based on historical data and trends.
045136 (15) Dresden Generating Station
51
CONESTOGA-ROVERS & ASSOCIATES
Revision 1
Concentrations in groundwater, similar to surface and drinking water,
are expected to
be less than precipitation values. The lower groundwater concentrations are related to
the age of the groundwater as compared to the half-life of tritium. Deep aquifers in
proximity to crystalline basement rock, however, can potentially show elevated
concentrations of tritium due to lithogenic sources.
As was noted in Section 7.0, the analytical laboratory
is reporting tritium results to a
LLD of 200 pCi/L. This concentration also provides a reasonable representation of
background groundwater quality, given the data for precipitation, surface water, and
drinking water.
Based on the evaluation presented above, the background concentration for
tritium at
the Station is reasonably represented by the LLD of 200 pCi/L.
7.3
IDENTIFICATION OF POTENTIAL EXPOSURE
PATHWAYS AND POTENTIAL RECEPTORS
Four potential exposure pathways were identified and considered during the evaluation
of tritium in groundwater.
•
potential groundwater migration to drinking water users on the Station property;
•
potential
groundwater migration off the Station property to private and public
groundwater users;
•
potential groundwater migration off the Station
property to a surface water body;
and
•
potential surface water migration to
groundwater off the Station property.
The following section provides an overview these four potential exposure pathways for
tritium in groundwater.
7.3.1
POTENTIAL GROUNDWATER MIGRATION TO
DRINKING WATER USERS AT THE STATION PROPERTY
At the Station, the tritium detected in groundwater samples has been isolated to the
water table aquifer, which is isolated from the deeper regional groundwater aquifer by
the Maquoketa Shale. Groundwater quality data from the Station's potable wells that
are completed below this aquitard do not contain concentrations of tritium greater than
the LLD of 200 pCi/L. As such, the tritium impact is limited to the water table aquifer.
045136 (15) Dresden Generating Station
52
CONESTOGA-ROVERS & ASSOCIATES
Revision 1
There are no water supply wells located on the Station property that draw water from
the water table aquifer.
There is no complete exposure pathway. Therefore, there is no current risk
of exposure
associated with groundwater ingestion at the Station.
7.3.2
POTENTIAL GROUNDWATER MIGRATION TO
DRINKING WATER USERS OFF THE STATION PROPERTY
The concentrations of tritium in groundwater are less than the USEPA drinking water
standard of 20,000 pCi/L.
Consequently, there is currently no tritium in the
groundwater that could migrate off the Station at concentrations exceeding the USEPA
drinking water standard.
There are private water supply wells located on land to the south of the Station.
Based
on groundwater flow maps, it is unlikely that tritiated groundwater beneath the Station
could migrate to the south in the intermediate flow system and onto the private
property.
Although there is a potentially complete exposure pathway, there is no current risk of
exposure associated with this pathway.
7.3.3
POTENTIAL GROUNDWATER MIGRATION TO SURFACE
WATER USERS OFF THE STATION PROPERTY
Groundwater at the Station discharges to Kankakee and Illinois Rivers or through the
Discharge
Canal.
Therefore, there is a potentially complete exposure route to
recreational users of surface water including boating, fishing, and swimming.
Tritium results for surface water samples collected as part of this investigation were less
than
the LLD of 200 pCi/L. In addition, based on the results of this investigation, the
Station is not causing any off-Station concentrations of tritium above detectable limits.
Although there is a potentially complete exposure pathway, there is no current risk of
exposure associated with
groundwater migration to surface water users off the Station
property.
045136 (15) Dresden Generating Station
53
CONESTOGA-ROVERS & ASSOCIATES
Revision 1
7.3.4
POTENTIAL SURFACE WATER MIGRATION TO
GROUNDWATER AND SURFACE WATER OFF
THE STATION PROPERTY
Surface water within the Canal System could potentially migrate from the Canal System
to groundwater off the Station property. Tritium
results for surface water samples
collected as part of this investigation were less than the LLD of 200 pCi/L.
As discussed in Section 7.2.4, private wells south of the Station were sampled to evaluate
potential impact of the Station's operations on
groundwater.
The Canal System
historically contained elevated tritium concentrations as high as approximately
6,900 pCi/L due to upgradient sources in the Kankakee River. Therefore, as discussed
above, the source of these low concentrations in the off-Station wells is principally, if not
entirely, due to the discharge of tritiated Kankakee River water to groundwater. In
addition, the HIR data demonstrate that there is no measurable tritium impact in the
canal network from current groundwater migration to the canal network in the vicinity
of the PA.
Although there is a potentially complete exposure pathway, there is no current risk of
exposure
associated with migration of tritium originating from the Station to the Canal
System to groundwater off the Station property.
7.4
SUMMARY OF POTENTIAL TRITIUM EXPOSURE PATHWAYS
In summary, there are four potential groundwater exposure pathways for tritium
originating at the Station:
•
potential groundwater migration to drinking water users on the Station property;
•
potential
groundwater migration off the Station property to private and public
groundwater users;
•
potential groundwater migration off the Station
property to a surface water body;
and
•
potential surface water migration to
groundwater off the Station property.
Based on the groundwater and surface water data provided and referenced in this
investigation,
none of the potential receptors are at risk of exposure to concentrations of
tritium in excess of USEPA drinking water standard (20,000 pCi/L).
045136 (15) Dresden Generating Station
54
CONESTOGA-ROVERS & ASSOCIATES
Revision 1
7.5
OTHER RADIONUCLIDES
Strontium-89/90 was detected in one monitoring well (MW-DN-108I) at a concentration
greater than the LLD of 2.0 pCi/L. In August 2006, a sample was collected from this
well, and strontium-89/90 was detected at a concentration of 2.72 ± 1.01 pCi/L. This
sample was further analyzed for strontium-90, which was detected at a concentration of
2.17 ± 0.783 pCi/L. Furthermore, a duplicate of this sample was analyzed for total
strontium and strontium-90. Since the strontium-90 results exceeded the sum of the
total strontium in the duplicate sample, it has been concluded that the results of this
sample are invalid.
In May 2006, a sample was collected from this monitoring well (MW-DN-108I).
Analyses in July
2006 detected strontium-89/90 at a concentration of 4.42 ± 1.23 pCi/L.
In July 2006, this sample was further analyzed for strontium-90, which was detected at a
concentration of 4.37 ± 0.66 pCi/L. In July 2006, the sample was re-analyzed and
strontium-89/90 was detected at a concentration of 3.39 ± 0.774 pCi/L. In July 2006, this
sample was further analyzed for strontium-90, which was detected at a
concentration of
2.72 ± 1.29 pCi/L. Because the total strontium from these two samples varied by almost
40
percent and the margin of error was nearly 50 percent, it became necessary to run a
third analysis to verify what, if any, detectable concentration existed. This could not be
completed for the May
2006 samples due to the samples becoming contaminated at the
analytical laboratory. Normal protocol for an anomalous positive result is to perform a
confirmatory sampling and analysis of the respective well. Consequently, the well
MW-DN-108I was re-sampled in August 2006, as discussed above.
It is concluded that this detection is localized to the vicinity of MW-DN-108I. On
this
basis, there is limited discussion of this result in this report.
No target radionuclides were detected in the
groundwater and surface water samples at
concentrations greater than their respective LLDs. Other non-target radionuclides were
also included in the tables but excluded from the discussion in this report. These
radionuclides were either a) naturally occurring and thus not produced by the Station,
or b) could be definitively evaluated as being naturally occurring due to the lack of
presence of other radionuclides which would otherwise indicate the potential of
production from the Station.
045136 (15) Dresden Generating Station
55
CONESTOGA-ROVERS & ASSOCIATES
Revision 1
8.0
CONCLUSIONS
Based on this hydrogeologic investigation, CRA concludes:
Groundwater Flow
•
There
are two significant underlying water-bearing units, Pottsville Sandstone
(shallow groundwater zone) and the Divine Limestone (intermediate groundwater
zone), beneath the Station. The two formations comprise the water table aquifer.
•
The water table aquifer extends through
the entire thickness of these two units and is
underlain by the Maquoketa Shale, which acts as an aquitard and is continuous
across the Station.
•
The depth to groundwater beneath the Station ranges between 3 to 23 feet bgs.
•
Groundwater flow is influenced by the canal network and the
foundations of
buildings such that the shallow and intermediate groundwater flows radially
outwards from the center of the PA towards the canals and rivers. The canals also
influence the flow of groundwater in the intermediate groundwater zone. The
shallow groundwater zone discharges to the canal as does the intermediate
groundwater zone but to a lesser degree.
•
The horizontal groundwater flow velocity for the shallow groundwater zone ranges
from 87 to 355
ft/yr while the intermediate groundwater flow velocity ranges from
17 to 225 ft/yr.
•
The Station canals act as an interceptor trench for the shallow groundwater
zone
while the intermediate zone is partially intercepted by the Station canals. Seasonal
changes result in differing degrees of hydraulic communication between the
groundwater and the canal system.
Groundwater Quality
•
Gamma-emitting radionuclides associated
with licensed plant operations were not
detected at concentrations greater than their respective LLDs in any of the
68 groundwater samples collected as part of this investigation.
•
Strontium-90 was not detected in groundwater at concentrations greater than the
USEPA drinking water standard of 8.0 pCi/L.
•
Strontium-89/90
was detected in one monitoring well (MW-DN-108I) at a
concentration greater than the LLD of 2.0 pCi/L. In August 2006, a sample was
collected from this well, and strontium-89/90 was detected at a concentration of
2.72 ± 1.01 pCi/L. This sample was further analyzed for strontium-90, which was
045136 (15) Dresden Generating Station
56
CONESTOGA-ROVERS & ASSOCIATES
Revision 1
detected at a concentration of 2.17 ± 0.783 pCi/L. Furthermore, a duplicate of this
sample was analyzed for total strontium and strontium-90. Since the
strontium-90
results exceeded the sum of the total strontium in the duplicate sample, it has been
concluded that the results of this sample are invalid.
In May 2006, a sample was collected from
this monitoring well (MW-DN-108I).
Analyses in July 2006 detected strontium-89/90 at a concentration of
4.42 ± 1.23 pCi/L. In July 2006, this sample was further analyzed for strontium-90,
which was detected at a concentration of 4.37 ± 0.66 pCi/L. In July 2006, the sample
was re-analyzed and strontium-89/90 was detected at a concentration of
3.39 ± 0.774 pCi/L. In July 2006, this sample was further analyzed for strontium-90,
which was detected at a concentration of 2.72 ± 1.29 pCi/L. Because the total
strontium from these two samples varied by almost 40 percent and the margin of
error was nearly 50
percent, it became necessary to run a third analysis to verify
what, if any, detectable concentration existed. This could not be completed for the
May 2006
samples due to the samples becoming contaminated at the analytical
laboratory. Normal protocol for an anomalous positive result is to perform a
confirmatory sampling and analysis of the respective well. Consequently, the well
MW-DN-108I was re-sampled in August 2006, as discussed above.
•
Tritium was not detected in groundwater at
concentrations greater than the USEPA
drinking water standard of 20,000 pCi/L.
•
Tritium
was detected in groundwater samples from nine monitoring wells in the
shallow groundwater zone at concentrations ranging from 220 ± 114 pCi/L to
4,250 ± 475 pCi/L.
•
Tritium was detected in groundwater samples from twenty-one
wells in the
intermediate groundwater zone at concentrations ranging from 210 ± 124 pCi/L to
13,200 ± 319 pCi/L.
Surface Water Quality
•
Tritium
was not detected at concentrations greater than the LLD of 200 pCi/L in any
of the six surface water samples collected as part of this investigation.
•
Gamma-emitting radionuclides associated
with licensed plant operations were not
detected at concentrations greater than their respective LLDs in any of the six surface
water samples collected as part of this investigation.
•
Strontium-89/90 was not detected at a concentration greater than the LLD
of
2.0 pCi/L in any of the six surface water samples collected as part of this
investigation.
045136 (15) Dresden Generating Station
57
CONESTOGA-ROVERS & ASSOCIATES
Revision 1
AFE-Dresden-1: CST System HPCI Piping for Units 2/3
•
Gamma-emitting radionuclides associated
with licensed plant operations were not
detected at concentrations greater than their respective LLDs in any of the
groundwater samples obtained from the monitoring wells located in close proximity
to the CST System HPCI Piping.
•
Strontium-89/90 was not detected at a concentration greater than the LLD
of
2.0 pCi/L in any of the groundwater samples obtained from the monitoring wells
located in close proximity to the CST System HPCI Piping.
•
In the area surrounding the CST System HPCI Piping, tritium was detected in
the
shallow and intermediate groundwater zones. The groundwater flows with the local
hydraulic gradient, to the northwest around the Units 2/3 Turbine Building, and
under the Unit 1 Turbine Building.
•
There are 12
monitoring wells associated with this AFE. The groundwater samples
contained tritium at concentrations ranging from less than the LLD of 200 pCi/L to
10,000 ± 284 pCi/L.
•
Tritium in groundwater samples collected
in the CST System HPCI Piping area is
primarily attributable to the historical releases in this area.
AFE-Dresden-2: Unit 1 Spent Fuel Pool
•
Gamma-emitting radionuclides associated
with licensed plant operations were not
detected at concentrations greater than their respective LLDs in any of the
groundwater samples collected from the monitoring wells near the fuel pool.
•
Strontium-89/90 was not detected at a concentration greater than the LLD
of
2.0 pCi/L in any of the groundwater samples obtained from the monitoring wells
located in close proximity to this AFE.
•
Tritium was detected in the area surrounding
the Unit 1 Spent Fuel Pool at
concentrations greater than LLD of 200 pCi/L in the groundwater samples from the
shallow and intermediate groundwater monitoring wells.
•
There are 10 monitoring wells associated
with this AFE. The groundwater samples
contained tritium at concentrations ranging from less than the LLD of 200 pCi/L to
13,200 ± 319 pCi/L.
•
Tritium in groundwater samples collected in the area north of the
Unit 1 Spent Fuel
Pool is likely attributable to the Unit 1 Spent Fuel Pool historical release.
045136 (15) Dresden Generating Station
58
CONESTOGA-ROVERS & ASSOCIATES
Revision 1
AFE-Dresden-3: Radwaste Discharge Lines for Units 2/3
•
Gamma-emitting radionuclides associated
with licensed plant operations were not
detected at concentrations greater than their respective LLDs in any of the
groundwater samples collected from the monitoring wells located in close proximity
to Radwaste Discharge Piping for Units 2/3.
•
Strontium-89/90 was not detected at a concentration greater than the LLD
of
2.0 pCi/L in any of the groundwater samples obtained from the monitoring wells
located in close proximity to this AFE.
•
Tritium was detected in samples from three of the six
monitoring wells near the
Radwaste Discharge Piping.
The groundwater samples contained tritium at
concentrations ranging from less than the LLD of 200 pCi/L to 1,440 ± 139 pCi/L.
•
Tritium in groundwater samples collected in
the area of the Radwaste Discharge
Lines for Units 2/3 is primarily attributable to the historical releases in this area.
AFE-Dresden-4: Piping from CST System and Storm Drain to Unit 1 Intake Canal
•
Gamma-emitting radionuclides associated
with licensed plant operations were not
detected at concentrations greater than their respective LLDs in any of the
groundwater samples obtained from the monitoring wells located near the storm
drain.
•
Strontium-89/90 was not detected at a concentration greater than the LLD
of
2.0 pCi/L in any of the groundwater samples obtained from the monitoring wells
located in close proximity to this AFE.
•
Tritium concentrations in samples
from monitoring wells near, or hydraulically
downgradient, of AFE-Dresden-4 may be impacted by tritium sources from other
AFEs.
•
There are 12
monitoring wells associated with this AFE. The groundwater samples
contained tritium at concentrations ranging in concentration from less than the LLD
of 200 pCi/L to 4,570 ± 208 pCi/L.
•
Groundwater infiltration into the storm drain system is providing
a pathway for
tritiated groundwater to the Unit 1 Intake Canal.
•
The Storm Drain System acts as a conduit for tritiated water rather than a
source of
tritium.
045136 (15) Dresden Generating Station
59
CONESTOGA-ROVERS & ASSOCIATES
Revision 1
Potential Receptors
•
Based on the results of this investigation
2
there is no current risk of exposure to
radionuclides associated with licensed plant operations through any of the identified
potential exposure pathways.
General Conclusions
•
Based
on the results of this investigation, tritium originating from the Station is not
migrating off the Station property at detectable concentrations.
•
Based on the results of this investigation, there
are no known active releases into the
groundwater at the Station.
2
Using the LLD specified in this HIR.
045136 (15) Dresden Generating Station
60
CONESTOGA-ROVERS & ASSOCIATES
Revision 1
9.0
RECOMMENDATIONS
The following presents CRA's recommendations for proposed activities to be completed
at the Station.
9.1
FILL DATA GAPS
Based on the results of this hydrogeologic investigation, there are no data gaps
remaining to support CRA’s conclusions regarding the characterization of the
groundwater regime and potential impacts from radionuclides at the Station.
9.2
GROUNDWATER MONITORING
Based on the information collected to date, CRA recommends that Exelon conduct
periodic monitoring of selected sample locations.
045136 (15) Dresden Generating Station
61
CONESTOGA-ROVERS & ASSOCIATES
Revision 1
10.0
REFERENCES
Agency for Toxic Substances and Disease Registry (ATSDR), April 2004. Toxicological
Profile for Strontium.
Burch, S, 2002. A Comparison of Potentiometric Surfaces for the Cambrian-Ordovician
Aquifers of Northeastern Illinois, 1995 and 2000, Illinois State Water Survey.
Buschbach, T.C., 1964. Cambrian and
Ordovician Strata of Northeastern Illinois, Illinois
State Geological Survey, Report of Investigation 218, 90 p.
Conestoga-Rovers & Associates (CRA), 2006. Hydrogeologic Investigation Work Plan.
Dresden Station Final Environmental Statement (FES), November 1973.
Dresden Station Radiological Environmental Monitoring Program (REMP) Reports.
Dresden Station Updated Final Safety Analysis Report (UFSAR), Revision 6, June 2005.
Exelon Generation Company, May 2005. Quad Cities Nuclear Power Station,
2004
Annual Radiological Environmental Operating Report, Exelon, Cordova, Illinois.
Frye, J.C., et al., 1969. Glacial Tills of Northwestern Illinois, Illinois State Geological
Survey, Cir. 437, 45 p.
Harza Engineering Company (Harza), July 1991. Dresden Station Groundwater Study.
Harza Environmental Services, Inc. (Harza),
January 1995. Dresden Groundwater Study
Report, Morris, Illinois.
Michigan Department of Environmental Quality, January
2002. Use of Tritium in
Assessing Aquifer Vulnerability,
http://www.deq.state.mi.us/documents/deq-dwrpd-gws-wpu-Tritium.pdf.
Puls and Barcelona, 1996, EPA/540/S-95/504.
RETEC Group, December 7, 2005. Groundwater Tritium Investigation Report.
Schicht, Richard J., J. Rodger Adams, and John B. Stall, 1976. Water Resources
Availability, Quality, and Cost in
Northeastern Illinois, Illinois State Water
Survey Report of Investigation 83.
Sundance Environmental and Energy Specialists, Ltd. (Sundance), January 2006. Effects
of Liquid
Releases from the Braidwood Nuclear Power Station on the Kankakee
River and Riparian Water Wells and the Influence of the Dresden Nuclear Power
Station Cooling Lake on Groundwater and the Kankakee River.
Visocky, A.P. 1997. Water-Level Trends and Pumpage in the Deep Bedrock Aquifers
in
the Chicago Region, 1991-1995, Illinois State Water Survey, Circular 182.
045136 (15) Dresden Generating Station
62
CONESTOGA-ROVERS & ASSOCIATES
Revision 1
Visocky, Adrian P., Marvin G. Sherrill, and Keros Cartwright, 1985.
Geology,
Hydrogeology,
and Water Quality of the Cambrian and Ordovician Systems in
Northern Illinois, Illinois State Geological Survey, Illinois State Water Survey,
Cooperative Groundwater Report 10.
Willman, H.B. and Frye, J.C., 1969. High-Level Glacial Outwash in the Driftless Area of
Northwestern Illinois, Circular 440, Illinois State Geological Survey.
Willman, H.B., 1943. High-Purity Dolomite in Illinois, Illinois State Geological Survey,
101 p.
Willman, H.B., et al., 1975. Handbook of Illinois Stratigraphy, Bulletin 95, Illinois State
Geological Survey.
Willman, H.B.; Kolata, Dennis, R, 1978. The Platteville and Galena Groups in Northern
Illinois, Illinois State Geological Survey.
045136 (15) Dresden Generating Station
63
CONESTOGA-ROVERS & ASSOCIATES
FIGURE 2.1 STATION BOUNDARIES
AND FEATURES
(Withheld)
FIGURE 3.1 AREAS FOR FURTHER
EVALUATION
(Withheld)
FIGURE 4.1 SURFACE WATER
MONITORING LOCATIONS
(Withheld)
FIGURE 4.2 GROUNDWATER
MONITORING LOCATIONS
(Withheld)
FIGURE 5.1 LOCAL GEOLOGIC
CROSS-SECTION LOCATIONS
(Withheld)
FIGURE 5.4 POTENTIOMETRIC
SURFACE CONTOURS AUGUST 2006
- SHALLOW GROUNDWATER ZONE
(Withheld)
FIGURE 5.5 POTENTIOMETRIC
SURFACE CONTOURS AUGUST 2006
– INTERMEDIATE GROUNDWATER
ZONE
(Withheld)
FIGURE 5.6 TRITIUM
CONCENTRATIONS - SHALLOW
GROUNDWATER ZONE
(Withheld)
FIGURE 5.7 TRITIUM
CONCENTRATIONS - INTERMEDIATE
GROUNDWATER ZONE
(Withheld)
FIGURE 5.8 RADIONUCLIDE
CONCENTRATIONS - SHALLOW
GROUNDWATER ZONE AUGUST
2006
(Withheld)
FIGURE 5.9 RADIONUCLIDE
CONCENTRATIONS - INTERMEDIATE
GROUNDWATER ZONE AUGUST
2006
(Withheld)
A
ELEVATION (ft. AMSL)
NORTHWEST
DISTANCE (ft.)
500
520
510
500
490
480
470
1000
1500
A'
ELEVATION (ft. AMSL)
SOUTHEAST
510
500
490
480
MW-DN-106S
MW-DN-106S
<LLD
RECYCLING CANAL
DSP-123
MW-DN-101S (O/S 5' EAST)
DSP-108
DSP-107
DSP-106
DSP-105
DSP-158S
DSP-152
DSP-121
460
0
450
DSP-121
<LLD
MW-DN-101I
MW-DN-101S
220
MW-DN-101I
4570
460
450
DSP-158M (O/S 2' WEST)
505.12
520
DSP-152
<LLD
DSP-158M
<LLD
DSP-158S
<LLD
470
UNIT 1 TURBINE
BUILDING
UNIT 1 DISCHARGE
UNITS 2 & 3
INTAKE CANAL
UNIT 1 INTAKE
CANAL
SOUTHERN DITCH
DSP-108
1930
504.66
513.02
508.15
508.89
505.86
506.17
504.67
504.53
2000
2500
3000
FENCE
ROAD
FENCE
504.38
505.88
504.12
503.68
503.90
APPROXIMATE
STORM DRAIN
DSP-123
13100/13200
DSP-107
9820
DSP-106
2370
DSP-105
319
508.09
MW-DN-118S
1650
MW-DN-118S (O/S 43.06' EAST)
Scale:
Source Reference:
Project Manager:
Reviewed By:
Project N
o
:
Date:
Report N
o
:
Drawing N
o
:
THIS BAR MEASURES 1" ON ORIGINAL. ADJUST SCALE ACCORDINGLY.
SCALE VERIFICATION
EXELON GENERATION COMPANY, LLC
MORRIS, ILLINOIS
HYDROGEOLOGIC PROFILE - A-A'
DRESDEN GENERATING STATION
FLEETWIDE ASSESSMENT
S. QUIGLEY
D.CRUICKSHANK
AUGUST 2006
45136-23
015
figure 6.1
45136-23(015)GN-WA064 AUG 31/2006
AS SHOWN
DSP-152
513.30
DSP-152
<LLD
WELL ID
WELL
STRAT LAYER
LEGEND
WELL SCREEN
TRITIUM CONCENTRATION
PICOCURIES PER LITER
SURFACE WATER ELEVATIONS ARE ASSUMED BASED
ON THE STATION OPERATIONS
*
pCi/L
TRITIUM RESULTS GREATER THAN 5,000 (pCi/L)
TRITIUM RESULTS 1,000 TO 5,000 (pCi/L)
TRITIUM RESULTS 200 TO 1,000 (pCi/L)
<LLD
LESS THAN LOWER LIMIT OF DETECTION
GROUNDWATER ELEVATION
(AUGUST 2006)
REVISION 1
STORM DRAIN
B
ELEVATION (ft. AMSL)
NORTHWEST
DISTANCE (ft.)
500
520
510
500
490
480
470
1000
1500
B'
ELEVATION (ft. AMSL)
SOUTH EAST
510
500
490
480
460
0
450
460
450
520
470
2000
2500
MW-DN-110I
MW-DN-110S (O/S 5' EAST)
MW-DN-110S
<LLD
MW-DN-110I
516
MW-DN-109S
DSP-124
MW-DN-102S
DSP-157M
DSP-153
MW-DN-109I (O/S 4' EAST)
MW-DN-111S (O/S 20' EAST)
MW-DN-102I (O/S 4' EAST)
DSP-157S (O/S 7' EAST)
MW-DN-109S
251
MW-DN-111S
638
MW-DN-102I
1380
MW-DN-102S
4250
DSP-157M
<LLD
DSP-157S
<LLD
507.53
DSP-153
<LLD
507.69
515.84
513.64
508.32
511.06
513.88
512.10
512.48
ROAD
FENCE
ROAD
FENCE
RAILROAD
ROAD
APPROXIMATE
STORM DRAIN
509.34
509.62
MW-DN-109I
3620/3750
DSP-124
10000
Scale:
Source Reference:
Project Manager:
Reviewed By:
Project N
o
:
Date:
Report N
o
:
Drawing N
o
:
THIS BAR MEASURES 1" ON ORIGINAL. ADJUST SCALE ACCORDINGLY.
SCALE VERIFICATION
EXELON GENERATION COMPANY, LLC
MORRIS, ILLINOIS
HYDROGEOLOGIC PROFILE - B-B'
DRESDEN GENERATING STATION
FLEETWIDE ASSESSMENT
S. QUIGLEY
D.CRUICKSHANK
AUGUST 2006
45136-23
015
figure 6.2
45136-23(015)GN-WA065 AUG 31/2006
AS SHOWN
DSP-124
WELL ID
WELL
STRAT LAYER
LEGEND
513.24
DSP-124
10000
WELL SCREEN
TRITIUM CONCENTRATION
pCi/L
PICOCURIES PER LITER
TRITIUM RESULTS GREATER THAN 5,000 (pCi/L)
TRITIUM RESULTS 1,000 TO 5,000 (pCi/L)
TRITIUM RESULTS 200 TO 1,000 (pCi/L)
<LLD
LESS THAN LOWER LIMIT OF DETECTION
GROUNDWATER ELEVATION
(AUGUST 2006)
REVISION 1
STORM DRAIN
C
ELEVATION (ft. AMSL)
SOUTHWEST
DISTANCE (ft.)
500
520
510
500
490
480
470
1000
1500
C'
ELEVATION (ft. AMSL)
NORTHEAST
510
500
490
480
460
0
450
460
450
520
470
2000
505.09
MW-DN-103S
MW-DN-103I (O/S 4' SOUTH)
DSP-124
MW-DN-111S (O/S 20' EAST)
MW-DN-107S
DSP-123
MW-DN-101S
MW-DN-101I
MW-DN-101S
220
MW-DN-101I
4570
DSP-117
DSP-117
<LLD
MW-DN-103I
<LLD
MW-DN-103S
<LLD/<LLD
UNITS 2 & 3
TURBINE BUILDING
UNIT 1 TURBINE
BUILDING
UNITS 2 & 3
INTAKE CANAL
UNIT 1 INTAKE
CANAL
ROAD
FENCE
RAILROAD
506.96
508.03
FENCE
RAILROAD
FENCE
FENCE
ROAD
FENCE
FENCE
513.64
505.88
APPROXIMATE
STORM DRAIN
APPROXIMATE
STORM DRAIN
503.90
MW-DN-112I
1520
MW-DN-112S
<LLD
MW-DN-117I
1030
514.11
509.95
MW-DN-112I (O/S 50.08' NORTH)
MW-DN-112S (O/S 51.95' NORTH)
MW-DN-117I (O/S 33.89' SOUTH)
MW-DN-111S
638
MW-DN-107S
1040
513.48
DSP-124
10000
504.70
504.67
504.12
DSP-123
13100/13200
513.95
Scale:
Source Reference:
Project Manager:
Reviewed By:
Project N
o
:
Date:
Report N
o
:
Drawing N
o
:
THIS BAR MEASURES 1" ON ORIGINAL. ADJUST SCALE ACCORDINGLY.
SCALE VERIFICATION
EXELON GENERATION COMPANY, LLC
MORRIS, ILLINOIS
HYDROGEOLOGIC PROFILE - C-C'
DRESDEN GENERATING STATION
FLEETWIDE ASSESSMENT
S. QUIGLEY
D.CRUICKSHANK
AUGUST 2006
45136-23
015
figure 6.3
45136-23(015)GN-WA066 AUG 31/2006
AS SHOWN
DSP-124
WELL ID
WELL
STRAT LAYER
LEGEND
513.24
DSP-124
10000
WELL SCREEN
TRITIUM CONCENTRATION
PICOCURIES PER LITER
SURFACE WATER ELEVATIONS ARE ASSUMED BASED
ON THE STATION OPERATIONS
*
pCi/L
PICOCURIES PER LITER
TRITIUM RESULTS GREATER THAN 5,000 (pCi/L)
TRITIUM RESULTS 1,000 TO 5,000 (pCi/L)
TRITIUM RESULTS 200 TO 1,000 (pCi/L)
<LLD
LESS THAN LOWER LIMIT OF DETECTION
GROUNDWATER ELEVATION
(AUGUST 2006)
REVISION 1
STORM DRAIN
TABLE 4.2
Page 12 of 13
SUMMARY OF MONITORING WELL DEVELOPMENT PARAMETERS
FLEETWIDE ASSESSMENT
DRESDEN GENERATING STATION
MORRIS, ILLINOIS
Sample
Well
Volume
Location
Date
Volume
Purged
pH
Conductivity
Temperature
Turbidity
Observations
(gallons)
(gallons)
(Std. Units)
(1)
(μS/cm)
(2)
(°C)
(3)
(NTU)
(4)
MW-DN-121S
7/24/2006
3.1
3.0
6.67
1300
17.2
turbid, gray
6.0
6.61
1210
16.3
turbid, light gray
9.0
6.57
1220
16.2
translucent, very light gray
12.0
6.6
1220
15.8
translucent, very light gray
15.0
6.55
1250
16.1
translucent, no color
18.0
6.46
1230
16.1
translucent, no color
21
6.5
1230
15.9
translucent, no color
24
6.3
1260
16.7
translucent, no color
27
6.4
1250
15.6
translucent, no color
30
6.4
1240
15.6
translucent, no color
33
6.4
1250
15.9
translucent, no color
MW-DN-122S
7/24/2006
0.9
1.0
7.79
960
18.1
very turbid, light brown
Well dry
1.0
7.7
1000
19.0
very turbid, light brown
Well dry
1.0
7.6
754
24.7
very turbid, light brown
Well dry
MW-DN-122I
7/24/2006
5.3
5.0
7.78
731
18.7
very turbid, gray
Well dry
2.0
7.74
844
18.8
very turbid, gray
Well dry
2.0
***
***
***
MW-DN-123S
7/25/2006
Well was dry; therefore, it was not developed.
CRA 045136 (15) Dresden Generating Station
Revision 1
TABLE 4.2
Page 13 of 13
SUMMARY OF MONITORING WELL DEVELOPMENT PARAMETERS
FLEETWIDE ASSESSMENT
DRESDEN GENERATING STATION
MORRIS, ILLINOIS
Sample
Well
Volume
Location
Date
Volume
Purged
pH
Conductivity
Temperature
Turbidity
Observations
(gallons)
(gallons)
(Std. Units)
(1)
(μS/cm)
(2)
(°C)
(3)
(NTU)
(4)
MW-DN-123I
7/25/2006
6.2
6.25
7.29
499
18.5
translucent, no color
12.50
7.16
498
17.2
opaque, light gray
18.75
7.06
475
16.4
opaque, light gray
25.00
7.01
474
17.0
translucent, no color
31.25
6.94
472
16.2
translucent, no color
37.50
6.94
470
16.0
translucent, no color
43.75
6.93
469
16.0
translucent, no color
50.00
6.88
466
16.0
translucent, no color
56.25
6.9
472
15.8
translucent, no color
62.50
6.85
468
16.4
translucent, no color
Notes:
(1)
Std. Units - standard units
(2)
μS/cm - microSiemens per centimeter
(3)
degrees Celsius
(4)
NTU - nephelometric turbidity units
(5)
Conductivity not available due to instrument calibration error. Removed minimum of 10 gallons or purge dry 3 times.
CRA 045136 (15) Dresden Generating Station
Revision 1
TABLE 4.6
Page 1 of 3
SAMPLE KEY
FLEETWIDE ASSESSMENT
DRESDEN GENERATING STATION
MORRIS, ILLINOIS
Sample Location
Sample Identification
QC Sample
Date
Time
Matrix
Analysis
DSP-152
WG-DN-DSP-152-052306-JH-001
5/23/2006
11:14
Groundwater
Tritium / Target
Radionuclides
DSP-157M
WG-DN-DSP-157M-052306-JH-002
5/23/2006
13:36
Groundwater
Tritium / Target
Radionuclides
DSP-157S
WG-DN-DSP-157S-052306-JH-003
5/23/2006
15:50
Groundwater
Tritium / Target
Radionuclides
DSP-126
WG-DN-DSP-126-052406-JH-004
5/24/2006
11:37
Groundwater
Tritium / Target
Radionuclides
DSP-153
WG-DN-DSP-153-052406-JH-005
5/24/2006
13:20
Groundwater
Tritium / Target
Radionuclides
DSP-154
WG-DN-DSP-154-052506-JH-006
5/25/2006
6:40
Groundwater
Tritium / Target
Radionuclides
DSP-158M
WG-DN-DSP-158M-052506-JH-007
5/25/2006
9:40
Groundwater
Tritium / Target
Radionuclides
DSP-158S
WG-DN-DSP-158S-052506-JH-008
5/25/2006
13:00
Groundwater
Tritium / Target
Radionuclides
DSP-159M
WG-DN-DSP-159M-052506-JH-009
5/25/2006
14:45
Groundwater
Tritium / Target
Radionuclides
MW-DN-103S
WG-DN-MW-DN-103S-052606-JH-010
5/26/2006
9:40
Groundwater
Tritium / Target
Radionuclides
MW-DN-103S
WG-DN-MW-DN-103S-052606-JH-011
Duplicate (010)
5/26/2006
10:00
Groundwater
Tritium / Target
Radionuclides
MW-DN-103I
WG-DN-MW-DN-103I-052606-JH-012
5/26/2006
11:05
Groundwater
Tritium / Target
Radionuclides
MW-DN-106S
WG-DN-MW-DN-106S-052606-JH-013
5/26/2006
14:00
Groundwater
Tritium / Target
Radionuclides
DSP-121
WG-DN-DSP-121-052606-JH-014
5/26/2006
15:20
Groundwater
Tritium / Target
Radionuclides
DSP-117
WG-DN-DSP-117-052606-JH-015
5/26/2006
16:55
Groundwater
Tritium / Target
Radionuclides
DSP-147
WG-DN-DSP-147-053006-JH-016
5/30/2006
9:40
Groundwater
Tritium / Target
Radionuclides
DSP-148
WG-DN-DSP-148-053006-JH-017
5/30/2006
13:50
Groundwater
Tritium / Target
Radionuclides
DSP-156
WG-DN-DSP-156-053006-JH-018
5/30/2006
15:50
Groundwater
Tritium / Target
Radionuclides
DSP-149R
WG-DN-DSP-149R-053106-JH-019
5/31/2006
10:00
Groundwater
Tritium / Target
Radionuclides
DSP-149R
WG-DN-DSP-149R-053106-JH-020
Duplicate (019)
5/31/2006
10:50
Groundwater
Tritium / Target
Radionuclides
DSP-159S
WG-DN-DSP-159S-053106-JH-022
5/31/2006
13:30
Groundwater
Tritium / Target Radionuclides
DSP-105
WG-DN-DSP-DN-105-052306-JL-051
5/23/2006
11:30
Groundwater
Tritium / Target Radionuclides
DSP-106
WG-DN-DSP-DN-106-052306-JL-052
5/23/2006
12:30
Groundwater
Tritium / Target Radionuclides
DSP-107
WG-DN-DSP-DN-107-052306-JL-053
5/23/2006
13:50
Groundwater
Tritium / Target Radionuclides
DSP-150
WG-DN-DSP-DN-150-052406-JL-054
5/24/2006
12:25
Groundwater
Tritium / Target Radionuclides
DSP-151
WG-DN-DSP-DN-151-052406-JL-055
5/24/2006
14:15
Groundwater
Tritium / Target Radionuclides
DSP-108
WG-DN-DSP-DN-108-052406-JL-056
5/24/2006
17:05
Groundwater
Tritium / Target Radionuclides
DSP-118
WG-DN-DSP-DN-118-052506-JL-057
5/25/2006
10:15
Groundwater
Tritium / Target Radionuclides
DSP-155
WG-DN-DSP-DN-155-052506-JL-058
5/25/2006
15:00
Groundwater
Tritium / Target Radionuclides
DSP-122
WG-DN-DSP-DN-122-052506-JL-059
5/25/2006
17:00
Groundwater
Tritium / Target Radionuclides
DSP-123
WG-DN-DSP-DN-123-052606-JL-060
5/26/2006
10:10
Groundwater
Tritium / Target Radionuclides
DSP-123
WG-DN-DSP-DN-123-052606-JL-061
Duplicate (060)
5/26/2006
10:20
Groundwater
Tritium / Target Radionuclides
DSP-124
WG-DN-DSP-DN-124-052606-JL-062
5/26/2006
12:00
Groundwater
Tritium / Target Radionuclides
MW-DN-101S
WG-DN-MW-DN-101S-052606-JL-063
5/26/2006
14:10
Groundwater
Tritium / Target Radionuclides
MW-DN-101I
WG-DN-MW-DN-101I-052606-JL-064
5/26/2006
15:35
Groundwater
Tritium / Target Radionuclides
CRA 45136 (15) Dresden Generating Station
Revision 1
TABLE 4.6
Page 2 of 3
SAMPLE KEY
FLEETWIDE ASSESSMENT
DRESDEN GENERATING STATION
MORRIS, ILLINOIS
Sample Location
Sample Identification
QC Sample
Date
Time
Matrix
Analysis
MW-DN-108I
WG-DN-MW-DN-108I-052606-JL-065
5/26/2006
17:00
Groundwater
Tritium / Target Radionuclides / Strontium-90
DSP-127
WG-DN-DSP-DN-127-053006-JL-066
5/30/2006
10:55
Groundwater
Tritium / Target Radionuclides
MW-DN-110S
WG-DN-MW-DN-110S-053006-JL-067
5/30/2006
14:10
Groundwater
Tritium / Target Radionuclides
MW-DN-110I
WG-DN-MW-DN-110I-053006-JL-068
5/30/2006
15:15
Groundwater
Tritium / Target Radionuclides
MW-DN-104S
WG-DN-MW-DN-104S-053006-JL-069
5/30/2006
17:20
Groundwater
Tritium / Target Radionuclides
MW-DN-109I
WG-DN-MW-DN-109I-053106-JL-070
5/31/2006
10:15
Groundwater
Tritium / Target Radionuclides
MW-DN-109I
WG-DN-MW-DN-109I-053106-JL-071
Duplicate (070)
5/31/2006
10:25
Groundwater
Tritium / Target Radionuclides
MW-DN-109S
WG-DN-MW-DN-109S-053106-JL-072
5/31/2006
11:45
Groundwater
Tritium / Target Radionuclides
MW-DN-111S
WG-DN-MW-DN-111S-053106-JL-073
5/31/2006
14:00
Groundwater
Tritium / Target Radionuclides
MW-DN-107S
WG-DN-MW-DN-107S-053106-JL-074
5/31/2006
14:50
Groundwater
Tritium / Target Radionuclides
MW-DN-102I
WG-DN-MW-DN-102I-060106-JL-075
6/1/2006
10:45
Groundwater
Tritium / Target Radionuclides
MW-DN-102S
WG-DN-MW-DN-102S-060106-JL-076
6/1/2006
11:50
Groundwater
Tritium / Target Radionuclides
MW-DN-105S
WG-DN-MW-DN-105S-060106-JL-077
6/1/2006
14:10
Groundwater
Tritium / Target Radionuclides
DSP-125
WG-DN-DSP-DN-125-060106-JL-078
6/1/2006
15:10
Groundwater
Tritium / Target Radionuclides
SW-DN-103
WS-DN-SW-103-053106-JH-021
5/31/2006
12:00
Surface Water
Tritium / Target
Radionuclides
SW-DN-101
WS-DN-SW-101-053106-JH-023
5/31/2006
14:00
Surface Water
Tritium / Target
Radionuclides
SW-DN-102
WS-DN-SW-102-053106-JH-024
5/31/2006
15:20
Surface Water
Tritium / Target
Radionuclides
SW-DN-105
WS-DN-SW-105-060106-JH-025
6/1/2006
9:00
Surface Water
Tritium / Target
Radionuclides
SW-DN-104
WS-DN-SW-104-060106-JH-026
6/1/2006
9:40
Surface Water
Tritium / Target
Radionuclides
SW-DN-106
WS-DN-SW-106-060106-JH-027
6/1/2006
11:20
Surface Water
Tritium / Target
Radionuclides
SW-DN-106
WS-DN-SW-106-060106-JH-028
Duplicate (027)
6/1/2006
11:40
Surface Water
Tritium / Target
Radionuclides
MW-DN-122I
WG-DN-MW-DN-122I-080806-GL-001
8/8/2006
8:50
Groundwater
Tritium / Target
Radionuclides
MW-DN-122S
WG-DN-MW-DN-122S-080806-GL-002
8/8/2006
10:05
Groundwater
Tritium / Target
Radionuclides
MW-DN-121S
WG-DN-MW-DN-121S-080806-GL-003
8/8/2006
12:05
Groundwater
Tritium / Target
Radionuclides
MW-DN-123I
WG-DN-MW-DN-123I-080806-GL-004
8/8/2006
14:30
Groundwater
Tritium / Target
Radionuclides
MW-DN-120I
RB-DN-MW-DN-120I-080806-GL-005
8/8/2006
14:40
Water
Tritium / Target
Radionuclides
MW-DN-120I
WG-DN-MW-DN-120I-080806-GL-006
8/8/2006
16:50
Groundwater
Tritium / Target
Radionuclides
MW-DN-120S
WG-DN-MW-DN-120S-080806-GL-007
8/8/2006
16:10
Groundwater
Tritium / Target
Radionuclides
MW-DN-113S
WG-DN-MW-DN-113S-080906-GL-008
8/9/2006
10:00
Groundwater
Tritium / Target
Radionuclides
MW-DN-113I
WG-DN-MW-DN-113I-080906-GL-009
8/9/2006
11:25
Groundwater
Tritium / Target
Radionuclides
MW-DN-113I
WG-DN-MW-DN-113I-080906-GL-010
Duplicate (009)
8/9/2006
11:45
Groundwater
Tritium / Target
Radionuclides
MW-DN-116S
WG-DN-MW-DN-116S-080906-GL-011
8/9/2006
13:35
Groundwater
Tritium / Target
Radionuclides
MW-DN-116I
WG-DN-MW-DN-116I-080906-GL-012
8/9/2006
13:50
Groundwater
Tritium / Target
Radionuclides
MW-DN-112S
WG-DN-MW-DN-112S-081006-GL-013
8/10/2006
11:05
Groundwater
Tritium / Target
Radionuclides
MW-DN-112I
WG-DN-MW-DN-112I-081006-GL-014
8/10/2006
12:10
Groundwater
Tritium / Target
Radionuclides
CRA 45136 (15) Dresden Generating Station
Revision 1
TABLE 4.6
Page 3 of 3
SAMPLE KEY
FLEETWIDE ASSESSMENT
DRESDEN GENERATING STATION
MORRIS, ILLINOIS
Sample Location
Sample Identification
QC Sample
Date
Time
Matrix
Analysis
MW-DN-117I
WG-DN-MW-DN-117I-081006-GL-015
8/10/2006
14:20
Groundwater
Tritium / Target
Radionuclides
MW-DN-118S
WG-DN-MW-DN-118I-081006-GL-016
8/10/2006
16:00
Groundwater
Tritium / Target
Radionuclides
MW-DN-119S
WG-DN-MW-DN-119S-081106-GL-017
8/11/2006
9:00
Groundwater
Tritium / Target
Radionuclides
MW-DN-119I
WG-DN-MW-DN-119I-081106-GL-018
8/11/2006
9:10
Groundwater
Tritium / Target
Radionuclides
MW-DN-115I
WG-DN-MW-DN-115I-081106-GL-019
8/11/2006
11:30
Groundwater
Tritium / Target
Radionuclides
MW-DN-114S
WG-DN-MW-DN-114S-081106-GL-020
8/11/2006
13:15
Groundwater
Tritium / Target
Radionuclides
MW-DN-114S
WG-DN-MW-DN-114S-081106-GL-021
Duplicate (020)
8/11/2006
13:40
Groundwater
Tritium / Target
Radionuclides
MW-DN-108I
WG-DN-MW-DN-108I-081406-GL-022
8/14/2006
9:45
Groundwater
Tritium / Target
Radionuclides
MW-DN-108I
WG-DN-MW-DN-108I-081406-GL-023
Duplicate (022)
8/14/2006
10:10
Groundwater
Tritium / Target
Radionuclides
MW-DN-115S
WG-DN-MW-DN-115S-081406-GL-024
8/14/2006
11:10
Groundwater
Tritium / Target
Radionuclides
MW-DN-114I
WG-DN-MW-DN-114I-081406-GL-025
8/14/2006
12:55
Groundwater
Tritium / Target
Radionuclides
MW-DN-123S
WG-DN-MW-DN-123S-080806-GL-026
8/8/2006
14:45
Groundwater
Tritium
Note:
QC - Quality Control
Target Radionuclides: Sr-89/90, Mn-54, Co-58, Fe-59, Co-60, Zn-65, Nb-95, Zr-95, Cs-134, Cs-137, Ba-140, and La-140
Duplicate (020) - Duplicate of sample number in parenthesis
CRA 45136 (15) Dresden Generating Station
Revision 1
Revision 1
45136 (15) Dresden Generating Station
APPENDIX A
MONITORING WELL LOGS
Overburden, not logged. Cleared using soft
dig.
END OF OVERBURDEN HOLE @ 8.0ft BGS
Concrete
Surface Seal
6" 0 / Borehole
'N' VALUE
(OVERBURDEN)
Page 1 of 3
NUMBER
INTERVAL
SAMPLE
REC (%)
MW-DN-101I
STRATIGRAPHIC AND INSTRUMENTATION LOG
2
4
6
8
10
12
14
16
18
20
22
24
26
28
30
32
34
DEPTH
ft BGS
PROJECT NAME: DRESDEN GENERATING STATION
PROJECT NUMBER: 45136-23
CLIENT: EXELON GENERATION COMPANY LLC
LOCATION: MORRIS, ILLINOIS
HOLE DESIGNATION:
STRATIGRAPHIC DESCRIPTION & REMARKS
NOTES:
MEASURING POINT ELEVATIONS MAY CHANGE; REFER TO CURRENT ELEVATION TABLE
DATE COMPLETED: May 10, 2006
DRILLING METHOD: 6" Air Rotary - Barber Rig
FIELD PERSONNEL: D. Deitner
OVERBURDEN LOG 45136-23-N REDWOOD
WLOO.GPJ CRA_CORP.GDT 6/13/06
Monitoring Well
TOP OF RISER
GROUND SURFACE
ELEV.
ft
AMSL
520.48
517.08
SANDSTONE - hard, moist to wet, yellowish
brown, changing to light gray
LIMESTONE - hard, moist, light gray
LIMESTONE - transitional zone limestone
interbedded with shale and sandstone
6" 0 / Borehole
Bentonite
Chip Seal
2" 0 / PVC
Well Casing
2" 0 / PVC
Well Casing
Bentonite
Chip Seal
509.08
484.08
482.08
(BEDROCK)
Page 2 of 3
RUN
NUMBER
CORE
RECOVERY %
RQD %
MW-DN-101I
STRATIGRAPHIC AND INSTRUMENTATION LOG
8
10
12
14
16
18
20
22
24
26
28
30
32
34
36
38
40
DEPTH
ft BGS
PROJECT NAME: DRESDEN GENERATING STATION
PROJECT NUMBER: 45136-23
CLIENT: EXELON GENERATION COMPANY LLC
LOCATION: MORRIS, ILLINOIS
HOLE DESIGNATION:
STRATIGRAPHIC DESCRIPTION & REMARKS
NOTES:
MEASURING POINT ELEVATIONS MAY CHANGE; REFER TO CURRENT ELEVATION TABLE
DATE COMPLETED: May 10, 2006
DRILLING METHOD: 6" Air Rotary - Barber Rig
FIELD PERSONNEL: D. Deitner
BEDROCK LOG 45136-23-N REDWOOD WLOO.GPJ CRA_CORP.GDT 6/13/06
Monitoring Well
ELEV.
ft
AMSL
SHALE - hard very moist, pale green
- greenish gray at 48.0ft BGS
END OF BOREHOLE @ 50.0ft BGS
6" 0 / Borehole
#10 Silica
Sand Pack
2" 0 / PVC
Well Screen
WELL DETAILS
Screened interval:
477.08 to 467.08ft AMSL
40.00 to 50.00ft BGS
Length: 10ft
Diameter: 2in
Slot Size: 10
Material: PVC
Seal:
516.08 to 479.08ft AMSL
1.00 to 38.00ft BGS
Material: Bentonite Chips
Sand Pack:
479.08 to 467.08ft AMSL
38.00 to 50.00ft BGS
Material: #10 Silica Sand
470.08
467.08
(BEDROCK)
Page 3 of 3
RUN
NUMBER
CORE
RECOVERY %
RQD %
MW-DN-101I
STRATIGRAPHIC AND INSTRUMENTATION LOG
42
44
46
48
50
52
54
56
58
60
62
64
66
68
70
72
74
DEPTH
ft BGS
PROJECT NAME: DRESDEN GENERATING STATION
PROJECT NUMBER: 45136-23
CLIENT: EXELON GENERATION COMPANY LLC
LOCATION: MORRIS, ILLINOIS
HOLE DESIGNATION:
STRATIGRAPHIC DESCRIPTION & REMARKS
NOTES:
MEASURING POINT ELEVATIONS MAY CHANGE; REFER TO CURRENT ELEVATION TABLE
DATE COMPLETED: May 10, 2006
DRILLING METHOD: 6" Air Rotary - Barber Rig
FIELD PERSONNEL: D. Deitner
BEDROCK LOG 45136-23-N REDWOOD WLOO.GPJ CRA_CORP.GDT 6/13/06
Monitoring Well
ELEV.
ft
AMSL
Overburden not logged, cleared by soft dig.
Rock/gravel Fill
END OF OVERBURDEN HOLE @ 8.0ft BGS
Concrete
Surface Seal
Bentonite
Chip Seal
2" 0 / PVC
Well Casing
6" 0 / Borehole
'N' VALUE
(OVERBURDEN)
Page 1 of 2
NUMBER
INTERVAL
SAMPLE
REC (%)
MW-DN-101S
STRATIGRAPHIC AND INSTRUMENTATION LOG
2
4
6
8
10
12
14
16
18
20
22
24
26
28
30
32
34
36
38
DEPTH
ft BGS
PROJECT NAME: DRESDEN GENERATING STATION
PROJECT NUMBER: 45136-23
CLIENT: EXELON GENERATION COMPANY LLC
LOCATION: MORRIS, ILLINOIS
HOLE DESIGNATION:
STRATIGRAPHIC DESCRIPTION & REMARKS
NOTES:
MEASURING POINT ELEVATIONS MAY CHANGE; REFER TO CURRENT ELEVATION TABLE
DATE COMPLETED: May 5, 2006
DRILLING METHOD: 6" Air Rotary - Barber Rig
FIELD PERSONNEL: K. Duwal
OVERBURDEN LOG 45136-23-N REDWOOD
WLOO.GPJ CRA_CORP.GDT 6/19/06
Monitoring Well
TOP OF RISER
GROUND SURFACE
ELEV.
ft
AMSL
520.30
517.10
1
AR
SANDSTONE, tan/gray
END OF BOREHOLE @ 20.0ft BGS
6" 0 / Borehole
#10 Silica
Sand Pack
2" 0 / PVC
Well Screen
WELL DETAILS
Screened interval:
507.10 to 497.10ft AMSL
10.00 to 20.00ft BGS
Length: 10ft
Diameter: 2in
Slot Size: 10
Material: Sch 40 PVC
Seal:
516.10 to 510.60ft AMSL
1.00 to 6.50ft BGS
Material: Bentonite Chips
Sand Pack:
510.60 to 497.10ft AMSL
6.50 to 20.00ft BGS
Material: Silica Sand
509.10
497.10
(BEDROCK)
Page 2 of 2
RUN
NUMBER
CORE
RECOVERY %
RQD %
MW-DN-101S
STRATIGRAPHIC AND INSTRUMENTATION LOG
8
10
12
14
16
18
20
22
24
26
28
30
32
34
36
38
40
42
44
DEPTH
ft BGS
PROJECT NAME: DRESDEN GENERATING STATION
PROJECT NUMBER: 45136-23
CLIENT: EXELON GENERATION COMPANY LLC
LOCATION: MORRIS, ILLINOIS
HOLE DESIGNATION:
STRATIGRAPHIC DESCRIPTION & REMARKS
NOTES:
MEASURING POINT ELEVATIONS MAY CHANGE; REFER TO CURRENT ELEVATION TABLE
DATE COMPLETED: May 5, 2006
DRILLING METHOD: 6" Air Rotary - Barber Rig
FIELD PERSONNEL: K. Duwal
BEDROCK LOG 45136-23-N REDWOOD WLOO.GPJ CRA_CORP.GDT 6/13/06
Monitoring Well
ELEV.
ft
AMSL
Overburden not logged. Cleared using soft
dig.
END OF OVERBURDEN HOLE @ 8.0ft BGS
Concrete
Surface Seal
6" 0 / Borehole
'N' VALUE
(OVERBURDEN)
Page 1 of 3
NUMBER
INTERVAL
SAMPLE
REC (%)
MW-DN-102I
STRATIGRAPHIC AND INSTRUMENTATION LOG
2
4
6
8
10
12
14
16
18
20
22
24
26
28
30
32
34
DEPTH
ft BGS
PROJECT NAME: DRESDEN GENERATING STATION
PROJECT NUMBER: 45136-23
CLIENT: EXELON GENERATION COMPANY LLC
LOCATION: MORRIS, ILLINOIS
HOLE DESIGNATION:
STRATIGRAPHIC DESCRIPTION & REMARKS
NOTES:
MEASURING POINT ELEVATIONS MAY CHANGE; REFER TO CURRENT ELEVATION TABLE
DATE COMPLETED: May 10, 2006
DRILLING METHOD: 6" Air Rotary - Barber Rig
FIELD PERSONNEL: D. Deitner
OVERBURDEN LOG 45136-23-N REDWOOD
WLOO.GPJ CRA_CORP.GDT 6/13/06
Monitoring Well
GROUND SURFACE
TOP OF CASING
ELEV.
ft
AMSL
516.91
516.63
SANDSTONE - hard, moist to very moist, light
gray, trace mica
LIMESTONE - hard, moist, light gray
LIMESTONE - transitional zone, limestone with
shale interbedded
6" 0 / Borehole
Bentonite
Chip Seal
2" 0 / PVC
Well Casing
508.91
495.41
478.91
(BEDROCK)
Page 2 of 3
RUN
NUMBER
CORE
RECOVERY %
RQD %
MW-DN-102I
STRATIGRAPHIC AND INSTRUMENTATION LOG
8
10
12
14
16
18
20
22
24
26
28
30
32
34
36
38
40
DEPTH
ft BGS
PROJECT NAME: DRESDEN GENERATING STATION
PROJECT NUMBER: 45136-23
CLIENT: EXELON GENERATION COMPANY LLC
LOCATION: MORRIS, ILLINOIS
HOLE DESIGNATION:
STRATIGRAPHIC DESCRIPTION & REMARKS
NOTES:
MEASURING POINT ELEVATIONS MAY CHANGE; REFER TO CURRENT ELEVATION TABLE
DATE COMPLETED: May 10, 2006
DRILLING METHOD: 6" Air Rotary - Barber Rig
FIELD PERSONNEL: D. Deitner
BEDROCK LOG 45136-23-N REDWOOD WLOO.GPJ CRA_CORP.GDT 6/13/06
Monitoring Well
ELEV.
ft
AMSL
SHALE - hard, very moist, pale green to
grayish green
END OF BOREHOLE @ 51.0ft BGS
6" 0 / Borehole
#10 Silica
Sand Pack
2" 0 / PVC
Well Screen
Cave
WELL DETAILS
Screened interval:
476.91 to 466.91ft AMSL
40.00 to 50.00ft BGS
Length: 10ft
Diameter: 2in
Slot Size: 10
Material: Sch 40 PVC
Seal:
515.91 to 478.91ft AMSL
1.00 to 38.00ft BGS
Material: Bentonite Chips
Sand Pack:
478.91 to 466.91ft AMSL
38.00 to 50.00ft BGS
Material: #10 Silica Sand
467.91
465.91
(BEDROCK)
Page 3 of 3
RUN
NUMBER
CORE
RECOVERY %
RQD %
MW-DN-102I
STRATIGRAPHIC AND INSTRUMENTATION LOG
42
44
46
48
50
52
54
56
58
60
62
64
66
68
70
72
74
DEPTH
ft BGS
PROJECT NAME: DRESDEN GENERATING STATION
PROJECT NUMBER: 45136-23
CLIENT: EXELON GENERATION COMPANY LLC
LOCATION: MORRIS, ILLINOIS
HOLE DESIGNATION:
STRATIGRAPHIC DESCRIPTION & REMARKS
NOTES:
MEASURING POINT ELEVATIONS MAY CHANGE; REFER TO CURRENT ELEVATION TABLE
DATE COMPLETED: May 10, 2006
DRILLING METHOD: 6" Air Rotary - Barber Rig
FIELD PERSONNEL: D. Deitner
BEDROCK LOG 45136-23-N REDWOOD WLOO.GPJ CRA_CORP.GDT 6/13/06
Monitoring Well
ELEV.
ft
AMSL
Overburden not logged. Cleared using soft dig.
END OF OVERBURDEN HOLE @ 8.0ft BGS
Concrete
Surface Seal
Bentonite
Chip Seal
6" 0 / Borehole
2" 0 / PVC
Well Casing
'N' VALUE
(OVERBURDEN)
Page 1 of 2
NUMBER
INTERVAL
SAMPLE
REC (%)
MW-DN-102S
STRATIGRAPHIC AND INSTRUMENTATION LOG
2
4
6
8
10
12
14
16
18
20
22
24
26
28
30
32
34
36
38
DEPTH
ft BGS
PROJECT NAME: DRESDEN GENERATING STATION
PROJECT NUMBER: 45136-23
CLIENT: EXELON GENERATION COMPANY LLC
LOCATION: MORRIS, ILLINOIS
HOLE DESIGNATION:
STRATIGRAPHIC DESCRIPTION & REMARKS
NOTES:
MEASURING POINT ELEVATIONS MAY CHANGE; REFER TO CURRENT ELEVATION TABLE
DATE COMPLETED: May 4, 2006
DRILLING METHOD: 6" Air Rotary - Barber Rig/Tricone
FIELD PERSONNEL: D. Deitner
OVERBURDEN LOG 45136-23-N REDWOOD
WLOO.GPJ CRA_CORP.GDT 6/13/06
Monitoring Well
GROUND SURFACE
TOP OF CASING
ELEV.
ft
AMSL
516.98
516.68
SANDSTONE - hard, moist to very moist, dark
brown changing to yellowish brown changing to
light gray
END OF BOREHOLE @ 15.0ft BGS
2" 0 / PVC
Well Casing
#10 Silica
Sand Pack
2" 0 / PVC
Well Screen
WELL DETAILS
Screened interval:
511.98 to 501.98ft AMSL
5.00 to 15.00ft BGS
Length: 10ft
Diameter: 2in
Slot Size: 10
Material: Sch 40 PVC
Seal:
515.98 to 512.98ft AMSL
1.00 to 4.00ft BGS
Material: Bentonite Chips
Sand Pack:
512.98 to 501.98ft AMSL
4.00 to 15.00ft BGS
Material: #10 Silica Sand
508.98
501.98
(BEDROCK)
Page 2 of 2
RUN
NUMBER
CORE
RECOVERY %
RQD %
MW-DN-102S
STRATIGRAPHIC AND INSTRUMENTATION LOG
8
10
12
14
16
18
20
22
24
26
28
30
32
34
36
38
40
42
44
DEPTH
ft BGS
PROJECT NAME: DRESDEN GENERATING STATION
PROJECT NUMBER: 45136-23
CLIENT: EXELON GENERATION COMPANY LLC
LOCATION: MORRIS, ILLINOIS
HOLE DESIGNATION:
STRATIGRAPHIC DESCRIPTION & REMARKS
NOTES:
MEASURING POINT ELEVATIONS MAY CHANGE; REFER TO CURRENT ELEVATION TABLE
DATE COMPLETED: May 4, 2006
DRILLING METHOD: 6" Air Rotary - Barber Rig/Tricone
FIELD PERSONNEL: D. Deitner
BEDROCK LOG 45136-23-N REDWOOD WLOO.GPJ CRA_CORP.GDT 6/13/06
Monitoring Well
ELEV.
ft
AMSL
Overburden not logged. Cleared for utilities
using soft dig.
END OF OVERBURDEN HOLE @ 3.5ft BGS
Concrete
Surface Seal
6" 0 / Borehole
'N' VALUE
(OVERBURDEN)
Page 1 of 3
NUMBER
INTERVAL
SAMPLE
REC (%)
MW-DN-103I
STRATIGRAPHIC AND INSTRUMENTATION LOG
2
4
6
8
10
12
14
16
18
20
22
24
26
28
30
32
34
36
38
DEPTH
ft BGS
PROJECT NAME: DRESDEN GENERATING STATION
PROJECT NUMBER: 45136-23
CLIENT: EXELON GENERATION COMPANY LLC
LOCATION: MORRIS, ILLINOIS
HOLE DESIGNATION:
STRATIGRAPHIC DESCRIPTION & REMARKS
NOTES:
MEASURING POINT ELEVATIONS MAY CHANGE; REFER TO CURRENT ELEVATION TABLE
DATE COMPLETED: May 2, 2006
DRILLING METHOD: 6" Air Rotary - Barber Rig
FIELD PERSONNEL: D. Deitner
OVERBURDEN LOG 45136-23-N REDWOOD
WLOO.GPJ CRA_CORP.GDT 6/19/06
Monitoring Well
TOP OF RISER
GROUND SURFACE
ELEV.
ft
AMSL
522.72
520.13
SANDSTONE - tan changing to gray, trace
mica, moist to very moist
- becoming harder at 12.5ft BGS
LIMESTONE - hard, light gray, moist
- wet at 38.0ft BGS
LIMESTONE - transitional zone, Limestone
and Shale interbedded, less dense
6" 0 / Borehole
Bentonite
Chip Seal
2" 0 / PVC
Well Casing
#10 Silica
Sand Pack
2" 0 / PVC
Well Screen
516.63
497.63
480.63
(BEDROCK)
Page 2 of 3
RUN
NUMBER
CORE
RECOVERY %
RQD %
MW-DN-103I
STRATIGRAPHIC AND INSTRUMENTATION LOG
4
6
8
10
12
14
16
18
20
22
24
26
28
30
32
34
36
38
40
DEPTH
ft BGS
PROJECT NAME: DRESDEN GENERATING STATION
PROJECT NUMBER: 45136-23
CLIENT: EXELON GENERATION COMPANY LLC
LOCATION: MORRIS, ILLINOIS
HOLE DESIGNATION:
STRATIGRAPHIC DESCRIPTION & REMARKS
NOTES:
MEASURING POINT ELEVATIONS MAY CHANGE; REFER TO CURRENT ELEVATION TABLE
DATE COMPLETED: May 2, 2006
DRILLING METHOD: 6" Air Rotary - Barber Rig
FIELD PERSONNEL: D. Deitner
BEDROCK LOG 45136-23-N REDWOOD WLOO.GPJ CRA_CORP.GDT 6/19/06
Monitoring Well
ELEV.
ft
AMSL
- water not present in cuttings at 42.0ft BGS
SHALE - hard, dark greenish gray, moist
END OF BOREHOLE @ 62.0ft BGS
6" 0 / Borehole
#10 Silica
Sand Pack
WELL DETAILS
Screened interval:
488.93 to 478.93ft AMSL
31.20 to 41.20ft BGS
Length: 10ft
Diameter: 2in
Slot Size: 10
Material: PVC
Seal:
519.13 to 492.13ft AMSL
1.00 to 28.00ft BGS
Material: Bentonite Chips
Sand Pack:
492.13 to 458.13ft AMSL
28.00 to 62.00ft BGS
Material: #10 Silica Sand
475.13
458.13
(BEDROCK)
Page 3 of 3
RUN
NUMBER
CORE
RECOVERY %
RQD %
MW-DN-103I
STRATIGRAPHIC AND INSTRUMENTATION LOG
44
46
48
50
52
54
56
58
60
62
64
66
68
70
72
74
76
78
80
DEPTH
ft BGS
PROJECT NAME: DRESDEN GENERATING STATION
PROJECT NUMBER: 45136-23
CLIENT: EXELON GENERATION COMPANY LLC
LOCATION: MORRIS, ILLINOIS
HOLE DESIGNATION:
STRATIGRAPHIC DESCRIPTION & REMARKS
NOTES:
MEASURING POINT ELEVATIONS MAY CHANGE; REFER TO CURRENT ELEVATION TABLE
DATE COMPLETED: May 2, 2006
DRILLING METHOD: 6" Air Rotary - Barber Rig
FIELD PERSONNEL: D. Deitner
BEDROCK LOG 45136-23-N REDWOOD WLOO.GPJ CRA_CORP.GDT 6/19/06
Monitoring Well
ELEV.
ft
AMSL
Overburden not logged. Cleared using soft
dig.
END OF OVERBURDEN HOLE @ 3.4ft BGS
Concrete
Surface Seal
Bentonite
Chip Seal
'N' VALUE
(OVERBURDEN)
Page 1 of 2
NUMBER
INTERVAL
SAMPLE
REC (%)
MW-DN-103S
STRATIGRAPHIC AND INSTRUMENTATION LOG
2
4
6
8
10
12
14
16
18
20
22
24
26
28
30
32
34
36
38
DEPTH
ft BGS
PROJECT NAME: DRESDEN GENERATING STATION
PROJECT NUMBER: 45136-23
CLIENT: EXELON GENERATION COMPANY LLC
LOCATION: MORRIS, ILLINOIS
HOLE DESIGNATION:
STRATIGRAPHIC DESCRIPTION & REMARKS
NOTES:
MEASURING POINT ELEVATIONS MAY CHANGE; REFER TO CURRENT ELEVATION TABLE
DATE COMPLETED: May 3, 2006
DRILLING METHOD: 6" Air Rotary - Barber Rig
FIELD PERSONNEL: D. Deitner
OVERBURDEN LOG 45136-23-N REDWOOD
WLOO.GPJ CRA_CORP.GDT 6/19/06
Monitoring Well
TOP OF RISER
GROUND SURFACE
ELEV.
ft
AMSL
522.12
519.53
SANDSTONE - hard, light brown, moist to very
moist
- yellowish brown at 4.5ft BGS
- light brown at 6.0ft BGS
- dark brown, trace mica at 12.5ft BGS
- light gray at 16.5ft BGS
END OF BOREHOLE @ 20.0ft BGS
Bentonite
Chip Seal
2" 0 / PVC
Well Casing
6" 0 / Borehole
#10 Silica
Sand Pack
2" 0 / PVC
Well Screen
WELL DETAILS
Screened interval:
509.53 to 499.53ft AMSL
10.00 to 20.00ft BGS
Length: 10ft
Diameter: 2in
Slot Size: 10
Material: PVC
Seal:
518.53 to 513.53ft AMSL
1.00 to 6.00ft BGS
Material: Bentonite Chips
Sand Pack:
513.53 to 499.53ft AMSL
6.00 to 20.00ft BGS
Material: #10 Silica Sand
516.13
499.53
(BEDROCK)
Page 2 of 2
RUN
NUMBER
CORE
RECOVERY %
RQD %
MW-DN-103S
STRATIGRAPHIC AND INSTRUMENTATION LOG
4
6
8
10
12
14
16
18
20
22
24
26
28
30
32
34
36
38
40
DEPTH
ft BGS
PROJECT NAME: DRESDEN GENERATING STATION
PROJECT NUMBER: 45136-23
CLIENT: EXELON GENERATION COMPANY LLC
LOCATION: MORRIS, ILLINOIS
HOLE DESIGNATION:
STRATIGRAPHIC DESCRIPTION & REMARKS
NOTES:
MEASURING POINT ELEVATIONS MAY CHANGE; REFER TO CURRENT ELEVATION TABLE
DATE COMPLETED: May 3, 2006
DRILLING METHOD: 6" Air Rotary - Barber Rig
FIELD PERSONNEL: D. Deitner
BEDROCK LOG 45136-23-N REDWOOD WLOO.GPJ CRA_CORP.GDT 6/13/06
Monitoring Well
ELEV.
ft
AMSL
Overburden, not logged. Cleared using soft
dig.
END OF OVERBURDEN HOLE @ 4.5ft BGS
Concrete
Surface Seal
Bentonite
'N' VALUE
(OVERBURDEN)
Page 1 of 2
NUMBER
INTERVAL
SAMPLE
REC (%)
MW-DN-104S
STRATIGRAPHIC AND INSTRUMENTATION LOG
2
4
6
8
10
12
14
16
18
20
22
24
26
28
30
32
34
36
38
DEPTH
ft BGS
PROJECT NAME: DRESDEN GENERATING STATION
PROJECT NUMBER: 45136-23
CLIENT: EXELON GENERATION COMPANY LLC
LOCATION: MORRIS, ILLINOIS
HOLE DESIGNATION:
STRATIGRAPHIC DESCRIPTION & REMARKS
NOTES:
MEASURING POINT ELEVATIONS MAY CHANGE; REFER TO CURRENT ELEVATION TABLE
DATE COMPLETED: May 9, 2006
DRILLING METHOD: 6" Air Rotary - Barber Rig
FIELD PERSONNEL: N. Kuhl
OVERBURDEN LOG 45136-23-N REDWOOD
WLOO.GPJ CRA_CORP.GDT 6/19/06
Monitoring Well
GROUND SURFACE
TOP OF CASING
ELEV.
ft
AMSL
516.60
516.38
Gravel and Rock Fill below asphalt
END OF OVERBURDEN HOLE @ 3.0ft BGS
Concrete
Surface Seal
Bentonite
Chip Seal
'N' VALUE
(OVERBURDEN)
Page 1 of 2
NUMBER
INTERVAL
SAMPLE
REC (%)
MW-DN-105S
STRATIGRAPHIC AND INSTRUMENTATION LOG
2
4
6
8
10
12
14
16
18
20
22
24
26
28
30
32
34
36
38
DEPTH
ft BGS
PROJECT NAME: DRESDEN GENERATING STATION
PROJECT NUMBER: 45136-23
CLIENT: EXELON GENERATION COMPANY LLC
LOCATION: MORRIS, ILLINOIS
HOLE DESIGNATION:
STRATIGRAPHIC DESCRIPTION & REMARKS
NOTES:
MEASURING POINT ELEVATIONS MAY CHANGE; REFER TO CURRENT ELEVATION TABLE
DATE COMPLETED: May 5, 2006
DRILLING METHOD: 6" Air Rotary - Barber Rig
FIELD PERSONNEL: K. Duwal
OVERBURDEN LOG 45136-23-N REDWOOD
WLOO.GPJ CRA_CORP.GDT 6/13/06
Monitoring Well
TOP OF RISER
GROUND SURFACE
ELEV.
ft
AMSL
516.68
516.52
SANDSTONE - light to dark gray with tan
END OF BOREHOLE @ 20.0ft BGS
Bentonite
Chip Seal
2" 0 / PVC
Well Casing
6" 0 / Borehole
#10 Silica
Sand Pack
2" 0 / PVC
Well Screen
WELL DETAILS
Screened interval:
506.52 to 496.52ft AMSL
10.00 to 20.00ft BGS
Length: 10ft
Diameter: 2in
Slot Size: 10
Material: PVC
Seal:
515.52 to 510.02ft AMSL
1.00 to 6.50ft BGS
Material: Bentonite Chips
Sand Pack:
510.02 to 496.52ft AMSL
6.50 to 20.00ft BGS
Material: #10 Silica Sand
513.52
496.52
(BEDROCK)
Page 2 of 2
RUN
NUMBER
CORE
RECOVERY %
RQD %
MW-DN-105S
STRATIGRAPHIC AND INSTRUMENTATION LOG
4
6
8
10
12
14
16
18
20
22
24
26
28
30
32
34
36
38
40
DEPTH
ft BGS
PROJECT NAME: DRESDEN GENERATING STATION
PROJECT NUMBER: 45136-23
CLIENT: EXELON GENERATION COMPANY LLC
LOCATION: MORRIS, ILLINOIS
HOLE DESIGNATION:
STRATIGRAPHIC DESCRIPTION & REMARKS
NOTES:
MEASURING POINT ELEVATIONS MAY CHANGE; REFER TO CURRENT ELEVATION TABLE
DATE COMPLETED: May 5, 2006
DRILLING METHOD: 6" Air Rotary - Barber Rig
FIELD PERSONNEL: K. Duwal
BEDROCK LOG 45136-23-N REDWOOD WLOO.GPJ CRA_CORP.GDT 6/13/06
Monitoring Well
ELEV.
ft
AMSL
Overburden not logged. Cleared using soft
dig.
END OF OVERBURDEN HOLE @ 2.5ft BGS
Concrete
Surface Seal
Bentonite
Chip Seal
'N' VALUE
(OVERBURDEN)
Page 1 of 2
NUMBER
INTERVAL
SAMPLE
REC (%)
MW-DN-106S
STRATIGRAPHIC AND INSTRUMENTATION LOG
2
4
6
8
10
12
14
16
18
20
22
24
26
28
30
32
34
36
38
DEPTH
ft BGS
PROJECT NAME: DRESDEN GENERATING STATION
PROJECT NUMBER: 45136-23
CLIENT: EXELON GENERATION COMPANY LLC
LOCATION: MORRIS, ILLINOIS
HOLE DESIGNATION:
STRATIGRAPHIC DESCRIPTION & REMARKS
NOTES:
MEASURING POINT ELEVATIONS MAY CHANGE; REFER TO CURRENT ELEVATION TABLE
DATE COMPLETED: May 3, 2006
DRILLING METHOD: 6" Air Rotary - Barber Rig
FIELD PERSONNEL: D. Deitner
OVERBURDEN LOG 45136-23-N REDWOOD
WLOO.GPJ CRA_CORP.GDT 6/19/06
Monitoring Well
TOP OF RISER
GROUND SURFACE
ELEV.
ft
AMSL
516.42
513.88
SANDSTONE - hard, moist to very moist,
yellowish brown, changes to light gray
END OF BOREHOLE @ 20.0ft BGS
Bentonite
Chip Seal
2" 0 / PVC
Well Casing
6" 0 / Borehole
#10 Silica
Sand Pack
2" 0 / PVC
Well Screen
WELL DETAILS
Screened interval:
503.88 to 493.88ft AMSL
10.00 to 20.00ft BGS
Length: 10ft
Diameter: 2in
Slot Size: 10
Material: PVC
Seal:
512.88 to 505.88ft AMSL
1.00 to 8.00ft BGS
Material: Bentonite Chips
Sand Pack:
505.88 to 493.88ft AMSL
8.00 to 20.00ft BGS
Material: #10 Silica Sand
511.38
493.88
(BEDROCK)
Page 2 of 2
RUN
NUMBER
CORE
RECOVERY %
RQD %
MW-DN-106S
STRATIGRAPHIC AND INSTRUMENTATION LOG
4
6
8
10
12
14
16
18
20
22
24
26
28
30
32
34
36
38
40
DEPTH
ft BGS
PROJECT NAME: DRESDEN GENERATING STATION
PROJECT NUMBER: 45136-23
CLIENT: EXELON GENERATION COMPANY LLC
LOCATION: MORRIS, ILLINOIS
HOLE DESIGNATION:
STRATIGRAPHIC DESCRIPTION & REMARKS
NOTES:
MEASURING POINT ELEVATIONS MAY CHANGE; REFER TO CURRENT ELEVATION TABLE
DATE COMPLETED: May 3, 2006
DRILLING METHOD: 6" Air Rotary - Barber Rig
FIELD PERSONNEL: D. Deitner
BEDROCK LOG 45136-23-N REDWOOD WLOO.GPJ CRA_CORP.GDT 6/13/06
Monitoring Well
ELEV.
ft
AMSL
WELL DETAILS
Screened interval:
515.13 to 510.13ft AMSL
1.50 to 6.50ft BGS
Length: 5ft
Diameter: 2in
Slot Size: 10
Material: PVC
Seal:
516.13 to 515.13ft AMSL
0.50 to 1.50ft BGS
Material: Bentonite Chips
Sand Pack:
515.13 to 510.13ft AMSL
1.50 to 6.50ft BGS
Material: #10 Silica Sand
SM SAND with silt, trace fine grained angular
gravel, loose, medium brown, moist
- wet at 5.0ft BGS
END OF BOREHOLE @ 8.0ft BGS
Concrete
Surface Seal
2" 0 / PVC
Well Casing
Bentonite
Chip Seal
6" 0 / Borehole
#10 Silica
Sand Pack
2" 0 / PVC
Well Screen
Cave
508.63
'N' VALUE
(OVERBURDEN)
Page 1 of 1
NUMBER
INTERVAL
SAMPLE
REC (%)
MW-DN-107S
STRATIGRAPHIC AND INSTRUMENTATION LOG
2
4
6
8
10
DEPTH
ft BGS
PROJECT NAME: DRESDEN GENERATING STATION
PROJECT NUMBER: 45136-23
CLIENT: EXELON GENERATION COMPANY LLC
LOCATION: MORRIS, ILLINOIS
HOLE DESIGNATION:
STRATIGRAPHIC DESCRIPTION & REMARKS
NOTES:
MEASURING POINT ELEVATIONS MAY CHANGE; REFER TO CURRENT ELEVATION TABLE
DATE COMPLETED: May 15, 2006
DRILLING METHOD: Vacuum Truck
FIELD PERSONNEL: D. Deitner
OVERBURDEN LOG 45136-23-N REDWOOD
WLOO.GPJ CRA_CORP.GDT 6/13/06
Monitoring Well
TOP OF RISER
GROUND SURFACE
ELEV.
ft
AMSL
518.23
516.63
SP - Sand, trace silt, trace clay
END OF OVERBURDEN HOLE @ 26.0ft BGS
Concrete
Surface Seal
6" 0 / Borehole
Bentonite
Chip Seal
2" 0 / PVC
Well Casing
'N' VALUE
(OVERBURDEN)
Page 1 of 3
NUMBER
INTERVAL
SAMPLE
REC (%)
MW-DN-108I
STRATIGRAPHIC AND INSTRUMENTATION LOG
2
4
6
8
10
12
14
16
18
20
22
24
26
28
30
32
34
36
38
DEPTH
ft BGS
PROJECT NAME: DRESDEN GENERATING STATION
PROJECT NUMBER: 45136-23
CLIENT: EXELON GENERATION COMPANY LLC
LOCATION: MORRIS, ILLINOIS
HOLE DESIGNATION:
STRATIGRAPHIC DESCRIPTION & REMARKS
NOTES:
MEASURING POINT ELEVATIONS MAY CHANGE; REFER TO CURRENT ELEVATION TABLE
DATE COMPLETED: May 10, 2006
DRILLING METHOD: 6" Air Rotary - Barber Rig
FIELD PERSONNEL: D. Deitner
OVERBURDEN LOG 45136-23-N REDWOOD
WLOO.GPJ CRA_CORP.GDT 6/19/06
Monitoring Well
GROUND SURFACE
TOP OF CASING
ELEV.
ft
AMSL
517.49
517.14
SANDSTONE - moist to very moist, hard, gray
LIMESTONE (transitional zone) - hard, light
gray, moist, strace sandstone interbedded
- sandstone interbedding not present, harder at
36.0ft BGS
- with sandstone interbedding, softer at 38.0ft
BGS
- harder, mix of limestone, sandstone and trace
chert at 38.5ft BGS
SHALE - trace sandstone, trace limestone,
pale green, hard
- gray at 48.0ft BGS
END OF BOREHOLE @ 62.0ft BGS
Natural
Collapse
From
Overburden
2" 0 / PVC
Well Casing
2" 0 / PVC
Well Screen
6" 0 / Borehole
Natural
Collapse
From
Overburden
WELL DETAILS
Screened interval:
491.49
484.49
469.99
455.49
(BEDROCK)
Page 2 of 3
RUN
NUMBER
CORE
RECOVERY %
RQD %
MW-DN-108I
STRATIGRAPHIC AND INSTRUMENTATION LOG
26
28
30
32
34
36
38
40
42
44
46
48
50
52
54
56
58
60
62
DEPTH
ft BGS
PROJECT NAME: DRESDEN GENERATING STATION
PROJECT NUMBER: 45136-23
CLIENT: EXELON GENERATION COMPANY LLC
LOCATION: MORRIS, ILLINOIS
HOLE DESIGNATION:
STRATIGRAPHIC DESCRIPTION & REMARKS
NOTES:
MEASURING POINT ELEVATIONS MAY CHANGE; REFER TO CURRENT ELEVATION TABLE
DATE COMPLETED: May 10, 2006
DRILLING METHOD: 6" Air Rotary - Barber Rig
FIELD PERSONNEL: D. Deitner
BEDROCK LOG 45136-23-N REDWOOD WLOO.GPJ CRA_CORP.GDT 6/13/06
Monitoring Well
ELEV.
ft
AMSL
477.49 to 467.49ft AMSL
40.00 to 50.00ft BGS
Length: 10ft
Diameter: 1in
Slot Size: 10
Material: PVC
Seal:
516.49 to 487.49ft AMSL
1.00 to 30.00ft BGS
Material: Bentonite Chips
Sand Pack:
487.49 to 467.49ft AMSL
30.00 to 50.00ft BGS
Material: Natural Collapse used
as filter pack from overburden
(BEDROCK)
Page 3 of 3
RUN
NUMBER
CORE
RECOVERY %
RQD %
MW-DN-108I
STRATIGRAPHIC AND INSTRUMENTATION LOG
66
68
70
72
74
76
78
80
82
84
86
88
90
92
94
96
98
100
102
DEPTH
ft BGS
PROJECT NAME: DRESDEN GENERATING STATION
PROJECT NUMBER: 45136-23
CLIENT: EXELON GENERATION COMPANY LLC
LOCATION: MORRIS, ILLINOIS
HOLE DESIGNATION:
STRATIGRAPHIC DESCRIPTION & REMARKS
NOTES:
MEASURING POINT ELEVATIONS MAY CHANGE; REFER TO CURRENT ELEVATION TABLE
DATE COMPLETED: May 10, 2006
DRILLING METHOD: 6" Air Rotary - Barber Rig
FIELD PERSONNEL: D. Deitner
BEDROCK LOG 45136-23-N REDWOOD WLOO.GPJ CRA_CORP.GDT 6/13/06
Monitoring Well
ELEV.
ft
AMSL
Overburden, not logged. Cleared using soft
dig.
END OF OVERBURDEN HOLE @ 2.5ft BGS
Concrete
Surface Seal
Bentonite
Chip Seal
'N' VALUE
(OVERBURDEN)
Page 1 of 3
NUMBER
INTERVAL
SAMPLE
REC (%)
MW-DN-109I
STRATIGRAPHIC AND INSTRUMENTATION LOG
2
4
6
8
10
12
14
16
18
20
22
24
26
28
30
32
34
36
38
DEPTH
ft BGS
PROJECT NAME: DRESDEN GENERATING STATION
PROJECT NUMBER: 45136-23
CLIENT: EXELON GENERATION COMPANY LLC
LOCATION: MORRIS, ILLINOIS
HOLE DESIGNATION:
STRATIGRAPHIC DESCRIPTION & REMARKS
NOTES:
MEASURING POINT ELEVATIONS MAY CHANGE; REFER TO CURRENT ELEVATION TABLE
DATE COMPLETED: May 9, 2006
DRILLING METHOD: 6" Air Rotary - Barber Rig
FIELD PERSONNEL: N. Kuhl
OVERBURDEN LOG 45136-23-N REDWOOD
WLOO.GPJ CRA_CORP.GDT 6/19/06
Monitoring Well
TOP OF RISER
GROUND SURFACE
ELEV.
ft
AMSL
516.31
516.27
Overburden, not logged. Cleared using soft
dig.
END OF OVERBURDEN HOLE @ 2.5ft BGS
Concrete
Surface Seal
Bentonite
Chip Seal
'N' VALUE
(OVERBURDEN)
Page 1 of 2
NUMBER
INTERVAL
SAMPLE
REC (%)
MW-DN-109S
STRATIGRAPHIC AND INSTRUMENTATION LOG
2
4
6
8
10
12
14
16
18
20
22
24
26
28
30
32
34
36
38
DEPTH
ft BGS
PROJECT NAME: DRESDEN GENERATING STATION
PROJECT NUMBER: 45136-23
CLIENT: EXELON GENERATION COMPANY LLC
LOCATION: MORRIS, ILLINOIS
HOLE DESIGNATION:
STRATIGRAPHIC DESCRIPTION & REMARKS
NOTES:
MEASURING POINT ELEVATIONS MAY CHANGE; REFER TO CURRENT ELEVATION TABLE
DATE COMPLETED: May 9, 2006
DRILLING METHOD: 6" Air Rotary - Barber Rig
FIELD PERSONNEL: N. Kuhl
OVERBURDEN LOG 45136-23-N REDWOOD
WLOO.GPJ CRA_CORP.GDT 6/19/06
Monitoring Well
TOP OF RISER
GROUND SURFACE
ELEV.
ft
AMSL
516.32
516.29
Overburden not logged. Cleared using soft dig.
END OF OVERBURDEN HOLE @ 6.0ft BGS
Concrete
Surface Seal
6" 0 / Borehole
'N' VALUE
(OVERBURDEN)
Page 1 of 3
NUMBER
INTERVAL
SAMPLE
REC (%)
MW-DN-110I
STRATIGRAPHIC AND INSTRUMENTATION LOG
2
4
6
8
10
12
14
16
18
20
22
24
26
28
30
32
34
DEPTH
ft BGS
PROJECT NAME: DRESDEN GENERATING STATION
PROJECT NUMBER: 45136-23
CLIENT: EXELON GENERATION COMPANY LLC
LOCATION: MORRIS, ILLINOIS
HOLE DESIGNATION:
STRATIGRAPHIC DESCRIPTION & REMARKS
NOTES:
MEASURING POINT ELEVATIONS MAY CHANGE; REFER TO CURRENT ELEVATION TABLE
DATE COMPLETED: May 4, 2006
DRILLING METHOD: 6" Air Rotary - Barber Rig
FIELD PERSONNEL: D. Deitner
OVERBURDEN LOG 45136-23-N REDWOOD
WLOO.GPJ CRA_CORP.GDT 6/13/06
Monitoring Well
TOP OF RISER
GROUND SURFACE
ELEV.
ft
AMSL
517.41
517.34
SANDSTONE - hard, moist to very moist, light
gray, trace mica
LIMESTONE - hard, light gray, moist to very
moist
6" 0 / Borehole
Bentonite
Chip Seal
2" 0 / PVC
Well Casing
511.34
485.34
(BEDROCK)
Page 2 of 3
RUN
NUMBER
CORE
RECOVERY %
RQD %
MW-DN-110I
STRATIGRAPHIC AND INSTRUMENTATION LOG
6
8
10
12
14
16
18
20
22
24
26
28
30
32
34
36
38
DEPTH
ft BGS
PROJECT NAME: DRESDEN GENERATING STATION
PROJECT NUMBER: 45136-23
CLIENT: EXELON GENERATION COMPANY LLC
LOCATION: MORRIS, ILLINOIS
HOLE DESIGNATION:
STRATIGRAPHIC DESCRIPTION & REMARKS
NOTES:
MEASURING POINT ELEVATIONS MAY CHANGE; REFER TO CURRENT ELEVATION TABLE
DATE COMPLETED: May 4, 2006
DRILLING METHOD: 6" Air Rotary - Barber Rig
FIELD PERSONNEL: D. Deitner
BEDROCK LOG 45136-23-N REDWOOD WLOO.GPJ CRA_CORP.GDT 6/13/06
Monitoring Well
ELEV.
ft
AMSL
LIMESTONE - transitional zone. Limestone
interbedded with shale; trace chert, trace
sandstone
SHALE - hard, greenish gray, very moist
END OF BOREHOLE @ 51.5ft BGS
Bentonite
Chip Seal
2" 0 / PVC
Well Casing
6" 0 / Borehole
#10 Silica
Sand Pack
2" 0 / PVC
Well Screen
Natural
Collapse
From
Overburden
WELL DETAILS
Screened interval:
476.14 to 466.14ft AMSL
41.20 to 51.20ft BGS
Length: 10ft
Diameter: 2in
Slot Size: 10
Material: PVC
Seal:
516.34 to 477.34ft AMSL
1.00 to 40.00ft BGS
Material: Bentonite Chips
Sand Pack:
477.34 to 466.14ft AMSL
40.00 to 51.20ft BGS
Material: #10 Silica Sand
473.34
466.84
465.84
(BEDROCK)
Page 3 of 3
RUN
NUMBER
CORE
RECOVERY %
RQD %
MW-DN-110I
STRATIGRAPHIC AND INSTRUMENTATION LOG
40
42
44
46
48
50
52
54
56
58
60
62
64
66
68
70
72
DEPTH
ft BGS
PROJECT NAME: DRESDEN GENERATING STATION
PROJECT NUMBER: 45136-23
CLIENT: EXELON GENERATION COMPANY LLC
LOCATION: MORRIS, ILLINOIS
HOLE DESIGNATION:
STRATIGRAPHIC DESCRIPTION & REMARKS
NOTES:
MEASURING POINT ELEVATIONS MAY CHANGE; REFER TO CURRENT ELEVATION TABLE
DATE COMPLETED: May 4, 2006
DRILLING METHOD: 6" Air Rotary - Barber Rig
FIELD PERSONNEL: D. Deitner
BEDROCK LOG 45136-23-N REDWOOD WLOO.GPJ CRA_CORP.GDT 6/13/06
Monitoring Well
ELEV.
ft
AMSL
Overburden not logged. Cleared using soft
dig.
END OF OVERBURDEN HOLE @ 6.0ft BGS
Concrete
Surface Seal
Bentonite
Chip Seal
2" 0 / PVC
Well Casing
'N' VALUE
(OVERBURDEN)
Page 1 of 2
NUMBER
INTERVAL
SAMPLE
REC (%)
MW-DN-110S
STRATIGRAPHIC AND INSTRUMENTATION LOG
2
4
6
8
10
12
14
16
18
20
22
24
26
28
30
32
34
36
38
DEPTH
ft BGS
PROJECT NAME: DRESDEN GENERATING STATION
PROJECT NUMBER: 45136-23
CLIENT: EXELON GENERATION COMPANY LLC
LOCATION: MORRIS, ILLINOIS
HOLE DESIGNATION:
STRATIGRAPHIC DESCRIPTION & REMARKS
NOTES:
MEASURING POINT ELEVATIONS MAY CHANGE; REFER TO CURRENT ELEVATION TABLE
DATE COMPLETED: May 4, 2006
DRILLING METHOD: 6" Air Rotary - Barber Rig
FIELD PERSONNEL: D. Deitner
OVERBURDEN LOG 45136-23-N REDWOOD
WLOO.GPJ CRA_CORP.GDT 6/13/06
Monitoring Well
TOP OF RISER
GROUND SURFACE
ELEV.
ft
AMSL
517.28
517.16
SANDSTONE - hard, moist to very moist, light
gray
END OF BOREHOLE @ 20.2ft BGS
2" 0 / PVC
Well Casing
6" 0 / Borehole
#10 Silica
Sand Pack
2" 0 / PVC
Well Screen
WELL DETAILS
Screened interval:
506.96 to 496.96ft AMSL
10.20 to 20.20ft BGS
Length: 10ft
Diameter: 2in
Slot Size: 10
Material: PVC
Seal:
516.16 to 511.16ft AMSL
1.00 to 6.00ft BGS
Material: Bentonite Chips
Sand Pack:
511.16 to 496.96ft AMSL
6.00 to 20.20ft BGS
Material: #10 Silica Sand
511.16
496.96
(BEDROCK)
Page 2 of 2
RUN
NUMBER
CORE
RECOVERY %
RQD %
MW-DN-110S
STRATIGRAPHIC AND INSTRUMENTATION LOG
6
8
10
12
14
16
18
20
22
24
26
28
30
32
34
36
38
40
42
DEPTH
ft BGS
PROJECT NAME: DRESDEN GENERATING STATION
PROJECT NUMBER: 45136-23
CLIENT: EXELON GENERATION COMPANY LLC
LOCATION: MORRIS, ILLINOIS
HOLE DESIGNATION:
STRATIGRAPHIC DESCRIPTION & REMARKS
NOTES:
MEASURING POINT ELEVATIONS MAY CHANGE; REFER TO CURRENT ELEVATION TABLE
DATE COMPLETED: May 4, 2006
DRILLING METHOD: 6" Air Rotary - Barber Rig
FIELD PERSONNEL: D. Deitner
BEDROCK LOG 45136-23-N REDWOOD WLOO.GPJ CRA_CORP.GDT 6/13/06
Monitoring Well
ELEV.
ft
AMSL
Overburden not logged. Cleared using soft
dig.
END OF OVERBURDEN HOLE @ 10.0ft BGS
Concrete
Surface Seal
Bentonite
Chip Seal
2" 0 / PVC
Well Casing
6" 0 / Borehole
'N' VALUE
(OVERBURDEN)
Page 1 of 2
NUMBER
INTERVAL
SAMPLE
REC (%)
MW-DN-111S
STRATIGRAPHIC AND INSTRUMENTATION LOG
2
4
6
8
10
12
14
16
18
20
22
24
26
28
30
32
34
36
38
DEPTH
ft BGS
PROJECT NAME: DRESDEN GENERATING STATION
PROJECT NUMBER: 45136-23
CLIENT: EXELON GENERATION COMPANY LLC
LOCATION: MORRIS, ILLINOIS
HOLE DESIGNATION:
STRATIGRAPHIC DESCRIPTION & REMARKS
NOTES:
MEASURING POINT ELEVATIONS MAY CHANGE; REFER TO CURRENT ELEVATION TABLE
DATE COMPLETED: May 4, 2006
DRILLING METHOD: 6" Air Rotary - Barber Rig
FIELD PERSONNEL: D. Deitner
OVERBURDEN LOG 45136-23-N REDWOOD
WLOO.GPJ CRA_CORP.GDT 6/13/06
Monitoring Well
GROUND SURFACE
TOP OF CASING
ELEV.
ft
AMSL
517.19
516.63
SANDSTONE - hard, moist to very moist,
yellowish brown then changing to light gray
END OF BOREHOLE @ 20.0ft BGS
6" 0 / Borehole
#10 Silica
Sand Pack
2" 0 / PVC
Well Screen
WELL DETAILS
Screened interval:
507.19 to 497.19ft AMSL
10.00 to 20.00ft BGS
Length: 10ft
Diameter: 2in
Slot Size: 10
Material: PVC
Seal:
516.19 to 510.19ft AMSL
1.00 to 7.00ft BGS
Material: Bentonite Chips
Sand Pack:
510.19 to 497.19ft AMSL
7.00 to 20.00ft BGS
Material: #10 Silica Sand
507.19
497.19
(BEDROCK)
Page 2 of 2
RUN
NUMBER
CORE
RECOVERY %
RQD %
MW-DN-111S
STRATIGRAPHIC AND INSTRUMENTATION LOG
10
12
14
16
18
20
22
24
26
28
30
32
34
36
38
40
42
44
46
DEPTH
ft BGS
PROJECT NAME: DRESDEN GENERATING STATION
PROJECT NUMBER: 45136-23
CLIENT: EXELON GENERATION COMPANY LLC
LOCATION: MORRIS, ILLINOIS
HOLE DESIGNATION:
STRATIGRAPHIC DESCRIPTION & REMARKS
NOTES:
MEASURING POINT ELEVATIONS MAY CHANGE; REFER TO CURRENT ELEVATION TABLE
DATE COMPLETED: May 4, 2006
DRILLING METHOD: 6" Air Rotary - Barber Rig
FIELD PERSONNEL: D. Deitner
BEDROCK LOG 45136-23-N REDWOOD WLOO.GPJ CRA_CORP.GDT 6/13/06
Monitoring Well
ELEV.
ft
AMSL
Revision 0
45136 (15) Dresden Generating Station
APPENDIX B
WATER SUPPLY WELL INVENTORY
PRIVATE/PUBLIC WATER SUPPLY
WELL LOCATIONS
(Withheld)
Revision 0
45136 (15) Dresden Generating Station
APPENDIX C
QUALITY ASSURANCE PROGRAM - TELEDYNE BROWN ENGINEERING,INC.
Page 2 of 32
TABLE OF CONTENTS
Section
Title
Page
1.0
KNOXVILLE QAM SECTION INTRODUCTION
7
2.0
QUALITY SYSTEM
10
2.1
Policy
10
2.2
Quality System Structure
10
2.3
Quality System Objectives
10
2.4
Personnel Orientation, Training, and Qualification
11
3.0
ORGANIZATION, AUTHORITY, AND RESPONSIBILITY
12
4.0
PERSONNEL ORIENTATION, DATA INTEGRITY, TRAINING,
AND QUALIFICATION
13
4.1
Orientation
13
4.2
Data Integrity
13
4.3
Training
13
4.4
Qualification
13
4.5
Records
13
5.0
CUSTOMER INTERFACES
14
5.1
Interface Personnel
14
5.2
Bid Requests and Tenders
14
5.3
Contracts
14
5.4
TBE’s Expectation of Customers
14
5.5
Customer Satisfaction
15
5.5.1
Customer Complaints
15
5.5.2
Customer Confidentiality
15
6.0
DOCUMENTATION GENERATION AND CONTROL
16
6.1
General
16
6.2
New Documentation
16
6.3
Documentation Changes
16
Page 3 of 32
TABLE OF CONTENTS - Continued
6.4
Documentation Lists and Distributions
16
6.5
Other Documentation
16
6.6
Documentation Reviews
16
7.0
DESIGN OF LABORATORY CONTROLS
17
7.1
General
17
7.2
Facility
17
7.3
Technical Processes and Methods
17
7.3.1
Operational Flow
17
7.3.2
Methods
18
7.3.3
Data Reduction and Analysis
18
7.4
Verification of Technical Processes, Methods, and Software
18
7.4.1
Operational Flow Verification
18
7.4.2
Method Verifications
18
7.4.3
Data Reduction and Analysis Verification
18
7.5
Design of Quality Controls
18
7.5.1
General
19
7.5.2
Demonstration of Capability (D of C)
19
7.5.3
Process Control Checks
19
7.6
Counting Instrument Controls
20
8.0
PURCHASING AND SUBCONTRACT CONTROLS
21
8.1
General
21
8.2
Source Selection
21
8.3
Procurement of Supplies and Support Services
21
8.3.1
Catalog Supplies
21
8.3.2
Support Services
21
8.3.3
Equipment and Software
22
8.4
Subcontracting of Analytical Services
22
8.5
Acceptance of Items or Services
22
Page 4 of 32
TABLE OF CONTENTS - Continued
9.0
TEST SAMPLE IDENTIFICATION AND CONTROL
23
9.1
Sample Identification
23
9.2
LIMS
23
9.3
Sample Control
23
10.0
SPECIAL PROCESSES, INSPECTION, AND TEST
24
10.1
Special Processes
24
10.2
Inspections and Tests
24
10.2.1 Intra Laboratory Checks (QC Checks)
24
10.2.2 Inter Laboratory Checks
24
10.2.3 Data Reviews
24
10.3
Control of Sampling of Samples
24
10.4
Reference Standards / Material
24
10.4.1 Weights and Temperatures
25
10.4.2 Radioactive Materials
25
11.0
EQUIPMENT MAINTENANCE AND CALIBRATION
26
11.1
General
26
11.2
Support Equipment
26
11.3
Instruments
26
11.4
Nonconformances and Corrective Actions
26
11.5
Records
27
12.0
NONCONFORMANCE CONTROLS
28
12.1
General
28
12.2
Responsibility and Authority
28
12.3
10CFR21 Reporting
28
Page 5 of 32
TABLE OF CONTENTS - Continued
13.0
CORRECTIVE AND PREVENTIVE ACTIONS
29
13.1
General
29
13.2
Corrective Actions
29
13.3
Preventive Actions
29
14.0
RESULTS ANALYSIS AND REPORTING
30
14.1
General
30
14.2
Results Review
30
14.3
Reports
30
15.0
RECORDS
31
15.1
General
31
15.2
Type of Records
31
15.3
Storage and Retention
31
15.4
Destruction or Disposal
31
16.0
ASSESSMENTS
32
16.1
General
32
16.2
Audits
32
16.3
Management Reviews
32
Page 6 of 32
REVISION HISTORY
Revision 7
Complete re-write
January 1, 2005
Bill Meyer
Revision 8
Updated organization
chart, minor change to
1.0, 4.4, 7.5.3.2,
10.2.3, and 12.3
Page 7 of 32
1.0
Knoxville QAM Section Introduction
This Quality Assurance Manual (QAM) and related Procedures describes the
Knoxville Environmental Services Laboratory’s QA system. This system is designed
to meet multiple quality standards imposed by Customers and regulatory agencies
including:
NRC’s 10 CFR 50 Appendix B
NRC’s Regulatory Guide 4.15
DOE’s Order 414.1
DOE’s QSAS
ANSI N 42.23
ANSI N 13.30
NELAC Standard, Chapter 5
The Environmental Services (ES) Laboratory does low level radioactivity
analyses for Power Plants and other customers. It primarily analyzes environmental
samples (natural products from around plants such as milk), in-plant samples (air
filters, waters), bioassay samples from customer’s employees, and waste disposal
samples (liquids and solids).
Potable and non-potable water samples are tested using methods based on
EPA standards as cited in State licenses (see Procedure 4010). The listing [current
as of initial printing of this Manual – see current index for revision status and
additions / deletions] of implementing Procedures (SOPs) covering Administration,
Methods, Counting Instruments, Technical, Miscellaneous, and LIMS is shown in
Table 1-1. Reference to these Procedures by number is made throughout this QAM.
Table 1-1
Number
Title
Part 1
Administrative Procedures
1001
Validation and Verification of Computer Programs for Radiochemistry Data
Reduction
1002
Organization and Responsibility
1003
Control, Retention, and Disposal of Quality Assurance Records
1004
Definitions
1005
Data Integrity
1006
Job Descriptions
1007
Training and Certifications
1008
Procedure and Document Control
1009
Calibration System
1010
Nonconformance Controls
1011
10CFR21 Reporting
1012
Corrective Action and Preventive Action
Page 8 of 32
Number
Title
1013
Internal Audits and Management Reviews
1014
RFP, Contract Review, and Order Entry (formerly 4001)
1015
Procurement Controls
Part 2
Method Procedures
2001
Alpha Isotopic and Plutonium-241
2002
Carbon-14 Activity in Various Matrices
2003
Carbon-14 and Tritium in Soils, Solids, and Biological Samples; Harvey
Oxidizer Method
2004
Cerium-141 and Cerium-144 by Radiochemical Separation
2005
Cesium-137 by Radiochemical Separation
2006
Iron-55 Activity in Various Matrices
2007
Gamma Emitting Radioisotope Analysis
2008
Gross Alpha and/or Gross Beta Activity in Various Matrices
2009
Gross Beta Minus Potassium-40 Activity in Urine and Fecal Samples
2010
Tritium and Carbon-14 Analysis by Liquid Scintillation
2011
Tritium Analysis in Drinking Water by Liquid Scintillation
2012
Radioiodine in Various Matrices
2013
Radionickel Activity in Various Matrices
2014
Phosphorus-32 Activity in Various Matrices
2015
Lead-210 Activity in Various Matrices
2016
Radium-226 Analysis in Various Matrices
2017
Total Radium in Water Samples
2018
Radiostrontium Analysis by Chemical Separation
2019
Radiostrontium Analysis by Ion Exchange
2020
Sulfur-35 Analysis
2021
Technetium-99 Analysis by Eichrom Resin Separation
2022
Total Uranium Analysis by KPA
2023
Compositing of Samples
2024
Dry Ashing of Environmental Samples
2025
Preparation and Standardization of Carrier Solutions
2026
Radioactive Reference Standard Solutions and Records
2027
Glassware Washing and Storage
2028
Moisture Content of Various Matrices
2029
Polonium-210 Activity in Various Matrices
2030
Promethium-147 Analysis
Page 9 of 32
Number
Title
Part 3
Instrument Procedures
3001
Calibration and Control of Gamma-Ray Spectrometers
3002
Calibration of Alpha Spectrometers
3003
Calibration and Control of Alpha and Beta Counting Instruments
3004
Calibration and Control of Liquid Scintillation Counters
3005
Calibration and Operation of pH Meters
3006
Balance Calibration and Check
3008
Negative Results Evaluation Policy
3009
Use and Maintenance of Mechanical Pipettors
3010
Microwave Digestion System Use and Maintenance
Part 4
Technical Procedures
4001
Not Used
4002
QC Checks on Data
4003
Sample Regent and Control
4004
Data Package Preparation and Reporting
4005
Blank, Spike, and Duplicate Controls
4006
Inter-Laboratory Comparison Study Process
4007
Method Basis and Initial Validation Process
4008
Not Used
4009
MDL Controls
4010
State Certification Process
4011
Accuracy, Precision, Efficiency, and Bias Controls and Data Quality Objectives
4012
Not Used
4013
Not Used
4014
Facility Operation and Control
4015
Documentation of Analytical Laboratory Logbooks (formerly 1002)
4016
Total Propagated Uncertainty (formerly 1004)
4017
LIMS Operation
4018
Instrument Calibration System
4019
Radioactive Reference Material Standards
Part 5
Miscellaneous Procedures
5001
Laboratory Hood Operations
5002
Operation and Maintenance of Deionized Water System
5003
Waste Management
5004
Acid Neutralization and Purification System Operation Procedure
Page 10 of 32
Part 6
LIMS
6001
LIMS Raw Data Processing and Reporting
6002
Software Development and/or Pilots of COTS Packages
6003
Software Change and Version Control
6004
Backup of Data and System Files
6005
Disaster Recovery Plan
6006
LIMS Hardware
6007
LIMS User Access
6008
LIMS Training
6009
LIMS Security
2.0
QUALITY SYSTEM
The TBE-ES QA system is designed to comply with multiple customer- and
regulatory agency-imposed specifications related to quality. This quality system
applies to all activities of TBE-ES that affect the quality of analyses performed by the
laboratory.
2.1
Policy
The TBE quality policy, given in Company Policy P-501, is “TBE will
continually improve our processes and effectiveness in providing products and
services that exceed our customer’s expectations.”
This policy is amplified by this Laboratory’s commitment, as attested to by the
title page signatures, to perform all work to good professional practices and to
deliver high quality services to our customers with full data integrity. (See Section
4.0 and Procedure 1005).
2.2
Quality System Structure
The Quality System is operated by the organizations described in Section 3.0
of this Manual. The Quality System is described in this Manual and in the
Procedures Manual, both of which are maintained by the QA Manager. Procedures
are divided into 6 sections – Administrative, Methods, Equipments, Technical,
Miscellaneous, and LIMS. This Manual is structured as shown in the Table of
Contents and refers to Procedures when applicable.
Cross references to the
various imposed quality specifications are contained in Appendices to this Manual.
2.3
Quality System Objectives
The Quality System is established to meet the objective of assuring all
operations are planned and executed in accordance with system requirements. The
Quality System also assures that performance evaluations are performed (see
Procedure 4006), and that appropriate verifications are performed (see Procedures
in the 1000 and 4000 series) to further assure compliance. Verification includes
Page 11 of 32
examination of final reports (prior to submittal to customers) to determine their
quality (see Procedure 4004).
To further these objectives, various in-process assessments of data, as well
as assessments of the system, via internal audits and management reviews, are
performed. Both internal experts and customer / regulatory agencies perform further
assessments of the system and compliance to requirements.
2.4
Personnel Orientation, Training, and Qualification
TBE provides indoctrination and training to employees and performs
proficiency evaluation of technical personnel. This effort is described in Section 4.0.
Page 12 of 32
3.0
ORGANIZATION, AUTHORITY, AND RESPONSIBILITY
TBE has established an effective organization for conducting laboratory
analyses at the Knoxville Environmental Services Laboratory.
The basic
organization is shown in Figure 3-1. Detail organization charts with names,
authorities, and responsibilities are given in Procedure 1002. Job descriptions are
given in Procedure 1006.
This organization provides clearly established Quality Assurance authorities,
duties, and functions. QA has the organizational freedom needed to:
(1)
Identify problems
(2)
Stop nonconforming work
(3)
Initiate investigations
(4)
Recommend corrective and preventive actions
(5)
Provide solutions or recommend solutions
(6)
Verify implementation of actions
All Laboratory personnel have the authority and resources to do their
assigned duties and have the freedom to act on problems. The QA personnel have
direct, independent access to Company management as shown in Figure 3-1.
Figure 3.1. Laboratory Organization
President
VP
Administration & QA
VP
Environmental
Product Assurance
Director
Lab QA Manager
Lab Operations
Manager
Program
Managers
Lab
Supervisor
Administration
Staff
Page 13 of 32
4.0 PERSONNEL ORIENTATION, DATA INTEGRITY, TRAINING, AND
QUALIFICATION
4.1
Orientation
All laboratory personnel must receive orientation to the quality program if their
work can affect quality. Orientation includes a brief review of customer- and
regulatory agency-imposed quality requirements, the structure of the QAM, and the
implementing procedures. The goal of orientation is to cover the nature and goals of
the QA program.
4.2
Data Integrity
The primary output of the Laboratory is data. Special emphasis and training
in data integrity is given to all personnel whose work provides or supports data
delivery. The Laboratory Data Integrity Procedure (Procedure 1005) describes
training, personnel attestations, and monitoring operations. Annual reviews are
required.
4.3
Training
The Quality Assurance Manager (QAM) maintains a training matrix indicating
which laboratory personnel need training in which specific Procedures. This matrix
is updated when personnel change or change assignments. All personnel are
trained per these requirements and procedures. This training program is described
in Procedure 1007. The assigned responsibilities for employees are described in
Procedure 1002 (See Section 3.0) on Organization and in Procedure 1006, Job
Descriptions. Refresher training or re-training is given annually as appropriate.
4.4
Qualification
Personnel are qualified as required by their job description. Management and
non-analysts are evaluated based on past experience, education, and
management’s assessment of their capabilities. Formal qualification is required of
analysts and related technical personnel who perform laboratory functions. Each
applicable person is given training and then formally evaluated by the Operations
Manager (or his designees) and by QA. Each analyst must initially demonstrate
capability to perform each assigned analytical effort. Each year, thereafter, he or
she must perform similar analyses on Interlab Comparison Samples (see Procedure
4006) or on equivalent blanks and spikes samples. Acceptable results extend
qualifications (certification). Unacceptable results require retraining in the subject
method / Procedures. (See Procedure 1007 for added information, records, forms,
etc. used.)
4.5
Records
Records of training subjects, contents, attendees, instructors, and
certifications are maintained by QA.
Page 14 of 32
5.0
CUSTOMER INTERFACES
5.1
Interface Personnel
The Laboratory has designated Program Managers as the primary interface
with all customers. Other interfaces may be the QA Manager or the Lab Operations
Manager.
5.2
Bid Requests and Tenders
The Program Managers respond to customer requests for bids and proposals
per Procedure 1014 for bids, proposals, and contract reviews. They clarify customer
requests so both the customer and the lab staff understand requests. As responses
are developed, internal reviews are conducted to ensure that requirements are
adequately defined and documented and to verify that the Laboratory has adequate
resources in physical capabilities, personal skills, and technical information to
perform the work. Accreditation needs are reviewed. If subcontracts are required to
perform any analysis, the subcontractor is similarly evaluated and the client notified
in writing of the effort. Most qualifications are routine with standard pricing and the
review of these quotes is performed by the Program Manager. Larger or more
complex quotes are reviewed by the Operations Manager and the QA Manager (or
designees). Evidence of review is by initialing and dating applicable papers,
signatures on quotations, or by memo.
5.3
Contracts
The Program Manager’s receive contract awards (oral or written) and
generate the work planning for initiation preparation (charge numbers, data structure
or contents in LIMS, etc.). They review contracts for possible differences from
quotations and, if acceptable, contracts are processed. Documentation of the review
is by initials and date as a minimum. Contract changes receive similar reviews and
planning.
5.4
TBE’s Expectation of Customers
TBE expects customers to provide samples suitable for lab analysis. These
expectations include:
Accurate and unambiguous identification of samples
Proper collection and preservation of samples
Use of appropriate containers free from external and internal
contamination
Integrity preservation during shipment and timely delivery of samples that
are age sensitive
Adequate sized samples that allow for retest, if needed
Specification of unique MOA/MDC requirements
Alerting the lab about abnormal samples (high activity, different chemical
contents, etc.)
Chain of custody initiation, when required.
Page 15 of 32
5.5
Customer Satisfaction
TBE’s quality policy centers on customer satisfaction (See 2.0). TBE will
work to satisfy customers through full compliance with contract requirements,
providing accurate data and properly responding to any questions or complaints.
Customers are provided full cooperation in their monitoring of Laboratory
performance. Customers are notified if any applicable State Accreditation is
withdrawn, revoked, or suspended.
5.5.1 Customer Complaints
Any customer complaints are documented and tracked to closure. Most
complaints concern analysis data and are received by Program Managers. They
log each such complaint, order retests for verification, and provide documented
results to customers. Complaints may also be received by QA or Operations.
If complaints are other than re-test type, the nonconformance and corrective
action systems (Sections 12 and 13) are used to resolve them and record all actions
taken.
5.5.2 Customer Confidentiality
All laboratory personnel maintain confidentiality of customer-unique
information.
Page 16 of 32
6.0
DOCUMENTATION GENERATION & CONTROL
6.1
General
The documentation generation and control system is detailed in Procedure
1008. An overview is given below. The basic quality system documents are
described in Section 2.0.
6.2
New Documentation
Each Procedure and this QAM is written by appropriate personnel, validated if
applicable (see Section 7.0), reviewed for adequacy, completeness, and
correctness, and, if acceptable, accepted by the authorized approver [QA Manager,
Operations Manager (or their designee)]. Both approvals are required if a Procedure
affects both QA and Operations. (See Responsibilities in Section 3.0).
These
procedures control the quality measurements and their accuracy.
Each document carries a unique identification number, a revision level, dates,
page numbers and total page count, and approver identification and sign off. If TBE
writes code for software, the software is version identified and issued after
Verification and Validation per Section 7.0.
6.3
Documentation Changes
Each change is reviewed in the same manner and by the same people as
new documentation. Revision identifications are updated and changes indicated by
side bars, italicized words, or by revision description when practical. Obsolete
revisions are maintained by QA after being identified as obsolete.
6.4
Documentation Lists and Distributions
Computer indexes of documents are maintained by Quality showing the
current authorized revision level of each document. These revisions are placed on
the Laboratory server and obsolete ones are removed so that all personnel have
only the current documents. If hard copies are produced and distributed, separate
distribution lists are maintained indicating who has them and their revision level(s).
Copies downloaded off the server are uncontrolled unless verified by the user (on
the computer) to be the latest revision.
6.5
Other Documentation
In addition to TBE-generated documentation, QA maintains copies of
applicable specifications, regulations, and standard methods.
6.6
Documentation Reviews
Each issued document is reviewed at least every third year by the approving
personnel. This review determines continued suitability for use and compliance with
requirements.
Page 17 of 32
7.0
DESIGN OF LABORATORY CONTROLS
7.1
General
The Laboratory and its operating procedures are designed specifically for low
level (environmental and in-plant) radioactive sample analysis. The various aspects
of the laboratory design include the following which are discussed in subsequent
paragraphs of this Section:
(a) Facility
(b) Technical Processes and Methods
(c) Verification of Design of Processes, Methods, and Software.
(d) Design of Quality Controls
(e) Counting Instrument Controls
7.2
Facility
The facility was designed and built in 2000 to facilitate correct performance of
operations in accordance with good laboratory practices and regulatory
requirements. It provides security for operations and samples. It separates sample
storage areas based on activity levels, separates wet chemistry from counting
instrumentation for contamination control, and provides space and electronic
systems for documentation, analysis, and record storage. Procedure 4014 describes
the facility, room uses, layouts, etc.
7.3
Technical Processes and Methods
7.3.1 Operational Flow
The laboratory design provides for sample receipt and storage (including
special environmental provisions for perishable items) where samples are received
from clients and other labs (see Section 9.0). The samples are logged into the
computer based Laboratory Information Management System (LIMS) and receive
unique identification numbers and bar code labels. (See Procedure 4017 for LIMS
description and user procedures). The Program Managers then plan the work and
assure LIMS contains any special instructions to analysts. Samples then go to
sample preparation, wet chemistry (for chemical separation), and counting based on
the radionuclides. See Procedures in the 2000 and 3000 series. Analysts perform
the required tasks with data being entered into logbooks, LIMS, and counting
equipment data systems as appropriate. Results are collected and reviewed by the
Operations Manager and Program Managers and reports to clients are generated
(See Section 14.0). All records (electronic or hard copy) are maintained in files or in
back-up electronic copies (see Section 15.0). After the required hold periods and
client notification and approval, samples are disposed of in compliance with
regulatory requirements (see Procedures 5003 and 5004).
Page 18 of 32
7.3.2 Methods
The laboratory methods documented in the 2000 and 3000 series of
Procedures were primarily developed by senior TBE laboratory personnel based on
years of experience at our prior facility in New Jersey. They have been improved,
supplemented and implemented here. Where EPA or other accepted national
methods exist (primarily for water analyses under State certification programs - see
Procedure 4010), the TBE methods conform to the imposed requirements or State
accepted alternate requirements. Any method modifications are documented and
described in the Procedure. There are no nationally recognized methods for most
other analysis methods but references to other method documents are noted where
applicable.
7.3.3 Data Reduction and Analysis
Whenever possible automatic data capture and computerized data reduction
programs are used. Calculations are either performed using commercial software
(counting system operating systems) or TBE developed and validated software is
used (see 7.4 below). Analysis of reduced data is performed as described in Section
14.0 and Procedure 4004.
7.4
Verification of Technical Processes, Methods, and Software
7.4.1 Operational Flow Verification
The entire QA Manual and related procedures describe the verification of
elements of the technical process flow and the establishment of quality check points,
reviews, and controls.
7.4.2 Method Verifications
Methods are verified and validated per Procedure 4007 prior to use unless
otherwise agreed to by the client. For most TBE methods initial validation occurred
well in the past. New or significantly revised Methods receive initial validation by
demonstration of their performance using known analytes (NIST traceable) in
appropriate matrices. Sufficient samples are run to obtain statistical data that
provides evidence of process capability and control, establishes detection levels
(see procedure 4009), bias and precision data (see Procedure 4011). All method
procedures and validation data are available to respective clients. Also see Section
7.5 below for the Demonstration of Capability program.
7.4.3 Data Reduction and Analysis Verification
Data reduction and analysis verification is performed by personnel who did
not generate the data. (See Section 14.0).
7.5
Design of Quality Controls
Page 19 of 32
7.5.1 General
There are multiple quality controls designed into the laboratory operations.
Many of these are described elsewhere in this manual and include personnel
qualification (Section 4.0), Document control (6.0), Sample identification and control
(9.0), Use of reference standards (10.0), intra- and inter- laboratory tests (10.0), etc.
This Section describes the basic quality control systems used to verify Method
capability and performance.
7.5.2 Demonstration of Capability (D of C)
The demonstration of capability system verifies and documents that the
method, analyst, and the equipment can perform within acceptable limits. The D of C
is certified for each combination of analyte, method, and instrument type. D of C's
are certified based on objective evidence at least annually. This program is
combined with the analyst D of C program (See Section 4.0). Initial D of C's use the
method validation effort as covered above. Subsequent D of C's use Inter-
Laboratory samples (Procedure 4006) or, if necessary, laboratory generated
samples using NIST traceable standards. If results are outside of control limits, re-
demonstration is required after investigation and corrective action is accomplished
(See Sections 12.0 and 13.0)
7.5.3 Process Control Checks
Process control checks are designed to include Inter-Lab samples, Intra-lab
QC check samples, and customer provided check samples. 10% of laboratory
analysis samples are for process control purposes.
7.5.3.1 Inter- Lab Samples.
Inter-lab samples are procured or
obtained from sources providing analytes of interest in matrices similar to normal
client samples. These samples may be used for Demonstration of Capability of
analyst's, equipment and methods. They also provide for independent insight into
the lab's process capabilities. Any value reported as being in the warning zone (over
2 sigma) is reviewed and improvements taken. Any value failing (over 3 sigma) is
documented on an NCR and formal investigation per Section 12.0 and 13.0 is
performed. If root causes are not clearly understood and fixed, re-tests are required
using lab prepared samples (See Procedure 4006).
7.5.3.2 QC Samples.
QC samples, along with Inter-lab samples and
customer check samples, are 10% of the annual lab workload for the applicable
analyte and method. If batch processing is used, some specifications require specific
checks with each batch or each day rather than as continuous process controls.
(See Procedure 4005)
QC samples consist of multiple types of samples including:
(a) Method blanks
(b) Blank spikes
(c) Matrix spikes
Page 20 of 32
(d) Duplicates
(e) Tracers and carriers
Acceptance limits for these samples are given in Procedures or in lab
standards. The number, frequency, and use of these sample types varies with the
method, matrix, and supplemental requirements. The patterns of use versus method
and the use of the resulting test data is described in Procedure 4005.
7.5.3.3 Customer Provided Check Samples.
Customers may
provide blind check samples and duplicates to aid in their evaluation of the
Laboratory. When the lab is notified that samples are check samples their results are
included in the QC sample percentage counts. Any reported problems are treated as
formal complaints and investigated per Section 5.
7.6
Counting Instrument Controls
The calibration of instruments is their primary control and is described in
Section 11.0. In addition, counting procedures (3000 series) also specify use of
background checks (method blank data is not used for this) to evaluate possible
counting equipment contamination. Instrument calibration checks using a lab
standard from a different source than the one used for calibration are also used.
Background data can be used to adjust client and test data. Checks with lab
standards indicate potential calibration changes.
Page 21 of 32
8.0
PURCHASING AND SUBCONTRACT CONTROLS
8.1
General
Procurement and Subcontracts efforts use the Huntsville-based Cost Point
computer system to process orders.
The Laboratory-generated Purchase
Requisitions are electronically copied into Purchase Orders in Huntsville. The
Laboratory also specifies sources to be used. Procured items and services are
received at the Laboratory where receiving checks and inspections are made.
Laboratory Procedure 1015 provides details on the procurement control system at
the Laboratory and references the Huntsville procedures as applicable.
8.2
Source Selection
Sources for procurements of items and services are evaluated and approved
by QA as described in Procedure 1015. Nationally recognized catalog item sources
are approved by the QA Manager based on reputation. Maintenance services by an
approved distributor or the equipment manufacturing company are pre-approved.
Sources for other services are evaluated by QA, based on service criticality to the
quality system, by phone, mail out, or site visit.
Subcontract sources for laboratory analysis services are only placed with
accredited laboratories (by NELAP, NUPIC, State, Client, etc.) as applicable for the
type of analysis to be performed. QA maintains lists of approved vendors and
records of evaluations performed.
8.3
Procurement of Supplies and Support Services
8.3.1 Catalog Supplies
The Laboratory procures reagents, processing chemicals, laboratory
“glassware,” consumables, and other catalog items from nationally known vendors
and to applicable laboratory grades, purities, concentrations, accuracy levels, etc.
Purchase Requisitions for these items specify catalog numbers or similar call-outs
for these off-the-shelf items. Requisitions are generated by the personnel in the lab
needing the item and are approved by the Operations or Production Manager.
Reagents are analytical reagent grade only.
8.3.2 Support Services
Purchase Requisitions for support services (such as balance
calibration, equipment maintenance, etc.) are processed as in 8.3.1 but technical
requirements are specified and reviewed before approvals are given.
Page 22 of 32
8.3.3 Equipment and Software
Purchase Requisitions for new equipment, software programs, and
major facility modifications affecting the quality system are reviewed and approved
by the Operations Manager and the QA Manager.
8.4
Subcontracting of Analytical Services
When necessary, the Laboratory may subcontract analytical services required
by a client. This may be because of special needs, infrequency of analysis, etc.
Applicable quality and regulatory requirements are imposed in the Purchase
Requisition and undergo a technical review by QA. TBE reserves the right of access
by TBE and our client for verification purposes.
8.5
Acceptance of Items or Services
Items and services affecting the quality system are verified at receipt based
on objective evidence supplied by the vendor. Supply items are reviewed by the
requisitioner and, if acceptable, are accepted via annotation on the vendor packing
list or similar document. Similarly, equipment services are accepted by the
requisitioning lab person. Calibration services are accepted by QA based on
certification reviews. (See Section 11.0.)
Data reports from analytical subcontractors are evaluated by Program
Managers and subsequently by the Operations Manager (or designee) as part of
client report reviews.
Items are not used until accepted and if items or services are rejected, QA is
notified and nonconformance controls per Section 12.0 are followed. Vendors may
be removed from the approved vendor’s list if their performance is unacceptable.
Page 23 of 32
9.0
TEST SAMPLE IDENTIFICATION AND CONTROL
9.1
Sample Identification
Incoming samples are inspected for customer identification, container
condition, chain of custody forms, and radioactivity levels. If acceptable, the sample
information is entered into LIMS which generates bar coded labels for attachment to
the sample(s). The labels are attached and samples stored in the assigned location.
If environmental controls are needed (refrigeration, freezing, etc.), the samples are
placed in these storage locations. If not acceptable, the Program Manager is
notified, the customer contacted, and the problem resolved (return of sample, added
data receipts, etc.). See Procedure 4003 for more information on sample receipt.
9.2
LIMS
The LIMS is used to schedule work, provide special information to analysts,
and record all actions taken on samples. See Procedure 4017 and the 6000 series
of procedures for more information on LIMS operations.
9.3
Sample Control
The sample, with its bar coded label, is logged out to the applicable lab
operation where the sample is processed per the applicable methods (Procedures
2000 and 3000). The LIMS-assigned numbers are used for identification through all
operations to record data. Data is entered into LIMS, log books (kept by the
analysts) or equipment data systems to record data. The combination of LIMS,
logbooks, and equipment data systems provide the Chain of Custody data and
document all actions taken on samples. Unused sample portions are returned to its
storage area for possible verification use. Samples are discarded after required time
limits are passed and after client notification and approval, if required.
Page 24 of 32
10.0 SPECIAL PROCESSES, INSPECTION, AND TEST
10.1 Special Processes
The Laboratory’s special processes are the methods used to analyze a
sample and control equipment. These methods are defined in Procedures in the
2000 and 3000 series. These processes are performed to the qualified methods
(see Section 7.0) by qualified people (see 4.0).
10.2 Inspections and Tests
The quality of the process is monitored by indirect means. This program
involves calibration checks on counting equipments (see Section 11.0), intra-
laboratory checks, and inter-laboratory checks. In addition, some customers submit
quality control check samples (blinds, duplicates, external reference standards). All
generated data gets independent reviews.
10.2.1 Intra Laboratory Checks (QC Checks)
The quantity and types of checks varies with the method, but basic checks
which may include blanks, spiked blanks, matrix spikes, matrix spike duplicates, and
duplicates are used as appropriate for customer samples. This process is described
in Procedure 4005 and in Section 7.0.
10.2.2 Inter Laboratory Checks
TBE participates in Inter-lab performance evaluation (check) programs with
multiple higher level labs. These programs provide blind matrices for the types of
matrix/analyte combinations routinely processed by the Lab, if available. This
program is described in Procedure 4006.
10.2.3 Data Reviews
Raw data and reports are reviewed by the Operations Manager, or
designees.
This review checks for data logic, expected results, procedure
compliance, etc. (See Section 14.0).
10.3 Control of Sampling of Samples
Samples for analysis are supplied by customers preferably in quantities
sufficient to allow re-verification analyses if needed. The samples are prepared for
analysis by analysts and then an aliquot (partial sample extraction) is taken from the
homogeneous customer sample for the initial analysis. Methods specify standard
volumes of sample material required. Sampling data is recorded in LIMS and/or
logbooks.
10.4 Reference Standards / Material
Page 25 of 32
10.4.1 Weights and Temperatures
Reference standards are used by the Laboratory’s calibration vendor to
calibrate the Labs working instruments measuring weights and thermometers.
10.4.2 Radioactive Materials
Reference radioactive standards, traceable to NIST, are procured from higher
level laboratories. These reference materials are maintained in the standards area
and are diluted down for use by laboratory analysts. All original and diluted volumes
are fully traceable to source, procedure, analyst, dilution, and acquisition dates. See
Section 11.0 and Procedure 1009.
Page 26 of 32
11.0 EQUIPMENT MAINTENANCE AND CALIBRATION
11.1 General
There are two types of equipment used by the Laboratory:
support
equipment (scales, glassware, weights, thermometers, etc.) and instruments for
counting. Standards traceable to NIST are used for calibration and are of the
needed accuracy for laboratory operations. Procedures 1009, 4018, and 4019
describe the calibration and maintenance programs.
11.2 Support Equipment
Analytical support equipment is purchased with the necessary accuracies and
appropriate calibration data. If needed, initial calibration by the Laboratory or its
calibration vendor is performed. Recalibration schedules are established and
equipment recalibrated by the scheduled date by a calibration vendor or by
Laboratory personnel. Maintenance is performed, as needed, per manufacturer’s
manuals or lab procedures.
In addition to calibrations and recalibrations, checks are made on the
continued accuracy of items as described in Procedure 1009. Records are
maintained of calibration and specified checks.
11.3 Instruments
Instruments receive initial calibration using radioactive sources traceable to
NIST. The initial calibration establishes statistical limits of variation that are used to
set control limits for future checks and recalibration. This process is described in
Procedure 4018. Instruments are maintained per Instrument Manual requirements.
Recalibrations are performed per the Procedure.
Between calibrations, check sources are used to assure no significant
changes have occurred in the calibration of items. Background checks are
performed to check for possible radioactive contamination. Background values are
used to adjust sample results. Hardware and software are safeguarded from
adjustments that could invalidate calibrations or results.
11.4 Nonconformances and Corrective Actions
If calibrations or checks indicate a problem, the nonconformance system
(Section 12.0) and corrective action system (Section 13.0) are initiated to document
the problem and its resolution. Equipment is promptly removed from service if
questionable.
Page 27 of 32
11.5 Records
Records of calibrations are maintained.
Calibration certificates from
calibration vendors are maintained by QA. Other calibration data and check data is
maintained in log books, LIMS, or instrument software as appropriate and as
described in Procedures 1009, 4018, and 4019.
Page 28 of 32
12.0 NONCONFORMANCE CONTROLS
12.1 General
The nonconformance control system is implemented whenever a
nonconforming condition on any aspect of Laboratory analysis, testing, or results
exist. The system takes graded actions based on the nature and severity of the
nonconformance. Nonconforming items or processes are controlled to prevent
inadvertent use. Nonconformances are documented and dispositioned. Notification
is made to affected organizations, including clients. Procedure 1010 describes the
procedures followed. Sample results are only reported after resolution.
12.2 Responsibility and Authority
Each Laboratory employee has the responsibility to report nonconformances
and the authority to stop performing nonconforming work or using nonconforming
equipment. Laboratory supervision can disposition and take corrective actions on
minor problems.
Any significant problem is documented by QA using the
Laboratory’s NCR system per Procedure 1010. QA conducts or assures the conduct
of cause analyses, disposition of items or data, and initiation of corrective action if
the nonconformance could recur.
12.3 10CFR21 Reporting
The QA Manager reviews NCRs for possible need of customer and/or NRC
notification per the requirements of 10CFR21. Procedure 1011 is followed in this
review and for any required reporting.
Page 29 of 32
13.0 CORRECTIVE AND PREVENTIVE ACTIONS
13.1 General
The Laboratory takes corrective actions on significant nonconformances (see
Section 12.0). It also initiates preventive and improvement actions per the Company
Quality Policy (see Section 2.0). The procedures for Corrective Action/Preventive
Action systems are contained in Procedure 1012.
13.2 Corrective Actions
Corrective actions are taken by Operations and Quality to promptly correct
significant conditions adverse to quality. The condition is identified and cause
analysis is performed to identify root causes. Solutions are evaluated and the
optimum one selected that will prevent recurrence, can be implemented by the
Laboratory, allows the Laboratory to meet its other goals, and is commensurate with
the significance of the problem. All steps are documented, action plans developed
for major efforts, and reports made to Management. QA verifies the implementation
effectiveness. Procedure 1012 provides instructions and designates authorities and
responsibilities.
13.3 Preventive Actions
Preventive actions are improvements intended to reduce the potential for
nonconformances. Possible preventive actions are developed from suggestions
from employees and from analysis of Laboratory technical and quality systems by
management. If preventive actions or improvements are selected for investigation,
the issues, investigation, recommendations, and implementation actions are
documented. Follow up verifies effectiveness.
Page 30 of 32
14.0 RESULTS ANALYSIS AND REPORTING
14.1 General
The Laboratory’s role is to provide measurement-based information to clients
that is technically valid, legally defensible, and of known quality.
14.2 Results Review
The results obtained from analytical efforts are collected and reviewed by the
Operations Manager and the Program Manager.
This review verifies the
reasonableness and consistency of the results. It includes review of sample and the
related QC activity data. Procedure 4002 describes the process. Any deficiencies
are corrected by re-analyses, recalculations, or corrective actions per Sections 12.0
and 13.0. Use of the LIMS with its automatic data loading features (see Procedure
4017) minimizes the possibility of transcription or calculation errors.
14.3 Reports
Reports range from simple results reporting to elaborate analytical reports
based on the client requirements and imposed specifications and standards. (See
Procedure 4004.) Reports present results accurately, clearly, unambiguously,
objectively, and as required by the applicable Method(s).
Reports include
reproduction restrictions, information on any deviations from methods, and any
needed data qualifiers based on QC data. If any data is supplied by analytical
subcontractors (see Section 8.0), it is clearly identified and attributed to that
Laboratory by either name or accreditation number.
If results are faxed or transmitted electronically, confidentiality statements are
included in case of receipt by other than the intended client.
Reports are approved by the Program Manager and Operations Manager and
record copies kept in file (See Section 15.0).
Page 31 of 32
15.0 RECORDS
15.1 General
The Laboratory collects generated data and information related to quality or
technical data and maintains them as records. Records are identified, prepared,
reviewed, placed in storage, and maintained as set forth in Procedure 1003.
15.2 Type of Records
All original observations, calculations, derived data, calibration data, and test
reports are included. In addition QA data such as audits, management reviews,
corrective and preventive actions, manuals, and procedures are included.
15.3 Storage and Retention
Records are stored in files after completion in the lab. Files are in specified
locations and under the control of custodians. Filing systems provide for retrieval.
Electronic files are kept on Company servers (with regular back up) or on media
stored in fireproof file cabinets. Records are kept in Laboratory files for at least 2
years after the last entry and then in Company files for another year as a minimum.
Some customers specify larger periods – up to 7 years – which is also met. Generic
records supporting multiple customers are kept for the longest applicable period.
15.4 Destruction or Disposal
Records may be destroyed after the retention period and after client
notification and acceptance, if required. If the Laboratory closes, records will go in to
company storage in Huntsville unless otherwise directed by customers. If the
Laboratory is sold, either the new owner will accept record ownership or the records
will go into Company storage as stated above.
Page 32 of 32
16.0 ASSESSMENTS
16.1 General
Assessments consist of internal audits and management reviews as set forth
in Procedure 1013.
16.2 Audits
Internal audits are planned, performed at least annually on all areas of the
quality system, and are performed by qualified people who are as independent as
possible from the activity audited.
(The Laboratory’s small size inhibits full
independence in some technical areas.) Audits are coordinated by the Quality
Manager who assures audit plans and checklists are generated and the results
documented. Reports include descriptions of any findings and provide the auditor’s
assessment of the effectiveness of the audited activity. Report data includes
personnel contacted.
Audit findings are reviewed with management and corrective actions agreed
to and scheduled. Follow up is performed by QA to verify accomplishment and
effectiveness of the corrective action.
16.3 Management Reviews
The Annual Quality Assurance Report, prepared for some clients, is the
Management Review vehicle. These reports cover audit results, corrective and
preventive actions, external assessments, and QC and inter-laboratory performance
checks. The report is reviewed with Management by the QA Manager for the
continued suitability of the Quality Program and its effectiveness. Any needed
improvements are defined, documented, and implemented. Follow ups are made to
verify implementation and effectiveness.
Revision 1
45136 (15) Dresden Generating Station
APPENDIX D
LABORATORY ANALYTICAL REPORTS
L28777 1 of 127
L28777 2 of 127
L28777 3 of 127
L28777 4 of 127
L28777 5 of 127
L28777 6 of 127
L28777 7 of 127
L28777 8 of 127
L28777 9 of 127
L28777 10 of 127
L28777 11 of 127
L28777 12 of 127
L28777 13 of 127
L28777 14 of 127
L28777 15 of 127
L28777 16 of 127
L28777 17 of 127
L28777 18 of 127
L28777 19 of 127
L28777 20 of 127
L28777 21 of 127
L28777 22 of 127
L28777 23 of 127
L28777 24 of 127
L28777 25 of 127
L28777 26 of 127
L28777 27 of 127
L28777 28 of 127
L28777 29 of 127
L28777 30 of 127
L28777 31 of 127
L28777 32 of 127
L28777 33 of 127
L28777 34 of 127
L28777 35 of 127
L28777 36 of 127
L28777 37 of 127
L28777 38 of 127
L28777 39 of 127
L28777 40 of 127
L28777 41 of 127
L28777 42 of 127
L28777 43 of 127
L28777 44 of 127
L28777 45 of 127
L28777 46 of 127
L28777 47 of 127
L28777 48 of 127
L28777 49 of 127
L28777 50 of 127
L28777 51 of 127
L28777 52 of 127
L28777 53 of 127
L28777 54 of 127
L28777 55 of 127
L28777 56 of 127
L28777 57 of 127
L28777 58 of 127
L28777 59 of 127
L28777 60 of 127
L28777 61 of 127
L28777 62 of 127
L28777 63 of 127
L28777 64 of 127
L28777 65 of 127
L28777 66 of 127
L28777 67 of 127
L28777 68 of 127
L28777 69 of 127
L28777 70 of 127
L28777 71 of 127
L28777 72 of 127
L28777 73 of 127
L28777 74 of 127
L28777 75 of 127
L28777 76 of 127
L28777 77 of 127
L28777 78 of 127
L28777 79 of 127
L28777 80 of 127
L28777 81 of 127
L28777 82 of 127
L28777 83 of 127
L28777 84 of 127
L28777 85 of 127
L28777 86 of 127
L28777 87 of 127
L28777 88 of 127
L28777 89 of 127
L28777 90 of 127
L28777 91 of 127
L28777 92 of 127
L28777 93 of 127
L28777 94 of 127
L28777 95 of 127
L28777 96 of 127
L28777 97 of 127
L28777 98 of 127
L28777 99 of 127
L28777 100 of 127
L28777 101 of 127
L28777 102 of 127
L28777 103 of 127
L28777 104 of 127
L28777 105 of 127
L28777 106 of 127
L28777 107 of 127
L28777 108 of 127
L28777 109 of 127
L28777 110 of 127
L28777 111 of 127
L28777 112 of 127
L28777 113 of 127
L28777 114 of 127
L28777 115 of 127
L28777 116 of 127
L28777 117 of 127
L28777 118 of 127
L28777 119 of 127
L28777 120 of 127
L28777 121 of 127
L28777 122 of 127
L28777 123 of 127
L28777 124 of 127
L28777 125 of 127
L28777 126 of 127
L28777 127 of 127
L28851 1 of 145
L28851 2 of 145
L28851 3 of 145
L28851 4 of 145
L28851 5 of 145
L28851 6 of 145
L28851 7 of 145
L28851 8 of 145
L28851 9 of 145
L28851 10 of 145
L28851 11 of 145
L28851 12 of 145
L28851 13 of 145
L28851 14 of 145
L28851 15 of 145
L28851 16 of 145
L28851 17 of 145
L28851 18 of 145
L28851 19 of 145
L28851 20 of 145
L28851 21 of 145
L28851 22 of 145
L28851 23 of 145
L28851 24 of 145
L28851 25 of 145
L28851 26 of 145
L28851 27 of 145
L28851 28 of 145
L28851 29 of 145
L28851 30 of 145
L28851 31 of 145
L28851 32 of 145
L28851 33 of 145
L28851 34 of 145
L28851 35 of 145
L28851 36 of 145
L28851 37 of 145
L28851 38 of 145
L28851 39 of 145
L28851 40 of 145
L28851 41 of 145
L28851 42 of 145
L28851 43 of 145
L28851 44 of 145
L28851 45 of 145
L28851 46 of 145
L28851 47 of 145
L28851 48 of 145
L28851 49 of 145
L28851 50 of 145
L28851 51 of 145
L28851 52 of 145
L28851 53 of 145
L28851 54 of 145
L28851 55 of 145
L28851 56 of 145
L28851 57 of 145
L28851 58 of 145
L28851 59 of 145
L28851 60 of 145
L28851 61 of 145
L28851 62 of 145
L28851 63 of 145
L28851 64 of 145
L28851 65 of 145
L28851 66 of 145
L28851 67 of 145
L28851 68 of 145
L28851 69 of 145
L28851 70 of 145
L28851 71 of 145
L28851 72 of 145
L28851 73 of 145
L28851 74 of 145
L28851 75 of 145
L28851 76 of 145
L28851 77 of 145
L28851 78 of 145
L28851 79 of 145
L28851 80 of 145
L28851 81 of 145
L28851 82 of 145
L28851 83 of 145
L28851 84 of 145
L28851 85 of 145
L28851 86 of 145
L28851 87 of 145
L28851 88 of 145
L28851 89 of 145
L28851 90 of 145
L28851 91 of 145
L28851 92 of 145
L28851 93 of 145
L28851 94 of 145
L28851 95 of 145
L28851 96 of 145
L28851 97 of 145
L28851 98 of 145
L28851 99 of 145
L28851 100 of 145
L28851 101 of 145
L28851 102 of 145
L28851 103 of 145
L28851 104 of 145
L28851 105 of 145
L28851 106 of 145
L28851 107 of 145
L28851 108 of 145
L28851 109 of 145
L28851 110 of 145
L28851 111 of 145
L28851 112 of 145
L28851 113 of 145
L28851 114 of 145
L28851 115 of 145
L28851 116 of 145
L28851 117 of 145
L28851 118 of 145
L28851 119 of 145
L28851 120 of 145
L28851 121 of 145
L28851 122 of 145
L28851 123 of 145
L28851 124 of 145
L28851 125 of 145
L28851 126 of 145
L28851 127 of 145
L28851 128 of 145
L28851 129 of 145
L28851 130 of 145
L28851 131 of 145
L28851 132 of 145
L28851 133 of 145
L28851 134 of 145
L28851 135 of 145
L28851 136 of 145
L28851 137 of 145
L28851 138 of 145
L28851 139 of 145
L28851 140 of 145
L28851 141 of 145
L28851 142 of 145
L28851 143 of 145
L28851 144 of 145
L28851 145 of 145
L28853 1 of 42
L28853 2 of 42
L28853 3 of 42
L28853 4 of 42
L28853 5 of 42
L28853 6 of 42
L28853 7 of 42
L28853 8 of 42
L28853 9 of 42
L28853 10 of 42
L28853 11 of 42
L28853 12 of 42
L28853 13 of 42
L28853 14 of 42
L28853 15 of 42
L28853 16 of 42
L28853 17 of 42
L28853 18 of 42
L28853 19 of 42
L28853 20 of 42
L28853 21 of 42
L28853 22 of 42
L28853 23 of 42
L28853 24 of 42
L28853 25 of 42
L28853 26 of 42
L28853 27 of 42
L28853 28 of 42
L28853 29 of 42
L28853 30 of 42
L28853 31 of 42
L28853 32 of 42
L28853 33 of 42
L28853 34 of 42
L28853 35 of 42
L28853 36 of 42
L28853 37 of 42
L28853 38 of 42
L28853 39 of 42
L28853 40 of 42
L28853 41 of 42
L28853 42 of 42
L288211 of 82
L288212 of 82
L288213 of 82
L288214 of 82
L288215 of 82
L288216 of 82
L288217 of 82
L288218 of 82
L288219 of 82
L2882110 of 82
L2882111 of 82
L2882112 of 82
L2882113 of 82
L2882114 of 82
L2882115 of 82
L2882116 of 82
L2882117 of 82
L2882118 of 82
L2882119 of 82
L2882120 of 82
L2882121 of 82
L2882122 of 82
L2882123 of 82
L2882124 of 82
L2882125 of 82
L2882126 of 82
L2882127 of 82
L2882128 of 82
L2882129 of 82
L2882130 of 82
L2882131 of 82
L2882132 of 82
L2882133 of 82
L2882134 of 82
L2882135 of 82
L2882136 of 82
L2882137 of 82
L2882138 of 82
L2882139 of 82
L2882140 of 82
L2882141 of 82
L2882142 of 82
L2882143 of 82
L2882144 of 82
L2882145 of 82
L2882146 of 82
L2882147 of 82
L2882148 of 82
L2882149 of 82
L2882150 of 82
L2882151 of 82
L2882152 of 82
L2882153 of 82
L2882154 of 82
L2882155 of 82
L2882156 of 82
L2882157 of 82
L2882158 of 82
L2882159 of 82
L2882160 of 82
L2882161 of 82
L2882162 of 82
L2882163 of 82
L2882164 of 82
L2882165 of 82
L2882166 of 82
L2882167 of 82
L2882168 of 82
L2882169 of 82
L2882170 of 82
L2882171 of 82
L2882172 of 82
L2882173 of 82
L2882174 of 82
L2882175 of 82
L2882176 of 82
L2882177 of 82
L2882178 of 82
L2882179 of 82
L2882180 of 82
L2882181 of 82
L2882182 of 82
L28990 1 of 24
L28990 2 of 24
L28990 3 of 24
L28990 4 of 24
L28990 5 of 24
L28990 6 of 24
L28990 7 of 24
L28990 8 of 24
L28990 9 of 24
L28990 10 of 24
L28990 11 of 24
L28990 12 of 24
L28990 13 of 24
L28990 14 of 24
L28990 15 of 24
L28990 16 of 24
L28990 17 of 24
L28990 18 of 24
L28990 19 of 24
L28990 20 of 24
L28990 21 of 24
L28990 22 of 24
L28990 23 of 24
L28990 24 of 24
L28845 R3 / 1 of 90
L28845 R3 / 2 of 90
L28845 R3 / 3 of 90
L28845 R3 / 4 of 90
L28845 R3 / 5 of 90
L28845 R3 / 6 of 90
L28845 R3 / 7 of 90
L28845 R3 / 8 of 90
L28845 R3 / 9 of 90
L28845 R3 / 10 of 90
L28845 R3 / 11 of 90
L28845 R3 / 12 of 90
L28845 R3 / 13 of 90
L28845 R3 / 14 of 90
L28845 R3 / 15 of 90
L28845 R3 / 16 of 90
L28845 R3 / 17 of 90
L28845 R3 / 18 of 90
L28845 R3 / 19 of 90
L28845 R3 / 20 of 90
L28845 R3 / 21 of 90
L28845 R3 / 22 of 90
L28845 R3 / 23 of 90
L28845 R3 / 24 of 90
L28845 R3 / 25 of 90
L28845 R3 / 26 of 90
L28845 R3 / 27 of 90
L28845 R3 / 28 of 90
L28845 R3 / 29 of 90
L28845 R3 / 30 of 90
L28845 R3 / 31 of 90
L28845 R3 / 32 of 90
L28845 R3 / 33 of 90
L28845 R3 / 34 of 90
L28845 R3 / 35 of 90
L28845 R3 / 36 of 90
L28845 R3 / 37 of 90
L28845 R3 / 38 of 90
L28845 R3 / 39 of 90
L28845 R3 / 40 of 90
L28845 R3 / 41 of 90
L28845 R3 / 42 of 90
L28845 R3 / 43 of 90
L28845 R3 / 44 of 90
L28845 R3 / 45 of 90
L28845 R3 / 46 of 90
L28845 R3 / 47 of 90
L28845 R3 / 48 of 90
L28845 R3 / 49 of 90
L28845 R3 / 50 of 90
L28845 R3 / 51 of 90
L28845 R3 / 52 of 90
L28845 R3 / 53 of 90
L28845 R3 / 54 of 90
L28845 R3 / 55 of 90
L28845 R3 / 56 of 90
L28845 R3 / 57 of 90
L28845 R3 / 58 of 90
L28845 R3 / 59 of 90
L28845 R3 / 60 of 90
L28845 R3 / 61 of 90
L28845 R3 / 62 of 90
L28845 R3 / 63 of 90
L28845 R3 / 64 of 90
L28845 R3 / 65 of 90
L28845 R3 / 66 of 90
L28845 R3 / 67 of 90
L28845 R3 / 68 of 90
L28845 R3 / 69 of 90
L28845 R3 / 70 of 90
L28845 R3 / 71 of 90
L28845 R3 / 72 of 90
L28845 R3 / 73 of 90
L28845 R3 / 74 of 90
L28845 R3 / 75 of 90
L28845 R3 / 76 of 90
L28845 R3 / 77 of 90
L28845 R3 / 78 of 90
L28845 R3 / 79 of 90
L28845 R3 / 80 of 90
L28845 R3 / 81 of 90
L28845 R3 / 82 of 90
L28845 R3 / 83 of 90
L28845 R3 / 84 of 90
L28845 R3 / 85 of 90
L28845 R3 / 86 of 90
L28845 R3 / 87 of 90
L28845 R3 / 88 of 90
L28845 R3 / 89 of 90
L28845 R3 / 90 of 90
L29515 1 of 70
L29515 2 of 70
L29515 3 of 70
L29515 4 of 70
L29515 5 of 70
L29515 6 of 70
L29515 7 of 70
L29515 8 of 70
L29515 9 of 70
L29515 10 of 70
L29515 11 of 70
L29515 12 of 70
L29515 13 of 70
L29515 14 of 70
L29515 15 of 70
L29515 16 of 70
L29515 17 of 70
L29515 18 of 70
L29515 19 of 70
L29515 20 of 70
L29515 21 of 70
L29515 22 of 70
L29515 23 of 70
L29515 24 of 70
L29515 25 of 70
L29515 26 of 70
L29515 27 of 70
L29515 28 of 70
L29515 29 of 70
L29515 30 of 70
L29515 31 of 70
L29515 32 of 70
L29515 33 of 70
L29515 34 of 70
L29515 35 of 70
L29515 36 of 70
L29515 37 of 70
L29515 38 of 70
L29515 39 of 70
L29515 40 of 70
L29515 41 of 70
L29515 42 of 70
L29515 43 of 70
L29515 44 of 70
L29515 45 of 70
L29515 46 of 70
L29515 47 of 70
L29515 48 of 70
L29515 49 of 70
L29515 50 of 70
L29515 51 of 70
L29515 52 of 70
L29515 53 of 70
L29515 54 of 70
L29515 55 of 70
L29515 56 of 70
L29515 57 of 70
L29515 58 of 70
L29515 59 of 70
L29515 60 of 70
L29515 61 of 70
L29515 62 of 70
L29515 63 of 70
L29515 64 of 70
L29515 65 of 70
L29515 66 of 70
L29515 67 of 70
L29515 68 of 70
L29515 69 of 70
L29515 70 of 70
L29543 1 of 58
L29543 2 of 58
L29543 3 of 58
L29543 4 of 58
L29543 5 of 58
L29543 6 of 58
L29543 7 of 58
L29543 8 of 58
L29543 9 of 58
L29543 10 of 58
L29543 11 of 58
L29543 12 of 58
L29543 13 of 58
L29543 14 of 58
L29543 15 of 58
L29543 16 of 58
L29543 17 of 58
L29543 18 of 58
L29543 19 of 58
L29543 20 of 58
L29543 21 of 58
L29543 22 of 58
L29543 23 of 58
L29543 24 of 58
L29543 25 of 58
L29543 26 of 58
L29543 27 of 58
L29543 28 of 58
L29543 29 of 58
L29543 30 of 58
L29543 31 of 58
L29543 32 of 58
L29543 33 of 58
L29543 34 of 58
L29543 35 of 58
L29543 36 of 58
L29543 37 of 58
L29543 38 of 58
L29543 39 of 58
L29543 40 of 58
L29543 41 of 58
L29543 42 of 58
L29543 43 of 58
L29543 44 of 58
L29543 45 of 58
L29543 46 of 58
L29543 47 of 58
L29543 48 of 58
L29543 49 of 58
L29543 50 of 58
L29543 51 of 58
L29543 52 of 58
L29543 53 of 58
L29543 54 of 58
L29543 55 of 58
L29543 56 of 58
L29543 57 of 58
L29543 58 of 58
L29557 1 of 49
L29557 2 of 49
L29557 3 of 49
L29557 4 of 49
L29557 5 of 49
L29557 6 of 49
L29557 7 of 49
L29557 8 of 49
L29557 9 of 49
L29557 10 of 49
L29557 11 of 49
L29557 12 of 49
L29557 13 of 49
L29557 14 of 49
L29557 15 of 49
L29557 16 of 49
L29557 17 of 49
L29557 18 of 49
L29557 19 of 49
L29557 20 of 49
L29557 21 of 49
L29557 22 of 49
L29557 23 of 49
L29557 24 of 49
L29557 25 of 49
L29557 26 of 49
L29557 27 of 49
L29557 28 of 49
L29557 29 of 49
L29557 30 of 49
L29557 31 of 49
L29557 32 of 49
L29557 33 of 49
L29557 34 of 49
L29557 35 of 49
L29557 36 of 49
L29557 37 of 49
L29557 38 of 49
L29557 39 of 49
L29557 40 of 49
L29557 41 of 49
L29557 42 of 49
L29557 43 of 49
L29557 44 of 49
L29557 45 of 49
L29557 46 of 49
L29557 47 of 49
L29557 48 of 49
L29557 49 of 49
L29576 1 of 57
L29576 2 of 57
L29576 3 of 57
L29576 4 of 57
L29576 5 of 57
L29576 6 of 57
L29576 7 of 57
L29576 8 of 57
L29576 9 of 57
L29576 10 of 57
L29576 11 of 57
L29576 12 of 57
L29576 13 of 57
L29576 14 of 57
L29576 15 of 57
L29576 16 of 57
L29576 17 of 57
L29576 18 of 57
L29576 19 of 57
L29576 20 of 57
L29576 21 of 57
L29576 22 of 57
L29576 23 of 57
L29576 24 of 57
L29576 25 of 57
L29576 26 of 57
L29576 27 of 57
L29576 28 of 57
L29576 29 of 57
L29576 30 of 57
L29576 31 of 57
L29576 32 of 57
L29576 33 of 57
L29576 34 of 57
L29576 35 of 57
L29576 36 of 57
L29576 37 of 57
L29576 38 of 57
L29576 39 of 57
L29576 40 of 57
L29576 41 of 57
L29576 42 of 57
L29576 43 of 57
L29576 44 of 57
L29576 45 of 57
L29576 46 of 57
L29576 47 of 57
L29576 48 of 57
L29576 49 of 57
L29576 50 of 57
L29576 51 of 57
L29576 52 of 57
L29576 53 of 57
L29576 54 of 57
L29576 55 of 57
L29576 56 of 57
L29576 57 of 57
Revision 1
45136 (15) Dresden Generating Station
APPENDIX E
DATA VALIDATION MEMORANDUM