1,06FEWSLE MA
Electronic Filing, Received, Clerk's Office May 1, 2007
3WYMI'Fq NQRGANjGSULFA-
.rE-jNDR1NK1NG
0 0ATTL0i ,-!
.
I
;
'arici
.
A .I.Weed,
UntagrWy of Nevada, Ratio 89507
SUMMARY
.
.
for Alallate Were 21 Agrad 344 MM, rcsaliec*~
-
-
.'Twelve
Hcrefor&Anps wcanling
holars
lyri
. Those or c
1~
. were 45.6• a
0
a 1556
'were
I
design
I
used its ppIAW lot d&% incorporating a
rtMolsr
. Apparently, sulfate was More impala-
'randomized
complete block"to determine phygi4
table than hlod
;
& when
M13
a
o, an
610"
C&dM of sUbroXic concentrations of ctimm6lar bails
. r appears that These be
lerate
W
to
i
inorgainid sulfate in drinking wttcr
. trtAtnl;um were able to tb1crat
2,500
wkq 0
sulfate
A
mere Mpr~wwe (110 m0liter suwstc)
. xZ50
d" drialting water y0thoat adverse effects,
00
The
°^d that this
concentration of afiliate .represents
mgMrq
a
urf-
2, 50.0
CC .
sulfate WSs added to the up water 48 sodium
a safe mlc#ncc concentration .
ate
. The sulfate-Waters did not affect
feed (Key Words' Water,~ Sulfate, .Maximum, Taste
t oo
su mption, water fonstimption or growth
sespc-IOI
during ihe
¢D-day expiriment. No 6wrt-nuxic,
icy wod-bbsoved.'Hei&ri.dnnldngadatewito
INTRODUCTION
had t;qdcqkq to accumulate .ingthertioglobin
Ir
'- b,
and SalflucYnoglobi, Without 'affecting mad
VID -I-, that I-- don
it
an
own P= u
eS
hemoglobin
. Sulfate loading did not induce
0
&rtsadc stdate via drinidnil'witer Produced
ditnesii alitpoujb hcjiO,, :dQdji8
. ~'
5D6
quaortitatiac
;luMgs in'blocut coin
and
Ter. siAt6p-water
ate : by 0.1% ,4na decreased , )coal
filtration
-rajalAMP
nf
Tang]
63 .1%
functionand
it 56,v?b
of- tattleTOM&
. Heifers
b
serum'showed
n--sulfasdo
a
don cit tw'iop uy 23 .,
~w'Nrefofa; in these
Whene
~.r-kldpg
i$kj n1jillitif sniffle
(Water
and Hjmter~'19.71)
experbnent
vore
absorbed
animadsiabscriuint[yh
. thewas
in
percentagedecreasedwhich
use(they
Of
je
by
infiltered,
were
44
a
.89k
cWercd
astThe
.,
sulfate
responseeitherheifersre,
(1ksalfhomostobin
boa'
ubsetv4d
.OtS
61t6tabarno
aid
were&pp~
increases
concentrations
1972),
bin
I
and
in
2,64
ATelative
rfiethemoglobxft
respwithout,
moto
.ttiv91ididresissulfateUteri=
; . Imso
waand.
sodium chloride or sodlum. clip in a two-
notedin
imth of ,the .-above cicitations with
A
i&
salt
o
hoicesoluPrOference
tion; or ca~sirairionwao,~ Th
. 1-be
e
its
choiceweno40
the tdgber
icrcotpe of ingested water being m
al
t o
tpapc"ter iii mcrcasmg
bt estimated equal
er,ted
through the
urine.
On th
e
basis ofthes
stride
It
was
sugg
275
ndonic
ested that growing
cattle
to
cong Onconlow
in six Increments from
uld t lerit, A
lost
I
or
aWtt
m
least
flize
40 da
r sulf
ys
4 ;40O'mgfiiter of anion The animals
ate In
water f
dsacritdidinedd
against
drinking
water confaining
and
kW~
1,6Zo
minjoer chloride
2,918
rr"=Y
face . q0nocraxitioup
chloride
at the
orestiourred
rejection
thattrite
rids
dL,&jmIconcentration
m
tj thresholdwas
probabl7ficauthdrld
(Weeds and
threshold were 3,52.4 and 3,317 raglitc fort
herein is aftt attempt
:
19'1'2)~ Reported
chloride, and, sulfate, respectively . On
. a
molar
which
mat to
.-C a
, a t r
basis, discrimination and p,)ccUv
-1
.
thresholds
the concentration ,of
inorganic
sulfate in the
'CAVITY evaluating phyla
response.,
'Conducted
drinking.
water: of
logkhl dfrcts and irate
6 cooperation with WOMM ROOM
EXPE RIMIENYAL PROCEDURE
,t,,cifth project W46. Th
. gfk~ of ¢hyjrmrntmt
SinsjOaraoilRaugePapa, CattleNO
somandSbftp
VMdF060" .
(fOqf
Twelvepr
Vestment)wort
Hereford-Anus
offered
Wcznhbg
either
heiferst2f
pornar cadres, Depwrawnt of Animal Pbyll.1-
wate
r (110 mgjliter sulk e), 1,250 mg/liter
agy .U .1var,ky
b
fcauwmx Dash "616 .
sulf.tewater or 2400
tog/liter
sulfate-witcr in
1498
JOURNAL OPANVAAL SCIENCE, Vol . 42 .
No .
1976
suifAe-*-tcta-Ss
.
.Iiu00
;
-d2Y-ro sulfate
-thd
was
animals'
Ithosclurci
werec
grinsylduitly,
iid Oirtially hitsid pilry .
addIfhy
,
11
.4% protein
; pelt
of "0 it=
Vi
MOIS
i
sulfate,
66% .
dairy
Matter
pellets
b
tabs"i
: prottin,
Matt,
,20a
47;tidal
fiber,.1
bodywe
.
9k askmaker
a
w 165 kilog
and 90 : a I
obsrstiisrioh was made 6o eat
Lcsptecbrdgytee
;;Ace
.
p,10
; .
SYWy
. -TotalAhemo
todgiobbi
aadrts
by
collected
the'-techniqueblood
. Forofother
obinIMO
de(pw-
t
pies of plasma, serdm
and uric
frleen until analyzed, , Ansayti.
Were' as noted by W6ib and 'I
Sincei
rcp"d - OibsOriradb nsbsOriadbns wet
"same
aptortgsuggestedadmalstrOAtinani
by
.
1Pill
dat &'were
and
ftic6sHats
ihajyaczl
;
ilOneU97
DuncOA-
.
s tin
.
dijp rAwctest(19!
warm
Thti
gild
whilliedry"
;
`clig-13at
,
dongCLIP
.2
Maidnamarind
I .
the
§.1do
&o n i US Weather 'Bur
.
ead
TADLE
2,$Ob
1
. EPPECrS
AIMMER
OF
SULIDam
;fray
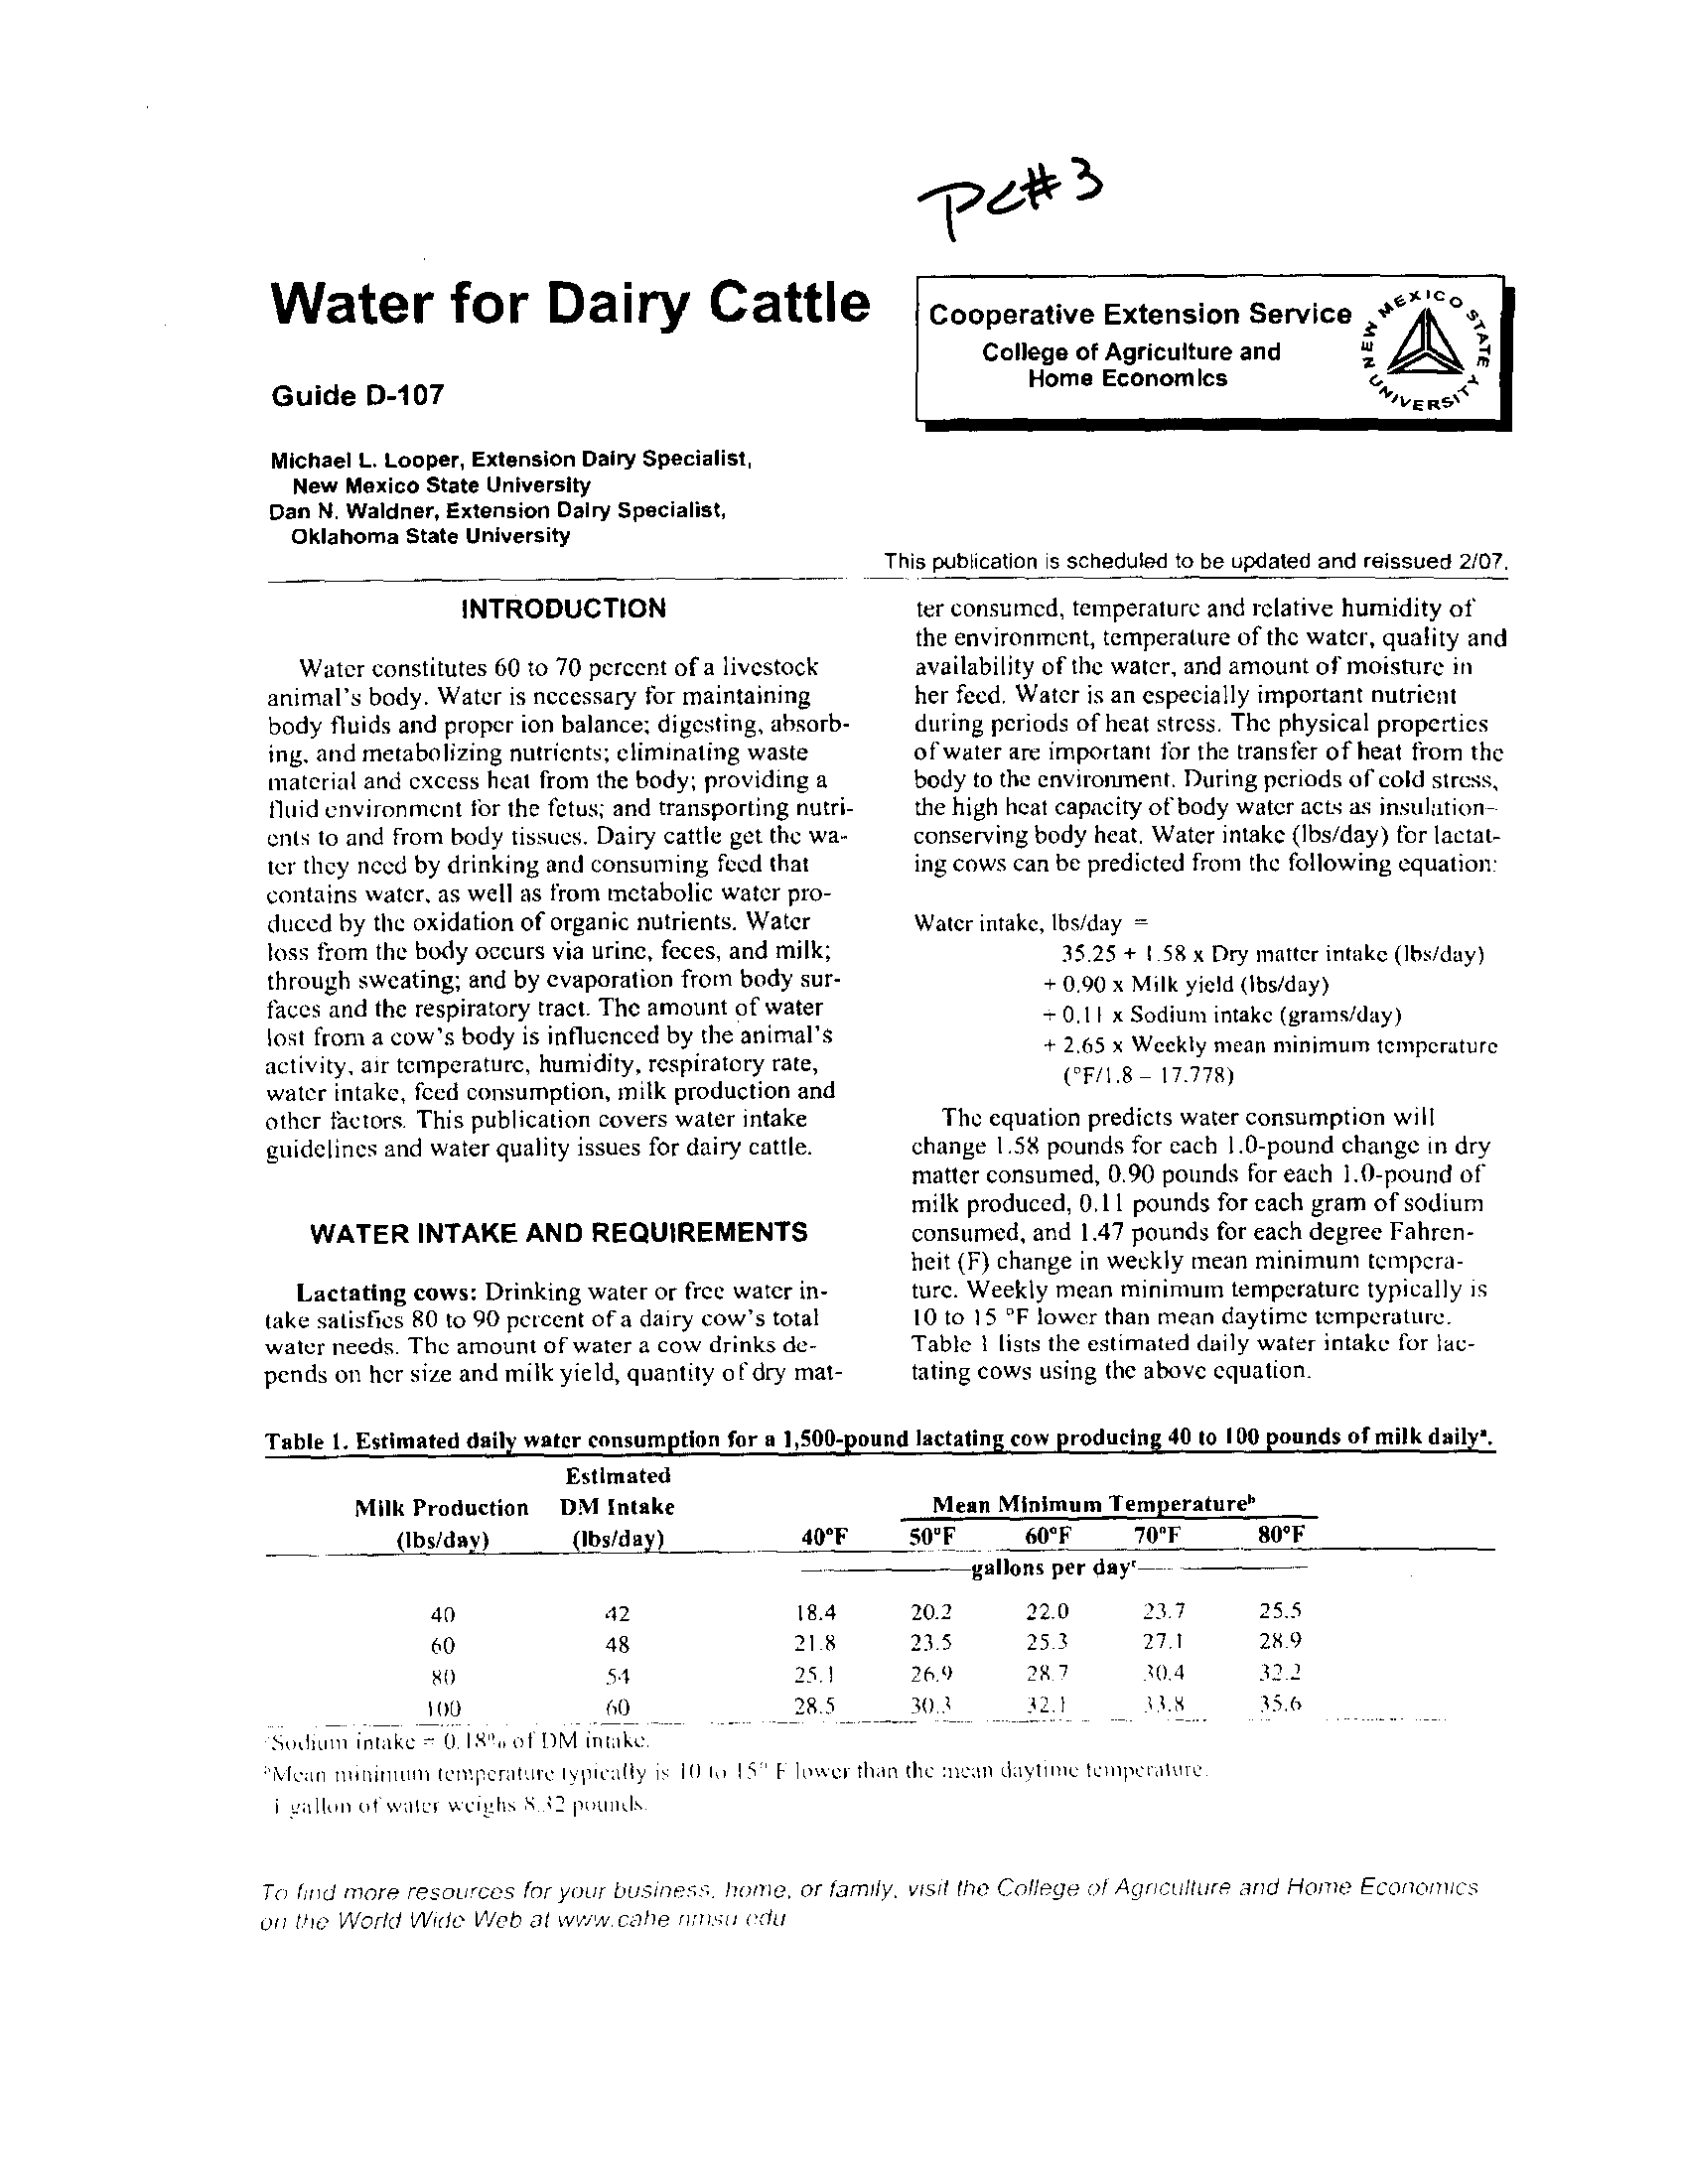
WitcrimaksIntake, .
4100Y4&Y
SaIfiae,
d"M"
Intakeickus
. g1day
. 4n
WeightFL6-m
Oftroldwygaii
. W,4ay
. manallg
)Aithe" glali',
mg/loognoo
.1ml
WomfV
'ob1p. mg/loo ml
twAOHAMKe1
;
~.
.94&.
Vq- bmxftjnm
per item mean,
,
t .c .didesur,
ua'orrc line basting dl
SULFATE IN DRINKING
;
we 21.0 and 34.5 MM, rcspcctf
Drr chloride were 4S:6-and
.155J6
Parently,:sulfate Was more Impala-
chloride, when eomyaredd on
. an
axis
. It appears that these heifers
tolerate 2,50b ~mgfiternlfate
in .
,gg water Nithopt
.adverse effects,
cqneebtraiion . of sulfate represents
cc eopcentration.
Water; Sulfate, Maximum
; Taste
INTRODUCTION
n. shown previously that ingestion
ulfatc bra drinking water produced
;hanger in blood composition
and .
in
i0
of
;0%
cattle
.
increase
. Heifers
iii Serum
showed
sulfate-a
tg 3',499 ing/Liter sulfa a (Weeth
1971), and 2,814 mg/Bier sulfate
Capps;, 1972), respeSvely
. Also
e
in
inereasesconcentrations
.i n metlieitoglobinwithout
. alter*-.and .
,ernoglobhs
. A rc]atlvc dhoress was
h of the above nitatioas- with
.a
rage of ingested Water being ex-
h the urine
. On the .basis .oftheir
55 suggested that growing cattle
'it '!east 1,450 mg/liter .sulfate in
-water-for . at
least 30 days and
entratiop, was, pmbablynear their
kiatjon threshold
. (Weed[
d
. Reported herein is an attempt
de' to'debnc a defensible limit for
titan" of inorganic sulfate 'in the
r Of cattle by evaluating physio-
and taste respotse .
RIMENTAL PRO
)
(!F.DURE
erefnrd-Angus weanling heifers
.oncnt) were offeredd either
Up-
ng/liter sulfate), 1,250 mg/Liter
)r 2
.500 stag/liter sulfate-water
in
IMAL SCIENCE,
Vol . 42, No .6,1976
Electronic Filing, Received, Clerk's Office May 1, 2007
******PC#
**
'90-day experiment conducted during summer
.
Sodium sulfate was the source of sulfate
in the
tulfate-waters
. The anhna4s wetemanaged iiadi-
StduaBy
.,in pktidt1ysh dedpedL They were fad
glass h"ay and 14% pkorem pelletss ad /tbiture
.
proximate analysis of
the grass bay .was : pro-
tein, 12
.06%, sullaW .60%, ether extract,
Z.(37%,
ash, 11 .20%i ; and, fiber, -19.29% - 6n'a
dty matter bash
. Proximate analysis of the
dairy
was . protein
; 20X6%, sulfate,
.47%, -
ether 'exttatt.:3.88%I ash, '1.57%i,and,
fiber, 11
.54% oh a dry matter basis. Merest,
initial body
weight was 165 kilograms!
Otl days 0 ; 41 add 90 a'rSal clearance
obse1vadbn was
mine bn'each heifer Win
tgchnlques previously described . (Weetb and
lespeianl:o, 1965). Total' hemoglobin, methe-
-moglobin'
and'sulfhetnoglobln were determined
by
the'technlqup of -[-hinltne'(1965) on freshly
collectedi blood. `For other determinations, sam-
ples'of plasma, serum and urine were stored
frdaen until analyzed
. Analytical 'procedures
were as noted by *eeth and Hunter (1971)
.
Spice repeated'obsefvanons were made on the
same animals data,
were analyzed-Statistically' as
suggested by GiO and Hafs (1971). DiHgencts
afoong
. treatmeot means weie'evaluated
by
Duncan'smnitiple'taegptest
(1935) .
The Weather -'during the experiment was
warm
and dry, averageninimum addminiitmn
temperaturcsbeing '33
.2and9,2,C.EVapbradon
from a
U.S
. Weattier - Bureau
'pen' was 7.6
mm/day.
Following the sulfate tolerance study, the
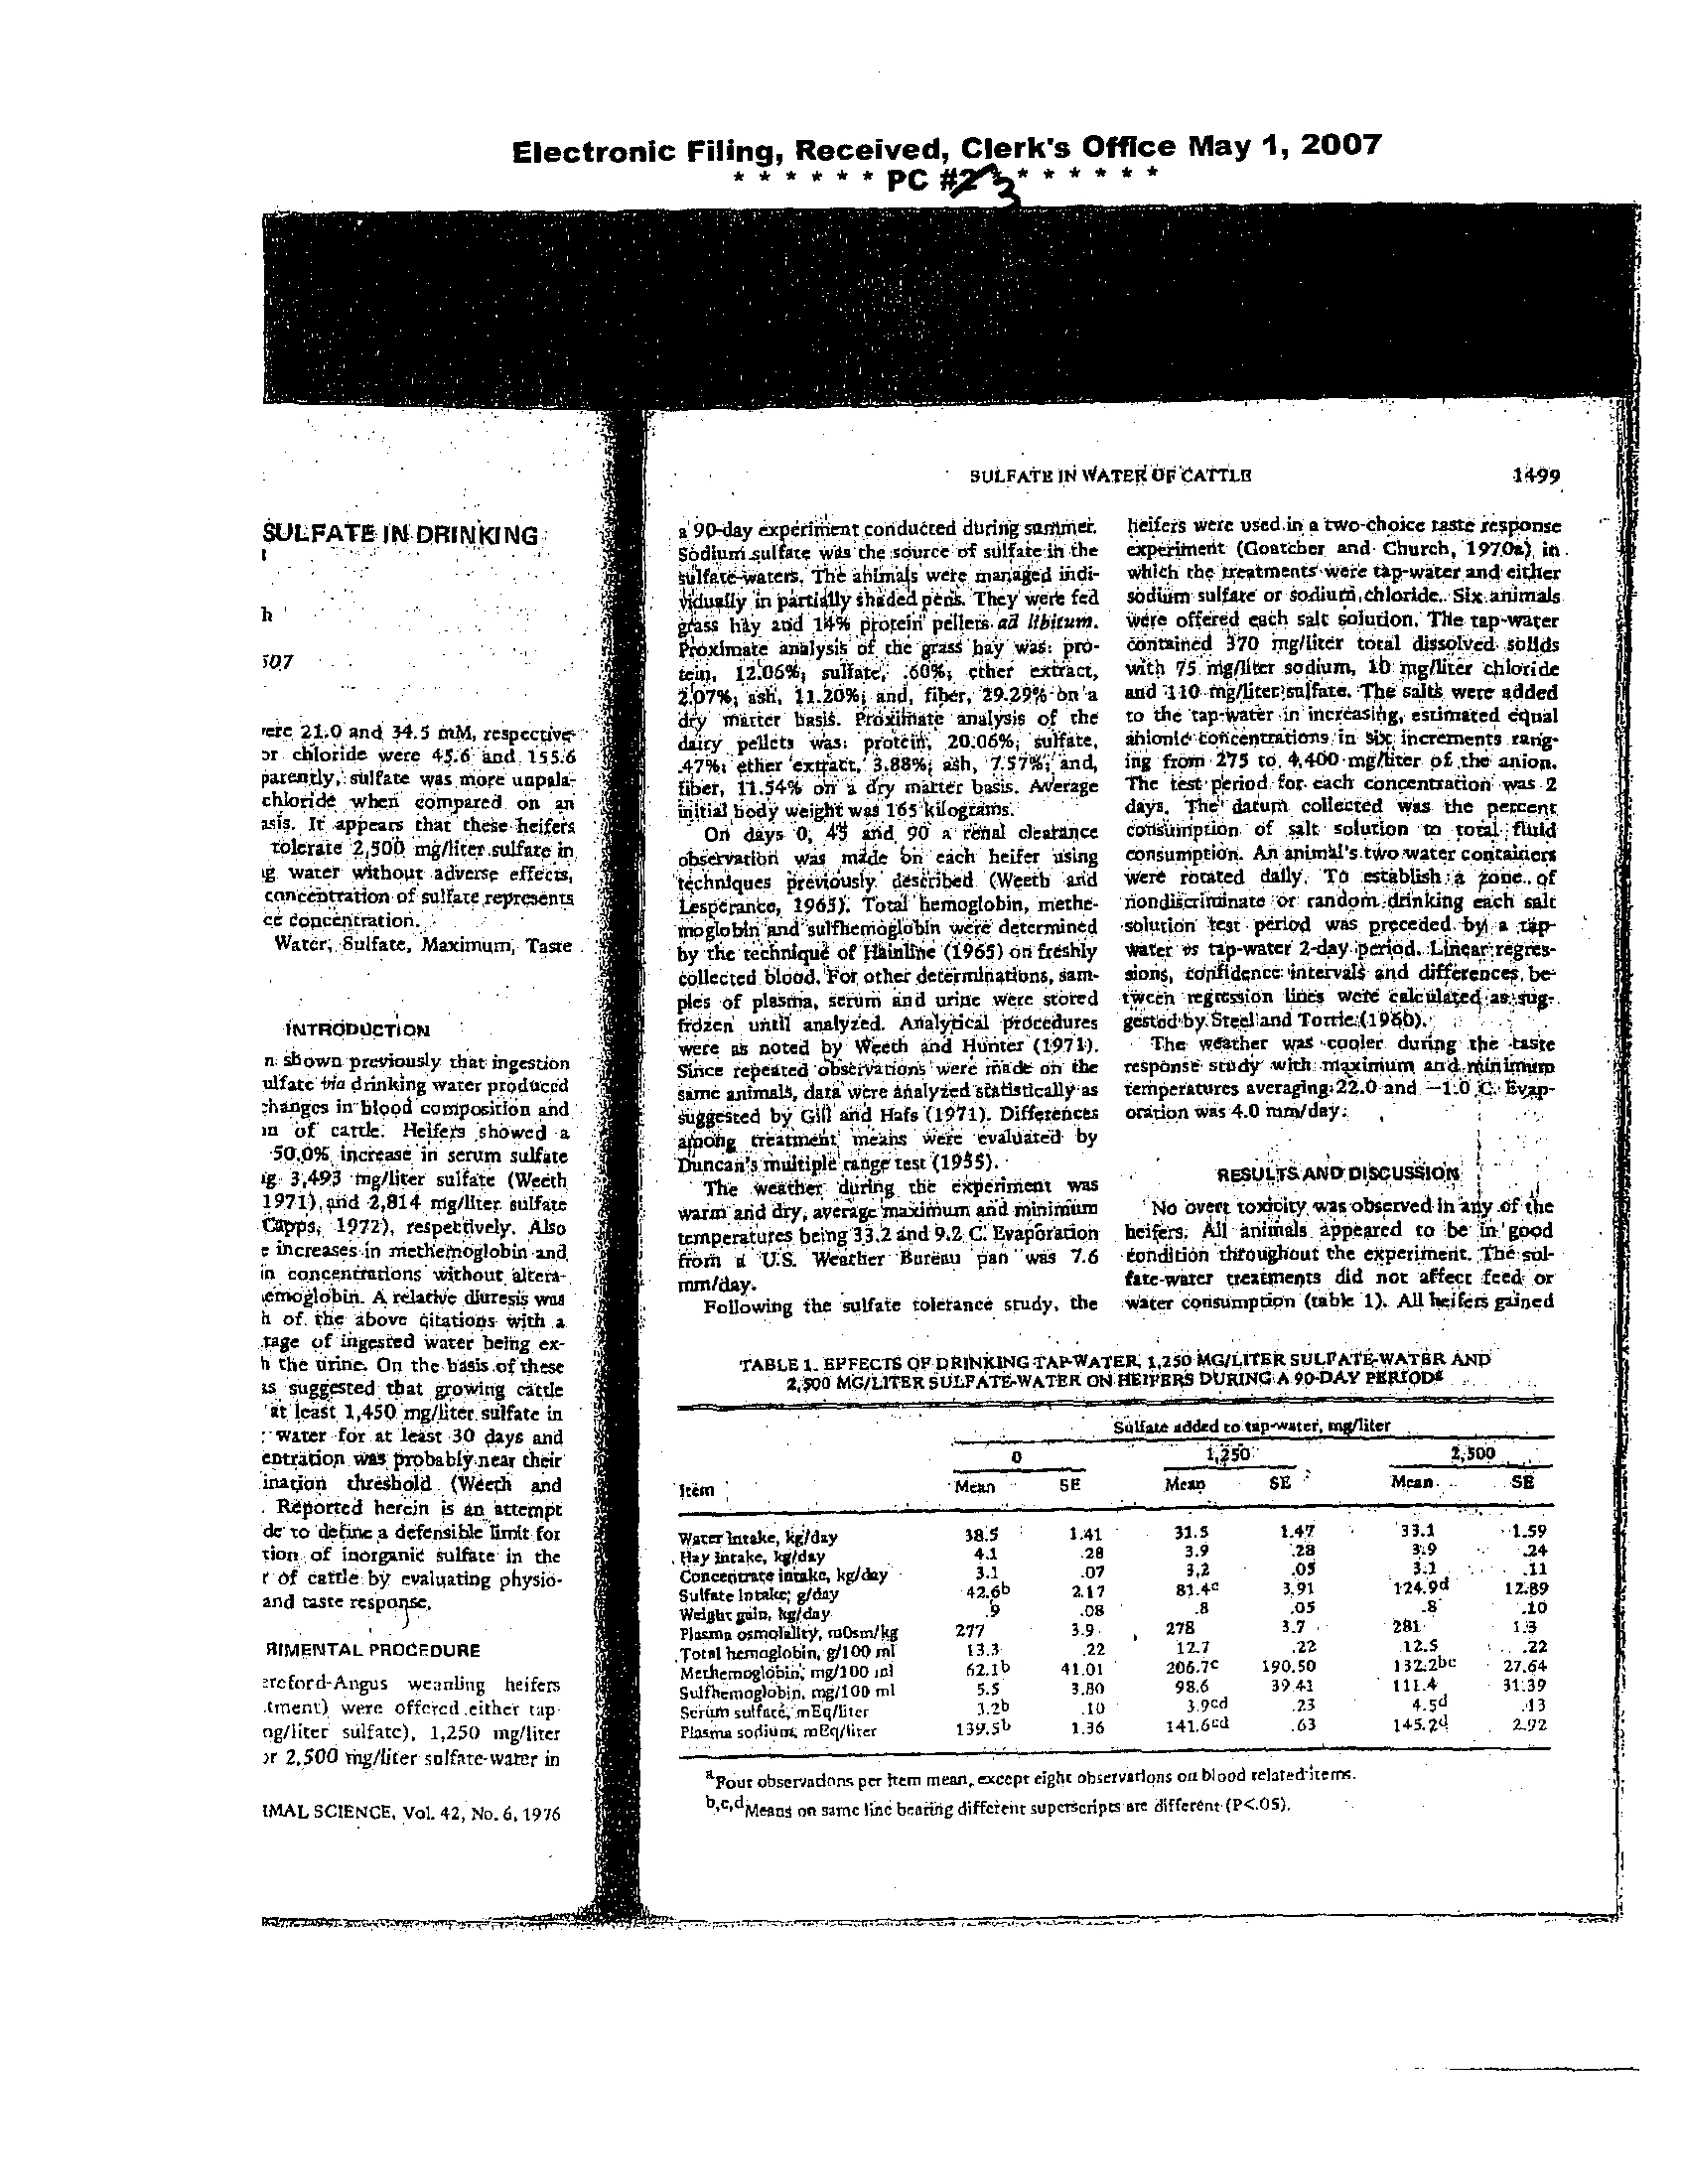
TABLE 1
. EPFECTS QF DRINl(It1G TAPWATER 1,250 AMG/L1TER SULPATFr
WATiR AND
2,00 MG/LITER SULPATFWATER
ON-H2IPBRS DURING A
.9O'DAY PERlQD4
Segaraaddedtoaap+atei
mgniter
.
i,d so: .
2,500
SE
Meao
SE
M .A . . .
~SE
Watrrkitake,kg'/day
Nay Intake, 4lday
Concentrate intake, kg/day
-
Sulfate lntake
; g/dey
Wdghtgain, kg/day
Plasma o%molalt
)k,
.(Dm/kgTotal hemnglobin, 5/10D ml
Mediemnglobio; mg/I00,n7
Suifhemaglobin. mg/lOD
ml
Scrum sulfas&,nEq/liter
Plasma
sodium; meq/liar
SULFATE 10 WATEIi OF'CATTLB
1499
Mean
38.5
1.41
-
31.5
4 .1
.28
3 .9
3 .1
.07
3,2
42.6b
2 .17
814e
9
.08
.8
277
3
.9
278
13 .3
22
127
62.1b
41 .01
206.7c
5.5
3 .80
98.6
32b
.10
3 .9cd
139.51,
1 .36
141.6ad
heifers were used in a two-choice taste response
caper
bunit (Goatcher and- Church, 1970*), in
.
which the tr tments-wore tap-water and eith e r
sodium 'sulfate or sodiurd,ehlorlde
., Slx .aidanals
were offered each
salt
solution
. Tile tap-water
contained 370 mg/liter total dissolved Solids
with 75 .hignitcr sodium . 2b'.pgfliter chloride
and 110- ink /litee?sn%fate
.
The
sank
; were added
to the tap,wattr lin' increasing, estimated equal
abionl&'tofleeptratlen9 in increments range
ing front, 175 to
. 4,400-mgfliter pf theanion
.
The test' period : for. each concentration -Was -2
days . Thn ; datum collected wass the percent
eontmption -
of salt solution m todl
:fhUd
consumption . Am ap(mki's .twowater contamers
Were rotated daily
TO establish ;
a tone-Of
'nondlic irninate or randotncddnking each salt
solution test period wass preceded by,;a ;tsp
water' as tap-water 2-day ;period Linear regres-
sions, udpfldence intetvai3-arid differeacea,be`
twcen regression lines weft cakulate4 :atrsug
gestad by.Stetl''iand Totdt':(i9Yb)
.
The' weather was •cooler-
during the -taste
response study' .widt',tn Ptinium and ;t{Miiiiirwsp
temperatures averagingt22
.0-and
EvAp-
oration was 4
.0 mm/day :. ,
RESUL`rSANDDISCUS$ION'
No overt toxicity, was observed in aiy .of-the
beifers . All -animals appeared to be'irl'gogd
fonditionthroughout the experiment
. The sol-
fate-water treatments did not affect feed or
water consumption (table 1). . All heifer; gained
*Pour
absermdnn per hem mean, except eight nhservadons on blood related'hemed
b,e,
dVines nn same line bearing diffcieia superscript, an different
(P<05).
1 .47
-
33 .1
-1.59
.28
.05 3
N.9
.1
.
.24.11
3 .91.05
124;9d
IL99
.10
37
281
1!}
.22
12 .5
190.50
13L21ee
- 27 .64
3941
111.4
3139
.2.3
4.Sd
!13
.63
145.24
292
Electronic Filing,
a
Received, Clerk's Office May 1, 2007
P
C
#y3 *aR+w
1
I
i
. .Item' . . . .
than
'. '(7rbasaHafq,raEq/litee -
39: b
iUiihi sodlum, ;mU4/Ilter
176 . ;
'creaming
rees)brlmadeakanee
.
Prtewater<kaanee, .
Iher/hrfm''
-
-. 26
Bone osmola)iry, mOem/kg
772
SulfatelNtired;'mFgAn
:101.3 6
Stdfareit totbed.wzgfbr. . 'g3:7b
FBtCredglfateto'diorbed,% ' 03.26
`'sodiwdfltetdt
.ro gAtr
4431.1 .
:
5odivmtealk6sbed,m0gnx 4351,4
SE
SWfpee4ddedMutp-waceei401-
t,zso .
moo'
Mem
R
5 .09
I01 .0bc
7 .69
n6 .6bc
.45
.
_Oat . '
..29
62.6
760
3 .92
114.8bc
1.90
60.4'
1
.02
J26e
251 .20 . .
3830.2
243 .72
3751.0
Figfnotteetcadoaspevueenbenrwssa
b,e.
dMears on same line bearing dffetent superscrlpn are different
(P<o
18.96- .
147 .2E
L
9
.55
250.95
1
.44
'9 .5
.
,001
.45' 1 '
71 .4
806
, .
;
a5.
5.89
09.0.
1
9}
3 .36
63.9
. .93
47 .9
0.. .'
108
.36
440,7 ,8
255.08
4273,2, ;
HT.
i
(
Js
aa-
C •
wn
DIGESTIAND . WEETI
pveight during tl)e study(
them being,po appar• glgbin t ricentradops of q@,.6
and I11
1,4
enettedtment effects
. No evidence
of
dehydta-
mg/1001M,respeetivciy The 'I
toncenv
don- .Was
. obaeNed, plasma osmotid
. preFure ooil
for heifers, driokiog tap-water Was •5 .5
remaining constantregardlen of
treatment.
mg/14
0 mWirJ (bill rnoglobiit
being derec;ed
Although : there .,was
much variation, heifers in
only 25% of the blood siuiples . Although
d%inklng sulfate-water Showed evidence of in-
got statistically aign$cant(hGse value,
dp
creased: production of nwdternoglobin, the
indicate that castle prodnee Increased- uunounfs
increase seen in the 1,260, mg/i!tpr, group being
tif, suljhemogtubin,wh5p mgcsdng large
significant (tablc,1)
.WCeth and-Lapps-(1972) ties' of sulfate
.
This
obtatlcn has been made
also noted increasedmcthemoglobfn
:concenra- previously,by
:Weetlysni1lunter(1971).
don in, h'eifea dridking.1,462
and 2,914-toga- . Serum
sulfate conccntttdoru of heifet5cod-
ter.sulfate
•w
ater . , ir is known
that m,Cthemo- suming 125,0 and, 2,599 m®/ircer sulfate water
globin, formation Finduced by soditun girdtc
increased by, 22 .6
and 40.5%, respyttiVSlyt
provides :prbphylaxisr:agaigsttoAcpopcenera
- (nhlel).This;igeonsistentw(ihprlier.
gbsetvs-
nyns of syltido (Srnitiq 1969) . Sulfide
pro-
boas Meter and Paul, .1434: Wean
aad lion¢
duued,byaheteduction of ingested sulfamby
per, L971).,agd._telleas the inemared d(etiry
runsinal •. lnlcA"rganB.nr,,(Lewis,
1954)_b rap- intake of Allan
by ammali
(tk'eir and lteli4
filly abg6rbipd in the upper alimentary
. -,rut
1954), Plasmasgdlum
coomni7ations WetaaJso
(Hansard andMob uppied, 196y)
.,In, the blood in9tFased (1'4.-
,
)5) in
tilt heifers consuming 4he- .'
stream'; : ;diue • J
the affide,is gapp5d
by larger ..quantities . of sulfate is,;podrgmsulfaie
methcruoglobin; thE[eby.p[evepdng.iohibitlon
Ruble 1) .
-
of cytoehtotM . oz.
.
e (5fiith
•a nd
.GgjseBn,
.Thc l
su1krf-wate9 treatments resulted
19641
.
;readily
oxidizes cmasert (P<05) "urinary- exaction of
„
'
n8{pbkt'
. tp •a
rretbemoglobld (Smith; and and
so4ilmt bgt,teail daarancea :ofpmatmine,
Beudat, }966), .ftol'mnate;Y
the+reversr, •reac- cralolalirles and
: rcc water Wera unaffected•
:den ,%tslyzed by1,rn van 10bioAf„is,111
(table t) Uriye.
:oslOcgF preaart was god .
amid •
chahgcdt therefp)u,
. ait(WUgh
.
urine wan to
Drabkin And Agstls (1935) also observed dented 4'or only
s.2,br
gertod U appedra t(ylt.
drat :
'6d'
cdn{cit functional .
these_goncehttsdona of
slr'atg cause d no dime•'
- hehpglcbht'to sul$emoglobi0 4n the present
.sis ; Ttiis It supp'ortpd
•py t1s4lack,Af pdydl4sio
'
study, heifers tonspm(ng .
a zSQ an0 740O
.To
ip heffets thinking au(fate-water (i le 1)
`. •~
sulfateperBacofWater •h
ad, eansolfhemp.
indicated'ip .tab1e2r
6affecrdt7nkIngN.
TABL2 2
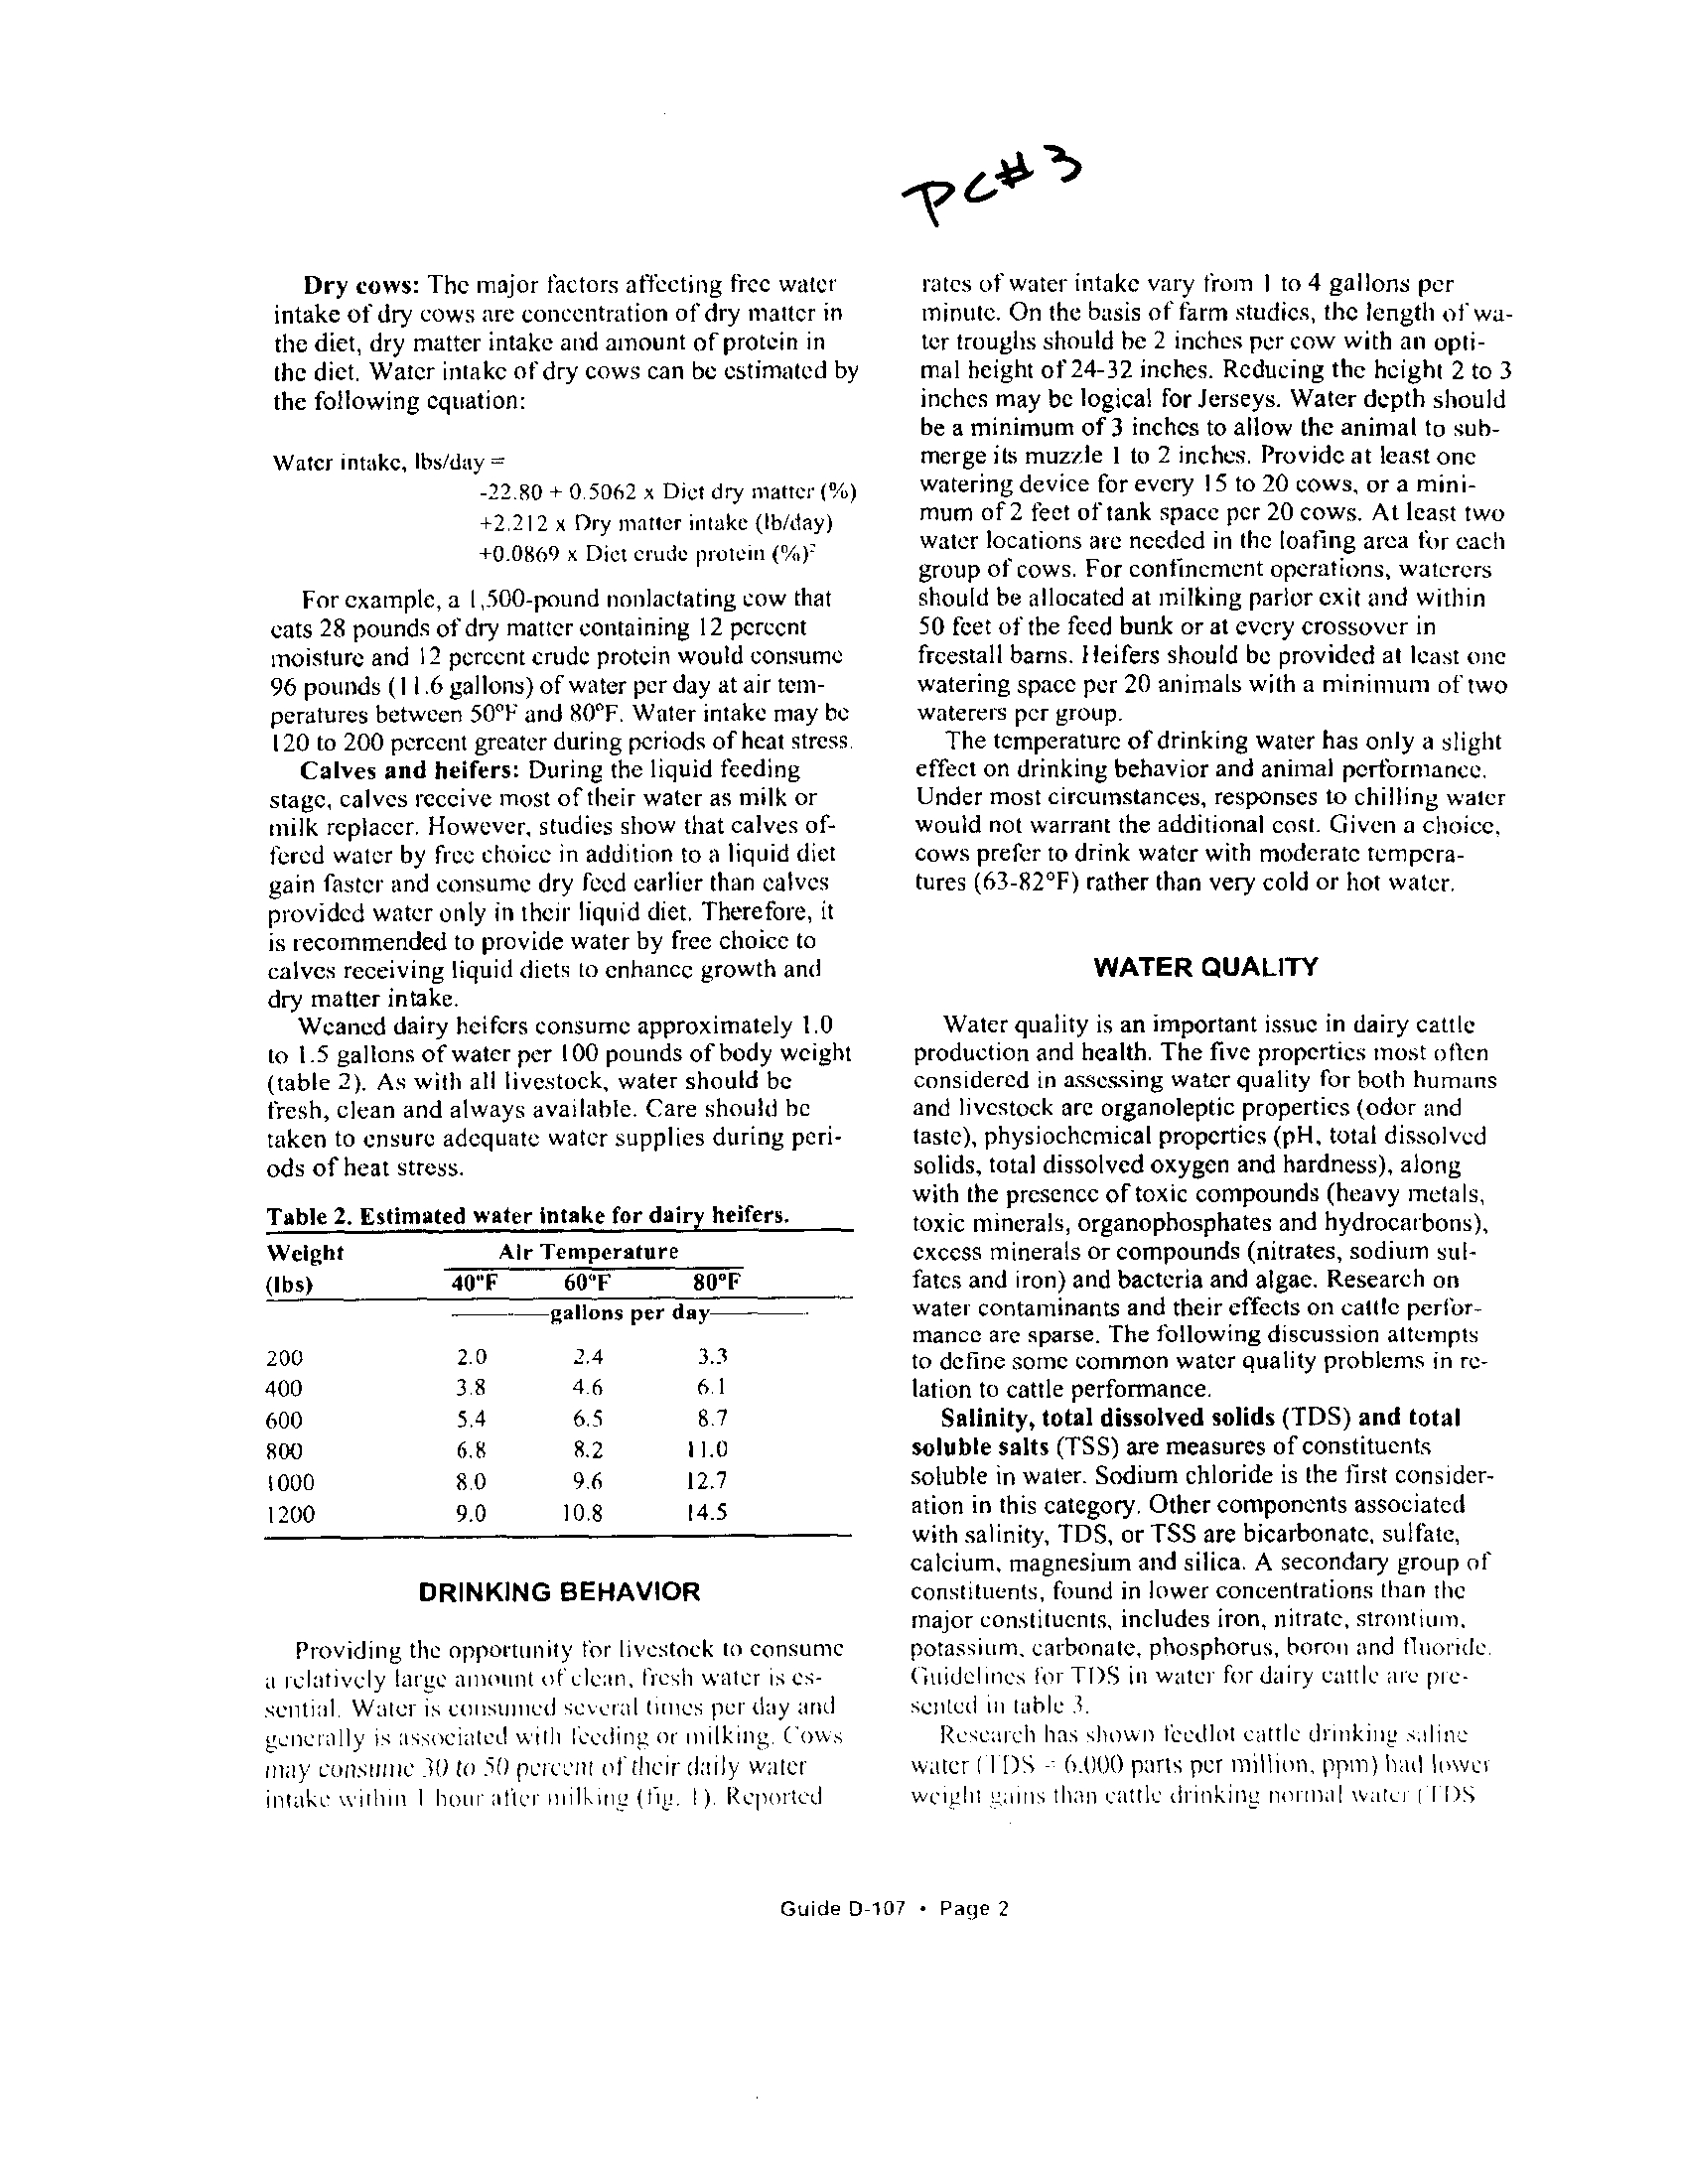
. zFFI}Cta OF DRINKING TAP-WATER, 1,250~MG/LITER SOLFATE-WATiR
AND :
500 MGJLLTER SIJLFATE-WATER ON RENAL FUNCTION OF HEIPEBS
-
- DURING A90DAY-PERJOI)a,
.
conceu~tnnons
.
.p1I sulfate-,
absorbed J4sa sg(fgie front
Date (27 .8 and~23
:7% less
2,500 mg/litec treatments,
r.
And, Hunter (1971) mad
. s
with heifers offered 3;49;
wire-,
. Because of the deer
iorpdon'And ineieasedfiltrat
of filtered sulfate which w
markedly decreased- by the
:.
meets . These observations $
of
. Leapeich 0947) of a rev
mum for,.so
",
but addict
heifers it appears that excee
'tnasdrrtum
depressed reabso
pressed reabsorptlon ivight f
tecdon to animals consuming
sulfate.
In the subsequent taste
resp
'ilie nondis lrnination acne
found to he berWeen d&
.4 an,
This zone is slightly wider thar
by GoatehgrandChdtch,(197t
than that gbsetvedhy
'Weeth at
Johnson
at al. (19:58) fetordc
four drinking per flay
, by scale
1 temnpejsture
. iris possible that
dtt*ibg'ttstdts in the wide 'a
, . ctif)una[e drbikin
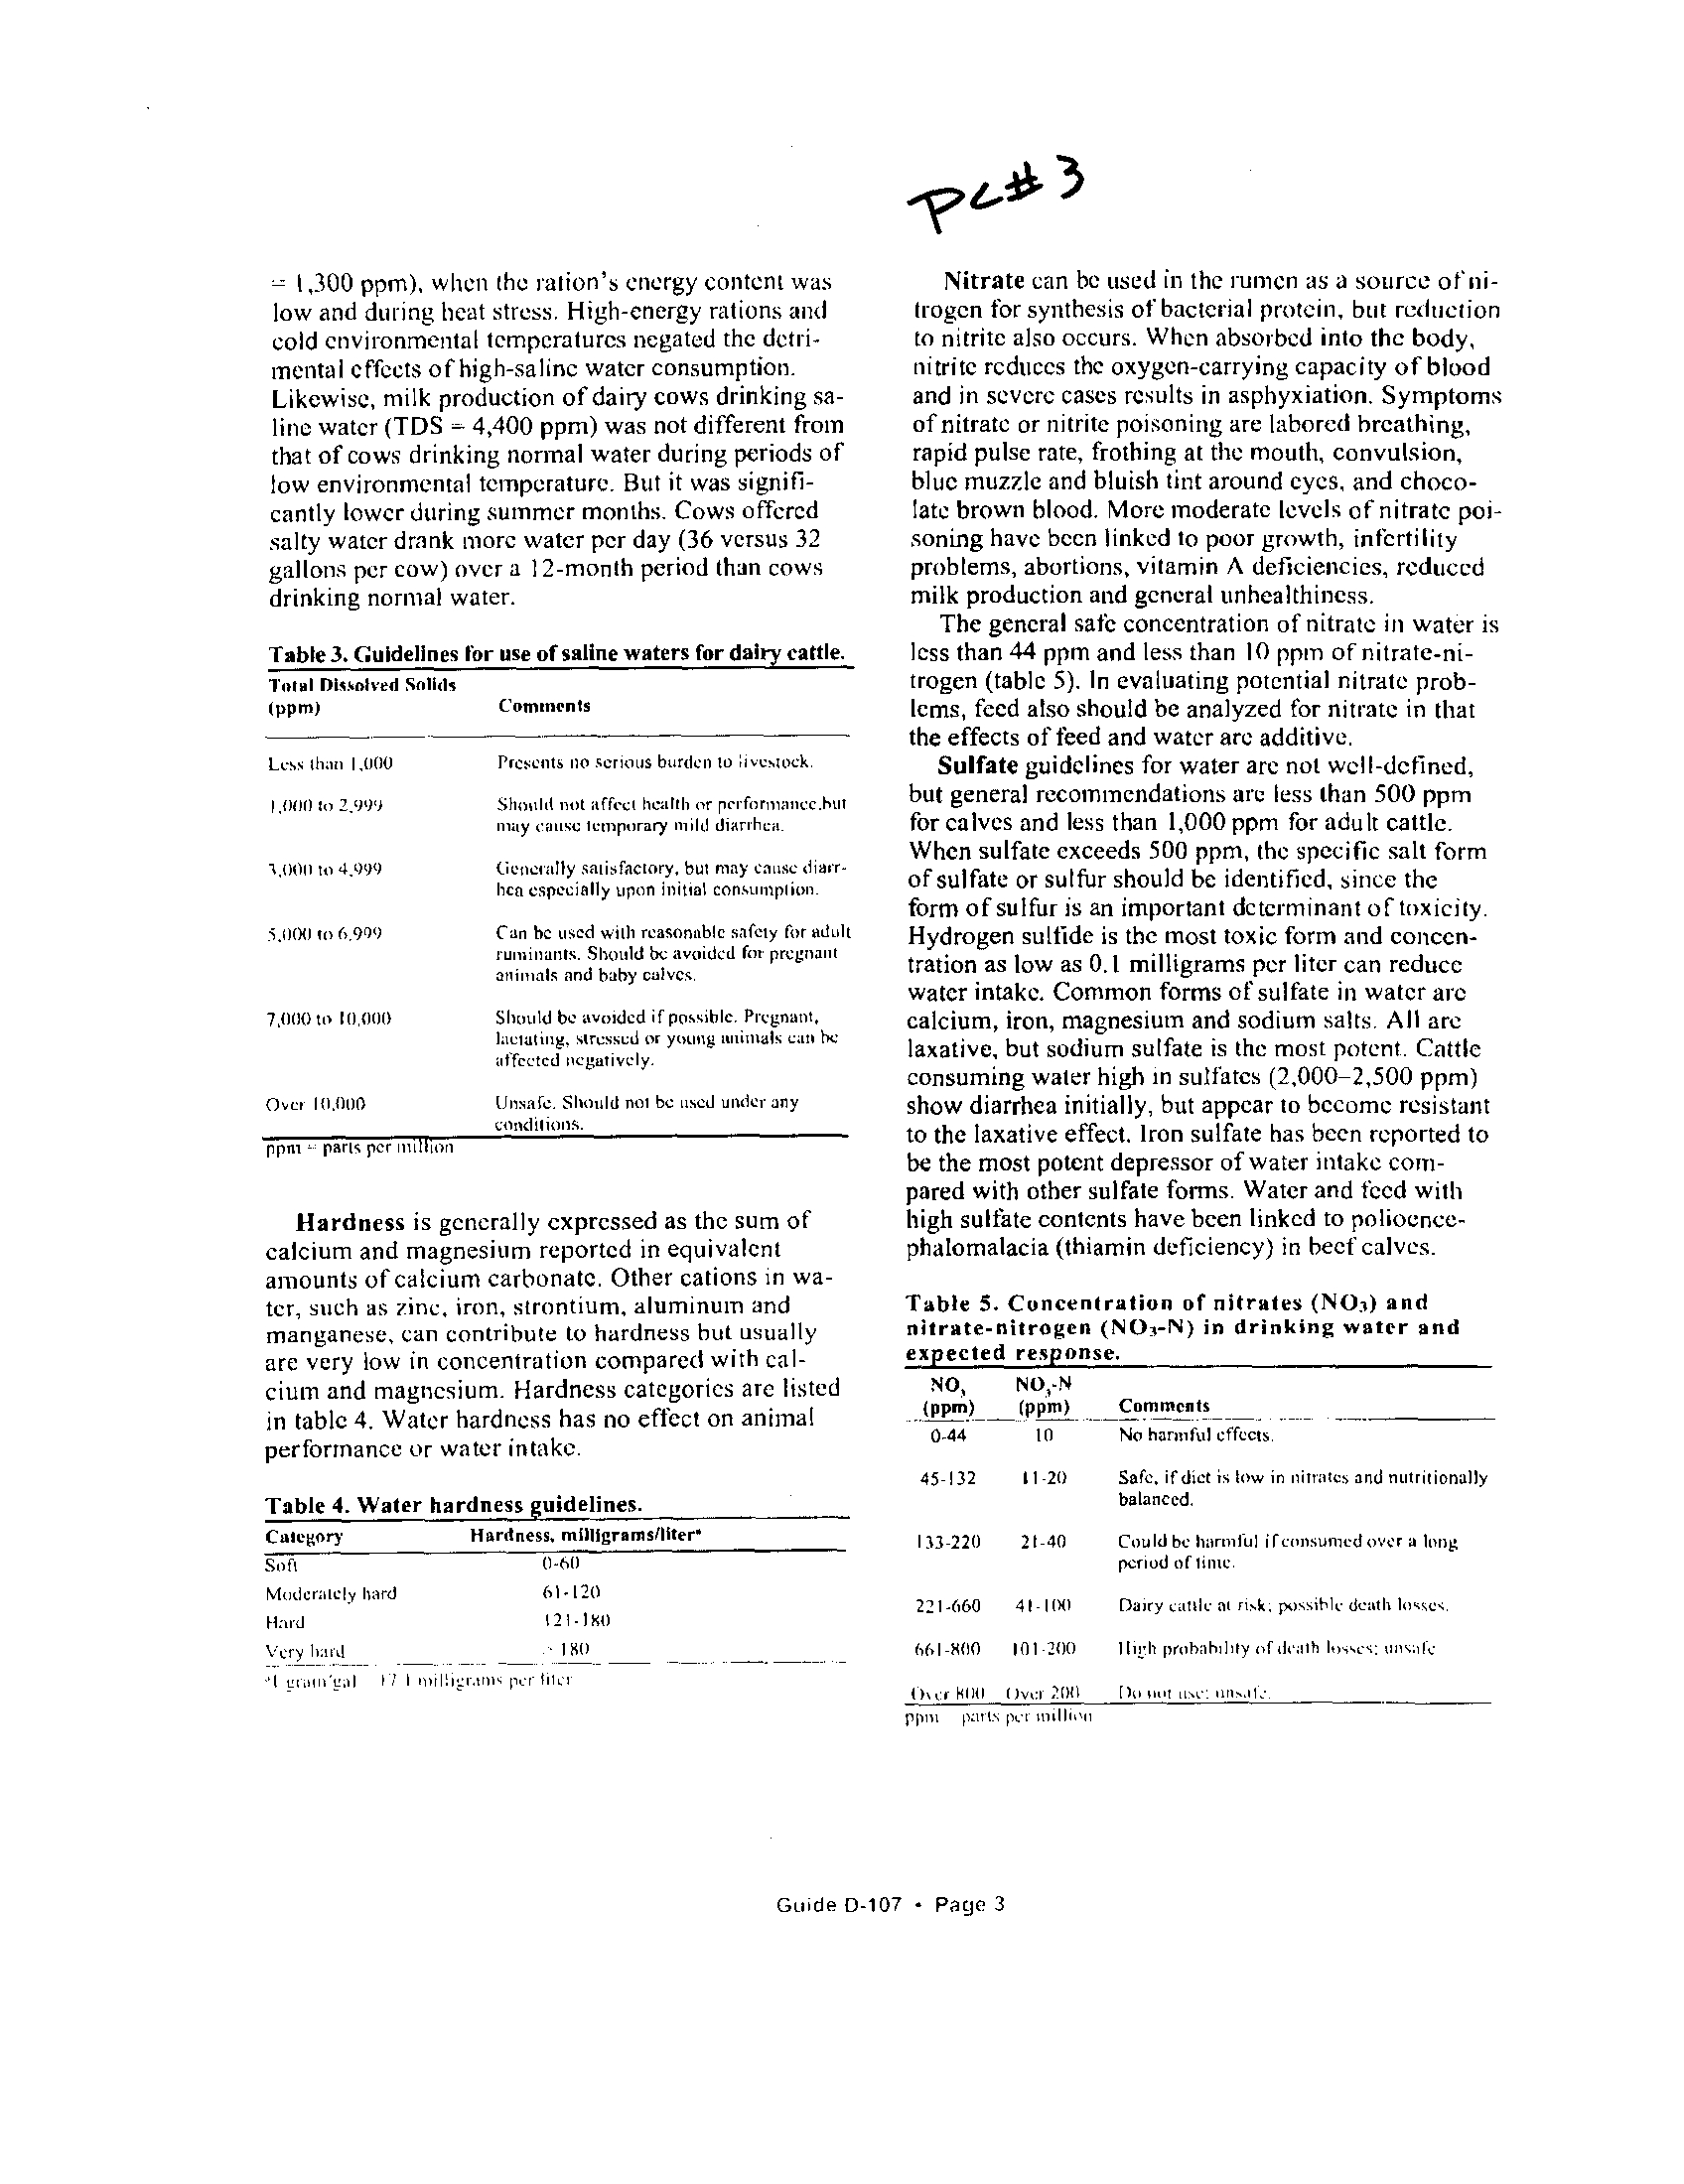
Since the mean percent ge of
total watts consumption did no,
candyabovc 5o (figure 1)
. it ca
that no prefFrence •
was shown
salt solutions offered . Caitchc
(1971a)
. found, no . . preference
.1;4000 to 12,500 iisglliter so,
Goats showed, peefernce for
n .
aeacenuadona
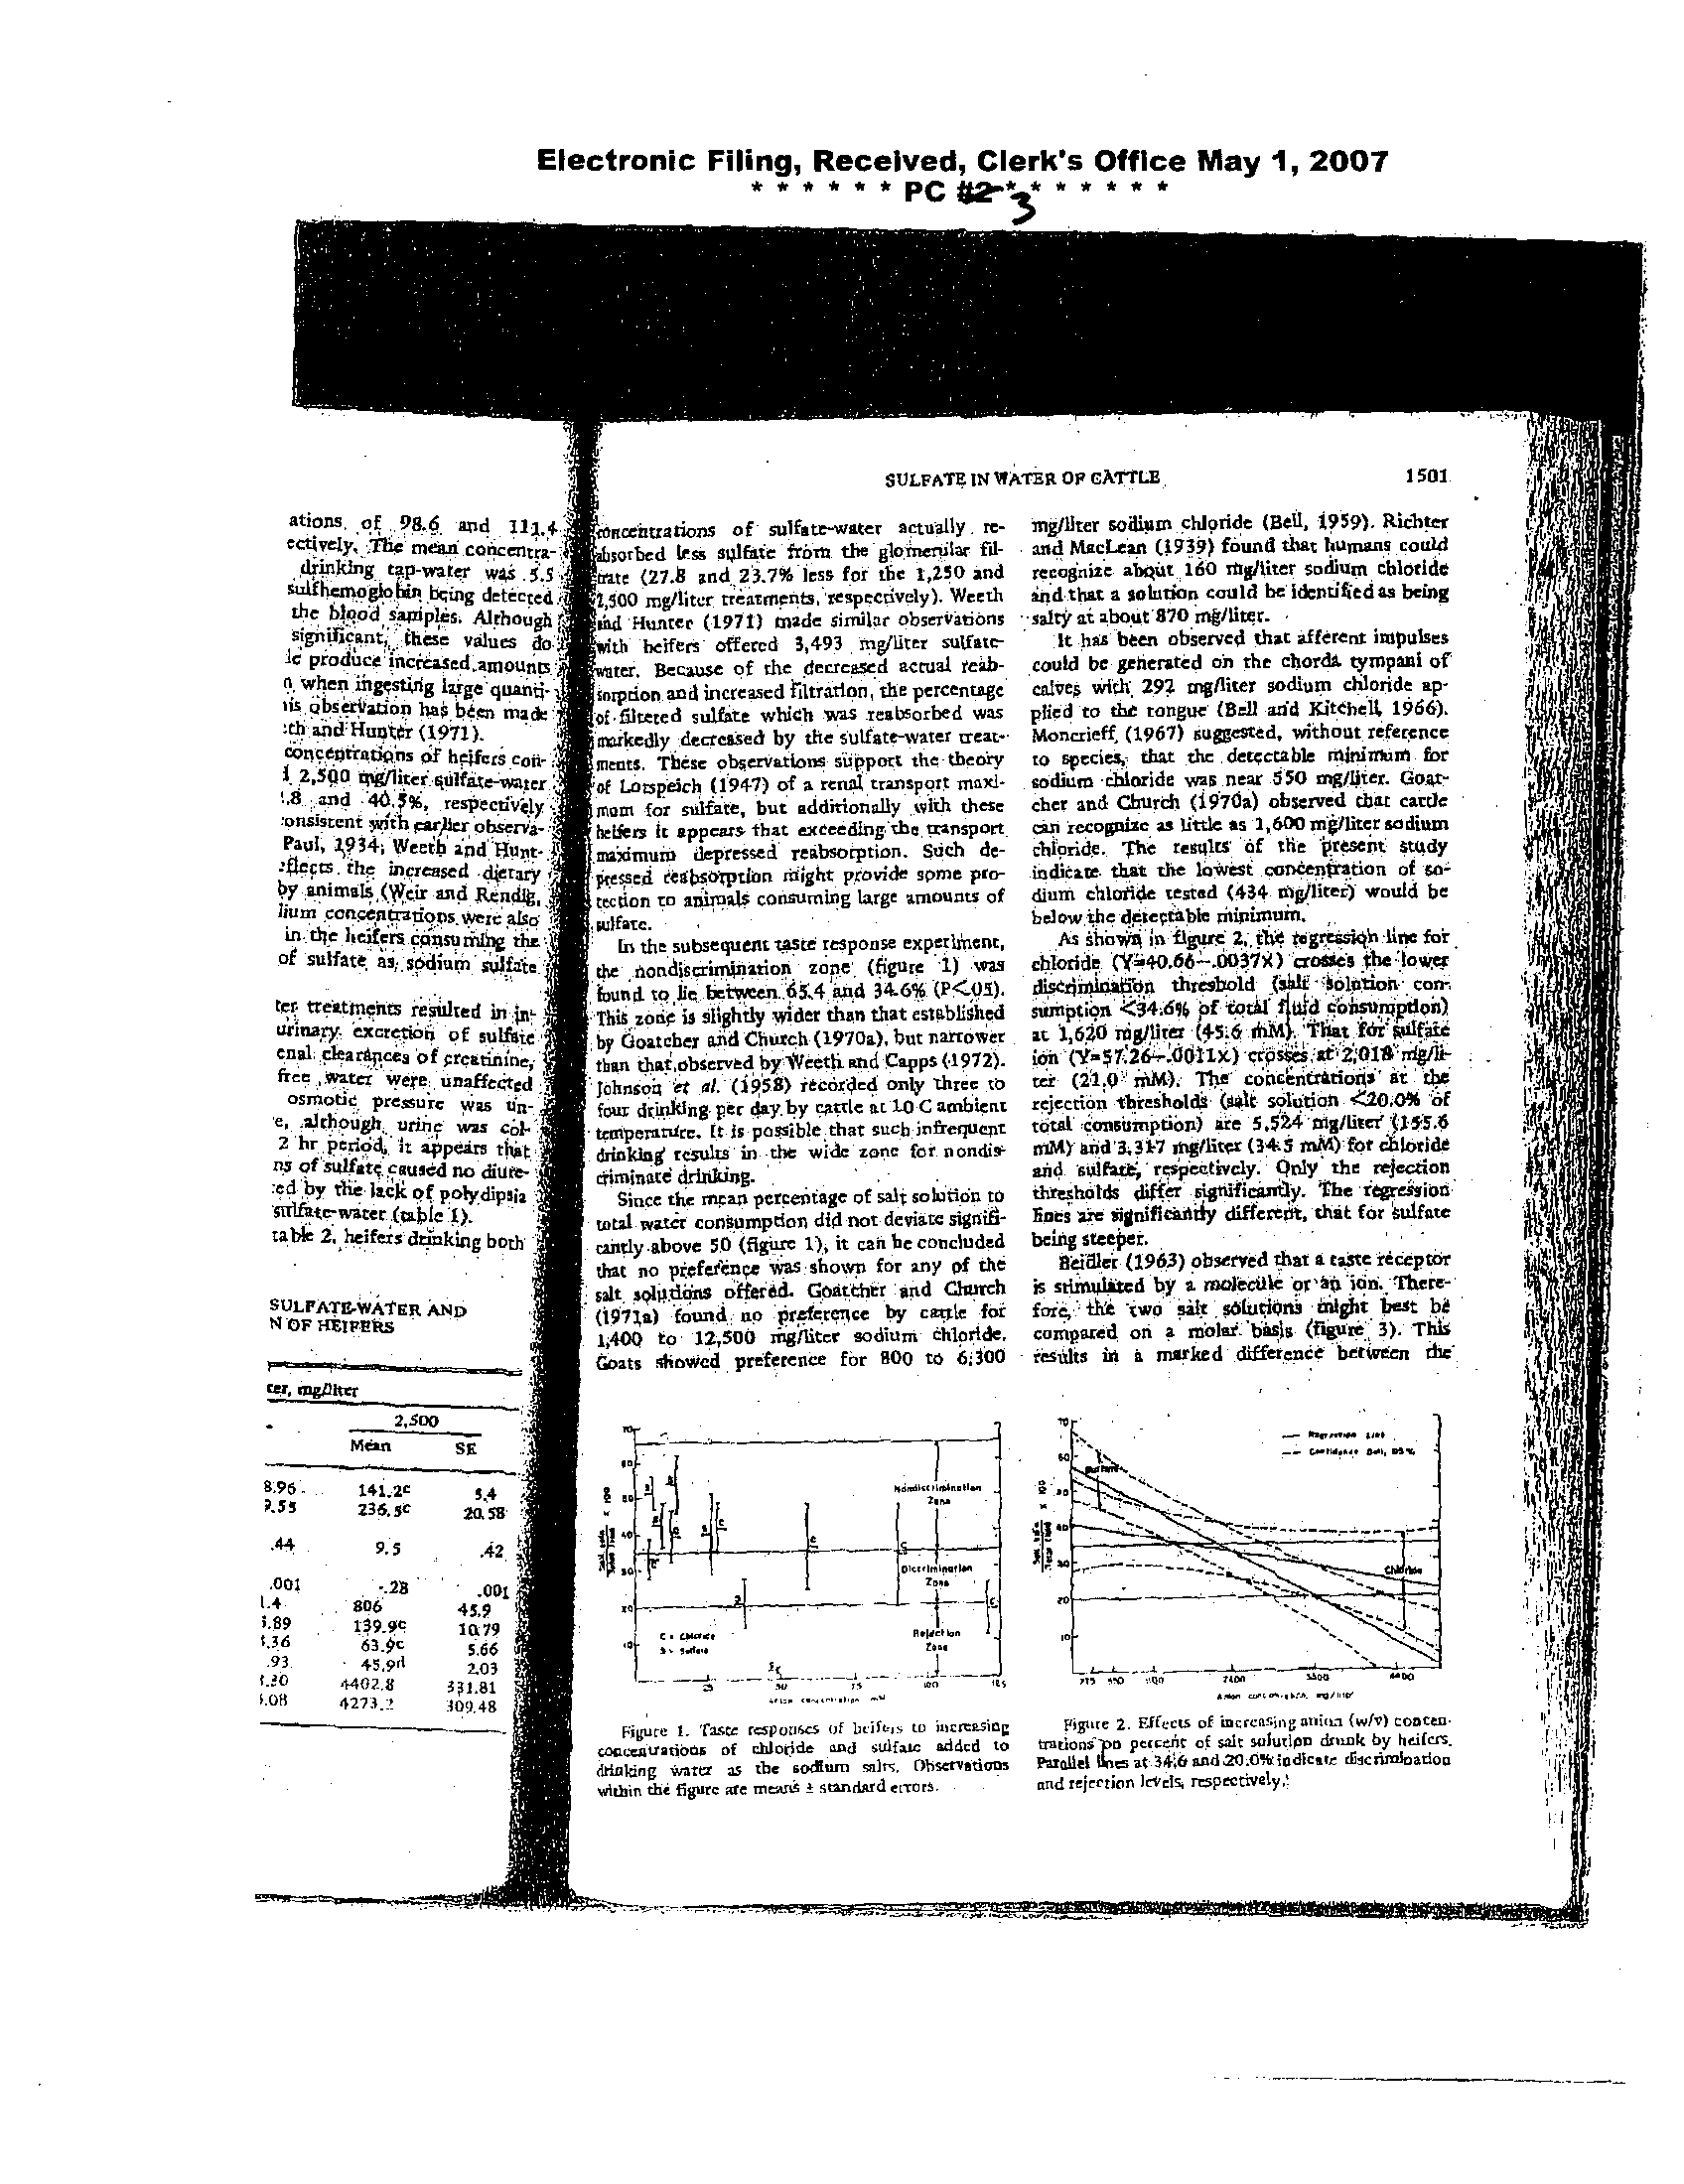
Fipne 1'
. Taatctaponses
of chloride
of
and
beiftn
driddag watt as 'dse aodh m salt
ditbin the figure ue mems t standard
ations,ect(vely,_of;The
98mead
.6 andconcentra-111.4
,
;
drinking tap-water
was
.5.5
the
significant,binod
n!o81obeing
samples.these
.
values
detectedAlthoughdo
le produce' increased
. amounts
n when ihgtstijtg large 'quantj-
tn tabsee4atron has been made
ah andHuntdt (1971
conpegtrat)gns of heifers cow
12
.500 spg/fite g8lfate-nutter
8
and 40
;%, respectively
onsi, em 3vith par)ler observa
Paul,
;934, Weevh and Bunt-
by+flects
.
animals,(Wcir
. the increasedand
Rendlg.d(erary
L n.
beifees
cent;apopsepnsun
.were
g theealso
of sulfate as sodium'sylfite'
•
os
let treatments resulted in jm
urinary
. exrattioq of sulfate
coal
free
clearapceWater
weres
of
.,
creatinineunaffected;
e,
2 hr
although,motic
period,
pressure
.
urineit
appean
was
wasthaeol51in-
•
ns of sulfate caused no diure-
ed by the lack
of
polydipsla
sulfutrwater (cable 1)
.
table 2, heifer, drinking both
SULPAT&WAT8AANDN
OF HSIFEtts
.44
9.5
5IA1.93.36.001.89
.
139958064563-.4c.9.28.1
f'b.08
4402 .8
4273 .1
Electronic Filing, Received, Clerk's Office May 1, 2007
SULFATE
IN WATER OF CATTLE
1501
archtrations of sulfate-water attually, rc-
mg/llter sodium chloride (Bell, 1959) . Richter
sorbed less sglfnc fromm
the
-
glonwnilar fd- and MacLean (1939) found that humans could
one (27 .8 and 23
.7% less for the 1,250 and
recognize about
., 160 mg/liter sodium ebloticit
500 M
hirer treatments,` respectively) . Weeth
ind.thac
a solution could be Menti$edas being
6ul'Hunter (1971) made similar observations
salty
itabout 870rng/liter .
'th heifers -
offered 3,493
mg/liter m1fatr
It
has been observed that afferent impulses
a Because of the decreased actual cab-
could
be
Puttated
on the chords. tympagi of
sntpdon and increased filtration, the percentage
calves with, 292
cog/liter
sodium c1doride ap-
of
.fdteted sulfate which was reabsorbed was
plied to the tongue (Ball add Kitehell, 1966)
,
markedly,decreased
by the sulfate-water
.
¢e-t- Monerieff
• (1967) suggested, without reference
scents. These observations support the theory
to upedes, chit the detecmble minimumr for
of Lorspeich (1947) of a renal transport maxi-
sodium'chlorlde was near 550 mg/liter. Goat-
mom for sulfate, but additionally with these
tier and Church (1970a) observed that cattle
heifers It appears that exeeedlngthe transport
oaf recognize as little as 1,600 mg/liter sodium
maximum
pressed reabsotptlon
ilepcesud reabsorptionmight
provide.nt
some
Such
pro-de-
chlorideindicatee
.
that
The studytheresults'
lowestOf coneenpztion
the prese
of so-
tecdon m animals consuming large amounts of
drum chloride tested
(434 mg/liter) would be
w1fare .
below the deteemble minimum
.
In the subsequent taste response experituent,
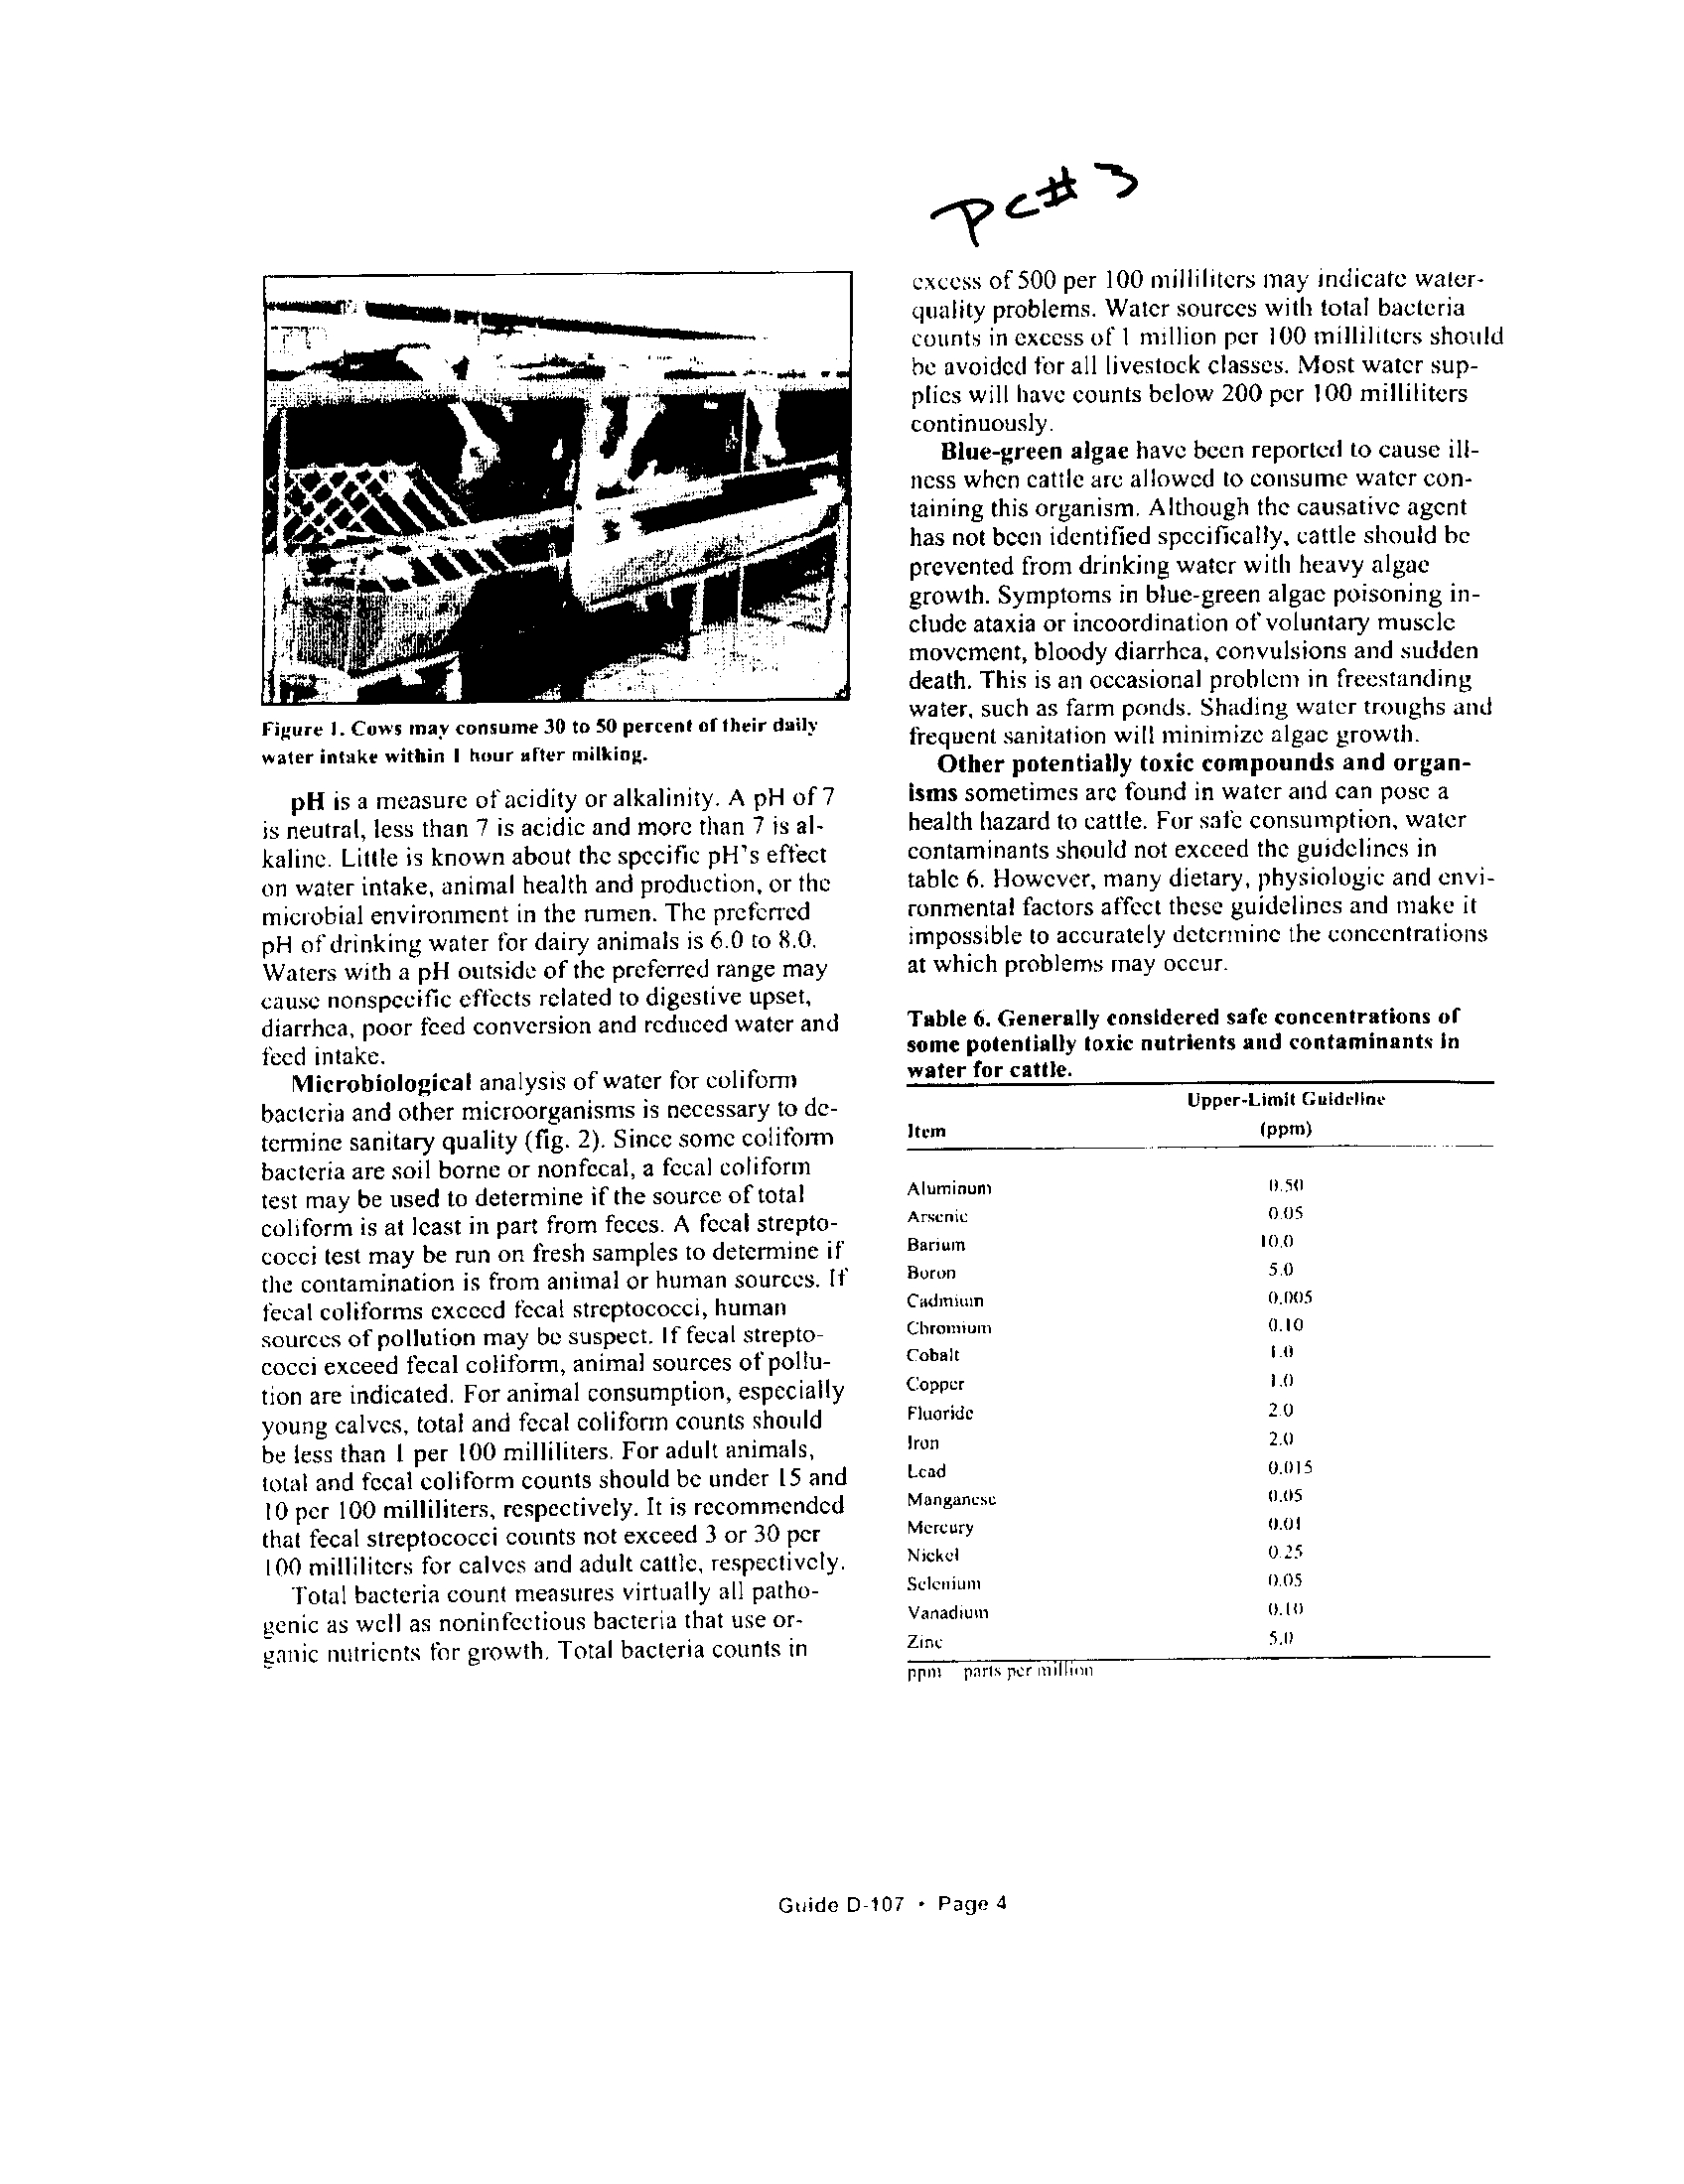
As shhvfi in fig= 2
;,the tagressEGh line for
the ;dondiscrimlnstion zone' (figure 1) was
chloride ('Ya40.66-
.00371) crosses the lower
found to Be betaten 65,4 and 34.6%
(P<US)
.
dsstgmmailba threshold (iii solatiun cow,
leis zone
is slightly ty)dec than that estabkshed
strmpt,gn
<74 695 pf total n}d ehnsut4Rdon)
by (ioatcher and Ckutch (197oa)
. but narrower
at 1,620 tnglhta
M
That f6r'autfate
thin thatobiervedbyWeettiandCapps(1972)
.
ion (Y- 1.26•.
.0011X)'crps5esat2'OIH`nlg/li-
Ithnsoo et u/
. - ( 11958) recorded only three to
ter (21 .0%'roM) . 771x' concentzatfoga''at'die.
tfour
emperaturedtm
1
. ipatt
Is
day
possible
. 1111
by retie
; that
at
such
10C
infrequentambient
zejett(ori
total comimpticn)
ebresholds
are
(salt5
.04
solution
mg/htcy
<20
f155.0% .6of
drinking results' inthe wide zone forr oondis-
mM) and 3,31t7 mg/Stet (34,5 mM)- for rSlot)de
u(mina ci drinking .
and sultan
; respectively. Qtly the rejection
Since the neap percentage of salt solution to
thresholds differ sigtufimntly
. The ilgression
total water consumption did not deviate
signifl-
lines are signifitadt(y diferent,
.chit for sulfate
cantly
.above 50 (figure 1), it can be concluded
being steeper .
that no preference was'shown
for any of the
8eidlei (1963) observed that a taste receptor
sit, aph)
.dons offered
. hatther and Church
's stimu)atcd by a
molecule
or
ass ion. There-
09711) found
: no preference
by
cattle
for
fore,.tltt
two
ask s6kttf9tts might bast be
1
;400 to- 12,500
mgflitcr sodium chloride,
compared on a molar
."basjs (fugue„ 3)
. This
Goats showed preference for 800 to 6
;100
- results id
a marked difference between the
t - 1
m
n . .
FSBure t
. Taste responus of belies m
inemvsioe
coeetnu,eibos of
chloride and sulfate added to
dialing watts as the socl
. mfrs
. Ohitnatiotn
within die figure ac mnu3
- standard errors .
Fig„ 2
. Riots. of iac
rensin 5 a i,e, (w/v) worm
uadonfq n
percent O
f salt suluelpn drink by heaters .
Pupllel Iho at34;6
and .20
.0%iadkate .iicrimloadon
and rejrrtion Irvcli rrsprctw-1Y,`
Electronic Filing, Received,
PC
Clerk's Office May 1, 2007
on-'
i[
1502
m
1 .
P
:..in
co'co'
d r4l. .den 1 .1,,
I- di.-E
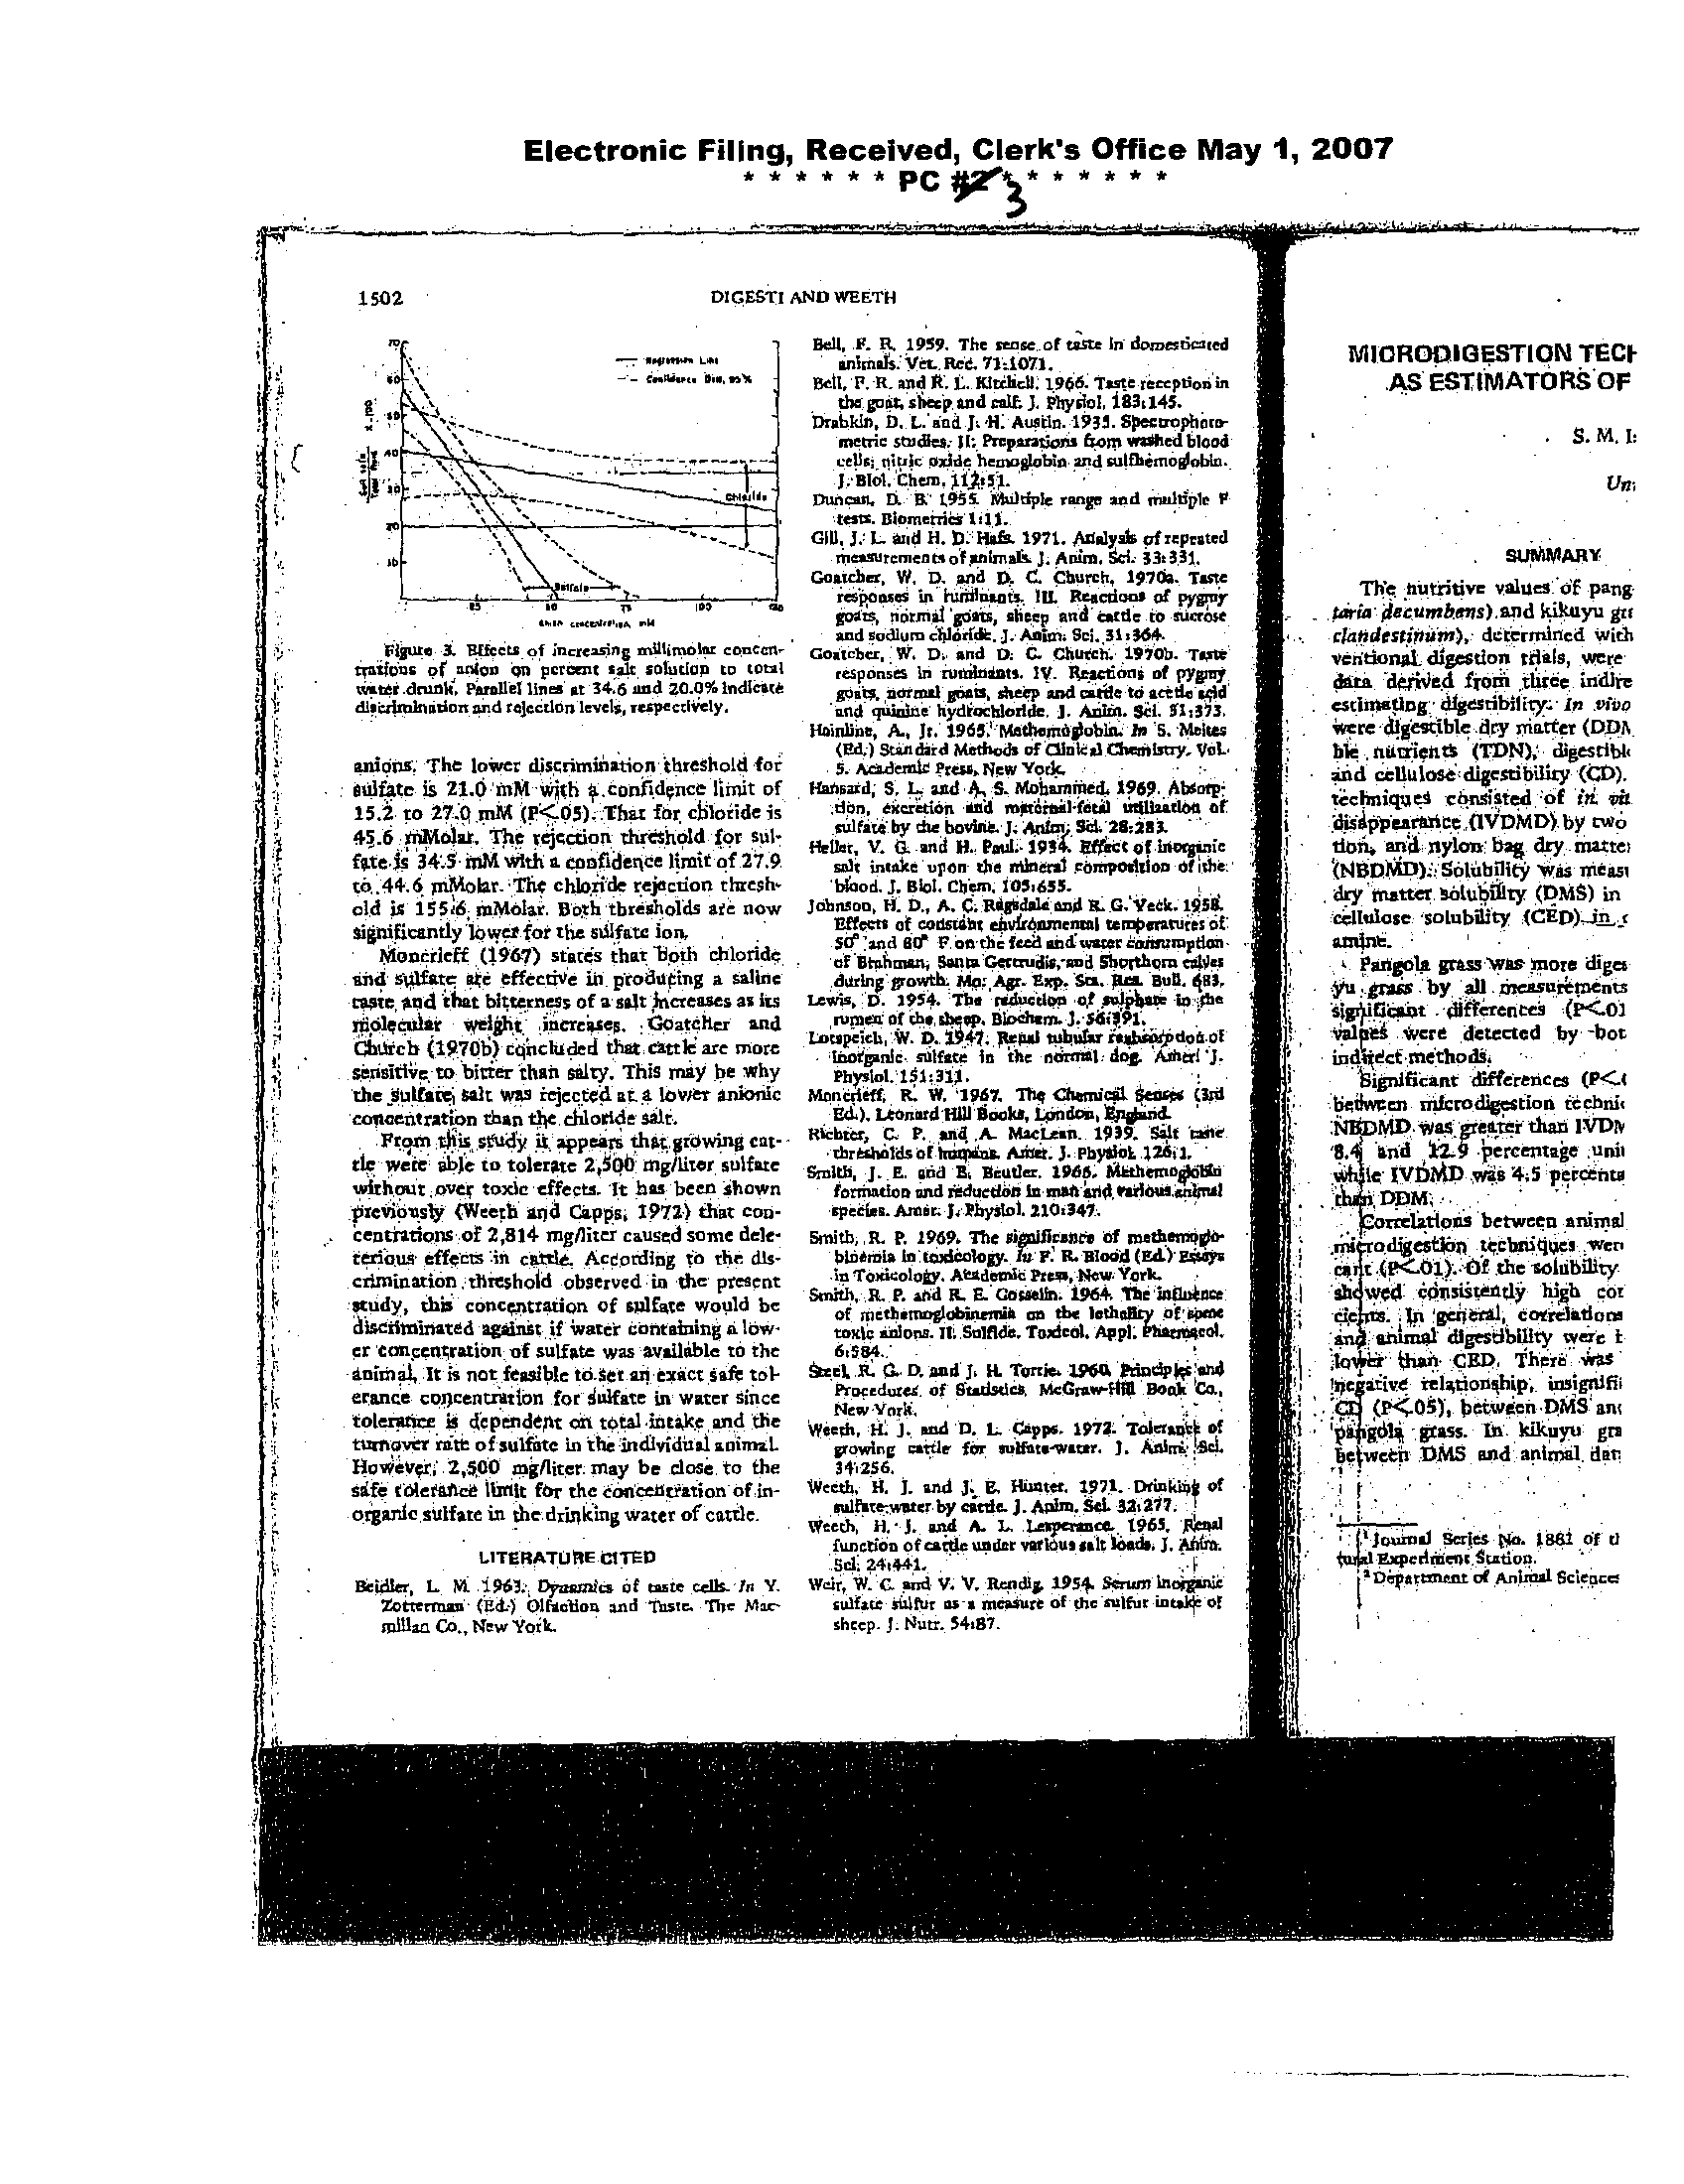
anions. The lower discrimination threshold for
sulfate is 21 .6 mM
whit
4 .confidqnce limit of
Mi to 27,p mM
forr cWoride is
45 .6 tribiolat The vcj~cczlon thresholdIhold
for Sul-
fate 4.5 rrM with e. confidence limit a
.
f 27.9
Q
.44.6 mjKlar- The chloride rejection thresh-
old is i55 ;66 mMalar . Both thresholds ate now
significantly
lower for the sulfate ion,
Moncrieff (1967) states that, Both eltloride
Bud sulfate are effective in proddPing a saline
awe and that bitterness of a'salt increases as its
rdoleco]lgr welilhtt iturciawa. Goatcher and
Much (19706) cir6cluded that cattle are more
sensitive
, up
bitter than salty . This may be why
the fiulftrcq salt was iejectedd
.
at g. lover anionic
coacentratbon than the chloride salt
.
From this, study it appears that ordwVrag cat-
tle
Were 4fe
to tolerate 2)di mg/liter , sulfate
without,cuef toxin effects. It has been shown
previously (Wee ;b and Upos,
1972) that
con-
.ceatradons of
2,814 mg/liter caused some dele-
retinas effects in cattle According t the dh-
crimination .threshoid observed in the present
Study, this concentration of sulfate wood be
AISCHurmated against if Crater containing a
low-
er concentration of sulfate was wallabler to the
animal, It is not feasible to .set an exact safe
tol-
erance concentration for Sulfate in water since
tolerance is dependent an total intake
and the
turnover rite of Sulfate in the individual animal
HowgV;r; 2,$AO wifliterr may be close to the
safe Wleftfct limit for the
of in-
orgarde sulfate in the drinking water of cattle.
LITERATURE CITrD
Beidler, L N1 1M . Dyaazaics of care cells- In Y
Zotternaa (1A.) CIraetion and Trim The Mac
mian Co., New V0 k.
DICESTI AND WEETH
Bell
anlreds
. F. 0.
:
1959Vet
.
.
.
RedThe
. 71--1071sense
.
.
of taste 1n doacertired
fth,
theP
.
gout,
R_ and
shay
R. Land
. Himlidlsalt
J
.
. Phydol1906
. Tane mccpu.. In
5.
Dr.bkln, D . L: end J, ,H: AustIn . 1931
. Specs
rophmo,
mai
c
studies; I [
:,
ftepeerticeS 6*M wished blood
Ce
I oxide he .glabla and sullbirn.gbla .
Dm,cgr . a a 195
; Multiple
range d mld& V
tat' . Band
1 .11 .
GIB . J .' L
H . 1) . Pee. 1971. A9.1y.]IS
9f repeated
megavrergent, of~hcak J . Anien . kL 33t 331.
G
o
Drbgr, W. D. and D. C. Church, 19701. Taste
hublawata. Ill. Iteacdco, of pygmy
sheep
responses in
end card. to
sucrose
and
..dlum
rVdA& : J . Count 90,31,11"
Gogt.ber
. W
. D, and D
. C. Chi red 19701,
. Tana
f
responses in rnalaints
. IV. Bud-, of PYBV
.0*8'q=e
..md
hydAhlridSeats,
Amp and
., Jcattle
.
.
Actinto Belseeds
. slAllS;ld.
twurbae,
(PA) StandardA.,
Jr.
Methods
19W Madwardl)obbuof
CH.k .1 tin
]a Sbay,
. birittsVA
.
5. Academia Press,
New
Yolk
Hansard; S, L sad 4, S. Mohammed, 1969. bbsurp:
r1b ., excretion end rngn6igikatil U011 .1164 of
Sulfate by the bovine. J Mini Sla 211
;211)
.
f*aw. V. Q and H. pawl- 193Z v4ct of Inorganic
snit uaAk . F0
. 60 mineral pbrepodrion wfltbe
.
bl).d. J . Blol . Gram; 105,635.
1
Johnson, a D ., A. C . F40dak sisal It, G.'V.dr. 105B.
Effects of codstibu eh&bAre .stal tompow"ats 61
set
.1 Stahumar,
sad Sof
SantaF
W f
he
Gertradis ; and Shorthorn c,$es
daring growth. Meu Agr. Up. Sm. Am Bur 453,
1,ewig,D
. 1954. Tho'nuUntlav, 0 palplm bane
rumen' of
.
op. Bwalum. J . Mill.,01 .
Iaupeich, W . D.
to . B.-Pa
tabular
Gripsel.. Sulfate in the atimMIA4 A*UI'J .
phy.l.l.
Monaieff, R . W. 7967. Thq Chradoil *eases
Clad
FA), L"rawd HW linaka, Inadou . *4grid. '
Richter, C P* M4 A MuLgan. 1939
. Salt cane
Smith,thresholds
" EE and
ohnirpent
B, BauderArker
.
.3
1966
. PhyiJOL
. M~heera
1741.
.peelersformation
. Astir
and
1,
reduction
pbl,31.1.210-347
In naft6dValoget"Tal
.
Smith,,
OWNS
It
.
In
P.
urdoology1969
. The.V
:
resere,
t Blood
of
(Ed)
methermo"EO*v
in To,e..lajY . Ahddftd . Peels, New
. York
&wth, % P. and FL F Garage. 196* The lanaJaza
of methanillobbremik on the haallay 0600M
fitetoxic
.1
6,584,Al
anionsG
. D,
.
tad
It
J,
Salfl&H
. Tianie,
. Taxical
1904
. Appl
Wndp*'*W
: .01,P1,""
procedures, of 6talsda WG :ww-ft B,,WgCM .
New York
.
We .0%, IL J . and D
. L Capes
. 1972 .
Td-aver
,V,.wl.g aide for
1 . AnI.*:V01
34!256.
Wreth,
,Wf.x
H.
.
wet1
.
g,
and
by
Je.
;tdF a.
HunterJ
. Apler
.
.
1971B4
32i277
. Drinklaa
.
of
We .th, H.' J. and & L 1 .11peraim 1965
. ASS
d
function of aide under various gait 1694 . 1 . A66n.
5 .1, 24,441 .
Weir, W. C .a V. V- Rend!; 1954 SSerum Injoaric
sulfate sulfur W a auga," of the relfur ints4 of
sheep
.
1 . N.=. 54,87 .
8
C*.
MIGRODIGESTION TECE
AS ESTIMATORS OF
S. M, 1 :
Um
. SUMMARY
Tlfe nutritive values oif pang
A" Occumb.ans) .and KL
k
zyu
gee
dabdestinum),
determined with
*cndonjL dilgestion trials, were
dim -doWed from three iodire
estimating digestibility In often
Were digestible, dry matter (DDA
bli .tairdeatt (TUN).'
digestibh
and celluloseI digestibility (CD) .
techniques consisted of is vin.
UVI)MO, by two
Lion acrd nylon :' bag dry matte!
(1481)JAD) . . Solubility' vas meant
dry matter tolubflty (DMS) in
'cellulose solubility (CEP)-
.m _c
ambee.
1
.
panvoll gross Was more digs
yu grass, by all mcaswr6ments
sJoilikawt . diftexentes (P<01
wdoi were detected by -hot
iridrl~dct methods,
bignifimat, differences (P<4
MD was greater than wDry
and 52..9 jrerlceatlje Ufth
le
DDMIVDMD
;
was 4,5 percentsI
I
.,
ftekl6ft
roclWons
t4between
; loritIcies
animalwcn
ca
.
E .4
the Solubility
It wo4 c"Vawtly high cot
n. . . gen . correlations
animal digestibility were t
Ban. CED. There
: was
Inc at ive Te 171noriqlhip,
~'Tgrdfil
:'p' ~
(P<05),
between
PMS 4 am
g0l* grass. in
. kikay. Bra
betweth DM5 and animal . der,
'Jovaaal Scries, t4ir. Ml of d
I EsxPeArden, Ated .a .
I
Electronic Filing,
* * * *
Received,
*
* PC #~*
Clerk's
* * * *
Office
* *
May 1, 2007
I
Human and Clinical Nutrition
High Levels of Inorganic Sulfate Cause Diarrhea in
Neonatal Pigletsl
,2'
3
G(JILLERMO G- GOM
_Z, * 14
ROBERTS
. SANDLER" AND ELSTON SEAL, JR
. **
*Department
of
Animal Science, North Carolina State University, Raleigh, NC 27695;
?School of Medicine, University of North Carolina, Chapel
Hill, NC 27599;
"*EPA Human Studies Division, Chapel Hill, NC 27599; and ?Center for Gastrointestinal
Biology and Disease, University of North Carolina, Chapel Hill,
NC 27599
ABSTRACT Artificially reared neonatal piglets were
used
function
to study
In human
the effect
Infantsof . Two
Inorganic
experiments
sulfate
were
on bowelcon-
sulfate
ducted to
on
evaluate
the growth,
the effect
feed Intake
of high
and
levels
feces
of
consistencyInorganic
of artificially reared piglets, and to determine the dose at
which
diarrheaat .
least
The effect
50% of
of sulfate
piglets
level
develop
on kidney
nonpathogenicweight
and
concentration of Inorganic sulfate In urine was also as-
sessedInitial .
age
In each
of 5 d
experiment,
were Individually
40 pigs
caged
with
and
an
reared
averagewith
an automatic feeding device
. Ten pigs per dietary
treatment were fed one of
four diets containing the tot-
lowing levels of added Inorganic sulfate (mg/L of diet),
as anhydrous sodium sulfate (USP)
: 0, 1200, 1600 and
2000 for Experiment 1 (16-d study), and 0, 1800 .2000
and 2200 for Experiment 2 (16-d study)
. The levels of
added sulfate did not affect (P > 0
.05) the growth of
piglets, or their feed Intake. Whereas 1200 mg added
sulfate/L had essentially no effect on feces consistency,
levels
>i600
mg/L of diet resulted in a persistent, non.
not affect
P>(P
> 0,05)
rerelative
kidneydded sulfate
did gank sulfate In udne reached maximum concentration
added
(P < 0sulfate/L
.05) In pigs
In Experiments
fed diets
I
with
and
1600
2, respectively,and
1800 mg
but declined at NOW levels . The results suggest that
the level of added dietary Inorganic sulfate at which 50%
of piglets develop nonpathogenic diarrhea is between
1600 and 1800 mg/L J
. Nutr . 125: 2325-2332, 1995 .
INDEXING KEY WORDS:
•
inorganic sulfate •
neonatal piglets
•
gastrointestinal
effects • liquid diets • swine
Sulfate is a common divalent anion found in the
environment, mainly in natural waters, in concentra-
tions ranging from a few tenths of a milligram per
liter to several thousand milligrams per liter (NRC
1977)
.
In a survey of the 100 largest cities in the
United States (Durfor and Becker
1964), the median
sulfate concentration of all samples was 26 mg/L,
with a range of 0 to 572 mg/L, and more than 90%
of
the samples contained <100 mg-sulfate/L
. McCabe et
al. (1970) examined a total of 2595 water samples that
included a large variety of drinking water sources in
the United States, and reported that only 3% of the
samples had sulfate concentrations exceeding the
recommended National Secondary Drinking Water
Standard (NSDWSJ of 250 mg/L, with a maximum
concentration of 770 mg/L . A study of 249 private
wells in North Dakota reported that 197
had dis .
solved solids content > 1000 mg/L, 125 had >2000, 63
had >3000, 33 had 4000 mg dissolved solids/L and in
the majority of the waters the sulfate ion constituted
the major proportion of the dissolved solids (cited by
Moore 1952) .
The lowest dose of sulfate that causes diarrhea in
humans is not certain . Moore (1952) reported that
62%
of people experienced a laxative effect when the
sulfate concentration in well water exceeded 1 g/L
.
Survey data collected from ground water users in
North Dakota (Peterson
1951)
indicated that waters
'Presented in pan at the 1994 joint Annual Mating of the
American Dairy Science Association and the American Society of
Animal Science, July
I1-15, 1994, Minneapolis, MN
(Comer, G .
119941
Effects of sulfate in liquid diets for artificially-reared piglets
.
). Anim
2 This
.
study
Set. 72
was
(supplconducted
. II : 164
at
(absthe.ll
.
NCSU Piglet Core with a
grant from the
U
.S
. Environmental Protection Agency through the
Center for
Gastrointestinal Biology
and Disease. Although the
research
EPA, it has
described
not been
in
subjected
this article
to agency
has ban
review
supported
and therefore
by the
does
U .S .
not necessarily reflect the views of the agency . No official en
.
dorsement should be infected . Mention of trade names or com-
mercial products does not constitute endorsement or recommen-
dation for use .
3The costs of publication of this article were defrayed in pan by
the
marked
payment
"advertisement"
of page chargesin
accordance
. This article
withmust
18
therefore
USC sectionbe
hereby
1734
solely to indicate this (act
.
"To whom correspondence should be addressed
.
0022-3166/95 33
.170 t 1995 American Institute of Nutrition
Manuscript received 17
November 1994 . Initial review completed 3
January 1995
. Revision
accepted 6 March
2,12>
1995 .
2326
Electronic Filing,
. . . #
Received,
.
.
GOMEZ
PCPt'ET
Clerk's
3
AL
.
.
# M
Office
* # #
May 1, 2007
with 600 to 750 mg sulfate/L had a laxative effect
.
Chien et al
. (1968) reported on three infants who
developed
diarrhea when given formula made with
water containing 620-1150 mg sulfate/L .
Young weanling pigs (3 to 4 wk of age) having
access to saline drinking water (6000 mg total solids/
L) high in sulfates
(2392
mg/L) showed increased
prevalence of diarrhea as well as higher water con-
sumption during the first week after weaning com-
pared with controls drinking low sulfate water, but
there was no difference in rate of growth, food con-
sumption and gain to feed ratios (Anderson and
Stothers 1978)
. Patterson et al . (1979) observed that
when pigs consumed water with a sulfate concen-
tration of 3000 mg/L, there was no effect on
reproduction or weight gain, but there was an in-
crease in fecal moisture content and water con-
sumption . Recently, Veenhuizen et al, (1992) reported
that weanling pigs tended to have better weight gain
over a 4-wk period when provided water with a
sulfate concentration of 600 or 1800 mg/L compared
with controls receiving water with 54 mg sulfate/L .
The prevalence of diarrhea was higher in pigs given
sulfate in the water than in the controls
.
No report has been found on the effects of high
sulfate levels in liquid diets fed to baby pigs in a
manner that would mimic situations encountered
with human infant formula feeding . Limited infor-
mation is available with respect to infants and
children . Because of the obvious limitations of using
infants as experimental subjects, this study used ar-
tificially reared neonatal piglets as a model to
evaluate the effect of inorganic sulfate on bowel
function in human infants .
Thus, the purpose of the present study was to
determine the dose of sulfate, as sodium sulfate, at
which diarrhea develops in neonatal pigs and to
ascertain the dose at which 50% of pigs had diarrhea
The experiments herein reported assessed the in-
fluence of sulfate on weight gain, feed intake and
feces consistency throughout the entire trial under
strictly controlled conditions
. The effect of sulfate on
kidney weight as well as on sulfate concentration in
urine of pigs at the end of the experiment was also
measured .
MATERIALS AND METHODS
Experimental
animals . Gestating sows were ob-
tained from the North Carolina State University
Swine Farm and transferred to an isolated farrowing
facility, 5 d before farrowing
. Crossbred pigs carrying
no known or defined pathogens were farrowed in an
atiFiseptically clean (washed three times daily) stall
after 4 to 5 d of repeated bathing and sanitizing of the
sows, before delivery, with an iodinated detergent
(Wescodyne® , American Sterilizer Company, Medical
Products Division, Erie, PA) . Piglets farrowed by five
third-parity and five first-parity sows were used in
Experiments 1 and 2, respectively . Forty crossbred
piglets were used in each experiment
. Piglets were left
with their dams for -48 h after farrowing and then
transferred to an isolated room containing an auto-
matic feeding device (Autosow) . The temperature of
the room was maintained at 32'C during the first
week and lowered to 27-29'C throughout the re-
mainder of each experimental period The ambient
relative humidity in the room varied between 55 and
75% . Lights were on at all times. The protocol of this
research was approved by the NCSU Institutional
Animal Care and Use Committee
.
Feeding protocol and basal diet. The Autosow is a
machine containing individual cages (length, 0
.50 m ;
width, 0.30 in, and height, 0.40 m) and regularly
dispensing, aseptically, small volumes of liquid diet
according to the weight of each piglet
. Piglets were
fed liquid diets only and did not have access to
drinking water. The diet reservoir was refrigerated,
and therefore, bacterial growth in the diets, if any,
was minimal. The feeding pans were washed under
pressure after each feeding with a warm chlorinated
detergent (Td-Foam'", Diversey Corp ., Wyandotte,
MI) . Details of the characteristics of this device have
been previously reported (Coalson and Lecce 1973) .
Piglets were fed a daily volume of diet that was -30%
of their body weight, i.e., a I-kg piglet was fed 300 mL
of diet/d. Previous studies (Coalson and Lecce 1973,
Lecce 1969) have shown that this daily volume to
weight ratio is near optimum with regard to weight
gain and feed efficiency when diets are made from
milk solids and have a dry weight of -20% . The
feeding interval used in both experiments was 1 .5 h
.
In Experiment 1, the daily volume of diet was divided
into 16 equal portions during the first 8 d of the trial
and 13 portions thereafter (feeding schedule was from
0600 to 2400 h). In Experiment 2, piglets were fed 13
times per day throughout the entire trial . The calcu-
lated feed intake per pig is expressed as kilograms of
dry matter consumed per experimental period .
Once piglets were housed in the Autosow, they
were fed a basal diet (Table 1) with no added sulfate
and adapted to the new environment throughout a
3- to 4-d period . At the end of the adaptation period
(at an average age of 5 d), piglets were weighed and
distributed according to body weight, sex and litter
origin to four groups of 10 pigs each
. Piglets used in
Experiment 2 had lower initial body weights, at a
similar age, than those in Experiment I because they
were from first-parity litters curnpared with third-
panty litters in Experiment I .
Experimental diets
. The experimental diets were
randomly assigned to each one of the groups. In each
experiment four levels of added sulfate, expressed as
milligram per liter of diet, were evaluated as follows
:
Electronic
GASTROINTESTINAL
Filing,
* * * *
Received,
* *
EFFECTS
PC
''4ta/,
Clerk's
OF
3
*
INORGANIC
* * *
Office
* *
SULFATE
May 1, 2007
2327
experimental and
experimental periods .
Every
morning, feces consistency scores of 2 or 3 were
further confirmed at the time of taking rectal swabs .
The results of feces consistency are expressed as the
daily relative proportion (percentage) of piglets
grouped according to their feces scores
. Rectal swabs
of pigs with feces consistency of 2 or 3 were taken,
placed in tubes containing 2 mL of 0.01
mol/L PBS,
pH 7.5, and assayed within a few hours after col-
lection for hemolytic Escherichia coil and rotavirus
assays to determine if these pathogens were the cause
of diarrhea . Rectal swabs were processed for bacterio-
logical culturing of hemolytic E . coli
using blood agar
with 5% sheep blood (Carr Scarborough Microbiolog-
icals, Decatur; GA) . After 24 h of incubation at 37'C,
the cultures were evaluated for presence of hemolysis
.
A commercial kit (Virogen RotatestS, Wampole
Laboratories, Cranbury, NJ), based on a rapid latex
particle agglutination slide test, was used for the
qualitative detection of rotavirus in fecal specimens
.
At the beginning of Experiment 1, urine samples
were obtained from 5 to 6 pigs of each group, using a
bladder puncture technique (Parker et al
. 1979) . At
the end of both experiments, urine samples of all
piglets were taken from the bladder after they were
killed and the abdominal cavity opened
. Urine
samples were frozen until they were assayed for inor-
ganic sulfate by a turbidimetric analysis (Jackson and
McCandless 1978)
.
At the end of each experiment, piglets were sedated
with an intramuscular injection of a mixture of 0
.8
mL of Ketamine hydrochloride (Ketaset ®,
100 g of
Ketamine per L, Fort Dodge Laboratories, Fort Dodge,
IA) and 0.2 m, of Xylazine (Rompune, 20 g Xylazine/
L, Mobay, Shawnee, KS), and killed with an in-
tracardiac lethal dose (1 mL/4 .5 kg body wt) of an
euthanasia
solution (Beuthanasia0-D
Special,
manufactured for Schering-Plough Animal Health, by
Steris Laboratories, Phoenix, AZ) . In each experiment,
five replicates (first, third, fifth, seventh and ninth) of
pigs, from the heaviest to the lightest, were used to
obtain kidney weight
. Kidneys were removed from
the abdominal cavity, connective tissue was trimmed,
and organs were blotted on paper towels and weighed .
Samples of each kidney were immediately taken,
weighed and placed in an oven (6S'C) for at least 48 h
to determine the dry matter content . Relative fresh
weights of kidneys are expressed as gram per kilogram
of body weight .
Statistical analyses . Data were analyzed as a ran-
domized complete block design, using individual
piglets as the experimental unit, and following the
general linear model procedures of SAS (SAS Institute,
Cary, NC) . Values are reported as means for each diet
group with either SEM or pooled SD
. Following a sig-
nificant F test (P c 0.05), the Duncan s multiple range
test (Steel and Torrie 19801 was used to identify differ-
ences among individual groups .
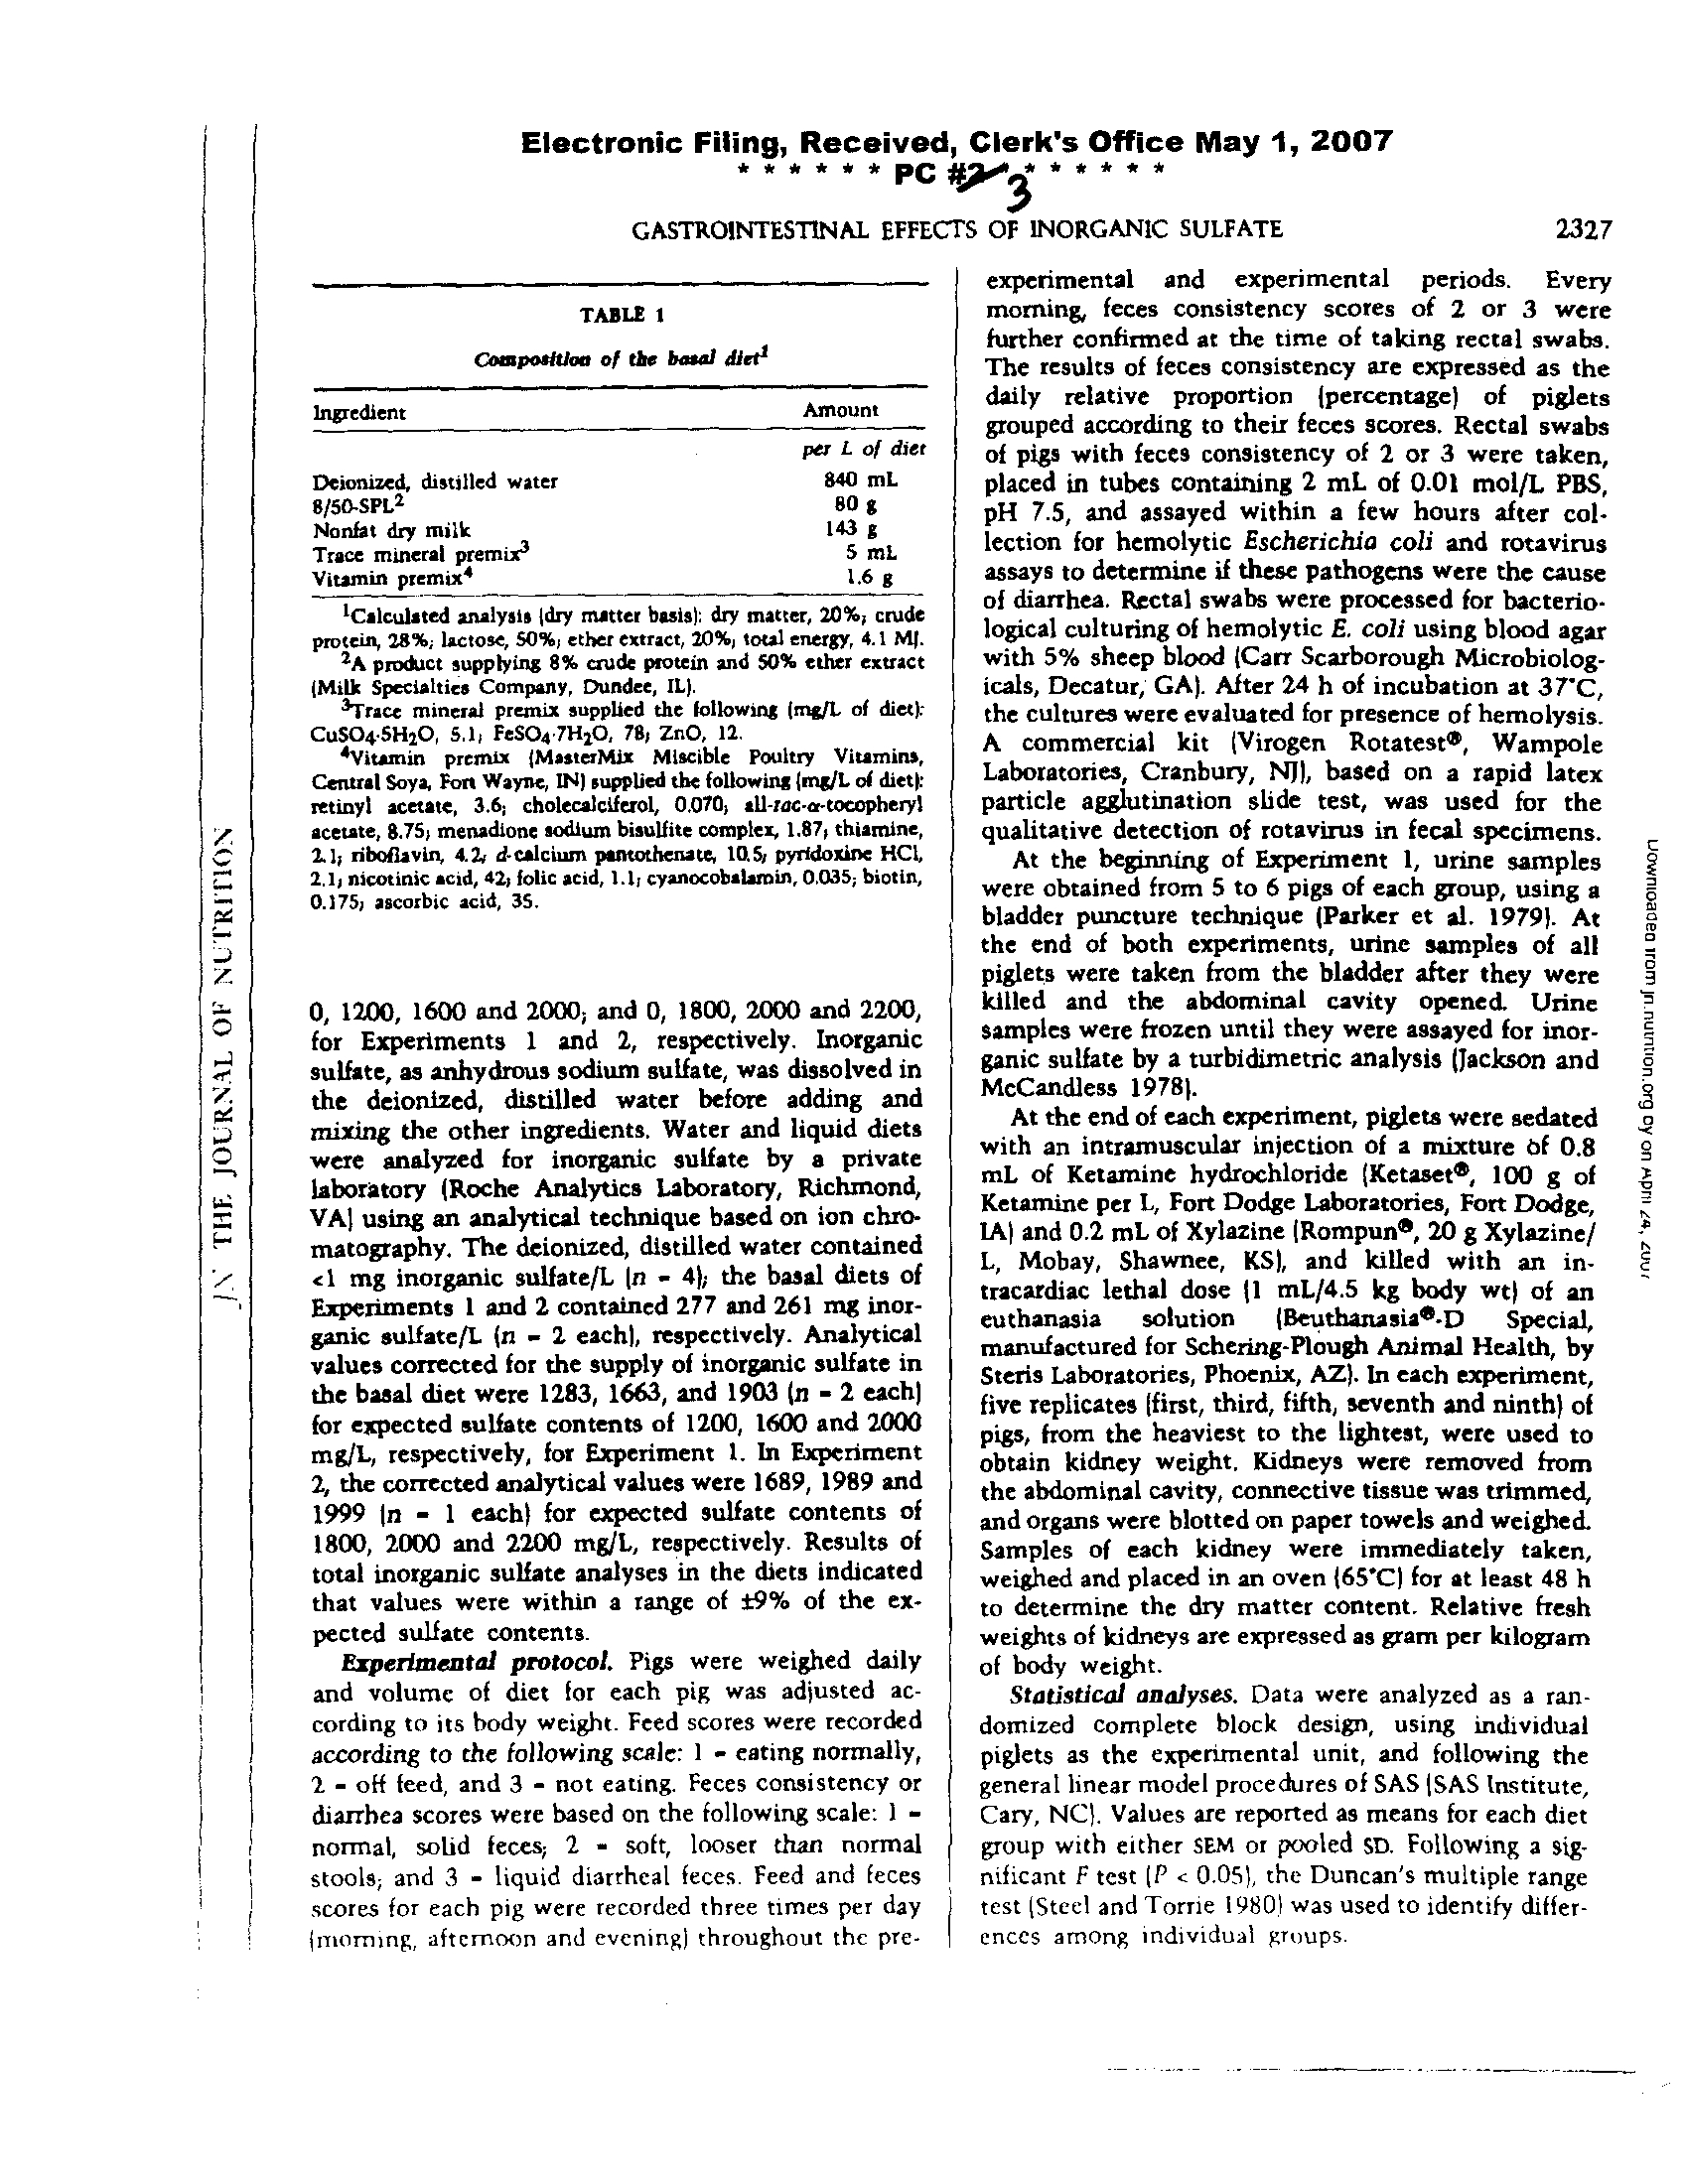
TABLE I
Caespoattfon of the basal diet[
Ingredient
Amount
per L of diet
840 mL
80 g
143 g
5 ml.
1 .6 g
Deionized, distilled water
8/50-SPL
2
Nonfat dry milk
Trace mineral premix3
Vitamin premix 4
'Calculated analysis ldry matter basial : dry matter, 20%, crude
protein, 28%;
lactose, 50%, ether extract, 20%, total energy, 4 .1 MI.
2A product supplying 8% crude protein and 50% ether extract
(Milk Specialties Company, Dundee, IL)
.
3Tracc mineral premix supplied the following (mg/L of dietk
CuSO45H20, 5.1 ) FeSO4 7H10, 78, ZnO, 12
.
4
Vitamin premix (MasterMix Miscible Poultry Vitamins,
Central Soya, Fan Wayne, IN) supplied the following lmg/L of dietk
retinyl acetate, 3 .6 ; cholecaleiferol, 0
.010,
all-roc-a-tocopheryl
•
acetate, 8.75, menadlone sodium bisulfite complex, 1
.87, thiamine,
11, riboflavin, 4.Z d-calcium pantothenate, 1Q5, pyndoxlnc HCL
•
2 .1, nicotinic acid, 42, folic acid, 1 .1, cyanocobalarnin, 0.035; biotin,
0 .175, ascorbic acid, 35
.
•
0,
for
1200,
Experiments
1600 and
1
2000and
;
2,
and
respectively0,
1800, 2000
.
and
Inorganic2200,
sulfate, as anhydrous sodium sulfate, was dissolved in
the deionized, distilled water before adding and
•
mixing the other ingredients . Water and liquid diets
were analyzed for inorganic sulfate by a private
laboratory (Roche Analytics Laboratory, Richmond,
VA) using an analytical technique based on ion chro-
matography
. The deionized, distilled water contained
ci mg inorganic sulfate/L In
- 4); the basal diets of
Experiments I and 2 contained 277 and 261 mg inor-
ganic sulfate/L (n -
2 each), respectively . Analytical
values corrected for the supply of inorganic sulfate in
the basal diet were 1283, 1663, and 1903 (n
- 2 each)
for expected sulfate contents of 1200, 1600 and 2000
mg/L, respectively, for Experiment 1 . In Experiment
2, the corrected analytical values were 1689, 1989 and
1999 (n - 1 each) for expected sulfate contents of
1800, 2000 and 2200 mg/L, respectively
. Results of
total inorganic sulfate analyses in the diets indicated
that values were within a range of t9% of the ex-
pected sulfate contents .
Experimental protocol. Pigs were weighed daily
and volume of diet for each pig was adjusted ac-
cording to its body weight . Feed scores were recorded
according to the following scale : I
- eating normally,
2 - off feed, and 3 - not eating. Feces consistency or
diarrhea scores were based on the following scale
: I -
normal, solid feces
; 2 - soft, looser than normal
stools; and 3 - liquid diarrheal feces
. Feed and feces
scores for each pig were recorded three times per day
)morning, afternoon and evening) throughout the pre-
c
0
C a0
•
00
00
n
g
20
I
40
•
0
I
Electronic Filing, Received, Clerk's Office May 1, 2007
f *
• * * * PC -yA * * *
GOMEZEET AL
.
1600
IqAtSS
s
12
Time, days
RESULTS
Food intake and weight gain
. By the end of the
adaptation period (from 2 to 5 d of age), piglets had
adjusted to the Autosow and were all eating the basal
diet normally (feed score of 1)
. From the beginning of
each trial, piglets consumed similar amounts (feed
scores of 1, not shown; P > 0.05)
of all four ex-
perimental diets throughout the entire experimental
periods, indicating that the levels of added sulfate did
not affect food intake
. The calculated overall food
intakes per pig were 3.76 ± 0.19 In - 40) and 3.10 ±
0
.10 in - 40) kg of dry matter for Experiments 1 and 2,
respectively
. Average initial body weights of piglets at
5 d of age were 1.94
10.08 kg In - 40) and 1.85 ± 0.07
kg (n
- 40)
for Experiments I and 2, respectively.
Final body weights were similar (P > 0
.50) among the
four experimental groups in each trial (6
.47 ± 0 .34 and
6.01 ± 0.41
kg, n - 40 each, for Experiments I and 2,
respectively)
. In each experiment, weight gains were
similar (P > 0
.05) for piglets fed the basal diet and the
sulfate-supplemented diets- The overall average gains
0
. - Normal
a - Soft
•
- Liquid
Is
100
50
60
40
20
0
100
so
so
40
20
0
1
s
12
Time, days
Is
relative
normal,
piglets
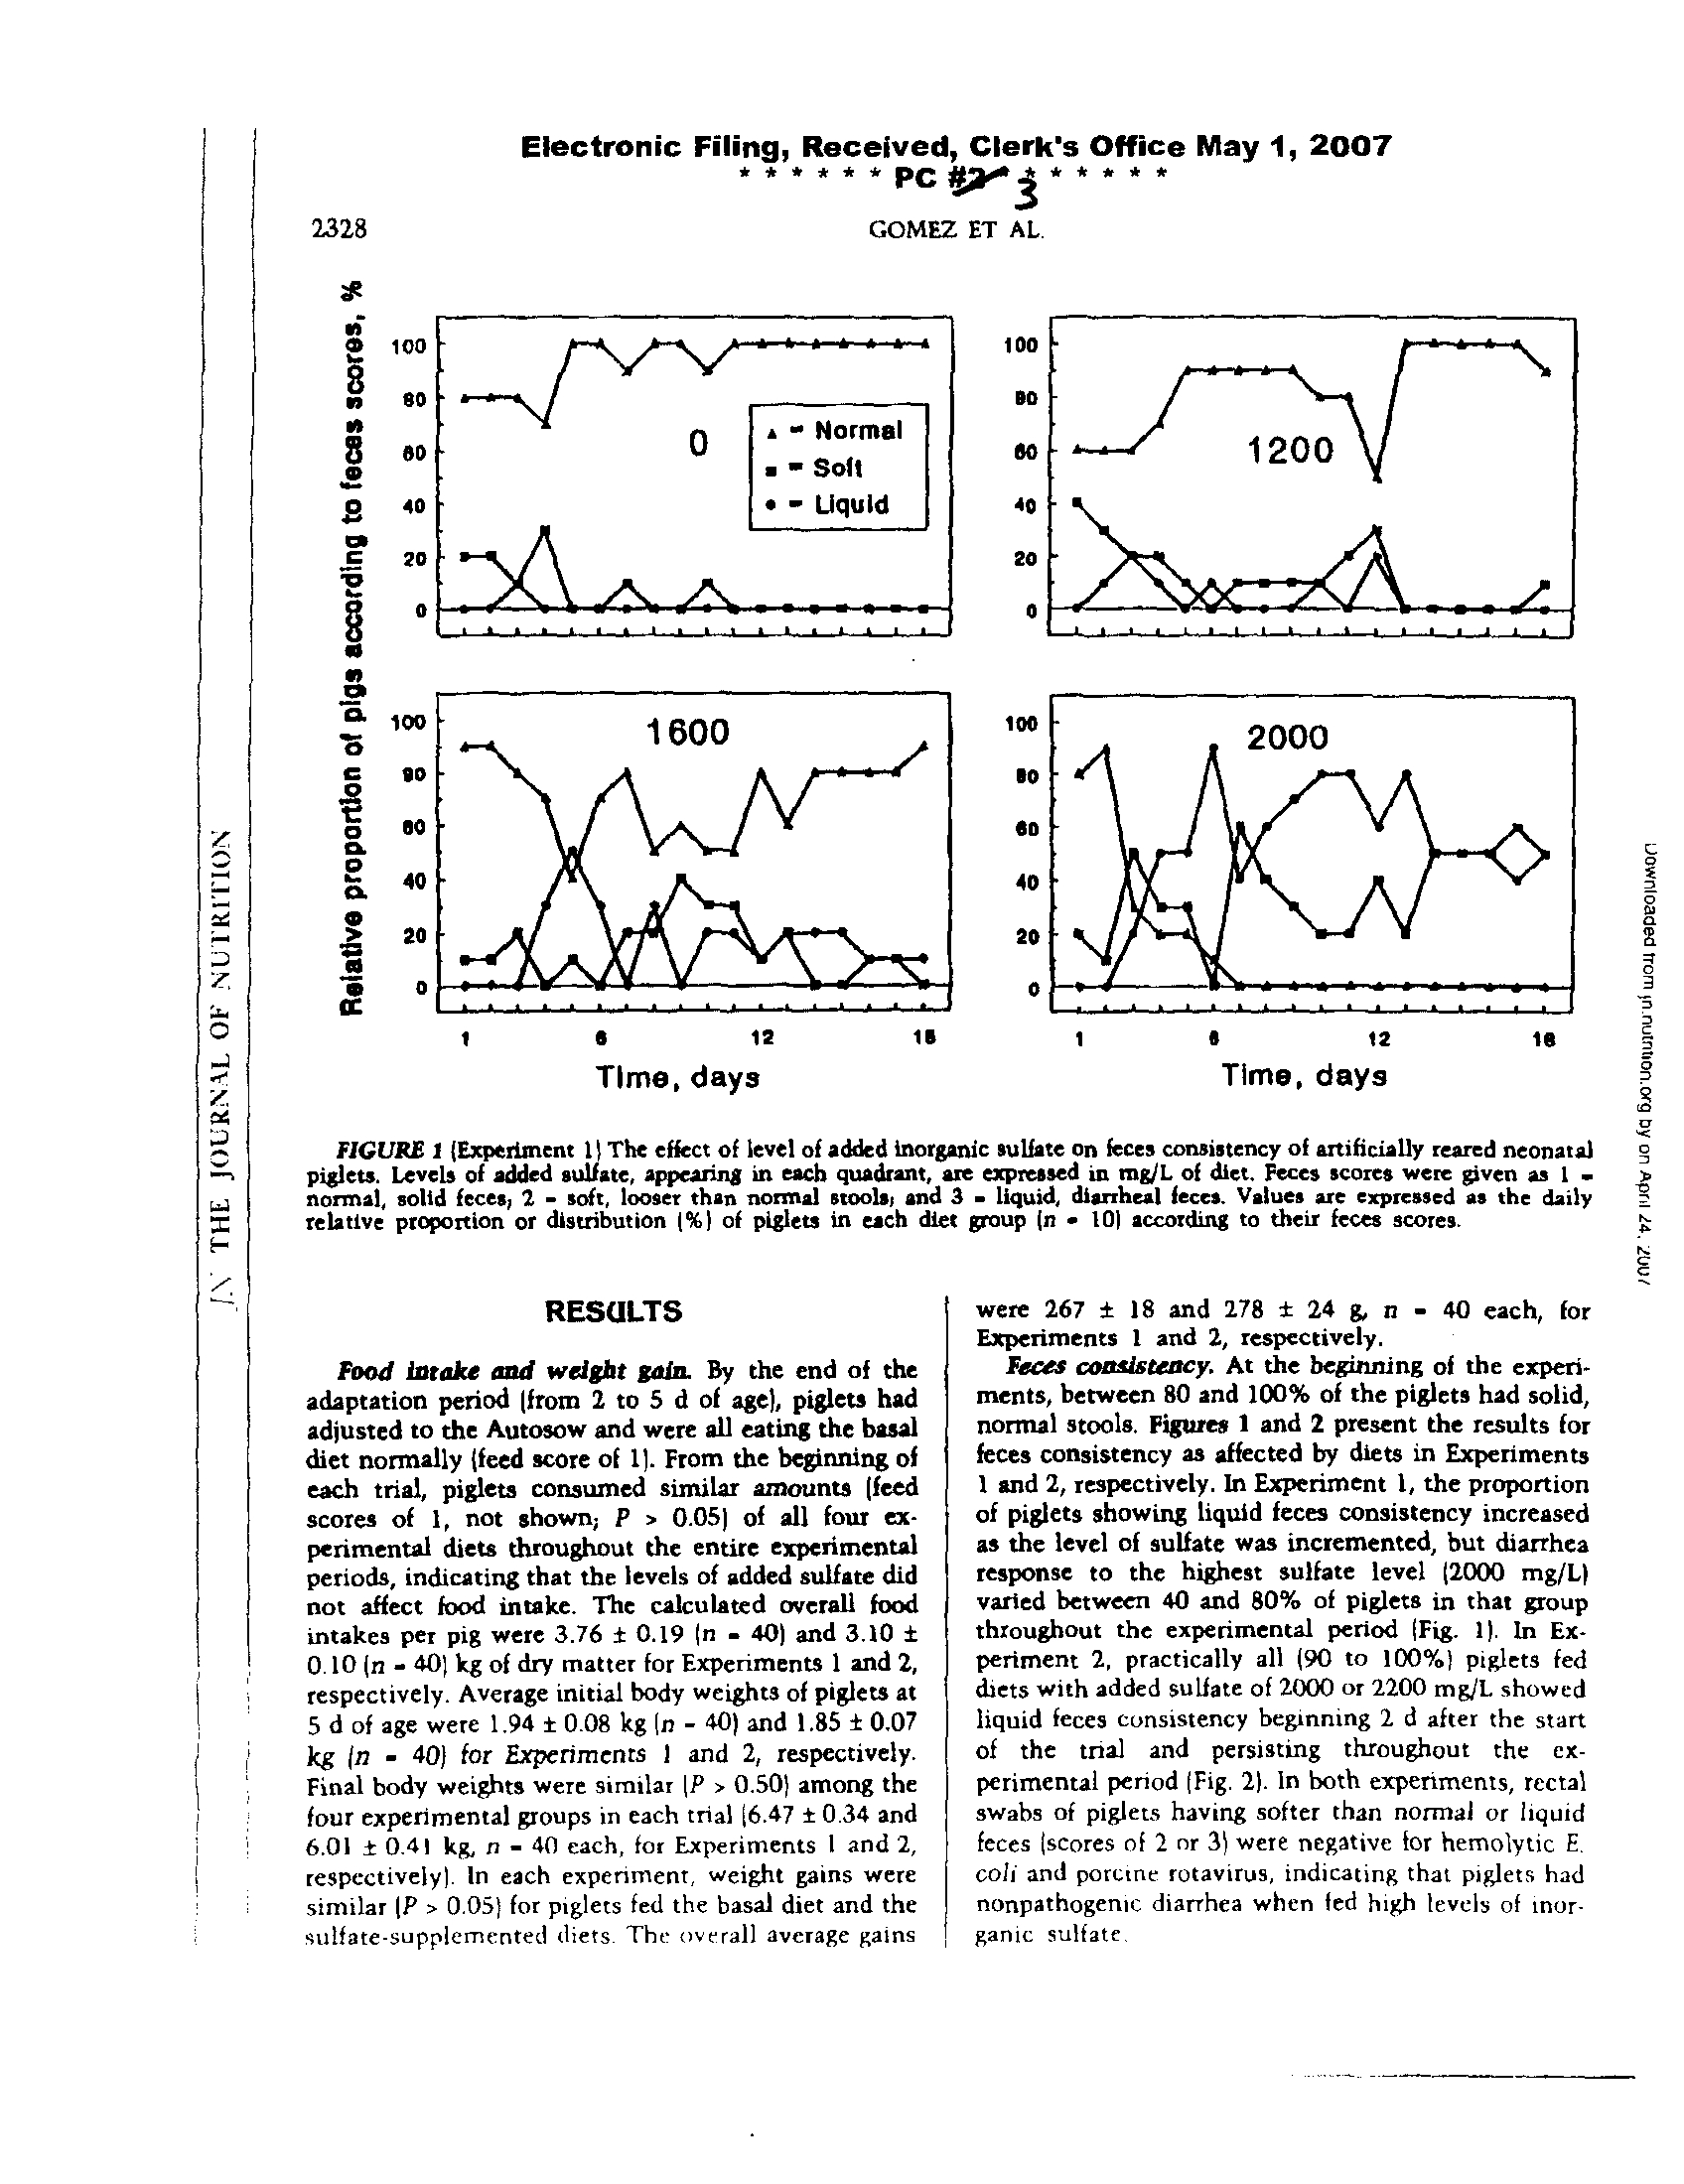
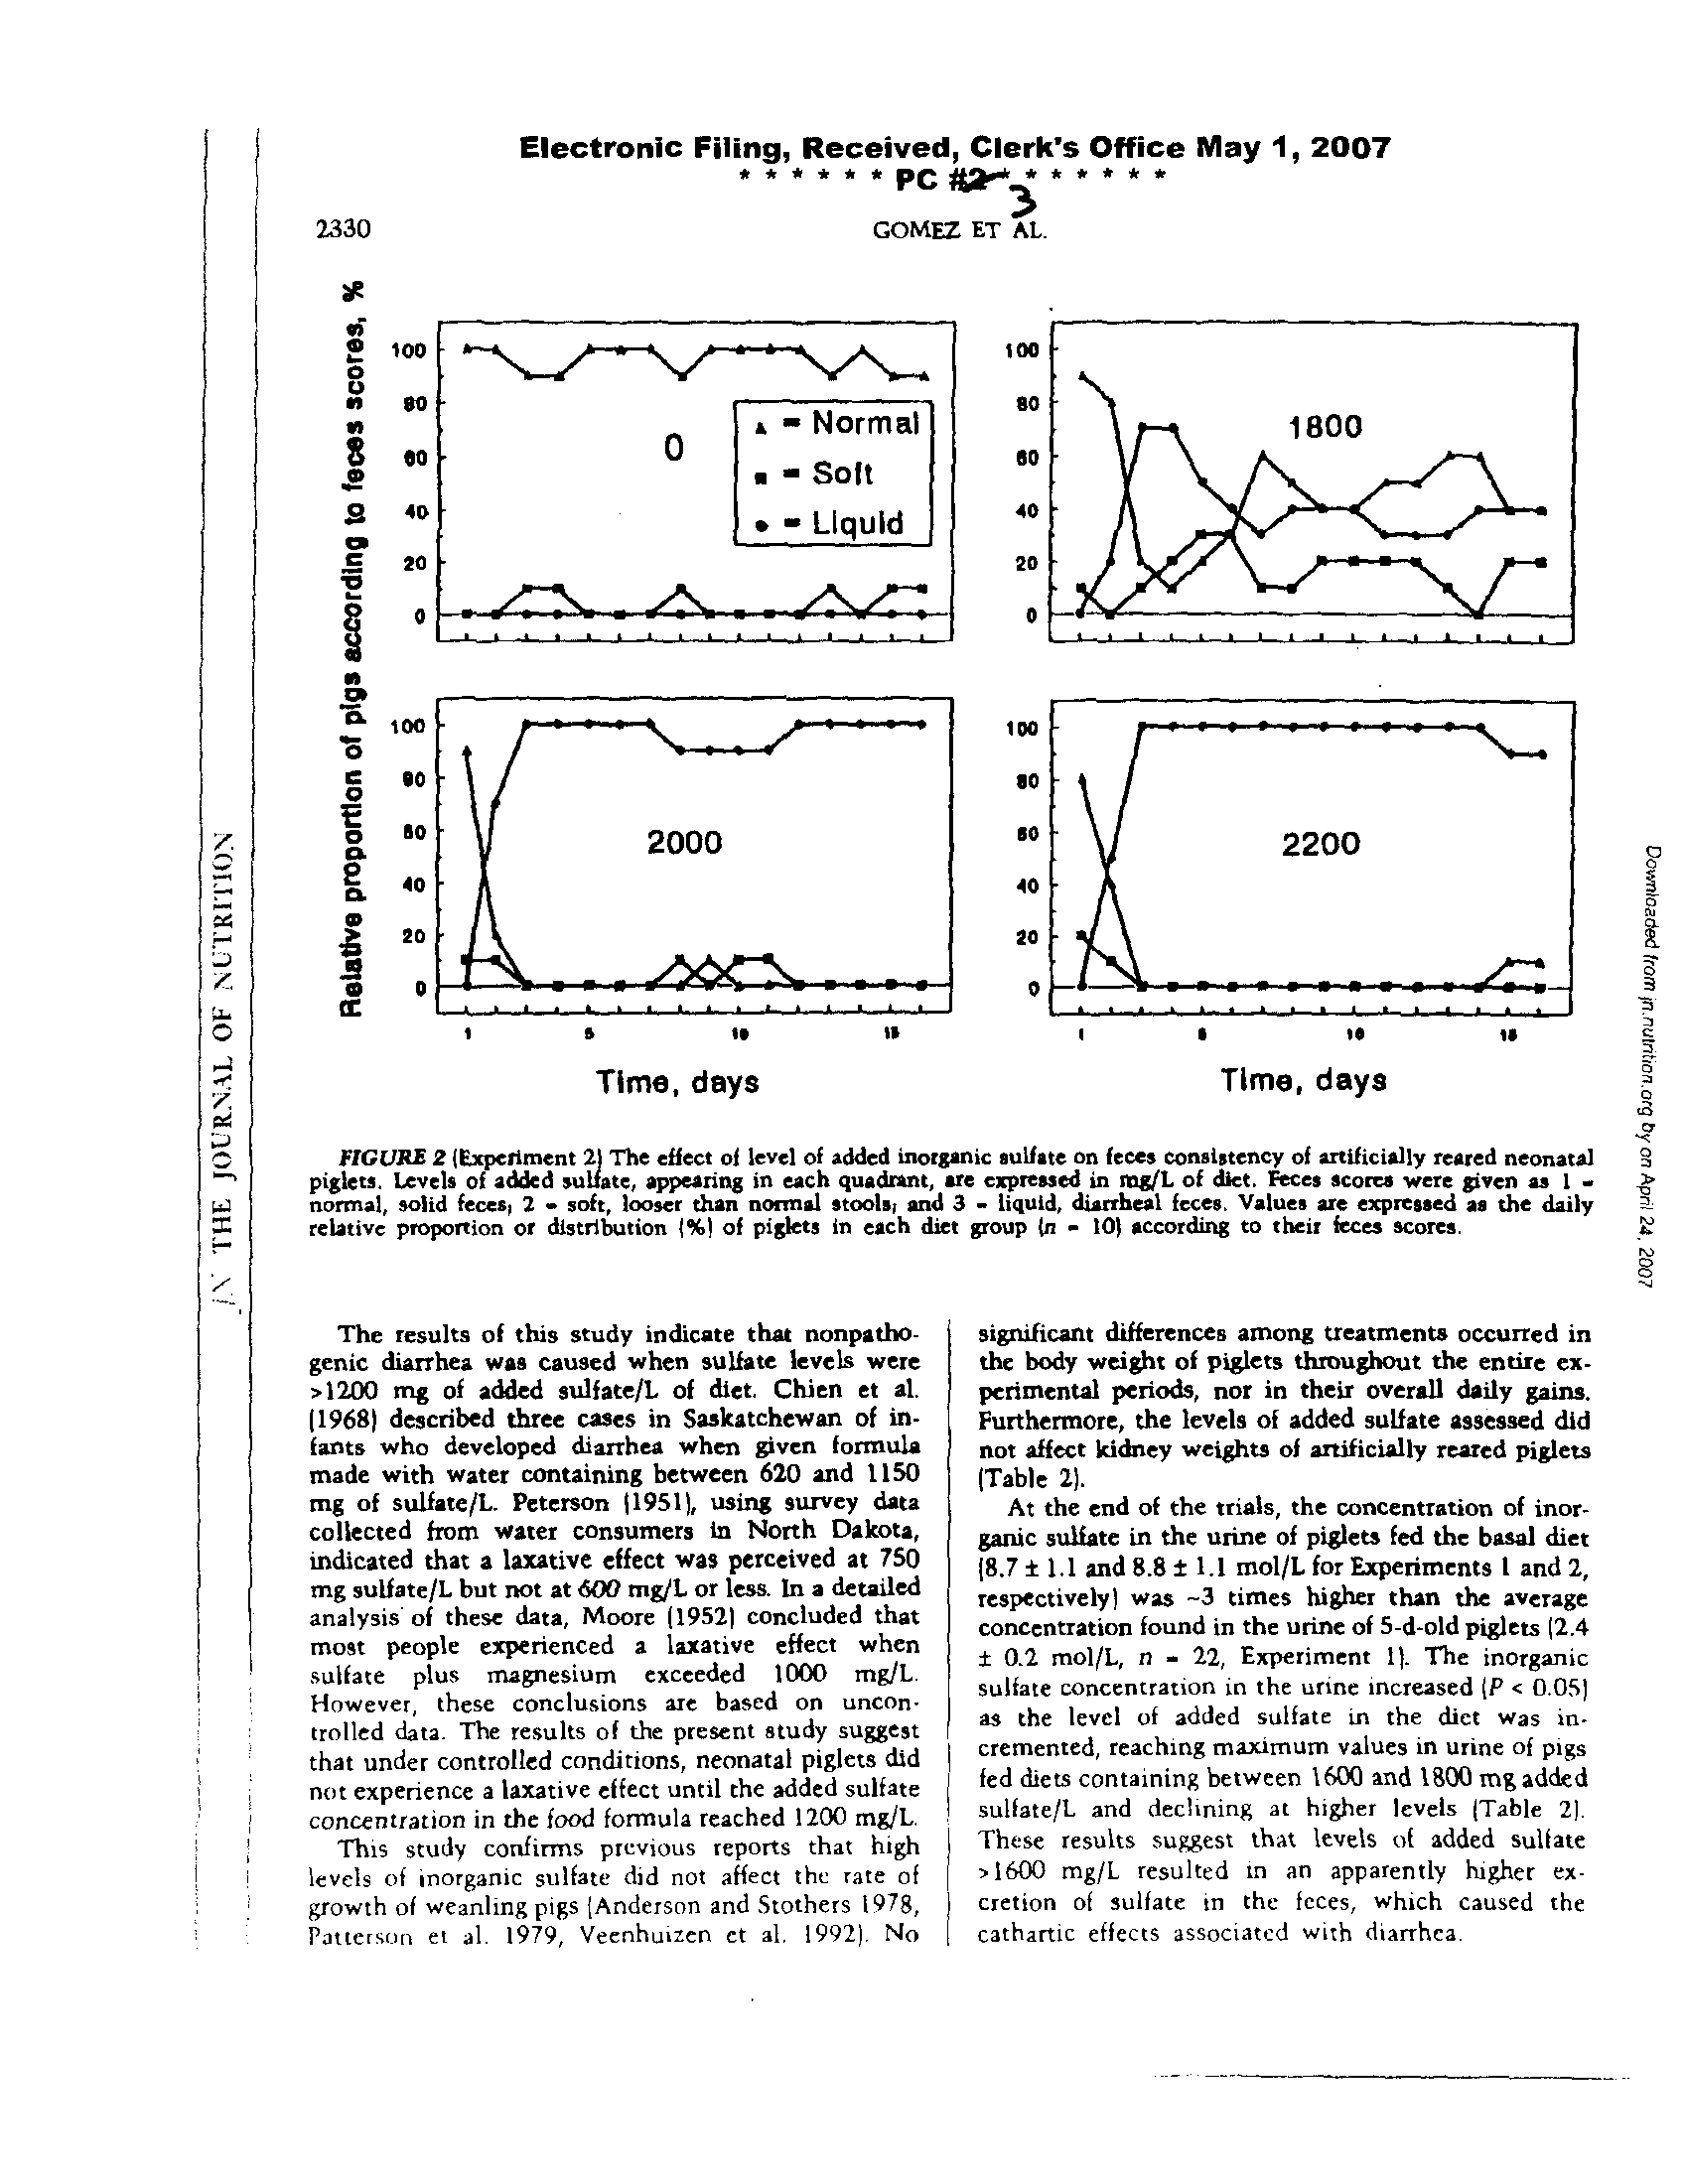
FIGURE
.
solid
Levels
proportion
1
feces,
(Experiment
of added
or
2 -
distribution
soft,
sulfate,
1) The
looser
effect
appearing
(%)
than
of
of
level
normal
piglets
in each
of
stools,
added
in
quadrant,
each
inorganic
and
diet
3
are
-
group
liquid,
expressed
sulfate
in
diarrheal
-
on
in
10)
feces
mg/L
according
fecesconsistency
of diet
.
to
Values
.
their
Feces
of artificially
are
feces
scores
expressed
scoreswere
reared
.
given
as the
neonatalasdaily
I -
were 267 ± 18 and 278 ± 24 g, n - 40 each, for
Experiments I and 2, respectively .
Feces
consistency.
At the beginning of the experi-
ments, between 80 and 100% of the piglets had solid,
normal stools . Figures 1 and 2 present the results for
feces consistency as affected by diets in Experiments
I and 2, respectively . In Experiment 1, the proportion
of piglets showing liquid feces consistency increased
as the level of sulfate was incremented, but diarrhea
response to the highest sulfate level (2000 mg/L)
varied between 40 and 80% of piglets in that group
throughout the experimental period IFig . 1). In Ex-
periment 2, practically all (90 to 100%) piglets fed
diets with added sulfate of 2000 or 2200 mg/L showed
liquid feces consistency beginning 2 d after the start
of the trial and persisting throughout the ex-
perimental period (Fig .
2).
In both experiments, rectal
swabs of piglets having softer than normal or liquid
feces (scores of 2 or 3) were negative for hemolytic E
.
coil and porcine rotavirus, indicating that piglets had
nonpathogenic diarrhea when fed high levels of inor-
ganic sulfate -
CO
3
a
0
2328
J
qO
100
80
M
a
•
00
40
v
t>C•
20
9
0
q
a
Qq
too
Electronic
GASTROINTESTINAL
Filing,
. . . .+*PC40,
Received,
EFFECTS
Clerk's
OF
3
INORGANIC
*„ .,
Office
.
.
SULFATE
May 1, 2007
2329
Relative kidney
weight and sulfate concentration
in urine
. The relative kidney weights along with their
dry matter concentration and the inorganic sulfate
concentration in urine at the end of the experimental
periods are given in Table 2
. There were no differ-
ences (P > 0
.05 in fresh kidney weights nor in their
dry matter content.
Sulfate concentration in urine of piglets at the
beginning of Experiment 1, at 5 d of age, was 2.4
± 0.2
mot of inorganic sulfate per L (n - 22) . By the end of
the experimental periods, the sulfate concentration in
urine of piglets fed the basal diet rose to 8.7± 1 .1 (n -
10) and 8 .8 ± 1.1 (n - 10) mol/L for Experiments 1 and
2, respectively. Concentration of inorganic sulfate in
urine was affected (P < 0
.05) by dietary levels of
inorganic sulfate (Table 2)
. The highest sulfate con-
with
centrations
added sulfate
were found
levels
in urine
of 1600
of
and
piglets
1800
fed
mg/L
dietsfor
Experiments I and 2, respectively .
DISCUSSION
A national secondary drinking water standard
(NSDWS) of 250 mg sulfate/L has_ been established by
the U .S . Public Health Service (1962)
. The appropriate
regulatory limit is uncertain because adequate studies
have not been performed. The present research was
conducted to provide preliminary estimates of the
level of sulfate that may be tolerated in human infant
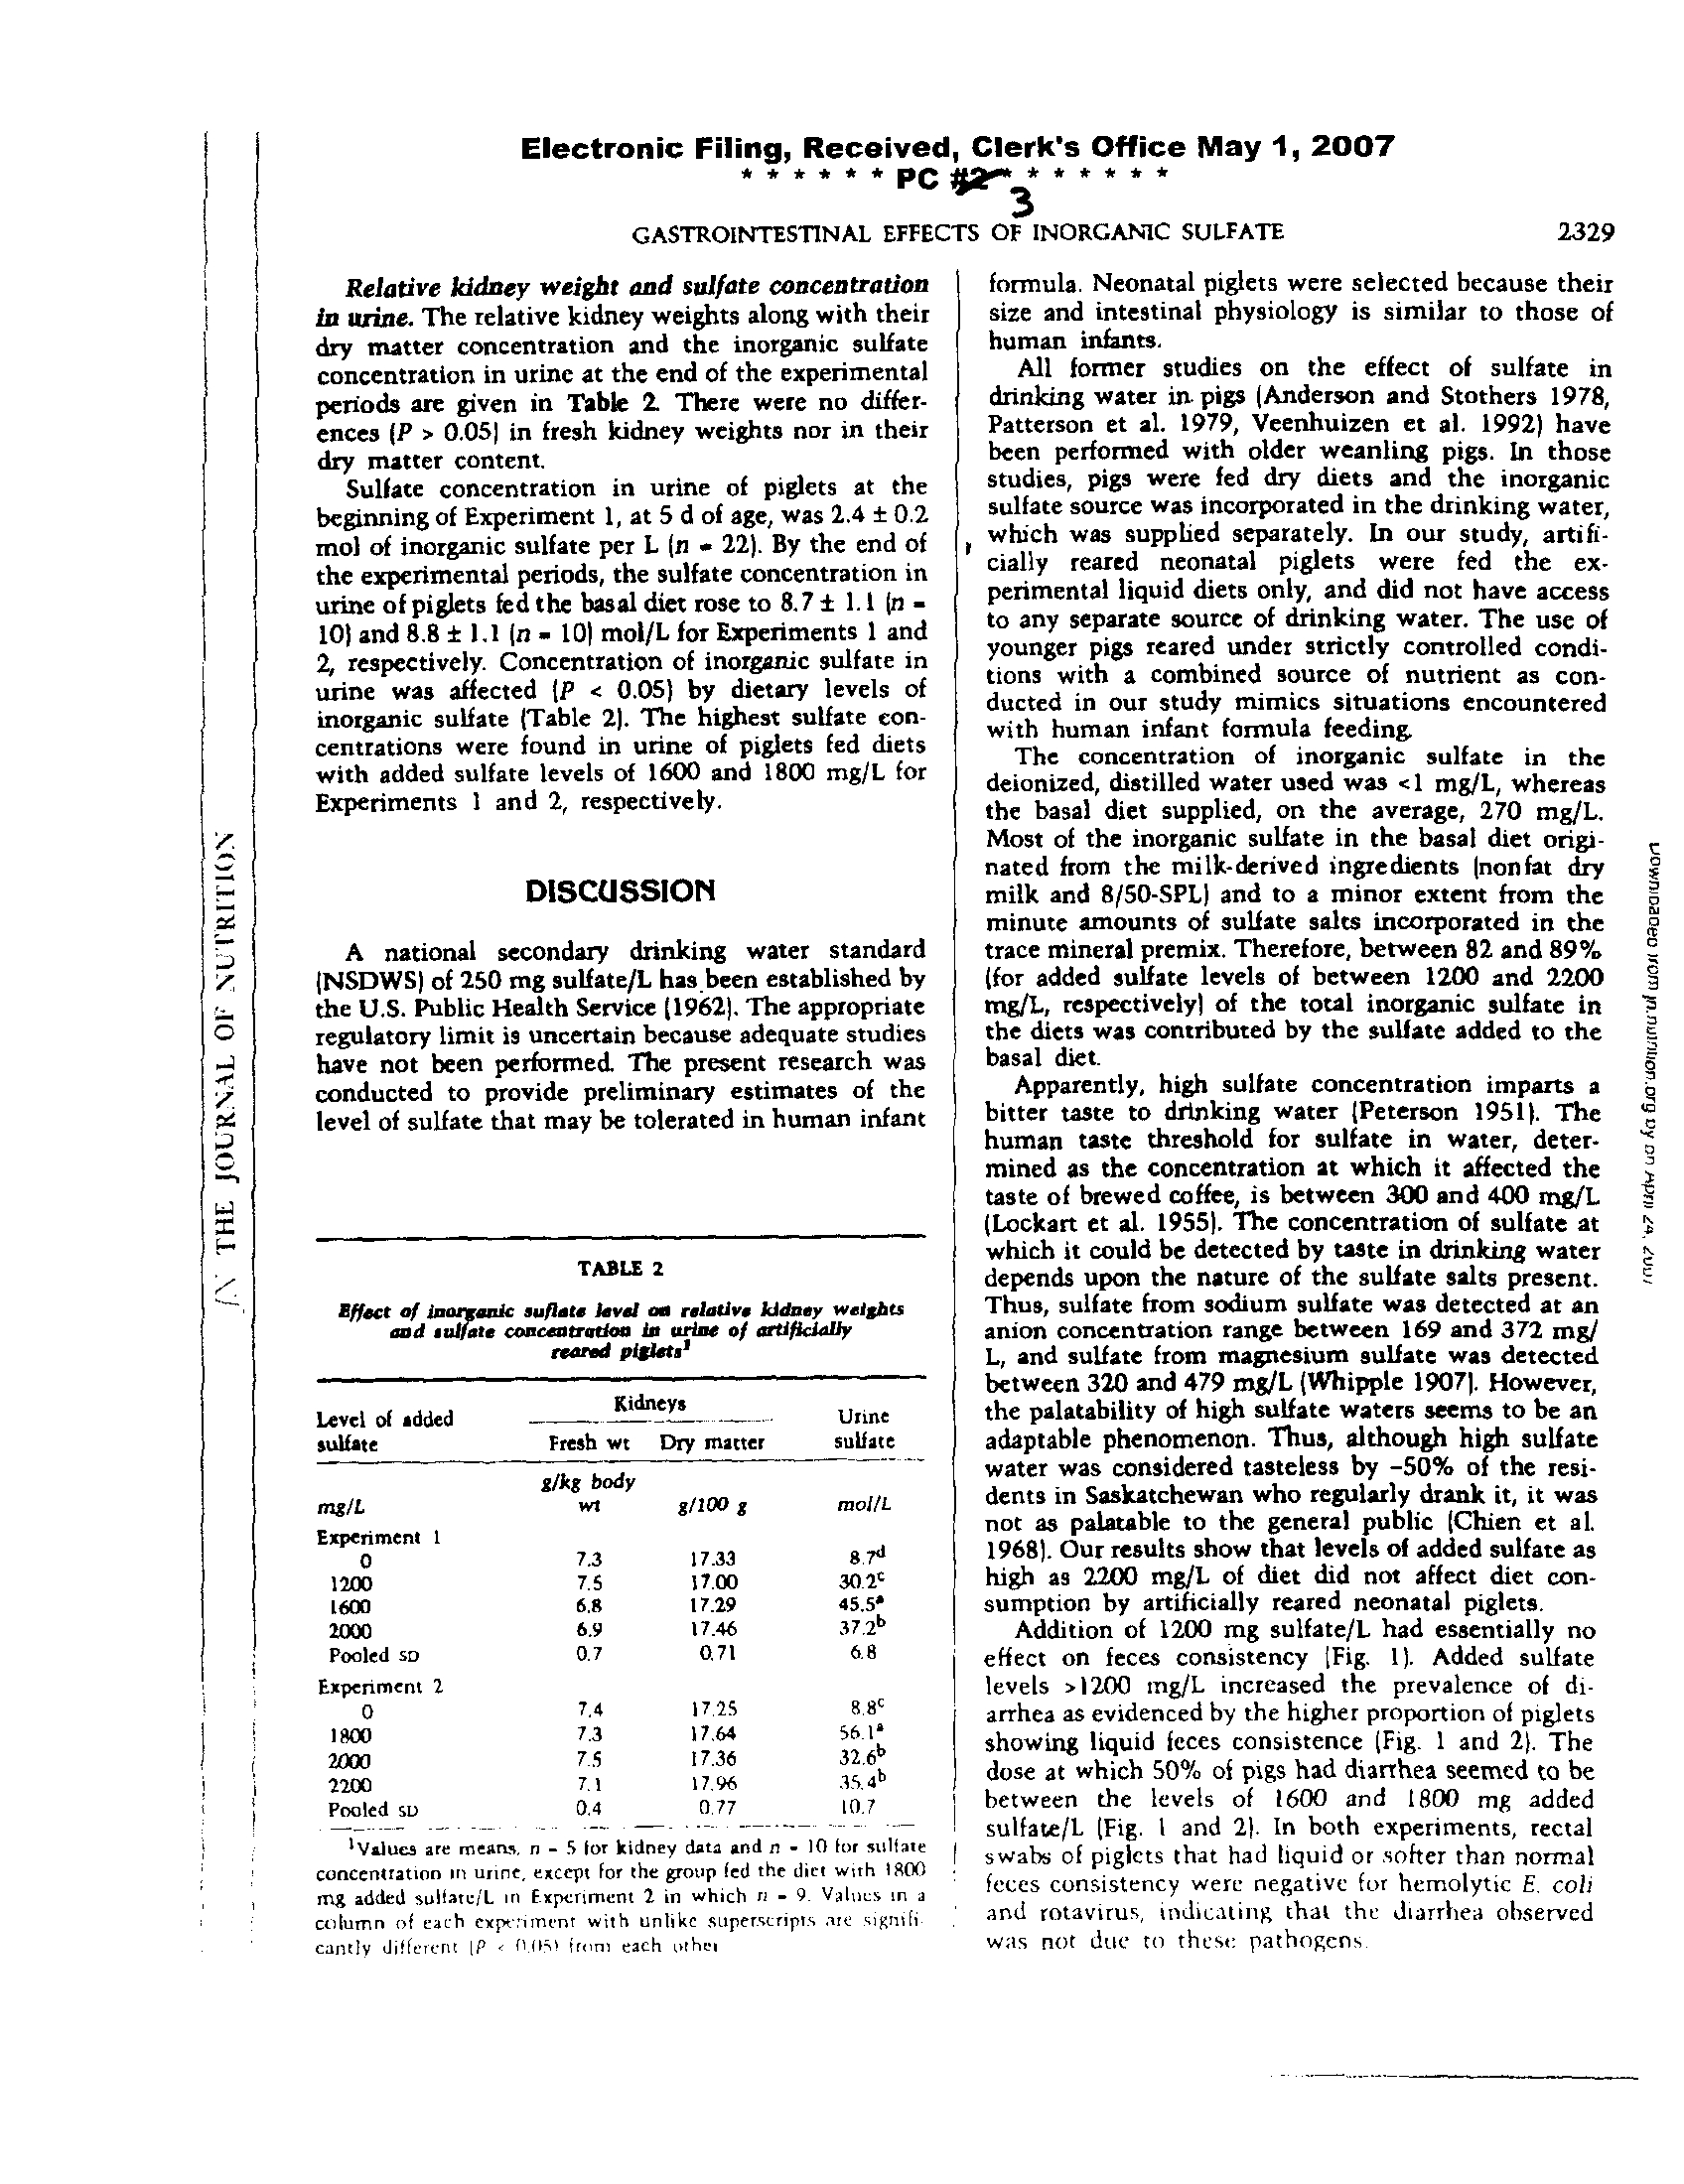
TABLE 2
tVducs are mean, n - 5
for kidney data and n - 10 for sulfate
concentration to
urine, except for the group fed the diet with ISM
mg added sulfatelL in Experiment
2 in which n -
9
. Values in a
celumn of
,
.,h
expn^invent with unlike superscripts .arc signiIi
candy different
P .
11(151
from each other
formula. Neonatal piglets were selected because their
size and intestinal physiology is similar to those of
human infants.
All former studies on the effect of sulfate in
drinking water in pigs (Anderson and Stothers 1978,
Patterson et al. 1979, Veenhuizen et al . 1992) have
been performed with older weanling pigs . In those
studies, pigs were fed dry diets and the inorganic
sulfate source was incorporated in the drinking water,
r which was supplied separately . In our study, artifi-
cially reared neonatal piglets were fed the ex-
perimental liquid diets only, and did not have access
to any separate source of drinking water. The use of
younger pigs reared under strictly controlled condi-
tions with a combined source of nutrient as con-
ducted in our study mimics situations encountered
with
The
human
concentration
infant formula
of inorganic
feeding
sulfate in the
deionized, distilled water used was <1 mg/L, whereas
the basal diet supplied, on the average, 270 mg/L .
Most of the inorganic sulfate in the basal diet origi-
nated from the milk-derived ingredients (nonfat dry
minute
milk and
amounts
8/50-SPL)
of sulfate
and to
salts
a minor
incorporated
extent from
in
thethe
trace mineral premix . Therefore, between 82 and 89%
mg/L,
(for added
respectively)
sulfate
of
levels
the total
of between
inorganic
1200
sulfate
and 2200in
the diets was contributed by the sulfate added to the
basal diet
.
Apparently, high sulfate concentration imparts a
bitter taste to drinking water (Peterson 1951)
. The
human taste threshold for sulfate in water, deter-
mined as the concentration at which it affected the
taste of brewed coffee, is between 300 and 400 rngJL
(Lockart et al . 1955) . The concentration of sulfate at
which
Thus,
anion
depends
it
sulfate
concentration
upon
could
the
from
be
nature
detected
sodium
range
of
sulfate
the
by
between
taste
sulfate
was
in
169
detected
salts
drinking
and
present372
at
watermg/an
.
L, and sulfate from magnesium sulfate was detected
between 320 and 479 mg/L (Whipple 19071 . However,
the palatability of high sulfate waters seems to be an
adaptable phenomenon . Thus, although high sulfate
water was considered tasteless by -50% of the resi-
dents in Saskatchewan who regularly drank it, it was
not as palatable to the general public (Chien et al .
1968) . Our results show that levels of added sulfate as
sumption
high as 2200
by artificially
mg/L of diet
reared
did not
neonatal
affect
pigletsdiet .
con-
Addition of 1200 mg sulfate/L had essentially no
effect on feces consistency (Fig. 1) . Added sulfate
levels >1200 mg/L increased the prevalence of di-
arrhea as evidenced by the higher proportion of piglets
showing liquid feces consistence (Fig . 1 and 2) . The
dose at which 50% of pigs had diarrhea seemed to be
between the levels of 1600 and 1800 mg added
sulfate/L (Fig . I and 2) . In both experiments, rectal
swabs of piglets that had liquid or softer than normal
feces
and rotavirus,
consistency
indicating
were negative
that the
for
diarrhea
hemolytic
observedE
.
cob
was not due to these pathogens .
level
sulfateof
added
Fresh wtKidneys
Dry matter
sulfateUrine
mg/L
g/kg body
wt
g/100 s
mol7L
Experiment 1
0
7 .3
17 .33
ii 7d
1200
7
.5
17
.00
30.2'
1600
6 .8
17.29
45 .5-
2000
6
.9
17 .46
37,21,
Pooled so
0 .7
0.71
6,8
Experiment 2
0
7
.4
17
.25
8 .8c
1800
7
.3
17,64
56 .1'
2000
7 . .5
17 .36
32 .66
2200
7
.1
17.96
354 6
Pooled so
0 .4
0 .77
10 .7
Effect of
enic satiate level a relative
kidney weights
cad
calf
tc coaceotrotiao in urine of
artificially
reared pisleter
I
2330
S
ofm
100
nnOU
a0
0
Electronic Filing,
Received,
GOMEZ
PCtt%
ET
Clerk's
.
3
AL
.
.
.+a
Office
.
May 1, 2007
0
. - Normal
. - Soft
L a - Liquid
/,-"*N" /
t r.
Time, days
The results of this study indicate that nonpatho-
genic diarrhea was caused when sulfate levels were
>1200 mg of added sulfate/L of diet. Chien et al.
(1968) described three cases in Saskatchewan of in-
fants who developed diarrhea when given formula
made with water containing between 620 and 1150
mg of sulfate/L. Peterson 119511, using survey data
collected from water consumers in North Dakota,
indicated that a laxative effect was perceived at 750
mg sulfate/L but not at 600 mg/L or less . In a detailed
analysis of these data, Moore (1952) concluded that
most people experienced a laxative effect when
sulfate plus
magnesium exceeded 1000 mg/L .
However, these conclusions are based on uncon-
trolled data . The results of the present study suggest
that under controlled conditions, neonatal piglets did
not experience a laxative effect until the added sulfate
concentration in the food formula reached 1200 mg/L
.
This study confirms previous reports that high
levels of inorganic sulfate did not affect the rate of
growth of weanling pigs (Anderson and Stothers 1978,
Patterson et al . 1979, Veenhuizen ct al . 1992)
. No
100
so
s0
.a
20
100
so
so
40
20
0
1800
k~*,
410
40*e
a
is
Time, days
is
normal,
relative
piglets
FIGURE
.
solid
Levels
proportion
2
feces,(Experiment
of added
or
2 -
distribution
sulfate,
soft,
2) The
looser
effect
appearing
(%l
than
of
of
level
piglets
normal
in each
of
stools,
added
in
quadrant,
each
inorganic
and
diet
are
3group
-expressed
sulfate
liquid,
(n -on
diarrheal
in
101
feces
mg/L
according
consistency
of
fecesdiet.
to
Values
.
their
Feces
of artificially
are
feces
scores
expressed
scoreswere
reared
.
given
as the
neonatalasdaily
I -
significant differences among treatments occurred in
the body weight of piglets throughout the entire ex-
perimental periods, nor in their overall daily gains
.
Furthermore, the levels of added sulfate assessed did
not affect kidney weights of artificially reared piglets
(Table 2) .
At the end of the trials, the concentration of inor-
ganic sulfate in the urine of piglets fed the basal diet
(8.7 t 1.1 and 8.8 t 1.1
mol/L for Experiments I and 2,
respectively) was -3 times higher than the average
concentration found in the urine of 5-d-old piglets (2 .4
t 0.2
mol/L, n - 22, Experiment 11. The inorganic
sulfate concentration in the urine increased (P < 0 .05)
as the level of added sulfate in the diet was in-
cremented, reaching maximum values in urine of pigs
fed diets containing between 1600 and 1800 mg added
sulfate/L and declining at higher levels (Table 2) .
These results suggest that levels of added sulfate
>1600 mg/L resulted in an apparently higher ex-
cretion of sulfate in the feces, which caused the
cathartic effects associated with diarrhea .
Electronic Filing,
"
*
Received,
,
**PC W
Clerk's
* * * *
Office
* *
May 1, 2007
GASTROINTESTINAL EFFECTS
OF
3
INORGANIC SULFATE
2331
Sulfate is absorbed by the intestine at a relatively
slow rate and, henceforth, sodium and particularly
magnesium sulfate are effective osmotic laxatives .
There is no information in the literature on the effect
of continuous administration of high levels
of inor-
ganic sulfate either in the diets or in drinking water
on sulfate absorption and excretion. Cocchetto and
Levy (1981) studied the absorption of a large amount
of sodium sulfate 118
.1 g as decahydrate, equivalent to
8 .0 g of the anhydrous salt) when administered orally
either as a single dose or as four equally divided
hourly doses to five healthy men
; the 72-h urinary
recovery of free sulfate was 53.4 ± 15.8 and 61.8 ±
7 .8% for single and divided doses, respectively . Fur-
thermore, whereas the single dose produced severe
diarrhea, the divided doses caused only mild or no
diarrhea
. A study on the absorption of sulfate from
orally administered magnesium sulfate )Morris
and
Levy 1983) in human subjects indicated that the bi-
oavailability of sulfate from magnesium sulfate was
lower and more variable than that found with sodium
sulfate (Cocchetto and Levy 1981) . Magnesium sulfate
seemed to be absorbed less completely and more er-
ratically, and produced more adverse effects on bowel
function than sodium sulfate (Cocchetto and Levy
1981, Morris and Levy 1983) . Although this study was
not intended to assess the absorption and excretion of
•
sulfate in artificially
reared neonatal piglets, the
•
results suggest that levels of added sulfate, as sodium
•
sulfate, >1800 mg/L of diet altered bowel function,
•
producing a laxative or cathartic effect in practically
all piglets that persisted throughout the
duration of
•
the feeding trials .
The contribution of dietary sulfate from food
sources is considered to be negligible
; thus human
exposure to sulfate is limited mainly to drinking
water
. The importance of sulfate as it affects water
quality is contingent upon its taste and laxative
properties
. The reports in the literature indicate that
taste as well as laxative properties of sulfate
ions
depends upon their concentration and the nature of
the sulfate salts present in drinking water . Our results
were obtained with sodium sulfate only, which seems
to have milder laxative properties than magnesium
sulfate (Cocchetto and
Levy 1981, Morris and Levy
1983) .
This study demonstrated
that added inorganic
sulfate levels as high as 2200 mg/L of diet did not
affect growth of artificially reared neonatal
piglets .
Although 1200 mg added sulfate/L of diet had essen-
tially no effect on feces consistency, levels >1800 mg/
L of diet resulted in a persistent, nonpathogenic di-
arrhea in neonatal piglets
. On the basis of the results
of this study as well as on the available reports on the
effects of sulfate in drinking
water, the national
secondary drinking
water standard set by the Ii S.
Public Health S,-rvice (1962) at 250 mg sulfate/L is a
safe quality standard for drinking water furnished by
public water supply systems, and this safe limit could
probably be set higher .
ACKNOWLEDGMENTS
We express special appreciation
to William D .
Heizer of the School of Medicine, University of North
Carolina, Chapel Hill, for his critical review of the
manuscript; J . G . Lecce for his support to this study,
R. Goforth, N . Carbajal, 0 . Thirakoune, and J
. Xu for
technical assistance; L. Enzor-Manzon for preparation
of figures; and Milk Specialties and Central Soya for
supplying the 8/50-SPL and vitamin premix, respec-
tively .
LITERATURE CITED
Anderson, D. M . & Stothers, S. C . 11978/ Effects of saline water
high
young
in
weanling
sulfates,
pigschlorides
. 1 Anusand
. Sci
nitrates
. 47 : 900-907
on the performance
.
of
o
Chins, L., Robertson, H . & Gerrard, J . W. (19681 infantile gas-
o
troenteritis due to water with high sulfate content . Can
. Med .
Assoc
. 1.
99 : 102-104
.
Coalson, 1 . A . & Leece, J
. G. 119731
Herd differences in the ex-
pression of fatal diarrhea in artificially reared piglets weaned
a
after 12 hours vs. 36 boars of nursing
. 1
. Anim . Sci . 36 :
b
1114-1121 .
Cocchetto, D . M . A Levy, G . 11981) Absorption of orally ad-
'a
ministered sodium sulfate in humans
. 1 .
Pharm
.
Sci . 70 :
331-333 .
Durfor, C. N . A Becker, E . (1964) Public Water Supplies of the
100
Largest Cities in the United States,
1962
. U .S . Government
0
Printing Office, Washington, DC
.
Jackson, S . G
. &
McCandless, E. L . (19781 Simple, rapid, turbid,_
metric determination of inorganic sulfate and/or protein . Anal .
Biochem . 90: 802-808
.
Lecce,
1.
G . 119691 Rearing colostrum-free pigs in an automatic
feeding device
. 1
. Amen. Sci . 28 : 27-33 .
Lockart,
E
. E .,
Tucker,
C .
L. & Merritt, M .
C. 11955) The effect of
water impurities on the flavor of brewed coffee. Food Res . 20-
598-605 .
McCabe, L . ) .,
Symons, J
. M
., Lee, R . D. & Robeck, G
. G . 11970)
Survey of community water supply systems . J. Am
. Water
Works Assoc . 62: 670-687 .
Moore, E . W. (19521 Physiological effects of the consumption of
saline drinking water. m: Bulletin Subcommotee on Water
Supply, National Research Council
. Appendix
B, pp . 221-227 .
National Academy of Sciences, Washington, DC .
Morris, M E . & Levy, G. (19831 Absorption d sulfate from orally
administered magnesium sulfate in man
. 1 .
Toxacoi Chat
Toxicol
. 20
: 107-114 .
National Research Council
119771
Drinking Water and Health, pp .
425-428
. National Academy of Sciences, Washington, DC
.
Parker, R . 0., Williams, P . EN, Aheme, F . X, N Young B . A.
11979)
An efficient method for collecting urine from neonatal piglet
.
Can . I . Anion . Sci . 59: 457-458 .
Patterson,
D. W.,
Wahlstrom, R . C, Libal, C W
& Olscm, 0 . E .
{19791 Effects of sulfate in water on swine
reproduction
and
young pig performance I . Anim . Sci .
49.
664--66'
Peterson, N L .
119,11
Sulfates in drinking water .
Othual Bulletin
2332
Electronic Filing, Received, Clerk's Office May 1, 2007
* * * a * *GOMEZ
PC
a
ET
2 a
AL
3
*
.
* * * a
*
North Dakota Water and Sewage Works Conference 1& 6-11
.
Steel, R .G .D
.
at
Tome, J
. H
. (1980) Principles and Procedures of
Statistics-A Biometrical Approach, 2nded McGraw-Hi1L New
York, NY .
Printing Office, Washington, DC .
Veerthuizen, M . F ., Shurson, G . C. & Kohler, E . M
. 11992) Effect of
concentration and source of sulfate on nursing pig performance.
1 .
Am. Vet
. Med
. Aasoc
. 201 : 1203-1208 .
U . S Public Health Service 11962) Drinking water standards, pp
.
3236. U. S
. Department of Health, Education, and Welfare .
Public Health Service Publication no. 956, U .S
. Government
Whipple, G. C. 11907) The Value of Pure Water, pp. 62-67
. John
Wiley & Sons, New York, NY
. Reprinted
: Clean Water and the
Health of the Cities 119771 Amo Press, New York, NY
.
C0
:.7
0
.-1
0
W
x
C
SD,SV
0
Electronic Filing,
******Received,
PC W
Clerk's
* * * *
Office
* *
May 1, 2007
3
Response of Cow-calf Pairs to Water High in Sulfates'
Hubert Patterson2 , Pat Johnson
3 , George Perry2 , Roger Gates', and Ron Haggh 4
Department of Animal and Range Sciences
BEEF 2005 - 05
Summary
Data from our laboratory showed water sulfate
levels of 3,000 ppm reduced performance and
health of growing steers during summer months .
In addition, water averaging 2,600 ppm in
sulfates for cow-calf pairs had little impact on
calf growth or milk production, but caused small
reductions in cow BW and body condition score
(BCS) . This experiment
was conducted to
evaluate the effects of high sulfate water on cow
and calf performance, milk production, and
reproduction . Ninety-six crossbred, lactating
cows (ages 2-13 ; average calving date of April
14) and their calves were
assigned, after
stratifying by age, weight, and previous winter
management, to one of six
pastures (16
cows/pasture) .
Pastures
were randomly
assigned to one of two water sulfate levels
(three pastures/level)
.
Treatments were low
sulfate (LS) water (average 368 ± 19 ppm
sulfates) or high sulfate (HS) water (average
3,045 ± 223 ppm sulfates) . The HS water was
created by adding sodium sulfate to the LS
water
. Cows grazed native range and received
a conventional mineral supplement ad-libitum
from June 3 to August 26, 2004 . Water was
provided in aluminum stock tanks . Cow 12-h
milk production was estimated by the weigh-
suckle-weigh method on August 7
. Cows were
synchronized with a single injection of
prostaglandin and bred by natural service
. There
were no differences in cow weight or BCS
change during the trial (P > 0
.15) . Twelve-hour
milk production in August was higher (P = 0 .02)
for LS (9 .0 Ib) than HS (7
.5lb) . Calf ADG tended
to be higher (P = 0.14) for LS (2.56
Ib/d) than HS
(2.45 Ila/d).
The percentage of cows that
became pregnant during the first 25 days of the
breeding season was higher (P = 0 .06) for LS
(81%) than HS (64%), and final pregnancy rates
(55-d breeding season) were 92% and 83%,
This project was funded by the
5D Ag 1 xperiment
Station
Assistant Professor
' Professor
Sr . Livestock Superin'.endent,
Cottonwood Research
Satiun
respectively (P = 0 .20) . Sulfate levels averaging
3,045 mg/L in the drinking water of cow-calf
pairs during the summer reduced cow milk
production and the number of cows bred early in
the breeding season
.
Introduction
Our research group continues to evaluate the
effects of high sulfate water on cattle, with a goal
of defining critical levels of total dissolved solids
(TDS) and sulfates in the drinking water.
Patterson et al
. (2002) reported that water with
3,000 ppm sulfates or greater reduced ADG,
DMI, water intake, and gain/feed of growing
steers in confinement compared to water with
approximately 400 ppm sulfates .
Additional
work showed a quadratic decline in ADG, DMI,
and gain/feed as sulfates in water for confined
steers increased from approximately 400 to
4,700 ppm (Patterson et al ., 2003) . These
reports also showed that cattle in confinement
consuming water with 3,000 ppm sulfates or
greater
were
at a
higher risk of
polioencephalomalacia (PEM
;
Patterson et al .
2002 ; 2003)
. Based on these studies, we have
concluded that the critical level of sulfates in the
water for growing cattle during the summer
months is 3,000 ppm . Since water requirements
increase with elevated temperatures (NRC,
1996), this critical level may be different in
various environments .
Johnson and Patterson (2004) reported that
water with 3,941
ppm sulfates
or greater
reduced performance of grazing stocker steers
in South Dakota
. Few health problems were
observed in stocker cattle receiving the high
sulfate water over that two-year
study .
In
addition, intermediate levels of sulfates were not
tested,
so a "critical" level could not be
determined .
Patterson et al . (2004) reported
that water averaging 2,600 ppm sulfates for
cow-calf pairs resulted in reduced cow weights
but had little impact on reproduction or calf
growth .
The objective of this study was to
evaluate the effects of sulfates in water
averaging 3,000 ppm for cow-calf pairs grazing
Electronic Filing,
* - * *
Received,
* *
PC
NrkClerk's
* * * *
Office
*
May 1, 2007
native range during the summer on cow and calf
performance,
milk production, and cow
reproduction .
Materials and Methods
The study was conducted from June 3 to August
26, 2004 at South Dakota State University's
Cottonwood Range and Livestock Research
Station, near Philip, SD .
Ninety-six crossbred,
lactating cows (ages 2-13 yr
; 1261 Ib) and their
calves (average birth date April 14
; ages 18-80
days
; 181 Ib) were assigned, after stratifying by
age, weight, and previous winter management,
to one of six pastures (16 cows/pasture) .
Pastures were randomly assigned to one of two
water sulfate levels (three pastures/level).
Treatments were low sulfate (LS) water or high
sulfate (HS) water. Water was provided daily in
aluminum
stock
tanks
(round
tanks ;
approximately 98 inches in diameter) .
The LS water was from a rural water system,
and the HS water was created by adding sodium
sulfate to LS water to a targeted 3,000 ppm
sulfate level . LS
water was added to two
storage tanks (one provided water for two HS
pastures and one provided water for the
remaining HS pasture) .
Sodium sulfate was
added to LS water in the storage tanks during
the afternoon of each day .
Stock tanks were
filled the following morning with either LS water
or the previously-mixed HS water from the
storage tanks
. Samples from each water source
were taken as stock tanks were being filled .
Water samples were composited weekly and
sent to the Water Resource Institute
in
Brookings, SD for sulfate analysis
. A locally
available commercial mineral was provided to
cows in each pasture ad-libitum (13% Ca', 12%
P; 13% salt; 2,000 ppm Cu
; 8,000 ppm Zn) .
On June 3 (trial initiation) and August 26 (trial
termination),
both cows and calves were
weighed and cows were assigned a body
condition score (BCS
; 1-9 scale ; Richards et al .,
1986) by two trained technicians (to the nearest
0
.5 of a BCS) . Cow-calf pairs were all on LS
water and grazed native range prior to trial
initiation . Cows and calves were separated and
not allowed access to feed or water for
approximately
12 h prior to initial weight
measurements . At the end of the trial, all cows
and calves were placed on LS water for three
days prior to final weight measurements
. Cows
and calves were separated and housed in a
drylot without access to feed or water for
20
3
approximately 12 h prior to final weight
measurements
.
On August 7, all cows were used to estimate
twelve-hour milk production by the weigh-suckle-
weigh method (Boggs et al ., 1980)
. In brief,
calves were separated from cows
at
approximately 0800 the day prior
to
measurements . Calves were returned to dams
at 1800, allowed to suckle until content, and
again removed
.
Calves were weighed the
following morning at 0600, returned to dams and
allowed to suckle until content,
and then
weighed again . The difference in calf weight
prior to and post-suckling was used as an
estimate of 12-h milk production .
There were
two calves in the LS group that did not suckle
their dam, so their data were removed from
analysis (LS : n = 46 ; HS : n = 48).
One two-year-old bull was turned into each
pasture on July 2 . On July 6, cows were given
an injection of prostaglandin F2a (25 mg i .m .
ProstaMate, Phoenix, Scientific, Inc
., St. Joseph,
MO) to synchronize estrus . Bulls were rotated
between pastures within treatment on July 29 .
Bulls were removed from pastures on August
26
. Pregnancy was determined by rectal
uttrasonagraphy 55 and 88 days following bull
turnout . Pregnancies detected at 55 days were
determined to be conceived in the first 25 d of
the breeding season .
Water disappearance was measured by the
daily change in water depth in the tank located
in each pasture . This was adjusted for
evaporation and precipitation using data
collected at a weather station located near the
experimental pastures .
Data were analyzed as completely randomized
design . Cow and calf weight and cow body
condition score data were analyzed by ANOVA
in PROC GLM of SAS (SAS Inst . Inc., Cary, NC)
with pasture as the experimental unit . Twelve-
hour milk production data were analyzed by
ANOVA with animal as the experimental unit .
Cow pregnancy rates were analyzed by Chi-
Square in PROC GENMOD of SAS, with pasture
as the observation and animal as the event
within observation .
Results and Discussion
Compiling all weekly water composite
sample
results revealed the LS water averaged 368
r 19
Electronic Filing, Received, Clerk's Office May 1, 2007
ppm
3,045
sulfates,
± 223 ppm
and
sulfatesthe
HS
.
treatment
The HS target
averagedof
3,000 pprn was achieved . Patterson et al .
(2004)
the
tanks
target
instead
added
sulfate
sodium
of storage
level
sulfate
tanks
of
directly
3,000
and reported
ppm
to
was
stockthatnot
achieved (average 2,608 ± 408 ppm) . Letting
the water set in the storage tanks during the
afternoon and overnight after mixing salts may
have allowed more sulfates to go into solution in
this experiment
.
One cow from the HS treatment died two weeks
prior to the end of the experiment
. Diagnostics
of
did
brain
show
tissue
high brain
revealed
sodium
no
levelsindication
.
of PEM but
Cow weight change from June 3 to August 26
was not different between treatments (P = 0
.17
;
Table 1)
. In addition, both groups of cows
maintained body condition over the experimental
period (P = 0
.93
; Table 1)
. Patterson et al .
had
(2004)
higher
showed
weight
that
and
cows
body
on
condition
2,600 ppm
score
sulfatesloss
sulfatesover
the
. Calves
summer
in this
than
study
cows
tended
on 390
to have
ppma
lower ADG (P = 0.14) when the cow-calf pair
was
was
= 0on
supported
.02)
HS
12-h
water
by
milk
(Table
the
production
HIS
1),
cows
and
having
the
than
differencelower
LS cows(P
(Table 2)
. Patterson et al
. (2004) did not report
a significant effect of high sulfate water on calf
performance or milk production
. There was no
difference in water disappearance (Table 1)
.
A higher (P = 0.06) percentage of cows on the
the
the
LS treatment
breeding
HIS treatment
season
were bred
(63(81.8%)in
.3%)
the
. This
than
first
difference
were
25
cows
days ofonin
early-season pregnancy could impact
reproduction and weaning weights the following
year
. Overall pregnancy rates were not
different (P = 0 .20) between treatments (LS
92%
; HS = 83%)
.
f f w * M * PC 4 ' i * * * * #
3
It is not evident why results varied between this
study and those reported by Patterson et al.
(2004)
. The water in the current study was
higher in sulfates and more consistent (narrower
range) than Patterson el . (2004) reported . In
addition, there were more two-year-old cows in
former
the current
study
study
(17/96(34/96
; 2-3/pasture)
; 5-6/pasture)
.
than
Weatherin
the
patterns and forage conditions are other
possible
studies . Indeed,
reasons
Johnson
for differences
and Patterson
between(2004)
reported a vegetation type by water quality
interaction for ADG in yearling steers .
It is important to note that in the current study
treatments were applied in a very specific and
rather narrow time frame (one to four months
post-calving)
. If the cattle were exposed to the
HS water at different times, influences of
different
physiological
responsesstate . For
and
example,
temperature
at four
may
to
causesix
months post-calving, calves would be expected
to consume less milk (as a % of 8W) and more
water, which could make them more directly
affected by water sulfates . Finally, the bull to
cow ratio used in this study was approximately
1
:16 . Lower bull to cow ratios could potentially
impact reproduction in high sulfate situations .
We conclude that water provided to cow-calf
reduced
pairs that
milk
averaged
production,
3,045
calf
ppm
gains,
in sulfatesand
the
percentage
season .
of cows bred early in the breeding
Implications
receiving
reproduction
High sulfate
high
and
water
sulfate
calf
had
gainswater
negative
.
may
Grazing
not
impacts
have
cattletheon
degree of reduction in gain that cattle in
confinement have. Additional work should
address whether the effects of high sulfate water
on reproduction are due to direct of effects of the
water, induced trace mineral deficiencies, or
both
.
Electronic Filing,
* * * *
Received,
*
*
PC #02-*
Clerk's
* * * *
Office
* *
May 1, 2007
3
Literature Cited
Boggs, D . L ., E. F . Smith, R . R. Schalles, B . E. Brent, L . R . Corah, and R . J . Pruitt . 1980 . Effects of milk
and forage intake on calf performance . J . Anim . Sci . 51 :550-553 .
Johnson, P .S. and H . H . Patterson . 2004. Effects of sulfates in water on performance of steers grazing
rangeland
. Proc . West. Sec, Amer . Soc. Anim . Sci . 55:261-264
.
NRC . 1996 . Nutrient Requirements of Beef Cattle . 7 1° ed . National Academy Press, Washington, DC .
Patterson, H. H ., P . S . Johnson, and W . B . Epperson . 2003 . Effect of total dissolved solids and sulfates in
drinking water for growing steers . Proc . West . Sec . Amer. Soc
. Anim . Sci . 54
: 378-380 .
Patterson, H . H ., P . S . Johnson, T . R. Patterson . D . B . Young, and R . Haigh . 2002 . Effects of water
quality on animal health and performance . Proc . West . Sec
. Amer
. Soc
. Anim
. Sci : 53:217-220 .
Patterson, H . H ., P . S . Johnson, E
. H . Ward, and R . N . Gates . 2004 . Effects of sulfates in water on
performance of cow-calf pairs . Proc . West . Sec . Amer . Soc . Anim . Sci . 55 :265-268 .
Richards, M . W., J . C . Spitzer, and M . B . Warner . 1986 . Effect of varying levels of postpartum nutrition
and body condition at calving on subsequent reproductive performance in beef cattle . J . Anim .
Sci . 62 :300-306 .
Tables
Table 1
. Performance of cow-calf pairs grazing native range and supplied water with low sulfates (average 368
ppm) or high sulfates (averaqe 3,045 ppm) during the summer (Least Squares
Means)'
Trial lasted from June 3 to August 26, 2004 (84
days) : Average calving date of April 14 .
bcWithin a row, means with unlike superscripts differ (P = 0
.14).
Table 2
. Estimates of twelve-hour milk production using the weigh-suckle-weigh method for cow-calf pairs
grazing native range and supplied water with low sulfates (average
368 ppm)
or high sulfates (average 3,045 ppm) during the
summer (Least Squares Means ± SEM)'
Treatment
Low Sulfate (LS)'
_
High Sulfate RSy
9 .0 r .49`0
7 .5 + 0.46
Item
- -
12-h Milk, lb
46
. - _
48
`'' Within a row, means with unlike
superscripts differ (P=0 .02) .
_
Treatment
_ Item
Low Sulfate (LS)
High Sulfate (HSL
SEM _
Cow initial weight, Ib
1279
1283
16 .8
Cow final weight, to
1305
1290
21 .0
Cow weight change, lb
26
9
17 .4
Cow initial body condition score
5 .54
5,46
0 .088
Cow final body condition score
5.45
5 .38
0 .122
Cow body condition score change
-0
.09
-0 .08
0 .059
Calf initial weight, lb
181
181
6 .8
Calf final weight, lb
397
388
8 .2
Calf ADG, Ib/d
2 .56 b
2 .45`
0 .042
Water Disappearance, gallons/d
18.6
18.2
0 .58 _
TIII'% tlNIVNRSII')' Or
BRI'I'InII COI.tr,M111A
Vol 2 No 9
Electronic Filing,
++++++PCReceived,
i
Clerk's Office May 1, 2007
++++ •+
3
Water Quality Affects Cattle Drinking Behaviour and Consumption
Amanda Zimmerman, Doug Veira, Marina von Keyserlingk, Dan Weary and David Fraser
Water forms the largest component of an ani-
mal's body and is an essential nutrient required
for all biological functions including temperature
regulation, digestion, fetal development, and milk
production . Dairy cattle require an adequate sup-
ply of fresh water-from 75 to over 100 L per day .
We know that water consumption is closely tied to
feed dry-matter intake and that milk production is
dependent upon access to large volumes of
water. Thus, if water intake declines due to
restricted access or inferior quality, both feed con-
sumption and milk production can be negatively
impacted .
It is well established that water quality is one of
the most important factors affecting water intake
which in turn can affect herd health and milk pro-
duction . There are two further aspects to consid-
er regarding water quality: what causes water
quality to decline, and what happens when cows
only have access to poor quality water?
Water quality is reduced when it contains
either biological or inorganic contaminants . One
of the main biological contaminants found in
water available to dairy cows is manure
. Manure
may contain pathogenic bacteria and when it con-
taminates drinking water disease can easily
spread between animals drinking from the same
trough
. Inorganic contaminants such as sul-
phates, which occur naturally in many water
sources, also decrease water quality and can
lead to nutritional disorders .
Previous research has shown that cattle do not
like bad smelling" water and, riot surprisingly, find
it unpalatable . We also know that they can learn
to associate illness with water flavour
. Once cat-
RESEARCH
REPORTS
tie establish this link it has been shown that they
will actually refuse to continue drinking the water
.
Water quality is an issue that affects both the
beef and dairy industries . All cattle are sensitive
to decreasing water quality whether it is through
biological or inorganic contamination
. Our
research was conducted using beef heifers and
steers but the findings apply equally to dairy cat-
tie
. We conducted several trials to examine the
effect of contaminated water on intake and drink-
ing behaviour of cattle . Our research has shown
that cattle respond to decreases in quality by
changing their drinking behaviour and reducing
their water consumption . In particular, cattle given
water containing sulphate compounds such as
sodium sulphate and magnesium sulphate found
it unpalatable and reacted to their presence in
water by changing their drinking patterns, drinking
more often at night when compared to the animals
that had access to good quality water . Additionally,
as sulphate concentration in the water increased,
cattle reduced their water consumption (Figure 1) .
UBC Dairy Education & Research Centre
i~nciilly of Agricullurnl °r cnc c
NeIci ;, Diri M uriger Err,A r u nr
,
sl . :obbit r . ;i
rJlNC
iI%In•>mry. .Jnox707Agaccr,RC, OMr,VI Tlrrh.one0(I4
.9t V,i7i
www .~ns'
. .I ., .
~,u
:,i ,,y rcicrc,
r4~tir-~
eduGatir,n
ri. .i: ;n
al centre.
December 2002
25
Y
15
n
m
10
A
3 s
Electronic Filing, Received, Clerk's Office May 1, 2007
* w * w **PC
+ * + i*
0
Tapwater
I
1500
3200
4700
Sulphate Concentration (ppm)
Figure 1 . Average water intake per drink, when drink-
ing twice daily, declines as concentration of sulphate
(in the form of MgSO4) in drinking water increased .
Other researchers have demonstrated that the
presence of manure in water also drastically
reduces how much cattle will drink . As manure is
one of the most common water contaminants in a
dairy barn, it is important to recognize the poten-
tial for reduced water intake and impaired milk
production .
Additionally, our research demonstrated that
some cattle are particularly sensitive to declining
water quality and that water intake was reduced
when cattle had access to water only twice daily
as compared to free access (Figure 2) .
60
Y
a
Y-
5o
ao
30
m
20
i
10
0
Tapwaler,
Sulphate,
Tepwaler,
Unresldctod
Unrestricted
Restricted
Treatment
L .
RestrictedSulprate,
Figure 2 . Cattle drink less water per day when it con-
tains sulphate compared to tapwater, and less water
when access is restricted to twice daily compared to
unrestricted access .
NEXT MONTH : Neck Rail Placement
If cattle do not have access to good quality
water, their behaviour is affected . When cattle
were forced to drink sulphate-contaminated water,
we saw a shift towards more aggressive encoun-
ters . This could result in even lower water intakes
in some animals, negatively impacting milk pro-
duction and decreasing animal welfare .
Not only is it important that good quality water
be provided to dairy cattle, but this clean water
must be available at all times .
Even if water
troughs are dirty only part of the day, cattle may
refuse to drink enough water to maintain milk pro-
duction . The quality of the water supplied to the
herd must be carefully monitored, which can be
done through visual inspection for manure and
simple chemical testing for minerals
.
Contamination can result in herd health problems
or cause cattle to drink less water, negatively
impacting feed intake and milk production .
We thank Lavona Liggins and the staff of Agriculture and
Agn-Food Canada - Kamloops Range Research Unit for the
use of their facilities and their assistance with this research .
We are grateful for the financial support of the Beef Cattle
Industry Development Fund, the British Columbia
Cattlemen's Association, and the dairy industry through the
funding of the Animal Welfare Program by the Dairy Farmers
of Canada, the British Columbia Dairy Foundation, and the
many others listed at www .agsci .ubc .ca/animalwellare .
This article is based on thesis research of graduate stu-
dent Amanda Zimmerman . Dr
. Veira is an adjunct professor
at The University of British Columbia and works closely with
the UBC Animal Welfare Program . He is based at the AAFC
Kamloops Range Research Unit . Dr. von Keyserlingk is an
assistant professor, Dr. Weary an associate professor, and
Dr
. Fraser a professor in the UBC Animal Welfare Program .
For more information on this research, please contact
Amanda at amandaz a© i nterchange .ubc .ca .
33eot WioIsea (on a Vwule4ue
CAthItitnaai and a J'cote penaux
JVCUL yea%
cam the 3.aeae*,,
Students, and Stag o f the
'US/IC 1?ai q
. Cducatian and
2e&jca" Qentxe.
Default
Electronic Filing,
* # * +Received,
• ~' PC 3(~
Clerk's
i
Office May 1, 2007
"p- 3
ldleton and
J .
M . Me-
mo acid .studies. If. Ef-
concentration, sex, and
nee lysine and threonine
ioehem . Physlol. 39 :1675 .
Sabry . 1963 . Factors in-
sulfur
value of
amino
fish
acidsflour.
.
Can
II1
.
9 .
and Feeding . (22nd Ed .) .
Co
quirements
., Ithaca,
of
N-
DomesticY
.
Requirements of Swine.
i
. Pub.
1599
. Washington,
landndels,
.
J
1970
. T
.
.
Influence
Typpo, R
. Jjof
I and stage of fast on
free amino acids in the
J .
31
A
:874
. Cray
.
and H . D .
dietary protein level on
amino acids in the blood
Ici . 38 :1234. (Abstr .) .
C .
Speer, J . D . Jones
The free blood plasma
related to the source of
6 :11 .
ylnck and C . M . Lyman .
amino acid supplements
in the blood plasma of
'ailability
growth of
of
chickstryplophan
. Arch .
tical Methods . (5th Ed .)d
ress,
MeadeArnes,
.
1970
Iowa
.
Meat
.
and
.in,, acids for the grow-
In
diet to predict amino
of plasma free amino
56.
! .de and A . L. Mellirm
t of the growing rat
:
spouse criterion . J .
Nude .
do and J . W. Nordstrom .
gals as sources of amino
Use of a reference diet
equaey by plasma levels .
q
nfluenre
J . W .
of
Nordstrom
time of fastand
,
amino
liver protein
acids in
of
plasmayoung
is .
M . Scott .
1965
. Inteere-
no acid levels and weight
cured by suboptimal oil
entrations of single amino
DRINKING OF SULFATE-WATER BY CATTLE''
H. J. WEETH AND J . E . HUNTER
University
of
Nevada, Reno 89507
A
CCORDING to the drinking water stand-
ards of the U. S
. Public Health Service
(1962) sulfate should not be present in a
drinking water supply in excess of 250 mg/
liter if more suitable supplies are or can be
made available
. What the physiological ef-
fects of such a drinking water might be are
not too apparent
. Surface and ground waters
which contain sulfate in excess of this maxi-
mum do occur . Miller, Hardman and Mason
(1953) analyzed 1,006 water samples taken
from wells, streams and lakes in Nevada
.
Twenty-three percent of these samples con-
tained more than 250 ppm sulfate . More re-
cently six samples taken from the Stillwater
Wildlife Management Area in Nevada con-
tained 364 to 4,757 ppm sulfate (D . Thran,
unpublished data) . Cattle graze on the area,
drinking the water . Macfadyen (1953) anal-
yzed water from an area of large gypsum de-
posits in British Somaliland . Many of the
samples contained between 2,000 and 3,000
ppm sulfate and the water from one Village
well contained 4,400 ppm sulfate
.
There is information on the tolerance of
animals (Heller and Paul, 1934 ; Heller and
Haddad, 1936 ; Ballantyne, 1957 ; Peirce,
1960) including cattle (Embry
et al., 1959)
for sulfate in the drinking water . From a
review of information available in 1963, Mc-
Kee and Wolf assumed that water containing
500 mg/liter of sulfate would not be detri-
mental to livestock . Reported below are the
results of a study designed to characterize
some of the effects on cattle of drinking water
contaminated with a known concentration of
sulfate
.
112 ppm sulfate
. The length of each water-
treatment period was 30 days
. Feeding was
mixed grass hay ad libitum . Proximate anal-
ysis of the hay was : protein, 11 .7% ; ether
extract, 2.8°/0 ; fiber, 29.2%x ; ash, 14.2%
;
and sulfate, 0.75% on a dry matter basis . It
contained 5 .1% water .
The experiment was conducted during sum-
mer . The heifers were in individual, partially
shaded pens
. Average daily maximum and
minimum temperatures were 31 and 8 C, and
relative humidity at 4 pal averaged 21%e .
Water loss from a nearby evaporating pen
averaged 7.6 mm per day . Sun was .shining
91% of the possible time,
During the last 7 days of each period the
heifers were haltered and total urine was col-
lected via indwelling, inflation-type catheters .
Collected urine was weighed and sampled
twice daily . A portion of the sample was acidi-
fied for calcium analysis . Samples were stored
frozen . On the sixth day of each urine collec-
tion week a 2-hr, clearance observation was
made, as previously described (Weeth and
Lesperance, 1965) on each heifer
.
For evidence of dehydration plasma pro-
tein concentration was estimated by refrac-
tometry (Weeth and Speth, 1968)
. Osmotic
pressures of plasma and urine were determined
with a vapor pressure osmometer . Concen-
trations of total hemoglobin, methemoglobin
and sulfhemnglobin were estimated by the
method of Hainline (1965) . Sodium concen-
trations were determined by atomic absorption
.spectrophotometry, calcium by the alizarin
method of Natelson and Penniall (1955), and
inorganic sulfate by the turbidimetric method
of Berglund and Sorbo (1960) . Renal clear-
ance and reabsorption estimates were made
as suggested by Pitts (1963) .
The various items observed were subjected
to analyses of variance, and differences among
means were tested for significance using Dun-
can's new multiple-range test (Steel and
Torrie, 1960) .
Experimental Procedure
Nine Hereford heifers averaging 256 kg
body weight were offered
ad libitum either
tap-water, 4,110 ppm NaCI-water or 5,000
ppm Na2SOs-water in a 3 x 3 latin square
with three replicates experiment
. The salts
were added to the tap-water which contained
- .
Results and Discussion
3`11,l„r
„awlm
W -,'[45
45
i rooa<,auon
Far,,, ci r
silt,
:n .,rmn
W
nnne
o
rmtai
Sri,,"
Region
oo
Re¢m
esner
.R
In a preliminary siudv with wcooling rats
moos
1, n,iShrre.mer
o
rr«i~gJor_uo
. 16,
-
it was found that their growth was onafkcted
277
'I .
lce(J acct;;o S
.
.MJap
. . Z#3d'paAiaoa$
'6u11!
j aiuoJ;3813
JOURNAL UV ANIMAL SCIFNUt coi
. 3'., no . 2
Electronic Filing, Received, Clerk's Office May1
t r
218
W EETII
by 7,500 ppnl Na2 SO,
in the drinking water
.
Total hemoglobin and methemoglobin con-
centrations were unaltered
. There was no de-
tectable stilfhemoglobin in any blood sample
.
The smallest amount of sulfhemoglobin de-
lectable
by the technique used was 1.46
mg/100 nil
. On the basis of these observa-
tions and those of Embry
et at
. (1959) with
cattle, the study described above, but using
7,500 ppm Na2SO 4
was initiated
. Some of the
heifers refused to drink this water for 24 hr
. ;
therefore, the experiment was restarted using
5,000 ppm NaSO 4 .
The concentration of
NaCl in the chloride-water was adjusted to
provide the same sodium concentration
( 1,619
ppm) as in the sulfate-water
.
Water consumption was reduced .75!- ;
oil
the sulfate-water and increased 19% on the
chloride-water treatment (table 1)
. Feed con-
sumption was reduced 30% by sulfate-water,
but unaffected by
chloride-water
. As a con-
sequence, the heifers lost weight while drink-
ing the sulfate-water, but gained weight in
equal amounts on the tap- and chloride-water
treatments.
As expected (Weeth, Lesperance and Bob
man, 1968) the heifers were diuretic when
drinking 4,110 ppm NaCl-water (table I)
.
Urine excretion on the sulfate-water treatment
******PC
AND
HUNTER
;g *******
3
did not differ from the excretion on tap-water,
although the Na
SO, reduced water consump-
tion
. The percentage of free-water intake lest
in urine was significantly higher with sulfate-
water than with tap-water
. Boyazoglu, Jordan
and Meade (1967) noted increased urine ex-
cretion without increased water intake by
sheep fed 7 .6 g sulfate sulfur per day .
Plasma protein concentrations were not al-
tered by the saline waters . Apparently the
reduced consumption of sulfate-water caused
no anhydremia
. That the heifers were able
to maintain nsmo-equilibrium is also suggested
by the unaltered plasma sodium concentra-
tions and osmotic pressures
. Both saline waters
were hypotonic, the 5,000 ppm Na_SO4-water
having an osmotic pressure of 101 mOsm/kg
and the 4,110 ppm NaCl-water 146 mOsm/kg
.
There were no differences among water
treatments in total hemoglobin, all values
being within a normal range (Schaler, 1965)
.
Drinking the sulfate-water caused a 450%
increase in methemoglobin concentration, at
which concentration it was 2.8%
of total
hemoglobin . The NaCl-water had no effect
on methemoglobin concentration, therefore,
the sulfate ion was involved in the formation
of methemoglobin
. Finch (1948) stated that
certain oxidizing drugs which produce suit
.
- Nine ohylvallon
. Iwr item Irealmpnl mean .
.Crine wafer nlimaled b1t
refraclomelry (Wee
II, R'iuon and Si,rlh 19601 . Free water is water drunk plus
Seed waler .
hemoglobin also prod
hemoglobin did appe
;
drinking sulfate-wale
the blood of any hl
sumed the sulfate-w
drinking the sulfat
concentration averag,
globin
. Methemoglnt
are incapable of ref
oxygen (Finch, 1948)
study there was no ua
Hematocrit values v
sulfate-water treatm
3 .5 .8±1
.31% tap-watt
Wintrobe (1967)
of hypoxia are seen to
prises more than 20-
a percentage consider
these heifers
. Scerley
and Emerick and En
nitrate ingestion to c
methemoglobinemia,
toms of hypoxia . Oxi,
methemoglobin occur .
(Smith and Beutler,
the natural reduction
curs most readily in
1
(1968) observed a
oxygen transport by
I
hemoglobin comprises
small and highly vari
.
TABLE 1
. EFFECTS OF DRINKING TAP-, 4,110
ppm NaCI- or 5,000 pp-
Na,SO,-WATER ON
globin. In the presen
concentrations of non
were only approaching
The sulfate-water
1
rum sulfate 63%
. Inl
is readily absorbed b
and Mohammed, 1969
HEREFORD HEIFERS
Mean
Tap
37
Drinking water treatment'
Na,SO,
Mean
S . E .
-
Item
Water consumption, kg/day
S E .
1 .6
Mean
44
S . E. -
2 5
24 . .
1.9
Feed consumption, kg, 30 day
203
5
.2
197
9 .4
14 .3
7 .1
alimentary tract
. Ser
Sulfate intake, g/day
52
2 .4
120
8 .3
lions reflect dietary i
:
Urine
Weight
excretion,change,
kg/30
pi/dayday
+199
.2
3 .4
+22
5 .0
-15
3 .5
and Rendig, 1954) .
S
22 .1
0 .51
1 .59
3416.0.8
1
.23
3,12
9 .3
31,8
0 .72
Plasma
Urine/free
protein,
waterg/100
." %
ml
7
.9
0.10
8 .0
0 . 12
8 .0
01 .15.72
reduced
and absorbedto
sulfide
. Some
in
ofIf
Plasma sodium, mg/
I W ml
359
4 .6
352
3
.2
354
6 .7
in amino acids (Block
Plasma osmnlality, mOsm/kg
294
2 .1
296
1 .7
298
2
.6
observed by Evans a
Total hemoglobin, r/100 ml
12 .1
0
.42
11.8
0
.52
12 .2
0 .44
Methcmoglobin,
mg/
1W ml
61_4
14 .39
55,2
18 .42
337,7
64 . 75
in the present study,
sulfhemoglobin, mg/100 ml
30 .9
21 .2a
92
.5
33A0
416 .9 85
.55
amounts of sulfate la
Serum sullaia, mg/100 ml
16 .8
1 .00
15 .3
0 .96
27 .4
2 .09
pronounced hydrogen ,
Plasma calrium, mg/loo mi
9 .9
0 .18
10.0
0 .19
10.0
0 .22
of the odor was not
Urine calcium, mg/l00 ml
Creatinio, clearance, liter/hr .
2 .8
24 .4
0 .39
0 .88
252
.0.8
0
.30
0 .99
3 .1
21.4
0,761
.05
Brav (1969) stated
Urine osmnlality, mOsm/kg
976
25 .6
845
25 .0
966
42 .3
could he detected on I
Osmolal clearance, liters/hr
1 3
0.09
1 .9
0 .17
1 .2
0.12
fused intraruminally y
Free water clearance, m1/hr
.
-876
62 .4
205
103 .8
-775
78 .0
From the
Sodium clearance, ml/hr
.
165
42 .2
840
100 .4
60 .3
270 .4
present st
Filtered sodium reabsorbed, %
99 .31
0 .190
96 . 77
0 .328
97 .18
0 .381
that the chronic cons
Urine sulfate, mg!1W ml
373
28 .9
1 91
14 .8
928
72 .4
NaSO4
-water caused
Sulfate filtered, g/hr .
4 .06
0 .141
3 .93
0 .252
5 .90
0,561
hypercalcuria in the
Sulfate reabsorbed, g'hr
.
2 .91
0 .127
2 .80
0 .193
2 .11
0 .204
concentration of rule,
775
73 .0
603
97 1x
270 4
928
0 341
90
72 .4
_..
0 .561
2_11.__ 0 .204
,tar d,unt plus
teed sate,
.
From the present study it does not appear
that the chronic consumption of 5,000 ppm
\ayS0 4 -water caused any hypocalcemia or
hypcrclcuria in the heifers (table I) . The
concentration of calcium in the urine was
small and highly variable on all treatments .
epcl* 3
plasma concentration iu dogs was fncreacd
by sulfate infusion . Wolf and Ball (1050)
concluded that the sulfate ion was diuretic
with n low threshokl . The peelliar problem
which 'Ii,- bovine with
:I high pot isuiunl in-
take could have in the renal excretion of ex-
* * * * * * *Z# 3d * * *
*
f`eW aol);O S.MJa13
`paAlaaa8'6ull!d3!uod! 3 a13
SULFATE WATER FOR CATTLE
279
xcretion on tap-water,
hemoglobin also produce methemoglubin, Sulf- Others have shown that intravenous infusion
duced water consump-
hemoglobin did appear in the blood of heifers
(Wolf and Ball, 1950 ; Walser and Browder,
free-water intake lest
drinking sulfate-water . It was not detected in 19 .59) or feeding (Goodrich and Tillman,
ly higher with sulfate-
the blood of any heifer before it had con- 1966) of inorganic sulfate adversely affects
ter
. Boyaxoglu, Jordan
sumed the sulfate-water . After 30 days of absorption and retention of calcium .
ed increased urine ex-
drinking
the sulfate-water, sulfhemoglohin
Endogenous crealinine clearance was re-
sed water intake by
concentration averaged 3 .4`% of total hemo- duced 12% (P< .05) by the sulfate-water,
sulfur per day .
globin . Methemoglobin and sulfhemoglobin but unchanged with the chloride-water treat-
mlrations were not al-
are incapable of reversibly combining with ment . The reason for the reduced creatinine
aters . Apparently the
oxygen (Finch, 1948), however, in the present clearance of heifers while drinking sulfate-
I sulfate-water caused
study there was no overt evidence of hvpoxia, water, is not apparent. Clearance urine vol-
the heifers were able
Hentatocrit values were unchanged by the times were not lower on the sulfate-water .
brium is also suggested
sulfate-water treatment (36 .2±1 .26 ;% vs . Walser and Browder (1959) state that glo-
na sodium concentra-
35 .8±1 .31°/ tap-water) .
mender filtration rates usually remained
Ires
. Both saline waters
Wintrobe (1967) states that no symptoms within normal limits when dogs were infused
100 ppm Nx SO4-water
of hypoxia are seen until methemoglobin corm with sulfate salts
.
sure of 101 mOsm/kg
prises more than 20% of total hemoglobin,
As seen in previous studies (Weeth
et al.,
'1-water 146 mOsm/kg
.
a percentage considerably above that seen in
1968
; Thornton, 1970), heifers had a saline
crences among water
these heifers . Seerley et al . (1965) used sheep diuresis while consuming the chloride-water .
emoglobin, all values
and Emerick and Embry (1961) cattle with This is indicated by the decreased daily urine
range (Schalm, 1965)
.
nitrate ingestion to develop a more marked osmotic pressure, increased osmulal clearance
vater caused a 450°/
methemoglobinemia, but reported no symp- and increased reabsorption of .wlute-free water
obis concentration, at
ones of hypoxia . Oxidation of hemoglobin to
(table 1)
. Similar effects were not seen with
t was 2
.8% of total
methemoglobin occurs rapidly in ruminants sulfate-water drinking . Both saline waters af-
'1-water had no effect
(Smith and Beutler, 1966) but fortunately fected renal clearance, reabsorption and ex-
ncentration, therefore,
the natural reduction of methemoglubin oc- cretion of sodium in a manner expected with
olved in the formation
curs most readily in ruminants . Harris ci al. sodium loading of cattle (Weeth et al ., 1968) .
ch (1948) stated that
(1968) observed a significant reduction in
Drinking water containing 5,000 ppm
s which produce sulf-
oxygen transport by human blood when met- Na 2
SO, increased
the concentration of in-
hemoglobin comprised 7 .6`/0 of total hemo- organic sulfate in the urine (table I) . Urinary
pm Na,50,-WATRR ON
globinconcentrations
. Tn the present
of non-functional
study with
hemoglohinscattle
the
sulfate-water
excretion of sulfate
increased
was
the
increased
renal filtration
150% . Thisof
were only approaching this level .
sulfate by 45% . Sodium chloride loading had
nt
'--
Na,50.
rum
The
sulfate
sulfate-water
63% . Ingested
treatment
inorganic
increased
sulfatese- The
no effect
sulfate-water
on sulfate
treatment
filtering
reduced
or reabsorptionthe
renal
.
Mean
5 E .
is readiy absorbed by the bovine (Hansard reabsorption of sulfate . Consequently, as a
24
and Mfohammed, 1969), perhaps in the upper result of the increased filtering and decreased
143
1 .9
7 .1
alimentary tract . Serum sulfate concentra- reabsurption, the percentage of filtered sulfate
0
3 .3
tions reflect dietary intakes of sulfur (Weir which was reabsorbed was only 36 for the
-t5
9 .3
3
.5
and Rendig, 1954) . Some ingested sulfate is
sulfate-water treatment vs . 72 for tap-water
.
33 .8
0
.72
reduced to sulfide in the rumen (l .ewis, 1954) This is, of course, advantageous to the animal
8 .0
1 .77
0 .15
and absorbed . Some of the sulfide can be fixed ingesting large amounts of sulfate . Goudsmit,
354
6 .7
in amino acids (Block and Stekol,
1950) .
As
['(over and Bollman (1939) noted with dogs
299
12 .2
2 .8
observed by Evans and Davis (1966), and the ratio of sulfate to crealinine clearance was
.337_7
0 .44
in the present study, cattle ingesting large normally about 0
.10 and reached 0
.70 when
416 .9
64 .76
85 .55
amounts of sulfate occasionally produced a plnsnm sulfate increased from 9 .3 up to 21
.8
27 4
2 .0')
pronounced hydrogen sulfide odor . The source
niEq,liter . In the present study the ratio in-
10_0
3 .1
0_22
of the odor was not established, however, creased froln 0 .27 to 0 .63 as seruot sulfate
21 4
0 .76
lirav (1969) stated that hydrogen sulfide
rnncentaations increased from 10
. .5 to 17 .1
966
I Os
42 4
mold he detected on the breath of sheep in-
mEq,'liter . Lotspeich (1947) observed
that
1 .2
0_12
(used intraruminally with ,sodium sulfide .
reabsorption of sulfate was not increased as
280
Electronic Filing, Received,
PC BClerk's
3
Office May-T,
vi
WEETH AND HUNTER
cessive sulfate has been mentioned by Dicker-
ing (1965) .
The adverse effects
noted when heifers
drank water containing 5,000 ppm Na 2
SO,
appear to be at variance with observations of
Embry et al . (1959)
. They observed definite
toxicity when growing cattle were watered
with 10,000 ppm Na,SOs, but animals were
unaffected
by 7,000 ppm Na2SO4-water.
Furthermore, a 10,000 ppm solution of mixed
salts containing 6,817 ppm of sulfate was not
deleterious . The season was summer, but water
consumption appears slightly lower than in
the present study
. Their data do indicate,
as dues this experiment, that there is a tox-
icity with the sulfate ion not seen with chlo-
ride
. Peirce (1960) offered mature sheep a
mixed NaCI-Na aSO,
saline drinking water
containing 5,000 ppm NaS0 4 in a 15-month
study, Body weight was unaffected, although
water consumption and plasma sulfate were
increased . There was no hypocalcemia
. Lot-
speich (1947) has shown that an excess of
chloride anion in tubular fluid of
the dog de-
creased the transport maximum for sulfate
ion
. It is apparent, however, from this study
that growing Hereford heifers were unable to
tolerate during summer drinking water con-
taining
.1,493 ppm of inorganic sulfate .
Summary
Nine growing Hereford heifers were offered
as drinking water either tap-water, 5,000 ppm
Na .SO4-watcr or 4,110 ppm NaCl-water . The
experimental design was a 3 x 3 latin square
with replicates.
Experimental periods were
30 days
. Total urine was collected on the last
7 days with renal clearance observations be-
ing made on the sixth day
. The season was
summer .
The heifers drank less, ate less and lost
weight while consuming the sulfate-water.
The sulfate ion caused a relative diuresis .
Percent urine water of free-water intake was
33,8 with sulfate-water, but only
22 .1% with
tap water . Total hemoglobin concentration
was unaffected by the saline drinking waters,
however, the sulfate-water caused a 450%
increase in methemoglobin concentration and
the development of 416 .9 mg/l00 ml of sulf-
hemoglobin . The two nonfunctional hemo-
globins comprise 6
.2%
of
total hemoglobin at
this time .
Drinking the sulfate-water in-
creased serum sulfate concentration 63 .1%,
increased renal filtration of sulfate 45 .2%,
but decreased renal reabsorption of sulfate by
27 .5% . Drinking sulfate-water did not alter
plasma calcium concentration or renal excre-
tion of calcium . A specific toxic effect of
drinking the Na_S04-water was not apparent,
however, the adverse effects seen were related
to the sulfate ion, Only a slight polyposia and
diuresis were observed with drinking of the
NaCl-water .
Literature Cited
Ballantyne,
Block,
Berglund,
Scandinavian
lysis
livestockof
R .
inorganic
.
F,
H .
ECanand
and
.
J
.
E
.
J
.
JB.
.
Clinsulfate
.
1957ASortieComp
.
.
Stekol,
.
LabDrinking
.
in
.
.
1960Medserum,
Invest19
.
.
.,1021Turbidimelric
waters
.
plasma
.
:254Synthesis
12:147
.
and
toxic
.
of
urine,ana-sul-for
fur amino acids from inorganic sulfate . Proc . Soc
.
Bray,
Boyazoglu,
The
sulphide
ovine
Erin1967absorption
.
.
ABininutrition
.
Sulfur-selenium-vitamin
Cfrom
.
.
P
.
1969MedAthe
.
of
.
.
.
.
73J
RSulphur
inorganic
sheep's
.
:391AnimM
.
.
.
Jordan
Scimetabolism
rumensulphate
. 26E
.
:1390interrelations
and
Australian
and
R
.
in
.
inorganicJsheep
.
JMeade
.
.
AgeinIl.
.
.
Embry,
CRes
.
.
W20.
L:739Carlson,
. B.,
.
M .
L.
A .
M .
Hoelscher,
Krisla, WR
.
.
RC.
.
Brose,
Wahlstrom,C
. F
.
Gastler
stock waterand
q0uality
. E
.
.
Olson,
S . Dak1959
. Age
. Salinity
. Exp
. Staand .
liveBull
.
Harris,
Mainline,
Goudsmit,
Emedck,
Finch,
Goodrich,
Hansard,
Evans,
48phorus,
prllocaineAnim,port
Jsulfate
tion,the
chlortetracycline
from
1939sulfur
position
(EdAnimglobinemia1968Vol
.
1Physiol
.
.
.)metabolism
.
.
following
C5
.
ingestion
Jexcretion
.
WMethemoglohin
.
SciThe
SciStandard
.
Sand
.
by
RAcademic
AAsulfur
.
R,
LAof
.,
.
.
H,
.
.
.
.
.
L
.
.
20excretion
the
194812525nitrogen
JAnesthesiology
Jr
.
rumen
D,
Jrand
.
DNew
:844,:484
.
and
.
:506.,
intravenous
bovine
.
and
and
1965of
of
and
and
WGMethods
Methcmoglobinemia
M
.
.
EngPress,
fluidA
.
.
on
sodium
.
certain
.
Cole,
.
ALmaternal-fetal
Kmolybdenum
of
formation
sources
.
H,
S
.
.
.
.
methemoglobinemia
Methemoglohin
.
1J
.
D,
sulfates
B,
Davis
.
.
Power
MohammedJMNew
of
nitrate
Animregional
.
29MedTillman
.
Embry,
minerals
AnimMl
:65and
.
Clinical
.
York
.
and
and
1966tat
239
.
Sriand
by
.
copper
.
by
Sci
.
anesthcsiausing:470
.
1961oxygen
and
utilization
.
.
theJ1966and
28
.
mineral
.
ruminants1969
.
Dietary
by
:283In
25I
.
MChemistry
.
dog
.
.
zellhemo-levels
.
.
resultingsheep:1010
.
Effects
SEffect
BollmanBlran,,Absorp-
.
.
.
.
MeitesAmerphos-Layercom-
.
.
of
.
onofofJJ,
.
.
.
.
.
Heller,
and mineral
V
. G .
balance
and M . Haddadin
animals
. 1936drinking
. Path, of
saline
excretionand
alkaline waters
. J
. Biol. Chem
. 113 :439 .
Heller,
LotspcichLewis,
bloodsalt
rumen
inorganic
intake
.
DVof
J
.
.
.
.
GG
1954the
W,
sulfate
Riot,
and
Dupon
.
sheep
.
The
1947ChemHin
the
.
.
.
reduction
the
Paul,
.
NorthernRenal
mineral
105normal
:6551934tubular
.
.
Jof
.
composition
dog
.
Effect
56sulphate
.
:391cabsAmerof
.
.,,ti
.
InorganicJ,
in
of
.cPhysthetheOf
.
1o1 . 151
:311
.
Schalm,Pickering,
Seerlcy,
Pitt,Smi,h,
Peirce,
Miller,
Natelson,
McKeeMacfadyen,
speciesJFehiger,
Olson,
formation
Illcontinuously
SocAustralian
dium
Board
Fluids111serum
27BullCriteriamotion
chloride
Irrigation
waters
.
.
.
:434
.
Anim
.
R
.
24The
.
and
J
.
A187
.
0
.
.
RM
.
.
Jas
1965
.
.
:
PubFof
.
.
.
73,
.
SYear
.
.
AmerPhiladelphia,
tolerance
Eand
ENature
.
Wpotassium
Sci
.
WR1963E
.
and
Second
Wthe
.
ultramicro
.
.
.,
.
.,
.
WJ
waters
and
.
.
Cand
1960in
sodium
Effect
No
.
.
Book
24
.
and
AgeRG1965reduction
.
complex
JA
.
.
.
1965:1014drinkingR172
.
PhysiologJ
.
.
3-A,E
.
.
Yardman
.
EdPhysiolH1953
.
of
StudiesMcdice
.
of
of
ResPennia
.
:59
.
EmeribalarsulpiVetcrBeer
.
.
she,nitsTheWNeequa
.
.
Cat.5,Pa
.
1)S,x
.
:
l
.
Ite-water did not alter
itration or renal excre-
Jlecific toxic effect of
cater was not apparent,
ffects seen were related
a slight polyposia and
I with drinking of the
ire Cited
Drinking waters toxic for
,. Med, 2L :254 .
rin . 1960serum,
. Turbidimetric
Plasma and urine,ana-
ab . Invest . 12 :147,
kol . 1950 . Synthesis of sul-
norganic sulfate . Pro, . Soc
.
Jordan and R
. J . Meade .
itamin F interrelations in
t . Sci . 26 :1390 .
metabolism in sheep . II1
anic sulphate and inorganic
'a rumen . Australian J
. Age .
i
,elscher, K . C . Wahlslrom,
Krista, W . R . Brnsz, G . F
.
n . 1959. Salinity and live-
Dak . Age . Fan. Sin . Bull.
Bethemoglobinemia
. Embry . 1961 .
resultingEffect
of
en nitrate by ruminants. J .
Davis . 1966. Dietary phos-
ybdenum
3 . Anionand
. Scimineral
. 25
:1010com-
.
noglobinemia and sullhemo-
I . Med
. 239 :470 .
D . Tillman . 1966, Effects of
mores and copper levels on
thin minerals by sheep . J .
Power and J . L Bollman .
sulfates by the dog
.
Amer .
lethemoglobin . In S . Mcites
.its
New
of
YorkClinical
.
Chemistry,
f
aalernal-fetal
Mohammed
.
Anim
. Sci .
.
28utilisation
1969:283.
.
Absorp-of
M . Mital and M
. B
. Layer
.
ormation and oxygen trans-
nus
gy 29regional
:65,
anesthesia using
dad . 1916 . Paths of excretion
animals drinking saline and
. Chcm . 113 .419 .
11. 1934 . Effect of inorganic
mineral tom posititin of the
D5 :655 .
duct ion ,d sulphate u, the
,orhem- J- 56' 191
,cal tubular r^dsngriion ul
normal dog
. Amer
. J . Phys-
Macladyen, W . A . 1953 . Sulphate in African inland
waters . Nature 172 :595 .
McKee, J . E . and H. W. Wolf. 1963 . Water Quality
Criteria, Second Ed . Calif . Water Quality Control
Board Pub . No
.3-A .
Miller, M. R ., G
. Hardman and H
. G
. Mason . 1953 .
Irrigation waters of Nevada. Nev . Air. Exp . Stn .
Bull
. 187,
Natelson, S . and R . Penniall. 1955, Colorimetrlc esti-
mation of ultramicro Qualities of calcium in human
serum as the complex with alizarin . Anal. Chem .
27 :434 .
Pebce . A
. W . 1960. Studies on salt tolerance of sheep .
Ill
. The tolerance of sheep for mixtures of sodium
chloride and sodium sulphate in the drinking water .
Australian J, Agr . Res
. 11 :48 .
Pickering, E
. C
. 1965 . The role of the kidney in so-
dium and potassium balance in the cow . Proc . Note.
Pitts,
Soc .
R
2473,
. F
. 1963, Physiology of the Kidney and Body
Fluids
. Year Book Medical Publishers Inc ., Chicago,
1B .
Schalm, 0, W . 1965 . Veterinary Hematology . Lee &
Febiger, Philadelphia, Pa .
.Serrky,
Olson .
R1965,
. W,
Effect
R . J . Emetic
of nitrate
k, Lor
. Bnitrite
. Fin bry
administeredan
it 0. E.
continuously in drinking water for swine and sheep,
J. Asian . Sri . 24 :1014 .
Smith, J . E . and E . Beutler . 1966 . Methemoglohin
formation and reduction in man and varicu, animal
species . Amer. J . Physiol. 210 : .347
.
SULFATE WATER FOR CATTLE
281
Steel . K . G . D . and
J .
H .'I'orne . 1960 . Principles and
Procedures of Statistics
. Mc(;mw-Hill
Book Co
.,
New York.
Thornton,
excretion
Rof .
urea
F . 1970nitrogen
. Factors
in cattleaffecting
. 1 . Sodium
the urinarychlor-
ide and water loads . Australian J . Agr. Res . 21
:1.71
.
U . S, Public Health Service. 1962 . Drinking Water
Standards . Jn Federal Register : 2152 .
Walser, M. and A . A . Browder. 1959, Ion association .
111 . The effect of sulfate infusion on calcium excre-
tion . J . Clin, Invest . 38 :1404 .
Weeth, 11
. J
. and A. L
. Lesperance
. 1965 . Renal func-
Weeth,
tion
J1968
. Amm
.
of
HIntermittent
.
.
cattle
JSci,
., A24.
:441under
L
.
saline
.
Lesperance
various
watering
water
and
of
Vand
.
growing
Rsalt
. Bohmanloadsbeef
.
.
heifers
. J . Anim . Sid
. 27 :739 .
Worth, H . J . and C . F' . Sixth . 1968 . Estimation of
bovine plasma protein from refractive index . J .
Weeth,
Amen SciH
. J
.
.,
27-146R
. Motion and C
. F . Speth . 1969, Pre-
diction of bovine urine specific gravity and total
solids by refractomctry . J . Action, Sci . 28
:66
.
Weir, W, C . and V . V . Rcndig. 1954 . Serum inorganic
sulfate
sheep J
sulfur
. Nutr .54as :87a
measure
.
of the sulfur intake of
Wintrohe, M
. M
. 1967 . Clinical Hematology, (6th
Ed .) . Lee and Febiger, Philadelphia, Pa .
Wolf, A V . and S, M . Ball . 1950 . Effect of intra-
venous sodium sulfate on renal excretion in the
dog. Amer, J . Physiol . 160
:353
.
LAM.
LAew
aa3;p
s,jsa13 epaAiaaaa'BuifiJ DIUOfaal3
Default
Electronic Filing,
. . + *
Received,
+ . PCTy*
Clerk's Office May 1, 2007
3
* f w * + h
Electronic Filing,
* * * *
Received,
* *
PC
#y*Clerk's
S* * * *
Office
* *
May 1, 2007
EFFECTS OF SULFATE IN WATER ON SWINE REPRODUCTION AND
YOUNG PIG PERFORMANCE'
D. W. Paterson2 , R, C . Wahlstrom 2 , G . W . Libal2 and O
. E
. Olson'
South Dakota State University, Brookings 57007
Summary
Thirty-one sows and 27 gilts were each al-
lotted to three treatments to study the effect of
water quality during gestation and lactation .
Sodium sulfate was added to the water to give
sulfate and total dissolved solids in ppm as fol-
lows : (1) 320, 620, (2) 1,820, 2,840 and (3)
3,320, 5,060. Water was offered ad libitum
from about 30 days postbreeding through 28
days lactation. There were no significant differ-
ences in gestation or lactation gains and number
or weight of pigs at birth or at weaning . Fecal
consistency was normal in all treatments . Water
consumption did not differ during gestation but
increased during lactation as salt level increased
.
These results suggest that sulfates up to and in-
cluding 3,320 ppm in water have no significant
effect
on reproduction in the gilt or sow .
Fifty-four weaned pigs representing the
above three sow treatments equally were given
water with 0, 3,000 ppm added sulfate from so-
dium sulfate or 3,000 ppm added sulfate from
magnesium and sodium sulfate in a 1 :1 ratio for
a 28-day period
. No significant treatment dif-
ferences (P< .05) occurred in average daily gain
or feed to gain ratio . Scouring was more com-
mon with fecal condition less firm (P<
.01) and
water consumption greater (P<
.05) among pigs
that received water with added sulfates . No dif-
ferences were observed in pigs that received
water containing sodium sulfate or equal parts
of sulfate from sodium and magnesium sulfate
.
(Key
Words : Water Quality . Sulfates, Swine,
Reproduction, Pigs.)
Introduction
Highly saline water are found in many
parts
' Published with the approval of the Director of the
South Dakota Agr . Exp . Sta, as Publication No . 1631
of the Journal Series .
' Department of Animal Science.
'Department of Chemistry .
of the western half of the United States (Sub-
committee on Nutrient and Toxic Elements in
Water, NRC, 1974) . Often these are the most
readily available or the only sources of livestock
water
. Several studies on the tolerance of live-
stock for saline waters have been reported as re-
viewed by Anderson and Stothers (1978)
. Of
the salts naturally present, chlorides and sul-
fates predominate . It has been suggested that
the sulfates are the more harmful (HelIer, 1933
;
Weeth, 1973), and that cattle and sheep are
more resistant to the effects of saline water
than are swine (Heller, 1933)
.
Experimental data on the effects on swine of
drinking waters of high sulfate content are
limited
. Such data are essential to the evalua-
tion of drinking water involvement in poor per-
formance or actual losses in swine . What data
are available are confined to wcanling pigs . Em-
bry et al. (1959) reported the addition of up to
6,300 ppm of a salt mixture to the drinking
water of wcanling pigs increased water intake
and caused a temporary diarrhea but had no
harmful effect on performance during the 80-
day trial . The salt mixture and the water to
which it was added gave a sulfate content of
4,400 ppm . Anderson and Stothers (1973) re-
ported similar findings with weanling pigs
allowed water containing about 6,000 ppm of
total dissolved salts (TDS) containing up to
2,400 ppm of sulfate . Their data did suggest
some slight but not statistically significant re-
duction in feed intake and increase in feed to
gain ratio
. Although the effects of salinity and
sulfate on reproduction and the rearing of the
young have not been reported for swine, The,
Committee on Water Quality Criteria (1972)
suggest that water containing over 5,000 ppm
of TDS should be avoided for pregnant animals-
Unconfirmed reports have suggested that a con-
centration of about one-half this level might be
harmful
. This experiment was conducted to in-
vestigate the effects of high sulfate waters given
to swine during gestation and lactation and to
their offspring when weaned at 28 days
.
664
JOURNAL OF ANIMAL SCIENCE, Vol . 49, No
. 3 (1979)
a
s
I
Electronic Filing,
* * *
Received,
* * * p(~
Clerk's Office May 1, 2007
SULFATESIff
* * * *
ROFSWINE
31,
665
Experimental Procedure
The reproductive trial involved 31 sows and
27 gilts of Hampshire X Yorkshire X Duroc
breeding
. Sows and gilts were grouped sepa-
rately on the basis of ancestry and weight . Out-
come groups were randomly assigned to the
three treatments, shown in table 1, about 30
days postbreeding . The local water supply was
used as a control and for making up the experi-
mental waters. Sodium sulfate was selected as
the salt for addition. A 10% solution of the salt
(analytical grade) was added as appropriate to
give the desired concentrations . Sulfate content
was determined weekly by a turbidimetric
method (Anonymous, 3973) . The averages with
their standard deviations for the entire experi-
mental period were as follows : control, 320 t
24 ppm
; low sulfate, 1,790 ± 35 ppm and high
sulfate, 3,298 ± 139 ppm .
During gestation, all animals were housed in
uninsulfated, wooden, colony type houses lo-
cated in dry lots . Feed was restricted to 1 .8 kg
per head daily and fed in individual feeding
stalls
. Water was available ad libitum from 227
liter circular tank waterers . Self-feeders contain-
ing the lactation diet and the 227-liter waterers
were located in concrete lots outside the far-
rowing house . Sows were allowed access to this
lot for feed and water each morning and eve-
ning for 2 .0 and 1
.5 hr, respectively . Saline
water was available in the creep area for pigs
after 10 days of age . Fortified corn-soybean
meal diets with 10% alfalfa meals (gestation)
and 10% beet pulp (lactation) included
.5%
trace mineralized salt . Calculated crude protein
content was 12 .65 and 15 .70% for gestation
and lactation diets, respectively .
At parturition, the number of live and still-
born pigs as well as litter weight and average pig
weight were obtaieed . Litter weight at 14 days,
number of pigs at 28 days, litter weight and
TABLEAND
AND
SODIUM
1 . TOTAL
EXPERIMENTAL
CONCENTRATIONS
DISSOLVED
WATERSSOLIDS,
IN
(PPM)'
CONTROLSULFATE
'Values for control water by analysis . Values for
low
analysisand
high
of the
sulfate
water and
treatments
[he known
were
salt
calculated
additionsfrom
.
average pig weight at 28 days were recorded
.
To determine the effect of water quality on
the offspring after weaning, 54 4-week-old pigs,
initially averaging 7 .5 to 8 .0' kg, were allotted
into nine groups. Each group consisted of two
pigs from each of the three sow treatments .
These groups were randomly allotted to three
replications of three treatments ; (1) control
water, (2) 3,000 ppm of added sulfate from
sodium sulfate and (3) 3,000 ppm of added sul-
fate supplied equally from magnesium and
sodium sulfate . Each 2 .4 X 3 m pen contained
six pigs . All pigs were offered water and an 18%
protein, fortified corn-soybean meal diet ad
libitum for the 28-day trial . Fecal condition
was scored on a one to five basis, with one
being most firm .
Data were analyzed by least squares analysis
of variance . Least square means arc presented in
all tables
.
Results and Disciassion
Sulfate content of water consumed during
gestation had no significant effect on gestation
gain, number of pigs per litter at birth (total
and live) or average pig and litter birth weights
(table 2) . Lactation gain, number of pigs at 28
days and average pig and litter weights at 28
days were not significantly affected by sulfates
in water during lactation . Slightly less saline
water was consumed during gestation . However,
in lactation, water consumption increased
(P> .05) as total dissolved solids increased . Gilts
consumed more water than sows during gesta-
tion but slightly less during lactation
.
Significant differences existed in gestation
and lactation gain between gilts and sows . Gilts
gained more during gestation and also gained an
average of 5
.5 kg during lactation, while sows
lost an average of 7
.0 kg during this time .
The general condition and performance of
the pigs during the 28-day nursing period were
similar among groups. No excessive scouring
was noted in any of the treatments . Roy and
Boyland (1964) also reported no excessive
scouring problem when 4,500 ppm total solids
were added to the water of four sows and their
litters over a 6-week period
.
No significant differences occurred at 28
days in average daily gain or feed to gain ratio
among weaned pigs that received the control
water and those that consumed saline water
containing 3,000 ppm of added sulfates (table
3). Sulfate was added as sodium sulfate or
Treatment
Totaldissolvedsolids
Sulfate
Sodium
Control
620
320
20
Low
sulfate
2840
1820
740
High sulfate
5060
3320
1460
Electronic Filing, Received,
Clerk's Office May 1, 2007
*Significant difference (P<
.01) between guts and sows
.
bSigniticant difference (P<
.05) between guts and sows.
equally from sodium and magnesium sulfate to
provide 5,080 ppm total solids
. Similar results
have been reported by Berg and Bowland (1960)
with 12-kg pigs supplied with 5,000 ppm of
TDS and Anderson and Stothers (1978) for 4-
to 6-kg pigs that consumed water with 6,000
ppm total solids
. These workers found no sig-
nificant differences in gains or feed efficiency
between control pigs and those that received
TABLE 3
. EFFECTS
PERFORMANCE
OF MAGNESIUM
OF WEANED
AND SODIUM
PIGS
SULFATES ON
*Three thousand ppm of sulfate
.
bThree thousand ppm of total sulfates from magnesium and sodium sulfates
.
°Three replications of six pigs per trcaunent
. Three pigs died, data nor included .
d
.e,fMean, on same line with different superscripts arc significantly different (P<05)
.
gBased on a score of I to 5, with I being firm
.
h. 'Means on same line with different superscripts are significantly different (P<
.01)
.
saline water .
Water consumption increased significantly
among treatments . Approximately 30% more
water was consumed by pigs that received saline
water that contained sodium and magnesium
sulfates and 50% more water was consumed by
pigs on the sodium sulfate treatment
. Ander-
son and Stothers (1978) reported a similar
magnitude of increase in water consumptionI
r
Water treatment
Parameter
Control
Sodiumsulfatca
Magnesium-sodiurrsulfate
No
. of pigst
16
18
17'
Avg initial wt, kg
7.5
8.0
7.7
Avg final wt, kg
13
.4
15.0
13
.8
Avg daily gain, kg
.21
.25
.22
Feed to gain ratio
2 .25
2.05
2.18
Avg daily warty consumption, liters
1.25pd
1 .89e
1 .63f
Avg fecal conditiong
1.7
3 .0
3.6'
666
~r
* * * *PATERMff,
TABLE 2 . EFFECT OF SULFATE CONTENT OF WATER ON REPRODUCTIVE PERFORMANCE
Added sulfates (ppm)
Parameter
0
1500
3000
Gilts
Sows
NoWater
Avg
Avg
GestationLactation
.
lactation
gestation
littersconsumption,
gain,gain
.
liters/dayk
131213301.5.6.3.2
-514111327.2.5.5.2
162614101.7.6.8.0
141516415.1.5.4.0
-71518239.5.2.0.6
Avg
NoAvg
Pigs/litter28-day
TotalLive
.
litter
pig
pigs
pig
birth
at
birth
weight,
28
weight,
daysweight,
kgkgbkg
11136691.5.1.7.1.4.6
131010661.5.2.9.0.4.9
10116618.3.8.5.0.2.3
1196681.3.6.5.1.7.8
14119661.4.5.2.8.9.7
28-day litter weight, kg
40.4
42.2
40
.2
39 .5
42.3
Electronic Filing, Received, ~C
ylae~rk's Office May 1, 2007
* * *SULFATEgIirtVATE *
* * * * *
I
during the initial week and an average 17% in-
3
R OF SWINE
667
crease during a 6-week trial
. Sulfate content of
their water was only 2,400 compared to 3,320
ppm in this experiment ; however, TDS was
higher in their water .
A significant difference existed in average
fecal condition between pigs that received con-
trol or saline water . Scouring was considerably
more evident during the first 2 weeks in pigs
that received saline water . High levels of sulfate
in water have been shown to cause scouring in
young pigs (Anderson and Stothers, 1978) and
growing-finishing pigs (Embry et at, 1959)
without affecting growth performance. Ander-
son and Stothers (1978) also reported fecal dry
matter was reduced 2 to 6% for pigs that re-
ceived water that contained TDS and sulfate
contents of 6,000 and 2,400 ppm, respectively .
Although saline water consumption of sows
also increased during lactation, there was no
evidence of scouring in either sows or their
nursing pigs. This study did not allow one to
determine the amount of total dissolved solids
in water necessary to cause problems in repro-
ducing swine
. However, the results confirm the
recommendation of the Committee on Water
Quality Criteria (1972) that water containing
5,000 ppm total solids is not harmful, even
when it contained 3,320 ppm sulfates
.
Literature Cited
Anonymous. 1973 . Water Analysis . Hach Chemical
Co ., Ames, [A .
Anderson,
saline
Dwater
. M, and
high
Sin
. C
.
sulfates,
Stothers.
chlorides
1978 . Effects
and ni-of
trates on the performance of young weanling
pigs. J . Anim . Sci . 47:900 .
Berg, R
. T. and J . P . Bowland. 1960 . Salt water toler-
ance of growing-finishing swine- Feeders' Day
Rep. 39:14, Univ . of Alberta, Edmonton .
Committee on Water Quality Criteria
. 1972. Water
quality criteria. National Academy of Sciences,
National
DC .
Academy of Engineering, Washington
.
EmbryWSalinity
.
. Carlson,
L . B.,
and
M.
L .
Alivestock
.
M.
Hoclscher,
Krista
water
and
R.
OC.
quality
.
E.
Washlstrom,
Olson,
. South1959C
.
.
Dakota Agr
. Exp
. Sta. Bull . 481 .
Hcller, V. G. 1933. The effect of saline and alkali
waters on domestic animals . Oklahoma Agr . Exp .
Sta. Bull . 217
.
Roy, G
. L . and W . J . Boylan . 1964
.
Performance of
swine on high salt content well water in the Red
River
Univ
.
Valleyof
Manitoba
. Annu
.
. Rep . Livestock Res . 14 :19
.
Subcommittee
Water .
1974on
.
Nutrient
Nutrients
and
and
Toxic
toxic substances
Elements inin
water for livestock end poultry . Committee on
Animal Nutrition, National Research Council -
National Academy of Sciences, Washington, DC ..
Weeth, H . J .
1973 . Nonapplicability of federal water
quality standards when applied to cattle . In H . F .
Mayland (Ed.) Proc. Water Animal Relations .
Kimberly. ID.
Default
Electronic Filing, Received,
PC #
Clerk's Office May 1, 2007
Electronic Filing,
* * * *
Received,
*
* PC #~`
Clerk's
* * * *
Office
* *
May 1, 2007
3
EFFECTS OF SALINE WATER HIGH IN SULFATES, CHLORIDES AND
NITRATES ON THE PERFORMANCE OF YOUNG WEANLING PIGS'
D. M Anderson and S. C. Stothers
University ofManitoba3
,
Winnipeg, Manitoba, Canada R3T 2N2
SUMMARY
Three experiments were conducted involving
162, 4 to 6 kg pigs group fed . Nine pigs were al-
lotted per treatment according to breed, weight
and sex and received feed and water ad libitum .
Each experiment had a control treatment (125
ppm total solids) compared to saline water
treatments (approximately 6,000 ppm total
solids) high in either sulfates or chlorides . In
addition the sulfate water was treated with 150
ppm nitrate nitrogen (N03-N) or with 300 ppm
INTRODUCTION
N03-N while the chloride water was also
treated with 300 ppm N03-N. Average final
weights in experiment I and III were 20 kg after
6 weeks on test while average final weights in
experiment II were 9 kg after a 3-week test No
significant treatment differences (P < .05) oc-
curred in average daily gain in any experiment
.
However, with the exception of the pigs given
the chloride water in experiment 111, the
control pigs tended to consume more feed,
gain faster and have a better F/G than those
receiving 6,000 ppm total solids, particularly
in experiment 1 .
Scouring was consistently more common
among the sulfate water fed pigs than either the
control of chloride fed pigs . Approximately
80% of the scouring occurred in the first week
on test
. Water consumption was generally
higher for saline water treatments . No treat-
ment differences occurred among liver vitamin
A values, kidney weights, or kidney histological
structure in the four pigs per treatment sacri-
ficed at the end of Experiment 1 . in conjunc-
tion with experiment 1, blood, fecal and urine
samples were collected from two pigs per treat-
ment housed in metabolic cages
. Urinary so-
dium was significantly higher (P<
.Ol) and fecal
dry matter percent tended to be less for pigs rc
ceiving the sulfate water with or without the
added N0 3 -N.
(Key Words
: Saline Water, Nitrates, Sulfates,
Chlorides, Weanling Swine, Water Consump-
tion .)
Heller (1933) reported that sodium chloride
at 15,000
parts per million (ppm) in water was
toxic to pigs, especially for pigs weighing less
than
45
kilograms . Subsequently several work-
ers experimented with saline water containing a
variety of pure and mixed salts at different
levels from 2,000 ppm to as high as 20,300
ppm total solids with pigs tested most com-
monly within the weight range of 20 to
90 kg
(Embry et al., 1959 ; Berg arid Bowland, 1960 ;
Stothers, 1960 ; Stothers and Palmer, 1961 ;
Stothers,
1970). Results ranged from slightly
improved average daily gain," feed consumption
and feed efficiency (Embry'et al ., 1959) when
pigs received up to 6,300 ppm total solids, to
decreased growth rates, poorer feed efficiency
and higher water consumption when the total
solids content of the water was
15,900 ppm or
higher (Stothers, 1960) .
Case
(1957, 1963) suggested that levels of
nitrate nitrogen (N03-N) above the recom-
mended maximum level of 10 ppm for humans
could be potentially hazardous for pigs . Seerley
et al, (1965)
administered i nitrate and nitrite
continuously in drinking water at levels up to
300 ppm NO, -N for growing-finishing pigs with
no performance differences among treatments
'Financial support for this project provided by
although they did note measurable but small in-
Feedritc mills (1962) Ltd ., Manitoba Pool
Elevators
creases in blood methemoglobin .
and the Manitoba Dcparanent of Agriculture .
'present address : Department of Animal Science,
Thus, separately, research has been reported
University of Alberta, Edmonton, Alberta, Canada,
on the effects of high levels of total solids and
T6G 2E3 .
of N0 3 -N (saline waters) on the performance of
' Department of Annual Science_
9017" owing pigs . No studies have been reported
JOURNAL OF ANIMAL SCIENCE
. Vol . 47, No . 4 (1918)
i
Electronic Filing,
* * * *
Received,
*
* PC
#"J
Clerk's
,* * * * *
Office
* *
May 1, 2007
EFFECTS OF SALINE WATt ON PIGS
901
considering the effects of these two factors in
combination
.
Field observations by producers and exten-
sion workers have related poorer pig perform-
ance to the use of saline waters. Most of the
data available are for older pigs and with the
trend to earlier weaning (3 weeks), information
is required on the response of the younger pig
which is generally more sensitive to its environ-
ment
. Since evaluation of water analyses re-
quested by producers indicated the predomi-
nant salts were chlorides, sulfates and minor
amounts of nitrates with the total of all salts at
a maximum of approximately 6,000 ppm total
solids, these experiments were initiated with
3- to 4-week-old weaned pigs (4 to 6 kg) to
study the effects of saline waters having a total
solid concentration of approximately 6,000
ppm, high in either sulfates or chlorides, alone
or in combination with either 150 ppm or 300
ppm N03-N
.
MATERIALS AND METHODS
Three experiments, involving 162 Managra
or Managra x Yorkshire pigs, group fed, nine
per treatment, were conducted with a control
water treatment compared to saline water treat-
ments containing either sulfates or chlorides
alone or in combination with either 150 ppm
NOs-N or 300 ppm N03-N (table 1) .
of arc,
Newly
and
weaned
initially
pigs
weighing
between
4 to
3
6
and
kg,
4
were
weeksal-
lotted to treatment by weight, sex and litter
.
Saline water prepared in plastic containers was
available to pigs ad libitum from 64 liter
painted metal barrels fitted with watering
bowls . Feed was available ad libitum .
A corn-
mercial feed (18% protein) for early weaned
pigs was fed to an average weight of 7 kg at
which time the ration was changed to a pre-
starter (wheat-soybean meal-fish meal, 19% pro-
tein) . After reaching a weight of approximately
15 kg pigs received a starter ration (barley-soy-
bean meal, 18% protein) . All rations were bal-
anced to meet or exceed the NRC (1973) nutri-
ent requirements for swine with .5% trace
mineralized salt added to all rations
. Combina-
tion of the sodium chloride in the dry feed and
mixed salts in the water gave a total salt intake
equivalent to 11,000 ppm for the saline treat-
ments pigs and 5,000 ppm for the control
treatment pigs . fens were checked daily for
scouring and water consumption while pig
weight and feed consumption were recorded
weekly in Experiments 1, 11 and Ill
.
During Experiment I blood samples were
drawn on days 24 and 31 from three pigs per
treatment selected at random for analysis of
percent methemoglobin by the method of
Evelyn and Malloy (1938) . At the termination
of experiment I, four pigs per treatment (two
per replicate) were sacrificed . Liver samples
were taken, frozen and maintained at -20 C for
subsequent analysis of Vitamin A content by
the method of Gallup and Hoefer (1946)
. Kid-
ney weights were recorded and slices of kidney
were prepared for histological examination
using the standard Harris hernatoxylin and
eosin staining technique (American Registry of
Pathology, 1968) .
Concurrent with Experiment 1, an additional
two barrows per treatment were housed in
circular, adjustable wire mesh metabolism
cages, described by Bell (1948), fitted with bite
waterers, for a total of three 7-day periods for
collection, separation and subsequent analysis
of feces and urine . Test periods were days 1 to
7, 8 to 14 and 29 to 35 . Quantities of daily
urine and fecal excretions were recorded
. Rep-
resentative aliquots of urine and feces were re-
tained and stored at -20 C for future analysis
of sodium and potassium by flame photometry
using a Technicon 11 (Model AA11-07) .
Fecal samples retained from odd numbered
days were analyzed for percent dry matter by
freeze drying in a Virtis freeze dryer and for
percent ash by aching at 500 C for 15 hours . To
the ached samples 5 ml of demineralized water
was added and the samples shaken for 24 hr be-
fore analysis of sodium and potassium by flame
photometry, The remainder of the fecal sam-
ples, those collected and retained from even
numbered days, were subjected to a Carver lab-
oratory press (Model C) from which expressed
juice was diluted and analyzed for sodium and
potassium concentration, using the same proce-
dure as for the other fecal samples. Fecal so-
dium and potassium data were reported in milli-
equivalents excreted per day . Blood samples
were drawn from the anterior vena caves on day
15 of the rest and analyzed for percent hemato-
crit, plasma sodium and potassium ion concen-
trations .
Statistical analysis was accomplished by the
method of Steel and Tonic (1960) . If analysis
of variance was significant (1'< .05) means were
differentiated using Student-Neurnan-Keuls
Test (SNK)
.
'Salt quantities and total solids reported in parts per million (ppm)
.
b
Total solids concentration includes that found in control water plus added salts
.
C
Expcrimenn I and III were replicated with nine
pigs/art/replicate.
Experiment duration was 42 days for Experiments I and III and 21 days for Experiment it
.
d
Experimcnt I treatments also used in a metabolic cage
study
.
0be
m
m
aR
TABLE 1
. SALT COMPOSITION OF WATER TREATMENTS AND EXPERIMENTAL DESIGN USED IN WEANLING PIG EXPERIMENTS
1
3
n
Water treatments
*
Sulfate plus
Sulfate plus
Sulfate plus
*{Q
150 ppm
300 ppm
300 ppm
*
Item
Control
Sulfate
NO,-N
NO, -N
Chloride
NO, -N
fD
A . S
al t
composition of water treatments
Salts
Calcium chloride
780
780
780
780
780
d * ~
Magnesium Sulfate
1694
1694
1694
. . .
. . .
Sodium bicarbonate
2671
1844
1040
2671
1040
Sodium nitrate
910
1818
1818
Sodium
Sodium sulfatechloride
708
,,,708
709
.
2401
. .
.
2401
. .
C
Total solidsb
125
5978
6061
6065
6077
6164
B . Experimental design
Experiment aqd
18
18
18
18
rn
* 0
Experiment 11
9
9
9
9
Experiment III
18
18
18
RESULTS AND DISCUSSION
No significant differences occurred in aver-
age e daily gain among treatments (table 2) . Feed
consumption and feed to gain ratio indicated a
similar result. These results are in general agree
meet with those of Berg and Bowland (1960)
using 12 kg pigs receiving 5,000 ppm of total
solids in the water with no supplemental salt in
the diets, Roy and Boylan (1964) using 6-week-
old, 13 kg pigs receiving a chloride water con-
taining 4,300 parts per million total solids and
Stothers (1970) using water containing 2,000
ppm total solids fed to 6.4 kg pigs who found
no significant differences between control pigs
and those receiving saline waters .
Although there
were no significant differ-
ences in experiment I there was a tendency for
ADG to be higher for the control pigs, whereas
in both experiment I and III the ADF were
slightly higher for the control pigs than those
receiving saline water treatments . FIG was gen-
erally more favorable for the control pigs with
the exception of chloride plus 300 ppm N0 3 -N
in experiments 11 and Ill . Stothers (1970) indi-
cated a similar trend towards decreased ADG
and FIG when pigs received saline waters
.
Water consumption was generally higher for
the saline treatments as compared to water con-
sumption by the controls with the difference
being most apparent during the initial week on
test. Although overall difference in water con-
sumption was 5 to 15% higher in favor of the
saline water treatments for the entire experi-
mental period the difference was most pro-
nounced during the initial week when saline
water consuming pigs recorded intakes 33 to
66% greater than the controls.
Similarily with respect to scouring, the inci-
dence was more pronounced during the initial
adaptation period (first week on test)
. Eighty
percent of all the scour days were observed dur,
ing the initial period. The pigs receiving sulfate
containing water had 148 to 182% more scour
days than the controls during the initial week
whereas the pigs receiving chloride containing
water had slightly fewer scour
days
. Since the
scour days did not persist and little or no loss
of condition accompanied their occurrence the
scouring could be considered to be of a dietary
nature . The work by Stothers (1970) and com-
ments by Ilerriek (1971) describe the cathartic
effect of high levels of sulfate in water on
young pigs evident only during the first week
nn experiment .
Performance of 3-week-old pigs as measured
Electronic Filing,
* * * *
Received,
* *
PC #.21*
Clerk's
*
* *
Office May 1, 2007
EFFECTS OF SALINE WATj ON PIGS
903
by weight gain and feed consumption was not
adversely affected by levels of N03-N up to 300
ppm
N03-N .
FIG for sulfate plus N03-N pigs
was slightly poorer than for sulfate alone . Inclu-
sion of NO 3 -N to the chloride water did not
produce the same results (table 2)
. Seerley et al.
(1965) supplied 300 ppm
N03-N or 100 ppm
NO, -N in water to older pigs with no resulting
reduction in weight gains or general thriftiness,
Concern has been expressed regarding the
conversion of nitrate to nitrite . Case (1963) re-
ported nitrite to be 10 to 15 times more toxic
than nitrate from farm water supplies
. Using
mixtures of minced grass and water Barnett
(1953) reported a range of 13 to 26% conver-
sion of nitrate to nitrite . Seerley et al
. (1965)
noted slight conversion of nitrate to nitrite
which they attributed to bacterial contamina-
tion of the drinking cups used resulting in sub-
sequent microbial reduction of the nitrate . In
our experiments, assuming a 25% conversion to
nitrite, the 300 ppm NO3-N water treatment
would result in a consumption of water con-
taining 75 ppm N02 -N. This level, significantly
higher than the 10 ppm NO3-N proposed by
Case (1963) as potentially hazardous did not re-
sult in reduced weight gains among the young
pigs .
Methemoglobin content of the blood ex-
pressed in gram per 100 ml of blood (table 3)
indicated elevated levels as the amount of NO 3 -
N increases
in the water . These values were the
same whether measured on days 24 or 31 of the
experiment
. Control animal values of .09 g
methemoglobin per 100 ml blood were identi-
cal to those reported by Seerley et al . (1965),
.09 g methemoglobin per
100
ml blood for
older pigs (32
.6 kg body weight) . Seerley et al
.
(1965) reported methemoglobin values of .34
and
.47 g/100 ml blood for pigs receiving 100
ppm N02-N
. Highest values obtained for 300
ppm NO3-N in this experiment were
.24 g/100
ml blood representing half the highest value
given by Seerley
et al.
Liver vitamin A stores were unaffected by
the levels of NO3
-N in the water (table 3) . Scer-
ley et al.
(1965) found similar results with
levels of (0, 25, 50, 100 ppm) N0
2-N given to
older pigs, although their vitamin A liver values
were lower (14 .4 to 17 .4 pg/g) than results re-
ported in this experiment
. According to Garris-
son et al.
(1966) growing and finishing pigs re-
ceiving N03-N at
420 ppm and 0
ppm showed
significant difference (P<MS) in liver stores of
vitamin A
. Since in our tests no significant dif-
b Y
TABLE 2
. PERFORMANCE OF WEANLING PIGS RECEIVING VARIOUS WATER TREATMENTS IN EXPERIMENTS 1, It AND III
a
ADG is average daily gain, ADF is average daily feed both reported in kg/day
.
b
ADIVC is daily water consumption (uteri day) reported only for first 3 Weeks since almost enire treatment differences occurred during this period
.
C
ADWC in parenthesis are consumption during the first week on experiment
d
scour days reported for first week only
; 1 scour day represents any amount of scouring occuring within a pen regardless of the number of animals involved
.
e
Scour days in parenthesis are for the total experimental period
.
o m
e
..
03
v
NOOV
Water treatment
Sulfate plus
Sulfate plus
Chloride plus
an
Item
Control
Sulfate
150 ppm
NO, -N
300 ppm
NO, -N
Chloride
300 ppm
NO, -N
*
*10
3
Experiment I
*
ADGa (kg/day)
.40
.33
.35
.37
ADFa (kg/day)
.79
.71
.75
.74
Feed/gain
1 .89
2.02
2 .32
2 .28
*0
ADWC
Scour
(1/day)bdaysd
1 .15 (
.66)r
1 .35 (1
.04)
1 .31 ( .85)
1 .36 (.86)
z*~
Experiment II
3 .5 (3.5)c
6.0 (8)
6.5
(8)
6.5 (6.5)
A
a
ADG
.19
.18
.19
.18
ADF
.45
.42
.45
.40
71
> -C
o
n
Fced/gain
2 .35
2 .41
2 .41
2.28
ADWC
.80( .63)
1 .24(1
.01)
1 .21(l .06)
1 .14 (1 .01)
Scour days
0
(0)
5
(5)
1
(1)
2 (2)
O
y
*
*
F
N
Experiment
ADFADG
III
.35.70
.62.31
.63.35
Ay
*
0
Fced/gain
2
.00
2.01
1 .84
*
ADWC
.88 ( .59)
.09
(
.72)
1 .15 ( .79)
Scour days
2
(4)
1
(2)
0 (0)
3
Electronic Filing,
* * * *
Received,
* * PC #2,*
Clerk's
* * * *
Office
* *
May 1, 2007
EFFECTS OF SALINE W,5ER ON PIGS
905 ,
g o e
ferences occurred among treatments it can be
n
E
'
r
assumed that very tittle nitrate was reduced to
8
a „
nitrite coinciding with little oxidation of vita-
6
'i
CI
?
min A in the gastrointestinal tract . This find-
v Z
ing is also supported by Emerick and Olson
t
(1962) who found liver vitamin A stores of rats
to be affected by dietary nitrite but not dietary
a
nitrate. Liver stores of vitamin A did not reflect
conversion of nitrate to nitrite therefore the in-
creasedcreased methemoglobin blood levels could be
due to the nitrate content of the water and not
caused by nitrite converted from nitrate by mi-
crobial reduction .
•
a az
r c
No apparent treatment differences occurred
•
o p"
in kidney weights (table 3) or histological sec-
<
n Z
`O
tions of kidney supporting the suggestion that
young pigs can adapt themselves to levels of sa-
z y
Wry of approximately 6,000 ppm
.
~
Performance data from the metabolic cage
v,
8
studies (table 4) support the data presented
F
2
from experiment I and 11 with the exception of
3
F/G where the metabolism caged pigs tended to
•
•
be more efficient . No apparent treatment
ferences in blood hematocrit, sodium and po-
tassiumtassium
were observed . Male pigs housed in the
circular cages minimized the possibility of con-
ramination of the urine by feces even during
the periods when scouring occurred . Urine
volumes were unaffected by treatment
. Urinary
potassium excretions were similar among treat-
ments but urinary sodium excretions were sig-
nifiantly higher (P< .01) in the saline water
treatments. No differences were observed in
fecal sodium and potassium values between the
two methods of preparing feces for analysis at-
though the expressed juice method required less
sample preparation time. Mean fecal sodium
values ±SEM were 38.3 ± 28.4 meq/day and
41.6
± 30.7
meglday while mean fecal potas-
sium values ±SEM were 77.1 ± 10.0 meq/day
and 80.5 t 10.6 meq/day for the aching proce-
dure and expressed juice procedures, respec-
tively.
Although there were no differences among
treatments for fecal % ash, fecal sodium and
fecal potassium, the fecal dry matter percent
seems to reflect the cathartic effect of the sul-
fate ion for the saline treatments tend to be
lower than the controls by 2 to 6%
. Pigs housed
in the metabolic cages showed a slightly greater
number of scour days with generally little ef-
o
E,cQ
u
feet on performance .
No marked adverse biological effects were
z
bc . a
a
observed
with or without
among the
addedpigs
N03
receiving
N
. The
saline
addition
watersof
<
3H
m
y".
.;
m
o
n
:.
3
Z
e m e
$
2
a
c
$c x
g
•~
.a
U
C
2
a
g0
z
e~'
6
p0
E
W
3°
•
°
<"'m
A
m 3!3g
pX=
x
K
° =~ E
TABLE 4
. PERFORMANCE, BLOOD, URINE AND FECAL DATA AS RELATED TO SALINE WATERS USED IN METABOLIC CAGE
STUDY OF EXPERIMENT I
aFrom blood samples drawn on day 15 .
bSteans
in the same row followed by different superscripts are significantly different (P< .01) using Student Newman Keuls (SNK)
.
3
V
aN00v
Water treatment
Item
Control
Sulfate
Sulfate plus
150 ppm
NO,-N
Sulfate plus
300 ppm
NO,-N
A . Performance
ADG (kg/day)
.33
.34
.28
.30
ADF (kg/day)
.48
.47
.41
.56
Feed/gain ratio
1 .45
1 .38-
1 .46
1 .87
ADWC (1/day)
1 .71
2.09
2 .05
1 .75
Scour days
1
9
11
7
B . Bloods
Hemarocrit (%)
31
.81
.4
28.6 1
.5
31.8 ±
1 .0
31.1 1 1.5
Serum sodium (meq/1)
140.11
1
.4
140.6 t 1.5
146.1 t 2.6
152.11 6.8
Serum. potassium (meq/1)
4.9 t
.4
4.9
1
.2
4.1
1
.5
4.8 1
.3
C . Urine and fecal
Urine volume (ml/day)
593 1 124
595 t 132
574
t 175
585
1
118
Urinary sodium (meq/1)
35.3
1
34.2Bb
85 .8 t 34.2A
77.3 1 34.2A
92.11 34.2A
Urinary potassium (meq/1)
51 .7 ±
4.4
56.6 1 10.6
45.3 1
5 .7
73.91 21.5
Fecal ash (%)
15 .1
1
2.0
16.5
t 1.8
15.4 t
1 .4
18.1
1
2.1
Fecal sodium (meq/day)
22.01 30.0
52.71 29.6
42.8 ± 29.6
42.5 1 29.6
Fecal potassium (meglday)
82 .5 ±
5
.8
82.6 1 11.6
76.0 t 12.9
74.0 1
10.9
Fecal drv matter (%)
26.2
1
1 .9
22.61 1.4
19.7 t
1 .1
24.01 1.4
Electronic Filing,
******
Received,
PC
CI
3
*Office
*, .
May 1, 2007
EFFECTS OF SALINE WATER ON PIGS
907
150 or 300 ppm N03-N to water resulted in
small increases in methemoglobin in blood . Sig-
nificantly
higher sodium urinary excretion and
the tendency toward lower fecal dry matter
percent were accompanied by the higher water
consumption recorded for pigs receiving saline
waters
high
in sulfate and sodium salts
.
LITERATURE CITED
American Registry of Pathology . 1968 . Manual of
Histological Staining Methods of the Armed
Forces Institute of Pathology (3rd Ed.) . McGraw-
Hill-Blakeston, New York
i Bamett, A . J . G, 1953 . The reduction of nitrate in
mixtures of minced grass and water . J. Sd . Food
Air. 4
:92 .
Bell, J
. M
. 1948. An adjustable cylindrical cage for use
in metabolic studies with young pigs . J . Nutr . 35
:
365.
Berg, R. T. and J . P. Bowland. 1960 . Salt water toler-
ance of growingfudshing swine. Feeders' Day
Rep . 39 :14, Univ. of Alberta, Edmonton.
Cue, A . A. 1957 . Some aspects of nitrate intoxication
in livestock J . Amer. Vet. Med. Assoc. 130 :323.
Cue, A, A . 1963 . The nitrate problem . National Hog
Farmer, Swine Information Service . Bull . D18 :1 .
Embry, L B ., M . A . Hoelscher, R C. Wahistrom, C. W.
Carlson, G . F. Krista and O . E. Olson. 1959. Sa-
linity and livestock water quality . S . Dakota Agr.
Exp . Sta. Bull 481 .
Emetick, R J. and O. E. Olson. 1962. Effects of ni-
trate and nitrite on vitamin A storage in the cat
J . Nutr. 78,73
.
Evelyn, K A. and H . T
. Malloy. 1938 . Microdetemu-
nation of oxyhcinoglobin, medtetnoglobin and
suiphemoglobin in a single sample of blood
. J .
Biol. Chem 126 :655
.
Gallup, W
. D. and J . A. Hoofer
. 1946, Determination
of vitamin A in liver
. Industr
. Eng. Chem. Ana-
lytical Ed 18 :285 .
Garrisson, G. W., R D. Wood, C. H . Chaney and D. G.
Waddill . 1966. Effects of nitrate and nitrite in
drinking water on the utilization of carotene in
swine. Univ. of Kentucky, Air . Exp. Sea. Prog.
Rep. 164, p . 85.
Heller, V . G . 1933. The effect of saline and alkali
waters on domestic animals. Oklahoma Agr. Exp .
Sta
. Bull. No
. 217.
Herrick, J . B. 1971 . Water quality for livestock and
poultry. Foodstuffs
. Feb
. 20:28.
NRC 1973. Nutrient Requirements of Domestic
Animals, No . 2. Nutrient Requirements of Swine
7th revised ed. National Academy of Scienccs-
National Research Council, Washington . DC.
Roy, G . L and W. J . Boylan. 1964 . Performance of
swine on high salt content well water in the Red
River Valley. Ann . Rep. Of Livestock Res
. Univ
.
of Manitoba 14:19 .
Seerley, R
. W .
. R. J . Emerick L B. Embry and O. E .
Olson . 1965 . Effect of nitrate or niaite adminis-
tered continuously in drinking water for sheep
and swine
. J
. Anim Sd. 24 :1014
.
Steel, R G
. D . and J
. H . Tonle . 1960. Principles and
Procedures of Statistic. McGraw-IIBl Book Co .,
New York .
Stothers, S. C, 1964 Studies on saline waters. Ann.
Rep . on livestock Res. Univ, of Manitoba, Winni-
peg, 10 :3.
Stothers, S . C. and W . M
. Palmer
. 1961 . Further
studies of saline water for swine
. Ann. Rep, of
Livestock Res.
Univ
.
of Manitoba, Winnipeg,
11 :6 .
Stothers, S. C. 1970. Saline water and weanling pip .
P
. 5
. Applied Rea
. Papers in Animal Sd . Dept of
Animal Sci. Univ
. of Manitoba, Winnipeg.
Water for Dairy Cattle
Guide D-107
Michael L
. Looper, Extension Dairy Specialist,
New Mexico State University
Dan N . Waldner, Extension Dairy Specialist,
Oklahoma State University
INTRODUCTION
Water constitutes 60 to 70 percent of a livestock
animal's body
. Water is necessary for maintaining
body fluids and proper ion balance
; digesting, absorb-
ing, and metabolizing nutrients ; eliminating waste
material and excess heat from the body ; providing a
fluid environment for the fetus ; and transporting nutri-
ents to and from body tissues . Dairy cattle get the wa-
ter they need by drinking and consuming feed that
contains water, as well as from metabolic water pro-
duced by the oxidation of organic nutrients . Water
loss from the body occurs via urine, feces, and milk
;
through sweating
; and by evaporation from body sur-
faces and the respiratory tract
. The amount of water
lost from a cow's body is influenced by the animal's
activity, air temperature, humidity, respiratory rate,
water intake, feed consumption, milk production and
other factors . This publication covers water intake
guidelines and water quality issues for dairy cattle .
WATER INTAKE AND REQUIREMENTS
Lactating cows
: Drinking water or free water in-
take satisfies 80 to 90 percent of a dairy cow's total
water needs . The amount of water a cow drinks de-
pends on her size and milk yield, quantity o f dry mat-
This publication is scheduled to be updated and reissued 2/07 .
ter consumed, temperature and relative humidity of'
the environment, temperature of the water, quality and
availability of the water, and amount of moisture in
her feed . Water is an especially important nutrient
during periods of heat stress . The physical properties
of water are important for the transfer of heat from the
body to the environment . During periods of cold stress,
the high heat capacity of body water acts as insulation-
conserving body heat . Water intake (lbs/day) for lactat-
ing cows can be predicted from the following equation
Water intake, lbs/day
-
35 .25 + 158 x Dry matter intake (lbs/day)
+ 0 .90 x Milk yield (lbs/day)
0 .11 x Sodium intake (grams/day)
+ 2 .65 x Weekly mean minimum temperature
(°F/1 .8- 17 .778)
The equation predicts water consumption will
change 1 .58 pounds for each 1 .0-pound change in dry
matter consumed, 0 .90 pounds for each 1 .0-pound of
milk produced, 0
.11 pounds for each gram of sodium
consumed, and 1 .47 pounds for each degree Fahren-
heit (F) change in weekly mean minimum tempera-
ture . Weekly mean minimum temperature typically is
10 to 15 °F lower than mean daytime temperature .
Table I lists the estimated daily water intake for lac-
tating cows using the above equation .
Table 1 .
Estimated daily water consumption for a 1,500-pound
lactating
cow
producing 40 to 100 pounds of milk daily' .
Estimated
'Sodium intake-
0 .18"., ot DM intake .
''IAtean nonunum temperatLie iyplcaliy is Ill i„ I5" F lower than the
u,111 deytin,c tempo-alvre .
i rallun (itw',tlcr wuulu s
. . i'-
pounL, .
To hod more resources for your business
. home, or family, visit the College of Agriculture and Home Economics
oil Lhe World Wide Web at wvrw.cahe n:nsu cdu
Milk Production
(Ibs/day)
DM Intake
(Ibs/day)
40°F
Mean Minimum Temperature^
50°F _
60°F
70"F
80°F
40
42
18 .4
20
.2
gallons per day---
22.0
23 .7
25 .5
60
48
21-8
23 .5
25 3
27 .1
289
80
25
.1
26 .9
287
10.4
32
100
60
28 .5
30 .3
11
.8
35 .6
Dry cows
: The major factors affecting free water
intake of dry cows are concentration of dry matter in
the diet, dry matter intake and amount of protein in
the diet . Water intake of dry cows can be estimated by
the following equation :
Water intake, lbs/day =
-22.80 + 0.5062 x Diet dry matter (%)
+2212 x Dry matter intake (lb/day)
+0 .0869 x Diet crude protein (%)=
For example, a 1,500-pound nonlactating cow that
cats 28 pounds of dry matter containing 12 percent
moisture and 12 percent crude protein would consume
96 pounds (11 .6 gallons) of water per day at air tem-
peratures between 50°F and 80 ° F
. Water intake may be
120 to 200 percent greater during periods of heat stress .
Calves and heifers : During the liquid feeding
stage, calves receive most of their water as milk or
milk replacer, However, studies show that calves of-
fered water by free choice in addition to a liquid diet
gain faster and consume dry feed earlier than calves
provided water only in their liquid diet . Therefore, it
is recommended to provide water by free choice to
calves receiving liquid diets to enhance growth and
dry matter intake .
Weaned dairy heifers consume approximately 1 .0
to 1
.5 gallons of water per 100 pounds of body weight
(table 2)
. As with all livestock, water should be
fresh, clean and always available . Care should he
taken to ensure adequate water supplies during peri-
ods of heat stress .
Table 2 . Estimated water intake for dairy heifers .
Weight
Air Temp e rat u re
(Ibs)
40 F
60 F
80°F
DRINKING BEHAVIOR
Providing the opportunity for livestock to consume
it relatively large amount of clean, fresh water is cs-
scnlial
. Water is consumed several tunes per day arid
generally is associated with
ceding or milking Cow,
may consume 30 to 50
pcrccnt of dicir daily water
intake within I hour diet' iuilkiti (tig . I ) . Reported
Guide D-107 - Page 2
rates of water intake vary from I to 4 gallons per
minute . On the basis of farm studies, the length of wa-
ter troughs should he 2 inches per cow with an opti-
mal height of 24-32 inches . Reducing the height 2 to 3
inches may be logical for Jerseys . Water depth should
be a minimum of 3 inches to allow the animal to sub-
merge its muzzle I to 2 inches . Provide at least one
watering device for every 15 to 20 cows, or a mini-
mum of 2 feet of tank space per 20 cows . At least two
water locations are needed in the loafing area for each
group
of cows . For confinement operations, waterers
should be allocated at milking parlor exit and within
50 feet of
the feed bunk or at every crossover in
frcestall barns . Heifers should be provided at least one
watering space per 20 animals with a minimum of two
waterers per group .
The temperature of drinking water has only a slight
effect on drinking behavior and animal performance .
Under most circumstances, responses to chilling water
would not warrant the additional cost . Given a choice,
cows prefer to drink water with moderate tempera-
tures (63-82°F) rather than very cold or hot water .
WATER QUALITY
Water quality is an important issue in dairy cattle
production and health . The five properties most often
considered in assessing water quality for both humans
and livestock are organoleptic properties (odor and
taste), physiochemical properties (pH, total dissolved
solids, total dissolved oxygen and hardness), along
with the presence of toxic compounds (heavy metals,
toxic minerals, organophosphates and hydrocarbons),
excess minerals or compounds (nitrates, sodium sul-
fates and iron) and bacteria and algae . Research on
water contaminants and their effects on cattle perfor-
mance are sparse . The following discussion attempts
to define some common water quality problems in re-
lation to cattle performance .
Salinity, total dissolved solids (TDS) and total
soluble salts (TSS) are measures of constituents
soluble in water. Sodium chloride is the first consider-
ation in this category . Other components associated
with salinity, TDS, or TSS are bicarbonate, sulfate,
calcium, magnesium and silica
. A secondary group of
constituents, found in lower concentrations than the
major constituents, includes iron, nitrate, strontium .
potassium, carbonate, phosphorus, boron and fluoride .
Gttidelines iorTDS in water for dairy cattle arc pre-
sctted in table i .
Research has shown feedlot cattle drinking saline
water (I
US''
6 .000 parts per million, ppm) had lower
weight ruins than cattle drinking normal water ITDS
gallons per day
200
2 .0
2 .4
3 .3
400
3 .8
4 .6
6 .1
600
5 .4
6.5
8 .7
800
6 .8
8 .2
11 .0
1000
8 .0
9 .6
12 .7
1200
9 .0
10 .8
14
.5
1,300 ppm), when the ration's energy content was
low and during heat stress . High-energy rations and
cold environmental temperatures negated the detri-
mental effects of high-saline water consumption
.
Likewise, milk production of dairy cows drinking sa-
line water (TDS = 4,400 ppm) was not different from
that of cows drinking normal water during periods of
low environmental temperature
. But it was signifi-
cantly lower during summer months
. Cows offered
salty water drank more water per day (36 versus 32
gallons per cow) over a 12-month period than cows
drinking normal water
.
Table 3 . Guidelines for use of saline waters for
dairy
cattle.
Total
(ppm)Dissolved
Solid,
Comments
Less hail 1,000
Presents no .ertous burden to Ilvestoek
.
ll0ll 1" 2,999
Should not tiffrel health or perfarnlanee hw
i"ay close It,
mpurary mild diarrhea .
1,001) to
4.099
(icocralty
bra especially
sail a
upon
factory,
Initial
but
eonsumplinn-may
canecdiair-
i 1)0x10+6,909
ruminantsaninmls
Can he usedand
. Should
baby
Wilts
calvesreasonable
be avoided
.
safety
(or pregnantfor
adult
7,11)10 to 10,00(I
lucmllng,
Should be
stressed
avoided if
Or
possibleyoung
R 111111U1%
. Pregnant,can
be
at'fcctcd n,garivcly,
Over 1(11)110
ppm ° part, per mltLnn
coad1110n4
Ulisnfc. ShouId not be used under any
Hardness is generally expressed as the sum of
calcium and magnesium reported in equivalent
amounts of calcium carbonate
. Other cations in wa-
ter, such as zinc, iron, strontium, aluminum and
manganese, can contribute to hardness but usually
are very low in concentration compared with cal-
cium and magnesium . Hardness categories are listed
in table 4
. Water hardness has no effect on animal
performance or water intake .
Table 4 . Water hardness
guidelines .
Category Hardness,
milligrams/liter-
Soft
0-611
Mudmad,y hard
61120)
Hard
111 .1X4)
'very b:vd
I X11
'I ururn'gol
i i
mil`.u,nmlr
prrlllor
Guide D-107 ' Page 3
Nitrate can be used in the rumen as a source of'ni-
trogen for synthesis of bacterial protein, but reduction
to nitrite also occurs
. When absorbed into the body,
nitrite reduces the oxygen-carrying capacity of blood
and in severe cases results in asphyxiation . Symptoms
of nitrate or nitrite poisoning are labored breathing,
rapid pulse rate, frothing at the mouth, convulsion,
blue muzzle and bluish tint around eyes, and choco-
late brown blood. More moderate levels of nitrate poi-
soning have been linked to poor growth, infertility
problems, abortions, vitamin A deficiencies, reduced
milk production and general unhealthiness .
The general safe concentration of nitrate in water is
less than 44 ppm and less than 10 ppm of nitrate-ni-
trogen (table 5) . In evaluating potential nitrate prob-
lems, feed also should be analyzed for nitrate in that
the effects of feed and water are additive .
Sulfate guidelines for water are not well-defined,
but general recommendations are less than 500 ppm
for calves and less than 1,000 ppm for adult cattle .
When sulfate exceeds 500 ppm, the specific salt form
of sulfate or sulfur should be identified, since the
form of sulfur is an important determinant of toxicity .
Hydrogen sulfide is the most toxic form and concen-
tration as low as 0 .1 milligrams per liter can reduce
water intake. Common forms of sulfate in water are
calcium, iron, magnesium and sodium salts . All are
laxative, but sodium sulfate is the most potent . Cattle
consuming water high in sulfates (2,000-2,500 ppm)
show diarrhea initially, but appear to become resistant
to the laxative effect . Iron sulfate has been reported to
be the most potent depressor of water intake com-
pared with other sulfate forms . Water and feed with
high sulfate contents have been linked to polioence-
phalomalacia (thiamin deficiency) in beef calves .
Table 5
. Concentration of nitrates (NO.,) and
nitrate-nitrogen (NOa-N) in drinking water and
expected response .
pilot
pare, per million
(ppm)
NO,
No,
tppm)
-N
Comments
0-04
10
No harmful
cf(uc1s
.
45-132
I1-21)
Safe, if diet i .s low in nitrates and nutritionally
133-221)
21-40
balanced .
Could behar ..1 .1 cnnsumcdoveralong
221-660 41IM
period oflinle .
Dairy catdv at r,sk, possible death losses .
661-X110
101 200
111Th probability of
' I'L . ,
lh losws
: una .
.I
IhtrHIlll I)vc1'Oil Dou'III'l
n".'1:.
Figure I . Cows may consume
30 to 50 percent oft heir
daily
water intake within I
hour after milking .
pH is a measure of acidity or alkalinity
. A pH of 7
is neutral, less than 7 is acidic and more than 7 is i l-
kaline
. Little is known about the specific pH's effect
on water intake, animal health and production, or the
microbial environment in the rumen
. The preferred
pH of drinking water for dairy animals is 6
.0 to 8.0.
Waters with a pH outside of the preferred range may
cause nonspecific effects related to digestive upset,
diarrhea, poor feed conversion and reduced water and
feed intake .
Microbiological analysis of water for colifoml
bacteria and other microorganisms is necessary to de-
termine sanitary quality (fig
. 2) . Since some coliform
bacteria are soil borne or nonfecal, a fecal coliform
test may be used to determine if the source of total
coliform is at least in part from feces
. A fecal strepto-
cocci test may be run on fresh samples to determine if
the contamination is from animal or human sources
. If
fecal coliforms exceed fecal streptococci, human
sources of pollution may be suspect
. If fecal strepto-
cocci exceed fecal coliform, animal sources of pollu-
tion are indicated
. For animal consumption, especially
young calves, total and fecal coliform counts should
be less than I per 100 milliliters
. For adult animals,
total and fecal coliform counts should be under 15 and
10 per 100 milliliters, respectively
. It is recommended
that fecal streptococci counts not exceed 3 or 30 per
100 milliliters for calves and adult cattle, respectively
.
Total bacteria count measures virtually all patho-
genic as well as noninfectious bacteria that use or-
ganic nutrients for growth, Total bacteria counts in
Guide D-107 - Page 4
4:0
_95
excess of 500 per 100 milliliters may indicate water-
quality problems . Water sources with total bacteria
counts in excess of I million per 100 milliliters should
be avoided for all livestock classes
. Most water sup-
plies will have counts below 200 per 100 milliliters
continuously
.
Blue-green algae have been reported to cause ill-
ness when cattle are allowed to consume water con-
taining this organism, Although the causative agent
has not been identified specifically, cattle should he
prevented from drinking water with heavy algae
growth . Symptoms in blue-green algae poisoning in-
clude ataxia or incoordination of voluntary muscle
movement, bloody diarrhea, convulsions and sudden
death . This is an occasional problem in freestanding
water, such as farm ponds
. Shading water troughs and
frequent sanitation will minimize algae growth
.
Other potentially toxic compounds and organ-
isms
sometimes are found in water and can pose a
health hazard to cattle
. For safe consumption, water
contaminants should not exceed the guidelines in
table 6
. However, many dietary, physiologic and envi-
ronmental factors affect these guidelines and make it
impossible to accurately determine the concentrations
at which problems may occur
.
Table 6 . Generally considered safe concentrations of
some potentially toxic nutrients and contaminants In
water for cattle .
Item
Upper-Limll Guideline
(PPM)
Aluminum
11 .511
Arsenic
005
Bar,un
1110
Boron
5 .0
Cadmium
0.005
Chromium
0 .10
Cobalt
10
Copper
LO
Fluoride
2
.0
Iron
20
Lead
0
.1115
Manganese
11115
Mercury
001
Nickel
0 .25
selenium
0 .05
vanadium
0 .10
Zinc
5
.11
ppm pmts
per null
Figure 2 . Microbiological analysis
of water for coliform bacte-
ria and other microorganisms is necessary to determine sani-
tary quality
.
WATER SAMPLING AND TESTING
Typically, 1 or 2 quarts of water from the source in
question should he adequate to complete any needed
tests . Samples may be sent to any accredited commer-
cial or state operated laboratory for analyses
. Produc-
ers should consult with their herd veterinarian or state
Extension personnel for assistance in selecting a labo-
ratory, as well as for assistance in selecting appropri-
ate tests and interpreting results .
SUMMARY
Water availability and quality are extremely impor-
tant for animal health and productivity . Limiting wa-
ter availability to cattle will depress production rap-
idly and severely .
The most common water quality problems affect-
ing livestock production include high concentrations
of minerals (excess salinity), high nitrogen content
(nitrates and nitrites), bacterial contamination, heavy
growth of blue-green algae and accidental contamina-
tion by petroleum, pesticides or fertilizer products .
On the basis of the scientific literature, no wide-
spread specific production problems have been caused
by consumption of low quality water
. Poor water
quality might cause reduced production or nonspecific
diseases and should be one aspect investigated when
there are herd health ant] production problems
.
Guide D-107 - Page
5
REFERENCES
Bcedc, D .K . 1992 . Water for Dairy Cattle . In :
Large Dairy Herd Management . Ed . H .H . Van
horn and C .J . Wilcox . Amer . Dairy Sci . Assoc .
Champaign, Ill .
Dairy Practices Council . 1990 . Guidelines for Po-
table Water on Dairy Farms 3rd rev . ed
. Barre, Vt .
McFarland, D .F . 2000 . Feed Area and Water Space
Design. In : Dairy Housing and Equipment Sys-
tems . NRAES-129 . Ithaca, NY .
Murphy, M.R., C.L . Davis and G .C. McCoy . 1993
.
Factors affecting water consumption by Holstein
cows in early lactation . J . Dairy Sci . 66
:35.
National Research Council
. 2001
. Nutrient Require-
ments of Dairy Cattle 7th rev . cd. Washington,
D.C.: National Academy Press .
PC,d 3
Guide D-107 -
Page
6
9
cS1
-A,)
Guide D-107 - Page
7
9 G0
Nccv Mc'ico Su,ity t'nirc
Ilcpnrlntcnl nl Aurieulturc
I
augmrriiugI,,
un equal
.
0pp0rturnv
.
.ItlIrtlu llcc action cmph VC
and tduculur . NM,StI
, iii , ;
lilt
US
Printed February 2002
Las Cruces, NM
5C
Guide 0-107 - Page 8
TENTS
Indies
3
Studies
S
Studies
9
y Studies
10
ory "' 11
?ersonnel of the South Dakota Agricultural Ex-
,re responsible for the work conducted and for
ion:
dry
mimalhusbandman
er, graduate assistant in animal husbandry
I'm, associate animal husbandman
dry
, poultry husbandman
.raduate assistant in poultry
istry
search assistant in biochemistry
ssociate chemist
eemist --- -
Salinity and Livestock Water Quality
Criteria for judging the suitabil-
ity of water for livestock have been
suggested in the past by several
sources . Often these criteria have
been based on observation, al-
though in some instances experi-
mental work has been done to assist
in their development. However, the
lack of experimental work and the
variation a m o n g standards that
have been published made the es-
tablishment of criteria for use at this
experiment station difficult
. There-
fore, research to assist in the devel-
opment of reasonably accurate
standards for livestock was under-
taken.
Some have recommended that
standards for livestock waters
should be the same as they are for
human consumption . This, how-
ever, would eliminate from use
dams, dugouts, and certain other
common sources because they
would fail to meet bacteriological
standards . In addition, animals pos-
sibly can tolerate higher salinities
than can humans, and it is conceiv-
able that they differ from man in
their tolerance for certain specific
.substances. Actually, the standards
used for water for human consump-
tion are obviously much higher in
many respects than is necessary for
livestock waters .
In establishing standards for live-
stock waters, several factors must
Male albino rats (Sprague-Daw-
be considered . These include mi-
ley) were placed on experiment at
crobial contamination,
presence of
an average weight of about 68
toxic inorganic chemicals, presence
grains
. They were housed on wire
3
of organic toxins, accidental cun-
tamination with agricultural chem-
icals, alkalinity, and salinit . Of
these, salinity seems to be' most
often involved
in
causing waters to
he unfit for livestock in South Da-
kota . For this reason, the studies re-
ported here have dealt entirely
with salts or mineral content
.
The tolerance of livestock and
poultry toward minerals in water
will depend on many things, includ-
ing; kind of animal, age, season of
year, climate, kind of salts in the
water, ph siological condition of
the anima and feed . All of these
variables could not be included in
the work reported here . However,
rats, cattle, poultry, and swine were
used and several types of salts were
studied. The experiments with the
different animals are reported sep-
arately .
RAT STUDIES
Experiments
with albino rats
were undertaken preliminary to
work with large animals. The pur-
pose here was two-fold : (1) to com-
pare several kinds of salts and get
some idea of their relative toxicities ;
and (2) to establish what concen-
trations of salts would be best used
in experimental work with large an-
imals .
Methods
4
Soul/ Dakota Experiment Station Bulletin 481
in individual cages and were al-
lowed feed and water free choice
.
The temperature of the room in
which they were housed was main-
tained at about 75-80° F
. The ex-
peri ment was terminated at 50 days .
The diet used for each group of
rats was as follows
: con, 77 .9% ;
casein, 15 .0% ; brewer's yeast, 2 .0% ;
salts (USP XIV), 2.0% ; a vitamin
B„ concentrate (Nutritional Bio-
chemicals Corp .), 0.1% ; and
cotton-
?
aof3
seed oil (Wesson), 3
.0% . Vitamin
A and D were administered orally
twice each week.
The plan of the experiment is
shown in table 1 . While the rats
were housed individually, feed and
water consumption were measured
Five rats were used pa
grow , and a control group receiv
ing distilled water was used for each
salt mixture . Five different salts
were studied, each being added to
Table 1 . Effect of Saline Drinking Waters on Rats
Fcedron-w.wcn..
Conccntntio. of alt
Average aumed/ aumed/
Salt
ist'
watt
chili gain nt/d
aY. at/day ,
Group
and
Equtrdent/1 . p.p.m
. of an, am
. am.
m1.
I
None 6
.18
17.7
37.2
I I
Sodium chloride 0 .05
2,923
6.44
16.2
38.1
111
Sodium chloride _ 0.10
5,845
6 .14
20.5
49.2
I V
Sodium chloride
0.15
8,768
637
19 .0
48 .0
V
Sodium chloride
0 .20
11,690
6 .03
18 .6
39 .9
VI
None . . . .._ .- .-_ . . ...
6
.16
17 .7
35 .0
VII
Sodium sulfate 0.05
3,552
6.20
17.6
43 .5
VIII
Sodium sulfate ------...---- 0.10
7,103
6 .06
17 .9
42 .2
IX
Sodium sulfate 0 .15
10,655
5 .88
17 .7
42 .2
X
Sodium sulfate .. .... 0 .20
14,206
5 .39
17
.5
36 .8
XI
None ----
6 .18
16.8
36.2
X11
Magnesium chloride
0.05
2,381
6 .07
17
.8
37.8
XIII
Magnesium chloride
0 .10
4,762
5 .98
17 .8
37 .1
XIV
Magnesium chloride 0.15
7,143
5 .58
15 .8
36.0
XV
Magnesium chloride
_ . 0.20
9,524
4 .93
16 .2
412
XVI
None .. .
.. ........ .. . .. ..
. . ..
6 .02
16 .7
34 .4
XVII
Magnesium sulfate
... .-._... 0.05
3,010
6 .16
7 .4
39 .4
XVIII Magnesium sulfate 0 .10
6,019
5 .56
16 .7
31 .9
XIX
Magnesium sulfate 0
.15
9,029
5 .71
17
.7
36.8
XX
Magnesium sulfate - 0
.20
12,038
5 .60
16 .0
34 .6
XXI
None
6.00
16 .5
39 .6
XXII Calcium chloride 0.05
2,775
6 .04
17 .6
33.1
XXIII Calcium chloride
___ 0
.10
5,550
6
.07 15
.6 363
XXIV Calcium
chloride 0.15
8,325
6 .10
17 .8
27 .4
XXV
Calcium chloride - 0 .20
11,100
5.84
15 .0
27 .8
Salinity and Livestock
the drinking water at four levels . if
Analytical grade salts were used in of
making up each of the waters .
ra
Results and Discussion
PSt,
Results of the work with rats are
summarized in table 1 . The various
salts and concentrations used ap-
peared to have no consistently great
effect on feed consumption. Sodium
chloride in the drinking water ap-
peared to increase water intake,
e s p e c i a l l y at the intermediate
levels
. Essentially the same was true
for sodium sulfate. The magnesium
salts had no particular effect on
water consumption at any of the
concentrations used . Calcium chlo-
ride reduced water intake at all
concentrations .
The average daily gains for the
rats were little affected by sodium
chloride at any of the levels used .
Sodium sulfate and the magnesium
salts caused reduced growth rates
at the higher levels
. Calcium chlo-
ride had some slight effect in reduc-
ing daily gains at the highest level
None of the animals died during
the experiment, and while several
showed symptoms of diarrhea on
the sulfate salts, the symptoms were
mild
. Reduction in rate of gain
seemed the most obvious effect of
the saline waters .
These experiments indicated
that the establishment of the exact
level
at
which
a salt or a mixture of
salts becomes toxic or harmful
would be difficult . Levels below
4,000 parts per million (p .p .m.) of w
a salt in the drinkin supply ap- d :
peared to have no averse effect, ec
while 10,000 p.p
.m . usually did . On as
C,
m
as
st
1E
sh
fc
ak a Experiment Station Bulletin 481
ad were al-
seed oil (Wesson), 3.0% . Vitamins
free choice . A and D were administered orally
he room in twice each week.
d was main-
d
Fat .
50
The
daysex-.
were
shown
The
housed
plan
in table
individually,
of the
1 . While
experiment
feed
the ratsand5
ch group of water consumption were measured
corn, 77.9%; by group. Five rats were used pa
yeast, 2.0%
;
grou , and a control group receiv-
a vitamin
ing stilled water was used for earl
'itional Bio- salt mixture. Five different sal
and cotton- were studied, each being added to
ffect of Saline Drinking Waters on Rats
0.05
2,923
0
.10 5,845
0
.15 8,768
0.20
11,690
3,552
7,103
10,655
14,206
------
0.05
0 .10
0.15
0.20
is
0.05
do
0 .10
de
0.15
de
0 .20
0 .05
0.10
C
. . . .
_ .
0.15
0 .20
0
.05
0.10
0.15
0
.20
Concentntioa of salt
Feedtna-wnermr .
Avenge sumed/ rimed/
Ladrinking water
dally gain rat/day, tat/day,
E9ulvdmb/1 . p.p .m.-..ofnb,gmm
Sm .
d .
6.18
17 .7
6.44
16 .2
6 .14 20.5
6.37
19.0
6.03
18.6
6.16
17.7
6.20 17.6
6 .06 17.9
5 .88
17.7
539
17.5
6 .18 16.8
6.07 17.8
5 .98
17.8
5
.58
15
.8
4 .93
16.2
6 .02
16.7
6
.16
17 .4
5 .56
5
.71
5 .60
6 .00
6
.04
6.07
6.10
5.84
2,381
4,762
7,143
9,524
3,010
6,019
9,029
12,038
2,775
5,550
8,325
11,100
37 .2
38.1
491
4B.0
39.0
35.0
43.5
42.2
42 .2
36.8
36.2
37.8
37.1
36.0
411
34 .4
39.4
16.7
31 .9
17 .7
36 .8
16.0 346
16 .5
39 .6
17 .6
33 .1
15 .6
363
17 .8
27 .4
15 .0
27 .8
the drinking water at four levels
.
Analytical grade salts were used in
making up each of the waters .
Results and Discussion
Results of the work with rats are
summarized in table 1 . The various
salts and concentrations used ap-
peared to have no consistently great
effect on feed consumption . Sodium
chloride in the drinking water ap-
peared to increase water intake,
e s p e c i ally at the intermediate
levels . Essentially the same was true
for sodium sulfate
. The magnesium
salts had no particular effect on
water consumption at any of the
concentrations used . Calcium chlo-
ride reduced water intake at all
concentrations.
The average daily gains for the
rats were little affected by sodium
chloride at any of the levels used .
Sodium sulfate and the magnesium
salts caused reduced growth rates
at the higher levels
. Calcium chlo-
ride had some slight effect in reduc-
ing daily gains at the highest level.
None of the animals died during
the experiment, and while several
showed symptoms of diarrhea on
the sulfate salts, the symptoms were
mild. Reduction in rate of
gain
seemed the most obvious effect of
the saline waters.
These experiments indicated
that the establishment of the exact
level at which a salt or a mixture of
salts becomes
toxic or harmful
would be difficult. Levels below
4,000 parts per million (p.p .m.) of
a salt in the drinking supply ap-
geared
d
to have no adverse effect,
while 10,000 p
.p.mp
usually did . On
Salinity and Livnrlock
Wooer Qualily
S
the basis of this work, and in view
of some previous observations, the
range between these two levels ap-
peared to be the most logical for
study with other animals
.
CATTLE STUDIES
The salts commonly present at
high concentrations in excessively
saline waters of South Dakota are
sodium sulfate, sodium chloride,
and magnesium sulfate. Either sodi-
um chloride or sodium sulfate will
often account for over 75% of the
total salts in these waters, while
magnesium sulfate usually accounts
for lesser amounts . As a rule magne-
sium sulfate is accompanied by high
levels of sodium sulfate and some
chlorides
.
In view of this, the cattle studies
were made with sodium chloride,
with sodium sulfate, and with a
mixture of magnesium sulfate with
these two salts . The first trial, with
sodium sulfate, included three lev-
els of the salt, 4,000, 7,000 and 10,-
000 p p .m
. The second trial, involv-
ing the other salts, was limited to the
two higher levels
.
Methods
First
trial
.
Twenty-four heifers in
medium condition and weighing an
average of about 670pounds were
started on the first trial on June 27,
1957
. They were weighed without
shrink and allotted into four uni-
form lots of six
each .
All lots were fed alike . Alfalfa bay
was limited to 8 pounds per head
daily, and a concentrate mixture
composed of 95% rolled shelled core
and 5% soybean meal was full fed .
1
PC-O-6-3
I
6
South Dakota Experiment Station Bulletin 481
Trace mineral salt and a mineral
mixture (3 parts bone meal, 1 part
limestone, and 1 part trace mineral
salt) were offered free choice. The
cattle were implanted with diethyl-
stilbestrol after being on the experi-
ment about 1 month .
Water from the Brookings water
system was supplied to each lot in
350
gallon steel tanks . Sodium sul-
fate was dissolved in the water in
these
p.p m .
;
proportionsLot
2, 7,000
: Lot
p.p.m1,
.;
10,000Lot
3,
4,000 p. .m .; Lot 4, none (con-
trol)
. No adjustment period was
accustomed
used to allow
to
the
the
cattle
water .
to become
ten
Second
heifers
trialof
.
Twenty
the Hereford
steers
andand
They
Angus
were
breeds
in
were
a fleshy
used in
condition
this trialand.
weighed an average of about 730
June
pounds
3,
1958when
.
put on experiment
Rations fed were similar to those
used id the first trial, except that the
parts
mineral
bonemeal,
mixture
1
was
part
composed
limestone,of2
and 1 part trace mineral salt . All
animals were Implanted with di-
ethylstilbestrol at the beginning of
the trial
.
The cattle were weighed without
shrink
the basis
and
of
allotted
weight,
into
condition,
five lots
andon
sex . Each lot was composed of four
steers and two heifers,
The system of watering was simi-
lar to that used in the first trial .
Salts were added to the water as
follows : Lot 1, none (control)
; Lot
_o, 7,000 p.p.mM sodium chloride ; Lot
:3. 10,000 p.p.m . sodium chloride ;
Lot 4,
7,000 p
.p.m . mixed salts (so-
dium 955 p.p.m ., sulfate 4,772
p.p.m ., chloride 425 p .p .m ., and
magnesium 848 p.p.m.) ; Lot 5,
10,000 p.p.m . mixed salts (sodium
1,364 p.p.m., sulfate 6,817 p.p.m.,
chloride 607 p.p.m ., and magnesi-
um 1,212 p.p .m . )
Results and Discussion
First trial. Results of the first trial
are summarized in table 2. Adding
10,000 P .P.M . of sodium sulfate to
the water caused a marked reduce
tion in feed consumption and rate of
gain . The heifers in this lot (Lot 1)
lost an average of 62 pounds per
head during the first 2 weeks of
averagethe
trial,
loss
and even
per
afterhead 56days
wasthe22
pounds
(0.4
pounds per day) .
Scours were rather severe in Let
pronounced
1, and two of
additional
the heifers
symptomsshowed
indicating
symptoms were
t o x
rapid
f e effectsand
difficult
. These
respiration and incoordination. One
of the heifers was removed from the
experiment and given control
water
. Respiration and gait were
normal on the following day and
the animal was returned to experi-
ment 8 days later
. The other sur-
vived
removed
the
from
experiment
the lot .
without
A third heiferbeing
without
died aftershowing
55 days
the
on experimentsymptoms
nation
mentioneddid .
not
A post
reveal
mortem
the cause
exami-of
death .
It was apparent after 56 clays of
the trial that 10,000 pp.m
. of so-
dium salfate made the water an-
Salinity and Liverrock
W
Table 2. Effect of Different Concentrations of
c
(June 27-Sept
. 19, I
Av
. daily water consumption, gal
.
June 27-Aug . 21 _
.
.__ S .6)
Aug
. 22-Sept
.
19 . . . .
June 27-Sept. 19
8.1
7.07
tone
.111',:V9ntheifer
1, cattle
for
died
entire
changed
. Gain
experimentto
madecontrol
up
.
to
water
last
afterweigh 56
day
daybefore
..
satisfactory, so at that time Lot 1 used
was
periment
offered
was
control
continued
waterfor . The
anotherex-
diunnot
the
28
tite
pounds
daysanimals
and
.
per
The
appearance
day
in
return
this
during
to
lot
was
normal
this
gained
rapid
periodappe-and4.8 thetractduesAl
ceiving
(tableThe
rates
2)the
.
of
water
gain
withfor
the
4,000lots andre-
7,00(eralAt
spectively,
7,000
fate werep.p.m
2.50of
as
andadded
compared
2.73sodium
pounds,
to
sul-2re-.60 sunlitlionin
sli
variation
pounds
ferences
for
probably
for
the
the
control
number
represent
lot,
of
The
cattlenormaldif-
Theredop.p.n
.
10,000
F.P .M .
sodium
.uUam
Non,
Number in lot
Days
6t
5t
56
28
Aft
Av .
daily
initial
gain,
weight,
lb
.
.
lb.___ 673.0
635.6
-
.40
4.8
Av . daily ration consumed, lb .
Alfalfa hay ---------
.2
5 .9
Concentrate
Mineral mixturemixture
. . . 5 .9
14.2
....
.0501
Trace mineral salt
.0601
Feed per 100 lb . gain, lb
.
Alfalfa hay ___
Concentrate mixture
,Mineral mixture
Trace mineral salt -
iota Experiment Station Bulletin 481
a mineral Lot 4, 7,000 p.p .m . mixed salts (so
leaf, 1 part dium 955
p.p
.m .,
sulfate 4,772
ice mineral p .p .m ., chloride 425 It p .m
., and
,hoice
. The magnesium 848 p.p .m.) ; Lot 5
ith diethyl- 10,000 p .p .m . mixed salts (sodium
the experi- 1,364
p .p
.m ., sulfate 6,817
p.p .m. .
chloride 607 p .p .m ., and magnesi
rings water
um 1,212 p .p .m.)
each lot in
:odium sui-
te water in
l
1, 10,000
.m . ; Lot 3,
one (con-
)eriod was
to become
r .
Results and Discussion
First trial. Results of the first trial
arc summarized in table 2. Adding
10,000 p.p.m. of sodium sulfate to
the water caused a marked reduc .
tion in feed consumption and rate of
gain . The heifers in this lot (Lot 1)
lost an average of 62 pounds per
head during the first 2 weeks d
the trial, and even after 58 days the
average loss per head was -
pounds (0,4 pounds per day) .
Scours were rather severe in Lot
1, and two of the heifers showed
pronounced additional symptoms
indicating toxic effects . These
symptoms were rapid and difficult
respiration and incoordination, One
of the heifers was removed from the
experiment and
g i v e n contrd
water. Respiration and gait wen
normal on the following day and
the animal was returned to expert
ted without
ment 8 days later. The other sur
five lots on
vived the experiment without being
.dition, and
removed from the lot
. A third heifer
,sed of four
died after 55 days on experiment
without
showing the symptoms
mentioned. A post mortem exam i
nation did not reveal the cause d
death .
steers and
reford anti
in this trial .
adition and
about 730
experiment
bar to those
-pt that the
a posed of 2
limestone,
al salt . All
d with di-
?ginning of
g was simi-
first trial.
;
intro])e
water
Lotas It was apparent after 56 days d
iloride ; Lot the trial that 10(x0) p.p
.m, of vt
n chloride ; dime salfate made the water
1111
Salinity and Lipenock Water Quality
7
Table 2. Effect of Different Concentrations of Sodium Sulfate in Water for Cattle
(June 27-Sept 19, 1957)
satisfactory, so at that time Lot 1
was offered control water . The ex-
periment was continued for another
28 days . The return to normal appe-
tite and appearance was rapid and
the animals in this lot gained 4.8
pounds per day during this period
(table 2) .
The rates of gain for the lots re-
ceiving the water with 4,000 and
7,000 p .p .m . of added sodium sul-
fate were
.50
2
and 2.73
pounds, re-
spectively, as compared to 2.60
pounds for the control lot . The dif-
ferences probably represent normal
variation for the number of cattle
used. Feed consumption also was
not affected by these levels of so-
dium sulfate in the water .
All levels of sodium sulfate re-
duced free choice consumption of
trace mineral salt. Consumption of
the salt-bonemeal-limestone min-
eral mixture was reduced by the
7,000 and 10,000 P .P.M . levels.
Adding 4,000 or 7,000 p.p .m. of
sodium sulfate to the water resulted
in slight increases in the consump-
tion of water . However, 10,000
p.p.m . of the salt caused a marked
reduction in water consumption .
The cattle offered the highly saline
A
10,000
7,000
4,000
P.P .M.
P
.P.-
p .p.m.
Control
radium
sulfate None
radiant,
sulfate
,odium
sulfate
(Brooking,)water
Number in lot 6t
5t
6
6
6
Days ._-
56
28
84
84
84
Av . initial weight, lb 673 .0
635 .6 669.7 676 .0 667.7
Av . daily gain, lb 40
4 .80
2 .73
2 .50
2 .60
Av, daily ration consumed, lb .
Alfalfa hay 3
.2
5.9
5 .8
5.9
5 .8
Concentrate mixture . . . .
5 .9
14.2
13 .9
13 .9
13 .9
Mineral mixture .050t
.034 .092
.089
Trace mineral salt ._ . .
.0602
.062
.043
.117
Feed per 100 lb. gain, lb
.
Alfalfa hay . . . .
215
236
222
Concentrate mixture
511
557
536
Mineral mixture
1 .23
3 .67
3 .44
Trace mineral salt -
2 .29 1 .71 4 .53
Av . daily water consumption, ~al.
June 27-Aug. 21
_ - lIX60
8 .52
8
.41
8.27
Aug. 22-Sept. 19
8 .16 7.86
7
.64
7.39
June 27-Sept. 19 7.07
8 .30
8.15
1 .98
tOne
9et
IValue,
l,
heifercarne
for
died
entire
changed
.
Cain
experimentto
madecontrol
up
.
to
water
law
afterweigh 56
day
days,before
dead, counted in gain for
the
Id.
gco3
8
South Dakota Experiment Station Bulletin 481
water would consume only a small
quantity atone drinking They often
licked the water with their tongues
rather than drinking in a normal
manner
. Cattle in Lot I drank much
more when returned to control
water .
Second trial . Results of the second
trial are presented in table 3. Since
7,000 p.p .mm of sodium sulfate in the
water was satisfactory for cattle but
10,000 p .p.m . was toxic, these levels
were used for testing the salts in
this trial.
Neither 10,000 p .p .m . of sodium
chloride nor the mixed salts pro-
duced the toxic effects or depression
in feed consumption noted with a
similar level of sodium sulfate in
the first trial . However, this level
of the salts resulted in a rather pro-
nounced decrease in the rate of gain .
Water with 7,000 p,p .m. sodium
chloride or mixed salts did not af-
fect rate of gain or feed consump
tion . This is in agreement with the
results of the first trial . Apparently
the toxic levels of salts in the water
lie between 7,000 and 10,000 pp .m .,
possibly at the physiological level
(about 8,500 to 0,000 p.p.m
. ) .
Effects of the added salts on min-
eral and salt consumption were var-
iable
. Both levels of added sodium
chloride reduced consumption of
the trace mineral salt and the salt-
bonemeal-limestone mixture. The
addition of mixed salts to the water,
however, increased consumption of
the mixture and had variable effects
on salt consumption .
To see if the type of water had an
effect on shrinkage, the cattle were
shrunk for 24 hours at the end of
the second trial. The differences
shown in table 3 are not large con-
sidering the small number of ani-
mals used . Shrinkage was greatest
for the control lot,
Four animals were removed from
the experiment in this trial. One
heifer was removed from Lot 1
after 88 days because of a prolapse
of the rectum. One steer, previously
treated with a sulfa drug for bloody
scours, was removed from Lot 3
after 27 days because of an edema-
tous condition . This condition may
have resulted from urinary calculi,
a matter that was not definitely
established. One steer was removed
from Lot 4 after 23 days because of
urinary calculi, and one was re-
moved from Lot 5 after 45 days with
a condition diagnosed as edema of
the glottis . In this latter case again
the animal had been treated with a
sulfa drug for bloody scours just
prior to the appearance of the
edema.
Cases of urinary calculi had been
observed in the group of cattle
from which those used In this exper-
iment were selected, and it is
doubtful that the water treatment
was involved in causing this prob
.
lem here . With reference to the
edematous condition, however, the
sulfa drug and the high level of salt
may have been contributing factors .
An increased water consumption
was noted for both levels of added
sodium chloride. However, the ad-
dition of the mixed salts appeared
td have no effect on water consump-
tion, the small differences between
the treatments and the control prob-
ably representing a normal varia-
Salinity and Livestock I
Table 3 . Effect of Different Concentrations of
Water for Cattle (June 3-Sept,
N umbers shown arc for the initial number
.
th¢ludcs gain made up to lag weigh day for those rer
tion for grows of such small num-
bers of anima
.
SWINE STUDIES
it is generally assumed that swine
are more susceptible to in)jury from
saline waters than are cattle . There-
fore, in undertaking a study with
growing pigs, it was decided that
lower concentrations of salts should
be used
. In addition, facilities were
such that the work had to be lim-
ited to one type of saline water, so
it was decided that a mixture of
salts should be used . This mixture
included sodium chloride, magne-
sium sulfate, and sodium sulfate,
added at a ratio similar to that found
often in natural waters,
S
app
in I
day,d
foul
of a
of F
rati.
pan
pan
bon
saltt
sup,
abo
crew
mm
5 at
Controlwater p .p.m
(aroohinga) chtori
aodim
Number in lot*
_
__ 6
6
Av
. initial weight, lb .
734
.0 729.0
Av . daily gain, Ib
.t _
2 .41
2
.3
Av . daily ration consumed, lb .
Alfalfa hay __ 5 .2
5.5
Concentrate mixture . . ._ 14 .0
14 .5
Mineral mixture
.037 .0
Trace mineral salt _ . . .
.071
.0
231
Feed per 100 lb. gain, lb .
Alfalfa hay 214
Concentrate mixture .. . . 583
615
Mineral mixture, 1
.55
1 .1
Trace mineral salt 2 .94
2 .2
Av,
daily water
consumption, gal
7 .69
8.9
Shrink, 24 bra . off
feed and water, % _ .
6 .72
5.7
thorn Experiment Station Bulletin 481
only a small
They often
heir tongues
n a normal
drank much
to control
Four animals were removed from
ble
f the
3 .
secondSince
heifer
the
after
experiment
88
was
days
removed
because
in this
of
from
triala
prolapseLot
. One1
ulfate in the
of the rectum . One steer, previously
tr cattle but treated with a sulfa dru for blood
these levels
scours, was removed from Lot 8
the salts in
after 27 days because of an edema
tous condition. This condition may
have resulted from urinary calm
a matter that was not definitely
established. One steer was removed
from Lot 4 after 23 days because of
urinary calculi, and one was re
moved from Lot 5 after 45 days with
a condition diagnosed as edema
the glottis, In this latter case again
the animal had been treated with a
sulfa drug for bloody scours just
prior
edema .
to the appearance of the
Cases of urinary calculi had been
observed in the group of cattle
from which those used in this exper-
iment wore selected, and it
doubtful that the water treatment
was involved in causing this prob-
lem here
. With reference to the
edematous condition, however, the
sulfa drug and the high level of salt
may have been contributing factors
An increased water consumption
was noted for both levels of added
sodium chloride
. However, the ad-
dition of the mixed salts appeared
td have no effect on water consump-
attle
ter had
werean
the
Lion,
treatments
the small
and
differences
the control
betweenprob
tee end of
ably representing a normal varia
of sodium
salts pro-
depression
led with a
sulfate in
this level
rather pro-
ate of gain .
m. sodium
did not af-
I consump-
it with the
Ipparently
t
the water
000p .p.m
.,
gical level
m . ).
Its on min-
t were var-
ed sodium
mption of
3 the salt-
ture . The
the water,
aription of
ble effects
the second trial
. The differences
shown in table 3 are not large con-
sidering the small number of aaF
trials used. Shrinkage was greatest
for the control lot .
?C#3
Salinity and Liwttock Water Quality
9
Table 3
. Effect of Different Concentrations of Sodium Chloride and Mixed
Salts in
Water for Cattle (Tine 3-Sept
. 23, 1958-112 days)
Lot number
.
.1
2
3
4
5
Number in Isx` _._ . 6
6
6
6
6
Av
. initial weight, lb 734
.0
729.0
733
.3
733 .3
730.0
Av . daily gain, lb.f 2.41
2 .36
1.96
2.28
1.80
Av . daily ration consumed, lb
.
Alfalfa hay
..
5 .2
5.5
5 .1
5 .6
5 .4
Concentrate mixture -..-
14 .0
14 .5
14 .1
143
13 .0
Mineral mixture .037
.028
.020
.044
.059
Trace mineral salt
- .
.071
.053
.052
.087
.050
Feed per 100 lb
. gain, lb.
Alfalfa hay ....-..
. 214
231
261
248
301
Concentrate mixture ..
583
615
718
627
723
Mineral mixture - .
-
1 .55
1.16
.99
1.95
318
Trace mineral salt ..- -
2 .94
2 .24
2
.66
3 .83
2 .77
Av. daily water
consumption, gal
7 .69
896
9 .94
738
7 .78
Shrink, 24 his
. off
feed and water,
%
6 .72
5.75
5 .46
5 .79
6.46
'Number, shown are for the initial number
.
tbcludea gain made up m last weigh day for those removed from lor_
tion for groups of such small num-
bers of animas.
SWINE STUDIES
It is generally assumed that swine
are mom susceptible to injury from
saline waters than are cattle
. There-
fore, in undertaking a study with
rowing pigs, it was decided that
er concentrations of salts should
be used . In addition, facilities were
such that the work had to be lim-
ited to one type of saline water, so
it was decided that a mixture of
salts should be used . This mixture
included sodium chloride, magrse-
sium sulfate, and sodium sulfate,
added at a ratio similar to that found
often in natural waters .
Mathods
Sixty weanling pigs averaging
approximately 37 pounds were used
in this trial conducted in concrete
drylot from June 10 to September
8, 1958 . The pigs were divided into
four lots of 15 pigs ach on the basis
of ancestry, weight, and sex . All lots
of pigs were sell fed the same basal
ration
. This ration consisted of 84
parts coos, 10 parts soybean meal, 5
parts tankage, 0.5
part steamed
bonemeal, 0.5
part trace mineral
salt, and B-vitamin and antibiotic
supplement
. When the pigs weighed
about 110 pounds the corn was in-
creased to 91 parts and the soybean
meal and tankage were reduced to
5 and 2 .5 parts, respectively .
7,000
10,000 7,000
10,000
CoatrvtWater
sodiumP
.P . .
tediumP
.P .M .
pmined.pan . .-.PPmixed
(smoking,) chloride chloride
Wn
ash,
Each of the four lots of pigs re-
ceived a different water, as follows :
Lot 1, Brookings water ; Lot 2,
Brookings water plus 2,100 p .p .m.
of added salt mixture; Lot 3, Brook-
ings water plus 4,200 p .p .m. of add-
ed salt mixture
; and Lot 4, Brook-
in
If's
water
mixtureplus .
0,300
The salt
p .pmixture
.m. of add-was
composed of 1 part of sodium chlor-
ide and 39 parts each of sodium sul-
fate and magnesium sulfate . The
pigs were placed on those waters di-
rectly, no attempt being made to ac-
custom them to each gradually .
Results and Discussion
The results summarized in table
4 show that there were
no harmful
effects from water containing up to
6,300 p.p .meof the salt mixture
( about, 7,000 p-p .m. total salts when
the composition of the Brookings
water is considered) on growing-
finishing pigs . In fact, the average
daily gain, feed consumption, and
feed efficiency were better for all
three lots iven water with added
salts than for the control lot (water
with no added salts) .
Increasing the salt content of the
water did increase water consump-
tion . It was also noted that the pigs
receiving the salt in their water
scoured during the early weeks of
this trial
. This scouring was more
apparent in Lot 4 than in the other
lots. However, it apparently had no
harmful effect on the gains or gen-
eral condition of the pigs
.
The increased weight of the pigs
getting water with added salt was
not due to an increase in fill . After
the final weigh period, all pigs were
PC
.#--5
10
Sootb Dakota Expcrintru Station Bulktio 481
withheld from feed and water lot
16 hours and reweighed . The aver-
age shrink per pig was 10.1,
8.9-9.3,
and 9.7
pounds for Lots 1, 2, 3, and
4, respectively . It was not deter-
mined in this trial whether there
was a greater water retention in the
tissues of the pigs receiving the
water with added salt,
POULTRY STUDIES
Only limited work with poultry
has been completed, but studies arc
being continued and results will he
reported more completely later,
Therefore only a summary of find-
ings to date is reported here.
Laying hens in cages have been
kept on waters containing 4,000,
7,000, and 10,000 p.p.m . of added
sodium chloride and on water with
no added salt, At all levels of added
salt, watery droppings have been
observed. The severity of this con-
dition appears to correlate with salt
content of the water
. It has also
been found that the added salt in .
creases water consumption, the
greater the salt content, the greater
the water consumption
.
Except for watery droppings, the
4,000 and 7,000p tin*
of added so-
dium chloride
not appear to
harm the birds . Egg production and
body weight data were as good for
these two salt levels as for the con-
trol hens. At the 10,000 p.p .m. level,
however, egg production and body
weight were adversely affected .
From
the study discussed here, it
appears that poultry may be very
much like other animals with re-
spect to their tolerance of saline
waters
. Studies now in progreu
Salinity and Livrrtork War
Table 4 . Saline Waters and Swir
should clarify this matter, especially
those studies dealing with growing
poultry.
SUMMARY
The purpose of the work de-
scribed here was to determine the
effects of saline waters on livestock
and the level at which salinity
makes a water unsuitable for live-
stock. Rats, cattle, swine, and poul-
try were used in the various studies .
Preliminary experiments were
made with rats, using five different
salts, each at four levels
. These ex-
periments indicated some differ-
ences with regard to effects of the
various salts, but it appeared that
water with a salinity of about 4,000
p.p .m. had no toxic effect, while
water with a salinity of around
10,000 p .p
.mp usually did, regard-
less of the
type of salt.
2
Trials with fattening cattle in-
cluded the study of waters contain-
in
added sodium sulfate, sodium
chloride, or a salt mixture contain-
ing sodium chloride, sodium sulfate,
and magnesium sulfate
. Here it
was found that in each case a level
of 7,000 p-p .m
. caused no reduction
so
added
in weil
and th
At a In
gains
waters
dium
toms o
Thrt
mixture
The hi
conten
than so
on the
perime
served,
sulted i
rate of
not ad,
In I
chiorid
pAt ap-m-7,01
verse t
10,000
body
offecte
In g
studies
can be
taining
salts, r
salts
Number
AvAv
.
. initial
final
of
weight,
pigs
weight,
_lbs lbs
.
.
164
37
15
.4
.6
Feed/pig/day,
Av . daily gain,
lbslbs
. _ ..._._.-.--..,_ .. .
531.4
Feed/pound of gain, lbs .
3.7
Water consumption
(gal./pig/day).
.-
1 .0
kola Experinmut Station Bulletin 481
of pigs re-
as s follows :
er ; Lot 2,
1,100 p.p.m .
of 3, Brook-
) .in. of add-
. 4, Brook-
, .m . of add-
nixture was
dium chlor-
sodium sul-
ulfate
. The
e waters di-
made toac-
adually .
anion
.ed in table
no harmful
ining up to
sit mixture
t salts when
Brookings
n growing-
he average
dption, and
aer for all
with added
t lot (water
)tent of the
r consump-
lat the pigs
heir water
y weeks of
was more
n the other
ntly had no
ins or gen-
POULTRY STUDIES
Only limited work with poultry
has been completed, but studies are
being continued and results will be
reported more completely later.
Therefore only a summary of find-
ings to date is reported here .
Laying hens in cages have beet
kept on waters containing 4,000,
7,000, and 10,000 p.p.m . of added
sodium chloride and on water with
no added salt. At all levels of added
salt, watery droppings have bee
observed
. The severity of this co
dition appears to correlate with s
content of the water. It has a
been found that the added salt in
creases water consumption, th
greater the salt content, the grea
the water consumption.
Except for watery droppings,
4,000
diumand
chloride
7,000
did
p.p.mnot
. of
appear
addedtoso-
harm the birds . Egg production and
body weight data were as good for
these two salt levels as for the coo-
trol hens . At the 10,000 p .p .m . level
however, egg production and body
weight were adversely affected.
From the study discussed here, i
of the pigs appears that poultry may be very
:d salt was much
like other animals with m
n fill . After
spect to their tolerance of saline
I pigs were waters
. Studies now in progress
withheld from feed and water lot
16 hours and reweighed . The aver-
age shrink per pig was 10.1, 8.9, 9 3,
and 9.7 pounds for Lots 1, 2, 3, and
4. respectively .
It was not deter-
mined In this trial whether there
was a greater water retention in the
tissues of the pigs receiving the
water with added salt.
in weight gain or feed consumption,
and the animals appeared normal .
At a level of 10,000 p.p.m., reduced
gains were found with all of the
waters, and in some animals on so-
dium sulfate water, severe symp-
toms of toxicity were observed
.
Three different levels of an added
mixture of salts were used for swine.
The highest level gave a total salts
content of about 7,000 p .p.m . Other
then some slight scouring in the pigs
on the higher levels early in the ex-
periment, no III effects were ob-
served
. Increasing salt content re-
sulted in increased water intake, but
rate of gain and feed efficiency were
not adversely affected .
In laying hens, added sodium
chloride at a level as low as 4,000
p.p .m. caused watery droppings
.
At 7,000 p .p .m . no additional ad-
verse effects were noted, while at
10,000 p.p.m . egg production and
body weight were both adversely
affected .
In general, the results of these
studies indicate that toxic effects
can be expected from waters con-
taining 10,000 p
.p .m . of soluble
salts, regardless of the type of salts
.
should clarify this matter, especially
those studies dealing with growing
poultry
.
SUMMARY
The purpose of the work de-
scribed here was to determine the
effects of saline waters on livestock
and the level at which salinity
makes a water unsuitable for live-
stock
. Rats, cattle, swine, and poul-
try were used in the various studies .
Preliminary experiments were
made with rats, using five different
salt, each at four levels . These ex-
periments indicated some differ-
ences with regard to effects of the
various salts, but it appeared that
water with a salinity of about 4,000
p.p .m
. had no toxic effect, while
water with a salinity of around
10,000 p .p .m . usually did, regard.
less of the type of salt.
Trials with fattening cattle in-
chided the study of waters contain-
ing added sodium sulfate, sodium
chloride, or a salt mixture contain-
ing sodium chloride, sodium sulfate,
and magnesium sulfate . Here it
was found that in each case a level
of 7,000 p .p
.m . caused no reduction
Salinity and Liwuoat Water Quality
Table 4 .
Saline Waters and Swine Performance
11
addedLot
noI
Lot
P2,100.P.-2 P
Lot
4,200.P
..
3
.
P
Lot
6,300.P
.
4
.
alb
added
awb
added
salts
added
Wb
Number
Av . initial
of pigsweight,
lbs.
3715 .4 3715 .4 3715 .2
1537
.2
Av . final weight, lbs .
164.6 172
.8 180.1 174 .8
Av . daily gain, lbs.
. . . 1 .41
1 .51
1 .59
1 .53
Fecd/pig/day, Ibs.
__
5 .35 5 .47 5 .54 5.59
Feed/pound of gain, lbs .
- 3 .79 3 .62 3 .47 3
.66
Water consumption (gal ./pig/day) . .- 1 .06
1 .30 1 .42
1 .48
Souib
Dakota Experiment Station Bulletin 481
Note alt deposits around the edge of
this dugout
Waters with 7,000 p.p.m. of soluble
salts apparently cause little, if any,
real damage to livestock, but be-
cause of taste qualities and laxative
effects from certain salts these
waters cannot be considered as en-
tirely satisfactory for livestock
. In-
corporating a reasonable margin of
safety to provide for exceptional
conditions, it appears that a water
with over 7,000 p .p.m . of soluble
salts should be classed as unsatisfac-
tory for livestock .
SM--7 .59-6719
Based on these studies and on
observations made during the past
several years, the following criteria
are suggested for relating salinity
to the quality of a livestock water :
Total Salts Content of Water-
Wm.)
Quality
0-999 ----- Excellent
1,000-3,999 Good
4,000-6,999
---. . Satisfactory
7,000 and over Unsatisfactory
OVslues for conductivity in micsomhos pcr cm .
at 25' C. may be used hoe if total sale mt
.
tent is not known .
Other factors are, of course, im-
portant in determining the quality
of livestock waters
. These include
such things as whether or not the
water is excessively turbid, stag-
nant, or insanitary .
In addition, excessive nitrates,
alkalinity (not to be confused with
salinity), or unusual poisons make
livestock waters unsatisfactory . Oc-
casionally iron content is so high as
to make a water objectionable be-
cause of its taste. Therefore, these
factors must be considered in addi-
tion to salinity in evaluating a live-
stock water . Lack of experimental
work prevents publication of stand-
ards relating to these factors at this
time
.
the northern
alfalfa seed pi
pro
I
ONOMICS DEPARTMENT
AGRICULTURAL
EXPERIMENT STATION
SOUTH
DAKOTA STATE COLLEGE, BROOKIN