BEFORE THE ILLINOIS POLLUTION CONTROL BOARD
IN THE MATTER OF:
)
)
PROPOSED NEW CAIR SO
2
, CAIR NO
x
)
R06-26
ANNUAL AND CAIR NO
x
OZONE
)
(Rulemaking – Air)
SEASON TRADING PROGRAMS, 35 ILL.
)
ADM CODE 255, CONTROL OF EMISSIONS
)
FROM LARGE COMBUSTION SOURCES,
)
SUBPARTS A, C, D, AND E
)
Notice of Filing
To:
See Attached Service List
PLEASE TAKE NOTICE that on January 5, 2007, we filed with the Clerk of the Illinois
Pollution Control Board the attached POST-HEARING COMMENTS a copy of which is
attached hereto and hereby served upon you.
Faith E. Bugel
Staff Attorney
Environmental Law & Policy Center
Representing the American Lung Association of Metropolitan Chicago
Keith Harley
Chicago Legal Clinic
Representing Environment Illinois
Bruce Nilles
Sierra Club
Dated: January 5, 2007
1
ELECTRONIC FILING, RECEIVED, CLERK'S OFFICE, JANUARY 5, 2007
* * * * * PC #7 * * * * *
BEFORE THE ILLINOIS POLLUTION CONTROL BOARD
IN THE MATTER OF:
)
)
PROPOSED NEW CAIR SO
2
, CAIR NO
x
)
R06-26
ANNUAL AND CAIR NO
x
OZONE
)
(Rulemaking – Air)
SEASON TRADING PROGRAMS, 35 ILL.
)
ADM CODE 255, CONTROL OF EMISSIONS
)
FROM LARGE COMBUSTION SOURCES,
)
SUBPARTS A, C, D, AND E
)
Post-Hearing Comments
NOW COMES Participants the Environmental Law & Policy Center (“ELPC”), by itself and on
behalf of American Lung Association of Metropolitan Chicago (“ALAMC”); Environment
Illinois, by and through its attorneys the Chicago Legal Clinic; and the Sierra Club (collectively,
“Environmental Advocates”). Pursuant to Hearing Officer’s Order of December 20, 2006, the
following post-hearing comments are submitted to the Illinois Pollution Control Board. Through
these comments, the Environmental Advocates urge that the Illinois Environmental Protection
Agency’s (“IEPA”) proposed Clean Air Interstate Rule (“CAIR”) rule be amended in the
following three ways. The renewable energy and energy efficiency set-asides should be
increased so as to better meet its own renewable energy goals. Secondly, Clean Air Set Aside
(“CASA”) proposed for circulating fluidized bed boilers (“CFBs”) should be removed, as CFBs
are not a clean coal technology. Finally, the fuel weighting factors should be eliminated, as they
discourage the use of cleaner fuels in energy production.
Along with these comments, we are also providing documents requested at the hearing of
November 28, 2006 during the testimony of Charles Kubert.
I.
The Energy Efficiency and Renewable Energy Set Aside Should Be Increased.
2
ELECTRONIC FILING, RECEIVED, CLERK'S OFFICE, JANUARY 5, 2007
* * * * * PC #7 * * * * *
In order to best meet the pollution reduction goals of CAIR and the Governor’s own
renewable energy plan, the renewable energy and energy efficiency (“RE/EE”) set asides in the
IEPA’s CAIR rule proposal must be increased. Encouraging RE/EE projects through allowance
set-asides directly contributes to the stated goals of the CAIR. Specifically, RE/EE allow
replacement and reduction of a portion of the energy need that is currently being delivered to
Illinois consumers through the burning of fossil fuels. This replacement and reduction will result
in a decrease in the burning of fossil fuels, leading to a decrease in Illinois’ emissions of NO
x
and SO
2
.
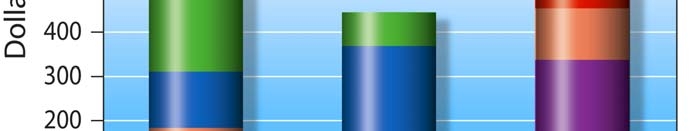
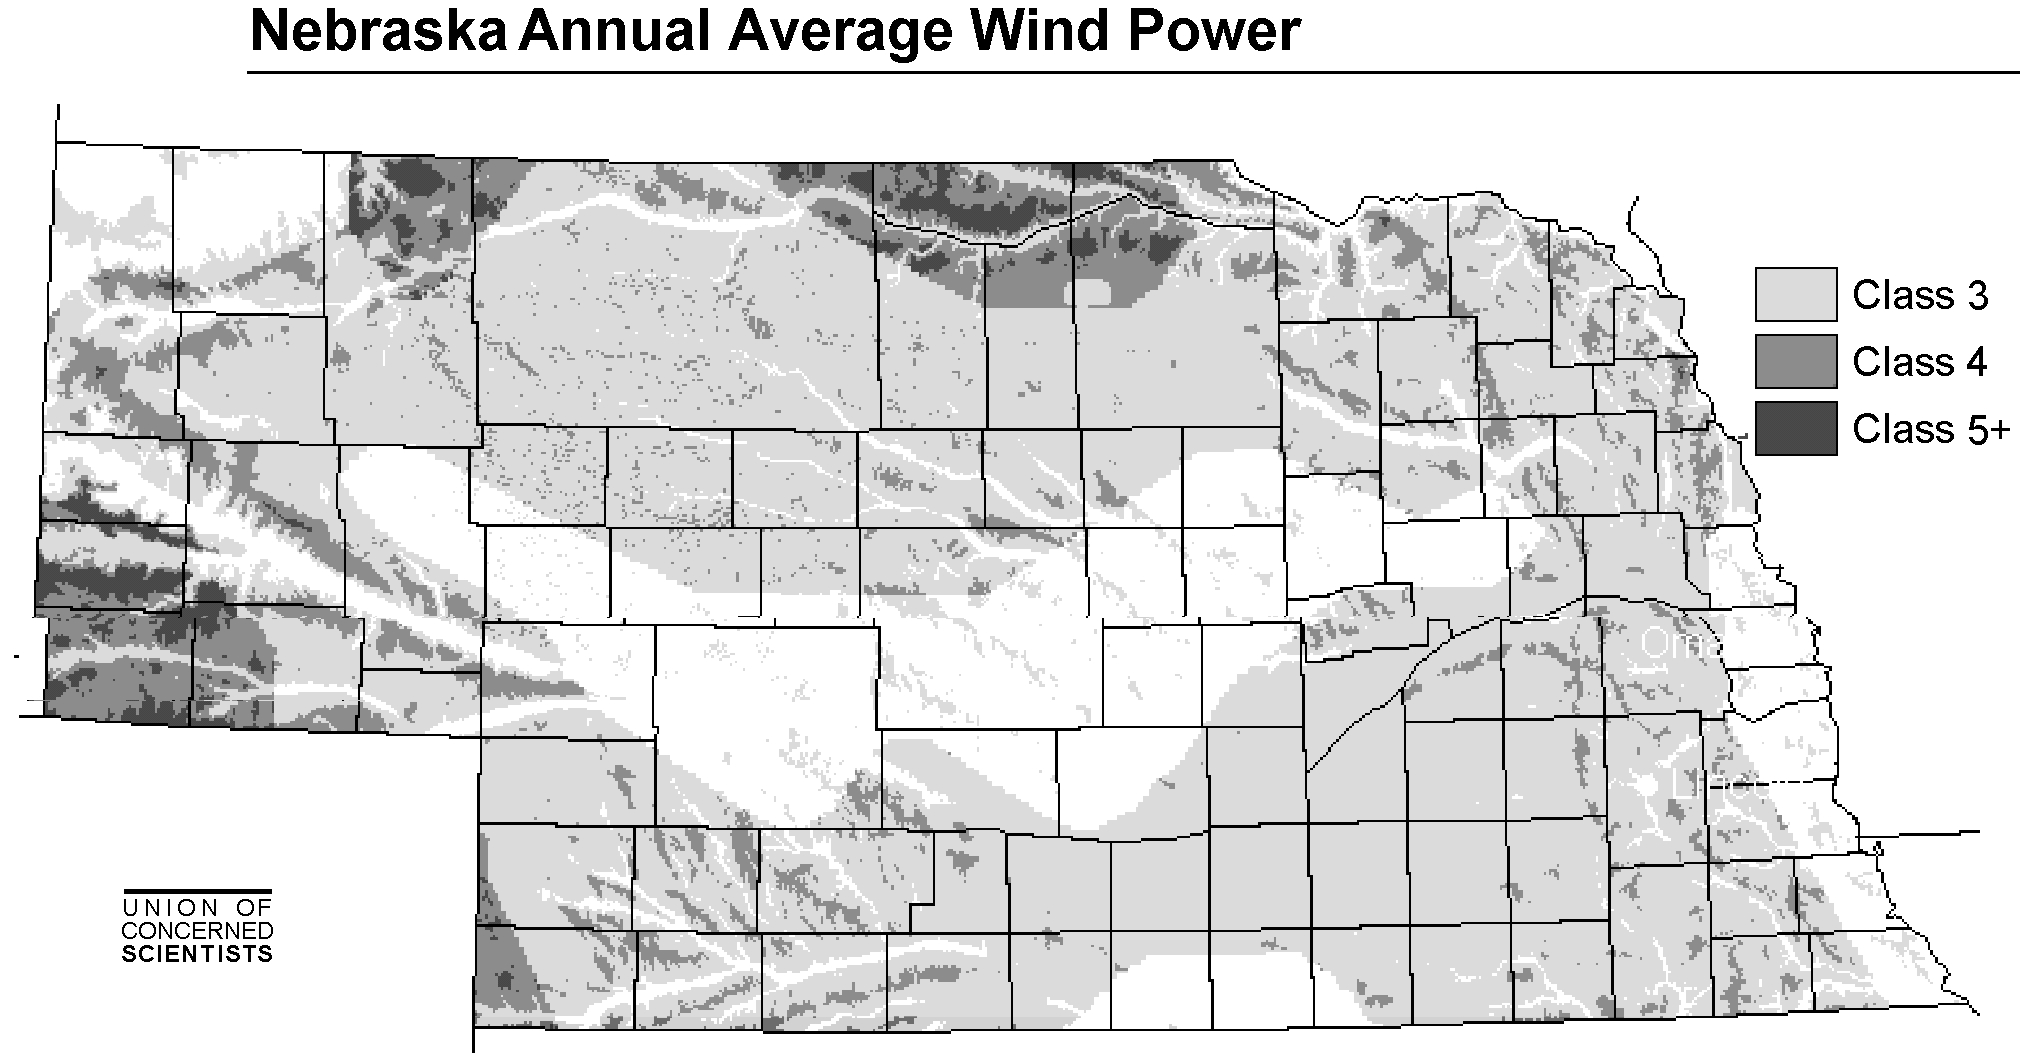
Illinois has great potential for the production of renewable energy from wind, solar
power, and biofuel. Renewable energy production projects will benefit from assignment of
allowances corresponding to the amount of energy they produce. IEPA has acknowledged that
while the Governor’s plan calls for 10% of Illinois energy to come from renewable sources by
2015, the current CAIR proposal will only lead to an offset of 5-8% of future need. (Cooper
10/12/2006 Tr. at 95-97). The renewable energy and energy efficiency set asides included in
CASA, currently set at 12%, should be raised to 15%, with an annual increase of 1% to a
maximum of 20%. This will best allow the Illinois CAIR rule to work toward both the
Governor’s plan and its own goals. (Kubert 11/29/2006 Tr. at 179;
see also
, Kubert 11/28/2006
Am. Test. at 7).
In response to requests made during the November 29, 2006 hearing, documents are
attached to this comment as exhibits. Exhibit 1 (in response to request on 11/29/2006 Tr. at 156)
is a Department of Defense study on the effects of wind turbines on radar. The study concludes
that with proper planning and site selection, any conflict between radar technology and wind
turbines may be mitigated.
3
ELECTRONIC FILING, RECEIVED, CLERK'S OFFICE, JANUARY 5, 2007
* * * * * PC #7 * * * * *
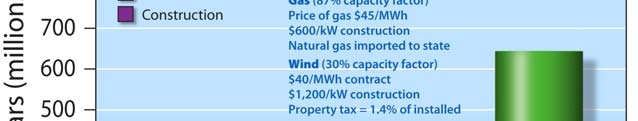
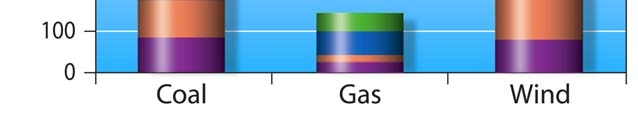
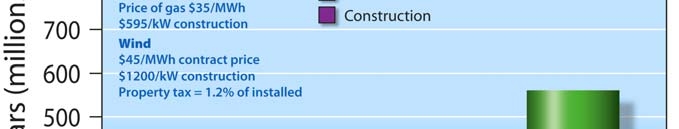
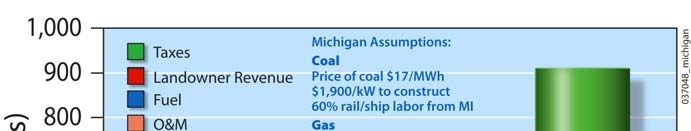
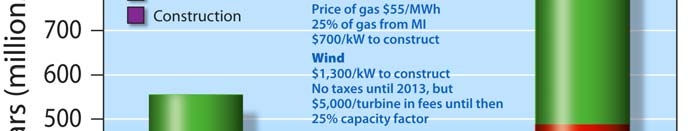
Exhibits 2 and 3 (in response to request on 11/29/2006 Tr. at 158-9) are relevant to the
subject of the economic impact on wind power versus coal power. Exhibit 2 is a report
published by the National Renewable Energy Laboratory. The study concludes that “adding new
wind power can be more economically effective than adding new gas or coal power and that a
higher percentage of dollars spent on coal and gas will leave the state.” Exhibit 3 is a study by
the Union of Concerned Scientists. The study shows that developing wind power instead of coal
and natural gas power can have a net benefit to a state’s economy.
Exhibit 4 (in response to request on 11/29/2006 Tr. at 172-3) includes the press release
and presentation by the office of Governor Blagojevich of his plan for the future development of
energy in Illinois. This plan calls for meeting 10% of Illinois’ electricity needs with renewable
resources by 2015.
Exhibit 5 (in response to request on 11/29/2006 Tr. at 157) is a document from the
Energy Information Administration comparing the generation costs of wind power, new coal,
and natural gas, among other energy sources and shows that the generation costs of RE/EE are
competitive with coal.
The Rule Should Not Provide Incentives for Circulating Fluidized Bed Boilers.
Circulating fluidized bed boilers (“CFBs”) should not receive CASA credits. Why?
•
Controlled CFBs are not lower in NO
x
emissions than controlled pulverized coal (“PC”)
boilers;
•
CFBs do not achieve the low NO
x
emissions that IGCC plants do; and
•
CFBs emit more greenhouse gases than PC boilers.
IEPA’s explanation of its reason for including CFBs in the CASA makes clear the lack of
justification for CFBs receiving CASA credits. Aside from the unsubstantiated assertions that
4
ELECTRONIC FILING, RECEIVED, CLERK'S OFFICE, JANUARY 5, 2007
* * * * * PC #7 * * * * *
CFBs “result in very low pollutant emissions,” and “very low emission that can be achieved”
with CFBs, the Technical Support Document for IEPA’s proposed rule (“TSD”) contains no
support for giving incentive credits to CFBs. (TSD at 112.) IEPA was apparently merely
responding to concerns of “the coal-fired power plants for fluidized bed boilers” and “listened to
concerns there, that there should be some set-asides available to them, and, in fact, we [IEPA] do
provide some set-asides to fluidized bed boilers.” (Ross, 10/10/2006, 9:00 A.M., Tr. at 46-47.)
In addition, these concerns apparently came from an existing CFB because the IEPA “in
particular, for the fluidized bed boilers . . . decided for a look back until 2001 to give some level
of credit to companies that undertook what we [IEPA] would consider a clean technology, clean
coal project.” (Ross, 10/11/2006, 1:00 P.M., Tr. at 135.) However, companies undertook these
projects independent of any consideration of the availability of credits or other financial rewards
or incentives under the CASA. Clearly, the economics of installing the technology were such
that no credit or reward was needed and it makes no sense to provide one retroactively. Because
IEPA puts forward no persuasive reason for including CFBs in the CASA, and because CFBs
emit more NO
x
and greenhouse gases than controlled PC boilers and IGCC plants, CFBs should
be removed from the CASA.
a. CFBs do not lead to reduced NO
x
emissions compared to PC boilers.
When looking at real-world operations, CFBs do not emit less NOx than PC boilers. In
fact, the opposite is the case. While CFBs may be lower emitting than PCs when looking at
uncontrolled emissions, CFBs are not lower emitting once controlled. By focusing on what “can
be achieved” with CFBs or the “result[ing] . . . emissions” from CFBs, IEPA underscores what
should be considered—the end point, not the starting point. (TSD at 112.) Air quality impacts
are the reason for this rulemaking. Consequently, real world operations and actual emissions
5
ELECTRONIC FILING, RECEIVED, CLERK'S OFFICE, JANUARY 5, 2007
* * * * * PC #7 * * * * *
impacts on air quality should be considered when deciding categories worthy of incentives. In
this day and age, new coal fired power plants are all built with controls. Therefore, it is
emissions from controlled CFBs compared to emissions from controlled PC boilers that should
be considered because that is demonstrative of what the actual emissions will be.
Historically, new CFBs have not been required to install the most effective NO
x
controls—SCR—while PC boilers have.
See, e.g.
, Babcock & Wilcox Report at 3 (Ex. 6).
Therefore, PC boilers achieve lower NO
x
emissions levels and have lower NO
x
permit levels
than CFBs. CFB permit levels for NO
x
have generally been in the 0.07 to 0.08 lb/MMBtu range.
See, e.g.
, Indeck, Spurlock, and Highwood Permits (Ex. 7, 8, 9). PC boilers, however, have been
permitted in the 0.04-0.05 lb/MMBtu range.
See, e.g.
, Trimble Permit (Ex. 10). In fact, there are
at least thirty PC units in the US operating with ozone season SCRs emitting less than 0.05
lb/MMBtu NO
x
as measured by an hourly average.
See
Erickson Paper at 8 (Ex. 11).
In sum, new PC boilers, which generally use the most modern NO
x
controls, achieve
approximately 30% lower NO
x
emissions than CFBs, which generally are built without the best
performing NO
x
controls. Consequently, there is no justification for offering incentives for
CFBs if in real world operations they do not achieve lower emission levels than PC boilers.
b. CFBs do not achieve emissions levels comparable to IGCC.
Furthermore, the CASAs categorize IGCC plants with CFB plants for the same “Clean
Coal Technology” incentive and also opened the category up to additional similar projects.
IEPA Proposed Rule, § 225.460(e). The TSD discusses the eligibility for other projects to
receive credits under this section for the “Clean Coal Technology” incentive and states that
projects that use “technologies that achieve comparable emission rates” to IGCC or CFBs may
be eligible for the set aside. (TSD at 112.) This further highlights the inappropriateness of
6
ELECTRONIC FILING, RECEIVED, CLERK'S OFFICE, JANUARY 5, 2007
* * * * * PC #7 * * * * *
allowing CFBs to receive credits as a “Clean Coal Technology” because CFBs and IGCC
projects themselves do not achieve comparable NO
x
emissions rates.
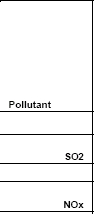
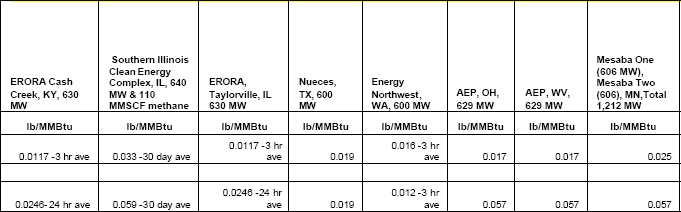
As pointed out above, CFB permit levels for NO
x
have generally been in the 0.07 to 0.08
lb/MMBtu range.
See, e.g.
, Indeck, Spurlock, and Highwood Permits (Ex. 7, 8, 9). Contrast
such levels to expected NO
x
emissions levels for recently proposed IGCC plants which average
.039 lb/MMBtu, resulting upwards of 45% lower NO
x
emissions. See Table 1 (Ex. 12). Since
CFBs do not perform nearly as well as IGCC, they should not be included in the same category
of incentives.
Table 1
1
Consequently, not only do CFB NO
x
emissions levels not come close to being as low as
IGCC NO
x
emissions levels but it would also be impossible to determine what other projects
ought to be eligible under the clean coal technologies category. The IEPA is required to
determine whether a project is “similar in its effects as the projects specifically listed in section
225.460 (c).” § 225.460(e). If the two projects listed in section 225.460(c), are not similar in
their effects—that is, similar in their emissions rates as articulated in the TSD—there is no
1
Taken from “Comments on EPA’s Proposed Construction Permit for Sithe Global Power to Construct the Desert
Rock Energy Facility,” submitted to Robert Baker by Dine Citizens Against Ruining our Environment et al., at 35
(Nov. 13, 2006) (Ex. 12).
7
ELECTRONIC FILING, RECEIVED, CLERK'S OFFICE, JANUARY 5, 2007
* * * * * PC #7 * * * * *
clarity on what emissions rates new projects ought to be achieving in order to receive clean coal
technology credits. For these reasons, CFBs should be removed from the CASA.
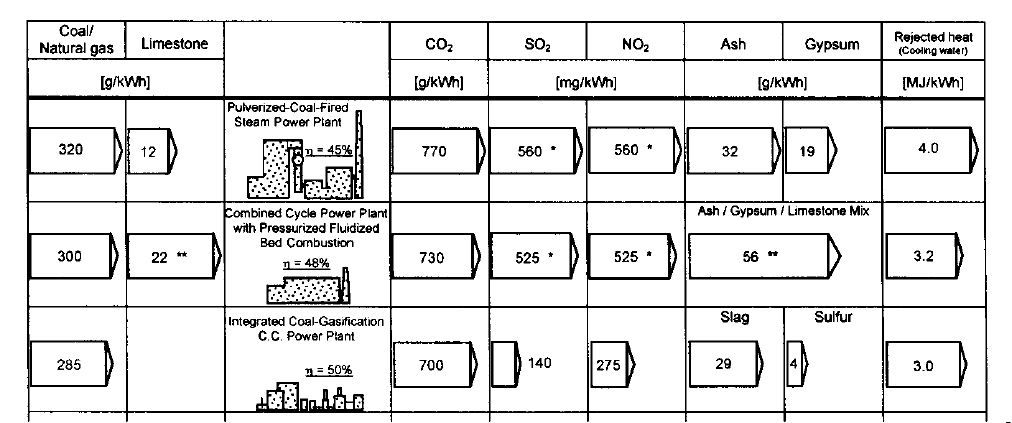
c. CFBs emit 15% more greenhouse gases.
Finally, and perhaps most egregiously, not only are CFBs emitting more NO
x
than
controlled PC boilers and IGCC plants, but CFBs pose a very serious additional environmental
and health concern: CFBs emit more N
2
O, a potent greenhouse gas, than PC boilers.
Comparatively, CFBs emit approximately 15% more global warming pollutants than PC boilers.
N
2
O has a GWP (Global Warming Potential) 296 times that of CO
2
. Because of
its long lifetime (about 120 years) it can reach the upper atmosphere, depleting the
concentration of stratospheric ozone, an important filter of UV radiation. N
2
O is
emitted from fluidized bed coal combustion; global emissions from FBC units are
0.2 Mt/year, representing approximately 2% of total known sources. N
2
O
emissions from PC units are much lower. Typical N
2
O emissions from FBC units
are in the range of 40-70 ppm (at 3% O2). This is significant because at 60 ppm,
the N
2
O emission from the FBC is equivalent to 1.8% CO
2
, an increase of about
15% in CO
2
emissions for an FBC boiler. Several techniques have been proposed
to control N
2
O emissions from FBC boilers, but additional research is necessary
to develop economically and commercially attractive systems.
2003 National Coal Council Report "Coal-Related Greenhouse Gas Management Issues" at 7
(Ex. 13). In fact, SNCR, the NO
x
controls most commonly used on CFBs, increase the amount
of N
2
O.
Once again, this weighs against providing a CASA incentive for CFBs. Creating an
incentive for a technology that emits 15% more global warming pollutants than the alternatives is
contrary to both state and IEPA goals. Both the Governor and IEPA Director Doug Scott have
publicly stated that reducing global warming pollutants is a state priority. The Governor is
committed to a “long-term strategy by the state to combat global climate change, and builds on
steps the state has already taken to reduce greenhouse gas (GHG) emissions, such as enhancing
the use of wind power, biofuels and energy efficiency.” Press Release, “Governor Launches
8
ELECTRONIC FILING, RECEIVED, CLERK'S OFFICE, JANUARY 5, 2007
* * * * * PC #7 * * * * *
Global Warming Initiative,” Office of the Governor (Oct. 5, 2006). In launching his Global
Warming Initiative, Governor Blagojevich stated
We’ve worked hard in Illinois to become a national leader in reducing toxic
pollutants like mercury, sulfur dioxide and nitrogen oxide. The next front is
greenhouse gases. The impact of global warming from greenhouse gases in
Illinois and around the globe could be devastating. We can’t wait for the federal
government to act because experts have warned that if we don’t address global
warming within the next decade, it may be too late to avoid serious and
irreversible consequences.
Id
. Similarly, IEPA Director Scott chairs the Illinois Climate Change Advisory Group.
Regarding global warming, he has stated, “By acting now we can take important steps to reduce
our greenhouse gas emissions and realize the economic development benefits that strategies to
confront climate change can offer.”
Id
. Consequently, by endorsing CFBs and providing
incentives for them, IEPA and the state are acting completely contrary to state policy on global
warming. For that reason, CFBs should be removed from the CASA.
In sum, incentives for CFBs are inappropriate because CFBs emit more NO
x
than
controlled PC boilers, emit significantly more NO
x
than other technologies receiving the same
“clean coal” incentives (IGCC), and emit 15% more global warming pollutants than PC boilers.
It is incumbent upon the IPCB to correct the course of this rule and remove “clean coal”
incentives for CFBs.
II.
Illinois Should Adopt A Fuel Neutral Approach In Allocating NO
x
Allowances To
Specific Sources In Order To Encourage The Use of Cleaner Fuels and Modern,
Well-Controlled Electric Generating Units.
The original federal CAIR proposal was fuel neutral, meaning it did not include an
adjusted fuel-weighting calculation to determine NO
x
emission credit allowances. 69 Fed. Reg.
4610 (2004). Fuel neutrality has generally been the approach taken for NO
x
allocation under the
9
ELECTRONIC FILING, RECEIVED, CLERK'S OFFICE, JANUARY 5, 2007
* * * * * PC #7 * * * * *
NO
x
SIP call.
Alternative
NO
x
Allowance Allocation Language for the Clean Air Interstate Rule,
prepared by State and Territorial Air Pollution Program Administrators (STAPPA) and the
Association of Local Air Pollution Control Officials (ALAPCO), August 2005, at 5. According
to STAPPA and ALAPCO, a fuel neutral allocation system that does not differentiate between
coal and non-coal units "…even[s] the playing field by treating all units the same. Among other
things, this allows the trading program to do a more effective job of determining the most cost
effective compliance mix."
Id
.
U.S. EPA received several comments in opposition to the fuel neutral approach to
determine NO
x
emission credit allowances. Predictably, virtually all of the comments in
opposition were submitted by the operators of coal-fired electric generating units or their trade
associations. For their part, states which commented on CAIR focused on other issues. For
example, Illinois EPA's comments of March 30, 2004 were largely supportive of CAIR, except
that Illinois EPA asserted that CAIR as originally proposed did not go far enough or fast enough
to protect public health and to achieve attainment with NAAQS (Ex. 14). From the perspective
of Illinois EPA, further reductions of emissions from fossil fuel fired power plants were
practicable, warranted, cost effective and long overdue. Illinois EPA did not object to the fuel
neutral approach in allocating NO
x
emission credit allowances.
When CAIR was promulgated in final form, it was no longer fuel neutral, and included
an adjustment factor of 1.0 for coal, 0.4 for gas and 0.6 for oil. 70 Fed. Reg. 25231 (2005). The
adjustment factor functioned in two ways. First, U.S. EPA used the adjustments in order to
establish the final NO
x
statewide budgets.
Id
. By virtue of the application of the fuel adjustment
factors, Illinois' statewide budget actually increased when compared with its budget under the
original CAIR proposal. The Illinois budget for 2009-2014 grew from 73,613 tons to 76,230
10
ELECTRONIC FILING, RECEIVED, CLERK'S OFFICE, JANUARY 5, 2007
* * * * * PC #7 * * * * *
tons of NO
x
.
See
Table V-2 at 70 Fed. Reg. 25231 (2005) and Table VI-10 at 69 Fed. Reg. 4620
(2004). The budget for 2015 and thereafter grew from 52,973 to 63,525 tons of NO
x
.
Id
.
Illinois, which had argued for deeper reductions, now found itself with more NO
x
allowances by
virtue of the elimination of fuel neutrality.
However, having given Illinois additional NO
x
allowances, CAIR in its final form
explicitly does not require Illinois or any other state to use the fuel allocation factors in
distributing allocations to individual sources. This is the second way that fuel allocation factors
can be used. For U.S. EPA, it was entirely left to individual states to decide whether to use a fuel
neutral or fuel weighted system in making allocations to individual sources. 70 Fed. Reg. 25231
(2005). In the words of U.S. EPA:
It is important to note that the methodology by which the
NO
x
State budgets are determined need not be used by
individual States in determining allocations to specific sources.
As discussed in section VIII of this document (Model Trading
Rule), EPA is offering States the flexibility to allocate
allowances from their budgets as they see fit.
Id
. According to U.S. EPA, any differences between the model federal rule and state rules in
allocating NO
x
allowances "…are possible without jeopardizing the environmental and other
goals of the [CAIR] program."
Id
. at 25278. Simply, Illinois is free to allocate NO
x
credits in a
fuel neutral manner. A fuel neutral allocation is the approach to which IEPA had no objection in
the initially proposed CAIR, and the approach which will achieve the deeper, faster reductions it
seeks. The Environmental Advocates urge the Illinois Pollution Control Board to eliminate or
modify the fuel weighting component of the proposed Illinois rule.
In making this recommendation, the Environmental Advocates are not alone among
Illinois stakeholders. In the fuel weighted system that is now a component of the proposed
11
ELECTRONIC FILING, RECEIVED, CLERK'S OFFICE, JANUARY 5, 2007
* * * * * PC #7 * * * * *
Illinois rule, coal-fired power plants are the clear beneficiaries by comparison to their oil- and
especially gas- fired counterparts. Coal-fired power plants are allocated NO
x
allowances on a
1:1 to basis, oil-fired power plants receive a 0.6:1 allocation and gas-fired EGUs receive only a
0.4:1 allocation. Because Illinois will freely distribute initial credits, coal-fired power plants will
receive a significant asset by comparison to their non-coal competitors. Because they will
receive proportionately greater credits, the market will be designed to perpetuate this arbitrary
advantage.
The immediate losers as a result of this market inefficiency are unmistakably identified in
the IEPA's Technical Support Document. According to IEPA, there are 229 existing generating
units that will be subject to the CAIR NO
x
Annual, the CAIR SO
2
, and the CAIR NO
x
Ozone
Season trading programs. (TSD at 25.) Of these units, the losers are the 170 gas and oil fired
boilers and combustion turbines identified by IEPA.
Id
. The winners are 59 coal-fired power
plants. The IEPA's reasoning for using a fuel weighted system that benefits one sector at the
expense of others has been consistent throughout these proceedings, and it is twisted. According
to IEPA, coal-fired EGUs have an "inherently higher emission rate" by comparison to their
cleaner EGU counterparts, and therefore deserve an advantage in the form of a disproportionate
allocation of credits. (TSD at 35.) In other words, oil- and gas-fired EGUs are being punished
for using an inherently cleaner fuel. This is twisted because it disadvantages an EGU that
generates an equivalent unit of energy with lower emissions by comparison with a coal-fired
unit. It moves Illinois farther from, not closer to, IEPA's stated objective of promoting cleaner,
sustainable energy alternatives.
Id
.
Many oil and gas fired EGUs are also being punished by virtue of operating more
modern, well-controlled facilities than their coal-fired counterparts. This is clear in the
12
ELECTRONIC FILING, RECEIVED, CLERK'S OFFICE, JANUARY 5, 2007
* * * * * PC #7 * * * * *
testimony of Jason Goodwin. In his testimony, Mr. Goodwin repeatedly called attention to the
fact that under the Illinois allocation scheme, many gas-fired units will receive
disproportionately fewer credits not only because they use cleaner fuel, but also because they
were constructed with modern pollution control equipment. Mr. Goodwin noted this was
particularly unfair for "…those that have undergone control technology review within the recent
past and have demonstrated compliance with best available control technology requirements."
(Goodwin 11/28/2006 Tr. at 21). Goodwin states "…the reduction in terms of allocations that
are available to gas-fired units ignores the basis and understanding that the facilities that we're
talking about…represent…not only the best available emission and technology threshold, but it
also satisfies the most available emission rate technology for similar sized facilities throughout
the country."
Id
. at 22. For Mr. Goodwin, one particularly worrisome consequence of
allocating disproportionately fewer credits to well-controlled gas-fired units is that if they
operate at a greater capacity than their baseline years, they may be forced to purchase credits
from older, poorly controlled coal-fired competitors. Because the facilities already employ state-
of the-art emission controls, Mr. Goodwin noted, "There really is no option for us to make any
sort of additional reductions at the facility itself."
Id
. at 26. Putting modern, well-controlled and
cleaner facilities at such disadvantage is a far cry from IEPA's stated objective. In the Technical
Support Document, the Agency asserts "…Illinois EPA believes that is good environmental
policy to provide more allowances to sources that operate more efficiently, install air pollution
control equipment, and upgrade their equipment. (TSD at 35.)
Perhaps just as importantly, Mr. Goodwin also testified that the new Illinois allocation
system represents a change in the approach under the existing NO
x
seasonal trading system. Mr.
Goodwin testified, "We see this as an unfortunate departure from the NO
x
trading program,
13
ELECTRONIC FILING, RECEIVED, CLERK'S OFFICE, JANUARY 5, 2007
* * * * * PC #7 * * * * *
which has been in effect and operational within Illinois for several years. We view the past
experience with the trading program as being highly successful and question the basis for
deviating from that concept." (Goodwin 11/28/2006 Tr. at 21-22.) In light of the success of the
fuel neutral NO
x
seasonal trading program and the IEPA's stated policy to provide more
allowances to efficient, modern facilities, why has IEPA proposed a fuel weighted system? Mr.
Goodwin's explanation is succinct, "Clearly, Illinois is strongly oriented to coal generation."
(
Id
. at 27.) On the issue of fuel weighting or fuel neutrality, the Illinois rulemaking proposal
may be politically savvy, but is not reasonably related to the stated purposes of encouraging
cleaner energy generation.
Illinois would not be alone among states in establishing a more fuel neutral system for
allocating NO
x
allowances. Several states at various stages of the rulemaking process have
decided a more fuel neutral allocation would be a better option. According to Jason Goodwin,
Alabama and Arkansas propose fuel neutral allocation systems. (Goodwin 11/28/2006 Tr. at 92).
At preliminary stages in the rule development process, both Massachusetts and Virginia have
indicated an intention to propose fuel neutrality. Wisconsin's proposed rule is fuel neutral.
2
Other states have modified the fuel allocation system to a two-tier system. South
Carolina has adopted fuel weighting but with only two fuel factors, 1.0 and 0.6. South Carolina
stated the following:
The Department presently supports the language in the Federal rule that allocates
allowances adjusted for fuel type. The reason for our support is because this
system recognizes the fact that coal combustion devices have inherently higher
NO
x
emissions than oil or natural gas sources. Thus, a fuel neutral allocation
system would provide a disproportionately larger share of NO
x
allocations to oil
and gas fired units. However, the Department recognizes that such a system may
tend to promote higher-emitting fuels. Furthermore, we acknowledge that a fuel-
neutral allocation system would be much easier to implement. Currently, the
2
http://www.dnr.state.wi.us/org/aw/air/HOT/8hrozonestd/cairbart/CAIRNOxallocations060605.pdf Last accessed
21 December, 2006
14
ELECTRONIC FILING, RECEIVED, CLERK'S OFFICE, JANUARY 5, 2007
* * * * * PC #7 * * * * *
information needed to calculate the ratios of fuel types to heat input for facilities
using different fuels is not available or is difficult to obtain. Also, the calculations
of adjusted heat input would probably be more complicated and time consuming.
Thus, we are continuing to look into our options regarding this issue and
appreciate further input. The Department is proposing modified fuel adjustment
language that allocates allowances adjusted for fuel type at two levels instead of
three as proposed in the Federal rule. The Department believes this represents a
compromise between those stakeholders that support fuel-adjusted allocations in
recognition of the fact that coal combustion devices have inherently higher NO
x
emissions and those stakeholders that believe that such a system provides a
subsidy for dirtier fuels. Under this proposal, the Department is proposing to use a
fuel adjustment factor of 1.0 for all sources that are permitted to burn any amount
of coal. For sources that are not permitted to burn coal, the unit’s heat input
would be subject to a fuel adjustment factor of 0.6.
3
A similar fuel neutral approach has been proposed in Texas. Finally, as noted, STAPPA
and ALAPCO have developed a model rule for state CAIR implementation that eliminates fuel
weighting, a copy of which is attached to these comments.
Alternative NO
x
Allowance
Allocation Language for the Clean Air Interstate Rule
, prepared by State and Territorial Air
Pollution Program Administrators (STAPPA) and the Association of Local Air Pollution Control
Officials (ALAPCO), August 2005.
IEPA's stated goals for CAIR are to allocate more credits to sources that operate
efficiently and install effective pollution control equipment. Throughout the CAIR process,
IEPA pressed for faster, deeper reductions through practicable, warranted, cost effective and
long-delayed pollution control upgrades at poorly controlled facilities. When measured against
its own goals, the fuel weighting system IEPA proposes fails. Fuel weighting rewards operators
of poorly controlled facilities and facilities that use inherently higher polluting fuel. IEPA
rewards these operators by freely allocating credits that are in inverse proportion to its
3
http://www.scdhec.gov/eqc/baq/pubs/CAIR/BAIICAIRCAMR.pdf#xml=http://www.scdhec.gov/cgi-
in/texis.exe/Webinator/search/xml.txt?query=CAIR&pr=page&rorder=500&rprox=500&rdfreq=500&rwfreq=500&
rlead=500&sufs=1&order=r&cq=&id=44ff994a2a last accessed: 21 December 2006.
15
ELECTRONIC FILING, RECEIVED, CLERK'S OFFICE, JANUARY 5, 2007
* * * * * PC #7 * * * * *
objectives. This not only benefits historically dirtier facilities, it punishes facilities that already
employ cleaner fuels and modern pollution control equipment. Fuel weighting is not mandated
by U.S. EPA, it is a retreat from the successful NO
x
seasonal trading program, and it is not a
feature of the STAPPA and ALAPCO model rule. The Illinois Pollution Control Board should
address the contradiction between IEPA's stated goals and its proposed allocation system by
eliminating or significantly modifying the fuel weighting component of the rule.
For all of the above reasons, it is recommended to the Illinois Pollution Control Board
that the IEPA’s proposed CAIR rule be amended to increase the renewable energy and energy
efficiency set-asides, remove any allowance incentives granted to fluidized boilers, and eliminate
the included fuel weighting factors.
Faith E. Bugel
Staff Attorney
Environmental Law & Policy Center
Representing the American Lung Association of Metropolitan Chicago
Keith Harley
Chicago Legal Clinic
Representing Environment Illinois
Bruce Nilles
Sierra Club
16
ELECTRONIC FILING, RECEIVED, CLERK'S OFFICE, JANUARY 5, 2007
* * * * * PC #7 * * * * *
CERTIFICATE OF SERVICE
I, Faith Bugel, hereby certify that on January 5, 2007 I filed the attached
POST-HEARING
COMMENTS. An electronic version was filed with the Illinois Pollution Control Board and
copies were served via United States Mail to those individuals included on the attached service
list.
Faith E. Bugel
Staff Attorney
Environmental Law & Policy Center
Representing the American Lung Association of Metropolitan Chicago
Keith Harley
Chicago Legal Clinic
Representing Environment Illinois
Bruce Nilles
Sierra Club
Dated: January 5, 2007
Environmental Law and Policy Center
35 East Wacker Drive, Suite 1300
Chicago, IL 60601
(312) 673-6500
17
ELECTRONIC FILING, RECEIVED, CLERK'S OFFICE, JANUARY 5, 2007
* * * * * PC #7 * * * * *
ELECTRONIC FILING, RECEIVED, CLERK'S OFFICE, JANUARY 5, 2007
* * * * * PC #7 * * * * *
REPORT TO THE CONGRESSIONAL DEFENSE
COMMITTEES
The Effect of Windmill Farms On Military Readiness
2006
Office of the Director of Defense Research and Engineering
ELECTRONIC FILING, RECEIVED, CLERK'S OFFICE, JANUARY 5, 2007
* * * * * PC #7 * * * * *
EXECUTIVE SUMMARY
SECTION 358, NATIONAL DEFENSE AUTHORIZATION ACT FOR FISCAL
YEAR 2006 (PUBLIC LAW 109-163)
REPORT ON EFFECTS OF WINDMILL FARMS ON MILITARY
READINESS.
Not later than 120 days after the date of the enactment of this Act, the Secretary of
Defense shall submit to the Committee on Armed Services of the Senate and the
Committee on Armed Services of the House of Representatives a report on the effects
of windmill farms on military readiness, including an assessment of the effects on the
operations of military radar installations of the proximity of windmill farms to such
installations and of technologies that could mitigate any adverse effects on military
operations identified.
Overview
There is growing public and private sector interest in generating electrical power
using wind energy. According to the Department of Energy, over 60,000 megawatts of
wind power capacity is in operation worldwide with over 10,000 megawatts installed in
the United States. These systems are largely comprised of installations of up to several
hundred wind turbines with rotating blades reaching to heights of up to 500 feet. The
numbers, height and rotation of these wind turbines present technical challenges to the
effectiveness of radar systems that must be carefully evaluated on a case-by-case basis to
ensure acceptable military readiness is maintained. For many cases, processes are in
place to allow responsible federal authorities to complete determination of acceptability
of wind turbine impacts on military readiness. However, since wind energy use in the
United States is dramatically increasing, research and interagency coordination is
warranted to enhance capability for completing timely determinations and developing
measures for mitigating readiness impacts. This report focuses on the effects of wind
farms on air defense and missile warning radars and the resulting potential impact on
military readiness. Its scope is limited to these specific subjects and is based on the
current level of understanding regarding interactions between such defense systems and
state-of-the-art wind turbines.
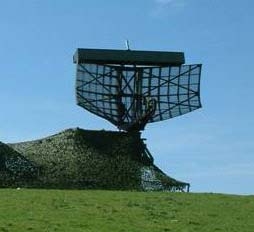
The report begins with a brief introduction of the key principles of radar systems,
describes in what circumstances wind farms might cause problems for the Department
and under what circumstances such wind farms would not cause problems. Radar test
results from multiple flight trials near wind farms performed by the United Kingdom
Ministry of Defence are discussed. The results from those flight trials documented that
state-of-the-art utility-class wind turbines can have a significant impact on the operational
capabilities of military air defense radar systems. The results demonstrated that the large
radar cross section of a wind turbine combined with the Doppler frequency shift
produced by its rotating blades can impact the ability of a radar to discriminate the wind
turbine from an aircraft. Those tests also demonstrated that the wind farms have the
potential to degrade target tracking capabilities as a result of shadowing and clutter
effects.
2
ELECTRONIC FILING, RECEIVED, CLERK'S OFFICE, JANUARY 5, 2007
* * * * * PC #7 * * * * *
The Department sponsored a testing campaign as a part of this study to establish a
technical database on the radar cross section and Doppler behavior of a modern utility-
class wind turbine that can be used to support development of future mitigation
approaches. This testing was performed using the state-of-the-art Air Force Research
Laboratory Mobile Diagnostic Laboratory (MDL) which is certified to perform radar
measurements to the most stringent national standards. The test procedures, samples of
the experimental test data, and calibration methodology have been documented in a
report. The full data set has been made available to U.S. radar contractors and
government-sponsored researchers.
The report discusses a number of mitigation approaches that might be employed
to reduce the impact wind turbines can have on an air defense radar. Only three methods
so far have been proven to be completely effective in preventing any impairment of
primary radar systems. Employment of these or other approaches that could produce
marginal, but acceptable, impacts on defense capabilities need to be assessed on a case-
by-case basis.
The report discusses potential wind farm impacts on Department test and training
capabilities, security on and around defense installations, through introduction of
electromagnetic noise in special electronic system testing areas, and the general
environment.
The Department recognizes that wind energy use is dramatically increasing in the
United States. Development of additional mitigation technologies is important to enable
robust expansion of wind generation capacity to continue while concurrently maintaining
defense capabilities for our Nation. The also describes exploratory development efforts
initiated by the Department to advance the state of maturity of other mitigation
approaches that could be employed in the future are also described in the report.
Appendices are provided describing the policies employed in several NATO
countries to govern wind farm development and how wind farms can impact the
performance of U.S. Comprehensive Test Ban Treaty monitoring systems.
Conclusions and Recommendations
Given the expected increase in the U.S. wind energy development, the existing
siting processes as well as mitigation approaches need to be reviewed and enhanced in
order to provide for continued development of this important renewable energy resource
while maintaining vital defense readiness. The Department of Defense strongly supports
the development of renewable energy sources and is a recognized leader in the use of
wind energy. As one of the largest consumers of energy, the Department is keenly aware
of the budgetary pressures that recent increases in the cost of energy have created for all
Americans and continues to invest in the development of alternative energy sources.
However, the Department is also mindful of its responsibility to maintain its capabilities
to defend the nation.
Consequently, the Department, as a result of this study, makes the following
conclusions and recommendations regarding the challenges and areas for further
attention, in coordination with other Federal agencies, to allow for construction of wind
turbines while maintaining defense readiness capabilities:
3
ELECTRONIC FILING, RECEIVED, CLERK'S OFFICE, JANUARY 5, 2007
* * * * * PC #7 * * * * *
!
Although wind turbines located in radar line of sight of air defense radars can
adversely impact the ability of those units to detect and track, by primary radar return,
any aircraft or other aerial object, the magnitude of the impact will depend upon the
number and locations of the wind turbines. Should the impact prove sufficient to
degrade the ability of the radar to unambiguously detect and track objects of interest
by primary radar alone this will negatively impact the readiness of U.S. forces to
perform the air defense mission.
!
The mitigations that exist at present to completely preclude any adverse impacts on
air defense radars are limited to those methods that avoid locating the wind turbines
in radar line of sight of such radars. These mitigations may be achieved by distance,
terrain masking, or terrain relief and requires case-by-case analysis.
!
The Department has initiated efforts to develop additional mitigation approaches.
These require further development and validation before they can be employed.
!
The analysis that had been performed for the early warning radar at Cape Cod Air
Force Station was overly simplified and technically flawed. A more comprehensive
analysis followed by development of appropriate offset criteria for fixed-site missile
early warning radars should be performed on an expedited basis.
!
Wind turbines in close proximity to military training, testing, and development sites
and ranges can adversely impact the “train and equip” mission of the Department.
Existing processes to include engagement with local and regional planning boards
and development approval authorities should be employed to mitigate such potential
impacts.
!
Wind turbines located in close proximity to Comprehensive Test Ban Treaty
monitoring sites can adversely impact their ability to perform this mission by
increasing ambient seismic noise levels. Appropriate offset distance criteria should be
developed to mitigate such potential impacts.
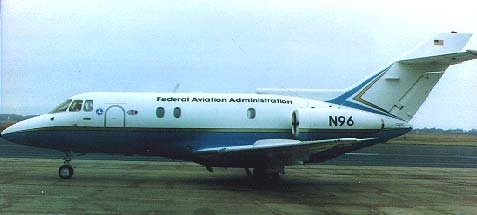
!
The Federal Aviation Administration (FAA) has the responsibility to promote and
maintain the safe and efficient use of U.S. airspace for all users. The Department
defers to the FAA regarding possible impacts wind farms may have on the Air Traffic
Control (ATC) radars employed for management of the U.S. air traffic control
system. The Department stands prepared to assist and support the FAA in any efforts
the FAA may decide to undertake in that regard.
!
The National Weather Service (NWS) has the primary responsibility to provide
accurate weather forecasting services for the nation. The Department defers to the
NWS regarding identification of impacts wind farms may have on weather radars and
development of appropriate mitigation measures. The Department stands prepared to
work with the NWS in this area on NWS identified mitigation measures that have the
potential to benefit Department systems.
4
ELECTRONIC FILING, RECEIVED, CLERK'S OFFICE, JANUARY 5, 2007
* * * * * PC #7 * * * * *
Table of Contents
1. Introduction
Focus of Study
Brief History of the Development of Wind Energy Systems
Fundamentals of Radar
2. Types of Radar Systems
Primary Surveillance Radar
Secondary Surveillance Radar
Missile Early Warning Radar
Weather Radar
3. General Principles of Operation
Use of Clutter Cells and Background Averagers
Moving Target Indication/Moving Target Detection Principles
Target Declaration and Tracking
4. Characteristics of Wind Turbines Applicable to Radars
DOD-Sponsored Field Testing of an SOA Wind Turbine
5. Observations of Impacts on Radar Systems
United Kingdom Flight Trials and Analyses
Observations of Wind Turbine Impacts on U.S. Operational Radars
Testing Performed at King Mountain, TX
Testing Performed at Tyler, MN
Other Observations About U.S. Radar Systems
Comments Regarding Air Traffic Control and Weather Radars
6. Potential Mitigation Approaches
Line of Sight Mitigation Techniques
Wind Turbine Radar Signature Suppression Concepts
Concepts for Radar Hardware/Software Modifications
Concepts for Gap Filler Mitigation Approaches
Testing and Verification Factors
7. Other Potential Impacts on DOD Readiness
Overflight and Obstruction
Security
Signature
Environment
Summary of Potential Mitigation Approaches
8. Summary
Air Defense Radars - Shadowing
Air Defense Radars - Clutter
Missile Early Warning Radars
Air Traffic Control Radars
Weather Radars
Other Potential Impacts on DOD Readiness
Treaty Compliance Sites
9. Conclusions
5
ELECTRONIC FILING, RECEIVED, CLERK'S OFFICE, JANUARY 5, 2007
* * * * * PC #7 * * * * *
References
Appendix 1: Policies Employed by Select NATO Countries
Appendix 2: Impacts on Treaty Compliance Systems
6
ELECTRONIC FILING, RECEIVED, CLERK'S OFFICE, JANUARY 5, 2007
* * * * * PC #7 * * * * *
List of Figures
1.
Scientific American
illustration of the 1888 Brush Windmill in Cleveland, Ohio
2. Illustration of a basic radar system
3. Notional main, side, and back lobes of a 2-D radar
4. Geometric approximation to estimate radar line of sight
5. Regions of partial and complete blockage of radar illumination
6. Effect of a diffraction grating on a propagating wave
7. RCS values for several common objects
8. RCS values for C-29 aircraft as a function of view angle
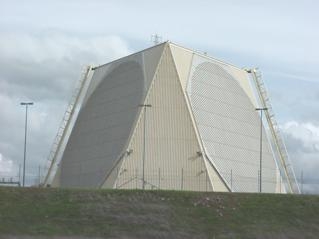
9. Two common types of 3-D radar
10. Notional elevation side lobe for fifth beam of the Figure 9b phased-array radar
11. PSR and SSR antennas of the UK Watchman ATC radar
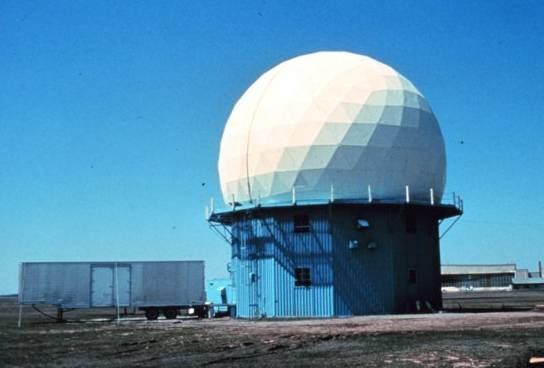
12. Upgraded Early Warning Radar at Beale AFB, CA
13. First NEXRAD WSR-88D radar, Norman, OK
14. Clutter cell example
15. Relationship between clutter and resolution cells
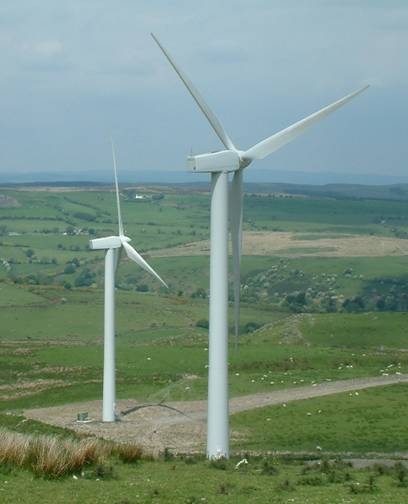
16. Picture of SOA wind turbines located in Wales, UK
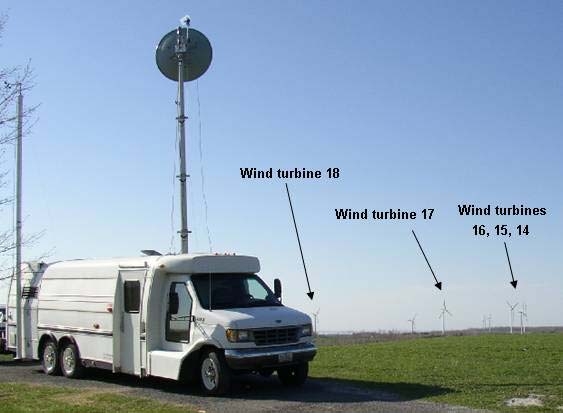
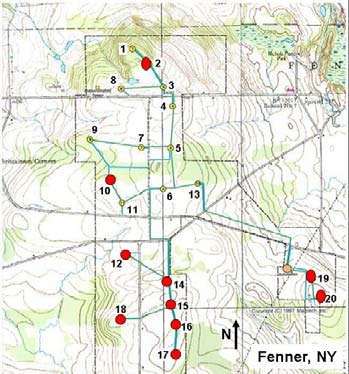
17. AFRL Mobile Diagnostics Laboratory measuring wind turbines at Fenner, NY
18. Layout of the wind farm at Fenner, NY, and locations of the turbines tested
19. Graphical representation of data obtained during field tests at Fenner, NY
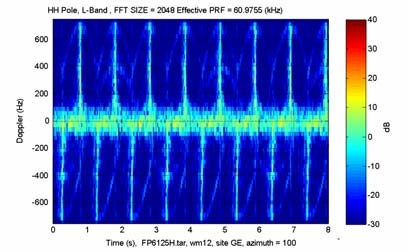
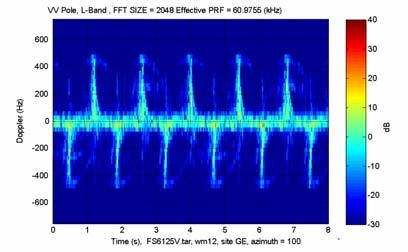
20. Example of Doppler characteristics of a wind turbine at L-band
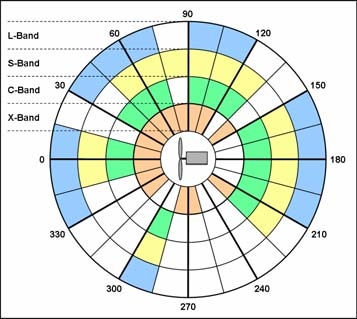
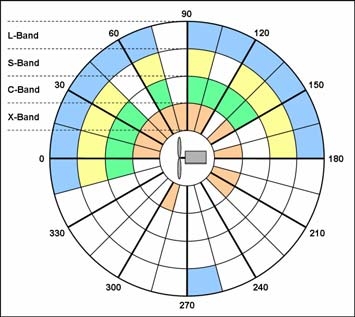
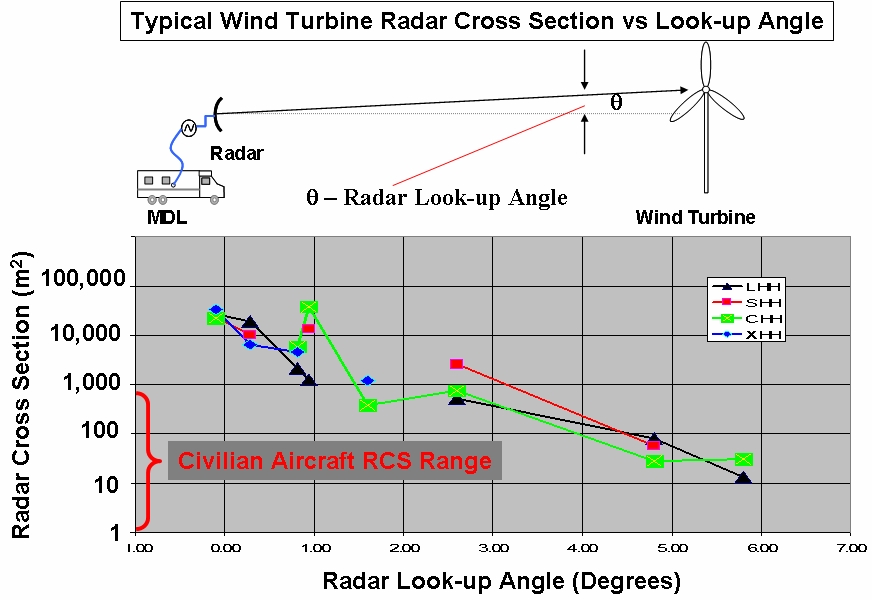
21. Graphical summary of RCS measurements for L-, C-, S-, and X-bands
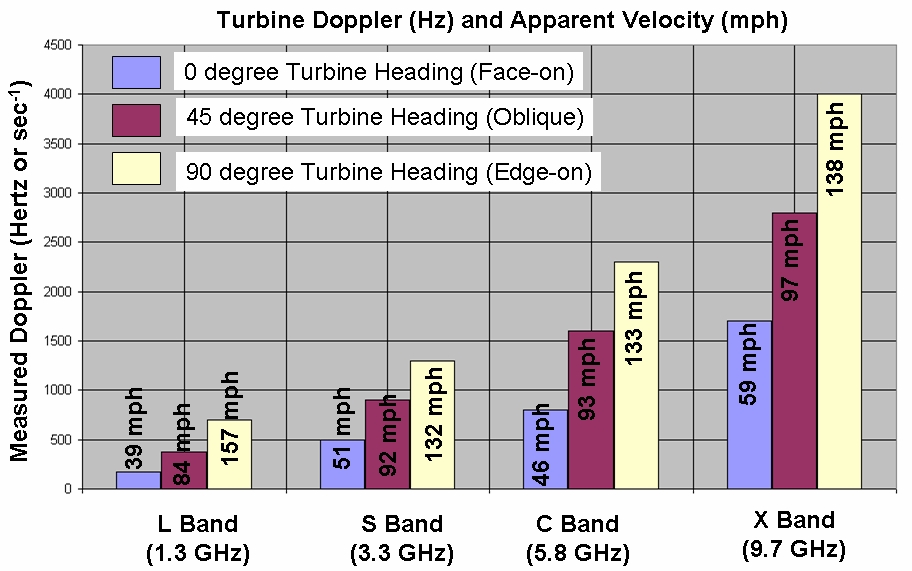
22. Doppler frequencies and derived tip velocities from measurements at L-, C-, S-, and
X-band frequencies
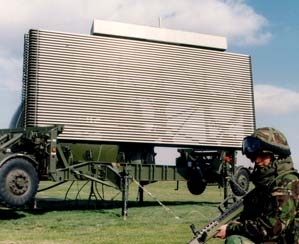
23. Commander AR327 - Type 101 air defense radar
24. Example of data obtained during Fall 2004 flight trial
25. Sector of clutter cells superimposed on flight trial data obtained during Spring 2005
flight trial
26. Location of wind turbines with respect to ARSR-4 radar at King Mountain
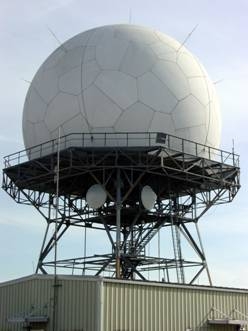
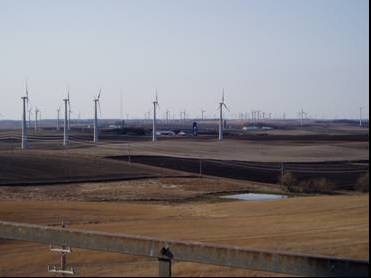
27. Picture of wind turbines and ARSR-2 radar at Tyler, MN
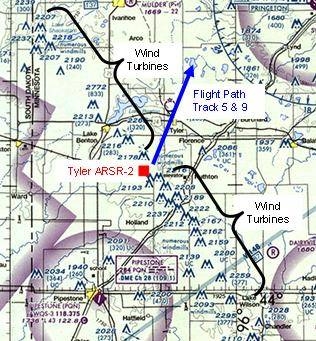
28. Location of wind turbines with respect to ARSR-2 radar at Tyler
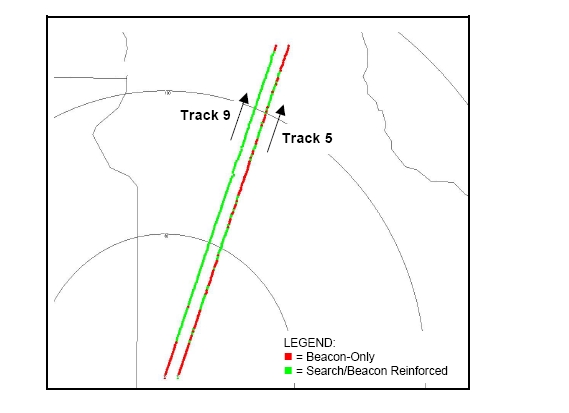
29. Tracking performance of ARSR-2 radar over wind farm at Tyler, MN
30. Illustration of “bald earth” line of sight mitigation approach
31. Illustrative results of line of sight distance offsets using a “bald earth” approach
32. Illustration of “terrain masking” line of sight mitigation approach
33. Illustration of “beam propagation” analysis to evaluate “terrain masking”
34. Overlapping radar coverage example
List of Tables
1. Physical data for representative SOA turbines
2. Decibel (dB) equivalents for some common numerical ratios
3. Approximate primary beam elevations for an Early Warning Radar
7
ELECTRONIC FILING, RECEIVED, CLERK'S OFFICE, JANUARY 5, 2007
* * * * * PC #7 * * * * *
1. INTRODUCTION
Focus of Study
This report has been prepared in response to Section 358 of the National Defense
Authorization Act for Fiscal Year 2006 concerning the impacts wind farms may have on
U.S. military readiness, to include an assessment on operation of military radar
installations and technologies that could mitigate any adverse effects identified. The
intent is to ensure that the accelerating development of wind energy systems within the
United States will occur in a manner that also preserves the capability of U.S. military
forces to protect the homeland.
This report specifically discusses how megawatt (MW) class state-of-the-art
(SOA) wind turbines can impact domestically sited U.S. air defense and missile warning
radar systems. Wind turbines of this size are typically considered to be “bulk-power
utility-scale” units often employed in “wind farms” to provide electricity for local or
regional power grids. Within the context of this report, the term “wind farm” will be
employed to denote a collection of two or more megawatt class wind turbines within a
geographical area that may range in size from a few acres to hundreds of acres.
The report does not attempt to consider impacts that could occur from small
“homeowner” type wind turbine systems. Modern versions of such units are relatively
small in physical size, with generating capacities in the low kilowatt (kW) range. They
are not anticipated to have significant impact unless located directly adjacent to a
domestic defense system. This is not considered to be a highly probable occurrence since
land directly adjacent to domestic defense systems is generally under the positive control
of the federal government.
The report describes existing as well as possible future mitigation techniques that
could be employed to mitigate impacts for megawatt wind turbines. Finally, it describes
science and technology efforts already being pursued to develop additional future
mitigation approaches.
Brief History of the Development of Wind Energy Systems
According to the history page of the Danish Wind Industry Association
(www.windpower.org), the first automatically operated windmill employed to generate
electricity was built in Cleveland, Ohio, in 1888. Figure 1 provides an illustration of this
system that appeared on the front page of the 20 December 1890 edition of
Scientific
American.
While physically large, the 17 m diameter rotor was only able to generate 12
kW of power.
For the next 40 years a variety of low-power wind turbine designs were
developed. Some were employed to provide power to local electrical grids or at remotely
located farms not connected to electrical grid networks. The development of bulk power
utility-scale turbines, units with generating capacities on the order of 100 kW or more,
appears to have begun in earnest in the 1930s in multiple nations but this did not lead to
the development of any major commercially operated “wind farms” for bulk power
8
ELECTRONIC FILING, RECEIVED, CLERK'S OFFICE, JANUARY 5, 2007
* * * * * PC #7 * * * * *
generation. Subsequent advances in turbine technologies during the 1960s and 1970s did,
however, provide the technical basis for current approaches.
Figure 1.
Scientific American
illustration of the 1888 Brush Windmill
in Cleveland, Ohio
One of the earliest large wind farms in the United States was built, starting in
1982, in the Altamont Pass area of California. The wind farm is actually a collection of a
number of different turbine designs owned and operated by several different
organizations. The Altamont Pass Wind Farm currently consists of more than 4700 units;
the vast majority being older 100 kW capacity units with, in 2003, a reported combined
net generating capacity on the order of 494 MW [1]. The significantly greater per-unit
generating capability of current SOA turbines means that far fewer, but physically much
larger, turbines can be employed to generate this level of power. For size comparison
purposes, note that a typical 1980s vintage 100 kW capacity wind turbine, such as those
at Altamont Pass, has a blade length on the order of 8 m and is mounted on towers 24 to
30 m high. In contrast, a SOA 1.5 MW unit may have blades on the order of 35 to 40 m
in length mounted on support towers 60 to 80 m or more high.
In terms of future trends, a recent report by the European Wind Energy
Association [2] discussed the numerous technical factors related to growth in turbine
sizes and capacities over the past several years. While it was expected that rotor sizes and
rated capacities may continue to increase as higher strength materials are employed in
fabrication of turbine blades and other components, it also indicated that economic and
operational factors could exert limitations. Consequently, the report concluded that
significant growth in size beyond the 5 MW class units currently in development would
not be automatic. Table 1 provides typical dimensions for SOA megawatt class turbines
currently available from two manufacturers. Similar size/capacity units are also produced
by a number of other firms.
9
ELECTRONIC FILING, RECEIVED, CLERK'S OFFICE, JANUARY 5, 2007
* * * * * PC #7 * * * * *
Table 1. Physical data for representative SOA turbines
Manufacturer & Data
Source
Rated Capacity
(MW)
Rotor Diameter
(m)
Rotor Speed
(rpm)
Tower Height
(m)
GE
(www.gepower.com)
1.5
77
10-20
65-100
GE
(www.gepower.com)
3.6
104
8.5-15
Site dependent
Vestas
(www.vestas.com)
1.65
82
11-14
59-78
Vestas
(www.vestas.com)
4.5
120
10-15
Site dependent
Fundamentals of Radar
*
Radar systems are widely employed for many commercial and defense
applications. In its simplest form (Figure 2), a radar is a sensor system utilizing
electromagnetic radiation in the radio frequency (rf) spectral region, spanning from
approximately 3 MHz to around 100 GHz, and consisting of a transmitter, an antenna, a
receiver, and a processor. The transmitter emits pulses of energy in the form of rf waves
that propagate through the atmosphere. An object, typically referred to as the target, in
this radar beam will reflect some of this energy back to the radar. This reflected energy is
collected by a receiving antenna for processing. The basis of operation of a specific radar
sensor system is determined by the content of the information contained in the reflected
radiation and how it is processed.
The degree of difficulty encountered in processing the radar reflection from the
target of interest depends upon the strength and variability of the signal at the receiver
relative to other sources. For example, the strength of the reflected signal received by the
radar will depend on the power of the transmitter, the distance to the target, atmospheric
effects, the radar cross section (RCS) of the target, the possible presence of intervening
physical objects, and the antenna geometry. The radar may also receive reflected
radiation from other objects such as trees, buildings, vehicles, and hills, as well as direct
radiation emitted by other natural and man-made rf sources, such as the atmosphere, cell
phone towers, television and radio antennas, and electrical generators.
Signal variability can occur due to motion of the target and changes in the
intervening physical environment, such as those caused by rain or hail, as well as
reflections from wind-blown trees. A number of other effects arising from the inherent
thermal electronic noise in the radar sensor, the physics of antenna systems, the
atmosphere and intervening objects on the propagation of electromagnetic radiation also
*
The term “RADAR” was an American acronym created in 1941, with the letters selected from the words
ra
dio
d
etection
a
nd
r
anging. The use of this acronym has become so prevalent that it is now generally
accepted as a common word in English and rarely capitalized.
10
ELECTRONIC FILING, RECEIVED, CLERK'S OFFICE, JANUARY 5, 2007
* * * * * PC #7 * * * * *
must be taken into account in determining the performance fidelity of a radar sensor
system.
Reflected Energy
Transmitted Energy
Antenna
Target
Processor
Radar
Electronics
Display
Reflected Energy
Transmitted Energy
Antenna
Target
Processor
Radar
Electronics
Display
Figure 2. Illustration of a basic radar system
The term “clutter” has been established to encompass any unwanted reflected
signal that enters the radar receiver and can interfere with the determination of the desired
attributes of the target of interest. Discussions in following sections of this report will
provide examples of the effects of clutter that interfere with resolving behavior, such as
detecting the presence of a valid target, discriminating between two closely spaced
targets, and subsequently tracking the motion of all targets of interest.
At the most basic level, the ability to successfully process the reflected radiation
depends on the strength of this signal relative to the background noise inherent in the
radar electronics. This is characterized as the signal-to-noise ratio (SNR). Increasing the
radar-to-target distance dramatically decreases the intensity of the received signal. For
example, if the distance between the radar and the target is doubled, the signal returned
decreases by a factor of 16. Since a design goal for a defense radar is to detect targets at
the maximum range possible, the ability to sense very low signal strengths is essential.
At the extreme, the absolute minimum level of noise that can occur in a system is
fundamentally limited to the thermally induced noise in the sensor electronic components
and thermal radiation from the atmosphere. However, the actual level of noise, to include
clutter effects, that a radar sensor must deal with are significantly greater than this
theoretical limiting case.
Many of the attributes characterizing a radar system involve values spanning
many orders of magnitude. For example, the SNR for a radar system can vary by more
than 1 million during operation. The decibel (dB), a logarithmic ratio of two quantities,
is used to describe these ratios in terms of smaller numerical values. For example, an
SNR value of -30 dB means that the signal strength is 1/1000 of the strength of the noise.
Similarly, for a value of 10 dB, the signal would be 10 times greater than the noise. The
dB unit will be used frequently in the sections to follow. For convenience to the reader,
Table 2 provides examples of the conversion of dB to the equivalent factor.
11
ELECTRONIC FILING, RECEIVED, CLERK'S OFFICE, JANUARY 5, 2007
* * * * * PC #7 * * * * *
Table 2. Decibel (dB) equivalents for some common numerical ratios
dB
-50 dB
-30 dB
- 10 dB
-3 dB
0 dB
3 dB
10 dB
30 dB
Factor
1/100,000 1/1,000
1/10
½
1
2
10
1,000
Due to the finite size and shape of an antenna, the emitted power is distributed in
a lobe-shaped pattern. The center (or main) lobe contains the majority of the radar
power, but the secondary, tertiary, etc., lobes (side lobes) can have sufficient energy to
introduce clutter into the system. Figure 3 illustrates the main, side, and back lobes for a
2-dimensional (2-D) radar. Figure 3a provides a range versus elevation plot of the -3 dB
(half power) point of the beam relative to the peak power level. Figure 3b provides an
azimuth beam shape plot, where power level as a function of azimuth angle is plotted
relative to peak main lobe power.
90°
0°
30°
60°
300°
120°
150°
180°
210°
240°
270°
330°
Range
A
l
t
i
t
u
d
e
Main Lobe
1
st
Side Lobe
Back Lobe
90°
0°
30°
60°
300°
120°
150°
180°
210°
240°
270°
330°
90°
0°
30°
60°
300°
120°
150°
180°
210°
240°
270°
330°
Range
A
l
t
i
t
u
d
e
Range
A
l
t
i
t
u
d
e
Main Lobe
1
st
Side Lobe
Back Lobe
0 dB
-10 dB
-20 dB
a. Main lobe as function of
b. Main, side, and back lobe amplitudes
range and altitude
as a function of azimuth angle
Figure 3: Notional main, side, and back lobes of a 2-D radar
Multiple side lobes can exist in both the vertical and azimuth directions with
respect to the axis of the main lobe. In a well-designed radar system, the power level of
the side lobes will be significantly below that of the main lobe.
Radars can detect sufficiently strong reflections from objects located in the
antenna side lobes. Side lobe suppression methods have been developed to reduce the
influence of such signals. The ultimate effectiveness of the side lobe attenuation provided
will depend significantly upon the power level of the side lobe beam and the strength of
the reflected signal in comparison to the primary signal of interest.
12
ELECTRONIC FILING, RECEIVED, CLERK'S OFFICE, JANUARY 5, 2007
* * * * * PC #7 * * * * *
The range of an optical viewing systems is ultimately limited by the optical or
“geometric” horizon. For radar systems, the electromagnetic radiation propagating
through the atmosphere is refracted (effectively bent), with the result that a radar beam
can be reflected by an object beyond the geometric horizon. Analysis of this refraction
effect has indicated that for radar frequencies, the radar horizon can be reasonably
approximated by employing a “4/3 earth model.” In this approximation, a geometric line
of sight is calculated, but using an “effective” radius for the earth equal to the actual
radius of the earth multiplied by the factor 1.33, as illustrated in Figure 4.
Radar Line of Sight
(4/3)R
earth
= 4587 nMi
H
Radar Line of Sight
h
(4/3)R
earth
= 4587 nMi
Hh
Figure 4. Geometric approximation to estimate radar line of sight
Objects in the path of an electromagnetic wave affect its propagation
characteristics. This includes actual blockage of wave propagation by large individual
objects and interference in wave continuity due to diffraction of the beam by individual
or multiple objects. The effect caused by either of these is often termed to cause
“shadowing” of the radar beam.
The presence of a single tall building within the radar field of view provides a
typical example for blockage. Since a tall building effectively blocks all propagation of a
radar rf wave, the zone immediately behind the building will not be illuminated by the
radar. If the building is close to the radar there will be zones of complete and partial
shadowing. This is illustrated in Figure 5.
In the region where the radar wave is completely blocked it is impossible to detect
any object in that region. In contrast, detection is still possible in the zone of partial
blockage but with greater difficulty. In this region both the level of illumination from the
radar and the reflected signal from the target will be weakened by the partial blockage.
This is one form of the shadowing effect.
The second form of disruption occurs because of a phenomenology referred to as
“diffraction.” Near-field and far-field diffraction effects were first studied by the Danish
physicist Christian Huygens and the French physicist Augustin-Jean Fresnel. As
illustrated by Figure 6, whenever a traveling wave encounters a line of objects, the
objects will disrupt the propagation of the wave in that locale. This phenomena can be
illustrated as propagation of spherical waves from each of the objects. These waves will
combine constructively and destructively on the far side of the objects. In the zone of the
13
ELECTRONIC FILING, RECEIVED, CLERK'S OFFICE, JANUARY 5, 2007
* * * * * PC #7 * * * * *
disrupted waves the reflection of the radar signal is significantly different from areas
where it has not been disturbed. These differences include variations in intensity and
phase angle and are a function of original frequency and the spacing of the objects
causing disruption.
Antenna
Radar
Electronics
O
B
J
E
C
T
T
O
T
A
L
S
H
A
D
O
W
P
A
R
T
I
A
L
S
H
A
D
O
W
Antenna
Radar
Electronics
O
B
J
E
C
T
T
O
T
A
L
S
H
A
D
O
W
P
A
R
T
I
A
L
S
H
A
D
O
W
Figure 5. Regions of partial and complete blockage of radar illumination
Radar Pulse
Wind Turbines
Interference
Waves
Shadowed
Region
Radar Pulse
Wind Turbines
Interference
Waves
Shadowed
Region
Figure 6. Effect of a diffraction grating on a propagating wave
These disruption effects will occur both for the original transmitted wave and the
wave reflected back to the radar by a target. As such, the ability to detect a target in this
zone will be degraded. This is the form of shadowing that has been raised as a concern in
relation to wind farms since the spacing of turbines over a field of view can create this
type of diffraction effect for a radar.
The strength of the reflected signal, whether the object is illuminated by the main
lobe or by one or more side lobes, depends not only upon the power level of that
illumination but how “large” a reflector of radar energy the object is. This “size” factor is
commonly referred to as its radar cross section (RCS). Objects with a large RCS will
14
ELECTRONIC FILING, RECEIVED, CLERK'S OFFICE, JANUARY 5, 2007
* * * * * PC #7 * * * * *
reflect, proportionately, a larger amount of radar energy than an object with a lower RCS
and thus be easier to detect. RCS is normally expressed in terms of “decibel square
meters” (dBsm), a logarithmic expression of an object’s radar reflecting surface area.
Figure 7 provides typical RCS values, in terms of both square meters and dBsm, for a
number of common items, including that of a 1.5MW SOA wind turbine. Unlike the
other objects depicted in Figure 7, the RCS for the wind turbine is a combination of a
near-zero Doppler reflecting surfaces consisting of the tower and nacelle and variable
Doppler reflecting surfaces consisting of the turbine blades. The near-zero Doppler
portion of the reflected signal generally will not cause a problem in a well designed radar.
However, the broadly spread variable Doppler portion of the reflected signal from the
wind turbine can often exceed that produced by an aircraft.
1.5MW WIND TURBINE
LARGE A/C (747)
CONVENTIONAL
AIRCRAFT (C-29)
IMPROVED
CONVENTIONAL AIRCRAFT
CONVENTIONAL
CRUISE MISSILES
BIRDS
MAN
CARS/TRUCKS
INSECTS
RCS
dB
= 10 log RCS
m
2
dBsm
.0001
.001
.01
.1
1
10
100
1000
10000
-40
-30
-20
-10
0
10
20
30
40
Square Meters
SPACE SHUTTLE
& BOOSTERS
(ENGINE VIEW)
Figure 7. RCS values for several common objects
The magnitude of the RCS of an object is dependent upon the angle, both in
bearing and elevation, from which it is observed by the radar. Figure 8 illustrates how the
RCS value for the C-29 “business jet” included in Figure 7 varies as a function of bearing
angle, where observing the airplane from a nose-to-tail perspective is denoted as a 0-
degree bearing angle. These values were measured at 2.9 GHz, with a “look down” angle
from the vertical of 15 degrees. Modifying the viewing angle or changing the frequency
band used for the measurement will change the measured RCS characteristics.
Radar systems have been designed and deployed for a wide variety of applications
and missions. These include air defense radars, air traffic control (ATC) radars, missile
warning radars, and weather radars. The design of each of these radar sensor systems
depends on the mission requirements, the phenomenology to be exploited, and the
C-29
747
1.5MW WIND TURBINE
LARGE A/C (747)
CONVENTIONAL
AIRCRAFT (C-29)
CONVENTIONAL
AIRCRAFT (C-29)
IMPROVED
CONVENTIONAL AIRCRAFT
CONVENTIONAL
CRUISE MISSILES
BBIIRRDDSS
MMAANN
CCAARRSS//TTRRUUCCKKSS
IINNSSEECCTTSS
RCS
dB
= 10 log RCS
m
2
dBsm
.0001
.001
.01
.1
1
10
100
1000
10000
-40
-30
-20
-10
0
10
20
30
40
Square Meters
dBsm
.0001
.001
.01
.1
1
10
100
1000
10000
-40
-30
-20
-10
0
10
20
30
40
Square Meters
SPACE SHUTTLE
& BOOSTERS
(ENGINE VIEW)
C-29
747747
15
ELECTRONIC FILING, RECEIVED, CLERK'S OFFICE, JANUARY 5, 2007
* * * * * PC #7 * * * * *
available technology. For example, current generations of weather radar systems exploit
the Rayleigh scattering properties of precipitation, i.e., scattering of radiation having
wavelengths, on the order of 10 cm, much larger than the characteristic size of rain, hail,
and snow particles. The computational schemes employed are designed to reduce the
effects of “clutter” to obtain the desired weather information. Surveillance radars, in
addition to having a capability to sense weather-related phenomena as just described,
exploit the scattering properties of objects much larger than the wavelength of the radar.
They also employ computational schemes specifically tailored to produce desired
surveillance information. The mission challenges introduced by clutter to the
performance of radar systems are discussed in the following sections of this report.
Figure 8. RCS values for C-29 aircraft as a function of view angle
Advances in electronics, processor, and computational technologies have enabled
a number of radar system performance enhancements. A key capability provided by
these advances and employed in virtually all modern radar systems today is the capacity
to sense pulse-to-pulse phase differences, thus enabling the Doppler effect to be
exploited.
The Doppler effect, specifically the shift in frequency of the reflected signal that
occurs when an object is moving, was first discovered by Christian Doppler. It applies to
all propagating waves and is particularly useful for radars. This Doppler shift results
from the fact that the frequency of a signal received by an observer will depend upon
whether the source of that signal is stationary, moving toward, or moving away from the
observer. For radar applications, the “source” of the signal is the radar wave reflected by
the target. If the target is moving away from the radar, the frequency of the reflected
16
ELECTRONIC FILING, RECEIVED, CLERK'S OFFICE, JANUARY 5, 2007
* * * * * PC #7 * * * * *
signal will be lower than the originally transmitted frequency. Conversely, if the object is
moving toward the radar the frequency will be higher. Additionally, the magnitude of the
signal frequency shift is directly proportional to the radial velocity between the object
and the radar. Only objects that are stationary or moving perfectly tangentially to the
radar wave will not produce a Doppler shift.
The development of high-performance processing capability, along with
innovative computational techniques tailored to extract desired information from the
massive amounts of data available, has provided desired radar enhancements, particularly
for defense capabilities.
2. TYPES OF RADAR SYSTEMS
Primary Surveillance Radar
Air defense radars typically operate in what is termed a “Primary Surveillance”
mode. When operated in that manner they are referred to as a “Primary Surveillance
Radar” (PSR). A PSR will send out rf waves (radar energy) focused by the antenna to
provide an “illuminated” volumetric region of coverage. For a radar with a single
transmitting element, the characteristics of this volume of coverage will be governed
primarily by the shape of the antenna and whether or not the antenna can be rotated about
one or two axes.
Figure 3 illustrated a radar coverage pattern where the antenna has been shaped to
produce an illuminated area that is broad in altitude and radial distance (range) but rather
narrow in width in terms of azimuth angle coverage. This type of radar is generally
rotated about a vertical axis to extend the volume of coverage. The angle of rotation may
be as little as a few degrees to observe a small sector or up to 360 degrees to cover the
entire airspace surrounding the radar. Alternatively, the antenna may oscillate back and
forth over a small angle to cover only a sector of airspace. Systems of this type able to
rotate a full 360 degrees can often be observed in use around airports.
Radars of the type illustrated in Figure 3 are often referred to as 2-D radars since
they are able to determine the position of an aircraft in terms of range and bearing angle
(angular position of the aircraft with respect to north) but are unable to determine the
height at which the airplane is above the surface of the earth. In contrast, most radars
designed to inherently determine aircraft range, bearing, and altitude employ multiple
beams. Radars able to determine all three aircraft parameters are typically referred to as
being three-dimensional (3-D) radars. Figure 9 illustrates two different types of
multibeam 3-D radars. The first employs several “stacked” transmit units to produce
overlapping illumination lobes. Similar to the 2-D radar illustrated in Figure 2, the entire
antenna would be rotated about a vertical axis to sweep the illuminated area over the
volume of airspace to be covered.
The second type of 3-D radar is known as a phased-array radar. In a phased-
array radar, hundreds to thousands of small transmitters and receivers make up the face of
the antenna. Radar beam patterns are formed by precisely adjusting (shifting) the phase
angle of the signal sent to each transmit element. Employing a similar technique, the
receive beam can also be “electronically steered” over an area to cover a specific volume
17
ELECTRONIC FILING, RECEIVED, CLERK'S OFFICE, JANUARY 5, 2007
* * * * * PC #7 * * * * *
of airspace. Mechanical steering can also be employed to increase the “field of regard”
for a phased-array radar.
a. Stacked Beam
b Phased Array
Figure 9. Two common types of 3-D radar
Phased-array radars also have side lobes. Multiple side lobes can exist in both the
vertical and azimuth directions with respect to the axis of a main beam lobe. In a well-
designed radar system, the power level of the side lobes will be significantly below that
of the main lobe. Figure 10 illustrates the first elevation side lobe for the fifth beam of a
planar phased-array radar.
5
Beam 5 Main Lobe
Beam 5 Side Lobe
(-20dB relative to main lobe peak)
5
Beam 5 Main Lobe
Beam 5 Side Lobe
(-20dB relative to main lobe peak)
Figure 10. Notional elevation side lobe for fifth beam of the Figure 9b phased-array
radar
Secondary Surveillance Radar
Secondary Surveillance Radar (SSR) is an “interactive” radar in that it requires
the cooperation of the target aircraft. SSR traces its origins to the Identification Friend or
18
ELECTRONIC FILING, RECEIVED, CLERK'S OFFICE, JANUARY 5, 2007
* * * * * PC #7 * * * * *
Foe (IFF) systems first developed during World War II to help air defense personnel to
clearly distinguish between friendly and hostile airplanes. SSR systems are sometimes
referred to as “beacon tracking” systems.
An SSR operates by sending out a coded signal (interrogation) that is received by
a transponder system on an aircraft. The airplane’s transponder system translates the
interrogation and responds by transmitting a coded signal back to the radar. This coded
signal will contain identification information about the aircraft and other data such as its
flight altitude. The frequencies of the interrogation and response are different, and both
are different from the primary radar frequency so that the signals do not interfere with
each other. The operating frequencies, signal strength, message format, and other key
parameters influencing the performance of transponders are defined by published
standards [3].
A major advantage of SSR is that the return from the aircraft transponder is much
stronger than the typical primary (skin) radar return and is generally unaffected by clutter
sources that can affect the primary radar return. This is because the SSR system does not
depend upon the “reflection” of its interrogation message. Instead, it receives a different
signal actually broadcast by the aircraft. Thus, wave propagation losses in each direction
are minimized. This in turn allows a much smaller antenna to be employed for SSR.
Figure 11 illustrates both the PSR and SSR antennas for the United Kingdom (UK)
Watchman series of Air Traffic Control (ATC) radar.
A disadvantage of the SSR is that the aircraft must have a functioning
transponder. Not all aircraft are required to have transponders. Additionally, even for
transponder-equipped airplanes, if the transponder fails or is turned off, the SSR will not
be able to track the airplane. Under these circumstances, only a primary surveillance
radar will be able to detect or track the aircraft.
PSR Antenna
SSR Antenna
PSR Antenna
SSR Antenna
Figure 11. PSR and SSR antennas of the UK Watchman ATC radar
Missile Early Warning Radar
There are two fixed-site missile Early Warning Radars (EWR) within the
continental United States. One is located at Cape Cod Air Force Station (AFS), MA. The
19
ELECTRONIC FILING, RECEIVED, CLERK'S OFFICE, JANUARY 5, 2007
* * * * * PC #7 * * * * *
other, an upgraded version, is located at Beale Air Force Base (AFB), CA. These two
fixed-site, ground-based radars are large phased-array systems that are housed in a three-
sided 32 m high building (Figure 12). The radars have two distinct radiating antennas,
each capable of covering a 120-degree sector. Each antenna can generate a narrow (2.2
degrees) primary radar beam that can be electronically steered between elevation angles
ranging from 3 to 85 degrees above the horizontal over the entire 120-degree field of
view. These radars have a maximum range in excess of 5000 km. The far-field region for
the primary radar beam begins approximately 439 m from the face of the radar.
Figure 12. Upgraded Early Warning Radar at Beale AFB, CA
Table 3 provides the elevation of the lower edge (-3 dB power level) of the
primary beam of an EWR as a function of distance from the radar referenced to the center
of the array face. The effect of a 3-degree upward angle in conjunction with the narrow
width of the beam produces a primary beam illumination pattern that is significantly
above the surface of the earth, even at short distances from the radar unit.
Table 3. Approximate radar primary beam elevation for an EWR
Distance from radar
(km)
Elevation of bottom
of primary beam (m)
Elevation of centerline
of beam (m)
5
167
263
10
338
530
15
510
799
20
687
1072
25
866
1347
Calculations employ 4/3 earth approximation to account for atmospheric refraction effects. All
elevations are relative to the center of array face. Beam size based on -3 dB power level.
The early warning radars, similar to others, also have side lobes. The first side
lobe forms a concentric circle about the main beam. The second and higher side lobes are
similar in character to the main beam and arranged about that beam. The power density
level of the first side lobe is 1/100 (-20 dB) of the power of the main lobe, whereas the
power density level of the second side lobe is 1/1000 (-30dB) of main beam power
20
ELECTRONIC FILING, RECEIVED, CLERK'S OFFICE, JANUARY 5, 2007
* * * * * PC #7 * * * * *
density. The first and second side lobes do intercept the ground in front of the array [4].
The distance away from the radar at which this intersection will occur varies based upon
how far above the horizontal the main beam is pointed.
Weather Radar
Radar can also be employed to monitor weather conditions. In the United States,
the NEXRAD WSR-88D represents the current generation of ground-based weather
radars. The NEXRAD network at present consists of 158 WSR-88D radars situated
across the country, with a few at various overseas locations. Figure 13 illustrates the first
NEXRAD WSR-88D radar, which was installed in Norman, OK, in 1988.
The phenomenology employed by a weather radar is Rayleigh scattering. Weather
radars do employ Doppler but not in the same way as air defense radars. Generally, when
monitoring weather conditions such as rain, hail, or snow, the Doppler frequency shift, a
function of particle velocity, will be too small to measure accurately with a single pulse.
Thus, weather radars such as the WSR-88D employ timed pairs of pulses. The phase-
angle difference between the reflections of two sequential pulses is directly proportional
to particle velocity in the direction toward or away from the radar. By combining these
measurements for multiple sequential pulse pairs over broad sweep angles, the radar is
able to construct a Doppler map illustrating the rain, hail, or snowfall pattern.
Figure 13. First NEXRAD WSR-88D radar, Norman, OK
3.
GENERAL PRINCIPLES OF OPERATION
Use of Clutter Cells and Background Averagers
As noted previously, the term “clutter” is defined as any undesired reflected
signal return that enters the radar receiver. For a primary radar seeking to track aircraft,
the earth’s surface and any man-made objects on the earth’s surface are sources of clutter.
Weather effects such as rain or hail can also cause clutter for an air defense radar.
Modern air defense radars normally include special algorithms to attenuate the effects of
such weather phenomena on tracking performance.
21
ELECTRONIC FILING, RECEIVED, CLERK'S OFFICE, JANUARY 5, 2007
* * * * * PC #7 * * * * *
The level of clutter a radar may see is highly dependent on the viewing geometry
of the radar in relation to the clutter sources. In general, the level of clutter will increase
when the radar views a larger area of the earth’s surface or of objects on the earth’s
surface. Clutter can occur at any angle within the radar field-of-view angle and at any
range within the radar line of sight. Clutter returns can be spread in Doppler frequency
due to the motion of the radar platform or motion of the source of clutter.
Traditionally, clutter for an air defense radar has been considered to be either
stationary or possessing a low velocity. Cars and trucks moving on roads, trees,
buildings, and even flags waving in a breeze can create this type of clutter. Stationary or
nearly stationary objects result in a return signal with a fluctuating near-zero Doppler
frequency shift. Since quasi-stationary objects will generally provide nearly identical
radar returns from successive scans, methods have been developed to eliminate such
returns from further processing and thereby reduce their influence on tracking capability.
The use of clutter “maps” and clutter cells has been one such technique
commonly employed. Figure 14 provides an example of how clutter cells are employed
within a radar to support target detection. This figure illustrates a portion of an area, in
terms of range (radial distance) and bearing angle (angular offset from north) under
observation. Such a plot is called a Plan Position Indicator (PPI) display and is one of the
most commonly recognized formats for displaying radar data.
TT
Figure 14. Clutter cell example
In this particular example the radar is seeking to determine if there is an aircraft
(T) in the blue colored area. A key element in performing that task is determining
whether the magnitude of the signal being reflected from that small region includes
reflections from trees, buildings, and other objects (clutter) of no interest to aircraft
tracking (clutter), as well as reflections from one or more aircraft. Using a grid pattern of
“clutter cells,” the radar compares the magnitude of reflected signals from a series of
prior sweeps for that cell to the signal level now being received to determine if there has
been an “above threshold” increase in reflected intensity.
*
The assumption here is that
*
Specific target detection and tracking methods are described in greater detail in the following sections
22
ELECTRONIC FILING, RECEIVED, CLERK'S OFFICE, JANUARY 5, 2007
* * * * * PC #7 * * * * *
typical clutter signals, representing reflections from stationary or nearly stationary
objects, will not change significantly over a short period time and thus will produce a
relatively stable history of clutter. Consequently, any sudden increase in received signal
level would imply that a new object has now appeared in this cell.
This “clutter history” for a given clutter cell is also usually averaged, using
weighting factors, with current clutter levels being observed in other cells in front of and
behind the cell of interest. In some cases, current clutter levels in cells adjacent to the cell
of interest also may be included in this weighted-averaging process. The yellow colored
cells in Figure 14 provides a simplified example of cells included in the process. This
weighting of clutter levels in adjacent cells enables the radar to adapt its performance to
short-term variations in atmospheric wave propagation parameters and other
environmental factors such as rain. Averaging of clutter cells is typically employed only
when the radar is operated in a surveillance mode. When in surveillance mode, the radar
will be sweeping over large volumes of airspace to determine how many aircraft are in
that region and where they are located.
While clutter cells are used by radars to monitor clutter in the field of view, actual
aircraft tracking employs “resolution cells.” Resolution cells are generally smaller than
clutter cells to enable the radar to accurately establish the actual position of an aircraft.
Figure 15 illustrates the relationship between clutter cells and resolution cells. Here, the
clutter cell is assumed to be 6 km in range length and 1 degree wide in azimuth angle. In
this hypothetical example, each clutter cell contains 6 resolution cells 1 km in range
length with the same 1 degree angular width.
CLUTTER
CELL
RESOLUTION
CELL
6
k
m
1 deg
6
k
m
1 deg
CLUTTER
CELL
RESOLUTION
CELL
6
k
m
1 1 dedegg
6
k
m
1
1 dedegg
Figure 15. Relationship between clutter and resolution cells
If this hypothetical radar were a 2-D radar with an operating range from 6 to 600
km over a 360-degree field of regard, there would be 35,640 separate clutter cells that the
radar processor would have to retain, and update the history of, with every sweep. If,
instead, it were a three-beam radar with individual clutter maps for each beam, the
number of clutter cells would increase to 106,920. As this example indicates, radar
processing loads are very dependent upon the size and number of clutter cells employed
for the clutter map.
As mentioned previously, the accuracy with which the radar can track the position
of an aircraft depends upon the size of the resolution cell. In this example, the 2-D radar
would be able to locate a non-cooperative airplane to only within a fraction of 1 km and 1
23
ELECTRONIC FILING, RECEIVED, CLERK'S OFFICE, JANUARY 5, 2007
* * * * * PC #7 * * * * *
degree of its exact position depending upon signal-to-noise ratio. Additionally, it would
be unable to tell if there is more than one aircraft in that small region since its tracking
ability is based only on detecting an above-threshold level of signal return in a given
resolution cell. Thus, a precision flight team flying in very close formation could appear
to the radar as a single target without other aids such as transponder returns.
This report noted earlier that certain types of air defense radars have the capability
to track individual aircraft. These are generally 3-D phase-array radars, but other
arrangements are possible as well. When operated in this mode, the radar will focus an
individual radar beam on the aircraft of interest much like a spotlight is used to illuminate
a small area on a stage. Rather than employing “clutter maps” as described above, such
target tracking systems often employ a “background averager” methodology to reduce the
impacts of clutter around the target. With this technique, the radar electronics and
processor systems will create a relatively small “sliding window” that is passed over the
volume of airspace where the target is located. Unlike a clutter cell, these sliding
windows are typically on the order of a few resolution cells in size. For the Figure 15
example, a two-cell size window could be “slid” over a few cells in front of and a few
cells behind the resolution cell of interest to establish a “background” level of average
clutter in that small zone. That is then used to set a clutter threshold level subsequently
employed in the target tracking algorithm.
Note that a key difference between a clutter-map approach and the background-
averager techniques is that a clutter map will be based on clutter levels observed over
multiple sequential scans, whereas the “clutter levels” determined by a background
averager are based only on observed clutter in the present scan and thus are a measure of
“instantaneous” clutter surrounding the target.
Moving Target Indication/Moving Target Detection Principles.
Moving target indicator (MTI) and subsequently moving target detection (MTD)
techniques have been developed to assist in the process of separating radar returns from
moving objects from those produced by stationary items. A radar employing the simplest
form of MTI compares two consecutive received pulses. The first pulse is stored in
memory and is subsequently subtracted from the second received pulse. Consecutive
return pulses from a nonmoving object will appear almost identical. Thus, subtracting
one pulse from the other produces a near-zero net result. On the other hand, the Doppler
shift from a moving target will have a relative change in the phase between consecutive
pulses. In this case, subtracting the first pulse from the second does not yield a near-zero
result. The remaining signal from the moving target is then processed to determine
particular characteristics about the moving target, such as target speed and direction.
This method is called filtering, where zero- (or low-) Doppler frequency signals are
rejected but high-Doppler frequency signals are passed for further processing. There are
alternative MTI filters that process more than two pulses, but in general they are limited
to five pulses or fewer.
While MTI filters cancel the stationary land clutter, they do not provide good
performance against moving clutter like rain. They also do not provide an indication of
the moving target’s radial velocity. Such performance can be obtained using banks of
Doppler filters. Typical designs use cascaded filtering systems, where MTI is used to
24
ELECTRONIC FILING, RECEIVED, CLERK'S OFFICE, JANUARY 5, 2007
* * * * * PC #7 * * * * *
remove most of the very strong land clutter and banks of Doppler filters are used to
provide improved detection in rain and improve estimates of the target’s radial velocity.
With the development of digital technology in the mid-1970s, several versions of
this technique were developed and implemented in laboratories. By the late-1970s,
improved systems were developed and procured to replace the older radars then being
used for long-range air surveillance. A similar Doppler radar approach to address the
short-range air surveillance needs was also developed. This particular radar used an MTI
followed by a bank of specially weighted Doppler filters to provide near-optimum
detection of moving targets. It also employed a zero-Doppler filter that passed the land
clutter, but used a clutter map to float the detection threshold just above the land clutter
return. This clutter-map technique prevented the land clutter from being detected, but
provided “super clutter visibility,” the ability to detect stronger aircraft returns over areas
of weak stationary land clutter. This enhanced radar-processing technique was
subsequently called a “Moving Target Detector” (MTD) method. With the increased use
of digital hardware, modern radar signal processing could now create near-optimum
Doppler filters directly.
Doppler filters do have drawbacks and limitations. For instance, Doppler filters
also have side lobes analogous to the range side lobes in pulse compression waveforms.
Most current air defense radars are designed to use a low-Doppler side lobe weighting
such that the Doppler side lobes of one aircraft are below the noise level and do not
inhibit the detection of another aircraft in the same range cell. However, since the clutter
models used in the design and procurement of these radars did not provide any strong
moving-clutter sources, the Doppler side lobes of some of these radar filters will be
inadequate in the presence of strong moving clutter.
The output signals of the Doppler filters will still contain noise and clutter, as well
as targets. The detection and track initiation process is started when a detection threshold
is exceeded by one of the output signals. Since a radar has limited resources for
performing the detection process, it is desirable to limit the tracking processes initiated
by noise and clutter (false alarms) while allowing all target signals to cross the detection
threshold. Modern radars are designed with resources to handle a limited number of false
alarms and make use of processing that tries to float the detection threshold just above
the noise and clutter, but low enough to detect the presence of an aircraft target. This
processing is called Constant False Alarm Rate (CFAR) processing. The specific
objective of CFAR processing is to set the detection thresholds so that the radar can
successfully track the most challenging targets of interest while keeping false target
declarations (false alarms) due to noise and clutter at a constant but manageable rate.
The two figures of merit that are used to rate the detection ability of a radar are
probability of detection (P
d
) and probability of false alarm (P
fa
). Probability of detection
is the likelihood that a target is detected when a target is present. Probability of false
alarm is the likelihood that a target is detected when no target is present. Note that a third
option, the probability that a target is not detected when a target is present, is also
possible. This is called probability of miss (P
m
). Since P
m
is directly related to P
d
by the
equation:
, only probability of detection and the probability of false alarm are
required to specify CFAR performance.
P
m
#1"
P
d
25
ELECTRONIC FILING, RECEIVED, CLERK'S OFFICE, JANUARY 5, 2007
* * * * * PC #7 * * * * *
In the CFAR processing scheme, a constant P
fa
is established for the radar.
Typical values for P
fa
range from 10
-4
(1 false alarm in 10,000 samples) to 10
-6
(1 false
alarm in 1,000,000 samples). A typical cell-averaging CFAR routine uses values from
either the clutter map or the background averager to estimate the clutter and noise
background. The threshold for target detection is then set at a level above the average
background, based on the clutter and noise statistics, to ensure a very low probability that
a background signal will cross the threshold and be declared a target. This processing
does presume that all the received signal values have the same noise and clutter statistics
as the cell under test and that the values used to determine the threshold level do not
contain a target.
Target Declaration and Tracking
Once a detection threshold is crossed, the detection and track initiation process is
started. This involves the estimation of the detected signal’s range, azimuth, height,
Doppler velocity, and other features. This information is passed to a tracker as a target
file and the tracker prepares a filter to correlate this return with future returns to confirm
the presence of a valid target. Once a track has been established, the tracker can predict
the expected location of the target during the next scheduled beam in the target’s
direction and even instruct the radar to lower the detection threshold at the expected
range, azimuth, and elevation to provide a higher probability of detection.
The trackers used in modern air defense radars have a large, but still limited,
target-handling capability. Furthermore, multiple detections in the same range-azimuth-
elevation volume create problems with track integrity. Therefore, it is important to limit
the number and frequency of false alarms that are passed to the tracker. On the other
hand, the most important criterion for air defense radar systems is the ability to provide
an acceptable probability of detection, track initiation, and track maintenance for all
targets within a certain range and within a specific velocity window. If a new clutter
source is created that cannot be controlled by the radar’s filtering and CFAR processing,
target detection, track initiation, and track maintenance will be severely impaired in the
vicinity of that clutter source. Maintaining a low false-alarm rate at the expense of
sacrificing detection and tracking performance is not an acceptable option for air defense
radars.
4. CHARACTERISTICS OF WIND TURBINES APPLICABLE TO RADARS
Modern SOA “utility-class” wind turbines consist of three major elements, as
shown in Figure 16. The actual power-generating unit is located in a nacelle mounted at
the top of a vertical column. Most columns today are tapered hollow cylindrical
structures fabricated from steel. The height of the tower is, at times, adapted to the
specific site conditions where the turbine is to be located. Increasing tower height can
position the turbine blades in more favorable wind conditions but conversely can increase
construction costs. Table 1 provides representative tower heights for some common SOA
wind turbines. The towers of the wind turbines tested at Fenner, NY, were approximately
113 m tall. From the perspective of a radar, the tower will appear as a stationary reflector
with no Doppler.
26
ELECTRONIC FILING, RECEIVED, CLERK'S OFFICE, JANUARY 5, 2007
* * * * * PC #7 * * * * *
Tower
Nacell
Turbine Blade
Figure 16. Picture of SOA wind turbines located in Wales, UK
The nacelle houses the power generator. For the wind turbines at Fenner, NY, the
nacelle is approximately 10 m long, 4 m wide, and 3 m high. In SOA turbines, the nacelle
can rotate a full 360 degrees to enable the turbine blades to face into the wind and
provide maximum efficiency. Rotation rates for the nacelle tend to be relatively low.
Thus the nacelle will appear to the radar as a virtually stationary object even when
rotating. The nacelle housing may be fabricated from a metal or glass-reinforced plastic
(GRP) to reduce its weight. Materials such as GRP can be partially transparent to rf
waves. This means that some of the radar energy striking the nacelle surface can be
transmitted to and reflected by the components within the nacelle. Since the majority of
these internal components will also be nearly stationary (moving only when the nacelle
rotates) these internal reflections should have only a second-order impact with little
apparent Doppler.
The turbine blades are large, aerodynamically shaped structures that operate on
the same principle as the wing of an airplane. In accordance with Bernoulli’s Law, the
flow of air over the surface of the turbine blade creates a pressure differential due to
differences in flow path length. This pressure differential creates a net force which, in the
case of the turbine blades, causes them to rotate. In SOA turbines, the blade angle of
attack is usually computer controlled to maximize power production while maintaining
blade rotation rates within a relatively narrow range.
Typical SOA turbine blades are fabricated using GRP and can include surface-
mounted metal inserts and internal wiring for lightning protection as well as internal
damping systems to control blade vibration. Again, due to the partial transparency of
GRP, the internal elements within the blade can serve as secondary reflection sources for
radar waves.
Most SOA turbines, including those tested at Fenner, NY, are “upwind” designs.
In this arrangement, the nacelle rotates so that the blades always remain on the windward
side of the tower, thus providing the blades an undisturbed flow of air. As indicated in
Table 1, blade rotation rates generally fall within a speed range of approximately 10 to 20
27
ELECTRONIC FILING, RECEIVED, CLERK'S OFFICE, JANUARY 5, 2007
* * * * * PC #7 * * * * *
rpm. For the two GE systems listed in Table 1, tip velocities fall in the range of 40 to 80
m/s (78 to 158 knots). Faster rotation rates, and thus tip velocities, are generally avoided
to limit centripetal acceleration forces and to minimize generation of acoustic noise.
The significant physical size of the turbine blades results in a substantial RCS
target irrespective of whether the blades are viewed face on or edge on by a radar. The tip
velocities for these blades fall within a speed range applicable to aircraft. Consequently,
the turbine blades will appear to a radar as a “moving” target of significant size if they
are within the radar line of sight. The following section provides specific technical data
on the RCS and Doppler characteristics for a 1.5 MW wind turbine based on field testing
conducted at Fenner, NY, in May 2006.
DOD-Sponsored Field Testing of an SOA Wind Turbine
The first comprehensive effort to measure the RCS and Doppler characteristics of
an SOA wind turbine reported in the literature [5] was performed by QinetiQ, a research
organization in the UK. Sponsored by the UK Department of Trade and Industry, QinetiQ
performed analytic modeling, compact range (scale model) tests, and actual field
measurements of SOA turbines under that effort. QinetiQ’s results documented that SOA
wind turbines possess a significant RCS signature and create Doppler frequency shifts
that will impact the ability of a radar to distinguish them from actual aircraft.
While this report provided important insights, the field test data were taken at
only a single frequency, 3.0 GHz (S-band), with only the upper portion of the tower in
the line of sight and at just one look-up angle. It also did not measure behavior when two
or more turbines were in the line of sight to determine whether or not effects added in a
linear manner. Instead, QinetiQ employed compact range testing and analytic models to
evaluate some of these other factors. However, it is well recognized that compact range
testing is very difficult to perform accurately for such large structures due to the difficulty
in replicating fine details at the extremely large scaling factors that are required. Thus,
their ability to predict with confidence behavior for other commonly employed radar
bands is limited. Finally, all the QinetiQ data were only available in the form of charts
and tables. This format is useful in describing behavior but inadequate as a source of data
to directly insert into radar performance models.
Consequently, the Department, as part of this study, undertook an effort to create
a digital database of actual radar signatures for an SOA wind turbine for all of the
common radar bands. This testing was performed using the Air Force Research
Laboratory’s (AFRL) Mobile Diagnostic Laboratory (MDL) (Figure 17). The MDL is an
SOA radar signature measurement and characterization van. It has been in use since 1997
to measure the radar reflectivity of aircraft (B-2, F/A-22) and, recently, to characterize
the Space Shuttle Orbiter Discovery for susceptibility to radar interference prior to
returning to space. It is currently certified to perform radar measurements to the most
stringent national standards, ANSI-Z-540-1994-1.
28
ELECTRONIC FILING, RECEIVED, CLERK'S OFFICE, JANUARY 5, 2007
* * * * * PC #7 * * * * *
.
Figure 17. AFRL Mobile Diagnostics Laboratory measuring wind turbines at Fenner,
NY
The wind farm at Fenner, NY, was selected for the testing site because it
contained 20 modern GE 1.5 MW wind turbines, was located in close proximity to the
AFRL Rome Research Site, included both locally flat and rolling terrain combinations
typical of many proposed U.S. wind farms, and had co-located GE personnel. The
cooperation of GE in providing access to turbine operating data during the test period was
vital to the success of the measurement campaign and is gratefully acknowledged. Figure
18 provides a map of the overall layout of the wind farm at Fenner, NY, with red circles
employed to indicate the turbines measured during the testing.
RCS and Doppler characteristics were obtained for a total of 10 different wind
turbines tested during the 10-day test window from 29 April 2006 through 9 May 2006. A
total of 479 individual calibrated measurements of turbines at L-, S-, C-, and X-bands
*
for both horizontal and vertical polarization were obtained. Figure 19 provides a
graphical representation of the data obtained as a function of the approximate radar
aspect angle to the axis of the turbine and radar frequency band (L-band: blue, S-band:
yellow, C-band: green, X-band: orange).
The test procedures, samples of test data, and calibration methodology are
documented in a report [6]. The full data set, in a digital format directly employable in
radar analysis routines, has been made available to U.S. radar contractors and
government-sponsored researchers.
*
The test frequencies used for these bands were 1.3 GHz, 3.3 GHz, 6.8 GHz and 9.7 GHz, respectively
29
ELECTRONIC FILING, RECEIVED, CLERK'S OFFICE, JANUARY 5, 2007
* * * * * PC #7 * * * * *
Figure 18. Layout of the wind farm at Fenner, NY, and locations of the turbines tested
Vertical Polarization
Horizontal Polarization
Figure 19. Graphical representation of data obtained during field tests at Fenner, NY
Figure 20 provides one example of the actual measured Doppler characteristics
for one of these turbines. These particular results were obtained at L-band, observing the
turbine blades almost edge on. Each positive peak represents the Doppler behavior as
each blade rotates into the line of sight while moving toward the top of its arc of rotation.
The negative peak that follows is produced by the change in Doppler shift as the blade
passes below the center of rotation and begins to move away from the radar.
Although difficult to see in this illustration, there is also a second, fainter return at
twice the apparent maximum Doppler shift. This signifies a “multi-bounce” reflection of
the radar wave. Multi-bounce of this nature occurs when the radar wave is reflected off
two different surfaces with relative velocity to one another before it returns to the radar
receiver. In the case of wind turbines, multi-bounce can occur, for example, when a radar
30
ELECTRONIC FILING, RECEIVED, CLERK'S OFFICE, JANUARY 5, 2007
* * * * * PC #7 * * * * *
wave is reflected by the turbine blade, then the turbine tower, and then again by the blade
before returning to the radar.
Horizontal Polarization
Vertical Polarization
Figure 20. Example of Doppler characteristics of a wind turbine at L-band
Figures 21 and 22 provide graphical summaries of the RCS and “apparent
velocities,” as deduced from Doppler-frequency shifts, for some select cases. The RCS
values indicated on Figure 21 are dominated by the tower and nacelle at the lower look-
up angles. However, at the larger look-up angles, where scattering from the rotating
blades dominates, the RCS values are comparable to or greater than typical RCS values
for aircraft. As mentioned earlier, a full summary of test results are provided in [6].
Figure 21. Graphical summary of RCS measurements for L-, C-, S-, and X-bands
31
ELECTRONIC FILING, RECEIVED, CLERK'S OFFICE, JANUARY 5, 2007
* * * * * PC #7 * * * * *
Figure 22. Doppler frequencies and derived tip velocities from measurements at L-, C-,
S-, and X-band frequencies
5. OBSERVATIONS OF IMPACTS ON RADAR SYSTEMS
During the past several years there has been an increased effort to explore and
document impacts that wind turbines have on operational air defense and ATC radar
systems. This has been a direct result of the increase in the number of wind farms
already built, the number of wind farms now being proposed for construction, and the
number of wind turbines included in these wind farms, as well as the dramatic increase in
their physical size. The first documented structured flight trials and analyses of these
potential impacts were conducted by the UK Ministry of Defence (MoD) in 1994 [7].
This set of trials conducted ground measurements and flight trials using an ATC radar
located near a small wind turbine farm. Starting in 2004 and continuing through this
year, the UK MoD has sponsored an extensive series of subsequent trials employing both
mobile air defense and ATC radar systems placed within a radar line of sight of several
wind farms. Behavior observed during the UK tests correlates well with observations
made at an operational U.S. long-range air defense radar site where wind farms have been
constructed within radar line of sight.
United Kingdom Flight Trials and Analyses
The 1994 trials undertaken by the UK MoD were conducted to understand the
characteristics and impacts of the radar interference observed immediately following
construction of a wind farm consisting of fourteen 300 kW wind turbines located about 7
km away and in the radar line of sight of a Watchman ATC radar. The significant
interference that was being observed in the radar primary surveillance mode of operation
had led to a degradation in detection performance.
This was a relatively small-scale trial that involved flying a Sea King Helicopter
over and around the wind turbines. This trial was structured to focus on the shadowing
32
ELECTRONIC FILING, RECEIVED, CLERK'S OFFICE, JANUARY 5, 2007
* * * * * PC #7 * * * * *
effect that the turbines could have on targets just above or behind the wind farm, to
estimate the RCS of the turbines and to investigate the Doppler shift they would produce.
The primary conclusion of that study [7] was
Wind turbines cause interference to primary surveillance radars. The responses appear
as valid targets on the radar display. Responses cannot be inhibited using normal MTI
based techniques since they are generated by a moving structure.
As a result of the trial, the MoD decided it needed to be consulted on all proposals
for wind turbines closer than 60% of the maximum instrumented range of military radars.
This 60% range was translated to be within 66 km (35.6 nmi) of an ATC radar and within
74 km (40 nmi) of an air defense radar.
*
In 2004, the policy of carefully scrutinizing wind turbine proposals so far away
from operational radars was increasingly being questioned by wind farm developers,
especially in light of much less restrictive constraints imposed by other European
countries. Consequently, the UK MoD commissioned additional studies to ascertain the
impact of wind farms on air defense and ATC radar systems in more detail. The studies
were conducted in 2004 and 2005 by the Air Command and Control Operational
Evaluation Unit (Air C2 OEU)
**
of the Royal Air Force (RAF) Air Warfare Centre
(AWC). Details of the flight trials, results, and recommendations are presented in the
three RAF reports completed in 2005 [8,9,10].
The first of these trials took place over two periods, 28–29 August 2004 and 14–
16 September 2004.
***
Several different types of aircraft (Hawk T Mk 1A, Tucano T Mk
1, Dominie T Mk 1A, and a King Air) flew sorties over and around two wind farms
within the radar line of sight of a mobile Commander AR327 - Type 101 air defense
radar (Figure 23). The study observed shadowing (masking the target when directly
behind the wind farm), clutter (unwanted primary radar returns), and tracking
interference (inability of the system to initiate and maintain a track on a target aircraft
because of the shadowing and clutter effects). Observations during the trial showed
significant obscuration of primary radar returns above wind turbines. This effect was
observed independent of the height of the aircraft throughout the full height range used
for the trial (2000 ft - 24,000 ft above mean sea level) and represented the most
significant operational effect of wind turbine farms on air defense operations. Figure 24,
for example, provides a representative result from this trial. In this figure, the blue circles
denote where both the primary radar return and the SSR return agreed on the position of
the test aircraft. The purple diamonds denote where the location of the plane could be
determined by SSR but was not detected by the primary radar. The yellow dots denote
other returns by the primary radar that do not correspond to an actual aircraft.
*
The origin of the 74 km threshold is not clear since it is significantly less than the 60% maximum
instrumented range of a typical air defense radar.
**
Designation of this group was recently changed to Air Command and Control, Intelligence, Surveillance
and Reconnaissance Operational Evaluation Unit (Air C2ISR OEU).
***
Hereafter referred to as the Fall 2004 trial
33
ELECTRONIC FILING, RECEIVED, CLERK'S OFFICE, JANUARY 5, 2007
* * * * * PC #7 * * * * *
Figure 23. Commander AR327 - Type 101 air defense radar
Tucano at 2000'
-4
-2
0
2
4
6
8
10
12
-50
-40
-30
-20
-10
0
Combined
SSR
Primary
Figure 24. Example of data obtained during Fall 2004 flight trial
These results provided incontrovertible evidence that the ability to track aircraft
by primary radar return alone was degraded over wind farms. In addition, it revealed that
numerous false primary radar returns were occurring over the wind farm. Finally, it was
found that the degradation in ability to track aircraft and the appearance of false returns
occurred at all altitudes. This was an unanticipated result as the Type 101 radar is a multi-
beam phased-array radar with separate beams employed to cover specific altitude regions.
The specific conclusions of the report [8] on this trial included, in part:
Overall, the Trial established that there is a significant operational impact of wind
turbines in line of sight of AD (Air Defense) radars. This effect was independent of
radar to turbine range and aircraft height. Where a target aircraft does not squawk SSR
it is highly likely that the associated track would drift when the aircraft overflies a wind
turbine farm or flies through the shadow area. Provided that the aircraft does not
manoeuvre and the track is not seduced then the system should resume normal tracking
as soon as primary radar returns are available. The existing MoD guideline safe-range
for wind turbine farms of 74 km from AD radar when in line of sight was deemed to be
irrelevant. Line of sight was assessed to be the only relevant criterion when considering
objections to wind farm development.
As a result of this trial, the MoD replaced the 66 km and 74 km thresholds with a
requirement for consultation on all wind development proposals within the radar line of
sight of an air defense or ATC radar, regardless of distance.
34
ELECTRONIC FILING, RECEIVED, CLERK'S OFFICE, JANUARY 5, 2007
* * * * * PC #7 * * * * *
The second of these studies was conducted over three separate periods, 3–4
November 2004, 23–25 November 2004, and 13–14 December 2004. This trial was very
similar to the Fall 2004 trial described above but was intended to determine the effect that
wind turbine farms had on ATC radars. As in the prior trial, several aircraft types (Hawk
T Mk 1A, Tucano T Mk 1, Dominie T Mk 1A, Griffin HT1, and Gazelle AH Mk 1) flew
sorties over and around several wind farms within the radar line of sight of a mobile
Watchman ATC radar. This trial confirmed the presence of shadowing effects for the
Watchman. Also, throughout the trial, clutter was displayed to the operator as a result of
the rotation of the turbines blades. This displayed clutter was assessed as highly
detrimental to the safe provision of air traffic services.
The third trial took place from 29 March 2005 through 8 April 2005 (Spring 2005
trial). This trial looked in greater detail at the obscuration above wind farms that was
observed in the Type 101 air defense radar employed in Fall 2004 trial. Again, several
different aircraft types (Hawk T Mk 1A, Tucano T Mk 1, and Dominie T Mk 1A) were
flown over wind turbine farms within the radar line of sight of a Type 101 air defense
radar. The results of this trial supported the theories formed as a result of the previous
trials and increased understanding of the causes for the loss of detection of aircraft above
wind farms.
Specifically, these tests demonstrated that the clutter produced by wind turbines
directly impacted the performance of not only the “ground” (lowest elevation) lobe of the
radar but also the shared aloft clutter map and the side lobe beams with line of sight to the
turbines. Figure 25 illustrates a small section of the clutter cells for this radar as measured
during the trial. The designation of the types of radar returns employed in this figure are
identical to those employed in Figure 24.
0
0.5
1
1.5
2
2.5
3
3.5
4
4.5
5
-36
-35
-34
-33
-32
-31
-30
-29
-28
-27
A1
A1
A1
A0
B1
B1
Prim ary
B1
SSR
B0
Com bined
Clutter Cells
Figure 25. Sector of clutter cells superimposed on flight trial data obtained during Spring
2005 flight trial
As a result of the understanding and insights gained from these trials, the MoD
and a few defense contractors conceived some potential mitigation concepts to reduce the
problem of target obscuration about wind farms. Two additional studies were performed
in May and June of this year to examine these mitigation concepts for 2-D radars in more
detail. The concepts and trial results will be discussed in more detail in Section 6 of this
report.
35
ELECTRONIC FILING, RECEIVED, CLERK'S OFFICE, JANUARY 5, 2007
* * * * * PC #7 * * * * *
The results presented in the UK reports clearly demonstrate degradation in the
target detection and tracking performance of the primary radar for air defense and ATC
radar systems. These flight trials constitute a reasonable set of operational tests to enable
identification of the probable failure mechanisms when combined (as these were) with
post-trial analyses. However, since by their very nature, they can only include a limited
number of flight sorties, aircraft types, variety of deceptive maneuvers employed, and
other relevant factors, they do not provide a sufficiently robust statistical database to
enable quantitative computations to be performed in terms of actual reduction in
probability of detection, increase in probability of loss of track, and increase in
probability of false alarms. Only analytic tools able to incorporate wind turbine behavior
as part of their input can accomplish that task. Such tools are currently unavailable.
Observations of Wind Turbine Impacts on U.S. Operational Radars
The testing described in the preceding section involved only UK radar systems.
Those tests demonstrated that wind farms would disrupt the ability to track aircraft using
only primary radar returns through two distinct phenomena. The first was that the
presence of a number of turbines within a limited zone would produce shadowing due to
diffraction effects. This is expected based on well-established physics principles. The
second disruption was due to increasing clutter levels, which adversely impacted the
clutter cell threshold levels and background average performance in ways that inhibited
the ability of the radar to distinguish aircraft from that clutter. From a behavioral
perspective, the UK systems operate on the same basic principles as U.S. air defense and
ATC radars. Thus, it would be reasonable to expect that similar performance degradation
would occur for U.S. systems.
There have been two limited opportunities where DOD has been able to obtain
some data from testing of operational U.S. long-range air defense radars to investigate
this question. These were at King Mountain, TX, in 2002 and Tyler, MN, in 2004.
Results from both of these are described in the following sections.
Testing Performed at King Mountain, TX
King Mountain, TX, provided a fledgling opportunity for a U.S. radar
optimization team to explore performance of an air defense long-range radar before and
after construction of a wind farm within the radar line of sight. Upon learning that a very
large wind farm was proposed for construction within the radar line of sight of the Air
Route Surveillance Radar-4 (ARSR-4) radar located at King Mountain, TX, a joint team
from the USAF 84
th
Radar Evaluation Squadron (84
th
RADES) and the Federal Aviation
Administration (FAA) conducted a very limited number of flight tests before and after
partial construction of the wind farm. The ARSR-4 is a modern long-range radar with
sophisticated clutter-control automation.
The wind farm proposed for construction was to consist of 214 1.3 MW turbines
arranged in several nearly linear groups at distances running from 7 to 20 nmi from the
radar over an azimuth sector spanning from 80 to 180 degrees with respect to north.
Figure 26 provides a topographical view of the relative locations of those turbines with
respect to the King Mountain radar. Approximately 80 of the 214 proposed turbines had
been installed at the time that the second set of flight tests was performed.
36
ELECTRONIC FILING, RECEIVED, CLERK'S OFFICE, JANUARY 5, 2007
* * * * * PC #7 * * * * *
King Mountain
Radar
Wind
Turbines
King Mountain
Radar
Wind
Turbines
Figure 26. Location of wind turbines with respect to ARSR-4 radar at King Mountain
The U.S. team decided to employ tangential flight paths 50 nmi and 175 nmi
away from the radar. Thus, the test aircraft were 30 to 155 nmi away from the turbine
closest to the flight paths. These flight paths had been selected because the team had
anticipated that the primary impact of the wind turbines would be shadowing and that this
effect would extend a considerable distance beyond the turbines.
At the time of this “first of its kind” U.S. field test, the U.S. team was not aware
of the 1994 flight trials that had been conducted by the UK MoD. Thus, they were not
able to benefit from the insights provided by the UK data or to incorporate lessons
learned during the UK tests in the development of their plans. The unfortunate
consequence was that the very few dedicated flight trials they had funding to perform
were too distant from the turbines to assess actual impacts. As indicated in Figure 6 and
demonstrated in the 2004 and 2005 UK flight trials, shadowing is an effect that is
localized to the vicinity around a wind farm. Additionally, the UK flight trials revealed
that the predominant impact of a wind farm is to the increase clutter levels in the clutter
cells around their location, thereby artificially raising detection and tracking thresholds as
well as producing false target returns. By their very nature, the distant tangential flight
paths employed in the King Mountain tests did not result in the aircraft flying even near
those clutter cells containing the wind turbines and thus would never reveal this type of
impact.
Not surprisingly, these shortfalls in the testing methodology employed at King
Mountain led the team to erroneously conclude that wind turbines in the radar line of
sight would not adversely impact radar performance [11]. In actuality, the most that
37
ELECTRONIC FILING, RECEIVED, CLERK'S OFFICE, JANUARY 5, 2007
* * * * * PC #7 * * * * *
might be concluded from those tests was that wind farm impacts on the ability of a ra
to track objects at significant distances beyond the wind farm are slight. Results obtained
from flight testing at Tyler, MN, would, however, lead to different conclusions regarding
impacts of wind farms on radar performance.
Testing Performed at Tyler, MN
dar
ES and the FAA performed a radar evaluation and
optimiz
r.
re 27. Picture of wind turbines and ARSR-2 radar at Tyler, MN
During the radar evaluation and optim zation process, the team found that
signific
evated
er
track low
dedicated flights were conducted after the radar had been optimized to
evaluat
m
R
In April 2004, the 84
th
RAD
ation of the ARSR-2 radar at Tyler, MN [12]. Upon arriving at the site, the team
discovered that several hundred wind turbines had been built within a 30 nmi radius
along a ridge line running approximately North-West (NW) to South-East (SE). The
Tyler ARSR-2 is also located on this ridge line. Thus the wind farm straddled the rada
The closest turbine was approximately 0.75 nmi from the radar. Figure 27 is a picture of
a portion of that wind farm taken from the platform where the radar is mounted. Figure
28 provides a topographical view of the relative locations of the majority of the turbines
with respect to the Tyler radar.
Radar
Platform
Railing
Figu
i
ant “constraints” had to be put in place in the radar to compensate for the el
clutter levels created by the wind turbines. The constraints employed required that a
target was not declared unless a predefined number of sequential positive returns had
been observed. This is also known as a runlength discriminator. When employed, a
typical constraint number is on the order of ten to sixteen sequential returns. The Tyl
radar constraint had to be set at 21 for ranges from 0 to 15 nmi and at 18 for distances
from 15 to 25 nmi to retain some useful capability. Use of such high runlength
discriminators severely degrades radar performance; in particular, the ability to
RCS targets.
A few
e its performance. One flight path used in these tests was approximately in the
North-North-East direction and thus at an offset angle of approximately 70 degrees fro
the axis of the wind farm. Track 5 in Figure 29 demonstrates the degraded performance
of the radar on April 20, 2004, when unfavorable weather conditions existed. The green
segments of this track denote the portions of that flight track where the position of the
aircraft determined from the primary radar return matched the position given by the SS
38
ELECTRONIC FILING, RECEIVED, CLERK'S OFFICE, JANUARY 5, 2007
* * * * * PC #7 * * * * *
system (beacon). The red portions of that track indicate where primary radar return was
lost and aircraft position could only be determined by beacon.
Figure 28. Location of wind turbines with respect to ARSR-2 radar at Tyler
at Tyler, MN
weathe
tter impacts observed at Tyler, MN, are consistent with the behavior
observed in the multiple flight trials conducted by the UK in 2004 and 2005. Specifically,
Figure 29. Tracking performance of ARSR-2 radar over wind fa
Lear 35
6800 ft MSL
rm
In contrast, Track 9, flown on April 21, 2004, when there were no unfavorable
r conditions, demonstrates a more typical level of performance expected for such
an air defense radar. There is a small segment of lost track capability for Track 9 when
the aircraft is very close to the radar. This track loss was attributable to the imposed
constraints.
The clu
39
ELECTRONIC FILING, RECEIVED, CLERK'S OFFICE, JANUARY 5, 2007
* * * * * PC #7 * * * * *
the rad
ing
posed to accommodate wind farm induced clutter for at least this
particu
ind
number of other U.S. radar systems
here are no “problems” being
o
radars sometimes mentioned in this context are space
oth
g
l
e that a large wind farm in the radar line of sight does
cause s
biguously detect and
ion and tracking
space.
mercial and general aviation sectors. The
FAA has the responsibility to provide for and promote the safe and efficient use of U.S.
ar experienced elevated clutter levels in the NW and SE directions correspond
to the locations of the wind turbines. Since the Tyler radar is an operational radar,
constraints, desensitizing the radar, needed to be imposed to retain a degree of acceptable
functionality.
The Tyler flight tests also revealed a collateral impact when constraints of such
magnitude are im
lar radar. Specifically, aircraft tracking capability in the presence of adverse
weather conditions will be degraded even for flight paths not along the axis of the w
farm. This indicates that remedial measures employed to mitigate one challenge can
create other forms of degradation.
Other Observations About U.S. Radar Systems
It has been noted by some individuals that a
have wind farms within their radar line of sight yet t
reported for them. As such, the question is raised as to why some air defense radars are s
prone to this and others are not.
In point of fact, those other radars with line of sight to large wind farms are
generally ATC radars. Two other
surveillance radars employed to monitor objects in space. ATC radars can rely on b
primary radar returns and SSR (beacon) returns to ensure safe airspace operations. As
Figure 29 and the UK flight trials demonstrates, the presence of a wind farm does not
appear to significantly affect the performance of SSR systems. This is not surprising
since SSR systems are actually two-way communications systems between the “trackin
radar” and the aircraft. As described earlier, the SSR unit sends out an “interrogation”
pulse to the aircraft. The aircraft transponder then replies with its own independent signal
to the SSR. Note that even the UK flight trials relied on SSR returns to document actua
aircraft positions during the tests.
The DOD has obtained proprietary information for at least one U.S. ATC radar
that provides documentary evidenc
ignificant loss of primary radar tracking capability for aircraft flying over that
wind farm. Unfortunately, due to the proprietary nature of that data, the Department is
legally prohibited from publicly sharing that information.
Comments Regarding Air Traffic Control and Weather Radars
Air defense and missile warning radars must be able to unam
track all objects of interest by primary radar alone. Thus, these detect
capabilities must be maintained whether or not the object being observed is “cooperative”
in sense of providing SSR signals. This requirement is distinctly different than the
primary radar tracking capability that may be required for an ATC radar. ATC primary
radars are only one element of a system employed to ensure safe use of the U.S. air
Other elements of this system include use of SSR, flight rules, and published approach
and departure procedures, to name a few.
The Department is but one of a number of users of U.S. airspace in this regard,
sharing that use with others such as the com
40
ELECTRONIC FILING, RECEIVED, CLERK'S OFFICE, JANUARY 5, 2007
* * * * * PC #7 * * * * *
airspace. Since ATC radars are an integral contributor to that overarching mission, the
Department does not believe it would be appropriate to independently evaluate how th
presence of wind farms in the radar line of sight of those ATC radar could influence the
air traffic management system. Instead, the Department is prepared, as one of multiple
stakeholders, to work with the FAA in such evaluations and, as appropriate, develop
mitigation approaches that would be mutually applicable to air defense and ATC radars.
In a similar manner, the National Weather Service of the National Oceanic and
Atmospheric Administration (NOAA/NWS) has the primary responsibility to provide
weather forecasts for the United States. These weather forecasts do, in part, depend upon
e
A/NWS
r
f potential mitigation approaches
rse impacts wind turbines can have
air defense and missile warning radars. For the purposes of this section, the word
mitiga
been
wing
rs
t be affected by objects that do not appear
l circumstances exist. With respect to objects
e earth, such as wind turbines, radar line of sight
e
sest
proper operation of the WSR-88D (NEXRAD) system of weather radars. The
Atmospheric Radar Research Center at Oklahoma University (http://arrl.ou.edu) is
currently conducting studies to examine potential impacts of wind turbines on ground-
based weather radars for NOAA/NWS. As such, the Department defers to NOA
regarding assessment of potential impacts of wind turbines on ground-based weathe
radars. The Department, as a consumer of their product, is prepared to assist
NOAA/NWS in development of mitigation measures where they have mutual
applicability for air defense and missile warning radars.
6. POTENTIAL MITIGATION APPROACHES
The following sections will describe a number o
that could be employed to reduce or eliminate the adve
on
“
tion” is specifically defined to include either an approach that completely prevents
any negative impact from occurring or an approach that sufficiently attenuates any
negative impacts so that there is no significant influence on the capability of an air
defense or missile warning radar. Additionally, it is noted that the ability to describe a
technique as a potential mitigation is not equivalent to saying that this technique has
tested and verified. Significantly, only a few of the techniques described in the follo
sections have been proven to actually work and can be employed today. All of the othe
are best characterized as “works in progress” still requiring further development and field
or analytic validation of effectiveness.
Line of Sight Mitigation Techniques
The performance of a radar will no
within its line of sight unless exceptiona
projecting upward from the surface of th
is determined by four factors when there is no intervening terrain. These factors are th
height of the focal point of the radar above the earth’s surface, the height of the wind
turbine, its distance from the radar, and how much the atmosphere will refract the radar
beam. Figure 30 illustrates how these parameters interact. The yellow zone outlines the
portion of the airspace that will be in the radar line of sight. Thus, the two turbines clo
to the radar are in the radar line of sight. The third turbine, on the far right-hand side, is
not. In fact, in colloquial terminology, this particular turbine would be described as being
“below the radar.”
41
ELECTRONIC FILING, RECEIVED, CLERK'S OFFICE, JANUARY 5, 2007
* * * * * PC #7 * * * * *
Atmospheric refraction of the radar beam is indicated by the dashed curved line a
the bottom of the yellow zone. Note that the curvature of the earth influences the line of
sight. As an estimati
t
ng rule (described in an earlier section of this report), radar engineers
often u
n approach
Figure 4 illustrated the basic geom
near the
rovides
n illustrative set of results that would be obtained using this method for the particular
situatio
of
e
radar li
f
se a “4/3rds earth” approximation to account for the effect of atmospheric
refraction near the surface of the earth. When doing this, they multiply the radius of the
earth by the factor 4/3 when performing the tangent line calculation to determine if an
object is in a radar line of sight.
Figure 30. Illustration of “bald earth” line-of-sight mitigatio
etry employed to estimate radar line of sight
surface of the earth when using this approximation technique. Figure 31 p
a
n where the focal point of the radar is approximately 50 ft above the local
elevation of the surrounding terrain. Note that in this case, a turbine where the tip of the
blade at the apex of the arc of rotation is less than 300 ft above the local terrain elevation
would need to be approximately 30 nmi away from the radar to be out of the radar line
sight. Turbines with lower peak elevations could be closer whereas those with blades
extending higher would need to be farther away. This is a proven method of mitigation.
Figure 32 illustrates a line of sight mitigation when there is elevated terrain
located between the radar and the wind turbines. This form of mitigation is sometimes
called “terrain masking.” Note that here only the turbine closest to the radar will be in th
ne of sight. The turbine in the middle of the drawing is no longer in the line o
sight due to the “masking” effect provided by the intervening terrain. The third turbine,
on the far right, is not in the line of sight due to both terrain masking and distance from
the radar.
42
ELECTRONIC FILING, RECEIVED, CLERK'S OFFICE, JANUARY 5, 2007
* * * * * PC #7 * * * * *
20
25
35
30
40
Figure 31. Illustrative results of line of sight distance offsets using a “bald earth”
approach
Figure 32. Illustration of “terrain masking” line of sight mitigation approach
Unlike the “bald earth” approach, there is no simple “back of the envelope”
metho
item
from a radar line of sight. In general, “beam propagation” techniques used in conjunction
with te in elevation databases must be employed to determine if this form of mitigation
will ap
d to quickly estimate whether or not intervening elevated terrain will mask an
rra
ply. Figure 33 illustrates this type of analysis. This particular analysis was
performed to determine if the wind turbines at Fenner, NY, would be within the radar line
of sight of the research radar located at the AFRL Rome Research Site. In that case, the
intervening terrain was very close to completely masking the wind turbines.
150
200
250
300
350
400
450
500
Max Blade Tip Height Above Ground (ft)
R
a
d
a
r
T
o
T
u
r
b
i
n
e
D
i
s
t
a
n
c
e
(
n
.
m
i
)
20
25
35
30
40
Beyond
Line of Sight
Within
Line of Sight
50 ft High Radar
Bald Earth
ILLUSTRATATIVE ONLY
150
200
250
300
350
400
450
500
Max Blade Tip Height Above Ground (ft)
R
a
d
a
r
T
o
T
u
r
b
i
n
e
D
i
s
t
a
n
c
e
(
n
.
m
i
)
20
25
35
30
40
115500
220000
225500
330000
335500
440000
445500
550000
Max Blade Tip Height Above Ground (ft)
R
a
d
a
r
T
o
T
u
r
b
i
n
e
D
i
s
t
a
n
c
e
(
n
.
m
i
)
ILLUSTRATATIVE ONLY
Beyond
Line of Sight
50 ft High Radar
Bald Earth
Within
Line of Sight
43
ELECTRONIC FILING, RECEIVED, CLERK'S OFFICE, JANUARY 5, 2007
* * * * * PC #7 * * * * *
Figure 33. Illustration of “beam propagation” analysis to evaluate “terrain masking”
m
be expl
e
on of the
wind tu
t
used
artially in the line of sight of the radar. This raises the question of whether a
portion
a
ures.
nt
ected into digital processors of modern operational radars. This enables
assessm
to assess
uld
While not difficult to perform, these computations can be time consuming when
ultiple sites must be evaluated. This method is a proven mitigation technique and may
oited, in select cases, to allow wind turbines to be constructed closer to air defens
and missile warning radars than what the “bald earth” approach would permit.
“Terrain relief”, a variant of the “terrain masking” mitigation approach, can be
employed when the elevation of the radar is significantly greater than the elevati
rbines. An example would be a radar located on a mountain ridge overlooking a
valley that contained wind turbines. Those wind turbines, provided they are not located
within either the main lobe or any side lobes of the radar, would not impact radar
performance. Effectively, this is an alternative methodology to keep the wind turbines ou
of the radar line of sight. This is another effective mitigation technique that can be
today.
Returning to Figure 30, it can be noted that the middle turbine in that illustration
is only p
of a wind turbine could be in the radar line of sight without causing significant
degradation in radar performance. Analytic models able to predict the radar signature of
partially visible turbine and simulation tools capable of artificially injecting such
signatures into operational radar processors would be needed to evaluate this potential
mitigation concept. Software routines have been developed to predict radar signat
These can be employed to develop appropriate models for wind turbines. The Departme
already has an effort underway to develop just such a model for the wind turbines tested
at Fenner, NY.
Software routines also have been developed to enable aircraft radar signatures to
be artificially inj
ents of the ability of that radar to detect and track aircraft under “real world”
clutter and other environmental conditions. Following this paradigm, the Department has
also initiated an effort to explore the feasibility of adapting such an approach to
determine if representative wind turbine generated clutter could also be artificially
injected. If such a methodology can be developed, it would enable air defenders
to what extent a wind farm proposed for construction within a radar line of sight wo
affect the probability of detection and the probability of false alarm for that radar. These
are the critical factors air defenders must know to determine if a proposed wind farm in a
radar line of sight would create an unacceptable degradation in their capabilities.
44
ELECTRONIC FILING, RECEIVED, CLERK'S OFFICE, JANUARY 5, 2007
* * * * * PC #7 * * * * *
Until such models and tools are available, the potential mitigation approach of
partially masking turbines must be categorized as unproven, requiring further
development and validation testing.
Wind Turbine Radar Signature Suppression Concepts
The development and deployment of radar signature suppression technologies for
military aircraft naturally leads to the question of whether or not a similar approach could
be employed to suppress the radar signature of a wind turbine. An excellent discussion of
a number of techniques that might be employed to accomplish this is available in a report
prepared by Alenia Marconi Systems Limited in 2003 [13]. Thus, they are not discussed
in detail here. Instead, two key points are noted.
First, as indicated in Figure 7, the RCS of an SOA utility-class wind turbine can
exceed that of a long-haul wide-body commercial airliner such as the Boeing 747. The
RCS of such an item would have to be reduced by 30 to 40 dB to be “relatively invisible”
to most air defense and missile warning radars. This is equivalent to reductions on the
order of 1/1000 to 1/10,000 of current RCS values. While lesser reductions in RCS may
be beneficial, the absence of tools to enable RCS clutter values for wind farms employing
suppressed signatures to be injected into radar processors means that there is no current
capability to assess how effective this would be.
The second point is that such radar signature suppression methods generally
require modifications to the shape of objects and use of special materials in their
construction. Some of these may be relatively cost neutral for a wind farm developer. For
example, increasing the angle of taper of the turbine tower will reduce its RCS and be
unlikely to result in a significant change in cost. Use of a radar-absorbing material in the
construction of the turbine blades, on the other hand, will significantly increase both first
and life cycle costs as these materials are more expensive to procure and less weather
durable than the GRP currently used.
As such, this approach ultimately becomes a cost-trade issue for the wind turbine
manufacturer and the wind farm developer. Specifically, would the increase in costs to
use radar suppression signature techniques counterbalance the possible increases in
transmission line costs and losses resulting from locating those turbines a greater distance
from an air defense or missile warning radar? Questions such as these should be
addressed by the wind turbine industry and not the Department. To date, radar signature
suppression techniques for SOA utility-class wind turbines have not been employed or
field tested.
Thus, this potential mitigation approach must be categorized as unproven,
requiring further development and validation testing.
Concepts for Radar Hardware/Software Modifications
A variety of approaches have been suggested for both hardware and software
modifications to radars that would reduce their sensitivity to wind farm generated clutter.
These include use of finer clutter cells, use of more and/or adaptive Doppler filters, use of
special post-processor track file maintenance routines to prevent track drops, use of
enhanced adaptive-detection algorithms, and use of special clutter suppression algorithms
developed for other applications.
45
ELECTRONIC FILING, RECEIVED, CLERK'S OFFICE, JANUARY 5, 2007
* * * * * PC #7 * * * * *
There is ongoing development work on some of these approaches being
conducted by the radar industry under internal research and development efforts. In most
cases, this work is focused on developing enhancements for existing products. Outputs
from some of these development activities are being tested in “engineering” units, but to
date none appear to have been deployed into operational units.
The Department is supporting these efforts by providing U.S. radar companies
access to, and free use of, the database the Department obtained from the testing efforts
conducted at Fenner, NY. In fact, this government-owned nonproprietary database was
created for this specific purpose.
In May and June of this year, the UK MoD conducted independent flight trials of
two proposed approaches developed for 2-D radars. Representatives from the Department
were invited to, and did observe, portions of those trials. The impression of the
Department’s observers was that both approaches showed promise, but neither was fully
successful.
Consequently, as a result of the above, it is concluded that all of the hardware and
software approaches described above must still be categorized as unproven, requiring
further development and validation testing.
Concepts for Gap Filler Mitigation Approaches
The underlying idea for this concept is exceptionally simple: if one radar cannot
see an object due to obscuration created by a wind farm, then use a second radar that
provides overlapping coverage. Figure 34 illustrates how such an arrangement would
operate. The lines denote the limits of the areas beyond the blocking item where radar
coverage would be inhibited. As indicated by this drawing, the radar zone of coverage for
the radar on the left-hand side covers all the area blocked from the view of the radar on
the right. Conversely, the radar on the right-hand side covers all the region where the
view of the radar on the left has been blocked.
Coordinating two radars by software does present a number of challenges. First, a
radar can locate the position of a target only within a finite level of accuracy determined
by the size of the resolution cell. In the example, the resolution cells for one radar unit
will never align with those of the other due to the offset positioning. Thus, inherent
uncertainties are created in actual position when returns from one must be compared with
returns from the other.
Second, it is unrealistic to expect that the radar beams from each unit will sweep
the exact same area of interest at precisely the same moment. As such, relative target
motion will always occur between the observations made by each radar. The coordination
software would need to account for that as well.
If the “blocking area” is a wind farm, each radar will also experience false returns
due to the rotation of the turbine blades and bleed through from the clutter map. There are
no data available at present to determine if such false returns will be seen by both radars
concurrently. If they are not, then the coordination software also will face the challenge
of determining if the changes in observed position are due only to positional uncertainty
and relative motion of the target or represent track “seductions” caused by false returns
seen by one radar but not the other. This further increases the coordination challenge.
46
ELECTRONIC FILING, RECEIVED, CLERK'S OFFICE, JANUARY 5, 2007
* * * * * PC #7 * * * * *
BB
AA
SHADOWED
REGIONS
WIND FARM
BB
AA
SHADOWED
REGIONS
WIND FARM
Figure 34. Overlapping radar coverage example
The Department is aware of only one study that explored such a concept in any
detail [14]. This study concluded that multiple significant changes would be required to
the radars that would be employed. Additional radar sensors would need to be procured,
and the physical layout (shape) of that wind farm would need to be “optimized” from a
radar perspective. Ultimately, the study concluded there would still be some negative
impacts.
An alternate approach would be to employ a “gap filler” radar positioned within
the wind farm but sufficiently high above the arcs of rotation of the turbine blades so as
not to be affected by the clutter they can create. Certain types of small tactical radars
developed for other applications may be suitable candidates. The use of such small
tactical radars in this manner is a new concept developed during the course of this study.
Analyses, including the susceptibility of such radars to clutter generated beneath them as
well as the capability of the air defense system to accept the additional input, need to be
performed to determine if there are merits in pursuing this concept further.
Based on the above discussions, it must be concluded that concepts that employ
gap filler or supplemental radars are still immature and cannot be categorized as proven
mitigations.
Testing and Verification Factors
A critical issue regarding validation of potential future mitigation approaches is
how to verify their effectiveness. As noted earlier, the key performance factors for any air
defense or missile warning radar are probability of detection, probability of false alarm,
and probability of loss of track. By their very nature, these are statistical metrics.
Accurate computation of these require numerous test cases to be examined to provide the
necessary statistical reliability. Such test cases are generally analyzed using
computational models with Monte Carlo techniques employed to replicate influences of
variances in key parameters. However, all these models are anchored with actual test data
to ensure they accurately replicate true system behavior.
47
ELECTRONIC FILING, RECEIVED, CLERK'S OFFICE, JANUARY 5, 2007
* * * * * PC #7 * * * * *
With regard to wind farms, the Department has initiated efforts to develop an
analytic model to replicate the RCS and Doppler characteristics of a specific SOA utility-
class wind turbine. Ultimately, additional models may need to be developed to replicate
other brands, styles, and sizes of wind turbines. This will ensure that wind turbine models
used in analytic simulation tools will be sufficiently robust to capture the key
characteristics of all current generation SOA utility-class wind turbines in an appropriate
statistical manner.
The Department also has initiated efforts to explore the feasibility of creating
simulations of wind farms that could be numerically injected into the processors of
operational radars. These would provide important tools to assess impacts that could
result from construction of future wind farms within radar line of sight of an air defense
or missile warning radar.
The final issue that must be addressed is how to anchor these models and tools
with test data to ensure they accurately replicate real-world behavior. The testing the
Department has already performed at Fenner, NY, should be sufficient to validate that
analytic RCS and Doppler models can be created for an SOA utility-class turbine. Flight
trials using radars that already have wind farms within the radar line of sight can provide
another critical validation tool. However, the selection of what specific site or sites that
should be used for this purpose requires careful consideration.
For example, the Altamont wind farm contains a very large number of wind
turbines where the overwhelming percentage are “out-of-date” designs with relatively
small turbine blades. The RCS characteristics of those blades inherently will be
significantly lower than current generation systems. Additionally, many of those wind
turbines are mounted on relatively short tubular truss towers. Those towers will have
significantly different RCS characteristics than the tapered cylindrical towers being used
now. Finally, the older model turbines at Altamont rotate at higher rate than that used for
more modern designs. All of these factors suggest that this particular location would not
serve as the best test site to explore or verify any proven mitigation strategy.
Consequently, an effort will need to be undertaken to establish appropriate criteria
for selection of test sites to conduct flight trials. Such an effort should be performed
before U.S.-sponsored flight trials are attempted to ensure the results obtained will
provide the data required for modeling and simulation purposes.
7. OTHER POTENTIAL IMPACTS ON DOD READINESS
This section of the report describes other areas where the presence of wind
turbines or wind farms have the potential to influence Department readiness. These
generally fall under the requirements associated with the Department mission to train and
equip U.S. forces. The discussions in this section are specifically limited to those aspects
as they pertain to Department facilities and sites within the 50 states and U.S. territories
and possessions. Possible impacts at overseas locations are not included as they must be
evaluated in light of existing agreements with host nations.
48
ELECTRONIC FILING, RECEIVED, CLERK'S OFFICE, JANUARY 5, 2007
* * * * * PC #7 * * * * *
The Department must carry out its national security missions effectively with
careful attention to the safety of the general public and Department personnel. The
presence of wind turbines in the vicinity where these military missions occur has the
potential to impact the effectiveness of such missions and thus military readiness.
It is important to note that while this section discusses potential areas of impact to
readiness it would be inappropriate to draw sweeping or broad-based conclusions that
these would occur at all facilities and sites employed by the Department. As operational
requirements at different locations vary, the particular characteristic of a wind farm may
present a challenge in one location but not others. Consequently, within the context of
this section, potential impacts on readiness due to any particular proposed wind farm
development need to be evaluated on a case-by-case basis. Where possible impacts to
readiness could occur it is important to ensure that appropriate measures to mitigate risk
are identified and implemented.
Finally, it should be noted that many of the potential impacts discussed in this
section are similar to those that can be posed by other tall objects such as radio antennas,
cell phone towers, and buildings proposed for construction in the vicinity of Department
sites and facilities. The Department has developed and employed, for many years,
strategies and mitigation techniques to effectively address those possible impacts. To
date, the Department has not identified any specific information that would lead to the
conclusion that those methods would not be similarly effective for addressing potential
impacts from proposed wind farm developments as they relate to the items in this section
of the report. As such, these items have been included in the report only to ensure
completeness of this overall assessment.
The potential impacts to readiness are generally categorized into the following
areas: 1) Overflight and Obstruction, 2) Security, 3) Signature, and 4) Environment.
Potential impacts to flying safety are considered in the area of overflight where
obstructions are introduced. Potential security issues during and after development are
addressed near installations or where the Department conducts operations. Potential
impacts related to the electromagnetic signature associated with wind turbines are
evaluated. Finally, possible impacts related to the responsibilities of the Department with
regard to environmental stewardship are discussed.
Overflight and Obstruction
The potential overflight obstruction hazard impact to readiness is a shared
potential impact to all aviation users including the Department, commercial, business,
and general aviation users. As with other large vertical construction projects, such as
telecommunication towers, the Department considers the potential impacts of wind farm
development on flight safety from obstructions introduced near Department airfields and
in other areas used for military flight operations.
The potential impact of any tall vertical development near Department airfields is
virtually identical to the risks associated with development near civilian airports such as
potential interference with flight operations during take off, departure, approach and
landing. In relation to flight operations away from airfields, excessive development of
49
ELECTRONIC FILING, RECEIVED, CLERK'S OFFICE, JANUARY 5, 2007
* * * * * PC #7 * * * * *
wind turbines in, under or adjacent to airspace, test ranges and training ranges where low-
flying operations are conducted may adversely affect the altitude at which operations can
be conducted. There is a potential increased risk due to the increased likelihood of
encountering tall vertical structures during low altitude flight operations. The nearby
location of overhead transmission lines to connect the wind turbines to the local power
grid can also present a flight hazard to low altitude flight operations. The individual
evaluation of any proposal considers such impacts of any specific development on a
specific section of airspace. Further, the Department must consider the potential for wind
farm development to obstruct or restrict military surface missions, ground maneuver
operations; sea surface and sub-surface operations.
Effective management procedures already are in place to deal with questions that
may arise from potential obstruction of airspace due to the proposed construction of wind
turbines. As a general rule, specific Department installations are assigned management
responsibilities for a section of airspace. If a proposed wind turbine is to extend more
than 199 ft above local elevation, a notification of proposed construction should come
through the FAA’s Obstruction Evaluation / Airport, Airspace, Analysis (OE/AAA)
process. The FAA will notify the managers of any affected military flying routes. The
affected Services evaluate the proposal for any possible detrimental impacts to
operations.
Security
In some circumstances, wind farm developments near Department facilities and
sites may pose temporary or long-term security risks of various degrees. Similar to other
large construction projects near Department installations, the increased level of personnel
and activity during construction requires increased monitoring for security purposes.
Additionally, similar to other tall vertical development, wind turbines can provide
increased visual and sensor access to sensitive Department areas and activities.
The Department, as part of its normal practices, adapts its security measures in
such situations. Thus wind farm development is not anticipated to create any special
challenges in this regard.
Signature
As discussed in other sections of this report, a wind turbine has a unique
electromagnetic “signature” that can vary based on environmental conditions. The
specific signature characteristics of a given development may have potential impact on
certain types of Department systems. Examples of the areas of potential impact include,
among others, systems specifically designed to operate in or influence the
electromagnetic spectrum such as electronic warfare activity for communications,
surveillance, threat, and radar systems. Further, the Department must determine potential
impacts to space launch activities and telemetry operations. The potential impact of the
signature may be increased in areas where the Department conducts high fidelity
developmental testing and evaluation in the electromagnetic spectrum.
50
ELECTRONIC FILING, RECEIVED, CLERK'S OFFICE, JANUARY 5, 2007
* * * * * PC #7 * * * * *
Additionally, the electromagnetic signature of a given development either created
by the wind turbine itself or as a result of reflection from other sources should be
evaluated for potential electromagnetic interference with electronic systems routinely
employed in military missions. The potential impact could be on Department
installations or in areas where the Department conducts operations. This includes
systems under development as well as those already fielded.
Special analyses will need to be conducted to evaluate situations where potential
electromagnetic signature impacts could occur.
Environment
Military installations, testing and training facilities expend considerable effort to
ensure adequate measures are being taken to conserve and protect the nation’s
environment and natural resources. Under the Readiness and Environmental Protection
Initiative (REPI), 10 USC 2684a, many Department installations have, or are developing,
encroachment and conservation buffer partnerships on lands in the vicinity of, or
ecologically related to, a military installation or training/testing area. These partnerships
are aimed at relieving encroachment pressure from either incompatible development
and/or loss of natural habitat, which could adversely impact military operations. This
program applies to installations, airspace, and coastal waters within the United States and
its territories.
Where such encroachment and conservation buffer partnerships exist or are in
development, proposals to develop wind farms in or adjacent to those areas should be
carefully evaluated to ensure compatibility with such partnerships and related activities.
Summary of Potential Mitigation Approaches
General recommendations for mitigation of potential impact include
establishment of multi-agency stakeholder groups to improve the processes used by
developers and the federal, state and local governments in the proposal and evaluation
phases. This will involve establishing stakeholder groups with other federal agencies that
have equities in this subject area. Such interagency forums should review and evaluate
existing processes and adjust those as necessary to identify and address potential impacts.
As a general rule, Department installations are assigned management
responsibilities for specific sections of airspace. In many cases, proper documentation
and charting of the location will provide sufficient mitigation. Methods to provide
aircrew with development notices and updates to air navigation charts that are prepared
and distributed expeditiously as wind power development continues to accelerate will be
reviewed and revised as appropriate to mitigate the potential risks associated with
overflight and obstruction.
Potential security risks identified may be mitigated through increased awareness
by Department personnel during and after construction depending on the nature of the
potential impact. Any unique, site-specific impact, would be addressed by the
appropriate Department organization and the potentially impacted facility.
51
ELECTRONIC FILING, RECEIVED, CLERK'S OFFICE, JANUARY 5, 2007
* * * * * PC #7 * * * * *
Additionally, at the regional and local installation level, community-outreach programs
provide viable venues for installation commanders to work with wind farm developers to
mitigate potential impacts. One successful Department initiative has been the
development of “Red/ Yellow/ Green,” traffic light charts to be used by both the
Department and developers for discussion and dialog. These charts identify specific
areas around installations where Red is employed to designate areas where a wind farm
development is highly likely to impact readiness, Yellow to denote areas where
collaboration is needed to avoid or mitigate impact and, Green to identify areas where
there is no anticipated impact to Department readiness. It is critical to note that this
approach is applicable to the topics discussed in this section but not appropriate to
address impacts on air defense and missile warning radars that were discussed elsewhere
in this report.
8. SUMMARY
Air Defense Radars - Shadowing
Wind turbines are physically large structures that will block the transmission of
radar waves in a manner similar to tall buildings. The blockage caused by a single
turbine, due to its slender shape, will be relatively small, resulting in a negligible shadow
area behind that single turbine. Multiple turbines located in proximity of each other will
also cause diffraction of radar waves. Decreasing the separation distance between the
turbines increases the diffraction effect.
The diffraction of the radar waves will reduce the intensity of the propagating
wave directly behind the turbines (see Figure 6) as well as the reflected signal from a
target. This two-way reduction in signal strength will increase the difficulty in detecting
and tracking targets flying at low altitude in the immediate vicinity of the wind turbines.
This effect will be most pronounced for targets with a small RCS. Such targets inherently
are the most challenging in all circumstances, and this added burden will result in a
noticeable reduction in probability of detection for them.
Predicting the reduction in signal strength due to diffraction effects is potentially a
mathematically tractable problem when it is assumed the turbine blades are stationary.
This has been the basis for the “spacing algorithms” employed by a few nations. No
method exists at present to accurately calculate the reduction in signal strength that will
occur when the turbine blades are rotating.
Turbine blade rotation will also create false returns when attempting to detect and
track targets at very low altitudes. This further complicates the situation, leading to the
potential that low-RCS targets can successfully employ wind turbines to execute a
“covert” approach to a high-value asset. This will compromise the ability of on-site or
nearby security forces to detect such a possible attack with sufficient lead time to react.
Consequently, special case-by-case analyses will be required to assess potential impacts
on local air defense systems for high-value assets to determine if a nearby wind farm
could compromise reaction capability. In such cases, any proposed wind farm should be
located at a sufficient distance so that the on-site defense forces are able to identify any
potential threat with sufficient warning time to enable them to react as required. Failure
52
ELECTRONIC FILING, RECEIVED, CLERK'S OFFICE, JANUARY 5, 2007
* * * * * PC #7 * * * * *
to incorporate such considerations in locating wind turbines either on site or in the nearby
vicinity will degrade military readiness for this mission.
Air Defense Radars - Clutter
Modern utility-class wind turbines, due to their large size, possess a significant
RCS at all common radar bands. Based on the data obtained during this study, the RCS
for one particular turbine ranged from that of a “business class” airplane to a value
greater than that of a long-haul, wide-body aircraft. In addition, the rotating blades of
such wind turbines create Doppler shifts equivalent to the velocities of aircraft.
Since the wind turbines in a wind farm are geographically stationary and near the
surface of the earth, these two effects will combine to appear as “clutter” to an air defense
radar. The amount of clutter produced will increase in direct proportion to the number of
turbines within the line of sight of the air defense radar. A single turbine located a
reasonable distance away from an air defense radar will have minimal impact on the
ability of that radar to successfully detect and track all potential targets of interest to
include challenging low-RCS targets. However, a large number of wind turbines spread
over a wide sector of coverage for that radar will significantly degrade the ability of that
radar to perform its mission. This form of impact has been documented in numerous UK
MoD-sponsored trials.
At present no tools exist to accurately determine where the transition point lies
between the minimal impact created by a single turbine and the unacceptable level of
degradation that will be produced by a large wind farm located in radar line of sight. The
Department has initiated efforts to develop such tools. Until such tools have been
developed and validated, the Department will be unable to ensure that fixed-site U.S. air
defense radars are not compromised in their performance should a wind farm be
constructed within the radar line of sight. Degradation in the detection and tracking
ability of long-range air defense radars will reduce their mission effectiveness and
thereby degrade the ability to defend the nation.
As discussed in a prior section of this report, the only currently proven mitigation
techniques to prevent compromising U.S. air defenses is to ensure wind farms are not
within radar line of sight of fixed-site air defense radars. As illustrated by Figures 4 and
31, radar line of sight near the surface of the earth is dependent upon the height of the
radar unit, the height of the wind turbine, and the separation distance between them.
Additionally, terrain irregularities, of the type illustrated in Figure 32, between the radar
and the wind farm can significantly reduce the distance to where the wind turbines will
no longer be within radar line of sight. Alternatively, a substantial elevation difference
between the radar and the wind farm can produce a similar effect. Since all these
parameters are site specific, each proposed wind farm would need to be evaluated on a
case-by-case basis for the present.
The DOD/DHS Long Range Radar Joint Program Office already has established
an informal consultation service to work with wind farm developers to assist them in
identifying locations where radar line of sight concerns could exist. This approach should
be continued and possibly expanded to include other defense-related concerns. This
53
ELECTRONIC FILING, RECEIVED, CLERK'S OFFICE, JANUARY 5, 2007
* * * * * PC #7 * * * * *
informal advisory assistance should remain optional and not replace or supplant existing
regulatory review processes.
A special note needs to be mentioned regarding protection provided during
“special events.” As part of its support to the homeland security mission, the Department
will, at times, deploy supplemental air defense assets to provide additional protection
during special events such as the Super Bowl, the World Series, Olympic type sporting
events, political conventions, and other major gatherings that could be targets for
terrorists. Air defenders providing such supplemental coverage will require knowledge of
the locations of all nearby wind farms so that they can optimally position and operate
those supplemental assets. The assistance of the wind energy industry to compile and
maintain a database that can provide such information in a readily accessible manner by
air defenders would be highly desirable.
Missile Early Warning Radars
The EWR fixed-site radars are required to be able to detect and track
exceptionally low-RCS objects at extreme ranges with high confidence and accuracy.
This also includes a requirement to be able to accurately discriminate between closely
spaced objects so that Inter-Continental Ballistic Missile delivered nuclear weapon
reentry vehicles can be distinguished from potential countermeasures specifically
employed to confuse defensive systems.
The early warning radars are large, high-power phased-array radar systems
specifically designed to accomplish this task. The high power level is required to ensure
adequate illumination of potential threat complexes at very long ranges. The phased-array
antenna is designed to enable the main beam to be focused on such complexes. The
critical technical performance requirement is to ensure that the signal-to-noise ratio
(SNR) is sufficient to accomplish the detect, track, and discriminate functions.
A simplified analysis had been performed for the early warning radar at Cape Cod
AFS to assess if a wind farm being proposed for construction in the Nantucket Sound
area would impact that radar. This simplified analysis contained three specific faults.
First, it incorrectly employed the sine function rather than the tangent function to
calculate beam elevation as a function of distance. This particular error, however, was
numerically insignificant since, for the small angle considered, the values for sine and
tangent of that angle are almost equal.
The second error in that analysis was the failure to account for atmospheric
refraction of the beam and curvature of the earth. At low altitudes, such as in the
immediate vicinity of the radar antenna, the main beam will be refracted by the
atmosphere. The result of this flaw is to incorrectly predict the elevation of the high
sensitivity region of the main beam as a function of distance from the radar. This was a
more significant error.
The third error was that the analysis assumed a wind turbine would only impact
radar performance if it was located in the main beam. In point of fact, a wind turbine
could provide “clutter” reflections to the radar if any portion of that turbine appears in
any portion of the main beam or in the side lobes, were the resulting level of the reflected
54
ELECTRONIC FILING, RECEIVED, CLERK'S OFFICE, JANUARY 5, 2007
* * * * * PC #7 * * * * *
signal to exceed allowable noise thresholds. If that were to occur, it would reduce the
SNR and thereby degrade the ability of the radar to detect, track, and discriminate the
most challenging threat objects. This error, too, is a potential source of significant error.
Consequently, a more comprehensive analysis needs to be performed for these
radars. Such an analysis should also include consideration of whether range gating or
other possible approaches can be employed to mitigate impacts. This analysis should also
seek to establish generalized “red zone” areas for U.S.-based fixed-site early warning
radars so that locations for future wind farms can be selected without requiring additional
studies. In this regard, such “red zones” should also consider impacts on “back lobes,” to
the extent they may exist, so as to guide placement of turbines on either Cape Cod AFS
or Beale AFB. The Department will be unable to assess if wind farms in the nearby
vicinity of either fixed-site early warning radar will impact their performance until such a
more comprehensive investigation is performed.
Air Traffic Control Radars
As with air defense radars, wind turbines within the radar line of sight of ATC
radars can cause reduction in their capability to track aircraft by primary radar return.
However, the primary radar element in an ATC radar employed for air traffic
management is only one part of a system developed to ensure the safe and efficient use of
U.S. airspace. Other elements of this system, for example, include SSR systems, flight
rules, and published approach and departure procedures for military airfields and civilian
airports.
The FAA has the responsibility for promoting and maintaining the safe and
efficient use of U.S. airspace for all users, to include the military. The Department,
consistent with the long tradition of cooperation with the FAA, is prepared to assist the
FAA in any subsequent investigations or analyses the FAA believes may be required to
assess how wind turbines in radar line of sight of ATC radars might influence the U.S. air
traffic control management system. As such, the Department defers any
recommendations in relation to this particular aspect to the FAA. As is standard practice,
the Department will adjust its processes and operating procedures for U.S.-based ATC
radars operated by the military consistent with any subsequent guidance developed by the
FAA.
Weather Radars
A number of studies have been performed to explore the impact wind turbines can
have on the performance of ground-based weather radars when located within their radar
line of sight. The bibliography provides just a few references [15-18] for some studies
that have been performed in both the United States and Europe on this topic.
The National Weather Service (NWS) of the National Oceanic and Atmospheric
Administration has been exploring this aspect and sponsoring efforts to develop
mitigation techniques. As such, the Department defers to the NWS regarding
identification of impacts on weather radars and development of any necessary mitigation
55
ELECTRONIC FILING, RECEIVED, CLERK'S OFFICE, JANUARY 5, 2007
* * * * * PC #7 * * * * *
approaches. The Department is willing to provide technical assistance, when appropriate,
where potential mitigation measures under development have specific applicability to air
defense and missile warning radar systems.
Other Potential Impacts on DOD Readiness
The Department conducts its operations in an increasingly complex environment.
Wind farm development has the potential to influence Department activities in such
diverse areas as military training, testing and development of current and future weapon
and other systems, security, and land use to name a few. As operational requirements
vary from location to location, any particular characteristic of a wind farm may present a
challenge in one location but not at others. In this regard, the challenges that may be
posed often but not always, will be similar to those associated with construction of other
large objects such as telecommunication towers and in this respect, are not, in fact,
unique to wind farms. For example, the de-confliction of land or airspace is an issue that
the Department manages in concert with other stakeholders on a daily basis.
The Department has developed and employed, for many years, strategies and
mitigation techniques to effectively address those possible impacts. To date, the
Department has not identified any specific information that would lead to the conclusion
that those methods would not be similarly effective for addressing potential impacts from
proposed wind farm developments as they relate specifically to the subject of Other
Potential Impacts on DOD Readiness.
Treaty Compliance Sites
The Department, in conjunction with the National Nuclear Security Agency
(NNSA) of the Department of Energy, employs special sites to monitor compliance with
the Comprehensive Test Ban Treaty. Those sites that employ seismic type sensors to
accomplish this task are sensitive to background seismic noise. Increasing the ambient
level of seismic noise will degrade the ability of these sites to perform their required task.
The UK has a similar site at Eskadalemuir and has conducted an in-depth study
[19] to establish guidelines to ensure adequate offset distances for any wind turbines
proposed for construction in that local area. The Department believes an effort should be
undertaken to develop similar guidelines for U.S. sites employed to monitor treaty
compliance. Additional information on this subject is provided in Appendix 2.
9. CONCLUSIONS
1.
Wind farms located within radar line of sight of an air defense radar have
the potential to degrade the ability of that radar to perform its intended
function. The magnitude of the impact will depend upon the number and
locations of the turbines. Should the impact prove sufficient to degrade the
56
ELECTRONIC FILING, RECEIVED, CLERK'S OFFICE, JANUARY 5, 2007
* * * * * PC #7 * * * * *
ability of the radar to unambiguously detect and track objects of interest by
primary radar alone this will negatively influence the ability of U.S.
military forces to defend the nation.
2.
The currently proven mitigations to completely prevent any degradation in
primary radar performance of air defense radars are limited to methods that
avoid locating wind turbines within their radar line of sight. These
mitigations may be achieved by distance, terrain masking or by terrain
relief and must be examined on a case-by-case basis.
3.
The Department has initiated research and development efforts to develop
additional mitigation approaches that in the future could enable wind
turbines to be within radar line of sight of air defense radars without
impacting their performance. Such development efforts should be
continued. Such future mitigation techniques will require adequate test and
validation before they can be employed.
4.
A more comprehensive analysis is required to determine how close wind
turbines can be built to early warning radars without causing negative
impacts on their performance.
5.
The FAA has the responsibility to promote and maintain the safe and
efficient use of U.S. airspace for all users. The Department defers to the
FAA regarding possible impacts wind farms may have on the Air Traffic
Control (ATC) radars employed for management of the U.S. air traffic
control system. The Department is prepared to assist the FAA in efforts the
FAA may decide to undertake in this regard.
6.
The Department is prepared to assist the NWS, where appropriate, in its
efforts to develop mitigation techniques for ground-based weather radars
where such techniques may have mutual benefit for Department systems.
7.
Wind turbines in close proximity to military training ranges, as well as test
and development sites, can adversely impact the “train and equip” mission
of the Department. Existing processes to include engagement with local and
regional planning boards and development approval authorities can be
employed to mitigate potential concerns in relation to this.
8.
Construction of wind turbines near Comprehensive Test Ban Treaty
monitoring sites can adversely impact their performance by increasing
ambient seismic noise levels. Analyses should be performed to develop
appropriate guidelines regarding how close wind turbines may be built to
such sites.
9.
Given the expected increase in the U.S. wind energy development, the
existing siting processes as well as mitigation approaches need to be
reviewed and enhanced in order to provide for continued development of
this important renewable energy resource while maintaining vital defense
readiness.
57
ELECTRONIC FILING, RECEIVED, CLERK'S OFFICE, JANUARY 5, 2007
* * * * * PC #7 * * * * *
REFERENCES
1. Wind Performance Report Summary 2002-2003, California Energy Commission,
June 06
2. Wind Energy--THE FACTS: An Analysis of Wind Energy in the EU-25, European
Wind Energy Association, circa 2003
3. Technical Standard Order C74c: Airborne ATC Transponder Equipment, Federal
Aviation Administration, February 20, 1973
4. Upgraded Early Warning Radar Supplement to the National Missile Defense (NMD)
Deployment Draft Environmental Impact Statement, US Army Space and Missile
Defense Command, January 21, 2000
5. Wind Farms Impact on Radar Aviation Interests-Final Report, QinetiQ, September
2003
6. The Air Force Research Laboratory (AFRL) Mobile Diagnostics Laboratory (MDL)
Wind Farm Turbine Measurements Fenner, NY – Final Report, July 20, 2006
7. Study Into the Effects of Wind Turbines On Radar Performance, UK Royal Air
Force Signals Engineering Establishment Technical Report 94010, December 1994.
8. The Effects of Wind Turbine Farms on AD RADARS, Air Warfare Center, Royal Air
Force, January 6, 2005
9. The Effects of Wind Turbine Farms on ATC RADARS, Air Warfare Center, Royal
Air Force, May 10, 2005
10. Further Evidence of the Effects of Wind Turbine Farms on AD RADARS, Air
Warfare Center, Royal Air Force, August 12, 2005
11. Special Evaluation Report to Assess Effect of Wind Turbine Farm on Air Route
Surveillance Radar-4, at King Mountain, Texas, USAF 84 RADES & FAA, May 30,
2002
12. Baseline Evaluation of the ARSR-2 RADAR at Tyler, MN, FAA and USAF 84
RADES, September 10, 2004
13. Feasibility of Mitigating the Effects of Windfarms on Primary Radar, Alenia Marconi
Systems Limited, 2003
14. Technical and Operational Feasibility Study on the Use of Additional Sensor(s) to
Mitigate Round 2 Offshore Windfarms in the Greater Wash Area, BAE Systems,
August 2005
15. Anomalous Propagation (AP) Ground Clutter in WSR-88D Base Data, Pratte,
ERL/FSL and NCAR/ATD, November 15, 1996
16. Developments in the DWD radarnetwork, Hafner, et al, Proceedings of the Second
European Conference on Radar Meteorology (ERAD 2004), 2004
17. The AP Ground Clutter Mitigation Scheme for the WSR-88D, Kessinger, NCAR,
undated
18. Impact of Wind Turbines on Weather Radars, EUMETNET, March 31, 2005
19. Microseismic and Infrasound Monitoring of Low Frequency Noise and Vibrations
from Windfarms (Eskdalemuir), Final Report and Summary & Recommendations (2
items), Styles, Keele University, 18 Jul 05
58
ELECTRONIC FILING, RECEIVED, CLERK'S OFFICE, JANUARY 5, 2007
* * * * * PC #7 * * * * *
APPENDIX 1. POLICIES EMPLOYED BY SELECT NATO COUNTRIES
Several European governments have developed policies and procedures to address
the siting of wind turbines in locations to reduce their impact on air defense and air traffic
control radars. The policies vary considerably, reflecting different degrees of
understanding that government policymakers have of the effects that wind turbines have
on radar, different radar systems employed by that country, and different relationships
between the military and industrial communities of that country. This appendix briefly
describes the current policy employed by each of several NATO governments in
regulating/influencing the placement of wind turbines in the vicinity of radar systems.
In November 2005, the Department, in cooperation with the UK Ministry of
Defence, co-sponsored a NATO research and development study on this topic. The
specific goal of that study is:
To assess studies, analyses and field trials already conducted by the participating
member nations to enable identification of gaps in understanding of underlying
phenomenology. To develop a coordinated approach to address these gaps and any
other concerns raised by participants. Finally, to develop a coordinated plan to conduct
the necessary studies, analyses, or field trials to obtain any additional data deemed to be
essential to fully comprehend this issue
.
United Kingdom
As a result of several years of extensive flight trials and analysis described
elsewhere in this report, the United Kingdom has the most robust understanding of the
various effects that wind turbines have on their specific air traffic control (ATC) and air
defense radar systems. Their regulatory process has undergone considerable evolution to
reach its current state.
For UK ATC radars, the civilian operators must always honor the presence of
displayed radar returns. Thus, displayed returns from wind turbines must be treated as
real aircraft. Under instrumented meteorological conditions, ATC must be used to ensure
safe separation between aircraft, including returns from wind turbines. On this basis the
UK policy is that a wind farm close to an airfield is not compatible with ATC operations.
A minimum lateral separation of 5 nmi should be maintained where critical ATC
operations take place.
For UK air defense radars, the radar operators must be able to reliably track all
aircraft that could pose a threat. The operators must include the ability to track by
primary radar alone if necessary. UK studies to date have concluded that the radar’s
probability of detection is reduced in air space over wind turbines due to technical aspects
of radars and the large radar cross section of wind turbines, and no mitigation solutions
have yet proven to provide the required level of radar coverage. On this basis, the UK
Ministry of Defence must be consulted on all proposed wind turbines that are within the
radar line of sight of an air defense radar, regardless of distance.
59
ELECTRONIC FILING, RECEIVED, CLERK'S OFFICE, JANUARY 5, 2007
* * * * * PC #7 * * * * *
Germany
The major concern of the German government was the shadowing of targets by
wind turbines when it developed its wind farm policy. A “protection zone” of 10 km
around all military ATC radars is protected by German law. An “area of interest” is
defined as the region up to 18 km from the ATC radars. The German policy is that
specific permission for construction of obstacles (buildings, high-voltage lines, wind
farms, etc.) must be granted by the German Defense Administration. For wind turbine
proposals the Bundeswehr Air Traffic Services Office evaluates potential impacts to
radar performance. Proposed construction within the “area of interest” is evaluated for
line of sight, height, distance, turbine size, existing obstacles, radar frequency, and local
topography. Technical comments and recommendations are requested from responsible
military commands and a determination, including potential mitigation options, is
communicated to the proposer by the German Defense Administration.
Netherlands
The Royal Netherlands Air Force (RNLAF) was concerned about the impact that
shadowing by wind turbines had on radars. The policy of the Netherlands’ government is
that plans for wind turbines within 15 nmi of military radars must be submitted to the
RNLAF, which then requests an impact analysis from The Netherlands Organisation for
Applied Scientific Research (TNO). TNO then performs analyses based on modeling and
simulation, helicopter-based field tests, and laboratory experiments and provides these to
RNLAF, who makes the final determination.
Austria
The Austrian Air Force, based on limited field tests, is concerned about wind
farms causing electromagnetic interference to radars, radio relays, and high-frequency
direction finders as well as being obstacles to low-flying routes. Austrian policy is for
wind turbine construction proposals to be evaluated by local authorities (mayor, district
governor) in consultation with the Austrian Ministry of Defense. For turbine proposals
further than 10 km from an air-defense radar no objections are raised; between 5 and 10
km an objection is raised unless the mast and gondola are outside the coverage volume
(i.e., the radar line of sight of the area that the radar surveils) and the angle of obstruction
is less than 5%; inside 5 km an objection is raised unless the whole turbine is outside the
coverage volume.
Norway
Norway is concerned about false tracks from wind farms within 50 km of a
military radar. Approval for construction is obtained from the Ministry of Oil and
Energy after consultation with the Ministry of Defense and its research establishment and
defense components. Possible mitigations that are considered include adjustments to the
wind farms, adjustments to the radar (if the cost is less than $3M), or moving the
radar/purchasing a new radar (if the costs to adjust the radar are greater than $3M).
60
ELECTRONIC FILING, RECEIVED, CLERK'S OFFICE, JANUARY 5, 2007
* * * * * PC #7 * * * * *
APPENDIX 2. IMPACTS ON TREATY COMPLIANCE SYSTEMS
In addition to impacts on defense radar systems, wind turbines generate seismic
and infrasound noise that could potentially contaminate monitoring stations providing
data to support the Comprehensive Test Ban Treaty (CTBT) and U.S. nuclear explosion
monitoring efforts.
United Kingdom Eskdalemuir Seismometer Array
The longest operating steerable seismometer array in the world is located at
Eskdalemuir, in Scotland. The array is one of a global network that monitors compliance
with the CTBT. This area has very little background seismological noise, and the
seismometer array is very accurately calibrated, having monitored approximately 400
nuclear explosions at distances up to 15,000 km and numerous other seismic events
(including detonations of conventional explosives, earthquakes etc.). It has recorded
explosions from detonations as small as 100 tons of conventional explosives in
Kazakhstan (about 5250 km away).
The Eskdalemuir area happens to be attractive to wind energy developers because
of a high average wind speed, the availability of good connections to the national grid,
and relatively few people living in the area who could object.
UK Microseismic and Infrasound Monitoring Studies
To assess the potential impact of wind turbines, in early 2004 the UK Ministry of
Defence, the Department of Trade and Industry, and the British Wind Energy Association
funded a study by Professor Peter Styles of the School of Earth Sciences and Geography
at Keele University to collect and analyze data about wind farms and their seismic and
infrasound noise generation. The study included review of existing research in the
United Kingdom and United States, and empirical tests at Dun Law and Ardrossan wind
farms. The Styles study reported their results and recommendations in July 2005. [19]
The Styles study included the installation and almost continuous 6-month
operation of 10 three-component seismic sites at increasing distances away from the Dun
Law wind farm, the deployment of 4 infrasound stations at certain distances from Dun
Law, and the installation of accelerometers on wind turbine towers and strong motion
detectors in the immediate vicinity of turbines at Dun Law and Ardrossan. The study
analyzed the seismic background noise levels recorded at Eskdalemuir at different times
and with different weather conditions. Seismic background noise results from several
different sources including: cultural, which includes vehicle and railroad traffic; coastal
noise, which results from ocean waves and surf, and local weather and seasons, which are
storm and wind-produced. Styles concluded that seismic and infrasound noise was
produced by wind turbines, the seismic noise is at a primary frequency related to the
frequency at which the turbine blades pass in front of the support post of the turbine, this
frequency covers a broad range from about 0.5 Hz to about 10 Hz, and this noise can be
detected at distances greater than 10 km from the turbines. Styles found that at
Eskdalemuir, wind was the predominant factor in noise and determined the median root-
61
ELECTRONIC FILING, RECEIVED, CLERK'S OFFICE, JANUARY 5, 2007
* * * * * PC #7 * * * * *
mean-square vertical displacement of a seismometer on windy days is 0.336 nanometers
thereby establishing the level of anticipated background noise.
UK Government Policy Concerning Wind Farm Development near Eskdalemuir
The Styles study also developed a method to estimate the seismic noise created by
wind farms. The study made recommendations concerning the amount of additional
noise that the Eskdalemuir array could tolerate, what impact that would have on its
operational performance, and how best to constrain wind farm development near it to
maximize wind energy output while remaining under this tolerable additional noise
amount.
The study assumed that the maximum additional noise “budget” that could be
accepted from wind farm development near the array to be 0.336 nanometers. This means
a potential doubling of the background noise level and with the model of noise and
detectability they present, the threshold of detection would rise from 100 tons in
Kazakhstan (distance 5250 km) to about 160 tons.
As a result of this research the UK Ministry of Defence has prohibited the
construction of wind turbines within 10 km of Eskdalemuir. Turbine development
between 10 and 50 km is constrained to not exceed the cumulative noise “budget”
outlined above. There are no restrictions on wind farm development outside of 50 km.
United States Monitoring Activities
In contrast to the single International Monitoring System (IMS) auxiliary
monitoring station in the United Kingdom, there are 4 primary IMS seismic stations and
10 auxiliary IMS seismic stations located in the United States. In addition to the IMS
stations, there are several stations of the U.S. Atomic Energy Detection System
(USAEDS) located in the United States. The USAEDS stations provide data for the U.S.
nuclear explosion monitoring effort.
Recommended U.S. Approach
The methodology used by Styles in measuring the noise spectrum of wind
turbines and assessing their effect on array sensitivity is comprehensive and based on
sound scientific principles.
The United States should adopt a similar methodology to assess the impact of
wind farms on U.S. monitoring activities and to develop objective criteria for evaluating
wind farm development activities near their location. Since seismic background noise
varies from site to site, site-unique measurements are needed for U.S. sites. A decision
about what level of additional noise is acceptable also needs to be made. In addition, the
measurements of seismic noise generated by wind turbines that Styles made must be
updated to reflect the increased size of SOA wind turbines. This recommended approach
should undergo a peer review within the seismic monitoring community to ensure all
concerns and possible alternative courses of action are robustly examined.
62
ELECTRONIC FILING, RECEIVED, CLERK'S OFFICE, JANUARY 5, 2007
* * * * * PC #7 * * * * *
National Renewable Energy Laboratory
Innovation for Our Energy Future
A national laboratory of the U.S. Department of Energy
Office of Energy Efficiency & Renewable Energy
NREL is operated by Midwest Research Institute
●
Battelle Contract No. DE-AC36-99-GO10337
Comparing Statewide Economic
Impacts of New Generation from
Wind, Coal, and Natural Gas in
Arizona, Colorado, and Michigan
S. Tegen
Technical Report
NREL/TP-500-37720
May 2006
ELECTRONIC FILING, RECEIVED, CLERK'S OFFICE, JANUARY 5, 2007
* * * * * PC #7 * * * * *
Comparing Statewide Economic
Impacts of New Generation from
Wind, Coal, and Natural Gas in
Arizona, Colorado, and Michigan
S. Tegen
Prepared under Task No. WER5.6103
Technical Report
NREL/TP-500-37720
May 2006
National Renewable Energy Laboratory
1617 Cole Boulevard, Golden, Colorado 80401-3393
303-275-3000
•
www.nrel.gov
Operated for the U.S. Department of Energy
Office of Energy Efficiency and Renewable Energy
by Midwest Research Institute
•
Battelle
Contract No. DE-AC36-99-GO10337
ELECTRONIC FILING, RECEIVED, CLERK'S OFFICE, JANUARY 5, 2007
* * * * * PC #7 * * * * *
NOTICE
This report was prepared as an account of work sponsored by an agency of the United States government.
Neither the United States government nor any agency thereof, nor any of their employees, makes any
warranty, express or implied, or assumes any legal liability or responsibility for the accuracy, completeness, or
usefulness of any information, apparatus, product, or process disclosed, or represents that its use would not
infringe privately owned rights. Reference herein to any specific commercial product, process, or service by
trade name, trademark, manufacturer, or otherwise does not necessarily constitute or imply its endorsement,
recommendation, or favoring by the United States government or any agency thereof. The views and
opinions of authors expressed herein do not necessarily state or reflect those of the United States
government or any agency thereof.
Available electronically at http://www.osti.gov/bridge
Available for a processing fee to U.S. Department of Energy
and its contractors, in paper, from:
U.S. Department of Energy
Office of Scientific and Technical Information
P.O. Box 62
Oak Ridge, TN 37831-0062
phone: 865.576.8401
fax: 865.576.5728
email:
mailto:reports@adonis.osti.gov
Available for sale to the public, in paper, from:
U.S. Department of Commerce
National Technical Information Service
5285 Port Royal Road
Springfield, VA 22161
phone: 800.553.6847
fax: 703.605.6900
email:
orders@ntis.fedworld.gov
online ordering:
http://www.ntis.gov/ordering.htm
Printed on paper containing at least 50% wastepaper, including 20% postconsumer waste
ELECTRONIC FILING, RECEIVED, CLERK'S OFFICE, JANUARY 5, 2007
* * * * * PC #7 * * * * *
Table of Contents
Abstract............................................................................................................................... 1
Summary ............................................................................................................................. 1
Introduction and Background ............................................................................................. 2
Existing Research........................................................................................................ 3
Goal and Scope ........................................................................................................... 4
Methodology ....................................................................................................................... 5
Components of the Estimated Direct Economic Impacts ................................................... 5
Construction................................................................................................................ 5
Financing..................................................................................................................... 6
Operations and Maintenance....................................................................................... 6
Fuel Extraction and Transport .................................................................................... 7
Landowner Revenue ................................................................................................... 7
Property Taxes ............................................................................................................ 8
Sales Tax................................................................................................................... 10
Discount Rate............................................................................................................ 10
State Specifics................................................................................................................... 10
Arizona...................................................................................................................... 11
Colorado.................................................................................................................... 12
Michigan ................................................................................................................... 13
Assumptions...................................................................................................................... 14
Results............................................................................................................................... 17
Individual State Results .................................................................................................... 19
Colorado Results and Specific Sensitivities ............................................................. 20
Sensitivity Analyses.......................................................................................................... 24
Lessons Learned................................................................................................................ 26
Conclusion ........................................................................................................................ 28
Acknowledgments............................................................................................................. 28
References......................................................................................................................... 29
Bibliography ..................................................................................................................... 31
Personal Communication .................................................................................................. 32
i
ELECTRONIC FILING, RECEIVED, CLERK'S OFFICE, JANUARY 5, 2007
* * * * * PC #7 * * * * *
Figure 1. Prediction of annual electricity sales from 1970 – 2025 by the Department of
Energy’s Energy Information Administration (released February 2005) ......... 2
Figure 2. Construction lead time for coal, gas, and wind plants ...................................... 6
Figure 3. Arizona’s coal-producing area. Source: EIA, 1999 ........................................ 11
Figure 4. Arizona’s electricity mix. Source: EIA, 2000................................................. 11
Figure 5. Colorado’s wind resource at 50 meters. Source: NREL, 2004 ....................... 12
Figure 6. Colorado’s electricity mix. Source: EIA, 2000............................................... 12
Figure 7. Michigan’s gas and oil production fields. Source: Michigan Economic
Development Corporation, 2000..................................................................... 13
Figure 8. Michigan’s electricity mix. Source: EIA, 2000 .............................................. 14
Figure 9. Natural gas transmission line capacities. Source: EIA, 2000 ......................... 15
Figure 10. Average weekly coal spot prices ($/ ton) from May 2002 through April 2005.
Source: EIA..................................................................................................... 16
Figure 11. U.S. natural gas spot prices from 2000 to 2006 in $/ thousand cubic feet.
Source: EIA..................................................................................................... 17
Figure 12. Base case scenarios of economic impact from new power plants in Arizona,
Colorado, and Michigan..................................................................................
18
Figure 13. Dollars spent on new electricity generation from coal, gas, and wind in
Arizona............................................................................................................
19
Figure 14. Dollars spent on new electricity generation from coal, gas, and wind in
Colorado.......................................................................................................... 19
Figure 15. Dollars spent on new electricity generation from coal, gas, and wind in
Michigan
......................................................................................................... 20
Figure 16. Colorado vs. out-of-state impacts from new electricity generation................ 21
Figure 17. Direct impact to Colorado economy from a new coal plant, with uncertainty
bars.................................................................................................................. 22
Figure 18. Spending in Colorado for a new natural gas plant, with uncertainty bars ...... 23
Figure 19. Spending in Colorado for a new wind power plant, with uncertainty bars..... 23
Figure 20. Sensitivity scenario: 100% of coal is from Colorado mines........................... 25
Figure 21. Sensitivity scenario: 66% of natural gas is from Colorado............................. 25
Figure 22. Total impacts (in and out-of-state) for a new Colorado coal plant, with and
without a discount rate of 5% ......................................................................... 26
Figure 23. Total impacts (in-state and out-of-state) for a new Colorado coal plant, with
and without a discount rate of 7%................................................................... 26
Table 1. Energy Equivalents .............................................................................................. 3
Table 2. Dollars Spent in Colorado from 270 MW New Energy Output over 20 Years.20
Table 3. Direct Economic Benefits from New Coal Generation ..................................... 22
Table 4. Direct Economic Benefits from New Natural Gas Generation.......................... 22
Table 5. Direct Economic Benefits from New Wind Generation
(635 1.5-MW turbines)
...................................................................................... 23
ii
ELECTRONIC FILING, RECEIVED, CLERK'S OFFICE, JANUARY 5, 2007
* * * * * PC #7 * * * * *
Abstract
With increasing concerns about energy independence, job outsourcing, and risks of
global climate change, it is important for policy makers to understand all impacts from
their decisions about energy resources. This paper assesses one aspect of the impacts:
direct economic effects. The paper compares impacts to states from equivalent new
electrical generation from wind, natural gas, and coal. Economic impacts include
materials and labor for construction, operations, maintenance, fuel extraction, and fuel
transport, as well as project financing, property tax, and landowner revenues. We
examine spending on plant construction during construction years, in addition to all other
operational expenditures over a 20-year span. Initial results indicate that adding new
wind power can be more economically effective than adding new gas or coal power and
that a higher percentage of dollars spent on coal and gas will leave the state. For this
report, we interviewed industry representatives and energy experts, in addition to
consulting government documents, models, and existing literature. The methodology for
this research can be adapted to other contexts for determining economic effects of new
power generation in other states and regions.
Summary
This paper compares direct spending in Arizona, Colorado, and Michigan on the new
construction and operation of three types of power plants: wind power, a natural gas
combined-cycle baseload plant, and a coal-fired power plant. We follow the flow of
money for each new plant and measure which dollars would be
spent in Colorado (for example, dollars paid to a Colorado
company to purchase concrete for a plant foundation or dollars
spent on Colorado concrete workers’ salaries). To reach a fair
comparison, spending is calculated based on the same amount of
energy generated by each plant—approximately 2,000,000
megawatt-hours (MWh) per year.
1
This amount of electricity
would be generated by a 270-megawatt (MW) natural gas plant
with an 87% capacity factor. Rated capacities of the coal and wind
plants were adjusted so that they would generate the energy
equivalent to the gas plant. The coal plant would be 280 MW in Arizona and Colorado
but 300 MW in Michigan (VanderVeen 2005).
2
The wind plant capacity will vary in each
state according to the wind regime. The components of each power plant included in this
analysis are parts and labor for construction, operations and maintenance (O&M), fuel
extraction, and fuel transport, in addition to money spent on financing, landowner
royalties, and property taxes.
Research components:
o Construction
o Operations and
maintenance
o Fuel extraction
o Fuel transport
o Land leases
o Financing
o Property taxes
1
In this study, coal, gas, and wind comparisons are based on an equivalent amount of energy produced.
Each resource will produce the equivalent energy from a 270-MW natural gas plant with a capacity factor
of 87%. To equal the output of the gas plant, this means that a coal plant with an 80%-85% capacity factor
will need 280 MW of generating capacity, and wind farms with a capacity factor of 25%-35% will need
680 MW-900 MW. Capacity factors for wind were determined by aggregate data from developers in each
state.
2
According to the assumption in the VanderVeen report for the Michigan Public Service Commission that
a coal plant will have the capacity factor of 80% versus 85% in Colorado and Arizona.
1
ELECTRONIC FILING, RECEIVED, CLERK'S OFFICE, JANUARY 5, 2007
* * * * * PC #7 * * * * *
Of the various impacts to the state economy involved in power generation over 20 years,
each state has varied results that show equivalent generation of wind power will bring the
highest direct economic benefit to the state. Tax revenue (especially for wind plants)
plays a significant role in the benefits to the state’s economies because a larger tax base
makes it possible to provide more funding for public goods, such as parks, roads, and
schools. If power plant owners negotiate a deal with localities in which they build so that
they are exempt from property and sales taxes, the local economy may benefit from some
job creation or fuel sales, but it will not receive what can be very significant property tax
benefits over the life of the plant. As shown in the results, much of the labor force for
plant construction, as well as for operations, is often brought in from outside each state.
When the labor forces for construction or fuel transport come from within the state’s
borders, economic impacts can be considerable, regardless of where the fuel is initially
extracted. Of course, if coal or gas comes from the same state where the power plant is
located, the economy is more likely to benefit from the sale of the fuel.
Results are based on the best available data from industry and government sources.
Examples of uncertainties in the data are represented for each generation technology in
the Results section of this paper. The methodology detailed in this report is useful for
researchers in regions where there are questions about which energy source to build next
and which generation source most benefits the local economy. Results may also help
inform decision-makers who want to maximize benefits to their state by providing an
energy-equivalent method of comparison.
Introduction and Background
In the United States, the need for additional electricity generation continues to increase
due to the growing population and demand from energy consumers. The Department of
Energy predicts that this growth will continue (Figure 1).
Figure 1. Prediction of annual electricity sales from 1970 – 2025 by the Department of
Energy’s Energy Information Administration (released February 2005)
2
ELECTRONIC FILING, RECEIVED, CLERK'S OFFICE, JANUARY 5, 2007
* * * * * PC #7 * * * * *
With a growing focus on domestic power resources for energy independence and the
need for new employment opportunities, it is important for decision-makers to understand
the economic impacts of energy generation sources on their local economy. For example,
when a new power plant is built, laborers will be needed to pour the concrete for the
foundation of the plant. If the workers come from within the state, this new project will
contribute to the state’s economic well-being by paying state residents.
This paper compares the flow of money into and out of states from three potential sources
of new electricity production. We examine the impact of developing three new
hypothetical power plants to produce electricity from coal, natural gas, and wind. We also
explore how much money each new plant would contribute to Colorado’s economy by
adding labor from Colorado, equipment sold in Colorado, landowner payments, and
property taxes. As indicated in Table 1, coal, gas, and wind comparisons will be based on
the amount of energy produced.
3
Table 1. Energy Equivalents
Capacity Factor
Equivalent MW Needed
MWh Produced per Year
Coal
80%-85%
280 - 300
~ 2,084,880
Gas
87%
4
270
~ 2,057,724
Wind
25%-35%
680 - 900 (1.5-MW turbines)
~ 2,084,880
The equivalent megawatts are determined by multiplying the capacity by the capacity
factor by the number of hours in a year. For example:
270MW x 0.87 x 8760 hrs/year = 2,057,724 MWh
.
The results of this study may be used in policy analysis for issues such as potential
renewable portfolio standards and system benefits charges or in decisions based on
maximization of economic benefits to states from their natural resource potential. Results
also indicate how much the specific components of new energy generation will benefit
the states’ economies.
Existing Research
Many informative studies about the impacts of electricity production have been
performed, including an examination of which energy sources create the most jobs or
produce the greatest advantages for consumers or the environment (Madsen et al. 2002;
National Wind Coordinating Committee 1997; Clemmer 2001; Goldberg et al. 2004;
Kaas Pollock and Gagliano, 2004; Regional Economics Applications Laboratory 2001;
Wind Energy Creates 1995). The body of literature about wind’s economic development
impacts and the uncertainty of gas pricing is growing (Wiser and Kahn 1996), as well as
3
Energy from each source is an estimate of potential generation for comparison purposes and is
independent of operational constraints, including those that might be driven by changes in fuel prices.
4
87% is the highest capacity factor given to a natural gas power plant by the Energy Information
Administration. This is used as a basis for comparison. Currently, natural gas prices are too high to make
construction of a baseload natural gas plant economically feasible, but prices of gas and other resources
will vary in the future. This study does not consider costs to consumers, but it should be noted that at
present fuel prices, an 87% capacity factor is unlikely.
3
ELECTRONIC FILING, RECEIVED, CLERK'S OFFICE, JANUARY 5, 2007
* * * * * PC #7 * * * * *
several modeling tools to calculate economic impacts (Goldberg et al., 2004; Costanti
2004). The methodology for this report was initially developed for a paper describing the
economic benefits to Colorado published in the Global WINDPOWER 2004 conference
proceedings (Tegen 2004). But a comparison of multiple states’ resources and their direct
economic impacts from sources of new utility-scale generation has not been conducted.
Unlike other work, this study compares direct impacts specific to statewide economies.
Wherever possible, data were gathered from state-specific energy companies
5
and energy
experts, instead of using national averages and extrapolating costs for each component.
Goal and Scope
The scope of this project is the measure of direct economic impacts from new sources of
electricity. In other words, we calculated how much money will be spent in each state for
salaries, purchasing materials, land revenues, financing, and taxes when new power
plants are built and operated. For each resource, the study compares the following
components of new electricity generation:
•
Materials and labor for construction
•
Materials and labor for O&M
•
Materials and labor for fuel extraction (gas well or coal mining)
•
Materials and labor for fuel transport (including railroads, shipping, and gas
pipelines)
•
Project financing
•
Landowner revenues
•
Property taxes
When analyzing direct economic impacts of coal, we include parts and labor for coal
mining and coal transport (from the mine to the power plant by railroad or ship) under the
fuel component for each state analyzed. For natural gas, we include parts and labor for
gas extraction at the wellhead and parts and labor for gas pipeline costs. This research
does not include indirect or induced effects of energy production (e.g., plant construction
worker’s hotel bills).
6
The new power generation facilities are assumed to be grid
connected. Other assumptions are found in the Assumptions section.
The primary goal of this research is to provide a careful state-specific comparison of the
money flow from new power generation. Project results are not meant to represent
national averages or economic impacts in other locations. However, strategies and
models for data gathering used in this study will be helpful for others working on similar
projects (see Lessons Learned). It is important to remember that data for this paper were
gathered in early 2005 and that the results presented here reflect these inputs. The
5
Companies include developers, utilities, municipalities, private wind generators, pipeline companies, coal
railroad companies, and energy-equipment companies.
6
Indirect effects are additional economic activities stimulated by direct spending associated with power
plant construction and operations (e.g., hotel revenue from out-of-state workers). Induced impacts are
increases in economic activity associated with increased disposable income created by power plant
constructions, operations, and other power plant spending (e.g., increased spending on clothing due to
increase in family incomes from power plant work salaries).
4
ELECTRONIC FILING, RECEIVED, CLERK'S OFFICE, JANUARY 5, 2007
* * * * * PC #7 * * * * *
purpose of this paper is to introduce a useful methodology. When utilizing this
methodology in the future, inputs should be changed to reflect the most current data
available.
Methodology
The methodology for this project includes a number of data-gathering techniques. In
addition to the aforementioned interviews with analysts, government energy offices, and
industry contacts, we also conducted literature searches. We used the BaseCase database
from Platts, a division of the McGraw-Hill Companies, Inc., and the jobs and economic
development impacts (JEDI) economic development analysis tool for wind projects from
the National Renewable Energy Laboratory (NREL).
7
After sufficient economic data
were gathered for the chosen energy sources, we sent the assumptions to energy experts
for each resource and compiled in a spreadsheet format most useful for comparisons of
each power source.
For each component of the study (e.g., labor for natural gas extraction), we compared the
best-estimate value based on $/kilowatt-hour (kWh).
8
Next, sensitivity analyses were
performed to determine how much higher and how much lower the dollar value could
potentially be. For example, if some industry reports conclude that average annual O&M
costs for natural gas are $15.50/kilowatt (kW, nameplate capacity), but reliable models
report that the same costs are $27/kW, it is necessary to conduct further analysis and
determine high and low ranges around a best-estimate dollar amount. Each component of
this study is represented by a best-estimate cost with a range of uncertainty above and
below it, when applicable. It is necessary to explain each dollar category or “component”
so that the scope, assumptions, and uncertainties are clear when viewing the project
results.
Components of the Estimated Direct Economic Impacts
Construction
For each energy resource, we conducted many interviews to determine prices of new
construction. We assumed that construction would begin in 2005. Interviews were
primarily with industry contacts or from each state’s energy experts. In Michigan, we
relied on experts and the Michigan Public Service Commission’s current reports. The
construction component includes the capital cost of equipment as well as overhead, legal
and permitting costs, and engineering. It also includes the cost of land, except for annual
land-lease payments (e.g., to farmers paid for wind turbines on their land). The
construction phase of a new power plant will vary for each generation technology.
Constructing a coal plant of this size can take 3 to 6 years, whereas natural gas plants
typically take 1.5 to 2 years, and wind plants can take between 6 months and 1 year to
develop. Wind generation of such large size would likely take about 1 year.
7
An easy-to-use tool to analyze potential jobs, economic development, and impacts from wind
development. www.windpoweringamerica.gov/filter_detail.asp?itemid=707
8
Some costs are typically reported in $/kW or $/megawatt, but we used a $/kWh calculation for a fair
comparison.
5
ELECTRONIC FILING, RECEIVED, CLERK'S OFFICE, JANUARY 5, 2007
* * * * * PC #7 * * * * *
1
2
5
20
20
20
Wind
Gas
Coal
Construction
Operation
Figure 2. Construction lead time for coal, gas, and wind plants
Financing
It is unlikely that an in-state bank would finance a utility-scale power plant project. Local
banks are increasingly willing to finance new wind projects, but those projects are usually
much smaller than 280-MW projects (typically 50 MW or less). A variety of financing
techniques exist for power plants, but this study assumes financing by a utility or large
bank. Options for funding a wind project are expanding, and there are examples of
community-financed projects in which community members own the project or team with
larger corporations to fund a wind project. In the latter case, known as the “flip” model, a
corporation owns the wind project for the first 10 years while realizing tax incentives and
then “flips” ownership to the local community. There are many options for funding wind
generation. For this study, whether the project is financed in state and by what amount
are important elements. We assumed that none of the financing for new power generation
would be from within the states, based on interviews with Colorado lenders. Researchers
may choose to use this methodology with the flip model or other community financing
options and learn how in-state benefits are increased.
Operations and Maintenance
O&M spending from a new power plant includes unscheduled but routine maintenance,
preventive maintenance, and costs of scheduled major overhauls. Some O&M estimates
also include property tax and landowner payments, but this study separately examines
those and does not incorporate them under this heading. O&M spending was difficult to
determine for natural gas, whereas the energy community agreed on coal and wind O&M
spending. Dollars spent for natural gas O&M ranged from $7.6/kW to $20/kW. We used
$10-$14, depending on state data, for our average because it is from actual recent power
plant figures (BaseCase). We used actual data from new power plants whenever possible
and spoke with representatives from each energy generation source to determine the
breakdown between parts and labor. In most cases, industry employees agreed that labor
(not materials) is the much larger component of O&M costs (between 70% and 99%).
One developer said labor might only comprise 60%, but most agreed it was a higher
percentage. Variations are reflected in sensitivity analyses.
6
ELECTRONIC FILING, RECEIVED, CLERK'S OFFICE, JANUARY 5, 2007
* * * * * PC #7 * * * * *
Fuel Extraction and Transport
This study includes the extraction of gas and coal from the well or mine and the transport
by pipeline or railroad to the utility’s power plant. We spoke with representatives from
the railroads and pipeline industries to obtain breakdowns of fuel costs (extraction vs.
transport and labor vs. parts). Breakdowns for coal vary greatly. For example, if the coal
is from Colorado, most of the direct dollar outflow for transport will also be by Colorado
laborers, and this makes a significant difference in the results. In Michigan, none of the
coal is from Michigan coal mines, but a large coal transport industry (rail and ship) is
based in Michigan; thus some of the direct expenditures for transporting the imported
coal will benefit Michigan’s economy.
Using this scope of work, wind power has no economic benefits in the category of fuel
extraction because the wind is free. Of course, having zero fuel costs could be viewed as
a cost advantage for utilities and their customers, but this study considers the state
economy’s overall impact from new power generation, not utility or customer costs or
prices.
Landowner Revenue
In this study, landowner revenues for power generation apply only to wind power
development. Studies show that the most common way for utilities to add wind to their
resource portfolios is to purchase generation from private companies instead of owning
and operating wind farms (Wiser and Kahn 1996, p.1). This means that the electric output
from a privately owned wind farm, such as the wind farm in Lamar, Colorado, is sold to
investor-owned utilities (IOUs) under long-term contracts. The company that owns the
wind farm usually leases land for its turbines from rural landowners, who are typically
farmers or ranchers. Wind developments are sited in rural areas for various reasons,
including wind speeds and site selection processes. Annual payments range from $1,500
to $6,000 per wind turbine per year, depending on individual contracts and size of
turbines.
9
Land leases can be structured in several ways. The most common in the wind
industry is to base lease payments on a percentage of gross revenue from wind power
production. Normally, a guaranteed minimum annual payment is included in a lease to
cover periods in which the project may be inoperable (National Wind Coordinating
Committee). Some landowners choose to accept payments per turbine instead of
payments based on gross revenue so that they are assured a set income.
It is possible for a utility to own the entire wind project and make payments to farmers
directly or even to buy the land outright. In another situation, an outside company, either
a utility or non-utility, could purchase land for wind turbines up front and therefore not be
required to make land payments to landowners after the initial payment. These cases are
unlikely but possible.
9
Net landowner revenues: landowners must calculate their cost of lost productivity and subtract it from
their income per turbine. Ranchers are usually not affected because animals can graze among installed
turbines. A Pacific Northwest study shows that farmers gain approximately 85% of their gross revenue
when land loss is figured in.
7
ELECTRONIC FILING, RECEIVED, CLERK'S OFFICE, JANUARY 5, 2007
* * * * * PC #7 * * * * *
For coal and gas plants, power plant owners usually purchase their land and include this
under their construction costs. Much less land is needed for a coal or gas plant than for a
wind farm, considering different technologies and the 25% to 35% assumed capacity
factor for wind compared to much higher capacity factors for fossil-fuel generation.
10
The
larger amount of land required for wind projects benefits rural landowners in the form of
landowner payments. Although wind plants need access to large land areas, they only use
a small fraction for roads, turbine foundations, and electric equipment. More than 90% of
the land used for a wind farm can still be used for crops or grazing.
Property Taxes
As mentioned, wind power requires much more land than either a natural gas or a coal
plant. More than 400 1.5-MW turbines are required to produce the energy equivalent to a
270-MW natural gas plant with a capacity factor of 87%. Utilities and plant owners may
be exempt from property taxes depending on contract negotiations or state incentives.
However, if taxes were collected, tax revenue would be greater from a wind plant than
from a fossil fuel plant due to the increased size of the project.
11
In Colorado, property taxes are paid to counties, and all county property taxes are
assessed by the State Office of Taxation (the State). The State bases assessments on the
value of the utility’s or plant owner’s “business valuation,” or the sum of real property,
personal property, tangible assets, and intangible assets.
12
The State then takes 29% of
the business valuation to be the assessed value of the company. The assessed value is
communicated to each company and county, and property taxes owed to the county are
based on power plant location. For example, if Xcel Energy Corporation were to build a
coal plant in Pueblo County, Colorado, they would negotiate tax rates with Pueblo
County assessors. Counties determine the amount of property taxes based on mill levies,
which are specific to each county but are usually higher in rural areas.
13
Annual county
mill levies range from 3% (La Plata County) to 9.9% (Phillips County).
14
For this
research, we assume 7% in Colorado. Because of the popularity of granting coal and gas
plants exemptions from property tax in Colorado, this study assumes that the coal and gas
plants will pay property taxes all 20 years, but during the first 10 years, they will only be
subject to half of the property tax.
Tax exemption is often automatic for municipally owned utility plants. Tax exemption
can play an important role in new power plant development for investor-owned or
10
Much less land is needed for the actual power generation. However, land impacts are greater when the
entire life cycle of the resource is considered. For example, coal mining sites, including roads and disposal
sites, were not included in the scope of this research.
11
In some states, wind energy projects are exempt from property taxes resulting from increased property
value because of wind plant development (NWCC Wind Energy Series).
12
It is common for utilities to operate in more than one state. In such cases, the Colorado Office of
Taxation assesses companies based on total historic cost (depreciation rate plus net book value of assets)
per county. According to Deb Meyer, State Division of Property Taxation, intangible assets could be for
items like franchising or the worth of a brand name.
13
Mill levies are a specified rate: 1 mill equals 1/10 of a cent ($0.001) per $1 of property value used to
determine the tax or assessment on property. Mill levy taxes are used for things like school districts and
road improvements.
14
Colorado tax information is based on conversations with Mark Walker of the State Office of Taxation.
8
ELECTRONIC FILING, RECEIVED, CLERK'S OFFICE, JANUARY 5, 2007
* * * * * PC #7 * * * * *
privately owned utilities. Non-municipally-owned power plants may be exempt from
property taxes unless they have non-operating properties, such as land that they do not
use. Tax exemption is a great advantage to power plant owners. The utility will often
negotiate a deal for tax exemption or partial tax exemption with counties in which they
locate a power plant.
For example, in Colorado, agreements between Xcel Energy and the City and County of
Pueblo state that, if Xcel builds a power plant there, the company would be forgiven 50%
of the total in property taxes over the next 10 years. The City also agreed to forgive sales-
and-use tax on the construction of the plant in return for a one-time $13 million payment,
which may be used to construct a new building for Pueblo police (Amos 2004). Cities
and counties negotiate deals like this because new plant construction and operations bring
new jobs to the area. However, as results show, much of the construction and operations
labor is brought in from out-of-state. For example, in-state coal plant construction labor
accounts for less than 20% of total labor.
In Michigan, the assessed value, or “State Equalized Value,” is equal to one-half of the
total value for real and personal property. The state’s average tax level applied to the
assessed value is 5% for annual property taxes. Air and water pollution control equipment
on power plants is exempt from property taxes.
Wind plants in Michigan will not be required to pay property taxes until the year 2013.
According to the Michigan Economic Development Corporation, “Alternative-Energy
Personal Property” … is exempt from the collection of personal property taxes. This
exemption includes (1) “Alternative-Energy Systems,” (2) “Alternative-Energy
Vehicles,” (3) the personal property of an “Alternative-Energy Technology Business,”
and (4) the personal property of a business not engaged in alternative-energy technology
that is used solely for the purpose of researching, developing, or manufacturing
“Alternative Energy Technology.” However, it is common for a community to negotiate
“host fees” in lieu of property taxes from $3,000 - $5,000 per turbine per year. After
discussions with a Michigan wind developer about recent projects, we have assumed a
$5,000/turbine/year payment for this study.
In Arizona, the assessed value of a plant is 25% of 80% of the installed project cost. Then
mill levies are applied to this number to determine county property taxes. The average,
and the assumed number for this report, is 7.6%.
Because of specifics of individual project negotiations, taxes for the average new power
plant are difficult to predict accurately. As stated, it is fair to assume that a utility-owned
plant will likely be partially tax exempt in Colorado, but a privately owned power plant
will be required to pay county property tax (Wiser and Kahn 1996). In Michigan, we
safely assume that wind projects will not pay property taxes until 2013. For this project,
we took examples of current power plant tax estimates and average tax payments from
existing plants and applied them to the appropriate size of the new plant. For wind, we
used existing plant data in Colorado and estimates in Arizona, and we based Michigan
assumptions from the Michigan Public Service Capacity Needs Forum.
9
ELECTRONIC FILING, RECEIVED, CLERK'S OFFICE, JANUARY 5, 2007
* * * * * PC #7 * * * * *
Taxes paid on gas wells and for coal mines will not likely increase when 280 to 300 MW
of generation are added to the state’s system mix. New gas wells and coal mines are not
required for this amount of electricity production, so taxes on these items were not
included in this study. If all the coal or gas came from within the state and resulting
extraction efforts were larger, or if the plant were of larger capacity, it is conceivable that
the associated increases in well or mine taxes should be considered.
Sales Tax
We did not separate sales tax in this report. We assume that sales tax is included in the
dollar amount of parts, such as the wind turbine shaft, or of processes, such as the natural
gas plant construction. To calculate sales tax, a researcher would have to obtain
information about which parts of the power plants, fuel extraction, and fuel transport
come from within the state or come from a company with an office within the state so
that the company may charge sales tax. For example, if wind turbine blades were
manufactured in South America or Denmark, but the manufacturing company had an
office in Arizona, the wind farm owner would be required to pay Arizona state sales taxes
for the wind turbine blade. If the Danish company had an office in Wyoming instead of
Arizona, no sales tax would be paid to Arizona. Most companies do not make any of this
sales tax information available. However, future studies may include estimated sales tax
based on state-specific models. For example, Colorado sales tax is 2.9%, and this could
be added (or broken out from existing dollar amounts) to parts purchased in Colorado,
depending on whether the sales tax is assumed to be included.
Discount Rate
For purposes of this research, results are displayed without a discount rate applied.
However, discount rates of 5% and 7% were applied to some results, and direct spending
can easily be calculated with a discount rate of the researcher’s choice. In the Results
section of this report, we show direct impacts without the discount rate, except when
specifically noted. This is due to the wide range of discount rates used by government,
policy makers, and industry.
State Specifics
The Components section of this report above has detailed each area of dollar flow,
including some state specific information (see Property Taxes). The Assumptions section
explains general suppositions for the paper. Some areas of inquiry require individual
explanation for each state’s energy background and attributes, which are in this section.
10
ELECTRONIC FILING, RECEIVED, CLERK'S OFFICE, JANUARY 5, 2007
* * * * * PC #7 * * * * *
Arizona
In Arizona, most of the state’s power comes from imported coal. (Coconino County,
Arizona, has some coal mines, but they supply an electricity generation facility in
Nevada). Coal for a new coal plant would likely come from Wyoming or New Mexico
(Tri-State Generation and Transmission Association, Inc.). The new plant is assumed to
be a sub-critical plant, based on the most recent Arizona coal plant proposals
(Springerville). The coal plant’s capacity factor is assumed to be 85%.
Figure 3. Arizona’s coal-producing area. Source: EIA, 1999
Arizona's Electricity Mix
34%
46%
0%
10%
10%
0%
Nuclear
Coal
Oil
Gas
Hydro
Other renewable
Source: Energy Information Administration, 2000
Figure 4. Arizona’s electricity mix. Source: EIA, 2000
Arizona also imports its natural gas (see the Assumptions section for further aspects and
complications on natural gas). The capacity factor for wind in Arizona is assumed to be
30% for this research, so the wind plant would require 520 1.5-MW turbines to equal 780
MW and generate the necessary amount of electricity.
11
ELECTRONIC FILING, RECEIVED, CLERK'S OFFICE, JANUARY 5, 2007
* * * * * PC #7 * * * * *
Colorado
In Colorado, the coal plant is assumed to be a super-critical plant based on the most
recent proposed coal plant in Colorado (Xcel Energy’s Comanche III coal plant in
Pueblo). Coal will most likely be transported by rail from the Powder River Basin in
Wyoming. The coal plant’s capacity factor is assumed to be 85%.
Colorado has natural gas fields, and this study assumes that 40% of the natural gas for the
new plant comes from within the state’s boarders. Colorado has a considerable wind
resource, as shown by the pink and purple areas (Figure 5).
Figure 5. Colorado’s wind resource at 50 meters. Source: NREL, 2004
Colorado's Electricity Mix
0%
81%
0%
15%
3%
1%
Nuclear
Coal
Oil
Gas
Hydro
Other renewables
Figure 6. Colorado’s electricity mix. Source: EIA, 2000
12
ELECTRONIC FILING, RECEIVED, CLERK'S OFFICE, JANUARY 5, 2007
* * * * * PC #7 * * * * *
Michigan
Like Colorado, Michigan’s power mix relies heavily on coal, with a small amount of
natural gas and almost no wind power. Michigan also imports coal to feed its power
plants.
Michigan does have some natural gas extraction fields, so we assume that 25% of
natural gas used in Michigan comes from Michigan. The multiple in-state pipeline,
railroad, and shipping companies provide direct benefits to the economy. For example, if
the coal is transported from Wyoming, some of the labor and materials for the railroad
cars are from outside Michigan. For the base cases in this study, we assume that 50% of
the natural gas transport labor is based in-state and 60% of the coal transport labor is
based in Michigan. These current estimates are from a report for the Michigan Public
Service Company (VanderVeen 2005).
Figure 7. Michigan’s gas and oil production fields. Source: Michigan Economic
Development Corporation, 2000
13
ELECTRONIC FILING, RECEIVED, CLERK'S OFFICE, JANUARY 5, 2007
* * * * * PC #7 * * * * *
Michigan's Electricity Mix
18%
67%
1%
12%
2%
Nuclear
Coal
Oil
Gas
Renewables
Figure 8. Michigan’s electricity mix. Source: EIA, 2000
Assumptions
Assumptions for this study are based on scenarios that are most probable for building
new energy-generation capacity. It is assumed that energy efficiency and demand-side
management options have been considered earlier in the decision-making process. In this
case, new energy generation is utility-scale and grid connected.
The new wind, coal, or gas power plant would produce approximately 2,000,000 MWh
per year for 20 years, and construction would begin in 2005. Power would be generated
in each state for its ratepayers. We used the most recently proposed coal, gas, and wind
projects in each state to determine our assumptions.
The natural gas plant is assumed to be a baseload combined-cycle plant. It is very
difficult to determine the exact wellhead in a power plant from which natural gas stems
from (Figure 9). Natural gas flows through pipelines and is mixed with gas from many
sources before it arrives at the plant. Interviews with 15 energy analysts and natural gas
industry employees in and around Colorado provided answers that ranged from “most of
our gas is from Wyoming” (Mercatur Energy
) to “80% of the gas should be from
Colorado if the plant is far enough from Colorado’s borders” (Colorado Oil and Gas
Commission). For this study, we assume that none of the gas used in the new power plant
would be from Arizona, 40% of gas is extracted from Colorado’s natural gas wells, and
25% of Michigan’s gas will be from Michigan.
We also assume that the new gas plant would have a capacity factor of 87%. This is
consistent with new efficient gas plants that are currently under construction.
15
However,
at the present (May 2005) high fuel price, some companies choose to only run their gas
peaking plants – not baseload (these plants are too expensive to utilize for electricity
15
Energy Information Administration’s maximum capacity credit assumption. Xcel Energy’s combined-
cycle gas plant in Fort Lupton, Colorado, was rated 86.5% in 2002.
14
ELECTRONIC FILING, RECEIVED, CLERK'S OFFICE, JANUARY 5, 2007
* * * * * PC #7 * * * * *
because of the high gas prices). A report for the Michigan Public Service Commission
assumes that natural gas has a capacity factor of merely 35% due to the heightened fuel
prices (VanderVeen 2005). In this study, we assume that the price of natural gas will
continue to fluctuate but will also be used as a baseload plant when costs for other
generation (e.g., pulverized coal) and construction (steel, etc.) also increase in the future.
One example of the market fluctuation is EIA data, which show that coal prices are also
rising in each region of the country. These rising prices are for spot markets, not long-
term fixed contracts, but they show the upward trend in prices nonetheless. The
methodology for this report can be used with the assumption that resources have a much
lower capacity factor, if required.
We assume that the gas project financing would come from the utility’s regular financial
lending institution (usually a large national or international bank not located within the
state).
Figure 9. Natural gas transmission line capacities. Source: EIA, 2000
Making assumptions about natural gas prices today and for the next 20 years is risky and
will inevitably be somewhat inaccurate. (See Figure 11 for obvious price shifts.)
However, we use the EIA’s assumptions and include high and low scenarios above and
below those predictions. Since the Colorado report (2003 data) (Tegen 2004), prices for
natural gas have continued to rise. The assumptions for natural gas base case prices in
this study range from $35/MWh to $55/MWh, or $5.2/MMBtu to $7.9/MMBtu, to
incorporate a range of prices. Assumed prices are based on data from actual natural gas
plants in each state. Utilities running natural gas plants have long-term contracts for
baseload natural gas, so they are not as vulnerable to spot market fluctuations.
15
ELECTRONIC FILING, RECEIVED, CLERK'S OFFICE, JANUARY 5, 2007
* * * * * PC #7 * * * * *
Figure 10. Average weekly coal spot prices ($/ ton) from May 2002 through April 2005.
Source: EIA
We assume that the capacity factor for wind power will be 30% in Arizona, 35% for the
wind farm installed in Colorado (Milligan, personal communication), and 25% in
Michigan (VanderVeen 2005). We also assume that the landowner revenue paid to a
landowner is a direct benefit to the state’s economy. This study does not try to determine
the next step for dollars brought into the economies by using a multiplier or other
calculations.
16
ELECTRONIC FILING, RECEIVED, CLERK'S OFFICE, JANUARY 5, 2007
* * * * * PC #7 * * * * *
Figure 11. U.S. natural gas spot prices from 2000 to 2006 in $/ thousand cubic feet.
Source: EIA
Results
The results show that benefits to the three state economies from energy resources vary
greatly, depending on specifics of each power plant project and its contracts. For fossil-
fuel-fired power, dollars spent on fuel are a significant benefit
if
the fuel is produced in
state or transported by in-state industry and workers, or both. As expected, results show
that states are positively impacted by new power generation when local labor is used to
install equipment and operate the new energy-generating facility.
Results in all three states show that adding wind facilities will provide a greater economic
benefit to the state economy, due in large part to payments for property taxes. Wind pays
a proportionally larger share in property taxes because more facilities must be erected to
generate equivalent power. Below are state-specific results. Some notable differences are:
•
Prices for fossil fuels are assumed to be higher in Michigan than in the other
states, and capacity factors are lower. This leads to an increase in overall capacity
needed and in dollars spent in Michigan.
•
Based on actual data for proposed new plants, installed cost for a coal plant is
much higher in Arizona ($2000/kW) than in Colorado ($1450/kW), which makes
a considerable difference. Coal benefits Arizona’s economy more than
Colorado’s. This could be due to varying pressures for new environmental
equipment or state policies.
17
ELECTRONIC FILING, RECEIVED, CLERK'S OFFICE, JANUARY 5, 2007
* * * * * PC #7 * * * * *
•
Even though a state may not have natural resources to generate electricity, if it has
a large resource (coal or gas) transportation industry, like Michigan, the economy
can benefit significantly from the imported resource.
Figure 12. Base case scenarios of economic impact from new power plants in Arizona,
Colorado, and Michigan
Direct impacts to state economies from
base case scenarios
$-
$100,000,000
$200,000,000
$300,000,000
$400,000,000
$500,000,000
$600,000,000
$700,000,000
$800,000,000
$900,000,000
$1,000,000,000
Arizona
Colorado
Michigan
Coal
Gas
Wind
18
ELECTRONIC FILING, RECEIVED, CLERK'S OFFICE, JANUARY 5, 2007
* * * * * PC #7 * * * * *
Individual State Results
Figure 13. Dollars spent on new electricity generation from coal, gas, and wind in Arizona
Note: The fuel components for coal and natural gas are prices paid by the power plant for fuel.
The contract price listed for wind is the amount the plant owner can charge for the output of the
wind farm and is used to calculate landowner revenue.
Figure 14. Dollars spent on new electricity generation from coal, gas, and wind in Colorado
19
ELECTRONIC FILING, RECEIVED, CLERK'S OFFICE, JANUARY 5, 2007
* * * * * PC #7 * * * * *
Figure 15. Dollars spent on new electricity generation from coal, gas, and wind in Michigan
Colorado Results and Specific Sensitivities
As Figure 14 and Table 2 indicate, the average wind plant would bring more dollars to
the Colorado economy than coal or gas plants, provided that the wind plant hires some in-
state labor and uses some Colorado materials (e.g., concrete). This result is partially due
to the large percentage of in-state workers (20%-46%) for construction, the even larger
percentage of workers during the operations phase (90% in state), and the size of the
project (680 MW versus 270 MW or 280 MW). A large part of the wind spending is also
due to county property taxes. In other states, wind plant owners have negotiated partial
exemptions from taxes, but this has not occurred in Colorado. However, coal and gas
plants have historically been at least partially exempt from property taxes.
Table 2. Dollars Spent in Colorado from 270 MW New Energy Output over 20 Years
Coal
Gas
Wind
Construction
$47,705,000
$24,458,963
$91,392,000
O&M
$90,125,000
$11,054,118 $223,040,000
Fuel
$8,756,496
$210,442,575 $
-
Landowner
Revenue
$
-
$
-
$43,500,000
Taxes
$17,271,121
$8,406,060 $193,228,800
* Construction times vary for each resource: coal 5 years, gas 2 years, wind 1 year
When in-state versus out-of-state spending is calculated, it becomes apparent that a new
gas plant would produce more total spending but that most of the money would be sent
out of state. Each generating source spends more out of state than in Colorado, regardless
of the fuel source or tax negotiation. Figure 16 shows in-state and out-of-state spending
20
ELECTRONIC FILING, RECEIVED, CLERK'S OFFICE, JANUARY 5, 2007
* * * * * PC #7 * * * * *
for new power generation. As previously noted, this project does not examine price
impacts to consumers but considers overall state economies. Clearly, if consumers have
to spend more of their income on electricity, they will have less to spend on other goods
and services. When making an informed decision about new power generation, a
policymaker should include consumer pricing and other issues, along with information
from studies like this one.
Direct impacts from new electricity generation in Colorado
a comparison of instate vs. out-of-state money flow s
$-
$200
$400
$600
$800
$1,000
$1,200
$1,400
$1,600
$1,800
$2,000
Coal
Gas
Wind
D
o
llar
s
(
m
ill
io
n
s
)
Total instate
Out-of-state
Figure 16. Colorado vs. out-of-state impacts from new electricity generation
The following series of figures and tables show individual energy-generation resources
broken down by component for the Colorado economy. In a forthcoming publication,
these figures will be presented for Arizona and Michigan and will be located in
assumptions sections specific to each state. The figures show direct economic benefits to
the economy from each resource, given the most likely scenario. I-shaped bars represent
uncertainty ranges in the data. Further explanation of sensitivity analyses for particular
energy resources may be found in Sensitivity Scenarios.
Table 3 and Figure 17 show direct economic benefits to Colorado for a coal plant with
sensitivity bars. The biggest range of uncertainty is caused from the plant using Colorado
coal, which is unlikely.
21
ELECTRONIC FILING, RECEIVED, CLERK'S OFFICE, JANUARY 5, 2007
* * * * * PC #7 * * * * *
Table 3. Direct Economic Benefits from New Coal Generation
COAL
Range
% CO* %CO range
Construction labor 25%
$1,450/kW
$1300 -$1800/kW
17%
7%-37%
Construction materials 75%
$1,450/kW
$1300 -$1800/kW
5%
0%-15%
O&M labor 65%-75%
$25/kW
$8 - $27/kW
65%
25%-95%
O&M materials 25%-35%
$25/kW
$8 - $27/kW
63%
60%-93%
Fuel
$14/MWh
$13 - $18/MWh
0%
0%-56%
Mining
40% of fuel
40% - 50%
0%
0%-56%
Railroad
60% of fuel
50% - 60%
10%
0%-10%
*Money spent in Colorado
Direct impact to Colorado economy from a
new coal plant (with sensitivity bars)
-
50,000,000
100,000,000
150,000,000
200,000,000
250,000,000
C
o
n
s
tr
uc
tion
O
&M
F
ue
l
T
a
xe
s
dollars
Figure 17. Direct impact to Colorado economy from a new coal plant, with uncertainty bars
As shown in Tables 4 and 5 and Figures 17 and 18, coal and gas have high uncertainty in
their fuel categories. Almost all of the uncertainty for natural gas is related to gas price
estimates. The price range is from $30/MWh to $55/MWh. Prices as high as the top
scenario ($55/MWh) are unlikely but possible in Colorado power plants’ long-term
contracts. Coal’s uncertainty bar has such a large range because of the chance that 100%
of the coal may come from Colorado, as opposed to the assumed 0%.
Table 4. Direct Economic Benefits from New Natural Gas Generation
GAS
Range
% CO* Range % CO
Construction labor 25%
$595/kW
$550-$800/kW
40%
15%-60%
Construction materials 75%
$595/kW
$550-$800/kW
5%
0%-10%
O&M labor 75%
$10/kW
$8-$19/kW
25%
16%-45%
O&M materials 25%
$10/kW
$8-$19/kW
5%
10%-45%
Fuel
$35/MWh
$30-$55/MWh
40%
10%-66%
Extraction
80% of fuel
-
15%
5%-20%
Pipeline
20% of fuel
-
0%
0%-10%
*Money spent in Colorado
22
ELECTRONIC FILING, RECEIVED, CLERK'S OFFICE, JANUARY 5, 2007
* * * * * PC #7 * * * * *
$-
$50,000,000
$100,000,000
$150,000,000
$200,000,000
$250,000,000
$300,000,000
$350,000,000
C
o
n
s
tr
uc
ti
o
n
O
&
M
Fuel
T
a
x
es
Figure 18. Spending in Colorado for a new natural gas plant, with uncertainty bars
Table 5. Direct Economic Benefits from New Wind Generation (635 1.5-MW turbines)
Wind
Range
% CO* Range % CO
Construction labor 10%
$1,200/kW
$1100-$1500
40% 20%-46%
Construction materials 90%
$1,200/kW
$1100-$1500
8%
6%-10%
O&M labor 70%
$20/kW
$10-$27/kW
90% 80%-99%
O&M materials 30%
$20/kW
$10-$27/kW
20%
5%-33%
Landowner revenue
3.5% of revenue $3000-$5,000
100%
-
Property taxes
1.2% of project
0.9% - 3%
100%
-
*Money spent in Colorado
$-
$100,000,000
$200,000,000
$300,000,000
$400,000,000
$500,000,000
$600,000,000
Construction
O&M
Land payments
Taxes
Figure 19. Spending in Colorado for a new wind power plant, with uncertainty bars
Table 5 and Figure 19 show direct economic impacts for building new wind power. For
wind, the component with the most uncertainty is taxes. Typically, taxes are assumed to
23
ELECTRONIC FILING, RECEIVED, CLERK'S OFFICE, JANUARY 5, 2007
* * * * * PC #7 * * * * *
be between 0.9% and 3% of total installed costs. The large range in dollars per kilowatt
for construction between $1100 and $1500, along with the property tax percentage, leads
to the sizable range in construction results. O&M is considered by some developers to be
60% labor and 40% parts, while most consider that the labor accounts for between 70%-
80%. Landowner revenue can fluctuate between $3,000 and $5,000 per turbine per year
(based on the assumed 1.5-MW turbine size).
The data show significant differences and implications between wind and fossil fuels in
the category of property taxes in all states. Coal and gas plants owned by utilities are
often but not always exempt from property taxes in Colorado, and the utility might
negotiate a deal with local communities by paying for county improvements such as a
library, school, or police station. Such negotiated costs cannot be captured in a study of
average power plant benefits because they are unique to each deal made between the
utility and county. It should be noted that these negotiated donations from utilities would
also benefit communities and, therefore, the Colorado economy. The County presumably
finds the short-term gain of the payment, in addition to jobs created by the new power
plant, worth the exchange for property taxes. However, the utility makes a one-time
payment to the county, whereas property taxes would be collected over the lifetime of a
power plant.
In addition to the consideration of tax exemption, wind plants purchase or lease a
considerably larger piece of property for the same energy output as gas and coal. The
State of Colorado does not base property taxes on the actual amount of space utilized by
wind turbines but by the value of the installed turbines. The installed turbine value is
greater than the value of a gas or coal plant because so many wind turbines are needed to
generate the same amount of electricity. This is significant in rural communities because
the county divides tax revenues to pay for services such as schools and roads. Wind
plants also cause an increase in a landowner’s property values.
Sensitivity Analyses
Following is an exploration of some uncertainty scenarios or sensitivity analyses
discussed above. In the most likely scenario, coal for a new Colorado coal plant will
come from Wyoming. Figure 20 shows a scenario in which all of the coal comes from
Colorado. With everything else remaining equal, coal will not bring as much spending to
Colorado as wind (but more than gas), and spending will be significantly higher than it is
with out-of-state coal.
As mentioned, another uncertainty is the origin of Colorado’s natural gas plants. At the
highest, according to most natural gas experts we spoke with, 66% of the natural gas will
come from Colorado. With everything else remaining in the base case, here are the results
for a higher percentage of gas from within the state.
We mentioned the differences between results without an applied discount rate and a
discount rate of 5% or 7%. In Figures 22 and 23 below, we see the results for Colorado
coal. In forthcoming versions of this paper, we will display other components and
resources with applied discount rates. When a discount rate is applied, the impacts are
naturally smaller.
24
ELECTRONIC FILING, RECEIVED, CLERK'S OFFICE, JANUARY 5, 2007
* * * * * PC #7 * * * * *
Direct impacts to the Colorado economy from new coal,
gas and wind plants (100% Colorado coal)
$-
$100
$200
$300
$400
$500
$600
$700
$800
$900
$1,000
Coal
Gas
Wind
D
o
ll
a
r
s in
m
i
lli
o
n
s
Taxes
Landowner revenue
Fuel
O&M
Construction
Figure 20. Sensitivity scenario: 100% of coal is from Colorado mines
Direct impacts to the Colorado economy from new coal,
gas and wind plants (2/3 of gas from Colorado)
$-
$100
$200
$300
$400
$500
$600
$700
$800
$900
$1,000
Coal
Gas
Wind
D
o
l
l
a
r
s
in
m
ill
io
n
s
Taxes
Landowner revenue
Fuel
O&M
Construction
Figure 21. Sensitivity scenario: 66% of natural gas is from Colorado
25
ELECTRONIC FILING, RECEIVED, CLERK'S OFFICE, JANUARY 5, 2007
* * * * * PC #7 * * * * *
Total coal costs for a new Colorado coal plant
with and without a discount rate of 5%
$0
$200,000,000
$400,000,000
$600,000,000
$800,000,000
$1,000,000,000
$1,200,000,000
$1,400,000,000
Total
NPV
Property taxes
Fuel
Financing
O&M
Construction
Figure 22. Total impacts (in and out-of-state) for a new Colorado coal plant, with and
without a discount rate of 5%
Note that construction and financing in both cases remain relatively unchanged because
construction occurs within the first 5 years, and we assume 10 years for financing.
Total costs from a new Colorado coal plant with
and without a 7% discount rate applied
$0
$200,000,000
$400,000,000
$600,000,000
$800,000,000
$1,000,000,000
$1,200,000,000
$1,400,000,000
Total
NPV
Property taxes
Fuel
Financing
O&M
Construction
Figure 23. Total impacts (in-state and out-of-state) for a new Colorado coal plant, with and
without a discount rate of 7%
Lessons Learned
When conducting a “follow the money” study in other regions, it will be helpful to draw
on lessons from this report to save time and frustration for researchers and interviewees.
Methods detailed here are transferable to other projects that explore economic questions
about which energy resource to build next.
26
ELECTRONIC FILING, RECEIVED, CLERK'S OFFICE, JANUARY 5, 2007
* * * * * PC #7 * * * * *
As with any research project, the first step is to define the required data and obtain
contacts for that information. Local data are almost always preferred, but when it is not
available, national averages may be sufficient. For example, is it important to have
precise railroad data for your state, or can you use national averages? We carefully chose
components of this research and selected the most economically significant benefits to
represent graphically. Unfortunately, many developers consider this type of information
proprietary due to competitive forces in the marketplace. Many costs and benefits of
electricity generation are proprietary and cannot be released. Some dollar values for this
project were indeed confidential and were given to us with the understanding that we
would use aggregate numbers and not mention sources.
Information for labor and equipment costs was obtained through much deliberation from
key industry contacts. In addition, we used JEDI (Goldberg et al. 2004), which was
especially helpful for cost breakdowns. For overall costs of fuel and O&M, we referred to
power plant operating companies and BaseCase. For specific numbers, such as the labor
component of natural gas transport, we spoke with industry representatives (e.g., natural
gas pipeline manufacturers). We obtained manufacturer names by speaking with people
at existing utility power plants. We did not add environmental or political costs and
benefits, which would be much harder to quantify than direct economic benefits. We
recommend including only operations and maintenance costs – not including “all-in,” or
costs such as taxes or landowner revenues, which should be broken out separately.
To obtain financing information, we initially contacted utility employees, who were
generally unable to answer our requests. Eventually, we learned from other energy
experts that financing for all three power sources is most likely an out-of-state impact,
with no money flowing into the Colorado economy. Some small wind projects may be
financed in-state, but usually financing comes from out of state, unless the plants in
question were in New York or Massachusetts, where large lending institutions are
located. We recommend contacting in-state independent banking associations. These
organizations may know about power plant financing. Additionally, municipalities and
electricity cooperatives might have helpful information and/or contacts. See the
Components section of this report for other financing options.
Tax information should be sought first from counties, which is where most property tax is
collected. Obtain mill levies and the procedure by which property taxes are assessed. If
county taxes are assessed by the State, researchers will likely need to combine
information from state assessors with details from county assessors and treasurers. The
Public Utilities Commissions, in this case, did not provide data for any categories
analyzed by this project, but we do recommend interviewing them in case they are able
and willing to help. Researchers working with the Public Service Commission in
Michigan, for example, were extremely helpful.
It is important to remain “resource neutral” when interviewing so that all parties feel
comfortable providing information. It is also crucial to state assumptions early, so that
they are clear in the project results. More important, stating assumptions early will ensure
27
ELECTRONIC FILING, RECEIVED, CLERK'S OFFICE, JANUARY 5, 2007
* * * * * PC #7 * * * * *
that they are clear to researchers throughout the project. Project boundaries and scope are
closely linked to assumptions.
Conclusion
The addition of a new generating facility equivalent to a 270-MW natural gas plant will
have direct economic benefits for a state’s economy. If the fuel of choice is coal or gas,
impacts to the economy may be fewer from coal or gas than if the fuel is wind. But
natural gas also has a significant impact to the economy if a portion of the natural gas
comes from within the state and is transported by state industry. If a big portion of the
labor for coal extraction or coal transportation comes from within the state, then coal will
bring significant spending to the state (however, according to our assumptions, not as
much as wind power would bring for the equivalent amount of energy produced).
Energy planners and the energy industry should consider studies like this when deciding
where to site a power plant and which benefits can be offered to local communities from
the addition of a new power plant. This information is also valuable in making state- or
regional-level policy decisions about energy resources and state-sponsored incentives,
such as renewable portfolio standards or energy incentives.
Additional research is needed on this topic, especially on county and state taxes and on
project financing. It is likely that tax impacts are so specific to each case that they will
have to be evaluated on a case-by-case basis. This study did not include externalities such
as air pollution, effects to the local environment, or payments to the state for black lung
disease. Another study might include such costs. Future work might also address the
difference in consumer rate impacts associated with different plants.
Acknowledgments
This work was funded by the U.S. Department of Energy’s Wind Powering America
program. An earlier version of this paper’s results was displayed in a poster session at the
Global WINDPOWER 2004 Conference in Chicago, Illinois. The author wishes to thank
the energy experts, developers, analysts, power plant owners and operators, railroad
administrators, and the county and state government officials who provided information.
Additionally, this work would not have been possible without generous help from
Michael Milligan of NREL, Brian Parsons of NREL, Marshall Goldberg, Steve Clemmer,
Rich VanderVeen, Kerry Battel, Peter Curtiss, Ron Lehr, John Nielson, Randy Udall,
Dale Osborn, Craig Cox, and Paul Komor. Finally, the author thanks Larry Flowers of
NREL for his support of this work.
28
ELECTRONIC FILING, RECEIVED, CLERK'S OFFICE, JANUARY 5, 2007
* * * * * PC #7 * * * * *
References
Amos, J. “Xcel Tax Credits Total $33 Million.”
The Pueblo Chieftain.
Pueblo, Colorado,
February 19, 2004.
Clemmer, S. (2001).
Strong Winds: Opportunities for Rural Economic Development
Blow Across Nebraska.
Cambridge, MA: Union of Concerned Scientists, February 2001.
Costanti, M. (2004).
Quantifying the Economic Development Impacts of Wind Power in
Six Rural Montana Counties Using NREL’s JEDI Model.
NREL/SR-500-36414. Golden,
CO: National Renewable Energy Laboratory.
Goldberg, M.; Sinclair, K; Milligan, M. (March 2004.) “Job and Economic Development
Impact (JEDI) Model: A User-Friendly tool to Calculate Economic Impacts from Wind
Projects.” Prepared for Global WINDPOWER 2004, March 28-31, 2004. NREL/CP-500-
35953. Golden, CO: National Renewable Energy Laboratory, 12 pp.
Kaas Pollock, L.; Gagliano, T.
Tax and Landowner Revenue from Wind Projects
.
Legisbrief Vol. 12, No. 5, Denver, CO: National Conference on State Legislatures.
January 2004.
Madsen, T.; Bonin, S.; Baker, M. (2002).
Wind Energy: Powering Economic
Development for Colorado
. Denver, Colorado: Colorado Public Interest Research
Foundation, November 2002
.
National Wind Coordinating Committee. (1997).
The Effect of Wind Energy Development
on State and Local Economies
, Wind Energy Series No. 5, accessed April 13, 2006 at
www.nationalwind.org/publications/wes/wes05.htm
Regional Economics Applications Laboratory.
Job Jolt: The Economic Impacts of
Repowering the Midwest: The Clean Energy Development Plan for the Heartland
.
Chicago, IL: Environmental Law and Policy Center, 2001. Accessed April 13, 2006 at
www.repowermidwest.org/Job%20Jolt/JJfinal.pdf
Tegen, S. (May 2004). “A Comparison of Statewide Economic Impacts of New
Generation from Wind, Coal, and Natural Gas in Colorado.” Prepared for the American
Wind Energy Association’s WINDPOWER Conference, May 2004. NREL/CP-500-
38154. Golden, CO: National Renewable Energy Laboratory, 34 pp.
VanderVeen, R.F.
Michigan Economic Impacts of Wind Energy Compared with Coal and
Natural Gas.
For the Michigan Public Service Commission. April 2005.
“Wind Energy Creates Jobs, Power in East Kern.”
Land and Progress,
Fall 1995.
29
ELECTRONIC FILING, RECEIVED, CLERK'S OFFICE, JANUARY 5, 2007
* * * * * PC #7 * * * * *
Wiser, R.; Kahn, E. (1996).
Alternative Windpower Ownership Structures: Financing
Terms and Project Costs
. LBNL-38921.
Berkeley, California: Lawrence Berkeley
National Laboratory.
30
ELECTRONIC FILING, RECEIVED, CLERK'S OFFICE, JANUARY 5, 2007
* * * * * PC #7 * * * * *
Bibliography
Acker, T.L.; Williams, S.N.; Duque, E.P.N. (September 2004). “Evaluating the Most
Promising Sites for Wind Energy Development in Arizona USA.” Prepared for the 8
th
World Renewable Energy Congress, September 2004. Working Paper Series 05-09.
Flagstaff, AZ: Northern Arizona University, 5 pp.
Bird, L.; Parsons, B.; Gagliano, T.; Brown, M.; Wiser, R., Bolinger, M. (2003).
Policies
and Market Factors Driving Wind Power Development in the United States.
NREL/TP-
620-34599. Golden, CO: National Renewable Energy Laboratory.
Boschee, Pam (ed.)
As the pendulum swings: Riding high on the boom – Operating
performance 2001-2002
. Industry report for Energy Ventures Analysis, Inc. November
2002, pp. 21-225.
Colorado Tax Law from the Colorado Constitution “Uniform Taxation and Exemption,”
Article X, Section 3 (1B).
http://i2i.org/Publications/ColoradoConstitution/cnart10.htm#Section%203
Darmstadter, J.
Productivity Change in U.S. Coal Mining.
www.rff.org/Documents/RFF-DP-97-40.pdf
. Washington, DC: Resources for the Future,
July 1997.
Energy Information Agency. Electric Power Annual 2000, Volume 1.
www.eia.doe.gov/cneaf/electricity/epav1/epav1_sum.html
Jacobsen, M.Z.; Masters, G.M. “Exploiting Wind Versus Coal.”
Science
, Vol. 293,
August 2001; p.1438.
Laitner, S; Goldberg, M.
Colorado’s Energy Future: Energy Efficiency and Renewable
Energy Technologies as an Economic Development Strategy.
A report for the U.S.
Department of Energy, Denver Support Office and Golden Field Office. Golden, CO.
April 1996.
Northwest Economics Associates.
Assessing the Economic Development Impacts of Wind
Power Final Report.
For National Wind Coordinating Committee, February 2003.
31
ELECTRONIC FILING, RECEIVED, CLERK'S OFFICE, JANUARY 5, 2007
* * * * * PC #7 * * * * *
Personal Communication
Some personal communication for this research is considered confidential.
Agencies,
companies, and organizations allowed the author to use their data in aggregate only. In
some cases, the author is able to list company or organization names, but not employee
names. Personal communication for this project included data and advice from the
following:
Andy Wyatt, Prowers County Assessor
Aquila Networks
Basin Electric Power Cooperative
Boulder County Treasurer’s Office
Colorado Mining Association
Colorado Oil and Gas Commission
Colorado Rural Electric Association
Craig Cox
Dale Osborn, DISGEN Systems
Energy Intelligence Group, Inc. for pipeline capacity information
EnXco, Inc.
La Plata County Assessor’s and Treasurer’s Offices
Mark Walker, State Division of Taxation
Marshall Goldberg, MRG & Associates
Michael Milligan, National Renewable Energy Laboratory
Deb Meyer, Colorado Office of Taxation, State Division of Property Taxation
Peter Curtiss, Curtiss Engineering
Platts Energy Consulting, a Division of McGraw-Hill
Prowers County Assessor’s Office
Ryan Wiser, Lawrence Berkeley Laboratories
Steve Clemmer, Union of Concerned Scientists
Susan Innis, Western Resource Advocates
Susan Norman Williams, Northern Arizona University
Tri-State Generation and Transmission Association, Inc.
Troy Gagliano, National Conference on State Legislatures
Weld County Treasurer
Xcel Energy’s power plant operators
32
ELECTRONIC FILING, RECEIVED, CLERK'S OFFICE, JANUARY 5, 2007
* * * * * PC #7 * * * * *
F1147-E(12/2004)
REPORT DOCUMENTATION PAGE
Form Approved
OMB No. 0704-0188
The public reporting burden for this collection of information is estimated to average 1 hour per response, including the time for reviewing instructions, searching existing data sources,
gathering and maintaining the data needed, and completing and reviewing the collection of information. Send comments regarding this burden estimate or any other aspect of this
collection of information, including suggestions for reducing the burden, to Department of Defense, Executive Services and Communications Directorate (0704-0188). Respondents
should be aware that notwithstanding any other provision of law, no person shall be subject to any penalty for failing to comply with a collection of information if it does not display a
currently valid OMB control number.
PLEASE DO NOT RETURN YOUR FORM TO THE ABOVE ORGANIZATION.
1. REPORT DATE
(DD-MM-YYYY)
May 2006
2. REPORT TYPE
Technical Report
3. DATES COVERED
(From - To)
5a. CONTRACT NUMBER
DE-AC36-99-GO10337
5b. GRANT NUMBER
4. TITLE AND SUBTITLE
Comparing Statewide Economic Impacts of New Generation from
Wind, Coal, and Natural Gas in Arizona, Colorado, and Michigan
5c. PROGRAM ELEMENT NUMBER
5d. PROJECT NUMBER
NREL/TP-500-37720
5e. TASK NUMBER
WER5 6103
6. AUTHOR(S)
S. Tegen
5f. WORK UNIT NUMBER
7. PERFORMING ORGANIZATION NAME(S) AND ADDRESS(ES)
National Renewable Energy Laboratory
1617 Cole Blvd.
Golden, CO 80401-3393
8. PERFORMING ORGANIZATION
REPORT NUMBER
NREL/TP-500-37720
10. SPONSOR/MONITOR'S ACRONYM(S)
NREL
9. SPONSORING/MONITORING AGENCY NAME(S) AND ADDRESS(ES)
11. SPONSORING/MONITORING
AGENCY REPORT NUMBER
12. DISTRIBUTION AVAILABILITY STATEMENT
National Technical Information Service
U.S. Department of Commerce
5285 Port Royal Road
Springfield, VA 22161
13. SUPPLEMENTARY NOTES
14. ABSTRACT
(Maximum 200 Words)
With increasing concerns about energy independence, job outsourcing, and risks of global climate change, it is
important for policy makers to understand all impacts from their decisions about energy resources. This paper
assesses one aspect of the impacts: direct economic effects. The paper compares impacts to states from equivalent
new electrical generation from wind, natural gas, and coal. Economic impacts include materials and labor for
construction, operations, maintenance, fuel extraction, and fuel transport, as well as project financing, property tax,
and landowner revenues. We examine spending on plant construction during construction years, in addition to all
other operational expenditures over a 20-year span. Initial results indicate that adding new wind power can be more
economically effective than adding new gas or coal power and that a higher percentage of dollars spent on coal and
gas will leave the state. For this report, we interviewed industry representatives and energy experts, in addition to
consulting government documents, models, and existing literature. The methodology for this research can be
adapted to other contexts for determining economic effects of new power generation in other states and regions.
15. SUBJECT TERMS
wind energy; economic development; economic impacts; coal; natural gas; Arizona; Michigan; Colorado; power
plants
16. SECURITY CLASSIFICATION OF:
19a. NAME OF RESPONSIBLE PERSON
a. REPORT
Unclassified
b. ABSTRACT
Unclassified
c. THIS PAGE
Unclassified
17. LIMITATION
OF ABSTRACT
UL
18. NUMBER
OF PAGES
19b. TELEPHONE NUMBER
(
Include area code)
Standard Form 298
(Rev. 8/98)
Prescribed by ANSI Std. Z39.18
ELECTRONIC FILING, RECEIVED, CLERK'S OFFICE, JANUARY 5, 2007
* * * * * PC #7 * * * * *
????????????
Opportunities
for
rural
economic
development
blow across Nebraska
S
TEVEN
C
LEMMER
????????????
Opportunities for rural economic development
blow across Nebraska
S
TEVEN
C
LEMMER
ELECTRONIC FILING, RECEIVED, CLERK'S OFFICE, JANUARY 5, 2007
* * * * * PC #7 * * * * *
????????????
Opportunities for Rural Economic Development
Blow Across Nebraska
S
TEVEN
C
LEMMER
Union of Concerned Scientists
February 2001
ELECTRONIC FILING, RECEIVED, CLERK'S OFFICE, JANUARY 5, 2007
* * * * * PC #7 * * * * *
© 2001 Union of Concerned Scientists
All rights reserved
Steven Clemmer
is a senior analyst in the UCS Clean Energy
Program.
The Union of Concerned Scientists is a partnership of citizens and
scientists working to preserve our health, protect our safety, and
enhance our quality of life. Since 1969, we’ve used rigorous
scientific analysis, innovative policy development, and tenacious
citizen advocacy to advance practical solutions for the
environment.
The UCS Clean Energy Program examines the benefits and costs
of the country’s energy use and promotes energy solutions that are
sustainable both environmentally and economically.
More information about UCS and the Clean Energy Program is
available at the UCS site on the World Wide Web, at
www.ucsusa.org/energy.
The full text of this report is available on the UCS website
(www.ucsusa.org/publications)
or may be obtained from
UCS Publications
2 Brattle Square
Cambridge, MA 02238-9105
Or email
pubs@ucsusa.org
or call 617-547-5552.
Printed on recycled paper
ELECTRONIC FILING, RECEIVED, CLERK'S OFFICE, JANUARY 5, 2007
* * * * * PC #7 * * * * *
????????
Figures
iv
Tables
v
Acknowledgements
vii
Executive Summary
ix
1. Introduction
1
2. Wind Power Development in the United States
4
State Policies and Wind Development
5
Wind Power and Economic Development
6
3. Wind Power in Nebraska
9
4. Methodology and Assumptions
13
Wind Power Costs in Nebraska
13
The Avoided Costs of Wind Power
16
Cost of Producing 10 Percent of Nebraska’s Electricity
from Wind Power
19
Estimating Economic Impacts
21
5. Potential Economic Impacts of Wind Development
in Nebraska
23
Construction and Manufacturing Impacts
24
Operation and Maintenance
25
Uncertainties
27
6. Conclusions
29
ELECTRONIC FILING, RECEIVED, CLERK'S OFFICE, JANUARY 5, 2007
* * * * * PC #7 * * * * *
iv
U
NION OF
C
ONCERNED
S
CIENTISTS
???????
1. Nebraska’s Wind Resources and Monitoring Sites
10
2. Median Income in Nebraska’s Most Windy Counties
11
3. Poverty Rate in Nebraska’s Most Windy Counties
11
4. Population is Declining in Most Windy Counties,
While the State Population Grows
12
5. Wind Power Capacity under an RPS of 10 Percent by 2012
in Nebraska and Displaced Capacity from New Natural
Gas Plants
20
6. New Jobs from the Construction and Operation of Wind
Projects under the RPS vs. an Equivalent Amount of
Electricity from Natural Gas and Coal
25
7. Additional Earnings from the Construction and Operation
of Wind Projects under the RPS vs. an Equivalent Amount
of Electricity from Natural Gas and Coal
26
8. Additional Gross State Product from the Construction and
Operation of Wind Projects under the RPS vs. an Equivalent
Amount of Electricity from Natural Gas and Coal
27
ELECTRONIC FILING, RECEIVED, CLERK'S OFFICE, JANUARY 5, 2007
* * * * * PC #7 * * * * *
Strong Winds
v
??????
1. Wind Technology Cost and Performance Projections
for a 50 MW Windfarm
16
2. Avoided Costs of Wind Power
18
3. The Incremental Cost of Providing 10 Percent of Nebraska’s
Electricity from Wind Power by 2013 vs. an Equivalent
Amount of Electricity from Natural Gas and Coal
21
4. Economic Impacts of Providing 10 Percent of Nebraska’s
Electricity with Wind Power in 2012 vs. an Equivalent
Amount of Electricity from Natural Gas and Coal
23
ELECTRONIC FILING, RECEIVED, CLERK'S OFFICE, JANUARY 5, 2007
* * * * * PC #7 * * * * *
????????????????
The author would like to thank Kate Allen, Marshall Goldberg,
Skip Laitner, Ben Paulos, Jeff Willis, and Tom Wind for their
assistance in providing information and review for this report.
We are grateful to the Energy Foundation for their support of this
work. The Union of Concerned Scientists is solely responsible for
its contents.
ELECTRONIC FILING, RECEIVED, CLERK'S OFFICE, JANUARY 5, 2007
* * * * * PC #7 * * * * *
Executive Summary
In recent years, wind power development and use has expanded rapidly in the United States
and around the world. This trend is expected to continue, especially in the Midwest. While
Nebraska has among the best wind energy resources in the nation, the state currently lags
behind its neighbors in developing wind power.
The Union of Concerned Scientists analyzed the potential economic benefits and costs of
expanding wind power in Nebraska. We found that the total net benefits to the state economy
of developing wind power instead of coal and natural gas are nearly $15 million per year
over a 20-year period. We based our analysis on a policy goal of generating 10 percent of
Nebraska’s electricity from wind power by the year 2012. This policy goal is achieved
through the implementation of a renewable portfolio standard (RPS). An RPS requires
electricity suppliers to sell a set amount of renewable energy to their customers. Meeting the
10 percent goal would result in 800 megawatts of wind capacity installed in the state by
2012.
New jobs and economic activity would be created directly from building, operating, and
maintaining wind facilities, as well as indirectly from local business supplying goods and
services to support those activities. We found that developing 800 megawatts of wind
capacity would, on net, create more jobs, earnings, and growth in gross state product than
developing natural gas and coal facilities to produce an equivalent amount of electricity. For
example, in 2012, the year the RPS goal is reached, there are 360 more jobs, $8 million more
in earnings, and $35 million more in gross state product. We found that wind projects
generate roughly 2.4 times more jobs during construction and 1.5 times more jobs from
ongoing operation and maintenance than do coal and natural gas plants.
Making a long-term commitment to develop wind power could help spur development and
expansion of businesses that manufacture wind turbines and related components in Nebraska.
We found that if half of the turbines and related components and all of the towers that are
needed to meet the 10 percent goal were manufactured in Nebraska, an additional 250 jobs,
$15 million in earnings, and $44 million in gross state product would be supported each year
over the 10-year period. Additional jobs and economic activity that could result from
exporting equipment to other states are not included in these estimates.
The analysis shows that wind power could be an important source of rural economic
development in Nebraska. We found that farmers and landowners would be receiving
$2.2 million in lease payments by 2012, assuming $2,000 per year for each wind turbine
installed on their land. Wind projects could also generate property tax revenues worth an
estimated $5.2 million by 2012, assuming private developers own half of the projects.
These benefits are most likely to accrue to the areas of the state that need them the most.
Median income levels in Nebraska’s ten windiest counties are, on average, 21 percent below
the state average, and poverty rates are higher than the state average in all but one of the
windiest counties. Moreover, while the state’s population is projected to grow 14 percent
between 1990 and 2010, population in the ten windiest counties is projected to decline by
ELECTRONIC FILING, RECEIVED, CLERK'S OFFICE, JANUARY 5, 2007
* * * * * PC #7 * * * * *
x
U
NION OF
C
ONCERNED
S
CIENTISTS
9 percent on average during the same period. This problem is particularly severe in Sheridan,
Keya Paha, and Scotts Bluff counties, where the population is projected to decline by 20 to
25 percent. The economic opportunity that wind power development provides has the
potential to offset this trend.
The two most important variables affecting the cost of wind power are ownership and the
availability of federal incentives. Our base case scenario assumed that Nebraska’s public
utilities would own half of the projects and private developers would own the other half, and
that federal incentives for wind power are available through 2006. Under this scenario, we
estimated that generating 10 percent of the state’s electricity with wind power instead of coal
and natural gas would cost an additional $3.5 million per year over a 20-year period or
roughly 7 cents per month on a typical household electric bill (using 500 kWh per month).
Under a high-cost scenario in which private developers own all of the projects and federal
incentives are not available, the typical household would pay an extra 59 cents per month in
2012. Under a low-cost scenario in which Nebraska’s public utilities owned all of the
projects and federal incentives are available through 2006, the typical household would save
about 20 cents per month in 2012.
By taking advantage of its as yet untapped wind resources, Nebraska will be taking an
important step toward reducing its reliance on expensive, aging nuclear power plants and
dirty coal plants that pollute the air and jeopardize the health of all Nebraskans. By starting
on this path now, the people of Nebraska can prepare themselves for the expected shortfall in
electricity generating capacity by relying on a clean source of power that is not subject to the
volatility of fuel markets.
Nebraska has a powerful opportunity to become a national leader in wind energy
development just as it has with ethanol production. States like Iowa, Minnesota, and Texas
are demonstrating that progressive state policies are key to fostering the growth of wind
power. This report shows that Nebraska can make a significant commitment to develop wind
power and maintain its low electricity rates, while providing net benefits to the state’s
economy and environment. Implementing a renewable portfolio standard in Nebraska could
help spur development of new industries, offer a new cash crop to farmers, and provide an
important source of jobs and income to rural communities.
ELECTRONIC FILING, RECEIVED, CLERK'S OFFICE, JANUARY 5, 2007
* * * * * PC #7 * * * * *
Introduction
The wind power industry is expanding rapidly all over the world. With an average annual growth
rate of 32 percent since 1995, wind power is the fastest growing energy source on the planet. In
2000, new wind power investments reached $4.6 billion. By 2004, global wind capacity is
projected to more than triple, and new wind power investments are projected to rise to
$7.6 billion.
1
Wind power is also booming in the United States. Between June 1998 and June 1999, nearly
$1 billion in wind turbines were installed in the United States— enough to power over 400,000
homes. US wind capacity is expected to double by the end of 2001, providing an estimated
$2.5 billion in new investment.
2
While wind power currently provides 0.1 percent of the
country’s power, the Department of Energy’s “Wind Powering America” initiative has set a goal
of producing 5 percent of the nation’s electricity from wind by 2020. DOE projects to achieve
this goal will add $60 billion in capital investment in rural America, provide $1.2 billion in new
income for farmers and rural landowners, and create 80,000 new jobs during the next 20 years.
Until recently, wind power was concentrated in California. Now large-scale turbines can be
found in more than half of the states. Farming regions in Minnesota and Iowa have emerged as
major wind power growth areas, followed by Texas, Wyoming, Colorado, and Wisconsin. By the
end of the year, the Northwest and Nevada will be home to the world’s two largest wind
projects.
3
State and federal policies have been the main driver for wind development in most
states. Wind power is also growing as a result of technology improvements, cost reductions, high
natural gas prices, and environmental concerns.
Nebraska has some of the best wind resources in the country. Yet it is lagging far behind its
neighbors in developing wind power. So far, only four large wind turbines have been built in the
state, providing 0.03 percent of its electricity. Moreover, Nebraska has not made a significant
future commitment to harness its wind potential.
Electricity generation in Nebraska is dominated by large coal and nuclear plants, which produce
enormous environmental and public health effects and risks. Coal is responsible for a host of ills,
including acid rain, smog, global warming, and mercury contamination of lakes. In 1998,
Nebraska spent about $113 million on imported coal to produce 64 percent of the electricity
generated in the state, exporting dollars and jobs in the process.
In 1998, nuclear plants produced 29 percent of the electricity generated in Nebraska. Nuclear
plants produce tons of highly radioactive waste, which must be stored safely for tens of
thousands of years. But nuclear power is slowly declining, mostly due to economic and safety
1
BTM Consult ApS, online at
www.btm.dk/overheads/wmu99/sld001.htm.
2
Brian Parsons, National Renewable Energy Laboratory, presentation at the
Harvesting Clean Energy
Conference,
Spokane, WA, January 29, 2001.
3
See “New Wind Plants in Northwest, Nevada to be World’s Largest,” American Wind Energy Association,
January 25, 2001, online at
www.awea.org/news/news010125nwn.html.
ELECTRONIC FILING, RECEIVED, CLERK'S OFFICE, JANUARY 5, 2007
* * * * * PC #7 * * * * *
2
U
NION OF
C
ONCERNED
S
CIENTISTS
problems. A 1997 study listed Nebraska’s
Cooper and Fort Calhoun plants as among the
least
competitive plants in the country.
4
Unlike other parts of the country, Nebraska has
sufficient electricity generating capacity to meet
its needs. In fact, Nebraska is a net exporter of
electricity. However, as the demand for
electricity continues to grow and as the state’s
aging coal and nuclear plants approach
retirement, new electricity supplies will be
needed to provide clean, reliable and affordable
power.
Nebraska’s 1997–2016 Integrated Resource Plan
indicates that the state could face a generating
capacity shortfall as early as 2005, when the
contract with out-of-state utilities for a share of
Cooper Nuclear Station’s power expires.
5
Assuming the contract is renewed or the power is sold
to another electricity provider, the report indicates that the state could still face a capacity
shortfall by 2008. The deficit grows to nearly 1,600 megawatts (MW) or 25 percent of the state’s
electricity needs by 2014, when the plant is scheduled to retire. A report by the North American
Electricity Reliability Council (NERC) predicts that the regional power pool that includes
Nebraska may need over 5,000 MW of new generating capacity by 2006, which is about the total
amount of electricity capacity currently used in Nebraska.
6
Nebraska is facing an important choice. It can continue to rely on imported fossil fuels and
expensive, aging nuclear plants, or it can invest in wind power and other clean homegrown
renewable electricity resources. Given Nebraska’s enormous wind and biomass resources, the
state could generate enough power to meet a significant portion of its own needs and could
export power from these resources to other states as well.
Beyond meeting its energy supply needs, wind power could provide an important boost for
Nebraska’s economy. Nebraska’s best wind resources are generally located in rural areas that
could benefit from new jobs and income. In September 2000, at the Nebraska Wind Energy
Forum in Lincoln, Governor Johanns suggested that wind power could provide a new
opportunity to grow the state’s economy, just as ethanol production has done (see box). He noted
that state policies had been instrumental in making Nebraska a national leader in ethanol
production.
4
Washington International Energy Group,
Nuclear Power Plants and Implications of Early Shutdowns for Natural
Gas Demand
, January 1997.
5
Nebraska Power Association,
Statewide Integrated Resource Planning Coordination Report (1997–2016)
, October
1996.
6
NERC 1999–2008 Reliability Assessment at page 71.
Until recently, few had mentioned Nebraska’s
wind resources as a way to grow the state’s
economy, and provide solid benefits to ag
producers. Once I started looking at the
numbers and what other states are doing, I
think we may have a tremendous opportunity
to build a new export industry just as we’ve
done with ethanol…The regional wind-to-
electricity story is not much different from the
development of Nebraska’s ethanol plants. We
were far behind other states in ethanol
production, but in six years we moved from an
also-ran to a national leader in ethanol
production because we established state
policies and incentives that made converting
corn to ethanol a state economic development
goal.
— Excerpts from Governor Johanns’ welcoming
remarks at the Nebraska Wind Energy Forum in
Lincoln, September 20, 2000.
ELECTRONIC FILING, RECEIVED, CLERK'S OFFICE, JANUARY 5, 2007
* * * * * PC #7 * * * * *
Strong Winds
3
Wind power is already stimulating economic development in several states. For example, wind
developers are paying farmers and landowners in Iowa and Minnesota about $2,000 per year for
each turbine installed on their land. These royalty payments can provide a stable supplement to a
farmer’s income, helping to counteract the swings in commodity prices. Wind development is
also creating new jobs in manufacturing, construction, operation, and maintenance of wind
turbines. In addition, private wind development is providing an important source of tax revenue
for many rural communities.
In this report, the Union of Concerned Scientists estimates the cost and potential economic
benefits of developing wind power in Nebraska. The impacts are based on generating 10 percent
of Nebraska’s electricity from wind power by 2012, as proposed in a bill introduced in the
Nebraska Legislature on January 16, 2001, by Senator Preister (LB 645). In addition to
estimating the potential statewide economic impacts of wind development, we also identify the
areas of the state that are most likely to benefit from wind development. Finally, we highlight
some of the economic benefits of wind development in other states that have adopted policies to
promote wind power.
ELECTRONIC FILING, RECEIVED, CLERK'S OFFICE, JANUARY 5, 2007
* * * * * PC #7 * * * * *
4
U
NION OF
C
ONCERNED
S
CIENTISTS
Wind Power Development in the United States
Several factors are fueling the growth of wind power in the United States. Among these are
technology improvements, declining cost, environmental and public health concerns, utility
green pricing, and federal incentives.
Since 1980, the cost of wind power has fallen by 80 to 90 percent, as a result of technology
improvements and economies of scale in manufacturing and installation. Wind energy experts
project that the cost will decline further in the future, as discussed later in the report.
While the cost of wind power is declining, the cost of natural gas— the fuel of choice for new
power plants— has suddenly increased. Natural gas prices have doubled over the past year, while
national spot market prices have quadrupled. Homeowners can expect to pay 70 percent more, on
average, for gas this winter than they paid last year, and the increase in gas use for electricity
generation will likely keep prices high for at least the next few years.
7
In contrast, the cost of wind power is relatively stable and predictable over a long period of time.
This is because most of the cost is in the initial capital investment, while the fuel (the wind) is
free. An increasing number of electricity providers have become interested in purchasing wind
power to provide insurance against volatile gas prices.
Environmental and public health concerns are also driving wind development growth. The
electricity industry is the single largest source of air pollution in the United States. Power plants
are responsible for over two-thirds of the sulfur dioxide emissions that produce acid rain, a
quarter of the smog-forming emissions, 40 percent of the heat-trapping emissions that cause
global warming. They are also the largest source of mercury emissions. One study found that by
2007, an estimated 30,000 people will die prematurely in the United States from coal plant soot.
8
In contrast, wind power does not produce air emissions, generate solid, toxic, or radioactive
waste, or use water. Therefore, wind power can help reduce both the cost of health care and the
cost of complying with environmental regulations. It can also provide insurance against more
stringent environmental requirements in the future.
Some wind development has resulted from voluntary customer purchases of green power. More
than 190 electric utilities in the United States are now offering a wind power product to their
customers, supporting an estimated 60 MW of new development.
9
Lincoln Electric Systems’ two
large wind turbines are supported through a green-pricing program.
7
See Bradley Keoun, “U.S. Natural Gas Costs Seen Even Higher Next Winter, AGA Says”
Bloomberg News
,
February 1, 2000; and EIA,
Short-term Energy Outlook
, December 2000, online at
www.eia.doe.gov.
8
Clean Air Task Force,
Death, Disease and Dirty Power: Mortality and Health Damage Due to Air Pollution from
Power Plants
, November 2000, based on Abt Associates, “Health Impacts Analysis” report, online at
http://cta.policy.net/fact/mortality/mortalitystudy.vtml.
9
Ed Holt and Associates, “A Quick Overview of Utility Green Pricing Programs,” presentation to the Nebraska
Wind Energy Forum, Lincoln, Nebraska, September 20, 2000.
ELECTRONIC FILING, RECEIVED, CLERK'S OFFICE, JANUARY 5, 2007
* * * * * PC #7 * * * * *
Strong Winds
5
Federal policy has also provided an important stimulus for wind development. The federal
production tax credit (PTC) and renewable energy production incentive (REPI) for public power
provides 1.5 cents per kilowatt-hour (adjusted for inflation) for 10 years. The PTC and REPI
were enacted to allow wind to compete on a more equal basis with fossil fuels and nuclear
power, which continue to receive billions of dollars in federal subsidies each year. Nebraska
public utilities are eligible to apply for REPI funds for any wind projects they develop.
State Policies and Wind Development
While these factors have contributed to the growth of wind power, the majority of US wind
development has occurred in states that have adopted supportive policies and created long-term
markets for renewable energy. In California, tax incentives and favorable long-term contracts for
renewables led to the birth of the modern wind industry in the early 1980s.
In the past few years, several states have made new commitments to develop renewable energy.
Twelve states have adopted minimum renewable electricity requirements. Fourteen states have
adopted renewable electricity funds, totaling about $3.7 billion by 2012. We estimate that these
new laws will, together, result in 8,550 MW of new renewable power between 1998 and 2012—
an increase of 63 percent over 1997 levels— as well as supporting 7,800 MW of existing
renewables.
10
This development will provide enough clean power to meet the entire electricity
needs of 5.6 million homes and reduce carbon dioxide— the main greenhouse gas implicated in
global warming— as much as taking 4 million cars off the road or planting 1.2 billion trees.
These new commitments have already led to large-scale wind development in Minnesota, Iowa,
Wisconsin, and Texas. The policies adopted in those states are described below.
Minnesota.
Minnesota is the second largest producer of wind power and the ninth windiest state
in the nation. Minnesota’s wind development stems from the 1994 “Prairie Island Settlement.”
The Minnesota Legislature passed a law allowing Xcel Energy (formerly Northern States Power)
to temporarily store nuclear waste at its Prairie Island nuclear plant on the Mississippi River. In
exchange, Xcel Energy was required to install or purchase 425 MW of wind power and 125 MW
of biomass power by 2002 and an additional 400 MW of wind by 2012. Under the requirement,
wind and biomass would provide about 5 percent of the state’s electricity in 2012. In addition,
the law requires Xcel to contribute $500,000 per year for each cask storing nuclear waste into a
fund to support new renewable energy projects. The fund will eventually provide up to
$8.5 million per year. To date, 272 MW of wind power has been installed in Minnesota and
another 164 MW has been proposed or is under development.
Iowa.
Iowa is the third largest producer of wind power and the tenth windiest state in the nation.
Iowa’s wind farm developments stem mostly from the Alternate Energy Production law of 1983.
In an effort to promote development of local resources and to implement the federal Public
Utility Regulatory Policy Act, the legislature required the state’s investor-owned utilities to
generate or purchase about 2 percent of their power from renewable resources. The utilities
fought the law for almost 15 years, appealing to both the Iowa Supreme Court and the Federal
10
These figures are based on an update to Steve Clemmer, Ben Paulos and Alan Nogee,
Clean Power Surge:
Ranking the States
, Union of Concerned Scientists, April 2000.
ELECTRONIC FILING, RECEIVED, CLERK'S OFFICE, JANUARY 5, 2007
* * * * * PC #7 * * * * *
6
U
NION OF
C
ONCERNED
S
CIENTISTS
Energy Regulatory Commission before finally complying.
11
Two large projects near Storm Lake
and Clear Lake totaling about 240 MW are supplying enough power to meet the needs of about
63,000 homes. While this development is sufficient to meet the utilities’ requirement under the
AEP law, two private wind developers are planning on building two new wind farms totaling
180 MW this year.
12
Developers have already made agreements with 40 landowners to lease
space for the turbines.
Wisconsin.
Wisconsin is the nation’s seventh largest producer of wind power, despite being
ranked eighteenth in terms of its wind energy potential. To address power shortages in the
summer of 1998, the Wisconsin Legislature passed a law requiring utilities to develop more
power plants, including 50 MW of new renewables. The four investor-owned utilities affected by
the law relied mostly on wind power to meet their renewables requirement. In 1999, Wisconsin
also adopted a renewable portfolio standard (RPS) and renewable energy fund under its
Reliability 2000 legislation. The RPS requires every electric utility in the state to provide
2.2 percent of its electricity sales from renewable energy by 2011, which could lead to an
estimated 300 MW of new renewables. The renewable energy fund will provide about
$2.8 million through 2008 for customer-owned renewable energy technologies.
Texas.
Texas is the fourth largest producer of wind power and has the second best wind resource
potential in the United States. In 1999, Governor George W. Bush signed into law a RPS
requiring 2,000 MW of new renewables by 2009. The RPS has led to a flurry of new wind
development. Over 730 MW of new wind development is currently planned, adding to the
188 MW already operating. Texas officials have said that the goal may be reached seven years
ahead of schedule and only two and a half years after the legislation was passed.
13
Wind Power and Economic Development
Wind power is providing important economic benefits in a number of states. The direct
economic benefits include new jobs and income from construction, operation and maintenance;
manufacturing of wind turbines and related components; payments to landowners; and tax
revenues. Examples of these benefits are discussed below. Indirect benefits also result as
expenditures for and income from these activities ripple through the local economy. Other
economic benefits can result from reducing energy imports, improving air quality, reducing
health care costs, and increasing tourism.
Construction, Operation, and Maintenance Jobs.
In Lake Benton, Minnesota, construction of
over 200 MW of wind power over a two-year period employed about 150 construction workers,
as well as 22 people to operate and maintain the plant. The facility is now the second largest
employer in town, after the school district, according to Jim Nichols, Lake Benton’s economic
development director. Iowa’s 240 MW of large-scale wind development created an estimated
200 short-term construction jobs and 40 long-term operation and maintenance jobs at an average
wage of $16 per hour.
11
Bentham Paulos, “Light at the End of the Wind Tunnel in Iowa,”
Windpower Monthly
, December 1999.
12
“Energy Companies Plan 2 Wind Farms in Iowa,” Associated Press, January 14, 2001.
13
“Texas Utilities Power Ahead on Meeting Renewable Energy Goal,” American Wind Energy Association press
release, August 31, 2000, online at
www.awea.org.
ELECTRONIC FILING, RECEIVED, CLERK'S OFFICE, JANUARY 5, 2007
* * * * * PC #7 * * * * *
Strong Winds
7
Manufacturing Jobs.
The recent growth in wind development in the Midwest has attracted new
businesses to the region to manufacture wind turbines and related components. For example, in
1999, LM Glasfiber, a Danish manufacturer of wind turbine blades, opened a plant in Grand
Forks, North Dakota, that employs 130 local people at a starting salary of roughly $10 per hour
with benefits.
14
The new jobs are equivalent to 20 percent of the total jobs in the state’s lignite
coal industry. NEG Micon, a Danish wind turbine manufacturer, recently opened a plant in
Champaign, Illinois, that employs over 30 people. It also located its US headquarters in Rolling
Meadows, Illinois.
15
In June 2000, Vestas, another Danish company and the world’s leading
manufacturer of wind turbines, announced plans to open their US headquarters and build their
first American turbine manufacturing plant in Pueblo, Colorado. It would employ over
600 people.
A few businesses in Nebraska have already benefited from wind development. When Enron
Wind built the two-turbine Springview project, they hired Daniels Manufacturing, a local family-
owned metal fabricating business in Ainsworth that specializes in making farm implements, to
design and fabricate custom parts for the towers. The design of the parts was so successful that
Enron Wind subsequently offered Daniels a contract to make the parts for an additional
300 towers in Minnesota and Iowa.
16
Valmont Industries, a leading manufacturer of center-pivot
irrigation systems headquartered in Omaha, was involved in the construction of some of the
turbines in Iowa and Texas and recently began development of a new support structure for wind
turbines.
Landowner Revenues.
Wind developers typically pay landowners around $2,000 per year over
a 30-year period for each turbine installed on their land, or roughly 2–3 percent of the project’s
annual revenue. Large wind turbines use only about a quarter acre of land, including access
roads, so farmers can continue to plant crops and graze livestock right up to the base of the
turbines. In a good year, it would take 20 acres of corn or 100 acres of rangeland to produce the
same amount of income as a single wind turbine.
17
Iowa’s wind farms are paying royalties to
115 landowners totaling $640,000 per year. At the Foote Creek wind facility in Carbon County,
Wyoming (the heart of coal country), landowners receive $140,000 in lease payments annually.
Tax Revenues.
Wind development can also generate significant property, sales, and income
revenues for rural communities. For example, a 20 MW wind farm in Kewaunee County,
Wisconsin, will result in annual property tax payments of $200,000 to the county, equivalent to
50 percent of their annual budget.
18
Iowa’s wind farms are generating an estimated $2 million
per year in property taxes. Wind developers typically pay 1–3 percent of the project’s value
annually in property taxes.
19
The extent to which wind power development in Nebraska would
14
Sam Black, “130 Jobs Blow into GF,”
Grand Forks Herald
, December 8, 1998.
15
Peter Kendall, “High Tech Windmills Churning up Hope,”
Chicago Tribune
, March 2, 1999.
16
Nebraska Wind Energy Task Force Report to Governor Johanns, January 25, 2001.
17
This assumes $100/acre for corn and $20/acre for producing beef on rangeland.
18
Michael Vickerman, RENEW Wisconsin, personal communication, 1999.
19
Matthew Brown and Johanna Woelfel,
Tax and Landowner Revenues from Wind Power Development
, National
Conference of State Legislators, State Legislative Report, April 2000.
ELECTRONIC FILING, RECEIVED, CLERK'S OFFICE, JANUARY 5, 2007
* * * * * PC #7 * * * * *
8
U
NION OF
C
ONCERNED
S
CIENTISTS
generate tax revenues will depend on whether the project is owned by public or private entities.
This is discussed in more detail later in the report.
Net Economic Benefits.
Several studies have shown that investments in wind and other
renewable energy sources can generate more jobs and income than investments in conventional
power plants. For example, the New York State Energy Research and Development Authority
estimates wind energy produces 27 percent more jobs per kilowatt-hour than coal plants and
66 percent more jobs than natural gas plants. A 1995 study by the Wisconsin Energy Bureau
found that investing in 800 MW of renewables (including 200 MW of wind) by 2010 would
create 3,300 more jobs, $81 million in higher disposable income, and a $165 million increase in
gross state product, compared with investing in coal and natural gas power plants.
20
The
additional income from renewables is equivalent to a benefit of 2 cents per kilowatt-hour for the
state.
20
Steven Clemmer, Wisconsin Energy Bureau,
Fueling Wisconsin’s Economy with Renewable Energy,
1995.
ELECTRONIC FILING, RECEIVED, CLERK'S OFFICE, JANUARY 5, 2007
* * * * * PC #7 * * * * *
Strong Winds
9
Wind Power in Nebraska
Nebraska has four large-scale wind turbines currently operating in the state, representing 2.8
MW of capacity. Lincoln Electric Systems owns two 660 kW turbines near Lincoln, which are
supported through a green-pricing program. The output from the first turbine was fully
subscribed in about two months, leading LES to install a second turbine.
21
The Nebraska Public
Power District and several other utilities are collaborating with the Electric Power Research
Institute and the US Department of Energy (DOE) on a demonstration project near Springview,
consisting of two 750 kW turbines.
Nebraska’s installed wind capacity is modest considering the state’s excellent wind resources
and the progress made in other states. Nebraska is the sixth windiest state in the nation,
according to a DOE study.
22
A 1993 study by the Union of Concerned Scientists,
Powering the
Midwest
, found that Nebraska has sufficient wind resources to theoretically produce 26 times its
1998 electricity use, though transmission constraints would limit the potential far below this
level.
23
To better understand the state’s wind potential, the Nebraska legislature, the Nebraska Power
Association, and the state energy office reached an agreement in 1994 to complete a state wind
resource assessment. During the next four years, data collected from eight sites around the state
identified average wind speeds ranging from 14.4 to 16.4 miles per hour at 40 meters above the
ground.
24
The results were largely consistent with the estimates made in
Powering the Midwest.
The sites with the best resources are located in the north-central part of the state near Valentine,
Springview, and Stuart, and in the southwestern part of the state near Imperial. However, many
other areas of the state are likely to have sufficient wind resources to support wind power
development.
The Nebraska wind resource map developed in
Powering the Midwest
is shown in Figure 1,
along with the wind monitoring sites. This map groups areas according to their predicted average
annual wind speeds. Most utility-scale wind plants are being installed in class 4, 5, and above
areas, but projected improvements in wind technology should make class 3 areas attractive in the
future.
25
Smaller wind turbines for residential and farm applications are designed to run in lower
class 2 and class 3 wind speeds.
21
Al J. Laukaitis,. “LES Harnesses Renewable Energy Blowin’ in the Wind,”
Lincoln Journal Star
, December 14,
1998.
22
D. L. Elliott, L. L. Wendell, and G. L. Gower,
An Assessment of the Available Windy Land Area and Wind Energy
Potential in the Contiguous United States
, Northwest Laboratory, Richland, Washington, 1991, PNL-7789. Selected
results from the study are available online at
www.eren.doe.gov/wind.
23
This is based on class 4 wind resources and higher. Michael Brower et al,
Powering the Midwest: Renewable
Electricity for the Economy and the Environment
, Union of Concerned Scientists, 1993.
24
Nebraska Wind Energy Site Data Study: Final Report
, prepared by Global Energy Concepts, Inc. for the Nebraska
Power Association, May 1999.
25
Wind classes are defined by a range of wind power densities at a given height above the ground and relate to a
range of wind speeds. Wind power density is expressed in watts per square meter of swept rotor area, or the area
perpendicular to the wind flow. A class 5 wind class has a wind power density of 500–600 watts per square meter
and reflects wind speeds of 16.8 to 17.9 miles per hour at 50 meters above the ground.
ELECTRONIC FILING, RECEIVED, CLERK'S OFFICE, JANUARY 5, 2007
* * * * * PC #7 * * * * *
10
U
NION OF
C
ONCERNED
S
CIENTISTS
Figure 1. Nebraska’s Wind Resources and Monitoring Sites
Kimball
Rushv lle
Valentine
Springview
Stuart
Winnebago
Wahoo
Imperial
Source: UCS, Powering the Midwest, 1993.
Nebraska’s best wind resources tend to be located in rural areas that are in need of new sources
of jobs and income. For example, median income is 21 percent lower in the state’s ten windiest
counties (based on the UCS wind map) than the statewide average, as shown in Figure 2. The
poverty rate is also higher than the state average in all but one of the state’s most windy counties,
as shown in Figure 3. In addition, while the state’s population is projected to grow 14 percent
between 1990 and 2010, population in the windy counties is projected to decline by 9 percent on
average during the same period, as Figure 4 shows. This problem is particularly severe in
Sheridan, Keya Paha, and Scotts Bluff counties, where the population is projected to decline by
20–25 percent.
26
New jobs and income from wind development could help keep people in the
community.
26
This information, which appears in the Nebraska Wind Energy Task Force’s January 2001 report to Governor
Johanns, was originally prepared by the author for a presentation given at Nebraska’s Wind Energy Forum in
Lincoln in September 2000.
ELECTRONIC FILING, RECEIVED, CLERK'S OFFICE, JANUARY 5, 2007
* * * * * PC #7 * * * * *
Strong Winds
11
Figure 2. Median Income in Nebraska’s Most Windy Counties
0
5,000
10,000 15,000 20,000 25,000 30,000 35,000
Keya Paha
Boyd
Brown
Sheridan
Rock
Dundy
Banner
Holt
Scotts Bluff
Kimball
Cheyenne
State Average
$/year
Windy counties
21% lower than
state average
Figure 3. Poverty Rate in Nebraska’s Most Windy Counties
0%
2%
4%
6%
8%
10% 12%
14% 16%
18%
Sheridan
Keya Paha
Scotts Bluff
Rock
Brown
Holt
Boyd
Banner
Cheyenne
Dundy
Kimball
State Average
Poverty Rate
ELECTRONIC FILING, RECEIVED, CLERK'S OFFICE, JANUARY 5, 2007
* * * * * PC #7 * * * * *
12
U
NION OF
C
ONCERNED
S
CIENTISTS
Figure 4. Population is Declining in Most Windy Counties,
While the State Population Grows
-30% -25% -20% -15% -10% -5%
0%
5%
10%
15%
20%
Rock
Keya Paha
Dundy
Boyd
Brown
Banner
Holt
Sheridan
Cheyenne
Kimball
Scotts Bluff
State Average
Population Growth (1990-2010)
ELECTRONIC FILING, RECEIVED, CLERK'S OFFICE, JANUARY 5, 2007
* * * * * PC #7 * * * * *
Strong Winds
13
Methodology and Assumptions
We estimated the potential economic impacts of developing wind power in Nebraska based on
the following four steps. First, we calculated current and projected costs of developing wind
power in Nebraska. Second, we estimated the market value or “avoided costs” of developing
wind power in Nebraska, based on the conventional generation wind power would displace.
Third, we calculated the total cost and displacement effects of producing 10 percent of the
electricity used in Nebraska with wind power by 2012 to meet the RPS proposed in LB 645.
Finally, we applied the expenditures for wind and conventional generating technologies to an
input-output model of Nebraska’s economy to calculate economic impacts. Each of these steps is
described in more detail below.
Wind Power Costs in Nebraska
The cost of developing wind power in Nebraska will depend on several variables, including the
size and ownership of projects, financing costs, and the availability of federal incentives and
excess transmission capacity. Our assumptions for capital and operation and maintenance costs,
capacity factor, federal incentives, transmission costs, ownership and financing, and property
taxes are discussed below and summarized in Table 1.
Capital and Operation and Maintenance Costs.
Our assumptions for the current costs of
building and operating wind projects were based on information from recent projects installed in
the Midwest. We assumed a gradual decline in capital and operation and maintenance (O&M)
costs and a steady increase in efficiency and production of wind projects over a 20-year period
based on trends from a 1997 study by the Electric Power Research Institute (EPRI) and the US
Department of Energy (DOE).
27
The study predicts a decline in capital costs largely due to
increasing production volumes over time and a decline in O&M costs from economies of scale
from large turbines and taller towers. We assumed a typical project size of 50 MW to achieve
greater economies of scale in construction and volume purchases of wind turbines from
manufacturers. While smaller projects or clusters of small projects could be developed in
Nebraska, they are likely to be more expensive. For example, the 1.5 MW Springview project
had a fairly high capital cost of $1,377/kW. The EPRI/DOE study estimates that a 10 MW
project would cost about 20 percent more than a 50 MW project and a 100 MW project would
cost about 5 percent less.
Capacity Factor.
Capacity factor is the ratio between the amount of electrical energy produced
by a generating unit during a given period of time and the amount of electrical energy that could
have been produced at continuous full-power operation during the same period.
28
For the year
2000, we assumed a capacity factor of 37 percent based on the long-term projection for the
Springview project, as calculated by Global Energy Concepts for the EPRI/DOE Wind Turbine
27
Electric Power Research Institute and US Department of Energy,
Renewable Energy Technology
Characterizations
, December 1997, online at
www.eren.doe.gov/utilities/techchar.html
.
28
Energy Information Administration,
Annual Energy Review 1998
.
ELECTRONIC FILING, RECEIVED, CLERK'S OFFICE, JANUARY 5, 2007
* * * * * PC #7 * * * * *
14
U
NION OF
C
ONCERNED
S
CIENTISTS
Verification Program.
29
They based this projection on data from Nebraska’s four-year wind
monitoring study and two years of actual operating data. In 2000, the Springview turbines
operated at a 38.6 percent capacity factor. Springview was assumed to represent a typical site for
wind development in Nebraska. The state’s wind monitoring study recorded higher wind speeds
at two of the six sites with wind resources suitable for commercial development. We assumed,
based on projections from the EPRI/DOE study, that capacity factors would increase over time
due to taller towers, larger rotors, increased efficiency, and a reduction in losses due to weather,
blade soiling, control and turbulence, line losses, and other factors.
Federal Incentives.
Two federal incentives are available to encourage wind power development.
A Production Tax Credit (PTC), currently worth 1.7 cents per kWh for the first 10 years of a
project’s operating life and adjusted annually for inflation, is available to private wind
developers. The Renewable Energy Production Incentive (REPI) is an equivalent payment that
public utilities can apply for on an annual basis for the first 10 years of a project’s life. Funding
for the REPI is subject to annual appropriations by Congress, which makes its long-term
availability more uncertain. Since funding for the PTC basically comes from a reduction in taxes
that are paid to the US Treasury, its availability is virtually guaranteed once a project is built.
While these incentives are scheduled to expire at the end of 2001, there appears to be broad
bipartisan support from key members of Congress and the Bush administration to extend the
incentives for at least five years. Thus, for this analysis, we assumed that the PTC and REPI
would be extended for five years.
The amounts shown in Table 1 represent the value of the incentives spread out over a 20-year
period to make this value comparable with the annualized value of other costs. The value of the
PTC is higher than the REPI payment because private developers can receive additional tax
benefits from the tax credit. The PTC is actually worth about 2.4 cents per kWh for the first
10 years to private developers with sufficient tax liability.
30
Transmission Costs.
Transmission capacity in Nebraska and the Midwest is limited, particularly
in rural areas where the best wind resources often exist. While existing and proposed wind
projects in Iowa and Minnesota have required relatively modest new investments in
transmission, any significant new development in those areas is likely to require new or
upgraded transmission lines to get the wind power to demand centers. The situation is likely to
be similar in Nebraska. For this analysis, we assumed that 150 MW of wind power could be
added in Nebraska without incurring additional transmission costs beyond interconnection to the
existing transmission system. These costs are included in the capital cost estimates above. For
wind power capacity additions above the first 150 MW, we assumed that new transmission lines,
substations, and collection systems would cost $120 per kW.
31
29
H. Rhodes, J. VandenBoshe, T. McCoy, and A. Compton, Global Energy Concepts, and Brian Smith, National
Renewable Energy Lab,
Comparison of Projections to Actual Performance in the DOE-EPRI Wind Turbine
Verification Program
, Presented at the Windpower 2000 Conference in Palm Springs, Calif., May 2000.
30
For more information on this topic see Wiser and Kahn,
Alternative Windpower Ownership Structures: Financing
Terms and Project Costs
, May 1996, p. 36.
31
This cost estimate was based on a very simple analysis completed for this report by Thomas A. Wind, PE, Wind
Utility Consulting, Jefferson, Iowa. The estimate includes the cost of installing 180 miles of 345 kV transmission
ELECTRONIC FILING, RECEIVED, CLERK'S OFFICE, JANUARY 5, 2007
* * * * * PC #7 * * * * *
Strong Winds
15
Ownership and Financing
. Our analysis considered three possible ownership scenarios:
•
100 percent public
•
100 percent private
•
50 percent public/50 percent private
Table 1 shows the estimated cost of developing wind power in Nebraska for both public and
private ownership. For publicly owned facilities, we assumed 100 percent tax-exempt bond
financing at a 6.5 percent interest rate, with cost recovery over a 20-year period.
32
For privately
owned facilities, we applied the same financing assumptions as in the EPRI/DOE study for a
generating company using balance sheet or corporate finance, where debt and equity investors
hold claim to a diversified pool of corporate assets.
33
Florida Power and Light, the largest wind
developer in the United States, uses this form of financing.
Financing costs have a significant impact on the cost of wind power, as Table 1 shows. This is
because wind power is a capital-intensive technology, with low operating costs. Based on our
financing assumptions, publicly financed facilities are between 53 and 65 percent less expensive
than privately financed projects. The higher value the PTC provides for private facilities helps
offset some of the cost advantage of publicly financed projects. The level of funding available
for the REPI incentive, on the other hand, is less certain, as discussed above. Without the REPI
payment, we estimated that publicly financed projects would be as much as 15 percent less
expensive than privately financed projects with the PTC.
34
Property Taxes.
The extent to which wind development in Nebraska would generate property
tax revenues will depend on who owns the project. In Nebraska, all electricity is from publicly
owned entities. Public power in the state is subject to a unique taxing structure. Public power
districts pay 5 percent of annual gross revenue derived from retail electricity sales that includes
an amount equal to the 1957 payment in lieu of taxes. Under this structure, wind projects would
not be subject to property tax payments. However, wind projects owned by municipal utilities
would contribute to the tax local base. Private wind development in rural areas would pay
property taxes at an average statewide rate of about 1.5 percent of the project’s assessed value.
35
Property taxes are included in O&M costs.
line and associated substation equipment in North Central Nebraska to connect approximately 650 MW of wind
power to the existing electric grid.
32
This is the same interest rate used for financing wind projects in the Nebraska Power Association’s
1997– 2016
Integrated Resource Plan
, 1996.
33
EPRI/DOE, 1997, p. 7-1. A typical generating company capital structure consists of 35 percent debt at a 7.5
percent annual return and 65 percent equity at a 13 percent return. We have assumed that all costs are recovered over
a 20-year period.
34
Ryan Wiser and Edward Kahn, 1996.
Alternative Windpower Ownership Structures: Financing Terms and
Project Costs
, Lawrence Berkeley National Laboratory, Berkeley, Calif.
35
Kate Allen, legislative aide to Senator Don Preister, personal communication, January 2001.
ELECTRONIC FILING, RECEIVED, CLERK'S OFFICE, JANUARY 5, 2007
* * * * * PC #7 * * * * *
16
U
NION OF
C
ONCERNED
S
CIENTISTS
Total Cost of Wind Power
. Our estimate of 3.8 cents per kWh in 2000 for the total cost of
privately owned wind projects (over a 20-year period) is within the range of costs of existing
projects in the Midwest. For example, the large projects near Alta, Iowa, and Lake Benton,
Minnesota, are reportedly producing power for 3 to 5 cents per kWh. Florida Power and Light
recently proposed a 100 MW wind project for Hancock County, Iowa, that is expected to
generate electricity at 2.8 cents per kWh over a 20-year period.
36
All reported costs include the
production tax credit.
Table 1. Wind Technology Cost and Performance Projections for a 50 MW Wind Farm
2000
2005
2010
2015
2020
Hub Height (m)
65
70
80
85
90
Rotor Diameter (m)
50
55
55
55
55
Capital cost ($/kW)
1,100
939
810
726
660
O&M Cost (¢/kWh)
0.8
0.65
0.5
0.45
0.4
Capacity factor (%)
37.0
38.6
42.1
43.1
43.2
Total
Cost
without
Incentives & Transmission
Public Ownership (¢/kWh)
3.3
2.7
2.1
1.9
1.7
Private Ownership (¢/kWh)
5.2
4.2
3.3
2.9
2.6
REPI (¢/kWh)
(1.0)
(1.0)
0
0
0
PTC (¢/kWh)
(1.4)
(1.4)
0
0
0
Transmission ($/kW)
0
120
120
120
120
Total Cost with Incentives
& Transmission
Public Ownership (¢/kWh)
2.3
1.9
2.3
2.1
1.9
Private Ownership (¢/kWh)
3.8
3.3
3.7
3.3
3.1
Notes:
All costs and incentives are levelized over a 20-year period.
Hub Height
refers to the distance from the ground to the center of the rotor.
REPI applies to public ownership, PTC applies to private ownership.
The Avoided Costs of Wind Power
The avoided costs or “market value” of wind projects built in Nebraska will depend on the type,
location, cost, and performance of the displaced capacity and generation. Our assumptions for
these variables are explained below and summarized in Table 2.
Displaced Capacity.
The Mid-Continent Area Power Pool (MAPP), which includes Nebraska
and all or part of five other states in the upper Midwest, allows utilities with intermittent
generation like wind power, to claim a certain percentage of the projects nameplate capacity as
firm capacity. The MAPP method for determining the capacity credit is based on the correlation
between wind power output for specific sites and utility load data. The credit varies by month
36
Presentation by Florida Power & Light to the Governor’s Energy Policy Task Force, Des Moines, Iowa, January
3, 2001.
ELECTRONIC FILING, RECEIVED, CLERK'S OFFICE, JANUARY 5, 2007
* * * * * PC #7 * * * * *
Strong Winds
17
and the four-hour window when the utility normally peaks, and is based on the median value of
wind generation (with half of the hours being both above and below this value).
Several wind energy experts believe that the MAPP approach underestimates the actual capacity
value of wind because it only looks at select hours during the months. The more appropriate way
to determine the capacity value of wind is to look at the statistical correlation between wind
output and hourly utility load data throughout the year and over a long period of time. The reason
is that wind can often displace conventional capacity during other times of the year besides the
summer months when most utilities reach their peak demand, and particularly during the winter,
when many utilities in the upper Midwest experience periods of high electricity demand.
A 1994 study by the Nebraska Power Association calculated capacity credits for wind power
across a wide range of conditions using wind patterns from Ainsworth.
37
The study found that for
wind speeds similar to the Springview project, the capacity credit was slightly higher than the
capacity factor of the project. Several other studies that have correlated measured hourly wind
speeds to utility loads for specific locations have found capacity credit values that are similar to a
project’s capacity factor.
38
Therefore, in this analysis, we assumed that the capacity credit equals
the capacity factor of the Springview project.
As discussed in the introduction, Nebraska is likely to need new electric generating capacity at
some point between 2005 and 2010, according to the most recent integrated resource plan
developed for the state. The capacity deficit in Nebraska is projected to reach 1,600 MW or
25 percent of the state’s electricity needs by 2014. In addition, the upper Midwest is projected to
face a deficit of around 5,000 MW by 2006. A large portion of the state and regional deficit is
likely to be met with new natural gas combustion turbines (NGCT) and natural gas combined
cycle (NGCC) power plants, which have been the technologies of choice for new generation
elsewhere. In this study, we assumed that half of the capacity displaced by new wind projects
would be NGCC plants and the other half would be NGCT plants.
39
This assumption was based
on regional data from a UCS analysis that examined the impacts of a federal renewable portfolio
standard.
40
37
Nebraska Power Association,
Statewide Wind Resource Preliminary Economic Study
, April 1994. Capacity credit
estimates can be found in Chapter 6.
38
See Michael Milligan and Brian Parsons,
A Comparison and Case Study of Capacity Credit Algorithms for
Intermittent Generators
, National Renewable Energy Laboratory, NREL/CP-4440-22591, March 1997, available
online at
www.nrel.gov/wind;
and Theresa Flaim and Susan Hock, “Wind Energy Systems for Electric Utilities: A
Synthesis of Value Studies,” National Renewable Energy Laboratory, Golden, Colorado, 1984; and UCS also
completed an analysis in
Powering the Midwest
of the correlation between measured hourly wind speeds in Holland,
Minnesota, and hourly load data from Northern States Power based on data from 1985 through 1991. We found that
during the top 50 load hours of 1988— a very hot year— there was a 58 percent probability that wind farm output
would exceed 50 percent of rated capacity and a 70 percent chance that wind output would exceed 25 percent of
rated capacity. We calculated that average annual wind power output of a wind plant at the Holland site would be 37
percent of rated capacity. The average output or capacity factor was close to what we estimated to be the capacity
value of a wind power plant at the Holland site.
39
This capacity mix is based on estimates of summer capacity credit
40
Steve Clemmer, Alan Nogee and Michael Brower,
A Powerful Opportunity: Making Renewable Electricity the
Standard
, 1999.
ELECTRONIC FILING, RECEIVED, CLERK'S OFFICE, JANUARY 5, 2007
* * * * * PC #7 * * * * *
18
U
NION OF
C
ONCERNED
S
CIENTISTS
Displaced Generation.
When new wind projects in Nebraska generate power, they will displace
generation from the most expensive power plant operating at that point in time. In most cases,
this would be generation from new NGCC plants. However, there will be times during the year
wind projects will be generating power and the demand for electricity is low. During these times,
wind is likely to displace existing coal generation. In this analysis, we assume that two-thirds of
the generation displaced by wind power would come from NGCC plants and one-third would
come from coal plants. This assumption was based on regional data from an analysis we
completed that examined the impacts of a federal renewable portfolio standard.
Table 2. Avoided Costs of Wind Power
2000
2005
2010
2015
2020
Capital Costs ($/kW)
NGCT
462
435
375
356
353
NGCC
576
551
499
478
466
Transmission
35
35
35
35
35
Fixed O&M Costs ($/kW-yr)
NGCT
8.9
8.9
8.9
8.9
8.9
NGCC
14.1
14.1
14.1
14.1
14.1
Wind Capacity Credit
Wind Capacity Credit (%)
37.0%
38.6%
42.1%
43.1%
43.2%
Wind Capacity Factor (%)
37.0%
38.6%
42.1%
43.1%
43.2%
Displaced Capital Cost ($/kW)
554
528
472
452
445
Displaced Fixed O&M ($/kW-yr)
11.5
11.5
11.5
11.5
11.5
Fixed Charge Rate
10.1%
10.1%
10.1%
10.1%
10.1%
Subtotal (¢/kWh)
0.77
0.76
0.68
0.66
0.65
NGCC Operating Costs
Variable O&M Cost (¢/kWh)
0.01
0.01
0.01
0.01
0.01
Fuel Cost ($/MMBtu)
3.98
2.87
3.02
3.57
3.98
Levelizing Factor for Fuel Escalation
1.00
1.21
1.25
1.22
1.22
Heat Rate (Btu/kWh)
6,927
6,639
6,350
6,350
6,350
Fuel Cost (¢/kWh)
2.76
2.31
2.39
2.76
3.08
Subtotal (¢/kWh)
2.77
2.32
2.40
2.77
3.09
Coal Operating Costs
Variable O&M Cost (¢/kWh)
0.60
0.60
0.60
0.60
0.60
Fuel Cost ($/MMBtu)
0.58
0.56
0.54
0.52
0.50
Levelizing Factor for Fuel Escalation
0.94
0.93
0.94
0.94
0.94
Heat Rate (Btu/kWh)
10,700
10,700
10,700
10,700
10,700
Fuel Cost (¢/kWh)
0.58
0.56
0.54
0.52
0.51
Subtotal (¢/kWh)
1.18
1.16
1.14
1.12
1.11
Total (¢/kWh)
3.0
2.7
2.7
2.9
3.1
ELECTRONIC FILING, RECEIVED, CLERK'S OFFICE, JANUARY 5, 2007
* * * * * PC #7 * * * * *
Strong Winds
19
Cost and Performance of Conventional Power Plants.
To calculate the value of the displaced
capacity and generation, we used assumptions for the cost and performance of new natural gas
power plants from the Energy Information Administration (EIA).
41
Natural gas prices were based
on EIA data for the region. We adjusted gas prices upward for the period 2000–2003 to reflect
the recent increase in gas prices as reported in EIA’s
Short-term Energy Outlook
(December
2000).
Our assumptions for coal generation were based on actual operating data for existing coal plants
in Nebraska. Current coal prices were based on the statewide average. We assumed that coal
prices would decline over time in real terms (without inflation) based on long-term projections
from EIA.
Cost of Producing 10 Percent of Nebraska’s Electricity from Wind Power
To estimate the economic impacts of developing wind power in Nebraska, we assumed that the
renewable portfolio standard proposed in LB 645 would be implemented.
42
The proposal would
require that 1 percent of each retail electricity supplier’s total sales to Nebraska customers come
from renewable energy sources other than hydroelectric in 2003. The percentage would rise 1
percent in each succeeding year to 10 percent in 2012, then remain at 10 percent each year
thereafter.
43
We assumed that retail electricity sales would rise 1.5 percent per year, on average.
44
We also assumed that the requirement would be met entirely with wind power because its cost is
relatively low compared with other renewable energy technologies.
45
Based on these assumptions, we projected that about 80 MW of new wind capacity would be
needed, on average, each year over the 10-year period to meet the RPS target, resulting in a total
installed capacity of just over 800 MW of wind power in 2012, as Figure 5 shows. After 2012,
wind capacity steadily increases to 900 MW, as the 10 percent standard remains in place while
total electricity sales continue to grow. Based on the assumptions in Table 2, we projected that
this new wind capacity would displace 170 MW of new natural gas combustion turbine plants
and 170 MW of natural gas combined cycle plants by 2012. Figure 5 shows the total capacity
displaced from new natural gas plants.
As discussed above, two of the most important variables affecting the cost of wind power are
ownership (public vs. private) and financing and the availability of the federal PTC (for privately
financed projects) and REPI (for publicly financed projects). We considered the following three
scenarios to show a range of potential costs for different ownership structures:
41
EIA, Assumptions to the Annual Energy Outlook 2001 (AEO 2001), DOE/EIA 0554 (2001), online at
www.eia.doe.gov.
42
LB 645 was introduced by Senator Preister in the 97
th
Legislature of Nebraska, January 16, 2001.
43
The bill also includes a separate standard for hydro of 7% in 2003 through 2012. Wind and other non-hydro
renewables can compete with hydro to meet this standard, but it is unlikely that any non-hydro renewables would be
developed given the availability of large amounts of low cost of hydro generation.
44
Nebraska Public Power Association,
Statewide Integrated Resource Planning Report (1997-2016)
, October 1996.
The report projects that peak electricity demand in Nebraska will grow by 1.3% per year and retail electricity sales
will grow by a slightly higher, but unspecified amount.
45
In reality, other renewable energy technologies would likely be installed to meet the requirement, but in relatively
small quantities.
ELECTRONIC FILING, RECEIVED, CLERK'S OFFICE, JANUARY 5, 2007
* * * * * PC #7 * * * * *
20
U
NION OF
C
ONCERNED
S
CIENTISTS
•
Under a low-cost scenario where all new wind and natural gas projects are publicly
owned and the REPI is extended through 2006, we estimated that the RPS would save
Nebraska electricity consumers $12.5 million per year, on average, over a 20-year period
compared with business as usual. This is equivalent to a savings of about 19 cents per
month for a typical non-electric heating household using 500 kWh per month.
•
Under a high-cost scenario where all new wind and gas projects are privately owned and
the PTC is not extended after 2001, we estimated that the RPS would cost Nebraska
electricity consumers about $34 million per year, on average, over a 20-year period
compared with business as usual. This would be an extra 59 cents per month for a typical
non-electric heating household using 500 kWh per month.
•
Under a scenario where half of the wind and gas projects are owned by public entities and
the other half are owned by private developers, and the PTC and REPI are extended for
5 years, the cost of the RPS would be $3.5 million per year, on average, over a 20-year
period compared with business as usual. This would be an extra 7 cents per month for a
typical non-electric heating household using 500 kWh per month. Going forward we used
the 50/50 split between public and private ownership as the base case for our analysis.
These results are summarized in Table 3.
Figure 5. Wind Power Capacity under an RPS of 10 Percent by 2012 in Nebraska
and Displaced Capacity from New Natural Gas Plants
0
100
200
300
400
500
600
700
800
900
1,000
2003 2004 2005 2006 2007 2008 2009 2010 2011 2012 2013 2014 2015 2016 2017 2018 2019 2020
MW
Natural Gas
Wind
ELECTRONIC FILING, RECEIVED, CLERK'S OFFICE, JANUARY 5, 2007
* * * * * PC #7 * * * * *
Strong Winds
21
Table 3. The Incremental Cost of Providing 10 Percent of Nebraska’s Electricity from
Wind Power by 2012 vs. an Equivalent Amount of Electricity from Natural Gas
and Coal
Ownership
100% Public
50% Public/Private
100% Private
Impact
with
Incentive
a
without
Incentive
a
with
Incentive
a
without
Incentive
a
with
Incentive
a
without
Incentive
a
Annual Avg cost over 20 years (mil 2000$)
-12.5
-2.2
3.5
15.9
19.6
34.1
Rate Impact in 2012 (mills/kWh)
-0.38
-0.02
0.15
0.58
0.68
1.18
Avg cost per household in 2012 ($/month)
b
-0.19
-0.01
0.07
0.29
0.34
0.59
Change in monthly bill in 2012 (%)
c
-0.4%
0.0%
0.2%
0.7%
0.8%
1.4%
Net Present Value (mil. 2000$)
-102.6
-5.2
20
136.6
142.1
278.4
Notes:
Negative numbers represent incremental savings.
a. For 100 percent public financing scenario, incentive is REPI; for 100 percent private financing scenario, incentive
is PTC; for 50 percent public/50 percent private, incentive is split between REPI and PTC.
b. Assumes a typical non-electric heating household using 500 kWh per month.
c. Assumes an average price of 6.4 cents per kilowatt-hour.
Estimating Economic Impacts
To estimate the economic impacts of wind development, we make three important assumptions.
First, we assumed that half of all new wind and natural gas facilities are financed by public
power entities and half are financed by private developers. Second, we assumed that all wind,
natural gas, and coal generation is produced in Nebraska rather than imported from outside the
state. Third, we assumed that the REPI and PTC would be extended for five years.
We used an input-output model called IMPLAN to estimate the economic impacts of building
and operating wind projects in Nebraska.
46
Input-output models trace supply linkages in the
economy, allowing us to analyze the changes in expenditures brought about by investments.
Expenditures affect overall economic activity and, depending upon the type of expenditure,
support varying levels of employment, income, and economic activity. To capture the full
economic multiplier effects of building and operating wind projects in Nebraska, three separate
effects— direct, indirect, and induced— must be examined for each change in expenditure.
•
The
direct effect
refers to the on-site or immediate effects created by an expenditure. This
would include the on-site expenditure and jobs of the electrical or special trade contractors
hired to build, operate, and maintain wind projects.
•
The
indirect effect
refers to when a contractor or vendor receives payment for goods or
services delivered and is then able to pay others who support their own businesses. It
includes equipment manufacturers and wholesalers who provide the new technologies. It also
46
IMPLAN was developed by the Minnesota IMPLAN Group, Inc., Stillwater Minnesota. More information is
available online at
www.implan.com.
ELECTRONIC FILING, RECEIVED, CLERK'S OFFICE, JANUARY 5, 2007
* * * * * PC #7 * * * * *
22
U
NION OF
C
ONCERNED
S
CIENTISTS
includes such people as the banker who finances the contractor, the accountant who keeps the
books for the vendor, and the building owner where the contractor maintains local offices.
•
The
induced effect
refers to the wages spent on goods and services in the local economy by
the people who are directly and indirectly employed by the construction and operation of the
wind facilities.
The sum of these three effects yields a total effect that results from a single expenditure. The
employment and income ultimately generated by new investments in wind power depends on the
structure of the local or state economy. States that produce fabricated metal or electronic
products, for instance, could conceivably benefit from expanded sales of locally manufactured
wind turbines. Similarly, states that have the necessary skilled trades and experienced
construction firms would benefit from local employment during construction of the wind
projects. As Table 2 shows, our analysis estimated that the cost of building and operating wind
facilities would be roughly the same over time as the assumed mix of new natural gas and
existing coal generation.
ELECTRONIC FILING, RECEIVED, CLERK'S OFFICE, JANUARY 5, 2007
* * * * * PC #7 * * * * *
Strong Winds
23
Potential Economic Impacts of Wind Development in Nebraska
The economic impacts of providing 10 percent of Nebraska’s electricity with wind power in
2012 are compared with the impacts of generating an equivalent amount of electricity from the
assumed mix of new natural gas and existing coal plants in Table 4. In terms of jobs, the results
of the analysis show that in 2012 the added wind power projects generate 2.4 times more jobs
from construction and 1.5 times more jobs from O&M than do coal and natural gas plants. In
2012, wind plants generate 2.6 times more earnings during the construction phase, and somewhat
less earnings during the ongoing O&M of the facilities. This is because the vast majority of the
cost of wind power is embodied in its up-front capital cost. Once wind projects are installed, they
require a relatively modest level of ongoing staff and other expenditures. In contrast, a large
share of the cost of natural gas and coal power plants goes to pay for ongoing expenditures for
imported fuel. New natural gas power plants also have considerably lower capital costs than
wind projects.
Table 4. Economic Impacts of Providing 10 Percent of Nebraska’s Electricity
with Wind Power in 2012 vs. an Equivalent Amount of Electricity
from Natural Gas and Coal
a
Jobs
Earnings
(Million $)
Gross State
Product
(Million $)
Wind Power
Construction
b
410
20
56
Operation & Maintenance
c
360
16
29
Natural Gas & Coal Generation
Construction
b
173
8
19
Operation & Maintenance
d
240
20
30
Net Impact of Wind Power
Construction
b
237
12
37
Operation & Maintenance
120
–4
–2
Notes:
Figures may not add due to rounding.
a. Assumes all wind, natural gas, and coal generation is produced in
Nebraska.
b. Includes the economic activity generated from building new
transmission lines to support new wind and natural gas plants.
c. Includes the economic activity generated from royalty payments to landowners.
d. Includes the economic activity generated from expenditures for fuel.
ELECTRONIC FILING, RECEIVED, CLERK'S OFFICE, JANUARY 5, 2007
* * * * * PC #7 * * * * *
24
U
NION OF
C
ONCERNED
S
CIENTISTS
Construction and Manufacturing Impacts
Based on the cost estimates presented in Table 1, total construction and equipment costs for 800
MW of wind capacity installed through 2012 would be $700 million. In addition, we estimated a
total capital investment in new transmission lines and associated equipment of $78 million
through 2012. The economic impacts reported in Table 4 are based on a total expenditure of $77
million for the installation of 87 MW of wind capacity in the year 2012, which includes $10
million in transmission costs.
Approximately 75 percent of the total construction cost (not including investments in new
transmission lines) is for the wind turbines, towers, and related components. Most of this is
specialized equipment produced by a relatively small number of businesses around the country.
We assumed that all of this equipment, except for half of the towers, would be manufactured
outside of Nebraska. The remaining 25 percent of construction related costs are mainly for labor,
materials and services to support construction crews. We assumed that most of the expenditures
for these activities would be in the Nebraska. These include:
•
construction of roads, pads and foundations
•
electrical substation, transformer and cabling equipment purchases, construction and
installation
•
project construction and management, including labor and management wages, vehicles,
room and board, field office, legal services, and miscellaneous local purchases
•
construction and furbishment of the operations and maintenance facility
•
engineering and design
•
interconnection of the wind turbines to the electricity system
47
Overall, we assumed that 30 percent of the total construction-related expenditures for building
wind facilities would be spent in Nebraska’s economy.
By making a long-term commitment to develop wind power, the RPS could help spur
development and expansion of businesses that manufacture wind turbines and related
components in Nebraska.
48
As mentioned earlier, Daniels Manufacturing in Ainsworth and
Valmont Industries in Omaha are examples of Nebraska companies that have already benefited
from wind development in the Midwest. Using the IMPLAN model, we found that if half of the
47
This information is based on the 42 MW Cerro Gordo wind farm in Iowa and the wind farm in Lakota Minnesota,
as reported in
Potential Economic Benefits from Commercial Wind Power Facilities in the State of New Mexico
,
prepared by BBC Research and Consulting for the New Mexico Energy, Minerals, and Natural Resources
Department, July 2000.
48
One example of manufacturing capabilities expanding to meet local demand is in Sacramento, California. In 1997,
the Sacramento Municipal Utility District (SMUD) decided to buy 10 MW of solar photovoltaic systems over the
next five years. As part of the winning bid, Energy Photovoltaics, Inc., and Trace Engineering are required to locate
their manufacturing facilities in the Sacramento area. These companies are expected to bring as many as 280 new
manufacturing jobs to the Sacramento community. See “SMUD Board votes to bring ten megawatts of solar power
to Sacramento, Renews commitment to renewable energy,” SMUD news release, May 16, 1997. More recently, the
City of Chicago agreed to purchase $6 million in photovoltaic panels from the Spire Corporation in exchange for
building a manufacturing and assembly plant on a brownfield site in the Chicago.
ELECTRONIC FILING, RECEIVED, CLERK'S OFFICE, JANUARY 5, 2007
* * * * * PC #7 * * * * *
Strong Winds
25
wind turbines and related components and all of the towers that are needed to meet the 10
percent RPS requirement were manufactured in Nebraska, an additional 250 jobs, $15 million in
earnings, and $44 million in gross state product would be supported each year on average over a
10-year period. These potential benefits are illustrated in Figures 6 through 8. Additional jobs
and economic activity that could result from exporting equipment to other states are not included
in these estimates.
Figure 6. New Jobs from the Construction and Operation of Wind Projects under the RPS
vs. an Equivalent Amount of Electricity from Natural Gas and Coal
0
200
400
600
800
1,000
1,200
2003 2004 2005 2006 2007 2008 2009 2010 2011 2012 2013 2014 2015 2016 2017 2018 2019 2020
Jobs
Natural Gas and Coal
Wind (No Turbine Mfg In-state)
Wind (50% of Turbines Mfg In-state)
The wind turbines would offset the need for approximately $171 million in new natural gas
power plants. While we assumed that wind power would displace conventional generation and
capacity in Nebraska, it is plausible that new wind projects would displace higher cost generation
outside the state. Under these circumstances, wind power would generate even greater net
benefits for Nebraska than estimated in this analysis.
Operation and Maintenance
Annual expenditures for operating and maintaining wind farms would increase gradually over
time to $16.4 million in 2012 as more wind power is added. By 2012, the operation and
maintenance of 800 MW of wind farms in Nebraska would create 360 new jobs, $15 million in
earnings, and $26 million in GSP. This includes the economic activity generated from
landowners spending a share of their royalty payments on local goods and services. By 2012, we
estimated that landowners would be receiving $2.2 million in royalty payments, assuming they
receive 2.5 percent of the revenues from the project, which is about equal to $2,000 per turbine.
We estimated that the projects would also generate property tax revenues worth $5.2 million by
ELECTRONIC FILING, RECEIVED, CLERK'S OFFICE, JANUARY 5, 2007
* * * * * PC #7 * * * * *
26
U
NION OF
C
ONCERNED
S
CIENTISTS
2012. The analysis assumed that half of the wind projects would be financed by public entities
and would not be subject to property taxes.
Total expenditures for producing an equivalent amount of generation from gas and coal plants
will steadily increase over time to $55 million in 2012, which is over three times higher than the
O&M expenditures for wind. Over 80 percent of this total will go to pay for imported fuel,
including $38 million for imported gas and $5 million for imported coal in 2012. We assume a
portion of the expenditures for fuel are spent in Nebraska to pay for transportation-related costs
(i.e., transporting coal by train and gas by pipeline).
Relative Impacts.
In 1997, Nebraska employed about 1.2 million people and total personal
income was $39.1 billion. While the impacts of developing wind power are relatively small
compared with the overall state economy, the jobs and income that would be generated from
building and operating wind projects could be significant for rural communities. As shown
earlier, Nebraska’s 10 windiest counties have higher poverty rates and lower median incomes
than the state average, as well as declining populations. New economic activity from wind
development could help counteract these trends while diversifying these local economies.
The analysis shows that even without the local benefits of manufacturing, wind power would
produce more in-state economic benefits than imported natural gas and coal. If Nebraska is able
to attract the manufacturing capacity to build wind turbines or components in state or if wind
power displaces out-of-state generation, the economic benefits would be even greater.
Figure 7. Additional Earnings from the Construction and Operation of Wind Projects
under the RPS vs. an Equivalent Amount of Electricity from Natural Gas and Coal
0
10
20
30
40
50
60
2003 2004 2005 2006 2007 2008 2009 2010 2011 2012 2013 2014 2015 2016 2017 2018 2019 2020
Earnings (Million 1997$)
Natural Gas and Coal
Wind (No Turbine Mfg In-state)
Wind (50% of Turbines Mfg In-state)
ELECTRONIC FILING, RECEIVED, CLERK'S OFFICE, JANUARY 5, 2007
* * * * * PC #7 * * * * *
Strong Winds
27
Figure 8. Additional Gross State Product from the Construction and Operation
of Wind Projects under the RPS vs. an Equivalent Amount of Electricity
from Natural Gas and Coal
0
20
40
60
80
100
120
140
2003 2004 2005 2006 2007 2008 2009 2010 2011 2012 2013 2014 2015 2016 2017 2018 2019 2020
Gross State Product (Million 1997$)Natural
Gas and Coal
Wind (No Turbine Mfg In-state)
Wind (50% of Turbines Mfg In-state)
Uncertainties
Any analysis that makes projections out into the future inevitably has areas of uncertainty. To the
extent possible, we relied on the best and most current information available from actual
projects, peer-reviewed studies and credible sources like the Electric Power Research Institute
and the Energy Information Administration to develop our assumptions. In areas with greater
uncertainty, we made an effort to adopt conservative assumptions.
Nevertheless, potential changes to key variables could increase or decrease projected costs and
economic impacts. For example, we assumed that a typical size project would be 50 MW. Recent
projects installed in states like Minnesota, Iowa and Texas that have minimum renewable energy
requirements like the one modeled for Nebraska have typically been larger than this. As
discussed earlier, larger projects are likely to have lower per unit costs. We decided to use higher
capital costs for wind than projected in the EPRI/DOE study based on our review of the
information available from projects recently installed in the Midwest. However, if smaller
projects were installed in Nebraska it would likely increase costs.
As we shown in the report, project ownership can have a significant impact on the cost of wind
power. Under the proposed RPS, it is not clear whether projects would be developed by public or
private entities. While it appears that Nebraska’s public utilities could develop projects at lower
ELECTRONIC FILING, RECEIVED, CLERK'S OFFICE, JANUARY 5, 2007
* * * * * PC #7 * * * * *
28
U
NION OF
C
ONCERNED
S
CIENTISTS
cost than private developers, they do not have much experience building and operating wind
projects and may not want to take on the risk.
The capacity credit we adopted for wind is basely largely on detailed studies (including one in
Nebraska) of the correlation between projected output from a wind project and utility loads.
These studies have shown values similar to the assumed capacity factor of a given project. While
this may be a reasonable assumption for determining how much conventional capacity wind will
actually displace on the system, the value assigned to a given project will be based on the method
MAPP uses. It appears that existing projects that have been accredited by MAPP have received
lower capacity credits than we assume, though the data is limited. More research is needed to see
what an appropriate value would be for a typical site in Nebraska.
It is likely that other resources besides wind would be installed to meet the proposed RPS. We
assumed that the proposed RPS would be met entirely with wind power based on the experience
of places like Texas that have a similar requirement in place and given the relative economics of
wind compared to other renewables. State policies to incentivize other renewables like biomass
and solar would likely increase the costs of meeting the RPS, but add fuel diversity and broaden
the economic development benefits.
Other variables that we did not consider that could potentially reduce the costs projected in this
study include higher natural gas prices and policies to reduce carbon and other emissions.
ELECTRONIC FILING, RECEIVED, CLERK'S OFFICE, JANUARY 5, 2007
* * * * * PC #7 * * * * *
Strong Winds
29
Conclusion
While the economic benefits of developing wind power are relatively small compared with the
overall state economy, the jobs and income that would be generated from building and operating
wind power in Nebraska could be significant for farmers and rural communities. Nebraska’s
windy counties need new economic opportunities. They have higher poverty rates and lower
incomes than the state average, as well as declining populations. New economic activity from
wind development could help counteract these trends while diversifying these local economies.
This report shows that even without the local benefits of manufacturing wind turbines and related
components, wind power would produce more in-state economic benefits than imported natural
gas and coal. If Nebraska is able to attract manufacturing capacity or if wind power displaces
out-of-state generation, the economic benefits would be even greater. By developing its own
wind industry, Nebraska could also become a supplier to the booming US and international wind
market.
Nebraska has a powerful opportunity to become a national leader in wind energy development
just as it has with ethanol production. States like Iowa, Minnesota, and Texas are demonstrating
that progressive state policies are key to fostering the growth of wind power. This report shows
that Nebraska can make a significant commitment to develop wind power and maintain its low
electricity rates, while providing net benefits to the state’s economy and environment.
Implementing a renewable portfolio standard in Nebraska could help spur development of new
industries, offer a new cash crop to farmers, and provide an important source of jobs and income
to rural communities.
ELECTRONIC FILING, RECEIVED, CLERK'S OFFICE, JANUARY 5, 2007
* * * * * PC #7 * * * * *
2 Brattle Square
Cambridge, MA 02238-9105
617-547-5552
www.ucsusa.org
ELECTRONIC FILING, RECEIVED, CLERK'S OFFICE, JANUARY 5, 2007
* * * * * PC #7 * * * * *
Opened New Window - Print Preview
12/14/2006 09:54 AM
http://www.illinois.gov/PressReleases/PrintPressRelease.cfm?SubjectID=2&RecNum=5200
Page 1 of 4
Illinois would be the first state to achieve this level of energy independence; Governor sets goal of replacing 50%
of our energy supply with homegrown fuels
Plan to triple ethanol production and invest in clean coal technology will create 30,000 new downstate jobs and save
consumers billions of dollars
SPRINGFIELD – Governor Rod R. Blagojevich today unveiled a comprehensive long-term energy plan to replace
Illinois’ dependence on foreign oil with homegrown alternatives. The plan will help free consumers from the grip of
foreign oil and gas interests by giving drivers and homeowners alternatives to the high cost of gasoline, stabilize energy
prices, give Illinois farmers new markets for their crops, and create 30,000 new jobs. The Governor’s plan sets a goal of
replacing 50% of the state’s energy supply with homegrown fuels by 2017. Illinois would be the first state to reach this
level of energy independence.
The Governor’s plan would provide new incentives to help triple Illinois’ production of ethanol and other biofuels, and
build up to ten new coal gasification plants to convert Illinois coal into natural gas, diesel fuel and electricity. The plan
also includes construction of a pipeline from Central to Southeastern Illinois to transport carbon dioxide produced by
new energy plants to where it can be pumped underground to extract more oil and gas that sits underground in Illinois.
Trapping carbon dioxide underground will permanently prevent this greenhouse gas from being emitted into the
atmosphere. The plan calls for a dramatic expansion of renewable energy production as well as significant reductions in
energy use through investments in energy efficiency and conservation. Specifically, the Governor’s plan will:
• Invest in renewable biofuels by providing financial incentives to build up to 20 new ethanol plants and five new
biodiesel plants. These increases in ethanol and biofuels production would allow Illinois to replace 50% of its current
supply of imported oil with renewable homegrown biofuels;
• Increase the number of gas stations that sell biofuels, so that all gas stations offer 85% ethanol fuel (E-85) by 2017 and
help the auto industry to produce more and better flexible fuels vehicles that can run on either E-85 or regular gasoline;
• Invest $775 million to help build up to ten new coal gasification plants that use Illinois coal to meet 25 percent of
Illinois’ diesel fuel needs, 25 percent of natural gas needs and 10 percent of electricity needs by 2017;
• Build a pipeline to move carbon dioxide, a greenhouse gas, captured from coal gasification plants to oilfields in
Southeastern Illinois to extract more oil and natural gas and permanently store the carbon dioxide underground;
Print Release
Close Window
FOR IMMEDIATE RELEASE
August 22, 2006
Gov. Blagojevich unveils ambitious energy independence plan to reduce Illinois’ reliance on foreign oil
Governor’s plan would meet 50 percent of state’s motor fuel needs with alternative homegrown sources made from
crops and coal by 2017
ELECTRONIC FILING, RECEIVED, CLERK'S OFFICE, JANUARY 5, 2007
* * * * * PC #7 * * * * *
Opened New Window - Print Preview
12/14/2006 09:54 AM
http://www.illinois.gov/PressReleases/PrintPressRelease.cfm?SubjectID=2&RecNum=5200
Page 2 of 4
• Meet 10% of the state’s electricity needs from renewable energy sources by 2015, greatly boost investment in energy
efficiency, while finding ways to cut emissions and reduce motor fuel consumption by 10% in 2017.
“No other state has the combination of natural resources that we have here in Illinois. We’re the nation’s leading
producer of soybeans. We’re the #2 producer of corn. And we have the nation’s third largest reserves of coal. That
means opportunity – opportunity to turn more corn into ethanol and more soybeans into diesel fuel. And it means
turning coal into home heating fuel and electricity. It means creating 30,000 new jobs downstate. It means helping
consumers save billions of dollars in energy costs. And it means finding ways to help drivers use less gas and help
homeowners cut their utility bills. Our plan will allow us to meet 50% of our fuel needs with alternative, homegrown
sources of fuel by 2017,” said Gov. Blagojevich.
“Stop and think about what that means. It means that if we make the right investments now, within ten years, we’ll be
able to produce enough energy from our own natural resource to cut our dependence on foreign energy in half. That
means billions of our hard-earned dollars will stay here at home, in our economy, rather than leaving Illinois forever.
We have the resources. We have the technology. We have the expertise. And if we start today, we can solve this
problem in the next ten years. No other state can say that. And the federal government hasn’t even conceived of that
yet. But we can do it here in Illinois,” the Governor said.
Part One: Invest in Biofuels
The goal of the Governor’s energy plan is to replace 50 percent of the state’s current supply of imported oil with
renewable homegrown biofuels like ethanol and biodiesel. Since February, the average price of gasoline increased from
$2.17 a gallon to more than $3.00. At $3 a gallon, the average person spends about $500 more on gas than last year.
The Governor proposes to invest $100 million over the next 5 years to build up to 20 new ethanol plants across Illinois.
The additional ethanol production would generate an estimated $1.7 billion in business investment. The Governor
proposes investing an additional $100 million over the next ten years to build four plants in downstate Illinois using new
technology to create ethanol made from plant waste materials like corn husks and wood pulp – or “cellulosic ethanol.”
This means boosting the state’s annual ethanol production by more than 200 percent and meeting 50 percent of gasoline
needs by 2017. And, the Governor’s plan would invest $25 million to help build five new biodiesel plants, boosting the
state’s production by 200 percent to 400 million gallons per year or the equivalent to 25 percent of the state’s annual
diesel fuel needs by 2017. This additional biodiesel production will generate another $225 million in business investment
in Illinois.
Besides building new plants, the Governor will create a task force to drive continued investment in Illinois’s biofuels
industry. He will also issue an executive order to speed up construction of biofuels plants by expediting state permits
and streamlining the permitting process.
These investments in biofuels are expected to create more than 800 direct and permanent jobs at the facilities and 8,000
construction jobs. These jobs will generate an additional 7,000 indirect permanent jobs in total. The plan would greatly
help farmers sell to new markets and put farmers on the forefront in the effort to make Illinois energy independent.
Part Two: Increase Use of Biofuels
As Illinois produces more biofuels, the second major goal of the Governor’s energy plan is to make sure every gas
station in Illinois offers 85% ethanol fuel (E-85) by 2017. To reach this goal, the Governor proposes investing $30
million over the next 5 years to add 900 more E-85 pumps statewide by 2010, meaning 20 percent of Illinois gas
stations will offer E-85. Illinois will also work with automakers to offer more flexible fuel vehicles to Illinois drivers, by
providing up to $25 million incentives to produce more vehicles that can run on E-85. The state will also increase public
awareness about E-85 and promote use by local governments and private fleets. Increasing biofuels production and
consumption means cars will use cleaner burning, homegrown fuel and give drivers real alternatives to the high cost of
ELECTRONIC FILING, RECEIVED, CLERK'S OFFICE, JANUARY 5, 2007
* * * * * PC #7 * * * * *
Opened New Window - Print Preview
12/14/2006 09:54 AM
http://www.illinois.gov/PressReleases/PrintPressRelease.cfm?SubjectID=2&RecNum=5200
Page 3 of 4
gasoline.
Part Three: Invest in Advanced Coal Gasification Technology
In addition to high prices at gas pumps, consumers are also feeling the heat of high natural gas costs. Natural gas prices
have doubled since 2003. Even a five percent annual increase in natural gas translates into $600 more in costs for
households by 2015. The Governor’s plan would ensure that 25 percent of natural gas consumed in Illinois would come
from Illinois coal. Coal is found under 37,000 square miles in Illinois and contains more energy than the oil reserves of
Saudi Arabia and Kuwait combined. In fact, Illinois has 38 billion tons of recoverable coal, accounting for 12 percent of
all coal in the U.S. The Governor’s plan would invest $775 million over the next ten years to help build up to ten new
coal gasification plants across Illinois. These plants would meet 25 percent of Illinois’ diesel fuel needs, 25 percent of
natural gas needs, and ten percent of electricity needs by 2017. Coal gasification technology converts coal from a solid
to a gas that can be substituted for natural gas, diesel or electricity. Gasification is the cleanest and most efficient way
to convert coal to energy with low emissions of mercury and other air pollutions and allows for the capture and
underground storage of carbon dioxide, a greenhouse gas.
Of all states, Illinois is the best suited for large-scale development of coal gasification because of its vast coal reserves
and geology appropriate for carbon dioxide storage. Because of these advantages, two Illinois sites were selected out of
four national finalists for the FutureGen project, a federal public/private partnership to build the nation’s first zero
emissions coal fired power plant. The sites are Tuscola and Mattoon. If Illinois wins FutureGen, businesses and the
federal government would invest $1 billion in Illinois, creating 150 permanent jobs and 1,300 construction jobs. If
Illinois does not win FutureGen, these sites would be ideal to develop coal gasification plants in the future.
An investment of $775 million to build coal gasification plants would generate more than
$10 billion in new business investment in Illinois. These plants could create an estimated 1,000 new permanent jobs,
2,500 new mining jobs and 10,000 construction jobs through Central and Southern Illinois. The Governor’s plan also
calls for partnering with utility companies to purchase electricity and natural gas from coal gasification plants under long
term contracts that will help stabilize energy prices for consumers for years to come.
Part Four: Reduce Emissions and Recover More Oil and Gas
Even though coal gasification plants are much cleaner than traditional plants, they still emit carbon dioxide. The fourth
part of the Governor’s plan will make coal gasification plants even more environmentally friendly by capturing carbon
dioxide and safely storing it underground, instead of emitting it into the air. The Governor proposes building a pipeline
from gasification facilities in Central and Southern Illinois to Illinois Basin oilfields in Southeastern Illinois. Illinois’ oil
reserves hold more than one billion recoverable barrels of oil. Because the fields are mature, production cannot increase
without using advanced recovery techniques. “Enhanced Oil Recovery,” which uses carbon dioxide to extract more oil
from existing reserves, could nearly double the amount of petroleum produced by Illinois annually. The 100-mile
pipeline would transport the carbon dioxide captured by the coal gasification plants to oilfields and use the pressurized
carbon dioxide to extract more oil and gas.
Additionally, the carbon dioxide transported by the pipeline could extract methane from Illinois coal reserves. Illinois
coal reserves hold enough methane, a fuel similar to natural gas, to meet all of the state’s natural gas needs for seven
years.
The pipeline would cost about $100 million to build and would generate an estimated $12 million in annual revenue.
The royalties from the recovered oil and gas would subsidize the costs of sequestering the carbon dioxide.
Part Five: Reduce Energy Use, Improve Efficiency, Invest in Renewable Energy
ELECTRONIC FILING, RECEIVED, CLERK'S OFFICE, JANUARY 5, 2007
* * * * * PC #7 * * * * *
Opened New Window - Print Preview
12/14/2006 09:54 AM
http://www.illinois.gov/PressReleases/PrintPressRelease.cfm?SubjectID=2&RecNum=5200
Page 4 of 4
The Governor’s plan also focuses on using more sources of renewable energy and strategies to improve energy
efficiency and reduce energy consumption. To make Illinois energy more efficient, the Governor’s plan sets a goal of
reducing motor fuel consumption in Illinois by ten percent by 2017, allowing residents to save billions annually in fuel
costs. The Governor also proposes to work with the automobile industry, environmental groups, and consumer advocates
to form the Illinois Fuel Conservation Task Force to explore strategies to reach the goal of reducing fuel use by ten
percent by 2017.
Additionally, the state will focus on ways to boost renewable energy use while finding ways to conserve energy. Illinois
has powerful wind resources that can be harnessed to provide electricity to more than one million homes. By adopting a
Renewable Portfolio Standard, ten percent of Illinois’ electricity can be generated by clean, renewable energy sources
like wind by 2015. The Governor proposes that Illinois adopt an Energy Efficiency Portfolio Standard to greatly increase
investments in energy saving programs and technologies that can reduce utility bills for homes and businesses.
In other efforts to improve energy efficiency, the Governor’s plan calls for a $25 million revolving loan fund to support
energy efficiency investments in public buildings to reduce government energy usage. The Governor also proposes a $25
million revolving loan fund to support energy efficiency investments by small businesses and manufacturers. Finally, the
Governor’s plan includes adopting a building code for single-family homes similar to the code already adopted for
commercial buildings to meet modern energy efficiency standards. 42 other states have already adopted such residential
efficiency codes.
The Governor’s plan will cost an estimated $27 million annually in general revenue to support $1.2 billion of total
capital investment. To pay for the plan, the Governor will increase enforcement efforts to collect taxes from corporations
that currently evade taxation. The Illinois Department of Revenue estimates that businesses owe $35-40 million in sales
and corporate income taxes to the state. Some businesses collect sales taxes from customers but don’t remit the revenue
to the state. Others, mainly out-of-state corporations, illegally shelter income that goes uncollected. The Illinois
Department of Revenue will hire 150 more tax auditors to collect these delinquent taxes, producing more than $30
million in Fiscal Year 2007, and as much as $40 million in Fiscal Year 2008. These new revenues will help ensure tax
fairness and be collected without raising income or sales taxes or changing Illinois’ tax code.
“Taking these five steps means creating 10,000 permanent jobs and almost 20,000 construction jobs – and almost all of
them would be downstate. It means generating over $12 billion in private investment. It means giving our farmers new
markets for their corn and soybeans. It means helping Illinois companies produce more ethanol. It means reducing global
warming. And most importantly, it means giving consumers a choice and giving consumers a chance. Right now, we’re
held hostage to the whims of OPEC. We’re held hostage to complex political situations and unstable leadership in places
like Iran and Venezuela. We’re patronized and ignored by our leaders in Washington, and manipulated and extorted by
oil barons in the Middle East. It’s about time someone stands up for the American people. It’s about time someone says:
here’s the problem, here’s a plan – let’s act and let’s solve this problem,” said Gov. Blagojevich.
“This plan is different from anything we’ve ever done before. It’s different from anything any other state has tried
before. But these aren’t normal times. As countries like China and India continue to develop, the demand for oil and gas
is only going to grow. The supply will only decline. As a nation, we represent only 4% of the world’s population. But
we consume 25% of its annual energy use. Staying the course is not an option. Using our own natural resources is.
Someone has to act. And that someone is us.”
ELECTRONIC FILING, RECEIVED, CLERK'S OFFICE, JANUARY 5, 2007
* * * * * PC #7 * * * * *
Governor Rod R. Blagojevich
Energy Independence |
1
Governor Rod R. Blagojevich
Leading the Way to
Energy Independence
• Reducing Our Dependence
on Foreign Oil and Gas
• Stabilizing Gasoline and
Home Heating Prices
• Creating Jobs
• Reducing Energy Use and
Protecting the Environment
ELECTRONIC FILING, RECEIVED, CLERK'S OFFICE, JANUARY 5, 2007
* * * * * PC #7 * * * * *
Governor Rod R. Blagojevich
Energy Independence |
2
Introduction
• Our nation is in the midst of an energy crisis: we are
dependent on – even addicted to – foreign oil and
imported natural gas, which means higher gasoline
prices, higher costs to heat our homes, and no control
over our own destiny. That has to change.
• Failure at the federal level to find energy solutions has
left consumers vulnerable to the whims of OPEC and to
natural disasters like Hurricane Katrina.
• Unless Illinois develops a comprehensive plan to
address our energy needs, we will remain reliant on
foreign fuels and energy prices will continue to rise.
ELECTRONIC FILING, RECEIVED, CLERK'S OFFICE, JANUARY 5, 2007
* * * * * PC #7 * * * * *
Governor Rod R. Blagojevich
Energy Independence |
3
An Energy Crossroads
• Fortunately, here in Illinois we have a choice.
• No other state has the combination of agricultural
and geological resources that Illinois has.
• We can use our abundant corn, soybeans and coal
to become America’s leading producer of
alternative fuels.
• We will reduce our dependence on foreign oil,
stabilize energy prices, improve energy efficiency,
and provide consumers with real alternatives to
imported energy sources.
• We will create over 10,000 new, permanent jobs
and nearly 20,000 construction jobs.
ELECTRONIC FILING, RECEIVED, CLERK'S OFFICE, JANUARY 5, 2007
* * * * * PC #7 * * * * *
Governor Rod R. Blagojevich
Energy Independence |
4
An Energy Opportunity
• Our 10-year plan will allow us to transform
more Illinois corn into ethanol, more soybeans
into diesel fuel, and more coal into natural gas
to power our vehicles and heat our homes –
meeting 50% of our motor fuel needs by 2017.
• We will reduce our state’s fuel consumption,
establishing a goal of cutting fuel use by 10%
by 2017, allowing us to save billions annually
in fuel costs, and emit less carbon dioxide, a
leading cause of global warming.
ELECTRONIC FILING, RECEIVED, CLERK'S OFFICE, JANUARY 5, 2007
* * * * * PC #7 * * * * *
Governor Rod R. Blagojevich
Energy Independence
Our Energy Crisis:
Dependence on
Imported Oil & Natural Gas
ELECTRONIC FILING, RECEIVED, CLERK'S OFFICE, JANUARY 5, 2007
* * * * * PC #7 * * * * *
Governor Rod R. Blagojevich
Energy Independence |
6
Reliance on Foreign Oil
• Without foreign oil and imported natural gas, Illinois
couldn't fuel its cars or heat its homes.
• Illinois only produces:
7% of the crude
oil we use
23% of the
gasoline to fuel
our cars
1% of the natural
gas to heat our
Governor Rod R. Blagojevich
Energy Independence |
7
No Alternatives for Consumers
• Today, only 2% of vehicles in Illinois
are “flex fuel” vehicles, which can run
on either gasoline or ethanol.
• Illinois has about 130 85% ethanol
(E-85) pumps – up from just 14
in 2003
!
representing just 2% of
gas stations in our state.
• The federal government has failed to
address our dependence on traditional
energy, leaving consumers with few
alternatives for powering their cars or
heating their homes.
Illinois E-85 Stations
ELECTRONIC FILING, RECEIVED, CLERK'S OFFICE, JANUARY 5, 2007
* * * * * PC #7 * * * * *
Governor Rod R. Blagojevich
Energy Independence |
8
Federal Government Inaction
• The U.S. purchases 19%
of its petroleum from the
Persian Gulf, including
Iran and Iraq. If
international tensions
continue, so will high
oil prices.
• Since the decision to
invade Iraq, crude oil prices
have more than doubled, leading to skyrocketing gasoline
and diesel fuel prices.
• Neither the President nor Congress have taken any concrete steps
this year to solve the problem. Instead, they have deliberately stalled
bills designed to promote alternative sources of energy.
US Crude Oil and Average Gasoline Prices
$20
$30
$40
$50
$60
$70
$80
Mar-03 Aug-03 Feb-04 Jul-04 Jan-05 Jul-05 Dec-05 Jun-06
Crude Oil Prices (per barrel)
$1.00
$1.50
$2.00
$2.50
$3.00
$3.50
Gas Prices (per gallon)
Crude Oil Prices
Gasoline Prices
ELECTRONIC FILING, RECEIVED, CLERK'S OFFICE, JANUARY 5, 2007
* * * * * PC #7 * * * * *
Governor Rod R. Blagojevich
Energy Independence |
9
Handouts to the Oil Industry
• Since the invasion of Iraq, oil companies have enjoyed
record profits, including a $36 billion 2005 profit by Exxon
Mobil – the largest annual profit ever by a corporation.
• Oil and gas companies still receive billions annually in
federal subsidies, including being allowed to pump $65
billion worth of oil from public lands without paying
royalties to the government.
• Last year’s federal energy bill provided oil companies
with over $4 billion in new handouts, but did little to
reduce our dependence on foreign oil, help consumers,
or boost renewable fuel use.
ELECTRONIC FILING, RECEIVED, CLERK'S OFFICE, JANUARY 5, 2007
* * * * * PC #7 * * * * *
Governor Rod R. Blagojevich
Energy Independence |
10
Don’t Look for Federal Relief
We can’t rely on the federal government to reduce our
nation’s dependence on oil. Leaders in Washington have
refused to improve automobile fuel economy standards or
to aggressively invest in homegrown alternative fuels.
1. Rescind tax breaks to oil and gas
companies.
2. Investigate oil company price
manipulation.
3. Institute a windfall excise tax on
oil companies.
4. Accelerate research and
development of energy options.
Short-Term
Impact
Long-Term
Impact
Yes
Yes
Yes
No
Yes
Yes
No
No
Proposed Federal Solutions
Enacted
No
No
No
No
ELECTRONIC FILING, RECEIVED, CLERK'S OFFICE, JANUARY 5, 2007
* * * * * PC #7 * * * * *
Governor Rod R. Blagojevich
Energy Independence
Our Energy Crisis:
Rising Prices
ELECTRONIC FILING, RECEIVED, CLERK'S OFFICE, JANUARY 5, 2007
* * * * * PC #7 * * * * *
Governor Rod R. Blagojevich
Energy Independence |
12
Rising Gasoline Prices
• Since February
2006, the price of
a gallon of gasoline
in Illinois has risen
from $2.17 to
more than $3.00.
• At $3.00 per
gallon, an Illinois
resident spends on
average about $150 per month on gasoline –
or almost $500 annually more than last year.
Average Retail Gasoline Price in Illinois
$1.00
$1.50
$2.00
$2.50
$3.00
$3.50
Mar-03
Sep-03
Mar-04
Sep-04
Mar-05
Sep-05
Mar-06
Dollars per gallon
ELECTRONIC FILING, RECEIVED, CLERK'S OFFICE, JANUARY 5, 2007
* * * * * PC #7 * * * * *
Governor Rod R. Blagojevich
Energy Independence |
13
Rising Natural Gas Prices
• If paying $3 a gallon today isn’t bad enough, think about what
it costs to heat your home.
• Eight out of ten Illinois residents heat their home with natural
gas, and natural gas prices have doubled since 2003, with no
end to market volatility in sight.
$0
$2
$4
$6
$8
$10
$12
Oct-
01
Feb-
02
Jun-
02
Oct-
02
Feb-
03
Jun-
03
Oct-
03
Feb-
04
Jun-
04
Oct-
04
Feb-
05
Jun-
05
Oct-
05
Feb-
06
Natural Gas Prices in Illinois
$
/
m
m
B
t
u
ELECTRONIC FILING, RECEIVED, CLERK'S OFFICE, JANUARY 5, 2007
* * * * * PC #7 * * * * *
Governor Rod R. Blagojevich
Energy Independence |
14
Falling Natural Gas Supplies
• The U.S. has only 3% of known world natural gas
reserves, but accounts for 25% of global consumption.
• Today, about 85% of our supply is produced
domestically, but with U.S. natural gas discoveries
declining, we will need to find new sources of natural
gas.
• Most of the world’s natural gas reserves are in countries
like Russia and Iran, where political upheaval and
instability make these nations an unreliable source of
natural gas.
ELECTRONIC FILING, RECEIVED, CLERK'S OFFICE, JANUARY 5, 2007
* * * * * PC #7 * * * * *
Governor Rod R. Blagojevich
Energy Independence |
15
No Relief In Sight
• In 2015, the United States Department of Energy
predicts Illinois residents will pay $4.00 per gallon for
gasoline, or an average of $600 more per year than
they do today, if we don’t act now.
• If we have to import expensive natural gas, even a
5% annual increase in natural gas bills would cost the
typical household $600 more annually to heat their
home in 2015.
• By acting now, we can begin to solve our energy
crisis and help protect consumers if energy prices
continue to rise.
ELECTRONIC FILING, RECEIVED, CLERK'S OFFICE, JANUARY 5, 2007
* * * * * PC #7 * * * * *
Governor Rod R. Blagojevich
A New Energy
Path For Illinois
Energy Independence
ELECTRONIC FILING, RECEIVED, CLERK'S OFFICE, JANUARY 5, 2007
* * * * * PC #7 * * * * *
Governor Rod R. Blagojevich
Energy Independence |
17
Control Our Energy Destiny
• Illinois – and our nation – is facing a real energy crisis.
With federal inaction in the face of rising prices and
increasing dependence on foreign fuel, we need a bold
energy plan. If the federal government won’t act, we will.
• Illinois has the natural resources to boost fuel supplies,
stabilize energy prices and give consumers energy
alternatives.
• Illinois can take steps to reduce fuel and energy
consumption, which will save consumers money and
protect the environment.
ELECTRONIC FILING, RECEIVED, CLERK'S OFFICE, JANUARY 5, 2007
* * * * * PC #7 * * * * *
Governor Rod R. Blagojevich
Energy Independence |
18
Illinois’ Abundant Resources
Illinois produces corn, soybeans and coal statewide.
These natural resources will help Illinois provide more
alternative fuels.
Corn
Soybeans
Coal
ELECTRONIC FILING, RECEIVED, CLERK'S OFFICE, JANUARY 5, 2007
* * * * * PC #7 * * * * *
Governor Rod R. Blagojevich
Energy Independence |
19
Illinois’ Abundant Resources
• Illinois is the nation’s #1 soybean producer and, with the
Governor’s elimination of the state sales tax on biodiesel,
Illinois is becoming the largest biodiesel market in the
country.
• Illinois is the nation’s #2 corn producer and, with advances
in biotechnology, we expect to dramatically increase the
amount of corn we produce over the next ten years.
• Illinois has 38 billion tons of coal – the nation’s third largest
coal reserve – that can be transformed into clean diesel
fuel, home heating gas and electricity.
ELECTRONIC FILING, RECEIVED, CLERK'S OFFICE, JANUARY 5, 2007
* * * * * PC #7 * * * * *
Governor Rod R. Blagojevich
Energy Independence |
20
Our Goals
We can develop Illinois’ unique natural resources to:
1. Meet 50% of our motor fuel needs we use by 2017, and
25% of the natural gas we use by 2017.
2. Give consumers real energy choices that can help them
use less energy and save money.
3. Create thousands of jobs from new fuel production plants
and from increased demand for agricultural crops and coal.
4. Clean our air and reduce greenhouse gas emissions that
lead to global warming, by cutting consumption of motor
fuel.
ELECTRONIC FILING, RECEIVED, CLERK'S OFFICE, JANUARY 5, 2007
* * * * * PC #7 * * * * *
Governor Rod R. Blagojevich
Energy Independence |
21
Our Plan
We propose a five-part plan to expand Illinois’ energy
options over the next decade:
1. Invest in renewable biofuels like ethanol made from corn and
biodiesel made from soybeans.
2. Increase the number of gas stations that sell biofuels until all
gas stations provide E-85, and help the auto industry to make
more and better flex fuel vehicles.
3. Invest in natural gas, diesel fuel and electricity produced from
Illinois coal using advanced coal gasification technology.
4. Use captured carbon dioxide to boost extraction of resources
from of Illinois’s oil and natural gas reserves, while reducing
the environmental impact of coal gasification facilities.
5. Invest in renewable power and energy efficiency, while
Governor Rod R. Blagojevich
Energy Independence |
22
Energy Alternatives
Each element of our plan will play a key role in moving
Illinois toward reduced dependence on imported energy.
1. Invest in renewable biofuels like
ethanol and biodiesel
2. Make biofuels more available and
more usable
3. Invest in natural gas, diesel fuel and
electricity made from Illinois coal
4. Use recaptured CO2 to extract
more oil and gas
5. Invest in renewable power / energy
efficiency and reduce consumption
Elements of Our Plan
50% of our motor fuel needs will be met
by Illinois crops by 2017
100% of gas stations will provide E-85 biofuels
by 2017 (up from 2% today)
25% of our natural gas will come from Illinois
coal by 2017
Double Illinois’ oil production and boost natural
gas production
Generate cleaner electricity and reduce heating
and electricity costs for homes and businesses
Projected Benefits
ELECTRONIC FILING, RECEIVED, CLERK'S OFFICE, JANUARY 5, 2007
* * * * * PC #7 * * * * *
Governor Rod R. Blagojevich
Energy Independence |
23
Reduced
consumption
Energy Benefits
By 2017, 50% of our motor fuel and 25% of our natural
gas in Illinois can come from alternative sources.
Motor Fuel
Natural Gas
Traditional
sources
Traditional
sources
50%
25%
Biodiesel &
Diesel from Coal
Ethanol
Coal
Gasification /
Methane
Extraction
Reduced
consumption
Traditional
sources
TODAY
2017
Traditional
sources
Biodiesel
Ethanol/
IL Crude
23%
TODAY
2017
1%
Alternatives
ELECTRONIC FILING, RECEIVED, CLERK'S OFFICE, JANUARY 5, 2007
* * * * * PC #7 * * * * *
Governor Rod R. Blagojevich
Energy Independence |
24
Economic Benefits
• Illinois’ economy will benefit from this plan through
more stable energy prices, more jobs, and billions of
dollars in new business investment.
• Economic models indicate that our investment will
directly and indirectly generate more than 10,000 new
permanent jobs, at least 20,000 construction jobs and
over $12 billion in private investment.
• Using more of our natural resources for energy
production and reducing our energy consumption will
strengthen our economy by keeping more of the
dollars we spend on energy here in Illinois.
ELECTRONIC FILING, RECEIVED, CLERK'S OFFICE, JANUARY 5, 2007
* * * * * PC #7 * * * * *
Governor Rod R. Blagojevich
Energy Independence |
25
New Jobs from the Energy Plan
Construction
Permanent
Initiative
Jobs
Jobs
Biofuels*
8,000
7,000
Coal Gasification
**
10,000
3,500
Renewable Power
**
1,700
400
Total
19,700
10,900
• By implementing this new energy plan we can create over
30,000 jobs: nearly 20,000 construction jobs and 10,900 direct
and indirect permanent jobs through 2017.
* Includes both direct job estimates based on experience with existing and planned biofuels projects plus
estimates of indirect jobs using models that predict broader economic impact of biofuels investment.
Governor Rod R. Blagojevich
Step 1:
Invest in Biofuels
Ethanol & Biodiesel
Governor Rod R. Blagojevich
Energy Independence |
27
What Are “Biofuels”?
• Biofuels are cleaner burning, homegrown, renewable
fuels produced from plants, like ethanol made from
corn and biodiesel made from soybeans.
• Unlike fossil fuels, which are exhausted over time,
biofuels are a homegrown renewable energy source
that is replenished with each year’s new crops.
• Almost all Illinois gasoline already contains 10%
ethanol as a fuel additive to help reduce air pollution.
• Auto manufacturers can easily and cheaply produce
new vehicles to run on biofuel based E-85.
ELECTRONIC FILING, RECEIVED, CLERK'S OFFICE, JANUARY 5, 2007
* * * * * PC #7 * * * * *
Governor Rod R. Blagojevich
Energy Independence |
28
Biofuels Can Replace Imported Oil
• Growing demand for oil is driving up gasoline prices, from
an average in the Midwest of $1.10 per gallon in 1992 to
over $3.00 today.
• To make matters worse,
Americans are using 23%
more gasoline than we did
in the early 1990’s.
• Increasing production of biofuels in Illinois will boost fuel
supplies and help stabilize prices.
100%
105%
110%
115%
120%
125%
1992 1993 1994 1995 1996 1997 1998 1999 2000 2001 2002 2003 2004
Increasing Demand for Gasoline
ELECTRONIC FILING, RECEIVED, CLERK'S OFFICE, JANUARY 5, 2007
* * * * * PC #7 * * * * *
Governor Rod R. Blagojevich
Energy Independence |
29
Invest in New Ethanol Plants
• Over the next four years, we propose investing $100 million to
support construction of up to 20 new ethanol plants, using about
$5 million in state grants for each plant. We have already attracted
several new ethanol plants to Illinois since 2003 with similar grants.
• These new ethanol plants would boost Illinois’ annual ethanol
production by 200% to 2.5 billion gallons per year, equivalent to
50% of our gasoline needs by 2017.
• With this additional ethanol production, Illinois can generate another
$1.7 billion in business investment (investors pay for more than 90%
Governor Rod R. Blagojevich
Energy Independence |
30
Invest in New Biodiesel Plants
• Biodiesel is a cleaner burning, homegrown, renewable fuel
made from natural oils like soybean oil.
• Biodiesel is used today across Illinois in trucks, buses, farm
equipment and other vehicles that run on diesel fuel.
• Over the next four years, we propose investing $25 million to
support the construction of up to 5 new biodiesel plants with
state grants. We have already attracted new biodiesel plants
to Illinois since 2003 using similar grants.
• These new plants would boost Illinois’ annual biodiesel
production by 200% to 400 million gallons per year,
equivalent to 25% of our annual diesel fuel needs by 2017.
• With this additional biodiesel production Illinois will generate
another $225 million in business investment, as investors
pay 90% of construction costs.
ELECTRONIC FILING, RECEIVED, CLERK'S OFFICE, JANUARY 5, 2007
* * * * * PC #7 * * * * *
Governor Rod R. Blagojevich
Energy Independence |
31
Promote Next Generation Biofuels
• This new technology would make a fuel
called “cellulosic ethanol,” and could double the amount of ethanol
we produce in Illinois using mainly plant material that would
otherwise go to waste. Research on cellulosic ethanol is already
under way at the National Corn to Ethanol Research Center at
Southern Illinois University in Edwardsville.
• Economic models indicate that constructing 4 cellulosic ethanol
plants could stimulate $1.2 billion in private investment.
• We propose investing another $100
million to support construction of
production facilities that can make
ethanol from materials like corn husks,
Governor Rod R. Blagojevich
Energy Independence |
32
• Besides building new plants, we propose providing other critical support to
Illinois’ biofuels industry:
– We will create the Biofuels Investment and Infrastructure Taskforce to
drive continued investment in Illinois’ biofuels industry and help make
cellulosic ethanol commercially viable.
– We will issue an executive order to speed construction of biofuels plants
by expediting state permits and streamlining the permitting process.
– We will support further research and development by increasing state
support for the National Corn to Ethanol Research Center.
– We will propose co-firing biofuels by-products with coal in gasification and
power facilities to reduce emissions and increase efficiency.
– We will eliminate the sunset on tax incentives for ethanol and biodiesel.
– We will upgrade our rail infrastructure to support transportation of biofuels.
Support The Biofuels Industry
ELECTRONIC FILING, RECEIVED, CLERK'S OFFICE, JANUARY 5, 2007
* * * * * PC #7 * * * * *
Governor Rod R. Blagojevich
Energy Independence |
33
Biofuels Create Jobs
• Our investment in Biofuels will create more than
800 direct permanent jobs at these facilities as
well as 8,000 construction jobs.
• We estimate that the creation of these jobs will
generate new Illinois farming jobs and an
additional 6,200 indirect permanent jobs in total.
ELECTRONIC FILING, RECEIVED, CLERK'S OFFICE, JANUARY 5, 2007
* * * * * PC #7 * * * * *
Governor Rod R. Blagojevich
Part 2:
Increase Use of Biofuels
Energy Independence
ELECTRONIC FILING, RECEIVED, CLERK'S OFFICE, JANUARY 5, 2007
* * * * * PC #7 * * * * *
Governor Rod R. Blagojevich
Energy Independence |
35
Increase Access to Biofuels
• As we produce more biofuels, we need to make sure
Illinois drivers can find it and use it.
• Auto manufacturers have recently pledged to boost
“flex fuel” vehicle production. We will work with
Illinois’ automakers to make more “flex fuel” vehicles
available to consumers.
• More Illinois gas
stations must sell
E-85 than the 2%
that currently do.
Flexible Fuel Dodge Stratus
ELECTRONIC FILING, RECEIVED, CLERK'S OFFICE, JANUARY 5, 2007
* * * * * PC #7 * * * * *
Governor Rod R. Blagojevich
Energy Independence |
36
Provide Biofuels Incentives
• We will invest $30 million to add 900 more E-85 pumps statewide by
2010, so 20% of Illinois gas stations will offer E-85 – and make E-85
available at all Illinois gas stations by 2017.
• We will provide automakers in Illinois with up to $25 million to help
them offer more flex fuel vehicles to Illinois drivers, improve the gas
mileage of these vehicles, and create the first generation of flex fuel
hybrid vehicles.
• We will increase public awareness about E-85 and promote E-85
use by local governments and private fleets.
• We will also require gas stations to notify customers if gasoline
prices are expected to rise the next day by 5 cents or more.
ELECTRONIC FILING, RECEIVED, CLERK'S OFFICE, JANUARY 5, 2007
* * * * * PC #7 * * * * *
Governor Rod R. Blagojevich
Part 3:
Invest in Advanced
Coal Technology
Energy Independence
ELECTRONIC FILING, RECEIVED, CLERK'S OFFICE, JANUARY 5, 2007
* * * * * PC #7 * * * * *
Governor Rod R. Blagojevich
Energy Independence |
38
Illinois Coal’s Great Potential
• Coal is found under 37,000 square miles of
Illinois – Illinois' coal reserves contain more
energy than the oil reserves of Saudi Arabia
and Kuwait.
• Illinois has 38 billion tons of recoverable coal
reserves, which is 12% of all the coal in the
United States.
ELECTRONIC FILING, RECEIVED, CLERK'S OFFICE, JANUARY 5, 2007
* * * * * PC #7 * * * * *
Governor Rod R. Blagojevich
Energy Independence |
39
What is Coal Gasification?
• Illinois’ vast coal reserves can be transformed into transportation
and home heating fuels using coal gasification technology.
• Instead of burning coal to release its energy, coal gasification
plants convert coal from a solid to a gas that can be processed
into a substitute for natural gas, diesel fuel or electricity.
• Gasification is the cleanest and most efficient way to convert coal
to energy with low emissions of mercury and other air pollutants,
while allowing carbon dioxide to be captured for underground
storage.
• Two coal gasification plants are operating now in the U.S. and
several coal gasification projects in Illinois are quickly
progressing.
ELECTRONIC FILING, RECEIVED, CLERK'S OFFICE, JANUARY 5, 2007
* * * * * PC #7 * * * * *
Governor Rod R. Blagojevich
Energy Independence |
40
FutureGen:
The Promise of Coal Gasification
• Among all states, Illinois is best suited for large scale
development of coal gasification due to its vast coal
reserves and its geology for carbon dioxide storage.
• Because of these advantages, two Illinois sites were
chosen among the final four selected as national finalists
for the FutureGen project, a federal public/private
partnership to build the nation’s first zero emissions coal
fired power plant. The state’s sites are located at Tuscola
and Mattoon.
• If we win the FutureGen project, businesses and the
federal government will invest $1 billion in Illinois and
create 150 permanent jobs and 1,300 construction jobs.
If we do not win, we will have several ideal sites to
develop gasification plants in the future.
ELECTRONIC FILING, RECEIVED, CLERK'S OFFICE, JANUARY 5, 2007
* * * * * PC #7 * * * * *
Governor Rod R. Blagojevich
Energy Independence |
41
Invest in Coal Gasification
• We will provide the nation’s
strongest package of financial and
tax incentives to develop coal
gasification plants.
• We will provide more than $750
million in state incentives to
stimulate construction of up to 10
coal gasification plants.
• These plants could meet 25% of
Illinois’ diesel fuel needs, 25% of
our natural gas and 10% of our
electricity needs by 2017.
ELECTRONIC FILING, RECEIVED, CLERK'S OFFICE, JANUARY 5, 2007
* * * * * PC #7 * * * * *
Governor Rod R. Blagojevich
Energy Independence |
42
Invest in Coal Gasification
• Investing more than $750 million to help construct up to
10 new coal gasification plants would generate more than
$10 billion in new business investment in Illinois (these
facilities average more than $1 billion each to construct).
• Partnering with utility companies to purchase electricity and
natural gas from coal gasification plants under
long-term contracts will help stabilize natural gas and
electricity prices for consumers.
• We will encourage large corporate and government fleets to
buy diesel fuel produced by coal gasification plants.
ELECTRONIC FILING, RECEIVED, CLERK'S OFFICE, JANUARY 5, 2007
* * * * * PC #7 * * * * *
Governor Rod R. Blagojevich
Energy Independence |
43
Coal Gasification Creates Jobs
• Ten coal gasification plants
would use enough coal to nearly
double the amount of coal mined in
Illinois.
• These plants would create about
1,000 new permanent jobs at the
plant, 2,500 new coal mining jobs, and
10,000 construction jobs throughout
Central and Southern Illinois.
• Winning the FutureGen project would
create an additional 150 permanent
jobs in Illinois.
ELECTRONIC FILING, RECEIVED, CLERK'S OFFICE, JANUARY 5, 2007
* * * * * PC #7 * * * * *
Governor Rod R. Blagojevich
Energy Independence |
44
Part 4:
Reduce Air Pollution &
Recover More Oil and Gas
ELECTRONIC FILING, RECEIVED, CLERK'S OFFICE, JANUARY 5, 2007
* * * * * PC #7 * * * * *
Governor Rod R. Blagojevich
Energy Independence |
45
Reduce Air Pollution
• Ethanol and biodiesel burn cleaner than gasoline
or diesel made from oil.
• Fueling new ethanol and biodiesel plants with
natural gas produced by coal gasification plants
will reduce air pollution from biofuels facilities.
• Plant materials and by-products known as biomass
can be used along with coal to co-fire power plants
and coal gasification plants to reduce emissions.
ELECTRONIC FILING, RECEIVED, CLERK'S OFFICE, JANUARY 5, 2007
* * * * * PC #7 * * * * *
Governor Rod R. Blagojevich
Energy Independence |
46
Capture & Store Greenhouse Gases
• Traditional power plants create
environmental problems by
producing significant amounts of
carbon dioxide (CO2), the source of
84% of emitted greenhouse gases.
• New coal gasification technology
allows us to capture CO2 rather
than releasing it into the
atmosphere.
• Captured CO2 can be transported
by pipeline to locations where it can
be safely stored underground,
preventing this greenhouse gas
from escaping into the atmosphere.
ELECTRONIC FILING, RECEIVED, CLERK'S OFFICE, JANUARY 5, 2007
* * * * * PC #7 * * * * *
Governor Rod R. Blagojevich
Energy Independence |
47
Our Untapped Oil Supply
• Illinois’ oil reserves hold about 1
billion barrels. Because Illinois
oil fields are mature, we cannot
increase production without
using costly recovery techniques.
• Enhanced Oil Recovery, which
uses CO2 to extract more oil
from existing reserves, could
double the amount of petroleum
produced by Illinois annually,
using CO2 that would otherwise
cause global warming. The
CO2 used to extract the oil stays
safely trapped underground.
•
Illinois
Indiana
Kentucky
0
15 30
60
Miles
IL Basin Oil Fields
OOIP (MMstb)
Greater than 750
100 to 750
50 to 100
25 to 50
Less than 25
ELECTRONIC FILING, RECEIVED, CLERK'S OFFICE, JANUARY 5, 2007
* * * * * PC #7 * * * * *
Governor Rod R. Blagojevich
Energy Independence |
48
The Illinois CO2 Pipeline
• We will work with coal gasification facilities, pipeline operators and oil
producers to construct a pipeline to transport CO2 produced at
gasification facilities for storage underground.
• Some of this CO2 will be used by oil producers to perform Enhanced Oil
Recovery (EOR) on Illinois oil fields, increasing the amount of oil we can
produce.
• Because petroleum producers will pay for the CO2 necessary to extract
more oil, we will partner with a private operator to maintain a 100 mile
pipeline from gasification facilities to oil fields in southeastern Illinois at
no annual cost to the State, using any excess proceeds to subsidize the
sequestration of excess CO2.
• A similar pipeline operated to provide CO2 to oil producers for EOR is
currently being profitably operated in Texas and New Mexico by a
private pipeline operator.
• A 100 mile pipeline from central Illinois to the oil fields of southeastern
Illinois would cost $100 million to build, but is estimated to generate
more than $12 million annually in revenue.
ELECTRONIC FILING, RECEIVED, CLERK'S OFFICE, JANUARY 5, 2007
* * * * * PC #7 * * * * *
Governor Rod R. Blagojevich
Energy Independence |
49
Our Untapped Natural Gas Supply
• Illinois’ coal reserves hold
enough methane (a gas very
similar to natural gas) to meet all
of our natural gas needs for
seven years.
• We will also extract methane by
pumping CO2 transported by the
pipeline to force out methane
and permanently store CO2.
Illinois
Indiana
Kentucky
0
15 30
60
Miles
IL Basin Coals CO2 Storage
Avg. tonnes per acre (best case)
Greater than 1,000
500 to 1,000
250 to 500
100 to 250
Less than 100
Area excluded; coal too thin or shallow
ELECTRONIC FILING, RECEIVED, CLERK'S OFFICE, JANUARY 5, 2007
* * * * * PC #7 * * * * *
Governor Rod R. Blagojevich
Energy Independence |
50
Part 5:
Reduce Energy Use,
Improve Efficiency,
Invest in Renewable Energy
ELECTRONIC FILING, RECEIVED, CLERK'S OFFICE, JANUARY 5, 2007
* * * * * PC #7 * * * * *
Governor Rod R. Blagojevich
Energy Independence |
51
Reducing Vehicle Emissions &
Conserving Fuel
• Another major cause of greenhouse gas emissions comes from
the gasoline in our cars. Consuming more fuel, whether due to
long commutes or inefficient cars, hurts the environment and
costs drivers more money.
• To improve air quality, reduce global warming and make Illinois
more energy efficient, we will aim to reduce pollution from
vehicles and reduce motor fuel consumption in Illinois by 10% by
2017, a goal which could allow Illinois residents to save billions
every year in fuel costs.
• We will work with the automobile industry, environmental groups
and consumer advocates to form the Illinois Fuel Conservation
Task Force, which will explore strategies to reduce fuel use by
10% in 2017.
ELECTRONIC FILING, RECEIVED, CLERK'S OFFICE, JANUARY 5, 2007
* * * * * PC #7 * * * * *
Governor Rod R. Blagojevich
Energy Independence |
52
Promoting Driving Alternatives
Ways to reduce fuel consumption that the
Task Force will consider will include:
– Increasing investment in public transportation
through the proposed capital budget, and
improve coordination among transit agencies to
achieve better service.
– Providing incentives to promote carpooling and
car sharing and encourage biking and walking
by incorporating bike and pedestrian lanes into
IDOT road projects.
– Promoting efforts to reduce suburban sprawl by
encouraging new development near public
transit stations.
ELECTRONIC FILING, RECEIVED, CLERK'S OFFICE, JANUARY 5, 2007
* * * * * PC #7 * * * * *
Governor Rod R. Blagojevich
Energy Independence |
53
Improve Energy Efficiency
• Conserving energy by improving the energy efficiency of Illinois’ homes,
businesses and public buildings is the most cost-effective way to reduce
energy use and lower utility bills.
• Adopting an Energy Efficiency Portfolio Standard to greatly increase
investments in energy saving programs and technologies will reduce
energy use, cut utility bills and improve reliability of the energy grid.
• Public buildings are a major user of energy in Illinois. We will create a
$25 million revolving loan fund to support energy efficiency investments
in public buildings to reduce government energy usage.
• Illinois businesses use nearly half of all energy consumed in Illinois. We
will create a $25 million revolving loan fund to support energy efficiency
investments by small businesses and manufacturers.
• We have already adopted a commercial building code to ensure that new
commercial and multi-family residential buildings are energy efficient.
We propose adopting a similar code to ensure that new single family
homes also meet modern energy efficiency standards. 42 other states
have already adopted such building codes.
ELECTRONIC FILING, RECEIVED, CLERK'S OFFICE, JANUARY 5, 2007
* * * * * PC #7 * * * * *
Governor Rod R. Blagojevich
Energy Independence |
54
Invest in Renewable Electricity
• Today Illinois generates 50% of
our electricity from nuclear power,
46% from coal, 2% from natural
gas and less than 2% from
renewable sources like wind.
• Adopting a Renewable Portfolio
Standard will greatly boost use
of renewable electricity in Illinois.
By 2015, we can generate 10%
of our electricity from clean,
renewable energy sources like
wind power.
• Adopting a Renewable Portfolio Standard will greatly boost use of
renewable electricity in Illinois. By 2015, we can generate 10% of
our electricity from clean, renewable energy sources like wind
power.
ELECTRONIC FILING, RECEIVED, CLERK'S OFFICE, JANUARY 5, 2007
* * * * * PC #7 * * * * *
Governor Rod R. Blagojevich
Energy Independence |
55
Conclusion
• Unless we act now as a state to solve our energy crisis, prices
will continue to rise and too many dollars will continue to flow
out of Illinois if we remain dependent on imported energy.
• With the right planning, vision and leadership, we can make
Illinois less reliant on foreign oil and gas by meeting a large
portion of our fuel needs here at home.
• By reducing energy consumption in our homes, businesses,
public buildings, and vehicles, we can protect the environment
and save consumers money.
• We can’t wait for the federal government. We can harness
Illinois' vast natural resources to stabilize energy prices and
give customers a real alternative if we are willing to act.
ELECTRONIC FILING, RECEIVED, CLERK'S OFFICE, JANUARY 5, 2007
* * * * * PC #7 * * * * *
Governor Rod R. Blagojevich
Paying for the Plan
Governor Rod R. Blagojevich
Energy Independence |
57
What the Plan will Cost
Total $305 million
$27 million
Energy Efficiency Revolving Funds
$50 million
$5 million
E-85 Station Conversions
$30 million
$2 million
Automakers’ Incentives
$25 million
$2 million
Biodiesel
$25 million
$2 million
Coal Gasification (Startup costs)
$175 million
$16 million
Annual Cost
New
New Programs
Spending
The Energy Plan includes new programs, self-funded
programs and programs funded with existing operations.
New programs include:
ELECTRONIC FILING, RECEIVED, CLERK'S OFFICE, JANUARY 5, 2007
* * * * * PC #7 * * * * *
Governor Rod R. Blagojevich
Energy Independence |
58
What the Plan will Cost
Ethanol Research/Permitting
$5 million
Existing Budget
Self-Funded (by coal sales
Coal Gasification
$600 million
tax revenues)
Self-Funded (by CO2
CO2 Pipeline
$100 million
pipeline transport fees)
Total $905 million
Cellulosic Ethanol
$100 million
Existing Budget
Ethanol Plant Grants
$100 million
Existing Budget
Annual Cost
Total
Existing/Self-Funded Programs
Spending
The Energy Plan includes new programs, self-funded
programs and programs funded with existing operations.
Existing and self-funded programs include:
ELECTRONIC FILING, RECEIVED, CLERK'S OFFICE, JANUARY 5, 2007
* * * * * PC #7 * * * * *
Governor Rod R. Blagojevich
Energy Independence |
59
Funding the Plan through Enhanced
Tax Revenues
• Every year, some taxes owed to the state are never collected.
The Department of Revenue estimates that businesses owe up to
$40 million in sales and corporate income taxes to the State.
Some businesses collect sales taxes from customers but don’t
remit that revenue to the State. Others, mainly out of state
corporations, illegally shelter income that goes uncollected.
• The Department of Revenue is hiring 150 more tax auditors to
collect these delinquent taxes, producing more than $30 million in
Fiscal Year 2007, and as much as $40 million in Fiscal Year 2008.
• This revenue will be used to cover the debt service and operating
costs associated with the Governor’s energy plan.
• These new revenues will help ensure tax fairness and be
collected without raising income or sales taxes or changing Illinois'
tax code.
ELECTRONIC FILING, RECEIVED, CLERK'S OFFICE, JANUARY 5, 2007
* * * * * PC #7 * * * * *
Governor Rod R. Blagojevich
Energy Independence |
60
First Steps to Achieving Our Goals
• Hold a Governor’s Energy Summit with state and elected officials
and leaders from the agricultural, coal, biofuels, utilities, renewable
energy, auto, and financial industries to launch our plan.
• Form the Illinois Clean Car and Energy Conservation Task Force to
identify methods to reduce vehicle emissions and fuel use by 10%
in 2017 as well as identify other energy-saving strategies.
• Create the Biofuels Investment & Infrastructure Taskforce.
• Issue an Executive Order to expedite state grants and permits for
proposed biofuels and gasification plants.
• Work with legislative leaders and the General Assembly to secure
strong state support for biofuels, coal gasification and for adoption
of renewable energy and energy efficiency portfolio standards.
ELECTRONIC FILING, RECEIVED, CLERK'S OFFICE, JANUARY 5, 2007
* * * * * PC #7 * * * * *
Report #:DOEIEIA-0554(2006)
Release date: March 2006
Next release date:
March 2007
ELECTRONIC FILING, RECEIVED, CLERK'S OFFICE, JANUARY 5, 2007
* * * * * PC #7 * * * * *
Table 38. Cost and Performance Characteristics of New Central Station Electricity Generating Technologies
-.saw
rvrnnrnyency Factors
Total
Overnight
Overnight
Variable
Hoatrate Heatrate
Costs
Proiect
Te
Cost
OBM'
Fixed
in
nth-of-
Online Size Leadtimes in
2005
Contingency
in
2005'
($2004
0.3,~'
2005
a-kind
Technology
2009
600
4
1,167
1.07
1.00
1.249
4.18
25.07
8.844
8.600
Integraled Coal-Gas~ficalfon
Combined Cycle (IGCC)'
IGCC wilh Carbon
Sequeslration
Conv GasiOil Comb Cycle
Adv Gas!Oil Comb Cycle (CC)
ADV CC wilh Carbon
Seqozstralion
Conv Combuslion Turbines
Adv combustion Turbine
Fuel Cells
Advanced Nuclear
Distribuled Generalion -0ase
Disllibuled Genelatian -Peak
Biornass
MSW - Land611 Gas
Geolhermal ".'
Conventional ~~droporve?
2009
500
4
1,320
1.10
100
1,452
3.20
12.72
10.338
10,338
Wind
2008
50
3
1,091
1.07
'1.00
1.167
0.00
27.59
10,280
10,280
Solar Thermal7
2008
100
3
2.599
1.07
'1
.
'1 0
3.047
0.00
51.70
10,280
10,280
'online year represents the first year that a new nit could be completed: given an order date of 2005
he technological optimism factor is applied to the first four units of a new, unproven design, or regulato~y structure. It reflects the
demonstrated tendency to underestimate actual costs for a first-of-a-kind unit.
bvernight capital cost including contingency factors, excluding regional multipliers and learning effects. Interest charges are also
excluded. These represent costs of new projects initiated in 2005.
%O&M
= Operations and maintenance.
"ombustion turbine units can be built by the model pl.ior to 2007 if necessary to meet a given region's reserve margin
"ecause geothermal and hydro cost and performance character~stics are specific for each site, the table entries represent the cost
of the least expensive plant that could be built in the Northwest Power Pool region, where most of the proposed sites are located.
'capital costs are shown before investment tax credits are applied.
Sources: The values shown in this table are developed by the Energy Information Administration, Office of
Integrated Analysis and
Forecasting,
from analysis of reports and discussions with various sources from industry, government, and the Department of
Energy Fuel Offices and National Laboratories. They
al-e not based on any specific technology model, but rather, are meant to
represent the cost and performance of typical plants under normal operating conditions for each plant type. Key sources reviewed
are listed in the 'Notes and Sources' section at the end of the chapter.
Energy Information
Administration/Assumptions to the Annual Energy Outlook 2006
ELECTRONIC FILING, RECEIVED, CLERK'S OFFICE, JANUARY 5, 2007
* * * * * PC #7 * * * * *
Babcock & Wilcox
1
S. Kavidass
D.J. Walker
G.S. Norton, Jr.
Babcock & Wilcox
Barberton, Ohio, U.S.A.
Presented to:
POWER-GEN International ‘99
November 30-December 2, 1999
New Orleans, Louisiana, U.S.A.
IR-CFB Repowering: A Cost-Effective Option for Older
PC-Fired Boilers
BR-1687a
Abstract
Worldwide, many older Pulverized Coal (PC) fired boilers
(25-35 years) are in operation. Performance of these boilers de-
teriorates over time due to poor fuel quality. Some of the units
are derated because of the varying fuel conditions (such as mois-
ture, ash, sulfur and heating value), pulverizer limitations, ero-
sion related issues, and environmental considerations.
Upgrading of the existing aged PC-fired boilers is one of the
urgent needs in most countries because of economic and envi-
ronmental pressures. Internal Recirculation Circulating Fluid-
ized Bed (IR-CFB) repowering will address fuel related issues
as well as current emission requirements and has the potential
to extend the life of an older plant for another 20-25 years. B&W
has completed extensive repowering feasibility studies of vari-
ous PC-fired boilers for customers in the U.S.A., China, India,
Ukraine and Thailand. These studies clearly show that IR-CFB
repowering is an economically viable option to utilize existing
fuel or low grade fuel, reduce emissions, eliminate high main-
tenance pulverizers and reduce auxiliary support fuel (oil/gas)
consumption. This paper presents Babcock & Wilcox (B&W)
IR-CFB boiler repowering findings for selected projects includ-
ing design and performance summaries, PC vs. CFB compari-
son, emission performance, and technical and economic ben-
efits.
Introduction
World demand for electric power continues to rise steeply,
as a result of three main factors: population growth, economic
development, and progressive substitution of alternate fuels
coupled with clean forms of energy. Power plant operators place
major importance on high plant efficiency and low fuel con-
sumption. The average plant efficiency of all coal-fired power
plants in operation today is around 33 percent. One of the im-
portant tasks facing the power industry is upgrade of the exist-
ing power plants.
Upgrading of the existing aged PC-fired boilers is one of the
urgent needs in most countries because of the economic and
environmental pressures. Many PC-fired boilers installed in the
1960s and early 70s require pressure parts replacement, high
pulverizer maintenance, large quantity of oil/gas auxiliary fuel
up to 50-60% MCR load, and many suffer from reduced output
due to deterioration of fuel quality. These units also produce
high emission levels.
Babcock & Wilcox is a leading global supplier of industrial/
utility boilers and has supplied more than 700 units totaling more
than 270,000 MWe. Understanding the operation and mainte-
nance complexity of the aged PC-fired boilers, B&W has ap-
plied its inherently compact, distinctive internal recirculation
circulating fluidized bed boiler (IR-CFB) featuring U-beam sol-
ids separators. The furnace and convection pass of the IR-CFB
boiler are enclosed in a single, gas–tight membrane enclosure
as commonly found in PC-fired boilers. Many of the boiler de-
sign features have been adapted from B&W’s long experience
designing and building boilers of all types and sizes for indus-
trial and electric utility applications. This compact, integral
design allows economical retrofit of aged PC-fired boilers with
CFB technology which will fit into the existing PC-fired boiler
support steel. This technology has been successfully introduced
in the global market.
While IR-CFB technology is a viable long term solution for
upgrading of power plants and for burning low grade fuels, PC-
ELECTRONIC FILING, RECEIVED, CLERK'S OFFICE, JANUARY 5, 2007
* * * * * PC #7 * * * * *
2
Babcock & Wilcox
fired boilers will continue to produce most of the coal-based
electric power for years to come. The objective of IR-CFB re-
powering is to replace the existing PC-fired boilers economi-
cally in an environmentally acceptable manner, to extend the
plant life for another 20-25 years, and to provide fuel flexibility.
To date, B&W, including B&W joint ventures and licensee
companies, have sold more than 18 CFB boilers worldwide,
shown in Table 1. B&W offers IR-CFB boilers to over 175 MWe,
both reheat and non-reheat with full commercial guarantees and
warranties. The IR-CFB boiler is simple in configuration and
compact, requires a smaller boiler footprint, has minimal re-
fractory, requires low maintenance, features quick start up and
provides high availability.
IR-CFB Repowering Approach
B&W is actively involved in working on several IR-CFB
repowering projects in various countries. Four IR-CFB repow-
ering feasibility studies are considered for this paper. The ob-
jectives of IR-CFB repowering are
:
• Increase MW output to rated capacity
• Burn poor quality domestic fuels (provide fuel flexibility)
• Increase boiler and plant efficiencies and thus improve
heat rate
• Reduce operating and maintenance cost
• Meet current emission requirements (SO
2
and NO
x
)
• Economically replace existing boilers with minimum
downtime
• Extend existing plant life (possibly 20-25 years)
• Utilize the existing plant to minimize capital cost
• Reduce some of the approval and permitting process
PC vs. CFB Technology Comparison
Designers and power plant operators have much experience
in PC-fired boiler design and operations. Adapting and under-
standing the CFB technology in the PC environment requires
time. CFB technology brings the capability of designs for a wide
range of fuel (from low quality to high quality fuels), lower
emissions, elimination of high maintenance pulverizers, low
auxiliary fuel support and lower life cycle costs. PC vs. IR-CFB
comparison is given in Table 2.
The combustion temperature of a CFB [840 to 900C (1550
to 1650F)] is much lower than PC [1350 to 1500C (2450 to
2750F)] which results in lower NO
x
formation and the ability to
capture SO
2
with limestone injection in the furnace. Even though
the combustion temperature of CFB is low, the fuel residence
time in CFB is higher than PC, which results in combustion
efficiencies comparable to PC. The PC pulverizers, which grind
the coal to 70% less than 75 microns, require significant main-
tenance expenses. These costs are virtually minimized in CFB
because the coal is crushed to 12 to 6 mm (0.5 to 0.25 in.) x 0
size. Even though CFB boiler equipment is designed for rela-
tively lower flue gas velocities, the heat transfer coefficient of
the CFB furnace is nearly double that of PC which will make
the furnace compact. In an IR-CFB, auxiliary fuel support is
needed for cold start up and operation below 25% versus 40-
60% MCR with PC. One of the most important aspects is that
Table 1
B&W Circulating Fluidized-Bed Boiler Experience
Including B&W Joint Ventures and Licensees
Start-up Customer Name &
Unit Type
No. of Units
Steam
Thermal
Fuels
Date
Plant Location
Output, TPH Output, MW
t
1986
Ultrapower
CFB
1
100
77.0
Wood wastes & wood chips
West Enfield, Maine, U.S.A.
1986
Ultrapower
CFB
1
100
77.0
Wood wastes & wood chips
Jonesboro, Main, U.S.A.
1986
Sithe Energy
CFB
1
74
58.0
Wood wastes
Marysville, California, U.S.A.
---
Los Angeles County Sanitation Dist. CFB
3
22
16.0
Sewage sludge
Carson, California, U.S.A.
1989
Lauhoff Grain Company
CFB
1
102
79.0
Bituminous coal, petroleum coke
Danville, Illinois, U.S.A.
1990
Ebensburg Power Co.
CFB
1
237
172.0
Waste coal
Ebensburg, Pennsylvnia, U.S.A.
1991
Pusan Dyeing Company
CFB
2
80
58.0
Coal & heavy fuel oil
Pusan, Republic of Korea
1993
Thai Petrochemical Industries
CFB
1
136
93.0
Coal, lignite, petroleum coke,
Rayong, Thailand
heavy fuel oil
1996
Southern Illinois University
CFB
1
54
35.0
Coal, petroleum coke & natural gas
Carbondale, Illinois, U.S.A.
1997
Kanoria Chemicals, Ltd.
CFB
1
105
81.0
High ash coal
Renukoot, India
2000
Anshan Co-Generation Plant
CFB
2
75
55.0
Bituminous coal
Anshan, Liaoning, P.R. China
2001
AES Beaver Valley
CFB
1
163
121.5
Bituminous coal
Monaca, Pennsylvania, U.S.A.
2001
Changguang Coal Mine Co.
CFB
1
220
155.0
High sulfur bituminous
Zhejiang Province, China
2001
Southern Indiana Gas & Electric Co. CFB
1
475
342.0
High sulfur coal, waste coal
Mount Vernon, Indiana, U.S.A.
ELECTRONIC FILING, RECEIVED, CLERK'S OFFICE, JANUARY 5, 2007
* * * * * PC #7 * * * * *
Babcock & Wilcox
3
CFB boilers release very low levels of SO
2
and NO
x
pollutants
compared to PC. These benefits lead owners to select CFB for
repowering.
Design Features of B&W IR-CFB Boiler
Technology
B&W IR-CFB technology is very compatible to PC-fired
boilers in arrangement. The IR-CFB boiler design consists of
the following major systems, shown in Figure 1. The main boiler
components are:
• Boiler furnace
• Furnace bottom air distributor and nozzles
• Primary solids separators and recirculation system
• Secondary solids separators and recirculation system
• Pendant superheater/reheater
• Economizer and horizontal tubular air heater
• Air assisted gravity fuel/limestone feed system
Boiler Furnace
The furnace cross section is selected based on flue gas su-
perficial velocity. B&W typically uses a 3.7 m, 4.6 m and 5.4 m
(12, 15 and 18 ft) deep furnace. The furnace enclosure is made
of gas-tight membrane water-cooled walls having 63.5 mm or
76 mm (2.5 or 3 in.) tube diameter on 102 mm (4 in.) centers.
The furnace primary zone is reduced in plan area cross section
to provide good mixing and promote solids entrainment at low
load. The auxiliary start-up burners, fuel feed points and sec-
ondary ash re-injection (multicyclone/MDC) points are located
in this region.
A thin layer of refractory is applied on all lower furnace walls,
including the lower portion of the division walls and wing walls
nose to protect against corrosion and erosion. An ultra high
strength abrasion-resistant low cement alumina refractory 16 to
25 mm (0.625 to 1 in.) thick is applied over a dense pin studded
pattern. The furnace temperature is precisely controlled by main-
taining proper inventory and thus the combustion efficiency and
the limestone utilization are maximized.
Air Distributors and Nozzles
The furnace bottom air plenum or wind box is made of wa-
ter-cooled panels or casing depending on start-up air tempera-
ture. Bubble caps are fitted on the water-cooled distributor floor
panels as shown in Figure 2. The bubble caps are designed to
distribute air uniformly, prevent the back sifting of solids at
low load operation, and create good turbulence for fuel /sor-
bent mixing in the primary zone. The bubble caps are spaced
102 mm x 117 mm (4 x 4.5 in.) with 60-70% of total combus-
tion air admitted through the bottom. The balance 30-40% of
total air is admitted through overfire nozzles (high velocity) in
the front and rear furnace walls.
Primary Solids Separators
The solids separation system is a key element of any CFB
boiler design, influencing life cycle costs. The B&W IR-CFB
has a two stage primary solids separator as shown in Figure 3,
comprised of in-furnace U-beam separators and external U-beam
separators. The in-furnace U-beams (two rows) are able to col-
lect nearly 75% of the solids. The remaining solids collected by
the three or four rows of external U-beams and are discharged
from the hopper directly into the furnace through the transfer
hopper located beneath the external U-beams. The flue gas ve-
locity across the U-beams is approximately 8 to 10 m/s (28 to
30 ft/s), limiting the gas side pressure drop to 0.25 kPa (<0.5 in.
Table 2
Benefits of a CFB Boiler Over a PC-Fired Boiler
Description
CFB Boiler
PC-Fired Boiler
Benefits of CFB
Fuel size
12-6 mm (0.5-0.25 in.) x 0
>70%<75 microns
Grinding cost is reduced
Fuel range (ash + moisture)
Up to 75%
Up to 60%
Accepts wider range
Higher sulfur fuels (1-6%)
Limestone injection
FGD plant required
Less expensive SO
2
removal system
Auxiliary fuel support (oil or gas)
Up to 20-30%
Up to 60%
Less oil/gas consumption
Auxiliary power consumption
Slightly higher
Lower
If FGD is used in PC, CFB power is lower
Emissions
SO
2
, ppm
<200
<200 with FGD
Lower emissions in process, less expensive
NO
x
, ppm
<100
<100 with SCR
No SCR (or SNCR) system required
Boiler efficiency, %
Same
Same
No difference
O&M cost (80% PLF)
Lower
Higher
Lower because of less moving equipment
Capital cost
5-10% higher
5-10% lower w/o FGD & SCR
—
8-15% lower
8-15% higher w/ FGD & SCR
—
Figure 1
B&W’s IR-CFB boiler.
Superheater/Reheater
Economizer
Secondary Solids
Separator
Tubular Air Heater
Forced Draft Fans
Primary U-Beam
Separators
Wing Wall
Division Wall
Fuel Silo
Air Assisted Gravity
Feed System
Furnace
Ash Cooler
ELECTRONIC FILING, RECEIVED, CLERK'S OFFICE, JANUARY 5, 2007
* * * * * PC #7 * * * * *
4
Babcock & Wilcox
wc) as compared with a typical cyclone separator’s pressure drop
of 1.5 to 2.0 kPa (6 to 8 in. wc). A commercially available, high-
grade stainless steel material is utilized for the U-beam separators.
Secondary Solids Separator
The multicyclone (MDC) is located in the convective pass
either upstream or downstream of the economizer. The MDC
typically has a top inlet and top outlet as shown in Figure 4.
The MDC tube diameter is normally 229 mm (9 in.) arranged
over the second pass entire cross-section. The MDC provides
outstanding retainment of fine particles up to 50 microns
(>95%). The MDC collection tubes and spin vanes have high
hardness (550 BHN), designed for longer life and easy replace-
ment during planned outages.
The small quantity of fines which escape from the external
U-beams is collected by the MDC. The collected fines are stored
in the MDC hopper. Variable speed rotary feeders or inclined
screws are used to control the ash recycle flow rate from the
hopper. Precise furnace temperature control is achieved by ad-
justing the speed of the rotary feeders or inclined screws, tak-
ing the temperature signal from the furnace.
Pendant Type Superheater/Reheater
The superheater may consist of vertical pendant type pri-
mary and secondary banks, located in the convection pass, as
well as surface in the furnace in the form of superheater wing
walls. An attemperator is used to control the final steam tem-
perature over the design load range. The flue gas velocities are
selected by considering the dust loading and ash erosivity of
the fuel. The reheater is located in the convection pass and proper
temperature control method is applied to control the final
reheater temperature.
Economizer and Horizontal Tubular Air Heater
The economizer is designed with tubes running front to back
and in-line, with reasonable flue gas velocities by considering
the dust loading and ash erosivity of the fuel. Both the econo-
mizer and the air heater are located in-line to minimize ash foul-
ing if the MDC is located upstream of the economizer. The air
heater is located after the MDC and the economizer. The flue
gas is outside the tubes and air is passed through the tubes. A
hopper is provided at the bottom of the air heater and the ash
collected in the hopper is purged to the ash disposal system.
The tube material and flue gas velocities are selected by con-
sidering the dust loading and the ash erosivity of the fuel. A
steam coil air heater (SCAH) is used to protect the cold end of
the air heater if required.
Air Assisted Gravity Fuel/Limestone Feed System
Fuel handling and feeding is one of the major challenges in
CFB boiler operation, especially with waste fuels because of
high fines and moisture content. The crushed fuel [12 mm (0.5
Figure 2
Furnace distributor floor panel and bubble caps.
Figure 3
U-beam primary separators—plan view.
1. Sidewall Membrane Panel
2. U-Beam
3. Seal Baffle
Figure 4
Multicyclone dust collector.
ELECTRONIC FILING, RECEIVED, CLERK'S OFFICE, JANUARY 5, 2007
* * * * * PC #7 * * * * *
Babcock & Wilcox
5
in.) x 0] is stored in the silo, usually located in front of the
boiler as shown in Figure 5. Fuel is fed to the boiler via down
spout from silo discharge to feeder and a series of feeders and
gravity feed chutes. The fuel chute will have at least a 60 to 65
degree angle from horizontal. Primary air is used to sweep the
fuel into the furnace and as seal air to the feeders. The number
of feed points is set to achieve even fuel distribution in the furnace.
The limestone handling and feeding system is relatively
simple compared to the fuel feed system. Limestone is fed ei-
ther pneumatically or mechanically into the CFB boiler. The
pneumatic system feeds the limestone directly into the furnace
through furnace openings in the front and rear walls. In the
mechanical system, the limestone is fed into the discharge end
of the fuel feeders via rotary feeders. The limestone falls by
gravity down the fuel feed chute with the fuel into the furnace.
IR-CFB Boiler Repowering
50 MW Older PC-Fired BoilerÑIR-CFB Repower-
ing StudyÑUkraine
This feasibility study was done for a typical 50 MW PC-
fired boiler in Ukraine. This boiler, built in 1950, a typical PC-
fired boiler TP-230, was manufactured by Taganrog Boiler
Works, Russia and is experiencing the following problems:
• The fuel quality has deteriorated [from 6,200 to 4,250
kcal/kg (11,160 to 7,650 Btu/lb)] due to increase in ash content
and thus tremendous amounts of oil and natural gas are being
used as supplemental fuels.
• The fuel currently available in the Ukraine is high-ash
anthracite (called schtib), not favorable for burning in the ex-
isting PC-fired boiler.
• The PC-fired boilers are aged and require refurbishment
for continuing operation.
• None of the existing PC boilers has a means of SO
2
and
NO
x
emission control.
• Extending the life of the existing plant is required.
The addition of coal-based generation capacity will be done
mainly through repowering and rehabilitation of the existing
power plants. The Ukraine power industry is facing the chal-
lenges of maximizing power generation from coal, improving
efficiency of coal utilization, improving the reliability and main-
tainability of the existing older units and reducing air pollution
from coal-fired power plants. To achieve these goals, CFB re-
powering is considered to be a viable option for 50 MW, 125
MW and 200 MW units in Ukraine.
This feasibility study included test firing of the coal in
B&W’s 2.5 MW IR-CFB test facility and designing the IR-CFB
boiler for repowering. Both were successfully accomplished.
The project is currently on hold for lack of funding. The fuel
and steam conditions are given in Table 3. The boiler prelimi-
nary design details including emissions are given in Table 4.
The arrangement of the 50 MW IR-CFB boiler is shown in
Figure 6. The B&W IR-CFB boiler fits within the footprint of
the existing boiler plan area, but furnace height needs to be in-
creased by 7 m (23 ft) for efficient combustion of high-ash coal.
The addition of boiler columns and top steel would need to be
installed to support the boiler.
A secondary coal crusher and limestone crushers should be
added in the existing central location with coal and limestone
transported to the boiler using existing conveyors. The crushed
coal can be stored in the existing coal bunkers, previously used
for raw coal. Two new fuel feeders will be used for feeding the
coal. The coal will be fed to the boiler in four points through
the front furnace wall using gravity feed chutes. Limestone will
be stored in an existing coal bunker and will be fed pneumati-
cally through the front and rear furnace walls. MDC and sec-
ondary ash recycle system would be added. Bed ash will be
drained from the furnace via three water-cooled screws. A
baghouse or electrostatic precipitator (ESP) will be installed for
particulate control. A new dry ash handling system will be in-
stalled in place of the plant’s existing wet sludge system which
can not be used due to the presence of unreacted lime in the bed
solids.
100 MW Older PC-Fired BoilerÑIR-CFB Repow-
ering StudyÑChina
B&W and BWBC, a joint venture company of B&W in China,
have jointly investigated IR-CFB boiler repowering for a 100
MW PC-fired boiler in China. This particular boiler was installed
in 1976. The unit is operating between 70 and 80 MW output.
The plant is equipped with two ball mills, and an indirect firing
system. The crushed coal is stored in the concrete bunkers. The
boiler is a tangentially fired type, with wet bottom ash removal
system, water screen cyclone separators and no pollution con-
trol devices. Some of the major issues involved are:
• The fuel quality has deteriorated. The fuel ash is highly
erosive and frequent tube failures and replacement are taking
place.
• Frequent ID fan erosion occurs due to poor particle col-
lection efficiency of water screen cyclone separators.
• The sulfur content has increased from 0.81% to 1.63 %
and SO
2
emission is high.
• SO
2
, NO
x
and PM emissions are very high. Recently,
China has introduced a SO
2
penalty for thermal power plants.
• Operation and maintenance cost has significantly in-
creased.
• In general, the boiler performance has been reduced over
time.
The plant is looking for a CFB boiler that will fit into the
existing support steel due to the space restriction at the plant.
B&W has evaluated whether or not the IR-CFB will fit into the
existing support steel frame. The evaluation indicated that the
Figure 5
IR-CFB gravity feed chutes.
IR-CFB boiler will fit into the existing support steel as shown
Fuel Silo
Down Spout
Feeder
Primary Air
ELECTRONIC FILING, RECEIVED, CLERK'S OFFICE, JANUARY 5, 2007
* * * * * PC #7 * * * * *
6
Babcock & Wilcox
Table 3
Fuel Data and Steam Conditions
Description
Ukraine, 50 MW
China, 100 MW
USA, 136 MW
India, 140 MW
Type of Fuel
Anthracite
Semi-Anthracite
Petroleum Coke
Bituminous Coal
Proximate analysis
Moisture, % weight
10.0
7.33
9.25
8.90
Volatile matter, % weight
4.0
10.76
9.94
25.40
Fixed carbon, % weight
40.0
47.23
80.41
28.70
Ash, % weight
36.0
29.14
0.40
37.0
Ultimate analysis
C, % weight
49.6
55.12
80.50
35.00
H, % weight
1.0
2.52
2.25
3.00
O, % weight
1.5
3.39
0.50
12.02
N, % weight
0.5
0.87
1.00
3.42
S, % weight
1.4
1.63
6.10
0.66
Ash, % weight
36.0
29.14
0.40
37.00
Moisture, % weight
10.0
7.33
9.25
8.90
Higher heating value, kcal/kg
4,059
5,100
7,500
3,300
(Btu/lb)
(7,306)
(9,180)
(13,800)
(5,940)
Steam conditions
SH steam flow, kg/hr
230,000
410,000
453,600
428,400
(lb/hr)
(507,050)
(903,880)
(1,000,000)
(944,440)
SH steam pressure, bar
98
98
108
145
(psig)
(1,420)
(1,420)
(1,566)
(2,100)
SH steam temperature, deg. C
510
540
540
543
(deg. F)
(950)
(1,005)
(1,005)
(1,010)
RH steam temperature, deg. C
—
—
343/540
344/540
(deg. F)
—
—
(649/1,005)
(651/1,005)
RH pressures, bar
—
—
27.2/24.1
42.7/40.0
(psig)
—
—
(395/350)
(619/580)
RH steam flow, kg/hr
—
—
383,200
384,500
(lb/hr)
—
—
(844,800)
(847,660)
FW temperature, deg. C
230
220
238
252
(deg. F)
(446)
(428)
(460)
(486)
in Figure 7. Existing components such as steam drum,
downcomers, risers, support steel, coal bunkers and the coal
handling system can be reused.
The new equipment required for this plant includes the IR-
CFB boiler and auxiliary equipment, dry ash handling system
Table 4
Predicted Performance for IR-CFB Repowering
Description
Ukraine, 50 MW
China, 100 MW
U.S.A., 136 MW
India, 140 MW
Existing PC-boiler column spacing
[width x depth], m x m
19.8 x 27.0
16.0 x 27.0
15.84 x 28.25
18.0 x 33.75
(ft x ft)
(65.0 x 88.6)
(52.5 x 88.6)
(52.0 x 92.7)
(59.0 x 110.7)
IR-CFB boiler size
[width x depth], m x m
9.8 x 27.0
14.0 x 26.0
14.1 x 28.0
16.2 x 33.0
(ft x ft)
(32’-2” x 18’-0”)
(46’-2 x 88’-6”)
(46’-2” x 19’-6”)
(52’-2” x 18’-0”)
Fuel flow rate, kg/hr
42,930
55,660
44,993
99,950
(lb/hr)
(94,640)
(122,700)
(99,190)
(220,350)
Limestone flow rate, kg/hr
9,650
7,330
21,900
3,700
(lb/hr)
(21,270)
(16,160)
(48,280)
(8,150)
Ca/S molar ratio
2.1
2.2
2.3
1.6
Sulfur capture, %
90
90
95
55
Boiler efficiency, %
86.4
87.5
90.5
85.3
Excess air, %
20
20
20
20
Ash split (bottom/fly) ratio, %
35/65
20/80
40/60
30/70
Stack flue gas temperature, deg. C
148
140
140
140
(deg. F)
(298)
(284)
(284)
(284)
Emissions
NO
X,
ppm
<100
<100
<100
<100
SO
2,
ppm
180
150
190
<220
with silo, ESP, DCS system, secondary coal crushers, limestone
crushers and handling and feeding system, and support steel
strengthening if required. The fuel and steam conditions are
given in Table 3. The design and performance data are given in
Table 4.
ELECTRONIC FILING, RECEIVED, CLERK'S OFFICE, JANUARY 5, 2007
* * * * * PC #7 * * * * *
Babcock & Wilcox
7
136 MW Older Coal Fired BoilerÑIR-CFB Repow-
ering StudyÑU.S.A.
Yet another technical feasibility study was done for an ex-
isting 136 MW coal fired boiler in the USA. Babcock & Wilcox
supplied this boiler in the 1960s, a typical front wall cyclone-
fired radiant boiler for utility application. Major issues with this
unit are:
• Most of the boiler equipment is aged.
• Pressure part replacements are required.
• Gas consumption is high to support boiler operation at
low load.
• Plant must meet new emissions regulations (SO
2
, NO
x
,
and PM).
• Plant is switching from coal to lower cost, high sulfur
petroleum coke.
The primary objective of IR-CFB repowering is to replace
the existing boiler economically by utilizing some of the exist-
ing equipment and completing the CFB repowering in a short
period of time. B&W’s preliminary technical evaluation indi-
cates that its IR-CFB boiler will fit into the existing support
steel, and the existing cyclone fired boiler plan area is adequate
for the IR-CFB boiler.
The study indicates that existing components such as steam
drum, downcomers, riser pipes, support steel, coal crushers, coal
bunkers, recently replaced valves, fuel handling system and stack
would be retained. B&W has estimated that IR-CFB repower-
ing of this unit can be done within three months of plant down-
time. The new equipment required at this plant includes IR-CFB
boiler and auxiliary equipment, dry ash handling system, DCS
system, limestone crushers, coke handling and feeding system,
support steel strengthening if required and baghouse filters. The
fuel and steam conditions are given in Table 3. The design and
performance data are given in Table 4. The new arrangement of
IR-CFB boiler with the existing support steel is shown in Figure 8.
Figure 6
50 MW IR-CFB boiler repowering for high-ash
anthracite fuel—Ukraine.
Existing Boiler Spacing 27.0 m
Figure 7
100 MW IR-CFB boiler repowering for high-ash
semi-anthracite fuel—China.
140 MW Older PC-Fired BoilerÑIR-CFB Repow-
ering StudyÑIndia
A technical feasibility study was done for an existing 140
MW PC-fired boiler in India. This boiler was installed in 1970,
supplied by Babcock in the UK. Most of the equipment is aged
and unit operation is limited to an average output of 95 to 105
MW. The major problems that are being faced by the plant are:
• Tremendous amount of erosion on water wall, SH, RH
and economizer tubes. This erosion is mainly due to high coal
ash content with significant alpha quartz.
• High pulverizer maintenance costs.
• High oil consumption to support the boiler load.
• Low boiler efficiency because of high unburned carbon
and high excess air.
• Boiler availability has deteriorated over the years.
One of the major issues is the deterioration of boiler perfor-
mance attributed to the fuel quality. The existing PC-fired boiler
was designed for a heating value of 5,000 kcal/kg (9,000 Btu/
lb) with ash content of 28%. The present fuel quality is 3,300
kcal/kg (5,940 Btu/lb) with ash content of 37%. This poor qual-
ity coal associated with aged equipment has led to reduced boiler
performance.
IR-CFB repowering is suitable to replace the existing PC-
fired boiler economically by utilizing existing equipment and
replacement of the PC unit with IR-CFB in a short time period.
The preliminary technical evaluation indicates that the B&W
IR-CFB boiler will fit into the existing support steel. The exist-
ing PC-fired boiler plan area is adequate for the IR-CFB boiler.
The existing equipment such as steam drum, downcomers,
riser pipes, ESP, support steel, coal bunkers, primary coal crush-
ers, fuel handling system and stack would be retained. B&W
has estimated that IR-CFB repowering of this unit can be done
in less than six months of plant downtime. The new equipment
identified for this plant includes IR-CFB boiler and auxiliary
ELECTRONIC FILING, RECEIVED, CLERK'S OFFICE, JANUARY 5, 2007
* * * * * PC #7 * * * * *
8
Babcock & Wilcox
Figure 8
136 MW IR-CFB boiler repowering for petroleum coke fuel—U.S.A.
Figure 9
140 MW IR-CFB boiler repowering for high-ash coal—India.
equipment, dry ash handling system, DCS system, secondary
coal crushers, limestone crushers and handling and feeding sys-
tem if needed and support steel strengthening if required. The
fuel and steam conditions are given in Table 3. The design and
performance data are given in Table 4. The new arrangement of
IR-CFB boiler with the ex-
isting support steel is
shown in Figure 9.
Preliminary
Economic
Evaluation
Economic Benefit for
IR-CFB Repowering
B&W has made a pre-
liminary economic evalua-
tion for all of these units.
By knowing the operating
and maintenance costs and
power selling costs, the
capital cost and payback
period are established as
given in Table 5. The capi-
tal costs for IR-CFB boiler
repowering with balance of
plant equipment vary from
country to country. The av-
erage Engineer/Procure/
Construct capital cost is
around $250 to $300 per
kw which is one-third of
the new power plant cost.
This cost includes the IR-
CFB boiler with some new
auxiliary equipment, DCS
system, dry ash handling
system with silo, secondary
fuel crushers, limestone
handling system with silo,
if required, boiler disman-
tling, erection and commis-
sioning. The payback pe-
riod typically varies from 4
years to 6 years (with some
exceptions) and is based on
the existing unit’s operat-
ing MWe output and the
selling price of power for
the existing units.
Conclusions
IR-CFB boiler technol-
ogy can be successfully
used for repowering the
existing older PC-fired
boilers. The CFB technol-
ogy can handle poor qual-
ity fuel and economically
return the plant to original
rating with a limited downtime while meeting the current emis-
sions requirements, providing a long-term solution for the plant.
The B&W IR-CFB boiler is compact and fits into the space uti-
lized by older PC-fired boilers, and features low maintenance
costs as compared to competing cyclone based CFB designs and
ELECTRONIC FILING, RECEIVED, CLERK'S OFFICE, JANUARY 5, 2007
* * * * * PC #7 * * * * *
Babcock & Wilcox
9
Table 5
Economic Evaluation for IR-CFB Repowering
Description
Unit
Ukraine, 50 MW
China, 100 MW USA, 136 MW
India, 140 MW
Unit rated output
MWe
50
100
136
140
Operating output (limited)
MWe
30
75
133
105
Selling price (average)
@
$/kw
0.0252
0.030
0.043
0.0364
Boiler life extension
years
25
25
25
25
IR-CFB boiler, aux. equipment and BOP
$/kw
244
182
228
231
Dismantling, erection and commissioning
$/kw
50
45
80
50
EPC cost for IR-CFB repowering (A)
$/kw
294
235
308
281
Capacity factor (assumed)
%
80
80
80
80
Plant downtime period
months
6
6
3
6
Income lost for downtime period (B)
+
$/kw
55
47
85
63
Total capital cost (A&B)
$/kw
349
229
393
344
Incremental MW generation income/year
$000’s
3523
4476
2428
8928
Aux. fuel and main fuel savings/year
$000’s
303
813
*4498
2555
Net annual benefit (C)
$000’s
3835
5289
6926
11,483
Payback period (A&B)/(C)
years
4.5
4.3
7.7
4.2
*Apart from IR-CFB repowering, fuel switching from coal to petroleum coke is considered.
@
Fuel and limestone operating costs are alone considered.
+
Fuel and maintenance costs are not considered.
also compared to PC. This is due to the B&W IR-CFB boiler
having significantly less refractory, no high temperature expan-
sion joints and no pulverizers, as well as quick start up which
saves auxiliary fuel consumption, and wide turndown range. All
of these factors can lead to lower life cycle costs for the power plant.
Technical feasibility studies of four different PC-fired boiler
plants have shown the suitability of using B&W’s compact IR-
CFB boiler for repowering. The studies covered a wide range
of domestic fuels for China, India, Ukraine and U.S.A. In each
case, re-use of the existing building, support steel with existing
foundation, some of the boiler component and balance of plant
equipment results in a very attractive capital cost per kilowatt
compared to other alternatives.
The advanced design features of B&W’s IR-CFB boiler of-
fer a clear advantage for repowering with its compact arrange-
ment as compared with conventional cyclone based CFB tech-
nology. These feasibility studies clearly demonstrate that B&W’s
IR-CFB boiler is capable of fitting into the existing older PC-
fired boiler structures from 50 MWe to 140 MWe and repower-
ing can be achieved with low capital cost and attractive pay-
back periods.
References
1. Belin F., Shang Yu J., Levin M. M., Maystrenko Yu A.,
“Repowering of Ukrainian Power Plants With CFB Boilers,”
Power-Gen Americas ’95, Anaheim, California, U.S.A.
2. Kavidass S., Alexander K. C., “Design consideration of
B&W IR-CFB Boilers,” Power-Gen Americas ’95, Anheim,
California, U.S.A., December 5-7, 1995.
3. Kavidass S., “Why CFB is perfect for India,” Powerline
Magazine, February 1999 issue, India.
Copyright © 1999 by The Babcock & Wilcox Company,
a McDermott company.
All rights reserved.
No part of this work may be published, translated or reproduced in any form or by any means, or incorporated into any information retrieval system,
without the written permission of the copyright holder. Permission requests should be addressed to: Market Communications, The Babcock &
Wilcox Company, P.O. Box 351, Barberton, Ohio, U.S.A. 44203-0351.
Disclaimer
Although the information presented in this work is believed to be reliable, this work is published with the understanding that The Babcock & Wilcox
Company and the authors are supplying general information and are not attempting to render or provide engineering or professional services.
Neither The Babcock & Wilcox Company nor any of its employees make any warranty, guarantee, or representation, whether expressed or implied,
with respect to the accuracy, completeness or usefulness of any information, product, process or apparatus discussed in this work; and neither The
Babcock & Wilcox Company nor any of its employees shall be liable for any losses or damages with respect to or resulting from the use of, or the
inability to use, any information, product, process or apparatus discussed in this work.
ELECTRONIC FILING, RECEIVED, CLERK'S OFFICE, JANUARY 5, 2007
* * * * * PC #7 * * * * *
217/782-2113
CONSTRUCTION PERMIT - PSD APPROVAL
NSPS-NESHAP EMISSION UNITS
PERMITTEE
Indeck-Elwood LLC
Attn: Mr. James Schneider
600 N. Buffalo Grove Road
Buffalo Grove, Illinois 60089
Application No.: 02030060
I.D. No.: 197035AAJ
Applicant's Designation
:
Date Received: March 21, 2002
Subject
: Electricity Generation Facility
Date Issued
: October 10, 2003
Location
: Southwest of the Intersection of Drummond and Baseline Roads, Elwood, Will
County
Permit is hereby granted to the above-designated Permittee to CONSTRUCT emission source
and air pollution control equipment consisting of an electric power plant with two
circulating fluidized bed boilers, fuel handling and storage, limestone handling and
storage, ash handling and storage, cooling towers, auxiliary gas-fired boiler, and
ancillary operations, as described in the above referenced application. This Permit is
granted based upon and subject to the findings and conditions that follow.
In conjunction with this permit, approval is given with respect to the federal
regulations for Prevention of Significant Deterioration of Air Quality (PSD) for the
plant, as described in the application, in that the Illinois Environmental Protection
Agency (IEPA) finds that the application fulfills all applicable requirements of 40 CFR
52.21. This approval is issued pursuant to the Clean Air Act, as amended, 42 U.S.C. 7401
et seq.,
the federal regulations promulgated thereunder at 40 CFR 52.21 for Prevention of
Significant Deterioration of Air Quality (PSD), and a Delegation of Authority agreement
between the United States Environmental Protection Agency (USEPA) and the Illinois EPA
for the administration of the PSD Program. This approval becomes effective in accordance
with the provisions of 40 CFR 124.15 and may be appealed in accordance with provisions of
40 CFR 124.19. This approval is based upon the findings that follow. This approval is
subject to the following conditions. This approval is also subject to the general
requirement that the plant be developed and operated consistent with the specifications
and data included in the application and any significant departure from the terms
expressed in the application, if not otherwise authorized by this permit, must receive
prior written authorization from the Illinois EPA.
If you have any questions on this permit, please call Shashi Shah at 217/782-2113.
Donald E. Sutton, P.E.
Manager, Permit Section
Division of Air Pollution Control
DES:SRS:jar
cc: Region 1
USEPA Region V
ELECTRONIC FILING, RECEIVED, CLERK'S OFFICE, JANUARY 5, 2007
* * * * * PC #7 * * * * *
Page 2
TABLE OF CONTENTS
SECTION 1 FINDINGS
SECTION 2 IDENTIFICATION OF SIGNIFICANT EMISSION UNITS
SECTION 3 SOURCE-WIDE CONDITIONS
1
Effect of Permit
2
Validity of Permit and Commencement of Construction
3
Emission Offsets
4
General Provisions for a Major HAP Source
5
Ancillary Equipment, including Diesel Engines
6
Authorization to Operate Emission Units
7
Ambient Assessment and Monitoring
8
Risk Management Plan (RMP)
9
Capacity of Plant
SECTION 4 UNIT-SPECIFIC CONDITIONS FOR PARTICULAR EMISSION UNITS
1
Boilers
2
Bulk Material Handling Operations
3
Cooling Towers
4
Auxiliary Boiler
5
Roadways and Other Sources of Fugitive Dust
SECTION 5 TRADING PROGRAM CONDITIONS
1
Acid Rain Program Requirements
2
Emissions Reduction Market Program
3
NO
x
Trading Program
SECTION 6 GENERAL PERMIT CONDITIONS
1
Standard Conditions
2
Requirements for Emission Testing
3
Requirements for Records for Deviations
4
Retention and Availability of Records
5
Notification or Reporting of Deviations
6
General Requirements for Notification and Reports
ATTACHMENTS
Tables
Acid Rain Permit
Standard Permit Conditions
ELECTRONIC FILING, RECEIVED, CLERK'S OFFICE, JANUARY 5, 2007
* * * * * PC #7 * * * * *
Page 3
SECTION 1: FINDINGS
1a. Indeck-Elwood LLC (Indeck) has requested a permit for a coal fired power plant with
a nominal capacity of 660 MWe
gross. The proposed plant would have two identical
circulating fluidized bed (CFB) boilers equipped with limestone injection to the
bed, selective noncatalytic reduction (SNCR), and a baghouse. Ancillary operations
would include coal handling and storage; ash handling and storage; limestone
handling and storage; cooling tower; auxiliary boiler, and other ancillary
operations.
b. The boilers, which each would have a maximum rated capacity of about 2900 million
Btu/hour, would be fired on coal as their primary fuel and petroleum coke and coal
tailings as supplemental fuels, with natural gas used as the startup fuel. The
boilers would generally be designed for coal mined in Illinois that, prior to being
washed, would nominally have 3.51 percent sulfur by weight and 9,965 Btu per pound
higher heating value (HHV), which is equivalent to an uncontrolled sulfur dioxide
emission rate of 7.0 pounds per million Btu heat input. The washed coal would have
an equivalent uncontrolled sulfur dioxide emission rate of approximately 4.7 pounds
per million Btu.
2. The plant would be located on an approximately 130-acre site near Elwood in Will
County. The site is in an area that is currently designated nonattainment for
ozone and attainment for all other criteria pollutants.
3. The proposed plant is a major source under the PSD rules. This is because the CFB
boilers, as indicated in the application, would have potential annual emissions of
sulfur dioxide (SO
2
), nitrogen oxides (NO
x
), particulate matter (PM), and carbon
monoxide (CO) that are each in excess of 100 tons. The plant would also have the
potential to emit significant amounts of sulfuric acid mist, fluorides, and
beryllium. (Refer to Table I for the potential emissions of the CFB boilers.)
4. The proposed plant is a major source under Illinois’s rules for nonattainment new
source review, Major Stationary Sources Construction and Modification (MSSCAM), 35
IAC Part 203. This is because the plant would be located in an area that is
designated nonattainment for ozone and, as indicated in the application, would have
potential annual emissions of volatile organic materials (VOM) that are in excess
of 25 tons. As the plant would be located in an ozone nonattainment, conditions of
this construction permit as they relate to emissions of VOM are not considered part
of the PSD approval.
5. The proposed plant is a major source for emissions of hazardous air pollutants (HAP).
The potential HAP emissions from the plant will be greater than 10 tons of an
individual HAP, i.e., hydrogen chloride and hydrogen fluoride. Therefore, the plant
is being subjected to review under Section 112(g) of the Clean Air Act.
6. After reviewing the materials submitted by Indeck, the Illinois EPA has determined
that the project will (i) comply with applicable Board emission standards (ii)
comply with applicable federal emission standards, (iii) utilize Best Available
Control Technology (BACT) on emissions of pollutants as required by PSD, (iii)
achieve the Lowest Achievable Emission Rate (LAER) for emissions of VOM as required
by 35 IAC Part 203, and (v) utilize Maximum Achievable Control Technology (MACT)
for emissions of HAP as required by Section 112(g) of the Clean Air Act.
The determinations of BACT, LAER and MACT made by the Illinois EPA for the proposed
plant are the control technology determination contained in the permit conditions
for specific emission units. For this purpose, limits related to VOM emissions
constitute LAER and limits related to hazardous air pollutants emissions constitute
ELECTRONIC FILING, RECEIVED, CLERK'S OFFICE, JANUARY 5, 2007
* * * * * PC #7 * * * * *
Page 4
MACT. As limits are not present for specific hazardous air pollutants, the MACT
determination relies upon the limits established for other pollutants to also
restrict emissions of the hazardous air pollutants for which individual limits are
not set. If USEPA were to adopt a MACT regulation that is applicable to the plant
that establishes a standard that is more stringent than a standard set as MACT by
this permit, the Permittee would be required to comply with such new standard as
expeditiously as practicable, with an appropriate compliance date set by the
Illinois EPA, pursuant to 40 CFR 63.44(b)(2).
7. The air quality analysis submitted by Indeck and reviewed by the Illinois EPA shows
that the proposed project will not cause violations of the ambient air quality
standard for NO
x
, SO
2
, PM/PM
10,
and CO. The air quality analysis shows compliance
with the allowable increment levels established under the PSD regulations.
8. The analysis of alternatives to the project submitted by Indeck shows that the
benefits of the proposed plant outweigh the potential impacts of its emissions of
VOM, as required by 35 IAC 203.306.
9. The Illinois EPA has determined that the proposed plant complies with all
applicable Illinois Pollution Control Board Air Pollution Regulations; the federal
Prevention of Significant Deterioration of Air Quality Regulations (PSD), 40 CFR
52.21; applicable federal New Source Performance Standards (NSPS), 40 CFR 60; and
Section 112(g) of the Clean Air Act and applicable federal regulations thereunder,
National Emission Standards for Hazardous Air Pollutants (NESHAP) 40 CFR 63,
Subpart B.
10. In conjunction with the issuance of this construction permit, the Illinois EPA is
also issuing an Acid Rain permit for the proposed CFB boilers, to address
requirements of the federal Acid Rain program. These CFB boilers would be affected
units under the Acid Rain Deposition Control Program pursuant to Title IV of the
Clean Air Act. As affected units under the Acid Rain Program, Indeck must hold SO
2
allowances each year for the actual emissions of SO
2
from the CFB boilers. The CFB
boilers are also subject to emissions monitoring requirements pursuant to 40 CFR
Part 75. As the Acid Rain permit relates to the Acid Rain Program, it is not
considered part of the PSD approval.
11. In conjunction with the issuance of this construction permit, the Illinois EPA is
also issuing a Budget Permit for the proposed CFB boilers, to address requirements
of the federal Acid Rain program and the NO
x
Trading Program. As the Budget Permit
relates to the NO
x
Trading Program, it is not considered part of the PSD approval.
12. A copy of the application, the project summary prepared by the Illinois EPA, a
draft of this construction permit, and a draft of the Acid Rain and Budget permits
were placed in public locations near the plant, and the public was given notice and
an opportunity to examine this material and to participate in a public hearing and
to submit comments on these matters.
13. Following consultation with the Illinois Department of Natural Resources, the
Illinois EPA has committed to participate in an interagency monitoring program as
needed to address concerns related to overall air quality at the Midewin National
Tallgrass Prairie (Midewin), as a result of the proposed plant and other
development that may occur near the Midewin.
ELECTRONIC FILING, RECEIVED, CLERK'S OFFICE, JANUARY 5, 2007
* * * * * PC #7 * * * * *
Page 5
SECTION 2: IDENTIFICATION OF SIGNIFICANT EMISSIONS UNITS
Unit
Number
Description
Emission Control Measures
Boiler 1 –
Circulating Fluidized Bed Boiler
Good Combustion Practices, Limestone
Addition to the Bed, Selective Non-
Catalytic Reduction, Trimming Scrubber
and Baghouse
1
Boiler 2 –
Circulating Fluidized Bed Boiler
(Identical to Boiler 1)
Good Combustion Practices, Limestone
Addition to the Bed, Selective Non-
Catalytic Reduction, Trimming Scrubber
and Baghouse (identical to control for
Boiler 1)
2 Bulk Material Handling Operations Baghouses and Dust Control Measures
3 Cooling Towers
High-Efficiency Drift Eliminators
4 Auxiliary Boiler –
Natural Gas Fired Boiler
Low-NO
x
Burners
5 Roadways and Other Sources of
Fugitive Dust
Paving and Dust Control Measures
ELECTRONIC FILING, RECEIVED, CLERK'S OFFICE, JANUARY 5, 2007
* * * * * PC #7 * * * * *
Page 6
SECTION 3: SOURCE-WIDE CONDITIONS
SOURCE-WIDE CONDITION 1: EFFECT OF PERMIT
a. This permit does not relieve the Permittee of the responsibility to comply with all
local, state and federal regulations that are part of the applicable Illinois State
Implementation Plan, as well as all other applicable federal, state and local
requirements.
b. In particular, this permit does not relieve the Permittee from the responsibility
to carry out practices during the construction and operation of the plant, such as
application of water or dust suppressant sprays to unpaved traffic areas, to
minimize fugitive dust and prevent an air pollution nuisance from fugitive dust, as
prohibited by 35 IAC 201.141.
SOURCE-WIDE CONDITION 2: VALIDITY OF PERMIT AND COMMENCEMENT OF CONSTRUCTION
a. This permit shall become invalid as applied to the plant and each CFB boiler at the
plant if construction is not commenced within 18 months after this permit becomes
effective, if construction of a boiler is discontinued for a period of 18 months or
more, or if construction of a boiler is not completed within a reasonable period of
time, pursuant to 40 CFR 52.21(r)(2) and 40 CFR 63.43(g)(4). This condition
supersedes Standard Condition 1.
b. For purposes of the above provisions, the definitions of "construction" and
"commence" at 40 CFR 52.21 (b)(8) and (9) shall apply, which requires that a source
must enter into a binding agreement for on-site construction or begin actual on-
site construction. (See also the definition of "begin actual construction," 40 CFR
52.21 (b)(11)).
SOURCE-WIDE CONDITION 3: EMISSION OFFSETS
a. The Permittee shall maintain 140.4 tons of VOM emission reduction credits generated
by other sources in the Chicago ozone nonattainment area such that the total is
greater than 1.3 times the VOM emissions allowed from this project.
b. These VOM emission reduction credits are provided by permanent emission reductions
as follows. These emission reductions have been relied upon by the Illinois EPA to
issue this permit and cannot be used as emission reduction credits for other
purposes.
Minnesota Mining and Manufacturing (3M), Bedford Park, I.D. No. 031012AAR
Shutdown of Coating Line 6H: 140.4 tons/year
This reduction has been made federally enforceable by the withdrawal of the air
pollution control permits for Coating Line 6H. Accordingly 3M, must obtain a
construction permit if it intends to resume operation of the line in the greater
Chicago area, in which permit the Illinois EPA will establish restrictions to
assure that the line’s actual VOM emissions are permanently reduced by at least
140.4 tons/year.
c. Documentation shall be submitted to the Illinois EPA as follows confirming that the
Permittee has obtained the requisite amount of VOM emission offsets as specified
above:
ELECTRONIC FILING, RECEIVED, CLERK'S OFFICE, JANUARY 5, 2007
* * * * * PC #7 * * * * *
Page 7
i. 3M must submit a letter or other document signed by a responsible official or
other authorized agent certifying that a transfer of emission reduction
credits from Line 6H at its Bedford Park plant has been made to the Permittee
in the requisite amount to provide offsets for this proposed plant.
ii. The Permittee must submit a letter or other document signed by a corporate
officer or other authorized agent certifying that a transfer of emission
reduction credits has been received from 3M in the requisite amount to
provide offsets for this proposed plant. In this letter, the Permittee must
also acknowledge that it may subsequently transfer these offsets to another
party or return them to 3M only if the preparation for or actual construction
of the proposed plant is terminated and this permit expires or is withdrawn,
as the Permittee is otherwise under a legal obligation to maintain these
offsets pursuant to 35 IAC 203.602.
iii. The above material must be submitted to the Illinois EPA no later than six
months after the date that this permit becomes effective.
d. The Permittee may obtain emission reduction credits from an alternate source
located in the Chicago ozone nonattainment area, other than 3M, if the following
requirements are met:
i. Any proposal for an alternate source of emission reduction credits must be
received by the Illinois EPA for review not later three months of the date
this permit becomes effective and be accompanied by detailed documentation to
support the amount and creditability of the proposed credits.
ii. The alternate source(s) of emission reduction credits must be subject to
appropriate measures given the nature of the underlying emission reduction to
make the reduction permanent and federally enforceable.
iii. The use of emission reduction credits from the alternate source(s) must be
approved by the Illinois EPA. In conjunction with any such approval, the
Illinois EPA may and shall revise this permit so that Condition 3(b)
appropriately identifies the source(s) of credits.
iv. The Permittee and the alternate source(s) of emission reduction credits must
submit to the Illinois EPA, no later than six months after the date that this
permit becomes effective, documentation similar in content to that specified
by Condition 3(c) to show that transfer of credits has been completed.
e. The Permittee shall not begin actual construction of the proposed plant until
applicable requirements with respect to emission offsets, as specified in Condition
3(b) or (c) above, have been satisfied.
Note: This condition represents the actions identified in conjunction with this
project to ensure that the project is accompanied by emission offsets and
does not interfere with reasonable further progress in reducing VOM emissions
in the Chicago ozone nonattainment area. Emission offsets are being required
for this project because USEPA has not approved provisions of the Emissions
Reduction Market System (ERMS) 35 IAC Part 205, that would allow compliance
with the ERMS to satisfy the emission offset requirements in 35 IAC Part 203.
SOURCE-WIDE CONDITION 4: GENERAL PROVISIONS FOR A MAJOR HAP SOURCE
As the plant is a new major source of hazardous air pollutants (HAP) for purposes of
Section 112(g) of the Clean Air Act, the Permittee shall comply with all applicable
requirements contained in 40 CFR Part 63, Subpart A, pursuant to 40 CFR 63.43(g)(2)(iv).
ELECTRONIC FILING, RECEIVED, CLERK'S OFFICE, JANUARY 5, 2007
* * * * * PC #7 * * * * *
Page 8
In particular, for the various emission units at the source, the Permittee shall comply
with the following applicable requirements of 40 CFR Part 63 Subpart A, related to
startup, shutdown, and malfunction, as defined at 40 CFR 63.2:
a. i. The Permittee shall at all times, including periods of startup, shutdown, and
malfunction as defined at 40 CFR 63.2, operate and maintain emission units at
the source, including associated air pollution control equipment and
monitoring equipment, in a manner consistent with safety and good air
pollution control practices for minimizing emissions to the levels required
by the relevant standards, i.e., meet the emission standard(s) or comply with
the applicable Startup, Shutdown, and Malfunction Plan (Plan), as required
below. Determination of whether such operation and maintenance procedures are
being used will be based on information available to the Illinois EPA and
USEPA, which may include, but is not limited to, monitoring results, review
of operation and maintenance procedures (including the Plan), review of
operation and maintenance records, and inspection of the unit. [40 CFR
63(e)(1)(i)]
ii. The Permittee shall correct malfunctions as soon as practicable after their
occurrence in accordance with the applicable Plan. To the extent that an
unexpected event arises during a startup, shutdown, or malfunction, the
Permittee shall comply by minimizing emissions during such a startup,
shutdown, and malfunction event consistent with safety and good air pollution
control practices. [40 CFR 63.6(e)(1)(ii)]
iii. These operation and maintenance requirements, which are established pursuant
to Section 112 of the Clean Air Act, are enforceable independent of
applicable emissions limitations and other applicable requirements. [40 CFR
63(e)(1)(iii)]
b. The Permittee shall develop, implement, and maintain written Startup, Shutdown, and
Malfunction Plans (Plans) that describe, in detail, procedures for operating and
maintaining the various emission units at the plant during periods of startup,
shutdown, and malfunction and a program of corrective action for malfunctioning
process, and air pollution control and monitoring equipment used to comply with the
relevant emission standards. These Plans shall be developed to satisfy the
purposes set forth in 40 CFR 63.6(e)(3)(i)(A), (B) and (C). The Permittee shall
develop its initial plans prior to the initial startup of an emission unit(s). [40
CFR 63.6(e)(3)(i)]
i. During periods of startup, shutdown, and malfunction of an emission unit, the
Permittee shall operate and maintain such unit, including associated air
pollution control and monitoring equipment, in accordance with the procedures
specified in the applicable Plan required above. [40CFR 63.6(e)(3)(ii)]
ii. When actions taken by the Permittee during a startup, shutdown, or
malfunction (including actions taken to correct a malfunction) are consistent
with the procedures specified in the applicable Plan, the Permittee shall
keep records for that event which demonstrate that the procedures specified
in the Plan were followed. In addition, the Permittee shall keep records of
these events as specified in 40 CFR 63.10(b), including records of the
occurrence and duration of each startup, shutdown, or malfunction of
operation and each malfunction of the air pollution control and monitoring
equipment. Furthermore, the Permittee shall confirm in the periodic
compliance report that actions taken during periods of startup, shutdown, and
malfunction were consistent with the applicable Plan, as required by 40 CFR
63.10(d)(5). [40 CFR 63.6(e)(3)(iii)]
ELECTRONIC FILING, RECEIVED, CLERK'S OFFICE, JANUARY 5, 2007
* * * * * PC #7 * * * * *
Page 9
iii. If an action taken by the Permittee during a startup, shutdown, or
malfunction (including an action taken to correct a malfunction) of an
emission unit is not consistent with the procedures specified in the
applicable Plan, and the emission unit exceeds a relevant emission standard,
then the Permittee must record the actions taken for that event and must
promptly report such actions as specified by 40 CFR 63.63.10(d)(5), unless
otherwise specified elsewhere in this permit or in the CAAPP Permit for the
plant. [40 CFR 63.6(e)(3)(iv)]
iv. The Permittee shall make changes to the Plan for an emission unit if required
by the Illinois EPA or USEPA, as provided for by 40 CFR 63.6(3)(3)(vii), or
as otherwise required by 40 CFR 63.6(3)(viii). [40 CFR 63.6(3)(3)(vii) and
(viii)]
v. These Plans are records required by this permit, which the Permittee must
retain in accordance with the general requirements for retention and
availability of records (General Permit Condition 4). In addition, when the
Permittee revises a Plan, the Permittee must also retain and make available
the previous (i.e., superseded) version of the Plan for a period of at least
5 years after such revision. [40 CFR 63.6(3)(v) and 40 CFR 63.10(b)(1)]
SOURCE-WIDE CONDITION 5: ANCILLARY EQUIPMENT, INCLUDING DIESEL ENGINES
a. Ancillary equipment, including diesel engines, shall be operated in accordance with
good air pollution control practice to minimize emissions.
b. i. Diesel engines shall be used to meet the internal electricity or power needs
of the plant.
ii. The power output of each diesel engine shall be no more than 1500 horsepower,
if it is an emergency or standby unit as defined by 35 IAC 211.1920, or
otherwise no more than 500 horsepower.
iii. Fuel fired in diesel engines shall contain no more than 0.05 percent by
weight sulfur, so as to qualify as very low sulfur fuel as addressed by the
federal Acid Rain program.
SOURCE-WIDE CONDITION 6: AUTHORIZATION TO OPERATE EMISSION UNITS
a. i. Under this permit, each CFB boiler and associated equipment may be operated
for a period that ends 180 days after the boiler first generates electricity
to allow for equipment shakedown and required emissions testing. This period
may be extended by Illinois EPA upon request of the Permittee if additional
time is needed to complete shakedown or perform emission testing. This
condition supersedes Standard Condition 6.
ii. Upon successful completion of emission testing of a CFB bed boiler
demonstrating compliance with applicable limitations, the Permittee may
continue to operate the boiler and associated equipment as allowed by Section
39.5(5) of the Environmental Protection Act.
b. i. The remainder of the plant, excluding the CFB boilers, may be operated under
this construction permit for a period of 365 days after initial startup of a
CFB boiler. This period of time may be extended by the Illinois EPA for up
to an additional 365 days upon written request by the Permittee as needed to
reasonably accommodate unforeseen difficulties experienced during shakedown
of the plant. This condition supersedes Standard Condition 6.
ELECTRONIC FILING, RECEIVED, CLERK'S OFFICE, JANUARY 5, 2007
* * * * * PC #7 * * * * *
Page 10
ii. Upon successful completion of emission testing of a CFB boiler demonstrating
compliance with applicable limitations, the Permittee may continue to operate
the remainder of the plant as allowed by Section 39.5(5) of the Environmental
Protection Act.
c. For the CFB boilers and other emission units that are subject to NSPS, the
Permittee shall fulfill applicable notification requirements of the NSPS, 40 CFR
60.7(a), including:
i. Written notification of commencement of construction, no later than 30 days
after such date (40 CFR 60.7(a)(1)); and
ii. Written notification of the actual date of initial startup, within 15 days
after such date (40 CFR 60.7(a)(3)).
SOURCE-WIDE CONDITION 7: AMBIENT ASSESSMENT AND MONITORING
a. The Permittee shall compile information on soil conditions (pH, nutrient levels,
trace element content, buffering capacity, etc.) and the condition of vegetation
(impact of air pollution and health as indicated by features, rate of growth, etc.)
in the Midewin National Tallgrass Prairie (Midewin) as would potentially be
affected by pollutants emitted by the proposed plant, as follows:
i. The Permittee shall complete this activity in accordance with a plan that has
been submitted to the Illinois Department of Natural Resources (IDNR), the
Midewin, and the Illinois EPA for review. As further field data must be
collected, the Permittee may contract with qualified experts to collect such
data with appropriate oversight by IDNR and the Midewin or work with IDNR and
the Midewin to collect such data.
ii. The plan shall be prepared following detailed consultation with IDNR, the
Midewin and the Illinois EPA. As part of this consultation with IDNR and the
Midewin, the Permittee shall review the existing data available for the area
and ongoing data collection efforts. The Permittee shall also solicit
recommendations on the scope of further study, including species that should
be addressed either as they are threatened or endangered or as they are
appropriate indicator species to generally assess the condition of particular
ecosystems, the adequacy of the existing data that has been collected in the
area for these species, locations for additional sampling sites, the
procedures and schedule to be used to collect further data, and the manner in
which such data should be collected.
iii. If necessary access to the Midewin can be readily obtained, information shall
be compiled for at least ten sites in the vicinity of the plant representing
the various ecosystems that are present and four sites in distant locations in
the Midewin. These sites shall be selected so as to allow continued collection
of representative data at the sites during the operation of the plant.
iv. The compilation of baseline information, representative of the conditions
prior to startup of the plant, shall be completed and a comprehensive report
submitted prior to the startup of the plant. A subsequent report containing
information collected following the startup of the plant shall be prepared
and submitted at the same time that the report for optimization of NOx
controls required by Unit-Specific Condition 1.16 is required to be
submitted. This report shall also include information on the actual
operating levels and emissions of the plant during the period over which the
soil and vegetation information was collected. Copies of these reports shall
be submitted to the IDNR, Midewin, and Illinois EPA
ELECTRONIC FILING, RECEIVED, CLERK'S OFFICE, JANUARY 5, 2007
* * * * * PC #7 * * * * *
Page 11
b. The Permittee shall support any monitoring program conducted by the Illinois EPA
(or jointly by the Illinois EPA and other governmental bodies) for air emissions
impacts in the Midewin, as follows:
i. Providing the Illinois EPA with any changes in the schedule for construction
and startup of the plant, so as to allow baseline monitoring to be conducted
for at least a 12-month period prior to initial startup of the plant.
ii. Assisting in the planning for such monitoring, by reviewing draft monitoring
plans, participating in planning meetings and providing comments, as
requested.
iii. Supporting such monitoring, by assisting in identifying suitable sites at
which ambient monitoring stations could be located and encouraging the
property owners to allow monitoring to be conducted at such sites.
SOURCE-WIDE CONDITION 8: RISK MANAGEMENT PLAN (RMP)
Should this source be subject to the Chemical Accident Prevention Provisions in 40 CFR
Part 68, then the Permittee shall submit:
a. A compliance schedule for meeting the requirements of 40 CFR Part 68 by the date
provided in 40 CFR 68.10(a); or
b. A certification statement that the source is in compliance with all applicable
requirements of 40 CFR Part 68, including the registration and submission of the
Risk Management Plan (RMP).
Note: This condition is imposed pursuant to 40 CFR 68.215(a).
SOURCE-WIDE CONDITION 9: CAPACITY OF PLANT
This permit allows the construction of a power plant that has less capacity than that
addressed by the application without obtaining prior approval by the Illinois EPA, as
follows. This condition does not affect the Permittee’s obligation to comply with the
applicable requirements for the various emission units at the plant:
a. The reduction in the capacity of the plant shall generally act to reduce air
quality impacts, as emissions from individual emission units are reduced, heights
of structures are reduced, but heights of stacks are not significantly affected.
b. The reduction in the capacity of the plant shall result in a pro-rata reduction in
the emission limitations established by this permit for the CFB boilers that are
based on the capacity of the boilers.
c. The Permittee shall notify the Illinois EPA prior to proceeding with any
significant reduction in the capacity of the plant. In this notification, the
Permittee shall describe the proposed change and explain why the proposed change
will act to reduce impacts, with detailed supporting documentation.
d. Upon written request by the Illinois EPA, the Permittee shall promptly have
dispersion modeling performed to demonstrate that the overall effect of the reduced
capacity of the plant is to reduce air quality impacts, so that impacts from the
plant remain at or below those predicted by the air quality analysis accompanying
the application.
ELECTRONIC FILING, RECEIVED, CLERK'S OFFICE, JANUARY 5, 2007
* * * * * PC #7 * * * * *
Page 12
SECTION 4: UNIT-SPECIFIC CONDITIONS FOR PARTICULAR EMISSION UNITS
UNIT-SPECIFIC CONDITION 1: CONDITIONS FOR THE CFB BOILERS
1.1 Emission Unit Description
The affected units for the purpose of these specific permit conditions are two
circulating fluidized bed (CFB) boilers with individual air pollution control
trains. The boilers are designed to use coal mixed with up to 20 percent petroleum
coke and waste coal as their primary fuel. The boilers also have the capability to
burn natural gas, which is used for startup of the boilers.
1.2 Control Technology Determination
a. Each boiler shall be operated and maintained with the following features to
control emissions.
i. Good combustion practices.
ii. Limestone addition to the bed.
iii. Selective noncatalytic reduction (SNCR).
iv. Trimming scrubber (dry lime scrubber).
v. Fabric filter or “baghouse”.
b. The emissions from each boiler shall not exceed the following limits except
during startup, shutdown and malfunction as addressed by Condition 1.2(e).
During the shakedown period provided by Source-Wide Condition 5, a boiler is
not subject to the SO
2
reduction requirement below and need only comply with
the reduction requirement of the NSPS, 40 CFR Part 60, Subpart Da.
i. PM – 0.015 lb/million Btu.
This limit shall apply as a 3-hour block average, with compliance
determined by emission testing in accordance with Condition 1.8 and
equipment operation.
ii. SO
2
– 0.15 lb/million Btu and, if emissions are 0.10 lb/million Btu or
greater, 8 percent of the potential combustion concentration (92
percent reduction) of the solid fuel supply, as received.
These limits shall apply on a 30 day rolling average with compliance
determined using the compliance procedures set forth in the NSPS, 40
CFR 60.48a.
iii. NO
x
- 0.10 lb/million Btu, or such lower limit as set by the Illinois
EPA following the Permittee's evaluation of NO
x
emissions and the SNCR
system in accordance with Conditions 1.15. For this purpose, the
demonstration period for the boiler shall be the first two years of
operation.
This limit shall apply on a 30-day rolling average using the compliance
procedures of the NSPS, 40 CFR Part 60.48a.
ELECTRONIC FILING, RECEIVED, CLERK'S OFFICE, JANUARY 5, 2007
* * * * * PC #7 * * * * *
Page 13
iv. CO – 0.11 lb/million Btu or 321.4 lb/hr*.
This limit shall apply on a 24-hour block average basis, with
continuous monitoring conducted in accordance with Condition 1.8.
v. VOM – 0.004 lb/million Btu or 11.7 lb/hr*.
This limit shall apply as a 3-hour block average, with compliance
determined by emission testing in accordance with Condition 1.8 and
equipment operation.
* This alternative standard is the product of the standard in
lb/million Btu and the rated heat input capacity of the boiler.
c. i. The boilers shall each comply with one of the following requirements
with respect to emissions of mercury:
A. An emission rate of 0.000002 lb/million Btu or emissions below
the detection level of established test methodology (Option A);
B. A removal efficiency of 95 percent achieved without injection of
activated carbon or other similar material specifically used to
control emissions of mercury, comparing the emissions and the
mercury contained in the fuel supply (Option B);
C. Injection of powdered activated carbon or other similar material
specifically used to control emissions of mercury in a manner
that is designed to achieve the maximum practicable degree of
mercury removal (Option C);
D. The requirements for control of mercury emissions established by
USEPA pursuant to Section 112(d) of the Clean Air Act (Option D),
if such regulations are adopted by USEPA prior to commencement of
construction of the affected boiler or if the standard
established by such regulations for mercury emissions would be
more stringent than one of the above standards. In such case, the
Permittee shall promptly notify the Illinois EPA that it intends
to comply with the applicable requirements of the adopted
regulations and explain the basis on which such election is made.
ii. A. Compliance with Option A or B shall be demonstrated by periodic
testing and proper operation of an affected boiler consistent
with other applicable requirements that relate to control of
mercury (e.g., requirements applicable to particulate matter and
SO
2
emissions) as may be further developed or revised in the
source’s CAAPP Permit. Compliance with Option C shall be
demonstrated by proper operation of a boiler and such other
measures specified by the applicable construction permit for the
injection system.
B. Options A, B and C shall take effect 18 months after initial
startup of an affected boiler, provided however, the Permittee
may, upon written notice to the Illinois EPA, extend this period
for up to an additional 12 months if needed for detailed
evaluation of mercury emissions from the boilers or physical
changes to the boilers related to control of mercury emissions.
ELECTRONIC FILING, RECEIVED, CLERK'S OFFICE, JANUARY 5, 2007
* * * * * PC #7 * * * * *
Page 14
As part of this notice, the Permittee shall explain why the
necessary evaluation of emissions or physical changes to the
boilers could not reasonably be completed earlier, identify the
activities that it intends to perform to evaluate emissions or
further enhance control for emissions, and specify the particular
practices it will use during this period as good air pollution
control practice to minimize emissions of mercury. Prior to the
date that Option A, B and C are in effect, the Permittee shall
use good air pollution control practices to minimize emissions of
mercury.
d. i. The boilers shall each comply with one of the following requirements
with respect to emissions of hydrogen chloride:
A. An emission rate of 0.01 lb/million or such lower limit, as low
as 0.006 lb/million Btu, as set by the Illinois EPA following the
Permittee's evaluation of hydrogen chloride emissions and the
acid gas control system, which evaluation shall be submitted with
the application for CAAPP permit for the source. This evaluation
shall be performed in a manner similar to the evaluation of NO
x
emissions required by Condition 1.15. Upon submission of the
evaluation and until such time as the Illinois EPA completes its
review of the evaluation, a boiler shall comply with the emission
limit proposed in the evaluation. (Option A);
B. A removal efficiency of 98 percent, comparing the emissions and
the chlorine content of the fuel supply, expressed as equivalent
hydrogen chloride (Option B);
C. The requirements for control of hydrogen chloride emissions
established by USEPA pursuant to Section 112(d) of the Clean Air
Act, once applicable regulations are adopted by USEPA (Option C),
if such regulations are adopted by USEPA prior to commencement of
construction of the affected boiler or if the standard
established by such regulations for hydrogen chloride emissions
would be more stringent than one of the above standards. In such
case, the Permittee shall promptly notify the Illinois EPA that
it intends to comply with the applicable requirements of the
adopted regulations and explain the basis on which such election
is made.
ii. A. Compliance with Option A and B shall be demonstrated by periodic
testing and proper operation of a boiler consistent with other
applicable requirements that relate to control of SO
2
emissions,
as may be further developed or revised in the source’s CAAPP
Permit.
B. Option A and B shall take effect 12 months after initial startup
of a boiler. Prior to such date, the Permittee shall use good
air pollution control practices to minimize emissions of hydrogen
chloride.
e. The Permittee shall use reasonable practices to minimize emissions during
startup, shutdown and malfunction of a boiler as further addressed in
Condition 1.6, including the following:
ELECTRONIC FILING, RECEIVED, CLERK'S OFFICE, JANUARY 5, 2007
* * * * * PC #7 * * * * *
Page 15
i. Use of natural gas, during startup to heat the boiler prior to
initiating firing of solid fuel;
ii. Operation of the boiler and associated air pollution control equipment
in accordance with written operating procedures that include startup,
shutdown and malfunction plan(s); and
iii. Inspection, maintenance and repair of the boiler and associated air
pollution control equipment in accordance with written maintenance
procedures.
1.3 Applicable Federal Emission Standards
a. i. The boilers are subject to a New Source Performance Standard (NSPS) for
Electric Utility Steam Generating Units, 40 CFR 60, Subparts A and Da.
The Illinois EPA administers NSPS in Illinois on behalf of the USEPA
under a delegation agreement.
ii. The emissions from each boiler shall not exceed the applicable limits
pursuant to the NSPS. In particular, the NO
x
emissions from each boiler
shall not exceed 1.6 lb/MW-hr gross energy output, based on a 30-day
rolling average, pursuant to 40 CFR 60.44a(d).
iii. The particulate matter emissions from each boiler shall not exceed 20
percent opacity (6-minute average), except for one 6- minute period per
hour of not more than 27 percent opacity pursuant to 40 CFR 60.42a(b).
b. At all times, the Permittee shall maintain and operate each boiler, including
associated air pollution control equipment, in a manner consistent with good
air pollution control practice for minimizing emissions, pursuant to 40 CFR
60.11(d).
1.4 Applicable State Emission Standards
Each boiler is subject to the following state emission standards.
a. Opacity – 35 IAC 212.122 (20 percent opacity, except as allowed by 35 IAC
212.122(b))*
b. Particulate Matter – 35 IAC 212.201 (0.1 lb/million Btu)**
c. Sulfur Dioxide – 35 IAC 214.121 (1.2 lb/million Btu)**
d. Carbon Monoxide – 35 IAC 216.121 (200 ppm, @ 50 % excess air)**
e. Nitrogen Oxides – 35 IAC 217.121 (0.7 lb/million Btu)**
* This standard is not as stringent as Condition 1.3(a)(iii).
** This standard is not as stringent as Condition 1.2.
1.5. Applicability of Other Regulations
a. Each boiler is an affected unit under the federal Acid Rain Deposition
Control Program pursuant to Title IV of the Clean Air Act and is subject to
certain control requirements and emissions monitoring requirements pursuant
to 40 CFR Parts 72, 73 and 75. (See also Trading Program Condition 1,
(Section 5, Condition 1).
ELECTRONIC FILING, RECEIVED, CLERK'S OFFICE, JANUARY 5, 2007
* * * * * PC #7 * * * * *
Page 16
b. The boilers would qualify as Electrical Generating Units (EGU) for purposes
of 35 IAC Part 217, Subpart W, the NO
x
Trading Program for Electrical
Generating Units. As EGU, the Permittee would have to hold NO
x
allowances for
the NO
x
emissions of the boilers during each seasonal control period. (See
also Trading Program Condition 3 (Section 5, Condition 3).
c. For particulate matter, the boilers are pollutant-specific emissions units
that will be subject to 40 CFR Part 64, Compliance Assurance Monitoring for
Major Stationary Sources. As such, the application for Clean Air Act Permit
Program (CAAPP) Permit for the source must include a Compliance Assurance
Monitoring (CAM) plan for the boilers.
1.6 Operating Requirements
a. The Permittee shall operate each boiler and associated air pollution control
equipment in accordance with good air pollution control practice to minimize
emissions, by operating in accordance with detailed written operating
procedures as it is safe to do so, which procedures at a minimum shall:
i. Address startup, normal operation, and shutdown and malfunction events
and provide for review of relevant operating parameters of the boiler
systems during startup, shutdown and malfunction as necessary to make
adjustments to reduce or eliminate any excess emissions.
ii. With respect to startup, address readily foreseeable startup scenarios,
including so called “hot startups” when the operation of a boiler is
only temporarily interrupted and provide for appropriate operating
review of the operational condition of a boiler prior to initiating
startup of the boiler.
iii. With respect to malfunction, identify and address likely malfunction
events with specific programs of corrective actions and provide that
upon occurrence of a malfunction that will result in emissions in
excess of the applicable limits in Condition 1.2, the Permittee shall,
as soon as practicable, repair the affected equipment, reduce the
operating rate of the boiler or remove the boiler from service so that
excess emissions cease.
Consistent with the above, if the Permittee has maintained and operated
a boiler and associated air pollution control equipment so that
malfunctions are infrequent, sudden, not caused by poor maintenance or
careless operation, and in general are not reasonably preventable, the
Permittee shall begin shutdown of the boiler within 90 minutes, unless
the malfunction is expected to be repaired within 120 minutes or such
shutdown could threaten the stability of the regional electrical power
supply. In such case, shutdown of the system shall be undertaken when
it is apparent that repair will not be accomplished within 120 minutes
or shutdown will not endanger the regional power system. In no case
shall shutdown of the boiler be delayed solely for the economic benefit
of the Permittee.
Note: If the Permittee determines that the continuous emission monitoring
system (CEMS) is inaccurately reporting excess emissions, the boiler
may continue to operate provided the Permittee records the
information it is relying upon to conclude that the boiler and
associated emission control systems are functioning properly and the
CEMS is reporting inaccurate data and the Permittee takes prompt
action to resolve the accuracy of the CEMS.
ELECTRONIC FILING, RECEIVED, CLERK'S OFFICE, JANUARY 5, 2007
* * * * * PC #7 * * * * *
Page 17
b. The Permittee shall maintain each boiler and associated air pollution control
equipment in accordance with good air pollution control practice to assure
proper functioning of equipment and minimize malfunctions, including
maintaining the boiler in accordance with written procedures developed for
this purpose.
c. The Permittee shall handle the fuel for the boilers in accordance with a
written Fuel Management Plan that shall be designed to provide the boilers
with a consistent fuel supply that meets relevant criteria needed for proper
operation of the boilers and their control systems.
d. The Permittee shall review its operating and maintenance procedures and its
fuel management plan for the boilers as required above on a regular basis and
revise them if needed consistent with good air pollution control practice
based on actual operating experience and equipment performance. This review
shall occur at least annually if not otherwise initiated by occurrence of a
startup, shakedown, or malfunction event that is not adequately addressed by
the existing plans or a specific request by the Illinois EPA for such review.
1.7 Emission Limitations
Emissions from the boilers shall not exceed the limits in Table I. The limits in
Table I are based upon the emission rates and the maximum firing rate specified in
the permit application consistent with the air quality analysis submitted by the
Permittee to comply with PSD. Compliance with hourly limits shall be determined
with testing and monitoring as required by Conditions 1.8 and 1.9 and proper
equipment operation in accordance with Condition 1.6.
1.8 Emission Testing
a. i. A. Within 60 days after achieving the maximum production rate at
which an affected boiler will be operated but not later than 180
days after initial startup of each boiler, the Permittee shall
have tests conducted for opacity and emissions of NO
x
, CO, PM,
VOM, SO
2,
hydrogen chloride, hydrogen fluoride, sulfuric acid
mist, and mercury and other metals as follows at its expense by
an approved testing service while the boiler is operating at
maximum operating load and other representative operating
conditions, including firing of coal only and coal with
supplemental fuel. (In addition, the Permittee may also perform
measurements to evaluate emissions at other load and operating
conditions.)
B. This period of time may be extended by the Illinois EPA for up to
an additional 365 days upon written request by the Permittee as
needed to reasonably accommodate unforeseen difficulties in the
startup and testing of the boiler, provided that initial
performance testing required by the NSPS, 40 CFR Part 60, Subpart
Da has been completed for the boiler and the test report
submitted to the Illinois EPA.
ii. Between 9 and 15 months after performance of the initial testing that
demonstrates compliance with applicable requirements, the Permittee
shall have the emissions of PM, VOM, hydrogen chloride, hydrogen
fluoride, sulfuric acid mist, and mercury and other metals from each
affected boiler retested as specified above.
ELECTRONIC FILING, RECEIVED, CLERK'S OFFICE, JANUARY 5, 2007
* * * * * PC #7 * * * * *
Page 18
iii. A. Thereafter, the Permittee shall have PM emissions from each
affected boiler tested at a regular interval. This interval
shall be no greater than 36 months, unless the results of two
consecutive PM tests for a boiler demonstrate PM emissions of
0.010 lb/million Btu or less, in which case the interval between
tests shall be no greater than 72 months. However, if a PM test
for a boiler then shows PM emissions above 0.010 lb/million Btu,
the maximum interval between testing shall revert to 36 months
until two consecutive tests again show PM emissions of 0.010
lb/million Btu or less. For the purposes of these provisions, the
two consecutive tests must be at least 24 months apart.
B. Whenever PM testing for a boiler is performed as required above,
testing for emissions of mercury and hydrogen chloride shall also
be performed as provided below.
iv. In addition to the emission testing required above, the Permittee shall
have emission tests conducted as requested by the Illinois EPA for a
boiler within 45 days of a written request by the Illinois EPA or such
later date agreed to by the Illinois EPA. Among other reasons, such
testing may be required if there is a significant increase in the
mercury or chlorine content of the fuel supply to the boilers.
Note: Specific requirements for periodic emission testing may be
established in the CAAPP Permit for the plant.
v. Within two years of the initial startup of each affected boiler, the
Permittee shall have emission testing conducted for dioxin/furan
emissions.
b. The following methods and procedures shall be used for testing, unless
otherwise specified or approved by the Illinois EPA.
Location of Sample Points Method 1
Gas Flow and Velocity
Method 2
Flue Gas Weight
Method 3 or 3A
Moisture
Method 4
Particulate Matter
1
Method 5, as specified by 40 CFR
60.48a(b), and Method 201 or 201A (40
CFR 51, Appendix M)
Condensable Particulate
Method 202
Opacity
2
Method 9, as specified by 40 CFR
60.48a(b)(3)
Nitrogen Oxides
2
Method 19, as specified by 40 CFR 60.48a(d)
Sulfur Dioxides
2
Method 19, as specified by 40 CFR 60.48a(c)
Carbon Monoxide
2
Method 10
Volatile Organic Material
3
Method 18 or 25A
Sulfuric Acid Mist
Method 8
Hydrogen Chloride
Method 26
Hydrogen Fluoride
Method 26
Metals
4, 5
Method 29
Dioxin/Furan
Method 23
ELECTRONIC FILING, RECEIVED, CLERK'S OFFICE, JANUARY 5, 2007
* * * * * PC #7 * * * * *
Page 19
Notes:
1. The Permittee may report all PM emissions measured by USEPA
Method 5 as PM
10
, in which case separate testing using USEPA
Method 201 or 201A need not be performed.
2. Emission testing shall be conducted for purposes of certification
of the continuous emission monitors required by Condition 1.9.
Thereafter, the NO
x
, SO
2
and CO emission data from certified
monitors may be provided in lieu of conducting emissions tests.
3. The Permittee may exclude methane, ethane and other exempt
compounds from the results of any VOM test provided that the test
protocol to quantify and correct for any such compounds is
included in the test plan approved by the Illinois EPA.
4. For purposes of this permit, metals are defined as mercury,
arsenic, beryllium, cadmium, chromium, lead, manganese, and
nickel.
5. During the initial emissions testing for metals, the Permittee
shall also conduct measurements using established test methods
for the principle forms of mercury present in the emissions,
i.e., particle bound mercury, oxidized mercury and elemental
mercury.
c. i. Test plans, test notifications, and test reports shall be submitted to
the Illinois EPA in accordance with the General Condition 2 (Section 6,
Conditions 2)
ii. In addition to other information required in a test report, test
reports shall include detailed information on the operating conditions
of a boiler during testing, including:
A. Fuel consumption (in tons);
B. Composition of fuel (Refer to Condition 1.10(b)), including the
metals, chlorine and fluorine content, expressed in pound per
million Btu;
C. Firing rate (million Btu/hr) and other significant operating
parameters of the boiler, including temperature in the boiler in
the area before the SNCR system;
D. Control device operating rates, e.g., limestone addition rate,
SNCR reagent injection rate, injection rate of trimming scrubber,
baghouse pressure drop, etc.;
E. Opacity of the exhaust from the boiler, 6-minute averages and 1-
hour averages;
F. Turbine/Generator output rate (MWe).
ELECTRONIC FILING, RECEIVED, CLERK'S OFFICE, JANUARY 5, 2007
* * * * * PC #7 * * * * *
Page 20
1.9 Emission Monitoring
a. i. The Permittee shall install, certify, operate, calibrate, and maintain
continuous monitoring systems on each boiler for opacity, emissions of
SO
2
, NO
x
and CO, and either oxygen or carbon dioxide in the exhaust.
ii. The Permittee shall fulfill the applicable requirements for monitoring
in the NSPS (40 CFR 60.13, 60.47a, and 40 CFR 60 Appendix B), the
federal Acid Rain Program (40 CFR Part 75), the NO
x
Trading Program for
Electrical Generating Units (35 IAC Part 217, Subpart W) and NESHAP (40
CFR 63.8 and 63.10). These rules require that the Permittee maintain
detailed records for both the measurements made by these systems and
the maintenance, calibration and operational activity associated with
the monitoring systems.
iii. The Permittee shall also operate and maintain these monitoring systems
according to site-specific monitoring plan(s), which shall be submitted
at least 60 days before the initial startup of a boiler to the Illinois
EPA for its review and approval. With this submission, the Permittee
shall submit the proposed type of monitoring equipment and proposed
sampling location(s), which shall be approved by the Illinois EPA prior
to installation of equipment.
b. In addition, when NO
x
or SO
2
emission data are not obtained from a continuous
monitoring system because of system breakdowns, repairs, calibration checks
and zero span adjustments, emission data shall be obtained by using standby
monitoring systems, emission testing using USEPA Reference Methods (Method 7
or 7A for NO
x
and Method 6 for SO
2
), or other approved methods as necessary to
provide emission data for a minimum of 75 percent of the operating hours in a
boiler operating day, in at least 22 out of 30 successive boiler operating
days, pursuant to 40 CFR 60.47a(f) and (h).
Note: Fulfillment of the above criteria for availability of emission data
from a monitoring system does not shield the Permittee from potential
enforcement for failure to properly maintain and operate the system.
1.10. Operational Monitoring and Measurements
a. The Permittee shall install, evaluate, operate, and maintain meters to
measure and record consumption of natural gas by each boiler.
b. i. A. The Permittee shall sample and analyze the sulfur and heat
content of the fuel supplied to the boilers in accordance with
USEPA Reference Method 19 (40 CFR 60, Appendix A, Method 19).
B. This sampling and analysis shall include separate measurements
for the sulfur and heat content of the fuels supplied to the
boilers.
ii. The Permittee shall analyze samples of all coal supplies and any
alternate fuel supplies that are components in the solid fuel supply to
the boilers and the solid fuel supply itself for mercury and other
metals, chlorine and fluorine content, as follows:
A. Analysis shall be conducted in accordance with USEPA Reference
Methods or other method approved by USEPA.
ELECTRONIC FILING, RECEIVED, CLERK'S OFFICE, JANUARY 5, 2007
* * * * * PC #7 * * * * *
Page 21
B. Analysis of the fuel supply to the boiler itself shall be
conducted in conjunction with performance testing of a boiler.
C. Analysis of representative samples of solid fuels shall be
conducted in conjunction with acceptance of fuel from a new coal
mine or an alternate fuel.
D. Analysis of representative samples of solid fuels shall be
conducted at least every two years, if a more frequent analysis
is not needed pursuant to the above requirements.
E. The CAAPP permit may revise or relax these requirements.
c. i. The Permittee shall install, operate and maintain systems to measure
key operating parameters of the control equipment and control measures
for each boiler, including:
A. Limestone addition rate to the bed;
B. Temperature in the boiler in the area before the SNCR system;
C. Reagent injection rate for the SNCR unit;
D. Sorbent injection rate for the trimming scrubber;
E. Pressure drop across the baghouse.
ii. The Permittee shall maintain the records of the measurements made by
these systems and records of maintenance and operational activity
associated with the systems.
d. If a Performance Specification for particulate matter continuous monitoring
systems is adopted by USEPA more than 6 months before the scheduled date for
initial start-up of the first boiler, the Permittee shall install and operate
such a system on each boiler for the purpose of compliance assurance
monitoring. The Permittee shall operate, calibrate and maintain each such
system in accordance with the applicable USEPA performance specification and
other applicable requirements of the NSPS for monitoring systems and in a
manner that is generally consistent with published USEPA guidance for use
such systems for compliance assurance monitoring, e.g.,
Fabric Filter Bag
Leak Detection Guidance
, EPA-454/R-98-015, September 1997. The Permittee
shall also operate and maintain these monitoring systems according to a site-
specific monitoring plan, which shall be submitted at least 60 days before
the initial startup of a boiler to the Illinois EPA for its review and
approval. With this submission, the Permittee shall submit the proposed type
of monitoring equipment and proposed sampling location, which shall be
approved by the Illinois EPA prior to installation of equipment.
1.11. Recordkeeping
a. The Permittee shall maintain the following records with respect to operation
and maintenance of each boiler and associated control equipment:
i. An operating log for the boiler that at a minimum shall address:
ELECTRONIC FILING, RECEIVED, CLERK'S OFFICE, JANUARY 5, 2007
* * * * * PC #7 * * * * *
Page 22
A. Each startup of the boiler, including the nature of the startup,
sequence and timing of major steps in the startup, any unusual
occurrences during the startup, and any deviations from the
established startup procedures, with explanation;
B. Each shutdown of the boiler including the nature and reason for
the shutdown, sequence and timing of major steps in the shutdown,
any unusual occurrences during the shutdown, and any deviations
from the established shutdown procedures, with explanation; and
C. Each malfunction of the boiler system that significantly impairs
emission performance, including the nature and duration of the
event, sequence and timing of major steps in the malfunction,
corrective actions taken, any deviations from the established
procedures for such a malfunction, and preventative actions taken
to address similar events.
ii. Inspection, maintenance and repair log(s) for the boiler system that at
a minimum shall identify such activities that are performed as related
to components that may effect emissions; the reason for such
activities, i.e., whether planned or initiated due to a specific event
or condition, and any failure to carry out the established maintenance
procedures, with explanation.
iii. Copies of the steam charts and daily records of steam and electricity
generation.
b. The Permittee shall maintain records of the following items related to fuels
used in the boilers:
i. Records of the sampling and analysis of solid fuel supply to the
boilers conducted in accordance with Condition 1.10(b).
ii. A. The sulfur content of solid fuel, lb sulfur/million Btu, supplied
to each boiler, as determined pursuant to Condition 1.10(b)(i);
and
B. The sulfur content of solid fuel supplied to the boiler on a 30-
day rolling average, determined from the above data.
iii. The amount of fuel combusted in each boiler by type of fuel as
specified in 40 CFR Part 60, Appendix A, Method 19.
c. For each boiler, the Permittee shall maintain records of the following items
related to emissions:
i. Records of SO
2
NO
x
and PM emissions and operation for each boiler
operating day, as specified by 40 CFR 60.49a.
ii. With respect to the SO
2
reduction based limit in Condition 1.2(b)(ii)
and 1.3, for each 30 day averaging period, the SO
2
emissions in
lb/million Btu and the required SO
2
emission rate as determined by
applying the permissible emission fraction to the potential SO
2
emission
rate of the solid fuel supply.
ELECTRONIC FILING, RECEIVED, CLERK'S OFFICE, JANUARY 5, 2007
* * * * * PC #7 * * * * *
Page 23
iii. Records of CO emissions of the boiler based on the continuous emissions
monitoring system required by Condition 1.9.
iv. Records of emissions of VOM, mercury and other pollutants from the
boiler, based on fuel usage and other operating data for the boiler and
appropriate emission factors, with supporting documentation.
d. The Permittee shall record the following information for any period during
which a boiler deviated from applicable requirements:
i. Each period when the operating parameters of the baghouse, such as
pressure drop, as measured pursuant to Condition 1.10, deviated outside
the levels set as good air pollution control practice (date, duration
and description of the event).
ii. Each period when a baghouse failed to operate properly, which records
shall include at least the information specified by General Condition 3
(Section 6, Condition 3).
iii. Each period during which an affected unit exceeded the requirements of
this permit, including applicable emission limits, which records shall
include at least the information specified by General Condition 3
(Section 6, Condition 3).
1.12. Notifications
a. The Permittee shall notify the Illinois EPA within 30 days of deviations from
applicable requirements that are not addressed by the regular reporting
required below. These notifications shall include the information specified
by General Condition 4 (Section 6, Condition 4).
b. The Permittee shall notify the Illinois EPA in writing at least 30 days prior
to initial firing of any solid fuel other than coal, petroleum coke or coal
tailings in a boiler.
1.13. Reporting
a. i. The Permittee shall fulfill applicable reporting requirements in the
NSPS, 40 CFR 60.7(c) and 60.49a, for each boiler. For this purpose,
quarterly reports shall be submitted no later than 30 days after the
end of each calendar quarter. (40 CFR 60.49a (i))
ii. In lieu of submittal of paper reports, the Permittee may submit
electronic quarterly reports for SO
2
, NO
x
or opacity. The electronic
reports shall be submitted no later than 30 days after the end of the
calendar quarter and shall be accompanied by a certification statement
indicating whether compliance with applicable emission standards and
minimum data requirements of 40 CFR 60.49a were achieved during the
reporting period. (40 CFR 60.49a(j))
b. i. Either as part of the periodic NSPS report or accompanying such report,
the Permittee shall report to the Illinois EPA any and all opacity and
emission measurements for a boiler that are in excess of the respective
requirements set by this permit. These reports shall provide for each
such incident, the pollutant emission rate, the date and duration of
the incident, and whether it occurred during startup, malfunction,
breakdown, or shutdown. If an incident occurred during malfunction or
breakdown, the corrective actions and actions taken to prevent or
minimize future reoccurrences shall also be reported.
ELECTRONIC FILING, RECEIVED, CLERK'S OFFICE, JANUARY 5, 2007
* * * * * PC #7 * * * * *
Page 24
ii. These reports shall also address any deviations from applicable
compliance procedures for a boiler established by this permit,
including specifying periods during which the continuous monitoring
systems were not in operation.
c. The Permittee shall comply with applicable reporting requirements under the
Acid Rain Program, with a single copy of such report sent to Illinois EPA,
Bureau of Air, Compliance and Enforcement Section.
1.14 Operational Flexibility/Anticipated Operating Scenarios
a. The Permittee is authorized to use fuel from different suppliers in the
boilers without prior notification to the Illinois EPA or revision of this
permit.
b. This condition does not affect the Permittee’s obligation to continue to
comply with applicable requirements or to properly obtain a construction
permit in a timely manner for any activity involving the boiler or the fuel
handling equipment that constitutes construction or modification of an
emission unit, as defined in 35 IAC 201.102.
1.15 Optimization of Control of NO
x
Emissions
a. i. The Permittee shall evaluate NO
x
emissions from boilers to determine
whether a lower NO
x
emission limit (as low as 0.08 lb/million Btu) may
be reliably achieved while complying with other emission limits and
without significant risk to equipment or personnel. This evaluation
shall also examine whether there will be significant increase in
ammonia-related emissions from the boilers, as well as unreasonable
increase in maintenance and repair needed for the boilers.
ii. This permit will be revised to set lower emission limit(s) for NO
x
emissions (but no lower than 0.08 lb/million Btu) if as a result of
this evaluation the Illinois EPA finds that the boilers can
consistently comply with such limit(s). Additional parameters or
factors, e.g., the nitrogen content of the fuel supply, may be included
in such limits to address particular modes of operation during which
particular emission limits may or may not be achievable.
iii. If the Permittee fails to complete the evaluation or submit the
required report in a timely manner, the NO
x
emission limit shall
automatically revert to 0.08 lb NO
x
per million Btu
b. The Permittee shall perform this evaluation of NO
x
emissions in accordance
with a plan submitted to the Illinois EPA for review and comment. The initial
plan shall be submitted to the Illinois EPA no later than 90 days after
initial start-up of a boiler.
c. The plan shall provide for systematic evaluation of changes, within the
normal or feasible range of operation, in the following elements as related
to the monitored NO
x
emissions:
i. Boiler operating load and operating settings;
ii. Operating rate and settings of the SNCR system;
iii. Flue gas temperature at SNCR injection point(s);
iv. Combustion settings, including excess oxygen;
ELECTRONIC FILING, RECEIVED, CLERK'S OFFICE, JANUARY 5, 2007
* * * * * PC #7 * * * * *
Page 25
v. Limestone and sorbent usage rates;
vi. Nitrogen content of the fuel supply;
vii. Particulate matter and operating parameters for baghouses;
viii. Opacity, particulate matter and sulfuric acid mist emissions; and
ix. Ammonia slip (emissions of ammonia and secondary ammonia compounds).
d. The Permittee shall promptly begin this evaluation after a boiler
demonstrates compliance with the applicable emission limits as shown by
emission testing and monitoring. At this time, the Permittee shall submit an
update to the plan that describes its findings with respect to control of NO
x
emissions during the shakedown of the boilers, which highlights possible
areas of concern for the evaluation.
e. i. This evaluation shall be completed and a detailed written report
submitted to the Illinois EPA within two years after the initial
startup of a boiler. This report shall include proposed alternative
limit(s) for NO
x
emissions.
ii. This deadline may be extended for an additional year if the Permittee
submits an interim report demonstrating the need for additional time to
effectively evaluate NO
x
emissions or to coordinate this evaluation with
the ambient assessment required by Source-Wide Condition 7.
1.16 Construction of Additional Control Measures
The Permittee is generally authorized under this permit to construct and operate
additional devices and features to control emissions from a boiler, which are not
described in the application for this permit, as follows. This condition does not
affect the Permittee’s obligation to comply with the applicable requirements for
the boilers:
a. This authorization only extends to devices or features that are designed to
reduce emissions, such as the addition of adsorbent materials other than
limestone to the boiler bed and ductwork injection of sorbent materials other
than lime or wet scrubbing prior to the baghouse. These measures may also
serve to improve boiler operation as they reduce consumption of materials but
do not include measures that would increase a boiler’s rated heat input
capacity.
b. This authorization only extends to additional devices or features that are
identified during the detailed design of the boilers and any refinements to
that design that occur during construction and the initial operation of the
boilers.
c. Prior to beginning actual construction of any new control device, the
Permittee shall apply for and obtain a separate construction permit for it
from the Illinois EPA pursuant to 35 IAC Part 201, Subpart D. In the
application for this permit, the Permittee shall describe the additional
device and explain how it will act to reduce emissions, with detailed
supporting documentation. In acting upon this permit, the Illinois EPA may
specify additional operating parameters that must be monitored or measured,
such as pressure drop across the scrubber, and additional provisions for
required emissions testing.
ELECTRONIC FILING, RECEIVED, CLERK'S OFFICE, JANUARY 5, 2007
* * * * * PC #7 * * * * *
Page 26
d. Upon written request by the Illinois EPA, the Permittee shall promptly have
dispersion modeling performed to demonstrate that the proposed device or
feature for which a construction permit would be required does not
significantly effect the air quality impacts from the boilers, so that
impacts from the boilers are of the same magnitude of those predicted by the
air quality analysis accompanying the application.
ELECTRONIC FILING, RECEIVED, CLERK'S OFFICE, JANUARY 5, 2007
* * * * * PC #7 * * * * *
Page 27
UNIT-SPECIFIC CONDITION 2: CONDITIONS FOR BULK MATERIAL HANDLING OPERATIONS
2.1 Description of Emission Units
The affected units for the purpose of these unit-specific permit conditions are
operations that handle materials in bulk that are involved with the operation of
the power plant and have the potential for particulate matter emissions, including
coal, petroleum coke, coal tailings, limestone, and ash. Affected units include
receiving, transfer, handling, storage, processing or preparation (drying,
crushing, etc.) and loading operations for such materials.
2.2 Control Technology Determination
a. i. Emissions of particulate matter from affected units, other than
operations associated with material storage in building or associated
with storage piles, shall be controlled with enclosures and aspiration
to baghouses or other filtration devices designed to emit no more than
0.005 grains/dry standard cubic foot (gr/dscf). These devices shall be
operated in accordance with good air pollution control practice to
minimize emissions.
ii. There shall be no visible fugitive emissions, as defined by 40 CFR
60.671, from storage buildings.
iii. Storage piles shall be controlled by enclosure, material quality,
temporary covers and application of water or other dust suppressants so
as to minimize fugitive emissions to the extent practicable.
b. i. The only fuel burned in the limestone drying mills shall be natural
gas, as defined by 40 CFR 60.41a.
ii. Emissions from each limestone drying mill attributable to combustion of
fuel shall not exceed the following limits, except during startup and
shutdown. These limits shall apply as a 3-hour block average, with
compliance determined in accordance with Condition 2.8 and proper
operation.
A. NO
x
– 0.073 lb/million Btu.
B. CO – 0.20 lb/million Btu.
C. VOM – 0.02 lb/million Btu.
2.3 Applicable Federal Emission Standards
a. Affected units engaged in handling limestone shall comply with applicable
requirements of the NSPS for Nonmetallic Mineral Processing Plants, 40 CFR
60, Subpart OOO and related provisions of 40 CFR 60, Subpart A.
i. Pursuant to the NSPS, stack emissions of particulate matter are subject to
the following limitations:
A. The rate of emissions shall not exceed 0.05 gram/dscm (0.02
g/dscf) (40 CFR 60.672(a)(1))*
ELECTRONIC FILING, RECEIVED, CLERK'S OFFICE, JANUARY 5, 2007
* * * * * PC #7 * * * * *
Page 28
B. The opacity of emissions shall not exceed 7 percent. (40 CFR
60.672(a)(2))
ii. Pursuant to the NSPS, fugitive emissions of particulate matter are
subject to the following limitations:
A. The opacity of emissions from grinding mills, screens (except
truck dumping), storage bins, and enclosed truck or railcar
loading operations shall not exceed 10 percent. (40 CFR
60.672(b) and (d))*
B. The opacity of emissions from crushers shall not exceed 10
percent. (40 CFR 60.672(c))*
C. Truck dumping into any screening operation, feed hopper, or
crusher is exempt from the above standards. (40 CFR 60.672(d))*
b. Affected units engaged in handling coal shall comply with applicable
requirements of the NSPS for Coal Preparation Plants, 40 CFR 60, Subpart Y,
and related provisions of 40 CFR 60, Subpart A. Note: These NSPS are
applicable because coal will be processed at the plant by crushing.
Pursuant to the NSPS, the opacity of the exhaust from coal processing and
conveying equipment, coal storage systems (other than open storage piles),
and coal loading systems shall not exceed 20 percent.*
* Condition 2.2(a) establishes a more stringent requirement than this
standard.
c. At all times, the Permittee shall maintain and operate affected units that
are subject to NSPS, including associated air pollution control equipment, in
a manner consistent with good air pollution control practice for minimizing
emissions, pursuant to 40 CFR 60.11(d).
d. This permit reflects a determination by the Illinois EPA that the NSPS for
Calciners and Dryers in Mineral Industries, 40 CFR 60 Subpart UUU, does not
apply to the limestone drying systems because processing of limestone is not
addressed by these standards.
2.4 Applicable State Emission Standards
a. The emission of smoke or other particulate matter from affected units shall
not have an opacity greater than 30 percent, except as allowed by 35 IAC
212.124. Compliance with this limit shall be determined by 6-minute averages
of opacity measurements in accordance with USEPA Reference Method 9. [35 IAC
212.109 and 212.123(a)]
b. With respect to emissions of fugitive particulate matter, affected units
shall comply with 35 IAC 212.301, which provides that visible emissions of
fugitive particulate matter shall not be visible from any process, including
any material handling or storage activity, when looking generally toward the
zenith at a point beyond the property line of the source, except as provided
by 35 IAC 212.314.
ELECTRONIC FILING, RECEIVED, CLERK'S OFFICE, JANUARY 5, 2007
* * * * * PC #7 * * * * *
Page 29
c. Affected units shall comply with applicable emission standards for fugitive
particulate matter, as follow, which generally apply to the source because it
is located in Channahon Township, Will County.
i. Crushers, grinding mills, screening operations, conveyor transfer
points, conveyors, bagging operations, storage bins, and fine product
truck and railcar loading operations shall be sprayed with water or a
surfactant solution, utilize choke-feeding, or be treated by an
equivalent method of emission control [35 IAC 212.308]
ii. All unloading and transportation of materials collected by pollution
control equipment shall be enclosed or shall utilize spraying,
pelletizing, screw conveying or other equivalent methods [35 IAC
212.307].
2.5 Applicability of Other Regulations
a. This permit is issued based on the outdoor storage piles at the plant not
meeting the applicability thresholds of 35 IAC 212.304, so that the
provisions of 35 IAC 212.304, 212.305, and 212.306 are not applicable.
b. This permit is issued based on affected units readily complying with the
applicable particulate matter emission limit pursuant to 35 IAC 212.321,
which rule limits emissions based on the process weight rate of an unit and
allows a minimum emission rate emission of 0.55 lb/hour for any unit.
2.6 Operating Requirements
a. i. The plant shall be designed and operated to store bulk materials that
have the potential for particulate matter emissions in silos, bins, and
buildings, without storage of such material in outdoor piles except on
a temporary basis during breakdown or other disruption in the
capabilities of the enclosed storage facilities.
ii. The plant shall be designed and operated with enclosed conveyors for
transfer of coal and limestone from the material storage facility to
the boiler facility, and these materials shall only be transferred by
truck on a temporary basis during breakdown of the conveyor system.
b. i. The Permittee shall carry out control of fugitive particulate matter
emissions from affected units in accordance with a written operating
program describing the measures being implemented in accordance with
Conditions 2.2 and 2.4 to control emissions at each area of the plant
with the potential to generate significant quantities of such
emissions, which program shall be kept current.
A. This program shall include maps or diagrams indicating the location
of affected units with the potential for fugitive emissions,
accompanied the following information for each such unit: a general
description of the unit, its size (area or volume), the expected
level of activity, the nature and extent of enclosure, and a
description of installed air pollution control equipment.
B. This program shall include a detailed description of any
additional emission control technique (e.g., water or surfactant
spray) including: typical flow of water and additive
ELECTRONIC FILING, RECEIVED, CLERK'S OFFICE, JANUARY 5, 2007
* * * * * PC #7 * * * * *
Page 30
concentration; rate or normal frequency at which measures would
be implemented; circumstances in which the measure would not be
implemented e.g., adequate surface moisture on material; triggers
for additional control, e.g. observation of 10 percent opacity;
and calculated control efficiency.
C. This program shall also meet any further requirements of 35 IAC
212.309 and 212.310 for affected units subject to 35 IAC 212.307
or 212.308 (Condition 2.4).
ii. The Permittee shall submit copies of this operating program to the
Illinois EPA for review as follows:
A. A program for the construction of the plant shall be submitted
with 30 days of beginning actual construction of the plant.
B. The initial operating program for plant shall be submitted within
90 days of initial start up of the plant.
C. Significant amendments to the program by the Permittee shall be
submitted within 30 days.
iii. A revised operating program shall be submitted to the Illinois EPA for
review within 90 days of a request from the Illinois EPA for revision
to address observed deficiencies in control of fugitive emissions.
c. The Permittee shall conduct inspections of affected units on at least a
monthly basis to verify that the measures identified in the operating program
and other measures required to control emissions from affected units are
being properly implemented. When the plant begins to handle bulk materials
in the affected units, these inspections shall include observation of
buildings and structures in which affected units are located for the
occurrence of visible emissions.
d. i. This permit does not authorize operation of the affected units for
purposes that are unrelated to the operation of the power plant, such
as receiving and storing coal that is then shipped to another source.
ii. A. The only fuel used for affected units shall be natural gas.
B. The rated heat input capacity of affected units shall not exceed
36 million Btu/hour, total.
2.7 Emission Limitations
Emissions from affected units shall not exceed the limitations in Table II and III
and the limitations specified in the records required by Condition 2.11(a).
2.8 Emission Testing
a. i. A. Within 60 days after achieving the maximum production rate at
which a limestone drying mill or other affected emission unit
subject to NSPS will be operated but not later than 180 days
after initial startup of each such unit, the Permittee shall have
emissions tests conducted as follows for such unit below by an
approved testing service at its expense under conditions that are
representative of maximum emissions.
ELECTRONIC FILING, RECEIVED, CLERK'S OFFICE, JANUARY 5, 2007
* * * * * PC #7 * * * * *
Page 31
B. This period of time may be extended by the Illinois EPA upon
written request by the Permittee as needed to reasonably
accommodate unforeseen difficulties in the startup and testing of
an affected unit, provided that initial emissions testing
required by the NSPS has been completed for the unit and the test
report submitted to the Illinois EPA.
ii. In addition to the initial emission testing required above, the
Permittee shall perform emission tests as requested by the Illinois EPA
for an affected unit within 45 days of a written request by the
Illinois EPA or such later date agreed to by the Illinois EPA.
b. The following methods and procedures shall be used for emission testing
i. The following USEPA methods and procedures shall be used for
particulate matter and opacity measurements for the affected units
subject to 40 CFR Part 60, Subpart OOO, as specified in 40 CFR 60.675:
Particulate Matter
Method 5 or 17
Opacity
Method 9
ii. The following USEPA methods and procedures shall be used for
particulate matter and opacity measurements for the affected units
subject to 40 CFR 60, Subpart Y, as specified in 40 CFR 60.254:
Particulate Matter - Method 5, the sampling time and sample volume for
each run shall be at least 60 minutes and 30 dscf. Sampling shall
begin no less than 30 minutes after startup and shall terminate before
shutdown procedures begin.
Opacity - Method 9, opacity measurements shall be performed by a
certified observer.
iii. The following USEPA methods and procedures shall be used for testing
the combustion emissions of one randomly selected limestone mill:
Nitrogen Oxides
Method 19
Carbon Monoxide
Method 10
Volatile Organic Material Method 18 or
25A and 18
c. Test plan(s), test notifications, and test reports shall be submitted to the
Illinois EPA in accordance with General Condition 2. (Section 6, Condition 2)
2.9 Emission Monitoring
None
2.10 Operational Monitoring and Measurements
a. The Permittee shall install, operate and maintain systems to measure the
pressure drop across the baghouse associated with each limestone mill.
b. The Permittee shall maintain the records of the measurements made by these
systems and records of maintenance and operational activity associated with
the systems.
ELECTRONIC FILING, RECEIVED, CLERK'S OFFICE, JANUARY 5, 2007
* * * * * PC #7 * * * * *
Page 32
2.11 Recordkeeping
a. The Permittee shall maintain files, which shall be kept current, that
contain:
i. A. For the baghouses or other filter devices associated with
affected units, design specifications for the device (type of
device, maximum design exhaust flow (acfm or scfm), filter area,
type of filter cleaning, performance guarantee for particulate
exhaust loading in gr/scf, etc.), the manufacturer’s recommended
operating and maintenance procedures for the device, and design
specification for the filter material in each device (type of
material, surface treatment(s) applied to material, weight,
performance guarantee, warranty provisions, etc.).
B. In addition, for each baghouse associated with a limestone mill,
the normal range of pressure drop across the device and the
minimum and maximum safe pressure drop for the device, with
supporting documentation.
ii. For the burners in the affected limestone drying mills, the
manufacturer’s rated heat input and guarantees or design data for
emissions of NOx, CO and VOM.
iii. The designated particulate matter emission rate, in pounds/hour, from
each stack or vent associated with the affected units, other than those
units individually addressed by Table III. For each category of
affected unit (e.g., receiving and handling), the sum of these emission
rates and the hourly limitations for any units that are addressed
individually shall not exceed the hourly subtotal in Table III for the
category of affected unit. (See also Condition 2.
b. i. The Permittee shall keep records for the amount of each bulk material
received by or shipped from the plant (tons/month).
ii. The Permittee shall keep records for any incident in bulk materials
were deposited outside of a building, with detailed explanation and a
description of the practices used to minimize emissions.
c. For affected units that are subject to NSPS, the Permittee shall fulfill
applicable recordkeeping requirements of the NSPS, 40 CFR 60.676
d. The Permittee shall keep inspection and maintenance logs for each control
device associated with an affected unit.
e. The Permittee shall maintain records documenting implementation of the
fugitive emission operating program required by Condition 2.6, including:
i. Records for inspections to verify the implementation of continuous
control measures (that are to be in place whenever an affected unit is
in operation), including the date and time, the name of the responsible
party, identification of the affected unit(s) that were inspected, and
the observed condition of control measures;
ELECTRONIC FILING, RECEIVED, CLERK'S OFFICE, JANUARY 5, 2007
* * * * * PC #7 * * * * *
Page 33
ii. Records for the implementation of intermittent control measures, i.e.,
application of suppressants including identification of the affected
unit, identification of the suppressant, application rate, dates or
date and time of applications, and quantity of total suppressant
applied;
iii. Records for application of physical or chemical control agents other
than water including the name of the agent; target application
concentration, if diluted with water; target application rate; and
usage of the agent, gallons/month; and
iv. A log recording incidents when control measures were not present or
were not used for an affected unit when it was in operation, including
description, date, duration, and a statement of explanation.
f. The Permittee shall record any period during which an affected unit was in
operation when its baghouse was not in operation or was not operating
properly, as follows:
i. Each period when the pressure drop of a baghouse for a limestone drying
system, as measured pursuant to Condition 2.9, deviated outside the
levels set as good air pollution control practice (date, duration and
description of the event).
ii. Each period when a baghouse failed to operate properly, which records shall
include at least the information specified by General Condition 3 (Section 6,
Condition 3).
iii. Each period during which an affected unit deviated from the
requirements of this permit, including applicable emission limits,
which records shall include at least the information specified by
General Condition 3 (Section 6, Condition 3).
g. The Permittee shall keep records for all opacity observations made in
accordance with USEPA Method 9 for affected units that it conducts or that
are conducted on its behalf by individuals who are certified to make such
observations. For each occasion on which such observations are made, these
records shall include the identity of the observer, a description of the
various observations that were made, the observed opacity from individual
units, and copies of the raw data sheets for the observations.
h. The Permittee shall maintain the following records for the emissions of the
affected units:
i. Records of emissions of particulate matter based on operating data for
the unit(s) and appropriate emission factors, with supporting
documentation.
ii. Records of emissions of emissions of NO
x
, CO and VOM from affected units
drying limestone based on fuel usage, operating data and appropriate
emission factors, with supporting documentation.
ELECTRONIC FILING, RECEIVED, CLERK'S OFFICE, JANUARY 5, 2007
* * * * * PC #7 * * * * *
Page 34
2.12 Notifications
The Permittee shall notify the Illinois EPA within 30 days of deviations from
applicable emission standards or operating requirements that continue* for more
than 24 hours. These notifications shall include the information specified by
General Condition 5 (Section 6, Condition 5).
* For this purpose, time shall be measured from the start of a particular
event. The absence of a deviation for a short period shall not be considered
to end the event if the deviation resumes. In such circumstances, the event
shall be considered to continue until corrective actions are taken so that
the deviation ceases or the Permittee takes the affected unit out of service
for repairs.
2.13 Reporting
a. The Permittee shall submit quarterly reports to the Illinois EPA for all
deviations from emission standards, including standards for visible emissions
and opacity, and operating requirements set by this permit for affected
units. These notifications shall include the information specified by
General Condition 5 (Section 6, Condition 5)
b. These reports shall also address any deviations from applicable compliance
procedures established by this permit for affected units.
2.14 Operating Flexibility
The Permittee is authorized to construct and operate affected units that are
different from those described in the application as follows without obtaining
prior approval by the Illinois EPA. This condition does not affect the Permittee’s
obligation to comply with the applicable requirements for affected units:
a. This authorization only extends to changes that result from the detailed
design of the plant and any refinements to that design that occur during
construction and the initial operation of the plant.
b. With respect to air quality impacts, these changes shall generally act to
improve dispersion and reduce impacts, as emissions from individual units are
lowered, units are moved apart or away from the fence line, stack heights are
increased, and heights of nearby structures is reduced.
c. The Permittee shall notify the Illinois EPA prior to proceeding with any
changes. In this notification, the Permittee shall describe the proposed
changes and explain why the proposed changes will act to reduce impacts, with
detailed supporting documentation.
d. Upon written request by the Illinois EPA, the Permittee shall promptly have
dispersion modeling performed to demonstrate that the overall effect of the
changes is to reduce air quality impacts, so that impacts from affected units
remain at or below those predicted by the air quality analysis accompanying
the application.
ELECTRONIC FILING, RECEIVED, CLERK'S OFFICE, JANUARY 5, 2007
* * * * * PC #7 * * * * *
Page 35
UNIT-SPECIFIC CONDITION 3: CONDITIONS FOR COOLING TOWERS
3.1 Description of Emission Units
The affected units for the purpose of these unit-specific conditions are two
mechanical draft wet cooling towers associated with the steam cycle for each CFB
boiler. The cooling towers are sources of particulate matter because of mineral
material present in the water, which is emitted to the atmosphere due to water
droplets that escape from the cooling tower or completely evaporate. The emissions
of particulate matter are controlled by drift eliminators at the top of the towers,
which collect water droplets entrained in the air exhausted from the cooling
towers.
3.2 Control Technology Determination
The affected units shall be equipped, operated, and maintained with drift
eliminators designed to limit the loss of water droplets from the unit to not more
than 0.0005 percent of the circulating water flow.
3.2 Applicable Federal Emission Standards
None
3.4 Applicable State Emission Standards
Visible emission of fugitive particulate matter from the affected units shall
comply with the provisions of 35 IAC 212.301, which provides that visible emissions
of fugitive particulate matter shall not be visible from any process, including any
material handling or storage activity, when looking generally toward the zenith at
a point beyond the property line of the source, except as provided by 35 IAC
212.314.
3.5 Applicability of Other Regulations
None
3.6 Operating Requirements
a. Chromium-based water treatment chemicals, as defined in 40 CFR 63.401, shall
not be used in the affected units.
b. i. A. The Permittee shall equip the affected units with appropriate
features, such as steam reheat, to enable them to be operated
without a significant contribution to fogging and icing on
offsite roadways during periods when fogging or icing are present
in the area or weather conditions are conducive to fogging or
icing.
B. Notwithstanding the above, the Permittee need not include such
features in the affected units if it demonstrates by appropriate
analysis, as approved in writing by the Illinois EPA, that the
cooling towers will be sited and designed and can be operated
such that additional features are not needed to prevent a
significant contribution to fogging and icing on offsite
roadways.
ELECTRONIC FILING, RECEIVED, CLERK'S OFFICE, JANUARY 5, 2007
* * * * * PC #7 * * * * *
Page 36
ii. No later than 30 days after completion of the detailed design of the
affected units and at least 60 days before construction of the affected
units is begun, the Permittee shall submit a summary of the detailed
design to the Illinois EPA and either:
A. A detailed description of the physical features that will be
included in the affected units to satisfy Condition 3.6(b)(i)(A),
the practices that would be followed for such features, and a
demonstration that such features will be sufficient to prevent a
significant contribution to fogging and icing on offsite
roadways, for review and comment by the Illinois EPA; or
B. An analysis pursuant to Condition 3.6(b)(i)(B), including any
operational practices that would be followed for the affected
units to prevent a significant contribution to fogging and icing
on offsite roadways, for review and approval by the Illinois EPA.
c. The Permittee shall operate and maintain the affected units, including the
drift eliminators, in a manner consistent with good air pollution control
practice for minimizing emissions.
d. The Permittee shall operate and maintain the affected units in accordance
with written operating procedures, which procedures shall be kept current.
These procedures shall address the practices that will be followed as good
air pollution control practice and the actions that will be followed to
prevent a significant contribution to icing and fogging on offsite roadways.
3.7 Emission Limitations
The total annual emissions of particulate matter from the affected units shall not
exceed 8.4 tons/year, as determined by appropriate engineering calculations.
3.8 Emission Testing
None
3.9 Emission Monitoring
None
3.10 Operational Monitoring and Measurements
a. The Permittee shall measure the total dissolved solids content in the water
being circulated in the affected units on at least a monthly basis.
Measurements of the total dissolved solids content in the wastewater
discharge associated with the affected units, as required by a National
Pollution Discharge Elimination System permit, may be used to satisfy this
requirement if the effluent has not been diluted or otherwise treated in a
manner that would significantly reduce its total dissolved solids content.
b. Upon written request by the Illinois EPA, the Permittee shall promptly have
the water circulating in the affected units sampled and analyzed for the
presence of hexavalent chromium in accordance with the procedures of 40 CFR
63.404(a) and (b).
ELECTRONIC FILING, RECEIVED, CLERK'S OFFICE, JANUARY 5, 2007
* * * * * PC #7 * * * * *
Page 37
3.11 Records
a. The Permittee shall keep a file that contains:
i. The design loss specification for the drift eliminators installed in
each affected unit.
ii. The suppliers recommended procedures for inspection and maintenance of
the drift eliminators.
iii. The operating factors, if any, used to determine the amount of water
circulated in the affected units or the particulate matter emissions
from the affected units, with supporting documentation.
iv. Copies of the Material Safety Data Sheets or other comparable
information from the suppliers for the various water treatment
chemicals that are added to the water circulated in the affected units.
b. The Permittee shall keep the following operating records for the affected
units:
i. The amount of water circulated in the affected units, gallons/month.
As an alternative to direct data for water flow, these records may
contain other relevant operating data for the units (e.g., water flow
to the units) from which the amount of water circulated in the units
may be reasonably determined.
ii. Each occasion when the Permittee took action to prevent a significant
contribution to fogging or icing from the affected units, including the
date and duration, the action or actions that were taken, the weather
conditions that triggered such actions, and the weather conditions when
actions were terminated.
c. The Permittee shall keep inspection and maintenance logs for the drift
eliminators installed in each affected unit.
d. The Permittee shall maintain records for the particulate matter emissions of
the affected units based on the above records, the measurements required by
Condition 3.10(a), and appropriate USEPA emission estimation methodology and
emission factors, with supporting calculations.
3.12 Notifications
The Permittee shall notify the Illinois EPA within 30 days of deviations from
applicable requirements for an affected unit. These notifications shall include the
information specified by General Condition 4 (Section 6, Condition 4).
ELECTRONIC FILING, RECEIVED, CLERK'S OFFICE, JANUARY 5, 2007
* * * * * PC #7 * * * * *
Page 38
UNIT-SPECIFIC CONDITION 4: CONDITIONS FOR THE AUXILIARY BOILER
4.1 Description of Emission Unit
The affected unit for the purpose of these unit-specific conditions is the
auxiliary boiler for the plant, which is fired with natural gas. The auxiliary
boiler is used to produce low-pressure steam to maintain the plant when the coal-
fired boilers are not in operation and support the startup of the coal-fired
boilers.
4.2 List of Emission Units and Pollution Control Equipment
Emission
Unit
Description
Emission Control
Equipment
Boiler
Natural Gas-Fired Boiler, with Rated Heat Input
Capacity of no More Than 99 Million Btu/Hr
Low-NO
x
Burner
4.2 Control Technology Determination
a. The only fuel burned in the affected boiler shall be natural gas.
b. The emissions from the boiler shall not exceed the following limits except
during startup, shutdown and malfunction as addressed by Condition 1.2(c).
i. NO
x
- 0.08 lb/million Btu.
This limit shall apply as a 3-hour block average, with compliance
determined by emission testing in accordance with Condition 4.8 and
proper operation.
ii. CO - 0.1 lb/million Btu.
This limit shall apply as a 3-hour block average, with compliance
determined by emission testing in accordance with Condition 4.8 and
proper operation.
iii. VOM – 0.02 lb/million.
This limit shall apply as a 3-hour block average, with compliance
determined by emission testing in accordance with Condition 4.8 and
proper operation.
c. The Permittee shall use reasonable practices to minimize emissions during
startup, shutdown and malfunction of the affected boiler, including:
i. Operation of the boiler and associated air pollution control equipment
in accordance with written operating procedures that include startup,
shutdown and malfunction plan(s); and
ii. Inspection, maintenance and repair of the boiler and associated air
pollution control equipment in accordance with written maintenance
procedures.
ELECTRONIC FILING, RECEIVED, CLERK'S OFFICE, JANUARY 5, 2007
* * * * * PC #7 * * * * *
Page 39
4.3 Applicable Federal Emission Standards
a. The affected boiler is subject to a New Source Performance Standard (NSPS)
for Small Industrial-Commercial-Institutional Steam Generating Units, 40 CFR
60, Subpart Dc, and related provisions in Subpart A.
b. At all times, the Permittee shall maintain and operate the affected boiler,
including associated air pollution control equipment, in a manner consistent
with good air pollution control practice for minimizing emissions, pursuant
to 40 CFR 60.11(d).
c. This permit reflects a determination by the Illinois EPA that the affected
boiler is not subject to emission standards under the NSPS because the boiler
does not burn oil or solid fuel.
4.4 Applicable State Emission Standards
a. The emission of smoke or other particulate matter from the affected boiler
shall not have an opacity greater than 30 percent, except as allowed by 35
IAC 212.124. Compliance with this limit shall be determined by 6-minute
averages of opacity measurements in accordance with USEPA Reference Method 9.
[35 IAC 212.109 and 212.123(a)]
b. The emission of carbon monoxide (CO) into the atmosphere from the affected
boiler shall not exceed 200 ppm, corrected to 50 percent excess air. [35 IAC
216.121]
4.5 Applicability of Regulations of Concern
This permit is issued on the affected boiler not being an electrical generating
unit, so that provisions of the federal Acid Rain Program are not applicable to the
boiler.
4.6 Operating Requirements
a. The affected boiler shall only be fired with natural gas.
b. The rated heat input of the affected boiler shall not exceed 99 million
Btu/hour.
c. The affected boiler shall not operate for more than 2500 hours per year when
a CFB boiler is in operation. Compliance with this limit shall be determined
from a running total of 12 months of data.
4.7 Emission Limitations
Emissions of NO
x
, VOM, CO, PM and SO2 from the affected boiler shall not exceed 9.9,
2.5, 12.4, 1.2 and 0.7 tons/year, respectively. Compliance with these annual limits
shall be determined on a monthly basis from the sum of the data for the current
month plus the preceding 11 months.
4.8 Emission Testing
a. i. Within 60 days after achieving the maximum production rate at which the
affected boiler will be operated but not later than 180 days after
initial startup of the boiler, the Permittee shall have tests conducted
for opacity and emissions of NO
x
, CO and VOC as follows at its expense
by an approved testing service while the boiler is operating at maximum
operating load and other representative operating conditions.
ELECTRONIC FILING, RECEIVED, CLERK'S OFFICE, JANUARY 5, 2007
* * * * * PC #7 * * * * *
Page 40
ii. In addition to the emission testing required above, the Permittee shall
perform emission tests as requested by the Illinois EPA for the
affected boiler within 45 days of a written request by the Illinois EPA
or such later date agreed to by the Illinois EPA.
b. The following methods and procedures shall be used for testing, unless
otherwise specified or approved by the Illinois EPA.
Opacity
Method 9
Location of Sample Points Method 1
Gas Flow and Velocity
Method 2
Flue Gas Weight
Method 3 or 3A
Moisture
Method 4
Nitrogen Oxides
1
Method 7, 7E or 19 as specified in 40 CFR
60.48b
Carbon Monoxide
Method 10
Volatile Organic Compounds Method 25A and 18
c. Test plans, test notifications, and test reports shall be submitted to the
Illinois EPA in accordance with the General Condition 2 (Section 6,
Conditions 2)
4.9 Operational Monitoring and Measurements
None
4.10 Emission Monitoring
None
4.11 Recordkeeping
a. The Permittee shall keep a file that contains:
i. The rated heat input capacity of the affected boiler as provided by the
manufacturer or subsequently determined based on the demonstrated heat
input capacity of the boiler.
b. The Permittee shall maintain the following operating records for the affected
boiler:
i. An operating log or other record that among other matters identifies
each period when the boiler is operated.
ii. A summary of operating hours (hours/month and hours/year) for all
operation and for operation when a CFB boiler was operating.
iii. Natural gas usage on a monthly basis (million Btu or cubic feet).
c. The Permittee shall maintain a maintenance and repair log for the affected
boiler.
d. The Permittee shall keep records of the annual NO
x
, VOM, CO, PM and SO
2
emissions from the affected boiler, based on fuel consumption, operating
data, and applicable emission factors, with supporting calculations.
ELECTRONIC FILING, RECEIVED, CLERK'S OFFICE, JANUARY 5, 2007
* * * * * PC #7 * * * * *
Page 41
4.12 Notifications
The Permittee shall notify the Illinois EPA within 30 days of deviations from
applicable requirements. These notifications shall include the information
specified by General Condition 4 (Section 6, Condition 4).
4.13 Reporting
The Permittee shall fulfill applicable reporting requirements of the NSPS, 40 CFR
60.49b, for the affected boiler by sending the following notifications and reports
to the Illinois EPA:
a. The Permittee shall submit notification of the date of initial startup of the
boiler, as provided by 40 CFR 60.7. This notification shall include: (1) the
design heat input of the boiler, and (2) the annual capacity factor at which
the Permittee anticipates operating the boiler. [40 CFR 60.49c(a)]
4.14 Operational Flexibility/Anticipated Operating Scenarios
None
4.15 Compliance Procedures
Compliance with the emission limits in Condition 4.7 shall be based on the
operating records required by Condition 4.11 and appropriate emission factors.
a. The emission factors for NO
x
, CO, and VOM shall be based on the results of the
emission testing required by Condition 4.8.
b. The following emission factors may be used for PM and SO
2
when the affected
boiler operates properly. These are the emission factors for small natural
gas fired boilers from USEPA’s
Compilation of Air Pollutant Emission Factors
,
AP-42, October 1996.
Emission Factor
Pollutant
(lb/million ft
3
)
PM
3.0
SO
2
0.6
ELECTRONIC FILING, RECEIVED, CLERK'S OFFICE, JANUARY 5, 2007
* * * * * PC #7 * * * * *
Page 42
UNIT-SPECIFIC CONDITION 5: CONDITIONS FOR ROADWAYS AND OTHER OPEN AREAS
5.1 Description of Emission Units
The affected units for the purpose of these unit-specific conditions are roadways,
parking areas and open areas at the plant, which may be sources of fugitive
particulate matter due to vehicle traffic or wind blown dust.
5.2 Control Technology Determination
a. Good air pollution control practices shall be implemented to minimize and
significantly reduce nuisance dust from affected units. After construction
of the plant is complete, these practices shall provide for pavement on all
regularly traveled roads and treatment (flushing, vacuuming, dust suppressant
application, etc.) of paved and unpaved roads and areas that are routinely
subject to vehicle traffic for very effective and effective control of dust,
respectively (nominal 90 percent for paved roads and areas and 80 percent
control for unpaved roads and areas).
b. For this purpose, roads that serve the main office, or are used on a daily
basis by operating and maintenance personnel for the plant or by security
personnel in the course of their typical duties, or experience heavy use
during regularly occurring maintenance of the plant during the course of a
year, shall all be considered subject to regular travel and required to be
paved. Regularly traveled roads shall be considered to be subject to routine
vehicle traffic except as they are used primarily for periodic maintenance
and are currently inactive or as traffic has been temporarily blocked off.
Other roads shall be considered to be subject to routine travel if activities
are occurring such that the roads are experiencing significant vehicle
traffic.
5.3 Applicable Federal Emission Standards
None
5.4 Applicable State Emission Standards
a. Affected units shall comply with 35 IAC 212.301, which provides that visible
emissions of fugitive particulate matter shall not be visible from any
process, including any material handling or storage activity, when looking
generally toward the zenith at a point beyond the property line of the
source, except as provided by 35 IAC 212.314.
b. The handling of material collected from affected unit by sweeping or
vacuuming trucks shall comply with 35 IAC 212.307, which provides that all
unloading and transportation of materials collected by pollution control
equipment shall be enclosed or shall utilize spraying, pelletizing, screw
conveying or other equivalent methods [35 IAC 212.307].
5.5 Applicability of Other Regulations
This permit reflects a determination by the Illinois EPA that the source is a power
plant or electrical generating operation so that the provisions of 35 IAC 212.306
are not applicable to roads and parking areas at the source. [35 IAC 212.306]
ELECTRONIC FILING, RECEIVED, CLERK'S OFFICE, JANUARY 5, 2007
* * * * * PC #7 * * * * *
Page 43
5.6 Operating Requirements
a. i. The Permittee shall carry out control of fugitive particulate matter
emissions from affected units in accordance with a written operating
program describing the measures being implemented in accordance with
Conditions 5.2 and 5.4 to control emissions at each unit with the
potential to generate significant quantities of such emissions, which
program shall be kept current.
A. This program shall include maps or diagrams indicating the
location of affected units with the potential to generate
significant quantities of fugitive particulate matter, with
description of the unit (length, width, surface material, etc.),
the volume and nature of expected vehicle traffic or other
activity on such unit, and an identification of any roadways that
are not considered regularly traveled, with justification.
B. This program shall include a detailed description of the
emissions control technique (e.g., vacuum truck, water flushing,
or sweeping) for the affected unit, including: typical
application rate; type and concentration of additives; normal
frequency with which measures would be implemented;
circumstances, in which the measure would not be implemented,
e.g., recent precipitation; triggers for additional control, e.g.
observation of 10 percent opacity; and calculated control
efficiency for particulate matter emissions.
ii. The Permittee shall submit copies of this operating program to the
Illinois EPA for review as follows:
A. A program addressing the construction of the plant shall be
submitted within 30 days of beginning actual construction of the
plant.
B. A program addressing the operation of the plant shall be
submitted within 90 days of initial start up of the plant.
C. Significant amendments to the program by the Permittee shall be
submitted within 30 days.
iii. A revised operating program shall be submitted to the Illinois EPA for
review within 90 days of a request from the Illinois EPA for revision
to address observed deficiencies in control of fugitive particulate
emissions.
b. The Permittee shall conduct inspections of affected units on at least a
weekly basis during construction of the plant and on a monthly basis
thereafter to verify that the measures identified in the operating program
and other measures required to control emissions from affected units are
being properly implemented.
5.7 Emission Limitations
The total annual emissions of particulate matter from the affected units shall not
exceed 5.5 tons/year, as determined by appropriate engineering calculations.
ELECTRONIC FILING, RECEIVED, CLERK'S OFFICE, JANUARY 5, 2007
* * * * * PC #7 * * * * *
Page 44
5.8 Emission Testing
None
5.9 Operational Monitoring and Measurements
None
5.10 Emission Monitoring
None
5.11 Records
a. The Permittee shall keep a file that contains:
i. The operating factors, if any, used to determine the amount of activity
associated with the affected units or the particulate matter emissions
from the affected units, with supporting documentation.
b. The Permittee shall maintain records documenting implementation of the
operating program required by Condition 5.6, including:
i. For each treatment of an affected unit or units, the name and location
of the affected unit(s), the date and time, and the identification of
the truck(s) or treatment equipment used;
ii. For each application of water or chemical solution by truck:
application rate of water or suppressant, frequency of each
application, width of each application, total quantity of water or
chemical used for each application and, for each application of
chemical solution, the concentration and identity of the chemical;
iii. For application of physical or chemical control agents: the name of the
agent, application rate and frequency, and total quantity of agent and,
if diluted, percent of concentration, used each day; and
iv. A log recording incidents when control measures were not used and
incidents when additional control measures were used due to particular
activities, including description, date, a statement of explanation,
and expected duration of the such circumstances.
c. The Permittee shall record any period during which an affected unit was not
properly controlled as required by this permit, which records shall include
at least the information specified by General Condition 3 (Section 6,
Condition 3) and an estimate of the additional emissions of particulate
matter that resulted, if any, with supporting calculations.
d. The Permittee shall maintain records for the particulate matter emissions of
the affected units based on plant operating data, the above records for the
affected unit including data for implementation of the operating program, and
appropriate USEPA emission estimation methodology and emission factors, with
supporting calculations.
ELECTRONIC FILING, RECEIVED, CLERK'S OFFICE, JANUARY 5, 2007
* * * * * PC #7 * * * * *
Page 45
5.12 Notifications
The Permittee shall notify the Illinois EPA within 30 days of deviations from
applicable requirements for affected units that are not addressed by the regular
reporting required below. These notifications shall include the information
specified by General Condition 4 (Section 6, Condition 4).
5.13 Reporting
The Permittee shall submit a quarterly report to the Illinois EPA for affected
units stating the following: the dates any necessary control measures were not
implemented, a listing of those control measures, the reasons that the control
measures were not implemented, and any corrective actions taken. This information
includes, but is not limited to, those dates when controls were not applied based
on a belief that application of such control measures would have been unreasonable
given prevailing atmospheric conditions. This report shall be submitted to the
Illinois EPA no later than 45 calendar days from the end of each calendar quarter.
ELECTRONIC FILING, RECEIVED, CLERK'S OFFICE, JANUARY 5, 2007
* * * * * PC #7 * * * * *
Page 46
SECTION 5: TRADING PROGRAM CONDITIONS
TRADING PROGRAM CONDITION 1: ACID RAIN PROGRAM REQUIREMENTS
a. Applicability
Under Title IV of the Clean Air Act, Acid Deposition Control, this plant or source
is an affected source and the following emission units at the source are affected
units for acid deposition:
Circulating Fluidized Bed Boilers 1 and 2
Note: Title IV of the Clean Air Act, and other laws and regulations promulgated
thereunder, establish requirements for affected sources related to control of
emissions of pollutants that contribute to acid rain. For purposes of this
permit, these requirements are referred to as Title IV provisions.
b. Applicable Emission Requirements
The owners and operators of the source shall not violate applicable Title IV
provisions. In particular, SO
2
emissions of the affected units shall not exceed any
allowances that the source lawfully holds under Title IV provisions.
[Environmental Protection Act, Sections 39.5(7)(g) and (17)(l)]
Note: Affected sources must hold SO
2
allowances to account for the SO
2
emissions
from affected units at the source that are subject to Title IV provisions.
Each allowance is a limited authorization to emit up to one ton of SO
2
emissions during or after a specified calendar year. The possession of
allowances does not authorize exceedances of applicable emission standards or
violations of ambient air quality standards.
c. Monitoring, Recordkeeping and Reporting
The owners and operators of the source and, to the extent applicable, their
designated representative, shall comply with applicable requirements for
monitoring, recordkeeping and reporting specified by Title IV provisions, including
40 CFR Part 75. [Environmental Protection Act, Sections 39.5(7)(b) and 17(m)]
Note: As already addressed in Unit-Specific Condition 1, the following emission
determination methods would be used for the affected units at this source.
NO
x
:
Continuous emissions monitoring (40 CFR 75.12)
SO
2
:
Continuous emissions monitoring (40 CFR 75.11)
Opacity: Continuous emission monitoring (40 CFR 75.14)
O
2
/CO
2
:
Continuous monitoring for oxygen or carbon dioxide (40 CFR 75.13)
d. Acid Rain Permit
The owners and operators of the source shall comply with the terms and conditions
of the source’s Acid Rain permit. [Environmental Protection Act, Section
39.5(17)(l)]
Note: The source is subject to an Acid Rain permit, which was issued pursuant to
Title IV provisions, including Section 39.5(17) of the Act. Affected sources
must be operated in compliance with their Acid Rain permits. The initial
Acid Rain permit is included as an attachment to this permit. Revisions and
ELECTRONIC FILING, RECEIVED, CLERK'S OFFICE, JANUARY 5, 2007
* * * * * PC #7 * * * * *
Page 47
modifications of this Acid Rain permit, including administrative amendments
and automatic amendments (pursuant to Sections 408(b) and 403(d) of the CAA
or regulations thereunder) are governed by Title IV provisions, as provided
by Section 39.5(13)(e) of the Environmental Protection Act, and revision or
renewal of the Acid Rain permit may be handled separately from this permit.
e. Coordination with Other Requirements
i. This permit does not contain any conditions that are intended to interfere
with or modify the requirements of Title IV provisions. In particular, this
permit does not restrict the flexibility under Title IV provisions of the
owners and operators of this source to amend their Acid Rain compliance plan.
[Environmental Protection Act, Section 39.5(17)(h)]
ii. Where another applicable requirement of this permit is more stringent than an
applicable requirement of Title IV provisions, both requirements are
enforceable and the owners and operators of the source shall comply with both
requirements. [Environmental Protection Act, Section 39.5(7)(h)]
TRADING PROGRAM CONDITION 2: EMISSIONS REDUCTION MARKET SYSTEM (ERMS)
a. Description of ERMS
The ERMS is a “cap and trade” market system for major stationary sources located in
the Chicago ozone nonattainment area. It is designed to reduce VOM emissions from
stationary sources to contribute to reasonable further progress toward attainment,
as required by Section 182(c) of the CAA.
The ERMS addresses VOM emissions during a seasonal allotment period from May 1
through September 30. Participating sources must hold “allotment trading units”
(ATUs) for their actual seasonal VOM emissions. Each year participating sources
are issued ATUs based on allotments set in the sources’ CAAPP permits. These
allotments are established from historical VOM emissions or “baseline emissions”
lowered to provide the emissions reductions from stationary sources required for
reasonable further progress.
By December 31 of each year, the end of the reconciliation period following the
seasonal allotment period, each source shall have sufficient ATUs in its
transaction account to cover its actual VOM emissions during the preceding season.
A transaction account’s balance as of December 31 will include any valid ATU
transfer agreements entered into as of December 31 of the given year, provided such
agreements are promptly submitted to the Illinois EPA for entry into the
transaction account database. The Illinois EPA will then retire ATUs in sources’
transaction accounts in amounts equivalent to their seasonal emissions. When a
source does not appear to have sufficient ATUs in its transaction account, the
Illinois EPA will issue a notice to the source to begin the process for Emissions
Excursion Compensation.
In addition to receiving ATUs pursuant to their allotments, participating sources
may also obtain ATUs from the market, including ATUs bought from other
participating sources and general participants in the ERMS that hold ATUs (35 IAC
205.630). During the reconciliation period, sources may also buy ATUs from a
secondary reserve of ATUs managed by the Illinois EPA, the “Alternative Compliance
Market Account” (ACMA) (35 IAC 205.710). Sources may also transfer or sell the
ATUs that they hold to other participants (35 IAC 205.630).
ELECTRONIC FILING, RECEIVED, CLERK'S OFFICE, JANUARY 5, 2007
* * * * * PC #7 * * * * *
Page 48
b. Applicability
This plant or source is considered a “new participating source” for purposes of the
ERMS, 35 IAC Part 205.
c. Obligation to Hold Allotment Trading Units (ATUs)
In accordance with 35 IAC 205.150(d)(1), at the end of the reconciliation period
each year, once the source commences operation, the source shall hold ATUs in an
amount not less than 1.3 times its VOM emissions during the preceding seasonal
allotment period (May 1 through September 30), determined in accordance with
applicable provisions in Section 3 of this permit or the source’s CAAPP permit
,
not
including VOM emissions from the following, or the source shall be subject to
“emissions excursion compensation,” as described in Condition 2(e):
i. VOM emissions from insignificant emission units, if any, as identified in the
source’s CAAPP permit, in accordance with 35 IAC 205.220;
ii. Excess VOM emissions associated with startup, malfunction, or breakdown of an
emission unit as authorized by 35 IAC 201.262, if any, in accordance with 35
IAC 205.225;
iii. Excess VOM emissions that are a consequence of an emergency at the source as
approved by the Illinois EPA, in accordance with 35 IAC 205.750; and
iv. Excess VOM emissions to the extent allowed by a Variance, Consent Order, or
Compliance Schedule, in accordance with 35 IAC 205.320(e)(3).
d. Market Transactions
i. The source shall apply to the Illinois EPA for and obtain authorization for a
Transaction Account prior to conducting any market transactions, as specified
at 35 IAC 205.610(a).
ii. The source shall promptly submit to the Illinois EPA any revisions to the
information submitted for its Transaction Account, pursuant to 35 IAC
205.610(b).
iii. The source shall have at least one account officer designated for its
Transaction Account, pursuant to 35 IAC 205.620(a).
iv. Any transfer of ATUs to or from the source from another source or general
participant must be authorized by a qualified Account Officer designated by
the source and approved by the Illinois EPA, in accordance with 35 IAC
205.620, and the transfer must be submitted to the Illinois EPA for entry
into the Transaction Account database.
e. Emissions Excursion Compensation
Pursuant to 35 IAC 205.720, if the source fails to hold ATUs in accordance with
Condition 2(c), it shall provide emissions excursion compensation in accordance
with the following:
i. Upon receipt of an Excursion Compensation Notice issued by the Illinois EPA,
the source shall purchase ATUs from the ACMA in the amount specified by the
notice, as follows:
ELECTRONIC FILING, RECEIVED, CLERK'S OFFICE, JANUARY 5, 2007
* * * * * PC #7 * * * * *
Page 49
A. The purchase of ATUs shall be in an amount equivalent to 1.2 times the
emissions excursion; or
B. If the source had an emissions excursion for the seasonal allotment
period immediately before the period for the present emissions
excursion, the source shall purchase ATUs in an amount equivalent to
1.5 times the emissions excursion.
ii. If requested in accordance with Condition 2(e)(iii) below or in the event
that the ACMA balance is not adequate to cover the total emissions excursion
amount, the Illinois EPA will deduct ATUs equivalent to the specified amount
or any remaining portion thereof from the ATUs issued to the source for the
next seasonal allotment period.
iii. Pursuant to 35 IAC 205.720(c), within 15 days after receipt of an Excursion
Compensation Notice, the owner or operator may request that ATUs equivalent
to the amount specified be deducted from the source’s next seasonal allotment
by the Illinois EPA, rather than purchased from the ACMA.
f. Quantification of Seasonal VOM Emissions
i. The methods and procedures specified in Sections 4 of this permit (Unit-
Specific Conditions) or the CAAPP permit for the source shall be used for
determining seasonal VOM emissions for purposes of the ERMS.
ii. The Permittee shall report emergency conditions at the source to the Illinois
EPA, in accordance with 35 IAC 205.750, if the Permittee intends to deduct
VOM emissions that are in excess of a technology-based VOM emission rate
normally achieved and are attributable to the emergency from the source’s
seasonal VOM emissions for purposes of the ERMS. These reports shall include
the information specified by 35 IAC 205.750(a), and shall be submitted in
accordance with the following:
A. An initial emergency conditions report within two days after the time
when such excess emissions occurred due to the emergency; and
B. A final emergency conditions report, if needed to supplement the
initial report, within 10 days after the conclusion of the emergency.
g. Annual Account Reporting
i. For each year in which the source is operational, the Permittee shall submit,
as a component of its Annual Emissions Report, seasonal VOM emissions
information to the Illinois EPA for the seasonal allotment period. This
report shall include the following information [35 IAC 205.300]:
A. Actual seasonal emissions of VOM from the source;
B. A description of the methods and practices used to determine VOM
emissions, as required by this permit, including any supporting
documentation and calculations;
C. A detailed description of any monitoring methods that differ from the
methods specified in this permit, as provided in 35 IAC 205.337;
ELECTRONIC FILING, RECEIVED, CLERK'S OFFICE, JANUARY 5, 2007
* * * * * PC #7 * * * * *
Page 50
D. If the source has experienced an emergency, as provided in 35 IAC
205.750, the report shall reference the associated emergency conditions
report that has been approved by the Illinois EPA;
ii. This report shall be submitted by October 31 of each year, for the preceding
seasonal allotment period.
h. Allotment of ATUs to the Source
i. As a new participating source, the source will not receive allotments of ATUs
from the State of Illinois.
ii. A. If the source enters into a multiple season transfer agreement with
another participating source or a general participant in the ERMS, ATUs
will be issued to the source's Transaction Account by the Illinois EPA
annually for the duration of such agreement. These ATUs will be valid
for the seasonal allotment period for which they are issued and, if not
retired for this period, the next seasonal allotment period.
B. Notwithstanding the above, part or all of the above ATUs will not be
issued to the source in circumstances as set forth in 35 IAC Part 205,
including:
1. Transfer of ATUs by the source to another participant or the
ACMA, in accordance with 35 IAC 205.630;
2. Deduction of ATUs as a consequence of emissions excursion
compensation, in accordance with 35 IAC 205.720.
i. Recordkeeping for ERMS
i. The Permittee shall maintain the following records related to actual VOM
emissions of the source during the seasonal allotment period:
A. Records of operating data and other information for each individual
emission unit or group of related emission units at the source, as
specified in Section 4 of this permit and in the source’s CAAPP permit,
as appropriate, to determine actual VOM emissions during the seasonal
allotment period;
B. Records of the VOM emissions, in tons, during the seasonal allotment
period, with supporting calculations, for each individual emission unit
or group of related emission units at the source, determined in
accordance with the procedures specified in Section 4 of this permit
and in the source’s CAAPP permit; and
C. Total VOM emissions from the source, in tons, during each seasonal
allotment period, which shall be compiled by October 31, of each year.
ii. The Permittee shall maintain copies of the following documents as its
Compliance Master File for purposes of the ERMS [35 IAC 205.335 and
205.700(a)]:
A. Seasonal component of the Annual Emissions Report;
ELECTRONIC FILING, RECEIVED, CLERK'S OFFICE, JANUARY 5, 2007
* * * * * PC #7 * * * * *
Page 51
B. Information on actual VOM emissions, as specified in detail in Section
4 of this permit and in the source’s CAAPP permits; and
C. Any transfer agreements for the purchase or sale of ATUs and other
documentation associated with the transfer of ATUs.
TRADING PROGRAM CONDITION 3: NO
x
TRADING PROGRAM
a. Description of NO
x
Trading Program
The NO
x
Trading Program is a regional “cap and trade” market system for large
sources of NO
x
emissions in the eastern United States, including Illinois. It is
designed to reduce and maintain NO
x
emissions from the emission units covered by the
program within a budget to help contribute to attainment and maintenance of the
ozone ambient air quality standard in the multi-state region covered by the
program, as required by Section 110 of the Clean Air Act. The NO
x
Trading Program
applies in addition to other applicable requirements for NO
x
emissions and in no way
relaxes these other requirements.
Electrical generating units (EGU) that are subject to the NO
x
Trading Program are
referred to as “budget EGU.” Sources that have one or more EGU or other units
subject to the NO
x
Trading Program are referred to as budget sources.
The NO
x
Trading Program controls NO
x
emissions from budget EGU and other budget
units during a seasonal control period from May 1 through September 30 of each
year, when weather conditions are conducive to formation of ozone in the ambient
air. (In 2004, the first year that the NO
x
Trading Program is in effect, the
control period will be May 31 through September 30.) By November 30 of each year,
the allowance transfer deadline, each budget source must hold “NO
x
allowances” for
the actual NO
x
emissions of its budget units during the preceding control period.
The USEPA will then retire NO
x
allowances in the source’s accounts in amounts
equivalent to its seasonal emissions. If a source does not have sufficient
allowances in its accounts, USEPA would subtract allowances from the source’s
future allocation for the next control period and impose other penalties as
appropriate. Stringent monitoring procedures developed by USEPA apply to budget
units to assure that NO
x
emissions are accurately determined.
The number of NO
x
allowances available for budget sources is set by the overall
budget for NO
x
emissions established by USEPA. This budget requires a substantial
reduction in NO
x
emissions from historical levels as necessary to meet air quality
goals. In Illinois, existing budget sources initially receive their allocation or
share of the NO
x
allowances budgeted for EGU in an amount determined by rule [35 IAC
Part 217, Appendix F]. Between 2007 and 2011, the allocation mechanism for
existing EGU gradually shifts to one based on the actual utilization of EGU in
preceding control periods. New budget EGU, for which limited utilization data may
be available, may obtain NO
x
allowances from the new source set-aside (NSSA), a
portion of the overall budget reserved for new EGU.
In addition to directly receiving or purchasing NO
x
allowances as described above,
budget sources may transfer NO
x
allowances from one of their units to another. They
may also purchase allowances in the marketplace from other sources that are willing
to sell some of the allowances that they have received. Each budget source must
designate an account representative to handle all its allowance transactions. The
USEPA, in a central national system, will maintain allowance accounts and record
transfer of allowances among accounts.
ELECTRONIC FILING, RECEIVED, CLERK'S OFFICE, JANUARY 5, 2007
* * * * * PC #7 * * * * *
Page 52
The ability of sources to transfer allowances will serve to minimize the costs of
reducing NO
x
emissions from budget units to comply with the overall NO
x
budget. In
particular, the NO
x
emissions of budget units that may be most economically
controlled will be targeted by sources for further control of emissions. This will
result in a surplus of NO
x
allowances from those units that can be transferred to
other units at which it is more difficult to control NO
x
emissions. Experience with
reduction of SO
2
emissions under the federal Acid Rain program has shown that this
type of trading program not only achieves regional emission reductions in a more
cost-effective manner but also results in greater overall reductions than
application of traditional emission standards to individual emission units.
The USEPA developed the plan for the NO
x
Trading Program with assistance from
affected states. Illinois’ rules for the NO
x
Trading Program for EGU are located in
35 IAC Part 217, Subpart W and have been approved by the USEPA. These rules
provide for interstate trading, as mandated by Section 9.9 of the Act.
Accordingly, these rules refer to and rely upon federal rules at 40 CFR Part 96,
which have been developed by USEPA for certain aspects of the NO
x
Trading Program,
and which an individual state must follow to allow for interstate trading of NO
x
allowances.
Note: This narrative description of the NO
x
Trading Program is for informational
purposes only and is not enforceable.
b. Applicability
The following emission units at this source are budget EGU for purposes of the NO
x
Trading Program. Accordingly, this source is a budget source and the Permittee is
the owner or operator of a budget source and budget EGU. In this condition, these
emission units are addressed as budget EGU.
Boiler 1
Boiler 2
c. General Provisions of the NO
x
Trading Program
i. This source and the budget EGU at this source shall comply with all
applicable requirements of Illinois’ NO
x
Trading Program, i.e., 35 IAC Part
217, Subpart W, and 40 CFR Part 96 (excluding 40 CFR 96.4(b) and 96.55(c),
and excluding 40 CFR 96, Subparts C, E and I), pursuant to 35 IAC 217.756(a)
and 217.756(f)(2).
ii. Any provision of the NO
x
Trading Program that applies to a budget source
(including any provision applicable to the account representative of a budget
source) shall also apply to the owner or operator of such budget sources and
to the owner and operator of each budget EGU at the source, pursuant to 35
IAC 217.756(f)(3).
iii. Any provision of the NO
x
Trading Program that applies to a budget EGU
(including any provision applicable to the account representative of a budget
EGU) shall also apply to the owner and operator of such budget EGU. Except
with regard to requirements applicable to budget EGUs with a common stack
under 40 CFR 96, Subpart H, the owner and operator and the account
representative of one budget EGU shall not be liable for any violation by any
other budget EGU of which they are not an owner or operator or the account
representative, pursuant to 35 IAC 217.756(f)(4).
ELECTRONIC FILING, RECEIVED, CLERK'S OFFICE, JANUARY 5, 2007
* * * * * PC #7 * * * * *
Page 53
d. Requirements for NO
x
Allowances
i. By November 30 of each year, the allowance transfer deadline, the account
representative of each budget EGU at this source shall hold allowances
available for compliance deduction under 40 CFR 96.54 in the budget EGU’s
compliance account or the source’s overdraft account in an amount that shall
not be less than the budget EGU’s total tons of NO
x
emissions for the
preceding control period, rounded to the nearest whole ton, as determined in
accordance with 40 CFR 96, Subpart H, plus any number necessary to account
for actual utilization (e.g., for testing, start-up, malfunction, and shut
down under 40 CFR 96.42(e) for the control period, pursuant to 35 IAC
217.756(d)(1). For purposes of this requirement, an allowance may not be
utilized for a control period in a year prior to the year for which the
allowance is allocated, pursuant to 35 IAC 217.756(d)(5).
ii. The account representative of a budget EGU that has excess emissions in any
control period, i.e., NO
x
emissions in excess of the number of NO
x
allowances
held as provided above, shall surrender the allowances as required for
deduction under 40 CFR 96.54(d)(1), pursuant to 35 IAC 217.756(f)(5). In
addition, the owner or operator of a budget EGU that has excess emissions
shall pay any fine, penalty, or assessment, or comply with any other remedy
imposed under 40 CFR 96.54(d)(3) and the Act, pursuant to 35 IAC
217.756(f)(6). Each ton of NO
x
emitted in excess of the number of NO
x
allowances held as provided above for each budget EGU for each control period
shall constitute a separate violation of 35 IAC Part 217 and the Act,
pursuant to 35 IAC 217.756(d)(2).
iii. An allowance allocated by the Illinois EPA or USEPA under the NO
x
Trading
Program is a limited authorization to emit one ton of NO
x
in accordance with
the NO
x
Trading Program. As explained by 35 IAC 217.756(d)(6), no provision of
the NO
x
Trading Program, the budget permit application, the budget permit, or a
retired unit exemption under 40 CFR 96.5 and no provision of law shall be
construed to limit the authority of the United States or the State of Illinois
to terminate or limit this authorization. As further explained by 35 IAC
217.765(d)(7), an allowance allocated by the Illinois EPA or USEPA under the
NO
x
Trading Program does not constitute a property right. As provided by 35
IAC 217.756(c)(4), allowances shall be held, deducted from, or transferred
among allowance accounts in accordance with 35 IAC Part 217, Subpart W, and 40
CFR 96, Subparts F and G.
e. Monitoring Requirements for Budget EGU
i. The Permittee shall comply with the monitoring requirements of 40 CFR Part
96, Subpart H, for each budget EGU and the compliance of each budget EGU with
the emission limitation under Condition 3(d)(i) shall be determined by the
emission measurements recorded and reported in accordance with 40 CFR 96,
Subpart H, pursuant to 35 IAC 217.756(c)(1), (c)(2) and (d)(3).
ii. The account representative for the source and each budget EGU at the source
shall comply with those sections of the monitoring requirements of 40 CFR 96,
Subpart H, applicable to an account representative, pursuant to 35 IAC
217.756(c)(1) and (d)(3).
ELECTRONIC FILING, RECEIVED, CLERK'S OFFICE, JANUARY 5, 2007
* * * * * PC #7 * * * * *
Page 54
f. Recordkeeping Requirements for Budget EGU
Unless otherwise provided below, the Permittee shall keep on site at the source
each of the following documents for a period of at least 5 years from the date the
document is created. This 5-year period may be extended for cause at any time
prior to the end of the 5 years, in writing by the Illinois EPA or the USEPA.
i. The account certificate of representation of the account representative for
the source and each budget EGU at the source and all documents that
demonstrate the truth of the statements in account certificate of
representation, in accordance with 40 CFR 96.13, as provided by 35 IAC
217.756(e)(1)(A). These certificates and documents must be retained on site
at the source for at least 5-years after they are superseded because of the
submission of a new account certificate of representation changing the
account representative.
ii. All emissions monitoring information, in accordance with 40 CFR 96, Subpart
H, (provided that to the extent that 40 CFR 96, Subpart H, provides for a 3-
year period for retaining records, the 3-year period shall apply,) pursuant
to 35 IAC 217.756(e)(1)(B).
iii. Copies of all reports, compliance certifications, and other submissions and
all records made or required under the NO
x
Trading Program or documents
necessary to demonstrate compliance with requirements of the NO
x
Trading
Program, pursuant to 35 IAC 217.756(e)(1)(C).
iv. Copies of all documents used to complete a budget permit application and any
other submission under the NO
x
Trading Program, pursuant to 35 IAC
217.756(e)(1)(D).
g. Reporting Requirements for Budget EGU
i. The account representative for this source and each budget EGU at this source
shall submit to the Illinois EPA and USEPA the reports and compliance
certifications required under the NO
x
Trading Program, including those under
40 CFR 96, Subparts D and H and 35 IAC 217.774, pursuant to 35 IAC
217.756(e)(2).
ii. These submittals need only be signed by the designated representative, who
may serve in place of the responsible official for this purpose as provided
by the Section 39.5(1) of the Act, and submittals to the Illinois EPA need
only be made to the Illinois EPA, Bureau of Air, Compliance and Enforcement
Section.
h. Allocation of NO
x
Allowances to Budget EGU
i. For the first four control periods that a budget EGU identified in Condition
3(b) operates, it will not be entitled to direct allocations of NO
x
allowances
because the EGU will be considered a “new” budget EGU, as defined in 35 IAC
217.768(a)(1).
ii. A.
Thereafter, the budget EGU will cease to be “new” budget EGU and the
source will be entitled to an allocation of NO
x
allowances for the
budget EGU as provided in 35 IAC 217.764. For example, for 2010, the
allocation of NO
x
allowances would be governed by 35 IAC 217.764(e)(2)
and (b)(4).
ELECTRONIC FILING, RECEIVED, CLERK'S OFFICE, JANUARY 5, 2007
* * * * * PC #7 * * * * *
Page 55
B.
In accordance with 35 IAC 217.762, the theoretical number of NO
x
allowances for these budget EGU, calculated as the product of the
applicable NO
x
emissions rate and heat input as follows, shall be the
basis for determining the allocation of NO
x
allowances to these EGU:
1. As provided by 35 IAC 217.762(a)(2), the applicable NO
x
emission
rates for these EGU is 0.010 lb/million Btu or such lower limit
as set pursuant to Unit-Specific Condition 1.15. This is the
permitted emission rate for these EGU as contained in Unit-
Specific Condition 1.2(b)(iii). The permitted NOx emission rate
is the applicable rate because it is between 0.15 lb/million Btu
and 0.055 lb/million Btu, as provided by 35 IAC 217.762(a)(2).
2. The applicable heat input (million Btu/control period) shall be
the average of the two highest heat inputs from the control
periods four to six years prior to the year for which the
allocation is being made, as provided by 35 IAC 217.762(b)(1).
Note: If the start of the NO
x
Trading program is shifted because
of a Court Decision, the years defining the different
control periods would be considered to be adjusted
accordingly, as provided by the Board note following 35
IAC 217.764.
i. Eligibility for NO
x
Allowances from the New Source Set-Aside (NSSA)
The Permittee is eligible to obtain NO
x
allowances for the budget EGU identified in
Condition 3(b) from the NSSA, as provided by 35 IAC 217.768, because the budget EGU
are “new” budget EGU.
j. Budget Permit Required by the NO
x
Trading Program
i. For this source, this condition of this permit, i.e., Trading Program
Condition 3, is the Budget Permit required by the NO
x
Trading Program and is
intended to contain federally enforceable conditions addressing all
applicable NO
x
Trading Program requirements. This Budget Permit shall be
treated as a complete and segregable portion of this permit, as provided by
35 IAC 217.758(a)(2).
ii. The Permittee and any other owner or operator of this source and each budget
EGU at the source shall operate the budget EGU in compliance with this Budget
Permit, pursuant to 35 IAC 217.756(b)(2).
iii. No provision of this Budget Permit or the associated application shall be
construed as exempting or excluding the Permittee, or other owner or operator
and, to the extent applicable, the account representative of a budget source
or budget EGU from compliance with any other regulation or requirement
promulgated under the CAA, the Act, the approved State Implementation Plan,
or other federally enforceable permit, pursuant to 35 IAC 217.756(g).
iv. Upon recordation by USEPA, under 40 CFR 96, Subparts F or G, or 35 IAC
217.782, every allocation, transfer, or deduction of an allowance to or from
the budget EGU’s compliance accounts or to or from the overdraft account for
the budget source is deemed to amend automatically, and become part of, this
budget permit, pursuant to 35 IAC 217.756(d)(8). This automatic amendment of
this budget permit shall be deemed an operation of law and will not require
any further review.
ELECTRONIC FILING, RECEIVED, CLERK'S OFFICE, JANUARY 5, 2007
* * * * * PC #7 * * * * *
Page 56
v. No revision of this Budget Permit shall excuse any violation of the
requirements of the NO
x
Trading Program that occurs prior to the date that the
revisions to this permit takes effect, pursuant to 35 IAC 217.756(f)(1).
vi. The Permittee, or other owner or operator of the source, shall reapply for a
Budget Permit for the source as required by 35 IAC Part 217, Subpart W and
Section 39.5 of the Act. For purposes of the NO
x
Trading Program, the
application shall contain the information specified by 35 IAC 217.758(b)(2).
ELECTRONIC FILING, RECEIVED, CLERK'S OFFICE, JANUARY 5, 2007
* * * * * PC #7 * * * * *
Page 57
SECTION 6: GENERAL PERMIT CONDITIONS
GENERAL PERMIT CONDITION 1: STANDARD CONDITIONS
Standard conditions for issuance of construction permits, attached hereto shall apply to
this project, unless superseded by provisions of other permit conditions.
GENERAL PERMIT CONDITION 2: REQUIREMENTS FOR EMISSION TESTING
a. i. At least 60 days prior to the actual date of initial emission testing
required by this permit, a written test plan shall be submitted to the
Illinois EPA for review. This plan shall describe the specific procedures
for testing and shall include at a minimum:
A. The person(s) who will be performing sampling and analysis and their
experience with similar tests.
B. The specific conditions, e.g., operating rate and control device
operating conditions, under which testing shall be performed including
a discussion of why these conditions are appropriate and the means by
which the operating parameters will be determined.
C. The specific determinations of emissions that are intended to be made,
including sampling and monitoring locations. As part of this plan, the
Permittee may set forth a strategy for performing emission testing in
the normal load range of the boilers.
D. The test method(s) that will be used, with the specific analysis method
if the method can be used with different analysis methods.
ii. As provided by 35 IAC 283.220(d), the Permittee need not submit a test plan
for subsequent emission testing that will be conducted in accordance with the
procedures used for previous tests accepted by the Illinois EPA or the
previous test plan submitted to and approved by the Illinois EPA, provided
that the Permittee’s notification for testing, as required below, contains
the information specified by 35 IAC 283.220(d)(1)(A), (B) and (C).
b. i. The Permittee shall notify the Illinois EPA prior to performing emission
testing required by this permit to enable the Illinois EPA to observe the
tests. Notification for the expected date of testing shall be submitted a
minimum of 30 days* prior to the expected date, and identify the testing that
will be performed. Notification of the actual date and expected time of
testing shall be submitted a minimum of 5 working days* prior to the actual
date of testing.
* For a particular test, the Illinois EPA may at its discretion accept
shorter advance notification provided that it does not interfere with
the Illinois EPA's ability to observe testing.
ii. This notification shall also identify the parties that will be performing
testing and the set or sets of operating conditions under which testing will
be performed.
c. Three copies of the Final Reports for emission tests shall be forwarded to the
Illinois EPA within 30 days after the test results are compiled and finalized. At
a minimum, the Final Report for testing shall contain:
ELECTRONIC FILING, RECEIVED, CLERK'S OFFICE, JANUARY 5, 2007
* * * * * PC #7 * * * * *
Page 58
i. General information, i.e., testing personnel and test dates;
ii. A summary of results;
iii. Description of test method(s), including a description of sampling points,
sampling train, analysis equipment, and test schedule;
iv. The operating conditions of the emission unit and associated control devices
during testing and any work practice standard established for the unit as
result of testing;
v. Data and calculations, including copies of all raw data sheets and records of
laboratory analysis, sample calculations, and data on equipment calibration.
GENERAL PERMIT CONDITION 3: REQUIREMENTS FOR RECORDS FOR DEVIATIONS
Except as specified in a particular provision of this permit or in a subsequent CAAPP
Permit for the plant, records for deviations from applicable emission standards and
control requirements shall include at least the following information: the date, time
and estimated duration of the event; a description of the event; the applicable
requirement(s) that were not met; the manner in which the event was identified, if not
readily apparent; the probable cause for deviation, if known, including a description of
any equipment malfunction/breakdown associated with the event; information on the
magnitude of the deviation, including actual emissions or performance in terms of the
applicable standard if measured or readily estimated; confirmation that standard
procedures were followed or a description of any event-specific corrective actions taken;
and a description of any preventative measures taken to prevent future occurrences, if
appropriate.
GENERAL PERMIT CONDITION 4: RETENTION AND AVAILABILITY OF RECORDS
Except as specified in a particular provision of this permit or in a subsequent CAAPP
Permit for the plant, the Permittee shall keep all records, including written procedures
and logs, required by this permit at a readily accessible location at the plant for at
least five years and shall make such records available for inspection and copying by the
Illinois EPA and USEPA.
GENERAL PERMIT CONDITION 5: NOTIFICATION OR REPORTING OF DEVIATIONS
Notifications and reports for deviation from applicable emission standards, control
requirements, and compliance procedures shall be submitted as follows, except as
specified in a particular provision of this permit or in a subsequent CAAPP Permit for
the plant:
a. Notification and reports for deviations include at least the following information:
a description of the event, the date and time or duration of the event, information
on the magnitude of the deviation, a description of the corrective measures taken,
and a description of any preventative measures taken to prevent future occurrences.
b. Exceedances of applicable emissions standards or limitations during periods of
startup, malfunction or breakdown, or shutdown shall be considered deviations for
purposes of notification and reporting, even if exceedance of the standard or
limitation is otherwise provided for by applicable rule or this permit.
ELECTRONIC FILING, RECEIVED, CLERK'S OFFICE, JANUARY 5, 2007
* * * * * PC #7 * * * * *
Page 59
GENERAL PERMIT CONDITION 6: GENERAL REQUIREMENTS FOR NOTIFICATION AND REPORTS
a. i. Two copies of notifications and reports required by this permit shall be sent
to the following address unless otherwise indicated above:
Illinois Environmental Protection Agency
Division of Air Pollution Control
Compliance and Enforcement Section
P.O. Box 19276
Springfield, Illinois 62794-9276
ii. One copy of notifications and reports required by this permit, except the
Annual Emission Report required by 35 IAC Part 254, shall be sent to the
Illinois EPA’s regional office at the following address unless otherwise
indicated above:
Illinois Environmental Protection Agency
Division of Air Pollution Control
9511 West Harrison
Des Plaines, Illinois 60123
b. Quarterly reports shall cover calendar quarters and be submitted no later than 45
days after the end of the calendar quarter if a shorter deadline is not specified
in a particular provision of this permit.
c. The Permittee shall submit Annual Emission Reports to the Illinois EPA in
accordance with 35 IAC Part 254. For hazardous air pollutants, this report shall
include emission information for at least the following pollutants: hydrogen
chloride, hydrogen fluoride, mercury, arsenic, beryllium, cadmium, chromium, lead,
manganese, and nickel.
ELECTRONIC FILING, RECEIVED, CLERK'S OFFICE, JANUARY 5, 2007
* * * * * PC #7 * * * * *
ATTACHMENT - TABLES
TABLE I
Emission Limitations for Each CFB Boiler
Pollutant
Pound/Million
Btu
1
Pounds/Hour
2
Tons/Year
Combined
Tons/Year
PM/PM
10
3
0.015
43.8
192
384
NO
x
4
0.10
4
292.2
1,280
2,560
SO
2
0.15
438.3
1,920
3,840
CO
0.11
5
321.4
1,408
2,816
VOM
0.004
5
11.7
51.2
102.4
Fluorides
6
----
5.7
25.1
50.2
Sulfuric Acid Mist
----
1.2
5.1
10.2
Beryllium
----
----
----
0.004
Hydrogen Chloride
----
----
----
256
Hydrogen Fluoride
----
----
----
50.2
Mercury
----
----
----
0.05
Lead
----
----
----
0.31
Notes
:
1
Compliance with the emission rates expressed in pound/million Btu heat input shall be
determined in accordance with the provisions in Condition 1.2(b).
2
Compliance with hourly emission limits shall be based on 24-hour block averages
(NO
x
, CO and SO
2
) and 3-hour block average (VOM, PM/PM
10
, fluorides, and sulfuric
acid mist. Short-term emission rates do not apply during startup, shutdown or
malfunction as addressed by Condition 1.6.
3
All particulate matter (PM) measured by USEPA Method 5 shall be considered PM
10
unless PM emissions are tested by USEPA Method 201 or 201A, as specified in 35 IAC
212.108(a). These PM limits do not address condensable particulate matter.
(Condensable particulate was addressed in the particulate matter air quality impact
analysis required by the PSD rules. For this purpose, the emission rate for
condensable particulate matter was estimated to be 0.035 lb/million Btu.)
4
The NO
x
limits are phased, with an initial limit for the demonstration period, and
provision for an even lower limit, which limit could be as low as 0.08 pound per
million Btu, pursuant to the optimization program required by Conditions 1.2(d) and
1.15.
5
As an alternative to this limitation expressed in pound/million Btu, the boiler may
comply with the limitation expressed in pounds/hour.
6
The limit for fluorides is expressed in terms of hydrogen fluorides.
ELECTRONIC FILING, RECEIVED, CLERK'S OFFICE, JANUARY 5, 2007
* * * * * PC #7 * * * * *
TABLE II
Emission Limitations for
Certain Bulk Material Preparation Operations Involving Gas Combustion
(Pounds per Hour and Tons per Year)
PM
CO
NO
x
VOM
Emission Unit
Hourly
Rate
Annual
Rate
Hourly
Rate
Annual
Rate
Hourly
Rate
Annual
Rate
Hourly
Rate
Annual
Rate
Limestone Preparation
Dryer/Mill System 1
0.24 1.05 2.4 10.5 0.9
3.85 0.24 1.05
Dryer/Mill System 2
0.24 1.05 2.4 10.5 0.9
3.85 0.24 1.05
Dryer/Mill System 3
0.24 1.05 2.4 10.5 0.9
3.85 0.24 1.05
Totals
3.15
31.5
11.5
3.2
ELECTRONIC FILING, RECEIVED, CLERK'S OFFICE, JANUARY 5, 2007
* * * * * PC #7 * * * * *
TABLE III
Particulate Matter (PM) Emission Limitations for
Bulk Material Handling Operations
(Grains Per Dry Cubic Foot, Pounds Per Hour, and Tons Per Year)
Emission Units
Exhaust
Loading
Hourly
Rate
Annual
Rate
Receiving and Handling
Railcar Unloading, Transfer House, Crusher Building,
Hoppers, etc., Except as Below
0.001
0.714
3.13
Limestone Reclaim
0.005
0.086
0.38
Material Storage Buildings
--
--
0.24
Subtotal
0.80
3.75
Limestone Preparation
Preparation Equipment, Except as Below
0.001
0.270
0.117
Dryer/Mill System 1*
0.001
0.240
1.05
Dryer/Mill System 2*
0.001
0.240
1.05
Dryer/Mill System 3*
0.001
0.240
1.05
Limestone and Infeed Silos
0.005
0.621
2.73
Subtotal
1.354
7.05
Ash Handling and Loadout
Bed Ash Silos, Transport Systems, Fly Ash Silos,
etc., Except as Below
0.001
0.428
1.88
Fly Ash Hoppers
0.005
0.026
0.12
Bed and Fly Ash Loadout
--
--
0.036
Subtotal
0.454
2.04
Total
--
12.84
* See also Table II
ELECTRONIC FILING, RECEIVED, CLERK'S OFFICE, JANUARY 5, 2007
* * * * * PC #7 * * * * *
ATTACHMENT – ACID RAIN PERMIT
217-782-2113
ACID RAIN PROGRAM PERMIT
Indeck-Elwood Energy Center
Attn: Mr. Thomas M Campone, Designated Representative
600 North Buffalo Grove Road, Suite 300
Buffalo Grove, Illinois 60089
Oris No.
:
55823
Illinois EPA I.D. No.
: 197035AAJ
Source/Unit
:
Indeck-Elwood Energy Center, Unit 1 and 2
Date Received
:
May 13, 2002
Date Issued
:
October 10, 2003
Effective Date
:
January 1, 2006
Expiration Date
:
December 31, 2010
STATEMENT OF BASIS:
In accordance with Section 39.5(17)(b) of the Illinois Environmental Protection Act and
Titles IV and V of the Clean Air Act, the Illinois Environmental Protection Agency is
issuing this Acid Rain Program permit for the Indeck-Elwood Energy Center.
SULFUR DIOXIDE (SO
2
) ALLOCATIONS AND NITROGEN OXIDE (NO
X
) REQUIREMENTS FOR EACH AFFECTED
UNIT:
SO
2
Allowances
These Units are Not Entitled to an
Allocation of SO
2
Allowances Pursuant to
40 CFR Part 73
Unit 1 and Unit 2
NO
x
Emission Limitation
These Units are Not Subject to a NO
x
Emissions Limitation Under 40 CFR Part
76.
This Acid Rain Program permit contains provisions related to sulfur dioxide (SO
2
)
emissions and requires the owners and operators to hold SO
2
allowances to account for SO
2
emissions beginning in the year 2000. An allowance is a limited authorization to emit up
to one ton of SO
2
during or after a specified calendar year. Although this plant is not
eligible for an allowance allocated by USEPA, the owners or operators may obtain SO
2
allowances to cover emissions from other sources under a marketable allowance program.
The transfer of allowances to and from a unit account does not necessitate a revision to
this permit (See 40 CFR 72.84).
This permit contains provisions related to nitrogen oxide (NO
x
) emissions requiring the
owners or operators to monitor NO
x
emissions from affected units in accordance with the
applicable provisions of 40 CFR Part 75.
This Acid Rain Program permit does not authorize the construction and operation of the
affected units as such matters are addressed by Titles I and V of the Clean Air Act. If
the construction and operation of one of the affected units is not undertaken, this
permit shall not cover such unit.
ELECTRONIC FILING, RECEIVED, CLERK'S OFFICE, JANUARY 5, 2007
* * * * * PC #7 * * * * *
In addition, notwithstanding the effective date of this permit as specified above, this
permit shall not take effect for an individual affected unit until January 1 of the year
in which the unit commences operation.
COMMENTS, NOTES AND JUSTIFICATIONS:
This permit does not affect the owners and operators responsibility to meet all other
applicable local, state, and federal requirements, including requirements addressing SO
2
and NO
x
emissions.
PERMIT APPLICATION:
The SO
2
allowance requirements and other standard requirements as set forth in the
application are incorporated by reference into this permit. The owners and operators of
this source must comply with the standard requirements and special provisions set forth
in the application.
If you have any questions regarding this permit, please contact Mohamed Anane at
217/782-2113.
Donald E. Sutton, P.E.
Manager, Permits Section
Division of Air Pollution Control
DES:MA:jar
cc: Cecilia Mijares, USEPA Region V
Illinois EPA Region 1
ELECTRONIC FILING, RECEIVED, CLERK'S OFFICE, JANUARY 5, 2007
* * * * * PC #7 * * * * *
ATTACHMENT – STANDARD PERMIT CONDITIONS
STANDARD CONDITIONS FOR CONSTRUCTION/DEVELOPMENT PERMITS
ISSUED BY THE ILLINOIS ENVIRONMENTAL PROTECTION AGENCY
The Illinois Environmental Protection Act (Illinois Revised Statutes, Chapter
111-1/2, Section 1039) authorizes the Environmental Protection Agency to
impose conditions on permits which it issues.
The following conditions are applicable unless superseded by special
condition(s).
1. Unless this permit has been extended or it has been voided by a newly
issued permit, this permit will expire one year from the date of
issuance, unless a continuous program of construction or development on
this project has started by such time.
2. The construction or development covered by this permit shall be done in
compliance with applicable provisions of the Illinois Environmental
Protection Act and Regulations adopted by the Illinois Pollution
Control Board.
3. There shall be no deviations from the approved plans and specifications
unless a written request for modification, along with plans and
specifications as required, shall have been submitted to the Illinois
EPA and a supplemental written permit issued.
4. The Permittee shall allow any duly authorized agent of the Illinois EPA
upon the presentation of credentials, at reasonable times:
a. To enter the Permittee’s property where actual or potential
effluent, emission or noise sources are located or where any
activity is to be conducted pursuant to this permit,
b. To have access to and to copy any records required to be kept
under the terms and conditions of this permit,
c. To inspect, including during any hours of operation of equipment
constructed or operated under this permit, such equipment and any
equipment required to be kept, used, operated, calibrated and
maintained under this permit,
d. To obtain and remove samples of any discharge or emissions of
pollutants, and
e. To enter and utilize any photographic, recording, testing,
monitoring or other equipment for the purpose of preserving,
testing, monitoring, or recording any activity, discharge, or
emission authorized by this permit.
ELECTRONIC FILING, RECEIVED, CLERK'S OFFICE, JANUARY 5, 2007
* * * * * PC #7 * * * * *
5. The issuance of this permit:
a. Shall not be considered as in any manner affecting the title of
the premises upon which the permitted facilities are to be
located,
b. Does not release the Permittee from any liability for damage to
person or property caused by or resulting from the construction,
maintenance, or operation of the proposed facilities.
c. Does not release the Permittee from compliance with other
applicable statutes and regulations of the United States, of the
State of Illinois, or with applicable local laws, ordinances and
regulations.
d. Does not take into consideration or attest to the structural
stability of any units or parts of the project, and
e. In no manner implies or suggests that the Illinois EPA (or its
officers, agents or employees) assumes any liability, directly or
indirectly, for any loss due to damage, installation,
maintenance, or operation of the proposed equipment or facility.
6. a. Unless a joint construction/operation permit has been issued, a
permit for operation shall be obtained from the Illinois EPA
before the equipment covered by this permit is placed into
operation.
b. For purposes of shakedown and testing, unless otherwise specified
by a special permit condition, the equipment covered under this
permit may be operated for a period not to exceed thirty (30)
days.
7. The Illinois EPA may file a complaint with the Board for modification,
suspension or revocation of a permit.
a. Upon discovery that the permit application contained
misrepresentations, misinformation or false statement or that all
relevant facts were not disclosed, or
b. Upon finding that any standard or special conditions have been
violated, or
c. Upon any violations of the Environmental Protection Act or any
regulation effective thereunder as a result of the construction
or development authorized by this permit.
July, 1985, Revised, May, 1999
IL 532-0226
ELECTRONIC FILING, RECEIVED, CLERK'S OFFICE, JANUARY 5, 2007
* * * * * PC #7 * * * * *
Commonwealth of Kentucky
Natural Resources and Environmental Protection Cabinet
Department for Environmental Protection
Division for Air Quality
803 Schenkel Lane
Frankfort, Kentucky 40601
(502) 573-3382
AIR QUALITY PERMIT
Permittee Name:
East Kentucky Power Cooperative, Inc.
Mailing Address:
P.O. Box 707, Winchester, Kentucky 40392-0707
is authorized to operate an
electric power generating plant at Maysville, Kentucky
Source Name:
Hugh L. Spurlock Power Station
Mailing Address:
P.O. Box 707, Winchester, Kentucky 40392-0707
Source Location:
1301 West Second Street
Permit Type
:
Federally-Enforceable
Review Type:
Title V
Permit Number:
V-97-050
Log Number:
E917
Application Complete
Date:
February 11, 1997
KYEIS ID #:
103-2640-0009
AFS Plant ID #:
21-161-00009
FINDS Number:
KYD072865272
SIC Code:
4911
Region:
Huntington-Ashland
County:
Mason
Issuance Date:
December 10, 1999
Expiration Date:
December 10, 2004
___________________________________
John E. Hornback, Director
Division for Air Quality
DEP7001 (1-97)
ELECTRONIC FILING, RECEIVED, CLERK'S OFFICE, JANUARY 5, 2007
* * * * * PC #7 * * * * *
TABLE OF CONTENTS
SECTION
DATE
OF ISSUANCE
PAGE
SECTION A
PERMIT AUTHORIZATION
December 10, 1999
1
SECTION B
EMISSION POINTS, EMISSIONS December 10, 1999
2
UNITS, APPLICABLE
REGULATIONS, AND
OPERATING CONDITIONS
SECTION C
INSIGNIFICANT ACTIVITIES
December 10, 1999
17
SECTION D
SOURCE EMISSION
December 10, 1999
20
LIMITATIONS AND
TESTING REQUIREMENTS
SECTION E
SOURCE CONTROL EQUIPMENT December 10, 1999
21
OPERATING CONDITIONS
SECTION F
MONITORING, RECORD
December 10, 1999
22
KEEPING, AND REPORTING
REQUIREMENTS
SECTION G
GENERAL CONDITIONS
December 10, 1999
25
SECTION H
ALTERNATIVE OPERATING
December 10, 1999
30
SCENARIOS
SECTION I
COMPLIANCE SCHEDULE
December 10, 1999
30
ELECTRONIC FILING, RECEIVED, CLERK'S OFFICE, JANUARY 5, 2007
* * * * * PC #7 * * * * *
Permit Number:
V-97-050
Page:
1
of
30
SECTION A - PERMIT AUTHORIZATION
Pursuant to a duly submitted application which was determined to be complete on February 11,
1997, the Kentucky Division for Air Quality hereby authorizes the operation of the equipment
described herein in accordance with the terms and conditions of this permit. This permit has been
issued under the provisions of Kentucky Revised Statutes Chapter 224 and regulations promulgated
pursuant thereto.
The permittee shall not construct, reconstruct, or modify any emission units without first having
submitted a complete application and receiving a permit for the planned activity from the permitting
authority, except as provided in this permit or in the Regulation 401 KAR 50:035, Permits.
Issuance of this permit does not relieve the permittee from the responsibility of obtaining any other
permits, licenses, or approvals required by this Cabinet or any other federal, state, or local agency.
ELECTRONIC FILING, RECEIVED, CLERK'S OFFICE, JANUARY 5, 2007
* * * * * PC #7 * * * * *
Permit Number:
V-97-050
Page:
2
of
30
SECTION B - EMISSION POINTS, EMISSIONS UNITS, APPLICABLE
REGULATIONS, AND OPERATING CONDITIONS
Emissions Unit 01 (01) - Indirect Heat Exchanger (Unit 1)
Description:
Pulverized coal-fired, dry-bottom, wall-fired unit equipped with electrostatic precipitator and low
NO
x
burners
Number two fuel oil used for startup and stabilization
Maximum continuous rating: 3500 mmBTU/hr
Construction commenced before: 1971
Applicable Regulations:
Regulation 401 KAR 61:015, Existing indirect heat exchangers applicable to an emission unit with
a capacity more than 250 MMBTU per hour and commenced before August 17, 1971. Regulation
7, Prevention and control of emissions of particulate matter from combustion of fuel in indirect heat
exchangers.
1.
Operating Limitations:
None
2.
Emission Limitations:
a) Pursuant to Regulation 401 KAR 61:015, Section 4 (4), and Regulation No. 7, particulate
emissions shall not exceed 0.22 lb/MMBTU based on a three-hour average.
b) Pursuant to Regulation 401 KAR 61:015, Section 4 (4), Regulation No. 7, emissions
shall not exceed 40 percent opacity based on a six-minute average except that a
maximum of 60 percent opacity is allowed for a period or aggregate of periods not more
than six minutes in any 60 minutes during building a new fire, cleaning the firebox, or
blowing soot.
c) Pursuant to Regulation 401 KAR 61:015, Section 5 (1), sulfur dioxide emission shall not
exceed 6.0 lbs/MMBTU based on a twenty-four-hour average.
3.
Testing Requirements:
a) The permittee shall submit a schedule within six months from the issuance date of this
permit to conduct at least one performance test for particulate within one year following the
issuance of this permit.
b) If no additional stack tests are performed pursuant to Condition 4. d), the permittee shall
conduct a performance test for particulate emissions within the third year of the term of this
permit to demonstrate compliance with the applicable standard.
ELECTRONIC FILING, RECEIVED, CLERK'S OFFICE, JANUARY 5, 2007
* * * * * PC #7 * * * * *
Permit Number:
V-97-050
Page:
3
of
30
SECTION B - EMISSION POINTS, EMISSIONS UNITS, APPLICABLE
REGULATIONS, AND OPERATING CONDITIONS
c) The permittee shall determine the opacity of emissions from the stack by EPA Reference
Method 9 annually, or more frequently if requested by the division.
4.
Specific Monitoring Requirements:
a) Pursuant to Regulation 401 KAR 61:005, Section 3 and Regulation 401 KAR 50:035,
Section 7(1)(c), continuous emission monitoring systems shall be installed, calibrated,
maintained, and operated for measuring sulfur dioxide emissions and either oxygen or carbon
dioxide emissions.The continuous emission monitoring systems shall comply with
Regulation 401 KAR 61:005, Section 3, particularly, performance specification 2 of
Appendix B to 40 CFR 60 or 40 CFR 75, Appendix A.
b) In accordance with Regulation 401 KAR 61:015, Section 6 (1), the sulfur content of solid
fuels, as burned shall be determined in accordance with methods specified by the division.
c) In accordance with Regulation 401 KAR 61:015, Section 6 (3) the rate of each fuel
burned shall be measured daily and recorded. The heating value and ash content of fuels
shall be ascertained at least once per week and recorded. The average electrical output, and
the minimum and maximum hourly generation rate shall be measured and recorded daily.
d) Pursuant to Regulation 401 KAR 50:035, Section 7(1)(c), to meet the periodic monitoring
requirement for particulate, the permittee shall use a continuous opacity monitor (COM).
Excluding the startup, shutdown, and once per hour exemption periods, if any six-minute
average opacity value exceeds the opacity standard, the permittee shall, as appropriate,
initiate an inspection of the control equipment and/or the COM system and make any
necessary repairs. If five (5) percent or greater of COM data (excluding startup, shutdown,
and malfunction periods, data averaged over six minute period) recorded in a calendar
quarter show excursions above the opacity standard, the permittee shall perform a stack test
in the following calendar quarter to demonstrate compliance with the particulate standard
while operating at representative conditions. The permittee shall submit a compliance test
protocol as required by condition Section G(a)(21) of this permit before conducting the test.
The division may waive this testing requirement upon a demonstration that the cause(s) of
the excursions have been corrected, or may require stack tests at any time pursuant to
Regulation 401 KAR 50:045, Performance tests.
e) Pursuant to Regulation 401 KAR 50:035, Section 7(1)(c), to meet the periodic monitoring
requirement for opacity, the permittee shall use a continuous opacity monitor (COM).
Excluding the startup, shutdown, and once per hour exemption periods, if any six-minute
average opacity value exceeds the opacity standard, the permittee shall, as appropriate,
initiate an inspection of the control equipment and/or COM system and make any necessary
repairs. If visible emissions from the stack are perceived or believed to exceed the applicable
standard, the permittee shall determine the opacity of emissions by Reference Method 9. If
a Method 9 cannot be performed, the reason for not performing the test shall be documented.
ELECTRONIC FILING, RECEIVED, CLERK'S OFFICE, JANUARY 5, 2007
* * * * * PC #7 * * * * *
Permit Number:
V-97-050
Page:
4
of
30
SECTION B - EMISSION POINTS, EMISSIONS UNITS, APPLICABLE
REGULATIONS, AND OPERATING CONDITIONS
f) Pursuant to Regulation 401 KAR 50:035, Section 7(1)(c), to meet the periodic monitoring
requirement for sulfur dioxide, the permittee shall use a continuous emission monitor (CEM)
Excluding the startup and shutdown periods, if any 24-hour average sulfur dioxide value
exceeds the standard, the permittee shall, as appropriate, initiate an investigation of the cause
of the exceedance and/or the CEM system and make any necessary repairs or take corrective
actions as soon as practicable.
g) Pursuant to Regulation 401 KAR 61:005, Section 3, a continuous monitoring system for
opacity shall conform to requirements of this section which include installing, calibrating,
operating, and maintaining the continuous monitoring system for accurate opacity
measurement, and demonstrating compliance with the applicable Performance Specification
1 of 40 CFR 60, Appendix B.
h) Pursuant to Regulation 401 KAR 61:005, Section 3(5), the division may provide a
temporary exemption from the monitoring and reporting requirements of Regulation 401
KAR 61:005, Section 3, for the continuous monitoring system during any period of
monitoring system malfunction, provided that the source owner or operator shows, to the
division’s satisfaction, that the malfunction was unavoidable and is being repaired as
expeditiously as practicable.
5.
Specific Record Keeping Requirements:
a) Records shall be kept in accordance with Regulations 401 KAR 61:005, Section 3(16) (f)
and 61:015, Section 6, with the exception that the records shall be maintained for a period
of five (5) years. Percentage of the COM data (excluding startup, shutdown, and malfunction
data) showing excursions above the opacity standard in each calendar quarter shall be
computed and recorded.
b) The permittee shall maintain the results of all compliance tests.
6.
Specific Reporting Requirements:
a) Pursuant to Regulation 401 KAR 61:005, Section 3 (16), minimum data requirements
which follow shall be maintained and furnished in the format specified by the division.
1. Owners or operators of facilities required to install continuous monitoring systems for
opacity and sulfur dioxide or those utilizing fuel sampling and analysis for sulfur dioxide
emissions shall submit for every calendar quarter, a written report of excess emissions and
the nature and cause of the excess emissions if known. The averaging period used for data
reporting should correspond to the emission standard averaging period which is a twenty-four
(24) hour averaging period. All quarterly reports shall be postmarked by the thirtieth (30th)
day following the end of each calendar quarter.
ELECTRONIC FILING, RECEIVED, CLERK'S OFFICE, JANUARY 5, 2007
* * * * * PC #7 * * * * *
Permit Number:
V-97-050
Page:
5
of
30
SECTION B - EMISSION POINTS, EMISSIONS UNITS, APPLICABLE
REGULATIONS, AND OPERATING CONDITIONS
2
.
For opacity measurements, the summary shall consist of the magnitude in actual percent
opacity of six (6) minute averages of opacity greater than the opacity standard in the
applicable standard for each hour of operation of the facility
.
Average values may be
obtained by integration over the averaging period or by arithmetically averaging a minimum
of four (4) equally spaced, instantaneous opacity measurements per minute. Any time period
exempted shall be considered before determining the excess average of opacity.
3. For gaseous measurements the summary shall consist of hourly averages in the units of
the applicable standard.
4. The date and time identifying each period during which the continuous monitoring system
was inoperative, except for zero and span checks, and the nature of system repairs or
adjustments shall be reported. Proof of continuous monitoring system performance is
required as specified by the division whenever system repairs or adjustments have been
made.
5. When no excess emissions have occurred and the continuous monitoring system(s) have
not been inoperative, repaired, or adjusted, such information shall be included in the report.
b) The permittee shall report the number of excursions (excluding startup, shutdown,
malfunction data) above the opacity standard, date and time of excursions, opacity value of
the excursions, and percentage of the COM data showing excursions above the opacity
standard in each calendar quarter.
7.
Specific Control Equipment Operating Conditions:
a) The electrostatic precipitator shall be operated as necessary to maintain compliance with
permitted emission limitations, in accordance with manufacturer’s specifications and/or
good operating practices.
b) Records regarding the maintenance of the electrostatic precipitator shall be maintained.
c) See Section E for further requirements.
ELECTRONIC FILING, RECEIVED, CLERK'S OFFICE, JANUARY 5, 2007
* * * * * PC #7 * * * * *
Permit Number:
V-97-050
Page:
6
of
30
SECTION B - EMISSION POINTS, EMISSIONS UNITS, APPLICABLE
REGULATIONS, AND OPERATING CONDITIONS
Emissions
Unit 02 (02) - Indirect Heat Exchanger (Unit 2)
Description:
Pulverized coal-fired, dry-bottom, tangientally fired unit equipped with electrostatic precipitator, low
NO
x
burners and flue gas desulfurization (FGD) system
Number two fuel oil used for startup and stabilization
Maximum continuous rating: 4850 mmBTU/hr
Construction commenced: 1981
Applicable Regulations:
Regulation 401 KAR 59:015, New indirect heat exchangers, incorporating by reference 40 CFR 60,
Subpart D, Standards of performance for fossil-fuel-fired steam generators applicable to an
emissions unit more than 250 MMBTU/hour and commenced after August 17, 1971
1.
Operating Limitations:
None
2.
Emission Limitations:
a) Pursuant to Regulation 401 KAR 59:015, Section 4 (1)(b), particulate emissions shall not
exceed 0.1 lb/MMBTU based on a three-hour average.
b) Pursuant to Regulation 401 KAR 59:015, Section 4 (2), emissions shall not exceed
twenty (20) percent opacity based on a six-minute average except a maximum of twenty-
seven (27) percent opacity for not more than one (1) six (6) minutes period in any sixty
(60) consecutive minutes.
c) Pursuant to Regulation 401 KAR 59:015, Section 5 (1)(b), sulfur dioxide emission shall
not exceed 1.2 lbs/MMBTU based on a three-hour average.
d) Pursuant to Regulation 401 KAR 59:015, Section 6(1)(c), nitrogen oxides emission shall
not exceed 0.70 lb/MMBTU based on a three-hour average.
3.
Testing Requirements:
a) The permittee shall submit a schedule within six months from the issuance date of this
permit to conduct at least one performance test for particulate within one year following the
issuance of this permit.
b) If no additional stack tests are performed pursuant to Condition 4. d), the permittee shall
conduct a performance test for particulate emissions within the third year of the term of this
permit to demonstrate compliance with the applicable standard.
ELECTRONIC FILING, RECEIVED, CLERK'S OFFICE, JANUARY 5, 2007
* * * * * PC #7 * * * * *
Permit Number:
V-97-050
Page:
7
of
30
SECTION B - EMISSION POINTS, EMISSIONS UNITS, APPLICABLE
REGULATIONS, AND OPERATING CONDITIONS
c) The permittee shall determine the opacity of emissions from the stack by EPA Reference
Method 9 annually, or more frequently if requested by the division.
4.
Specific Monitoring Requirements:
a) Pursuant to Regulation 401 KAR 50:035, Section 7(1)(c), Regulation 401 KAR 59:015,
Section 7, and Regulation 401 KAR 59:005, Section 4, continuous emission monitoring
systems shall be installed, calibrated, maintained, and operated for measuring the opacity of
emissions, sulfur dioxide emissions, nitrogen oxides emissions and either oxygen or carbon
dioxide emissions. The owner or operator shall ensure the continuous emission monitoring
systems are in compliance with, and the owner or operator shall comply with the
requirements of Regulation 401 KAR 59:005, Section 4.
b) Pursuant to Regulation 401 KAR 50:035, Section 7(1)(c), to meet the periodic monitoring
requirement for particulate, the permittee shall use a continuous opacity monitor (COM).
Excluding the startup, shutdown, and once per hour exemption periods, if any six minute
average opacity value exceeds the opacity standard, the permittee shall, as appropriate,
initiate an inspection of the control equipment and/or the COM system and make any
necessary repairs. If five (5) percent or greater of COM data (excluding startup, shutdown,
and malfunction periods, data averaged over six minute period) recorded in a calendar
quarter show excursions above the opacity standard, the permittee shall perform a stack test
in the following calendar quarter to demonstrate compliance with the particulate standard
while operating at representative conditions. The permittee shall submit a compliance test
protocol as required by condition Section G(a)(21) of this permit before conducting the test.
The division may waive this testing requirement upon a demonstration that the cause(s) of
the excursions have been corrected, or may require stack tests at any time pursuant to
Regulation 401 KAR 50:045, Performance tests.
c) Pursuant to Regulation 401 KAR 50:035, Section 7(1)(c), to meet the periodic monitoring
requirement for opacity, the permittee shall use a continuous opacity monitor (COM).
Excluding the startup, shutdown, and once per hour exemption periods, if any six minute
average opacity value exceeds the opacity standard, the permittee shall, as appropriate,
initiate an inspection of the control equipment and/or the COM system and make any
necessary repairs. If visible emissions from the stack are perceived or believed to exceed the
applicable standard, the permittee shall determine the opacity of emissions by Reference
Method 9. If a Method 9 test cannot be performed, the reason for not performing the test
shall be documented.
d) Pursuant to Regulation 401 KAR 50:035, Section 7(1)(c), to meet the periodic monitoring
requirement for sulfur dioxide, the permittee shall use a continuous emission monitor (CEM)
Excluding the startup and shutdown periods, if any 3-hour average sulfur dioxide value
exceeds the standard, the permittee shall, as appropriate, initiate an investigation of the cause
of the exceedance and/or the CEM system and make any necessary repairs or take corrective
actions as soon as practicable.
ELECTRONIC FILING, RECEIVED, CLERK'S OFFICE, JANUARY 5, 2007
* * * * * PC #7 * * * * *
Permit Number:
V-97-050
Page:
8
of
30
SECTION B - EMISSION POINTS, EMISSIONS UNITS, APPLICABLE
REGULATIONS, AND OPERATING CONDITIONS
e) Pursuant to Regulation 401 KAR 50:035, Section 7(1)(c), to meet the periodic monitoring
requirement for nitrogen oxide, the permittee shall use a continuous emission monitor
(CEM).Excluding the startup and shutdown periods, if any 3-hour average nitrogen oxide
value exceeds the standard, the permittee shall, as appropriate, initiate an investigation of the
cause of the exceedance and/or the CEM system and make any necessary repairs or take
corrective actions as soon as practicable.
f) Pursuant to Regulation 401 KAR 59:015, Section 7(3), for performance evaluations of the
sulfur dioxide and nitrogen oxides continuous emission monitoring system as required under
Regulation 401 KAR 59:005, Section 4(3) and calibration checks as required under
Regulation 401 KAR 59:005, Section 4(4), Reference Methods 6 or 7 shall be used as
applicable as described by Regulation 401 KAR 50:015.
g) Pursuant to Regulation 401 KAR 59:015, Section 7(3), sulfur dioxide or nitric oxides
(nitrogen oxides), as applicable, shall be used for preparing calibration gas mixtures under
Performance Specification 2 of Appendix B to 40 CFR 60, filed by reference in Regulation
401 KAR 50:015.
h) Pursuant to Regulation 401 KAR 59:015, Section 7(3), the span value of all continuous
emission monitoring system measuring opacity of emissions shall be eighty (80), ninety (90),
or one-hundred (100) percent and the span value for the continuous emission monitoring
system measuring sulfur dioxide and nitrogen oxides emissions shall be in accordance with
Regulation 401 KAR 59:015, Appendix C or 40 CFR 75, Appendix A.
i) Continuous emission monitoring data shall be converted into the units of applicable
standards using the conversion procedure described in Regulation 401 KAR 59:015, Section
7(5).
j) Pursuant to Regulation 401 KAR 59:015, Section 7(3), for an indirect heat exchanger that
simultaneously burns fossil fuel and nonfossil fuel, the span value of all continuous
monitoring systems shall be subject to the division’s approval.
5.
Specific Record Keeping Requirements:
a) Pursuant to Regulation 401 KAR 59:005, Section 3 (4), the owner or operator of the
indirect heat exchanger shall maintain a file of all measurements, including continuous
monitoring system, monitoring device, and performance testing measurements; all
continuous monitoring system performance evaluations; all continuous monitoring system
or monitoring device calibration checks; adjustments and maintenance performed on these
systems and devices; and all other information required by Regulation 401 KAR 59:005
recorded in a permanent form suitable for inspection.
b) Pursuant to Regulation 401 KAR 59:005, Section 3(2), the owner or operator of this unit
shall maintain the records of the occurrence and duration of any startup, shutdown, or
malfunction in the operation of the affected facility, any malfunction of the air pollution
control equipment; or any period during which a continuous monitoring system or
monitoring device is inoperative.
ELECTRONIC FILING, RECEIVED, CLERK'S OFFICE, JANUARY 5, 2007
* * * * * PC #7 * * * * *
Permit Number:
V-97-050
Page:
9
of
30
SECTION B - EMISSION POINTS, EMISSIONS UNITS, APPLICABLE
REGULATIONS, AND OPERATING CONDITIONS
c) The permittee shall compute and record percentage of the COM data (excluding startup,
shutdown, and malfunction data) showing excursions above the opacity standard in each
calendar quarter.
d) The permittee shall maintain the results of all compliance tests.
6.
Specific Reporting Requirements:
a) Pursuant to Regulation 401 KAR 59:005, Section 3 (3), minimum data requirements
which follow shall be maintained and furnished in the format specified by the division.
Owners or operators of facilities required to install continuous monitoring systems shall
submit for every calendar quarter a written report of excess emissions (as defined in
applicable sections) to the division. All quarterly reports shall be postmarked by the thirtieth
(30th) day following the end of each calendar quarter and shall include the following
information:
1) The magnitude of the excess emission computed in accordance with the Regulation
401 KAR 59:005, Section 4(8), any conversion factors used, and the date and time of
commencement and completion of each time period of excess emissions.
2) All hourly averages shall be reported for sulfur dioxide and nitrogen oxides monitors.
The hourly averages shall be made available in the format specified by the division.
3) Specific identification of each period of excess emissions that occurs during startups,
shutdowns, and malfunctions of the affected facility. The nature and cause of any
malfunction (if known), the corrective action taken or preventive measures adopted.
4) The date and time identifying each period during which continuous monitoring
system was inoperative except for zero and span checks and the nature of the system
repairs or adjustments.
5) When no excess emissions have occurred or the continuous monitoring system(s)
have not been inoperative, repaired, or adjusted, such information shall be stated in the
report.
b) Pursuant to Regulation 401 KAR 59:015, Section 7(7), for the purposes of reports
required under Regulation 401 KAR 59:005, Section 3(3), periods of excess emissions that
shall be reported are defined as follows:
1) Excess emissions are defined as any six minute period during which the average
opacity of emissions exceeds twenty percent opacity, except that one (1) six (6) minute
average per hour of up to twenty-seven (27) percent opacity need not be reported.
ELECTRONIC FILING, RECEIVED, CLERK'S OFFICE, JANUARY 5, 2007
* * * * * PC #7 * * * * *
Permit Number:
V-97-050
Page:
10
of
30
SECTION B - EMISSION POINTS, EMISSIONS UNITS, APPLICABLE
REGULATIONS, AND OPERATING CONDITIONS
2) Excess emissions of sulfur dioxide is defined as any three (3) hour period during
which the average emissions (arithmetic average of three contiguous one hour periods)
exceed the applicable sulfur dioxide emissions standards.
3) Excess emissions for emissions units using a continuous monitoring system for
measuring nitrogen oxides are defined as any three (3) hour period during which the
average emissions (arithmetic average of three contiguous one hour periods) exceed the
applicable nitrogen oxides emissions standards.
c) The permittee shall report the number of excursions (excluding startup, shutdown,
malfunction data) above the opacity standard, date and time of excursions, opacity value of
the excursions, and percentage of the COM data showing excursions above the opacity
standard in each calendar quarter.
7.
Specific Control Equipment Operating Conditions:
a) The electrostatic precipitator (ESP), flue gas desulfurization unit (FGD), and the low NO
X
burner shall be operated as necessary to maintain compliance with permitted emission
limitations, consistence with manufacturer’s specifications and / or good operating practices.
b) Records regarding the maintenance of the control equipments shall be maintained.
c) See Section E for further requirements.
ELECTRONIC FILING, RECEIVED, CLERK'S OFFICE, JANUARY 5, 2007
* * * * * PC #7 * * * * *
Permit Number:
V-97-050
Page:
11
of
30
SECTION B - EMISSION POINTS, EMISSIONS UNITS, APPLICABLE
REGULATIONS, AND OPERATING CONDITIONS
Emissions Unit 03 (03) - Indirect Heat Exchanger (Auxiliary Boiler )
Description:
Number two fuel oil-fired
Maximum continuous rating: 144 mmBTU/hr
Construction commenced: 1971
Applicable Regulations:
Regulations 401 KAR 61:015, Existing indirect heat exchangers, commenced before August 17,
1971, and Regulation 7, Prevention and Control of Emissions of Particulate Matter from
Combustion of Fuel in Indirect Heat Exchangers
1.
Operating Limitations:
None
2.
Emission Limitations:
a) Pursuant to Regulation 401 KAR 61:015, Section 4 (4), and Regulation No. 7, particulate
emissions shall not exceed 0.22 lb/MMBtu based on a three-hour average.
b) Pursuant to Regulation 401 KAR 61:015, Section 4 (4), and Regulation No. 7, emissions
shall not exceed 40 percent opacity based on a six-minute average except that a
maximum of 60 percent opacity is allowed for a period or aggregate of periods not more
than six minutes in any sixty minutes during building a new fire, cleaning the firebox, or
blowing soot.
c) Pursuant to Regulation 401 KAR 61:015, Section 5 (1), sulfur dioxide emissions shall
not exceed 4.0 lb/MMBtu based on a twenty-four-hour average
3.
Testing Requirements:
When the unit is in operation, the permittee shall read, weather permitting, the opacity of the
emissions from the stack using EPA Reference Method 9 once per day.
4.
Specific Monitoring Requirements:
a) Pursuant to Regulation 401 KAR 61:015, Section 6 (2), the sulfur content of liquid fuels,
as burned, shall be determined based on certification from the fuel supplier. This
certification shall include the name of the oil supplier and a statement that the oil
complies with the specifications under the definition for distillate oil in Regulation 401
KAR 60:043.
ELECTRONIC FILING, RECEIVED, CLERK'S OFFICE, JANUARY 5, 2007
* * * * * PC #7 * * * * *
Permit Number:
V-97-050
Page:
12
of
30
SECTION B - EMISSION POINTS, EMISSIONS UNITS, APPLICABLE
REGULATIONS, AND OPERATING CONDITIONS
b) In accordance with Regulation 401 KAR 61:015, Section 6 (3), the rate of fuel burned
shall be measured daily on an as-burned basis and recorded while the boiler is in
operation.
5.
Specific Record Keeping Requirements:
a) Records documenting the amount of fuel oil consumed shall be maintained.
b) Records documenting the sulfur content and heating value of the fuel oil shall be
maintained.
c) The permittee shall keep the results of all compliance tests.
6.
Specific Reporting Requirements:
a) See Section F.
7.
Specific Control Equipment Operating Conditions:
NA
ELECTRONIC FILING, RECEIVED, CLERK'S OFFICE, JANUARY 5, 2007
* * * * * PC #7 * * * * *
Permit Number:
V-97-050
Page:
13
of
30
SECTION B - EMISSION POINTS, EMISSIONS UNITS, APPLICABLE
REGULATIONS, AND OPERATING CONDITIONS
Emissions Unit 04 (05, 06, 10, 11, 12) - Coal Handling Operations
Description:
Reclaim hoppers onto coal conveyor, crusher house, and conveyor drop points.
Operating rate: 4000 tons/hr
Construction commenced : 1981
Applicable Regulations:
Regulation 401 KAR 60:005, Standards of performance for new stationary sources, which
incorporates by reference 40 CFR 60.250 (40 CFR 60, Subpart Y), applies to conveyors and crushers
which process more than 200 tons of coal per day and commenced after October 24, 1974 .
1.
Operating Limitations:
None
2.
Emission Limitations:
Pursuant to Regulation 401 KAR 60:005, 40 CFR 60.252, the owner or operator subject to
the provisions of this regulation shall not cause to be discharged into the atmosphere from
any coal processing and conveying equipment, coal storage system, or transfer and loading
system processing coal, emissions which exhibit 20 percent opacity or greater.
3.
Testing Requirements:
Pursuant to Regulation 401 KAR 60:005, 40 CFR 60.254, EPA Reference Method 9 and the
procedures in 40 CFR 60.11 shall be used to determine opacity quarterly.
4.
Specific Monitoring Requirements:
The permittee shall perform a qualitative visual observation of the opacity of emissions from
each stack on a weekly basis and maintained a log of the observation. If visible emissions
from any stack are perceived or believed to exceed the applicable standard, the permittee
shall determined the opacity of emissions by Reference Method 9 and instigate an inspection
of the control equipment for any necessary repairs.
ELECTRONIC FILING, RECEIVED, CLERK'S OFFICE, JANUARY 5, 2007
* * * * * PC #7 * * * * *
Permit Number:
V-97-050
Page:
14
of
30
SECTION B - EMISSION POINTS, EMISSIONS UNITS, APPLICABLE
REGULATIONS, AND OPERATING CONDITIONS
5.
Specific Record Keeping Requirements:
a) The permittee shall maintain the records of amount of coal received and processed.
b)The permittee shall maintain the result of all compliance tests.
6.
Specific Reporting Requirements:
See Section F.
7.
Specific Control Equipment Operating Conditions:
a) The control equipment enclosures, wet suppression, and baghouses used to control
particulate emissions shall be operated as necessary to maintain compliance with
applicable requirements, in accordance with manufacturer’s specifications and / or
standard operating practices.
b) Records regarding the maintenance of the control equipment shall be maintained.
c) See Section E for further requirements.
ELECTRONIC FILING, RECEIVED, CLERK'S OFFICE, JANUARY 5, 2007
* * * * * PC #7 * * * * *
Permit Number:
V-97-050
Page:
15
of
30
SECTION B - EMISSION POINTS, EMISSIONS UNITS, APPLICABLE
REGULATIONS, AND OPERATING CONDITIONS
Emissions Unit 07 (04, 07, 08, 09) - Coal Handling Operations
Description:
Transfer tower # 1 & 2, rotary railcar unloader, barge unloader, sampling tower, radial stacker, coal
stockpiles, haul roads, and yard area.
Operating rate: 4600 tons/hr
Construction commenced prior to: 1970
Applicable Regulations:
Regulation 401 KAR 63:010, Fugitive emissions
Applicable Reguirements:
a)
Pursuant to Regulation 401 KAR 63:010, Section 3, reasonable precautions shall be taken
to prevent particulate matter from becoming airborne. Such reasonable precautions shall
include, when applicable, but not be limited to the following:
1. Application and maintenance of asphalt, water, or suitable chemicals on roads,
material stockpiles, and other surfaces which can create airborne dusts;
2. Installation and use of hoods, fans, and fabric filters to enclose and vent the handling
of dusty materials, or the use of water sprays or other measures to suppress the dust
emissions during handling;
b)
Pursuant to Regulation 401 KAR 63:010, Section 3, discharge of visible fugitive dust
emissions beyond the property line is prohibited.
1.
Operating Limitations:
None
2.
Emission Limitations:
None
3.
Testing Requirements:
None
ELECTRONIC FILING, RECEIVED, CLERK'S OFFICE, JANUARY 5, 2007
* * * * * PC #7 * * * * *
Permit Number:
V-97-050
Page:
16
of
30
SECTION B - EMISSION POINTS, EMISSIONS UNITS, APPLICABLE
REGULATIONS, AND OPERATING CONDITIONS
4.
Specific Monitoring Requirements:
The permittee shall monitor the amount of coal received and processed.
5.
Specific Record Keeping Requirements:
The permittee shall maintain records of amount of coal received and processed.
6.
Specific Reporting Requirements:
See Section F, Conditions 5,6,7, and 8.
7.
Specific Control Equipment Operating Conditions:
a) The control equipment (including but not limited to hoods, enclosures, use of dust
suppressant/foam, telescopic chute, and wet suppression) shall be operated as necessary
to maintain compliance with applicable requirements, in accordance with manufacturer’s
specifications and / or standard operating practices.
b) Records regarding the maintenance of the control equipment shall be maintained.
c) See Section E for further requirements.
ELECTRONIC FILING, RECEIVED, CLERK'S OFFICE, JANUARY 5, 2007
* * * * * PC #7 * * * * *
Permit Number:
V-97-050
Page:
17
of
30
SECTION C - INSIGNIFICANT ACTIVITIES
The following listed activities have been determined to be insignificant activities for this source
pursuant to Regulation 401 KAR 50:035, Section 5(4). While these activities are designated as
insignificant the permittee must comply with the applicable regulation(s). Process and emission
control equipment at each insignificant activity subject to a generally applicable regulation shall be
inspected weekly and a qualitative visible emissions evaluation made. The results of the inspections
and observations shall be recorded in a log, noting color, duration, density (heavy or light), cause and
any corrective actions taken for any abnormal visible emissions.
Description
Generally Applicable Regulation
1.
Storage vessels containing petroleum or organic
NA
liquids with a capacity of less than 10,567 gallons,
providing (a) the vapor pressure of the stored
liquid is less than 1.5 psia at storage temperature,
or (b) vessels greater than 580 gallons with stored
liquids having greater than 1.5 psia vapor pressure
are equipped with a permanent submerged fill pipe.
2.
Storage vessels containing inorganic aqueous liquids,
NA
except inorganic acids with boiling points below the
maximum storage temperature at atmospheric pressure.
3.
#2 oil-fired space heaters or ovens rated at less than two
NA
million BTU per hour actual heat input, provided the
maximum sulfur content is less than 0.5% by weight.
4.
Machining of metals, providing total solvent usage at
NA
the source for this activity does not exceed 60 gallons
per month.
5.
Internal combustion engines using only gasoline, diesel
NA
fuel, natural gas, or LP gas rated at 50 hp or less.
6.
Volatile organic compound and hazardous air pollutant
NA
storage containers, as follows:
(a)
Tanks, less than 1,000 gallons, and throughput
less than 12,000 gallons per year;
(b)
Lubricating oils, hydraulic oils, machining oils,
and machining fluids.
ELECTRONIC FILING, RECEIVED, CLERK'S OFFICE, JANUARY 5, 2007
* * * * * PC #7 * * * * *
Permit Number:
V-97-050
Page:
18
of
30
SECTION C - INSIGNIFICANT ACTIVITIES (Continued)
Description
Generally Applicable Regulation
7.
Machining where an aqueous cutting coolant
NA
continuously floods machining interface.
8.
Degreasing operations, using less than
NA
145 gallons per year.
9.
Maintenance equipment, not emitting HAPs:
NA
brazing, cutting torches, soldering, welding.
10.
Underground conveyors.
NA
11.
Coal bunker and coal scale exhausts.
401 KAR 63:010
12.
Blowdown (sight glass, boiler, compressor,
NA
pump, cooling tower).
13.
Stationary fire pumps.
NA
14.
Grinding and machining operations vented through
401 KAR 63:010
fabric filters, scrubbers, mist eliminators, or
electrostatic precipitators (e.g., deburring, buffing,
polishing, abrasive blasting, pneumatic conveying,
woodworking).
15.
Vents from ash transport systems not operated at
401 KAR 63:010
positive pressure.
16.
Wastewater treatment (for stream less than 1% oil
NA
and grease).
17.
Heat exchanger cleaning and repair.
NA
18.
Repair and maintenance of ESP, fabric filters, etc.
NA
19.
Any operation using aqueous solution (less than 1% VOC).
NA
20.
Laboratory fume hoods and vents used
NA
exclusively for chemical or physical analysis,
or for “bench scale production” R&D facilities.
ELECTRONIC FILING, RECEIVED, CLERK'S OFFICE, JANUARY 5, 2007
* * * * * PC #7 * * * * *
Permit Number:
V-97-050
Page:
19
of
30
SECTION C - INSIGNIFICANT ACTIVITIES (Continued)
Description
Generally Applicable Regulation
21.
Machinery lubricant and waxes, including
NA
oils, greases or other lubricants applied as
temporary protective coatings.
22.
Purging of gas lines and vessels related to
NA
routine maintenance.
23.
Flue gas conditioning systems.
NA
24.
Equipment used to collect spills.
NA
25.
Ash pond and ash pond maintenance.
NA
26.
Emergency generators: gasoline-powered ( <110 hp),
NA
diesel-powered ( <1600 hp).
27.
Lime handling system; including truck unloading
401 KAR 63:010
(for scrubber lime and stabilization lime), and lime
feed systems.
28.
Fly ash storage silos (both loading and unloading).
401 KAR 63:010
29.
Off-specification used oil fuel burned for energy recovery
NA
30.
Bottom ash screening and sizing system.
401 KAR 63:010
31.
Railcar/truck flyash loadout.
401 KAR 63:010
ELECTRONIC FILING, RECEIVED, CLERK'S OFFICE, JANUARY 5, 2007
* * * * * PC #7 * * * * *
Permit Number:
V-97-050
Page:
20
of
30
SECTION D - SOURCE EMISSION LIMITATIONS AND TESTING
REQUIREMENTS
Particulate, sulfur dioxide, nitrogen oxide, and visible (opacity) emissions, as measured by methods
referenced in Regulation 401 KAR 50:015, Section 1, shall not exceed the respective limitations
specified herein.
ELECTRONIC FILING, RECEIVED, CLERK'S OFFICE, JANUARY 5, 2007
* * * * * PC #7 * * * * *
Permit Number:
V-97-050
Page:
21
of
30
SECTION E - CONTROL EQUIPMENT CONDITIONS
Pursuant to Regulation 401 KAR 50:055, Section 2(5), at all times, including periods of startup,
shutdown and malfunction, owners and operators shall, to the extent practicable, maintain and
operate any affected facility including associated air pollution control equipment in a manner
consistent with good air pollution control practice for minimizing emissions. Determination of
whether acceptable operating and maintenance procedures are being used will be based on
information available to the division which may include, but is not limited to, monitoring results,
opacity observations, review of operating and maintenance procedures, and inspection of the source.
ELECTRONIC FILING, RECEIVED, CLERK'S OFFICE, JANUARY 5, 2007
* * * * * PC #7 * * * * *
Permit Number:
V-97-050
Page:
22
of
30
SECTION F - MONITORING, RECORD KEEPING, AND REPORTING
REQUIREMENTS
1.
When continuing compliance is demonstrated by periodic testing or instrumental monitoring,
the permittee shall compile records of required monitoring information that include:
a.
Date, place as defined in this permit, and time of sampling or measurements.
b.
Analyses performance dates;
c.
Company or entity that performed analyses;
d.
Analytical techniques or methods used;
e.
Analyses results; and
f.
Operating conditions during time of sampling or measurement;
2.
Records of all required monitoring data and support information, including calibrations,
maintenance records, and original strip chart recordings, and copies of all reports required
by the Division for Air Quality, shall be retained by the permittee for a period of five years
and shall be made available for inspection upon request by any duly authorized representative
of the Division for Air Quality. [401 KAR 50:035, Permits, Section 7(1)(d)2 and 401 KAR
50:035, Permits, Section 7(2)(c)]
3.
In accordance with the requirements of Regulation 401 KAR 50:035, Permits, Section
7(2)(c) the permittee shall allow the Cabinet or authorized representatives to perform the
following:
a.
Enter upon the premises where a source is located or emissions-related activity is
conducted, or where records are kept;
b.
Have access to and copy, at reasonable times, any records required by the permit:
i.
During normal office hours, and
ii.
During periods of emergency when prompt access to records is essential to
proper assessment by the Cabinet;
c.
Inspect, at reasonable times, any facilities, equipment (including monitoring and
pollution control equipment), practices, or operations required by the permit.
Reasonable times shall include, but are not limited to the following:
i.
During all hours of operation at the source,
ii.
For all sources operated intermittently, during all hours of operation at the
source and the hours between 8:00 a.m. and 4:30 p.m., Monday through
Friday, excluding holidays, and
iii.
During an emergency; and
d.
Sample or monitor, at reasonable times, substances or parameters to assure
compliance with the permit or any applicable requirements. Reasonable times shall
include, but are not limited to the following:
i.
During all hours of operation at the source,
ii.
For all sources operated intermittently, during all hours of operation at the
source and the hours between 8:00 a.m. and 4:30 p.m., Monday through
Friday, excluding holidays, and
iii.
During an emergency.
ELECTRONIC FILING, RECEIVED, CLERK'S OFFICE, JANUARY 5, 2007
* * * * * PC #7 * * * * *
Permit Number:
V-97-050
Page:
23
of
30
SECTION F - MONITORING, RECORD KEEPING, AND REPORTING
REQUIREMENTS (CONTINUED)
4.
No person shall obstruct, hamper, or interfere with any Cabinet employee or authorized
representative while in the process of carrying out official duties. Refusal of entry or access
may constitute grounds for permit revocation and assessment of civil penalties.
5.
Summary reports of any monitoring required by this permit, other than continuous emission
or opacity monitors, shall be submitted to the Division’s Florence Regional Office at least
every six (6) months during the life of this permit, unless otherwise stated in this permit. The
reports are due within 30 days after the end of each six month reporting period which
commences on the initial issuance date of this permit. The permittee may shift to semi-annual
reporting on a calendar year basis upon approval of the regional office. If calendar year
reporting is approved, the semi-annual reports are due January 30th and July 30th of each year.
Data from the continuous emission and opacity monitors shall be reported to the Technical
Services Branch in accordance with the requirements of Regulation 401 KAR 59:005, General
Provisions, Section 3(3). All reports shall be certified by a responsible official pursuant to
Section 6(1) of Regulation 401 KAR 50:035, Permits. All deviations from permit
requirements shall be clearly identified in the reports.
6.
a. In accordance with the provisions of Regulation 401 KAR 50:055, Section 1 the owner or
operator shall notify the Division for Air Quality’s Ashland Regional Office concerning
startups, shutdowns, or malfunctions as follows:
1. When emissions during any planned shutdowns and ensuing startups will exceed the
standards notification shall be made no later than three (3) days before the planned
shutdown, or immediately following the decision to shutdown, if the shutdown is due
to events which could not have been foreseen three (3) days before the shutdown.
2. When emissions due to malfunctions, unplanned shutdowns and ensuing startups are
or may be in excess of the standards notification shall be made as promptly as possible
by telephone (or other electronic media) and shall cause written notice upon request.
b. In accordance with the provisions of Regulation 401 KAR 50:035, Section 7(1)(e)2, the
owner or operator shall promptly report deviations from permit requirements including
those attributed to upset conditions to the Division for Air Quality’s Ashland Regional
Office.
Prompt reporting shall be defined as quarterly for any deviation related to
emission standards (other than emission exceeding covered by general condition 6(a)
above) and semi-annually for all other deviations from the permit requirements if not
otherwise specified in the permit.
7.
Pursuant to Regulation 401 KAR 50:035, Permits, Section 7(2)(b), the permittee shall certify
compliance with the terms and conditions contained in this permit, annually on the permit
issuance anniversary date or by January 30th of each year if calendar year reporting is approved
by the regional office, by completing and returning a Compliance Certification Form (DEP
7007CC) (or an approved alternative) to the Division for Air Quality’s Ashland Regional
Office and the U.S. EPA in accordance with the following requirements:
a. Identification of each term or condition of the permit that is the basis of the certification;
ELECTRONIC FILING, RECEIVED, CLERK'S OFFICE, JANUARY 5, 2007
* * * * * PC #7 * * * * *
Permit Number:
V-97-050
Page:
24
of
30
SECTION F - MONITORING, RECORD KEEPING, AND REPORTING
REQUIREMENTS (CONTINUED)
b. The compliance status regarding each term or condition of the permit;
c. Whether compliance was continuous or intermittent; and
d. The method used for determining the compliance status for the source, currently and over
the reporting period, pursuant to 401 KAR 50:035, Section 7(1)(c),(d), and (e).
e. The certification shall be postmarked by the thirtieth (30) day following the applicable
permit issuance anniversary date, or by January 30th of each year if calendar year reporting
is approved by the regional office. Annual compliance certifications should be mailed to
the following addresses
:
Division for Air Quality
U.S. EPA Region IV
Ashland Regional Office
Air Enforcement Branch
P.O. Box 1507
Atlanta Federal Center
Ashland, Kentucky 41105-1507
61 Forsyth St.
Atlanta, GA 30303-8960
Division for Air Quality
Central Files
803 Schenkel Lane
Frankfort, KY 40601
8.
In accordance with Regulation 401 KAR 50:035, Section 23, the permittee shall provide the
division with all information necessary to determine its subject emissions within thirty (30)
days of the date the KEIS emission report is mailed to the permittee.
9.
Pursuant to Section VII.3 of the policy manual of the Division for Air Quality as referenced
by Regulation 401 KAR 50:016, Section 1(1), results of performance test(s) required by the
permit shall be submitted to the division by the source or its representative within forty-five
days after the completion of the fieldwork.
ELECTRONIC FILING, RECEIVED, CLERK'S OFFICE, JANUARY 5, 2007
* * * * * PC #7 * * * * *
Permit Number:
V-97-050
Page:
25
of
30
SECTION G - GENERAL CONDITIONS
(a) General Compliance Requirements
1.
The permittee shall comply with all conditions of this permit. A noncompliance shall be (a)
violation(s) of state regulation 401 KAR 50:035, Permits, Section 7(3)(d) and for federally
enforceable permits is also a violation of Federal Statute 42 USC 7401 through 7671q (the
Clean Air Act
)
and is grounds for enforcement action including but not limited to the
termination, revocation and reissuance, or revision of this permit.
2.
The filing of a request by the permittee for any permit revision, revocation, reissuance, or
termination, or of a notification of a planned change or anticipated noncompliance, shall not
stay any permit condition.
3.
This permit may be revised, revoked, reopened and reissued, or terminated for cause. The
permit will be reopened for cause and revised accordingly under the following circumstances:
a. If additional applicable requirements become applicable to the source and the remaining
permit term is three (3) years or longer. In this case, the reopening shall be completed no
later than eighteen (18) months after promulgation of the applicable requirement. A
reopening shall not be required if compliance with the applicable requirement is not
required until after the date on which the permit is due to expire, unless this permit or any
of its terms and conditions have been extended pursuant to Regulation 401 KAR 50:035,
Section 12(2)(c);
b. The Cabinet or the U. S. EPA determines that the permit must be revised or revoked to
assure compliance with the applicable requirements;
c. The Cabinet or the U. S. EPA determines that the permit contains a material mistake or that
inaccurate statements were made in establishing the emissions standards or other terms or
conditions of the permit;
d. If any additional applicable requirements of the Acid Rain Program become applicable to
the source.
Proceedings to reopen and reissue a permit shall follow the same procedures as apply to initial
permit issuance and shall affect only those parts of the permit for which cause to reopen exists.
Reopenings shall be made as expeditiously as practicable. Reopenings shall not be initiated
before a notice of intent to reopen is provided to the source by the division, at least thirty (30)
days in advance of the date the permit is to be reopened, except that the division may provide
a shorter time period in the case of an emergency.
4.
The permittee shall furnish to the division, in writing, information that the division may request
to determine whether cause exists for modifying, revoking and reissuing, or terminating the
permit, or to determine compliance with the permit. [401 KAR 50:035, Permits, Section
7(2)(b)3e and 401 KAR 50:035, Permits, Section 7(3)(j)]
5.
The permittee, upon becoming aware that any relevant facts were omitted or incorrect
information was submitted in the permit application, shall promptly submit such
supplementary facts or corrected information to the permitting authority.
ELECTRONIC FILING, RECEIVED, CLERK'S OFFICE, JANUARY 5, 2007
* * * * * PC #7 * * * * *
Permit Number:
V-97-050
Page:
26
of
30
SECTION G - GENERAL CONDITIONS (CONTINUED)
6.
Any condition or portion of this permit which becomes suspended or is ruled invalid as a result
of any legal or other action shall not invalidate any other portion or condition of this permit.
[401 KAR 50:035, Permits, Section 7(3)(k)]
7.
The permittee shall not use as a defense in an enforcement action the contention that it would
have been necessary to halt or reduce the permitted activity in order to maintain compliance.
[401 KAR 50:035, Permits, Section 7(3)(e)]
8.
Except as identified as state-origin requirements in this permit, all terms and conditions
contained herein shall be enforceable by the United States Environmental Protection Agency
and citizens of the United States.
9.
This permit shall be subject to suspension if the permittee fails to pay all emissions fees within
90 days after the date of notice as specified in 401 KAR 50:038, Section 3(6). [401 KAR
50:035, Permits, Section 7(3)(h)]
10. Nothing in this permit shall alter or affect the liability of the permittee for any violation of
applicable requirements prior to or at the time of permit issuance. [401 KAR 50:035, Permits,
Section 8(3)(b)]
11. This permit shall not convey property rights or exclusive privileges. [401 KAR 50:035,
Permits, Section 7 (3)(g)]
12. Issuance of this permit does not relieve the permittee from the responsibility of obtaining any
other permits, licenses, or approvals required by the Kentucky Cabinet for Natural Resources
and Environmental Protection or any other federal, state, or local agency.
13. Nothing in this permit shall alter or affect the authority of U.S. EPA to obtain information
pursuant to Federal Statute 42 USC 7414, Inspections, monitoring, and entry. [401 KAR
50:035 , Permits, Section 7(2)(b)5]
14. Nothing in this permit shall alter or affect the authority of U.S. EPA to impose emergency
orders pursuant to Federal Statute 42 USC 7603, Emergency orders. [401 KAR 50:035,
Permits, Section 8(3)(a)]
15
Permit Shield
: Except as provided in State Regulation 401 KAR 50:035, Permits, compliance
by the emissions units listed herein with the conditions of this permit shall be deemed to be
compliance with all applicable requirements identified in this permit as of the date of issuance
of this permit.
16. All previously issued construction and operating permits are hereby subsumed into this
permit.
ELECTRONIC FILING, RECEIVED, CLERK'S OFFICE, JANUARY 5, 2007
* * * * * PC #7 * * * * *
Permit Number:
V-97-050
Page:
27
of
30
SECTION G - GENERAL CONDITIONS (CONTINUED)
17. The permittee may conduct test burns of materials other than those listed in the permit without
a construction permit or a reopening of this permit provided that:
a) Notification is provided to the division at least 30 days prior to initiation of the test burning
of the material;
b) The source complies with all applicable regulations and emission limitations;
c) The permittee agrees to perform such additional testing as may be required
by the
division;
18. The permanent burning of any materials ( addressed in above condition) shall be allowed
upon completion of testing provided that:
a) The division determines that a permit is not required. Such determination shall be
made within sixty (60) days of the application receipt along with the test result;
b) The permittee keep records of date and time of burn;
c) The permittee keeps records of analysis and feed rate of material;
b) Burning any of those materials shall not be subject to any applicable regulation and
the source shall comply with all applicable regulation and emission limitations.
19. Fugitive emissions shall be controlled in accordance with Regulation 401 KAR 63:010.
20. Emission limitations listed in this permit shall apply at all times except during periods of
startup, shutdown, or malfunctions, and opacity limitations listed in this permit shall apply at
all times except during periods of startup and shutdown in accordance with Regulation 401
KAR 50:055, provided the permittee complies with the requirements of Regulation 401 KAR
50:055.
21. Pursuant to Section VII 2.(1) of the policy manual of the Division for Air Quality as
referenced by regulation 401 KAR 50:016, Section 1(1), at least one month prior to the date
of the required performance test, the permittee shall complete and return a Compliance Test
Protocol( Form DEP 6027) to the division’s Frankfort Central Office. Pursuant to Regulation
401 KAR 50:045, Section 5, the division shall be notified of the actual test date at least ten
(10) days prior the test.
(b) Permit Expiration and Reapplication Requirements
This permit shall remain in effect for a fixed term of five (5) years following the original date
of issue. Permit expiration shall terminate the source's right to operate unless a timely and
complete renewal application has been submitted to the division at least six months prior to
the expiration date of the permit. Upon a timely and complete submittal, the authorization to
operate within the terms and conditions of this permit, including any permit shield, shall
remain in effect beyond the expiration date, until the renewal permit is issued or denied by the
Division. [401 KAR 50:035, Permits, Section 12]
ELECTRONIC FILING, RECEIVED, CLERK'S OFFICE, JANUARY 5, 2007
* * * * * PC #7 * * * * *
Permit Number:
V-97-050
Page:
28
of
30
SECTION G - GENERAL CONDITIONS (CONTINUED)
(c) Permit Revisions
1.
A minor permit revision procedure may be used for permit revisions involving the use of
economic incentive, marketable permit, emission trading, and other similar approaches, to the
extent that these minor permit revision procedures are explicitly provided for in the SIP or in
applicable requirements and meet the relevant requirements of Regulation 401 KAR 50:035,
Section 15.
2.
This permit is not transferable by the permittee. Future owners and operators shall obtain a
new permit from the Division for Air Quality. The new permit may be processed as an
administrative amendment if no other change in this permit is necessary, and provided that a
written agreement containing a specific date for transfer of permit responsibility coverage and
liability between the current and new permittee has been submitted to the permitting authority
thirty (30) days in advance of the transfer.
(d) Acid Rain Program Requirements
1.
If an applicable requirement of Federal Statute 42 USC 7401 through 7671q (the Clean Air
Act) is more stringent than an applicable requirement promulgated pursuant to Federal Statute
42 USC 7651 through 7651o (Title IV of the Act), both provisions shall apply, and both shall
be state and federally enforceable.
2.
The source shall comply with all requirements and conditions of the Title IV Acid Rain Permit
(A-98-010, Attachment C ) and the Phase II permit application ( including the Phase II NO
x
compliance plan and averaging plan, if applicable) issued for this source. The source shall also
comply with all requirements of any revised or future acid rain permit(s) issued to this source.
(e) Emergency Provisions
1.
An emergency shall constitute an affirmative defense to an action brought for noncompliance
with the technology-based emission limitations if the permittee demonstrates through properly
signed contemporaneous operating logs or other relevant evidence that:
a. An emergency occurred and the permittee can identify the cause of the emergency;
b. The permitted facility was at the time being properly operated;
c. During an emergency, the permittee took all reasonable steps to minimize levels of
emissions that exceeded the emissions standards or other requirements in the permit; and,
d. The permittee notified the division as promptly as possible and submitted written notice
of the emergency to the division within two working days after the time when emission
limitations were exceeded due to the emergency. The notice shall meet the requirements
of 401 KAR 50:035, Permits, Section 7(1)(e)2, and include a description of the emergency,
steps taken to mitigate emissions, and the corrective actions taken.This requirement does
not relieve the source of any other local, state or federal notification requirements.
ELECTRONIC FILING, RECEIVED, CLERK'S OFFICE, JANUARY 5, 2007
* * * * * PC #7 * * * * *
Permit Number:
V-97-050
Page:
29
of
30
SECTION G - GENERAL CONDITIONS (CONTINUED)
2. Emergency conditions listed in General Condition (f)1 above are in addition to any emergency
or upset provision(s) contained in an applicable requirement.
3.
In an enforcement proceeding, the permittee seeking to establish the occurrence of an
emergency shall have the burden of proof. [401 KAR 50:035, Permits, Section 9(3)]
(f). Risk Management Provisions
1.
The permittee shall comply with all applicable requirements of 40 CFR Part 68, Risk
Management Plan provisions. If required, the permittee shall comply with the Risk
Management program and submit a Risk Management Plan to:
RMP Reporting Center
P.O. Box 3346
Merrifield, VA, 22116-3346
(g). Ozone Depleting Substances
1.
The permittee shall comply with the standards for recycling and emissions reduction pursuant
to 40 CFR 82, Subpart F, except as provided for Motor Vehicle Air Conditioners (MVACs)
in Subpart B:
a. Persons opening appliances for maintenance, service, repair, or disposal shall comply with
the required practices contained in 40 CFR 82.156.
b. Equipment used during the maintenance, service, repair, or disposal of appliances shall
comply with the standards for recycling and recovery equipment contained in 40 CFR
82.158.
c. Persons performing maintenance, service, repair, or disposal of appliances shall be certified
by an approved technician certification program pursuant to 40 CFR 82.161.
d. Persons disposing of small appliances, MVACs, and MVAC-like appliances (as defined
at 40 CFR 82.152) shall comply with the recordkeeping requirements pursuant to 40 CFR
82.166.
e. Persons owning commercial or industrial process refrigeration equipment shall comply
with the leak repair requirements pursuant to 40 CFR 82.156.
f. Owners/operators of appliances normally containing 50 or more pounds of refrigerant shall
keep records of refrigerant purchased and added to such appliances pursuant to 40 CFR
82.166.
2.
If the permittee performs service on motor (fleet) vehicle air conditioners containing ozone-
depleting substances, the source shall comply with all applicable requirements as specified in
40 CFR 82, Subpart B, Servicing of Motor Vehicle Air Conditioners.
ELECTRONIC FILING, RECEIVED, CLERK'S OFFICE, JANUARY 5, 2007
* * * * * PC #7 * * * * *
Permit Number:
V-97-050
Page:
30
of
30
SECTION H - ALTERNATE OPERATING SCENARIOS
None
SECTION I - COMPLIANCE SCHEDULE
None
ELECTRONIC FILING, RECEIVED, CLERK'S OFFICE, JANUARY 5, 2007
* * * * * PC #7 * * * * *
3423-00
1
Supplemental PD: 06/22/06
MONTANA AIR QUALITY PERMIT
Issued To:
Southern Montana Electric
Permit: #3423-00
Generation and Transmission Cooperative –
Application Complete: 5/16/06
Highwood Generating Station
Preliminary Determination Issued: 3/30/06
3521 Gabel Road, Suite 5
Supplemental Preliminary Determination
Billings, MT 59102
Issued: 6/22/06
Department’s Decision Issued:
Permit Final:
AFS #: 030-013-0038
An air quality permit, with conditions, is hereby granted to Southern Montana Electric Generation and
Transmission Cooperative – Highwood Generating Station (SME-HGS), pursuant to Sections 75-2-204
and 211 of the Montana Code Annotated (MCA), as amended, and Administrative Rules of Montana
(ARM) 17.8.740,
et seq
., as amended, for the following:
SECTION I: Permitted Facilities
A. Permitted Equipment
SME-HGS operates a gross 270-megawatt (MW) electrical power generating plant. The
SME-HGS facility is a coal-fired steam/electric generating station incorporating a
circulating fluidized bed boiler (CFB Boiler). Auxiliary power to operate the facility is
estimated to be approximately 20 MW resulting in an approximate net power production
capacity of 250 MW. Emissions from the CFB-Boiler are controlled by CFB limestone
injection technology, a fabric filter baghouse (FFB), a hydrated ash re-injection system
(HAR), and a selective non-catalytic reduction unit (SNCR). The total CFB-Boiler
emission control strategy is characterized as an integrated emission control system (IECS).
A complete list of permitted equipment/emission sources is contained in Section I.A of the
permit analysis to this permit.
B. Plant Location
The SME-HGS plant encompasses approximately 720 acres of property and is located
approximately 8 miles east of Great Falls, Montana, and approximately 1.5 miles southeast
of the Morony Dam on the Missouri River. The legal description of the site is in Section
24 and 25, Township 21 North, Range 5 East, M.P.M., in Cascade County, Montana. The
approximate universal transverse mercator (UTM) coordinates are Zone 12, Easting 297.8
kilometers (km), and Northing 5,070.1 km. The site elevation is approximately 3,290 feet
above sea level.
C. Supplemental Preliminary Determination
The Department of Environmental Quality (Department) issued a preliminary
determination on air quality Permit #3423-00 on March 30, 2006, and accepted comments
on the preliminary determination through May 1, 2006. On April 25, 2006, Bison
Engineering, Inc., on behalf of SME-HGS, verbally notified the Department of additional
emitting units that were not previously analyzed and permitted under Preliminary
Determination #3423-00 and are necessary for the construction and operation of the CFB
Boiler. SME-HGS submitted an application for the proposed additional emitting units on
May 16, 2006.
ELECTRONIC FILING, RECEIVED, CLERK'S OFFICE, JANUARY 5, 2007
* * * * * PC #7 * * * * *
3423-00
2
Supplemental PD: 06/22/06
Specifically, SME-HGS determined that during the CFB Boiler construction phase and
periodically thereafter, as necessary, SME-HGS will need to operate portable/temporary
propane-fired heaters for the purpose of curing the CFB Boiler refractory brick. In
addition, the supplemental preliminary determination corrects various administrative errors
contained in the initial preliminary determination. A more detailed discussion of the
supplemental preliminary determination permit action is contained in the permit analysis to
this permit.
All comments regarding the Department’s initial preliminary determination issued for
public comment on March 30, 2006, and received by May 1, 2006, have been accepted by
the Department as applicable to this supplemental preliminary determination and
subsequent comments on the same issues are not necessary. The only changes to the initial
preliminary determination under the supplemental preliminary determination are related to
the refractory brick curing heaters and administrative errors contained in the initial
preliminary determination.
SECTION II: Conditions and Limitations
A. General Plant Requirements
1.
SME-HGS shall not cause or authorize emissions to be discharged into the outdoor
atmosphere from any sources installed after November 23, 1968, that exhibit an
opacity of 20% or greater averaged over 6 consecutive minutes (ARM 17.8.304 and
ARM 17.8.752).
2.
SME-HGS shall not cause or authorize emissions to be discharged into the atmosphere
from haul roads, access roads, parking lots, or the general plant property without taking
reasonable precautions to control emissions of airborne particulate matter (ARM
17.8.308 and ARM 17.8.752).
3.
SME-HGS shall treat all unpaved portions of the haul roads, access roads, parking
lots, or general plant area with water and/or chemical dust suppressant as necessary
to maintain compliance with the reasonable precautions limitation in Section II.A.2
(ARM 17.8.752).
4.
SME-HGS shall not cause or authorize the production, handling, transportation, or
storage of any material unless reasonable precautions to control emissions of airborne
particulate matter are taken. Such emissions of airborne particulate matter from any
stationary source shall not exhibit an opacity of 20% or greater averaged over 6
consecutive minutes (ARM 17.8.308 and ARM 17.8.752).
5.
SME-HGS shall comply with all applicable standards and limitations, and the
reporting, monitoring, recordkeeping, testing, and notification requirements
contained in 40 CFR 60, Subpart Da (ARM 17.8.340 and 40 CFR 60, Subpart Da).
6.
SME-HGS shall comply with all applicable standards and limitations, and the
reporting, monitoring, recordkeeping, testing, and notification requirements
contained in 40 CFR 60, Subpart Db (ARM 17.8.340 and 40 CFR 60, Subpart Db).
7.
SME-HGS shall comply with all applicable standards and limitations, and the
reporting, monitoring, recordkeeping, testing, and notification requirements
contained in 40 CFR 60, Subpart Y (ARM 17.8.340 and 40 CFR 60, Subpart Y).
ELECTRONIC FILING, RECEIVED, CLERK'S OFFICE, JANUARY 5, 2007
* * * * * PC #7 * * * * *
3423-00
3
Supplemental PD: 06/22/06
8.
SME-HGS shall comply with all applicable standards and limitations, and the
reporting, monitoring, recordkeeping, testing, and notification requirements
contained in 40 CFR 60, Subpart OOO (ARM 17.8.340 and 40 CFR 60, Subpart
OOO).
9.
SME-HGS shall comply with all applicable standards and limitations, and the
reporting, monitoring, recordkeeping, testing, and notification requirements
contained in 40 CFR 63, Subpart DDDDD, Industrial/Commercial/Institutional/
boiler and Process Heater MACT (ARM 17.8.342 and 40 CFR 63, Subpart
DDDDD).
10. SME-HGS shall comply with all applicable standards and limitations, and the
reporting, monitoring, recordkeeping, testing, and notification requirements
contained in 40 CFR 63, Subpart ZZZZ, Reciprocating Internal Combustion Engines
(RICE) MACT (ARM 17.8.342 and 40 CFR 63, Subpart ZZZZ).
11. SME-HGS shall comply with all applicable standards and limitations, and the
reporting, recordkeeping, and notification requirements of the Acid Rain Program
contained in 40 CFR 72-78 (ARM 17.8.1202 and 40 CFR 72-78).
12.
SME-HGS shall obtain a written coal analysis that is representative of each load of
coal received from each coal supplier. The analysis shall contain, at a minimum,
sulfur content, ash content, Btu value (Btu/lb), mercury content, and chlorine content
(ARM 17.8.749).
13. SME-HGS shall obtain a written fuel oil analysis for each shipment of fuel oil
received from each fuel oil supplier. The analysis shall contain, at a minimum, the
sulfur content of the fuel oil and the vapor pressure of the fuel oil (ARM 17.8.749).
B. CFB Boiler Start-Up and Shutdown Operations
1.
The requirements contained in Section II.B shall apply during start-up and shutdown
operations. CFB start-up and shutdown operations shall be conducted as specified in
the
CFB Boiler Start-Up and Shutdown Procedures
included in Attachment 3 of
Permit #3423-00 (ARM 17.8.749).
2.
CFB Boiler start-up operations, as described in Attachment 3, shall not exceed 48
hours from initial fuel feed to the CFB Boiler (ARM 17.8.749).
3.
During start-up and shutdown operations, the CFB Boiler may combust coal with a
sulfur content less than or equal to 1% sulfur by weight , fuel oil with a sulfur content
less than or equal to 0.05% sulfur by weight, or pipeline quality natural gas
(ARM
17.8.752).
4.
During start-up and shutdown operations, oxides of nitrogen (NO
x
) emissions from
the CFB Boiler stack shall not exceed 388 lb/hr (ARM 17.8.749).
5.
During start-up and shutdown operations, carbon monoxide (CO) emissions from the
CFB Boiler stack shall not exceed 194 lb/hr (ARM 17.8.749).
ELECTRONIC FILING, RECEIVED, CLERK'S OFFICE, JANUARY 5, 2007
* * * * * PC #7 * * * * *
3423-00
4
Supplemental PD: 06/22/06
C. CFB Boiler
1.
The CFB Boiler shall combust only coal with a sulfur content less than or equal to
1% sulfur by weight except during periods of start-up or shutdown
(ARM 17.8.749
and ARM 17.8.752).
2.
SME-HGS shall operate an IECS including CFB limestone injection technology,
HAR technology, a SNCR unit, and a FFB for CFB Boiler emissions control except
as specified in Attachment 3 during start-up and shutdown operations (ARM
17.8.752).
3.
SME-HGS shall not cause or authorize to be discharged into the atmosphere from the
CFB Boiler stack any visible emissions that exhibit an opacity
of 20% or greater
averaged over 6 consecutive minutes except for one 6-minute period per hour of not
greater than 27% opacity (ARM 17.8.340, ARM 17.8.752, and 40 CFR 60, Subpart
Da).
4.
Filterable particulate matter (filterable PM) emissions from the CFB Boiler stack
shall be limited to 0.012 lb/MMBtu and 33.25 lb/hr (ARM 17.8.752).
5.
Particulate matter with an aerodynamic diameter les than or equal to 10 microns
(PM
10
) emissions (filterable and condensable) from the CFB Boiler stack shall be
limited to 0.026 lb/MMBtu and 72.04 lb/hr (ARM 17.8.752).
6.
The CFB Boiler’s PM
10
emission limit shall be used as a surrogate emission limit for
radionuclides and trace metals (ARM 17.8.752).
7.
Except during periods of start-up and shutdown, NO
x
emissions from the CFB Boiler
stack shall not exceed the following:
a. 0.10 lb/MMBtu based on a 1-hour average (ARM 17.8.749 and ARM 17.8.752);
b. 0.09 lb/MMBtu based on a 24-hour average (ARM 17.8.749 and ARM 17.8.752);
and
c. 0.07 lb/MMBtu based on a rolling 30-day average (ARM 17.8.752).
8.
Except during periods of start-up and shutdown, CO emissions from the CFB Boiler
stack shall be controlled by proper boiler design and good combustion practices. CO
emissions from the CFB Boiler stack shall not exceed 0.10 lb/MMBtu averaged over
any 1-hour time period (ARM 17.8.752).
9.
Sulfur dioxide (SO
2
) emissions from the CFB Boiler stack shall not exceed the
following:
a. 0.057 lb/MMBtu based on a 3-hour average (ARM 17.8.749 and ARM 17.8.752);
b. 0.048 lb/MMBtu based on a 24-hour average (ARM 17.8.749 and ARM
17.8.752); and
c. 0.038 lb/MMBtu based on a rolling 30-day average (ARM 17.8.752).
ELECTRONIC FILING, RECEIVED, CLERK'S OFFICE, JANUARY 5, 2007
* * * * * PC #7 * * * * *
3423-00
5
Supplemental PD: 06/22/06
10. Volatile Organic Compounds (VOC) emissions from the CFB Boiler stack shall be
controlled by proper boiler design and good combustion practices. VOC emissions
from the Boiler stack shall not exceed 0.003 lb/MMBtu averaged over any 1-hour
time period (ARM 17.8.752).
11. Hydrochloric acid (HCl) emissions from the CFB Boiler stack shall not exceed
0.0021 lb/MMBtu averaged over any 1-hour time period (ARM 17.8.752).
12. Hydrofluoric acid (HF) emissions from the CFB Boiler stack shall not exceed 0.0017
lb/MMBtu averaged over any 1-hour time period (ARM 17.8.752).
13. Sulfuric Acid (H
2
SO
4
) mist emissions from the CFB Boiler stack shall not exceed
0.0054 lb/MMBtu averaged over any 1-hour time period (ARM 17.8.752).
14. Mercury Emissions
a. Following commencement of commercial operations (as defined in 40 CFR 60,
Subpart HHHH), at the operator’s choice, mercury emissions from the CFB
Boiler shall not exceed 0.0000015 lb/MMBtu (1.5 pounds per trillion Btu
(lb/TBtu)) based on a rolling 12-month average, or an emission rate equal to a
90% or greater reduction of mercury in the as-fired coal, as measured in lb/TBtu
and based on a rolling 12-month average. Mercury emissions from the CFB
Boiler shall be controlled by the IECS or, at SME-HGS’s request and as may be
approved by the Department in writing, an equivalent technology (equivalent in
removal efficiency) (ARM 17.8.752).
b. If SME-HGS is unable to comply with the mercury limits, within 18 months after
commencement of commercial operations (as defined in 40 CFR 60, Subpart
HHHH), SME-HGS shall install and operate an activated carbon injection control
system or, at SME-HGS’s request and as may be approved by the Department in
writing, an equivalent technology (equivalent in removal efficiency) to comply
with the applicable mercury emission limits (ARM 17.8.752).
15. Heat input to the CFB-Boiler shall not exceed 23,004,636 MMBtu during any rolling
12-month time period (ARM 17.8.749).
16. The CFB Boiler stack height shall, at a minimum, be maintained at 400 feet above
ground level (ARM 17.8.749).
D. Auxiliary Boiler
1.
The Auxiliary Boiler shall be limited to 850 hours of operation during any rolling 12-
month time period (ARM 17.8.752 and 40 CFR 60, Subpart Db).
2.
The Auxiliary Boiler shall combust only fuel-oil with a sulfur content less than or
equal to 0.05% sulfur by weight, propane, or pipeline quality natural gas (ARM
17.8.752).
3.
SO
2
emissions from the Auxiliary Boiler shall be limited to 12.63 lb/hr (ARM
17.8.749).
ELECTRONIC FILING, RECEIVED, CLERK'S OFFICE, JANUARY 5, 2007
* * * * * PC #7 * * * * *
3423-00
6
Supplemental PD: 06/22/06
4.
NO
x
emissions from the Auxiliary Boiler shall be controlled by the installation and
operation of dry low-NO
x
(DLN) burners. NO
x
emissions from the Auxiliary Boiler
shall be limited to 46.80 lb/hr (ARM 17.8.749 and ARM 17.8.752).
5.
CO emissions from the Auxiliary Boiler shall be controlled by proper boiler design
and operation and good combustion practices. CO emissions from the Auxiliary
Boiler shall be limited to 18.60 lb/hr (ARM 17.8.749 and ARM 17.8.752).
6.
VOC emissions from the Auxiliary Boiler shall be controlled by proper boiler design
and operation and good combustion practices (ARM 17.8.752).
7.
PM
10
emissions from the Auxiliary Boiler shall be limited to 3.20 lb/hr (ARM
17.8.749).
8.
The Auxiliary Boiler stack height shall, at a minimum, be maintained at 220 feet
above ground level (ARM 17.8.749).
E. Coal Fuel Processing, Handling, Transfer, and Storage Operations
1.
Visible emissions from any Standards of Performance for New Stationary Source
(NSPS)-affected equipment shall not exhibit an opacity of 20% or greater averaged
over 6 consecutive minutes (ARM 17.8.340, ARM 17.8.752, and 40 CFR 60, Subpart
Y).
2.
All conveyors shall be covered and all outdoor conveyor transfer points shall be
covered and vented to a FFB (ARM 17.8.752).
3.
All railcar coal deliveries/transfers shall be unloaded within the Rail Unloading
Building via belly-dump to a below grade hopper. The Railcar Unloading Building
shall be vented to FFB DC1 and maintained under constant negative pressure when
coal is being unloaded and conveyed within the building (ARM 17.8.752).
4.
PM
10
emissions from FFB DC1 shall be limited to 0.005 gr/dscf (ARM 17.8.752).
5.
All coal deliveries to the Railcar Unloading Building shall be transferred via below
ground feeders to a belt conveyor (MC02) (ARM 17.8.752).
6.
Transfer Tower 16 shall be enclosed and vented to FFB DC2 (ARM 17.8.752).
7.
PM
10
emissions from FFB DC2 shall be limited to 0.005 gr/dscf (ARM 17.8.752).
8.
The emergency coal pile shall be compacted and sprayed with water and/or chemical
dust suppressant, as necessary, to maintain compliance with the reasonable
precautions requirement and opacity limits (ARM 17.8.752).
9.
Coal Silo (CS-1) shall be enclosed and vented to FFB DC2 (ARM 17.8.752).
10. The Coal Crusher House shall be vented to FFB DC3 and shall be maintained under
constant negative pressure when processing coal (ARM 17.8.752).
11. The coal crushers (2), surge bin, and rotary feeders (2) shall be enclosed within the
Coal Crusher House and vented to FFB D3 (ARM 17.8.752).
ELECTRONIC FILING, RECEIVED, CLERK'S OFFICE, JANUARY 5, 2007
* * * * * PC #7 * * * * *
3423-00
7
Supplemental PD: 06/22/06
12. PM
10
emissions from FFB D3 shall be limited to 0.005 gr/dscf (ARM 17.8.752).
13. All coal transfers through the tripper system to the day bins located in the CFB Boiler
house shall be enclosed and routed to FFB DC4 (ARM 17.8.752).
14. PM
10
emissions from FFB DC4 shall be limited to 0.005 gr/dscf (ARM 17.8.752).
F. Limestone and Lime Material Processing, Handling, Transfer, and Storage Operations
1.
Visible emissions from any NSPS-affected crusher shall not exhibit an opacity of
15% or greater averaged over 6 consecutive minutes (ARM 17.8.340, ARM 17.8.752,
and 40 CFR 60, Subpart OOO).
2.
Visible emissions from any other NSPS-affected equipment, such as screens or
conveyor transfers, shall not exhibit an opacity of 10% or greater averaged over 6
consecutive minutes (ARM 17.8.340, ARM 17.8.752, and 40 CFR 60, Subpart
OOO).
3.
All limestone material shall be delivered to the facility via covered bottom dumping
haul-trucks and unloaded within a limestone material unloading drive-through
building. The limestone material unloading drive-through building shall be
maintained under constant negative pressure and vented through FFB DC5 when
limestone material is being unloaded and conveyed within the drive-through building
(ARM 17.8.752).
4.
All conveyors shall be covered and all outdoor conveyor transfer points shall be
covered and vented to FFB DC5 (ARM 17.8.752).
5.
All limestone material transfers to the Bucket Elevator and the Limestone Silo shall
be vented to FFB DC5 (ARM 17.8.752).
6.
PM
10
emissions from FFB DC5 shall be limited to 0.005 gr/dscf (ARM 17.8.752).
7.
Visible emissions from FFB DC5 shall not exhibit an opacity of greater than 7%
averaged over 6 consecutive minutes (ARM 17.8.340, ARM 17.8.752, and 40 CFR
60, Subpart OOO).
G. Fly and Bottom-Ash Material Processing, Handling, Transfer, and Storage Operations
1.
Fly-ash shall be pneumatically transferred from the CFB Boiler FFB to the Fly-Ash
Silo (AS1) (ARM 17.8.752).
2.
Bed-ash shall be pneumatically transferred from the CFB Boiler to the Bed-Ash Silo
(AS2) (ARM 17.8.752).
3.
PM
10
emissions resulting from the charging of AS1 and AS2 shall be controlled by
fabric filter Bin vents DC6 and DC7, respectively (ARM 17.8.752).
4.
Fly-ash and bed-ash shall be gravity-fed into haul trucks through a wet pug-mill for
transfer to the on-site ash monofill/landfill (ARM 17.8.752).
ELECTRONIC FILING, RECEIVED, CLERK'S OFFICE, JANUARY 5, 2007
* * * * * PC #7 * * * * *
3423-00
8
Supplemental PD: 06/22/06
5.
Air displaced by ash loading into haul trucks shall be vented through AS1 and AS2
and associated bin vents DC6 and DC7, respectively (ARM 17.8.752).
6.
PM
10
emissions from each bin vent DC6 and DC7 shall be limited to 0.01 gr/dscf
(ARM 17.8.752).
7.
Visible emissions from bin vent DC6 and DC7 shall not exhibit an opacity of 20% or
greater averaged over 6 consecutive minutes (ARM 17.8.752).
H. Coal Thawing Shed Operations
1.
The Coal Thawing Shed Heater shall be limited to 240 hours of operation during any
rolling 12-month time period (ARM 17.8.749 and ARM 17.8.752).
2.
The Coal Thawing Shed Heater shall combust only propane or pipeline quality
natural gas (ARM 17.8.752).
3.
NO
x
, SO
2
, CO, VOC, and PM
10
emissions from the Coal Thawing Shed Heater
operations shall be controlled by proper design and operation, good combustion
practices, and the combustion of propane and pipeline quality natural gas only (ARM
17.8.752).
I. Emergency Fire Pump Operations
1. The Emergency Fire Pump shall be limited to 500 hours of operation during any
rolling 12-month time period (ARM 17.8.749 and ARM 17.8.752).
2. The Emergency Fire Pump shall combust only fuel oil with a sulfur content less than
or equal to 0.05% sulfur by weight (ARM 17.8.752).
3. NO
x
, SO
2
, CO, VOC, and PM
10
emissions from the Emergency Fire Pump shall be
controlled by proper design and operation and good combustion practices (ARM
17.8.752).
J. Emergency Generator Operations
1.
The Emergency Generator shall be limited to 500 hours of operation during any
rolling 12-month time period (ARM 17.8.749 and ARM 17.8.752).
2.
The Emergency Generator shall combust only fuel oil with a sulfur content less than
or equal to 0.05% sulfur by weight (ARM 17.8.752).
3.
NO
x
, SO
2
, CO, VOC, and PM
10
emissions from the Emergency Generator shall be
controlled by proper design and operation and good combustion practices (ARM
17.8.752).
4.
NO
x
emissions from the Emergency Generator shall be limited to 41.20 lb/hr (ARM
17.8.749 and ARM 17.8.752).
5.
CO emissions from the Emergency Generator shall be limited to 2.70 lb/hr (ARM
17.8.749 and ARM 17.8.752).
ELECTRONIC FILING, RECEIVED, CLERK'S OFFICE, JANUARY 5, 2007
* * * * * PC #7 * * * * *
3423-00
9
Supplemental PD: 06/22/06
K. Cooling Tower
1.
PM
10
emissions from the Cooling Tower shall be controlled by drift eliminators
(ARM 17.8.752).
2.
The Cooling Tower drift rate shall be limited to 0.002% of the total circulating water
flow (ARM 17.8.752).
L. Fuel Storage Tank
SME-HGS shall not store any liquid fuel with a vapor pressure greater than 3.5 kilopascals
(kPa) in the 275,000-gallon capacity fuel storage tank (ARM 17.9.749).
M. CFB Boiler Refractory Brick Curing Heaters
1. SME-HGS shall operate the CFB Boiler refractory brick curing heater(s) only for the
purpose of curing CFB Boiler refractory brick. The CFB Boiler refractory brick curing
heater(s) shall be limited to a combined maximum of 320 hours of operation during any
rolling 12-month time period (ARM 17.8.752).
2. The CFB Boiler refractory brick curing heaters shall combust propane fuel only (ARM
17.8.752).
3. The CFB Boiler refractory brick curing heater(s) shall be limited to a combined
maximum heat input capacity of 2771 MMBtu/hr (ARM 17.8.749).
4. SME-HGS shall not operate the CFB Boiler refractory brick curing heater(s) when
electricity is being generated through CFB Boiler operations or when the boiler fuel
feed (diesel or coal) is operational (ARM 17.8.749).
N. Testing Requirements
1.
CFB Boiler Testing Requirements
a.
SME-HGS shall initially test the CFB Boiler for opacity within 60 days after
achieving the maximum production rate at which the affected facility will be
operated but not later than 180 days after initial startup of the CFB Boiler, or
according to another testing/monitoring schedule as may be approved by the
Department in writing (ARM 17.8.105, ARM 17.8.749, and 40 CFR 60,
Subpart Da).
After the initial source test, SME-HGS shall use the data from the continuous
opacity monitoring system (COMS) to monitor compliance with the applicable
opacity limit (ARM 17.8.749).
b.
SME-HGS shall initially test the CFB Boiler for filterable PM emissions within
60 days after achieving the maximum production rate at which the affected
facility will be operated but not later than 180 days after initial startup of the
CFB Boiler, or according to another testing/monitoring schedule as may be
approved by the Department in writing (ARM 17.8.105, ARM 17.8.749, and 40
CFR 60, Subpart Da).
ELECTRONIC FILING, RECEIVED, CLERK'S OFFICE, JANUARY 5, 2007
* * * * * PC #7 * * * * *
3423-00
10
Supplemental PD: 06/22/06
After the initial source test, additional testing shall continue on an annual basis,
or according to another testing/monitoring schedule as may be approved by the
Department in writing (ARM 17.8.105 and ARM 17.8.749).
c.
SME-HGS shall initially test the CFB Boiler for PM
10
(filterable and
condensable) emissions within 60 days after achieving the maximum
production rate at which the affected facility will be operated but not later than
180 days after initial startup of the CFB Boiler, or according to another testing/
monitoring schedule as may be approved by the Department in writing (ARM
17.8.105 and ARM 17.8.749).
After the initial source test, additional testing shall continue on an annual basis,
or according to another testing/monitoring schedule as may be approved by the
Department in writing (ARM 17.8.105 and ARM 17.8.749).
d.
SME-HGS shall initially test the CFB Boiler for NO
x
emissions within 60 days
after achieving the maximum production rate at which the affected facility will
be operated but not later than 180 days after initial startup of the CFB Boiler, or
according to another testing/monitoring schedule as may be approved by the
Department in writing. SME-HGS shall conduct the initial performance source
testing for NO
x
and CO, concurrently (ARM 17.8.105, ARM 17.8.749, and 40
CFR 60, Subpart Da).
After the initial source test, SME-HGS shall use the data from the NO
x
continuous emissions monitoring system (CEMS) to monitor compliance with
the applicable NO
x
emission limits (ARM 17.8.105 and ARM 17.8.749).
e.
SME-HGS shall initially test the CFB Boiler for CO emissions within 60 days
after achieving the maximum production rate at which the affected facility will
be operated but not later than 180 days after initial startup of the CFB Boiler, or
according to another testing/monitoring schedule as may be approved by the
Department in writing. SME-HGS shall conduct the initial performance source
testing for CO and NO
x
, concurrently (ARM 17.8.105 and ARM 17.8.749).
After the initial source test, additional testing shall continue on an annual basis,
or according to another testing/monitoring schedule as may be approved by the
Department in writing (ARM 17.8.105 and 17.8.749).
f.
SME-HGS shall initially test the CFB Boiler for SO
2
emissions within 60 days
after achieving the maximum production rate at which the affected facility will
be operated but not later than 180 days after initial startup of the CFB Boiler, or
according to another testing/monitoring schedule as may be approved by the
Department in writing (ARM 17.8.105, ARM 17.8.749, and 40 CFR 60,
Subpart Da).
After the initial source test, SME-HGS shall use the data from the SO
2
CEMS
to monitor compliance with the applicable SO
2
emission limits (ARM
17.8.749).
g.
SME-HGS shall initially test the CFB Boiler for HCl emissions within 60 days
after achieving the maximum production rate at which the affected facility will
be operated but not later than 180 days after initial startup of the CFB Boiler, or
according to another testing/monitoring schedule as may be approved by the
Department in writing (ARM 17.8.105 and ARM 17.8.749).
ELECTRONIC FILING, RECEIVED, CLERK'S OFFICE, JANUARY 5, 2007
* * * * * PC #7 * * * * *
3423-00
11
Supplemental PD: 06/22/06
After the initial source test, additional testing shall continue on an every 5-year
basis, or according to another testing/monitoring schedule as may be approved
by the Department in writing (ARM 17.8.105 and ARM 17.8.749).
h.
SME-HGS shall initially test the CFB Boiler for HF emissions within 60 days
after achieving the maximum production rate at which the affected facility will
be operated but not later than 180 days after initial startup of the CFB Boiler, or
according to another testing/monitoring schedule as may be approved by the
Department in writing (ARM 17.8.105 and ARM 17.8.749).
After the initial source test, additional testing shall continue on an every 5-year
basis, or according to another testing/monitoring schedule as may be approved
by the Department in writing (ARM 17.8.105 and 17.8.749).
i.
SME-HGS shall initially test the CFB Boiler for H
2
SO
4
emissions within 60
days after achieving the maximum production rate at which the affected facility
will be operated but not later than 180 days after initial startup of the CFB
Boiler, or according to another testing/monitoring schedule as may be approved
by the Department in writing (ARM 17.8.105 and ARM 17.8.749).
After the initial source test, additional testing shall continue on an every 5-year
basis, or according to another testing/monitoring schedule as may be approved
by the Department in writing (ARM 17.8.105 and ARM 17.8.749).
j.
Pursuant to 40 CFR 60.48a through 60.52a and 40 CFR 75, Subpart I, SME-
HGS shall monitor compliance with the applicable mercury emission limit(s).
Any mercury CEMS used must be operated in compliance with 40 CFR 60,
Appendix B (ARM 17.8.105, ARM 17.8.749, 40 CFR 60, Subpart Da, and 40
CFR 75, Subpart I)
2. Coal Fuel, Limestone, and Ash Processing, Handling, Transfer, and Storage
Operations Testing Requirements
a.
Compliance with the opacity limit for FFB DC1, controlling emissions from
rail unloading material transfers, shall be monitored by an initial performance
source test conducted within 60 days after achieving the maximum production
rate at which the affected facility will be operated but not later than 180 days
after initial startup, or according to another testing/monitoring schedule as may
be approved by the Department in writing. After the initial source test, testing
shall continue as required by the Department (ARM 17.8.105, ARM 17.8.340,
ARM 17.8.749, and 40 CFR 60, Subpart Y).
b.
Compliance with the PM
10
emission limit for FFB DC1 shall be monitored by
an initial performance source test conducted within 60 days after achieving the
maximum production rate at which the affected facility will be operated but not
later than 180 days after initial startup, or according to another testing/
monitoring schedule as may be approved by the Department in writing. After
the initial source test, testing shall continue on an annual basis, or according to
another testing/monitoring schedule as may be approved by the Department in
writing (ARM 17.8.105, ARM 17.8.340, ARM 17.8.749, and 40 CFR 60,
Subpart Y).
ELECTRONIC FILING, RECEIVED, CLERK'S OFFICE, JANUARY 5, 2007
* * * * * PC #7 * * * * *
3423-00
12
Supplemental PD: 06/22/06
c.
Compliance with the opacity limit for FFB DC2, controlling emissions from
coal silo material transfers, shall be monitored by an initial performance source
test conducted within 60 days after achieving the maximum production rate at
which the affected facility will be operated but not later than 180 days after
initial startup, or according to another testing/monitoring schedule as may be
approved by the Department in writing. After the initial source test, testing
shall continue as required by the Department (ARM 17.8.105, ARM 17.8.340,
ARM 17.8.749, and 40 CFR 60, Subpart Y).
d.
Compliance with the PM
10
emission limit for FFB DC2 shall be monitored by
an initial performance source test conducted within 60 days after achieving the
maximum production rate at which the affected facility will be operated but not
later than 180 days after initial startup, or according to another testing/
monitoring schedule as may be approved by the Department in writing. After
the initial source test, testing shall continue on an every 2-year basis, or
according to another testing/monitoring schedule as may be approved by the
Department in writing (ARM 17.8.105, ARM 17.8.340, ARM 17.8.749, and 40
CFR 60, Subpart Y).
e.
Compliance with the opacity limit for FFB DC3, controlling emissions from
coal crusher material transfers, shall be monitored by an initial performance
source test conducted within 60 days after achieving the maximum production
rate at which the affected facility will be operated but not later than 180 days
after initial startup, or according to another testing/monitoring schedule as may
be approved by the Department in writing. After the initial source test, testing
shall continue as required by the Department (ARM 17.8.105, ARM 17.8.340,
ARM 17.8.749, and 40 CFR 60, Subpart Y).
f.
Compliance with the PM
10
emission limit for FFB DC3 shall be monitored by
an initial performance source test conducted within 60 days after achieving the
maximum production rate at which the affected facility will be operated but not
later than 180 days after initial startup, or according to another testing/
monitoring schedule as may be approved by the Department in writing. After
the initial source test, testing shall continue on an every 2-year basis, or
according to another testing/monitoring schedule as may be approved by the
Department in writing (ARM 17.8.105, ARM 17.8.340, ARM 17.8.749, and 40
CFR 60, Subpart Y).
g.
Compliance with the opacity limit for FFB DC4, controlling emissions from
tripper deck plant silos material transfers, shall be monitored by an initial
performance source test conducted within 60 days after achieving the maximum
production rate at which the affected facility will be operated but not later than
180 days after initial startup, or according to another testing/monitoring
schedule as may be approved by the Department in writing. After the initial
source test, testing shall continue as required by the Department (ARM
17.8.105, ARM 17.8.340, ARM 17.8.749, and 40 CFR 60, Subpart Y and
Subpart OOO).
h.
Compliance with the PM
10
emission limit for FFB DC4 shall be monitored by
an initial performance source test conducted within 60 days after achieving the
maximum production rate at which the affected facility will be operated but not
later than 180 days after initial startup, or according to another testing/
ELECTRONIC FILING, RECEIVED, CLERK'S OFFICE, JANUARY 5, 2007
* * * * * PC #7 * * * * *
3423-00
13
Supplemental PD: 06/22/06
monitoring schedule as may be approved by the Department in writing. After
the initial source test, testing shall continue on an every 2-year basis, or
according to another testing/monitoring schedule as may be approved by the
Department in writing (ARM 17.8.105, ARM 17.8.340, ARM 17.8.749, and 40
CFR 60, Subpart Y and Subpart OOO).
i.
Compliance with the opacity limit for FFB DC5, controlling emissions from
limestone material transfers, shall be monitored by an initial performance
source test conducted within 60 days after achieving the maximum production
rate at which the affected facility will be operated but not later than 180 days
after initial startup, or according to another testing/monitoring schedule as may
be approved by the Department in writing. After the initial source test, testing
shall continue as required by the Department (ARM 17.8.105, ARM 17.8.340,
ARM 17.8.749, and 40 CFR 60, Subpart OOO).
j.
Compliance with the PM
10
emission limit for FFB DC5 shall be monitored by
an initial performance source test conducted within 60 days after achieving the
maximum production rate at which the affected facility will be operated but not
later than 180 days after initial startup, or according to another testing/
monitoring schedule as may be approved by the Department in writing. After
the initial source test, testing shall continue on an every 2-year basis, or
according to another testing/monitoring schedule as may be approved by the
Department in writing (ARM 17.8.105, ARM 17.8.340, ARM 17.8.749, and 40
CFR 60, Subpart OOO).
k.
Compliance with the opacity limit for Bin vent DC6, controlling emissions
from ash silo material transfers, shall be monitored by an initial performance
source test conducted within 60 days after achieving the maximum production
rate at which the affected facility will be operated but not later than 180 days
after initial startup, or according to another testing/monitoring schedule as may
be approved by the Department in writing. After the initial source test, testing
shall continue as required by the Department (ARM 17.8.105 and ARM
17.8.749).
l.
Compliance with the opacity limit for bin vent DC7, controlling emissions from
ash silo material transfers, shall be monitored by an initial performance source
test conducted within 60 days after achieving the maximum production rate at
which the affected facility will be operated but not later than 180 days after
initial startup, or according to another testing/monitoring schedule as may be
approved by the Department in writing. After the initial source test, testing
shall continue as required by the Department (ARM 17.8.105 and ARM
17.8.749)
3.
All compliance source tests shall conform to the requirements of the Montana
Source Test Protocol and Procedures Manual (ARM 17.8.106).
4.
The Department may require further testing (ARM 17.8.105).
ELECTRONIC FILING, RECEIVED, CLERK'S OFFICE, JANUARY 5, 2007
* * * * * PC #7 * * * * *
3423-00
14
Supplemental PD: 06/22/06
O. Operational Reporting Requirements
1.
SME-HGS shall submit to the Department annual production information for all
emission points, as required by the Department in the annual emission inventory
request. The request will include, but is not limited to, all sources of emissions
identified in the emission inventory contained in the permit analysis.
Production information shall be gathered on a calendar-year basis and submitted to
the Department by the date required in the emission inventory request. Information
shall be in the units required by the Department. This information may be used to
calculate operating fees, based on actual emissions from the facility, and/or to verify
compliance with permit limitations (ARM 17.8.505).
2.
SME-HGS shall notify the Department of any construction or improvement project
conducted pursuant to ARM 17.8.745, that would include a change in control
equipment, stack height, stack diameter, stack flow, stack gas temperature, source
location or fuel specifications, or that would result in an increase in source capacity
above its permitted operation or the addition of a new emission unit. The notice must
be submitted to the Department, in writing, at least 10 days prior to start up or use of
the proposed de minimis change, or as soon as reasonably practicable in the event of
an unanticipated circumstance causing the de minimis change, and must include the
information requested in ARM 17.8.745(1)(d) (ARM 17.8.745).
3.
All records compiled in accordance with this permit must be maintained by SME-
HGS as a permanent business record for at least 5 years following the date of the
measurement, must be available at the plant site for inspection by the Department,
and must be submitted to the Department upon request (ARM 17.8.749).
4.
SME-HGS shall document, by month, the total heat input to the CFB Boiler. By the
25
th
day of each month, SME-HGS shall total heat input to the CFB Boiler for the
previous month. The monthly information will be used to verify compliance with the
rolling 12-month boiler heat input limitation (ARM 17.8.749).
5.
SME-HGS shall document, by month, the hours of operation of the Auxiliary Boiler.
By the 25
th
day of each month, SME-HGS shall total the operating hours of the
Auxiliary Boiler for the previous month. The monthly information will be used to
verify compliance with the applicable rolling 12-month limitation (ARM 17.8.749).
6.
SME-HGS shall document, by month, the hours of operation of the Emergency
Generator. By the 25
th
day of each month, SME-HGS shall total the operating hours
of the Emergency Generator for the previous month. The monthly information will
be used to verify compliance with the applicable rolling 12-month limitation (ARM
17.8.749).
7.
SME-HGS shall document, by month, the hours of operation of the Emergency Fire
Water Pump. By the 25
th
day of each month, SME-HGS shall total the operating
hours of the Emergency Fire Water Pump for the previous month. The monthly
information will be used to verify compliance with the applicable rolling 12-month
limitation (ARM 17.8.749).
ELECTRONIC FILING, RECEIVED, CLERK'S OFFICE, JANUARY 5, 2007
* * * * * PC #7 * * * * *
3423-00
15
Supplemental PD: 06/22/06
8.
SME-HGS shall document, by month, the hours of operation of the Coal Thawing
Shed Heater. By the 25
th
day of each month, SME-HGS shall total the operating
hours of the Coal Thawing Shed Heater for the previous month. The monthly
information will be used to verify compliance with the applicable rolling 12-month
limitation (ARM 17.8.749).
9.
SME-HGS shall maintain on site the coal fuel and fuel oil analyses required under
Section II.A and submit this information to the Department upon request (ARM
17.8.749).
10. SME-HGS shall maintain a record of CFB Boiler start-up operations. SME-HGS
shall document the total start-up operating hours from initial fuel feed to the CFB
Boiler for each start-up period. The information shall be submitted to the
Department upon request. The information will be used to monitor compliance with
the CFB Boiler start-up operating hour limit (ARM 17.8.749).
11. SME-HGS shall monitor and analyze the CFB Boiler mercury control performance
data following commencement of commercial operations (as defined in 40 CFR 60,
Subpart HHHH). By the 25
th
day of each month, SME-HGS shall summarize the
applicable mercury emissions data (percent reduction and/or emission rate). SME-
HGS shall submit this information to the Department quarterly, or according to
another reporting schedule as may be approved by the Department. The information
will be used to verify the IECS mercury control capabilities (ARM 17.8.749).
12. SME-HGS shall document, by month, the hours of operation of the refractory brick
curing heaters. By the 25
th
day of each month, SME-HGS shall total the operating
hours of the refractory brick curing heaters for the previous month. The monthly
information will be used to verify compliance with the applicable rolling 12-month
limitation (ARM 17.8.749).
P. Continuous Emissions Monitoring Systems (CEMS/COMS)
1.
SME-HGS shall install, operate, calibrate, and maintain CEMS as follows:
a.
A CEMS for the measurement of SO
2
shall be operated on the CFB Boiler stack
(ARM 17.8.105, ARM 17.8.749 and 40 CFR 72-78).
b. A flow monitoring system to complement the SO
2
monitoring system shall be
operated on the CFB Boiler stack (ARM 17.8.105 and 40 CFR 72-78).
c.
A CEMS for the measurement of NO
x
shall be operated on the CFB Boiler stack
(ARM 17.8.105, ARM 17.8.749 and 40 CFR 72-78).
d. A COMS for the measurement of opacity shall be operated on the CFB Boiler
stack (ARM 17.8.105, ARM 17.8.749 and 40 CFR 72-78).
e.
A CEMS for the measurement of oxygen (O
2
) or carbon dioxide (CO
2
) content
shall be operated on the CFB-Boiler stack (ARM 17.8.105 and ARM 17.8.749).
f.
A CEMS for the measurement of mercury shall be operated on the CFB-Boiler
stack (ARM 17.8.105 and ARM 17.8.749).
ELECTRONIC FILING, RECEIVED, CLERK'S OFFICE, JANUARY 5, 2007
* * * * * PC #7 * * * * *
3423-00
16
Supplemental PD: 06/22/06
2.
SME-HGS shall determine CO
2
emissions from the CFB Boiler Stack by one of the
methods listed in 40 CFR 75.10 (40 CFR 72-78).
3.
All continuous monitors required by this permit and by 40 CFR Part 60 shall be
operated, excess emissions reported, and performance tests conducted in accordance
with the requirements of 40 CFR Part 60, Subpart A; 40 CFR Part 60, Subpart Da; 40
CFR Part 60, Appendix B (Performance Specifications #1, #2, and #3); and 40 CFR
Part 72-78, as applicable (ARM 17.8.749 and 40 CFR 72-78).
4.
On-going quality assurance for the gas CEMS must conform to 40 CFR Part 60,
Appendix F (ARM 17.8.749).
5.
SME-HGS shall inspect and audit the COMS annually, using neutral density filters.
SME-HGS shall conduct these audits using the applicable procedures and forms in
the EPA Technical Assistance Document: Performance Audit Procedures for Opacity
Monitors (EPA-450/4-92-010, April 1992). The results of these inspections and
audits shall be included in the quarterly excess emission report (ARM 17.8.749).
6.
SME-HGS shall maintain a file of all measurements from the CEMS, and
performance testing measurements: all CEMS performance evaluations; all CEMS or
monitoring device calibration checks and audits; and adjustments and maintenance
performed on these systems or devices, recorded in a permanent form suitable for
inspection. The records shall be retained on site for at least 5 years following the
date of such measurements and reports. SME-HGS shall supply these records to the
Department upon request (ARM 17.8.749).
7.
SME-HGS shall maintain a file of all measurements from the COMS, and
performance testing measurements: all COMS performance evaluations; all COMS or
monitoring device calibration checks and audits; and adjustments and maintenance
performed on these systems or devices, recorded in a permanent form suitable for
inspection. The records shall be retained on site for at least 5 years following the
date of such measurements and reports. SME-HGS shall supply these records to the
Department upon request (ARM 17.8.749).
Q. Notification
1.
Within 30 days after commencement of construction of the SME-HGS facility, SME-
HGS shall notify the Department of the date of commencement of construction
(ARM 17.8.749)
2.
Within 30 days after commencement of construction of the CFB Boiler, SME-HGS
shall notify the Department of the date of commencement of construction (40 CFR
Part 60.7 and ARM 17.8.749)
3.
Within 15 days after actual startup of the CFB Boiler, SME-HGS shall notify the
Department of the date of actual startup (40 CFR Part 60.7 and ARM 17.8.749).
4.
Within 30 days after commencement of construction of the Auxiliary Boiler, SME-
HGS shall notify the Department of the date of commencement of construction (40
CFR Part 60.7 and ARM 17.8.749)
ELECTRONIC FILING, RECEIVED, CLERK'S OFFICE, JANUARY 5, 2007
* * * * * PC #7 * * * * *
3423-00
17
Supplemental PD: 06/22/06
5.
Within 15 days after actual startup of the Auxiliary Boiler, SME-HGS shall notify the
Department of the date of actual startup (40 CFR Part 60.7 and ARM 17.8.749).
6.
Within 30 days after commencement of construction of material handling/processing
fabric filter baghouses DC1, DC2, DC3, DC4, and DC5, SME-HGS shall notify the
Department of the date of commencement of construction of the affected fabric filter
baghouse(s) (40 CFR 60.7 and ARM 17.8.749).
7.
Within 15 days after actual startup of material handling/processing fabric filter
baghouses DC1, DC2, DC3, DC4, and DC5, SME-HGS shall notify the Department
of the date of actual startup of the affected fabric filter baghouse(s) (40 CFR 60.7 and
ARM 17.8.749).
8.
Within 30 days after commencement of construction of the ash silo fabric filter bin
vents DC6 and DC7, respectively, SME-HGS shall notify the Department of the date
of commencement of construction of the affected fabric filter bin vent(s) (ARM
17.8.749).
9.
Within 15 days after actual startup of the ash silo fabric filter bin vents DC6 and
DC7, respectively, SME-HGS shall notify the Department of the date of actual
startup of the affected fabric filter bin vent(s) (ARM 17.8.749).
10. Within 30 days after commencement of construction of the CFB Boiler refractory
brick curing heater(s), SME-HGS shall notify the Department of the date of
commencement of construction of the affected unit(s) and provide the maximum heat
input capacity of the affected unit(s) (ARM 17.8.749).
11. Within 15 days after actual startup of the CFB Boiler refractory brick curing
heater(s), SME-HGS shall notify the Department of the date of actual startup of the
affected fabric filter bin unit(s) (ARM 17.8.749).
SECTION III: General Conditions
A. Inspection – SME-HGS shall allow the Department’s representatives access to the facility
at all reasonable times for the purpose of making inspections or surveys, collecting
samples, obtaining data, auditing any monitoring equipment (CEMS, CERMS, COMS) or
observing any monitoring or testing, and otherwise conducting all necessary functions
related to this permit.
B. Waiver – The permit and the terms, conditions, and matters stated herein shall be deemed
accepted if SME-HGS fails to appeal as indicated below.
C. Compliance with Statutes and Regulations – Nothing in this permit shall be construed as
relieving SME-HGS of the responsibility for complying with any applicable federal or
Montana statute or rule, except as specifically provided in ARM 17.8.740,
et seq
. (ARM
17.8.756).
D. Enforcement – Violations of requirements contained herein may constitute grounds for
permit revocation, penalties, or other enforcement action as specified in Section 75-2-401,
et seq
., MCA, and ARM 17.8.763.
E. Appeals – Any person or persons jointly or severally adversely affected by the
Department’s decision may request, within 15 days after the Department renders its
decision, upon affidavit setting forth the grounds therefore, a hearing before the Board of
ELECTRONIC FILING, RECEIVED, CLERK'S OFFICE, JANUARY 5, 2007
* * * * * PC #7 * * * * *
3423-00
18
Supplemental PD: 06/22/06
Environmental Review (Board). A hearing shall be held under the provisions of the
Montana Administrative Procedures Act. The filing of a request for a hearing does not
stay the Department’s decision, unless the Board issues a stay upon receipt of a petition
and a finding that a stay is appropriate under Section 75-2-211(11)(b), MCA. The issuance
of a stay on a permit by the Board postpones the effective date of the Department’s
decision until conclusion of the hearing and issuance of a final decision by the Board. If a
stay is not issued by the Board, the Department’s decision on the application is final 16
days after the Department’s decision is made.
F. Permit Inspection – As required by ARM 17.8.755, Inspection of Permit, a copy of the air
quality permit shall be made available for inspection by the Department at the location of
the source.
G. Permit Fee – Pursuant to Section 75-2-220, MCA, as amended by the 2005 Legislature,
failure by SME-HGS to pay the annual operation fee may be grounds for revocation of this
permit, as allowed by that section and rules adopted thereunder by the Board.
H. Construction Commencement – Construction must begin within 3 years after permit
issuance and proceed with due diligence until the project is complete or Permit #3423-00
shall expire. If the permit expires, SME-HGS shall not commence construction until SME-
HGS has applied for and received a new air quality permit pursuant to Sections 75-2-204
and 75-2-211, Montana Code Annotated, and ARM 17.8.740
et seq
., as amended (ARM
17.8.762).
ELECTRONIC FILING, RECEIVED, CLERK'S OFFICE, JANUARY 5, 2007
* * * * * PC #7 * * * * *
Attachment 2
3423-00
19
Supplemental PD: 06/22/06
INSTRUCTIONS FOR COMPLETING EXCESS EMISSION REPORTS (EER)
PART 1
Complete as shown. Report total time during the reporting period in hours. The
determination of plant operating time (in hours) includes time during unit start up, shut down,
malfunctions, or whenever pollutants of any magnitude are generated, regardless of unit
condition or operating load.
Excess emissions include all time periods when emissions, as measured by the CEMS, exceed
any applicable emission standard for any applicable time period.
Percent of time in compliance is to be determined as:
(1 – (total hours of excess emissions during reporting period / total hours of CEMS availability during reporting period)) x 100
PART 2
Complete as shown. Report total time the point source operated during the reporting period
in hours. The determination of point source operating time includes time during unit start up,
shut down, malfunctions, or whenever pollutants (of any magnitude) are generated, regardless
of unit condition or operating load.
Percent of time CEMS was available during point source operation is to be determined as:
(1–(CEMS downtime in hours during the reporting period
a
/total hours of point source operation during reporting period)) x 100
a - All time required for calibration and to perform preventative maintenance must be included in the CEMS downtime.
PART 3
Complete a separate sheet for each pollutant control device. Be specific when identifying
control equipment operating parameters. For example: number of TR units, energizers for
electrostatic precipitators (ESP); pressure drop and effluent temperature for baghouses; and
bypass flows and pH levels for scrubbers. For the initial EER, include a diagram or
schematic for each piece of control equipment.
PART 4
Use Table I as a guideline to report all excess emissions. Complete a separate sheet for each
monitor. Sequential numbering of each excess emission is recommended. For each excess
emission, indicate: 1) time and duration, 2) nature and cause, and 3) action taken to correct
the condition of excess emissions. Do not use computer reason codes for corrective actions
or nature and cause; rather, be specific in the explanation. If no excess emissions occur
during the quarter, it must be so stated.
PART 5
Use Table II as a guideline to report all CEM system upsets or malfunctions. Complete a
separate sheet for each monitor. List the time, duration, nature and extent of problems, as
well as the action taken to return the CEM system to proper operation. Do not use reason
codes for nature, extent or corrective actions. Include normal calibrations and maintenance as
prescribed by the monitor manufacturer. Do not include zero and span checks.
PART 6
Complete a separate sheet for each pollutant control device. Use Table III as a guideline to
report operating status of control equipment during the excess emission. Follow the number
sequence as recommended for excess emissions reporting. Report operating parameters
consistent with Part 3, Subpart e.
PART 7
Complete a separate sheet for each monitor. Use Table IV as a guideline to summarize
excess emissions and monitor availability.
PART 8
Have the person in charge of the overall system and reporting certify the validity of the report
by signing in Part 8.
ELECTRONIC FILING, RECEIVED, CLERK'S OFFICE, JANUARY 5, 2007
* * * * * PC #7 * * * * *
Attachment 2
3423-00
20
Supplemental PD: 06/22/06
EXCESS EMISSIONS REPORT
PART 1 – General Information
a.
Emission Reporting Period
b.
Report Date
c.
Person Completing Report
d.
Plant Name
e.
Plant Location
f.
Person Responsible for Review
and Integrity of Report
g.
Mailing Address for 1.f.
h.
Phone Number of 1.f.
i.
Total Time in Reporting Period
j.
Total Time Plant Operated During Quarter
k.
Permitted Allowable Emission Rates: Opacity
SO
2
NO
x
TRS
l.
Percent of Time Out of Compliance: Opacity
SO
2
NO
x
TRS
m.
Amount of Product Produced
During Reporting Period
n.
Amount of Fuel Used During Reporting Period
ELECTRONIC FILING, RECEIVED, CLERK'S OFFICE, JANUARY 5, 2007
* * * * * PC #7 * * * * *
Attachment 2
3423-00
21
Supplemental PD: 06/22/06
PART 2 - Monitor Information: Complete for each monitor.
a.
Monitor Type (circle one)
Opacity
SO
2
NO
x
O
2
CO
2
TRS Flow
b.
Manufacturer
c.
Model No.
d.
Serial No.
e.
Automatic Calibration Value: Zero
Span
f.
Date of Last Monitor Performance Test
g.
Percent of Time Monitor Available:
1)
During reporting period
2)
During plant operation
h.
Monitor Repairs or Replaced Components Which Affected or Altered
Calibration Values
i.
Conversion Factor (f-Factor, etc.)
j.
Location of monitor (e.g. control equipment outlet)
PART 3 - Parameter Monitor of Process and Control Equipment. (Complete one sheet for each
pollutant.)
a.
Pollutant (circle one):
Opacity
SO
2
NO
x
TRS
b.
Type of Control Equipment
c.
Control Equipment Operating Parameters (i.e., delta P, scrubber
water flow rate, primary and secondary amps, spark rate)
d.
Date of Control Equipment Performance Test
e.
Control Equipment Operating Parameter During Performance Test
ELECTRONIC FILING, RECEIVED, CLERK'S OFFICE, JANUARY 5, 2007
* * * * * PC #7 * * * * *
Attachment 2
3423-00
22
Supplemental PD: 06/22/06
PART 4 - Excess Emission (by Pollutant)
Use Table I: Complete table as per instructions. Complete one sheet for each monitor.
PART 5 - Continuous Monitoring System Operation Failures
Use Table II: Complete table as per instructions. Complete one sheet for each monitor.
PART 6 - Control Equipment Operation During Excess Emissions
Use Table III: Complete as per instructions. Complete one sheet for each pollutant control
device.
PART 7 - Excess Emissions and CEMS performance Summary Report
Use Table IV: Complete one sheet for each monitor.
PART 8 - Certification for Report Integrity, by person in 1.f.
THIS IS TO CERTIFY THAT, TO THE BEST OF MY KNOWLEDGE, THE
INFORMATION PROVIDED IN THE ABOVE REPORT IS COMPLETE AND
ACCURATE.
SIGNATURE
NAME
TITLE
DATE
ELECTRONIC FILING, RECEIVED, CLERK'S OFFICE, JANUARY 5, 2007
* * * * * PC #7 * * * * *
Attachment 2
3423-00
23
Supplemental PD: 06/22/06
TABLE I
EXCESS EMISSIONS
Time
Date
From
To
Duration
Magnitude
Explanation/Corrective Action
ELECTRONIC FILING, RECEIVED, CLERK'S OFFICE, JANUARY 5, 2007
* * * * * PC #7 * * * * *
Attachment 2
3423-00
24
Supplemental PD: 06/22/06
TABLE II
CONTINUOUS MONITORING SYSTEM OPERATION FAILURES
Time
Date
From
To
Duration
Problem/Corrective Action
ELECTRONIC FILING, RECEIVED, CLERK'S OFFICE, JANUARY 5, 2007
* * * * * PC #7 * * * * *
Attachment 2
3423-00
25
Supplemental PD: 06/22/06
TABLE III
CONTROL EQUIPMENT OPERATION DURING EXCESS EMISSIONS
Time
Date
From
To
Duration
Operating Parameters
Corrective Action
ELECTRONIC FILING, RECEIVED, CLERK'S OFFICE, JANUARY 5, 2007
* * * * * PC #7 * * * * *
Attachment 2
3423-00
26
Supplemental PD: 06/22/06
TABLE IV
Excess Emission and CEMS Performance Summary Report
Pollutant (circle one): SO
2
NO
x
TRS H
2
S CO Opacity
Monitor ID
Emission data summary
1
CEMS performance summary
1
1.
Duration of excess emissions in reporting period due to:
a. Startup/shutdown
b. Control equipment problems
c. Process problems
d. Other known causes
e. Unknown causes
2.
Total duration of excess emissions
3.
┌┐
│Total
duration of excess emissions
X 100 =
⎟
│Total
time CEM operated
│
└┘
1.
CEMS
2
downtime in reporting due to:
a. Monitor equipment malfunctions
b. Non-monitor equipment malfunctions
c. Quality assurance calibration
d. Other known causes
e. Unknown causes
2.
Total CEMS downtime
3.
┌
┐
│Total
CEMS downtime
X 100 =
⎟
│Total
time source emitted
⎟
└
┘
1
For opacity, record all times in minutes. For gases, record all times in hours. Fractions are acceptable (e.g., 4.06 hours)
2
CEMS downtime shall be regarded as any time CEMS is not measuring emissions.
ELECTRONIC FILING, RECEIVED, CLERK'S OFFICE, JANUARY 5, 2007
* * * * * PC #7 * * * * *
Attachment 3
CFB Boiler Start-Up and Shutdown Procedures
Permit #3423-00
3423-00
27
Supplemental PD: 06/22/06
The requirements contained in Section II.B of Montana Air Quality Permit #3423-00 shall apply during
CFB Boiler start-up and shutdown operations. CFB Boiler start-up and shutdown operations shall be
conducted as specified in this attachment.
I.
CFB Boiler Startup
Startup of a circulating fluidized bed (CFB) boiler can take up to 48 hours depending on the
initial furnace temperature and condition of the fluidized bed. During the startup process, the unit
steps through a series of changes to reach full load firing on coal with the addition of limestone
into the CFB furnace. During this process, particulate matter (PM), oxides of nitrogen (NO
x
), and
sulfur dioxide (SO
2
) emissions may vary until air pollution control equipment can be operated at
a minimum continuous load.
a.
CFB Boiler Bed Material Preparation
The first step in the startup of a CFB involves loading the initial bed material into the
furnace. Either sand or used bed ash is loaded into the bed utilizing a pneumatic system.
This step can take several hours to complete, during which time there is no fuel
combustion taking place. The emissions present during the ash loading cycle are
particulate matter. The fabric filter baghouse will collect any of the particulate matter
during this step.
b.
Startup Hours 1-12
Once the bed material is loaded into the furnace, the fans are started and the CFB Boiler
begins to fire on fuel oil. The fuel oil is utilized to warm up the bed material and the
CFB Boiler components. The fuel oil usage is increased until the temperature inside the
cyclone reaches approximately 1150°F. From a cold start, this process may take 14
hours. During this warm-up period NO
x
is controlled through efficient low NO
x
fuel oil
burners; SO
2
is minimized through the use of low sulfur fuel oil; and PM emissions are
controlled by the fabric filter. Carbon monoxide (CO) emissions may be higher than full
load operation due to the combustion conditions in the furnace during this period. The
firing rate is expected to be approximately 831 million British thermal units per hour
(MMBtu/hr) (30% of the maximum CFB Boiler heat input rate of 2,771 MMBtu/hr).
c.
Startup Hours 12-18
After approximately 12 hours of firing on fuel oil, coal and limestone are introduced into
the furnace and the feed rate is increased over the next 2 hours until the coal becomes the
primary fuel source. During this time both fuel oil and coal are combusted together. The
fuel oil feed rate is slowly reduced and is eventually shut off. During this transition NO
x
is controlled by the use of low NO
x
fuel oil burners and the staged combustion of the
coal. SO
2
is controlled by the use of low sulfur fuel oil and the addition of limestone to
the fluidized bed. The fabric filter continues to control PM.
At approximately 50% of full load the NO
x
is further reduced by adding ammonia
injection via the Selective Non-catalytic Reduction (SNCR) system. In addition,
approximately 4 hours after limestone is injected into the fluidized bed, the hydrated ash
reinjection system is activated to further reduce SO
2
emissions. At this point all
emissions control equipment is fully activated. The total time to reach a point where all
air pollution control technologies are operating is approximately 18 hours from a cold
start. Start-up operations are limited, by permit, to a maximum of 48 hours.
ELECTRONIC FILING, RECEIVED, CLERK'S OFFICE, JANUARY 5, 2007
* * * * * PC #7 * * * * *
Attachment 3
CFB Boiler Start-Up and Shutdown Procedures
Permit #3423-00
3423-00
28
Supplemental PD: 06/22/06
II.
CFB Boiler Shutdown
Several steps are required for a controlled shutdown of the boiler and the associated ancillary
equipment. The first step of the process is to shut down the coal feed into the furnace. In order to
accomplish this, the coal feed and firing rate is gradually reduced. As the temperature is reduced
below the minimum requirements for the hydrated ash re-injection and SNCR systems, these
systems are turned off. The furnace is brought down to the minimum coal firing rate. At this
point the coal feed is completely shut off and the furnace is purged with air. The air will be used
to gradually lower the boiler temperature for inspection or maintenance. Once the boiler is
cooled off, the ID Fan will be turned off. If no access into the furnace is required, the bed ash
will be left in the furnace area of the CFB Boiler. If access is required, the bed ash will be
discharged and pneumatically conveyed to the ash silo, where it will be stored until the next
startup. In the event that the boiler shutdown is only for a short period, and re-operation of the
unit is anticipated, the fans will be turned off, and the ID Fan control damper will be closed in
order to bottle up the furnace and maintain the maximum amount of heat.
ELECTRONIC FILING, RECEIVED, CLERK'S OFFICE, JANUARY 5, 2007
* * * * * PC #7 * * * * *
3423-00
1
Supplemental PD: 06/22/06
Permit Analysis
Southern Montana Electric Generation and Transmission Cooperative –
Highwood Generating Station
Permit #3423-00
I.
Introduction/Process Description
A. Permitted Equipment
Southern Montana Electric Generation and Transmission Cooperative – Highwood Generating
Station (SME-HGS) operates a net 250-megawatt (MW) electrical power generating plant
located approximately 8 miles east of Great Falls, Montana, and approximately 1.5 miles
southeast of the Morony Dam on the Missouri River. The legal description of the site is in
Section 24 and 25, Township 21 North, Range 5 East, M.P.M., in Cascade County, Montana.
The approximate universal transverse mercator (UTM) coordinates are Zone 12, Easting 297.8
kilometers (km), and Northing 5,070.1 km. The site elevation is approximately 3,290 feet
above seal level.
The SME-HGS facility is a coal-fired steam/electric generating station incorporating a
circulating fluidized bed boiler (CFB Boiler) with an average annual heat input value of 2,626
million British thermal units per hour (MMBtu/hr) and a maximum short-term heat input
capacity of 2,771 MMBtu/hr to produce approximately 1.8 million pounds of steam per hour.
The steam is routed to a steam turbine, which drives an electric generator capable of producing
an estimated 270 gross MW of electrical power. Auxiliary power to operate the facility is
estimated to be approximately 20 MW resulting in the approximate net power production
capacity of 250 MW. The following equipment/emission sources are permitted for this facility:
•
2771 MMbtu/hr heat input capacity coal fired CFB Boiler (2626 MMBtu/hr average)
•
225 MMBtu/hr heat input capacity diesel fuel-oil, propane, or natural gas fired Auxiliary
Boiler
•
2000 kilowatt (kW) emergency diesel fuel-oil fired generator set
•
230 Kw emergency diesel fuel-oil fired Emergency fire pump
•
40 MMBtu/hr heat input capacity propane/natural gas fired Coal Thawing Shed Heater
•
Cooling Tower
•
Fabric Filter Baghouse (FFB) DC1 controlling rail unloading material transfers
•
FFB DC2 controlling coal silo material transfers
•
FFB DC3 controlling coal crusher operation and material transfers
•
FFB DC4 controlling tripper deck plant silos material transfers
•
FFB DC5 controlling limestone material transfers
•
Fabric Filter bin vent DC6 controlling fly ash silo (AS-1) material transfers
•
Bin vent DC7 controlling bottom ash silo (AS-2) material transfers
•
Emergency Coal Storage Pile
•
Ash Storage/Disposal Monofill
•
275,000 gallon capacity diesel fuel-oil storage tank
•
Haul Roads/vehicle traffic
•
2771 MMBtu/hr heat input capacity portable/temporary propane fired CFB Boiler
refractory brick curing heater(s)
ELECTRONIC FILING, RECEIVED, CLERK'S OFFICE, JANUARY 5, 2007
* * * * * PC #7 * * * * *
3423-00
2
Supplemental PD: 06/22/06
B. Source Description
1. CFB Boiler
The CFB Boiler will combust low-sulfur coal except during periods of start-up and
shutdown where pipeline quality natural gas, propane, or low-sulfur diesel fuel-oil may be
combusted. Regulated pollutants emitted from the CFB-Boiler will be controlled by CFB
limestone injection technology, a fabric filter baghouse (FFB), a hydrated ash re-injection
system (HAR), and a selective non-catalytic reduction unit (SNCR). The total CFB-Boiler
emission control strategy is characterized as an integrated emission control system (IECS).
The CFB Boiler technology uses a bed of crushed coal and limestone and recycled heavy
ash particles suspended (fluidized) in an upwardly flowing air stream. Air enters near the
bottom of the furnace and is staged through air distribution nozzles to minimize the
formation of NO
x
. The coal and limestone are metered and fed into the furnace bed.
Combustion takes place in the fluidized bed, which is limited in temperature to reduce the
formation of NO
x
. The fine particles of limestone react with the sulfur in the coal and
reduce the formation of SO
2
. The heavier combustion byproduct particles are carried in the
flue gas through the furnace, collected in a cyclone separator, and are then circulated back
into the furnace.
The SNCR system is used to control NO
x
emissions. Ammonia (NH
3
) is injected into the
cyclone separator and mixed with the flue gas. The NH
3
reacts with the flue gas to convert
NO
x
into nitrogen gas (N
2
), and water vapor (H
2
O). The HAR system is used to control
SO
2
emissions. The HAR is a dry flue gas desulfurization process; the system mixes water
with fly ash and available lime (produced during heating of the limestone in the CFB
Boiler) to react with the SO
2
in the flue gas to form particulate, which is collected
downstream in FFB. The FFB is used for particulate emissions control. The fabric filter
consists of multiple fabric bags that capture lighter particles in the exhaust gases
downstream of the cyclone separator. These lighter particles include fly ash and lighter
solids created in the chemical reaction processes. Carbon monoxide (CO) and Volatile
Organic Compounds (VOC) emissions will be controlled by best management practices
(BMP) and staged combustion of air ensuring proper operation of the CFB Boiler.
Limestone injection in the CFB Boiler and the HAR system, collectively, will also remove
acid gases including sulfuric acid (H
2
SO
4
), hydrochloric acid (HCl) and hydrofluoric acid
(HF). In addition, the FFB will reduce emissions of metals including antimony, arsenic,
beryllium, cadmium, chromium, cobalt, lead, mercury, and manganese. A co-benefit of
mercury emission reduction will result from the overall IECS design. Absorption of
mercury will be realized in the CFB Boiler due to the source of unburned carbon, use of
limestone injection, SNCR, and the HAR system. The mercury in particulate form will
then be collected in the FFB. In addition, mercury specific emission controls may be
required (see mercury BACT analysis and determination, Section III, Permit Analysis).
After passing through the FFB, the flue gas will exit to atmosphere through the 400-feet
tall CFB Boiler stack. The height of the stack was selected to minimize the visual impact
of the plant while maintaining adequate dispersion.
2. Auxiliary Boiler, Emergency Generator, Emergency Fire Pump, and Coal Thawing Shed
The auxiliary boiler will combust #2 diesel fuel, natural gas, or propane and will only be in
operation during periods of CFB Boiler startup, shutdown, commissioning and during
extended downtimes of the CFB Boiler during winter months to aid in the prevention of
freezing of the CFB Boiler components. The Emergency Generator and Emergency Fire
ELECTRONIC FILING, RECEIVED, CLERK'S OFFICE, JANUARY 5, 2007
* * * * * PC #7 * * * * *
3423-00
3
Supplemental PD: 06/22/06
Pump will combust only low-sulfur diesel fuel-oil and operate only during emergencies
and during required maintenance. The Coal Thawing Shed Heater will only operate on
propane or natural gas during times when the coal is frozen in the coal train cars.
3. Cooling Tower
A wet cooling tower will be used to dissipate the heat from the condenser by using the
latent heat of water vaporization to exchange heat between the process and the air passing
through the cooling tower. The cooling tower will be an induced, counter flow draft design
equipped with drift eliminators. The average make-up water rate for the proposed cooling
tower will be approximately 2,250 gallons per minute (gpm). Water will be delivered to
the facility via pipeline from the Missouri River.
4. Coal Fuel Processing, Handling, Transfer, and Storage Operations
Facility operations will utilize several proposed conveyors, transfer points, and storage
facilities to handle the coal fuel material required for the operation of the CFB Boiler. The
coal storage and handling system begins with coal delivered by railcars to the SME-HGS
facility. Coal deliveries are estimated to be two trains per week or approximately 22,000
tons of coal.
The coal delivery railcars will pass through the Coal Thawing Shed, which will thaw
frozen wintertime coal shipments before the railcars enter the Rail Unloading Building.
Inside the Rail Unloading Building the coal railcars will be unloaded via a belly dump into
a below-grade hopper. From the hopper, the coal will be transferred onto a covered belt
conveyor (MC02). The Rail Unloading Building will be vented to an induced draft FFB
DC1, which will maintain a constant negative pressure within the building. FFB DC1will
provide emission control for coal transfers from the below-grade feeders to conveyor
MC02. MC02 will deliver the coal to the enclosed Transfer Tower 16. The Transfer
Tower will be vented to the induced draft FFB DC2 located near the coal silo. The
Transfer Tower will direct the coal to either the coal silo or to the outdoor long-term coal
storage pile (emergency coal pile). The emergency coal pile will store enough coal to
supply the CFB Boiler for approximately one month and be used during interruptions in
coal deliveries. The emergency coal pile will be compacted and sprayed with water or
surfactant to minimize coal dust emissions. Coal transferred to the emergency coal storage
pile will be diverted to the Coal Stackout Conveyor (CC01) and will then enter the
Lowering Well where emissions will be controlled by the Lowering Well design. Coal will
be reclaimed from the coal storage pile by below-grade vibrating reclaim hoppers and a
belt feeder. The reclaimed coal will be moved onto the Coal Reclaim Conveyor (CC03)
and returned to Transfer Tower 16. Coal not directed to the emergency coal pile or
reclaimed from the emergency coal pile will be transferred to the Coal Transfer Conveyor
(CC02) inside Transfer Tower 16. CC02 feeds the Coal Silo (CS-1), which is sized to hold
coal for several days of CFB Boiler operations. The coal transfers associated with CC04
are controlled by FFB DC2 located at the coal silo. FFB DC2 will also control coal dust
emissions from the transfer of coal from the feeder located at the bottom of CS-1 to Coal
Feeder Conveyor (CC04). CC04 transfers coal to the Coal Crusher House which encloses
a coal surge bin, two rotary feeders, and two coal crushers and is controlled by FFB DC3,
which also controls emissions from the Coal Transfer Conveyor CC05. Crushed coal on
CC06 is transferred to the Tripper System (comprised of the Tripper Conveyor and
Traveling Tripper) and is controlled by FFB DC4.
ELECTRONIC FILING, RECEIVED, CLERK'S OFFICE, JANUARY 5, 2007
* * * * * PC #7 * * * * *
3423-00
4
Supplemental PD: 06/22/06
5. Limestone Processing, Handling, Transfer, and Storage Operations
Covered, over-the-highway, bottom-dumping trucks will deliver limestone material to the
SME-HGS facility and will be unloaded in a drive-through building, which is controlled by
FFB DC5. The Limestone Transfer Conveyor (LC01) will move the delivered limestone to
the Limestone Bucket Elevator (LC02), and discharge into the Limestone Silo (LS1). LS1
loading and unloading limestone dust emissions from this silo will also be controlled by
FFB DC5. Limestone unloaded from the silo will be transferred to a feed chute by the
Limestone Weight Feeder (LC03). The feed chute dumps directly into the Limestone
Mills, which feed directly into the furnace of the boiler.
6. Fly and Bed Ash Handling, Transfer, and Storage/Disposal Operations
Combustion of coal in the CFB Boiler will produce two types of dry ash: bed ash (20-30%)
and fly ash (70-80%). Both fly ash and bed ash will be dry and will be collected in two
separate ash silos. Fly ash collected by the baghouse will be pneumatically transferred to
the fly ash silo (AS1). Air displaced by fly ash silo charging will be controlled by Bin-
Vent DC6, while bed ash from the CFB Boiler will be transferred pneumatically to the bed
ash silo (AS2) where emissions will be controlled by a bin vent DC7. Bed ash and fly ash
will be gravity-fed into trucks through a pug mill where water and ash are mixed to reduce
dust generation. Air displaced by ash loading into trucks will be vented through AS1 and
AS2 and their associated bin vents DC6 and DC7, respectively. The ash will be transferred
from AS1 and AS2 to trucks and disposed of in the on-site ash monofill. In addition to
disposal on-site, SME-HGS is researching beneficial uses for the ash.
7. Fuel-Oil Storage Tank
The diesel fuel will be used for CFB Boiler startup, shut-down, and commissioning
operations, auxiliary boiler operations, emergency generator operations, and emergency
fire pump operations, and will be stored in an above-ground fuel tank. The tank will hold
up to 275,000 gallons of #2 diesel fuel. The tank will be limited to the storage of fuels
with a vapor pressure of 3.5 kilopascals (kPa) or less to avoid 40 CFR 60, Subpart Kb,
applicability.
8. Haul Roads
Trucks will be used for the delivery of limestone and the transport of ash to the monofill.
The facility will also have bulldozers and front-end loaders, which will be utilized to
maintain the emergency coal storage pile. SME-HGS will use BMP, including water
sprays, to reduce fugitive emissions from unpaved work areas and roadways.
9. CFB Boiler Refractory Brick Curing Heaters
Because information on the final CFB Boiler design is dependent on the choice of boiler
manufacturer and this information is not available at the time of application for this
supplemental preliminary determination, SME-HGS formulated a conservative refractory
brick curing scenario (i.e., scenario with conservatively high emission rates). This scenario
includes a total heat input to cure the CFB Boiler refractory brick that would not exceed
the maximum hourly heat input to the CFB Boiler of 2771 MMBtu/hr. The CFB Boiler
refractory brick curing heater(s) shall be limited to a combined maximum of 320 hours of
operation per year and shall combust only propane fuel.
ELECTRONIC FILING, RECEIVED, CLERK'S OFFICE, JANUARY 5, 2007
* * * * * PC #7 * * * * *
3423-00
5
Supplemental PD: 06/22/06
C. Permit History
The Department issued a preliminary determination on air quality Permit #3423-00 on March
30, 2006, and accepted comments on the preliminary determination through May 1, 2006. On
April 25, 2006, Bison Engineering, Inc., on behalf of SME-HGS, verbally notified the
Department of additional air pollutant emitting units that were not previously analyzed and
permitted under Preliminary Determination #3423-00 and are necessary for the construction
and operation of the CFB Boiler. SME-HGS submitted an application for the proposed
additional emitting units on May 16, 2006. Because these units were not included in the initial
preliminary determination, the Department issued a supplemental preliminary determination for
public comment.
D. Supplemental Preliminary Determination
SME-HGS determined that during the CFB Boiler construction phase and periodically
thereafter, as necessary, SME-HGS will need to operate portable/temporary propane-fired
heater(s) for the purpose of curing the CFB Boiler refractory brick (refractory heaters). At the
time of application for the supplemental preliminary determination, SME-HGS had not
determined the specific boiler manufacturer to supply the CFB Boiler for the proposed project;
therefore, specific information regarding the refractory heaters was not available prior to
application for the supplemental preliminary determination. In light of this, The Department
required that SME-HGS provide a conservative analysis of potential worst-case impacts
resulting from operation of the proposed refractory heater(s).
SME-HGS formulated a conservative refractory heater operating scenario (i.e., a scenario with
conservatively high emission rates). The scenario proposes a total refractory heater heat input
limit that would not exceed the maximum hourly heat input to the CFB Boiler of 2771
MMBtu/hr, as reported in the initial application for air quality Permit #3423-00. The refractory
heaters would potentially combust approximately 30,280 gallons of propane per day to achieve
this conservatively estimated heat input scenario. The analysis of potential impacts and the
Department’s Best Available Control Technology (BACT) determination for the proposed
refractory heaters is based on the above-cited maximum heat input scenario firing propane and
an annual operating limit of 320 hours per year to accommodate initial and periodic refractory
heater(s) operations. In addition, the CFB Boiler refractory brick heater(s) emissions exhaust
will exit the CFB Boiler through a temporary stack 11 feet in diameter and 210 feet tall. The
stack will be located above the CFB Boiler cyclone. The required BACT analysis for the
refractory heater(s) project is contained in Section III.F of the permit analysis to this permit.
SME-HGS modeled potential impacts from the portable/temporary CFB Boiler refractory brick
curing heater(s) and the modeling conducted for the project demonstrates compliance with all
applicable standards.
In addition, the following administrative errors contained in the Department’s initial preliminary
determination have been corrected under this supplemental preliminary determination:
•
Correction of applicable Auxiliary Boiler PM
10
emission limit in Section II.D.7 of the
permit. The correct emission limit is 3.20 lb/hr not 5.43 lb/hr as required in the
Department’s initial preliminary determination;
•
Table contained in Section III.A.5.C of the permit analysis, CFB Boiler VOC BACT
Analysis, corrected to indicate “VOC” not “CO” emission rates, as reported in the
Department’s initial preliminary determination;
ELECTRONIC FILING, RECEIVED, CLERK'S OFFICE, JANUARY 5, 2007
* * * * * PC #7 * * * * *
3423-00
6
Supplemental PD: 06/22/06
•
The CFB Boiler mercury emission estimate contained in Section IV, Emission Inventory,
of the permit analysis, has been modified from an estimate of 0.02 tons per year reported in
the Department’s initial preliminary determination to 0.017 tons per year to reflect
potential mercury emissions resulting from the permitted mercury BACT emission limit of
1.5 lb/TBtu.
•
Correction of the years of surface and upper air meteorological data used to demonstrate
compliance with the Class II modeling contained in the second paragraph in Section VI of
the permit analysis, Ambient Impact Analysis. The correct years of meteorological data
are 1987-1991 and not 1984, 1986-1991, as reported in the Department’s initial
preliminary determination.
•
Correction of modeled concentration of CO reported in Table 1, Section VI, Ambient Air
Impact Analysis, from 662 ug/m
3
reported in the Department’s initial preliminary
determination to 66.2 ug/m
3
and the reported net increase of VOC from 36.5 reported in
the Department’s initial preliminary determination to 35.6 tons per year.
•
Correction of the NO
x
control efficiencies reported in the Department’s initial preliminary
determination for SCR, SNCR, and baseline uncontrolled CFB Boiler emissions in the
table in Section III.A.3.C of the permit analysis. The correct control efficiencies are 90%
for SCR, 50% for SNCR, and 0% for uncontrolled baseline emissions.
•
Addition of footnote to Emission Inventory table contained in Section IV of the permit
analysis to clarify estimated PM and PM
10
emissions from the CFB Boiler.
•
Correction of SNCR urea chemical reaction contained in Section III.A.3.A.vi, BACT
Determination, of the permit analysis.
All comments regarding the Department’s initial preliminary determination issued for public
comment on March 30, 2006, and received by May 1, 2006, have been accepted by the
Department as applicable to this supplemental preliminary determination and subsequent
comments on the same issues are not necessary. The only changes to the initial preliminary
determination under the supplemental preliminary determination are related to the refractory
brick curing heaters and administrative errors contained in the initial preliminary determination,
as detailed above. The supplemental Preliminary Determination #3423-00 replaces the initial
Preliminary Determination #3423-00 issued for public comment on March 30, 2006.
II. Applicable Rules and Regulations
The following are partial explanations of some applicable rules and regulations that apply to the
facility. The complete rules are stated in the Administrative Rules of Montana (ARM) and are
available, upon request, from the Department. Upon request, the Department will provide references
for location of complete copies of all applicable rules and regulations or copies where appropriate.
A. ARM 17.8, Subchapter 1 – General Provisions, including but not limited to:
1. ARM 17.8.101 Definitions
. This rule includes a list of applicable definitions used in this
chapter, unless indicated otherwise in a specific subchapter.
2. ARM 17.8.105 Testing Requirements
. Any person or persons responsible for the emission
of any air contaminant into the outdoor atmosphere shall, upon written request of the
Department, provide the facilities and necessary equipment (including instruments and
sensing devices) and shall conduct tests, emission or ambient, for such periods of time as
may be necessary using methods approved by the Department.
ELECTRONIC FILING, RECEIVED, CLERK'S OFFICE, JANUARY 5, 2007
* * * * * PC #7 * * * * *
3423-00
7
Supplemental PD: 06/22/06
3. ARM 17.8.106 Source Testing Protocol. The requirements of this rule apply to any
emission source testing conducted by the Department, any source or other entity as
required by any rule in this chapter, or any permit or order issued pursuant to this chapter,
or the provisions of the Clean Air Act of Montana, 75-2-101,
et seq
., Montana Code
Annotated (MCA).
SME-HGS shall comply with the requirements contained in the Montana Source Test
Protocol and Procedures Manual, including, but not limited to, using the proper test
methods and supplying the required reports. A copy of the Montana Source Test Protocol
and Procedures Manual is available from the Department upon request.
4. ARM 17.8.110 Malfunctions
. (2) The Department must be notified promptly by telephone
whenever a malfunction occurs that can be expected to create emissions in excess of any
applicable emission limitation or to continue for a period greater than 4 hours.
5. ARM 17.8.111 Circumvention
. (1) No person shall cause or permit the installation or use
of any device or any means that, without resulting in reduction of the total amount of air
contaminant emitted, conceals or dilutes an emission of air contaminant that would
otherwise violate an air pollution control regulation. (2) No equipment that may produce
emissions shall be operated or maintained in such a manner as to create a public nuisance.
B. ARM 17.8, Subchapter 2 – Ambient Air Quality, including, but not limited to the following:
1. ARM 17.8.210 Ambient Air Quality Standards for Sulfur Dioxide
2. ARM 17.8.211 Ambient Air Quality Standards for Nitrogen Dioxide
3. ARM 17.8.212 Ambient Air Quality Standards for Carbon Monoxide
4. ARM 17.8.213 Ambient Air Quality Standard for Ozone
5. ARM 17.8.220 Ambient Air Quality Standard for Settled Particulate Matter
6. ARM 17.8.221 Ambient Air Quality Standard for Visibility
7. ARM 17.8.223 Ambient Air Quality Standard for PM
10
SME-HGS must maintain compliance with the applicable ambient air quality standards.
C. ARM 17.8, Subchapter 3 – Emission Standards, including, but not limited to:
1. ARM 17.8.304 Visible Air Contaminants
. This rule requires that no person may cause or
authorize emissions to be discharged into the outdoor atmosphere from any source installed
after November 23, 1968, that exhibit an opacity of 20% or greater averaged over 6
consecutive minutes.
2. ARM 17.8.308 Particulate Matter, Airborne
. (1) This rule requires an opacity limitation of
less than 20% for all fugitive emission sources and that reasonable precautions be taken to
control emissions of airborne particulate matter. (2) Under this rule, SME-HGS shall not
cause or authorize the use of any street, road, or parking lot without taking reasonable
precautions to control emissions of airborne particulate matter.
3. ARM 17.8.309 Particulate Matter, Fuel Burning Equipment
. This rule requires that no
person shall cause, allow, or permit to be discharged into the atmosphere particulate matter
caused by the combustion of fuel in excess of the amount determined by this rule.
ELECTRONIC FILING, RECEIVED, CLERK'S OFFICE, JANUARY 5, 2007
* * * * * PC #7 * * * * *
3423-00
8
Supplemental PD: 06/22/06
4. ARM 17.8.310 Particulate Matter, Industrial Process. This rule requires that no person
shall cause, allow, or permit to be discharged into the atmosphere particulate matter in
excess of the amount set forth in this rule.
5. ARM 17.8.322 Sulfur Oxide Emissions--Sulfur in Fuel
. This rule requires that no person
shall burn liquid, solid, or gaseous fuel in excess of the amount set forth in this rule.
6. ARM 17.8.324 Hydrocarbon Emissions--Petroleum Products
. (3) No person shall load or
permit the loading of gasoline into any stationary tank with a capacity of 250 gallons or
more from any tank truck or trailer, except through a permanent submerged fill pipe, unless
such tank is equipped with a vapor loss control device as described in (1) of this rule.
7. ARM 17.8.340 Standard of Performance for New Stationary Sources and Emission
Guidelines for Existing Sources. This rule incorporates, by reference, 40 CFR 60,
Standards of Performance for New Stationary Sources (NSPS). SME-HGS is an NSPS
affected facility under 40 CFR 60 and is subject to the requirements of the following
subparts:
a.
40 CFR 60, Subpart A. The general provisions provided in 40 CFR 60, Subpart A,
apply to all equipment or facilities subject to any Subpart listed below
b.
40 CFR 60, Subpart Da. As applicable to CFB Boiler and associated affected
equipment.
c.
40 CFR 60, Subpart Db. As applicable to Auxiliary Boiler and associated affected
equipment.
d.
40 CFR 60, Subpart Y. As applicable to coal processing, handling, and storage
equipment and activities.
e.
40 CFR 60, Subpart OOO. As applicable to limestone processing, handling, and
storage equipment and activities.
f.
40 CFR 60, Subpart HHHH. Model rules for a Mercury Budget Trading Program.
8. ARM 17.8.341 Emission Standards for Hazardous Air pollutants
. This source shall
comply with the standards and provisions of 40 CFR 61, as appropriate.
9. ARM 17.8.342 Emission Standards for Hazardous Air Pollutants for Source Categories
.
The source, as defined and applied in 40 CFR 63, shall comply with the requirements of 40
CFR 63, as listed below:
a.
40 CFR 63, Subpart A. The general provisions provided in 40 CFR 63, Subpart A,
apply to all equipment or facilities subject to any Subpart listed below:
b.
40 CFR 63, Subpart B. As applicable facility wide.
c.
40 CFR 63, Subpart ZZZZ. As applicable to the Emergency Generator.
d.
40 CFR 63, Subpart DDDDD. As applicable to the Auxiliary Boiler.
ELECTRONIC FILING, RECEIVED, CLERK'S OFFICE, JANUARY 5, 2007
* * * * * PC #7 * * * * *
3423-00
9
Supplemental PD: 06/22/06
D. ARM 17.8, Subchapter 4 – Stack Height and Dispersion Techniques, including, but not limited
to:
1. ARM 17.8.401 Definitions
. This rule includes a list of definitions used in this chapter,
unless indicated otherwise in a specific subchapter.
2. ARM 17.8.402 Requirements
. SME-HGS must demonstrate compliance with the ambient
air quality standards with a stack height that does not exceed Good Engineering Practices
(GEP). The proposed height of the stacks for the SME-HGS CFB Boiler and Auxiliary
Boiler are below the allowable GEP stack height and SME-HGS has demonstrated
compliance with all applicable ambient air quality standards as part of the complete permit
application for this permit.
E. ARM 17.8, Subchapter 5 – Air Quality Permit Application, Operation, and Open Burning Fees,
including, but not limited to:
1. ARM 17.8.504 Air Quality Permit Application Fees
. This rule requires that an applicant
submit an air quality permit application fee concurrent with the submittal of an air quality
permit application. A permit application is incomplete until the proper application fee is
paid to the Department. SME-HGS submitted the appropriate permit application fee for
the current permit action.
2. ARM 17.8.505 Air Quality Operation Fees
. An annual air quality operation fee must, as a
condition of continued operation, be submitted to the Department by each source of air
contaminants holding an air quality permit (excluding an open burning permit) issued by
the Department. The air quality operation fee is based on the actual or estimated actual
amount of air pollutants emitted during the previous calendar year.
An air quality operation fee is separate and distinct from an air quality permit application
fee. The annual assessment and collection of the air quality operation fee, described above,
shall take place on a calendar-year basis. The Department may insert into any final permit
issued after the effective date of these rules, such conditions as may be necessary to require
the payment of an air quality operation fee on a calendar-year basis, including provisions
that prorate the required fee amount.
F. ARM 17.8, Subchapter 7 – Permit, Construction, and Operation of Air Contaminant Sources,
including, but not limited to:
1. ARM 17.8.740 Definitions
. This rule is a list of applicable definitions used in this chapter,
unless indicated otherwise in a specific subchapter.
2. ARM 17.8.743 Montana Air Quality Permits--When Required
. This rule requires a person
to obtain an air quality permit or permit modification to construct, modify, or use any air
contaminant sources that have the Potential to Emit (PTE) greater than 25 tons per year of
any pollutant. SME-HGS has a PTE greater than 25 tons per year of PM, PM
10
, NO
x
, CO,
SO
2
, and VOC; therefore, an air quality permit is required.
3. ARM 17.8.744 Montana Air Quality Permits--General Exclusions
. This rule identifies the
activities that are not subject to the Montana Air Quality Permit program.
ELECTRONIC FILING, RECEIVED, CLERK'S OFFICE, JANUARY 5, 2007
* * * * * PC #7 * * * * *
3423-00
10
Supplemental PD: 06/22/06
4. ARM 17.8.745 Montana Air Quality Permits--Exclusion for De Minimis Changes. This
rule identifies the de minimis changes at permitted facilities that do not require a permit
under the Montana Air Quality Permit Program.
5. ARM 17.8.748 New or Modified Emitting Units--Permit Application Requirements
. (1)
This rule requires that a permit application be submitted prior to installation, alteration, or
use of a source. SME-HGS submitted the required permit application for the current
permit action. (7) This rule requires that the applicant notify the public by means of legal
publication in a newspaper of general circulation in the area affected by the application for
a permit. SME-HGS submitted an affidavit of publication of public notice for the
December 7, 2005, issue of the
Great Falls Tribune
, a newspaper of general circulation in
the Town of Great Falls in Cascade County, as proof of compliance with the public notice
requirements.
6. ARM 17.8.749 Conditions for Issuance or Denial of Permit
. This rule requires that the
permits issued by the Department must authorize the construction and operation of the
facility or emitting unit subject to the conditions in the permit and the requirements of this
subchapter. This rule also requires that the permit must contain any conditions necessary
to assure compliance with the Federal Clean Air Act (FCAA), the Clean Air Act of
Montana, and rules adopted under those acts.
7. ARM 17.8.752 Emission Control Requirements
. This rule requires a source to install the
maximum air pollution control capability that is technically practicable and economically
feasible, except that BACT shall be utilized. The required BACT analysis is included in
Section III of this permit analysis.
8. ARM 17.8.755 Inspection of Permit
. This rule requires that air quality permits shall be
made available for inspection by the Department at the location of the source.
9. ARM 17.8.756 Compliance with Other Requirements
. This rule states that nothing in the
permit shall be construed as relieving SME-HGS of the responsibility for complying with
any applicable federal or Montana statute, rule, or standard, except as specifically provided
in ARM 17.8.740,
et seq
.
10. ARM 17.8.760 Additional Review of Permit Applications
. This rule describes the
Department’s responsibilities for processing permit applications and making permit
decisions on those applications that require an environmental impact statement.
11. ARM 17.8.762 Duration of Permit
. An air quality permit shall be valid until revoked or
modified, as provided in this subchapter, except that a permit issued prior to construction
of a new or altered source may contain a condition providing that the permit will expire
unless construction is commenced within the time specified in the permit, which in no
event may be less than 1 year after the permit is issued.
12. ARM 17.8.763 Revocation of Permit
. An air quality permit may be revoked upon written
request of the permittee, or for violations of any requirement of the Clean Air Act of
Montana, rules adopted under the Clean Air Act of Montana, the FCAA, rules adopted
under the FCAA, or any applicable requirement contained in the Montana State
Implementation Plan (SIP).
ELECTRONIC FILING, RECEIVED, CLERK'S OFFICE, JANUARY 5, 2007
* * * * * PC #7 * * * * *
3423-00
11
Supplemental PD: 06/22/06
13. ARM 17.8.764 Administrative Amendment to Permit. An air quality permit may be
amended for changes in any applicable rules and standards adopted by the Board of
Environmental Review (Board) or changed conditions of operation at a source or stack that
do not result in an increase of emissions as a result of those changed conditions. The
owner or operator of a facility may not increase the facility’s emissions beyond permit
limits unless the increase meets the criteria in ARM 17.8.745 for a de minimis change not
requiring a permit, or unless the owner or operator applies for and receives another permit
in accordance with ARM 17.8.748, ARM 17.8.749, ARM 17.8.752, ARM 17.8.755, and
ARM 17.8.756, and with all applicable requirements in ARM Title 17, Chapter 8,
Subchapters 8, 9, and 10.
14. ARM 17.8.765 Transfer of Permit. This rule states that an air quality permit may be
transferred from one person to another if written notice of Intent to Transfer, including the
names of the transferor and the transferee, is sent to the Department.
G. ARM 17.8, Subchapter 8 – Prevention of Significant Deterioration of Air Quality, including,
but not limited to:
1. ARM 17.8.801 Definitions. This rule is a list of applicable definitions used in this
subchapter.
2. ARM 17.8.818 Review of Major Stationary Sources and Major Modifications--Source
Applicability and Exemptions. The requirements contained in ARM 17.8.819 through
ARM 17.8.827 shall apply to any major stationary source and any major modification, with
respect to each pollutant subject to regulation under the FCAA that it would emit, except as
this subchapter would otherwise allow.
This facility is a listed source because it is a fossil-fuel fired steam-electric generating plant having
more than 250 MMBtu/hr heat input capacity. Furthermore, the facility's emissions of
PM, PM
10
,
NO
X
, SO
2
, and CO are greater than 100 tons per year; therefore, the facility is a major source under
the New Source Review Prevention of Significant Deterioration (PSD) program.
H. ARM 17.8, Subchapter 12 – Operating Permit Program Applicability, including, but not limited
to:
1. ARM 17.8.1201 Definitions. (23) Major Source under Section 7412 of the FCAA is
defined as any source having:
a.
PTE > 100 tons/year of any pollutant;
b. PTE > 10 tons/year of any one Hazardous Air Pollutant (HAP), PTE > 25 tons/year of
a combination of all HAPs, or lesser quantity as the Department may establish by rule;
or
c.
PTE > 70 tons/year of particulate matter with an aerodynamic diameter of 10 microns
or less (PM
10
) in a serious PM
10
nonattainment area.
2. ARM 17.8.1204 Air Quality Operating Permit Program. (1) Title V of the FCAA
amendments of 1990 requires that all sources, as defined in ARM 17.8.1204(1), obtain a
Title V Operating Permit. In reviewing and issuing Air Quality Permit #3423-00 for SME-
HGS, the following conclusions were made:
a.
The facility’s PTE is greater than 100 tons/year for PM, PM
10
, NO
X
, SO
2
, and CO.
ELECTRONIC FILING, RECEIVED, CLERK'S OFFICE, JANUARY 5, 2007
* * * * * PC #7 * * * * *
3423-00
12
Supplemental PD: 06/22/06
b. The facility’s PTE is greater than 10 tons/year for any one HAP and greater than 25
tons/year for all HAPs.
c.
This source is not located in a serious PM
10
nonattainment area.
d. This facility is subject to NSPS requirements under 40 CFR 60, Subpart(s) A, Da, Db,
Y, and OOO.
e.
This facility is subject to NESHAP standards under 40 CFR 60, subpart DDDDD and
ZZZZ, as applicable.
f.
This source is a Title IV affected source.
g. This source is not a solid waste combustion unit.
h. This source is not an EPA designated Title V source.
Based on the above information, the SME-HGS facility is a major source of air pollutants
as defined under the Title V operating permit program; therefore, a Title V Operating
Permit is required. SME-HGS submitted an application for a major source Title V
operating permit concurrent with the submittal of the application for Montana Air Quality
Permit #3423-00.
III. BACT Determination
A BACT determination is required for each new or modified source of emissions. SME-HGS shall
install on the new or modified source of emissions the maximum air pollution control capability that
is technically practicable and economically feasible, except that the BACT shall be utilized.
Under the current permit action, SME-HGS proposed a coal-fired power plant incorporating a CFB
Boiler for the production of steam to be routed to a steam turbine, which in turn drives an electric
generator capable of producing electrical power. The United States Environmental Protection
Agency’s (EPA) Draft New Source Review Workshop Manual (October 1990) (NSR Manual) states
that, “historically, EPA has not considered the BACT requirement a means to re-define the design of
the source when considering available control technologies.” However, the NSR Manual goes on to
indicate “…this is an aspect of the New Source Review – Prevention of Significant Deterioration
permitting process in which states have the discretion to engage in a broader analysis if they so
desire.” Based on the analysis provided below, the Department does not believe that redefining the
source is appropriate in this case.
In support of the Department’s position on this issue, a recent EPA policy/guidance statement titled
Best Available Control Technology Requirements for Coal-Fired Power Plants,
authored by Stephen
D. Page, Director, EPA Office of Air Quality, Planning, and Standards (December 13, 2005),
provides that inclusion of technologies such as integrated gasification combined cycle (IGCC) in the
BACT analysis for a coal-fired power plant, such as that proposed in this case, constitutes re-
definition of the source and is not appropriate under the BACT analysis and determination process.
Despite the above-cited reasons for not requiring consideration of other energy production processes,
during the research and development phase leading to the proposed SME-HGS project, SME-HGS
evaluated various alternative energy technologies including the following: Wind; Solar -
Photovoltaic; Solar - Thermal; Hydroelectric; Geothermal; Biomass; Biogas; Municipal Solid Waste;
Natural Gas Combined Cycle; Microturbines; Pulverized Coal (PC) Boilers; CFB Boilers; and
ELECTRONIC FILING, RECEIVED, CLERK'S OFFICE, JANUARY 5, 2007
* * * * * PC #7 * * * * *
3423-00
13
Supplemental PD: 06/22/06
IGCC. This analysis is compiled in a document created for the U.S. Department of Agriculture,
Rural Utility Service (RUS) titled, A
lternative Evaluation Study
(AES). A copy of this document is
available for review on the RUS website at www.usda.gov/rus/water/ees/eis.htm
and in Appendix D
of the SME-HGS application for this air quality permit. This document constitutes a detailed study
of alternative energy technologies that were analyzed for future power requirements. The purpose of
the AES, as stated in the AES document is “…to determine
an appropriate source of wholesale
electric energy and related services post 2008…Provide an analysis of alternatives that SME-HGS
has considered to meet its wholesale energy and related supply obligations currently met through the
use of power purchase agreements…The alternatives studied by SME-HGS were evaluated in terms
of cost effectiveness, technical feasibility, and environmental soundness.”
Additional Evaluation of IGCC and PC Technology
As previously stated, the Department determined that re-defining the proposed CFB coal-fired power
project is not appropriate in this case. However, because IGCC and PC technologies represent
available and technically feasible electrical power production technologies using coal as fuel, the
following information has been summarized to provide additional basis for rejecting these
technologies as BACT for the proposed SME-HGS project based on technical, environmental, and
economic factors.
IGCC Power Generation
Based on the analysis included in the SME-HGS application materials and independent Department
research, the Department determined that IGCC represents an available and potentially technically
feasible strategy for the production of electricity using coal. However, the Department determined
that IGCC is technically, economically, and environmentally infeasible for the purpose of meeting
the SME-HGS wholesale energy and related supply obligations to its energy cooperative customers.
As provided in the NSR Manual (Section B-19), an analysis of technical feasibility should include an
evaluation of the capabilities of the technology for project specific application. At the time of draft
permit issuance, IGCC has not been adequately demonstrated to provide acceptable reliability, with
current approaches to improving reliability resulting in less efficient facilities thereby negatively
impacting the cost-competitiveness of IGCC for a base-load power generation project. Currently,
IGCC incurs an approximate 20% increase in project cost-effective values when compared to CFB
power production projects. Therefore, the Department determined that the application of IGCC for
the proposed SME-HGS project presents currently un-resolvable reliability concerns leading to
unacceptable project cost increases.
Further, based on Department analysis of existing and currently operational similar sized IGCC plant
operations, the Department determined that criteria pollutant emissions from IGCC plants, when
compared to CFB technology, result in relatively little or no additional environmental protection.
The Department understands that the carbon sequestration (greenhouse gas reduction) capabilities of
the IGCC technology potentially represents a significant environmental benefit associated with the
application of this technology when compared to historically prevalent coal-fired power plant
projects (CFB and PC). However, greenhouse gasses, such as carbon dioxide (CO
2
), are not
currently regulated under the Montana or federal Clean Air Act. Therefore, because IGCC results in
relatively little increased regulated environmental protection, the environmental benefits associated
with IGCC greenhouse gas sequestration capabilities do not justify application of this technology for
the proposed project.
ELECTRONIC FILING, RECEIVED, CLERK'S OFFICE, JANUARY 5, 2007
* * * * * PC #7 * * * * *
3423-00
14
Supplemental PD: 06/22/06
As summarized above, the Department determined that, at this time, IGCC constitutes a technically,
economically, and environmentally infeasible alternative electric power production alternative for
the proposed SME-HGS project; therefore, IGCC is eliminated from further consideration under the
BACT analysis and determination process.
PC-Boiler Power Generation
Based on the analysis included in the SME-HGS application materials and direct recent and
historical Department experience in permitting PC-fired electrical power production projects, the
Department determined that PC-fired electrical power production represents an available, technically
feasible, and cost-effective strategy for the production of electricity using coal. However, the
Department determined that PC-fired electrical power generation does not constitute BACT in this
case considering the environmental benefits associated with the proposed CFB coal-fired power
project when compared to a PC coal-fired power project.
Operation of a PC-fired boiler in place of the proposed CFB Boiler for the SME-HGS project would
result in significantly increased emissions of SO
2
, CO, PM
10
, and total HAPs and relatively similar
emissions of NO
x
and mercury (specific HAP). Therefore, because SME-HGS proposed a CFB
electrical power generation project and the CFB technology would result in less emissions of
regulated air pollutants when compared to the PC-fired technology, the Department determined that
PC-fired electrical power generation does not constitute BACT in this case.
Project BACT Applicability
The Department determined that the proposed CFB coal-fired power plant represents the most
appropriate technology to supply energy to SME-HGS customers taking into consideration technical,
environmental, and economic factors. Coal-fired electrical power generation, specifically CFB coal
combustion is carried forward into the following BACT analysis and determination process. The
following BACT analysis addresses available methods of controlling air pollutant emissions from the
following affected equipment:
•
CFB Boiler: SO
2
, filterable PM, PM
10
(filterable and condensable), NO
x
, CO, VOC, H
2
SO
4
,
acid gasses (HCl and HF), trace metals, radionuclides, and mercury.
•
Coal, Limestone, and Ash (Bottom and Fly Ash) Material Processing, Handling, Transfer, and
Storage Operations: PM/PM
10
•
Auxiliary Boiler, Emergency Generator, Emergency Fire Water Pump, and Coal Thawing Shed
Heater: PM
10
, NO
x
, CO, SO
2
, and VOC.
•
Cooling Tower
: PM/PM
10
•
Haul Roads/Truck Traffic
: PM/PM
10
•
CFB Boiler Refractory Brick Curing Heaters
: PM
10
, NO
x
, CO, SO
2
, and VOC.
The Department reviewed the following control options, as well as previous BACT determinations
for similar permitted sources in order to make the following pollutant specific BACT determinations.
A.
CFB Boiler BACT Analysis and Determination
1. SO
2
Emissions
Sulfur oxide (SO
x
) emissions from fossil fuel combustion consist primarily of SO
2
.
Additional compounds of SO
x
also form at a much lower quantity and consist of sulfur
trioxide (SO
3
) and gaseous sulfates. These compounds form as the sulfur in the fossil
fuel is oxidized during the combustion process. SME-HGS is proposing to use Powder
ELECTRONIC FILING, RECEIVED, CLERK'S OFFICE, JANUARY 5, 2007
* * * * * PC #7 * * * * *
3423-00
15
Supplemental PD: 06/22/06
River Basin (PRB) sub-bituminous coal as the CFB Boiler fuel source and, as such, has
analyzed the use of low-sulfur coal for the proposed project.
Low sulfur coal is typically considered coal with sulfur content at or below 1.0% by
weight. Sulfur content and heating content of coal can vary between coal mine and coal
seam, which can impact SO
2
emissions from the source. High sulfur coal is typically
between 1% and 5% sulfur by weight. Coal analyzed for the proposed project will
typically have sulfur content less than 0.8% by weight and heating values greater than
8,600 Btu/lb.
A. Identification of Available SO
2
Control Strategies/Technologies
Several techniques can be used to reduce SO
2
emissions from CFB Boiler fossil
fuel combustion. SO
2
control options can be divided into pre-combustion strategies
(e.g., combusting low sulfur fuels, fuel blending, coal cleaning, etc.), combustion
techniques, and post-combustion controls typically characterized as flue gas de-
sulfurization (FGD) units (e.g., wet scrubbers, dry scrubbers, etc.). The following
available SO
2
control options/technologies/strategies were evaluated for the
proposed project:
i.
CFB Boiler with High-Sulfur Coal
ii.
CFB Boiler with Low-Sulfur Coal (Fuel Blending or Switching)
iii. CFB Boiler with Limestone Injection
iv. CFB Boiler with Coal Cleaning
v.
CFB Boiler with FGD
a. Wet Lime Scrubber/Wet Limestone Scrubber
b. Dual Alkali Wet Scrubber
c. Spray Dry Absorber
d. Dry-Sorbent Injection
e. Circulating Dry Scrubber
f.
Hydrated Ash Re-injection (HAR)
vi.
CFB Boiler with Low-Sulfur Coal and Coal Cleaning
vii. CFB Boiler with Low-Sulfur Coal and FGD
viii. CFB Boiler with Low-Sulfur Coal Limestone Injection
ix.
CFB Boiler with High or Low-Sulfur Coal, Coal Cleaning, and FGD
x.
CFB Boiler with High or Low-Sulfur Coal, Limestone Injection, and Coal
Cleaning
xi.
CFB Boiler with High or Low-Sulfur Coal, Limestone Injection, and FGD
xii. CFB Boiler with High or Low-Sulfur Coal, Limestone Injection, Coal
Cleaning, and FGD
The following text provides a brief overview of the above-cited SO
2
control
options/technologies/strategies that have been evaluated for the proposed project.
i.
CFB Boiler with High-Sulfur Coal
SO
2
emissions from a CFB Boiler with no control are strictly dependent on
the sulfur content of the coal being fired. The coal for a CFB Boiler is
crushed to a specific size and injected into the CFB Boiler. The coal mixes
with the bed material and circulates through the boiler until all of the coal is
combusted. The bed material can be made up of stone, sand, and/or
limestone. The use of limestone as a bed material is a common industry
practice as a first stage SO
2
control strategy.
ELECTRONIC FILING, RECEIVED, CLERK'S OFFICE, JANUARY 5, 2007
* * * * * PC #7 * * * * *
3423-00
16
Supplemental PD: 06/22/06
ii.
CFB Boiler with Low-Sulfur Coal (Fuel Blending or Switching)
Another potential control option for reducing SO
2
emissions is to reduce the
amount of sulfur contained in the coal by using low-sulfur coal (e.g., current
project proposal) or by blending low-sulfur coal with relatively higher sulfur
coal (e.g., Midwestern United States bituminous coal). Low-sulfur coal is
used as a means to decrease the SO
2
emissions without installing SO
2
add-on
control devices. By blending low sulfur coal with high sulfur coal or by
switching from high sulfur coal to a lower sulfur coal, SO
2
emissions will
decrease. When low-sulfur coal is readily available, fuel blending or
switching can be a cost-effective means to reduce SO
2
emissions. CFB
Boilers are typically not sensitive (from an operational standpoint) to different
types of coal or solid fuels. This is one of the benefits of a CFB Boiler.
iii. CFB Boiler with Limestone Injection
In a CFB Boiler, crushed limestone (CaCO
3
) is fed to the combustor and
becomes part of the solid medium that makes up the combustion bed. Within
the combustion zone, lime (CaO) is formed by calcining the CaCO
3
. SO
2
formed during the combustion process combines with the calcined CaO to
form gypsum (CaSO
4
), a stable byproduct, or CaSO
3
as shown in the
following reactions:
SO
2
+ CaO + ½O
2
→
CaSO
4
or
SO
2
+ CaO
→
CaSO
3
The SO
2
removal equation shows that one mole of calcium is required to
capture one mole of sulfur. Therefore, the theoretical minimum Ca/S ratio
required for the removal of a given sulfur concentration is 1/1, assuming 100%
utilization of the sorbent. However, the actual removal efficiency that can be
achieved in practice for a given unit is dependent on several factors including
the size and porosity of the lime, temperature of the combustion bed, residence
time within the combustion bed, mixing, and uncontrolled SO
2
concentration.
In practice, it has been found that approximately 50% of the SO
2
will be
removed at a Ca/S ratio of 1. As the Ca/S ratio increases, a greater amount of
SO
2
will be removed, but with diminishing return. Limestone injection is an
integral part of the CFB Boiler process; however, the actual limestone
injection rate varies from unit to unit as the sulfur in the coal or fuel varies.
iv.
CFB Boiler with Coal Cleaning
Various coal cleaning processes may be employed to reduce the coal sulfur
content. Physical coal cleaning removes mineral sulfur (such as pyrite) but is
not effective in removing organic sulfur. Chemical cleaning and solvent
refining processes are being developed to remove organic sulfur. Coal
cleaning has generally been used on high mineral, high sulfur, coal for power
plants without FGD systems with some success. In some studies, coal-
cleaning processes have been noted to reduce the feed coal sulfur content by
1% in high sulfur coal with sulfur contents up to 5%. This equates to an
approximate 20% reduction in total sulfur-in-coal. Coal cleaning requires
water and/or chemicals for removing the sulfur, pyrite, and other materials;
consequently, a wastewater stream is produced by the coal cleaning system,
which must be treated before discharge from the facility.
ELECTRONIC FILING, RECEIVED, CLERK'S OFFICE, JANUARY 5, 2007
* * * * * PC #7 * * * * *
3423-00
17
Supplemental PD: 06/22/06
v. CFB Boiler with FGD
Post-combustion methods for CFB Boilers mainly consist of FGD and are
typically classified as either wet or dry systems. Wet and dry FGD are well-
established SO
2
control options. Wet FGD removes SO
2
with a wet lime or
limestone slurry as compared to dry FGD, which injects dry lime or limestone
and produces a dry by-product that is removed with the fly ash in the
particulate control device (e.g., fabric filter baghouse (FFB)). Dry FGD, as the
name applies, does not use water and does not require a wastewater disposal
system. The following text provides a brief overview of available FGD
systems:
a. Wet Lime/Limestone Scrubber
The wet lime scrubbing process uses alkaline slurry made by adding lime
(CaO) to water. The alkaline slurry is sprayed into the exhaust stream and
reacts with the SO
2
in the flue gas. Insoluble calcium sulfite (CaSO
3
) and
calcium sulfate (CaSO
4
) salts are formed in the chemical reaction that
occurs in the scrubber. The salts are removed as a solid waste by-product.
The waste by-product is mainly CaSO
3
, which is difficult to dewater.
Solid waste by-products from wet lime scrubbing are typically managed
in dewatering ponds and landfills.
Wet limestone scrubbers are very similar to wet lime scrubbers.
However, the use of limestone (CaCO
3
) instead of CaO requires different
feed preparation equipment and a higher liquid-to-gas ratio. The higher
liquid-to-gas ratio typically requires a larger absorbing unit. The CaCO
3
slurry process also requires a ball mill to crush the CaCO
3
feed.
Forced oxidation of the scrubber slurry can be used with either the lime or
limestone wet FGD system to produce gypsum solids instead of calcium
sulfite by-product. Forced oxidation of the scrubber slurry provides a
more stable by-product and reduces the potential for scaling in the FGD.
The gypsum by-product may be sold for other uses, reducing the quantity
of solid waste that needs to be disposed of in a landfill.
Wet lime/limestone scrubbers can achieve SO
2
control efficiencies of
approximately 95% or greater when used on boilers burning higher sulfur
bituminous coals, but may be less efficient when the boiler is combusting
lower sulfur coals, such as that proposed for the current project. The
actual control efficiency of a wet lime/limestone FGD system depends on
several factors, including the uncontrolled SO
2
concentration entering the
scrubber.
b. Dual Alkali Wet Scrubber
Dual-alkali scrubbers use a sodium-based alkali solution to remove SO
2
from the combustion exhaust gas. The process uses both sodium-based
and calcium-based compounds. The sodium-based reagents absorb SO
2
from the exhaust gas, and the calcium-based solution (lime or limestone)
regenerates the spent liquor. Calcium sulfites and sulfates are precipitated
and discarded as sludge, and the regenerated sodium solution is returned
ELECTRONIC FILING, RECEIVED, CLERK'S OFFICE, JANUARY 5, 2007
* * * * * PC #7 * * * * *
3423-00
18
Supplemental PD: 06/22/06
to the absorber loop. The dual-alkali process requires lower liquid-to-gas
ratios than scrubbing with lime or limestone. The reduced liquid-to-gas
ratios generally mean smaller reaction units; however, additional
regeneration and sludge processing equipment is necessary.
A sodium-based scrubbing solution, typically consisting of a mixture of
sodium hydroxide, sodium carbonate, and sodium sulfite, is an efficient
SO
2
control reagent. However, the high cost of the sodium-based
chemicals may limit feasibility of such an installation on a generating unit
size of 100 MW or larger utility boiler. In addition, the process generates
a less stable sludge that can create material handling and disposal issues.
The control efficiency is similar to the wet lime/limestone scrubbers at
approximately 95% or greater. As with the wet lime/limestone scrubbers,
control efficiencies are highly dependent upon the uncontrolled SO
2
concentration entering the scrubber.
c. Spray Dryer Absorber (SDA)
The typical SDA uses lime slurry and water injected into a tower to
remove SO
2
from the combustion gases. The towers must be designed to
provide adequate contact and residence time between the exhaust gas and
the slurry in order to produce a relatively dry by-product. The process
equipment associated with an SDA typically includes an alkaline storage
tank, mixing and feed tanks, an atomizer, spray chamber, particulate
control device, and a recycle system. The recycle system collects solid
reaction products and recycles them back to the spray dryer feed system
to reduce alkaline sorbent use. SDAs are a commonly used dry scrubbing
method in large industrial and utility boiler applications. SDAs have
demonstrated the ability to achieve greater than 95% SO
2
reduction.
Again, control efficiencies are highly dependent upon the uncontrolled
SO
2
concentration entering the scrubber.
d. Dry Sorbent Injection
Dry sorbent injection involves the injection of powdered or hydrated
sorbent (typically alkaline) directly into the flue gas exhaust stream. Dry
sorbent injection systems are simple systems, and generally require a
sorbent storage tank, feeding mechanism, transfer line and blower, and
injection device. The dry sorbent is typically injected countercurrent to
the gas flow through a Venturi orifice. An expansion chamber is often
located downstream of the injection point to increase residence time and
contact efficiency. Particulates generated in the reaction are controlled in
the system’s particulate control device. SO
2
control efficiencies for dry
sorbent injection systems are approximately 50%, but if the sorbent is
hydrated lime, then 80% or greater removal can be achieved. These
systems are commonly called lime spray dryers. Once again, control
efficiencies are highly dependent upon the uncontrolled SO
2
concentration entering the scrubber.
ELECTRONIC FILING, RECEIVED, CLERK'S OFFICE, JANUARY 5, 2007
* * * * * PC #7 * * * * *
3423-00
19
Supplemental PD: 06/22/06
e. Circulating Dry Scrubber
A third type of dry scrubbing system, the circulating dry scrubber (CDS),
uses a circulating fluidized bed of dry hydrated lime reagent to remove
SO
2
. Flue gas passes through a Venturi orifice at the base of a vertical
reactor tower and is humidified by a water mist. The humidified flue gas
then enters a fluidized bed of powdered hydrated lime where SO
2
is
removed. The dry by-product produced by this system is routed with the
flue gas to the unit’s particulate removal system.
f.
Hydrated Ash Re-Injection (HAR) System.
The HAR process is a modified dry FGD process developed to increase
utilization of un-reacted lime (CaO) in the CFB ash and any free CaO left
from the furnace burning process. The hydrated ash re-injection process
will further reduce the SO
2
concentration in the flue gas. The actual
design of a HAR system is vendor-specific and hydrated ash re-injection
type systems may be referred to as a Flash Dry Absorber
TM
(Alstom trade
name) or a polishing scrubber.
In a hydrated ash re-injection system, a portion of the collected ash and
lime is hydrated and re-introduced into a reaction vessel located ahead of
the fabric filter inlet. In conventional boiler applications, additional lime
may be added to the ash to increase the mixture’s alkalinity. For CFB
applications, sufficient residual CaO is available in the ash and additional
lime is not required. It is estimated that potential SO
2
emissions would be
reduced by approximately 90 to 95% in the CFB with an additional 60 to
80% reduction achieved with the addition of a HAR system. The overall
control efficiency would be approximately 97% to 98% with low sulfur
coal and even greater with high sulfur coal fuel.
vi. CFB Boiler with Low-Sulfur Coal and Coal Cleaning
As stated previously, coal cleaning is typically performed on high-sulfur coals.
The economics of cleaning low-sulfur coal show this to be an expensive
method with relatively little benefit of additional reduction in sulfur.
vii. CFB Boiler with Low-Sulfur Coal and FGD
Low-sulfur coal is typically used to reduce overall SO
2
emissions from a CFB
Boiler. However, the control efficiency decreases as the inlet SO
2
decreases
with a lower-sulfur coal.
viii. CFB Boiler with Low-Sulfur Coal Limestone Injection
As stated previously, limestone can be injected in the CFB Boiler as bed
material, which can help reduce SO
2
emissions. Low sulfur coal would not
require as much limestone injection as a high sulfur coal to achieve an
equivalent SO
2
emission rate.
ix. CFB Boiler with High or Low-Sulfur Coal, Coal Cleaning, and FGD
ELECTRONIC FILING, RECEIVED, CLERK'S OFFICE, JANUARY 5, 2007
* * * * * PC #7 * * * * *
3423-00
20
Supplemental PD: 06/22/06
As stated previously, coal cleaning can remove approximately 20% of the
boiler SO
2
emissions. Coal cleaning is typically applied to high-sulfur coals
on systems without FGD. When FGD systems are installed, coal cleaning is
typically not justified due to limited additional SO
2
reduction realized for a
relatively high cost.
x. CFB Boiler with High or Low-Sulfur Coal, Limestone Injection, and Coal
Cleaning
As stated previously, coal cleaning is typically performed on high sulfur coals
with no additional SO
2
control. The cost of cleaning coal prior to a CFB with
limestone injection is expensive with relatively little benefit of reduction in
SO
2
emissions through the reduction of sulfur-in-coal.
xi. CFB Boiler with High or Low-Sulfur Coal, Limestone Injection, and FGD
FGD systems can be added as a “polishing” scrubber on a CFB Boiler with
limestone injection. This control option typically can remove SO
2
emissions at
control efficiency greater than 97% with low-sulfur coal and can achieve
higher control efficiency with a high sulfur coal. The CFB Boiler technology
with low sulfur coal, limestone injection, and HAR FGD SO
2
control strategy
has been proposed by SME-HGS for the project.
xii. CFB Boiler with High or Low-Sulfur Coal, Limestone Injection, Coal
Cleaning, and FGD
As stated previously, coal cleaning is typically performed on high sulfur coals
for use in boilers with no additional SO
2
control. The economics of cleaning
coal prior to a CFB with limestone injection and FGD is expensive with very
little benefit of reduction in sulfur.
B. Technical Feasibility Analysis
SME-HGS is proposing to use low sulfur coal with an average sulfur content of
approximately 0.7% sulfur by weight. Therefore, although high sulfur coal is
technically feasible, all control options for high sulfur coal are eliminated from
further evaluation. Since coal cleaning is typically performed on high sulfur coals,
and provides minimal additional benefit when performed on low sulfur coal, all
control options with coal cleaning are eliminated from further evaluation.
The circulating dry scrubber has limited application, and has not been used on large
CFB Boilers. Furthermore, circulating dry scrubber systems result in high
particulate loading to the unit’s particulate control device. Because of the high
particulate loading, the pressure drop across a fabric filter would be unacceptable;
therefore, electrostatic precipitators (ESP) are generally used for particulate control.
For reasons further discussed in the filterable PM (filterable and condensable)
BACT analysis for the CFB Boiler, the Department determined that FFB constitutes
BACT for CFB Boiler particulate control. Based on limited technical data from
non-comparable applications and engineering judgment, the Department determined
that CDS is not technically feasible with a CFB Boiler equipped with FFB
particulate control. Therefore, the CDS will not be evaluated further.
ELECTRONIC FILING, RECEIVED, CLERK'S OFFICE, JANUARY 5, 2007
* * * * * PC #7 * * * * *
3423-00
21
Supplemental PD: 06/22/06
Although a dry sorbent injection system may be technically feasible, it is not
practical for use with a CFB. The CFB flue gas contains excess un-reacted lime and
heavy ash particles that will be re-injected back into the CFB combustion bed. A
dry sorbent injection system would simply add additional unreacted lime to the flue
gas. Furthermore, SO
2
control efficiencies for dry sorbent injection systems are
typically around 50% on units with a much higher uncontrolled SO
2
concentration
in the flue gas. If used in conjunction with a CFB unit (with a relatively low SO
2
concentration in the flue gas), the control efficiency would be expected to be
something less than 50%. Because the dry sorbent injection system is not practical
with a CFB, and because the control efficiency of the dry sorbent system is lower
than the control efficiency of other post-combustion control options, the system will
not be evaluated further.
Summary Table: SO
2
Control Option Infeasibility
SO
2
Control Option
Basis for Infeasibility
All Control Options with High Sulfur Fuel
SME-HGS is proposing to use low sulfur
coal
All Control Options with Low Sulfur Fuel and
Coal Cleaning
Coal cleaning is considered ineffective
with low sulfur coal because it is mostly
organic sulfur and does not react to
cleaning as well as the higher sulfur
content bituminous coals.
CFB with or without Limestone Injection with
Low Sulfur Coal and Dry Sorbent Injection
Not as effective an SO
2
option as dual-
alkali, SDA, or hydrated ash re-injection.
Eliminated from further evaluation.
CFB with or without Limestone Injection with
Low Sulfur Coal and Circulating Dry
Scrubber
Limited actual experience and not
considered technically feasible because of
the high particulate loading and excess
pressure drop across a FFB.
C. Ranking of Available and Technically Feasible SO
2
Control Options by Efficiency
Wet scrubbing systems (without additional control options) are capable of
removing approximately 90-95% of SO
2
emissions from higher sulfur coals.
Though various reagents such as lime, limestone, or magnesium-enhanced lime all
have different SO
2
removal efficiencies, overall system efficiency is maintained by
operating with a slurry feed rate that is appropriate for the reagent being used. For
the present analysis, the wet FGD system will be evaluated with an upstream fabric
filter baghouse (FFB) followed by a wet lime scrubber. Particulate control is
required upstream from the scrubber to maintain scrubber efficiency.
Dry FGD systems are reported to be capable of removing up to 95% of the SO
2
in
flue gas streams resulting from combustion of high-sulfur coal. These systems
must include downstream particulate control equipment since the FGD adds
particulate to the gas stream. FFBs and electrostatic precipitators (ESPs) provide
essentially equivalent particulate control efficiency. The dry FGD system will be
evaluated with an FFB since it potentially enhances SO
2
and sulfuric acid mist
(H
2
SO
4
) removal efficiency. As the exhaust gas passes through a filter cake
containing alkaline ash and un-reacted reagent, additional SO
2
is removed. For this
reason, the system configuration of a dry FGD in combination with an ESP will not
be further evaluated for the proposed project.
ELECTRONIC FILING, RECEIVED, CLERK'S OFFICE, JANUARY 5, 2007
* * * * * PC #7 * * * * *
3423-00
22
Supplemental PD: 06/22/06
The combination of a CFB Boiler with limestone injection and an FGD can have an
overall SO
2
control efficiency of approximately 97% to 98%. This level of
collection efficiency is achieved due to the reaction time allowed for the lime in
both the CFB furnace as well as the FGD.
Summary Table: SO
2
Control Option Rank by Efficiency
SO
2
Control Option
Emission Rate
(lb/MMBtu)
a
SO
2
Control
Efficiency
CFB with Limestone Injection, Low Sulfur
Coal, and Wet Lime/Limestone Scrubber
0.038
97.3%
CFB with Limestone Injection, Low Sulfur
Coal, and Dual-Alkali Wet Scrubber
0.038
97.3%
CFB with Limestone Injection, Low Sulfur
Coal, and Spray Dry Absorber
0.038
97.3%
CFB with Limestone Injection, Low Sulfur
Coal, and Hydrated Ash Reinjection
0.038
97.3%
CFB with Limestone Injection, Low Sulfur
Coal (Fuel Blending or Switching)
0.08
94.4%
CFB Boiler (without Limestone Injection)
with Low Sulfur Coal and Wet Lime
Scrubber
0.10
93%
CFB Boiler (without Limestone Injection)
with Low Sulfur Coal and Wet Limestone
Scrubber
0.10
93%
CFB Boiler (without Limestone Injection)
with Low Sulfur Coal and Dual-Alkali Wet
Scrubber
0.16
88.7%
CFB Boiler (without Limestone Injection)
with Low Sulfur Coal and Spray Dry
Absorber
0.16
88.7%
CFB Boiler (without Limestone Injection)
with Low Sulfur Coal and Dry Sorbent
Injection
0.80
43.7%
CFB Boiler (without Limestone Injection)
with Low Sulfur Coal (without control)
1.42
---
a
Based on a 30-day rolling average
D. Evaluation of Control Technologies Including Environmental, Economic, and
Energy Impacts
The following paragraphs evaluate environmental, economic, and energy impacts
associated with the remaining SO
2
control options on a CFB Boiler with limestone
injection. All control options/strategies without limestone injection have been
eliminated from further BACT consideration because SME-HGS proposed
limestone injection technology and because a CFB Boiler with limestone injection
represents greater SO
2
control efficiency when compared to CFB without limestone
injection.
i.
Environmental Impacts
Wet FGD systems emit some level of mist that poses negative environmental
impacts related to acid gas emissions (H
2
SO
4
, HCl, and HF), fine particulate
emissions, and near and far-range visibility degradation. Dry FGD systems
avoid these problems because the technology does not produce mist and
ELECTRONIC FILING, RECEIVED, CLERK'S OFFICE, JANUARY 5, 2007
* * * * * PC #7 * * * * *
3423-00
23
Supplemental PD: 06/22/06
because emissions from the absorber must pass through a filter cake of alkaline
material collected in the downstream FFB before exhausting to the
atmosphere. Another negative environmental impact associated with a wet
FGD system is related to water usage. A wet FGD system uses approximately
20% more water than a dry FGD.
Both wet and dry systems produce solid waste streams containing fly ash and
spent lime or limestone and these wastes are generally disposed of in a landfill
area or stored in surface impoundments. The wet dual-alkali system uses
sodium-based chemicals, which generates a less stable sludge than wet
lime/limestone scrubber sludge. This can create material handling and
disposal issues of concern.
Even though wet FGD systems use more water and generate a wastewater
sludge, wet FGD systems cannot be eliminated from further investigation
under the BACT analysis and are thereby evaluated further for economic and
energy impacts. The dual-alkali wet scrubber will be eliminated from further
investigation due to the material handling and disposal issues (e.g., leachate
polluting the ground water causing long-term storage issues) associated with
the sludge byproducts.
ii. Economic Impacts
Department verified economic impacts associated with CFB Boilers for each
of the above FGD systems were compared in the SME-HGS application using
estimated annualized capital, operating, and maintenance costs. Cost estimates
were provided from commercial suppliers of this type of equipment. Where
appropriate, constant operation and maintenance factors were identified and
applied consistently to control options. As reported in the application, the cost
effective value for CFB with limestone injection, low-sulfur coal, and wet
lime/limestone scrubber is approximately $27,365/ton SO
2
removed; the cost
effective value for CFB with limestone injection, low sulfur coal, and SDA is
approximately $7939/ton SO
2
removed; and the cost effective value for CFB
with limestone injection, low sulfur coal, and HAR is approximately
$4,054/ton SO
2
removed. Based on the cost-effective values provided above,
CFB with limestone injection, low sulfur coal, and HAR is deemed
economically feasible for the affected unit and all other control options are
deemed economically infeasible for the affected unit in this case. A detailed
cost analysis is included in the application for this air quality permit.
iii. Energy Impacts
Both wet and dry FGD systems require electricity to operate. The wet FGD
system uses electricity primarily for the ID fan, re-circulation pumps, reagent
handling, and for wet waste dewatering. The dry FGD uses electricity
primarily for the ID fan, lime/limestone handling equipment and FFB blowers.
Wet FGD system power consumption is approximately 40% greater than that
of the dry FGD system. With a HAR system, there is no recirculation pump,
wet waste dewatering and reduced power consumption for the reagent
(lime/limestone) handling system. None of the control options are eliminated
based on energy impacts.
ELECTRONIC FILING, RECEIVED, CLERK'S OFFICE, JANUARY 5, 2007
* * * * * PC #7 * * * * *
3423-00
24
Supplemental PD: 06/22/06
E. SO
2
BACT Determination
SME-HGS proposed the use of CFB Boiler technology with limestone injection,
low sulfur coal, and HAR, to maintain compliance with a proposed SO
2
BACT
emission limit of 0.038 lb/MMBtu (30-day average). Based on Department verified
information contained in the SME-HGS application for Permit #3423-00 and taking
into consideration technical, environmental, and economic factors, the Department
determined that the proposed SO
2
emission control strategy and emission limit
constitute BACT in this case. This BACT determined control option constitutes an
approximate 97% SO
2
reduction efficiency.
Other recent SO
2
BACT determinations for coal-fired power plants were researched
in the RACT/BACT/LAER Clearinghouse (RBLC) and Western US agency
websites. The Department verified data from these websites is summarized in the
application. The SME-HGS BACT determined SO
2
emission limit is at the low end
of all other recently permitted similar source SO
2
BACT determinations, world-
wide. The only facilities with permitted and BACT determined SO
2
emission limits
lower than SME-HGS are the AES facility in Puerto Rico and the proposed
NEVCO facility in Utah. The applicable SO
2
BACT emission limit for both of
these facilities is 0.022 lb/MMBtu. To the best of the Department’s knowledge, as
of the date of permit issuance, compliance with the applicable SO
2
BACT emission
limit had not been demonstrated at the AES facility or the NEVCO facility.
The Department determined that the CFB Boiler operating under the BACT
determined control requirements is capable of meeting the established SO
2
BACT
emission limit of 0.038 lb SO
2
/MMBtu (30-day average). Further, the Department
determined that the periodic SO
2
source testing, the applicable provisions contained
in the Acid Rain Program (40 CFR 72-78), applicable continuous monitoring, and
the applicable recordkeeping and reporting requirements will adequately monitor
compliance with the permitted SO
2
BACT limit(s).
2. Filterable PM Emissions
Particulate matter emissions consist of filterable and condensable particulate. Filterable
PM resulting from the proposed SME-HGS project is comprised of ash from the
combustion of fuel, noncombustible metals present in the fuel, and unburned carbon
resulting from incomplete combustion. Filterable PM is material that is in particulate
form within the boiler stack and thus collects on the filter of a particulate sampling train.
Condensable particulates include condensable organic compounds and minerals (in
vapor form) that pass through the filter on a sampling train and are collected in glass
impingers that contain a chilled wet solution to condense the vapors from the exhaust
stream.
This BACT analysis focuses on control technologies for filterable PM. PM
10
(filterable
and condensable) is addressed later in the BACT analysis for the proposed project (see
PM
10
(filterable and condensable) BACT Analysis and Determination).
A. Identification of Available Filterable PM Control Strategies/Technologies
Several techniques can be used to reduce filterable PM emissions from fossil fuel
combustion. Three of the most commonly available and effective methods for
control of filterable PM emissions are listed below:
ELECTRONIC FILING, RECEIVED, CLERK'S OFFICE, JANUARY 5, 2007
* * * * * PC #7 * * * * *
3423-00
25
Supplemental PD: 06/22/06
i.
Wet scrubbers,
ii. Electrostatic precipitators (ESP), and
iii. Fabric filter baghouses (FFB)
The above-cited control strategies and/or combinations thereof, as detailed in the
following table, can be used to effectively control filterable PM/PM
10
.
Summary Table: Available Filterable PM Control Options
Emitting Unit
Control Option
Combined Control
Option
Wet or Dry ESP
FFB with Fiberglass Bags
Wet Scrubber with Wet
ESP
FFB with Specialty Bags
CFB Boiler
Wet/Dry Scrubber
Wet Scrubber with FFB
A general description of the ESP, FFB, and wet scrubber control technologies is
described below. Only the control device is described, not each control option
listed above.
i.
Wet Scrubbers
Wet scrubbers typically use water to impact, intercept, or diffuse a particulate-
laden gas stream. With impaction, particulate matter is accelerated and
impacted onto a surface area or into a liquid droplet through devices such as
venturi or spray chamber. When using interception, particles flow nearly
parallel to the water droplets, which allow the water to intercept the particles.
Interception works best for submicron particles. Spray-augmented scrubbers
and high-energy venturi employ this mechanism. Diffusion is used for
particles smaller than 0.5 micron and where there is a high temperature
difference between the gas and the scrubbing liquid. The particles migrate
through the spray along lines of irregular gas density and turbulence,
contacting droplets of approximately equal energy.
Six particulate scrubber designs are used in wet scrubber control applications:
spray, wet dynamic, cyclonic spray, impactor, Venturi, and augmented. In all
of these scrubbers, impaction is the main collection mechanism for particles
larger than 3 microns. Since smaller sized particles respond to non-inertial
capture, a high density of small liquid droplets is needed to trap the particles.
This is done at the price of high-energy consumption due to hydraulic or
velocity pressure losses (William Vatavuk,
Estimating Costs of Air Pollution
Control
, 1990). Wet scrubbers used specifically for particulate control are not
commonly used on large utility boilers because of the high pressure drop to
remove particulate to levels equivalent to those achieved with an FFB or ESP.
Wet scrubbers are commonly designed for SO
2
removal instead of particulate
control.
ii. ESP
An ESP is a particulate control device that uses electric forces to move
particles out of the gas stream and onto collector plates. The particles are
given an electric charge by forcing them to pass through the corona that
surrounds a highly charged electrode, frequently a wire. The electrical field
ELECTRONIC FILING, RECEIVED, CLERK'S OFFICE, JANUARY 5, 2007
* * * * * PC #7 * * * * *
3423-00
26
Supplemental PD: 06/22/06
then forces the charged particles to the opposite charged electrode, usually a
plate. Solid particles are removed from the collection electrode by a shaking
process know as “rapping.” ESPs may be configured in several ways
including the plate wire precipitator, the flat plate precipitator, the tubular
precipitator, the wet precipitator, and the two-stage precipitator. These
descriptions are outlined in the EPA
OAQPS Cost Control Manual
for ESP
control.
The plate wire precipitator is the most common variety. It is commonly
installed on coal fired boilers, cement kilns, solid waste incinerators, paper
mill recovery boilers, petroleum refining catalytic cracking units, sinter plants,
and different varieties of furnaces. Plate wire precipitators are designed to
handle large volumes of gas. The flat plate precipitator is designed to use flat
plates instead of wires for high-voltage electrodes. Small particle sizes with
low-flow velocities are ideal for the flat plate precipitator. The flat plate
precipitator usually handles gas flows ranging from 100,000 to 200,000 actual
cubic feet per minute (acfm). Tubular precipitators are typically parallel tubes
with electrodes running along the axis of the tubes. Tubular precipitators have
typical applications in sulfuric acid plants, coke oven byproduct gas cleaning,
and steel sinter plants. Wet precipitators can be any of the three previously
discussed precipitators but with wet collection plates instead of dry collection
plates. A wet precipitator aids in further collection of particles by preventing
the collected ash from being re-entrained in the exhaust stream during the
rapping of the walls, a problem common to dry precipitators. The
disadvantages are the complexity of handling the wash and disposal of the
slurry.
Finally, two-stage precipitators are parallel in nature (i.e., the discharge and
collecting electrodes are side by side). Two-stage precipitators are designed
for indoor applications, low gas flows below 50,000 acfm, and submicrometer
sources emitting oil mists, smokes, fumes, and other sticky particulates. Two-
stage systems are specialized types of devices that are very limited in
applications.
Dry ESPs may be used downstream of a dry FGD unit to collect the dry FGD
media and the ash formed during fuel combustion. However, they do not
enhance SO
2
or SO
3
control. Dry ESPs are not suited for use downstream of
wet FGD systems due to the high moisture content of the gas stream and the
resulting stickiness of the particles. Wet ESPs may be used downstream of a
wet FGD unit to capture both residual flue gas particulate and H
2
SO
4
that may
have formed in the wet FGD unit.
iii. FFB
FFBs consist of one or more isolated compartments containing rows of fabric
filter bags or tubes. The exhaust stream passes through the fabric where the
filterable particulate is retained on the upstream face of the bags, while the
cleaned gas stream is vented to the atmosphere or to another pollution control
device. FFBs collect particle sizes ranging from submicron to several hundred
microns at gas temperatures up to approximately 500°F. Specialty bags can be
used to achieve lower particulate emission rates or with stack temperatures
above 500°F. FFBs can be categorized by the types of cleaning devices
ELECTRONIC FILING, RECEIVED, CLERK'S OFFICE, JANUARY 5, 2007
* * * * * PC #7 * * * * *
3423-00
27
Supplemental PD: 06/22/06
(shaker, reverse-air, and pulse-jet), direction of the gas flow, location of the
system fan, and/or the gas flow quantity. Typically, the type of cleaning
method distinguishes the FFB.
Advantages to FFBs are the high collection efficiency (in excess of 99%) and
the collection of a wide range of particle sizes. The operational disadvantages
of FFBs are limits on gas stream temperatures above 500°F (for typical
installations), high-pressure drops, wet gas streams, and issues resulting from
gas or particles that are corrosive and/or sticky in nature.
FFBs are not used downstream of a wet FGD system due to the high moisture
content of the exhaust gas, which will saturate and ultimately plug the fabric
filters. When used downstream of a dry FGD system, the FFB provides
additional sulfur oxide control. The alkaline filter cake continues to react with
and remove gaseous SO
2
and SO
3
as they pass through the filters. The alkaline
filter cake also captures acid gas mist that may have formed in the exhaust
system.
B. Technical Feasibility Analysis
Wet scrubbers designed for particulate control are technically infeasible on large
utility boilers because of the high-pressure drops. FFB and ESP particulate control
devices are commonly used on large utility boilers and are examined further for
BACT applicability.
C. Ranking of Available and Technically Feasible Filterable PM/PM
10
Control Options
by Efficiency
FFBs and ESPs have proven capabilities in removing greater than 99% of the
filterable PM from the exhaust gas stream generated by processes similar to the
SME-HGS CFB Boiler. FFBs are generally specified for use downstream of a dry
FGD system. The following table ranks the filterable PM control efficiency for the
specified control options.
Summary Table: Filterable PM Control Option Rank by Efficiency
Filterable PM/PM
10
Technology
Emission Rate
(lb/MMBtu)
Estimated Control
Efficiency
CFB with FFB with Teflon-Coated
Bags
0.012
99.85%
CFB with FFB with Fiberglass Bags
0.015
99.81%
CFB with ESP
0.018
99.77%
CFB with No Add-on Control
7.78
---
D. Evaluation of Control Technologies Including Environmental, Economic, and
Energy Impacts
The following paragraphs evaluate environmental, economic, and energy impacts
associated with the Filterable PM control options on a CFB Boiler with limestone
injection.
ELECTRONIC FILING, RECEIVED, CLERK'S OFFICE, JANUARY 5, 2007
* * * * * PC #7 * * * * *
3423-00
28
Supplemental PD: 06/22/06
i.
Environmental Impacts
The predominant environmental impact from controlling particulate in an FFB
or ESP is related to the fly ash that is collected. The fly ash needs to be
properly handled and deposited. SME-HGS is proposing to dispose the fly ash
and bed ash in an on-site monofill. Further, an ESP does not provide the
additional co-benefit SO
2
/SO
3
collection due to the alkaline filter cake on the
bags, but has not been eliminated based on environmental impacts.
ii. Economic Impacts
Department verified economic impacts associated with filterable particulate
control options were compared in the SME-HGS application using estimated
annualized capital, operating, and maintenance costs. Where appropriate,
constant operation and maintenance factors were identified and applied
consistently to control scenarios. Department verified and detailed
information regarding economic impacts is contained in the application for this
air quality permit.
The annual operating cost for Teflon-coated bags is approximately $500,000
more than the operating cost for standard fiberglass bags. The increase in
annual cost is mainly associated with more expensive bags, and a smaller
portion of the annual cost increase is associated with additional operating and
maintenance costs. Despite the increase in costs associated with the use of
Teflon-coated bags, the Department determined that an emission limit of 0.012
lb/MMBtu represents an achievable and cost-effective limit. As reported in
the application, the annual cost-effective value for Teflon-coated bags for the
proposed project is approximately $83/ton filterable PM removed as compared
to approximately $78/ton filterable PM removed using standard fiberglass
bags. Based on the cost-effective values provided above, all control options
are deemed economically feasible for the affected unit in this case. A detailed
cost analysis is included in the application for this air quality permit.
iii. Energy Impacts
Each of the control options require power in the form of fan horsepower to
overcome the control device pressure drop. However, energy impacts do not
eliminate any of the control options.
E. Filterable PM BACT Determination
SME-HGS proposed the use of FFB to maintain compliance with a proposed
filterable PM BACT emission limit of 0.015 lb/MMBtu. Based on Department
verified information contained in the SME-HGS application for this air quality
permit and taking into consideration technical, environmental, and economic
factors, the Department determined that the proposed FFB PM control strategy
constitutes BACT in this case. However, the Department determined that the
proposed emission limit of 0.015 lb/MMBtu does not constitute BACT in this case.
The FFB provides better particulate control than an ESP, is widely used in the coal-
fired power generation industry, and was analyzed and is required as part of the SO
2
BACT control determination. An FFB on a CFB with limestone injection and HAR
provides a co-benefit of SO
2
/SO
3
control, whereas an ESP does not provide this co-
benefit control.
ELECTRONIC FILING, RECEIVED, CLERK'S OFFICE, JANUARY 5, 2007
* * * * * PC #7 * * * * *
3423-00
29
Supplemental PD: 06/22/06
The Department determined that maintaining compliance with a limit of 0.012
lb/MMBtu constitutes BACT in this case. In the BACT analysis contained in the
application, SME-HGS states that discussions with baghouse manufacturers and
vendors indicates a limit of 0.012 lb/MMBtu will not be guaranteed without
significant increases in costs in order to cover any risks associated with
performance guarantees and liquidated damages. However, the Department
determined that the cost-effective values incurred by SME-HGS in order to meet a
filterable PM emission limit of 0.012 lb/MMBtu are well within industry norms and
constitute BACT in this case. Further, the Department determined that the BACT-
determined FFB is capable of reducing visible emissions from the CFB Boiler stack
to a level that will not exceed 20% opacity averaged over 6 consecutive minutes
except for one 6-minute period per hour of not greater than 27% opacity. The
Department determined that these opacity limits constitute BACT in this case.
Further, the BACT determined filterable PM emission limit and opacity limits are
consistent with the values reported in the RBLC for other recently permitted and
similar sources, including recently permitted sources permitted and operating in
Montana. The data from the RBLC website is summarized in the application.
The Department determined that the CFB Boiler operating under the BACT
determined control requirements is capable of meeting the established filterable PM
BACT emission limit of 0.012 lb/MMBtu and 33.25 lb/hr (0.012 lb/MMBtu *
2770.6 MMBtu/hr average boiler heat input capacity) and the visible emissions
standard of less than 20% opacity averaged over 6 consecutive minutes except for
one 6-minute period per hour of not greater than 27% opacity. Further, the
Department determined that the periodic filterable PM source testing, continuous
opacity monitoring, and the applicable recordkeeping and reporting requirements
will adequately monitor compliance with the permitted filterable PM
and opacity
BACT limit(s).
3. NO
x
Emissions
NO
x
is formed by thermal oxidation of nitrogen in the combustion air and by oxidation
of nitrogen in the fuel. Thermal NO
x
is formed in the high temperature region of the
flame or combustion zone of the affected combustion unit. The major factors
influencing thermal NO
x
formation are temperature, residence time within the
combustion zone, and concentration of nitrogen and oxygen in the inlet air. The amount
of fuel NO
x
formed is wholly dependent on the amount of nitrogen compounds
contained in the fuel.
A. Identification of Available NO
x
Control Strategies/Technologies
Applicable NO
x
control technologies can be divided into two main categories:
combustion controls, which limit NO
x
production, and post-combustion controls,
which destroy NO
x
after formation.
The following specific add-on technologies were identified as having the potential
to reduce NO
x
emissions from a CFB Boiler:
ELECTRONIC FILING, RECEIVED, CLERK'S OFFICE, JANUARY 5, 2007
* * * * * PC #7 * * * * *
3423-00
30
Supplemental PD: 06/22/06
Emitting
Unit
Individual Control Options
Dual Combined Control Options
Low Excess Air (LEA)
Flue Gas Recirculation (FGR)
Combination of LEA, FGR,
OFA, and LNB
Overfire Air (OFA)
Low NOx Burners (LNB)
Combination of LEA, FGR,
OFA, and/or LNB and SCR
Selective Catalytic Reduction
(SCR)
CFB Boiler
Selective Non-Catalytic
Reduction (SNCR)
Combination of LEA, FGR
OFA, and/or LNB and SNCR
A general description of the NO
x
control options listed in the table above is
described in the following text. Only the control device/strategy is described, not
each control option listed above.
i.
Low Excess Air (LEA)
LEA operation involves lowering the amount of combustion air to the
minimum level compatible with efficient and complete combustion. Limiting
the amount of air fed to the furnace reduces the availability of oxygen for the
formation of fuel NO
x
and lowers the peak flame temperature, which inhibits
thermal NO
x
formation.
Emissions reductions achieved by LEA are limited by the need to have
sufficient oxygen present for flame stability and to ensure complete
combustion. As excess air levels decrease, emissions of CO, hydrocarbons
and unburned carbon increase, resulting in lower boiler efficiency. Other
impediments to LEA operation are the possibility of increased corrosion and
slagging in the upper boiler because of the reducing atmosphere created at low
oxygen levels. This option cannot be utilized on CFB due to the level of air
needed to fluidize the bed.
ii. Flue Gas Recirculation (FGR)
FGR is a flame-quenching technique that involves recirculating a portion of
the flue gas from the economizers or the air heater outlet and returning it to the
furnace through the burner or windbox. The primary effect of FGR is to
reduce the peak flame temperature through absorption of the combustion heat
by relatively cooler flue gas. FGR also serves to reduce the O
2
concentration
in the combustion zone. This option can not utilized on CFB due to the level
of air needed to fluidize the bed.
iii. Overfire Air (OFA)
OFA allows staged combustion by supplying less than the stoichiometric
amount of air theoretically required for complete combustion through the
burners. The remaining necessary combustion air is injected into the furnace
through overfire air ports. Having an oxygen-deficient primary combustion
zone in the furnace lowers the formation of fuel NO
x
. In this atmosphere, most
of the fuel nitrogen compounds are driven into the gas phase. Combustion
occurring over a larger portion of the furnace lowers peak flame temperatures.
Use of a cooler, less intense flame limits thermal NO
x
formation.
ELECTRONIC FILING, RECEIVED, CLERK'S OFFICE, JANUARY 5, 2007
* * * * * PC #7 * * * * *
3423-00
31
Supplemental PD: 06/22/06
Poorly controlled OFA may result in increased CO and hydrocarbon
emissions, as well as unburned carbon in the fly ash. These products of
incomplete combustion result from a decrease in boiler efficiency. OFA may
also lead to reducing conditions in the lower furnace that in turn may lead to
corrosion of the boiler. This option cannot be utilized on CFB due to the level
of air needed to fluidize the bed.
iv. Low NO
x
Burners (LNB)
LNB integrate staged combustion into the burner creating a fuel-rich primary
combustion zone. Fuel NO
x
formation is decreased by the reducing conditions
in the primary combustion zone. Thermal NO
x
is limited due to the lower
flame temperature caused by the lower oxygen concentration. The secondary
combustion zone is a fuel lean zone where combustion is completed. LNB
may result in increased CO and hydrocarbon emissions, decreased boiler
efficiency, and increased fuel costs. This option cannot be utilized on CFB
due to the level of air needed to fluidize the bed.
v. Selective Catalytic Reduction (SCR)
SCR is a post-combustion gas treatment technique that uses a catalyst to
reduce NO and NO
2
to molecular nitrogen and water. Ammonia (NH
3
) is
commonly used as the reducing agent. The basic reactions are:
4 NH
3
+ 4 NO + O
2
→
4 N
2
+ 6 H
2
O
8 NH
3
+ 6 NO
2
→
7 N
2
+ 12 H
2
O
2 NO
2
+ 4 NH
3
+ O
2
→
3 N
2
+ 6 H
2
O
Ammonia is vaporized and injected into the flue gas upstream of the catalyst
bed, and combines with NO
x
at the catalyst surface to form an ammonium salt
intermediate. The ammonium salt intermediate then decomposes to produce
elemental nitrogen and water. The catalyst lowers the temperature required for
the chemical reaction between NO
x
and ammonia.
Technical factors that impact the effectiveness of this technology include the
catalyst reactor design, operating temperature, type of fuel fired, sulfur content
of the fuel, design of the ammonia injection system, and the potential for
catalyst poisoning. SCR has been demonstrated to achieve high levels of NOx
reduction in the range of 80% to 90% control for a wide range of industrial
combustion sources, including PC and stoker coal-fired boilers and natural
gas-fired boilers and turbines. SCR has not been demonstrated on a CFB
Boiler in the United States. Typically, installation of the SCR is upstream of
the particulate control device (e.g., baghouse). However, calcium oxide (from
a dry scrubber) in the exhaust stream can cause the SCR catalyst to plug and
foul, which would lead to an ineffective catalyst. SCRs are classified as a low
or high dust SCR. A low dust SCR is usually applied to natural gas
combustion units or after a particulate control device. High dust SCR units
can be installed on solid fuel combustion units before the particulate control
device. However, a high dust SCR cannot be installed on a CFB Boiler prior
to the particulate control device because the high alkaline particulate will
contaminate and possibly plug the catalyst. Therefore, the exhaust stream after
a particulate control device on a CFB Boiler would need to be reheated to
maintain an effective operating temperature of the catalyst.
ELECTRONIC FILING, RECEIVED, CLERK'S OFFICE, JANUARY 5, 2007
* * * * * PC #7 * * * * *
3423-00
32
Supplemental PD: 06/22/06
vi. Selective Non-Catalytic Reduction (SNCR)
SNCR involves the non-catalytic decomposition of NO
x
to nitrogen and water.
A NO
x
reducing agent, typically ammonia or urea, is injected into the upper
reaches of the furnace. Because a catalyst is not used to drive the reaction,
temperatures of 1600°F to 2100°F are required. The basic reactions are:
Ammonia: 4 NH
3
+ 4NO + O
2
→
4N
2
+ 6H
2
O
Urea: CO(NH
2
)
2
+ 2NO + ½O
2
→
2N
2
+ CO
2
+ H
2
O
Typical NO
x
control efficiencies range from 40% to 60% depending on inlet
NO
x
concentrations, fluctuating flue gas temperatures, residence time, amount
and type of nitrogenous reducing agent, mixing effectiveness, acceptable levels
of ammonia slip, and presence of interfering chemical substances in the gas
stream. SNCR has been applied to a number of different types of combustion
sources. SNCR has been widely implemented for NO
x
control on new coal-
fired CFBs throughout the United States.
B. Technical Feasibility Analysis
LNB, OFA, LEA, and FGR are used to reduce flame temperature and reduce the
thermal NO
x
; therefore, these control options separately or in combination with
another control option, including SCR and SNCR, are technically ineffective on a
CFB Boiler that has inherently low combustion temperatures and relatively lower
thermal NO
x
emissions. These control options separately or in combination with
another control option including SCR and SNCR are technically infeasible. The
remaining NO
x
control options cannot be eliminated based on technical
infeasibility.
C. Ranking of Available and Technically Feasible NO
x
Control Options by Efficiency
Various information sources evaluated by the Department through the NO
x
BACT
analysis process assigned varying NO
x
control efficiencies for each of the identified
available NO
x
control technologies/strategies. The following analysis uses the
average of expected control efficiencies reported for each strategy:
NO
x
Control Option
NO
x
Emission Rate
(lb/MMBtu)
Estimated NO
x
Control Efficiency
CFB Boiler with SCR
0.014
90.00%
CFB Boiler with SNCR
0.07
50.00%
CFB Boiler without Controls
0.14
0.00%
D. Evaluation of Control Technologies Including Environmental, Economic, and
Energy Impacts
The following text evaluates the environmental, economic, and energy impacts
associated with the NO
x
control options on a CFB Boiler.
i.
Environmental Impacts
The environmental impacts from both SCR and SNCR result from the
handling of the anhydrous ammonia. Spent catalyst from an SCR will have to
be properly disposed as a possible hazardous waste. An SCR unit would have
to be installed downstream of the baghouse to reduce fouling of the catalyst.
ELECTRONIC FILING, RECEIVED, CLERK'S OFFICE, JANUARY 5, 2007
* * * * * PC #7 * * * * *
3423-00
33
Supplemental PD: 06/22/06
Therefore, as an example, natural gas would have to be used to reheat the
exhaust gas to optimal temperature for the SCR unit. The combustion of the
natural gas would cause additional NO
x
, CO, VOC, and PM
10
emissions into
the atmosphere. Even though there are environmental concerns associated
with SCR and SNCR, these NO
x
control options cannot be eliminated based on
these concerns.
ii. Energy Impacts
SCR would cause significant backpressure in the CFB Boiler leading to lost
boiler efficiency and, thus, a loss of power production. Along with the power
loss, SME-HGS would be subject to the additional cost of reheating the
exhaust gas, which would be expensive at the current price of natural gas. The
energy impacts from an SNCR are minimal and an SNCR does not cause a loss
of power output from the facility. Even though these are energy impact
concerns, the control options cannot be eliminated based on these concerns.
The impacts of additional cost due to reheating the exhaust gas are included in
the annual cost of operating an SCR unit, which is presented in the economic
impact analysis.
iii. Economic Impacts
Department verified economic impacts associated with NO
x
control options
were compared in the SME-HGS application using estimated annualized
capital, operating, and maintenance costs. Cost estimates for SCR and SNCR
were derived from Chapter 4 in the
OAQPS COST Control Manual
(EPA
452/B-02-001). Where appropriate, assumptions were made from
suggested/typical data that were supplied in the manual, and if data was not
available from the manual, best engineering judgment was used. As reported
in the application, the cost effective value for SNCR is approximately
$2137/ton of NO
x
removed and the cost effective value for SCR is
approximately $12,562/ton of NO
x
removed. Based on the cost-effective
values provided above, SNCR is deemed economically feasible for the affected
unit and SCR is deemed economically infeasible for the affected unit in this
case. A detailed cost analysis is included in the application for this air quality
permit.
E. NO
x
BACT Determination
SME-HGS proposed the use of SNCR to maintain compliance with a proposed NO
x
BACT emission limit of 0.07 lb/MMBtu (30-day rolling average). Based on
Department verified information contained in the SME-HGS application for this air
quality permit and taking into consideration technical, environmental, and
economic factors, the Department determined that the proposed NO
x
emission
control strategy and emission limit constitute BACT in this case. This BACT
determined control option will provide an approximate 90% NO
x
reduction
efficiency.
SCR was eliminated based on the high cost per ton of NO
x
removed. Further, since
the SCR unit would have to be installed downstream from the permitted and BACT
determined FFB to eliminate fouling and excessive loading of the catalyst, the CFB
exhaust gas would need to be reheated. Reheating the exhaust gas is a significant
factor in the high annual cost of SCR and leads to a substantial increase in
ELECTRONIC FILING, RECEIVED, CLERK'S OFFICE, JANUARY 5, 2007
* * * * * PC #7 * * * * *
3423-00
34
Supplemental PD: 06/22/06
emissions from the reheat process summarized. Finally, the Department is unaware
of any CFB Boiler permitted or in operation in the United States, which has an SCR
unit installed for NO
x
emission control.
The BACT determined NO
x
emission limit is equal to the lowest NO
x
BACT
emission rates contained in the RBLC. Further, two of the boilers permitted with
NO
x
BACT emission limits of 0.07 lb/MMBtu, respectively, are CFB Boilers that
employ SNCR. The data from the RBLC website is summarized in the application.
The Department determined that the CFB Boiler operating under the BACT-
determined control requirements is capable of meeting the established NO
x
BACT
emission limit of 0.07 lb NO
x
/MMBtu (30-day rolling average). Further, the
Department determined that the periodic NO
x
source testing, continuous NO
x
emission monitoring, and the applicable recordkeeping and reporting requirements
will adequately monitor compliance with the permitted NO
x
BACT limit(s).
4. CO Emissions
CO emissions from a CFB coal-fired boiler are typically controlled using proper design
and combustion techniques. Typical CO control technologies (e.g., catalytic and thermal
oxidizers) are available; however, they are not typically considered appropriate for coal-
fired boilers because of high particulate loading, catalyst fouling, and/or high cost to
reheat the exhaust gas.
A. Identification of Available CO Control Strategies/Technologies
The following control options are evaluated as available CO control options for the
proposed SME-HGS project:
i.
CFB Boilers with Proper Design and Combustion (no add-on control); and
ii. CFB Boilers Catalytic or Thermal Oxidizers.
The following text provides a brief overview of the above-cited CO control
options/technologies/strategies that have been evaluated for the proposed project.
i.
Proper Design and Combustion (No Add-On Control)
In an ideal combustion process, all of the carbon and hydrogen contained
within the fuel is oxidized to carbon dioxide (CO
2
) and water (H
2
O). The
emission of CO in a combustion process is the result of incomplete fuel
combustion. Reduction of CO emissions can be accomplished by controlling
the combustion temperature, residence time, and available oxygen. Normal
combustion practice at the facility will involve maximizing the heating
efficiency of the fuel in an effort to minimize fuel usage. This efficiency of
fuel combustion will also minimize CO formation.
ii. Catalytic or Thermal Oxidation of Post-Combustion Gases
Oxidizers or incinerators use heat to destroy CO in the gas stream.
Incineration is an oxidation process that ideally breaks down the molecular
structure of an organic compound into carbon dioxide and water vapor.
ELECTRONIC FILING, RECEIVED, CLERK'S OFFICE, JANUARY 5, 2007
* * * * * PC #7 * * * * *
3423-00
35
Supplemental PD: 06/22/06
Temperature, residence time, and turbulence of the system affect CO control
efficiency. A thermal incinerator generally operates at temperatures between
1,450 and 1,600ºF. Heat recovery between 35% and 70% can be realized with
recuperative systems and up to 95% can be realized with regenerative systems.
The thermal oxidation system analyzed for the main boiler is a regenerative
thermal oxidation (RTO) system with 95% heat recovery. Regenerative
systems are typically designed for exhaust flow rates between 10,000 and
100,000 standard cubic feet per minute (scfm). Recuperative systems are
typically designed for exhaust flow rates between 500 and 50,000 scfm.
Regenerative systems typically have higher capital costs than recuperative
systems, but capital costs are typically offset by savings on auxiliary fuel use.
Catalytic incineration is similar to thermal incineration; however, catalytic
incineration generally allows for oxidation at temperatures ranging from 600 to
1,000ºF and can achieve up to 70% heat recovery. The catalyst systems are
typically metal oxides such as nickel oxide, copper oxide, manganese dioxide,
or chromium oxide. Noble metals such as platinum and palladium may also be
used. Fixed bed or fluid bed catalytic incinerators can be used on combustion
exhaust streams and can achieve up to 70% heat recovery. A fixed bed
catalytic incinerator with 70% heat recovery is examined in this BACT
analysis because of its comparatively lower capital cost.
B. Technical Feasibility Analysis
For the purposes of this BACT analysis, proper design and combustion control and
catalytic and thermal oxidation
are considered technically feasible, although
oxidation is not typically applied to coal-fired boilers. No available CO control
options are eliminated due to technical infeasibility.
C. Ranking of Available and Technically Feasible CO
Control Options by Efficiency
Various information sources evaluated by the Department through the CO BACT
analysis process assigned varying CO control efficiencies ranging from 70%
control for good combustion practices to 95% for the CO oxidation control
technologies/strategies. To be conservative, the SME-HGS application considered
90% control efficiency for the top oxidation control. The following table ranks the
CO control options.
CO Control Option
CO Emission
Rate
(lb/MMBtu)
Estimated
Control
Efficiency
CFB Boiler with Thermal Oxidation
0.01
90%
CFB Boiler with Catalytic Oxidation
0.01
90%
CFB Boiler with Proper Design and
Combustion Practices (no add-on control)
0.10
---
D. Evaluation of Control Technologies Including Environmental, Economic, and
Energy Impacts
The following text evaluates the environmental, economic, and energy impacts
associated with the CO control options on a CFB Boiler.
ELECTRONIC FILING, RECEIVED, CLERK'S OFFICE, JANUARY 5, 2007
* * * * * PC #7 * * * * *
3423-00
36
Supplemental PD: 06/22/06
i.
Environmental Impacts
Catalytic oxidation results in adverse environmental impact from the handling
of the spent catalyst and may have to be disposed of as a hazardous waste. A
catalytic oxidation unit would have to be installed downstream of the FFB to
reduce fouling of the catalyst; therefore, the exhaust gas would require
reheating to achieve optimal CO reduction. The combustion of the additional
fuel for reheating purposes would cause an increase in NO
x
, SO
2
, CO, VOC,
and PM
10
emissions. However, the control options cannot be eliminated based
on these concerns alone.
ii. Energy Impacts
The additional consumption of fuel to reheat the exhaust gas would result in
energy impacts. With current market prices for fuel, this strategy would also
be very expensive. Even though these energy impacts exist, the control
options cannot be eliminated based on these concerns.
iii. Economic Impacts
Department verified economic impacts associated with CO control options
were compared in the SME-HGS application using estimated annualized
capital, operating, and maintenance costs. Cost estimates for catalytic or
thermal oxidation were derived from Section 3, Chapter 2 (9/2000) in the
OAQPS COST Control Manual
. Where appropriate, assumptions were made
from suggested/typical data that were supplied in the manual and if data was
not available from the manual, best engineering judgment was used. As
reported in the application, the cost effective value for thermal oxidation is
approximately $6916/ton of CO removed and the cost effective value for
catalytic oxidation is approximately $4373/ton of CO removed. Based on the
cost-effective values provided above, all control options are deemed
economically infeasible for the affected unit in this case. A detailed cost
analysis is included in the application for this air quality permit.
E. CO BACT Determination
SME-HGS proposed the use of good combustion practices with no additional
control to maintain compliance with a proposed CO BACT emission limit of 0.10
lb/MMBtu (1-hr average). Based on Department verified information contained in
the SME-HGS application for this air quality permit and taking into consideration
technical, environmental, and economic factors, the Department determined that the
proposed CO emission control strategy and emission limit constitute BACT in this
case.
Catalytic and thermal oxidation were eliminated based on the high cost per ton of
CO removed and because the increased fuel consumption associated with reheating
the gas stream would result in additional environmental impacts.
The BACT determined CO emission limit is equal to the lowest CFB Boiler CO
BACT emission rates contained in the RBLC. Two non-CFB boilers listed in the
RBLC have lower emission limits, but these two sources do not have a control
device and rely on good combustion practices for CO control. The data from the
RBLC website is summarized in the application.
ELECTRONIC FILING, RECEIVED, CLERK'S OFFICE, JANUARY 5, 2007
* * * * * PC #7 * * * * *
3423-00
37
Supplemental PD: 06/22/06
The Department determined that the CFB Boiler operating under the BACT-
determined control requirements is capable of meeting the established CO BACT
emission limit of 0.10 lb CO/MMBtu (1-hr average). Further, the Department
determined that the periodic CO source testing and the applicable recordkeeping
and reporting requirements will adequately monitor compliance with the permitted
CO BACT limit(s).
5. VOC Emissions
VOC emissions from a CFB coal-fired boiler are typically controlled using proper
design and combustion techniques that were identified in the CO BACT analysis.
Typical VOC control technologies (e.g., catalytic and thermal oxidizers) are available;
however, they are not typically considered appropriate for coal-fired boilers because of
high particulate loading, catalyst fouling, or high cost to reheat the exhaust gas.
A. Identification of Available VOC Control Strategies/Technologies
The following control options were evaluated for the CO control options and will
be evaluated for the VOC control options. A description of each control technology
is provided in the CO BACT analysis:
i.
CFB Boilers with Proper Design and Combustion (no add-on control); and
ii. CFB Boilers with Catalytic or Thermal Oxidizers.
B. Technical Feasibility Analysis
For the purposes of this BACT analysis, proper design and combustion control,
catalytic oxidation, and thermal oxidation will be considered technically feasible,
although oxidation is not typically applied to coal-fired boilers. No available VOC
control options are eliminated due to technical infeasibility.
C. Ranking of Available and Technically Feasible VOC
Control Options by Efficiency
Various information sources evaluated by the Department through the VOC BACT
analysis process assigned varying VOC control efficiencies ranging from 70% for
good combustion practices to 95% for the VOC oxidation control technologies/
strategies. To be conservative, the SME-HGS application considered 90% control
efficiency for the top oxidation control. The following table ranks the VOC control
options.
VOC Control Option
VOC Emission
Rate
(lb/MMBtu)
Estimated
Control
Efficiency
CFB Boiler with Thermal Oxidation
0.0003
90%
CFB Boiler with Catalytic Oxidation
0.0003
90%
CFB Boiler with Proper Design and
Combustion Practices (no add-on control)
0.003
---
ELECTRONIC FILING, RECEIVED, CLERK'S OFFICE, JANUARY 5, 2007
* * * * * PC #7 * * * * *
3423-00
38
Supplemental PD: 06/22/06
D. Evaluation of Control Technologies Including Environmental, Economic, and
Energy Impacts
The following text evaluates the environmental, economic, and energy impacts
associated with the VOC control options on a CFB Boiler.
i.
Environmental Impacts
Catalytic oxidation results in adverse environmental impact from the handling
of the spent catalyst and may have to be disposed of as a hazardous waste. A
catalytic oxidation unit would have to be installed downstream of the FFB to
reduce fouling of the catalyst; therefore, the exhaust gas would require
reheating to achieve optimal VOC reduction. The combustion of the
additional fuel for reheating purposes would cause an increase in NO
x
, SO
2
,
CO, VOC, and PM
10
emissions. However, the control options cannot be
eliminated based on these concerns alone.
ii. Energy Impacts
The additional consumption of fuel would result in energy impacts from
reheating the exhaust. With current market prices for natural gas, this strategy
would also be very expensive. Even though these energy impacts exist, the
control options cannot be eliminated based on these concerns.
iii. Economic Impacts
Department verified economic impacts associated with VOC control options
were compared in the SME-HGS application using estimated annualized
capital, operating, and maintenance costs. Cost estimates for catalytic or
thermal oxidation were derived from Section 3, Chapter 2 (9/2000) in the
OAQPS COST Control Manual
. Where appropriate, assumptions were made
from suggested/typical data that were supplied in the manual, and, if data was
not available from the manual, best engineering judgment was used. As
reported in the application, the cost effective value for thermal oxidation is
approximately $222,928/ton of VOC removed and the cost effective value for
catalytic oxidation is approximately $142,546/ton of VOC removed. Based on
the cost-effective values provided above, all control options are deemed
economically infeasible for the affected unit in this case. A detailed cost
analysis is included in the application for this air quality permit.
E. VOC BACT Determination
SME-HGS proposed the use of good combustion practices with no additional
control to maintain compliance with a proposed VOC BACT emission limit of
0.003 lb/MMBtu (1-hr average). Based on Department verified information
contained in the SME-HGS application for this air quality permit and taking into
consideration technical, environmental, and economic factors, the Department
determined that the proposed VOC emission control strategy and emission limit
constitute BACT in this case.
Catalytic and thermal oxidation were eliminated based on the high cost per ton of
VOC removed and because the increased fuel consumption associated with
reheating the gas stream would result in additional environmental impacts.
ELECTRONIC FILING, RECEIVED, CLERK'S OFFICE, JANUARY 5, 2007
* * * * * PC #7 * * * * *
3423-00
39
Supplemental PD: 06/22/06
The BACT determined VOC emission limit is among the lowest CO BACT
emission rates contained in the RBLC for PC or CFB Boiler technologies. Further,
the permitted VOC BACT emission rate of 0.003 lb/MMBtu matches recently
permitted VOC BACT limits permitted for operation in Montana. The data from
the RBLC website is summarized in the application.
The Department determined that the CFB Boiler operating under the BACT-
determined control requirements is capable of meeting the established VOC BACT
emission limit of 0.003 lb VOC/MMBtu (1-hr average). Further, the Department
determined that the periodic VOC source testing and the applicable recordkeeping
and reporting requirements will adequately monitor compliance with the permitted
VOC BACT limit(s).
6. H
2
SO
4
, Acid Gases (HCl and HF), Trace Metals, and Condensable PM
10
Emissions
Sulfuric acid mist, acid gases (primarily HF and HCl), trace metals (including lead), and
condensable PM
10
are grouped together in this BACT evaluation because these
pollutants are a major component of condensable PM
10
. Other inorganic and organic
species (e.g., ammonium bisulfate and certain VOCs) can also contribute to condensable
PM
10
. Control options from a CFB boiler are typically limited to the available SO
2
and/or filterable PM/PM
10
control options.
H
2
SO
4
, acid gases (HCl and HF), trace metals (including lead), and condensable PM
10
generally form in the exhaust system of a boiler. The formation is dependent upon
several factors including residence time within specific temperature ranges, flue gas
moisture content, combustion conditions, and concentrations of chlorine, fluorine, and
trace metals in the coal.
Sulfuric Acid Mist (H
2
SO
4
)
H
2
SO
4
is typically created when SO
3
in the flue gas reacts with water. SO
3
is formed
during the combustion process in a coal-fired boiler. H
2
SO
4
mist in boiler flue gas
generally forms in three phases as described below:
Sulfur in the boiler fuel oxidizes to form sulfur dioxide (SO
2
).
S + O
2
→
SO
2
A portion of the SO
2
further oxidizes to sulfur trioxide (SO
3
).
SO
2
+ ½ O
2
→
SO
3
SO
3
reacts with water in the exhaust stream or the atmosphere to form H
2
SO
4
.
SO
3
+ H
2
O
→
H
2
SO
4
Because H
2
SO
4
mist is created in several steps, control strategies can be approached in a
variety of ways that may be applied individually or in combination. Control strategies
generally focus on reducing the amount of SO
2
and SO
3
in the flue gas, capturing
sulfuric acid mist aerosol particles, and controlling exhaust system conditions to limit
mist formation.
ELECTRONIC FILING, RECEIVED, CLERK'S OFFICE, JANUARY 5, 2007
* * * * * PC #7 * * * * *
3423-00
40
Supplemental PD: 06/22/06
Acid Gases (HCl and HF)
Acid gases can be controlled to different degrees by standard control technologies for
other criteria pollutants (primarily with SO
2
and filterable PM control technologies).
Trace Metals (Including Lead)
Depending on the physical and chemical properties of a metal and boiler combustion
conditions, some metals can be emitted in the gas phase, while others may be emitted as
particulates and will tend to be captured either in the fly or bed ash. Metals emitted
from coal combustion include: arsenic, beryllium, cadmium, chromium, manganese, and
lead and based on the physical and chemical properties of these listed metals, most
would be emitted as particulate matter. A smaller percentage of these metals and other
metals may also be emitted as volatiles and condensable particulates.
Condensable Particulate
Condensable particulate can be controlled to different degrees by controlling the
components that make up condensable particulate (H
2
SO
4
mist, acid gases, volatile trace
metals, etc.) with standard control technologies for other criteria pollutants (primarily
SO
2
and filterable PM control technologies).
A. Identification of Available H
2
SO
4
, Acid Gases (HCl and HF), Trace Metals, and
Condensable PM
10
Emissions Control Strategies/Technologies
Available control technologies for H
2
SO
4
mist, acid gases (HCl and HF), trace
metals (including lead), and condensable PM
10
emissions from a CFB Boiler are
listed below:
i.
Wet FGD;
ii. Wet FGD followed by wet ESP;
iii. Dry FGD followed by FFB or ESP; and
iv. No additional add-on control.
The following text provides a brief overview of the above-cited control
options/technologies/strategies that have been evaluated for the proposed project.
i.
Wet FGD
Wet FGD is limited in its ability to control H
2
SO
4
mist and acid gas emissions
for two reasons. First, the moisture inherent in the system, combined with the
sudden cooling created by the slurry spray, tends to create sulfuric acid mist
and acid gases (two significant components of condensable PM
10
). Second,
because the condensable particulates are extremely small, they are not
effectively captured by the washing action of the wet FGD. A wet FGD
system would be expected to control sulfuric acid mist and acid gas (including
HF) emissions with efficiency less than 25%.
ii. Wet FGD Followed by Wet ESP
Wet ESPs can control H
2
SO
4
mist and acid gases with a very high efficiency.
Not all of the SO
3
in the gas stream is converted to sulfuric H
2
SO
4
mist, which
results in an overall H
2
SO
4
mist control efficiency for this system of
approximately 90% (other acid gases will also be collected at an efficiency of
ELECTRONIC FILING, RECEIVED, CLERK'S OFFICE, JANUARY 5, 2007
* * * * * PC #7 * * * * *
3423-00
41
Supplemental PD: 06/22/06
90%). Use of an FFB downstream of a wet scrubber is not technically
feasible, the high moisture content of the flue gas exiting the scrubber would
cause the filter cake to agglomerate, clogging the filter and making the filter
cleaning extremely difficult.
iii. Dry FGD Followed by FFB or ESP
Dry FGD systems, including SDAs and fly-ash reinjection systems, are
generally capable of controlling SO
3
(and H
2
SO
4
) and acid gases with an
efficiency of at least 90%. As noted above, a particulate control device is
required following a dry FGD system to collect the injected reagent particles.
While ESPs and FFBs provide essentially the same level of particulate control,
FFBs have the potential to enhance SO
2
, SO
3
, and HF removal efficiency as
the exhaust gas passes through a filter cake containing alkaline ash and
unreacted reagent. FFBs also have a high removal efficiency of trace metals
and may provide some additional control for other acid gases.
B. Technical Feasibility Analysis
None of the identified available H
2
SO
4
, acid gas (HCl and HF), trace metals
(including lead), and condensable PM
10
control technologies are technically
infeasible. Therefore, no available control options are eliminated at this stage.
C. Ranking of Available and Technically Feasible H
2
SO
4
, Acid Gas (HCl and HF),
Trace Metals (including lead), and condensable PM
10
Control Options by
Efficiency
The following table summarizes the available control options, their respective
potential control efficiency values, and their ranking for the purposes of this BACT
analysis. Limited data is available on control efficiencies for these pollutants;
therefore, the proposed CFB Boiler may not perform to the exact control
efficiencies highlighted in the table.
Technology
H
2
SO
4
Control
Efficiency
Acid Gas
Control
Efficiency
Trace
Metal
Control
Efficiency
Condensable
PM
10
Control
Efficiency
Dry FGD &FFB or ESP
90%
80%
90%
90%
Wet FGD & Wet ESP
90%
90%
80%
90%
Wet FGD
25%
80%
70%
80%
No Add-On Control
---
---
---
---
The top two control alternatives potentially provide similar H
2
SO
4
and condensable
PM
10
control efficiency, while the top two differ in acid gas and trace metal control
efficiencies. Because SME-HGS proposes to implement one of these two top
alternatives based on SO
2
and filterable PM BACT analysis, no further analysis is
required for H
2
SO
4
, acid gases, trace metals, and condensable PM
10
control.
D. Evaluation of Control Technologies Including Environmental, Economic, and
Energy Impacts
The environmental, economic, and energy impacts associated with the available
H
2
SO
4
, acid gas, trace metals, and condensable PM
10
control options are the same
as the impacts addressed in the BACT analyses for SO
2
and filterable PM
ELECTRONIC FILING, RECEIVED, CLERK'S OFFICE, JANUARY 5, 2007
* * * * * PC #7 * * * * *
3423-00
42
Supplemental PD: 06/22/06
emissions. Because these control strategies have been determined to constitute
BACT for SO
2
and filterable PM, no additional environmental, economic, and
energy impacts will be realized through the control of H
2
SO
4
, acid gas, trace metals,
and condensable PM
10
, through utilization of these co-benefit control strategies.
E. H
2
SO
4
, Acid Gas, Trace Metals, and Condensable PM
10
BACT Determination
H
2
SO
4
As previously stated, either of the two top technologies for H
2
SO
4
mist control will
reduce emissions by 90%. SME-HGS proposes a CFB Boiler combusting low
sulfur coal with dry FGD followed by an FFB to maintain compliance with a
proposed H
2
SO
4
BACT emission limit of 0.0054 lb/MMBtu. Based on Department
verified information contained in the SME-HGS application for this air quality
permit and taking into consideration technical, environmental, and economic
factors, the Department determined that the proposed H
2
SO
4
emission control
strategy and emission limit constitute BACT in this case.
This emission rate, although not the lowest, compares favorably to similar facilities
in the RBLC and is lower than the BACT-determined emissions rates for the
recently permitted Gascoyne CFB Boiler and the two most recent coal-fired utilities
permitted for operation in Montana. The data from the RBLC website is
summarized in the application.
The Department determined that the CFB Boiler operating under the BACT-
determined control requirements is capable of meeting the established H
2
SO
4
BACT emission limit of 0.0054 lb/MMBtu over any 1-hour time period. Further,
the Department determined that the periodic source testing and the applicable
recordkeeping and reporting requirements contained in the permit will adequately
monitor compliance with the permitted BACT limit(s).
Acid Gases
As previously stated, either of the two top technologies for acid gas control will
reduce emissions by 80% to 90%. SME-HGS proposes a CFB Boiler combusting
low sulfur coal with dry FGD followed by an FFB to maintain compliance with a
proposed HF BACT emission limit of 0.0017 lb/MMBtu and a proposed HCl
BACT emission limit of 0.0021 lb/MMBtu. Based on Department verified
information contained in the SME-HGS application for this air quality permit and
taking into consideration technical, environmental, and economic factors, the
Department determined that the proposed emission control strategy and emission
limit(s) for HF and HCl, respectively, constitute BACT in this case.
These BACT-determined acid gas emission rates, although not the lowest, compare
favorably to similar facilities in the RBLC, representing an average BACT emission
rate for those sources contained in the RBLC. The data from the RBLC website is
summarized in the application.
The Department determined that the CFB Boiler operating under the BACT-
determined control requirements is capable of meeting the established HF and
HCl
BACT emission limits of 0.0017 lb/MMBtu and 0.0021 lb/MMBtu over any 1-hour
time period, respectively. Further, the Department determined that the periodic
ELECTRONIC FILING, RECEIVED, CLERK'S OFFICE, JANUARY 5, 2007
* * * * * PC #7 * * * * *
3423-00
43
Supplemental PD: 06/22/06
source testing and the applicable recordkeeping and reporting requirements
contained in the permit will adequately monitor compliance with the permitted
BACT limit(s).
Trace Metals (including Lead)
As previously stated, either of the two top technologies for trace metals control will
reduce emissions by 80% to 90%. SME-HGS proposes a CFB Boiler combusting
low sulfur coal with dry FGD followed by an FFB as BACT for trace metals.
SME-HGS proposes the PM
10
emission rate as a surrogate emission limit for trace
metal emissions.
The Department determined that the CFB Boiler operating under the BACT-
determined control requirements is capable of meeting the established PM
10
surrogate emission limit of 0.026 lb/MMBtu. Further, the Department determined
that the periodic source testing (PM
10
) and the applicable recordkeeping and
reporting requirements contained in the permit will adequately monitor compliance
with the permitted BACT limit.
PM
10
The PM
10
emission rate is calculated based on the assumed components that make
up the condensable PM
10
fraction plus the BACT-determined filterable PM
emission limit. The following table presents the emissions rates for the components
that are assumed to make up the condensable PM
10
fraction as well as the BACT-
determined filterable PM emission rate.
Component
Emission Rate (lb/MMBtu)
HCl
0.0021
HF
0.0017
H2SO4
0.0054
VOC
0.0030
Ammonium Bisulfate
0.0015
Trace Metals
0.0002
Organic Condensables
0.0005
Total Condensables
0.014
Filterable PM
0.012
PM
10
Limit
0.026
*
*
PM
10
BACT-determined emission limit equals the condensable PM
10
fraction plus the BACT-
determined filterable PM limit
As previously stated, either of the two top technologies for the pollutants making up
the condensable PM
10
fraction will reduce emissions by 80% to 90%. SME-HGS
proposes a CFB Boiler combusting low sulfur coal with dry FGD followed by an
FFB to maintain compliance with a PM
10
emission limit of 0.026 lb/MMBtu.
Based on Department verified information contained in the SME-HGS application
for this air quality permit and taking into consideration technical, environmental,
and economic factors, the Department determined that the proposed emission
control strategy and the Department-established emission limit for condensable
PM
10
constitutes BACT in this case.
ELECTRONIC FILING, RECEIVED, CLERK'S OFFICE, JANUARY 5, 2007
* * * * * PC #7 * * * * *
3423-00
44
Supplemental PD: 06/22/06
The BACT-determined PM
10
emission rate, although not the lowest, compares
favorably to similar facilities in the RBLC. The data from the RBLC website is
summarized in the application.
The Department determined that the CFB Boiler operating under the BACT-
determined control requirements is capable of meeting the established PM
10
emission limit of 0.026 lb/MMBtu. Further, the Department determined that the
periodic source testing and the applicable recordkeeping and reporting requirements
contained in the permit will adequately monitor compliance with the permitted
BACT limit(s).
7. Mercury
Emissions
Coal contains trace levels of a variety of metals and other elements or compounds.
Mercury is one of those trace elements. Emissions of mercury into the atmosphere have
been identified as a health concern principally due to its capacity to react chemically
with the environment to form a toxic compound – methyl mercury – that accumulates
through the aquatic food chain with a potential to threaten human populations.
Depending on its chemical form, mercury can persist in the atmosphere and travel vast
distances before being deposited on terrestrial features.
When coal burns, mercury is released in one of three forms, or species: elemental
mercury vapor, oxidized mercury vapor, or mercury adsorbed to the surface of a solid
particle. The different species of mercury respond differently to different types of
control technologies.
Elemental mercury is the most difficult of the three mercury species to control. To date,
no technologies have been demonstrated in field-testing to consistently and significantly
reduce elemental mercury emissions. Most research is focused on developing effective
means for converting elemental mercury to one of the other two species of mercury.
Oxidized mercury is water soluble and generally more reactive than elemental mercury.
Because of this, technologies for controlling SO
2
emissions have demonstrated promise
for controlling oxidized mercury emissions as well. Research has shown a strong
correlation between coal chlorine content and the proportion of oxidized mercury in coal
combustion products. Under specific conditions, the addition of chlorine or other
halides has been shown to promote mercury oxidation.
Particulate mercury may be controlled with FFBs and/or ESPs – devices commonly used
to control particulate emissions from coal combustion processes. The proportion of
particulate mercury emissions appears to be related to the amount of oxidized mercury.
Oxidized mercury is more readily adsorbed to the surface of particles such as coal ash,
FGD media, or activated carbon than is elemental mercury. Higher levels of unburned
carbon (UBC) in the ash have also been shown to favor mercury adsorption.
Department of Energy, U.S. Environmental Protection Agency, and Industry Research
For the last several years the Department of Energy/National Energy Technology
Laboratory (DOE/NETL) and the Electric Power Research Institute (EPRI) have
evaluated mercury removal technologies for potential application to the power
generation industry. However, the Department and SME-HGS have been unable to find
research specifically evaluating control of mercury emissions from CFB Boilers.
ELECTRONIC FILING, RECEIVED, CLERK'S OFFICE, JANUARY 5, 2007
* * * * * PC #7 * * * * *
3423-00
45
Supplemental PD: 06/22/06
A recent white paper from the EPA (“the technology review report”) describes and
summarizes the status of test programs throughout the country aimed at understanding
and improving capabilities for reducing mercury emissions from coal-fired electric
generators (“
Control of Mercury Emissions from Coal Fired Electric Utility Boilers: An
Update
,” Air Pollution Prevention and Control Division, National Risk Management
Research Laboratory, Office of Research and Development, U.S. Environmental
Protection Agency; February 18, 2005). Results have varied greatly, from an actual
increase of mercury emissions to over 90 percent mercury removal efficiency.
It has long been recognized that coal quality is a primary determining factor in mercury
removal effectiveness. Bituminous coal generally contains higher levels of chlorine and
UBC, and has therefore proven to provide enhanced capacity for mercury reduction.
Conversely, subbituminous coal and lignite, often grouped as the single category of “low
rank coal,” generally contain low concentrations of chlorine and UBC. Control of
mercury emissions resulting from combustion of these fuels has proven to be highly
variable.
Mercury emissions control research, as it relates to coal-fired power generation, has
followed two general paths: characterizing and enhancing co-benefits from existing
control equipment (sometimes referred to as “native capture”), and development of
mercury-specific control technologies. The two paths at times intermingle since
mercury-specific control technologies often must be used in tandem with native capture.
For example, modified or standard powdered activated carbon injection (ACI) is one of
the most promising mercury-specific control technologies under certain conditions.
Once injected into the exhaust stream, however, it must be captured by a particulate
emissions control device. Following are some concluding observations from the EPA’s
technology review report:
•
“Assuming sufficient RD&D of representative technologies, new and existing
systems installed to control NO
x
and SO
2
(e.g., SCR+FGD+FFB) have the
potential to achieve 90%+ control of mercury for bituminous coal-fired boilers.
Subbituminous and lignite systems appear to require mercury oxidation
technology and/or additional advanced sorbents to achieve these levels.”
•
“It is believed that ACI and enhanced multi-pollutant controls will be available
after 2010 for commercial application on most, if not all, key combinations of
coal type and control technology to provide mercury removal levels between 60
and 90%. Also, optimized multi-pollutant controls may be available in the 2010-
2015 timeframe for commercial application on most, if not all, key combinations
of coal type and control technology to provide mercury removal levels between
90 and 95%.”
•
“The principle concerns relating to broad-scale use of mercury controls are the
reliability of mercury reductions possible and the risks of adverse side effects.
To the extent that required mercury reductions are within the capabilities of the
technology with minimum risks of side effects, mercury controls could be
considered available. However, as discussed in this paper, there remain some
questions regarding their performance relative to broad-scale use. These
questions are being investigated in ongoing efforts.”
Project Coal Supply
SME-HGS is proposing to use Powder River Basin (PRB) subbituminous coal as the
CFB Boiler fuel source. Specifically, SME-HGS is currently considering purchasing
coal from one of the following three southeastern Montana coal mines: Spring Creek,
ELECTRONIC FILING, RECEIVED, CLERK'S OFFICE, JANUARY 5, 2007
* * * * * PC #7 * * * * *
3423-00
46
Supplemental PD: 06/22/06
Decker, and/or Absaloka coal mines. Coal quality data from two of these sources
indicates average coal mercury content is 0.05-0.07 ppmw, compared with a national
average of 0.17 ppmw (“Mercury in U.S. Coal – Abundance, Distribution, and Modes of
Occurrence,” USGS Fact Sheet FS-095-01, September 2001; available at
pubs.usgs.gov/fs/fs095-01/fs095-01.pdf). The upper 95 percent confidence level
mercury content value from these coal analyses is 0.13 ppmw. The corresponding
uncontrolled mercury emission rate, assuming all of the mercury in the coal is released
to the atmosphere, would be 10.0 lb/TBtu or 230 lb/yr.
A. Identification of Available Mercury Control Strategies/Technologies
The following paragraphs describe alternative technologies that are being evaluated
for feasibility and effectiveness of controlling mercury emissions from electric
utility boilers as presented in the 2005 EPA technology review report. The
technologies are grouped into the following categories:
i.
Native Controls:
a. Particulate Controls
b. SO
2
Controls
c. NO
x
Controls
d. SDA/FFB Controls
ii. Enhanced Controls
a. Fuel Blending
b. Oxidizing Chemicals
c. UBC Enhancement
d. Mercury Specific Catalyst
e. Improvement of Wet FGD Mercury Capture
iii. Sorbent Injection: Add-on mercury control equipment; and
iv. Additional Alternatives
The following text provides a brief overview of the above-cited control
options/technologies/strategies that have been evaluated for the proposed project.
i.
Native Controls
Native controls include mercury removal accomplished by existing controls for
NO
x
, SO
2
, and particulate.
a. Particulate Controls
Survey and test data indicate that ESPs provide limited mercury emissions
control. Because the control they do provide results from the capture of
particulate-bound mercury, its effectiveness depends on the relative
amount of particulate mercury speciation. FFBs have been demonstrated
to be relatively more effective at controlling mercury emissions from
bituminous and low rank coals. This appears to be due to the effect of the
ELECTRONIC FILING, RECEIVED, CLERK'S OFFICE, JANUARY 5, 2007
* * * * * PC #7 * * * * *
3423-00
47
Supplemental PD: 06/22/06
ash-cake that collects on the surface of the filters. The cake enhances gas-
particle interactions, promoting adsorption of oxidized mercury and,
where there is adequate chlorine, oxidation of elemental mercury.
b. SO
2
Controls
Wet FGD scrubbers have demonstrated mercury removal efficiencies
ranging from less than 50% to approximately 75% for bituminous coal.
No data were found that evaluated effectiveness when burning low rank
coal. Because oxidized mercury – which is generally present in high
proportion for bituminous coal – is water soluble, wet FGD removal
effectiveness would be expected to be higher than has been observed. It
is thought that wet FGD systems tend to promote chemical reduction of
oxidized mercury to elemental mercury, resulting in subsequent re-
emission.
While evaluations of mercury emissions from CFB Boilers do not appear
in the literature, one of the primary advantages of CFB Boiler technology
is the reduction of SO
2
emissions, which in turn may benefit mercury
capture in the exhaust gas stream. Potential for mercury capture co-
benefits associated with CFB technology will be addressed in a
subsequent portion of this analysis.
c. NO
x
Controls
SCR units appear to enhance oxidation of elemental mercury when
burning bituminous coal, but limited data indicate marginal effectiveness
when burning subbituminous coal.
d. SDA/FFB Systems
Emissions control systems consisting of spray dryer absorbers (SDAs)
and FFBs have been demonstrated to provide over 90 percent mercury
control efficiency for bituminous coal combustion. Average control
efficiency when burning subbituminous coal is approximately 25 percent.
This low effectiveness – less than has been observed with FFBs alone – is
thought to be the result of HCl removal by the SDA. It is thought that
bituminous coal contains enough excess chlorine that HCl scrubbing by
the SDA is not a limiting factor for that coal rank.
ii. Enhanced Controls
Enhanced controls include mercury control strategies accomplished through
the enhancement of existing controls.
a. Fuel Blending
Replacing a portion of PRB subbituminous coal with bituminous coal has
been evaluated with mixed results (“Evaluation of Sorbent Injection for
Mercury Control,” Quarterly Technical Report, Reporting Period:April 1,
2005 – June 30, 2005; Sharon Sjostrom; available at
www.netl.doe.gov/coal/E&WR
/mercury/control-tech/sorbent-
ELECTRONIC FILING, RECEIVED, CLERK'S OFFICE, JANUARY 5, 2007
* * * * * PC #7 * * * * *
3423-00
48
Supplemental PD: 06/22/06
injection2.html.). In one short-term test, mercury capture increased from
approximately 25 percent to nearly 80 percent. At another facility, no
additional mercury capture was observed.
b. Oxidizing Chemicals
Limited short-term testing has been conducted on the effects of
introducing chlorine and other halogens into the combustion system. The
test results vary depending on boiler type, coal quality, and downstream
pollution control equipment. Test results show some promise for adding
these chemicals with ACI to achieve high levels of mercury emission
reduction. However, further evaluation of impacts to operations has been
recommended in addition to further evaluation of effectiveness over
various conditions and durations.
c. UBC Enhancement
Derivative data from field tests have provided evidence that increasing the
portion of unburned carbon (UBC) in coal ash enhances mercury capture.
Adjusting combustion conditions to increase ash UBC levels will require
evaluation on a case-by-case basis of detrimental effects to boiler
operation and efficiency.
d. Mercury-Specific Catalysts
Testing is ongoing regarding the effectiveness and feasibility of injecting
oxidizing chemicals or employing catalyst systems designed to facilitate
oxidation of elemental mercury.
e. Improvement of Wet FGD Mercury Capture
Limited testing has been conducted on the potential for SCR and an
injected chemical additive to improve elemental mercury oxidation and to
limit or eliminate chemical reduction of oxidized mercury in a wet FGD
system. Results from the tests, which so far have been carried out only on
bituminous coal, indicate that SCR and/or chemical additives can improve
overall mercury capture in a wet FGD/ESP system firing bituminous coal.
iii. Sorbent Injection
Injection of various sorbents into the boiler exhaust stream has been the
primary technology under evaluation that is specific to mercury control (i.e., it
does not rely on a co-benefit of controlling some other pollutant). This
technology was identified as having potential to reduce mercury emissions
from coal-fired electric utility boilers because of its successful history of
application to waste incinerators for the same purpose. Sorbent injection
technology used in waste incinerators is not directly transferable to electric
utility boilers, however, due to significant differences in operational
requirements and in exhaust gas characteristics such as mercury
concentrations, chemical makeup, and volume.
ELECTRONIC FILING, RECEIVED, CLERK'S OFFICE, JANUARY 5, 2007
* * * * * PC #7 * * * * *
3423-00
49
Supplemental PD: 06/22/06
As suggested by the name, sorbent injection technology works by providing
active surfaces that promote adsorption of exhaust mercury. The result is
particulate-bound mercury that can be captured by particulate emissions
control equipment such as an ESP or FFB. Standard ACI has proven to be
effective for improving mercury emissions from bituminous coal on a
relatively consistent basis. Its effectiveness on subbituminous coal emissions
is dependent upon facility and operating parameters, and has been consistently
lower than that observed with bituminous coal. Recent research suggests that
the levels of chlorine and sulfur in the combustion gases are key in
determining mercury capture efficiency.
Several alternative injection media have been and continue to be evaluated to
address deficiencies and concerns associated with ACI. One class of
alternative media consists of standard ACI that has been treated with a
halogen, most commonly boron. The treatment serves to enhance elemental
mercury oxidation and overall mercury adsorption. Initial results from several
short-term tests indicate that halogenated ACI could potentially be more
effective at mercury removal than standard ACI over a range of parameters
while offering other benefits. Several evaluations of this technology are
ongoing, and additional tests are planned.
Other specialty sorbent materials have been identified and are being evaluated
for specific applications. These materials are being developed and evaluated
primarily for the purposes of reducing control costs and improving potential
for beneficial use of the collected ash.
iv. Additional Alternatives
An additional mercury control alternative, one that was not discussed in the
EPA technology review report, is to treat the coal in order to remove a portion
of its mercury prior to combustion. A joint venture company, the Alaska
Cowboy Coal Power Consortium, has demonstrated in small-scale tests that
their process for drying low rank coals can also remove a portion of the coal’s
mercury content. It has yet to be demonstrated on a full scale.
B. Technical Feasibility Analysis
The NSR Manual describes two key criteria for determining whether an alternative
control technology is technically feasible. According to the NSR Manual, a
technology must be “available” and “applicable” in order to be considered
technically feasible. A technology is available “if it has reached the licensing and
commercial sales stage of development.” An identified alternative control
technique may be considered presumptively applicable if “it has been or is soon to
be deployed (e.g., is specified in a permit) on the same or similar source type.” The
following paragraphs evaluate the technical feasibility of the alternative control
technologies identified above by applying these criteria of availability and
applicability.
i.
Native Controls
Insofar as technologies applied to control emissions of other pollutants also
provide mercury control co-benefits, these technologies are considered
technically feasible.
ELECTRONIC FILING, RECEIVED, CLERK'S OFFICE, JANUARY 5, 2007
* * * * * PC #7 * * * * *
3423-00
50
Supplemental PD: 06/22/06
ii. Enhancement of Existing Controls
None of the native control enhancement technologies described above have
demonstrated widespread applicability to coal-fired utility boilers on a full-
scale basis. Further, and more importantly, none have been evaluated on any
level for applicability to CFB Boiler technology. For these reasons, identified
native control enhancement technologies are considered to be technically
infeasible for application to the SME-HGS. The Department has recently
determined that mercury capture enhancement technologies are generally not
technically feasible. In the analysis of a recent permit for a PC electrical utility
boiler the Department stated: “The Department determined that enhanced FGD
is not currently an available control strategy and thus is not a suitable
candidate for a full-scale mercury BACT control system at this time”
(Montana Air Quality Permit #3185-02, Final: 05/16/05; page 29).
iii. Sorbent Injection
While sorbent injection technology has been tested under a variety of
conditions, it is still being evaluated as an applicable control technology for
mercury emissions. Its applicability has not been demonstrated on a full-scale
CFB Boiler. Based on two recently permitted coal-fired electrical generating
units in Montana accepting conditions requiring ACI installation for mercury
control and the availability of vendor guarantees on ACI, the Department
determined that sorbent injection is available. The following citations provide
further information regarding this determination. Also, under the current
BACT analysis, SME-HGS proposed, and the Department required, mercury
control equipment (IECS) that is equivalent to ACI/sorbent injection.
•
The DOE Office of Fossil Energy has recently published a circular that
describes ACI as the most promising near-term mercury control
technology, but it qualifies that observation by stating that “the process
applied to coal-fired boilers is still in its early stages and its effectiveness
under varied conditions…is still being investigated.” It further states,
“technology to cost-effectively reduce mercury emissions from coal fired
power plants is not yet commercially available” (“Mercury Emissions
Control R&D,” updated June 21, 2005; available at
http://www.fossil.energy.gov/programs/powersystems/pollutioncontrols/o
verview_mercurycontrols.html).
•
As noted above, the EPA technology review document concludes, “It is
believed that ACI and enhanced multipollutant controls will be available
after 2010 for commercial application on most, if not all, key
combinations of coal type and control technology to provide mercury
removal levels between 60 and 90%. Also optimized multi-pollutant
controls may be available in the 2010-2015 timeframe for commercial
application on most, if not all, key combinations of coal type and control
technology to provide mercury removal levels between 90 and 95%”
(“Control of Mercury Emissions from Coal Fired Electric Utility Boilers:
An Update,” Air Pollution Prevention and Control Division, National
Risk Management Research Laboratory, Office of Research and
Development, U.S. Environmental Protection Agency; February 18,
2005).
ELECTRONIC FILING, RECEIVED, CLERK'S OFFICE, JANUARY 5, 2007
* * * * * PC #7 * * * * *
3423-00
51
Supplemental PD: 06/22/06
iv. Additional Alternatives
Coal drying, with the co-benefit of mercury removal, has not been proven on a
large scale and is not commercially available. It is therefore not technically
feasible.
C. Ranking of Available and Technically Feasible Mercury Control Options by
Efficiency
The only remaining alternative mercury control technologies are those that provide
mercury control co-benefits while reducing emissions of other pollutants. As noted
above, the native controls that have been evaluated for mercury control
effectiveness are wet and dry (or semi-dry) FGD scrubbers for SO
2
control; ESPs
and FFBs for particulate control; and, to a lesser extent, SCR for NO
x
control.
These systems, individually and in combination, have demonstrated wide variability
with respect to mercury reduction efficiency – anywhere from zero to over 90
percent. Effectiveness depends largely on coal quality (especially chlorine content),
but also on a host of other design and operational parameters.
SME-HGS is proposing to control NO
x
emissions with an SNCR system, SO
2
emissions by CFB technology that employs limestone and hydrated ash reinjection,
and particulate emissions with an FFB. The combined air pollution control system
is referred to as an integrated emissions control system (IECS). As part of
evaluating the performance of CFB in combusting PRB coal, SME-HGS conducted
a pilot-scale test burn in February 2005. The test burn was conducted in an
ALSTOM Power test facility using 80 tons of Montana PRB coal and 20 tons of
Montana limestone (80 tons of coal would be combusted in approximately 30
minutes in the SME-HGS main boiler when firing at full capacity). A summary of
the test results is included in Section 3.12 of the application for this air quality
permit and a complete copy of the test burn report is in Appendix I of the
application for this air quality permit.
The pilot test results indicate a potential for approximately 88% (0.7 lb/TBtu)
mercury removal in a CFB combustor with HAR and fabric filter controls. This
level of mercury control is much greater than most utility boilers burning
subbituminous coal and utilizing native control systems. It is also near the high end
of values observed in the many test programs that have been and are being
conducted on subbituminous coal combustion in utility boilers. However, the test
burn alone does not provide sufficient data to allow boiler manufacturers to
confidently extrapolate the data and guarantee mercury emissions control in a full-
scale CFB unit with IECS.
The Department has recently become aware of emissions testing at East Kentucky
Power Cooperative Gilbert Unit 3 during the summer of 2005. This testing
program included measurements of mercury emissions on a CFB Boiler equipped
with an HAR, SNCR and FFB. Short-term testing results showed stack mercury
emissions of 1.0 lbs/Trillion Btu (TBtu) and 89.5% control of the input mercury
from coal. While these test results are very promising, Gilbert Unit 3 burns eastern
bituminous coal with a relatively high chlorine content (0.031% during test period)
from many different sources in Kentucky and Illinois. For comparison, Spring
Creek coal has a chlorine content of <0.01%. Recent research conducted by ADA-
ES, with support from DOE/NETL, EPRI and industry partners, confirms that
ELECTRONIC FILING, RECEIVED, CLERK'S OFFICE, JANUARY 5, 2007
* * * * * PC #7 * * * * *
3423-00
52
Supplemental PD: 06/22/06
available chlorine is a key factor in oxidizing elemental mercury in the combustion
gases and in controlling mercury emissions from PRB coal (“Full-Scale Evaluations
of Mercury Control for Units Firing Powder River Basin Coals” Sjostrom, Sharon,
et al
., ADA-ES, O’Palko, Andrew, USDOE/NETL, Chang, Ramsay, EPRI. DATE
not given).
D. Evaluation of Control Technologies Including Environmental, Economic, and
Energy Impacts
For a discussion of collateral economic, energy, and environmental impacts
associated with the proposed CFB Boiler and associated controls, refer to previous
sections of this BACT analysis.
E. Mercury BACT Determination
SME-HGS proposed a mercury emissions floor and to conduct continuous mercury-
specific monitoring of the CFB Boiler technology including limestone injection,
SNCR, HAR, and FFB control, collectively termed the integrated emission control
system (IECS), as mercury BACT for the proposed project. Further, as necessary,
SME-HGS proposed the installation and operation of additional mercury emissions
control technologies to establish scientifically justifiable and site-specific mercury
emissions reductions above and beyond the permitted and BACT determined
mercury floor emissions levels. The SME-HGS proposed mercury emissions floor
was a maximum mercury emission rate expressed as either:
•
80% mercury reduction, based on a 12-month rolling average, or
•
2.0 lb mercury/TBtu, based on a 12-month rolling average.
Based on Department verified information contained in the SME-HGS application
for this air quality permit, including mercury specific source testing results obtained
through the simulated and comprehensive combustion, performance, and emission
testing program conducted prior to application, and taking into consideration
technical, environmental, and economic factors, the Department determined that the
proposed mercury emission control strategy and mercury floor emission limit(s) do
not constitute BACT in this case. Considering the above-cited information as well
as a recent mercury specific BACT determination for a similar source permitted for
operation in Montana, the Department determined that the appropriate mercury
BACT emissions limit(s) for the proposed project incorporating the IECS is either:
•
90% mercury reduction, based on a 12-month rolling average, or
•
1.5 lb mercury/TBtu, based on a 12-month rolling average.
The two-part limit accounts for two complementary operational factors. First, coal
quality is not constant, even within a given coal deposit. At the extremely low
values under consideration, a small proportional change in coal mercury content
can have a significant impact in compliance potential. Second, control efficiencies
generally decrease as inlet concentrations decrease, particularly as inlet
concentrations become very low, as in the case of mercury concentrations in utility
boiler exhaust. If SME-HGS should receive coal with higher than normal mercury
content, it may be difficult to comply with the lb/TBtu limit, but compliance with
the percent reduction requirement would be achievable. Conversely, if a particular
coal supply contains less mercury than normal, the percent reduction requirement
may be less readily attainable while the emission rate may be more so.
ELECTRONIC FILING, RECEIVED, CLERK'S OFFICE, JANUARY 5, 2007
* * * * * PC #7 * * * * *
3423-00
53
Supplemental PD: 06/22/06
To confirm the performance of the CFB Boiler and IECS in reducing mercury
emissions, SME-HGS will be required to monitor and analyze mercury control
performance data after commencement of commercial operations and to report this
information to the Department. The results of the final analysis will then be used to
confirm compliance with the BACT-determined mercury emissions limit(s).
If the CFB Boiler operating with the IECS is unable to demonstrate compliance
with the mercury limits established through the BACT determination, SME-HGS is
required to achieve the BACT-determined mercury reductions/limits through the
installation and operation of mercury-specific emission controls. Within 18 months
after commencement of commercial operations, SME-HGS shall install and operate
an activated carbon injection control system or, at SME-HGS’s request and as
approved by the Department, an equivalent technology (equivalent in removal
efficiency) to comply with the applicable mercury BACT emission limits.
8. Radionuclide
Emissions
Most natural materials, including coal, contain trace quantities of radioactive
components. When coal is combusted, radionuclides are contained in the combustion
gases. Radionuclides from a CFB Boiler are emitted primarily as particulate matter.
Pollution control equipment that is used to remove PM as described in the CFB Boiler
filterable PM BACT determination will also effectively remove radionuclides. The
Department determined that radionuclides can be controlled by more than 95% with
traditional PM/PM
10
control equipment (e.g., FFB or ESP).
A. Identification of Available Radionuclide Control Strategies/Technologies
The two most effective and available control options for radionuclides are an FFB
and ESP as described in the CFB Boiler BACT determination for filterable PM
emissions. Other less effective control options are also listed in the CFB Boiler
BACT determination for filterable PM.
B. Technical Feasibility Analysis
FFB and ESP are technically feasible.
C. Ranking of Available and Technically Feasible NO
x
Control Options by Efficiency
FFB and ESP control options have the capability of controlling radionuclides by
more than 95%, although FFBs are slightly more effective, particularly for smaller
particulate matter.
D. Evaluation of Control Technologies Including Environmental, Economic, and
Energy Impacts
Both FFB and ESP would produce a solid waste stream, with a wet ESP creating a
wet solid waste stream. No significant environmental, economic, or energy impacts
are identified as being associated with the use of an FFB or ESP, although an ESP
would require more energy than a FFB. In addition, when an FFB is downstream of
a dry FGD unit, additional SO
2
is removed, along with acid gases and H
2
SO
4
mist
that have formed in the exhaust stream, thereby, providing additional co-benefit
pollution control.
ELECTRONIC FILING, RECEIVED, CLERK'S OFFICE, JANUARY 5, 2007
* * * * * PC #7 * * * * *
3423-00
54
Supplemental PD: 06/22/06
E. Radionuclide BACT Determination
SME-HGS proposed the use of an FFB as BACT for radionuclide emissions.
Based on Department verified information contained in the SME-HGS application
for this air quality permit and taking into consideration technical, environmental,
and economic factors, the Department determined that the FFB emission control
strategy constitutes BACT for radionuclides in this case.
Because an FFB will achieve slightly better control than an ESP and FFB control is
deemed BACT for filterable PM. The Department determined that the filterable
PM BACT emission limit will act as a surrogate BACT emission limit for
radionuclides. The BACT determination for radionuclides is consistent with
previous Department BACT determinations for radionuclides. Further, the
Department determined that the periodic source testing (filterable PM) and
applicable recordkeeping and reporting requirements contained in the permit will
adequately monitor compliance with the permitted BACT requirements.
B.
Coal, Limestone, and Ash (Fly and Bed Ash) Material Handling and Storage Operations
BACT Analysis and Determination
The following BACT determination was conducted for PM/PM
10
emissions resulting from
both the handling and storage of coal, used as primary CFB Boiler fuel; limestone, used for
CFB injection technology and SO
2
control; and ash (fly and bed-ash) produced by coal
combustion in the CFB Boiler. The BACT analysis is broken down in to two parts including
material handling operations and material storage operations.
1. Material Handling PM/PM
10
Emissions
Material handling at the SME-HGS facility includes the transfer and conveying of coal,
limestone, and ash. PM/PM
10
emissions will be emitted from the conveying, handling,
and transferring of these materials. The application for this permit lists all of the
conveyors and material handling transfer points located throughout the SME-HGS
facility.
Typically, limestone and coal are moved within a facility using belt conveyors and
bucket elevators. Ash is typically moved via pneumatic conveyors. Both methodologies
have the potential to create particulate emissions.
As the flow of material passes through the transfer or drop point to a conveyor,
particulate emissions are generated. The quantity of particulate emissions generated by
a transfer point varies with the volume of material passing through the point, the particle
size distribution of the material, the moisture content of the material, and the exposure to
prevailing winds at the transfer point. EPA’s AP-42, Section 13.2.4 describes a
methodology and provides equations to calculate uncontrolled particulate emissions
from both batch and continuous process transfers, or drop point transfers, with an
emission factor rating of A, giving the equation the highest level of confidence.
A. Identification of Available PM/PM
10
Control Strategies/Technologies
Methods of controlling particulate emissions from conveyors and transfer points
have been developed, which can significantly reduce emissions rates. These
methods are based on several principles: reducing the amount or flowrate of
material passing through the transfer point, passing larger sized material and
minimizing the small particle size content of the material, increasing the moisture
ELECTRONIC FILING, RECEIVED, CLERK'S OFFICE, JANUARY 5, 2007
* * * * * PC #7 * * * * *
3423-00
55
Supplemental PD: 06/22/06
content of the material to increase agglomeration of fine material, and shielding or
enclosing the transfer point to protect the transfer point from wind. Enclosures
often include fan-powered FFB to collect any airborne particulate at a common
point for re-use or disposal.
As previously stated, there are a number of available control technologies that can
theoretically be employed to control PM/PM
10
emissions from materials handling
sources. The following table summarizes available controls for PM/PM
10
emissions
from conveyors and transfer points.
Technology
Description
Wet Dust Suppression / Wetted
Material
A water spray or fogger adds water to the material
being handled with or without surfactant. Emissions
are prevented through agglomerate formation by
combining small dust particles with larger particles or
with liquid droplets. Water retained by the material
prevents emissions from storage systems and
downstream transfers.
Enclosure (including partial
enclosure)
Structures or underground placement can be used to
shelter conveyors and material transfer points from
wind to prevent particulate entrainment. Enclosures
can either fully or partially enclose the source.
Enclosure with ESP
Conveyors can be enclosed and have emissions-laden
air collected from the enclosure and ducted to an ESP.
An ESP uses electrical forces to move entrained
particles in the air onto a collection surface. A cake of
particulate forms on the collection surface, which is
periodically “rapped” by a variety of means to dislocate
the particulate, which drops down into a hopper for
collection and disposal or reuse.
Enclosure with FFB
Conveyors are often enclosed and emissions-laden air
is collected and ducted to the FFB. Pneumatic
conveyors are typically sealed with the exception of a
FFB or bin vent on the air discharge. In either case, the
air-flow passes through tightly woven or felted fabric,
causing particulates in the flow to be collected on the
fabric by sieving and other mechanisms. As particulate
collects on the filter, collection efficiency increases.
However, as the dust cake thickness increases so does
the pressure drop across the bags. Bags are
intermittently cleaned by mechanisms such as shaking
the bag, pulsing air through the bag, or temporarily
reversing the airflow direction. Material cleaned from
the bags is collected in a hopper at the bottom of the
FFB.
B. Technical Feasibility Analysis
The technologies listed in the above table are considered technically feasible, with
the following exceptions. Since the proposed emergency coal storage pile is not
enclosed, having an enclosed transfer point to the pile is considered technically
infeasible. As a result, adding FFB or ESP to the enclosure is also considered
technically infeasible; therefore, these strategies are removed from further
consideration for that transfer point.
ELECTRONIC FILING, RECEIVED, CLERK'S OFFICE, JANUARY 5, 2007
* * * * * PC #7 * * * * *
3423-00
56
Supplemental PD: 06/22/06
Ash handling from temporary storage (e.g., silo) to permanent storage (e.g.,
monofill) by enclosure with ESP or FFB control is not an industry accepted
practice. Fly ash consists primarily of fine particles, which easily become airborne,
and bed ash has a significant portion of fine particles. These materials are not
suitable for collection with these listed technologies, as the baghouse or ESP will
pick up a significant portion of the material stream and quickly become overloaded.
Therefore, these strategies are removed from further consideration for ash handling.
C. Ranking of Available and Technically Feasible PM/PM
10
Control Options by
Efficiency
The following table summarizes the available control options, their respective
potential control efficiency values, and their ranking for the purposes of this BACT
analysis.
Technology
Estimated Control Efficiency
Rank
Enclosure with FFB
99.5%
1
Enclosure with ESP
Up to 99%
2
Enclosure
Varies with Degree of Enclosure
3-Sided Enclosure = 50%
Complete Enclosure = 90%
3
Wet Dust Suppression (including
water spray with or without surfactant
and wet material
50%
4
No Add-On Control
---
5
D. Evaluation of Control Technologies Including Environmental, Economic, and
Energy Impacts
The following text provides a brief discussion of the available control options and
an analysis of BACT applicability in this case.
i.
Enclosure with FFB
For most of the proposed sources, an enclosure with FFB dust collector control
has been deemed technically feasible. FFB operations and maintenance are
relatively simple. FFB are generally considered an industry standard for
material transfer point particulate control and are deemed economically
feasible in this case. Because FFB provides the highest level of control, no
further evaluations are necessary for sources with proposed with FFB control.
ii. Enclosure with ESP
Because ESPs can theoretically attain up to 99% control efficiency, ESP
control was evaluated. The ESP could only be used to control the limestone
and ash particulate emissions and not for coal handling because of the high
explosion potential of coal dust collection in an ESP. ESPs are not typically
used for control of limestone or ash handling emissions due to the high initial
costs of installation, complexity, and technical difficulty of operations. Costs
associated with the technical obstacles have not been quantified in this
analysis. Industry norms indicate, however, that use of ESPs for particulate
control from material handling transfer points is unduly complex and cost
prohibitive. Therefore, the use of enclosures with an ESP is eliminated from
further consideration in this BACT analysis.
ELECTRONIC FILING, RECEIVED, CLERK'S OFFICE, JANUARY 5, 2007
* * * * * PC #7 * * * * *
3423-00
57
Supplemental PD: 06/22/06
iii. Enclosures
Using enclosure structures or underground placement to shelter material from
wind entrainment is often an economic means to control PM/PM
10
emissions.
Enclosures can either fully or partially enclose the source and control
efficiency is dependent on the level of enclosure. Enclosures are considered
for the coal pile reclaim hopper, belt feeder and transfer to Conveyor CC03.
All of this equipment is located underground, and covered by the coal pile.
The emergency storage pile has no regularly scheduled use. Only a very small
fraction of the total coal consumed at the SME-HGS facility is anticipated to go
through the storage pile. As such, SME-HGS believes the cost of providing
additional control by the installation of an enclosure is difficult to quantify and
would result in relatively large cost/ton effectiveness figures. Complete
enclosure provides the highest level of control of the remaining alternatives.
iv. Wet Dust Suppression
Wet dust suppression works by causing fine particles to agglomerate through
the introduction of moisture into the material stream. The agglomerated
particles resist entrainment by wind. Because use of wet dust suppression
techniques, including fogging water spray with or without surfactant, can
achieve control efficiency of 50% or greater, wet dust suppression was
evaluated.
Wet dust suppression is not always a practical control alternative.
Occasionally, moisture may interfere with further processing such as screening
or grinding where agglomeration is counterproductive. In addition, application
of additional moisture in fuel handling operations can increase fuel costs and/or
cause upset combustion conditions. In some cases, water may not be readily
available and piping water to the site may be cost-prohibitive. Finally, using
water sprays when the temperatures are below freezing causes operational
difficulties.
When using wet dust suppression, the decision to use or not to use surfactants
is often somewhat discretionary and based on availability of a water source.
Addition of surfactants to the water lowers its surface tension and improves
wetting efficiency. As a result, less water is used and application is required
less frequently. Wet dust suppression is particularly applicable to ash handling
activities. Ash is often mixed with small quantities of water in a pug mill
before disposal.
E. Material Handling PM/PM
10
Emissions BACT Determination
In summary, SME-HGS proposed the use of the highest level of control that is
technically and practically feasible for the affected material handling PM/PM
10
emission sources.
Proposed BACT for coal, limestone, and ash handling conveyors will be partial or
full enclosures. Coal/limestone belt conveyors will be partially enclosed with a
cover that extends past the conveyor belt, or is fully contained within a building.
The limestone bucket elevator conveyors will be fully enclosed, and the ash
handling pneumatic conveyors will be fully enclosed and sealed.
ELECTRONIC FILING, RECEIVED, CLERK'S OFFICE, JANUARY 5, 2007
* * * * * PC #7 * * * * *
3423-00
58
Supplemental PD: 06/22/06
SME-HGS proposes to use enclosures with FFB or bin vent control as BACT for
PM/PM
10
on almost all of the material transfer emission points. Enclosure with a
baghouse or bin vent provides the most effective control and is considered the
industry norm for control of materials handling transfer points. Based on
Department verified information contained in the application for this permit, the
following exceptions to the material transfer point BACT determination of FFB or
bin vent control apply in this case: Complete enclosure is BACT for PM/PM
10
on
the transfer points at the emergency coal pile to reclaim hoppers, reclaim hopper to
belt feeder, and belt feeder to Conveyor CC03 because FFB or ESP control would
not be cost-effective due to the relatively low potential to emit of the sources since
the transfer points are located beneath (i.e., underground) the emergency coal pile.
Further, enclosures for these sources is the most cost effective control given the
infrequent operation of the equipment.
Further, the Department determined that wet dust suppression constitutes BACT for
PM/PM
10
emissions from the fly ash and bed ash conveyor and transfer emission
points (removal from the silo). The FFB, ESP, and enclosure control options are
technically infeasible. Wet dust suppression is proposed for ash handling after the
pug mill for removal from the plant collection system. Wet dust suppression and
partial enclosure (i.e., lowering well) are also proposed for the transfer of coal to
the emergency coal storage pile because the FFB and ESP control options are
practically infeasible for a single transfer point that will operate intermittently.
A review of the EPA’s RBLC database shows that the proposed BACT presented in
the sections above conforms to similar sources recently permitted under the PSD
program. The data from the RBLC website is summarized in the application.
The Department determined that the affected material handling and transfer points
operating under the proposed control requirements and the established FFB and bin
vent emission limit(s) of 0.005 gr/dscf and 0.01 gr/dscf, respectively, constitute
BACT in this case. Further, the Department determined that the periodic PM/PM
10
source testing and the applicable recordkeeping and reporting requirements will
adequately monitor compliance with the permitted material transfer
BACT
requirements.
2. Material Storage PM/PM
10
Emissions
Materials stored at the SME-HGS facility include coal, limestone, fly ash and bed ash.
particulate emissions will be emitted from the storage of these materials. Storage of
these materials in large quantities, as required by a coal-fired power plant of this size,
has historically been accomplished with piles. More recently, control technologies have
been applied to the storage of these materials.
Sections 13.2.4 and 13.2.5 of AP-42 describe the process by which storage piles
generate fugitive particulate emissions. The quantity of particulate emissions generated
by a storage pile varies with several factors, including wind speed acting upon the
surface of the pile, threshold friction velocity of the pile, frequency of disturbance of the
pile, and area of disturbance of the pile. Threshold friction velocity takes into account
materials makeup of the pile, material size distribution and moisture content of the
material in the pile. Emissions are only generated when the wind speed acting upon the
pile exceeds the friction threshold velocity.
A storage pile of aggregate material, such as coal, limestone or ash, is typically
composed of pieces of material of different sizes, including non-erodible elements of the
ELECTRONIC FILING, RECEIVED, CLERK'S OFFICE, JANUARY 5, 2007
* * * * * PC #7 * * * * *
3423-00
59
Supplemental PD: 06/22/06
material (greater than 1 cm in diameter) mixed with smaller, erodible material sizes,
including silt. The pile surface has a finite availability of the erodible portion of
material, which tends to be removed from the pile rapidly during a wind event. This is
referred to as erosion potential of the pile. Since undisturbed piles quickly lose their
erosion potential during a wind gust, emissions are significantly reduced until the pile is
disturbed, when the erosion potential is restored. If a crust is formed on the pile due to
erosion, precipitation, water spray or surfactant application, the emission potential is
significantly reduced because of the resulting increase of the threshold friction velocity
of the pile.
Methods of controlling particulate emissions from the storage of materials have been
developed which can significantly reduce fugitive emissions from storage of materials.
These methods are similar to the transfer point emissions reduction methods, and are
based on several principles:
•
Minimizing material transfers to and from the pile (pile disturbances),
•
Storing larger sized material and minimizing the small particle size content of the
material,
•
Increasing the moisture content of the material to increase agglomeration and
cementation of fine material to larger particles, and
•
Shielding or enclosing the materials to protect from wind erosion
Enclosures may include fan-powered fabric filter baghouses or un-powered bin vent
filters to collect airborne particulate.
A. Identification of Available PM/PM
10
Control Strategies/Technologies
A number of available control technologies can theoretically be employed to
control PM/PM
10
emissions from materials storage. The following table
summarizes available controls for PM/PM
10
emissions.
Technology
Description
Inactive Storage Pile
with No Additional
Control
An inactive storage pile minimizes or eliminates disturbances
which reduces the erosion potential of the pile. It also allows a
crust to form on the pile over time, which helps resist erosion by
increasing the pile’s threshold friction velocity.
Inactive Storage Pile
with Wind Fence
An inactive pile with a wind barrier or wind fence builds upon
the control listed above by reducing the wind speed that acts
upon the pile surface. This minimizes the number of times that
the wind velocity exceeds the threshold friction velocity, thereby
reducing the number of emission events or the duration of
emission events.
Inactive Storage Pile
with a Permanent Wet
Suppression System and
Wind Fence
An inactive pile with compaction and wet suppression builds
upon the control listed for an inactive storage pile alone.
Compaction and wet suppression actively promote the formation
of a crust on the pile by increasing the amount of agglomeration
or cementing of the surface materials. This significantly
increases the threshold friction velocity of the surface and
reduces erosion potential. This strategy works especially well
with materials that bond together with water application, such as
ash. Wind fences may or may not be applied with this option
depending on the additional control a wind fence may add to the
overall control of this option.
ELECTRONIC FILING, RECEIVED, CLERK'S OFFICE, JANUARY 5, 2007
* * * * * PC #7 * * * * *
3423-00
60
Supplemental PD: 06/22/06
Enclosure
Using structures or underground placement to shelter material
from windentrainment. Enclosures can either fully or partially
enclose the source.
Enclosure with FFB or
Bin Vent
Emissions-laden air is collected from the enclosure and ducted
to the FFB or bin vent. The flow passes through tightly woven
or felted fabric, causing particulates in the flow to be collected
on the fabric by sieving and other mechanisms. As particulate
collects on the filter, collection efficiency increases. However,
as the dust cake thickness increases so does the pressure drop
across the bag.
B. Technical Feasibility Analysis
All of the potentially applicable control technologies listed above are considered
technically feasible for the storage of coal, limestone, and ash.
C. Ranking of Available and Technically Feasible PM/PM
10
Control Options by
Efficiency
The following table summarizes the available options, their respective potential
effectiveness values, and their ranking for this BACT analysis.
Technology
Estimated Control Efficiency
Rank
Enclosure with FFB or bin vent
99.5%
1
Inactive Storage Pile with Permanent
Wet Suppression System and Wind
Fence
95%
2
Inactive Storage Pile with Wind
Fence
Varies with Degree of Enclosure
3-Sided Enclosure = 50%
Complete Enclosure = 90%
3
Enclosure
50%
4
Inactive Storage Pile with Best
Management Practices
25-90%
5
Active Storage Pile with No Add-On
Control
---
6
D. Evaluation of Control Technologies Including Environmental, Economic, and
Energy Impacts
The following text provides a brief discussion of the available control options and
an analysis of BACT applicability in this case.
i.
Enclosure with FFB or Bin Vent
If a storage system is completely enclosed, a FFB or bin vent can usually be
added to the enclosure to more efficiently control particulate emissions. FFBs
or bin vents on enclosures are generally considered an industry standard for
particulate control on enclosed, active aggregate storage systems. Enclosures
(silos) with bin vent control are proposed for short-term coal storage,
limestone storage and short-term ash storage. SME-HGS proposes to use
enclosure and FFB or bin vent control for all active coal, limestone, and ash
storage.
ELECTRONIC FILING, RECEIVED, CLERK'S OFFICE, JANUARY 5, 2007
* * * * * PC #7 * * * * *
3423-00
61
Supplemental PD: 06/22/06
ii. Enclosures
Using enclosure structures to shelter material from wind entrainment is often
used to limit control particulate emissions from stored aggregate materials.
Enclosures can either fully or partially enclose the source and control
efficiency is dependent on the level of enclosure. Enclosures for aggregate
materials often come in the form of walls around a pile, storage buildings or
silos. Enclosures are generally not sealed and have emissions associated with
adding and removing materials. Active storage piles are often enclosed.
Inactive storage piles are generally not enclosed.
iii. Inactive Storage Pile with Permanent Wet Suppression System and Wind
Fence
Applying wet dust suppression to an inactive pile contributes greatly to crust
formation, which maximizes particle agglomeration on the pile surface. The
agglomerated particles resist entrainment by wind on the pile surface, and
minimize particulate emissions. Wet dust suppression is not without its
drawbacks. Occasionally, moisture may interfere with further processing such
as screening or grinding where agglomeration is counterproductive. In
addition, application of additional moisture in fuel handling operations can
increase fuel costs and/or cause upset combustion conditions. Using water
sprays when the temperatures are below freezing causes operational
difficulties. Piles are usually not watered when the ambient temperature is
below freezing.
When using wet dust suppression, the decision to use or not to use surfactants
is often somewhat discretionary and based on availability of a water source.
Addition of surfactants to the water lowers its surface tension and improves
wetting efficiency. As a result, less water is used and application is required
less frequently. In the case of the coal pile, application of surfactants may be
required to achieve 90% control efficiency.
iv. Inactive Storage Pile with Wind Fence
An inactive storage pile can be protected from prevailing winds with a wind
barrier or wind fence. A properly designed wind barrier can effectively reduce
wind speeds at the pile surface by 20 – 60%. The wind barrier should be as
high as the pile, and at least as wide as the pile to achieve maximum
effectiveness. Reducing wind speed acting on the pile surface reduces particle
entrainment and thereby reduces particulate emissions from the stored
material.
v. Inactive Pile with Best Management Practices
Using an inactive storage pile with best management practices generally
includes initial compaction of material by bulldozer or other tracked heavy
equipment, minimizing the number of pile disturbances, minimizing the
frequency of pile disturbances, minimizing the surface area of the pile, and
applying wet dust suppression to disturbed areas of the pile to help re-form a
crust as necessary to reduce fugitive emissions.
ELECTRONIC FILING, RECEIVED, CLERK'S OFFICE, JANUARY 5, 2007
* * * * * PC #7 * * * * *
3423-00
62
Supplemental PD: 06/22/06
vi. Active with No Additional Control
SME-HGS believes that it is not modern, standard industry practice to store
coal or ash in an active pile without further emissions controls. Recent BACT
determinations show that additional control on active or inactive piles is
warranted.
SME-HGS proposes to use enclosure and baghouse or bin vent control for all active
coal, limestone and ash storage. Since this option has the highest degree of
particulate control, no economic analysis of this option has been performed for
active storage. Economic impacts associated with the PM/PM
10
control options for
inactive storage piles of coal and ash listed above were compared using estimated
annualized capital, operating, and maintenance costs. Cost estimates were supplied
by SME-HGS and its engineering contractors. If data was not available from SME-
HGS, best engineering judgment was used. Detailed information regarding
economic impacts is contained in the application for this air quality permit.
E. Material Storage PM/PM
10
Emissions BACT Determination
SME-HGS proposes to use a combination of enclosures (silos) with bin vent control
for active storage of coal, limestone, and ash, and best management practices for the
emergency coal storage and ash storage. Based on Department verified information
contained in the SME-HGS application for this air quality permit and taking into
consideration technical, environmental, and economic factors, the Department
determined that the proposed PM/PM
10
emission control strategies and applicable
emission limits constitute BACT in this case. The following table lists the
proposed BACT control requirements and emissions limits, as applicable.
Material Stored
Method
Applicable Limit
Active Coal Storage
Coal Silo and Coal Bunkers
with FFB Control
0.005 gr/dscf
Inactive Coal Storage –
Emergency Coal Storage
Pile
Inactive Storage Pile with
Best Management Practices
NA
Limestone Storage
Limestone Silo and
Limestone Bunkers with
FFB Control
0.005 gr/dscf
Short-Term Ash Storage
Fly-Ash Silo and Bed-Ash
with bin vent Control
0.01 gr/dscf
Long-Term Ash Storage
Inactive Storage Pile with
Best Management Practices
until Monofill is Capped
NA
Based on Department verified information contained in the application and taking
into consideration technical, environmental, and economic factors, the Department
determined that enclosure in silos with FFB or bin vent control for active coal,
limestone, and short-term ash storage constitutes BACT in this case. Enclosure
with FFB or bin vent control provides the highest level of particulate control, with
reasonable costs and minimal adverse environmental impacts. Normal material
flow consists of loading the coal and limestone bunkers on a daily basis from the
enclosed coal and limestone silos, through the tripper conveyor system. The
bunkers will be enclosed and controlled by baghouse DC4. The coal silo will be
enclosed and controlled by baghouse DC2. The limestone silo will be enclosed and
ELECTRONIC FILING, RECEIVED, CLERK'S OFFICE, JANUARY 5, 2007
* * * * * PC #7 * * * * *
3423-00
63
Supplemental PD: 06/22/06
controlled by baghouse DC5. After the fly ash is removed from the FFB associated
with the boiler exhaust gas stream, the ash will be temporarily stored in ash silo
AS1, which is enclosed and controlled by a bin vent filter, DC6. Bed ash removed
from the boiler will be temporarily stored in the bed ash silo AS2, which is
enclosed and controlled by bin vent DC7.
Based on Department verified information contained in the application and taking
into consideration technical, environmental, and economic factors, the Department
determined that an inactive storage pile, with best management practices, including
compaction and wet dust suppression as necessary (i.e., water truck application)
constitutes BACT for emergency reserve storage of coal and long-term storage of
ash prior to capping of the open on-site ash storage cell. SME-HGS will be
submitting, separate from the air quality permit application, a solid waste
management plan for the long-term storage of the ash in the monofill. Based on the
emission inventory prepared for the SME-HGS facility, the inactive emergency coal
storage pile is estimated to emit 1.63 tons per year of PM
10
(based on conservative
emission calculations). Recent PSD permitting actions show this storage method
constitutes BACT. The Department determined that the addition of a wind fence or
permanent wet suppression system to the inactive coal pile yields a minimal
additional control of particulate emissions once the coal pile is compacted and
becomes encrusted. The cost analysis supplied in the application for this air quality
permit shows that the control options with higher particulate control have extremely
high costs on a dollar per ton of PM
10
removed basis. Detailed information
regarding the cost analysis is contained in the application for this permit action.
The Department determined that these costs are excessive and far above industry
norms for PM
10
control. Therefore, all additional control options above best
management practices for inactive coal storage have been eliminated from further
consideration under this BACT analysis.
Based on Department verified information contained in the application, the
Department determined that an inactive storage pile, with best management
practices, including compaction and wet dust suppression as necessary (i.e., water
truck application), constitutes BACT for storage of ash prior to capping of the open
monofill cell. SME-HGS proposes to mix fly ash and bed ash with small quantities
of water in the pug mill after removal from the ash silos. The ash-water mixture is
hauled to the ash monofill, where it is pushed into location and compacted. Ash,
when mixed with small quantities of water, forms a cement-like material that has
very low wind erosion potential. The monofill is composed of cells, formed by
excavating earthen material from the cell location and using that material to form a
berm around the monofill cell. The monofill has a “built-in” wind barrier, due to
the construction of the monofill cells, which are partially below grade and
considered “bermed.”
Based on the emission inventory prepared for the SME-HGS facility, the inactive
ash storage pile is estimated to emit 1.62 tons per year of PM
10
(based on
conservative emission calculation equations). All of the additional controls
identified in the application for this permit yield minimal particulate removal with
extremely high cost effective values. Detailed information regarding the cost
analysis is contained in the application for this permit action. Therefore, the BACT
analysis eliminates these methodologies on an economic basis. Although the
RBLC database does not explicitly show any BACT determinations for ash storage
or disposal in a monofill, the Department determined that an inactive ash storage
ELECTRONIC FILING, RECEIVED, CLERK'S OFFICE, JANUARY 5, 2007
* * * * * PC #7 * * * * *
3423-00
64
Supplemental PD: 06/22/06
pile, with best management practices, including compaction and wet dust
suppression as necessary (i.e., water truck application) constitutes BACT in this
case.
The proposed BACT technologies conform to similar sources recently permitted
under the PSD program that are listed in the RBLC database. The data from the
RBLC website is summarized in the application.
The Department determined that the affected material storage emission sources
operating under the proposed control requirements and the established FFB and bin
vent emission limit(s) of 0.005 gr/dscf and 0.01 gr/dscf, respectively, constitute
BACT in this case. Further, the Department determined that the periodic PM/PM
10
source testing and the applicable recordkeeping and reporting requirements will
adequately monitor compliance with the permitted material storage BACT
requirements.
C.
Cooling Tower PM/PM
10
Emissions BACT Analysis and Determination
A wet cooling tower will be used at the SME-HGS facility to dissipate waste heat from the
generating system. The proposed cooling tower will be a fan-induced draft, counter-flow
design. Latent heat of water evaporation is used to provide the cooling effect. The design
circulating water rate is 102,800 gallons per minute (gpm). Approximately 2,250 gpm of the
cooling water will be evaporated by the cooling tower.
The cooling tower provides direct contact between the cooling water flow and air passing
through the tower. Some of the cooling water becomes entrained in the air stream and
carried out of the tower as water droplets (in liquid phase). Water lost in the liquid phase is
known as “drift.” The drift loss is independent of water lost to evaporation. When the drift
droplets evaporate, dissolved solids crystallize and create particulate emissions. The
particulate emissions consist of mineral matter and chemicals used for corrosion control in
the piping systems. PM/PM
10
emissions from the cooling tower are estimated in the
emissions inventory at 13.5 tons per year.
Factors that affect PM/PM
10
emission rates from wet cooling towers include: air and water
flow patterns, the amount of total dissolved solids (TDS) in the cooling cycle water,
circulating water volumes, the number of cooling tower concentration cycles and operation
and maintenance practices.
1. Identification of Available PM/PM
10
Control Strategies/Technologies
The Department is only aware of one control technology for PM
10
emissions from wet
cooling towers: drift eliminators. Drift eliminators work by intercepting as many water
droplets as possible from the airflow leaving the cooling tower, thus minimizing PM
10
emissions. Drift eliminators are designed to cause sudden directional changes to the air
flow and the inertia of the water droplets causes them to impact the eliminator surfaces.
The drift is then collected and returned to the cooling water flow. The drift eliminators
also help minimize the amount of make-up water required for the cooling tower cycle
operation. High efficiency drift eliminators of modern design can control the drift to
less than 0.005% of the cooling tower circulating water flow.
ELECTRONIC FILING, RECEIVED, CLERK'S OFFICE, JANUARY 5, 2007
* * * * * PC #7 * * * * *
3423-00
65
Supplemental PD: 06/22/06
2. Technical Feasibility Analysis
Drift eliminators are technically feasible and commonly employed for wet cooling tower
operations such as that proposed by SME-HGS.
3. Ranking of Available and Technically Feasible PM/PM
10
Control Options by Efficiency
Add-on PM/PM
10
control would result in no additional control of PM/PM
10
emissions
resulting from wet cooling tower operations. The only available PM/PM
10
control
strategy/technology identified for the proposed cooling tower is a drift eliminator. Drift
eliminators are capable of an approximate 90% reduction in particulate emissions
resulting from wet cooling tower operations.
4. Evaluation of Control Technologies Including Environmental, Economic, and Energy
Impacts
The cooling tower design proposed by SME-HGS incorporates high efficiency drift
eliminators. Because this control technology has the highest PM/PM
10
control
efficiency, no further analysis is required.
5. Cooling Tower PM/PM
10
Emissions BACT Determination
The top technology (drift eliminators), for cooling tower PM/PM
10
control will reduce
emissions by at least 90%. SME-HGS proposes to install, operate and maintain high
efficiency drift eliminators on the cooling tower. The proposed design includes a drift
rate of 0.002% circulating flow. The resulting potential PM/PM
10
emission rate is 3.09
lb/hr, or 13.52 tons per year. This is equivalent to a normalized rate of 0.50 pounds of
PM
10
emitted per million gallons of circulating water (lbs/MMgal).
The BACT determined PM/PM
10
emission rate of 0.002% of circulating flow is one of
the lowest values reported in the RBLC for other recently permitted and similar sources.
The data from the RBLC website is summarized in the application.
The Department determined that the installation, operation and maintenance of high
efficiency drift eliminators on the cooling tower and a PM/PM
10
emission limit of
0.002% of circulating flow constitute BACT in this case. Further, the Department
determined that the periodic PM/PM
10
source testing and the applicable recordkeeping
and reporting requirements will adequately monitor compliance with the permitted
material storage BACT requirements.
D.
Auxiliary Boiler, Emergency Generator, Emergency Fire Water Pump, and Coal Thawing
Shed BACT Analysis and Determination
The following BACT analysis evaluates NO
x
, CO, SO
2
, PM/PM
10
, and VOC emissions from
the intermittent and limited use of the Auxiliary Boiler, Emergency Generator, Emergency
Fire Water Pump, and Coal Thawing Shed Heater for support and emergency operations at
the SME-HGS facility.
The Auxiliary Boiler will run on #2 diesel fuel-oil, natural gas, or propane and will only be
operated during startup, shutdown, commissioning of the CFB Boiler and during extended
downtimes of the CFB Boiler during the winter months to aid in the prevention of freezing
of the CFB Boiler components. The Emergency Generator and Emergency Fire Pump will
ELECTRONIC FILING, RECEIVED, CLERK'S OFFICE, JANUARY 5, 2007
* * * * * PC #7 * * * * *
3423-00
66
Supplemental PD: 06/22/06
run only on #2 diesel fuel oil and operate only during emergencies and during required
equipment maintenance. The Coal Thawing Shed Heater will operate only on propane or
natural gas during times when the coal is frozen in the coal train cars.
1. Auxiliary Boiler, Emergency Generator, Emergency Fire Water Pump, and Coal
Thawing Shed NO
x
Emissions
NO
x
will be formed during the combustion of natural gas, propane, or diesel fuel in the
Auxiliary Boiler, Emergency Generator, Emergency Firewater Pump, and Coal Thawing
Shed Heater. Three fundamentally different mechanisms produce NO
x
during the
combustion of hydrocarbon fuels. The formation of NO
x
is dominated by the thermal
mechanism, which involves the thermal dissociation and subsequent reaction of nitrogen
(N
2
) and oxygen (O
2
) molecules in the combustion air. Most of the “thermal NO
x
” is
formed in the high temperature flame zone near the burners or in the combustion
chambers. The amount of thermal NO
x
formed is directly proportional to oxygen
concentration, peak temperature, and time of exposure to peak temperature. Virtually all
thermal NO
x
is formed in the region of the flame at the highest temperature. Maximum
thermal NO
x
production occurs at a slightly lean fuel-to-air ratio due to the excess
availability of oxygen for reaction with the nitrogen in the air and fuel.
A second mechanism for the formation of NO
x
, termed “prompt NO
x
,” occurs through
early reactions of nitrogen molecules in the combustion air and hydrocarbon radicals
present in the fuel. The prompt NO
x
reactions occur within the flame and are usually
negligible when compared to the amount of thermal NO
x
. However, prompt NO
x
levels
may become significant when technologies are applied that control thermal NO
x
to ultra-
low levels.
A third mechanism, “fuel NO
x
,” stems from the evolution and reaction of fuel-bound
nitrogen compounds with oxygen. The contribution of this mechanism to the total NO
x
depends entirely on the nitrogen content in the fuel. For natural gas, propane, and fuel
oil, the contribution of fuel NO
x
is usually negligible.
A. Identification of Available NO
x
Control Strategies/Technologies
NO
x
emissions from the Auxiliary Boiler, Emergency Generator, Emergency
Firewater Pump, and Coal Thawing Shed Heater can be reduced by several
different methods. The following list presents methods listed in the
RACT/BACT/LAER database and other technologies that are applicable to natural
gas combustion processes:
i.
Selective Catalytic Reduction (SCR);
ii. Selective Non-Catalytic Reduction (SNCR);
iii. Low Temperature Oxidation (LoTOx);
iv. Dry Low NOX (Staged Combustion);
v. Non-Selective Catalytic Reduction (NSCR);
vi. Wet Controls;
vii. Innovative Catalytic Systems (SCONOX and XONON);
viii. Process Limitations; and
ix. Proper Design (no additional control).
These control technologies may be applied individually or in combination. A brief
discussion of each type of control technology that was not presented in the Main
Boiler NOx BACT is presented below.
ELECTRONIC FILING, RECEIVED, CLERK'S OFFICE, JANUARY 5, 2007
* * * * * PC #7 * * * * *
3423-00
67
Supplemental PD: 06/22/06
i.
SCR
A detailed discussion of SCR NO
x
control technology is included in the CFB
Boiler NO
x
BACT analysis.
ii. SNCR
A detailed discussion of SNCR NO
x
control technology is included in the CFB
Boiler NO
x
BACT analysis.
iii. Low Temperature Oxidation (LoTO
x
)
Oxygen and nitrogen are injected at ~380°F to transform NO and NO
2
into
N
2
O
5
using an ozone generator and a reactor duct. N
2
O
5
, which is soluble,
dissociates into N
2
and H
2
O in a wet scrubber. Requirements of this system
include a wet scrubber, oxygen, and a cooling water supply. Scrubber effluent
treatment must also be provided. The estimated control efficiency of the
system is 80-90%.
iv. Dry Low NO
x
Dry technologies may be identified as dry low NO
x
(DLN) burners, dry low
emissions (DLE), or SoLoNO
x
. These technologies incorporate multiple stage
combustors that may include premixing, fuel-rich zones that reduce the amount
of O
2
available for NO
x
production, fuel-lean zones that control NO
x
production through lower combustion temperatures, or some combination of
these. A quench zone may also be present to control gas temperature. Almost
all new process heaters/boilers presently being manufactured incorporate these
technologies into their combustor designs to some extent. These systems
typically result in 40-60% reduction in NO
x
.
v. Non-Selective Catalytic Reduction
An NSCR unit controls NO
x
emissions by using available CO and residual
hydrocarbons in the exhaust of a rich-burn internal combustion engine as an
NO
x
reducing agent. Without the catalyst, in the presence of oxygen, the
hydrocarbons will be oxidized instead of reacting with the NO
x
. As the excess
hydrocarbon and NO
x
pass over a honeycomb or monolithic catalyst (usually a
combination of noble metals such as platinum, palladium, and/or rhodium), the
reactants are reduced to N
2
, H
2
O, and CO
2
.
The noble metal catalyst usually operates between 800°F and 1,200°F;
therefore, the unit would normally be mounted near the engine exhaust to
maintain a high enough temperature to allow the various reactions to occur. In
order to achieve maximum performance, 80% to 90% reduction of NO
x
concentration, the engine must burn a rich fuel mixture, causing the engine to
operate less efficiently. The NSCR can only be applied to rich-burn engines
and not to the Auxiliary Boiler.
ELECTRONIC FILING, RECEIVED, CLERK'S OFFICE, JANUARY 5, 2007
* * * * * PC #7 * * * * *
3423-00
68
Supplemental PD: 06/22/06
vi. Wet Controls
Water or steam injection technology has been well demonstrated to suppress
NO
x
emissions from gas turbines, but it is not commonly used to control NO
x
on process heaters or boilers. The injected fluid increases the thermal mass by
dilution and thereby reduces peak temperatures in the flame zone. NO
x
reduction efficiency increases as the water-to-fuel ratio increases. For
maximum efficiency, the water must be atomized and injected with
homogeneous mixing throughout the combustor. This technique reduces
thermal NO
X
, but may actually increase the production of fuel NO
x
.
Depending on the initial NO
x
levels, wet injection may reduce NO
x
by 60% or
more.
vii. Innovative Catalytic Systems
Innovative catalytic technologies integrate catalytic oxidation and absorption
technology. In the SCONO
x
process, CO and NO are catalytically oxidized to
CO
2
and NO
x
; the NO
2
molecules are subsequently absorbed on the treated
surface of the SCONO
x
catalyst. Ammonia is not required. The limited
emissions data for this process reflects that there is an associated increase in
HAP emissions when applying this technology. SCONO
x
technology has
recently been applied to combined cycle turbine generation facilities, since
steam produced by a heat recovery steam generator (HRSG) is required in the
process.
The XONON system is applicable to diffusion and lean-premix combustors. It
utilizes a flameless combustion system where fuel and air react on a catalyst
surface, preventing the formation of NO
X
while achieving low CO and
unburned hydrocarbon emission levels. The overall combustion system
consists of the partial combustion of the fuel in the catalyst module followed
by completion of combustion downstream of the catalyst. Initial partial
combustion produces no NO
x
and downstream combustion occurs in a
flameless homogeneous reaction that produces almost no NO
x
. The system is
totally contained within the combustor and is not an add-on control device.
This technology has not been fully demonstrated.
viii. Process Limitations
The amount of NO
x
and other pollutants formed by fossil fuel combustion can
be reduced proportionately by limiting operating hours or reducing fuel
consumption.
B. Technical Feasibility Analysis
Innovative catalytic systems typically installed on combustion turbines are
technically infeasible to install on the Auxiliary Boiler, Emergency Generator,
Emergency Firewater Pump, and Coal Thawing Shed Heater.
LoTOx and wet controls are technically impractical on the Auxiliary Boiler,
Emergency Generator, Emergency Firewater Pump, and Coal Thawing Shed Heater
as these types of control options have never been installed on emergency use
equipment and equipment in intermittent use. SCR and SNCR are classified as
ELECTRONIC FILING, RECEIVED, CLERK'S OFFICE, JANUARY 5, 2007
* * * * * PC #7 * * * * *
3423-00
69
Supplemental PD: 06/22/06
technically infeasible on small emergency use equipment. These controls are
brought forward for the Auxiliary Boiler and Coal Thawing Shed Heater since these
units are planned to operate more frequently and potentially for longer durations
than the emergency equipment.
DLN technology is technically infeasible on spark or compression ignition
reciprocating internal combustion engines. Therefore, DLN is eliminated from use
on the Emergency Generator and Emergency Firewater Pump.
NSCR technology is technically infeasible on the Auxiliary Boiler, Emergency
Generator, Emergency Fire Water Pump, and Coal Thawing Shed Heater because
an NSCR technology requires a lean oxygen exhaust stream (<1% O2). These four
units will operate with a rich oxygen exhaust stream.
C. Ranking of Available and Technically Feasible NO
x
Control Options by Efficiency
The following table ranks the available and technically feasible control options
according to control effectiveness and includes the no additional add-on control and
process limitations control strategies.
NO
x
Control Option
Auxiliary Boiler and Coal
Thawing Shed Heater
Control Efficiency
Emergency Generator and
Emergency Fire Water
Pump Control Efficiency
SCR
80-90%
Technically Infeasible
NSCR
Technically Infeasible
Technically Infeasible
DLN (Auxiliary Boiler only)
40-60%
Technically Infeasible
(Except Coal Thawing Shed
Heater)
SNCR
40-60%
Technically Infeasible
Process Limitations
Varies with Limitation
Varies with Limitation
Proper Design (no additional
Control
N/A
N/A
D. Evaluation of Control Technologies Including Environmental, Economic, and
Energy Impacts
No environmental or energy impacts exist for the NO
x
control options for the
Auxiliary Boiler or Coal Thawing Shed Heater that would eliminate the control
option. The application provides a detailed economic evaluation for the Auxiliary
Boiler. No economic cost analysis is provided for the Coal Thawing Shed Heater
because the only add-on control option is a DLN burner, which will be employed
on the heater.
The control efficiency used for the SCR was 90%, SNCR was 50%, and DLN was
50%. The DLN equipment cost for the Auxiliary Boiler was provided by Nebraska
Boilers, and the DLN equipment cost for the Coal Thawing Shed Heater was based
on a ratio of the Auxiliary Boiler DLN cost and the heat input values for the
Auxiliary Boiler and Coal Thawing Shed Heater. The SCR and SNCR equipment
costs were derived from equations in OAQPS Section 4 – NO
x
Controls (10/2000).
Capital costs were annualized at 10% for 10 years as recommended by OAQPS. As
reported in the application, the Auxiliary Boiler cost effective value for SCR is
approximately $36,925/ton of NO
x
removed; for SNCR the cost effective value is
approximately $18,514/ton NO
x
removed; and for DLN the cost effective value is
ELECTRONIC FILING, RECEIVED, CLERK'S OFFICE, JANUARY 5, 2007
* * * * * PC #7 * * * * *
3423-00
70
Supplemental PD: 06/22/06
approximately $1341/ton NO
x
removed. The Coal Thawing Shed Heater cost
effective value for SCR is approximately $158,172/ton of NO
x
removed; for SNCR
the cost effective value is approximately $179,635/ton NO
x
removed; and for DLN
the cost effective value is approximately $16,678/ton NO
x
removed. Based on the
cost-effective values provided above, the Department determined that DLN
constitutes a cost-effective control option for the Auxiliary Boiler in this case.
Further, based on the cost-effective values provided above, all control options are
deemed economically infeasible for the Coal Thawing Shed Heater in this case. A
detailed cost analysis is included in the application for this air quality permit.
E. Auxiliary Boiler, Emergency Generator, Emergency Fire Water Pump, and Coal
Thawing Shed NO
x
Emissions BACT Determination
Based on the annual cost-effectiveness of DLN, the Department determined that
NO
x
BACT control for the Auxiliary Boiler is DLN burners with process limits in
this case. Further, based on Department verified information contained in the
application for this air quality permit and the NO
x
BACT analysis summarized
previously, the Department determined that NO
x
BACT for the Emergency
Generator, Emergency Fire Water Pump, and Coal Thawing Shed Heater is proper
design and combustion practices and process limitations. The unit specific process
limitations are included in the following table.
Combustion Unit
Process Limitation
Annual Hours
of Operation
Auxiliary Boiler
Start-Up, Shutdown and
Commissioning Operation
Only
850
Emergency Generator
Emergency Use and
Required Equipment
Maintenance Operation Only
500
Emergency Fire Water Pump
Emergency Use and
Required Equipment
Maintenance Operation Only
500
Coal Thawing Shed Heater
Necessary Coal Thawing
Operation Only
240
SME-HGS did not propose any NO
x
emission limits (BACT or otherwise) on the
Auxiliary Boiler, Emergency Generator, Emergency Fire Water Pump, and Coal
Thawing Shed Heater because these units will only operate during limited
situations. The Department determined that the enforceable process limits and fuel
specifications constitute BACT for the affected units. Further, the Department
determined that the Emergency Fire Water Pump and Coal Thawing Shed Heater
operations do not warrant emission limitations due to limited potential NO
x
impact
associated with enforceable limitations. However, in order to protect the ambient
air quality impact analysis conducted for this air quality permit, the Department
determined that non-BACT NO
x
emission limit(s) of 46.79 lb/hr (1-hr averaging
time) for the Auxiliary Boiler and 41.20 lb/hr (1-hr averaging time) for the
Emergency Generator are necessary.
2. Auxiliary Boiler, Emergency Generator, Emergency Fire Water Pump, and Coal
Thawing Shed CO Emissions
ELECTRONIC FILING, RECEIVED, CLERK'S OFFICE, JANUARY 5, 2007
* * * * * PC #7 * * * * *
3423-00
71
Supplemental PD: 06/22/06
A. Identification of Available CO Control Strategies/Technologies
Control of CO and VOC can be achieved through oxidation of post-combustion
gases with or without a catalyst. The following is a list of available CO control
technologies:
i.
Oxidation Catalyst;
ii. Thermal Oxidation;
iii. NSCR;
iv. Process Limitations; and
v. Proper Design (no additional control).
The oxidation catalyst and thermal oxidation control options are described in detail
in the CFB Boiler BACT analysis. NSCR has been described in the NO
x
BACT
analysis in the previous section. NSCR has the ability to control NO
x
and CO from
rich-burn internal combustion engines.
B. Technical Feasibility Analysis
NSCR technology is technically infeasible on the Auxiliary Boiler, Emergency
Generator, Emergency Fire Water Pump, and Coal Thawing Shed Heater because
an NSCR technology requires a lean oxygen exhaust stream (<1% O2). These four
affected units will operate with a rich oxygen exhaust stream. The other available
CO control options are technically feasible.
C. Ranking of Available and Technically Feasible CO
Control Options by Efficiency
The following table ranks the control options according to control effectiveness.
CO Control Options for Auxiliary Boiler,
Emergency Generator, Emergency Fire Water
Pump, and Coal Thawing Shed Heater
Percent Reduction
Catalytic Oxidation
80-90%
Thermal Oxidation
80-90%
Process Limitation
Varies with Limitation
Proper Design and Operation (no add-on control)
N/A
D. Evaluation of Control Technologies Including Environmental, Economic, and
Energy Impacts
No environmental or energy impacts exist for the CO control options for the
Auxiliary Boiler, Emergency Generator, Emergency Fire Water Pump, and Coal
Thawing Shed Heater that would eliminate the control option. The application for
this air quality permit provides an economic evaluation for the four affected
emitting units. The control efficiency for thermal and catalytic incineration is 90%
and equipment costs were derived from the equation in OAQPS Chapter 2 –
Incinerators (9/2000). Capital costs were annualized at 10% for 10 years as
recommended by OAQPS. As reported in the application, the Auxiliary Boiler cost
effective value for thermal oxidation is approximately $78,794/ton of CO removed
and the catalytic oxidation cost effective value is approximately $64,829/ton CO
removed. The Emergency Generator cost effective value for thermal oxidation is
approximately $157,653/ton of CO removed and the catalytic oxidation cost
ELECTRONIC FILING, RECEIVED, CLERK'S OFFICE, JANUARY 5, 2007
* * * * * PC #7 * * * * *
3423-00
72
Supplemental PD: 06/22/06
effective value is approximately $280,198/ton CO removed. The Emergency Fire
Water Pump cost effective value for thermal oxidation is approximately
$354,202/ton of CO removed and the catalytic oxidation cost effective value is
approximately $585,551/ton CO removed. The Coal Thawing Shed Heater cost
effective value for thermal oxidation is approximately $163,320/ton of CO removed
and the catalytic oxidation cost effective value is approximately $253,926/ton CO
removed. Based on the cost-effective values provided above, all control options are
deemed economically infeasible for the affected units in this case. A detailed cost
analysis is included in the application for this air quality permit.
E. Auxiliary Boiler, Emergency Generator, Emergency Fire Water Pump, and Coal
Thawing Shed CO Emissions BACT Determination
Based on Department verified information contained in the application for this air
quality permit and the CO BACT analysis summarized previously, the Department
determined that CO BACT for the Auxiliary Boiler, Emergency Generator,
Emergency Fire Water Pump, and Coal Thawing Shed is proper design and
combustion practices and the process limitations included in the following table.
Combustion Unit
Process Limitation
Annual Hours
of Operation
Auxiliary Boiler
Start-Up, Shutdown and
Commissioning Operation
Only
850
Emergency Generator
Emergency Use and
Required Equipment
Maintenance Operation Only
500
Emergency Fire Water Pump
Emergency Use and
Required Equipment
Maintenance Operation Only
500
Coal Thawing Shed Heater
Necessary Coal Thawing
Operation Only
240
SME-HGS did not propose any CO emission limits (BACT or otherwise) on the
Auxiliary Boiler, Emergency Generator, Emergency Fire Water Pump, and Coal
Thawing Shed Heater because these units will only operate during limited
situations. The Department determined that the enforceable process limits and fuel
specifications constitute BACT for the affected units. Further, the Department
determined that the Emergency Generator, Emergency Fire Water Pump, and Coal
Thawing Shed Heater operations do not warrant emission limitations due to limited
potential CO impact associated with enforceable limitations. However, in order to
protect the ambient air quality impact analysis submitted with the application for
this air quality permit, the Department determined that a non-BACT CO emission
limit of 18.6 lb/hr (1-hr averaging time) for the Auxiliary Boiler is necessary.
3. Auxiliary Boiler, Emergency Generator, Emergency Fire Water Pump, and Coal
Thawing Shed SO
2
Emissions
ELECTRONIC FILING, RECEIVED, CLERK'S OFFICE, JANUARY 5, 2007
* * * * * PC #7 * * * * *
3423-00
73
Supplemental PD: 06/22/06
A. Identification of Available SO
2
Control Strategies/Technologies
The following is a list of available SO
2
control technologies.
i.
Wet or dry FGD;
ii. Low sulfur fuels;
iii. Process limitations; and
iv. No additional control.
Wet and dry flue gas desulfurization control options are described in the SO
2
CFB
Boiler BACT. Using low sulfur fuels such as propane, pipeline quality natural gas,
and low sulfur diesel is an effective SO
2
emissions control strategy.
B. Technical Feasibility Analysis
Wet and dry FGD on the Auxiliary Boiler, Emergency Generator, Emergency Fire
Water Pump, and Coal Thawing Shed Heater are considered technically infeasible
because these emitting units will be intermittently operating on gaseous or liquid
fuel with low sulfur concentrations. Wet and dry FGD are typically employed on
solid fuel or gaseous and liquid fuel that have high sulfur contents and high
potential SO
2
emissions. Natural gas, propane, and #2 diesel fuel oil are required
by regulation to have relatively low sulfur concentrations. Therefore, the
Department determined that wet and dry FGD control options are considered
technically infeasible for the control of SO
2
from the affected units in this case.
C. Ranking of Available and Technically Feasible SO
2
Control Options by Efficiency
The following table ranks the available and feasible SO
2
control options according
to control effectiveness.
SO
2
Control Options
Percent Reduction
Low Sulfur Fuels
Varies
Process Limitations
Varies with Limitation
No Additional Controls
N/A
D. Evaluation of Control Technologies Including Environmental, Economic, and
Energy Impacts
No economic, environmental, or energy impacts exist for the available and feasible
SO
2
control options that would eliminate the control options from further
evaluation. An economic analysis is not provided for the remaining control options
listed because SME-HGS proposed the use of low sulfur fuels and process
limitations.
E. Auxiliary Boiler, Emergency Generator, Emergency Fire Water Pump, and Coal
Thawing Shed SO
2
Emissions BACT Determination
Based on Department verified information contained in the application for this air
quality permit and the SO
2
BACT analysis summarized previously, the Department
determined that SO
2
BACT for the Auxiliary Boiler, Emergency Generator,
Emergency Fire Water Pump, and Coal Thawing Shed is the combustion of low
sulfur fuels only and the process limitations included in the following table.
ELECTRONIC FILING, RECEIVED, CLERK'S OFFICE, JANUARY 5, 2007
* * * * * PC #7 * * * * *
3423-00
74
Supplemental PD: 06/22/06
Combustion Unit
Process Limitation
Annual Hours
of Operation
Auxiliary Boiler
Start-Up, Shutdown and
Commissioning Operation
Only
850
Emergency Generator
Emergency Use and
Required Equipment
Maintenance Operation Only
500
Emergency Fire Water Pump
Emergency Use and
Required Equipment
Maintenance Operation Only
500
Coal Thawing Shed Heater
Necessary Coal Thawing
Operation Only
240
SME-HGS did not propose any SO
2
emission limits (BACT or otherwise) on the
Auxiliary Boiler, Emergency Generator, Emergency Fire Water Pump, and Coal
Thawing Shed Heater because these units will only operate during limited
situations. The Department determined that the enforceable process limits and fuel
specifications constitute BACT for the affected units. Further, the Department
determined that the Emergency Generator, Emergency Fire Water Pump, and Coal
Thawing Shed Heater operations do not warrant emission limitations due to limited
potential SO
2
impact associated with enforceable limitations. However, in order to
protect the ambient air quality impact analysis submitted with the application for
this air quality permit, the Department determined that an effects-based non-BACT
SO
2
emission limit of 12.63 lb/hr (3-hr averaging time) for the Auxiliary Boiler is
necessary.
4. Auxiliary Boiler, Emergency Generator, Emergency Fire Water Pump, and Coal
Thawing Shed PM/PM
10
Emissions
A. Identification of Available PM/PM
10
Control Strategies/Technologies
The following is a list of available PM/PM10 control technologies.
i.
Fabric Filter Baghouse;
ii. Electrostatic Precipitator;
iii. Low Ash Fuels;
iv. Process Limitations; and
v. No Additional Control.
Fabric filter baghouses and ESPs are described in the PM/PM
10
Main Boiler BACT.
B. Technical Feasibility Analysis
Fabric filter baghouses are technically infeasible control options for the emergency
generator and emergency fire water pump because the exhaust temperature is too
hot for fabric filter bags. The remaining available control options are assumed to be
technically feasible for the Emergency Generator, Emergency Fire Water Pump,
and Coal Thawing Shed Heater. All of the available control options are technically
feasible for the Auxiliary Boiler.
ELECTRONIC FILING, RECEIVED, CLERK'S OFFICE, JANUARY 5, 2007
* * * * * PC #7 * * * * *
3423-00
75
Supplemental PD: 06/22/06
C. Ranking of Available and Technically Feasible PM/PM
10
Control Options by
Efficiency
The following table ranks the available and feasible PM/PM
10
control options
according to control effectiveness.
PM/PM
10
Control Technology
Percent Reduction
FFB (Auxiliary Boiler and Coal Thawing Shed)
99%+
ESP (Auxiliary Boiler and Coal Thawing Shed)
99%+
Low Ash Fuels
Varies with Limitation
Process Limitations
Varies with Limitation
No Additional Controls
N/A
D. Evaluation of Control Technologies Including Environmental, Economic, and
Energy Impacts
No environmental, or energy impacts exist for the PM/PM
10
control options that
would eliminate the control options for any of the affected emitting units. An
economic impact analysis is provided for FFB and ESP control options for the
Auxiliary Boiler and Coal Thawing Shed Heater based on cost data provided in the
EPA fact sheets for FFB and ESP control. As reported in the application, the
Auxiliary Boiler cost-effective value for FFB is approximately $153,981/ton
PM/PM
10
removed and the cost-effective value for ESP is approximately
$230,971/ton PM/PM
10
removed. The Coal Thawing Shed Heater cost-effective
value for FFB is approximately $922,141/ton PM/PM
10
removed and the cost-
effective value for ESP is approximately $1,383,212/ton PM/PM
10
removed. Based
on the cost-effective values provided above, all control options are deemed
economically infeasible for the affected units in this case. A detailed cost analysis
is included in the application for this air quality permit.
E. Auxiliary Boiler, Emergency Generator, Emergency Fire Water Pump, and Coal
Thawing Shed PM/PM
10
Emissions BACT Determination
Based on Department verified information contained in the application for this air
quality permit and the PM/PM
10
BACT analysis summarized previously, the
Department determined that PM/PM
10
BACT for the Auxiliary Boiler, Emergency
Generator, Emergency Fire Water Pump, and Coal Thawing Shed is process
limitations, as indicated in the following table.
Combustion Unit
Process Limitation
Annual Hours
of Operation
Auxiliary Boiler
Start-Up, Shutdown and
Commissioning Operation
Only
850
Emergency Generator
Emergency Use and
Required Equipment
Maintenance Operation Only
500
Emergency Fire Water Pump
Emergency Use and
Required Equipment
Maintenance Operation Only
500
Coal Thawing Shed Heater
Necessary Coal Thawing
Operation Only
240
ELECTRONIC FILING, RECEIVED, CLERK'S OFFICE, JANUARY 5, 2007
* * * * * PC #7 * * * * *
3423-00
76
Supplemental PD: 06/22/06
SME-HGS did not propose any PM/PM
10
emission limits (BACT or otherwise) on
the Auxiliary Boiler, Emergency Generator, Emergency Fire Water Pump, and Coal
Thawing Shed Heater because these units will only operate during limited
situations. The Department determined that the enforceable process limits and fuel
specifications constitute BACT for the affected units. Further, the Department
determined that the Emergency Generator, Emergency Fire Water Pump, and Coal
Thawing Shed Heater operations do not warrant emission limitations due to limited
potential PM/PM
10
impact associated with enforceable limitations. However, in
order to protect the ambient air quality impact analysis submitted with the
application for this air quality permit, the Department determined that a non-BACT
PM/PM
10
emission limit of 3.22 lb/hr (24-hr averaging time) for the Auxiliary
Boiler is necessary.
5. Auxiliary Boiler, Emergency Generator, Emergency Fire Water Pump, and Coal
Thawing Shed VOC Emissions
A. Identification of Available VOC Control Strategies/Technologies
Control of VOC and CO can be achieved through oxidation of post-combustion
gases with or without a catalyst. The following is a list of available VOC control
technologies.
i.
Oxidation Catalyst;
ii. Thermal Oxidation;
iii. Process Limitations; and
iv. Proper Design (no additional control).
The oxidation catalyst and thermal oxidation VOC control options are described in
detail in the CFB Boiler BACT analysis.
B. Technical Feasibility Analysis
Thermal and catalytic oxidation as well as process limits are considered technically
feasible for all of the affected units.
C. Ranking of Available and Technically Feasible VOC Control Options by Efficiency
The following table ranks the control options according to control effectiveness.
VOC Control Options for Auxiliary Boiler,
Emergency Generator, Emergency Fire Water
Pump, and Coal Thawing Shed Heater
Percent Reduction
Catalytic Oxidation
80-90%
Thermal Oxidation
80-90%
Process Limitation
Varies with Limitation
Proper Design and Operation (no add-on control)
N/A
D. Evaluation of Control Technologies Including Environmental, Economic, and
Energy Impacts
No environmental or energy impacts exist for the VOC control options for the
Auxiliary Boiler, Emergency Generator, Emergency Fire Water Pump, and Coal
Thawing Shed Heater that would eliminate the control option. The application for
this air quality permit provides an economic evaluation for the four affected
emitting units. As reported in the application, the Auxiliary Boiler cost effective
value for thermal oxidation is approximately $1,198,837/ton of VOC removed and
ELECTRONIC FILING, RECEIVED, CLERK'S OFFICE, JANUARY 5, 2007
* * * * * PC #7 * * * * *
3423-00
77
Supplemental PD: 06/22/06
the catalytic oxidation cost effective value is approximately $983,985/ton VOC
removed. The Emergency Generator cost effective value for thermal oxidation is
approximately $1,206,310/ton of VOC removed and the catalytic oxidation cost
effective value is approximately $980,693/ton VOC removed. The Emergency Fire
Water Pump cost effective value for thermal oxidation is approximately
$3,317,579/ton of VOC removed and the catalytic oxidation cost effective value is
approximately $4,098,854/ton VOC removed. The Coal Thawing Shed Heater cost
effective value for thermal oxidation is approximately $2,462,650/ton of VOC
removed and the catalytic oxidation cost effective value is approximately
$3,724,499/ton VOC removed. Based on the cost-effective values provided above,
all control options are deemed economically infeasible for the affected units in this
case. A detailed cost analysis is included in the application for this air quality
permit.
E. Auxiliary Boiler, Emergency Generator, Emergency Fire Water Pump, and Coal
Thawing Shed VOC Emissions BACT Determination
Based on Department verified information contained in the application for this air
quality permit and the VOC BACT analysis summarized previously, the
Department determined that VOC BACT for the Auxiliary Boiler, Emergency
Generator, Emergency Fire Water Pump, and Coal Thawing Shed is proper design
with process limitations, included in the following table.
Combustion Unit
Process Limitation
Annual Hours
of Operation
Auxiliary Boiler
Start-Up, Shutdown and
Commissioning Operation Only
850
Emergency Generator
Emergency Use and Required
Equipment Maintenance
Operation Only
500
Emergency Fire Water Pump
Emergency Use and Required
Equipment Maintenance
Operation Only
500
Coal Thawing Shed Heater
Necessary Coal Thawing
Operation Only
240
SME-HGS did not propose any VOC emission limits (BACT or otherwise) on the
Auxiliary Boiler, Emergency Generator, Emergency Fire Water Pump, and Coal
Thawing Shed Heater because these units will only operate during limited
situations. The Department determined that the enforceable process limits and fuel
specifications constitute BACT for the affected units. Further, the Department
determined that the affected unit operations do not warrant emission limitations due
to limited potential VOC impact associated with enforceable limitations.
E.
Vehicle Traffic/Haul Roads PM/PM
10
Emissions BACT Analysis and Determination
Fugitive PM/PM
10
emissions will be generated at the SME-HGS facility by vehicle travel in
and around the plant site. The Department determined that SME-HGS must use reasonable
precautions to limit the fugitive emissions of airborne particulate matter on haul roads,
access roads, parking areas, and the general plant property. SME-HGS proposed to pave the
roads and parking areas around the main complex of buildings at the site to allow for
unimpeded traffic flow during wet and muddy conditions. The roads further from the site
complex (e.g., the haul road to the ash monofill) will be unpaved.
ELECTRONIC FILING, RECEIVED, CLERK'S OFFICE, JANUARY 5, 2007
* * * * * PC #7 * * * * *
3423-00
78
Supplemental PD: 06/22/06
As previously discussed, SME-HGS proposed to use a combination of paved and unpaved
roads at the site. The Department determined that best management practices including the
application of water and/or chemical dust suppressants, as necessary, to the unpaved roads
and the sweeping of paved roads, as necessary, constitutes BACT in this case. This is
common industry practice and is typically considered BACT for fugitive road dust resulting
from vehicle traffic at industrial sites.
F.
CFB Boiler Refractory Brick Curing Heaters (2771 MMBtu/hr)
Section II.M.1-4 of the supplemental preliminary determination incorporates enforceable
operational limits and a maximum heat input capacity limit for the proposed propane-fired
CFB Boiler refractory curing heater(s). Because these enforceable operational limits restrict
the allowable operating time, type of fuel, and heat input capacity of the affected units,
potential emissions of all regulated pollutants from CFB Boiler refractory brick curing
heater(s) operations are limited. Given the limited potential to emit of the CFB Boiler
refractory curing heater(s), the Department determined that add-on control equipment would
be cost prohibitive. Therefore, the Department determined that normal operation within the
permit limits contained in Section II.M of the supplemental preliminary determination
constitutes BACT for the affected unit(s), in this case.
The control options selected have controls and control costs comparable to other recently permitted
similar sources and are capable of achieving the appropriate emission standards.
IV. Emission Inventory
ton/year
Emission Source
PM
PM
10
NO
x
SO
x
CO
VOC
Pb
Hg
HCl
HF
H
2
SO
4
CFB Boiler (2626 MMBtu/hr)
138.0
*
299.1 805.2 437.1 1150.2
34.5
0.28 0.017 24.15 19.55
62.11
Aux. Boiler (225 MMBtu/hr)
1.4
1.4
19.9
5.4
7.9
0.5
---
---
---
---
---
Emergency Generator
0.13
0.13
10.3
0.3
0.7
0.2
---
---
---
---
---
Emergency Fire Water Pump
0.04
0.04
0.9
0.03
0.2
0.03
---
---
---
---
---
Coal Thawing Shed
0.03
0.03
1.0
0.00
0.17
0.03
---
---
---
---
---
Car Unloading Baghouse (DC1)
24.4
24.4
0.00
0.00
0.00
0.00
0.00
0.00
0.00
0.00
0.00
Coal Silo Baghouse (DC2)
3.6
3.6
0.00
0.00
0.00
0.00
0.00
0.00
0.00
0.00
0.00
Coal Crusher Baghouse (DC3)
2.8
2.8
0.00
0.00
0.00
0.00
0.00
0.00
0.00
0.00
0.00
Tripper System Baghouse
(DC4)
3.8
3.8
0.00
0.00
0.00
0.00
0.00
0.00
0.00
0.00
0.00
Limestone Baghouse (DC5)
5.0
5.0
0.00
0.00
0.00
0.00
0.00
0.00
0.00
0.00
0.00
Fly-Ash Silo Bin Vent (DC6)
1.5
1.5
0.00
0.00
0.00
0.00
0.00
0.00
0.00
0.00
0.00
Bed-Ash Silo Bin Vent (DC7)
1.4
1.4
0.00
0.00
0.00
0.00
0.00
0.00
0.00
0.00
0.00
Coal Pile Dressing
1.7
0.3
0.00
0.00
0.00
0.00
0.00
0.00
0.00
0.00
0.00
Emergency Coal Pile Transfers
3.4
1.6
0.00
0.00
0.00
0.00
0.00
0.00
0.00
0.00
0.00
Emergency Coal Pile Storage
3.3
1.6
0.00
0.00
0.00
0.00
0.00
0.00
0.00
0.00
0.00
Ash Landfill (Truck Dump)
3.2
1.6
0.00
0.00
0.00
0.00
0.00
0.00
0.00
0.00
0.00
Cooling Tower
13.53
13.53
0.00
0.00
0.00
0.00
0.00
0.00
0.00
0.00
0.00
Heavy Truck Traffic
4.8
1.0
0.00
0.00
0.00
0.00
0.00
0.00
0.00
0.00
0.00
Building Heaters
0.28
0.28
9.72
0.01
1.32
0.35
---
---
---
---
---
Fuel Oil Storage Tank
0.00
0.00
0.00
0.00
0.00
0.03
0.00
0.00
0.00
0.00
0.00
Refractory Brick Curing
Heaters (2771 MMBtu/hr)
3.05
3.05
96.65
0.09
16.28
2.36
---
---
---
---
---
Total Emissions
215
366
944
443
1177
38
0.28
0.02
24.15 19.55
62.11
*
CFB Boiler PM emissions represent only front-half filterable PM emissions. Total PM emissions including PM
10
and
condensable PM emissions are estimated under the column for CFB Boiler PM
10
emissions.
A complete emission inventory for Permit #3423-00 is on file with the Department
ELECTRONIC FILING, RECEIVED, CLERK'S OFFICE, JANUARY 5, 2007
* * * * * PC #7 * * * * *
3423-00
79
Supplemental PD: 06/22/06
CFB Boiler Emissions
Heat Input:
2626.1 MMBtu/hr (Average Annual Heat Input – SME-HGS Information)
Hours of Operation:
8760 hr/yr (Annual Potential)
Filterable PM Emissions
Emission Factor: 0.012 lb/MMBtu (BACT Limit Permit #3423-00)
Calculations:
2626.1 MMBtu/hr * 0.012 lb/MMBtu =
31.51 lb/hr
31.51 lb/hr * 8760 hr/yr * 0.0005 ton/lb = 138.03 ton/yr
PM
10
Emissions (filterable and condensable)
Emission Factor: 0.026 lb/MMBtu (BACT Limit Permit #3423-00)
Calculations:
2626.1 MMBtu/hr * 0.026 lb/MMBtu =
68.28 lb/hr
68.28 lb/hr * 8760 hr/yr * 0.0005 ton/lb = 299.06 ton/yr
NO
x
Emissions
Emission Factor: 0.07 lb/MMBtu (Annual BACT Limit Permit #3423-00)
Calculations:
2626.1 MMBtu/hr * 0.07 lb/MMBtu =
183.83 lb/hr
183.83 lb/hr * 8760 hr/yr * 0.0005 ton/lb = 805.16 ton/yr
SO
x
Emissions
Emission Factor: 0.038 lb/MMBtu (Annual BACT Limit Permit #3423-00)
Calculations:
2626.1 MMBtu/hr * 0.038 lb/MMBtu =
99.79 lb/hr
99.79 lb/hr * 8760 hr/yr * 0.0005 ton/lb = 437.09 ton/yr
CO Emissions
Emission Factor: 0.10 lb/MMBtu (Annual BACT Limit Permit #3423-00)
Calculations:
2626.1 MMBtu/hr * 0.10 lb/MMBtu =
262.61 lb/hr
262.61 lb/hr * 8760 hr/yr * 0.0005 ton/lb = 1150.23 ton/yr
VOC Emissions
Emission Factor: 0.003 lb/MMBtu (Annual BACT Limit Permit #3423-00)
Calculations:
2626.1 MMBtu/hr * 0.003 lb/MMBtu =
7.88 lb/hr
7.88 lb/hr * 8760 hr/yr * 0.0005 ton/lb =
34.51 ton/yr
Hg Emissions
Emission Factor: 1.50E-06 lb/MMBtu (Annual BACT Limit Permit #3423-00)
Calculations:
2626.1 MMBtu/hr * 1.50E-06 lb/MMBtu = 0.0039 lb/hr
0.0039 lb/hr * 8760 hr/yr * 0.0005 ton/lb = 0.017 ton/yr
HCl Emissions
Emission Factor: 0.0021 lb/MMBtu (Annual BACT Limit Permit #3423-00)
Calculations:
2626.1 MMBtu/hr * 0.0021 lb/MMBtu =
5.51 lb/hr
5.51 lb/hr * 8760 hr/yr * 0.0005 ton/lb =
24.15 ton/yr
ELECTRONIC FILING, RECEIVED, CLERK'S OFFICE, JANUARY 5, 2007
* * * * * PC #7 * * * * *
3423-00
80
Supplemental PD: 06/22/06
HF Emissions
Emission Factor: 0.0017 lb/MMBtu (Annual BACT Limit Permit #3423-00)
Calculations:
2626.1 MMBtu/hr * 0.0017 lb/MMBtu =
4.46 lb/hr
4.46 lb/hr * 8760 hr/yr * 0.0005 ton/lb =
19.55 ton/yr
H
2
SO
4
Emissions
Emission Factor: 0.0054 lb/MMBtu (Annual BACT Limit Permit #3423-00)
Calculations:
2626.1 MMBtu/hr * 0.0054 lb/MMBtu =
14.18 lb/hr
14.18 lb/hr * 8760 hr/yr * 0.0005 ton/lb = 62.11 ton/yr
V. Existing Air Quality
The air quality classification for the SME-HGS project area is “Unclassifiable or Better than
National Standards” (40 CFR 81.327) for the National Ambient Air Quality Standards (NAAQS) for
all criteria pollutants. However, the facility will locate in an area that has recently been re-
designated attainment for CO under a limited maintenance plan. The SME-HGS facility has not
been identified in any studies as impacting the previous CO nonattainment area.
Under the requirements of the PSD program, SME-HGS was required to conduct modeling to
determine pollutant-specific pre-monitoring applicability. Because air modeling showed that the
concentration of PM
10
exceeded the level identified in ARM 17.8.818(7), SME-HGS was required to
conduct on-site pre-monitoring for this pollutant. SME-HGS collected PM
10
pre-monitoring data at
the proposed site from November 12, 2004, through November 11, 2005. The following table lists
the background monitoring data from the SME-HGS PM
10
monitoring site. The measured PM
10
values establish the baseline concentrations and demonstrate compliance with all applicable ambient
air quality standards.
PM
10
Pre-monitoring Results
Pollutant
Avg.
Period
High
Impact
(ppm)
High
Impact
(
μ
g/m
3
)
HSH
Impact
(ppm)
HSH
Impact
(
μ
g/m
3
)
Ambient
Standard
a
(
μ
g/m
3
)
% of
Standard
24-hr
------
23
------
19
150
13
PM
10
Annual
------
7
------
------
50
14
a
MAAQS and NAAQS
VI. Ambient Air Impact Analysis
The nearest PSD Class I area is the Gates of the Mountains Wilderness Area located approximately
53 miles [85 kilometers (km)] southwest of the proposed site. Impacts have also been evaluated at
the following other Class I areas within 250 km of the site: Scapegoat Wilderness Area, Bob
Marshall Wilderness Area, Glacier National Park, Mission Mountains Wilderness Area, UL Bend
Wilderness Area, and Anaconda Pintler Wilderness Area. Bison Engineering, Inc. (Bison) submitted
modeling on behalf of SME-HGS.
Emissions of NO
x
, SO
2
, CO, PM
10
and Pb were modeled to demonstrate compliance with the
NAAQS and Montana Ambient Air Quality Standards (MAAQS) and the PSD increments. The
modeling was performed in accordance with the methodology outlined in the Draft New Source
Review Workshop Manual, EPA, October 1990 (NSR Manual), and Appendix W of 40 CFR 51,
ELECTRONIC FILING, RECEIVED, CLERK'S OFFICE, JANUARY 5, 2007
* * * * * PC #7 * * * * *
3423-00
81
Supplemental PD: 06/22/06
Guideline on Air Quality Models (revised), April 15, 2003. SME-HGS’s Class II modeling used five
years of surface and upper air meteorological data (1987-1991) collected at the Great Falls Airport
National Weather Service (NWS) station.
SME-HGS submitted a significant impact analysis based on emissions from all proposed SME-HGS
sources, including the CFB Boiler refractory brick curing heater(s) proposed under the supplemental
preliminary determination. The modeled SME-HGS impacts are compared to the applicable Class II
significant impact levels (SIL’s) in Table 1. The SILs are contained in Table C-4 of the NSR
Manual. The impacts exceed the SIL’s for PM
10
, NO
x
and SO
2
; therefore, a cumulative impact
analysis is required for these pollutants to demonstrate compliance with the NAAQS/MAAQS. The
radius of impact (ROI) for each pollutant and averaging period is included in Table 1.
Table 1: SME Class II Significant Impact Modeling
Pollutant
Avg.
Period
Modeled Conc.
(
μ
g/m
3
)
Class II SIL
a
(
μ
g/m
3
)
Significant (y/n)
Radius of Impact
(km)
24-hr
18.7
5 (1)
b
Y
3.0
PM
10
Annual
3.1
1
Y
1.4
NO
x
c
Annual
1.6
1
Y
0.7
1-hr
66.2
2,000
N
------
CO
8-hr
26.9
500
N
------
3-hr
13.6
25
N
------
SO
2
24-hr
7.4
5 (1)
b
Y
0.7
Annual
0.24
1
N
------
O
3
Net Increase of VOC: 35.6 tpy. Less than 100 tpy, source is exempt from O
3
analysis.
a
All concentrations are 1
st
-high for comparison to SIL’s.
b
If a proposed source is located w/in 100 km of a Class I area, an impact of 1
μg/m
3
on a 24-hour basis is
significant.
c
Significant impact area (SIA) based on NO
x
impact (rather than NO
2
).
NAAQS/MAAQS modeling was conducted for PM
10
, SO
2
, and NO
x
. CO impacts from SME-HGS
alone were below the modeling significance level and no additional modeling was conducted for CO
emissions. The full ambient impact analysis included emissions from other industrial sources in the
Great Falls area.
Modeling results are compared to the applicable NAAQS/MAAQS in Table 2. Modeled
concentrations show the impacts from SME-HGS and off-site sources and include the background
values. As shown in Table 2, the modeled concentrations are below the applicable
NAAQS/MAAQS.
ELECTRONIC FILING, RECEIVED, CLERK'S OFFICE, JANUARY 5, 2007
* * * * * PC #7 * * * * *
3423-00
82
Supplemental PD: 06/22/06
Table 2: SME-HGS NAAQS/MAAQS Compliance Demonstration
Pollu-
tant
Avg.
Period
Modeled
Conc.
a
(
μ
g/m
3
)
Backgrnd
Conc.
(
μ
g/m
3
)
Ambient
Conc.
(
μ
g/m
3
)
NAAQS
(
μ
g/m
3
)
% of
NAAQS
MAAQS
(
μ
g/m
3
)
% of
MAAQS
24-hr
10.5
23
33.5
150
22
150
22
PM
10
Annual
3.2
7
10.2
50
20
50
20
1-hr
240
b
75
315
------
------
564
56
NO
2
Annual
2.0
c
6
8.0
100
8.0
94
8.5
1-hr
87.2
35
122
------
------
1,300
9.4
3-hr
42.7
26
68.7
1,300
5.3
------
-----
24-hr
6.3
11
17.3
365
4.7
262
6.6
SO
2
Annual
0.8
3
3.8
80
4.8
52
7.3
Quarterly
d
0.0005
Not. Avail.
0.0005
1.5
0.03
Pb
90-day
d
0.0005
Not. Avail.
0.0005
-----
-----
1.5
0.03
a
Concentrations are high-second high values except annual averages and SO
2
1-hr, which is high-6th-high.
b
One-hour NOx impact is converted to NO
2
by applying the ozone limiting method, as per DEQ guidance.
c
Annual NOx is converted to NO
2
by applying the ambient ratio method, as per DEQ guidance.
d
SME reported the 24-hour average impact for compliance demonstration.
Cumulative impact modeling, including emissions from all PSD increment-consuming sources in the
Great Falls area, was used to demonstrate compliance with the Class II PSD increments for PM
10
,
NO
x
and SO
2
. Class II increment modeling results are compared to the applicable PSD increments in
Table 3.
Table 3: Class II PSD Increment Compliance Demonstration
Pollutant
Avg.
Period
Met Data
Set
Modeled
Conc.
(
μ
g/m
3
)
Class II
Increment
(
μ
g/m
3
)
% Class II
Increment
Consumed
Peak Impact Location
(UTM Zone 12)
24-hr
Great
Falls 1988
10.5
30
35%
(497701, 5266846)
PM
10
Annual
Great
Falls 1987
3.2
17
19%
(497701, 5267036)
3-hr
Great
Falls 1987
11.0
512
2.1%
(497100, 526076)
24-hr
Great
SO
2
Falls 1991
6.3
91
6.9%
(497290, 5268077)
Annual
Great
Falls 1987
0.4
20
2.0%
(497386, 5268078)
NO
2
Annual
b
Great
Falls 1988
1.7
25
6.8%
(497386, 5268078)
a – Compliance with short-term standards is based on high-second-high impact.
b – Annual NO
x
impacts are compared to the NO
2
standards.
SME-HGS submitted CALPUFF modeling to determine concentration, visibility and deposition
impacts at the Class I areas within 250 km of the project site. CALMET was used to prepare
meteorological data for input to CALPUFF. Meteorological data inputs to CALMET are included in
Table 4.
ELECTRONIC FILING, RECEIVED, CLERK'S OFFICE, JANUARY 5, 2007
* * * * * PC #7 * * * * *
3423-00
83
Supplemental PD: 06/22/06
Table 4: CALPUFF MET Data
Input Data
Model Year
Parameter
1990
1992
1996
Number of Surface Stations
14
13
13
Number of Upper Air Stations
7
7
5
Number of Precipitation Stations
98
99
92
MM4/MM5 Data Grid Size
80 km
80 km
36 km
SME-HGS modeled PM
10
, SO
2
, and NO
x
emissions from the SME-HGS project, and compared
SME-HGS impacts to EPA’s proposed Class I SIL’s. SME-HGS’s impacts exceeded the Class I SO
2
SILs at the Gates of the Mountain and Scapegoat Wilderness Areas. Modeling of PM
10
and NO
x
emissions did not show any exceedances of the Class I SILs at any of the Class I areas. Cumulative
impact modeling for SO
2
, including all PSD increment-consuming sources, was provided for the
Class I areas. Results of the Class I cumulative impact modeling are included in Table 5 and show
that the cumulative modeled concentrations are lower than the Class I PSD increments.
Table 5: Class I PSD Increment Compliance Demonstration, Peak Impacts
Pollutant
Avg.
Period
Met Data
Period
SME
Modeled
Conc. (
μ
g/m
3
)
Non-SME
Modeled
Conc. (
μ
g/m
3
)
Total
Modeled
Conc. (
μ
g/m
3
)
% Class I
Increment
Consumed
Gates of the Mountains
3-hr
July 23, 1996
1.08
1.26
2.34
9.4%
SO
2
24-hr
March 5, 1996
0.25
0.29
0.54
11%
Scapegoat Wilderness Area
SO
2
24-hr
April 11, 1990
0.21
0.36
0.57
11%
a – Compliance with short-term standards is based on high-first-high impact.
SME-HGS used the CALPUFF modeling results and the CALPOST program to determine
deposition values in the Class I areas. The results are shown in Table 6 and are compared to the
deposition level of concern identified in the Federal Land Managers Air Quality Related Values
Workgroup (FLAG) Phase I Report (December 2000). None of the modeled deposition impacts
exceeded the FLAG level of concern. The Department concluded that no additional analysis of
deposition impacts is needed.
Table 6: SME-HGS CALPUFF Deposition Modeling Results
Class I
1990
1992
1996
Area
N (kg/ha/yr)
S (kg/ha/yr)
N (kg/ha/yr)
S (kg/ha/yr)
N (kg/ha/yr)
S (kg/ha/yr)
Ana-Pintler
0.0003
0.0004
0.0001
0.0002
0.0002
0.0002
Bob Marsh.
0.001
0.001
0.001
0.001
0.001
0.001
Gates Mtns.
0.002
0.002
0.002
0.002
0.002
0.003
Glacier NP
0.0003
0.0003
0.0003
0.0003
0.001
0.001
Mission
Mtns
0.0002
0.0003
0.0005
0.001
0.0004
0.001
Scapegoat
0.001
0.001
0.001
0.001
0.002
0.002
UL Bend
0.002
0.002
0.001
0.002
0.002
0.002
FLAG Level
of Concern
0.005
0.005
0.005
0.005
0.005
0.005
SME-HGS provided an analysis of the impact of the proposed project on air quality related values
(AQRV) in the Class I and Class II areas. The effects of deposition on sensitive plant species and
the effects of trace elements deposition on soils, plants, and animals were found to be below
ELECTRONIC FILING, RECEIVED, CLERK'S OFFICE, JANUARY 5, 2007
* * * * * PC #7 * * * * *
3423-00
84
Supplemental PD: 06/22/06
guideline levels contained in the USEPA screening guideline (EPA 450/2-81-078). The Department
and affected FLMs have concluded that lake acidification analyses were not necessary because there
are no sensitive lakes in the project impact area.
A visibility impact assessment is required under ARM 17.8.825 and ARM 17.8.1103, which states
that the visibility requirements are applicable to the owner or operator of a proposed major stationary
source, as defined by ARM 17.8.802(22). ARM 17.8.1106(1) requires that “the owner or operator of
a major stationary source “…demonstrate that the actual emissions (including fugitive emissions)
will not cause or contribute to adverse impact on visibility within any federal Class I area or the
Department shall not issue a permit.”
SME-HGS provided a visibility impact assessment as required under ARM 17.8.825 and ARM
17.8.1103 using the CALPUFF/CALPOST modeling system. CALPOST compares visibility
impacts from the modeled source(s) to pre-existing visual range at the affected Class I areas and
calculates a percent reduction in background extinction (%ΔB
ext
). The results of SME-HGS’s final
visibility analysis are included in Table 7 and show six days in which the modeled %ΔB
ext
values
from SME were
≥
5%. Cumulative impact modeling was performed for those days to determine the
%ΔB
ext
value from all the existing permitted PSD increment-consuming sources that could contribute
to visibility reduction. The modeling showed four days with cumulative modeled %ΔB
ext
value
greater than 10%.
Table 7: SME Final Visibility Results (Refined Methodology)
Class I Area
Met Data Year
Max.
ΔB
ext
24-hr Average
Number of Days
%ΔB
ext
≥
5.0%
Peak Cumulative
%ΔB
ext
1990
1.57
0
NA
Bob Marshall
1992
6.90
1
14.45
Wilderness Area
1996
9.92
2
19.21
1990
5.62
1
5.63
Gates of the Mountains
1992
4.32
0
NA
Wilderness Area
1996
5.77
1
15.05
Glacier National Park
1919996
2
1.3.21
92
0
0
NA
NA
1990
2.31
0
NA
Scapegoat
1992
4.30
0
NA
Wilderness Area
1996
5.31
1
13.65
UL Bend
1992
2.09
0
NA
Wilderness Area
1996
4.47
0
NA
The Department reviewed the visibility analysis and determined that the SME-HGS project alone
and the cumulative impact of all permitted PSD increment-consuming sources will not cause or
contribute to an adverse impact on visibility. The proposed emissions will not result in visibility
impairment which the Department determines does, or is likely to, interfere with the management,
protection, preservation, or enjoyment of the visual experience of visitors within the affected federal
Class I area. This determination takes into account the geographic extent, intensity, duration,
frequency, and time of visibility impairment, and how these factors correlate with times of visitor use
of the federal Class I area, and the frequency and occurrence of natural conditions that reduce
visibility.
Conclusion
The preceding analysis represents a summary of predicted ambient air quality impacts resulting from
the proposed SME-HGS project. A comprehensive and complete dispersion modeling analysis
demonstrating compliance with all applicable increments and standards is on file with the
ELECTRONIC FILING, RECEIVED, CLERK'S OFFICE, JANUARY 5, 2007
* * * * * PC #7 * * * * *
3423-00
85
Supplemental PD: 06/22/06
Department. Based on this analysis, the Department determined that the proposed project operating
in compliance with the applicable requirements contained in Permit #3423-00 is expected to
maintain compliance with all applicable increments and standards as required for permit issuance.
VII. Taking or Damaging Implication Analysis
As required by 2-10-105, MCA, the Department conducted a private property taking and damaging
assessment and determined there are no taking or damaging implications.
VIII.Environmental Assessment
The proposed SME-HGS project is subject to review under the requirements of the Montana
Environmental Policy Act. A comprehensive draft environmental impact statement (EIS) is
scheduled for issuance on June 30, 2006.
Permit Analysis Prepared By: M. Eric Merchant, MPH
Date: May 25, 2006
ELECTRONIC FILING, RECEIVED, CLERK'S OFFICE, JANUARY 5, 2007
* * * * * PC #7 * * * * *
Commonwealth of Kentucky
Environmental and Public Protection Cabinet
Department for Environmental Protection
Division for Air Quality
803 Schenkel Lane
Frankfort, Kentucky 40601
(502) 573-3382
Final
AIR QUALITY PERMIT
Issued under 401 KAR 52:020
Permittee Name:
Louisville Gas and Electric Company
Mailing Address:
P.O. Box 32010, Louisville, Kentucky, 40232
Source Name:
Louisville Gas and Electric Company
Mailing Address:
P.O. Box 32010, Louisville, Kentucky, 40232
Source Location:
487 Corn Creek Road, Bedford, Kentucky,
Permit Number:
V-02-043 Revision 2
Source A. I. #:
4054
Activity #:
APE20040003
Review Type:
Operating, PSD/TV
Source ID #:
21-223-00002
ORIS Code:
6071
Regional Office:
Florence Regional Office
8020 Veterans Memorila Drive, Suite 110
Florence, KY 41042
(859) 525-4923
County:
Trimble
Application
Complete Date:
February 11, 2005
Issuance Date:
June 20, 2003
Revision Date:
November 17, 2005
January 4, 2006
Expiration Date:
June 20, 2008
E-Signed by Diana Andrews
VERIFY authenticity with ApproveIt
John S. Lyons, Director
Division for Air Quality
Revised 10/19/05
ELECTRONIC FILING, RECEIVED, CLERK'S OFFICE, JANUARY 5, 2007
* * * * * PC #7 * * * * *
TABLE OF CONTENTS
SECTION
DATE OF
PAGE
ISSUANCE
A. PERMIT AUTHORIZATION
June 20, 2003
1
B
.
EMISSION POINTS, EMISSIONS UNITS, APPLICABLE
June 20, 2003
2
REGULATIONS, AND OPERATING CONDITIONS
January 4, 2005
January 4, 2006
C. INSIGNIFICANT ACTIVITIES
June 20, 2003
54
January 4, 2006
D. SOURCE EMISSION LIMITATIONS AND TESTING
June 20, 2003
55
REQUIREMENTS
January 4, 2006
E. SOURCE CONTROL EQUIPMENT OPERATING
June 20, 2003
56
REQUIREMENTS
F. MONITORING, RECORDKEEPING, AND REPORTING
June 20, 2003
57
REQUIREMENTS
G. GENERAL PROVISIONS
June 20, 2003
60
H. ALTERNATE OPERATING SCENARIOS
June 20, 2003
66
I. COMPLIANCE SCHEDULE
June 20, 2003
66
J.
ACID RAIN
June 20, 2003
67
January 4, 2006
K.
NOx BUDGET PERMIT
January 4, 2006
72
Rev#
Permit type
Log #
Complete
Date
Issuance
Date
Summary of
Action
----
Initial Issuance
F720
12-13-1996
NA
Was not issued proposed or final. Public
notification was done.
1
Acid Rain Permit
F526
3-03-1998
3-05-1999
Permit for Unit 1-tangential coal fired boiler
2
PSD permit
53460
01-14-2001
06-22-2001
Permit issued for CT unit only without expiration
3
PSD/TV
proposed
permit
53460
12-19-02
06-06-03
Consolidating all permits into one
4
Permit Revision one
APE2004
0003
12-24-04
01-04-05
Emission limit as enforceable as practical matter
(emission reduction) and the usage of two to three
dry bulk trailers for fly ash transport
5
Significant Revision
APE2004
0004
2-11-05
1-4-06
Construction of new utility boiler, creditable
emission reduction on source wide sulfur dioxide,
and addition of NOx budget to the permit.
ELECTRONIC FILING, RECEIVED, CLERK'S OFFICE, JANUARY 5, 2007
* * * * * PC #7 * * * * *
Permit Number:
V-02-043 R2
Page:
1
of
72
SECTION A - PERMIT AUTHORIZATION
Pursuant to a duly submitted application the Kentucky Division for Air Quality hereby authorizes
the operation of the equipment described herein in accordance with the terms and conditions of this
permit. This permit has been issued under the provisions of Kentucky Revised Statutes Chapter 224
and regulations promulgated pursuant thereto.
The permittee shall not construct, reconstruct, or modify any affected facilities without first having
submitted a complete application and receiving a permit for the planned activity from the permitting
authority, except as provided in this permit or in 401 KAR 52:020, Title V Permits.
Issuance of this permit does not relieve the permittee from the responsibility of obtaining any other
permits, licenses, or approvals required by this Cabinet or any other federal, state, or local agency.
ELECTRONIC FILING, RECEIVED, CLERK'S OFFICE, JANUARY 5, 2007
* * * * * PC #7 * * * * *
Permit Number:
V-02-043 R2
Page:
2
of
72
SECTION B -EMISSION POINTS, EMISSIONS UNITS, APPLICABLE
REGULATIONS, AND OPERATING CONDITIONS
Emissions Unit: 01 (01) - Unit 1 Indirect Heat Exchanger
Description:
Construction commenced: on or before September 18, 1978
Pulverized coal-fired, dry bottom, tangentially fired, equipped with Selective Catalytic Reduction
(SCR), electrostatic precipitator and wet spray scrubber with limestone/lime injection
Up to forty (40) percent petroleum coke co-firing with coal
Number two fuel oil used for startups and flame stabilization
Maximum continuous rating: 5,333 mmBtu/hour
Applicable Regulations:
401 KAR 51:017, Prevention of significant deterioration of air quality
401 KAR 51:160, NO
x
requirements for large utility and industrial boilers; incorporating by
reference 40 CFR 96
401 KAR 52:060, Acid rain permits, incorporating by reference the Federal Acid Rain provisions as
codified in 40 CFR Parts 72 to 78
401 KAR 59:015, New Indirect Heat exchangers with more than 250 mmBtu per hour capacity and
commenced on or after August 17, 1971;
40 CFR 60 Subpart D, Standards of Performance for fossil-fuel-fired steam generators, for an
emissions unit greater than 250 mmBtu/hour and commenced after August 17, 1971;
1.
Operating Limitations:
None
2.
Emission Limitations:
a)
Pursuant to 401 KAR 59:015, Section 4(1)(b), and 401 KAR 51:017, particulate
emissions shall not exceed 0.1 lb/mmBtu based on a three-hour average.
The permittee may assure continuing compliance with the particulate emission
standard by operating the affected facility and associated control equipment such that
the opacity does not exceed the upper limit of the indicator range developed from
continuous opacity monitoring (COM) data collected during stack tests. If five (5)
percent of COM data (based on a three-hour rolling average) recorded in a calendar
quarter show excursions from the indicator range, the permittee shall contact the
Division within thirty (30) days after the end of the quarter to schedule a stack test to
demonstrate compliance with the particulate standard while operating at the
conditions which resulted in the excursions. The Division may waive this testing
requirement upon a demonstration that the cause of the excursions has been
corrected, or may require stack tests at any time pursuant to 401 KAR 50:045,
Performance tests.
b)
Pursuant to 401 KAR 59:015, Section 4(2), emissions shall not exceed twenty (20)
percent opacity based on a six-minute average except a maximum of twenty-seven
(27) percent opacity for not more than one (1) six (6) minute period in any sixty (60)
ELECTRONIC FILING, RECEIVED, CLERK'S OFFICE, JANUARY 5, 2007
* * * * * PC #7 * * * * *
Permit Number:
V-02-043 R2
Page:
3
of
72
SECTION B - EMISSION POINTS, EMISSIONS UNITS, APPLICABLE
REGULATIONS, AND OPERATING CONDITIONS (CONTINUED)
2.
Emission Limitations continued:
consecutive minutes. Opacity shall be demonstrated by using EPA reference
Method 9. Alternatively, the permittee may use COM in determining compliance
with opacity.
c)
Pursuant to 401 KAR 51:017, sulfur dioxide emissions shall not exceed 0.84
lb/mmBtu based on a three-hour rolling average.
d)
Pursuant to 401 KAR 59:015, Section 6(1)(c), nitrogen oxides emissions expressed
as nitrogen dioxide shall not exceed 0.7 lb/mmBtu based on a three-hour rolling
average.
e)
Pursuant to 401 KAR 51:001, Section 1, (146), source has accepted a voluntary limit
such that consecutive twelve month rolling total of nitrogen oxide emissions shall not
exceed 5,556 tons per year, which through this permit is enforceable as a practical
matter. This limit commenced on January 1, 2005.
f)
Pursuant to 40 CFR Part 76, nitrogen oxides emissions expressed as nitrogen dioxide
shall not exceed 0.45 lb/mmBtu on an annual basis. See Section J, Acid Rain Permit.
g)
Pursuant to 401 KAR 51:001, Section 1, (146), source has accepted a voluntary limit
such that consecutive twelve month rolling total of sulfur dioxide emissions shall not
exceed 4,822 tons per year, which through this permit is enforceable as a practical
matter. This limit shall commence on January 1, 2006.
Compliance with nitrogen oxide and sulfur dioxide emissions:
Permittee shall monitor and calculate emissions on a consecutive twelve month
rolling total as measured by the continuous emissions monitor (CEM) required
pursuant to 40 CFR 75.2(a)
3.
Testing Requirements:
a)
The permittee shall submit a schedule within six months from the initial issuance
date of this permit to conduct at least one performance test for particulate within one
year following the issuance of this permit. The upper limit of the indicator range
shall be developed from the COM data collected during the stack tests.
b)
If no additional stack tests are performed pursuant to Condition 2. a) above, the
permittee shall conduct one performance test for particulate emissions within the
third year of the term of this permit to demonstrate compliance with the allowable
standard.
c)
The permittee shall determine the opacity of emissions from the stack by EPA
Reference Method 9 annually, or more frequently if requested by the Division.
ELECTRONIC FILING, RECEIVED, CLERK'S OFFICE, JANUARY 5, 2007
* * * * * PC #7 * * * * *
Permit Number:
V-02-043 R2
Page:
4
of
72
SECTION B - EMISSION POINTS, EMISSIONS UNITS, APPLICABLE
REGULATIONS, AND OPERATING CONDITIONS (CONTINUED)
4.
Specific Monitoring Requirements:
a)
Pursuant to 401 KAR 59:015, Section 7(1) and Section 7(4), 401 KAR 59:005,
Section 4, continuous emission monitoring systems shall be installed, calibrated,
maintained, and operated for measuring the opacity of emissions, sulfur dioxide,
nitrogen oxides, and either oxygen or carbon dioxide emissions. The owner or
operator shall ensure the continuous emission monitoring systems are in compliance
with, and the owner or operator shall comply with the requirements of 401 KAR
59:005, Section 4.
b)
Pursuant to 401 KAR 59:015, Section 7(3), for performance evaluations of the sulfur
dioxide and nitrogen oxides continuous emission monitoring system as required
under 401 KAR 59:005, Section 4(3) and calibration checks as required under 401
KAR 59:005, Section 4(4), reference methods 6 or 7 shall be used as applicable as
described by 401 KAR 50:015.
c)
Pursuant to 401 KAR 59:015, Section 7(3), sulfur dioxide or nitric oxide, as
applicable, shall be used for preparing calibration gas mixtures under Performance
Specification 2 of Appendix B to 40 CFR 60, filed by reference in 401 KAR 50:015.
d)
Pursuant to 401 KAR 59:015, Section 7(3), the span value for the continuous
emission monitoring system measuring opacity of emissions shall be eighty (80),
ninety (90), or one-hundred (100) percent and the span value for the continuous
emission monitoring system measuring sulfur dioxide and nitrogen oxides emissions
shall be in accordance with 401 KAR 59:015, Appendix C.
e)
All span values computed under (d) above for burning combinations of fuels shall be
rounded to the nearest 500 ppm.
f)
Continuous emission monitoring data shall be converted into the units of applicable
standards using the conversion procedure described in 401 KAR 59:015, Section
7(5).
g)
Pursuant to 401 KAR 59:015, Section 7(3), for an indirect heat exchanger that
simultaneously burns fossil fuel and non-fossil fuel, the span value of all continuous
monitoring systems shall be subject to the Division’s approval.
5.
Specific Record Keeping Requirements:
a)
Pursuant to 401 KAR 59:005, Section 3 (4), the owner or operator of the indirect heat
exchanger shall maintain a file of all measurements, including continuous monitoring
system, monitoring device, and performance testing measurements; all continuous
monitoring system performance evaluations; all continuous monitoring system or
monitoring device calibration checks; adjustments and maintenance performed on
these systems and devices; and all other information required by 401 KAR 59:005
recorded in a permanent form suitable for inspection.
ELECTRONIC FILING, RECEIVED, CLERK'S OFFICE, JANUARY 5, 2007
* * * * * PC #7 * * * * *
Permit Number:
V-02-043 R2
Page:
5
of
72
SECTION B - EMISSION POINTS, EMISSIONS UNITS, APPLICABLE
REGULATIONS, AND OPERATING CONDITIONS (CONTINUED)
b)
Pursuant to 401 KAR 52:020, records, including those documenting the results of
each compliance test, shall be maintained for five (5) years.
c)
Pursuant to 401 KAR 59:005, Section 3(2), the owner or operator of this unit shall
maintain the records of the occurrence and duration of any startup, shutdown, or
malfunction in the operation of the emissions unit, any malfunction of the air
pollution control equipment; or any period during which a continuous monitoring
system or monitoring device is inoperative.
d)
The permittee shall maintain records of the COM data on a three-hour rolling
average basis, the number of excursions above the indicator range, time and date of
excursions, opacity value of the excursions, and percentage of the COM data
showing excursions from the indicator range in each calendar quarter.
6.
Specific Reporting Requirements:
a)
Pursuant to 401 KAR 59:005, Section 3 (3), minimum data requirements which
follow shall be maintained and furnished in the format specified by the Division.
Owners or operators of facilities required to install continuous monitoring systems
shall submit for every calendar quarter a written report of excess emissions
(as defined in applicable sections) to the Division. All quarterly reports shall be
postmarked by the thirtieth (30th) day following the end of each calendar quarter and
shall include the following information:
1) The magnitude of the excess emission computed in accordance with the 401 KAR
59:005, Section 4(8), any conversion factors used, and the date and time of
commencement and completion of each time period of excess emissions.
2) All hourly averages shall be reported for sulfur dioxide and nitrogen oxides
monitors. The hourly averages shall be made available in the format specified by the
Division.
3) Specific identification of each period of excess emissions that occurs during
startups, shutdowns, and malfunctions of the emissions unit. The nature and cause of
any malfunction (if known), the corrective action taken or preventive measures
adopted.
4) The date and time identifying each period during which continuous monitoring
system was inoperative except for zero and span checks and the nature of the system
repairs or adjustments.
5) When no excess emissions have occurred or the continuous monitoring system(s)
have not been inoperative, repaired, or adjusted, such information shall be stated in
the report.
b)
Pursuant to 401 KAR 59:015, Section 7(7), for the purposes of reports required under
401 KAR 59:005, Section 3(3), periods of excess emissions are defined as follows:
ELECTRONIC FILING, RECEIVED, CLERK'S OFFICE, JANUARY 5, 2007
* * * * * PC #7 * * * * *
Permit Number:
V-02-043 R2
Page:
6
of
72
SECTION B - EMISSION POINTS, EMISSIONS UNITS, APPLICABLE
REGULATIONS, AND OPERATING CONDITIONS (CONTINUED)
6.
Specific Reporting Requirements continued:
1) Excess emissions are defined as any six minute period during which the average
opacity of emissions exceeds twenty percent opacity, except that one (1) six (6)
minute average per hour of up to twenty-seven (27) percent opacity need not be
reported.
2) Excess emissions of sulfur dioxide are defined as any three (3) hour period during
which the average emissions (arithmetic average of three contiguous one-hour
periods) exceed the applicable sulfur dioxide emissions standards.
3) Excess emissions for emissions units using a continuous monitoring system for
measuring nitrogen oxides are defined as any three (3) hour period during which the
average emissions (arithmetic average of three contiguous one hour periods) exceed
the applicable nitrogen oxides emissions standards.
c)
The permittee shall report the number of excursions above the indicator range, date
and time of excursions, opacity value of the excursions, and percentage of the COM
data showing excursions from the indicator range in each calendar quarter.
d)
The permittee shall report quarterly the twelve-month rolling total sulfur dioxide and
nitrogen oxides emissions.
7.
Specific Control Equipment Operating Conditions:
a)
The electrostatic precipitator and wet spray scrubber with limestone/lime injection
shall be operated as necessary to maintain compliance with permitted emission
limitations, in accordance with manufacturer’s specifications and/or standard
operating practices.
b)
Records regarding the maintenance of the control equipment shall be maintained.
c)
See Section E for further requirements.
ELECTRONIC FILING, RECEIVED, CLERK'S OFFICE, JANUARY 5, 2007
* * * * * PC #7 * * * * *
Permit Number:
V-02-043 R2
Page:
7
of
72
SECTION B -EMISSION POINTS, EMISSIONS UNITS, APPLICABLE
REGULATIONS, AND OPERATING CONDITIONS (CONTINUED)
Emissions Units: 02 (02, 03, 04) - Auxiliary boilers A, B, and C
Description:
Constructed commenced on or before: December 28, 1987
#2 Fuel Oil-fired Units
Maximum continuous rating: 11.76 mmBtu/hour, each
Applicable Regulations:
401 KAR 59:015, New indirect heat exchangers, applicable to an emissions unit less than 250
mmBtu/hour and commenced on or after April 9, 1972.
1.
Operating Limitations:
Total annual #2 fuel oil usage rate for all auxiliary boilers A, B, and C (emission point 02)
shall not exceed 682,500 gallons per year and sulfur content shall not exceed 0.8 percent, to
demonstrate non-applicability of Prevention of Significant Deterioration of Air Quality.
2.
Emission Limitations:
a)
Pursuant to 401 KAR 59:015, Section 4(1)(b), particulate emissions shall not exceed
0.1 lb/mmBtu based on a three-hour average. Compliance with the allowable
particulate standard may be demonstrated by calculating particulate emissions using
fuel heating value, and emission factor information (Particulate formula: (0.002
lbs/gallon) / heating value in mmBtu/gallon.)
b)
Pursuant to 401 KAR 59:015, Section 4(2), emissions shall not exceed twenty (20)
percent opacity based on a six-minute average except a maximum of forty (40)
percent opacity for not more than six (6) consecutive minutes in any sixty (60)
consecutive minutes during cleaning the firebox or blowing soot is allowed.
c)
Pursuant to 401 KAR 59:015, Section 5(1)(b), the sulfur dioxide emission rate shall
not exceed 0.8 lb/mmBtu based on a three-hour average. Compliance with the
allowable sulfur dioxide standard shall be demonstrated by calculating sulfur dioxide
emissions using fuel heating value, fuel supplier certification with sulfur content, and
emission factor information (AP-42 factors below). Sulfur dioxide formula: (0.142
lb/gallon x Percent Sulfur in fuel) / heating value in mmBtu/gallon.
3.
Testing Requirements:
Compliance with the opacity standard shall be demonstrated by reading the opacity once in
every quarter by EPA Reference Method 9.
ELECTRONIC FILING, RECEIVED, CLERK'S OFFICE, JANUARY 5, 2007
* * * * * PC #7 * * * * *
Permit Number:
V-02-043 R2
Page:
8
of
72
SECTION B - EMISSION POINTS, EMISSIONS UNITS, APPLICABLE
REGULATIONS, AND OPERATING CONDITIONS (CONTINUED)
4.
Specific Monitoring Requirements:
a)
To demonstrate continuing compliance with the fuel oil sulfur content limitation,
monitoring of operations shall consist of, on an as-received basis, fuel supplier
certification of the sulfur content of the fuel oil to be combusted. The fuel supplier
certification shall include the name of the oil supplier, sulfur content, and a statement
that the oil complies with the specifications under the definition for distillate oil in
401 KAR 60:005.
b)
The fuel oil sulfur content and heating value shall be determined for the #2 fuel oil,
as received, by fuel supplier certification.
5.
Specific Record Keeping Requirements:
a)
Pursuant to 401 KAR 59:005, Section 3 (4), the owner or operator of the indirect heat
exchanger shall maintain a file of all measurements, including monthly #2 fuel oil
usage. The owner or operator shall maintain a file of the fuel supplier certification;
and all other information required by 401 KAR 59:005 recorded in a permanent form
suitable for inspection. The file shall be retained for at least five (5) years following
the date of such measurements, maintenance, reports, and records.
b)
Records of the #2 fuel oil used shall be maintained.
6.
Specific Reporting Requirements:
See Section F.
7.
Specific Control Equipment Operating Conditions:
NA
ELECTRONIC FILING, RECEIVED, CLERK'S OFFICE, JANUARY 5, 2007
* * * * * PC #7 * * * * *
Permit Number:
V-02-043 R2
Page:
9
of
72
SECTION B - EMISSION POINTS, EMISSIONS UNITS, APPLICABLE
REGULATIONS, AND OPERATING CONDITIONS (CONTINUED)
Emissions Unit: 05 (05, 06, -) -
Fossil Fuel Handling Operations and Plant Roadways
Description:
Construction commenced on or before: 1990
Equipment includes:
Maximum Operating Rate (Tons/hour)
Continuous barge unloader, one barge unloader bin,
5500
and fossil fuel stacker reclaimer
One active pile, one inactive pile, stackout
3000
conveyor S, one reclaim hopper
Plant Roadways
NA
Applicable Regulations:
401 KAR 63:010, Fugitive emissions, and
401 KAR 51:017, Prevention of significant deterioration of air quality.
1.
Operating Limitations:
a)
Pursuant to 401 KAR 63:010, Section 3, reasonable precautions shall be taken to
prevent particulate matter from becoming airborne. Such reasonable precautions
shall include, when applicable, but not be limited to the following:
1. application and maintenance of asphalt, application of water, or suitable
chemicals on roads, material stockpiles, and other surfaces which can create
airborne dusts;
2. operation of hoods, fans, and fabric filters to enclose and vent the handling of
dusty materials, or the use of water sprays or other measures to suppress the dust
emissions during handling;
3. the maintenance of paved roadways in a clean condition;
4. the prompt removal of earth or other material from a paved street which earth or
other material has been transported thereto by trucking or other earth moving
equipment or erosion by water.
b)
Pursuant to 401 KAR 63:010, Section 3, discharge of visible fugitive dust emissions
beyond the property line is prohibited.
e)
No one shall allow earth or other material being transported by truck or earth moving
equipment to be deposited onto a paved street or roadway, pursuant to 401 KAR
63:010, Section 4.
ELECTRONIC FILING, RECEIVED, CLERK'S OFFICE, JANUARY 5, 2007
* * * * * PC #7 * * * * *
Permit Number:
V-02-043 R2
Page:
10
of
72
SECTION B - EMISSION POINTS, EMISSIONS UNITS, APPLICABLE
REGULATIONS, AND OPERATING CONDITIONS (CONTINUED)
2.
Emission Limitations:
None
3.
Testing Requirements:
None
4.
Specific Monitoring Requirements:
See Section F.
5.
Specific Record Keeping Requirements:
a)
Records of the fossil fuels received and processed shall be maintained for emissions
inventory purposes.
b)
Annual records estimating the tonnage hauled for plant roadways shall be maintained
for emissions inventory purposes.
6.
Specific Reporting Requirements:
See Section F.
7.
Specific Control Equipment Operating Conditions:
a)
The surfactants, enclosures, and a rotoclone for the fossil fuel receiving operations
and the dust water suppressant system for the stockpile operations shall be used as
necessary to maintain compliance with applicable requirements, in accordance with
manufacturer’s specifications and/or standard operating practices.
b)
Plant roadways shall be controlled with water as necessary to comply with 401 KAR
63:010.
c)
Records regarding the maintenance and use of the surfactants, enclosures, and a
rotoclone for the fossil fuel receiving operations and the dust water suppressant
system for the stockpile operations shall be maintained.
d)
See Section E for further requirements.
ELECTRONIC FILING, RECEIVED, CLERK'S OFFICE, JANUARY 5, 2007
* * * * * PC #7 * * * * *
Permit Number:
V-02-043 R2
Page:
11
of
72
SECTION B - EMISSION POINTS, EMISSIONS UNITS, APPLICABLE
REGULATIONS, AND OPERATING CONDITIONS (CONTINUED)
Emissions Unit: 07 (07, 08, 09) - Fossil Fuel Handling Operations (Please refer to Units 36,
37, 38, and 39 for additional future fossil fuel handling
operation information)
Description:
Construction commenced on or before: 1990
Continuous Barge Unloader
–
One Barge Unloader Bin
Conveyor System
-
Conveyor Belt A:
From Continuous Barge Unloader to Conveyor B
Conveyor Belt B:
From Conveyor A to Transfer House/Conveyor C
Conveyor Belt C:
From Transfer House to Coal Sample House Bin
Conveyor Belt D:
From Coal Sample House Bin to Conveyor E1 or S
Conveyor Belt E1:
From Conveyor D to Active Storage and Crusher House
Conveyor Belts F1 & F2:
From Crusher House to Conveyors G1 & G2
Conveyor Belts G1 & G2:
From Conveyors F1 & F2 to Unit 1 & 2 Coal Silos
Conveyor Belt S:
From Conveyor D to One Inactive Fossil Fuel Pile
Reclaim Hopper & Conveyor Belt R1: From One Inactive Fossil Fuel Pile to Crusher House
Crusher House -
Two crushers, fossil fuel crusher bin, and fuel blender:
Crusher House Activities
Operating Rate
–
Continuous Barge Unloader
Transfer Rates
One Barge Unloader
5,500 tons/hour
Conveyor System
-
Conveyor Belt A:
5,500 tons/hour
Conveyor Belt B:
5,500 tons/hour
Conveyor Belt C:
5,500 tons/hour
Conveyor Belt D:
3,000 tons/hour
Conveyor Belt E1:
2,640 tons/hour
Conveyor Belts F1 & F2:
1,320 tons/hour
Conveyors G1 & G2
1,320 tons/hour
Conveyor Belt S:
1,650 tons/hour
Reclaim Hopper & Conveyor Belt R1:
1,320 tons/hour
Crusher House
-
Two crushers, fossil fuel crusher bin, and fuel blender:
3,600 tons/hour
Power House
-
Six Unit 1 fossil fuel silos:
800 tons/hour
ELECTRONIC FILING, RECEIVED, CLERK'S OFFICE, JANUARY 5, 2007
* * * * * PC #7 * * * * *
Permit Number:
V-02-043 R2
Page:
12
of
72
SECTION B - EMISSION POINTS, EMISSIONS UNITS, APPLICABLE
REGULATIONS, AND OPERATING CONDITIONS (CONTINUED)
Applicable Regulations:
401 KAR 60:005, incorporating by reference 40 CFR 60 Subpart Y, Standards of Performance for
Coal Preparation Plants for units commenced after October 24, 1974
401 KAR 51:017, Prevention of significant deterioration of air quality
1.
Operating Limitations:
None
2.
Emission Limitations:
Pursuant to 401 KAR 60:005 incorporating by reference 40 CFR 60.252, the owner or
operator subject to the provisions of this regulation shall not cause to be discharged into the
atmosphere from any coal processing and conveying equipment, coal storage system, or
transfer and loading system processing coal, gases which exhibit 20 percent opacity or
greater.
3.
Testing Requirements:
Pursuant to 401 KAR 60:005 incorporating by reference, 40 CFR 60.254, EPA Reference
Method 9 and the procedures in 40 CFR 60.11 shall be used to determine opacity at least
annually, or more frequently if requested by the Division.
4.
Specific Monitoring Requirements:
The permittee shall perform a qualitative visual observation of the opacity of emissions from
each stack on a weekly basis and maintain a log of the observations. If visible emissions
from any stack are seen, the permittee shall determine the opacity of emissions by Reference
Method 9 and instigate an inspection of the control equipment making any necessary repairs.
5.
Specific Record Keeping Requirements:
Records of the fossil fuels processed shall be maintained for emissions inventory purposes.
6.
Specific Reporting Requirements:
See Section F.
7.
Specific Control Equipment Operating Conditions:
a)
The enclosures, surfactants, and rotoclone(s) for crushing and associated conveying
operations, the partial enclosures for conveyor system with belts A, B, C, D, G1, G2,
1, 2, and fuel blender, and baghouse for the six fossil fuel silos shall be used/operated
as necessary to maintain compliance with permitted emission limitations, in
accordance with manufacturer’s specifications and/or standard operating practices.
b)
Records regarding the maintenance and use/operation of the control equipment listed
in 7(a) shall be maintained.
c)
See Section E for further requirements.
ELECTRONIC FILING, RECEIVED, CLERK'S OFFICE, JANUARY 5, 2007
* * * * * PC #7 * * * * *
Permit Number:
V-02-043 R2
Page:
13
of
72
SECTION B - EMISSION POINTS, EMISSIONS UNITS, APPLICABLE
REGULATIONS, AND OPERATING CONDITIONS (CONTINUED)
Emissions Unit: 10 (10 and 11) - Lime/Limestone Handling and Processing
Description:
Equipment includes: Receiving Operations: clamshell unloader, clamshell barge unloader bin;
Stockpile/Stackout Operations: active pile, inactive pile
Construction commenced on or before: 1990
Maximum Operating Rate (Receiving): 1650 Tons/hour
Maximum Operating Rate (Stockpile/Stackout): 1500 Tons/hr
Applicable Regulations:
401 KAR 63:010, Fugitive emissions
401 KAR 51:017, Prevention of significant deterioration of air quality
1.
Operating Limitations:
a)
Pursuant to 401 KAR 63:010, Section 3, reasonable precautions shall be taken to
prevent particulate matter from becoming airborne. Such reasonable precautions
shall include, when applicable, but not be limited to the following:
1. application and maintenance of asphalt, application of water, or suitable
chemicals on roads, material stockpiles, and other surfaces which can create airborne
dusts;
2. operation of hoods, fans, and fabric filters to enclose and vent the handling of
dusty materials, or the use of water sprays or other measures to suppress the dust
emissions during handling.
b)
Pursuant to 401 KAR 63:010, Section 3, discharge of visible fugitive dust emissions
beyond the property line is prohibited.
2.
Emission Limitations:
None
3.
Testing Requirements:
None
4.
Specific Monitoring Requirements:
See Section F.
5.
Specific Record Keeping Requirements:
Records of the lime and/or limestone received and processed shall be maintained for
emissions inventory purposes.
6.
Specific Reporting Requirements:
See Section F.
ELECTRONIC FILING, RECEIVED, CLERK'S OFFICE, JANUARY 5, 2007
* * * * * PC #7 * * * * *
Permit Number:
V-02-043 R2
Page:
14
of
72
SECTION B - EMISSION POINTS, EMISSIONS UNITS, APPLICABLE
REGULATIONS, AND OPERATING CONDITIONS (CONTINUED)
7.
Specific Control Equipment Operating Conditions:
a)
The wet spray low water surfactant and enclosures shall be used as necessary to
maintain compliance with applicable requirements, in accordance with
manufacturer’s specifications and/or standard operating practices.
b)
Records regarding the maintenance and use of the wet spray low water surfactant and
enclosures shall be maintained.
c)
See Section E for further requirements.
ELECTRONIC FILING, RECEIVED, CLERK'S OFFICE, JANUARY 5, 2007
* * * * * PC #7 * * * * *
Permit Number:
V-02-043 R2
Page:
15
of
72
SECTION B - EMISSION POINTS, EMISSIONS UNITS, APPLICABLE
REGULATIONS, AND OPERATING CONDITIONS (CONTINUED)
Emissions Units: 12 (12, 13) -
Lime/Limestone Handling and Processing
Description:
Equipment Includes: underground crushing operation (one crusher);
and milling operations (two ball mills)
Construction commenced on or before: 1990
Operating Rate: 260 Tons/hour, each
Applicable Regulations:
401 KAR 60.670, New nonmetallic mineral processing plants, incorporating by reference 40 CFR
60, Subpart OOO, applies to each of the emissions units listed above, commenced after August 31,
1983
401 KAR 51:017, Prevention of significant deterioration of air quality
1.
Operating Limitations:
None
2.
Emission Standards:
a)
Pursuant to 401 KAR 60.670, incorporating by reference 40 CFR 60.672(e), no
owner or operator shall cause to be discharged into the atmosphere from any building
enclosing any transfer point on a conveyor belt or any other emissions unit any
visible fugitive emissions.
Note that the crusher building is located underground with no direct vent to the atmosphere;
therefore as long as this is the case it is assumed to be in compliance.
3.
Testing Requirements:
In determining compliance with 401 KAR 60.670, incorporating by reference 40 CFR
60.672(e) for fugitive emissions from buildings, the owner(s) or operator(s) shall determine
fugitive emissions while all emissions units are operating in accordance with EPA Reference
Method 22, annually.
4.
Specific Monitoring Requirements:
The permittee shall inspect the control equipment weekly and make repairs as necessary to
assure compliance.
5.
Specific Record Keeping Requirements:
Records of the lime and/or limestone processed shall be maintained for emissions inventory
purposes.
ELECTRONIC FILING, RECEIVED, CLERK'S OFFICE, JANUARY 5, 2007
* * * * * PC #7 * * * * *
Permit Number:
V-02-043 R2
Page:
16
of
72
SECTION B - EMISSION POINTS, EMISSIONS UNITS, APPLICABLE
REGULATIONS, AND OPERATING CONDITIONS (CONTINUED)
6.
Specific Reporting Requirements:
a)
Pursuant to 401 KAR 60.670, incorporating by reference 40 CFR 60.676, the
owner(s) or operator(s) of any emissions unit shall submit written reports of the
results of all performance tests conducted to demonstrate compliance with the
standards of 40 CFR 60.672 and 401 KAR 59:310, including reports of observations
using Method 22 to demonstrate compliance.
b)
See Section F.
7.
Specific Control Equipment Operating Conditions:
a)
The enclosure shall be used as necessary to maintain compliance with permitted
emission limitations, in accordance with manufacturer’s specifications and/or
standard operating practices.
b)
Records regarding the maintenance of the enclosure shall be maintained.
c)
See Section E for further requirements.
ELECTRONIC FILING, RECEIVED, CLERK'S OFFICE, JANUARY 5, 2007
* * * * * PC #7 * * * * *
Permit Number:
V-02-043 R2
Page:
17
of
72
SECTION B - EMISSION POINTS, EMISSIONS UNITS, APPLICABLE
REGULATIONS, AND OPERATING CONDITIONS (CONTINUED)
Emissions Unit: 14 (14) - Lime/Limestone Handling and Processing
Description:
Equipment Includes: conveyors and transfer points (conveyor system, belts A, B, C, transfer bin, and
reclaim hopper)
Construction commenced on or before: 1990
Maximum Operating Rate: 1500 Tons/hour, each
Applicable Regulations:
401 KAR 60:670, incorporating by reference 40 CFR 60 Subpart OOO, Standards of Performance
for Nonmetallic Mineral Processing Plants, as modified by Section 3 of 401 KAR 60:670, applies to
each of the emissions units listed above, commenced after August 31, 1983
401 KAR 51:017, Prevention of significant deterioration of air quality
1.
Operating Limitations:
None
2.
Emission Standards:
a)
Pursuant to 401 KAR 60.670, incorporating by reference 40 CFR 60.672 (b), the
owner(s) or operator(s) shall not cause to be discharged into the atmosphere from any
transfer point on belt conveyors or from any other emissions unit any fugitive
emissions which exhibit greater than ten (10) percent opacity.
b)
Pursuant to 401 KAR 60.670, incorporating by reference 40 CFR 60.672(e), no
owner or operator shall cause to be discharged into the atmosphere from any
building/enclosure enclosing any transfer point on a conveyor belt or any other
emissions unit any visible fugitive emissions.
3.
Testing Requirements:
a)
EPA Reference Method 9 and the procedures in 40 CFR 60.11 and 40 CFR 60.675
shall be used for determining opacity, annually.
b)
In determining compliance with 401 KAR 401 KAR 60.670, incorporating by
reference 40 CFR 60.672(e) for fugitive emissions from buildings/enclosures, the
owner(s) or operator(s) shall determine fugitive emissions while all emissions units
are operating in accordance with EPA Reference Method 22, annually.
4.
Specific Monitoring Requirements:
The permittee shall inspect the control equipment weekly and make repairs as necessary to
assure compliance.
5.
Specific Record Keeping Requirements:
Records of the lime and/or limestone processed shall be maintained for emissions inventory
purposes.
ELECTRONIC FILING, RECEIVED, CLERK'S OFFICE, JANUARY 5, 2007
* * * * * PC #7 * * * * *
Permit Number:
V-02-043 R2
Page:
18
of
72
SECTION B - EMISSION POINTS, EMISSIONS UNITS, APPLICABLE
REGULATIONS, AND OPERATING CONDITIONS (CONTINUED)
6.
Specific Reporting Requirements:
a)
Pursuant to 401 KAR 60.670, incorporating by reference 40 CFR 60.676, the
owner(s) or operator(s) of any emissions unit shall submit written reports of the
results of all performance tests conducted to demonstrate compliance with the
standards of 40 CFR 60.672, including reports of opacity observations made using
Method 9 to demonstrate compliance, and reports of observations using Method 22
to demonstrate compliance.
b)
See Section F.
7.
Specific Control Equipment Operating Conditions:
a)
The partial enclosures shall be used as necessary to maintain compliance with
permitted emission limitations, in accordance with manufacturer’s specifications
and/or standard operating practices.
b)
Records regarding the maintenance of the partial enclosures shall be maintained.
c)
See Section E for further requirements.
ELECTRONIC FILING, RECEIVED, CLERK'S OFFICE, JANUARY 5, 2007
* * * * * PC #7 * * * * *
Permit Number:
V-02-043 R2
Page:
19
of
72
SECTION B - EMISSION POINTS, EMISSIONS UNITS, APPLICABLE
REGULATIONS, AND OPERATING CONDITIONS (CONTINUED)
Emissions Unit: 18 (18) - Emergency Diesel Generator
Description:
Maximum Output: 150 kW
Rated capacity: 16.1 gallons/hour diesel fuel
Constructed on or before date: 1995
Applicable Regulations:
None
1.
Operating Limitations:
None
2.
Emission Limitations:
None
3.
Testing Requirements:
None
4.
Specific Monitoring Requirements:
See Section F.
5.
Specific Record Keeping Requirements:
Records of the fuel usage rate shall be maintained for emissions inventory purposes.
6.
Specific Reporting Requirements:
See Section F.
7.
Specific Control Equipment Operating Conditions:
NA
ELECTRONIC FILING, RECEIVED, CLERK'S OFFICE, JANUARY 5, 2007
* * * * * PC #7 * * * * *
Permit Number:
V-02-043 R2
Page:
20
of
72
SECTION B - EMISSION POINTS, EMISSIONS UNITS, APPLICABLE
REGULATIONS, AND OPERATING CONDITIONS (CONTINUED)
Emissions Unit: 20 (17) - Existing Natural Draft Cooling Tower (with five chemical
injection pumps and two circulating water pumps)
Description:
Control Equipment:
0.008% Drift Eliminators
Circulating Water Rate:
238,227 Gallons per Minute
Construction Commenced Date:
September 1990
Applicable Regulations:
401 KAR 63:010, Fugitive emissions
401 KAR 51:017, Prevention of Significant Deterioration of Air Quality applicable to major
construction or modification commenced after September 22, 1982.
1.
Operating Limitations:
a)
Pursuant to 401 KAR 63:010, Section 3, reasonable precautions shall be taken to
prevent particulate matter from becoming airborne.
b)
Pursuant to 401 KAR 63:010, Section 3, discharge of visible fugitive dust emissions
beyond the property line is prohibited.
2.
Emission Limitations:
a)
Pursuant to 401 KAR 51:017, the cooling tower shall utilize 0.008% Drift
Eliminators.
b)
Pursuant to 401 KAR 63:010, Section 3, reasonable precautions shall be taken to
prevent particulate matter from becoming airborne.
3.
Testing Requirements:
None
4.
Specific Monitoring Requirements:
The permittee shall monitor of total dissolved solids content of the circulating water on a
monthly basis.
5.
Specific Record Keeping Requirements:
a)
The owner or operator shall maintain records of the manufacturer’s design of the
Drift Eliminators.
b)
The owner or operator shall maintain records of water circulation rate and monthly
records of the circulating water total dissolved solids content.
6.
Specific Reporting Requirements:
See Section F for further requirements.
ELECTRONIC FILING, RECEIVED, CLERK'S OFFICE, JANUARY 5, 2007
* * * * * PC #7 * * * * *
Permit Number:
V-02-043 R2
Page:
21
of
72
SECTION B - EMISSION POINTS, EMISSIONS UNITS, APPLICABLE
REGULATIONS, AND OPERATING CONDITIONS (CONTINUED)
7.
Specific Control Equipment Operating Conditions:
a)
Pursuant to 401 KAR 50:055, Section 5, the drift eliminators shall be maintained and
operated to ensure the emission units are in compliance with applicable requirements
of 401 KAR 63:010 and in accordance with manufacturer’s specifications and/or
standard operating practices.
b)
See Section E for further requirements.
ELECTRONIC FILING, RECEIVED, CLERK'S OFFICE, JANUARY 5, 2007
* * * * * PC #7 * * * * *
Permit Number:
V-02-043 R2
Page:
22
of
72
SECTION B -EMISSION POINTS, EMISSIONS UNITS, APPLICABLE
REGULATIONS, AND OPERATING CONDITIONS (CONTINUED)
Emissions Units: 25 – 30 (Emission Points 25 -30) - 6 Combustion Turbines (TC5 - TC10)
Description:
1763 mmBtu/hr maximum rated heat input capacity (@ -10 degrees F), each, 160 MW nominal
rated capacity output each. General Electric 7FA natural gas-fired simple cycle combustion
turbines equipped with dry low NOx burners.
Units 25 & 26 (TC 5 & TC6) are proposed to be installed in April of 2002
Units 27 & 28 (TC 7 & TC8) are proposed to be installed in February of 2004
Units 29 & 30 (TC 9 & TC10) are proposed to be installed in April of 2004
The following requirements are applicable to each combustion turbine
Applicable Regulations:
401 KAR 60:005, incorporating by reference 40 CFR 60, Subpart GG, Standards of Performance for
Stationary Gas Turbines, for emissions unit with a heat input at peak load equal to or greater than 10
mmBtu/hour for which construction commenced after October 3, 1977, and 40 CFR 60, Subpart A,
General Provisions.
401 KAR 51:017, Prevention of significant deterioration of air quality
401 KAR 63:020, Potentially hazardous matter or toxic substances
1.
Operating Limitations:
a)
The Permittee shall not operate any combustion turbine below load levels at which
performance testing has proven compliance with emission limitations, except during
periods of startup and shutdown. Startup and shutdown periods shall be limited to no
more than two hours for each startup/shutdown event.
b)
The Permittee shall use only natural gas in the turbines.
2.
Emission Limitations
:
a)
Pursuant to 401 KAR 51:017, nitrogen oxides emission levels in the exhaust gas
shall not exceed a hourly average of 12 ppm by volume at 15 percent oxygen on a
dry basis, and an annual (12 month rolling) average of 9 ppm by volume at 15
percent oxygen on a dry basis, except during periods of startup, shutdown, or
malfunction. Continuous compliance with this limit shall be demonstrated by a
continuous emission monitor (CEM). Compliance with this limit constitutes
compliance with the nitrogen oxide limit contained in 40 CFR 60 Subpart GG.
b)
Pursuant to 401 KAR 51:017, the fuel sulfur content due to the firing of natural gas
shall not exceed 2.0 grains/100 SCF. Compliance with this limit shall be
demonstrated by fuel sampling or vendor guarantees.
ELECTRONIC FILING, RECEIVED, CLERK'S OFFICE, JANUARY 5, 2007
* * * * * PC #7 * * * * *
Permit Number:
V-02-043 R2
Page:
23
of
72
SECTION B - EMISSION POINTS, EMISSIONS UNITS, APPLICABLE
REGULATIONS, AND OPERATING CONDITIONS (CONTINUED)
c)
Pursuant to 401 KAR 51:017, except during periods of startup, shutdown, or
malfunction, the carbon monoxide emission level in the exhaust gas shall not exceed
9 ppm by volume at 15 % oxygen, on a dry basis, during any 3-hour average period.
Continuous compliance with this limit shall be demonstrated by a continuous
emission monitor (CEM).
d)
Pursuant to 401 KAR 51:017, particulate emissions shall not exceed 19 pounds
per hour.
e)
The permittee shall not allow total formaldehyde emissions in the exhaust gas to
exceed 10 tons during any consecutive 12- month period.
f)
See Section D.
3.
Testing Requirements:
a)
Pursuant to 40 CFR 60.335(b), in conducting performance tests required by 40 CFR
60.8, the owner or operator shall use as test methods and procedures the test methods
in Appendix A of Part 60 or other methods or procedures as specified in 40 CFR
60.335, except as provided for in 40 CFR 60.8(b).
b)
Pursuant to 401 KAR 50:045, the owner or operator shall conduct an initial
performance test on at least one of the turbines for sulfur dioxide, nitrogen oxides,
carbon monoxide, particulate matter and formaldehyde, with use of a reference test
method approved by the Division.
c)
See General Conditions G(d)(5) and G(d)(6).
4.
Specific Monitoring Requirements:
a)
Pursuant to 401 KAR 52:020, Section 10, and 40 CFR 75.2, the permittee shall
install, calibrate, maintain, and operate the nitrogen oxides Continuous Emissions
Monitor (CEM). The nitrogen oxides CEM shall be used as the indicator of
continuous compliance with the nitrogen oxides emission standard. Excluding the
startup and shut down periods, if any (1) one-hour average exceeds the nitrogen
oxides emission limitation, the permittee shall, as appropriate, initiate an
investigation of the cause of the exceedance and complete necessary control
device/process/CEM repairs or take corrective action as soon as practicable.
b)
Pursuant to 401 KAR 52:020, Section 10, the permittee shall monitor the quantity of
natural gas, in millions of cubic feet, fired in each combustion turbine on a daily
basis.
ELECTRONIC FILING, RECEIVED, CLERK'S OFFICE, JANUARY 5, 2007
* * * * * PC #7 * * * * *
Permit Number:
V-02-043 R2
Page:
24
of
72
SECTION B - EMISSION POINTS, EMISSIONS UNITS, APPLICABLE
REGULATIONS, AND OPERATING CONDITIONS (CONTINUED)
c)
Pursuant to 40 CFR 60.334(b), the owner or operator of any stationary turbine shall
monitor sulfur content of the fuel being fired in the turbine. The frequency of
determination of these values shall be as specified in the following approved Custom
fuel monitoring schedule. The permittee will sample the natural gas for sulfur content
every six months or use vendor guarantees that the gas contains 2.0 grains/100 SCF
of sulfur or less as proof of natural gas quality.
d)
Pursuant to 401 KAR 52:020, Section 10, to meet the periodic monitoring
requirement for carbon monoxide the permittee shall use a continuous emission
monitor (CEM). Excluding the startup and shut down periods, if any (3) three-hour
average carbon monoxide value exceeds the standard, the permittee shall, as
appropriate, initiate an investigation of the cause of the exceedance and complete
necessary process or CEM repairs or take corrective action as soon as practicable.
e)
The permittee shall install, calibrate, operate, test, and monitor all continuous
monitoring systems and monitoring devices in accordance with 40 CFR 60.13 or 40
CFR 75.10
f)
The Permittee shall monitor the hours of operation of each combustion turbine on a
daily basis.
g)
The Permittee shall monitor the power output, in MW, of each combustion turbine on
a daily basis.
5.
Specific Record Keeping Requirements:
a)
Pursuant to 40 CFR 60.7 (f), the owner or operator of the gas turbines shall maintain
a file of all measurements, including continuous monitoring system, monitoring
device, and performance testing measurements; all continuous monitoring system
performance evaluations; all continuous monitoring system or monitoring device
calibration checks; adjustments and maintenance performed on these systems and
devices; and all other information required by 40 CFR 60, Subpart A recorded in a
permanent form suitable for inspection.
b)
Records, including those documenting the results of each compliance test and all
other records and reports required by this permit, shall be maintained for five (5)
years pursuant to 401 KAR 52:020.
ELECTRONIC FILING, RECEIVED, CLERK'S OFFICE, JANUARY 5, 2007
* * * * * PC #7 * * * * *
Permit Number:
V-02-043 R2
Page:
25
of
72
SECTION B -EMISSION POINTS, EMISSIONS UNITS, APPLICABLE
REGULATIONS, AND OPERATING CONDITIONS (CONTINUED)
c)
The permittee shall maintain a log of all sulfur content measurements as required in
the approved custom fuel sulfur-monitoring plan (Condition 4(c) above).
d)
The permittee shall maintain a daily log of the natural gas, in millions of cubic feet,
fired in each combustion turbine, for any consecutive twelve (12) month period.
e)
The permittee shall maintain a daily log of all hours of operation for each
combustion turbine, for any consecutive twelve (12) month period.
f)
The permittee shall maintain a daily log of all power output, in MW, for each
combustion turbine, for any consecutive twelve (12) month period.
6.
Specific Reporting Requirements:
a)
Pursuant to 40 CFR 60.7 (c), minimum data requirements which follow shall be
maintained and furnished in the format specified by the Division. Owners or
operators of facilities required to install continuous monitoring systems shall submit
for every calendar quarter a written report of excess emissions (as defined in
applicable sections) to the Division. All quarterly reports shall be postmarked by the
thirtieth (30th) day following the end of each calendar quarter and shall include the
following information:
1) The magnitude of the excess emissions computed in accordance with the 40 CFR
60.13 (h), any conversion factors used, and the date and time of commencement
and completion of each time period of excess emissions.
2) Specific identification of each period of excess emissions that occurs during
startups, shutdowns, and malfunctions of the emissions unit. The nature and
cause of any malfunction (if known), the corrective action taken or preventive
measures adopted.
3) The date and time identifying each period during which continuous monitoring
system was inoperative except for zero and span checks and the nature of the
system repairs or adjustments.
4) When no excess emissions have occurred or the continuous monitoring system(s)
have not been inoperative, repaired, or adjusted, such information shall be stated
in the report.
ELECTRONIC FILING, RECEIVED, CLERK'S OFFICE, JANUARY 5, 2007
* * * * * PC #7 * * * * *
Permit Number:
V-02-043 R2
Page:
26
of
72
SECTION B - EMISSION POINTS, EMISSIONS UNITS, APPLICABLE
REGULATIONS, AND OPERATING CONDITIONS (CONTINUED)
b)
Pursuant to 401 KAR 52:020 Section 10, monitoring requirement with CEM for
nitrogen oxides, excess emissions are defined as any (1) one-hour period during
which the average emissions (arithmetic average) exceed the applicable nitrogen
oxides emission standard. These periods of excess emissions shall be reported
quarterly. The nitrogen oxide CEM reports will be used in lieu of the water to fuel
ratio requirements of 40 CFR 60.334(c).
c)
Pursuant to 40 CFR 60.334(c), excess emissions of sulfur dioxide are defined as any
daily period (or as otherwise required in an approved custom fuel sulfur monitoring
plan) during which the sulfur content of the fuel being fired in the gas turbine(s)
exceeds the limitations set forth in Subsection 2, Emission Limitations. These
periods of excess emissions shall be reported quarterly.
d)
Pursuant to 401 KAR 52:020, Section 10, monitoring requirement with CEM for
carbon monoxide, excess emissions are defined as any (3) three-hour period during
which the average emissions (arithmetic average) exceed the applicable carbon
monoxide emission standard. These periods of excess emissions shall be reported
quarterly.
7.
Specific Control Equipment Operating Conditions:
a)
The Dry Low-NOx Burners shall be operated to maintain compliance with permitted
emission limitations, in accordance with manufacturer’s specifications and/or
standard operating practices.
b)
See Section E for further requirements.
ELECTRONIC FILING, RECEIVED, CLERK'S OFFICE, JANUARY 5, 2007
* * * * * PC #7 * * * * *
Permit Number:
V-02-043 R2
Page:
27
of
72
SECTION B - EMISSION POINTS, EMISSIONS UNITS, APPLICABLE
REGULATIONS, AND OPERATING CONDITIONS (CONTINUED)
Emissions Unit: 31 -
Unit 2 - Supercritical Pulverized Coal Fired Steam Electric
Generating Unit Nominal rating 750 MW
Description:
Supercritical Pulverized Coal (SPC) Boiler, equipped with Selective Catalytic Reduction (SCR);
Pulse Jet Fabric Filter (PJFF); Wet Flue Gas Desulfurization (WFGD); and Wet Electrostatic
Precipitator (WESP).
ASTM Grade No. 2-D S15 fuel oil used for startup and stabilization.
Design capacity rating: 6,942 mmBtu/hour
Fuels include (i) Eastern bituminous coal, and (ii) a blend of Western sub bituminous coal and
Eastern bituminous coal.
Construction Commence Date: Estimated 2006
Applicable Regulations:
401 KAR 51:017, Prevention of Significant Deterioration of Air Quality applicable to major
construction or modification commenced after September 22, 1982;
401 KAR 51:160, NO
x
requirements for large utility and industrial boilers; incorporating by
reference 40 CFR 96;
401 KAR 52:060, Acid rain permits, incorporating by reference the Federal Acid Rain provisions as
codified in 40 CFR Parts 72 to 78;
401 KAR 59:016, New Electric Utility Steam Generating Units;
40 CFR 60, Appendix F, Quality Assurance Procedures
401 KAR 60:005, incorporating by reference 40 CFR 60, Subpart Da, Standards of Performance for
Electric Utility Steam Generating Units applicable to an emission unit with a capacity of more than
250 mmBtu per hour and commenced construction on or after September 19, 1978;
401 KAR 63:020, Potentially Hazardous Matter or Toxic Substances
40 CFR 64, Compliance Assurance Monitoring
40 CFR 75, Continuous Emission Monitoring
Compliance with 40 CFR 75, Continuous Emissions Monitoring, shall constitute compliance with
the monitoring and quality assurance requirements of 401 KAR 59:016 and 40 CFR 60, Appendix F.
1.
Operating Limitations:
The owner or operator shall install control devices selected as BACT.
•
BACT for PM/PM
10
is PJFF.
•
BACT for CO is good combustion controls.
•
BACT for H
2
SO
4
mist is WESP.
•
BACT for fluorides (as HF) is WFGD.
•
BACT does not apply to NO
x
and SO
2
, however BACT type controls with similar
emission levels will be installed with a SCR for NO
x
emissions and WFGD for SO
2
.
•
Only ASTM Grade No.2-DS15, with a sulfur content not to exceed 15 ppm shall be used
for startup and stabilization.
ELECTRONIC FILING, RECEIVED, CLERK'S OFFICE, JANUARY 5, 2007
* * * * * PC #7 * * * * *
Permit Number:
V-02-043 R2
Page:
28
of
72
SECTION B - EMISSION POINTS, EMISSIONS UNITS, APPLICABLE
REGULATIONS, AND OPERATING CONDITIONS (CONTINUED)
2.
Emission Limitations:
a)
Pursuant to 401 KAR 59:016, Section 3(1)(b), and 401 KAR 51:017, particulate and
PM
10
emissions shall not exceed 0.018 lb/mmBtu (filterable and condensable) of heat
input based on the average of three one-hour tests. Pursuant to 401 KAR 59:016,
Section 6(1), compliance with the 0.018lb/mmBtu (filterable and condensable)
emission limitation shall constitute compliance with the 99% reduction requirement
contained in 401 KAR 59:016, Section 3(1)(b).
b)
Pursuant to 401 KAR 60:005, Section 3(1)(c) and 40 CFR 60.42a(c), [per proposed
revisions to NSPS Subpart Da published in the Federal Register on February 28,
2005] filterable particulate emissions shall not exceed 0.015 lb/mmBtu of heat input
based on a three-hour rolling average.
c)
Pursuant to 401 KAR 59:016, Section 3(2), emissions shall not exceed twenty (20)
percent opacity based on a six-minute average except that a maximum of twenty-
seven (27) percent is allowed for not more than one (1) six (6) minute period per
hour.
d)
Pursuant to 401 KAR 51:017, Sulfur dioxide emissions shall not exceed 8.94 tons per
calendar day and 3,263.1 tons per 12 consecutive months total.
e)
Pursuant to 401 KAR 60:005, Section 3(1)(c) and 40 CFR 60.43a(i), [per proposed
revisions to NSPS Subpart Da published in the Federal Register on February 28,
2005], sulfur dioxide emissions shall not exceed 2.0 lb/MWh gross energy output,
based on a thirty (30) day rolling average. Pursuant to 401 KAR 59:016, Section 4,
compliance with this limit shall constitute compliance with the 70% reduction
requirement contained in 401 KAR 59:016, Section 4(1)(b).
f)
Pursuant to 401 KAR 51:017, Carbon monoxide emissions shall not exceed 0.10
lbs/mmBtu based on a thirty day rolling average or 0.5 lbs/mmBtu on a three hour
rolling average.
g)
Pursuant to 401 KAR 51:017, Nitrogen oxides emissions shall not exceed 4.17 tons
per calendar day and 1,506.72 tons per 12 consecutive months total.
h)
Pursuant to 401 KAR 60:005, Section 3(1)(c) and 40 CFR 60.44a(e), [per proposed
revisions to NSPS Subpart Da published in the Federal Register on February 28,
2005], nitrogen oxides emissions shall not exceed 1.0 lb/MWh gross energy output,
based on a 30-day rolling average. Pursuant to 401 KAR 59:016, Section 5,
compliance with this limitation shall constitute compliance with the 65% reduction
requirement contained in 401 KAR 59:016, Section 5(2)(e).
i)
Pursuant to 401 KAR 51:017, VOC emissions shall not exceed 0.0032 lbs/mmBtu
based on a three (3) hour rolling average. Compliance with this limit shall be
demonstrated by compliance with Subsection 2(f) above.
ELECTRONIC FILING, RECEIVED, CLERK'S OFFICE, JANUARY 5, 2007
* * * * * PC #7 * * * * *
Permit Number:
V-02-043 R2
Page:
29
of
72
SECTION B - EMISSION POINTS, EMISSIONS UNITS, APPLICABLE
REGULATIONS, AND OPERATING CONDITIONS (CONTINUED)
j)
Pursuant to 401 KAR 51:017, Sulfuric acid mist emissions shall not exceed 26.6
lbs/hr based on a three (3) hour rolling average.
k)
Pursuant to 401 KAR 51:017, Fluorides emissions shall not exceed 1.55 lbs/hr based
on a three (3) hour rolling average.
l)
Mercury emissions shall not exceed 13 x 10
-6
lbs/MWh (Gross output) based on a
consecutive twelve (12) month rolling average. Compliance with this limit ensures
compliance with 40 CFR 60.45a.
m)
Lead emissions shall not exceed 0.55 tons per year based on a 12-month rolling total.
n)
Pursuant to 401 KAR 63:020, the use of good combustion controls, PJFF, WFGD,
and WESP shall be used for the control of organic toxic substances.
o)
Compliance with emission limits in Subsections (a), (d), (f) and (i) shall constitute
compliance with 401 KAR 63:020 with respect to toxic substances. Mercury is not
regulated under 401 KAR 63:020 pursuant to 401 KAR 63:020 Section 1.
p)
The above emission limitations shall not apply during periods of startup and
shutdown. However, emissions during startup and shutdown shall be included in
determining compliance with tons per year limits specified in this permit. Pursuant to
401 KAR 51:017, the owner or operator shall utilize good work and maintenance
practices and manufacturer’s recommendations to minimize emissions during, and
the frequency and duration of, such events.
3.
Testing Requirements:
a)
Pursuant to 401 KAR 50:055, Section 2(1)(a) the owner or operator shall
demonstrate compliance with the applicable emission standards within sixty (60)
days after achieving the maximum production rate at which the affected facility will
be operated, but not later than 180 days after initial startup of the unit.
b)
Pursuant to 401 KAR 50:045, Section 2 and 50:015, Section 1, the owner or operator
shall determine the opacity of emissions from the stack by EPA Reference Method 9
as requested by the Division.
c)
See Section D for further requirements.
4.
Specific Monitoring Requirements:
a)
Pursuant to 401 KAR 52:020, 401 KAR 59:016, Section 7, 401 KAR 51:017, 401
KAR 60:005, Section 3(1)(c), and 401 KAR 59:005, Section 4, the owner or operator
shall install, calibrate, maintain, and operate continuous monitoring systems for
measuring the opacity of emissions, sulfur dioxide emissions, carbon monoxide
emissions, nitrogen oxides emissions, particulate matter emissions, mercury
ELECTRONIC FILING, RECEIVED, CLERK'S OFFICE, JANUARY 5, 2007
* * * * * PC #7 * * * * *
Permit Number:
V-02-043 R2
Page:
30
of
72
SECTION B - EMISSION POINTS, EMISSIONS UNITS, APPLICABLE
REGULATIONS, AND OPERATING CONDITIONS (CONTINUED)
emissions, and either oxygen or carbon dioxide diluents. Oxygen or carbon dioxide
shall be monitored at each location where sulfur dioxide or nitrogen oxides emissions
are monitored. The owner or operator shall ensure the continuous monitoring
systems are in compliance with the requirements of 401 KAR 59:005, Section 4.
Due to the wet nature of the stack, a continuous opacity monitor (COM) shall be
located after the PJFF and before the WFGD as an indicator of performance.
b)
Pursuant to 401 KAR 52:020, 401 KAR 59:016, Section 7(2) and 40 CFR 75.2, to
meet the continuous monitoring requirement for sulfur dioxide, the owner or operator
shall use a continuous emission monitor (CEM). If any 30 day rolling average
(excluding the startup and shut down periods) or 8.94 tons per day limit for sulfur
dioxide exceeds the limits, the owner or operator shall, as appropriate, initiate an
inspection of the control equipment and/or the CEM system and make any necessary
repairs as soon as practicable.
c)
Pursuant to 401 KAR 52:020, 401 KAR 59:016, Section 7(3) and 40 CFR 75.2, to
meet the continuous monitoring requirement for nitrogen oxide, the owner or
operator shall use a CEM. If any 30 day rolling average (excluding the startup and
shut down periods) or 4.17 tons per day limit for nitrogen oxide exceeds the limits,
the owner or operator shall, as appropriate, initiate an inspection of the control
equipment and/or the CEM system and make any necessary repairs as soon as
practicable.
d)
Pursuant to 401 KAR 52:020, Section 10 and 401 KAR 51:017, to meet the periodic
monitoring requirement for CO, the owner or operator shall use a CEM.
e)
Pursuant to 401 KAR 52:020, Section 10 and 401 KAR 51:017, to meet the periodic
monitoring requirement for PM/PM
10
, the owner or operator shall use a CEM.
f)
Pursuant to 401 KAR 52:020, Section 10 and 40 CFR 60.49a(p), to meet the periodic
monitoring requirement for mercury the owner or operator shall use a CEM.
g)
Pursuant to 40 CFR 60.49a, 401 KAR 52:020 and 401 KAR 59:016, Section 7(5), all
the CEM systems shall be operated and data shall be recorded during all periods of
operation of the emissions units including periods of startup, shutdown, malfunction
or emergency conditions, except for continuous monitoring system breakdowns,
repairs, calibration checks, and zero and span adjustments.
ELECTRONIC FILING, RECEIVED, CLERK'S OFFICE, JANUARY 5, 2007
* * * * * PC #7 * * * * *
Permit Number:
V-02-043 R2
Page:
31
of
72
SECTION B - EMISSION POINTS, EMISSIONS UNITS, APPLICABLE
REGULATIONS, AND OPERATING CONDITIONS (CONTINUED)
h)
Pursuant to 401 KAR 52:020 and 401 KAR 59:016, Section 7(6), when emission
data are not obtained because of continuous monitoring system breakdowns, repairs,
calibration checks, and zero and span adjustments, the owner or operator shall obtain
emission data by using other monitoring systems as approved by the Division or the
reference methods as described in 401 KAR 59:016, Section 7(8) or other data
substitution methods, including 40 CFR 75, to provide emission data for a minimum
of eighteen hours in at least twenty-two out of thirty successive boiler operating
days.
i)
Pursuant to 401 KAR 59:016, Section 7(9), the following procedures shall be used to
conduct monitoring system performance evaluations and calibration checks as
required under 401 KAR 59:005, Section 4(3):
1. Reference Method 6 or 7, as applicable shall be used for conducting performance
evaluations of sulfur dioxide and nitrogen oxides CEM systems.
2. Sulfur dioxide or nitrogen oxides, as applicable, shall be used for preparing
calibration mixtures under Performance Specification 2 of Appendix B to 40
CFR 60 incorporated by reference in 401 KAR 50:015, or under 40 CFR 75.
3. The span value for the continuous monitoring system for measuring opacity shall
be between sixty (60) and eighty (80) percent and the span value for the
continuous monitoring system for measuring nitrogen oxides shall be 1,000 ppm,
or span values as specified in 40 CFR 75, Appendix A.
4. The span value for the continuous monitoring system for measuring sulfur
dioxide at the outlet of the control device shall be 50 percent of the maximum
estimated hourly potential emissions of the fuel fired, or span values as specified
in 40 CFR 75, Appendix A.
j)
CAM Requirements. The owner or operator shall use Sulfur Dioxide (SO
2
),
Nitrogen Oxides (NO
x
), and particulate matter (PM/PM
10
) Continuous Emissions
Monitors (CEMs) as continuous compliance determination methods consistent with
40 CFR 64.4(d) for those specific parameters, and to demonstrate compliance with
Best Available Control Technology (BACT) limits contained in this permit, as
applicable.
ELECTRONIC FILING, RECEIVED, CLERK'S OFFICE, JANUARY 5, 2007
* * * * * PC #7 * * * * *
Permit Number:
V-02-043 R2
Page:
32
of
72
SECTION B - EMISSION POINTS, EMISSIONS UNITS, APPLICABLE
REGULATIONS, AND OPERATING CONDITIONS (CONTINUED)
Pursuant to 40 CFR 64.6, monitoring for H
2
SO
4
and Fluoride is shown in the table below:
TABLE 1: CAM MONITORING APPROACH
Applicable CAM
Requirement
H
2
SO
4
Mist
Fluoride
General
Requirements
26.6 lb/hr
3 hour rolling average
1.55 lb/hr
3 hour rolling average
Monitoring
Methods and
Location
SO
2
CEMs plus initial source test,
WESP liquid flow rate, voltage,
secondary currents and/or operating
parameters, in conjunction with
initial performance tests to
establish excursion and
exceedance, shall be monitored
SO
2
CEMs plus initial source test,
weekly coal sampling (as received)
with quarterly coal composites
Indicator Range
Initial source testing to establish
correlation to SO
2
and coal quality,
then establish SO
2
CEM and coal
range appropriate
Initial source testing to establish
correlation to SO
2
and coal quality,
then establish SO
2
CEM and coal
range appropriate
Data Collection
Frequency
Continuous SO
2
CEM, weekly coal
sampling (as received) with
quarterly coal composites
Continuous SO
2
CEM, weekly coal
sampling (as received) with
quarterly coal composites
Averaging Period
3 hour rolling
3 hour rolling
Recordkeeping
Coal quality information will be
kept in a designated hard copy or
electronic archive, plus CEM data
system records
Coal quality information will be
kept in a designated hard copy or
electronic archive, plus CEM data
system records
QA/QC
WFGD/WESP will be maintained
and operated in accordance with
manufacturer specifications and
recommendations
WFGD/WESP will be maintained
and operated in accordance with
manufacturer specifications and
recommendations
5.
Specific Record Keeping Requirements:
a)
Pursuant to 401 KAR 59:005, Section 3(4), the owner or operator of this unit shall
maintain a record of applicable measurements, including CEM system, monitoring
device, and performance testing measurements; all CEM system performance
evaluations; all continuous monitoring system or monitoring device calibration
checks; adjustments and maintenance performed on these systems and devices; and
all other information required by 401 KAR 59:005 recorded in a permanent form
suitable for inspection.
ELECTRONIC FILING, RECEIVED, CLERK'S OFFICE, JANUARY 5, 2007
* * * * * PC #7 * * * * *
Permit Number:
V-02-043 R2
Page:
33
of
72
SECTION B - EMISSION POINTS, EMISSIONS UNITS, APPLICABLE
REGULATIONS, AND OPERATING CONDITIONS (CONTINUED)
b)
Pursuant to 401 KAR 59:005, Section 3(2), the owner or operator of this unit shall
maintain records of the occurrence and duration of any startup, shutdown, or
malfunction in the operation of the affected facility, any malfunction of the air
pollution control equipment; or any period during which a CEM system or emission
monitoring device is inoperative.
c)
Pursuant to KAR 52:020, Section 10 and 401 KAR 50:045, Section 6, the owner or
operator shall maintain the results of all compliance tests.
d)
CAM Requirements
1.
Pursuant to 40 CFR 64.9(b), the owner or operator shall record on a daily
basis for the WFGD the following:
a.
The WFGD liquid pH in the reaction tank;
b.
Recycle pump amps and status.
2.
Pursuant to 40 CFR 64.9(b), the owner or operator shall record, on a daily
basis, voltages, or other parameters identified during the performance test
for the WESP, as approved by the Division.
6.
Specific Reporting Requirements:
a)
Pursuant to 401 KAR 59:005, Section 3(3), minimum data requirements which
follow shall be maintained and furnished in the format specified by the Division.
Owners or operators of facilities required to install continuous monitoring systems
shall submit for every calendar quarter a written report of excess emissions (as
defined in applicable sections) to the Division. All quarterly reports shall be
postmarked by the thirtieth (30th) day following the end of each calendar quarter and
shall include the following information:
1.
The magnitude of the excess emission computed in accordance with the 401
KAR 59:005, Section 4(8), any conversion factors used, and the date and
time of commencement and completion of each time period of excess
emissions.
2.
All hourly averages shall be reported for sulfur dioxide and nitrogen oxides
monitors. The hourly averages shall be made available in the format specified
by the Division.
3.
Specific identification of each period of excess emissions that occurs during
startups, shutdowns, and malfunctions of the affected facility. The permittee
shall determine the nature and cause of any malfunction (if known), and
initiate the corrective action taken or preventive measures adopted.
ELECTRONIC FILING, RECEIVED, CLERK'S OFFICE, JANUARY 5, 2007
* * * * * PC #7 * * * * *
Permit Number:
V-02-043 R2
Page:
34
of
72
SECTION B - EMISSION POINTS, EMISSIONS UNITS, APPLICABLE
REGULATIONS, AND OPERATING CONDITIONS (CONTINUED)
4.
The date and time identifying each period during which continuous
monitoring system was inoperative except for zero and span checks and the
nature of the system repairs or adjustments.
5.
When no excess emissions have occurred or the continuous monitoring
system(s) have not been inoperative, repaired, or adjusted, such information
shall be stated in the report.
6.
For sulfur dioxide and nitrogen oxides, all information listed in 401 KAR
59:016, Section 9(2)(a) through (i), shall be reported to the Division for each
twenty-four (24) hour period.
7.
If the minimum quantity of emission data as required by 401 KAR 59:016,
Section 7 is not obtained for any thirty successive boiler operating days, the
owner or operator shall report all the information listed in 401 KAR 59:016,
Section 9(3) for that thirty (30) day period.
8.
If any sulfur dioxide standards as specified in 401 KAR 59:016, Section 4(a
and b) are exceeded during emergency conditions because of control system
malfunction, the owner or operator shall submit a signed statement including
all information as described in 401 KAR 59:016, Section 9(4).
9.
For any periods for which opacity, sulfur dioxide or nitrogen oxides
emissions data are not available, the owner or operator shall submit a signed
statement pursuant to 401 KAR 59:016, Section 9(6) indicating if any
changes were made in the operation of the emission control system during
the period of data unavailability. Operations of control system and emissions
units during periods of data unavailability are to be compared with operation
of the control system and emissions units before and following the period of
data unavailability.
10.
The owner or operator shall submit a signed statement including all
information as described in 401 KAR 59:016, Section 9(7).
11.
Pursuant to 401 KAR 59:016, Section 9(8), for the purposes of the reports
required under 401 KAR 59:005, Section 4, periods of excess emissions are
defined as all six (6) minute periods during which the average opacity
exceeds the applicable opacity standards as specified in 401 KAR 59:016,
Section 3(2). Opacity levels in excess of the applicable opacity standard and
the date of such excesses are to be submitted to the Division each calendar
quarter. As the COM system is located after the PJFF as an indicator of
performance for that device but before the WFGD which provides additional
particulate control, in the event of an opacity exceedance, as indicated by
COM data, the owner or operator may conduct a Method 9 test to verify that
ELECTRONIC FILING, RECEIVED, CLERK'S OFFICE, JANUARY 5, 2007
* * * * * PC #7 * * * * *
Permit Number:
V-02-043 R2
Page:
35
of
72
SECTION B - EMISSION POINTS, EMISSIONS UNITS, APPLICABLE
REGULATIONS, AND OPERATING CONDITIONS (CONTINUED)
actual opacity from the stack complies with the applicable opacity standard,
in which case the owner or operator shall promptly complete any necessary
repairs to the PJFF. Such events shall not be considered in excess of the
applicable opacity standard for reporting or other purposes. The CEM
systems for sulfur dioxide and nitrogen oxide shall be certified, operated and
maintained in accordance with the applicable provisions of 40 CFR 75
,
compliance with which shall be deemed compliance with monitoring
provisions of 40 CFR 60.49a.
b)
Pursuant to 401 KAR 59:005, Section 3(3), the owner or operator shall report the
number of excursions (excluding startup, shut down, malfunction data) above the
opacity trigger level, date and time of excursions, opacity value of the excursions,
and percentage of the COM data showing excursions above the opacity trigger level
in each calendar quarter to the Division’s Regional Office consistent with the
reporting provisions of paragraph B.6.a.11..
c)
CAM Requirements. Pursuant to 40 CFR 64.9(a) the owner or operator shall report
the following information regarding its CAM plan according to the general reporting
requirements specified in Section F.5. of this permit:
1.
Number of exceedances or excursions;
2.
Duration of each exceedance or excursion;
3.
Cause of each exceedance or excursion;
4.
Corrective actions taken on each exceedance or excursion;
5.
Number of monitoring equipment downtime incidents;
6.
Duration of each monitoring equipment downtime incident;
7.
Cause of each monitoring equipment downtime incident;
8.
Description of actions taken to implement a quality improvement plan and
upon completion of the quality improvement plan, documentation that the
plan was completed and reduced the likelihood of similar excursions or
exceedances.
9.
The permittee shall take a sample of fuel “as received” upon delivery
schedule to the PCs. The samples taken shall be uniformly mixed to form a
composite sample analyzed to determine fluoride content on a quarterly
basis. This data, along with the baseline data established during the initial
compliance and subsequent tests, shall be used to demonstrate compliance
with the emission limits for HF.
d)
The permittee shall report quarterly the twelve (12) month rolling total sulfur dioxide
and nitrogen oxides emissions.
ELECTRONIC FILING, RECEIVED, CLERK'S OFFICE, JANUARY 5, 2007
* * * * * PC #7 * * * * *
Permit Number:
V-02-043 R2
Page:
36
of
72
SECTION B - EMISSION POINTS, EMISSIONS UNITS, APPLICABLE
REGULATIONS, AND OPERATING CONDITIONS (CONTINUED)
7.
Specific Control Equipment Operating Conditions:
a)
Pursuant to 401 KAR 50:055, Section 2 (5), the SCR, PJFF, WFGD, and WESP,
shall be operated to maintain compliance with permitted emission limitations, in
accordance with manufacturer’s specifications and/or standard operating practices.
b)
Pursuant to 401 KAR 59:005, Section 3(4), records regarding the maintenance of the
control equipment shall be maintained.
c)
See Section E for further requirements.
ELECTRONIC FILING, RECEIVED, CLERK'S OFFICE, JANUARY 5, 2007
* * * * * PC #7 * * * * *
Permit Number:
V-02-043 R2
Page:
37
of
72
SECTION B - EMISSION POINTS, EMISSIONS UNITS, APPLICABLE
REGULATIONS, AND OPERATING CONDITIONS (CONTINUED)
Emissions Unit 32 -
Auxiliary Steam Boiler D
Description:
40 mmBtu/hr . ASTM Grade No. 2-D S15 fired auxiliary steam boiler
Construction Commenced Date: Estimated 2006
Applicable Regulations:
40 CFR 60, Subpart Dc, Standards of Performance for Small Industrial-Commercial-Institutional
Steam Generating Units, incorporated by reference in 401 KAR 60:005, Section 3(1)(e).
401 KAR 59:015, New Indirect Heat Exchangers.
40 CFR 63, Subpart DDDDD
401 KAR 63:020, Potentially Hazardous Matter or Toxic Substances.
40 CFR 60, Appendix F, Quality Assurance Procedures
401 KAR 51:017, Prevention of significant deterioration of air quality applicable to major
construction or modification commenced after September 22, 1982.
1.
Operating Limitations:
The auxiliary steam boiler, except for testing purposes, shall only operate during periods
when Unit 31 is operating at less than 50 percent load. The auxiliary boiler shall not operate
more than 1,000 hours in any twelve (12) consecutive months.
2.
Emission Limitations:
a)
Pursuant to 401 KAR 60:005, Section 3(1)(e), 401 KAR 59:015, Section 4(1)(c), 401
KAR 51:017, 40 CFR 60.43c(e) [per proposed revised NSPS Subpart Dc as
published in the Federal Register on February 28, 2005], and 40 CFR 63 Subpart
DDDDD Table 1, particulate emissions shall not exceed 0.03 lb/mmBtu heat input.
b)
Pursuant to 401 KAR 60:005, Section 3(1)(e) and 401 KAR 59:015, Section 4(2)(a),
emissions from the auxiliary steam boiler shall not exceed twenty (20) percent
opacity based on a six-minute average except that a maximum of twenty-seven (27)
percent is allowed for not more than one (1) six (6) minute period per hour.
c)
Pursuant to 401 KAR 60:005, Section 3(1)(b); 401 KAR 59:015, Section 5(1)(b); and
401 KAR 51:017, the fuel oil used must meet the sulfur content standards in ASTM
Grade No. 2-D S15 and cannot exceed a sulfur content of 15 ppm.
d)
Pursuant to 401 KAR 51:017 and 40 CFR 63 Subpart DDDDD Table 1, carbon
monoxide emissions shall not exceed 400 ppm by volume on a dry basis corrected to
3 percent oxygen and a 3-hour average.
e)
Pursuant to 40 CFR 63 Subpart DDDDD Table 1, hydrogen chloride emissions shall
not exceed 0.0005 lbs/mmBtu of heat input.
ELECTRONIC FILING, RECEIVED, CLERK'S OFFICE, JANUARY 5, 2007
* * * * * PC #7 * * * * *
Permit Number:
V-02-043 R2
Page:
38
of
72
SECTION B - EMISSION POINTS, EMISSIONS UNITS, APPLICABLE
REGULATIONS, AND OPERATING CONDITIONS (CONTINUED)
3.
Testing Requirements:
a)
Pursuant to 401 KAR 59:005, Section 2(1) and 401 KAR 59:015, Section 8, the
owner or operator shall demonstrate compliance with the applicable emission
standards within sixty (60) days after achieving the maximum production rate at
which the affected facility will be operated, but not later than 180 days after initial
startup of such facility.
b)
Pursuant to 40 CFR 63.7506, a performance test to demonstrate compliance with the
carbon monoxide and hydrogen chloride emission limits is not required. However
the following requirements must be met.
1.
To demonstrate initial compliance, a signed statement in the Notification of
Compliance Status report that indicates that the unit burns only liquid fossil
fuels other than residual oils, either alone or in combination with gaseous
fuels.
2.
To demonstrate continuous compliance, records must be kept that
demonstrate that the unit burned only liquid fossil fuels other than residual
oil, either alone or in combination with gaseous fuels. A signed statement
must be included in each semiannual compliance report that indicates that the
unit burned only liquid fossil fuels other than residual oils, either alone or in
combination with gaseous fuels, during the reporting period.
c)
Pursuant to 401 KAR 59:015, Section 8(1)(f), if the unit has operated during the
previous 12 consecutive months, the owner or operator shall determine the opacity of
emissions from the stack by EPA Reference Method 9 upon request by the Division.
d)
See Section D for further requirements.
4.
Specific Monitoring Requirements:
a)
The owner or operator shall monitor the hours of operation during each twelve (12)
consecutive months.
b)
To demonstrate continuing compliance with the fuel oil sulfur content limitation,
monitoring of operations shall consist of, on an as-received basis, fuel supplier
certification of the sulfur content of the fuel oil to be combusted. The fuel supplier
certification shall include the name of the oil supplier, sulfur content, and a statement
that the oil complies with the specifications under the definition for distillate oil in
401 KAR 60:005
c)
The fuel oil sulfur content and heating value shall be determined for the No. 2 fuel
oil, as received, by fuel supplier certification.
ELECTRONIC FILING, RECEIVED, CLERK'S OFFICE, JANUARY 5, 2007
* * * * * PC #7 * * * * *
Permit Number:
V-02-043 R2
Page:
39
of
72
SECTION B - EMISSION POINTS, EMISSIONS UNITS, APPLICABLE
REGULATIONS, AND OPERATING CONDITIONS (CONTINUED)
5.
Specific Record Keeping Requirements:
a)
Pursuant to 401 KAR 59:005, Section 3(4), the owner or operator of the indirect heat
exchanger shall maintain a file of all measurements and performance testing
measurements required by 401 KAR 59:005 recorded in a permanent form suitable
for inspection.
b)
Pursuant to 401 KAR 59:005, Section 3(2), the owner or operator of this unit shall
maintain the records of the occurrence and duration of any startup, shutdown, or
malfunction in the operation of the affected facility.
c)
The owner or operator shall maintain the results of all compliance tests.
d)
The owner or operator shall maintain records of hours of operation during each
twelve (12) consecutive months.
e)
Pursuant to 401 KAR 59:005, Section 3 (4), the owner or operator of the indirect heat
exchanger shall maintain a file of all measurements, including monthly No. 2 fuel oil
usage. The owner or operator shall maintain a file of the fuel supplier certification;
and all other information required by 401 KAR 59:005 recorded in a permanent form
suitable for inspection. The file shall be retained for at least five (5) years following
the date of such measurements, maintenance, reports, and records.
f)
Records of the No. 2 fuel oil used shall be maintained.
6.
Specific Reporting Requirements:
a)
Pursuant to 401 KAR 60:005, Section 3(1)(e), the owner or operator shall follow the
applicable Reporting and Recordkeeping requirements specified in 40 CFR 60.48c.
b)
Pursuant to 40 CFR 63 Subpart DDDDD, the owner or operator shall make
notifications required by 40 CFR 63.7545.
c)
Pursuant to 40 CFR 63 Subpart DDDDD, the owner or operator shall submit reports
required by 40 CFR 63.7550.
7.
Specific Control Equipment Operating Conditions:
a)
Pursuant to 401 KAR 50:055, Section 5, the auxiliary steam boiler shall be operated
in accordance with manufacturer’s specifications and / or standard operating
practices.
b)
See Section E for further requirements.
ELECTRONIC FILING, RECEIVED, CLERK'S OFFICE, JANUARY 5, 2007
* * * * * PC #7 * * * * *
Permit Number:
V-02-043 R2
Page:
40
of
72
SECTION B - EMISSION POINTS, EMISSIONS UNITS, APPLICABLE
REGULATIONS, AND OPERATING CONDITIONS (CONTINUED)
Emissions Unit 33 -
Backup Diesel Generator
Description:
12.5 mmBtu/hr - ASTM Grade No. 2-D S15 fuel oil-fired Backup Generator without oxidation
catalyst or Non-Selective Catalytic Reduction (NSCR).
Construction Commenced Date: Estimated 2006
Applicable Regulations:
401 KAR 63:002, incorporating by reference 40 CFR 63, Subpart ZZZZ National Emission
Standards for Hazardous Air Pollutants for Stationary Reciprocating Internal Combustion Engines
401 KAR 51:017, Prevention of significant deterioration of air quality applicable to major
construction or modification commenced after September 22, 1982.
1.
Operating Limitations:
Pursuant to 401 KAR 51:017, the backup diesel generator, except for testing purposes, shall
only operate during periods when Unit 31 is operating less than 50 percent load. The backup
diesel generator shall not operate more than 1,000 hours per twelve (12) consecutive months.
2.
Emission Limitations:
Pursuant to 401 KAR 63:002, formaldehyde concentration in the exhaust shall not exceed
580 ppbvd at 15 percent O
2
except during periods of startup, shutdown, and malfunction.
3.
Testing Requirements:
a)
Pursuant to 401 KAR 63:002, the owner or operator shall demonstrate compliance
with the applicable emission standards upon startup.
b)
Pursuant to 401 KAR 63:002, the average formaldehyde concentration, corrected to
15 percent O
2
, dry basis, from the three test runs shall not exceed the formaldehyde
emission limit specified in 2
.
c)
Pursuant to 401 KAR 63:002, semiannual performance tests for formaldehyde will be
performed to determine compliance. If compliance is demonstrated with two
consecutive semiannual tests, subsequent compliance tests shall be performed on an
annual basis, unless otherwise approved by the Division
.
d)
See Section D for further requirements.
ELECTRONIC FILING, RECEIVED, CLERK'S OFFICE, JANUARY 5, 2007
* * * * * PC #7 * * * * *
Permit Number:
V-02-043 R2
Page:
41
of
72
SECTION B - EMISSION POINTS, EMISSIONS UNITS, APPLICABLE
REGULATIONS, AND OPERATING CONDITIONS (CONTINUED)
4.
Specific Monitoring Requirements:
a)
Pursuant to 401 KAR 63:002, the owner or operator shall install, calibrate, maintain,
and operate a continuous parameter monitoring system, or alternative method, as
allowed by regulation. The operating parameters are to be approved by the Division.
b)
See Section D for further requirements.
5.
Specific Record Keeping Requirements:
a)
The owner or operator shall maintain the results of all compliance tests.
b)
The owner or operator shall maintain records of hours of operation during each
twelve (12) consecutive month period.
6.
Specific Reporting Requirements:
a)
Pursuant to 401 KAR 60:005, Section 3(1)(e), the owner or operator shall follow the
applicable Reporting and Recordkeeping requirements specified in 40 CFR 60.48c.
b)
Pursuant to 40 CFR 63 Subpart ZZZZ, the owner or operator shall make notifications
required by 40 CFR 63.6645.
c)
Pursuant to 40 CFR 63 Subpart ZZZZ, the owner or operator shall submit reports
required by 40 CFR 63.6645.
7.
Specific Control Equipment Operating Conditions:
None
ELECTRONIC FILING, RECEIVED, CLERK'S OFFICE, JANUARY 5, 2007
* * * * * PC #7 * * * * *
Permit Number:
V-02-043 R2
Page:
42
of
72
SECTION B - EMISSION POINTS, EMISSIONS UNITS, APPLICABLE
REGULATIONS, AND OPERATING CONDITIONS (CONTINUED)
Emissions Unit: 34, 35 -
Fossil Fuel Handling Operations-Coal Piles
(FUGITIVES)
Description:
Construction Commenced Date:
Estimated 2006
Active Northwest Fossil Fuel Pile “A”
Active Northeast Fossil Fuel Pile “B”
Fuel Pile Storage and Maintenance Activities
Fuel Pile Storage and Maintenance Activities
Control Equipment
Active Northwest Fossil Fuel Pile “A”
Active Northeast Fossil Fuel Pile “B”
Compaction and Water Suppression
Compaction and Water Suppression
Applicable Regulations:
401 KAR 63:010, Fugitive emissions.
401 KAR 51:017, Prevention of significant deterioration of air quality applicable to major
construction or modification commenced after September 22, 1982.
1.
Operating Limitations:
a)
Pursuant to 401 KAR 51:017 and 401 KAR 63:010, Section 3, reasonable
precautions shall be taken to prevent particulate matter from becoming airborne.
Such reasonable precautions shall include, as needed, but not be limited to the
following:
1.
Application and maintenance of asphalt, application of water, or suitable
chemicals on roads, material stockpiles, and other surfaces which can create
airborne dusts;
2.
Operation of hoods, fans, and fabric filters to enclose and vent the handling
of dusty materials, or the use of water sprays or other measures to suppress
the dust emissions during handling;
3.
The maintenance of paved roadways.
4.
The prompt removal of earth or other material from a paved street which
earth or other material has been transported thereto by trucking or other earth
moving equipment or erosion by water;
5.
Installation and use of compaction or other measures to suppress the dust
emissions during handling.
ELECTRONIC FILING, RECEIVED, CLERK'S OFFICE, JANUARY 5, 2007
* * * * * PC #7 * * * * *
Permit Number:
V-02-043 R2
Page:
43
of
72
SECTION B - EMISSION POINTS, EMISSIONS UNITS, APPLICABLE
REGULATIONS, AND OPERATING CONDITIONS (CONTINUED)
b)
Pursuant to 401 KAR 63:010, Section 3, discharge of visible fugitive dust emissions
beyond the property line is prohibited.
c)
No one shall allow earth or other material being transported by truck or earth moving
equipment to be deposited onto a paved street or roadway, pursuant to 401 KAR
63:010, Section 4.
d)
Pursuant to 401 KAR 51:017, the owner or operator shall apply compaction and
water suppression control methods as BACT.
2.
Emission Limitations:
None
3.
Testing Requirements:
40 CFR 60 Appendix A, Reference Method 22 shall be used to determine opacity upon
request by the Division.
4.
Specific Monitoring Requirements:
a)
The owner or operator shall perform a qualitative visual observation on a weekly
basis and maintain a log of the observations and corrective actions.
b)
See Section F for further requirements.
5.
Specific Record Keeping Requirements:
a)
Records of the fossil fuels received and processed shall be maintained for emissions
inventory purposes.
b)
Annual records estimating the tonnage hauled on plant roadways shall be maintained
for emissions inventory purposes.
c)
The owner or operator shall maintain a log of the date, time and results of the
monitoring required in Subsection 4 above.
6.
Specific Reporting Requirements:
See Section F for further requirements.
ELECTRONIC FILING, RECEIVED, CLERK'S OFFICE, JANUARY 5, 2007
* * * * * PC #7 * * * * *
Permit Number:
V-02-043 R2
Page:
44
of
72
SECTION B - EMISSION POINTS, EMISSIONS UNITS, APPLICABLE
REGULATIONS, AND OPERATING CONDITIONS (CONTINUED)
7.
Specific Control Equipment Operating Conditions:
a)
Pursuant to 401 KAR 50:055, Section 5 and 401 KAR 51:017, the dust water
suppressant system for the coal stockpile operations shall be maintained and operated
to ensure the emission units are in compliance with applicable requirements of 401
KAR 63:010, and in accordance with manufacturer’s specifications and standard
operating practices.
b)
Plant roadways shall be paved and controlled with water as necessary to comply with
401 KAR 63:010.
c)
Pursuant to 401 KAR 59:005, Section 3(4), records regarding the maintenance of the
control equipment shall be maintained.
d)
See Section E for further requirements.
ELECTRONIC FILING, RECEIVED, CLERK'S OFFICE, JANUARY 5, 2007
* * * * * PC #7 * * * * *
Permit Number:
V-02-043 R2
Page:
45
of
72
SECTION B - EMISSION POINTS, EMISSIONS UNITS, APPLICABLE
REGULATIONS, AND OPERATING CONDITIONS (CONTINUED)
Emissions Unit: 36, 37, 38, 39 -- Fossil Fuel Handling Operations, Dust Control
Devices, and Associated Systems (Please refer to Units
7, 8 and 9 for additional existing fossil fuel handling
operation information)
Description:
Construction Commenced Date: on or Before 1990
Continuous Barge Unloader
–
One Barge Unloader Bin
Conveyor System
-
Conveyor Belt A:
From Continuous Barge Unloader to Conveyor B
Conveyor Belt B:
From Conveyor A to Transfer House/Conveyor C
Conveyor Belt C:
From Transfer House to Coal Sample House Bin
Conveyor Belt D:
From Coal Sample House Bin to Conveyor E1 or S
Conveyor Belt E1:
From Conveyor D to Active Storage and Crusher
House
Conveyor Belts F1 & F2:
From Crusher House to Conveyors G1 & G2
Conveyor Belts G1 & G2:
From Conveyors F1 & F2 to Unit 1 & 2 Coal Silos
Conveyor Belt S:
From Conveyor D to One Inactive Fossil Fuel Pile
Reclaim Hopper & Conveyor Belt R1: From One Inactive Fossil Fuel Pile to Crusher House
Crusher House -
Two crushers, fossil fuel crusher bin, and fuel blender:
Crusher House Activities
Construction Commenced Date: Estimated 2006
Power House –
Six Unit 2 fossil fuel silos:
Unit 2 Coal Storage
Conveyor System
–
Conveyor Belt E2:
From Unit 2 Active Coal Piles “A & B” to Crusher
House
Fuel Blending System:
From Active Coal Storage to Conveyor E2
Control Equipment
EU#36-
Barge Unloader Dust Collector (CDC01):
Conveyors A&B
EU#37-
U/R Reclaim Vault Dust Collector (CDC02):
Drop from Coal Feeders 1-7 to Conveyor E2
EU#38-
Coal Crusher Dust Collector (CDC03):
Coal Crusher House Activities
EU#39-
Unit 2 Coal Silo Dust Collector (CDC04):
Conveyors F1&2 and Drop to G1&2; Unit 2
Coal Silos
ELECTRONIC FILING, RECEIVED, CLERK'S OFFICE, JANUARY 5, 2007
* * * * * PC #7 * * * * *
Permit Number:
V-02-043 R2
Page:
46
of
72
SECTION B - EMISSION POINTS, EMISSIONS UNITS, APPLICABLE
REGULATIONS, AND OPERATING CONDITIONS (CONTINUED)
Description
Conveyors:
Enclosures, water suppression, low drops, and baghouse filters, hoods
Conveyor S:
Stackout Chute
Operating Rate
–
Continuous Barge Unloader
Transfer Rates
One Barge Unloader
5,500 tons/hour
Conveyor System
-
Conveyor Belt A:
5,500 tons/hour
Conveyor Belt B:
5,500 tons/hour
Conveyor Belt C:
5,500 tons/hour
Conveyor Belt D:
3,000 tons/hour
Conveyor Belt E1:
2,640 tons/hour
Conveyor Belt E2:
1,320 tons/hour
Conveyor Belts F1 & F2:
1,320 tons/hour
Conveyors G1 & G2
1.320 tons/hour
Conveyor Belt S:
1,650 tons/hour
Reclaim Hopper & Conveyor Belt R1:
1,320 tons/hour
Unit2 Fuel Blending System:
800 tons/hour
Crusher House
-
Two crushers, fossil fuel crusher bin, and fuel blender:
3,600 tons/hour
Power House
-
Six unit 2 fossil fuel silos:
800 tons/hour
Applicable Regulations:
401 KAR 60:005, incorporating by reference 40 CFR 60, Subpart Y, Standards of Performance for
Coal Preparation Plants for units commenced after October 24, 1974
401 KAR 51:017, Prevention of Significant Deterioration of Air Quality applicable to major
construction or modification commenced after September 22, 1982.
1.
Operating Limitations:
Pursuant to 401 KAR 51:017, the owner or operator shall install the following dust collectors
as BACT:
a)
Barge Unloader Dust Collector
b)
U/R Reclaim Vault Dust Collector
c)
Coal Crusher Dust Collector
d)
Unit 2 Coal Silo Dust Collector
ELECTRONIC FILING, RECEIVED, CLERK'S OFFICE, JANUARY 5, 2007
* * * * * PC #7 * * * * *
Permit Number:
V-02-043 R2
Page:
47
of
72
SECTION B - EMISSION POINTS, EMISSIONS UNITS, APPLICABLE
REGULATIONS, AND OPERATING CONDITIONS (CONTINUED
2.
Emission Limitations:
a)
Pursuant to 401 KAR 60:005 incorporating by reference 40 CFR 60.252, the owner
or operator subject to the provisions of this regulation shall not cause to be
discharged into the atmosphere from any coal processing and conveying equipment,
coal storage system, or transfer and loading system processing coal, gases which
exhibit 20 percent opacity or greater.
b)
Pursuant to 401 KAR 51:017, the dust collectors utilized shall exhibit a particulate
design control efficiency of at least 99%.
3.
Testing Requirements:
Pursuant to 401 KAR 60:005, Section 3(1)(ff) incorporating by reference, 40 CFR 60.254,
EPA Reference Method 9 and the procedures in 40 CFR 60.11 shall be used to determine
opacity upon request by the Division.
4.
Specific Monitoring Requirements:
The owner or operator shall perform a qualitative visual observation of the opacity of
emissions from each stack on a weekly basis and maintain a log of the observations. If
visible emissions from any stack are seen, the owner or operator shall determine the opacity
of emissions by Reference Method 9 and instigate an inspection of the control equipment
making any necessary repairs.
5.
Specific Record Keeping Requirements:
a)
The owner or operator shall maintain the records of amount of coal received and
processed.
b)
The owner or operator shall maintain the results of all compliance tests. The owner
or operator shall record each week, the date and time of each observation and opacity
of visible emissions monitoring. In case of exceedances, the owner or operator must
record the reason (if known) and the measures taken to minimize or eliminate
exceedances.
6.
Specific Reporting Requirements:
See Section F for further requirements.
7.
Specific Control Equipment Operating Conditions:
a)
Pursuant to 401 KAR 50:055, Section 5, the enclosures/partial enclosures,
baghouses, bin vent filters, conveyor systems, fuel blending operations, fossil fuel
storage silos, and stackout chute shall be maintained and operated to ensure the
emission units are in compliance with applicable requirements of 40 CFR 60,
Subpart Y and in accordance with manufacturer’s specifications and/or standard
operating practices.
b)
Pursuant to 401 KAR 59:005, Section 3(4), records regarding the maintenance and
use/operation of the control equipment listed in 7(a) shall be maintained.
c)
See Section E for further requirements.
ELECTRONIC FILING, RECEIVED, CLERK'S OFFICE, JANUARY 5, 2007
* * * * * PC #7 * * * * *
Permit Number:
V-02-043 R2
Page:
48
of
72
SECTION B - EMISSION POINTS, EMISSIONS UNITS, APPLICABLE
REGULATIONS, AND OPERATING CONDITIONS (CONTINUED
Emissions Units: 40 -
Limestone Handling Operations, Dust Control Devices,
and Associated Systems
Description:
Construction Commenced Date: Estimate
2006
Stockpile/Stackout Operations:
Active Limestone Pile
Active Limestone Pile Reclaimer
Limestone Storage Activities
Limestone Reclaim Activities
Control Equipment
Active Limestone Pile
Active Limestone Pile Reclaimer
EU#40-
Limestone Dust Collector (LDC01)
Low Drop/Enclosure/Dust Collector (LDC01)
Enclosure/Dust Collector (LDC01)
Conveyor B onto Active Pile and
Active Pile Reclaimer onto Conveyor C
Operating Rate
Active Limestone Pile
Active Limestone Pile Reclaimer
N/A
200 tons/hour
Applicable Regulations:
401 KAR 60.670, New Nonmetallic Mineral Processing Plants, incorporating by reference 40 CFR
60, Subpart OOO – Nonmetallic Mineral Processing Plants, applies to the emissions unit listed
above, commenced after August 31, 1983
401 KAR 51:017, Prevention of Significant Deterioration of Air Quality applicable to major
construction or modification commenced after September 22, 1982.
1.
Operating Limitations:
Pursuant to 401 KAR 51:017, the owner or operator shall install a dust collector as BACT.
2.
Emission Limitations:
a)
Pursuant to 401 KAR 60.670, incorporating by reference 40 CFR 60.672(e), no
owner or operator shall cause to be discharged into the atmosphere from any building
enclosing any transfer point on a conveyor belt or any other emissions unit any
visible fugitive emissions.
b)
Pursuant to 401 KAR 51:017 and 401 KAR 60:670, emissions of particulate shall be
controlled by dust collectors.
ELECTRONIC FILING, RECEIVED, CLERK'S OFFICE, JANUARY 5, 2007
* * * * * PC #7 * * * * *
Permit Number:
V-02-043 R2
Page:
49
of
72
SECTION B - EMISSION POINTS, EMISSIONS UNITS, APPLICABLE
REGULATIONS, AND OPERATING CONDITIONS (CONTINUED)
c)
Pursuant to 401 KAR 60:670, specifically 40 CFR 60.672(a), stack emissions of
particulate shall not exceed 0.05 gr/dscm and shall not exhibit greater than 7%
opacity.
d)
Pursuant to 401 KAR 60:607, specifically 40 CFR 60.672(b), fugitive emissions of
particulate shall not exhibit greater than 10% opacity.
3.
Testing Requirements:
In determining compliance with 401 KAR 60:670, incorporating by reference 40 CFR
60.672(e), for fugitive emissions from buildings, the owner(s) or operator(s) shall determine
fugitive emissions while all emissions units are operating in accordance with EPA Reference
Method 22, annually.
4.
Specific Monitoring Requirements:
The owner or operator shall inspect the control equipment weekly and make repairs as
necessary to assure compliance.
5.
Specific Record Keeping Requirements:
Records of the limestone processed shall be maintained for emissions inventory purposes.
6.
Specific Reporting Requirements:
a)
Pursuant to 401 KAR 60:670, incorporating by reference 40 CFR 60.676, the
owner(s) or operator(s) of any emissions unit shall submit written reports of the
results of all performance tests conducted to demonstrate compliance with the
standards of 40 CFR 60.672 including reports of observations using Method 22 to
demonstrate compliance.
b)
See Section F for further requirements.
7.
Specific Control Equipment Operating Conditions:
a)
Pursuant to 401 KAR 50:055, Section 5, the dust collector and enclosures shall be
maintained and operated to ensure the emission units are in compliance with
applicable requirements of 40 CFR 60, Subpart OOO and in accordance with
manufacturer’s specifications and/or standard operating practices.
b)
Pursuant to 401 KAR 50:050, Section 1, records regarding the maintenance of the
control equipment shall be maintained.
c)
See Section E for further requirements.
ELECTRONIC FILING, RECEIVED, CLERK'S OFFICE, JANUARY 5, 2007
* * * * * PC #7 * * * * *
Permit Number:
V-02-043 R2
Page:
50
of
72
SECTION B - EMISSION POINTS, EMISSIONS UNITS, APPLICABLE
REGULATIONS, AND OPERATING CONDITIONS (CONTINUED
Unit: 41 -
Linear Mechanical Draft Cooling Tower (11 cells)
Description:
Control Equipment:
0.0005% Drift Eliminators
Circulating Water Rate:
173,120 Gallons per Minute
Construction Commenced Date:
Estimated 2006
Applicable Regulations:
401 KAR 63:010, Fugitive emissions
401 KAR 51:017, Prevention of Significant Deterioration of Air Quality applicable to major
construction or modification commenced after September 22, 1982.
1.
Operating Limitations:
a)
Pursuant to 401 KAR 63:010, Section 3, reasonable precautions shall be taken to
prevent particulate matter from becoming airborne.
b)
Pursuant to 401 KAR 63:010, Section 3, discharge of visible fugitive dust emissions
beyond the property line is prohibited.
2.
Emission Limitations:
a)
Pursuant to 401 KAR 51:017, the cooling tower shall utilize 0.0005% Drift
Eliminators.
b)
Pursuant to 401 KAR 63:010, Section 3, reasonable precautions shall be taken to
prevent particulate matter from becoming airborne.
3.
Testing Requirements:
Initial performance test to verify drift percent achieved by the drift eliminator will be
conducted based on the Cooling Technology Institute (CTI) Acceptance Test Code (ATC) #
140
4.
Specific Monitoring Requirements:
The permittee shall monitor total dissolved solids content of the circulating water on a
monthly basis.
5.
Specific Record Keeping Requirements:
a)
The owner or operator shall maintain records of the manufacturer’s design of the
Drift Eliminators.
b)
The owner or operator shall maintain records of maximum pumping capacity and
monthly records of the total dissolved solids content.
ELECTRONIC FILING, RECEIVED, CLERK'S OFFICE, JANUARY 5, 2007
* * * * * PC #7 * * * * *
Permit Number:
V-02-043 R2
Page:
51
of
72
SECTION B - EMISSION POINTS, EMISSIONS UNITS, APPLICABLE
REGULATIONS, AND OPERATING CONDITIONS (CONTINUED)
6.
Specific Reporting Requirements:
See Section F for further requirements.
7.
Specific Control Equipment Operating Conditions:
a)
Pursuant to 401 KAR 50:055, Section 5, the drift eliminators shall be maintained and
operated to ensure the emission units are in compliance with applicable requirements
of 401 KAR 63:010 and in accordance with manufacturer’s specifications and/or
standard operating practices.
b)
See Section E for further requirements.
ELECTRONIC FILING, RECEIVED, CLERK'S OFFICE, JANUARY 5, 2007
* * * * * PC #7 * * * * *
Permit Number:
V-02-043 R2
Page:
52
of
72
SECTION B - EMISSION POINTS, EMISSIONS UNITS, APPLICABLE
REGULATIONS, AND OPERATING CONDITIONS (CONTINUED
Unit: 42 -
Fly Ash Storage Silo and Dust Control Device
Description:
Construction Commenced Date: Estimate
2006
Fly Ash Silo Bins
Fly Ash Storage Activities
Control Equipment
EU#42-
Fly Ash Dust Collector (FDC01)
Fly Ash from Units 1 and 31 into Fly Ash Silo
Bins and Fly Ash from Fly Ash Silo Bins into
Dry Bulk Trailers with Tractors
Operating Rate
Fly Ash Silo Bins
Material Throughput: 33 tons/hour each
Applicable Regulations:
401 KAR 59:010, New Process Operations, applicable to an emission unit, which commenced on or
after 1972
401 KAR 51:017, Prevention of Significant Deterioration of Air Quality applicable to major
construction or modification commenced after September 22, 1982.
1.
Operating Limitations:
Pursuant to 401 KAR 51:017, the owner or operator shall install a dust collector as BACT.
2.
Emission Limitations:
a)
Pursuant to 401 KAR 59:010, Section 3(1), the owner or operator shall not cause to
be discharged into the atmosphere from any of the above listed units emissions
greater than twenty (20) percent opacity.
b)
Pursuant to 401 KAR 59:010, particulate matter emissions from the bin dust collector
shall not exceed [3.59 ( P )
0.62
] lbs/hr based on a three-hour average, where P is the
material throughput rate in tons/hour.
3.
Testing Requirements:
None
4.
Specific Monitoring Requirements:
The owner or operator shall perform a qualitative visual observation of the opacity of
emissions from the stack on a weekly basis and maintain a log of the observations. If visible
emissions from any stack included in this emission unit are seen, then the owner or operator
shall determine the opacity of emissions by Reference Method 9 and perform an inspection
of the control equipment for any necessary repairs.
ELECTRONIC FILING, RECEIVED, CLERK'S OFFICE, JANUARY 5, 2007
* * * * * PC #7 * * * * *
Permit Number:
V-02-043 R2
Page:
53
of
72
SECTION B - EMISSION POINTS, EMISSIONS UNITS, APPLICABLE
REGULATIONS, AND OPERATING CONDITIONS (CONTINUED
5.
Specific Record Keeping Requirements:
a)
The owner or operator shall maintain the records of amount of fly ash processed.
b)
Pursuant to 401 KAR 59:005, Section 3(4), the owner or operator shall maintain the
results of all compliance tests and calculations.
c)
The owner or operator shall record each week the date, time and opacity of the
visible emissions monitoring. In case of an exceedance, the owner or operator
must record the reason (if known) and the measures taken to minimize or
eliminate the exceedance.
6.
Specific Reporting Requirements:
See Section F for further requirements.
7.
Specific Control Equipment Operating Conditions:
a)
Pursuant to 401 KAR 50:055, Section 5, the dust collector equipment shall be
maintained and operated to ensure the emission unit is in compliance with applicable
requirements of 401 KAR 59:010 and in accordance with manufacturer’s
specifications and/or standard operating practices
b)
Pursuant to 401 KAR 59:005, Section 3(4), records regarding the maintenance of the
control equipment shall be maintained.
c)
See Section E for further requirements.
ELECTRONIC FILING, RECEIVED, CLERK'S OFFICE, JANUARY 5, 2007
* * * * * PC #7 * * * * *
Permit Number:
V-02-043 R2
Page:
54
of
72
SECTION C - INSIGNIFICANT ACTIVITIES
The following listed activities have been determined to be insignificant activities for this source
pursuant to 401 KAR 52:020, Section 6. While these activities are designated as insignificant the
permittee must comply with the applicable regulation and some minimal level of periodic
monitoring may be necessary. Process and emission control equipment at each insignificant activity
subject to a general applicable regulation shall be inspected monthly and qualitative visible emission
evaluation made. The results of the inspections and observations shall be recorded in a log, noting
color, duration, density (heavy or light), cause and any conservative actions taken for any abnormal
visible emissions.
Description
Generally Applicable Regulation
1.
Two station #2 fuel oil tanks, each 100,000 gallons (401 KAR
59:050), and auxiliary boiler day tank storing #2 fuel oil with a
size of 16,000 gallons. General recordkeeping requirements -
40 CFR 60.116b(a) and (b)
401 KAR 59:050
40 CFR 60.116b(a) and (b)
2.
Metal degreaser using a maximum throughput of 832
gallons/year solvent.
NA
3.
3,000 gallon unleaded gasoline storage tank.
NA
4.
3,000 gallon diesel storage tank.
NA
5.
1,100 gallon used oil storage tank.
NA
6.
1,100 gallon #1 fuel oil tank.
NA
7.
Fly ash collection system
401 KAR 59:010
8.
Infrequent evaporation of boiler cleaning solutions.
NA
9.
Infrequent burning of De Minimis quantities of used oil for
energy recovery.
NA
10.
Paved and Unpaved Roads.
401 KAR 63:010
11.
Preheater (for CTs Units 9 & 10) Max. Heat Input 10.9
mmBtu/hr.
401 KAR 59:010
12.
Preheater (for CTs Units 11 &12) Max. Heat Input 10.9
mmBtu/hr.
401 KAR 59:010
13.
Preheater (for CTs Units 13 & 14) Max. Heat Input 10.9
mmBtu/hr.
401 KAR 59:010
14.
Gypsum Storage Piles
401 KAR 63:010
15.
Coal and Limestone Storage Piles (Inactive Outdoor Piles)
401 KAR 63:010
16.
Bottom Ash and Debris Collection Basin
401 KAR 63:010
17.
Bottom Ash Reclaim Operation
401 KAR 63:010
18.
Three dry bulk fly ash transport trailers
401 KAR 59:010
19.
Maintenance Shop Activities
NA
20.
Miscellaneous Water Storage Tanks
NA
21.
Anhydrous Ammonia Storage Tanks
401 KAR 68
22.
Fire Water Pump Engines
NA
23.
Three dry bulk fly ash transport trailers
401 KAR 59:010
ELECTRONIC FILING, RECEIVED, CLERK'S OFFICE, JANUARY 5, 2007
* * * * * PC #7 * * * * *
Permit Number:
V-02-043 R2
Page:
55
of
72
SECTION D - SOURCE EMISSION LIMITATIONS AND TESTING
REQUIREMENTS
1.
As required by Section 1b of the
Cabinet Provisions and Procedures for Issuing Title V
Permits
incorporated by reference in 401 KAR 52:020, Section 26; compliance with annual
emissions and processing limitations contained in this permit, shall be based on emissions
and processing rates for any twelve (12) consecutive months.
2.
Compliance with visible emission limitations for indirect heat exchanger Unit 01, shall be
determined by using EPA reference Method 9. Alternatively, the owner or operator may use
COM in determining compliance with opacity.
3.
Conditions in permit V-02-043 Revision 1 and PSD permit V-01-012 were merged into one
source-wide permit. Limitations from both permits were combined into this permit.
4.
Nitrogen oxides, sulfur dioxide, PM (filterable), formaldehyde, visible emissions (opacity),
mercury, and carbon monoxide emissions, measured by applicable reference methods, or an
equivalent or alternative method specified in 40 C.F.R. Chapter I, or by a test method
specified in the state implementation plan shall not exceed the respective limitations
specified herein.
5.
Unit 31 shall be performance tested initially for compliance with the emission standards for
PM/PM
10
(filterable and condensable), sulfur dioxide (SO
2
), nitrogen oxides (NO
x
), and
carbon monoxide (CO), VOCs, mercury, and H
2
SO
4
, lead and fluorides by applicable
reference methods, or by equivalent or alternative test methods specified in this permit or
approved by the cabinet or U.S. EPA. For Unit 31 annual performance tests for PM/PM
10
,
VOCs, and lead will be conducted.
6.
After the initial compliance test for Unit 31, and CEMS/COMs certification as stated in 401
KAR 50:055, continuing compliance with the emission standards shall be determined by
continuous monitoring systems for NO
x
, CO, PM/PM
10
, mercury, and SO
2
. Continuing
compliance with the emission standards for H
2
SO
4
mist and Fluorides shall be determined by
following provision of the CAM plan in Section B of this permit.
7.
The 12-month rolling total emissions from Units 31, 32, 33, and emergency fire water pump
engine shall be less than: 1,523 NO
x
tons, 3,264 SO
2
tons, and 0.55 lead tons.
8.
The permittee shall evaluate the relationship between CO and VOC during the initial and
annual stack tests. Results of this evaluation shall be submitted to the Division within
sixty days after submitting the annual test results.
ELECTRONIC FILING, RECEIVED, CLERK'S OFFICE, JANUARY 5, 2007
* * * * * PC #7 * * * * *
Permit Number:
V-02-043 R2
Page:
56
of
72
SECTION E - SOURCE CONTROL EQUIPMENT REQUIREMENTS
Pursuant to 401 KAR 50:055, Section 2(5), at all times, including periods of startup, shutdown and
malfunction, owners and operators shall, to the extent practicable, maintain and operate any affected
facility including associated air pollution control equipment in a manner consistent with good air
pollution control practice for minimizing emissions. Determination of whether acceptable operating
and maintenance procedures are being used will be based on information available to the Division
which may include, but is not limited to, monitoring results, opacity observations, review of
operating and maintenance procedures, and inspection of the source.
ELECTRONIC FILING, RECEIVED, CLERK'S OFFICE, JANUARY 5, 2007
* * * * * PC #7 * * * * *
Permit Number:
V-02-043 R2
Page:
57
of
72
SECTION F - MONITORING, RECORD KEEPING, AND REPORTING
REQUIREMENTS
1.
When continuing compliance is demonstrated by periodic testing or instrumental monitoring,
the permittee shall compile records of required monitoring information that include:
a.
Date, place as defined in this permit, and time of sampling or measurements.
b.
Analyses performance dates;
c.
Company or entity that performed analyses;
d.
Analytical techniques or methods used;
e.
Analyses results; and
f.
Operating conditions during time of sampling or measurement.
[Section 1b (IV)1 of the
Cabinet Provisions and Procedures for Issuing Title V Permits
incorporated by reference in 401 KAR 52:020, Section 26].
2.
Records of all required monitoring data and support information, including calibrations,
maintenance records, and original strip chart recordings, and copies of all reports required by
the Division for Air Quality, shall be retained by the permittee for a period of five years and
shall be made available for inspection upon request by any duly authorized representative of
the Division for Air Quality [Sections 1b(IV) 2 and 1a(8) of the
Cabinet Provisions and
Procedures for Issuing Title V Permits
incorporated by reference in 401 KAR 52:020,
Section 26].
3.
In accordance with the requirements of 401 KAR 52:020 Section 3(1)h the permittee shall
allow authorized representatives of the Cabinet to perform the following during reasonable
times:
a.
Enter upon the premises to inspect any facility, equipment (including air pollution
control equipment), practice, or operation;
b.
To access and copy any records required by the permit:
c.
Inspect, at reasonable times, any facilities, equipment (including monitoring and
pollution control equipment), practices, or operations required by the permit.
Reasonable times are defined as during all hours of operation, during normal office
hours; or during an emergency.
d.
Sample or monitor, at reasonable times, substances or parameters to assure
compliance with the permit or any applicable requirements.
e.
Reasonable times are defined as during all hours of operation, during normal office
hours; or during an emergency.
4.
No person shall obstruct, hamper, or interfere with any Cabinet employee or authorized
representative while in the process of carrying out official duties. Refusal of entry or access
may constitute grounds for permit revocation and assessment of civil penalties.
5.
Summary reports of any monitoring required by this permit, other than continuous emission
or opacity monitors, shall be submitted to the Regional Office listed on the front of this
permit at least every six (6) months during the life of this permit, unless otherwise stated in
this permit. For emission units that were still under construction or which had not commenced
operation at the end of the 6-month period covered by the report and are subject to monitoring
requirements in this permit, the report shall indicate that no monitoring was performed during
ELECTRONIC FILING, RECEIVED, CLERK'S OFFICE, JANUARY 5, 2007
* * * * * PC #7 * * * * *
Permit Number:
V-02-043 R2
Page:
58
of
72
SECTION F - MONITORING, RECORD KEEPING, AND REPORTING
REQUIREMENTS (CONTINUED)
the previous six months because the emission unit was not in operation [Section 1b (V )1 of the
Cabinet Provisions and Procedures for Issuing Title V Permits
incorporated by reference in
401 KAR 52:020, Section 26].
6.
The semi-annual reports are due by January 30th and July 30th of each year. Data from the
continuous emission and opacity monitors shall be reported to the Technical Services Branch
in accordance with the requirements of 401 KAR 59:005, General Provisions, Section 3(3).
All reports shall be certified by a responsible official pursuant to 401 KAR 52:020 Section
23. All deviations from permit requirements shall be clearly identified in the reports.
7.
In accordance with the provisions of 401 KAR 50:055, Section 1 the owner or operator shall
notify the Regional Office listed on the front of this permit concerning startups, shutdowns,
or malfunctions as follows:
a. When emissions during any planned shutdowns and ensuing startups will exceed the
standards, notification shall be made no later than three (3) days before the planned
shutdown, or immediately following the decision to shut down, if the shutdown is
due to events which could not have been foreseen three (3) days before the
shutdown.
b. When emissions due to malfunctions, unplanned shutdowns and ensuing startups are
or may be in excess of the standards, notification shall be made as promptly as
possible by telephone (or other electronic media) and shall be submitted in writing
upon request.
8.
The owner or operator shall report emission related exceedances from permit requirements
including those attributed to upset conditions (other than emission exceedances covered by
Section F.7. above) to the Regional Office listed on the front of this permit within
30 days
.
Other deviations from permit requirements shall
be included in the semiannual report
required by Section F.6
[Section 1b (V) 3, 4. of the
Cabinet Provisions and Procedures for
Issuing Title V Permits
incorporated by reference in 401 KAR 52:020, Section 26].
9.
Pursuant to 401 KAR 52:020, Permits, Section 21, the permittee shall certify compliance
with the terms and conditions contained in this permit, by completing and returning a
Compliance Certification Form (DEP 7007CC) (or an alternative approved by the regional
office) to the Regional Office listed on the front of this permit and the U.S. EPA in
accordance with the following requirements:
a.
Identification of the term or condition;
b.
Compliance status of each term or condition of the permit;
c.
Whether compliance was continuous or intermittent;
d.
The method used for determining the compliance status for the source, currently and
over the reporting period, and
e.
For an emissions unit that was still under construction or which has not commenced
operation at the end of the 12-month period covered by the annual compliance
certification, the permittee shall indicate that the unit is under construction and that
compliance with any applicable requirements will be demonstrated within the
timeframes specified in the permit.
ELECTRONIC FILING, RECEIVED, CLERK'S OFFICE, JANUARY 5, 2007
* * * * * PC #7 * * * * *
Permit Number:
V-02-043 R2
Page:
59
of
72
SECTION F - MONITORING, RECORD KEEPING, AND REPORTING
REQUIREMENTS (CONTINUED)
f.
The certification shall be postmarked by January 30th of each year. Annual
compliance certifications should be mailed to the following addresses:
Division for Air Quality
U.S. EPA Region 4
Florence Regional Office
Air Enforcement Branch
8020 Veterans Memorial drive
Atlanta Federal Center
Suite 110, Florence, KY 41042
61 Forsyth St. Atlanta, GA 30303-8960
Division for Air Quality
Central Files
803 Schenkel Lane
Frankfort, KY 40601
10.
In accordance with 401 KAR 52:020, Section 22, the permittee shall provide the Division
with all information necessary to determine its subject emissions within thirty (30) days of
the date the KYEIS emission survey is mailed to the permittee.
11.
Results of performance test(s) required by the permit shall be submitted to the Division by
the source or its representative within forty-five days or sooner if required by an applicable
standard, after the completion of the fieldwork.
ELECTRONIC FILING, RECEIVED, CLERK'S OFFICE, JANUARY 5, 2007
* * * * * PC #7 * * * * *
Permit Number:
V-02-043 R2
Page:
60
of
72
SECTION G - GENERAL PROVISIONS
(a)
General Compliance Requirements
1.
The permittee shall comply with all conditions of this permit. Noncompliance shall be a
violation of 401 KAR 52:020 and of the Clean Air Act and is grounds for enforcement action
including but not limited to termination, revocation and reissuance, revision or denial of a
permit [Section 1a, 3 of the
Cabinet Provisions and Procedures for Issuing Title V Permits
incorporated by reference in 401 KAR 52:020 Section 26].
2.
The filing of a request by the permittee for any permit revision, revocation, reissuance, or
termination, or of a notification of a planned change or anticipated noncompliance, shall not
stay any permit condition [Section 1a, 6 of the
Cabinet Provisions and Procedures for
Issuing Title V Permits
incorporated by reference in 401 KAR 52:020, Section 26].
3.
This permit may be revised, revoked, reopened and reissued, or terminated for cause in
accordance with 401 KAR 52:020, Section 19. The permit will be reopened for cause and
revised accordingly under the following circumstances:
a.
If additional requirements become applicable to the source and the remaining permit
term is three (3) years or longer. In this case, the reopening shall be completed no
later than eighteen (18) months after promulgation of the applicable requirement. A
reopening shall not be required if compliance with the applicable requirement is not
required until after the date on which the permit is due to expire, unless this permit or
any of its terms and conditions have been extended pursuant to 401 KAR 52:020,
Section 12;
b.
The Cabinet or the U. S. EPA determines that the permit must be revised or revoked
to assure compliance with the applicable requirements;
c.
The Cabinet or the U. S. EPA determines that the permit contains a material mistake
or that inaccurate statements were made in establishing the emissions standards or
other terms or conditions of the permit;
d.
If any additional applicable requirements of the Acid Rain Program become
applicable to the source.
Proceedings to reopen and reissue a permit shall follow the same procedures as apply to
initial permit issuance and shall affect only those parts of the permit for which cause to
reopen exists. Reopenings shall be made as expeditiously as practicable. Reopenings shall
not be initiated before a notice of intent to reopen is provided to the source by the Division,
at least thirty (30) days in advance of the date the permit is to be reopened, except that the
Division may provide a shorter time period in the case of an emergency.
4.
The permittee shall furnish information upon request of the Cabinet to determine if cause
exists for modifying, revoking and reissuing, or terminating the permit; or to determine
compliance with the conditions of this permit [Section 1a, 7,8 of the
Cabinet Provisions and
Procedures for Issuing Title V Permits
incorporated by reference in 401 KAR 52:020,
Section 26].
ELECTRONIC FILING, RECEIVED, CLERK'S OFFICE, JANUARY 5, 2007
* * * * * PC #7 * * * * *
Permit Number:
V-02-043 R2
Page:
61
of
72
SECTION G - GENERAL PROVISIONS (CONTINUED)
5.
The permittee, upon becoming aware that any relevant facts were omitted or incorrect
information was submitted in the permit application, shall promptly submit such facts or
corrected information to the permitting authority [401 KAR 52:020, Section 7(1)].
6.
Any condition or portion of this permit which becomes suspended or is ruled invalid as a
result of any legal or other action shall not invalidate any other portion or condition of this
permit [Section 1a, 14 of the
Cabinet Provisions and Procedures for Issuing Title V Permits
incorporated by reference in 401 KAR 52:020, Section 26].
7.
The permittee shall not use as a defense in an enforcement action the contention that it would
have been necessary to halt or reduce the permitted activity in order to maintain compliance
[Section 1a, 4 of the
Cabinet Provisions and Procedures for Issuing Title V Permits
incorporated by reference in 401 KAR 52:020, Section 26].
8.
Except for requirements identified in this permit as state-origin requirements, all terms and
conditions shall be enforceable by the United States Environmental Protection Agency and
citizens of the United States [Section 1a, 15 of the
Cabinet Provisions and Procedures for
Issuing Title V Permits
incorporated by reference in 401 KAR 52:020, Section 26].
9.
This permit shall be subject to suspension if the permittee fails to pay all emissions fees
within 90 days after the date of notice as specified in 401 KAR 50:038, Section 3(6) [Section
1a, 10 of the
Cabinet Provisions and Procedures for Issuing Title V Permits
incorporated by
reference in 401 KAR 52:020, Section 26].
10.
Nothing in this permit shall alter or affect the liability of the permittee for any violation of
applicable requirements prior to or at the time of permit issuance [401 KAR 52:020, Section
11(3)(b)].
11.
This permit does not convey property rights or exclusive privileges [Section 1a, 9 of the
Cabinet Provisions and Procedures for Issuing Title V Permits
incorporated by reference in
401 KAR 52:020, Section 26].
12.
Issuance of this permit does not relieve the permittee from the responsibility of obtaining any
other permits, licenses, or approvals required by the Kentucky Cabinet for Environmental
and Public Protection or any other federal, state, or local agency.
13.
Nothing in this permit shall alter or affect the authority of U.S. EPA to obtain information
pursuant to Federal Statute 42 USC 7414, Inspections, monitoring, and entry [401 KAR
52:020, Section 11(3)(d)].
14.
Nothing in this permit shall alter or affect the authority of U.S. EPA to impose emergency
orders pursuant to Federal Statute 42 USC 7603, Emergency orders [401 KAR 52:020,
Section 11(3)(a)].
ELECTRONIC FILING, RECEIVED, CLERK'S OFFICE, JANUARY 5, 2007
* * * * * PC #7 * * * * *
Permit Number:
V-02-043 R2
Page:
62
of
72
SECTION G - GENERAL PROVISIONS (CONTINUED)
15.
This permit consolidates the authority of any previously issued PSD, NSR, or Synthetic
minor source preconstruction permit terms and conditions for various emission units and
incorporates all requirements of those existing permits into one single permit for this source.
16.
Pursuant to 401 KAR 52:020, Section 11, a permit shield shall not protect the owner or
operator from enforcement actions for violating an applicable requirement prior to or at the
time of issuance. Compliance with the conditions of a permit shall be considered compliance
with:
(a)
Applicable requirements that are included and specifically identified in the permit
and
(b)
Non-applicable requirements expressly identified in this permit.
17.
The permittee shall submit a startup and shut down plan to implement the requirements of
this permit and 401 KAR 50:055. The plan shall be submitted at least ninety (90) days prior
to the startup of the Unit #2 for the Division’s approval. The startup/shutdown plan will be
accessible for public review at the Division’s central office and the regional office.
18.
The permittee shall provide the Division the final design information consistent with
Kentucky Open Records Act. The design plan will be accessible for public review at the
Division’s central office and the regional office
(b)
Permit Expiration and Reapplication Requirements
1.
This permit shall remain in effect for a fixed term of five (5) years following the original
date of issue. Permit expiration shall terminate the source's right to operate unless a timely
and complete renewal application has been submitted to the Division at least six months
prior to the expiration date of the permit. Upon a timely and complete submittal, the
authorization to operate within the terms and conditions of this permit, including any permit
shield, shall remain in effect beyond the expiration date, until the renewal permit is issued or
denied by the Division [401 KAR 52:020, Section 12].
2.
The authority to operate granted shall cease to apply if the source fails to submit additional
information requested by the Division after the completeness determination has been made
on any application, by whatever deadline the Division sets [401 KAR 52:020 Section 8(2)].
(c)
Permit Revisions
1.
A minor permit revision procedure may be used for permit revisions involving the use of
economic incentive, marketable permit, emission trading, and other similar approaches, to
the extent that these minor permit revision procedures are explicitly provided for in the SIP
or in applicable requirements and meet the relevant requirements of 401 KAR 52:020,
Section 14(2).
ELECTRONIC FILING, RECEIVED, CLERK'S OFFICE, JANUARY 5, 2007
* * * * * PC #7 * * * * *
Permit Number:
V-02-043 R2
Page:
63
of
72
SECTION G - GENERAL PROVISIONS (CONTINUED)
2.
This permit is not transferable by the permittee. Future owners and operators shall obtain a
new permit from the Division for Air Quality. The new permit may be processed as an
administrative amendment if no other change in this permit is necessary, and provided that a
written agreement containing a specific date for transfer of permit responsibility coverage
and liability between the current and new permittee has been submitted to the permitting
authority within ten (10) days following the transfer.
(d)
Construction, Start-Up, and Initial Compliance Demonstration Requirements
Pursuant to a duly submitted application the Kentucky Division for Air Quality hereby
authorizes the construction of the equipment described herein, emission points 31-42 in
accordance with the terms and conditions of this permit.
1.
Construction of any process and/or air pollution control equipment authorized by this permit
shall be conducted and completed only in compliance with the conditions of this permit.
2.
Within thirty (30) days following commencement of construction and within fifteen (15)
days following start-up and attainment of the maximum production rate specified in the
permit application, or within fifteen (15) days following the issuance date of this permit,
whichever is later, the permittee shall furnish to the Regional Office listed on the front of this
permit in writing, with a copy to the Division's Frankfort Central Office, notification of the
following:
a.
The date when construction commenced.
b.
The date of start-up of the affected facilities listed in this permit.
c.
The date when the maximum production rate specified in the permit application was
achieved.
3.
Pursuant to 401 KAR 52:020, Section 3(2), unless construction is commenced within
eighteen (18) months after the permit is issued, or begins but is discontinued for a period of
eighteen (18) months or is not completed within a reasonable timeframe then the
construction and operating authority granted by this permit for those affected facilities for
which construction was not completed shall immediately become invalid. Upon written
request, the Cabinet may extend these time periods if the source shows good cause.
4.
For those affected facilities for which construction is authorized by this permit, a source
shall be allowed to construct with the proposed permit. Operational or final permit approval
is not granted by this permit until compliance with the applicable standards specified herein
has been demonstrated pursuant to 401 KAR 50:055. If compliance is not demonstrated
within the prescribed timeframe provided in 401 KAR 50:055, the source shall operate
thereafter only for the purpose of demonstrating compliance, unless otherwise authorized by
Section I of this permit or order of the Cabinet.
ELECTRONIC FILING, RECEIVED, CLERK'S OFFICE, JANUARY 5, 2007
* * * * * PC #7 * * * * *
Permit Number:
V-02-043 R2
Page:
64
of
72
SECTION G - GENERAL PROVISIONS (CONTINUED)
5.
This permit shall allow time for the initial start-up, operation, and compliance demonstration
of the affected facilities listed herein. However, within sixty (60) days after achieving the
maximum production rate at which the affected facilities will be operated but not later than
180 days after initial start-up of such facilities, the permittee shall conduct either a
performance demonstration or test as required on the affected facilities in accordance with
401 KAR 50:055, General compliance requirements. These performance tests must also be
conducted in accordance with General Provisions G(d)7 of this permit and the permittee
must furnish to the Division for Air Quality's Frankfort Central Office a written report of the
results of such performance test
(d)
Construction, Start-Up, and Initial Compliance Demonstration Requirements (continued)
6.
Terms and conditions in this permit established pursuant to the construction authority of
401 KAR 51:017 or 401 KAR 51:052 shall not expire.
7.
At least one month prior to the date of the required performance test, the permittee shall
complete and return a Compliance Test Protocol using the current approved format, to the
Division's Frankfort Central Office. Pursuant to 401 KAR 50:045, Section 5, the Division
shall be notified of the actual test date at least ten (10) days prior to the test.
8.
Pursuant to 401 KAR 50:045 Section 5 in order to demonstrate that a source is capable of
complying with a standard at all times, a performance test shall be conducted under normal
conditions that are representative of the source’s operations and create the highest rate of
emissions. If [When] the maximum production rate represents a source’s highest emissions
rate and a performance test is conducted at less than the maximum production rate, a source
shall be limited to a production rate of no greater than 110 percent of the average production
rate during the performance tests. If and when the facility is capable of operation at the rate
specified in the application, the source may retest to demonstrate compliance at the new
production rate. The Division for Air Quality may waive these requirement on a case-by-
case basis if the source demonstrates to the Division's satisfaction that the source is in
compliance with all applicable requirements..
(e)
Acid Rain Program Requirements
1.
If an applicable requirement of Federal Statute 42 USC 7401 through 7671q (the Clean Air
Act) is more stringent than an applicable requirement promulgated pursuant to Federal
Statute 42 USC 7651 through 7651o (Title IV of the Act), both provisions shall apply, and
both shall be state and federally enforceable.
2.
The source shall comply with all requirements and conditions of the Title IV, Acid Rain
Permit contained in Section J of this document and the Phase II permit application (including
the Phase II NO
x
compliance plan, if applicable) issued for this source. The source shall also
comply with all requirements of any revised or future acid rain permit(s) issued to this
source.
ELECTRONIC FILING, RECEIVED, CLERK'S OFFICE, JANUARY 5, 2007
* * * * * PC #7 * * * * *
Permit Number:
V-02-043 R2
Page:
65
of
72
SECTION G - GENERAL PROVISIONS (CONTINUED)
(f)
Emergency Provisions
1.
Pursuant to 401 KAR 52:020 Section 24(1), an emergency shall constitute an affirmative
defense to an action brought for the noncompliance with the technology-based emission
limitations if the permittee demonstrates through properly signed contemporaneous operating
logs or relevant evidence that:
a.
An emergency occurred and the permittee can identify the cause of the emergency;
b.
The permitted facility was at the time being properly operated;
c.
During an emergency, the permittee took all reasonable steps to minimize levels of
emissions that exceeded the emissions standards or other requirements in the permit;
and
d.
Pursuant to 401 KAR 52:020, 401 KAR 50:055, and KRS 224.01-400, the permittee
notified the Division as promptly as possible and submitted written notice of the
emergency to the Division when emission limitations are exceeded due to an
emergency. The notice shall include a description of the emergency, steps taken to
mitigate emissions, and corrective actions taken.
e.
This requirement does not relieve the source from other local, state or federal
notification requirements.
2.
Emergency conditions listed in General Condition (f)1 above are in addition to any
emergency or upset provision(s) contained in an applicable requirement [401 KAR 52:020,
Section 24(3)].
3.
In an enforcement proceeding, the permittee seeking to establish the occurrence of an
emergency shall have the burden of proof [401 KAR 52:020, Section 24(2)].
(g)
Risk Management Provisions
1.
The permittee shall comply with all applicable requirements of 401 KAR Chapter 68,
Chemical Accident Prevention, which incorporates by reference 40 CFR 68, Risk
Management Plan provisions. If required, the permittee shall comply with the Risk
Management Program and submit a Risk Management Plan to:
RMP Reporting Center
P.O. Box 1515
Lanham-Seabrook, Maryland 20703-1515
2.
If requested, submit additional relevant information to the Division or the U.S. EPA.
ELECTRONIC FILING, RECEIVED, CLERK'S OFFICE, JANUARY 5, 2007
* * * * * PC #7 * * * * *
Permit Number:
V-02-043 R2
Page:
66
of
72
SECTION G - GENERAL PROVISIONS (CONTINUED)
(h)
Ozone depleting substances
1.
The permittee shall comply with the standards for recycling and emissions reduction
pursuant to 40 CFR 82, Subpart F, except as provided for Motor Vehicle Air Conditioners
(MVACs) in Subpart B:
a.
Persons opening appliances for maintenance, service, repair, or disposal shall comply
with the required practices contained in 40 CFR 82.156.
b.
Equipment used during the maintenance, service, repair, or disposal of appliances
shall comply with the standards for recycling and recovery equipment contained in
40 CFR 82.158.
c.
Persons performing maintenance, service, repair, or disposal of appliances shall be
certified by an approved technician certification program pursuant to 40 CFR 82.161.
d.
Persons disposing of small appliances, MVACs, and MVAC-like appliances (as
defined at 40 CFR 82.152) shall comply with the recordkeeping requirements
pursuant to 40 CFR 82.166
(i)
Ozone depleting substances continued
e.
Persons owning commercial or industrial process refrigeration equipment shall
comply with the leak repair requirements pursuant to 40 CFR 82.156.
f.
Owners/operators of appliances normally containing 50 or more pounds of
refrigerant shall keep records of refrigerant purchased and added to such appliances
pursuant to 40 CFR 82.166.
2.
If the permittee performs service on motor (fleet) vehicle air conditioners containing ozone-
depleting substances, the source shall comply with all applicable requirements as specified in
40 CFR 82, Subpart B, Servicing of Motor Vehicle Air Conditioners.
SECTION H - ALTERNATE OPERATING SCENARIOS
None
SECTION I - COMPLIANCE SCHEDULE
None
ELECTRONIC FILING, RECEIVED, CLERK'S OFFICE, JANUARY 5, 2007
* * * * * PC #7 * * * * *
Permit Number:
V-02-043 R2
Page:
67
of
72
SECTION J – ACID RAIN
TITLE IV PHASE II ACID RAIN
ACID RAIN PERMIT CONTENTS
1)
Statement of Basis
2)
SO
2
allowances allocated under this permit and NO
x
requirements for each affected
unit.
3)
Comments, notes and justifications regarding permit decisions and changes made to
the permit application forms during the review process, and any additional
requirements or conditions.
4)
The permit application submitted for this source. The owners and operators of the
source must comply with the standard requirements and special provisions set forth
in the Phase II Application and the Phase II NO
x
Compliance Plan.
5)
Summary of Actions
•
Statement of Basis:
Statutory and Regulatory Authorities:
In accordance with KRS 224.10-100 and Titles IV and V
of the Clean Air Act, the Kentucky Natural Resources and Environmental Protection Cabinet,
Division for Air Quality issues this permit pursuant to 401 KAR 52:020, Permits, 401 KAR 52:060,
Acid Rain Permit, and Federal Regulation 40 CFR 76. (Unit 1 only)
ELECTRONIC FILING, RECEIVED, CLERK'S OFFICE, JANUARY 5, 2007
* * * * * PC #7 * * * * *
Permit Number:
V-02-043 R2
Page:
68
of
72
SECTION J – ACID RAIN (CONTINUED)
PERMIT (Conditions)
Plant Name:
Louisville Gas & Electric Company
Affected Units:
1
1. SO2 Allowance Allocations and NO
x
Requirements for the affected unit:
Year
SO2 Allowances
2003
2004
2005
2006
2007
Tables 2, 3 or 4 of
40 CFR 73
9,634*
9,634*
9,634*
9,634*
9,634*
NO
x
Requirements
NO
x
Limits
Pursuant to 40 CFR 76, the Kentucky Division for Air Quality approves the NO
x
Early Reduction Plan for this unit. This plan is effective for calendar year 2003
through 2008. Under this NO
x
compliance plan, this unit’s annual average NO
x
emission rate for each year, determined in accordance with 40 CFR 75, shall not
shall not exceed the applicable emission limitation, under 40 CFR 76.5, of 0.45
lb/mmBtu for tangentially fired boiler. If the unit is in compliance with its
applicable emission limitation for each year of the plan, then the unit is not subject
to the applicable limitation, under 40 CFR 76.7 (a)(1), of 0.40 lb/mmBtu until
calendar year 2008.
In addition to the described NO
x
compliance plan, this unit shall comply with all
other applicable requirements of 40 CFR 76, including the duty to reapply for a
NO
x
compliance plan and requirements covering excess emissions.
In accordance with 40 CFR 72.40(b)(2), approval of the averaging plan shall be
final only when all affected organizations have also approved this averaging plan.
*
The number of allowances allocated to Phase II affected units by U. S. EPA may change under 40
CFR 73. In addition, the number of allowances actually held by an affected source in a unit may
differ from the number allocated by U.S.EPA. Neither of the aforementioned condition does not
necessitate a revision to the unit SO
2
allowance allocations identified in this permit (See 40 CFR
72.84).
ELECTRONIC FILING, RECEIVED, CLERK'S OFFICE, JANUARY 5, 2007
* * * * * PC #7 * * * * *
Permit Number:
V-02-043 R2
Page:
69
of
72
SECTION J – ACID RAIN (CONTINUED)
PERMIT (Conditions)
Plant Name:
Louisville Gas and Electric Company
Affected Units:
25- 30 (TC5-TC10)
•
SO
2
Allowance Allocations and NO
x
Requirements for the affected unit:
Year
SO
2
Allowances
2003
2004
2005
2006
2007
Tables 2, 3 or 4 of
40 CFR 73
0*
0*
0*
0*
0*
NO
x
Requirements
NO
x
Limits
N/A**
*
For newly constructed units, there are no SO
2
allowances per USEPA Acid Rain Program
**
These units currently do not have applicable NO
x
limits set by 40 CFR, part 76
.
ELECTRONIC FILING, RECEIVED, CLERK'S OFFICE, JANUARY 5, 2007
* * * * * PC #7 * * * * *
Permit Number:
V-02-043 R2
Page:
70
of
72
SECTION J – ACID RAIN (CONTINUED)
PERMIT (Conditions)
Plant Name:
Louisville Gas and Electric Company
Affected Units: 31
(Unit 2)
•
SO
2
Allowance Allocations and NO
x
Requirements for the affected unit:
Year
SO
2
Allowances
2005
2006
2007
2008
2009
Tables 2, 3 or 4 of
40 CFR 73
0*
0*
0*
0*
0*
NO
x
Requirements
NO
x
Limits
N/A**
*
For newly constructed units, there are no SO
2
allowances per USEPA Acid Rain Program
**
This unit currently does not have applicable NO
x
limits set by 40 CFR, part 76
.
ELECTRONIC FILING, RECEIVED, CLERK'S OFFICE, JANUARY 5, 2007
* * * * * PC #7 * * * * *
Permit Number:
V-02-043 R2
Page:
71
of
72
SECTION J – ACID RAIN (CONTINUED)
2. Comments, Notes, and Justifications:
1.
Affected units are one (1) tangentially fired boiler and six combustion turbines, and one (1)
supercritical PC boiler.
2.
A revised Phase II NO
x
Permit Application was received on June 12, 2001, including the
existing unit.
3.
All previously issued Acid Rain permits are hereby null and void
4.
Nitrogen Oxide Compliance Plan for the facility remains unchanged since September 19,
1996.
5.
Initial SO Compliance Plan was submitted with AR-96-007 application.
3. Permit Application:
Attached
The Phase II Permit Application, and the Phase II NO
x
Early Reduction Plan are part of this
permit and the source must comply with the standard requirements and special provisions set
forth in the Phase II Application, the revised Phase II NO
x
Compliance Plan, and the revise
Phase II NO
x
Early Reduction Plan.
4. Summary of Actions:
Previous Actions:
1. Draft Phase II Permit (# AR-96-007) including SO
2
compliance was issued for public comments
on September 19, 1996.
2. Final Phase II Permit (# AR-96-007) including SO
2
compliance plan was issued on December 19,
1996.
3. Draft Phase II Permit (# A-98-011) was advertised in the 1998 revised SO
2
allowance allocations
and NO
x
emissions standard for public comment on December 8, 1998.
4. Final Phase II Permit (# A-98-011) was issued with the 1998 revised SO
2
allowance allocations
and NO
x
emissions standards.
5. Draft Phase II Permit (# V-02-043) has been issued with the revised SO
2
allowance allocations
and NO
x
Early Reduction Plan. Draft permit relates to the Combustion turbines permitted in June
22, 2001.
6. Final Permit revised with the revised SO
2
allowance allocation and NO
x
Early Reduction Plan.
Present Action:
1. Draft Revised Title V with Acid Rain Permit is being advertised for public comments.
ELECTRONIC FILING, RECEIVED, CLERK'S OFFICE, JANUARY 5, 2007
* * * * * PC #7 * * * * *
Permit Number:
V-02-043 R2
Page:
72
of
72
SECTION K – NOx BUDGET PERMIT
1)
Statement of Basis
Statutory and Regulatory Authorities:
In accordance with KRS 224.10-100, the
Kentucky Environmental and Public Protection Cabinet issues this permit pursuant to
401 KAR 52:020 Title V permits, 401 KAR 51:160, NO
x
requirements for large utility
and industrial boilers, and 40 CFR 97, Subpart C.
2)
NO
x
Budget Permit Application, Form DEP 7007EE
The NO
x
Budget Permit application for these electrical generating units was submitted to
the Division and received on May 27, 2005. Requirements contained in that application
are hereby incorporated into and made part of this NO
x
Budget Permit. Pursuant to 401
KAR 52:020, Section 3, the source shall operate in compliance with those requirements.
3)
Comments, notes, justifications regarding permit decisions and changes made to
the permit application forms during the review process, and any additional
requirements or conditions.
Affected units are one (1) Pulverized coal-fired, dry bottom, tangentially fired boiler, six
(6) 150-megawatt simple cycle natural gas fired units and one (1) Supercritical
Pulverized Coal (SPC) fired boiler. Each unit has a capacity to generate 25 megawatts
or more of electricity, which is offered for sale. The units use coal and natural gas as fuel
source, and are authorized as base load electric generating units.
4)
Summary of Actions
The NO
x
Budget Permit is being issued as part of this revised Title V permit for this
source. Public, affected state, and U.S. EPA review will follow procedures specified in
401 KAR 52:100.
ELECTRONIC FILING, RECEIVED, CLERK'S OFFICE, JANUARY 5, 2007
* * * * * PC #7 * * * * *
Selective Catalytic Reduction
System Performance and
Reliability Review
James E. Staudt
Andover Technology Partners
Clayton Erickson
Babcock Power Environmental Inc.
ELECTRONIC FILING, RECEIVED, CLERK'S OFFICE, JANUARY 5, 2007
* * * * * PC #7 * * * * *
Flaw of Averages
ELECTRONIC FILING, RECEIVED, CLERK'S OFFICE, JANUARY 5, 2007
* * * * * PC #7 * * * * *
Past Work
• Study One
– Focused on ability to meet removal efficiency
– Number of SCR systems analyzed small
• Study Two
– Focused on removal efficiency
– Considered operational choices
• Study Three
– Analyzed more units
– Investigated effect of system design and
arrangement
ELECTRONIC FILING, RECEIVED, CLERK'S OFFICE, JANUARY 5, 2007
* * * * * PC #7 * * * * *
Current Work
• Investigated two parameters to measure
reliability
– Coefficient of Variation (CV)
– Load Effect (LE)
• Evaluated data sets
– 2005 hourly emissions less than 0.15 lb/MMBtu
– 2005 hourly emissions on SCR equipped, Ozone
and yearly
– 2002 thru 2005 on select SCR systems
ELECTRONIC FILING, RECEIVED, CLERK'S OFFICE, JANUARY 5, 2007
* * * * * PC #7 * * * * *
Reliability Parameters
• Coefficient of Variation (CV)
– Dimensionless number allows comparison of
variation with different mean values
– If CV greater than 100% indicates values standard
deviation greater than average for data set
• Load Effect (LE)
– Dimensionless number comparing average hourly
emission to overall emission based on mass emitted
– Measure of load effect on SCR ability to operate
ELECTRONIC FILING, RECEIVED, CLERK'S OFFICE, JANUARY 5, 2007
* * * * * PC #7 * * * * *
Emissions and Removal Efficiency
• All data obtained from EPA Electronic Data
Reporting (EDR) website
• Ozone season emissions determined from may
1
st
to September 30
th
• Removal efficiency calculated using 1
st
quarter
emissions as uncontrolled based
ELECTRONIC FILING, RECEIVED, CLERK'S OFFICE, JANUARY 5, 2007
* * * * * PC #7 * * * * *
Units with NO
x
Emissions Below 0.15
lb/MMBtu for 2005 Ozone Season
-50%
0%
50%
100%
150%
200%
-20% -10%
0%
10% 20% 30% 40% 50% 60% 70% 80% 90% 100%
2005 Ozone season NOx reduction versus 2005 Q1
LE
CV
ELECTRONIC FILING, RECEIVED, CLERK'S OFFICE, JANUARY 5, 2007
* * * * * PC #7 * * * * *
-0.15
-0.10
-0.05
0.00
0.05
0.10
0.15
0.20
0.25
0.30
0.35
1 13 25 37 49 61 73 85 97 109 121 133 145 157 169 181 193 205 217
A
v
e
r
a
g
e
H
r
l
y
O
z
o
n
e
N
O
x
p
l
u
s
/
m
i
n
u
s
s
t
d
d
e
v
i
a
t
i
o
n
Average of Hourly Ozone Season NOx Emission Rates
2005 Ozone Season NOx Emission Rate
Units with NO
x
Emissions Below 0.15
lb/MMBtu for 2005 Ozone Season
ELECTRONIC FILING, RECEIVED, CLERK'S OFFICE, JANUARY 5, 2007
* * * * * PC #7 * * * * *
y = 4.307x + 0.415
R
2
= 0.416
0%
50%
100%
150%
200%
250%
0%
10%
20%
30%
40%
50%
absolute value of Load Effect
C
V
Units with NO
x
Emissions Below 0.15
lb/MMBtu for 2005 Ozone Season
ELECTRONIC FILING, RECEIVED, CLERK'S OFFICE, JANUARY 5, 2007
* * * * * PC #7 * * * * *
Units with NO
x
Emissions Below 0.15
lb/MMBtu for 2005 Ozone Season
• CV & LE correlation indicated some, not all,
variation associated with load change
• May not be indicative of SCR reliability but
how unit is requested to be operated
• Not all variation associated with load change,
other factors resulting in variability
ELECTRONIC FILING, RECEIVED, CLERK'S OFFICE, JANUARY 5, 2007
* * * * * PC #7 * * * * *
2005 Ozone Performance for Units
Equipped with SCR Systems
• Effect of bituminous vs. PRB coals
• Effect of catalyst type
• Effect of ammonia source
• Effect of year commissioned
• Comparison of 2004 to 2005 Ozone season
operation
ELECTRONIC FILING, RECEIVED, CLERK'S OFFICE, JANUARY 5, 2007
* * * * * PC #7 * * * * *
Effect of bituminous vs. PRB coals
0
20
40
60
80
100
120
140
160
180
200
Coal Type
C
V
o
f
H
o
u
r
l
y
N
O
x
Bituminous
Powder River Basin
ELECTRONIC FILING, RECEIVED, CLERK'S OFFICE, JANUARY 5, 2007
* * * * * PC #7 * * * * *
Effect of bituminous vs. PRB coals
0.00
0.02
0.04
0.06
0.08
0.10
Coal Type
A
v
e
r
a
g
e
H
o
u
r
l
y
O
z
o
n
e
N
O
x
(
l
b
/
M
M
B
t
u
)
Bituminous
Powder River Basin
ELECTRONIC FILING, RECEIVED, CLERK'S OFFICE, JANUARY 5, 2007
* * * * * PC #7 * * * * *
Effect of bituminous vs. PRB coals
• SCR systems on PRB fired unit have no
greater control or reliability issues
• Bituminous SCR systems can attain same
range of outlet NO
x
as PRB
• Small data set for analysis
• Appears PRB units could operate with
removals of bituminous resulting in lower
outlet emissions
ELECTRONIC FILING, RECEIVED, CLERK'S OFFICE, JANUARY 5, 2007
* * * * * PC #7 * * * * *
Variability of 2005 ozone hrly NOx
0%
50%
100%
150%
200%
0
0.2
0.4
0.6
0.8
1
Fraction of Units
C
V
Corrugated
Honeycomb
Plate
Effect of Catalyst Type
ELECTRONIC FILING, RECEIVED, CLERK'S OFFICE, JANUARY 5, 2007
* * * * * PC #7 * * * * *
2005 Ozone Season Removal versus 2005 Q1
75%
80%
85%
90%
95%
100%
0
0.2
0.4
0.6
0.8
1
Fraction of Units
P
e
r
c
e
n
t
R
e
m
o
v
a
l
Corrugated
Honeycomb
Plate
includes some annually controlled
units that show low removal due to
screening method
Effect of Catalyst Type
ELECTRONIC FILING, RECEIVED, CLERK'S OFFICE, JANUARY 5, 2007
* * * * * PC #7 * * * * *
2005 Ozone Season Removal versus 2005 Q1
75%
80%
85%
90%
95%
100%
0
0.2
0.4
0.6
0.8
1
Fraction of Units
P
e
r
c
e
n
t
R
e
m
o
v
a
l
Anhydrous
Aqueous
Urea
includes some annually
controlled units that
show low removal due
to screening method
Effect of Ammonia Source
ELECTRONIC FILING, RECEIVED, CLERK'S OFFICE, JANUARY 5, 2007
* * * * * PC #7 * * * * *
Load Effect for 2005 Ozone Season
-30%
-20%
-10%
0%
10%
20%
30%
40%
0
0.2
0.4
0.6
0.8
1
Fraction of Units
L
E
Anhydrous
Aqueous
Urea
Effect of Ammonia Source
ELECTRONIC FILING, RECEIVED, CLERK'S OFFICE, JANUARY 5, 2007
* * * * * PC #7 * * * * *
Effect of Catalyst Type and
Ammonia Source
• Catalyst type does not affect removal
efficiencies, control variability or reliability
• System design and operation have greater
influence than catalyst type
• Aqueous ammonia appears to affect removal
efficiencies, no other affect found
• Ammonia source data set statistically small
for aqueous, conclusion questionable
ELECTRONIC FILING, RECEIVED, CLERK'S OFFICE, JANUARY 5, 2007
* * * * * PC #7 * * * * *
CV during 2005 Ozone Season
0%
20%
40%
60%
80%
100%
120%
140%
160%
180%
200%
0
0.2
0.4
0.6
0.8
1
Fraction of Units
C
V
2000
2001
2002
2003
2004
2005
Effect of Year Commissioned
ELECTRONIC FILING, RECEIVED, CLERK'S OFFICE, JANUARY 5, 2007
* * * * * PC #7 * * * * *
Load Effect during 2005 Ozone Season
-30%
-20%
-10%
0%
10%
20%
30%
40%
0
0.2
0.4
0.6
0.8
1
Fraction of Units
L
E
2000
2001
2002
2003
2004
2005
Effect of Year Commissioned
ELECTRONIC FILING, RECEIVED, CLERK'S OFFICE, JANUARY 5, 2007
* * * * * PC #7 * * * * *
2004 vs 2005 removal efficiency
70%
75%
80%
85%
90%
95%
100%
0%
20%
40%
60%
80%
100%
Percent of units
O
z
o
n
e
S
e
a
s
o
n
R
e
m
o
v
a
l
2005 Rem Eff
2004 Rem Eff
Comparison of 2004 vs.
2005 Ozone Season
ELECTRONIC FILING, RECEIVED, CLERK'S OFFICE, JANUARY 5, 2007
* * * * * PC #7 * * * * *
Effect of Year Commissioned
• 2000 and 2005 data contains small number of
units and is not considered
• Operator require at least one year to develop
operating practices
• Most benefits learned in first year
• 2004 vs. 2005 marked increase (10% to 30%
respectively) in units greater than 90%
removal
ELECTRONIC FILING, RECEIVED, CLERK'S OFFICE, JANUARY 5, 2007
* * * * * PC #7 * * * * *
Operational Improvement and
Stability Over Time
0%
50%
100%
150%
200%
1234
Years of Operation
C
V
o
f
H
o
u
r
l
y
N
O
x
Plant 1
Plant 2
Plant 3
ELECTRONIC FILING, RECEIVED, CLERK'S OFFICE, JANUARY 5, 2007
* * * * * PC #7 * * * * *
Operational Improvement and
Stab
LE
i
v
l
e
i
rs
t
u
y
s Ye
O
ars
v
of
e
Op
r
era
T
tion
ime
-20%
-10%
0%
10%
20%
30%
1234
Years of Operation
L
o
a
d
E
f
f
e
c
t
(
L
E
)
Plant 1
Plant 2
Plant 3
ELECTRONIC FILING, RECEIVED, CLERK'S OFFICE, JANUARY 5, 2007
* * * * * PC #7 * * * * *
Operational Improvement and
Stability Over Time
• Three bituminous coal greater than 600 MW
investigated
• Plant 1 uses anhydrous ammonia while Plant
2 and 3 use urea based ammonia
• Plant operations play major role even with
same design and utility
• Certainty and number of conclusion limited
based on available data set
ELECTRONIC FILING, RECEIVED, CLERK'S OFFICE, JANUARY 5, 2007
* * * * * PC #7 * * * * *
0
20
40
60
80
100
120
Plant
1
Plant
2
Plant
3
Plant
4
Plant
5
Plant
6
Plant
7
Plant
8
Plant
9
Plant
10
Plant
11
Plant
12
C
V
o
f
H
o
u
r
l
y
N
O
x
Year
Ozone
Comparison of Ozone vs.
Year Round Operation
ELECTRONIC FILING, RECEIVED, CLERK'S OFFICE, JANUARY 5, 2007
* * * * * PC #7 * * * * *
• Plants 1 – 6 early SCR retrofits
• Plants 7 & 8 original Ozone units operated year
round
• Plants 9 – 12 designed with boiler
• Low variability during year typically resulted in low
for Ozone
• CV increases for Ozone season on almost all,
possibly due to increase NO
x
removal
• Considerable variation of CV between 12 plants
Comparison of Ozone vs.
Year Round Operation
ELECTRONIC FILING, RECEIVED, CLERK'S OFFICE, JANUARY 5, 2007
* * * * * PC #7 * * * * *
Conclusions
• 90% NO
x
removal being achieved by significant
portion of US fleet
• High CV demonstrated for units with combustion only
and SCR NO
x
control equipment
• Units with highest CV not units with lowest absolute
emission rates
• Outlet NO
x
variability associated with operational
practices
• Bituminous SCR units achieving similar outlet
emissions rates
ELECTRONIC FILING, RECEIVED, CLERK'S OFFICE, JANUARY 5, 2007
* * * * * PC #7 * * * * *
Conclusions
• Higher removal rates with PRB possible with current
control variability
• Catalyst type shows not impact on NO
x
removal or
variability
• Ammonia source appears not to impact performance,
incomplete data for aqueous ammonia
• Significant learning occurring across fleet resulting in
increase in unit above 90% removal
• Ozone season variability greater than year round
possibly do to increased removal efficiency
ELECTRONIC FILING, RECEIVED, CLERK'S OFFICE, JANUARY 5, 2007
* * * * * PC #7 * * * * *
Future Areas of Interest
• Determine other measurable SCR performance
and reliability attributes
• Attempt to access plant by plant difference that
affect performance
• Investigate method of determining affect of
plant operations on performance
ELECTRONIC FILING, RECEIVED, CLERK'S OFFICE, JANUARY 5, 2007
* * * * * PC #7 * * * * *
Questions
ELECTRONIC FILING, RECEIVED, CLERK'S OFFICE, JANUARY 5, 2007
* * * * * PC #7 * * * * *
1
DINE’ CITIZENS AGAINST RUINING OUR ENVIRONMENT*
SAN JUAN CITIZENS ALLIANCE*
ENVIRONMENTAL DEFENSE*WESTERN RESOURCE ADVOCATES*
NATURAL RESOURCES DEFENSE COUNCIL*
SIERRA CLUB*FOREST GUARDIANS*
ENVIRONMENT COLORADO*CLEAN AIR TASK FORCE*
GRAND CANYON TRUST
November 13, 2006
By email
(
desertrockairpermit@epa.gov
and
baker.robert@epa.gov) and Fed. Ex.
Robert Baker (AIR-3)
Air Permitting
EPA Region IX
75 Hawthorne Street
San Francisco, CA 94105
RE: Comments on EPA’s Proposed Construction Permit for Sithe Global Power to
Construct the Desert Rock Energy Facility
Dear Mr. Baker:
Dine Citizens Against Ruining Our Environment, San Juan Citizens Alliance, Environmental
Defense, Western Resource Advocates, Natural Resources Defense Council, Sierra Club, Forest
Guardians, Environment Colorado, Clean Air Task Force, and Grand Canyon Trust (collectively
referred to as “conservation organizations”) respectfully submit the following comments on the
EPA’s proposed construction permit to be issued to Sithe Global Power (Sithe) to construct the
Desert Rock Energy Facility (DREF) on Navajo Nation lands. Your point of contact for the
conservation organizations will be Mark Pearson or Mike Eisenfeld at San Juan Citizens
Alliance (970) 259-3583.
Included with this comment letter are the following five expert affidavits or reports that address
certain deficiencies in the proposed DREF permit in greater detail:
1. Declaration of John Thomp son, Clean Air Task Force, November 10, 2006.
2. “Comments on the Air Quality and Visibility Impact Analyses of the PSD Permit
Application for the Desert Rock Energy Facility,” prepared by Khanh Tran, AMI
Environmental, October 5, 2006.
3. “Ozone Air Quality Analyses in the PSD Permit Application for the Desert Rock Energy
Facility,” prepared by Dr. Jana Milford, Environmental Defense, October 25, 2006.
ELECTRONIC FILING, RECEIVED, CLERK'S OFFICE, JANUARY 5, 2007
* * * * * PC #7 * * * * *
2
4. “Review of the Class I SO2 PSD Increment Consumption Analyses Performed for the
Desert Rock Prevention of Significant Deterioration Permit,” prepared by Vicki Stamper,
November 9, 2006.
5. “Cumulative SO
2
Modeling Analyses of Desert Rock Energy Facility and Other Sources
at PSD Class I Areas,” prepared by Khanh Tran of AMI Environmental, November 9,
2006.
Copies of the aforementioned affidavits and reports are attached hereto and are incorporated by
reference in their entirety into this comment letter.
1
As discussed in our comments provided below and in the attached reports, EPA’s proposed
issuance of this preve ntion of significant deterioration (PSD) permit is contrary to law on
numerous grounds. Thus, EPA must not issue the permit for DREF as currently proposed and
must instead provide adequate public notice and opportunity for public comment.
1. EPA FAILED TO MEET PUBLIC NOTICE REQUIREMENTS
Section 165(a)(2) requires that, in order for a PSD permit to be issued, “the proposed
permit has been subject to a review in accordance with [section 165 of the Clean Air
Act]. . .and a public hearing has been held with opportunity for interested
persons. . .including representatives of the Administrator to appear and submit written
or oral presentations on the air quality impact of such source, alternatives thereto,
control technology requirements, and other appropriate considerations.” In EPA’s
implementing regulations for PSD SIPs, it is stated that the public notice for a proposed
permit must provide “the degree of increment consumption that is expected from the
source.” 40 C.F.R.
§
51.166(q)(2)(iii). The EPA’s Environmental Appeals Board has
interpreted these provisions as meaning that the public notice for a PSD permit must
include the degree of increment consumption that is expected in all of the locations
impacted by the proposed source. IN THE MATTER OF HADSON POWER 14-
BUENA VISTA, PSD Appeal Nos. 92-3, 92-4, 92-5, 4 E.A.D. 258, 272-3 (EAB 1992). In
particular the EAB noted “Different potential commentors may have an interest in
different areas to be impacted and would want, and would reasonably be entitled to,
available data on increment consumption at the area of their particular concern.”
Id.
at
273.
EPA’s public notice for the DREF as published in the Navajo Times on July 27, 2006
only listed one value for each pollutant for the “Modeled Class I Impacts.” The notice
did not make clear which Class I area the modeled impacts were modeled in, and it did
not identify the predicted amount of increment consumption expected in all Class I
areas to be impacted by DREF. Thus, the public did not know what Class I areas would
be impacted by DREF, much less that at least six Class I areas in four states could be
1
All documents cited or specifically relied upon in these comments are hereby incorporated by reference into the
administrative record for the DREF PSD permit.
ELECTRONIC FILING, RECEIVED, CLERK'S OFFICE, JANUARY 5, 2007
* * * * * PC #7 * * * * *
3
impacted by DREF.
2
Therefore, EPA failed to meet public notice requirements for the
DREF proposed permit.
The imperative to provide public notice of increment consumption at specific class I
areas flows directly from the core statutory purposes of the PSD program. Section
160(2) of the Clean Air Act plainly provides that a central statutory purpose of the PSD
program is “to preserve, protect, and enhance the air quality in national parks, national
wilderness areas, national monuments, national seashores, and other areas of special
national, scenic, or historic value.” Congress also instructed that the PSD program is
intended “to assure that any decision to permit increased air pollution in any area to
which this section applies is made only after careful evaluation of all the consequences
of such a decision and after adequate procedural opportunities for informed public
participation in the decisionmaking process.” CAA Sec. 160(5). Adequate notice is a
necessary predicate to informed public participation in the PSD permit process.
In addition to EPA’s PSD public notice requirements, the federal public participation
requirements at 40 C.F.R.
§
124.8 also require a discussion of the degree of increment
consumption to be included in any fact sheet prepared by EPA for a PSD permit. See 40
C.F.R.
§
124.8(b)(3). It appears that EPA did prepare a fact sheet for the proposed DREF
permit (“Desert Rock Energy Facility Proposed Clean Air Permit – Air Pollution
Reduction Technology”), but this document did not provide the degree of increment
consumption expected by the DREF in
any
area.
Thus, EPA failed to adequately inform the public of the degree of increment
consumption expected by DREF in all areas to be impacted by the proposed facility and,
accordingly, EPA must re-issue its public notice to comply with its public participation
requirements.
3
2. THE DRAFT AIR QUALITY PERMIT DOES NOT ADDRESS CARBON
DIOXIDE AND OTHER GREENHOUSE GAS EMISSIONS
The proposed permit for the DREF does not address carbon dioxide (CO
2
) or other greenhouse
gases to be emitted from the proposed power plant. However, such
emissions can be quite significant from coal-fire boilers. Due to its sheer size, the Desert Rock
plant will be a significant contributor to global warming pollution in the West, with an estimated
2
Sithe’s modeling analysis of DREF indicated the facility would significantly impact SO2 increment at six Class I
areas: Mesa Verde National Park, Weminuche Wilderness Area, San Pedro Parks Wilderness Area, Bandelier
National Monument, Petrified Forest National Park, and Canyonlands National Park. January 2006 DREF Class I
Area Modeling Update at 4-9.
3
As discussed later in these comments, EPA also failed to develop an adequate analysis of impacts on soils and
vegetation prior to issuing the draft permit and did not make a meaningful soils and vegetation analysis available
prior to convening public hearings as required by the Act. EPA must also remedy this procedural flaw in the DREF
permit.
ELECTRONIC FILING, RECEIVED, CLERK'S OFFICE, JANUARY 5, 2007
* * * * * PC #7 * * * * *
4
13.7 million tons of carbon dioxide emitted to the air each year.
4
Its annual carbon dioxide
emissions would be akin to the annual carbon dioxide emissions from 2.4 million cars.
5
As
shown in the Table 1, the Desert Rock facility would increase heat-trapping carbon dioxide
emissions from the existing coal-fired power plants in the West by over 5%, and it would rank
among the top ten carbon dioxide emitters of all western coal-fired power plants.
6
4
Carbon dioxide emissions were calculated based on the maximum coal throughput of the two planned boilers of
382 tons per hour (as provided in the May 2004 Application for Prevention of Significant Deterioration Permit for
the Desert Rock Energy Facility, at 2-9) and the U.S. EPA’s AP-42 Emission Factors for subbituminous coal
combustion
5
Assumed an
at
average
1.1-42 (available
annual carbon
at www.epa.gov/ttn/chief/ap42/index.html).
dioxide emission rate from cars of 11,450 pounds per year, as provided in the
U.S. EPA’s report “Average Annual Emissions and Fuel Consumption for Passenger Cars and Light Trucks,” EPA-
420
6
Based
-F-00on
-013
comparison
(April 2000).
to the 2002-2003 average carbon dioxide emissions from existing Western coal-fired power
plants obtained from the U.S. EPA’s Clean Air Markets Database, available at
http://www.epa.gov/airmarkets/emissions/prelimarp/index.html.
ELECTRONIC FILING, RECEIVED, CLERK'S OFFICE, JANUARY 5, 2007
* * * * * PC #7 * * * * *
5
Table 1: Top Ten Western Coal-Fired Electric Utility Steam Generating Power Plants for
CO
2
Emissions, Including the Proposed Desert Rock Power Plant
7
Rank Power Plant
Annual CO
2
Emissions,
tons
1
Navajo
19,600,000
2
Colstrip
16,900,000
3
Jim Bridger
16,500,000
4
Four Corners
15,600,000
5
Intermountain
15,000,000
6
Laramie River
14,500,000
7
Proposed Desert Rock Facility
13,700,000
8
San Juan
13,400,000
9
Centralia
11,800,000
10
Craig
10,700,000
EPA is required to regulate CO
2
and other greenhouse gases as pollutants under the Clean Air
Act. CO
2
and other greenhouse gases are squarely within the Act’s definition of “air pollutant.”
The Act defines “air pollutant” expansively to include “any physical, chemical, biological,
radioactive . . . substance or matter which is emitted into or otherwise enters the ambient air.” §
302(g), 42 U.S.C. § 7602(g) (emphasis added). Further, the Act specifically includes carbon
dioxide in a list of “air pollutants.” Section 103(g) directs EPA to conduct a research program
concerning “[i]mprovements in nonregulatory strategies and technologies for preventing or
reducing multiple air pollutants, including . . . . . carbon dioxide, from stationary sources,
including fossil fuel power plants.” 42 U.S.C. § 7403(g)(1)(emphasis added). EPA is required
to regulate emissions of air pollutants, including CO
2,
under a number of the Clean Air Act’s
major substantive provisions, whe n, in EPA’s judgment, such emissions cause or contribute to
air pollution which “may reasonably be anticipated to endanger public health or welfare.” Egs. §
111 (establishing new source performance standards for categories of stationary sources); § 202
(establishing standards for emissions from new motor vehicles). Further, the Act’s definition of
“welfare,” specifically includes effects on “climate” and “weather.” § 302(h), 42 U.S.C. §
7602(h). Section 165(a)(2) plainly provides that a major emitting facility is “subject to the best
available control technology for each pollutant subject to regulation under [the Clean Air Act]
emitted from, or which results from, such facility.”
As is discussed more fully below, coal-fired power plants are the nation’s largest source of CO
2
emissions, and the scientific community is virtually unanimous in acknowledging the
contributions of greenhouse gas emissions to climate change, i.e., global warming. EPA itself
acknowledges numerous adverse effects to public health and welfare likely to result from global
warming. See, e.g.,
http://www.epa.gov/climatechange/
. EPA has no lawful basis for
7
Based on a review of CO2 emissions from coal-fired electric utility power plants in the western states of
Washington, Oregon, California, Idaho, Montana, Nevada, Wyoming, Utah, Colorado, Arizona and New Mexico.
CO2 emissions for existing coal-fired electric utility power plants based on average of 2002-2003 CO2 emissions as
reported to EPA’s Clean Air Markets Database, available at
http://www.epa.gov/airmarkets/emissions/prelimarp/index.html.
ELECTRONIC FILING, RECEIVED, CLERK'S OFFICE, JANUARY 5, 2007
* * * * * PC #7 * * * * *
6
declining to limit carbon dioxide emissions from coal-fired power plants such as the proposed
Desert Rock facility by reducing the extensive CO
2
emissions.
Twelve states, fourteen environmental groups and two cities have filed suit against EPA,
asserting that EPA has ample authority under the Clean Air Act to regulate air pollutants
associated with climate change and that EPA must adhere to the enumerated statutory factors in
determining whether global warming pollution is reasonably anticipated to endanger public
health and welfare. This issue is now before the U.S. Supreme Court, with oral argument
scheduled for November 29, 2006.
8
At minimum EPA/Sithe must consider the collateral environmental impacts of carbon
dioxide emissions
The EPA has long recognized the obligation for a permitting authority to meaningfully cons ider
collateral environmental impacts.
See In re North County
, 2 E.A.D. 229, 230 (Adm’r 1986).
The Administrator stated in that case:
Region IX’s [asserts] that EPA lacks the authority to “consider” pollutants not regulated
by the [CAA] when making a PSD determination. This assertion is correct only if it is
read narrowly to mean EPA lacks the authority to impose limitations or other restrictions
directly on the emission of unregulated pollutants. EPA clearly has no such authority over
emissions of unregulated pollutants. Region IX’s assertion is overly broad, however, if it
is meant as a limitation on EPA’s authority to evaluate, for example, the environmental
impact of unregulated pollutants in the course of making a BACT determination for the
regulated pollutants. EPA’s authority in that respect is clear. . . . Hence, if application of a
control system results directly in the release (or removal) of pollutants that are not
currently regulated under the Act, the net environmental impact of such emissions is
eligible for consideration in making the BACT determination. The analysis may take the
form of comparing the incremental environmental impact of alternative emission control
systems with the control system proposed as BACT; however, as in any BACT
determination, the exact form of the analysis and the level of detail required will depend
upon the facts of the individual case. Depending upon what weight is assigned to the
environmental impact of a particular control system, the control system proposed as
BACT may have to be modified or be rejected in favor of another system. In other words,
EPA may ultimately choose more stringent emission limitations for a regulated pollutant
than it would otherwise have chosen if setting such limitations would have the incidental
benefit of restricting a hazardous but, as yet, unregulated pollutant
.
9
Consistent with this authority, the EAB has made it clear that EPA has an affirmative duty under
the “environmental impact” prong of the BACT analysis, where competing BACT technologies
would have different collateral environmental impacts, to specifically evaluated those impacts
8
Commonwealth of Massachusetts, et al. v. EPA
,
U.S. Supreme Court Docket No. 05-1120 (cert. granted June 26,
2006).
9
The Board
See Brief
has consistently
for the Petitioners,
upheld his
filed
proAug.
position.
31, 2006.
See
, e.g.,
In re Genesee Power Station
, 4 E.A.D. 832 (EAB
1993);
In re Steel Dynamics
, 9 E.A.D. 165 (EAB 2000).
ELECTRONIC FILING, RECEIVED, CLERK'S OFFICE, JANUARY 5, 2007
* * * * * PC #7 * * * * *
7
and consider the relative benefits and disadvantages of competing options. This requirement
grows directly from the language of CAA section 169(3).
10
Accordingly, even were EPA to conclude (erroneously in our view) that CO
2
is not a regulated
“pollutant” under the CAA or otherwise subject to BACT emission limitations, it still must
assess any differences in the potential global warming impacts of competing BACT technologies
as part of the mandatory collateral impacts analysis. By its very nature the collateral impacts
analysis is intended to target pollutants that are otherwise unregulated under the PSD provisions
– and nothing in the Act suggests that such analyses should be limited exclusively to “pollutants”
that the CAA otherwise regulates.
11
Significantly, none of the EPA’s arguments (made in other contexts) about why the CAA should
not directly regulate CO
2
as a “pollutant” are relevant to the consideration of CO
2
’s
environmental impacts in the BACT analysis.
12
Considering CO2 in the BACT analysis carries
none of the regulatory implications that EPA argues in other instances demonstrate that Congress
did not intend to allow regulation of CO2 as a “pollutant” under the CAA. Rather, the
consideration of CO
2
in the PSD context simply provides an additional informational tool to
distinguish among competing technologies in order to identify the technology that is likely to
have the smallest environmental footprint. That is, it is just another factor to be weighed in the
balancing of benefits between competing technologies – albeit, an incredibly important
consideration that should be accorded weight that is commensurate with the scope and
magnitude of the potential environmental, ecological, and economic damage with which it is
associated.
The scientific consensus around global warming, and the significance of anthropogenic sources,
has reached a point of unanimity; that is to say, global warming is real, and people are
contributing to this phenomenon in a significant way. Moreover, the likely impacts of global
warming are profound. As a result, the sense of urgency related to addressing global warming –
by reducing greenhouse gas emissions – has increased dramatically.
13
10
In this context, it is clear that relevant differences may include differences in the quantity or nature of non-PSD air
emissions, such as hazardous air pollutants, as well as impacts related to other factors such as water usage, solid
waste handling, waste water or process water discharge, etc.
See, e.g
.,
In re General Motors,
10 E.A.D. 360, 379-81
(discussing
11
EPA may
collateral
also consider
impacts).
impacts from CO
2
emissions as a part of its analysis of alternatives under CAA §
165(a)(2); and indeed EPA must do so where, as here, commenters have directly raised the issue. However, EPA
may not rely on its authority to consider CO
2
-related impacts under section 165(a)(2) as an excuse to not property
evaluate such impacts as a part of the BACT analysis.
12
See
68 Fed. Reg. 52922. EPA’s position that it may not regulate CO
2
under the CAA (under the Act‘s mobile
source regulatory program in particular) is the subject of an ongoing law suit that is now before the U.S. Supreme
Court.
Massachusetts vs. EPA
, 05-1120 (appealed from
Mass. v. EPA
,
415 F.3d 50 (D.C. Cir. 2005).
13
Global emissions of carbon amount to more than seven billion tons each year, and in order to address the
impending effects of serious climate destabilization we must take action now to reduce these emissions. The more
carbon we add to the atmosphere, the more dramatic the rise in temperature will be, and the more severe the climate-
related environmental impacts, social costs, human health effects, and impacts on habitat, species, ecosystems, and
biodiversity.
See
SCIENTIFIC AMERICAN, What To Do About Coal (Sept. 2006) available at:
http://www.sciam.com/article.cfm?chanID=sa006&articleID=0003F275-08F2-14E6-BFF883414B7F0000.
ELECTRONIC FILING, RECEIVED, CLERK'S OFFICE, JANUARY 5, 2007
* * * * * PC #7 * * * * *
8
In the BACT context, there is also no reason to dismiss important considerations of CO
2
emissions simply because numerous sources collectively contribute to global warming. Indeed,
many of the foundational regulatory provisions of the CAA, such as the National Ambient Air
Quality Standard (NAAQS), are predicated on the principle of reducing relatively small
quantities of emissions from large numbers of sources in order to reduce harmful levels of
pollutants in the ambient air.
14
Indeed, the potential health, environmental, energy, and welfare
consequences of global warming are profound, and reducing CO2 emissions (especially those
associated with coal-fired power plants) is the single most important strategy to fight these
effects.
15
EPA itself recognizes that global warming is likely to have numerous and particularly severe
adverse public health and environmental consequences, including direct heat-related effects,
extreme weather events, climate-sensitive disease impacts, air quality effects, agricultural effects
(and related impacts on nutrition), wildlife and habitat impacts, biodiversity impacts, impacts on
marine life, economic effects, and social disruption (such as population displacement).
16
Indeed,
numerous studies directly link global warming with increases in a variety of serious
environmental, health, economic, and ecological impacts.
17
14
CAA § 112 similarly seeks to bring levels of hazardous air pollutants down to safe levels by regulating multiple
source and multiple source categories of certain pollutants. There are other examples as well (e.g., SO
2
reductions
under the acid rain program, and the regulations of emission from mobile sources). As a former EPA Assistant
General Counsel puts it, ignoring CO
2
in the collateral impacts analysis because of the collective contribution of
numerous sources would be:
a recipe for total inaction that has been rejected in considering other air pollution problems and should be
as to CO
2
as well. Rather, sizable sources such as coal-fired power plants must be viewed in terms of their
contribution to the cumulative problem of climate change and the need—at least in the absence of a
comprehensive regulatory program of CO
2
control—to mitigate that contribution.
Foote, 34 ELR at 10665. See also Foote, 34 ELR 10663-665 (discussing among other things why consideration of
CO
2
in this context would not have unintended negative environmental effects).
15
See, e.g
., SCIENTIFIC AMERICAN, What To Do About Coal (Sept. 2006), available at:
http://www.sciam.com/article.cfm?chanID=sa006&articleID=0003F275-08F2-14E6-BFF883414B7F0000.
16
17
See
The
http://www.epa.gov/climatechange/effects/health.html
Los Angeles Times recently reported on a new study that
.
shows that global warming is likely to cause
extreme events that will damage ecosystems, harm public health, and disrupt society well before the end of the
century.
See
http://www.latimes.com/news/nationworld/nation/la-na-climate20oct20,0,4849957.story?coll=la -
home-nation.
See, also
links to the following studies at http://www.pewclimate.org/global-warming-in-
depth/environmental_impacts/reports/
: Observed Impacts of Climate Change in the U.S., Coping With Global
Climate Change: The Role of Adaptation in the United States, A Synthesis of Potential Climate Change Impacts on
the United States, Coral Reefs & Global Climate Change: Potential Contributions of Climate Change to Stresses on
Coral Reef Ecosystems , Forests & Global Climate Change: Potential Impacts on U.S. Forest Resources, Coastal and
Marine Ecosystems and Global Climate Change: Potential Effects on U.S. Resources, Aquatic Ecosystems and
Global Climate Change: Potential Impacts on Inland Freshwater and Coastal Wetland Ecosystems in the United
States, Human Health & Global Climate Change: A Review of Potential Impacts in the United States, Ecosystems &
Global Climate Change: A Review of Potential Impacts on U.S. Terrestrial Ecosystems and Biodiversity, Sea-Level
Rise & Global Climate Change: A Review of Impacts to U.S. Coasts, Water and Global Climate Change: Potential
Impacts on U.S. Water Resources, The Science of Climate Change: Global and U.S. Perspectives, Agriculture &
Global Climate Change: A Review of Impacts to U.S. Agricultural Resources. STERN REVIEW ON THE ECONOMICS
OF CLIMATE CHANGE, available at: http://www.hm-
treasury.gov.uk/Independent_Reviews/stern_review_economics_climate_change/sternreview_index.cfm
. These studies are incorporated
here by reference.
ELECTRONIC FILING, RECEIVED, CLERK'S OFFICE, JANUARY 5, 2007
* * * * * PC #7 * * * * *
9
EPA has never purported to carve out a CO
2
“exemption” under the PSD program, nor would
such a carve-out be permissible under the statute. Moreover, because coal-fired power plants are
the single largest source of CO
2
emissions, they are a critical part of any efforts to address the
effects of global warming. In short, the consideration of the consequence of CO
2
emissions as a
collateral environmental impact in the BACT analysis is completely independent of CO
2
’s status
as a pollutant under the Act, and considering CO
2
emissions when a
new
coal plant is proposed
(i.e. as a part of the process of pre-construction review), is
by far
the most cost-effective stage to
evaluate the possibility of achieving reductions.
18
Given the potential for extremely severe environmental and public health related impacts from
global warming; given that the phenomenon of global warming is undeniably conne cted to
anthropogenic releases of CO
2
; given that electric power production is the single most significant
source of CO
2
emissions in the U.S. and the world; and given that coal fired power plants (such
as the one proposed by Sithe) contribute the vast majority of energy-sector CO
2
emission; it is
simply untenable that the effects of global warming would be inherently outside the scope of the
“collateral impacts” that permit applicants and permitting authorities must consider in connection
with the issuance of PSD permits. Thus, any assertion that CO
2
emissions (and global warming)
are somehow beyond the broad mandate to consider “environmental impacts” under the CAA
generally and the PSD program in particular must be rejected.
19
At a minimum, therefore, EPA must consider emissions of CO
2
in its BACT analysis for the
DREF. The federal Environmental Appeals Board (EAB) has interpreted the definition of BACT
as requiring consideration of unregulated pollutants in setting emission limits and other terms of
a permit, since a BACT determination is to take into account environmental impacts.
20
A
recently issued paper entitled
Considering Alternatives: The Case for Limiting CO
2
Emissions
from New Power Plants through New Source Review
by Gregory B. Foote (attached hereto and
listed as
Attachment 1
in the attached exhibit list) discusses the regulatory background to
support consideration of CO
2
impacts when permitting a new source and, in particular, a new
coal-fired power plant. This paper indicates that it is entirely appropriate to consider CO
2
emissions when evaluating environmental impacts under the new source review permit program,
and the paper also suggested approaches for evaluating technologies in terms of CO
2
emissions.
Further, support for consideration of greenhouse gas emissions in new source permitting can also
be found in EPA’s own New Source Review Workshop Manual (October 1990 draft) which
states, “significant differences in noise levels, radiant heat, or dissipated static electrical energy,
or greenhouse gas emissions may be considered” in permitting a new source or in the application
18
For example, industry would consider it cost prohibitive to consider retrofits for a pulverized coal plant in order to
seriously address CO
2
emissions (by installing CO2 capture and control equipment for example).
19
Such a position would necessarily read out of the Act the ability to address emerging environmental threats, and
consider the real world consequence of specific industrial activities in the context where it matters most – the
concrete permitting decisions that help to define the nature, scope, and impact of such activities. As discussed
above, the Act itself clearly contemplates that permit applicants and permit issuers will evaluate, quite broadly, the
environmental implications of individual projects. It follows, quite naturally, that carbon emissions and global
warming would be among the concerns that are relevant in the process of permitting a coal-fired power plant,
especially where competing BACT technologies would have significantly different life -cycle implications for global
warming.
20
See
In Re North County Resource Recovery Associates
, 2 E.A.D. 229, 230 (Adm’r 1986), 1986 EPA App. LEXIS
14.
ELECTRONIC FILING, RECEIVED, CLERK'S OFFICE, JANUARY 5, 2007
* * * * * PC #7 * * * * *
10
of a specific technology. Attached hereto and listed as
Attachment 2
in the attached exhibit list
hereto. Even the meager “Mitigation Proposal” negotiated between the Federal Land Managers
and Sithe encompassed greenhouse gas emissions and impacts, plainly recognizing that these
emissions affect air quality related values and impacts with the scope of the PSD program.
Attached hereto and listed as
Attachment 64
in the attached exhibit list hereto (“Sithe Global
Power, LLC (Sithe) Mitigation Proposal for the Desert Rock Energy Project (DREP), April
2006”).
EPA/Sithe must consider the collateral costs of future CO2 regulation
BACT also requires consideration of costs that are relevant to the selections of one BACT option
over another. In this context, costs associated with the future regulation of carbon dioxide
emissions from power plants should be considered in deciding between BACT options for the
DERF, and BACT options that are less intense emitters of CO2 should be given preference.
The regulation of CO2 emissions in the U.S. in the very near future is virtually certain. The
international community has already begun to take action to curb such emissions – 190 countries
have joined the United Nation’s Framework Convention on Climate Change, and most have
ratified the Kyoto Protocol (the U.S. and Australia alone among the industrialized countries have
not). More recently certain States have also taken concrete steps to reduce their carbon footprint
– for example, several Northeast States have formed the Region Greenhouse Gas Initiative
(RGGI) to reduce carbon emission in that part of the country.
21
The state of California also has
passed legislation to limit the state’s greenhouse gas emissions, and to require that new long-
term investments in baseload generation meet a minimum standard for greenhouse gas
emissions, and several Western and Midwest States are now contemplating action to limit
greenhouse gases. Moreover, members of Congress have introduced numerous bills,
amendments, and resolutions specifically addressing global warming, and the Senate last year
passed a resolution calling for a “comprehensive and effective national program of mandatory,
market-based limits and incentives on emissions of greenhouse gases that slow, stop, and reverse
the growth of such emissions.”
22,23
Studies continue to show that such regulation is the only
responsible and economically sensible course of action; for example the Stern Report
24
concluded that while the cost of inaction could range from 5-20% of global GDP, the cost of
stabilizing ambient concentrations at 450 to 550 ppm CO
2
-equivalent can be accomplished for
about 1% of GDP. According to the report, the key policies required to meet this goal are the
implementation of carbon emission regulations (such as cap and trade measures), the deployment
of low carbon-technologies and further low-carbon innovation, and the removal of barriers to
energy efficiency.
21
22
SSee
enate
www.rggi.org
Amendment
.
866 a Sense of the Senate climate change resolution proposed by Senators Bingaman,
Specter, Domenici, Alexander, Cantwell, Lieberman, Lautenberg, McCain, Jeffords, Kerry, Snowe, Collins and
Boxer adopted by a vote of 53 to 44 on June 22, 2005. Congressional Record, Vol. 151, June 22 2005, S7033 –
S7037,
23
See www.aip.org/fyi/2005/114.html
S7089.
. In May of this year the House Appropriations Committee approved similar
language. See www.pewclimate.org/what_s_being_done/in_the_congress/index.cfm
for more information on
Congressional
24
STERN REVIEW
action
ON
on
THE
global
ECONOMICS
warming.
OF CLIMATE CHANGE, available at: http://www.hm-
treasury.gov.uk/Independent_Reviews/stern_review_economics_climate_change/sternreview_index.cfm
..
ELECTRONIC FILING, RECEIVED, CLERK'S OFFICE, JANUARY 5, 2007
* * * * * PC #7 * * * * *
11
The general consensus in the U.S. is that federal CO
2
emission controls are inevitable. Notably,
the utility industry as well has begun to recognize that national carbon emission limits are both
necessary and desirable – for example, executives from Duke Energy and NRG have recently
made statements strongly supporting the idea of national carbon limits, and emphasizing the
responsibility of the electric power sector to take action to address global warming.
25
Because
power generation is the single most significant source of CO
2
in the United States (accounting
for nearly 40% of U.S. emission), this industry – and coal-fired power generation in particular –
is certain to be among the first industry sectors affected by carbon-related regulation.
As the momentum to regulate greenhouse gas emissions continues to grow around the country
and internationally, businesses are increasingly recognizing the monetary risk associated with
impending carbon emissions controls. For example:
•
PacifiCorp and Idaho Power Company have explicitly addressed the financial risk
associated with carbon emissions in their recent IRPs. Idaho Power’s draft IRP,
for example, explains that the utility analyzed the financial risk of carbon
emissions because “it is likely that carbon dioxide emissions will be regulated
within the thirty year timeframe addressed in the 2004 IRP.”
26
•
PG&E’s long-term plan recognizes the risk of increasing costs for carbon
emissions.
•
Last year, the Coalition for Environmentally Responsible Economies (CERES)
convened a Dialogue among experts from the power sector, environmental
groups, and the investment community focusing on climate change. The Dialogue
participants found that greenhouse gas emissions will be regulated in the U.S.,
and that the “issue is not whether the U.S. government will regulate these
emissions, but when and how.”
27
•
Utility shareholders are recognizing that the likelihood of regulation of carbon
emissions represents a real financial risk, and are asking utilities to disclose those
risks. Thirteen major public pension funds, which manage $800 billion in assets,
recently asked the Securities and Exchange Commission to require companies to
disclose the financial risks they face from climate change.
28
Meanwhile, in 2004
alone institutional shareholder groups filed 29 proposals asking individual
companies to outline their response to global warming.
There is overwhelming evidence that carbon emissions will likely be regulated in the very near
future, and accordingly, businesses in the U.S. are taking this financial risk quite seriously.
29
25
26
See,
See PacifiCorp,
e.g
., http://www.cleartheair.org/proactive/newsroom/release.vtml?id=25835
“2003 Integrated Resource Plan,” www.pacificorp.com
.
. Idaho Power Co mpany, “Draft 2004
Integrated Resource Plan,” www.idahopower.com/energycenter/2004irpdraft.htm.
27
Coalition for Environmentally Responsible Economies, “Electric Power, Investors, and Climate Change,” June
28
2003,
Margaret
p. 4 (www.ceres.org/reports/main.htm).
Kriz, “Measuring The Climate For Change,” Congress Daily, April 22 2004.
29
Moreover, emission allowances that effectively “grandfather” the CO2 emissions of existing power plants
(particularly those plants being permitted now – when the writing is already on the wall) is highly unlikely and
would be entirely inappropriate. Rather, it is probable that the Congress will adopt legislation in the near term that
is consistent with the 2005 U.S. Senate resolution calling for a “comprehensive and effective national program of
ELECTRONIC FILING, RECEIVED, CLERK'S OFFICE, JANUARY 5, 2007
* * * * * PC #7 * * * * *
12
In short, the costs associated with the imminent regulation of CO2 (certainly within the lifetime
of the proposed DREF) should be expressly considered in connection with the selection of
BACT. Because the DREF proposes to use a carbon-intensive pulverized coal technology, and
because other BACT options have significantly better CO2 emissions performance (in particular
IGCC, as discussed below – especially when used in conjunction with carbon capture and
disposal),
30
the cost of future CO2 regulation is directly relevant to the BACT analysis in this
case. To the extent that EPA fails to fully evaluated this cost consideration it will be in violation
of its statutory obligations under the CAA.
31
3. THE DRAFT AIR QUALITY PERMIT DID NOT ADEQUATELY EVALUATE
INTEGRATED GASIFICATION COMBINED CYCLE AS AN AVAILABLE METHOD
TO LOWER AIR EMISSIONS IN THE BACT ANALYSIS
EPA’s Ambient Air Quality Impact Report (NSR 4-1-3, AZP-04-01) (hereinafter “AAQIR”)
explains that the EPA did not require evaluation of IGCC as BACT for the DREF because
consideration of IGCC would be redefining the source. AAQIR at 35.
The EPA’s determination that IGCC would be redefining the source is wrong. The Clean Air
Act’s definition of BACT specifically requires consideration of inherently lower emitting
processes.
mandatory, market-based limits and incentives on emissions of greenhouse gases that slow, stop, and reverse the
growth of such emissions.” Given the number of plants being proposed and the fact that the Senate is on record
calling for a program to reduce emissions, the law is likely to limit emission allowances to coal plants that were fully
permitted or actually in operation prior to the Senate resolution (at the latest). This would be particularly
appropriate in a state such as New Mexico, where the Governor has already adopted specific, numeric greenhouse
gas reduction targets by executive order. The Desert Rock facility, for example, would pose a direct threat to the
state's
30
IGCC
ability
inherently
to meet
emits
its goals
less CO2
for reducing
than pulverized
greenhouse
coal
gas
technologies,
emissions.
but it also provides the ability to capture and
dispose
31
There
of
are
CO2
various
in order
cost
to
estimates
reduce CO2
related
emission
to future
by
carbon
perhaps
di80oxide
-90%.
emissions control that span a range from about $8
per ton to $40 per ton. For example, there is currently a carbon dioxide trading program in Europe that serves as one
component of European efforts to address global warming. In that trading program, carbon dioxide emissions have
reached a high of about $42 per ton.
See
http://pubs.acs.org/subscribe/journals/esthag-
w/2006/jul/business/mb_carbonprices.html. Several states in the U.S. have specifically required consideration of
future carbon costs as a part of their energy planning processes. In particular, the California Public Utilities
Commission requires that the utilities use a “greenhouse gas adder” of $8 per ton CO
2
, beginning in 2004 and
escalated at 5% per year, in long-term planning and procurement for purposes of evaluating new long-term resource
investments. See California Public Utilities Commission, Decision No. 04-12-048, and Decision 05-04-024. The
Montana Public Service Commission has a similar requirement. See Montana Public Service Commission, “Written
Comments Identifying Concerns Regarding Northwestern Energy’s Compliance with A.R.M. 38.5.8201-8229,”
Docket No. N2004.1.15,
In the Matter of the Submission of Northwestern Energy’s Default Electricity Supply
Resource Procurement Plan
(August 17, 2004). Idaho Power is using a carbon cost of $14/ton starting in 2012
. See
http://www.idahopower.com/energycenter/irp/2006/2006IRPFinal.htm
. As a result, reasonable estimates for CO
2
costs under expected U.S. regulations range from about $8 to about $40 per ton. Even assuming a relatively low
carbon cost, of say $12 per ton, it is clear that emission from a facility like DREF could create a significant financial
burden.
ELECTRONIC FILING, RECEIVED, CLERK'S OFFICE, JANUARY 5, 2007
* * * * * PC #7 * * * * *
13
Integrated Gasification Combined Cycle (IGCC) is an available, demonstrated coal combustion
technology with significant emission reduction benefits. There are numerous benefits to IGCC,
including fewer emissions of criteria and hazardous air pollutants, the opportunity for capturing
greenhouse gases, such as CO
2
, that cause global warming, and a general increase in efficiency
over other coal burning technologies.
Federal Law Requires a Thorough Evaluation of IGCC as Part of the BACT Analysis.
Section 165(a)(4) of the Clean Air Act (CAA) provides that “no major emitting facility on which
construction is commenced after August 7, 1977, may be constructed in any area to which this
part applies unless…the facility is subject to the best available control technology for each
pollutant subject to regulation under this chapter emitted from, or which results from, such
facility.”
32
The requirement for conducting a BACT analysis is codified in the Federal PSD
regulations at 40 C.F.R. § 52.21(j). 40 C.F.R. § 52.21(n) further requires that “the owner or
operator of a proposed source. . . shall submit. . .all information necessary to perform any
analysis or make any determination” required under the PSD regulations.”
BACT requires a comprehensive analysis of all potentially available emission control measures,
expressly including input changes (such as use of clean fuels), process and operational changes,
and the use of add-on control technology. Additionally, it requires that a new source comply
with emission limits that correspond to the
most effective
control measures available, unless the
source can affirmatively demonstrate that use of the most effective control measures would be
technologically or economically infeasible.
BACT is specifically defined under Federal law as follows:
an emissions limitation (including a visible emissions standard) based on the
maximum degree of reduction for each pollutant subject to regulation under the
[Clean Air] Act which would be emitted from any proposed major stationary
source or major modification which the Administrator, on a case-by-case basis,
taking into account energy, environmental, and economic impacts and other costs,
determines is achievable for such source or modification through application of
production processes or available methods, systems, and techniques, including
fuel cleaning or treatment or innovative fuel combustion techniques for control of
such pollutant.
33
EPA has repeatedly ackno wledged that the PSD program is technology forcing and intended to
become more stringent over time as control technologies improve and new cleaner processes are
introduced. For example, the EAB has explained that:
A major goal of the CAA was to create a program that was technology
forcing. . . . “The Clean Air Amendments were enacted to ‘speed up,
expand, and intensify the war against air pollution in the United States
with a view to assuring that the air we breathe throughout the Nation is
wholesome once again.’” . . . .
32
42 U.S.C. §7475(a)(4).
33
40 C.F.R. §52.21(b)(12), emphasis added. See also CAA§169(3), 42 U.S.C. §7479(3).
ELECTRONIC FILING, RECEIVED, CLERK'S OFFICE, JANUARY 5, 2007
* * * * * PC #7 * * * * *
14
In keeping with this objective, the program Congress established was
particularly aggressive in its pursuit of state-of-the-art technology at newly
constructed sources. At these sources, pollution control methods could be
efficiently and cost-effectively engineered into plants at the time of
construction.
34
Similarly, the EPA Administrator has explained that the BACT provisions of the PSD program
are principally technology-forcing and are intended to foster “rapid adoption” of improvements
in emissions control technology.
35
The definition of BACT includes coal gasification. The legislative history of the amendment
adding the term “innovative fuel combustion techniques” to the Clean Air Act’s definition of
“BACT” is clear. Coal gasification must be considered. The relevant passage of the debate is
excerpted below:
Mr. HUDDLESTON. Mr. President, the proposed provisions for application of
best available control technology to all new major emission sources, although
having the admirable intent of achieving consistently clean air through the
required use of best controls, if not properly interpreted may deter the use of some
of the most effective pollution controls. The definition in the committee bill of
best available control technology indicates a consideration for various control
strategies by including the phrase “through application of production processes
and available methods systems, and techniques, including fuel cleaning or
treatment.” And I believe it is likely that the concept of BACT is intended to
include such technologies as low Btu gasification and fluidized bed combustion.
But, this intention is not explicitly spelled out, and I am concerned that without
clarification, the possibility of misinterpretation would remain. It is the purpose
of this amendment to leave no doubt that in determining best available control
technology, all actions taken by the fuel user are to be taken into account--be they
the purchasing or production of fuels which may have been cleaned or up-graded
through chemical treatment, gasification, or liquefaction; use of combustion
systems such as fluidized bed combustion which specifically reduce emissions
and/or the post-combustion treatment of emissions with cleanup equipment like
stack scrubbers. The purpose, as I say, is just to be more explicit, to make sure
there is no chance of misinterpretation. Mr. President, I believe again that this
amendment has been checked by the managers of the bill and that they are
inclined to support it.
Mr. MUSKIE. Mr. President, I have also discussed this amendment with the
distinguished Senator from Kentucky. I think it has been worked out in a form I
34
In Re Tenn. Valley Authority
, 9 E.A.D. 357, 391 (EAB 2000) (citing
WEPCO
, 893 F.2d at 909 and H.R. Rep. No.
35
95-
In
294,
re Columbia
at 185,
reprinted
Gulf Transmission
in
1977 U.S.C.C.A.N.
Co., 2 E.A.D.
at 1264).
824, 828-29 (Adm’r 1989).
See also In re Kawaihae
Cogeneration Project
, 7 E.A.D. 107, 127 n.26 (EAB 1997);
In re Metcalf Energy Center
, PSD Appeal 01-7, 01-8, at
15 (Aug. 10, 2001).
ELECTRONIC FILING, RECEIVED, CLERK'S OFFICE, JANUARY 5, 2007
* * * * * PC #7 * * * * *
15
can accept. I am happy to do so. I am willing to yield back the remainder of my
time.
36
Clearly, both the language of the Act itself and the unequivocal expressions of Congressional
intent in the legislative history indicate, that in order to fully comply with the Act, the emission
limits identified as BACT must incorporate consideration of more than just add-on emission
control technology – they must also reflect appropriate considerations of fuel quality (such as
low sulfur coal) and process changes (including specifically innovative combustion techniques
such as coal gasification). Indeed, this requirement is not only consistent with, but necessary to
the very core objective of PSD permitting – to bring about the rapid adoption of cleaner
technologies that provide for a greater reduction in regulated emissions.
37
In “notably capacious
terms,”
Alaska v. EPA,
540 U.S. 461 (2004), the statute provides that BACT includes
“application of production processes and available methods, systems, and techniques, including
fuel cleaning, clean fuels, or treatment or innovative fuel combustion techniques.” CAA Sec.
169(3).
EPA and federal courts have consistently interpreted the BACT provisions found in the CAA and
the agency’s regulations as embodying certain core criteria that require the permit applicant
either to implement the most effective available means for minimizing air pollution or justify its
selection of less effective means on grounds consistent with the purposes of the Act. Indeed, the
discretion of the permitting agency in determining BACT is deliberately confined by the statute’s
use of the “strong, normative terms ‘maximum’ and ‘achievable.’”
Alaska v. EPA,
540 U.S. 461
(2004).
In
Citizens for Clean Air v. EPA
,
38
the Ninth Circuit held that “initially the burden rests with the
PSD applicant to identify the best available control.” As stated in long-standing EPA guidance,
“[r]egardless of the specific methodology used for determining BACT, be it ‘top-down,’
‘bottom-up,’ or otherwise, the same core criteria apply to any BACT analysis: the applicant must
consider all available alternatives, and [either select the most stringent of them or] demonstrate
why the most stringent should not be adopted.”
39
Accordingly, the PSD permit applicant not
only must identify all available technologies, including the most stringent, but it must also
provide adequate justification for dismissing any available technologies.
36
95th Congress, 1st Session (Part 1 of 2) June 10, 1977 Clean Air Act A mendments of 1977 A&P 123 Cong.
Record S9421.
37
Emission controls under the CAA are universally recognized as including process changes (including inherently
cleaner processes) as well as add-on control technology. The PSD provisions expressly recognize this in the
definition of BACT included in section 169 of the Act. Other sections of the Act reinforce the fact that Congress
generally understood and accepted that emission control is often most effectively achieved through process changes.
See
CAA § 112(d)(2) (identifying mechanisms for reducing emission of hazardous air pollutants as including, in
addition to add-on controls, “process changes, substitutions of materials or other modifications,” as well as “design,
39
equipment,
38
959
Memorandum
F.2d
work
839, 845
from
practice,
(9John
th
Cir.
or
Calcagni,
operationa1992)
Director
l standards”).
of EPA Air Quality Management Division, to EPA Regional Air
Directors (June 13, 1989), at 4 (emphasis added).
ELECTRONIC FILING, RECEIVED, CLERK'S OFFICE, JANUARY 5, 2007
* * * * * PC #7 * * * * *
16
Consistent with these core criteria, the EPA’s New Source Review (NSR) Workshop Manual
establishes that, as the first step in the “top-down” BACT analysis, the applicant
must
consider
all “available” control options:
The first step in a "top-down" analysis is to identify, for the emissions unit in
question (the term "emissions unit" should be read to mean emissions unit,
process or activity), all "available" control options. Available control options are
those air pollution control technologies or techniques with a practical potential for
application to the emissions unit and the regulated pollutant under evaluation. Air
pollution control technologies and techniques include the application of
production process or available methods, systems, and techniques, including fuel
cleaning or treatment or innovative fuel combustion techniques for control of the
affected pollutant. This includes technologies employed outside of the United
States. As discussed later, in some circumstances inherently lower-polluting
processes are appropriate for consideration as available control alternatives.
40
“The term ‘available’ is used…to refer to whether the technology ‘can be obtained by the
applicant through commercial channels or is otherwise available within the common sense
meaning of the term.’”
41
In keeping with the stringent nature of the BACT requirement, EPA
has repeatedly emphasized that “available”
is used in the broadest sense under the first step and refers to control
options with a “practical
potential
for application to the emissions unit”
under evaluation. . . . The goal of this step is to develop a comprehensive
list of control options.
42
EPA adjudicatory decisions also examine the core requirements for the BACT determination
process. “Under the top-down methodology, applicants must apply the best available control
technology unless they can demonstrate that the technology is technically or economically
infeasible. The top-down approach places the burden of proof on the
applicant
to justify why the
proposed source is unable to apply the best technology available.”
43
40
NSR Manual, at p. B.5 (emphasis added).
41
In re: Maui Electric Company, PSD Appeal No. 98-2 (EAB September 10, 1998), at 29-30 (quoting NSR Manual
at
42
B.17).
In re: Knauf Fiber Glass, PSD Appeal Nos. 98-3 – 98-20 (EAB February 4, 1999), at 12-13 (quoting NSR Manual
at B.5) (emphasis added by EAB); see also In re: Steel Dynamics, Inc., PSD Appeal Nos. 99-4 and 99-5 (EAB June
22, 2000), at 29 n.24 (citing Knauf with approval); NSR Manual at B.10 (“The objective in step 1 is to identify all
control options with potential application to the source and pollutant under evaluation.”); id. at B.6 (emphasizing
that a proper Step 1 list is “comprehensive”).
43
In re: Spokane Regional Waste-to-Energy Applicant, PSD Appeal No. 88-12 (EPA June 9, 1989), at 9) (internal
quotation marks omitted) (emphasis in original); see also In re: Inter-Power of New York, Inc. PSD Appeal Nos. 92-
8 and 92-9 (EAB March 16, 1994) (“Under the ‘top-down’ approach, permit applicants must apply the most
stringent control alternative, unless the applicant can demonstrate that the alternative is not technically or
economically achievable.”); In the Matter of Pennsauken County, New Jersey Resource Recovery Facility, PSD
Appeal No. 88-8 (EAB November 10, 1988) (“Thus, the ‘top-down’ approach shifts the burden of proof to the
applicant to justify why the proposed source is unable to apply the best technology available.”)
ELECTRONIC FILING, RECEIVED, CLERK'S OFFICE, JANUARY 5, 2007
* * * * * PC #7 * * * * *
17
Whatever analytical process is utilized for determining BACT, these core criteria – the
requirement to consider all available technologies, including the most stringent, and to provide
adequate justification in the administrative record for dismissing any of the technologies based
on relevant statutory factors – must be satisfied.
44
Thus, to conduct a BACT analysis consistent with the requirements of Federal law for the DREF,
EPA must thoroughly evaluate all available control measures. IGCC is commercially available
today. Federal law therefore requires that this technology be thoroughly evaluated as part of the
DREF BACT analysis.
EPA’s Erred in Failing to Consider IGCC in the BACT Analysis for Desert Rock Because It
Would be “Redefining the Source”
In the “Ambient Air Quality Impact Report” (AAQIR) which reflects EPA Region 9’s analysis
and justification for its permitting decision in this case, EPA explains that it has not even
assessed the possibility of achieving additional emission reductions from the proposed Desert
Rock facility through process changes. That is, EPA has utterly ignored in the context of its
evaluation of Sithe’s PSD permit, process options for generating electricity from coal that could
significantly reduce emissions from the facility.
45
This decision on the part of EPA Region 9
flies in the face of the plain language of the Act, the clear expressions of Congressiona l intent,
and the rulings of the Environmental Appeals Board.
Instead of evaluating, or requiring the permit applicant to seriously evaluate, potential process
changes (like IGCC) that could significantly reduce the proposed facility’s emissions, EPA
states:
Consideration of Integrated Gasification Combined Cycle (IGCC) technology . . . has not
been included in step 1 of the BACT analysis above, since IGCC would be redefining the
source.
AAQIR at 35.
46
This categorical dismissal of any obligation on the part of the permit issuer to
consider or evaluate the availability, applicability, effectiveness, collateral environmental
benefits, or cost effectiveness of a recognized process option for further reducing emission from
coal-fired power plant is flatly contrary to the Agency’s responsibilities under the PSD program.
EPA has argued in other contexts that the concept of “redefining the source” may relieve it of
certain obligations under the PSD program.
47
In particular, in the
Prairie State
case befo re the
EAB, EPA argued as a matter of statutory interpretation that the CAA did not contemplate that
permitting authorities would require a permit applicant to consider building a source other than
the one it had proposed. In that case, the issue involved whether a proposed Illinois coal-fired
power plant, that was being planned in conjunction with a new coal mine, needed to consider (as
a element of its BACT analysis) using coal that was lower in sulfur than the coal that the co-
44
The EAB has made clear that, regardless of the analytic process, if a control option is left out of the analysis
because it is erroneously identified as not potentially available, the permit will be sent back on appeal.
See In re
Three Mountain Power
, 10 E.A.D. 39, 50 (EAB 2001) (explaining that “proper BACT analysis requires
consideration of all potentially ‘available’ control technologies”).
ELECTRONIC FILING, RECEIVED, CLERK'S OFFICE, JANUARY 5, 2007
* * * * * PC #7 * * * * *
18
located mine would produce. EPA argued (as did Illinois EPA) that requiring the source to use
coal other than that from the co-located mine would constitute an impermissible redefinition of
the source.
Ultimately, in a very narrow ruling, the Board in the
Prairie State
case held that the use of coal
from the co-located mine was so integral to the very purpose and intent of the project that
requiring the permit applicant to consider using some other source of coal instead would defeat
the purpose of the original permit application. Accordingly, the Board ruled that the Illinois
EPA did not “clearly err when it determined that consideration of low-sulfur coal, because it
necessarily involves a fuel source other than the co-located mine, would require Prairie State to
redefine the fundamental purpose or basic design of its proposed Facility, and that, therefore,
low-sulfur coal could appropriately be rejected from further BACT analysis at step 1 of the top-
down review method.” Prairie State at 36-37.
Even assuming that the Board’s decision in Prairie State was consistent with the CAA, that
decision clearly demonstrates that EPA’s failure to require consideration of innovative
combustion technologies as process options for controlling emission from the Desert Rock plant
is fundamentally flawed. First, the EAB’s ruling recognized that the default assumption under
the CAA’s PSD provisions is that the use of potentially cleaner fuels (such as low-sulfur coal)
will normally be a required part of the BACT analysis.
48
Only where some unique element of
the facility’s basic purpose made the particular BACT-related consideration
fundamentally
incompatible
with the permit application, did the EAB recognize that further analysis of that
BACT-related consideration might by unnecessary.
49
45
In particular, the use of Integrated Gasification Combined Cycle (IGCC) would allow the facility to produce
electricity from coal with dramatically lower emission of NOx, SOx, CO, VOC, and PM.
See, e.g.,
Permit
Application
46
Although
for
EPA
Nueces
claims
IGCC
to have
Plant
requested
(submitted
“detailed
to Texas
information
Commission
from
on
Sithe
Envirregarding
onmental
whether
Quality
or
September
not IGCC
2006).
would
be technically feasible,” that “detailed information” consists of approximately ten pages of discussion, much of
which is simply inaccurate. Moreover, as Region 9 did not scrutinize this analysis, draw any conclusions from it, or
discuss it
at all
as a component of its decision-making, it failed to meet its statutory obligation as the permitting
authority in this case, and has denied the public any opportunity to understand or respond to the nature or scope of
its reliance on the Sithe analysis. Accordingly, even were EPA to rely on the Sithe analysis to conclude that IGCC
is not technically or economically feasible in this instance, it must first specifically evaluate the Sithe analysis and
specifically justify any reliance on that analysis, and thereafter allow the public an opportunity to evaluate and
comment
47
See In re
on
Prairie
EPA’s
State
conclusions.
Generating Co.
, PSD Appeal 05-05, 13 E.A.D. __ (Sept. 24, 2006).
48
Prairie State at 22 (“Petitioners correctly observe that . . . consideration of ‘clean fuels’ must be a part of the
BACT analysis. Specifically, . . . the Agency must consider both the cleanliness of the fuel and the use of add-on
pollution control devices.”). Indeed, numerous other PSD permits have identified the use of clean fuel (including
low sulfur coal) as BACT for new major sources.
See, e.g. In re AES Puerto Rico
8 E.A.D. 324 (EAB 1999);
In re
Encogen Cogeneration
, 8 E.A.D. 244 (EAB 1999);
In re Hawaiian Commercial & Sugar Co.y
, PSD Appeal No. 92-
1 at 5, n.7 (EAB, July 20, 1992).
49
In
Prairie State
the Board concluded that the mine and the coal-fired power plant were proposed together as a
single source under the PSD provisions, and the mine was intended to supply the entirety of the power plant’s fuel
throughout the plant’s entire operating life. Therefore, the EAB concluded, the plant and the mine were integral
parts of a single proposal and the use of coal from another source would undermine the purpose of that proposal. If
the mine were capable of supplying less than the full fuel needs of the power plant over its entire life cycle, for
example, the Board’s analysis would likely have been different; the Board’s decision suggests that in such a case the
consideration of low-sulfur supplemental fuel would have been required.
ELECTRONIC FILING, RECEIVED, CLERK'S OFFICE, JANUARY 5, 2007
* * * * * PC #7 * * * * *
19
In the end, even the Board’s decision in Prairie State reflects an understanding that the concept
of redefining the source must be subordinate to the primary objectives of the BACT analysis.
That is, the specific requirements inherent in the definition of BACT will define the obligations
of permit applicants and permitting authorities, unless some specific fundamental conflict exists.
Moreover, while the Board concluded that the permit issuer should look “in the first instance” at
“how the permit applicant, in proposing the facility, defines the goals, objectives, purposes, or
basic design for the proposed facility,” the permit applicant cannot manipulate the definition of
the facility as a mechanism to avoid appropriate BACT analysis.
Prairies State
at 29-30. In
evaluating the permit, the permit issuer must “discern which design elements are inherent to [the]
purpose [of the facility], articulated for reasons independent of air quality permitting, and which
design elements may be changed to achieve pollutant emissions reductions without disrupting the
applicant’s basic business purpose for the proposed facility.”
Id
. at 30.
Significantly, the Board specifically recognized that cost savings are not a valid purpose for a
particular facility design; similarly, “the business objective of avoiding risk associated with new,
innovative or transferable control technologies is not treated as a basic design element.”
Prairies
State
at 30 n.23. Rather cost and risk considerations are appropriately addressed during the later
steps of the top-down BACT analysis.
For Desert Rock, EPA seeks to stretch the EAB’s recognition of a narrow exception to the
BACT requirements
far
beyond the breaking point, by flatly rejecting the idea that a PSD permit
applicant
ever
needs to evaluate the achievability of emission reductions from process changes or
innovated combustion techniques for converting coal into electricity. As described above, EPA
states simply that requiring an applicant to examine the possibility of using an inherently less
polluting process (such as IGCC, or presumably CFB, or other advanced coal-to-energy
technology) is categorically beyond the scope of what the Act requires because it would redefine
the source.
This position is out of sync with both the Act itself and with the EAB’s treatment of the concept
of “redefining the source.” First, as discussed above, the Act specifically calls for consideration
of “the application of
production processes
and available methods, systems, and techniques,
including fuel cleaning, clean fuels, or treatment or
innovative fuel combustion techniques
for
control of each pollutant.” CAA § 169(3). This language, on its face, requires as a part of the
BACT analysis the consideration of innovative technologies like IGCC that make the generation
power from coal significantly cleaner.
50
Further, the two early decisions by the EPA Administrator that introduce the “redefining the
source” policy, identify a policy that is much more limited that that which EPA now advocates.
In
In re Pennsauken County, New Jersey, Resource Recovery Facility
the petitioner asked the
EPA Administrator to deny a PSD permit to a municipal waste combustor and, instead, require
the county to dispose of its waste by co-firing it with coal in existing power plants.
See
PSD
Appeal No. 88-8 at 10 (Adm’r, Nov. 10, 1988). In effect, the petitioner wanted the EPA to order
the applicant to engage in a different type of activity: electricity generation, rather than waste
disposal. The Administrator rejected this option because the petitioner’s argument was based on
50
As discussed above, the legislative history of the CAA is equally as clear that the definition of BACT
contemplates consideration of technologies like IGCC.
ELECTRONIC FILING, RECEIVED, CLERK'S OFFICE, JANUARY 5, 2007
* * * * * PC #7 * * * * *
20
his objection to a waste combustor generally, not to the conditions in the permit. Thus, the
Administrator held, the petitioner was asking EPA to “redefine the source” from a waste
combustor to a power plant.
51
The Administrator subsequently reaffirmed the
Pennsauken
County
decision and explained that “source,” within the newly created “redefining the source”
policy, refers to a
source category
.
52
After clarifying the “redefining the source” policy as only preventing a change in the
“fundamental purpose,” i.e., the source category, the Administrator further explained that the
“redefining the source” policy did not allow the permitting agency to blindly accept the source
design proposed by the applicant.
Id.
at 842-843. In
Hibbing
, the permit applicant wanted to
burn petroleum coke at its taconite plant, but EPA required the applicant to consider burning
natural gas – a lower polluting process and cleaner fuel – as part of a BACT determination.
Id.
The Administrator specifically rejected the idea that requiring consideration of cleaner fuel
constitutes “redefining the source” because the fundamental purpose, or source category, remains
the same.
53
In other words,
from its inception
, prior to the 1990 Manual, the “redefining the source” policy
has merely stood for the concept that EPA will not require an applicant to abandon its intended
purpose for some other industrial venture. To the extent EPA’s subsequently-issued
draft
NSR
Manual is inconsistent with prior Administrator interpretations in
Pennsauken
and
Hibbing
,
which constitute the agency’s official position, the draft Manual is not entitled to any
deference.
54
51
“Petitioner Filipczak’s fundamental objections to the Pennsauken permit are not with the control technology, but
rather, with the municipal waste combustor itself. He urges rejection of the combustor in favor of co-firing a
mixture of 20% refuse derived fuel and 80% coal at existing power plants. These objections are beyond the scope of
this proceeding and therefore are not reviewable under 40 C.F.R. 124.19, which restricts review to “conditions” in
the permit. Permit conditions are imposed for the purpose of ensuring that the proposed source of pollutant
emissions-- here, a municipal waste combustor-- uses emission control systems that represent BACT, thereby
reducing the emissions to the maximum degree possible. These control systems, as stated in the definition of
BACT, may require application of “production processes and available methods, systems, and techniques, including
fuel cleaning as treatment or innovative fuel combustion techniques” to control the emissions. The permit
conditions that define these systems are imposed on the source as the applicant has defined it… [T]he source itself is
not
52
“In
a condition
Pennsauken,
of the
the
permit.”
petitioner
Pennsauken
was urging
County
EPA to
at
reject
10-11
the
(emphasis
proposed
added).
source (a municipal waste combustor) in
favor of using existing power plants to co-fire a mixture of 20% refuse derived fuel and 80% coal. In other words,
the petitioner was seeking to substitute power plants (having as a fundamental purpose the generation of electricity)
for a municipal waste combustor (having as a fundamental purpose the disposal of municipal waste).” In re Hibbing
Taconite
53
[O]ne argument
Company
that
, 2 E.A.D.
could be
at n.
made
12 (Adm’r
is that the
1989)
Region,
(parentheticals
by requiring
original,
the burning
emphasiof s
natural
added).
gas to be an alternative
to be considered in the BACT analysis [for a petroleum coke-fired plant], is seeking to "redefine the source."
Traditionally, EPA has not required a PSD applicant to redefine the
fundamental scope
of its project… [The
redefining the source] argument has no merit in this case.
EPA regulations define major stationary sources by their product or purpose (e.g., "steel mill," "municipal
incinerator," "taconite ore processing plant," etc.)
, not by fuel choice. Here,
Hibbing will continue to manufacture
the same product (i.e., taconite pellets) regardless of whether it burns natural gas or petroleum coke
… The record
here indicates that there are other taconite plants that burn natural gas, or a combination of natural gas and other
fuels. Thus, it is reasonable for Hibbing to consider natural gas as an alternative in its BACT analysis.
Id.
(parentheticals
54
In addition to
original,
simply being
emphasis
wrong,
added).
the NSR Manual’s application of the “redefining the source” policy is due no
deference because it conflicts with the agency’s prior interpretations.
See Pauley v. Beth-Energy Mines
, 501 U.S.
ELECTRONIC FILING, RECEIVED, CLERK'S OFFICE, JANUARY 5, 2007
* * * * * PC #7 * * * * *
21
Because the Act specifically calls for consideration of
production processes
and
innovative fuel
combustion techniques
as means for reducing emissions from industrial sources regulated under
the PSD program, even the Board’s analysis in
Prairie State
would require evaluation of IGCC
as part of the BACT analysis,
unless there were a specific, objectively discernable reason why
doing so would be fundamentally at odds with the primary objective of the project, based on
appropriate considerations not related to cost or the avoidance of risk
.
55
For Desert Rock, EPA
has articulated no such rationa le.
56
What EPA suggests by way of its off-hand dismissal of
IGCC is that consideration of such control measures is never appropriate under the Act.
57
As
discussed above, this position is simply untenable as a matter of statutory interpretation.
Moreover, it also runs counter to the EAB’s favorable consideration of Illinois EPA’s
requirement for permit applicants to consider IGCC.
In
Prairie State
, the Petitioners argued that the scope of EPA’s “redefining the source” policy
lacked any “principled standards,” and would therefore allow permit applicants to define-away
basic elements of the BACT analysis.
See Prairie State
at 33. The EAB rejected this argument,
but in doing so relied specifically on Illinois EPA’s policy of requiring consideration of IGCC to
demonstrate why the policy was not fatally overbroad.
58
Id
33-37. The Board noted that Illinois
EPA “required Prairie State to submit a detailed analysis of [IGCC] as a method for controlling
emissions from the proposed Facility.”
Prairie State
at 35.
59
The Board explained, “IGCC is not
simply an add-on emission control technology, but instead would have required a completely
redesigned ‘power block.’ . . . [Illinois EPA’s] demand that Prairie State provide a detailed
analysis of IGCC, which [Illinois EPA] noted has the promise to achieve greater [emissions]
reductions, demonstrates that [Illinois EPA’s] application of the policy against redefining the
design of the source through application of BACT did not treat “very few” design changes as
consistent with the proposed Facility’s basic design. . . . To the contrary, [Illinois EPA’s]
consideration of IGCC demonstrates that [it] gave due regard to Prairie State’s objective in
submitting a permit application for the proposed Facility, namely development of an electric
680, 698 (1991) (no deference to agency interpretations that are inconsistent with previously held view);
see also
Malcomb v. Island Creek Coal Co
., 15 F.3d 364, 369 (4
th
Cir. 1994) (deference is not due to an agency interpretation
of its own rules that is inconsistent); Brotherhood of
Locomotive Engineers v. Atchison, Topeka Santa Fe R.R. Co.
,
116 S.Ct. 595, 133 L.Ed.2d 535 (1996).
55
“The assertion, and finding, that the design is for reasons independent of air quality permitting must be reasonable
and supported by the record.”
Prairie State
at 34 n.29. For Desert Rock, however, EPA has failed to even make an
evidence-based finding that IGCC is incompatible with the purpose of the project – it merely asserts, without record-
based explanation, that consideration of IGCC would constitute redefining the source. This is both substantively
inadequate
56
In addition
and
to
inadequate
rendering this
as a
part
matter
of the
of public
BACT
notice.
analysis inadequate, EPA’s failure to specifically identify why
IGCC would be fundamentally incompatible with the objectives of this project has deprived commenters of EPA’s
essential rationale for a major part of its decision. Accordingly, EPA must describe the basis for its determination
and
57
EPA
provide
said
the
as much
public
in
with
a December
an opportunity
13, 2005
to comment
letter to an
on
energy
its ratioconsulting
nale.
company. That letter is now the subject
of a settlement agreement under which EPA acknowledges that the letter has no legal significance or legally binding
effects
58
If the
on
EAB
anyone.
affirmed IEPA’s authority to require consideration of IGCC, such consideration must be within the
permitting authority’s discretion under the statutory definition of BACT, and therefore cannot be a fundamental
59
“redefinition”
The Board references
of the source
a letter
that
from
is impermissible
Donald Sutton,
under
Illinois
the Act.
EPA to Diana Tickner, Prairie State (March 29, 2003),
that letter is incorporated by reference here.
ELECTRONIC FILING, RECEIVED, CLERK'S OFFICE, JANUARY 5, 2007
* * * * * PC #7 * * * * *
22
power generating plant that would be co-located and co-permitted with a 30-year supply of fuel,
and then explored every potential add-on technology and potentially lower-emitting production
processes or methods consistent with that basic design to determine the maximum emissions
reductions achievable for the Facility.”
Id
at 35-36.
60
In contrast, for the Desert Rock facility (which like the Prairie State facility is an electric power
generating plant that would be co-located with a proprie tary coal supply), EPA has completely
abrogated its BACT-related responsibilities when it comes to identifying “every potential add-on
technology
and potentially lower-emitting production processes or methods
consistent with that
basic design to determine the maximum emissions reductions achievable.” Instead, EPA has
casually referenced the policy against “redefining the source” as a justification to completely
ignore the plain language of the statute and the clear expressions of Congressional intent.
While the Board ultimately concluded in
Prairie State
that IGCC was not required at the facility,
that determination resulted from the Board’s conclusion that IGCC was essentially equivalent to
the proposed boiler technology in terms of its potential emissio n control effectiveness.
See
Prairie State
at 47. That conclusion was the unfortunate result of a poor record. As discussed at
length below, it is very clear that IGCC is capable of achieving a level of emissions performance
for virtually every regulated PSD pollutant that is significantly better than the performance of a
pulverized coal boiler.
61
Moreover, IGCC plants have a multitude of collateral environmental
benefits: they achieve better reductions in hazardous air pollutants like mercury, they produce
less solid waste, they use less water, and they both emit less CO
2
and provide the ability to
capture CO
2
emissions for permanent storage to help address global warming. Accordingly, the
60
In its analysis, the Board specifically recognized that EPA guidance requires consideration of process-related
technology advances like IGCC.
Prairie State
at 33 (“The NSR Manual also states with respect to production
processes, that where ‘a given production process or emission unit can be made to be inherently less polluting’ ‘the
ability of design considerations to make the process inherently less polluting
must be considered
as a control
alternative for the source.’”). The Board went on to explain that “viewing the proposed facility’s basic design as
something that generally should not be redefined through BACT review does not prevent the permit issuer from
taking a ‘hard look’ at whether the proposed facility may be improved to reduce its pollutant emissions.”
Id
at 33-
34. By “hard look” it is clear that the Board means a real, substantive BACT examination that explains in detail the
technological, engineering, process, and/or design factors that make a particular emission control option
incompatible with the projects objectives.
See Prairies State
at 34 (citing
Knauf
, 8 E.A.D. 121, 127 (EAB 1999)).
The Board explained that a permit issuer’s failure to take a sufficiently hard look at the design issues has “the
potential to circumvent the purpose of BACT, which is to promote use of the best control technologies as widely as
possible.”
Prairie State
at 34 (quoting
Knauf
, 8 E.A.D. at 140). Significantly, the EAB gave short shrift to EPA’s
essentially meaningless “alternatives analysis” which would have relegated consideration of any process, technique
or alternative approach to pollution control to an analysis separate and apart from the BACT determination. EPA’s
treatment of IGCC in the Desert Rock case is a perfect illustration of the danger that the EAB identified as inherent
in the concept of a “redefining the source” exemption – EPA has not taken a “hard look” at whether IGCC might be
an appropriate consideration under the BACT analysis here, and EPA’s casual dismissal of its obligations in this
regard threaten to “circumvent the purpose of BACT.”
61
The PSD permit application for Nueces Syngas, LLC for example, includes emission limits for the IGCC turbines
(in lb/MMBTU) of 0.018 for NOx, 0.017 for SO
2
, 0.037 for CO, 0.003 for VOC, 0.006 for PM and PM
10
, and 0.001
for H
2
SO
4
. There are other recent permit applications in the record that also demonstrate the tremendous
opportunities for emission reductions with IGCC. Moreover, this technology is now a viable and ready option for
electric power production, as evidenced by among other things the 25 or so proposed IGCC plants around the
country. See the Department of Energy’s document: Tracking New Coal-Fired Power Plants, available at:
http://www.netl.doe.gov/coal/refshelf/ncp.pdf
.
ELECTRONIC FILING, RECEIVED, CLERK'S OFFICE, JANUARY 5, 2007
* * * * * PC #7 * * * * *
23
Board’s justification for rejecting IGCC in the Prairie State case is simply inapplicable for the
Desert Rock plant.
62
Indeed, EPA itself has publicly recognized IGCC as an “inherently low-polluting
process/practice,”
63
and has reaffirmed its view that IGCC is an available method for cleaning
and treating coal to remove air pollutants prior to combustion:
One approach to controlling SO
2
emissions from steam generating units is
to limit the maximum sulfur content in the fuel. This can be accomplished
by burning… a fuel that has been pre-treated to remove sulfur from the
fuel… There are two ways to pre-treat coal before combustion to lower
sulfur emissions: Physical coal cleaning and gasification…
Coal
gasification breaks coal apart into its chemical constituents (typically a
mixture of carbon monoxide, hydrogen, and other gaseous compounds)
prior to combustion. The product gas is then cleaned of contaminants
prior to combustion. Gasification reduces SO
2
emissions by over 99
percent.
64
As a result of fuel cleaning, IGCC units “will inherently have only trace SO
2
emissions because
over 99 percent of the sulfur associated with the coal is removed by the coal gasification
process.” 70 Fed. Reg. at 9715.
65
Documents obtained through FOIA further demonstrate that EPA seriously erred in its treatment
of IGCC in this permit proceeding. Attached hereto and listed as
Attachment 62
in the attached
exhibit list hereto. In detailed notes of an EPA meeting with the permit applicant, Sithe
officials explain that Sithe has extensive experience with IGCC: “Sithe did the 1
st
IGCC in the
world.” (Statement of Dick Straussfeld). At the same time, Sithe officials steadfastly refuse to
submit an IGCC analysis as part of the BACT determination and EPA agrees. In detailed notes
reflecting a pivotal exchange between Sithe and EPA officials, it is manifest that EPA has pre-
ordained the outcome of the permit proceeding in contravention of basic procedural rights and
protections, that EPA agreed with the permit applicant up front before any opportunity for notice
62
Moreover, to the extent that Sithe or EPA is concerned about cost implications of IGCC, the technological
availability or reliability of the technology, or other technological or economic considerations, the appropriate
mechanism to address those concerns is the BACT top-down analysis – not through up-front exclusion of the
technology from consideration.
63
See, e.g
., Robert J. Wayland, U.S. EPA Office of Air and Radiation, OAQPS, “U.S. EPA’s Clean Air
Gasification Activities”, Presentation to the Gasification Technologies Council Winter Meeting, January 26, 2006,
slide 4; and “U.S. EPA’s Clean Air Gasification Initiative”, Presentation at the Platts IGCC Symposium, June 2,
2005, slide 11 (citing the “inherently lower emissions of nitrogen oxides, sulfur dioxides, and mercury,” as among
the “fundamental advantages” of IGCC). Mr. Wayland also correctly notes that IGCC units use less water, and
produce fewer global warming pollutants than conventional pulverized coal units, another point relevant to the
statutory directive to “take into account environmental . . . impacts” in determining BACT limits. Wayland January
26,
64
U.S.
2005
EPA,
Presentation,
Standards
Slide
of Performance
4; 42 U.S.C.
for
§
Electric
7479(3).
Utility Steam Generating Units for Which Construction is
Commenced
65
Indeed, IGCC
After
is
September
a prime example
18, 1978,
of “fuel
70 Fed.
cleaning”
Reg. 9706,
(which
9710also
-11
is
(February
a required
28,
BACT
2005).
consideration under the Act)
– involving the
pre-combustion
transformation of otherwise dirty coal into a fuel (syngas) that can be more cleanly
burned in a combined-cycle power block.
ELECTRONIC FILING, RECEIVED, CLERK'S OFFICE, JANUARY 5, 2007
* * * * * PC #7 * * * * *
24
and public comment that IGCC would not be considered as part of the BACT analysis and that
the meager information submitted by Sithe on IGCC was designed merely to paper the record not
to aid EPA in engaging in reasoned decision-making on the merits. Here is the pivotal exchange
reflects an EPA decision-making process that is contrary to the core procedural and substantive
requirements of a PSD permit determination:
“Bob said project as proposed probably satisfies BACT for a P.C. Boiler, even sets a new
standard. Need a complete record that looks at all technologies. Coal gasification
(IGCC) info was submitted but was confusing, we need additional info. Circulating
fluidized bed (CFB) – also more info including costs. Ann asked that it be framed in a
top-down analysis. Gus said he doesn’t think IGCC should be BACT and will not go on
record as submitting it as BACT. Bob said OK. Said top-down doesn’t work for IGCC
since it’s a process technology, not dedicated to a pollutant. Ann stated that there are 2
EAB decisions that opened the door – we need to deal with it. Gus said in the next 2-3
weeks will get us a report on IGCCV and CFB.”
See listing as
Attachment 62
to the exhibit list attached hereto (FOIA Appeal
,
FOIA Request
#09-RIN-00434-06, Sept. 19, 2006 Correspondence from Enrique Manzanilla, EPA, Director,
Communities and Ecosystems Division, to Environmental Defense (“Desert Rock meeting with
applicant,”under heading “BACT issues”)
.
Because the CAA and implementing regulations clearly require evaluation of technologies like
IGCC which can achieve the statutory intent of reducing emissions through process changes,
available methods and systems and techniques, innovative combustion techniques, and fuel
cleaning, and because EPA failed entirely to conduct an analysis of IGCC as a possible control
option, the draft PSD permit is unlawful and the public has unlawfully been deprived of the
opportunity to meaningfully engage with the agency on this issue. Therefore, the draft permit
must be withdrawn, EPA must evaluate in detail the potential for applying IGCC, and the
Agency must make its determination and its justification available for public comment.
66
Recent State Actions Requiring Consideration of Cleaner Coal Technology Establish Irrefutable
Precedence for the Consideration of IGCC.
In recent PSD permitting actions implementing the Federal PSD permitting program (either
through a direct delegation from EPA or via approval of equivalent state rules in a state
66
Even were EPA correct that it may ignore IGCC in the context of BACT based on the policy against “redefining
the source” (which it cannot), there is no argument whatsoever that EPA does not retain discretionary authority
under both the BACT provisions and under the “alternatives” provision of section 165(a)(2) to require consideration
of IGCC (on this point the EAB precedent is crystal clear). The arguments presented here regarding appropriateness
of considering IGCC as BACT apply equally to the need for EPA to consider IGCC as an alternative under
165(a)(2). Thus, to the extent that EPA does not exercise its authority under section 165(a)(2), even in light of
significant and detailed public comments indicating that IGCC should be considered and adopted for Desert Rock,
EPA must offer a rational explanation for its decision adequate to demonstrate that its refusal is not an abuse of
discretion. It is clear, however, as discussed above, that the consideration of IGCC in connection with the BACT
analysis is both appropriate and required in this instance, and EPA should not use is discretion under the
“alternatives” language in section 165(a)(2) as a justification to avoid its statutory obligation under section 165 and
169(3) to require consideration of IGCC in the BACT analysis – one is not an adequate replacement for the other.
ELECTRONIC FILING, RECEIVED, CLERK'S OFFICE, JANUARY 5, 2007
* * * * * PC #7 * * * * *
25
implementation plan (SIP)), several states have required consideration of IGCC in the BACT
review process for new coal-fired power plants. These state decisions implementing the federal
PSD program validate the plain language of the definition of BACT described above.
Specifically, in March 2003, the State of Illinois required the applicant for a proposed CFB coal-
fired electric generation facility to conduct a robust analysis of IGCC as a core element of its
BACT analysis:
Additional material must be provided in the BACT demonstration to address Integrated
Gasification Coal Combustion (IGCC) as it is a `production process’ that can be used to
produce electricity from coal. In this regard, the Illinois EPA has determined that IGCC
qualifies as an alternative emission control technique that must be addressed in the BACT
demonstration for the proposed plant. In addition, based on the various demonstration
projects that have been completed for IGCC, the Illinois EPA believes that IGCC
constitutes a technically feasible production process.
Accordingly, Indeck must provide detailed information addressing the emission
performance levels of IGCC, in terms of expected emissions rates and possible emission
reductions, and the economic, environmental and/or energy impacts that would
accompany application of IGCC to the proposed plant. This information must be
accompanied by copies of relevant documents that are the basis of or otherwise
substantiate the facts, statements and representations about IGCC provided by Indeck. In
this regard, Indeck as the permit applicant is generally under an obligation to undertake a
significant effort to provide data and analysis in its application to support the
determination of BACT for the proposed plant.
67
In an ensuing letter, the State of Illinois then formally informed EPA that Illinois has “concluded
that it is appropriate for applicants for [proposed coal-fired power plants] to consider IGCC as
part of their BACT demonstrations.”
68
Similarly, the Georgia Department of Natural Resources, in a March 2002 letter regarding the
permit application of Longleaf Energy Station, also relied, in part, on the failure of the permit
applicant to consider cleaner coal combustion technology in finding the application deficient. In
making its determination of deficiency, Georgia stated that the applicant did not “discuss any
other methods from generating electricity from the combustion of coal, such as pressurized
fluidized bed combustion or integrated gasification combined cycle.
” 69
Georgia further stated
that the applicant “should discuss these technologies and explain why you elected to propose a
pulverized coal-fired steam electric power plant instead.”
70
67
Letter from Illinois Division of Air Pollution Control to Jim Schneider, Indeck-Elwood, LLC (March 8, 2003),
Attachment 3 .
68
69
Letter
Letter
from
from
James
Illinois
A.
EPA
Capp,
Director
Manager,
to EPA
Stationary
Regional
Source
Administrator,
Permitting
Region
Program,
V (March
Georgia
19,
DNR,
2003),
to D.
Attachment
Blake
4.
Wheatley, Assistant Vice President, Longleaf Energy Associates, LLC (March 6, 2002). Attachment 5.
70
Id.
ELECTRONIC FILING, RECEIVED, CLERK'S OFFICE, JANUARY 5, 2007
* * * * * PC #7 * * * * *
26
Reflecting the viability of IGCC, the State of New Mexico issued a letter on December 23, 2002
requiring the permit applicant for a new coal-fired power plant to conduct a site-specific analysis
of IGCC as well as CFB as part of the BACT analysis for the proposed facility: “The Department
requires a site-specific analysis of IGCC and CFB in order to make a determination regarding
BACT for the proposed facility.” The New Mexico determination goes on to provide: “The
analysis must include a discussion of the technical feasibility and availability of IGCC and CFB
for the proposed site in McKinley County, including a discussion of existing IGCC and CFB
systems.”
71
On August 29, 2003, New Mexico issued its evaluation of the applicant’s response. New
Mexico found that the applicant’s BACT analysis had in fact indicated that IGCC is
commercially available but that the applicant had improperly relied on cost to find that the
technology was infeasible:
Mustang concludes that neither IGCC nor CFB are technically feasible control options
for the Mustang site. After careful review of the revised BACT analysis, as well as
information gathered from independent sources, the Department determines that
Mustang’s conclusion is not supported by the evidence. Accordingly, the Department
finds that Mustang has not demonstrated the technical infeasibility of IGCC and CFB.
Moreover, applying the criteria in the NSR Manual, the Department determines that
IGCC and CFB are technically feasible at the Mustang site, and must be evaluated in the
remaining steps of the top down BACT methodology.
(a) IGCC and CFB are technically feasible at the Mustang site. A technology is
considered to be technically feasible if it is commercially available and
applicable to the source under consideration.
See
NSR Manual at B.17-18.
A technology is commercially available if it has reached a licensing and
commercial sales stage of development.
Id.
A technology is applicable if it
has been specified in a permit for the same or a similar source type.
Id.
Mustang’s revised BACT analysis indicates that IGCC is commercially
available, and IGCC has been specified in air quality permits for coal-fired
power plants.
See, e.g.,
Lima Energy Facility, 580 megawatt coal-fired power
plant. Similarly, CFB is commercially available and has been specified in air
quality permits for coal-fired power plants.
See, e.g.,
AES Puerto Rico 454
megawatt coal-fired power plant; Reliant Energy Seward 584 megawatt coal-
fired power plant.
(b) For both IGCC and CFB, Mustang improperly relies on cost to determine
technical infeasibility. A technology is technically feasible when the
resolution of technical difficulties is a matter of cost.
See
NSR Manual at
B.19-20. Mustang’s revised BACT analysis indicates that the resolution of
technical difficulties for both IGCC and CFB are a matter of cost. These costs
do not support a finding of technical infeasibility, but may be considered
71 Letter from New Mexico Environment Department to Larry Messinger, Mustang Energy Corporation (Dec. 23,
2002). Attachment 6.
ELECTRONIC FILING, RECEIVED, CLERK'S OFFICE, JANUARY 5, 2007
* * * * * PC #7 * * * * *
27
during Step 4 of the top down BACT methodology.
See
NSR Manual at
B.26.
72
In addition, the Montana Board of Environmental Review found that the Montana Department of
Environmental Quality must consider IGCC as an available technology in the BACT review for a
coal-fired power plant. Specifically, the Board of Environmental Review stated “. . .the
Department should require applicants to consider innovative fuel combustion techniques in their
BACT analysis and the Department should evaluate such techniques in its BACT determination
in accordance with the top-down five-step method.”
73
It is important to note that, while some of these states were operating under SIP-approved PSD
programs, the definition of BACT that applied in all cases is virtually identical to the federal
definition of BACT with respect to consideration of inherently lower emitting processes. It is
noteworthy that these states determined it was entirely appropriate to require consideration of
IGCC in the BACT review for a coal-fired power plant.
The aforementioned state determinations are attached hereto.
EPA Region 8 Has Also Determined It Was Appropriate to Evaluate IGCC in the BACT
Analysis for a Coal-Fired Power Plant
Further, EPA Region 8 submitted comments to the Utah Division of Air Quality in an April 6,
2004 letter on Utah’s proposed permit for NEVCO Energy’s Sevier Power Company Project in
which EPA requested that further documentation on costs be provided to support Utah’s claim
that IGCC was too costly.
74
EPA did not indicate that IGCC didn’t need to be considered as an
alternative for the proposed Sevier CFB boiler. Instead, EPA stated “It is our understanding that
IGCC is a potentially lower polluting process than Circulating Fluidized Bed combustion.”
EPA’s comments requesting more documentation of the costs of IGCC provide strong indication
that EPA found it appropriate to consider IGCC in the BACT analysis.
Thus, for all of the reasons described above, EPA erred in failing to fully evaluate IGCC for
DREF in a top-down BACT review. Below we have provided an analysis of IGCC in a top-
down BACT review and the results indicated that IGCC is the top technology.
Information about IGCC is Readily Available and EPA is Obligated to Meaningfully Examine
Such Information for Desert Rock’s Permit
Gasification is not a new technology, but rather one that has been around for at least a hundred
years. Detailed information about the gasification process and IGCC is readily available to the
utility industry and regulatory decision-makers, including EPA. For example, the Gasification
72
Letter from New Mexico Environment Department to Larry Messinger, Mustang Energy Company (Aug. 29,
73
2003),
Montana
at p.
Board
3, Attachment
of Environmental
7.
Review, Findings of Fact, Conclusions of Law, and Order In the Matter of the
Air Quality Permit for the Roundup Power Project (Permit No, 3182-00), Case No. 2003-04 AQ (June 23, 2003) at
74
18-April
19. See
6, 2004
Attachment
letter from
9 for
Richard
a copy
R.
of
Long,
this finding.
EPA, to Rick Sprott, Utah Division of Air Quality, at 1 (Attachment
8).
ELECTRONIC FILING, RECEIVED, CLERK'S OFFICE, JANUARY 5, 2007
* * * * * PC #7 * * * * *
28
Technologies Council (GTC) (which “was created in 1995 to promote a better understanding of
the role Gasification can play in providing the power, chemical and refining industries with
economically competitive technology options to produce electricity, fuels and chemicals in an
environmentally superior manner”) maintains a website with copious information about
gasification, IGCC, specific IGCC technologies, vendor products, and existing IGCC projects.
See
http://www.gasification.org/
.
75
Among other things, the GTC accurately explains that “Gasification offers the cleanest, most
efficient method available to produce synthesis gas from low or negative-value carbon-based
feedstocks such as coal, petroleum coke, high sulfur fuel oil or materials that would otherwise be
disposed as waste. The gas can be used in place of natural gas to generate electricity, or as a
basic raw material to produce chemicals and liquid fuels.” Among the important information
available on the GTC website are papers and presentations compiled into an on-line library that
can function as an important resource for both utilities and regulators.
See
http://www.gasification.org/library.htm
. Among the important resources on this website is
information about gasification generally, IGCC, and use of IGCC with low-rank coals;
76
information about the readiness of IGCC technology and the appropriateness of requiring
examination of IGCC as a part of the BACT analysis;
77
information about polygeneration and
capture of global warming gases from gasification plants;
78
and information about IGCC projects
currently in the works.
79
Indeed, the GTC’s 2006 annual conference this summer generated
literally dozens of papers and presentations about gasification and IGCC technology.
80
In the face of the remarkable wealth of available information, EPA has made the clearly arbitrary
decision to ignore IGCC entirely as a possible option for the proposed Desert Rock facility.
Even a cursory examination would demonstrate that IGCC is a technology that has arrived and
that is available
now
as an option for utilities planning new coal-based power plant projects,
81
and that information regarding the technology is readily available to appropriately inform the
top-down BACT decisionmaking process.
82
Moreover, it is clear that EPA is aware that IGCC is
75
The Depart ment of Energy also has a website dedicated to gasification:
http://www.netl.doe.gov/technologies/coalpower/gasification/database/database.html
76
http://www.gasification.org/Docs/Bismarck%2006/02Amick.pdf
.
;
http://www.gasification.org/Docs/Bismarck%2006/01Phillips.pdf
.
77
http://www.gasification.org/Docs/Tampa%2006/Ely.pdf
.
78
http://www.gasification.org/Docs/Bismarck%2006/03RJones.pdf
;
http://www.gasification.org/Docs/Bismarck%2006/05pan.pdf
.
79
http://www.gasification.org/Docs/Bismarck%2006/07Smet.pdf
80
http://www.gasification.org/Presentations/2006.htm
;
. Additional technical information about IGCC and carbon
capture and storage is available from U.S government websites, environmental organizations, and organizations like
the World Energy Council (see http://www.worldenergy.org/wec-geis/focus/ccs/
;
http://www.fe.doe.gov/sequestration/index.html; http://www.pewclimate.org/). The fifth annual conference on
carbon capture and sequestration was held this past May just outside Washington, D.C. (see
http://www.carbonsq.com/
81
Even the utility industry
).
is beginning to acknowledge the all-too-obvious fact that the time for IGCC has come
and that the nation must begin to seriously address its carbon future. See:
http://www.cleanenergypartnership.org/news/article_detail.cfm?id=231
. Sadly, when it come to carbon emissions,
82
global
In addition
warming,
to the
and
tremendous
advance coal
amount
technologof
activity
ies, even
directed
the utility
at refining
industry,
the
it
technology,
appears, is
making
out in front
it cheaper,
of EPA.
more
reliable, and more commercially attractive, the fact that there are now more than 25 proposals for IGCC plants
ELECTRONIC FILING, RECEIVED, CLERK'S OFFICE, JANUARY 5, 2007
* * * * * PC #7 * * * * *
29
a technology that is rapidly becoming a market force in the utility industry – for example, in July
2006 EPA issued a report entitled
Environmental Footprints and Costs of Coal-Based Integrated
Gasification Combined Cycle and Pulverized Coal Technologies,
83
which examined various
aspects of IGCC.
84
Given the wealth of available information, the fact that EPA has failed
utterly to examine the possibility of employing IGCC as a technology option for the proposed
Desert Rock plant is especially egregious and demonstrably at odds with its statutory
responsibilities.
85
EPA should conduct a full top-down analysis for this project, including (among other things)
examination of:
86
•
The technological availability of IGCC;
•
The dramatic reduction in pollutant emissions that IGCC is capable of achieving;
•
The various collateral environmental benefits of IGCC, including reductions of
non-PSD air pollutants, reductions in generation of solid waste, decreased water
use, and potential for capture and storage of global warming gases;
•
The potential for reduced impacts on soil, vegetation, endangered or threatened
species and habitat; and
•
The economic and energy benefits of IGCC fuel and product flexibility.
EPA has an independent and affirmative obligation to evaluate IGCC as a possible techno logy
option, and to specifically scrutinize any rationale offered by Sithe relating to IGCC.
87
nationwide make it clear that it is an option that is technologically available. See
http://www.netl.doe.gov/coal/refshelf/ncp.pdf
83
See
http://www.gasification.org/Docs/News/2006/EPA%20
.
-%20IGCC%20cf%20PC.pdf
.
84
This report however, by its own terms, was a snapshot in time of the state of IGCC, based on 2004 information –
information that is now badly out of date (especially given the rapid advances being made in this dynamic field).
Even from a PSD perspective, a two-year-old analysis is inadequate (PSD permits expire after eighteen months
precisely because the information upon which they are predicated is expected to become stale as processes and
control technologies become more effective at reducing pollutant emissions). In this case, the data upon which EPA
relied for its IGCC Footprints report simply cannot alone function as the basis for a case-specific analysis of IGCC
85
for
Other
the proposed
information
Desert
that
Rock
EPA
facility.
should consider in its examination of IGCC for Desert Rock includes among other
things:
http://www.ciel.org/Publications/CO2_Foote_11May04.pdf
(article by Greg Foote, former EPA Assistant General
Council); http://www.synapse-energy.com/Downloads/SynapsePaper.2006-06.Climate-Change-and-Power.pdf
(report by Synapse Energy Economics); http://www.grida.no/climate/ipcc_tar/wg2/index.htm
(Climate Change 2001
Report); http://www.synapse-energy.com/Downloads/SynapseReport.2006-02.SCE.Mohave-Alternative-
Generation-Resources.05-020.pdf
(Synapse Mojave Report); http://www.epa.gov/climatechange/ (information
available on EPA’s own climate web site); http://www.publicaffairs.noaa.gov/pdf/economic -statistics-may2006.pdf
(NOAA economic statistics); http://www.wvecouncil.org/issues/gambling_with_coal.pdf
(Union of Concerned
Scientists Report); STERN REVIEW ON THE ECONOMICS OF CLIMATE CHANGE, available at: http://www.hm-
treasury.gov.uk/Independent_Reviews/stern_review_economics_climate_change/sternreview_index.cfm
.
86
Given the wealth of information regarding IGCC, EPA is not subject to a reduced burden of regulatory
consideration
87
Sithe’s discussion
for IGCC.
of IGCC
See In
in
re
its
Mecklenburg
“Design Comparison”
, 3 E.A.D.
document
492, 494 n.3
is woefully
(Adm’r 1990).
inadequate and in many ways
disingenuous. For example, the document is intentionally misleading about the level of emissions performance
achievable using IGCC (IGCC is capable of performing
much
better then Sithe suggests, as evidenced by the best
emission limits included in permit applications for IGCC plants); it also incorrectly suggests that altitude would
stand as a technological barrier to the use of IGCC (at most issues related to altitude would raise cost considerations
ELECTRONIC FILING, RECEIVED, CLERK'S OFFICE, JANUARY 5, 2007
* * * * * PC #7 * * * * *
30
Moreover, the public is entitled to examine and comment on EPA’s analysis and conclusions – to
the extent that the public has been denied that opportunity by EPA’s failure to independently
examine IGCC (or to specifically scrutinize Sithe’s analysis and conclusion) EPA’s permit
decision is procedurally flawed and must the withdrawn and corrected, and the public must be
given an opportunity to meaningfully participate through additional notice and comment
proceedings.
88
that would need to be examined at step four of the BACT analysis – but without a full BACT analysis this issue has
not been adequately explored).
88
The following materials are incorporated by reference and are attached to this letter as
Attachment 9
: (1)
LETTER TO STEPHEN L. JOHNSON, ADMINISTRATOR, US ENVIRONMENTAL PROTECTION AGENCY
RE: December 13, 2005 Memorandum “Best Available Control Technology Requirements for Proposed Coal-Fired
Power Plant Projects,” signed by Stephen D. Page, Director, EPA Office of Air Quality Planning and Standards. (2)
APPENDICES TO LETTER TO STEPHEN L. JOHNSON, ADMINISTRATOR, US ENVIRONMENTAL
PROTECTION AGENCY RE: December 13, 2005 Memorandum “Best Available Control Technology
Requirements for Proposed Coal-Fired Power Plant Projects,” signed by Stephen D. Page, Director, EPA Office of
Air Quality Planning and Standards.
(a)
APPENDIX 1
. Letter from Mr. Stephen D. Page, Director, US EPA Office of Air Quality Planning and
Standards (OAQPS), to Mr. Paul Plath, Senior Partner, E3 Consulting, LLC, “Best Available Control Technology
Requirements for Proposed Coal-Fired Power Plant Projects,” (December 13, 2005). Also available at
http://www.epa.gov/Region7/programs/artd/air/nsrmemos/igccbact.pdf
(last visited February 6, 2006). (b)
APPENDIX 2
. Letter from Mr. Paul Plath, Senior Partner, E3 Consulting, LLC, to Mr. Steve Page and Mr. Dan
Deroeck, U.S. EPA, “Analysis of Best Available Control Technology for a Non-Specific Coal-Fired Power Project”
(February 28, 2005). (c)
APPENDIX 3
. “EPA’s Position on IGCC,” electronic mail from Richard Long, Director,
U.S. EPA Region 8 Air and Radiation Program to Don Vidrine, Bureau Chief, Air Resources Management Bureau,
Montana Department of Environmental Quality, and to other state permitting authorities in Region 8 states
(December 13, 2005)(covering and forwarding an email from Scott Mathias, Associate Director, Information
Transfer and Program Integration Division, U.S. EPA Office of Air Quality Planning and Standards, also dated
December 13, 2005, and attaching the Page memo, the February 2005 E3 Plath request letter, and an EPA document
entitled “igcc bact q&a.doc”). (d)
APPENDIX 4
. Gregory B. Foote, Considering Alternatives: The Case For
Limiting CO2 Emissions From New Power Plants Through New Source Review, 34 ELR 10642 (July 2004). (e)
APPENDIX 5
. Jay Ratafia-Brown, et al., Major Environmental Aspects of Gasification-Based Power Generation
Technologies, Final Report ES-5 (DOE/NETL Contract Number DE-AT26-99FT20101 (December 2002). (f)
APPENDIX 6
. The ERORA Group, L.L.C., Prevention of Significant Deterioration, Title V Operating Permit &
Phase II Acid Rain Joint Application for Cash Creek Generating Station, Henderson County KY, Volume 1 of 2,
(July 2005). (g)
APPENDIX 7
. Wisconsin Department of Natural Resources Permit No. 03-RV-166, Elm Road
Generating Station North Site With Accommodations (January 14, 2004). (h)
APPENDIX 8
. Edward Lowe,
General Manager, Gasification, GE Energy, GE’s Gasification Developments, presented at Gasification
Technologies 2005 Conference, San Francisco, CA, (October 10, 2005). (i)
APPENDIX 9
. Ron Herbanek,
Mechanical Engineering Director, E-Gas and Thomas A. Lynch, Project Development Manager, ConocoPhillips, E-
Gas Applications for sub-Bituminous Coal, presented at Gasification Technologies 2005 Conference, San Francisco,
CA, (October, 11 2005). (j)
APPENDIX 10
. George Boras and Neville Holt, EPRI, Pulverized Coal and IGCC
Plant Cost and Performance Estimates, presented at the Gasification Technologies 2004 Conference Washington DC
(October 3-6, 2004). (k)
APPENDIX 11
. The ERORA Group, Taylorville Energy Center IGCC Feasibility
Analysis, report prepared pursuant to agreement no. SIUC 04-15 with Southern Illinois University (January 2005).
(l)
APPENDIX 12
. Robert J. Wayland, U.S. EPA Office of Air and Radiation, OAQPS, “U.S. EPA’s Clean Air
Gasification Activities”, Presentation to the Gasification Technologies Council Winter Meeting, January 26, 2006.
(m)
APPENDIX 13
. Robert J. Wayland, U.S. EPA Office of Air and Radiation, OAQPS, “U.S. EPA’s Clean Air
Gasification Initiative”, Presentation at the Platts IGCC Symposium, June 2, 2005. (n)
APPENDIX 14
. Letter from
Renee Cipriano, Director, Illinois Environmental Protection Agency, to Mr. Thomas Skinner, Regional
Administrator, U.S. EPA Region V, Re: Scope of Evaluation of Best Available Control Technology (BACT)
Integrated Gasification Coal Combustion (IGCC) (March 19, 2003). (o)
APPENDIX 15
. Letter from Donald E.
Sutton, Manager, Permit Section, Division of Air Pollution Control, Illinois Environmental Protection Agency, to
Jim Schneider, Indeck-Elwood LLC, “Request for Additional Information” Re: Application No. 02030060 (March
ELECTRONIC FILING, RECEIVED, CLERK'S OFFICE, JANUARY 5, 2007
* * * * * PC #7 * * * * *
31
Below we have provided an analysis of IGCC in a top-down BACT review and the results
indicated that IGCC is the top technology.
IGCC Analysis for the DREF
Step 1: Identify All Available Control Technologies.
Conclusion: IGCC is an Available Control Technology
Coal gasification projects have gained wide acceptance in the United States among coal
developers in the last two years. Today, over half the new coal projects proposed in some
Midwestern states would use gasification to produce electricity, methane, fertilizer, and low-
sulfur diesel fuel from coal. These projects include:
•
Two 629 MWe IGCC plant to be built by the nation’s largest utility, American Electric
Power Company (AEP), in Ohio and West Virginia scheduled to be operational in
2010;
•
600 MWe IGCC plant proposed by the nation’s fourth largest utility, Cinergy, near
Edwardsport, Indiana;
•
630 MW IGCC plant proposed by Tondu in Texas;
•
630 MW IGCC plant proposed by Energy Northwest in Washington
•
330 MW IGCC plant proposed by Summit in Oregon,
•
Three repowering projects to take old PC plants and convert them to IGCC by NRG in
CT, DE, and NY. Each would be 630 MW
•
Two 630 MW IGCC plants proposed by the ERORA Group (one in Illinois and one in
Kentucky) and
•
Two 606 MWe IGCC in Hoyt Lake Minnesota by Excelsior Energy
Other gasification projects include Power Holdings in Illinois and Peabody in Illinois, both of
which would make methane from coal; Rentech in Illinois which would make fertilizer from
coal, and Baard Energy in Ohio that would produce F-T diesel from coal, and a variety of
coal to diesel projects in the West and Midwest. The figure below illustrates the range
and locations of gasification projects across the United States
89
:
8, 2003). (p)
APPENDIX 16
. Hearing Officer’s Report and Recommended Secretary’s Order, Sierra Club, et al. v.
Environment & Pub. Prot. Cabinet, File Nos. DAQ-26003-037 & DAQ-26048-037 (Environmental and Public
Protections Cabinet, Commonwealth of Kentucky 2005) (EXCERPTS). (q)
APPENDIX 17
. In re Air Quality
Permit for the Roundup Power Project (Permit No. 3182-00), Case No 2003-04 AQ (MT BER, June 2003). (r)
APPENDIX 18
. Letter from Richard L. Goodyear, New Mexico Environment Department to Mr. Larry Messinger,
Mustang Energy Corporation, L.L.C. (December 23, 2002). (s)
APPENDIX 19
. Letter from Raj Solomon, New
Mexico Environment Department to Ms. Diana Tickner, Vice President, Peabody Energy (Septemb er 16, 2005). (t)
APPENDIX 20
. West Virginia DAQ, Longview, Permit No. R-14-0024, Response to Comments 2 (Comments
Received Between October 1, 2003 and January 14, 2004)(EXCERPTS). Most of these documents are available at
www.catf.us/advocacy/legal/BACT_LAER
.
89
Phil Amick, “Experience with Gasification of Low-Rank Coals,” presented at Workshop on Gasification
Technologies, Bismark North Dakota, June 28, 2006.
ELECTRONIC FILING, RECEIVED, CLERK'S OFFICE, JANUARY 5, 2007
* * * * * PC #7 * * * * *
32
Two full scale commercial IGCC electric generating units are in operation in the United States:
Tampa Electric Company’s 262 MW unit at the Polk plant in Florida and Cinergy’s 192 MW
unit at the Wabash River plant in Indiana, which both rely on coal as a fuel source.
90
Two other
coal-based IGCC plants operate in Europe, NUON/Demkolec is a 253 MW plant in the
Netherlands, and ELCOGAS in Spain is 298 MW.
91
IGCC units can be constructed with
multiple gasifiers to achieve unit availability at levels comparable to those of conventional
baseload facilities. For instance, the Eastman Chemical plant in Kingsport, Tennessee has
utilized a dual-gasifier design to produce chemicals from syngas and has experienced 98 percent
availability since 1986.
92
Worldwide there are 131 gasification projects in operation with a combined capacity equivalent
to 23,750 MW of IGCC units.
93
An additional 31 projects are planned that would increase this
capacity by more than 50 percent.
94
Although not all of these projects produce electricity from
coal, they demonstrate widespread commercial application of gasification technology for fuel
processing, one of two key components of an IGCC plant. The second component is a combined
90
Resource Systems Group, Inc., EPIndex. See www.epindex.com
91
Major Environmental Aspects of Gasification-Based Power Generation Technologies, Dec 2002, Table 1-7, page
1
92
-26.
Smith, R.G., “Eastman Chemical Plant Kingsport Plant Chemicals from Coal Operations,1983-2000,” 2000
Gasification Technologies Conference.
93
Simbeck, Dale, SFA Pacific Inc. Gasification Technology Update, presented to the European Gasification
Conference, April 8-10, 2002. The total capacity is based on output of synthesis gas. Many of these projects produce
chemicals in addition to or instead of electricity.
94
Id.
QuickTime™ and a
TIFF (LZW) decompressor
are needed to see this picture.
ELECTRONIC FILING, RECEIVED, CLERK'S OFFICE, JANUARY 5, 2007
* * * * * PC #7 * * * * *
33
cycle electricity generating system, which is now commonplace for new natural gas fired power
plants.
IGCC units are available from major well-known vendors. Coal gasification equipment is
available from GE, Shell, and ConocoPhillips. The National Coal Council, in a May 2001 report,
confirms that IGCC is "viable, commercially available technology."
95
The Center for Energy and
Economic Development (CEED) states that, “IGCC technology is available for deployment
today.”
96
Step 2. Eliminate Technically Infeasible Options.
Conclusion: IGCC is a Technically Feasible Option for the DREF.
This step of the BACT analysis eliminates options based upon physical, chemical, and
engineering principles that would preclude the successful use of the control option. Two issues
appear to be uncontroversial with respect to IGCC technology. They are:
1) The design fuel for the DREF poses no technical barrier for using IGCC. As discussed in
the attached Affidavit from John Thompson, gasification has been extensively used with
subbituminous coals in the United States.
2) Water use poses no barrier IGCC deployment at the DREF site. That’s because an IGCC
plant uses approximately one-half to two-third less water than a pulverized coal plant.
97
3) Plant Size: The 1,500 MW DREF facility would be larger than any IGCC plant in the
nation. The Wabash, Polk, ELCOGAS, and NUON plants are all roughly 270 MW.
Existing IGCC plants in Italy are 500 –600 MW, and IGCC plants in Europe (Nuon
Magnum) will be 1200 MW. Mesaba One and Two would be 1212 MW (subbituminous
coal) To scale up an IGCC plant to 1336MW would involve 5 gasifier trains, consisting
of a gasifier, combustion turbine, and HRSG. The addition of more trains does not pose a
technical barrier. In Italy, refinery IGCC plants operate at more than 500 MW, which
consist of two trains and a spare gasifier. Moving to 5 trains and a spare is a natural
extension of previous plants.
4) Availability: IGCC plants have demonstrated availabilities of 85% for single train
gasifiers in the United States. As described more fully in the affidavit by John
Thompson, Italian IGCC plants are achieving greater than 90% availability with and
without a spare gasifier.. Therefore, plant availability poses no technical barriers for an
IGCC plant at the DREF site.
95
National Coal Council, Increasing Electricity Availability from Coal-Fired Power Plants in the Near Term, p. 20
(May
96
See
2001).
www.ceednet.org/fueling/investing.asp
97
Major Environmental Aspects of Gasification-Based Power Generation Technologies, U.S. DOE/NETL,
December 2002 at page 2-61.
ELECTRONIC FILING, RECEIVED, CLERK'S OFFICE, JANUARY 5, 2007
* * * * * PC #7 * * * * *
34
Step 3. Rank Remaining Control Technologies by Control Effectiveness
Conclusion: IGCC is the Top Ranked (i.e. Lowest Emission Rate) Control Technology.
The coal gasification fuel-processing step in IGCC power plants results in superior
environmental performance and lower emissions compared to the pulverized coal technology
that is proposed for the DREF. Gasifying coal at high pressure prior to combustion facilitates
removal of pollutants that would otherwise be released into the air.
Attached to these comments is an affidavit by John Thompson that summarizes recent IGCC air
permit applications and air permits. The table below summarizes the findings:
ELECTRONIC FILING, RECEIVED, CLERK'S OFFICE, JANUARY 5, 2007
* * * * * PC #7 * * * * *
35
Table 2: Summary of Recent IGCC Permits and Proposed Permit Levels
Approved Permit
Application Filed, Draft Permit Not Issued Yet
Pollutant
Global
Energy
Lima, Oh,
590 MW
Kentucky
Pioneer
Energy, KY
Wisconsin
Electric Elm
Road, 600 MW
ERORA Cash
Creek, KY, 630
MW
Southern Illinois
Clean Energy
Complex, IL, 640
MW & 110
MMSCF methane
ERORA,
Taylorville, IL
630 MW
Nueces,
TX, 600
MW
Energy
Northwest,
WA, 600 MW
AEP, OH,
629 MW
AEP, WV,
629 MW
Mesaba One
(606 MW),
Mesaba Two
(606), MN,Total
1,212 MW
Duke,
Edwardsport,
IN, 630 MW
lb/MMBtu
lb/MMBtu
lb/MMBtu
lb/MMBtu
lb/MMBtu
lb/MMBtu
lb/MMBtu
lb/MMBtu
lb/MMBtu
lb/MMBtu
lb/MMBtu
lb/MMBtu
SO2
0.021
0.032 -3 hr ave
0.03 -24 hr ave
0.0117 -3 hr ave
0.033 -30 day ave
0.0117 -3 hr
ave
0.019
0.016 -3 hr
ave
0.017
0.017
0.025
Repower, net
from BACT
NOx
0.097
0.0735 -3 hr
ave
0.07 (15 ppmdv)
-30 day ave
0.0246- 24 hr ave
0.059 -30 day ave
0.0246 -24 hr
ave
0.019
0.012 -3 hr
ave
0.057
0.057
0.057
Repower, net
from BACT
Mercury
.56 x 10- 6
.197 x10-6 (1)
.547 X10-6
.19 x 10- 6 (1)
1.825 x10⁻⁶
1.1 x10⁻⁵
90% removal
.026 tons Phase
I and II total
.008 tons/yr
PM
0.01
.0.011
0.011 (backhalf)
0.015
0.001
0.009
18.1 lbs/hr
PM10
0.011 (backhalf)
0.0063 -3 hr ave
(filterable)
0.00924
(filterable)
0.0063 -3 hr
ave (filterable)
0.014
.006
(filterable)
.006
(filterable)
VOCs
0.0082
0.0044
0.0017 -24 hr ave
(LAER) (3)
0.006 -24 hr ave
0.0029
0.006 -24 hr
ave
0.004
0.003
0.001
0.001
0.0032
1.4 ppmvw
H2SO4
0.0005 -3 hr ave
0.0026 -3 hr ave
0.0042 -30 day
ave
0.0026 -3hr ave
0.0001
98 tons/yr
98 tons/yr
CO
0.137
0.032 -3 hr ave
.030 -24 hr ave
0.036 -24 hr ave
0.04 -30 day ave
0.036 -24 hr
ave
0.04
0.036
0.031
0.031
0.0345
15 ppmvd
Lead
0.0000257
Fluorides(2)
Sulfur Control
Technology
MDEA
MDEA
MDEA
Selexol
MDEA
Selexol
Selexol
Selexol
Selexol
Selexol
MDEA
Selexol
NOx Control
Technology
Diluent
injection
Diluent
injection
Diluent injection
Diluent/SCR
Diluent injection
Diluent/SCR
Diluent/SCR
Diluent/SCR
Diluent
injection
Diluent
injection
Diluent injection
Diluent/SCR
(1) Application estimates this emission limit but does not proposed an emission limit
(2) No limit established. Fluorides from IGCC plants are below PSD significance
(3) Polk IGCC also has this emission rate effective July 2003 as set by BACT.
ELECTRONIC FILING, RECEIVED, CLERK'S OFFICE, JANUARY 5, 2007
* * * * * PC #7 * * * * *
36
Table 2 shows the emission rates for IGCC plants permitted since 2001 and recently filed air
permit applications for proposed IGCC plants.
Table 2 shows several trends:
1) The majority of IGCC plants proposed in the last 12 months have sought to control sulfur
using Selexol, a more effective control strategy than MDEA. These plants include:
•
AEP in Ohio (application filed Oct 2006)
•
AEP in W Virginia (application filed Oct 2006)
•
Northwest Energy (application filed September 2006)
•
Tondu in Texas (application filed September 2006)
•
Duke in Indiana (application filed August 2006)
•
ERORA (revised application filed June 2006)
•
ERORA in Illinois (revised application filed March 2006)
Only one air permit application filed in the last 12 months, Mesaba (filed June 2006) uses the
less effective MDEA.
Selexol effectively removes sulfur levels to between .00117 to .0019 lb/MMBtu heat input
into the gasifier.
2) A narrow majority of IGCC plants that have filed applications in the last 12 months
include SCRs to control NOx. These include:
•
Northewest Energy
•
Tondu
•
ERORA in Illinois
•
ERORA in Kentucky
•
Duke in Indiana
The NOx emission rates for SCR controlled IGCC plants is .012 - .025 lb/MMBtu based upon
heat into the gasifier.
These trends toward Selexol and SCR are occurring faster than USEPA predicted in its recently
released (July 2006) report, “Environmental Footprints and Costs of Coal-Based Integrated
Gasification Combined Cycle and Pulverized Coal Technologies.” The July 2006 EPA report
assumed that MDEA and diluent injection would be BACT for the near-term. Clearly, the
market has responded with technology faster than the USEPA report anticipated.
ELECTRONIC FILING, RECEIVED, CLERK'S OFFICE, JANUARY 5, 2007
* * * * * PC #7 * * * * *
37
Table 3 summarizes the range of recently filed air permit for IGCC plants (filed in the last 12
months plus the most recently issued air permit for We Energies in Wisconsin) and compares
them to the proposed DREF permit.
Table 3: Emission Rates of Proposed DREF Permit Compared to IGCC Requested Rates
DREF
IGCC
Proposed
Emission
Rates
a
Sulfur control
using MDEA
Sulfur control
using Selexol
Nitrogen
control using
diluent
injection
Nitrogen control
using both diluent
injection and SCR
(lb/MMBtu) (lb/MMBtu)
(lb/MMBtu)
(lb/MMBtu) (lb/MMBtu)
SO2
0.06
.025-.033
.0117-.019
NOx
0.06
.057-.07
.012-.025
PM
(filterable)
0.010
0.0063-0.014
PM10
(total)
0.020
CO
0.10
0.03-0.04
Sulfuric
Acid Mist
0.0040
0.0005-0.0042
VOC
0.0030
0.001-0.006
Hg
No limit
0.00000019-0.00000056
a
All proposed DREF emission rates listed would apply on a 24-hour average basis with the
exception of the limit for sulfuric acid mist which would apply on a 3-hour average basis.
As Table 3 shows, recently all permitted and proposed IGCC plants have lower limits for SO2,
NOx, PM (filterable), and CO, and some facilities also have lower sulfuric acid mist and VOC
limits. The SO2 removal rates correspond to over 99.2% with Selexol and around 98% -99%
with MDEA. The DREF removal rate, in contrast, is only about 96.8%.
The differences between IGCC with Selexol and SCR and DREF emission rates are vast. An
IGCC plant can be expected to emit approximately one-third as much sulfur dioxide, one-third as
much nitrogen oxide, about 40% less PM, two-thirds less CO, and significantly less sulfuric acid
mist and VOCs.
Sithe incorrectly estimates the emissions of an IGCC plant by assuming that the likely control
devices would involve MDEA and diluent injection, using higher emission rates for other criteria
pollutants than current BACT applications show, and assuming the IGCC plant to be less
efficient than it actually would be.
ELECTRONIC FILING, RECEIVED, CLERK'S OFFICE, JANUARY 5, 2007
* * * * * PC #7 * * * * *
38
Step 4. Evaluate the Most Effective Controls and Document the Results.
Conclusion: Evaluation of Economic, Environmental and Energy Impacts Confirms that IGCC
is the Effective Control Technology.
Economic Impacts:
1. Heat Rate - In October 2005, ConocoPhillips presented a paper at the Gasification
Technologies Council Conference entitled, “E-Gas Applications for Sub-bituminous Coal.” The
report describes the design, environmental performance and costs for a 555 MW (net) IGCC
plant at an altitude and coal heat content comparable to Desert Rock.
Sithe also assumed ConocoPhillips gasifiers in its September 2005 report to Region 9. The table
below compares Sithe’s estimate of IGCC design at Desert Rock to design in the ConocoPhillips
presentation (scaled to the same size and including spare):
Table 4
As the table shows, the Sithe report significantly overstates the heat rate and the number of
turbines needed for an IGCC plant at the Desert Rock site.
USEPA estimates the heat rate of an IGCC plant to be even lower on subbituminous coals. In its
report, “Environmental Footprints and Costs of Coal-Based Integrated Gasification Combined
Design
Presented
by Sithe (1)
Design based
on CP
Presentation
(2)
Design based on CP
Presentation (2)
Spare
With spare
No Spare
With Spare
Net Power (MW)
1366
1387
1387
Net Heat rate (HHV)
9775
9075
9075
altitude
5415 MSL
5000 MSL
5000 MSL
coal heat content
(Btu/lb)
8953
8340
8340
Number of gasifiers
12
10
12
Number of Turbines
7 GE7FA 5 SGT6-5000F
5 SGT6-5000F
Number of Air Separation
Units
6
not specified
not specified
Pollution controls
not specified
Selexol/SCR
Selxol/SCR
Notes
1. "Desert Rock Energy Project Design Comparison to Integrated Gasification
Combined Cycle and Circulating Fluidized Bed Combustion,”
ENSR Corporation, September 2005, at 4-9.
2. "E-Gas Applications on Sub-bituminous Coals," Presentation
by ConocoPhillips, October 2005.
ELECTRONIC FILING, RECEIVED, CLERK'S OFFICE, JANUARY 5, 2007
* * * * * PC #7 * * * * *
39
Cycle and Pulverized Coal Technologies,” USEPA estimates the heat rate of a supercritical PC
as 9,000 Btu/kWh and an IGCC as 8,520 Btu/kWh.
98
An IGCC is either more efficient or nearly equivalent to a supercritical PC plant at the Desert
Rock location using coal with a heat content of 8,900 Btu/lb. The Sithe report incorrectly
reaches the wrong conclusion
2. Capital Costs and Cost of Electricity
Sithe estimates that an IGCC at the Desert Rock site would cost $250/kW to $400/kW higher
than a PC plant. Sithe estimates that the cost of electricity using IGCC at the Desert Rock
location would be between $3.5/MWh and $6/MWh. According to the affidavit filed by John
Thompson, these cost estimates represents a conservative upper bound for both the capital cost
premium for an IGCC plant at the Desert Rock location and the added cost of electricity. As
noted in the affidavit, the costs could be lower due the acquisition by Siemens of the Future
Energy gasification technology that is well adapted to inexpensively gasify low-rank coals, rising
PC costs, and advances in the IGCC learning curve.
In any case, these added costs are small compared to the enormous reduction in criteria
pollutants emitted if the Desert Rock plant employed IGCC technology, As described more fully
in the Thompson affidavit, the table below shows the emissions for Desert Rock as a
conventional plant, Sithe’s estimates for an IGCC at Desert Rock, and more realistic estimates
for heat rate and emission limits based upon more recent applications.
98
USEPA, Environmental Footprints and Costs of Coal-Based Integrated Gasification Combined Cycle and
Pulverized Coal Technologies, July 2006, at page ES -7.
ELECTRONIC FILING, RECEIVED, CLERK'S OFFICE, JANUARY 5, 2007
* * * * * PC #7 * * * * *
40
Sithe incorrectly calculates the main pollutant benefit (as measured by tons) as a 1,726 ton per
year of SO2. In fact, the total tons of pollutants removed are more nearly 8,700 tons/yr. As a
result, Sithe incorrectly calculates the benefit computes the incremental cost of $23,000 to
$40,000 per ton of SO2 controlled. A more plausible incremental value ranges between
$4,500/ton and $7,600/ton, a range considered cost effective.
Environmental Issues: Greenhouse Gases:
IGCC also has several other environmental
advantages beyond its reductions in criteria pollutants. Carbon dioxide (CO
2
) removal is easier
and less expensive at IGCC units than at other coal-fired plants. Because an IGCC plant is
typically more efficient in terms of heat rate compared to a PC unit,
99
CO
2
emissions -- the
primary greenhouse gas responsible for anthropogenic contributions to global warming -- are
also reduced by that same amount.
Furthermore, IGCC has an option to make even deeper cuts in carbon dioxide that conventional
coal plants cannot do. The CO
2
in the syngas can be captured and sequestered at a fraction of
the cost of post-combustion carbon capture and sequestration other coal plants.
The reduced CO
2
emissions rate has important environmental benefits in addressing the urgent
problem of global climate change and also reduces increased costs due to future climate change
regulations.
99
USEPA, Environmental Footprints and Costs of Coal-Based Integrated Gasification Combined Cycle and
Pulverized Coal Technologies, July 2006, at page ES -7..
Parameter
Desert Rock
IGCC
Corrected IGCC Units
Average Heat Rate
8792
9755
9075 Btu/kw
SO2 Emissions
0.06
0.0229
0.0117 lb/MMBtu
SO2 emissions
2998
1272
590 ton/yr
IGCC benefit
Decrease 1726 Decrease 2408ton/yr
NOx emissions
0.06
0.06
0.012 lb/MMBtu
NOx emissions
2998
3333
605 ton/yr
IGCC benefit
Increase 335 Decrease 2393 ton/yr
PM emissions
0.01
0.01
0.0063 lb/MMBtu
PM emissions
500
556
317 ton/yr
IGCC benefit
Increase 56
Decrease 183ton/yr
VOC emissions
0.003
0.003
0.001 lb/MMBtu
VOC emissions
150
167
50 ton/yr
IGCC benefit
Increase 13.5
Decrese 100 ton/yr
CO emissions
0.1
0.04
0.03 lb/MMBtu
CO emissions
4997
2222
1513 ton/yr
IGCC benefit
Decrease 2775 Decrease 3484ton/yr
Sulfuric Acid Mist emissions
0.004
0.0023
0.0005 lb/MMBtu
Sulfuric Acid Mist emissions
200
128
25 ton/yr
IGCC benefit
Decrease 72
Decrease 175ton/yr
Mercury emissions
9.28E-06
2.52E-06
1.90E-07 lb/MMBtu
Mercury emissions
103
29
19 lb/yr
IGCC benefit
Decrease 75
Decrease 84lb/yr
Estimated by Sithe
ELECTRONIC FILING, RECEIVED, CLERK'S OFFICE, JANUARY 5, 2007
* * * * * PC #7 * * * * *
41
Environmental Issues, Solid Wastes:
The waste leaving an IGCC plant is vitrified, thereby
potentially reducing some of the solid waste disposal issues associated with coal combustion.
Indeed, IGCC plants produce 30-50% less solid waste than PC plants.
100
Also, because of the
better heat rate associated with IGCC, less coal would have to be mined when compared to
conventional coal plants.
Energy Issues:
As noted above, IGCC plants are 10-15% more efficient than PC plants. IGCC is
ranks above PC when energy issues are addressed.
Step 5. Select BACT
Conclusion: IGCC is BACT for the DREF
In summary, IGCC is clearly an available method, system and technique for producing electricity
from the subbituminous coal to be utilized at the DREF and thus must be fully and fairly
evaluated in the BACT analysis for this facility. Our analysis described above and supported by
the attached Thompson Affidavit demonstrates that, had EPA properly evaluated IGCC in the
DREF BACT analysis, IGCC would have been the selected technology for the DREF facility.
4. THE PROPOSED BACT EMISSION LIMITS FAIL TO REFLECT THE MAXIMUM
LEVEL OF CONTROL THAT CAN BE ACHIEVED
The NO
x
Emission Limit Does Not Reflect BACT
EPA has proposed a NO
x
BACT limit of 0.06 lb/MMBtu on a 24-hour average basis. (Condition
IX.E.2. of the proposed permit). This is the same as what was proposed by Sithe for the DREF.
(May 2004 DREF PSD Permit Application, at 4-9). However, neither the DREF PSD Permit
Application nor the EPA’s AAQIR provide any discussion or analysis of whether this emission
limit reflects the maximum degree of reduction of NO
x
that can be achieved at DREF. Instead,
Sithe has proposed an emission limit slightly lower than what is typically proposed as NO
x
BACT at new coal-fired power plants today, and claims that it reflects the lowest achievable
emission rate (LAER).
Id.
While this proposed NO
x
emission limit is one of the lowest emission limits proposed for any
new coal-fired power plant, it does not necessarily reflect the maximum degree of reduction in
NO
x
emissions that can be achieved as required by the definition of BACT at 40 C.F.R.
§52.21(b)(12). Vendor literature for ultra low NO
x
burners shows that extremely low NO
x
emission rates can be achieved from ultra low NO
x
burners. (See www.babcock.com
). For
example, a Babcock & Wilcox study of a retrofit of ultra low NO
x
burners at the 690 MW W.A.
Parrish power plant showed that a NO
x
emission rate of 0.17 lb/MMBtu was achievable
at full
100
Major Environmental Aspects of Gasification-Based Power Generation Technologies, US DOE, December 2002,
Table 1-7, Page 1-27.
ELECTRONIC FILING, RECEIVED, CLERK'S OFFICE, JANUARY 5, 2007
* * * * * PC #7 * * * * *
42
load.
101
Further, according to Babcock & Wilcox, commercial SCR installations have shown
that 90% NO
x
reductions can be achieved with low ammonia slip.
102
Indeed, Babcock & Wilcox
states that up to 95% NO
x
control can be achieved with SCR. Thus, considering 90% control
and a NO
x
emission rate exiting the boiler of 0.17 lb/MMBtu, a NO
x
emission rate of 0.017
lb/MMBtu should be considered to reflect the maximum degree of reduction achievable.
While Sithe did include a brief discussion in its May 2004 PSD Permit Application
regarding the W.A. Parrish power plant in Texas, which also uses selective catalytic
reduction (SCR) in addition to the ultra low NO
x
burners and which is required to meet a
NO
x
emission limit of 0.03 lb/MMBtu (May 2004 DREF PSD Permit Application at 4-4
to 4-5), Sithe discounted this lower NO
x
emission rate on various points including that
the facility will be using Powder River Basin coal, that this facility was operating in a
nonattainment area, and that compliance with this emission rate had not yet been
demonstrated in practice. However, Sithe failed to provide sufficient detailed
information as to why this or similar emission limits could not be met with the coal that is
currently planned for DREF. The fact that the source was operating in an ozone
nonattainment area is irrelevant. Even lowest achievable emission rate (LAER)
determinations required under nonattainment NSR permits are to be considered in the
BACT analysis. See October 1990 draft New Source Review Workshop Manual at B.5.
While the area that DREF is proposing to locate is not currently an ozone nonattainment
area, the northwestern part of New Mexico has monitored extremely high levels of ozone.
As discussed elsewhere in this comment letter and in an attachment, Sithe has failed to
verify whether the DREF will cause or contribute to ozone NAAQS violations in the
region. Further, the state of New Mexico has entered into an Early Action Compact
(EAC) with EPA as a pre-emptive move to avoid being designated as a nonattainment
area for ozone.
103
Thus, although the DREF is not formally subject to a NO
x
LAER
determination under the New Source Review rules, EPA is bound to consider
environmental impacts in determining the maximum degree of NO
x
reduction achievable
and in setting the NO
x
BACT limits. Such environmental impacts should include that the
area is essentially a borderline ozone nonattainment area. Thus, the lowest emission rates
and maximum degree of NO
x
emission reductions must be evaluated by Sithe in its
BACT analysis.
Further, whether compliance with this emission rate had been achieved is not as relevant in the
BACT analysis as whether there is sufficient information such as manufacturing data and
engineering estimates showing that the emission rate
can
be achieved. See, e.g., New Source
Review Workshop Manual (October 1990 draft) at B.24. Rather than attempt to discount this
data for the W.A. Parrish plant, Sithe instead should have evaluated the lowest level of NO
x
101
See Bryk, S.A., R.J. Kleisley, A.D. LaRue, H.S. Blinka, R.M. Gordon, and R.H. Hoh, First Commercial
Application of DRB-4Z
TM
Ultra Low-NOx Coal-Fired Burner, presented at POWER GEN International 2000,
102
November
See Bielawski,
2000. (
Attachment
G.T., J.B. Rogan,
14
).
and D.K. McDonald, How Low Can We Go? Controlling Emissions in New
Coal-Fired Power Plants, Presented to the U.S. EPA/DOE/EPRI Combined Power Plant Air Pollutant Control
Symposium:
103
December
“The
20, 2002
Mega
Early
Symposium,”
Action Compact
August
Memorandum
2001. (
Attachment
of Understanding,
15
.)
available at
http://www.nmenv.state.nm.us/aqb/ozonetf/index.html.
ELECTRONIC FILING, RECEIVED, CLERK'S OFFICE, JANUARY 5, 2007
* * * * * PC #7 * * * * *
43
emissions that
could
be met with state-of-the-art low NO
x
burners at DREF, and then evaluated
the maximum degree of reduction of NOx that could be achieved with the addition of SCR.
Sithe did not provide information on the NO
x
emission rate that is expected to be emitted from
the DREF boilers considering the low NO
x
burners. The permit analysis for the recently issued
Intermountain Power Plant Unit 3 PSD permit indicated that the NO
x
emission rate expected
from low NO
x
burners at that unit, which would burn western bituminous coal from Utah, would
be 0.35 lb/MMBtu. Attached hereto and listed as
Attachment 16
in the attached exhibit list
hereto, March 22, 2004 Modified Source Plan Review for Intermountain Power Service
Corporation at 9. Assuming that DREF would achieve a similar or better level of NO
x
control
with its planned low NO
x
burners (and a lower emission rate is more likely considering its
planned supercritical boiler), that would mean a 0.06 lb/MMBtu NO
x
emission rate reflects at
best an 82.9% reduction in NO
x
from the SCR. Yet, vendors have indicated that at least 90%
NO
x
control can be consistently achieved with SCR systems.
In addition, a recently issued permit for a coal-fired power plant set a NO
x
emission limit
that reflects 0.05 lb/MMBtu on a 24-hour basis. Specifically, the Trimble County LG&E
coal-fired power plant, a 750 MW unit with a supercritical pulverized coal boiler with
maximum heat input capacity of 6,942 MMBtu per hour, was issued a permit on
November 17, 2005 that includes a NO
x
limit of 4.17 tons per calendar day. November
17, 2005 Title V Air Quality Permit for the Trimble County Generating Station (Permit
Number V-02-043 Revision 2), at 27-28 (Attached hereto and listed as
Attachment 17
in
the attached exhibit list hereto). When the unit is operating at maximum heat input
capacity, this equates to a NO
x
limit of 0.05 lb/MMBtu per 24-hour period. This facility
will burn eastern bituminous coal or a blend of western subbituminous and eastern
bituminous coal. While this NO
x
emission limit was not a BACT limit, it was to reflect
“BACT type controls with similar emissions levels.”
Id.
at 27. Further, PSD permit
applicants are not bound only to what has been required as BACT in determining an
emission limit reflecting the maximum degree of emission reduction that can be
achieved. Instead, the permit applicant and permitting authority must examine all of the
relevant data available, and evaluate the maximum degree of reduction that can be
achieved as the top level of BACT to be evaluated first.
Thus, for all of the above reasons, Sithe and EPA have not adequately evaluated BACT for NO
x
at DREF. Sithe and EPA failed to show that the proposed emission limit reflects the maximum
degree of NO
x
reduction that can be achieved. Further, Sithe and EPA failed to indicate the level
of NO
x
reductions expected of the pollution control equipment evaluated and failed to evaluate
the varying levels of control that the selected control equipment can achieve based on vendor
information and/or practical experience. Consequently, EPA must determine through a true and
thorough top-down analysis the level of control that reflects the maximum degree of NO
x
reduction that can be achieved at DREF and impose a NO
x
emission limit that reflects that
maximum degree of NO
x
control.
The DREF Permit Record Does Not Support the SO
2
Emission Limit As Reflecting BACT
ELECTRONIC FILING, RECEIVED, CLERK'S OFFICE, JANUARY 5, 2007
* * * * * PC #7 * * * * *
44
EPA has proposed an SO
2
BACT emission limit of 0.06 lb/MMBtu (24-hour average).
(Condition IX.D.2 of the proposed permit). EPA also proposed a 3-hour average SO
2
emission
limit of 612 lb/hr (Condition IX.D.1. of the proposed permit). At maximum hourly heat input
capacity, this hourly SO
2
limit would equate to 0.09 lb/MMBtu. There are two major problems
with this BACT determination. First, the proposed BACT limit is unsupported in the record and
apparently arises out of a flawed BACT analysis. Second, the proposed level does not
correspond to the maximum degree of reduction that is achievable, as required by the plain
language definition of BACT.
ELECTRONIC FILING, RECEIVED, CLERK'S OFFICE, JANUARY 5, 2007
* * * * * PC #7 * * * * *
45
Improper BACT Analysis
The NSR Manual sets out a six step process for determining BACT. NSR Manual, Section 3.
Step 4 of this process is missing. If the top control option, e.g., a 98% efficient scrubber
(AAQIR, Table 4), is not selected, Step 4 requires a case-by-case quantitative analysis of energy,
economic, and environmental impacts, comparable to Table B-3 in the NSR Manual.
Id.
at B.28.
This analysis is missing and in its place is an unsupported assertion that Sithe has selected a SO
2
BACT limit that is lower than any formerly permitted level, thus corrupting the technology
forcing nature of BACT and the obligation to set a limit that is based on the maximum degree of
reduction that is achievable.
The Application and AAQIR report an SO
2
control range for wet scrubbing of 90% to 98%.
AAQIR, Table 4; and May 2004 DREF PSD Permit Application, Table 4-2. However, neither
indicates what levels of SO
2
control were evaluated for a wet scrubber at DREF, the uncontrolled
SO
2
emission rate, the control efficiency that was ultimately determined to be achievable at
DREF, and the basis for the BACT determination. This information is needed to evaluate
whether the limits reflect the maximum degree of SO
2
reduction that can be achieved with a wet
scrubber. Instead, Sithe simply compared its proposed BACT limit to other recently issued
permits for coal-fired power plants to show that its SO
2
limit would be lower. In determining
BACT for SO
2
, the emission limit must be based on the maximum degree of reduction that can
be achieved, taking into account energy, environmental, and economic impacts. In the top-down
BACT review process relied on by the EPA, the top level of control must be evaluated first. See
EPA’s New Source Review Workshop Manual, October 1990 Draft, at B.1., B.23-B.25. The
record contains no evidence that the top level of control, 98%, was evaluated and if it was, why it
wasn’t chosen.
Sithe’s permit application for DREF indicates wet scrubbers can remove up to 98% of the SO
2
in
the flue gas. May 2004 DREF PSD Permit Application at 4-11. However, the control efficiency
corresponding to the selected BACT limit of 0.06 lb/MMBtu is not disclosed, making it
impossible for reviewers to determine if the limit corresponds to the maximum degree of SO
2
reduction. The SO
2
control efficiency for the “system” (as opposed to the scrubber) can be
backcalculated from coal quality data in the Application, but the public should not be left to
second guess the agency.
This backcalculation suggests that the SO
2
BACT limit of 0.06 lb/MMBtu assumes about 97% of
the sulfur in coal is removed between the coal pile and the stack.
104
Some of this sulfur is
removed with pyrites at the pulverizer. Some is removed with the bottom ash and fly ash. Some
exits the stack as sulfate. Some is converted into sulfuric acid mist.
105
Assuming about 15% of
the sulfur in the coal appears as SO
2
at the scrubber inlet, a typical number used in BACT
analyses, the SO
2
control efficiency of the scrubber selected as BACT is about 96%. This
104
The Application indicates that the design fuel has 0.82% S and a higher heating value of 8,910 Btu/lb. May 2004
DREF PSD Permit Application, Table 2-2. Thus, the uncontrolled SO2 content of the coal is: (0.82/8910)(20,000) =
1.84
105
R.
lb/MMBtu.
Evers, V.E.
The
Vandergriff,
implicit conand trol
R.L.
efficiency
Zielke, Field
is: 100(1Study
-.06/1.84)
to Obtain
= 96.7%
Trace Element
based on
Mass
HHV.
Balances at a Coal-fired
Utility Boiler, Report EPA-600/7-80-171, October 1980, Calculated at 15% from S data in Tables 6, 7, 10 & 11.
See also AP-42, Table 1.1-3, note b. (
Attachment 18
).
ELECTRONIC FILING, RECEIVED, CLERK'S OFFICE, JANUARY 5, 2007
* * * * * PC #7 * * * * *
46
control level is less than the upper value of 98% reported in the DREF PSD Permit Application
(Table 4-2) and AAQIR (Table 4) for the scrubber alone. A 2% increase in SO
2
control
efficiency would halve SO
2
stack emissions. The DREF PSD Permit Application and AAQIR
fail to provide any basis for not selecting a 98% efficient wet scrubber, the top control level that
both Sithe and the EPA reported. The top-reported SO
2
control efficiency of 98% should have
been explicitly evaluated because 98% control has been determined to be BACT for SO
2
in
several recent coal-fired power plant permitting cases, including Thoroughbred in Kentucky and
Prairie State and Dallman 5 in Illinois. NSR Manual at B.23.
Higher SO
2
Control Efficiencies Are Achievable
Further, 98% is not the highest achievable SO
2
control efficiency for low sulfur coal similar to
Navajo’s coal. The Application and AAQIR rely on other permitted sources, corrupting the
BACT process. Many other sources of information, other than just permitted levels, must be
consulted to determine BACT. See, e.g., October 1990 draft New Source Review Workshop
Manual at B.11. A higher control efficiency would have been reported had a thorough review of
available sources been conducted. The top control option is a wet FGD designed to achieve
99%+ SO
2
control. This level of control has been achieved at the Mitchell Station in
Pennsylvania using magnesium enhanced lime, a type of wet FGD. Attached hereto and listed as
Attachment
19 in the attached exhibit list hereto. It has also been achieved at several coal-fired
power plants in Japan and is proposed for several U.S. coal fired power plants.
Chiyoda’s bubbling jet reactor (a type of wet FGD) has consistently achieved >99% SO
2
removal
during long-term operation at the Shinko-Kobe power plant in Japan. This facility consists of
two 700-MW coal-fired utility boilers. The wet FGD was designed to achieve 0.014 lb
SO
2
/MMBtu (9 ppmv at 3% oxygen) on an instantaneous basis and has consistently exceeded
this level while treating gases with inlet SO
2
concentrations within the range proposed for DREF
(1.78 lb SO
2
/MMBtu compared to 1.84 lb SO
2
/MMBtu for DREF).
106
This technology has been
guaranteed by Chiyoda to achieve 99% SO
2
removal on three coal-fired boilers in Japan.
107
It
also has been demonstrated in the U.S. at the University of Illinois’s Abbott power plant and
Georgia Power’s Plant Yates
108
and recently was licensed for use on several additional plants in
the US, including Plant Bowen in Georgia, Dayton Power & Light’s Killen and Stuart plants, and
AEP’s Big Sandy Unit 2, Conesville Unit 4, Cardinal Units 1 and 2, and Kyger Creek, among
others.
109
Black & Veatch and Southern Company are both U.S. licensees.
106
Yasuhiko Shimogama, Hirokazu Yasuda, Naohiro Kaji, Fumiaki Tanaka, and David K. Harris, Commercial
Experience of the CT -121 FGD Plant for 700 MW Shinko-Kobe Electric Power Plant, Paper No. 27, presented at
MEGA Symposium, Air & Waste Management Association, May 19-22, 2003 (
Attachment 20
).
108
107
109
EmissionChiyoda
CT-121 FGD
Licenses
-control
Process
Technologies
Its Flue
– Jet
Gas
Bubbling
Desulfurization
Continue
Reactor,
to Clear
http://www.bwe.dk/fgd
Technology
the Air, Powerin
USA
, May/June
Newly
-ct121.html
for
2002.
5 Coal
. (
Attac
-Fired
hment
Generation
21
).
Units,
Press Release, May 2, 2005 (
Attachment 22
); Chiyoda Licenses its Flue Gas Desulfurization Process in USA for
Georgia Power Owned 4 FGD Units, January 26, 2005 (
Attachment 23
).
ELECTRONIC FILING, RECEIVED, CLERK'S OFFICE, JANUARY 5, 2007
* * * * * PC #7 * * * * *
47
Mitsubishi, a vendor of scrubber systems, reports it has guaranteed SO
2
removal efficiencies up
to 99.8 percent, including four coal-fired boilers.
110, 111, 112
The Application and AAQIR do not acknowledge control efficiencies greater than 98%. The
NSR Manual specifically states that technologies in application outside of the Unit ed States
should be considered in the BACT analysis. NSR Manual, p. B.11.
Finally, a recent Lake Michigan Air Directors Consortium (“LADCO”) and the Midwest
Regional Planning Organization (“MRPO”) presentation indicated that advanced FGD
technologies could achieve 99.5% control for $1,240 to $2,875 per ton of SO
2
removed and wet
FGD could achieve 99% SO
2
control for $1,881 to $3,440 per ton of SO
2
removed. Attached
hereto and listed as
Attachment 27
in the attached exhibit list hereto. These costs are well within
the range that EPA normally considers to be cost effective.
Lower SO
2
Emission Limits Are Achievable
Japan regulates SO
2
emissions to about 10 ppm (0.02 lb/MMBtu) from new industrial facilities
locating in polluted areas. There are currently two Japanese vendors who supply wet FGD
systems in the U.S. market that are able to achieve 99% SO
2
control on low sulfur coals. These
are Chiyoda and Mitsubishi, as discussed supra. These two wet FGD systems are more cost
effective, require less water and electricity, generate less wastes, and remove more mercury and
particulate matter than the type of wet FGD selected for DREF. They do not have any adverse
energy, environmental, or economic impacts.
This Japanese experience is supported by two facilities in the U.S. The U.S. EPA issued a PSD
permit to AES Puerto Rico to construct and operate a 454-MW coal-fired CFB project. The
permit requires the unit to meet an SO
2
limit of 0.022 lb/MMBtu or 9.00 ppmvd corrected to 7%
oxygen on a 3-hour basis, compared to 0.09lb/MMBtu on a 3-hour basis and 0.06 lb/MMBtu on
a 24-hour basis for DREF.
113
The much lower AES Puerto Rico limit has been achieved.
114
Further, Utah issued a permit for the Nevco Sevier project in October 2004. Its SO
2
limits are:
0.022 lb/MMBtu based on a 30-day average and 0.05 lb/MMBtu based on a 24-hour average.
We are not advocating CFBs for DREF, but rather that the emission limits proposed for these
CFB units should be included in the top down BACT analysis for PC boilers, as set out below.
110
Jonas S. Klingspor, Kiyoshi Okazoe, Tetsu Ushiku, and George Munson, High Efficiency Double Contact Flow
Scrubber for the U.S. FGD Market, Paper No. 135 presented at MEGA Symposium, Air & Waste Management
Association, May 19-22, 2003, p.8, Table 4 (
Attachment 24
).
111
Yoshio Nakayama, Tetsu Ushiku, and Takeo Shinoda, Commercial Experience and Actual-Plant-Scale Test
Facility
112
http://www.mhi.co.jp/mcec/product/fgd.htm
of MHI Single Tower FGD, (
Attachment 25
).
(
Attachment 26
).
113
U.S. EPA, Region 2, Second Revision to the Final Prevention of Significant Deterioration of Air Quality (PSD)
Permit for the AES Puerto Rico Cogeneration Plant (AES -PRCP) – Administrative Permit Modification, August 10,
2004 (
Attachment 28
).
114
Memorandum from Donald G. Wright to John P. Aponte, U.S. EPA, Re: AES Puerto Rico Total Energy Plant –
Review of the March 3, 2003 Stack Test Report (
Attachment 29
); Memorandum from Donald G. Wright to
Francisco Claudio, U.S. EPA, Re: AES Puerto Rico Total Energy Project – Review of the October 2002 Test
Report, February 3, 2003 (
Attachment 30
).
ELECTRONIC FILING, RECEIVED, CLERK'S OFFICE, JANUARY 5, 2007
* * * * * PC #7 * * * * *
48
The Application rejects AES Puerto Rico, arguing that CFB “is a fundamentally different source
type…” May 2004 DREF PSD Permit Application., p. 4-10. The underlying combustion
method, CFB versus a PC boiler, is not determinative if the gas streams are similar and the same
control technologies can be used. October 1990 draft New Source Review Workshop Manual,
pp. B.10, B.11, B.16 (“The fact that a control option has never been applied to process emission
units similar or identical to that proposed does not mean it can be ignored in the BACT analysis
if the potential for its application exists.”). The record contains no evidence that the gas streams
from these two types of coal combustion technologies differ in any substantial way that would
affect the achievable SO
2
control efficiency or emission limitation.
Further, the U.S. EPA in its rulemakings does not distinguish CFBs and PC boilers when
establishing nationwide emission standards. See, for example, 70 FR 39104 (July 6, 2005); 70
FR 9706 (Feb. 28, 2005); and 63 FR 49442 (Sept. 16, 1998) and supporting dockets. Likewise,
the National Park Service (“NPS”) commented that limits achievable by CFBs should be
evaluated for DREF and demonstrate why such limits cannot be met. The EPA’s comments on
the Longview, WV facility also recommended BACT limits based on two CFBs, Northampton
and JEA Northside. Attached hereto and listed as
Attachment 31
in the attached exhibit list
hereto.
The Application also argues that AES Puerto Rico is not applicable to DREF because the
electricity markets differ in Puerto Rico and the U.S. May 2004 DREF PSD Permit Application,
p. 4-11. However, these types of market issues and economic impacts to the permittee are
considered in the top down BACT analysis process and have been explicitly rejected by the
courts. See
Alaska v. United States EPA
, 244 F.3d 748 (9th Cir. 2002), aff'd, 537 U.S. 1186
(2003).
The PSD Permit Must Also Specify a SO
2
Control Efficiency Requirement
EPA must impose a SO
2
removal efficiency requirement in addition to an SO
2
BACT limit in
terms of lb/MMBtu to ensure that the maximum degree of emission reduction is required at
DREF. Such a requirement would ensure proper operation and maintenance of the scrubber
regardless of the sulfur content in the coal. The predicted SO
2
increment violations at Mesa
Verde National Park discussed further below and the visibility impacts of DREF at nearby Class
I areas provide further basis for such a removal efficiency requirement reflective of what the wet
scrubber can achieve. EPA Region VIII made this same comment to the Montana Department of
Environmental Quality pertaining to the recently issued Roundup Power Plant PSD permit.
Attached hereto and listed as
Attachment 32
in the attached exhibit list hereto.
Thus, for all of the above reasons and as shown in the Attachments provided, the SO2 BACT
determination for DREF is significantly flawed.
The PM and Total PM
10
BACT Analyses Are Flawed
EPA has proposed a PM (filterable) BACT limit of 0.010 lb/MMBtu and a total PM
10
limit
(filterable plus condensables) of 0.020 lb/MMBtu, which would both apply on a 24-hour average
basis. Conditions IX.H.2. and I.2. of the proposed DREF permit. Both Sithe and EPA justified
ELECTRONIC FILING, RECEIVED, CLERK'S OFFICE, JANUARY 5, 2007
* * * * * PC #7 * * * * *
49
the PM BACT limit as “lower than the lowest emission level for a new coal-fired boiler (Wygen
2 in Wyoming) listed in EPA’s RACT/BACT/LAER Clearinghouse or other reference materials
discussed in the BACT analysis for NO
x
and SO
2
.” See EPA’s AAQIR at 26.
As discussed above regarding the NO
x
and SO
2
BACT determinations, it is not sufficient to
simply compare the proposed BACT limit to the BACT emission limits of other recently
permitted coal-fired power plants. The PM/PM
10
BACT analysis should also be based on a
review of the maximum degree of emission reduction that can be achieved. And there is a
significant amount of data available indicating that a greater degree of PM reduction, and a lower
PM emission rate, can be achieved with a fabric filter baghouse.
Environmental Defense et al’s April 29, 2005 comment letter to EPA on its proposed New
Source Performance Standards revisions for steam generating units included as Exhibit 4 results
from recent stack tests of Florida coal-burning steam generating units, which indicated that more
than half of the units tested were meeting PM/PM
10
emission rates of 0.0090 lb/MMBtu or
lower, with the lowest emission rate achieved being 0.0004 lb/MMBtu at JEA Northside Unit 2.
Environmental Defense also submitted PM/PM
10
stack test data for Unit #2 of the Craig power
plant and for the Northampton Generating Station as Exhibits 5 and 6 to their April 29, 2005
letter. We have attached all of these exhibits as
Attachment 33
on the attached exhibit list. The
Craig Unit #2 data shows that, on average, the unit is emitting PM at 0.005 lb/MMBtu, which is
significantly lower than the 0.010 lb/MMBtu PM emission rate proposed by EPA as BACT at
DREF.
The Northampton facility, which has a total PM BACT limit of 0.0088 lb/MMBtu (a recently
issued coal-fired power plant permit that EPA and Sithe failed to consider in their BACT review
for DREF), is emitting both filterable PM and total PM at 0.0043 lb/MMBtu on average based on
the stack test data included in Attachment 33. A copy of the permit for this facility is also
included as
Attachment 34
on the attached exhibit list to this letter.
Thus, EPA and Sithe must revise the DREF PM and total PM
10
BACT analyses to evaluate the
maximum degree of reduction in these pollutants that can be achieved at DREF, which considers
the data provided in this letter on what is actually being achieved in practice.
Further, EPA’s proposed permit provision at Condition IX.T. that allows for a permit revision if,
at the end of 18 months following startup, performance testing indicates that DREF is not
achieving the total PM
10
BACT limit of 0.020 lb/MMBtu emission limit is entirely inconsistent
with the PSD regulations. Any relaxation of the PM
10
BACT limit must be evaluated in another
BACT analysis, and all modeling that relied on the proposed 0.020 lb/MMBtu BACT limit must
be revised (which would include the determination of the DREF’s PM
10
significant impact area
which defines which sources need to be included in cumulative modeling assessments, the Class
I and II PM
10
increment analyses, and the near-field and Class I area visibility analyses). Thus,
EPA cannot allow the PM
10
BACT limit to be revised without going through a PSD permit
revision and without providing the public with the opportunity to review and provide comments
on the revised BACT analysis and modeling analyses. Condition IX.T. of the proposed DREF
permit must be removed.
ELECTRONIC FILING, RECEIVED, CLERK'S OFFICE, JANUARY 5, 2007
* * * * * PC #7 * * * * *
50
EPA Must Make Clear that the Opacity Limit is a BACT Limit
EPA has proposed an opacity limit on the DREF boilers of not more than 10%. (Condition
IX.J.1. of the proposed DREF permit). While we firmly support an opacity limit as a necessary
requirement of the PSD permit, EPA must make clear that this opacity limit reflects a BACT
opacity limit (consistent with the definition of BACT at 40 C.F.R. §52.21(b)(12) which indicates
that BACT includes “a visible emissions limit”). The EPA’s AAQIR should also include a
discussion to support why the 10% opacity limit was chosen as representing BACT. It should be
noted that several recently issued permits for coal-fired power plants have 10% opacity BACT
limits, including Unit #3 of the Intermountain Power Plant in Utah
115
, the Sevier CFB power
plant in Utah,
116
and the Longview power plant in West Virginia, which is required to utilize PM
CEMS to ensure compliance with its PM BACT limit
and
to meet a 10% opacity BACT limit.
117
EPA must set the opacity BACT limit as reflecting the maximum degree of reduction in opacity
that is achievable, and compliance must be based on a continuous opacity monitoring systems
(COMS) that will be required to be installed at DREF pursuant to acid rain requirements.
The H
2
SO
4
Emission Limit Was Not Justified as Representative of BACT
EPA has proposed a sulfuric acid mist (H
2
SO
4
) emission limit of 0.0040 lb/MMBtu (Condition
IX.K.2. of the proposed DREF permit). However, neither Sithe nor EPA provided a review of
all of the control technologies that could be applied at DREF to achieve the maximum degree of
reduction in H
2
SO
4
emissions that could be achieved at the facility. Instead, Sithe indicated that,
through the use of its proprietary technology using hydrated lime upstream of the baghouse to
remove H
2
SO
4
before it enters the wet scrubber, DREF’s H
2
SO
4
emission rate would be less than
the H
2
SO
4
emission limit required at the Thoroughbred Generating Station which will be
equipped with a wet electrostatic precipitator (WESP) for H
2
SO
4
control. May 2004 DREF PSD
Permit Application at 4-22 to 4-23. EPA simply accepted Sithe’s claim as sufficient information
to justify its proposed 0.0040 lb/MMBtu permit limit as BACT. AAQIR at 29. Yet, as stated by
EPA, generation of H
2
SO
4
occurs from the oxidation of sulfur in the fuel (AAQIR at 29), and
thus facilities that burn coal with higher sulfur content will emit higher levels of H
2
SO
4
. The
Thoroughbred Generation Station will burn coal with much higher sulfur content (4.24%) than
the New Mexico coal to be utilized at DREF with a sulfur content of 0.82%. One would thus
expect the uncontrolled H
2
SO
4
emissions at the Thoroughbred Generating Station to be much
higher than at DREF. Consequently, Sithe’s comparison of its proposed H
2
SO
4
emission limit to
the H
2
SO
4
emission limit that applies to the Thoroughbred Generating Station based on its
planned use of a WESP does not sufficiently show that the proposed H
2
SO
4
limit reflects the
maximum degree of H
2
SO
4
reduction that can be achieved at DREF.
Further, information submitted with the DREF permit application from EPA’s
RACT/BACT/LAER Clearinghouse shows that there are two other facilities with lower H
2
SO
4
limits: Unit 8 at the W.A. Parrish power plant which is subject to a 0.00150 lb/MMBtu H
2
SO
4
115
See October 15, 2004 Approval Order for New Unit 3 at the Intermountain Power Generating Station, Condition
117
12,
116
See
See
at 9
October
March
(
Attachment
2,
12,
2004
2004
35
Permit
).
Approval
to Construct
Order for
for
Sevier
Longview
Power
Power,
Company,
Conditions
Condition
A.8.
12,
and
at
A.18.,
10 (
Attachment
at 4, 9. (
Attachment
36
).
37
).
ELECTRONIC FILING, RECEIVED, CLERK'S OFFICE, JANUARY 5, 2007
* * * * * PC #7 * * * * *
51
emission limit and the AES-PRCP power plant which is subject to a 0.00240 H
2
SO
4
lb/MMBtu
emission limit. See Table 2-6 of Attachment 2 to the May 2004 DREF PSD Permit Application.
Thus, in summary, neither Sithe’s DREF permit application or EPA’s AAQIR provide adequate
justification to show that the proposed H
2
SO
4
limit truly reflects BACT at DREF.
5. THE PROPOSED STARTUP AND SHUTDOWN EMISSION LIMITS ARE
UNJUSTIFIED AND VIOLATE CLEAN AIR ACT BACT REQUIREMENTS
EPA has proposed to allow Sithe to be exempt from continuously operating and maintaining its
air pollution control equipment for controlling NO
x
, SO
2
, H
2
SO
4
, HF, or PM emissions during
periods of startup and shutdown. See Condition IX.B.7. of the proposed DREF permit. EPA has
also proposed separate pound per hour emission limits for NO
x
, SO
2
, and CO that would apply
during startup and shutdown. Condition IX.N.2 of the proposed DREF permit. These conditions
amount to outright exemptions from BACT requirements during startup and shutdown which are
clearly not allowed under the Clean Air Act and EPA policy.
The emission limits defined as BACT may not include exemptions for excess emissions due to
startup or shutdown, or malfunction or maintenance/planned outage for that matter. Emission
limits defined as BACT under the PSD program are established under Title I of the Clean Air
Act and are intended to be protective of ambient air standards as well as to be technology
forcing. The ambient air quality standards are to be met on a continuous basis. Thus compliance
with the BACT limits must also be on a continuous basis.
118
Indeed, Section 302(k) of the Clean Air Act expressly defines the term “emission limitation” as a
limitation on emissions of air pollutants “on a continuous basis.” Section 169(3) of the Clean
Air Act, in turn, defines BACT as an “emission limitation.” Accordingly, the Clean Air Act
mandates that BACT continuously limit emissions of air pollutants.
EPA’s January 28, 1993 guidance memo entitled “Automatic or Blanket Exemptions for Excess
Emissions During Startup, and Shutdowns Under PSD” (
Attachment 38
on the attached exhibit
list) specifically disallows automatic exemptions from BACT emission limits and instead
informs states to use enforcement discretion in determining whether to enforce for violations of
118
As the EAB has recently explained, “because routine startup and shutdown of process equipment are considered
part of the normal operation of a source . . . [e]xcess emissions (i.e., air emission that exceed any applicable
emission limitation) that occur during these periods are generally not excused and are considered illegal.”
In re
Indeck-Elwood
, PSD Appeal 03-04, slip op at 72-73, (EAB, Sept. 26, 2006), 13 E.A.D. __, Thus, sources must be
subject to emission limitations during startup and shutdown and such limitation must “be equivalent to BACT, and
the permitting authority must provide a methodology for compliance.” Id. slip op at 74. Moreover, the Board has
held that even where the permitting authority can demonstrate that less stringent “secondary limits” are appropriate
(which it has not done here), such limits “must be, nonetheless, justified as BACT.” Id, slip op at 71 n.100 (noting
that the permitting authority must determine “that compliance with the permit’s BACT and other emission limits
cannot be achieved during startup and shutdown
despite best efforts
” before establishing alternative limits, and even
then such limits “must be . . . justified as BACT”) quoting
In re Tallmadge Generating Station
, PSD Appeal No. 02-
12, at 28 (EAB, May 21, 2003). Accordingly, to the extent that EPA has included exemptions in the permit for the
DREF that apply during startup or shutdown, or has included alternative “secondary” limitation in the PSD permit, it
has failed utterly to justify those permit conditions and therefore must either remove them or specifically justify
them and provide an opportunity for public comment on such justifications.
ELECTRONIC FILING, RECEIVED, CLERK'S OFFICE, JANUARY 5, 2007
* * * * * PC #7 * * * * *
52
BACT emission limits. EPA’s policy also indicates that alternative emission limits for startup
and shutdown “could effectively shield excess emissions arising from poor operation and
maintenance or design, thus precluding attainment.” EPA’s January 28, 1993 guidance memo at
3. Instead, EPA policy indicates that enforcement discretion is the preferred approach for
addressing the occurrence of excess emissions. EPA states:
. . .infrequent periods of excess emissions during startup and shutdown need not
be treated as violations where the source adequately shows that the excess could
not have been prevented through careful planning and design and that bypassing
of control equipment was unavoidable to prevent loss of life, personal injury, or
severe property damage. Startup and shutdown of process equipment are part of
the normal operation of a source and should be accounted for in the planning,
design and implementation of operating procedures for the process and control
equipment. Accordingly, it is reasonable to expect that careful and prudent
planning and design will eliminate violations of emission limitations during such
periods.
Id.
at 2.
Indeed, even Sithe indicated in its May 2004 PSD Permit Application for DREF that it did not
need exemptions or alternative emission limits during startup and shutdown:
Start up and shutdown emissions have received much attention in the permitting
of combustion turbines, since those sources may exhibit higher mass emissions
during start up than during maximum operation. This is generally not the case for
coal-fired boilers, which exhibit peak mass emission rates at maximum firing rate.
Startup and shutdown procedures for the pulverized coal-fired boilers are
designed to provide for equipment protection while minimizing emissions. Initial
start up duration after an outage may be dictated by the need to gradually warm
up refractory materials, metal surfaces, and the 750 MW steam turbine, and this is
normally accomplished with start up fuel (such as oil), auxiliary steam (to help
preheat steam-side components) and low load operation. . . The maximum number
of startups is anticipated to be 60 per year, an average of 30 per boiler (4 cold, 10
warm and 16 hot). Startup and shutdown operations do not result in any excess
daily or annual emissions compared to normal continuous operation. Thus, Desert
Rock Energy Facility does not request any additional limits (beyond maximum
allowable mass emission limits) to govern operations during start up and
shutdown.
May 2004 DREF PSD Permit Application at 5-1.
Not only did Sithe not request or provide any justification for exemptions from BACT
limits or for alternative emission limits during startup and shutdown, but EPA did not
provide any discussion or justification in its AAQIR for its proposed startup/shutdown
exemptions and emission limits in the DREF proposed permit.
119
119
Any decisions regarding allowances for facility performance during startup or shutdown that do not reflect
continuous compliance with BACT limitations must be reflected in an “on-the-record determination.”
See Indeck-
ELECTRONIC FILING, RECEIVED, CLERK'S OFFICE, JANUARY 5, 2007
* * * * * PC #7 * * * * *
53
The proposed startup/shutdown limits do not by any measure meet BACT, especially
since Condition IX.B.7. of the proposed DREF permit doesn’t even require the operation
of the BACT control equipment during startup or shutdown periods. The alternative
startup/shutdown limit for both SO
2
and NO
x
is 797 lb/hr per boiler, which equates to, at
the very best, SO
2
and NO
x
emission rates of 0.12 lb/MMBtu. However, this is assuming
that each unit is operating at the maximum hourly heat input capacity of 6,800 MMBtu/hr
during startup and shutdown, which is not generally the case. Instead the units would be
operating at lower heat input capacities and thus the equivalent lb/MMBtu emission rate
would be much higher than 0.12 lb/MMBtu. Clearly, the alternative provisions for
startup and shutdown do not meet BACT.
Further, EPA did not even require Sithe to model the DREF at the significantly higher
startup and shutdown limits for SO
2
, NO
x
and CO allowed in Condition IX.N.2. of the
proposed permit nor did EPA require PM, H
2
SO
4
, and HF emissions be modeled at
uncontrolled emission rates, which is essentially what is allowed pursuant to Condition
IX.B.7. of the proposed DREF permit. Yet, as Sithe and EPA have indicated, there could
be 60 startups and shutdowns at DREF during each year! In addition, EPA’s proposed
definitions of startup and shutdown in Conditions IX.N.2. and 3. of the proposed DREF
permit are quite vague and unenforceable, and could allow such periods of excess
emissions to go on for long periods of time. For example, “startup” is defined in the
proposed permit as:
the period beginning with ignition and lasting until the equipment has reached a
continuous operating level and operating permit limits.
Condition IX.N.2. of the proposed DREF permit.
It is not clear at all what is meant by “the equipment has reached a continuous operating
level and operating permit limits.” What equipment? All equipment associated with the
facility? And what is meant by “operating permit limits?” It seems this could mean the
facility can be considered in startup mode until it complies with its operating permit
limits. The definition of “shutdown” is similarly vague:
Shutdown shall be defined as the period beginning with the lowering of
equipment from base load and lasting until fuel is no longer added to the
boiler and combustion has ceased.
Condition IX.N.3. of the proposed DREF permit.
It is not clear what is “base load” and what exactly is the “lowering of equipment from
base load.”
Elwood
, slip op at 69 (requiring an on-the-record determination of the infeasibility of measuring emissions in order
to justify alternative “work practice” standards during startup and shutdown).
ELECTRONIC FILING, RECEIVED, CLERK'S OFFICE, JANUARY 5, 2007
* * * * * PC #7 * * * * *
54
Thus, based on the wording of these exemptions and defined terms, not only are the
requirements of the permit effectively unenforceable, but it seems probable that excess
emissions could occur for periods of 24 hours or longer and still be considered to occur
during startup or shutdown. If one boiler was in startup mode for one day, that could
equate to 19,128 lb/day (or 9.5 tons per day) of each SO
2
and NO
x
emissions that would
be allowed to be emitted to the air. Filterable particulate emissions could be emitted at
uncontrolled emission rates, which could equal 6,800 lb/hr or a total of 163,200 lb/day
(81.6 tons per day).
120
The levels that Sithe modeled for the NAAQS, Class I and II increment, and visibility
analyses were much lower than what is allowed to occur during startup and shutdown
under the proposed permit. (See Table 2-2 of DREF’s Class II Modeling Update (June
2006) at 2-6 and Table 2-2 of DREF’s Class I Modeling Update (January 2006) at 2-7).
Thus, EPA cannot rely on the modeling analyses performed for the DREF permit to
verify that, during startup or shutdown, the DREF facility will not cause or contribute to
violations of the NAAQS or PSD increments, or that it won’t cause or contribute to
adverse impacts on visibility or other air quality related values at affected Class I areas.
Not only would the DREF modeled ambient impacts increase as a result of EPA’s
proposed exemption and alternative SO
2
, NO
x
and CO emission limits for startup and
shutdown, but also DREF’s area of significant impact (both for Class II areas and for
Class I areas) would increase and that increased significant impact area would likely
cover more existing air pollution sources that should have been included in a cumulative
analysis as well as require cumulative increment and visibility analyses in additional
Class I areas than those already modeled by Sithe.
In short, if EPA persists in retaining Conditions IX.B.7. and IX.B.2. in the final DREF
permit (or in including another exemptions or alternative emission limits for startup and
shutdown emissions), all of the modeling analyses for DREF would have to be
completely redone to verify that the DREF would not cause or contribute to violations of
ambient air standards or adversely impact air quality related values during periods of
startup and shutdown. Moreover, because of the va gueness of the startup and shutdown
provisions, the permit terms are effectively unenforceable and therefore invalid.
Thus, for all of the above reasons, EPA must remove the exemptions and alternative
emission limits for startup and shutdown currently in Conditions IX.B.7. and IX.B.2. of
the draft DREF permit. There is no legal basis in the Clean Air Act and no technical
justification in the permit record for including these conditions in the DREF permit.
6. EPA FAILED TO PROPOSE ANY EMISSION LIMITS FOR MERCURY
The proposed permit for Desert Rock does not include any proposed emission limits for mercury.
Although Sithe committed to install mercury specific control technology “if required” and
achieve 80% mercury reductions (see May 2004 DREF PSD Permit Application at 2-10, 2-11,
and 4-26), EPA is silent on this significant issue in both the proposed permit and in its AAQIR.
120
The level of uncontrolled PM emissions was backcalculated assuming the 0.010 lb/MMBtu emission limit
reflects at least 99% control.
ELECTRONIC FILING, RECEIVED, CLERK'S OFFICE, JANUARY 5, 2007
* * * * * PC #7 * * * * *
55
It is important to note that the highest nationwide atmospheric mercury concentration in 2001
was measured in New Mexico.
121
As EPA is aware, recent studies sponsored by the Agency
demonstrate that up to 70 percent of local deposition of mercury from power plants and
industrial sources can be linked to local sources during wet deposition events.
122
While DREF is
located in a generally dry region, episodes of wet deposition do occur with some frequency, with
the result that there are already high levels of mercury in water bodies nearby the proposed
Desert Rock power plant. Specifically, fish consumption advisories due to mercury
contamination have been issued for the nearby San Juan River, the Lake Farmington Reservoir
and the Navajo Reservoir, as well as for Narraguinnep and McPhee Reservoirs in southwest
Colorado.
123
Thus, mercury controls and emissions from the Desert Rock power plant are an extremely
important public and environmental health issue, that also implicate the trust relationship
between EPA and the Navajo Nation and that must be addressed by EPA before issuing a permit
authorizing construction of the Desert Rock power plant.
Given the high levels of local mercury contamination already present, it defies logic for EPA to
ignore the opportunity to require state-of-the-art mercury controls at this plant, which can
achieve up to 90 percent removal rates. ADA-ES systems as early as 2002 were reporting up to
90 percent mercury removal.
124
At a minimum, EPA’s Clean Air Mercury Rule requires that states submit plans to control
mercury from electrical generating units no later than November 17, 2006. 40 C.F.R.
§60.24(h)(2). EPA’s regulation further provides that the Navajo Nation may submit a plan if
approved for treatment as a state under 40 C.F.R. Part 49. 40 C.F.R. §60.24(h)(1). Each “State
Plan” is to contain:
emission standards and compliance schedules and demonstrate that they will
result in compliance with the State’s annual electrical generating unit (EGU)
mercury (Hg) budget for the appropriate periods.
40 C.F.R. §60.24(h)(3).
The Annual EGU Hg Budget for the Navajo Nation Indian Country is 0.601 tons between
2010 and 2017, and 0.237 tons beginning in 2018 and thereafter.
Id.
121
National Atmospheric Deposition Program (NRSP-3)/Mercury Deposition Network. (2003). NADP Program
Office, Illinois State Water Survey, 2204 Griffith Drive, Champaign, IL 61820. Available at
http://nadp.sws.uiu
122
Gerald Keeler, Matthew
c.edu/mdn/
Landis,
et al
., Sources of Mercury Wet Deposition in Eastern Ohio, USA, 40 Envtl. Sci.
&
123
Tech.
EPA 2002
5874-and
5881
data
(Sept.
from
2006)
National
(
Attachment
Listing of
39
Fish
).
and Wildlife Advisories. Available at http://map1.epa.gov/
124
Michael Durham, ADA Environmental Solutions, Testimony before the U.S. Senate Committee on
Environmental & Public Works (January 29, 2002),
Attachment 40;
see also Michael Durham, PhD, MBA,
Institute of Clean Air Companies “Availability of Mercury Measurement and Control Technology” (June 1, 2006),
Attachment 63
.
ELECTRONIC FILING, RECEIVED, CLERK'S OFFICE, JANUARY 5, 2007
* * * * * PC #7 * * * * *
56
The 1999 mercury emissions of the Navajo and Four Corners power plants already
exceed this cap. Specifically, the Navajo power plant emitted 0.1517 tons of mercury in
1999 and the Four Corners power plant emitted 0.5258 tons of mercury in 1999, which
combined total 0.6775 tons. See EPA’s Emissions of Mercury by Plant – 1999, listed as
Attachment 41
on the attached exhibit list).
Sithe indicated that it would take three years to complete construction of the first Desert
Rock unit, with the second unit coming on line approximately one year later. May 2004
DREF PSD Permit Application at 1-1. Thus, the DREF will be operating and emitting
mercury emissions by the time the mercury cap for the Navajo Nation Indian Country
applies in 2010.
It must be noted that EPA incorrectly identified potential mercury emissions from Desert
Rock as 0.057 tons per year (or 114 pounds per year). AAQIR at 5. However, this total
of mercury emissions clearly took into account Sithe’s plans, “if necessary,” to control
mercury emissions by 80% and meet a mercury emissions level of 8.64 x 10
-6
lb/MWh.
May 2004 DREF PSD Permit Application at 4-26 and 5-2. EPA has not proposed any
level of mercury control or any mercury emission limitation for DREF so the only
enforceable limitation on mercury emissions is the limit of 42 x 10
-6
lb/MWh that applies
to new EGUs burning subbituminous coal and equipped with wet scrubbers pursuant to
40 C.F.R. §60.45a(a)(2)(i). This would equate to allowable mercury emissions from
DREF of 0.27741 tons per year (or 554.82 pounds per year).
Thus, adding the allowable mercury emissions from DREF with the 1999 Hg emissions
from the Navajo and Four Corners power plants equals a total of 0.95491 tons of mercury
that could be emitted in 2010. It is also significant to note that the Hg emissions from the
Four Corners and Navajo power plants will likely increase by 2010 as these facilities
move toward operating at higher capacities. In any case, it is clear that, without a plan to
reduce Hg emissions from either the Navajo or Four Corners power plants (or both), the
Navajo Nation will exceed its allowable Annual EGU Hg budget in 2010. The DREF
facility will only exacerbate this problem.
In the absence of an approved mercury reduction plan from the Navajo Nation for these sources,
it is incumbent upon EPA to ensure that this mercury cap will be complied with and, especially,
to ensure that any new Hg emissions allowed to be emitted from new EGUs on the Navajo
Nation lands are minimized to the greatest extent possible. In this case, Sithe has committed to
install mercury controls “if necessary.” In order for the Navajo Nation to comply with the
applicable Annual EGU Hg Budgets for 2010 and 2018 as well as to limit the amount of mercury
to be added to this already significantly contaminated part of the West, clearly it is “necessary”
for EPA to require stringent mercury controls at DREF reflective of current state-of-the-art
technology. EPA must not issue the permit authorizing construction of DREF without
addressing this significant issue.
7. SITHE FAILED TO PROVIDE ANY ANALYSIS OF DREF’S IMPACTS ON
OZONE CONCENTRATIONS IN THE REGION
ELECTRONIC FILING, RECEIVED, CLERK'S OFFICE, JANUARY 5, 2007
* * * * * PC #7 * * * * *
57
The DREF will be a major source of ozone precursors. Specifically, the potential to emit
volatile organic compounds (VOCs) of DREF is 166 tons per year and the potential to
emit NO
x
is 3,325 tons per year. AAQIR at 5. EPA has identified both of these
pollutants as precursors to ozone formation. See 40 C.F.R. §52.21(b)(1)(ii) as amended
on November 29, 2005 (70 Fed. Reg. 71612). Accordingly, Sithe was required to
provide a demonstration that DREF would not cause or contribute to a violation of the
ozone NAAQS pursuant to 40 C.F.R. §52.21(k)(1). Sithe did not provide such a
demonstration. Instead, Sithe relied on the photochemical modeling study that was done
by the New Mexico Environment Department (NMED) in 2004 which included new
sources such as one claimed to be similar to DREF. May 2004 DREF PSD Permit
Application at 6-50. Because that modeling demonstrated compliance with the 8-hour
ozone NAAQS, Sithe concluded that DREF will not cause or contribute to a violation of
the ozone NAAQS in the region.
Id.
However, as discussed in comments prepared on October 5, 2006 by Khanh Tran of AMI
Environmental (“October 5, 2006 Tran report” incorporated herein and attached to this
comment letter) and comments prepared on October 25, 2006 by Dr. Jana Milford of
Environmental Defense (“Milford Report” incorporated herein and attached to this
comment letter), the ozone study prepared by the NMED is not adequate to demonstrate
that DREF won’t cause or contribute to a violation of the ozone NAAQS for many
reasons including the following:
•
The NMED study relied on incorrect NO
x
, VOC and SO2 emissions for DREF.
For example, the NO
x
emissions modeled for DREF were less than half of
DREF’s allowable NO
x
emissions as report in the May 2004 DREF PSD Permit
Application. See October 5, 2006 Tran report at 9-10.
•
The DREF project location and stack parameters are different than what was
modeled for Desert Rock in the NMED study.
Id.
at 10.
•
These discrepancies in modeled emissions, location, and stack parameters for the
DREF “raise serious doubts about the validity of the modeling results of the
NMED modeling study.”
Id.
at 11.
•
The portion of NMED’s study that included the emissions of a power plant
similar to DREF was limited to a 4-day episode, which is not a long enough
period to represent DREF’s impacts on ozone in the region. See Milford report at
5.
•
At best, only two of the four days evaluated in the NMED study included
meteorological conditions that may have transported DREF’s emissions to the
impact area of greatest concern.
Id.
at 6.
•
Model performance was inadequate on one of the 4 days modeled, with predicted
concentrations much lower than actual ozone concentrations.
Id.
ELECTRONIC FILING, RECEIVED, CLERK'S OFFICE, JANUARY 5, 2007
* * * * * PC #7 * * * * *
58
Even if the NMED modeling results were considered acceptable for assessing DREF’s
impacts on ozone concentrations, the model results indicate that the ozone precursor
emissions from the power plants modeled would have a significant impact on ozone
concentrations in the region especially when compared to the impacts of other sources
modeled. And this determination is based on modeled NO
x
emissions for the “Desert
Rock” power plant that were less than half of the allowable NO
x
emissions that could be
emitted from DREF.
Id.
at 7.
In addition, it is important to note that to comply with the mandates of the prevention of
significant deterioration program of the Clean Air Act, DREF’s impact on ozone
concentrations “must be evaluated for their impact in degrading air quality and harming
human health and the environment, not just whether or not they push the Farmington area
over the existing NAAQS.
125
”
Id.
at 11. As discussed in the Milford Report, the
mandates of the PSD program are:
(1)
to protect public health and welfare from any actual or potential adverse effect
which in the Administrator’s judgment may reasonably be anticipated to
occur, … notwithstanding attainment and maintenance of all national ambient
air quality standards;
(2)
to preserve, protect, and enhance the air quality in national parks, national
wilderness areas, …;
(3)
to insure that economic growth will occur in a manner consistent with the
preservation of existing clean air resources;
(4)
to assure that emissions from any source in any State will not interfere with
any portion of the applicable implementation plan to prevent significant
deterioration for any other State; and
(5)
to assure that any decision to permit increased air pollution in any area … is
made only after careful evaluation of all the consequences of such a decision
and after adequate procedural opportunities for informed public participation
in the decisionmaking process.
126
Further, section 166(a) of the Clean Air Act requires EPA to promulgate additional
regulations to prevent the significant deterioration of air quality which would result from
hydrocarbons, carbon monoxide, photochemical oxidants [ozone], and nitrogen oxides,
which regulations are to “fulfill the goals and purposes set forth in section 7401 and 7470
[160] of this title” and “provide specific measures at least as effective as the increments
established in section 7473 [for particulate matter and sulfur dioxide].” EPA has never
promulgated the required regulations for photochemical oxidants or ozone, but EPA is
still obligated to ensure that PSD permits comply with all of the mandates of the
prevention of significant deterioration program.
Considering that the Clean Air Science Advisory Committee has recommended that the
current NAAQS for ozone needs to be lowered to no more than 70 parts per billion,
127
a
127125
126
See
Environmental
42 U.S.C.
October
§
24,
7470.
Defense
2006 letter
Fund
to the
v. EPA,
EPA
898
from
F.2d
Dr.
183,
Rogene
190
Henderson,
(D.C. Cir. 1990).
Chair, Clean Air Scientific Advisory
Committee with CASAC’s Peer Review of the Agency’s 2
nd
Draft Ozone Staff Paper, at 2 (
Attachment 61
).
ELECTRONIC FILING, RECEIVED, CLERK'S OFFICE, JANUARY 5, 2007
* * * * * PC #7 * * * * *
59
level of ozone pollution which San Juan County has exceeded in recent years
128
, it is
imperative that Sithe and/or EPA provide a sufficient analysis of the DREF facility’s
impact on ambient ozone concentrations in the region. The DREF PSD permit
application is entirely incomplete without such an analysis, and EPA would have no basis
to issue a permit to DREF without this critical information on the facility’s impacts on
ozone air quality.
8. SITHE FAILED TO PROVIDE A DEMONSTRATION THAT DREF WON’T
CAUSE OR CONTRIBUTE TO A VIOLATION OF THE PM
2.5
NAAQS
Sithe did not perform any modeling to determine DREF’s impacts on fine particulate (PM
2.5
)
concentrations in the area. EPA failed to require any such modeling and instead stated that it
was treating PM
10
as a surrogate for PM
2.5
for the Desert Rock permit. AAQIR at 5. This is
scientifically unacceptable. Sithe must be required to perform modeling to assess its impact on
PM
2.5
concentrations and to ensure that it won’t cause or contribute to a violation of the PM
2.5
ambient air quality standards as revised by EPA on October 17, 2006 (71 Fed.Reg. 61144).
PM
2.5
is a significant public health concern that must not be ignored.
9. DREF’S NEAR-FIELD MODELING ANALYSES FOR THE CLASS II PSD
INCREMENT AND NAAQS SHOULD NOT HAVE UTILIZED CALPUFF
As discussed in the October 5, 2006 Tran report (at 7), the near-field analysis utilized the
Calpuff model which is inappropriate for estimating near-field, short-range impacts of
DREF. The use of AERMOD is instead recommended to insure that air quality impacts
are not underpredicted.
Id.
This is especially important since the 24-hour PM
10
concentration predicted to occur as a result of DREF is only 8% below the PM
10
Class II
PSD increment.
Id.
, see also Table 4-6 of DREF Class II Modeling Update (June 2006),
at 4-8. Sithe must be required to use the model that will most accurately predict its near-
field impacts.
10. THE DREF NAAQS MODELING IS INADEQUATE
The SO
2
NAAQS Modeling is Flawed Because Sithe Failed to Model Allowable
Emission Rates of Nearby Sources
In addition to the issue discussed above of failing to use the appropriate model to
estimate near-field impacts of DREF, there are numerous other reasons why the NAAQS
modeling is inadequate. EPA cannot rely on the near-field modeling as adequately
demonstrating that DREF won’t cause or contribute to a violation of the NAAQS.
First, as discussed earlier in this comment letter, no modeling was done of the maximum
emission rates allowed by the startup/shutdown exemptions and alternative emission
limits of Conditions IX.B.7. and IX.B.2. of the proposed DREF permit.
128
See http://www.nmenv.state.nm.us/aqb/projects/Ozone.html.
ELECTRONIC FILING, RECEIVED, CLERK'S OFFICE, JANUARY 5, 2007
* * * * * PC #7 * * * * *
60
Second, the DREF cumulative NAAQS modeling analysis failed to model all sources at
allowable emission rates. As required by EPA’s Guideline on Air Quality Models,
nearby sources are to be modeled at allowable emission rates. See 40 C.F.R. Part 51,
Appendix W, Table 9-2 and Section 9.1.2.i. DREF’s modeling is required to comply
with EPA’s modeling guidelines pursuant to 40 C.F.R. §52.21(l). This major flaw is
particularly apparent for the SO
2
NAAQS analysis. The sources included in the NAAQS
modeling for SO
2
are listed in Appendix A to the DREF Class II Area Modeling Update
(June 2006). The Four Corners and San Juan power plants are by far the largest SO
2
sources included in the cumulative SO
2
NAAQS analysis. A review of what was
modeled for those sources compared to what those sources are allowed to emit shows that
Sithe greatly underestimated cumulative SO
2
impacts in its NAAQS analysis. Table 6
below identifies the SO
2
emission rates modeled for these two power plants in the SO
2
NAAQS analysis.
Table 6. SO
2
Emission Rates Modeled in NAAQS Analysis for Existing Power
Plants, from Appendix A of June 2006 DREF Class II Area Modeling Update
Power Plant Unit Modeled
SO
2
Emission Rate Modeled, lb/hr
San Juan Unit 1
1,608.60
San Juan Unit 2
1,600.30
San Juan Units 3 and 4
129
4,997.40
Four Corners Units 1 and 2
130
1,496.35
Four Corners Unit 3
873.52
Four Corners Unit 4
2,169.86
Four Corners Unit 5
1,496.35
Thus, the total modeled for the San Juan power plant was 8,206.3 lb/hr and the total
modeled for the Four Corners power plant was 6,036.08 lb/hr. It appears that these
emission rates were modeled for all averaging times in the SO
2
NAAQS analysis.
However, the emission rates modeled fall far short of these power plants’ allowable
emissions. The 3-hour allowable SO
2
plantwide emission limit at San Juan is 13,000
lb/hr.
131
Each unit is also subject to a 1.2 lb/MMBtu SO
2
limit on a 3-hour average
basis.
132
The emission rates modeled for San Juan were one-third lower than what the
facility is allowed to emit on a 3-hour average basis. The short term average allowable
SO
2
emission rate should have been modeled in both the 3-hr and 24-hr SO
2
NAAQS
cumulative analyses for DREF.
A review of the Title V permit for the Four Corners power plant shows that this facility is
only subject to annual ton per year SO
2
limits under the acid rain program.
133
Although
EPA has recently proposed a Federal Implementation Plan (FIP) for the Four Corners
power plant that includes a 3-hour average plantwide cap of 17,900 lb/hr (71 Fed.Reg.
130
129
These
These
two
two
units
units
also
appear
appear
to have
to have
been
been
combined
combined
in the
in
DREF
the DREF
modemodeling.
ling.
132
131
133
Id.
See
See
August
6/12/01
7,
Title
1998
V
Title
Permit
V
to
Permit
Operate
for
for
the
Four
San Juan
Corners
Generating
Steam Electric
Station at
Sta12
tion,
(
Attachment
Condition II.A.3.a.
42
).
(
Attachment
43
), downloaded from EPA Region 9’s permit tracking website.
ELECTRONIC FILING, RECEIVED, CLERK'S OFFICE, JANUARY 5, 2007
* * * * * PC #7 * * * * *
61
53636, September 12, 2006), this FIP has not been promulgated. Because there are no
currently enforceable limitations on short term SO
2
emission rates at Four Corners power
plant, these units must be modeled at uncontrolled SO
2
emission rates in the NAAQS
analyses as what is currently allowed at these units. The plantwide uncontrolled SO
2
emissions at Four Corners would be roughly 33,000 lb/hr of SO
2
.
134
Even if the 17,900
lb/hr cap was an enforceable emission limit, Sithe modeled total SO
2
emissions that were
about one-third of this proposed allowable SO
2
emissions limit.
Thus, the DREF cumulative SO
2
NAAQS modeled is significantly flawed and EPA
cannot proceed to issue a permit to DREF because it is not clear whether the facility will
cause or contribute to a violation of the SO
2
NAAQS. Sithe must be required to model
the allowable SO
2
emissions of all sources including minor sources and sources on tribal
lands in addition to the major sources of SO
2
in the area.
The SO
2
NAAQS Modeling Also Relied on Incorrect Background Concentrations
According to the June 2006 DREF Class II Area Modeling Update, a value of 6.2 μgm
3
was considered as the background concentration for the 3-hr, 24-hr, and annual SO
2
NAAQS analyses. June 2006 DREF Class II Area Modeling Update at 4-20. However,
this background concentration is much lower than what Sithe previously reported were
the background concentrations in the May 2004 DREF PSD Permit Application (at 6-7).
Specifically, the SO
2
regional background concentrations used in the May 2004 NAAQS
analyses for DREF were 68.1 μgm
3
for the 3-hour average SO
2
NAAQS and 21.0μgm
3
for the 24-hour average SO
2
NAAQS. (May 2004 DREF PSD Permit Application at 6-7
and 6-27). Thus, not only was the cumulative DREF SO
2
NAAQS analysis not based on
the allowable emission rates of the Four Corners and San Juan power plants, and also
probably other nearby sources, but it also did not add in the appropriate background
concentrations.
With all of these errors, the DREF cumulative modeling analyses significantly
underestimated impacts on the SO
2
NAAQS and thus the DREF SO
2
modeling cannot be
relied upon to verify whether DREF will cause or contribute to a violation of the SO
2
NAAQS. The inappropriate use of the Calpuff model for the near-field impacts as
described in comment 9 above also likely exacerbates the deficiencies in the SO
2
NAAQS analysis.
The PM
10
NAAQS Modeling Failed to Model the Allowable Emission Rates of All
Nearby Sources, including the Four Corners Power Plant
As discussed above, Sithe failed to model all nearby sources in the SO
2
NAAQS analysis
at allowable emission rates. This flaw likely persists for the sources modeled in the
cumulative PM
10
NAAQS analysis. EPA must review the allowable emissions of all
134
The uncontrolled SO2 emissions were estimated based on reported heat input capacities of each unit and
uncontrolled SO2 emission rate of 1.68 that was backcalculated out of the information in EPA’s June 10, 1981
Federal Register notice (i.e., that Four Corners would meet a plantwide emission rate of 0.47 lb/MMBtu which was
to reflect 72% control). See 46 Fed.Reg.30653-4, June 10, 1981.
ELECTRONIC FILING, RECEIVED, CLERK'S OFFICE, JANUARY 5, 2007
* * * * * PC #7 * * * * *
62
sources included in the cumulative NAAQS analyses and ensure that such sources were
modeled at allowable emission rates as required by EPA modeling regulations.
While it appears that the San Juan power plant was modeled at its allowable PM emission
rates, the PM
10
NAAQS modeling for DREF as updated failed to include any PM
emissions from the Four Corners power plant. Specifically, a review of all of the sources
included in the cumulative PM
10
NAAQS assessment shows that Four Corners power
plant was not one of those sources. Appendix A to the DREF Class II Area Modeling
Update (June 2006). Interestingly, the Four Corners power plant was included in the
PM
10
NAAQS modeling done for the May 2004 DREF PSD Permit Application. (See
May 2004 DREF PSD Permit Application at 6-24). This is a major oversight in the
cumulative PM
10
NAAQS modeling. EPA has recently proposed a Federal
Implementation Plan (FIP) for the Four Corners power plant that includes PM emission
limits of 0.05 lb/MMBtu (71 Fed.Reg. 53636, September 12, 2006), but this FIP has not
yet been promulgated. As discussed above, because there are no currently enforceable
limitations on short term PM
10
emission rates at Four Corners power plant, these units
must be modeled at uncontrolled PM
10
emission rates in the NAAQS analyses as that is
what these units are allowed to emit. It is also important to note that, if these units were
subject to enforceable 0.05 lb/MMBtu PM emission limits as proposed by EPA, then
what was modeled for these units as identified in the May 2004 DREF PSD Permit
Application was only half as much as what would be the facility’s allowable PM
emissions if EPA promulgates the FIP as proposed.
Thus, the DREF cumulative PM
10
NAAQS modeling is significantly flawed and EPA
cannot proceed to issue a permit to DREF because it is not clear whether the facility will
cause or contribute to a violation of the PM
10
NAAQS. Sithe must be required to model
the allowable SO
2
emissions of all sources including minor sources and sources on tribal
lands in addition to the major sources of SO
2
in the area.
The PM
10
NAAQS Modeling Also Relied on Incorrect Background Concentrations
According to the June 2006 DREF Class II Area Modeling Update, a value of 20 μgm
3
was considered as the background concent ration for the 24-hr and annual PM
10
NAAQS
analyses. June 2006 DREF Class II Area Modeling Update at 4-20. However, this
background concentration is much lower than what Sithe previously reported was the 24-
hour average PM
10
background concentrations in the May 2004 DREF PSD Permit
Application (at 6-7). Specifically, the PM
10
regional background concentration used in
the May 2004 NAAQS analyses for DREF was 38 μgm
3
for the 24-hour average PM
10
NAAQS. (A background value of 17.0μgm
3
was used for the annual average PM
10
NAAQS analysis in the May 2004 DREF PSD Permit Application, which is somewhat
lower than what was considered as background for the June 2006 Class II Area Modeling
Update.) May 2004 DREF PSD Permit Application at 6-7 and 6-27. Thus, in addition to
the major flaws with the PM
10
NAAQS inventory modeled, the 24-hour PM
10
NAAQS
ELECTRONIC FILING, RECEIVED, CLERK'S OFFICE, JANUARY 5, 2007
* * * * * PC #7 * * * * *
63
analysis as updated did not add in the appropriate 24-hour average PM
10
background
concentrations.
With these major errors, the DREF cumulative modeling analyses significantly
underestimated impacts on the PM
10
NAAQS and thus the DREF PM
10
modeling cannot
be relied upon to verify whether DREF will cause or contribute to a violation of the PM
10
NAAQS. The inappropriate use of the Calpuff model for the near-field impacts as
described in comment 9 above also likely exacerbates the deficiencies in the PM
10
NAAQS analysis.
11. THE DREF NO2 MODELING UNDERESTIMATED AMBIENT IMPACTS
The DREF NO
2
modeling is flawed for numerous reasons. First, the national default
ratio of 0.75 for NO
2
/NO
x
was used. June 2006 DREF Class II Area Modeling Update at
4-6. However, use of this conversion ratio is not appropriate unless justified, and
especially when determining whether “significant” NO
2
impacts would occur as a result
of DREF. As discussed in EPA’s Guidelines for Air Quality Models, 100% NO
x
to NO
2
conversion should be assumed – especially for an initial analysis to determine a facility’s
significant impact area. See 40 C.F.R. Part 51, Appendix S, Section 6.2.4.b. In addition,
the modeling guideline cautions against using the national 0.75 NO
2
/NO
x
ratio in
assessing long range transport impacts, and states that any ratio “can underestimate long
range transport NO
2
impacts.”
Id.
, Section 6.2.4.c. Thus, for determining significance,
Sithe should have modeled 100% of NO
x
emissions as NO
2
.
Second, Sithe did not model all NO
x
emissions associated with the DREF facility in its
NO
2
impacts analysis. Specifically, Sithe did not model any tailpipe NO
x
emissions
expected from the vehicular traffic associated with the DREF. According to the June
2006 Class II Area Modeling Update (at page 2-13), 15,017 vehicle miles traveled
(VMT) per year are expected from vehicular travel associated with the transport of
limestone, ash, gypsum, fuel oil, hydrated lime/activated carbon, and anhydrous
ammonia.”
Id.
at 2-8. Further, Sithe did not include any NO
x
emissions associated with
production of the coal supply for DREF from the nearby BHP Billiton coal mine. Sithe
must include all NO
x
emissions associated with DREF in determining whether the facility
will have a significant impact on NO
2
concentrations nearby or in Class I areas in the
region.
Third, as discussed in comment 9 above, it was not appropriate to use Calpuff for the
near-field modeling.
All of these deficiencies could have resulted in an underestimate of NO
2
impacts
expected from the DREF. Further, DREF could have been improperly exempted from a
cumulative NO
2
NAAQS analysis. As discussed in further detail in the next comment,
this region is experiencing, and will continue to experience, a surge in NO
x
emissions
associated with gas and coalbed methane development. This is on top of the 68,500 tons
per year of NO
x
emitted by the Four Corners and San Juan power plants (based on 2005
ELECTRONIC FILING, RECEIVED, CLERK'S OFFICE, JANUARY 5, 2007
* * * * * PC #7 * * * * *
64
data)
135
. Thus, it is imperative that EPA require Sithe to properly and conservatively
model the ambient NO
2
impacts that could occur from DREF, and to require cumulative
NO
2
NAAQS and PSD increment analyses based on the results. Without a revised NO
2
analysis, EPA cannot justify a determination that the DREF facility won’t cause or
contribute to a violation of the NO
2
NAAQS or Class I or II NO
2
PSD increment.
12. SITHE MUST CONDUCT A CUMULATIVE PSD NO
2
INCREMENT
ANALYSES
No cumulative Class II NO
2
PSD increment analysis was done for DREF because the
modeling of DREF sources did not predict NO
2
concentrations above modeling
significance levels. See June 2006 Class II Area Update at 4-6, 4-14. However, there is
a substantial body of information to indicate that the NO
2
Class II increments will soon
be, or are already being, violated in northwestern New Mexico and southwestern
Colorado.
The fundamental NO
2
modeling requirement for EPA and the applicant in this permit
review process is to comply with Clean Air Act section 165(6), which requires that a
major emitting facility may not be constructed unless “there has been an analysis of any
air quality impacts projected for the area as a result of growth associated with such
facility.” 40 CFR § 52.21(k) makes clear this requirement entails a demonstration that the
proposed source would not cause or contribute to air pollution in violation of: “(1) any
national ambient air quality standard in any air quality control region; or (2) any
applicable maximum allowable increase over the baseline concentration in any area.”
EPA regulations implementing section 165(6) contain no
de minimis
exception to
requirements for a cumulative modeling analysis. As the Code of Federal Regulations
clearly states, the monitoring significance levels cited in Sithe’s June 2006 Class II Area
Update only provide an exemption from “the requirements of paragraph (m) of this
section, with respect to monitoring…” 40 CFR § 52.21(i)(5)(i). EPA’s October 1990
Draft New Source Review Workshop Manual suggests a full modeling impact analysis is
not required if a preliminary analysis predicts maximum NOx concentrations in Class II
areas of 1 μg m
-3
, annual average. NSR Manual at C.28. However, the guidance provided
in the NSR Manual does not modify EPA’s legal obligation to ensure compliance with
the Clean Air Act and the implementing regulations. As the preface to the NSR Manual
states “[this document] is not intended to be an official statement of policy and standards
and does not establish binding regulatory requirements; such requirements are contained
in the statute, regulations and approved state implementation plans.” EPA cannot blindly
follow the NSR Manual without consideration of the circumstances attending a particular
permit application. The question of whether DREF would “cause or contribute” to a
violation of the NO
2
increment clearly depends on whether the increment is already
being approached or exceeded in the area affected by the proposed facility. A
contribution of 1 μg m
-3
or less might rationally be disregarded in a setting where the full
25 μg m
-3
annual average Class II increment remains available. But where evidence
exists to suggest the increment is nearly exhausted or has already been exhausted, EPA
cannot rationally dismiss a contribution of up to 1 μg m
-3
as “insignificant” without
135
Annual NOx emissions data obtained from EPA’s Clean Air Markets Database.
ELECTRONIC FILING, RECEIVED, CLERK'S OFFICE, JANUARY 5, 2007
* * * * * PC #7 * * * * *
65
requiring further analysis. EPA’s August 7, 1980 rulemaking on its PSD regulations
clearly recognizes this point, stating that the use of ambient significance levels is not
always appropriate to exempt a source from a cumulative impacts analysis, especially
when “existing air quality is poor or adverse impacts to a Class I area are in question.”
(45 Fed.Reg. 52678, August 7, 1980). Furthermore, EPA’s longstanding
contemporaneous interpretatio n of the statutory and regulatory provisions for the PSD
increments clearly mandate that, in an area with existing PSD increment violations, the
violations “must be entirely corrected before PSD sources which affect the area can be
approved.” (See 45 Fed.Reg. 52678, August 7, 1980). There is a strong likelihood of
NO
2
increment violations in this area that cannot be ignored by EPA.
Oil, gas and coal bed methane energy resources are being extensively developed in
northwestern New Mexico and southwestern Colorado, and substantial increases in the
amount and intensity of this development are expected to occur over the next twenty
years or more. There are numerous sources of NO
x
emissions associated with this
development including drill rig engines, wellhead compressor engines, centralized
compressor stations, gas processing plants, glycol dehydrators, and separators, as well as
tailpipe emissions from the increased vehicular traffic needed to construct, operate and
maintain each well and the associated production facilities. Currently, the San Juan
Basin is already substantially developed. In the Final Environmental Impact Statement
(FEIS) for Oil and Gas Development on the Southern Ute Indian Reservation (July 2002)
(Southern Ute FEIS), it is stated that there are currently more than 26,000 wells in the
entire San Juan Basin (Southern Ute FEIS at 1-3, excerpt listed as
Attachment 44
on the
attached exhibit list). That figure was most likely based on the level of development at
the time the draft EIS was prepared in early 2001. Much more development has occurred
in the last 5 years.
In 1999, likely as a result of the significant increases in air emissions sources associated
with energy resource development in the region, the state of Colorado Department of
Public Health and Environment released a study of the consumption of the NO
2
PSD
increments in southwest Colorado.
136
While the conclusions of that study were that, in
general, the NO
2
increments were being met in southwest Colorado, the modeling study
did find a “hot spot” of extremely high NO
2
concentrations, above the level of the Class
II NO
2
PSD increment as well as the NO
2
NAAQS. Specifically, the state modeled the
Williams Field PLA-9 Compressor Station, which is located about 0.6 miles from the
New Mexico border, and the predicted NO
2
concentration assuming 75% conversion of
NO
x
to NO
2
was 461 μg/m
3
. See listing as
Attachment 45
at 73 on the attached exhibit
list. This source is located in “Indian country” and thus EPA Region VIII is the
permitting authority. It is not clear whether these issues have been resolved by the
region.
More recent modeling performed for the Williams Field Services Company PLA-9
source in conjunction with a permit modification showed that, after several model
“refinements,” 19 μg/m
3
of the total Class II NO
2
increment of 25 μg/m
3
had been
136
Periodic Assessment of Nitrogen Dioxide PSD Increment Consumption in Southwest Colorado, Phase I, October
29, 1999 (
Attachment 45
), available at http://apcd.state.co.us/permits/psdinc/.
ELECTRONIC FILING, RECEIVED, CLERK'S OFFICE, JANUARY 5, 2007
* * * * * PC #7 * * * * *
66
consumed by this and other nearby contributing sources. See Air Quality Modeling
Report, Nitrogen Dioxide PSD Increment Consumption in Class II Areas Surrounding
PLA-9 Central Delivery Point, prepared by Cirrus Consulting, LLC, April 2001, listed as
Attachment 46
on the attached exhibit list. This modeling exercise was based on only
one year of meteorological data.
Id.
at 3-4. Although showing compliance, these model
results indicate there is not much room left for additional growth in NO
x
emissions in this
area before the Class II NO
2
increment will be violated.
Several additional air quality analyses have been conducted for the region in recent years
for the issuance of several environmental planning documents to authorize increased rates
of development of oil, gas, coal bed methane and other energy resources. These include
the Southern Ute FEIS that was issued in July 2002, the Farmington Resource
Management Plan and FEIS (Farmington RMP/FEIS) issued in March 2003, and the
Northern San Juan Basin Coal Bed Methane Project FEIS (NSJB FEIS) which was made
available for public review in July 2006 although no Record of Decision has been issued
yet. In both the Southern Ute FEIS and the Farmington EIS, projected increases in NO
x
emissions from energy development were predicted to cause NO
2
concentrations in
excess of the NO
2
PSD increments.
Specifically, modeling performed for the Southern Ute FEIS predicted annual average
NO
2
concentrations ranging from 31.2 μg/m
3
to 39.8 μg/m
3
. See “Responses to
Comment ‘O’ from Mark McMillan, State of Colorado, Air Pollution Control Division,”
excerpt from Section 5.9 of Volume 2 of the Southern Ute FEIS (July 2002) listed as
Attachment 44
on the attached exhibit list. It is important to note that most likely all of
the NO
x
emissions modeled in the Southern Ute air quality analysis were increment
consuming emissions, since any increase in emissions after the NO
2
minor source
baseline date (which was set for the entire state of Colorado on March 30, 1989)
consumes the available increment.
Air quality modeling performed for the Farmington RMP/FEIS also predicted NO
2
concentrations in excess of the NO
2
Class II increments. The NO
2
minor source baseline
date in northwestern New Mexico was set on June 6, 1989, and thus all of the sources
modeled would be increment-consuming. The Farmington analysis was based on the
modeling of an “emissions module” of 4 sections (i.e., a 4 square mile area) of 32 wells
that was considered to be high density well development, and these sources were
modeled as if in flat terrain. Farmington Proposed RMP/FEIS (March 2003) at 4-60 – 4-
61 (see listing as
Attachment 47
on the attached exhibit list). It is important to note that
this was a very small subset of the 9,942 new wells that would be allowed in the
Farmington planning area. Farmington Proposed RMP/FEIS (March 2003) at 2-
238(
Attachment 47
). The results of modeling this small subset of sources predicted a
maximum annual average NO
2
concentration of 33 μg/m
3
. Farmington Proposed
RMP/FEIS (March 2003) at 4-63(
Attachment 47
). The Farmington RMP/FEIS does not
include a cumulative assessment of increment consumption by existing sources, but the
BLM admitted that “[t]here are several localized areas within the planning area where the
available Class II increment is nearly exhausted.”
Id.
The air quality modeling done for
this EIS had some significant deficiencies and likely underestimated NO
2
impacts. See,
ELECTRONIC FILING, RECEIVED, CLERK'S OFFICE, JANUARY 5, 2007
* * * * * PC #7 * * * * *
67
e.g., May 5, 2003 Protest of the Farmington RMP/FEIS Submitted to the BLM by San
Juan Citizens Alliance et al. (see listing as
Attachment 48
on the attached exhibit list).
Air quality modeling performed for the NSJB CBM FEIS also predicted NO
2
concentrations in excess of the Class II NO
2
PSD increments. Specifically, the predicted
maximum NO
2
concentration just from the NSJB CBM Project sources was 24.8 μg/m
3
.
See June 2004 Draft Environmental Impact Statement Northern San Juan Basin Coal Bed
Methane Project Air Quality Impact Assessment Technical Support Document, prepared
by RTP Environmental (see listing as
Attachment 49
on the attached exhibit list), at 52.
Further, the cumulative NO
2
analysis prepared for the NSJB CBM Project EIS just
considering NSJB CBM sources and other existing and reasonably foreseeable sources
predicted a combined total maximum NO
2
concentration of 29.3 μg/m
3
.
Id.
It must be
noted that the predicted NO
2
impacts of other existing and reasonably foreseeable sources
reported in the NSJB CBM Technical Support Document only reflected the concentration
predicted at the receptors with maximum concentration due to the NSJB CBM Project
alone.
Id.
at footnote (1). In other words, there were likely higher overall peak
concentrations modeled when existing and reasonably foreseeable sources were added to
the mix (especially due to the growth in gas development allowed under the Farmington
RMP), but those predicted concentrations were not reported as the NSJB CBM modeling
was focused primarily on evaluating maximum impacts from NSJB CBM sources.
All of these analyses indicate that the NO
2
Class II increments in northwestern New
Mexico and southwestern Colorado will likely be violated in the near future, if the
increments are not already being violated in parts of the region due to NO
x
emissions
sources associated with the intense levels of energy development in the region. And,
with the exception of the Colorado NO
2
increment assessment completed in 1999, these
analyses prepared under NEPA did not evaluate all NO
2
increment-consuming emissions
from stationary sources or from mobile and area source growth in the region.
Although the DREF’s modeled NO
2
impacts were less than the “significant impact level”
contained in the Draft New Source Re view Workshop Manual (a modeling result for
which we question its accuracy as discussed in comment 11 above), Sithe should be
required to conduct a cumulative NO
2
increment analysis considering all of the
increment-consuming NO
x
emission sources in the region for numerous reasons. In this
case, the existing air quality in the region is either violating or close to violating the Class
II NO
2
PSD increments, or the increments will be violated in the near future. In addition,
adverse NO
2
impacts at Mesa Verde National Park
are
in question as a result of existing
and future growth in NOx emissions in the region. Indeed, the Colorado NO
2
increment
study includes the results of model runs with ISCT3 that indicated a potential violation of
the NO
2
increment, and that study only included emissions that existed as of 1999. See
Attachment 45 at 15.
Significantly, none of the increment consumption analyses prepared for the energy development
projects in the region included the emissions of the DREF. While a NO
2
increment analysis
may
be done for the DREF EIS that is forthcoming, EPA Region IX is not coordinating issuance of its
construction permit for DREF with that EIS and may in fact issue the permit before the DREF
ELECTRONIC FILING, RECEIVED, CLERK'S OFFICE, JANUARY 5, 2007
* * * * * PC #7 * * * * *
68
EIS even comes out. Specifically, EPA’s October 20, 2006 letter to the San Juan Citizens
Alliance states in part “"when the draft EIS for the Desert Rock Energy Facility is released, EPA
will consider any requests to reopen the public comment period
if we have not yet issued our
Response to Comments and reached a final PSD permit decision
." EPA’s October 20, 2006
letter at 1, emphasis added. Yet, information on the status of NO
2
increment consumption in the
area affected by the DREF is of critical importance to the PSD program in the region. And, even
though a NEPA analysis should evaluate whether a proposed action will comply with all Clean
Air Act standards, including a review of cumulative impacts, neither the BLM or the BIA have
conducted a proper cumulative NO
2
increment analysis (considering all increment consuming
emissions) as part of any EIS for the region. Indeed, the BLM consistently states that the
responsibility for a complete PSD increment analysis lies with the permitting authority when
issuing a PSD permit or with the agency responsible for implementing the PSD program in the
area. See, e.g., NSJB CBM FEIS (July 2006) at 3-528 - 3-530, (Chapter 3 of this FEIS is listed
as
Attachment 50
on the attached exhibit list).
For all of these reasons, EPA must not exempt DREF from a cumulative NO
2
PSD increment
consumption analysis. Such a cumulative analysis must include all sources of NO
2
increment
affecting emissions in the area including minor sources, tribal sources and mobile source growth.
If EPA proceeds to issue the permit for DREF without such an analysis, it will be issuing the
permit without any firm basis for determining that the project won’t contribute to violations of
the NO
2
increments in the region. Given the other air quality studies that have been done to date,
EPA’s action would be entirely unjustified.
13. THE CLASS I AREA MODELING METHODOLOGY IS FLAWED
As discussed in the October 5, 2006 Tran report, there are several flaws in the
methodologies used in the Class I area modeling for air quality including the PSD
increment assessment and the air quality related values evaluation. The following flaws
are common to all of the Class I analysis:
•
The meteorological data used in the air quality and visibility modeling analyses
are too coarse to resolve the effects of complex terrain in the areas that could be
impacted by DREF. October 5, 2006 Tran Report at 3-4. Further, the modeling
used a set of meteorological data that is proprietary, namely the 2003 RUC data.
Use of such proprietary data does not afford the public the opportunity to review
and comment on the data.
Id.
at 12. Note that EPA also made the comment to the
Desert Rock applicant and its consultant, ENSR, in a 5/14/04 email that “[a] PSD
application, including all modeling inputs, is required under regulation to be
public information, i.e., available for public examination.”
137
•
The National Park Service 4 kilometer meteorological data may not have been
properly used in the regional haze assessment.
Id.
at 5.
137
See May 14, 2004 email from Scott Bohning, EPA Region IX, to Gus Eghneim et al with subject “Desert Rock
completeness & modeling inputs” which was included in EPA’s Administrative Record for the proposed DREF
permit.
ELECTRONIC FILING, RECEIVED, CLERK'S OFFICE, JANUARY 5, 2007
* * * * * PC #7 * * * * *
69
•
Air quality and visibility impacts may be understated because Sithe failed to
include emissions from the auxiliary boilers and other low level emissions sources
associated with DREF.
Id.
at 5.
These deficiencies in the Class I modeling likely resulted in an underestimate of Class I
area impacts by DREF. Thus, these deficiencies must be corrected before EPA can rely
on the Class I modeling in issuing a PSD permit for DREF. There are other deficiencies
specific to each of the modeling analyses for visibility, regional haze and PSD increments
that are discussed in detail in the next few comments.
14. SIGNIFICANT CUMULATIVE IMPACTS ON PSD INCREMENTS HAVE
BEEN OVERLOOKED IN THE DREF PSD ANALYSES
Sithe only conducted cumulative PSD increment analyses for those Class I areas where the
DREF facility would have an ambient impact greater than “Class I significant impact levels.” As
discussed in comment 19 below and in the October 5, 2006 Tran report at 13, National Park
Service studies have raised serious concerns that the Calpuff modeling used in the DREF Class I
analysis greatly underestimated DREF’s SO
2
impacts in Grand Canyon National Park and other
Class I areas in the region. Thus, Sithe’s determination that DREF will have only “insignificant”
SO
2
impacts at several Class I areas including Grand Canyon National Park is questionable.
Further, no federal regulation or guidance allows for a permit applicant to be exempt from the
PSD requirement to show that the proposed source won’t cause
or contribute
to a violation of the
Class I PSD increments based on an “insignificant” ambient impact. Such an approach could
result in Sithe overlooking significant PSD increment impacts in areas where DREF’s impact
may be insignificant, but cumulatively there are significant impacts such as violations. See
October 5, 2006 Tran report at 11. Indeed, there is sufficient reason to believe that increment
violations have been overlooked by Sithe in some Class I areas.
While EPA proposed use of Class I significant impact levels in July of 1996 (61 Fed.Reg. 38338,
July 23, 1996), EPA never finalized promulgation of those significant impact levels. Until
significant impact levels for Class I increment analyses are promulgated by EPA,
any
impact in a
Class I area by DREF must warrant a cumulative PSD increment analysis.
In addition, use of Class I significant impact levels in areas where, cumulatively, there could be
violations of the increment is contrary to EPA’s interpretation of the law. EPA Region VIII
stated in an April 12, 2002 letter to the North Dakota Department of Health that the use of
significant impact levels to allow a PSD permit to be issued in the case of a Class I area showing
increment violations is not consistent with the intent of the Clean Air Act’s PSD program. (See
Attachment to April 12, 2002 letter from EPA to North Dakota Department of Health, listed as
Attachment 51
on the attached exhibit list, at pages 5-6).
As discussed above in comment 12, there is a strong probability that the NO
2
increments
in Mesa Verde National Park are violated or are close to being violated. Thus, DREF
must not be exempt from a cumulative NO
2
increment analysis at this Class I area. It is
ELECTRONIC FILING, RECEIVED, CLERK'S OFFICE, JANUARY 5, 2007
* * * * * PC #7 * * * * *
70
imperative that EPA properly determine whether DREF will contribute to NO
2
increment
violations at this Class I area.
In addition, existing violations of the Class I SO
2
increment are occurring in Capitol Reef
National Park. During the permit review and proceedings for the proposed Unit 3 of the
Intermountain Power Plant located in Delta, Utah, the National Park Service conducted a Class I
SO
2
increment analysis and determined that
existing
sources in Utah are causing violations of
the 3-hour average Class I SO
2
increment in Capitol Reef National Park. Specifically, on March
25, 2004, the National Park Service submitted a letter to the Utah Division of Air Quality that
provided, among other things, the Park Service’s formal findings that the 3-hour average SO
2
increment was being violated by existing sources in Utah at Capitol Reef National Park.
138
In
May of 2003, the Assistant Secretary for Fish and Wildlife and Parks submitted a letter and
accompanying Technical Support Document reiterated that existing sources are causing
violations of the 3-hour average SO
2
increment at Capitol Reef National Park.
139
Because the
SO
2
emissions from DREF will increase 3-hour average SO
2
concentrations in this Class I area,
the DREF facility could contribute to SO
2
increment violations at Capitol Reef National Park.
Therefore, EPA must require Sithe to conduct a cumulative 3-hour average SO
2
increment
analysis at Capitol Reef National Park to determine whether DREF will contribute to existing
SO
2
increment violations. Further, any such analysis must address all of the deficiencies
currently existing in the DREF SO
2
increment analyses as discussed in the next comment.
Further, as discussed further below, it appears that there may be existing SO
2
increment
violations at Mesa Verde National Park. EPA must therefore consider any impact by DREF on
Class I increment violations at Mesa Verde National Park to be significant.
Thus, for all of the above reasons, EPA must require Sithe to provide cumulative PSD increment
analyses for all pollutants and all Class I areas that will be affected by DREF.
15. THE DREF CUMULATIVE SO
2
INCREMENT ANALYSES ARE
SEVERELY DEFICIENT AND CANNOT BE RELIED UPON BY EPA
The DREF cumulative SO
2
increment analyses are fatally flawed for numerous reasons as
discussed in the November 9, 2006 report prepared by Vicki Stamper entitled “Review of the
Class I SO
2
PSD Increment Consumption Analyses Performed for the Desert Rock Prevention of
Significant Deterioration Permit” which is incorporated herein and attached to this comment
letter. A Class I SO
2
increment modeling analyses prepared by Khanh Tran in which just a few
of the numerous deficiencies in the modeled PSD increment inventory are corrected indicates
that DREF will contribute to violations of the 3-hour and 24-hour average SO
2
increments at
Mesa Verde National Park. See November 9, 2006 report entitled “Cumulative SO
2
Modeling
Analyses of Desert Rock Energy Facility and Other Sources at PSD Class I Areas,” by Khanh
138
National Park Service Comments on the Intermountain Power Agency Prevention of Significant Permit
Application for the Addition of Unit 3 at its Intermountain Power Plant, March 2004, attached to its March 25, 2004
letter to Rick Sprott, Utah Division of Air Quality, at 5. (
Attachment 52
).
139
National Park Service Supplemental Technical Comments on the Intermountain Power Agency Prevention of
Significant Permit Application for the Addition of Unit 3 at its Intermountain Power Plant, May 2004, attached to its
May 2004 letter from the Assistant Secretary for Fish and Wildlife and Parks to Rick Sprott, Utah Division of Air
Quality, at 8-9. (
Attachment 53
).
ELECTRONIC FILING, RECEIVED, CLERK'S OFFICE, JANUARY 5, 2007
* * * * * PC #7 * * * * *
71
Tran of AMI Environmental, incorporated herein and attached to this letter. EPA therefore
cannot issue the PSD permit to DREF as proposed pursuant to 40 C.F.R. §52.21(k)(2).
Specifically, 40 C.F.R. §52.21(k)(2) mandates that Sithe must demonstrate DREF won’t cause
or
contribute
to a violation of any PSD increment.
The SO
2
Reductions Made at the San Juan and Four Corners Power Plants in the 1970’s to early
1980’s Cannot Be Used to Expand the SO
2
Increment for DREF.
Many of the deficiencies noted in the Stamper report pertain to Sithe’s modeling of SO
2
emission
reductions at the Four Corners power plant and at Units 1 and 2 of the San Juan power plant as
expanding the available SO
2
increment. Under the PSD regulations, emission reductions that
occurred after the minor source baseline date at sources which were in existence as of the minor
source baseline date can expand the amount of available increment to the extent that ambient
concentrations would be reduced. See October 1990 Draft New Source Review Workshop
Manual at C.10. However, emission reductions that were made to attain the NAAQS cannot be
credited as increment-expanding. If SO
2
baseline concentrations in the region were inflated by
emissions from these power plants that were considered to be causing or contributing to NAAQS
violations, then the SO
2
emission reductions made to bring the area into compliance cannot also
be used to expand the available PSD increment, as this would be entirely inconsistent with the
mandates of the Clean Air Act.
It would turn the PSD program on its head to expand increment based on pollution reductions
made to comply with the NAAQS. The very essence, purpose and fabric of the PSD program is
to preserve and enhance air quality in areas that meet the NAAQS. Accordingly, EPA’s
implementing PSD regulations, like the statute, establish the NAAQS as ironclad ambient air
quality “ceilings” that shall not be exceeded under any circumstances:
(d)
Ambient air ceilings
. No concentration of a pollutant shall exceed:
(1)
The concentration permitted under the national secondary ambient air quality
standard, or
(2)
The concentration permitted under the national primary ambient air quality
standard, whichever concentration is lowest for the pollutant for a period of exposure.
See 40 CFR 52.21(d).
Further, the PSD program by its plain terms applies to areas designated “as attainment or
unclassifiable” for purposes of the NAAQS. CAA Sec. 161; 40 CFR 52.21(a)(2). Baseline
concentrations for such “clean air” areas are specifically prescribed by statute and regulation.
CAA Sec. 169(4); 40 CFR 52.21(b)(13). Thus, the benchmarks of the PSD program are
deliberately delineated by law: ranging from a clean air area’s baseline concentration to the
NAAQS ceiling. These are the ambient air quality yardsticks. The entire PSD program is
carefully calibrated to allocate increment within these touchstones, considering important public
interests such as heightened protections for national parks and wilderness areas and other
statutory considerations.
ELECTRONIC FILING, RECEIVED, CLERK'S OFFICE, JANUARY 5, 2007
* * * * * PC #7 * * * * *
72
Pollution levels above the NAAQS exceed the maximum “[a]mbient air ceiling” established by
statute and regulations. Pollution concentrations above the NAAQS are manifestly outside the
permissible boundaries of the PSD program. To enlarge increment based on pollution
reductions made to meet the NAAQS ceiling would be to provide “credit” for complying with
the law and restoring air quality to within the PSD program boundaries. This would pervert the
entire statutory terms, structure and purposes of the PSD program.
Accordingly, in this very proceeding, EPA’s principal air quality modeler, Scott Bohning,
explained in a meeting with Sithe officials: “Increment expansion – historically emission
reduction for 4 Corners and San Juan, but reduction to meet NAAQS shouldn’t be used for
increment expansion.” See attachment listed as Attachment 62 “FOIA Appeal” in the attached
exhibit list (emphasis added)
.
This prohibition is a fundamental and unyielding requirement of
the PSD program.
Indeed, the SO
2
emission reductions made at the Four Corners Power Plant and Units 1 and 2 of
the San Juan Power Plant during the mid-1970s through the mid-1980s were made because of
state and federal regulations that were intended to resolve SO
2
NAAQS compliance problems in
San Juan County, New Mexico. The state and federal regulatory history of the SO
2
reduction
requirements is provided in the November 9, 2006 Stamper report at pages 7-8. A review of that
history makes clear that, had Public Service Company of New Mexico and Arizona Public
Service Company simply complied with the SO
2
reduction requirements when first mandated to
do so by 1974 as required under a federally imposed implementation plan
140
, we would not now
be debating whether and to what extent the SO
2
emission reductions made in the late
1970’s/early 1980’s at the Four Corners Power Plant and at Units 1 and 2 of the San Juan Power
Plant can expand the available increment because the reductions would have been made before
the applicable minor source baseline date.
141
Instead, due to litigation against EPA mainly
brought by Arizona Public Service Company
142
, installation of SO
2
controls was significantly
delayed at Four Corners Power Plant and, to a lesser extent, also delayed at the San Juan Power
Plant, and now Sithe is attempting to use those delays to its advantage to gain approval to
construct a new 1,500 MW power plant in this already heavily polluted area. Sithe’s attempt to
take credit for these SO
2
reductions, and EPA’s proposed approval of Sithe’s approach, are
entirely inconsistent with the mandates of the Clean Air Act and the prevention of significant
deterioration program.
140
EPA imposed a federal implementation plan to reduce SO2 emissions at all 5 of the Four Corners Power Plant
units and at Units 1 and 2 of the San Juan Power Plant by 70% in 1973. 38 Fed.Reg. 7554-7 (March 23, 1973),
These regulations were promulgated because EPA found the New Mexico SIP to be deficient in failing to ensure
compliance with the primary and secondary SO2 NAAQS. These power plant units were required to comply with
the SO2 emission limitations by January 31, 1974, and could request EPA approval of a compliance schedule that
demonstrates
141
In general,
compliance
emissions changes
“as expeditiously
that occur
as
before
practicable
the minor
but
source
no later
baseline
than March
date
15,
become
1976.”
part
38
of
Fed.Reg.
the baseline
7557.
concentration and do not affect the increment. See 40 C.F.R. §52.21(b)(13)(ii)(b). Also, emissions changes
associated with construction at existing major source that occurs after the major source baseline date, which is
January 6, 1975 for SO2, also affect the available increment. See 40 C.F.R. §52.21(b)(13)(ii)(a).
142
See 39 Fed.Reg. 10583 (March 21, 1974).
ELECTRONIC FILING, RECEIVED, CLERK'S OFFICE, JANUARY 5, 2007
* * * * * PC #7 * * * * *
73
Sithe cannot obtain its permit to construct DREF without these increment expanding emissions.
As shown in the November 9, 2006 modeling report by Khanh Tran, if Sithe was disallowed its
use of SO
2
reductions at just the San Juan power plant alone to expand the SO
2
increment, the
DREF facility would be shown to cause or contribute to significant SO
2
increment violations at
Mesa Verde National Park. See also Stamper report 34-35. Specifically, with the increment
expanding emissions from just San Juan Units 1 and 2 excluded from Sithe’s SO
2
increment
consumption modeling and all of the DREF low level emission sources properly modeled
143
, the
second high 3-hour SO
2
concentration was predicted to be 49.7μg/m
3
and the second high 24-
hour SO
2
concentratio n was predicted to be 8.9 μg/m
3
, both well in excess of the 3-hour SO
2
Class I increment of 25 μg/m
3
and the 24-hour Class I increment of 5 μg/m
3
. Consequently, any
decision by EPA Region IX to allow this unprecedented use of emission reductions intended to
comply with NAAQS-imposed regulations to expand the increment for a new source must be
made with absolute assurance that any such reductions are indeed creditable.
EPA is proposing to allow Sithe to take credit for SO
2
emission reductions at the Four Corners
and San Juan power plants that go beyond what was necessary to attain the SO
2
NAAQS.
AAQIR at 42. However, EPA failed to diligently investigate the background of the SO
2
emission reductions at the Four Corners and San Juan power plants. EPA allowed Sithe to rely
on a discussion in a June 10, 1981 Federal Register preamble (in which EPA proposed approval
of the New Mexico SO2 SIP) and an unorthodox method to provide its estimate of what the
maximum short term average SO
2
emission rates was to show compliance with the SO
2
NAAQS.
January 2006 DREF Class I Area Modeling Update, at A-1 and 4-22. See also Stamper report at
16-17. Then, any reductions in current emissions that went beyond that deemed level of control
to meet the NAAQS were modeled as increment expanding emissions. AAQIR at 42.
Had EPA more thoroughly researched what was modeled to demonstrate attainment of the short
term average SO2 NAAQS by New Mexico in its 1981 SIP, it would have found that the SO
2
reductions at Units 1 and 2 of the San Juan power plant should not provide for any increment
expansion credit for the 3-hour average SO2 increment and at best only limited increment
expansion at Unit 1 for the 24-hour average increment. See Stamper report at 36-37. Indeed,
when maximum actual 3-hour and 24-hour average emission rates that currently have occurred at
the San Juan Power Plant are also considered along with all DREF emissions sources, modeling
based all other Sithe model inputs indicates that the second high 3-hour SO
2
concentration at
Mesa Verde National Park would be 86.978 μg/m
3
and the second high 24-hour SO
2
concentration was predicted to be 8.5284 μg/m
3
.
Id.
at 38. See also November 9, 2006 Tran
report at 5. These concentrations reflect the high second high values where DREF would also
contribute in excess of EPA’s proposed Class I SO2 significant impact levels. Thus, DREF
would contribute in excess of EPA’s proposed Class I significance levels to violations of the 3-
hour and 24-hour average SO2 increment at Mesa Verde National Park. And this analysis did
not adjust any other source inputs from Sithe’s DREF modeling.
With respect to the SO
2
emission reductions at the Four Corners power plant, Sithe and EPA
completely ignored the fact that EPA is currently in the process of proposing a federal
implementation plan (FIP) for this facility which includes limitations on SO
2
emissions. 71
Fed.Reg. 53631, September 12, 2006. As part of that proposed rulemaking, EPA should have
143
See comment 13 above, and October 5, 2006 Tran report at 5.
ELECTRONIC FILING, RECEIVED, CLERK'S OFFICE, JANUARY 5, 2007
* * * * * PC #7 * * * * *
74
performed an analysis to verify that its proposed emission limitations were sufficient to ensure
attainment and maintenance of the SO
2
NAAQS in the region as required for state plans under
section 110(a)(2)(A) of the Clean Air Act. Such an analysis could then be relied upon by EPA
and Sithe in determining if any credit for increment expansion can be provided by the Four
Corners Power Plant. Based on a review of the Four Corners Power Plant emissions that New
Mexico modeled to demonstrate attainment of the SO2 NAAQS for its 1981 SIP, and a
comparison to current maximum 3-hour and 24-hour average emissions, this means there are
probably no SO
2
reductions at Four Corners power plant in 2003-2004 that could expand the
available increment. Indeed, emissions from the Four Corners Power Plant may cons ume the
available SO2 increment. Stamper report at 38-39.
It is important to note that the flaws in Sithe’s Class I SO
2
increment analysis with
respect to the Four Corners and San Juan Power Plants also carry over into Sithe’s Class
II cumulative SO
2
increment analysis because Sithe relied on the same SO
2
emission
reductions at Units 1 and 2 of the San Juan Power Plant and at the Four Corners Power
Plant to expand the available increment. Stamper report at 40. For all of the reasons
discussed above, Sithe’s Class I and II modeling is flawed and cannot be relied upon to
ensure that the Class I or II SO
2
increments will be complied with.
Sithe Failed to Model Maximum Short Term Average SO
2
Emissions as Reflecting
Current Actual Emissions.
In determining the amount of increment consumption, the permit applicant is to evaluate
changes in actual emissions. According to the New Source Review Workshop Manual,
for analysis of the short term (24-hour and 3-hour) average increments, the “highest
occurrence” of emissions for each averaging period during the previous two years of
operation must be modeled as reflecting current emissions in a PSD increment analysis.
New Source Review Workshop Manual, October 1990 draft, at C.49. Sithe failed to
model the current maximum SO
2
emission rates of all increment-affecting power plant
units. Instead, Sithe modeled the “99
th
percentile” hourly SO
2
emission rate averaged
over 2003-2004 for current power plant units. There is absolutely no justification for this
approach in any federal regulation or guidance. As a result of using this unjustified
approach to determining current emissions from power plant units, Sithe underestimated
total current 3-hour average SO
2
emissions almost by a factor of 3, and only modeled
about three quarters of the current total maximum 24-hour SO
2
emission rates, from all of
the increment consuming power plants. Stamper report at 24-30. Thus, Sithe’s SO
2
increment consumption analyses greatly underestimated the total amount of increment
consuming emissions in its Class I SO
2
increment consumption analyses.
Thus, EPA cannot rely on the SO
2
PSD increment analyses provided by Sithe to
demonstrate that DREF won’t cause or contribute to a violation of either the Class I or
the Class II 3-hour and 24-hour average SO
2
increments. Further, based on the modeling
analyses performed by Khanh Tran (see November 9, 2006 Tran report), it appears there
are existing violations of the 3-hour and 24-hour average SO
2
increment in Mesa Verde
National Park and possibly other Class I areas. EPA’s policy on this matter makes clear
that such increment violations “must be entirely corrected before PSD sources which
ELECTRONIC FILING, RECEIVED, CLERK'S OFFICE, JANUARY 5, 2007
* * * * * PC #7 * * * * *
75
affect the area can be approved.” See 45 Fed.Reg. 52678, August 7, 1980. EPA cannot
assume that the planned SO
2
emission reductions at the San Juan Generating Station and
at Four Corners Power Plant will remedy these 3-hour and 24-hour SO
2
increment
violations. The SO
2
emission reductions that are in the March 10, 2005 San Juan power
plant Consent Decree and that have been proposed to be required of the Four Corners
power plant in EPA’s proposed Federal Implementation Plan (FIP) (71 Fed.Reg. 53636,
September 12, 2006) apply on longer term averaging periods and cannot be relied upon to
ensure reductions in SO
2
emissions during each 3-hour or 24-hour period.
144
Further, the
percent reduction SO
2
requirements in both the San Juan Consent Decree and in the
proposed Four Corners FIP also do not guarantee any specific level of emissions because
sulfur content of the coal could change over time.
EPA must resolve these SO
2
increment issues before proposing to issue a permit
authorizing construction of a new power plant in the area.
16. EPA MUST NOT ISSUE THE PSD PERMIT TO DREF BECAUSE THE
USFS HAS FOUND IT WILL ADVERSELY IMPACT VISIBILITY AND OTHER
AIR QUALITY RELATED VALUES IN SEVERAL CLASS I AREAS
The DREF visibility modeling showed that, using FLAG procedures
145
, the DREF
facility will cause an adverse impact on visibility at 11 Class I areas, causing greater than
a 5% change in visibility at these Class I areas. January 2006 DREF Class I Area
Modeling Update at 4-13 (Table 4-5, Method 2 results). This modeling also showed that
the DREF facility would cause greater than a 10% change in visibility at Mesa Verde
National Park, San Pedro Parks Wilderness Area, Canyonlands National Park, Petrified
Forest National Park, and the Weminuche Wilderness Area.
Id.
These levels of visibility
impacts are above the levels the Federal Land Managers would typically consider to be
adverse.
146
And, based on the deficiencies in the modeling methodology discussed in
comment 13 above, these visibility impacts were likely underestimated.
Accordingly, the US Forest Service (USFS) submitted comments to EPA on April 26,
2006 that essentially indicated DREF’s impacts on visibility and atmospheric deposition
(i.e., acid rain) in USFS Class I areas would be considered adverse unless an appropriate
mitigation strategy is approved and made enforceable by EPA as part of the PSD permit.
See listing as
Attachment 54
on the attached exhibit list. The USFS submitted an
144
Under the March 10, 2005 Consent Decree with Public Service Company of New Mexico for the San Juan
Generating Station, there is a 7-day block average SO2 emission limit of 0.25 lb/MMBtu which appears to exclude 3
hour periods in excess of this limit due to startup, and there is a 90% SO2 reduction requirement that applies on an
annual rolling average. See March 10, 2005 Consent Decree at 14-15. Neither of these emission limits will ensure
that SO2 emissions are consistently reduced on a 3-hour or a 24-hour average basis. Under the EPA’s September
12, 2006 proposed FIP for the Four Corners Power Plant, this facility would be subject to an 88% reduction
requirement that would apply on a yearly plantwide basis. 71 Fed. Reg. 53636. The proposed FIP also includes a 3-
hour average SO2 emission limit of 17,900 lb/hr that applies on a plantwide basis (
Id.
), but this limit will not ensure
any sustained emission reductions from current SO2 emission levels. The annual average 88% SO2 reduction
145
requirement
Federal Land
will not
Managers’
ensure that
Air
SO2
Quality
emissions
Related
are
Values
consistently
Workgroup
reduced
(FLAG)
on a
Phase
3-hour
I
or
Report,
a 24-hour
December
average
2000.
basis.
146
Id.
at 26.
ELECTRONIC FILING, RECEIVED, CLERK'S OFFICE, JANUARY 5, 2007
* * * * * PC #7 * * * * *
76
additional comment letter to EPA on September 6, 2006 to clarify its April 26, 2006 letter
by stating that “the USDA-FS does find that the predicted impacts [of DREF} would be
adverse.” See listing as
Attachment 55
at 1 on the attached exhibit list. In its AAQIR
for the DREF permit, EPA did briefly mention the USFS April 26, 2006 letter, but only
stated that the USFS letter referred to a “‘mitigation strategy’ that Sithe had proposed to
the FLMs.” AAQIR at 38. Based on this adverse impact determination by the USFS,
EPA cannot issue the permit until, at the very least, it addresses the requirements of the
PSD permitting regulations at 40 C.F.R. §52.21(p)(3). Specifically, under federal PSD
permitting regulations
The Administrator shall
consider
any analysis performed by the Federal land
manager, provided within 30 days of the notification required by [40 C.F.R.
§52.21(p)(1)], that shows a proposed new major stationary source. . .may have an
adverse impact on visibility in any Federal Class I area.
Where the Administrator
finds that such an analysis does not demonstrate to the satisfaction of the
Administrator that an adverse impact on visibility will result in the Federal Class
I area, the Administrator must, in the notice of public hearing on the permit
application, either explain his decision or give notice as to where the explanation
can be obtained.
40 C.F.R. §52.21(p)(3), emphasis added.
EPA has failed to meet its responsibility to address visibility impacts in its proposed
issuance of the DREF PSD permit. The italicized language above makes clear that EPA
cannot simply ignore the Class I visibility impacts of DREF and leave it to the FLMs and
Sithe to work out a mitigation strategy. EPA has a responsibility to make its own finding
of whether it agrees with the FLMs’ analysis of DREF’s impacts on Class I areas. And,
if EPA disagrees with the FLMs’analysis, it must explain its decision.
EPA did not even mention any FLM letters indicating that DREF may have an adverse
impact on visibility and other air quality related values (AQRVs) in its public notice for
the DREF permit. In its AAQIR, EPA only briefly mentioned the USFS April 26, 2006
letter, but did not characterize it as a letter indicating adverse visibility or atmospheric
deposition impacts. AAQIR at 38. Indeed, EPA erroneously stated in its AAQIR that the
FLMs did not find any adverse impacts to visibility as a result of DREF. AAQIR at 36.
EPA has also not issued any revised public notice or other statement regarding the
USFS’s September 8, 2006 letter that clarified the earlier USFS April 26, 2006 letter by
stating that DREF would adversely impact visibility and atmospheric deposition in
Federal Class I areas. (See Attachment 55). Clearly, the USFS’s April 26, 2006 letter
was an adverse impact finding that EPA should have responded to in accordance with 40
C.F.R. §52.21(p)(3). While EPA did discuss the regional haze modeling analysis
prepared by Sithe in its AAQIR, EPA did not indicate that this analysis would offset or
remedy the adverse visibility impacts predicted to occur at Federal Class I areas by the
DREF visibility modeling that followed FLAG methodology. AAQIR at 44-45. Further,
EPA never provided its own review and opinion on whether the construction of DREF
would be consistent with visibility new source review requirements. Instead, EPA stated
without further discussion of its own review “EPA has concluded that construction and
ELECTRONIC FILING, RECEIVED, CLERK'S OFFICE, JANUARY 5, 2007
* * * * * PC #7 * * * * *
77
operation of the proposed Facility is consistent with the requirements for visibility
improvement under the Regional Haze rule.” AAQIR at 45.
EPA’s visibility protection new source review requirements expressly command EPA to “ensure
that the source’s emissions will be consistent with making reasonable progress toward the
national visibility goal referred to in 51.300(a).” 40 CFR 51.307. This duty applies to EPA
when it is acting in the shoes of the tribe as the permitting agency. As EPA itself has found: “In
such cases, all of the rights and duties that would otherwise fall to the State [or Tribe] accrue
instead to EPA.” 56 Fed. Reg. 50,172, 50,173 (Oct. 3, 1991). The national visibility goal in
turn has two essential dimensions: to remedy any existing visibility impairment and to prevent
any future visibility impairment.
EPA’s regional haze rules adopted specific regulatory requirements to carry out the national
visibility goals. The haze rules establish, by regulation, “reasonable progress goals” that “must
provide for an improvement in visibility for the most impaired days over the period of the
implementation plan and ensure no degradation in visibility for the least impaired days over the
same period.” 40 CFR 51.308(d)(1). EPA may not approve a permit that will add extensive
visibility-impairing emissions that adversely impact visual air quality at numerous mandatory
class I areas. EPA must show that the “reasonable progress goal” for these areas will be
protected.
Moreover, EPA may not disregard its own regulatory prohibition on visibility degradation for the
least impaired days. It must be adhered to. It is provided for directly in the implementing
regulations and has been affirmed by the D.C. Circuit. When EPA adopted the anti-degradation
requirement it explained “this approach is consistent with the national goal in that it is designed
to prevent future impairment, a fundamental concept of section 169A of the CAA.” 64 Fed. Reg.
at 35,733 (July 1, 1999).
EPA’s failure to demonstrate that the haze-impairing emissions from Desert Rock will comply
with its own “core requirements” to protect mandatory class I areas from regional haze is plainly
contrary to law. 40 CFR 51.308(d).
A review of the DREF regional haze modeling in fact would show that the modeling is
flawed and that it can’t be relied upon to show that emission reductions at Four Corners
and San Juan power plants would more than offset DREF’s adverse visibility impacts, as
discussed further below.
In any case, an adverse visibility and AQRV impact determination has been made by
USFS regarding the DREF permit. EPA has never properly notified the public of this
determination or provided its explanation as to why it has (apparently) found that DREF
won’t adversely impact visibility or atmospheric deposition in nearby Class I areas in
spite of the USFS’s finding. Consequently, EPA has not met its responsibilities under 40
C.F.R. §52.21(p)(3), and the DREF PSD permit cannot be issued by EPA.
ELECTRONIC FILING, RECEIVED, CLERK'S OFFICE, JANUARY 5, 2007
* * * * * PC #7 * * * * *
78
17. THE REFINED VISIBILITY MODELING IS FLAWED AND CANNOT BE
RELIED UPON TO DEMONSTRATE THAT DREF WILL NOT ADVERSELY
IMPACT VISIBILITY IN CLASS I AREAS
As described in the DREF Class I Area Modeling Update (January 2006) at 4-12, Sithe
used several alternative approaches to modeling the direct visibility impacts due to the
DREF facility at nearby Class I areas in addition to modeling that followed the FLAG
guidance “Method 2.” However, the alternatives are not technically defensible nor is it
recommended as a method to be used for visibility impact determinations by the FLMs.
The deficiencies in the alternative DREF visibility modeling approaches are described in
the October 5, 2006 by Khanh Tran of AMI Environmental at 6. The National Park
Service also commented on deficiencies in the refined visibility modeling. Those
comments are discussed in Section 2.0 of the January 2006 Addendum to Modeling
Protocol for the Proposed Desert Rock Generating Station. Even when all of Sithe’s
visibility modeling refinements are considered, Sithe’s modeling still indicates that
DREF would cause greater than a 5% change in visibility at several Class I areas
modeled. DREF Class I Area Modeling Update (January 2006) at 4-13 – 4-15. In any
case, this modeling cannot be relied upon to demonstrate that DREF will not adversely
impact visibility in Class I areas.
18. THE PREDICTED PLUME BLIGHT IMPACTS FROM DREF ARE
SIGNIFICANT
As discussed in the comments prepared on October 5, 2006 by Khanh Tran of AMI
Environmental, the plume blight impacts from DREF alone will be significant in Class I
areas in the region. See October 5, 2006 Tran report at 12.
19. OTHER MODELING STUDIES INDICATE THAT THE CALPUFF
MODELING USED BY SITHE UNDERESTIMATED DREF’S VISIBILITY
IMPACTS AT THE GRAND CANYON NATIONAL PARK AND OTHER CLASS
I AREAS IN THE REGION
Studies were completed by the National Park Service in 2005 and 2006 that provide evidence to
indicate the Calpuff modeling utilized by Sithe greatly underestimated DREF’s visibility impacts
in Grand Canyon Nationa l Park and most likely in other Class I areas in the region. See Barna,
M. et al., 2006.
Simulation of the potential impacts of the Sithe power plant in the Four Corners
basin using CAM
x, listed as
Attachment 56
in the attached exhibit list, and Schichtel, B.A. et
al, 2005.
Simulation of the Impact of the SO2 emissions from the proposed Sithe power plant on
the Grand Canyon and other Class I Area
s, listed as
Attachment 57
in the attached exhibit list.
A comparison of these studies against the DREF Calpuff analyses was completed by Khanh Tran
of AMI Environmental, and his conclusion was that “[t]he severe underprediction of Calpuff
compared to the other models seriously questions the validity of the modeling results for PSD
Class I increment analysis and visibility impact analysis at the Grand Canyon and other PSD
Class I areas.” See October 5, 2006 Tran report at 2-13 for a review of these National Park
Service analyses.
ELECTRONIC FILING, RECEIVED, CLERK'S OFFICE, JANUARY 5, 2007
* * * * * PC #7 * * * * *
79
The EPA must seriously consider these studies in making its finding as to whether or not the
Agency concurs with the USFS’s finding that DREF will adversely impact visibility and
atmospheric deposition in Class I areas in the region.
20. EPA FAILED TO REQUIRE SITHE TO CONDUCT A CUMULATIVE
VISIBILITY IMPACTS ANALYSIS
As commented by the National Park Service in its July 6, 2004 letter to EPA (listed as
Attachment 58
on the attached exhibit list, a cumulative visibility impacts analysis needs
to be performed for the DREF project considering all other PSD permitted sources
including those not constructed yet. See July 6, 2004 NPS letter to EPA, at 2. See also
October 5, 2006 Tran report at 11. Yet, Sithe did not conduct a cumulative visibility
analysis. Sithe’s supplemental regional haze analysis is not a cumulative analysis
because it only evaluated the San Juan and Four Corners power plants and did not include
all PSD sources in the region. Thus, the DREF permit application is incomplete without
such an analysis.
21. THE SUPPLEMENTAL REGIONAL HAZE MODELING IS FLAWED AND
CANNOT BE RELIED UPON TO DEMONSTRATE THAT DREF WILL NOT
ADVERSELY IMPACT VISIBILITY IN CLASS I AREAS
Sithe provided an update to its Class I modeling in March of 2006. DREF Class I Modeling
Supplement (March 2006) . This analysis was done to evaluate the regional ha ze benefits of
emissions reductions planned at the Four Corners and San Juan power plants. DREF Class I
Modeling Supplement (March 2006) at 1-1. Based on this analysis, Sithe concluded “the
operation of the proposed DREF will not adversely affect compliance with the goals of the
Regional Haze Rule in the early part of the rule’s implementation.” DREF Class I Modeling
Supplement (March 2006) at 5-1. It appears that EPA may have relied on this modeling to
justify its proposed issuance of the DREF permit in spite of the adverse impact on visibility
claimed by the USFS (as discussed in comment 16 above). Specifically, EPA stated in its
AAQIR “[t]his modeling showed that visibility would improve in the area regardless of the
emissions from the proposed Facility.” AAQIR at 45. However, Sithe’s supplemental regional
haze modeling is flawed for several reasons and cannot be relied upon by EPA to justify issuance
of the DREF permit in spite of the USFS’s April 26, 2006 finding that the facility would have an
adverse impact on Class I area visibility.
First, the March 2006 Class I modeling only considers the impacts of DREF and the Four
Corners and San Juan power plants on meeting regional haze goals in the region’s Class I
areas. There are numerous other existing sources that are impacting visibility at the
region’s Class I areas. Further, there are numerous new sources of emissions that will
impact the ability of the region’s Class I areas to meet regional haze goals in the future,
including several new coal-fired power plant units planned in the region and air
emissions sources associated with significant oil, gas and coal bed methane development
planned for the region. In the BLM’s Farmington Field Office Area alone, the BLM has
projected an increase in NO
x
emissions of over 62,000 tons per year within 20 years from
compressor engines associated with gas development authorized under the Farmington
ELECTRONIC FILING, RECEIVED, CLERK'S OFFICE, JANUARY 5, 2007
* * * * * PC #7 * * * * *
80
RMP. See March 2003 Farmington Proposed RMP/FEIS at Summary-6 (listed as
Attachment 59
on the attached exhibit list). Thus, the March 2006 Class I analysis
cannot be relied upon to demonstrate anything with respect to the area meeting regional
haze goals without looking at the big picture of all existing and future emissions sources
that impact regional haze in the region’s Class I areas.
EPA’s proposed action on Desert Rock contravenes EPA’s obligations under the regional haze
program and the visibility NSR requirements. As explained above, EPA must evaluate the haze-
impairing emissions at Desert Rock, in conjunction with other visibility-impairing pollution in
the region, in determining whether the dual reasonable progress goals for each mandatory class I
area are met. The regional haze rules establish, by regulation, “reasonable progress goals” that
“must provide for an improvement in visibility for the most impaired days over the period of the
implementation plan and ensure no degradation in visibility for the least impaired days over the
same period.” 40 CFR 51.308(d)(1). EPA may not approve a permit that will add extensive
visibility-impairing emissions that adversely impact visual air quality at numerous mandatory
class I areas. EPA must show that the “reasonable progress goals” for these areas will be
protected.
The regional haze program is ma nifest that the plan itself is a “long-term strategy” and that
compliance with the reasonable progress goal requiring an improvement in visibility involves a
careful examination of the “rate of progress needed to attain natural visibility conditions by the
year 2064.” See 40 CFR 51.308(d)(1). EPA’s regulations explain that the determination of this
“rate of progress” or evaluation of the glidepath is an essential element of complying with the
regional haze reasonable progress goals and that EPA must:
“Analyze and determine the rate of progress needed to attain natural visibility
conditions by the year 2064. To calculate this rate of progress, the State must compare
baseline visibility conditions to natural visibility conditions in the mandatory Federal
Class I area and determine the uniform rate of visibility improvement (measured in
deciviews) that would need to be maintained during each implementation period in order
to attain natural visibility conditions by 2064. In establishing the reasonable progress
goal, the State must consider the uniform rate of improvement in visibility and the
emission reduction measures needed to achieve it for the period covered by the
implementation plan.”
40 CFR 51.308(d)(1)(B).
Thus, EPA must demonstrate both durable long-term compliance with the anti-degradation
requirement and the glidepath or “rate of progress” necessary to achieve natural visibility
conditions by the year 2064. This demonstration of compliance is required for Mesa Verde
National Park and the other numerous mandatory class I areas in the region affected by the
additional visibility-impairing pollution discharged from Desert Rock and must be determined
considering the overall pollution occurring and the haze-impairing pollution reasonably
foreseeable in the area. EPA’s regulations are clear in requiring a comprehensive assessment of
emissions and require identification of “all anthropogenic sources of visibility impairment
considered by the State in developing its long-term strategy. The State should consider major
ELECTRONIC FILING, RECEIVED, CLERK'S OFFICE, JANUARY 5, 2007
* * * * * PC #7 * * * * *
81
and minor stationary sources, mobile sources, and area sources.” 40 CFR 51.308(d)(3)(iv).
Further, the rules require evaluation of “[t]he anticipated net effect on visibility due to projected
changes in point, area, and mobile source emissions over the period addressed by the long-term
strategy.” 40 CFR 51.308(d)(3)(v)(G). Unfortunately, EPA has failed to carry out its own
regulatory mandates under the regional haze program in proposing to approve the Desert Rock
power plant.
Further, EPA must likewise evaluate all visibility-impairing sources in the area in conducting the
visibility assessment for a new source under section 165(d) of the Act. EPA has long required
that in carrying out section 165(d) of the PSD program the evaluation of visibility impacts from a
new source includes the cumulative evaluation of the combination of sources on visibility
conditions at mandatory class I areas:
“Environmental groups and private citizens expressed the need for a policy on
reviewing cumulative impacts from new sources. Rapid industrial growth is expected
near some of the Class I areas. These commenters are concerned that any one source
would not cause significant impairment, but the combination of sources may adversely
affect air quality related values (including visibility). This would occur if the permitting
authority only review the potential impacts of a new source on prevailing visibility
conditions, without regard to the impacts of permitted sources not yet completed. * * *
“In assessing a proposed source’s impact on visibility, the reviewing authority
must necessarily review that impact in the context of existing background visibility. This
point does not seem debatable. The question raised by the commenters focuses on
whether previously permitted sources that have not yet been constructed are part of the
existing background. The EPA concludes that such sources are part of existing
background. In other situations, EPA has always regarded permitted sources as part of
existing background. For instance, in assessing impacts on the national ambient air
quality standards, permit applicants must account for the air quality impacts of permitted,
as well as constructed, sources. This treatment should be the same for visibility
assessment. The EPA does not believe that a change in the proposed language for new
source review is necessary to effect this implementation.”
See 50 Fed. Reg. 28,544, 28,548 (July 12, 1985). Accordingly, in evaluating the visibility
impacts of a proposed source on mandatory class I areas EPA and the FLMs must thoroughly
consider the additional pollution from the source in light of all other visibility-impairing
pollutants in fact being discharged and planned to be discharged under other projects such as oil
and gas-related stationary and area sources permitted under NEPA but not yet constructed.
Failure to do so is contrary to law.
Sithe’s March 2006 modeling is also silent on whether regional haze goals will be met
beyond the year 2010 and, given all the growth in visibility-impairing emissions expected
in the region, such progress in meeting regional haze goals seems very unlikely.
Second, there are no guarantees that the emission reductions planned at the San Juan and
Four Corners power plants will offset DREF’s impacts during every daily period that
ELECTRONIC FILING, RECEIVED, CLERK'S OFFICE, JANUARY 5, 2007
* * * * * PC #7 * * * * *
82
DREF impacts visibility and other AQRVs in Class I areas in the region. That is because
the SO
2
emission reductions that are in the March 10, 2005 San Juan power plant Consent
Decree and that have been proposed to be required of the Four Corners power plant in
EPA’s proposed Federal Implementation Plan (FIP) (71 Fed.Reg. 53636, September 12,
2006) apply on longer term averaging periods and cannot be relied upon to ensure
reductions in SO
2
emissions during each 24-hour period.
147
Further, the percent
reduction SO
2
requirements in both the San Juan Consent Decree and in the proposed
Four Corners FIP also do not guarantee any specific level of emissions because sulfur
content of the coal could change over time.
Third, there are deficiencies in March 2006 modeling methodologies, which are
discussed in the October 5, 2006 Tran report. As a result of these flaws in the modeling,
Sithe’s March 2006 Class I modeling update may have underestimated regional haze
impacts at the Class I areas modeled (and thus overstated the benefit of the San Juan and
Four Corners emission reductions when considered in conjunction with the DREF
emissions).
Fourth, the National Park Service raised numerous questions to Sithe and EPA about the
validity of the baseline emissions and future emissions assumed for the San Juan and
Four Corners power plants in the modeling. See emails from National Park Service staff
to EPA Region IX and/or Bob Paine of ENSR from 3/20/06 through 4/6/06, listed as
Attachment 60
on the attached exhibit list. It is not clear that any of these issues were
addressed by Sithe.
Thus, for all of the above reasons, the March 2006 supplemental regional haze modeling
is flawed and is not adequate to show that DREF’s adverse visibility impacts will be
offset by forthcoming emission reductions at the Four Corners and San Juan power
plants.
22. EPA CANNOT RELY ON THE FLM/SITHE MITIGATION STRATEGY TO
ADDRESS DREF’S ADVERSE VISIBILITY IMPACTS
Although it is not certain that EPA is relying at all on the mitigation strategy that has
been developed between Sithe and the FLMs, the AAQIR gives the strong impression
that EPA has relied on that mitigation strategy to justify its issuance of the DREF permit.
147
Under the March 10, 2005 Consent Decree with Public Service Company of New Mexico for the San Juan
Generating Station, there is a 7-day block average SO2 emission limit of 0.25 lb/MMBtu which appears to exclude 3
hour periods in excess of this limit due to startup, and there is a 90% SO2 reduction requirement that applies on an
annual rolling average. See March 10, 2005 Consent Decree at 14-15. Neither of these emission limits will ensure
that SO2 emissions are consistently reduced on a 24-hour average basis. Under the EPA’s September 12, 2006
proposed FIP for the Four Corners Power Plant, this facility would be subject to an 88% reduction requirement that
would apply on a yearly plantwide basis. 71 Fed. Reg. 53636. The proposed FIP also includes a 3-hour average
SO2 emission limit of 17,900 lb/hr that applies on a plantwide basis (
Id.
), but this limit will not ensure any sustained
emission reductions from current SO2 emission levels. Indeed, this limit was not relied on by Sithe in its
supplemental regional haze modeling, and instead Sithe relied on the 88% SO2 reduction requirement that would
apply on an annual average as providing for future SO2 emission reductions at the Four Corners Power Plant. The
annual average 88% SO2 reduction requirement will not ensure that SO2 emissions are consistently reduced on a
24-hour average basis.
ELECTRONIC FILING, RECEIVED, CLERK'S OFFICE, JANUARY 5, 2007
* * * * * PC #7 * * * * *
83
Yet, EPA did not propose to include such a mitigation strategy as part of the permit.
AAQIR at 38. Indeed, the mitigation strategy was not even made available to the public,
and is not listed as part of the administrative record for the proposed DREF PSD permit.
EPA cannot rely on this strategy to address DREF’s adverse Class I visibility impacts or
to address other air impacts unless EPA
•
re-issues public notice indicating the EPA is relying on the strategy to remedy
adverse visibility impacts
•
proposes to make the mitigation strategy federally enforceable
•
makes the mitigation strategy available for public review and comment
•
demonstrates the legal and technical basis for finding that the mitigation strategy
is sufficient to remedy the adverse air impacts of DREF, including providing a
modeling analysis that follows proper modeling procedures, and
•
provides at least 30 days for public review and comment.
According to an October 15, 2006 article in the Farmington Daily Times, it is stated that
“EPA may include the mitigation strategy in a revised permit.” However, if EPA is
relying on the mitigation strategy in any way to justify issuance of the DREF PSD permit,
then it cannot move forward with issuance of the permit now and then revise the permit
later to add in the mitigation strategy as a requirement. The EPA must properly address
all PSD requirements that apply to DREF before issuance of the permit.
Based on a copy of a draft mitigation strategy dated “April 2006” that Environmental
Defense obtained from EPA pursuant to a Freedom of Information Act request, we find
that EPA could not rely on the mitigation strategy to resolve DREF’s adverse visibility
impacts and justify issuance of the permit. While the April 2006 draft mitigation strategy
does include some provisions that we would support as environmentally beneficial and
also as necessary requirements of a DREF PSD permit (e.g., requirements to reduce
mercury emissions by 90%, reduce in NO
x
and SO
2
emissions, and commitment of funds
to environmental improvement projects to reduce greenhouse gas emissions in the
region), the mitigation strategy including the emission offset provisions are not sufficient
to properly remedy DREF’s visibility impacts at Class I areas in the region. The
mitigation strategy would also not address other inconsistencies in the DREF permit
application and proposed PSD permit with Clean Air Act requirements discussed above
including the need to address CO
2
emissions and to properly consider inherently lower
emitting processes in the BACT analysis and to ensure protection of the SO
2
increments
in nearby Class I areas among other things. Further, because the emission offset
requirements in the draft mitigation strategy could vary from year to year (i.e., the
sources from which DREF obtains SO
2
emission reductions from could vary each year),
it is improbable that Sithe could demonstrate that each of the various options for emission
offsets would offset Sithe’s adverse impacts on visibility, other AQRVs, or on the SO
2
PSD increments at Class I areas in the region during every year of operation of DREF.
Thus, EPA cannot rely on the mitigation strategy that Sithe has apparently negotiated
with the FLMs as remedying DREF’s adverse visibility impacts or to justify issuance of
the DREF PSD permit for all of the reasons discussed above.
ELECTRONIC FILING, RECEIVED, CLERK'S OFFICE, JANUARY 5, 2007
* * * * * PC #7 * * * * *
84
23.
THE CLEAN AIR ACT REQUIRES THAT EPA SPECIFICALLY EVALUATE
THE IMPACT OF DREF ON SOILS AND VEGETATION
The CAA’s PSD requirements include a specific obligation for permitting authorities and permit
applicants to evaluate impacts on soils and vegetation, CAA § 165(e)(3)(B), as well as an
obligation for EPA (and other permitting authorities) to evaluate the collateral environmental
impacts associated with competing technology options (169(3)).
Recently, the EAB has spoken directly to the specific obligations of the EPA regarding its
consideration of impacts on soil, vegetation, species and habitat, and how those obligations relate
to the permitting authority’s obligation to consider collateral impacts.
148
In
In re Indeck-Elwood
the Board explained:
[W]e find [that the] CAA provides that, in establishing BACT limits, the permit issuer is
to “tak[e] into account energy,
environmental
, and economic
impacts
and other costs.”
CAA § 169(3), 42 U.S.C. § 7479(3) (emphasis added). We think “environmental
impacts” is most naturally read to include ESA-identified impacts to endangered or
threatened species. Furthermore, the CAA essentially requires an analysis of the “soils
and vegetation * * * in the area potentially affected by the emissions,” which may
likewise be informed by ESA-identified impacts on endangered or threatened vegetative
species. CAA § 165(e)(3)(B), 42 U.S.C. § 7475(e)(3)(B);
accord
40 C.F.R. § 52.21(o).
These statutory predicates would appear to provide the necessary authority to address
ESA-related concerns through the provision of ameliorative conditions in the permit,
particularly where the endangered or threatened species is a plant species (i.e., is
“vegetation”).
C.f. Turtle Island
, 340 F.3d at 977 (finding that statute allowing action
agency to issue permits entrusted action agency with discretion to condition permits to
inure to the benefit of listed species). We therefore conclude that the CAA’s PSD
requirements and the ESA requirements are appropriately viewed as complementary in
nature, such that impacts on ESA-identified threatened and/or endangered species can be
taken into account when considering a PSD permit application and establishing a permit’s
terms and conditio ns. As the Ninth Circuit has noted, “an agency cannot escape its
obligation to comply with the ESA merely because it is bound to comply with another
statute that has consistent, complementary objectives.”
Wash. Toxics Coal. v. EPA
, 413
F.3d 1024, 1031 (9th Cir. 2005) (concluding that “compliance with FIFRA [the Federal
Fungicide, Rodenticide, and Rodenticide Act] requirements does not overcome an
agency’s obligation to comply with environmental statutes with different purposes,” in
particular, the ESA),
cert. denied
,
CropLife Am. v. Wash. Toxics Coal.
, 126 S. Ct. 1024
(2006);
see also Headwaters, Inc. v. Talent Irrigation Dist.
, 243 F.3d 526, 531-32 (9th
Cir. 2001) (finding that FIFRA and the Clean Water Act (“CWA”) have different and
complementary purposes and thus the registration and labeling of a substance under
FIFRA does not exempt a party from its CWA obligations).
149
148
As discussed already, EPA has long recognized the obligation for a permitting authority to meaningfully consider
collateral environmental impacts (
See In re North County
, 2 E.A.D. 229, 230 (Adm’r 1986), and the EAB has
consistently reaffirmed this requirement.
149
In re Indeck-Elwood
, PSD Appeal 03-04, at 108-109, 13 E.A.D. __ (Sept. 27, 2006).
ELECTRONIC FILING, RECEIVED, CLERK'S OFFICE, JANUARY 5, 2007
* * * * * PC #7 * * * * *
85
Thus, the Board has made it clear that EPA has affirmative duties under the “environmental
impact” analysis prong of BACT, and those dut ies specifically include the consideration of
impacts on soils, vegetation, and species. Where competing BACT technologies would have
significantly different collateral environmental impacts – that would have distinct affects on
soils, vegetation, and/or threatened or endangered species – this analysis is especially important
to the meaningful participation of the public in the PSD permitting process.
150
Moreover, EPA is
obligated (based on the definition of BACT in section 169) to specifically evaluate the
differences in collateral environmental impacts between competing technologies.
151
Here again,
because EPA did not evaluate IGCC, it has failed to meet it statutory obligation, and the public
has been denied its right to comment on a vital component of the statutory decision-making
process.
152
In addition to EPA’s obligation to evaluate the comparative impacts of different BACT options,
the CAA imposes an independent obligation to evaluate the impacts of a proposed project on soil
and vegetation in the area.
See
CAA § 165(e)(3)(B), 40 C.F.R. § 52.21(o). This long-standing
requirement of the PSD program includes an obligation to perform a site-specific inventory of
soils and vegetation, before the issuance of a draft permit. Such analysis must consider the
variety of soils and vegetation in the area, the possibility of adverse impacts on soils and
vegetation for PSD-regulated pollutants (including the possibility of adverse impacts at ambient
concentrations that are lower than the applicable NAAQS, the impact of PSD pollutants – like
fluoride – for which there is no NAAQS, and impacts from concentrations of pollutants that are
lower than generalized screening levels),
153
the possibility of adverse impact from non-PSD
150
The collateral impacts analysis for soils and vegetation is important for each facet of the DREF permit, including
ambient air quality assessment; technology assessments and selection (for both primary and secondary emission
units); and other collateral environmental effects (such as water, solid waste, and non-PSD air pollutants) –
especially when the relative benefits of other technologies (like IGCC) are considered.
151
In this context, relevant difference may include difference in the quantity or nature of air emissions, such as NOx,
SO2, CO, PM, and VOC, as well as impacts related to other factors such as water usage, solid waste handling, waste
water or process water discharge, etc.
152
One perversion created by EPA’s interpretation of the Act with respect to “redefining the source” is the ability
for EPA to avoid any up-front obligation to perform a comparative evaluation of mandatory factors such as
collateral environmental impact, impacts on soil and vegetation, and impact on species – instead shifting the burden
to commenters to essentially perform this analysis in the first instance in order to create an obligation on the part of
EPA to respond in detail. Through this manipulation of the statute, EPA places itself in the position of not having to
put forward any affirmative collateral impacts-related rationale for its decision which might then be subject to public
scrutiny. Instead, under EPA’s interpretation, it need only reasonably respond in a general fashion to comments on
the subject, without actually performing any further analysis. Thus, in order to ensure that EPA meets its statutory
obligations, commenters must anticipate and respond to every possible rationale that EPA might put forward
(without the benefit of any discussion whatsoever in the record for the draft permit). This approach is both
substantively and procedurally invalid, and places a burden on the public that is unreasonable on its face. A similar
perversion exists with respect to IGCC and the core BACT obligation for a thorough technology review (discussed
earlier in these comments). This serves as yet another example why EPA’s interpretation of the Act simply cannot
be
153
given
In particular,
any credence.
EPA cannot blindly rely on the 1980
Screening Procedure for the Impacts of Air Pollution Sources
on Plants, Soils, and Animals
(“1980 Screening Levels)
.
For example, the NSR Manual specifically recognizes that
“there are sensitive species which may be harmed by long term exposure to low concentrations of pollutants for
which there are no NAAQS” and that under certain circumstances soil and vegetation analysis “has to go beyond a
simple screening.”
See Indeck-Elwood
, slip op. at 38.
ELECTRONIC FILING, RECEIVED, CLERK'S OFFICE, JANUARY 5, 2007
* * * * * PC #7 * * * * *
86
regulated pollutants, and the potential for any other site-specific environmental effects.
See In re
Indeck-Elwood
, PSD Appeal 03-04, slip op at 31-52 (EAB Sept. 27, 2006).
154
As a result, EPA is obligated to perform (or require of Sithe) an analysis that
specifically
inventories the various soils and plant life
in the vicinity of the proposed facility (including but
not limited to threatened or endangered species). The analysis must then determine whether such
soils or vegetation will be adversely affected by any of the plant’s emissions. At least, such
analysis must include the full range of PSD pollutants (including fluoride), as well as any
relevant non-PSD pollutants (including sulfuric acid mist, mercury, beryllium, etc.).
155
Here, the draft permit for the proposed Desert Rock plant does not include an adequate
discussion of potential impacts on soils and plant life.
156
Among other things, the permit
application itself explains that an analysis of impacts on the many threatened or endangered
species in the area of the proposed plant will be considered at a later date in connection with the
process of ESA compliance.
157
This, whether adequate from an ESA standpoint or not, is clearly
inadequate from a PSD perspective. The soil/vegetation analysis must be completed
before a
draft permit can appropriately issue
, among other things to allow the public and other federal
agencies a meaningful opportunity to comment on the analysis and any possible or likely
impacts.
EPA’s rationale for issuing the draft permit, found in the Ambient Air Quality Impact Report, is
also shamefully deficient when it comes to meaningfully discussing possible impacts on soil and
vegetation. In essence, EPA concludes that because the project will not cause a violation of the
NAAQS or the PSD increments, it adequately protects soil and vegetation.
158
This analysis is
154
It is worth noting that the requirement to evaluate impacts on soil and vegetation apply not only to the coal-fired
155
steam
Among
boilers
other
but
things,
to all sources
acidic pollutants
at the proposed
(or precursors),
plant, individually
such as SO2,
and in
NOx,
the agand
gregate.
hydrogen chloride can directly
affect soil chemistry and have significant impacts on important habitat, vegetation, and potentially animal life
(especially aquatic life). EPA and Sithe must examine the full range of these possible effects in connection with the
Desert Rock project as a precursor to issuing a draft PSD permit.
156
The original Permit Application itself stated:
The proposed project requires Federal permits and an agreement to use trust lands of the Navajo Nation. As
a result, the project requires review under and compliance with the National Environmental Policy Act
(NEPA) (42 U.S.C. 4321-4347) and its implementing regulations. Under NEPA, the protection of
environmental resources will be assessed and the potential impacts of the Project will be determined. This
work will include a review under the Endangered Species Act (ESA) (7 U.S.C. 136; 16 U.S.C. 460 et seq.)
and Section 106 of the National Historic Preservation Act (NHPA) and its implementing regulations
(Protection of Historic Properties, 36 CFR 800). Steag is prepared to work with the Bureau of Indian
Affairs (BIA), as the lead Federal agency under NEPA, in complying with all applicable regulations. A
discussion of the Project reviews to date under the ESA is contained in Attachment 8 and work related to
the NHPA is contained in Attachment 9 of this application.
Permit Application at section 6.6.4. However, the NEPA analysis was not prepared before a draft permit was issued
and therefore the analysis regarding potential impact of the proposal on species (including vegetation), was not
157
available
Notably
for
the
public
ESA
comment
consultation
as required
itself, in
by
this
the
case,
act.
is flawed, as discussed elsewhere in these comments.
158
EPA’s discussion of soil and vegetation states in its entirety:
The PSD regulations require analysis of air quality impacts on sensitive vegetation types, with significant
commercial or recreational value, and sensitive types of soil. Evaluation of impacts on sensitive vegetation
were performed by comparing the predicted impacts attributable to the project with the screening levels
ELECTRONIC FILING, RECEIVED, CLERK'S OFFICE, JANUARY 5, 2007
* * * * * PC #7 * * * * *
87
facially inadequate. First, reference simply to the NAAQS and PSD increments as evidence that
proposed major source will not harm soils or vegetation would essentially write the soils and
vegetation analysis out of the Act – making it an unnecessary redundancy. This reading is
contrary to fundamental principles of statutory interpretation; rather, EPA must require or
conduct an actual, site-specific analysis of potential impacts on soil and vegetation. EPA may
not substitute a discussion of compliance with NAAQS and PSD increments for an actual
evaluation based on an inventory and assessment of the impacts to soils and plant life in the area
of a proposed major source.
159
Secondly, EPA may not blindly rely on the 1980 Screening Levels. As was the case in
Indeck-
Elwood
, the permitting authority here has simply glossed over an incredibly important facet of
the PSD analysis. In this case, EPA fails utterly to address the significance of the proximity of
the plant to important natural environments on the Navajo Lands where the plant will be located
and other nearby locations.
160
Instead, EPA (and the permit applicant) seeks to avoid any
meaningful analysis by referencing screening criteria that have been repeatedly criticized as
inadequate. The EAB itself recognized that:
there is ample indication in the Screening Procedure itself that, in keeping with a concept
of a “screening” tool, the analysis provided in the Screening Procedure may in some
cases be incomplete and preliminary. In its overview section, for example, the 1980
Screening Procedure states as follows:
In keeping with the screening approach, the procedure provides conservative,
not
definitive results
. * * * The estimation of potential impacts on plants, animals, and
soils is extremely difficult. The screening concentrations provided here are not
necessarily safe levels nor are they levels above which concentrations will
necessarily cause harm in a particular situation. However,
a source which passes
through the screen without being flagged for detailed analysis cannot necessarily
be considered safe
.
161
Additionally, there are indications that the Screening Procedure does not purport to be
complete in its coverage. The guidance observes in this regard, “[i]deally, the screening
procedure should address the impacts of
all the pollutants
currently regulated under the
presented in A Screening Procedure for the Impacts of Air Pollution Sources on Plants, Soils, and Animals
(EPA 1980).
The modeling analysis showed all impacts to be well below the screening levels. Most of the designated
vegetation screening levels are equivalent to or less stringent than the NAAQS and/or PSD increments,
therefore satisfaction of NAAQS and PSD increments assures that sensitive vegetation will not be
negatively affected.
AAQIR at 45. The analysis in the Permit Application was almost identical, and was similarly uninformative.
See
Permit Applicant at section 6.6.2. Attachments to the proposed permit also provided not meaningful elucidation.
159
Nor can EPA (or the permit applicant) rely on vague generalizations, such as assertions that emission of a
particular kind are “trivial,” without evaluating what those emissions will be and why that area expected to have no
adverse impacts.
See Indeck-Elwood
, slip op at 40.
160
Some of these important resources are referenced in the permit application at Appendix 8 (regarding threatened
and endangered species). Similarly, in
Indeck-Elwood
, Illinois EPA failed entirely to address or consider impacts on
an the nationally protected Midewin prairie.
161
Citing 1980 Screening Procedure at 2-3 (emphasis added).
ELECTRONIC FILING, RECEIVED, CLERK'S OFFICE, JANUARY 5, 2007
* * * * * PC #7 * * * * *
88
[CAA], but as shown in Table 2.1, screening concentrations were found for
only half
of
the regulated pollutants.” Id. at 4. In fact, the guidance can only be used to screen for
potential effects caused by concentrations of the pollutants in the ambient air
for only
seven pollutants
because, at the time the guidance was developed, there were only
sufficient data for those seven pollutants. Id. at 5; see also id. at 11, tbl. 3.1 (listing
vegetation sensitivity levels for seven pollutants: sulfur dioxide, ozone, nitrogen oxide,
carbon monoxide, sulfuric acid, ethylene, and fluorine). Also, the guidance notes that
there was a
lack of data on chronic effects
when it was developed. In short, the 1980
Screening Procedure does not purport to address a number of pollutants with respect to
which concerns have been raised here, including sulfuric acid mist, volatile organic
materials (VOM), hydrogen chloride, and beryllium, and it does not consider the kinds of
chronic effects that may be germane to a protected area like the Midewin.
Indeck-Elwood
, slip op at 43-45.
The EAB observed as well that the data upon which the screen limits are based are
more than 26
years old
and did not even rely on native species for their analysis.
Id
at 45. Indeed, for Desert
Rock the screening limits do not appear to specifically address many of the species identified in
Appendix 8 of the permit application; nor does EPA claim that they do in the AAQIR.
162
The 1990 NSR Manual, which reflects the Agency’s more recent thinking about how to evaluate
impacts on soil and vegetation, states that such analysis “should be based on an inventory of the
soils and vegetation types found in the impact area,” and an applicant must “determine the
sensitivities of the plant species listed in the inventory to the applicable pollutants that would be
emitted from the facility and compare this information to the estimates of pollutant
concentrations calculated in the air quality modeling analysis (conducted pursuant to 40 C.F.R. §
52.21(m)) in order to determine whether there are any local plant species that may potentially be
sensitive to the facility’s projected emissions. . . . For those plants that show potential
sensitivity, a more careful examination would be conducted. . . .
Plainly, the NSR Manual
contemplates the development of site-specific information that goes beyond the scope of simple
screening under the 1980 Screening Procedure.
”
Indeck-Elwood
, slip op at 46 (citing and
quoting the NSR Manual).
163
With respect to Desert Rock, as was the case in
Indeck
, the permitting authority (here EPA
Region 9) has treated the screening levels as if they provide conclusive proof of no impacts, and
fully satisfy the Agency’s and the Applicant’s obligations vis a vis soils and vegetation. In fact,
they do not even satisfy EPA’s affirmative pre-hearing obligations to have completed and made
162
It should be noted that the May 2004 DREF PSD permit application indicated a maximum 1-hour SO2
concentration well above the screening level for sensitive vegetation, and the June 2006 Class II Area Modeling
Update shows a lower 1-hour SO2 concentration. See October 5, 2005 Tran report at 8. The reason for the
discrepancy in the modeling results in unclear, but the May 2004 results at the least provide further basis for EPA to
require a much more thorough evaluation of the potential impacts DREF could have on soils and vegetation in the
region.
163
While Appendix 8 of DREF’s permit application may be viewed as providing an inventory of certain endangered
or threatened plant species, it does not even purport to inventory all local plant species, or even all “significant” or
“potentially sensitive” local vegetation. Moreover, it fails entirely to evaluate whether or which of the identified
species might be adversely affected by emission from the proposed facility.
ELECTRONIC FILING, RECEIVED, CLERK'S OFFICE, JANUARY 5, 2007
* * * * * PC #7 * * * * *
89
available a meaningful analysis of such impacts. As the EAB has explained, the soils and
vegetation component of the PSD requirements “contemplates a
comparative analysis
of some
kind between the existing baseline conditions of soils and vegetation at the site and in the
potentially affected area, and the effects of the emissions on such baseline conditions” that “shall
be available
at the time of the public hearing on the application for such permit
.”
Indeck-
Elwood
, slip op at 42-43. Nonetheless, because of EPA’s unqualified reliance on the 1980
Screening Leve ls, the Agency has effectively failed to adequately articulate the reasons for its
conclusion or adequately document its decisionmaking as part of the permit decision itself, upon
which the public has a right to comment.
This appalling abdication of a critical substantive obligation demonstrates that EPA has not taken
seriously its solemn statutory responsibility to fully evaluate the impact of new major sources
such as Desert Rock, and in so doing EPA has denied the public its ability to meaningfully
comment on EPA’s decisionmaking process, and contribute constructively to the permit
determination. As a result, EPA must withdraw the draft permit, prepare an appropriate soils and
vegetation analysis, and provide an adequate opportunity for public comment (including public
hearing) as the PSD provisions require.
164
24. EPA FAILED TO CONSULT UNDER THE ENDANGERED SPECIES ACT
SECTION 7
The EAB has specifically found that the EPA has an obligation to comply with ESA section 7 in
connection with the issuance of PSD permits. As the Board acknowledged, “Section 7 of the
ESA requires all federal agencies to, among other things, ensure through consultation with the
Secretary of Interior (and/or the Secretary of Commerce), whose authority in the instant case is
exercised by the U.S. Fish and Wildlife Service (“FWS”), that their actions are not likely to
jeopardize the continued existence of any endangered or threatened species. ESA § 7(a)(2), 16
U.S.C. § 1536(a)(2).”
Indeck-Elwood
, PSD Appeal 03-04, at 18 n.35. According to the EAB,
“federal PSD permits, including those issued by a delegated state, fall within the meaning of
federal ‘action’ as that term is used in the ESA. Accordingly, ESA consultation is required in this
setting when the permitting decision ‘may affect’ listed species or designated critical habitat. 50
C.F.R. § 402.14(a).”
Id
at 109. Moreover, the Board explained that although there is no
statutory obligation to conduct the ESA and PSD exercises in concert, “to ensure compliance
with the law, any consultation required under the ESA should in the ordinary course conclude
prior to issuance of the final federal PSD permit.”
Id
at 110.
This recognition on the part of the Board that ESA consultation is required in connection with
PSD permits, and that such consultation should occur before a PSD permit is issued, reflects the
fact that the purpose and intent of the ESA consultation is to ensure that the agency taking the
federal action adequately considers the impact of that federal action on specie s and habitat
before
164
Again, if all EPA need do now is respond to these comments, it will have impermissibly failed to address a core
substantive element of the PSD permitting process, and denied the public the ability to evaluate its specific rationale
– shifting the burden to commenters to anticipate and respond in advance to all possible shortcomings that may
emerge in EPA’s after-the-fact analysis. At some point the question must be asked: at what stage is the public being
asked unreasonably to do EPA’s work for it? Clearly, in this case, the burden on the public goes too far. This
cannot suffice as a matter of procedure, and EPA must withdraw and re -notice the permit for the Desert Rock plant
once it has conducted the required substantive analyses.
ELECTRONIC FILING, RECEIVED, CLERK'S OFFICE, JANUARY 5, 2007
* * * * * PC #7 * * * * *
90
the final decision is made. More specifically, the intent of the consultation requirement is to
make sure that the agency with authority over the federal action takes steps, when necessary, to
limit the impact on species and habitat in the context of that federal action. It follows from the
basic intent of this requirement, that the consultation must involve the agency with authority to
modify the federal action (that is agency that is the implementing authority for the particular
federal action in question) and that the consultation must occur before the final action is
complete.
In short, where there may be adverse impact on protected species, valid consultation under
Section 7 is a prerequisite to the existence of a valid PSD permit. Once a PSD permit is issued,
the construction process may proceed, so consultation that occurs after that point necessarily is
inadequate to meet the dictates of the ESA – and accordingly the PSD permit cannot
appropriately issue.
In this case, EPA has not only failed to conduct a Section 7 consultation before issuing its draft
permit,
165
but it has indicated that it intends to conduct
no such consultation
. Instead, EPA
explains that another agency entirely, the Bureau of Indian Affairs (BIA), will conduct the
consultation – despite the fact that BIA has no role in and no authority to modify the relevant
“federal action” – the final PSD permit.
166
EPA states in the Air Quality Impact Report:
Pursuant to Section 7 of the Endangered Species Act (ESA), 16 U.S.C. § 1536, and its
implementing regulations at 50 C.F.R. Part 402, EPA is required to ensure that any action
authorized, funded, or carried out by EPA is not likely to jeopardize the continued
existence of any endangered species or threatened species or result in the destruction or
adverse modification of such species’ designated critical habitat. EPA has determined
that this PSD permitting action triggers ESA Section 7 consultation requirements. EPA is
therefore required to consult with the U.S. Fish and Wildlife Service (FWS) and/or the
National Marine Fisheries Service (NMFS) if an endangered species or threatened
species may be present in the area affected by the permit project and EPA’s action (i.e.,
permit issuance) may affect such species. EPA is also required to confer with the
Services on any action which is likely to jeopardize the continued existence of any
species proposed for listing (as endangered or threatened) or result in the destruction or
adverse modification of habitat proposed to be designated as critical for such species.
When a Federal action involves more than one agency, consultation and conference
responsibilities may be fulfilled through a lead agency pursuant to 50 CFR § 402.07.
Since the land, electrical transmission lines, and access roads required for the proposed
project are located on the Navajo Indian Reservation and lands under the jurisdiction of
165
The Board concluded that the public was not legally entitled to comment on the consultation document in
connection with a draft PSD permit. Nonetheless, information regarding impact on species and habitat is undeniably
relevant to EPA specific BACT-related obligation to assess collateral environmental impacts, and neither EPA nor
Sithe performed any meaningful assessment of potential impacts on protected species that is available in connection
with the draft permit, despite the fact that Sithe has identified dozens of species in the region that are protected either
under
166
The
federal
Board
law
specifically
or Navajo
recognized
Tribal Law.
that the issuance of a PSD permit itself was a covered “federal action.”
Indeck-Elwood
at 109.
ELECTRONIC FILING, RECEIVED, CLERK'S OFFICE, JANUARY 5, 2007
* * * * * PC #7 * * * * *
91
the Bureau of Indian Affairs (BIA), the BIA will act as the lead Federal agency for
purposes of fulfilling the responsibilities under Section 7 of the ESA for the project.
EPA may proceed with the final permit issuance upon conclusion of consultation, review
of FWS’s Biological Opinion, and our determination that issuance of the permit will be
consistent with the ESA requirements.
EPA’s position with respect to its ESA consultation obligations flies in the face of the EAB’s
ruling that a PSD permit is itself a “federal action” under the ESA, and that section 7 obligates
EPA to consult with the appropriate agency in connection with issuance of such a permit. EPA
is mistaken that more than one agency is involved in the “federal action” of issuing a PSD
permit. EPA
alone
bears responsibility for that action. Moreover, EPA and not the BIA has the
substantive expertise to consult with appropriate agencies regarding air emission, ambient air
modeling, deposition, solid waste generation, water use, and global warming, and the potential
for these factors to adversely affect species and habitat.
EPA, not BIA, must consult with the FWS regarding impacts on protected species, and it must
do so
before
it may issue a final PSD permit. Moreover, to the extent that any impacts on
species or habitat is relevant to the collateral impacts of competing BACT option, EPA must
evaluate those impacts in the context to the PSD permit process and must make such analysis
available to the public for comment (and adequately respond to any public comment) before it
may issue a final permit.
25. EPA’S PROPOSED DREF PERMIT FAILS TO COMPLY WITH THE EXECUTIVE
ORDER TO ENSURE ENVIRONMENTAL JUSTICE
Low-income communities of color (“EJ communities”) often bear a disproportionate share of
industrialization’s harmful byproducts, such as resource contamination and resource extraction.
EJ communities may lack the political agency and economic leverage required for effective
participation in environmental decision-making processes. Moreover, the persistence of
structural racism in modern American society often manifests itself in the decision-making
processes that affect EJ communities, as a disregard for the concerns of those communities.
Seeking to mitigate the federal government’s contribution to these disparities, President Clinton
in 1994 signed Executive Order 12898: “Federal Actions to Address Environmental Justice in
Minority Populations and Low Income Populations”. Exec. Order No. 12,898, 59 Fed. Reg.
7629 (Feb. 16, 1994)(“EO”). The EO recognized that environmental justice (“EJ”) cannot be
achieved in our nation unless federal agencies develop programs, policies, and activities
specifically targeted to ensure that low-income communities of color are no longer subjected to
disproportionately high levels of environmental risk and illness.
167
By doing so, the EO sought
to rectify the long history of environmental injustices in these communities.
Championed by Native Americans on tribal lands, and by African-Americans, Latinos, and
Asian and Pacific Islanders in large cities and small rural towns, the EJ movement addresses a
167
Id.
at §§ 1-101, 3-3, and 4-401.
ELECTRONIC FILING, RECEIVED, CLERK'S OFFICE, JANUARY 5, 2007
* * * * * PC #7 * * * * *
92
statistical fact: people who live, work, and play in America's most polluted environments are
most often people of color and the poor.
168
EJ advocates have shown that this is no coincidence:
communities of color and low-income communities are often forced to host facilities that bring
negative environmental impacts.
As demonstrated by a wealth of studies, and by EPA’s own admission, race and class clearly
play significant roles in environmental decision-making – resulting in these communities being
disproportionately affected by siting decisions and the permitting of facilities.
169
In addition, it is
clear that low-income communities of color are most often exposed to multiple pollutants from
multiple sources.
170
The landmark report of the United Church of Christ’s Commission for Racial Justice
(“Commission for Racial Justice”) identified some key tools that can improve how communities
respond to environmental justice. The report identified access to information, including data and
scientific research, as particularly critical for communities disproportionately and adversely
affected by environmental decision-making.
171
In addition, the Commission for Racial Justice
reported that “institutional resistance to providing information is likely to be greater when
agencies are confronted by groups, such as those among racial and ethnic communities and the
poor, who are perceived to wield less political clout.”
172
To address this “institutional resistance,” the Executive Order required federal agencies to adopt
key tools in order to address EJ issues, including:
173
1. to identify and address the disproportionately high and adverse human health,
environmental, social, and economic effects of agency programs and policies on
communities of color and low-income; and
2. to develop policies, programs, procedures, and activities to ensure that these specific
impacted communities are meaningfully involved in environmental decision-making.
168
See
U.S. General Accounting Office,
Siting Hazardous Waste Landfills and Their Correlation with Racial and
Economic Status of Surrounding Communities
, June 1983; United Church of Christ, Commission for Racial Justice
,
Toxic Wastes and Race in the United States: A National Report on the Racial and Socioeconomic Characteristics of
Communities with Hazardous Waste Sites
, 1987, pp. xiii, 13-21 (“UCC Report”); and Benjamin A. Goldman and
Laura Fitton,
Toxic Wastes and Race Revisited: An Update of the 1987 Report on the Racial and Socioeconomic
Characteristics of Communities with Hazardous Waste Sites
(Center for Policy Alternatives and the United Church
of Christ, Commission for Racial Justice, 1994), pp. 2-4; and Luke W. Cole and Sheila R. Foster,
From the Ground
Up: Environmental Racism and the Rise of Environmental Justice Movement
(New York University Press, 2001),
pp.
169
54
Id.
-55,
EPA’s
167-Office
83.
of Environmental Justice has testified that “at least 76-90 studies have consistently said that
minorities and low-income communities are disproportionately exposed to environmental harms and risks” (Barry
Hill, Director, Office of Environmental Justice, U.S. EPA, testimony before the U.S. Commission on Civil Rights,
hearing,
170
Id. supra
Washington,
note. Unfortunately,
D.C., February
there
8, 2002,
continues
official
to be
transcript,
insufficient
p. 48).
data collection and scientific research done to
clearly
172
171
Id.
See
identify
UCC Report
the health
supra
implications
note *** at
of
pp.
multiple
6-7.
exposures.
173
See
Executive Order at §§ 1-101, 3-3, and 4-401.
ELECTRONIC FILING, RECEIVED, CLERK'S OFFICE, JANUARY 5, 2007
* * * * * PC #7 * * * * *
93
These requirements recognized historical inequities in the distribution of toxic pollution in
impacted communities, and sought to provide assistance, policies, and programs to address these
inequities. In other words, the EO creates requirements on federal agencies in at least three
ways. At the outset, federal agencies are required to
identify
the impacts of their actions on the
health and environmental quality of EJ communities. After identifying the EJ impacts, federal
agencies are required to
address
, to the extent possible, the impacts of their actions on the health
and environmental quality of EJ communities. Finally, federal agencies are required to include
EJ communities in the decision-making process.
In response to the Executive Order, many agencies created internally-applicable environmental
justice directives and mandates. The EPA issued an environmental justice strategy as required
by the EO in 1995. EPA’s environmental justice strategy does not specifically address if or how
the broad goals of the EO are to be implemented in the context of a PSD permit process carried
out. Accordingly, this Board’s determination is directly controlled by the language of the EO
and EAB decisions interpreting it. As will be shown below, the EPA’s failure to fulfill its EJ
responsibilities represents a violation of the EO and a deficient rendering of the requirements
therein.
EPA Committed Clear Error In Connection With Its Analysis of EJ Issues by Failing to
Identify EJ Issues
EPA’s failure to perform a thorough analysis of environmental justice issues at the permit stage
is clear error of the requirements of the EO and applicable EAB decisions.
The EO’s mandate, discussed above, is clear: each Federal agency shall make achieving
environmental justice part of its mission by
identifying
and addressing disproportionately high
and adverse human health and environmental effects of its programs, policies and activities on
minority and low-income populations. The EAB has interpreted this mandate to require that EJ
issues must be considered in connection with the issuance of PSD permits by EPA.
In re Knauf
Fiber Glass, GmbH
, 8 E.A.D. 121, 174-75 (EAM 1999)(remand to supplement the record with
environmental justice analysis);
In re AES Puerto Rico, L.P.
, 8 E.A.D. 324, 351 (EAB 1999),
aff’d sub nom Sur Contra La Contaminación v. EPA
, 202 F.3d 443 (1st Cir. 2000);
In re
EcoEléctrica, L.P.
, E.A.D. 56, 67-69 (EAB 1997). At a minimum, EPA must issue findings that
enable parties to determine whether and on what basis they should seek review and, in the event
of that review, to apprise the reviewing body of the basis for that conclusion.
See, In re Knauf
Fiber Glass, GmbH
, 8 E.A.D. 121, 175 (EAM 1999). EAP has failed to do so.
As an initial matter, EPA’s failure to identify the adverse environmental effects – other than a
cursory acknowledgement that issues do exist – violates its responsibilities to identify these
adverse environmental impacts. Mere acknowledgement that adverse impacts may or may not
exist is insufficient. Moreover, EPA’s refusal to consider the adverse environmental impacts at
the permit level violates its responsibility to address these impacts in its action on the permit in
question, as discussed at length below.
The scope of adverse environmental impacts raised to EPA is broad. Through the submission of
comments and oral testimony, local community members and interested stakeholders have raised
ELECTRONIC FILING, RECEIVED, CLERK'S OFFICE, JANUARY 5, 2007
* * * * * PC #7 * * * * *
94
numerous concerns. For example, commentators have raised objections to the impacts on health
in light of elevated indices of asthma and other respiratory diseases in the area, based on the high
levels of admittances to local clinics/hospitals and personal experience. Commentators have
further expressed concerns over the interplay between health and poverty, noting that poverty
exacerbates their health problems by making medical attention inaccessible, especially
compelling in light of the chronic state of under-funding of health services on the reservation.
Moreover, commentators have noted the high number of unpaved roads and poor infrastructure,
which further aggravates the air quality and health concerns. Other examples of environmental
injustices raised by commentators include: objections over water use, specifically Sithe’s
request to use 4,500 acre-feet of water and its effects on water resources in light of the 20-year
drought and current inaccessibility to adequate water supplies by large number of Navajos;
objections to land use; opposition to “pre-approval” agreements, whereby elderly and non-
English speaking community members were induced to sign over grazing permits, negatively
impacting grazing, agriculture, ceremonial, and cultural rituals;
174
failure to disclose documents
and exhibits that would enable local communities to participate in the permitting process;
concerns for agriculture and the effects of increased emissions on crops, pastoral lifestyle and
income; objections to impacts on cultural, burial and historical sites of religious significance,
including the desecration of burial sites and relocation/displacement of individuals, which severs
the spiritual tie to the homeland;
175
and concerns over the failure to consider the cumulative
impacts, including foreseeable power plant projects in the area.
176
Other concerns are outlined in
the Newcomb and Burnham Chapter Resolutions – rural governmental associations – which
oppose the project on a number of EJ issues.
In response to substantial public comment, EPA has generally categorized five EJ issues.
177
But
simply acknowledging a few categorical subject matter areas of concern and
identifying
the
issues are materially distinct. By way of legal analogy, commentators have overcome their
burden of proof by raising significant EJ issues, the burden of persuasion now rests with EPA to
identify
these issues so that they may be addressed.
EPA even goes so far as to admit its shortcomings with regards to
identifying
EJ issues. EPA
alludes to undefined prospective outreach and the hiring of translators, underscoring its deficient
174
As discussed under trust and fiduciary section, commentators have voiced their opposition to the practices of
Diné Power Authority officials and BHP Billiton representatives to secure the land for the Sithe power plant.
Specifically, commentators object to the practice of approaching the elderly, non-English or limited English-
speaking
175
Local
community
residents have
members
described
to sign
the adverse
over grazing
effects
permits
of relocation
and other
and
rights
displacement,
to the land.
describing that soon after birth,
a ceremony is held where a child’s umbilical cord is buried in the land, representing a symbolic and spiritual tie
between the land and people forever. Separating people from their lands through force is an affront to these
symbolic
176
The combined,
and spiritual
incremental
relationships.
effects
Removal
of human
from
activity,
their originareferred l place
to as cumulative
of occupancy
impacts,
raises serious
pose a serious
objections.
threat to
the environment. While they may be insignificant by themselves, cumulative impacts accumulate over time, from
one or more sources, and can result in the degradation of important resources. Because federal projects cause or are
affected by cumulative impacts, this type of impact must be assessed.
177
EPA has generally categorized five EJ issues: (1) lack of jobs provided to people of Navajo Nation, (2) social
impacts, (3) use of local water sources as disproportionately damaging to local communities, (4) disproportionate
exposure to pollutants, potential health problems (respiratory, heavy metals in fish), and (5) impacts without benefits
- power goes to other locations and is not distributed locally.
ELECTRONIC FILING, RECEIVED, CLERK'S OFFICE, JANUARY 5, 2007
* * * * * PC #7 * * * * *
95
rendering of such services during the permit process.
178
By pronouncing translation services at a
future date without more, EPA is turning a deaf ear to the substance of the comments and their
potential impact on the permit in question
now
. In addition, the assertion that translation services
will be provided is speculative at best, offering nothing more than an “intention” to do
something.
Further underscoring EPA’s deficient identification of EJ issues, EPA announces that the project
applicant has a data presentation “to better characterize the issues raised.” Once again,
speculative future identification (or presentation) of EJ issues without more is a failure on the
part of EPA to
identify
EJ issues to inform its decisionmaking.
In re Knauf Fiber Glass, GmbH
,
8 E.A.D. 121, 174-75 (EAM 1999)(no details regarding the EPA’s environmental justice analysis
required remand). The EO and EAB decisions require that they be identified during the course
of a federal agency’s action. To the extent EPA is relying on the data presentation, it must be
identified and included in the administrative record, and opportunity to comment must be
afforded.
In re AES Puerto Rico, L.P.
, 8 E.A.D. 324, 351 (EAB 1999),
aff’d sub nom Sur Contra
La Contaminación v. EPA
, 202 F.3d 443 (1st Cir. 2000)(Board found EPA conducted a thorough
EJ analysis at the permit stage, including air quality analyses, responses to community-conducted
health studies, and efforts to receive comments in Spanish). Insofar that these pronouncements
intend to comply with the requirements of EO and EAB decisions, they fall far short of the bar
established by the EO and precedent.
EPA Committed Clear Error In Connection With Its Analysis of EJ Issues by Failing to
Address EJ Issues
As a result of EPA’s failure to
identify
EJ issues at the permit stage, EPA wholly fails to
address
EJ issues. As noted above, the EO’s mandate is clear in that each Federal agency shall make
achieving EJ a part of its mission by identifying and
addressing
disproportionately high and
adverse human health and environmental effects of its programs, policies and activities on
minority and low-income populations. The EAB has interpreted this mandate to require that EJ
issues must be considered in connection with the issuance of PSD permits by EPA, and steps to
address these issues taken.
In re Knauf Fiber Glass, GmbH
, 8 E.A.D. 121, 174-75 (EAM
1999)(remand to supplement the record with environmental justice analysis);
In re AES Puerto
Rico, L.P.
, 8 E.A.D. 324, 351 (EAB 1999),
aff’d sub nom Sur Contra La Contaminación v. EPA
,
202 F.3d 443 (1st Cir. 2000)(permit conditions not required by PSD regulations but within
EPA’s discretion were found to be an indication of its efforts to address EJ issues).
In the current instance, EPA attempts to address EJ issues by pronouncing that it “expects that
these issues will be addressed through the NEPA process.” EPA’s efforts to delay postpone its
obligation to address EJ issues until the NEPA process is an admission of non-compliance with
EO and precedent on its face, and therefore is represents a failure to proceed as required by law.
178
Translation services are an obligation that ensures proper identification of issues. It is a response to linguistic
inaccessibility of non-English speaking populations, but does not address anything other the ability to participate. In
other words, translation services are a procedural mechanism to ensure communication and participation in
decisionmaking by non-English speaking populations.
ELECTRONIC FILING, RECEIVED, CLERK'S OFFICE, JANUARY 5, 2007
* * * * * PC #7 * * * * *
96
EPA’s Committed Clear Error by Failing to Include EJ Communities in its
Decisionmaking
Under the EO, EPA shall to develop policies, programs, procedures, and activities to ensure that
specific impacted communities are meaningfully involved in environmental decision-making.
The failure to develop these policies, programs and activities has contributed to the failure to
ensure meaningful involvement and participation. EPA failed to publicize public meetings
through means readily accessible to local residents – e.g., radio announcements in Diné. Many
Navajos are dispersed or solitary, immobilized during heavy rains or snows and inaccessible to
written means of communication. Radio is a recognized medium, and commentators have raised
the necessity for radio announcements that provide timely notice. In addition, EPA has failed to
provide adequate translation services at the permit stage, precluding the ability of non-English
speakers or those with limited English proficiency to participate in the decisionmaking process.
Commentators have also raised EPA’s failure to disclose documents and exhibits that would
enable local communities to participate in the permitting process. EPA’s committed clear error
by failing to include EJ communities in its decisionmaking processes.
EPA Breached its Trust and Fiduciary Duties
The EPA has a special trust and fiduciary duty to the Navajo and to the management of their
resources. From the early nineteenth century, American law has embraced the concept that the
federal government owes a unique duty to Native Americans. The existence of such a duty was
first articulated by John Marshall, Chief Justice of the Supreme Court, in the seminal 1831 case
Cherokee Nation v. Georgia
.
179
Marshall described the relationship between the various Native
American tribes and the federal government as “perhaps unlike that of any two other peoples in
existence, . . . [m]arked by peculiar and cardinal distinctions which exist nowhere else.” To
Marshall, the tribes were nothing less (and nothing more) than “domestic dependent nations.”
“Their relation to the United States,” he concluded, “resembles that of a ward to his guardian.”
Cherokee Nation v. Georgia
, United States Reporter 30 (5 Pet.) (1831), pp. 16, 17.
Marshall's characterization of the tribes will justifiably strike modern ears as paternalistic and
condescending.
See generally
“Rethinking the Trust Doctrine in Federal Indian Law,”
Harvard
Law Review
98 (1984), pp. 422, 426. By nineteenth-century standards, however, it was
enlightened, holding as basic legal principle that the federal government must safeguard the
interests of the sovereign peoples it absorbed in its expansion westward. Unfortunately, as the
tribes were pushed onto reservations and into poverty over subsequent decades, Marshall's
characterization of the tribes as dependent nations became increasingly accurate and the
government's duty – its trust responsibility – grew by necessity in scope and importance. When
179
The origins of the notion of a special duty on the part of the federal government towards the tribes arguably
predates the ratification of the Constitution. For example, the Northwest Ordinance of 1787 states that "[t]he utmost
good faith shall always be observed towards the Indians; their lands and property shall never be taken from them
without their consent; and in their property, rights and liberty, they shall never be invaded or disturbed . . . but laws
founded in justice and humanity shall from time to time be made, for preventing wrongs being done to them, and for
preserving peace and friendship with them." Article III, Northwest Ordinance (1787) (reprinted in Melvin I.
Urofsky, ed.,
Documents of American Constitutional and Legal History
(New York: Knopf, 1989)). Unfortunately,
the United States has more often than not failed to live up to these goals.
ELECTRONIC FILING, RECEIVED, CLERK'S OFFICE, JANUARY 5, 2007
* * * * * PC #7 * * * * *
97
the Supreme Court wrote of the government's trust responsibilities in 1886, there was a grim
reality behind its words. "These Indian tribes," the Court observed,
are the wards of the nation. They are communities dependent on the
United States – dependent largely for their daily food; dependent for their
political rights. They owe no allegiance to the states, and receive from
them no protection. Because of the local ill feeling, the people of the states
where they are found are often their deadliest enemies. From their very
weakness and helplessness, so largely due to the course of dealing of the
federal government with them, and the treaties in which it has been
promised, there arises the duty of protection, and with it the power. This
has always been recognized by the executive, and by congress, and by this
court, whenever the question has arisen.
United States v. Kagama
, United States Reporter 118 (1886): pp. 384–85.
Modern courts have recognized that the general duty articulated by Marshall and his brethren
obligates the federal government to consider and protect tribal interests – recognizing that tribes
are not monolithic groups and tribal interests are diverse. The specific trust duty owed to tribes
by the federal government in such circumstances rises to the level of a fiduciary duty – a duty
similar to what lawyers owe their clients, executives their shareholders, and trustees their
beneficiaries. In a typical case from 1983, the Supreme Court held that the federal government
could be sued for violating its fiduciary duty and be liable for monetary damages after it
mismanaged timber resources belonging to the Quinault Tribe.
United States v. Marshall
,
United States Reporter 463 (1983): pp. 225–27. Justice Thurgood Marshall, writing for the
Court, found that “a fiduciary relationship [between the tribe and the federal government]
necessarily arises when the government assumes such elaborate control over forests and property
belonging to Indians.”
Id.
at 225.
As a federal agency, EPA is in a unique position to safeguard the health and well-being of the
Navajo peoples, and its trust responsibility and fiduciary duty require that the government act
decisively to protect their environmental and cultural resources. Nevertheless, EPA has breached
these responsibilities. For example, commentators have voiced their opposition to the practices
of Diné Power Authority officials and BHP Billiton representatives to secure the land for the
Sithe power plant. These officials and representatives have approached the elderly, non-English
and limited English-speaking community members to sign over grazing permits and other rights
to the land. Commentators have forcefully objected to those practices, and requested that all
communications, negotiations, monetary exchanges, etc., only be permitted on weekends when
the more educated family members are home. Moreover, objections over water use, specifically
Sithe’s request to use 4,500 acre-feet of water and its effects on water resources in light of the
20-year drought and current inaccessibility to adequate water supplies by large number of
Navajos, and concerns over land use require EPA attention. In short, these duties are incumbent
upon the EPA at all times, and must inform its every action.
EPA Violates National and International Laws and Policies to Protect Religious Sites and
Freedom to Worship
ELECTRONIC FILING, RECEIVED, CLERK'S OFFICE, JANUARY 5, 2007
* * * * * PC #7 * * * * *
98
Also weighing on the EPA are national and international laws and policies that protect Native
American religious sites and practices from degradation. In 1978, Congress passed the American
Indian Religious Freedom Act (AIRFA), making it “the policy of the United States to protect and
preserve for American Indians their inherent right of freedom to believe, express, and exercise
the traditional religions of the American Indian . . . including but not limited to access to sites,
use and possession of sacred objects, and the freedom to worship through ceremonies and
traditional rites.” United States Code 42 (1999): § 1996(1). In 1996, President Clinton used an
executive order to strengthen the law. In order to "protect and preserve Indian religious
practices," he ordered all federal agencies to avoid adversely affecting the physical integrity of
sacred sites.
See
preamble and § 1(a) of Executive Order 13007, Federal Register 61 (May 24,
1996), p. 26771.
As noted above, local Navajo residents have testified to the EPA the adverse effects that
relocation and displacement would have, describing that soon after birth, a ceremony is held
where a child’s umbilical cord is buried in the land, representing a symbolic and spiritual tie
between the land and people forever. Separating people from their lands unwillingly or through
trickery is an affront to these symbolic and spiritual relationships. By allowing Sithe to displace
and relocate Navajo community members, EPA is adversely affecting the deep spiritual and
religious connection to the land, contrary to AIRFA and President Clinton's executive order.
International principles further strengthen the case for the agency's intervention. Recognizing the
value of water and land resources to indigenous society, culture and religion, the United Nations
Draft Declaration on the Rights of Indigenous Peoples asserts their “right to maintain and
strengthen their distinctive spiritual and material relationship with the lands, territories, [and]
waters . . . which they have traditionally owned or otherwise occupied or used, and to uphold
their responsibilities to future generations in this regard.” Draft United Nations Declaration on
the Rights of Indigenous People (Aug. 26, 1994), art. 25 at 552 (reprinted in International Legal
Materials 34 (1995): p. 541). The Navajo may be denied their fundamental right to "manifest
[their] religion or belief in worship, observance, [and] practice," guaranteed them by the
International Covenant of Civil and Political Rights, which the United States recently ratified.
International Covenant on Civil and Political Rights, General Assembly Resolution 2200A (XXI)
(Dec. 16, 1966, entry into force Mar. 23, 1976), art. 18 (reprinted in Center for Human Rights,
Human Rights: A Compilation of International Instruments
(New York: United Nations, 1988)
(U.N. Sales No. E.88.XIV.1), p. 26). The Covenant was ratified by the United States on
September 9, 1992. See Public Notice 1853, Federal Register 54 (1993): p. 45934.
Sithe Has Not Analyzed Air Toxics Impacts and Associated Health Impacts
As discussed in the October 5, 2006 report by Khanh Tran of AMI Environmental, a
detailed quantification and health impacts assessment should have been completed for the
DREF permit application to fully address public health and environmental justice
concerns. October 5, 2006 Khanh Report at 8-9. EPA cannot issue the permit without
receiving this data and analysis and without making it available to the public for review
and comment.
ELECTRONIC FILING, RECEIVED, CLERK'S OFFICE, JANUARY 5, 2007
* * * * * PC #7 * * * * *
99
26. EPA’S PROPOSED DREF PSD PERMIT MUST INCLUDE
REQUIREMENTS TO ENSURE SITHE IS HELD TO ITS REPRESENTATIONS
REGARDING THE DREF FACILITY THAT WERE MADE IN ITS PSD
PERMIT APPLICATION
EPA’s proposed permit for DREF fails to include any provisions to ensure that the DREF
facility cannot be modified from the source parameters that were reflected in the DREF
PSD permit application. Yet, the EPA’s proposed PSD permit does not even specify the
date of the PSD permit application for DREF, nor does EPA’s AAQIR for that matter.
Without references to the representations made in the permit application, Sithe could
change its design in ways that could change air pollutant dispersion or alter BACT
analyses without limitation.
Accordingly, EPA must, at a minimum, include a description of the proposed DREF
facility that defines the type of coal to be burned, the MW capacity (net and gross), and
the maximum heat input capacity of each boiler. Further, EPA must include a provision
in the proposed permit stating that construction of the DREF facility must be in accord
with the information provided in the May 2004 PSD permit application, that EPA must
be notified of any deviations from the information included in the DREF permit
application, and that any significant deviation from the representations made by Sithe in
its DREF PSD permit application may be grounds for suspension or revocation of the
permit. Provisions such as these are commonly required in PSD permits, and provide a
necessary assurance to the public and federal, tribal and state regulatory agencies that
construction of a significantly different facility, or significant modification of the DREF
facility, cannot be done without further evaluation.
27. EPA HAS FAILED TO COORDINATE THE PSD PERMIT PROCEEDING,
NEPA REVIEWS AND REVIEWS CONDUCTED UNDER SECTION 309 OF
THE CLEAN AIR ACT TO THE MAXIMUM EXTENT FEASIBLE AND
REASONABLE AS REQUIRED BY LAW
40 CFR 52.21(s) provides that EPA’s PSD permit reviews “shall be coordinated with”
environmental reviews conducted under NEPA and under section 309 of the Clean Air
Act “to the maximum extent feasible and reasonable.” This mandate is common sense
and effectuates good public policy. Unfortunately, EPA has failed to adhere to its own
regulatory command. EPA has steadfastly declined public requests to review the EIS
under NEPA (and EPA’s associated comments under section 309) in parallel with the
PSD permit review. Further, documents obtained under FOIA, demonstrate that EPA is
deliberately moving ahead with the permit with disregard for the NEPA proceeding in
response to the entreaties of Sithe officials: “Gus [Sithe] said they need air permit before
the EIS. Ann [EPA] said they understood and didn’t expect NEPA would slow that
down and assured they are not waiting b/c of NEPA and are proceeding with work on the
permit.” See listing as
Attachment 62
in the attached exhibit list (“FOIA Appeal”).
This is contrary to the mandate for coordination under the law.
ELECTRONIC FILING, RECEIVED, CLERK'S OFFICE, JANUARY 5, 2007
* * * * * PC #7 * * * * *
100
Thank you for considering these comments. Please notify us regarding any EPA action
on the DREF permit.
Sincerely,
Mark Pearson/Mike Eisenfeld
Anna M. Frazier
San Juan Citizens Alliance
Dine’ Citizens Against Ruining Our
PO Box 2461
Environment
Durango, Colorado 81302
HC-63, Box 263
(970) 259-3583
Winslow, Arizona 86047
mpearson@frontier.net
Patrice Simms
Vickie Patton
Senior Project Attorney at Law
Senior Attorney
Natural Resources Defense Council
Environmental Defense
1200 New York Ave. NW, Suite 400
2334 N. Broadway
Washington, D.C. 20005
Boulder, CO 80304
(202) 289-2437
(303) 440-4901
psimms@nrdc.org
vpatton@environmentaldefense.org
John Nielsen
Matt Baker
Energy Program Director
Executive Director
Western Resource Advocates
Environment Colorado
2260 Baseline Road
1536 Wynkoop
Boulder, CO 80302
Denver, CO 80202
(303) 444-1188
(303) 573-3871
jnielsen@westernresources.org
mbaker@environmentcolorado.org
Sanjay Narayan
Nicole Rosamarino
Staff Attorney
Conservation Director
Sierra Club
Forest Guardians
85 Second St., Second Floor
312 Montezuma Ave. Suite A
San Francisco, CA 94105
Santa Fe, NM 87501
(415) 977-5769
(505) 988-9126
sanjay.narayan@sierraclub.org
nrosamarino@fguardians.org
Roger Clark
Ann B. Weeks
Air Director
Litigation Director
Grand Canyon Trust
Clean Air Task Force
2601 N. Fort Valley Road
18 Tremont St., Suite 530
Flagstaff, AZ 86001
Boston, MA 02108
(928) 774-7488
(617) 624-0234
rclark@grandcanyontrust.org
aweeks@catf.us
ELECTRONIC FILING, RECEIVED, CLERK'S OFFICE, JANUARY 5, 2007
* * * * * PC #7 * * * * *
Coal-Related Greenhouse Gas Management Issues
May 2003
THE NATIONAL COAL COUNCIL
ELECTRONIC FILING, RECEIVED, CLERK'S OFFICE, JANUARY 5, 2007
* * * * * PC #7 * * * * *
Coal-Related Greenhouse Gas Management Issues
May 2003
Chair: J. Brett Harvey
Study Work Group Chair: Dr. Frank Burke
The National Coal Council
May 2003
ELECTRONIC FILING, RECEIVED, CLERK'S OFFICE, JANUARY 5, 2007
* * * * * PC #7 * * * * *
THE NATIONAL COAL COUNCIL
Wes M. Taylor, Chairman
Robert A. Beck, Executive Director
U.S. DEPARTMENT OF ENERGY
Spencer Abraham, U.S. Secretary of Energy
All Rights Reserved.
Library of Congress Catalog Card Number:
2003 106 573
Copyright 2003 by the National Coal Council.
Printed in the United States.
The National Coal Council is a Federal Advisory Committee to the Secretary of Energy. The sole
purpose of the National Coal Council is to advise, inform, and make recommendations to the Secretary
of Energy
on any matter requested by the Secretary relating to coal or to the coal industry.
ELECTRONIC FILING, RECEIVED, CLERK'S OFFICE, JANUARY 5, 2007
* * * * * PC #7 * * * * *
TABLE OF CONTENTS
Principal Contributors
..............................................................................................................................
i
Preface
........................................................................................................................................................
ii
Abbreviations
...........................................................................................................................................
iii
Section 1:
Executive Summary .....................................................................................................................................
1
Section 2:
Existing Voluntary Programs and Public-Private Partnerships for Greenhouse Gas Management ..........
11
Section 3:
Evaluation of Research and Development Needs for Greenhouse Gas Management ...............................
23
Section 4:
Achieving Greenhouse Gas Emission Reductions – Challenges and Costs ..............................................
60
References
.................................................................................................................................................
81
Appendix A:
Selected Tables and Figures................................................................................................
84
Appendix B:
Description of the National Coal Council ...........................................................................
90
Appendix C:
The National Coal Council Membership Roster.................................................................
91
Appendix D:
The National Coal Council Coal Policy Committee Roster .............................................
102
Appendix E:
The National Coal Council Study Work Group Roster.....................................................
103
Appendix F:
Correspondence Between the U.S. Department of Energy and National Coal
Council.....................................................................................................................................................
108
Appendix G:
Correspondence from Industry Experts ............................................................................
109
Appendix H:
Acknowledgements...........................................................................................................
115
ELECTRONIC FILING, RECEIVED, CLERK'S OFFICE, JANUARY 5, 2007
* * * * * PC #7 * * * * *
i
PRINCIPAL CONTRIBUTORS
Sy Ali
Tom Altmeyer
Eric Balles
Dick Bajura
János Beér
Jackie Bird
Stu Dalton
Kyle Davis
Mike Gregory
Manoj Guha
Howard Herzog
Steve Jenkins
Deborah Kosmack
John Marion
Ed Rubin
Dwain Spencer
Dick Winschel
ELECTRONIC FILING, RECEIVED, CLERK'S OFFICE, JANUARY 5, 2007
* * * * * PC #7 * * * * *
ii
PREFACE
The National Coal Council is a private, nonprofit advisory body, chartered under the Federal
Advisory Committee Act.
The mission of the Council is purely advisory: to provide guidance and recommendations as
requested by the U.S. Secretary of Energy on general policy matters relating to coal. The
National Coal Council is forbidden by law from engaging in lobbying or other such activities.
The National Coal Council receives no funds or financial assistance from the Federal
Government. It relies solely on the voluntary contributions of members to support its activities.
The members of the National Coal Council are appointed by the Secretary of Energy for their
knowledge, expertise and stature in their respective fields of endeavor. They reflect a wide
geographic area of the U.S. and a broad spectrum of diverse interests from business, industry and
other groups, such as:
•
Large and small coal producers;
•
Coal users such as electric utilities and industrial users;
•
Rail, waterways, and trucking industries as well as port authorities;
•
Academia;
•
Research organizations;
•
Industrial equipment manufacturers;
•
State government, including governors, lieutenant governors, legislators, and public utility
commissioners;
•
Consumer groups, including special women’s organizations;
•
Consultants from scientific, technical, general business, and financial specialty areas;
•
Attorneys;
•
State and regional special interest groups; and
•
Native American tribes.
The National Coal Council provides advice to the Secretary of Energy in the form of reports on
subjects requested by the Secretary and at no cost to the Federal Government.
ELECTRONIC FILING, RECEIVED, CLERK'S OFFICE, JANUARY 5, 2007
* * * * * PC #7 * * * * *
iii
ABBREVIATIONS
AEO
Annual Energy Outlook
AFBC
Atmospheric fluidized bed combustion
AMM
Abandoned mine methane
API
American Petroleum Institute
BACT
Best available control technology
Bcf
Billion cubic feet
Btu
British thermal units
Btu/kWh
British thermal units per kilowatt-hour
CAA
Clean Air Act
CAAA
Clean Air Act Amendments of 1990
CBM
Coalbed methane
CCS
CO
2
capture and storage
CCT
Clean Coal Technology
CDM
Clean Development Mechanism
CFB
Circulating fluidized bed
CMM
Coal mine methane
CO
Carbon monoxide
CO
2
Carbon dioxide
COE
Cost of electricity
DOE
Department of Energy
DSM
Demand side management
EEI
Edison Electric Institute
EIA
Energy Information Administration
EIIP
Emission Inventory Improvement Program
EPA
Environmental Protection Agency
EPRI
Electric Power Research Institute
FBC
Fluidized bed combustor
FE
Fossil energy
FGD
Flue gas desulfurization
FY
Fiscal year
GCCI
Global Climate Change Initiative
GDP
Gross domestic product
GHG
Greenhouse gas
GW
Gigawatts
GWP
Global warming potential
H
2
Hydrogen
IGCC
Integrated gasification combined cycle
IPCC
Intergovernmental Panel on Climate Change
JI
Joint implementation
kW
Kilowatt
kWh
Kilowatt-hour
lb/MBtu
Pounds of emissions per million Btu of heat input
lb/MWh
Pounds of emissions per megawatt-hour generated
LHV
Lower heating value
LNB
Low NO
x
burners
MBtu
Million Btu
MMTCE
Million metric tons carbon
ELECTRONIC FILING, RECEIVED, CLERK'S OFFICE, JANUARY 5, 2007
* * * * * PC #7 * * * * *
iv
MTCO
2
Million tons of carbon dioxide
MW
Megawatts
MWh
Megawatt-hour
N
2
O
Nitrous oxide
NCC
National Coal Council
NETL
National Energy Technology Laboratory
NGCC
Natural Gas Combined Cycle
NMA
National Mining Association
NO
x
Nitrogen oxides
NSR
New Source Review
O&M
Operating and maintenance
PC
Pulverized coal
PFBC
Pressurized fluidized bed combustion
PFBCwTC
Pressurized fluidized bed combustion with topping combustor
PPM
Parts per million
PSI
Pounds per square inch
R&D
Research and development
RD&D
Research, development and deployment
SC
Supercritical
SCR
Selective catalytic reduction
SNCR
Selective non-catalytic reduction
SO
2
Sulfur dioxide
TPY
Tons per year
UNFCCC
United Nations Framework Convention on Climate Change
USC
Ultrasupercritical
VAC
Ventilation air methane
WBCSD
World Business Council for Sustainable Development
WRI
World Resources Institute
ELECTRONIC FILING, RECEIVED, CLERK'S OFFICE, JANUARY 5, 2007
* * * * * PC #7 * * * * *
1
SECTION 1:
EXECUTIVE SUMMARY
Purpose
By letter dated September 24, 2002 (see Appendix F), U.S. Secretary of Energy Spencer
Abraham requested that the National Coal Council prepare a study of how increased energy
efficiency and carbon sequestration can be utilized as part of a greenhouse gas (GHG)
management program. The Secretary asked the Council to use as a starting point for this report
its previous report, entitled “Research and Development Needs for the Sequestration of Carbon
Dioxide as Part of a Carbon Management Strategy” as it was submitted to then-Secretary of
Energy Bill Richardson in May 2000.
Secretary Abraham specifically asked that the Council evaluate the effectiveness and economics
of sequestering carbon. He asked that the Council highlight the public-private partnerships
already established between the U.S. Department of Energy and industry that currently address
the issues of increasing electricity generation efficiency and carbon sequestration. Secretary
Abraham also requested that the Council recommend ways that additional such partnerships
could be established. Lastly, he asked the Council for its perspective on how voluntary
approaches to reduce greenhouse gas emissions could best be achieved.
The Secretary expressed his hope that this report “will serve as a carbon management blueprint
for industry and act as a catalyst to promote additional public-private partnerships to support
voluntary reduction of greenhouse gases and carbon sequestration."
The Council accepted the Secretary’s request and formed a study group of experts to conduct the
work and draft a report. The list of participants of this study group can be found in Appendix E
of this report.
Introduction
This report updates and expands on the findings and recommendations concerning greenhouse
gas management by coal-related industries made by the NCC to the Secretary of Energy in May
2000. It should be read in conjunction with that earlier report, which provides a good overview
of the political, environmental and economic factors framing the greenhouse gas issue, and a
detailed discussion of various carbon sequestration options. In this report, we have built on the
findings of the earlier report, incorporating new information gathered over the last three years
and analyzing in more detail the opportunities, needs and impediments to the development and
deployment of technology to reduce greenhouse gas emissions from coal-based industries.
ELECTRONIC FILING, RECEIVED, CLERK'S OFFICE, JANUARY 5, 2007
* * * * * PC #7 * * * * *
2
Findings
Status of Current Programs for Voluntary Action
There has been widespread participation across a range of industries in voluntary programs to
reduce greenhouse gas emissions. As described below, the number of participants and reported
projects in the Voluntary Reporting of Greenhouse Gases Program ("1605b Reporting") has
grown steadily since the program's inception a decade ago, and a wide variety of emissions
reduction and sequestration projects have been reported.
In February 2003, the Bush Administration's Climate VISION program drew responses from
essentially all of the major energy-intensive industrial sectors, which put forward specific action
plans to meet the goal of reducing greenhouse gas emissions intensity by 18% in the next decade.
The various public-private partnership programs, such as Climate Wise, the Landfill and Coalbed
Methane Outreach, and the Green Lights programs, have drawn formal commitments to reduce
future emissions from 85 entities.
This significant response of U.S. businesses to calls for voluntary action demonstrates that they
view global climate change as an important issue. Companies are taking steps to identify not
only the risks and challenges associated with the evolving climate change arena, but also the
business opportunities that could be developed. To do this, however, companies must first have
an understanding of the extent and nature of their GHG emissions. In that regard, all of the
voluntary action programs should benefit from the current work underway in the Department of
Energy to provide improved guidelines for reporting GHG emissions and reductions under the
1605b program. It is important that changes to the 1605b program are consistent with
accounting and reporting principles supported by U.S. industry, and, to the extent possible,
harmonized with international accounting and reporting protocols.
To some extent, greenhouse gas reductions through voluntary actions have been inhibited by
certain regulatory impediments. That is, environmental regulations can be a disincentive for
businesses to take actions to sequester or control greenhouse gas emissions. Two examples are
cited in this report: reclamation requirements that inhibit more productive forestation practices
on mined lands, and the implementation of New Source Review procedures that discourage
power plant operators from making efficiency improvements.
Partnerships for Greenhouse Gas Management
The federal government has established or announced several programs to address the technical,
environmental and societal challenges to widespread adoption of GHG management technologies
by private industry, both domestically and internationally. Three of these programs, highlighted
in this report, are the Regional Partnerships for Carbon Sequestration, the Climate VISION
Program (see above), and the Carbon Sequestration Leadership Forum.
The Regional Partnerships program recognizes that opportunities for and impediments to large-
scale carbon sequestration are likely to have a great deal of regional specificity. There will be
differences in technical, economic and regulatory requirements depending on the type of
sequestration sink and its location. The Regional Partnerships will address these issues through
assessment projects during Phase I and field testing of promising options in Phase II.
ELECTRONIC FILING, RECEIVED, CLERK'S OFFICE, JANUARY 5, 2007
* * * * * PC #7 * * * * *
3
Efforts also are under way to coordinate research and voluntary action on greenhouse gas
management internationally.
Since its climate change policy was announced, the Bush
Administration has announced a number of bilateral international partnerships and other
initiatives for international cooperation focused on collaborative efforts meant to address
climate-related issues. Examples of opportunities for cooperation that may result in significant
GHG reductions include, but are not limited to, CCT and CO
2
capture and storage technology
development, expanded use of cogeneration and renewable sources of energy, as well as concrete
ways of reducing GHG emissions through sustainable agriculture and forestry management
practices.
On February 27, 2003, the Departments of State and Energy announced the formation of the
Carbon Sequestration Leadership Forum, a ministerial-level international organizational focusing
on enhancing international opportunities to address GHG management. The partnership will
promote coordinated research and development with international partners and private industry,
including data gathering, information exchange, and collaborative projects.
Efficiency in Electricity Generation
Efficiency improvement in electricity generation is a very important near-term option for
reducing greenhouse gas emissions from coal-based power plants. Increased efficiency has
several benefits. First, it can decrease the cost of electricity generation by reducing fuel
consumption. Second, it can provide additional generating capacity at relatively low cost,
without the need to site and build new plants. Third, it will, in most cases, reduce emissions of
the criteria pollutants and the production of solid waste in proportion to the efficiency increase.
Finally, it will decrease emissions of CO
2
in the same proportion.
In this report, we considered efficiency improvements that can be applied to the existing
generating fleet, and those that can be achieved by the commercial deployment of advanced
clean coal technologies in new facilities.
With respect to the existing fleet, 75% of existing plants are candidates for retrofit of
technologies to increase boiler or steam turbine efficiency, and 25% could be retrofitted with a
CCT.
If these improvements all were implemented it would result in an overall efficiency
increase of approximately 8%, with a proportional decrease in CO
2
emissions. In terms of
emission reductions, this would be the equivalent of replacing or repowering 24 GW of existing
coal-based generating capacity with “zero-emission” technology, with a corresponding CO
2
emission reduction of approximately 200 million tons annually.
As a result of the DOE-industry sponsored CCT Program, a number of new coal-based power
generating systems of increased efficiency are now commercially available. Others will be
available for demonstration and deployment after 2010. Four specific technologies are discussed
in this report, either because of their readiness for application or significant promise of
performance in the near future (with further development):
•
Pulverized coal (PC) combustion with supercritical (SC) and ultra-supercritical (USC) steam;
•
Pressurized Fluidized Bed (PFBC) Combined Cycle with Topping Combustor (PFBCwTC);
•
Integrated Gasification Combined Cycle (IGCC); and
•
Hybrid Gasification/Fuel Cell/GT/Steam (DOE’s Vision 21Cycle)
ELECTRONIC FILING, RECEIVED, CLERK'S OFFICE, JANUARY 5, 2007
* * * * * PC #7 * * * * *
4
These technologies offer 45% cycle efficiency (LHV), leading to a potential for a 25% CO
2
emissions reduction, compared to installed capacity. United States and international R&D
efforts are in progress to develop advanced materials for USC plants with the prospect of an
efficiency increase up to 50% (LHV). Such plants are expected to be available for initial
deployment by 2010.
At present, capital costs, operating costs and the cost of electricity are lower for PC-SC steam
than for the combined cycles. However, PFBCwTC and, especially, IGCC could become more
competitive if CO
2
sequestration were required, because of the lower potential cost for CO
2
capture with these advanced systems.
Vision 21 Cycle aims at “zero emissions” and >60% cycle efficiency. Development of this
advanced power generation system is worthy of governmental and industrial support. It is the
best prospect for extending coal use while meeting more stringent environmental limitations.
CO
2
Capture Technology
Analysis of the pathways to atmospheric CO
2
stabilization suggests that carbon capture and
storage (i.e., sequestration) could ultimately account for more than 40% of global CO
2
emission
reductions. However, this will require an extraordinary acceleration of current research
programs, because there are no suitably developed technologies for capturing CO
2
at large
sources, including coal-fired power plants, or for storing CO
2
in geologic or oceanic sinks.
Capturing CO
2
, in particular, poses large challenges in the areas of cost and energy consumption,
and is generally considered to be a major economic impediment to the large-scale adoption of
sequestration technology.
For conventional combustion-based plants, the partial pressure of CO
2
in the flue gas is only 2-3
psia. Of the five major types of processes being studied, the most developed is chemical
absorption, which is commercial in the chemical and natural gas processing industries, although
at a smaller scale than that required for power plants. A few power plant demonstrations using
amine-based CO
2
removal systems are under way worldwide on relatively small generating
units.
The chief drawbacks are large and expensive contacting and pumping equipment and the large
amount of energy needed to desorb captured CO
2
and regenerate the sorbent. The total impact on
a new supercritical unit would raise the cost of electricity (COE) by >60% and reduce net
electrical output by about 30%. The impact of a retrofit to an existing subcritical unit would be
even greater. Nonetheless, gaining experience operating pilot and full-scale systems at power
plants is crucial to overall commercialization efforts, and these processes offer a solid basis for
such testing as well as opportunities for cost and performance improvement.
Removing CO
2
from integrated gasification combined cycle (IGCC) plants is relatively easier.
Gasifiers can be operated in a “steam shifted” mode to produce synthesis gas with a CO
2
partial
pressure exceeding 150 psia. Of the five major types of process being explored, the most
developed is physical absorption. According to a recent DOE-EPRI study for a 90% CO
2
reduction requirement at new power plants, an IGCC unit with CO
2
capture could have a COE
25% lower than that of a PC unit using monoethanol amine (MEA), assuming IGCC power block
ELECTRONIC FILING, RECEIVED, CLERK'S OFFICE, JANUARY 5, 2007
* * * * * PC #7 * * * * *
5
cost reduction goals are met. In absolute terms, however, the cost adders and energy penalties
for IGCC CO
2
removal are high, and warrant further R&D.
Given the magnitude of the problem, research is needed on a wide range of new concepts, such
as CO
2
clathrate (hydrate) separation, which offer promise for lower-cost CO
2
and H
2
S removal.
Given the time before wide-scale sequestration is likely to be practiced, there is an opportunity to
explore a wide range of potential capture options, applicable to both gasification and combustion
systems, in the hope that breakthrough technology can be identified to reduce the onerous costs
and energy penalties of current approaches.
Carbon Sequestration
After CO
2
has been separated and captured from flue gas or syngas, it must either be stored or
put to use. Several concepts for storage have been evaluated; however, options for carbon
sequestration vary depending on the locations of storage sites and types of storage/ sequestration
technologies used. The choice of sequestration option may also depend on the technology that
generates the CO
2
. For example, for combustion systems, it may be desirable to sequester CO
2
that contains other flue gas components, such as the acid gases. The capacity, effectiveness, and
potential health and environmental impacts of various types of CO
2
storage systems and the
potential impacts of inadvertent releases are key areas of scientific uncertainty. Leading
approaches to CO
2
storage described in this report include:
•
Geologic Sequestration
•
Terrestrial Sequestration
•
Ocean Sequestration
•
Novel Sequestration Systems
•
Novel Integrated Systems
•
Utilization
Funding provided by the DOE and the private sector for carbon capture and sequestration
research has increased considerably since the first National Coal Council report on this subject in
May 2000. In FY 2000, the DOE carbon sequestration budget was around $8 million. By FY
2003, this had been increased to $42 million. As of October 2002, the DOE/FE portfolio
included 104 projects, with a total value of $162 million. Significantly, the non-federal cost share
($66 million) represents 40% of the total, indicating willingness on the part of private industry to
invest in this research, despite the uncertain need for and timing of its eventual application.
Demonstration of Capture and Sequestration Technology
One common need for all potential sequestration technologies is large-scale demonstration that is
long enough to prove their technical and economic feasibility and to ensure that their CO
2
remains permanently in storage. Given the number of possible sinks and likely regional
differences in the characteristics of these sinks, there is a need for a several of these large-scale,
long-duration demonstrations.
As with any major new technology with enormous financial, environmental, and energy security
ramifications, CO
2
sequestration technologies cannot be considered commercially ready until
successfully proven at full-scale, under “real-world” conditions, for a period of time adequate to
assure expectations of prolonged safety and reliability. Any demonstration needs to convince
prospective public- and private-sector investors that the costs and risks are sufficiently
understood and acceptable so as to enlist the commitment of manufacturers and service
ELECTRONIC FILING, RECEIVED, CLERK'S OFFICE, JANUARY 5, 2007
* * * * * PC #7 * * * * *
6
providers, financiers and insurers, state and local authorities, and the public. These
demonstrations also must provide adequate scientific information on which to base future
regulatory requirements related to the deployment of sequestration technology.
Given the diverse make-up of the coal-based generating fleet, the wide variation in the types and
properties of regionally economical fuels for power production, and the tremendous range of
terrestrial ecosystems and subsurface geological features found across the U.S., effective national
deployment of carbon sequestration measures will require the development and
commercialization of a portfolio of CO
2
capture and storage technologies.
In this regard, we note the Department's current call for proposals to create regional partnerships
in the U.S. to identify sequestration options pertinent to specific geographic areas of the country,
and to conduct feasibility and field studies of promising sequestration options. One outcome of
this program should be a much clearer picture of the number of demonstrations that are
necessary to qualify sinks of sufficient size to support large-scale sequestration (if it is required
in the future).
To begin to populate a commercial sequestration technology portfolio over the medium-term (8-
15 years), development and/or refinement of the most defined promising options and
demonstration at pilot scale must begin immediately. Commercial success at full scale will
require the effective integration of technologies for capturing CO
2
at power plants, safely
transporting it to storage sites, and assuring that placed CO
2
will remain sequestered from the
atmosphere for centuries. Therefore, addressing integration issues in conjunction with the pilot-
scale demonstrations will accelerate their resolution at full scale.
Carbon Sequestration and the “Hydrogen Economy”
Just as coal plays a major role in the production of electricity, it has the potential to do the same
for hydrogen. The added costs for CO
2
capture and storage will be significantly lower for
hydrogen production than for electricity production. To the extent that gasification is the
preferred route of producing hydrogen from coal, implementing gasification technologies will
position coal to take advantage of this potential new market should a hydrogen economy evolve.
The recently announced Presidential FutureGen Sequestration and Hydrogen Research Initiative
could well serve as a major platform for developing CO
2
sequestration in conjunction with coal
gasification. This unique facility is envisioned to provide R&D capability to allow testing of
novel equipment under realistic conditions and may carry a significant share of U.S. R&D
activities. However, it will still be necessary to have multiple demonstrations or combinations of
pilot and demonstration projects to cover differing gasification designs, or designs not based on
gasification technology, with differing coals and differing regional types of sequestration.
Non-CO
2
Greenhouse Gases from Coal Production and Use
Carbon dioxide from coal combustion is the principal greenhouse gas emission associated with
coal. However, two additional gases, methane and nitrous oxide, also are emitted during coal
production and use. They may represent targets of opportunity for near-term reductions in
greenhouse gas emissions.
Coal mine methane (CMM) is one of several major sources of anthropogenic methane,
accounting for about 10% of anthropogenic methane emissions in the U.S. CMM is responsible
ELECTRONIC FILING, RECEIVED, CLERK'S OFFICE, JANUARY 5, 2007
* * * * * PC #7 * * * * *
7
for about 1% of the total GWP of U.S. anthropogenic emissions of all GHGs. The U.S. coal
industry has made substantial progress in recovering and using CMM though drainage systems.
Of the 134 Bcf of CMM liberated from underground mines in 2000, 36 Bcf was recovered and
used. This recovery represents an almost three-fold increase from the 13.8 Bcf recovered in
1990.
Currently, the recovery of CMM is driven by two factors: the resulting improvement in mining
conditions and the value of the gas. Most of the recovered CMM is used as pipeline-quality gas,
although smaller quantities are used at qualities not meeting pipeline specifications and some is
used as combustion air. Technologies under development -- including ultra-lean-burn turbines
and methane concentration systems -- could expand the options available for recovery and use.
Future GHG reduction requirements, in conjunction with advanced recovery technologies, could
easily result in increased recovery or utilization of CMM.
N
2
O has a GWP 296 times that of CO
2
. Because of its long lifetime (about 120 years) it can
reach the upper atmosphere, depleting the concentration of stratospheric ozone, an important
filter of UV radiation. N
2
O is emitted from fluidized bed coal combustion; global emissions
from FBC units are 0.2 Mt/year, representing approximately 2% of total known sources. N
2
O
emissions from PC units are much lower. Typical N
2
O emissions from FBC units are in the
range of 40-70 ppm (at 3% O
2
). This is significant because at 60 ppm, the N
2
O emission from
the FBC is equivalent to 1.8% CO
2
, an increase of about 15% in CO
2
emissions for an FBC
boiler. Several techniques have been proposed to control N
2
O emissions from FBC boilers, but
additional research is necessary to develop economically and commercially attractive systems.
Assessing the Cost of Greenhouse Gas Management
The cost of technological options to reduce, capture, and sequester CO
2
depends on a large
number of factors. Different cost studies typically employ different assumptions that often are
not fully communicated or well understood by their audience. Different assumptions can
significantly influence cost results, and lead to large uncertainties that are frequently not
reported. For technologies at pre-commercial stages of development, costs are especially
uncertain. To the extent that cost estimates often are a factor in decisions about technology
development or deployment, the basis for those estimates, and their uncertainties, needs to be
better characterized in ongoing work.
Future GHG emission constraints would affect the price and availability of electricity — two
factors that could have a profound impact on the U.S. economy. Because coal is abundant
domestically, and its price is low and stable relative to other fossil fuels, the predominance of
coal-based power plants has helped keep U.S. electricity affordable, reliable, and secure.
If stringent CO
2
reduction requirements are imposed, the cost of electricity and the balance in the
fuel mix could change dramatically. CO
2
removal technologies would be unprecedented in their
cost and energy consumption, compared to the emission controls for SO
2
, NOx, and particulates
adopted over the last 30 years. In the absence of commercially available CO
2
capture and
sequestration technologies, substantial near-term (less than 10-12 years) CO
2
emission reduction
requirements would likely force many coal-fired plants to be retired prematurely. This would
likely lead to a further surge in the construction of new NGCC plants. Such a shift would place
tremendous pressure on the gas production and pipeline industries to keep up with demand, and
would tend to tie electricity prices ever more tightly to the price of natural gas, a fuel with a
much more volatile price history than coal. While the historic price differential of gas to coal is
ELECTRONIC FILING, RECEIVED, CLERK'S OFFICE, JANUARY 5, 2007
* * * * * PC #7 * * * * *
8
about 2:1, recent trends and availability projections may make that gap even greater in the future.
Under this scenario, higher natural gas price prices would result in great impacts on the cost of
electricity and on the economy in general.
Deployment of Greenhouse Gas Emission Reduction Technology
Implementing the technologies described in this report will require transitions both in the
technology itself and in the policies and regulations that will govern the electricity generation
business of the future. The need for orderly transitions is necessary due to the desire to minimize
technical and financial risk on the parts of the generating companies and the financial institutions
that will invest in new power plants.
It is likely that existing coal-fired plants will continue to provide the majority of our nation’s
electricity for decades to come, unless political decisions are made which force their retirement
for economic reasons. Ultimately, economic and technical factors will make it necessary to build
new power plants to replace retiring capacity and to meet load growth. As indicated in this
report, significant reductions in CO
2
emissions can be achieved in the near term by increasing the
efficiency of the existing generating fleet. Moreover, replacement or repowering of the existing
units with new, more advanced CCTs can further increase fleet efficiency and reduce CO
2
emissions. Finally, new plants can be designed to facilitate CO
2
capture and sequestration, if this
becomes necessary and technologically and economically feasible.
Three important components of federal policy in this regard are support of research and
development, cost-sharing by the federal government in the first-of-a-kind demonstration of new
technology, and tax incentives to encourage replicate deployment of demonstrated technologies.
The latter is particularly important for encouraging investment in capital-intensive technologies
such as central-station coal-fired power plants. The argument is that some number of these new
technologies must be built to move the technology along a “learning curve” that reduces
technical risk and cost to the point that plants can attract conventional commercial financing.
This concept is embodied in the National Environmental and Energy Technology (NEET)
legislation, which has been introduced in both the House and the Senate.
Timely advances in coal technology cannot be achieved without a significant increase in RD&D
funding that will permit commercial viability within the next 10 years. This is problematic in the
current economic and regulatory environment because power plant operators are under extreme
pressure to reduce costs and are unwilling to invest in new technologies. Investing now in an
advanced power plant technology requires patience, because the investment will not earn a return
until some time after successful commercialization.
All of these issues suggest that traditional forms of private-sector funding for new technologies
may not be feasible in today’s electricity generation business environment. Public-private
consortia are emerging as a mechanism to provide the needed resources for technology
development. They allow for front-loading the R&D processes, as well as the early stages of
pilot and full-scale tests. DOE funding of research for the advanced coal program follows this
precept, in that the DOE cost share is higher for high-risk technology development and lower for
commercialization activities. This approach has been a success in prior programs, such as the
CCT Program, and it is working well to sustain interest in the current Vision 21 program. It is
anticipated that it will be successful in the FutureGen program as well.
ELECTRONIC FILING, RECEIVED, CLERK'S OFFICE, JANUARY 5, 2007
* * * * * PC #7 * * * * *
9
Although these programs encourage private-sector participation in the technology development
process, the current funding levels are not adequate to develop and commercialize the
technologies that the U.S. will need to deploy a new fleet of advanced coal-based generation
systems.
Recommendations
Implementing Greenhouse Gas Management Technology
•
The Department should continue to promote public-private partnerships, both domestically
and internationally, to identify opportunities, incentives and regulatory impediments
affecting voluntary actions to reduce GHG emissions, and to conduct research and technical
assessments of carbon management technologies and opportunities.
•
The Department should expedite revisions (as detailed in this report) to the National Energy
Policy Act 1605b reporting guidelines for GHG emissions in a way that ensures they are
sufficiently flexible to encourage voluntary action, and consistent with similar guidelines
being developed by other public- and private-sector organizations.
•
The Department should provide objective technical and economic information to inform
public policy decisions and private investment decisions regarding GHG technologies. The
Department also should work with other government agencies and the private sector to help
develop and implement economic and other incentives (including removal of regulatory
impediments) to accelerate the deployment of highly efficient advanced coal-based power
technologies and other means of GHG emissions reduction.
Early deployment of these
advanced technologies is critical to reducing the cost of commercial application.
•
The Department, working with other agencies as appropriate, should identify and assist in
exploiting near-term opportunities for reductions of non-CO
2
GHGs associated with coal
production and use, including emissions of methane and N
2
O, and enhanced carbon
management on mining lands.
•
The Department should expand its cooperation with the Departments of State and Commerce
in the areas of international research, development and demonstration for carbon
management technologies as it has begun to do with the FutureGen Project. This cooperation
should be conducted in concert with the domestic programs underway at DOE, in recognition
of the global nature of GHG issues.
Developing Greenhouse Gas Management Technology
•
The Department should continue to work closely with the private sector to improve and
refine the technology “roadmap" for advanced coal-based power generation technology and
carbon capture, transport and sequestration technology with particular attention to defining
the time and cost necessary to achieve the roadmap's technical and economic goals.
•
The Department should conduct and support R&D to improve the efficiency of coal-based
ELECTRONIC FILING, RECEIVED, CLERK'S OFFICE, JANUARY 5, 2007
* * * * * PC #7 * * * * *
10
power generation for both new and existing (or repowered) units as the most cost-effective
and commercially available near-term means for reducing GHG and other emissions. This
R&D includes:
o Materials for ultrasupercritical steam units capable of up to 50% LHV (47.5% HHV)
cycle efficiency;
o Improvements in IGCC technology (syngas cleanup and gas turbine development) to
enhance availability and reliability;
o Novel combustion processes capable of lower-cost CO
2
capture; and
o Development of the Vision 21 Fuel Cell Gas Turbine Hybrid to enable demonstration
by 2010.
•
The Department should expedite research on a wide range of CO
2
capture options applicable
to either gasification or combustion technologies, to improve energy efficiency and reduce
the cost of capture, and to explore promising novel technologies now in the laboratory or
conceptual stage of development.
•
The Department should continue and expand the core R&D and demonstration programs as
described in the report. In addition, the Department should further develop the FutureGen
project (including its associated goals for hydrogen and fuels production) as a research
platform leading to technology demonstrations, while recognizing that the core R&D
program is necessary to support not only FutureGen but a wider range of important coal
technology.
•
The Department should develop a set of guidelines regarding the key assumptions that should
be reported when estimating the costs of CO
2
reduction technologies (including carbon
capture and sequestration systems). These guidelines should include methods to characterize
uncertainty in the reported results.
Demonstrating Greenhouse Gas Management Technology
•
The Department should conduct a sufficient number of large-scale, long-term field tests of
promising sequestration options to ensure that sinks of sufficient size and integrity are
available to store the large volumes of CO
2
that would need to be sequestered if reductions
were required. The tests are necessary to fully understand the technical, economic and
environmental consequences of sequestration within the context of regional characteristics.
The Department should begin them as soon as possible, because of the long time duration
needed for adequate evaluation.
•
The Department should support multiple, large-scale, integrated demonstrations combining
the most promising generation, capture and sequestration technologies based on the
development of the unit components and design studies of the integrated systems.
ELECTRONIC FILING, RECEIVED, CLERK'S OFFICE, JANUARY 5, 2007
* * * * * PC #7 * * * * *
11
SECTION 2:
EXISTING VOLUNTARY PROGRAMS AND
PUBLIC-PRIVATE PARTNERSHIPS FOR
GREENHOUSE GAS MANAGEMENT
2.1 Summary
This section outlines the recent voluntary actions by industry to reduce, avoid, sequester and
control GHGs. The main emphasis will be on actions taken by coal producers and consumers,
but other examples of voluntary actions by other entities are also presented. U.S. industry has
been able to produce significant reductions in GHG emissions through a range of voluntary
programs initiated in partnership with DOE. The success of these programs (and the lessons
learned from them) have formed the bases for follow-on voluntary programs which will continue
to provide GHG emission reductions in the future.
The main source for this information is the U.S. Energy Information Administration’s (EIA)
report, “Voluntary Reporting of Greenhouse Gases 2001.” Values presented in this section are as
reported by participants in this program for 2001.
2.2 Energy Policy Act of 1992 - Section 1605(b) Program
The Voluntary Reporting of Greenhouse Gases Program, established by Section 1605(b) of the
Energy Policy Act of 1992, records the results of voluntary measures to reduce, avoid, or
sequester GHG emissions. Since its inception in 1994, this program has received reports of over
2,000 projects to reduce or sequester GHG emissions. Reports have been filed from entities
representing 38 different industry segments, as distinguished by the SIC codes of the reporting
organizations. As exemplified by the projects highlighted in this report, voluntary GHG
reductions since 1994 have been achieved by a wide variety of actions, including increased
energy efficiency, enhanced resource recovery, waste minimization and changes in land use
practices to increase terrestrial sequestration. The number of reporting entities has more than
doubled since the program began, while the number of reported projects has almost tripled.
A total of 228 U.S. companies in 25 different industries or services reported to the EIA that they
had undertaken 1,705 projects to reduce or sequester GHG emission reductions. The projects
reported a total of 60.5 million metric tons carbon equivalent (MMTCE) or 244.5 million tons of
CO
2
(MTCO
2
) of direct reductions, 19.4 MMTCE (78 MTCO
2
) of indirect reductions, 2.2
MMTCE (8.8 MTCO
2
) of reductions from carbon sequestration, and 4.1 MMTCE (16.5 MTCO
2
)
of unspecified reductions.
Of the 109 organizations reporting at the entity level, 104 calculated their entity-wide GHG
emissions. These entities reported direct GHG emissions of 246 MMTCE (993 MTCO
2
), equal
to about 15% of total U.S. GHG emissions. Also reported by these organizations were 40
MMTCE (162 MTCO
2
) of indirect emissions, equal to 2% of total U.S. GHG emissions. Also,
107 entity-level reporters tallied emission reductions, including 46 MMTCE (186 MTCO
2
) of
ELECTRONIC FILING, RECEIVED, CLERK'S OFFICE, JANUARY 5, 2007
* * * * * PC #7 * * * * *
12
direct emissions reductions, 7.7 (31 MTCO
2
) of indirect emission reductions, and 1.9 MMTCE
(7.7 MTCO
2
) of emission reductions resulting from carbon sequestration projects.
In the early years of the program, reporting was dominated by electric utilities. In the first
reporting year, the 95 submissions from electricity producers represented 88% of the 108 reports
received. Since then, the program has seen an influx of new participants from outside the
electric utility sector, representing a diverse set of other industries. Several mergers and
acquisitions involving reporters to the program have accompanied the ongoing restructuring of
the electric utility industry. Many of these merged entities have submitted single, consolidated
reports, thus reducing the number of reports received from electricity producers. As a result,
only 45% of the organizations reporting to the program for data year 2001 were from the electric
utility industry.
Most projects involve actions within the U.S. Some are conducted in foreign countries, designed
to test various concepts of joint implementation (JI) with other nations. Fifty-eight of the 89
foreign projects represent shares in two forestry programs in Belize and Malaysia sponsored by
the electric utility industry.
The principal objective of the majority of the projects reported was to reduce CO
2
emissions.
Most of these projects reduced CO
2
either by reducing fossil fuel consumption or by switching to
less carbon-intensive sources of energy. Many also achieved small reductions in emissions of
other gases. A total of 900 projects involved either efficiency improvements and switching to
less carbon-intensive sources in the electricity industry or energy end-use measures affecting
stationary or mobile combustion sources. Projects that primarily reduced CO
2
emissions also
included the 87 “other” emissions reduction projects -- most of which involved either the reuse
of fly ash as a cement substitute in concrete or the recycling of waste materials.
Projects that primarily affected CO
2
emissions accounted for reported direct reductions of 51
MMTCE (206 MTCO
2
), representing 76% of the total direct reductions reported. In addition,
indirect reductions totaling 8.5 MMTCE (34 MTCO
2
) were also reported for the projects that
reduced CO
2
emissions.
A variety of efforts to reduce emissions of gases with high global warming potentials (GWPs)
were also reported. In this group, 293 of the reported projects (17%) reduced methane and
nitrous oxide emissions from waste management systems, animal husbandry operations, oil and
gas systems, or coal mines. The direct emission reductions for these projects totaled 7.9
MMTCE (32 MTCO
2
), representing 13% of the total direct reductions reported. Indirect
reductions reported for projects that reduced methane and nitrous oxide emissions totaled 11
MMTCE (44 MTCO
2
). The 47 projects reported on the short form reduced emissions from
unspecified sources by a reported 1.1 MMTCE (4.4 MTCO
2
).
Coal Mining
CONSOL Coal Group reported its reductions as an entity-level reporter, without defining
specific projects that were responsible for directly reducing the emissions. CONSOL was one
out of the 48 companies that reported only entity-level information. 109 of the 228 companies
reported entity-level information, while 61 of all the participants in the program reported both
entity-level information and project-level information.
ELECTRONIC FILING, RECEIVED, CLERK'S OFFICE, JANUARY 5, 2007
* * * * * PC #7 * * * * *
13
CONSOL Coal Group reported the largest individual entity-level direct emissions reduction at
5.2 MMTCE (21 MTCO
2
), accounting for 11% of the total reported CO
2
equivalent direct
reductions. These reductions are the combined effect of changes in mining operation, the
initiation of coal bed methane (CBM) gas sales projects, and the internal use of CBM as a fuel.
There were 16 projects reported to specifically reduce methane emissions from coal mines, with
total direct emission reductions of 538,285 metric tons (3.15 MMTCE) and indirect reductions of
96 metric tons methane (550 metric tons carbon equivalent).
Jim Walter Resources, Inc., reduced methane emissions by 242,570 metric tons (1.4 MMTCE) ,
mostly due to the capture and sale of gob gas to an interstate pipeline. These gob wells are
drilled in advance of the longwall mining in order to assist in the removal of methane from the
active mine operations. The company also practices degasification through horizontal boreholes
on all their deep mines.
Two other companies contributing to the methane reductions at coal mines were U.S. Steel
Mining Company, reporting direct methane reductions of 106,771 metric tons methane (0.6
MMTCE) from its two projects and El Paso Production Company, reporting direct reductions of
79,914 metric tons (0.45 MMTCE) from its project in White Oak Creek coalbed in Alabama.
None of the coal mining companies reported any sequestration projects that involved
afforestation or reforestation. Mining companies are required under Subchapter B 30 CFR
Surface Mining Law Regulations, to re-vegetate all post-mining areas. Under Part 715, the code
requires that “a diverse, effective, and permanent vegetative cover of species native to the area of
disturbed land or species that will support the planned post-mining uses of the land approved
according to Sec. 715.13.” If the land use category is changed, i.e., from a rangeland, cropland,
hayland, or pasture to a forest land, it would have to be approved by the regulatory authority,
after consultation with the landowner provided it meets the criteria outlined in Sec. 30 CFR
715.13 (d). If introduced species were to be substituted for native species, the regulatory
authority would have to approve it after the appropriate field trials demonstrated the species had
equal or superior utility.
While there are opportunities for mining companies to be involved with afforestation projects,
regulations have not allowed companies to transform a rangeland into a forest.
Electric Utilities
Eighty-four electric power providers reported 391 projects that reduced emissions a total of 45.6
MMTCE (184 MTCO
2
) through direct and indirect sources. Electric power projects are reported
in two categories:
(1) carbon content reduction; and
(2) increased energy efficiency in generation, transmission, and distribution.
Carbon content reduction projects include availability improvements, fuel switching and
increases in lower emitting capacity. Increased efficiency through generation, transmission, and
distribution projects includes such activities as heat rate improvements, cogeneration and waste
heat recovery, high-efficiency transformers, and reductions in line losses associated with
ELECTRONIC FILING, RECEIVED, CLERK'S OFFICE, JANUARY 5, 2007
* * * * * PC #7 * * * * *
14
electricity transmission and distributions. A total of 188 projects reporting 4.6 MMTCE (18.5
MTCO
2
) were for increased energy efficiency and 225 projects representing 42 MMTCE (169
MTCO
2
) were reported under carbon content reductions. About three-quarters of the reported
electric power projects were related to nuclear power.
Of the 188 projects related to energy efficiency, 117 projects were defined as improvements in
generating efficiency. Heat rate improvements at coal-fired power plants are a commonly
reported means of increasing efficiency and reducing CO
2
emissions. There are numerous
opportunities for improving efficiency at existing power plants. The reductions reported were
2.5 MMTCE (10.2 MTCO
2
) – 5.56% of the total emissions reported by power companies.
FirstEnergy Corporation reported heat rate efficiency improvements on the Ohio Edison System
that were accomplished through:
(1) shutdown of less efficient coal-fired boilers;
(2) installation of enhanced boiler controls; and
(3) turbine modifications.
This project reported a reduction of 8.6 trillion Btu in consumption of bituminous coal, resulting
in direct reductions of 0.22 MMTCE (0.89 MT CO
2
) emissions.
American Electric Power (AEP) reported 71 projects that reduced emissions. Two of these were
related to emission reductions from heat rate improvement projects at their coal-fired power
plants accomplished through operational changes, equipment changes, and improved load
optimization. The emission reductions reported were 0.35 MMTCE (1.4 MT CO
2
).
Southern Company reported one project out of 34 on heat rate improvement on coal-fired
capacity. From 1990 to 1994, Southern Company improved their average net heat rate by better
operation and maintenance of plant equipment. Examples include enhanced boiler heat recovery
in economizer and air preheater systems, component replacement for efficiency gain (fans, heat
exchangers, pumps), heat rejection upgrades, and improved turbine performance
monitoring/maintenance. For 1995-2000, the average coal-fired heat rate increased, mostly due
to emission control projects required by the 1990 Clean Air Act Amendments. With the number
of selective catalytic reduction (SCR) systems coming on-line and installation of flue gas
desulfurization (FGD) systems, further improvements in heat rates will no longer be achievable.
Tennessee Valley Authority has reported a total of 7.4 MMTCE (30 MT CO
2
) direct and indirect
emission reductions, with 25 projects defined.
Coal Ash
Thirty-seven projects were reported that reused coal ash. This accounted for indirect reductions
of 1.46 MMTCE (5.9 MT CO
2
) that represented over 7 million metric tons of coal ash reused.
FirstEnergy recovered 177,800 tons of fly ash to be used in the production of Portland cement,
which was an indirect reduction of 0.42 MMTCE (0.14 MTCO
2
). Fly ash substitution for
Portland cement saves CO
2
emissions by displacing Portland cement that would otherwise need
to be produced. CO
2
emissions saved in the Portland cement manufacturing process results from
the direct combustion of fossil fuels plus from the calcination of limestone that will be avoided.
ELECTRONIC FILING, RECEIVED, CLERK'S OFFICE, JANUARY 5, 2007
* * * * * PC #7 * * * * *
15
AEP sold fly ash for use in ready-mix concrete, pozzolan, and concrete block. They recycled
741,827 tons of fly ash for an indirect reduction of 0.17 MMTCE (0.58 MTCO
2
). This was the
second largest quantity of coal ash reuse. (TXU recorded the largest.)
Energy End Use
Reported reductions for the 329 energy end-use projects reported on the long form included 5.2
MMTCE (21 MTCO
2
) from direct sources and 2.2 MMTCE (8.8 MTCO
2
) from indirect sources.
Energy end-use reductions were reported for stationary-source applications, such as building
shell improvements, lighting and lighting control, appliance improvement or replacement, and
heating, ventilation and air conditioning improvements. Much smaller reductions were reported
for the 53 transportation projects reported on the long form, including 0.12 MMTCE (0.049
MTCO
2
) from direct sources and 0.024 MMTCE (0.097 MTCO
2
) from indirect sources.
Carbon Sequestration
Almost all of the 369 carbon sequestration projects reported to EIA increased the amount of
carbon stored in sinks through various forestry measures, including afforestation, reforestation,
urban forestry, forest preservation, and modified forest management techniques. EIA recorded
that 45 of the 51 reporters involved in forestry or natural resources programs that sequestered
carbon or reduced emissions in 2001 were electric utilities.
These activities accounted for 25% of the projects reported on the long form; 243 of the reported
carbon sequestration projects presented 27 electric utilities’ shares in nine projects conducted by
the UtiliTree Carbon Company. The sequestration reported for carbon sequestration projects on
the long form totaled 2.2 MMTCE (8.8 MTCO
2
). Direct emission reductions totaling 0.0003
MMTCE (0.0012 MTCO
2
) were also reported for a few carbon sequestration projects in which
changes in forest management practices reduced fuel consumption. A further 14 carbon
sequestration projects reported on the short form sequestered or avoided emissions of 0.0025
MMTCE (0.01 MTCO
2
).
AEP accounted for the largest number of projects (14% of the 251 afforestation and reforestation
projects). AEP reported 34 afforestation projects on land owned by its operating companies,
which sequestered a reported 0.04 MMTCE (0.16 MTCO
2
). Three of the projects were initiated
in 2001.
AEP reported 11 projects that involved the utility’s annual additions to its modified forest
management efforts conducted in upland central hardwood stands. The stands are selectively
harvested, removing over-mature, mature, cull, and diseased trees. Other steps are undertaken,
as necessary, to improve growing space relationships and maximize the growth rates of the
stands. The combined additional sequestration reported by AEP for these projects in 2001 was
0.004 MMTCE (0.017 MTCO
2
).
FirstEnergy is involved in an urban forestry project since 1992. Under the tree source project,
17,900 trees were planted in 2001. The company provided ornamental trees, free of charge, to its
Ohio customers for residential planting.
ELECTRONIC FILING, RECEIVED, CLERK'S OFFICE, JANUARY 5, 2007
* * * * * PC #7 * * * * *
16
Methane Emissions
Emission reductions for the 246 methane abatement projects reported on the long form included
7.9 MMTCE (29 MTCO
2
) from direct sources and 11 MMTCE (44 MTCO
2
) from indirect
sources. The three most frequently reported sources of methane reductions were municipal
waste landfills (198 projects), natural gas systems (19 projects), and coal mines (16 projects). In
addition to reducing methane emissions, projects that involved the recovery and use of methane
for energy also reduced CO
2
emissions by displacing fossil fuels – such as oil and coal – that
have higher carbon contents and thus produce more CO
2
when burned.
Future Commitments
Eighty-five entities reported formal commitments to reduce future emissions, to take action to
reduce emissions in the future, or to provide financial support for activities related to GHG
reductions. More than one-third (34%) of these entities are electricity generators participating in
the Climate Challenge Program. Fifty-six other entities also reported commitments. Other
voluntary programs represented among the commitments reported included Climate Wise, the
Voluntary Aluminum Industrial Program, the U.S. Initiative on Joint Implementation, the Green
Lights Program, the Landfill Methane Outreach Program, the Coalbed Methane Outreach
Program, Motor Challenge, and the Sulfur Hexafluoride Emissions Reduction Partnership for
Electric Power Systems.
There are three forms of future commitments in the Voluntary Reporting Program:
1) entity commitments;
2) financial commitments; and
3) project commitments.
Entity and project commitments parallel the entity and project aspects of emissions reporting.
An entity commitment is a commitment to reduce the emissions of an entire organization. A
project commitment is a commitment to take a particular action that will have the effect of
reducing the reporter’s emissions through a specific project. A financial commitment is a pledge
to spend a particular sum of money on activities related to emission reductions, without a
specific promise about the emissions consequences of the expenditure.
Twenty-five firms made 32 specific promises to reduce, avoid, or sequester future emissions at
the entity level. Some of these entity-level commitments were to reduce emissions below a
specific baseline, others to limit the growth of emission per unit of output, and others to limit
emissions by a specific mount relative to a baseline emissions growth trend. In their reports,
companies committed to reducing future entity-level emissions by a total of 25.7 MMTCE (104
MTCO
2
) – 44% of entity-level emission reduction commitments were for the year 2000, with an
additional 31% falling within the 2001 to 2005 time horizon.
Twenty-nine companies reported on commitments to undertake 182 individual emission
reductions projects. Some of the commitments were linked to future results from projects
already under way and forming part of the reporters’ submissions. Others were for projects not
yet begun. Reporters indicated that the projects were expected to reduce future emissions by 41
MMTCE (166 MTCO
2
), most of which (24.5 MMTCE or 99 MTCO
2
or 60%) would be
reductions of methane emissions.
ELECTRONIC FILING, RECEIVED, CLERK'S OFFICE, JANUARY 5, 2007
* * * * * PC #7 * * * * *
17
Twenty-one firms made 39 separate financial commitments. The total amount of funds promised
was $51 million, of which $7 million was reported to have been spent in 2001.
The Business Roundtable Climate RESOLVE Program
The Business Roundtable is an association of chief executive officers of leading corporations
with a combined workforce of more than 10 million employees in the U.S. and over $3.7 trillion
in revenues. In February 2003, the BRT announced the Climate RESOLVE (
R
esponsible
E
nvironmental
S
teps,
O
pportunities to
L
ead by
V
oluntary
E
fforts) program at a U.S.
Department of Energy event in conjunction with the Department of Agriculture, Environmental
Protection Agency and Department of Transportation. The event highlighted cooperative public
and private programs to address climate change. The Climate RESOLVE program encourages
BRT members to report their greenhouse gas management efforts to the Department of Energy.
BRT will regularly report on progress towards the 100% participation goal.
In addition to its call for voluntary action, the Business Roundtable will give its member
companies support and tools to effectively manage GHG emissions. The BRT will assist
companies through workshops, one-on-one consulting support, an implementation workbook and
examples of cost-effective options to reduce, avoid, offset and sequester GHG emissions.
The BRT has stated their belief that the development and deployment of breakthrough
technologies will provide the most effective long-term response to concerns about global climate
change. In the meantime, BRT member CEOs have pledged to apply best management practices
to make American companies among the most greenhouse-gas efficient in the world.
2.3
Improvements in Reporting Protocols
2.3.1 Corporate GHG Accounting and Reporting
Global climate change is viewed as one of the important issues of the 21
st
century. The
momentum for responding is increasing as governments are adopting aggressive actions,
including potential ratification of the Kyoto Protocol in 2003, and establishing national,
statewide, and regional emissions reporting initiatives or trading schemes. There also is
increasing pressure on businesses in the developed world to demonstrate that they are taking
responsibility to quantify and manage their GHG emissions, particularly for carbon intensive
industries.
Proactive companies are taking steps to identify not only the risks and challenges associated with
the evolving climate change arena, but also the business opportunities that could be developed.
To do this, however, companies must first have an understanding of the extent and nature of their
GHG emissions.
2.3.2 Hierarchy of Existing GHG Accounting and Reporting Initiatives
A range of programs currently exist for reporting, registering, and trading GHG emissions and
emissions reductions. While these programs differ from each other, one thing they have in
common is the need for guidance on how GHG emissions are accounted for and reported. The
ELECTRONIC FILING, RECEIVED, CLERK'S OFFICE, JANUARY 5, 2007
* * * * * PC #7 * * * * *
18
approaches taken by these programs often differ widely, however, even among programs with
similar purposes.
The programs referenced within this chapter can be grouped into four categories:
1. U.S. Government-Sponsored Programs at the Federal and State Level
a. DOE’s Voluntary Reporting of Greenhouse Gases Program - 1605(b) Program
b. EPA’s Climate Leaders Program
c. The California Climate Action Registry
d. The New Hampshire Voluntary GHG Reductions Registry
e. The New Jersey Open Market Emissions Trading Program
f. The Wisconsin Voluntary Emission Reduction Registry
2. Programs Offered by Non-Governmental Organizations
a. The Climate Neutral Network
b. The Climate Trust
c. Environmental Defense Fund’s Partnership for Climate Action
d. Environmental Resources Trust’s GHG Registry
e. World Wildlife Fund’s Climate Savers Program
3. International Initiatives
a. The UNFCCC (e.g., National Registries & Flexible Mechanisms)
b. The World Bank’s Prototype Carbon Fund
c. The World Resources Institute (WRI)/World Business Council for Sustainable
Development (WBCSD) Greenhouse Gas Protocol Initiative
d. The American Petroleum Institute’s (API) Compendium of Greenhouse Gas
Emissions Estimation Methodologies for the Oil and Gas Industry
e. The Chicago Climate Exchange
4. Existing Programs in Specific Foreign Countries or Regions
a. The Australian Greenhouse Challenge
b. Denmark’s National GHG Trading Scheme
c. EurElectric Group’s GHG Emissions Trading Simulations
d. The European Union’s Emissions Trading Directive
e. The Netherlands’ ERUPT (JI) and CERUPT (CDM) Tenders
f. The United Kingdom’s National Emissions Trading Scheme
Within these categories, the programs have a range of purposes. Typically they exist to promote
public recognition of efforts to reduce emissions, to provide protection for emissions baselines
(e.g., ensure that voluntary actions are taken into account if and when a mandatory regime is
adopted), or to promote emissions trading. In some cases, the programs serve more than one
purpose.
2.3.3 Initiatives With Heavy Industry Participation
While there is no universally accepted international business standard for estimating GHG
emissions, three efforts have enjoyed heavy participation from the private sector:
ELECTRONIC FILING, RECEIVED, CLERK'S OFFICE, JANUARY 5, 2007
* * * * * PC #7 * * * * *
19
1. DOE’s Voluntary Reporting of Greenhouse Gases Program – 1605(b)
2. API Compendium of Greenhouse Gas Emissions Estimation Methodologies for the Oil and
Gas Industry, (API, 2001)
3. WRI/WBCSD
The Greenhouse Gas Protocol
and associated Stationary Combustion Tool
(WRI/WBCSD, 2001)
The DOE Program
The DOE’s Voluntary Reporting of Greenhouse Gases Program, created under Section 1605(b)
of the Energy Policy Act of 1992, allows any company, organization or individual to establish a
public record of emissions, reductions, or sequestration achievements in a national database.
Reporters can gain recognition for environmental stewardship, demonstrate support for voluntary
approaches to achieving environmental policy goals, support information exchange, and inform
the public debate over GHG emissions.
During 2002, the President directed the Secretary of Energy, working with the Secretaries of
Commerce and Agriculture and the Administrator of the EPA, to propose improvements to the
current 1605(b) program to “enhance measurement accuracy, reliability and verifiability,
working with and taking into account emerging domestic and international approaches.” The
President also requested recommendations “to ensure that businesses and individuals that register
reductions are not penalized under a future climate policy, and to give transferable credits to
companies that can show real emissions reductions.”
The API Compendium
The API Compendium project reviewed numerous GHG protocols and methodology documents
in an effort to compare and contrast different greenhouse emission estimation techniques and
develop a document of internationally recognized best practices. Protocols from participating
petroleum companies and publicly available guidance documents and inventory protocols were
included in this detailed review. Internationally recognized sources reviewed under the API
project include:
•
EPA’s AP-42 (EPA, 1995 including supplements A through F);
•
Intergovernmental Panel on Climate Change (IPCC, 1996);
•
Emission Inventory Improvement Program (EIIP, 1999);
•
Energy Information Administration (EIA, 1996; EIA, 2001); and
•
WRI/WBCSD (WRI/WBCSD, 2001)
API is currently reaching out to other protocol development organizations (governmental and
non-governmental) to gain broad peer-review of its efforts, with the ultimate goal of achieving
harmonization of estimation methods and improved global comparability of emission estimates.
Although the focus of the Compendium is on oil and gas industry operations, methodologies
presented for combustion sources and energy generation are directly applicable to electric utility
operations.
ELECTRONIC FILING, RECEIVED, CLERK'S OFFICE, JANUARY 5, 2007
* * * * * PC #7 * * * * *
20
The GHG Protocol Initiative
The WRI/WBCSD GHG Protocol Initiative is an international undertaking to promote the use of
standardized methods for estimating and reporting GHG emissions. Proposed principles and
standards are provided for developing a corporate GHG inventory and for performance reporting.
A separate spreadsheet tool is available for estimating emissions from stationary combustion
sources and energy generation. The WRI/WBCSD GHG Protocol is widely cited and recognized
as the accepted approach for developing GHG inventories.
Module I of the WRI/WBCSD GHG Protocol addressing entity-wide reporting has been
completed. Module II on project-based reporting was launched in 2002 and is not expected to be
completed until the end of 2003. WRI is seeking feedback on reporting efforts using Module I
guidelines.
The EPA Climate Leaders program is using a reporting protocol based on a modified version of
the WRI/WBCSD GHG Protocol. It held a workshop October 2002 to discuss feedback on the
reporting protocol and GHG reduction-setting methodology. Climate Leaders has also “released
for comment”
1
its first draft GHG Protocol document, the Stationary Combustion Module.
During 2003, EPA will seek comments on the draft Climate Leaders GHG Inventory Protocol
documents. The protocol will be released in stages as individual modules are completed. After
gathering feedback on all of the inventory protocol modules, EPA will integrate comments,
finalize the modules, and publish the protocol, updating it as needed.
2.3.4 Accounting and Reporting Recommendations
Consistency in Accounting and Reporting Metrics
The U.S. government, through the DOE, should make every effort to ensure that:
•
Changes to the 1605(b) program are consistent with the accounting and reporting
principles supported by U.S. industry (e.g., API and GHG Protocol Initiative); and
•
Wherever possible, be consistent with international accounting and reporting best
practices in an effort to reduce the accounting and reporting burden of U.S. multi-national
corporations.
Nature of Reporting
Reporting should:
•
Stay flexible, including retention of the flexibility to report either entity-wide
emissions or project-specific reductions only;
•
Accommodate multiple purposes for reporting, including (but not limited to)
recording emissions and achievements, informing public debate, participating in
educational exchange, as well as providing transferable credits, baseline protection
and credit for past actions; and
•
Allow the reporter to specify those projects and reductions for which transferable
credits, baseline protection, and/or credit for past action is being sought versus those
reported activities for which it is not being sought.
1
This is not public comment via the Federal Register.
ELECTRONIC FILING, RECEIVED, CLERK'S OFFICE, JANUARY 5, 2007
* * * * * PC #7 * * * * *
21
Reference Cases
1. Multiple options should be available for setting reference cases.
2
2. Modified reference cases
3
should remain an option (including those developed from emission
rates).
Project-Based "Reductions"
1. Accounting and reporting guidelines should:
•
Continue to allow project "reductions" to be reported separately from the reporting of
entity-wide emissions. If entity-wide emissions are reported, the ability to report
project-level reductions should not depend on the entity-wide emissions showing a
reduction.
•
Continue to allow reporting of off-site sequestration projects, including abandoned
mine land reclamation programs.
•
Include projects that avoid emissions and provide an indirect emissions benefit by
reducing energy consumption (including energy efficiency and DSM).
•
Continue to allow reductions from international projects, including those approved by
governments under activities implemented jointly (under the UNFCCC) and CDM
and JI flexible mechanisms (under the Kyoto Protocol).
2. Reporters should distinguish between projects where they have direct control (
e.g.
.,
electricity generators' heat rate improvement programs, enhanced CBM recovery, etc.) versus
those activities where others may affect the level of direct reductions (
e.g
., electric utilities’
DSM programs).
Entity-Wide Reporting
1. Entities should continue to have the flexibility to choose their reporting boundaries and
otherwise define the scope of their reports in a way that is consistent with a specific
industry’s best practices.
2. Indirect emissions should continue to be a separate, optional category for reporting.
3. If an entity
opts
to assign a portion of its direct emissions from their operations to purchasers
of their products, they should also report that portion assigned to their customers as an
indirect emissions reduction (e.g., credit) against their direct emissions, in order to accurately
account for all of their emissions. Any reporting in this manner should be in addition to the
reporting of all direct emissions of GHGs from their operations.
2
“Reference case” is the term used in the 1605(b) guidelines for a project baseline, or what the emissions would
have been in the absence of the project.
3
“Modified reference cases” are references cases that recognize that, even in the absence of the project, future
emission levels would differ from historic levels.
ELECTRONIC FILING, RECEIVED, CLERK'S OFFICE, JANUARY 5, 2007
* * * * * PC #7 * * * * *
22
4. Reporting entities should be urged (but not required) to report other categories of direct
emissions if they believe that the emissions from any of the other categories (
e.g
., fleet
vehicles, methane, N
2
O) are greater than a
de minimis
amount established for that industry.
5. Quantification of reductions based on
entity-wide
emissions should meet the same standards
for “leakage” (and other relevant criteria) that are applied for quantification of reductions
from
projects
.
Verification
1. Third-party verification should be optional (e.g., it may be desirable for some projects in
order to create fungible/tradable emission reduction credits).
2. In those cases where reporters have elected to have third-party verification of projects, it
would be helpful to have some uniform standards for such verification.
Confidentiality
1. Trade secret and commercial or financial information that is privileged or confidential should
continue to be protected under the Freedom of Information Act, Section 1605(b)(3) or other
applicable law. Any other approach would discourage participation in a voluntary program.
ELECTRONIC FILING, RECEIVED, CLERK'S OFFICE, JANUARY 5, 2007
* * * * * PC #7 * * * * *
23
SECTION 3:
EVALUATION OF RESEARCH AND DEVELOPMENT
NEEDS FOR GREENHOUSE GAS MANAGEMENT
Introduction
Approximately one-third of all CO
2
emissions due to human activity arise from the combustion
of fossil fuels used to generate electricity, with each power plant capable of emitting several
million tons of CO
2
each year. This contributes to the build-up of GHGs in the atmosphere.
Policy proposals to limit emissions of CO
2
and other GHGs are being considered at the
international, national, regional, and local levels.
International efforts to limit GHG emissions are based primarily on the United Nations
Framework Convention on Climate Change (UNFCCC), which seeks “stabilization of
greenhouse gas concentrations in the atmosphere at a level that would prevent dangerous
anthropogenic interference with the climate system.” Although a target concentration has not
been specified, actions to reduce emissions of CO
2
and five other major GHGs are proceeding
through policy instruments, such as the emission reduction targets set for developed countries
under the 1997 Kyoto Protocol.
The U.S. has not agreed to the GHG reduction targets set forth under the Kyoto Protocol, but the
Bush Administration has proposed a Global Climate Change Initiative (GCCI) to voluntarily
reduce the carbon intensity of the U.S., as measured by CO
2
emitted per unit of GDP, over the
next 10 years. The GCCI has set forth the goal of significantly reducing the GHG intensity of
the U.S. economy over the next 10 years, while maintaining the economic growth needed to
finance investment in new, clean energy technologies. This will require increased R&D
investments with a heightened emphasis on carbon sequestration and reductions in non-CO
2
GHG emissions, such as methane and N
2
O.
Because more than 85% of the CO
2
emitted by the power sector originates from coal, achieving
the GCCI-targeted 18% reduction in GHG intensity over the next decade within the power sector
will be a challenge. By focusing on GHG intensity as the metric of choice, the government must
promote vital R&D while minimizing the economic impact of GHG emission reduction on the
U.S. This goal could be accomplished through a synergistic, three-pronged approach, consisting
of:
•
Increasing the efficiency of the energy system;
•
Increasing the use of low-carbon fuels; and
•
Developing technologies to capture and store CO
2
from fossil fuels used for energy.
A portfolio of new advanced technologies that would increase energy system efficiency holds
great potential to reduce GHG emissions. In addition, the development of carbon capture and
sequestration technologies will play a critical role if the U.S. is to successfully manage its GHG
emissions.
ELECTRONIC FILING, RECEIVED, CLERK'S OFFICE, JANUARY 5, 2007
* * * * * PC #7 * * * * *
24
Plotting and Following the Technology Roadmap
If GHG management on the scale envisioned in various futurist scenarios is required, it will be a
massive technical and economic undertaking.
On the other hand, if the international
community’s will to utilize its abundant fossil fuel resources is not to be denied, the undertaking
will require the development and deployment of new technology at an unprecedented pace and
scale. To achieve this, particularly in an international context, will take a clear vision of what is
needed and what must be done to accomplish it. Therefore, it is imperative that there be broad
consensus embodied in national energy policy that outlines the overall goals, time frame and
costs for achieving them in a comprehensive technology roadmap. The roadmap must include
both a range of options for achieving the goals and a framework for allocating resources to meet
the goals with the greatest economic and temporal efficiency.
Recently, there has been a substantial effort in the technical community to achieve agreement on
a common road map for coal utilization technology directed at the production of electricity and
fuels. This road map has been drawn from individual roadmaps of the DOE, the Coal Utilization
Research Council, and EPRI, and includes greenhouse gas management as a specific objective.
It is important that the roadmapping effort continue to assist DOE, private industry and the
public to update and focus performance objectives, technology options and economic resources.
3.1
Energy Efficiency Improvements
3.1.1 Summary
Enhancing generation efficiency can be the most cost-effective approach for reducing CO
2
emissions and simultaneously improving the utilization of coal, a critical domestic energy
resource. With higher efficiency, less coal is used to produce the same power output, resulting in
reduced emissions of pollutants and GHGs. The application of highly efficient, clean power
generating systems is essential for coal to maintain its position as the most important energy
source for power generation.
As a result of the DOE-industry sponsored CCT Program, a number of coal-based power
generating systems of increased efficiency are now commercially available. Others will be
available for demonstration and deployment after 2010. Four specific technologies are discussed
in this section, because of their readiness for application or significant promise of performance in
the near future, with further development:
•
Pulverized coal (PC) combustion with supercritical (SC) and ultra-supercritical
(USC) steam;
•
Pressurized fluidized bed (PFBC) combined cycle with topping combustor
(PFBCwTC);
•
Integrated gasification combined cycle (IGCC); and
•
Hybrid gasification/fuel cell/GT/steam (DOE’s Vision 21Cycle).
These technologies offer 45% cycle efficiency (LHV), with a potential 25% CO
2
emissions
reduction compared to currently installed capacity. U.S. and international R&D efforts are in
progress to develop further materials for USC plants with prospects of efficiency increases up to
50% (LHV). Such plants are expected to be available by 2010.
ELECTRONIC FILING, RECEIVED, CLERK'S OFFICE, JANUARY 5, 2007
* * * * * PC #7 * * * * *
25
Capital costs, operating costs, and the cost of electricity are lower for PC-SC steam than for the
combined cycles. However, PFBCwTC and, especially, IGCC could become more competitive
when it becomes commercially viable to add CO
2
capture equipment.
Vision 21 Cycle aims at “zero emissions” and >60% cycle efficiency
.
Development of this
advanced power generation system is worthy of governmental and industrial support. It is the
best prospect for extending coal use while meeting more stringent environmental limitations.
3.1.2 Coal-Based Generation Technologies for New Plants
The efficiency of the existing coal-based power plant fleet in the U.S. is about 35% (LHV).
Advanced coal-based power generation technologies are able to generate electricity at
significantly increased efficiency (>45%, LHV). Several of these technologies have been
developed over the last 15 years through successful government-industry cooperation under
DOE’s CCT Program, and are now commercially available.
Higher efficiency is the key to the reduction of all emissions, since higher efficiency means less
fuel is burned and fewer pollutants are emitted. This includes GHGs such as CO
2
. Until CO
2
capture and removal from flue gas becomes a commercially available technology, efficiency
increases will remain the most practical and cost-effective method for mitigating CO
2
emissions.
SC and USC Technology
PC-SC boilers have been in use since the 1930s. With improvements in materials and efficiency,
this system has become the choice of new PC plants worldwide. Efficiency improvements have
been achieved by using higher temperatures. In subcritical steam cycles, the maximum practical
efficiency is just under 40% (LHV). The efficiency of a PC steam plant can be increased in
small steps to beyond 45% (LHV) using SC steam parameters as shown in Figure 1 (Schilling
[1]). The diagram illustrates reduction in waste heat loss, improved combustion to reduce excess
air, and reduction in stack temperature.
Figure 3-1. Improving efficiency in PC power plants
(Schilling [1])
ELECTRONIC FILING, RECEIVED, CLERK'S OFFICE, JANUARY 5, 2007
* * * * * PC #7 * * * * *
26
SC steam parameters of 3750 psi/1000 °F single or double reheat with efficiencies that can reach
42% (LHV) represent a mature, commercially available technology for U.S. power plants.
In several papers [2-8], the EPRI reviewed the history and performance of SC units in the U.S.
and in the former Soviet Union, where most of the SC plants have been operated since the 1930s.
SC plants also have a long history in the U.S. The original Eddystone Unit 1 with the most
advanced steam parameters of 4800 psi/1150 °F was constructed in1960 and is still in operation.
There are 157 PC-SC power plants in the U.S. These plants show significant efficiency
advantages of up to three percentage points, without increased outages, over subcritical units.
Further improvement in efficiency achieved by USC parameters is dependent on the availability
of new, high-temperature alloys for superheaters, reheaters, and steam turbines. The state of
development and new USC plant commissioning internationally are shown in Table 3-1. USC
steam plants in service or under construction in Europe and in Japan during the last five years are
listed in Table 3-2. Today, steam parameters of 4500 psi and 1110°F can be realized, resulting in
efficiencies >45% (LHV) for bituminous PC power plants. There are over five years of
experience with these plants in service, with excellent availability.[2] This improved efficiency
represents a significant 25% reduction in CO
2
emissions, compared to the emissions from
existing coal-fired capacity.
EPRI is the technical lead organization in a program of materials development [2] aimed at
steam temperatures in excess of 1300°F and enabling further efficiency gains up to 50% (LHV).
The program is undertaken by DOE at its National Energy Technology Laboratory (NETL) and
the Ohio Coal Development Office, with U.S. boiler manufacturers as participants and major
contractors. Specific technical issues being addressed include maintaining efficiency at partial
load, and the effect of load changes on the lifetime of boiler and turbine components.
International efforts, such as the USC Materials Consortium in the U.S., and AD700 in the
European Union aim for further improvement of USC power generation with steam parameters
of 5440 psi and 1292/1328 °F and efficiencies of 50% (LHV). Such plants are expected to be
available within a decade. Application of SC steam cycle parameters is also planned for FBC
systems in order to improve efficiency.
ELECTRONIC FILING, RECEIVED, CLERK'S OFFICE, JANUARY 5, 2007
* * * * * PC #7 * * * * *
27
Table 3-1. International materials development.
(Blum and Hald) [2]
Japan
USA
Europe
Development and Plant
Operation: EPDC
Development:
EPRI
Development:
Cost
1981-2000
EPRI Projects: 1978-2003
Cost 501/522: 1983-2003
Turbine and boiler
-Materials development
-Component manufacture
-Pilot plant operation (50 MW)
-Target: 300 bar, 630 °C/ 630 °C
-Basic studies, turbine and boiler
-Thick-walled pipe steels (USA, J, EU
-Standardization achieved
-Trial components in service
Turbine and boiler
-Interaction with VGB, Brite-Euram,
Marcko, ECCC, etc.
-All major power plant components
-Target: 300 bar, 620 °C/ 650 °C
Power Plant Orders
Power Plant Orders
-1000 MW, 241 bar, 593°C, 593°C, comm 97
-1050 MW, 250 bar, 600°C, 610°C, comm 01
- 600 MW, 250 bar, 600°C, 610°C, comm 02
-400 MW, 285 bar, 580°C, 580°C, comm 97
-530 MW, 300 bar, 580°C, 600°C, comm 01
-975 MW, 260 bar, 565°C, 600°C, comm 02
NIMS Materials
Development
DOE Vision 21
Thermie AD700
1997-2007
2002-2007
1998-2013
-Ferritic Steel for 650°C
Materials development and qualification
Target: 350 bar, 760°C (870°C)
-Materials development and qualification
-Component design and demonstration
plant demo
Target: 400-1000 MW, 350 bar, 700°C,
720°C
ELECTRONIC FILING, RECEIVED, CLERK'S OFFICE, JANUARY 5, 2007
* * * * * PC #7 * * * * *
28
Table 3-2. USC plants in service or under construction in Europe and Japan.
(Blum and Hald 2002) [2]
Power Station
Cap.
MW
Steam Parameters
Fuel
Year of
Com.
Eff.
%
Boiler/Steam
Line Materials
Turbine
Materials
Matsuura 2
1000 255 bar/598°C/596°C
PC
1997
Super304H/P91
TMK1
Skaerbaek 3
400 290 bar/580°C/580°C/580°C
NG
1997
49 TP347FG/P91
COST 501 F
Haramachi 2
1000 259 bar/604°C/602°C
PC
1998
Super304H/P91
HR1100
Nordjylland 3
400 290 bar/580°C/580°C/580°C
PC
1998
47 TP347FG/P91
COST 501 F
Nanaoota 2
700 255 bar/597°C/595°C
PC
1998
TP347FG/P91
Toshiba 12Cr
Misumi 1
1000 259 bar/604°C/602°C
PC
1998
Super304H/HR3C/P91
TMK2/TMK1
Lippendorf
934 267 bar/554°C/583°C
Lignite
1999
42.3 1.4910/P91
COST 501 E
Boxberg
915 267 bar/555°C/578°C
Lignite
2000
41.7 1.4910/P91
COST 501 E
Tsuruga 2
700 255 bar/597°C/595°C
PC
2000
Super304H/HR3C/P122 Toshiba 12 Cr
Tachibanawan 2
1050 264 bar/605°C/613°C
PC
2001
Super304H/P122/P92
TMK2/TMK1
Avedore 2
400 300 bar/580°C/600°C
NG
2001
49.7 TP347FG/P92
COST 501E
Niederaussen
975 265 bar/565°C/600°C
Lignite
2002
>43 TP347FG/E911
COST 501E
Isogo 1
600 280 bar/605°C/613°C
PC
2002
Super304H/P122
COST 501E
Materials Guide
Superheater:
TP347FG:Fine Grain 18 Cr10NiMoNb Super304H: 18Cr9Ni3Cu
HR3C:25Cr20Ni
1.4910: 18Cr12Ni2 1/2Mo
Steam Lines and Headers:
P91: 9CrMoVNb
P92: 9Cr1/2Mo2WVNb
E911: 9CrMoWVNb
P122: 11Cr1/2Mo2WCuVNb
Turbine Rotors
COST 501 F: 12CrMoVNbN101
COST 501 E: 12CrMoWVNbN1011
HR1100: 111Cr1.2Mo0.4WVNbN
TMK1: 10Cr1.5Mo0.2VNbN
TMK2: 10Cr0.3Mo2W0.2VNbN
Toshiba: 11Cr1Mo1WVNbN
PFBC
PFBC has all the advantages of atmospheric fluidized bed combustion (AFBC), including sulfur
capture in the bed, low-NOx emissions, and the capability to use low-quality fuels, plus the
enhanced efficiency of combined-cycle operation. While the low temperature of the fluidized
bed is advantageous for avoiding “thermal NO” formation, it has the disadvantage of nitrous
oxide (N
2
O) emission and an inability to take advantage of the higher inlet temperature range of
modern gas turbines.
PFBCwTC responds to the need for a higher gas turbine inlet temperature. In this cycle
(Figure 3-2), a coal-water slurry is injected into a pressurized carbonizer where it undergoes mild
gasification to produce a low heating value syngas and char. The char is burned in a PFBC boiler
with high excess air, and the 1600 °F combustion products are cleaned of particulate and alkalis,
and then enter the gas turbine. Sulfur is captured in the PFBC boiler and in the fluidized bed
carbonizer by adding dolomite. The syngas is injected into the topping combustor, where it is
burned to raise the temperature of the PFBC exhaust gas at the inlet to the gas turbine to 2280 °F.
This temperature rise increases the cycle efficiency to about 47% (LHV). N
2
O emissions are
eliminated because the N
2
O decomposes at the elevated temperature in the topping
combustor.[10]
ELECTRONIC FILING, RECEIVED, CLERK'S OFFICE, JANUARY 5, 2007
* * * * * PC #7 * * * * *
29
Figure 3-2. Pressurized Fluidized Bed with Topping Combustor.
Further improvements in efficiency can be obtained by the application of advanced gas turbine
technology and, on the steam side, by SC steam parameters with high-temperature double reheat.
Commercial realization has been hampered by slow progress on hot gas filter development,
expense of turbines for this application, and complex plant integration. The future of PFBC is
uncertain.
IGCC
IGCC involves the total gasification of coal with oxygen and steam to produce a high heating
value syngas. The syngas is cleaned of particulate, alkalis, ammonia, and sulfur compounds and
the syngas is burned in a gas turbine with low-NOx combustors. IGCC also produces steam for a
steam power cycle. Main features of IGCC are shown in Figure 3-3
.
ELECTRONIC FILING, RECEIVED, CLERK'S OFFICE, JANUARY 5, 2007
* * * * * PC #7 * * * * *
30
Figure 3-3. Integrated Gasification Combined Cycle (IGCC).
IGCC is the cleanest advanced coal technology, and has been successfully demonstrated at full
commercial scale over the past 7-8 years, although long-term reliability and availability concerns
remain. The future of IGCC depends on further reductions in capital and operating costs and
increases in overall efficiency. The capital cost is presently high, mainly for the oxygen-blown
gasifier, which requires an air separation plant for producing oxygen. There is a need for more
complete integration of the various subsystems, such as the gasifier air separation plant, syngas
coolers and cleanup, gas turbine, and steam plant.
Existing IGCC demonstration plants in the U.S. have efficiencies just below 40% (LHV). Two
European IGCC demonstration plants (Buggenum in the Netherlands and the Puertollano plant in
Spain, both of which began operation in 1993) have higher design efficiencies of 43% and 45%
(LHV), respectively. The higher cycle efficiencies are mainly due to improved gas turbine and
steam plant efficiencies and better sub-system integration. Current work being done by the gas
turbine manufacturers on IGCC is aimed at utilizing ultra-high efficiency H-Class gas turbines
designed and developed in a DOE-funded program. The goal is to achieve an efficiency greater
than 45% (LHV) and to reduce the cost. A recent estimate indicates that a 500 MW IGCC plant
would cost approximately $1,300/kW in 2002 dollars. [12] At that price, IGCC plants are not
economically competitive with other advanced coal-based systems. Further considerations may,
in the future, tilt the balance in favor of IGCC applications, including the facts that:
•
IGCC lends itself to the efficient capture and removal of CO
2
from the high pressure
syngas; and
•
Mercury emissions can be controlled at relatively low cost.
ELECTRONIC FILING, RECEIVED, CLERK'S OFFICE, JANUARY 5, 2007
* * * * * PC #7 * * * * *
31
DOE’s Vision 21 Cycle
One of the most promising advanced coal-based cycles with “zero emissions” is DOE's Vision
21 Cycle[13] (one example is presented in Figure 3-4). In this cycle, syngas produced in an
oxygen-blown gasifier is cleaned to remove contaminants harmful to the gas turbine. CO
2
is also
captured. The clean syngas is composed mainly of H
2
and CO. The H
2
, along with compressed
air, is used to generate electricity in a solid oxide fuel cell, and the CO is burned in a combustion
turbine that drives the air compressor. The efficiency could reach 60% (LHV) in this “zero
emission” scheme. Several advanced concepts, including Integrated Gasification Fuel Cell,
might meet these ambitious goals. In this concept, high-pressure compressor exhaust is
introduced into the fuel cell. The fuel cell exhaust is used in a gas turbine to produce additional
power without the addition of fuel in the gas turbine. The gas turbine exhaust can then be used in
the steam turbine to produce additional power. DOE estimates that 63% efficiency (LHV) is
achievable by 2010[13], when it should be ready for demonstration. The combination of high
efficiency and CO
2
capture will result in significant reductions in CO
2
compared to existing coal-
fired technologies.
Figure 3-4. Gasification/Fuel Cell/Gas Turbine/Steam Turbine Cycle (DOE Vision 21).
[11]
ELECTRONIC FILING, RECEIVED, CLERK'S OFFICE, JANUARY 5, 2007
* * * * * PC #7 * * * * *
32
Comparison of CCTs
Advanced power generation schemes vary in efficiency, capability for CO
2
capture, commercial
availability, and cost. Potential efficiencies of PC, PFBC, and IGCC as a function of gas turbine
inlet temperature are illustrated in Figure 3-5. [14][15]). As the gas turbine inlet temperature
rises, so does the combined cycle efficiency.
Figure 3-5. Effect of gas turbine inlet temperature on combined cycle efficiency.
Options for coal-based generation, efficiency, and CO
2
emissions are presented in Figure 3-6.
The diagram shows the significant effect of the cycle efficiency upon CO
2
emissions. SOx, NOx,
and PM are also proportionately reduced with increasing efficiency as illustrated by a
comparison of emissions and by-products of different 600 MW plants in Figure 3-7.[16] The
excellent environmental performance of IGCC is also illustrated.
ELECTRONIC FILING, RECEIVED, CLERK'S OFFICE, JANUARY 5, 2007
* * * * * PC #7 * * * * *
33
Figure 3-6. Efficiency of and CO
2
Emissions from Advanced Power Plants.
(Stamatelopoulos et al. 2002)
[16]
(1000g/kWh=2.205 lb/kWh and 8000 kJ/kWh=7584 Btu/kWh)
Figure 3-7. Comparison of emissions and byproducts for different 600 MW power plants.
(after Haupt et al. 1998)
[17]
ELECTRONIC FILING, RECEIVED, CLERK'S OFFICE, JANUARY 5, 2007
* * * * * PC #7 * * * * *
34
The costs of the PFBCwTC and of IGCC relative to that of PC-SC units have been assessed by a
team at Electricité de France)[18]. Table 3-3 shows that, at the time of their calculations, the
cost of electricity (COE) produced by an IGCC plant or a PFBCwTC plant was estimated to be
16% and 7% higher, respectively, than that produced by PC-SC. The higher cost of IGCC,
however, might be weighed against its superior environmental performance and its potential for
CO
2
capture. In the meantime, PC-SC remains the cost-effective advanced coal-based power
technology option.
Table 3-3. Advanced Power Generating Plant Costs as % of PC-SC costs.
(after Delot et al. EDF 1996)
[18]
Technology
PC/SC
PFBCwTC
IGCC
Space requirement ( acres) 2.2
1-1.7
7
Net Efficiency (% LHV)
45
47
44.5
Capital cost (%)
100
106
118
O&M costs (%)
100
145
155
Relative COE (%)
100
107
116
Two recent EPRI Reports [19, 20] provide further support for IGCC with CO
2
removal. It is
estimated [19] that, given a coal price of $1.24/MBtu, the breakeven point with natural gas
combined cycle (NGCC) for the lowest COE occurs at a natural gas price of $4.00/MBtu. Above
that gas price, IGCC with CO
2
removal will have lower COE than NGCC with CO
2
removal, and
will produce electricity for 20% lower cost than PC-SC plants with CO
2
removal.
3.1.3 Technologies for Existing Plants
Increasing the Efficiency of Existing Power Generation Equipment
In order for coal to continue its role in supplying more than one-half of all electricity generated
in the U.S., it will be necessary to develop advanced coal-based technologies which will be able
to generate electricity at significantly higher efficiency than existing plants. A wide range of
technologies, including boiler and steam turbine enhancements, are available for retrofitting
existing units.
Technologies for retrofit include:
•
Improved materials for steam-generation and superheater tubing;
•
Steam turbine modernization improvements and upgrades;
•
Control system improvements, i.e. neural networks;
•
General plant efficiency improvements; and
•
Consolidation of multiple, smaller inefficient units to larger, more efficient units.
Recent examples of the success of such retrofits include turbine upgrades (more aerodynamic
steam paths) that were made on two 400-MW rated units to obtain an additional 25 MW per unit
(a 6% increase in efficiency). No additional steam was required from the boiler. Another utility
plans to replace existing turbine blades with a new, more durable blading configuration to
increase the efficiency of two turbines by 4.5% each. Neural networks, which interface with
existing control systems and provide real-time combustion optimization, have been shown to
ELECTRONIC FILING, RECEIVED, CLERK'S OFFICE, JANUARY 5, 2007
* * * * * PC #7 * * * * *
35
increase efficiency by up to 0.5%, still a notable increase. Overall, 5% efficiency increases could
be readily accomplished across the fleet of existing units, at low cost.
Repowering With More Efficient Technologies
DOE’s CCT Technology Program has demonstrated advanced coal-based technologies which
can be used to repower existing units to become significantly more efficient. A prime example of
this is repowering with IGCC. Repowering an existing coal-fired plant with IGCC will typically
provide considerable opportunities for reducing costs by optimizing the reuse of existing steam
cycle equipment, cooling tower and other infrastructure (i.e., buildings, coal handling systems,
plant water systems, existing substation and transmission system components). Repowering (or
brownfield application) with IGCC results in a significant increase in efficiency. Since less fuel
is used for the same amount of generation, emissions per MWh are reduced proportionally. This
includes SO
2
, NOx, and CO
2
.
Two of the IGCC projects constructed as part of the CCT Technology Program have efficiencies
of approximately 38% (HHV). With lessons learned from these facilities, as well as continued
enhancements to the gasification and combined cycle portions of this technology, present IGCC
technology can provide an efficiency of approximately 41% (HHV) when retrofitted to existing
plants. For existing units, an improvement of 6 percentage points, from 35% to 41%, is actually a
17% increase, with emissions of CO
2
being reduced proportionally. One very good example of
the size of potential CO
2
emission reductions is Global Energy’s Wabash River Plant in Indiana,
where an existing coal-fired power plant was repowered with IGCC. Repowering the plant
resulted in a reduction in emissions of CO
2
from 0.64 lbs/MWh to 0.55 lbs/MWh, a 14%
decrease.
Potential Reductions in CO
2
Emissions from Existing Plants
Given the size of efficiency increases that are currently available from either retrofitting
individual technologies or repowering existing plants, significant reductions in CO
2
can be
realized on the existing fleet of coal-fired capacity. The National Coal Council’s 2001 report
noted that 75% of existing plants could easily retrofit one or more technologies to enhance boiler
and/or steam turbine efficiency. The report also noted that 25% of the existing units could be
repowered with a CCT. Assuming a 5% increase in efficiency on 75% of existing plants (from
efficiency enhancements), and a 17% increase on the other 25% (from repowering with existing
IGCC technology), an overall 8% increase in efficiency of today’s coal-fired generating plants
could be accomplished. This would result in a proportional 8% decrease in emissions, including
CO
2
.
3.2 CO
2
Capture Technology
3.2.1 Summary
Processes for removing CO
2
from flue gas or syngas can be classified in terms of the subject gas
stream’s pressure and the partial pressure of CO
2
within the gas stream. Typically, low-pressure
processes are applied to combustion sources and high pressure to IGCC sources of CO
2
.
Low total and CO
2
partial pressure gas streams are predominantly flue gases from power plants,
refinery off gases, and industrial boiler flue gases. High total and CO
2
partial pressure gas
ELECTRONIC FILING, RECEIVED, CLERK'S OFFICE, JANUARY 5, 2007
* * * * * PC #7 * * * * *
36
streams are less common, with the primary example being syngas from IGCC plants.
Technologies used for capture of CO
2
and other gases, used in other industries, may be able to be
applied to coal-based power plants for CO
2
. Much work remains to be done to determine how to
integrate these technologies into both combustion-based and IGCC plants. Even with sufficient
R&D to make these technologies commercially available, capital and O&M costs will be
significant, as will impacts on power plant efficiency.
3.2.2 Technology for Coal Combustion Applications
Conventional processes for CO
2
separation/removal from multi-component gaseous streams at
atmospheric pressure include:
•
chemical absorption;
•
physical absorption;
•
adsorption;
•
gas permeation (i.e., selective membranes); and
•
cryogenic cooling or cryogenic-supported absorption.
Chemical absorption
is the most common of these, most frequently using organic chemical
absorbents such as monoethanol amine (MEA), di-ethanol amine (DEA), methyl di-ethanol
amine (DMEA), tert-ethanol amine (TEA), and 2 amino-2-methyl-1-propanol (AMP). Alkaline
compounds such as sodium hydroxide, potassium carbonate, and sodium carbonate are also used.
The CO
2
that is absorbed is then removed by either raising the temperature or lowering the
pressure of the amine solution to desorb CO
2
. The liberated CO
2
stream usually contains small
amounts of H
2
S and other acidic gases, and may require further cleanup before compression and
transportation to an end user or to a sequestration site.
The chief drawbacks of amine-based processes are their limited absorption and the significant
amount of energy necessary to release the captured CO
2
. Typically, one pound of low-pressure
steam is required to liberate one pound of absorbed CO
2
. Thus, the absorber and stripper towers
are large and require very large amounts of heat to regenerate the amines. Amine-based systems
also require large pumps to circulate liquid absorbents and heat exchangers to manage the heat
released in the process, as well as large compressors that raise the flue gas pressure to 15-30 psi
to compensate for the pressure drop in the absorber tower.
Physical absorbents
, such as methanol, dimethyl ether of polyethylene glycol (Selexol), and
other organic sorbents, dissolve CO
2
without chemical reaction. These fluids are most often used
in IGCC plants where CO
2
pressure is high, and are candidates for treating flue gases from coal
combustion sources. CO
2
liberation and solvent regeneration are accomplished by pressure
swings or temperature swings. High cost is the primary drawback of physical absorbent
technologies for PC units.
Adsorption-based
CO
2
removal processes are based on the significant intermolecular force
between gases and the surface of certain solid materials, such as activated carbon. The
adsorbents are usually arranged as packed beds of spherical particles. Either pressure or
temperature swings are employed to capture and release CO
2
in a cyclic adsorption/desorption
sequence.
ELECTRONIC FILING, RECEIVED, CLERK'S OFFICE, JANUARY 5, 2007
* * * * * PC #7 * * * * *
37
Adsorption processes are used commercially for CO
2
removal from industrial steam-based
natural gas reformers. While they are relatively simple, the CO
2
loading and selectivity of
available adsorbents is low. Since flue gas is at atmospheric pressure, some compression is
necessary, particularly with pressure swing desorption. Very high CO
2
purity is obtained, but
overall costs are high. Activated carbon or carbon molecular sieves would be the likely
adsorbents used for CO
2
removal from PC units.
Gas separation membranes
operate on the principle that porous structures permit the preferential
permeation of certain gas stream components. The primary design and operational parameters
for membranes are selectivity and permeability. Permeability is the major limiting factor for
membranes used to remove CO
2
from flue gas, which means very large surface areas are
necessary and, thus, costs are high. In order to provide an adequate driving force, the flue gas
must be compressed to at least 50 psi. A two-stage separation system may be required to
effectively remove CO
2
from flue gas, at about twice the cost of amine-based systems.
Gas absorption membranes
consist of microporous solid membranes in contact with an aqueous
absorbent. In a common arrangement, called membrane-assisted absorption, CO
2
diffuses
through the membrane and is then absorbed by MEA. The equipment for this process tends to be
more compact than that for conventional membrane systems. Since the captured CO
2
is in the
liquid phase, it can be cost-effectively pumped to high pressure for discharge from the plant or
to a sequestration site. Membrane-assisted absorption costs are comparable to that for
conventional MEA absorption. Further R&D might identify a more optimal membrane/absorber
coupling, improving the economics.
Cryogenic separation
of flue gas constituents involves compressing and cooling the flue gas in
stages to induce phase changes in CO
2
and other gases. Although cryogenic processes can lead
to high levels of CO
2
recovery, the processes are very energy intensive. The cost of cryogenic
CO
2
removal may not be significantly higher than for amine absorption processes.
3.2.3 Technology for Gasification Applications
Removing concentrated CO
2
from IGCC syngas, which is usually at pressures from 300-1,000
psi, allows a broader range of process options than does removal from atmospheric-pressure flue
gas. As a consequence, the costs per ton of CO
2
removed from IGCC power plants are lower
than for PC plants (primarily due to the higher concentration in IGCC syngas than in PC plant
flue gas). Cost reductions and performance improvements for “high pressure” CO
2
removal
systems are still necessary to approach the goals of DOE’s Vision 21 and the recently announced
FutureGen program.
Because virtually all CO
2
control options for IGCC plants involve removal prior to syngas
combustion, effective overall plant CO
2
reductions require operation of the gasifier in a "steam
shifted" mode to produce less CO (which would oxidize to CO
2
in the gas turbine combustor)
and more H
2
and CO
2
. Although "shifting" leads to reduced power output, higher CO
2
partial
pressures substantially improve CO
2
separation process performance.
ELECTRONIC FILING, RECEIVED, CLERK'S OFFICE, JANUARY 5, 2007
* * * * * PC #7 * * * * *
38
CO
2
removal process candidates for IGCC plants are:
•
selective physical absorption using an organic fluid such as methanol, with desorption by
low-pressure steam;
•
physical adsorption on activated carbon, with CO
2
regeneration by pressure swing;
•
selective polyamide or ceramic membranes for CO
2
separation;
•
cryogenic distillation; and
•
CO
2
hydrate separation.
The most analyzed and practiced high-pressure CO
2
separation processes involve
physical
absorption
with Selexol, Rectisol (low-temperature methanol), propylene carbonate, or other
organic working fluids. CO
2
is liberated and the solvent regenerated at relatively low pressures
(15-30 psi). Because the gas stream to be treated does not require compression, and because
extensive heating is not required to regenerate the solvent, physical absorption processes for
gasification power plants are much less energy-intensive than low-pressure processes for PC
plants. However, even this lower rate of parasitic energy demand is still costly.
Adsorption processes
for removing CO
2
from gasifier synthesis gas are functionally similar to
those for treating flue gas. The adsorption/desorption processes are cyclic, with the most
common desorption approach being pressure swing. The two main concerns being investigated
by researchers are: (a) the selectivity of adsorbents to capture only CO
2
, and (b) low-surface
adsorbing capacity for CO
2
, requiring large, costly contact areas.
Gas separation membranes
have been widely explored for CO
2
capture from high-pressure
synthesis gas as well as from flue gas. Membrane separation of CO
2
from light hydrocarbons
has been very successful in the oil and gas industry because of its simplicity of operation,
absence of moving parts, and modular construction. The main disadvantages are the limitations
in CO
2
flow through the membrane and the large CO
2
pressure drop necessary to effect
separation. A new class of high-temperature, high-pressure "ion transport membranes" is being
developed, which may enhance the performance of membrane processes. Most of the effort
associated with this research is, at present, focused on O
2
separation from air, but it may also be
a promising research field for CO
2
separation.
Cryogenic separation
of gas mixtures involves cooling in stages to induce selected phase
changes in constituents, including CO
2
. For syngas, however, water vapor in the gas stream
could lead to formation of solid CO
2
hydrates and ice, which with solid CO
2
can cause major
plugging problems. Because cryogenic processes are inherently energy intensive, their use for
CO
2
removal in IGCC plants will constitute a major parasitic load.
CO
2
hydrate separation processes
are designed to produce CO
2
clathrates in high-pressure,
multi-component gaseous streams to selectively remove CO
2
and H
2
S. In the SIMTECHE
process, syngas (generated by a gasifier operating in a shift mode) is cooled to about 35°F and
contacted with a nucleated water stream to form a CO
2
/H
2
S hydrate slurry. The remaining gas,
containing primarily H
2
(and also N
2
if using an air-blown gasifier), is separated from the hydrate
slurry in a gas/liquid separator. The CO
2
/H
2
S hydrate slurry can be decomposed in a "flash
reactor." Performance and economic analyses suggest that this process may be substantially less
energy intensive and less costly than established processes for extracting CO
2
from shifted
synthesis gas and compressing it for transportation. New organic salt "promoters" have been
identified, which could enable very high CO
2
separation rates. These compounds are highly
ELECTRONIC FILING, RECEIVED, CLERK'S OFFICE, JANUARY 5, 2007
* * * * * PC #7 * * * * *
39
soluble in water and could permit CO
2
hydrate formation at temperatures as high as 75-85°F and
with low CO
2
partial pressures. Operation under these conditions should reduce both parasitic
power losses and cost.
3.3
Non-CO
2
GHG Emission Reductions
3.3.1 Methane
Methane is the second most important non-water GHG, with a Global Warming Potential (GWP)
21 times as great as that of CO
2
on a mass basis, assuming a 100-year time horizon. Coal mine
methane (CMM) is one of several major sources of anthropogenic methane, accounting for about
10% of anthropogenic methane emissions in the U.S. CMM is responsible for about 1% of the
total GWP of all U.S. anthropogenic GHG emissions.
The total volume of CMM liberated from active mines in the U.S. in 2000 was 187 billion cubic
feet. Underground mining activities alone liberated 134 Bcf of CMM (72% of U.S. total CMM).
A substantial part of the CMM liberated from underground mining is recovered for use rather
than being emitted. Other sources of liberated CMM include surface mines and post-mining
activities (e.g., coal storage, processing, and transportation). Methane from abandoned coal
mines is called abandoned mine methane (AMM), and for current purposes is considered
separately from CMM. During 2000, 11.5 Bcf of AMM was liberated, with a fraction of that
recovered for use. Coal bed methane (CBM) that is produced strictly for sale into natural gas
pipelines (i.e., not in association with coal mining activities) is not addressed in this discussion.
Table 3-4 summarizes the amounts of CMM and AMM liberated, recovered, and emitted in the
U.S. in 2000.
ELECTRONIC FILING, RECEIVED, CLERK'S OFFICE, JANUARY 5, 2007
* * * * * PC #7 * * * * *
40
Table 3-4. Relevant Data of U.S. CMM and AMM for 2000.
Category
Quantity, Bcf
Active Mines (CMM)
CMM liberated
CMM emitted
CMM recovered
Underground mine CMM liberated
Underground mine CMM drained
Underground mine CMM drained and recovered
Underground mine CMM drained and emitted
Underground mine ventilation air methane
Underground mine CMM emitted
187
151
36
134
45
36
9
89
98
Abandoned Mines (AMM)
AMM Liberated
AMM Recovered
AMM Emitted
11.5
2.5
9
Total Active Plus Abandoned Mines
CMM + AMM liberated
CMM + AMM recovered
CMM + AMM emitted
198.5
38.5
160
Note:
This table does not consider CBM obtained solely for injection into
natural gas pipelines or CBM not produced in association with coal mining.
Types of CMM
Methane is liberated from underground coal mines either in advance of mining, during mining
activities, or after mining has occurred. The liberated methane exits the mine through drainage
(degasification) systems or mine ventilation systems. In the case of abandoned underground
mines, the liberated methane exits through vents or drainage systems.
When liberated in advance of mining, methane is drained through vertical boreholes drilled into
the coal seam much as in conventional natural gas production. This type of CMM recovery often
occurs years ahead of the mining activity. CMM that is drained in advance of mining is also
considered to be coalbed methane, or CBM. This methane is often of very high quality, and
acceptable for injection into natural gas pipelines. Horizontal boreholes are sometimes used for
degasification in advance of, but near the time of, mining. This process often produces high-
quality gas that can be recovered. However, its recovery is frequently impractical and much of
this gas is emitted through boreholes to the surface or with the ventilation air.
After coal is extracted in a longwall type of underground mine, the methane can be released into
the mine to mix with the ventilation air or it can be drained through vertical wells. This CMM
can be of pipeline quality; however, it is often contaminated with air and must be processed prior
to being injected into the pipeline.
Ventilation air is another source of methane emissions from underground coal mines. Air is
drawn through underground mines, to provide a breathable atmosphere and to dilute the liberated
ELECTRONIC FILING, RECEIVED, CLERK'S OFFICE, JANUARY 5, 2007
* * * * * PC #7 * * * * *
41
methane to concentrations usually below 1% for safety reasons. The ventilation air mixes with
liberated methane and the mixture is exhausted into the atmosphere.
Recovery of CMM and AMM for Use
The U.S. coal industry has made substantial progress in recovering and using CMM though
drainage systems. Of the 134 Bcf of CMM liberated from underground mines in 2000, 45 Bcf
was liberated through drainage systems. The remainder, 89 Bcf, was emitted as ventilation air.
U.S. industry recovered 36 Bcf (or 80%) of the CMM liberated through drainage systems in
2000. This recovery represents an almost three-fold increase from the 13.8 Bcf recovered in
1990. The unrecovered CMM from drainage systems (9 Bcf per year) is generally low- to
medium-quality gob gas or stranded gas.
During 2000, the methane liberated from underground mines but not recovered included 9 Bcf of
low-quality or stranded drained gas and 89 Bcf of ventilation-air methane (VAM). VAM is the
single largest source of unrecovered CMM. Although VAM is a potential fuel resource,
essentially 100% of it is emitted because its capture and use is difficult due to its low methane
concentration (typically 0.3% to 1.5%). This concentration is too low for use in even the most
lean-burning of available combustion systems that require methane concentrations of 2% or
more. The utilization of VAM currently is limited to a few isolated cases in which it can be used
as combustion air in fossil-fuel-fired power plants located at the ventilation fan.
An estimated 2.5 Bcf (22%) of the 11.5 Bcf of liberated AMM was recovered for use in 2000.
The total CMM plus AMM recovered in 2000 (38.5 Bcf) represents a resource of approximately
0.4 quadrillion Btu of fuel energy, and the avoided emissions are equivalent in GWP to the
emission of approximately 17 MTCO
2
(see Table 3-5 for equivalencies). This amount of energy
is much greater than the fuel plus electricity consumption of the entire U.S. coal mining industry,
which was only about 0.1 quadrillion Btu in 1997. In the event that it becomes desirable to
reduce coal-mining GHG emissions, it will be important to maintain and expand the recovery of
CMM and AMM.
Table 3-5. Selected Equivalencies.
1 Bcf of methane
~ 21,085 short tons of methane
~19,128 metric tonnes of methane
~ 1.010 X 10
12
Btu (HHV)
~ 442,785 short tons of CO
2
GWP equivalent
~ 120,760 short tons of carbon GWP equivalent
~ 401,688 metric tonnes of CO
2
GWP equivalent
~ 109,551 metric tonnes of carbon GWP equivalent
Currently, the recovery of CMM is driven by two factors: the resulting improvement in mining
conditions and the value of the gas. Most of the recovered CMM is used as pipeline-quality gas,
but smaller quantities are used at qualities not meeting pipeline specifications and some is used
as combustion air. Technologies under development, including ultra-lean-burn turbines and
methane concentration systems could expand the options available for CMM recovery and use.
Future GHG reduction requirements, in conjunction with advanced recovery technologies, could
ELECTRONIC FILING, RECEIVED, CLERK'S OFFICE, JANUARY 5, 2007
* * * * * PC #7 * * * * *
42
easily result in increased recovery of CMM. Further development and demonstration of
additional recovery and use options for CMM and AMM is recommended.
Table 3-6. 1997 Energy and Fuel Consumption by U.S. Coal Mining Industry.
Fuel or Energy
Lignite &
Bituminous
Surface
Mines
(d)
Bituminous
Underground
Mines
(d)
Anthracite
Mines
(d)
Total
Coal
Mines
Fuel energy,
Btu/unit
(e)
(gross)
Energy
consumption
1E+09 Btu
(gross)
Energy
consumption
quads
(gross)
Electricity purchased, MWh
4203672
7061319
89914 11354905
3.4121E+06
38745
Distillate fuel, 1000 Bbl
7420.4
655.9
97.2
8173.5
5.8270E+09
47627
Residual fuel, 1000 Bbl
721.8
144.8
35.8
902.4
6.1880E+09
5584
Gas, bcf
0.7
0.5
D
1.2
1.0350E+12
1242
Gasoline, million gal
29.4
4
0.3
33.7
1.2480E+11
4206
Coal, 1000 ton
(a)
31.5
221.4
D
252.9
2.4000E+10
6070
Coal, 1000 ton
(b)
D
D
0
0
2.4000E+10
0
Total
103473
0.1035
Coal energy production in U.S. in 1997, quads
(c)
23.211
Energy used to produce U.S. coal in 1997, quads
(f)
0.1035
Parasitic energy consumption in 1997 for U.S. coal
industry, %
0.446
D = not disclosed
(a) produced and used in same plant
(b) purchased
(c) source: U.S. Energy Information Administration, Annual Energy Review 2002.
(d) source: U.S. Economic Census, Mining Sector, EC97N-2121A, B, C, 1999.
(e) assumes electricity is 100% efficient, values for gross Btu/unit of fuels are author's estimate.
Conversion of CMM
Because the combustion of a given mass of methane to CO
2
and water reduces its GWP by 87%,
it is possible to greatly reduce the GWP of the unrecovered CMM emissions by combustion (or
more precisely, oxidation) even if the fuel value of the methane is not realized. For example,
CMM of sufficient concentration could be combusted in a flare. This technique is being
demonstrated at a coal mine in Australia. Alternatively, CMM of low concentration, such as
VAM, could be oxidized in thermal or catalytic oxidation systems. Small-scale thermal
oxidation systems have been operated on VAM in both Australia and Great Britain, and there are
plans to demonstrate a small commercial-scale system in a coal mine in Pennsylvania as part of a
public-private initiative by the DOE.
The 98 Bcf of CMM emitted in 2000 represents the equivalent GWP of 43 MTCO
2
. Recovery
and use (or oxidation) of these methane emissions may be an attractive means of reducing GHG
emissions at relatively low cost. Further development and demonstration of CMM destruction
and utilization options is recommended.
ELECTRONIC FILING, RECEIVED, CLERK'S OFFICE, JANUARY 5, 2007
* * * * * PC #7 * * * * *
43
Projected Costs for Further Abatement of CMM Emissions
The EPA performed a marginal abatement cost analysis for CMM and AMM. That study
projects that in the year 2005 and in the absence of carbon credits, it will be possible to
economically capture and use 33% of the CMM plus AMM liberated from U.S. coal mines (66.6
Bcf out of 203.5 Bcf liberated in that year). This compares with the 19% actually captured and
used in the year 2000. The percentages of the total liberated CMM plus AMM that could be
reduced at various levels of carbon credits are shown in Table 3-7. For example, at carbon credit
values of $9.09/ton and $18.20/ton ($2.48/ton and $4.96/ton of CO
2
), EPA projects that it will be
possible to economically increase the amount captured and used to 39% and 48%, respectively.
Table 3-7. Marginal Abatement Costs for CMM and AMM, Projected for the Year 2005
Credit Value
$/ton carbon
$/ton CO
2
% reduction
0
0
33
9.09
2.48
39
18.20
4.96
48
27.27
7.44
55
45.45
12.40
60
90.90
24.80
64
181.81
49.59
65
In the table, “% reduction” refers to the percentage of the total CMM plus AMM liberated (projected to
be 203.5 Bcf in 2005) that could be captured and used at the corresponding credit value. Values have
been converted to standard tons of C and CO
2
.
Source: U.S. Environmental Protection Agency, “Addendum to the U.S. Methane Emissions
1990-2020: 2001 Update for Inventories, Projections, and Opportunities for Reductions”,
downloaded from www.epa.gov/ghginfo/pdfs/final_addendum2.pdf
, last modified February 20,
2002.
3.3.2 N
2
O Emissions
Background
N
2
O is a highly effective GHG, with a GWP 296 times that of CO
2
. Because of its long lifetime
(about 120 years) it can reach the upper atmosphere, depleting the concentration of stratospheric
ozone, an important filter of UV radiation. Estimates of N
2
O emissions from coal combustion
globally are 0.2 Mt/year, approximately 2% of total known sources.
The origin of the small amount of N
2
O emitted from coal combustion is the fuel nitrogen,
released both during devolatilization and char combustion.[1,2] Maximum N
2
O formation occurs
at about 1350°F. As the temperature rises, N
2
O is increasingly reduced to NO. As a result, only
a negligible amount of N
2
O (0.5-2.0 ppm in the flue gas) is emitted from high temperature
(>2300°F) PC combustion.
ELECTRONIC FILING, RECEIVED, CLERK'S OFFICE, JANUARY 5, 2007
* * * * * PC #7 * * * * *
44
N
2
O Emissions From FBC
In optimum FBC operation, there is a conflict between the lower temperature favoring sulfur
capture and the higher temperature required to reduce N
2
O emissions. Typical N
2
O emissions in
the range of 40-70 ppm (at 3% O
2
) result from operation at 1472-1562°F, the optimum
temperature range for sulfur capture. At higher temperatures, CaSO
4
, the product of sulfur
capture, gradually decomposes and SO
2
is released.
An inventory of N
2
O emissions from FBC is shown in Table 3-8.[4] It is noted that 60 ppm N
2
O
emission is equivalent to 1.8% CO
2
, an increase of about 15% in CO
2
emission for an FBC
boiler.
Table 3-8. N
2
O Emissions from FBC (from IEA Coal Research [4])
Unit Size, MWe
N
2
O Emissions, ppmv
Hard Coal
Mean
Range
O
2
, %
Reference
160
110
70
50
40
24
21
21
16
14
13
11
6.7
0.7
40
70
60
70
50
52.5
50.5
69
68
77.5
45
28
70
88
20-60
40-100
20-100
40-100
40-60
45-60
53-83
20-70
25-150
3-4
3-4
6
6
3-4
1.5-2
6
3
6
6
6
6
6
6
Brown and Muzio, 1991
Brown and Muzio, 1991
Bonn and others, 1993
Kimura, 1992
Boemer and others, 1993
Boemer and others, 1993
Vitovec and Hackl, 1992
EER, 1991
Sage, 1992
Vitovec and Hackl, 1992
Sage, 1992
Sage, 1992
Svensson and others, 1993
Hulgaard and Johansen, 1992
More research is needed to understand how fuel type, boiler operating conditions, post-
combustion flue gas treatment, and pressure affect N
2
O emissions. Qualitative effects of FBC
operating parameters upon N
2
O emissions are illustrated in Table 3-9.
ELECTRONIC FILING, RECEIVED, CLERK'S OFFICE, JANUARY 5, 2007
* * * * * PC #7 * * * * *
45
Table 3-9. Effect of FBC operating parameters on N
2
O emissions.
(after Takeshita et al.[4])
Parameter increases
N
2
O emissions
Temperature
↓ ↓
Excess air
↑
Air staging
↓
Boiler load
↓
Limestone feed
−
Coal rank
↑
Fuel N content
↑
SNCR-NH
3
↑
SNCR-Urea
↑ ↑
SCR
−
↑↑
emission strongly increases
↑
emission increases
↓↓
emission strongly decreases
↓
emission decreases
−
no effect observed
Possibilities for N
2
O Control
Several techniques have been proposed to control N
2
O emissions from FBC boilers. There have
been several proposals that involve adjusting the combustion process to lower the N
2
O
emissions.[11,12] Since temperature is the strongest factor for N
2
O reduction, many of these
involve various staging techniques to achieve a higher temperature at the top or downstream of
the combustion zone. This may be achieved by staging the air or by introducing additional fuel.
For example, the temperature of the particle-free gas at the exit from the process cyclone can be
raised by after-burning, but this may require about 10% natural gas to produce an effect of about
50% reduction.[5] Similar reductions achieved by afterburning with 10% ethane or propane
injection were reported from laboratory studies.[13,14] Proprietary strategies to increase FBC
combustion temperatures above the stability temperature of calcium sulfate have also been
developed, and it has been proposed that various catalysts, structural or powdered, may be used
in or following the combustion zone to reduce the N
2
O emissions.[15] Further R&D is needed to
find economically attractive solutions.
PFBC emits N
2
O at somewhat lower levels, but N
2
O can be strongly reduced at the elevated
temperature in the topping combustor of the PFBCwTC cycle.[6]
Published N
2
O Emission Factors
Published emission factors represent an average emission rate from a typical emission source
and, therefore, on average are applicable to other similar emission sources. However, emission
rates may vary with equipment size, efficiency, and vintage, as well as maintenance and
operational practices. Applicability of an emission factor to a specific emission source requires
ELECTRONIC FILING, RECEIVED, CLERK'S OFFICE, JANUARY 5, 2007
* * * * * PC #7 * * * * *
46
an understanding of the conditions associated with developing the emission factor or a
measurement of potential bias -- information that may not be readily available.
Ideally, data quality is assessed through statistical analysis of accuracy and precision. EPA’s
AP-42 provides quality ratings for each of their emission factors. These are shown in Table 3-10
for the N
2
O emission sources. A rating of “A” represents excellent quality data, meaning the
factor is based on a large data set with a random pool of facilities in the population. Rating “B”
represents above average quality, and “C” is average. A rating of “D” represents a factor with
below-average quality, mainly resulting from limited data points or not having a random sample
of the industry. A rating of “E” represents a poor quality factor, with a high degree of variability
within the source category population.
Table 3-10. Comparison of Coal N
2
O Emission Factors.
IPCC
Table 1-15,
Volume 3
IPCC
Table 1-15,
Volume 3
AP-42
AP-42
%
Difference
Combustion
Technology
Equipment
Configuration
g N
2
O/GJ
(LHV)
Converted
to
g N
2
O/ GJ
(HHV)
Converted
to
g N
2
O/ GJ
(HHV)
Reference Table,
Year, and Quality
Rating
(AP-42 vs.
IPCC)
Dry Bottom,
wall fired
1.6
1.5
0.5
206.2%
Dry Bottom,
tangentially fired
0.5
0.5
1.3
64.1%
PC Bituminous
Wet Bottom
1.6
1.5
1.3
14.8%
Bituminous
Spreader
Stokers
With and without
re-injection
1.6
1.5
0.7
Table 1.1-19, 9/98, E
129.7%
Circulating Bed
96
91.2
57.9
Bituminous
57.5%
FBC
Bubbling Bed
96
91.2
57.9
Table 1.1-19, 9/98, B
57.5%
Bituminous Cyclone Furnace
1.6
1.5
1.5
Table 1.1-19, 9/98, E
2.1%
Lignite AFBC
42
39.9
41.4
Table 1.7-4, 9/98, E
-3.6%
Early studies (prior to 1988) reported substantial levels of N
2
O emissions from PC units, with
levels proportional to NOx emissions. However, it was later determined that the high levels of
N
2
O measured were an artifact of the sampling procedure. Since 1988, measurement programs
have utilized corrected sampling techniques and have measured much lower N
2
O emission rates.
The data cited in Table 3-8 for FBC are free from the sampling artifact, and current AP-42
emission factors in Table 3-10 also reflect these more recent results. N
2
O emission values in
Table 3-10 for PC and cyclone furnaces are small, their rating is poor (E), and the number of
measurements is limited. In contrast, measurement data for FBC are of much higher value, and
their ratings are also higher (B). When converted from to ppm (at 3% O
2
), data for FBC give
good agreement with those in Table 3-8.
The API GHG Emissions Workgroup, which developed the API Compendium, has begun a
study of N
2
O emission factors for stationary combustion sources. This study will compile
additional N
2
O emission measurements from an earlier API program, review literature for more
recent studies, and gather data from participating petroleum companies.
ELECTRONIC FILING, RECEIVED, CLERK'S OFFICE, JANUARY 5, 2007
* * * * * PC #7 * * * * *
47
The information will be evaluated to assess the quality and applicability of the emissions factors
and to determine the relative contribution of N
2
O emissions for different facility types. An
assessment of emission factor quality or access to information from which to analyze emission
factor quality is generally not available from published sources. It would benefit industry if
DOE, in cooperation with EPA, were to improve AP-42 by increasing the number of N
2
O
emissions measurements for the different coal types and combustion technology combinations.
3.4
Carbon Sequestration
After carbon is removed from a flue or fuel gas stream, it must be “sequestered” or stored to
avoid its emission into the atmosphere. While carbon capture technology is in commercial use in
a number of industries, carbon sequestration technology is, except for a few relatively small-
scale examples, unproven. The DOE Carbon Sequestration Program is developing a suite of
technologies that have the potential to reduce GHG emissions from power generation. These
systems could make a substantial contribution to efforts to meet GHG intensity goals. The
availability of these systems as commercially proven technologies would be an important
component of the decision-making process for any future actions taken to reduce GHG
emissions.
Goals of the Carbon Sequestration Program
The NETL has summarized its vision and goals as follows (values converted to $/ton CO
2
and
standard tons):
Vision:
Possess the scientific understanding of carbon sequestration options and provide cost-
effective, environmentally sound technology options that ultimately lead to a reduction in GHG
intensity and stabilization of overall atmospheric concentrations of CO
2
.
Overarching Goals:
•
By 2006, develop instrumentation and measurement protocols for direct sequestration in
geologic formations and for indirect sequestration in forests and soils that enable the
implementation of wide-scale carbon accounting and trading schemes.
•
By 2008, begin demonstration of large-scale carbon storage options (>1 MTCO
2
/year) for
value-added (enhanced oil recovery, enhanced CBM recovery, enhanced gas recovery) and
non-value-added (depleted oil/gas reservoirs and saline aquifers) applications.
•
By 2008, develop (to the point of commercial deployment) systems for advanced indirect
sequestration of GHGs that protect human and ecosystem health and cost no more than $2.48
per ton of CO
2
sequestered, net of any value-added benefits.
•
By 2010, develop instrumentation and protocols to accurately measure, monitor, and verify
both carbon storage and the protection of human and ecosystem health for carbon
sequestration in terrestrial ecosystems and geologic reservoirs. Such protocols should
represent no more than 10% of the total sequestration system cost.
•
By 2012, develop (to the point of commercial deployment) systems for direct capture and
sequestration of GHG emissions from fossil fuel conversion processes that protect human
and ecosystem health and result in less than a 10% increase in the cost of energy services, net
of any value-added benefits.
•
By 2015, develop (to the point of commercial deployment) systems for direct capture and
sequestration of GHG emissions and criteria pollutant emissions from fossil fuel conversion
ELECTRONIC FILING, RECEIVED, CLERK'S OFFICE, JANUARY 5, 2007
* * * * * PC #7 * * * * *
48
processes that result in near-zero emissions and approach a no net cost increase for energy
services, net of any value-added benefits.
•
Enable sequestration deployments to contribute to the President’s GCCI goal of an 18%
reduction in the GHG intensity of the U.S. economy by 2012.
•
Provide a portfolio of commercial-ready sequestration systems and one to three breakthrough
technologies that have progressed to the pilot test stage for the 2012 assessment under the
GCCI.
Sequestration Technology
Several concepts for storage have been evaluated; however, technological and economic
feasibility (and public acceptance) of carbon sequestration options vary depending on the
locations of disposal sites and types of disposal/storage/sequestration technologies used. The
capacity, effectiveness, and health and environmental impacts of various types of CO
2
disposal
systems and the impacts of inadvertent releases are key areas of scientific uncertainty. Leading
approaches to CO
2
storage presently include:
•
Injection into deep saline aquifers or coal seams;
•
Stimulation of oil and gas production;
•
Disposal in depleted oil and gas reservoirs;
•
Terrestrial sequestration (e.g., forestation, improved land-use practices);
•
Growth of plants or algae for use as bio-fuels;
•
Ocean sequestration; and
•
Use as a feedstock for the manufacture of chemical products.
Potential Capacity of Sequestration Sinks
One of the most frequently asked questions related to carbon sequestration is that of storage
capacity. While the conventional wisdom is that this capacity is quite large (i.e., 1000s of GtC
4
worldwide), the actual capacity is quite uncertain. This is because one first must estimate the
total amount of void space available underground (or under water). Next, an estimate of what
fraction of void space would be appropriate for CO
2
storage is required. For the first estimate
(total void space), data are sparse. While many wells have been drilled, they have only revealed
data on a small fraction of the underground. The second estimate (usable fraction) relies both on
data about underground reservoirs (which data are sparse), as well as an understanding of how
CO
2
would behave in these reservoirs. Despite these difficulties, estimates have been made, but
there is no consensus on the numbers. It does seem safe to assume that the geologic storage
capacity in the U.S. is over 100 GtC and could potentially be over 1,000 GtC. Several of the
published estimates for the U.S. and the world are given below.
4
1 GtC = one billion (10
9
) metric tons carbon. Note that 1 GtC = 3.67 GtCO
2
. Also, current world anthropogenic
carbon emissions are less than 7 GtC.
ELECTRONIC FILING, RECEIVED, CLERK'S OFFICE, JANUARY 5, 2007
* * * * * PC #7 * * * * *
49
Table 3-11. The Worldwide Capacity of Potential CO
2
Storage Reservoirs.
Ocean and land-based sites together contain an enormous capacity for storage of CO
2
a
.
The world’s oceans have by far the largest capacity for carbon storage.
Sequestration option
Worldwide capacity
b
Ocean
1,000 – 10,000+ GtC
Deep saline formations
100–10,000 GtC
Depleted oil and gas reservoirs
100 – 1,000 GtC
Coal seams
10–1,000 GtC
Terrestrial
10 - 100 GtC
Utilization
currently <0.1 GtC/yr
a
Worldwide total anthropogenic carbon emissions are ~7 GtC per year (1 GtC = 1 billion metric tons of carbon equivalent).
b
Orders of magnitude estimates.
Source: Herzog, H.J. and D. Golomb, "Carbon Capture and Storage from
Fossil Fuel Use," contribution to Encyclopedia of Energy, to be published (2004).
Table 3-12. Worldwide Potential for CO
2
Sequestration.
Human activity
6 GtC/yr
Forest & Soils
> 100 GtC
Geologic
300-3200 GtC
Oceans
1400-20,000,000 GtC
Deep saline aquifers
10,000 – 200,000 GtC
Source: U.S. DOE Fossil Energy website (http://www.fe.doe.gov/coal_power/sequestration/);
Bruant et.al., “Safe Storage of CO
2
in Deep Saline Aquifers,” ES&T, pp. 241A-245A, June 1, 2002;
IPCC Workshop on Carbon Capture and Storage, Regina, Canada, 18-21 Nov 2002.
See http://www.climatepolicy.info/ipcc/ipcc-ccs-2002/index.html
.
Table 3-13. U.S. Potential for CO
2
Sequestration.
Deep saline aquifers
1-130 GtC
Natural gas reservoirs
25 GtC
Active gas
0.3 GtC/yr
Enhanced coalbed methane
10 GtC
Source: U.S. DOE, "Carbon Sequestration Research and Development,"
Rpt # DOE/SC/FE-1 (1999). page 5-5
ELECTRONIC FILING, RECEIVED, CLERK'S OFFICE, JANUARY 5, 2007
* * * * * PC #7 * * * * *
50
Table 3-14. U.S. potential for sequestration.
Depleted gas fields
690 GtC
Depleted oil fields/CO2-EOR 120 GtC
Deep saline aquifers
400-10,000 GtC
Unmineable coal seams
400 GtC
Source: IPCC Workshop on Carbon Capture and Storage, Regina, Canada,
18-21 Nov 2002. See http://www.climatepolicy.info/ipcc/ipcc-ccs-2002/index.html
These studies have shown that there is substantial potential for CO
2
storage in natural reservoirs,
such as deep saline aquifers or in the deep ocean. While some have estimated that the
storage/disposal process may be considerably less costly than the CO
2
capture process, large-
scale carbon sequestration has yet to be demonstrated and significant uncertainty remains about
the economic costs and environmental impacts of the site-specific applications described above.
Such issues indicate a need for further research; collaborative programs are being developed to
examine many of these topics.
Certain underground geologic formations exhibit structure, porosity, and other properties that
render them suitable as potential CO
2
storage sites. These structures are ones that already have
stored crude oil, natural gas, brine, and CO
2
over millions of years.
CO
2
injection is practiced at numerous sites worldwide for enhanced oil and natural gas recovery
(EOR and EGR, respectively). However, in the current applications of CO
2
injection for EOR
and EGR, processes have not been optimized for underground CO
2
disposal, and the long-term
stability of the stored CO
2
remains unknown. Furthermore, political and siting issues must be
addressed before any major quantity of CO
2
can be stored underground in this manner.
Long-term storage of CO
2
in geologic formations has the potential to be feasible in the near-
term. Many power plants and other large point sources of CO
2
emissions are located near
geologic formations that may be amenable to CO
2
storage. Saline formations do not contain oil
and gas resources and thus do not offer the value-added benefits of enhanced hydrocarbon
production. However, the potential CO
2
storage capacity of domestic saline formations is
enormous; estimates are on the order of several hundred years of CO
2
emissions.
The primary goal of research in this area is to better understand the behavior of CO
2
when it is
stored in geologic formations in order to ensure secure and environmentally acceptable storage
of CO
2
. The fastest and surest means of obtaining the necessary information is to conduct field
tests in which a relatively small amount of CO
2
is injected into a formation, with its fate and
transport under close monitoring. The DOE program includes several such field tests, which
ultimately should provide industry with tools and techniques to measure the movement of CO
2
in
underground formations. These tests will provide field protocols that preserve the integrity of
geologic formations.
ELECTRONIC FILING, RECEIVED, CLERK'S OFFICE, JANUARY 5, 2007
* * * * * PC #7 * * * * *
51
Research and Development Requirements for CO
2
storage
1. Geologic Sequestration
Unmineable coal seams
•
Coal seams that are unmineable for economic or technical reasons (e.g., depth or reserve
characteristics) are potential CO
2
storage sinks.
•
Existing recovery technologies should be used to evaluate the feasibility of storing CO
2
in unmineable coal seams for commercial-scale field demonstrations.
•
The knowledge gained to verify and validate gas storage mechanisms in coal seams can
be used to develop a screening model to assess CO
2
storage potential.
CBM production
•
Carbon dioxide injection may be used to stimulate methane production from coal seams,
improving the economic attractiveness of this sequestration option.
•
A broad-based geologic screening model should be developed to quantify the CO
2
storage potential in CBM regions and apply the model to identify additional sites with
high CO
2
storage potential.
Depleted oil reservoirs
•
Research is needed to investigate down-hole injection of CO
2
into depleted oil reservoirs
and conduct computer simulations, laboratory tests, field measurements, and monitoring
efforts to understand the geomechanical, geochemical, and hydrogeologic processes
involved in CO
2
storage.
•
These observations could be used to calibrate, modify, and validate modeling and
simulation needs.
Carbon storage in geologic formations
•
Geologic sinks, such as deep saline reservoirs, represent some of the largest potential
sequestration sinks.
•
The capacity and availability of these potential sinks needs to be quantified.
•
Research is needed to investigate safe and cost-effective methods for geologic
sequestration of CO
2
.
•
Research is needed on the siting, selection, and longevity of optimal sequestration sites to
lowering the cost of geologic storage.
•
Monitoring techniques need to be identified and demonstrated which are cost-effective
for tracking the potential for CO
2
migration in storage.
2. Terrestrial Approaches
Carbon sequestration in terrestrial ecosystems is either the net removal of CO
2
from the
atmosphere or the prevention of CO
2
net emissions from the terrestrial ecosystems into the
atmosphere. The terrestrial biosphere is estimated to sequester large amounts of carbon
(approximately 2 billion metric ton of carbon per year). There are two fundamental approaches
to sequestering carbon in terrestrial ecosystems:
(1) Protection of ecosystems that store carbon; and
(2) Management of ecosystems to increase carbon sequestration.
ELECTRONIC FILING, RECEIVED, CLERK'S OFFICE, JANUARY 5, 2007
* * * * * PC #7 * * * * *
52
Research is under way to evaluate these approaches for the following ecosystems, which offer
significant opportunity for carbon sequestration:
•
Forest lands, including below-ground carbon and long-term management and utilization
of standing stocks, understory, ground cover, and litter.
•
Agricultural lands, including crop lands, grasslands, and rangelands, with emphasis on
increasing long-lived soil carbon.
•
Biomass croplands related to biofuels.
•
Deserts and degraded lands in both below-and above-ground systems.
•
Boreal wetlands and peatlands including management of soil carbon pools and
conversion to forest or grassland.
3. Ocean storage
The oceans are the ultimate natural sink for CO
2
and may have potential for long-term CO
2
storage, but the environmental impacts of ocean sequestration are not adequately understood and
the acceptability of empirical tests is problematic, given environmental sensitivity to marine
systems. If ocean sequestration is to be accepted by the public, certain key questions must be
answered.
•
How well can the performance of storage be predicted?
•
What will be the environmental impacts?
•
Can such systems be successfully engineered?
•
How can legal and jurisdictional obstacles be overcome?
•
What will be the public acceptance of this idea?
4. Utilization of CO
2
Captured CO
2
could also be used for commercial purposes, such as a feedstock from which to
derive chemicals. If economically feasible, such applications would offer the co-benefits of
sequestering this GHG and replacing the use of other, manufactured feedstocks. CO
2
already is
used for a wide range of applications in the food and petroleum industries, although in most
cases the gas is not permanently stored in final products but is released to the atmosphere at a
later date. The income generated from the sale of CO
2
would help to offset the cost of capturing
and cleaning the gas. Significant costs would be incurred in producing chemical products and
such processes generally require the input of energy, resulting in the emission of additional CO
2
if this energy is generated from fossil fuels.
The utilization of CO
2
to make chemicals is only effective as a mitigation option if, overall, less
CO
2
enters the atmosphere than would otherwise have been the case. Also, the direct use of CO
2
to grow algae in order to make bio-fuels might be feasible, but only under certain conditions and
in specific locations. A similar conclusion has been reached about the growth of crops to
produce liquid fuels, which currently remains only an option for discussion.
ELECTRONIC FILING, RECEIVED, CLERK'S OFFICE, JANUARY 5, 2007
* * * * * PC #7 * * * * *
53
Status of Carbon Capture and Sequestration Research
Funding provided by the DOE and the private sector for carbon capture sequestration research
has increased considerably since the first National Coal Council report on this subject in May
2000. In FY 2002, the DOE carbon sequestration budget was around $8 million. By FY 2003,
this had been increased to $42 million. As of October, 2002, the DOE/FE portfolio included 104
projects, with a total value of $162 million, with about 40% directed to carbon capture, and 60%
to sequestration. Of this total, DOE funds $96 million. Significantly and importantly, the non-
federal cost share ($66 million) represents 40% of the total, demonstrating a willingness on the
part of private industry to invest in research partnerships to develop capture and sequestration
technology, despite the uncertain need for and timing of its eventual application. Four of these
research partnerships are described below.
Dakota Gasification Project (Weyburn).
The Weyburn Carbon Dioxide Sequestration Project is a $27-million research project intended to
expand the knowledge of the capacity, transport, fate, and storage integrity of CO
2
injected into
geological formations located in southeastern Saskatchewan, near the U.S. border with North
Dakota. DOE will support this project by funding $4 million over a three-year period. The
knowledge obtained from this project will enable DOE to inform public policy makers, energy
industries, and the general public by providing reliable information and analysis of the geological
sequestration of CO
2
.
Sequestration of Carbon Dioxide in an Unmineable Appalachian Coal Seam.
Unmineable coal seams offer large, permanent storage potential for geologic sequestration of
CO
2
. These coal seams also represent an opportunity to sequester CO
2
while enhancing the
production of coalbed methane as a value added product. CONSOL Energy is performing a
seven-year R&D project to evaluate the effectiveness and economics of carbon sequestration in
an unmineable coal seam in tandem with enhanced coalbed methane production. This project is
a Cooperative Agreement at a total cost of $9.2 million with a 24% industry cost share.
Research and Commercial-Scale Field Demonstration for CO
2
Sequestration and Coalbed
Methane Production.
In 2001, DOE awarded a $5.9 million, 70% cost-shared cooperative agreement with Advanced
Resources International, BP Amoco, and Shell Oil for demonstrating existing and evolving
recovery technology to evaluate the viability of storing CO
2
in deep, unmineable coal seams in
the San Juan Basin in northwest New Mexico and southwestern Colorado. The knowledge
gained with this demonstration effort will be used to verify and validate gas storage mechanisms
in deep coal reservoirs, and to develop a screening model to assess CO
2
sequestration potential in
coalbeds in the U.S.
The DOE has established a website listing all DOE-supported capture and sequestration projects
(as of October 2002) and providing links to similar sites containing information on carbon
sequestration research throughout the federal government and internationally. Current DOE
projects are listed in Table 1 in Appendix A of this document. These project span a wide range
of topics relevant to carbon capture and sequestration, including:
ELECTRONIC FILING, RECEIVED, CLERK'S OFFICE, JANUARY 5, 2007
* * * * * PC #7 * * * * *
54
Separation and Capture
•
Pre-combustion decarbonization
•
Oxygen-fired combustion
•
Post-combustion capture
•
Advanced integrated capture systems
•
Crosscutting science
Geologic Sequestration
•
Monitoring, verification and remediation
•
Health, safety and environmental risk assessment
•
Knowledge base and technology for storage reservoirs
Terrestrial Sequestration
•
Productivity enhancement
•
Ecosystem dynamics
•
Monitoring and verification
Ocean Sequestration
•
Ecosystem dynamics
•
Measurement and prediction
•
Direct injection
•
Ocean fertilization
Novel Sequestration Systems
•
Biogeochemical processes
•
Mineral conversion
•
Novel integrated systems
3.5. GHG Management and the "Hydrogen Economy"
Hydrogen is called by many “the fuel of the future.” However, it is important to realize that
hydrogen is
not
a primary energy source like coal, oil, natural gas, wind, solar, biomass, hydro,
nuclear, etc. Instead, like electricity, it is an energy carrier. As a result, hydrogen must be
produced from the same array of primary energy sources that we use to produce electricity.
Therefore, hydrogen is not in direct competition with coal as a fuel, but presents an opportunity
to develop a new market for coal as a major feedstock for hydrogen production.
Figure 3-8 shows costs for the production of hydrogen from four possible sources: gas, coal,
biomass, and water (via electrolysis).
5
This case assumes a central plant design of 165 ton/day of
hydrogen with compression of the product to 1,100 psi, suitable for pipeline transportation.
Costs of transmission and distribution are not included in this figure. Hydrogen is produced
from natural gas by steam reforming, from coal and biomass by gasification, and from water by
5
Data from Simbeck and Chang, Hydrogen Supply: Cost Estimate for Hydrogen Pathways – Scoping Analysis,
NREL/SR-540-32525 (July 2002).
ELECTRONIC FILING, RECEIVED, CLERK'S OFFICE, JANUARY 5, 2007
* * * * * PC #7 * * * * *
55
electrolysis (electricity is from the grid). Gas prices used were $3.50 per MBtu and coal prices
were $1.10 per MBtu.
Figure 3-8. Hydrogen Production Costs
At relatively low natural gas prices, the lowest-cost hydrogen is produced from a natural gas
feedstock, as is the case today in much of the commercial marketplace. However, the break-even
price is very sensitive to natural gas cost. Other studies indicate an even lower break-even price
for hydrogen from coal (at a gas price of $3.15-$4.00/MMBtu for gas, compared to
$1.00/MMBtu for coal). At the time of this report, the forward curve for gas did not go below
$4.00/MMBtu for any time that is currently traded. Therefore, if gas prices remain high or rise
in the future (or gasification technology becomes less costly), coal is or would become the lowest
cost feedstock. This is one of several similarities that can be drawn between hydrogen
production and electricity production. It should also be noted that producing hydrogen from
electrolysis is very expensive when compared to other options.
The cost and energy penalties for CO
2
capture from hydrogen production via gas, coal, or
biomass are relatively small. This is because to produce hydrogen from hydrocarbon feedstocks,
the capability to remove CO
2
is an integral part of the process. On the other hand, for CO
2
-free
hydrogen production from electrolysis, one must use CO
2
-free sources of electricity. Since these
are significantly more expensive than the current fuel mix, one can expect that hydrogen costs
will grow significantly from those indicated in Figure 3-8. In the case of producing CO
2
-free
hydrogen, the advantage for using coal or gas will be even greater than the differential shown in
Figure 3-8.
0
1
2
3
4
5
6
Gas
Water
Coal
Biomass
$/kg hydrogen
O&M
Fuel
Capital
ELECTRONIC FILING, RECEIVED, CLERK'S OFFICE, JANUARY 5, 2007
* * * * * PC #7 * * * * *
56
Just as coal plays a major role in the production of electricity, it has the potential to do the same
for hydrogen. The added costs for CO
2
capture and storage will be significantly lower for
hydrogen production than for electricity production. Since gasification is the preferred route of
producing hydrogen from coal, implementing gasification technologies will position coal to take
advantage of this potential new market should a hydrogen economy evolve.
3.6
International R&D Partnerships
3.6.1 Bush Administration Climate Change Policy
President Bush's climate plan announced on February 14, 2002, consists of long-term and short-
to medium-term components. One component is a stated goal to “promote new and expanded
international policies to complement the domestic program.” The President’s plan specifically
cites the following examples of international cooperation:
•
Investing $25 Million in Climate Observation Systems in Developing Countries. In
response to the National Academy of Sciences' recommendation for better observation
systems, the President has allocated $25 million and challenged other developed nations
to match the U.S. commitment.
•
Tripling Funding for "Debt-for-Nature" Forest Conservation Programs. Building upon
recent Tropical Forest Conservation Act (TFCA) agreements with Belize, El Salvador,
and Bangladesh, the President's FY '03 budget request of $40 million to fund "debt for
nature" agreements with developing countries nearly triples funding for this successful
program. Under TFCA, developing countries agree to protect their tropical forests from
logging, avoiding emissions and preserving the substantial carbon sequestration ability
therein. The President also announced a new agreement with the Government of Thailand
that will preserve important mangrove forests in Northeastern Thailand in exchange for
debt relief worth $11.4 million.
•
Fully Funding the Global Environmental Facility (GEF). The Administration's FY '03
budget request of $178 million for the GEF is more than $77 million above this year's
funding and includes a substantial $70 million payment for arrears incurred during the
prior administration. The GEF is the primary international institution for transferring
energy and sequestration technologies to the developing world under the UNFCCC.
•
Dedicating Significant Funds to the U.S. Agency for International Development
(USAID). The President's FY '03 budget requests $155 million in funding for USAID
climate change programs. USAID serves as a critical vehicle for transferring American
energy and sequestration technologies to developing countries to promote sustainable
development and minimize their GHG emissions growth.
•
Pursue Joint Research with Japan. The U.S. and Japan continue their High-Level
Consultations on climate change issues. Later this month, a team of U.S. experts will
meet with their Japanese counterparts to discuss specific projects within the various areas
of climate science and technology, and to identify the highest priorities for collaborative
research.
ELECTRONIC FILING, RECEIVED, CLERK'S OFFICE, JANUARY 5, 2007
* * * * * PC #7 * * * * *
57
•
Pursue Joint Research with Italy. Following up on a pledge of President Bush and Prime
Minister Berlusconi to undertake joint research on climate change, the U.S. and Italy
convened a Joint Climate Change Research Meeting in January, 2002. The delegations
for the two countries identified more than 20 joint climate change research activities for
immediate implementation, including global and regional modeling.
•
Pursue Joint Research with Central America. The U.S. and Central American Heads of
Government signed the Central American-United States of America Joint Accord
(CONCAUSA) on December 10, 1994. The original agreement covered cooperation
under action plans in four major areas: conservation of biodiversity, sound use of energy,
environmental legislation, and sustainable economic development. On June 7, 2001, the
U.S. and its Central American partners signed an expanded and renewed CONCAUSA
Declaration, adding disaster relief and climate change as new areas for cooperation. The
new CONCAUSA Declaration calls for intensified cooperative efforts to address climate
change through scientific research, estimating and monitoring GHGs, investing in
forestry conservation, enhancing energy efficiency, and utilizing new environmental
technologies.
3.6.2 Bilateral Partnerships
Since its climate change policy was announced, the Bush Administration has also announced a
number of bilateral partnerships (
see
Table 3-15) focused on collaborative efforts meant to
address climate-related issues. Examples of opportunities for cooperation that may result in
significant GHG reductions include, but are not limited to, CCT and CO
2
capture and storage
technology development, expanded use of cogeneration and renewable sources of energy, as well
as concrete ways of reducing GHG emissions through sustainable agriculture and forestry
management practices.
Recommendation
Current efforts at forming bilateral partnerships are important steps in addressing the policy issue
of global climate change. However, absent in most of the agreements is a particular emphasis on
identifying opportunities to pursue collaborative CCT and
CO
2
capture and storage technology
development projects. In recognition of its vast U.S. coal reserves, the DOE has been one of the
world’s major funders of carbon sequestration RD&D. It is of vital importance that the U.S. now
engage other nations in funding new CCT RD&D and pursue policies advocating upgrades or
replacement of older coal-fired power stations around the globe with newer, more efficient
technologies.
The DOE, acting as a principal agent of the U.S. within the bilateral partnerships, should perform
the role of information clearinghouse on the partnerships’ various efforts to develop
CCT and
CO
2
capture and storage technology development projects.
Such a role could
be accomplished by
enhancing
the
existing
materials
on
the
agency’s
website
(http://www.fe.doe.gov/international).
ELECTRONIC FILING, RECEIVED, CLERK'S OFFICE, JANUARY 5, 2007
* * * * * PC #7 * * * * *
58
TABLE 3-15
Date
County
Partnership Agreement Details
July 19, 2001 Italy
Pledge joint research in several critical areas, including:
- atmospheric studies related to climate
- low-carbon technologies
- global and regional climate modeling
- carbon cycle research
Feb. 27, 2002 Australia
Focus will be on such issues as:
- emissions measurement and accounting
- climate change science
- stationary energy technology
- engagement with business to create economically efficient climate
change solutions
- agriculture and land management
- collaboration with developing countries to build capacity to deal with
climate change
Feb. 28, 2002 Japan
The Partnership’s priority research areas include:
- improvement of climate models making use of the “Earth Simulator”
and research on earth processes for modeling
- impact and adaptation/mitigation policy assessment employing
emission-climate-impact integrated models
- observations and international data exchange/quality control
- research on greenhouse gas (GHG) sinks including LULUCF (land
use, land-use change and forestry)
- research on polar regions
- development of mitigation and prevention technologies such as
separation, recovery, sequestration and utilization of carbon and
GHGs
- research and development of renewable and alternative energy
technologies, resources, and products, as well as energy efficiency
measures and technologies
Mar. 7, 2002
Canada
Both countries have agreed to pursue increased bilateral cooperation that
will focus on such issues as:
- climate change science and research
- technology development
- carbon sequestration
- emissions measurement and accounting
- capacity building in developing countries
- carbon sinks
- targeted measures to spur the uptake of cleaner technology and
market-based approaches
May 6, 2002
India
The two sides announced their intention to enhance ongoing collaborative
projects in:
- clean and renewable sources of energy
- energy efficiency
- energy conservation
ELECTRONIC FILING, RECEIVED, CLERK'S OFFICE, JANUARY 5, 2007
* * * * * PC #7 * * * * *
59
Date
Country
Partnership Agreement Details
Oct. 24, 2002 New
Zealand
Themes for potential enhanced cooperation might include:
- climate change science and monitoring in the Pacific;
- assistance to developing countries, particularly Pacific Island states
- climate change research in Antarctica
- cooperation in the development of emission unit registries
- GHG accounting in forestry and agriculture
- technology development aimed at carbon reduction technologies
Jan. 16, 2003
China
The U.S. and China identified 10 areas for cooperative research and
analysis:
- non-CO
2
gases
- economic/environmental modeling
- integrated assessment of potential consequences of climate change
- adaptation strategies
- hydrogen and fuel cell technology
- carbon capture and sequestration
- observation/measurement
- institutional partnerships
- energy/environment project follow-up to the World Summit on
Sustainable Development (WSSD)
- existing clean energy protocols/annexes
Jan. 17, 2003
Russia
- Discuss and exchange information related to climate change policy and
related scientific, technological, socioeconomic, and legal issues of
mutual concern and interest.
- Explore possible common approaches to addressing climate change
issues before the United Nations Framework Convention on Climate
Change, the Intergovernmental Panel on Climate Change, and other
relevant international arenas.
- Identify and encourage needed climate change science and technology
research that is or could be performed individually or jointly by U.S.
and Russian departments, agencies, ministries, and scientific insti-
tutions.
- Benefit from and complement other established bilateral activities
between the two countries.
ELECTRONIC FILING, RECEIVED, CLERK'S OFFICE, JANUARY 5, 2007
* * * * * PC #7 * * * * *
60
SECTION 4:
ACHIEVING GREENHOUSE GAS EMISSION
REDUCTIONS – CHALLENGES AND COSTS
4.1 Assessing the Costs of CO
2
Capture and Sequestration
Although there is some consensus in the literature on the approximate cost of currently available
CO
2
capture and storage (CCS) technologies, published cost estimates still vary widely (by as
much as a factor of two). Cost estimates for many advanced technologies currently under study
or development offer an even broader range of values. In some studies, CO
2
abatement costs are
reported not for a specific technology, but on a sector-wide or nationwide basis (e.g., for the
electric power industry, or the U.S. economy as represented by the GDP).
In this section of the report, we discuss some of the factors that underlie these differences and
cloud a simple answer to what many believe is the simple question: How much does it cost to
capture and sequester CO
2
emissions from power plants?
4.1.1 Defining the System Boundary
The first requirement of any economic assessment is to clearly define the “system” for which
CO
2
emissions and cost are being characterized. The most common assumption in economic
studies of carbon sequestration is a single power plant that captures CO
2
and transports it to an
off-site storage area such as a geologic formation. The CO
2
emissions not captured are released
from the power plant stack along with other emissions.
Other system boundaries that are used in reporting CO
2
abatement costs for a single facility
include the power plant only, without CO
2
transport and storage. Alternatively, costs sometimes
include CO
2
emissions over the complete fuel cycle that encompasses the mining, cleaning, and
transportation of coal used for power generation, as well as any emissions from by-product use
or disposal. Emissions of other GHGs are included in some analyses.
Still larger systems might include all power plants in a utility company’s system, all plants in a
regional or national grid, or a national economy where power plant emissions are but one
element of the overall energy system being modeled. In each of these cases it is possible to
derive a mitigation cost for CO
2
, but the results are not directly comparable because they reflect
different system boundaries and considerations.
4.1.2 Defining the Technology of Interest
Costs will vary with the choice of CCS technology and the choice of the power system that
generates CO
2
in the first place. In studies of a single plant or technology, such definitions are
usually clear. But where larger systems are being analyzed (as in regional or national studies),
ELECTRONIC FILING, RECEIVED, CLERK'S OFFICE, JANUARY 5, 2007
* * * * * PC #7 * * * * *
61
some of these choices may be unclear. The context for reported cost results is then unclear as
well.
4.1.3 Defining the Technology Time Frame
Another factor that is often unclear in economic evaluations is the nature or basis of the assumed
time frame for technology costs, particularly for “advanced” technologies that are not yet
commercial. Such cost estimates frequently reflect assumptions about the “n
th
plant” to be built
sometime in the future when the technology is mature. Such estimates reflect the expected
benefits of technological learning. The choice of time frame and assumed rate of cost
improvements can make a big difference in CCS cost estimates.
4.1.4 Different Measures of Cost
Several different measures of cost are used to characterize CCS systems. Because many of these
have the same units (e.g., $/ton CO
2
), there is great potential for misuse or misunderstanding.
One of the most widely used measures in studies of individual technologies is the “cost of CO
2
avoided.” This is defined as:
Cost of CO
2
Avoided =
(COE)
capture
– (COE)
ref
(CO
2
/kWh)
ref
– (CO
2
/kWh)
capture
This value reflects the average cost ($/ton CO
2
) of reducing atmospheric CO
2
emissions by one
unit of mass (nominally 1 ton), while still providing one unit of electricity to consumers
(nominally 1 kWh). Thus, the choice of both the capture plant and the reference plant without
CO
2
capture and storage plays a key role in determining the CO
2
avoidance cost. Usually, the
reference plant is assumed to be a single unit the same type and size as the plant with CO
2
capture. If there are significant economies of scale in power plant construction costs, differences
in power plant size also can affect the cost of CO
2
avoided.
A measure having the same units as avoided cost can be defined as the difference in net present
value of projects with and without CCS, divided by the difference in their CO
2
mass emissions.
Unless the two projects produce the same net power output, the resulting cost per ton is not the
cost of CO
2
avoided; rather, we call it the “cost of CO
2
abated.” Numerically, this value can be
quite different from the cost of CO
2
avoided for the same two facilities.
The marginal or average cost of CO
2
abatement for a
collection of plants
(as in a utility system,
regional grid, or national analysis) also can be expressed in terms of $ per ton of CO
2
reduced.
These results depend on a host of assumptions about the technologies and fuels included in the
analysis (including fuel price projections). Results from such studies have a different meaning
than those from studies of a single plant or technology.
Arguably, the impact of CO
2
abatement on the COE is most relevant for economic, technical and
policy analyses. For a single plant or technology, the COE can be calculated as:
COE = [(TCR)(FCF) + (FOM)]/[(CF)(8760)(kW)] + VOM + (HR)(FC)
ELECTRONIC FILING, RECEIVED, CLERK'S OFFICE, JANUARY 5, 2007
* * * * * PC #7 * * * * *
TCR = total capital requirement ($),
FCF = fixed charge factor(fraction/yr),
FOM = fixed operating costs ($/yr),
VOM = variable operating costs ($/kWh),
FC = fuel cost ($/kJ),
CF = capacity factor (fraction),
8760 = hrs/yr
kW = net plant power (kW).
Thus, many factors affect the COE (and hence, the cost of CO
2
avoided as well). Cost studies
can differ widely in their assumptions about these factors. For example, assumptions about the
plant capacity factor have a large impact on the calculated COE.
For a variety of reasons, cost studies often do not report all of the key assumptions that affect the
cost of CO
2
control. For example, the total capital requirement includes the cost of purchasing
and installing all plant equipment, plus a number of “indirect” costs that typically are estimated
as percentages of total plant cost.[10] Assumptions about such factors (such as contingency
costs) can have a pronounced effect on cost results. Further, some CO
2
cost studies exclude
certain items (like interest during construction and other “owner’s costs”) when reporting total
capital cost and COE. Thus, the use of terms like “total plant cost” doesn’t always mean what it
seems. Unless such assumptions are transparent, results can easily be misunderstood.
Finally, for studies involving multiple plants (often using different fuels and technologies),
aggregate cost results, such as a change in the average COE, reflect a much larger set of
assumptions than cost estimates for a single plant. Macroeconomic studies of a national
economy, in which energy costs are but one element of a complex modeling framework, offer
cost measures such as the change in GDP from the imposition of a carbon constraint. These
reflect myriad assumptions about the structure of the economy and the values of specific model
parameters. Such results are far more difficult to understand fully, in terms of the influence of
particular assumptions on reported results.
4.2
Economics of CO
2
Capture and Sequestration
4.2.1 Impacts of GHG Reduction Requirements on Existing Coal-Based Plants
Future GHG emission constraints would affect the price and availability of electricity — two
factors that could have a profound impact on the U.S. economy. Because coal is abundant
domestically and its price is low and stable relative to other fossil fuels, the predominance of
coal-based power plants has helped keep U.S. electricity affordable, reliable, and secure.
If stringent CO
2
reduction requirements are imposed, the cost of electricity and the balance in the
fuel mix could change dramatically. CO
2
removal technologies would be unprecedented in their
cost and energy consumption, compared to the emission controls for SO
2
, NOx, and particulates
adopted over the last 30 years. In the absence of commercially available CO
2
capture and
sequestration technologies, near-term (<10-12 years) CO
2
emission reduction requirements
would likely force many coal-fired plants to be retired prematurely. This would likely lead to a
ELECTRONIC FILING, RECEIVED, CLERK'S OFFICE, JANUARY 5, 2007
* * * * * PC #7 * * * * *
to tie electricity prices ever more tightly to the price of natural gas, a fuel with a much more
volatile price history than coal. While the historic price differential of gas to coal is about 2:1,
recent trends and availability projections may make that gap even greater in the future. Under
this scenario, higher natural gas price prices would result in great impacts on the cost of
electricity, and on the economy in general.
4.2.2 Technical Challenges of CO
2
Removal and Sequestration at Coal-Based Plants
The key challenges for CO
2
removal are energy use and cost. The key challenge of long-term
storage or sequestration is the fate of the CO
2
(how well it will stay sequestered). The leading
candidates for demonstrations to gain experience with CO
2
removal at coal-based plants are
solvent absorption/stripping processes that are commercially used in other industries. Only
modest work has been completed to date on adapting these technologies for use in existing
power plants. Serious technical and economic challenges remain both within the CO
2
removal
step itself and in pre-process cleanup of the gas stream to remove trace constituents that would
contaminate the solvents.
In PC plants with today’s commercial technology, CO
2
would be removed from flue gas in an
absorber vessel using a solvent such as MEA. The CO
2
would next be stripped from the solvent
via heat in a separate vessel, and the solvent returned to the absorber column. The heating
requirements reduce the net power plant output. Because flue gas is at atmospheric pressure, and
is composed primarily of nitrogen from the combustion air, the partial pressure of CO
2
(the key
parameter determining the necessary solvent quantity, equipment size, and regeneration energy)
is low. This results in large and costly CO
2
removal equipment. For example, the MEA process
will increase the wholesale COE for a new, high-efficiency PC-SC plant by approximately 60%
and consume about 29% of the plant’s energy output.
IGCC plants offer the opportunity for CO
2
removal at a lower incremental cost and with a lower
energy penalty because the removal step can be performed on high-pressure/high CO
2
concentration syngas prior to its combustion in the gas turbine. The partial pressure of CO
2
is
higher if the gasifier is oxygen-blown (rather that air-blown), and the synthesis gas is "shifted" to
convert CO to CO
2
. A physical solvent absorption/stripping method, such as the Selexol process,
appears most promising for bulk CO
2
removal. A DOE-EPRI study suggested that coal-based
IGCC systems might be the most economical option for new generating capacity
if
CO
2
removal
is required and
if
goals for reducing IGCC cost and improving availability are met.
ELECTRONIC FILING, RECEIVED, CLERK'S OFFICE, JANUARY 5, 2007
* * * * * PC #7 * * * * *
and Natural Gas
In 2000, DOE and EPRI conducted a comprehensive engineering economics study (subsequently
updated in 2002
6
) to look at new plant economics and design for CO
2
removal. This study
developed engineering and cost estimates to:
(1) predict the cost and performance impacts of MEA absorption/stripping applied to
conventionally designed PC plants and NGCC plants, and those of the Selexol process applied to
IGCC plants; and
(2) identify which coal plant options would most effectively compete with NGCC plants if 90%
CO
2
removal were required.
The plant designs evaluated in the study were intended to represent the next generation of
commercially available power systems: PC plants with SC and USC steam conditions, IGCC
plants with H-Class gas turbines, and NGCC plants with F-Class and H-Class gas turbines.
Key results from this study include (values converted to tons of CO
2
):
•
The levelized cost per metric ton of CO
2
removed was $17.73 for IGCC units, $38.55 for
USC PC units, and $54.91 for NGCC units with H-Class turbines.
•
If 90% CO
2
removal were required for new fossil fuel power plants, and the constant dollar
cost of coal remains at approximately its current rate of $1.26/MBtu, then NGCC plants
appear to offer the lowest levelized COE up to a natural gas price of $3.64/MBtu. If the
constant dollar cost of natural gas were higher, then IGCC plants would have the lowest
COE.
•
For 90% CO
2
removal, IGCC plants appear to have a COE up to $18/MWh (~ 25%) lower
than PC plants.
4.2.4 Strategies for an Economically Feasible Transition to a CO
2
-Restricted
Environment
There are approximately 305 GW of coal-fired generating capacity in the U.S. Eighty percent of
this existing capacity will be at least 30 years old by 2007. The capital costs and efficiency
penalties for retrofitting this fleet with current CO
2
removal technology would be considerably
higher than the values discussed above for new plants. However, the existing plants are likely to
continue operation for decades, and thus will represent the greatest source of coal-related CO
2
emissions for the foreseeable future. Therefore, the development of cost-effective CO
2
removal
technology for retrofit application to existing plants, while a great technical challenge, is a
worthwhile research target.
Retrofits would be costly because of the usual retrofit considerations, such as space constraints
and site access difficulties, and because of difficulties in installing the equipment required for
6
Evaluation of Innovative Fossil Fuel power plants with CO
2
Removal
US DOE and EPRI Report December 2000,
EPRI report number 1000316
. Updated Cost and Performance Estimates for Fossil Fuel Power Plants with CO
2
ELECTRONIC FILING, RECEIVED, CLERK'S OFFICE, JANUARY 5, 2007
* * * * * PC #7 * * * * *
absorption/stripping amines or cause corrosion problems. The cost of retrofitting CO
2
removal
systems based on current technology would be prohibitive for most coal-based power plants, and
many might be replaced with NGCC, despite concerns about natural gas price volatility and fuel
diversity.
A recent study by EPRI
7
provided costs to remove CO
2
and upgrade existing emission controls at
existing plants. The cost is estimated to be much higher than for new plants. The capital cost for
a variety of emission control schemes, including retrofitting CO
2
scrubbers, or retrofitting O
2
combustion and recycle, all exceeded $1,000/kW, doubling or tripling the COE.
Given the significant cost and performance issues for retrofitting existing CO
2
control
technologies on existing coal-based plants, which provide the basis for low-cost electricity in the
U.S., it may be appropriate to allocate R&D dollars toward the development of more cost-
effective removal options for both new and existing plants. Such an effort should include not
only a means to better adapt existing solvent-based techniques to coal-based power plants, but
also to explore promising novel technologies now in the laboratory or conceptual stage of
development.
Because CO
2
removal methods appear much more energy-efficient and cost-effective when
applied to IGCC plants, R&D to improve the cost and reliability of the power block portions of
IGCC plants will be a crucial complement to work on CO
2
removal systems. Because the nature
and timing of CO
2
reduction requirements are uncertain, the development of “phased” IGCC
plant designs, in which plants are built to accommodate later installation of CO
2
removal
technology, could help avoid retrofit burdens.
IGCC may only become broadly competitive with PC and NGCC plants under a CO
2
-restricted
scenario. Therefore, vendors currently do not have an adequate economic incentive to invest
R&D dollars in IGCC advancement. Similarly, power companies are not likely to pay the
premium to install today’s IGCC designs in the absence of clear regulatory direction on the CO
2
issue. Therefore, accelerating the development of low-cost, low-CO
2
-emitting CCTs, such as
IGCC, will require substantial cooperation and funding from both public and private sources.
4.3
The Need for Large-Scale Demonstrations
4.3.1 R&D Timeframe
As with any major new technology with enormous financial, environmental, and energy security
ramifications, CO
2
sequestration technologies cannot be considered commercially ready until
they are successfully proven at full-scale, under “real-world” conditions, for a period of time
adequate to assure expectations of prolonged safety and reliability. Any demonstration needs to
convince prospective public-sector and private-sector investors that the costs and risks are
sufficiently understood and acceptable so as to enlist the commitment of manufacturers and
service providers, financiers and insurers, state and local authorities, as well as the public.
7
ELECTRONIC FILING, RECEIVED, CLERK'S OFFICE, JANUARY 5, 2007
* * * * * PC #7 * * * * *
Given the diverse make-up of the coal-based generating fleet, the wide variation in the types and
properties of regionally economical fuels for power production, and the tremendous range of
terrestrial ecosystems and subsurface geological features found across the U.S., effective national
deployment of carbon sequestration measures will require the development and
commercialization of a
portfolio
of CO
2
capture and disposal technologies.
To begin to populate a commercial sequestration technology portfolio over the medium term
(i.e., 8-15 years), development and/or refinement of the most defined promising options and
pilot-scale demonstrations must begin immediately. Commercial success at full scale will
require the effective integration of technologies for capturing CO
2
at power plants, safely
transporting it to disposal sites, and assuring that placed CO
2
will remain sequestered from the
atmosphere for centuries. Therefore, addressing integration issues in conjunction with the pilot-
scale demonstrations will accelerate their resolution at full scale.
4.3.2 CO
2
-Capture Technologies
Because a requirement for CO
2
emissions reductions much greater than those attainable through
efficiency improvement could occur before any substantial turnover in the capital stock of U.S.
power plants, capture technology RD&D should concentrate on systems suitable for retrofit to
today’s PC units and for incorporation in coal repowering projects. Successful development of
such retrofit and repowering technology would not only satisfy domestic needs, but also position
the U.S. to be a technology exporter because PC plants are the predominant type of generating
unit throughout the world.
Another priority for CO
2
-capture technology RD&D should be the development of systems for
IGCC plants. As a major DOE-EPRI evaluation of potential capture technologies found, the
incremental cost and energy penalty for CO
2
removal from IGCC syngas is much lower for PC
flue gas. IGCC plants can also accommodate low-grade fuels and offer the potential for co-
production of steam and clean transportation fuels, making them attractive for new coal capacity,
assuming that goals for cost reduction and availability improvement can be met.
Because the costs and energy penalties for the most-developed CO
2
-capture technologies (i.e.,
those that are commercial in other, albeit smaller, industrial applications) appear high, two
parallel research paths are recommended for the near term (within the next 5-7 years):
•
Refine, to the extent practical in a short period, the processes that are commercial in other
industries and are adaptable to large coal-fired power plants. Then begin demonstration
testing at “flexible” pilot-scale facilities. These pilot-scale facilities would accommodate
equipment configurations to allow testing of multiple processes, including those that are not
yet ready at the commencement of initial tests, thereby avoiding the expense and time delay
of having to build a separate pilot plant for each candidate process. This approach will
advance capabilities in technology assessment, help researchers gain experience in running
pilot CO
2
-capture tests, and produce CO
2
gas streams with trace constituents representative
of “real-world” power plants, which is vital for sequestration demonstrations.
ELECTRONIC FILING, RECEIVED, CLERK'S OFFICE, JANUARY 5, 2007
* * * * * PC #7 * * * * *
promise lower cost, the production of easier-to-place solid products, and greater public
acceptance. Emphasizing more “fundamental” research is important because breakthroughs
in cost and energy use for commercially available chemical and physical processes are not
expected.
4.3.3 PC Plants
The commercial technology most cited as potentially applicable to capturing CO
2
from the large
volumes of flue gas produced by PC power plants is MEA absorption/ stripping. DOE and EPRI
have estimated that the MEA process will increase the wholesale COE for a new, high-efficiency
SC-PC plant by about 60% and consume about 29% of the plant’s energy output. The cost and
energy penalties for most existing PC plants, which have lower-efficiency subcritical steam
conditions, will be considerably higher.
There are opportunities for improvement. Pilot-scale demonstrations of MEA scrubbing at
power plants would allow researchers to experiment with designs that use less energy and,
therefore, reduce the COE increase. Parametric testing could correlate MEA scrubbing
performance as a function of fuel type, gas temperature, concentration of minor or trace flue gas
constituents, such as SO
2
, and other factors. Multiple pilot units will be required to span the full
range of conditions present in the U.S. generating fleet.
Since the use of MEA-based systems will lead to significant reductions in efficiency for coal-
based power plants, continuing to work solely with this technology will likely not provide the
performance or economics needed for low-cost GHG emission reductions. Since these systems
require significant amounts of energy, more fuel resources will be utilized in the long run in
order to overcome the lost power output. Development of other processes that utilize a new
generation of solid and liquid sorbents with low regeneration energy may provide the needed
answers. One alternative is the use of high temperature CaO-CaCO
3
cycles that operate above
the thermodynamic power cycle and potentially do not reduce efficiency.
Pilot-scale testing also provides insight into the scalability of equipment to full scale. By
leveraging the “best-of-breed” process conditions and equipment designs from a series of pilot-
scale demos, large-scale demonstrations can be conducted at lower risk of material and other
“nuisance” failures, thereby helping to assure cost-effective development of information suitable
for commercialization decisions.
4.3.4 IGCC Plants
The commercial technologies that appear most promising for removing CO
2
from IGCC syngas
are derived from acid-gas cleanup methods used in the oil and gas industry, such as the Selexol
process. Selexol, in particular, also has been used in conventional IGCC units (i.e., those
without CO
2
capture) for removing H
2
S and COS from syngas to prevent corrosion in
downstream heat exchangers and the combustion turbine.
ELECTRONIC FILING, RECEIVED, CLERK'S OFFICE, JANUARY 5, 2007
* * * * * PC #7 * * * * *
CO
2
emissions, they require that the gasifier be operated in a “shift” mode to produce syngas
with more H
2
and CO
2
and less CO. Selexol and other candidate processes for CO
2
capture from
IGCC power systems exact a smaller loss in the plant’s energy output, relative to MEA
processing of PC plant flue gas, because the volume of syngas to be treated is approximately
1/200
th
of that involved in treating post-combustion flue gas
According to a DOE-EPRI study, the total incremental cost of CO
2
removal from an IGCC plant
could be only about 40% of that from a PC plant. The overall relative competitiveness of IGCC
plants and PC plants with CO
2
removal is unclear, and depends on future relative capital costs,
fuel costs, availability rates, and non-fuel O&M costs. Under one scenario examined by DOE
and EPRI, an IGCC plant’s COE could be as much 25% lower than that of a PC plant. Given
such projections, developing and commercializing CO
2
-capture technologies for IGCC plants
would be vital to improving the economics of clean coal power systems.
As with PC plants, multiple IGCC demonstrations would be necessary given the substantial
differences in the major types of gasifier designs and in the properties of regionally economical
IGCC fuels.
4.3.5 Novel CO
2
-Capture Technologies
Current candidate technologies for CO
2
capture from PC and IGCC units will remain relatively
energy intensive and expensive. Over the near- to mid-term, it will be crucial to accelerate
development and pilot-scale testing of novel CO
2
removal processes. Today, numerous novel
processes have shown promise on the basis of conceptual evaluations and/or laboratory tests, but
need refinement and subsequent testing at bench and pilot scale to assess their true potential and
scalability. Such processes involve myriad physical, chemical, and biological principles.
Examples include membrane separation, biomimetic reproduction of the enzyme used by
mollusks to repair damaged shells (which then is used as gas scrubbing medium), chemical
looping, mineralization, microbe/genetic engineering, oxyfuel combustion, and more.
4.3.6 CO
2
-Sequestration Technologies
Because carbon sequestration requires the safe storage of CO
2
or other carbonaceous compounds
and associated trace substances for indefinite periods, determining the capacity, effectiveness,
and health and environmental impacts of CO
2
disposal options may require demonstrations
lasting a decade or more (to assure confidence in the environmental integrity of storage sites and
methods). It is highly desirable to begin such demonstration projects as soon as possible using
CO
2
gas streams as “realistic” as possible in terms of the trace constituents produced by CO
2
-
capture process applied to coal-fired power plants.
Public acceptance of carbon sequestration demonstrations, let alone full-scale applications, can
be expected to vary depending on the location(s) of storage sites and the types of storage
technology used. In general, public acceptance is likely to be highest for terrestrial solutions
(e.g., tree planting) and for geologic solutions involving pre-existing formations—such as
ELECTRONIC FILING, RECEIVED, CLERK'S OFFICE, JANUARY 5, 2007
* * * * * PC #7 * * * * *
In the intermediate and long-term, geologic solutions offer significant potential for CO
2
storage
capacity. Terrestrial options, such as forests, require long-range planning and may take 25-50
years to reach full capacity but they may have collateral benefit (habitat creation, enhanced
agricultural practices, ecological restoration, etc.) which mean that they should be implemented
early. Currently, the injection of CO
2
into geological formations is practiced at numerous sites
worldwide for EOR and EGR.
Small-scale demonstrations of geologic CO
2
disposal options could establish a benchmark for
trace leakage and help gauge risks for rapid release. Over the medium term, larger-scale
demonstrations of geologic solutions as well as pilot-scale demonstrations of the potentially
more complex oceanic disposal will be necessary to ensure sufficient CO
2
disposal capacity to
support significant CO
2
emissions reductions via sequestration.
R&D should also evaluate novel sequestration options that produce stable, solid products, ideally
with a market value to help offset processing costs. DOE’s Albany Research Center is already
experimenting with CO
2
-rich “bricks.”
4.3.6 The Value of Integrated Demonstrations
Integrated demonstrations, in which power plant CO
2
capture, transport, and disposal
components are combined, are critical to improving the industry’s understanding of the real-
world feasibility of carbon sequestration in terms of costs, health and environmental impacts,
risks, legal and liability issues, and public acceptability.
Early insights in this regard could prove highly valuable in terms of informing today’s decisions
on technology selection and siting for new power plants that would make them more or less
amenable to subsequent CO
2
-capture technology retrofits.
Large-scale integrated demonstrations also give power plant owners, technology developers,
financiers and insurers, and policymakers greater confidence that successful demonstration
results portend collective movement of all the necessary market actors toward true, self-
sustaining commercialization of carbon sequestration technology.
4.3.7 Challenges
Key challenges include securing funding for multiple large-scale demonstrations and, especially
for CO
2
disposal, obtaining permits from local governments. Addressing the funding issue will
require strong public-private partnerships. In some cases, the power industry may work closely
with other industrial sectors, such as where valuable products could be co-produced and sold in
the process of disposing of CO
2
(e.g., EOR, EGR, or CBM production). Local permitting agency
concerns may be addressed through education programs designed to accurately present potential
risks and benefits of carbon sequestration. Leveraging small-scale demonstrations to gather data
prior to large-scale storage projects will help researchers quantify these risks.
ELECTRONIC FILING, RECEIVED, CLERK'S OFFICE, JANUARY 5, 2007
* * * * * PC #7 * * * * *
The recently announced Presidential FutureGen Sequestration and Hydrogen Research Initiative
could well serve as a major platform for developing CO
2
sequestration in conjunction with coal
gasification. This initiative will speed the development of hydrogen production based on coal
and of CO
2
sequestration technologies applicable to coal gasification. This program also
matches the recommendation of the National Research Council's Review of Vision 21 in which
they recommended..."The Vision 21 program should continue to sharpen its focus. It should
focus on the development of cost-competitive, coal-fueled systems for electricity production on a
large scale (200-500 MW) using gasification-based technologies that produce sequestration -
ready CO
2
and near-zero emissions of conventional pollutants." This program also should meet
specific gasification development and sequestration goals developed in joint industry-
government roadmapping documents such as those developed in conjunction with DOE/ EPRI
and CURC (refer to http://www.coal.org/rdmap.htm
).
This unique facility is envisioned to provide R&D capability to allow testing of novel equipment
under realistic conditions and may carry a significant share of U.S. R&D activities. It will still
be necessary to have multiple demonstrations or combinations of pilot and demonstration
projects to cover differing gasification designs, or designs not based on gasification technology,
with differing coals, and differing regional types of sequestration.
4.4 Future Programs for Voluntary Actions
4.4.1 Summary
The federal government has established or is establishing several programs to address the
technical, environmental and societal challenges to widespread adoption of GHG management
technologies by private industry. Three of these programs are highlighted in this report:
Regional Partnerships for Carbon Sequestration; the Climate VISION Program, and the Carbon
Sequestration Leadership Forum.
Under the
Regional Partnerships
program, DOE has called for proposals to identify the
opportunities and impediments to carbon sequestration, recognizing the distinct differences
likely for different geographic regions. These projects, conducted over the next two years, are
intended to lead to larger scale field tests of promising sequestration options on a regional basis.
In February, 2002, the President announced the goal of reducing GHG intensity by 18% over the
next decade, and called on private industry to work in partnership with the government to meet
this goal. In February, 2003, DOE responded by announcing agreements with the major
industrial sectors
8
to participate in its
Climate VISION
program, creating voluntary public-
private partnerships administered by the DOE, to pursue cost-effective initiatives that will reduce
the projected growth in America’s GHG emissions.
8
Oil and Gas Production, Transportation and Refining, Electricity Generation, Coal Production and Mining, The
Portland Cement Association (PCA) , The American Iron and Steel Institute (AISI), The Semiconductor Industry
Association (SIA), Magnesium Coalition and the International Magnesium Association, The American Chemistry
ELECTRONIC FILING, RECEIVED, CLERK'S OFFICE, JANUARY 5, 2007
* * * * * PC #7 * * * * *
On February 27, 2003, the Departments of State and Energy announced the formation of the
Carbon Sequestration Leadership Forum
, a ministerial-level international organizational focus
on development of carbon capture and storage technologies as a means to stabilizing atmospheric
GHG concentrations. The partnership will promote coordinated research and development with
international partners and private industry, including data gathering, information exchange, and
collaborative projects.
4.4.2 Regional Partnerships for Carbon Sequestration
Among the many elements of its GHG management program, the DOE has issued a solicitation
9
to establish “regional partnerships” to facilitate the development and use of technology for the
capture, transport, and storage of CO
2
from anthropogenic sources throughout the U.S. This
concept recognizes that patterns of fossil fuel use, and the nature and location of potential
sequestration sinks differ widely throughout the U.S. As a result, distinctly different regional
approaches may be required if the country as a whole is going to address the issue of CO
2
in a
cost effective manner.
In addition to the technological factors affecting the regional
sequestration option, social, legal and regulatory issues (including permitting requirements and
public acceptance) need to be addressed on a regional and local basis.
DOE envisions these issues being addressed by a number of regional partnerships, which would
include fuel producers, energy producers, consumers, industrial entities, the academic and
research community (academia and environmental advocacy organizations), and state agencies.
The regions will be defined by the participants in a partnership based on commonality of
technical, economic, and political interests. The specific objectives set out by DOE for Phase I
of the regional partnership program include:
•
Defining the geographical boundary of the region;
•
Characterizing the region for its sources, potential sinks, and key infrastructure
requirements, such as CO
2
transportation mechanisms;
•
Developing action plans which identify and address critical issues for wide-scale use
of the most attractive regional sequestration approaches;
•
Defining mechanisms to ensure public awareness and acceptance of carbon
sequestration; and
•
Analyzing the results of the foregoing steps to identify the most attractive options in a
regional context on the basis of economic, environmental, and social criteria to select
prime candidates for future large-scale demonstrations.
Under Phase II of the program, participants would conduct small-scale field tests to demonstrate
the validity of the sequestration options identified in the assessment and analysis phase of this
program.
9
ELECTRONIC FILING, RECEIVED, CLERK'S OFFICE, JANUARY 5, 2007
* * * * * PC #7 * * * * *
million to each for initial Phase I planning. As much as $7 million could be provided to
partnerships for the field verification tests and further regulatory and infrastructure assessment
expected to be conducted in Phase II.
4.4.3 Industrial Commitments to Voluntary Emissions Reductions Under the Climate
VISION Program
On February 14, 2002, President Bush committed to reducing America's GHG intensity (the ratio
of emissions to economic output) by 18% in the next decade. On February 12, 2003, the DOE
announced the Administration’s Climate VISION (Voluntary Innovative Sector Initiatives:
Opportunities Now) Program, a voluntary, public-private partnership to pursue cost-effective
initiatives that will reduce the projected growth in America’s GHG gas emissions. Climate
VISION will be administered through the DOE’s policy and international program. The industry
sectors which announced their participation and their stated goals are described below.
Oil and Gas Production, Transportation and Refining
The API proposed to increase the energy efficiency of members' U.S. refinery operations by 10%
from 2002 to 2012 through reduced gas flaring and other energy efficiency improvements,
expanded combined heat and power facilities, increased by-product utilization, and reduced CO
2
venting.
API members will develop GHG management plans to identify and pursue
opportunities to further reduce emissions.
Electricity Generation
EEI and six other power sector groups
10
formed the Electric Power Industry Climate Initiative
(EPICI) to reduce the sector's carbon intensity. The EPICI will pledge to reduce the power
sector's carbon impact in this decade by the equivalent of 3-5% through increased natural gas and
CCT, increased nuclear generation, offsets, and expanded investment in wind and biomass
projects.
Coal Production and Mining
The National Mining Association (NMA) committed to achieving a 10% increase in the
efficiency of those systems that can be further optimized with processes and techniques
developed by DOE and made available through the pending NMA-DOE Allied Partnership. The
commitment includes steps to recover additional CMM, expansion of land reclamation, carbon
sequestration efforts, and coal and mining research.
The Portland Cement Association (PCA)
PCA has committed to reduce
CO
2
emissions by 10% per ton of cement from a 1990 baseline by
2020 through enhancements to the production process, the product itself, and how the product is
applied.
10
National Rural Electric Cooperative Association, the Nuclear Energy Institute, the American Public Power
Association, the Large Public Power Council, the Electric Power Supply Association, and the Tennessee Valley
ELECTRONIC FILING, RECEIVED, CLERK'S OFFICE, JANUARY 5, 2007
* * * * * PC #7 * * * * *
Thirty-three member firms, representing nearly three-quarters of the nation's steel-producing
capacity, have committed to achieving a 10% increase in sector-wide average energy efficiency
by 2012 from 1998 levels.
The Semiconductor Industry Association (SIA)
SIA committed to reduce a suite of the most potent GHG emissions (HFC, PFC and SF6
"perfluorocompounds") by 10% from 1995 levels by the end of 2010. EPA estimates that this
will reduce emissions by over 13.5 MMTCE in the year 2010, or the equivalent of eliminating
GHG emissions from 9.6 million cars.
Magnesium Coalition and the International Magnesium Association
Magnesium Coalition and the International Magnesium Association companies have committed
to eliminate sulfur hexafluoride (SF6) emissions from their magnesium operations by 2010,
which will have a climate benefit equivalent to eliminating 1.4 MMTCE in GHG emissions.
The American Chemistry Council (ACC)
The ACC, whose members operate 90% of the chemical industry production in the U.S., has
agreed to an overall GHG intensity reduction target of 18% by 2012 from 1990 levels through
increased production efficiencies, promoting coal gasification technology, increasing bio-based
processes, and by developing products which increase energy efficiency in other sectors
The Aluminum Association
The Aluminum Association is committed to reducing sector-wide GHG emissions. Through one
of the first voluntary partnerships with EPA in 1995, the Voluntary Aluminum Industry
Partnership (VAIP) reduced perfluorocarbon (PFC) emissions in 2000 by over 45% compared to
1990 levels.
The Association of American Railroads (AAR)
The AAR has committed to reducing the transportation-related GHG intensity of their Class 1
railroads by 18% in the next decade.
The Alliance of Automobile Manufacturers (AAM)
AAM has agreed to reduce GHG emissions from its members' manufacturing facilities by at least
10% by 2012, based on U.S. vehicle production from a 2002 baseline by installing energy
efficient lighting, converting facilities' coal and oil power sources to cleaner natural gas, and
upgrading ventilation systems.
The American Forest and Paper Association (AF&PA)
AF&PA members expect to reduce their GHG intensity by 12% by 2012 relative to emissions
levels in 2000 through the Sustainable Forestry Initiative program, recycling, avoiding landfill
methane emissions, and increasing carbon storage.
ELECTRONIC FILING, RECEIVED, CLERK'S OFFICE, JANUARY 5, 2007
* * * * * PC #7 * * * * *
On February 27, 2003, the Departments of State and Energy announced the formation of the
Carbon Sequestration Leadership Forum
, a ministerial-level international organization
focusing on enhancing international opportunities related to GHG management. The partnership
will promote coordinated research and development with international partners and private
industry, including data gathering, information exchange, and collaborative projects.
An inaugural meeting, scheduled for June, 2003, will involve presentations by government, the
private sector, and non-governmental organizations on the status of sequestration research and
the technical, economic, and public policy challenges that must be addressed. A Ministerial
Roundtable will be held to discuss the Forum and each country's goals in participating.
The Carbon Sequestration Leadership Forum does not change any of the existing bilateral
agreements that the U.S. has with many countries. Instead, it is intended to focus the efforts of
the international community specifically on carbon sequestration as one option in an overall
GHG mitigation strategy.
In that regard, it is worth noting that, at its meeting on February 19-21, 2003, the IPCC
11
gave
formal approval to the writing of a Special Report on CO
2
Capture and Storage as a climate
change mitigation option. The report will be written under the auspices of Working Group III
(WGIII) on Mitigation. The Energy Research Centre of the Netherlands (ECN) operates the
Technical Support Unit for WGIII. The Special Report will take two years to complete, with
delivery planned for the first half of 2005. A workshop to prepare a scoping paper for this report
met November 18-21, 2002, in Regina, Canada (workshop proceedings available at
http://www.climatepolicy.info/ipcc). According to that scoping paper, reasons to proceed with
this report include:
•
CO
2
capture and storage is an emerging technology option with a very high
mitigation potential. It has been suggested that about half the world cumulative
emissions to 2050 may be stored at costs comparable to other mitigation options.
•
The keen interest in this subject is demonstrated by plans considered by several
leading industrial countries to invest in this emerging technology in the coming years.
•
There is a growing interest in the scientific and technical community in the subject of
CO
2
capture and storage, demonstrated by the growing availability of the literature.
•
Policymakers have a growing need for a reliable synthesis of the available scientific
literature in order to facilitate the decision making process on the plans for CO
2
capture and storage as a climate change mitigation option.
11
The IPCC has been established by WMO and UNEP to assess scientific, technical and socio- economic
ELECTRONIC FILING, RECEIVED, CLERK'S OFFICE, JANUARY 5, 2007
* * * * * PC #7 * * * * *
4.5.1 Incentives for New and Existing Facilities
Background
It is likely that existing coal-fired plants will continue to provide the bulk of our nation’s
electricity for decades to come, unless political decisions are made which force their retirement
for economic reasons. Ultimately, economic and technical factors will make it necessary to build
new power plants to replace retiring capacity and to meet load growth. As indicated in this
report, significant reductions in CO
2
emissions can be achieved in the near term by increasing the
efficiency of the existing generating fleet. Moreover, replacement of the existing units with new,
more advanced CCTs can further increase fleet efficiency, and reduce CO
2
emissions. Finally,
new plants can be designed to facilitate CO
2
capture and sequestration, if this becomes
necessary, and technologically and economically feasible. Therefore, three principal elements of
a strategy to reduce CO
2
emissions, while continuing to utilize our domestic coal resources are to
increase efficiency on the existing generating fleet, replace existing capacity or add new capacity
with more highly efficient advanced technologies, and prepare for possibility that carbon capture
and sequestration may be necessary in the future.
An analysis of the previously reported actions under Section 1605(b) of the Energy Policy Act
demonstrates that private companies are willing to take voluntary actions to reduce GHG
emissions if technological and financial risks and rewards are acceptable. However, the goal of
advancing new technology can be accelerated if incentives are available to offset the incremental
risk taken on in early full-scale demonstrations and deployment of the most advanced
technologies. These incentives can take the form of financial instruments intended to reduce the
financial risk engendered by the technical uncertainty inherent in the demonstration or early use
of new technology.
Two important components of federal policy in this regard are cost-sharing by the federal
government in the first-of-a-kind demonstration of new technology, and tax incentives to
encourage replicate deployment of demonstrated technologies.
The latter is particularly
important for encouraging investment in capital intensive technologies such as central-station
coal-fired power plants. The argument is that some number of these new technologies needs to
be built to move along the technology along a “learning curve” that reduces the technical risk
and cost to the point that plants can attract conventional commercial financing.
This concept is embodied in the National Environmental and Energy Technology (NEET)
legislation which has been introduced in both the House and the Senate.
Under NEET, tax incentives are provided for the installation of CCT that increases thermal
efficiency and reduces emissions at coal-fired power plants. The bill includes provisions for
existing and new plants. For existing facilities, the bill provides a production tax credit of
$0.0034/kWh for retrofitting or repowering of units to meet the energy efficiency and emission
requirements qualifying it as CCT as defined in the bill.
For new units, NEET provides a 10% investment tax credit, and production tax credits of varying
ELECTRONIC FILING, RECEIVED, CLERK'S OFFICE, JANUARY 5, 2007
* * * * * PC #7 * * * * *
incentive increases as the efficiency of the unit increases.
4.5.2 Addressing regulatory issues
In some instances, environmental regulations can have the effect of impeding actions that would
otherwise result in the reduction or sequestration of greenhouse gases. Two examples are cited
here: reclamation requirements affecting carbon sequestration on mined lands; and interpretation
of New Source Review regulations affecting the ability of power plants to make efficiency
improvements.
1. Statutory and regulatory impediments to terrestrial sequestration at mining sites.
Opportunities exist for more CO
2
to be sequestered at surface coal mining reclamation sites by
changing the laws, interpretations of laws, and local practices of mine reclamation to allow for
more effective approaches to reforestation. Practices and laws governing post-mining land use,
approximate original contour requirements, topsoil requirements, and revegetation requirements
need to be addressed in order to promote increased forestation.
Post Mining Land Use.
The Surface Mining Control and Reclamation Act (SMCRA) established
that all areas disturbed during mining be restored in a timely manner to: (1) conditions that are
capable of supporting the uses which they were capable of supporting before any mining; or (2)
higher and better uses under certain criteria and procedures.
If land was not forested before mining, some jurisdictions have ruled that reforestation is not a
higher and better use of the land. In particular, this is the case in the Midwest where pre-mine
lands are designated as prime farmland. With the significant potential for CO
2
sequestration on
mining lands through reforestation, State and Federal regulatory agencies should allow
reforestation as a higher beneficial post-mining land use. This would require no change in
regulation, just a change in classification.
Approximate Original Contour Requirements.
Mining laws require that the land surface be
returned to the approximate original contour (AOC) that existed prior to mining or an approved
postmining topography (PMT) for thin overburden mines. The action of heavy equipment
required to transport, backfill, and grade the material needed to create a narrowly defined
AOC/PMT results in a highly compacted soil surface.
Highly compacted soils decrease tree survivability and do not allow for rapid and large tree
growth. Reclamation regulations or enforcement practices should be changed to allow more
flexibility in this area. This would reduce the intensity of grading, thus enabling an environment
for proper tree growth and survivability, as well as enhancing CO
2
sequestration.
Topsoil Requirements.
Topsoil removal, segregation, storage, and replacement are required in
many jurisdictions. Some jurisdictions also require that topsoil be replaced at a uniform
thickness.
In many areas of the country, larger and faster tree growth can be demonstrated by using mixed
ELECTRONIC FILING, RECEIVED, CLERK'S OFFICE, JANUARY 5, 2007
* * * * * PC #7 * * * * *
reclaimed surfaces, even though varying depths are found in the premining environment. Using
thicker topsoil in valleys and thinner on peaks would help foster a more diverse vegetation cover.
Flexibility in topsoil requirements would help to increase reforestation and the re-establishment
of shrubs, also enhancing CO
2
sequestration.
Revegetation Requirements.
SMCRA requires that mine permit holders establish a diverse,
effective, and permanent vegetative cover of species native to the area to support the planned
post-mining uses of the land. While this provision allows for non-native species of plants to be
used, local regulation has not always allowed for this to happen. In order to maximize CO
2
uptake, non-native vegetation may need to be allowed.
2.
New Source Review.
A wide range of technologies are available for improving efficiency at coal-fired power plants.
These include improvements in materials, upgrades of boiler pressure parts, burner
improvements, and new designs for steam turbine blades. Such efficiency increases, as
previously noted, would result in fewer GHG emissions per unit of fuel burned. As the Council
noted in its May, 2001, report, “Increasing Electricity Availability from Coal-Fired Generation in
the Near Term,” the change in enforcement procedures by EPA (reinterpreting as violations of
the Clean Air Act what had previously been considered routine maintenance at power plants) has
had a direct and chilling effect on all maintenance and efficiency improvements at existing
power plants.
At issue is whether or not these changes would in fact result in increased emissions of various
pollutants, and if the utilities in question should have submitted permit applications prior to
doing the maintenance or making the efficiency upgrades. EPA contends that certain methods of
calculating future emissions could show increases, which would require that emission control
systems would need to be retrofitted, at great cost and with significant project delay, negating
any achievable increases in efficiency.
Over the past several years, EPA has continued to pursue the legal action, while at the same time
proposing potential “fixes” to the new source review definitions, calculation methods, and
enforcement. With some of the companies “settling” their cases, other cases being handled in
venues in various states, and EPA continuing to re-propose various regulatory “fixes,” it is likely
that various outcomes will occur, making it even more difficult for utilities to determine how to
proceed on what would otherwise have been the “right” thing to do, with improvements in
efficiency being stalled. As the Council noted previously, legislative action to make the
appropriate corrections on a nationwide basis may be the best option to promote efficiency
improvements that would led to lower emissions of GHGs from coal-fired power plants.
4.5.3 Transition Issues for Coal Generation
Implementing the technologies described in the previous sections of this report will require
transitions both in the technology itself and in the policies and regulations that will govern the
generation business of the future. The need for orderly transitions is necessary due to the desire
to minimize technical and financial risk on the parts of the generating companies and the
ELECTRONIC FILING, RECEIVED, CLERK'S OFFICE, JANUARY 5, 2007
* * * * * PC #7 * * * * *
Coal-fired power plants, once thought to be facing a rapid demise, now are broadly perceived as
one element of a strategy to use indigenous resources for the future energy security of the
country. Transitioning to this future will require concerted efforts in four interdependent areas:
•
Developing public/private partnerships to fund technology development and
demonstrations;
•
Creating tax and other incentives to encourage investment in technology development
and implementation;
•
Designing a technology rollout strategy to implement new technologies while
reducing the associated technology and financial risks; and
•
Managing an institutional transition to address public policy, regulatory, and
environmental/ ecological issues.
4.5.4 Funding Technology Development Through Public/Private Partnerships
To assure the future of coal-based generation, it will be necessary to increase efficiency and
reduce emissions while decreasing capital and operating costs. CCTs, such as USC and IGCC
power plants, have the potential for conversion efficiencies of >50% (LHV). Deployment of
these technologies will depend on lower fuel costs to help offset the higher capital cost of these
options. Current estimates suggest that these technology advances have the potential to make
new clean coal generation competitive with equivalent NGCC plants on a cost of electricity basis
in the 2010 to 2020 time frame. In certain niche areas or cases, IGCC may be able to take
advantage of low-cost and opportunity fuels, and of its superior environmental performance, to
compete in the next seven to 10 years.
Timely advances in coal technology cannot be achieved without a significant increase in RD&D
funding that will permit commercial viability within the next 10 years. This is problematic in the
current economic and regulatory environment because power plant operators are under extreme
pressure to reduce costs and are unwilling to invest in new technologies. Investing now in an
advanced power plant technology requires patience, because the investment will not earn a return
until some time after successful commercialization.
All of these issues suggest that traditional forms of private-sector funding for new technologies
may not be feasible in today’s electricity generation business environment. Public-private
consortia are emerging as a mechanism to provide the needed resources for technology
development. They allow for front-loading the R&D processes, as well as the early stages of
pilot and full-scale tests. DOE funding of research for the advanced coal program follows this
precept, in that the DOE cost share is higher for high-risk technology development and lower for
commercialization activities. This approach has been a success in prior programs, such as the
CCT Program, and is working well to sustain interest in the current Vision 21 program. It is
anticipated that it will be successful in the FutureGen program as well.
Although these programs encourage private sector participation in the technology development
process, the current funding levels are not adequate to develop and commercialize the
ELECTRONIC FILING, RECEIVED, CLERK'S OFFICE, JANUARY 5, 2007
* * * * * PC #7 * * * * *
systems.
Additional R&D is necessary for the following specific technologies and high priority issues:
•
High-pressure solid feed systems;
•
Fuel cell development and testing;
•
Slip stream testing of fuel cells;
•
High-temperature metallic heat exchangers (for service at 1800°F);
•
Gasifiers for high-ash, high-moisture coals;
•
Enhanced trace element monitoring; and
•
Char combustion and gasification.
4.5.4 Investment Incentives
Government action should not be limited to research funding. There is a clear role for
government in supporting the deployment of CCT to improve fuel diversity and reduce
emissions. Without a strong advanced technology development program, there will be dramatic
reductions in the use of coal over the next 30 years and a huge increase in natural gas
consumption for electricity generation. This prospect threatens the energy security and perhaps
the economic well-being of the U.S. One answer is a national strategy that encourages the
balanced use of all our energy resources -- coal, gas, nuclear, and renewable energy sources.
With respect to coal-based technologies, incentives are needed to address the issues associated
with building new plants due to uncertainties about future emissions control requirements.
It is possible to define a tax and incentive package aimed at boosting the maximum generation
efficiency of coal-based power plants to 50% or higher (LHV). Achieving these goals would
produce significant environmental benefits.
Three types of incentive package have been proposed to encourage early commercialization of
advanced coal technologies:
•
An investment tax credit tied to the project owner’s equity;
•
A variable production tax credit tied to energy production and energy efficiency over
the first 10 years of operation, with higher benefits to early implementation of high
efficiency technologies; and
•
A “risk pool” to cover repairs or modifications necessary to achieve the required
performance during startup and the first three years of operation.
4.5.5 Technology Rollout Strategy
Investors and operators are reluctant to be the owners of “Serial No. 1.” This suggests the need
for a strategy of rolling out technologies in a series. The first units in a series would have modest
improvements in performance, with minimal additional financial risk. In addition, the initial
technology advances would be familiar to the operators, minimizing re-training. This suggests
ELECTRONIC FILING, RECEIVED, CLERK'S OFFICE, JANUARY 5, 2007
* * * * * PC #7 * * * * *
gas produced by a slagging gasifier might be a better choice for an organization with prior
experience in some or all of the unit processes implied in a sophisticated hydrogen production
operation.
ELECTRONIC FILING, RECEIVED, CLERK'S OFFICE, JANUARY 5, 2007
* * * * * PC #7 * * * * *
References (3.1.2)
1. Schilling, H.D., VGB Kraftwerkstechnik (English Edition) (73) 8., pp. 564-576 (1993)
2. Armor, A.F., R.Wiswanathan, S.M. Dalton, Ultrasupercritical Steam Turbines: Design
and Materials Issues for the Next Generation, U.S. DOE 28
th
Int. Technical Conference
on Coal Utilization and Fuel Systems, Clearwater, FL, March 2003.
3. Fruchtman, I., Armor, A.F., "Supercritical Units: A Performance Report," Joint Power
Generation Conference, Milwaukee, WI, October 20-24, 1985. ASME Paper 85-JPGC-
Pwr-33.
4. Armor, A.F., Hottenstine, R.D., “Cycling Capability of Supercritical Turbines: A
Worldwide Assessment”, ASME/IEEE Joint Power Generation Conference, Paper 85-
JPGC-Pwr-6, Milwaukee, WI, October 1985.
5. Oliker, I., Armor, A.F., Supercritical Power Plants in the USSR, EPRI report 100364,
February 1992.
6 Ultrasupercritical Steam Turbines: Design and Materials Issues for the Next Generation,
EPRI report 1006844, March 2002.
7 Skowyra et al, “Design of a Supercritical, Sliding Pressure, Circulating Fluid Bed Boiler
with Vertical Water Walls”. Proceedings of 13
th
International Conference on Fluid Bed
Combustion, ASME, New York, NY, 1995.
8. Viswanathan, R., Bakker, W.T., Materials for Ultra Supercritical Fossil Power Plants,
EPRI Report TR-114750, March 2000.
9. Blum, R.,and J. Hald ELSAM, Skaerbaek, Denmark (2002)
10. Beér, J.M. and R.V. Garland, A Coal Fueled Combustion Turbine Cogeneration
System with Topping Combustion, Trans. ASME Journal of Engineering for Gas
Turbines and Power Vol. 119, No. 1, pp. 84-92, January 1997.
11. Ruth L.A., U.S. DOE Vision 21 Workshop FETC Pittsburgh, PA., December 1998.
12. Shilling, N. Z. and Jones, R. M. GE Power Systems. IGCC-Leadership in Clean Power
From Solid Fuels. PowerGen International. December.
13. U.S. DOE Fuel Cell Handbook -- Sixth Edition. November 2002.
14. Lovis,M., A.Drdziok and A.Witchow, Proc. Power-Gen Europe 94 '.Penn Well Utrecht,
Netherlands pp. 327-349 (1994).
15. Couch G. R., OECD Coal Fired Power Generation IEA Per/33 (1997).
16. Stamatelopoulos, G.N., J.L.Marion, N.Nskala, T.Griffin and A. Bill, Int Conf. on Clean
Coal Technologies for our Future, Sardinia, Italy, October 2002.
17. Haupt,G. and Karg,J.,Proc. of the 12th Conference on the Electric Supply Industry
(CEPSI), Pattaya/Thailand, November 1998.
18. Delot,P., DiMaggio, I., Jaquet, L., Roulet V., EDF Comparative Study of Clean Coal
Technologies, Electricite de France Thermal Dept. (1996).
19. Evaluation of Innovative Fossil Fuel Power Plants with CO
2
Removal, Interim Report
Dec 2000, EPRI, Palo Alto, CA, U.S. DOE Office of Fossil Energy, Germantown, MD,
and U.S. DOE/NETL, Pittsburgh, PA., 2000. 1000316.
20. Updated Cost and Performance Estimates for Fossil fuel Power Plants with CO
2
ELECTRONIC FILING, RECEIVED, CLERK'S OFFICE, JANUARY 5, 2007
* * * * * PC #7 * * * * *
References (3.3.1)
Cote, M. M.; Collings, R. C.; Talkington, C. C. “Methane Emission Estimates & Methodology
for Abandoned Coal Mines in the United States”, for presentation at the International Coal Bed
Methane Symposium, Atlanta, GA, May 2003.
Intergovernmental Panel on Climate Change,
Climate Change 2001: The Scientific Basis.
Summary for Policymakers
, Cambridge University Press, Cambridge, U.K., 2001.
U.S. Census Bureau, “U.S. Economic Census, Mining Sector, Bituminous Coal and Lignite
Surface Mining” (EC97N-2121A, October 1999), “Bituminous Coal Underground Mining”
(EC97N-2121B, October 1999), and “Anthracite Mining” (EC97N-2121C, July 1999).
U.S. Environmental Protection Agency “Inventory of U.S. Greenhouse Gas Emissions and
Sinks: 1990-2000”, EPA Report 430-R-02-003, April 2002.
U.S. Environmental Protection Agency, “Methane Emission Estimates & Methodology for
Abandoned Coal Mines in the United States, Peer Review Draft Report”, July 2000.
Website of the Coalbed Methane Outreach Program of the U.S. Environmental Protection
Agency, http://www.epa.gov/cmop/about.htm
.
References (3.3.3)
1.
Tullin, C.J., S. Goel, A. Morihara, A.S. Sarofim, and J.M. Beér, NO and N
2
O Formation
for Coal Combustion in a Fluidized Bed: Effect of Carbon Conversion and Bed
Temperature, Energy & Fuels, Vol. 7, pp. 796-802, 1993.
2.
Tullin, C.J., A.F. Sarofim, and J.M. Beér, Formation of NO and N
2
O Coal
Combustion: The Relative Importance of Volatile and Char Nitrogen, Journal of
the Institute of Energy, 66, pp. 207-215, December 1993.
3.
Hayhurst ,A.N. and Lawrence, A.D:. Emissions of nitrous oxide from combustion
Sources. Prog. Energy Cmbust. Sci. 1992, 18, 529-552.
4.
Takeshita, M., Sloss L.L., Smith, M.I:. N
2
O emissions from coal use IEA Coal Research
1993.
5
Leckner B. and Amand L.E. N
2
O emission from solid fuels in fluidized bed. Joint
Meeting of the French, Italian, Swedish Sections of the Combustion Institute 1992.
6.
Beér, J.M. and R.V. Garland, A Coal Fueled Combustion Turbine Cogeneration System
with Topping Combustion, Trans. ASME Journ. of Engineering for Gas Turbines and
Power Vol. 119, No.1, pp. 84-92, January 1997.
7.
American Petroleum Institute (API). Compendium of Greenhouse Gas Emissions
Estimation Methodologies for the Oil and Gas Industry, Pilot Test Version, April 2001.
The API Compendium is available from API in either printed form or on CD-ROM.
ELECTRONIC FILING, RECEIVED, CLERK'S OFFICE, JANUARY 5, 2007
* * * * * PC #7 * * * * *
line at www.global.ihs.com.
8.
Canadian Association of Petroleum Producers (CAPP).
Global Climate Change
Voluntary Challenge Guide, Canadian Association of Petroleum Producers, Publication
Number 2000-0004, June 2000. Available on-line at: http://www.capp.ca/default.asp
?
V_DOC_ID=763&PubID=25024
9.
Intergovernmental Panel on Climate Change (IPCC). Revised 1996 IPCC Guidelines for
National Greenhouse Gas Inventories, Reference Manual (Volume 3), United Nations
Environment Programme, the Organization for Economic Co-operation and Develop-
ment, the International Energy Agency, and the Intergovernmental Panel on Climate
Change, 1996. Available on-line at:
http://www.ipcc-nggip.iges.or.jp/public/gl/invs1.htm
10.
U.S. Environmental Protection Agency (EPA). Compilation of Air Pollutant Emission
Factors, Volume I: Stationary Point and Area Sources, AP-42, (GPO 055-000-005-001),
U.S. EPA Office of Air Quality Planning and Standards, Fifth Edition, January 1995,
with Supplements A, B, and C, 1996; Supplement D, 1998; Supplement E, 1999; and
Supplement F, 2000. Available on-line at:
http://www.epa.gov/ttn/chief/ap42/index.html
11.
A method of controlling nitrous oxide in circulating fluidized bed steam generators
Inventor(s): Schmidt, Peter and Tanca, Michael, Patent assignee(s):Alstom Power Inc.,
Patent No.- 00851173/EP B1, Patent application No. 97122925, Date filed:- 12/29/97.
12.
Process and Apparatus for the Thermal Decomposition of Nitrous Oxide
Inventor(s): Hofmann, John and Sun, William, H., Patent assignee(s): Foster Wheeler
Energia Oy Patent No. 00564550/EP B1, Date filed: 12/23/91.
13.
Liu, Hao; Gibbs, Bernard M. Reduction of N2O emissions from a coal-fired circulating
fluidized-bed combustor by secondary fuel injection, proceedings of the 1998 27th
International Symposium on Combustion , Vol. 2 1998. p 3077-3083 August, 1998
Boulder, CO, USA
14.
Rutar, T.; Kramlich, J. C.; Malte, P. C., Glarborg, P.,Nitrous oxide emissions control by
reburning, Combustion and Flame, Vol. 107, No. 4, 1996-12 pp. 453-463.
15.
Ruiz, E.; Otero, J.; Cillero, D.; Sanchez, J. M,. Catalytic abatement of nitrous oxide from
fluidized bed combustion, The proceedings of the 24th international technical conference
on coal utilization and fuel systems pp. 625-636 Coal and Slurry Technology
Association, ed. Sakkestad, B. A. ,1999.
References (3.4)
International Energy Agency, http://www.ieagreen.uk
U.S. Climate Science Workshop, http://www.climatescience.org
,
U.S. DOE National Energy Technology Laboratory,
http://www.netl.doe.gov/coalpower/sequestration
ELECTRONIC FILING, RECEIVED, CLERK'S OFFICE, JANUARY 5, 2007
* * * * * PC #7 * * * * *
APPENDIX A
SELECTED TABLES & FIGURES
ELECTRONIC FILING, RECEIVED, CLERK'S OFFICE, JANUARY 5, 2007
* * * * * PC #7 * * * * *
85
Project Title
Performer Type Performer
Project
Start Date
Project
End
Date
Total
Estimated
Cost
DOE Share
Ocean Carbon Sequestration
Gov't Agency
Department of Navy - Naval Sea
Systems Command
07/07/1999 03/30/2003
$576,094
$576,094
Terrestrial Sequestration of CO
2
Gov't Agency
USDA - Forest Service - Southern
Research Station
09/07/1999 09/29/2004
$75,000
$25,000
Carbon Capture and Water Emissions Treatment System
(CCWESTRS) at Fossil-Fueled Electric Generators
Gov't Agency
Tennessee Valley Authority
09/17/2000 09/29/2003
$1,289,007
$729,007
Chemical Fixation of CO
2
in Coal Combustion Products
and Recycling Through Algal Biosystems
Gov't Agency
Tennessee Valley Authority
09/17/2000 09/29/2002
$755,291
$604,233
Economic Evaluation of CO
2
Sequestration Technologies
Gov't Agency
Tennessee Valley Authority
09/17/2000 07/30/2002
$1,321,113
$1,056,890
CO
2
Capture by Absorption with Potassium Carbonate
State Univ.
University of Texas at Austin
03/31/2002 03/31/2005
$728,007
$461,849
Laboratory Investigations in Support of
CO
2
-Limestone
Sequestration in the Ocean
State Univ.
University of Massachusetts
03/31/2002 03/31/2004
$267,840
$206,290
Calcium Carbonate Prod. by Coccolithophorid Algae in
Long-Term CO
2
Sequestration
State Univ.
California State University San Marcos 04/30/2001 04/25/2004
$306,846
$212,371
Atomic Level Modeling of CO
2
Disposal as a Carbonate
Mineral
State Univ.
Arizona State University
06/11/1998 07/30/2002
$369,225
$199,697
P-H Neutral Concrete for Attached Microalgae &
Enhanced CO
2
State Univ.
Louisiana State University
07/14/1998 05/14/1999
$50,373
$50,373
Optimal Geological Environments for
CO
2
Disposal in
Saline Reservoirs
State Univ.
University of Texas at Austin, Bureau
of Economic Geology
07/23/1998 07/14/2004
$404,434
$404,434
Reactive, Multi-phase Behavior of CO
2
in Saline Aquifers
Beneath the Colorado Plateau
State Univ.
University of Utah - OSP
08/08/2000 08/12/2003
$428,049
$342,412
Separation of Hydrogen and
CO
2
Using a Novel
Membrane Reactor
State Univ.
North Carolina A&T State University
08/18/1999 08/30/2002
$199,963
$199,963
High Temperature
CO
2
Semi-Permeable Dense Ceramic
Membranes
State Univ.
University of Cincinnati
08/24/2000 08/30/2002
$57,195
$49,999
An Innovative Concept for CO
2
-Based Tri-generation of
Fuels, Chemicals, and Electricity Using Flue Gas in Vision
21 Plants
State Univ.
Pennsylvania
State
University
-
University Park
08/29/2000 11/29/2001
$50,000
$50,000
Oxygen-Enriched Coal Combustion with CO
2
Recycle and
Recovery
State Univ.
University of Utah - OSP
08/30/2000 05/29/2002
$49,719
$49,719
ELECTRONIC FILING, RECEIVED, CLERK'S OFFICE, JANUARY 5, 2007
* * * * * PC #7 * * * * *
86
Project Title
Performer Type Performer
Project
Start Date
Project
End
Date
Total
Estimated
Cost
DOE Share
Preliminary Characterization of CO
2
Separation and
Storage Properties of Coal Gas Reservoirs
State Univ.
University of Arizona
09/11/2001
09/10/2002
$49,997
$49,997
Development of Superior Sorbents for Separation of CO
2
From Flue Gas at a Wide Temperature Range During Coal
Combustion
State Univ.
University of Cincinnati
09/17/2001
09/16/2002
$57,650
$50,000
Enhancement of Terrestrial C Sinks Through Reclamation
of Abandoned Mine Lands in the Appalachians
State Univ.
Stephen F. Austin State University
09/19/2000
09/18/2003
$839,504
$628,169
Understanding Olivine CO
2
Mineral Sequestration
Reaction Mechanisms at the Atomic Level: Optimizing
Reaction Process Design
State Univ.
Arizona State University
09/19/2001
09/18/2002
$77,113
$49,170
Enhancing the Atomic Level Understanding of CO
2
Mineral Sequestration Mechanisms via Advanced
Computational Modeling
State Univ.
University of Arizona
09/19/2001
09/18/2004
$262,545
$195,717
Active Carbonation: A Novel Concept to Develop an
Integrated CO
2
Sequestration Module for Vision 21 Plants
State Univ.
Pennsylvania State University -
University Park
09/23/2001
09/22/2002
$55,000
$50,000
CO
2
Sequestration and Recycle by Photosynthesis
State Univ.
University of Akron
09/23/2001
09/22/2004
$266,620
$199,965
Novel Nanocomposite Membrane Structures for Hydrogen
Separation
State Univ.
University of Texas at Austin
09/26/2001
09/25/2004
$200,000
$200,000
Maximizing Storage Rate and Capacity and Insuring the
Environmental Integrity of
CO
2
State Univ.
Texas Tech University
09/27/2000
09/30/2003
$2,618,393
$2,081,348
Enhanced Practical Photosynthetic CO
2
Mitigation
State Univ.
Ohio University
09/27/2000
09/30/2003
$1,369,495
$1,075,022
Unminable Coalbeds & Enhancing Methane Production
Sequestering CO
2
State Univ.
Oklahoma State University
09/28/1998
03/14/2003
$876,175
$820,649
CO
2
Sequestering Using Microalgal Systems
State Univ.
University of North Dakota Energy and
Environmental Research Center
09/30/1998
03/30/2003
$0
$0
Geologic Screening Criteria for Sequestration of CO
2
in
Coal: Quantifying Potential of the Black Warrior Coalbed
Methane Fairway, Alabama
State Agency
Geological Survey of Alabama
09/28/2000
10/04/2003
$1,398,068
$789,565
CO
2
Removal from Natural Gas
Small Business - Carbozyme,Inc.
08/26/2001
05/25/2002
$100,000
$100,000
ELECTRONIC FILING, RECEIVED, CLERK'S OFFICE, JANUARY 5, 2007
* * * * * PC #7 * * * * *
87
Project Title
Performer Type Performer
Project
Start Date
Project
End
Date
Total
Estimated
Cost
DOE Share
Obtaining EPA Permits for CO
2
Ocean Sequestration
Experiment in Hawaii
Small Business
Pacific International Center for High
Technology Research
05/31/2002
10/29/2002
$60,495
$60,495
A Zeolite Membrane for Separation of Hydrogen from
Process Streams
Small Business
TDA Research, Inc.
06/14/1998
03/13/1999
$100,000
$100,000
A Novel CO
2
Separation System
Small Business
TDA Research, Inc.
07/09/1998
12/30/2003
$549,999
$549,999
Sequestration of CO
2
Using Coal Seams
Small Business
Northwest Fuel Development Inc.
07/14/1998
05/14/1999
$56,752
$56,752
Natural Analogs for Geologic Sequestration
Small Business
Advanced Resources International
07/29/2001
07/30/2004
$1,736,390
$1,123,390
Organization of 2003 National Carbon Sequestration
Conference
Small Business
Exchange Monitor Publications, Inc.
07/31/2002
07/31/2002
$245,120
$100,000
Oil Reservoir Characterization and CO
2
Injection
Monitoring in the Permian Basin with Cross-Well
Electromagnetic Imaging
Small Business
ElectroMagnetic Instruments, Inc.
09/10/2000
08/30/2003
$1,150,630
$767,821
Geologic Sequestration of CO
2
in Deep, Unmineable
Coalbeds: An Integrated Research and Commer
Small Business
Advanced Resources International
09/27/2000
03/31/2004
$5,543,246
$1,387,224
Recovery & Sequestration of CO
2
from Stationary Comb.
Systems by Photosynthesis of Microalgae
Small Business
Physical Sciences, Inc.
09/28/2000
09/30/2003
$2,361,111
$1,682,028
Support for the International CO
2
Ocean Sequestration
Field Experiment
Small Business
Pacific International Center for High
Technology Research
09/28/2001
09/29/2002
$93,613
$44,613
Weyburn
CO
2
Sequestration Project
Non-US
Natural Resources Canada-CANMET
05/31/2002
12/29/2002
$27,000,000
$4,000,000
CANMET CO
2
Consortium-O2/ CO
2
Recycle Combustion Non-US
Natural Resources Canada-CANMET
09/29/1999
09/29/2002
$765,000
$35,000
An Integrated Modeling Framework for Carbon
Management Technologies
Private Univ.
Carnegie Mellon University
08/13/2000
09/29/2003
$896,466
$717,172
International Collaboration on CO
2
Sequestration
Private Univ.
Massachusetts Institute of Technology
08/23/1998
10/22/2002
$950,000
$950,000
CO
2
Sequestration in Coalbed Methane Reservoirs
Private Univ.
University of Southern California
09/19/2001
09/18/2002
$50,000
$50,000
Development of Mesoporous Membrane Materials for
CO
2
Separation
Private Univ.
Drexel University
08/30/2000
12/30/2002
$53,458
$50,000
Photoreductive Sequestration of CO
2
to Form C1 Products
and Fuel
Nonprofit
SRI International Corporation
03/19/2002
03/18/2003
$124,967
$99,974
ELECTRONIC FILING, RECEIVED, CLERK'S OFFICE, JANUARY 5, 2007
* * * * * PC #7 * * * * *
88
Project Title
Performer Type Performer
Project
Start Date
Project
End
Date
Total
Estimated
Cost
DOE Share
Development of Synthetic Soil Materials for the
Reclamation of Abandoned Mine Sites
Nonprofit
Western Research Institute
04/09/1998
06/29/2003
$279,434
$139,717
Recovery of
CO
2
in Advanced Fossil Energy
Nonprofit
Research Triangle Institute
07/14/1998
02/27/2002
$550,000
$550,000
CO
2
Capture From Flue Gas Using Dry Regenerable
Sorbents
Nonprofit
Research Triangle Institute
08/30/2000
08/30/2003
$1,050,889
$812,285
The Potential of Reclaimed Lands to Sequester Carbon
and Mitigate the Greenhouse Effect
Nonprofit
Western Research Institute
11/14/1999
09/29/2002
$0
$0
Application and Development of Appropriate Tools and
Technologies for Cost-effective Carbon Sequestration
Nonprofit
The Nature Conservancy (TNC)
07/10/2001
07/09/2004
$2,023,597
$1,618,878
Feasibility of Large-Scale CO
2
Ocean Sequestration
Nonprofit
Monterey Bay Aquarium Research
Institute
09/17/2000
09/29/2003
$1,106,409
$812,695
The University of Kansas Center for Research
Nonprofit
University of Kansas Center for
Research
09/26/2000
12/20/2003
$3,307,515
$2,436,690
Zero Emissions Power Plants Using SOFCs and Oxygen
Transport Membranes
Large Business
Siemens Westinghouse Power Corp. -
Pittsburgh
05/31/2000
11/29/2002
$3,084,061
$2,311,108
CO
2
Capture Project
Large Business
BP Corporation North America Inc
07/10/2001
11/10/2004
$9,994,165
$4,995,000
R&D Entitled, "Large Scale CO
2
Transportation and Deep
Ocean Sequestration"
Large Business
McDermott Technology, Inc. (MTI-
OH)
07/14/1998
12/30/2001
$619,732
$619,732
The Removal and Recovery of
CO
2
from Syngas and
Acid Gas Streams in an IGCC Power Plant
Large Business
Tampa Electric Company
08/23/1998
04/23/1999
$112,950
$50,000
Evaluation of Oxygen Enriched Combustion Technology
for Enhanced CO
2
Recovery
Large Business
McDermott Technology, Inc, (MTI-
Lynchburg)
09/01/1999
08/30/2002
$99,985
$99,985
CO
2
Capture from Industrial Process Gases
Large Business
Air Products and Chemicals, Inc.
09/17/1998
05/17/1999
$70,143
$50,000
Fuel-Flexible Gasification-Combustion Technology for
Production of H2 and Sequestration-Ready CO
2
Large Business
GE Energy and Environmental
Research Corporation
09/18/2000
09/29/2003
$3,378,920
$2,500,000
Sequestration of
CO
2
Gas in Coal Seams
Large Business
CONSOL Inc.
09/20/2001
12/30/2008
$9,269,333
$6,959,601
Advanced Oxyfuel Boilers and Process Heaters for Cost
Effective CO
2
Capture and Sequestration
Large Business
Praxair, Inc.
09/23/2001
12/30/2005
$5,836,482
$4,085,537
Greenhouse Gas Emissions Control by Oxygen Firing in
Circulating Fluidized Bed Boilers
Large Business
ALSTOM Power, Inc., US Power Plant
Laboratories
09/26/2001
10/26/2004
$1,996,486
$1,597,189
CO
2
Hydrate Process for Gas Separation from a Shifted
Synthesis Gas Stream
Large Business
Bechtel National Inc.
09/29/1999
12/30/2005
$9,076,621
$9,076,621
Land Application Uses of Dry FGD By-Products
For-profit
Organization
Dravo Lime Company
07/22/1991
07/21/1999
$4,302,804
$1,341,125
ELECTRONIC FILING, RECEIVED, CLERK'S OFFICE, JANUARY 5, 2007
* * * * * PC #7 * * * * *
89
Project Title
Performer Type Performer
Project
Start Date
Project
End
Date
Total
Estimated
Cost
DOE Share
CO
2
Selective Ceramic Membrane for Water-Gas-Shift
Reaction with Simultaneous Recovery of CO
2
For-profit
Organization
Media and Process Technology Inc.
08/30/2000
08/30/2003
$900,000
$720,000
Novel Composite Membrane and Process for Natural Gas
Upgrading
For-profit
Organization
Innovative Membrane Systems, Inc.
09/28/1999
06/29/2002
$512,248
$392,373
Evaluation of Multiple Product Power Cycles
Natl Lab
Argonne National Laboratory (ANL)
02/08/2000
09/29/2002
$400,000
$400,000
Zero Emissions Steam Technology Research Facility
Study
Natl Lab
Lawrence Livermore National
Laboratory (LLNL)
02/09/2001
03/24/2002
$2,400,000
$1,200,000
Developing an Atomic Level Understanding to Enhance
CO
2
Mineral Sequestration Reaction
Natl Lab
Argonne National Laboratory (ANL)
02/15/2001
02/14/2002
$357,000
$357,000
Nonaqueous Biocatalysis Applied to Coal Utilization
Natl Lab
Idaho National Engineering and
Environmental Laboratory (INEEL)
03/08/1998
09/29/2002
$130,000
$130,000
Whitings as a Potential Mechanism for Controlling
Atmospheric
CO
2
Natl Lab
Idaho National Engineering and
Environmental Laboratory (INEEL)
03/08/1999
09/29/2002
$1,600,000
$1,600,000
Vortex Tube Design and Demo for the Removal of
CO
2
from Natural Gas and Flue Gas
Natl Lab
Idaho National Engineering and
Environmental Laboratory (INEEL)
04/14/2000
09/29/2002
$925,000
$625,000
CO
2
Separation Using a Thermally Optimized Membrane
Natl Lab
Los Alamos National Laboratory
(LANL)
04/14/2000
04/13/2003
$1,215,360
$1,215,360
Continue Evaluation of Feasibility of CO
2
Disposal in a
Deep Saline Aquifer in
Natl Lab
Battelle Columbus Laboratories
04/29/1998
02/27/1999
$99,995
$99,995
Natural Gas Vehicle Fuel from Landfill Gas
Natl Lab
Brookhaven National Laboratory
(BNL)
04/30/2000
09/29/2003
$50,000
$50,000
Sequestration of CO
2
in a Depleted Oil Reservoir - LANL Natl Lab
Los Alamos National Laboratory
(LANL)
04/30/2000
09/29/2002
$1,053,000
$1,053,000
Geological Sequestration of CO
2
: GEO-SEQ / ORNL
Natl Lab
Oak Ridge National Laboratory
(ORNL)
04/30/2000
09/29/2002
$1,540,000
$1,540,000
Sequestration of CO
2
in a Depleted Oil Reservoir
Natl Lab
Sandia National Laboratories (SNL) -
NM
04/30/2000
04/30/2003
$2,295,095
$2,295,095
GEO-SEQ Project
Natl Lab
Lawrence Berkeley National
Laboratory (LBNL)
04/30/2000
09/29/2002
$14,550,000
$2,750,000
Geological Sequestration of CO
2
: GEO-SEQ
Natl Lab
Lawrence Livermore National
Laboratory (LLNL)
04/30/2000
09/29/2002
$1,500,000
$1,500,000
CO
2
Separation Using Thermally Optimized Membranes-
Nanocomposite Development
Natl Lab
Idaho National Engineering and
Environmental Laboratory (INEEL)
05/14/2000
05/13/2003
$185,000
$185,000
Evaluation of CO
2
Capture, Utilization, and Disposal
Options
Natl Lab
Argonne National Laboratory (ANL)
05/21/1992
04/29/1997
$815,000
$815,000
ELECTRONIC FILING, RECEIVED, CLERK'S OFFICE, JANUARY 5, 2007
* * * * * PC #7 * * * * *
90
Project Title
Performer Type Performer
Project
Start Date
Project
End
Date
Total
Estimated
Cost
DOE Share
Experimental Evaluation of Chemical Sequestration of
CO
2
in Deep Saline Formations
Natl Lab
Battelle Columbus Laboratories
07/09/1998
09/29/2004
$596,649
$596,649
Enhancement of CO
2
Emissions Conversion Efficiency by
Structured Microorganisms
Natl Lab
Idaho National Engineering and
Environmental Laboratory (INEEL)
07/31/1999
09/29/2002
$327,000
$327,000
Biomineralization for Carbon Sequestration
Natl Lab
Oak Ridge National Laboratory
(ORNL)
07/31/1999
09/29/2002
$1,000,000
$1,000,000
Enhanced Practical Photosynthesis Carbon Sequestration
Natl Lab
Oak Ridge National Laboratory
(ORNL)
07/31/1999
09/29/2002
$172,000
$172,000
Modification/Development of Carbon Fiber Composite
Molecular Sieve for Removal of CO
2
Natl Lab
Oak Ridge National Laboratory
(ORNL)
07/31/2001
12/30/2002
$344,000
$172,000
CO
2
Hydrate Process for Gas Separation from a Shifted
Synthesis Gas Stream
Natl Lab
Los Alamos National Laboratory
(LANL)
08/14/1999
01/29/2005
$5,230,000
$5,230,000
Renewable Hydrogen Production for Fossil Fuel
Processing
Natl Lab
Oak Ridge National Laboratory
(ORNL)
09/01/1998
09/29/1999
$22,000
$22,000
CO
2
Sequestration by Mineral Carbonation Using a
Continuous Flow Reactor
Natl Lab
Albany Research Center (ALRC)
09/29/2001
09/29/2003
$1,300,000
$1,300,000
Evaluation of CO
2
Capture/Utilization/Disposal Options
Natl Lab
Argonne National Laboratory (ANL)
09/30/1997
09/29/2002
$544,000
$544,000
Mineral Carbonation - Preliminary Feasibility Study
Natl Lab
Albany Research Center (ALRC)
09/30/1997
11/29/2001
$2,145,700
$945,700
Development of Hydrogen Separation and Purification
Membranes
Natl Lab
Sandia National Laboratories (SNL) -
CA
09/30/1998
09/29/2002
$594,000
$594,000
Exploratory Measurements of Hydrate and Gas
Compositions
Natl Lab
Lawrence Livermore National
Laboratory (LLNL)
09/30/1998
09/29/2002
$500,000
$500,000
Screening of Marine Microalgae for Maximum CO
2
Biofixation Potential
Natl Lab
Pacific Northwest National Laboratory
(PNNL)
09/30/2000
09/29/2002
$200,000
$200,000
Advanced Plant Growth
Natl Lab
Los Alamos National Laboratory
(LANL)
09/30/2000
11/29/2001
$880,000
$880,000
Ecosystem Dynamics
Natl Lab
Los Alamos National Laboratory
(LANL)
09/30/2000
11/29/2001
$1,705,000
$1,145,000
Enhancing Carbon Sequestration & Reclamation of
Degraded Lands with Fossil Fuel Combustion Byproducts
Natl Lab
Oak Ridge National Laboratory
(ORNL)
12/31/1999
12/30/2001
$1,067,000
$1,067,000
Full-Scale Bioreactor Landfill
County Agcy
Yolo County
08/01/2001
07/31/2004
$1,748,103
$563,000
Fossil Fuel Derivatives with Reduced Carbon
tbp
Applied Sciences, Inc.
09/30/1998
09/29/1999
$99,845
$99,845
Total
$161,998,484
$95,624,581
ELECTRONIC FILING, RECEIVED, CLERK'S OFFICE, JANUARY 5, 2007
* * * * * PC #7 * * * * *
91
Appendix B
DESCRIPTION OF THE
NATIONAL COAL COUNCIL
In the fall of 1984, The National Coal Council was chartered and in April 1985, the Council
became fully operational. This action was based on the conviction that such an industry advisory
council could make a vital contribution to America’s energy security by providing information
that could help shape policies relative to the use of coal in an environmentally sound manner
which could, in turn, lead to decreased dependence on other, less abundant, more costly, and less
secure sources of energy.
The Council is chartered by the Secretary of Energy under the Federal Advisory Committee Act.
The purpose of The National Coal Council is solely to advise, inform, and make
recommendations to the Secretary of Energy with respect to any matter relating to coal or the
coal industry that he may request.
Members of the National Coal Council are appointed by the Secretary of Energy and represent
all segments of coal interests and geographical disbursement. The National Coal Council is
headed by a Chairman and a Vice-Chairman who are elected by the Council. The Council is
supported entirely by voluntary contributions from its members. To wit, it receives no funds
whatsoever from the Federal Government. In reality, by conducting studies at no cost which
might otherwise have to be done by the Department, it saves money for the government.
The National Coal Council does not engage in any of the usual trade association activities. It
specifically does not engage in lobbying efforts. The Council does not represent any one segment
of the coal or coal-related industry nor the views of any one particular part of the country. It is
instead to be a broad, objective advisory group whose approach is national in scope.
Matters which the Secretary of Energy would like to have considered by the Council are
submitted as a request in the form of a letter outlining the nature and scope of the requested
study. The first major studies undertaken by the National Coal Council at the request of the
Secretary of Energy were presented to the Secretary in the summer of 1986, barely one year after
the start-up of the Council.
ELECTRONIC FILING, RECEIVED, CLERK'S OFFICE, JANUARY 5, 2007
* * * * * PC #7 * * * * *
92
Appendix C
NATIONAL COAL COUNCIL
MEMBERSHIP ROSTER
Robert Addington
Appalachian Fuels
1500 North Big Run Road
Ashland, KY 41102
Ph: 606-928-3433
Fx: 606-928-0450
crystal@appalachianfuels.com
James R. Aldrich
State Director
The Nature Conservancy
642 West Main Street
Lexington, KY 40508
Ph: 606-259-9655
Fx: 606-259-9678
jaldrich@tnc.org
Allen B. Alexander
President & CEO
Savage Industries, Inc.
5250 S. Commerce Dr.
Salt Lake City, UT 84107
Ph: 801-263-9400
Fx: 801-261-8766
aba@savageind.com
Sy Ali
President
Clean Energy Consulting Corp.
7971 Black Oak Drive
Plainfield, IN 46168
Ph: 317-839-6617
Syali1225@aol.com
Barbara F. Altizer
Executive Director
Eastern Coal Council
P.O. Box 858
Richlands, VA 24641
Ph: 276-964-6363
Fx: 276-964-6342
barb@netscope.net
Gerard Anderson
President & COO
DTE Energy Company
2000 2
nd
Avenue, 2409 WCB
Detroit, MI 48226-1279
Ph: 313-235-8880
Fx: 313-235-0537
andersong@dteenergy.com
Dan E. Arvizu
Sr Vice President
CH2M Hill
9191 South Jamaica Street
Englewood, CO 80112
Ph: 720-286-2436
Fx: 720-286-9214
Cell: 303-619-7485
darvizu@ch2m.com
Richard Bajura
Director
National Research Center for Coal & Energy
West Virginia University
P.O. Box 6064, Evansdale Dr.
Morgantown, WV 26506-6064
Ph: 304-293-2867 (ext. 5401)
Fx: 304-293-3749
bajura@wvu.edu
Michael F. Barnoski
President
ALSTOM USA
2000 Dayhill Road
Windsor, CT 06095-0500
michael.f.barnoski@power.alstom.com
ELECTRONIC FILING, RECEIVED, CLERK'S OFFICE, JANUARY 5, 2007
* * * * * PC #7 * * * * *
93
Janós M. Beér
Professor of Chemical & Fuel Engineering
Dept. of Chemical Engineering
Massachusetts Institute of Technology
25 Ames St., Bldg. 66-548
Cambridge, MA 02139
Ph: 617-253-6661
Fx: 617-258-5766
jmbeer@mit.edu
Richard Benson
President
Caterpillar Global Mining
100 N.E. Adams St.
Peoria, IL 61629-2495
Ph: 309-675-5127
Fx: 309-675-4777
Benson_Richard_a@cat.com
Jacqueline F. Bird
Director
OH Coal Development Ofc.
OH Dept. of Development
77 S. High St., 25
th
Fl., PO Box 1001
Columbus, OH 43216
Ph: 614-466-3465
Fx: 614-466-6532
jbird@odod.state.oh.us
www.odod.state.oh.us/tech.coal
Sandy Blackstone
Natural Resources Attorney/Economist
8122 North Sundown Trail
Parker, CO 80134
Ph: 303-805-3717
Fx: 303-805-4342
sblackstone@ssbg.net
Charles P. Boddy
Vice President, Government Relations
Usibelli Coal Mine, Inc.
100 Cushman St., Ste. 210
Fairbanks, AK 99701-4659
Ph: 907-452-2625
Fx: 907-451-6543
cboddy@usibelli.com
Donald B. Brown
President
Horizon Natural Resources
1500 N. Big Run Rd.
Ashland, KY 41102
Ph: 606-928-3438
Fx: 606-928-0450
Robert L. Brubaker
Porter, Wright, Morris & Arthur
41 S. High St.
Columbus, OH 43215
Ph: 614-227-2033
Fx: 614-227-2100
rbrubaker@porterwright.com
Michael Carey
President
Ohio Coal Association
17 S. High Street, Suite 215
Columbus, OH 43215-3413
Ph: 614-228-6336
Fx: 614-228-6349
info@ohiocoal.com
www.ohiocoal.com
William Carr
200 Oak Pointe Dr.
Cropwell, AL 35054
Ph: 205-525-0307
Fx: 205-525-4855
Maryann R. Correnti
Partner
Arthur Andersen & Company
200 Public Sq., Ste. 1800
Cleveland, OH 44114
Ph: 216-348-2774
Fx: 216-771-7733
maryann.r.correnti@us.arthurandersen.com
Ernesto A. Corte
Chairman
Gamma-Metrics
5788 Pacific Ctr. Blvd
San Diego, CA 92121
Ph: 858-882-1200
Fx: 858-452-2487
ecorte@attglobal.net
ELECTRONIC FILING, RECEIVED, CLERK'S OFFICE, JANUARY 5, 2007
* * * * * PC #7 * * * * *
94
Kelly A. Cosgrove
Vice President, Marketing & Sales
Kennecott Energy Company
PO Box 3009
Gillette, WY 82717-3009
Ph: 307-687-6053
cosgrovek@kenergy.com
Henry A. Courtright
Vice President
Power Generation & Distributed Resources
Electric Power Research Institute
3412 Hillview Ave.
Palo Alto, CA 94304
Ph: 650-855-8757
Fx: 650-855-8500
hcourtri@epri.com
Joseph W. Craft, III
President
Alliance Coal
1717 S. Boulder Ave.
Tulsa, OK 74119
Ph: 981-295-7602
Fx: 981-295-7361
josephc@arlp.com
Curtis H. Davis
Sr. Vice President, Power Generation
Duke Energy
526 S. Church St.
Charlotte, NC 28202-1804
Ph: 704-382-2707
Fx: 704-382-9840
cdavis@duke-energy.com
E. Linn Draper, Jr.
Chairman, President & CEO
American Electric Power Company
One Riverside Plaza
Columbus, OH 43215
Ph: 614-223-1500
Fx: 614-223-1599
eldraper@aep.com
Michael D. Durham
President
ADA Environmental Solutions
8100 SouthPark Way B2
Littleton, CO 80120
Ph: 303-737-1727
Fx: 303-734-0330
miked@adaes.com
John Dwyer
President
Lignite Energy Council
1016 E. Owens Ave., Ste. 200
PO Box 2277
Bismarck, ND 58502-2277
Ph: 701-258-7117
Fx: 701-258-2755
jdwyer@lignite.com
Richard W. Eimer, Jr.
Sr. Vice President
Dynegy Marketing & Trade
2828 N. Monroe St.
Decatur, IL 62526
Ph: 217-876-3932
Fx: 217-876-7475
rich_eimer@dynegy.com
Ellen Ewart, Sr.
Consultant
Resource Data International
3333 Walnut St.
Boulder, CO 80301
Ph: 720-548-5515
Fx: 720-548-5007
eewart@ftenergy.com
eewart@resdata.com
Andrea Bear Field
Partner
Hunton & Williams
1900 K St., NW, 12
th
Fl.
Washington, DC 20036
Ph: 202-955-1558
Fx: 202-778-2201
afield@hunton.com
ELECTRONIC FILING, RECEIVED, CLERK'S OFFICE, JANUARY 5, 2007
* * * * * PC #7 * * * * *
95
Paul Gatzemeier
Vice President & General Manager
Centennial Holdings Capital Corp.
Schuchart Bldg., 918 E. Divide Ave.
PO Box 5650
Bismarck, ND 58506-5650
Ph: 701-222-7985
Fx: 701-222-7877
paul.gatzemeier@mduresources.com
Janet Gellici
Executive Director
American Coal Council
5765 Olde Wadsworth Blvd., Ste. 18
Arvada, CO 80002
Ph: 303-431-1456
Fx: 303-431-1606
jgellici@americancoalcouncil.org
www.americancoalcouncil.org
Patrick Graney
President
Petroleum Products, Inc.
500 Rivereast Dr.
Belle, WV 25015
Ph: 304-926-3000, ext. 113
Fx: 304-926-3009
pgraney@petroleumproductsinc.com
Alex E. S. Green
University of Florida
ICAAS, Clean Combustion Tech. Lab
PO Box 112050
Gainesville, FL 32611-2050
Ph: 352-392-2001
Fx: 352-392-2027
aesgreen@ufl.edu
Richard R. Grigg
President & CEO
WeEnergies
231 West Michigan Ave.
Milwaukee, WI 53203
Ph: 414-221-2102
Fx: 414-221-2132
John Nils Hanson
President & CEO
Joy Global, Inc.
100 E. Wisconsin Ave., Ste. 2780
Milwaukee, WI 53202
Ph: 414-319-8500
Fx: 414-319-8510
jnha@hii.com
Vascar G. Harris
Head of Aerospace Engineering
Tuskegee Institute
Tuskegee, AL 36088
Ph: 334-727-8659
Fx: 334-724-4199
vharris@tusk.edu
Clark D. Harrison
President
CQ, Inc.
160 Quality Ctr. Rd.
Homer City, PA 15748
Ph: 724-479-3503
Fx: 724-479-4181
clarkh@cq-inc.com
www.cq-inc.com
J. Brett Harvey
President & CEO
CONSOL Energy, Inc.
1800 Washington Rd.
Pittsburgh, PA 15241
Ph: 412-854-6671
Fx: 412-854-6613
brettharvey@consolenergy.com
Warren J. Hoffman, Esquire
Frost Brown Todd LLC
250 W. Main St., Ste. 2700
Lexington, KY 40507-1749
Ph: 859-244-3320
Fx: 859-231-0011
whoffman@fbtlaw.com
ELECTRONIC FILING, RECEIVED, CLERK'S OFFICE, JANUARY 5, 2007
* * * * * PC #7 * * * * *
96
Gerald (Jerry) A. Hollinden
Vice President, Power Sector Manager
URS Corporation
Waterfront Plaza Tower One
325 W. Main St., Ste. 1200
Louisville, KY 40202-4251
Ph: 502-217-1516
Fx: 502-569-3326
jerry_hollinden@urscorp.com
Chris Jenkins
Sr. Vice President, Coal Service Group
CSX Transportation
5000 Water St., J120
Jacksonville, FL 32202
Ph: 904-366-5693
Fx: 904-359-3443
chris_jenkins@csx.com
William Dean Johnson
Executive Vice President, General
Counsel and Secretary
Progress Energy, Inc.
411 Fayetteville St. Mall
Raleigh, NC 27602
Ph: 919-546-6463
bill.johnson@pgnmail.com
Judy A. Jones
Commissioner
Public Utilities Commission of OH
180 E. Broad St.
Columbus, OH 43215-3793
Ph: 614-644-8226
Fx: 614-466-7366
judy.jones@puc.state.oh.us
www.puc.state.oh.us
William M. Kelce
President
Alabama Coal Association
2090 Columbiana Rd., Ste 2500
Vestavia Hills, AL 35216
Ph: 205-822-0384
Fx: 205-822-2016
aca@bellsouth.net
Dick Kimbler
PO Box 186
Danville, WV 25053
Ph: 304-369-3347
Thomas G. Kraemer
Group Vice President
Burlington Northern Santa Fe Railway Co.
2650 Lou Menk Dr.
Ft. Worth, TX 76131-2830
Ph: 817-867-6242
Fx: 817-352-7940
thomas.kraemer@bnsf.com
Max L. Lake
President
Applied Sciences, Inc.
141 W. Xenia Ave, PO Box 579
Cedarville, OH 45314-0579
Ph: 937-766-2020 ext. 111
Fx: 937-766-5886
mllake@apsci.com
Steven F. Leer
President & CEO
Arch Coal Inc.
Cityplace One, Ste. 300
St. Louis, MO 63141
Ph: 314-994-2900
Fx: 314-994-2919
sleer@archcoal.com
David A. Lester
Executive Director
Council on Energy Resource Tribes
695 S. Colorado Blvd., Ste. 10
Denver, CO 80246-8008
Ph: 303-282-7576
Fx: 303-282-7584
adlester@qwest.net
ELECTRONIC FILING, RECEIVED, CLERK'S OFFICE, JANUARY 5, 2007
* * * * * PC #7 * * * * *
97
Peter B. Lilly
President & CEO
Triton Coal Company
141 Market Place Dr., Ste. 100
Fairview Heights, IL 62208
Ph: 618-394-2620
Fx: 618-394-2638
lilly@triton-coal.com
James V. Mahoney
Sr. Vice President, Asset Management
PG&E National Energy Group
7500 Old Georgetown Rd., Ste 1300
Bethesda, MD 20814
Ph: 301-280-6610
Fx: 301-280-6909
jim.mahoney@neg.pge.com
James K. Martin
Vice President, Business Development
Dominion Energy
PO Box 26532
Richmond, VA 23261
Ph: 804-819-2176
Fx: 804-819-2219
james_k_martin@dom.com
Christopher C. Mathewson
Dept. of Geology & Geophysics
Texas A&M University, MS-3115
College Station, TX 77843-3115
Ph: 409-845-2488
Fx: 409-847-9313
mathewson@geo.tamu.edu
Rodger W. McKain
Vice President & General Manager
SOFCo EFS
1562 Beeson St.
Alliance, OH 44601
Ph: 330-829-7878
rodger.w.mckain@mcdermott.com
Michael W. McLanahan
President
McLanahan Corporation
200 Wall St., PO Box 229
Hollidaysburg, PA 16648-0229
Ph: 814-695-9807
Fx: 814-695-6684
mikemcl@mclanahan.com
Emmanuel R. Merle
President
Energy Trading Corporation
164 Mason St.
Greenwich, CT 06830
Ph: 203-618-0161
Fx: 203-618-0454
thion@mindspring.com
Paulette Middleton
Director
ESPC
2385 Panorama Ave.
Boulder, CO 80304
Ph: 303-442-6866
Fx: 303-442-6958
paulette@rand.org
www.rand.org
Clifford R. Miercort
President & CEO
The North American Coal Corporation
14785 Preston Rd, Ste. 1100
Dallas, TX 75240-7891
Ph: 972-448-5402
Fx: 972-661-9072
clifford.miercort@nacoal.com
Jeffrey Miller
Managing Editor
Definitive Solutions Company, Inc.
880 Corporate Park Dr., Ste 220
Cincinnati, OH 45242
Ph: 513-719-9150
Cell: 513-678-5456
Fx: 513-719-9130
jeff_miller@dsc-online.com
ELECTRONIC FILING, RECEIVED, CLERK'S OFFICE, JANUARY 5, 2007
* * * * * PC #7 * * * * *
98
Janie Mitcham
President
TX Region/Wholesale Dept.
Reliant Energy
PO Box 45467
Houston, TX 77210-4567
Ph: 713-207-3700
Fx: 713-207-9720
jmitcham@reliant.com
Benjamin F. Montoya
Chairman, President & CEO
Public Service Company of New Mexico
Alvarado Sq., MS-2824
Albuquerque, NM 87158
Ph: 505-241-2754
Fx: 505-241-2322
Michael G. Mueller
Vice President
Ameren Energy Fuels & Services Co.
PO Box 66149, Mail Code 611
St. Louis, MO 63166-6149
Ph: 314-554-4174
Robert E. Murray
President & CEO
Murray Energy Corporation
29325 Chagrin Blvd., Ste. 300
Pepper Pike, OH 44122
Ph: 216-765-1240
Fx: 216-765-2654
bobmurray@coalsource.com
Ram G. Narula
Bechtel Fellow & Principal Vice President
Bechtel Power Corporation
5275 Westview Dr.
Frederick , MD 21703
Ph: 301-228-8804
Fx: 301-694-9043
rnarula@bechtel.com
Georgia Ricci Nelson
President
Midwest Generation
440 S. LaSalle St., Ste. 3500
Chicago, IL 60605
Ph: 312-583-6015
Fx: 312-583-4920
gnelson@mwgen.com
George Nicolozakes
Chairman
Marietta Coal Company
67705 Friends Church Rd.
St. Clairsville, OH 43950
Ph: 740-695-2197
Fx: 740-297-8055
marietta@1st.net
Mary Eileen O’Keefe
Director
Pegasus Technologies
1362 N. State Parkway
Chicago, IL 60610
Ph: 312-482-9701
Fx: 312-482-9703
maryeileenokeefe@aol.com
Umit Ozkan
Associate Dean for Research
College of Engineering & Professor of Chemical
Engineering
Ohio State University
167 Hitchcock Hall, 2070 Neil Ave.
Columbus, OH 43210
Ph: 614-292-6623 (Dept)
Ph: 614-292-2986 (College)
Fx: 614-292-9615
ozkan.1@osu.edu
www.che.eng.ohio-state.edu/facultypages/ozkan.html
Daniel F. Packer
President
Entergy New Orleans
PO Box 61000
New Orleans, LA 70161
Ph: 504-670-3622
Fx: 504-670-3605
dpacker@entergy.com
ELECTRONIC FILING, RECEIVED, CLERK'S OFFICE, JANUARY 5, 2007
* * * * * PC #7 * * * * *
99
Fredrick D. Palmer
Exec. Vice President
Peabody Energy
701 Market St.
St. Louis, MO 63101-1826
Ph: 314-342-7624
Fx: 314-342-7614
fpalmer@peabodyenergy.com
Timothy J. Parker
(Awaiting new address)
Earl B. Parsons, III
Vice President-Fuels
Southern Company
600 N. 18
th
St., 14N-8160, PO Box 2641
Birmingham, AL 35291
Ph: 205-257-6100
Fx: 205-257-0334
eabparso@southernco.com
Craig E. Philip
President & CEO
Ingram Barge Company
One Belle Meade Place 4400 Harding Rd
Nashville, TN 37205-2290
Ph: 615-298-8200
Fx: 615-298-8213
philipc@ingrambarge.com
William J. Post
President & CEO
Arizona Public Service Company
PO Box 53999, Station 9036
Phoenix, AZ 85072-3999
Ph: 602-250-2636
Fx: 602-250-3002
Stephen M. Powell
SKSS
1800 N. Meridian St, Ste 1511
Indianapolis, IN 46202
Ph: 317-920-8652
Fx: 317-554-6209
powellsm@iquest.net
Robert M. Purgert
Vice President
Energy Industries of Ohio
6100 Oaktree Blvd, Ste. 200
Independence OH 44131
Ph: 216-643-2952
Fx: 216-643-2901
purgert@energyinohio.com
William Raney
President
West Virginia Coal Assn.
PO Box 3923
Charleston, WV 25339
Ph: 304-342-4153
Bill Reid
Managing Editor
Coal Leader
106 Tamarack St.
Bluefield, WV 24701-4573
Ph: 304-327-6777
Fx: 304-327-6777
billreid@netscope.net
George Richmond
President
Jim Walter Resources, Inc.
PO Box 830079
Birmingham, AL 35283-0079
Ph: 205-481-6100
Fx: 205-481-6011
grichmond@jwrinc.com
James F. Roberts
President & CEO
RAG American Coal Holding Inc.
999 Corporate Blvd, 3
rd
Fl.
Linthicum Heights, MD 21090
Ph: 410-689-7500 (7512)
Fx: 410-689-7511
jroberts@rag-american.com
ELECTRONIC FILING, RECEIVED, CLERK'S OFFICE, JANUARY 5, 2007
* * * * * PC #7 * * * * *
100
Karen Roberts
Regional Manager, Coal Supply
Xcel Energy
PO Box 1261
Amarillo, TX 79170
Ph: 806-378-2505
Fx: 806-378-2790
karenr@swps.com
Daniel A. Roling
First Vice President
Merrill Lynch
Four World Finance Ctr., 19
th
Fl.
New York, NY 10080
Ph: 212-449-1905
Fx: 212-449-0546
daniel_roling@ml.com
Margaret L. Ryan
Editorial Director, Nuclear/Coal Group
Platts, The McGraw-Hill Companies Inc
1200 G St, NW, Ste 1100
Washington DC 20005
Ph: 202-283-2160
margaret_ryan@platts.com
William B. Schafer, III
Managing Director
NexGen Coal Services
710 Sunshine Canyon
Boulder, CO 80302
Ph: 303-417-417-0444
Fx: 303-417-0443
bschafer@nexgen-group.com
Debbie Schumacher
Women in Mining
915 Mayfair Dr.
Booneville, IN 47601
Ph: 812-922-8524
Fx: 813-922-5711
wolfie66@email.msn.com
Michael J. Sierra
President & CEO
The Ventura Group
8550 Lee Highway, Ste 450
Fairfax, VA 22031-1515
Ph: 703-208-3303
Fx: 703-208-3305
msierra@theventuragroup.com
Ann E. Smith
Vice President
Charles River Associates
1201 F St. NW, Ste 700
Washington DC 20004
Ph: 202-662-3872
Fx: 202-662-3910
asmith@crai.com
Chester B. Smith
CEO
The Medford Group
5250 Galaxie Dr, Ste 8A
Jackson, MS 39206
Ph: 601-368-4583
Fx: 601-368-4541
chestervision@aol.com
Daniel D. Smith
President
Norfolk Southern Corporation
Three Commercial Place
Norfolk, VA 23510-9239
Ph: 757-629-2813
Fx: 757-664-5117
dzsmith@nscorp.com
Dwain F. Spencer
Principal
SIMTECHE
13474 Tierra Heights Rd.
Redding, CA 66003-8011
Ph: 530-275-6055
Fx: 530-275-6047
bwanadwain@aol.com
ELECTRONIC FILING, RECEIVED, CLERK'S OFFICE, JANUARY 5, 2007
* * * * * PC #7 * * * * *
101
David F. Surber
Syndicated Environmental TV Producer/
Journalist Producer/Host
Make Peace With Nature TV Show
PO Box 15555
Covington, KY 41015-0555
Ph: 859-491-5000
Fx: 513-291-5000
surber@surber.com
surber@makepeacewithnature.com
Wes M. Taylor
President
Generation Business Unit
TXU Energy
1601 Bryan St., 42
nd
Fl.
Dallas, TX 75201-3411
Ph: 214-812-4699
Fx: 214-812-4758
wtaylor1@txu.com
Michael D. Templeman
Manager, Public & Government Affairs
Alliance Coal LLC
771 Corporate Dr., Ste 1000
Lexington, KY 40503
Malcolm R. Thomas
Exec. Vice President
Charah Environmental, Inc.
2266 Anton Road, PO Box 813
Madisonville KY 42431
Ph: 270-825-3677 ext. 27
Fx: 270-821-6364
mthomas@charah.com
Paul M. Thompson
Energy Consultant
216 Corinthian
Lakeway, TX 78734
Ph: 512-608-0672
pmthompson23@austin.rr.com
Frank L. Torbert, Jr.
President
FLT Trading, Inc.
110 Roessler Rd, Ste 200B
Pittsburgh, PA 15220-1014
Ph: 412-531-9533
Fx: 412-531-4846
ftorbert@flttrading.com
www.flttrading.com
Arvin Trujillo
Executive Director
Division of Natural Resources
The Navajo Nation
PO Box 9000
Window Rock, AZ 86515-9000
Ph: 928-871-6592/6593
Fx: 928-871-7040
dirdnr@email.com
Steve Walker
President
Walker Machinery
PO Box 2427
Charleston, WV 25329
Ph: 304-949-6400
swalker@walker-cat.com
John L. Waltman
Vice President
DM&E Railroad
140 North Phillips Av, PO Box 1260
Sioux Falls, SD 57101
Ph: 605-782-1222
Fx: 605-782-1299 Cell: 605-321-8445
jwaltman@dmerail.com
Kathleen A. Walton
Director
(awaiting new address)
Doris Kelley-Watkins
(awaiting new address)
ELECTRONIC FILING, RECEIVED, CLERK'S OFFICE, JANUARY 5, 2007
* * * * * PC #7 * * * * *
102
Alan W. Wendorf
Exec. Vice President
Fossil Power Technologies Group
Sargent & Lundy
55 E. Monroe St
Chicago, IL 60603
Ph: 312-269-6551
Fx: 312-269-3681
alan.w.wendorf@sargentlundy.com
James F. Wood
President & CEO
Babcock Power Inc.
82 Cambridge Street
Burlington, MA 01803
Ph: 781-993-2415
Cell: 303-351-0766
Fx: 781-993-2499
powerjim@aol.com
Lillian Wu
Consultant
Corp. Tech. Strategy Development
IBM Corporation
Route 100, MD 2434
Somers, NY 10589
Ph: 914-766-2976
Fx:914-766-7212
NCC Staff
Robert A. Beck, Exec Vice President
1730 M St NW, Ste 907
Washington DC 20036
Ph: 202-223-1191
Fx: 202-223-9031
robertabeck@natcoal.org
Larry B. Grimes, General Counsel
1730 M St NW, Ste 907
Washington DC 20036
Ph: 202-223-1191
Fx: 202-223-9031
larrygrimes@msn.com
Richard A. Hall, CPA
1420 Beverly Rd, Ste 140
McLean, VA 22101-3719
Ph: 703-821-5434
Fx: 703-761-4006
Pamela A. Martin, Executive Assistant
1730 M St NW, Ste 907
Washington DC 20036
Ph: 202-223-1191
Fx: 202-223-9031
pmartin@natcoal.org
Not Yet Official
Robert O. Agbede
Advanced Technology Systems
639 Alpha Drive
Pittsburgh, PA 15238
Ph: 412-967-1900 ext. 203
Fx: 412-967-1910
ragbede@atsengineers.com
ELECTRONIC FILING, RECEIVED, CLERK'S OFFICE, JANUARY 5, 2007
* * * * * PC #7 * * * * *
102
Appendix D
THE NATIONAL COAL COUNCIL
COAL POLICY COMMITTEE ROSTER
Robert E. Murray
President & CEO
Murray Energy Corporation
29325 Chagrin Blvd., Ste. 300
Pepper Pike, OH 44122
Ph: 216-765-1240
Fx: 216-765-2654
bobmurray@coalsource.com
Ram G. Narula
Bechtel Fellow & Principal Vice President
Bechtel Power Corporation
5275 Westview Dr.
Frederick , MD 21703
Ph: 301-228-8804
Fx: 301-694-9043
rnarula@bechtel.com
Georgia Ricci Nelson
(Chair)
President
Midwest Generation
440 S. LaSalle St., Ste. 3500
Chicago, IL 60605
Ph: 312-583-6015
Fx: 312-583-4920
gnelson@mwgen.com
Mary Eileen O’Keefe
Director
Pegasus Technologies
1362 N. State Parkway
Chicago, IL 60610
Ph: 312-482-9701
Fx: 312-482-9703
maryeileenokeefe@aol.com
Stephen M. Powell
SKSS
1800 N. Meridian St, Ste 1511
Indianapolis, IN 46202
Ph: 317-920-8652
Fx: 317-554-6209
powellsm@iquest.net
Wes M. Taylor
President
Generation Business Unit
TXU Energy
1601 Bryan St., 42
nd
Fl.
Dallas, TX 75201-3411
Ph: 214-812-4699
Fx: 214-812-4758
wtaylor1@txu.com
Malcolm R. Thomas
Exec. Vice President
Charah Environmental, Inc.
2266 Anton Road, PO Box 813
Madisonville KY 42431
Ph: 270-825-3677 ext. 27
Fx: 270-821-6364
mthomas@charah.com
ELECTRONIC FILING, RECEIVED, CLERK'S OFFICE, JANUARY 5, 2007
* * * * * PC #7 * * * * *
103
Appendix E
THE NATIONAL COAL COUNCIL
STUDY WORK GROUP ROSTER
Sy Ali
Clean Energy Consulting Corp.
Ph: 317-839-6617
Syali1225@aol.com
Barb Altizer
Eastern Coal Council
Ph: 276-964-6363
Fx: 276-964-6342
barb@netscope.net
Tom Altmeyer
Arch Coal Inc
Ph: 202-333-5265
taltmeyer@archcoal.com
Dan Arvizu
CH2M Hill
Ph: 720-286-2436
Fx: 720-286-9214
Cell: 303-619-7485
darvizu@ch2m.com
Dick Bajura
National Research Center for Coal & Energy
West Virginia University
Ph: 304-293-2867 (ext. 5401)
Fx: 304-293-3749
bajura@wvu.edu
Eric Balles
Babcock Borsig Power, Inc.
Ph: 508-854-4004
Fx: 508-853-2572
Cell: 508-615-1136
eballes@bbpwr.com
Janós Beér
Massachusetts Institute of Technology
Ph: 617-253-6661
Fx: 617-258-5766
jmbeer@mit.edu
Jackie Bird
Ohio Dept. of Development
Ph: 614-466-3465
Fx: 614-466-6532
jbird@odod.state.oh.us
Sandy Blackstone
Natural Resources Attorney/Economist
Ph: 303-805-3717
Fx: 303-805-4342
sblackstone@ssbg.net
Andrew Blumenfeld
Arch Coal, Inc.
Ph: 314-994-2900
Fx: 314-994-2919
ablumenfeld@archcoal.com
Judy Brown
Kennecott/US Borax
Ph: 202-393-0266
brownju@kennecott.com
Bill Brownell
Hunton & Williams
Ph: 202-955-1500
Fx: 202-778-2201
bbrownell@hunton.com
ELECTRONIC FILING, RECEIVED, CLERK'S OFFICE, JANUARY 5, 2007
* * * * * PC #7 * * * * *
104
Bob Brubaker
Porter, Wright, Morris & Arthur
Ph: 614-227-2033
Fx: 614-227-2100
rbrubaker@porterwright.com
Frank Burke
(Chairman)
CONSOL R&D
Ph: 412-854-6676
Fx: 412-854-6613
FrankBurke@consolenergy.com
Fred Bush
Savage Industries
Ph: 801-263-9400
Fx: 801-261-6638
fredb@savageind.com
Tami Carpenter
Duke Energy
Ph: 704-382-2707
Fx: 704-382-9840
tscarpen@duke-energy.com
Sonny Cook
Duke Energy
Ph: 704-382-2707
Fx: 704-382-9840
dgcook@duke-energy.com
Ernesto Corte
Gamma-Metrics
Ph: 858-882-1200
Fx: 858-452-2487
ecorte@thermo.com
Hank Courtright
Electric Power Research Institute
Ph: 650-855-8757
Fx: 650-855-8500
hcourtri@epri.com
Stu Dalton
Electric Power Research Institute
Ph: 650-855-2000
Fx: 650-855-2800
sdalton@epri.com
Kyle Davis
Manager
MidAmerican Energy
Ph: 515-281-2612
Fx: 515-242-3084
KLDavis@midamerican.com
Bill DePriest
Sargent & Lundy
Ph: 312-269-6678
Fx: 312-269-2499
william.depriest@sargentlundy.com
Richard Eimer
Dynegy Marketing & Trade
Ph: 217-876-3932
Fx: 217-876-7475
rich_eimer@dynegy.com
Ellen Ewart
Resource Data International
Ph: 720-548-5515
Fx: 720-548-5007
eewart@ftenergy.com
eewart@resdata.com
Joel Friedlander
The North American Coal Corporation
joel.friedlander@nacoal.com
Steve Gehl
Electric Power Research Institute
Ph: 650-855-2000
Fx: 650-855-2800
sgehl@epri.com
ELECTRONIC FILING, RECEIVED, CLERK'S OFFICE, JANUARY 5, 2007
* * * * * PC #7 * * * * *
105
Janet Gellici
American Coal Council
Ph: 303-431-1456
Fx: 303-431-1606
jgellici@americancoalcouncil.org
Shawn Glacken
TXU Energy
Ph: 214-812-4452
Fx: 214-812-2884
shawn_glacken@txu.com
Jerry Golden
Tennessee Valley Authority
Ph: 423-751-6779
Fx: 423-751-7545
jlgolden@tva.gov
Tom Grahame
Department of Energy
Ph: 202-586-7149
Fx: 202-586-7085
thomas.graham@hq.doe.gov
Mike Gregory
The Northern American Coal Corporation
Ph: 972-448-5443
Fx: 972-661-9072
mike.gergory@nacoal.com
Larry Grimes
The National Coal Council
Ph: 202-223-1191
Fx: 202-223-9031
larrygrimes@msn.com
Manoj Guha
Energy & Environmental Services
Ph: 614-451-3929
manojguha@sbcglobal.net
John Hanson
Joy Global, Inc.
Ph: 414-319-8500
Fx: 414-319-8510
jnha@hii.com
Howard Herzog
Massachusetts Institute of Technology
Ph: 617-253-0688
Fx: 617-253-8013
hjherzog@mit.edu
Jerry Hollinden
URS Corporation
Ph: 502-217-1516
Fx: 502-569-3326
jerry_hollinden@urscorp.com
Connie Holmes
National Mining Association
Ph: 202-463-2654
Fx: 202-
cholmes@nma.org
Steve Jenkins
URS Corporation
Ph: 813-397-7807
Fx: 813-874-7424
steve_jenkins@urscorp.com
Judy Jones
Public Utilities Commission of OH
Ph: 614-644-8226
Fx: 614-466-7366
judy.jones@puc.state.oh.us
Bob Kane
Department of Energy
Ph: 202-586-4753
robert.kane@hq.doe.gov
ELECTRONIC FILING, RECEIVED, CLERK'S OFFICE, JANUARY 5, 2007
* * * * * PC #7 * * * * *
106
Gary Kaster
American Electric Power
ggkaster@aep.com
John Kinsman
Edison Electric Institute
Ph: 202-430-5630
jkinsman@eei.org
Ron Litzinger
Edison Mission Energy
Ph: 949-798-7912
Fx: 949-752-6431
rlitzinger@edisonmission.com
John Marion
ALSTOM Power Inc.
Ph: 860-285-4539
Cell: 860-424-1657
john.l.marion@power.alstom.com
Jim Martin
Dominion Energy
Ph: 804-819-2176
Fx: 804-819-2219
james_k_martin@dom.com
Mike McLanahan
McLanahan Corporation
Ph: 814-695-9807
Fx: 814-695-6684
mikemcl@mclanahan.com
Georgia Nelson
Midwest Generation
Ph: 312-583-6015
Fx: 312-583-4920
gnelson@mwgen.com
Harvey Ness
Lignite Energy Council
Ph: 701-258-7117
Fx: 701-258-2755
hness@lignite.com
Ed Rubin
Carnegie-Mellon University
rubin@cmu.edu
L. Scott
Peabody Energy
lscott@peabodyenergy.com
Dwain Spencer
SIMTECHE
Ph: 530-275-6055
Fx: 530-275-6047
bwanadwain@aol.com
Michael Stroben
Duke Energy
mwstrobe@duke-energy.com
John Vella
Edison Mission Energy
Ph: 949-798-7935
Fx: 949-225-7735
jvella@edisonmission.com
Jerry Weeden
NiSource
Ph: 219-647-5730
jbweeden@nisource.com
Dick Winschel
CONSOL Energy
4000 Brownsville Rd
South Park, PA 15129
Ph: 412-854-6683
Fx: 412-854-6613
dickwinschel@consolenergy.com
ELECTRONIC FILING, RECEIVED, CLERK'S OFFICE, JANUARY 5, 2007
* * * * * PC #7 * * * * *
107
John Wolfmeyer
Duke Energy
Ph: 704-382-4017
Fx: 704-382-9849
jcwolfme@duke-energy.com
John Wooten
Peabody Energy
Ph: 314-342-7560
Fx: 314-342-7562
jwooten@peabodyenergy.com
ELECTRONIC FILING, RECEIVED, CLERK'S OFFICE, JANUARY 5, 2007
* * * * * PC #7 * * * * *
108
Appendix F
CORRESPONDENCE BETWEEN THE
U.S. DEPARTMENT OF ENERGY
& THE NATIONAL COAL COUNCIL
ELECTRONIC FILING, RECEIVED, CLERK'S OFFICE, JANUARY 5, 2007
* * * * * PC #7 * * * * *
109
Appendix G
CORRESPONDENCE
FROM INDUSTRY EXPERTS
ELECTRONIC FILING, RECEIVED, CLERK'S OFFICE, JANUARY 5, 2007
* * * * * PC #7 * * * * *
110
Comments on R&D Needs for Coal Related Global GHG Management (re Draft NCC Report)
Alex Green, University of Florida, aesgreen@ufl.edu
Essential Comment
: Some attention was given to natural processes in the Terrestrial Sequestering section of the May
2000 and in this NCC report. However, the writer believes that the forestry-agriculture component of coal related GHG
management deserves more R&D emphasis via two thrusts and possible combinations of these thrusts:
T1
) Co-utilization of some CO
2
neutral biomass with coal in electrical generation.
T2
) Increasing natural carbon dioxide sequestering by restoring soil organic carbon in agriculturally depleted areas, by
fostering the growth of trees and by constructing long lived wooden or carbon structures
Background:
Nature over billions of years developed photosynthesis and plants that extract CO
2
from the atmosphere
and convert it to biomass via reactions such as
5CO
2
+ 5H
2
O + solar energy
Æ
C
5
H
10
O
5
+ 5 O
2
The use of biomass for energy, human-kinds oldest technology, simply completes a CO
2
neutral cycle:
C
5
H
10
O
5
+ 5O
2
Æ
5CO
2
+ 5H
2
O + heat energy
Nature, has also developed natural biological and physical processes (coalification) that transform
biomass successively into peat, lignite, sub-bituminous bituminous and anthracite coal. Somewhat
similar natural de-oxygenating processes changed some types of plant matter into oil and natural gas.
The several hundred million year deposits of coal, oil and natural gas since the Carboniferous age
became a vast storehouse of underground solar energy. However, since the industrial revolution
human withdrawals from this bank have been at very high rates and oil and natural gas deposits will
probably be depleted in few decade. However, since coal, widely distributed on the globe, should last
two or three centuries, it is prudent, to use this resource in eco-friendly ways.
IC on CDF (T1):
An International Conference (IC) on Co-utilization of Domestic Fuels (CDF) was held at the
University of Florida on February 5 and 6, 2003. The main purpose of the CDF conference was to examine various CDF
technologies and their energy, environmental and economic benefits. Particular attention was given to co-use of coal
with biomass (wood, agricultural residues, municipal solid waste, bio-solids, etc.) in eco-friendly thermo-chemical
reactors for electrical generation, waste disposal and for production of gaseous fuels, liquid fuels and chemicals.
The CDF conference participants included 8 senior academics from abroad 12 from the USA, 32 utility persons or
persons from engineering firms supporting utilities, 10 from government agencies or organizations advising government
agencies (including NCC's Bob Beck and Irene Smith, a CDF expert from UK), one Sierra Club representative, and 3
experts from a forestry conference then assembled in Gainesville. Table 1 gives the list of conference sponsors.
To set the stage for discussions at the CDF conference three books [1-3], two recent reports [4,5] and a compact disc [6]
of a Florida report on renewables in electrical generation were distributed at registration. The CDF conference
proceeding are available in CD form and selected papers will be published in a special issue of IJPES.[7]
Global Aspects:
The GHG emissions problem is a global one and proposed solutions must be examined from a global
perspective with serious consideration of the policies of other countries on GHG emissions. . Figure 1 shows the global
fuel shares in % (see www.iea.org). Since it is important to be mindful of the location of the decimal place note that
over the globe, renewables (non-GHG energy sources) are at the same order of magnitude as oil, coal, natural gas and
nuclear. Among the renewables, combustible renewable and waste (CRW) are at 11% and hydro at 2.3% whereas solar
is only at 0.04% and wind at 0.03 %..
ELECTRONIC FILING, RECEIVED, CLERK'S OFFICE, JANUARY 5, 2007
* * * * * PC #7 * * * * *
111
Table 1 lists the total primary energy supply (TPES) for various regions of the world or country groupings. The TPES
in the 2
nd
column are in Mtoe ( Mtoe=one million tons of oil equivalent = 42
*
10
15
joules = 0.040 quads = 40.10
12
BTU)
The Organization for Economic Co-operation and Development (OECD) countries are here subdivided into OECD-Pac
(Pacific for Japan, Korea, Australia and New Zealand), OECD-Europe, and OECD-NA (North America for USA,
Canada and Mexico). Column 2 gives the regions TPES. Column 3 gives the percentage of the TPES that is
combustible renewable and waste (CRW). Column 4 gives the percentage of the other renewable components (hydro-
electric, geothermal, wind, solar and tide/wave/ocean).
The large CRW levels for Africa, Asia, China, and Latin America in Table 1 reflect large residential consumption of
biomass for home cooking and heating. In view of population growth in these geographic areas the ability of annual
biomass resources to keep up with these residential needs is a matter of concern. In these regions CDF technologies
might be developed in which coal or natural gas is used in small percentages to enhance the efficiency of biomass
utilization. On the other hand in developed regions where CRWs are now in low percentages a proven CO
2
management strategy would be to rebuild the use of biomass to a larger percentage of TPES.
The extra row at the bottom of Table 2 gives specific data for the USA. The USA with 4.6% of the global population
accounts for about 24% of the global energy consumption and some 24% of global CO
2
emissions. Developing and
fostering practical CDF systems in the USA to facilitate greater use of CO
2
neutral biomass energy could help the
USA’s balance its military leadership by environmental leadership.
The USA has considered returning to the use of wood and other forms of biomass since the oil crises of 1973.
Residential use of wood increased strongly nationwide and biomass generating capacity gradually built up to
6 Gigawatts by 1990. California with favorable legislation led the way, however, by 1995 half of the
California biomass power industry shut down. Today biomass is regaining attention both as a GHG
management and for energy security. A number of states are mandating or otherwise encouraging the use of
renewables in the electric generating mix. In most geographic locations biomass stands out as the only
renewable that can significantly be expanded in the next decade or two via CDF technologies.
Table 3 illustrates representative solid fuel properties that resulted from the "coalification" process. Columns
2-4 give representative ultimate analyses in weight % corrected to apply for dry, ash, sulfur and nitrogen free
feedstock. The 5
th
and 6th columns give total volatiles (V
T
) and fixed carbon (FC) also in wt%.. The 7
th
column gives heating value (HVs in MJ/Kg). The 8th and 9
th
columns give energy density, (E/vol, in MJ/liter)
and estimated relative char reactivities. Biomass has advantages of high volatility and char reactivities that
make conversions from solids to more useful gaseous or liquid fuels relatively easy. On the other hand coals
have advantages of global abundance, high HVs, high energy densities and other features that fosters low
costs. Technologies for co-utilizing biomass with coal enable the useful properties of one fuel to assist the
thermal processing of the other.
Since 1992 the European Union has actively pursued co-utilization of coal and biomass [8-10], (see additional
references in [4]) as a means of bringing more advanced technologies to bear on the use of biomass, and as a CO
2
mitigation measure. The costs and availability of biomass in various parts of the globe have been studied extensively in
this context [11]. A recent European Union White Paper [12] projects the growth of biomass use from 3.1% of their
total energy in 1995 to 8.5% in 2010. By taking advantage of regions with abundant sunshine and rain the USA could
easily match or exceed this goal. To some experts our emphasis on R&D towards zero emission technologies or
hydrogen as the solution of our emission problems is distracting the USA from pursuit of doable near term measures
that can benefit the environment and the economy and restore USA's environmental leadership. .
Terrestrial CO2 Sequestering (T2)
: As summarized on page 11 of the May 2000 NCC report and on page 16 of this
report and in the literature [13] GHG management can be fostered by restoring forests, soil organic carbon (SOC) and
the use of long lived wood or carbon structures. The possibility of restoring SOC with mildly oxidized low rank coal is
an R&D area that seems worth pursuing [14]. Going from lignite back to peat and other modest manipulations of
nature’s coalification processes does not seem as remote as zero-emissions. Research on optimum combinations of T1
ELECTRONIC FILING, RECEIVED, CLERK'S OFFICE, JANUARY 5, 2007
* * * * * PC #7 * * * * *
112
and T2 is sorely needed. In R&D projects, in contrast to demonstration projects, we appear to be overlooking the
possibility of modest improvements upon nature’s ways in favor of "all or nothing" moon -shots type methods. Getting
plant people together with the coal people to examine and possibly improve upon of nature’s ways is probably the
fastest way of bringing more renewables into our energy mix and also enhancing carbon sequestration.
Table 4 list why “the farmers and the miners should be friends” a theme that has been almost as hard to sell as
getting the farmers and the cow-men to be friends after the Oklahoma land-rush.
References
[1] A. Green, ed. (1981),
An Alternative to Oil, Burning Coal with Gas
, University Presses of Florida. Gainesville FL.
[2] A. Green, ed. (1980),
Coal Burning Issues
, University Presses of Florida. Gainesville FL.
[3] A. Green and W. H. Smith, Eds. Acid Deposition Causes and Effects Eds. Government Institutes Inc.,Rockville,
MD
[4] A. Green,
A green alliance of biomass and coal (GABC)
. Appendix F. in Increasing coal –fired generation through
2010: challenges & opportunities, Report of the
The National Coal Council (NCC)
, May 2002: (also published in Proc.
of the 28
th
Intern. Conf. Clearwater FL March 2003, 689-700)
[5] I.M. Smith, & K. Rousaki,
Prospects for co-utilisation of coal with other fuels - greenhouse gas emissions
reduction
(London, UK: IEA Coal Research, 2002).
[6]
Florida Public Service Commission and the Department of Environmental Protection
An assessment of renewable
electric generating technologies for Florida, CD. February 2003
[7] A. Green, Proceedings of the International Confernce on Co-utilization of Domestic Fuels (to be published)
[8] J. Bemtgen, K. Hein, A. Minchener, (1994),
Cogasification of coal/biomass and coal/waste mixtures
, European
Union Clean Coal Technology Programme 1992-1994, Stuttgart.
[9] Rohan Fernando,
Experience of indirect cofiring of biomass and coal
, IEA Clean Coal Centre, October 2002.
[10] Klaus Hein, Sven Unterberger, Roland Berger, Jorg Maier Biomass Utilization in Europe- Present Status and
Future Options, 1127-1138, Proc. of the 28
th
Intern. Conf. Clearwater FL March 2003
[11] European Commission 1998, Biomass Energy: Data, Analysis and Trends Proc. Conf. Paris France March
[12] European Communities (2001) Towards a European Strategy for the Security of Energy Supply.
[13] R. Lai et al.( 1998) Potential of US Cropland to Sequester Carbon and Mitigate the Greenhouse Fffect, Sleeping
Bear Press , Chelsea, MI
[14] A. Green (2001) What to do with CO2. Paper 2001-GT-1 presented at the International Gas Turbine Institute
meeting , New Orleans
ELECTRONIC FILING, RECEIVED, CLERK'S OFFICE, JANUARY 5, 2007
* * * * * PC #7 * * * * *
113
Table 1: List of Sponsors
1) United States Department of Energy
2) Mick A. Naulin Foundation
3) College of Engineering, University of Florida
4) Division of Sponsored Research, University of Florida
5) School of Forest Resources and Conservation,
6) Public Utility Research Center, University of Florida
7) Florida Agricultural Experiment Station
8) National Rural Electric Cooperative Association
9) Triangle Consulting Group
10) Science and Technology Corporation
11) Green Liquids and Gas Technologies
12) Fuel and Combustion Technology Division, ASME
13) Coal, Biomass and Alternative Fuels Committee, IGTI
14) Florida Department of Agriculture & Consumer Services, Division of Forestry
15) International Association of Science and Technology for Development
Table 2: Total Primary Energy and Renewable Indicators
Region
TPES
(Mtoe)
CRW
(%)
Other (%)
Africa
508
49.6
1.3
Latin America
456
17.1
10.8
Asia
1123
31.5
2.5
China
1158
18.5
1.7
Former USSR
921
1.2
2.1
Middle East
380
0.3
0.5
Non-OECD-
Eu
95
5.3
4.6
OECD Europe
1765
3.9
3.1
OECD Pacific
847
1.7
2.2
OECD NA
2705
3.6
2.8
Total
9957
11.0
2.8
USA
2300
3.4
1.6
ELECTRONIC FILING, RECEIVED, CLERK'S OFFICE, JANUARY 5, 2007
* * * * * PC #7 * * * * *
114
Table 3. Solid fuel properties along coalification path
Table 4: Why “the farmers and
the miners should be friends”
I.
What can Biomass do for Coal
A)
Co-firing Biomass with Coal
1) Lower CO
2
, SO
2
and NOx emissions
2) Foster renovation and ecofriendly use of coal facilities
3) Foster IGCC, IG-cogen, CHP and chemical factories.
B)Co-gasifying Biomass with Coal
1) Facilitate conversion to useful gases and liquids
2) Provide important environmental roles for coal
3) Facilitate capture of toxics (mercury, arsenic…)
C) CO
2
Sequestration, Nature's Way
1) Federal, state land reforestation, new parks
2) Interstate highway plantings
3) Urban forestation (elms)
4) Wood buildings and long lived carbon products
5) Restore agriculturally depleted lands
D
)
Phytoremediation
1) Restoration of mined lands
2) Foster phyto-mining
3) Remediate toxic sites
II. What can Coal do for Biomass?
A. Make Opportunity fuels competitive
1) Lower capital cost of co-utilization (co-firing)
2) Foster use with turbine generators (co-gasifying)
B. Provide economic agricultural alternatives
1) Energy crops
2) Use of agricultural residues
3) Disposition of problem plant matter
4) Overcome biomass-use problems
III.
What can friends do for the Globe?
A. Foster greening of planet earth
1) Lower CO
2
, pollution and toxic emission problems
2) Foster advanced environmental technologies
3) Foster phyto-remediation, phyto-mining
B. Facilitate economic recovery
1) Develop a biomass market and supply infrastructure
2) Foster biomass to liquid fuels and chemicals
3) General development of fuel co-utilization
From the Musical Oklahoma
The farmer and the miner should be friends
Oh the farmer and the miner should be friends
One likes to plant a tree, the other likes to set
coal free
but that's no reason they caint be friends
Energy folks should stick together
Energy folks should all be pals
Miners dance with farmers daughters
Farmers dance with miners gals
Repeat
Rank
Ultimate Analysis Proximate Analysis
Other properties
Name
C
H
O
VT
FC
HV
E/vol
React
Cellulose
44
6
50
88
12
10
9
1600
Wood
49
7
44
81
19
18
11
500
Peat
60
6
34
69
31
23
18
150
Lignite
70
5
25
58
42
27
27
50
Sub Bitum
75
5
20
51
49
30
36
16
Bitum
85
5
10
33
67
33
49
5
Anthracite
94
3
3
7
93
34
58
1.5
ELECTRONIC FILING, RECEIVED, CLERK'S OFFICE, JANUARY 5, 2007
* * * * * PC #7 * * * * *
115
Appendix H
ACKNOWLEDGEMENTS
The members of the Council wish to acknowledge, with sincere thanks, the special assistance
received from the following persons in connection with various phases of the development of
this report:
Julie Clendenin,
Editor
Pam Martin,
NCC Staff
Lorna Schlutz,
CONSOL Energy, R&D
David Surber,
Make Peace With Nature TV Show
ELECTRONIC FILING, RECEIVED, CLERK'S OFFICE, JANUARY 5, 2007
* * * * * PC #7 * * * * *
Ron R. BLAGOJEVICH!
GOVERNOR
RENEE CIPRIANO, DIRECTOR
2
1 7/785-4140
TDD
2
1
71782-4 143
March 30,
2004
Docket
ID
No. OAR 2003-0053
Air
Docket
U.S.
Environmental Protection Agency
Mail Code 61 02T
1200 Pennsylvania
Ave,
NW
Washingion, DC 20460
Re:
Proposed Rule to Reduce Interstate Transport of Fine Particulate Matter and Ozone
(Interstate Air Quality Rule) January 30,2004, 69
Federal Register
4566
To
Whom It May Concern:
The llllnois Environmental Protection Agency (Illinois EPA) appreciates this opportunity to
comment
on the U.S. Environmental Protection Agency's (U.S.
EPA's)
"Proposed Rule to
Reduce Interstate Transport of Fine Particulate Matter and Ozone" referred
to
herein as the
Interstate Air Quality Rule. These comments are provided to supplement the testimony I
presented on behalf of the Illinois EPA at the public hearing held in Chicago on February 26,
2004.
Illinois EPA fully supports U.S. EPA's efforts to reduce the levels of transported pollutants. We
urge U.S. EPA to move fonvard with an aggressive national control program to reduce interstate
transport of ozone
and
fine particulate matter. We have several concerns rezarding the
shortcomings of the proposed Interstate Air Quality Rule, and we urge U.S. EPA to amend its
proposed rules in a manner that will provide greater regional reductions of nitrogen oxides
(NOx)
and sulfur dioxide
(SOz)
in a time frame that is consistent with expected attainment
deadlines for both the 8-hour ozone and fine particulate matter National Ambient Air Quality
Standards (NAAQS). 11 I inois EPA considers further reduction of these emissions from Fossil
fuel fired power plants
to
be practicable, warranted, cost-effective and long
overdue.
Further,
Illinois EPA is concerned that the proposed Interstate Air Quality Rule omits important sources
that contribute
to
interstate pollutant transport.
RQCKFOR~
-
4
102 Nolttl
Marc
Stre~t,
Rockfurd,
I1
61 103 - (8151 987-7760
.
DF~
PLAINES
- 951
1
W Harr~son
51
, De< Plalnes, IL 6001 6 - (847) 294-4000
~LCIN -
545
50~1th
Stare
EIpn. IF 601 23 -
(847)
608-31 ;1
PEORIA - 541
5
IU
Urilve~s~tv
51,
Peolla I1 61
614
- 1309) 643-5463
Hwnr~u
OF
LAY>
- PFOR~A
-
7b20
N Unluersttv St, P~orla, IC 6161
4
-
(3091
6Q3-5462
CHAUPAILN - 21
25
South
Firs: S(re~t, Ch~nil~al~n,
IL
63820
-
(21
7)
276-5800
SPKINC~LFL.~
- 1500
5
S.x~h
Street Rd
,
Sp~~n~f~eld,
IL
61706
- (217)
786-bD92
COLLINEVILCE - 2009 Mall Street, Coll~nsv~lle,
11 62234 -
(blH)
346-51
20
Mnk!r~td
- 2304
W
Mabn
ST,
5u1te 116, Marlon, 11
61459
- I61
8)
s93-7100
ELECTRONIC FILING, RECEIVED, CLERK'S OFFICE, JANUARY 5, 2007
* * * * * PC #7 * * * * *
Attainment of the NAAQS
Illinois has recent1
y
provided recommendations to U.S. EPA to
designate
portio~ls of the Chicago
and East St. Louis rnetropolilail areas as nonattainment areas for the fine particulate matter
NAAQS and the S-hour ozone NAAQS. It is likely that these areas will be required
to
attain
each of these air quality slandards by 2010. Ambient air quality n~easureinents at rural monitors
in Illjnois clearly show that there arc significant background concentrations of these pollutants, at
levels that approach the NAAQS, which are the result of transport. The high levels of these
pollutants will make it virtually rmpossjble fo~
Illinois to attain the NAAQS by the sratutory
deadlines without a strong regional. and even national, approach to reducl~ig them. U.S. EPA's
own
technical analysrs used to support this rule shows that even with the proposed controls,
portions of the Chicago metropolitan area will not meet either tlie fine particulate matter or 8-
hour ozone NAAQS by
201
5,
five years after the required attainmenl date. We believe that
greater seductions in transported pollutants can and should be required, and that the reductions
mzlst occur soon enough for states to include them in their plans to attain the 8-hour ozone and
fine particulate matter standards by the proposed federal attainment deadlines.
Altl~ough U.S. EPA has not finalized its &hour ozone implementation policy guidance
ox
issued
its PM2.5 irnplenlentation policy guidance, it appears that 201 0 is the likely attainment year for
areas iu Illinois that are not meeting the 8-hour ozone and fine particulate matter standards. In
our opinion, supported by U.S. EPA's modeling, the Interstate Air Quality Rule does not provide
sufficient emission reductions to reduce the impacts of interstate transport by 203 0, especially for
ozone. Consequently, the Illinois EPA recommends that state emission budgets for NOx for
electrical generating units, or EGUs, be tightened during the ozone season. The NOx SIP Call
requires a regionat NOx emission cap of
5
15.400
tons per ozone season. The Illinois EPA
recommends that an emissions cap be retained for the ozone season for the NOx SIP Call region,
and
that the level of the cap be seduced to 41 0,000 tons per ozone season beginning in 201 0.
Illinois
believes that the Xnlerstate Air Quality rule should apply to the >&state region pIus the
District of Columbia alternative proposed by U.S. EPA for NOx and also for
SO2.
Based on a
30-state region plus D.C., the NOx emission cap for EGUs should be
set
at
7
-45
million tons, and
the
SOz
em~ssion
cap
should be
set at
3.5 million tons annually by 2010. This level of reduction
would still
fall within the range of reductions considered "highly cost effective" under the NOx
SIP Call (See.
gerrerallv,
63 FR 57399-47402 (October 27, 1998)).
Subpart 1 of the Clean Air Act provides for the possibility of extending the fine particulate
matter attainment
date until 201 5. Illlinais EPA, therefore, recommends that a second phase of
NOx
and
SOz
emission reducrions should occur by that year. Accordingly, Illinois EPA
recommends that the 30-state and D.C. region annual NOx emissions
cap
for EGUs be seduced
to
a level of
1.26
rnil1101-1 tons on an annual basis beginning in 201 5, and that
SOz
emissions from
EGUs be capped
to
a
level of 2.1
1
million tons annually.
Control of Non-EGUs
U.S. EPA did not include non-EGUs in the proposed Interstate Air Quality Rule NOx emissions
cap, and the Illiilois EPA strongly urges U.S. EPA to reconsider its proposal in this regard,
U.S.
EPA ~ncluded certain categories of non-EGUs in the NOx SIP Call and in doing
so,
madc the
ELECTRONIC FILING, RECEIVED, CLERK'S OFFICE, JANUARY 5, 2007
* * * * * PC #7 * * * * *
determinahon tllal seasonal
reductio~zs
of NOx based on an emission limit of 0.1
5
Ibs
NOxlmmBtu would be liigl~l
y cost effective. Pursuant to the NOx SIP Call, Illinois' non-EGUs
are required to reduce thc~r NOx em~ssions on a seasonal hasis by 7,284 tons. If U.S EPA
included the non-EGUs ill tlie Interstate Air Quality Rule at the
same
level of control required
pursuant to the NOx SIP Call, then llltnois' non-EGUs would be required to control their
NOx
elnissions on an annual basis. resulling in an additional reduction of 10,092 tons of NOx
emissions per year. U7e recommend that U.S. EPA include highly cost effectwe
NOx
controls at
non-EGUs in the Intersraze F\lr Quahty Rule.
We
also
urge U.S. EPA to propose, as part of this n~leznaking, conrrols on NOx emissions from
stationary intenla1 combustion engines and lo require these coi~trols on an annual basis U.S.
EPA's actions with regards lo
his
source category as part of Phase I1 of the NOx SIP Call are
JOII~ overdue. In addition, th~s tulemaking should also require lhat existing
NOx
cot~trols on
cement kilns, inlposed as part of llie NOx
SIP
Call, be applied on an annual basis.
Emissions Tradinq
llli~lciis has been recognized as a leader in the area of enlissions trading, and based on oul-
experience with a number of eir~iss~or~s
trading programs, we concur with the concept of an
interstale trading program to he admilzistered as part of the Interstate Air Quality Rule. We are
concerned, however, that the hankrng of the Acid Rairr Program SOz emission allowances may
delay full irnpfernentatlon of contl-01s and may hinder the states'aability to meet their attainment
deadlines.
We urge U.S. EPA to severely ljrnit the number of
SOT
allowances that can be
banked.
Illinois supports the integration of the trading program under the Interstate Air Quality Rule with
the existing
NOx SIP Call trading program, provided that the NOx SIP Call emission caps are
retained and reduced dunng the ozone season until 201 5. A well-designed and properly
implemented emissions trading progam, including both EGUs and non-EGUs in a combined
program, will not only help ensure that emission reductions are cost effective but will act~~ally
promote greater emission seduc lions, as financial resources are directed to sources with the
greatest emission reduction polential. We do not support interpollutan~ trade under any
cir~umstances.
We recommend that both NOx and SOz allowances be given to the states to be allocated at the
States' discretion, includrng the dlscretjon to allocate some of their allowances for energy
efficiency
purposes.
Re~onaE Haze Pro~ram Consistency
While
tt is clear that additional reductions from EGUs are warranted and achievable,
we
must
take all available steps to provide the electric power industry
with
a reasonable degree of
certainty regarding future regulatory requirements. The industry must be given the opportunity
to
plan for the most cost-effective set of compliance options. Thus, U.S. EPA should ensure that
the Interslate Air Quality Rule conforms to the Regional Haze requirements of the Clean Air Act
and is so structured that it will meet the requirements that U.S. EPA will ultimately propose to
address Regional Haze, including requirements for Best Available Retrofi~ Technology (BART).
ELECTRONIC FILING, RECEIVED, CLERK'S OFFICE, JANUARY 5, 2007
* * * * * PC #7 * * * * *
Acid
Rain
Atlowances
On page 4626 of the proposal, U.S. EPA states that SIPS may
need
to require the retirement or
elirn~natjon of certaln Title IV allowailces under the Acid Rain Program. Tlus obligation raises
several issues. While nlost states have the authority to adopt more stringent
S021NOx
emission
limits, or can require compliance with their own trading programs established for purposes that
are different from the Acid Rain program, it is not clear what authority states would have to
require retirement of allowances issued by U.S. EPA under Title
TV.
U.S. EPA should clarify in
the final rule how a state can require a source to retire or eliminate allowances that have been
given under the federal
Acid
Rain Prngi.am.
Section 126
U.S.
EPA
included language
In
the proposal regarding section 126 petitions. Illino~s EPA agrees
that an aggressive control program that eliminates signifjcant contributions from interstate
transpofl would be the preferred remedy, but as stated previously,
we
are concerned that this
rule,
as proposed, wrll not resolve a!] interstate tral~sport problems. However, if U.S. EPA
proceeds to adopt an Interstale Air Qt~ali
ty Rule, there shouId be a moratorium
017
Section
1
26
petitions untll states have conlpleted their attainment demonstrations, and can de~nonstrate that
further regional reduct~o'ns are requ~red. We recommend that this rnoratosiunl should be
contingent upon states' compliance with the rule
as
adopted.
Technical Comments
While we applaud the efforts of U.S. EPA staff to evaluate the impact of the proposed Interstate
Air Quality Rule through photochemical modeling, we must note that the U.S. EPA modeling
would
fall far short of he~ng acceptable as a SLP submittal from
a
State.
We support the
technical comments prepared by the Lake Michigan Air Directors Consortium (LADCO) on
behalf of its member States.
A
copy of their comments is included as an attachment.
The Illinois EPA does not support the use of growth factors derived from the PM model and
acknowledges U.S. EPA's efforts to develop a more equitable approach. However, U.S. EPA's
Technical Support documentatlon does not adequately explain the methodology employcd in this
proposal. Consequently we are unable
to
understand how the heat input values used to calculate
states' budgets were derived. We urge U.S. EPA to provide a more thorough discussion of its
methodology,
and
provide another opportunity for states to comment on the accuracy of the
calcularions.
The Illinois EPA appreciates this opportunity to conlrnent on the U.S. EPA's Interstate Air
Quality Rule. If you have any questions regarding our comments, please contact Laurel L.
Kroack, Manager of the Dlvislon of Air Pollution Control, at 21
7/785-4140.
Sincerely,
-----+
Renee Cjpriano
Director
Attachments
ELECTRONIC FILING, RECEIVED, CLERK'S OFFICE, JANUARY 5, 2007
* * * * * PC #7 * * * * *
March
22,2004
Lake Michigan
Air
Directors Consortium
Technical Comments: Rule to Reduce
Interstate
Transport of Fine Particulate
Matter and Ozone (interstate Air Quality Rule)
(1)
LADCO
Modeling: To assess the impact of the proposed emission reductions,
LADCO performed air quality modeling. A summary of this modeling is provided in the
attached repod ("Interstate Air Quality Rule: Modeling Analysis", March 22, 2004). The
key
findings of this modeling are as follows:
rn
The proposed SOX
and NOx emission reductions, in combination with
expected federal and
state controls, will reduce ozone and fine particle
concentrations,
and
improve visibility
levels
in the eastern U.S.
Although
future
year design values are estimated to below the ambient
standards
in many counties, residual ozone and fine particle
nonattainment problems exist in a number of urban areas in the
eastern
U.S.
a
Future year visibility levels are estimated to be on (or below) the "glide
path" towards natural conditions in
many Class I areas in the eastern U.S.
The modeling results are qualitatively similar to those reported by
USEPA
in their Federal Register notice and "Technical Support Document for the
lnterstate
Air
Quality Rule, Air Quality Modeling Analysis" (January 2004).
It should be noted that there are several limitations with this analysis, including less than
desirable model performance for various
PM2.5
species
(e.g.,
nitrates and organics},
concerns with emission estimation methodologies
for several source categories, and
use of growh and control factors of unknown quality.
As
such, the modeling results are
not definitive and
should only be viewed as qualitative in nature (i.e., approximating
the
improvement in air quality, but not defining a specific level of [future] air quality). More
reliable modeling will be performed over the next couple of years to support SIP
development. Nevertheless, some modeling now
to
assess the air quality benefits of
the
proposed rule is appropriate both to serve as the
basis
for commenting on the
proposed rule
and
helping direct initial control strategy work.
(2) Use
of
USEPA
Modeling Guidance: We support use of
USEPA'S
modeling guidance
and encourage
USEPA
to finalize these draft documents (i.e., "Draft Guidance on the
Use
of Models and Other Analyses in Attainment Demonstrations for the 8-Hour Ozone
NAAQS",
EPA-454/R-99-004,
May 1999 and "Guidance for Demonstrating Attainment
of Air Quality Goals for PM2 and Regional Haze", draft 2.1, January
2,
2001 $.
We also wish to make several comments
related
to this guidance:
ELECTRONIC FILING, RECEIVED, CLERK'S OFFICE, JANUARY 5, 2007
* * * * * PC #7 * * * * *
March
22,2004
m
We encourage
USEPA
to follow its modeling guidance in conducting its air
quality analyses. With
the respect to the modeling performed for the
proposed rule, for example, it is not
clear
that
USEPA
has followed its own
guidance for model selection, episode selection, emissions inventory
development,
and evaluating model performance. USEPA even
suggested
that its analyses are not sufficient to demonstrate attainment
(e.g.,
Page 4599:
"It
is not feasible at this time to identify the levels of
emissions reductions from sources of regional transport and reductions
from local sources
that will lead to attainment of the PM standards. Much
technical remains as States develop their
SIPS,
including improvements in
local emissions inventories, local area and subregional air quality
analyses, and impact analysis of
the
effects and
costs
of local
controls.")
a
We encourage USEPA to provide software programs for applying its
attainment and
reasonable progress tests.
USEPA
is apparently using in-
house
software, which it is unable to provide to states for their use in
calculating future year design values for ozone and
PM2.5.
TO ensure
consistency
(and avoid misinterpretations) in applying USEPA's tests,
USEPA
should make the attainment software programs available. This is
necessary to enhance the credibility of the state attainment
demonstrations.
Although we agree with
USEPA'S
use of the models in a relative way to
assess the air quality impact of the proposed emission reductions, we
believe that additional analysis should
be
conducted to justify such use of
the models.
USEPA
stated that the negative effects of relatively poor
model performance for some
PM2.5
chemical species is mitigated
to
some
extent by using the model predictions in a relative way. To add credibility
to the modeling analysis,
we believe that
USEPA"
performance
evaluation should consider not just the absolute model results, but the
relative results, as wet!.
USEPA's
modeling guidance recommends
"...evaluating
model
performance in a way
which
is
closely related to how
models
are used to support attainment and reasonable progress
demonstrations."
These diagnostic evaluations are identified by
W
S EPA
as being more important
than
operational evaluations, which is what
USEPA has done as part of
the
modeling for the proposed rule. We,
therefore, encourage
USEPA
to conduct a relative model performance
evaluation.
a
Finally,
USERA
used
one
approach far estimating future year
design
values for ozone and another approach for PMZ5. We encourage
USEPA
to resolve this discrepancy and adopt a consistent approach for both
ozone
and
PM2.5.
ELECTRONIC FILING, RECEIVED, CLERK'S OFFICE, JANUARY 5, 2007
* * * * * PC #7 * * * * *
March
22,2004
(3)
Modeling Inventory:
We
have concerns about
the
use
of
the 1996 National
Emissions lnventoly (NEI) as the basis for
USEPA's
modeling inventoty. In particular,
we believe that this inventory is out-dated, and that more current information is available
and should be
used (e.g., USEPA's
1999
NEI
data).
Additional inventory concerns are as follows:
€GUS:
For
EGUs, USEPA
used state-level adjustment factors for deriving
the 2001 "proxy" inventory, and possibly for the
2010
and 2015 future year
inventories. This appr~ach treats all plants in the state the same, which
may or may not be the case, in light plant-by-plant differences in
compliance with Title IV and the
NOx
SIP call.
We believe
that the plant-
level data from IPM should be used instead. The plots below show The
difference in emissions for these two cases.
.-
Kg/day
131
78
15
Differences in SOX (!eft)
and
NOx (right)
emissions between using plant-
level
and stafe-level adjustments for the
201 Obase in
wentory
Proposed
EGU
Caps:
USEPA
should clarify the level of emission
reductions expected in 201 0 and 201 5 associated with the proposed
emission caps. Based on
USEPA'S
modeling files, it appears that the
USEPA
expects the annual EGLl emissions in the affected states to be
5.4M
tons (not 3.9M tons) and
1.7M
tons (not
1.6M
tons) for
SOX
and
NOx, respectively, in 201 0; and 4.7M tons (not
2,JM
tons) and 1.5M
tons
(not t .3M tons) for
SOX
and NOx, respectively, in 201 5. The higher
emissions
modeled by USEPA account for
banked
emissions under the
Title IV program. Given the significance difference in air quality due to the
banked emissions (as demonstrated by our modeling),
USEPA
should
acknowledge the true (lesser) emission reductions expected from the
proposed rule.
ELECTRONIC FILING, RECEIVED, CLERK'S OFFICE, JANUARY 5, 2007
* * * * * PC #7 * * * * *
March
22,2004
Ammonia: Reliable estimates of the amount and temporal pattern of
ammonia emissions are important in the modeling. Although
USEPA
has
provided little or no information concerning ammonia emissions, we
believe that USEPA is using emissions information which may be out-
dated (e.g., temporal profiles derived by model-to-monitor comparisons,
rather
than actual process-level data). We encourage
USEPA
to use up-
to-date methodologies for estimating these emissions.
a
Other Sectors: USEPA has stated that its baseline emissions inventory
used
for its modeling has "some known gaps"
(page
4599).
Efforts
to
improve the inventory to correct
these problems should be undertaken. In
addition, little or no information is provided by
USERA
concerning biogenic
emissions
(e.g.,
what meteorological data were used, including PAR
values) and dust emissions
(e.g.,
how was the transportable fraction of
PM2.5
estimated}. These source categories can produce unrealistically
large
emission estimates, if not handled properly. Clarification of the
methodology used by
USEPA
for these categories should be provided.
(4) Validity
of
USEPA's
Zero-Out Modeling:
USEPA
conducted
modeling
in which it
eliminated ("zeroed-out")
the anthropogenic
SOX
and
NOx
emissions in individual
states.
USEPA should be aware that we are having our contractor develop a source
apportionment methodology for fine particles.
To supplement
USEPA's
zero-out
modeling for
PM2.5,
we offer
some
preliminary
source
apportionment results. The plots
below compare the impact on sulfate levels from an imaginary large
SOX
source
located
in the Midwest using the zero-out method and the new source apportionment method.
On the first day presented (July
21,
the two methods produce very consistent results.
On the other day (July
4),
however, the source apportionment
method
indicates
substantially greater impact. (Note, our contractor
is convinced that this is credible and
can
be
explained
by understanding
the
underlying conditions associated with sulfate
production.) Thus, it
would appear that the zero-out method is reliable and may, in
some
cases, even underestimate the impact from large
SOX
sources on sulfate levels.
Zero
Out
PSAT
Tracer
hgt Sourcr
--
Region6
Large Source
--
Acglon
8
PS04
P504
Sulfate concentrations for
zero-out
(/eft)
analysis v. PSA T (right) analysis for July 2, 2001
ELECTRONIC FILING, RECEIVED, CLERK'S OFFICE, JANUARY 5, 2007
* * * * * PC #7 * * * * *
March
22,2004
Zero
Out
PSAT
Tracer
Luge Source
--
Rcglon 6
PS
04
Sulfate concentrations for
zero-out
(left) analysis v. PSA T (right) analysis for July 4,200
I
One
other comment on
USEPA's
zero-out modeling is what we believe it
says
about
transport
for
PM2.5. Based
on
the results
in
Appendix
H of
USEPA's
modeling technical
support
document (and supplemental information provided via e-mail on February 9,
2004),
we prepared the following summary of
contributions
to
PM2,5~i~lation~,
(Note, all
nonattainment sites in a given state were averaged together to produce the single
values for that state presented here.) The figure indicates that
SOX
and
NOx
sources
from nearby states (within that Regional Planning Organization) have a large impact on
a given urban nonattainment problem, but also that
transport from SOX
and NOx
sources located in more distant states (in other Regional Planning Organizations) is an
important factor. (Note, it is our understanding that the difference between the "other"
amount shown in the figure represents anthropogenic emissions other than
SOX
and
NOx, and natural emissions.)
Cl
WRAP
1
MANEW
CENRAP
Per
ce
nt
CO
ntri
but
ion
5
fa
PM
-2.5
no
nat
ent sites
ELECTRONIC FILING, RECEIVED, CLERK'S OFFICE, JANUARY 5, 2007
* * * * * PC #7 * * * * *
March
22.2004
(5) Potential Applicability to Regional Haze:
USEPA
has requested public comments on
'Yhe
extent to which the reductions achieved by these rules would, for States covered by
the
VAQR,
satisfy the first long
tern
strategy for regional haze, which is required to
achieve reasonable progress towards the national visibility goal by
205
8."
USERA
has
also requested comment on whether the proposed emissions reductions would satisfy
the Best Available Retrofit Technology
(BART) requirements under the CAA for the
affected
EGUs
in
the affected states.
In response,
we wish
to
note that our modeling analyses (see attached modeling report)
show that the proposed emission reductions may be sufficient to meet the reasonable
progress
goals in many Class I areas located in and impacted by emissions from our
States.
With respect to the issue of satisfying the BART requirements, we do not believe that
USEPA
has provided sufficient information for us to comment. As
USEPA
knows, the
CAA requires consideration of several factors in determining BART, including the costs
of compliance, the energy and non-air quality environmental impacts of compliance,
any
existing
pollution control technology in use at the source, the remaining useful life of
the
source,
and
the
degree of improvement in visibility which may reasonably be anticipated
to result
from the use of such technology. We do not believe that
USEPA
has provided
this
information for the affected sources and, thus, are unable to comment on this issue.
It is
clear, however, that the BART requirement remains in place for the other 25
BART-
eligible source categories and states will be required to conduct the necessary BART
analyses for sources in these other (non-EGU) categories.
(6) Adequacy of Proposed Emissions Reductions: It may be premature to comment on
the adequacy of the proposed
SOX
and
NOx emissions reductions
from EGU sources.
The relative amounts of regional and local reductions needed for attainment should be
estimated
prior to finalizing this
rulemaking.
This is because once USEPA establishes
the federal requirement for emission reductions for certain source categories
(i.e,,
EGUs),
some
states are prohibited by state statute from imposing more stringent
requirements.
We agree with
USEPA's
statement about the need to "set up a
reasonable balance of regional and local controls
to
provide a
cost
effective and
equitable governmental approach to attainment with the
NAAQS
for fine particles and
ozone ." (Page
46
1
2)
Furthermore, we believe that this determination is the responsibility of the state
governments.
(USEPA
acknowledges this on page 4585: 'Yhe
CAA
places the
responsibility for
controls needed for attainment on both upwind States and their
sources, and on local
sources.")
Consequently, we intend to perform initial attainment
analyses later
this year (or early next year) to estimate what it will
take
to meet the
ambient standards for ozone and
PM25,
and the reasonable progress goals for haze.
We will share
the
results of
these
analyses with
USEPA
at that time and hope that
USEPA
will c~nsider them prior to finalizing this rulemaking.
ELECTRONIC FILING, RECEIVED, CLERK'S OFFICE, JANUARY 5, 2007
* * * * * PC #7 * * * * *
March
22,2004
Finally, we believe that
USEPA
should continue to study and, if appropriate, require
regional emission
reductions for other pollutants,
especially
ammonia. (On
page
4583,
USEPA
has requested comment on its decision to not regulate other components of
transported PM2.5.)
Our preliminary model sensitivity
analyses
(see
plots below)
indicate that reducing ammonia emissions is effective in reducing
PM2.5
concentrations
on a broad spatial scale, especially during the winter. Independent analyses of air
quality
data by our contractor also showed ammonia-limited conditions in portions of the
upper Midwest, including several urban areas
(see
"The Effects of Changes in Sulfate,
Ammonia,
and Nitric Acid on Fine PM Composition at Monitoring Sites in Illinois,
Indiana, Michigan, Missouri, Ohio, and Wisconsin,
2000-2002", February 20,
2004,
C.
Blanchard).
In
addition, USE
PA's
source apportionment studies (page 4605) found that
back
trajectories
point to areas with high ammonia emissions in the upper Midwest,
suggesting
the effects of transport. Furthermore, we believe that a consistent federal
approach
may
be the
most
effective way to regulate emissions from the major ammonia
sources. Thus, we
encourage USEPA
to look carefully at the need for requiring
regional
ammonia emission reductions.
Changes in PM2,#oncentrations associated with a
30%
reduction in
NOx
(left),
SOX
(middle), and ammonia (right) emissions for winter
(fop)
and
summer
(bottom) periods
ELECTRONIC FILING, RECEIVED, CLERK'S OFFICE, JANUARY 5, 2007
* * * * * PC #7 * * * * *
March
26.
2004
Lake
Michigan
Air
Drrector Consortium
Interstate Air Quality Rule: Modeling Analysis
The purpose of this document is to summarize the modeling performed by the Lake
Michigan Air Directors Consortium to assess the air quality benefits of the proposed
Interstate Air
Quality
Rule (69
FR 4566).
The
key findings
of the modeling are as
follows:
o
The
proposed
SOX
and
NOx
emission reductions, in
combination
with
expected
federal and state
controls, will
reduce
ozone and
fine
particle
concentrations, and imprave
Gsibiliw
levels in the eastern U.S. (Note, if
"banked"
SOX
and
NOx
emissions are accounted for, then the air quality
benefit is less than that associated with the proposed emission caps.)
J
Although future year design values are estimated to
bellow
the ambient
standards
in
many counties, residual ozone and
PM2.5
nonatfainrnent
problems exist in a number of urban areas in the eastern
U.S.
rn
Future year visibility
levels
are estimated to be on (or below) the
"glide
path" towards
natural
conditions in many
Class
I areas in the eastern
U.S.
*
The modeling results are qualitatively similar to those reported by WSEPA
in their Federal Register notice and "Technical
Support
Document for the
Interstate Air Quality Rule, Air Quality Modeling Analysis" (January 2004).
Modeling Overview
The elements of the modeling are as follows:
tn
Model:
CAMx
DornainlGrid:
Eastern U.S. domain at 36 km
(see box in
"red"
to
the
right)
Year:
2002 (full year)
Scenarios:
1999base
(Base E)
I
1
201 Obase
201
Ocontrol
(IAQR emissions reductions}
201
OcontroCaltemative (IAQR reductions
wlo
"banked" emissions)'
201
5base
201 Scontrol (IAQR emissions reductions)
201 5controCalternative (IAQR reductions
wfo
"banked" emissions)"
1
This scenario
reflects the
proposed ern~ssion caps
ELECTRONIC FILING, RECEIVED, CLERK'S OFFICE, JANUARY 5, 2007
* * * * * PC #7 * * * * *
March
26,
2004
It should be noted that there are several limitations with this analysis, including less than
desirable
model performance for various
PM2.5
species
(i.e.,
sulfates, nitrates, and
organics), concerns with emission estimation
methodologies
for several
source
categories, and use of
growth
and control factors of unknown quality. As such. the
modeling results
are
not definitive and should only be viewed as qualitative in nature
(i.e.,
approximating the improvement in air quality, but
not defining a specific
level of
[future] air quality). More reliable modeling will be performed over the next couple of
years to support SIP development. Nevertheless, some modeling now to assess the air
quality
benefits
of
the
proposed rule is appropriate bath to serve as the basis for making
comments
on the proposed
rule
and to
help
direct initial
control
strategy work.
Modeling Inventory
LADCO prepared a base year modeling inventdry using
USEPA's
National Emissions
Inventory for
1999 (version
2.01,
with
the following improvements:
Point Sources:
Utility temporal profiles based on analysis of CEM data
Mobile Sources:
Based on MOBILE6
Ammonia:
Monthly and hourly livestock emissions based on new
temporal profiles from Rob Finder; dairy cow emissions
based on Rob Pinder's model; monthly fertilizer application
emissions derived
using a consistent national profile ; and
eliminated emissions for people and
pets
(dogs
and
cats)
Dust:
Other:
Fires:
Biogen
ics:
Spatial:
Temporal:
Emissions reduced
to reflect the transportable fraction
of
fugitive
dust
Updated Canadian emissions inventory
(I
995 data)
Eliminated
NEI (and
CMU)
fire
emissions
Used
810ME3, with
updated
meteorology and PAR values
Revisedlcorrected surrogates
for
other area
(including
ammonia), nonroad, and mobile sources
Revisedlcorrected profiles for point, other area, nonroad,
and mobile; profile for recreational marine based on
Wisconsin data
Documentation
far
the 1999
Base
E inventory is provided at
h~p:I/www.ladco.orqltech/emislBaseEJbaseEreo.pf.
A cursory comparison of Base
E to
USEPA's
4996 and 2007 (proxy) inventories showed mixed results
(i.e., for
some
source categories and pollutants, Base E compared better with the 1996 inventory, for
others, with the 2001 inventory).
ELECTRONIC FILING, RECEIVED, CLERK'S OFFICE, JANUARY 5, 2007
* * * * * PC #7 * * * * *
March
26,
2004
The
2010
and 2015 base inventories were derived by adjusting the 1999 base inventory
to reflect expected growth and control.
The
adjustment
factors
are based on data
supplied by USEPA for
1 9962, 2001
'q3,
~oIo'~,
and 201
53.
The adjustment factors
were calculated based
on
the
ratio of 2010
to
2001
and 201 5 to 2001 emissions. (Note,
in light of
the
comparisons between
the
1999
Base
E
inventory
and USEPA's 1996 and
2001 inventories, use of the 2001
inventory
to derive these factors provided a
somewhat consewative estimate.)
Adjustment factors were calculated based on the following source, pollutant, and
geographic classes:
Source: EGU (applied to
elevated
point source file),
Non-EGU (applied to low point
source file), Area
(wlo
livestock and
wl
livestock), Motor Vehicles, and Non-Road
Pollutant: VOC,
NOx,
CO, 502,
PM2.5,
PWcoarse, and
NH3
Geography: state-specific
for
IL,
IN, MI, OH,
and
Wl; and
region-specific
for CENRAP
(north), CENRAP (south), MANEW,
VISTAS,
and
WRAP
The
201
0
and
201
5 control inventories
were
derived by adjusting the 201
0
and 201 5
base inventories to reflect the additional SOX and
NOx
reductions from the proposed
rule.
The
adjustment factors were based on data supplied by USEPA. An alternative
set of adjustment factors were also derived to reflect strict compliance with the
proposed emission caps
(i.e.,
elimination of any banked emissions.)
The table below provides a summary of the future year
EGU
emissions for
all
states in
the continental
U.S. (and the 28 states affected by the proposed rule). The following
pages show a graphical
summary
of SOX, NOx, and
VOC
emissions
and
the assumed
changes in elevated point source emissions.
EGU Emissions Summa
y
-
All States
(28 States)
SOX
NOx
2010
Base
9.8M
3.9M
IAQR
6.1M
(5.4M)
2.5M
(7.7M)
'!,.,7~'3
-.
3 l~?
.' ,,;:LI
,
2015
Base
9.2M
4.OM
IAQR
5.4M
(4.7M)
,
j
.:),-,
2.3M
(1.5M)
C*?L~
*
2
'3
.
,
. &
See April 18,2003, e-mail
from Ron
Ryan. EMAD, OAQPS, USEPA to
Mark
Janssen,
LADCO
%ee
May
20, 2003,
amail
from Phil
Lorang,
EMAD,
OAQPS, USEPA
to
Amy
Royden,
STAPPAIALAPCO
4
See
Januaw
14,
2004,
e-mail from Ron
Ryan, EMAD, OAQPS, USEPA
to
Mark Janssen,
LADCO
ELECTRONIC FILING, RECEIVED, CLERK'S OFFICE, JANUARY 5, 2007
* * * * * PC #7 * * * * *
March
26, 2004
25,000,000
r-
--
. ----
1
15,000,000
r Nmroad
a Motor Veh
10,000,000
NonEGUs
5,600,000
rn EGUs
0
25,000,000
20,000,000
15,000,1100
l Nonroad
C)
Motor Veh
10,000,000
NonEGUs
5,000.000
0
I
.
Nwlroad
01
Motor Veh
NonEGUs
I
Domainwide annual SOX (top),
NOx
(middle), and VOC (bottom) emissions
ELECTRONIC FILING, RECEIVED, CLERK'S OFFICE, JANUARY 5, 2007
* * * * * PC #7 * * * * *
ELECTRONIC FILING, RECEIVED, CLERK'S OFFICE, JANUARY 5, 2007
* * * * * PC #7 * * * * *
March
26. 2004
Ozone Modeling Results
Future year design values were calculated in accordance with
USEPA's
modeling
guidance ("Draft
Guidance
on the
Use
of
Models
and
Other Analyses
in
Attainment
Demonstrations for the 8
-Hour
Ozone
NAAQS", EPA454JR-99-004,
May 1 999). The
observed
(base year) design
values
were based
on.2000-2002
air quality data,
consistent with
USEPA's
modeling analysis.
Maps of the design values
are
presented on the following page for the base
case
(2000-
2002
observed data),
201
Obase,
201 OIAQR, and 201
01AQR
without banking. In
addition,
the number of "nonattainment" counties
(i.e.,
design value estimated to be
a'bove the standard) are as follows:
Base Year
201
Obase
201
01AQR
201 Sbase
201 51AQR
State
EPWDCO EPNCADCO EPAAADCO EPNADCO
IL
3
011
011
(1)"
111
017
(l)*
WI
8
315
315 (5)*
215
1/4
(2)*
=
without banked
emissions
Additional analyses were performed to assess the effect
of:
(1) estimating future year
design values using a single high
ozone episode (i.e.,
late June
2002),
(2) using 12 km
grid resolution, and (3)
using
plant-specific emissions projections (based on the IPM
model). Using the
same metric as
above lime.,
number of nonattainment counties), the
results below indicate only a slight difference using episode data (compared to the full
summer) and using
12km
data
(compared to
the
36
krn data).
Base
Year
201
Qbase
20101AQR
State
Summer36 June36 June12
Summer36
June36
June12
IL
3
1
1
2
1
1
2
ELECTRONIC FILING, RECEIVED, CLERK'S OFFICE, JANUARY 5, 2007
* * * * * PC #7 * * * * *
ELECTRONIC FILING, RECEIVED, CLERK'S OFFICE, JANUARY 5, 2007
* * * * * PC #7 * * * * *
March
26. 2004
The differences in elevated point source SOX and NOx emissions with IPM plant-
specific data are shown in the figures below. (Note, in addition
to
the obvious spatial
differences
in emissions, the amount of emissions En the IPM plant-specific data files are
lower.
The
reason for the lower emissions is not clear.)
The results with the IPM plant-specific data show generally lower
future
year design
values
far ozone,
as
might
be expected
with
lowr emission levels:
2010base
201
01AQR
State County
Summer36
IPM(Summer36)
Summer36
lPM(Surnmer36)
IL
Cook
92.7
90.0
91.7
90.2
IN
Hamilton
85.5
85.0
Lake
96.9
94.9
Porter
88.6
87.6
OH Clinton
86.0
84.4
Geauga
90.5
90.4
Lake
88.8
88.3
Lucas
87.2
86.6
Summit
88.8
89.0
W1 Kenosha
97.5
96.9
Milwaukee
88.6
88.0
Ozaukee
88.3
87.6
Rac~ne
89.3
88.7
Sheboygan
92.8
91.6
In
summary,
the modeling results show considerable improvement in future year design
values, but there
are
residual ozone nonattainment problems. These results are similar
to those reported by USEPA.
ELECTRONIC FILING, RECEIVED, CLERK'S OFFICE, JANUARY 5, 2007
* * * * * PC #7 * * * * *
March
26,
2004
PM2.5
Modeling Results
Future year design values were calculated in accordance with
USEPA's
modeling
guidance ('Guidance for Demonstrating Attainment of Air Quality Goals for
PM2.5
and
Regional
Haze",
draft
2.1, January 2,2001). The observed (base year) design values
were based on 2000-2002 air quality data, consistent with
USEPA's
modeling analysis.
Maps of
the base year and future year design values are presented on the following
pages for the base case (2000-2002 observed data), 201
Obase, ZOIOIAQR,
and
201
01AQR
without banking; and the base case (2000-2002 observed data), 201
Sbase,
20151AQR, and ZOTSIAQR without banking. In addition, the number of "nonattainrnent"
counties (i.e., design value estimated to be above the standard) are
as follows:
Base Year
201
Obase
201
OlAQR
201 Sbase
201 SIAQR
State
EPAMDCO EPAlLADCO
EPAllADCO
EPAILADCO
IL
5
415
012
(2)*
314
112
(2)"
V'Jl
0
010
010
(O)*
Of0
010
=
without
banked emissions
Stacked
bar charts are presented (on the page following the design value maps)
showing the chemical speciation of the PM2
5
concentrations in urban areas in the
region. The charts
show
reductions in future year sulfate levels, but relatively little
change in future year organic carbon and nitrate
levels.
Additional
analyses
were performed to assess the effect of using plant-specific
emissions projections (based on the IPM
model).
The results with the IPM plant-
specific data show generally lower future year design values for PM25, as
might
be
expected with lower emission levels:
201
0base
201
OIAQR
State
County
Summer36
IPM(Sumrner36)
Summer36
IPM(Summer36)
II
Cook
19.6
77.9
18.0
16.9
DuPage
15.3
14.0
---
--
Madison
19.5
18.0
17.9
16.7
St.
Clair
16.0
14.8
---
----
W111
15.5
14.0
----
--
IN
Elkhart
15.4
14.3
Lake
17.7
16.1
Marion
17.5
16.4
MI
Kalamazoo
15.0
13.9
Oakland
?
5.6
14.9
Wayne
19.8
19.0
ELECTRONIC FILING, RECEIVED, CLERK'S OFFICE, JANUARY 5, 2007
* * * * * PC #7 * * * * *
March
26,
2004
OH Butler
15.0
Cuyahoga
17.8
Franklin
16.0
Hamilton
16.4
Jefferson
15.9
Montgomery
17.1
Scioto
15.7
Stark
16.6
Summit
15.5
in conclusion, the modeling results show considerable improvement in future
year
design values, but there are residual PM2
5
nonattainrnent problems. These results are
similar to those reported by USEPA.
ELECTRONIC FILING, RECEIVED, CLERK'S OFFICE, JANUARY 5, 2007
* * * * * PC #7 * * * * *
ELECTRONIC FILING, RECEIVED, CLERK'S OFFICE, JANUARY 5, 2007
* * * * * PC #7 * * * * *
ELECTRONIC FILING, RECEIVED, CLERK'S OFFICE, JANUARY 5, 2007
* * * * * PC #7 * * * * *
ELECTRONIC FILING, RECEIVED, CLERK'S OFFICE, JANUARY 5, 2007
* * * * * PC #7 * * * * *
March
26,
2004
Visibility Modeling Results
Future year visibility levels were calculated in accordance
with
USEPA's modeling
guidance
("Guidance
for
Demonstrating Attainment of Air Quality Goals for PM25 and
Regional Haze",
draft
2.1,
January 2,
2001
).
The observed (base year) visibility levels
were based on 2002 air quality data. The modeling results are presented here for eight
nearby Class I areas:
A table of visibility levels
is
provided on the following page for the baseline (estimated
using 2002 air quality data),
TO1
0,
207
5, and "natural" conditions. (The
default
values
in
"Guidance
for Estimating Natural Visibility Conditions Under the
Regional
Haze Rule",
EPA-4541B-03-005, September
2003, were used to
represent natural conditions.) Also
provided
is a graphical depiction
of the
future visibility levels for Shenandoah National
Park
and Seney
National Wildlife
Refuge. As
can
be seen, future year visibility levels
are estimated to be on (or below) the "glide path" towards natural conditions.
ELECTRONIC FILING, RECEIVED, CLERK'S OFFICE, JANUARY 5, 2007
* * * * * PC #7 * * * * *
mow
qr-m
mri4
CVNN
-
al
m
$7
WCUOWb-'
NNN
z
.
rCqo-?Q!(q:
yQ!o
....
ramarco,:
oaok.-. - . ..
N
~rrrr
r a-7-
...
U1
ELECTRONIC FILING, RECEIVED, CLERK'S OFFICE, JANUARY 5, 2007
* * * * * PC #7 * * * * *
March
26.
2004
Seney
National Wildlife Refuge
25
23.8
dv
20
15
70
5
0
2000 2010 2020 2030 2040 2050 2060
I
+
20%
best
+ 20%
worst
Shenandoah National Park
35
30
25
20
15
10
5
0
2000
201
0 2020 2030 2040
2050 2060
-=- 20%
best
-R-
20%
worst
28.9
&
-
-.
24.6 dv
, ,
23.0
dv
I.
I
I
I
I
1
I
-1
-
I
I
I
I
.-
I..
I
,- *
I
I
I
F
I
I
I
I
" ----
I
I
I
I
I
I
t
I
I
ELECTRONIC FILING, RECEIVED, CLERK'S OFFICE, JANUARY 5, 2007
* * * * * PC #7 * * * * *