BEFORE THE ILLINOIS POLLUTION CONTROL BOARD
IN THE MATTER OF :
RECEIVED
)
R04-25
CLERK'S OFFICE
PROPOSED AMENDMENTS TO
)
(Rulemaking - Water)
OCT 0 2 2006
DISSOLVED OXYGEN STANDARD )
35
ILL. ADM. CODE 302.206
STATE OF ILLINOIS
)
Pollution Control Board
NOTICE OF FILING
TO : SEE ATTACHED SERVICE LIST .
PLEASE TAKE NOTICE that on October 2, 2006, we filed the attached Pre-Filed
Testimony of Louis Kollias On Behalf Of The Metropolitan Water Reclamation District of
Greater Chicago In Support Of Proposed Amendments To Dissolved Oxygen Standard with
the Clerk of the Pollution Control Board, a copy of which is herewith served upon you .
METROPOLITAN WATER RECLAMATION
DISTRICT F GREATER CHICAGO
Subscribed and Sworn to
Before me this
2nd
day of
October, 2006
.
By: ~,
Frederick M . Feldman, Its Attorney
47
MWRDGC
Frederick M . Feldman
Ronald M. Hill
Margaret T. Conway
100 East Erie
Chicago, IL 60611
(312) 751-6587 telephone
(312) 751-6598
CERTIFICATE OF SERVICE
1, IJVP
r>,
(k
LI
R ,
being duly sworn on oath, certify that I caused a copy of the
above(lVotice and
attached Pre-Filed Testimony , of Louis Kollias On Behalf Of The
Metropolitan Water Reclamation District of Greater Chicago In Support Of Proposed
Amendments To Dissolved Oxygen Standard to be sent via first-class U
.S. Mail to the
individuals identified on the attached service list, at their address as shown, with proper postage
prepaid, from 100 East Erie Street, Chicago, Illinois, at or near the hour of 4:30
p.m. this 2 nd day
of October, 2006 .
ublic
OFFICIAL SEAL
T T CONWAY
STATE
tY-07-08
Office of the Attorney General
Interested Party
188 W
. Randolph, 20th Floor
Chicago, IL 60601
Gardner, Carton & Douglas
Interested Party
191 N . Wacker Drive, Suite 3700
Chicago, IL 60606-1698
Sonnenschein, Nath & Rosenthal
Interested Party
8000 Sears Tower
233 S . Wacker Drive
Chicago, IL 60606-6404
Illinois Environmental Regulatory Group
Interested Party
3150 Roland Avenue
Springfield, IL 62703
Thom Creek Basin Sanitary District
Interested Party
700 West End Avenue
Chicago Heights, IL 60411
Hedinger Law Office
Interested Party
2601 S
. Fifth Street
Springfield, IL 62703
Fred L. Hubbard, Attorney at Law
Interested Party
16 West Madison, P .O. Box 12
Danville, IL 61834-0012
Illinois Pollution Control Board
Interested Party
100 W . Randolph Street, Suite 11-500
Chicago, IL 60601
SERVICE LIST
Bloomington/Normal Water Reclamation District
Interested Party
P.O. Box 3307
2
IEPA
Respondent
1021 N. Grand Avenue East
P.O. Box 19276
Springfield, IL 62794-9276
Hodge, Dwyer, Zeman
Interested Party
3150 Roland Avenue
P .O. Box 5776
Springfield, IL 62705-5776
Ross & Hardies
Interested Party
150 N . Michigan Avenue, Suite 2500
Chicago, IL 60601-7567
Chemical Industry Council of Illinois
Interested Party
2250 E . Devon Avenue, Suite 239
Des Plaines, IL 60018-4509
American Water Company
Interested Party
727 Craig Road
St. Louis, MO 63141
Vermillion Coal Company
Interested Party
1979 Johns Drive
Glenview, IL 60025
Blackwell, Sanders, Peper, Martin LLP
Interested Party
4801 Main Street, Suite 1000
Kansas City, MO 64112
City of Joliet
Department of Public Works and Utilities
Interested Party
921 E. Washington Street
Joliet, IL 60431
Downers Grove Sanitary District
Interested Party
2710 Curtiss Street
Bloomington, IL 61702-3307
Fox Metro Water Reclamation District
Interested Party
682 State Route 31
Oswego, IL 60543
Dr. Thomas J. Murphy
Interested Party
2325 N . Clifton Street
Chicago, IL 60614
Environmental Law & Policy Center
Interested Party
35 E. Wacker, Suite 1300
Chicago, IL 60601
Office of Lt. Governor Pat Quinn
Interested Party
Room 214 State House
Springfield, IL 62706
City of Geneva
Interested Party
22 South First Street
Geneva, IL 60134-2203
Friends of the Chicago River
Interested Party
22 South First Street
Geneva, IL 60134-2203
3
Downers Grove, IL 60515
Illinois Department of Natural Resources
Interested Party
One Natural Resources Way
Springfield, IL 62702-1271
Barnes & Thornburg
Interested Party
I N. Wacker, Suite 4400
Chicago, IL 60606
Evanston Environment Board
Interested Party
223 Grey Avenue
Evanston, IL 60202
Ecological Monitoring and Assessment
Interested Party
3206 Maple Leaf Drive
Glenview, IL 60025
Brown, Hay & Stephens LLP
Interested Party
700 First Mercantile Bank Building
205 South Fifth Street
P.O. Box 2459
Springfield, IL 62705-2459
Richard J . McGill, Jr., Hearing Officer
Illinois Pollution Control Board
100 West Randolph Street, Suite 11-500
Chicago, IL 60601
ILLINOIS POLLUTION CONTROL BOARD
RECEIVED
CLERK'S
OFFICE
IN THE MATTER OF
)
OCT 0
2
2006
STATE OF ILLINOIS
PROPOSED AMENDMENTS TO R04-25
)
R04-25
Pollution Control Board
DISSOLVED OXYGEN STANDARD
)
(Rulemaking -
Water)
35 ILL . ADM . CODE 302 .206
PRE-FILED TESTIMONY OF LOUIS KOLLIAS ON BEHALF OF THE
METROPOLITAN WATER RECLAMATION DISTRICT OF GREATER CHICAGO
IN SUPPORT OF PROPOSED AMENDMENTS TO DISSOLVED OXYGEN STANDARD
My name is Louis Kollias
. I am the Director of Research and Development (R&D) for the Metropolitan
Water Reclamation District of Greater Chicago ("District")
. I am submitting the following testimony on
behalf of the District in support of the subject proposed amendments to the dissolved oxygen standards
for General Use waters in Illinois
.
I have been the Director of R&D since June 2006
. Prior to that, I had been Assistant Chief Engineer in the
District's R&D Department since January 2003
. As Director of R&D, I supervise the District's R&D
Department, which has a staff of 317
. I have been employed by the District since 1977
.
I hold a Bachelor of Science Degree in Civil Engineering from the Illinois Institute of Technology
. I am a
Licensed Professional Engineer in the State of Illinois and a Board Certified Environmental Engineer in
the American Academy of Environmental Engineers
. I am also currently the President of the Illinois
Water Environment Association .
My responsibilities as the District's Director of R&D include, but are not limited to, the following
:
•
Control of commercial and industrial waste discharges to the District's sewers and the waterways via
the Sewage and Waste Control Ordinance
;
•
Recovery of certain District operating, maintenance, and replacement costs via administration of the
User Charge Ordinance ;
•
Providing analytical laboratory support for the control of commercial and industrial wastes and for
control of treatment and other operations ;
•
Monitoring the water quality of Lake Michigan, Chicago area waterways, and the Illinois Waterway
;
and
•
Conducting basic and applied research on new wastewater and sludge treatment processes
.
The District previously submitted comments in support of the proposed amendments to 35 Ill
. Adm
. Code
302.206
. This testimony is being submitted to address certain other testimony that has been filed, and to
provide information concerning continuous dissolved oxygen (DO) monitoring and how such monitoring
results in Chicago area waterways would have complied with the proposed standards
.
The District appreciates the opportunity to express its views on the pending rulemaking for a DO water
quality standard . We will address three areas :
1 . Comment on the testimony of Thomas J . Murphy .
2. Complexity and cost of conducting the District's continuous DO monitoring program .
3. Compliance with proposed DO standards in Chicago area waterways .
Comment on the Testimony of Thomas J. Murphy
The testimony of Thomas J . Murphy, Ph .D., is very critical of the USEPA (1986) National Criteria
Document and at the same time does not properly acknowledge the current data and research that have
been considered for this proposed amendment to the DO standard . The 1986 document is a foundation
and guideline from which current data and research have been used to substantiate the proposed
amendment.
The USEPA (1986) criteria document noted that a select committee of scientists, established by the
Research Advisory Board of the International Joint Commission, reviewed DO criterion for the Great
Lakes
. The Commission concluded that a simple criterion based on dissolved oxygen concentration (an
average criterion of 6 .5 mg/L and a minimum criterion of 5 .5 mg/L) was preferable to one based on
percent saturation (or oxygen partial pressure) and was scientifically sound because the rate of oxygen
transfer across fish gills is directly dependent on the mean difference in oxygen partial pressure across the
gill and this is directly proportional to dissolved oxygen concentration
. Also, the total amount of oxygen
delivered to the gills is a more specific limiting factor than is oxygen partial pressure
per se . The USEPA
agreed with this conclusion .
In the article by Davis (1975, page 2298) that is cited by Dr
. Murphy in his testimony, a statement is
made that, "It is more conventional for water quality or oceanographic purposes to express water oxygen
levels in terms of their concentration rather than partial pressure
." Davis goes on to state that partial
pressure, percent saturation, and concentration of dissolved oxygen are all interrelated
.
DO concentration in mg/L is easier and more practical to measure, and the vast majority of monitoring
data, and data in the scientific literature relating dissolved oxygen effects on fish communities are based
on this unit of measure. Since the preponderance of current field data and research demonstrates DO
concentration levels in mg/L can be correlated to fish population dynamics, then how is the use of this
parameter not scientifically sound? Using DO saturation by itself could result in situations of 100 percent
DO saturation at high
temperatures with concentrations that are still harmful to fish and invertebrates
. In
low temperatures DO saturation could be very low yet waters could still have sufficient concentrations of
DO to be nonlimiting to the aquatic ecosystem. Dr
. Murphy does not take into account the metabolic rates
of fish at different temperatures
. Fish do not require as much DO in colder conditions
. Davis (1975) states
that it must be emphasized that fish require both the correct oxygen tension (pressure) gradient to move
02
into the blood and sufficient oxygen concentration (amount per volume of water breathed) to fulfill the
requirements of metabolism
.
In addition to these points, DO concentration must be utilized in the standard because it is possible to
control DO concentration through management practices by supplemental aeration and other mechanical
means
. It is much more difficult to control oxygen tension, and oxygen saturation can be extremely
variable
. A standard based on DO concentration in mg/L is practical, easily understandable, and
scientifically defensible
. Dr. Murphy does not make a convincing case for the use of dissolved oxygen
saturation rather than dissolved oxygen concentration as the state standard
.
2
Comments on Continuous Dissolved Oxygen Monitoring Technical and Cost Issues
Selection of DO Monitoring Locations
In order to obtain quality DO data, a monitoring station must be located at a point that is representative of
the waterway DO throughout the station's cross-section. Many physical features such as mixing zones for
wastewater treatment plant outfalls, tributary confluences, CSO outfalls, instream structures that disrupt
flow, oxygen consuming sediment deposits, variability of phytoplankton oxygen production, and thermal
discharges can influence DO uniformity at a waterway monitoring location .
•
The first step in site location is to conduct grab sample DO surveys longitudinally throughout the
waterway system to be monitored to identify reaches where DO is consistently at or below the
applicable IPCB standard . Ideally, these surveys to identify low-DO reaches should continue for at
least one year in order to account for seasonal variability . Once these reaches have been identified,
cross-sectional (depth profile DO readings measured across a transect) are conducted at potential
monitoring locations to verify that DO is uniform across the channel transect . To verify continued
cross-sectional DO uniformity during the monitoring period these surveys must be repeated at least
two and preferably three times per year at each monitoring location . Cost of each of the District's
cross-sectional DO surveys is approximately $80 per monitoring location
.
• In urban areas, DO monitors must be protected from vandalism while deployed in the field
. This is
accomplished by placing the monitors in protective steel housings, typically eight inch diameter
vertical steel pipes with hinged lids secured by a lock
. The submerged portions of these housings are
perforated with numerous circular openings to allow water flow across the DO probe
. Probes
currently used to measure DO require water flow across the probe surface for accurate measurements
.
New optical DO probe technology has eliminated this flow requirement but these probes cost two to
three times as much as the ones they replace
. Because of the flow requirement by the DO probe,
monitors currently deployed by the District frequently record inconsistent DO readings in waterway
reaches that do not have continuous flow
.
•
Protective housings must also be placed in the waterway in such a way that they do not interfere with
commercial or recreational navigation, further limiting monitoring location choices
. Use of vertical
protective housings limits DO monitoring locations to waterway locations with sufficient depth that
have adjacent vertical steel or concrete walls (bridge supports) to which the housings can be attached
.
This limitation in locating the vertical protective housing may result in a DO monitoring location that
may, under certain conditions, be subject to interference from CSO discharges and/or disruptions in
flow patterns by instream structures
. Attachment of these housings to structures owned by public
agencies generally requires issuance of permits which can delay the installation process by months
.
•
An additional limitation on vertical protective housing location is that the housing must be placed in
an area that is accessible for routine servicing by field personnel
. While it is possible to install DO
monitors in protective housings on the bottom of a waterway using short, horizontally-placed pipe
sections secured to both banks by chains, this is a less than ideal monitoring location since it puts the
DO probe closer to oxygen-demanding sediment deposits which can affect the accuracy of DO
readings
. Protective housings installed horizontally on the waterway bottom, due to their weight, can
only be efficiently deployed and recovered by personnel on a boat using an electric winch
. Horizontal
monitor housings are not suitable for installation in small streams since equipment is accessible to
vandals who can wade in the stream .
3
•
Placement of vertical pipe protective housings in small streams presents problems with finding an
area with sufficient water depth, greater than six inches at low-flow, to submerge the DO probe
. The
protective housings are also at risk of being dislodged from their mountings by impacts from large
floating debris during high-flow events and from collisions with recreational or commercial vessel
traffic in the waterway
. Obstruction of the waterway by protective housings also can pose liability
issues for the installing entity from recreational users who claim injury from the installations
.
• Fabrication of the protective housings is done by skilled trades
. Cost for labor and materials to
fabricate a typical vertical protective housing is approximately $2,100
. Vertical protective housings
range between 15 and 30 feet in length and weigh between 350 and 650 pounds
. Installation of these
housings, therefore, requires heavy equipment and skilled-trades labor
. Installation cost for a typical
protective housing used in the District's monitoring program ranges between $1,500 and $2,100
.
Water Quality Monitors
The District currently utilizes 78 monitors in its Continuous DO Monitoring Program
. Each monitor,
with water temperature probe, costs approximately $3,500
. Each of these monitors must be equipped with
a DO, specific conductivity, and water temperature probe since DO readings are derived from inputs from
these three probes
. Individual probe costs are DO (including water temperature), $450
; specific
conductivity, $250.
Monitors are subject to operating temperature limits, which are satisfied as long as the monitor is
submerged in the waterway during field deployments
. Problems arise when the waterway DO monitoring
location selected is not deep enough to completely submerge the monitor
. Incomplete submergence can
expose the monitor to temperatures outside its factory specified operating range and may result in
erroneous DO readings or electronics failure
. At least two feet of depth in the waterway is required to
submerge the monitor, and it is rare to find smaller creeks with this depth near places where protective
housings can be mounted
.
Field Deployment and Laboratory Operations
•
In order to assure that the DO data collected meets data quality objectives, all field and laboratory
operations must follow procedures outlined in a Quality Assurance Project Plan (QAPP) and Standard
Operating Procedure (SOP)
. Development of these two documents cost the District approximately
$6,000 to $7,000
. The District's QAPP and SOP have been approved by IEPA
.
•
The manufacturer claims that monitors are capable of being deployed in the field for periods of up to
two months
. However, concerns with probe fouling, premature battery failure, data loss from
electronics failure, and availability of DO data for reports and compliance monitoring usually limit
deployment periods to one to two weeks
.
•
The District's monitoring program assigns two monitors to each waterway DO monitoring location
.
One monitor is deployed in the field for a period of one week while the second monitor is maintained
in the laboratory
.
•
Calibration, data downloading, and maintenance can be done in the field, thereby requiring only one
monitor per station but the field environment is poorly suited to the exacting procedures required to
maintain this precision equipment and does not assure that data quality objectives will be met
. The
value of laboratory maintenance and calibration of the monitors is supported by the fact that less than
5 percent of the District's DO monitoring data has been lost during eight years of monitoring
.
4
•
Between deployments the monitors remaining in the laboratory must be maintained and calibrated
daily to assure they are ready for deployment, and to minimize equipment failure in the field
.
Personnel cost to the District for these laboratory operations is approximately $5,000 per year per
monitor based on one-week deployment intervals
.
•
In order to calibrate each monitor for deployment and download stored data following field
deployment, a personal computer and proprietary software are required
. Cost for these items and
proprietary-connecting cables is approximately $1,000 to $1,500 .
•
To efficiently manage the downloaded DO data, an electronic database must be used
. Development
costs for a custom database to organize DO monitoring information range from $3,000 to $4,000
.
•
Consumable items, consisting of batteries to power the monitors and parts and supplies to clean and
maintain the monitors, cost the District approximately $700 per monitor per year
.
•
In the District's DO monitoring program, field operations consist of exchanging monitors deployed in
the field with laboratory calibrated monitors
. Field operations are conducted on a weekly schedule at
all monitoring locations .
•
Additional duties of the field operations personnel consist of examining the protective housings for
damage and removing debris accumulations that may impede water circulation through the housing
.
In some cases, large trees have become lodged on the protective housings during high flow events in
the waterway
. Equipment and personnel costs incurred during removal of this debris has not been
tabulated but can involve the use of heavy equipment
.
•
Access to the monitoring locations requires a boat for deep-draft waterways or a vehicle for shallow-
draft waterway sites
.
•
Annual cost to the District for field operations conducted by boat at each DO monitoring location is
approximately $21,000
. Cost for field operations at each shallow-draft waterway DO monitoring
location serviced by vehicle is approximately $9,000 per year
.
Data Review and Management
The District's DO monitoring QAPP requires that all DO data be reviewed before acceptance
. Each week
DO data from each monitor are evaluated against limits outlined in the QAPP before it is incorporated
into the DO monitoring database
. This database management and DO data review costs the District
approximately $800 per monitoring location per year
.
Overall Program Costs
The District currently maintains 32 monitoring locations in Chicago area waterways
. A total of 78
monitors are available for use at these 32 locations
. This includes two monitors per location for weekly
retrieval and deployment and the reminder available to substitute for monitors being serviced or repaired
and for those that fail the QA/QC procedures prior to deployment
. Sixteen of these installations monitor
land-accessible waterway monitoring locations, generally on the Des Plaines, Little Calumet, and Grand
Calumet River Systems
. Another 16 installations monitor boat-accessible waterway monitoring locations,
including the commercially navigable portions of the Chicago and Calumet River Systems
.
5
•
Total cost to install equipment at 16 land-accessible waterway DO monitoring locations was $74,805
.
Total annual program cost during 2005 for these 16 land-accessible waterway DO monitoring
locations was $243,469 .
•
Total cost to install equipment at 16 boat-accessible waterway DO monitoring locations was $64,833
.
Total annual program cost at these 16 boat-accessible DO monitoring locations during 2005 was
$436,336.
•
Total cost to install DO monitoring equipment at 32 DO monitoring locations which monitor
approximately 225 river miles in District waterways was $139,638
. Total annual monitoring cost at
these 32 locations during 2005 was $679,805 .
•
Total cost for the 78 monitors purchased for the monitoring program is $327,600
.
Comments onCompliance
of ChicagoArea
Waterways with Proposed DO Standards
As was mentioned in previous District testimony, the proposed DO standards include two sets of
standards, one for specific named rivers and streams referred to as
"(d) Other Dissolved Oxygen
Streams," and the other being all other waters in subsection (b).
The latter, subsection (b), is divided into
two time periods, (1) March through July and (2) August through February
. The standards for the March
through July period are similar to the current General Use DO standards, a minimum of (A) "5
.0 mg/L at
any time" and (B) "6
.0 mg/L as a daily mean averaged over 7 days
." The subsection (b) standards for
August through February include a minimum of (A) "3
.5 mg/L at any time," (B) "4
.0 mg/L as a daily
minimum averaged over 7 days," and (C) "5
.5 mg/L as a daily mean averaged over 30 days
."
In order to determine how Chicago area waterways would comply with the proposed standards, results of
hourly DO measurements from the District's Continuous Dissolved Oxygen Monitoring (CDOM)
Program are summarized in the following exhibits :
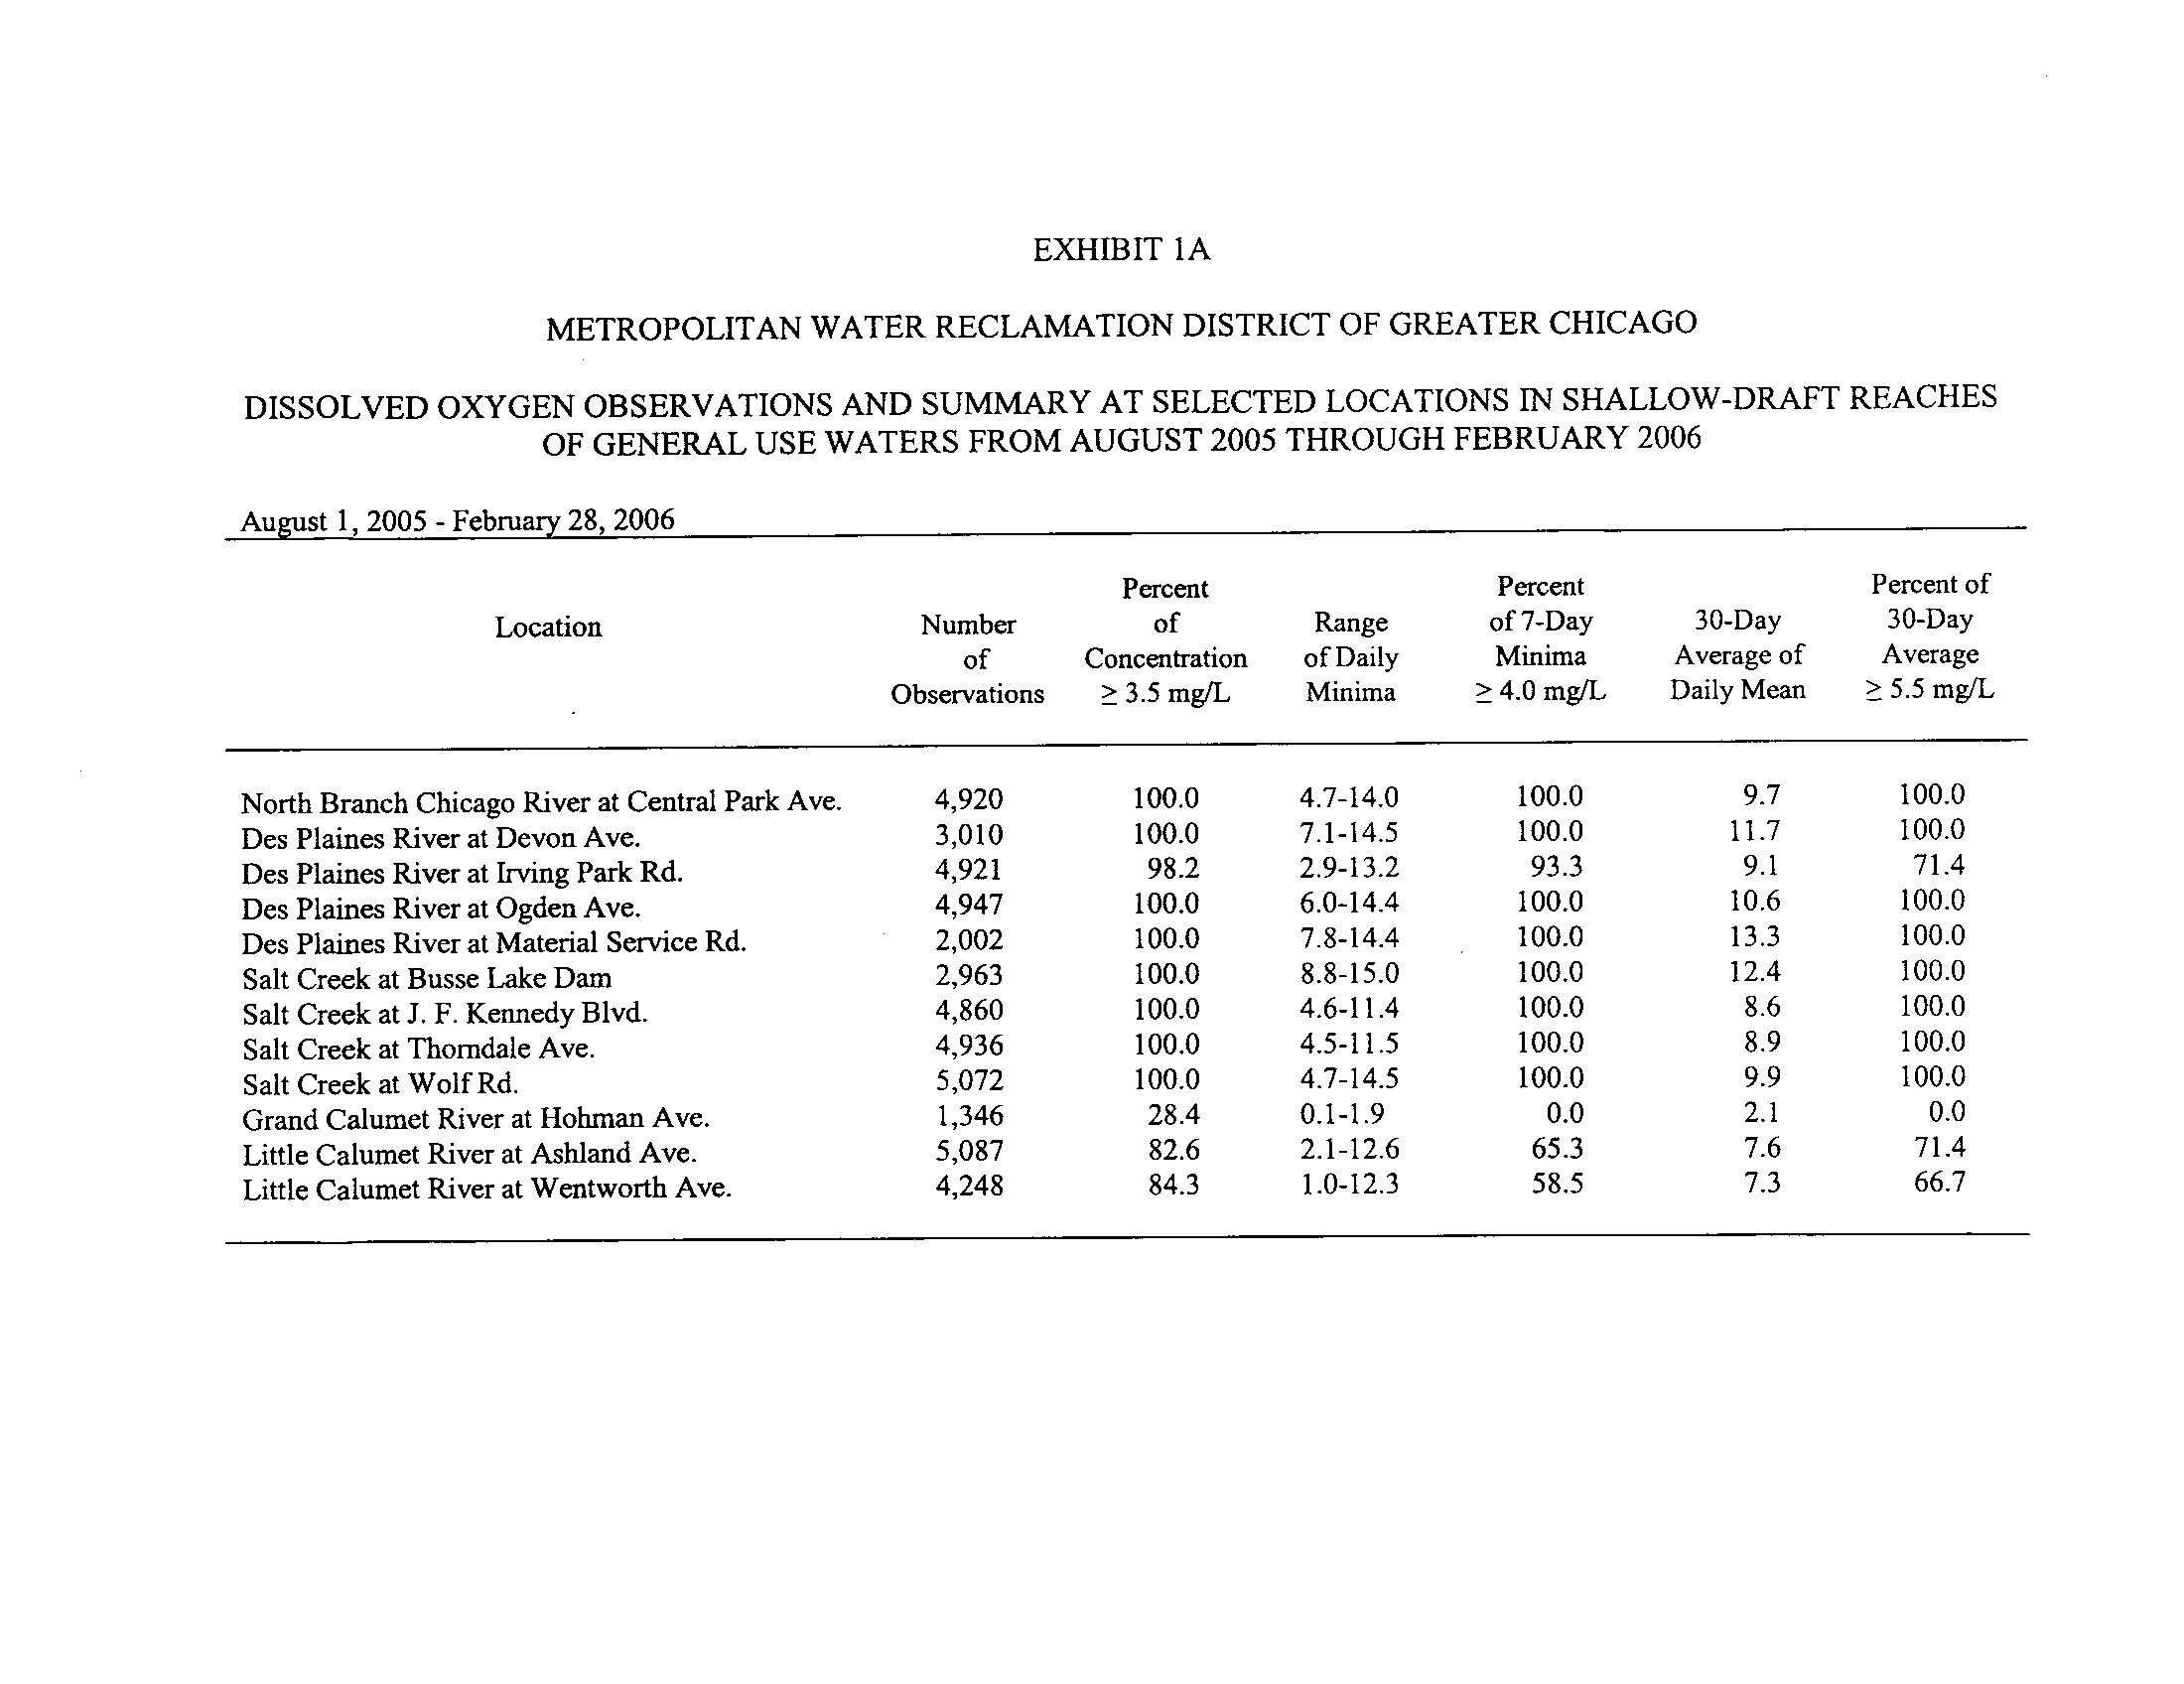
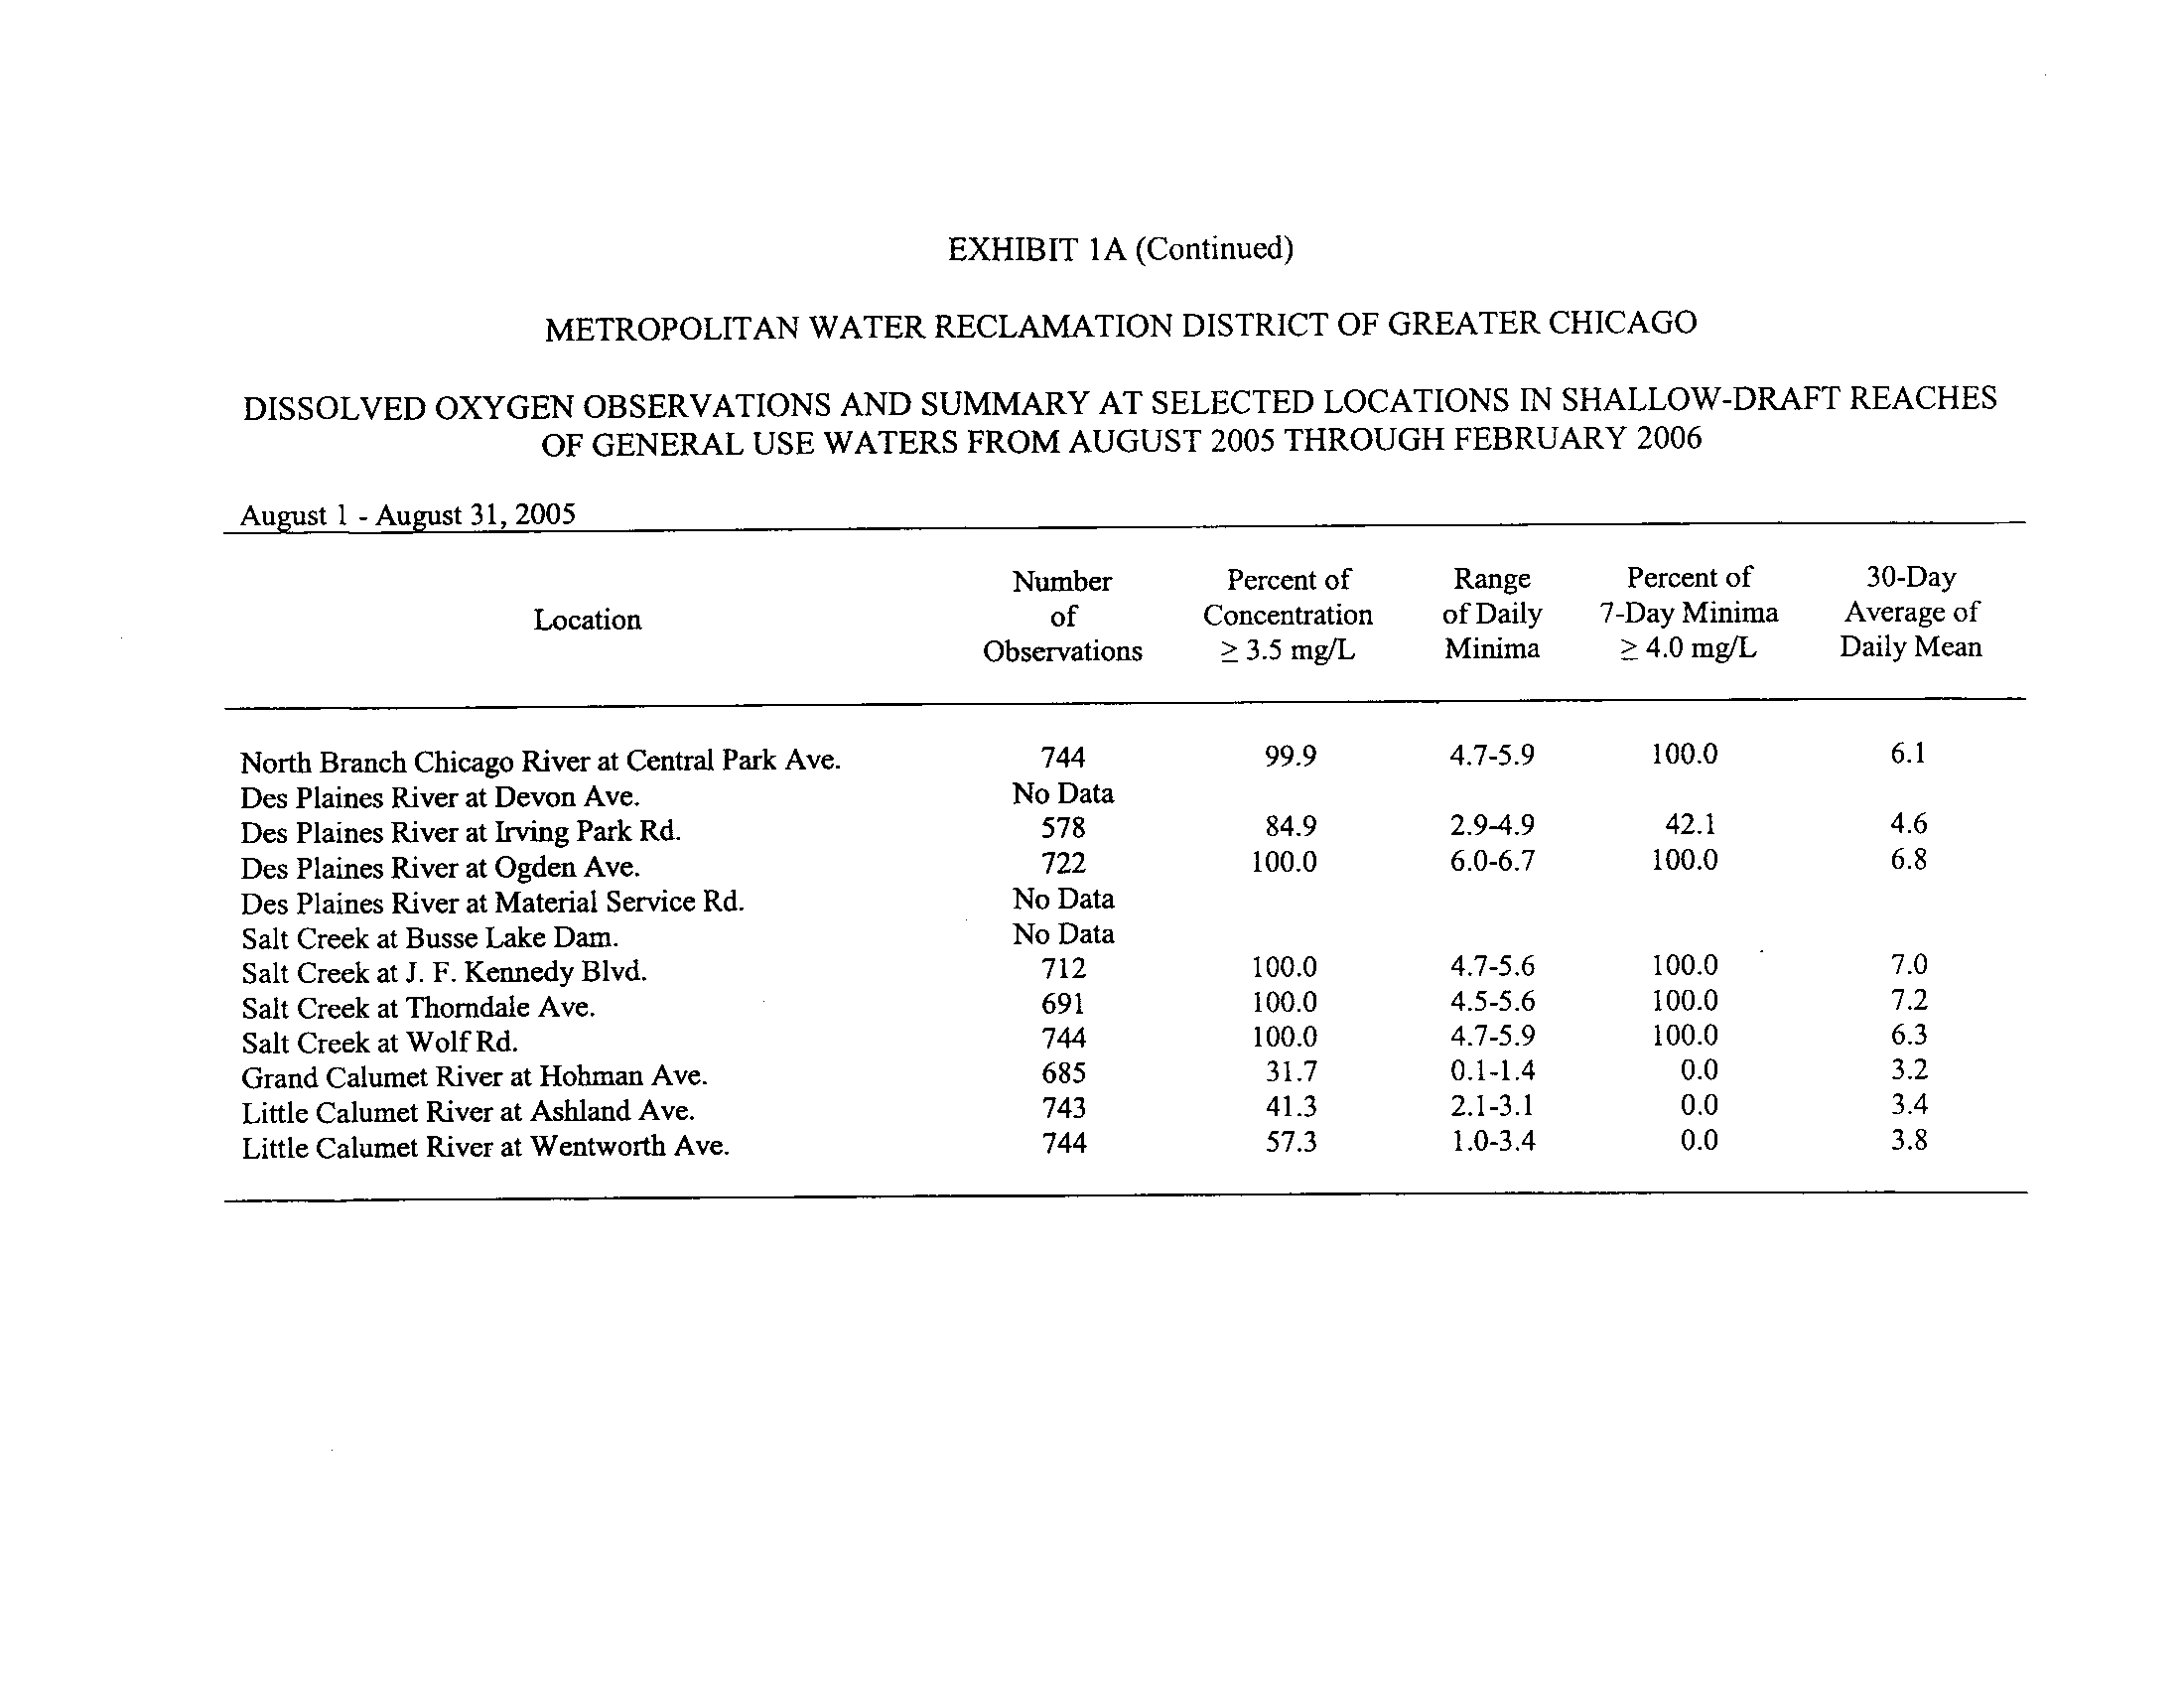
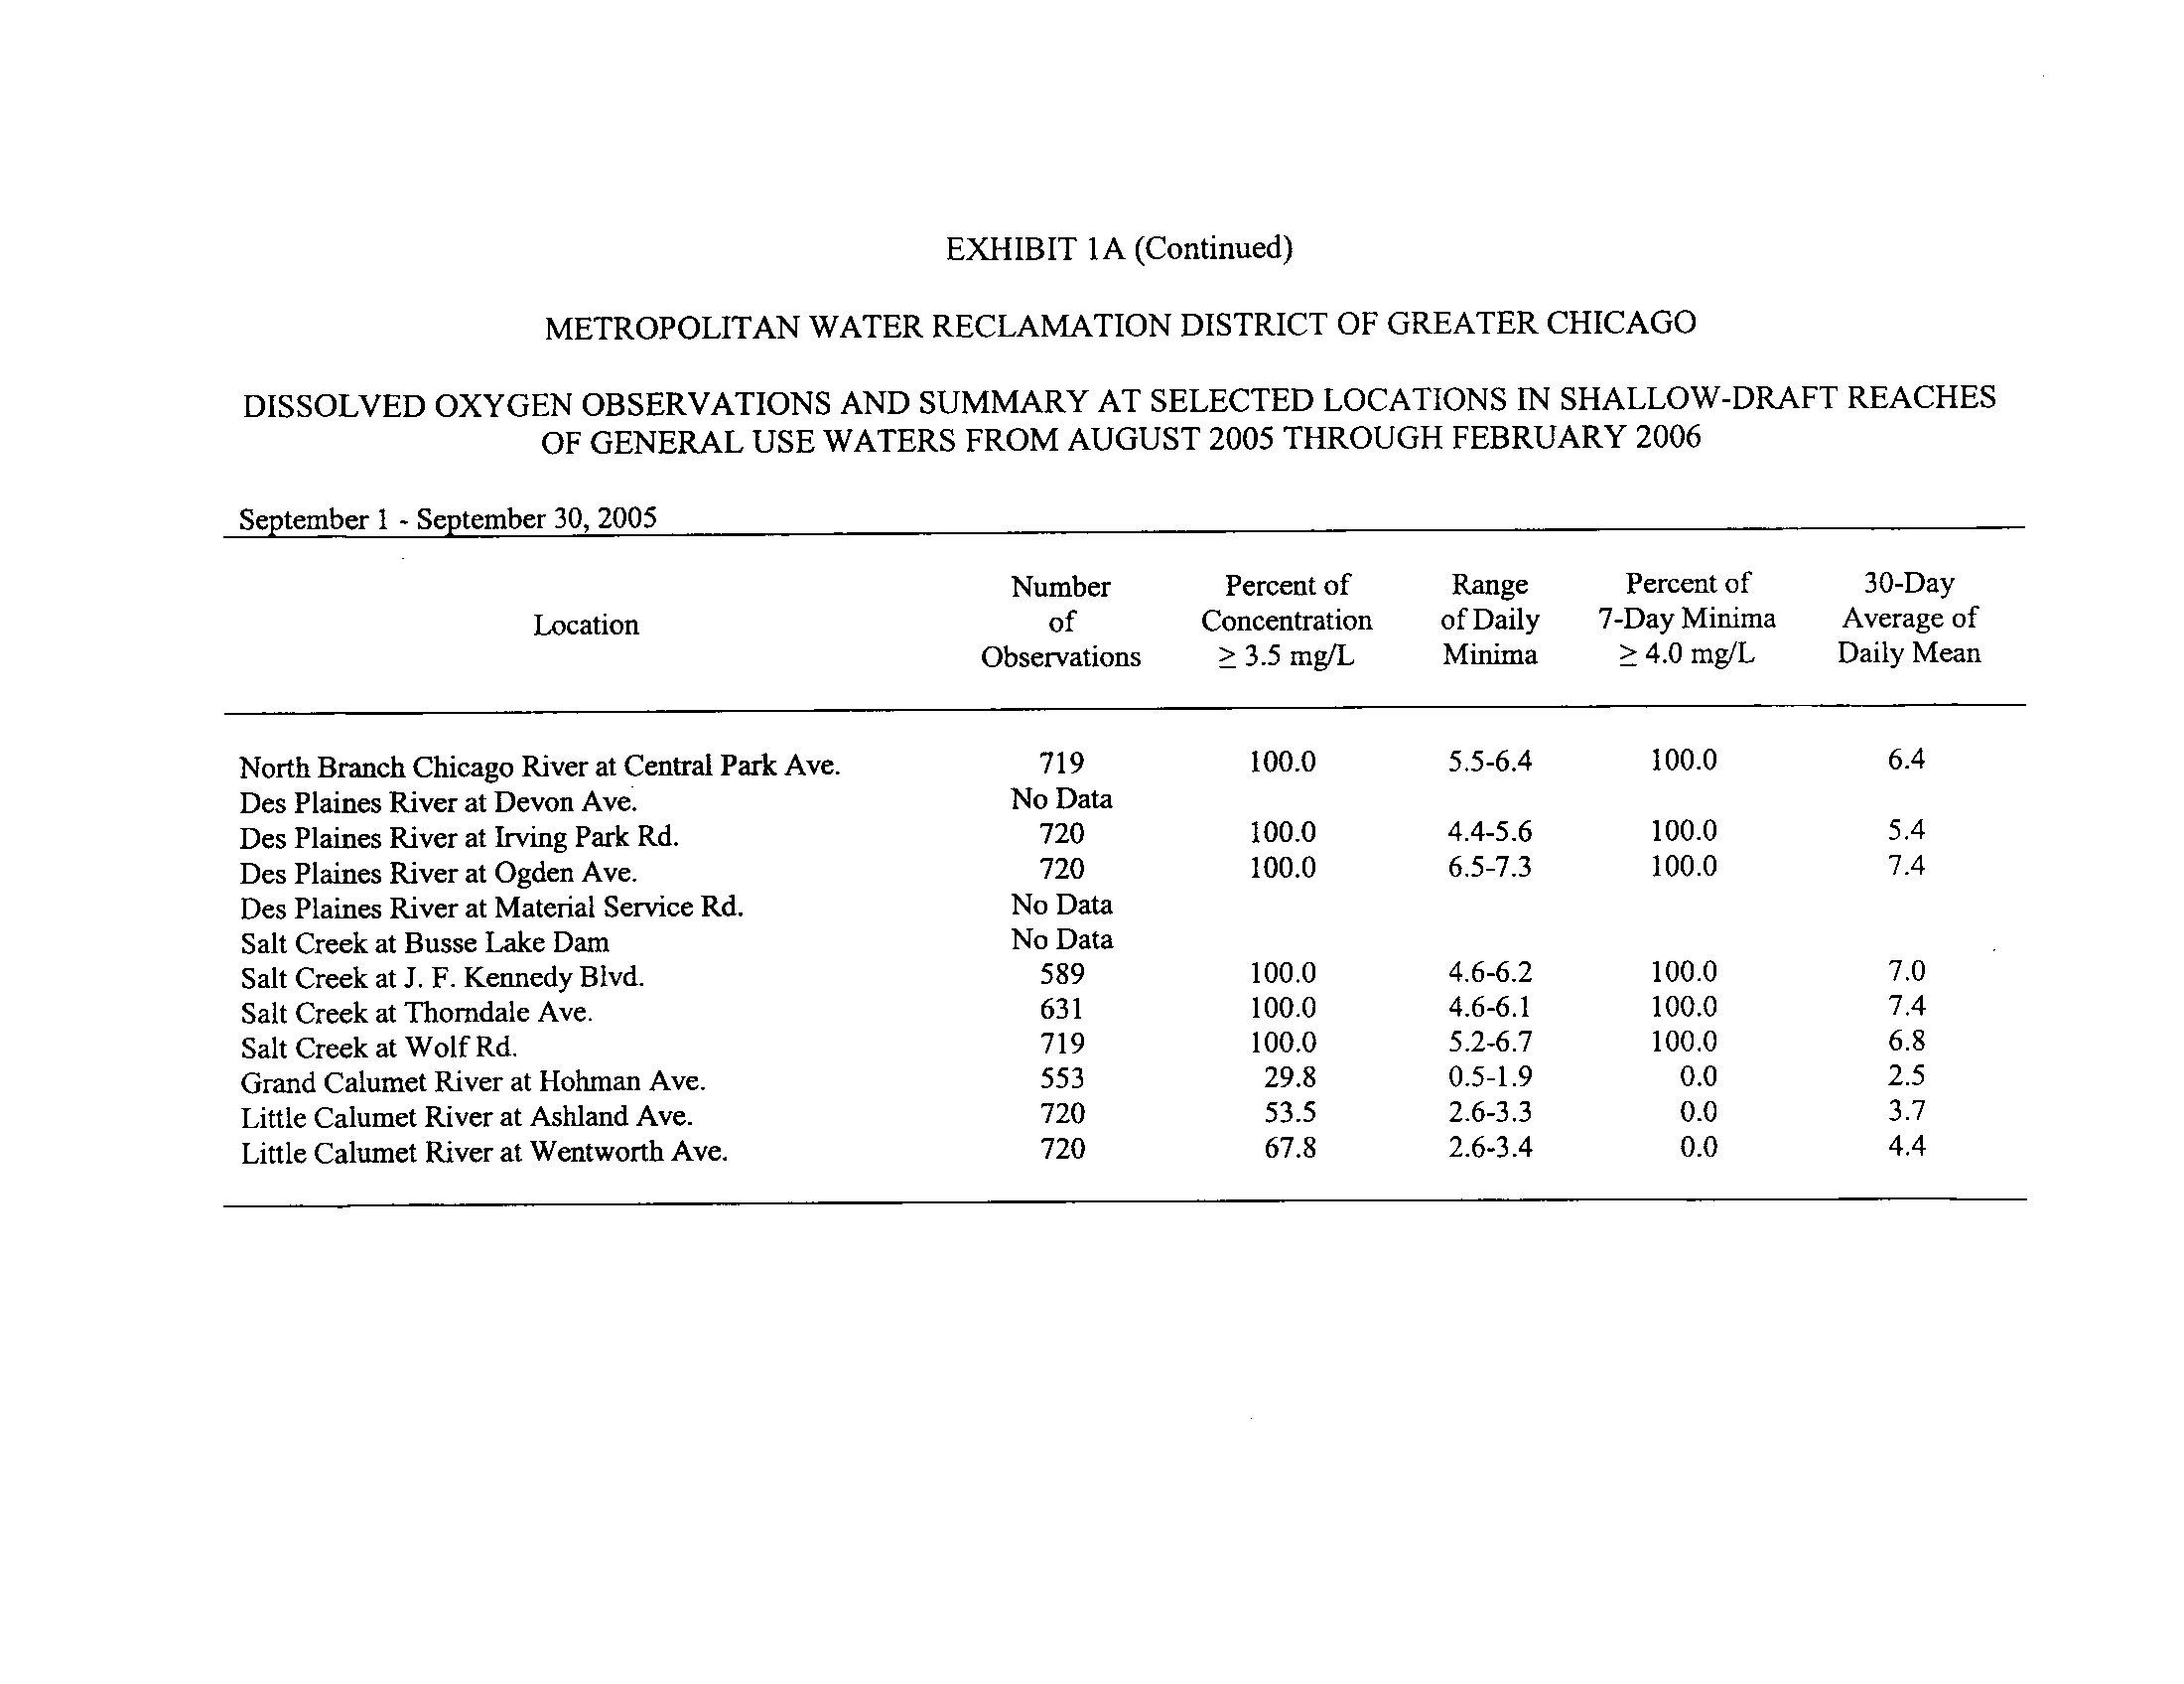
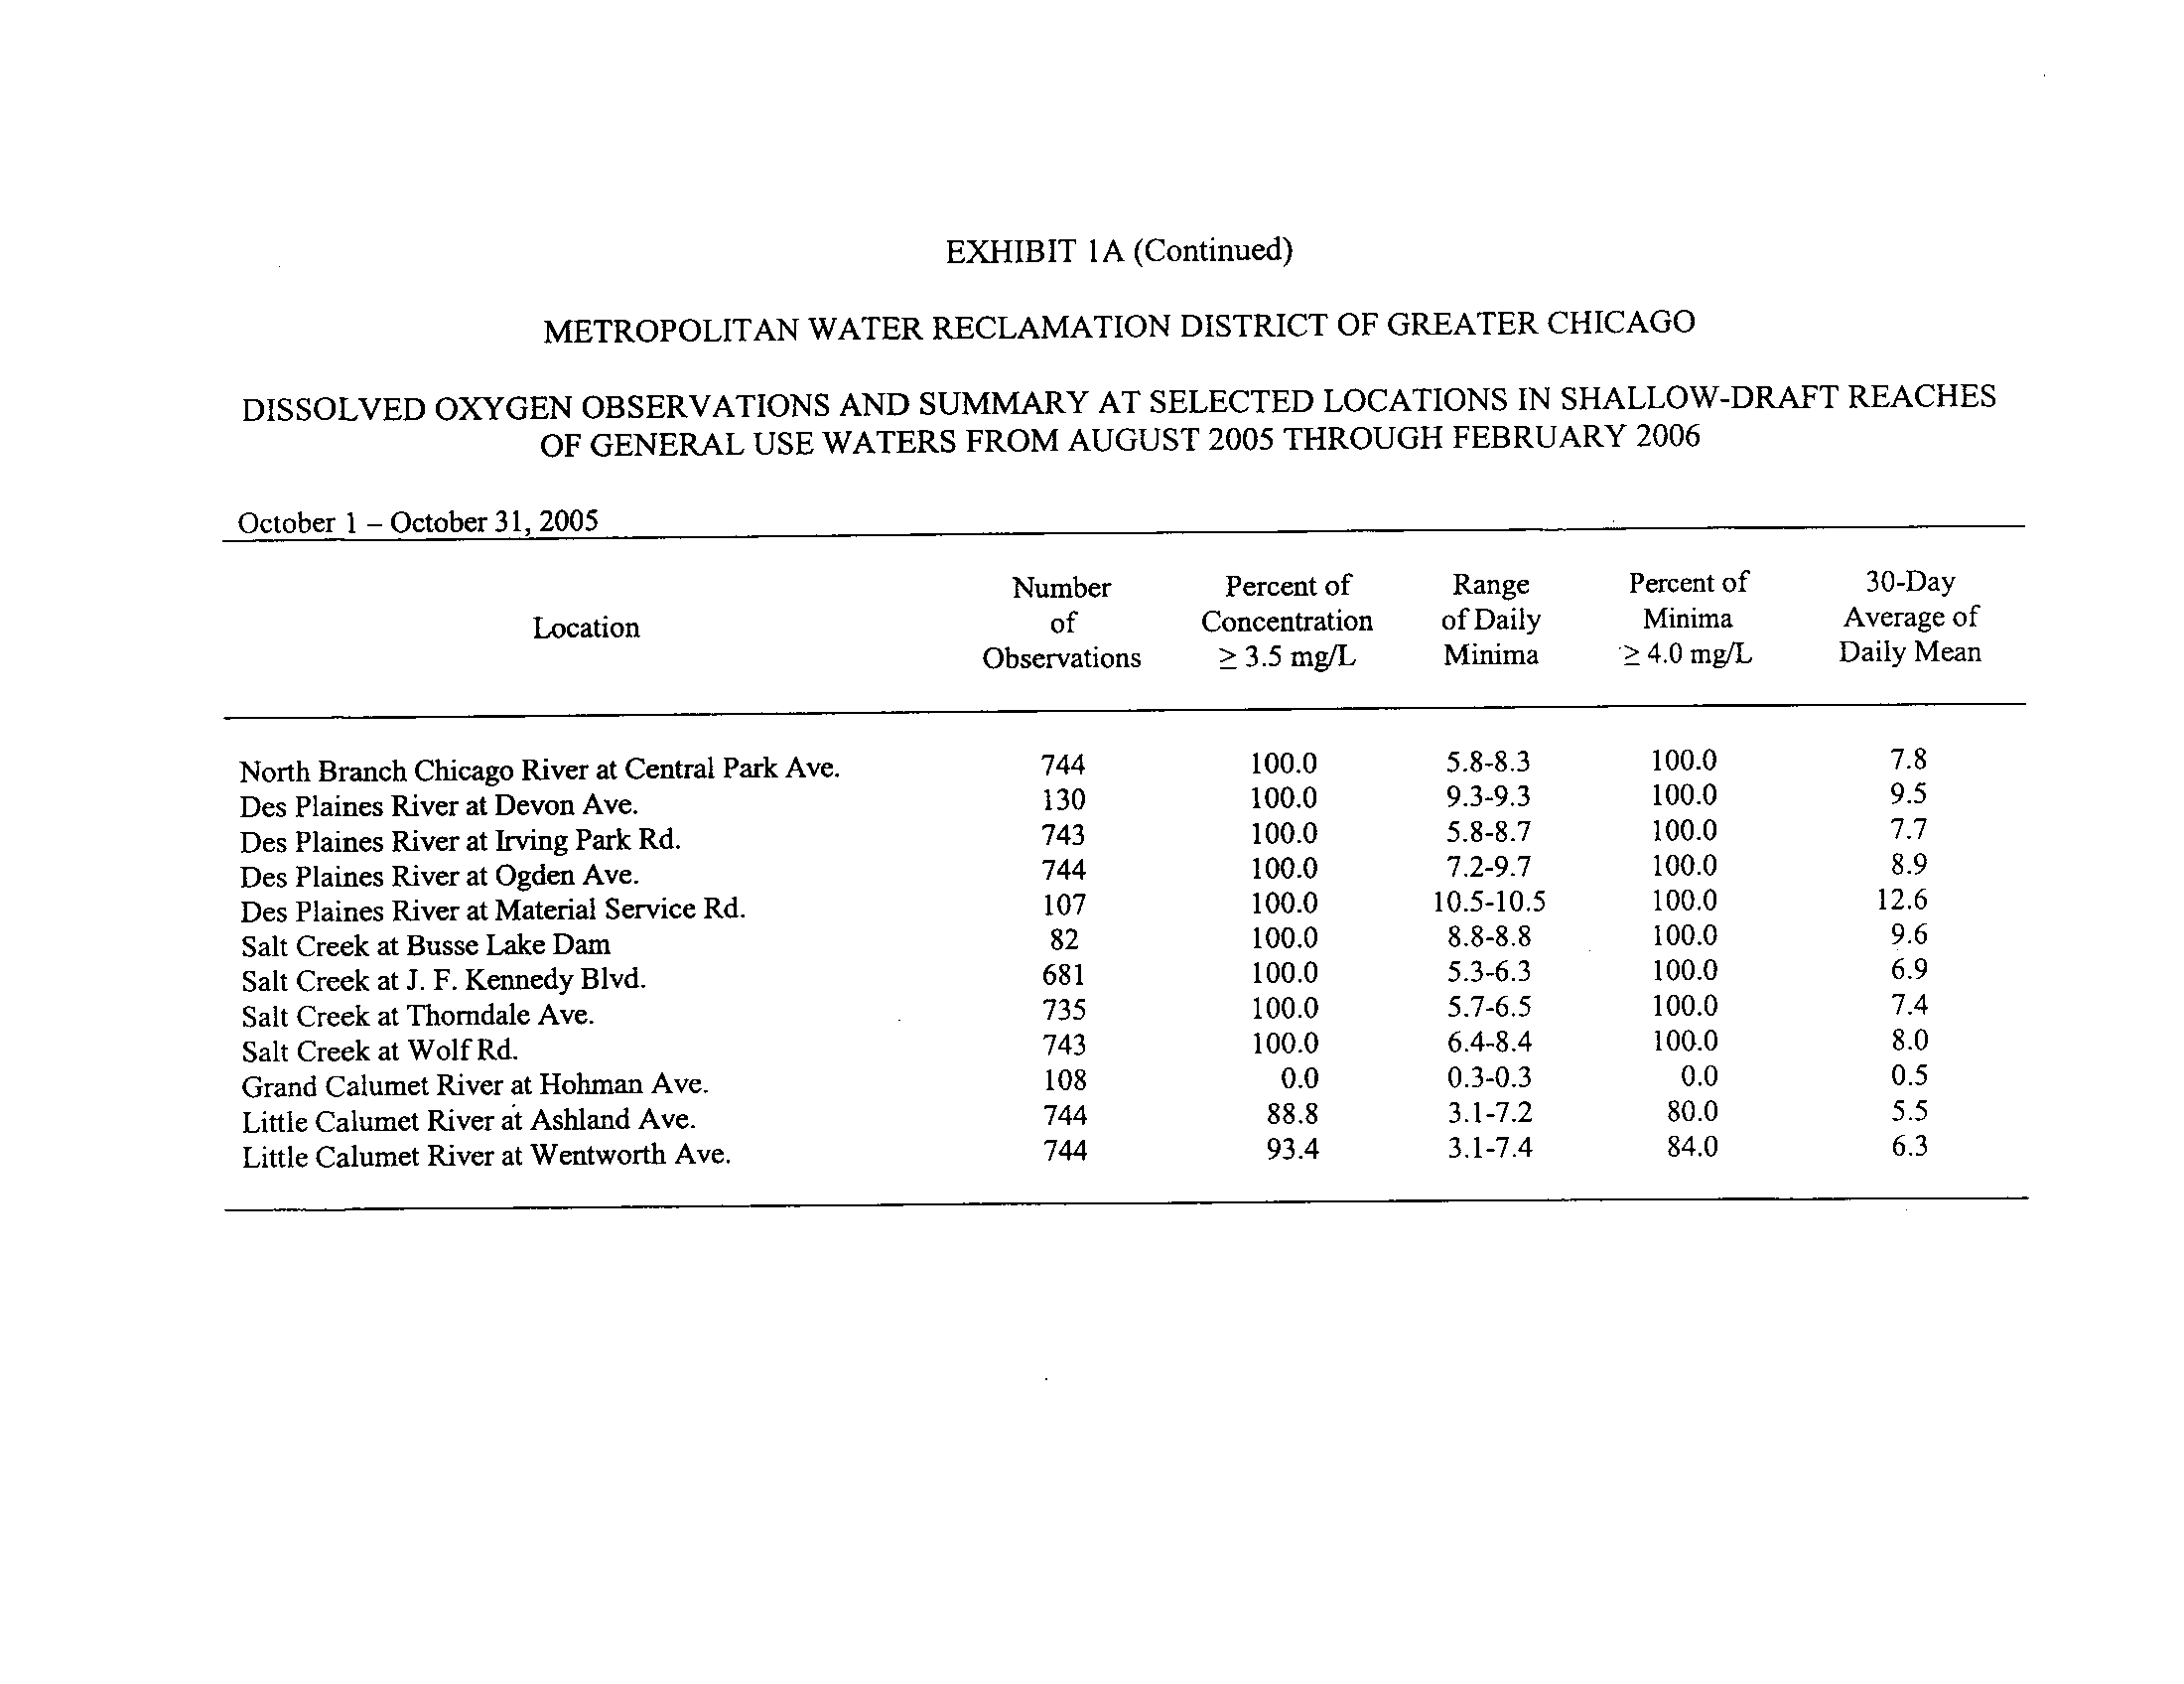
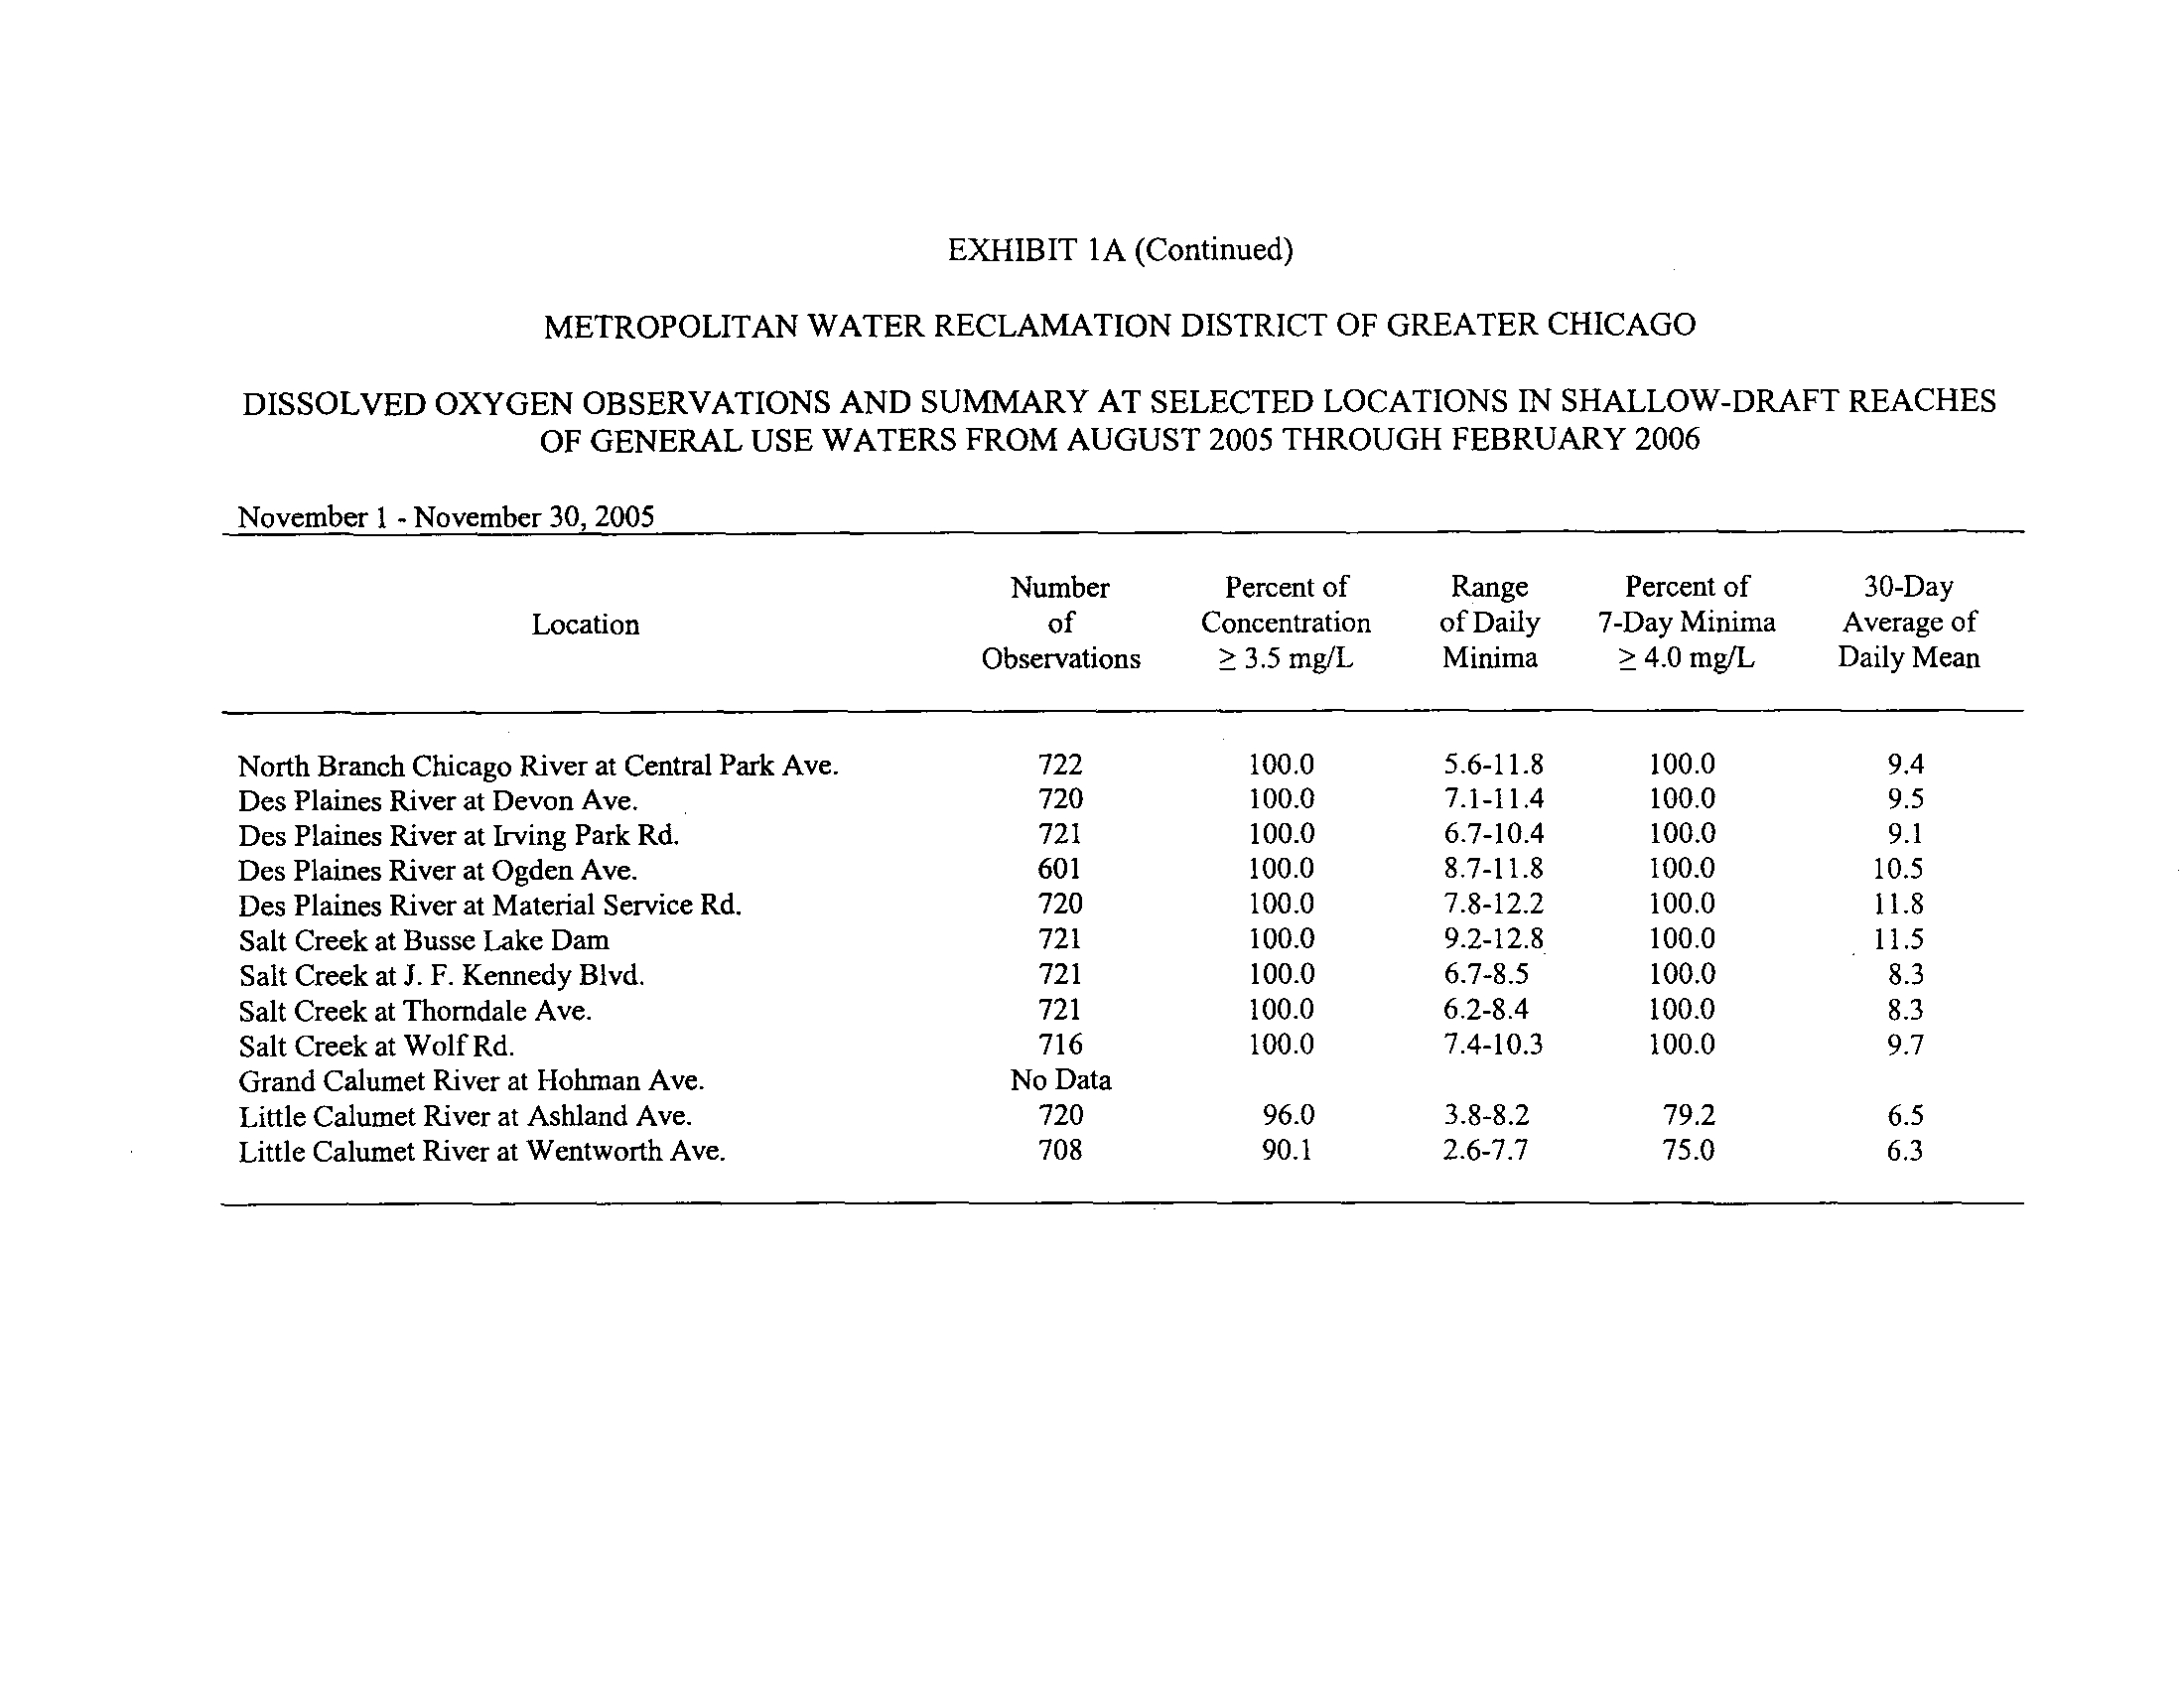
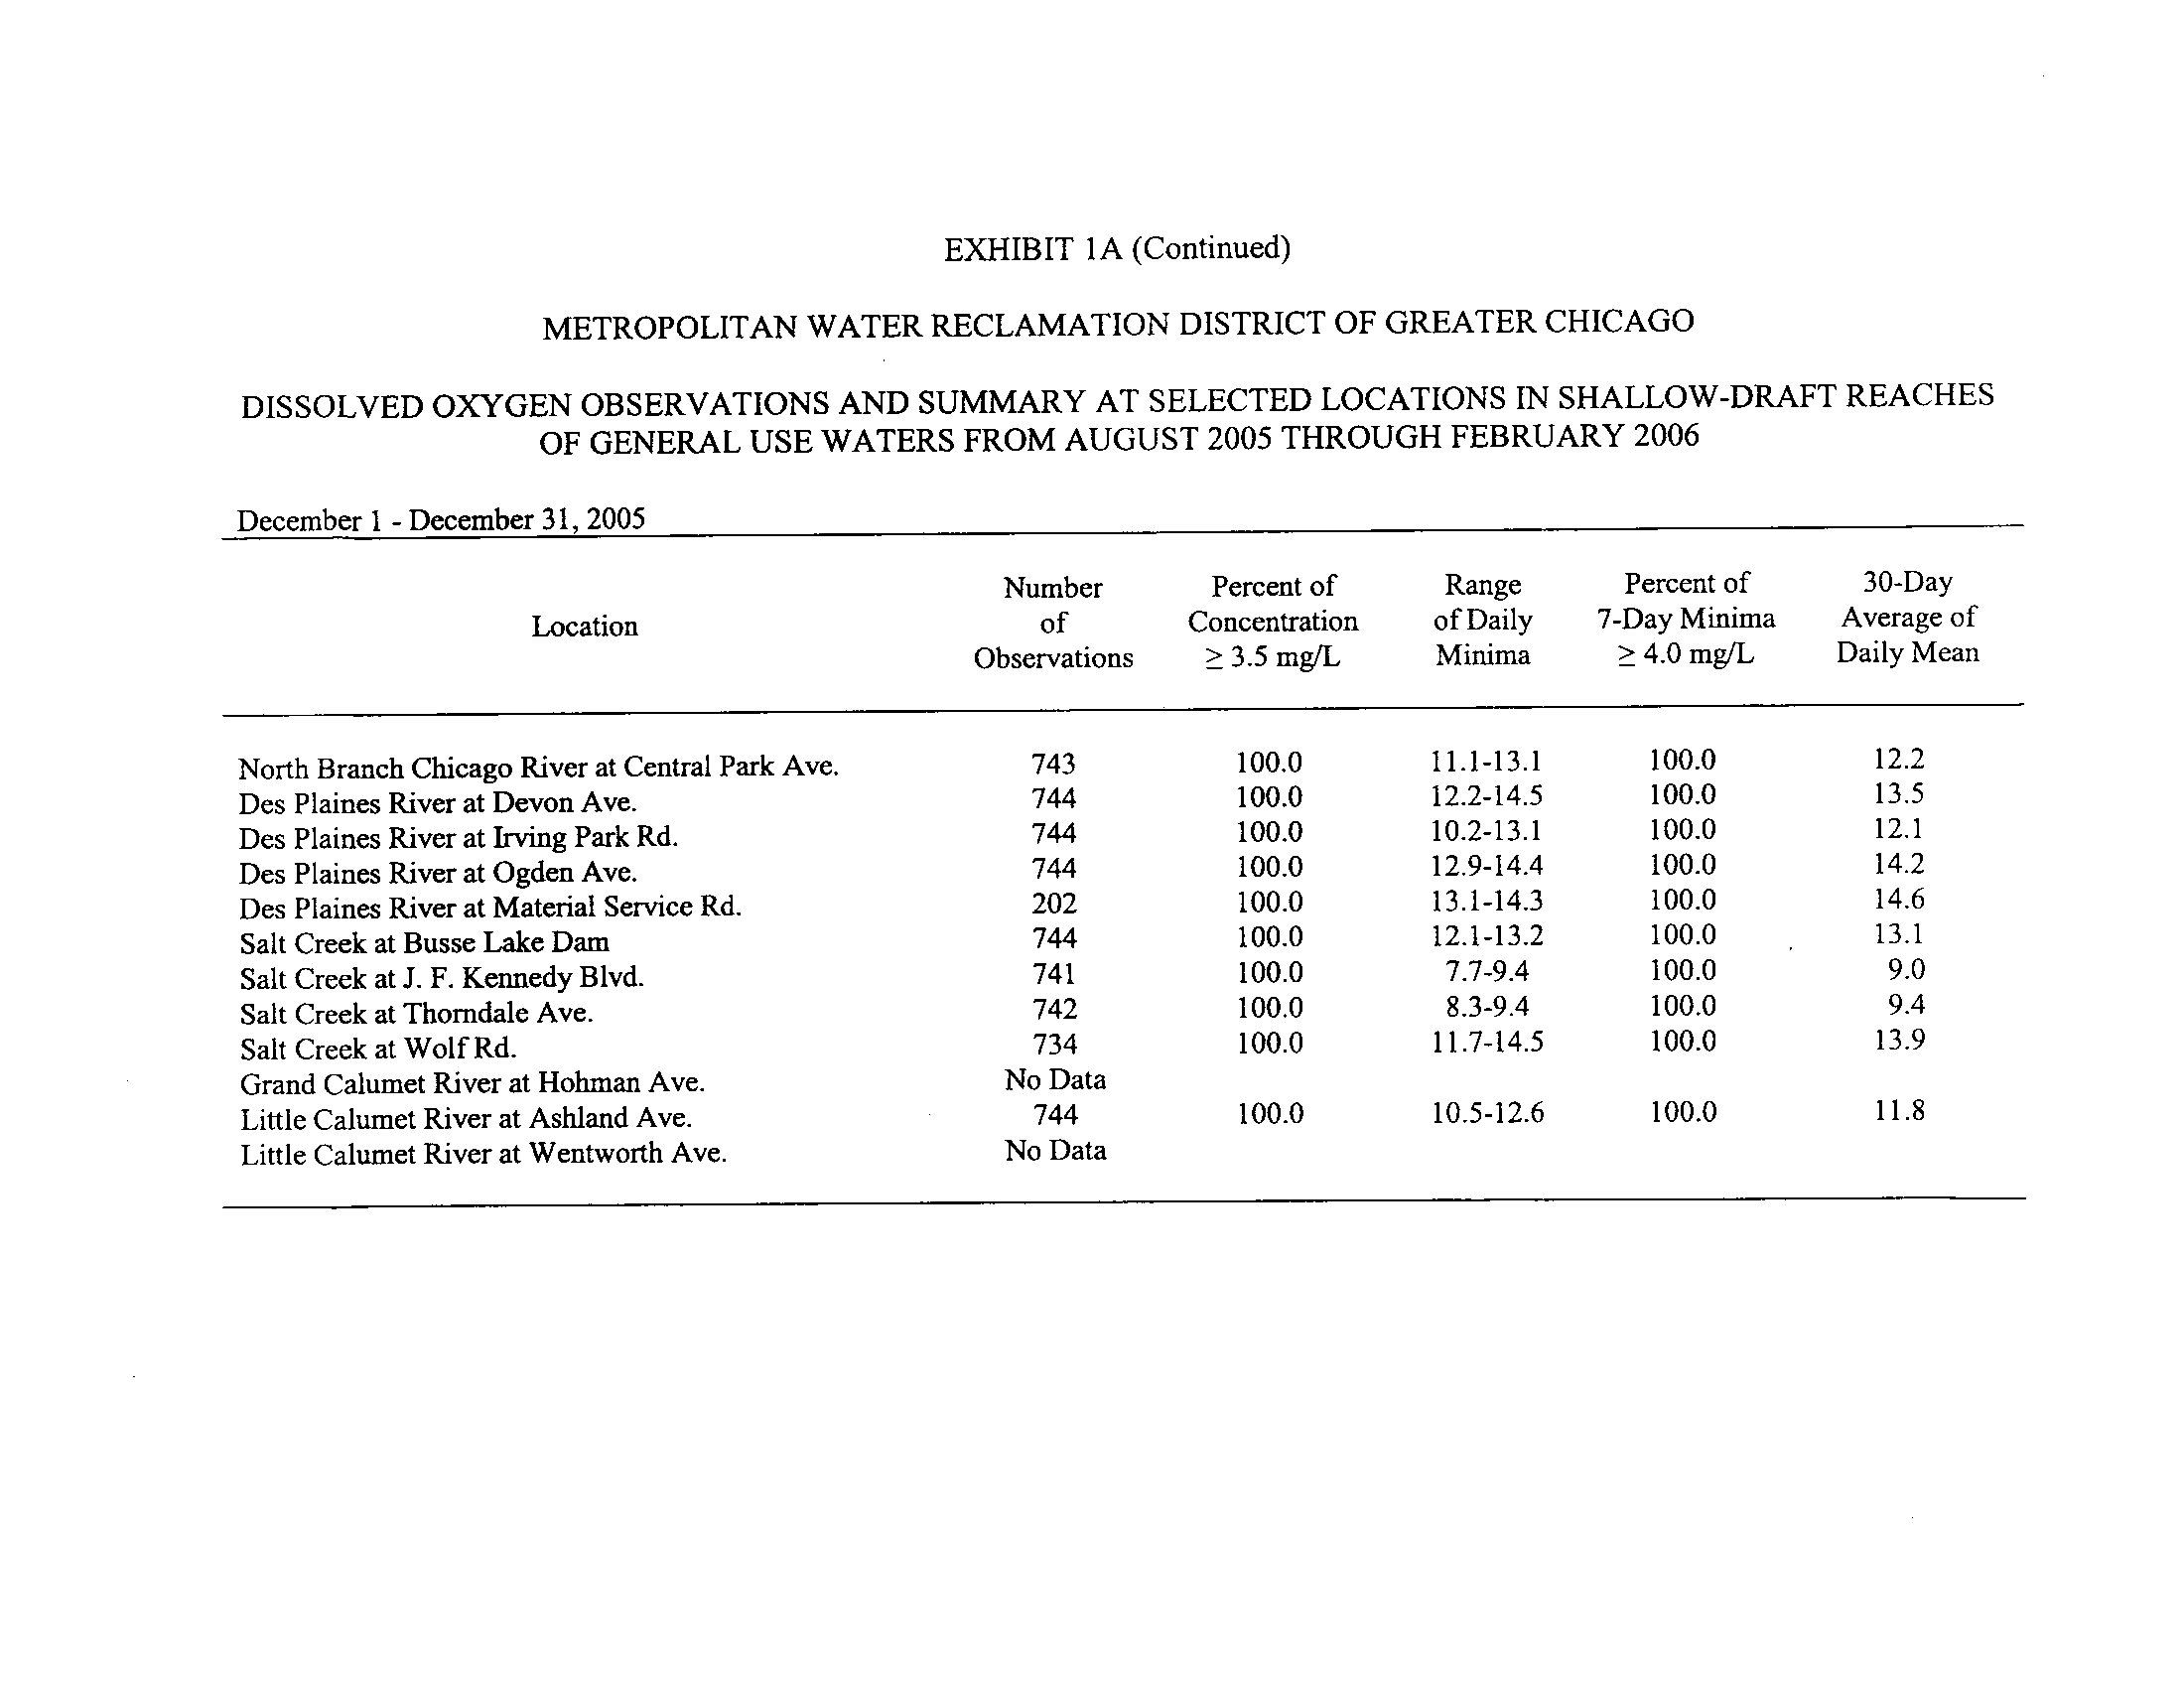
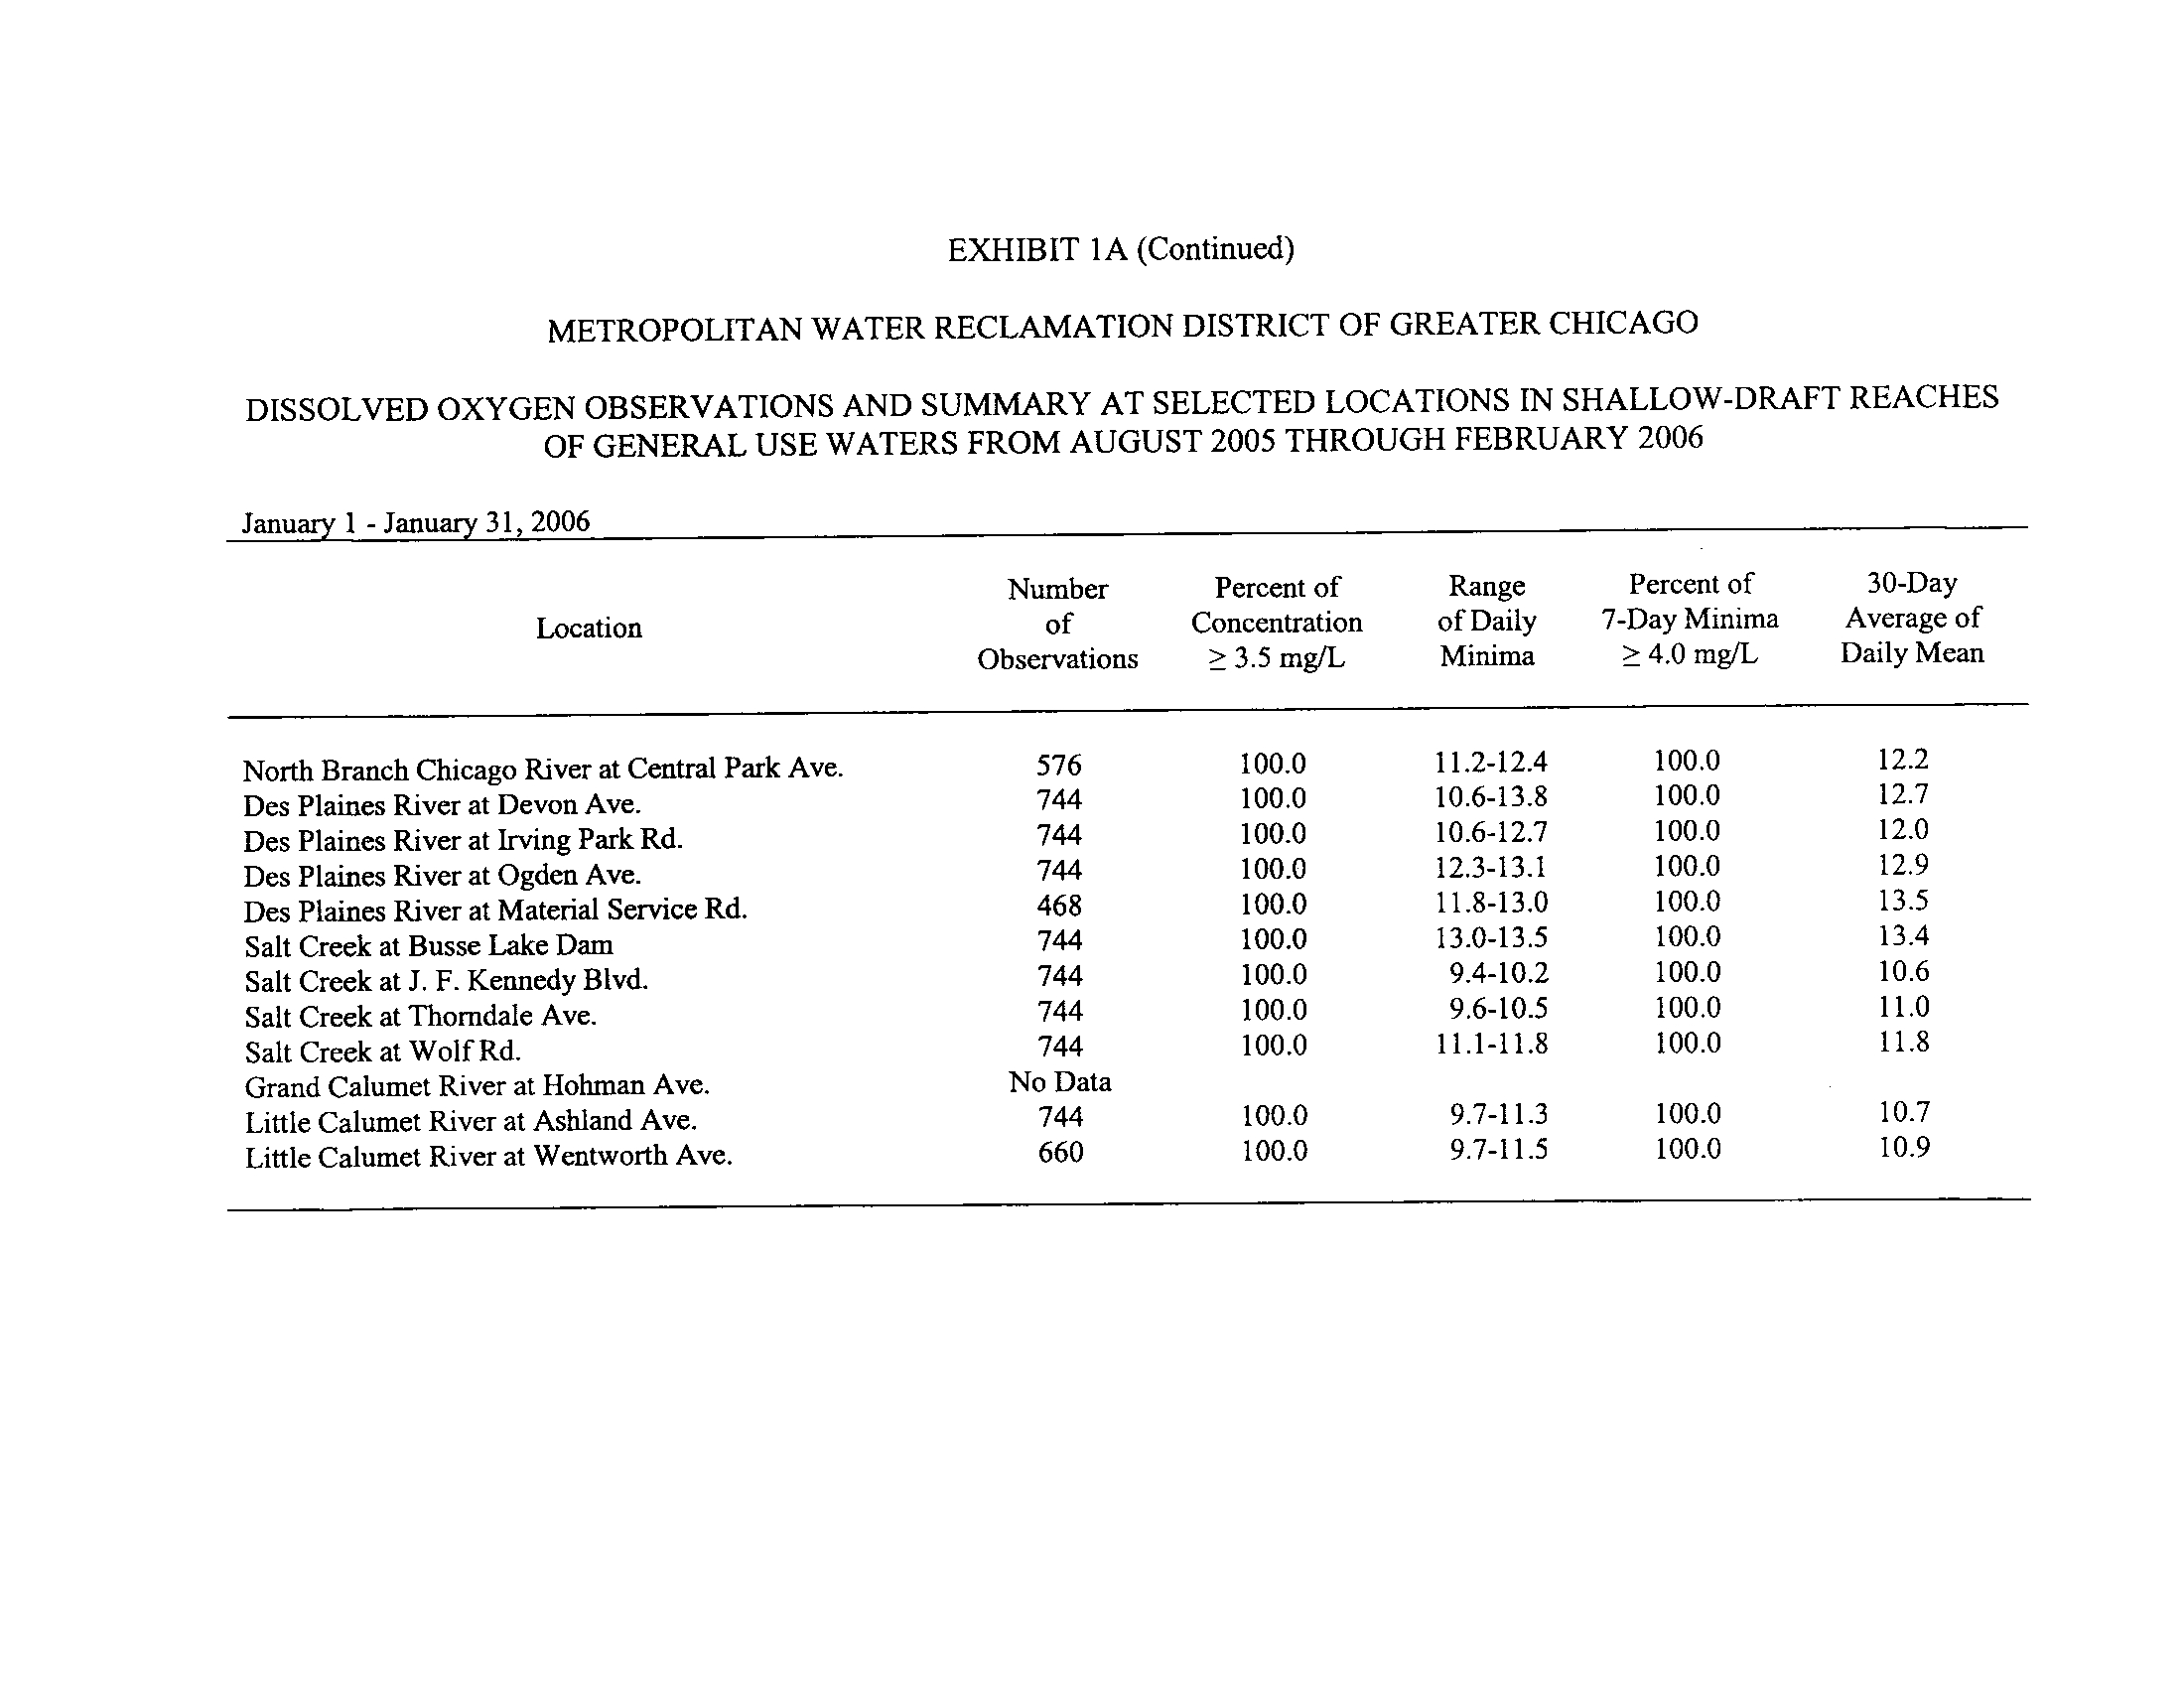
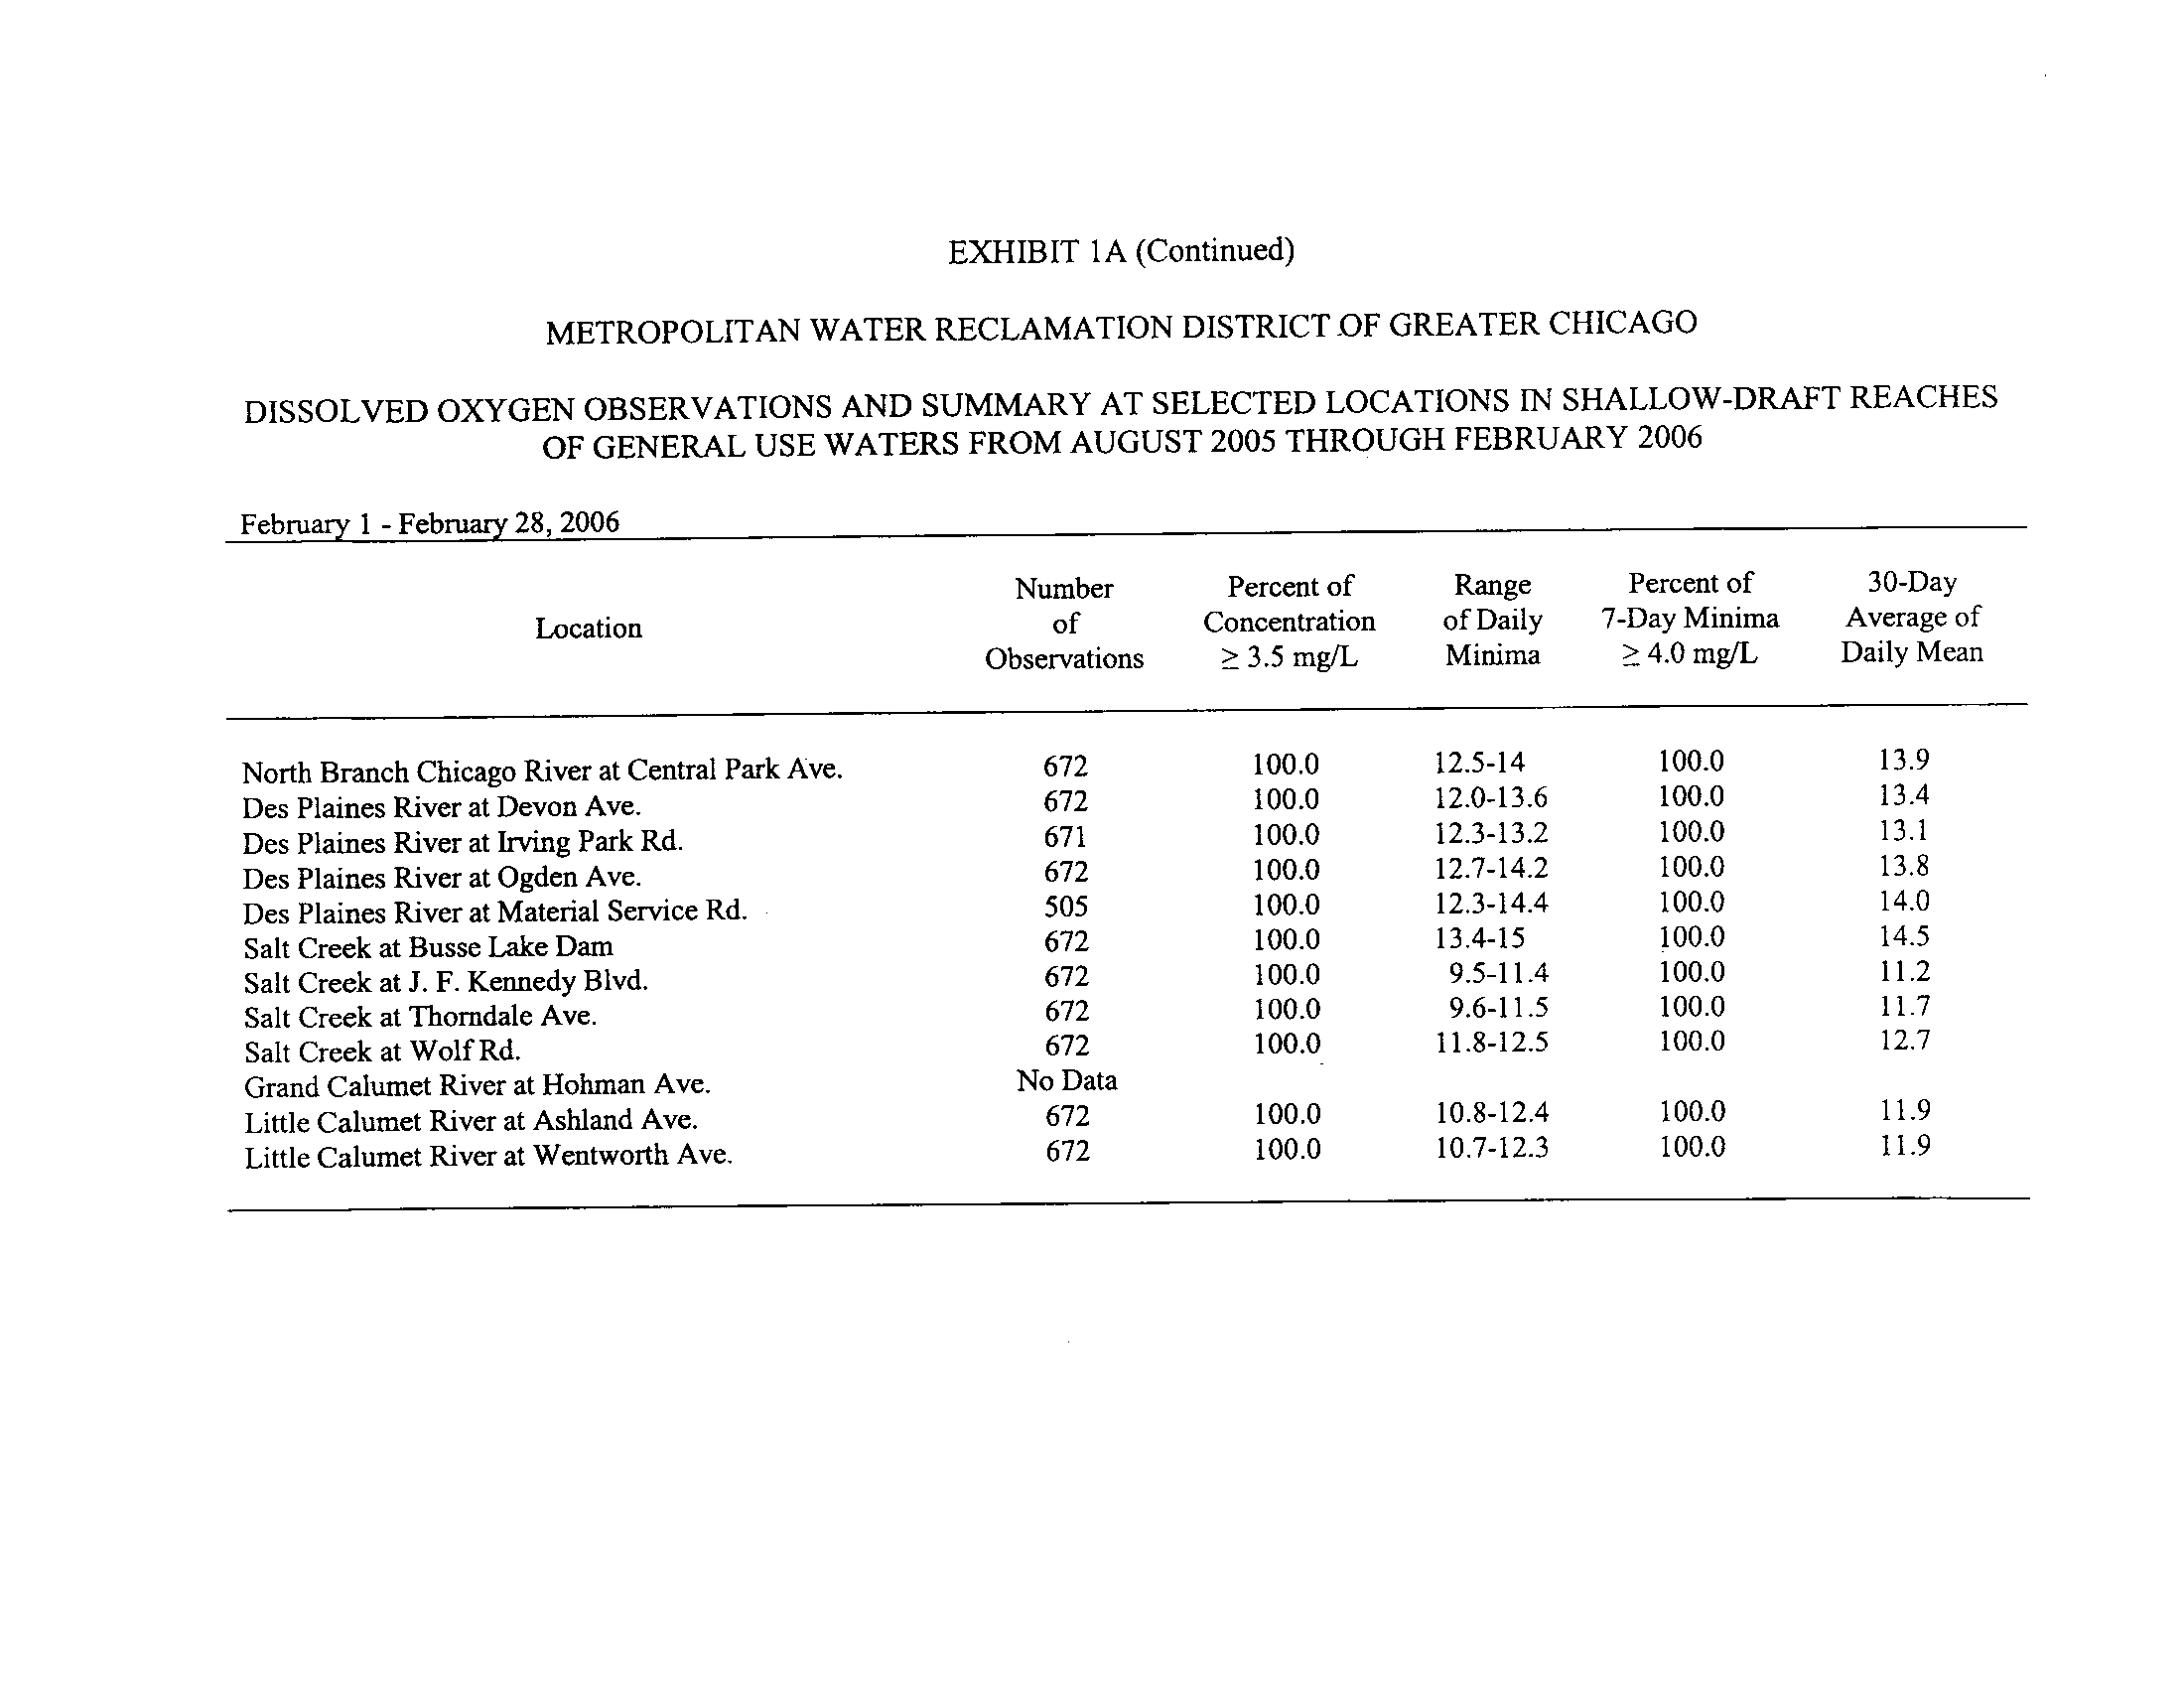
ExhibitIA.
Dissolved oxygen observations and summary at selected locations in shallow-draft reaches
of General Use Waters for August 2005 through February 2006
.
•
Eight of the twelve shallow water CDOM locations were 100 percent compliant with the proposed
DO standards
. These included the North Branch of the Chicago River at Central Park Avenue, the
Des Plaines River at Devon Avenue, Ogden Avenue, and Material Service Road, Salt Creek at Busse
Lake Dam, J . F
. Kennedy Boulevard, Thomdale Avenue, and Wolf Road
.
•
Locations not in 100 percent compliance were the Des Plaines River at Irving Park Road, the Little
Calumet River at Ashland Avenue and Wentworth Avenue, and the Grand Calumet River at Hohman
Avenue.
•
It should be noted that no data were available during August and September 2005 for three of the
stations that were 100 percent compliant
.
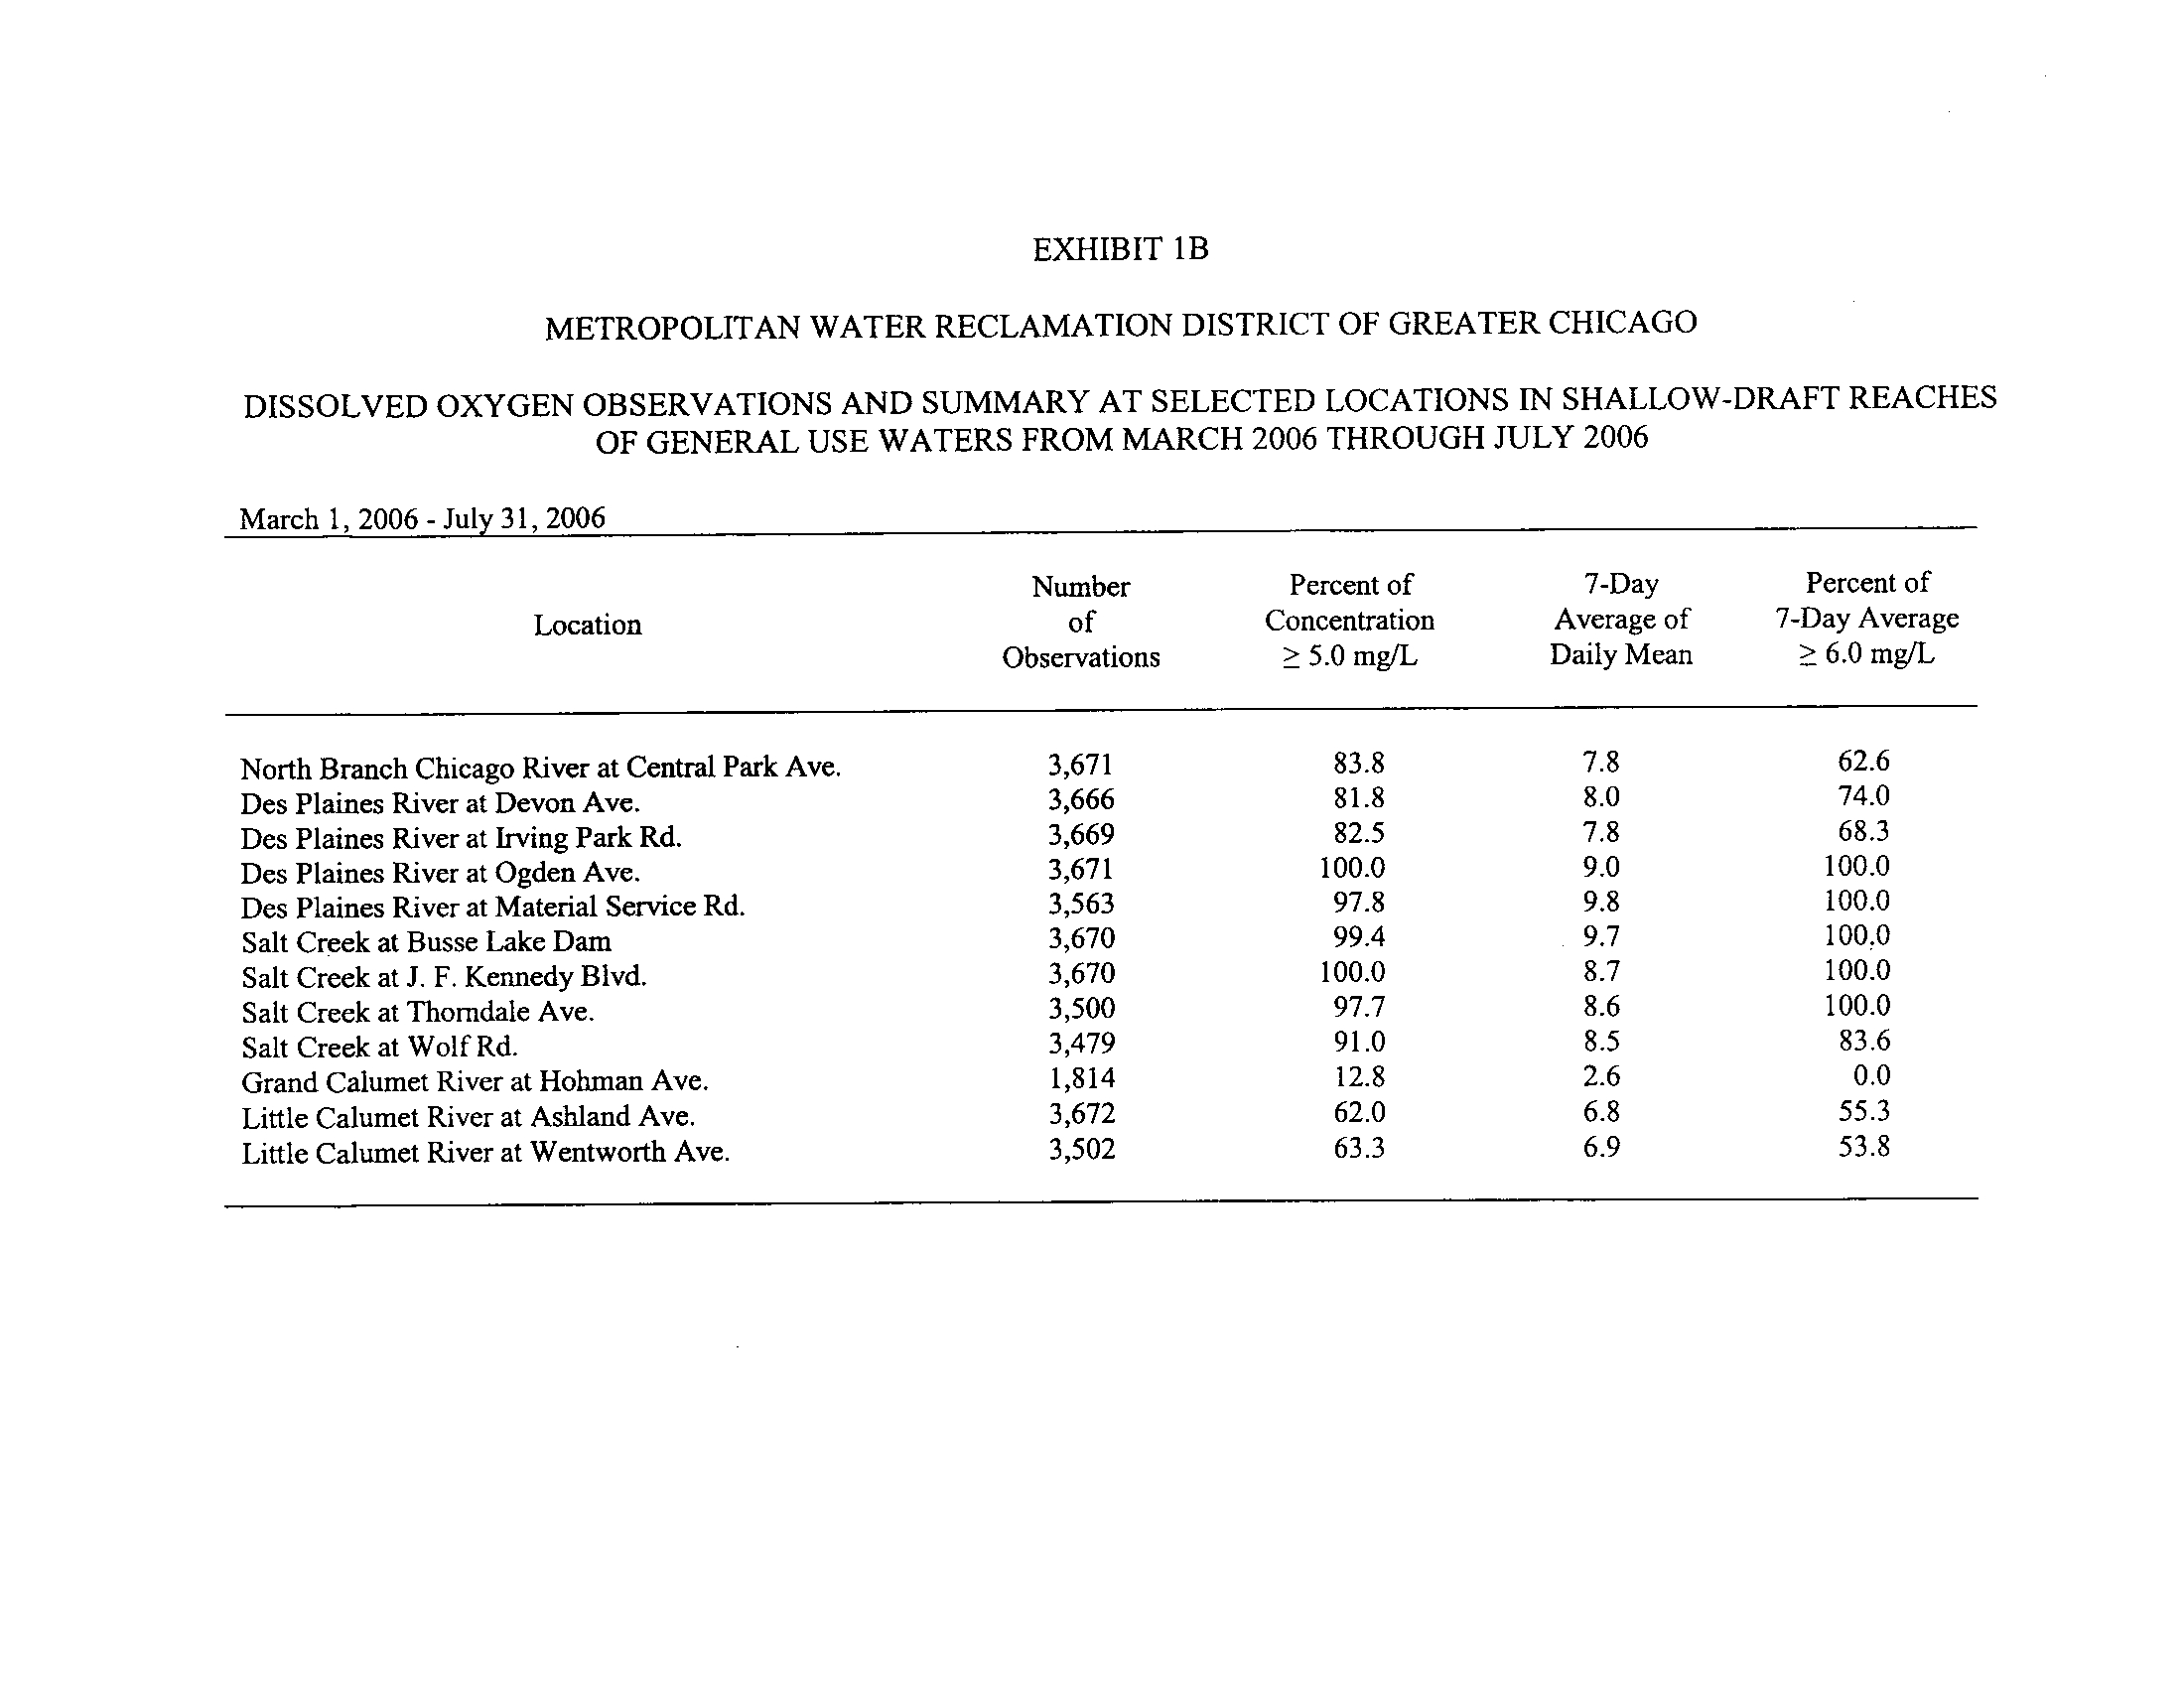
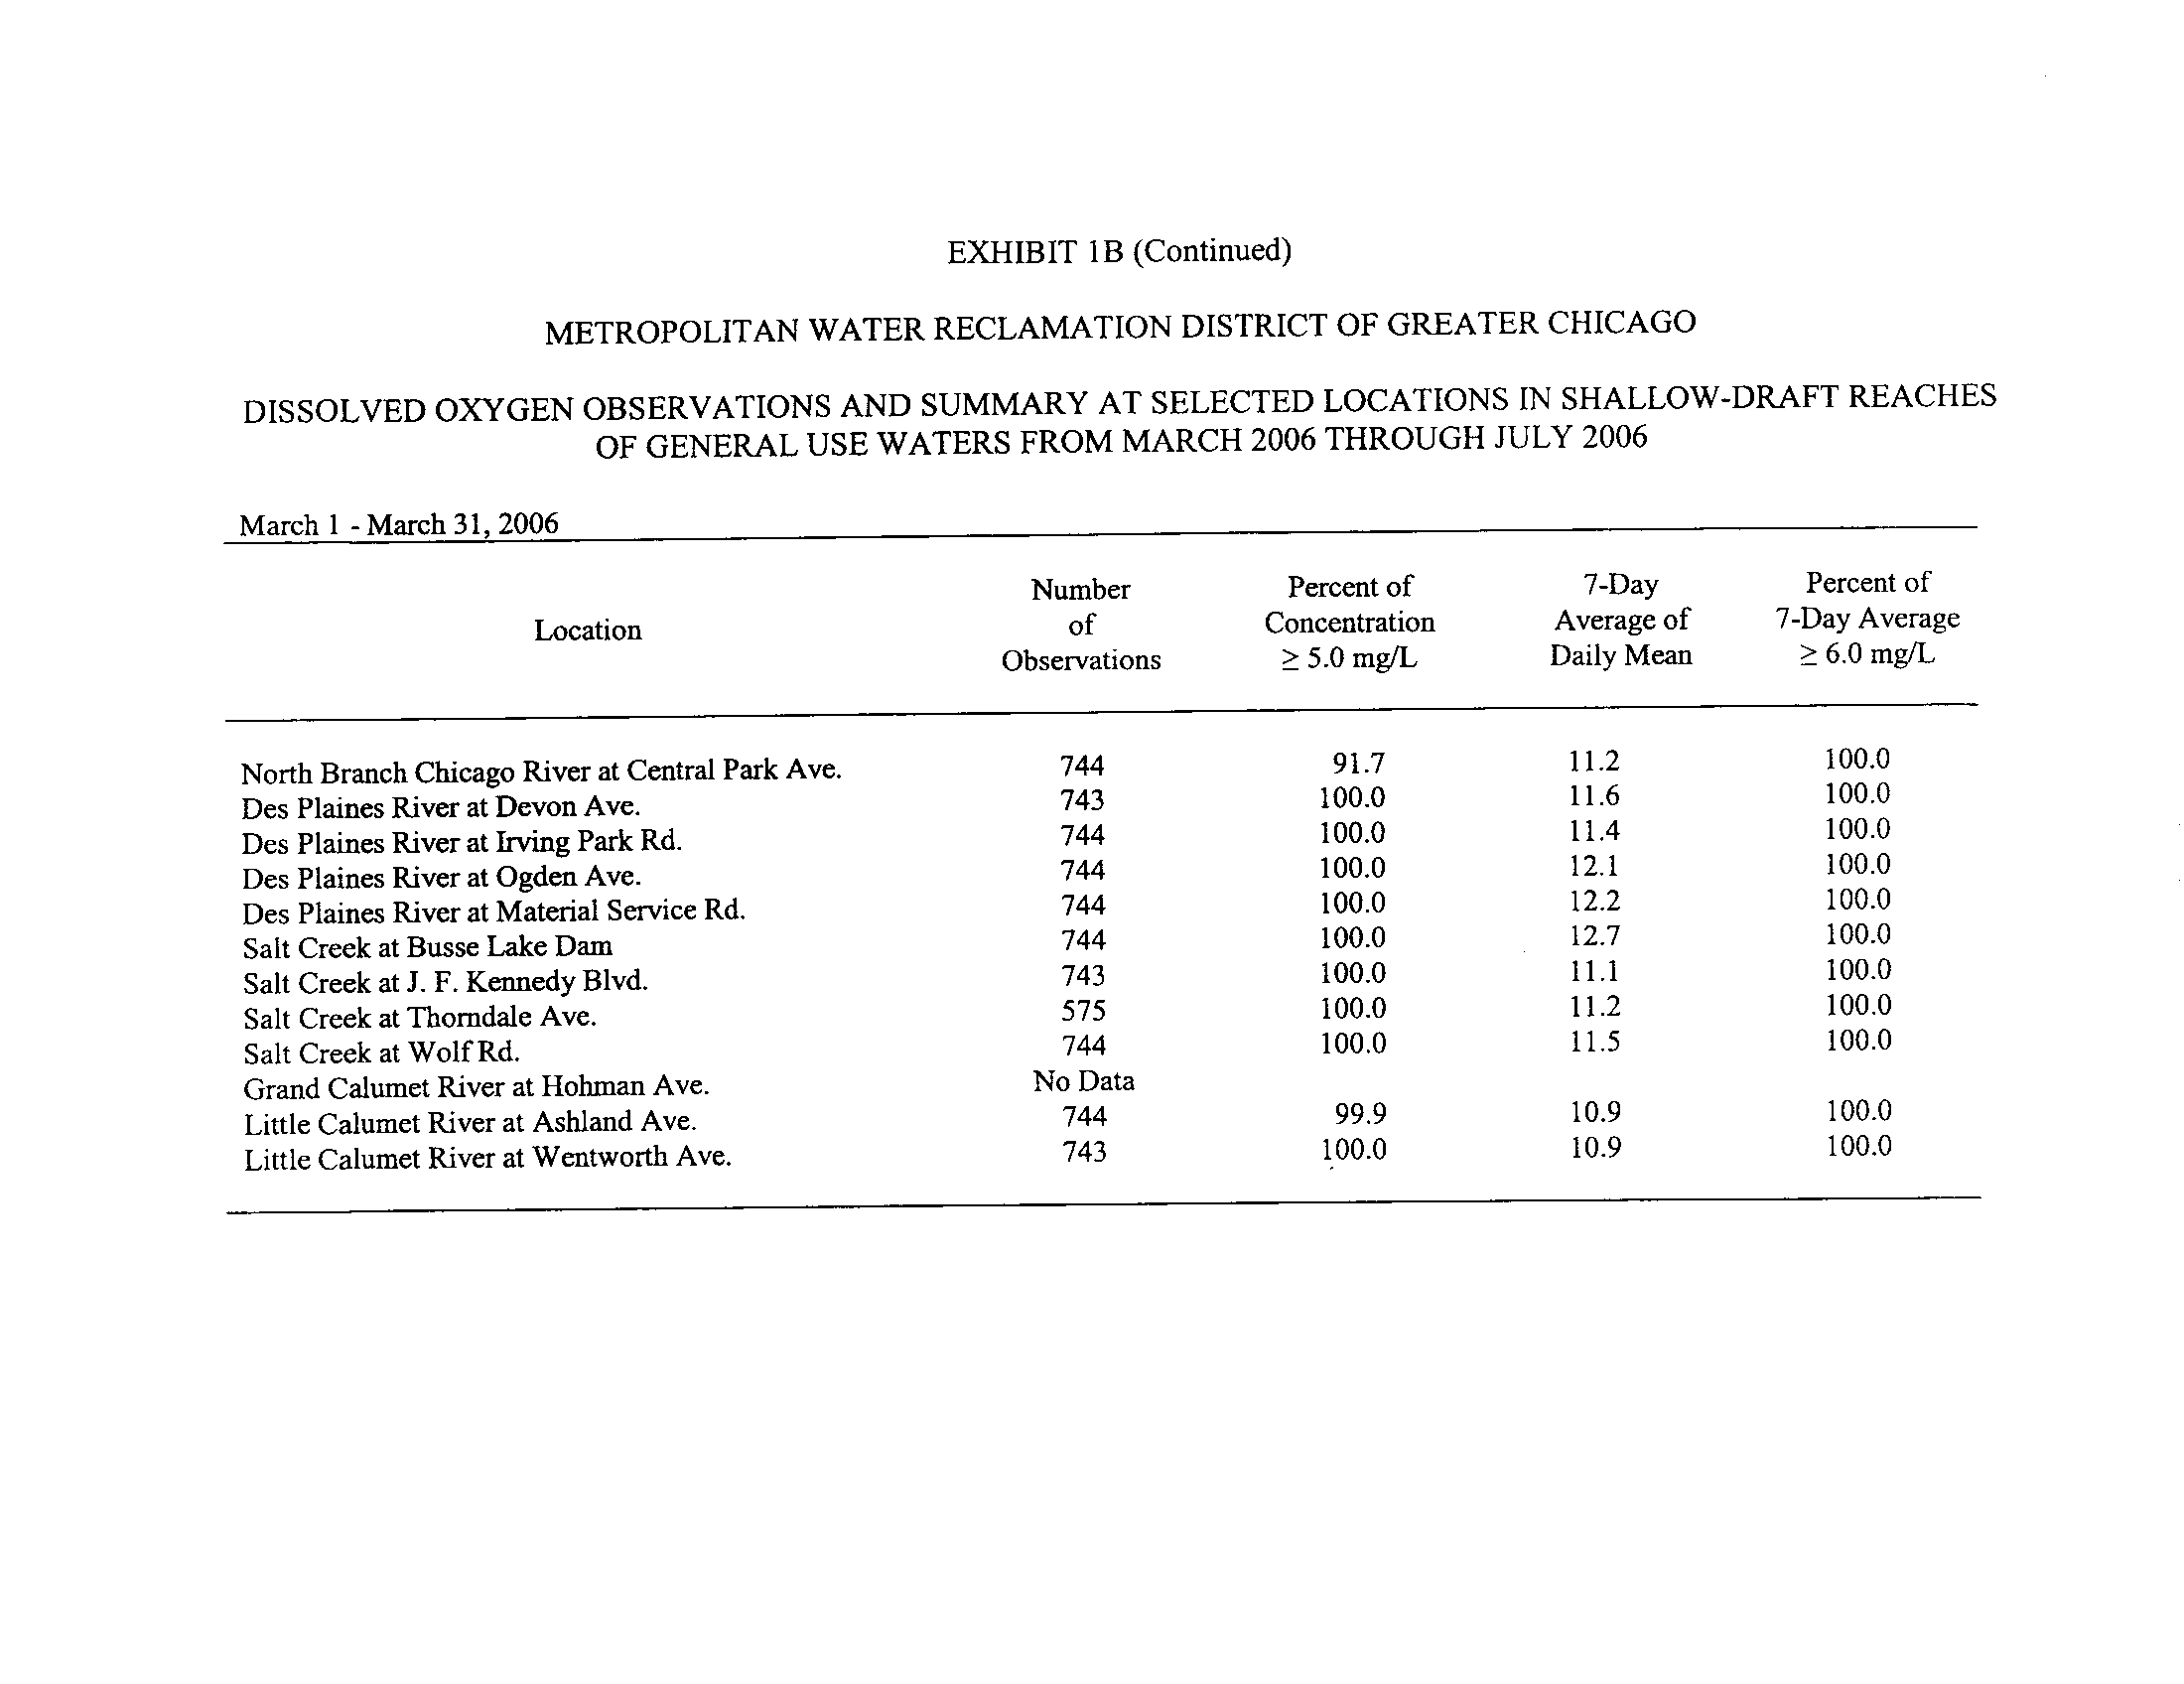
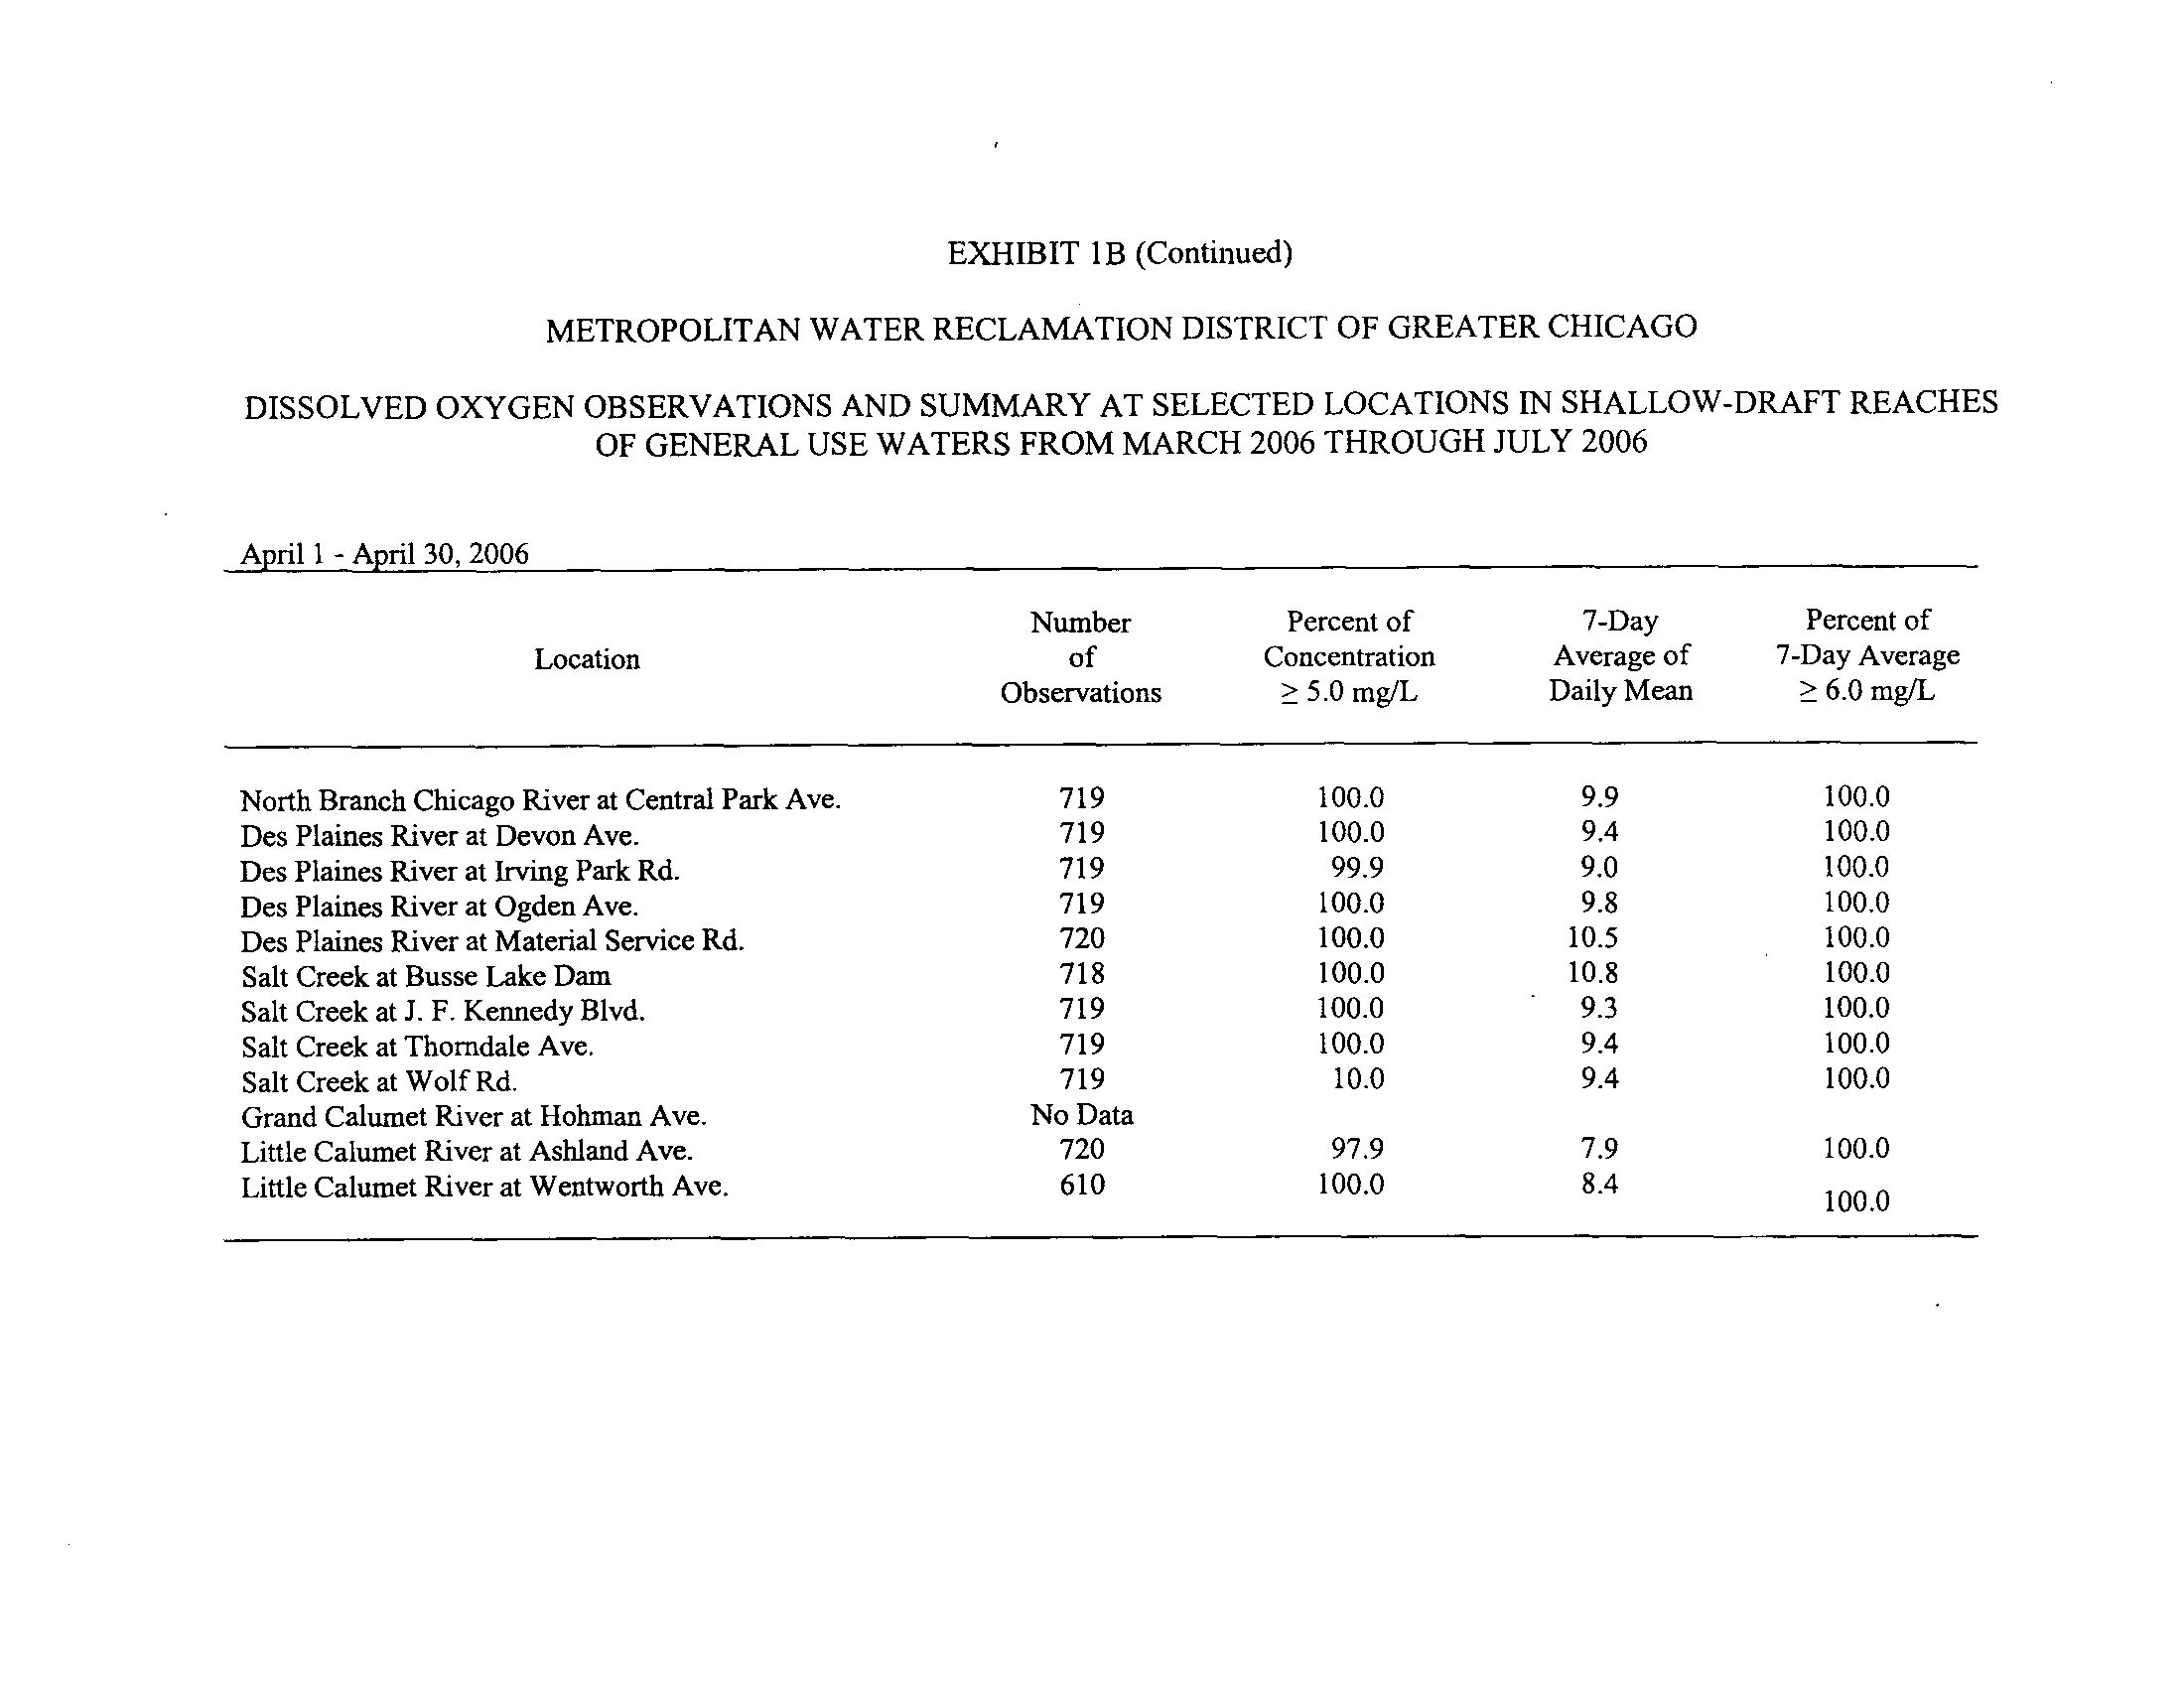
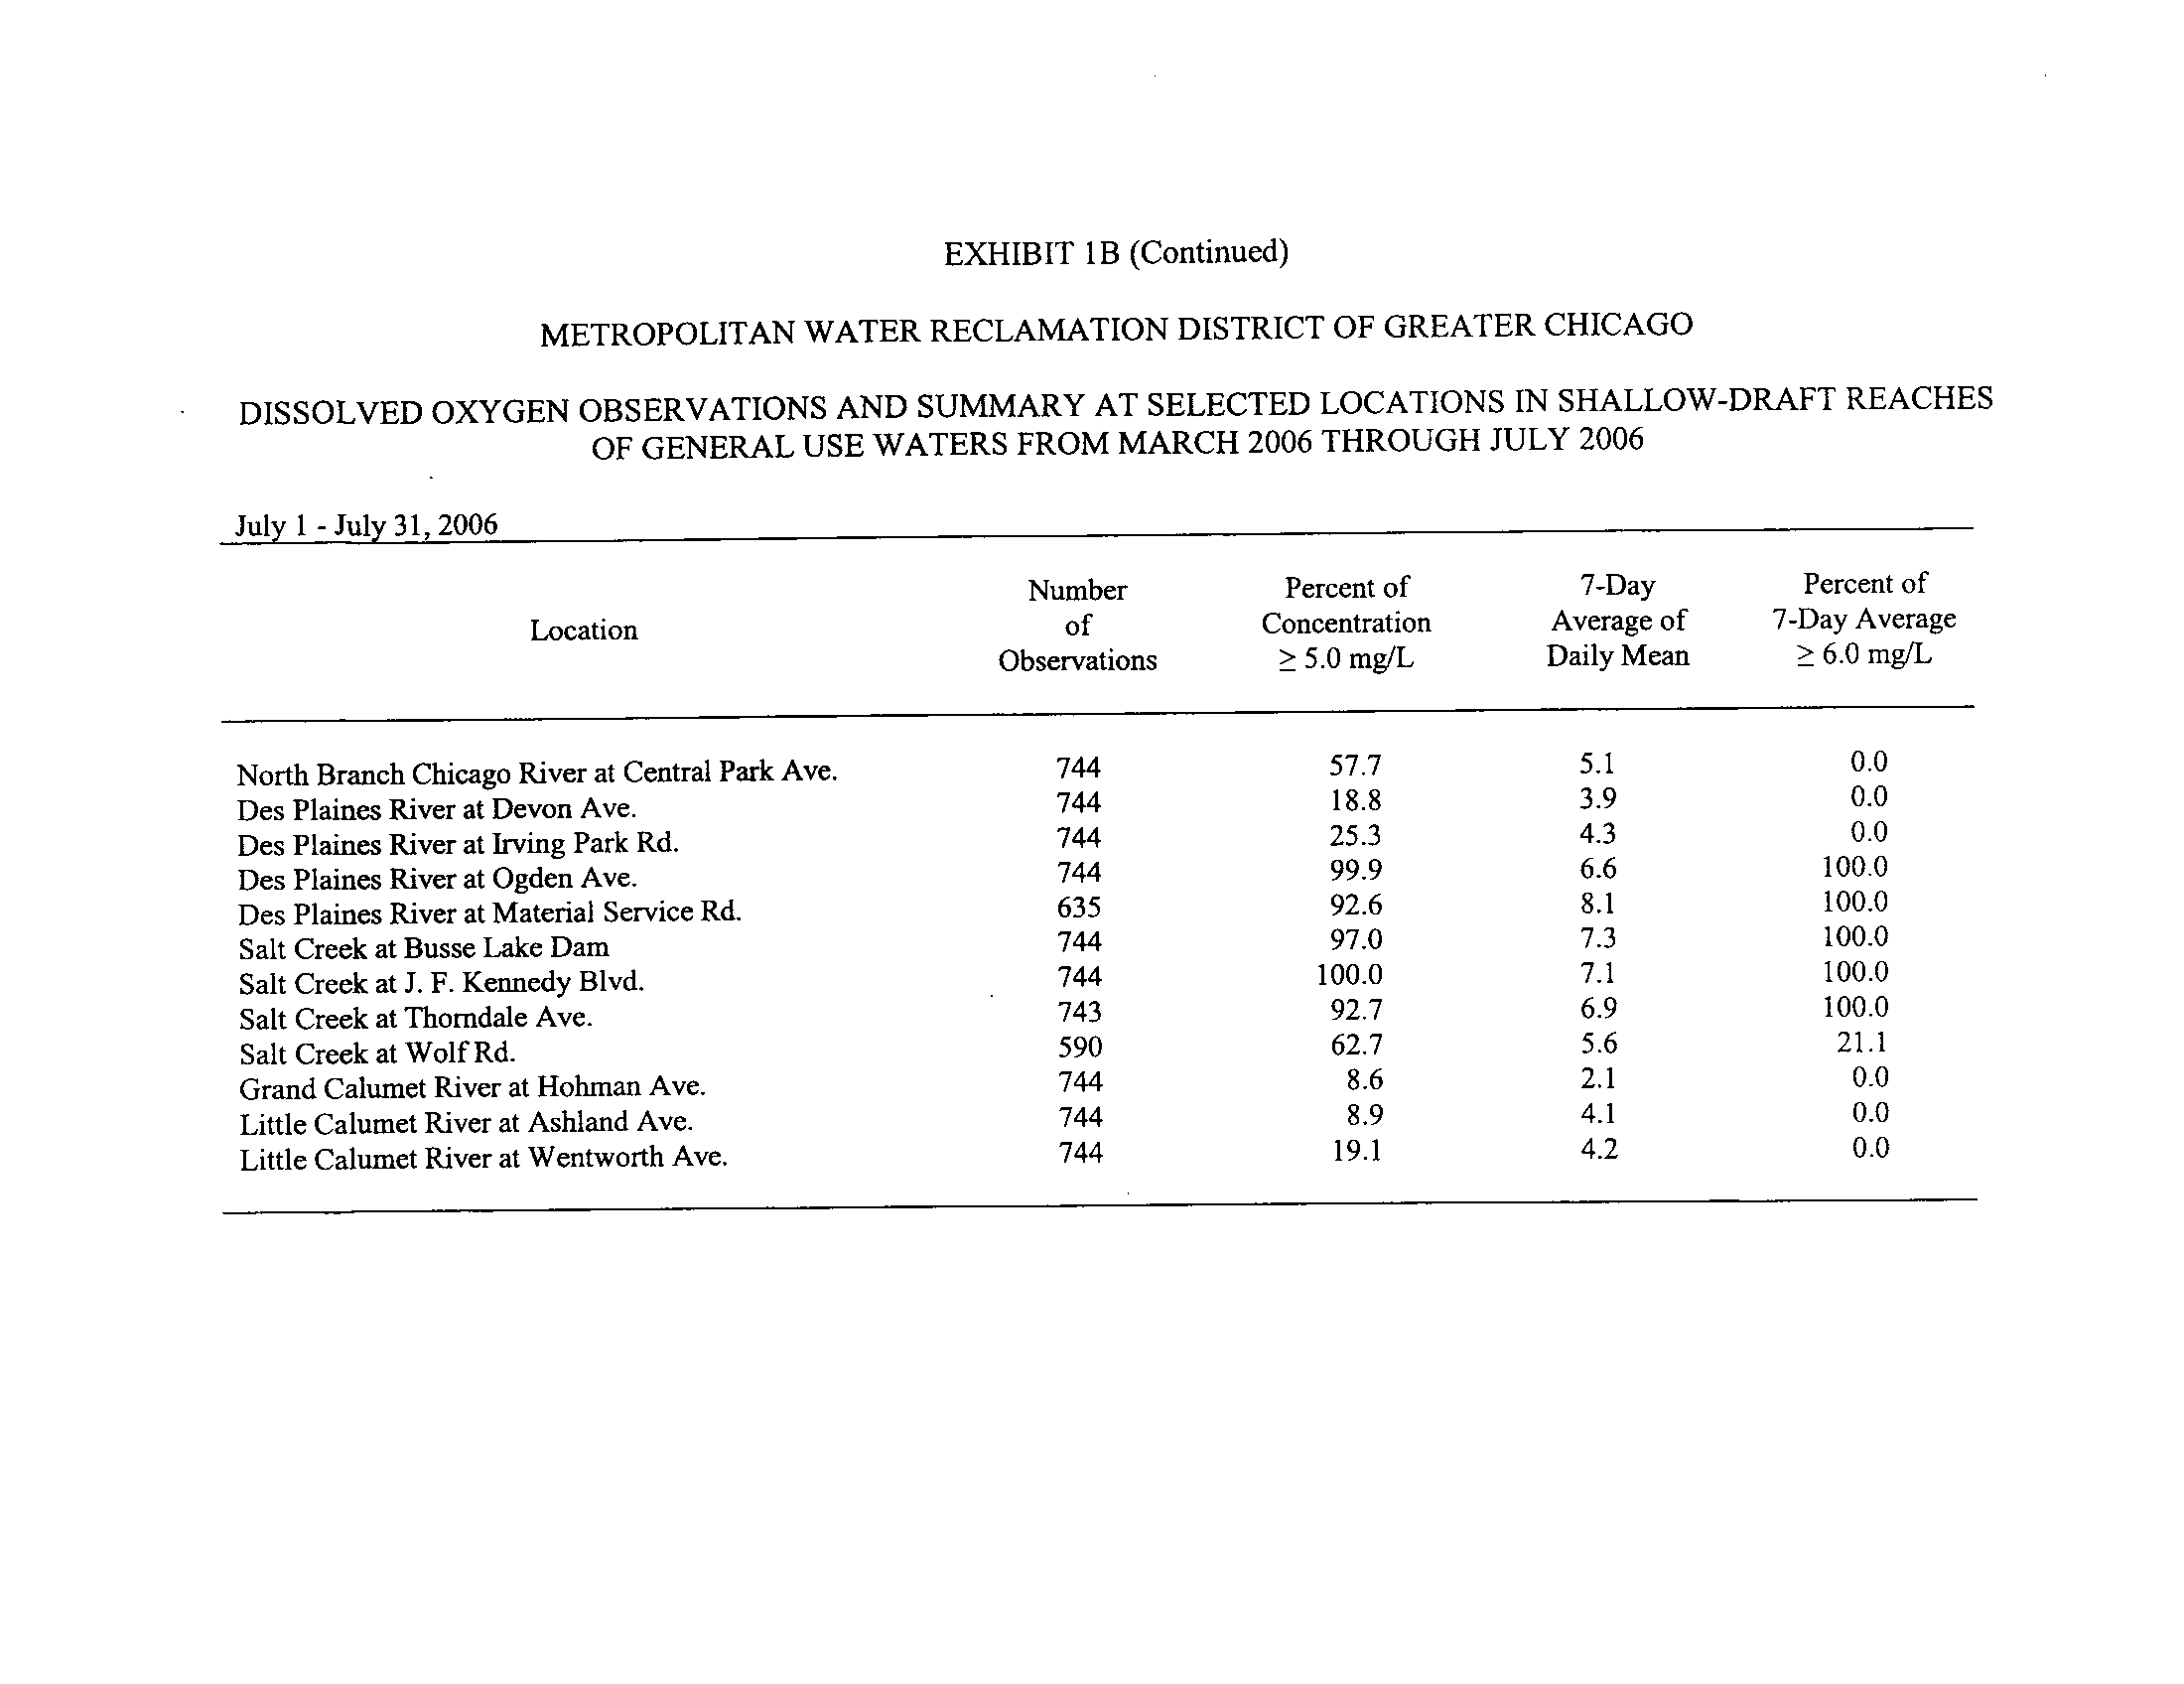
Exhibit 1B .
Dissolved oxygen observations and summary at selected locations in shallow-draft reaches
of General Use Waters for March 2006 through July 2006
.
•
Two of the twelve shallow water CDOM locations were 100 percent compliant with the proposed DO
standards
. These included the Des Plaines River at Ogden Avenue and Salt Creek at J
. F . Kennedy
Boulevard
.
6
• Three locations were not 100 percent compliant with the >_ 5 .0 mg/L standard, but were 100 percent
compliant with the 6
.0 mg/L 7-day Average of the Daily Mean standard . These were Salt Creek at
Busse Lake and Thomdale Avenue, and the Des Plaines River at Material Service Road .
•
Locations not in 100 percent compliance with either standard were the North Branch of the Chicago
River at Central Park Avenue, the Des Plaines River at Devon Avenue and Irving Park Road, Salt
Creek at Wolf Road, the Little Calumet River at Ashland Avenue and Wentworth Avenue, and the
Grand Calumet River at Hohman Avenue .
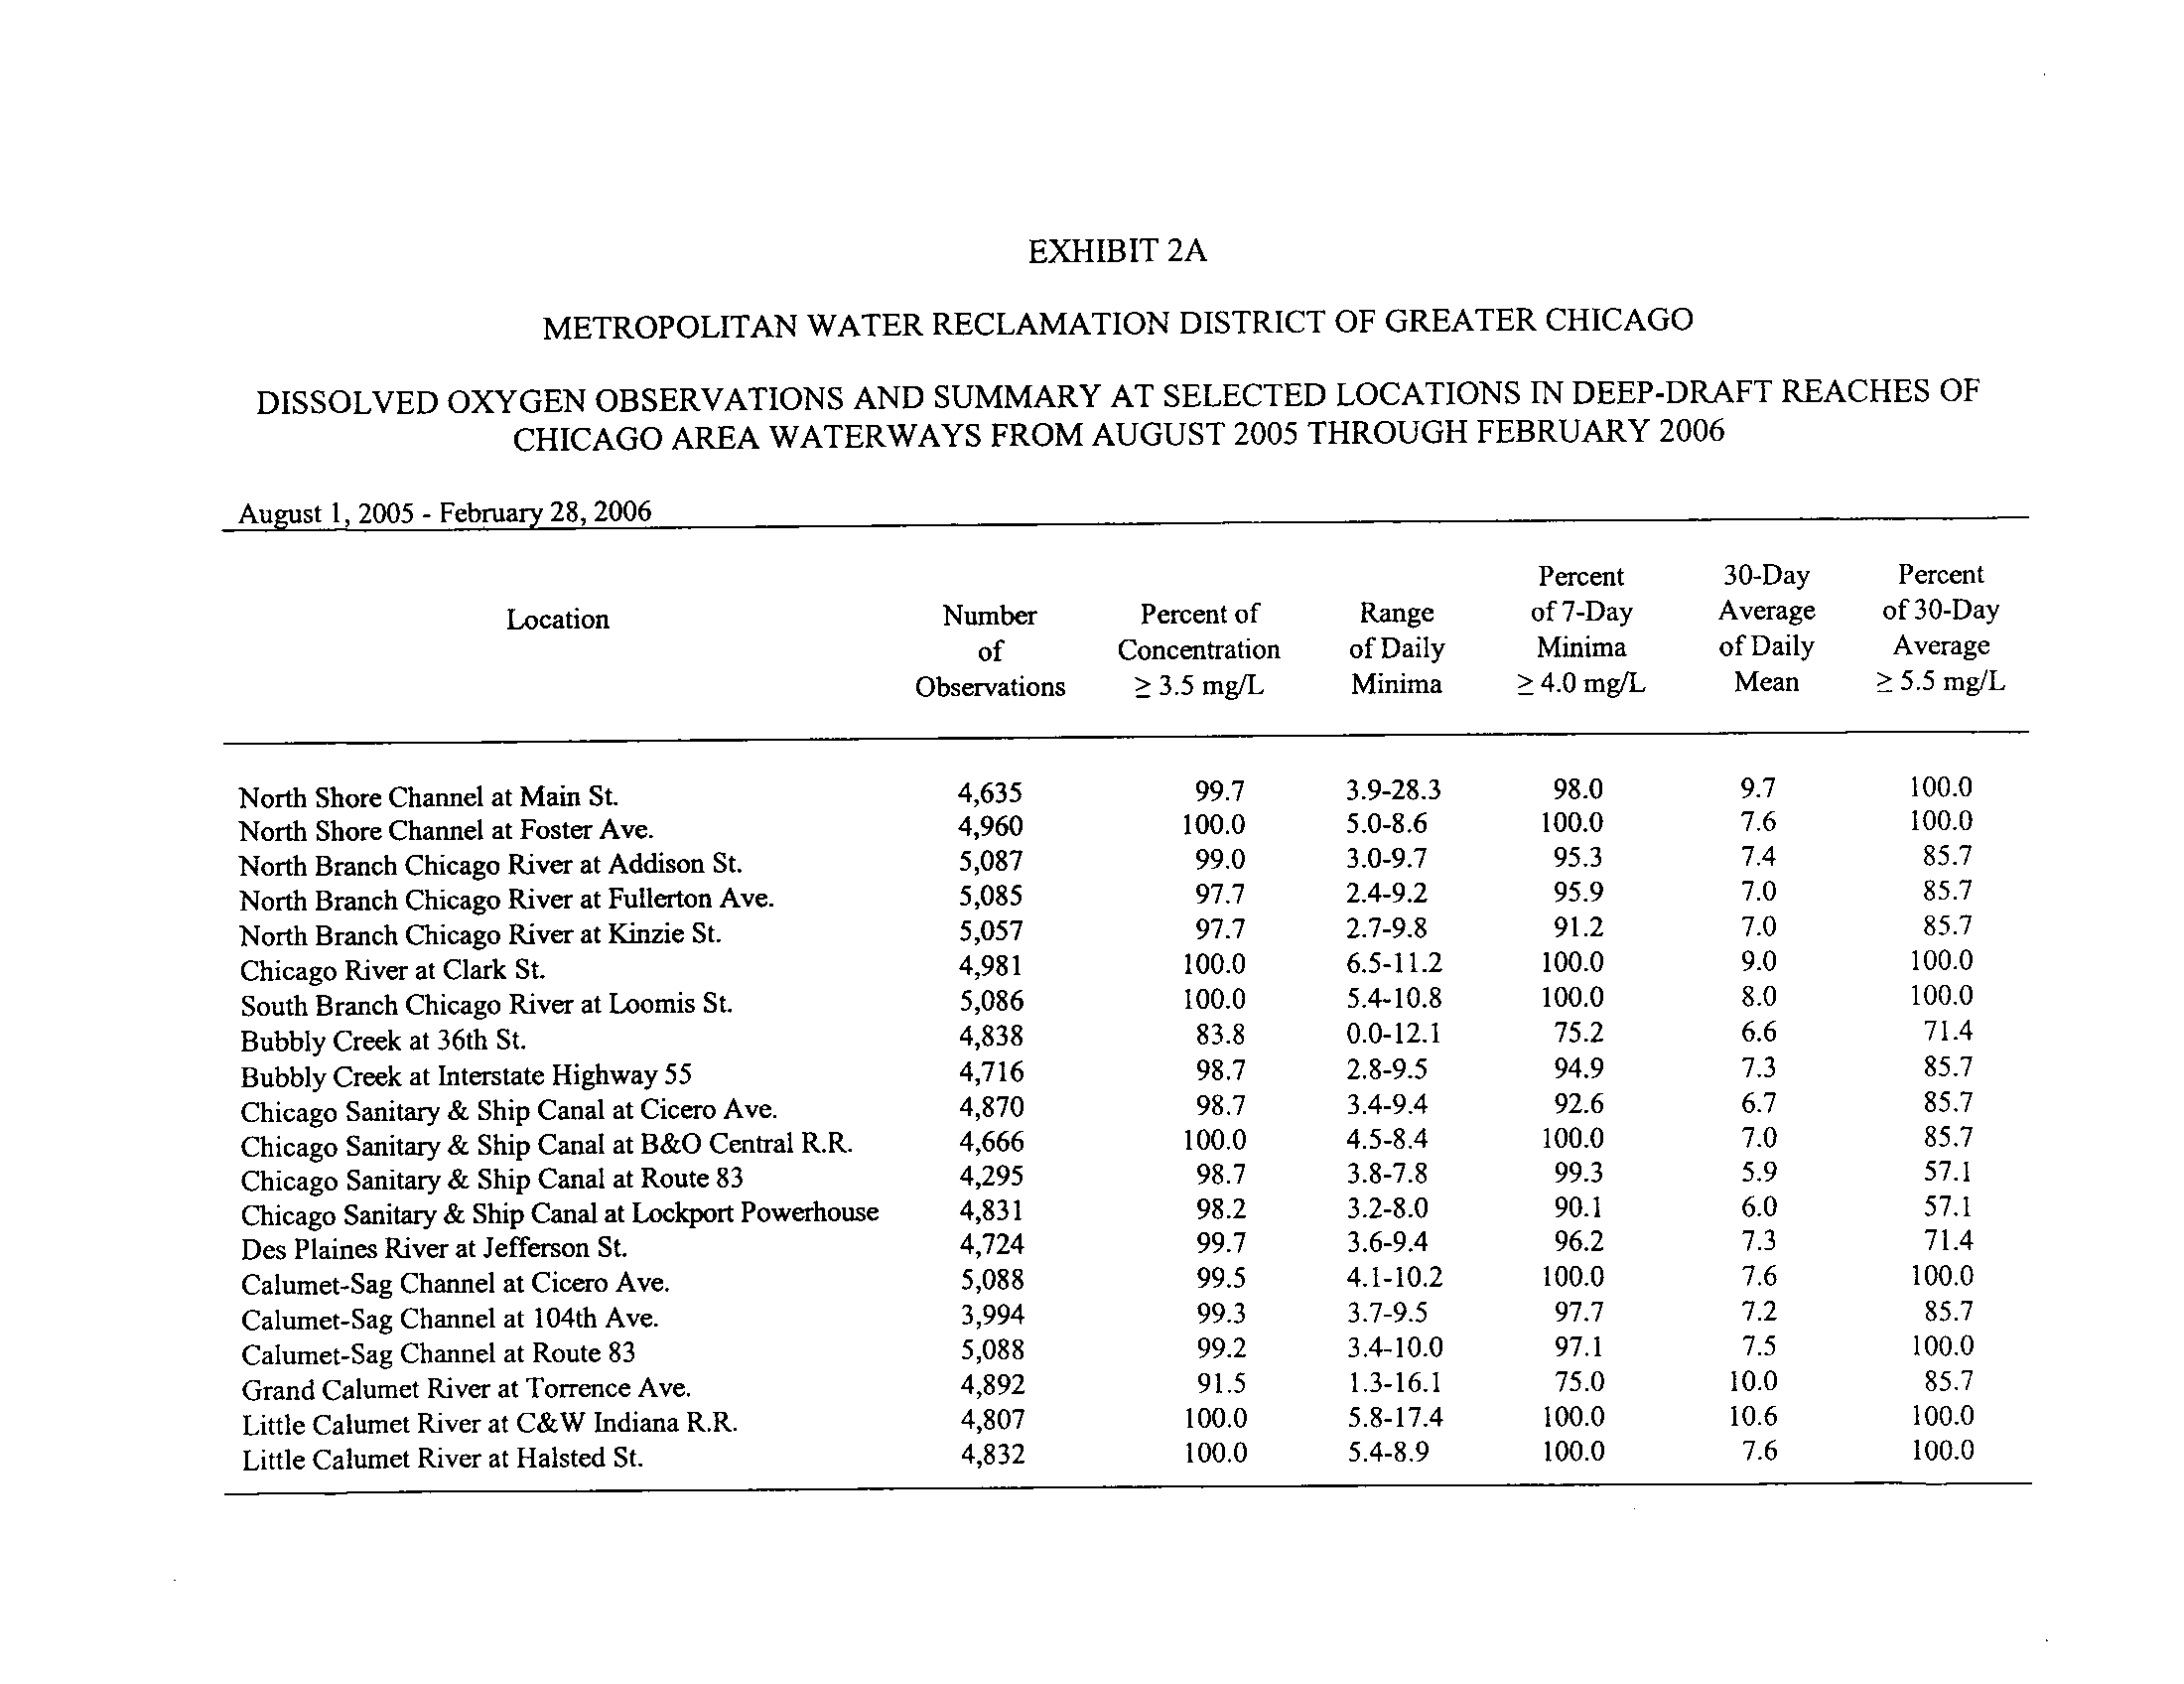
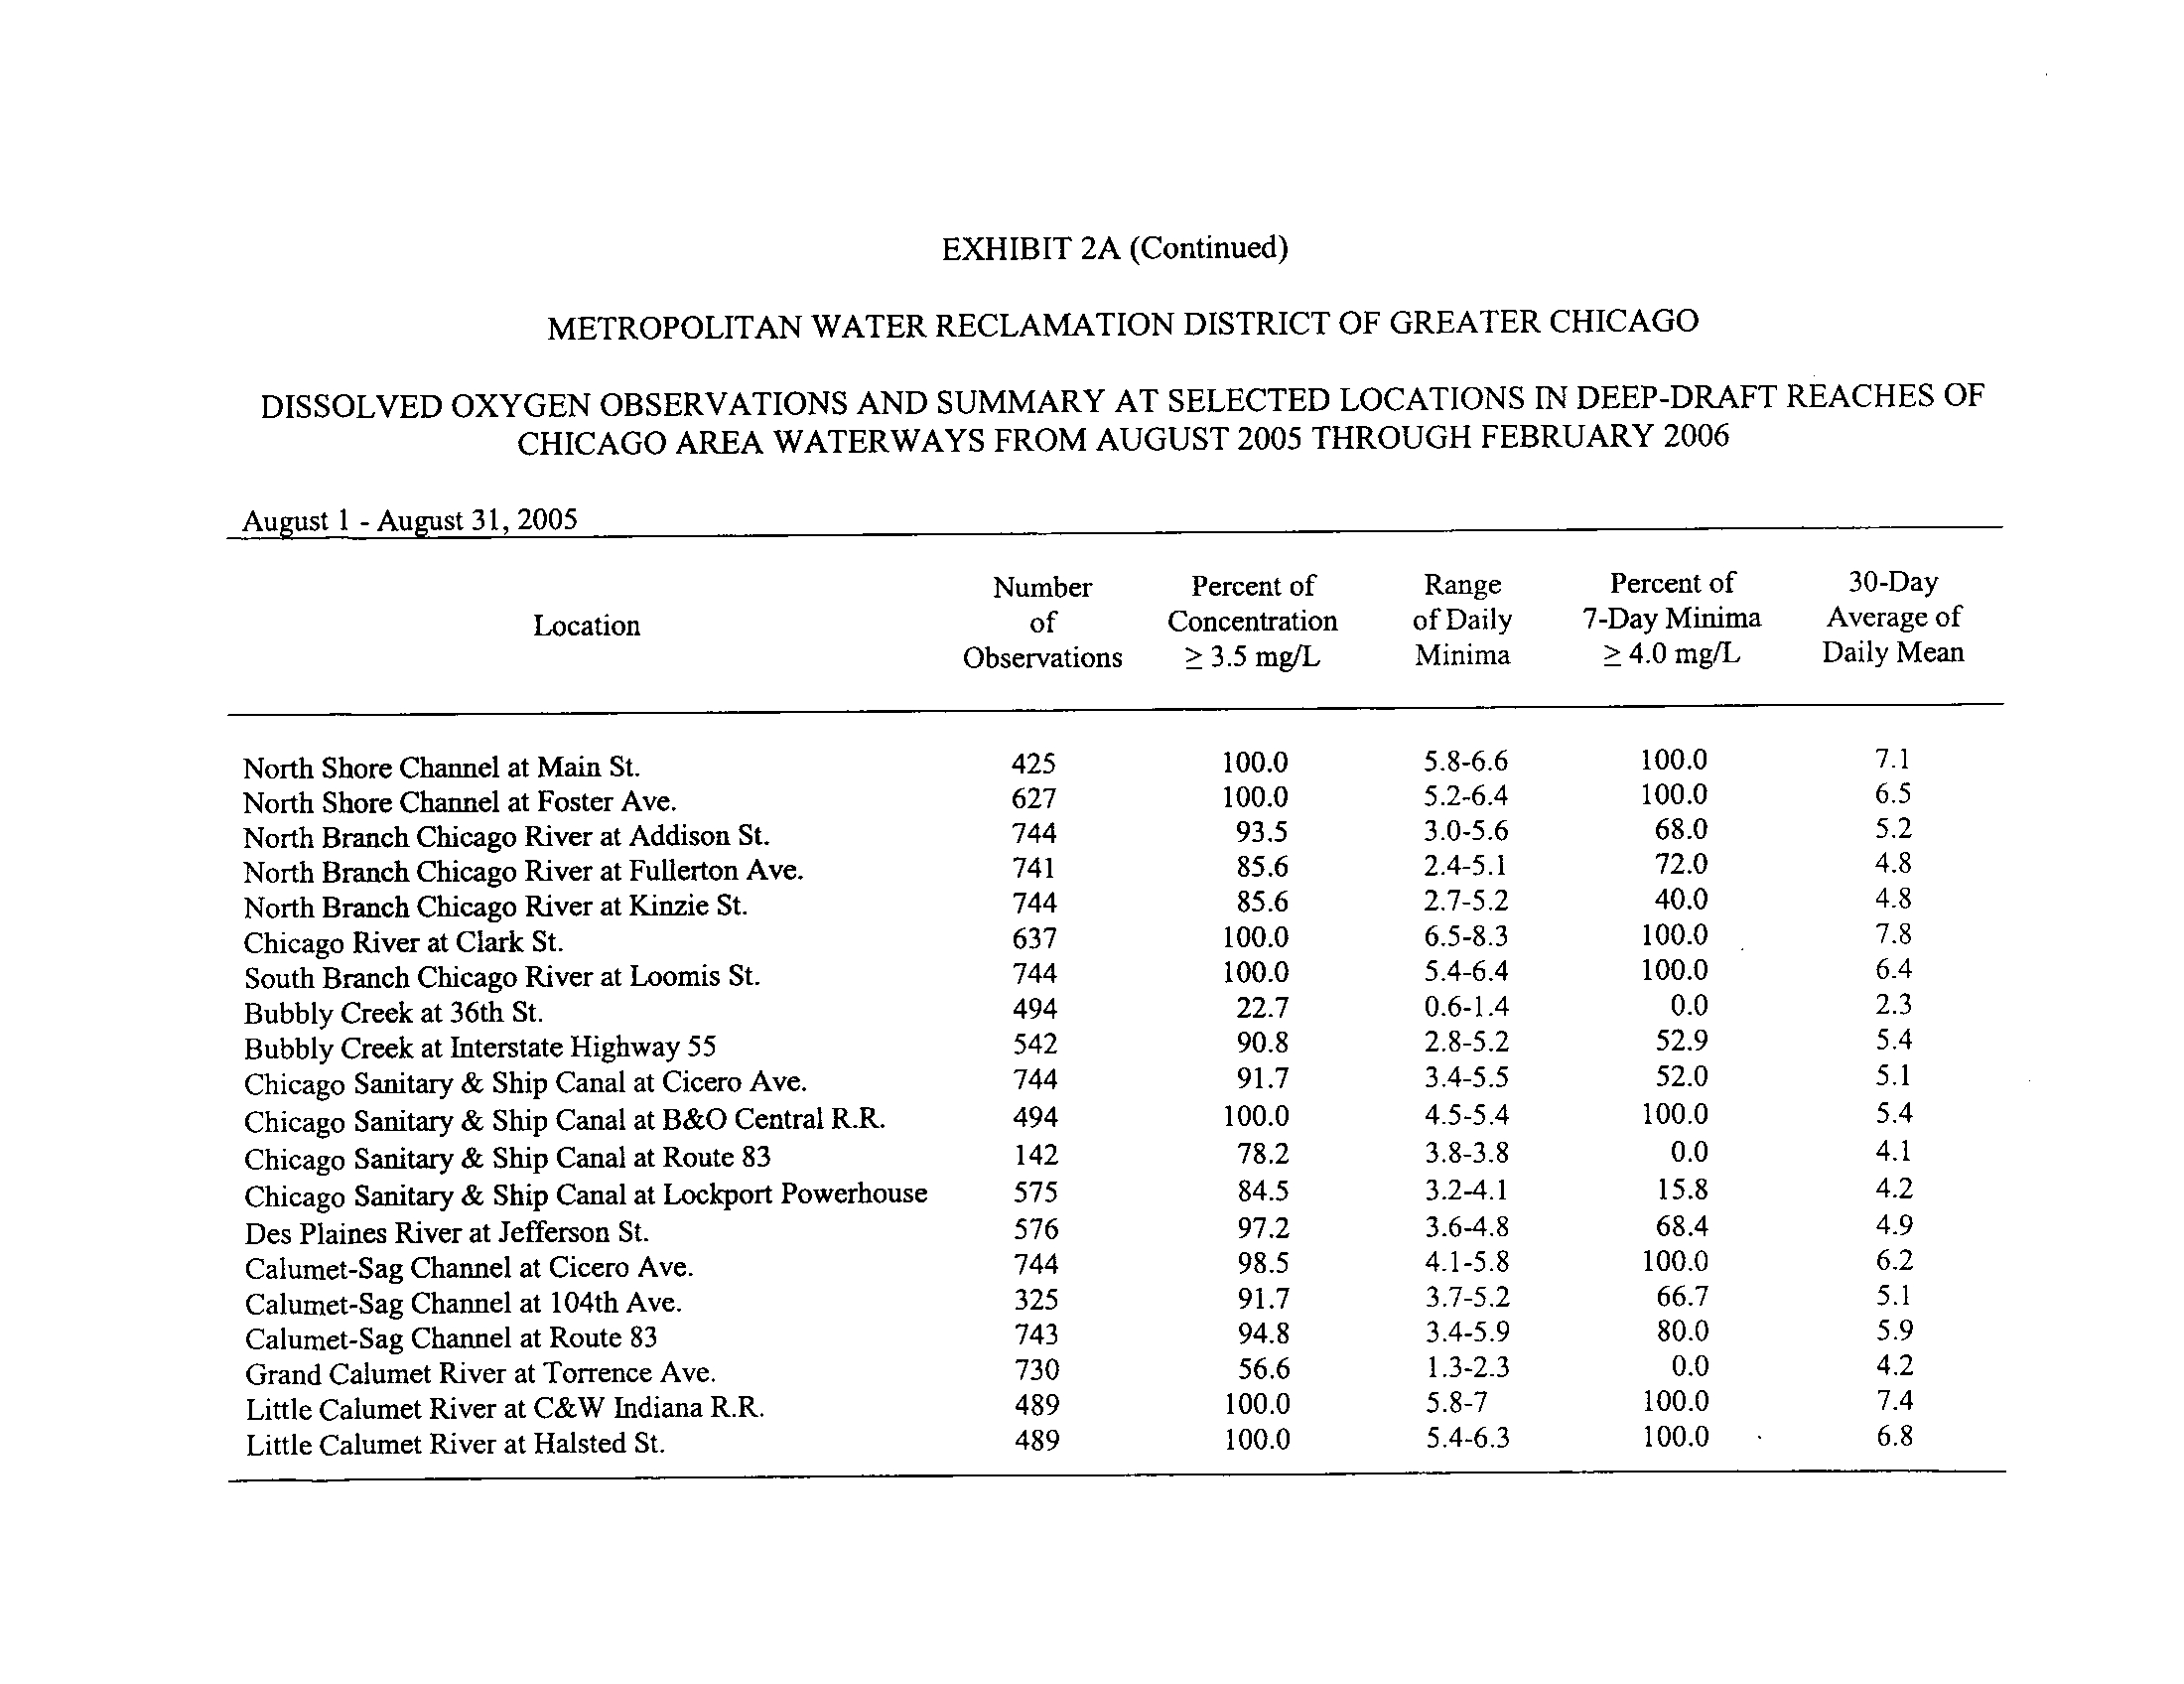
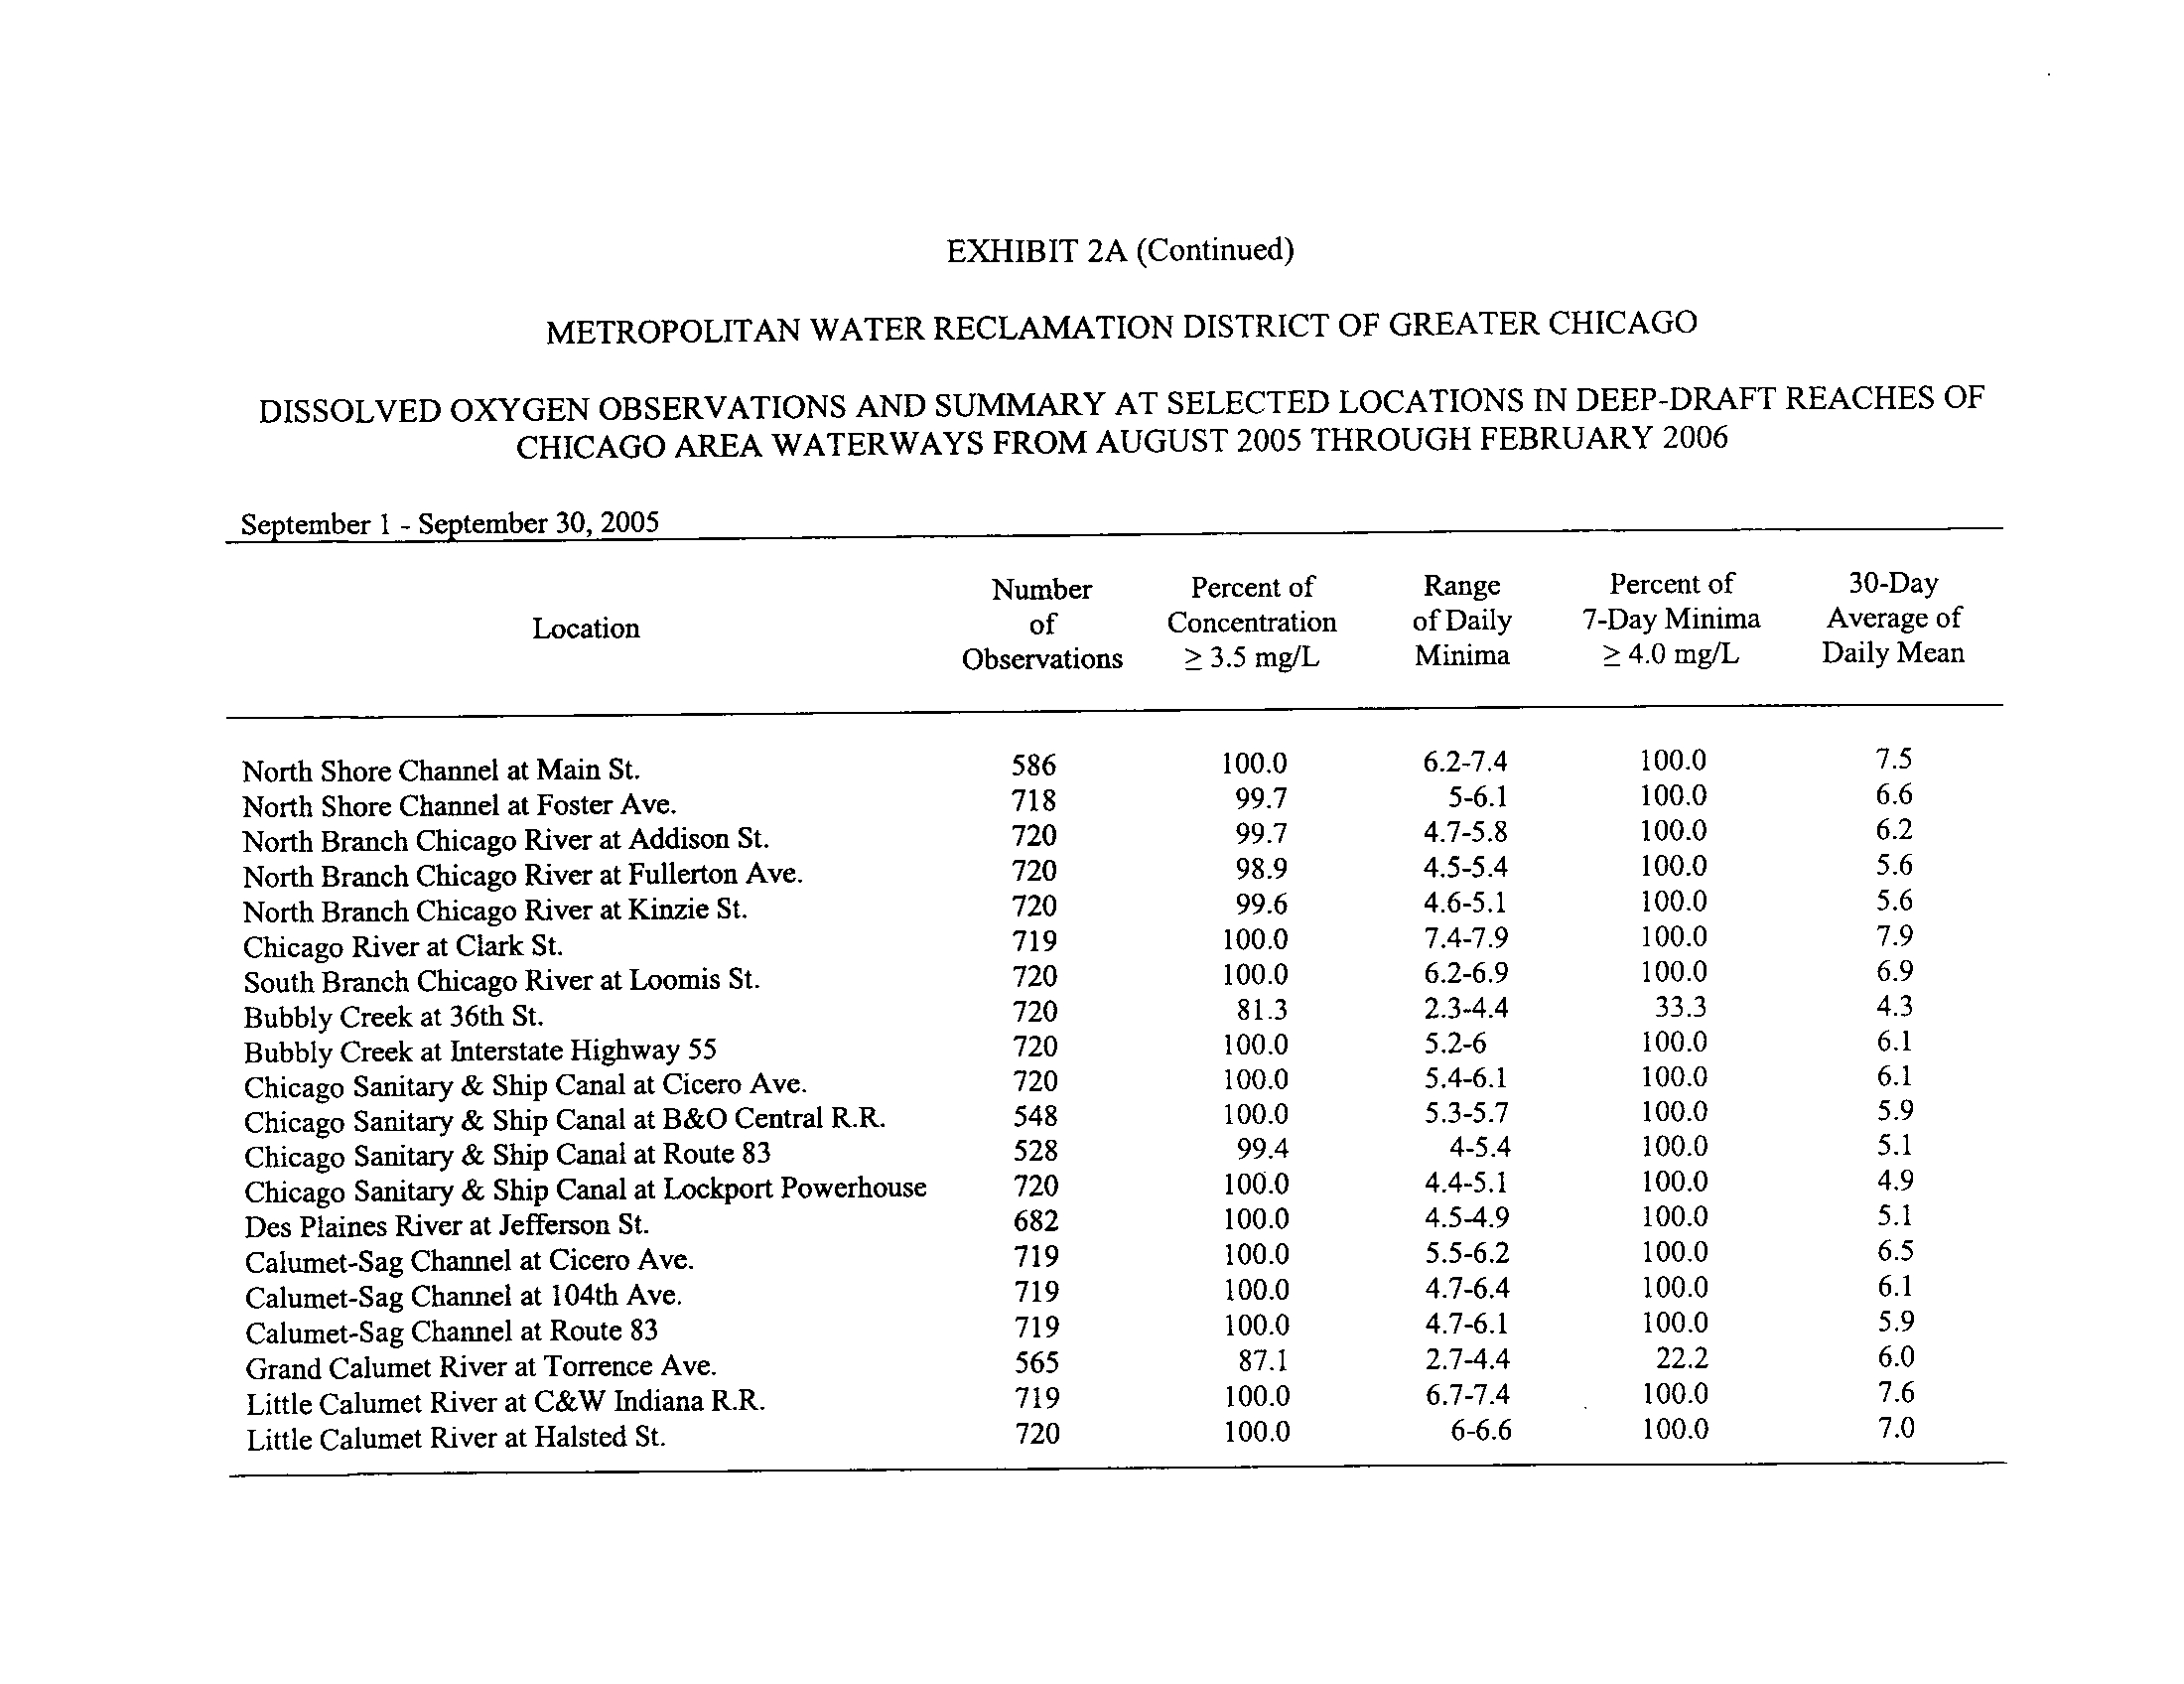
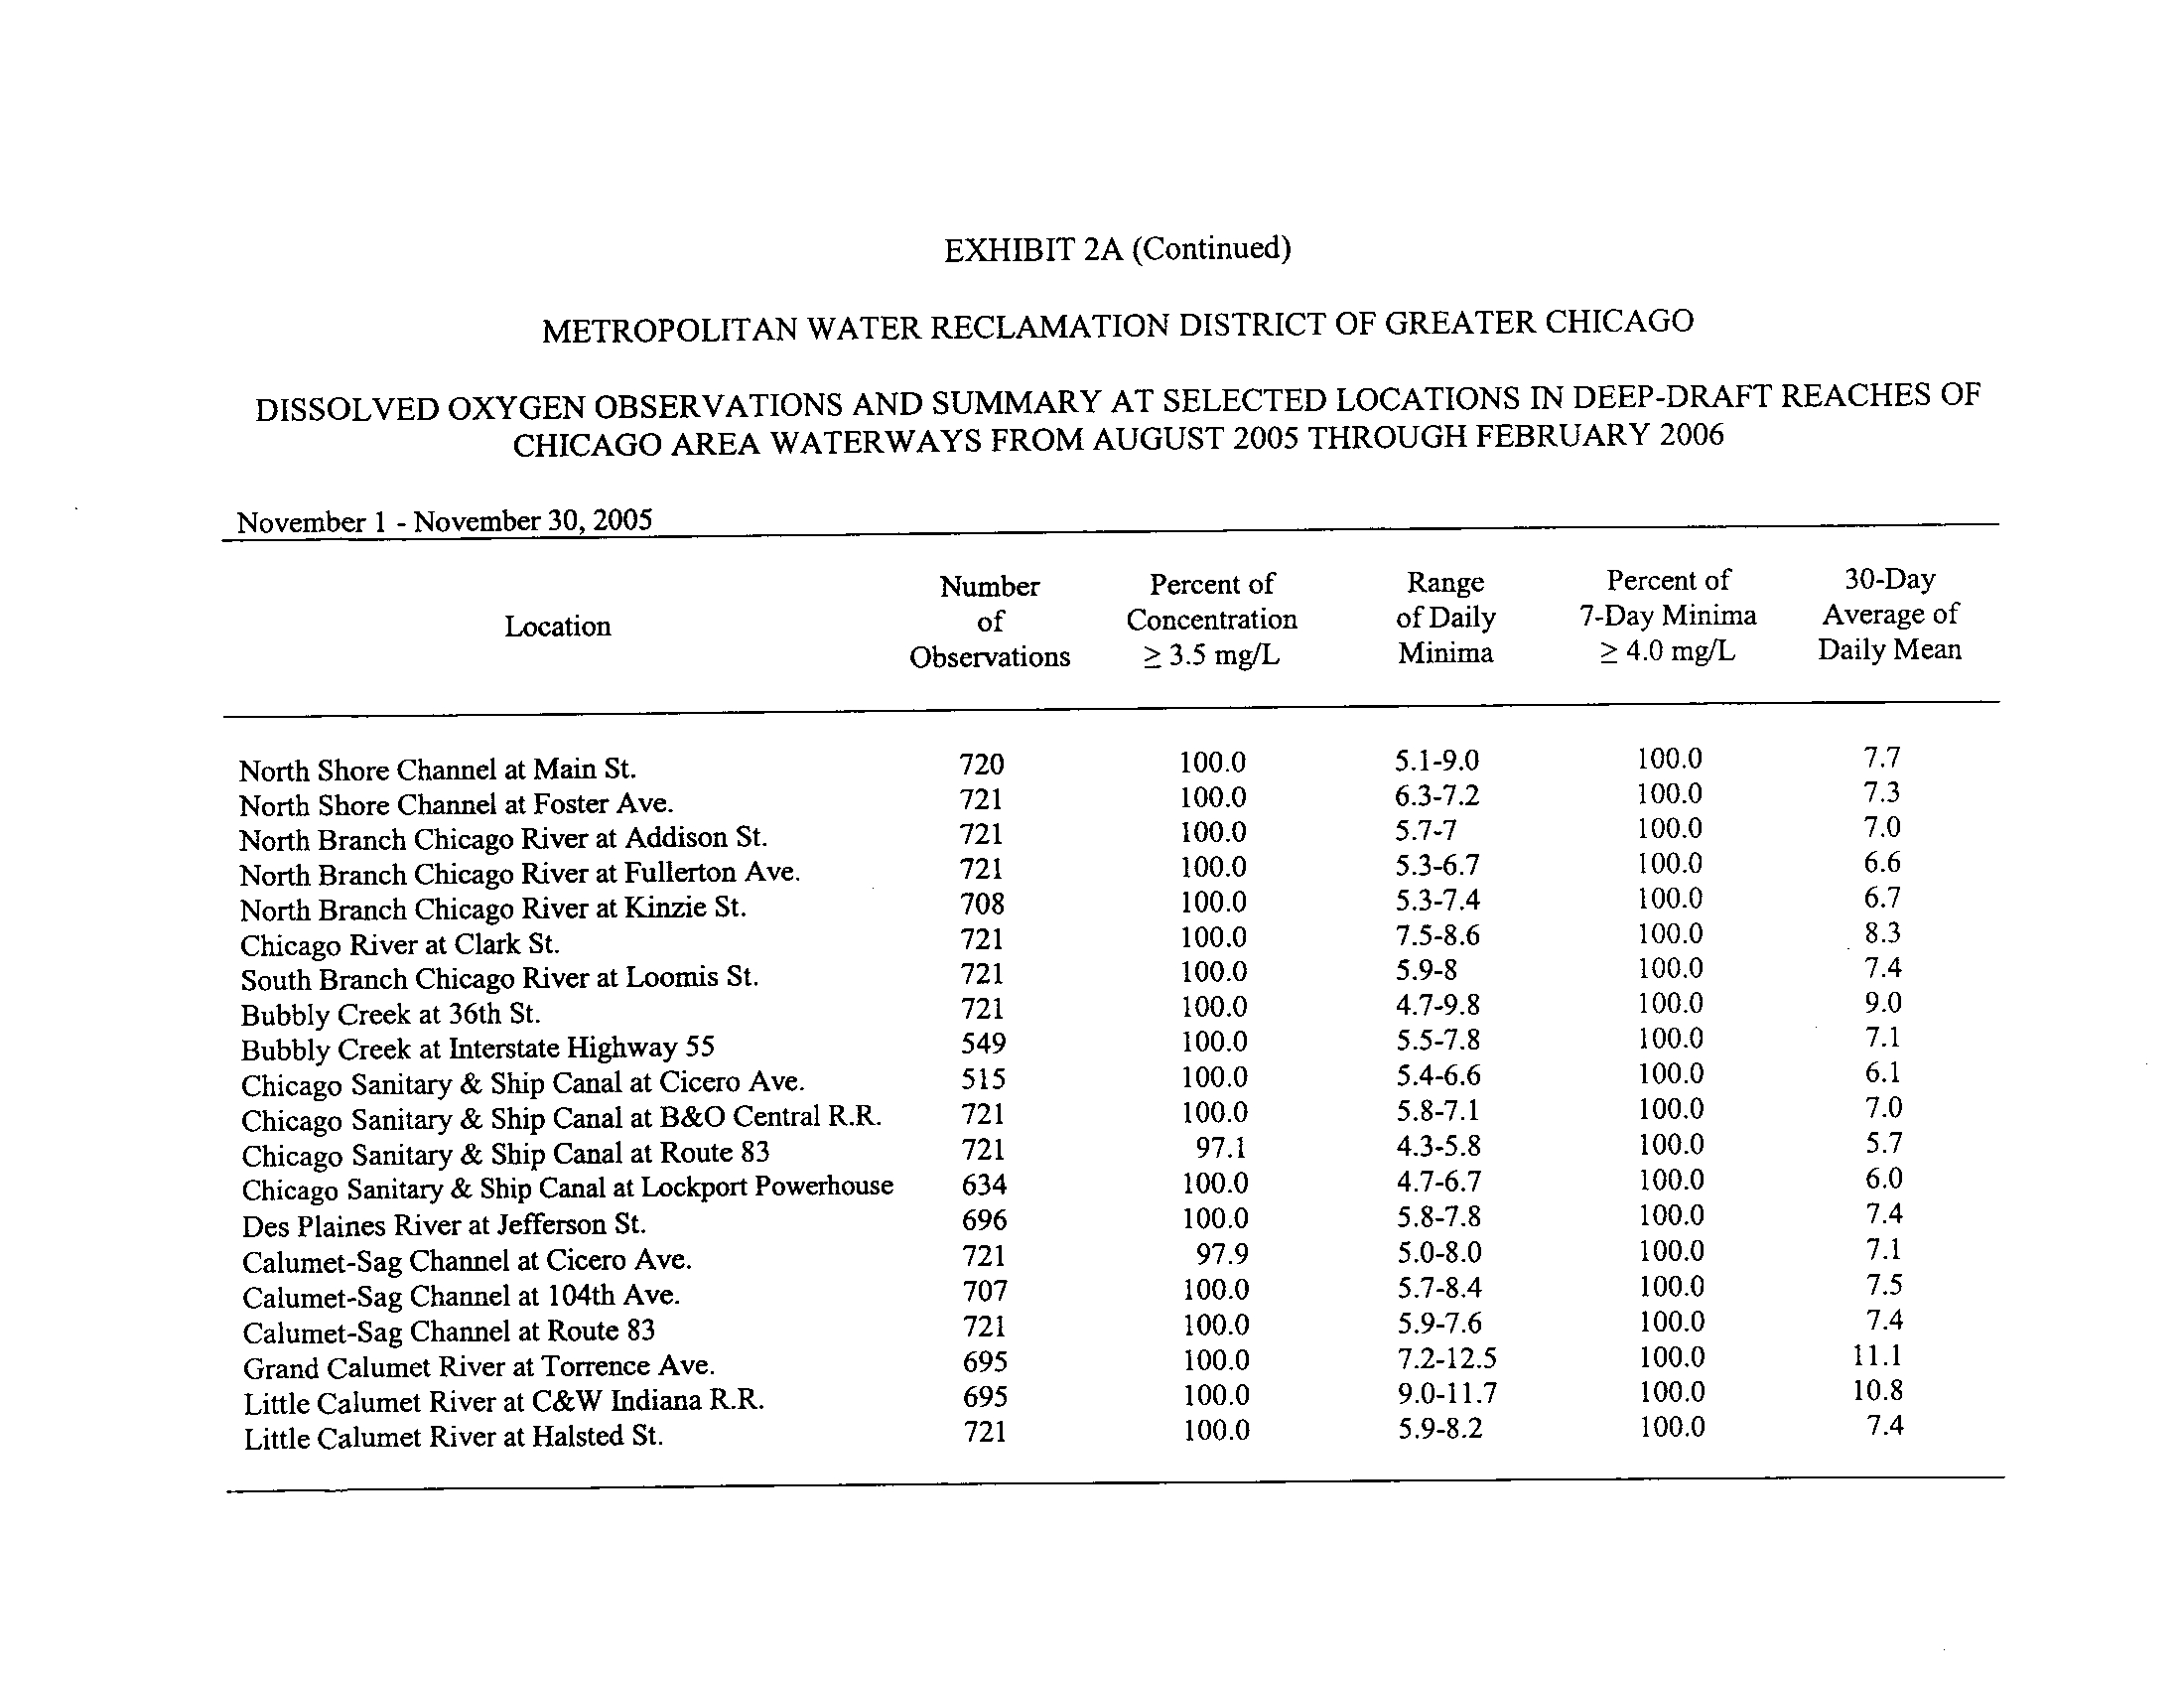
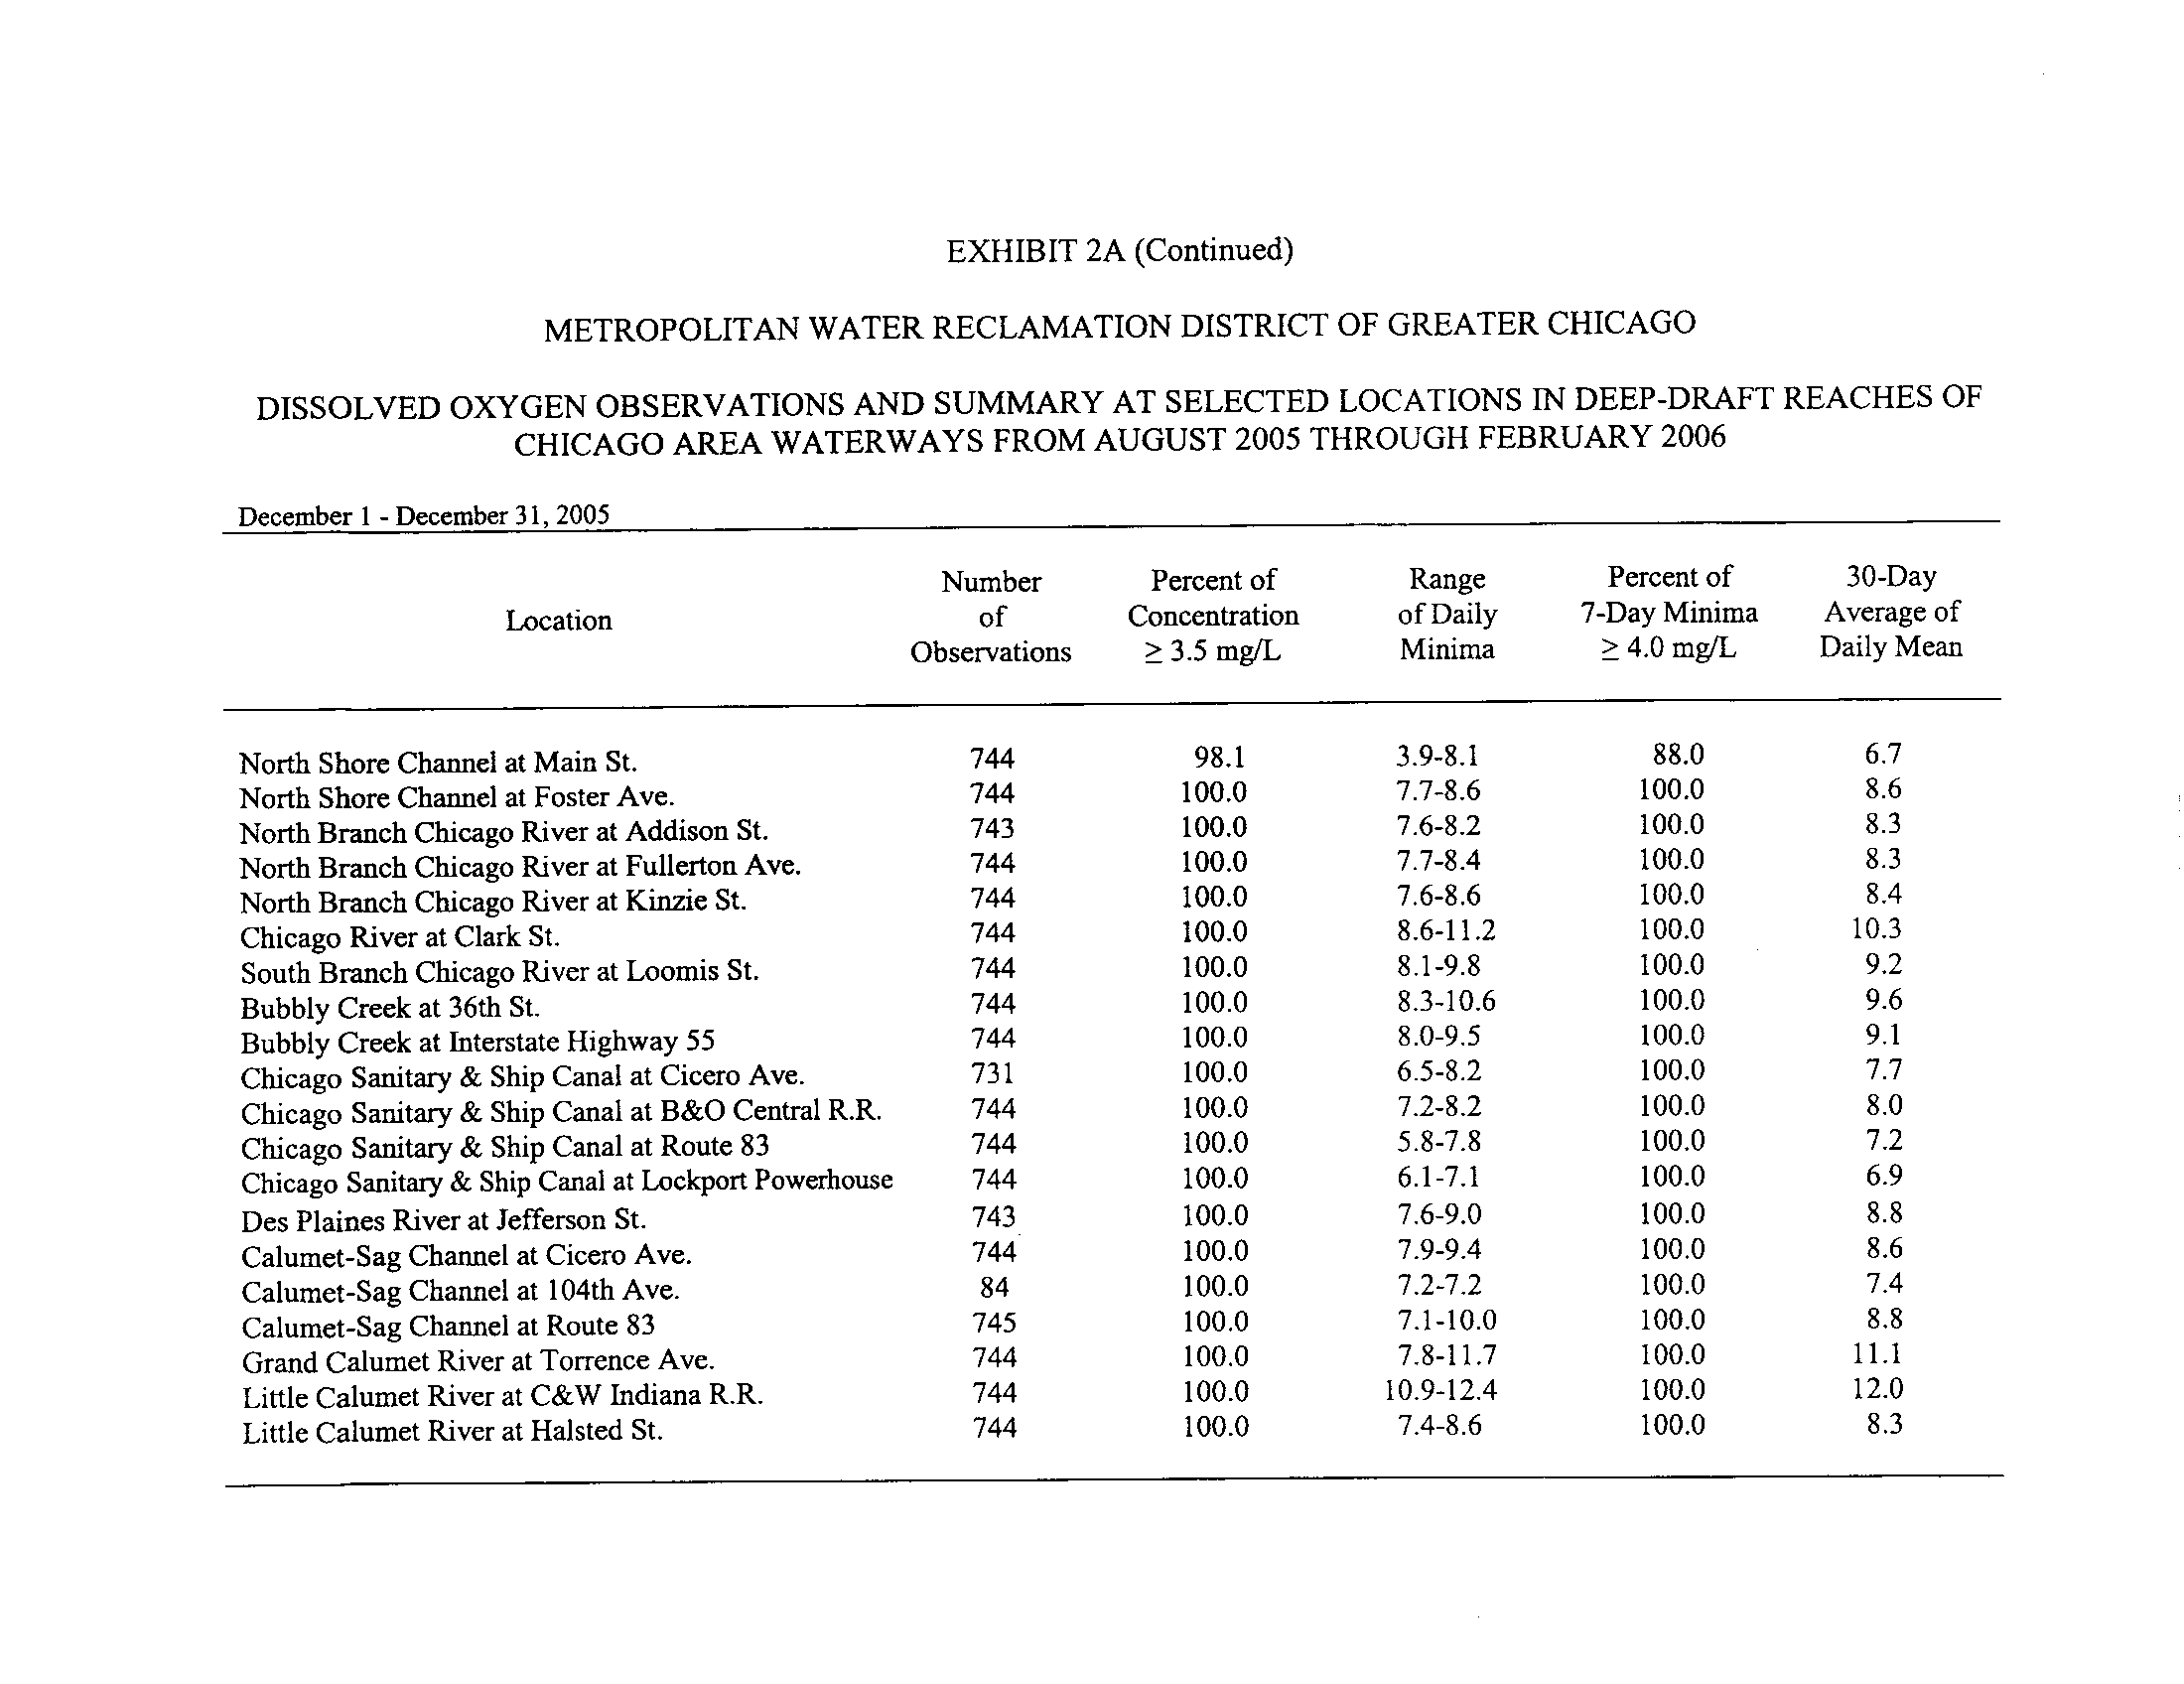
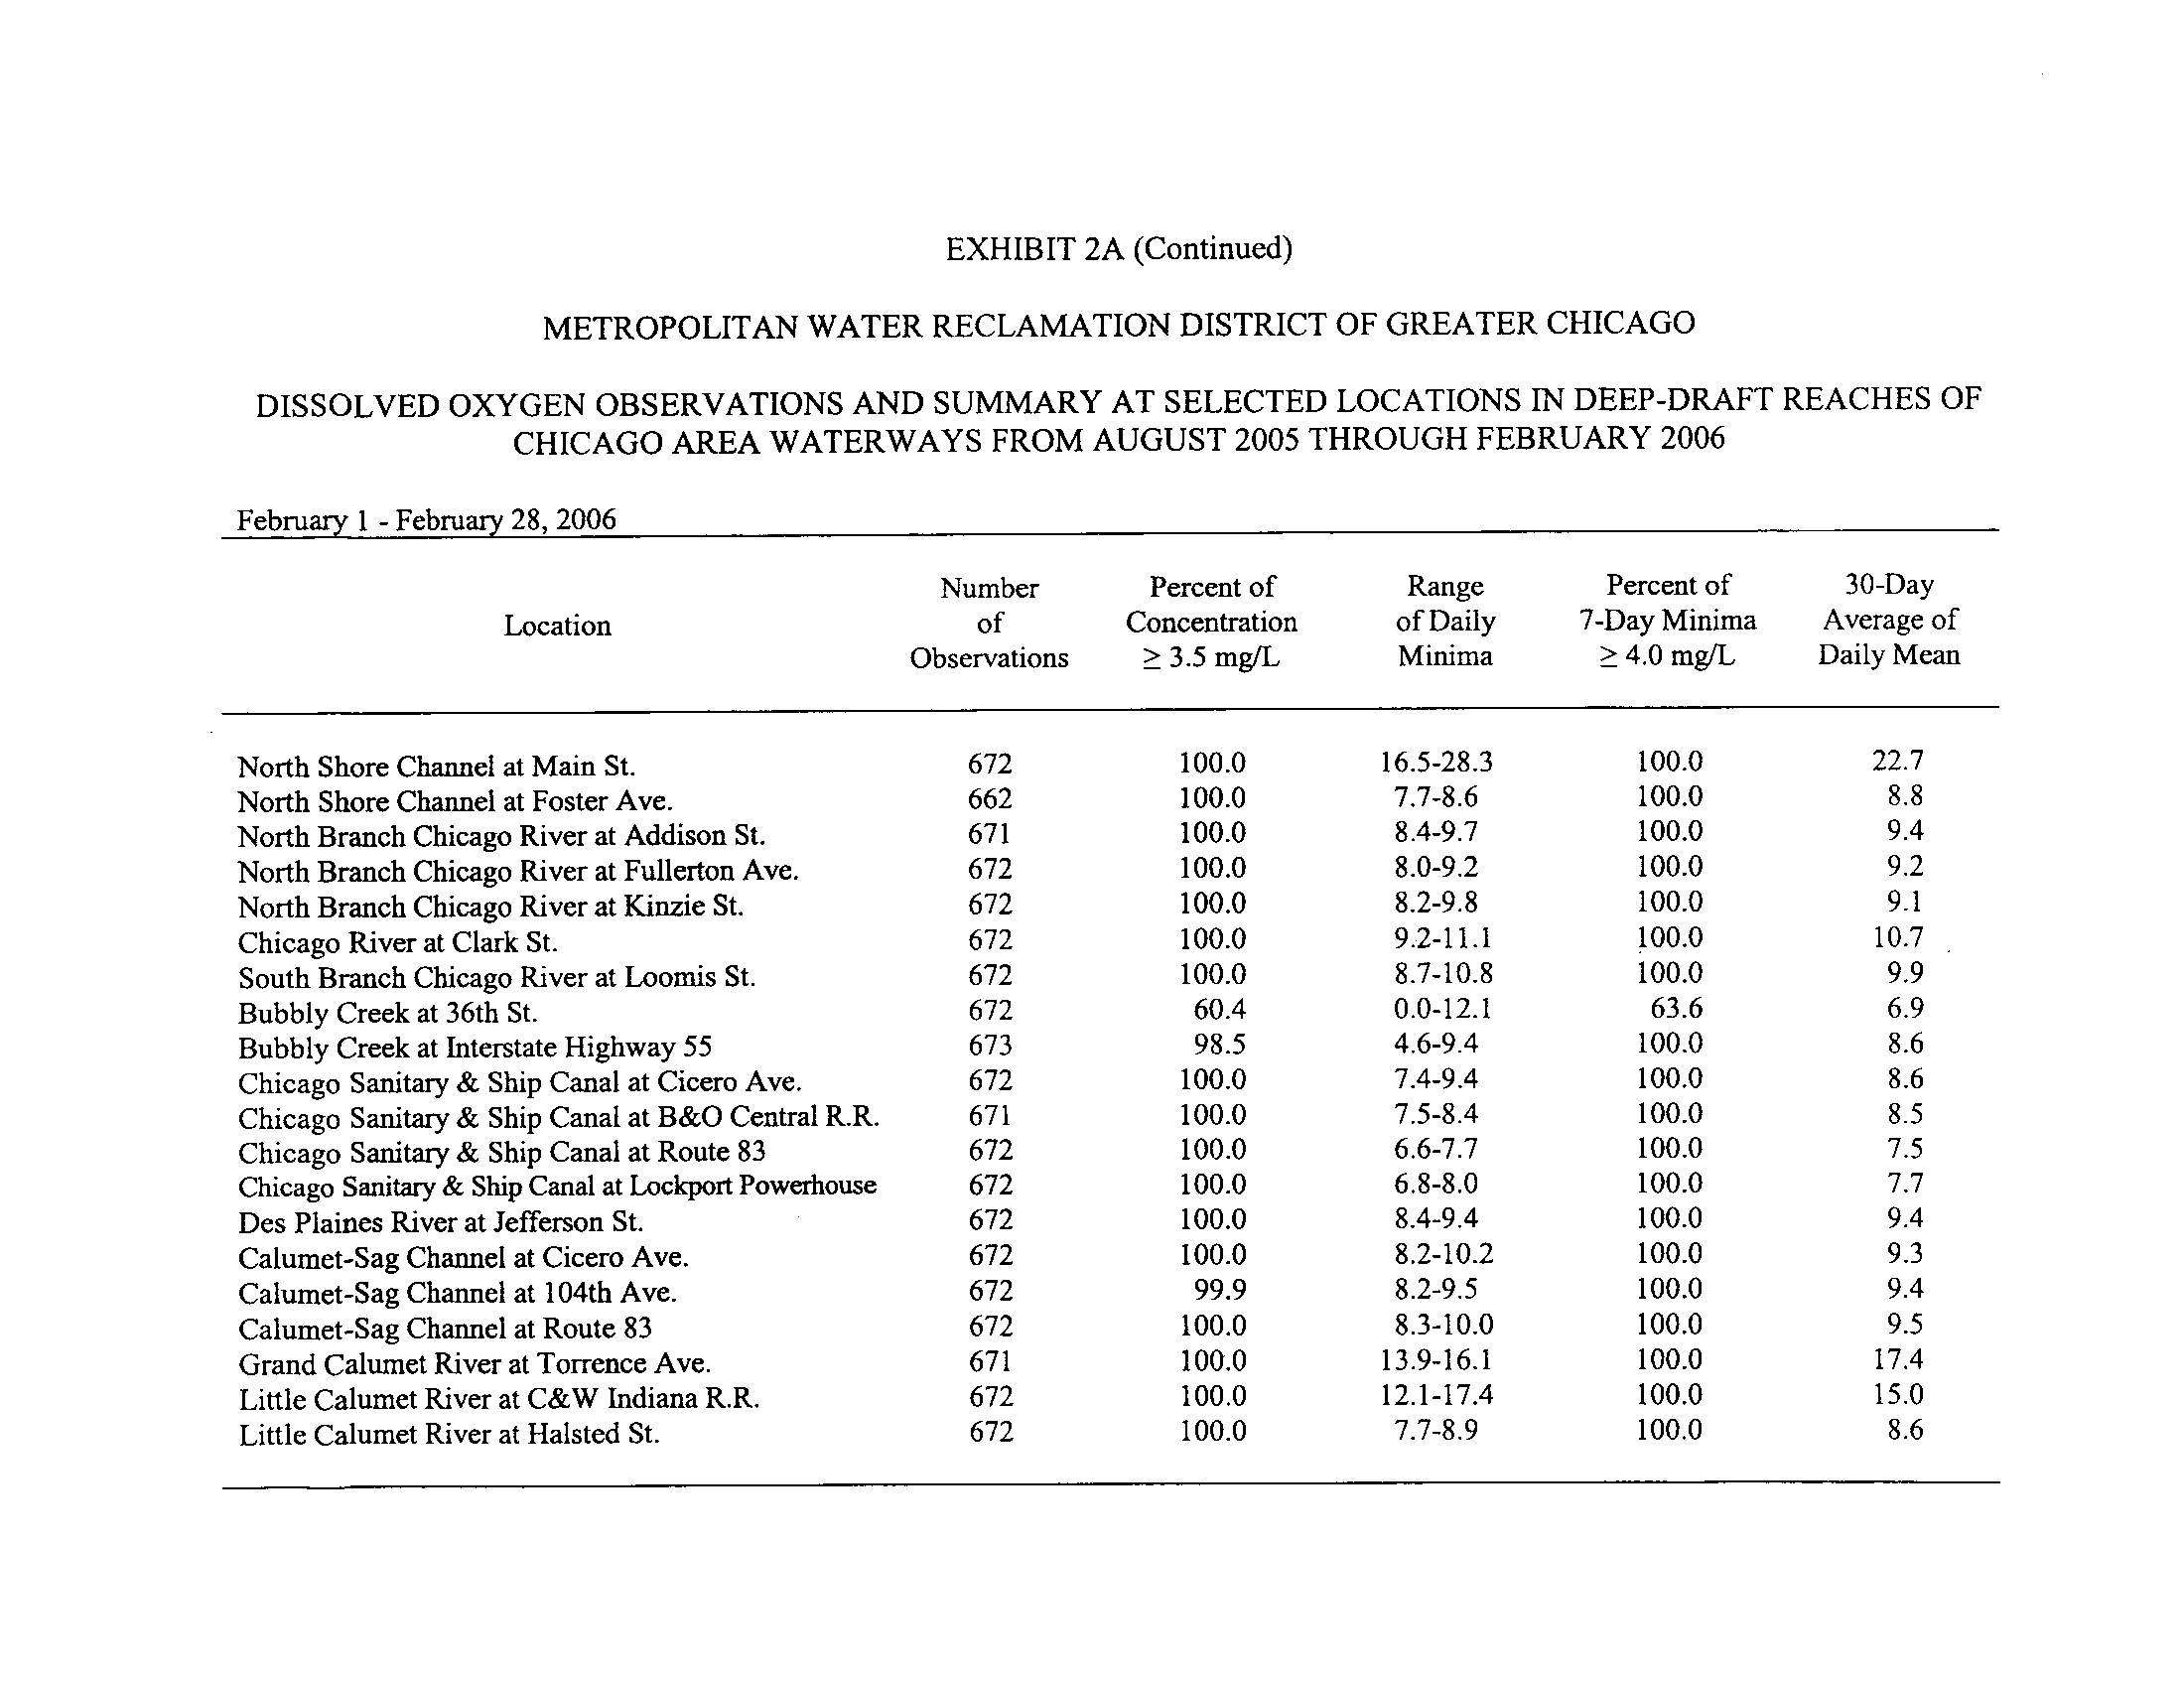
Exhibit 2A.
Dissolved oxygen observations and summary at selected locations in deep-draft reaches of
Chicago area waterways for August 2005 through February 2006 .
•
Five of the twenty locations were in 100 percent compliance with the proposed DO standards
. These
included the North Shore Channel at Foster Avenue, the Chicago River at Clark Street, the South
Branch of the Chicago River at Loomis Street, and the Little Calumet River at C&W Indiana Railroad
and Halsted Street
.
•
The Chicago Sanitary and Ship Canal at the B&O Central Railroad had 100 percent of its DO
observations ? 3
.5 mg/L and 100 percent of the 7-day daily minima were >_ 4
.0 mg/L, but only 85 .7
percent of the daily mean averages within the 30-day period were
? 5 .5 mg/L .
•
The Calumet-Sag Channel at Cicero Avenue had 100 percent of the 7-day daily minima
? 4 .0 mg/L
and 100 percent of the 30-day daily mean averages were
? 5 .5 mg/L, but only 99 .5 percent of the DO
concentrations were >_ 3 .5 mg/L.
•
The Calumet-Sag Channel at Route 83 had 100 percent of its 30-day daily mean averages >_ 5
.5 mg/L,
but only 99.2
percent of its DO concentrations were >_ 3 .5 mg/L and 97
.1 percent of the 7-day daily
minima were >_ 4.0 mg/L .
•
Twelve locations were less than 100 percent compliance for all three requirements
.
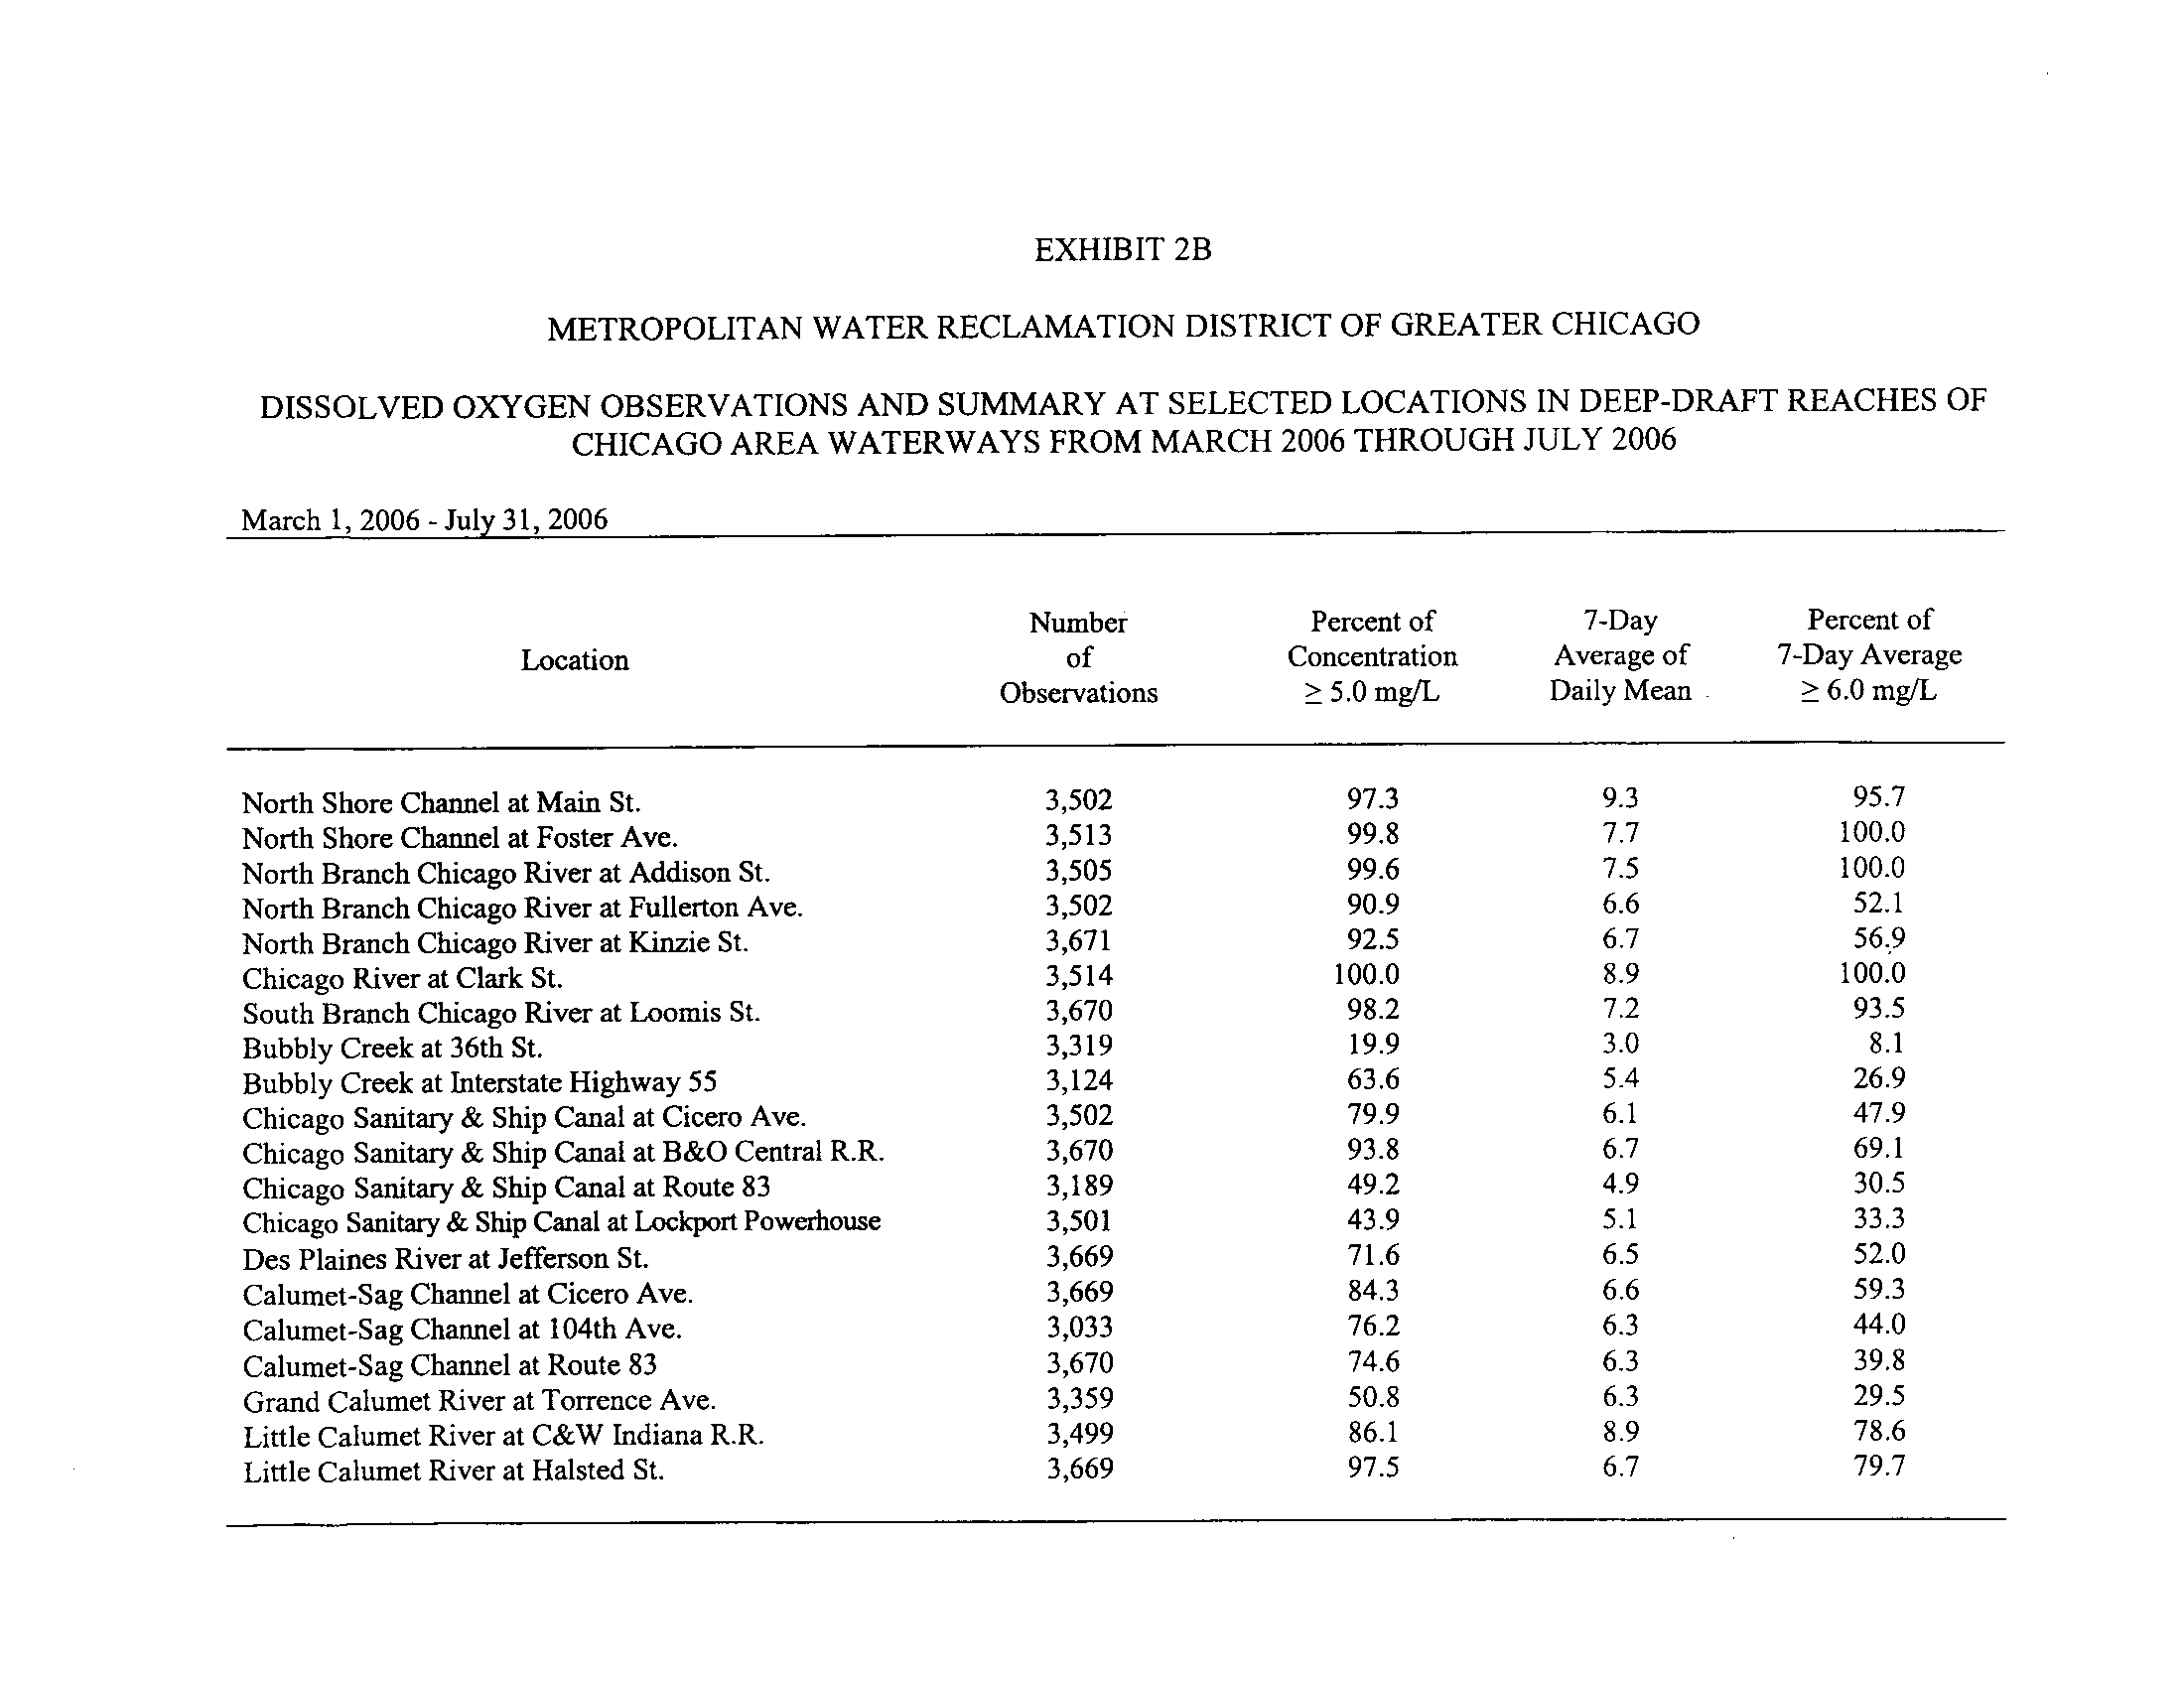
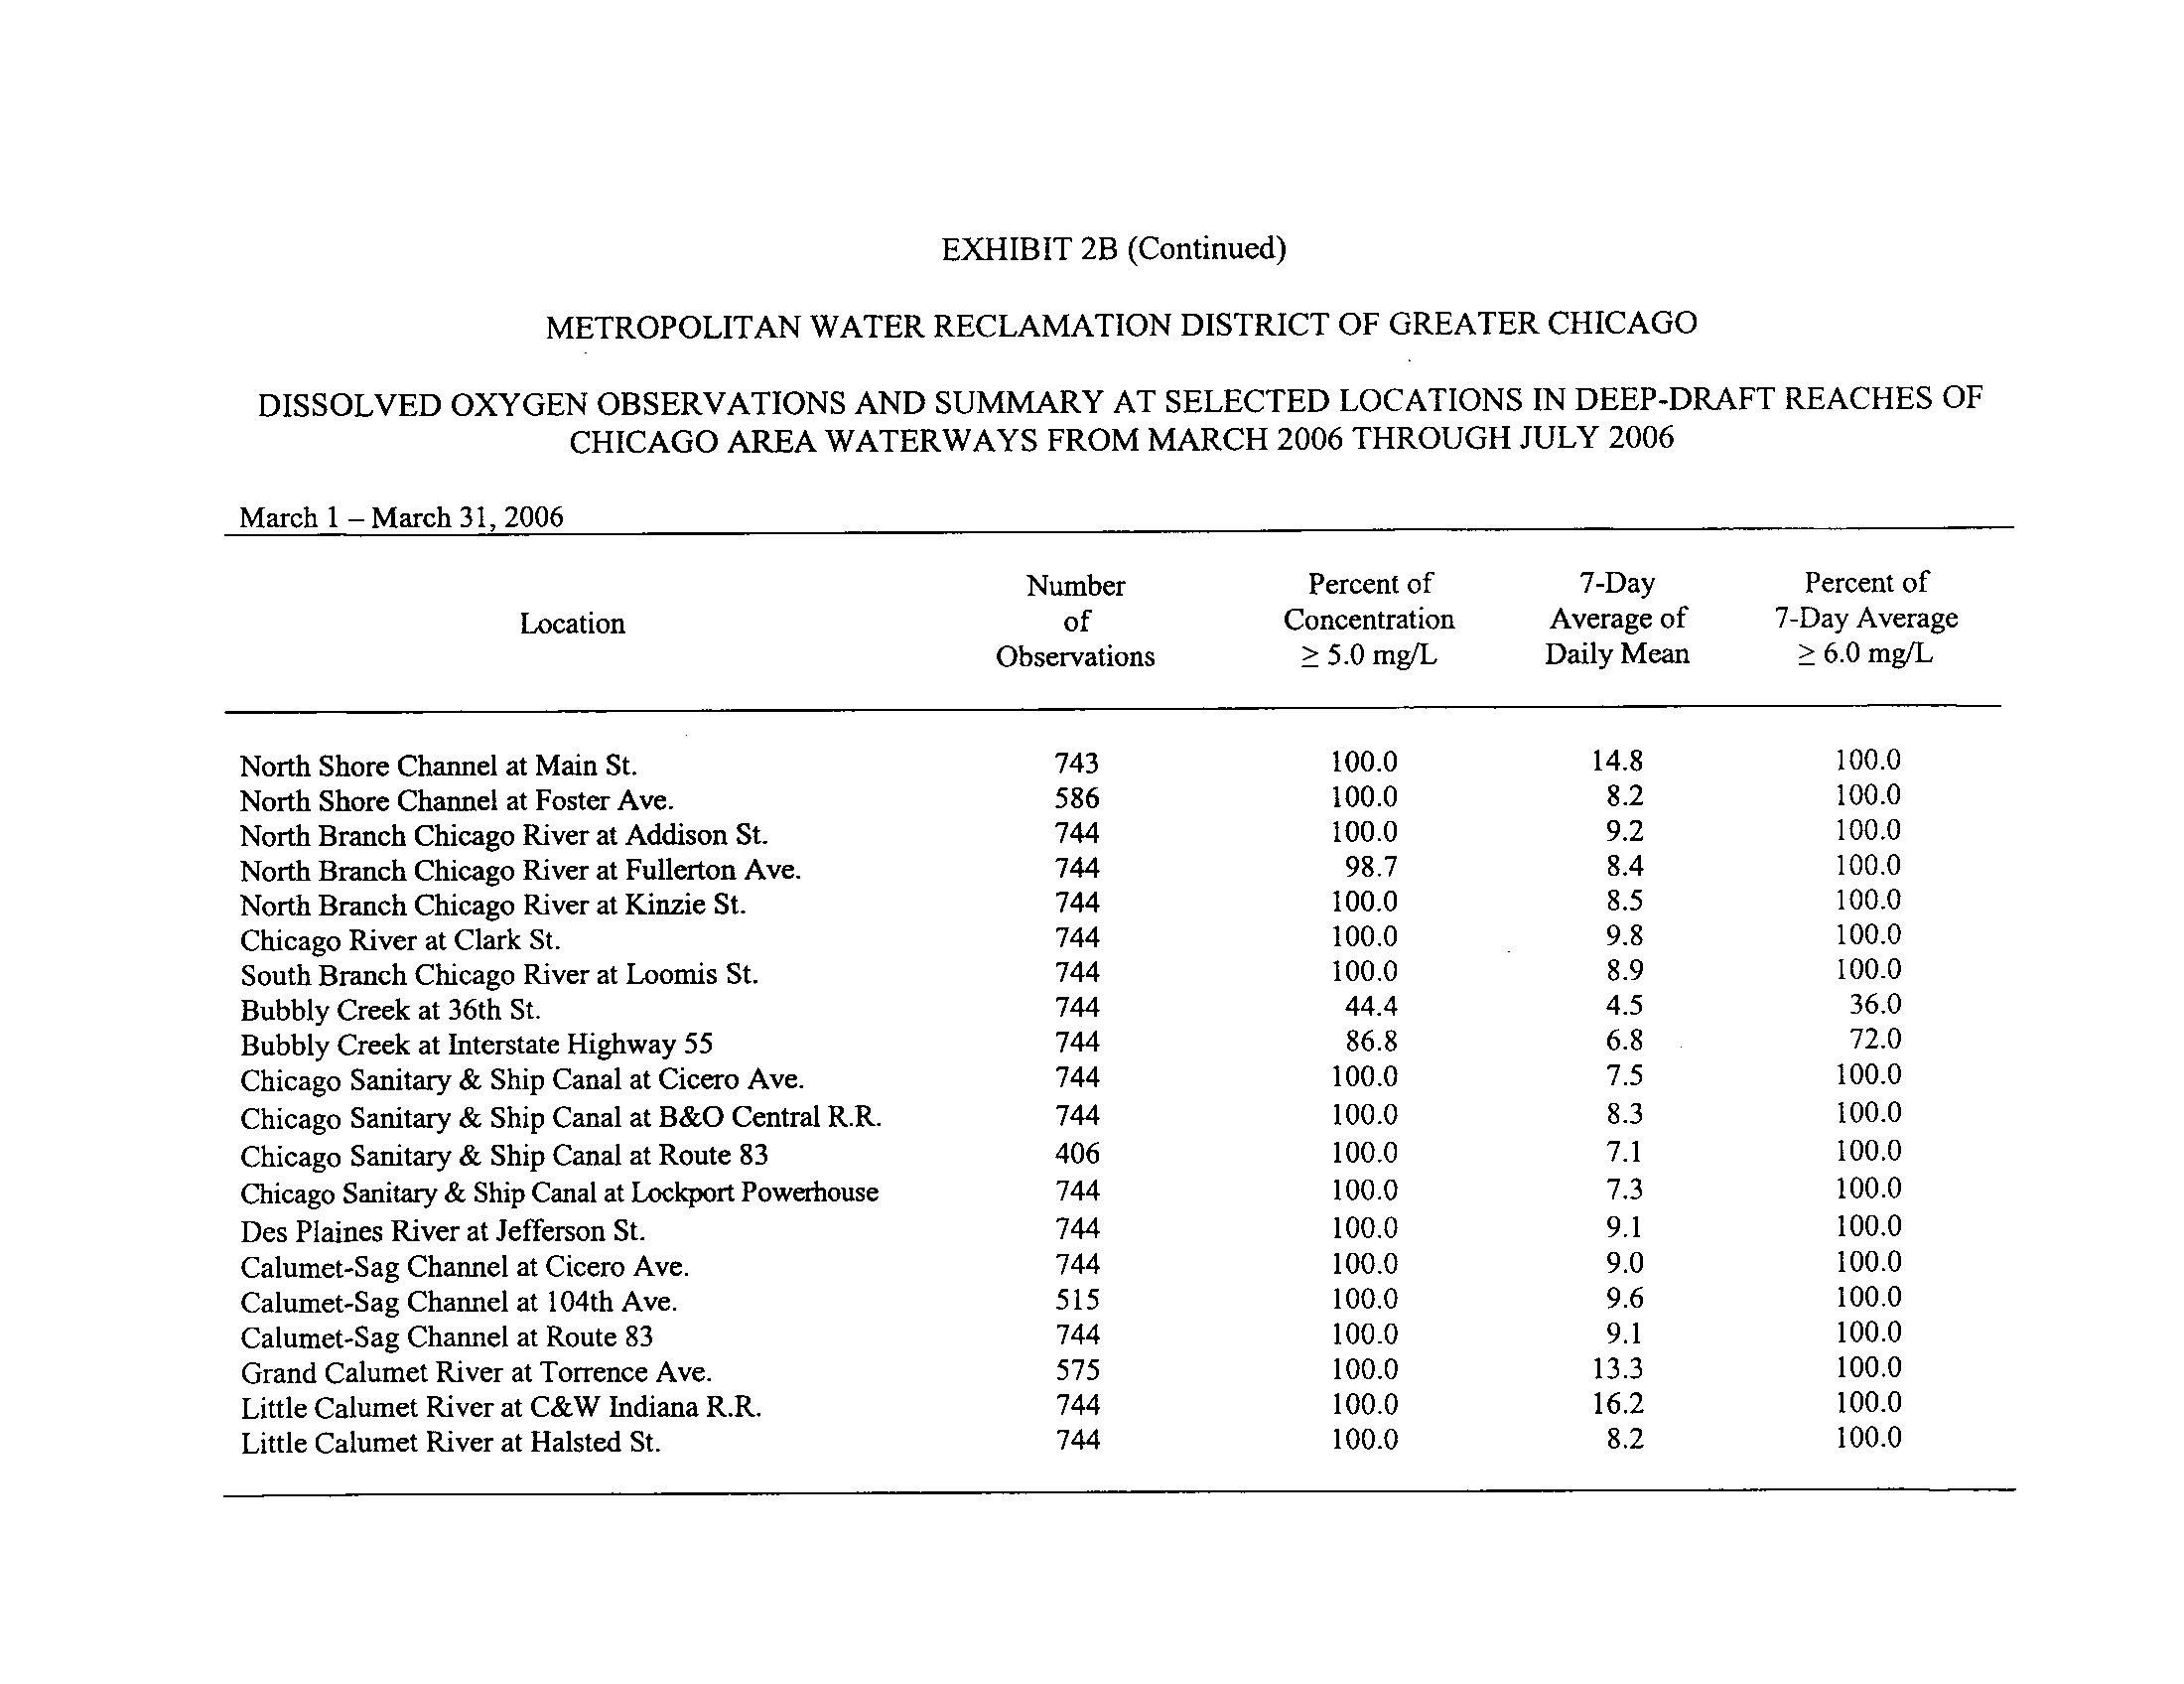
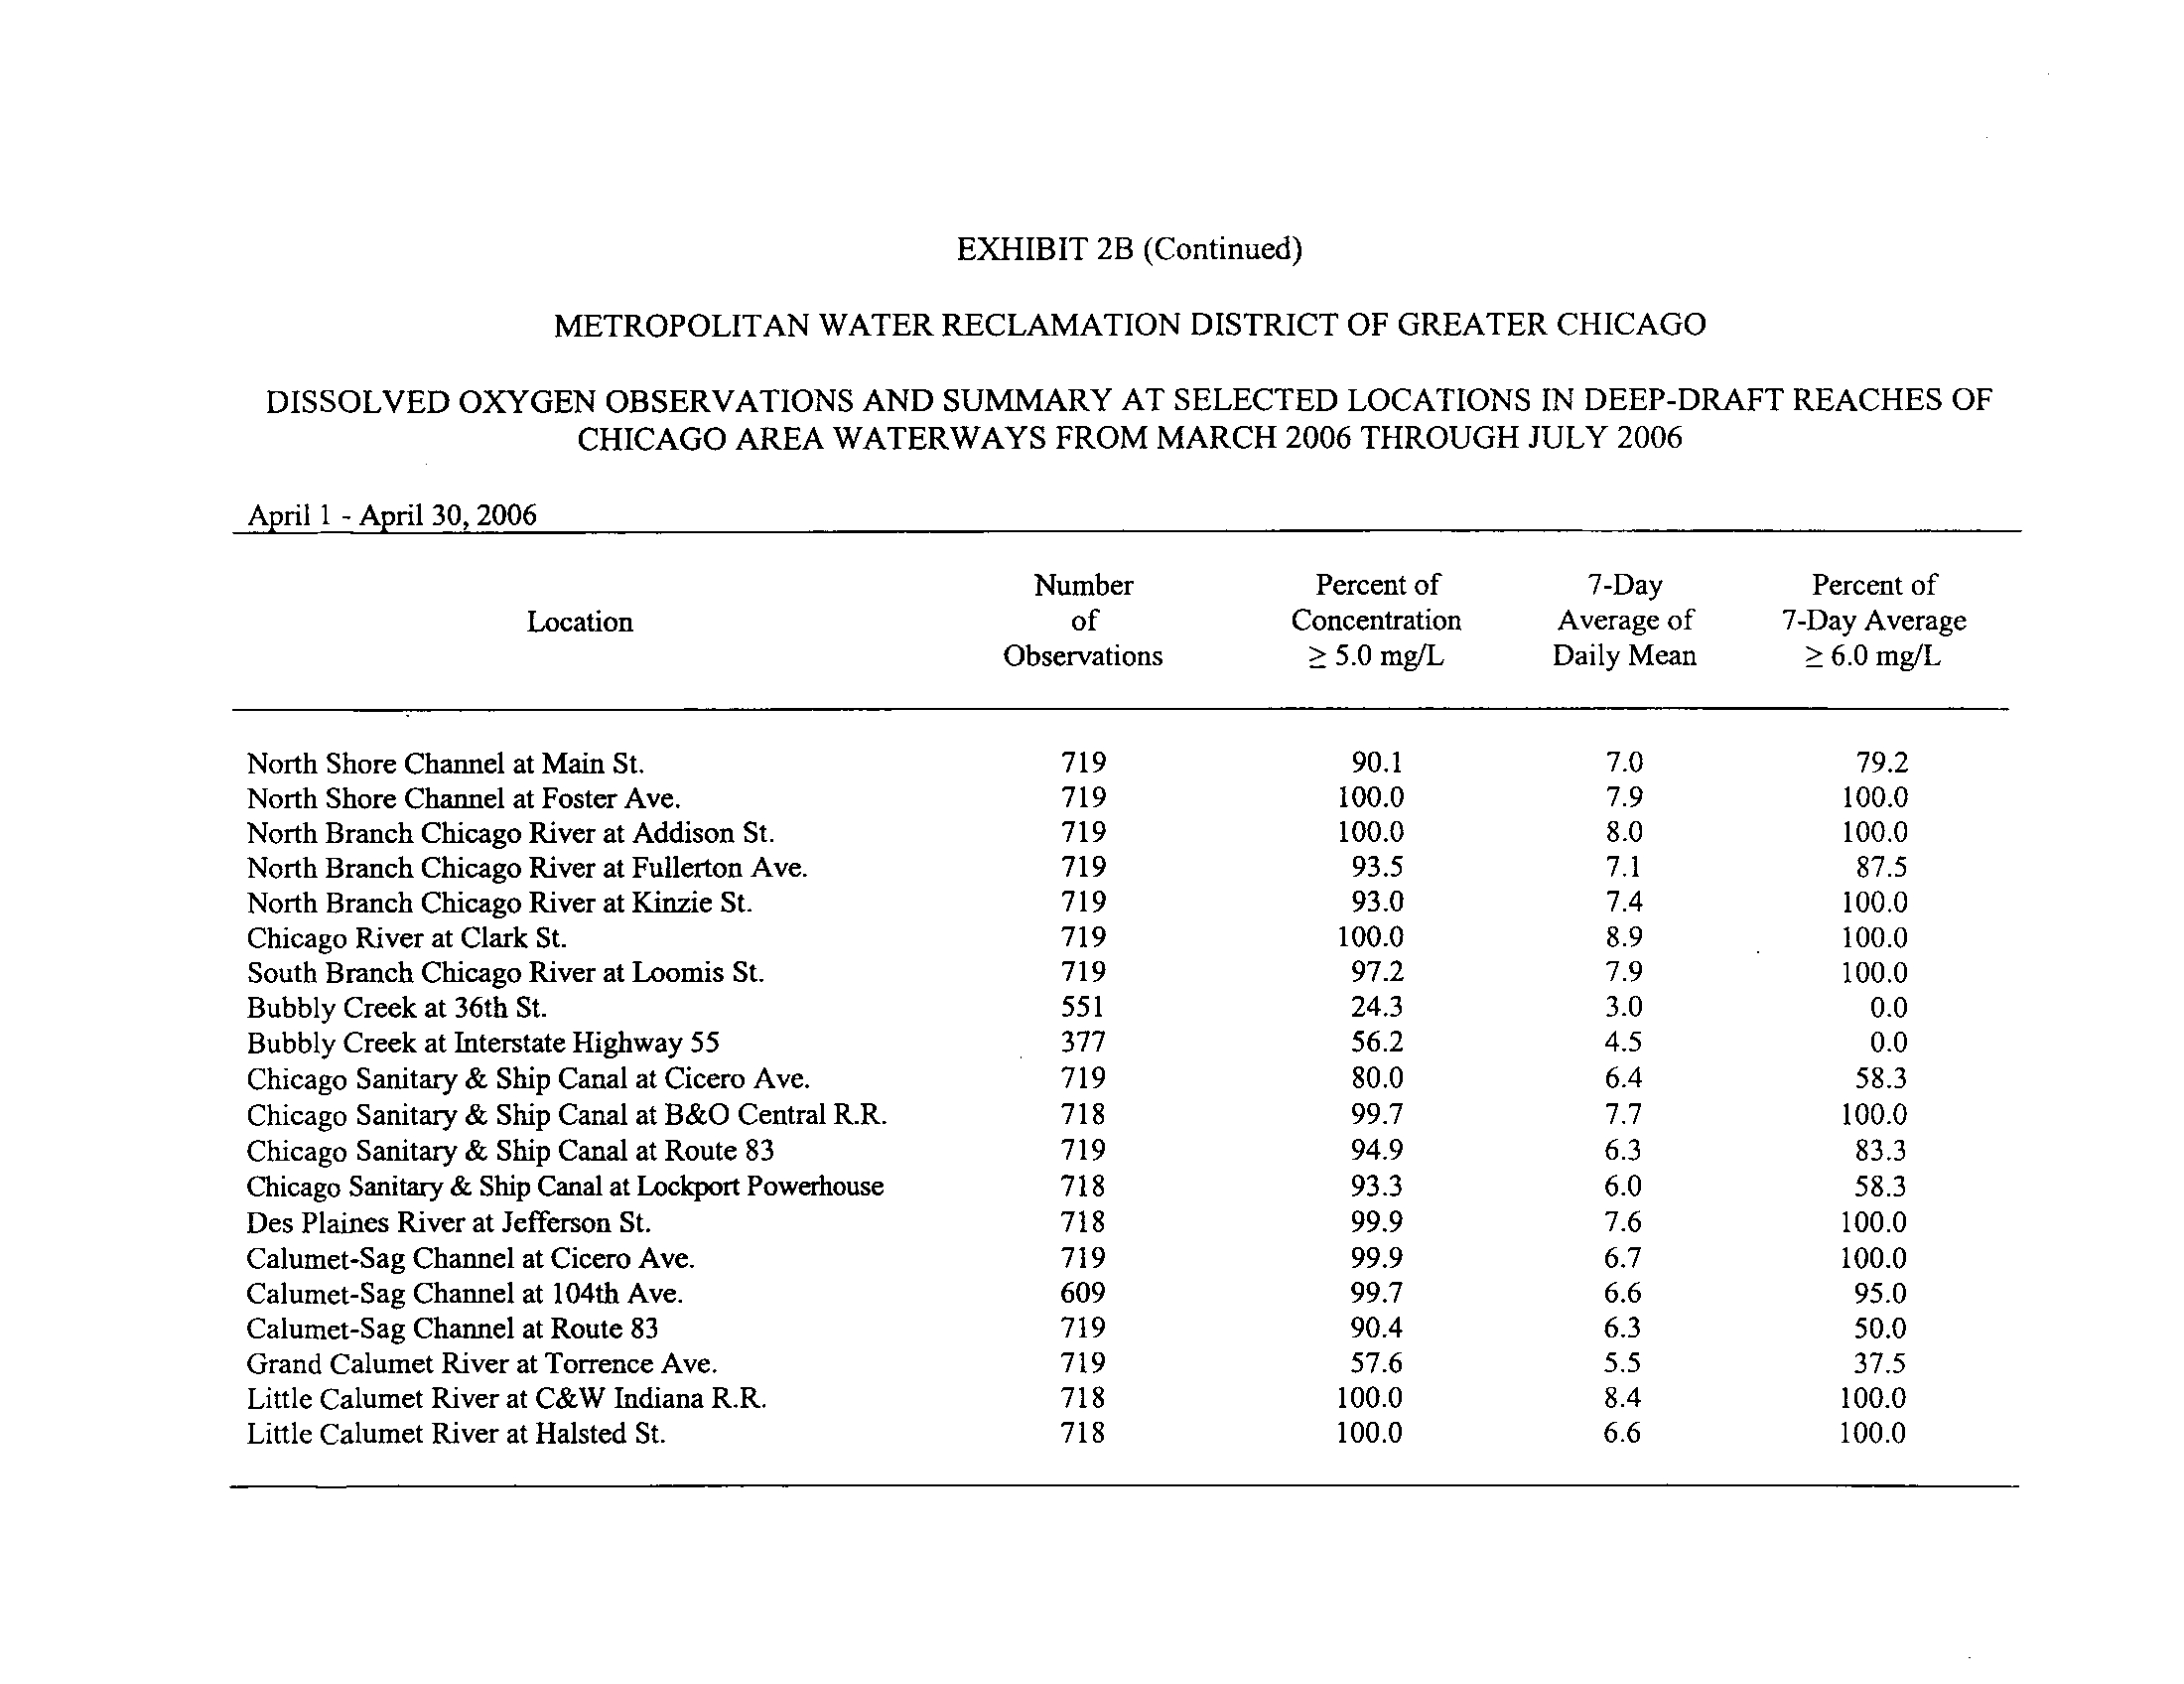
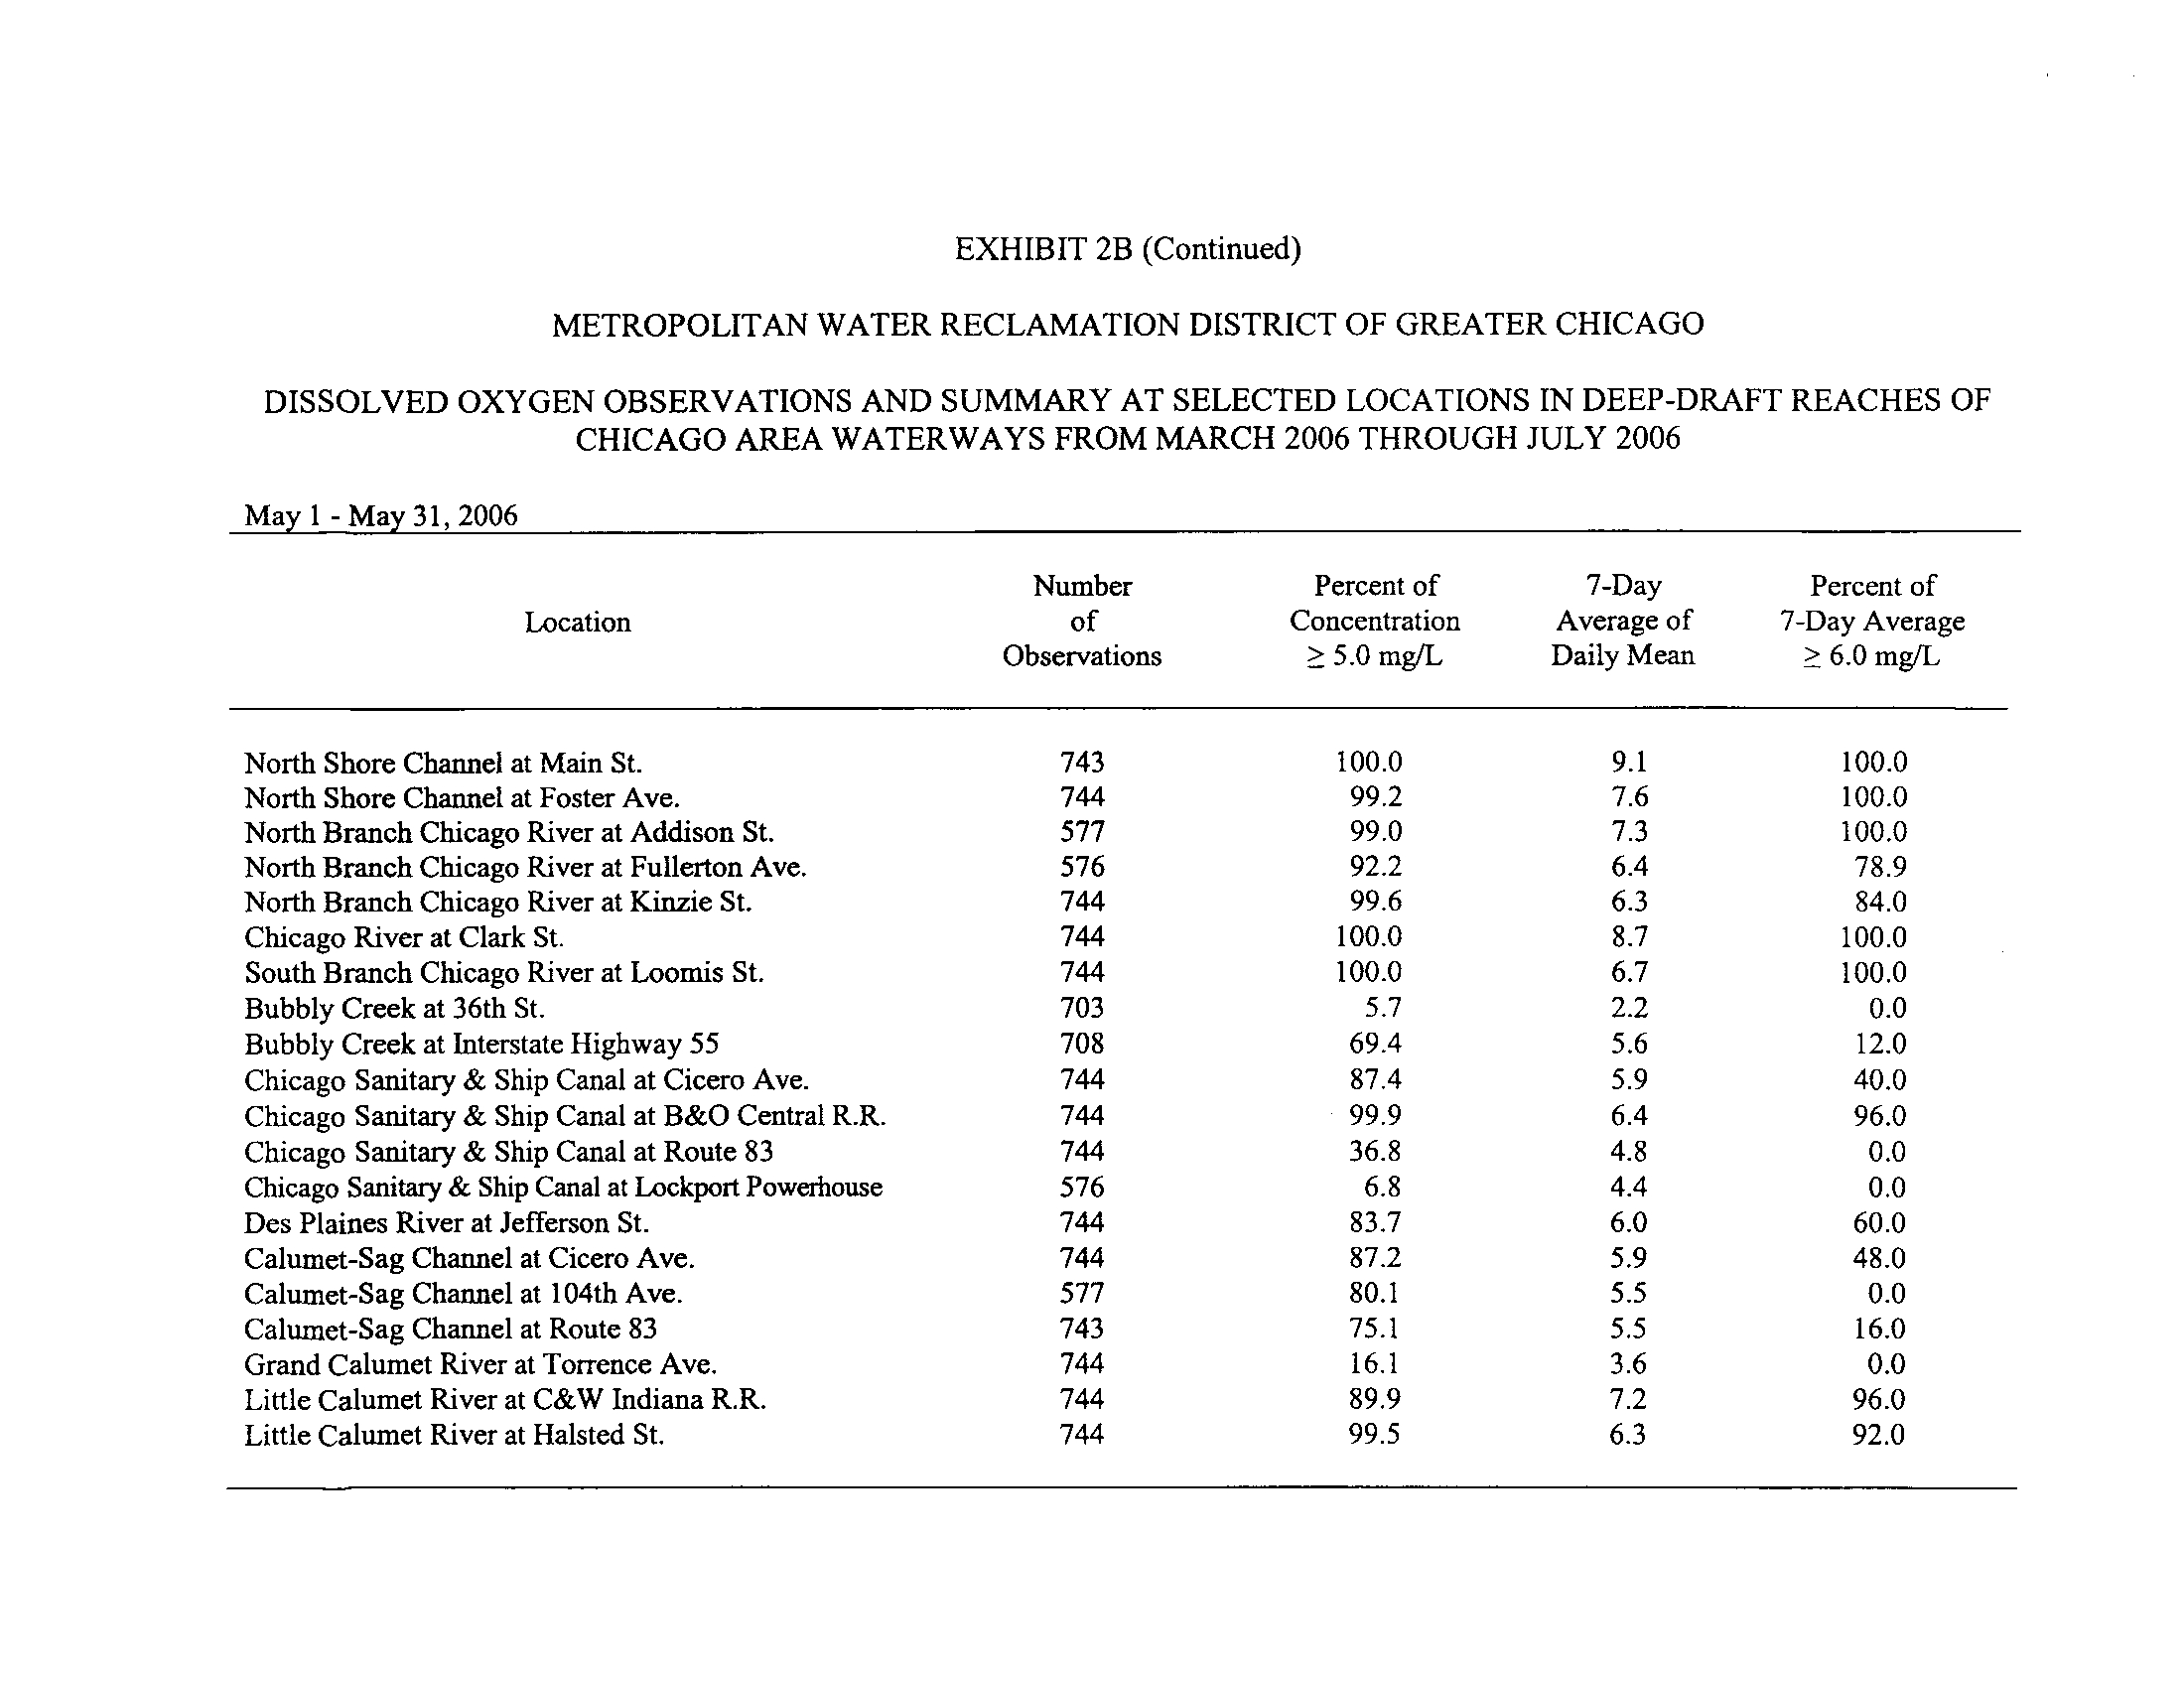
Exhibit 213.
Dissolved oxygen observations and summary at selected locations in deep-draft reaches of
Chicago area waterways for March 2006 through July 2006
.
•
One of the twenty locations was in 100 percent compliance with the proposed DO standards
. This was
the Chicago River at Clark Street.
•
Two locations were greater than the 6
.0 mg/L 7-day Average of the Daily Mean standard 100 percent
of the time, but had less than 100 percent of DO concentrations >_ 5 .0 mg/L
. These included the North
Shore Channel at Foster Avenue (99
.8 percent) and the North Branch of the Chicago River at
Addison Street (99 .6 percent) .
•
Seventeen locations were less than 100 percent compliance for both requirements
.
Calculation of 7-Dav Average Daily Minimum or Daily Mean
.
It was unclear as to what method to use to calculate both the 7-day daily minima during the August
through February period, and the 7-day daily mean for the March through July period
. Results were
calculated for one month during each period using a running average method and a weekly calendar day
7
method for the shallow-draft locations and for the deep-draft locations . These are shown in the following
exhibit for purposes of comparison of the two methods .
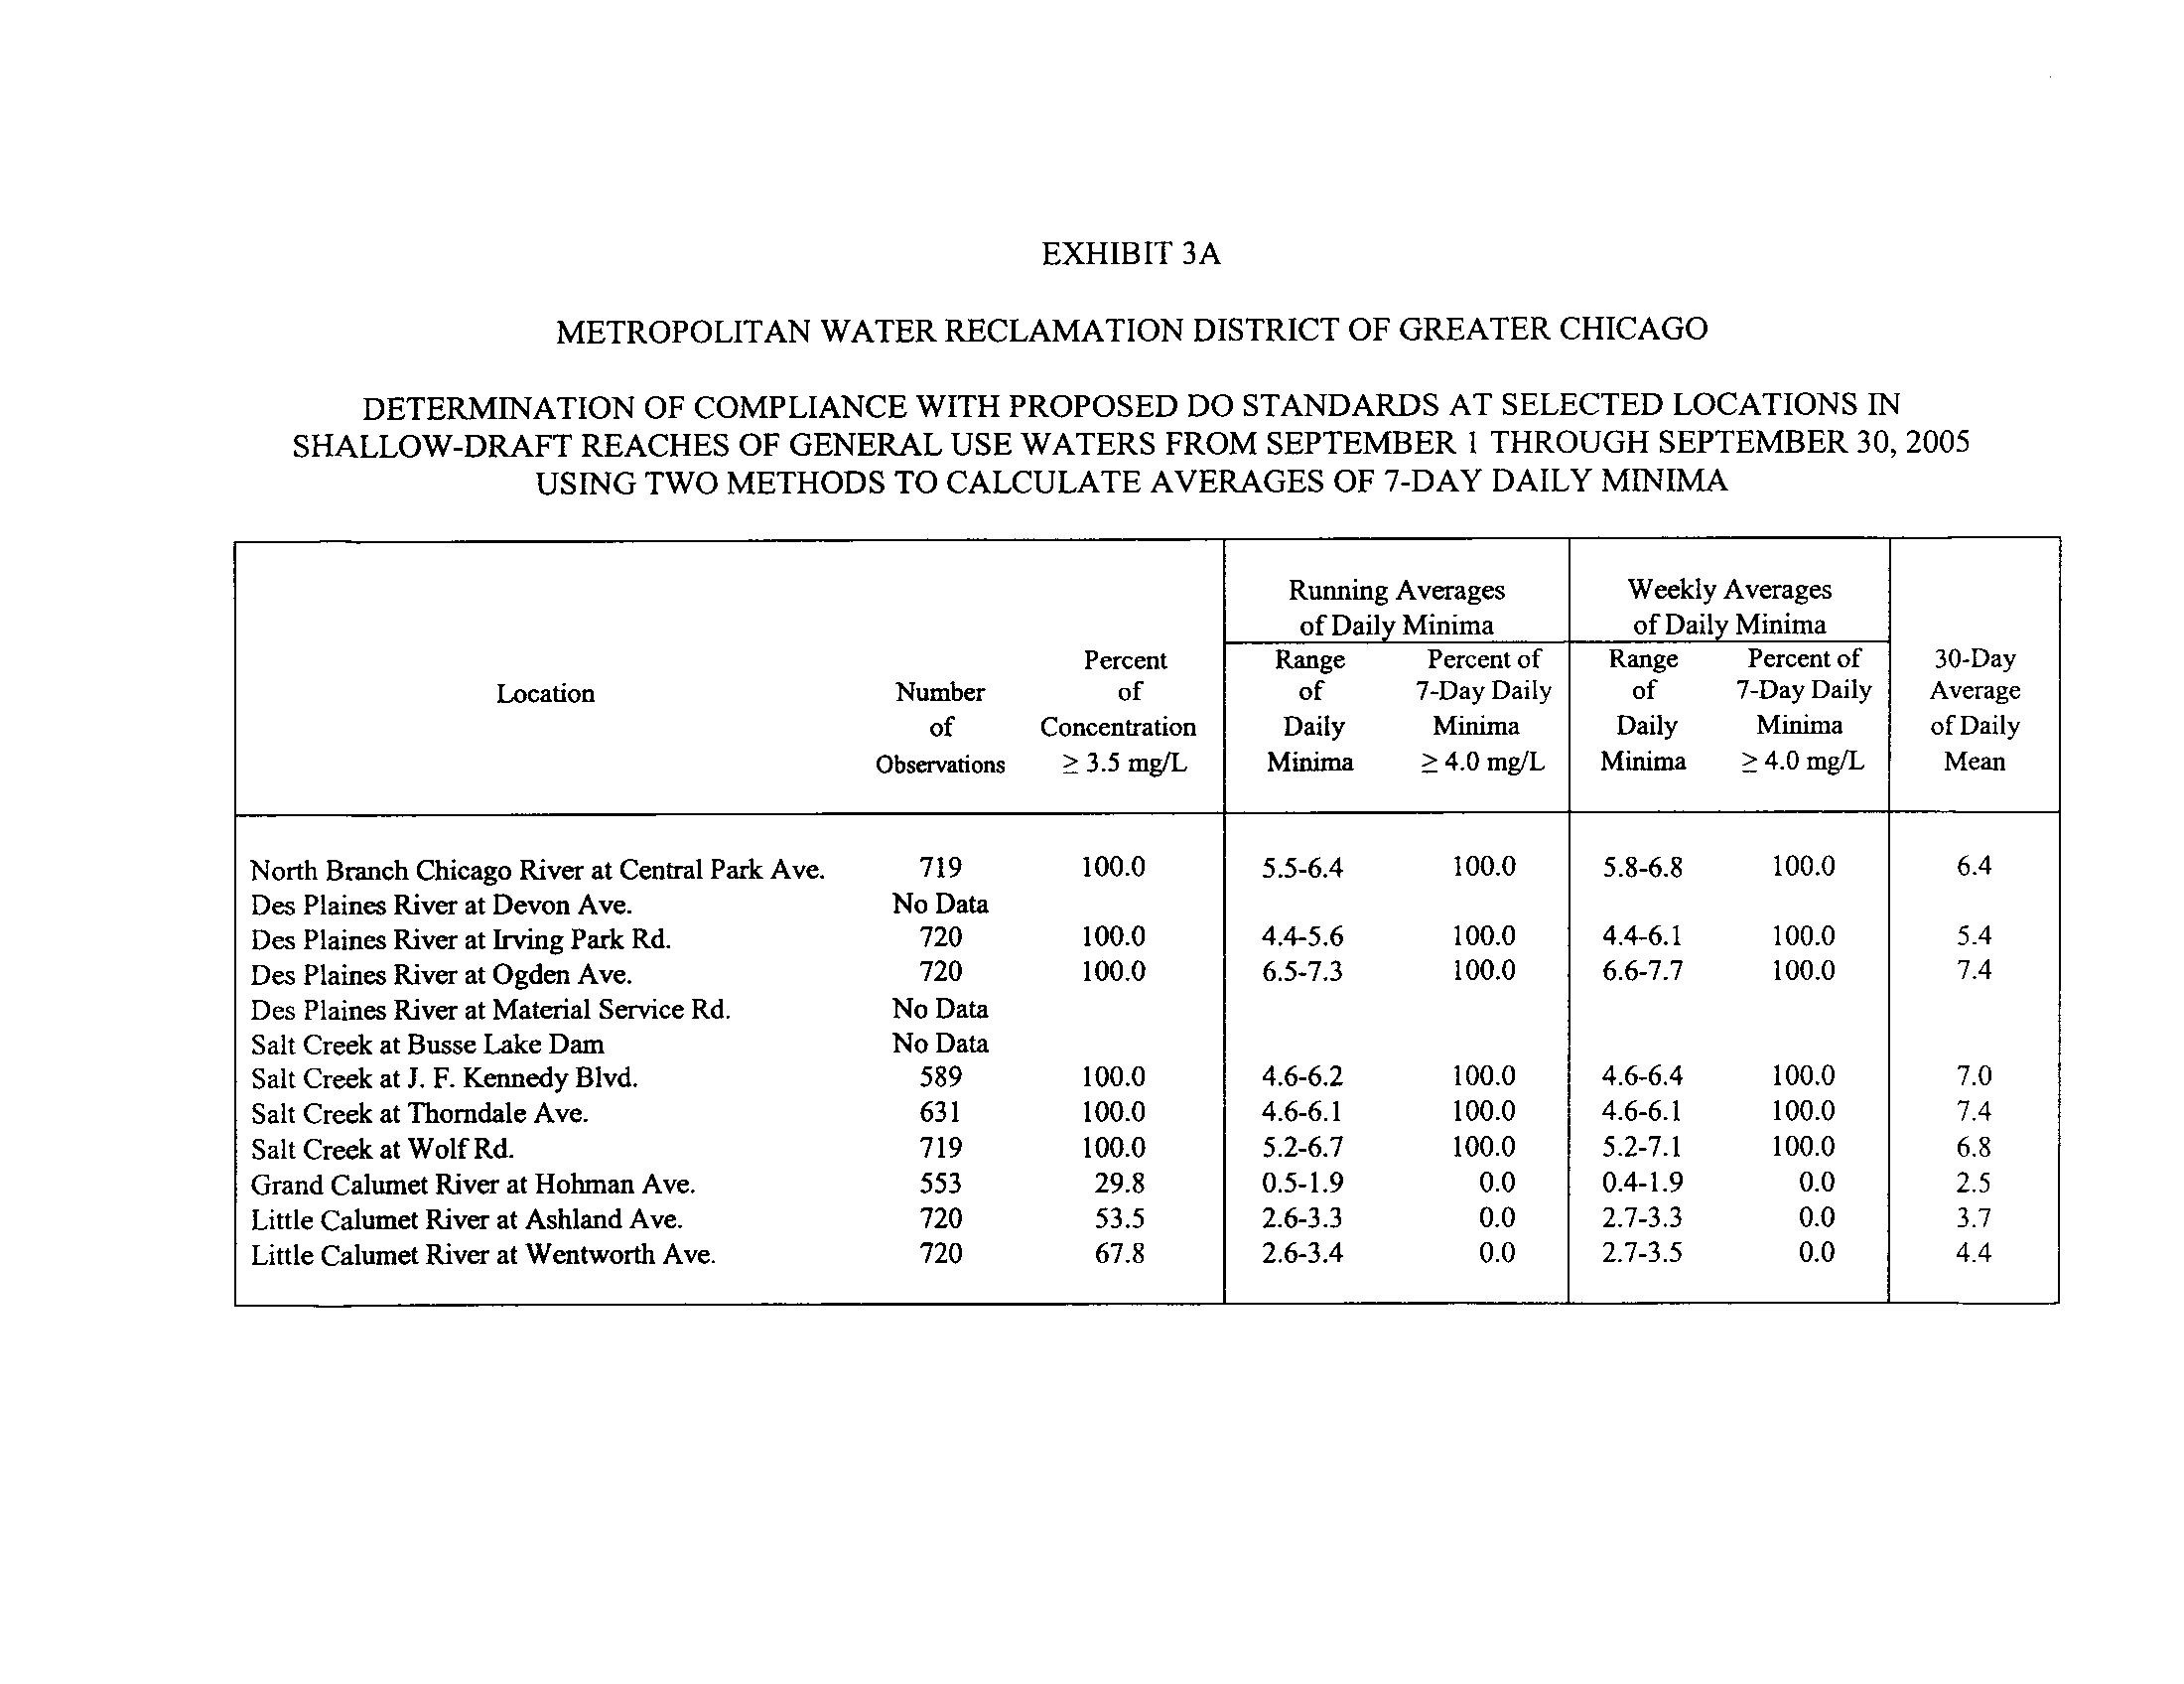
Exhibit3A
. Determination of compliance with proposed DO standards at selected locations in shallow-
draft reaches of General Use Waters from September 1 through September 30, 2005, using two methods
to calculate averages of 7-day daily minima .
•
Results using both methods were very similar for nine shallow-draft stream locations during
September 2005 .
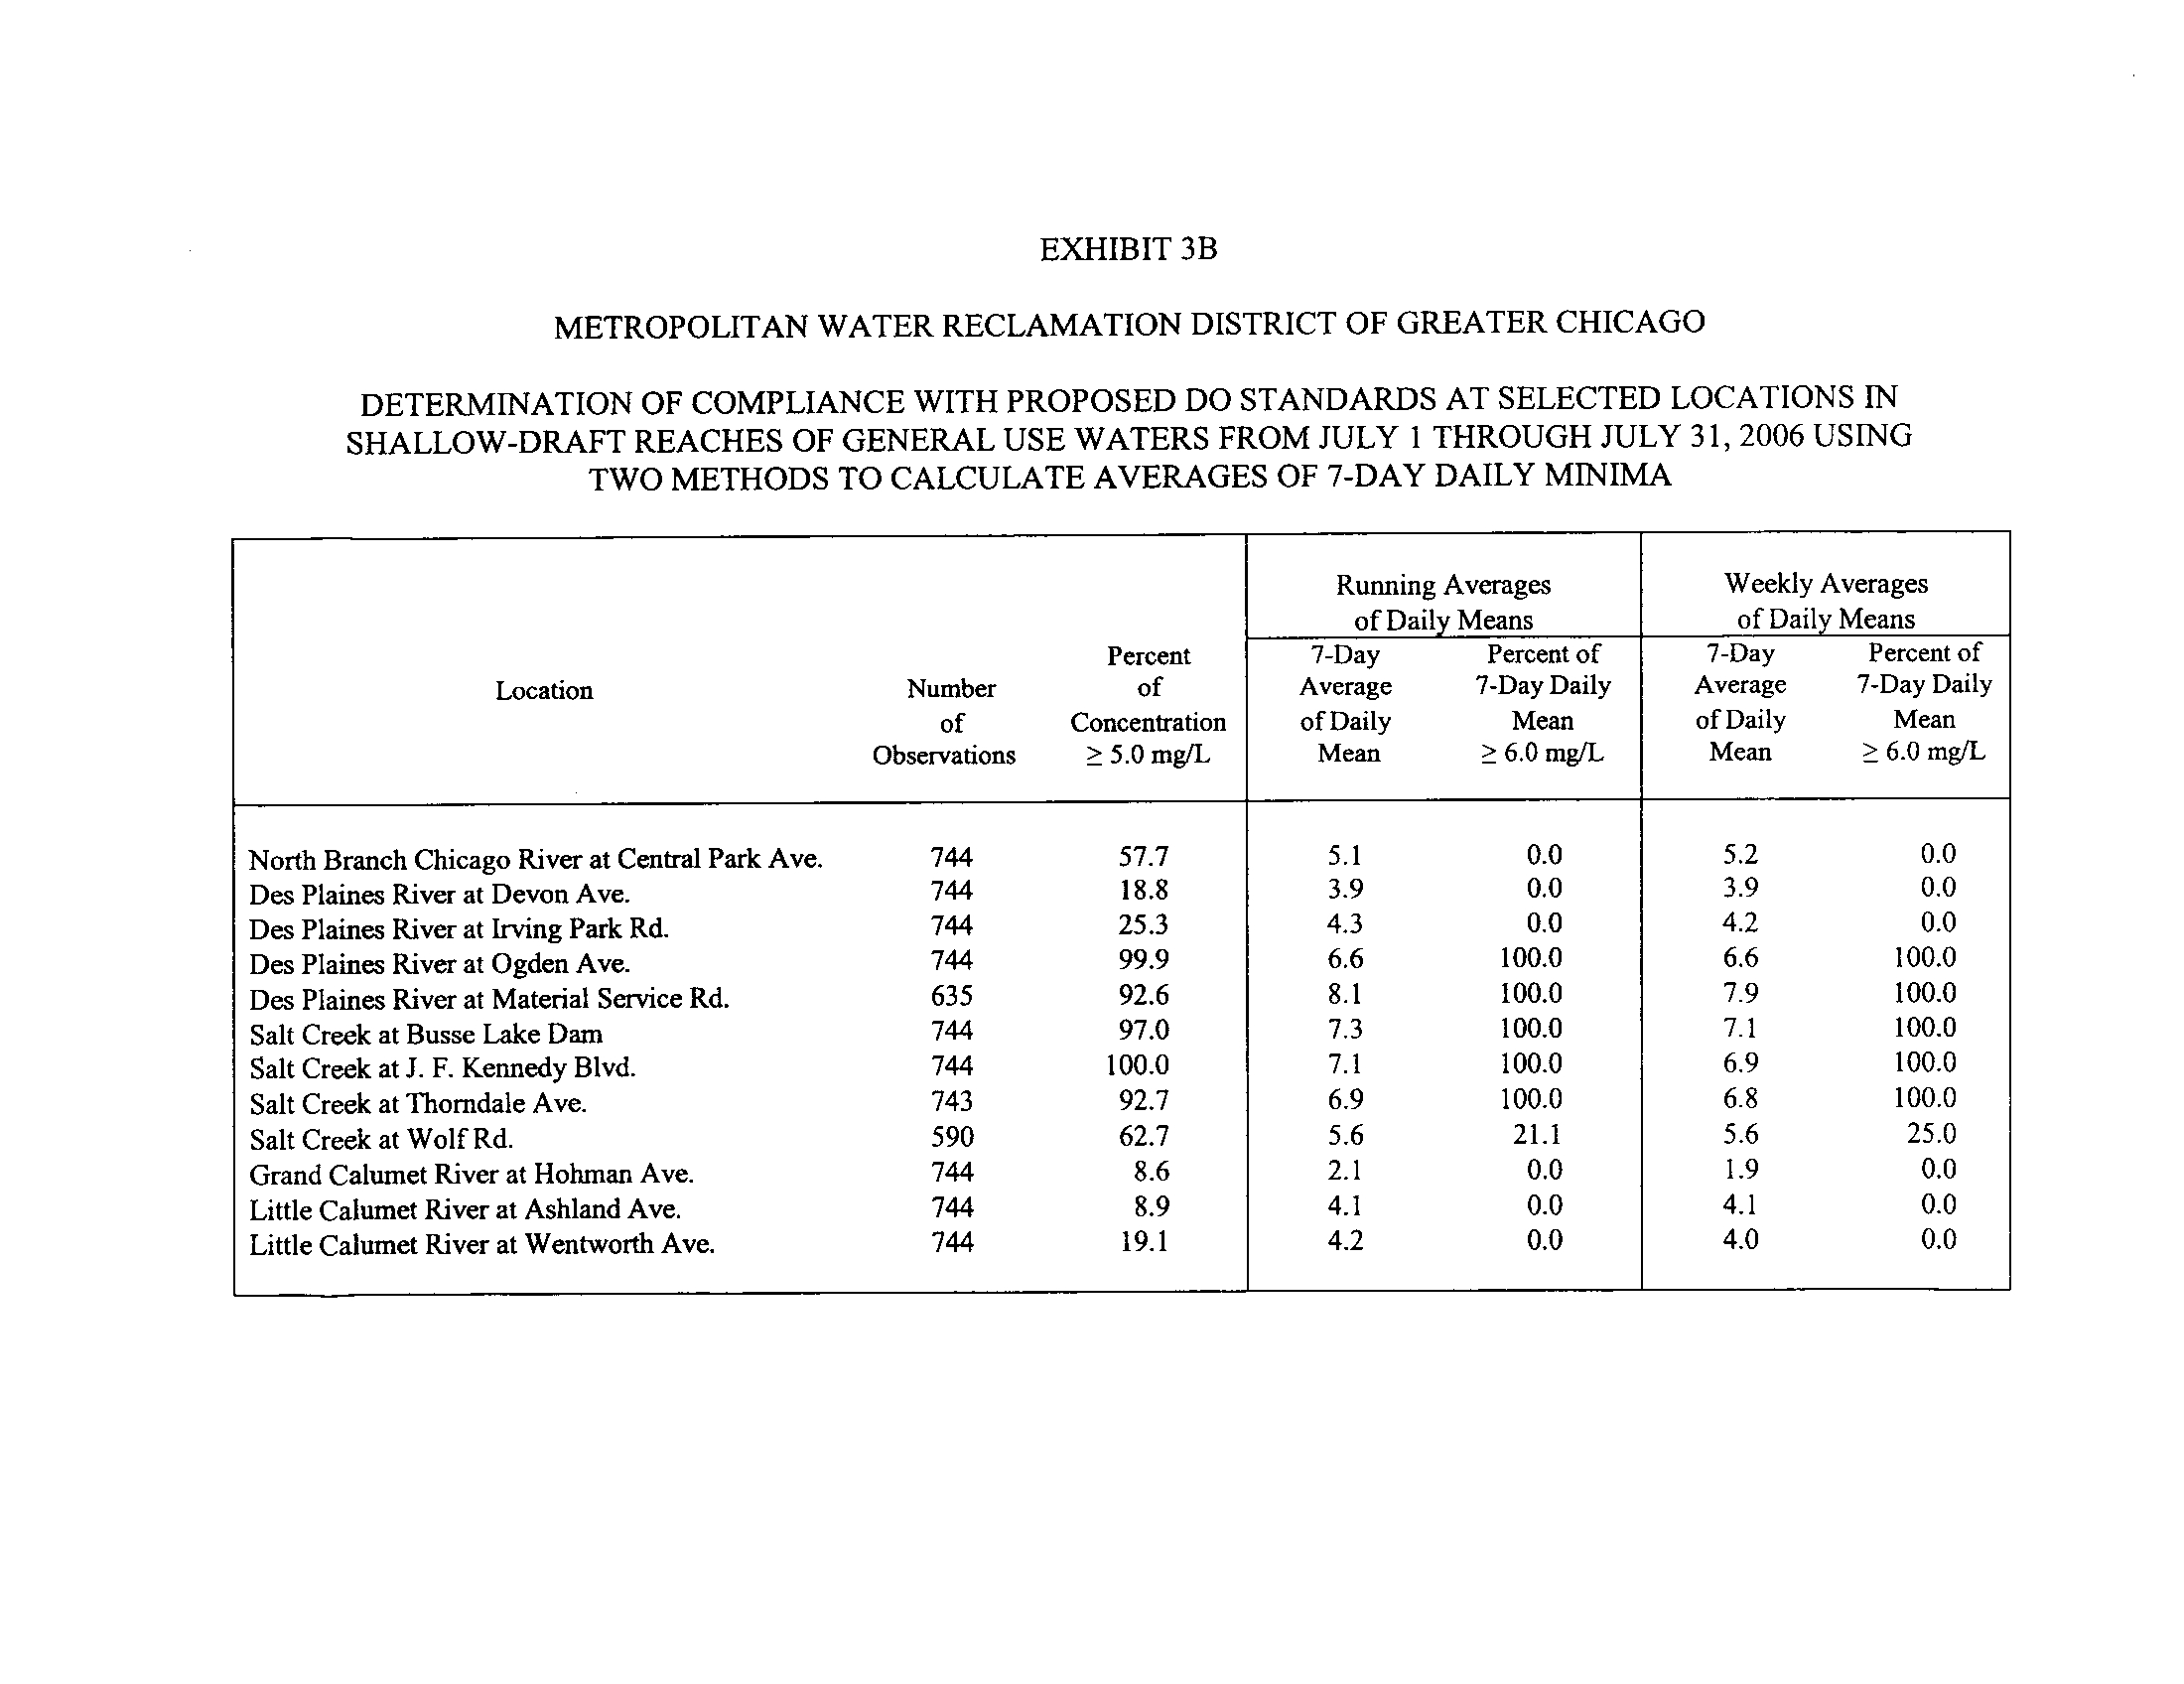
Exhibit 3B
.,
Determination of compliance with proposed DO standards at selected locations in shallow-
draft reaches of General Use Waters from July I through July 31, 2006, using two methods to calculate
averages of 7-day daily means .
•
Results using both methods were very similar for 12 shallow-draft stream locations during July 2006
.
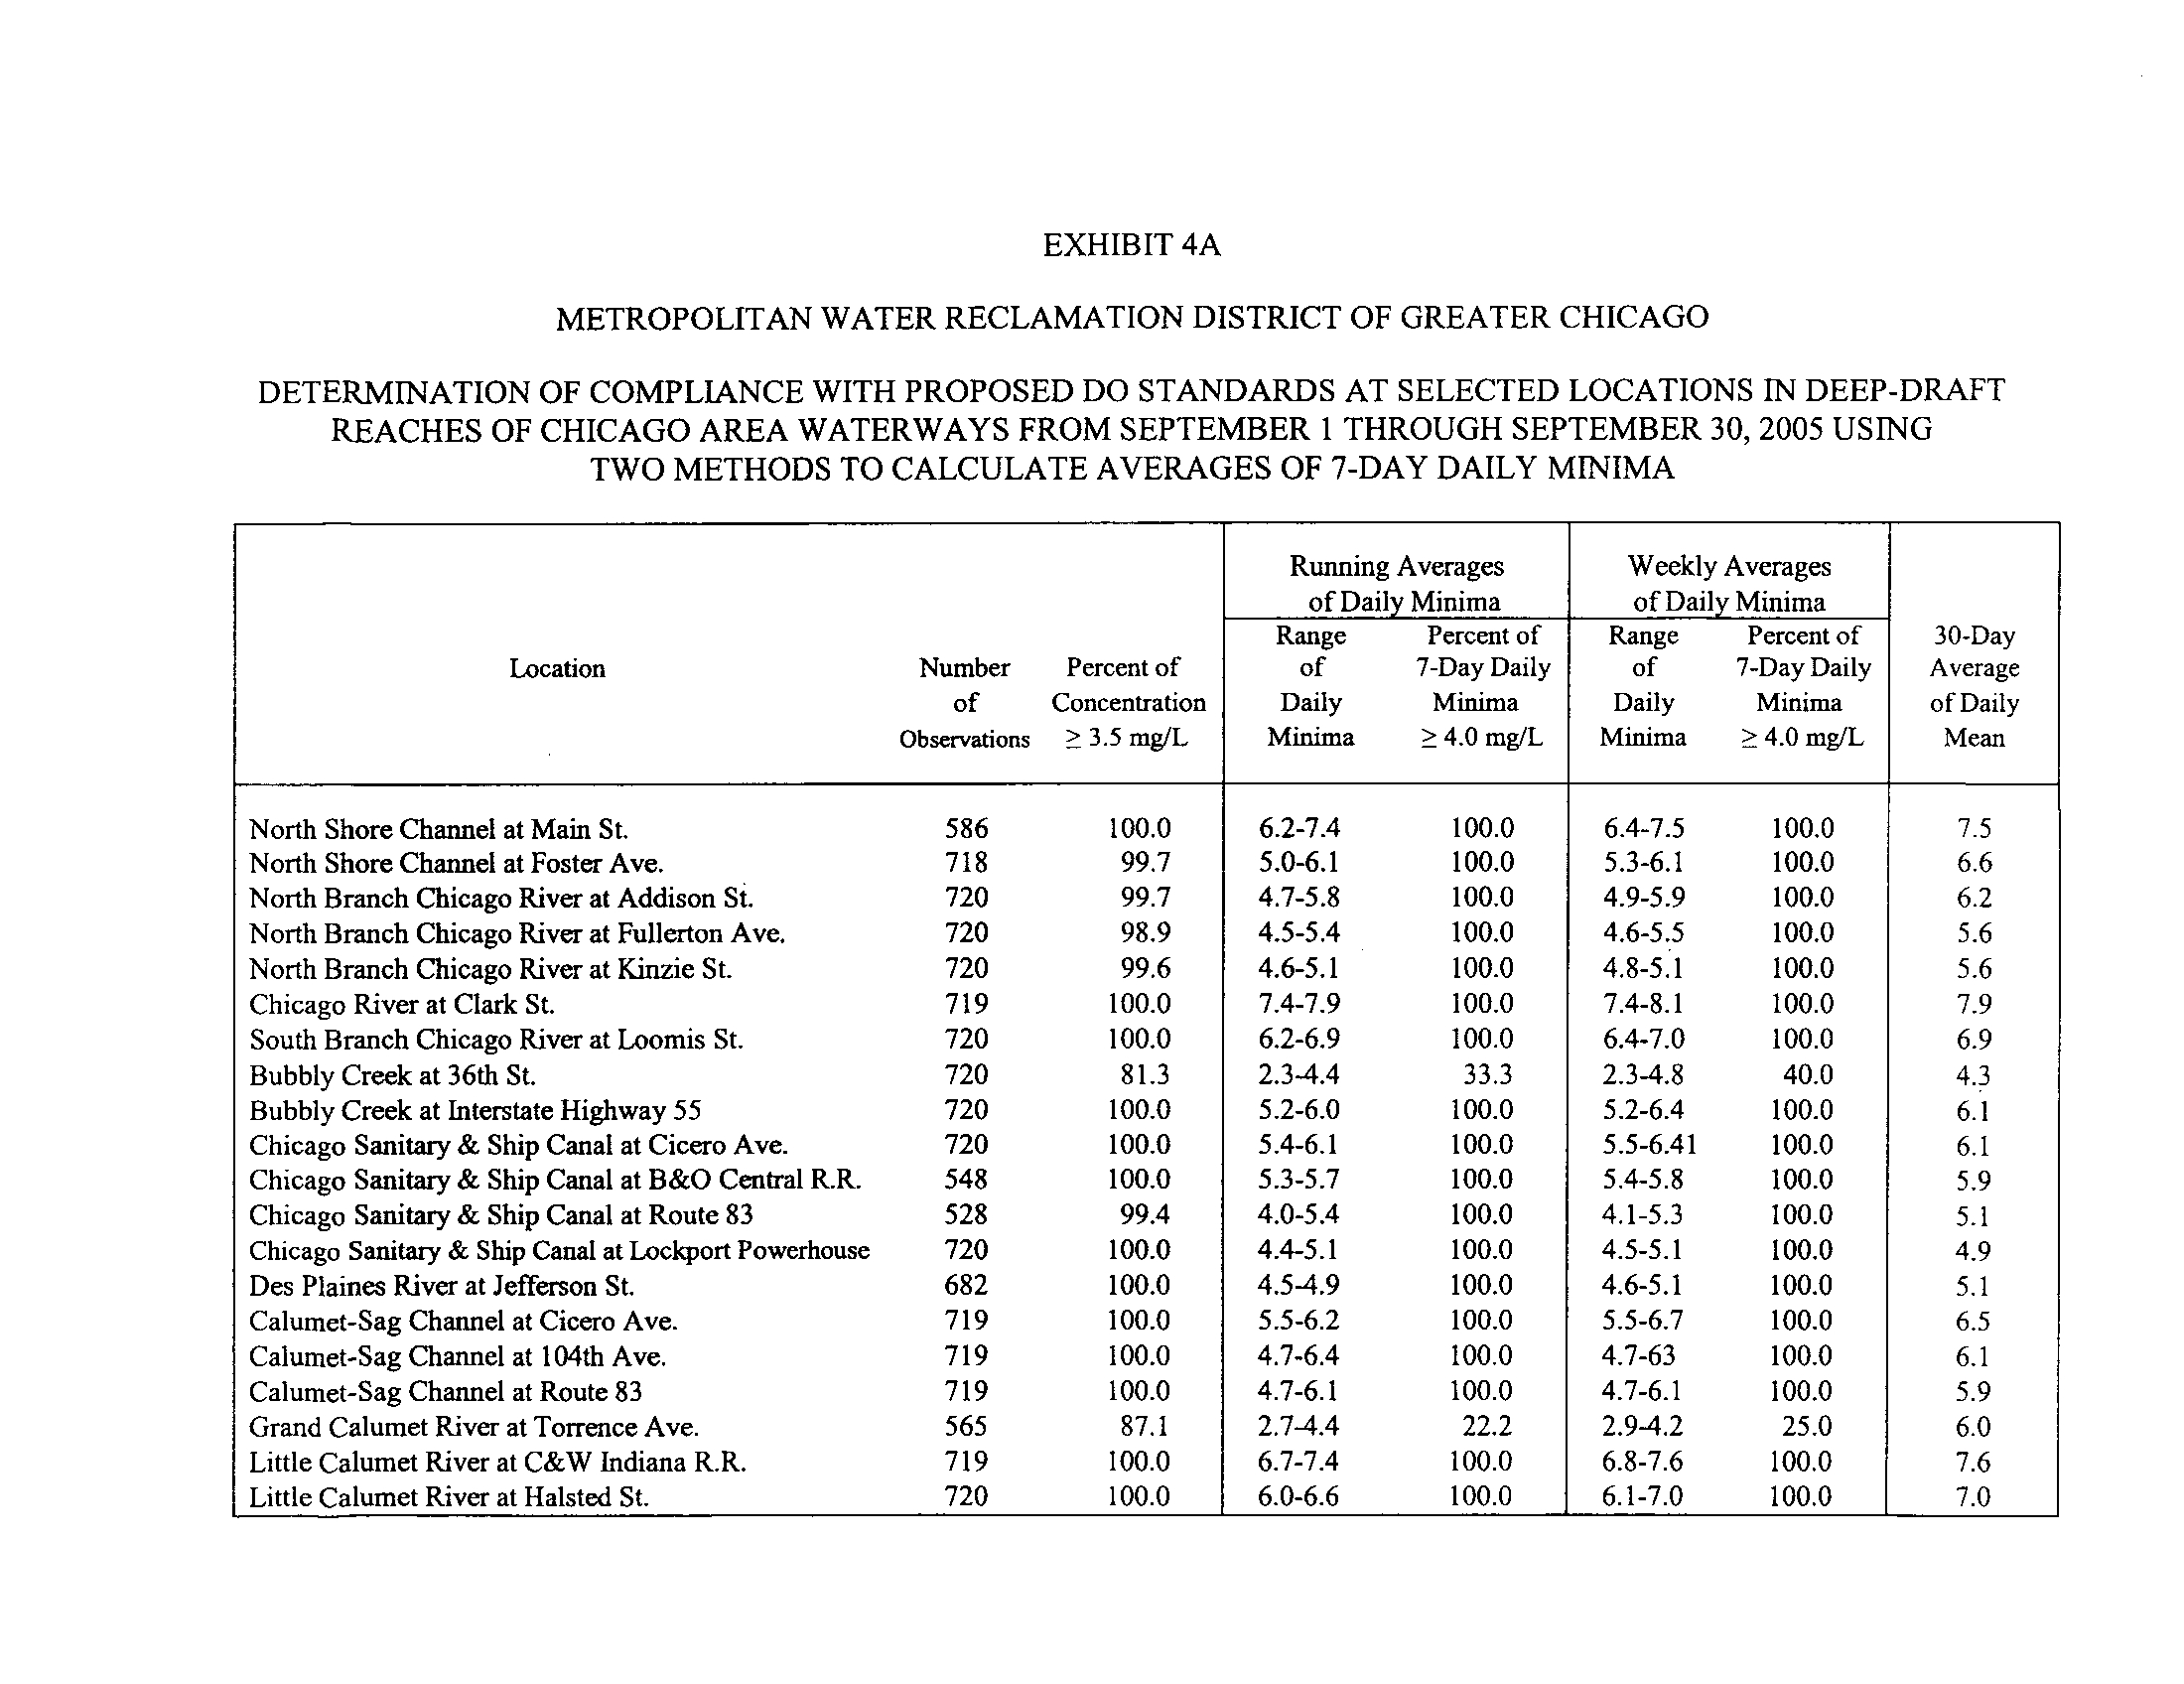
Exhibit 4A .
Determination of compliance with proposed DO standards at selected locations in deep-draft
reaches of Chicago area waterways from September 1 through September 30, 2005, using two methods to
calculate averages of 7-day daily minima .
•
Results using both methods were very similar for 20 deep-draft stream locations during September
2005.
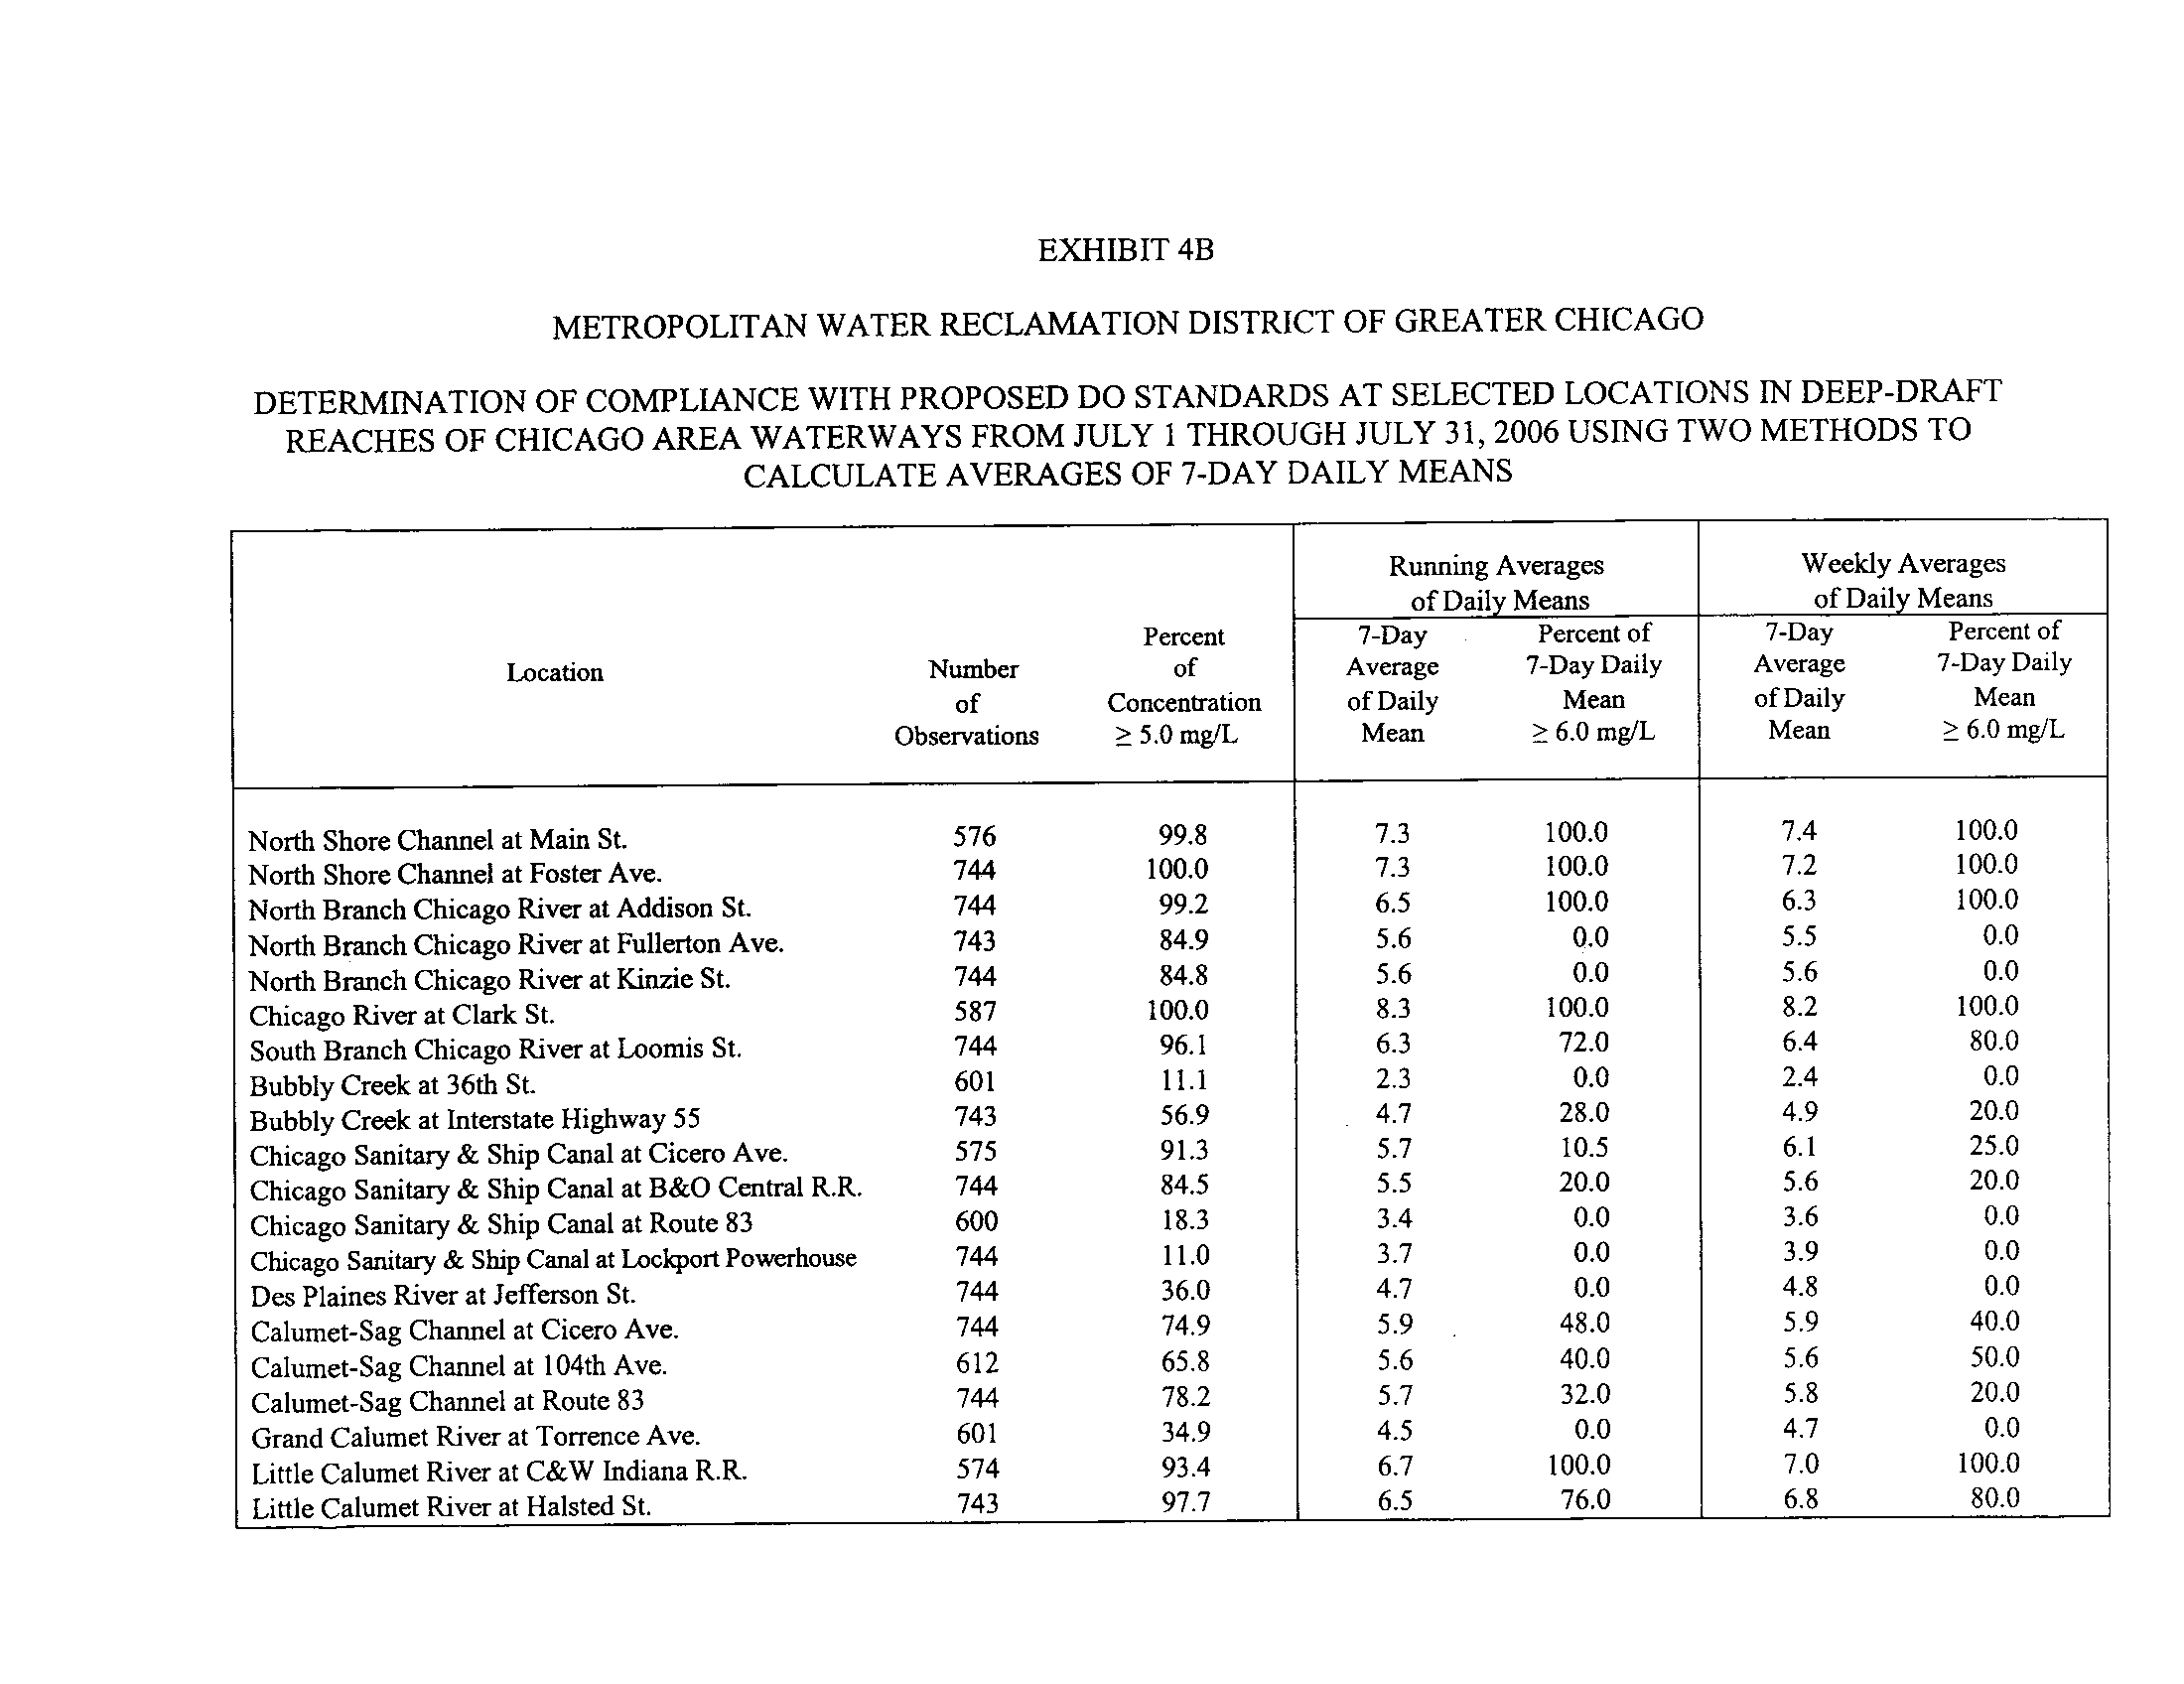
Exhibit 4B .
Determination of compliance with proposed DO standards at selected locations in deep-draft
reaches of Chicago area waterways from July 1 through July 31, 2006, using two methods to calculate
averages of 7-day daily means .
•
Results using both methods were very similar for 20 deep-draft stream locations during July 2006
.
Conclusion:
Both the running average method and the calendar week method give very similar results
for calculating a 7-day daily minimum or 7-day daily mean DO value
. However, for consistency, one or
the other method should be recommended if the standards are accepted by the IPCB
. The same
clarification should be made to determine the 30-day average of daily means for the August through
February period
.
The following comments should also be considered by the Pollution Control Board prior to promulgation
of the final rule .
•
This testimony focuses on use of continuous monitoring to determine compliance with the proposed
standards
. However, in all likelihood this will not be the predominant method utilized throughout the
state to determine compliance
. The draft rule as it is currently written does not specify a minimum
frequency of monitoring requirement for either the sensitive period or the non-sensitive period
. The
final rule should address this .
•
The draft rule as it is currently written does not specify or offer guidance as to how many sample
points must be maintained to ensure compliance of a waterway segment, a river or stream, or an entire
river system with the DO standards . The final rule should address this
.
As was mentioned in the District's testimony at the April 25, 2006 hearing, actual monitoring using
continuous monitors gives us critical insight into the impact of a water quality standard proposal
. Before
8
adopting any proposal there must be a reasonable chance that compliance will occur
. It is suggested that
the Board give consideration to the following:
•
For urban-impacted and CSO-impacted streams, a waiver provision should be allowed for time for
further study of the affordability and feasibility of technology that must be installed for these streams
to come into compliance .
•
A separate wet weather standard applicable to the time following stormwater runoff that would allow
reduced DO levels for a limited period needs to be investigated .
In closing, several areas have been identified where the IDNR/IEPA proposal requires clarification and
scientific justification
. The District supports the promulgation of a scientifically sound standard with
clearly outlined requirements for compliance verification . The standard must acknowledge and address
the unique nature of urban waterways and provide flexibility to accommodate the anthropogenic factors
that impact DO and aquatic ecology in these systems .
Metropolitan Water Reclamation District
of Greater Chicago
By :
Louis
(
Kollias
h-tJtxt
.V 4~_
Director
Research and Development
October 2, 2006
Metropolitan Water Reclamation
District of Greater Chicago
100 East Erie St .
Chicago, Illinois 60611
312.751 .5190
9
August 1, 2005
-
February 28, 2006
EXHIBIT IA
METROPOLITAN WATER RECLAMATION DISTRICT OF GREATER CHICAGO
DISSOLVED OXYGEN OBSERVATIONS AND SUMMARY AT SELECTED LOCATIONS IN SHALLOW-DRAFT REACHES
OF GENERAL USE WATERS FROM AUGUST 2005 THROUGH FEBRUARY 2006
Location
Number
of
Observations
Percent
of
Concentration
> 3
.5 mg/L
Range
of Daily
Minima
Percent
of 7-Day
Minima
> 4
.0 mg/L
30-Day
Average of
Daily Mean
Percent of
30-Day
Average
?
5
.5 mg/L
North Branch Chicago River at Central Park Ave
.
4,920
100
.0
4
.7-14
.0
100
.0
9
.7
100
.0
Des Plaines River at Devon Ave
.
3,010
100
.0
7
.1-14
.5
100
.0
11
.7
100
.0
Des Plaines River at Irving Park Rd
.
4,921
98
.2
2
.9-13
.2
93
.3
9
.1
71
.4
Des Plaines River at Ogden Ave
.
4,947
100
.0
6
.0-14
.4
100
.0
10
.6
100
.0
Des Plaines River at Material Service Rd
.
2,002
100
.0
7
.8-14
.4
100
.0
13
.3
100
.0
Salt Creek at Busse Lake Dam
2,963
100
.0
8
.8-15
.0
100
.0
12
.4
100
.0
Salt Creek at J
. F
. Kennedy Blvd
.
4,860
100
.0
4
.6-11
.4
100
.0
8
.6
100
.0
Salt Creek at Thomdale Ave
.
4,936
100
.0
4
.5-11
.5
100
.0
8
.9
100
.0
Salt Creek at Wolf Rd
.
5,072
100
.0
4
.7-14
.5
100
.0
9
.9
100
.0
Grand Calumet River at Hohman Ave
.
1,346
28
.4
0
.1-1
.9
0
.0
2
.1
0
.0
Little Calumet River at Ashland Ave
.
5,087
82
.6
2
.1-12
.6
65
.3
7
.6
71
.4
Little Calumet River at Wentworth Ave
.
4,248
84
.3
1
.0-12
.3
58
.5
7
.3
66
.7
EXHIBIT IA (Continued)
METROPOLITAN WATER RECLAMATION DISTRICT OF GREATER CHICAGO
DISSOLVED OXYGEN OBSERVATIONS AND SUMMARY AT SELECTED LOCATIONS IN SHALLOW-DRAFT REACHES
OF GENERAL USE WATERS FROM AUGUST 2005 THROUGH FEBRUARY 2006
August 1 -August 31, 2005
Location
Number
of
Observations
Percent of
Concentration
> 3
.5 mg/L
Range
of Daily
Minima
Percent of
7-Day Minima
>_ 4
.0 mg/L
30-Day
Average of
Daily Mean
North Branch Chicago River at Central Park Ave
.
744
99
.9
4
.7-5
.9
100
.0
6
.1
Des Plaines River at Devon Ave
.
Des Plaines River at Irving Park Rd
.
No Data
578
84
.9
2
.9-4
.9
42
.1
4
.6
Des Plaines River at Ogden Ave
.
722
100
.0
6
.0-6
.7
100
.0
6
.8
Des Plaines River at Material Service Rd
.
Salt Creek at Busse Lake Dam
.
Salt Creek at J
. F
. Kennedy Blvd
.
No Data
No Data
712
100
.0
4
.7-5
.6
100
.0
7
.0
Salt Creek at Thomdale Ave
.
691
100
.0
4
.5-5
.6
100
.0
7
.2
Salt Creek at Wolf Rd
.
744
100
.0
4
.7-5
.9
100
.0
6
.3
Grand Calumet River at Hohman Ave
.
685
31
.7
0
.1-1
.4
0
.0
3
.2
Little Calumet River at Ashland Ave
.
743
41
.3
2
.1-3
.1
0
.0
3
.4
Little Calumet River at Wentworth Ave
.
744
57
.3
1
.0-3
.4
0
.0
3
.8
EXHIBIT 1A (Continued)
METROPOLITAN WATER RECLAMATION DISTRICT OF GREATER CHICAGO
DISSOLVED OXYGEN OBSERVATIONS AND SUMMARY AT SELECTED LOCATIONS IN SHALLOW-DRAFT REACHES
OF GENERAL USE WATERS FROM AUGUST 2005 THROUGH FEBRUARY 2006
September 1
-
September 30, 2005
Location
Number
of
Observations
Percent of
Concentration
> 3
.5 mg/L
Range
of Daily
Minima
Percent of
7-Day Minima
>_ 4
.0 mg/L
30-Day
Average of
Daily Mean
North Branch Chicago River at Central Park Ave
.
719
100
.0
5
.5-6
.4
100
.0
6
.4
Des Plaines River at Devon Ave
.
Des Plaines River at Irving Park Rd
.
No Data
720
100
.0
4
.4-5
.6
100
.0
5
.4
Des Plaines River at Ogden Ave
.
720
100
.0
6
.5-7
.3
100
.0
7
.4
Des Plaines River at Material Service Rd
.
Salt Creek at Busse Lake Dam
Salt Creek at J
. F
. Kennedy Blvd
.
No Data
No Data
589
100
.0
4
.6-6
.2
100
.0
7
.0
Salt Creek at Thomdale Ave
.
631
100
.0
4
.6-6
.1
100
.0
7
.4
Salt Creek at Wolf Rd
.
719
100
.0
5
.2-6
.7
100
.0
6
.8
Grand Calumet River at Hohman Ave
.
553
29
.8
0
.5-1
.9
0
.0
2
.5
Little Calumet River at Ashland Ave
.
720
53
.5
2
.6-3
.3
0
.0
3
.7
Little Calumet River at Wentworth Ave
.
720
67
.8
2
.6-3
.4
0
.0
4
.4
EXHIBIT IA (Continued)
METROPOLITAN WATER RECLAMATION DISTRICT OF GREATER CHICAGO
DISSOLVED OXYGEN OBSERVATIONS AND SUMMARY AT SELECTED LOCATIONS IN SHALLOW-DRAFT REACHES
OF GENERAL USE WATERS FROM AUGUST 2005 THROUGH FEBRUARY 2006
October 1
-
October 3
,
2005
North Branch Chicago River at Central Park Ave
.
744
100
.0
5
.8-8
.3
100
.0
7
.8
Des Plaines River at Devon Ave
.
130
100
.0
9
.3-9
.3
100
.0
9
.5
Des Plaines River at Irving Park Rd
.
743
100
.0
5
.8-8
.7
100
.0
7
.7
Des Plaines River at Ogden Ave
.
744
100
.0
7
.2-9
.7
100
.0
8
.9
Des Plaines River at Material Service Rd
.
107
100
.0
10
.5-10
.5
100
.0
12
.6
Salt Creek at Busse Lake Dam
82
100
.0
8
.8-8
.8
100
.0
9
.6
Salt Creek at J
. F
. Kennedy Blvd
.
681
100
.0
5
.3-6
.3
100
.0
6
.9
Salt Creek at Thomdale Ave
.
735
100
.0
5
.7-6
.5
100
.0
7
.4
Salt Creek at Wolf Rd
.
743
100
.0
6
.4-8
.4
100
.0
8
.0
Grand Calumet River at Hohman Ave
.
108
0
.0
0
.3-0
.3
0
.0
0
.5
Little Calumet River at Ashland Ave
.
744
88
.8
3
.1-7
.2
80
.0
5
.5
Little Calumet River at Wentworth Ave
.
744
93
.4
3
.1-7
.4
84
.0
6
.3
Number
Percent of
Range
Percent of
30-Day
Location
of
Concentration
of Daily
Minima
Average of
Observations
> 3
.5 mg/L
Minima
2 4
.0 mg/L
Daily Mean
EXHIBIT 1A (Continued)
METROPOLITAN WATER RECLAMATION DISTRICT OF GREATER CHICAGO
DISSOLVED OXYGEN OBSERVATIONS AND SUMMARY AT SELECTED LOCATIONS IN SHALLOW-DRAFT REACHES
OF GENERAL USE WATERS FROM AUGUST 2005 THROUGH FEBRUARY 2006
November 1
-
November 30, 2005
Location
Number
of
Observations
Percent of
Concentration
?
3
.5 mg/L
Range
of Daily
Minima
Percent of
7-Day Minima
> 4
.0 mg/L
30-Day
Average of
Daily Mean
North Branch Chicago River at Central Park Ave
.
722
100
.0
5
.6-11
.8
100
.0
9
.4
Des Plaines River at Devon Ave
.
720
100
.0
7
.1-11
.4
100
.0
9
.5
Des Plaines River at Irving Park Rd
.
721
100
.0
6
.7-10
.4
100
.0
9
.1
Des Plaines River at Ogden Ave
.
601
100
.0
8
.7-11
.8
100
.0
10
.5
Des Plaines River at Material Service Rd
.
720
100
.0
7
.8-12
.2
100
.0
11
.8
Salt Creek at Busse Lake Dam
721
100
.0
9
.2-12
.8
100
.0
11
.5
Salt Creek at J
. F
. Kennedy Blvd
.
721
100
.0
6
.7-8
.5
100
.0
8
.3
Salt Creek at Thomdale Ave
.
721
100
.0
6
.2-8
.4
100
.0
8
.3
Salt Creek at Wolf Rd
.
716
100
.0
7
.4-10
.3
100
.0
9
.7
Grand Calumet River at Hohman Ave
.
Little Calumet River at Ashland Ave
.
No Data
720
96
.0
3
.8-8
.2
79
.2
6
.5
Little Calumet River at Wentworth Ave
.
708
90
.1
2
.6-7
.7
75
.0
6
.3
EXHIBIT IA (Continued)
METROPOLITAN WATER RECLAMATION DISTRICT OF GREATER CHICAGO
DISSOLVED OXYGEN OBSERVATIONS AND SUMMARY AT SELECTED LOCATIONS IN SHALLOW-DRAFT REACHES
OF GENERAL USE WATERS FROM AUGUST 2005 THROUGH FEBRUARY 2006
December 1
-
December 31, 2005
Location
Number
of
Observations
Percent of
Concentration
> 3
.5 mg/L
Range
of Daily
Minima
Percent of
7-Day Minima
?
4
.0 mg/L
30-Day
Average of
Daily Mean
North Branch Chicago River at Central Park Ave
.
743
100
.0
11
.1-13
.1
100
.0
12
.2
Des Plaines River at Devon Ave
.
744
100
.0
12
.2-14
.5
100
.0
13
.5
Des Plaines River at Irving Park Rd
.
744
100
.0
10
.2-13
.1
100
.0
12
.1
Des Plaines River at Ogden Ave
.
744
100
.0
12
.9-14
.4
100
.0
14
.2
Des Plaines River at Material Service Rd
.
202
100
.0
13
.1-14
.3
100
.0
14
.6
Salt Creek at Busse Lake Dam
744
100
.0
12
.1-13
.2
100
.0
13
.1
Salt Creek at J
. F
. Kennedy Blvd
.
741
100
.0
7
.7-9
.4
100
.0
9
.0
Salt Creek at Thomdale Ave
.
742
100
.0
8
.3-9
.4
100
.0
9
.4
Salt Creek at Wolf Rd
.
Grand Calumet River at Hohman Ave
.
734
No Data
100
.0
11
.7-14
.5
100
.0
13
.9
Little Calumet River at Ashland Ave
.
Little Calumet River at Wentworth Ave
.
744
No Data
100
.0
10
.5-12
.6
100
.0
11
.8
EXHIBIT IA (Continued)
METROPOLITAN WATER RECLAMATION DISTRICT OF GREATER CHICAGO
DISSOLVED OXYGEN OBSERVATIONS AND SUMMARY AT SELECTED LOCATIONS IN SHALLOW-DRAFT REACHES
OF GENERAL USE WATERS FROM AUGUST 2005 THROUGH FEBRUARY 2006
January 1
-
January 31, 2006
Location
Number
of
Observations
Percent of
Concentration
> 3
.5 mg/L
Range
of Daily
Minima
Percent of
7-Day Minima
>_ 4
.0 mg/L
30-Day
Average of
Daily Mean
North Branch Chicago River at Central Park Ave
.
576
100
.0
11
.2-12
.4
100
.0
12
.2
Des Plaines River at Devon Ave
.
744
100
.0
10
.6-13
.8
100
.0
12
.7
Des Plaines River at Irving Park Rd
.
744
100
.0
10
.6-12
.7
100
.0
12
.0
Des Plaines River at Ogden Ave
.
744
100
.0
12
.3-13
.1
100
.0
12
.9
Des Plaines River at Material Service Rd
.
468
100
.0
11
.8-13
.0
100
.0
13
.5
Salt Creek at Busse Lake Dam
744
100
.0
13
.0-13
.5
100
.0
13
.4
Salt Creek at J
. F
. Kennedy Blvd
.
744
100
.0
9
.4-10
.2
100
.0
10
.6
Salt Creek at Thomdale Ave
.
744
100
.0
9
.6-10
.5
100
.0
11
.0
Salt Creek at Wolf Rd
.
Grand Calumet River at Hohman Ave
.
744
No Data
100
.0
11
.1-11
.8
100
.0
11
.8
Little Calumet River at Ashland Ave
.
744
100
.0
9
.7-11
.3
100
.0
10
.7
Little Calumet River at Wentworth Ave
.
660
100
.0
9
.7-11
.5
100
.0
10
.9
EXHIBIT IA (Continued)
METROPOLITAN WATER RECLAMATION DISTRICT OF GREATER CHICAGO
DISSOLVED OXYGEN OBSERVATIONS AND SUMMARY AT SELECTED LOCATIONS IN SHALLOW-DRAFT REACHES
OF GENERAL USE WATERS FROM AUGUST 2005 THROUGH FEBRUARY 2006
February 1
-
February 28, 2006
Location
Number
of
Observations
Percent of
Concentration
>_ 3
.5 mg/L
Range
of Daily
Minima
Percent of
7-Day Minima
?
4
.0 mg/L
30-Day
Average of
Daily Mean
North Branch Chicago River at Central Park Ave
.
672
100
.0
12
.5-14
100
.0
13
.9
Des Plaines River at Devon Ave
.
672
100
.0
12
.0-13
.6
100
.0
13
.4
Des Plaines River at Irving Park Rd
.
671
100
.0
12
.3-13
.2
100
.0
13
.1
Des Plaines River at Ogden Ave
.
672
100
.0
12
.7-14
.2
100
.0
13
.8
Des Plaines River at Material Service Rd
.
505
100
.0
12
.3-14
.4
100
.0
14
.0
Salt Creek at Busse Lake Dam
672
100
.0
13
.4-15
100
.0
14
.5
Salt Creek at J
. F
. Kennedy Blvd
.
672
100
.0
9
.5-11
.4
100
.0
11
.2
Salt Creek at Thomdale Ave
.
672
100
.0
9
.6-11
.5
100
.0
11
.7
Salt Creek at Wolf Rd
.
672
100
.0
11
.8-12
.5
100
.0
12
.7
Grand Calumet River at Hohman Ave
.
Little Calumet River at Ashland Ave
.
No Data
672
100
.0
10
.8-12
.4
100
.0
11
.9
Little Calumet River at Wentworth Ave
.
672
100
.0
10
.7-12
.3
100
.0
11
.9
March 1, 2006
-
July 31, 2006
EXHIBIT 1B
METROPOLITAN WATER RECLAMATION DISTRICT OF GREATER CHICAGO
DISSOLVED OXYGEN OBSERVATIONS AND SUMMARY AT SELECTED LOCATIONS IN SHALLOW-DRAFT REACHES
OF GENERAL USE WATERS FROM MARCH 2006 THROUGH JULY 2006
Location
Number
of
Observations
Percent of
Concentration
> 5
.0 mg/L
7-Day
Average of
Daily Mean
Percent of
7-Day Average
?
6
.0 mg/L
North Branch Chicago River at Central Park Ave
.
3,671
83
.8
7
.8
62
.6
Des Plaines River at Devon Ave
.
3,666
81
.8
8
.0
74
.0
Des Plaines River at Irving Park Rd
.
3,669
82
.5
7
.8
68
.3
Des Plaines River at Ogden Ave
.
3,671
100
.0
9
.0
100
.0
Des Plaines River at Material Service Rd
.
3,563
97
.8
9
.8
100
.0
Salt Creek at Busse Lake Dam
3,670
99
.4
9
.7
100
.0
Salt Creek at J
. F
. Kennedy Blvd
.
3,670
100
.0
8
.7
100
.0
Salt Creek at Thomdale Ave
.
3,500
97
.7
8
.6
100
.0
Salt Creek at Wolf Rd
.
3,479
91
.0
8
.5
83
.6
Grand Calumet River at Hohman Ave
.
1,814
12
.8
2
.6
0
.0
Little Calumet River at Ashland Ave
.
3,672
62
.0
6
.8
55
.3
Little Calumet River at Wentworth Ave
.
3,502
63
.3
6
.9
53
.8
EXHIBIT IB (Continued)
METROPOLITAN WATER RECLAMATION DISTRICT OF GREATER CHICAGO
DISSOLVED OXYGEN OBSERVATIONS AND SUMMARY AT SELECTED LOCATIONS IN SHALLOW-DRAFT REACHES
OF GENERAL USE WATERS FROM MARCH 2006 THROUGH JULY 2006
March 1
-
March 3
2006
,
Location
Number
of
Observations
Percent of
Concentration
?
5
.0 mg/L
7-Day
Average of
Daily Mean
Percent of
7-Day Average
>_ 6
.0 mg/L
North Branch Chicago River at Central Park Ave
.
744
91
.7
11
.2
100
.0
Des Plaines River at Devon Ave
.
743
100
.0
11
.6
100
.0
Des Plaines River at Irving Park Rd
.
744
100
.0
11
.4
100
.0
Des Plaines River at Ogden Ave
.
744
100
.0
12
.1
100
.0
Des Plaines River at Material Service Rd
.
744
100
.0
12
.2
100
.0
Salt Creek at Busse Lake Dam
744
100
.0
12
.7
100
.0
Salt Creek at J
. F
. Kennedy Blvd
.
743
100
.0
11
.1
100
.0
Salt Creek at Thomdale Ave
.
575
100
.0
11
.2
100
.0
Salt Creek at Wolf Rd
.
744
100
.0
11
.5
100
.0
Grand Calumet River at Hohman Ave
.
Little Calumet River at Ashland Ave
.
No Data
744
99
.9
10
.9
100
.0
Little Calumet River at Wentworth Ave
.
743
100
.0
10
.9
100
.0
EXHIBIT 1B (Continued)
METROPOLITAN WATER RECLAMATION DISTRICT OF GREATER CHICAGO
DISSOLVED OXYGEN OBSERVATIONS AND SUMMARY AT SELECTED LOCATIONS IN SHALLOW-DRAFT REACHES
OF GENERAL USE WATERS FROM MARCH 2006 THROUGH JULY 2006
April 1
-
April 30, 2006
Location
Number
of
Observations
Percent of
Concentration
> 5
.0 mg/L
7-Day
Average of
Daily Mean
Percent of
7-Day Average
>_ 6
.0 mg/L
North Branch Chicago River at Central Park Ave
.
719
100
.0
9
.9
100
.0
Des Plaines River at Devon Ave
.
719
100
.0
9
.4
100
.0
Des Plaines River at Irving Park Rd
.
719
99
.9
9
.0
100
.0
Des Plaines River at Ogden Ave
.
719
100
.0
9
.8
100
.0
Des Plaines River at Material Service Rd
.
720
100
.0
10
.5
100
.0
Salt Creek at Busse Lake Dam
718
100
.0
10
.8
100
.0
Salt Creek at J
. F
. Kennedy Blvd
.
719
100
.0
9
.3
100
.0
Salt Creek at Thomdale Ave
.
719
100
.0
9
.4
100
.0
Salt Creek at Wolf Rd
.
719
10
.0
9
.4
100
.0
Grand Calumet River at Hohman Ave
.
Little Calumet River at Ashland Ave
.
No Data
720
97
.9
7
.9
100
.0
Little Calumet River at Wentworth Ave
.
610
100
.0
8
.4
100
.0
EXHIBIT iB (Continued)
METROPOLITAN WATER RECLAMATION DISTRICT OF GREATER CHICAGO
DISSOLVED OXYGEN OBSERVATIONS AND SUMMARY AT SELECTED LOCATIONS IN SHALLOW-DRAFT REACHES
OF GENERAL USE WATERS FROM MARCH 2006 THROUGH JULY 2006
May 1
-
May 31, 2006
Location
Number
of
Observations
Percent of
Concentration
> 5
.0 mg/L
7-Day
Average of
Daily Mean
Percent of
7-Day Average
>_ 6
.0 mg/L
North Branch Chicago River at Central Park Ave
.
744
81
.7
6
.8
80
.0
Des Plaines River at Devon Ave
.
742
95
.7
8
.7
100
.0
Des Plaines River at Irving Park Rd
.
744
95
.0
8
.3
96
.0
Des Plaines River at Ogden Ave
.
744
100
.0
9
.1
100
.0
Des Plaines River at Material Service Rd
.
744
100
.0
10
.1
100
.0
Salt Creek at Busse Lake Dam
744
100
.0
9
.8
100
.0
Salt Creek at J
. F
. Kennedy Blvd
.
744
100
.0
8
.5
100
.0
Salt Creek at Thomdale Ave
.
743
100
.0
8
.3
100
.0
Salt Creek at Wolf Rd
.
744
98
.9
8
.4
100
.0
Grand Calumet River at Hohman Ave
.
504
8
.9
2
.5
0
.0
Little Calumet River at Ashland Ave
.
744
75
.0
6
.2
60
.0
Little Calumet River at Wentworth Ave
.
685
75
.6
6
.4
78
.3
EXHIBIT 1B (Continued)
METROPOLITAN WATER RECLAMATION DISTRICT OF GREATER CHICAGO
DISSOLVED OXYGEN OBSERVATIONS AND SUMMARY AT SELECTED LOCATIONS IN SHALLOW-DRAFT REACHES
OF GENERAL USE WATERS FROM MARCH 2006 THROUGH JULY 2006
June 1
-
June 30, 2006
Location
Number
of
Observations
Percent of
Concentration
> 5
.0 mg/L
7-Day
Average of
Daily Mean
Percent of
7-Day Average
?
6
.0 mg/L
North Branch Chicago River at Central Park Ave
.
720
88
.9
5
.8
33
.3
Des Plaines River at Devon Ave
.
718
95
.8
6
.4
70
.8
Des Plaines River at Irving Park Rd
.
718
93
.5
6
.0
45
.8
Des Plaines River at Ogden Ave
.
720
100
.0
7
.4
100
.0
Des Plaines River at Material Service Rd
.
720
95
.4
7
.5
100
.0
Salt Creek at Busse Lake Dam
720
100
.0
7
.9
100
.0
Salt Creek at J
. F
. Kennedy Blvd
.
720
100
.0
7
.7
100
.0
Salt Creek at Thomdale Ave
.
720
96
.1
7
.5
100
.0
Salt Creek at Wolf Rd
.
682
87
.4
6
.5
82
.6
Grand Calumet River at Hohman Ave
.
566
21
.7
3
.5
0
.0
Little Calumet River at Ashland Ave
.
720
28
.2
4
.8
16
.7
Little Calumet River at Wentworth Ave
.
720
28
.3
4
.8
0
.0
EXHIBIT 1B (Continued)
METROPOLITAN WATER RECLAMATION DISTRICT OF GREATER CHICAGO
DISSOLVED OXYGEN OBSERVATIONS AND SUMMARY AT SELECTED LOCATIONS IN SHALLOW-DRAFT REACHES
OF GENERAL USE WATERS FROM MARCH 2006 THROUGH JULY 2006
July 1
-
July 3
2006
,
Location
Number
of
Observations
Percent of
Concentration
> 5
.0 mg/L
7-Day
Average of
Daily Mean
Percent of
7-Day Average
> 6
.0 mg/L
North Branch Chicago River at Central Park Ave
.
744
57
.7
5
.1
0
.0
Des Plaines River at Devon Ave
.
744
18
.8
3
.9
0
.0
Des Plaines River at Irving Park Rd
.
744
25
.3
4
.3
0
.0
Des Plaines River at Ogden Ave
.
744
99
.9
6
.6
100
.0
Des Plaines River at Material Service Rd
.
635
92
.6
8
.1
100
.0
Salt Creek at Busse Lake Dam
744
97
.0
7
.3
100
.0
Salt Creek at J
. F
. Kennedy Blvd
.
744
100
.0
7
.1
100
.0
Salt Creek at Thomdale Ave
.
743
92
.7
6
.9
100
.0
Salt Creek at Wolf Rd
.
590
62
.7
5
.6
21
.1
Grand Calumet River at Hohman Ave
.
744
8
.6
2
.1
0
.0
Little Calumet River at Ashland Ave
.
744
8
.9
4
.1
0
.0
Little Calumet River at Wentworth Ave
.
744
19
.1
4
.2
0
.0
August
2005
-
February 28, 2006
,
EXHIBIT 2A
METROPOLITAN WATER RECLAMATION DISTRICT OF GREATER CHICAGO
DISSOLVED OXYGEN OBSERVATIONS AND SUMMARY AT SELECTED LOCATIONS IN DEEP-DRAFT REACHES OF
CHICAGO AREA WATERWAYS FROM AUGUST 2005 THROUGH FEBRUARY 2006
North Shore Channel at Main St
.
4,635
99
.7
3
.9-28
.3
98
.0
9
.7
100
.0
North Shore Channel at Foster Ave
.
4,960
100
.0
5
.0-8
.6
100
.0
7
.6
100
.0
North Branch Chicago River at Addison St
.
5,087
99
.0
3
.0-9
.7
95
.3
7
.4
85
.7
North Branch Chicago River at Fullerton Ave
.
5,085
97
.7
2
.4-9
.2
95
.9
7
.0
85
.7
North Branch Chicago River at Kinzie St
.
5,057
97
.7
2
.7-9
.8
91
.2
7
.0
85
.7
Chicago River at Clark St
.
4,981
100
.0
6
.5-11
.2
100
.0
9
.0
100
.0
South Branch Chicago River at Loomis St
.
5,086
100
.0
5
.4-10
.8
100
.0
8
.0
100
.0
Bubbly Creek at 36th St
.
4,838
83
.8
0
.0-12
.1
75
.2
6
.6
71
.4
Bubbly Creek at Interstate Highway 55
4,716
98
.7
2
.8-9
.5
94
.9
7
.3
85
.7
Chicago Sanitary & Ship Canal at Cicero Ave
.
4,870
98
.7
3
.4-9
.4
92
.6
6
.7
85
.7
Chicago Sanitary & Ship Canal at B&O Central R
.R
.
4,666
100
.0
4
.5-8
.4
100
.0
7
.0
85
.7
Chicago Sanitary & Ship Canal at Route 83
4,295
98
.7
3
.8-7
.8
99
.3
5
.9
57
.1
Chicago Sanitary & Ship Canal at Lockport Powerhouse
4,831
98
.2
3
.2-8
.0
90
.1
6
.0
57
.1
Des Plaines River at Jefferson St
.
4,724
99
.7
3
.6-9
.4
96
.2
7
.3
71
.4
Calumet-Sag Channel at Cicero Ave
.
5,088
99
.5
4
.1-10
.2
100
.0
7
.6
100
.0
Calumet-Sag Channel at 104th Ave
.
3,994
99
.3
3
.7-9
.5
97
.7
7
.2
85
.7
Calumet-Sag Channel at Route 83
5,088
99
.2
3
.4-10
.0
97
.1
7
.5
100
.0
Grand Calumet River at Torrence Ave
.
4,892
91
.5
1
.3-16
.1
75
.0
10
.0
85
.7
Little Calumet River at C&W Indiana R
.R
.
4,807
100
.0
5
.8-17
.4
100
.0
10
.6
100
.0
Little Calumet River at Halsted St
.
4,832
100
.0
5
.4-8
.9
100
.0
7
.6
100
.0
Percent
30-Day
Percent
Location
Number
Percent of
Range
of 7-Day
Average
of 30-Day
of
Concentration
of Daily
Minima
of Daily
Average
Observations
?
3
.5 mg/L
Minima
?
4
.0 mg/L
Mean
?
5
.5 mg/L
EXHIBIT 2A (Continued)
METROPOLITAN WATER RECLAMATION DISTRICT OF GREATER CHICAGO
DISSOLVED OXYGEN OBSERVATIONS AND SUMMARY AT SELECTED LOCATIONS IN DEEP-DRAFT REACHES OF
CHICAGO AREA WATERWAYS FROM AUGUST 2005 THROUGH FEBRUARY 2006
August 1
-
August 3
2005
,
North Shore Channel at Main St
.
425
100
.0
5
.8-6
.6
100
.0
7
.1
North Shore Channel at Foster Ave
.
627
100
.0
5
.2-6
.4
100
.0
6
.5
North Branch Chicago River at Addison St
.
744
93
.5
3
.0-5
.6
68
.0
5
.2
North Branch Chicago River at Fullerton Ave
.
741
85
.6
2
.4-5
.1
72
.0
4
.8
North Branch Chicago River at Kinzie St
.
744
85
.6
2
.7-5
.2
40
.0
4
.8
Chicago River at Clark St
.
637
100
.0
6
.5-8
.3
100
.0
7
.8
South Branch Chicago River at Loomis St
.
744
100
.0
5
.4-6
.4
100
.0
6
.4
Bubbly Creek at 36th St
.
494
22
.7
0
.6-1
.4
0
.0
2
.3
Bubbly Creek at Interstate Highway 55
542
90
.8
2
.8-5
.2
52
.9
5
.4
Chicago Sanitary & Ship Canal at Cicero Ave
.
744
91
.7
3
.4-5
.5
52
.0
5
.1
Chicago Sanitary & Ship Canal at B&O Central R
.R
.
494
100
.0
4
.5-5
.4
100
.0
5
.4
Chicago Sanitary & Ship Canal at Route 83
142
78
.2
3
.8-3
.8
0
.0
4
.1
Chicago Sanitary & Ship Canal at Lockport Powerhouse
575
84
.5
3
.2-4
.1
15
.8
4
.2
Des Plaines River at Jefferson St
.
576
97
.2
3
.6-4
.8
68
.4
4
.9
Calumet-Sag Channel at Cicero Ave
.
744
98
.5
4
.1-5
.8
100
.0
6
.2
Calumet-Sag Channel at 104th Ave
.
325
91
.7
3
.7-5
.2
66
.7
5
.1
Calumet-Sag Channel at Route 83
743
94
.8
3
.4-5
.9
80
.0
5
.9
Grand Calumet River at Torrence Ave
.
730
56
.6
1
.3-2
.3
0
.0
4
.2
Little Calumet River at C&W Indiana R
.R
.
489
100
.0
5
.8-7
100
.0
7
.4
Little Calumet River at Halsted St
.
489
100
.0
5
.4-6
.3
100
.0
6
.8
Number
Percent of
Range
Percent of
30-Day
Location
of
Concentration
of Daily
7-Day Minima
Average of
Observations
> 3
.5 mg/L
Minima
> 4
.0 mg/L
Daily Mean
EXHIBIT 2A (Continued)
METROPOLITAN WATER RECLAMATION DISTRICT OF GREATER CHICAGO
DISSOLVED OXYGEN OBSERVATIONS AND SUMMARY AT SELECTED LOCATIONS IN DEEP-DRAFT REACHES OF
CHICAGO AREA WATERWAYS FROM AUGUST 2005 THROUGH FEBRUARY 2006
September 1
-
September 30, 2005
Location
Number
of
Observations
Percent of
Concentration
> 3
.5 mg/l,
Range
of Daily
Minima
Percent of
7-Day Minima
>_ 4
.0 mg/L
30-Day
Average of
Daily Mean
North Shore Channel at Main St
.
586
100
.0
6
.2-7
.4
100
.0
7
.5
North Shore Channel at Foster Ave
.
718
99
.7
5-6
.1
100
.0
6
.6
North Branch Chicago River at Addison St
.
720
99
.7
4
.7-5
.8
100
.0
6
.2
North Branch Chicago River at Fullerton Ave
.
720
98
.9
4
.5-5
.4
100
.0
5
.6
North Branch Chicago River at Kinzie St
.
720
99
.6
4
.6-5
.1
100
.0
5
.6
Chicago River at Clark St
.
719
100
.0
7
.4-7
.9
100
.0
7
.9
South Branch Chicago River at Loomis St
.
720
100
.0
6
.2-6
.9
100
.0
6
.9
Bubbly Creek at 36th St
.
720
81
.3
2
.3-4
.4
33
.3
4
.3
Bubbly Creek at Interstate Highway 55
720
100
.0
5
.2-6
100
.0
6
.1
Chicago Sanitary & Ship Canal at Cicero Ave
.
720
100
.0
5
.4-6
.1
100
.0
6
.1
Chicago Sanitary & Ship Canal at B&O Central R
.R
.
548
100
.0
5
.3-5
.7
100
.0
5
.9
Chicago Sanitary & Ship Canal at Route 83
528
99
.4
4-5
.4
100
.0
5
.1
Chicago Sanitary & Ship Canal at Lockport Powerhouse
720
100
.0
4
.4-5
.1
100
.0
4
.9
Des Plaines River at Jefferson St
.
682
100
.0
4
.5-4
.9
100
.0
5
.1
Calumet-Sag Channel at Cicero Ave
.
719
100
.0
5
.5-6
.2
100
.0
6
.5
Calumet-Sag Channel at 104th Ave
.
719
100
.0
4
.7-6
.4
100
.0
6
.1
Calumet-Sag Channel at Route 83
719
100
.0
4
.7-6
.1
100
.0
5
.9
Grand Calumet River at Torrence Ave
.
565
87
.1
2
.7-4
.4
22
.2
6
.0
Little Calumet River at C&W Indiana R
.R
.
719
100
.0
6
.7-7
.4
100
.0
7
.6
Little Calumet River at Halsted St
.
720
100
.0
6-6
.6
100
.0
7
.0
October 1
-
October 31, 2005
EXHIBIT 2A (Continued)
METROPOLITAN WATER RECLAMATION DISTRICT OF GREATER CHICAGO
DISSOLVED OXYGEN OBSERVATIONS AND SUMMARY AT SELECTED LOCATIONS IN DEEP-DRAFT REACHES OF
CHICAGO AREA WATERWAYS FROM AUGUST 2005 THROUGH FEBRUARY 2006
Location
Number
of
Observations
Percent of
Concentration
?
3
.5 mg/L
Range
of Daily
Minima
Percent of
7-Day Minima
>_ 4
.0 mg/L
30-Day
Average of
Daily Mean
North Shore Channel at Main St
.
745
100
.0
6
.8-9
.0
100
.0
8
.3
North Shore Channel at Foster Ave
.
744
100
.0
6
.1-7
.2
100
.0
7
.2
North Branch Chicago River at Addison St
.
744
100
.0
5
.9-6
.9
100
.0
6
.8
North Branch Chicago River at Fullerton Ave
.
744
100
.0
5
.1-6
.2
100
.0
6
.1
North Branch Chicago River at Kinzie St
.
726
99
.4
4
.9-6
.2
100
.0
6
.3
Chicago River at Clark St
.
744
100
.0
7
.6-8
.8
100
.0
8
.6
South Branch Chicago River at Loomis St
.
741
100
.0
6
.2-7
.9
100
.0
7
.3
Bubbly Creek at 36th St
.
743
100
.0
4
.8-5
.7
100
.0
5
.6
Bubbly Creek at Interstate Highway 55
744
100
.0
5
.8-6
.8
100
.0
6
.7
Chicago Sanitary & Ship Canal at Cicero Ave
.
744
100
.0
4
.9-5
.7
100
.0
5
.7
Chicago Sanitary & Ship Canal at B&O Central R
.R
.
744
100
.0
5
.7-6
.3
100
.0
6
.3
Chicago Sanitary & Ship Canal at Route 83
744
100
.0
4
.6-5
.7
100
.0
5
.4
Chicago Sanitary & Ship Canal at Lockport Powerhouse
743
100
.0
4
.7-5
.6
100
.0
5
.4
Des Plaines River at Jefferson St
.
612
100
.0
5
.7-6
.5
100
.0
6
.6
Calumet-Sag Channel at Cicero Ave
.
744
100
.0
5
.7-6
.9
100
.0
6
.9
Calumet-Sag Channel at 104th Ave
.
743
100
.0
5
.3-6
.8
100
.0
6
.5
Calumet-Sag Channel at Route 83
744
100
.0
5
.5-6
.4
100
.0
6
.4
Grand Calumet River at Torrence Ave
.
744
96
.5
3
.5-7
.7
92
.0
7
.6
Little Calumet River at C&W Indiana R
.R
.
744
100
.0
7
.7-8
.8
100
.0
8
.6
Little Calumet River at Halsted St
.
744
100
.0
6
.4-7
.2
100
.0
7
.1
EXHIBIT 2A (Continued)
METROPOLITAN WATER RECLAMATION DISTRICT OF GREATER CHICAGO
DISSOLVED OXYGEN OBSERVATIONS AND SUMMARY AT SELECTED LOCATIONS IN DEEP-DRAFT REACHES OF
CHICAGO AREA WATERWAYS FROM AUGUST 2005 THROUGH FEBRUARY 2006
November 1
-
November 30, 2005
Location
Number
of
Observations
Percent of
Concentration
>_ 3
.5 mg/L
Range
of Daily
Minima
Percent of
7-Day Minima
?
4
.0 mg/L
30-Day
Average of
Daily Mean
North Shore Channel at Main St
.
720
100
.0
5
.1-9
.0
100
.0
7
.7
North Shore Channel at Foster Ave
.
721
100
.0
6
.3-7
.2
100
.0
7
.3
North Branch Chicago River at Addison St
.
721
100
.0
5
.7-7
100
.0
7
.0
North Branch Chicago River at Fullerton Ave
.
721
100
.0
5
.3-6
.7
100
.0
6
.6
North Branch Chicago River at Kinzie St
.
708
100
.0
5
.3-7
.4
100
.0
6
.7
Chicago River at Clark St
.
721
100
.0
7
.5-8
.6
100
.0
8
.3
South Branch Chicago River at Loomis St
.
721
100
.0
5
.9-8
100
.0
7
.4
Bubbly Creek at 36th St
.
721
100
.0
4
.7-9
.8
100
.0
9
.0
Bubbly Creek at Interstate Highway 55
549
100
.0
5
.5-7
.8
100
.0
7
.1
Chicago Sanitary & Ship Canal at Cicero Ave
.
515
100
.0
5
.4-6
.6
100
.0
6
.1
Chicago Sanitary & Ship Canal at B&O Central R
.R
.
721
100
.0
5
.8-7
.1
100
.0
7
.0
Chicago Sanitary & Ship Canal at Route 83
721
97
.1
4
.3-5
.8
100
.0
5
.7
Chicago Sanitary & Ship Canal at Lockport Powerhouse
634
100
.0
4
.7-6
.7
100
.0
6
.0
Des Plaines River at Jefferson St
.
696
100
.0
5
.8-7
.8
100
.0
7
.4
Calumet-Sag Channel at Cicero Ave
.
721
97
.9
5
.0-8
.0
100
.0
7
.1
Calumet-Sag Channel at 104th Ave
.
707
100
.0
5
.7-8
.4
100
.0
7
.5
Calumet-Sag Channel at Route 83
721
100
.0
5
.9-7
.6
100
.0
7
.4
Grand Calumet River at Torrence Ave
.
695
100
.0
7
.2-12
.5
100
.0
11
.1
Little Calumet River at C&W Indiana R
.R
.
695
100
.0
9
.0-11
.7
100
.0
10
.8
Little Calumet River at Halsted St
.
721
100
.0
5
.9-8
.2
100
.0
7
.4
EXHIBIT 2A (Continued)
METROPOLITAN WATER RECLAMATION DISTRICT OF GREATER CHICAGO
DISSOLVED OXYGEN OBSERVATIONS AND SUMMARY AT SELECTED LOCATIONS IN DEEP-DRAFT REACHES OF
CHICAGO AREA WATERWAYS FROM AUGUST 2005 THROUGH FEBRUARY 2006
December 1
-
December 31, 2005
Location
Number
of
Observations
Percent of
Concentration
>_ 3
.5 mg/L
Range
of Daily
Minima
Percent of
7-Day Minima
>_ 4
.0 mg/L
30-Day
Average of
Daily Mean
North Shore Channel at Main St
.
744
98
.1
3
.9-8
.1
88
.0
6
.7
North Shore Channel at Foster Ave
.
744
100
.0
7
.7-8
.6
100
.0
8
.6
North Branch Chicago River at Addison St
.
743
100
.0
7
.6-8
.2
100
.0
8
.3
North Branch Chicago River at Fullerton Ave
.
744
100
.0
7
.7-8
.4
100
.0
8
.3
North Branch Chicago River at Kinzie St
.
744
100
.0
7
.6-8
.6
100
.0
8
.4
Chicago River at Clark St
.
744
100
.0
8
.6-11
.2
100
.0
10
.3
South Branch Chicago River at Loomis St
.
744
100
.0
8
.1-9
.8
100
.0
9
.2
Bubbly Creek at 36th St
.
744
100
.0
8
.3-10
.6
100
.0
9
.6
Bubbly Creek at Interstate Highway 55
744
100
.0
8
.0-9
.5
100
.0
9
.1
Chicago Sanitary & Ship Canal at Cicero Ave
.
731
100
.0
6
.5-8
.2
100
.0
7
.7
Chicago Sanitary & Ship Canal at B&O Central R
.R
.
744
100
.0
7
.2-8
.2
100
.0
8
.0
Chicago Sanitary & Ship Canal at Route 83
744
100
.0
5
.8-7
.8
100
.0
7
.2
Chicago Sanitary & Ship Canal at Lockport Powerhouse
744
100
.0
6
.1-7
.1
100
.0
6
.9
Des Plaines River at Jefferson St
.
743
100
.0
7
.6-9
.0
100
.0
8
.8
Calumet-Sag Channel at Cicero Ave
.
744
100
.0
7
.9-9
.4
100
.0
8
.6
Calumet-Sag Channel at 104th Ave
.
84
100
.0
7
.2-7
.2
100
.0
7
.4
Calumet-Sag Channel at Route 83
745
100
.0
7
.1-10
.0
100
.0
8
.8
Grand Calumet River at Torrence Ave
.
744
100
.0
7
.8-11
.7
100
.0
11
.1
Little Calumet River at C&W Indiana R
.R
.
744
100
.0
10
.9-12
.4
100
.0
12
.0
Little Calumet River at Halsted St
.
744
100
.0
7
.4-8
.6
100
.0
8
.3
EXHIBIT 2A (Continued)
METROPOLITAN WATER RECLAMATION DISTRICT OF GREATER CHICAGO
DISSOLVED OXYGEN OBSERVATIONS AND SUMMARY AT SELECTED LOCATIONS IN DEEP-DRAFT REACHES OF
CHICAGO AREA WATERWAYS FROM AUGUST 2005 THROUGH FEBRUARY 2006
January 1
-
January 31, 2006
Location
Number
of
Observations
Percent of
Concentration
> 3
.5 mg/L
Range
of Daily
Minima
Percent of
7-Day Minima
> 4
.0 mg/L
30-Day
Average of
Daily Mean
North Shore Channel at Main St
.
743
100
.0
5
.6-9
.3
100
.0
8
.0
North Shore Channel at Foster Ave
.
744
100
.0
7
.5-8
.2
100
.0
8
.5
North Branch Chicago River at Addison St
.
744
100
.0
7
.6-8
.8
100
.0
8
.9
North Branch Chicago River at Fullerton Ave
.
743
100
.0
7
.3-8
.3
100
.0
8
.4
North Branch Chicago River at Kinzie St
.
743
100
.0
7
.3-8
.1
100
.0
8
.1
Chicago River at Clark St
.
744
100
.0
8
.3-9
.6
100
.0
9
.3
South Branch Chicago River at Loomis St
.
744
100
.0
8-8
.8
100
.0
8
.7
Bubbly Creek at 36th St
.
744
100
.0
7
.7-9
.2
100
.0
8
.5
Bubbly Creek at Interstate Highway 55
744
100
.0
7
.8-8
.5
100
.0
8
.4
Chicago Sanitary & Ship Canal at Cicero Ave
.
744
100
.0
6
.3-7
.6
100
.0
7
.3
Chicago Sanitary & Ship Canal at B&O Central R
.R
.
744
100
.0
6
.9-8
.3
100
.0
8
.1
Chicago Sanitary & Ship Canal at Route 83
744
100
.0
4
.4-6
.6
100
.0
6
.5
Chicago Sanitary & Ship Canal at Lockport Powerhouse
743
100
.0
5
.9-6
.9
100
.0
6
.8
Des Plaines River at Jefferson St
.
743
100
.0
7
.4-9
.3
100
.0
9
.1
Calumet-Sag Channel at Cicero Ave
.
744
100
.0
7
.7-8
.9
100
.0
8
.4
Calumet-Sag Channel at 104th Ave
.
744
100
.0
7
.8-9
.1
100
.0
8
.6
Calumet-Sag Channel at Route 83
744
100
.0
7
.6-9
.2
100
.0
8
.6
Grand Calumet River at Torrence Ave
.
743
100
.0
9
.7-13
.4
100
.0
13
.0
Little Calumet River at C&W Indiana R
.R
.
744
100
.0
12
.0-12
.8
100
.0
12
.6
Little Calumet River at Halsted St
.
742
100
.0
6
.7-7
.7
100
.0
7
.6
EXHIBIT 2A (Continued)
METROPOLITAN WATER RECLAMATION DISTRICT OF GREATER CHICAGO
DISSOLVED OXYGEN OBSERVATIONS AND SUMMARY AT SELECTED LOCATIONS IN DEEP-DRAFT REACHES OF
CHICAGO AREA WATERWAYS FROM AUGUST 2005 THROUGH FEBRUARY 2006
February 1
-
February 28, 2006
Location
Number
of
Observations
Percent of
Concentration
?
3
.5 mg/l,
Range
of Daily
Minima
Percent of
7-Day Minima
?
4
.0 mg/L
30-Day
Average of
Daily Mean
North Shore Channel at Main St
.
672
100
.0
16
.5-28
.3
100
.0
22
.7
North Shore Channel at Foster Ave
.
662
100
.0
7
.7-8
.6
100
.0
8
.8
North Branch Chicago River at Addison St
.
671
100
.0
8
.4-9
.7
100
.0
9
.4
North Branch Chicago River at Fullerton Ave
.
672
100
.0
8
.0-9
.2
100
.0
9
.2
North Branch Chicago River at Kinzie St
.
672
100
.0
8
.2-9
.8
100
.0
9
.1
Chicago River at Clark St
.
672
100
.0
9
.2-11
.1
100
.0
10
.7
South Branch Chicago River at Loomis St
.
672
100
.0
8
.7-10
.8
100
.0
9
.9
Bubbly Creek at 36th St
.
672
60
.4
0
.0-12
.1
63
.6
6
.9
Bubbly Creek at Interstate Highway 55
673
98
.5
4
.6-9
.4
100
.0
8
.6
Chicago Sanitary & Ship Canal at Cicero Ave
.
672
100
.0
7
.4-9
.4
100
.0
8
.6
Chicago Sanitary & Ship Canal at B&O Central R
.R
.
671
100
.0
7
.5-8
.4
100
.0
8
.5
Chicago Sanitary & Ship Canal at Route 83
672
100
.0
6
.6-7
.7
100
.0
7
.5
Chicago Sanitary & Ship Canal at Lockport Powerhouse
672
100
.0
6
.8-8
.0
100
.0
7
.7
Des Plaines River at Jefferson St
.
672
100
.0
8
.4-9
.4
100
.0
9
.4
Calumet-Sag Channel at Cicero Ave
.
672
100
.0
8
.2-10
.2
100
.0
9
.3
Calumet-Sag Channel at 104th Ave
.
672
99
.9
8
.2-9
.5
100
.0
9
.4
Calumet-Sag Channel at Route 83
672
100
.0
8
.3-10
.0
100
.0
9
.5
Grand Calumet River at Torrence Ave
.
671
100
.0
13
.9-16
.1
100
.0
17
.4
Little Calumet River at C&W Indiana R
.R
.
672
100
.0
12
.1-17
.4
100
.0
15
.0
Little Calumet River at Halsted St
.
672
100
.0
7
.7-8
.9
100
.0
8
.6
March 1, 2006
-
July 31, 2006
EXHIBIT 2B
METROPOLITAN WATER RECLAMATION DISTRICT OF GREATER CHICAGO
DISSOLVED OXYGEN OBSERVATIONS AND SUMMARY AT SELECTED LOCATIONS IN DEEP-DRAFT REACHES OF
CHICAGO AREA WATERWAYS FROM MARCH 2006 THROUGH JULY 2006
Location
Number
of
Observations
Percent of
Concentration
> 5
.0 mg/L
7-Day
Average of
Daily Mean
Percent of
7-Day Average
?
6
.0 mg/L
North Shore Channel at Main St
.
3,502
97
.3
9
.3
95
.7
North Shore Channel at Foster Ave
.
3,513
99
.8
7
.7
100
.0
North Branch Chicago River at Addison St
.
3,505
99
.6
7
.5
100
.0
North Branch Chicago River at Fullerton Ave
.
3,502
90
.9
6
.6
52
.1
North Branch Chicago River at Kinzie St
.
3,671
92
.5
6
.7
56,9
Chicago River at Clark St
.
3,514
100
.0
8
.9
100
.0
South Branch Chicago River at Loomis St
.
3,670
98
.2
7
.2
93
.5
Bubbly Creek at 36th St
.
3,319
19
.9
3
.0
8
.1
Bubbly Creek at Interstate Highway 55
3,124
63
.6
5
.4
26
.9
Chicago Sanitary & Ship Canal at Cicero Ave
.
3,502
79
.9
6
.1
47
.9
Chicago Sanitary & Ship Canal at B&O Central R
.R
.
3,670
93
.8
6
.7
69
.1
Chicago Sanitary & Ship Canal at Route 83
3,189
49
.2
4
.9
30
.5
Chicago Sanitary & Ship Canal at Lockport Powerhouse
3,501
43
.9
5
.1
33
.3
Des Plaines River at Jefferson St
.
3,669
71
.6
6
.5
52
.0
Calumet-Sag Channel at Cicero Ave
.
3,669
84
.3
6
.6
59
.3
Calumet-Sag Channel at 104th Ave
.
3,033
76
.2
6
.3
44
.0
Calumet-Sag Channel at Route 83
3,670
74
.6
6
.3
39
.8
Grand Calumet River at Torrence Ave
.
3,359
50
.8
6
.3
29
.5
Little Calumet River at C&W Indiana R
.R
.
3,499
86
.1
8
.9
78
.6
Little Calumet River at Halsted St
.
3,669
97
.5
6
.7
79
.7
March 1
-
March 31, 2006
EXHIBIT 2B (Continued)
METROPOLITAN WATER RECLAMATION DISTRICT OF GREATER CHICAGO
DISSOLVED OXYGEN OBSERVATIONS AND SUMMARY AT SELECTED LOCATIONS IN DEEP-DRAFT REACHES OF
CHICAGO AREA WATERWAYS FROM MARCH 2006 THROUGH JULY 2006
Location
Number
of
Observations
Percent of
Concentration
> 5
.0 mg/L
7-Day
Average of
Daily Mean
Percent of
7-Day Average
> 6
.0 mg/L
North Shore Channel at Main St
.
743
100
.0
14
.8
100
.0
North Shore Channel at Foster Ave
.
586
100
.0
8
.2
100
.0
North Branch Chicago River at Addison St
.
744
100
.0
9
.2
100
.0
North Branch Chicago River at Fullerton Ave
.
744
98
.7
8
.4
100
.0
North Branch Chicago River at Kinzie St
.
744
100
.0
8
.5
100
.0
Chicago River at Clark St
.
744
100
.0
9
.8
100
.0
South Branch Chicago River at Loomis St
.
744
100
.0
8
.9
100
.0
Bubbly Creek at 36th St
.
744
44
.4
4
.5
36
.0
Bubbly Creek at Interstate Highway 55
744
86
.8
6
.8
72
.0
Chicago Sanitary & Ship Canal at Cicero Ave
.
744
100
.0
7
.5
100
.0
Chicago Sanitary & Ship Canal at B&O Central R
.R
.
744
100
.0
8
.3
100
.0
Chicago Sanitary & Ship Canal at Route 83
406
100
.0
7
.1
100
.0
Chicago Sanitary & Ship Canal at Lockport Powerhouse
744
100
.0
7
.3
100
.0
Des Plaines River at Jefferson St
.
744
100
.0
9
.1
100
.0
Calumet-Sag Channel at Cicero Ave
.
744
100
.0
9
.0
100
.0
Calumet-Sag Channel at 104th Ave
.
515
100
.0
9
.6
100
.0
Calumet-Sag Channel at Route 83
744
100
.0
9
.1
100
.0
Grand Calumet River at Torrence Ave
.
575
100
.0
13
.3
100
.0
Little Calumet River at C&W Indiana R
.R
.
744
100
.0
16
.2
100
.0
Little Calumet River at Halsted St
.
744
100
.0
8
.2
100
.0
April 1
-
April 30, 2006
EXHIBIT 2B (Continued)
METROPOLITAN WATER RECLAMATION DISTRICT OF GREATER CHICAGO
DISSOLVED OXYGEN OBSERVATIONS AND SUMMARY AT SELECTED LOCATIONS IN DEEP-DRAFT REACHES
OF
CHICAGO AREA WATERWAYS FROM MARCH 2006 THROUGH JULY 2006
Location
Number
of
Observations
Percent of
Concentration
>_ 5
.0 mg/L
7-Day
Average of
Daily Mean
Percent of
7-Day Average
?
6
.0 mg/L
North Shore Channel at Main St
.
719
90
.1
7
.0
79
.2
North Shore Channel at Foster Ave
.
719
100
.0
7
.9
100
.0
North Branch Chicago River at Addison St
.
719
100
.0
8
.0
100
.0
North Branch Chicago River at Fullerton Ave
.
719
93
.5
7
.1
87
.5
North Branch Chicago River at Kinzie St
.
719
93
.0
7
.4
100
.0
Chicago River at Clark St
.
719
100
.0
8
.9
100
.0
South Branch Chicago River at Loomis St
.
719
97
.2
7
.9
100
.0
Bubbly Creek at 36th St
.
551
24
.3
3
.0
0
.0
Bubbly Creek at Interstate Highway 55
377
56
.2
4
.5
0
.0
Chicago Sanitary & Ship Canal at Cicero Ave
.
719
80
.0
6
.4
58
.3
Chicago Sanitary & Ship Canal at B&O Central R
.R
.
718
99
.7
7
.7
100
.0
Chicago Sanitary & Ship Canal at Route 83
719
94
.9
6
.3
83
.3
Chicago Sanitary & Ship Canal at Lockport Powerhouse
718
93
.3
6
.0
58
.3
Des Plaines River at Jefferson St
.
718
99
.9
7
.6
100
.0
Calumet-Sag Channel at Cicero Ave
.
719
99
.9
6
.7
100
.0
Calumet-Sag Channel at 104th Ave
.
609
99
.7
6
.6
95
.0
Calumet-Sag Channel at Route 83
719
90
.4
6
.3
50
.0
Grand Calumet River at Torrence Ave
.
719
57
.6
5
.5
37
.5
Little Calumet River at C&W Indiana R
.R
.
718
100
.0
8
.4
100
.0
Little Calumet River at Halsted St
.
718
100
.0
6
.6
100
.0
May 1
-
May 31, 2006
EXHIBIT 2B (Continued)
METROPOLITAN WATER RECLAMATION DISTRICT OF GREATER CHICAGO
DISSOLVED OXYGEN OBSERVATIONS AND SUMMARY AT SELECTED LOCATIONS IN DEEP-DRAFT REACHES OF
CHICAGO AREA WATERWAYS FROM MARCH 2006 THROUGH JULY 2006
Location
Number
of
Observations
Percent of
Concentration
>_ 5
.0 mg/L
7-Day
Average of
Daily Mean
Percent of
7-Day Average
>_ 6
.0 mg/L
North Shore Channel at Main St
.
743
100
.0
9
.1
100
.0
North Shore Channel at Foster Ave
.
744
99
.2
7
.6
100
.0
North Branch Chicago River at Addison St
.
577
99
.0
7
.3
100
.0
North Branch Chicago River at Fullerton Ave
.
576
92
.2
6
.4
78
.9
North Branch Chicago River at Kinzie St
.
744
99
.6
6
.3
84
.0
Chicago River at Clark St
.
744
100
.0
8
.7
100
.0
South Branch Chicago River at Loomis St
.
744
100
.0
6
.7
100
.0
Bubbly Creek at 36th St
.
703
5
.7
2
.2
0
.0
Bubbly Creek at Interstate Highway 55
708
69
.4
5
.6
12
.0
Chicago Sanitary & Ship Canal at Cicero Ave
.
744
87
.4
5
.9
40
.0
Chicago Sanitary & Ship Canal at B&O Central R
.R
.
744
99
.9
6
.4
96
.0
Chicago Sanitary & Ship Canal at Route 83
744
36
.8
4
.8
0
.0
Chicago Sanitary & Ship Canal at Lockport Powerhouse
576
6
.8
4
.4
0
.0
Des Plaines River at Jefferson St
.
744
83
.7
6
.0
60
.0
Calumet-Sag Channel at Cicero Ave
.
744
87
.2
5
.9
48
.0
Calumet-Sag Channel at 104th Ave
.
577
80
.1
5
.5
0
.0
Calumet-Sag Channel at Route 83
743
75
.1
5
.5
16
.0
Grand Calumet River at Torrence Ave
.
744
16
.1
3
.6
0
.0
Little Calumet River at C&W Indiana R
.R
.
744
89
.9
7
.2
96
.0
Little Calumet River at Halsted St
.
744
99
.5
6
.3
92
.0
EXHIBIT 2B (Continued)
METROPOLITAN WATER RECLAMATION DISTRICT OF GREATER CHICAGO
DISSOLVED OXYGEN OBSERVATIONS AND SUMMARY AT SELECTED LOCATIONS IN DEEP-DRAFT REACHES OF
CHICAGO AREA WATERWAYS FROM MARCH 2006 THROUGH JULY 2006
June 1
-
June 30, 2006
Location
Number
of
Observations
Percent of
Concentration
?
5
.0 mg/L
7-Day
Average of
Daily Mean
Percent of
7-Day Average
> 6
.0 mg/L
North Shore Channel at Main St
.
721
97
.1
7
.8
100
.0
North Shore Channel at Foster Ave
.
720
100
.0
7
.4
100
.0
North Branch Chicago River at Addison St
.
721
99
.7
6
.5
100
.0
North Branch Chicago River at Fullerton Ave
.
720
85
.7
5
.6
0
.0
North Branch Chicago River at Kinzie St
.
720
84
.9
5
.7
0
.0
Chicago River at Clark St
.
720
100
.0
8
.8
100
.0
South Branch Chicago River at Loomis St
.
719
97
.5
6
.3
95
.8
Bubbly Creek at 36th St
.
720
12
.2
2
.7
0
.0
Bubbly Creek at Interstate Highway 55
552
38
.8
4
.6
0
.0
Chicago Sanitary & Ship Canal at Cicero Ave
.
720
42
.4
5
.0
20
.8
Chicago Sanitary & Ship Canal at B&O Central R
.R
.
720
84
.7
5
.6
29
.2
Chicago Sanitary & Ship Canal at Route 83
720
13
.5
4
.0
0
.0
Chicago Sanitary & Ship Canal at Lockport Powerhouse
719
0
.1
3
.8
0
.0
Des Plaines River at Jefferson St
.
719
38
.4
4
.8
0
.0
Calumet-Sag Channel at Cicero Ave
.
718
59
.3
5
.3
0
.0
Calumet-Sag Channel at 104th Ave
.
720
44
.9
5
.0
0
.0
Calumet-Sag Channel at Route 83
720
28
.5
4
.8
0
.0
Grand Calumet River at Torrence Ave
.
720
53
.9
5
.8
20
.8
Little Calumet River at C&W Indiana R
.R
.
719
48
.0
5
.0
0
.0
Little Calumet River at Halsted St
.
720
90
.1
5
.8
29
.2
July 1
-
July 31, 2006
EXHIBIT 2B (Continued)
METROPOLITAN WATER RECLAMATION DISTRICT OF GREATER CHICAGO
DISSOLVED OXYGEN OBSERVATIONS AND SUMMARY AT SELECTED LOCATIONS IN DEEP-DRAFT REACHES OF
CHICAGO AREA WATERWAYS FROM MARCH 2006 THROUGH JULY 2006
Location
Number
of
Observations
Percent of
Concentration
> 5
.0 mg/L
7-Day
Average of
Daily Mean
Percent of
7-Day Average
?
6
.0 mg/L
North Shore Channel at Main St
.
576
99
.8
7
.3
100
.0
North Shore Channel at Foster Ave
.
744
100
.0
7
.3
100
.0
North Branch Chicago River at Addison St
.
744
99
.2
6
.5
100
.0
North Branch Chicago River at Fullerton Ave
.
743
84
.9
5
.6
0
.0
North Branch Chicago River at Kinzie St
.
744
84
.8
5
.6
0
.0
Chicago River at Clark St
.
587
100
.0
8
.3
100
.0
South Branch Chicago River at Loomis St
.
744
96
.1
6
.3
72
.0
Bubbly Creek at 36th St
.
601
11
.1
2
.3
0
.0
Bubbly Creek at Interstate Highway 55
743
56
.9
4
.7
28
.0
Chicago Sanitary & Ship Canal at Cicero Ave
.
575
91
.3
5
.7
10
.5
Chicago Sanitary & Ship Canal at B&O Central R
.R
.
744
84
.5
5
.5
20
.0
Chicago Sanitary & Ship Canal at Route 83
600
18
.3
3
.4
0
.0
Chicago Sanitary & Ship Canal at Lockport Powerhouse
744
11
.0
3
.7
0
.0
Des Plaines River at Jefferson St
.
744
36
.0
4
.7
0
.0
Calumet-Sag Channel at Cicero Ave
.
744
74
.9
5
.9
48
.0
Calumet-Sag Channel at 104th Ave
.
612
65
.8
5
.6
40
.0
Calumet-Sag Channel at Route 83
744
78
.2
5
.7
32
.0
Grand Calumet River at Torrence Ave
.
601
34
.9
4
.5
0
.0
Little Calumet River at C&W Indiana R
.R
.
574
93
.4
6
.7
100
.0
Little Calumet River at Halsted St
.
743
97
.7
6
.5
76
.0
EXHIBIT 3A
METROPOLITAN WATER RECLAMATION DISTRICT OF GREATER CHICAGO
DETERMINATION OF COMPLIANCE WITH PROPOSED DO STANDARDS AT SELECTED LOCATIONS IN
SHALLOW-DRAFT REACHES OF GENERAL USE WATERS FROM SEPTEMBER 1 THROUGH SEPTEMBER 30, 2005
USING TWO METHODS TO CALCULATE AVERAGES OF 7-DAY DAILY MINIMA
Running Averages
of Daily Minima
Weekly Averages
of Daily Minima
Location
Percent
Number
of
of
Concentration
Range
Percent of
of
7-Day Daily
Daily
Minima
Range
Percent of
of
7-Day Daily
Daily
Minima
30-Day
Average
of Daily
Mean
Observations
?
3
.5 mg/L
Minima
>_
4
.0 mg/L
Minima
?
4
.0 mg/L
North Branch Chicago River at Central Park Ave
.
719
100
.0
5
.5-6
.4
100
.0
5
.8-6
.8
100
.0
6
.4
Des Plaines River at Devon Ave
.
Des Plaines River at Irving Park Rd
.
No Data
720
100
.0
4
.4-5
.6
100
.0
4
.4-6
.1
100
.0
5
.4
Des Plaines River at Ogden Ave
.
720
100
.0
6
.5-7
.3
100
.0
6
.6-7
.7
100
.0
7
.4
Des Plaines River at Material Service Rd
.
Salt Creek at Busse Lake Dam
Salt Creek at J
. F
. Kennedy Blvd
.
No Data
No Data
589
100
.0
4
.6-6
.2
100
.0
4
.6-6
.4
100
.0
7
.0
Salt Creek at Thomdale Ave
.
631
100
.0
4
.6-6
.1
100
.0
4
.6-6
.1
100
.0
7
.4
Salt Creek at Wolf Rd
.
719
100
.0
5
.2-6
.7
100
.0
5
.2-7
.1
100
.0
6
.8
Grand Calumet River at Hohman Ave
.
553
29
.8
0
.5-1
.9
0
.0
0
.4-1
.9
0
.0
2
.5
Little Calumet River at Ashland Ave
.
720
53
.5
2
.6-3
.3
0
.0
2
.7-3
.3
0
.0
3
.7
Little Calumet River at Wentworth Ave
.
720
67
.8
2
.6-3
.4
0
.0
2
.7-3
.5
0
.0
4
.4
EXHIBIT 3B
METROPOLITAN WATER RECLAMATION DISTRICT OF GREATER CHICAGO
DETERMINATION OF COMPLIANCE WITH PROPOSED DO STANDARDS AT SELECTED LOCATIONS IN
SHALLOW-DRAFT REACHES OF GENERAL USE WATERS FROM JULY 1 THROUGH JULY 31, 2006 USING
TWO METHODS TO CALCULATE AVERAGES OF 7-DAY DAILY MINIMA
Running Averages
of Daily Means
Weekly Averages
of Daily Means
Location
Percent
Number
of
of
Concentration
7-Day
Percent of
Average
7-Day Daily
of Daily
Mean
7-Day
Percent of
Average
7-Day Daily
of Daily
Mean
Observations
?
5
.0 mg/L
Mean
?
6
.0 mg/L
Mean
?
6
.0 mg/L
North Branch Chicago River at Central Park Ave
.
744
57
.7
5
.1
0
.0
5
.2
0
.0
Des Plaines River at Devon Ave
.
744
18
.8
3
.9
0
.0
3
.9
0
.0
Des Plaines River at Irving Park Rd
.
744
25
.3
4
.3
0
.0
4
.2
0
.0
Des Plaines River at Ogden Ave
.
744
99
.9
6
.6
100
.0
6
.6
100
.0
Des Plaines River at Material Service Rd
.
635
92
.6
8
.1
100
.0
7
.9
100
.0
Salt Creek at Busse Lake Dam
744
97
.0
7
.3
100
.0
7
.1
100
.0
Salt Creek at J
. F
. Kennedy Blvd
.
744
100
.0
7
.1
100
.0
6
.9
100
.0
Salt Creek at Thomdale Ave
.
743
92
.7
6
.9
100
.0
6
.8
100
.0
Salt Creek at Wolf Rd
.
590
62
.7
5
.6
21
.1
5
.6
25
.0
Grand Calumet River at Hohman Ave
.
744
8
.6
2
.1
0
.0
1
.9
0
.0
Little Calumet River at Ashland Ave
.
744
8
.9
4
.1
0
.0
4
.1
0
.0
Little Calumet River at Wentworth Ave
.
744
19
.1
4
.2
0
.0
4
.0
0
.0
EXHIBIT 4A
METROPOLITAN WATER RECLAMATION DISTRICT OF GREATER CHICAGO
DETERMINATION OF COMPLIANCE WITH PROPOSED DO STANDARDS AT SELECTED LOCATIONS IN DEEP-DRAFT
REACHES OF CHICAGO AREA WATERWAYS FROM SEPTEMBER 1 THROUGH SEPTEMBER 30, 2005 USING
TWO METHODS TO CALCULATE AVERAGES OF 7-DAY DAILY MINIMA
Running Averages
of Daily Minima
Weekly Averages
of Daily Minima
Location
Number
Percent of
of
Concentration
Range
Percent of
of
7-Day Daily
Daily
Minima
Range
Percent of
of
7-Day Daily
Daily
Minima
30-Day
Average
of Daily
Mean
Observations
>
3
.5 mg/L
Minima
?
4
.0 mg/L
Minima
>
4
.0 mg/L
North Shore Channel at Main St
.
586
100
.0
6
.2-7
.4
100
.0
6
.4-7
.5
100
.0
7
.5
North Shore Channel at Foster Ave
.
718
99
.7
5
.0-6
.1
100
.0
5
.3-6
.1
100
.0
6
.6
North Branch Chicago River at Addison St
.
720
99
.7
4
.7-5
.8
100
.0
4
.9-5
.9
100
.0
6
.2
North Branch Chicago River at Fullerton Ave
.
720
98
.9
4
.5-5
.4
100
.0
4
.6-5
.5
100
.0
5
.6
North Branch Chicago River at Kinzie St
.
720
99
.6
4
.6-5
.1
100
.0
4
.8-5
.1
100
.0
5
.6
Chicago River at Clark St
.
719
100
.0
7
.4-7
.9
100
.0
7
.4-8
.1
100
.0
7
.9
South Branch Chicago River at Loomis St
.
720
100
.0
6
.2-6
.9
100
.0
6
.4-7
.0
100
.0
6
.9
Bubbly Creek at 36th St
.
720
81
.3
2
.3-4
.4
33
.3
2
.3-4
.8
40
.0
4
.3
Bubbly Creek at Interstate Highway 55
720
100
.0
5
.2-6
.0
100
.0
5
.2-6
.4
100
.0
6
.1
Chicago Sanitary & Ship Canal at Cicero Ave
.
720
100
.0
5
.4-6
.1
100
.0
5
.5-6
.41
100
.0
6
.1
Chicago Sanitary & Ship Canal at B&O Central R
.R
.
548
100
.0
5
.3-5
.7
100
.0
5
.4-5
.8
100
.0
5
.9
Chicago Sanitary & Ship Canal at Route 83
528
99
.4
4
.0-5
.4
100
.0
4
.1-5
.3
100
.0
5
.1
Chicago Sanitary & Ship Canal at Lockport Powerhouse
720
100
.0
4
.4-5
.1
100
.0
4
.5-5
.1
100
.0
4
.9
Des Plaines River at Jefferson St
.
682
100
.0
4
.5-4
.9
100
.0
4
.6-5
.1
100
.0
5
.1
Calumet-Sag Channel at Cicero Ave
.
719
100
.0
5
.5-6
.2
100
.0
5
.5-6
.7
100
.0
6
.5
Calumet-Sag Channel at 104th Ave
.
719
100
.0
4
.7-6
.4
100
.0
4
.7-63
100
.0
6
.1
Calumet-Sag Channel at Route 83
719
100
.0
4
.7-6
.1
100
.0
4
.7-6
.1
100
.0
5
.9
Grand Calumet River at Torrence Ave
.
565
87
.1
2
.7-4
.4
22
.2
2
.9-4
.2
25
.0
6
.0
Little Calumet River at C&W Indiana R
.R
.
719
100
.0
6
.7-7
.4
100
.0
6
.8-7
.6
100
.0
7
.6
Little Calumet River at Halsted St
.
720
100
.0
6
.0-6
.6
100
.0
6
.1-7
.0
100
.0
7
.0
EXHIBIT 4B
METROPOLITAN WATER RECLAMATION DISTRICT OF GREATER CHICAGO
DETERMINATION OF COMPLIANCE WITH PROPOSED DO STANDARDS AT
SELECTED LOCATIONS IN DEEP-DRAFT
REACHES OF CHICAGO AREA WATERWAYS FROM JULY 1 THROUGH JULY 31,
2006 USING TWO METHODS TO
CALCULATE AVERAGES OF 7-DAY DAILY MEANS
Running Averages
of Daily Means
Weekly Averages
of Daily Means
Location
Percent
Number
of
of
Concentration
7-Day
Average
of Daily
Mean
Percent of
7-Day Daily
Mean
?
6
.0 mg/L
7-Day
Average
of Daily
Mean
Percent of
7-Day Daily
Mean
?
6
.0 mg/L
Observations
?
5
.0 mg/L
North Shore Channel at Main St
.
576
99
.8
7
.3
100
.0
7
.4
100
.0
North Shore Channel at Foster Ave
.
744
100
.0
7
.3
100
.0
7
.2
100
.0
North Branch Chicago River at Addison St
.
744
99
.2
6
.5
100
.0
6
.3
100
.0
North Branch Chicago River at Fullerton Ave
.
743
84
.9
5
.6
0
.0
5
.5
0
.0
North Branch Chicago River at Kinzie St
.
744
84
.8
5
.6
0
.0
5
.6
0
.0
Chicago River at Clark St
.
587
100
.0
8
.3
100
.0
8
.2
100
.0
South Branch Chicago River at Loomis St
.
744
96
.1
6
.3
72
.0
6
.4
80
.0
Bubbly Creek at 36th St
.
601
11
.1
2
.3
0
.0
2
.4
0
.0
Bubbly Creek at Interstate Highway 55
743
56
.9
4
.7
28
.0
4
.9
20
.0
Chicago Sanitary & Ship Canal at Cicero Ave
.
575
91
.3
5
.7
10
.5
6
.1
25
.0
Chicago Sanitary & Ship Canal at B&O Central R
.R
.
744
84
.5
5
.5
20
.0
5
.6
20
.0
Chicago Sanitary & Ship Canal at Route 83
600
18
.3
3
.4
0
.0
3
.6
0
.0
Chicago Sanitary & Ship Canal at Lockport Powerhouse
744
11
.0
3
.7
0
.0
3
.9
0
.0
Des Plaines River at Jefferson St
.
744
36
.0
4
.7
0
.0
4
.8
0
.0
Calumet-Sag Channel at Cicero Ave
.
744
74
.9
5
.9
48
.0
5
.9
40
.0
Calumet-Sag Channel at 104th Ave
.
612
65
.8
5
.6
40
.0
5
.6
50
.0
Calumet-Sag Channel at Route 83
744
78
.2
5
.7
32
.0
5
.8
20
.0
Grand Calumet River at Torrence Ave
.
601
34
.9
4
.5
0
.0
4
.7
0
.0
Little Calumet River at C&W Indiana R
.R
.
574
93
.4
6
.7
100
.0
7
.0
100
.0
Little Calumet River at Halsted St
.
743
97
.7
6
.5
76
.0
6
.8
80
.0