Center for Energy and Economic Development, Inc.
Midwest Region
712 South Second Street
Springfield, Illinois 62704
Scott Wiseman
Vice President
swiseman@ceednet.org
Office Phone
: 703-302-1217
Cell Phone
: 217-816-3283
Office Fax
: 703-302-1247
Office of the Clerk
August 17, 2006
Illinois Pollution Control Board
100 West Randolph
Chicago, IL 60601
Re: Comments on Proposed New 35 ILL. ADM. CODE 225,
Control of Emissions from Large Combustion Sources (Mercury);
R06-25
Ladies & gentlemen:
I am writing on behalf of the Center for Energy & Economic
Development, Inc. (CEED) regarding the proposed rule for controlling
mercury emissions from coal-fueled powerplants in Illinois.
CEED is a national membership organization representing major U.S.
railroads, coal producers, electric generating firms and numerous other
industrial interests. CEED members have direct and substantial interests in
the generation of electricity and the production and transportation of coal
used for electric generation throughout Illinois.
On March 14, 2006, the Illinois Environmental Protection Agency
(IEPA) filed a proposed rule with the Illinois Pollution Control Board
requiring coal-fired electric generating units (EGUs) to reduce mercury
emissions through a state-specific program. The IEPA proposed rule
contains emission limitations more stringent than the U.S. Environmental
Protection Agency’s (EPA) Clean Air Mercury Rule (CAMR), to be
achieved on a timetable inconsistent both with CAMR and EPA’s
ELECTRONIC FILING, RECEIVED, CLERK'S OFFICE, AUGUST 18, 2006
* * * R2006-025 PC 6282 * * *
2
companion Clean Air Interstate Rule (CAIR) for reducing emissions of
sulfur dioxide (SO
2) and nitrogen oxides (NOx).
CEED strongly supports state implementation of U.S. EPA’s CAMR
and CAIR as the most cost-effective approach to reducing EGU emissions of
mercury, SO
2 and NOx. The restructured Illinois electric generation
industry requires a level playing field to compete effectively against firms in
nearby states - such as Iowa, Kentucky, Missouri, Indiana and Ohio - that
plan to implement CAIR and CAMR. For the reasons discussed below,
CEED respectfully recommends that the Pollution Control Board reject the
proposed IEPA rule, and recommend adoption of CAMR in its place.
Summary of CEED’s Objections to the IEPA Mercury Rule
CEED has four basic objections to the proposed IEPA mercury rule:
1) The proposed rule would increase electric generation costs and
reduce the competitiveness of Illinois electric generators with no
demonstrable environmental or public health benefits relative to
implementation of U.S. EPA’s CAIR and CAMR.
2) Increasing energy costs for consumers and industries would
discourage job creation and retention at new and existing industries
throughout Illinois, to the detriment of the state economy and
public health, forcing households to make increasingly difficult
budget choices between energy and other essential goods and
services such as nutrition, health care, and education.
3) The proposed rule incorporates unrealistic deadlines and inflexible,
plant-by-plant emission mandates. Unlike IEPA’s rule, EPA’s
CAMR is designed to take advantage of the “co-benefit” mercury
reductions resulting from implementation of CAIR, with a national
emissions trading program to further reduce the costs of mercury
reductions.
4) If implemented as proposed, the Illinois mercury rule could
jeopardize electric system reliability by causing the premature
shutdown of older and smaller coal-fueled generating units that
could no longer provide competitively-priced electricity.
ELECTRONIC FILING, RECEIVED, CLERK'S OFFICE, AUGUST 18, 2006
* * * R2006-025 PC 6282 * * *
3
The proposed rule would reduce the competitiveness
of Illinois electric generators
This rulemaking record demonstrates that the proposed IEPA rule
would increase the costs of electric generation well above the costs of
compliance with EPA’s CAMR. There is no corresponding evidence that
the rule would provide demonstrable environmental or public health benefits
beyond those provided by CAIR and CAMR.
We first look to IEPA’s own economic impact evaluation of its
proposed rule. A study by ICF Resources
1
conducted for IEPA shows that
the proposed mercury rule would:
•
Decrease generation from coal-fueled EGUs in Illinois by 15
percent in 2015;
•
Substantially reduce Illinois’ electricity exports; and
•
Increase overall consumer electric costs by $271 million in the
year 2015 relative to CAIR/CAMR.
A study conducted by James Marchetti and Ed Cichanowicz for this
rulemaking finds that implementation of the proposed IEPA rule would
increase electric generation costs in Illinois by $2.0 billion over the period
2009-2018, compared to the costs of compliance with EPA’s CAIR and
CAMR. A summary of their findings appears below:
Cumulative Annualized Compliance Costs for SO
2, NOx
and Mercury Controls in Illinois, 2009-2018
(in billions of 2006 $)
Rules
SO2
NOx
Hg
Total
CAIR/CAMR
1.91
0.65
0.54
3.10
CAIR/IL Rule
1.85
0.62
2.63
5.10
Differential Cost
-0.06
-0.03
2.09
2.00
Source: Prefiled testimony of James Marchetti, July 28, 2006, Table 4.
1
ICF Resources, “Analysis of the Proposed Illinois Mercury Rule,” March 10, 2006
(prepared under contract to the Lake Michigan Air Directors Consortium.)
ELECTRONIC FILING, RECEIVED, CLERK'S OFFICE, AUGUST 18, 2006
* * * R2006-025 PC 6282 * * *
4
Increasing power production costs by $2 billion over the period 2009
to 2018 - or roughly $200 million per year - would harm the competitiveness
of Illinois electric generators, as well as the overall state economy. IEPA’s
finding that its rule would reduce Illinois coal-based electric generation by
15% should be sufficient, in itself, to raise serious concerns about the
proposed mercury rule.
Increased energy costs would harm Illinois consumers
and public health
The projected economic impacts of the IEPA rule are significant for
the Illinois economy. Like other Midwest states, Illinois is struggling to cope
with rapidly escalating energy costs and the loss of well-paying industrial
jobs. Since 1990, Illinois has lost more than 220,000 highly-paid
manufacturing jobs.
2
In the past six years, the median household income in
Illinois has dropped by $6,000, a 12% decline.
3
IEPA’s economic analysis reveals that average household electric
rates would increase by $1.50 per month in 2015, compared to the costs
associated with U.S. EPA’s CAIR and CAMR.
4
This is, in effect, a
“mercury tax” of $1.50 per month levied on every household in Illinois.
With declining wage rates and a shrinking industrial base, imposing costs of
this magnitude on Illinois households is simply unsupportable, without a
demonstration of significant environmental and public health benefits to the
state’s workers and consumers.
CEED recommends that the Board consider the potential adverse
public health consequences of the rule’s impacts on consumer energy costs
and employment. The attached article
5
by M. Harvey Brenner, Professor of
Public Health at Johns Hopkins University and Senior Professor of
Epidemiology at the Berlin Institute of Technology, points out the strong
statistical association between U.S. mortality trends and changes in real per
2
Northern Illinois University and Center for Tax and Budget Accountability, “State of
Working Illinois,” (November 2005).
3
Id
.
4
ICF Resources, op. cit., p. 8.
5
See Attachment 1, M. Harvey Brenner, Ph.D., “Health Benefits of Low-Cost Energy
Supplies,” Environmental Manager, November 2005 (calculating potential increased
premature mortality of 150,000 lives annually for implementation of the McCain-
Lieberman climate bill, SA 2028).
ELECTRONIC FILING, RECEIVED, CLERK'S OFFICE, AUGUST 18, 2006
* * * R2006-025 PC 6282 * * *
5
capita GDP, personal income, and unemployment rates. Policies that lead to
increased unemployment can induce premature mortality. In Dr. Brenner’s
case study of proposed climate change legislation, an estimated 150,000
premature deaths could result from the adverse income and employment
consequences of large-scale decreases in coal-based electric generation in
favor of higher-cost generation alternatives.
CEED is not asserting that premature mortality effects of this
magnitude could flow from IEPA’s proposed mercury rule. The purpose of
Dr. Brenner’s case study is to highlight the other side of the “environmental
externality” equation, namely, the need for careful assessment of the
potential adverse public health consequences of policies that increase energy
costs and risk increased unemployment.
The proposed rule offers no demonstrable
environmental benefits
CEED urges the Pollution Control Board to scrutinize any claims of
environmental or public health benefits associated with the IEPA rule.
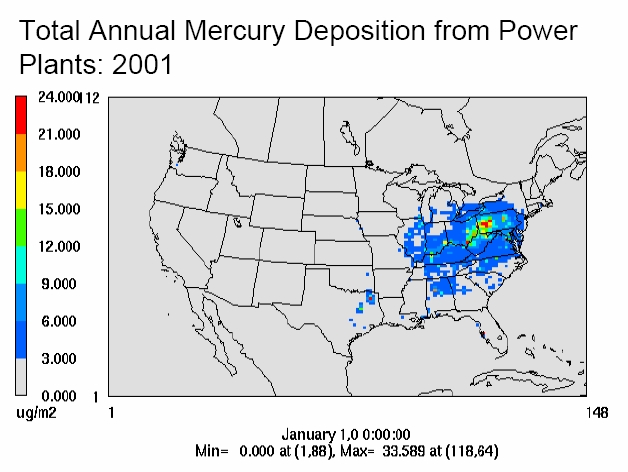
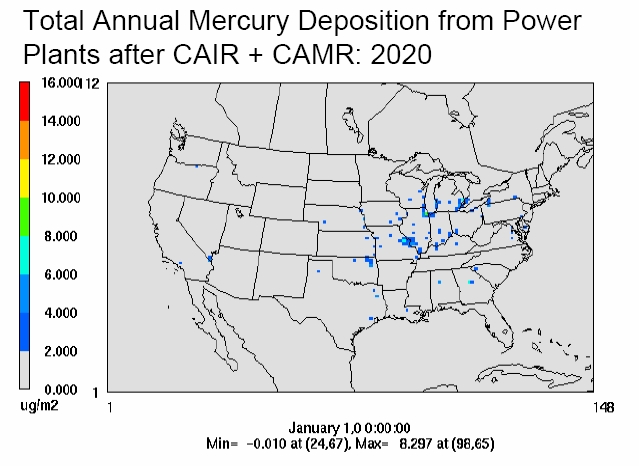
Mercury deposition modeling
6
conducted by U.S. EPA for its CAIR and
CAMR rules indicates that, by 2020, these two rules will virtually eliminate
mercury deposition in Illinois from electric generating facilities (see Figures
1 and 2, below). The rulemaking record, as discussed below, does not show
that the IEPA rule will provide measurable public health or environmental
benefits in excess of those provided by U.S. EPA’s CAIR and CAMR.
6
Figures 1 and 2 are from U.S. EPA, Region III.
ELECTRONIC FILING, RECEIVED, CLERK'S OFFICE, AUGUST 18, 2006
* * * R2006-025 PC 6282 * * *
6
Figure 1
Figure 2
ELECTRONIC FILING, RECEIVED, CLERK'S OFFICE, AUGUST 18, 2006
* * * R2006-025 PC 6282 * * *
7
The rulemaking record contains an intensive examination of the
sources of mercury exposure in Illinois, and the environmental rationale for
the proposed IEPA rule. The testimony of Peter M. Chapman, Ph.D., an
international expert in aquatic ecology and ecotoxicology, addresses a
central question: whether the proposed rule “will ensure that impairment
restrictions can be lifted for water bodies where fish have elevated mercury
concentrations?”
7
Dr. Chapman’s conclusion - considering among other
facts that the proposed rule would result in only a 4% reduction in mercury
deposition in Illinois relative to CAMR
8
- is simply “no.”
9
The testimony of Gail Charnley, Ph.D., a toxicologist and expert in
environmental risk assessments, analyzes the relationship between
reductions of mercury emissions and changes in mercury concentrations in
fish tissue. Dr. Charnley’s conclusion underscores the lack of credible
scientific evidence supporting the imposition of IEPA’s rule in lieu of U.S.
EPA’s CAIR and CAMR:
“I do not dispute the desirability of limiting mercury emissions
from coal-based power plants as a means of limiting its
contribution to fish methylmercury levels in places where it
may be significant. I do dispute the simplistic notion that
limiting power plant mercury emissions in Illinois is going to
have a direct and noticeable impact on Illinois fish
methylmercury levels, on Illinois methylmercury exposures, or
on public health in Illinois. A tremendous amount of
uncertainty remains regarding the relationship between power
plant mercury emissions and fish methylmercury levels and
toxicity, but the weight of the scientific evidence does not
suggest that they are simply and directly related. The public
health benefits of limiting Illinois mercury emissions are being
oversold and the benefits of limiting mercury emissions deeper
and faster than is required by US EPA are political only.”
10
7
Prefiled testimony of Peter M. Chapman, Ph.D., (July 28, 2006), p. 2.
8
Id
., citing prefiled testimony of K. Vijayaraghavan at p. 7 (see p. 10 of prefiled
testimony).
9
Id
., p. 14.
10
Prefiled testimony of Gail Charnley, Ph.D., (July 28, 2006), p. 20.
ELECTRONIC FILING, RECEIVED, CLERK'S OFFICE, AUGUST 18, 2006
* * * R2006-025 PC 6282 * * *
8
The proposed rule jeopardizes electric
reliability in Illinois
Illinois has many older, smaller coal-based generating units that are at
risk of retirement if the IEPA mercury rule were implemented. Units more
than 40 years of age and smaller than 200 megawatts generating capacity
generally do not offer cost-effective opportunities for emission controls due
to their relatively low capacity factors, the lack of “economies of scale” in
control technology installations, and limited remaining lifetimes for the
recovery of capital investments.
Many of these older generating units perform critical tasks as “load-
following” units helping to meet high demand conditions, and providing
system stability. The analysis presented by James Marchetti and Ed
Chicanowicz outlines the risks that the inflexible IEPA rule poses for older
generating units:
“An important technology deployment presumption is that units
older than 50 years at the time a compliance decision is
required
do not
receive any control technology. The rationale
for the 50 year old rule on technology deployment is that …
industry is unlikely to make major capital investments on older
units, which could result in one trying to recover capital on
units that may be in excess of 65 years old at the end of the
recovery period. The IL Rule is so stringent that the averaging
provisions that are included in the Rule are not sufficient to
allow companies to avoid controlling the older units, and the
prohibition of trading precludes their buying allowances if they
are not able to comply. …
Another potential implication … is the uncertainty of whether
IL generators would be able to recover the $1.77 billion they
would need to invest in the mercury control equipment before
July 1, 2009. If generators are unable to recover their
investment, it may force them to retire or shutdown some older/
uneconomical units that are required to install mercury control
technologies under the IL Rule. A potential casualty could be
some or all of the … 3,093 MW of capacity that would be
ELECTRONIC FILING, RECEIVED, CLERK'S OFFICE, AUGUST 18, 2006
* * * R2006-025 PC 6282 * * *
9
greater than 50 years old in 2009 and required to install
mercury control technology.”
11
The risk of premature retirements of generating capacity due to
stringent state mercury regulations is substantial and imminent. State
mercury regulations are cited by PJM as a factor supporting its application to
the U.S. Department of Energy for the designation of several new “National
Interest Transmission Corridors” to facilitate increased electric transmission
capability between the Midwest and Mid-Atlantic states:
“The risk of more retirements is very real. Nearly 90,000 MW
of the approximately 164,000 MW of existing generating
capacity in PJM are from fossil steam generating units. More
than 75% of that capacity is from units that are at least 30 years
old; more than 20% is from units that are 50 or more years old.
New limits on mercury emissions from coal-fired power plants
now under consideration in Pennsylvania, New Jersey and
Maryland, among other states, may prove to be an important
factor in potential future retirements. PJM has been closely
monitoring the states’ deliberations on these requirements; its
analyses indicate that, should the current proposed requirements
be adopted, as much as 4,000 MW of older, coal-fired
generation capacity potentially could be retired because the
investment needed at such units to meet the new emission limits
would be deemed uneconomic.”
12
In view of these concerns, CEED recommends that the Pollution
Control Board seek appropriate consultation with - or input from - PJM and
the Illinois Commerce Commission to assess the nature and magnitude of
reliability risks posed by the IEPA rule. Recent power shortages and
outages across the eastern U.S. demonstrate our critical dependence upon
safe, reliable, and affordable electricity. The citizens of Illinois can ill afford
new threats to the reliability of their electric supplies from costly, ineffective
state mercury regulations.
11
Prefiled testimony of James Marchetti, at pp. 3, 9.
12
Request of PJM Interconnection, L.L.C. for Early Designation of National Interest
Electric Transmission Corridors (submitted to U.S. Department of Energy, March 6,
2006), p. 30.
ELECTRONIC FILING, RECEIVED, CLERK'S OFFICE, AUGUST 18, 2006
* * * R2006-025 PC 6282 * * *
10
CAMR provides a superior alternative
U.S. EPA’s Clean Air Mercury Rule offers a more balanced, cost-
effective approach to reducing mercury emissions than IEPA’s plant-by-
plant control regime. CAMR is based on the successful federal “cap-and-
trade” program developed to reduce acid rain. By infusing market forces
within a firm emissions cap, CAMR offers several key advantages:
•
Plants that over-control mercury emissions are rewarded by
earning tradable mercury allowances, potentially offsetting
some of the costs incurred for installing and operating pollution
controls.
•
Provisions for “banking” of emission reductions in excess of
annual emission limits create an incentive for early reduction of
emissions, with no adverse effect on the environment.
•
Market-based trading assures power generators the ability to
demonstrate compliance with mercury emission control
requirements, critical to their ability to finance pollution control
investments.
U.S. EPA developed CAMR as a separate but closely related
companion to its CAIR rule for reducing emissions of SO
2 and NOx. CAMR
builds upon the mercury “cobenefits” resulting from compliance with CAIR,
achieved by the installation of scrubbers and selective catalytic reduction
systems at utilities throughout the eastern United States.
By linking these two major rules together, on similar compliance
timelines, EPA’s approach maximizes the cost-effectiveness of achieving an
overall 70% national reduction in mercury emissions from EGUs. State
mercury rules that use different compliance timetables than CAMR, or that
impose plant-by-plant control limits, essentially discard the mercury
“cobenefits” of CAIR. The high compliance costs projected for IEPA’s rule,
cited above, reflect the inherent inefficiency of command-and-control
regulation compared to market-based alternatives.
ELECTRONIC FILING, RECEIVED, CLERK'S OFFICE, AUGUST 18, 2006
* * * R2006-025 PC 6282 * * *
11
For the foregoing reasons, CEED respectfully requests the Pollution
Control Board to reject the proposed IEPA mercury rule.
CEED appreciates the opportunity to submit these comments.
Sincerely,
/s/
Scott Wiseman
Vice President
CEED Midwest Region
Attachment
ELECTRONIC FILING, RECEIVED, CLERK'S OFFICE, AUGUST 18, 2006
* * * R2006-025 PC 6282 * * *
28 em november 2005
awma.org
Governmental
programs
intended to protect public
health and the environment
should take into account
potential income and employ-
ment effects of required
compliance measures.
em
forum
Numerous studies conducted in the
past 10–15 years have indicated that economic factors, such
as income, employment, and socioeconomic status, affect
disease and death.
1
The case study research described in
this article shows how a large-scale econometric model—
the application of statistical methods to the study of eco-
nomic data and problems—can accurately predict long-term
U.S. mortality trends based on variables such as per-capita
income and unemployment rates (see Figure 1). In addi-
tion, it demonstrates that even short-term, year-to-year
fluctuations in economic indicators can accurately predict
year-to-year fluctuations in population mortality rates (see
Figure 2). These results leave little doubt that the statisti-
cally significant relationships between socioeconomic indi-
cators and population mortality rates identify principal risk
factors to a population’s health.
AN ECONOMETRIC MODEL
An econometric model was applied to a hypothetical regu-
latory case study, whereby U.S. coal was replaced by alter-
native higher-cost fuels such as natural gas for the purpose
of electricity generation. The model was used to estimate
the premature mortality associated with increased unem-
ployment and reduced personal income. The adverse
impacts on household income and unemployment due to
the substitution of higher-cost energy sources were estimated
to result in 195,000 additional premature deaths annually
(see Table 1).
The results from this hypothetical case study may be
scaled to apply to specific policy initiatives affecting the
U.S. coal-based electricity generation sector. For example,
the U.S. Department of Energy’s Energy Information
Administration (EIA) estimates that climate change bills
currently before the U.S. Congress—such as Senate Amend-
ment No. 2028, rejected by the Senate in 2003 and again in
June 2005—could result in the displacement of up to 78%
of U.S. coal-based electricity generation with higher-cost
energy sources.
2
The methodology employed here suggests
that, absent any direct mitigation measures to offset expected
decreases in employment and income,
3
implementation of
such measures could result in an annual increase of pre-
mature mortality rates by more than 150,000.
These predicted mortality trends are an order of magni-
tude greater than recent estimates of the premature mortal-
ity benefits associated with implementation of the U.S.
Environmental Protection Agency’s 8-hr ozone standard
(approximately 1000–3000 premature deaths avoided an-
nually)
4
and fine particulate (PM
2.5
) standard (approxi-
mately 15,000 premature deaths avoided annually).
5
In this
context, a major implication of this research is that govern-
mental programs intended to protect public health should
take into account potential income and employment effects
of required compliance measures. By increasing the costs of
goods and services such as energy, and decreasing dispos-
able incomes, regulation can inadvertently harm the socio-
economic status of individuals and, thereby, contribute to
poor health and premature death.
M. Harvey Brenner, Ph.D., is a professor at Johns Hopkins
University, School of Public Health, Baltimore, MD, and senior
professor of epidemiology at Berlin University of Technology,
Berlin, Germany. E-mail: hbrenner@ifg.tu-berlin.de.
Disclaimer: The research described in this article was supported
by a grant from the Center for Energy & Economic Development
Inc. The author accepts sole responsibility for the findings,
conclusions, and opinions expressed herein.
Forum invites authors to share their opinions on
environmental issues with EM readers. Opinions
expressed in Forum are those of the author(s), and
do not reflect official A&WMA policy. EM encourages
your participation by either responding directly to this
Forum or addressing another issue of interest to you.
Copyright 2005 Air & Waste Management Association
ELECTRONIC FILING, RECEIVED, CLERK'S OFFICE, AUGUST 18, 2006
* * * R2006-025 PC 6282 * * *
awma.org
november 2005 em 29
ENERGY AND HEALTH
Energy is among the most indispensable ingredients of
human existence. Like most advanced industrial economies,
the United States depends primarily on carbon-based (and
carbon-emitting) energy. In 2003, U.S. energy users con-
sumed a total of 98 quadrillion British Thermal Units
(quads) of energy, including 39 quads of petroleum, 23 quads
of natural gas, and 23 quads of
coal. Nuclear, hydro, and other
non-carbon-emitting energy
sources supplied the remaining 14
quads, or 15% of total energy con-
sumption.
6
Emissions from coal-
based electricity generation plants
alone represented one-third of
U.S. carbon dioxide (CO
2
) emis-
sions in 2002.
7
A substantial body of literature
has developed examining the po-
tential impacts of proposed restric-
tions on greenhouse gas emissions
on the national gross domestic
product (GDP), energy prices, in-
come, and employment.
8
It has
been estimated, for example, that
global climate change initiatives
requiring expanded use of high-
cost, lower-carbon energy alterna-
tives such as natural gas would
increase the cost of energy to the
point that per-capita income and
employment rates would decrease
in a quantitatively predictable
manner. Assuming these estimates
to be approximately correct, and
given the epidemiological findings
on socioeconomic status and
health,
1,3,9-11
it follows that these pro-
posed policies might, in effect, bring
about a net increase in population
mortality.
LINKS BETWEEN HEALTH
AND INCOME
The socioeconomic-status findings
show that changes in the economic
status of individuals produce subse-
quent changes in the health and life
span of those individuals. Unfortu-
nately, traditional epidemiological lit-
erature has not dealt with the issue
of change in socioeconomic status in
relation to changes in health status.
However, another body of research
shows that decreased real income
per capita and increased unemploy-
ment have consequences that lead
to increased mortality in U.S. and
European populations.
3,9-11
This literature uses economet-
ric analyses of time-series data to measure the relationship
between changes in the economy and changes in health
outcomes.
The econometric approach to health impact assessments
was developed initially in two studies for the Joint Economic
Committee (JEC) of the U.S. Congress in 1979
9
and 1984.
10
Figure 1.
U.S. total mortality rate, real and projected, 1965–2000 (Level model;
age-adjusted per 100,000 population).
Figure 2.
Annual changes of U.S. total mortality rate, real and projected, 1966–2000 (First
difference model using error correction method [ECM]; age-adjusted per 100,000 population).
Copyright 2005 Air & Waste Management Association
ELECTRONIC FILING, RECEIVED, CLERK'S OFFICE, AUGUST 18, 2006
* * * R2006-025 PC 6282 * * *
30 em november 2005
awma.org
These studies demon-
strated that declines in real
income per capita and in-
creases in unemployment
led to elevated mortality rates
over a subsequent period of
six years. For example, the
1984 JEC study found that a
one-percentage-point in-
crease in the unemployment
rate (e.g., from 5% to 6%)
would lead to a 2% increase
in the age-adjusted mortality
rate. The growth of real
income per capita also
showed a significant corre-
lation to decreases in mor-
tality rates (except for
suicide and homicide),
mental hospitalization, and
property crimes. Over the
past four years, the Euro-
pean Commission has sup-
ported similar research
showing comparable results
throughout the European
Union.
11
UPDATED MODEL
RESULTS
The research described in
this article updates the 1984
JEC analysis. U.S. data for the
period 1965–2000 were em-
ployed to estimate mortality
rates and other health effects
of changes in economic con-
ditions. The econometric
model combined four pre-
dictive factors in the expla-
nation of U.S. mortality
trends and fluctuations:
1. real GDP per capita
(beneficial impact on
mortality);
2. employment ratio
(beneficial impact);
3. unemployment rate
(harmful impact); and
4. the interaction
between GDP and
unemployment as
coincident and
lagging business-cycle
indicators (harmful
impact).
At the national level, the
findings confirmed that the
Table 1.
Estimates of pr
emature mortality impacts in 2010 of hypothesized elimination of coal utilization for electricity generation.
Year
U.S. Population
Annual Growth
2000
282,125,000
2010
310,013,000
0.95%
Mor
tality Rates
a
Number of Deaths
Low SD
High SD
Delta
(95%
(95%
Growth
Model Types
Base (2010)
Final
Delta
Base
Final
confidence)
b
Delta
confidence)
b
(%)
c
Model 1 – Unemployment
Level model
797
852
55
2,470,804
2,641,311
166,505
170,507
174,510
6.9
Rate (UR)
First difference model
811
870
59
2,514,205
2,697,113
178,282
182,908
187,533
7.3
Model 2 – Employment
Level model
885
947
62
2,743,615
2,935,823
188,555
192,208
195,861
7
Rate (ER)
First difference model
915
976
61
2,836,619
3,025,727
185,620
189,108
192,596
6.7
Model 3 – GDP per
Level model
1392
1,504
112
4,315,381
4,662,596
342,597
347,215
351,832
8
capita (GDPP)
First difference model
1463
1,582
119
4,535,490
4,904,406
364,252
368,915
373,579
8.1
Model 4 – Model # 3
First difference model
1406
1469
63
4,358,783
4,554,091
193,181
195,308
197,435
4.5
level with Model #2
first difference
Average
1096
1171
76
3,396,414
3,631,581
231,285
235,167
239,049
6.9
Model Type
Mortality Rate
Weights
d
Number of Deaths
Model 4
Delta
First difference model
195,308
UR
0.246
48,079
ER
0.266
52,037
GDPP
0.487
95,192
Total
1.000
195,308
a
Base = 2010 for
ecast;
Final = 2010 for
ecast with coal utilization impact. The impact on UR is the average of the DRI
14
and Rose and Y
ang
15
estimates for job loss % change fr
om the 4% assumed 2010 base level. The impact on ER is
assumed to be a minus 2% change fr
om the 2010 base level. The impact on GDPP is the average of the DRI
14
and Rose and Y
ang
15
estimates for personal income % change the 2010 base level; Delta = 2010 for
ecast, no population
assumption needed.
B
Error forecast standard deviation (SD).
c
Delta mortality rate divided by the 2010 base for
ecast.
d
Weights calculation = Step 1: GDPP weight is estimated as 1 minus Delta fr
om Model 2 first dif
ference divided by Delta
from Model 3 first dif
ference; Step 2: UR weight is estimated as 1 minus GDPP weight divided by 2 multiplied by Delta fr
om Model 1 first dif
ference divided by Delta fr
om Model 2 first dif
ference; Step 3: ER weight is estimated as 1 minus
GDPP weight minus UR weight; by definition weights sum to 1.
Copyright 2005 Air & Waste Management Association
ELECTRONIC FILING, RECEIVED, CLERK'S OFFICE, AUGUST 18, 2006
* * * R2006-025 PC 6282 * * *
awma.org
november 2005 em 31
hypothesized benefits of real income per capita and employ-
ment were strong and statistically significant, while the dam-
aging effects of increased unemployment and acute
business-cycle disturbances were similarly robust and statis-
tically significant. Figure 1 demonstrates the model’s pro-
jection of U.S. mortality rates.
As in the 1984 JEC study, the upward trends in real
income per capita represented the most important factor in
decreased U.S. mortality rates since the 1960s. Also, the un-
employment rate continued to bear a significant correla-
tion to increased mortality rates, such that an increase of
1% in the unemployment rate eventuates in an approxi-
mately 2% increase in the age-adjusted mortality rate, esti-
mated cumulatively over at least the subsequent decade.
In sum, growth in real income per capita is the back-
bone of decreases in the U.S. mortality rate. There are sev-
eral reasons for this. First, with respect to physical health,
In sum, growth in real income
per capita is the backbone
of decreases in the U.S.
mortality rate.
economic growth is fundamental in meeting basic popula-
tion needs, such as nutrition, housing, health insurance,
12
medical care, sanitation, electricity, transportation, and
climate control. In addition, economic growth enables
increased industrial investment in pollution control
technologies and safer work environments, with minimal
adverse workplace exposures to chemicals, noise, and un-
sanitary conditions.
Year-to-year fluctuations in mortality rates are largely ex-
plained by annual changes in the behavior of variables in
the model (see Figure 2). This means that a decline in the
mortality rate from one year to the next (e.g., between 1981
and 1982) is related to increased real income per capita and
declining unemployment rates during that same year’s
change (1981–1982) and the (approximately) 10 years prior
to that same year’s mortality decline.
State and Regional Analyses
If the economic model explaining mortality changes in the
overall United States applied to all of its regions, or to a
large number of states, then it would necessarily follow that
the historical pattern of mortality rate changes in the re-
gions and states would resemble one another. If true, this
would be remarkable, in that there is no existing literature
indicating that the trends and fluctuations in mortality rates
are similar among the major regions of the United States.
What’s New in the Online Library...
A&WMA Members: Take Advantage of
Discounted Pricing on These Great New CDs
2005 A&WMA Annual Conference Proceedings
CD-ROM
Order Code: ACE-05-CD
This CD-ROM contains the more than 450 full technical presentations
made at A&WMA's 98th Annual Conference & Exhibition, held in
Minneapolis, MN, June 2005. Included is the 2005 Critical Review on
Nanotechnology and the Environment.
Sustainable Development and the Importance
of Chemicals Management in the 21st Century
Order Code: CP-136-CD
This CD proceedings contains 25+ PowerPoint presentations from the
international specialty conference held December 7-9, 2004 in Ottawa,
Ontario. The conference focused on the positive and negative aspects
of the management of chemicals from the points of view of health, the
environment, and business.
Combined Power Plant Air Pollutant Control
Mega Symposium-2004
Order Code: VIP-131-CD
This CD contains the presentations from the fifth "Mega" Symposium
on air pollutant controls for power plants, held August 2004 in
Washington, DC. Cosponsored by A&WMA, EPRI, the U.S.
Environmental Protection Agency, and the U.S. Department of Energy,
this conference focused on SO2, NOx, particulate, mercury, and air
toxic emissions, and showcased the latest development and opera-
tional experience with state-of-the-art methods for reducing air emis-
sions from fossil-fueled boilers.
With the newly remodeled
A&WMA Online Library, it’s
easier than ever to access,
purchase, and download
thousands of
Journal of the
Air & Waste Management
Association
,
EM
, and
conference articles, plus
pick up a copy of the latest
technical publication!
New Titles Added Monthly!
There are now more than 3000
items in the Online Library, and
we are adding more each
month. Don’t forget that the
Online Library also includes
all of the books and CDs previ-
ously housed in the A&WMA
Bookstore—so now you can
get all the environmental infor-
mation you need in one place!
Check it out today!
www.awma.org
Copyright 2005 Air & Waste Management Association
ELECTRONIC FILING, RECEIVED, CLERK'S OFFICE, AUGUST 18, 2006
* * * R2006-025 PC 6282 * * *
32 em november 2005
awma.org
REFERENCES
1.
See Wildavsky, A.
Searching for Safety
;
Transaction Books (Rutgers Univer-
sity): New Brunswick, NJ, 1988;
Keeney, R. Mortality Risks Induced
by Economic Expenditures;
Risk
Analysis
1990
,
10
(1); 147-59; Adler,
N. Ostrove, J. Socioeconomic Sta-
tus and Health: What We Know and
What We Don’t;
Ann. NY Acad. Sci.
1999
,
896
; 3-15.
2.
Analysis of Senate Amendment, 2028
;
U.S. Department of Energy’s En-
ergy Information Administration:
Washington, DC, May 2004; Table
2.
3.
See
Employment in Europe 2000, Re-
cent Trends and Prospects
; European
Commission Dir.-Gen. for Employ-
ment and Social Affairs, Unit A.1:
Luxembourg, 2003;
Employment Poli-
cies in the EU and in the Member
States—Joint Report, 2002
; European
Commission Dir.-Gen. for Employ-
ment and Social Affairs, Unit A.1:
Luxembourg, 2003;
Human Capital
in a Global and Knowledge-Based
Economy, Part II: Assessment at the EU
Country Level
; European Commis-
sion Dir.-Gen. for Employment and
Social Affairs, Unit A.1: Luxem-
bourg, 2003.
4.
Hubbell, B.; Hallberg, A.;
McCubbin, D.; Post, E. Health-Re-
lated Benefits of Attaining the 8-Hr
Ozone Standard;
Environ. Hlth.
Perspect.
2005
,
113
; 83-82.
5.
Regulatory Impact Analysis for the Par-
ticulate Matter and Ozone National
Ambient Air Quality Standards and
Proposed Regional Haze Rule
; ES-18;
U.S. Environmental Protection
Agency: Washington, DC, July 15,
1997.
6.
Short-Term Energy Outlook, 2004
; U.S.
Department of Energy’s Energy In-
formation Administration: Wash-
ington, DC, 2004.
7.
Annual Energy Outlook, 2004
; U.S.
Department of Energy’s Energy In-
formation Administration: Wash-
ington, DC, 2004.
8.
See
Impacts of the Kyoto Protocol on
U.S. Energy Markets and Economic
Activity
; U.S. Department of
Energy’s Energy Information Ad-
ministration: Washington, DC,
1998; The High Costs of the Kyoto
Protocol; Wharton Econometric
Forecasting Associates Inc.: Phila-
delphia, PA, 1998; Manne, A.;
Richels, R.
Economic Impacts of Alter-
native Emission Reduction Scenarios
;
American Council for Capital For-
mation Center for Policy Research:
Washington, DC, 1998.
9.
Brenner, M.H.
Estimating the Social
Costs of National Economic Policy: Im-
plications for Mental and Physical
Health and Criminal Aggression
; Joint
Economic Committee, U.S. Con-
gress: Washington, DC, 1979.
10. Brenner, M.H.
Estimating the Effects
of Economic Change on National
Health and Social Well-Being
; Joint
Economic Committee, U.S. Con-
gress: Washington, DC, 1984.
Regional and state modeling to test the robustness of the
national model constituted a major effort of the present
analysis.
The U.S. national-level model was applied to the expla-
nation of mortality rate changes in five populous and geo-
graphically diverse states: California, Texas, New York,
Florida, and Illinois. The results were remarkably similar in
that the overall U.S. model applied quite precisely to each
of those five states. The model’s principal predictive vari-
ables all showed statistically robust relations to the age-
adjusted mortality rate. It should be pointed out that the
coefficients, representing the extent of change in mortality
related to changes in the economic variables, were not iden-
tical from state to state. Nevertheless, it is important to note
that the same economic model described historical changes
in mortality rates of states thousands of miles from one an-
other, with vastly different economies, patterns of urbaniza-
tion, and a host of lifestyle, social, and environmental factors.
Similar findings resulted from application of the model to
regional data for the United States.
All statistical tests traditionally used in time-series analy-
sis, as well as the forecasting capacity of the model, demon-
strate that each of the variables in the model plays a highly
significant role and that the entire model is of great statisti-
cal significance. The overall results, prevalent throughout
the United States, demonstrate (1) long-term declining mor-
tality rates related to patterns of economic growth, and (2)
short-term fluctuations in mortality rates associated with re-
cessions, structural unemployment rates, and the lag of un-
employment rates behind changes in real GDP per capita
(a standard feature of the business cycle).
CASE STUDY: MORTALITY EFFECTS OF
ENERGY SUPPLY CHANGES
The national econometric model was applied to a case study
to quantify the increased mortality rate that could result from
potential decreased real income per capita and increased
unemployment rates due to regulatory constraints on U.S.
coal utilization. Numerous policy proposals to reduce green-
house gas emissions have called for restrictions of carbon
emissions by the U.S. electricity-generating sector.
13
Under the hypothetical scenario that coal production
and related electricity generation were eliminated in favor
of lower-carbon, higher-cost alternatives such as natural gas
combined-cycle generation, an additional 195,000 prema-
ture deaths were estimated to occur by the year 2010 (see
Table 1). This is a conservative estimate based on a tight
construction of the assumptions of the future behavior of
the study variables (e.g., real income per capita, unemployment
rates) to 2010.
The case study used inputs from two analyses of the im-
pacts of reduced coal utilization on U.S. income and em-
ployment data, each offering disaggregated state-level
estimates of income and employment effects. Standard &
Poor’s DRI (1998)
14
and Rose and Yang of The Pennsylva-
nia State University (2001)
15
used alternative macro-
economic and input–output models, respectively, to estimate
the reductions of income and employment associated with
large-scale displacement of
coal use. The findings from
these studies were scaled to
approximate the effects of a
hypothetical 100% replace-
ment of coal. Thus adjusted,
the estimated increased un-
employment in 2010 ranged
from 3.2 million (Rose and
Yang) to 4.6 million jobs
(DRI). The reduction in
household income was esti-
mated in a range of $166 bil-
lion (Rose and Yang, 1999$)
to $363 billion (DRI, 1992$).
This upward scaling pro-
vided the basis for an assess-
ment of policy proposals that
could result in specific en-
ergy supply changes. For ex-
ample, in a recent study, EIA
estimates that the climate
change proposals currently
before the U.S. Congress
could lead to the displace-
ment of 59–78% of U.S. coal-
based electricity generation
by higher-cost natural gas
and other alternative genera-
tion sources.
2
The results from this hy-
pothetical case study demon-
strate that increased
mortality rates would result
from decreased household
income and increased un-
employment associated with
a shift to higher cost energy
supply options, absent any
direct mitigation programs
that effectively prevented or
offset these effects. The esti-
mated increased mortality in
the year 2010, based on four
different variations of the
econometric model, ranges
from an additional 170,507
to 368,915 deaths for the
displacement of 100% of
coal-based generation. A
moderately conservative es-
timate based on an annual
change model would be an
additional 195,308 deaths.
This point estimate has a 95% confidence interval of
193,181–197,435 individual deaths.
Given an estimated potential displacement of 78% of U.S.
coal generation based on EIA’s study of proposed climate
Copyright 2005 Air & Waste Management Association
ELECTRONIC FILING, RECEIVED, CLERK'S OFFICE, AUGUST 18, 2006
* * * R2006-025 PC 6282 * * *
awma.org
november 2005 em 33
em
11. See Brenner, M.H.
Estimating the
Social Cost of Unemployment and Em-
ployment Policies in the European
Union and the United States
; Euro-
pean Commission Dir.-Gen. for Em-
ployment, Industrial Relations, and
Social Affairs: Luxembourg, 2000;
Brenner, M.H.
Unemployment and
Public Health in Countries of the Euro-
pean Union
; European Commission
Dir.-Gen. for Employment, Indus-
trial Relations, and Social Affairs:
Luxembourg, 2003.
12. See McWilliams, J.M.; Zaslavsky, A.;
Meara, E.; Ayanian, J. Health Insur-
ance Coverage and Mortality
Among the Near-Elderly;
Health Af-
fairs
2004
,
23
(4); 223.
13. For example, S.139 calls for a two-
phase reduction of U.S. carbon di-
oxide emissions, achieving stabili-
zation of emissions at 2000 levels by
2010, and a return to 1990 emission
levels by 2020. The scaled-down ver-
sion of this bill (S.A. 2028) rejected
by the U.S. Senate in 2003 sought
to achieve stabilization of carbon
emissions at 2000 levels by 2010.
14. The Impact of Meeting the Kyoto
Protocol on Energy Markets and
the Economy, Standard & Poor’s
DRI, New York, 1998.
15. Rose, A.; Yang, B. The Economic
Impact of Coal Utilization in the
Continental United States, The
Pennsylvania State University, Uni-
versity Park, PA, 2001.
16. Ruhm, C.J.
Healthy Living in Hard
Times
; Working Paper No. 9468;
National Bureau of Economic Re-
search: Cambridge, MA, 2003.
17. See Bjorklund, A.; Eriksson, T.
(1998) Unemployment and Mental
Health: Evidence from Research;
Work and Stress
,
2000
,
13
; 204-222;
Kokko, K.; Pulkkinen, L.;
Puustinen, M. Selection into Long-
Term Unemployment and Psycho-
logical Consequence;
Int. J. Behav-
ioral Develop.
2000
,
24
; 310-320;
Novo, M. Unemployment and Men-
tal Health in Galicia, Spain;
Int.
Arch. Occ. & Environ. Hlth.
1999
,
72
;
s14-s15; Tausig, M.; Fenwick, R. Re-
cession and Well-Being;
J. Health
and Soc. Behavior
1999
,
40
; 1-16.
change initiatives, the indi-
cated premature mortality
from reduced income and
increased unemployment
would exceed 150,000
deaths annually, absent any
direct and effective mitiga-
tion programs.
3
The effects
of other policy measures en-
tailing significant, near-term
disruption of energy supply
markets could be estimated
with a similar linear interpo-
lation of these model results.
However, the model does
not reliably lend itself to es-
timation of mortality effects
associated with relatively mi-
nor shifts in regional coal
production or electricity
generation (e.g., 10–15%).
In many instances, such pro-
duction shifts tend to be off-
setting, as production
decreases in one region are
offset by gains elsewhere.
Effects of Lagged
Relationships
The relationship between
change in the economic cir-
cumstances of people’s lives
and their subsequent health
status unfolds over time. In
the case of sharp stress reac-
tions to financial or employ-
ment catastrophes, the
reaction patterns may be
very rapid, that is, within a
single year. This is clearly the
case when suicide rates are
factored in, as these rates typically rise sharply within several
months of increases in national unemployment rates.
Chronic diseases such as cardiovascular diseases, on the other
hand, are known to respond to many different health risk
factors within years, if not decades.
In addition to the potential health effects of income loss
and unemployment, one has the problem of judging at what
point to begin the estimation of the impact of increased
unemployment. The difficulty here is that in classic analyses
of business cycles, national income—specifically, GDP per
capita—is a “coincident” business cycle indicator, meaning
that changes in it tend to coincide with the timing of busi-
ness cycles. Unemployment rates, on the other hand, are
“lagging” business cycle indicators. This means that, despite
even robust economic growth, during much of the initial
year of recovery from a recession, unemployment rates may
still remain high.
If one does not take into account these basic relation-
ships between income and unemployment change on one
hand and mortality on the other over at least a decade, it is
possible to arrive at the misinterpretation that without lag
there might be a negative relation between unemployment
and mortality. This could imply that unemployment (in the
very short term) is related to decreased mortality.
16
This type
of error becomes more likely if one does not control for the
usual impact of traditional risk factors on mortality, such as
the effects of tobacco and saturated fat consumption on car-
diovascular mortality rates over at least a decade.
In virtually all of the studies on unemployment and
health, unemployment (especially long-term) is definitively
associated with higher illness and mortality rates at the indi-
vidual level of analysis.
17
But perhaps the most powerful evi-
dence that economic growth is the fundamental source of
life-span longevity improvement is that, as shown in the
present study, the trends of decline in mortality rates across
diverse states and regions of the United States are related to
those in real GDP per capita cumulated for at least 10 years.
Influence of Other Health Factors
The model described here was evaluated to determine
whether control for principal epidemiological risk factors
to health would render the predictive variables insignificant.
The result was that, while known risk factors to health, such
as high consumption of tobacco, alcohol, and fatty foods,
are additionally significant predictors of mortality, they are
subordinate to the main economic predictors of the model
that routinely influence mortality.
Since the late 1960s, increasing real income per capita
in the United States is no longer positively related to con-
sumption of tobacco, alcohol, and fatty foods. Indeed, after
1970, in the United States and much of Europe, these health
risk factors ceased to be found more frequently in higher
income segments of society and came to be linked instead
to the lifestyles of lower socioeconomic groups. Thus, the
population groups that generally have benefited least from
economic growth and have been most vulnerable to prob-
lems of structural and cyclical losses of employment are most
likely to suffer from the risks of dietary and addictive
“lifestyle” health risks.
CONCLUSIONS
This study demonstrates the fundamental importance of
sustained economic growth to health and improved life span
for the U.S. population. The technological bases of long-
term economic growth continue to involve the harnessing
of energy supplies to enable humans to produce more per
unit of labor or capital investment. The economic growth
that continuously improves human life expectancy requires
access to affordable energy. In this fundamental sense, any
policy change that reduces growth or raises the level of un-
employment should therefore be defined and addressed as
a public health issue requiring an economic policy response
that limits or offsets these results. The implication of the
research described in this article provides an important
basis for future studies of energy and health.
Copyright 2005 Air & Waste Management Association
ELECTRONIC FILING, RECEIVED, CLERK'S OFFICE, AUGUST 18, 2006
* * * R2006-025 PC 6282 * * *