BEFORE THE ILLINOIS POLLUTION CONTROL BOARD
IN THE MATTER OF:
)
)
PROPOSED NEW 35 ILL. ADM. CODE 225
)
R06-25
CONTROL OF EMISSIONS FROM
)
(Rulemaking – Air)
LARGE COMBUSTION SOURCES (MERCURY)
)
NOTICE OF FILING
PLEASE TAKE NOTICE that the Environmental Law and Policy Center has
electronically filed the attached MICHAEL MURRAY ADDITIONAL REFERENCES IN
SUPPORT OF TESTIMONY.
s/ Faith E. Bugel
Faith E. Bugel
Counsel for Environmental Law and Policy Center
DATED: August 11, 2006
Environmental Law and Policy Center
35 E. Wacker Drive, Suite 1300
Chicago, Illinois 60601
312-673-6500
ELECTRONIC FILING, RECEIVED, CLERK'S OFFICE, AUGUST 14, 2006
BEFORE THE ILLINOIS POLLUTION CONTROL BOARD
IN THE MATTER OF:
)
)
PROPOSED NEW 35 ILL. ADM. CODE 225
)
R06-25
CONTROL OF EMISSIONS FROM
)
(Rulemaking – Air)
LARGE COMBUSTION SOURCES (MERCURY)
)
MICHAEL MURRAY ADDITIONAL REFERENCES IN SUPPORT OF TESTIMONY
The following documents are additional references in support of the testimony of Michael
Murray which was filed in PCB R06-25 on July 24, 2006.
s/ Faith E. Bugel
Faith E. Bugel
Counsel for Environmental Law and Policy Center
DATED: August 11, 2006
Environmental Law and Policy Center
35 E. Wacker Drive, Suite 1300
Chicago, Illinois 60601
312-673-6500
ELECTRONIC FILING, RECEIVED, CLERK'S OFFICE, AUGUST 14, 2006
241
Critical Reviews in Environmental Science and Technology,
31(3):241–293 (2001)
1064-3389/01/$.50
© 2001 by CRC Press LLC
Mercury in the Aquatic Environment: A
Review of Factors Affecting Methylation
Susanne M. Ullrich,
a*
Trevor W. Tanton,
a
and Svetlana A.
Abdrashitova
b
a
Dept. of Civil and Environmental Engineering, University of Southampton, U.K.;
b
Institute of Microbiology and Virology, Almaty, Kazakhstan
ABSTRACT:
Mercury is one of the most hazardous contaminants that may be present in the
aquatic environment, but its ecological and toxicological effects are strongly dependent on the
chemical species present. Species distribution and transformation processes in natural aquatic
systems are controlled by various physical, chemical, and biological factors. Depending on the
prevailing environmental conditions, inorganic mercury species may be converted to many times
more toxic methylated forms such as methylmercury, a potent neurotoxin that is readily accu-
mulated by aquatic biota. Despite a considerable amount of literature on the subject, the behavior
of mercury and many of the transformation and distribution mechanisms operating in the natural
aquatic environment are still poorly understood. This review examines the current state of
knowledge on the physicochemical behavior of mercury in the aquatic environment, and in
particular the environmental factors influencing its transformation into highly toxic methylated
forms.
KEY WORDS:
methylmercury, speciation, environmental transformation, bioaccumulation.
I. INTRODUCTION
Mercury (Hg), a toxic element, is widely distributed in the environment and is
naturally present in aquatic systems in very low concentrations. The extensive past
industrial use of the metal and its compounds together with widespread agricultural
application of organomercurials frequently has resulted in serious contamination
of surface waters and sediments (e.g., Hosokawa;
147
Wilken and Wallschläger;
334
Heaven et al.
140
). Long-range atmospheric transport of Hg from fossil fuel combus-
tion and other sources has led to increased concentrations in freshwater systems
and biota even in remote areas that are free from direct anthropogenic influences
(Rada et al.,
265
; Lindqvist
200
).
The chemistry of Hg is complex, making it difficult to predict the behavior of
mercuric pollutants in the natural environment. Sediments act both as sinks and
potential sources of Hg (Covelli et al.
81
) and once contaminated may pose a risk
*
Corresponding author.
130348.pgs
241
7/12/01, 1:29 PM
ELECTRONIC FILING, RECEIVED, CLERK'S OFFICE, AUGUST 14, 2006
242
to aquatic life for many years (Kudo
187
). Depending on the prevailing physical,
chemical and biological conditions, Hg compounds in aquatic systems can be
interconverted and can be released from sediments to the water phase, taken up by
aquatic biota, be lost to the atmosphere, or be transported with sediment particulate
matter to new, previously uncontaminated locations.
The ecological and toxicological effects of Hg are strongly dependent on the
chemical form (species) present (Clarkson
63
). Inorganic Hg forms may be trans-
formed to organic, methylated species that are many times more toxic to aquatic
organisms (WHO;
332,333
Boening
46
). The formation of methylmercury (MMHg), a
potent neurotoxin, is of particular importance. Owing to its lipophilic and protein-
binding properties, MMHg is readily accumulated by aquatic biota and may thus
also pose a threat to humans and other fish-eating animals. Notorious incidents of
mercury poisoning occurred in the 1950s and 1960s at Minamata Bay and on the
Agano River in Japan (Takizawa
310
).
Many of the chemical and biological processes that control Hg methylation
and bioaccumulation are still insufficiently understood, but if Hg pollution is to be
effectively managed, we need to have a better understanding of the behavior of
mercuric contaminants in the natural environment. This review discusses the
behavior of Hg in aquatic systems and the factors that are thought to play a role
in environmental MMHg formation. It also identifies areas in need of further
research.
II. MERCURY IN THE AQUATIC ENVIRONMENT
A. Mercury Species in Aquatic Systems
Mercury occurs in three valence states (0, +1, and +2) and may be present in
various physical and chemical forms in the natural aquatic environment. The
nature and reactions of these species determine the solubility, mobility, and toxic-
ity of Hg in aquatic ecosystems, as well as the potential for methylation. The main
dissolved Hg species are elemental mercury (Hg
0
), complexes of Hg(II) with
various inorganic and organic ligands, and organic Hg forms, mainly methylmer-
cury (MMHg) and dimethylmercury (DMHg). Between 10 to 30% of the dissolved
Hg in the ocean is present as Hg
0
(Kim and Fitzgerald;
176
Mason and Fitzgerald
212
),
and similar concentrations have been found for freshwaters (Vandal et al.;
313
Xiao
et al.
341
). Hg
0
in surface waters occurs mainly from the reduction of Hg(II)
compounds by aquatic microorganisms (Furukawa et al.;
111
Nelson et al.;
250
Mason
et al.
216
) as well as from abiotic reduction by humic substances (Alberts et al.;
3
Miller;
237
Allard and Arsenie
4
), decomposition of organic Hg forms (Mason and
Fitzgerald;
212
Mason and Sullivan
223
), and from anthropogenic discharges, a typical
source being the chloralkali industry. Recent studies have shown that photoreduc-
tion of divalent Hg is another important mechanism of Hg
0
production in a wide
130348.pgs
242
7/12/01, 1:29 PM
ELECTRONIC FILING, RECEIVED, CLERK'S OFFICE, AUGUST 14, 2006
243
range of aquatic systems (Xiao et al.;
341,342
Schroeder et al.;
288
Amyot et al.;
5-9
Krabbenhoft et al.
181
), and that this process is mediated by humic material (Costa
and Liss
79,80
). Hg
0
is relatively unreactive and is stable under mildly oxidizing or
reducing conditions, but can be oxidized to Hg(II), particularly in the presence of
chloride ions (Demagalhaes and Tubino;
89
Yamamoto
347
). Amyot et al.
5,6
have
demonstrated the oxidation of Hg
0
in lake water and coastal seawater.
Most surface waters are supersaturated in Hg
0
relative to the atmosphere,
especially in summer (Vandal et al.;
313
Fitzgerald et al.
104
). Due to its relatively
high volatility, elemental Hg is readily lost from the aquatic environment at normal
temperatures. The evasion of Hg
0
from water surfaces plays an important part in
the global Hg cycle (Mason et al.;
214
Fitzgerald and Mason
105
). It has also been
suggested that Hg
0
production is an important mechanism in aquatic systems for
reducing the Hg(II) substrate used in the microbiological synthesis of MMHg
(Fitzgerald et al.;
103,104
Mason et al.
215
).
Hg(I) is only stable as a dimer (Hg
2
2+
) in aqueous solution and readily
disproportionates into Hg
0
and Hg
2+
, the most stable form in water. Until very
recently, it was generally considered that the Hg
2+
ion is the main species that is
methylated in a bacterially mediated process (cf. Section III). Recent research,
however, has shown that uncharged Hg complexes are much more likely to be
taken up by bacteria (cf. Section III.B.1). Therefore, Hg speciation is a primary
factor governing the methylation potential of a system.
The chemical form of Hg in aquatic systems is strongly influenced by redox
(E
h
) and pH conditions as well as by the concentrations of inorganic and organic
complexing agents. Both the Hg
2+
ion and the methylmercuric (CH
3
Hg
+
) cation
have a high tendency to form complexes, in particular with soft ligands such as
sulfur. Lindqvist
200
gives a list of potentially important inorganic and methylmer-
cury complexes for fresh and sea water, and predominance diagrams showing the
relative regions of stability of various soluble Hg species can be found in the
literature (Hem;
90
Gavis and Fergusson;
118
Lockwood and Chen;
201
Beneˇs and
Havlík;
24
Hudson et al.;
148
Stumm and Morgan
304
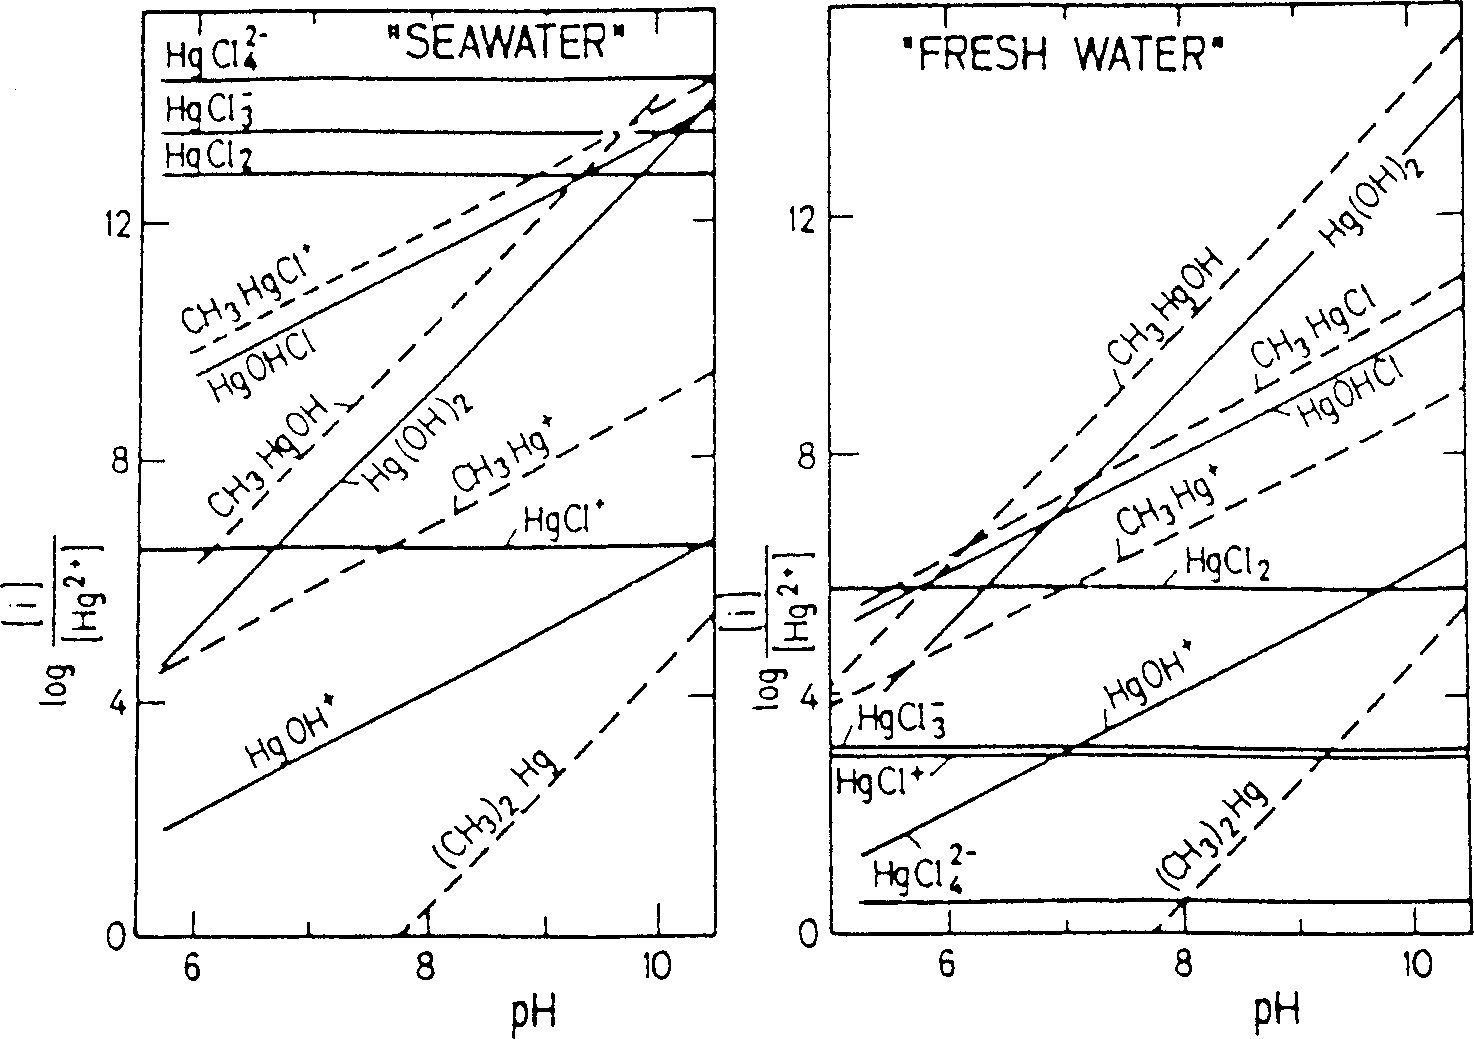
). In the absence of sulfide, the
speciation of inorganic Hg in freshwaters is dominated by three uncharged com-
plexes, Hg(OH)
2
, HgOHCl, and HgCl
2
(cf. Figure 1). In the presence of increasing
chloride ion concentrations, Hg
2+
forms HgCl
+
, HgCl
2
, HgCl
3
–
, and HgCl
4
2-
com-
plexes, and in full-strength seawater (3.5% salinity), containing an average concen-
tration of 0.56
M
of Cl
-
, it exists primarily as HgCl
4
2-
and HgCl
3
-
(Lockwood and
Chen;
201
Hahne and Kroontje;
134
Stotzky and Babich
303
). Methylmercuric hydrox-
ide, CH
3
HgOH, is the most stable methylmercury species in the freshwater envi-
ronment, whereas in seawater MMHg is present mainly as the chloride, CH
3
HgCl
(Craig;
82
Stumm and Morgan
304
). Equilibrium constants for MMHg and some of its
complexes have been published, for example, by Stumm and Morgan.
304
Predominance diagrams do not usually consider organic complexation due to
a paucity of thermodynamic data on Hg and especially MMHg binding with
polyfunctional natural ligands such as humic and fulvic acids. Hg speciation in
130348.pgs
243
7/12/01, 1:29 PM
ELECTRONIC FILING, RECEIVED, CLERK'S OFFICE, AUGUST 14, 2006
244
natural waters is largely dominated by organic rather than chloride or hydroxide
complexes, however (Lövgren and Sjöberg;
202
Coquery et al.
71
). Particularly strong
associations are formed with humic matter, where the Hg atom is most likely
bound to thiol (-RSH) groups (Gavis and Fergusson;
118
Reimers et al.;
275
Benes ˇ and
Havlík;
24
Lindqvist
200
). Organic colloids comprise a substantial proportion of the
traditionally defined dissolved Hg fraction (<0.45
µm)
in freshwater, estuarine and
marine environments (Mason et al.;
213
Watras et al.;
326
Leermakers et al.;
195
Stordal
et al.;
302
Guentzel et al.
129
). In freshwaters more than 90% of Hg is complexed by
organic matter (Mantoura et al.;
208
Meili
233
). Most MMHg (>70%) is probably also
associated with dissolved organic carbon (DOC) in lake water (Lindqvist;
200
Hudson
et al.
148
). Hudson et al.
148
have modeled the cycling of Hg in Wisconsin lakes and
have calculated that 94 to 99+% of Hg(II) and 72 to 97% of MMHg in lakewaters
is complexed by dissolved humic matter. In seawater, however, the proportion of
Hg
2+
bound to humics is decreased due to chloride ion competition (Lindberg and
Harriss;
198
Mantoura et al.;
208
Leermakers et al.
195
). Hg complexation with humic
matter also varies greatly depending on redox and pH conditions (cf. Section II.C),
and the presence of sulfide ligands. Hudson et al.
148
calculated that in oxic waters
sulfide may outcompete humic acid for Hg(II) and MMHg at a concentration of 10
µ
M
.
FIGURE 1.
Concentration ratio diagrams illustrating the relative thermodynamic stability
of mercury species in fresh water and sea water. Conditions: sea water [Cl
-
] = 0.6 M,
[CH
4(aq)
] = 10
-4
M: fresh water [Cl
-
] = 2
×
10
-4
M [CH
4(aq)
] = 10
-4
M. (Source: Stumm and
Morgan.
304
Reprinted by permission of John Wiley & Sons, Inc.)
130348.pgs
244
7/12/01, 1:29 PM
ELECTRONIC FILING, RECEIVED, CLERK'S OFFICE, AUGUST 14, 2006
245
Although organic complexation is likely to dominate in oxic fresh water, under
anoxic conditions the chemistry of Hg is mainly controlled by sulfide. In sediments
Hg is mainly bound to sulfur as well as organic matter and inorganic particles
(Morel et al.;
242
Lindberg and Harriss;
198
Dyrssen and Wedborg;
95
Fabbri et al.;
97
Mason and Lawrence
225
). Mercuric sulfide (HgS) is the main insoluble (L
HgS
=
10
-53
mol
2
l
-2
) inorganic Hg compound in aquatic systems. Mercuric oxide (HgO),
which is sparingly soluble (10
-4
mol l
-1
) is also commonly encountered in contami-
nated environments (Sakamoto et al.
283
). Hg compounds in the mud of Minamata
Bay, for example, were mainly sulfides and oxides (Fujiki and Tajima
110
). HgS
formation is generally favored at low pH and low sulfide concentrations. Under
low E
h
and high pH conditions, or if an excess of sulfide ions is present, HgS can
be converted to soluble Hg-S complexes such as HgS
2
2-
. Organic matter also
enhances the solubility of HgS and may lead to a significant release of Hg into
solution (Ravichandran et al.
270
), but other complexing agents do not appear to
enhance HgS dissolution (Frimmel;
109
Ravichandran et al.
270
). Early work sug-
gested that mercury in the HgS form is not available for bacterial methylation
under anaerobic conditions, which was believed to be the reason for the generally
lower MMHg concentrations encountered in sulfidic sediments, but recent re-
search suggests that dissolved HgS
0
can in fact be methylated (Benoit et al.
26
), and
that the mechanism of sulfide inhibition of Hg methylation is more complex (cf.
Section III.B.6
).
At high sulfide concentrations, for example, in sulfidic marine waters and
interstitial waters of bottom sediments, Hg forms soluble bi- and polysulfide
complexes such as HgSH
+
, Hg(SH)
2
, Hg(SH)S
-
, HgS
2
2-
, Hg(S
x
)
2
2-
, or Hg(S
x
)OH
-
,
depending on pH and E
h
conditions and S
0
/S
2-
concentrations (Gardner;
117
Dyrssen
and Wedborg;
95
Paquette and Helz;
257
Jay et al.
163
). Methylmercury also forms
highly stable complexes with sulfur ligands (Zepp et al.
348
), but in contrast to Hg
2+
,
the chloride complex dominates at low concentrations (0.1 n
M
) of H
2
S and thiols
(Dyrssen and Wedborg
95
). The most important sulfide complex of methylmercury
is CH
3
HgS
-
.
Organomercurials may be present in surface waters due to natural processes
such as biomethylation of inorganic Hg or human activities. Many of these com-
pounds have in the past been widely used, for example, as fungicides, slimicides,
or industrial catalysts, but with most of these uses now banned in many parts of the
world, transformation of inorganic Hg is the predominant source of methylated Hg
compounds in aquatic systems (Craig
82
). Atmospheric deposition is the main
source of inorganic Hg to oceanic waters (Mason et al.;
215
Mason and Fitzgerald
220
)
and many lakes (Watras et al.
328
), but it is not a significant source of MMHg
(Mason and Fitzgerald
210,211
). Precipitation and surface run-off can be important
sources of MMHg to freshwaters besides internal methylation (Rudd
280
).
Only methyl- and dimethylmercury are thought to occur naturally in waters,
where they can be formed from divalent inorganic Hg by various mechanisms (cf.
Section III). MMHg is the most ubiquitous organomercury compound in freshwa-
130348.pgs
245
7/12/01, 1:29 PM
ELECTRONIC FILING, RECEIVED, CLERK'S OFFICE, AUGUST 14, 2006
246
ter and estuarine systems, while DMHg is not normally detected. MMHg is
kinetically inert toward decomposition, which accounts for its remarkable stability
in natural waters (Stumm and Morgan
304
). It is efficiently degraded by microbial
action, however, and can also be decomposed photochemically (cf. Section III.A.4).
Organomercury compounds other than MMHg decompose rapidly in the environ-
ment (Jensen and Jernelöv;
166
Craig
82
), with typical breakdown products being
organic compounds such as ethane and inorganic Hg (Hg
0
and Hg
2+
). Compounds
such as dimethyl and diphenyl Hg are volatile, nonpolar, and very poorly soluble
in water. Unlike MMHg, DMHg is readily lost from aquatic systems by evapora-
tion (Talmi and Mesmer
311
) and is not considered to be available for accumulation
by aquatic organisms (Morel et al.
243
).
In contrast to freshwater systems, DMHg is the dominant methylated species
in deep ocean waters (Mason and Fitzgerald;
210,211
Cossa et al.;
75
Mason et al.;
218
),
where it appears to be produced from labile inorganic Hg complexes predomi-
nantly, although not exclusively, in the low-oxygen region (Mason and
Fitzgerald;
210,211,220
Cossa et al.;
77
Mason et al.
221
). Little or no methylated Hg
species are found in oceanic surface waters (Mason and Fitzgerald
210,211
; Cossa et
al.
75
; Mason et al.
218,221
; Mason and Sullivan
223
), with enhanced demethylation,
evaporation, and/or photodegradation of DMHg, and particulate scavenging of
MMHg from surface waters being suggested as potential loss mechanisms (Mason
and Fitzgerald;
212
Mason et al.
218,221
).
B. Mercury Concentrations in the Aquatic Environment
1. Water
Mercury is naturally present in waters at very low levels. It should be noted that
accepted background levels have fallen steadily in recent years following signifi-
cant improvements in both sampling and analytical techniques (Horvat
146
), while
previously reported high results are now believed to have resulted from sample
contamination. Recently established Hg levels in aquatic systems in Antarctica
have been suggested as global baseline values. Total Hg in surface waters of
antarctic lakes and glacial streams ranged from 2.2 to 9.5 p
M
, dissolved Hg from
0.5 to 2.2 p
M
and MMHg from <0.4 to 2.1 p
M
(Vandal et al.;
314
Lyons et al.
206
).
Uncontaminated freshwaters generally contain <5 ng l
-1
(≅ 25 p
M
) total Hg
(Bloom;
37
Craig
82
), although up to 10 or 20 ng l
-1
can be found in humic lakes or
rivers rich in particulate Hg (Meili
233
). Total Hg concentrations in the marine
environment are much lower and were found to range between 0.5 and 4 p
M
in the
Mediterranean and North Atlantic (Cossa et al.;
77
Mason et al.
221
). Mercury con-
centrations in contaminated waters can be in the
µg
l
-1
range. Dissolved Hg
concentrations in the River Nura in Central Kazakhstan were typically between 0.2
and 0.5
µg
l
-1
, for example, depending on season and suspended solids content
130348.pgs
246
7/12/01, 1:29 PM
ELECTRONIC FILING, RECEIVED, CLERK'S OFFICE, AUGUST 14, 2006
247
(Heaven et al.
140
). Considerably less data are available on organic Hg compounds
in natural waters. Recommended water-quality criteria in the Netherlands give
target values of 0.05
µg
l
-1
for total dissolved Hg and 0.005
µg
l
-1
for organic Hg
(Stumm and Morgan
304
after Behra et al.
,
1993).
The proportion of MMHg to total Hg is usually higher in the water column than
in sediments, and is higher in freshwater than in estuarine environments. In
estuarine and marine waters, MMHg is typically less than 5% of total Hg content
(Coquery et al.;
71
Mason and Sullivan
223
), whereas up to about 30% of total Hg can
be found as MMHg in freshwater lakes and rivers (Kudo et al.;
186
Meili;
233
Leermakers et al.
196
). Elevated concentrations of both total Hg and MMHg are
frequently found in anoxic waters. Bloom
37
reported MMHg concentrations in
natural surface waters are typically in the range of 0.02 to 0.1 ng l
-1
(0.1 to 0.5 p
M
),
but found up to 4 ng l
-1
(37% of total Hg) in the anoxic bottom waters of a stratified
pristine lake. DMHg has not been detected in temperate freshwater lakes (e.g.,
Vandal et al.;
313
Cossa et al.
74
) but is the most common methylated species in the
marine environment. Up to 280 f
M
MMHg and 670 f
M
DMHg were found below
the thermocline in the equatorial Pacific (Mason and Fitzgerald
210
), and up to 0.29
p
M
DMHg were detected in the Western Mediterranean (Cossa et al.
75
); average
DMHg concentrations in the North Atlantic were 0.08 p
M
(Mason et al.
221
).
2. Sediments
Sediments constitute the main reservoir of Hg in freshwater systems. Back-
ground levels of Hg in uncontaminated sediments are comparable to levels in
unpolluted surface soils, with average concentrations in ocean sediments in the
order of 0.02 to 0.1
µg
g
-1
(Lindqvist et al.
199
). Craig
82
reported concentration
ranges of 0.2 to 0.4
µg
g
-1
total Hg for uncontaminated sediments, whereas
sediments in urban, industrial, or mineralized areas can contain up to 100
µg
g
-1
total Hg and up to 100 ng g
-1
MMHg. Methylmercury concentrations in sediments
are typically only about 1 to 1.5% of total Hg content and tend to be lower
(typically <0.5%) in estuarine and marine environments (Olson and Cooper;
251
Bartlett and Craig;
21
Craig and Moreton;
85
Craig;
82
Bubb et al.;
53
Gobeil and
Cossa;
126
Gagnon et al.;
114
Benoit et al.
25
). Total Hg concentrations in sediment
porewaters are usually much higher than in the overlying watercolumn, however
(e.g., Gobeil and Cossa;
126
Cossa and Gobeil
78
), and the proportion of MMHg can
reach between 30 and 85% (Gagnon et al.;
114
Covelli et al.;
81
Hines et al.
141
).
Contaminated sediments may exhibit extremely high total Hg concentrations.
Mud from Minamata Bay contained up to 908
µg
g
-1
(d.w.) Hg (Fujiki and
Tajima
110
). MMHg was mostly less than 0.005
µg
g
-1
(d.w.) with a maximum of
0.03
µg
g
-1
(Hosokawa
147
), however, possibly due to the high sulfide content of the
sediment, or the inhibition of microbial activity at high Hg levels (Chen et al.
59
).
The River Nura has average sediment concentrations between 150 and 240
µg
g
-1
130348.pgs
247
7/12/01, 1:29 PM
ELECTRONIC FILING, RECEIVED, CLERK'S OFFICE, AUGUST 14, 2006
248
(d.w.) total Hg in the most polluted section (Heaven et al.
140
), and River Elbe
sediments were found to contain 12
µg
g
-1
(d.w.) total Hg and 35 ng g
-1
(d.w.)
MMHg (Hintelmann and Wilken
142
). DMHg has rarely been detected to date, but
Quevauviller et al.
263
reported 211 to 233 ng g
-1
DMHg (d.w.) in subsurface
mangrove sediments.
Sediment quality criteria for Hg have been set in some countries, but due to the
uncertainties regarding the bioavailability of Hg, it has been suggested that these
should be applied with caution and in concert with other site-specific data (Chapman
et al.
58
). It is also important to note that there has been considerable controversy in
recent years regarding the ‘true’ methylmercury content of environmental samples,
in particular sediments, after it was found that MMHg may be artificially formed
during the sample preparation process. Although methods have been devised since
to overcome this problem (e.g., Hintelmann et al.
144
), MMHg values cited in the
literature should be interpreted with caution, and it is now generally accepted that
values in excess of ca. 1% of total Hg content are probably unrealistic.
3. Biota
Freshwater biota can accumulate detectable quantities of Hg even from natural
sources, and most fish nowadays have analyzable levels in their tissues. Maximum
background levels for Hg in uncontaminated freshwater fish are about 0.2
µg
g
-1
,
although considerably more can be found in large predators and in fish from waters
near geological sources. Craig
82
reported concentration ranges of 0.01 to 1.5
µg
Hg g
-1
and 0.14 to 0.75
µg
Hg g
-1
for unpolluted marine fish and shellfish, respectively,
and 0.2 to 1
µg
g
-1
for uncontaminated freshwater fish. For comparison, fish and
shellfish from the highly polluted Minamata Bay contained up to 15
µg
Hg g
-1
(w.w.) and 178
µg
Hg g
-1
(d.w.), respectively (Fujiki and Tajima
110
). Human
exposure to mercury occurs mainly from the ingestion of contaminated fish and
seafood (Myers et al.
245
), and quality criteria have been set by various regulatory
bodies. EEC quality objectives state a limit value of 0.3
µg
Hg g
-1
(w.w.) in fish
(Craig
82
), whereas WHO
332
and the U.S. Food and Drug Administration (FDA
101
)
have suggested maximum permissible concentrations of 0.5 and 1
µg
Hg g
-1
,
respectively.
C. Mercury Transport and Distribution in Surface Waters
Mercury has a high tendency to be sorbed on surfaces. Therefore, in natural
waters it is mostly bound to sediments, and a large proportion of Hg in the water
phase is attached to suspended particles (Andren and Harriss;
11
Craig;
82
Mason et
al.;
213
Cossa et al.
76
). MMHg is also strongly sorbed (Craig;
82
Baeyens et al.;
14
Rytuba
282
), although usually to a lesser extent than inorganic Hg (e.g., Suchanek
130348.pgs
248
7/12/01, 1:29 PM
ELECTRONIC FILING, RECEIVED, CLERK'S OFFICE, AUGUST 14, 2006
249
et al.
305
) Thus, suspended matter plays an important role in the transport of Hg and
MMHg in aquatic systems (Kudo et al.;
183,185
Baeyens and Leermakers;
13
Coquery
et al.;
71
Mason and Sullivan;
222,223
Maurice-Bourgoin et al.;
230
Lawson et al.
191
).
Particulate transport is more important in particle-rich fresh and coastal waters than
in the open sea (Coquery and Cossa;
69
Coquery et al.;
71
Fitzgerald and Mason
106
).
Particulate Hg consists of Hg bound to inorganic particles and particulate organic
matter, as well as biogenic particles such as bacteria, algae, and phytoplankton.
Inorganic Hg tends to bind more strongly to mineral particles and detrital organic
matter, whereas MMHg is more strongly associated with biogenic particles (Hurley
et al.;
150
Meili
233
). In freshwater lakes, the distribution of Hg and MMHg is largely
controlled by particulate scavenging in surface waters and particulate dissolution
at the redox boundary (Hurley et al.
149
). Settling of particulate matter is considered
a major Hg delivery mechanism to the sediment/water interface, the main site for
methylation, whereas (redox-driven) upward diffusion from sediment porewater is
probably less important (Hurley et al.;
149,151
Watras et al.
323
). Similarly, vertical
transport of particulate matter in the ocean is the main supplier of Hg to low-
oxygen waters and thus is a major factor controlling Hg methylation (Mason and
Fitzgerald;
212,220
Mason and Sullivan
223
).
Oxyhydoxides and organic matter are the main vectors controlling the mobility
and transport of Hg in aquatic systems. Due to the high stability of Hg-humic
complexes, a high percentage of Hg in natural waters is present in organically
complexed form (cf. Section II.A), and Hg concentrations in lake water or in the
interstitial waters of sediments are often significantly correlated with dissolved
organic matter (Lindberg and Harriss;
198
Meili et al.;
232
Watras et al.
325,326
). Hg
concentrations in sediments or suspended particles are also often closely related to
organic content (Lindberg and Harriss;
198
Coquery et al.;
70
Benoit et al.;
25
Mason
and Lawrence;
225
Harland et al.;
139
Lawson et al.
191
). Hg appears to be more
strongly sorbed by humic substances than MMHg (Hudson et al.;
148
Sjöblom et
al.
291
), which may be the reason why it is less easily mobilized from sediments than
MMHg (Bloom et al.;
42
Gill et al.
119
). In watersheds, MMHg is also considered
more mobile than inorganic Hg (Bishop and Lee;
33
Mason and Sullivan;
222
Hurley
et al.;
152
Lawson et al.
191
). The strong association of Hg with humic matter has
important implications for the watershed transport of Hg (Bishop and Lee
33
).
Transport of terrestrial organic matter with surface runoff can be a major source
of Hg and MMHg to lakes and rivers (Mierle and Ingram;
236
Verta et al.;
317
Hurley
et al.;
152
Lee et al.
194
) and may even constitute the main source of MMHg in
drainage lakes receiving high amounts of runoff (Lee and Hultberg
193
). In seepage
lakes, on the other hand, the relative importance of atmospheric MMHg deposition
and in-lake MMHg production is increased (Verta et al.
317
). Watershed character-
istics such as catchment type, land use, and soil organic content play an important
role in Hg and MMHg fate and transport (Bringmark
52
). Wetlands and peatlands
are sites of active MMHg production and have been recognized as important
sources of MMHg for freshwaters (St. Louis et al.;
301
Hurley et al.;
152
Branfireun
130348.pgs
249
7/12/01, 1:29 PM
ELECTRONIC FILING, RECEIVED, CLERK'S OFFICE, AUGUST 14, 2006
250
et al.;
49-51
Waldron et al.
330
). Soil erosion and increased mobilization of Hg by
runoff is an important source of Hg to tropical aquatic ecosystems, especially
during the rainy season (Roulet et al.;
278
Maurice-Bourgoin et al.
230
), and in arid
regions storm-driven runoff following forest fires may lead to elevated sediment
Hg levels while simultaneously providing a carbon source for microbial methyla-
tion processes (Caldwell et al.
54
).
Iron and manganese oxides play a particularly important role in the cycling
and transport of Hg in aquatic systems. This is due to their large surface areas
and high capacity to adsorb and co-precipitate Hg, and to rerelease it after their
dissolution (Fagerström and Jernelöv
99
). Many workers have found the distri-
bution and concentration of dissolved and particulate Hg species to be influ-
enced, among other factors, by the redox cycling of Fe, and less frequently Mn
(e.g., Mason et al.;
213
Hurley et al.;
151
Bonzongo et al.;
47
Gagnon et al.;
115
Regnell et al.;
274
Quemerais et al.;
262
Gobeil et al.;
127
Bloom et al.
41
). Bloom et
al.
41
reported, for example, that the mobility of MMHg in estuarine surface
sediments was linked to the Fe redox cycle, while the mobility of Hg(II) was
controlled by the formation of soluble polysulfide or organic complexes. The
formation and dissolution of Fe and Mn oxides is strongly controlled by the
redox state and oxygen content of waters and sediments. In anoxic conditions,
oxyhydroxides dissolve and release any associated Hg (Gobeil and Cossa;
126
Gagnon et al.;
115
Cossa and Gobeil
78
), which is thought to be one reason for the
frequently observed Hg and MMHg enrichment in (seasonally) anoxic waters
(Hurley et al.;
149
Cossa et al.;
74
Watras et al.
327
). Seasonal and diurnal trends in
MMHg concentrations in sediment porewaters (Covelli et al.;
81
Gill et al.
119
)
may also be linked with redox effects. Meili
233
noted that oxyhydroxides form
labile complexes with organic matter and clay minerals, which may further
increase their metal scavenging capacity. The formation and dissolution of
oxyhydroxides and organic complexes may influence methylation by control-
ling the availability of inorganic Hg.
Sediments can act both as sinks and as secondary sources of Hg. Covelli et al.
81
estimated that in the Gulf of Trieste up to 25% of Hg may be released annually
from sediments and recycled at the sediment/water interface, and Stein et al.
300
have reviewed the chemical and physical processes governing the distribution of
Hg between environmental media. Partition coefficients describe the equilibrium
partitioning of Hg between the solid and dissolved phases. Sediment-water parti-
tion coefficients (K
d
= mg sorbed Hg per kg sediment/mg dissolved Hg per liter)
vary widely both within and between systems but are broadly in the order of 10
4
to 10
6
for Hg and 10
3
to 10
5
for MMHg (Hurley et al.;
150
Watras et al.;
326
Stordal
et al.;
302
Coquery et al.;
71
Lyon et al.;
205
Mason and Sullivan;
222
Bloom et al.;
41
Lawson et al.
191
). Sorption/desorption phenomena and precipitation reactions are
also likely to affect Hg bioavailability (King et al.
177
) and need to be taken into
account when estimating rates of MMHg production in the natural environment
(Bisogni
35
).
130348.pgs
250
7/12/01, 1:29 PM
ELECTRONIC FILING, RECEIVED, CLERK'S OFFICE, AUGUST 14, 2006
251
D. Influence of Environmental Factors on Hg Partitioning
The cycling and distribution of Hg between the sediment and water phases may
be physically, chemically, or biologically mediated, and hence may be affected by
parameters such as pH, temperature, redox changes, availability of nutrients and
complexing agents. This should be considered when evaluating the effect of
environmental factors on Hg methylation. The degree of binding of MMHg by
sediments, for instance, depends on sediment properties as well as pH and dis-
solved oxygen concentrations (Reimers et al.;
275
Kudo et al.;
182
Gambrell et al.
116
).
Although the proportion of Hg in dissolved form may sometimes decrease under
anoxic conditions due to the formation of reduced species such as HgS (Baeyens
and Leermakers
13
), oxic conditions generally favor sediment uptake of Hg and
MMHg, whereas anoxic conditions favor Hg release (Wang et al.;
320
Regnell and
Tunlid;
272
Regnell et al.
273
). The observed effects are most likely linked to the
precipitation and dissolution of Fe and Mn oxides and oxyhydroxides. The solu-
bility of Hg and MMHg under anoxic conditions may also be increased due to the
formation of soluble sulfide complexes (Regnell et al.;
273
Benoit et al.
25
). Apart
from redox effects, seasonal variations in the partitioning of Hg and MMHg may
also be related to changes in biotic particulate matter (Hurley et al.;
149
Watras et
al.;
323
Coquery et al.
70
).
Methylmercury release from sediments also increases with increasing tem-
perature and nutrient addition (Wright and Hamilton
339
) and decreasing pH. Miller
and Akagi
238
reported that a change in pH from 7.0 to 5.0 doubles the release of
MMHg from sediments, and Hintelmann et al.
143
found that the binding of MMHg
to humic and fulvic acids decreases with decreasing pH. The observed pH-depen-
dent changes in the partitioning of MMHg between the sediment and water phases
may be partly responsible for the often noted increased Hg concentrations in fish
from low-pH lakes (e.g., Lindqvist et al.
199
).
The presence of organic or inorganic complexing agents also affects the
partitioning of Hg. The formation of soluble humic complexes may significantly
increase the solubility and mobility of Hg in aquatic systems (Miller;
237
Reimers
et al.;
275
Miskimmin;
239
Melamed et al.;
234,235
Ravichandran et al.
270,271
), especially
above pH 5, while HgCl
2
is effectively sorbed at lower pH values (Stein et al.
300
after Bodek et al. 1988). The situation in sediments may be comparable to that in
soils, where adsorption of Hg to humus predominates in acidic conditions, and Hg
is preferentially sorbed to mineral particles (Fe oxides and clay minerals) in the
neutral to alkaline pH range, due to formation of the more particle reactive HgOH
+
species (Bringmark
52
). High chloride concentrations appear to reduce the amount
of Hg associated with suspended particulate matter and organic colloids, most
likely due to competition of Cl
-
for binding sites. Increased mobilization of Hg with
increasing salinity was observed both in model experiments (Reimers et al.
275
) and
in estuarine and marine environments (Cossa and Noel;
72
Cossa and Martin;
73
Leermakers et al.;
195
Guentzel et al.
129
).
130348.pgs
251
7/12/01, 1:29 PM
ELECTRONIC FILING, RECEIVED, CLERK'S OFFICE, AUGUST 14, 2006
252
E. Accumulation in Aquatic Biota
Mercury, and in particular methylmercury, is effectively taken up by aquatic biota,
and bioconcentration factors in the order of 10
4
to 10
7
have been reported (WHO;
332
Stein
et al.
300
). Accumulation in the aquatic food chain therefore can be high even at the
generally very low environmental MMHg concentrations. While MMHg typically con-
stitutes between 10 and 30% of total Hg in the water phase, more than 85 to 90% of Hg
in fish is present in the MMHg form (Grieb et al.;
128
Bloom;
39
Southworth et al.
292
). Other
organomercurials are also sometimes detected. Fish caught downstream of a source of
phenylmercury effluent contained both methyl and ethylmercury (Ashby and Craig
12
after Frieberg 1971), and methylmercury methanethiol (CH
3
HgSCH
3
) has been found in
shellfish (Ashby and Craig
12
after Kitamura 1963 and Lofroth 1969). The Hg content of
aquatic organisms and the percentage present as MMHg usually increases with increasing
size and increasing level in the food chain (Boudou and Ribeyre;
48
Meili;
233
Watras et
al.;
329
Mason et al.
226
). Hg concentrations in fish often remain high for many years after
Hg inputs have ceased or contaminated sediments have been dredged (Rada and Findley;
264
Kudo;
187
Francesconi et al.;
108
Southworth et al.
293
).
The precise factors controlling the accumulation of Hg in aquatic biota are poorly
understood. The high tendency of MMHg for bioaccumulation is usually explained by
its high stability and lipid solubility, and by its high tendency to bind to -SH groups
associated with proteins. However, this alone cannot account for the predominance of
MMHg in fish muscle tissue (Mason et al.;
217
Boudou and Ribeyre
48
). MMHg is taken
up by fish mainly through their diet, while direct uptake from the water is of minor
importance (Bodaly et al.;
45
Boudou and Ribeyre;
48
Meili
233
). Hg concentrations in fish
thus are primarily determined by the accumulation of MMHg at the base of the food
chain, that is, in phyto- and bacterioplankton (Mason et al.
217,219
; Watras et al.
329
). The
predominance of MMHg in fish appears to be the result of its greater trophic transfer
efficiency compared with inorganic Hg (Watras and Bloom;
322
Mason et al.
219
). Uptake
into biota is influenced by the physicochemical form in which Hg exists in the water.
Uncharged lipophilic chloride complexes (HgCl
2
and CH
3
HgCl) appear to be most
bioavailable (Mason et al.
217,219
; Laporte et al.
190
), whereas DMHg and Hg
0
are not
bioaccumulated (Morel et al.
243
). A number of other factors such as temperature, DOC,
alkalinity, and in particular pH may also influence Hg bioaccumulation as well as
methylation (Watras and Bloom;
322
Boudou and Ribeyre;
48
Meili;
233
Watras et al.
329
).
The accumulation of Hg in the aquatic food chain has been reviewed recently (Bodaly
et al.;
45
Boudou and Ribeyre
48
).
III. METHYLATION OF MERCURY IN THE AQUATIC ENVIRONMENT
A. General Aspects
The methylation of inorganic Hg in waters and sediments constitutes a key step
in the cycling of Hg in aquatic systems (Fitzgerald and Mason
106
) and takes place
130348.pgs
252
7/12/01, 1:29 PM
ELECTRONIC FILING, RECEIVED, CLERK'S OFFICE, AUGUST 14, 2006
253
in both remote and impacted environments (Cossa et al.
74
). It is important to note
that since both methylation and demethylation processes occur, environmental
MMHg concentrations reflect
net
methylation rather than actual rates of MMHg
synthesis. It appears that the combined effect of MMHg production and degrada-
tion leads to a state of equilibrium with a near constant level of MMHg in
sediments (Beijer and Jernelöv;
23
Pak and Bartha
256
) that rarely exceeds 1 to 1.5%
of total Hg concentration (cf. Section II.B.2), whereas the proportion of MMHg in
fish and other aquatic biota may be much higher (cf. Section II.E). On the basis of
mass balance studies, estimated rates for MMHg production in temperate freshwa-
ter lakes currently range from 0.5 to 5 g MMHg per km
2
per year (Watras et al.
328
).
Methylation occurs predominantly in sediments and to a lesser extent in the
water column (Olson and Cooper;
251
Robinson and Tuovinen;
277
Callister and
Winfrey;
55
Korthals and Winfrey;
180
Xun et al.
343
), but it should be borne in mind
that water column methylation is potentially more important, because the volume
of water is typically much larger than the volume of surficial sediments. Maximum
methylation rates usually occur at the redox boundary, which may vary seasonally
and frequently coincides with the sediment-water interface, and decrease with
increasing sediment depth (Rudd et al.;
279
Korthals and Winfrey;
180
Matilainen
227
).
In tropical systems, the root zones of floating aquatic macrophytes are further
important sites of methylation (Mauro et al.;
231
Guimarães et al.
130
).
The effects of environmental factors on MMHg formation and decomposition
were studied in the past mainly by relating MMHg concentrations in sediments,
water, and aquatic biota to changes in environmental conditions. In recent years the
use of radiotracers and stable isotopes has made it possible to distinguish between
the two opposing processes of MMHg formation and decomposition, but it must
be borne in mind that rates measured after Hg additions may differ considerably
from
in situ
rates. Gilmour and Henry
122
give an overview of the techniques that
are typically employed for measuring MMHg concentrations and methylation/
demethylation rates in aquatic systems, and their limitations.
The methylation of Hg requires the presence of a suitable methyl donor
molecule. In the natural aquatic environment, a large variety of potential donor
molecules are present, most of which are biologically synthesized. Whereas it had
first been assumed that Hg methylation requires the presence of bacteria, both
microbially mediated and abiotic methylation mechanisms are now known, al-
though the latter is thought to be of only minor importance.
1. Biomethylation
Biological methylation of inorganic Hg was first observed in sediments from
aquaria and lakes and in coastal waters in Sweden (Jernelöv;
167
Jensen and
Jernelöv
165
) and has been studied since by many other workers. Hg methylation by
organisms may be enzymatic or nonenzymatic. Enzymatic methylation requires
the presence of actively metabolizing organisms, while nonenzymatic methylation
130348.pgs
253
7/12/01, 1:29 PM
ELECTRONIC FILING, RECEIVED, CLERK'S OFFICE, AUGUST 14, 2006
254
requires only the methylated products of active metabolism. Detailed mechanisms
for Hg methylation were first proposed by Wood et al.
336
and Landner.
188
Wood et
al.
336
suspected that methylcobalamin, a vitamin B
12
derivative (methylcorrinoid)
produced by many organisms, is involved in microbial Hg methylation and sug-
gested that the process involves nonenzymatic transfer of the methyl group of
methylcobalamin to the mercuric ion. DeSimone et al.
91
have shown that methyl
transfer to Hg
2+
is a carbanion (CH
3
-
) process. Although there are many potential
methyl donor molecules in the aquatic environment, methylcobalamin is thought
to be the only natural methylating agent capable of transferring methyl groups as
carbanions (Ridley et al.
276
). This together with its prevalence in anaerobic ecosys-
tems and living organisms makes it the most likely methyl source for environmen-
tal Hg methylation.
Metabolically produced methylcobalamin can spontaneously methylate Hg
2+
in aqueous solution (Bertilsson and Neujahr;
31
Imura et al.
154
), but little is known
about the biochemistry of MMHg formation in the natural environment. Organisms
capable of Hg methylation have been found among anaerobes, facultative anaer-
obes, and aerobes, but the potential for microbial methylation is generally thought
to be higher under anaerobic conditions, and sulfate-reducing bacteria have been
identified as the principal methylators of inorganic Hg in anaerobic sediments
(Compeau and Bartha
66
). Methylation of Hg is generally thought to occur inside
bacteria by transfer of a methyl group from a methylcorrinoid donor molecule,
although Parkman et al.
258
suggested that methylation is an extracellular process
that is enhanced by the activity of bacterial exoenzymes that also catalyze the
microbial decompositon of organic matter. Choi and Bartha
60
demonstrated that
methylcobalamin is the methyl group donor when divalent Hg is methylated by the
LS strain of
Desulfovibrio desulfuricans
. Within the cell, Hg methylation appears
to be an enzyme-catalyzed process rather than a spontaneous chemical reaction,
with the rate of methylation at pH 7 being 600-fold higher than transmethylation
by free methylcobalamin (Choi et al.
62
). The process is oxygen sensitive, with
optimal methylation conditions at 35°C and pH 6.5. The enzyme responsible for
transferring methyl groups from methylcorrinoid protein to Hg
2+
has yet to be
identified. As biological Hg methylation takes place within microorganisms, cel-
lular uptake of Hg plays a key role in the methylation process. This is discussed
in detail in Section III.B.1.
2. Abiotic Methylation
Purely chemical methylation of Hg is also possible if suitable methyl donors
are present. DeSimone
90
showed that water-soluble methylsilicon compounds react
with Hg
2+
to form MMHg. Organosiloxanes and other silicone-related substances
have also been considered as possible methylating agents (Nagase et al.
248,249
;
Watanabe et al.
321
). Akagi et al.
1
demonstrated the photochemically induced alky-
130348.pgs
254
7/12/01, 1:29 PM
ELECTRONIC FILING, RECEIVED, CLERK'S OFFICE, AUGUST 14, 2006
255
lation of mercuric chloride with methanol, ethanol, acetic acid, and propionic acid.
Sewage effluent and industrial wastewater have also been reported as methyl
sources in the photochemical methylation of Hg. Hamasaki et al.
136
have summa-
rized some of the available data on photochemical methylation.
Wood
337
suggested Hg methylation can also occur as a result of transmethyla-
tion reactions between Hg and lead and tin alkyls used as gasoline additives. Jewett
et al.
171
demonstrated that both trimethyl lead chloride and trimethyltin chloride are
able to transfer methyl groups to Hg
2+
. Trimethyl lead was found to be a particu-
larly effective methylator for Hg, and high MMHg concentrations in sediments of
the St. Clair River were attributed to transmethylation reactions caused by alkyllead
emissions (Beijer and Jernelöv
23
after Jernelöv et al
.,
1972). More recent investi-
gations of Hg methylation by organolead, organotin, and organoarsenic com-
pounds have been carried out, for example, by Ebinghaus et al.
96
Humic matter may be another significant environmental methylating agent (We-
ber
331
). Abiological formation of MMHg by humic compounds has been demonstrated,
for example, by Nagase et al.
246,247
The capacity for MMHg formation generally
increased with increasing temperature and Hg concentration, but was low at naturally
occurring temperatures and pH values. Falter and Wilken
100
have shown that small
amounts of MMHg can be formed abiotically at environmentally relevant temperatures
and pH values, however. More than 400 pg MMHg, corresponding to ca. 0.05% of the
added
200
Hg
2+
spike, were produced in the acetone extract of a river sediment within
2 h at 40ºC between pH 3 and 7. At 35ºC, up to 160 pg could still be formed. In the
river sediment itself, however, methylation was only detected at 40ºC, with between
50 and 100 pg MMHg (0.005 to 0.01% of added
200
Hg
2+
) being formed.
Thus, mercury methylation may be biotic or abiotic, or may involve a mixture
of biotic and abiotic processes, such as the bacterial methylation of tin (IV) species
followed by abiotic methyl transfer to Hg. The relative importance of abiotic vs.
biotic methylation mechanisms in the natural aquatic environment has not yet been
established, but it is generally believed that Hg methylation is predominantly a
microbially mediated process, and Berman and Bartha
30
demonstrated that in
anoxic sediments MMHg levels resulting from chemical methylation were ap-
proximately one order of magnitude lower than those formed by biochemical Hg
methylation. Ebinghaus et al.
96
reported that organo Pb, Sn, and As compounds are
more effective methylators than biogenic methyl donors such as methylcobalamin,
but this is probably not material in the natural environment, because
in vivo
Hg
methylation is enzymatically catalyzed and is much faster than transmethylation by
free methylcobalamin (Choi et al.
62
).
3. Methylation Products
MMHg may be formed from ionic Hg and many divalent Hg compounds
(Yamada and Tonomura
344
), as well as from organic Hg compounds and metallic
130348.pgs
255
7/12/01, 1:29 PM
ELECTRONIC FILING, RECEIVED, CLERK'S OFFICE, AUGUST 14, 2006
256
Hg (Jernelöv;
168
Jacobs and Keeney
162
), possibly via formation of Hg
2+
. DMHg can
be synthesized from both methyl- and ionic Hg (Craig and Moreton;
85,86
Baldi et
al.;
18
Filipelli and Baldi
102
). There is still considerable uncertainty, however, re-
garding the pathways of MMHg and DMHg formation. Filipelli and Baldi
102
have
demonstrated that the initial product of the reaction between methylcobalamin and
Hg
2+
is MMHg, which is then further transformed into DMHg. The reaction is pH
and temperature dependent and MMHg and DMHg formation rates are of similar
magnitude at 20°C. Low pH values appear to favor the production of MMHg, while
DMHg formation is favored under neutral and basic (pH>7) conditions (Jensen and
Jernelöv;
165
Beijer and Jernelöv;
23
Fagerström and Jernelöv
99
). Below pH 5, DMHg
is thermodynamically unstable and decomposes to form MMHg (Fagerström and
Jernelöv;
99
Fitzgerald and Mason
106
), which may be one reason why DMHg has not
been detected in freshwaters, where the pH is typically lower compared with
estuarine and marine systems. Mason et al.
218
suggested that DMHg forms directly
from Hg(II), but is rapidly decomposed to MMHg in freshwaters and hence does
not accumulate to detectable levels. In deep ocean waters, on the other hand, the
stability of DMHg might be enhanced by low-light, low-temperature, and high pH
conditions (Fitzgerald and Mason;
106
Mason et al.
221
). Pongratz and Heumann
259,260
have also suggested that DMHg may be the primary biogenic methylation product
in the ocean, and it appears that MMHg in the deep ocean is formed by decompo-
sition of DMHg (Mason and Fitzgerald;
210,212
Fitzgerald and Mason;
105,106
Mason
et al.;
221
Mason and Sullivan
223
). DMHg decomposition is thought to be primarily
abiotic (Fitzgerald and Mason
106
), whereas MMHg decomposition is predomi-
nantly biologically mediated (see below). Because DMHg formation in the ocean
also occurs in oxygenated environments (Mason et al.;
218,221
Cossa et al.
75
), it has
been suggested that it may be formed by a different mechanism than in freshwaters
(Mason et al.;
220,221
Fitzgerald and Mason
106
).
4. Demethylation
The biological and abiological decomposition of methylated Hg species is an
important process regulating the organic Hg content of sediments and waters.
MMHg degradation is thought to be predominantly microbially mediated (Robinson
and Tuovinen
277
). Numerous bacterial strains capable of demethylating MMHg are
known (Spangler et al.;
294,295
Billen et al.;
32
Robinson and Tuovinen;
277
Oremland
et al.;
254
Matilainen and Verta
228
), including both aerobic and anaerobic species, but
demethylation appears to be predominantly accomplished by aerobic organisms
(cf. Section III.B.5). Bacterial demethylation has been demonstrated both in sedi-
ments (e.g., Billen et al.;
32
Oremland et al.
254
) and in the water column of freshwa-
ter lakes (Xun et al.;
343
Winfrey and Rudd;
335
Matilainen
227
). Degradation of methyl
and phenyl mercury by fresh water algae has also been described (Beneˇs and
Havlík
24
after Havlík
et al.,
1979a,b).
130348.pgs
256
7/12/01, 1:29 PM
ELECTRONIC FILING, RECEIVED, CLERK'S OFFICE, AUGUST 14, 2006
257
Mercury demethylation by bacteria appears to be a predominantly reductive
process (Furukawa et al.;
111
Spangler et al.;
294,295
Nelson et al.
250
). The commonly
accepted mechanism of microbial MMHg decomposition involves cleavage of the
carbon-mercury bond by the organomercurial lyase enzyme, yielding methane and
Hg
2+
, followed by the reduction of Hg
2+
to Hg
0
by the mercuric reductase enzyme
(Robinson and Tuovinen;
277
Summers;
309
Walsh et al.
319
). Synthesis of these en-
zymes is encoded by the
merB
and
merA
genes in bacteria possessing broad-
spectrum Hg resistance. More recent work indicates that
mer
detoxification is not
the only microbial degradation pathway, however. Oremland et al.
254
found that
while methane was the sole product of MMHg degradation in aerobic estuarine
sediments, aerobic demethylation in freshwater sediments and anaerobic
demethylation in both freshwater and estuarine sediments produced primarily
carbon dioxide, indicating the presence of an oxidative pathway. Oremland et al.
255
and Hines et al.
141
have since shown that oxidative demethylation is significant in
both contaminated and uncontaminated river sediments and is most pronounced at
sediment surfaces. Inhibitor studies suggest that both sulfate reducers and
methanogens, and possibly other anaerobes, are involved in oxidative demethylation
(Oremland et al.;
254,255
Marvin-Dipasquale and Oremland
209
). Marvin-Dipasquale
and Oremland
209
recently have proposed specific mechanisms for the oxidative
demethylation of Hg by sulfate-reducing bacteria and methanogens and have
suggested that methanogens dominate MMHg degradation at
in situ
concentra-
tions. Either process produces Hg
2+
, but it is unclear whether the Hg
2+
produced in
oxidative demethylation is subsequently reduced to Hg
0
as has been demonstrated
for the
mer
-mediated pathway (Robinson and Tuovinen
277
). Alternatively, it may
be remethylated, bound by sulfur species, or volatilized as DMHg (Baldi et al.
16
).
At present, it is also not known which of the abovementioned degradation path-
ways (i.e., organomercurial-lyase, or oxidative demethylation by sulfate reducers
and/or methanogens) dominate under specific environmental conditions. The rela-
tive importance of these pathways has major implications for the fate of Hg in
natural systems, however, and thus may ultimately determine its residence time in
sediments.
Photolytic decomposition appears to be the only significant
abiotic
decompo-
sition mechanism. DMHg in the atmosphere is photolytically decomposed to Hg
0
and hydrocarbons (Craig
82
). Phenylmercury and sulfur-bonded MMHg species
(e.g., CH
3
HgS
-
) can undergo quite rapid photolytic decay, but photodegradation
was thought to be insignificant for methylmercuric ion and methylmercuric hy-
droxide due to their low sunlight absorption rates (Baughman et al.
22
). Suda et al.
307
have shown that methyl- and ethylmercury are photodegraded by singlet oxgen in
seawater, however, and recent work by Sellers et al.
289
demonstrates that MMHg
is photolytically decomposed in surface waters, and that this process is potentially
an important step in the aquatic Hg cycle. Mass-balance calculations show that
microbial demethylation may not be the dominant removal mechanism for MMHg
in epilimnetic freshwaters. Model simulations by Branfireun et al.
50
have since
130348.pgs
257
7/12/01, 1:29 PM
ELECTRONIC FILING, RECEIVED, CLERK'S OFFICE, AUGUST 14, 2006
258
confirmed the findings of Sellers et al.
289
The overall impact of photodegradation
on the aquatic Hg cycle is still unclear, however, because the end products of
MMHg photodegradation in natural waters have not yet been identified. Further-
more, although photolytic decay contributes to Hg demethylation in the water
phase, it is unlikely to be significant in deeper sediments, where bacterial
demethylation is more important (Xun et al.;
343
Ramlal et al.
268
).
The ability of microorganisms to degrade Hg can be employed in the treatment
of sewage (Hansen et al.
138
) and Hg-contaminated liquid wastes (Baldi et al.
16,17
).
Hansen et al.
138
reported that >98% of Hg present at a concentration of 70 mg l
-1
can be removed from municipal sewage water by bacterial treatment. However, it
should be noted that sewage treatment plants themselves can be sources of MMHg
(Gilmour and Bloom;
124
Carpi et al.
57
). In the bioremediation field, efforts have
been made to devise methods for reducing the amount of MMHg in contaminated
aquatic ecosystems by stimulating the bacterial conversion of MMHg and Hg
2+
to
less harmful elemental Hg (Saouter et al.
284
). Very recently, transgenic plants have
been specifically engineered to express bacterial
mer
genes (Rugh et al.;
281
Bizily
et al.
36
). Such plants show a high resistance to inorganic Hg and organomercurials
and may in the future be used to degrade MMHg at polluted sites and to accumulate
Hg for later safe disposal.
B. Factors Affecting Methylation
The synthesis of MMHg in aquatic systems is influenced by a wide variety of
environmental factors. The efficiency of microbial Hg methylation generally de-
pends on factors such as microbial activity and the concentration of bioavailable
Hg (rather than the total Hg pool), which in turn are influenced by parameters such
as temperature, pH, redox potential, and the presence of inorganic and organic
complexing agents. Total Hg concentrations generally are not useful in predicting
MMHg concentrations (Kelly et al.
174
). While there is no simple relationship, it
appears that enhanced rates of MMHg production are linked in particular with low
pH, low salinity, and the presence of decomposable organic matter in reducing
environments. The main factors known to affect methylation are discussed below;
it should be borne in mind, however, that they cannot be viewed independently
from each other, as they often interact, forming a complex system of synergistic
and antagonistic effects.
1. Microbiology
Microorganisms play a pivotal role in aquatic Hg cycling and catalyze many
of the inter-conversions between different forms of Hg, such as the conversion of
Hg
2+
to methyl and dimethyl Hg and the reduction of Hg
2+
to Hg
0
(Summers and
130348.pgs
258
7/12/01, 1:29 PM
ELECTRONIC FILING, RECEIVED, CLERK'S OFFICE, AUGUST 14, 2006
259
Silver;
308
Robinson and Tuovinen;
277
Silver
290
). Mercury compounds are acutely
toxic to freshwater microorganisms, but many bacteria are known to have devel-
oped resistance mechanims (Baldi;
19
Hobman and Brown
145
), and positive corre-
lations are often found in sediments between the distribution of Hg compounds and
Hg-resistant microorganisms (Timoney et al.;
312
Bubb et al.
53
). Bacterial Hg resis-
tance is inducible and is regulated by the
mer
operon (Baldi
19
). Hg volatilization
is regarded as a detoxification mechanism, whereas Hg methylation appears to be
an accidental process and not a detoxification mechanism as previously suggested.
A large number of organisms, including strict and facultative anaerobes as well
as aerobes, have been shown to methylate Hg
in vitro
(Wood et al.;
336
Kitamura et
al.;
179
Yamada and Tonamura;
344-346
Vonk and Sijpesteijn;
318
Robinson and
Tuovinen
277
), but it is not certain whether these bacteria are responsible for Hg
methylation in the natural aquatic environment. Several more recent studies have
indicated that anaerobic sulfate-reducing bacteria (SRB) are the principal methy-
lators of inorganic Hg in both freshwater and estuarine sediments (Compeau and
Bartha;
66,67
Berman and Bartha;
29
Gilmour and Henry;
122
Gilmour et al.
123
). Con-
trary to earlier assumptions (e.g., Wood et al.
336
), methanogenic bacteria seem to
play only a minor role in MMHg production. Interestingly, the same bacteria that
are primarily responsible for MMHg production also appear to mediate MMHg
degradation (Robinson and Tuovinen
277
). Both sulfate reducers and methanogens
are important demethylators in estuarine and freshwater sediments (e.g., Oremland
et al.;
254,255
cf. Section III.A.4). In pure culture, the formation of DMHg from
MMHg is also mediated by SRB (Baldi et al.
16,18
). DMHg formation in the ocean
is thought to be microbial (Pongratz and Heumann;
259,260
Mason and Sullivan
223
),
but is is not known whether SRB or other organisms are the primary methylators
(Mason et al.;
220,221
Fitzgerald and Mason
106
).
Hg methylation activity in sediments is often significantly correlated with
sulfate-reduction rates (Choi and Bartha;
61
King et al.
177,178
) or with the distribution
of SRB populations (Devereux et al.;
92
Macalady et al.
207
), but not all SRB are
capable of Hg methylation. Many studies have focussed on
Desulfovibrio
popula-
tions (e.g., Baldi et al.;
16
Choi and Bartha;
60
Choi et al.
62
) but recently King et al.
178
have noted that SRB capable of acetate utilization (i.e., members of the family
Desulfobacteriaceae
) appear to methylate Hg more effectively than members of
the
Desulfovibrio
group. Macalady et al.
207
also found that
Desulfobacter
popula-
tions are important methylators in lake sediments and that they were more abun-
dant than
Desulfovibrio
.
The efficiency of microbial MMHg production appears to depend chiefly on
the activity and structure of the bacterial community (Macalady et al.
207
), Hg
availability, the availability of nutrients, and the abundance of electron acceptors
such as sulfate (Choi and Bartha
61
). At low concentrations, sulfate stimulates both
sulfate reduction and methylation (Compeau and Bartha;
66
Gilmour et al.
123
). The
in situ
addition of small amounts of sulfate thus may lead to increased MMHg
production in freshwater environments when sulfate is limiting (Gilmour et al.;
123
130348.pgs
259
7/12/01, 1:29 PM
ELECTRONIC FILING, RECEIVED, CLERK'S OFFICE, AUGUST 14, 2006
260
Branfireun et al.
51
). Although a sulfate concentration of <10 mg l
-1
(0.1 m
M
)
generally starts to become limiting for the activities of SRB (Ingvorsen et al.;
155
Lovley and Klug
203
), they can remain active even at the very low sulfate concen-
trations (ca. 3 mg l
-1
, 0.03 m
M
) typically encountered in freshwater systems by
successfully competing with methanogens for common substrates, that is, hydro-
gen and acetate (Lovley and Klug;
203
Matilainen
227
). Compeau and Bartha
66
re-
ported that the methylating potential of SRB is highest when sulfate is limiting and
other organic substrates are available that can be utilized in place of sulfate, which
may be due to the inhibitory effect of sulfide on Hg methylation. At high sulfate
concentrations, the accumulation of sulfide generated by sulfate respiration inter-
feres with Hg methylation, thereby limiting MMHg production (e.g., Baker et al.;
15
Compeau and Bartha;
66,67
Winfrey and Rudd
335
). Sulfide inhibition was previously
ascribed to HgS precipitation, but is now thought to be linked with charged Hg-S
complexes (cf. Section III.B.6). Gilmour and Henry
122
proposed an optimal sulfate
concentration range of 0.2 to 0.5 m
M
SO
4
2-
for Hg methylation by SRB in
sediments, above which methylation is inhibited, and below which sulfate becomes
limiting for methylation and sulfate-reduction processes. For comparison, seawater
has ca. 28 m
M
or 2.7 g l
-1
SO
4
2-
(Ingvorsen et al.
155
), which may explain the
typically low MMHg levels encountered in estuarine and marine environments (cf.
Section III.B.7). Methylation is only partly inhibited by sulfur chemistry, however.
For example, King et al.
177
have observed active MMHg formation in the presence
of 30 m
M
sulfate and millimolar concentrations of dissolved sulfide. The addition
of amorphous Fe(III) oxyhydroxide to sediments may inhibit both sulfate reduction
and methanogenesis (Lovley and Phillips
204
), probably due to iron-reducing bac-
teria suppressing hydrogen and acetate concentrations. Whether this might lead to
lower Hg methylation rates in Fe(III)-rich sediments still needs to be determined,
however.
Many researchers have noted that net MMHg production in methylation ex-
periments is highest in the first few days or weeks of equilibration (depending on
study), after which accumulation apparently stops, and in some cases MMHg
concentrations decline, and some studies have noted a cyclical production pattern
for MMHg (Jacobs and Keeney;
162
Spangler et al.;
295
Hamdy and Noyes;
137
Olson;
253
Furutani and Rudd;
112
Ikingura and Akagi
153
). It has been suggested that cyclical
variations in the supply of bacterial substrates may be the cause (Stary et al.
297
), but
changes in the bacterial population may be a more likely explanation. Bacterial life
stages can also affect the speciation and fate of Hg, but the available data appear
contradictory. Ramamoorthy et al.
266
found growing bacterial cells promote Hg
0
formation, whereas living but nongrowing cells cause demethylation, and dead
cells lead to the formation of MMHg. This would appear to agree with Parkman
et al.,
258
who suggested Hg methylation is an accidental process that does not
require the presence of living bacterial cells. In contrast, Ebinghaus et al.
96
ob-
served active methylation during the phase of exponential growth of sediment
bacteria, whereas demethylation became dominant when the bacterial population
130348.pgs
260
7/12/01, 1:29 PM
ELECTRONIC FILING, RECEIVED, CLERK'S OFFICE, AUGUST 14, 2006
261
began to die off, and Pongratz and Heumann
260
reported methylated Hg species
were preferably formed in the stationary period of bacterial growth.
Compeau and Bartha
65
reported MMHg concentrations approached a steady
state after 8 to 12 days of incubation, but renewed addition of Hg
2+
resulted in
MMHg synthesis at the previous rate. The percentage of total Hg converted to
MMHg declined significantly with increasing spiking levels, however, a phe-
nomenon that has also been noted by other authors (Berdichevsky et al.;
28
Jeffries;
164
Lexmond et al.;
197
Robinson and Tuovinen
277
). Chen et al.
59
observed
an increase in methylation rates when the HgCl
2
spike was less than or equal to
15.3
µg
g
-1
d.w., whereas microbial methylation activity appeared to be inhibited
at concentrations exceeding this value. Sediments containing high levels of Hg
have also shown higher rates of demethylation compared with less-contaminated
sediments (Gilmour and Henry;
122
Oremland et al.
255
). The results suggest that
high concentrations of inorganic Hg may depress MMHg production or may
favor demethylation. In water samples, on the other hand, an increase in specific
methylation rates that was proportionally greater than the increase in added Hg
2+
was observed, possibly due to increased availability of Hg following the satura-
tion of binding sites (Xun et al.
343
). The above results may explain why the ratio
of methyl : total Hg in sediments or waters is frequently found to increase with
increasing distance from the pollution source (e.g., Suchanek et al.;
305
, Hines et
al.
141
). The apparent cyclical nature of the methylation process together with a
possible inverse relationship of net MMHg production with total Hg concentra-
tions may be one reason why MMHg levels in sediments rarely exceed a thresh-
old value of 1%.
The availability of nutrients is an important factor controlling microbial Hg
methylation in aquatic systems (Jernelöv;
169
Langley;
189
Wright and Hamilton
339
).
Methylation and sulfate reduction rates therefore are generally highest in the upper
layers of sediments, where microbial activity and nutrient supply are greatest, and
on suspended organic material (Jernelöv;
169
Callister and Winfrey;
55
Korthals and
Winfrey;
180
Jorgensen and Bak;
172
Bubb et al.;
53
Choi and Bartha;
61
Gilmour et
al.;
125
Bloom et al.;
41
Hines et al.
141
). Microbial DMHg formation in the ocean is
also driven by the supply of labile organic matter (Mason and Sullivan
223
). Many
studies have found a positive correlation between sediment organic matter content
and MMHg production (Callister and Winfrey;
55
Jackson;
158
Choi and Bartha;
61
Hadjispyrou et al.;
133
Pak and Bartha
256
). Macalady et al.
207
observed a correlation
between microbial community structure and organic carbon content and suggested
that organic-rich sediments support microbial communities with higher Hg methy-
lation activity per unit of microbial biomass. Because of the generally stimulating
effect of organic matter on microbial activity, bacterial demethylation rates may
also be increased (Ramlal et al.;
268
Pak and Bartha
256
). Ramlal et al.
268
found net
MMHg production in organic-rich soils from a recently flooded reservoir was
always higher compared with clay sites, but the organic sites also had rapid
demethylation rates.
130348.pgs
261
7/12/01, 1:29 PM
ELECTRONIC FILING, RECEIVED, CLERK'S OFFICE, AUGUST 14, 2006
262
The creation of new hydroelectric reservoirs and enlargement of lakes signifi-
cantly increases MMHg production, leading to elevated Hg concentrations in fish
that can remain high for several decades (Morrison and Therien;
244
Jackson;
161
Bodaly et al.;
45
Schetagne et al.
286
). Kelly et al.
175
found that MMHg production
increased by almost 40 times following the experimental flooding of a boreal forest
wetland. Recent data by Montgomery et al.
241
indicate that dissolved MMHg
concentrations in flooded environments are on average about four times greater
than in natural lakes. It is thought that the flooding of vegetation and soils releases
associated inorganic Hg as well as large amounts of organic matter and nutrients,
thereby stimulating microbial methylation activity (Porvari and Verta;
261
Bodaly et
al.
45
). The effect is enhanced further by the prevailing anaerobic conditions, but it
may be mitigated by the provision of additional Hg-binding sites when an excess
of organic substrates is supplied (Jackson
161
). Surprisingly, reservoir creation does
not appear to increase microbial demethylation rates (Bodaly et al.
45
).
The availability of Hg to methylating bacteria is frequently believed to be
determined by the concentration of free Hg
2+
ions. However, microbial uptake of
Hg involves diffusive transport of Hg across bacterial membranes, which are
known to have higher permeability for uncharged molecules than for ionic species
(e.g., Gutknecht
131,132
). Whereas uncharged HgCl
2
may diffuse rapidly through
lipid bilayers, charged chloride complexes HgOHCl and Hg(OH)
2
do not cross
membranes at a significant rate under physiological conditions, for example
(Gutknecht
131
). Recent studies (Mason et al.;
219
Barkay et al.;
20
Benoit et al.;
26
Wright and Mason
340
) therefore have suggested that Hg bioavailability is con-
trolled by the concentration of neutral dissolved Hg complexes. HgCl
2
may be the
key chemical species determining cellular uptake of inorganic Hg in oxic waters
(Morel et al.
243
), while uncharged HgS
0
, bisulfide Hg(SH)
2
0
, or polysulfide HgS
n
0
complexes may be important for bacterial uptake in anoxic waters (Hudson et
al.;
148
Benoit et al.;
26
Jay et al.
163
). Wright and Mason
340
speculated that there may
be other mechanisms of uptake besides passive diffusion, because bioavailability
is reduced but not inhibited by organic complexation (Barkay et al.
20
).
Other factors that may affect microbial Hg methylation and/or demethylation
are discussed in the following. In many cases these parameters appear to affect
methylation by controlling the bioavailability of inorganic Hg. Net MMHg produc-
tion rates in natural aquatic systems appear to depend to a large extent on the
environmental conditions that determine whether bacterial methylation or
demethylation will dominate.
2. Temperature
It has been observed frequently that Hg methylation rates in aquatic systems
peak during the summer months (Jackson et al.;
157
Callister and Winfrey;
55
Korthals
and Winfrey;
180
Bubb et al.;
53
Hintelmann and Wilken;
142
Watras et al.
326
). Most
130348.pgs
262
7/12/01, 1:29 PM
ELECTRONIC FILING, RECEIVED, CLERK'S OFFICE, AUGUST 14, 2006
263
studies have shown maximum methylation activity occurs during mid or late
summer, although Bloom et al.
41
found a sharp peak in sediment MMHg produc-
tion in early spring, followed by a slow decrease throughout the remainder of the
year. Seasonal variations in MMHg production and decomposition generally have
been attributed to temperature effects, but are probably also linked with seasonal
changes in productivity/nutrient supply and redox conditions (cf. Section III.B.5).
Temperature most likely affects methylation as a result of its effect on the
overall microbial activity (Bisogni and Lawrence
34
). Wright and Hamilton
339
noted
that MMHg release from sediments at 4°C was only 50 to 70% of that observed
at 20°C, suggesting that net MMHg production may be significantly decreased in
winter due to lower rates of growth and metabolic activity, and Callister and
Winfrey
55
reported microbial Hg methylation in surficial river sediments had a
temperature optimum of 35°C. Korthals and Winfrey
180
found that while both
temperature and anoxic conditions were important factors influencing net methy-
lation, temperature alone accounted for about 30% of the variation. The data
suggested that increased net MMHg production was partly due to decreased
demethylation rather than an increase in the actual methylation rate, however.
Several other workers have also found that demethylation is favored by low
temperatures, whereas higher temperatures favor methylation, leading to a large
increase in net MMHg production in the summer (Bodaly et al.;
44
Ramlal et al.
269
).
Abiotic methylation by humic substances has also been shown to gain in impor-
tance with increasing temperature (cf. Section III.A.2), but it is probably of little/
minor significance compared with biotic methylation. In contrast to the findings of
Ramlal et al.
269
and Bodaly et al.
44
, Matilainen et al.
229
found that the highest rates
of
both
methylation and demethylation in surficial lake sediments coincided with
maximum temperatures. Similarly, Matilainen and Verta
228
found microbial
demethylation rates in aerobic surface waters of small forest lakes (up to 13.2% d
-1
)
were decreased by low temperatures.
Temperature is clearly an important factor controlling both methylation and
demethylation. It appears that moderately high temperatures have a stimulating
effect on Hg methylation, which is most likely due to increased microbial activity.
Together with seasonal changes in oxygen levels and organic content/primary
production, this seems to account for the increased MMHg production rates usually
observed in the summer. The results for Hg demethylation are somewhat contra-
dictory, but most workers found demethylation is favored by lower temperatures.
It may be that the rate of methylation increases faster than the rate of demethylation
with increasing temperature.
3. pH
The effect of pH on the methylation of Hg has received considerable attention
over the last 2 decades, in particular with regard to lakewater acidification caused
130348.pgs
263
7/12/01, 1:29 PM
ELECTRONIC FILING, RECEIVED, CLERK'S OFFICE, AUGUST 14, 2006
264
by atmospheric deposition. Many workers have noted elevated Hg levels in fish
from acidified lakes (e.g., Scheider et al.;
285
Akielaszek and Haines;
2
Wren and
McCrimmon;
338
Lindqvist et al.;
199
Håkanson et al.;
135
Spry and Wiener
296
), and
there has been concern that low pH values may lead to an increase in the production
and/or bioaccumulation of MMHg. Modeling results suggest that observed inverse
correlations between lakewater pH and fish Hg content are due to a combination
of generally higher MMHg concentrations at low pH and lower bioconcentration
factors at high pH (Hudson et al.
148
). There are, however, many ways in which pH
changes may influence MMHg concentrations in aquatic systems, and the effect of
pH is not necessarily a direct effect on methylation rates. The solubility and
mobility of Hg and MMHg is pH dependent, for example, and acid rain/snow may
increase Hg inputs from watersheds (Lee and Hultberg
193
). Furthermore, the added
sulfate may stimulate MMHg production (Gilmour et al.;
123
Branfireun et al.
51
).
Acid mine drainage, which typically is high in sulfate, has also been linked to
elevated MMHg concentrations in lake water (Suchanek et al.
306
).
Low pH conditions generally facilitate the release of heavy metals from
sediments and particulate matter, but data on the partitioning and mobility of Hg
are somewhat contradictory. Some workers have noted that the mobility of Hg is
higher in the acidic pH range (Beijer and Jernelöv;
23
Duarte et al.
94
), but Jackson
et al.
156
found that Hg was not leached from sediments by HCl, and Schindler et
al.
287
reported that lakewater acidification caused a higher proportion of Hg to bind
to particulates, thereby decreasing the solubility of Hg in the water column. The
amount of dissolved Hg in sediment porewater was also found to decrease with
decreasing pH (Ramlal et al.
267
). The available data on the pH-dependent partition-
ing of MMHg between the sediment and water phases and the transport of MMHg
in watersheds (cf. Sections II.C and II.D) strongly suggest that the solubility of
MMHg is increased at low pH values. Thus, lakewater acidification probably does
not result in the release of Hg
2+
from organic sediments, but affects the partitioning
of MMHg.
Several studies have indicated that the volatilization of Hg
0
may be positively
correlated with lakewater pH (Winfrey and Rudd
335
after Rada et al., 1987, Hudson
et al.;
148
Watras et al.
326
), which may decrease Hg(II) substrate concentrations for
methylation in high pH waters (Fitzgerald et al.
103
). Modeling calculations by
Hudson et al.
148
predict an increase in the ratio of Hg
0
/Hg(II) and Hg
0
evasion rates
with increasing pH, whereas low pH values favor methylation over Hg(II) reduc-
tion. In agreement with this, Watras et al.
326
observed an increase in Hg
0
and a
corresponding decrease in MMHg with increasing pH values. High pH values also
favor the formation of volatile DMHg (cf. Section III.A.3). Neutral and slightly
alkaline conditions thus may reduce MMHg concentrations, whereas low pH
waters may contain a relatively higher share of MMHg. This would appear to agree
with Swedish field studies that have shown that the treatment of lakes with lime
to raise lakewater pH can help reduce the Hg content of fish (e.g., Andersson and
Håkanson
10
).
130348.pgs
264
7/12/01, 1:29 PM
ELECTRONIC FILING, RECEIVED, CLERK'S OFFICE, AUGUST 14, 2006
265
The effect of pH on Hg methylation has been studied both in waters and
sediments. MMHg concentrations in lake water generally have been found to
increase with decreasing pH (e.g., Xun et al.;
343
Bloom et al.;
40
Miskimmin et
al.
240
). Xun et al.
343
reported that net MMHg production in lake water was about
seven times faster at low pH (ca. 4.5) than at high pH (ca. 8.5), although in samples
that were artificially acidified the observed effect may have been partly due to
sulfate stimulation. A pH decrease at the aerobic sediment-water interface resulted
in a two- to threefold increase in MMHg production. Miskimmin et al.
240
also
reported that a reduction in lakewater pH from 7.0 to 5.0 led to significant increases
in net methylation rates. In anaerobic sediments, on the other hand, net MMHg
production was generally found to be decreased at low pH values (Steffan and
Winfrey;
298
Furutani et al.;
113
Ramlal et al.;
267
Steffan et al.
299
). The acidification of
surficial lake sediments always resulted in a significant decrease in
203
Hg methy-
lation rates. Ramlal et al.
267
reported that the decrease in
203
Hg methylation with
decreasing pH appeared to be linked to a reduction of available inorganic Hg in the
sediment porewater, which may have been due to increased sorption to particles at
low pH. Aerobic methylation in surface sediments was also found to decrease with
decreasing water pH (Matilainen et al.
229
).
Demethylation rates are also pH sensitive. Matilainen et al.
229
observed a
decrease in anaerobic demethylation in surface sediments with decreasing water
pH and speculated that high MMHg concentrations found in the anoxic bottom
waters of stratified, low pH lakes may be partly the result of a decrease in
demethylation rather than an increase in methylation. Other workers have also
found a decrease in demethylation activity at low pH values, but in general
demethylation rates in both sediments and lake water were found to be much less
affected by pH than methylation rates (Ramlal et al.;
267
Xun et al.;
343
Steffan et
al.
299
), indicating that the changes observed in net MMHg production are largely
due to an effect of pH on methylation rather than demethylation. However, the
results of Ramlal et al.
267
and Steffan et al.
299
show that in sediments demethylation
may gain in importance at low pH values. Steffan et al.
299
found little change in
demethylation over the pH range 8.0 to 4.5, but methylation decreased sharply with
decreasing pH, leading to a substantial increase in the relative importance of
demethylation vs methylation under acidic conditions. This may also explain why
Ramlal et al.
267
did not observe methylation below pH 5.0.
One of the ways in which pH might affect methylation may be by decreasing
microbial activity under acidic conditions, causing a corresponding decrease in
bacterial methylation rates. The published literature indicates that microbial activ-
ity in lakes is not reduced after acidification, however. Furutani et al.
113
and Kelly
and Rudd
173
reported that acidification did not affect general microbial activity
(CO
2
+ CH
4
production) in sediments, and Miskimmin et al.
240
found that microbial
respiration rates had only a very small effect on net MMHg production in lake
water and were insensitive to pH changes between pH 5 and 7. However, there are
indications that the activity of sulfate-reducing bacteria may be significantly
130348.pgs
265
7/12/01, 1:29 PM
ELECTRONIC FILING, RECEIVED, CLERK'S OFFICE, AUGUST 14, 2006
266
decreased in the acidic pH range (Connell and Patrick
68
), and Furutani et al.
113
observed a decrease in sulfate reduction at low pH that was independent of general
microbial activity. It may also be that pH affects the population distribution of
methylating vs. demethylating bacteria in sediments such that demethylation pro-
cesses dominate at low pH values. This would agree with the results obtained by
Ramlal et al.
267
and Steffan et al.
299
and might merit further investigation. It is also
possible that pH affects cellular uptake of Hg, but Gutknecht
132
found that the
diffusion of Hg
2+
through lipid bilayer membranes was only dependent on Cl
-
concentrations and not on pH.
In summary, it appears that acidic conditions generally favor Hg methylation
in lake water and at the sediment/water interface, whereas methylation in anoxic
sediments is decreased, possibly due to increased demethylation activity at low pH
values. Lakewater acidification thus may lead to increased methylation in the water
phase, but it is unlikely to substantially affect methylation in deeper sediments
.
The
observed differences in the effect of pH on Hg methylation in waters and sediments
may be related to differences in redox conditions: whereas sediments were gener-
ally studied under anoxic conditions, the water samples appear to have been
oxygenated to some degree.
It is not clear whether the stimulation of methylation in lake water is a direct
effect of low pH on the methylation process, or whether it is related to other factors
that are influenced by pH, such as the loss of volatile Hg species from water
surfaces, or changes in Hg solubility and partitioning. Winfrey and Rudd
335
hy-
pothesized that the likely decrease in DOC binding sites at low pH values resulting
from the protonation of functional groups may stimulate methylation by promoting
Hg binding directly onto microbial cells. Increased MMHg concentrations in the
water phase at low pH are also likely to be partly attributable to increased desorp-
tion of MMHg from surficial sediments (Miller and Akagi;
238
Hintelmann et al.
143
),
and thus do not necessarily reflect increased methylation.
It should be mentioned briefly that the abiotic methylation of Hg by organic
substances is also pH dependent, but the data are somewhat contradictory (Nagase
et al.;
246,247
Varshal et al.;
315
Falter and Wilken
100
). Nagase et al.
246
reported that
MMHg formation in fulvic acid solution was strongly enhanced at pH 4 and
declined at higher pH values, whereas Varshal et al.
315
found MMHg production
increased with increasing pH, for example. While the relative importance of abiotic
mechanisms in the methylation of Hg under natural environmental conditions is
still unclear, it is generally thought to be low.
4. Organic Material
The role of organic matter in the methylation of Hg is not well understood.
Conversion rates of inorganic Hg to MMHg are generally much higher when
sediments contain organic substances and can be very high in or near sewage
130348.pgs
266
7/12/01, 1:29 PM
ELECTRONIC FILING, RECEIVED, CLERK'S OFFICE, AUGUST 14, 2006
267
treatment plants (Jernelöv;
168
Jackson
158
). Observed increases in MMHg concen-
trations in water, sediments, or fish tissue with increasing levels of organic carbon
(Olson and Cooper;
252
Furutani and Rudd;
112
Wright and Hamilton;
339
Lee and
Hultberg;
193
Fjeld and Rognerud
107
) generally have been attributed to a stimulating
effect of organic nutrients on microbial methylation activity (cf. Section III.B.1),
but in some cases transport of (methyl)mercury-DOC complexes to surface waters
with runoff (Section II.C) is likely to be an additional factor. Direct abiotic
methylation by humic and fulvic acids generally is considered to be of minor
importance (cf. Section III.A.2), although it is possible that its influence is in-
creased in organic-rich lakes. However, the data of Porvari and Verta
261
indicate
that although humic substances are chiefly responsible for the transport of MMHg,
they are not themselves active methylating agents. To date it is not clear to what
extent abiotic methylation contributes to MMHg production in organic-rich sedi-
ments and lake waters.
Many workers have reported decreased methylation at high concentrations of
organic matter, and several studies have suggested that dissolved organic carbon
(DOC) may have a mitigating effect on the production and/or bioaccumulation of
MMHg in natural waters (Grieb et al.;
128
Jackson;
161
Miskimmin et al.;
240
Driscoll
et al.;
93
Watras et al.;
326
Barkay et al.
20
). Miskimmin
239
reported that natural levels
of DOC had no effect on the production of MMHg in sediments, although they
enhanced the water solubility of MMHg. However, Miskimmin et al.
240
demon-
strated that MMHg production in lake water is reduced at high DOC concentra-
tions, presumably as a result of complexation of inorganic Hg with organic matter.
A reduction in pH from 7.0 to 5.0 significantly increased methylation rates at both
low and high DOC concentrations (500 to 2600
µ
M
), possibly due to competition
of H
+
with Hg
2+
for negatively charged binding sites and increased bioavailability
of Hg. Using a bioindicator that responds exclusively to bioavailable Hg
2+
, Barkay
et al.
20
demonstrated that DOC affects the rate of MMHg synthesis by reducing the
availability of the Hg
2+
substrate to methylating bacteria. The exact nature of the
Hg-DOC interaction remains unknown, however. The reduction in bioavailable Hg
was more pronounced under neutral (pH 7) than under acidic (pH 5) conditions,
which is in good agreement with the study by Miskimmin et al.
240
The availability of Hg for methylation reactions may also be decreased by
complexation with sulfur ligands (cf. Section III.B.6). The degradation of or-
ganic matter in aquatic environments leads to the production of low-molecular-
weight S compounds (Cutter and Krahforst
88
) that can potentially form com-
plexes with Hg
2+
. On the other hand, increased oxygen consumption during the
degradation of organic matter causes progressively more anoxic conditions at the
sediment/water interface, which may lead to the mobilization and potential
methylation of inorganic Hg (Gagnon et al.;
115
Cossa and Gobeil
78
). DOC also
significantly enhances the solubility of HgS (Ravichandran et al.
270
) and may
inhibit the precipitation and aggregation of HgS even at low concentrations
(Ravichandran et al.
271
).
130348.pgs
267
7/12/01, 1:29 PM
ELECTRONIC FILING, RECEIVED, CLERK'S OFFICE, AUGUST 14, 2006
268
Humic substances are capable of reducing Hg
2+
to Hg
0
in aqueous systems
(e.g., Miller
237
), which may lead not only to reduced availability of Hg
2+
for
methylation, but potentially also to a reduction in the overall Hg content. Allard
and Arsenie
4
suggested Hg
0
production is highest in anaerobic systems in the
absence of chloride at a pH of about 4.5, but it is considerably reduced by the
presence of competing ions. In contrast to the findings of Miskimmin et al.,
240
Watras et al.
326
observed an increase in the MMHg fraction in Wisconsin lakewaters
with increasing levels of DOC, in particular at DOC concentrations >5 mg l
-1
,
whereas the Hg
0
fraction decreased. This is in agreement with modeling calcula-
tions by Hudson et al.,
148
which predict that as DOC increases, the fraction of
Hg(II) that is reduced declines, while the fraction that is methylated increases. The
relative importance of Hg
0
evasion is increased in humic-rich lakes, however,
despite the observed decrease in the Hg
0
fraction. Watras et al.
328
hypothesized that
high DOC conditions in lakes favor either methylation (at low pH) or evasion (at
high pH), whereas low pH low DOC conditions favor sedimentation processes.
The role of humic matter in the methylation of Hg remains unclear. It seems
that, on the one hand, organic carbon can enhance methylation by stimulating the
activity of heterotrophic microorganisms, or through direct abiotic methylation of
Hg by humic or fulvic substances. On the other hand, Hg methylation may be
inhibited at high DOC concentrations due to increased complexation of Hg with
organic ligands, reducing Hg bioavailability to bacteria, particularly in the neutral
pH range. The observed differences may partly reflect different methylation mecha-
nisms. Anaerobic methylation was found to be enhanced by high concentrations of
organic matter, presumably due to stimulated microbial growth, whereas aerobic
methylation frequently has been observed to be suppressed by high organic matter
or particulate concentrations and does not appear to be microbially mediated (cf.
Section III.B.5).
5. Redox Conditions
Mercury methylation occurs in both aerobic and anaerobic environments.
Early work based on pure culture studies showed that methylation was faster under
aerobic conditions (Bisogni and Lawrence;
34
Hamdy and Noyes;
137
Ramamoorthy
et al.
266
), but in the natural environment, methylation rates are highest in anoxic
sediments and waters, and it is now generally accepted that Hg methylation takes
place mainly in anaerobic conditions (Olson and Cooper;
252
Compeau and Bartha;
65
Callister and Winfrey;
55
Craig and Moreton;
87
Jackson;
159
Rudd et al.;
279
Matilainen
et al.
229
). Both methylation rates and the stability of MMHg in sediments appear to
be enhanced under anaerobic conditions (e.g., Olson and Cooper;
252
Compeau and
Bartha
65
), whereas methylation rates are low under aerobic conditions, probably
because of the reduced activity of anaerobic sulfate-reducing bacteria. Compeau
and Bartha
65
found that Hg methylation in estuarine sediments was strongly
130348.pgs
268
7/12/01, 1:29 PM
ELECTRONIC FILING, RECEIVED, CLERK'S OFFICE, AUGUST 14, 2006
269
favored at low (-220 mV) E
h
, for example, and Callister and Winfrey
55
reported
that the oxygenation of sediments inhibited microbial methylation activity. Regnell
and Tunlid
272
used radiolabeled HgCl
2
in model aquatic systems to demonstrate
that Hg methylation in freshwater sediments and water is significantly higher under
anaerobic than under aerobic conditions. MMHg concentrations in anaerobically
incubated water and sediment samples from a Hg-contaminated lake were also at
least an order of magnitude higher than in aerobic incubation (Regnell et al.
273
);
both the production and water solubility of MMHg appeared to be increased under
anaerobic conditions.
On the other hand, the degradation of MMHg appears to be generally favored
by aerobic conditions. Although some workers have found demethylation rates in
freshwater sediments were similar under aerobic and anaerobic conditions (Billen
et al.;
32
Matilainen et al.
229
), most studies have shown that MMHg degradation is
faster under aerobic/high E
h
conditions (Olson and Cooper;
252
Compeau and Bartha;
65
Ramlal et al.;
268
Oremland et al.;
254
Ebinghaus et al.
96
). Oremland et al.
254
found that
demethylation in estuarine sediments was more rapid and extensive under aerobic
conditions, but anaerobic sulfate reducers were also important demethylators,
suggesting that there are multiple degradation pathways (cf. Section III.A.4).
It may be that different mechanisms are responsible for Hg methylation under
aerobic and anaerobic conditions. Anaerobic methylation was found to be en-
hanced by high concentrations of organic matter, presumably due to stimulated
microbial growth (Olson and Cooper;
252
Compeau and Bartha
65
). Aerobic methy-
lation on the other hand is frequently observed to be suppressed by high organic
matter or particulate concentrations, and does not appear to be microbially medi-
ated (Matilainen et al.;
229
Matilainen;
227
Matilainen and Verta
228
). Matilainen
227
found, for example, that aerobic methylation was abiotic and was suppressed by
humic compounds and particulate matter, whereas methylation in the anaerobic
hypolimnion was microbial. Matilainen et al.
229
reported that aerobic methylation
in organic-rich surficial lake sediments was abiotic and was slow compared with
anaerobic methylation, but increased in importance with increasing sediment
mineral content. Aerobic methylation and the methylation/demethylation ratio
correlated positively with the Fe and Mn content of the sediment. The authors
suggested that sediments with high metal content may have more bioavailable Hg,
owing to the interaction of these metals with sulfur, which would appear to agree
with more recent results by Gagnon et al.,
114
who found that high dissolved Fe
concentrations in sediment porewaters seem to limit the amount of dissolved H
2
S
that may potentially interfere with the methylation process. A possible catalytic
effect of Fe on Hg methylation can also not be ruled out. Lee et al.
192
reported that
Hg methylation in lake waters in the presence of fulvic acid was increased by the
addition of metal ions, and in particular Fe.
In most aquatic sediments, only the upper few millimetres are aerobic, while
the rest of the sediment is in an anaerobic state. MMHg concentrations are usually
highest in the moderately anaerobic surface sediments and rapidly decline with
130348.pgs
269
7/12/01, 1:29 PM
ELECTRONIC FILING, RECEIVED, CLERK'S OFFICE, AUGUST 14, 2006
270
increasing sediment depth (Korthals and Winfrey;
180
Bubb et al.;
53
Hintelmann and
Wilken;
142
Bloom et al.;
41
Hines et al.
141
). In sediment porewaters, MMHg concen-
trations were very low in the oxic zone, but were high in anoxic layers (Gagnon
et al.
114
). Bubb et al.
53
suggested that subsurface maxima of methylation activity
just below the sediment/water interface are caused by increased MMHg production
under moderately anaerobic conditions, whereas bacterial degradation of MMHg
dominates in the oxygenated surface zone, and in deeper sediment layers where
conditions are strongly reducing sulfide limits the availability of Hg for methyla-
tion (cf. Section III.B.6). MMHg concentrations in sediments are also influenced
by the redox cycling of Fe and Mn oxides that partly control dissolved Hg
concentrations in sediment porewaters (Gobeil and Cossa;
126
Gagnon et al.
115
),
thereby influencing Hg bioavailability. In the oxidized surface layers of marine
sediments, Hg was found to be primarily associated with fresh particulate organic
matter and Fe and/or Mn oxyhydroxides, which was limiting dissolved Hg concen-
trations (Gagnon et al.
115
). High dissolved Hg concentrations were observed at the
redox boundary, however, due to the accumulation and subsequent dissolution of
oxyhydroxides (Gagnon et al.
115
). Similarly, Gobeil and Cossa
126
found that dis-
solved Hg and Fe concentrations increased below 2 cm from the sediment/water
interface.
In the water column, MMHg (and DMHg) production is also related to zones
of low oxygen concentration (e.g., Bloom et al.;
40
Hurley et al.;
149
Verta and
Matilainen;
316
Mason and Fitzgerald;
211,212
Mason et al.
214
), whereas levels are
typically low in the oxic zone, both in freshwater lakes (Bloom et al.;
40
Cossa et
al.;
74
Watras and Bloom
323
) and ocean waters (e.g., Mason and Fitzgerald
210,211
). In
stratified lakes and estuaries, MMHg concentrations are usually highest in the oxic/
anoxic boundary layer and in anoxic water layers (Bloom et al.;
40
Mason et al.;
213
Cossa et al.;
74
Parkman et al.;
258
Verta et al.;
317
Watras and Bloom;
323
Watras et
al.;
324
Matilainen
227
). High MMHg concentrations at the oxic/anoxic boundary do
not necessarily reflect
in situ
MMHg production, but could result from the accu-
mulation of settling particulate matter. For instance, Matilainen
227
found MMHg
concentrations were elevated in the particle-rich oxic/anoxic boundary layer de-
spite low methylation rates (<0.1% d
-1
), apparently as a result of the settling of
particle bound MMHg from the epilimnion. The low net methylation rates were
attributed to the binding of Hg to particles and demethylation by heterotrophic
bacteria. Cossa et al.
74
also observed a peak in particulate MMHg in the upper
region of the redoxcline. The results suggest that methylation occurs mainly in the
low oxygen region, but the concentration and distribution of MMHg are strongly
influenced by the redox cycling of Fe and Mn at the oxic/anoxic boundary.
Seasonal variations in MMHg concentrations are also strongly linked to changes
in redox state. MMHg levels in hypolimnetic waters of seasonally stratified lakes
and reservoirs generally increase during summer stratification, and decrease again
following fall turnover (Bloom and Effler;
38
Bloom et al.;
40
Watras and Bloom;
323
Watras et al.;
324
Driscoll et al.;
93
Regnell et al.;
274
Canavan et al.
56
). Similar trends
130348.pgs
270
7/12/01, 1:29 PM
ELECTRONIC FILING, RECEIVED, CLERK'S OFFICE, AUGUST 14, 2006
271
are observed in surface sediments (Korthals and Winfrey
180
). The increased de-
composition of organic matter and primary production during the summer months
renders sediments and hypolimnetic waters progressively more anoxic, which
together with the generally higher temperatures is thought to have a stimulating
effect on bacterial methylation activity. Hypolimnetic enrichment of MMHg and
Hg in (seasonally) anoxic lake waters may also be due to redox-controlled release
of Hg from bottom sediments or sedimenting particles (Hurley et al.;
149,151
Mason
et al.
224
). Meili
233
suggested that the build-up of MMHg in anoxic waters may be
due to suppressed demethylation rather than enhanced methylation, however.
Passive uptake of neutral Hg(SH)
2
0
and HgS
0
complexes by methylating bacteria
may be another reason for increased Hg methylation in anoxic waters (Hudson et
al.;
148
Benoit et al.
26
). Demethylation processes are expected to dominate when
hypolimnetic waters are reaerated during lake turnover.
In summary, it is clear that microbially mediated methylation is generally
favored by anaerobic conditions, while demethylation is favored by aerobic con-
ditions. On the other hand, abiotic methylation appears to be largely aerobic.
Sediment redox state also affects the partitioning of Hg species between the
sediment and water phases. Other environmental factors can interact significantly
with redox effects, in particular organic matter and pH.
6. Sulfide
Hydrogen sulfide plays an important role in the chemistry of anaerobic sedi-
ments where it is produced as a result of bacterial sulfate reduction. Conditions of
high sulfide typically develop in anoxic, organic-rich sediments that are high in
sulfate, but can also occur in surface waters as a result of industrial or domestic
wastewater discharges. Early studies noted that high sulfide concentrations appear
to inhibit MMHg formation in soils, sediments, and bacterial cultures (Fagerström
and Jernelöv;
98
Bisogni and Lawrence;
34
Yamada and Tonomura;
346
Jacobs and
Keeney;
162
Talmi and Mesmer
311
), and significant reductions of MMHg in fish
were achieved in aquarium experiments by adding sulfides as S
2-
, FeS, or FeS
2
(Jernelöv and Åséll
170
). An inverse relationship between (dissolved) sulfide con-
centration and MMHg production or concentration in sediments or sediment
porewaters has also been noted in many more recent studies (e.g., Craig and
Moreton;
85
Compeau and Bartha;
64,67
Winfrey and Rudd;
335
Gilmour et al.;
125
Benoit et al.
25,26
). Craig and Moreton
85
found MMHg levels in sediments were
initially in direct proportion to sulfide concentrations, but declined sharply beyond
a sulfide concentration of about 1.8 mg g
-1
, and Berman and Bartha
29
observed that
Hg added to sediments containing 7.06 mg g
-1
(d.w.) acid labile and 1.98 mg g
-1
(d.w.) free sulfide became rapidly unavailable for methylation, whereas increasing
amounts of MMHg were formed when the sediment was diluted with a low-sulfide
control sediment, or when it was partially depleted of sulfide.
130348.pgs
271
7/12/01, 1:29 PM
ELECTRONIC FILING, RECEIVED, CLERK'S OFFICE, AUGUST 14, 2006
272
The presence of sulfide clearly decreases the availability of Hg
2+
for methyla-
tion. However, although MMHg production is generally greatly reduced at high
sulfide concentrations, it is not usually completely inhibited. Furutani and Rudd
112
found that
203
Hg
2+
was actively methylated in anaerobic sediments even in the
presence of about 30
µg
g
-1
of bound sulfide (d.w., as amorphous FeS), for
example. Furthermore, MMHg levels in sediments are sometimes found to in-
crease with increasing sulfide concentrations (Hintelmann and Wilken
142
), and in
stratified lakes and estuaries high MMHg concentrations are frequently found in
the sulfidic boundary layer (Bloom et al.;
40
Mason et al.;
213
Parkman et al.;
258
Verta
et al.;
317
Watras et al.;
324
Matilainen
227
).
In the presence of sulfide, Hg forms insoluble HgS (cf. Section II.A). Several
early reports indicated that mercury in the HgS form is not readily available for
methylation under anaerobic conditions (Fagerström and Jernelöv;
98
Gillespie;
121
Yamada and Tonomura
344-346
). In aerobic conditions, the sulfide may be oxidized
to sulfate, leading to increased solubility and greater availability of Hg
2+
(Fagerström
and Jernelöv;
98
Jensen and Jernelöv
166
), but aerobic methylation rates are several
orders of magnitude lower compared to anaerobic conditions (Fagerström and
Jernelöv;
98
Gillespie and Scott;
120
Jacobs and Keeney
162
). Nevertheless, exposure
of contaminated sediments to aerobic conditions may lead to the remobilization
and subsequent methylation of Hg (Berman and Bartha
29
).
It is commonly speculated that the inhibitory effect of sulfide on Hg methyla-
tion is the result of decreased solubility and bioavailability of Hg
2+
due to HgS
precipitation (e.g., Craig and Bartlett;
84
Gavis and Fergusson;
118
Blum and
Bartha;
43
Compeau and Bartha;
64,67
Winfrey and Rudd;
335
Gilmour and Henry
122
).
However, high dissolved Hg(II) concentrations in the porewater of sulfidic sedi-
ments (Gagnon et al.;
115
Benoit et al.;
25
Bloom et al.
41
) indicate that the solubility
of Hg is actually increased in the presence of excess sulfide, most likely due to the
formation of soluble sulfide complexes. Furthermore, the lack of a relationship
between dissolved Hg(II) concentrations in porewater and MMHg production
suggests that Hg
2+
may not be the main species that is methylated (Benoit et al.
25
).
The work of Benoit et al.
25-27
shows that sulfide affects the bioavailability of Hg
by controlling Hg speciation. Benoit et al.
26
suggest that the bioavailability of Hg
in sediments is determined by the concentration of neutral dissolved Hg complexes
such as HgS
0
, which may readily diffuse across bacterial cell membranes. Under
sulfidic conditions, on the other hand, Hg methylation is inhibited due to the
formation of charged disulfide complexes which are likely to be less bioavailable
(Benoit et al.
27
). The formation of polysulfides (Paquette and Helz;
257
Jay et al.
163
)
and complexes with dissolved organic matter (Ravichandran et al.
270,271
) may
contribute to the solubility of Hg in sulfidic environments. Barkay et al.
20
have
shown that DOC complexation reduces the availability of Hg to bacteria, but the
effect of polysulfide formation on Hg methylation is not clear. Jay et al.
163
specu-
late that although the formation of charged polysulfide species may decrease the
concentration of bioavailable HgS
0
, bioavailability could potentially be increased
130348.pgs
272
7/12/01, 1:29 PM
ELECTRONIC FILING, RECEIVED, CLERK'S OFFICE, AUGUST 14, 2006
273
due to the formation of small concentrations of other lipid-soluble uncharged
species such as HgS
5
.
A number of studies have suggested that in the presence of high sulfide
concentrations, MMHg may be converted to volatile DMHg (Craig and Bartlett;
84
Craig and Moreton;
86
Baldi et al.
16,18
). Craig and Bartlett
84
proposed that the
reaction proceeds via the formation of an instable organomercury sulfide interme-
diate, (CH
3
Hg)
2
S, which decomposes into DMHg and HgS. The volatile hydropho-
bic DMHg produced may diffuse through the water column and be lost to the
atmosphere, potentially leading to a significant reduction in the organic Hg content
of sediments (Craig;
83
Craig and Moreton
85
). Craig and Moreton
86
demonstrated
the evolution of DMHg from a sediment containing a natural unamended level of
MMHg on exposure to sulfide. Baldi et al.
18
have shown that MMHg added to
polluted sediments can also be converted to DMHg, but the study was performed
under high sulfide and high MMHg conditions that would thermodynamically
favor DMHg production. The formation of DMHg is considered a potentially
important loss mechanism of MMHg from anaerobic sediments high in sulfide
(Craig;
83
Baldi et al.
18
), but it is not clear to what extent it occurs in the natural
environment.
7. Salinity
The methylating activity of marine and estuarine sediments is usually lower
than that of freshwater sediments (e.g., Olson and Cooper;
251
Blum and Bartha;
43
Compeau and Bartha
67
), which generally has been attributed to salinity effects.
Blum and Bartha
43
and Compeau and Bartha
67
observed a strong inverse relation-
ship between the salinity of anaerobic sediments and their ability for Hg
2+
methy-
lation. High-salinity sediments methylated Hg at only 40% of the level observed
in low-salinity sediments (Compeau and Bartha
67
). The inhibitory effect of salinity
on Hg methylation is particularly pronounced under reducing conditions, and high-
salinity conditions appear to promote demethylation processes (Compeau and
Bartha
65
). Low-salinity coastal waters have also been found to contain a relatively
higher proportion of MMHg (Coquery et al.
71
).
The negative effect of salinity on Hg methylation appears to be mainly linked
with the microbial production of sulfide from sea salt sulfate. However, while
MMHg production in sediments is often strongly reduced in the presence of sulfate
(Baker et al.;
15
Compeau and Bartha;
67
Winfrey and Rudd
335
), methylation does not
necessarily stop at high sulfate concentrations. Compeau and Bartha
67
reported that
methylation still occurred at 2.4% salinity, corresponding to 19.5 m
M
sulfate per
liter and 7.1 mg sulfide per gram of dry sediment, whereas the same level of sulfide
had been found to almost completely inhibit methylation in a freshwater sediment
(Berman and Bartha
29
). While it was previously believed that sulfide originating
from sulfate-reduction processes limits the bioavailability of Hg in anaerobic
130348.pgs
273
7/12/01, 1:29 PM
ELECTRONIC FILING, RECEIVED, CLERK'S OFFICE, AUGUST 14, 2006
274
sediments due to HgS formation (Blum and Bartha;
43
Compeau and Bartha;
64,67
Winfrey and Rudd
335
), recent evidence suggests that methylation is inhibited at
high sulfide concentrations due to changes in Hg speciation (cf. Section III.B.6).
Not only sulfate, but other sea salt anions may also affect Hg speciation and/
or methylation in estuarine and marine environments. Compeau and Bartha
64
demonstrated that bicarbonate has a negative influence on Hg methylation under
both aerobic and anaerobic conditions, possibly due to the formation of HgCO
3
.
The authors speculated that the availability of Hg for methylation may hence be
higher in ‘soft’ than in ‘hard’ (i.e., bicarbonate rich) freshwater systems. Compeau
and Bartha
64,67
found no noticeable effect of chloride on Hg methylation, but it has
been suggested that the negative charge of mercuric chloride species may reduce
their availability to methylating bacteria. Using a mercury-specific bioindicator,
Barkay et al.
20
demonstrated that uncharged HgCl
2
is indeed more bioavailable
than anionic forms. On the basis of the data available to date, it would appear that
the formation of charged sulfide and chloride complexes offers the best explana-
tion for the apparently reduced methylation activity in estuarine and marine envi-
ronments.
IV. SUMMARY AND CONCLUSIONS
Mercury methylation is mainly a microbially mediated process with
methylcobalamin being the most likely environmental methyl donor. Abiotic
methylation appears to be of minor importance, although its influence may be
increased in organic-rich lakes. The precise mechanism of MMHg and DMHg
formation is still unclear. Although it is generally believed that DMHg is the final
product of Hg methylation, MMHg in the ocean appears to be produced mainly by
decomposition of DMHg, indicating that there may be more than one methylation
mechanism. More research is also needed into the factors controlling bacterially
mediated and abiotic demethylation processes.
Mercury methylation and demethylation rates in aquatic systems are clearly
influenced by both the speciation and biochemical availability of Hg and by a large
number of environmental variables, many of which are interrelated. Biological
activity, nutrient availability, pH, temperature, redox potential, and the presence of
inorganic and organic complexing agents all have significant effects, with the net
rate of MMHg production being determined by their complex interaction. Which
factors dominate is likely to differ from ecosystem to ecosystem. Furthermore, the
distribution of Hg between the sediment and water phases as well as the gaseous
evasion of volatile Hg species is also influenced by environmental factors. The
interrelatedness of these processes has often hampered research into the factors
controlling Hg methylation. Nevertheless, certain general trends are apparent.
MMHg formation is generally favored under anaerobic conditions, whereas aero-
bic conditions promote demethylation processes. In stratified lakes and estuaries,
130348.pgs
274
7/12/01, 1:29 PM
ELECTRONIC FILING, RECEIVED, CLERK'S OFFICE, AUGUST 14, 2006
275
MMHg formation occurs primarily at the oxic/anoxic interface, whether this
occurs in bottom waters or surface sediments. Methylation in the ocean is not
confined to low-oxygen zones, however, which is another indicator that there may
be more than one mechanism for MMHg/DMHg formation. Seasonal variations in
MMHg production appear to be mainly related to temperature and redox effects,
as well as seasonal changes in productivity and hence nutrient availability. Mod-
erately high temperatures have a stimulating effect on methylation, whereas
demethylation processes are favored by lower temperatures. Lakewater acidifica-
tion may lead to increased methylation in the water column, but in sediments
methylation is generally found to be decreased, which may be due to a reduction
in the activity of sulfate-reducing bacteria, or increased demethylation. It may also
be that different mechanisms are responsible for Hg methylation in waters and in
sediments, and there are indications that methylation in the water column may be
abiotic and linked to particles. Studies investigating the effect of pH on Hg
methylation should consider that increased MMHg concentrations in the water
phase are likely to be partly attributable to increased desorption of MMHg from
sediments at low pH.
Sulfur chemistry is a particularly important factor controlling methylation.
Sulfate-reducing bacteria are important methylators of Hg in anaerobic sediments,
and sulfate stimulates microbial Hg methylation at the typically low sulfate con-
centrations prevailing in freshwater systems. However, at high levels in reducing
conditions methylation is inhibited due to sulfide formation, which may be one
reason why MMHg levels in sediments rarely exceed 1% of the total Hg concen-
tration. Recent studies have shown that the inhibitory effect of sulfide on Hg
methylation is not due to HgS precipitation, but that sulfide lowers the availability
of Hg for bacterial methylation by formation of less bioavailable charged Hg-S
complexes.
The role of organic matter in the methylation of Hg is not well understood.
Humic matter is an important factor controlling the solubility and mobility of Hg
in natural waters. Organic nutrients generally stimulate microbial activity and
hence Hg methylation, although they may also have an effect on bacterial
demethylation activity. Direct abiotic methylation of Hg by humic and fulvic acids
has also been reported. On the other hand, high levels of dissolved organic carbon
appear to have a mitigating effect on both the production and bioaccumulation of
MMHg due to Hg complexation, particularly in the neutral pH range. The forma-
tion and dissolution of Hg-OM complexes is pH sensitive, with complexation
being reduced at low pH.
Unfortunately, despite a vast body of literature on the subject, we are still
unable to predict Hg methylation rates and the likely effects of environmental
perturbations on methylation and demethylation processes in aquatic systems.
Owing to the complexity of processes in the natural environment, it is difficult to
directly compare the results of the studies that have been published to date. Future
laboratory-based studies of methylation/demethylation rates that address not only
130348.pgs
275
7/12/01, 1:29 PM
ELECTRONIC FILING, RECEIVED, CLERK'S OFFICE, AUGUST 14, 2006
276
the direct effects of environmental variables but that place particular emphasis on
understanding how these factors interact would be desirable. These studies should
aim to quantify Hg transformation rates at environmentally relevant concentra-
tions, thereby providing a more realistic assessment of
in situ
rates than the
traditionally large Hg additions. The effect of pH under oxic compared with anoxic
conditions should receive particular attention. Further research is also needed on
the binding and partitioning of both inorganic and MMHg, which is also influenced
by the above-mentioned factors and that may to a certain extent confound the
primary effects of these variables on methylation/demethylation rates. This work
is particularly important if we are to find more effective ways of minimizing the
ecological risk of mercury in the aquatic environment.
ACKNOWLEDGMENTS
We are grateful to the European Union INCO-Copernicus programme and BG
Group for funding this work. We would also like to thank the referees who
reviewed the first draft of this paper and made a considerable number of sugges-
tions for its improvement.
REFERENCES
1.
Akagi, H., Miller, D. R., and Kudo, A.,
Photochemical transformation of mercury.
in:
Distribution and transport of pollutants in flowing water ecosystems
, Final Report, Ottawa
River Project, Univ. Ottawa — National Research Council of Canada, 1977.
2.
Akielaszek, J. J. and Haines, T. A
., Mercury in the muscle-tissue of fish from 3 Northern
Maine lakes,
Bull. Environ. Toxicol.,
27, 201, 1981.
3.
Alberts, J. J., Schindler, J. E., and R. W. Miller,
Elemental mercury evolution mediated by
humic acid,
Science,
184, 895, 1974.
4.
Allard, B. and Arsenie, I.,
Abiotic reduction of mercury by humic substances in aquatic
systems — an important process for the mercury cycle,
Water Air Soil Pollut.,
56, 457, 1991.
5.
Amyot, M., Mierle, G., Lean, D. R. S., and D. J. McQueen
, Sunlight-induced forma-
tion of dissolved gaseous mercury in lake waters.
Environ. Sci. Technol.,
28, 2366,
1994.
6.
Amyot, M., Gill, G. A., and F. M. M. Morel
, Production and loss of dissolved gaseous
mercury in coastal seawater.
Environ. Sci. Technol.,
31, 3606, 1997.
7.
Amyot, M., Lean, D., and G. Mierle,
Photochemical formation of volatile mercury in high
Arctic lakes.
Environ. Toxicol. Chem.,
16, 2054, 1997.
8.
Amyot, M., Mierle, G., Lean, D., and D. J. McQueen,
Effect of solar radiation on the
formation of dissolved gaseous mercury in temperate lakes,
Geochim. Cosmochim. Acta,
61,
975, 1997.
9.
Amyot, M., Lean, D. R. S., Poissant, L., and M. R. Doyon
, Distribution and transformation
of elemental mercury in the St. Lawrence River and Lake Ontario,
Can. J. Fish. Aquat. Sci.,
57, 155, 2000.
10.
Andersson, T. and Håkanson, L.
, Mercury content in lake sediments and suspended matter
— temporal variation and relation to water chemistry,
Hydrobiologia,
235, 685, 1992.
130348.pgs
276
7/12/01, 1:29 PM
ELECTRONIC FILING, RECEIVED, CLERK'S OFFICE, AUGUST 14, 2006
277
11.
Andren, A. W. and Harriss, R. C.
, Observations on the association between mercury and
organic matter dissolved in natural waters,
Geochim. Cosmochim. Acta,
39, 1253, 1975.
12.
Ashby, J. R. and Craig, P. J.,
Organometallic Compounds in the Environment.
in: Pollution
— Causes, Effects and Control.
R.M. Harrison, Ed., Royal Soc. Chem., 1990, chap. 16.
13.
Baeyens, W. and M. Leermakers,
Particulate, dissolved and methylmercury budgets for the
Scheldt estuary (Belgium and the Netherlands), in
Global and Regional Mercury Cycles:
Sources, Fluxes and Mass Balances.
ed. W. Baeyens, R. Ebinghaus and O. Vasiliev, Kluwer
Academic Publishers, Dordrecht, 1996, p. 285–301.
14.
Baeyens, W., Meuleman, C., Muhaya, B., and M. Leermakers,
Behaviour and speciation
of mercury in the Scheldt estuary (water, sediments and benthic organisms).
Hydrobiologia,
366, 63, 1998.
15.
Baker, M. D., Inniss, W. E., and Mayfield, C. I.
, Effect of pH on the methylation of mercury
and arsenic by sediment microorganisms,
Environ. Technol. Lett.,
4, 89, 1983.
16.
Baldi, F., Pepi, M., and Filipelli, M
., Methylmercury resistance in Desulfovibrio-desulfuricans
strains in relation to methylmercury degradation,
Appl. Environ. Microbiol.,
59, 2479, 1993.
17.
Baldi, F., Parati, F., Semplici, F., and Tandoi, V.
, Biological removal of inorganic Hg(II)
as gaseous elemental Hg(0) by continuous culture of a Hg-resistant
Pseudomonas-Putida
strain FB-1,
World J. Microbiol. & Biotechnol
. 9, 275, 1993.
18.
Baldi, F., Parati, F., and Filipelli, M.,
Dimethylmercury and dimethylmercury-sulfide of
microbial origin in the biogeochemical cycle of Hg,
Water Air Soil Pollut.,
80, 805, 1995.
19.
Baldi, F.,
Microbial Transformation of Mercury Species and Their Importance in the Bio-
geochemical Cycle of Mercury. In
: Metal Ions in Biological Systems. Vol. 34: Mercury and
its Effect on Environment and Biology.
A. Sigel and H. Sigel, eds., Marcel Dekker Inc., New
York, 1997, chp. 8, 213-257.
20.
Barkay, T., Gillman, M., and Turner, R. R.,
Effects of dissolved organic carbon and salinity
on bioavailability of mercury,
Appl. Environ. Microbiol.,
63, 4267, 1997.
21.
Bartlett, P. D. and Craig, P. J.,
Total mercury and methyl mercury levels in British estuarine
sediments,
Water Res
. 15, 37, 1981.
22.
Baughman, G. L., Gordon, J. A., Wolfe, N. L., and Zepp, R. G.,
Chemistry of
organomercurials in aquatic systems. US Environmental Protection Agency, Ecol. Res. Ser.
EPA-660/3-73-012, 1973.
23.
Beijer, K. and Jernelöv, A.,
Methylation of mercury in aquatic environments,
in: The
Biogeochemistry of Mercury in the Environment
, ed. J.O. Nriagu, Elsevier/North-Holland
Biomedical Press, Amsterdam, 1979, 203–210.
24.
Beneˇs, P. and Havlík, B.,
Speciation of mercury in natural waters,
in: The Biogeochemistry
of Mercury in the Environment
, J.O. Nriagu, Ed., Elsevier/North-Holland Biomedical Press,
Amsterdam 1979, 175–202.
25.
Benoit, J. M., Gilmour, C. C., Mason, R. P., and Riedel, G. S.,
Behavior of mercury in the
Patuxent River estuary,
Biogeochemistry,
40, 249, 1998.
26.
Benoit, J. M., Gilmour, C. C., Mason, R. P., and Heyes, A
., Sulfide controls on mercury
speciation and bioavailability to methylating bacteria in sediment pore waters,
Environ. Sci.
Technol.,
33, 951, 1999.
27.
Benoit, J.M., Mason, R.P., and C.C. Gilmour
, Estimation of mercury-sulfide speciation in
sediment pore waters using octanol-water partitioning and implications for availability to
methylating bacteria,
Environ. Toxicol. Chem.
18, 2138, 1999.
28.
Berdichevsky, I., Shoyerman, H., and Yannai, S.,
Formation of methylmercury in the
marine sediment under
in vitro
conditions,
Environ. Res.,
20, 325, 1979.
29.
Berman, M. and Bartha, R.
, Control of the methylation process in a mercury-polluted
aquatic sediment,
Environ. Pollut. Ser. B
, 11, 41, 1986.
30.
Berman, M. and Bartha, R.
, Levels of chemical versus biological methylation of mercury in
sediments,
Bull. Environ. Contam. Toxicol
. 36, 401, 1986.
130348.pgs
277
7/12/01, 1:29 PM
ELECTRONIC FILING, RECEIVED, CLERK'S OFFICE, AUGUST 14, 2006
278
31.
Bertilsson, L. and Neujahr, H. Y.,
Methylation of mercury compounds by methylcobalamin,
Biochemistry,
10, 2805, 1971.
32.
Billen, G., Joiris, C., and Wollast, R.
, Bacterial methylmercury-mineralizing activity in river
sediments,
Water Res.,
8, 219, 1974.
33.
Bishop, K. H. and Y. H. Lee,
Catchments as a source of mercury/methylmercury in boreal
surface waters. In:
Metal Ions in Biological Systems. Vol. 34: Mercury and its Effect on
Environment and Biology.
A. Sigel and H. Sigel, Eds., Marcel Dekker Inc., New York, 1997,
chap. 4, 113-130.
34.
Bisogni, J. J. and Lawrence, A. W.,
Kinetics of mercury methylation in aerobic and
anaerobic aquatic environments,
J. Water Pollut. Control Fed.,
47, 135, 1975.
35.
Bisogni, J. J.
, Kinetics of methyl mercury formation and decomposition in aquatic environ-
ments, In:
The Biogeochemistry of Mercury in the Environment
, J.O. Nriagu, Ed., Elsevier/
North-Holland Biomedical Press, Amsterdam 1979, 211-230.
36.
Bizily S. P., Rugh C. L., Summers A. O., and R. B. Meagher,
Phytoremediation of
methylmercury pollution:
merB
expression in
Arabidopsis thaliana
confers resistance to
organomercurials,
Proc. Natl. Acad. Sci. USA
96, 6808, 1999.
37.
Bloom, N.,
Determination of picogram levels of methylmercury by aqueous phase ethylation,
followed by cryogenic gas chromatography with cold vapour atomic fluorescence detection,
Can. J. Fish. Aquat. Sci.,
46 1131, 1989.
38.
Bloom, N. S. and Effler, S. W.,
Seasonal variability in the mercury speciation of Onondaga
Lake (New York),
Water Air Soil Pollut.,
53, 251, 1990.
39.
Bloom, N. S.,
On the chemical form of mercury in edible fish and marine invertebrate tissue,
Can. J. Fish. Aquat. Sci.
49, 1010, 1992.
40.
Bloom, N. S., Watras, C. J., and Hurley, J. P.,
Impact of acidification on the methylmercury
cycle of remote seepage lakes,
Water Air Soil Pollut.,
56, 477, 1991.
41.
Bloom, N. S., Gill, G. A., Cappellino, S., Dobbs, C., McShea, L., Driscoll, C., Mason, R.,
and Rudd, J.,
Speciation and cycling of mercury in Lavaca Bay, Texas, sediments,
Environ.
Sci. Technol
., 33, 7, 1999.
42.
Bloom, N. S. and B. K. Lasorsa,
Changes in mercury speciation and the release of methyl
mercury as a result of marine sediment dredging activities,
Sci. Total Environ.,
238, 385, 1999.
43.
Blum, J. E. and Bartha, R
., Effect of salinity on methylation of mercury,
Bull. Environ.
Chem. Toxicol
., 25, 404, 1980.
44.
Bodaly, R. A., Rudd, J. W. M., Fudge, R. J. P., and Kelly, C. A.,
Mercury concentrations
in fish related to size of remote Canadian Shield lakes,
Can. J. Fish. Aquat. Sci
., 50, 980, 1993.
45.
Bodaly, R. A., St. Louis, V. L., Paterson, M. J., Fudge, R. J. P., Hall, B. D., Rosenberg,
D. M., and J. W. M. Rudd,
Bioaccumulation of Mercury in the Aquatic Food Chain in newly
flooded Areas. In:
Metal Ions in Biological Systems. Vol. 34: Mercury and its Effect on
Environment and Biology.
A. Sigel and H. Sigel, Eds., Marcel Dekker Inc., New York, 1997,
chap. 9, 259–287.
46.
Boening, D. W.
, Ecological effects, transport and fate of mercury: a general review.
Chemo-
sphere,
40, 1335, 2000.
47.
Bonzongo, J. C. J., Heim, K. J., Chen, Y. A., Lyons, W. B., Warwick, J. J., Miller, G. C.,
and Lechler, P. J.,
Mercury pathways in the Carson River-Lahontan Reservoir system,
Nevada, USA,
Environ. Toxicol. Chem
., 15, 677, 1996.
48.
Boudou, A. and F. Ribeyre,
Mercury in the Food Web: Accumulation and Transfer Mecha-
nisms.
In: Metal Ions in Biological Systems. Vol. 34: Mercury and its Effect on Environment
and Biology.
A. Sigel and H. Sigel, Eds., Marcel Dekker Inc., New York, 1997, chap. 10, 289-
319.
49.
Branfireun, B. A., Heyes, A., and N. T. Roulet
, The hydrology and methylmercury dynamics
of a Precambrian Shield headwater peatland,
Water Resources Res.
32, 1785, 1996.
130348.pgs
278
7/12/01, 1:29 PM
ELECTRONIC FILING, RECEIVED, CLERK'S OFFICE, AUGUST 14, 2006
279
50.
Branfireun, B. A., Hilbert, D., and N. T. Roulet
, Sinks and sources of methylmercury in a
boreal catchment.
Biogeochemistry
41, 277, 1998.
51.
Branfireun, B. A., Roulet, N. T., Kelly, C. A., and J. W. M. Rudd
,
In situ
sulphate stimulation
of mercury methylation in a boreal peatland: Toward a link between acid rain and methylmercury
contamination in remote environments,
Glob. Biogeochem. Cycles,
13, 743, 1999.
52.
Bringmark, L.,
Accumulation of mercury in soil and effects on soil biota.
In: Metal Ions in
Biological Systems. Vol. 34: Mercury and its Effect on Environment and Biology.
A. Sigel and
H. Sigel, Eds., Marcel Dekker Inc., New York, 1997, chap. 6, 161-184.
53.
Bubb, J. M., Williams, T. P., and Lester, J. N.,
The behaviour of mercury within a
contaminated tidal river system
, Water Sci. Technol.,
28, 329, 1993.
54.
Caldwell, C. A., Canavan, C. M., and N. S. Bloom
, Potential effects of forest fire and storm
flow on total mercury and methylmercury in sediments of an arid-lands reservoir,
Sci. Total
Environ.,
260, 125, 2000.
55.
Callister, S. M. and Winfrey, M. R
., Microbial methylation of mercury in upper Wisconsin
River sediments,
Water Air Soil Pollut.,
29, 453, 1986.
56.
Canavan, C. M., Caldwell, C. A., and N. S. Bloom,
Discharge of methylmercury-enriched
hypolimnetic water from a stratified reservoir,
Sci. Total Environ.,
260, 159, 2000.
57.
Carpi, A., Lindberg, S. E., Prestbo, E. M., and N. S. Bloom
, Methyl mercury contamination
and emission to the atmosphere from soil amended with municipal sewage sludge,
J. Environ.
Qual.,
26, 1650, 1997.
58.
Chapman, P.M., Wang, F., Adams, W. J., and A. Green
, Appropriate applications of
sediment quality values for metals and metalloids,
Environ. Sci. Technol.,
33, 3937, 1999.
59.
Chen, Y., Bonzongo, J. C., and G. C. Miller
, Levels of methylmercury and controlling
factors in surface sediments of the Carson River system, Nevada.
Environ. Poll.
92, 281, 1996.
60.
Choi, S. C. and Bartha, R.,
Cobalamin-mediated mercury methylation by Desulfovibrio
desulfuricans LS,
Appl. Environ. Microbiol.,
59, 290, 1993.
61.
Choi, S. C. and Bartha, R.,
Environmental factors affecting mercury methylation in estuarine
sediments,
Bull. Environ. Contam. Toxicol.,
53, 805, 1994.
62.
Choi, S. C., Chase, T., and Bartha, R
., Enzymatic catalysis of mercury methylation by
Desulfovibrio desulfuricans LS,
Appl. Environ. Microbiol.,
60, 1342, 1994.
63.
Clarkson, T. W
., Human toxicology of mercury.
J. Trace Elem. Exp. Med.,
11, 303, 1998.
64.
Compeau, G. and Bartha, R
., Effects of sea salt anions on the formation and stability of
methylmercury,
Bull. Environ. Contam. Toxicol.,
31, 486, 1983.
65.
Compeau, G. and Bartha, R.,
Methylation and demethylation of mercury under controlled
redox, pH and salinity conditions,
Appl. Environ. Microbiol.,
48, 1203, 1984.
66.
Compeau, G. C. and Bartha, R.,
Sulfate-reducing bacteria: principal methylators of mercury
in anoxic estuarine sediment,
Appl. Environ. Microbiol.,
50, 498, 1985.
67.
Compeau, G. C. and Bartha, R.,
Effect of salinity on mercury-methylating activity of
sulfate-reducing bacteria in estuarine sediments,
Appl. Environ. Microbiol.,
53, 261, 1987.
68.
Connell, W. E. and W. H. Patrick,
Sulfate reduction in soil: effects of redox potential and
pH,
Science
, 159, 86, 1968.
69.
Coquery, M. and D. Cossa,
Mercury speciation in surface waters of the North Sea,
Nether-
lands J. Sea Res.,
34, 245, 1995.
70.
Coquery, M., Cossa, D., and J. M. Martin
, The distribution of dissolved and particulate
mercury in three Siberian estuaries and adjacent arctic coastal waters,
Water Air Soil Pollut.,
80, 653, 1995.
71.
Coquery, M., Cossa, D., and J. Sanjuan,
Speciation and sorption of mercury in two macro-
tidal estuaries,
Mar. Chem.,
58, 213, 1997.
72.
Cossa, D. and J. Noel
, Concentrations of mercury in near-shore surface waters of the Bay of
Biscay and in the Gironde estuary,
Mar. Chem.,
20, 389, 1987.
130348.pgs
279
7/12/01, 1:29 PM
ELECTRONIC FILING, RECEIVED, CLERK'S OFFICE, AUGUST 14, 2006
280
73.
Cossa, D. and J. M. Martin
, Mercury in the Rhone delta and adjacent marine areas,
Mar.
Chem.,
36, 291, 1991.
74.
Cossa, D., Mason, R. P., and W. F. Fitzgerald
, Chemical speciation of mercury in a
meromictic lake.
In: Mercury Pollution — Integration and Synthesis,
C. J. Watras and J. W.
Huckabee, Eds. Lewis Publishers, Boca Raton, FL, 1994, 57-67.
75.
Cossa, D., Martin, J.-M., and J. Sanjuan,
Dimethylmercury formation in the Alboran Sea,
Marine Poll. Bull.,
28, 381, 1994.
76.
Cossa, D., Sanjuan, J., and J. Noel
, Mercury transport in waters of the Strait of Dover,
Marine Poll. Bull.,
28, 385, 1994.
77.
Cossa, D., Martin, J. M., Takayanagi, K., and J. Sanjuan
, The distribution and cycling of
mercury species in the western Mediterranean,
Deep-Sea Res. Part II-Top. Stud. Oceanogr.,
44, 721, 1997.
78.
Cossa, D. and C. Gobeil,
Mercury speciation in the Lower St. Lawrence Estuary,
Can. J. Fish.
Aquat. Sci.
57, 138, 2000.
79.
Costa, M. and P. S. Liss,
Photoreduction of mercury in sea water and its possible implications
for Hg-0 air-sea fluxes,
Marine Chem.,
68, 87, 1999.
80.
Costa, M. and P. Liss,
Photoreduction and evolution of mercury from seawater,
Sci. Total
Environ.,
261, 125, 2000.
81.
Covelli, S. Faganeli, J. Horvat, M., and Brambati
A Porewater distribution and benthic flux
measurements of mercury and methylmercury in the Gulf of Trieste (northern Adriatic Sea),
Estuar. Coast. Shelf Sci.,
48, 415, 1999.
82.
Craig, P. J.,
Organomercury compounds in the environment, in:
Organometallic Compounds in the
Environment: Principles and Reactions
. Craig P.J., Ed., Longman, Harlow, 1986, chap. 2, 65-110.
83.
Craig, P. J.
, Chemical species in industrial discharges and effluents, In:
The importance of
chemical speciation in environmental processes
, Report of the Dahlem Workshop, Berlin 1984
Sept 2-7, Bernhard M., Brinckman F.E. and P.J. Sadler, Eds. Springer, 1986, 447–464.
84.
Craig, P. J. and Bartlett, P. D.,
The role of hydrogen sulphide in environmental transport of
mercury,
Nature,
275, 635, 1978.
85.
Craig, P. J. and Moreton, P. A.,
Total mercury, methyl mercury and sulphide in river carron
sediments,
Mar. Pollut. Bull.
14, 408, 1983.
86.
Craig, P. J. and Moreton, P. A.,
The role of sulphide in the formation of dimethyl mercury
in river and estuary sediments,
Mar. Pollut. Bull.,
15, 406, 1984.
87.
Craig, P. J. and Moreton, P. A.,
The role of speciation in mercury methylation in sediments
and water,
Environ. Pollut. Ser. B,
10, 141, 1985.
88.
Cutter, G. A. and Krahforst, C. F.,
Sulfide in surface waters of the Western Atlantic Ocean,
Geophys. Res. Lett.,
15, 1393, 1988.
89.
Demagalhaes, M. E. A. and M. Tubino
, A possible path for mercury in biological systems
— the oxidation of metallic mercury by molecular oxygen in aqueous solutions,
Sci. Total
Environ.,
170, 229, 1995.
90.
DeSimone, R. E.,
Methylation of mercury by common nuclear magnetic resonance reference
compounds,
Chem. Commun.,
13, 780, 1972.
91.
DeSimone, R. E., Penley, M. W., Charbonneau, L., Smith, S. G., Wood, J. M., Hill, H. A.
O., Pratt, J. M., Ridsdale, S., and Williams, R. J. P.,
The kinetics and mechanisms of
cobalamin-dependent methyl and ethyl transfer to mercuric ion,
Biochim. Biophys. Acta,
304,
851, 1973.
92.
Devereux, R., Winfrey, M. R., Winfrey, J., and D. A. Stahl,
Depth profile of sulfate-
reducing bacterial ribosomal RNA and mercury methylation in an estuarine sediment.
FEMS
Microbiol. Ecol.,
20, 23, 1996.
93.
Driscoll, C. T., Blette, V., Yan, C., Schofield, C. L., and Munson, R.,
The role of dissolved
organic carbon in the chemistry and bioavailability of mercury in remote Adirondack lakes,
Water Air Soil Pollut.
80, 499, 1995.
130348.pgs
280
7/12/01, 1:29 PM
ELECTRONIC FILING, RECEIVED, CLERK'S OFFICE, AUGUST 14, 2006
281
94.
Duarte, A. C., Pereira, M. E., Oliveira, J. P., and Hall, A.,
Mercury desorption from
contaminated sediments,
Water Air Soil Pollut.,
56, 77, 1991.
95.
Dyrssen, D. and Wedborg, M.,
The sulphur-mercury(II) system in natural waters,
Water Air
Soil Pollut.,
56, 507, 1991.
96.
Ebinghaus, R., Wilken, R.D., and Gisder, P.,
Investigations on the formation of
monomethylmercury (II) in the Elbe,
Vom Wasser,
82, 19, 1994.
97.
Fabbri, D., Felisatti, O., Lombardo, M., Trombini, C., and I. Vassura,
The Lagoon of
Ravenna (Italy): Characterisation of mercury-contaminated sediments,
Sci. Total Environ.,
213, 121, 1998.
98.
Fagerström, T. and Jernelöv, A.
, Formation of methylmercury from pure mercuric sulfide
in aerobic organic sediment,
Water Res
., 5, 121, 1971.
99.
Fagerström, T. and Jernelöv, A.,
Some aspects of the quantitative ecology of mercury,
Water
Res
., 6, 1193, 1972.
100.
Falter, R. and Wilken, R.D.,
Isotope experiments for the determination of abiotic mercury
methylation potential of a River Rhine sediment,
Vom Wasser,
90, 217, 1998.
101.
FDA
, Compliance Policy Guide 1984, Food and Drug Administration, Washington DC, sec.
7108.07, 1984.
102.
Filipelli, M. and Baldi, F.,
Alkylation of ionic mercury to methyl mercury and dimethyl
mercury by methylcobalamine: simultaneous determination by purge and trap GC in line with
FTIR,
Appl. Organomet. Chem
. 7, 487, 1993.
103.
Fitzgerald, W. F., Mason, R. P., and G. M. Vandal,
Atmospheric cycling and air-water
exchange of mercury over midcontinental lacustrine regions,
Water Air Soil Pollut.,
56, 745,
1991.
104.
Fitzgerald, W. F., Mason, R. P., Vandal, G. M., and F. Dulac,
Air-water cycling of mercury
in lakes. In:
Mercury Pollution — Integration and Synthesis,
C. J. Watras and J. W. Huckabee,
Eds. Lewis Publishers, Boca Raton, FL, 1994, 203–220.
105.
Fitzgerald, W. F. and R. P. Mason,
The global mercury cycle: oceanic and anthropogenic
aspects.
in: Global and Regional Mercury Cycles: Sources, Fluxes and Mass Balances
. W.
Baeyens, R. Ebinghaus and O. Vasiliev, Eds. Kluwer Academic Publishers, Dordrecht, 1996,
85–108.
106.
Fitzgerald, W. F. and R. P. Mason,
Biogeochemical Cycling of Mercury in the Marine
Environment. In:
Metal Ions in Biological Systems. Vol. 34: Mercury and its Effect on
Environment and Biology,
A. Sigel and H. Sigel, Eds., Marcel Dekker Inc., New York, 1997,
chap. 3, 53-111.
107.
Fjeld, E. and Rognerud, S.,
Use of path-analysis to investigate mercury accumulation in
brown trout (salmo trutta) in Norway and the influence of environmental factors,
Can. J. Fish.
Aquat. Sci
., 50, 1158, 1993.
108.
Francesconi, K. A., Lenanton, R. C. J., Caputi, N., and S. Jones,
Long-term study of
mercury concentrations in fish following cessation of a mercury-containing discharge.
Marine
Environ. Res.,
43, 27, 1997.
109.
Frimmel, F.
, Remobilization of mercury: experimental models and their relation to natural
conditions,
Z. Wasser Abwasser Forsch.,
9, 170, 1976.
110.
Fujiki, M. and Tajima, S.,
The pollution of Minamata Bay by mercury,
Water Sci. Technol
.,
25, 133, 1992.
111.
Furukawa, K., Suzuki, T., and Tonomura, K
., Decomposition of organic mercurial com-
pounds by mercury-resistant bacteria,
Agric. Biol. Chem.,
33, 128, 1969.
112.
Furutani, A. and Rudd, J. W. M.
, Measurement of mercury methylation in lake water and
sediment samples,
Appl. Environ. Microbiol.,
40, 770, 1980.
113.
Furutani, A., Rudd, J. W. M., and Kelly, C. A.
, A method for measuring the response of
sediment microbial communities to environmental perturbation,
Can. J. Microbiol.
, 30, 1408,
1984.
130348.pgs
281
7/12/01, 1:29 PM
ELECTRONIC FILING, RECEIVED, CLERK'S OFFICE, AUGUST 14, 2006
282
114.
Gagnon, C., Pelletier, E., Mucci, A., and W. F. Fitzgerald
, Diagenetic behaviour of
methylmercury in organic-rich coastal sediments.
Limnol. Oceanogr.
41, 428, 1996.
115.
Gagnon, C., Pelletier, E., and A. Mucci
, Behaviour of anthropogenic mercury in coastal
marine sediments.
Marine Chem.
59, 159, 1997.
116.
Gambrell, R. P., Khalid, R. A., and Patrick, W. H. Jr.,
Chemical availability of mercury,
lead and zinc in Mobile Bay sediment suspensions as affected by pH and oxidation reduction
conditions,
Environ. Sci. Technol
., 14, 431, 1980.
117.
Gardner, L. R.,
Organic vs. inorganic trace metal complexes in sulfidic marine waters.
Speculative calculations based on available stability constants,
Geochim. Cosmochim. Acta,
38, 1297, 1974.
118.
Gavis, J. and Fergusson, J. F.
, The cycling of mercury through the environment,
Water Res
., 6, 989, 1972.
119.
Gill, G. A., Bloom, N. S., Cappellino, S., Driscoll, C. T., Dobbs, C., McShea, L., Mason,
R., and J. W. M. Rudd
, Sediment-water fluxes of mercury in Lavaca Bay, Texas,
Environ.
Sci. Technol.,
33, 663, 1999.
120.
Gillespie, D. C. and Scott, D. P.,
Mobilization of mercuric sulfide from sediment into fish
under aerobic conditions,
J. Fish Res. Board Can
., 28, 1807, 1971.
121.
Gillespie, D. C.
, Mobilization of mercury from sediments into guppies,
J. Fish. Res. Board
Can
., 29, 1035, 1972.
122.
Gilmour, C. C. and Henry, E. A.
, Mercury methylation in aquatic systems affected by acid
deposition,
Environ. Pollut.
71, 131, 1991.
123.
Gilmour, C. C., Henry, E. A., and Mitchell, R
., Sulfate stimulation of mercury methylation
in freshwater sediments,
Environ. Sci. Technol.,
26, 2281, 1992.
124.
Gilmour, C. C. and N. S. Bloom,
A case study of mercury and methylmercury dynamics in
a Hg-contaminated municipal waste-water treatment plant.
Water Air Soil Pollut.,
80, 799,
1995.
125.
Gilmour, C. C., Riedel, G. S., Ederington, M. C., Bell, J. T., Benoit, J. M., Gill, G. A., and
Stordal, M. C.,
Methylmercury concentrations and production rates across a trophic gradient
in the northern Everglades,
Biogeochemistry,
40, 327, 1998.
126.
Gobeil, C. and D. Cossa,
Mercury in sediments and sediment pore water in the Laurentian
Trough,
Can. J. Fish. Aquat. Sci.
, 50, 1794, 1993.
127.
Gobeil, C., Macdonald, R. W., and J. N. Smith
, Mercury profiles in sediments of the Arctic
Ocean basins,
Environ. Sci. Technol.,
33, 4194, 1999.
128.
Grieb, T. M., Driscoll, C. T., Gloss, S. P., Schofield, C. L., Bowie, G. L., and Porcella, D.
B.
, Factors affecting mercury accumulation in fish in the upper Michigan peninsula,
Environ.
Toxicol. Chem
., 9, 919, 1990.
129.
Guentzel, J.L., Powell, R. T., Landing, W. M., and R. P. Mason,
Mercury associated with
colloidal material in an estuarine and an open-ocean environment,
Mar. Chem.,
55, 177, 1996.
130.
Guimarães, J. R. D., Meili, M., Hylander, L. D., Silva, E. D. E., Roulet, M., Mauro, J. B.
N., and R. A. de Lemos,
Mercury net methylation in five tropical flood plain regions of Brazil:
high in the root zone of floating macrophyte mats but low in surface sediments and flooded
soils,
Sci. Total Environ.,
261, 99, 2000.
131.
Gutknecht, J.
, Inorganic mercury (Hg
2+
) transport through lipid bilayer membranes,
J.
Membrane Biol.,
61, 61, 1981.
132.
Gutknecht, J.,
Heavy metal (thallium, cadmium and mercury) transport through lipid bilayer
membranes,
Biophysical J.,
41, 183a, 1983.
133.
Hadjispyrou, S. A., Anagnostopoulos, A., Nicholson, K., Nimfopoulos, M. K., and
Michailidis, K. M.,
Correlation of the methylating capacity of river and marine sediments to
their organic sediment index,
Environ. Geochem. and Health,
20, 19, 1998.
134.
Hahne, H. C. H. and Kroontje, W.,
Significance of pH and chloride concentration on
behaviour of heavy metal pollutants: mercury (II), cadmium (II), zinc (II), and lead (II),
J.
Environ. Qual
., 2, 444, 1973.
130348.pgs
282
7/12/01, 1:29 PM
ELECTRONIC FILING, RECEIVED, CLERK'S OFFICE, AUGUST 14, 2006
283
135.
Håkanson, L., Nilsson, A., and Andersson, T.,
Mercury in fish in Swedish lakes,
Environ.
Pollut
., 49, 145, 1988.
136.
Hamasaki, T., Nagase, H., Yoshioka, Y., and Sato, T.
, Formation, distribution and ecotoxicity
of methylmetals of tin, mercury, and arsenic in the environment,
Crit. Rev. Environ. Sci.
Technol.,
25, 45, 1995.
137.
Hamdy, M. K. and Noyes, O. R.,
Formation of methylmercury by bacteria,
Appl. Microbiol.,
30, 424, 1975.
138.
Hansen, C. L., Zwolinski, G., Martin, D., and Williams, J. W.
, Bacterial removal of
mercury from sewage,
Biotechnol. Bioeng.,
26, 1330, 1984.
139.
Harland, B. J., Taylor, D., and K. Wither,
The distribution of mercury and other trace metals
in the sediments of the Mersey estuary over 25 years 1974–1998.
Sci. Total Environ.
253, 45,
2000.
140.
Heaven, S., Ilyushchenko, M. A., Tanton, T. W., Ullrich, S. M., and Yanin, E. P.,
Mercury
in the River Nura and its floodplain, Central Kazakhstan. I. River sediments and water,
Sci.
Total Environ.,
260, 35, 2000.
141.
Hines, M. E., Horvat, M., Faganeli, J., Bonzongo, J. C. J., Barkay, T., Major, E. B., Scott,
K. J., Bailey, E. A., Warwick, J. J., and W. B. Lyons,
Mercury biogeochemistry in the Idrija
River, Slovenia, from above the mine into the Gulf of Trieste,
Environ. Res.,
83, 129, 2000.
142.
Hintelmann, H. and Wilken, R. D.,
Levels of total mercury and methylmercury compounds
in sediments of the polluted Elbe River: influence of seasonally and spatially varying environ-
mental factors,
Sci. Total Environ.,
166, 1, 1995.
143.
Hintelmann, H., Welbourn, P. M., and Evans, R. D.,
Binding of methylmercury compounds
by humic and fulvic acids,
Water Air Soil Pollut.,
80, 1031, 1995.
144.
Hintelmann, H., Falter, R., Ilgen, G., and Evans, R. D.,
Determination of artifactual
formation of monomethylmercury (CH
3
Hg
+
) in environmental samples using stable Hg
2+
isotopes with ICP-MS detection: Calculation of contents applying species specific isotope
addition,
Fresenius J. Anal. Chem
., 358, 363, 1997.
145.
Hobman J. L. and N. L. Brown,
Bacterial Mercury-Resistance Genes. In:
Metal Ions in
Biological Systems
.
Vol. 34: Mercury and its Effect on Environment and Biology
. A. Sigel and
H. Sigel, Eds., Marcel Dekker Inc., New York, 1997, chap. 19, 527–568.
146.
Horvat, M.
, Mercury analysis and speciation in environmental samples.
in: Global and
Regional Mercury Cycles: Sources, Fluxes and Mass Balances.
W. Baeyens, R. Ebinghaus and
O. Vasiliev, Eds. Kluwer Academic Publishers, Dordrecht, 1996, 1–31.
147.
Hosokawa, Y.,
Remediation work for mercury contaminated bay — experiences of Minamata
Bay Project, Japan,
Water Sci. Technol
., 28, 339, 1993.
148.
Hudson, R. J. M., Gherini, S. A., Watras, C. J., and D. B. Porcella,
Modeling the
biogeochemical cycle of mercury in lakes: The Mercury Cycling Model (MCM) and its
application to the MTL study lakes. In:
Mercury Pollution — Integration and Synthesis,
C. J.
Watras and J. W. Huckabee, Eds. Lewis Publishers, Boca Raton, FL, 1994, 473-523.
149.
Hurley, J. P., Watras, C. J., and N. S. Bloom
, Mercury cycling in a northern Wisconsin
seepage lake — The role of particulate matter in vertical transport,
Water Air Soil Pollut.
, 56,
543, 1991.
150.
Hurley, J. P., Watras, C. J., and N. S. Bloom
, Distribution and flux of particulate mercury
in four stratified seepage lakes. In:
Mercury Pollution — Integration and Synthesis,
C. J.
Watras and J. W. Huckabee, Eds. Lewis Publishers, Boca Raton, FL, 1994, 69-82.
151.
Hurley, J. P., Krabbenhoft, D. P., Babiarz, C. L., and Andren, A. W.
, Cycling of mercury
across the sediment-water interface in seepage lakes,
Advances in Chemistry Series,
237, 425,
1994.
152.
Hurley, J. P., Benoit, J. M., Babiarz, C. l., Shafer, M. M., Andren, A. W., Sullivan, J. R.,
Hammond, R., and D. A. Webb,
Influences of watershed characteristics on mercury levels
in Wisconsin rivers,
Environ. Sci. Technol.,
29, 1867, 1995.
130348.pgs
283
7/12/01, 1:29 PM
ELECTRONIC FILING, RECEIVED, CLERK'S OFFICE, AUGUST 14, 2006
284
153.
Ikingura, J. R. and Akagi, H.,
Methylmercury production and distribution in aquatic sys-
tems,
Sci. Total Environ
., 234, 109, 1999.
154.
Imura, N., Sukegawa, E., Pan, S., Nagao, K., Kim, J., Kwan, T., and Ukita, T
., Chemical
methylation of inorganic mercury with methylcobalamin, a vitamin B12 analog,
Science,
172,
1248, 1971.
155.
Ingvorsen, K., Zeikus, J. G., and Brock, T. D.,
Dynamics of bacterial sulfate reduction in
a eutrophic lake,
Appl. Environ. Microbiol
. 42, 1029, 1981.
156.
Jackson, T. A., Kipphut, G., Hesslein, R. H., and Schindler, D. W.,
Experimental study of
trace metal chemistry in soft-water lakes at different pH levels,
Can. J. Fish. Aquat. Sci.,
37,
387, 1980.
157.
Jackson, T. A., Parks, J. W., Jones, P. D., Woychuk, R. N., Sutton, J. A., and Hollinger,
J. D.,
Dissolved and suspended mercury species in the Wabigoon River (Ontario, Canada):
seasonal and regional variations,
Hydrobiologia,
92, 473, 1982.
158.
Jackson, T. A.
, Methyl mercury levels in a polluted prairie river — lake system: seasonal and
site-specific variations, and the dominant influence of trophic conditions,
Can. J. Fish. Aquat.
Sci
., 43, 1873, 1986.
159.
Jackson, T. A.
, The mercury problem in recently formed reservoirs of Northern Manitoba
(Canada) — effects of impoundment and other factors on the production of methyl mercury
by microorganisms in sediments,
Can. J. Fish. Aquat. Sci
., 45, 97, 1988.
160.
Jackson, T. A.
, The influence of clay minerals, oxides, and humic matter on the methylation
and demethylation of mercury by microorganisms in freshwater sediments,
Appl. Organomet.
Chem
., 3, 1, 1989.
161.
Jackson, T. A.,
Biological and environmental control of mercury accumulation by fish in
lakes and reservoirs of Northern Manitoba, Canada,
Can. J. Fish. Aquat. Sci.,
48, 2449, 1991.
162.
Jacobs, L. W. and Keeney, D. R.,
Methylmercury formation in mercury-treated river sedi-
ments during in situ equilibration,
J. Environ. Qual.,
3, 121, 1974.
163.
Jay, J. A., Morel, F. M. M., and H. F. Hemond,
Mercury speciation in the presence of
polysulfides,
Environ. Sci. Technol.,
34, 2196, 2000.
164.
Jeffries, T. W.
, The microbiology of mercury, in:
Progress in industrial microbiology,
ed.
M.J. Bull, Elsevier/North Holland Press, New York, 1982, 23-75.
165.
Jensen, S. and Jernelöv, A.,
Biological methylation of mercury in aquatic organisms,
Nature,
223, 753, 1969.
166.
Jensen, S. and Jernelöv, A.,
Behaviour of mercury in the environment,
Int. At. Energy Agency
Tech. Rep. Ser.
No. 137, chap. 4, 43-47, 1972.
167.
Jernelöv, A.,
Laboratorieförsök rörande kvicksilvrets omvandling mellan olika
förekomstformer,
Vatten,
24, 456, 1968.
168.
Jernelöv, A.,
Conversion of mercury compounds, in
: Chemical fallout,
M.W. Miller and G.G.
Berg, Eds. C.C Thomas, Springfield, Illinois, USA, 1969, 68-73.
169.
Jernelöv, A.,
Release of methylmercury from sediments with layers containing inorganic
mercury at different depths,
Limnology and Oceanography,
15, 958, 1970.
170.
Jernelöv, A. and Åséll, B.,
The feasibility of restoring mercury-contaminated waters,
in:
Heavy metals in the aquatic environment,
Proceedings of the international conference held in
Nashville, Tennessee, Dec 1973, P.A. Krenkel, Ed. Pergamon Press, Oxford, 1975, 299-309.
171.
Jewett, K. L., Brinckman, F. E., and Bellama, J. M.,
Chemical factors influencing metal
alkylation in water, In:
Marine chemistry in the coastal environment
, Church T. M., Ed.
American Chemical Society, Washington D.C., 1975, 304–318.
172.
Jorgensen, B. B. and Bak, F.,
Pathways and microbiology of thiosulfate transformations and
sulfate reduction in a marine sediment (Kattegat, Denmark),
Appl. Environ. Microbiol
., 57,
846, 1991.
173.
Kelly, C. A. and Rudd, J. W. M.
, Epilimnetic sulfate reduction and its relationship to lake
acidification,
Biogeochemistry
, 1, 63, 1984.
130348.pgs
284
7/12/01, 1:29 PM
ELECTRONIC FILING, RECEIVED, CLERK'S OFFICE, AUGUST 14, 2006
285
174.
Kelly, C. A., Rudd, J. W. M., Louis, V. L., and A. Heyes
, Is total mercury concentration a good
predictor of methyl mercury concentration in aquatic systems,
Water Air Soil Pollut.,
80, 715, 1995.
175.
Kelly, C. A., Rudd, J. W. M., Bodaly, R. A., Roulet, N. P., StLouis, V. L., Heyes, A.,
Moore, T. R., Schiff, S., Aravena, R., Scott, K. J., Dyck, B., Harris, R., Warner, B., and
Edwards, G.,
Increases in fluxes of greenhouse gases and methyl mercury following flooding
of an experimental reservoir,
Environ. Sci. Technol
., 31, 1334, 1997.
176.
Kim, J. P. and Fitzgerald, W. F.,
Sea-air partitioning of mercury in the equatorial Pacific
Ocean,
Science,
231, 1131, 1986.
177.
King, J. K., Saunders, F. M., Lee, R. F., and R. A. Jahnke,
Coupling mercury methylation
rates to sulfate reduction rates in marine sediments,
Environ. Toxicol. Chem.,
18, 1362, 1999.
178.
King, J. K., Kostka, J. E., Frischer, M. E., and F. M. Saunders,
Sulfate-reducing bacteria
methylate mercury at variable rates in pure culture and in marine sediments,
Appl. Environ.
Microbiol.,
66, 2430, 2000.
179.
Kitamura, S., Sumino, A., and Taina, N.,
Synthesis and decomposition of organic mercury
compounds by bacteria,
Jpn. J. Hyg.,
24, 76, 1969.
180.
Korthals, E. T. and Winfrey, M. R.,
Seasonal and spatial variations in mercury methylation
and demethylation in an oligotrophic lake,
Appl. Environ. Microbiol.,
53, 2397, 1987.
181.
Krabbenhoft, D. P., Hurley, J. P., Olson, M. L., and L. B. Cleckner,
Diel variability of mercury
phase and species distributions in the Florida Everglades,
Biogeochemistry,
40, 311, 1998.
182.
Kudo, A., Mortimer, D. C., and Hart, J. S.
, Factors influencing desorption of mercury from
bed sediments,
Can. J. Earth Sci
., 12, 1036, 1975.
183.
Kudo, A., Miller, D. R., Townsend, D. R., and Sayeed, H.,
Laboratory investigation of
mercury transport through bed sediment movements, In:
Environmental Biogeochemistry
, ed.
J.O. Nriagu, Ann Arbor Science, Michigan, 1976, chap. 31, 499-511.
184.
Kudo, A., Akagi, H., Mortimer, D. C., and Miller, D. R.
, Equilibrium concentrations of
methylmercury in Ottawa River sediments,
Nature,
270, 419, 1977.
185.
Kudo, A., Miller, D. R., Akagi, H., Mortimer, D. C., DeFreitas, A. S., Nagase, H.,
Townsend, D. R., and Warnock, R. G.,
The role of sediments on mercury transport (total-
and methyl-) in a river system,
Prog. Water Technol.,
10, 329, 1978.
186.
Kudo, A., Nagase, H., and Ose, Y.,
Proportion of methylmercury to the total amount of
mercury in river waters in Canada and Japan,
Water Res.,
16, 1011, 1982.
187.
Kudo, A.,
Natural and artificial mercury decontamination — Ottawa River and Minamata Bay
(Yatsushiro Sea),
Water Sci. Technol
., 26, 217, 1992.
188.
Landner, L.
, Biochemical model for the biological methylation of mercury suggested from
methylation studies
in vivo
with
Neurospora crassa
,
Nature,
230, 452, 1971.
189.
Langley, D. G.,
Mercury methylation in an aquatic environment,
J. Water Pollut. Control
Fed
., 45, 44, 1973.
190.
Laporte, J. M., Truchot, J. P., Ribeyre, F., and A. Boudou
, Combined effects of water pH
and salinity on the bioaccumulation of inorganic mercury and methylmercury in the shore crab
Carcinus maenas,
Marine Poll. Bull.,
34, 880, 1997.
191.
Lawson, N. M., Mason, R. P., and J.-M. Laporte,
The fate and transport of mercury,
methylmercury, and other trace metals in Chesapeake Bay Tributaries,
Water Res.,
35, 501,
2001.
192.
Lee, Y. H., Hultberg, H., and Andersson, I.,
Catalytic effect of various metal ions on the
methylation of mercury in the presence of humic substances,
Water Air Soil Pollut.,
25 391,
1985.
193.
Lee, Y. H. and Hultberg, H.,
Methylmercury in some Swedish surface waters,
Environ.
Toxicol. Chem.,
9, 833, 1990.
194.
Lee, Y. H., Bishop K. H., and J. Munthe,
Do concepts about catchment cycling of meth-
ylmercury and mercury in boreal catchments stand the test of time? Six years of atmospheric
inputs and runoff export at Svartberget, northern Sweden,
Sci. Total Environ.,
260, 11, 2000.
130348.pgs
285
7/12/01, 1:29 PM
ELECTRONIC FILING, RECEIVED, CLERK'S OFFICE, AUGUST 14, 2006
286
195.
Leermakers, M., Meuleman, C., and W. Baeyens,
Mercury speciation in the Scheldt
estuary,
Water Air Soil Pollut.,
80, 641, 1995.
196.
Leermakers, M., Meuleman, C., and W. Baeyens,
Mercury distribution and fluxes in Lake
Baikal.
in: Global and Regional Mercury Cycles: Sources, Fluxes and Mass Balances
. W.
Baeyens, R. Ebinghaus and O. Vasiliev, Eds. Kluwer Academic Publishers, Dordrecht, 1996,
p. 303-315.
197.
Lexmond, T. M., de Haan, F. A. M., and Frissel, M. J.,
On the methylation of inorganic
mercury and the decomposition of organo-mercury compounds — a review,
Neth. J. Agric.
Sci
., 24, 79, 1976.
198.
Lindberg, S. E. and Harriss, R. C.,
Mercury-organic matter associations in estuarine sedi-
ments and interstitial waters,
Environ. Sci. Technol.,
8, 459, 1974.
199.
Lindqvist, O., Jernelöv, A., Johansson, K., and Rohde, H.,
Mercury in the Swedish
Environment. Global and local sources, National Swedish Environmental Protection Board,
SNV Report PM 1816, 1984.
200.
Lindqvist, O
. (Ed.), Mercury in the Swedish Environment: Recent research on causes,
consequences and corrective methods,
Water Air Soil Pollut.,
55, 1, 1991.
201.
Lockwood, R. A. and Chen, K. Y.,
Adsorption of Hg(II) by hydrous manganese oxides,
Environ. Sci. Technol.,
7, 1028, 1973.
202.
Lövgren, L. and S. Sjöberg,
Equilibrium approaches to natural water systems — 7. Complex-
ation reactions of copper(II), cadmium(II) and mercury(II) with dissolved organic matter in a
concentrated bog water,
Water Res.,
23, 327, 1989.
203.
Lovley, D. R. and Klug, M. J.,
Sulfate reducers can outcompete methanogens at freshwater
sulfate concentrations,
Appl. Environ. Microbiol.,
45, 187, 1983.
204.
Lovley, D. R. and Phillips, E. J. P.,
Competitive mechanisms for inhibition of sulfate
reduction and methane production in the zone of ferric iron reduction in sediments,
Appl.
Environ. Microbiol.,
53, 2636, 1987.
205.
Lyon, B. F., Ambrose, R., Rice, G., and C. J. Maxwell,
Calculation of soil-water and
benthic-sediment partition coefficients for mercury,
Chemosphere,
35, 791, 1997.
206.
Lyons, W. B., Welch, K. A., and J. C. Bonzongo,
Mercury in aquatic systems in Antarctica,
Geophys. Res. Lett.,
26, 2235, 1999.
207.
Macalady, J. L., Mack, E. E., Nelson, D. C., and K. M. Scow,
Sediment microbial
community structure and mercury methylation in mercury-polluted Clear Lake, California.
Appl. Environ. Microbiol.,
66, 1479, 2000.
208.
Mantoura, R. F. C., Dickson, A., and J. P. Riley,
The complexation of metals with humic
materials in natural waters,
Estuarine Coastal Mar. Sci.,
6, 387, 1978.
209.
Marvin-Dipasquale M. C. and R. S. Oremland,
Bacterial methylmercury degradation in
Florida Everglades peat sediment,
Environ. Sci. Technol.
32, 2556, 1998.
210.
Mason, R. P. and W. F. Fitzgerald,
Alkylmercury species in the equatorial Pacific,
Nature,
347, 457, 1990.
211.
Mason, R. P. and Fitzgerald, W. F.,
Mercury speciation in open ocean waters,
Water Air Soil
Pollut.,
56, 779, 1991.
212.
Mason, R. P. and Fitzgerald, W. F.,
The distribution and biogeochemical cycling of mercury
in the equatorial Pacific Ocean,
Deep-Sea Res
., 40, 1897, 1993.
213.
Mason, R. P., Fitzgerald, W. F., Hurley, J., Hanson, A. K., Donaghay, P. L., and Sieburth,
J. M.,
Mercury biogeochemical cycling in a stratified estuary,
Limnol. Oceanogr.,
38, 1227,
1993.
214.
Mason, R. P., Fitzgerald, W. F., and Morel, F. M. M.,
The biogeochemical cycling of
elemental mercury — anthropogenic influences,
Geochim. Cosmochim. Acta,
58, 3191, 1994.
215.
Mason, R. P., J. O’Donnell, and W. F. Fitzgerald,
Elemental mercury cycling within the
mixed layer of the equatorial Pacific ocean, In:
Mercury Pollution — Integration and Synthe-
sis,
ed. C. J. Watras and J. W. Huckabee, Lewis Publishers, Boca Raton, FL, 1994, 83-97.
130348.pgs
286
7/12/01, 1:29 PM
ELECTRONIC FILING, RECEIVED, CLERK'S OFFICE, AUGUST 14, 2006
287
216.
Mason, R. P., Morel, F. M. M., and Hemond, H. F.,
The role of microorganisms in elemental
mercury formation in natural waters,
Water Air Soil Pollut.,
80, 775, 1995.
217.
Mason, R. P., Reinfelder, J. R., and F. M. M. Morel,
Bioaccumulation of mercury and
methylmercury,
Water Air Soil Pollut.,
80, 915, 1995.
218.
Mason, R. P. Rolfhus, K. R., and W. F. Fitzgerald,
Methylated and elemental mercury
cycling in surface and deep ocean waters of the North Atlantic,
Water Air Soil Pollut.,
80, 665,
1995.
219.
Mason, R. P., Reinfelder, J. R., and F. M. M. Morel,
Uptake, toxicity, and trophic transfer
of mercury in a coastal diatom,
Environ. Sci. Technol.,
30, 1835, 1996.
220.
Mason, R. P. and W. F. Fitzgerald,
Sources, sinks and biogeochemical cycling of mercury
in the ocean. In:
Global and Regional Mercury Cycles: Sources, Fluxes and Mass Balances.
W. Baeyens, R. Ebinghaus and O. Vasiliev, Eds. Kluwer Academic Publishers, Dordrecht,
1996, 249–272.
221.
Mason, R. P. Rolfhus, K. R., and W. F. Fitzgerald,
Mercury in the North Atlantic,
Marine
Chem.,
61, 37, 1998.
222.
Mason, R. P. and K. A. Sullivan,
Mercury and methylmercury transport through an urban
watershed,
Water Res.,
32, 321, 1998.
223.
Mason, R. P. and K. A. Sullivan,
The distribution and speciation of mercury in the South and
equatorial Atlantic,
Deep-Sea Res. Part II-Top. Stud. Oceanogr.,
46, 937, 1999.
224.
Mason, R. P., Lawson, N.M., Lawrence, A. L., Leaner, J. J., Lee, J. G., and G. R. Sheu,
Mercury in the Chesapeake Bay,
Mar. Chem.,
65, 77, 1999.
225.
Mason, R. P. and A. L. Lawrence,
Concentration, distribution, and bioavailability of mer-
cury and methylmercury in sediments of Baltimore Harbor and Chesapeake Bay, Maryland,
USA,
Environ. Toxicol. Chem.,
18, 2438, 1999.
226.
Mason, R. P., J. M. Laporte, and S., andres,
Factors controlling the bioaccumulation of
mercury, methylmercury, arsenic, selenium, and cadmium by freshwater invertebrates and
fish,
Arch. Environ. Contam. Toxicol.,
38, 283, 2000.
227.
Matilainen, T.,
Involvement of bacteria in methylmercury formation in anaerobic lake waters,
Water, Air, Soil Pollut
, 80, 757, 1995.
228.
Matilainen, T. and Verta, M.,
Mercury methylation and demethylation in aerobic surface
waters,
Can. J. Fish. Aquat. Sci
., 52, 1597, 1995.
229.
Matilainen, T., Verta, M., Niemi, M., and Uusirauva, A.,
Specific rates of net methylmer-
cury production in lake sediments,
Water Air Soil Pollut.,
56, 595, 1991.
230.
Maurice-Bourgoin, L., Quiroga, I., Chincheros, J., and P. Courau,
Mercury distribution
in waters and fishes of the upper Madeira rivers and mercury exposure in riparian Amazonian
populations,
Sci. Total Environ.,
260, 73, 2000.
231.
Mauro, J. B. N., Guimarães, J. R. D., and R. Melamed
, Mercury methylation in a tropical
macrophyte: Influence of abiotic parameters,
Appl. Organomet. Chem.,
13, 631, 1999.
232.
Meili, M., Iverfeldt, Å., and Håkanson, L.,
Mercury in the surface water of Swedish forest
lakes – concentrations, speciation and controlling factors,
Water Air Soil Pollut.,
56, 439,
1991.
233.
Meili, M.,
Mercury in Lakes and Rivers. In:
Metal Ions in Biological Systems. Vol. 34:
Mercury and its Effect on Environment and Biology.
A. Sigel and H. Sigel, Eds., Marcel
Dekker Inc., New York, 1997, chp. 2, 21-51.
234.
Melamed, R., Boas, R. C. V., Goncalves, C. O., and Paiva, E. C.
, Mechanisms of physico-
chemical interaction of mercury with river sediments from a gold mining region in Brazil:
relative mobility of mercury species,
J. Geochem. Explor
., 58, 119, 1997.
235.
Melamed, R., Trigueiro, F. E., and R. C. V. Boas,
The effect of humic acid on mercury
solubility and complexation,
Appl. Organomet. Chem.,
14, 473, 2000.
236.
Mierle, G. and R. Ingram
, The role of humic substances in the mobilization of mercury from
watersheds.
Water Air Soil. Pollut.,
56, 349, 1991.
130348.pgs
287
7/12/01, 1:29 PM
ELECTRONIC FILING, RECEIVED, CLERK'S OFFICE, AUGUST 14, 2006
288
237.
Miller, D. R.,
The role of humic acids in the uptake and release of mercury by freshwater
sediments,
Verb. Internat. Verein Limnol.,
19, 2082, 1975.
238.
Miller, D. R. and Akagi, H.
, pH affects mercury distribution not methylation,
Ecotoxicology
and Environmental Safety,
3, 36, 1979.
239.
Miskimmin, B. M.
,
Effect of natural levels of dissolved organic carbon (DOC) on methyl mercury
formation and sediment-water partitioning,
Bull. Environ. Contam. Toxicol
., 47, 743, 1991.
240.
Miskimmin, B. M., Rudd, J. W. M., and Kelly, C. A.,
Influence of dissolved organic carbon,
pH, and microbial respiration rates on mercury methylation and demethylation in lake water,
Can. J. Fish. Aquat. Sci
., 49, 17, 1992.
241.
Montgomery, S., Lucotte, M., and I. Rheault,
Temporal and spatial influences of flooding
on dissolved mercury in boreal reservoirs,
Sci. Total Environ.,
260, 147, 2000.
242.
Morel, F., McDuff, R. E., and Morgan, J. J.,
Interaction and chemostasis in aquatic chemical
systems: role of pH, pE, solubility and complexation, In:
Trace Metals and Metal-Organic
Interactions in Natural Waters
, P.C. Singer, Ed., Ann Arbor Sci. Publ. Inc., Ann Arbor, Mich.
1973, 157-200.
243.
Morel, F. M. M., Kraepiel, A. M. L., and M. Amyot,
The chemical cycle and bioaccumulation
of mercury,
Annu. Rev. Ecol. Syst.,
29, 543, 1998.
244.
Morrison, K. A. and Therien, N.,
Experimental evaluation of mercury release from flooded
vegetation and soils
, Water Air Soil Pollut.,
56, 607, 1991.
245.
Myers, G. J., Davidson, P. W., Cox, C., Shamlaye, C., Cernichiari, E., and T. W.
Clarkson,
Twenty-seven years studying the human neurotoxicity of methylmercury exposure,
Environ. Res.,
83, 275, 2000.
246.
Nagase, H., Ose, Y., Sato, T., and Ishikawa, T.,
Methylation of mercury by humic sub-
stances in an aquatic environment,
Sci. Tot. Environ.,
24, 133, 1982.
247.
Nagase, H., Ose, Y., Sato, T., and Ishikawa, T.
, Mercury methylation by compounds in
humic material,
Sci. Tot. Env
., 32, 147, 1984.
248.
Nagase, H., Ose, Y., Sato, T., and Yamada, M.
, Mercury methylation by ash from refuse
incineration,
Sci. Tot. Env
., 53, 133, 1986.
249.
Nagase, H., Ose, Y., and Sato, T.,
Possible methylation of inorganic mercury by silicones in
the environment,
Sci. Tot. Env
., 73, 29, 1988.
250.
Nelson, J. D., Blair, W., Brinckman, F. E., Colwell, R. R., and Iverson, W. P.
, Biodegradation
of phenylmercuric acetate by mercury resistant bacteria,
Appl. Microbiol.,
26, 321, 1973.
251.
Olson, B. H. and Cooper, R. C.
, In situ methylation of mercury by estuarine sediment,
Nature,
252, 682, 1974.
252.
Olson, B. H. and Cooper, R. C
., Comparison of aerobic and anaerobic methylation of
mercuric chloride by San Francisco Bay sediments,
Water Res.,
10, 113, 1976.
253.
Olson, B.H
., In situ methylation of mercury by estuarine sediments, In:
Microbial Ecology,
M.W. Loutit and J.A.R. Eds. Miles, Springer, 1978.
254.
Oremland, R. S., Culbertson, C. W., and Winfrey, M. R
., Methylmercury decomposition
in sediments and bacterial cultures — involvement of methanogens and sulfate reducers in
oxidative demethylation,
Appl. Environ. Microbiol
., 57, 130, 1991.
255.
Oremland, R. S., Miller, L. G., Dowdle, P., Connell T., and R. Barkay,
Methylmercury
oxidative degradation potentials in contaminated and pristine sediments of the Carson River,
Nevada,
Appl. Environ. Microbiol.
61, 2745, 1995.
256.
Pak, K. R. and R. Bartha,
Mercury methylation and demethylation in anoxic lake sediments
and by strictly anaerobic bacteria,
Appl. Environ. Microbiol.,
64, 1013, 1998.
257.
Paquette, K. E. and G. R. Helz,
Inorganic speciation of mercury in sulfidic waters: The
importance of zero-valent sulfur,
Environ. Sci. Technol.,
31, 2148, 1997.
258.
Parkman, H., Östlund, P., Samuelsson, M. O., and Iverfeldt, Å.
, Methylmercury in a
permanently stratified fjord. In:
Mercury Pollution – Integration and Synthesis
, C.J. Watras
and J.W. Huckabee, Eds. Lewis Publishers, Boca Raton, 1994, chap. I/9, 107-118.
130348.pgs
288
7/12/01, 1:29 PM
ELECTRONIC FILING, RECEIVED, CLERK'S OFFICE, AUGUST 14, 2006
289
259.
Pongratz, R. and K. G. Heumann,
Determination of concentration profiles of methyl
mercury compounds in surface waters of polar and other remote oceans by GC-AFD,
Int. J.
Environ. Anal. Chem.,
71, 41, 1998.
260.
Pongratz, R. and K. G. Heumann,
Production of methylated mercury, lead, and cadmium by
marine bacteria as a significant natural source for atmospheric heavy metals in polar regions,
Chemosphere,
39, 89, 1999.
261.
Porvari, P. and Verta, M.,
Methylmercury production in flooded soils — a laboratory study,
Water Air Soil Pollut.,
80, 765, 1995.
262.
Quemerais, B., Cossa, D., Rondeau, B., Pham, T. T., and B. Fortin,
Mercury distribution
in relation to iron and manganese in the waters of the St. Lawrence river,
Sci. Total Environ.
213, 193, 1998.
263.
Quevauviller, P., Donard, O. F. X., Wasserman, J. C., Martin, F. M., and J. Schneider,
Occurrence of methylated tin and dimethyl mercury-compounds in a mangrove core from
Sepetiba Bay, Brazil,
Appl. Organomet. Chem.,
6, 221, 1992.
264.
Rada, R.G. and Findley, J.E.,
Environmental fate of mercury discharged into the upper
Wisconsin River,
Water Air Soil Pollut.,
29, 57, 1986.
265.
Rada, R. G., Wiener, J. G., Winfrey, M. R., and D. E. Powell,
Recent increases in
atmospheric deposition of mercury to north-central Wisconsin lakes inferred from sediment
analyses,
Arch. Envir. Contam. Toxicol.,
18, 175, 1989.
266.
Ramamoorthy, S., Cheng, T. C., and Kushner, D. J.
, Effect of microbial life stages on the
fate of methylmercury in natural waters,
Bull. Environ. Contam. Toxicol
., 29, 167, 1982.
267.
Ramlal, P. S., Rudd, J. W. M., Furutani, A., and Xun, L.,
The effect of pH on methyl mercury
production and decomposition in lake sediments,
Can. J. Fish. Aquat. Sci.,
42, 685, 1985.
268.
Ramlal, P. S., Rudd, J. W. M., and Hecky, R. E.,
Methods for measuring specific rates of
mercury methylation and degradation and their use in determining factors controlling net rates
of mercury methylation,
Appl. Environ. Microbiol.,
51, 110, 1986.
269.
Ramlal, P. S., Kelly, C. A., Rudd, J. W. M., and Furutani, A.,
Sites of methyl mercury
production in remote Canadian Shield lakes,
Can. J. Fish. Aquat. Sci
., 50, 972, 1993.
270.
Ravichandran, M., Aiken, G. R., Reddy, M. M., and J. N. Ryan,
Enhanced dissolution of
cinnabar (
mercuric sulfide
) by dissolved organic matter isolated from the Florida Everglades,
Environ. Sci. Technol.
32, 3305, 1998.
271.
Ravichandran, M., Aiken, G. R., Ryan, J. N., and M. M. Reddy,
Inhibition of precipitation
and aggregation of metacinnabar (
mercuric sulfide
) by dissolved organic matter from the
Florida Everglades,
Environ. Sci. Technol.
33, 1418, 1999.
272.
Regnell, O. and Tunlid, A.,
Laboratory study of chemical speciation of mercury in lake sediment
and water under aerobic and anaerobic conditions,
Appl. Environ. Microbiol.,
57, 789, 1991.
273.
Regnell, O., Tunlid, A., Ewald, G., and Sangfors, O.,
Methyl mercury production in fresh-
water microcosms affected by dissolved-oxygen levels — role of cobalamin and microbial
community composition,
Can. J. Fish. Aquat. Sci
., 53, 1535, 1996.
274.
Regnell, O., Ewald, G., and Lord, E.,
Factors controlling temporal variation in methyl
mercury levels in sediment and water in a seasonally stratified lake,
Limnol. Oceanogr.,
42,
1784, 1997.
275.
Reimers, R. S., Krenkel, P. A., Eagle, M., and Tragitt, G.,
Sorption phenomenon in the
organics of bottom sediments,
in: Heavy metals in the aquatic environment,
Proc. of the
internat. conf. held in Nashville, Tennessee, Dec 1973, P.A. Krenkel, Ed. Pergamon Press,
Oxford 1975, 117–129.
276.
Ridley, W. P., Dizikes, L. J., and Wood, J. M.
, Biomethylation of toxic elements in the
environment,
Science,
197, 329, 1977.
277.
Robinson, J. B. and Tuovinen, O. H.,
Mechanisms of microbial resistance and detoxification
of mercury and organomercury compounds — physiological, biochemical and genetic analy-
ses,
Microbiol. Reviews,
48, 95, 1984.
130348.pgs
289
7/12/01, 1:29 PM
ELECTRONIC FILING, RECEIVED, CLERK'S OFFICE, AUGUST 14, 2006
290
278.
Roulet, M., Lucotte, M., Farella, N., Serique, G., Coelho, H., Passos, C. J. S., da Silva, E.
D., de Andrade, P. S., Mergler, D., Guimaraes, J. R. D., and M. Amorim,
Effects of recent
human colonization on the presence of mercury in Amazonian ecosystems,
Water Air Soil
Pollut.,
112, 297, 1999.
279.
Rudd, J. W. M., Turner, M. A., Furutani, A., Swick, A. L., and Townsend, B. E.,
The
English-Wabigoon river system: I. A synthesis of recent research with a view towards mercury
amelioration,
Can. J. Fish. Aquat. Sci
., 40, 2206, 1983.
280.
Rudd, J. W. M.,
Sources of methyl mercury to freshwater ecosystems: a review,
Water Air
Soil Pollut.,
80, 697, 1995.
281.
Rugh, C. L., Wilde, H. D., Stack, N. M., Thompson, D. M., Summers A. O., and R. B.
Meagher,
Mercuric ion reduction and resistance in transgenic
Arabidopsis thaliana
plants
expressing a modified bacterial merA gene,
Proc. Natl. Acad. Sci. USA
93, 3182, 1996.
282.
Rytuba, J. J.,
Mercury mine drainage and processes that control its environmental impact.
Sci.
Total Environ.,
260, 57, 2000.
283.
Sakamoto, H., Tomiyasu, T., and N. Yonehara,
The contents and chemical forms of
mercury in sediments from Kagoshima Bay, in comparison with Minamata Bay and Yatsushiro
Sea, Southwestern Japan,
Geochem. J.,
29, 97, 1995.
284.
Saouter, E., Gillman, M., and Barkay, T.,
An evaluation of mer-specified reduction of ionic
mercury as a remedial tool of a mercury-contaminated freshwater pond,
J. Industrial Microbiol
.,
14, 343, 1995.
285.
Scheider, W. A., Jeffries, D. S., and Dillon, P. J.,
Effects of acidic precipitation on
Precambrian freshwaters in southern Ontario,
J. Great Lakes Res.,
5, 45, 1979.
286.
Schetagne, R., Doyon, J. F., and J. J. Fournier,
Export of mercury downstream from
reservoirs.
Sci. Total Environ.,
260, 135, 2000.
287.
Schindler, D. W., Hesslein, R. H., Wagemann, R., and Broeker, W. S.,
Effects of acidifi-
cation on mobilization of heavy metals and radionuclides from the sediment of a freshwater
lake,
Can. J. Fish. Aquat. Sci.,
37, 373, 1980.
288.
Schroeder, W., Lindqvist, O., Munthe, J., and Z. F. Xiao,
Volatilization of mercury from
lake surfaces,
Sci. Total Environ.,
125, 47, 1992.
289.
Sellers, P., Kelly, C. A., Rudd, J. W. M., and A. R. MacHutchon,
Photodegradation of
methylmercury in lakes,
Nature
380, 694, 1996.
290.
Silver, S.,
Bacterial transformations of and resistances to heavy metals,
in: Changing metal
cycles and human health
, Nriagu, J.O., Ed. Rept. Dahlem Workshop, Berlin, March 20-25,
1983. Springer, 1984, 199-223.
291.
Sjöblom, A., Meili, M., and Sundbom M.,
The influence of humic substances on the
speciation and bioavailability of dissolved mercury and methylmercury, measured as uptake
by Chaoborus larvae and loss by volatilization,
Sci. Total Environ.,
261, 115, 2000.
292.
Southworth, G. R., Turner, R. R., Peterson, M. J., and M. A. Bogle,
Form of mercury in
stream fish exposed to high concentrations of dissolved inorganic mercury,
Chemosphere,
30,
779, 1995.
293.
Southworth, G. R., Turner, R. R., Peterson, M. J., Bogle, M. A., and M. G. Ryon,
Response of mercury contamination in fish to decreased aqueous concentrations and loading
of inorganic mercury in a small stream,
Environ. Monit. Assess.,
63, 481, 2000.
294.
Spangler, W. J., Spigarelli, J. M., Rose, J. M., Flippin, R. S., and Miller, H. H.,
Degra-
dation of methylmercury by bacteria isolated from environmental samples,
Applied Microbi-
ology,
25, 488, 1973.
295.
Spangler, W. J., Spigarelli, J. M., Rose, J. M., and Miller, H. H.,
Methylmercury: Bacterial
degradation in lake sediments,
Science,
180, 192, 1973.
296.
Spry, D. J. and Wiener, J. G.
, Metal bioavailability and toxicity to fish in low-alkalinity lakes
— a critical review.
Environ. Pollut.,
71, 243, 1991.
130348.pgs
290
7/12/01, 1:29 PM
ELECTRONIC FILING, RECEIVED, CLERK'S OFFICE, AUGUST 14, 2006
291
297.
Stary, J., Havlík, B., Práˇsilová, J., Kratzer, K., and Hanuˇsová, J.
, Determination of
phenylmercury, methylmercury and inorganic mercury in potable and surface waters,
Int. J.
Environ. Anal. Chem.,
5, 84, 1978.
298.
Steffan, R. J. and Winfrey, M. R.,
Effect of experimental acidification on mercury methy-
lation and volatilization in a Northern Wisconsin lake,
Abstr. Annu. Am. Soc. Microbiol
., 84,
207, 1984.
299.
Steffan, R. J., Korthals, E. T., and Winfrey, M. R.
, Effect of acidification on mercury
methylation, demethylation, and volatilization in sediments from an acid-susceptible lake,
Appl. Environ. Microbiol
., 54, 2003, 1988.
300.
Stein, E. D., Cohen, Y., and Winer, A. M
., Environmental distribution and transformation
of mercury compounds,
Crit. Rev. Environ. Sci. Technol
., 26 (1), 1, 1996.
301.
St. Louis, V. L., Rudd, J. W. M., Kelly, C. A., Beaty, K. G., Bloom, N. S., and R. J. Flett,
Importance of wetlands as sources of methyl mercury to boreal forest ecosystems,
Can. J. Fish.
Aquat. Sci.,
51, 1065, 1994.
302.
Stordal, M. C., Gill, G. A., Wen, L.S., and P. H. Santschi,
Mercury phase speciation in the
surface waters of three Texas estuaries: importance of colloidal forms,
Limnol. Oceanogr.,
41,
52, 1996.
303.
Stotzky, G. and Babich, H.,
Environmental factors that influence toxicity of heavy metals and
gaseous pollutants to microorganisms,
Crit. Rev. Microbiol.,
8 (2), 99, 1980.
304.
Stumm, W. and Morgan, J
.
J
., Eds.,
Aquatic Chemistry — Chemical Equilibria and Rates
in Natural Waters
, 3rd ed., Wiley Interscience, New York, 1996, chp. 10.
305.
Suchanek, T. H., Mullen, L. H., Lamphere, B. A., Richerson, P. J., Woodmansee, C. E.,
Slotton, D. G., Harner, E. J., and L. A. Woodward,
Redistribution of mercury from
contaminated lake sediments of Clear Lake, California.
Water Air Soil Pollut.,
104, 77, 1998.
306.
Suchanek, T. H., Richerson, P. J., Flanders, J. R., Nelson, D. C., Mullen, L. H., Brister,
L. L., and J. C. Becker,
Monitoring inter-annual variability reveals sources of mercury
contamination in Clear Lake, California,
Environ. Monit. Assess.,
64, 299, 2000.
307. S
uda, I., Suda, M., and K. Hirayama,
Degradation of methyl and ethyl mercury by singlet
oxygen generated from sea water exposed to sunlight or ultraviolet light,
Arch. Toxicol.,
67,
365, 1993.
308.
Summers, A. O. and Silver, S.,
Microbial transformations of metals,
Annu. Rev. Microbiol
.,
32, 637, 1978.
309.
Summers, A. O.,
Organization, expression and evolution of genes for mercury resistance,
Ann. Rev. Microbiol.
40, 607, 1986.
310.
Takizawa, Y.
, Epidemiology of mercury poisoning.
in: The Biogeochemistry of Mercury in
the Environment
, J.O. Nriagu, Ed. Elsevier/North-Holland Biomedical Press, Amsterdam,
1979, 325-366.
311.
Talmi, Y. and Mesmer, R. E.,
Studies on vaporization and halogen decomposition of methyl
mercury compounds using GC with a microwave detector,
Water Res
., 9, 547, 1975.
312.
Timoney, J. F., Port, J., Giles, J., and Spanier, J.,
Heavy-metal and antibiotic resistance in
the bacterial flora of sediments of New York Bight,
Appl. Environ. Microbiol
., 36, 465, 1978.
313.
Vandal, G. M., Mason, R. P., and Fitzgerald, W. F.,
Cycling of volatile mercury in
temperate lakes,
Water Air Soil Pollut.,
56, 791, 1991.
314.
Vandal, G. M., Mason, R. P., McKnight, D., and W. Fitzgerald,
Mercury speciation and
distribution in a polar desert lake (Lake Hoare, Antarctica) and two glacial meltwater streams,
Sci. Total Environ.,
213, 229, 1998.
315.
Varshal, G. M., Buachidze, N. S., Velyukhanova, T. K., and D. N. Chkhetia,
The role of
organic matter in mercury cycle.
in: Global and Regional Mercury Cycles: Sources, Fluxes
and Mass Balances.
W. Baeyens, R. Ebinghaus and O. Vasiliev, Eds. Kluwer Academic
Publishers, Dordrecht, 1996, 403-414.
130348.pgs
291
7/12/01, 1:29 PM
ELECTRONIC FILING, RECEIVED, CLERK'S OFFICE, AUGUST 14, 2006
292
316.
Verta, M. and Matilainen, T.,
Methylmercury distribution and partitioning in stratified
Finnish forest lakes,
Water Air Soil Pollut.,
80, 585, 1995.
317.
Verta, M., Matilainen, T., Porvari, P., Niemi, M., Uusi-Rauva, A., and Bloom, N. S.,
Methyl mercury sources in boreal lake ecosystems,
in: Mercury pollution — Integration and
Synthesis
, C.J. Watras and J.W. Huckabee, Eds. Lewis Publishers, Boca Raton, 1994, chap. I/
10, 119-136.
318.
Vonk, J. W. and Sijpesteijn, A. K.,
Studies on the methylation of mercuric chloride by pure
cultures of bacteria and fungi,
Antonie van Leeuwenhoek,
39, 505, 1973.
319.
Walsh C. T., Distefano M. D., Moore M. J., Shewchuk L. M., and G. L. Verdine
,
Molecular basis of bacterial resistance to organomercurial and inorganic mercuric salts,
FASEB J.
2, 124, 1988.
320.
Wang, J. S., Huang, P. M., Hammer, U. T., and Liaw, W. K.,
Role of dissolved oxygen in
the desorption of mercury from freshwater sediment, In:
Aquatic Toxicology and Water
Quality Management
, J.O. Nriagu and J.S.S. Lakshminarayana, Wiley, Eds. 1989, chap. 11.
321.
Watanabe, N., Nagase, H., Nakamura, T., Watanabe, E., and Ose, Y.,
Chemical methy-
lation of mercury(II) salts by polydimethylsiloxanes in aqueous solution,
Ecotox. Environ.
Safety,
11, 174, 1986.
322.
Watras, C. J. and N. S. Bloom,
Mercury and methylmercury in individual zooplankton -
implications for bioaccumulation,
Limnol. Oceanogr.,
37, 1313, 1992.
323.
Watras, C. J. and Bloom, N. S.,
The vertical distribution of mercury species in Wisconsin lakes:
accumulation in plankton layers, In:
Mercury Pollution — Integration and Synthesis
, C.J. Watras
and J.W. Huckabee, Eds. Lewis Publishers, Boca Raton, 1994, chap. I/11, 137-152.
324.
Watras, C. J., Bloom, N. S., Hudson, R. J. M., Gherini, S., Munson, R., Claas, S. A., et
al.
Sources and fates of mercury and methylmercury in Wisconsin lakes,In:
Mercury Pollution
— Integration and Synthesis
, C.J. Watras and J.W. Huckabee, Eds. Lewis Publishers, Boca
Raton, 1994, chap. I/12, 153-177.
325.
Watras, C. J., Morrison, K. A., and Bloom, N. S.,
Chemical correlates of Hg and methyl Hg
in Northern Wisconsin lake waters under ice cover,
Water Air Soil Pollut.,
84, 253, 1995.
326.
Watras, C.J., Morrison, K.A., Host, J.S., and Bloom, N.S.,
Concentration of mercury
species in relationship to other site-specific factors in the surface waters of northern Wisconsin
lakes,
Limnol. and Ocean.,
40, 556, 1995.
327.
Watras, C. J., Bloom, N. S., Claas, S. A., Morrison, K. A., Gilmour, C. C., and S. R. Craig
,
Methylmercury production in the anoxic hypolimnion of a dimictic seepage lake,
Water Air
Soil Pollut.,
80, 735, 1995.
328.
Watras, C. J., Morrison, K. A., and R. C. Back
, Mass balance studies of mercury and methyl
mercury in small temperate/boreal lakes of the northern hemisphere. In:
Global and Regional
Mercury Cycles: Sources, Fluxes and Mass Balances.
W. Baeyens, R. Ebinghaus, and O.
Vasiliev, Eds. Kluwer Academic Publishers, Dordrecht, 1996, 329-358.
329.
Watras, C. J., Back, R. C., Halvorsen, S., Hudson, R. J. M., Morrison, K. A., and S. P.
Wente,
Bioaccumulation of mercury in pelagic freshwater food webs,
Sci. Total. Environ.,
219, 183, 1998.
330.
Waldron, M. C., Colman, J. A., and R. F. Breault,
Distribution, hydrologic transport, and
cycling of total mercury and methyl mercury in a contaminated river-reservoir-wetland system
(Sudbury River, eastern Massachusetts),
Can. J. Fish. Aquat. Sci.,
57, 1080, 2000.
331.
Weber, J. H.,
Review of possible paths for abiotic methylation of mercury(II) in the aquatic
environment.
Chemosphere,
26, 2063, 1993.
332.
WHO
, Mercury — Environmental Aspects,
Environmental Health Criteria 86
, Geneva, 1989.
333.
WHO
, Methylmercury,
Environmental Health Criteria 101
, Geneva, 1990.
334.
Wilken, R. D. and D. Wallschläger
, The Elbe River: A special example of a European river
contaminated heavily with mercury. In:
Global and Regional Mercury Cycles: Sources, Fluxes
130348.pgs
292
7/12/01, 1:29 PM
ELECTRONIC FILING, RECEIVED, CLERK'S OFFICE, AUGUST 14, 2006
293
and Mass Balances.
W. Baeyens, R. Ebinghaus, and O. Vasiliev, Eds. Kluwer Academic
Publishers, Dordrecht, 1996, 317–328.
335.
Winfrey, M. R. and Rudd, J. W. M.,
Environmental factors affecting the formation of
methylmercury in low pH lakes,
Environ. Toxicol. Chem.,
9, 853, 1990.
336.
Wood, J. M., Kennedy, P. S., and Rosen, C. G.
, Synthesis of methylmercury compounds by
extracts of a methanogenic bacterium,
Nature,
220, 173, 1968.
337.
Wood, J. M.,
Metabolic cycles for toxic elements in the environment. A study of kinetics and
mechanism,
in: Heavy Metals in the Aquatic Environment,
Proc. of the internat. conf. held in
Nashville, Tennessee, Dec 1973, ed. P.A. Krenkel, Pergamon Press, Oxford, 1975, 105-112.
338.
Wren, C. D. and McCrimmon, H. R.,
Mercury levels in the sunfish,
Lepomis gibbosus
,
relative to pH and other environmental variables of Precambrian Shield lakes,
Can. J. Fish.
Aquat. Sci.,
40, 1737, 1983.
339.
Wright, D. R. and Hamilton, R. D.,
Release of methyl mercury from sediments: effects of
mercury concentration, low temperature and nutrient addition,
Can. J. Fish. Aquat. Sci
., 39,
1459, 1982.
340.
Wright, D. A. and R. P. Mason,
Biological and chemical influences on trace metal toxicity
and bioaccumulation in the marine and estuarine environment,
Int. J. Environ. Pollut.,
13, 226,
2000.
341.
Xiao, Z. F., Munthe, J., Schroeder, W. H., and Lindqvist, O.
, Vertical fluxes of volatile
mercury over forest soil and lake surfaces in Sweden,
Tellus Ser. B,
43, 267, 1991.
342.
Xiao, Z. F., Stromberg, D., and O. Lindqvist,
Influence of humic substances on photolysis
of divalent mercury in aqueous solution,
Water Air Soil Pollut.,
80, 789, 1995.
343.
Xun, L., Campbell, N. E. R., and Rudd, J. W. M.,
Measurement of specific rates of net
methyl mercury production in the water column and surface sediments of acidified and
circumneutral lakes,
Can. J. Fish. Aquat. Sci
., 44, 750, 1987.
344.
Yamada, M. and Tonomura, K.
, Formation of methylmercury compounds from inorganic
mercury by
Clostridium cochlearium
,
J. Ferment. Technol
., 50, 159, 1972.
345.
Yamada, M. and Tonomura, K.,
Further study of formation of methylmercury from inor-
ganic mercury by
Clostridium cochlearium
T2,
J. Ferment. Technol
., 50, 893, 1972.
346.
Yamada, M. and Tonomura, K.,
Microbial methylation in hydrogen sulfide evolving envi-
ronments,
J. Ferment. Technol
. 50, 901, 1972.
347.
Yamamoto, M.,
Stimulation of elemental mercury oxidation in the presence of chloride ion
in aquatic environments,
Chemosphere,
32, 1217, 1996.
348.
Zepp, R. G., Baughman, N. L., Wolfe, N. L., and Cline, D. M.
, Methylmercuric complexes
in aquatic systems.
Environ. Lett.,
6, 117, 1974.
130348.pgs
293
7/12/01, 1:29 PM
ELECTRONIC FILING, RECEIVED, CLERK'S OFFICE, AUGUST 14, 2006
Critical Review
The Case for Atmospheric Mercury Contamination in
Remote Areas
WILLIAM F . FITZGERALD*
Department of Marine Sciences, University of Connecticut,
Groton, Connecticut 06340
DANIEL R . ENGSTROM
St. Croix Watershed Research Station, Science Museum of Minnesota,
Marine on St. Croix, Minnesota 55047
ROBERT P . MASON
Chesapeake Biological Laboratory, University of Maryland,
Solomons, Maryland 20688
EDWARD A . NATER
Department of Soil, Water, and Climate, University of Minnesota,
St. Paul, Minnesota 55155
Elevated levels of mercury in aquatic environments remote
from industrial sources have been broadly attributed to long-
range atmospheric transport and deposition of
anthropogenic Hg. Evidence in support of this prevailing
scientific viewsglobal biogeochemical Hg models,
sedimentary archives of historic Hg fluxes, and geographic
trends in soil Hgshave been challenged as being insuf-
ficiently rigorous to rule out the alternative explanation
that natural geologic sources are the principal contributors
of Hg in remote locations. In this review, we examine
the weaknesses in interpretation and the choice of information
that has been used to argue against atmospheric Hg
contamination. Analytical advances in measuring trace
levels of environmental Hg have greatly narrowed estimates
of natural Hg fluxes, providing a clear measure of the
relative magnitude of anthropogenic Hg emissions and
deposition. Recent experimental results indicate that
diagenetic processes cannot explain the mounting number
of lake sediment and peat profiles showing substantial
increases in Hg flux during the past century. Geologic sources
of Hg may be important in specific localities but cannot
explain corresponding geographic trends in soil Hg and
industrial emission sources. Despite uncertainties in
current understanding, there is a broad and geochemically
consistent data base indicating that, over large regions
of the globe, human-related Hg emissions have increased
relative to natural sources since the onset of the industrial
period.
Introduction
Human exposure to monomethylmercury (MMHg) through
the consumption of freshwater and marine fish is the
principal public health concern with Hg in the environment.
Alkylated Hg species such as MMHg and dimethylmercury
(DMHg) are integral components of the Hg cycle. Their
distribution and fate at the earth's surface will be affected
by natural and anthropogenic sources and processes. El-
evated MMHg concentrations in fish are common even in
the oceans and terrestrial waters distant from point sources.
Long-range atmospheric transport and deposition of an-
thropogenically-derived Hg has been implicated (e.g., refs
1-4). Much of the recent work appears in the conference
volumes from three international conferences on ªMercury
as a Global Pollutantº (
5
-
7
).
However, in a recent
Environ. Sci. Technol.
critical review
of the subject, Rasmussen (
8
) argues that the underlying
assumptions linking anthropogenic Hg emissions to the
atmosphere and to subsequent Hg deposition in remote
continental and oceanic settings ªdeserve careful scrutinyº
because the ªconclusions hold serious implications to both
government and industryº. In Rasmussen's view, recent
investigations suggesting that atmospheric transport and
deposition of human-related Hg emissions dominate the
cycling and bioaccumulation of Hg in systems distant from
anthropogenic point sources underestimate the influence of
natural geological sources. Evidence in support of anthro-
pogenic interruption of the global Hg cycle such as historic
records of Hg accumulation in lake sediments and peat cores
or geographic gradients in soil Hg concentrations are
dismissed as diagenetic artifacts or the product of underlying
geologic variation.
The purpose of this review is to provide the ªcareful
scrutinyº that such controversial conclusions demand. It is
our contention that the case for atmospheric Hg contamina-
tion in remote areas is stronger than ever, having been
advanced by worldwide improvements in analytical methods,
sampling techniques, and experimental design over the past
decade. Much of the earlier uncertainty regarding Hg
contributions from natural sources has been replaced by a
convergence of data that points unequivocally toward
significant human-related Hg emissions and deposition over
large regions of the globe.
* Corresponding author e-mail: wfitzger@uconnvm.uconn.edu;
tel: 860-405-9158; fax: 860-405-9153.
S0013-936X(97)00284-8 CCC: $14.00
1997 American Chemical Society
VOL. 32, NO. 1, 1998 / ENVIRONMENTAL SCIENCE & TECHNOLOGY
9
1
Published on Web 01/01/1998
ELECTRONIC FILING, RECEIVED, CLERK'S OFFICE, AUGUST 14, 2006
In contrast to previous views, it has become evident that
atmospheric and aquatic cycling of Hg and the bioaccu-
mulation of MMHg in aquatic systems are driven by complex
chemical and biological reactions involving exceedingly small
quantities of Hg. Accordingly, environmental investigations
of Hg require an ultraclean trace metal analytical approach
that was rarely used during the 1960s to the mid-1980s. Thus,
one must carefully evaluate the Hg literature for analytical
quality and the assurance that the findings are geochemically
consistent. In the following review, we address the weak-
nesses in interpretation and the choices of information used
to support the contention that geological sources of Hg are
the principal contributors of Hg in remote locations. We
consider first the geological fluxes associated with the global
cycle of Hg, then examine the reliability of lake sediments
and peat cores as recorders of past Hg deposition, and finally
explore geographic gradients in soil Hg relative to industrial
emission sources.
Global Hg Cycle
The global biogeochemical cycling of Hg has been described
often using mass balance formulations (e.g., refs 1-3 and
9-18). These simulations, in general, show the prominent
role of the atmosphere in mobilizing and depositing Hg at
the earth's surface and indicate that anthropogenic Hg
emissions to the atmosphere represent a significant interfer-
ence in the modern Hg cycle. Environmental assessments
of source strengths for natural and anthropogenic processes
have often been in error due to the inclusion of inaccurate
published information and the limited availability of accurate
data for important aspects of the Hg cycle. The geochemical
picture of the global mercury cycle has improved significantly
during the past decade. Present estimates for mercury fluxes
to the earth's surface and for the mercury content of active
reservoirs (e.g., natural waters; atmosphere) are converging.
Continued improvements are expected from the large
number of on-going high-quality studies concerning the
emissions, chemical speciation, and reactivity of Hg in the
environment. Indeed, the field is so active that a fourth
international conference on ªMercury as a Global Pollutantº
(since 1990) was held in Hamburg in August 1996.
A scrupulously critical approach must be employed in
evaluating environmental Hg measurements, especially those
obtained prior to the mid-1980s. Unfortunately, Rasmussen
(
8
) was not discriminating in her tabulation of global
estimates of annual Hg emissions from natural sources. By
including results from the early work by Lantzy and MacK-
enzie (
12
) and alluding to others, she concludes that estimates
for natural global Hg emissions to the atmosphere vary by
orders of magnitude. While modern values for average
annual natural Hg flows to the air range from 8 to 20 Mmol
(
1
,
2
,
18
), the estimate of 29 325 Mg yr
-1
(150 Mmol yr
-1
)
reached by Lantzy and MacKenzie (
12
) is much larger and
certainly wrong. This value, which is derived using a global
Hg model developed by MacKenzie and Wollast (
11
), is in
gross error because it is based on inaccurate Hg measure-
ments of the Hg content of Greenland ice that were published
by Weiss and co-workers (
19
) in 1971. Weiss et al. reported
that the average Hg concentration in ice between 800 BC
and 1952 was 60 ( 20 pg g
-1
and 130 ( 50 pg g
-1
for the
period between 1952 and 1965. The enhanced levels were
attributed to anthropogenic Hg emissions, which were
determined by Lantzy and Mackenzie (
12
) to be 15 800 Mg
yr
-1
(79 Mmol yr
-1
), which is also an erroneously large value.
The Greenland Icesheet studies illustrate the need for
scrupulous attention to analytical methodology and field
sampling protocols in ultratrace studies of Hg. They also
show clearly the need to evaluate critically the literature for
accuracy and geochemical consistency. Historically, Hg
measurements in the Greenland Icesheet range from <1 to
880 pg g
-1
, approximately 3 orders of magnitude. The highest
levels were reported by Weiss and co-workers in 1971 (
19
)
and in 1977 (
20
). These concentrations reflect gross con-
tamination acquired during sample collection, processing,
and analysis. Using improved techniques, later work by
investigators from the Danish Isotope Center (
21
) reported
Hg concentrations between 2 and 19 pg g
-1
over the time
period of 1727-1971. Most recently, Vandal et al. (
22
) found
a range in between (<1-1.5 pg g
-1
) for samples within any
one year for the past 30 years that have been analyzed thus
far. These collections were made using extraordinarily careful
and ultratrace metal free techniques developed especially
for depositional studies in polar regions by C. Boutron and
co-workers at the Laboratoire de Glaciologie et GeÂophysique
de l'Environnement, France (see refs 23 and 24 for technical
details). These latter results are the order of magnitude
consistent with recent measurements of Hg in snows from
the mid-continental lakes region in northcentral Wisconsin,
which show concentrations between 2.3 and 8.2 pg g
-1
(
25
,
26
). Thus, an estimate of natural Hg emission to the
atmosphere of 150 Mmol is not supported by modern data.
Indeed, using modern data, Mason et al. (
2
) have applied a
model similar to the one developed by Lantzy and MacKenzie
(
11
) to assess the role of anthropogenic emissions within the
global cycle of Hg. Their estimate for annual average Hg
emissions from natural sources at 8 Mmol is nearly 20-fold
lower.
Geological Hg Fluxes to the Oceans
Global tectonic theory may provide a useful framework for
evaluating natural Hg fluxes. However, the suggestion (in
Table 3, ref 8) that there are extraordinarily large geothermal
Hg fluxes from ocean ridges and oceanic crust at 9.3-18.6
Mmol yr
-1
(1860-3720 Mg yr
-1
) and 36.7-73.4 Mmol yr
-1
(7340 -14 680 Mg yr
-1
) respectively, that affect the oceanic
concentration of Hg is not supported by oceanic profiles of
Hg. Deep ocean profiles (e.g., ref 27) do not show any
significant increase in concentration with depth, which would
be expected if inputs from the ocean floor exceeded the rate
of vertical mixing. Thus, this source cannot exceed the rate
of vertical mixing. Use of a vertical mixing coefficient of 3
m/yr (
28
) and 2 pM Hg concentration (a conservatively high
value) yields a flux of 6 nmol m
-2
yr
-1
. Eddy diffusion
calculations yield a value of the same order. This is equivalent
to a (maximum) flux of 1.8 Mmol yr
-1
or 360 Mg yr
-1
. These
field data negate the heat flow-based flux estimate suggesting
that a geothermal Hg input to the oceans that would be 20-
40 times larger
(
8
)
. Furthermore, many trace metals such as
Hg are scavenged by precipitating hydrous oxides of Fe and
Mn and trapped close to their hydrothermal entry points.
Accordingly, elevated concentrations of Hg are found in
hydrothermally derived metal-rich sediments of the East
Pacific Rise (
29
) and the Gorda Ridge (
30
).
Unfortunately, erroneous data from the literature were
published by Camargo (
31
). He gives a value of 100 ng/L or
500 pM as the ocean concentration. Oceanic concentrations
of Hg range between <1 and 10 pM (<0.2 and 2 ng/L) (
27
,
32
-
34
; see recent review in ref 35). This gross error
invalidates arguments that the ocean reservoir is so large
that anthropogenic inputs are undetectable. It also ignores
ocean mixing processes and the rapid recycling of mercury
to the atmosphere due to volatilization (
2
). Estimates for
the annual volatilization of Hg from the oceans are large
ranging between 6 (
3
) and 10 Mmol (
2
). Moreover, a
substantial fraction of these oceanic emissions represents
the recycling of Hg that entered the marine environment
from anthropogenic sources.
2
9
ENVIRONMENTAL SCIENCE & TECHNOLOGY / VOL. 32, NO. 1, 1998
ELECTRONIC FILING, RECEIVED, CLERK'S OFFICE, AUGUST 14, 2006
Lake Sediments and Peat Bogs as Historical Archives
Lake-Sediment Records.
Anthropogenic Hg emissions on
a global scale have been increasing for at least 100-150 years,
which is a short period as compared to processes occurring
over geological time. For example, it takes about 500-1000
years to mix the oceans (
28
,
36
). Indeed, geological sources
of Hg have varied very little during this modern industrial
interval because large-scale geologic processes associated
with plate tectonics are essentially constant over such short
time intervals. In contrast, there is much evidence from the
tabulation of various emission sources and from the historical
record of Hg as preserved in lake sediments and peat bogs
that indicate that significant human-related Hg interferences
have been impressed on the Hg cycle over a broad geographic
area.
An estimate of the potential impact from human-related
Hg emissions to the atmosphere on a national basis can be
developed for the United States. In an extensive recent effort,
the Environmental Protection Agency (EPA) determined the
overall annual fluxes (1990) of Hg from U.S. anthropogenic
sources to the atmosphere to be ca. 1 Mmol (205 t yr
-1
;
37
).
These amounts are considerably smaller (50-70%) than
Watson's (
38
) estimate of 2.4 Mmol for the year 1975.
Nevertheless, even 1 Mmol from the United States alone
appears as a very large interference (ca. 20%) as compared
to the annual worldwide natural terrestrial Hg emissions,
which were estimated to be about 5 Mmol (
2
).
Lake-sediment records provide the most compelling
evidence thus far that remote regions receive significant
inputs of anthropogenic Hg by long-range atmospheric
transport. Although numerous studies from European (
39
-
42
) and North American (
43
-
51
) sites show consistently
elevated Hg levels (and fluxes) in recent sediments as
compared to deeper preindustrial strata, Rasmussen (
8
)
suggests that many (if not all) such profiles are generated by
post-depositional diagenesis and diffusion (or advection) of
Hg. As we argue elsewhere, such assertions, in general, are
clearly not supported by recent experimental studies. More-
over, the lake-sediment records themselves show a pattern
of recent Hg enrichment that is spatially and temporally
coherent and not easily explained by either diagenetic
processes or local geological sources.
In almost every well-dated sediment core from the
midwestern United States, Hg concentrations (or fluxes)
increase above background in the mid-19th century, shortly
after the start of the industrial period (
48
,
52
,
53
). These
sediment profiles range in length from <20 cm (Thrush L.)
to more than 90 cm (Wirth L.), yet the timing of the increase
is the same. Although Hg levels rise somewhat later in cores
from northern Canada and Scandinavia (
40
,
42
,
51
), the
chronology is again consistent among lakes within each
geographic area. In lakes where multiple sediment cores
have been analyzed, Hg increases are likewise synchronous,
though sediment depth may vary by a factor of 2 or more
(
54
). It seems highly improbable that temporally concordant
patterns of Hg accumulation could be generated in numerous
sediment profiles of varying thickness by post-depositional
sedimentary processes.
Not only is the timing of Hg increase synchronous among
sites, but also the magnitude of the change is remarkably
similar across a large geographic area. In mid-continental
North America, four studies of 40 U.S. and Canadian lakes
(
45
-
48
) show modern Hg concentrations (or fluxes) elevated
over background values by a ratio of 2.7 ( 0.9 (SD). A similar
range of enrichments (modern/background) has been re-
ported for northern Canada (2.3 ( 0.6,
n
) 10) (
51
) and
Scandinavia (mean ) 2.0-2.6) (
39
,
41
), although ratios
become higher for sites closer to industrialized areas of
eastern Europe (mean ) 5.0-6.3) where direct measurements
of atmospheric Hg deposition are also higher (
55
). It is
difficult to imagine how sediment diagenesis and Hg diffusion
could generate such a convergence of enrichment ratios or
the north-south increase that parallels measured Hg depo-
sition in the Nordic countries. There is clearly variability in
Hg loading among lakes [in some cases attributable to
differences in local geology; e.g., Coker et al. (
56
)], but the
similar timing and magnitude of recent increases and a
concordance with spatial trends in measured Hg deposition
argue strongly that long-distance transport of anthropogenic
Hg is the cause of increasing Hg concentrations and fluxes
in the sediments of lakes in sparsely populated regions that
are not impacted by localized human-related sources of Hg.
A particularly convincing case for the utility of lake
sediments in preserving the anthropogenic perturbation to
the background Hg pattern is found in the work of Swain et
al. (
48
) and Fitzgerald et al. (
25
,
57
). Swain and co-workers
(
48
) employed an innovatively simple but effective multiple
core mass-balance approach to obtain modern and historical
Hg flux information from the sediment record of seven
ªrelatively undisturbedº lakes in Minnesota and Wisconsin.
Regression analysis using the seven lakes yielded an average
value for present atmospheric deposition of 12.5 ígm
-2
yr
-1
and a preindustrial value of 3.7 ígm
-2
yr
-1
. This represents
an average enrichment ratio of 3.4. The recent depositional
determination is similar to the estimate for atmospheric Hg
deposition of 11.5 ( 3.8 ígm
-2
yr
-1
for the period of 1988-
1990 (
57
). This estimate was established by Fitzgerald and
co-workers for the Little Rock Lake region (one of the study
lakes in the Swain et al. work) in Wisconsin. The good
agreement between these two independent measures of
modern Hg deposition is a strong indication that the Hg
accumulating in lake sediments is not significantly affected
by diagenetic processes and the anthropogenic signal is
preserved.
An additional example of the utility of lake sediments to
preserve the Hg accumulation signal is evident at a relatively
unusual core site in Clay Lake, Northwestern Ontario. This
lake received inputs of a chloralkali plant at Dryden, Ontario,
during the 1960's, but Hg emissions ceased in 1970. A core
was taken in 1971 by Armstrong and Hamilton (
58
), and it
showed a peak at the surface of the sediment, consistent
with recent inputs. In 1978, another core was taken by Rudd
et al. (
59
), which showed the peak a few centimeters deeper,
consistent with cleaner recent inputs. The latest core was
obtained in 1995, and it shows the peak several centimeters
lower than observed in 1978 (
60
).Thus, the three cores
preserved accurate records of mercury consistent with known
history. This is similar to the experience of Smith and Loring
(
61
), but the availability of three cores from Clay Lake provides
convincing evidence that diagenetic factors are not major
influences on the Hg accumulation pattern in lake sediments.
Geological Context.
High variability in background Hg
concentrations in lake sediments has been offered as evidence
that local geology, not long-distance atmospheric transport,
controls the natural distribution of Hg in Canadian lakes (
8
).
However, much of this variability may be explained by
differences in sediment flux among lakes and by spatial
variability in Hg sedimentation within lakes. Most of the Hg
data in the studies Rasmussen (
8
) cites are based on single
sediment collections from which Hg concentrations are
calculated on a dry-weight basis (
62
). Concentration data,
however, are very sensitive to differences in dilution by the
flux of the sediment matrix, which is known to vary
considerably among and within lakes (
63
-
66
). Mercury
concentrations are also highly variable (by a factor of 10 or
more) within lake basins because of density-dependent
particle settling (focusing) (
44
,
54
,
67
). When these factors
(sediment flux and focusing) are taken into account, either
by the calculation of Hg flux ratios for individual cores or by
VOL. 32, NO. 1, 1998 / ENVIRONMENTAL SCIENCE & TECHNOLOGY
9
3
ELECTRONIC FILING, RECEIVED, CLERK'S OFFICE, AUGUST 14, 2006
multiple-core studies of whole-basin Hg accumulation (
54
),
much of the between-lake variability evident in raw con-
centration data vanishes. Variations of Hg concentrations
in surface sediments do not automatically imply local
differences in geological Hg supply as some have claimed (
8
,
68
).
Diagenetic Questions.
The main argument against the
use of sediments as historical records of atmospheric
pollution is that diagenetic processes may bring Hg up to the
sediment surface (as organo-mercury complexes, mercury
organosulfide complexes, or vapor-phase Hg), followed by
adsorption on oxides and hydroxides (Fe, Mn) with higher
redox potential (
8
). Support for this view is contained in a
study of Hg in slowly accumulating deep lake sediments and
porewaters of four depositional environments in Lake
Superior and Lake Michigan (
69
). However, if this were
generally true, we should find (1) approximately the same
kind of profiles for Fe, Mn, and Hg, (2) a probable correlation
of Hg with Fe and Mn in surface sediments when comparing
several lakes, and (3) no clear geographical pattern for Hg.
None of these points are valid in several studies conducted
by Verta and co-workers in Finland (
40
,
41
,
70
).
These researchers studied 25 lake profiles from 16 lakes
for all major elements including Fe, Mn, Hg, Cu, Zn, Pb, and
Cd (
40
,
41
,
70
). They found that the geographical patterns
for Pb, Cd, Hg, and Zn in surface sediments (uppermost 5-10
cm) were very similar with the higher concentrations in the
southern more industrialized areas. This distribution is
preserved at depth in sediments deposited after the late 1800s
(and shows an earlier increase in Pb deposition than other
elements). In general, no such geographical or vertical
pattern was found for Fe or Mn. Large variations in Fe and
Mn occurred among lakes, and in most lakes a surface or
subsurface maximum for Fe was found with no increase in
Hg (
70
). There was also a positive correlation of sulfate in
lake water with surface sediment Hg concentrations.
These observations are consistent with the measured
higher atmospheric Hg deposition rates in southern Scan-
dinavia (including one station in Finland) than in the north
and with positive correlation of rainwater sulfate and
rainwater Hg in the area (
55
). They do not support indications
of any major effects of diagenetic processes on Hg partitioning
and vertical movement in sediments.
Lucotte and co-workers (
51
) studied Hg in 12 oligotrophic
lakes in northern Quebec, where the redox boundary layer
lies at or very close to the water-sediment interface. Below
this sharp redox gradient, sedimentary iron is reduced and
liberated in pore waters and diffuses upward toward the water
column. Only in rare cases could they identify a layer of iron
re-precipitation at the very interface between the water
column and the sediment (
71
,
72
). Along with these early
diagenetic reactions, loss of detrital organic matter through
biodegradation does not appear to be measurable within
the sediments as all profiles of organic carbon remain fairly
constant below the immediate surface of the sediment (
51
,
71
,
72
). At the same time, all mercury profiles decrease
progressively with depth to baseline concentrations in
sediments older than about 1940. These trends appear totally
decoupled from the iron or the carbon profiles (
51
,
71
,
72
)
and thus clearly contrast with the Hg profiles reported for
marine sediments (
73
). On the other hand, Dmytriw et al.
(
71
) demonstrated that most Hg in a lake sediment (85%)
was bound to NaOH-extractable organic matter. As the
organic matter load remains fairly stable in the sampled
sediments, the surficial increases of mercury concentrations
in the sedimentary profiles thus represent larger Hg fluxes
in the recent years.
It can also be argued that the inference of historic Hg
fluxes from sediment cores requires that there has been no
loss of Hg to pore water during the decomposition of humic
material, no transport within the sediment column, and no
Hg transfer between the sediment pore water and overlying
waters. However, recent experimental studies indicate that
these restrictions are overstated. Because gross sedimenta-
tion of Hg to the sediment surface exceeds net accumulation,
there is likely to be recycling of Hg prior to incorporation in
the permanent sediment record. The important factor is
the depth of the zone of recycling. Gobeil and Cossa (
73
)
found that post-depositional migration of Hg in pore waters
in estuarine environments could not account for the surface
enrichment. Similarly, and in lacustrine experiments, Hurley
et al. (
52
) observed
K
d
values between sediments and pore
waters to be about 10
4
, suggesting a strong affinity for the
particulate phase. Additionally, in long-term (12 and 27
month) sediment mixing-incubation experiments, Henning
(
74
) and Hurley et al. (
75
) found little post-depositional
redistribution of Hg due to diffusion in pore water. Hurley
et al. (
75
) reported little or no diffusion below 2-4 cm,
concluding that any pore water release to overlying waters
must occur above the 2 cm sediment depth.
If deep pore water release were important in regulating
hypolimnetic increases in anoxic lakes, pore water Hg
concentrations of several hundred nanograms per liter would
be necessary to create a diffusion gradient in sediments (
52
).
No such levels have been reported by researchers using
ultratrace metal clean techniques. Montgomery et al. (
76
)
in their northern Quebec study, for example, report the
absence of gradients in the profiles of dissolved Hg in
sediment pore water, and the concentrations were found to
be in equilibrium with the water column.
The work of Krabbenhoft and Babiarz (
77
) can be
considered as an example where advection obscures Hg
profiles in sediments. However, it must be stressed that the
Krabbenhoft and Babiarz (
77
) study was not one designed
for interpretation of historical profiles, but was rather a study
of transport of Hg through a sandy, shallow aquifer. A
sediment core for use in evaluating historical accumulation
would never be taken in shallow, sandy sediments. In deep,
high organic matter sediments (where cores for historical
evaluation are commonly taken), advective processes are
usually minimal.
Peat Bogs.
The use of ombrotrophic peat bogs as
depositional archives of Hg has been criticized on the basis
of potential
in situ
diagenetic remobilization of Hg and
contributions to the peat record that may be derived from
localized gaseous evasion of elemental Hg from soils (
8
).
However, a number of studies on the adsorptive capacity of
mosses suggest high retention of Hg in peat (
78
-
82
).
Speciation calculations for Fe, Al, and Mn show that the
vertical distribution of metals in ombrotrophic bogs can be
explained by the redox potential gradient in peat and seasonal
fluctuations in water table depth (
83
). A geochemical model
for metal mobility indicates that the Hg (and Pb) profiles in
peat cores cannot readily be explained by redistribution
processes but that they probably reflect changes in deposition
to the bog over time (
83
). In this study, total Hg inventories
(ígm
-2
) for the past several hundred years were extremely
consistent among hummocks, which indicates no significant
horizontal movement of Hg as water drains laterally through
the surface peat. Similarly, Urban et al. (
82
) found that Pb-
210 inventories from Minnesota peatlands were similar to
that expected from atmospheric deposition and that there
was little evidence of transport of Pb from hummocks to
hollows.
With respect to local gaseous evasion of Hg from soils, we
note that the residence time of Hg
0
in the atmosphere is
about 1 yr (
2
,
13
,
14
,
84
). This long residence time allows for
hemispheric-scale mixing of this gas before it is returned to
the soil via precipitation and dry deposition. Furthermore,
there is no evidence of large-scale temporal changes in the
4
9
ENVIRONMENTAL SCIENCE & TECHNOLOGY / VOL. 32, NO. 1, 1998
ELECTRONIC FILING, RECEIVED, CLERK'S OFFICE, AUGUST 14, 2006
magnitude of soil degassing of Hg
0
over time. This is
analogous to the gaseous evasion of
222
Rn from soils. The
deposition of
210
Pb (derived from
222
Rn), which has remained
fairly constant over the past several hundred years, indicates
that
222
Rn emissions from soils have also been relatively stable
with time (85).
The discussion of peat cores from ombrotrophic bogs in
Rasmussen's (
8
) review uses the Scandinavian study of Jensen
and Jensen (
86
) as a case study. It is implied that soil Hg
concentrations varying from one geological setting to another
may partly explain the variability of Hg shown in these bogs.
If instead another Scandinavian study (
87
; also referenced
in ref 8) had been chosen to discuss the origin of Hg in these
bogs, a different conclusion would have seemed more
reasonable. Data from that study showed a uniform Hg level
of 31 ( 8 ng g
-1
(mean ( SD) at 50 cm depth in 13
ombrotrophic bogs distributed all over Norway, reflecting a
general pre-industrial level. In recent peat layers, the Hg
concentration had increased to 169 ( 32 ng g
-1
in four bogs
along the southern coast where the general impact of long-
range atmospheric transport of pollutants from Europe is
considerable (
88
). In central Norway (which is much less
exposed to air pollution), the corresponding figure for four
bogs was 66 ( 10 ng g
-1
. These figures are very difficult to
explain on the basis of soil-derived Hg, which might be
expected to vary considerably with geological setting but not
so much with time.
As documented, Hg accumulation trends in surface
sediments are similar in a great variety of biological and
geographical settings and seem independent of local geo-
logical conditions. For example, chronologies for Hg from
lower latitude subtropical Florida wetlands (
89
) corresponded
well with reported trends in lacustrine systems in Scandinavia,
the northern United States, and Canada. Rood and co-
workers (
89
) studied a total of 18 sediment cores from four
major hydrologic units in the Florida Everglades and a
dynamic linear wetland system along Florida's Atlantic coast
(Savannas Marsh). The field sites varied from organic peat
to predominantly marl spanning a wide range of geological
conditions. Post-1985 Hg accumulation rates averaged 53
(23-141) ígm
-2
yr
-1
with pre-1900 rates generally below 10
ígm
-2
yr
-1
. Recent Hg fluxes were an average of 4.9 times
higher than those of ca. 1900 and appeared to be unrelated
to geochemical conditions. Rates increased starting about
1940, coinciding with mid-century alterations of the hydrol-
ogy of these wetlands and increased regional agricultural
and urban development.
Geographic Gradients in Soils
Nater and Grigal (
90
) inferred a regional gradient in atmo-
spheric Hg deposition and anthropogenic impact based on
observation of a gradient in Hg burdens in forest floor (a
partially-decomposed surficial organic layer) and surface
mineral soils (0-25 cm depth) along a transect from
northwestern Minnesota to northeastern Michigan. Ras-
mussen (
8
) has questioned the assumption that Hg in soil
organic matter originates from the atmosphere and argues
for the possibility that ª... geological variations override
regional deposition effectsº.
Concerning these objections, we note that atmospheric
Hg deposition directly to soils, complexation of Hg by organic
matter (
91
), and atmospheric inputs to leaves (
92
-
94
) and
hence to surface soils are well-documented processes (
95
).
Significant plant uptake of Hg directly from deeper geological
materials is unlikely because of limited root uptake of Hg
(
96
) and the lack of a trend in Hg burdens in subsoils (75-
100 cm depths) along the transect (
90
). Deeper geological
materials are beyond the rooting zone. Consequently, for
deeper geological sources to affect the Hg accumulation in
soil, as discussed by Rasmussen (
8
), there must be an indirect
pathway requiring (1) volatilization/emission of Hg from the
geological substrate as Hg
0
; (2) diffusion to the soil-
atmosphere interface; (3) Hg
0
uptake and/or Hg
0
oxidation
and capture by leaves; (4) leaf senescence and deposition of
Hg to the soil surface; and (5) retention by soil.
Such an indirect pathway may exist, and while we agree
with Rasmussen (
8
) that it is possible that deep geological
sources may be responsible for part of the Hg trends observed
in forest litter and surficial mineral soils, the magnitude of
this geological contribution would be small as compared
with that from other atmospheric sources. The 155 study
sites from Nater and Grigal (
90
) were located across a large
region on a wide variety of bedrock and surficial materials,
where the distributional pattern for Hg corresponded well
with similar trends for Cd and Pb that were found in the
same samples (
97
,
98
). Pb and Cd are elements known to
be atmospheric deposition products of anthropogenic activ-
ity. In addition, the metal distribution corresponded with
known patterns of acid sulfate deposition across this region
(
99
,
100
) and with a general increase in anthropogenic activity
toward the southeast. The high correspondence between
Hg and other known atmospheric pollutants in this region
strongly supports a regional gradient in anthropogenic
atmospheric Hg deposition rather than undetermined trends
in deep geological sources. The statistically significant trend
produced by the 155 samples measured, by definition, shows
that the regional trend was sufficiently clear to override local
scale variability.
Summary
In summary, there is much published literature on the Hg
cycle. While the quality of the data has improved dramatically
over the past decade, one must be most diligent in evaluating
the quality of published data for the cycling of Hg in the
environment. Inaccurate results plague the Hg literature
and mislead the unwary researcher. There has been much
recent research on Hg in nature that has been reported and
published especially in association with the 1990, 1992, 1994,
and 1996 international conferences on ªMercury as a Global
Pollutantº. Nevertheless, critical information is lacking
concerning natural and anthropogenic emissions, chemical
speciation, and reactivity of Hg in the environment. This
discussion stresses appropriately that, while our under-
standing of the biogeochemical cycling of Hg and assessments
of the impact from anthropogenic Hg releases are as yet
limited by many ªuncertaintiesº in current knowledge, there
is a broad and geochemically consistent data base indicating
that, over large regions of the globe, human-related emissions
and deposition during the past century have increased relative
to natural sources (
5
-
7
). Moreover, the signal is evident in
remote regions. The results demonstrate that (carefully
selected) lake sediments, bogs, and soils can be used as
indicators of airborne Hg pollution.
We have noted that the critical concern associated with
Hg in the environment is human exposure to MMHg through
the consumption of fish and fish products. Current studies
show the insidiously complex nature of the biogeochemical
cycle of Hg. The production and bioaccumulation of MMHg
in aquatic systems (especially piscivorous fish) and the
resultant exposure to humans and wildlife are driven by
chemical reactions and biologically-mediated transforma-
tions involving ultratrace amounts of Hg in the atmosphere
and natural waters. It is apparent from the modern high
quality work we have summarized that human-related Hg
emissions are significant and that plausible linkages between
the releases of Hg to the atmosphere from anthropogenic
sources and the exposure to humans and wildlife to MMHg
can be drawn. At present, however, a comprehensive
quantitative assessment of the relationship between an-
thropogenic Hg releases to the atmosphere and the potential
VOL. 32, NO. 1, 1998 / ENVIRONMENTAL SCIENCE & TECHNOLOGY
9
5
ELECTRONIC FILING, RECEIVED, CLERK'S OFFICE, AUGUST 14, 2006
exposure to people, wildlife, and terrestrial and aqueous
systems is not possible. For example, deposition is critically
dependent on the chemical form of Hg. Yet, there are few
data on the physical and chemical species of Hg emitted
from various sources (e.g., refs 101 and 102); near-source
contamination is most likely related to the emission of ionic
and particulate forms of Hg, while the farther field effects are
associated with elemental Hg (
2
,
103
,
104
). There is much
research to be done. Modern studies are providing a
scientifically reasonable blueprint to use in designing and
conducting experimental research on Hg in the environment.
It does not appear that large natural sources of Hg have been
missed, and there is evidence for the impact of atmospheri-
cally transported human-related Hg emissions in remote
regions of the globe.
Acknowledgments
The following members of the international Hg community
contributed materially and critically in this development of
this work: Janina M. Benoit, Chesapeake Biological Labora-
tory, University of Maryland, Solomons; Claude F. Boutron,
Laboratoire de Glaciologie et Geophysique de l'Environne-
ment, Saint Martin-d'Heres, France; Charles Driscoll, De-
partment of Civil and Environmental Engineering, Syracuse
University, Syracuse; Johan F. Gottgens, Department of
Biology, College of Arts and Sciences, University of Toledo,
Toledo; David F. Grigal, Department of Soil, Water, and
Climate, University of Minnesota, St. Paul; Chad Gubala, U.S.
Environmental Research Laboratory, Environmental Protec-
tion Agency, Corvallis, OR; Hans Hultberg, Swedish Envi-
ronmental Protection Agency, GoÈteborg, Sweden; James P.
Hurley, Wisconsin Department of Natural Resources, Water
Chemistry Laboratory, University of Wisconsin, Madison;
Togwell A. Jackson, Aquatic Ecosystem Restoration Branch,
National Water Research Institute, Burlington, Ontario; Kjell
Johansson, Swedish Environmental Protection Agency, Solna,
Sweden; Dixon H. Landers, U.S. Environmental Protection
Agency, National Health and Environmental Effects Research
Laboratory, Western Ecology Division, Corvallis, OR; Lyle
Lockhart, Canada Department of Fisheries and Oceans,
Winnipeg, Mannitoba; Marc Lucotte, Universite du QueÂbec
aÁ MontreÂal, MontreÂal, QueÂbec; Brian E. Rood, Department
of Chemistry, Mercer University, Macon, GA; James Rytuba,
U.S. Geological Survey, Menlo Park, CA; Eiliv Steinnes,
Department of Chemistry, University of Trondheim, Dragvoll,
Norway; Edward B. Swain, Minnesota Pollution Control
Agency, St. Paul; and Matti Verta, Finnish Environment
Institute, Helsinki, Finland.
Literature Cited
(1) Lindqvist, O.; Johansson, K.; Aastrup, M.; Anderson, A.
Water,
Air Soil Pollut.
1991
,
55
, 7.
(2) Mason, R. P.; Fitzgerald, W. F.; Morel, F. M. M.
Geochim.
Cosmochim. Acta
1994
,
58
(15), 3191.
(3) Hudson, R. J. M.; Gherini, S. A.; Fitzgerald, W. F.; Porcella, D.
B.
Water, Air Soil Pollut.
1995
,
80
, 265.
(4) Petersen, G.; Iverfeldt, A¡ .; Munthe, J.
Atmos. Environ.
1995
,
29
(1), 47.
(5) Mercury as an Environmental Pollutant. In
Water, Air and Soil
Pollution
; Special Volume 56; Lindqvist, O., Ed.; Kluwer
Academic Press: Dordrecht, 1991.
(6) Mercury as an Environmental Pollutant. In
Water, Air and Soil
Pollution
; Special Volume 80; Porcella, D., Huckabee, J. W.,
Wheatley, B., Eds.; Kluwer Academic Press: Dordrecht, 1995.
(7) Watras, C. J.; Huckabee, J. W.
Mercury as a Global Pollutant:
Towards Integration and Synthesis
; Watras, C. J., Huckabee, J.
W., Eds.; Lewis Press: Boca Raton, 1994.
(8) Rasmussen, P. E.
Environ. Sci. Technol.
1994
,
28
, 2233.
(9) Wollast, R.; Billen, F.; MacKenzie, F. T. In
Ecological Toxicology
Research
; McIntyre, A. D., Mills, C. F., Eds.; Plenum Press: New
York, 1975; p 145.
(10)
An Assessment of Mercury in the Environment
; National Academy
of Sciences: Washington, DC, 1978.
(11) MacKenzie, F. T.; Wollast, R. In
The Sea, Vol. 6 Marine Modeling
;
Goldberg, E. D., McCave, J. N., O'Brien, J. J., Steele, J. H., Eds.;
John Wiley and Sons: New York, 1977; pp 765-777.
(12) Lantzy, R.; MacKenzie, F.
Geochim. Cosmochim. Acta
1979
,
43
,
511.
(13) Slemr, F.; Seiler, W.; Schuster, G.
J. Geophys. Res.
1981
,
86
, 1159.
(14) Lindqvist, O.; Rodhe, H.
Tellus
1985
,
337B
, 136.
(15) Fitzgerald, W. F. In
The Role of Air-Sea Exchange in Geochemical
Cycling
; Buat-Menard, P., Ed.; NATO ASI Series; Reidel Press:
Dordrecht, 1986; C185, pp 363-408.
(16) Fitzgerald, W. F. In
Chemical Oceanography
; Riley, J. P., Chester,
R., Eds.; Academic Press: London, 1989; Vol. 10, pp 151-186.
(17) Nriagu, J. O.
Nature
1989
,
338
, 47.
(18) Fitzgerald, W. F.; Clarkson, T. W.
Environ. Health Perspect.
1991
,
96
, 159.
(19) Weiss, H. V.; Koide, M.; Goldberg, E. D.
Science
1971
,
174
, 692.
(20) Herron, M. M.; Langway, C.; Weiss, H.; Kerr, P.; Cragin, J. In
Isotopes and Impurities in Snow and Ice
; International Associa-
tion Hydrological Science: Surrey, UK, 1977; pp 98-102.
(21) Appleqvist, H.; Jensen, K. O.; Sevel, T.; Hammer, C.
Nature
1978
,
273
, 657.
(22) Vandal, G. M.; Fitzgerald, W. F.; Boutron,, C. F.; Candelone, J.
P. Unpublished data, 1996.
(23) Vandal, G. M.; Fitzgerald, W. F.; Boutron, C. F.; Candelone, J.
P.
Nature
1993
,
362
, 621.
(24) Vandal, G. M.; Fitzgerald, W. F.; Boutron, C. F.; Candelone, J.
P. In
Ice Core Studies of Global Biogeochemical Cycles
; Delmas,
R. J., Hammer, C., Kley, D., Mayewski, P., Eds.; NATO-ARW Series;
Springer: Berlin, 1995, pp 401-415.
(25) Fitzgerald, W. F.; Vandal, G. M.; Mason, R. P.
Water, Air Soil
Pollut.
1991
,
56
, 745.
(26) Lamborg, C. H.; Fitzgerald, W. F.; Vandal, G. M.; Rolfhus, K. R.
Water, Air Soil Pollut.
1995
,
80
, 189.
(27) Gill, G. A.; Fitzgerald, W. F.
Geochim. Cosmochim. Acta
1988
,
52
, 1719.
(28) Broecker, W. S.; Peng, J. H. In
Tracers in the Sea
; Lamont-Doherty
Geological Observatory, Columbia University: New York, 1982.
(29) Bostrom, K.; Fisher, D. E.
Geochim. Cosmochim. Acta
1969
,
33
,
743.
(30) Koski, R. A.; Benninger, L. M.; Zierenberg, R. A.; Jonasson, I. R.
U.S. Geol. Surv. Bull.
1994,
No. 2022
, 293.
(31) Camargo, J. A.
Nature
1993
,
365
, 302.
(32) Gill, G. A.; Fitzgerald, W. F.
Deep-Sea Res.
1985
,
32
(3), 287.
(33) Gill, G. A.; Fitzgerald, W. F.
Global Biogeochem. Cycles
1987
,
3
,
199.
(34) Mason, R. P.; Fitzgerald, W. F.
Deep-Sea Res.
1993
,
40
, 1897.
(35) Fitzgerald, W. F.; Mason, R. P. In
Metal Ions in Biological Systems,
Vol. 34: Mercury and its Effects on Environment and Biological
Systems
; Sigel, H.; Sigel, A., Eds.; Marcel Dekker, Inc.: New York,
1997; pp 53-110.
(36) Stuiver, M.; Quay, P.; Ostlund, H. G.
Science
1983
,
219
, 849.
(37)
Mercury Study Report to Congress
(Draft); U.S. Environmental
Protection Agency, 1997.
(38) Watson, W. D. In
The Biogeochemistry of Mercury in the
Environment
; Nriagu, J. O., Ed.; Elsevier: Amsterdam, 1979; pp
42-77.
(39) Johansson, K.
Verh. Int. Ver. Theor. Angew. Limnol.
1985
,
22
,
2359.
(40) Verta, M.; Tolonen, K.; Simola, H.
Sci. Total Environ.
1989
,
87/
88
, 1.
(41) Verta, M.; Mannio, J.; Livonen, P.; Hirvi, J. P.; Ervinen, O.;
Piepponen, S. In
Acidification in Finland
; Kauppi, P., Kenttamies,
K., Anttila, P., Eds.; Springer-Verlag: Berlin, 1990; pp 883-908.
(42) Renberg, I.
Hydrobiologia
1986
,
143
, 379.
(43) Meger, S. A.
Water, Air Soil Pollut.
1986
,
30
, 411.
(44) Evans, R. D.
Arch. Environ. Contam. Toxicol.
1986
,
15
, 505.
(45) Johnson, M. G.; Culp, L. R.; George, S. E.
Can. J. Fish. Aquat. Sci.
1986
,
43
, 754.
(46) Johnson, M. G.
Can. J. Fish. Aquat. Sci.
1987
,
44
, 3.
(47) Rada, R. G.; Wiener, J. G.; Winfrey, M. R.; Powell, D. E.
Arch.
Environ. Contam. Toxicol.
1989
,
18
, 175.
(48) Swain, E. B.; Engstrom, D. R.; Brigham, M. E.; Henning, T. A.;
Brezonik, P. L.
Science
1992
,
257
, 784.
(49) Hermanson, M. H.
Water Sci. Technol.
1993
,
28
, 33.
(50) Lockhart, W. L.; Wilkinson, P.; Billeck, B. N.; Brunskill, G. J.;
Hunt, R. V.; Wagemann, R.
Water Sci. Technol.
1993
,
28
, 43.
(51) Lucotte, M.; Mucci, A.; Hillaire-Marcwel, C.; Pichet, P.; Grondin,
A.
Water, Air Soil Pollut.
1995
,
80
, 467.
(52) Hurley, J. P.; Krabbenhoft, D. P.; Babiarz, C. L.; Andren, A. W.
In
Environmental Chemistry of Lakes and Reservoirs
; Baker, L.
A., Ed.; American Chemical Society: Washington, DC, 1994; pp
425-449.
6
9
ENVIRONMENTAL SCIENCE & TECHNOLOGY / VOL. 32, NO. 1, 1998
ELECTRONIC FILING, RECEIVED, CLERK'S OFFICE, AUGUST 14, 2006
(53) Engstrom, D. R.; Swain, E. B.
Environ. Sci. Technol.
1997
,
312
,
960.
(54) Engstrom, D. R.; Swain, E. B.; Henning, T. A.; Brigham, M. E.;
Brezonik, P. L. In
Environmental Chemistry of Lakes and
Reservoirs
; Baker, L. A., Ed.; American Chemical Society:
Washington, DC, 1994; pp 33-66.
(55) Iverfeldt, A¡ .
Water, Air Soil Pollut.
1991
,
56
, 251.
(56) Coker, W. B.; Kettles, I. M.; Shilts, W. W.
Water, Air Soil Pollut.
1995
,
80
, 1025.
(57) Fitzgerald, W. F.; Vandal, G. M.; Mason, R. P.; Dulac, F. In
Mercury
as a Global Pollutant: Towards Integration and Synthesis
;
Watras, C. J., Huckabee, J. W., Eds.; Lewis Publishers: Boca
Raton, 1994; pp 203-220.
(58) Armstrong, F. A. J.; Hamilton, A. L. In
Trace Metals and Metal-
Organic Interactions in Natural Waters
; Singer, P., Ed.; Ann Arbor
Science Publishers Inc.: Ann Arbor, MI,
1973
; pp 131-156.
(59) Rudd, J. W. M.; Turner, M. A.; Furutani, A.; Swick, A.; Townsend,
B. E.
Can. J. Fish. Aquat. Sci.
1983
,
40
, 2206.
(60) Lockhart, W. L.; Ramlal, K.; Wilkinson, P.
Abstr. Soc. Environ.
Toxicol. Chem.
1995
,
16th
.
(61) Smith, J. N.; Loring, D. H.
Environ. Sci. Technol.
1981
,
15
, 944.
(62) Friske, P. W. B.; Hornbrook, E. H. W.
Trans. Inst. Min. Metall.
1991
,
100
, B47.
(63) Webb, R. S.; Webb, T., III.
Quat. Res.
1988
,
30
, 284.
(64) Hilton, J.; Lishman, J. P.; Allen, P. V.
Limnol. Oceanogr.
1986
,
31
, 125.
(65) Dillon, P. J.; Evans, R. D.
Hydrobiologia
1982
,
91
, 121.
(66) Davis, M. B.; Ford, M. S.
Limnol. Oceanogr.
1982
,
27
, 137.
(67) Wren, C. D.; MacCrimmon, H. R.; Loescher, B. R.
Water, Air Soil
Pollut.
1983
,
19
, 277.
(68) Friske, P. W. B.; Coker, W. B.
Water, Air Soil Pollut.
1995
,
80
,
1047.
(69) Matty, J. P.; Long, D. T.
J. Great Lakes Res.
1995
,
21
(4).
(70) Verta, M.; Mannio, J. In
Proceedings of an International
Symposium on Acidification and Water Pathways, Vol. II
; The
Norwegian National Committee: Bolkesjo, Norway, 1987; pp
343-352.
(71) Dmytriw, R.; Mucci, A.; Lucotte, M.; Pichet, P.
Water, Air Soil
Pollut.
1995
,
80
, 1099.
(72) Louchouarn, P.; Lucotte, M.; Mucci, A.; Pichet, P.
Can. J. Fish.
Aquat. Sci.
1993
,
50
, 269.
(73) Gobeil, C.; Cossa, D.
Can. J. Fish. Aquat. Sci.
1993
,
50
, 1794.
(74) Henning, R. A. In Historical and Areal Deposition of Mercury
in Northeast Minnesota and Northern Wisconsin Lakes; M.S.
Thesis, University of Minnesota, Minneapolis, 1989.
(75) Hurley, J. P.; Benoit, J. M.; Babiarz, C. L.; Krabbenhoft, D. P.;
Andren, A. W.
Abstracts, 4th International Mercury Conference
;
Hamburg, 1996.
(76) Montgomery, S.; Mucci, A.; Lucotte, M.
Water, Air Soil Pollut.
1995,
87
, 219.
(77) Krabbenhoft, D. P.; Babiarz, C. L.
Water Resour. Res.
1992
,
28
,
3119.
(78) Gorham, E.
Can. J. Bot.
1959
,
37
, 327.
(79) Clymo, R. S.
Ann. Bot.
1963
,
27
, 309.
(80) RuÈhling, A.; Tyler, G.
Oikos
1970
,
21
, 92.
(81) Huckabee, J. W.
Atmos. Environ.
1973
,
7
, 749.
(82) Urban, N, R.; Eisenreich, S. J.; Grigal, D. F.; Schurr, K. T.
Geochem.
Cosmochim. Acta
1990
,
54
, 3329.
(83) Benoit, J. M.; Fitzgerald, W. F.; Damman, A. W. H. In
Mercury
Pollution: Integration and Synthesis
; Watras, C. J., Huckabee,
J. W., Eds.; Lewis Publishers: Boca Raton, 1994; pp 187-202.
(84) Slemr, F.; Schuster, G.; Seiler, W.
J. Atmos. Chem.
1985
,
3
, 407.
(85) Oldfield, F.; Appleby, P. G. In
Lake Sediments and Environmental
History
; Haworth, E. Y., Lund, J. W. G., Eds.; University of
Minnesota Press: Minneapolis, 1984; pp 93-124.
(86) Jensen, A.; Jensen, A.
Water, Air Soil Pollut.
1991
,
56
, 769.
(87) Steinnes, E.; Andersson, E. M.
Water, Air Soil Pollut.
1991
,
56
,
391.
(88) Amundsen, C. E.; Hanssen, J. E.; Semb, A.; Steinnes, E.
Atmos.
Environ.
1992
,
26A
, 1309.
(89) Rood, B. E.; Gottgens, J. F.; Delfino, J. J.; Earle, C. D.; Crisman,
T. L.
Water, Air Soil Pollut.
1995
,
80
, 981.
(90) Nater, E. A.; Grigal, D. F.
Nature
1992
,
358
, 139.
(91) Grigal, D. F.; Nater, E. A.; Homann, P. A. In
Mercury Pollution:
Integration and Synthesis
; Watras, C. J., Huckabee, J. W., Eds.;
Lewis Publishers: Boca Raton, 1994; pp 305-312.
(92) Lindberg, S. E.; Jackson, D. R.; Huckabee, J. W.; Janzen, S. A.;
Levin, M. J.; Lund, J. R.
J. Environ. Qual.
1979
,
8
, 572.
(93) Lindberg, S. E.; Turner, R. R.; Meyers, T. P.; Taylor, G. E. J.;
Schroeder, W. H.
Water, Air, Soil Pollut.
1991
,
56
, 577.
(94) Lindberg, S. E. In
Regional and Global Mercury Cycles: Sources,
Fluxes and Mass Balances
; Baeyens, W., Vasiliev, O., Ebinghaus,
R., Eds.; Kluwer Academic Publishers: Dordrecht, The Neth-
erlands, 1996; pp 359-380.
(95) Iverfeldt, Å.
Water, Air Soil Pollut.
1991
,
56
, 553.
(96) Chaney, R. L.
Biocycle
1990
,
31
, 54.
(97) Grigal, D. F.; Ohmann, L. F.
J. Environ. Qual.
1989
,
18
, 368.
(98) Ohmann, L. F.; Grigal, D. F. In
USDA For. Ser. Res. Bull. NC-130
,
1991
.
(99) Verry, E. S.; Harris, A. R.
Water Resour. Res.
1988
,
24
, 481.
(100) Harris, A. R.; Verry, E. S. In
Hydrological and Hydrogeochemical
Mechanisms and Model Approaches to the Acidification of
Ecological Systems
; Johansson, I., Ed.; Proceedings on Inter-
national Hydrological Program Workshop: Uppsala, Sweden,
1985; pp 57-65.
(101) Meij, R.
Water, Air Soil Pollut.
1991
,
56
, 21.
(102) Prestbo, E. M.; Bloom, N. S.
Water, Air Soil Pollut.
1995
,
80
,
145.
(103) Keeler, G.; Glinsorn, G.; Pirrone, N.
Water, Air Soil Pollut.
1995
,
80
, 159.
(104) Iverfeldt, A¡ .; Munthe, J.; Brosset, C.; Pacyna, J.
Water, Air Soil
Pollut.
1995
,
80
, 227.
Received for review March 27, 1997. Revised manuscript
received September 9, 1997. Accepted September 15, 1997.
X
ES970284W
X
Abstract published in
Advance ACS Abstracts,
November 1, 1997.
VOL. 32, NO. 1, 1998 / ENVIRONMENTAL SCIENCE & TECHNOLOGY
9
7
ELECTRONIC FILING, RECEIVED, CLERK'S OFFICE, AUGUST 14, 2006
ELECTRONIC FILING, RECEIVED, CLERK'S OFFICE, AUGUST 14, 2006
ELECTRONIC FILING, RECEIVED, CLERK'S OFFICE, AUGUST 14, 2006
ELECTRONIC FILING, RECEIVED, CLERK'S OFFICE, AUGUST 14, 2006
ELECTRONIC FILING, RECEIVED, CLERK'S OFFICE, AUGUST 14, 2006
ELECTRONIC FILING, RECEIVED, CLERK'S OFFICE, AUGUST 14, 2006
ELECTRONIC FILING, RECEIVED, CLERK'S OFFICE, AUGUST 14, 2006
ELECTRONIC FILING, RECEIVED, CLERK'S OFFICE, AUGUST 14, 2006
ELECTRONIC FILING, RECEIVED, CLERK'S OFFICE, AUGUST 14, 2006
ELECTRONIC FILING, RECEIVED, CLERK'S OFFICE, AUGUST 14, 2006
ELECTRONIC FILING, RECEIVED, CLERK'S OFFICE, AUGUST 14, 2006
ELECTRONIC FILING, RECEIVED, CLERK'S OFFICE, AUGUST 14, 2006
ELECTRONIC FILING, RECEIVED, CLERK'S OFFICE, AUGUST 14, 2006
Atmospheric Mercury Deposition
during the Last 270 Years: A
Glacial Ice Core Record of Natural
and Anthropogenic Sources
PAUL F . SCHUSTER , *
DAVID P . KRABBENHOFT ,
²
DAVID L . NAFTZ ,
³
L . DEWAYNE CECIL ,
§
MARK L . OLSON ,
²
JOHN F . DEWILD ,
²
DAVID D . SUSONG ,
³
JAROMY R . GREEN ,
§
AND
MICHEAL L . ABBOTT
|
U.S. Geological Survey, Boulder, Colorado 80303, National Ice
Core Laboratory, Box 25046, MS 975, Denver, Colorado 80225,
and U.S. Geological Survey, Wisconsin District Mercury
Research Laboratory, Middleton, Wisconsin 53562
Mercury (Hg) contamination of aquatic ecosystems and
subsequent methylmercury bioaccumulation are significant
environmental problems of global extent. At regional to
global scales, the primary mechanism of Hg contamination
is atmospheric Hg transport. Thus, a better understanding
of the long-term history of atmospheric Hg cycling and
quantification of the sources is critical for assessing the
regional and global impact of anthropogenic Hg emissions.
Ice cores collected from the Upper Fremont Glacier
(UFG), Wyoming, contain a high-resolution record of total
atmospheric Hg deposition (ca. 1720-1993). Total Hg in
97 ice-core samples was determined with trace-metal clean
handling methods and low-level analytical procedures to
reconstruct the first and most comprehensive atmospheric
Hg deposition record of its kind yet available from North
America. The record indicates major atmospheric releases
of both natural and anthropogenic Hg from regional and
global sources. Integrated over the past 270-year ice-core
history, anthropogenic inputs contributed 52%, volcanic
events 6%, and background sources 42%. More significantly,
during the last 100 years, anthropogenic sources
contributed 70% of the total Hg input. Unlike the 2-7-fold
increase observed from preindustrial times (before 1840)
to the mid-1980s in sediment-core records, the UFG record
indicates a 20-fold increase for the same period. The
sediment-core records, however, are in agreement with
the last 10 years of this ice-core record, indicating declines
in atmospheric Hg deposition.
Introduction
Atmospheric transport and fate of mercury (Hg) and sub-
sequent methylmercury bioaccumulation in the environment
are critical contamination issues (
1
). Of continuing debate
is whether atmospheric Hg deposition is due to local, regional,
or global sources (
2
,
3
). Recent estimates indicate that
anthropogenic emissions of Hg have exceeded natural inputs
since the onset of the industrial period (
4
). The potential
effectiveness of proposed Hg emission reductions hinges on
an accurate estimate of the function of current atmospheric
deposition from ªmanageableº sources. A significant question
facing scientists and environmental agencies is the relative
contribution of natural and anthropogenic sources to
atmospheric Hg. Mercury concentrations in glacial ice
provide a direct measurement and historic record of atmo-
spheric Hg deposition (
5
-
7
). Research on total Hg in glacial
ice, especially in the midlatitudes, is scarce. Although some
polar ice cores have provided a limited record of past Hg
deposition, polar ice cores are, at best, proxy indicators of
historic Hg deposition in the midlatitudes.
Increasingly, ice cores from low- and midlatitudes are
becoming recognized as valuable tools for reconstructing
paleoclimatic and paleoenvironmental records (
8
-
15
). These
records, however, are uncommon; the Hg record presented
here is the first and most comprehensive of its kind yet to
be available in North America. To underscore the importance
and uniqueness of these records, increasing global temper-
atures are threatening the existence and integrity of low-
and midlatitude glaciers, which are receding rapidly. If
recession continues at these rates, the Dinwoody Glacier,
about 3 km north of the Upper Fremont Glacier (UFG), will
be gone in about 20 years (
16
). Other estimates show that the
remaining glaciers in Glacier National Park, Montana, will
no longer exist in 50-70 years (
17
) and that high alpine
glaciers in the Andies of South America (i.e., Quelccaya) will
be severely compromised by meltwater processes (
13
). This
irreplaceable paleoenvironmental resource may literally melt
away in the near future, releasing an additional and
potentially large reservoir of Hg trapped in snow and ice to
the environment.
The dynamics of Hg in glacial ice are not well-known.
Although Hg deposition to polar cores has been investigated
(
5
-
7
), it is recognized that, unlike polar ice cores, meltwater
processes can influence the chemical stratigraphy of alpine
glaciers. This process is described in terms of an elution
sequence (
18
) and may ªdampenº or complicate the envi-
ronmental signal by mobilizing or removing solutes. A
complete removal of chemical signal from the ice by
meltwater processes limits paleoenvironmental interpreta-
tion in that it is impossible to know if an environmental
signal initially existed. Therefore, any chemical signal
preserved in the ice, albeit possibly stratigraphically shifted,
may have potentially been much larger during deposition.
To date, there has been no work to place metals such as Hg
in the elution sequence. Thus, the mobility of Hg in temperate
ice, in relation to other ions, is largely unknown. Despite
these potential problems, previous studies (
8
-
11
,
19
) indicate
that the UFG preserves chemical stratigraphy with sufficient
resolution to support the interpretation of valuable paleo-
environmental records. Moreover, Hg concentrations in ice
cores are not subject to controversial diagenetic processes
that may affect Hg concentrations in sediment cores, peat
bogs, and soils (
20
-
21
). Hg(0) is sparingly soluble (equilib-
rium concentrations with typical air concentrations are about
2-6 pg/L) and, with respect to other solutes, the solubility
of Hg(II) and HgO is low, suggesting that movement in glacial
ice due to meltwater is minimal.
Experimental Section
Continuous ice cores were collected from UFG in the Wind
River Range, Wyoming (Figure 1), in 1991 and again in 1998.
* Corresponding author phone: (303) 541-3052; fax: (303) 447-
2505: e-mail: pschuste@usgs.gov.
²
U.S. Geological Survey, Middleton, WI.
³
U.S. Geological Survey, Salt Lake City, UT.
§
U.S. Geological Survey, Idaho Falls, ID.
|
Geoscience Research, INEEL, Idaho Falls, ID.
Environ. Sci. Technol.
2002
, 36, 2303-2310
10.1021/es0157503 Not subject to U.S. Copyright. Publ. 2002 Am. Chem. Soc.
VOL. 36, NO. 11, 2002 / ENVIRONMENTAL SCIENCE & TECHNOLOGY
9
2303
Published on Web 04/24/2002
ELECTRONIC FILING, RECEIVED, CLERK'S OFFICE, AUGUST 14, 2006
For a temperate glacier, the UFG has some unique qualifica-
tions conducive to preserving paleoenvironmental signal.
The drill site elevation is 4100 m. Minimum, maximum, and
average annual air temperatures during 5 years of record
were -36, 13, and -7
°
C, respectively. Temperature profiles
from snow pits, conducted on an intermittent basis, on the
UFG indicated that the snowpack was typically isothermal
at 0
°
C during the summer months. During the winter months,
the snowpack was below 0
°
C, ranging from -7to -2
°
C. The
net accumulation rate is 96 cm ice equivalent/year, based
on the 29-m depth of ice (the 1963 tritium peak) divided by
time. The glacial surface gradient is near level, reducing
crevassing and fracturing of the ice strata (
9
). These
characteristics reduce the potential for meltwater to alter
any paleoenvironmental signal. Because the remoteness of
the site limits the influence of local sources of atmospheric
Hg deposition to the UFG, the location is favorable for
measuring historical regional and global deposition of total
Hg from the atmosphere (Figure 2) (
22
).
Typically, ice cores are recovered with electromechanical
drills, and deep polar cores require the use of liquid lubricants
such as fuel oil or antifreeze to keep the drill hole open. The
UFG cores, located about 220 m apart roughly along the
same contour elevation, were recovered with a 7.6-cm
diameter thermally heated aluminum coring device (
9
). The
thermal drilling process excludes the use of lubricants,
reducing the potential for Hg contamination. The drill winch
cable was a Kevlar braid protected by an outer Nylon braid.
All bolts on the core barrel were stainless steel, and silver
was a major component of the thermal blade. The metals
exposed to the ice-core surface during recovery and pro-
cessing were composed of aluminum and stainless steel. To
assess possible Hg contamination from these metals, ªveneer
experimentsº similar to those reported for polar ice (
23
) were
performed on a 20-cm piece of archived UFG ice (ca. 1855)
from a depth of 103 m. Four successive ˘1 cm layers (i.e.,
concentrai rings) were scraped from the sample using a
titanium blade onto a Teflon working platform inside a
laminar-flow hood. Powder-free Latex gloves were worn
throughout the procedure (
24
). The scrapings were collected
into acid-boiled 250-mL Teflon bottles and allowed to melt
at room temperature. The melted samples, ranging in volume
from 51 to 71 mL, were analyzed for Hg using internationally
adopted and proven analytical methods (
25
). Rinse water
from the titanium blade was measured at 0.35 ng/L. Selected
metal concentrations (including rare earths) were measured
by ICP-MS. Mercury concentrations from the veneer experi-
ment ranged from 9.3 to 11.2 ng/L with no obvious trend in
those data, and the average concentration was within 6% of
the composite sample taken from the same horizon for the
development of the Hg profile. The uniform concentrations
through the thickness of this ice-core sample suggest two
possibilities: (1) the source of Hg is from atmospheric
deposition and represents an uncontaminated signal, or (2)
an Hg source from the core barrel has penetrated the entire
thickness of the core. The latter is unlikely for three reasons:
(1) Hg(0) is sparingly soluble and, with respect to other
solutes, the solubility of Hg(II) and HgO is low, and reducing
movement in ice, a solid-phase exchange process would be
required; (2) the significant variations in Hg concentrations
observed throughout the length of the core would be masked
or dampened by a constant source of contamination; and
most significantly, (3) if a contamination source existed,
concentrations of these constituents would decrease from
outer to inner core (
23
); this trend was not observed in the
UFG ice core. Aluminum and zinc, two major components
of the core barrel and saw blade, also showed no decreasing
trends from the outer layers to the ice-core center. Moreover,
silver, a major component of the thermal blade, and
chromium, a component in stainless steel, were not detected.
Aluminum did not correlate with the rare earth elements La,
Ce, and Nd in the outermost layer as a function of radius
from the center, suggesting that a fraction of this aluminum
is from the core barrel. The next five layers to the center of
the core, however, show that aluminum is correlated to these
rare earth elements, indicating that the source is natural or
crustal earth. Although the potential for Hg contamination
exists, based on these results, removal of the outer layer of
the ice-core samples (discussed next) greatly reduces the
potential for Hg contamination from recovery and processing
techniques used for the UGF ice cores.
After the ice core was removed from the aluminum core
barrel, 1-m sections were quickly sealed in polyethylene bags
and placed in core tubes by personnel wearing Tyvek suits
and powder-free Latex gloves. During the entire process,
ªclean handsº protocol was used (
24
). To prevent melting,
FIGURE 1. Map showing the location of the 1991 and 1998 ice-core
drilling sites. Each site was located at about the same altitude
separated by about 220 m.
FIGURE 2. Location of the Upper Fremont Glacier showing very
little impact from upwind local sources of atmospheric Hg.
2304
9
ENVIRONMENTAL SCIENCE & TECHNOLOGY / VOL. 36, NO. 11, 2002
ELECTRONIC FILING, RECEIVED, CLERK'S OFFICE, AUGUST 14, 2006
the core tubes were stored at 0
°
C in snow vaults on the
glacier. Immediately after drilling was complete, the cores
were transported to a freezer truck via a 10-min helicopter
flight to storage in the National Ice Core Lab (NICL) storage
room (-36
°
C) in Denver, CO, until processing and analysis.
All processing took place in the clean -24
°
C environment
of NICL. The cores, totaling 160 m in length, were cut into
7-cm sections with a stainless steel band saw cleaned with
methanol. A total of 57 samples and 40 samples were removed
from the 1991 and 1998 cores, respectively. The sections were
placed in Hg-free clean polyethylene bags and shipped frozen
on dry ice overnight to the U.S. Geological Survey's Wisconsin
District Mercury Research Lab (WDMRL) in Middleton, WI.
Temperature recorders were placed in the shipping contain-
ers, and the temperature inside the containers during
shipment did not exceed 0
°
C.
At the WDMRL, ice samples were removed from the bags
with gloved hands and rinsed with about 50 mL of WDML
deionized water (total Hg e0.1 ng/L) to remove any potential
contamination from field procedures. After rinsing, the
samples were placed in Hg-clean (
25
) Teflon jars. Four
milliliters of bromine monochloride (BrCl) was added to
oxidize all species of Hg to Hg(II), the jars were capped, and
the samples were allowed to thaw at room temperature.
Samples ranged in volume from 25 to 75 mL. Although there
are small variations in ice density, this is not the main reason
for sample-volume variation. In some sections of the ice core,
demands for ice to address other research interests (i.e.,
chlorine-36 studies and paleoclimate and paleoenviron-
mental studies) limited the volume of ice available for Hg
research. Because all samples were run in duplicate for Hg
analysis and the likely possibility Hg concentrations would
be relatively low in many preindustrial samples (<1 íg/L),
creating further demand for a maximum volume needed for
accurate Hg analysis, 50 mL of rinse water was used to remove
the potentially contaminated outer core layer. Once thawed,
the liquid was transferred to Hg-clean Teflon bottles that
were placed in an oven at 50
°
C overnight to ensure complete
oxidation of all mercury species. Analysis for total Hg was
performed with dual amalgamation cold vapor atomic
fluorescence spectrometry (
25
) with a method detection limit
(MDL) of 0.04 ng/L (
26
).
Quality control (QC) check samples were analyzed at the
beginning of the run, at least every 10th sample, and at the
end of the run to establish daily statistical control. QC checks
were prepared with WDMRL deionized water and a known
amount of Hg standard from a source other than that used
for standardization. The QC standards measure any possible
instrument drift and provide an external check on the
accuracy of the calibration standards. Four jar blanks (process
blanks) were run during the period of analysis. A jar blank
consisted of brominated deionized water that was allowed
to sit in a clean jar for the time it took for the ice to melt and
then was transferred into a Teflon bottle and treated like a
sample. Results from the jar blanks were used to determine
the contribution of Hg from the oxidant BrCl and any Hg
sources from the jars. The blanks ranged in concentration
from 0.30 to 0.86 ng/L (mean ) 0.66, std dev ) 0.25,
n
) 4).
After blank subtraction of the mean blank value, the lowest
total Hg concentration from 97 samples was 1.21 ng/L, which
is still significantly above the highest blank value. All samples
were analyzed in duplicate. If the percent difference between
the two duplicates was greater than 10%, the sample was
analyzed a third time. In all cases, the relative standard
deviation between the three replicates was less than 10%.
On each work day, at least one sample was spiked and the
percent recoveries ranged from 90 to 111 (mean ) 99, std
dev ) 6,
n
) 15).
Results and Discussion
Ice Core Chronology.
Accurate ice-core chronology is
essential to paleoenvironmental interpretation. Unlike polar
ice cores from Greenland and Antarctica, which are more
likely to preserve visual stratigraphy in the form of annual
summer dust layers (
27
,
28
), annual dust layers in the UFG
were not always visible, thereby making visual age-dating
methods unreliable. Although long-term trends in the water
isotopes appear to be preserved, there is no evidence that
seasonal isotopic signatures have been preserved in the UFG
ice (
8
,
9
). Instead, the chronology of the UFG was determined
using other isotopic and chemical age-dating techniques.
The 1963 tritium (
8
) and 1958 chlorine-36 (
10
) peaks were
found at depths of 28 and 32 m respectively. A carbon-14
value from a grasshopper leg found at 152 m yielded a most
probable age of 221 ( 95 years (
8
). These dates, in combina-
tion with estimated snow accumulation and ablation mea-
surements (
9
), established a low-resolution chronology for
the UFG cores. Additional time markers of volcanic origin at
88 and 123 m were identified through electrical conductivity
measurements (ECM), establishing a confident age-depth
relationship and refining the ice-core chronology to predic-
tion limits of (10 years (90% confidence level) and confidence
limits of 2-3 years (
11
). Although the resolution of the UFG
ice cores is considered low by polar ice-core research
standards, it provides a chronology of sufficient resolution
over its 270-year record to support the conclusions made
about historical changes in Hg deposition. Development of
the UFG ice-core chronology is described in detail in other
work (
8
,
9
,
11
,
29
).
Hg Concentrations in the UFG.
The remote location and
high elevation of the UFG (Figure 1) most likely reduce the
contributions from local anthropogenic influences of at-
mospheric Hg (Figure 2) (
22
). As such, Hg concentrations in
ice cores from the UFG reflect regional and global atmo-
spheric inputs. Although the range of Hg concentrations
found in the UGF ice cores (Figure 3) were much greater
than those found in Antarctic and Greenland ice, preindustrial
or background concentrations not influenced by volcanic
activity, however, were similar to those found in Antarctic
ice and Greenland ice (
5
,
6
), indicating that the large ranges
of Hg concentrations found in the UFG are not an artifact
of contamination but rather reflect natural and anthropogenic
deposition of atmospheric Hg at this latitude. Total Hg
measured in 97 ice-core samples spanning 160 m provided
an average Hg profile resolution of 3 years. The detailed
chronology of the UFG cores, coupled with analytical
advances in measuring trace levels of Hg, together with a
3-year profile resolution, provide a clear and direct measure
of historical natural and anthropogenic contributions to
atmospheric Hg deposition. Furthermore, the continuity of
the Hg profile from the 1991 core to the 1998 core indicates
that Hg is preserved in the ice (Figure 3).
By integrating the peak areas identified as separate
atmospheric sources of Hg, the relative contributions of these
sources were quantified. Eighteen preindustrial (before 1840)
measurements of Hg were used to extrapolate a background
value (3 ng/L) through the ice-core record. Background
concentrations contributed 42% of the total Hg in the ice
core during its 270-year record.
Volcanic Sources of Hg.
Volcanic eruptions are a known
atmospheric Hg source (
30
,
31
); however, their importance
on a global scale has remained unresolved. Three distinct
peaks in the ice-core Hg profile are coincident (within the
chronology prediction limits of (10 years) with increased
chloride and sulfate concentrations and ECM (Figure 4) (
11
).
ECM is a direct measurement of the acidity of the ice (
32
).
Volcanic eruptions increase the acidity of precipitation,
resulting in increased ECM of the ice. Strong ECM signals,
VOL. 36, NO. 11, 2002 / ENVIRONMENTAL SCIENCE & TECHNOLOGY
9
2305
ELECTRONIC FILING, RECEIVED, CLERK'S OFFICE, AUGUST 14, 2006
along with increased chloride and sulfate concentrations in
the ice-core profile suggest that the snow falling on the glacier
surface at that time contained volcanic fallout.
The two largest eruptions in recorded history, Krakatau
(1883 AD) and Tambora (1815 AD), albeit in the southern
hemisphere 20 000 km from the UFG, reached well into the
stratosphere with global effects. The ship, Medea, measured
the Krakatau eruption column height to be up to 26 km (
33
).
The Tambora event, perhaps the largest eruption in the last
10 000 years, injected volcanic material to a height estimated
to be as high as 44 km into the stratosphere (
34
). Historical
observations of remarkable sunsets in Europe, North America,
and Hawaii and optical effects for up to 2 years after each
eruption were another indication that the dust columns
reached the stratosphere (
35
). Fallout from the Tambora and
Krakatau events has been identified in Antarctic and Green-
land ice cores (
36
,
37
). These natural geologic events were
point sources in terms of Hg origin but were followed by
global scale deposition. The Mount St. Helens eruption (1980),
although orders of magnitude smaller in scale, was only 600-
km distant and directly upwind of the UFG, blanketing the
region with volcanic ash (
9
). The proximity of Mount St.
Helens to the UFG qualifies the corresponding Hg peak as
a regional Hg source. The peak's superposition on elevated
concentrations due to near-peak anthropogenic Hg emissions
resulted in the profile's highest measured Hg concentrations
(Figure 3). Differences in Hg loads among the three volcanic
peaks may have been due to differences in volcanic dust
compositions as indicated by differences in chloride, sulfate,
and ECM peaks. Whether the volcanic source of Hg was
regional, global, or altered by postdepositional processes, it
is clear that these globally impacting natural events have
ªpunctuatedº the historical Hg record in the UFG and likely
elsewhere.
Integrating the peak areas attributed to volcanic activity
with global impact (Figure 3), these natural atmospheric Hg
sources were quantified. During the past 270 years, three
major volcanic events (Tambora, Krakatau, and Mount St.
Helens) contributed 6% of the total Hg measured in the ice
cores. It is likely, however, that 6% is an underestimate. There
are three main possibilities for this underestimate. (1) There
have been numerous smaller volcanic events (
38
) during the
past 270 years. Some of these events undoubtedly had some
global impact, but the volcanic signal was likely masked by
the background or anthropogenic signal. (2) Only 6.7 m of
a total length of 160 m of ice was sampled for Hg throughout
the length of the core. The Hg signal from a volcanic source
is of short duration (1-2 years). Thus, it is likely that some
volcanic events were not sampled. (3) It is also possible that
elution processes (described earlier) dampened the volcanic
Hg signal of the three major volcanic eruptions identified in
the UFG ice core.
Anthropogenic Sources of Hg.
Mercury was used on a
large scale to recover gold from mining operations throughout
the western United States beginning around 1850. These
activities peaked around 1860 and then again around 1877
(Figure 3, inset B) (
39
). The bimodal nature of these activities
was reflected in the ice-core Hg profile, showing significant
increases coincident with peak Hg production in California
during this period. The age-depth prediction limit for the
UFG ice cores is (10 years, thus accounting for the slight
offsets among Figure 3A and insets B and C. Mercury
production decreased significantly in 1884 with the intro-
duction of legislation (The Sawyer Decision) (
39
) that greatly
reduced the use of Hg for gold extraction in California. A
precipitous drop in UFG ice-core Hg concentrations coin-
cided with this period.
Most sediment-core studies do not indicate an increase
in Hg concentrations coincident with the start of the
California Gold Rush. There are some studies, however, that
do record a ªjumpº in the sediment Hg profile ca. 1850 (
40
,
41
). Nriagu (
42
) explains that most of the Hg would have
blown west, describing this transport as a ªgrasshopper-like
dispersal patternº. The mercury-gold amalgamation prac-
tices during the California gold rush during the mid-to-late
1800's were unregulated and unrivaled by any other mining
activity up to that time (
39
). During this time, unknown
amounts of Hg were volatilized to the atmosphere. The
depositional pattern of atmospheric Hg from this source
would be, in a large part, dependent on storm trajectories
and jet stream patterns for which there is obviously no data
for that period. On the basis of (1) today's general knowledge
that it is not uncommon for storm trajectories and the jet
stream to migrate north and south, (2) the UFG's proximity
to the California mining belts, and (3) the magnitude of the
estimates of Hg volatilized into the atmosphere for 30 years
(ca. 1849-1884), it is suggested that the source of elevated
Hg concentrations measured in the UFG ice core coincident
with the same time period is Hg from California mining
activities (Figure 3). If the source of these elevated Hg
concentrations is from California gold-mining activities, as
suggested by Figure 3, then the integration of the profile
indicates that the mercury-gold amalgamation activities
during the California Gold Rush contributed 13% of the total
Hg in the 270-year ice-core record. These data suggest that
FIGURE 3. (A) Profile of historic concentrations of Hg in the Upper
Fremont Glacier. A conservative concentration of 4 ng/L was
estimated as preindustrial inputs and extrapolated to 1993 as a
background concentration. Age
-
depth prediction limits are
(
10
years (90% confidence level); confidence limits are 2
-
3 years (11).
(Inset B) Hg production during the California Gold Rush (adapted
from Figure 5 in ref
39). (Inset C) World production of Hg in tons
per year during the last century (adapted from Figure 4B in ref
43).
2306
9
ENVIRONMENTAL SCIENCE & TECHNOLOGY / VOL. 36, NO. 11, 2002
ELECTRONIC FILING, RECEIVED, CLERK'S OFFICE, AUGUST 14, 2006
the California Gold Rush had a significant regional impact
in terms of atmospheric Hg deposition in the western United
States.
At the turn of the 20th century, atmospheric Hg levels
remained elevated as compared to preindustrial (before ca.
1840 AD) or background values. Increases in anthropogenic
Hg emissions during the past century have been attributed
mainly to coal-burning power plants, waste incineration, and
chlor-alkali plants (
3
,
43
,
44
). The next significant increase
in ice-core Hg concentrations coincided (within the (10 year
prediction limits) with increased global Hg production (Figure
3, inset C), most likely in response to industrial mobilization
for World War II. There was a post-WWII decline in global
Hg production, once again coincident with decreases in ice-
core Hg concentrations. The last half of the 20th century up
until 1990 shows a consistent increase in both global Hg
production and Hg concentrations in the UFG ice cores.
Volcanic eruptions contributed to the global Hg pool for
brief periods (<2 years) and, thus, cannot account for the
substantial increase in ice-core Hg concentrations during
the last century. The volcanic inputs, albeit competitive with
industrial inputs, were short in comparison to the chronic
levels of elevated Hg concentrations during the last 100 years,
indicating that anthropogenic inputs have had the greatest
influence on the atmospheric Hg deposition record in the
UFG. During the past 270 years, anthropogenic inputs
contributed 52% of the Hg accumulation in the core. More
significantly, during the last 100 years, anthropogenic sources
contributed 70% of the total Hg input. A post-1990 decline
in the ice-core Hg concentrations is discussed next.
Hg Deposition Rates to the UFG.
Historical Hg deposition
rates were calculated from Hg concentrations measured in
the ice cores (Table 1). The calculated rates of deposition
assume an average accumulation rate of 1moficeequivalent
to the UFG per year. Obviously, this rate varies from year to
year. However, on the basis of average measurements of
accumulation and ablation rates (
8
,
9
) this estimate is not
unreasonable. Moreover, up to 50% of seasonal snowfall
accumulation is lost through ablation (
9
). This process,
although difficult to quantify, would, most likely, lead to an
underestimate of Hg deposition calculated from concentra-
tions in the ice core.
There is a down-core change in the age-depth relation-
ship due mostly to glacial flow processes leading to layer
thinning with depth. Basically, the same 7-cm section of ice-
core sample represents more time with depth. Considering
the calculation of Hg deposition rates and utilizing the age-
depth relationship (
11
), a ratio (change in age/change in
depth) was calculated and applied to Hg deposition results
to develop corrected Hg deposition rates using eq 1
where
A
is the calculated age (years) (
10
),
D
is the ice-core
depth (meters), and
i
denotes the sequential Hg sample (1-
97). At the base of the core (the 97th Hg sample), the ratio
is 2.88. Thus, at this depth, 1moficerepresentsapproximately
2.88 years. Equation 1 was applied to Hg deposition rates as
a correction factor to compensate for down-core changes of
FIGURE 4. Profiles for Hg compared to chloride, sulfate, and electrical conductivity measurements (ECM). The y axis is scaled with the
age
-
depth relation ship, thus giving the Hg profile a slightly different appearance from Figure 3. ECM is a measure of the acidity of the
ice. A correlation among chloride, sulfate ECM, and Hg is a strong indication of a volcanic source. Age
-
depth prediction limits are
(
10
years (90% confidence level); confidence limits are 2
-
3 years (10)
(adapted from Figure 3 in ref 11).
(
A
i
-
A
i
-1
)/(
D
i
-
D
i
-1
)
(1)
VOL. 36, NO. 11, 2002 / ENVIRONMENTAL SCIENCE & TECHNOLOGY
9
2307
ELECTRONIC FILING, RECEIVED, CLERK'S OFFICE, AUGUST 14, 2006
the age-depth relationship (due to thinning) on each 7-cm
sample.
The ratio attained one at about 35 m. It is assumed there
is no change in the age-depth relationship (due to thinning)
from 35 m to the top of the core (1 m of ice ˘ 1 year). The
residence time of Hg(0) in the atmosphere is on the order
of a year (
1
). Thus, deposition from volcanic sources
represents, at most, a 1-year period. Therefore, volcanic
deposition values were calculated and reported without age-
depth correction factors. Also, preindustrial (background)
and industrial inputs were subtracted from the calculated
volcanic deposition to isolate the volcanic signal. Using
maximum input from each volcanic event and the conditions
described previously, deposition rates from the volcanic
events identified here indicate an 8-18-fold increase in Hg
deposition over background due to globally impacting
volcanic activity.
Again, assuming an accumulation rate of 1 m of ice/year
(
9
) at the top of the ice core and accounting for changes in
the age-depth relation down-core (
11
), there was a 20-fold
increase from preindustrial times to an ªindustrial maximumº
ca. 1984. During the last century, the average increase due
to industrialization was 11-fold. Analysis of sediment cores
from lakes (
40
,
45
-
48
) and precipitation (
49
) also indicate
increases in atmospheric Hg deposition (2-9-fold) since the
1700s. The increase in Hg deposition rates from preindustrial
times to the mid-1980s, as indicated by the ice cores, are up
to 10 times higher than increases determined from sediment
cores and precipitation. Recent work indicates that ice-core
response to changes in global atmospheric cycling masses
and deposition may be amplified for snow (
50
). Although
the mechanisms are unclear, the work concluded there is a
positive relationship of altitude to Hg loading in snow. A
more recent study, however, indicates that Hg in snow packs
is susceptible to reemission due to photochemical redox
reactions, resulting in reductions of Hg levels by 54% within
24 h after deposition (
51
). If this process does occur at the
UFG, the estimated Hg deposition rates calculated from the
UGF ice cores could be underestimated by as much as one-
half. On the other hand, recent work has also shown that
mercury deposition may be affected by altitude, resulting in
increases in atmospheric Hg deposition. Work in the Wasatch
and Teton ranges near the UFG indicate that annual Hg
accumulation rates increase from 100% to 175%, with an
elevation gain of 1000 m (
50
). In addition, recent work on
Denali (Mt. McKinley) in Alaska (Krabbenhoft, to be submit-
ted for publication) showed a 30-75-fold increase in Hg
concentrations in the surface snow with an elevation gain
of about 5500 m; the ice-core site on the UFG is at an elevation
of 4100 m (Figure 1). It appears that the altitude effect is
much larger than the reemission processes indicated by
LaLonde (
51
). This may by why there are measurable and
distinct volcanic and anthropogenic Hg signals in the UFG
ice cores and why this profile differs greatly from those found
in sediment cores. The nearly 50% decline in mercury
accumulation at the top of the ice core compares very
favorably in magnitude with independent estimates of recent
global declines of mercury production and use (
43
,
52
). Lake
sediments, on the other hand, retain only a small fraction of
the total Hg deposition, and the remainder is generally
recycled back to the lake (
53
). Moreover, uncertainties such
as sediment focusing associated with using sediment cores
to estimate accumulation rates prevent simple comparisons
of the two methods.
Estimation of ªGlobal Impact
º
Volcanic Hg Deposition.
An estimated 21 km
3
of volcanic material was ejected during
the 1883 Krakatau eruption (
54
). The 1815 Tambora event
produced a bulk volume of approximately 150 km
3
of pumice
and ash (
55
). Assuming that the ejecta and gases reached the
stratosphere and were distributed evenly over the earth's
hemisphere (
56
), an estimation of the atmospheric deposition
attributed to these globally impacting volcanic events was
calculated by eq 2
where Hg
vol
is the atmospheric deposition from a globally
impacting volcanic eruption,
V
eje
is the volume of volcanic
ejecta, F
plu
is the density of the volcanic plume, F
str
is the
TABLE 1. Mercury (Hg) Deposition Measured among Three Sample Media
site
sample
media
episode
(reference)
year(s)
(AD)
average [Hg]
(ng/L)
deposition
a
(íg/m
2
/year)
change from
preindustrial
(fold)
UFG
ice
Clean Air Act
1986-1993
9
11.4
11
UFG
ice
industrial max
1984
20
20.3
20
UFG
ice
Mt. St. Helens
1980
11
b
12.7§
12
UFG
ice
industrial
1900-1993
10
11.0
11
UFG
ice
WWII
1938-1946
7
4.73
5
UFG
ice
Krakatau
1883
21
c
18.2§
18
UFG
ice
Gold Rush
1850-1878
8
4.84
5
UFG
ice
Tambora
1815
10
c
8.60§
8
UFG
ice
preindustrial
1719-1847
3
0.78
na
d
Minnesota
wet ppt
e
(49)
1997-1999
14
6.99
7
Colorado
wet ppt
(49)
1999
10
9.20
9
<1880
na
80.0
na
Minnesota
lake sed**
(48)
>1880
na
170
2
#
<1850
na
3.70
na
Minnesota
lake sed
(45)
modern
na
12.5
3
<1750
na
2.00
na
Arctic
lake sed
(47)
1980
na
12.5
6
<1850
na
5.00
na
New York
lake sed
(46)
modern
na
8.90
2
<1850
na
7.60
na
California
lake sed
(40)
>1980
na
38.0
5
a
Deposition calculated using age-depth correction factor.
b
Preindustrial and industrial inputs subtracted to isolate volcanic signal; maximum
input reported.
c
Preindustrial input subtracted to isolate volcanic signal; maximum input reported.
d
Not applicable or not available.
e
Wet precipitation.
§
Age-depth correction factor not used to calculate deposition rate. ** Sediment.
#
Change measured from ªpreindustrialº dated cores from cited
study.
Hg
vol
(íg/m
2
) )
[
V
eje
(cm
3
)F
plu
(g/cm
3
)1/F
str
(g/m
3
)Hg
plu
(íg/m
3
)]/
A
hem
(m
2
)
(2)
2308
9
ENVIRONMENTAL SCIENCE & TECHNOLOGY / VOL. 36, NO. 11, 2002
ELECTRONIC FILING, RECEIVED, CLERK'S OFFICE, AUGUST 14, 2006
density of air at 5000-m elevation (pressure ˘ 0.4 atm, and
average air temperature in the volcanic plume is ˘ -20
°
C
(
57
)), Hg
plu
is the concentration of Hg in the plume, and
A
hem
is the area of the earth's hemisphere.
On the basis of previous work (
58
-
62
), the concentration
of Hg in an atmospheric volcanic plume or volcanic fumarolic
gases can range from 1 to >7000 íg/m
3
. For the sake of
argument, a conservative value of 48 íg/m
3
(
61
) and a fine
ash density of 1 g/cm
3
(
56
) were used in eq 2. Assuming
conditions at 5000-m elevation (the approximate lower limit
of the stratosphere), the estimated Hg deposition for the
Tambora eruption is 25.6 íg/m
2
; approximately 3 times the
estimated Hg deposition calculated from Hg concentrations
in the ice core (8.6 íg/m
2
). In eq 2, if the atmospheric
deposition (Hg
vol
) is set equal to the estimated value from
the ice core and the equation solved for the concentration
of Hg in the volcanic plume (Hg
plu
), a value of 16 íg/m
3
is
calculated. When the same assumptions are applied to the
Krakatau eruption, atmospheric Hg deposition is estimated
to be 3.6 íg/m
2
, almost 5 times less than the deposition
calculated from ice-core Hg concentrations (18.2 íg/m
2
).
Again, setting atmospheric deposition equal to the Hg
deposition estimated from the ice core in the equation and
solving for the concentration of Hg in the volcanic plume
(Hg
plu
), a value of 244 íg/m
3
is calculated. On the basis of a
limited number of studies measuring Hg concentrations in
volcanic plumes, the volcanic plume estimate for the Krakatau
eruption is comparatively high. The measurements made in
previous studies (
58
-
62
), however, suggest that large ranges
of Hg concentrations in volcanic ash plumes are possible.
This estimation, although basic and oversimplified, dem-
onstrates that the Hg deposition calculated from concentra-
tions in the ice core attributed to the globally impacting
volcanic eruptions of Tambora and Krakatau are not un-
reasonable. While individual volcanic events lead to short-
term deposition rates similar to the industrial maximum
(Table 1), the brief duration of the events limits their
importance in overall deposition.
Recent Declines in Atmospheric Hg Deposition.
Since
the industrial maximum (ca. 1984), Hg concentrations in the
UFG ice core have declined from the 20-fold increase since
preindustrial times to an 11-fold increase during the 1990s.
This decline is corroborated by recent declining trends
observed in dated sediment cores (
41
,
43
,
63
) and precipita-
tion (
50
). The declining trends recorded during the last 10
years are consistent with the last 7 years of precipitation
data (
22
). The top 10 m of the ice core have a calculated
average deposition rate of about 1 íg/m
2
. Figure 2 shows the
UGF region receiving 1-3 íg/m
2
. The recent declines may
be in response to emission controls implemented through
the United States Clean Air Act of 1970 and the Clean Air
Amendment of 1990 requiring pollutant scrubbers that also
likely remove a fraction of the Hg in flue gases. If so, the
results presented here suggest that further reductions are
achievable.
Acknowledgments
We thank the selfless and dedicated UFG drilling teams.
Special thanks to Jay Kyne whose drilling expertise was
invaluable. We also thank Doug Halm and Chuck Turner for
lending support when most needed. Finally, we thank Dr.
Gary Gill, Dr. Jim Wiener, and three anonymous reviewers
for many helpful comments on the manuscript. This work
was supported, in part, by the DOE and the USGS National
Research and Toxics Programs.
Literature Cited
(1) Morel, F. M. M.; Kraepiel, A. M. L.; Amyot, M.
Annu. Rev. Ecol.
Syst.
1998
,
29
, 543-566.
(2) Mason, R. P.; Fitzgerald, W. F.; Morel, F. M. M.
Geochim.
Cosmochim. Acta
1994
,
58
, 3191-3198.
(3) Hanisch, C.
Science Technol
./
News
1998
, 176A-179A.
(4) Fitzgerald, W. F.; Engstrom, D. R.; Mason, R. P.; Nater, E. A.
Environ. Sci. Technol.
1998
,
32
,1-7.
(5) Vandal, G. M.; Fitzgerald, W. F.; Boutron, C. F.; Candelone, J.
P.
Nature
1993
,
362
, 621-623.
(6) Boutron, C. F.; Vandal, G. M.; Fitzgerald, W. F.; Ferrari, C. P.
Geophys. Res. Lett
.
1998
,
25
, 3315-3318.
(7) Appelquist, H.; Jensen, K. O.; Sevel, T.
Nature
1978
,
273
, 657-
659.
(8) Naftz, D. L.; Klusman, R. W.; Michel, R. L.; Schuster, P. F.; Reddy,
M. M.; Taylor, H. E.; Yanosky, T. M.; McConnaughey, E. A.
Arct.
Alp. Res.
1996
,
28
, 35-41.
(9) Naftz, D. L. Ph.D. Thesis, Colorado School of Mines, 1993, pp
1-204.
(10) Cecil, L. D.; Vogt, S.
Nucl. Instrum. Methods Phys. Res., Sect. B.
1997
,
123
, 287-289.
(11) Schuster, P. F.; White, D. E.; Naftz, D. L.; Cecil, L. D.
J. Geophys.
Res.
2000
,
105
, 4657-4666.
(12) Cecil, L. D.; Green, J. R.; Naftz, D. L.
U.S. Geolological Survey
Fact
Sheet
003.
http://idaho.usgs.gov/projects/icecore/
index.html (accessed 2000).
(13) Thompson, L. G.; Mosley-Thompson, E.; Bolzan, J. F.; Koci, B.
R.
Science
1985
,
229
, 971.
(14) Thompson, L. G.; Davis, E.; Mosely-Thompson, T. A.; Sowers,
T. A.; Henderson, K. A.; Zagorodnov, V. S.; Lin, P.-N.; Mikhalenko,
V. N.; Campen, R. K.; Bolzan, J. F.; Coloe-Dai, J.; Francou, B.
Science
1998
,
282
, 1858-1864.
(15) Steig, E. J.
Eos
,
Trans. Am. Geo. Union.
1999
,
80
, S143.
(16) Marston, R. A.; Pochop, L. O.; Kerr, G. L.; Varuska, M. L.; Veryzer,
D. J.
Phys. Geogr
.
1991
,
12
, 115-123.
(17) Meier, M.
Eos
,
Trans. Am. Geo. Union
,
Langbein Lecture
1998
,
79
, S80.
(18) Brimblecomb, P.; Tranter, M.; Abrahams, P. W.; Blackwood, I.;
Davies, T. D.; Vincent, C. E.
Ann. Glaciol
.
1985
,
7
, 141-147.
(19) Naftz, D. L.; Schuster, P. F.; Reddy, M. M.
Nord. Hydrol.
1994
,
25
, 371-388.
(20) Rasmussen, P. E.
Environ. Sci. Technol.
1994
,
28
, 2233-2241.
(21) Benoit, J. M.; Fitzgerald, W. F.; Damman, A. W. H.
Environ. Res.
1998
,
78
, 118-133.
(22) United States Environmental Protection Agency. Mercury Study
Report to Congress; EPA-452-97-003-010; U.S. EPA, Office of
Air and Radiation: 1997.
(23) Boutron, C. F.; Candelone, J. P.; Hong, S. M.
Geochim. Cosmo-
chim. Acta
.
1994
,
58
, 3217-3225.
(24)
U.S. EPA Method 1669,
Method for sampling ambient water for
the determination of metals at EPA ambient criteria levels; U.S.
Environmental Protection Agency, Office of Water, Office of
Science and Technology, Engineering and Analysis Division
(4303): Washington, DC, Jan 1996.
(25)
U.S. EPA Method 1631
, Revision B, Mercury in water by oxidation,
purge and trap, and cold vapor atomic fluorescence spectrom-
etry; U.S. Environmental Protection Agency, Office of Water,
Office of Science and Technology, Engineering and Analysis
Division (4303): Washington, DC, Jan 1999.
(26) U.S. Environmental Protection Agency,
Guidelines establishing
test procedures for the analysis of pollutants
; Appendix B, Part
136, Definitions of procedures for the determination of a method
detection limit, Revision 1.11, 1990; revised July 1999, pp 537-
539.
(27) Meese, D. A.; Gow, A. J.; Alley, R. B.; Zielinski, G. A.; Grootes,
P. M.; Ram, M.; Taylor, K. C.; Mayewski, P. A.; Bolzan, J. F.
J.
Geophys. Res.
,
[Oceans]
1997
,
102
, 26367-26381.
(28) Petit, J. R.; Moumier, L.; Jouzel, J.; Korotkevich, Y. S.; Kotlyakov,
V. I.; Lorius, C.
Nature
1990
,
343
, 56-58.
(29) Naftz, D. L.; Susong, D. D.; Schuster, P. F.; Cecil, L. D.; Dettinger,
M. D.; Michel, R. L.; Kendall, C.
J. Geophys. Res
., in press.
(30) Varekamp, J. C.; Buseck, P. R.
Appl. Geochem.
1986
,
1
, 65-73.
(31) Varekamp, J. C.; Buseck, P. R.
Nature
1981
,
293
, 555-556.
(32) Hammer, C. U.
J. Glaciol
.
1980
,
25
, 359-372.
(33) Self, S.
GeoJournal
1992
,
28
, 109-121.
(34) Sigurdsson, H.; Carey, S. N.
Eos
,
Trans Am. Geo. Union
.
1987
,
68
, 1549-1550.
(35) Lamb, H. H.
Philos. Trans. R. Soc. London
1970
,
266
, 425-533.
(36) Delmas, R. J.; Kirchner, S.; Palais, J. M.; Petit, J. R.
Tellus
,
Ser.
B
1992
,
44
, 335-350.
(37) Kohno, M.; Fugii, Y.; Kusakabe, M.; Fukuoka, T.
J. Japanese Soc.
Snow Ice
1999
,
61
, 13-24.
(38) White, D. E.; White, J. W. C.; Steig, E. J.; Barlow, L. K.
J. Geophys.
Res.
1997
,
102
, 19683-19694.
VOL. 36, NO. 11, 2002 / ENVIRONMENTAL SCIENCE & TECHNOLOGY
9
2309
ELECTRONIC FILING, RECEIVED, CLERK'S OFFICE, AUGUST 14, 2006
(39) Alpers, C. N.; Hunerlach, M. P.
U.S. Geological Survey Fact Sheet
061-00.
http://ca.water.usgs.gov/mercury/fs06110.html (ac-
cessed 2000).
(40) Heyvaert, A. C.; Reuter, J. E.; Slotton, D. G.; Goldman, C. R.
Environ. Sci. Technol.
2000
,
34
, 3588-3597.
(41) Bindler, R.; Renberg, I.; Appleby, P. G.; Anderson, N. J.; Rose,
N. L.
Environ. Sci. Technol.
2001
,
35
, 1736-1741.
(42) Nriagu, J. O.
Sci. Total Environ
.
1994
,
149
, 167-181.
(43) Engstrom, D. R.; Swain, E. B.
Environ. Sci. Technol
.
1997
,
31
,
960-967.
(44) Nriagu, J. O.; Pacyna, J. M.
Nature
1988
,
333
, 334-339.
(45) Swain, E. B.; Engstrom, D. R.; Brigham, M. E.; Henning, T. A.;
Brezonik, P. L.
Science
1992
,
257
, 784-787.
(46) Lorey, P.; Driscoll, C. T.
Environ. Sci. Technol.
1999
,
33
, 718-
722.
(47) Hermanson, M. H.
Water, Air, Soil Pollut.
1998
,
101
, 309-321.
(48) Meger, S. A.
Water, Air, Soil Pollut.
1986
,
30
, 411-419.
(49) National Atmospheric Deposition Program/Mercury Deposition
Network (NADP/MDN). http://nadp.sws.uiuc.edu/nadpdata/
mdnsites.asp (accessed Jan 15, 2001).
(50) Susong, D. D.; Abbott, M.; Krabbenhoft, D. P.
Eos
,
Trans Am.
Geo. Union
1999
,
80
, H12b-06.
(51) LaLonde, J. D.; Poulain, A. J.; Amyot, M.
Environ. Sci. Technol
.
2002
,
36
, 174-178.
(52) Pacyna, J. M.; Pacyna, E. G.
Environ. Rev.
2001
,
9
, 269-298.
(53) Hurley, J. P.; Krabbenhoft, D. P.; Babiarz, C. L.; Andren, A. W.
In
Environ. Chem. Lakes and Reservoirs: Advances in Chemistry
Series
; Baker, L. A., Ed.; ACS: Washington, DC, 1994; pp 426-
449.
(54) Self, S.; Rampino, M. R.
Nature
1981
,
294
, 699-704.
(55) Stothers, R. B.
Science
1984
,
224
, 1191-1198.
(56) Rampino, M. R.; Self, S.
Quat. Res.
1982
,
18
, 127-143.
(57) Dean, K.; Bowling, S. A.; Shaw, G.; Tanaka, H.
J. Volcanol.
Geotherm. Res
.
1994
,
62
, 339-352.
(58) Lepel, E. A.; Stefansson, K. M.; Zoller, W. H.
J. Geophys. Res. A
.
1978
,
83
, 6213-6220.
(59) Siegel, B. Z.; Siegel, S. M.
Environ. Sci. Technol.
1978
,
12
, 1036-
1039.
(60) Phelan, J. M.; Finnegan, D. L.; Ballantine, D. S.; Zoller, W. H.
Geophys. Res. Lett
.
1982
,
9
, 1093-1096.
(61) Unni, C.; Fitzgerald, W.; Settle, D.; Gill, B. R.; Patterson, C.; Duce,
R.
Eos
,
Trans. Am. Geo. Union
1978
,
59
, 1223.
(62) Fruchter, J. S., et al.
Science
1980
,
209
, 1116-1125.
(63) Norton, S. A.; Evans, G. C.; Kahl, J. S.
Water, Air
,
Soil Pollut
.
1997
,
100
, 271-286.
Received for review October 15, 2001. Revised manuscript
received March 13, 2002. Accepted March 18, 2002.
ES0157503
2310
9
ENVIRONMENTAL SCIENCE & TECHNOLOGY / VOL. 36, NO. 11, 2002
ELECTRONIC FILING, RECEIVED, CLERK'S OFFICE, AUGUST 14, 2006
Reproductive Performance of Two Generations of Female Semidomesticated Mink
Fed Diets Containing Organic Mercury Contaminated Freshwater Fish
M. Dansereau, N. Larivie`re, D. Du Tremblay, D. Be´langer
University of Montreal, Faculty of Veterinary Medicine, C.P.5000, St-Hyacinthe, Que´bec, Canada, J2S 7C6
Received: 11 November 1997/Accepted: 24 August 1998
Abstract.
Semidomesticated female mink (
Mustela vison
) were
fed daily diets containing 0.1 ppm, 0.5 ppm, and 1.0 ppm of
total mercury. Piscivorous and nonpiscivorous fish naturally
contaminated with organic mercury were used to prepare the
diets. Twenty-month-old females (G1 generation) that were
exposed to the experimental diets for approximately 400 days in
1994 and 1995 and their 10-month-old female offspring (G2
generation) that were exposed to mercury for approximately
300 days in 1995, were all mated to 10-month-old males. Males
were fed the diet containing 0.1 ppm mercury 60 days prior to
the mating season. Diets containing 0.1 ppm and 0.5 ppm were
not lethal to G1 and G2 females for an exposure period of up to
704 days. At the age of 11 months, mortalities occurred in 1994
for G1 females (30/50) and in 1995 for G2 females (6/7) fed the
1.0 ppm mercury diet after 90 days and 330 days of exposure,
respectively. The length of the gestation periods and the number
of kits born per female were not different among dietary groups
for the two generations of females. The proportion of females
giving birth was low for all groups, except for the G1 females
fed the 0.1 ppm diet. There was an inverse relationship between
whelping proportion and exposure group, but was not statisti-
cally significant. There was evidence that kits were exposed to
mercury both
in utero
and/or during lactation as indicated by
the presence of mercury in their livers. Mercury exposure did
not influence the survival and growth of neonatal kits.
It is well documented that the creation of hydroelectric reser-
voirs in Canada, Sweden, and the United States caused an
increase in Hg levels in water and aquatic biota (Hydro-Que´bec
1993). Mercury, in its inorganic form, is first released from the
soil and plants by submersion of the land from the creation of
the reservoir. Inorganic mercury is transformed by bacterial
activity into methylmercury (MeHg). Methylmercury is then
taken up by aquatic biota and passed on in the food chain.
By consuming contaminated fish on a regular basis, piscivo-
rous mammals can bioaccumulate MeHg. Therefore, it is
important to evaluate the possible risks associated with a
natural chronic exposure to MeHg in regard to survival and
reproduction.
Mink (
Mustela vison
) and river otter (
Lutra canadensis
) are
reported to be sensitive to MeHg. Wobeser and Swift (1976)
reported a case of intoxication in a wild female mink located
near a river known to be polluted with mercury. Farm-bred
female mink receiving 1.0 ppm died after 70 days (Wren
et al.
1987a) and mink fed 5.0 ppm died after 30 days of exposure
(Aulerich
et al.
1974). No signs of toxicity were reported in
female mink exposed for 90 days to 0.5 ppm MeHg originating
from fish (Kirk 1971).
Reproduction is a biological process very sensitive to low
levels of toxins (Kihlstro¨m 1983); therefore, MeHg could affect
the reproductive performance of various mammalian species
because of its ability to cross the placental barrier and to be
passed on in maternal milk (Goyer 1986). Very few studies have
examined the impact of MeHg on the reproduction of fish-
eating mammals following chronic exposure. Wren
et al.
(1987b) carried out a study on the effects of MeHg contamina-
tion on reproduction of semidomesticated mink that received a
diet supplemented with 1.0 ppm of MeHg every other day. At
the time of parturition, the females had been exposed to MeHg
for 150 days. No effects on reproduction (litter size, kit survival,
or kit development) were noted.
In order to evaluate the effects of a chronic exposure targeting
the reproductive system of fish-eating mammals, the semidomes-
ticated mink was used as a model. The main objective of our
study was to examine the reproductive effects of methylmer-
cury with diets containing 0.1 ppm, 0.5 ppm, or 1.0 ppm of total
mercury (ww) in two generations of female mink (G1 and G2)
exposed for approximately 400 and 300 days, respectively,
before mating. Mercury levels were also assessed in some dead
kits.
Materials and Methods
Animals
Male and female pastel mink were housed individually at a mink farm
Correspondence to:
D. Be´langer
(Morrow Furs, St-Paul d’Abbotsford, Que´bec, Canada). They were
Arch. Environ. Contam. Toxicol. 36, 221–226 (1999)
A R C H I V E S O F
Environmental
Contamination
and
Toxicology
r
1999 Springer-Verlag New York Inc.
ELECTRONIC FILING, RECEIVED, CLERK'S OFFICE, AUGUST 14, 2006
subjected to natural variations in temperature and photoperiod. All
were vaccinated annually for canine distemper, botulism, and viral
enteritis.
1
Each individual was identified with a subcutaneous implant.
2
The experiment was conducted between January 1994 and July 1995.
Diet
The diets were composed of 40% eviscerated chicken carcasses free of
contaminants, 40% whole ground freshwater fish, 20% commercial
mink feed, a supplement of thiamin and minerals, and water. The fish
naturally contaminated with mercury was caught from the Robert
Bourassa Reservoir (La Grande Hydroelectric Complex), Quebec, in
the fall of 1994 and 1995.
Three diets were prepared to provide mercury concentrations of 0.1
ppm, 0.5 ppm, and 1.0 ppm. The 0.1 ppm mercury diet was constituted
from nonpredatory fish, the lake whitefish (
Coregonus clupeaformis
),
whose average total Hg concentration was 0.5 ppm. The 1.0 ppm diet
was formulated by incorporating a predatory fish, the northern pike
(
Esox lucius
), whose average total Hg concentration was 3.0 ppm. The
intermediary diet (0.5 ppm) was obtained through a mixture of 50%
northern pike and 50% lake whitefish. No free mercury diet was
constituted due to the nonavailability of noncontaminated fish of the
same species.
Diet Analysis and Total Mercury Concentration in Tissue
Samples of whole ground fish were taken for mercury analysis in both
1994 and 1995. Samples of the experimental diets were collected
between February 2, 1994, and July 24, 1995, for mercury analysis.
Some nutrient analysis was done by the Center for Nutrition and
Environment of Indigenous Peoples (McGill University, Macdonald
Campus, Montre´al, Que´bec, Canada). Livers were collected from adult
G1 and G2 females killed at the beginning of April 1995 after 430 and
330 days of exposure. These were not part of the reproductive cohort,
except for some mated females that died during this period. Livers were
also taken from kits born from G1 and G2 females in 1995 that died
accidentally at 29–30 days of age. Total Hg (ww) concentrations in
liver, fish, and in experimental diets were determined by acid digestion
and reduction of the samples prior to analysis by cold-vapor flameless
atomic absorption spectrophotometry by Le Centre de Toxicologie du
Que´bec (CHUL, Sainte-Foy, Que´bec, Canada). Even though total
mercury (inorganic and organic form) was determined from samples, it
is known that its organic form (MeHg) constituted the large portion of
mercury in tissue (Hydro-Que´bec 1993). A toxic screen test was also
performed on many samples of the three experimental diets (Michigan
State University, Animal Health Diagnostic Laboratory, East Lansing,
MI).
Generations Description
Description of the G1:
At the beginning of January 1994, 50 female
mink were randomly assigned to each of the three dietary groups. At
the beginning of March, 20 females were randomly selected from each
group to participate in the reproductive study. The 10-month-old
primiparous females from the three dietary groups were mated to males
of the same age fed a diet contained 0.1 ppm Hg for 60 days prior to
mating.
Description of the G2:
At 8 to 10 weeks of age, the kits born from the
G1 groups, identified as G2, were weaned. They were exposed to
MeHg
in utero
and/or throughout lactation. They also ingested mercury
when they began to eat solid food at around 30–35 days via their
mother’s food. They continued to receive the same diet as their mothers
after the weaning.
Reproductive Season for 1995 (G1 and G2 Females)
Ten-month-old males, chosen from the farm colony and not originally
exposed to Hg, received a diet containing 0.1 ppm Hg for 2 months
prior to the mating period. The males had their testes checked by
palpation just before the breeding season for abnormalities. One male
was dismissed from the experiment because he showed unilateral
cryptorchidism. In all, 29 males participated in the breeding process.
Mating:
In March 1995, G1 females, now 20 months old, and their
offspring, the 10-month-old G2 females, were mated after a period of
400 and 300 days of exposure, respectively, to the 0.1 ppm Hg males
(Figure 1). Only six G1 and seven G2 females of the 1.0 ppm dietary
group were mated, whereas there were 20 females in each of the other
dietary groups. Each female was brought to the cage of a randomly
chosen male and was remated 8 days after the initial mating with the
same male. If a female refused her first partner, she was introduced to
another male. Females that were not mated a second time were omitted
from the experiment. In all, 78 females were mated twice (Table 1).
1
Biocom
Mc
—D, United Vaccines Inc. Madison, WI, USA.
2
Implants T-IS 6110, Datamars SA. Syste`mes Idelec, Inc., Que´bec,
Canada.
Fig. 1.
Reproduction calendar for 1994 and 1995 for G1
and G2 females mated in March to 10-month-old males fed
a diet containing 0.1 ppm Hg.
222
M. Dansereau
et al.
ELECTRONIC FILING, RECEIVED, CLERK'S OFFICE, AUGUST 14, 2006
Birth Period and Weaning:
Near the whelping period (April 29–May
18, 1995), the mink farm was visited each day to verify new births. The
number of kits born alive and dead and the number of deaths
subsequent was noted daily. Each kit was sexed, and weighed with an
electronic scale (
6
0.1 g) twice weekly starting the day following birth
(day 1) until the age of 35 days. Each kit was identified with a
subcutaneous implant. Kits were weaned at around 10 weeks of age.
Statistical Analyses
Data were processed by the BMDP (BMDP Statistical Software Inc.,
Los Angeles, CA) and the SAS programs (SAS Institute Inc., Cary,
NC). No statistical comparisons between data from the G1 and G2 were
made because females of the two generations were not of the same age,
the length of mercury exposure was different, and most likely, G2
females had been exposed to mercury
in utero.
Reproduction data for
the G2 at 1.0 ppm were not included in the statistical analysis because
only one female from this group survived until parturition.
Values from the nutrient analysis were initially expressed as a
percentage. In order to compare each variable (moisture, fat, protein,
ash, HCO
3
, energy) among dietary groups, the percentage values were
submitted to the following transformation (known as the angular
transformation):
y
5
arcin (
3
1/2
)
(1)
where y is the transformed values and x is the nutrient values (%)
(Sokal and Rohlf 1995).
Nutrient data for 0.1 ppm, 0.5 ppm, and 1.0 ppm mercury groups
were then analyzed by a nonparametric analysis of variance test
(Kruskal-Wallis) as were the data for the mercury content in experimen-
tal diets.
Statistical comparisons of gestation length and the number of kits per
female were made by the Kruskal-Wallis test for the G1 generation and
the Wilcoxon rank sum test for the G2 generation. Groups that were
statistically different were compared by pairs by experiment-wise error
rate (Scherrer 1984). Proportions of females giving birth were analyzed
by the heterogeneity G-test. Simultaneous test procedure (STP) was
used as
a posteriori
procedure (Sokal and Rohlf 1995).
The overall analysis of G1 and G2 kit survival (day 0 to weaning at
70 days) was done by a nonparametric life table using the Kaplan-
Meier procedure. The Mantel-Cox test was used to compare the
survival functions across the dietary groups. Proportions of mortality
(day 1 to weaning) were described according to two categorized
variables,
i.e.,
kit weight (
,
10g,
$
10g) and litter size (1–3, 4–6, 7–9)
at day 1.
An ANOVA procedure for repeated measures could not be used for
analyzing the postnatal kit growth data because of insufficient data
points. Therefore, in order to analyze kit growth, we used a linear
regression of natural logarithm weight against age for two randomly
chosen individuals within each family, one male and one female, that
had survived at least 35 days. We used the intercept and the slope from
each regression line to characterize the growth of each individual. We
analyzed separately the relationship between the intercept and the slope
and the following variables: dietary groups, generation of mother, litter
size at day 1 (categorized 1–5 and 6–9). The analysis was done
separately for males and females. Growth data of kits born to G1
females fed 1.0 ppm mercury were excluded from the analysis because
the sample was too small.
The level of statistical significance was set at alpha
5
0.05 for all
analyses. However, for the growth data, a 0.025 level was used since
we divided the statistical analysis in two to maintain the experiment-
wise error rate at 0.05 (Bonferroni method) (Sokal and Rohlf 1995).
Results
Diet
As shown in Table 2, no significant statistical difference was
found according to the various nutrient factors: % moisture
(p
5
0.51), % fat (p
5
0.32), % protein (p
5
0.53), % ash
(p
5
0.35), % HCO
3
(p
5
0.32), and energy (p
5
0.26) be-
tween the 0.1 ppm, 0.5 ppm and 1.0 ppm diets.
The actual means Hg concentration for the three types of
rations: 0.12 ppm, 0.56 ppm, and 0.9 ppm are very close to the
expected Hg concentration (0.1 ppm, 0.5 ppm, 1.0 ppm). The
Hg concentration statistically differed from one diet to the other
(p
5
0.0001). No toxic compounds other than mercury were
detected.
Adult Mortality, 1994 and 1995
In 1994, 30 out of the 50 G1 females initially assigned to the 1.0
ppm mercury diet died at the age of 11 months after demonstrat-
ing neurological clinical signs between 75–100 days of expo-
sure. Six of 20 females survived until the 1995 breeding season
and no subsequent deaths followed. Since few 1.0 ppm G1
females gave birth in 1994, only 11 G2 females were born.
Seven of these females survived until the mating period of
1995; the causes of the four that died are unknown.
Mortality of six G2 females (1.0 ppm) out of seven occurred
at the beginning of April 1995 after 330 days of exposure at the
age of 11 months before whelping. They exhibited weight loss,
weakness, lethargy, incoordination, and splaying of the hind
Table 1.
Number of G1 (20-month-old) and G2 (10-month-old)
females mated twice in the 1995 breeding season and fed experimental
diets containing various concentrations of mercury
Dietary
Mercury
(ppm)
G1 Generation
# Females Mated Twice/
Total # Females
G2 Generation
# Females Mated Twice/
Total # Females
0.1
16/20
16/20
0.5
17/20
16/20
1.0
6/6
7/7
Table 2.
Comparison of the mean (
6
standard deviation) nutrient and
mercury content (Hg) in experimental diets
Diets Containing Hg (ppm)
0.1
p
0.5
1.0
Nutrient analysis
% moisture
65.4
6
3.16
63.8
6
3.79
65.0
0.5130
% fat
6.95
6
0.79
7.79
6
1.28
6.64
0.3208
% protein
13.4
6
1.29
14.0
6
1.43
13.3
0.5252
% ash
3.11
6
0.44
2.96
6
0.45
3.37
0.3511
% HCO
3
10.8
6
1.67
11.5
6
1.54
11.7
0.3208
energy
(Kcal)
159.2
6
11.2
172.0
6
20.1
159.8
0.2614
n
10
7
1
Hg analysis
Hg (ppm)
0.12
6
0.06
0.56
6
0.19
0.9
6
0.26 0.0001
n
25
18
5
Reproductive Performance of Mink
223
ELECTRONIC FILING, RECEIVED, CLERK'S OFFICE, AUGUST 14, 2006
legs and died approximately 7 days after the initial clinical
signs. Only one female reached parturition even though she
presented the same signs. She died a few hours after giving
birth. The clinical signs observed prior to death were consistent
with MeHg intoxication (Aulerich
et al.
1974; Wren
et al.
1987a).
Nine G1 and G2 females receiving 0.1 ppm and 0.5 ppm
died. They exhibited loss of appetite and apathy, but didn’t
demonstrate any neurological clinical signs.
Total Hg Concentration (ww) in Adult Female Livers,
April 1995
The Hg concentrations in the liver of G1 females were analyzed
after 430 days of exposure. Means were as follows: 28.2
6
8.88
ppm, 80.4
6
59.9 ppm, and 96.6 ppm for the 0.1 ppm (n
5
4),
the 0.5 ppm (n
5
3), and the 1.0 ppm (n
5
1) groups, respec-
tively. The average Hg concentration of the G2 female livers
after 330 days of exposure were 15.2 ppm, 49.5
6
9.96 ppm,
and 99.8
6
27.6 ppm for the 0.1 ppm (n
5
1), the 0.5 ppm
(n
5
6), and the 1.0 ppm (n
5
5) groups, respectively.
Reproduction
The mean gestation length for G1 females was 49.5 days and
was not significantly different among the three dietary groups
(p
5
0.26). Neither was there a significant difference in the
mean gestation length (48.3 days) between the two dietary
groups for the G2 females (p
5
0.09) (Table 3).
The proportion of females giving birth was statistically
higher for the G1 females exposed to 0.1 ppm (93.7%) than the
females receiving 0.5 ppm (52.0%) or 1.0 ppm of mercury
(33.0%) (p
5
0.005). The proportion of G2 females giving birth
did not differ statistically between those exposed to 0.1 ppm
(73.0%) or 0.5 ppm of mercury (62.5%) (p
5
0.704) (Table 3).
The G1 and G2 females gave birth to an average of 5.7 kits
per litter (including stillbirths) with the exception of a G2
female exposed to 1.0 ppm of mercury that gave birth to two
kits that died within 24 h. There was no significant difference
between the litter size (including stillbirths) per female at day 0
among dietary groups for G1 (p
5
0.70) and G2 (p
5
0.88)
(Table 4).
Kit Mortality
Most kit mortalities occurred during the first 3 days of life
(21.9%) including stillbirths. Twelve percent died within 24 h
and 30.6% of the kits died from day 0 to weaning time (70
days).
The overall survival according to the life table for kits born to
G1 females in the 0.5 ppm dietary group was statistically higher
(p
5
0.02) than for kits from the 0.1 ppm and 1.0 ppm groups.
There was no significant difference in overall postnatal survival
according to the life table between G2 kits from the 0.1 ppm and
0.5 ppm dietary groups (p
5
0.72). No statistical difference was
found between the overall survival of males and females kits
born from G1 females (p
5
0.39) and also for kits born from G2
females (p
5
0.43).
Tables 5 and 6 show the distribution of G1 and G2 kit
mortality between day 1 to weaning (70 days) in relation to
litter size and kit weight on day 1. Mortality of 0.1 ppm G1 kits
occurred primarily in groups with lower body weights (
,
10 g)
and in litters of 4–6 kits in size (Table 5). Mortality of G2 kits
born to females receiving 0.1 ppm and 0.5 ppm of mercury
appeared in the largest litters (7–9). Body weight did not seem
to influence the mortality distribution for G2 kits (Table 6).
Kit Growth (Day 1 to 35 Days)
The overall postnatal growth for the male and female kits was
not significantly affected, as shown in Table 7, by the generation
of females, dietary mercury, or litter size. Even though the
growth data of kits born from G1 females at 1.0 ppm of mercury
were not analyzed, gross observation indicated that their growth
was similar to any of the kits of the other dietary mercury.
Total Hg Concentration (ww) in Kit Liver
Mercury concentrations in livers of kits that died accidentally at
the age of 29–30 days were analyzed before the kits began to eat
Table 3.
Reproductive performance in 1995 of G1 and G2 female
mink fed experimental diets containing various concentration of
mercury
Generation
Dietary
Mercury
(ppm)
# Females
Mated
Twice
# Females
Whelped
Females
Whelped/
Mated
(%)
Gestation
Length
1
(days)
G1
0.1
16
15
93.7
a
50.4
6
4.7
a
0.5
17
9
52.0
b
47.9
6
1.9
a
1.0
6
2
33.0
b
50.0
6
1.4
a
G2
0.1
16
12
73.0
a
47.6
6
4.0
a
0.5
16
10
62.5
a
49.0
6
2.9
a
1.0
7
1
14.3*
51.0*
1
Mean
6
standard deviation. Based on date of final mating
* Not included in statistical test
a,b
Groups with different letters within columns and generations are
considered statistically different (p
#
0.05)
Table 4.
Litter size in 1995 of G1 and G2 female mink fed
experimental diets containing various concentrations of mercury
(including stillbirths)
Generation
Dietary Mercury
(ppm)
Total of Kits Born
(Alive and Dead)
Kits per Litter,
1
Day 0
2
G1
0.1
90
6.0
6
2.2
a
0.5
49
5.4
6
2.0
a
1.0
11
5.5
6
0.7
a
G2
0.1
71
5.9
6
2.2
a
0.5
51
5.7
6
2.4
a
1.0
2
2.0*
1
Mean
6
standard deviation
2
Stillbirths are included
* Not included in statistical test
a,b
Groups with different letters within columns and generations are
considered statistically different (p
#
0.05)
224
M. Dansereau
et al.
ELECTRONIC FILING, RECEIVED, CLERK'S OFFICE, AUGUST 14, 2006
solid food at around 33 days according to our observation.
Mean were 0.10
6
0.007 ppm, 0.10
6
0.02 ppm, and 0.69
6
0.23 ppm for G1 kits at 0.1 ppm (n
5
2), for G2 kits at 0.1 ppm
(n
5
6), and for G2 kits at 0.5 ppm (n
5
8), respectively.
Discussion
The concentrations of Hg used in this study did not affect the
gestation length of G1 and G2 females. The mean gestation
length was similar to the 51-day average period reported by
Enders (1952), Eagle and Whitman (1987), Sundqvist
et al.
(1989), and Murphy (1996) for untreated female mink. Wren
et
al.
(1987b) reported no difference in gestation length for
females fed a diet containing 1.0 ppm of MeHg added in the diet
every other day for 150 days relative to the control group.
The whelping percentages for the G1 and G2 females, except
for the 0.1 ppm G1 group (93.7%), were all low relative to the
reported performance of untreated female mink (around 90%)
(Bleavins
et al.
1984; Wren
et al.
1987b). Wren
et al.
(1987b)
reported a diminution of the whelping percentage between the
treatment group at 1.0 ppm of MeHg (75%) and the control
group (93.3%). Despite the fact that our protocol of reproduc-
tion is different from a commercial setting, which might explain
the overall lower whelping performance, the linear decrease of
performance with increasing mercury exposure, may suggest a
certain effect (negative) of mercury on the reproduction pro-
cess. However, statistically, we could not show a significant
difference.
Hg levels in experimental diets did not influence the litter
size at day 0. G1 and G2 females gave birth to an average of 5.7
kits per litter (including stillbirths), which concurred with the
average of four to five kits per litter (including stillbirths)
reported by Enders (1952), Eagle and Whitman (1987),
Sundqvist
et al.
(1989), and Wren (1991) for unexposed female
mink. No difference in litter size between exposed females and
the control group was reported by Wren
et al.
(1987b).
This study showed that most kit mortalities occurred within
the first 3 days of life (21.9%) which is a high risk period for
mortality in unexposed farm-bred mink (Villemin 1956). The
percentage of G1 and G2 kit mortalities within 24 h of birth
(12%) or between day 0 and weaning time (70 days) (30.6%)
was only slightly greater than the percentages for nonexposed
kits (11.5% and 25%, respectively) (Martino and Villar 1990;
Korhonen 1992).
The survival of kits born from G1 and G2 females between
birth and weaning (70 days) was not influenced by the Hg level
in the diets, but most likely by other factors such as kit body
weight and litter size at birth. Kits in G1 generation that were
lighter tended to die more. According to the study of Martino
and Villar (1990), kit body weights at birth may influence
survival. However, for G2 kits, mortality occurred primarily in
large litters (7–9). Mortality of G2 kits could be attributed to a
lack of experience of the young mothers having to take care of
that many kits. It has been observed in pigs and many rodents
species that multiparous females were better mothers because
of their greater parenting experience (Mason 1994). Wren
et al.
(1987b) reported that there was no difference in kit survival
between the control kits and kits in the 1.0 ppm mercury group
at 5 weeks of age.
The concentrations of Hg that females received in this
experiment did not have an impact on kit growth between day 1
and day 35 for G1 and G2 kits. According to our observation,
kits before eating solid food, at 29–30 days old, had higher liver
Hg (range 0.10–0.69 ppm) than nonexposed kits in the study of
Wren
et al.
(1987a) killed at 35 days of age (mean 0.06 ppm). It
is apparent that mercury passed the placental barrier and/or was
Table 7.
Factors influencing mink kit growth between day 1 until the
age of 35 days
Variables
Categories
Female Kits
(n
5
35)
Male Kits
(n
5
28)
Intercept p Slope p Intercept p Slope p
Generation G1 (2 years old) 0.3856
0.1974 0.9416
0.8409
G2 (1 year old)
Dietary
0.1 ppm
0.9263
0.9025 0.7211
0.1499
mercury 0.5 ppm
Litter size
1–5
0.5682
0.3778 0.8970
0.5464
6–9
Table 5.
Mortality of mink kits born to G1 females between day 1 to
weaning time (70 days) in relation to litter size and kit weight recorded
on day 1
Dietary
Mercury
(ppm)
Weight (g)
,
10
$
10
Total
%
Mortality
(# Kits
Born)
%
Mortality
(# Kits
Born)
%
Mortality
(# Kits
Born)
Litter size: 1–3
0.1
0
(6)
0
(3)
0
(9)
0.5
0
(1)
0
(0)
0
(1)
1.0
0
(3)
0
(0)
0
(3)
Litter size: 4–6
0.1
50
(16)
0
(8)
33
(24)
0.5
6.7
(15)
20
(10)
12
(25)
1.0
0
(0)
33
(6)
33
(6)
Litter size: 7–9
0.1
26
(19)
4.3
(23)
14
(42)
0.5
25
(4)
5.9
(17)
9.5
(21)
1.0
0
(0)
0
(0)
0
(0)
Table 6.
Mortality of mink kits born to G2 females between day 1 to
weaning time (70 days) in relation to litter size and kit weight recorded
on day 1
Dietary
Mercury
(ppm)
Weight (g)
,
10
$
10
Total
%
Mortality
(# Kits
Born)
%
Mortality
(# Kits
Born)
%
Mortality
(# Kits
Born)
Litter size: 1–3
0.1
17
(6)
100
(1)
29
(7)
0.5
0
(0)
0
(2)
0
(8)
Litter size: 4–6
0.1
33
(6)
10
(10)
19
(16)
0.5
29
(14)
0
(1)
27
(15)
Litter size: 7–9
0.1
44
(16)
95
(21)
73
(37)
0.5
86
(7)
86
(7)
86
(14)
Reproductive Performance of Mink
225
ELECTRONIC FILING, RECEIVED, CLERK'S OFFICE, AUGUST 14, 2006
passed on through the maternal milk, but the transfer of
mercury from the dam to the kit did not affect neonatal growth.
Kit growth was not affected by either litter size or generation of
female. The study of Wren
et al.
(1987b) did not show any
difference in growth between kits born in the 1.0 ppm group and
kits in the control group.
No negative control group was present in this study because
it was not possible to make a diet with freshwater fish
noncontaminated by MeHg. However, the 1.0 ppm diet level
was regarded as a kind of positive control group because this
Hg concentration in the diet is considered to be toxic for mink.
The study of Kirk (1971) showed that female mink died 2
months after being fed a daily diet of 1.0 ppm of mercury. Wren
et al.
(1987a) also reported adult mortalities in mink exposed
daily to 1.0 ppm of MeHg. In the present study an exposure of
1.0 ppm of mercury for a period of more than 330 days was
toxic to G2 females. In fact, clinical signs prior to death support
MeHg intoxication as the cause of death for the G2 adult
females in this dietary group (Aulerich
et al.
1974; Wren
et al.
1987a). The survival and consequently the reproduction of the
G2 females fed 1.0 ppm Hg diet were therefore affected.
It is interesting to note that the death of G1 females at 1.0
ppm Hg in 1994 (30/50) occurred at the age of 11 months after
90 days of exposure after showing neurological clinical signs
consistent with mercury toxicity and that the females that
reproduced successfully in 1995 survived up to 704 days of
exposure (end of the study). The role of the genetics relative to
mercury tolerance was not explored in this study, and to our
knowledge, it has not been shown. However, their descendants
(G2) all died after a longer time of exposure than the G1
females the previous year but at about the same age.
The 0.1 ppm and 0.5 ppm Hg diets were not lethal to G1 and
G2 female mink and no females showed neurological signs. In
the study of Kirk (1971), a daily exposure of 0.5 ppm of
mercury for a 90-day period did not result in female mink death.
In our study, even an exposure period for as long as 704 days for
the G1 (July 1995) did not affect female survival.
Another aspect of the validation of our model, besides the
deaths from the 1.0 ppm Hg group, is the level of accumulation
of mercury in adults female livers, which was exposure
group-related (range of 28.2 to 96.6 ppm for G1 females and
15.2 to 99.8 ppm for G2 females in April 1995). Normally, for
untreated semidomesticated female mink, the Hg concentra-
tions in the liver is approximately 0.02 ppm (Wren
et al.
1987a).
In conclusion, our present findings indicate that the survival
and overall reproductive performance of semidomesticated
female mink, was not affected by chronic exposure to mercury.
The 1.0 ppm diet was toxic relative to survival for G1 and G2
females around the reproduction season in 1994 and 1995,
respectively. Even though mercury crossed the placental barrier
and/or was present in maternal milk as demonstrated by the kit
liver Hg concentrations, survival and growth of neonate kits
were unaffected. The impact of MeHg on the reproduction of
wild fish-eating mammals following chronic exposure are
unknown. Moreover, the reproductive function of wild female
and male mink exposed to Hg could interact with other
environmental risk factors.
Acknowledgment.
This research was funded by La Socie´te´ Hydro-
Que´bec, the James Bay Mercury Committee, and by le Ministe`re de
l’Environnement et de la Faune de la province de Que´bec.
References
Aulerich RJ, Ringer RK, Iwamoto S (1974) Effects of dietary mercury
on mink. Arch Environ Contam Toxicol 2:43–51
Bleavins MR, Aulerich RJ, Ringer RK (1984) Effects of chronic dietary
hexachlorobenzene exposure on the reproductive performance and
survivability of mink and European ferrets. Arch Environ Contam
Toxicol 13:357–365
Eagle TC, Whitman JS (1987) Mink. In: Novak M, Baker JA, Obbard
ME, Malloch B (eds) Wildfurbearer management and conservation
in North America. Ontario Trappers Association, North Bay, p 614
Enders RK (1952) Reproduction in the mink (
Mustela vison
). Proc Am
Philos Soc 96:691–741
Goyer RA (1986) Toxic effects of metals. In: Klaassen CD, Amdur
MO, Doull J (eds) Casarett and Doull’s toxicology: the basic
science of poisons, 3rd ed. Macmillan, New York, p 605
Hydro-Que´bec (1993) Complexe Grande-Baleine: Partie 2. Complexe
hydro-e´lectrique. Tome 6: Mercure, p 156
Kihlstro¨m JE (1983) Appraisal of reproductive failure in wildlife. In:
Vouk VB, Sheehan PJ (eds) Methods for assessing the effects of
chemicals on reproductive functions. SCOPE 20, John Wiley and
Sons, Toronto, p 339
Kirk RJ (1971) Fish meal, higher cereal levels perform well. US Fur
Rancher 50:4
Korhonen H (1992) Activated mammary number and litter size in the
mink. Reprod Nutr Dev 32:67–71
Martino PE, Villar JA (1990) A survey on perinatal mortality in young
mink. Vet Res Commun 14:199–205
Mason GJ (1994) The influence of weight, sex, birthdate and maternal
age on the growth of weanling mink. J Zool Lond 233:203–214
Murphy BD (1996) Female reproductive system. In: Hunter DB,
Lemieux N (eds) Mink: biology, health and disease. Canada Mink
Breeders Association, pp 9.1–9.19
Scherrer B (1984) Biostatistique. Gae´tan Morin E´ diteur, Que´bec, p 850
Sokal RR, Rohlf FJ (1995) Biometry, 3rd ed. W. H. Freeman and Co.,
New York, p 887
Sundqvist C, Amador AG, Bartke A (1989) Reproduction and fertility
in the mink (
Mustela vison
). J Reprod Fertil 85:413–441
Villemin M (1956) Le vison. Vigot Fre`res E´ diteurs, Paris, p 338
Wobeser G, Swift M (1976) Mercury poisoning in a wild mink. J Wild
Dis 12:335–340
Wren CD (1991) Cause-effect linkages between chemicals and popula-
tions of mink (
Mustela vison
) and otter (
Lutra canadensis
) in the
Great Lakes basin. J Toxicol Environ Health 33:549–585
Wren CD, Hunter DB, Leatherland JF, Stokes PM (1987a) The effects
of polychlorinated biphenyls and methylmercury, singly and in
combination, on mink. I: Uptake and toxic responses. Arch
Environ Contam Toxicol 16:441–447
Wren CD, Hunter DB, Leatherland JF, Stokes PM (1987b) The effects
of polychlorinated biphenyls and methylmercury, singly and in
combination on mink. II: Reproduction and kit development. Arch
Environ Contam Toxicol 16:449–454
226
M. Dansereau
et al.
ELECTRONIC FILING, RECEIVED, CLERK'S OFFICE, AUGUST 14, 2006
Predominant anthropogenic sources and rates of atmospheric
mercury accumulation in southern Ontario recorded by peat cores
from three bogs: comparison with natural ‘‘background’’ values (past
8000 years)
Nicolas Givelet,
a
Fiona Roos-Barraclough
a
{ and William Shotyk*
b
a
Institute of Geological Sciences, University of Berne, Baltzerstrasse 1-3, CH-3012 Berne,
Switzerland. E-mail: givelet@geo.unibe.ch; Fax:
1
41 31 631 4843; Tel:
1
41 31 631 8772
b
Institute of Environmental Geochemistry, University of Heidelberg, Im Neuenheimer Feld
236, D-69120 Heidelberg, Germany. E-mail: shotyk@ugc.uni-heidelberg.de;
Fax:
1
49 (6221) 54 5228; Tel:
1
49 (6221) 54 4803
Received 23rd June 2003, Accepted 17th October 2003
First published as an Advance Article on the web 6th November 2003
Peat cores from three bogs in southern Ontario provide a complete, quantitative record of net rates of
atmospheric Hg accumulation since pre-industrial times. For comparison with modern values, a peat core
extending back 8000 years was used to quantify the natural variations in Hg fluxes for this region, and their
dependence on climatic change and land use history. The net mercury accumulation rates were separated into
‘‘natural’’ and ‘‘excess’’ components by comparing the Hg/Br ratios of modern samples with the long-term,
pre-anthropogenic average Hg/Br. The average background mercury accumulation rate during the
pre-anthropogenic period (from 5700 years BC to 1470 AD) was 1.4
¡
1.0 mgm
2
2
per year (n
~
197). The
beginning of Hg contamination from anthropogenic sources dates from AD 1475 at the Luther Bog,
corresponding to biomass burning for agricultural activities by Native North Americans. During the late 17th
and 18th centuries, deposition of anthropogenic Hg was at least equal to that of Hg from natural sources.
Anthropogenic inputs of Hg to the bogs have dominated continuously since the beginning of the 19th century.
The maximum Hg accumulation rates decrease in the order Sifton Bog, in the City of London, Ontario (141 mg
Hg m
2
2
per year), Luther Bog in an agricultural region (89 mg Hg m
2
2
per year), and Spruce Bog which is in a
comparatively remote, forested region (54 mg Hg m
2
2
per year). Accurate age dating of recent peat samples
using the bomb pulse curve of
14
C shows that the maximum rate of atmospheric Hg accumulation occurred
during AD 1956 and 1959 at all sites. In these (modern) samples, the Hg concentration profiles resemble those
of Pb, an element which is known to be immobile in peat bogs. The correlation between these two metals,
together with sulfur, suggests that the predominant anthropogenic source of Hg (and Pb) was coal burning.
While Hg accumulation rates have gone into strong decline since the late 1950’s, Hg deposition rates today still
exceed the average natural background values by 7 to 13 times.
1. Introduction
Mercury is a potentially toxic trace metal which is released
from the Earth to the atmosphere, biosphere, and hydrosphere
from a variety of natural processes. Degassing from hydro-
thermal systems, volcanism, soil erosion, biomass burning, and
marine emissions are believed to dominate natural sources of
Hg to the air.
1
By far the majority of Hg emitted from these
natural sources is gaseous, elemental mercury (Hg
0
). Because
Hg is used in many industrial applications and also present in
coal, natural gas and industrial and domestic waste, it is also
emitted to the atmosphere during combustion for energy
production or waste incineration. In contrast to the natural
sources, at least one-half of anthropogenic Hg is emitted in
various particulate forms.
2
Most of the mercury deposited from
the atmosphere is either Hg
II
or particulate mercury. Whereas
particulate Hg is mainly deposited in the vicinity of its sources,
Hg
0
is added to the global pool of atmospheric Hg: the
volatility and low solubility of Hg
0
, combined with its
comparative stability in the atmosphere, are factors which
contribute to the long atmospheric residence time (
y
1–2 years)
of gaseous elemental Hg.
3
Eventually, this species also will be
deposited, but only after oxidation and washout, including
non-industrial regions far from the original source. Because of
the relatively rapid atmospheric scavenging and deposition of
particulate mercury, Hg
0
is preferentially enriched in the air
and, on average, accounts for 98% of atmospheric mercury.
4
These facts, combined with the potential of methylated forms
of Hg to bioaccumulate in aquatic ecosystems, renders Hg a
trace metal of global environmental concern.
5
Increases in the accumulation rates of Hg have been
observed in the uppermost, modern layers of lake sediment
cores
6,7
and ombrotrophic bogs
8
in northeastern North
America, and these have been attributed to recent increases
in atmospheric Hg emissions (and deposition) related to human
activities. In these studies, estimates of the ‘‘natural back-
ground’’ atmospheric deposition rates of Hg are poorly
constrained, as they are derived from relatively short cores
(less than one meter), which typically span only the last few
hundred years of accumulation. These natural background
accumulation rates of Hg are then assumed to represent the
‘‘pre-industrial’’ accumulation rates. However, age dating these
materials is difficult, as the peats/sediments are usually too old
to be age dated reliably using
210
Pb, and too young to be dated
using
14
C. Not only are the natural background Hg
accumulation
rates
inadequately
quantified
using
this
{Present affiliation: Chemical Analytical R&D, Cilag, Switzerland
approach, but the extent to which these natural background
DOI: 10.1039/b307140e
J. Environ. Monit., 2003, 5, 935–949
935
This journal is
#
The Royal Society of Chemistry 2003
ELECTRONIC FILING, RECEIVED, CLERK'S OFFICE, AUGUST 14, 2006
accumulation rates have varied with time, and the natural
processes which control this variation, often are not adequately
considered. To quantify the effects of human activities on
atmospheric Hg deposition in southeastern Canada, an
improved understanding is needed of the long-term, natural
variations in the concentrations, fluxes and sources of Hg for
this industrial region.
Ombrotrophic
9
peat bogs receive metals only from the
atmosphere. Because Hg supplied to peat bogs from the air is
very well preserved in the peat column
10,11
peat cores from bogs
can be used as long-term archives of atmospheric Hg
deposition.
8,12–16
Peat cores were collected from three ombro-
trophic peat deposits in Southern Ontario: Sifton Bog in the
City of London, Ontario, Luther Bog which is in a rural
location, and Spruce Bog which is comparatively remote, in
Algonquin Provincial Park. The main goal of this study was to
quantify the changing rates of atmospheric Hg accumulation
from the modern period through the pre-industrial period, into
pre-European times. To help put these results into perspective,
the entire peat profile from Luther Bog (representing ca. 8000
years of peat accumulation) has been studied in detail, to
quantify the long-term, natural variation in atmospheric Hg
accumulation rates. Radiocarbon dating methods (the atmo-
spheric bomb pulse of
14
C and conventional
14
C age dating)
have been combined with
210
Pb to allow reliable age–depth
models to be constructed for each of the peat profiles. To
bridge the gap between
210
Pb and
14
C age dating, the pro-
bability distribution of
14
C age dates was used to model the
age–depth relationship. In an effort to distinguish between
natural and anthropogenic sources of Hg, the natural variation
in Hg to bromine (Br) in ancient samples is used to calculate the
amount of ‘‘excess’’ mercury in modern samples. Taken
together, this is the first comprehensive, long-term study of
changes in atmospheric Hg accumulation rates for this part of
northeastern North America.
To compare with mercury in the three peat profiles, we have
measured lead (Pb) which is transported primarily in the fine
aerosol fraction.
17
Lead is known to be well preserved in
ombrotrophic bogs,
18–20
with bogs recording Pb chronologies
which are comparable to lake sediment archives
12,21
and
historical records of ancient Pb mining.
22
Here, Pb is used to
help identify the predominant source of anthropogenic Hg
contamination.
2. Material
2.1. Luther Bog
Situated along a headwater tributary of the Grand River,
Luther Marsh Provincial Wildlife Area lies near the southern
fringe of the Dundalk Plateau, about 25 km west of the town of
Orangeville, in a predominately agricultural region of southern
Ontario. The Dundalk plateau, with an elevation of approxi-
mately 480 m above sea level, is the coldest off-shield region of
southern Ontario, with temperatures and precipitation similar
to those of Algonquin Park, 300 km to the northeast.
23
Historically, Luther Marsh was a large peatland complex
surrounding two small lakes and containing several streams. In
1954 the Grand River Conservation Commission constructed a
dam across Black Creek, a headwater tributary of the Grand
River, which created Luther Lake. Peat cores were collected on
July 26, 2000 at a site (43
u
54’30N, 80
u
24’36W) which is
characterised by vegetation typical of continental, ombro-
trophic Sphagnum bogs. Visual inspection of the modern
vegetation growing on the surface of the bog today, as well as
the peat cores collected at this site, provided no botanical
evidence that flooding had affected the ombrotrophic zone of
the bog in any way. A visit to the same site to collect peat cores
in 1984 had drawn the same conclusion (W.S., personal
observation). However, to overcome the uncertainty of
possible impacts by past flooding at this site, peat cores were
also collected at two other Sphagnum bogs in southern Ontario.
2.2. Spruce Bog Trail
Spruce Bog Trail is situated in Algonquin Park, a 3000 km
2
nature reserve in a predominately recreational region of rural
southern Ontario, at an elevation of about 410 m above sea
level. Samples were collected on the northwest side, directly
across from the boardwalk, on the far side of the peatland. The
core was taken on July 10, 2000 in a very small (ca. 50 cm wide)
Sphagnum lawn within a zone of dense growth of dwarf shrubs.
This zone is between the floating mat and the forest, and the
core was removed from the edge of the floating mat. This
coring area (45
u
35’51N, 78
u
22’16W) was chosen because it is
still open with respect to the surrounding forest and because it
was firm and stable compared to the floating mat.
2.3. Sifton Bog
The Sifton Bog is an acidic Sphagnum peat bog located within
the city of London, Ontario (population ca. 300 000). The bog
covers an area of about 28 hectares and is formed in a large
depression, left behind as a glacial block melted about 13 000
years ago. This bog rests on about 25 m of glacial deposits of
sands and gravels, which overlies Devonian limestones. The
peatland today consists of a small pond surrounded by a
floating mat of Sphagnum moss, flanked by a marginal
hardwood swamp. Beyond the swamp are lowland and
upland forest, respectively. The central portion of the bog
contains as much as 10 m of peat accumulation.
24
The sampling
site (42
u
58’31N, 81
u
19’48W) was chosen in an area between
the floating mat and the damp woods. The thickness of peat
accumulation at the sampling site was about 6 m at the time of
collection (27 July, 2000).
3. Methods
3.1. Sample collection and preparation
The topmost layers of peat were collected using a 1 m titanium
Wardenaar corer as a 15 6 15 cm monolith.
25
In addition to
the short peat cores collected at all sites, a complete peat profile
was taken at Luther Bog (ca. 600 cm) in 50 cm sections using a
stainless steel Belarus corer.
26
Unfortunately, a 50 cm section
was lost during the coring session. Peat cores were removed
from two holes, approximately 30 cm apart, in parallel
overlapping fashion. The Luther Bog profile was reconstructed
by correlating depth to depth using the bog surface as
reference, assuming that samples from equal depths, but
different hole, were the same distance from the bog surface. All
samples were frozen at
2
18
u
C for storage and transport to
Berne, Switzerland.
The Wardenaar and Belarus cores were cut in the laboratory
(while frozen) into 1 cm and 2 cm slices respectively using a
stainless steel band saw. The outside edges of each slice were
cut away, dried overnight at 105
u
C in a drying oven and milled
in a centrifugal mill with titanium sieve. The powdered samples
(used for XRF and
14
C analyses) were manually homogenized
and stored in airtight plastic beakers.
3.2 Analysis
One gram of dried, milled powder was analyzed for 22 selected
major and trace elements, including lead, calcium (Ca),
strontium (Sr), manganese (Mn), iron (Fe), Br and selenium
(Se), using the EMMA XRF spectrometer.
27
Titanium (Ti) was
measured
using
a
new
analytical
spectrometer
for
Ti
(NASTIA), which was described earlier.
28
The instruments
were calibrated and checked for accuracy and precision as
described elsewhere.
29
The XRF methods were validated using
936
J. Environ. Monit., 2003, 5, 935–949
ELECTRONIC FILING, RECEIVED, CLERK'S OFFICE, AUGUST 14, 2006
standard reference materials (Table 1). Ca and Sr can be used
to identify mineral weathering reactions in peat profiles, Mn
and Fe redox processes, Br and Se atmospheric aerosols of
marine origin, and Ti atmospheric aerosols of continental
origin.
Four plugs were subsampled from the middle of each slice
with a sharpened stainless steel tube (16 mm diameter). Three
of them were used for Hg analyses. These were air-dried
overnight at room temperature in a class 100 laminar flow clean
air cabinet. Mercury concentrations were measured by atomic
absorption spectrometry (AAS) in solid peat samples
30
using
the LECO AMA 254 as described in detail elsewhere.
31
The
instrument was calibrated using liquid standards prepared
from a Merck 1000 mg l
2
1
Hg standard solution. Precision was
determined by measuring replicates of international standard
reference materials, either NIST 1515 (Apple Leaves) or NIST
1547 (Peach Leaves), after every 10th sample (Table 1). The
mean relative standard deviation of the determination of Hg
within a peat slice was 11.7% (n
~
3) which is primarily a
reflection of the heterogeneity of the slices. The fourth plug was
use to determine the dry bulk density. The height of each plug
was measured to an accuracy of 0.1 mm and the volume
calculated. After recording wet weights, plugs were dried at
105
u
C overnight and the dry mass was weighed to 1 mg.
The degree of decomposition of the peat was measured by
colorimetry on alkaline peat extracts at 550 nm using a Cary 50
UV-visible spectrophotometer. The powdered peat samples
(0.02 g) were placed in test tubes and 8% NaOH solution
(10 ml) was added. The samples were shaken then heated 95
¡
5
u
C for 1 h, then made up to 20 ml with deionised water,
shaken and left to stand for 1 h before being re-shaken and
filtered through Whatman no. 1 filter papers. Samples were
diluted with an equal quantity of deionised water directly
before colorimetric measurement. The percentage of light
absorption (% absorbance) in these extracts was used as a
proxy of peat humification.
32
3.3. Age dating
Macrofossils of Sphagnum moss were collected, cleaned, and
submitted for
14
C age dating by Acceleration Mass Spectro-
metry (AMS) at A˚ rhus University, Denmark, and at the ETH
Zurich, Switzerland. In cases when it was not possible to
identify macrofossils, bulk peat samples were used. Samples
dated using AMS were prepared using a standard procedure
for plant material (washed, acid-base-acid treatment) which
removes humic matter that could overestimate the
14
C ages.
33
Selected bulk peat samples were also age dated using decay
counting at the Institute of Environmental Physics, University
of Heidelberg, Germany.
Age dates of plant macrofossils younger than AD 1950 can
be obtained using
14
C by directly comparing the absolute
concentration of
14
C in the sample to the general-purpose curve
derived from annually averaged atmospheric
14
CO
2
values in
the northernmost northern hemisphere: post-1950
14
C con-
centrations in the atmosphere are elevated compared to natural
levels due to atomic weapons testing. This approach which
effectively matches the
14
C concentrations (percent modern
carbon, or PMC) in successive plant macrofossils to the
increase (since AD 1950) and subsequent decrease (since AD
1963) in
14
C concentrations is the so called ‘‘bomb pulse curve
of
14
C’’ and has been successfully used to date peat accumu-
lation in Denmark and in southern Greenland.
34
This
comparatively new dating method has been found to provide
high-resolution age dates which are accurate to
¡
2 years.
The other
14
C calibrated ages were calculated using the
Seattle CALIB program
35
version 4.0 (A˚ rhus University) and
version 4.3 (University of Heidelberg), and the program
calibETH (ETH Zurich). The calibration curves used for the
calibration were taken from Stuiver et al.
36
and Niklaus et al.
37
respectively. Due to irregular multimodal shapes of probability
distributions of the major part of these dates, it was decided to
present the results in the form of 95% confidence intervals
(2
s
-ranges) of the highest probability (narrowest 95% con-
fidence intervals). The results of calibration of individual dates
are presented in Table 2, 3 and 4.
In addition to the
14
C age dating using the bomb pulse curve,
the uppermost layers of the Spruce bog core were also age
dated down to 65 cm using the
210
Pb (CRS) model.
38
4. Results
4.1. Peat chronologies
Absolute chronologies were reconstructed for each of the three
peat profiles (Fig. 1) using calibrated
14
C dates (Luther and
Sifton bogs), and both calibrated
14
C and
210
Pb dates
(Algonquin bog); in each case, it is assumed that peat
accumulation was continuous. The points included in the
age–depth models were specified by taking the average depth of
the peat slice together with the mid-point of the calibrated age.
A significant challenge in dating peat accumulation is the gap
which exists between the oldest reliable
14
C bomb pulse date
(late 1950s) or
210
Pb date (ca. mid 19th century) to the first
reliable conventional
14
C date (ca. 17th century). To bridge
these gaps, composite probability distributions were used: for a
given sample, these provide an estimate of the probability of
each
14
C age. Assuming that the overlying samples are younger
than the deeper samples, a best fit can be made using
polynomial regression, linking the uppermost
14
C ages
(obtained using the bomb pulse curve) to the deeper,
conventional
14
C ages. Calibrated age ranges were considered
only in visually assessing the fit of the regression line through
the data. Moreover, the age of the top sample (the date of core
collection, AD 2000) was used as a fixed point with 100%
confidence interval. A series of regression models were used to
fit the age–depth plots. The choice of the model finally selected
was based on best fit (r
2
values) of available age dates, and a
consideration of the published range of peat accumulation
rates.
For the Luther Bog profile (Fig. 1a), the age-depth relation-
ship was constructed from the dated points using a third-degree
polynomial regression from 0 to 45 cm and a sixth-degree
polynomial regression from 45 cm to
y
535 cm. The gap from
the beginning of the oldest reliable
14
C bomb pulse date (AD
1956 at 20.0 cm) to the first reliable conventional radiocarbon
Table 1 Summary of measurements of Hg, Br, Se, and Ti in certified, Standard Reference Materials. Information values are indicated by *
Element
Method
SRM
Measured value
Certified value
Hg
AAS
NIST 1515
31.8
¡
0.8 ng g
2
1
, n
~
27
31
¡
7 ng g
2
1
Hg
AAS
NIST 1547
43.0
¡
0.7 ng g
2
1
, n
~
45
44
¡
4 ng g
2
1
Br
Emma XRF
NIST 1515
2.0
¡
0.2 mgg
2
1
, n
~
3
1.8* mgg
2
1
Br
Emma XRF
NIST 1547
12.9
¡
0.2 mgg
2
1
, n
~
2
11* mgg
2
1
Br
Emma XRF
NIST 1575
9.3
¡
1.1 mgg
2
1
, n
~
9
9* mgg
2
1
Se
Emma XRF
NIST 1632b
1.3
¡
0.4 mgg
2
1
, n
~
3
1.29
¡
0.11 mgg
2
1
Pb
Emma XRF
NIST 1575
12.0
¡
1.1 mgg
2
1
, n
~
3
10.8
¡
0.5 mgg
2
1
Ti
Nastia XRF
NIST 1635
189
¡
14 mgg
2
1
, n
~
11
200* mgg
2
1
J. Environ. Monit., 2003, 5, 935–949
937
ELECTRONIC FILING, RECEIVED, CLERK'S OFFICE, AUGUST 14, 2006
Table 2 Radiocarbon age dates (conventional
14
C years BP (before the present era)) and calibrated ages (calendar years AD/BC) obtained from bulk
peat samples and Sphagnum moss in selected samples from the Luther Bog profile (calendar dates calculated from Niklaus et al. 1992 (ETH) and
Stuiver et al. 1993 (Hd))
Average
depth/cm
Material dated
Dating method
Laboratory No.
Date
(
14
C years BP)
d
13
C(
%
)
Date (calendar years
AD/BC)
0
1
Year of collection
AD 2000
6.7
Sphagnum
14
C bomb pulse
ETH-26042
2
1065
¡
45
2
23.0
¡
1.2
AD 1992–1993
9.1
Sphagnum
14
C bomb pulse
ETH-26043
2
1030
¡
45
2
19.5
¡
1.2
AD 1993
12.7
Sphagnum
14
C bomb pulse
ETH-26044
2
1985
¡
45
2
23.1
¡
1.2
AD 1979–1980
15.2
Sphagnum
14
C bomb pulse
ETH-26045
2
3980
¡
40
2
27.3
¡
1.2
AD 1967
17.6
Sphagnum
14
C bomb pulse
ETH-26046
2
1470
¡
45
2
29.9
¡
1.2
AD 1958–9
20.0
Sphagnum
14
C bomb pulse
ETH-26047
2
480
¡
45
2
29.9
¡
1.2
AD 1956
24.9
Sphagnum
Conventional
14
C
ETH-26049
245
¡
45
2
26.8
¡
1.2
AD 1617–1692
44.3
Sphagnum
Conventional
14
C
ETH-26052
220
¡
50
2
30.0
¡
1.2
AD 1631–1822
51.6
Sphagnum
Conventional
14
C
ETH-26053
315
¡
50
2
28.7
¡
1.2
AD 1459–1666
68.6
Sphagnum
Conventional
14
C
ETH-26055
630
¡
50
2
30.1
¡
1.2
AD 1290–1408
83.6
Bulk peat sample
Conventional
14
C
ETH-25977
1130
¡
50
2
28.3
¡
1.2
AD 800–1010
96.1
Bulk peat sample
Conventional
14
C
ETH-25978
1310
¡
50
2
31.6
¡
1.2
AD 649–829
116.9
Bulk peat sample
Conventional
14
C
ETH-25941
1670
¡
50
2
21.6
¡
1.2
AD 317–532
139.9
Bulk peat sample
Conventional
14
C
ETH-25942
2150
¡
50
2
21.9
¡
1.2
260–44 BC
160.7
Bulk peat sample
Conventional
14
C
ETH-25943
2280
¡
50
2
23.4
¡
1.2
328–200 BC
216.9
Bulk peat sample
Conventional
14
C
ETH-25944
2825
¡
50
2
25.9
¡
1.2
1088–890 BC
248.4
Bulk peat sample
14
C decay counting
Hd-21554
3486
¡
24
1834–1739 BC
268.4
Bulk peat sample
14
C decay counting
Hd-21553
3557
¡
37
1979–1855 BC
308.6
Bulk peat sample
Conventional
14
C
ETH-25945
3935
¡
55
2
24.5
¡
1.2
2508–2275 BC
366.3
Bulk peat sample
Conventional
14
C
ETH-25946
4930
¡
60
2
29.3
¡
1.2
3810–3629 BC
427.4
Bulk peat sample
Conventional
14
C
ETH-25947
5815
¡
60
2
26.2
¡
1.2
4807–4520 BC
498.2
Bulk peat sample
Conventional
14
C
ETH-25948
6720
¡
65
2
27.3
¡
1.2
5686–5474 BC
535.1
Bulk peat sample
14
C decay counting
Hd-21694
8175
¡
71
7355–7052 BC
Table 3 Radiocarbon age dates (conventional
14
C years BP) and calibrated ages (calendar years AD/BC) obtained from bulk peat samples and
Sphagnum moss in selected samples from the Spruce Bog profile (calendar dates calculated from Stuiver et al. 1998)
Average
depth/cm
Material
dated
Dating method
Laboratory
No.
Date (
14
C
years BP)
d
13
C(
%
)
Date (calendar
years AD/BC)
0
1
Year of collection
AD 2000
1.7
Sphagnum
14
C bomb pulse
AAR-7536
2
880
¡
32
2
28.90
AD 1996–8
7.5
Sphagnum
14
C bomb pulse
AAR-7537
2
997
¡
39
2
30.38
AD 1994
14.5
Sphagnum
14
C bomb pulse
AAR-7538
2
1565
¡
37
2
29.5
AD 1984–5
21.5
Sphagnum
14
C bomb pulse
AAR-7539
2
2966
¡
29
2
27.17
AD 1972–3
25.0
Sphagnum
14
C bomb pulse
AAR-7540
2
3641
¡
30
2
28.20
AD 1968
27.3
Sphagnum
14
C bomb pulse
AAR-7541
2
3704
¡
32
2
28.31
AD 1962–3
29.6
Sphagnum
14
C bomb pulse
AAR-7542
2
1124
¡
36
2
28.76
AD 1957–8
33.1
Sphagnum
14
C bomb pulse
AAR-7543
2
899
¡
34
2
28.74
AD 1957
35.4
Sphagnum
Conventional
14
C
AAR-7544
133
¡
37
2
29.20
AD 1676–1779
37.7
Sphagnum
Conventional
14
C
AAR-7545
87
¡
41
2
29.05
AD 1804–1939
45.9
Sphagnum
Conventional
14
C
AAR-7547
124
¡
37
2
28.48
AD 1802–1839
56.3
Sphagnum
Conventional
14
C
AAR-7549
97
¡
34
2
25.59
AD 1805–1935
65.6
Sphagnum
Conventional
14
C
AAR-7551
138
¡
37
2
26.22
AD 1670–1780
Table 4 Radiocarbon age dates (conventional
14
C years BP) and calibrated ages (calendar years AD/BC) obtained from from bulk peat samples and
Sphagnum moss in selected samples from the Sifton Bog profile (calendar dates calculated from Niklaus et al. 1992 (ETH) and Stuiver et al. 1993
(Hd))
Average
depth/cm
Material dated
Dating method
Laboratory
No.
Date (
14
C
years BP)
d
13
C(
%
)
Date (calendar
years AD/BC)
0
1
Year of collection
AD 2000
0.5
Sphagnum
14
C bomb pulse
ETH-26273
2
785
¡
45
2
32.0
¡
1.2
AD 1999–2000
4.8
Sphagnum
14
C bomb pulse
ETH-26274
2
1050
¡
45
2
32.8
¡
1.2
AD 1992–3
6.9
Sphagnum
14
C bomb pulse
ETH-26275
2
1580
¡
50
2
30.3
¡
1.2
AD 1985
9.0
Sphagnum
14
C bomb pulse
ETH-26276
2
2025
¡
50
2
29.5
¡
1.2
AD 1979–80
11.2
Sphagnum
14
C bomb pulse
ETH-26277
2
3140
¡
50
2
30.0
¡
1.2
AD 1972
13.3
Sphagnum
14
C bomb pulse
ETH-26278
2
3345
¡
45
2
28.7
¡
1.2
AD 1962–3
15.4
Sphagnum
14
C bomb pulse
ETH-26279
2
1460
¡
55
2
28.2
¡
1.2
AD 1958–9
17.5
Sphagnum
Conventional
14
C
ETH-26280
70
¡
50
2
30.1
¡
1.2
AD 1804–1937
22.8
Sphagnum
Conventional
14
C
ETH-26281
175
¡
55
2
31.1
¡
1.2
AD 1656–1891
36.7
Sphagnum
Conventional
14
C
ETH-26282
105
¡
45
2
33.4
¡
1.2
AD 1802–1939
51.5
Sphagnum
Conventional
14
C
ETH-26283
105
¡
45
2
28.6
¡
1.2
AD 1802–1939
66.4
Sphagnum
Conventional
14
C
ETH-26284
25
¡
45
2
29.1
¡
1.2
AD 1813–1925
66.4
1
Bulk peat sample
14
C decay counting
Hd-21686
206
¡
24
AD 1738–1805
938
J. Environ. Monit., 2003, 5, 935–949
ELECTRONIC FILING, RECEIVED, CLERK'S OFFICE, AUGUST 14, 2006
date (AD 1631 to 1822; average age AD 1727 at 44.3 cm) was
bridged by using the probability distribution for the sample
from 24.9 cm. Specifically, the probability distribution of this
sample shows that four age dates are possible (Fig. 1a). Of
these four age dates, the three oldest ones do not lie on the age–
depth trend. Therefore, the youngest age (AD 1935) was
selected as being the most reasonable of the four, and this age
was used to construct the age–depth relationship.
The age–depth relationship for Sifton Bog (Fig. 1b) was
reconstructed using a second-degree polynomial regression
from nine reliable points. Between 15.4 to 66.4 cm depths, the
probability distribution profiles of three conventional radio-
carbon dates were used. For Spruce Bog (Fig. 1c), the age–
depth relationship was reconstructed using a third-degree
polynomial regression from the reliable age dated points from
the surface to 33.1 cm depth. Below, the probability
distributions of four conventional radiocarbon dates were
used. Using this approach, sample depths for each peat profile
were converted into calendar dates using the age–depth
relationships.
4.2. Trophic status of the profiles
Visual inspection of the Luther bog core indicates that the
profile consists of clay-rich sediments up to 560 cm; gyttja
(a lacustrine organic-rich sediment), from 560 to 490 cm; and
peat above 490 cm (Fig. 2). The concentrations of Ti and ash
provide an index of the amount of mineral matter in the peat
16
which can be used to help distinguish between ombrotrophic
peat (mineral matter supplied exclusively from the air) from
minerotrophic peat (mineral matter from the air, as well as
terrestrial and aquatic inputs). Calcium and Sr may be used to
describe the trophic status of the peat profile,
39
and are also
sensitive indicators of inputs to the peat profile from mineral-
fluid interactions subsequent to peat formation. The concen-
trations of these parameters allow the following zones to be
distinguished within the peat column, in ascending order
(Fig. 2): clay, gyttja, minerotrophic fen peat, transitional peat,
ombrogenic peat, and ombrotrophic peat. ‘‘Ombrogenic’’ peat
consists of organic matter derived from ombrotrophic bog
plants, but has since been overprinted with a minerotrophic
signature because of the upward diffusion of Ca and Sr derived
from chemical weathering of the underlying sediments. Taken
together, the geochemical data, briefly summarised here, show
that the uppermost 165 cm of the Luther profile are
ombrotrophic and therefore that all elements were supplied
to the peat in this section of the bog exclusively via the
atmosphere.
The abundance and distribution of Ca, Sr, Ti and ash in the
Spruce bog and Sifton peat cores are comparable to those in the
ombrotrophic section of the Luther bog profile. In the peat
cores from Spruce and Sifton bogs, therefore, these cores also
have received their inputs from the atmosphere. As observed in
the ombrotrophic section of the Luther bog profile, there is an
exceptional zone of elevated ash content and lithogenic
elements concentration in the uppermost layer of Spruce bog
and Sifton bog at 35 and 20 cm respectively.
4.3. Mercury and lead concentration profiles in the three
Wardenaar peat cores
Mercury concentrations are lowest in the top and bottom
layers of the Wardenaar cores, with the maximum concentra-
tions (189, 251 and 333 ng g
2
1
in Spruce Bog, Luther Bog and
Sifton Bog respectively) at intermediate depths. Each peat core
shows a unique variation in Hg concentrations with respect to
depth (Fig. 3), with peaks in Hg concentration found at depths
varying between 15 and 35 cm. Despite this, the chronologies of
the changing Hg concentrations are remarkably similar, with
maximum Hg concentrations dating from the late 1950’s in
each core (Fig. 3). The Pb concentration profiles resemble the
Hg concentration profiles (r
2
~
0.72, 0.77 and 0.82 in the
Luther bog, Spruce bog and Sifton bog profiles respectively) in
the sense that the zones which contain elevated Hg concentra-
tions, also are elevated with respect to Pb. As is true of Hg,
therefore, Pb displays a similar chronology in each of the cores,
Fig. 1 Age–depth relationship for Luther Bog (a), Sifton Bog (b) and Spruce Bog (c). Calibrated age dates (obtained using
14
C) and their errors are
reported as crosses (
1
), or as a composite of the probability distribution. Radiometric age dates obtained using
210
Pb (CRS model) are indicated by
the diamonds (
e
).
J. Environ. Monit., 2003, 5, 935–949
939
ELECTRONIC FILING, RECEIVED, CLERK'S OFFICE, AUGUST 14, 2006
with the maximum Pb concentration dating from the late
1950’s in each case. The coincidence of the Hg and Pb
concentrations in the modern peat samples from the surface
layers of all three bogs suggests that either these elements have
a predominant source in common, that they behave similarly in
peat bogs, or both.
4.4. ‘‘Background’’ Hg concentrations in the Luther Bog profile
For comparison with the Hg concentrations in modern peat
samples from the surface layers of each of the bogs, it is
important to establish the ‘‘natural background’’ Hg concen-
tration for peat in this region. Analysis of the peat core from
Luther Bog shows low and quite stable Hg concentrations
below 150 cm, even in the transitional and minerotrophic peat
sections, with values in the range of 13 to 35 ng g
2
1
from 150 to
495 cm (Fig. 4). Again, the peat samples from the fen,
transitional, and ombrogenic zones are rich in Ca, out of
proportion with Ti (Fig. 2); these peats, therefore, have been
overprinted with chemical signatures indicating pronounced
mineral–water interactions (Fig. 2). However, these reactions
and processes have not measurably contributed Hg to the
profile, and Hg concentrations are effectively constant (22.3
¡
4.0 ng g
2
1
) from 300 to 500 cm (Fig. 4). Because the
concentrations of Hg in the transitional and minerotrophic
peats are not significantly different from the ombrotrophic peat
(which has received Hg only from the atmosphere), even in the
transitional and minerotrophic, Hg was supplied exclusively by
the atmosphere. Assuming that the Hg concentrations between
150 and 495 cm at Luther (13 to 35 ng g
2
1
) reflect the range in
natural concentrations of Hg in ombrotrophic peat, the
maximum Hg concentrations at Spruce Bog, Luther Bog and
Sifton Bog exceed this range by factors of 6–13, 8–18, and 10–
23 respectively.
5. Discussion
5.1. Effects of natural biogeochemical processes on Hg
concentration profiles
Diagenesis of Fe and Mn within the peat profile. It has
previously been shown that redox-related transformation of Fe
Fig. 2 Concentration profiles of elements discussed in the text and ash content in the Luther Bog (a), Spruce Bog (b) and Sifton Bog (c) profiles and
assigned peat/sediment type. The year of collection and selected calibrated age dates obtained by
14
C AMS are shown for convenience. The vertical
dashed line indicates the average Sr concentration in the ombrotrophic zone of Etang de la Grue`re, a continental bog in the Jura Mountains of
Switzerland.
940
J. Environ. Monit., 2003, 5, 935–949
ELECTRONIC FILING, RECEIVED, CLERK'S OFFICE, AUGUST 14, 2006
Fig. 3 Concentrations of Hg (ng g
2
1
), Pb (mgg
2
1
), Mn (mgg
2
1
) and Fe (mgg
2
1
), and degree of humification (corrected absorbance) for the
Wardenaar peat profiles from Luther (a), Spruce (b) and Sifton bogs (c). The age dates represent those
14
C bomb pulse age dates (
¡
2 years) which
are closest to the peaks in Hg concentration and are included for convenience.
Fig. 4 Mercury concentrations (ng g
2
1
), degree of humification (corrected absorbance) and bulk density (g cm
2
3
) in the peat profile from Luther
Bog. The ratio Hg/Abs is also shown to compensate the Hg concentrations for changes in peat decay. The ratio bulk density/Abs shows that these
parameters provide a comparable index of the degree of humification for Sphagnum-dominated bog peats (above ca. 180 cm) but not for Carex-
dominated fen peats (below ca. 250 cm).
J. Environ. Monit., 2003, 5, 935–949
941
ELECTRONIC FILING, RECEIVED, CLERK'S OFFICE, AUGUST 14, 2006
and Mn in marine and lacustrine sediments may contribute
significantly to Hg enrichments in the surface layers of these
sediments, and it is important to know if these processes may
have affected the Hg concentration profiles near the surface
layers of the peat bogs. At the bog surface, Fe and Mn are
deposited as soil dust particles, primarily as oxides and
hydroxides derived from the chemical weathering of soils. In
acidic, anoxic peat, these will react via reductive dissolution,
releasing Fe(
II) and Mn(II) to the porewaters which will diffuse
upward into the oxic zone, become oxidised and precipitate.
40
It is conceivable, therefore, that Hg may have become enriched
in the surface layers of the peat profiles via absorption onto the
reactive surfaces of Fe and Mn oxides in the anoxic zone.
41
To
evaluate this hypothesis, the distribution of Fe and Mn in the
three Wardenaar cores is shown along with that of Hg in Fig. 3.
The surface layers of each core are clearly enriched in Mn:
given the LLD (lower limit of detection) of Mn in peat using
the EMMA XRF (12 mgg
2
1
), the Mn concentration profile
shows that Mn concentrations in the top of each core may be as
much as two orders of magnitude greater than the underlying
peat layers. However, these pronounced Mn enrichments are
restricted to the top of the peat core, and in each peat core they
clearly overlie the zone of elevated Hg concentrations (Fig. 3).
Thus, the distribution of Hg and the distribution of Mn are
clearly separated in space and time at all sites. With respect to
Fe, the maximum in Hg concentrations in each core also is
below the maximum Fe concentration (Fig. 3). Thus, in each of
the three profiles, the maximum concentrations of Fe and Mn
are separated in both space and time with respect to Hg
(Fig. 3). The onset of changing Hg concentrations, there-
fore, precedes and pre-dates the changes in Mn and Fe
concentrations.
Normalizing Mn and Fe to Ti emphasizes the change in Mn
and Fe abundance, relative to the abundance of mineral matter
(Fig. 5). In the peat core from Sifton Bog (Fig. 5b) and in the
core from Spruce Bog (Fig. 5c), the maximum concentration of
Hg corresponds to the minimum in Fe/Ti and Mn/Ti ratios. In
these two peat profiles, therefore, there is no indication that the
distribution of Hg has been affected in any way by redox-
related transformations of either Fe or Mn.
Even in the case of the Luther bog (where a dam was
constructed in 1954), the distribution of Hg does not
correspond to that of Fe/Ti or Mn/Ti (Fig. 5a). The construc-
tion of the dam may have affected the hydrology of the bog by
changing the level of the water table and therefore the depths at
which redox processes take place within the peat column. The
peaks in Fe/Ti at ca. 75 cm, 65 cm, and 45 cm may somehow be
related to these hydrological changes to the peatland. However,
even in these cases, the changes in Fe/Ti do not have a
corresponding change in Hg concentration. The maximum Hg
concentration, for example, at a depth of ca. 22 cm,
corresponds to the minimum in Fe/Ti (Fig. 5a). Therefore,
the distribution of Fe and Mn has not noticeably influenced the
Hg concentration profiles in any of the cores. Although
reductive dissolution of Mn and Fe in the peat cores is
probably taking place (as seen in their chemical separation
from Ti subsequent to deposition from the air as dust particles)
this process has not discernibly affected the distribution of Hg.
Other diagenetic processes. There are other factors which
argue that the peaks in Hg concentration have not been caused
by chemical diagenesis within the peat profile. First, given the
differences in the structure and morphology of the three peat
bogs studied, and the spatial variability within each peatland,
each peat core shows a unique variation in Hg concentrations
with respect to depth: the maximum Hg concentrations are
found at depths of ca. 15 cm (Sifton Bog), 22 cm (Luther Bog),
and 35 cm (Spruce Bog). Each of the peat bogs is a naturally
acidic, organic-rich, ombrotrophic ecosystem. Considering that
the climate regime is reasonably similar at all sites, the average
depth to water table should also be similar in each of the bogs.
Therefore, if the distribution of Hg concentrations within the
peat profiles was controlled or dominated by geochemical
processes, there is no obvious reason why the maximum Hg
concentrations should be found at different depths at each of
the sites. However, the change in Hg concentrations with
respect to time are similar, with Hg concentrations having
reached their maximum concentrations during the late 1950’s
at each site. The similar chronologies of Hg accumulation in
the three peat cores, therefore, suggest that the changing rate of
atmospheric Hg deposition is the dominating process affecting
the Hg concentration profiles.
Second, many published studies have concluded that Pb is
effectively immobile in acidic, ombrotrophic peat bogs, and
that these bogs faithfully preserve a record of atmospheric Pb
deposition.
18–20
Given the pronounced differences between the
geochemical behaviour of Hg and Pb, the correlation between
the peaks in Hg and Pb concentrations (Fig. 3) cannot be mere
Fig. 5 Concentrations of Hg (ng g
2
1
), Fe/Ti and Mn/Ti ratio for the
Wardenaar peat cores from (a) Luther Bog, (b) Sifton Bog, and
(c) Spruce Bog. Note that the peaks in Hg concentrations correspond
to minima in Fe/Ti in all three cores.
942
J. Environ. Monit., 2003, 5, 935–949
ELECTRONIC FILING, RECEIVED, CLERK'S OFFICE, AUGUST 14, 2006
coincidence. In fact, taking Pb to represent an immobile
reference element, the similar distribution of Hg and Pb in these
peat cores suggests that Hg too, is well preserved, and that
these bogs do indeed serve as archives of atmospheric Hg
deposition. Taken together, the available evidence suggests
that:
(i) the Hg concentrations measured in the peat core were
supplied exclusively by the atmosphere,
(ii) there has been no significant diagenetic remobilisation of
Hg, and
(iii) the peat bog has faithfully preserved a record of
atmospheric Hg accumulation.
Effect of organic matter decay on Hg concentration
profiles. In a recent study about Hg accumulation rates in
Patagonian peat cores,
42
it has been suggested that humifica-
tion processes and mass losses during the diagenesis of peat
might have a strong influence on Hg concentrations or
accumulation rates. Moreover, those authors suggested that
bulk density is not an adequate parameter to express changes in
peat humification, and that Hg accumulation rates should be
corrected for humification to take into account mass loss
during peat decay. In the present study, absorbance of alkaline
extracts of peat was used as a measure of decay, and these data
are compared with the Hg concentration profiles for the three
Wardenaar cores in Fig. 3. These data show that the changes in
Hg concentration within the profile are disproportional to the
changes in peat humification (as reflected by the absorbance
measurements). For example, at the Luther Bog the peat
samples between 100 and 150 cm are clearly more decomposed
than the peat samples above 50 cm (Fig. 4); however, the peat
samples above 50 cm contain far higher Hg concentrations
(Fig. 4). Thus, the variation in degree of decomposition of
peats from the Luther bog profile alone cannot explain the
most significant changes in the Hg concentration profile
(Fig. 4). To emphasise this, the Hg concentrations have been
normalised to absorbance and this ratio (Hg/Abs) is found to
be elevated in three zones: in the Carex fen peat (ca. 450 to
300 cm), around 100 to 150 cm (to be discussed later), and
above 50 cm (Fig. 4). In contrast to the small changes in
absorbance within the peat profile, the changes in Hg
concentrations relative to absorbance (Hg/Abs) are far greater.
As a result, physical processes such as organic matter
decomposition cannot explain the magnitude of the variation
in Hg concentrations with depth in these peat bog profiles.
Also, the small variation in the ratio between bulk density and
absorbance in the Sphagnum peats (Fig. 4) shows that other
physical processes such as compaction also cannot explain the
magnitude of the Hg concentration differences.
5.2. Predominant sources of atmospheric Hg
Lithogenic sources of Hg and Pb. In the upper part of all
three profiles, Hg, Pb and Ti have some peaks in common
(Figs. 2 and 3) and it is necessary to quantify to what extent
atmospheric soil dust may be a potential source of Hg (and Pb)
and to the bog. Recent research, for example, has demonstrated
that mineralised bedrock or/and bedrock with high natural
background concentration in Hg and Pb constitutes significant
sources of these elements to lake sediments in the south-eastern
part of the Canadian Shield.
43
The lithogenic Hg and Pb
fractions derived from atmospheric mineral matter can be
estimated as the product of the concentrations of a con-
servative lithogenic element in a given profile (e.g. Ti), and the
Hg/Ti or Pb/Ti ratio of the pre-anthropogenic, background
period of the Luther bog profile. The pre-anthropogenic,
natural background values of Hg/Ti and Pb/Ti are taken from
the 60–290 cm section of the Luther bog profile which is
ombrotrophic with respect to all three elements. These values
are more representative of the pre-anthropogenic ratio of
Hg/Ti and Pb/Ti ratios in atmospheric aerosols of southern
Ontario than ratios obtained from compiled values published
in the literature for the Upper Continental Crust.
44
Calcula-
tions of lithogenic Hg using the background Hg/Ti values,
show the atmospheric deposition of mineral matter cannot
explain more than 0.2% of the peak Hg concentrations, and no
more than 15.5% of the Pb. Clearly, natural inputs of Hg from
soil dust represent a negligible source of Hg to the peat bog
profiles. Further evidence supporting this conclusion is the
notable peak in Ti concentration at a depth of ca. 375 cm in the
Luther profile which has no corresponding peak in Hg
concentration (Figs. 2 and 4).
The elevated Ti concentrations seen in all three peat cores
(Fig. 2) indicate recent increases in the deposition of dust
particles from the atmosphere. These changes are most likely
caused by soil dust because of the extensive forest clearance for
agriculture. During the period ca. AD 1800 to 1900, southern
Ontario was more or less deforested by European settlers, and
the increased rate of soil erosion would have created a
significant increase in the release of dust particles to the air;
the surface layers of these bogs bear witness to this process.
Again, however, these inputs are not a significant source of Hg
to the bogs. While there certainly are elevated concentrations of
Hg and Pb in the samples which are enriched in Ti, these three
elements only share a common chronology, and not a common
source. In other words, the processes which have enhanced Ti
inputs to the bog (enhanced fluxes of soil dust) are independent
of those providing Hg and Pb (mainly coal-burning; see below):
however, the chronology of the changing importance of these
two processes is similar.
If the changing Hg concentrations seen in the recent peat
layers of all three peat cores cannot be explained by chemical
processes operating within the peat profiles, and if the changing
rates of atmospheric soil dust cannot explain their distribution,
then anthropogenic sources of Hg must be invoked to explain
the increased rate of deposition of this element.
Distinguishing between natural and anthropogenic mercury
sources. Hg in relation to Br and Se. To distinguish between
natural and anthropogenic Pb in peat bog profiles, we have
previously used scandium (Sc) as a conservative reference
element to represent the natural Pb component contributed by
atmospheric soil dust.
19
This approach is valid because
atmospheric Pb deposition in pre-anthropogenic times was
dominated by inputs of soil dust, and because Sc behaves
conservatively both during chemical weathering in soil profiles,
but also subsequent to deposition in the bog.
16
It is highly
desirable to have an analogous ‘‘reference element’’ for Hg, to
quantify the natural inputs of Hg to the bog. In the case of Hg,
however, the data and arguments given above show that soil
dust inputs of Hg were insignificant in pre-anthropogenic
times, and therefore that a reference element is needed whose
inputs to the bog are independent of soil dust.
Bromine and selenium are two elements whose supply to the
bog is independent of soil dust. The chemistry of Br and Se is
very different to that of Hg: Br is probably supplied to the bog
primarily as ionic bromide and Se perhaps as dimethyl selenide;
both are ultimately supplied by the oceans. In contrast, Hg in
the atmosphere in pre-anthropogenic times must have been
present primarily as the volatile, unreactive, gaseous elemental
form.
1,2
The physical and chemical processes which affect and
control their atmospheric transport and deposition also are
very different. Despite these great differences, Hg/Br and Hg/Se
ratios in ombrotrophic peat dating from pre-anthropogenic
times were remarkably constant for thousands of years (Fig. 6):
from 495 to 150 cm, the Hg/Br and Hg/Se ratios averaged
0.0010
¡
0.0003 and 0.021
¡
0.007, respectively (n
~
144).
Therefore, even though these elements may have different
atmospheric sources, chemical properties, and different modes
of transport and deposition, their rates of accumulation in
J. Environ. Monit., 2003, 5, 935–949
943
ELECTRONIC FILING, RECEIVED, CLERK'S OFFICE, AUGUST 14, 2006
pre-anthropogenic peat were in constant proportions for
thousands of years. The constant ‘‘background’’ ratios warrants
an attempt to use Hg/Br and Hg/Se to try to quantify
anthropogenic Hg. Further support for this approach is provided
by the peat core collected at Etang de la Grue`re in the Jura
Mountains of Switzerland, where the natural ‘‘background’’
Hg/Br ratio
14,29
was constant for several thousand years (average
0.0012
¡
0.0002 from ca. 14 500 to 800 years BP).
Relative to the ‘‘background’’ values, the ratios Hg/Br and
Hg/Se increase below 495 cm where the profile consists of gyttja
and clays, as well as in samples from 150 to 85 cm and in all
samples above 70 cm depth. The increases in Hg/Br and Hg/Se
in the peat samples above 70 cm (dating from recent times) are
of particular interest.
If Hg, Br and Se in peat are conserved during decomposition,
then they will increase in concentration with increasing
humification (as measured using corrected absorbance). In the
Luther Bog profile from 300 cm to 60 cm depth, there is a
constant botanical composition of peat, but variable degree of
humification (Fig. 4): here, the Br/Abs and Se/Abs ratios are low
and constant (Fig. 6). Thus, during decomposition, these
elements appear to behave similarly and become enriched to
the same extent; this is true also of Hg (Fig. 4). Humification
processes operating with the peatland, therefore, affect Hg, Br
and Se to the same extent, and as a first approximation, they are
conserved during organic matter decay. In the Carex fen peat
layers, the Br/Abs and Se/Abs ratios are clearly elevated, but here
emphasis is placed on the corresponding ratios in ombrotrophic
peat which are constant from ca. 200 to 50 cm (Fig. 6).
Calculating an enrichment factor for Hg (EF Hg) using Hg/
Br and Hg/Se. Enrichment factors have been calculated for Hg
(EF Hg) using the constant, pre-anthropogenic values for
Hg/Br and Hg/Se. These EF calculations (Fig. 6) show that Hg
is enriched in the Luther profile by a factor of up to 6 times,
relative to ‘‘background’’ values. In the uppermost peat
samples, however, the Br/Abs and Se/Abs profiles show that
both Br and Se themselves are enriched, relative to ‘‘back-
ground’’ values (Fig. 6). Thus, the EF calculations under-
estimate the true extent of anthropogenic enrichment of Hg.
The enrichments of Br and Se may be due to natural processes,
anthropogenic inputs, or both. The topmost sample of the core
is made up of living plant matter, but here the Br and Se
concentrations are lower than in underlying samples (Fig. 6).
Therefore, biological uptake of Br and Se by plants does not
appear to be the dominant cause of the elevated Br/Abs and Se/
Abs values in the surface layers of the bog. Possible
anthropogenic sources of Br
45
and Se
46
include Br compounds
added as gasoline Pb additives (to scavenge Pb from motors)
and Se release during coal burning and metal sulfide refining.
The calculated EF values for Hg, therefore, are at best rather
conservative estimates of anthropogenic Hg.
Separating total Hg into natural and anthropogenic compo-
nents using Br. Because the ratio Hg/Br and Hg/Se in peat
dating from pre-anthropogenic times was effectively constant,
these ratios can be used to separate total Hg into its natural and
anthropogenic components. With respect to Se, the concentra-
tions of Se in the pre-anthropogenic section of the peat profile
are typically ca. 56 the LLD provided by EMMA XRF
(0.4 ppm), but in some cases the Se concentrations in peat
approach the LLD. In contrast, Br concentrations in the same
peats are always at least a factor of ten above the LLD
(0.7 ppm). Because measurements of element concentrations
Fig. 6 Bromine and selenium concentration profiles (mgg
2
1
) for the Luther Bog peat profile. The Br/Abs and Se/Abs ratios show that the surface
peat layers are enriched in Br and Se, out of proportion with the extent of humification. The Hg/Br and Hg/Se ratios show that these values were
relatively constant for many thousands of years. The vertical dashed line indicates the analytical limit of detection for Se (0.4 ppm). Mercury
enrichment factors (EF Hg) have been calculated using both the pre-anthropogenic Hg/Br and Hg/Se ratios to calculate the extent of enrichment (no.
of times) relative to these pre-anthropogenic, background values.
944
J. Environ. Monit., 2003, 5, 935–949
ELECTRONIC FILING, RECEIVED, CLERK'S OFFICE, AUGUST 14, 2006
106 LLD are more accurate than those approaching the LLD,
Br was selected as the better reference element for Hg. There-
fore, the natural Hg component in the peat cores was calculated
using the Hg/Br ratio. Here, ‘‘excess Hg’’ is defined as the
difference between the natural Hg component and the total Hg
concentration:
[Hg]
excess
~
[Hg]
total
2
[Hg]
natural
(1)
where
[Hg]
natural
~
[Br]
sample
6 [Hg]/[Br]
background
(2)
A similar approach was used previously to separate Pb in
peat cores into its natural and anthropogenic components
using the background Pb/Sc or Pb/Ti ratio.
28
Excess Hg
calculated in this way cannot be attributed to the residual
enrichment of Hg during the decomposition of organic matter
because this effect is already taken into account by the Br
concentrations: the Br concentrations (Fig. 6) vary with peat
humification (Fig. 3) and by normalising the Hg concentrations
to Br, therefore, this process is already considered. In the
uppermost peat layer where Br/Abs reveals an enrichment of
Br, out of proportion with humification (Fig. 6), however,
excess Hg calculated as described above will certainly be
underestimated. To have a better measure of excess Hg in the
surface peat layers, a reference element for atmospheric Hg
deposition is needed which has no significant anthropogenic
contribution: we are not aware of any such element. For the
moment, therefore, there is no choice but to use Br as a
reference element for atmospheric Hg inputs, as imperfect as
this may be.
Excess Hg in the peat core consists of Hg in a concentration
range which exceeds that which can be attributed to the natural
ratio of Hg to Br. This excess Hg may be due to Hg inputs from
volcanic emissions,
29
changes in intensity of biogenic emissions
including biomass burning, climate changes such as variations
in temperature or rainfall,
29
or anthropogenic Hg inputs.
Previous studies using peat cores from Swiss bogs
29
have shown
excess Hg due to climate change and volcanic emissions are
small compared to the concentrations of excess Hg in modern
peat samples dating from the Industrial Period.
Below 495 cm in the Luther Bog profile, excess Hg cannot be
interpreted with respect to atmospheric inputs because the peat
core at these depths consists of gyttja, a nutrient-rich
sedimentary peat dominated by plankton and other plant
and animal residues. The Hg/Br and Hg/Se ratios are elevated
in this zone of the peat profile (not shown), as well as the Hg
concentrations, possibly reflecting other Hg enrichment pro-
cesses related to intense bacterial activity (bioaccumulation) at
the gyttja/water interface during sedimentation in a quiet water
environment. These natural Hg enrichment processes are
beyond the scope of this paper.
5.3. Calculating net atmospheric Hg accumulation rates
To estimate the atmospheric Hg fluxes, net Hg accumulation
rates (AR) were calculated using:
AR
~
10 6 [Hg] 6 BD 6 GR
(3)
where AR is the net accumulation rate of Hg (mgm
2
2
per year),
[Hg] the Hg concentration (ng g
2
1
), BD the bulk density of the
peat (g cm
2
3
) and GR the growth rate (cm per year). Growth
rates were determined using ages calculated for each layer by
the age–depth relationship of each core. The net rate of Hg
accumulation (Hg AR) for the past 8000 years derived from the
Luther Bog peat profile is shown in Fig. 7 and for the three
Wardenaar peat cores in Fig. 8. The error associated with the
mercury accumulation rates for the last 50 years is calculated to
be 21%, based on conservative estimates of the errors
associated with
14
C dates (ca. 5%), Hg concentrations (ca.
5%), and bulk density measurements (ca. 20%). The error range
for the samples pre-dating AD 1950 and too young to be
dated using
14
C is more difficult to quantify because the
age–depth model does not permit uncertainties to be calcu-
lated; however, these are assumed to be comparable to the
others.
Natural background Hg accumulation rates. The Hg AR
profile for Luther Bog shows total Hg deposition for the last
8000 years (Fig. 7). Here, the net rate of atmospheric Hg
accumulation during the Holocene (past ten thousand years)
varied between 0.4 and 7.7 mgm
2
2
per year with an average
accumulation rate of 1.4
¡
1.0 mgm
2
2
per year (n
~
197) from
5700 years BC to AD 1470. These values are consistent with
natural Hg AR measured in peat cores from bogs in Sweden,
15
Switzerland,
14,29
Greenland.
16
and Maine, USA.
47
The varia-
tion exhibited by Hg AR is thought to be primarily due to
Holocene climate change. For example, during a warm, dry
period in southern Ontario
48
from ca. 3600 to 200 calendar
years BC, the natural rate of atmospheric Hg accumulation was
Fig. 7 Total (solid line) and natural (shaded area) Hg accumulation rates (past 8000 years) in the Luther Bog profile calculated using the background
Hg–Br relationship. Inset: past 700 years.
J. Environ. Monit., 2003, 5, 935–949
945
ELECTRONIC FILING, RECEIVED, CLERK'S OFFICE, AUGUST 14, 2006
particularly low and constant (Fig. 7). During the pre-
anthropogenic period, an excess of Hg occurred only once,
in peat from ca. 72 to 135 cm and dating from ca. 200 calendar
years BC to AD 1200 (Fig. 7).
Several physical and chemical properties of peat from
ombrotrophic bogs have been used as proxy climate indica-
tors,
49
including the degree of peat decomposition.
32
The
increase in the absorbance values (degree of humification) of
the Luther Bog peat core (Fig. 3) from 4000 to 0 calendar years
BC (385 cm to 135 cm) reflects an increase in the degree of peat
decomposition; this, in turn, indicates a period of low effective
precipitation. The occurrence of this climate phase in the
Luther Bog is consistent in timing (from other archival records)
with the late middle Holocene warm and dry period in
Ontario.
48
Recent paleohydrological studies of water levels at
other sites in eastern North America indicate similar dry
climate periods which are thought to be due to more frequent
incursions of drier Pacific air into the northeast of North
America.
50,51
Following this warm, dry phase, the subsequent period (ca.
200 calendar years BC to AD 1200) shows a decrease in the
degree of humification which reflects a shift in climatic
conditions to a period of higher effective precipitation. Lake
sediment records throughout the northeast USA document
increasing lake levels by 2000 BP which suggests increased
humidity and colder conditions; this has been interpreted as a
response to a more southward displacement of the Arctic front
relative to it’s modern position.
52,53
Of special interest here, an
excess of Hg is observed throughout this period, with the Hg
AR increasing by more than a factor of three from 1.4 to
4.6 mgm
2
2
per year. These changes reflect an increase in
atmospheric humidity in southern Ontario at that time,
following the preceding warm and dry period: this must have
led to a corresponding increase in wet deposition of atmo-
spheric Hg which is recorded by the peat core from Luther Bog
(Fig. 7). The elevated Hg fluxes for this period (Fig. 7), and the
elevated Hg/Br and Hg/Se ratios (Fig. 6), are therefore
interpreted as a direct reflection of climate change. The
magnitude of the change in Hg AR from this period (a factor
of three times) documents the sensitivity of natural ‘back-
ground’’ Hg accumulation rates to Holocene climate change.
Clearly, these variations must be duly considered when
quantifying modern Hg accumulation rates for comparison
with background values. Similar climate-driven Hg accumula-
tion rate phenomena have been seen in others bogs.
13,29
In addition to direct effects of climate change on Hg
accumulation rates, there are several possible indirect effects.
For example, the change in climate may have led to changes in
the relative abundance of dominant plant species growing on
the bog surface at that time. Some bog plant species are
particularly efficient at retaining Hg compared to others
14
such
that small differences in net rates of Hg accumulation may be
partly due to changes in the abundance of predominant plant
species. For example, the deposition of Hg associated with
litterfall and throughfall may provide up to 60% of the total Hg
deposited beneath a spruce forest canopy.
54
Therefore, a
change in vegetation such as a change of the relative abundance
of bog plant species or greater tree cover, may have led to a
long-term change in the efficiency by which Hg was deposited,
captured and/or retained by the bog. While differential
retention or release of Hg during organic matter decay may
also play a role, this seems far less likely to be important
because the relationship between Hg concentration and
absorbance (Figs. 3, 4) suggests that Hg is very well retained
by the peat. Also, experimental studies have shown that little of
the Hg deposited on peat bog surfaces is re-emitted to the air.
55
The fluctuations in Hg AR due to Holocene climate change
are dwarfed by the dramatic increases in Hg AR in peat
samples dating from the modern period; these more recent
changes are discussed in more detail below.
Excess Hg beginning in peat dating from the 15th century
AD. A notable peak of Hg AR (up to 56 relative to
‘‘background’’) occurs from AD 1475 to AD 1650 and reaches
a maximum flux of 7.7 mgm
2
2
per year (Fig. 7, inset). Since AD
1475, Hg AR has been elevated and the Hg/Br and Hg/Se ratios
have continuously been outside of their long-term average
range. This excess of Hg relative to both Br and Se may be an
entirely natural phenomenon such as enhanced Hg deposition
from the global cycle of gaseous elemental Hg due to increased
atmospheric humidity and its effects on Hg oxidation and
precipitation scavenging, or an anthropogenic process such as
local or regional scale changes in Hg emission rates due to gold
and silver mining.
There are at least two regional anthropogenic sources of Hg
which may have resulted in Hg contamination of the Luther
bog profile in the late 15th century. First, this enrichment may
be a reflection of Hg consumed and emitted by amalgamation
associated with silver mining activities in Spanish America.
Hylander et al.
56
have recently reported that the onset of Hg
use in South America dates from around AD 1550. The impact
of fugitive Hg release from industrial silver production in
Spanish America may explain part of the peak in Hg
contamination observed in Luther profile from AD 1475 to
AD 1650 (Fig. 7). However, at Caribou bog in Maine, about
1000 km east of the Luther bog, onset of Hg contamination
from anthropogenic sources began during the nineteenth
century.
47
No peak of HgAR is observed at that site in the
period of industrial Hg use for silver recovery in South
Fig. 8 Chronologies of total (solid line) and natural (shaded area) Hg
accumulation rates for Spruce Bog, Luther Bog and Sifton bog. The
difference between the total AR and the natural AR is an estimate of
the anthropogenic contribution.
946
J. Environ. Monit., 2003, 5, 935–949
ELECTRONIC FILING, RECEIVED, CLERK'S OFFICE, AUGUST 14, 2006
America. In addition, the peak in Hg concentration and Hg AR
in the Luther Bog correlates with smaller but significant peaks
in Pb (Fig. 3) and sulfur (S, not shown) concentrations during
the same period. Taken together, those two observations
suggest that a local source of anthropogenic Hg is probably
needed to explain the Hg, Pb and S contamination observed in
the Luther profile from AD 1475 to AD 1650.
Second, southern Ontario has its own unique record of
regional scale human impacts. It is known from archaeological
evidence that Iroquoians settled in the Grand River watershed
of southern Ontario from AD 1370 to AD 1650. Although
paleoecological evidence for impact of Iroquois farmers on the
forests of southern Ontario is limited to few sites,
57–59
there is
abundant archaeological evidence for their presence in the
period between AD 900 and AD 1600.
60
High-resolution pollen
and charcoal analyses from Crawford Lake (30 km SE of
Luther Bog) by McAndrews and others
57,59,61
reveal a pro-
nounced change in the composition of upland forests around
1500 AD which was caused by deliberate forest burning by
Iroquois for maize cultivation. The Iroquoian practiced long-
fallow cultivation which involved clearing a plot of land by
cutting the underbrush and girdling large trees, burning the
residue, and planting crops for several years until the soluble
nutrients supplied from the wood ashes became depleted. The
cycle was repeated on other sections of land over a number of
years until all the arable soils within a reasonable distance to
the village were exhausted. Once this point had been reached,
the village would be relocated to a new area and the process
would begin over again.
60
Published studies from Manitoba, Canada, and the Amazon
basin of Brazil have shown that forest fires can be significant
sources of Hg emissions.
62
It is quite possible, therefore, that
the increase in Hg AR seen in the Luther Bog reflects biomass
burning by Native North Americans. The peak in excess Hg
dates from ca. AD 1580 when the Neutral population is
estimated to have reached its maximum. The population of the
Neutral has been variously estimated to range from 12 000 to
40 000 people.
63
The lower estimates may reflect the devastat-
ing effects of European diseases and periods of famine which
swept through the region between AD 1634 and 1640.
64
The
introduction of European diseases, for which native popula-
tions had little immunity, and intensified warfare during the
beginning of the 17th century led to the collapse of the Huron
and Neutral tribes in 1649.
65
The Hg AR recorded by the peat
core decreased from AD 1580 to reach a plateau around AD
1650 and may reflect well the decline of biomass burning by at
that time.
The partitioning of Hg released from biomass burning
remains controversial. Combustion gases from fires would
resemble those from fossil fuel burning,
62
with up to 50% of
total Hg in the form of water-soluble Hg
II
.
66
Recent laboratory
experiments,
67
however, report that during biomass burning,
mercury is emitted almost exclusively as elemental Hg (
w
95%)
and
v
5% as particulate mercury. Thus, it remains unclear how
the Hg released from regional biomass burning for native
agriculture gave rise to the peak in Hg accumulation rate (AD
1580) in the Luther Bog. However, if 50 to 95% of the Hg
released was in the form of Hg
0
, then the Hg recorded by the
bog probably only reflects a fraction of the total emission flux,
with much of the emitted Hg having been dispersed globally.
Modern Hg accumulation rates. During the late 17th and
18th centuries, the approach used here to calculate anthro-
pogenic Hg in the Luther Bog profile indicates that the
accumulation of Hg from anthropogenic sources was equiva-
lent to or exceeded the inputs of Hg from natural sources
(Fig. 7). All three bogs show that Hg contamination increased
again at the beginning of the 19th century, with the greatest
change seen at the beginning of the 20th century (Fig. 8).
The chronology of Hg accumulation recorded by the three
ombrotrophic bogs in southern Ontario is similar, with
maximum rates of accumulation of anthropogenic Hg dating
from the 1950–60s at all three sites (Fig. 8). At that time,
anthropogenic mercury contributed at least to 85% of the total
Hg AR and the greatest accumulation rates recorded by the
bogs (54, 89 and 141 mgm
2
2
per year at Spruce Bog, Luther
Bog and Sifton Bog, respectively) are up to 39, 63 and 101 times
greater than the average natural background rates. Clearly,
there is a gradient within southern Ontario of the intensity in
anthropogenic Hg inputs, with Hg AR increasing in the order
remote
v
rural
v
urban site. Assuming that inputs to the
relatively remote Spruce Bog are more indicative of global
changes in the atmospheric Hg cycle, the much greater Hg AR
recorded by the Sifton bog in London, Ontario reflects the
importance of regional and local sources.
The Hg AR values today (10, 12 and 18 mgm
2
2
per year at
Spruce Bog, Luther Bog and Sifton Bog, respectively), are
approximately 7, 9 and 13 times the average natural back-
ground values. The modern fluxes obtained using these peat
cores can be compared with the direct measurements of
atmospheric Hg deposition at regional Mercury Deposition
Network (MDN) monitoring sites in southern Ontario. Wet
deposition of mercury monitored at regional MDN sites in
Ontario reported values of 7.4 mgm
2
2
per year in 1998 at the
Dorset site and 4.7 mgm
2
2
per year in 2001 at the Edbergt site.
Assuming that dry deposition constitutes no more than 40
¡
50% of wet deposition,
68
these direct measurements indicate
total mercury deposition rates ranging from 5.6 to 13.3 mgm
2
2
per year which is in good agreement with the values reported by
this study for the same period of time. The agreement between
the two independent methods for quantifying atmospheric Hg
deposition rates suggests that the approach described here
(using peat cores from ombrotrophic bogs to reconstruct
accumulation rates) is reasonable. Moreover, the retrospective
approach using peat cores from bogs is especially valuable
because it not only provides a detailed chronology of the
changes extending back in time, but also because it yields the
‘‘natural background’’ rate of atmospheric Hg accumulation,
against which modern values may be compared.
Because Br and Se have also been emitted by anthropogenic
sources
69
such as gasoline additives (to scavenge Pb) and coal
burning, respectively, the natural Hg component for the
modern period has been overestimated by the peat cores.
Given the changes in Br/Abs and Se/Abs seen in the top layers
of the Luther Bog (Fig. 6), we estimate that the natural Hg
component found in modern peats has been overestimated by
at least a factor of two, compared to the pre-anthropogenic
period. As a result, the rates of anthropogenic Hg accumula-
tion which we have calculated for the modern period in each of
the peat cores (Fig. 8) represent conservative estimates.
Identifying the predominant source of anthropogenic Hg
during the 20th century. The similarities in Hg accumulation
chronologies among the three peat bogs from southern Ontario
(Fig. 8) imply a common, predominant source. We note that
the peat samples containing the greatest Hg concentrations and
Hg accumulation rates (Fig. 8) are also the samples containing
the highest Pb concentrations (Fig. 3). While traditional
chloro-alkali plants were the predominant source of anthro-
pogenic Hg to the global atmosphere in the recent past,
70
these
did not emit Pb. While leaded gasoline was the single most
important source of anthropogenic Pb to the global atmo-
sphere
71
until recently, this was not a source of Hg. In fact, the
predominant anthropogenic source that these two elements
have in common is coal burning. In southern Ontario,
therefore, the maximum rates of atmospheric Hg and Pb
deposition, and the maximum contributions of these metals
from anthropogenic sources, was due to coal burning, and this
source peaked in the late 1950’s. Support for this hypothesis is
provided by the sulfur concentration profiles (not shown)
J. Environ. Monit., 2003, 5, 935–949
947
ELECTRONIC FILING, RECEIVED, CLERK'S OFFICE, AUGUST 14, 2006
which show that the maximum S concentrations in all three
peat cores coincide with the peaks in Hg and Pb; coal is
enriched in all three of these elements. We note further that a
peat bog in Denmark and a minerotrophic fen in southern
Greenland provide very similar chronologies of both metals,
16
with maximum accumulation rates (also obtained using the
bomb pulse curve of
14
C) dating from AD 1953. In that study,
16
the isotopic composition of Pb in the most contaminated
section of the Danish peat bog profile was found to be
comparable with that of British coals lending further support
to the importance of coal burning as a source of both metals.
5.4. Comparison with other archives
For comparison with the results presented here, we know of no
published studies providing a record of atmospheric Hg
deposition for North America extending so far back in time.
However, there are several published chronologies of Hg
contamination for the modern period, and the results presented
here are generally in good agreement with those studies. For
example, data from lake sediments in Minnesota
72
indicate that
mercury deposition peaked in the 1960’s, with recent declines
appearing in both rural and urban sites. The emission budget
by Pirrone
7
suggests that atmospheric Hg deposition from local
sources dominated from 1940 to 1960, with deposition
subsequently dominated by long-range atmospheric transport.
The results presented here also are consistent with other
findings that indicate that a substantial fraction of anthro-
pogenic Hg emissions are deposited locally near the source of
pollution.
2
The Upper Fremont Glacier (UFG) has yielded a high-
resolution record of total atmospheric mercury deposition for
the past ca. three centuries.
73
The ice core taken from this site
indicates a 20-fold increase in Hg accumulation rates between
pre-industrial (ca. AD 1720) and industrial times which is
comparable to the peat records from southern Ontario for the
same period of time. The UGC core is the only other high-
resolution record, along with the present study, reporting
atmospheric mercury deposition in North America as far back
in time as AD 1720. Without long-term records of atmospheric
mercury deposition, it is difficult if not impossible to determine
pre-industrial rates of atmospheric Hg accumulation, and to
quantify the natural variation in ‘‘background’’ fluxes. Many
of the studies published to date appear to have overestimated
the natural ‘‘background’’ rates of atmospheric Hg deposition,
and therefore may have underestimated the true impact of
human activities on the geochemical cycle of mercury.
For example, lake sediment archives document smaller
differences between anthropogenic and natural Hg fluxes. In
many studies of peat and lake sediments archives by authors
mentioned previously, accumulation rates of atmospheric
mercury are reported to be in the range of 4 to 7 mgm
2
2
per
year for the ‘‘natural background’’ and ranging between 10 and
50 mgm
2
2
per year for the modern period. In contrast, the peat
cores studied here suggest that the maximum rates of net Hg
deposition are between 54 and 141 mg Hg m
2
2
per year, com-
pared with a natural background of approximately 1.4 mgm
2
2
per year which was fairly constant for thousands of years.
We see two important reasons for the discrepancies. First,
unlike lake sediments, peat bogs receive Hg only from the
atmosphere. Thus, the total amount of Hg retained by a peat
core is a reasonable approximation of the total atmospheric
input. In contrast, the Hg concentrations in lake sediments
reflect not only direct inputs from the atmosphere, but also
terrestrial and aquatic inputs. Second, many of the lake
sediment Hg records do not provide high-resolution recon-
structions. As a consequence, Hg concentrations are often
averaged over longer time intervals which tends to ‘‘flatten’’
any peaks in concentration change (or flux). As a consequence,
it is difficult to compare in detail the trace metal accumulation
chronologies when there are large differences in the time
increments being examined.
The results presented here and other recent studies using peat
bog archives dated using the bomb pulse curve of
14
C have
shown that undisturbed peat bogs are excellent paleoenviron-
mental archives. These bogs certainly do record in a faithful
way the changing chronologies of atmospheric mercury
deposition. In fact, the historical records of net atmospheric
Hg deposition appear to be so well preserved in the peat
profiles that our ability to read and interpret these records is
much less dependent upon physical and chemical processes
taking place within the bog, and more dependent on
appropriate and accurate methods for peat core sampling,
handling, sectioning, sub-sampling, preparation, and age
dating.
5.5. Implications for the global atmospheric Hg cycle
The changing fluxes of atmospheric Hg accumulation recorded
by the peat bogs in southern Ontario, especially the decline
since the 1960’s (Fig. 8), is probably related to the introduction
and growth of nuclear power, but also the regulatory
developments or/and industrial process changes, including
the introduction of filter technologies which retain particulate
Hg.
74
In addition, residential home heating evolved from coal
to oil and then to natural gas. While these trends are certainly
positive and encouraging, they must also be viewed with
caution and concern. Even though the various filtration
technologies deal effectively with the removal of particulate
Hg from flue gas streams, more volatile species such as gaseous
elemental Hg are largely unaffected.
72,75
As a result, the
changing fluxes of atmospheric Hg accumulation recorded by
the peat bogs (Fig. 8) do not necessarily document a decrease in
total Hg emissions. Most likely, these changes primarily reflect
strong declines in atmospheric emission of particulate Hg. The
large differences in Hg AR between the three sites demonstrate
the quantitative importance of local inputs of particulate and
ionic Hg: the decline in Hg AR since the late 1950’s recorded by
all three bogs certainly reflects a decrease in deposition of this
fraction. However, these peat cores may provide little
information about the changes in emissions of gaseous
elemental Hg because it is volatile, much less reactive, and
has a long atmospheric residence time. Peat cores from bogs in
remote areas of Canada, for comparison with the results shown
here, might provide more insight into the changing rates of
atmospheric deposition of elemental Hg from anthropogenic
sources. The effect of particle size distribution plays an
important role in transferring Hg from the atmosphere to
lakes
76
and this phenomenon may have important implications
for atmospheric Hg accumulation in remote areas such the
Arctic.
Acknowledgements
Sincere thanks to Dr. A.K. Cheburkin for trace element
analyses,
Gae¨l
Le
Roux
for
210
Pb
age
dating,
Prof.
J. Heinemeier, Drs. G. Bonani and B. Kromer for
14
C age
dating, P. Kaltenrieder, W. Finsiger and V. Valsecchi for
macrofossil identification and B. Grose for administrative
assistance. Thanks also to anonymous reviewers for helpful
comments on a previous version of the manuscript. Financial
support for this work, including graduate student assistantship
to N.G. and F.R., was provided by the Swiss National
Scientific Foundation (grants 21-061688.00 and 21-55669.98)
to W.S. Peat core collection in southern Ontario was made
possible by a grant to W. S., H.F. Scho¨ler (University of
Heidelberg) and S.A. Norton (University of Maine) by the
International Arctic Research Centre (IARC) and Cooperative
Institute for Arctic Research (CIFAR), Fairbanks, Alaska.
Ontario Power Generation Corporation supported some
948
J. Environ. Monit., 2003, 5, 935–949
ELECTRONIC FILING, RECEIVED, CLERK'S OFFICE, AUGUST 14, 2006
analytical costs for which we are most grateful. Finally, we
thank our colleagues at the Thames River Conservation
Authority, the Grand River Conservation Authority, and
Algonquin Provincial Park, for permission to collect the peat
cores.
References
1
W. H. Schroeder and J. Munthe, Atmos. Environ., 1998, 32, 809.
2
R. P. Mason, W. F. Fitzgerald and F. M. M. Morel, Geochim.
Cosmochim. Acta, 1994, 58, 3191.
3
F. Slemr and E. Langer, Nature, 1992, 355, 434.
4
C. H. Lamborg, W. F. Fitzgerald, J. O’Donnel and T. Torgensen,
Geochim. Cosmochim. Acta, 2002, 66, 1105.
5
W. H. Schroeder, in Mercury pollution: integration and synthesis,
ed. C. J. Watras and J. W. Huckabee, Lewis, Boca Raton, 1994,
pp. 281–291.
6
E. B. Swain, D. R. Engstrom, M. E. Brigham, T. A. Henning and
P. L. Brezonik, Science, 1992, 257, 784.
7
N. Pirrone, I. Allegrini, G. J. Keeler, J. O. Nriagu, R. Rossmann
and J. A. Robbins, Atmos. Environ., 1998, 32, 929.
8
J. M. Benoit, W. F. Fitzgerald and A. W. H. Damman, in Mercury
Pollution: Integration and Synthesis, ed. C. J. Watras and
J. W. Huckabee, Lewis, Boca Raton, 1994, pp. 187–203.
9
W. Shotyk and P. Steinmann, Chem. Geol., 1994, 116, 137.
10
P. Pheiffer-Madsen, Nature, 1981, 293, 127.
11
J. M. Benoit, W. F. Fitgerald and A. W. H. Damman, Environ.
Res., 1998, 78, 118.
12
S. A. Norton, G. C. Evans and J. S. Kahl, Water, Air, Soil Pollut.,
1997, 100, 271.
13
A. Martı´nez Cortizas, X. Pontevedra Pombal, E. Garcı´a-Rodeja,
J. C. No´voa Mun˜oz and W. Shotyk, Science, 1999, 284, 939.
14
F. Roos-Barraclough and W. Shotyk, Environ. Sci. Technol., 2003,
37, 235.
15
R. Bindler, Environ. Sci. Technol., 2003, 37, 40.
16
W. Shotyk, M. E. Goodsite, F. Roos-Barraclough, R. Frei,
J. Heinemeier, G. Asmund, C. Lohse and T. S. Hansen, Geochim.
Cosmochim. Acta, 2003, 67, 3991.
17
H. Puxbaum, in Metals and their compounds in the environment, ed.
E. Merian, VCH, Weinheim, 1991, pp. 257–286.
18
M. A. Vile, R. K. Wieder and M. Novak, Biogeochemistry, 1999,
45, 35.
19
W. Shotyk, D. Weiss, P. G. Appleby, A. K. Cheburkin, R. Frei,
M. Gloor, J. D. Kramers and W. O. Van Der Knaap, Science,
1998, 281, 1635.
20
D. Weiss, W. Shotyk, P. G. Appleby, J. D. Kramers and
A. K. Cheburkin, Environ. Sci. Technol., 1999, 33, 1340.
21
M.-L. Bra¨nnvall, R. Bindler, O. Emteryd, M. Nilsson and
I. Renberg, Water, Air, Soil Pollut., 1997, 100, 243.
22
H. Kempter and B. Frenzel, Water, Air, Soil Pollut., 2000, 121, 93.
23
A. P. Sandilands, Ontario Field Biologist, 1984, Special edition 2.
24
B. G. Warner and D. J. Charman, Boreas, 1994, 23, 270.
25
E. Wardenaar, Can. J. Bot., 1987, 65, 1772.
26
I. E. Belokopytov and V. V. Beresnevich, Torfiannaia Prom’ish-
lennost, 1955, 8, 9.
27
A. K. Cheburkin and W. Shotyk, Fresenius J. Anal. Chem., 1996,
354, 688.
28
W. Shotyk, D. Weiss, M. Heisterkamp, A. K. Cheburkin,
P. G. Appleby and F. C. Adams, Environ. Sci. Technol., 2002,
36, 3893.
29
F. Roos-Barraclough, A. Martı´nez-Cortizas, E. Garcia-Rodeja
and W. Shotyk, Earth Planet. Sci. Lett., 2002, 202, 435.
30
N. Salvato and C. Pirola, Microchim. Acta, 1996, 123, 63.
31
F.
Roos-Barraclough,
N.
Givelet,
A.
Martı´nez-Cortizas,
M. E. Goodsite, H. Biester and W. Shotyk, Sci. Total Environ.,
2002, 292, 129.
32
C. J. Caseldine, A. Baker, D. J. Charman and D. Hendon,
Holocene, 2000, 10, 649.
33
J. S. Shore, D. D. Bartley and D. D. Harkness, Quat. Sci. Rev.,
1995, 14, 373.
34
M. E. Goodsite, W. Rom, J. Heinemeier, T. Lange, S. Ooi,
P. G. Appleby, W. Shotyk, W. O. Van Der Knaap, C. Lohse and
T. S. Hansen, Radiocarbon, 2001, 43, 1.
35
M. Stuiver and P. J. Reimer, Radiocarbon, 1993, 35, 215.
36
M. Stuiver, P. J. Reimer, E. Bard, J. W. Beck, G. S. Burr,
K. A. Hughen, B. Kromer, F. G. McCormac, J. v.d. Plicht and
M. Spurk, Radiocarbon, 1998, 40, 1041.
37
T. R. Niklaus, G. Bonani, M. Simonius, M. Suter and W. Wo¨lfli,
Radiocarbon, 1992, 34, 483.
38
P. G. Appleby, P. Nolan, F. Oldfield, N. Richardson and
S. Higgitt, Sci. Total Environ., 1988, 69, 157.
39
P. Steinmann and W. Shotyk, Fresenius J. Anal. Chem., 1996, 354,
709.
40
P. Steinmann and W. Shotyk, Geochim. Cosmichim. Acta, 1997,
61, 1143.
41
J. M. Matty and D. T. Long, J. Great Lakes Res., 1995, 21, 574.
42
H. Biester, A. Martinez-Cortizas, S. Birkenstock and R. Kilian,
Environ. Sci. Technol., 2003, 37, 32.
43
W. B. Coker, I. M. Kettles and W. W. Shilts, Water, Air, Soil
Pollut., 1995, 80, 1025.
44
K. H. Wedepohl, Geochim. Cosmochim. Acta, 1995, 59, 1217.
45
V. M. Thomas, J. A. Bedford and R. J. Cicerone, Geophys. Res.
Lett., 1997, 24, 1371.
46
R. A. Duce, G. L. Hoffman and W. H. Zoller, Science, 1975, 187,
59.
47
F. Roos-Barraclough, PhD, University of Berne, 2002.
48
Z. Yu, J. H. McAndrews and U. Eicher, Geology, 1997, 25, 251.
49
J. J. Blackford, Tree, 2000, 15, 193.
50
B. N. Shuman, J. Bravo, J. Kaye, J. A. Lynch, P. Newby and
T. Webb, III, Q. Res., 2001, 56, 401.
51
H. Almquist, A. C. Dieffenbacher-Krall, R. Flanagan-Brown and
D. Sanger, Holocene, 2001, 11, 189.
52
S. P. Harrison and S. E. Metcalfe, Geogr. Phys. Quatern., 1985, 39,
141.
53
K. Gajewski, Vegetatio, 1987, 68, 179.
54
A. Iverfeldt, Water, Air, Soil Pollut., 1990, 56, 553.
55
M. Lodenius, A. Seppa¨nen and A. Uusi-Rauva, Chemosphere,
1983, 12, 1575.
56
L. Hylander and M. Meili, Sci. Total Environ., 2003, 304, 13.
57
J. S. Clark and P. D. Royall, Holocene, 1995, 5, 1.
58
E. T. Burden, J. H. McAndrews and N. Geoffrey, Can. J. Earth
Sci., 1986, 23, 43.
59
J. H. McAndrews and M. Boyko-Diakonow, Geological Survey of
Canada, 1989, 528.
60
I. D. Campbell and C. Campbell, Great Lakes Geograph., 1994, 1.
61
J. S. Clark and P. D. Royall, J. Ecolog., 1996, 84, 365.
62
M. M. Veiga, J. A. Meech and N. Onate, Nature, 1994, 368, 816.
63
W. C. Noble, Can. J. Archeol., 1984, 8, 3.
64
B. G. Trigger, Ontario History, 1982, 74, 246.
65
C. Heidenreich, Huronia: A history and geography of the Huron
Indians 1600–1650, McClelland and Stewart Limited, 1972.
66
J. M. Pacyna and J. Mu¨nch, Water, Air, Soil Pollut., 1991, 56, 51.
67
H. R. Friedly, L. F. Radke, J. Y. Lu, C. M. Banic, W. R. Leaitch
and J. I. MacPherson, Atmos. Environ., 2003, 37, 253.
68
C. H. Lamborg, W. F. Fitzgerald, A. W. H. Damman, J. M. Benoit,
P. H. Balcom and D. R. Engstrom, Global Biogeochem. Cycles,
2002, 16(10), 1029.
69
K. A. Rahn and D. H. Lowenthal, Science, 1985, 223, 132.
70
S. E. Lindberg, P. M. Stockes, E. Goldberg and C. Wren, in Lead,
mercury, cadmium, and arsenic in the environment, ed. H. a.
K. M. Meema, John Wiley and Sons, New York, 1987, pp. 17–33.
71
B. K. Schaule and C. C. Patterson, Earth Planet. Sci. Lett., 1981,
54, 97.
72
D. R. Engstrom and E. B. Swain, Environ. Sci. Technol., 1997, 31,
960.
73
P. F. Schuster, D. P. Krabbenhoft, D. L. Naftz, L. Dewayne Cecil,
M. L. Olson, J. F. Dewild, D. D. Susong, J. R. Green and
M. L. Abbott, Environ. Sci. Technol., 2002, 36, 2303.
74
J. H. Pavlish, E. A. Sondreal, M. D. Mann, E. S. Olson,
K. C. Galbreath, D. L. Laudal and S. A. Benson, Fuel Process.
Technol., 2003, 82, 89.
75
L. Trip and R. J. Allan, Water, Air, Soil Pollut., 2000, 42, 171.
76
N. Pirrone, G. J. Keeler and J. Nriagu, Atmos. Environ., 1996, 30,
2981.
J. Environ. Monit., 2003, 5, 935–949
949
ELECTRONIC FILING, RECEIVED, CLERK'S OFFICE, AUGUST 14, 2006
Mercury Concentrations in Bicknell’s Thrush and Other Insectivorous
Passerines in Montane Forests of Northeastern North America
CHRISTOPHER C. RIMMER,
1,
* KENT P. MCFARLAND,
1
DAVID C. EVERS,
2
ERIC K. MILLER,
3
YVES AUBRY,
4
DANIEL BUSBY
5
AND ROBERT J. TAYLOR
6
1
Vermont Institute of Natural Science, 2723 Church Hill Road, Woodstock, VT, 05091,
2
BioDiversity Research Institute, 19 Flaggy Meadow Road, Gorham ME, 04038
3
Ecosystems Research Group, Ltd., P.O. Box 1227 Norwich, VT 05055
4
Canadian Wildlife Service, Environment Canada, 1141Route de l‘E´glise, P.O. Box 10100, Sainte-Foy,
PQ Canada G1V 4H5
5
Canadian Wildlife Service, Environment Canada, P.O. Box 6227 Sackville, NB Canada E4L 1G6
6
Trace Element Research Laboratory, Texas A & M University, VMA Building, Room 107, Highway 60,
College Station, TX, 77843–4458
Accepted 4 December 2004
Abstract. Anthropogenic input of mercury (Hg) into the environment has elevated risk to fish and wildlife,
particularly in northeastern North America. Investigations into the transfer and fate of Hg have focused on
inhabitants of freshwater aquatic ecosystems, as these are the habitats at greatest risk for methylmercury
(MeHg) biomagnification. Deviating from such an approach, we documented MeHg availability in a
terrestrial montane ecosystem using a suite of insectivorous passerines. Intensive and extensive sampling of
Bicknell’s thrush (Catharus bicknelli) indicated significant heterogeneity in MeHg availability across 21
mountaintops in northeastern North America. Southern parts of the breeding range tended to be at greater
risk than northern parts. Mean blood Hg concentrations for Bicknell’s thrush at 21 distinct breeding sites
ranged from 0.08 to 0.38 ug/g (ww) and at seven Greater Antillean wintering sites ranged from 0.03 to
0.42 ug/g (ww). Overall concentrations were significantly greater in wintering than in breeding areas.
Mercury exposure profiles for four passerine species on Mt. Mansfield, Vermont indicated greatest MeHg
uptake in Bicknell’s thrush and yellow-rumped warbler (Dendroica coronata) and lowest in blackpoll
warbler (Dendroica striata) and white-throated sparrow (Zonotrichia albicollis). The MeHg and total Hg
ratio in blood in these four species was nearly 1:1. There was no correlation between blood and feather Hg
concentrations in breeding Bicknell’s thrush, in part because of apparent retention of winter Hg body
burdens, within-season variation of MeHg availability, and confounding factors such as influences from
age. Adult thrushes had significantly higher concentrations of feather Hg than did young-of-the-year.
Although individual patterns of inter-year feather Hg concentrations were disordered, some individuals
exhibited bioaccumulation of MeHg. Female blood Hg concentrations were significantly lower than males’,
in part because females have additional depurating mechanisms through eggs. Older male Bicknell’s
thrushes that breed in New England are therefore likely at greatest risk. Mechanisms for Hg methylation in
montane areas without standing water are not yet fully understood. However, recent studies indicate that
*To whom correspondence should be addressed:
Tel.: +802-457-1053 ext. 120; Fax: +802-457-1053;
E-mail: crimmer@vinsweb.org
Ecotoxicology, 14, 223–240, 2005
? 2005 Springer ScienceþBusiness Media, Inc. Manufactured in The Netherlands.
ELECTRONIC FILING, RECEIVED, CLERK'S OFFICE, AUGUST 14, 2006
MeHg is present in forest tree leaves and leaf detritus; saturated soils and other moist microhabitats may
also contribute to MeHg availability. Our finding of a correlation between regional litterfall Hg flux
patterns and Bicknell’s thrush blood Hg concentrations demonstrates on-site availability of MeHg. Further
investigations into MeHg availability in montane environments are recommended to assess risk to insec-
tivorous passerines, particularly the Bicknell’s thrush.
Keywords: Songbirds; Catharus bicknelli; Nearctic-neotropical migratory birds; methylmercury
Introduction
It is well established that elevated levels of atmo-
spheric mercury (Hg) deposition and methylmer-
cury (MeHg) bioavailability in the northeastern
United States influence wildlife populations.
Investigations have focused on multiple trophic
levels
of
freshwater
aquatic
ecosystems
(Evers et al., 2004; Bank et al., 2005; Chen et al.,
2005; Kamman et al., 2005; Pennuto et al., 2005),
where converted MeHg biomagnifies through the
aquatic foodweb, from phytoplankton and zoo-
plankton to invertebrates, amphibians, fish, and
piscivorous vertebrates. Particular emphasis has been
on higher trophic piscivorous wildlife, which are most
at risk from mercury’s ability to bioaccumulate
and biomagnify (Thompson, 1996; USEPA, 1997;
Evers et al., 2005).
Little is known about MeHg availability or
toxicity in passerine birds, especially those species
not associated with aquatic systems (Thompson,
1996; Wolfe and Norman, 1998; Wiener et al.,
2003). Further, exceedingly few data exist on
MeHg burdens in migratory passerine birds, which
are potentially exposed to varying environmental
levels of Hg during their breeding, migration, and
wintering periods. Birds are an important taxon
for sampling because they are well-established
bioindicators of MeHg availability (Burger, 1993;
Furness and Greenwood, 1993; Bowerman et al.,
2002; Mason et al., 2005), they are relatively easily
sampled, and commonly used matrices reflect
>95% of the total body burden of Hg (Evers et al.,
2005). Among passerines, obligate insectivorous
species are most likely to be at risk from Hg tox-
icity, although established impact thresholds are
only now being developed at the individual level
(G. Heinz, pers. com.) and no published studies
have investigated population level risk.
While pathways for Hg uptake and bioaccu-
mulation in terrestrial ecosystems are not well
understood, recent research has shown that Hg
deposition varies by a factor of three at both
regional and local scales due to proximity of
emissions sources, climatic effects, and variations
in surface characteristics that influence dry deposi-
tion (Miller et al., 2005; VanArsdale et al., 2005).
Mercury loading is significantly (2–5·) higher in
montane areas of the Northeast than in sur-
rounding low elevation areas (Lawson, 1999;
Miller et al., 2005). Orographically enhanced pre-
cipitation and interception of acidic, pollutant-la-
den cloud water contribute to increased Hg
deposition in high elevation ecosystems. However,
the possible toxic effects of such deposition on
montane biota are largely unknown. Numerous
studies have demonstrated that MeHg is present in
both live and recently senesced forest foliage in
proportions of approximately 1% of the total Hg
content (e.g. Lee et al., 2000; Schwesig and
Matzner, 2000; St. Louis et al., 2001; Ericksen
et al., 2003; see earlier studies reviewed by Grigal,
2002). It is not clear at this time if this MeHg is
methylated within the leaf or if it represents direct
deposition of atmospheric gas-phase MeHg.
Evergreen species have both higher total Hg con-
centrations and higher proportions of MeHg than
deciduous species. Using their model of Hg accu-
mulation in leaves, Miller et al. (2005) estimated
that MeHg made available to terrestrial food webs
by forest foliage ranges from 5 to 135 ng m
)
2
y
)
1
in northeastern North American forests. Baseline
data on total Hg levels and ratios of MeHg:Hg in
wildlife from terrestrial habitats are needed to
address this issue.
In this paper, we present data on Hg concentra-
tions in terrestrial passerine birds of montane for-
ests in the northeastern United States and adjacent
Canada. We focus on the Bicknell’s thrush (Cath-
arus bicknelli), a 25–30 g passerine that breeds from
southern Quebec and the Maritime provinces south
through New York and New England, where it is
224 Rimmer et al.
ELECTRONIC FILING, RECEIVED, CLERK'S OFFICE, AUGUST 14, 2006
restricted to coniferous forest typically above 900 m
(Ouellet, 1993; Atwood et al., 1996; Rimmer et al.,
2001). It winters in the Greater Antilles from sea
level to >2000 m, chiefly in mesic and wet broadleaf
forest (Rimmer et al., 2001). Due to its small global
population, estimated at <50,000 individuals
(Rimmer et al., 2001), its geographically restricted
breeding range, and its dwindling winter habitat,
Bicknell’s Thrush is considered among the Nearctic-
Neotropical migrant species of highest conservation
priority in the Northeast (Pashley et al., 2000;
Rosenberg and Wells, 2000). Its specialization on
high elevation fir-dominated forests suggests that it
might be an appropriate bioindicator of MeHg
bioavailability in these habitats.
Study area and methods
Field sampling
We sampled passerines in montane forests at two
spatial scales, intensive (sites with ‡ 10 samples)
and extensive (sites with <10 samples). We sam-
pled 28 sites overall (Fig. 1). Of these, 21 were on
breeding areas and included two sites in Maine
(ME), five sites in New Brunswick (NB), two sites
in New Hampshire (NH), one site in New York
(NY), one site in Nova Scotia (NS), three sites in
Quebec (PQ), and seven sites in Vermont (VT). We
sampled an additional seven sites within the win-
tering range of Bicknell’s thrush. These included
two sites in Cuba, four sites in the Dominican
Republic (DR), and one site in Haiti.
Intensive sampling was conducted on two US
peaks, Mt. Mansfield (hereafter ‘‘Mansfield’’) in
north-central Vermont and Stratton Mountain
(hereafter ‘‘Stratton’’) in southwestern Vermont.
Both are sites of long-term demographic research
on montane forest bird populations. We collected
Hg samples on Mansfield during June and July of
2000–2003, and on Stratton in late May to July
2001–2003. Vegetation at these and other breeding
sites (see below) is dominated by balsam fir (Abies
balsamea), with scattered red spruce (Picea rubra),
heart-leafed paper birch (Betula papyrifera var.
cordifolia) and mountain ash (Sorbus americana). This
vegetation is stunted by chronic exposure to high
winds and heavy winter ice loads, and it is ex-
tremely dense. Canopy heights on the Mansfield
study site average 1–4 m (mean 2.2 m) and
stem densities average 8274/ha (Rimmer and
McFarland, 2000); these are typical characteristics
of montane fir forests in the northeastern US and
Canada.
On Stratton, we sampled Hg levels only in
Bicknell’s thrush, while on Mansfield, we sampled
this and three additional breeding passerines:
blackpoll warbler (Dendroica
striata), yellow-
rumped warbler (Dendroica coronota coronota),
and white-throated sparrow (Zonotrichia albicollis).
Bicknell’s thrush and blackpoll warbler are
near-obligate breeding residents of montane for-
ests in the Northeast (Hunt and Eliason, 1999;
Rimmer et al., 2001), while yellow-rumped warbler
and white-throated sparrow breed at high densities
in these forests, but are also common in a variety
of low elevation forested habitats throughout the
Northeast (Falls and Kopachena, 1994; Hunt and
Flaspohler, 1998). All four species are primarily
insectivorous during the breeding season with
Bicknell’s thrush and white-throated sparrow for-
aging mainly on or close to the ground, blackpoll
warblers mainly gleaning foliage, and yellow-
rumped warblers capturing insect prey both by
foliage gleaning and fly-catching. Bicknell’s thrush
and blackpoll warbler are long-distance migrants
to the Greater Antilles and northern South
America, respectively, while yellow-rumped war-
bler and white-throated sparrow are short- to
medium-distance migrants, wintering primarily in
the southeastern US. These four species thus rep-
resent a diverse array of habitat specialization,
foraging guilds, and migration strategies.
We conducted additional intensive sampling of
Bicknell’s thrush during 2003 at three montane
sites in Canada: two in southern Quebec and one
on Cape Breton Island, NS. Mont Gosford (here-
after ‘‘Gosford’’), adjacent to the Maine border, is
dominated by 35-year old balsam fir stands, many
of which were thinned in the 1980s and 1990s for
timber production. Mine Madeleine (hereafter
‘‘Gaspe´’’) is located on the Gaspe´ Peninsula,
475 km northeast of Quebec City and adjacent to
the Gaspe`sie National Conservation Park. This
mountainous study area is characterized by steep
rocky slopes covered with dense balsam fir forest
interspersed with white birch, balsam poplar
(Populus balsamifera), and alder (Alnus spp.)
stands. Cape North is located on the extreme
Mercury Levels in Bicknell’s Thrush 225
ELECTRONIC FILING, RECEIVED, CLERK'S OFFICE, AUGUST 14, 2006
northern tip of Cape Breton Island, covering an
extensive plateau that projects into the Cabot
Strait. The dense habitat at this site consists
primarily of balsam fir, paper birch and mountain
ash, ranging from 2 to 5 m in height. The forests at
Gaspe´ and Cape North contain many dead stand-
ing trees and are stunted due to heavy winter snow
cover, ice loading, and chronically harsh winds.
Our extensive sampling included only Bicknell’s
thrush and was conducted during 2000–2004 at 10
additional peaks in the northeastern US, six
additional sites in eastern Canada, and seven sites
on the species’ Greater Antillean wintering range
(Table 1). Preferred winter habitats of this species
are mesic to wet broadleaf forests with a dense
understory, mainly at high elevations (Rimmer
et al., 2001). At all sampling sites in North America
and the Caribbean, birds were captured in nylon
mist nets (12 · 2.6 m, 36-mm mesh), either pas-
sively or using vocal playbacks as lures. Each
Figure 1. Distribution of sampling locations for the Bicknell’s thrush.
226 Rimmer et al.
ELECTRONIC FILING, RECEIVED, CLERK'S OFFICE, AUGUST 14, 2006
individual was banded, aged, sexed, measured, and
weighed. A 30–50 ll blood sample from the
subcutaneous ulnar (brachial) vein was collected in
a heparinized capillary tube, refrigerated in a vac-
cutainer in the field, and frozen within 12–48 h.
Samples were frozen until contamination analyses
were conducted. We collected both fifth secondary
wing feathers from most birds by clipping the cal-
amus close to its insertion point; these were stored
in glassine envelopes prior to Hg analyses.
Laboratory analyses
Analysis of tissue samples from 2000 was con-
ducted at the Environmental Chemistry Labora-
tory of the Sawyer Research Center, Orono,
Maine, while all 2001–2003 samples from the US,
Dominican Republic, and Haiti were analyzed at
Texas A & M Trace Element Research Laboratory
(TERL), College Station, Texas. Analysis of
Canadian and Cuban samples was performed at
Table 1. Montane forest sites sampled for Bicknell’s thrush blood and feather Hg levels, 2000–2004
Site name
State/
Province
Geographic
cluster
a
Lat-long
Elevation (s)
Sampled (m)
Feather
Hg (ug/g, fw)
Mean ± SD (n)
b
Blood Hg
(ug/g, ww)
Mean ± SD (n)
Canada
Cape North
(Cape Breton Island)
NS
8
46?53¢ N, 60?31¢ W
344–426
0.13 ± 0.03 (12)
Mt. DesBarres
NB
5
47?19¢ N, 66?35¢ W
668–683
0.13 ± 0.05 (2)
Fisher Ridge
NB
5
47?15¢ N, 66?38¢ W
654
0.08 (1)
Gaspe´ Peninsula
PQ
2
49?00¢ N, 66?00¢ W
1040
0.37 ± 0.2 (18)
0.09 ± 0.02 (21)
Mt. Gosford
PQ
9
45?18¢ N, 70?52¢ W
1192
0.64 ± 0.23 (24)
0.11 ± 0.04 (26)
Mt. Mitchell
NB
5
47?16¢ N, 66?34¢ W
688
0.15 (1)
Mt. Nalaisk
NB
5
47?12¢ N, 66?45¢ W
621
0.12 ± 0.04 (2)
Mt. Valin
PQ
7
48?37¢ N, 70?50¢ W
860
0.46 ± 0.18 (6)
0.08 ± 0.14 (5)
Unnamed Mtn. near
Mt. Mitchell
NB
5
47?14¢ N, 66?35¢ W
645–664
0.11 ± 0.01 (3)
United States
Avery Peak
ME
9
45?09¢ N, 70?16¢ W
900–990
0.29 ± 0.09 (4)
0.27 ± 0.28 (6)
Burke Mtn.
VT
6
44?34¢ N, 71?54¢ W
930
0.18 ± 0.05 (4)
Carter Notch
NH
44?16¢ N, 71?12¢ W
1025
0.48 (1)
East Mtn.
VT
6
44?40¢ N, 71?46¢ W
1010–1030
0.15 ± 0.08 (5)
Equinox Mtn.
VT
3
43?10¢ N, 73?06¢ W
1122
0.09 (1)
Mt. Mansfield
VT
4
44?32¢ N, 72?49¢ W
990–1175
0.70 ± 0.23 (34)
0.10 ± 0.04 (56)
Mt. Snow
VT
3
42?57¢ N, 72?55¢ W
1025
0.141 (1)
Spruce Peak
VT
4
44?33¢ N, 72?47¢ W
1000
0.75 ± 0.45 (2)
0.06 ± 0.01 (3)
Stratton Mtn.
VT
3
43?05¢ N, 72?55¢ W
1065–1200
0.81 ± 0.36 (12)
0.12 ± 0.04 (45)
Mt. Washington
NH
1
44?15¢ N, 71?17¢ W
1350
0.91 (1)
0.09 (1)
W. Kennebago Mtn.
ME
9
45?07¢ N, 70?48¢ W
1060
0.38 (1)
Whiteface Mtn.
NY
4
44?22¢ N, 73?54¢ W
1275–1330
1.21 ± 0.39 (5)
0.08 ± 0.004 (5)
Hispaniola
Pueblo Viejo
DR
n/a
18?12¢ N, 71?32¢ W
1400
0.34 ± 0.14 (21)
Cienaga de Manabao
DR
n/a
19?04¢ N, 70?47¢ W
900
0.03 (1)
Valle Nuevo
DR
n/a
18?50¢ N, 70?42¢ W
1935
0.10 ± 0.05 (2)
El Cachote
DR
n/a
18?06¢ N, 71?11¢ W
1190–1240
0.13 ± 0.05 (5)
Plaine Boeuf
Haiti
n/a
18?21¢ N, 73?59¢ W
1824–1901
0.28 ± 0.57 (8)
Cuba
Pico Cuba
Cuba
n/a
19?58¢ N, 76?51¢ W
1426–1800
0.42 ± 0.28 (3)
Pico Suecia
Cuba
n/a
19?59¢ N, 76?49¢ W
1763
0.21 (1)
a
Geographic clusters of North American sites reflect spatial proximity (see Fig. 1), which is useful for comparing an abiotic com-
partment (models of litterfall Hg flux) (Miller et al., 2005) and a biotic compartment (thrush blood Hg) (Fig. 6): 1 = White Mts.
(NH); 2 = Gaspe´ (PQ); 3 = southern VT; 4 = northern Green Mts. (VT) and Adirondack Mt. (NY); 5 = northern NB;
6 = northeastern VT; 7 = northern PQ; 8 = NS; and 9 = northwest ME and southern PQ.
b
Includes all adult age and sex classes. Individuals sampled in more than one year are counted separately for each year, while only the
first sample is included for birds sampled more than twice in a single year.
Mercury Levels in Bicknell’s Thrush 227
ELECTRONIC FILING, RECEIVED, CLERK'S OFFICE, AUGUST 14, 2006
the National Wildlife Research Centre of En-
vironment Canada, Ottawa, Ontario.
Blood samples were expressed from sealed
capillary tubes and diluted with 2 ml of double
deionized water, then homogenized and aliquoted
into total Hg and MeHg fractions. Samples were
prepared for total Hg according to TERL
SOP-ST16, with volumes reduced to accommodate
the small volumes available. This method incorpo-
rated digestion with nitric acid, sulfuric acid,
potassium permanganate, and potassium persulfate.
Digest solutions were reduced with hydroxylamine
hydrochloride to eliminate excess MnO
2
. Samples
were prepared for MeHg analysis according to
TERL SOP-9712, again with volumes reduced to
accommodate sample size limitations. In this meth-
od, MeHg was extracted from an acid bromide
sample into an organic solvent and prepared for
analysis by a permanganate digestion. Feathers were
analyzed only for total Hg; using the same digestion
process and reagents as were used for blood samples.
Prior to 2003, total Hg and MeHg were both
analyzed by element-specific cold vapor atomic
absorption using an LDC Mercury Monitor
equipped with a 30 cm path cell (SOP-9024).
Samples were quantified based on peak height
compared with external calibration standards.
Quality assurance samples accompanying sample
batches included method blanks, laboratory con-
trol samples (LCS), certified reference materials
(NRCC DOLT-2), matrix spike samples, and
duplicate samples. All analytes are reported in
units of parts per million (ppm or ug/g), on a wet
weight (ww) basis for blood and a fresh weight
(fw) basis for feathers. Detection limits were
dependent upon sample weights and dilution fac-
tors but averaged approximately 0.009 ug/g for
both total Hg and MeHg and 0.04 ug/g for total
Hg in feathers.
In 2003 and 2004, blood and feather samples
were analyzed for total Hg according to TERL
SOP-0301. This method utilized a Milestone DMA
80 to combust blood and feather samples in nickel
boats in an oxygen-rich atmosphere. Combustion
products were passed through a heated catalyst to
complete oxidation and then through a gold col-
umn which trapped Hg. Upon completion of
combustion, the gold trap was heated and the Hg
released for analysis by atomic absorption. Some
blood samples were analyzed for moisture content
prior to Hg analysis. Moisture loss was determined
via freeze drying blood samples in aluminum cups,
and the cups were then placed in the DMA 80s
nickel boats in order to determine Hg content.
Statistical analyses
We examined all data for normality. Non-normal
data were log-transformed prior to analyses.
Because samples from Canada were collected only
in 2003, we examined blood and feather Hg data
from Mansfield and Stratton for effects of
year; there were no year effects or interactions of
year with other variables (ANOVA for year:
F
2,67
=1.86, p = 0.164). We thus combined data
across years for all North American sites. Statis-
tical analyses were performed on SYSTAT 10.2
(SYSTAT, 2002). Data are presented as arithmetic
means and standard deviations (SD).
For population-level analyses of blood Hg
levels, we used only the first sample obtained from
each individual in each year, although we treated
samples from individual thrushes obtained in
multiple years independently. This avoided
potential problems of within-year autocorrelation,
as blood samples reflect short-term dietary Hg
uptake (Evers et al., 2005) and thus cannot be
considered independent within the same season.
Table 2. Mercury concentrations and blood MeHg:Hg ratios in four species of montane forest breeding birds (adults only) sam-
pled in 2000 and 2001 on Mt. Mansfield, VT. Data presented as arithmetic mean ± SD in ug/g (ww)
Species
a
Total blood Hg (n)
Blood MeHg:Hg ratio (n)
Total feather Hg (n)
BITH
0.094 ± 0.47 (43)
0.983 ± 0.254 (39)
0.699 ± 0.25 (38)
BLPW
0.055 ± 0.017 (10)
0.895 ± 0.21 (12)
0.397 ± 0.237 (5)
YRWA
0.091 ± 0.055 (13)
0.959 ± 0.189 (15)
1.099 ± 1.119 (4)
WTSP
0.062 ± 0.026 (12)
1.091 ± 0.372 (14)
0.502 (1)
a
BITH = Bicknell’s thrush; BLPW = blackpoll warbler; YRWA = yellow-rumped warbler; WTSP = white-throated sparrow.
228 Rimmer et al.
ELECTRONIC FILING, RECEIVED, CLERK'S OFFICE, AUGUST 14, 2006
Further, because individuals sampled in both June
and July within a single year invariably showed
significantly higher blood Hg concentrations in
June (see below), we excluded all July samples in
our population-level analyses. For feather Hg
analyses from individuals that provided samples in
multiple years, we used only those samples ob-
tained in the first year. Feathers reflect chronic Hg
body burdens (Burger, 1993), such that between-
year samples can not be treated independently. We
examined differences in blood and feather Hg
samples from the five intensive breeding sites using
ANOVA with sex, age, sample site, and their
interactions as independent variables.
To correlate Bicknell’s thrush Hg levels at
Mansfield and Stratton with those of regional
atmospherically-deposited Hg, we calculated aver-
age values for the aggregate presumed breeding
home ranges of sampled birds from modeled data
(Miller et al., 2005). We selected deposition data for
two of eight available habitat classes within this
sampling area on each mountain, balsam fir-red
spruce-white birch and balsam fir-red spruce, as
Bicknell’s thrush is most closely associated with
these two montane forest types (Rimmer et al.,
2001). We considered total deposition rates as well
as three different Hg deposition modes (wet, reac-
tive gaseous, and litterfall) that might reflect
different degrees of bioavailability of atmospherically-
borne Hg to Bicknell’s thrush (Miller et al., 2005).
Mercury deposited with litterfall is thought to
represent primarily elemental mercury vapor that has
been assimilated by leaves. Reactive gaseous mercury
is HgCl
2
that deposits to the surface of leaves.
Results
MeHg: total Hg ratio
The mean ratio of total blood Hg to blood MeHg
was close to 1:1 in each of the four species sampled
on Mansfield (Table 2). This ratio did not signifi-
cantly differ among the four species (v
2
= 3.344,
df = 3, p = 0.342).
Species patterns of Hg levels
Mean blood Hg concentrations were significantly
different among the four species sampled on
Mansfield (ANOVA: F
3,56
=4.35, p = 0.008;
Table 2). Overall mean blood Hg concentrations
were highest in Bicknell’s thrush, and these were
significantly higher than levels of blackpoll warbler
and white-throated sparrow (post-hoc pairwise
comparisons
with
Bonferroni
adjustment:
p = 0.028 for blackpoll warbler, p = 0.046 for
white-throated sparrow). Excluding one yellow-
rumped warbler with aberrantly high feather Hg of
2.62 ug/g, mean feather Hg concentrations were
highest in Bicknell’s thrush, but small samples sizes
for the three other species limit comparisons
(Table 2). Excluding this one yellow-rumped
warbler outlier, Bicknell’s thrush demonstrated the
greatest overall variability in both blood and feather
Hg concentrations.
Geographic patterns in Hg levels of Bicknell’s
thrush
Among the five intensively-sampled sites, blood Hg
concentrations differed significantly (ANOVA:
F
4,92
= 3.66, p = 0.02), being highest at the two
most geographically disparate sites, Cape North
and Stratton, and lowest at Gaspe´ (Table 1). There
was no significant interaction of either age or sex
and site. Although small sample sizes precluded
statistical testing of geographic trends among all 21
breeding sites, within New England, blood Hg levels
were markedly higher in northeastern Vermont
(Burke and East mountains) and Maine than else-
where in Vermont or in New York (Table 1). Can-
ada lacked a clear pattern, although Quebec
samples tended to exhibit lower blood Hg concen-
trations than in New Brunswick and Nova Scotia.
Our initial comparison of feather Hg concentra-
tions among the four sites that yielded feather
samples showed significant between-site differences
(F
3,76
= 8.37, p < 0.001), but also a significant
interaction between age and sampling site
(F
3,76
= 11.86, p < 0.001). This interaction likely
resulted from our unequal samples of age-sex
cohorts among sites, with the two Quebec sites
strongly skewed by males >2 years old. We there-
fore pooled feather Hg data from all sites for
demographic analyses (below), but were unable to
test for differences among sites. Qualitatively,
feather Hg concentrations at the four sites showed a
similar trend to that of blood, being highest at
Stratton and lowest at Gaspe´ (Table 1). Unlike
Mercury Levels in Bicknell’s Thrush 229
ELECTRONIC FILING, RECEIVED, CLERK'S OFFICE, AUGUST 14, 2006
blood, however, feather Hg data from all sampling
sites increased along an East–West gradient, with
levels highest in New York and lowest in Maine and
Canada (Table 1).
Blood Hg concentrations of Bicknell’s Thrush
from breeding areas in North America (Cape
North, Gaspe´, Gosford, Mansfield, and Stratton)
and wintering areas in the Greater Antilles
(Dominican Republic and Haiti) were compared
using an ANOVA with sample site nested within
season. Significant effects were found between
season
(F
1,182
= 149.55,
p < 0.00001)
and
site(season) (F
5,182
= 4.96, p = 0.00028). Blood
Hg concentrations in wintering birds were gener-
ally 2–3 times higher than in birds sampled on
their breeding sites. Although small sample sizes
limit statistical comparisons among wintering
sites, birds from more western locations (Cuba,
Haiti, and western Sierra de Bahoruco [Pueblo
Viejo]) tended to have higher blood Hg concen-
trations than birds further east in the Dominican
Republic (eastern Sierra de Bahoruco [El Cachote]
and Cordillera Central [Valle Nuevo and Cienaga
de Manabao]; Table 1).
Bicknell’s thrush Hg levels and regional deposition
patterns
The significantly higher Hg blood concentrations
of thrushes on Stratton versus Mansfield paral-
leled modeled deposition patterns at the two sites.
In the two forest types used by Bicknell’s thrush at
each site, deposition was consistently higher at
Stratton for the three deposition modes we
examined (Table 3). Both absolute and relative
differences were higher for total Hg deposition
than for the other three Hg deposition modes.
Bicknell’s thrush demographic Hg profile
Among the five intensively-sampled North Amer-
ican sites, male Bicknell’s thrushes had a signifi-
cantly higher mean blood Hg concentration
(0.11 ug/g ± 0.05; SD range 0.04–0.29) than
females (0.09 ug/g ± 0.04; SD range 0.02–0.23)
(ANOVA: F
1,92
= 4.9, p = 0.04). Mean feather
Hg concentrations did not differ significantly
between males and females (ANOVA: F
1,84
= 0,
p = 0.96). The relationship between blood and
feather Hg concentrations for Bicknell’s thrushes
from which we obtained both samples in a given
year was only weakly positive and not significant
(Fig. 2).
Mean feather Hg concentrations of ‡ 2-year old
(after second-year [ASY]) Bicknell’s thrushes were
significantly higher overall than those of yearling
(second-year [SY]) birds (ANOVA: F
1,84
= 16.63,
p < 0.0001), although this was not the case at
Gaspe´ (Table 4). However, among ASY individ-
uals of precisely known age at Mansfield and
Stratton, based on multi-year banding histories,
no relationship existed between feather Hg
concentrations and age. Similarly, no consistent
trend was evident among the 20 individuals from
which we obtained feathers in multiple years
(Fig. 3). Of these birds, from which we obtained
samples 1–3 years apart, nine had increased
feather Hg concentrations between first and last
captures, while the concentrations of 11 individu-
als decreased. The overall population mean rate of
Hg accumulation was
)
0.01 ug/g ± 0.51 SD
(range
)
0.81 to 1.55). Males (n = 13) accumu-
lated feather Hg at an overall mean rate of
)
0.13 ug/g ± 0.37 (range
)
0.81 to 0.44), while the
mean overall accumulation rate of females (n = 7)
Table 3. Modeled atmospheric Hg deposition for Stratton and Mansfield. Data presented as lg/m
2
/yr (extracted from maps de-
scribed in Miller et al., 2005)
Deposition mode
Fir-spruce-birch zone
Fir-spruce zone
Mansfield
Stratton
Mansfield
Stratton
Reactive gaseous Hg
10.8
12.9
10.8
12.6
Litterfall Hg
13.8
13.9
15.4
15.6
Wet (rain + cloud)
9.3
12.9
13.5
20.7
Total Hg
a
35.2
42.4
41.2
51.5
a
Includes dry particulate deposition.
230 Rimmer et al.
ELECTRONIC FILING, RECEIVED, CLERK'S OFFICE, AUGUST 14, 2006
was 0.22 ug/g ± 0.68 SD (range
)
0.56 to 1.55). Of
thrushes examined in consecutive years, repre-
senting 26 accumulation-years, the mean annual
accumulation rate was
)
0.03 ug/g ± 0.48 SD
(range =
)
0.94 to 0.87). Of 13 males representing
23 accumulation-years, 12 of those years showed
an increase, and the mean annual accumulation
rate in males was
)
0.04 ug/g ± 0.51 SD. Of five
recaptured females representing six accumulation-
years, Hg feather levels increased in four years,
and the mean annual accumulation rate for
females was 0.02 ± 0.36 ug/g.
Mean blood Hg concentrations of individual
Bicknell’s thrushes examined on Mansfield and
Stratton in multiple years did not show a clear
pattern (Fig. 4). We used only those birds sampled
during June in each year to limit within-season
variability (see below). Of the 16 individuals that
provided data in at least two years, representing 20
between-year changes, blood Hg concentrations
increased between 11 successive-year captures and
declined between nine. Of four birds examined in
three consecutive years, none showed a consistent
trend over all three years. Mean blood Hg con-
centrations of males (n = 10) increased 0.004 ug/
g + 0.06 SD between successive years, while those
of females (n = 3) declined 0.05 ug/g + 0.09 SD.
To examine within-season variability in Hg
blood concentrations, we sampled 13 Bicknell’s
thrushes at three- to four-week intervals during a
single breeding season. Every bird showed a
decrease in Hg blood concentration between its
first and subsequent capture. The mean Hg blood
concentration of first captures was 0.14 ug/
g ± 0.05 SD, while later-captured birds had mean
levels of 0.09 ug/g ± 0.03 SD. This difference was
Table 4. Mean feather Hg levels (ug/g, fw) ± SD (n) by age class in Bicknell’s thrush
Age class
a
Stratton
Mansfield
Gosford
Gaspe´
SY
0.322 ± 0.041 (3)
0.485 ± 0.12 (11)
0.49 ± 0.129 (6)
0.463 ± 0.297 (7)
ASY
0.974 ± 0.231 (9)
0.796 ± 0.193 (23)
0.687 ± 0.236 (18)
0.309 ± 0.079 (11)
a
SY = second-year (yearling); ASY = after second-year (‡ 2 years old).
R
2
= 0.0975
0
0.05
0.1
0.15
0.2
0.25
0.3
0.35
0
0.2
0.4
0.6
0.8
1
1.2
1.4
1
.
Feather Hg (ug/g)
Blood Hg(ug/g)
Figure 2. Relationship between blood (ug/g, ww) and feather Hg (ug/g, fw) concentrations in Bicknell’s thrushes on Mt. Mansfield
and Stratton Mtn., Vermont.
Mercury Levels in Bicknell’s Thrush 231
ELECTRONIC FILING, RECEIVED, CLERK'S OFFICE, AUGUST 14, 2006
significant (paired t-test: t = 4.41, df = 12,
p < 0.001). The mean change in Hg blood con-
centrations between first and subsequent samples
was
)
0.05 ug/g ± 0.04 SD. A less pronounced
seasonal decline in Hg blood concentrations of
Bicknell’s thrush on Mansfield and Stratton is
reflected by population-level data, which show
weakly negative relationships between blood Hg
concentrations and date on both mountains
(Fig. 5).
Discussion
The data presented here for Bicknell’s thrush are
the most comprehensive and detailed yet available
for a strictly terrestrial, insectivorous passerine.
The Hg concentrations in this and the other three
montane forest species are relatively low compared
to those documented in other free-ranging North
American birds. However, nearly all species
examined to date are associated with aquatic-based
systems and are at the top of piscivorous or aquatic
insectivorous trophic webs (Thompson, 1996;
Evers et al., 2005). Bicknell’s thrushes inhabit
conifer-dominated forests and are not closely tied
to aquatic habitats at any phase of their annual
cycle. Methylation dynamics and MeHg availability
in terrestrial systems are not well understood, but
our results indicate that a mechanism for biotic
uptake of MeHg exists in montane forests.
Total Hg and MeHg relationships in blood
All four species sampled on Mansfield exhibited
MeHg:Hg ratios of nearly 1:1 (Table 2). Such a
ratio in blood is well-established in piscivorous
birds (Scheuhammer, 1991; Thompson, 1996;
Evers et al., 1998; Fournier et al., 2002), however,
it is less well known for insectivorous passerines.
The high proportion (90–100%) of MeHg in blood
from our suite of montane insectivorous passerines
0.0
0.5
1.0
1.5
2.0
2
0
0
0
2
0
0
1
2
0
0
2
2
0
0
3
Year
Feather
Hg
(ug/g)
Figure 3. Feather Hg concentrations (ug/g, fw) of Bicknell’s thrushes examined in multiple years on Mt. Mansfield and Stratton
Mtn., Vermont.
232 Rimmer et al.
ELECTRONIC FILING, RECEIVED, CLERK'S OFFICE, AUGUST 14, 2006
was expected, even though there are species-spe-
cific differences in how MeHg is absorbed into the
blood (Monteiro and Furness, 2001). Unlike fish,
which form the dietary basis for piscivorous birds
and generally have whole body content >85%
MeHg (Wiener and Spry, 1996), insects generally
have far less MeHg content (average ?65%;
Pennuto et al., 2005), but exhibit a broad range
with lowest levels in detritivores (20–25%) and
highest levels in predatory insects like dragonflies
(95%) (Tremblay et al., 1996; Tremblay and
Lucotte, 1997). However, the transfer of more
limited MeHg concentrations in insect prey
to insectivorous birds does not appear to be
significantly
different
than
in
piscivorous
birds. Both Gerrard and St. Louis (2001) and
Wolfe and Norman (1998) found high MeHg:Hg
ratios in the tissues of various insectivorous
passerines. Our analysis indicates that even
insectivorous birds dependent on terrestrial food-
webs are susceptible to MeHg availability and
bioaccumulation.
Comparisons of Hg exposure during the breeding
season
Blood Hg concentrations of four montane breed-
ing birds at Mansfield fell into two general groups:
higher exposure (pooled mean, 0.09 ug/g) in
Bicknell’s thrush and yellow-rumped warbler and
lower exposure in blackpoll warbler and white-
throated sparrow (pooled mean, 0.06 ug/g).
Compared to other sampling sites in northeastern
North America, Bicknell’s thrush blood Hg con-
centrations were 34% lower at Mansfield than
elsewhere (unweighted, arithmetic mean = 0.14
± 0.08 SD, n = 18 sampling locations). Because
there are few studies documenting insectivorous
passerine Hg exposure (Bishop et al., 1995; Wolfe
and Norman, 1998; Gerrard and St. Louis, 2001;
Reynolds et al., 2001; Adair et al., 2003) and be-
cause none of the existing studies sampled blood
for Hg analysis, few comparisons are available.
Two exceptions are from northeastern North
America. Shriver et al. (2002) sampled and
0.0
0.1
0.2
0.3
Blood
Hg
(ug/g)
Year
2
0
0
0
1
9
9
9
2
0
0
1
2
0
0
2
2
0
0
3
2
0
0
4
Figure 4. Blood Hg concentrations (ug/g, ww) of Bicknell’s thrushes examined during June in multiple years on Mt. Mansfield and
Stratton Mtn., Vermont.
Mercury Levels in Bicknell’s Thrush 233
ELECTRONIC FILING, RECEIVED, CLERK'S OFFICE, AUGUST 14, 2006
analyzed the blood Hg concentrations of saltmarsh
and Nelson’s sharp-tailed sparrows (Ammodramus
caudacutus and A. nelsoni, respectively) at five
Maine estuaries and found relatively high Hg levels.
Mean concentrations for the saltmarsh sharp-tailed
sparrow (0.69 ug/g) were significantly higher than
for the closely related Nelson’s sharp-tailed sparrow
(0.41 ug/g), and both were higher than the mean
concentrations found in Bicknell’s thrush from 21
distinct breeding sites (Table 1). Blood Hg concen-
trations in 10 insectivorous passerines associated
with riverine habitats on the Sudbury River, Mas-
sachusetts varied from 0.04 ug/g in the yellow
warbler (Dendroica petechia) to 0.92 ug/g in the
northern waterthrush (Seiurus
noveboracensis)
(Evers et al., 2005). In that study, adult mean Hg
blood concentrations were lower than those of
Bicknell’s thrush for three of the 10 species (barn
swallow [Hirundo rustica], gray catbird [Dumetella
carolinensis], and yellow warbler).
The causes of intra-site differences in the blood
Hg concentrations of insectivorous passerines
likely parallel patterns found in piscivorous birds.
Evers et al. (2005) identified differences among
species within the same habitat as primarily related
to trophic level. Biomagnification of MeHg in
aquatic systems is largely dictated by the diversity
and density of the planktivorous community
(Chen et al., 2005). An analogous community of
terrestrially-based microorganisms is likely present
in montane habitats, as passerine blood Hg
concentrations average only one order of magni-
tude less than concentrations in small piscivores
such as the belted kingfisher (Ceryle alycon) (Evers
et al., 2005). The trophic level of MeHg in the diet
of a Bicknell’s thrush is likely higher than in a
blackpoll warbler because thrushes are larger-
bodied and feed on larger arthropods (Hunt and
Eliason, 1999; Rimmer et al., 2001) that tend to be
more predaceous and have higher levels of MeHg
than smaller arthropods (Tremblay and Lucotte,
1997). While Bicknell’s thrush and blackpoll war-
bler follow the regression model by Evers et al.
(2005) that predicts >70% of the variation in
passerine blood Hg levels as a function of body
weight, the yellow-rumped warbler and white-
throated sparrow deviate from this model. The
white-throated sparrow has a lower component of
insects in its breeding season diet (Falls and
Kopachena, 1994), and this may contribute to
R
2
= 0.1342
R
2
= 0.1475
0
0.1
0.2
0.3
150
160
170
180
190
200
210
Julian Date
Blood Hg (ug/g)
Mt. Mansfield
Stratton Mtn.
Figure. 5. Relationship of blood Hg concentrations (ug/g, ww) in Bicknell’s thrush by Julian date (150 = 31 May, 180 = 30 June,
210 = 30 July) on Mt. Mansfield and Stratton Mtn., Vermont. Mt. Mansfield = lowerline, Stratton Mtn. = upperline.
234 Rimmer et al.
ELECTRONIC FILING, RECEIVED, CLERK'S OFFICE, AUGUST 14, 2006
lower blood and feather Hg concentrations than
those in thrushes and even smaller species such as
warblers. The relatively high and variable mean
Hg concentrations in yellow-rumped warbler
blood may be an artifact of small sample size, a
more varied diet, and preference toward black flies
(Simulus spp.), which have an aquatic larval phase
that is likely more exposed to MeHg availability
than terrestrial insects.
Geographic patterns in Bicknell’s thrush
The lack of a clear geographic pattern in Hg levels
of Bicknell’s thrush by individual mountain is not
surprising, given the heterogeneity of Hg deposi-
tion across northeastern North America (Miller
et al., 2005; VanArsdale et al., 2005). However, the
overall trend of higher Hg blood and feather
concentrations in thrushes in the southern part of
the species’ breeding range and lower concentra-
tions in northern areas implies a linkage between
atmospherically-deposited Hg and MeHg avail-
ability. This is reinforced by the strong correlation
of deposition and thrush blood data on Stratton
and Mansfield. Higher modeled deposition data
from Stratton reflect a plume of atmospheric-
borne Hg from the southwestern part of the study
area (Miller et al., 2005), which decreases north-
ward and eastward. The significantly higher blood
and feather Hg concentrations of Bicknell’s thru-
shes on Stratton versus Mansfield further suggest
linkages with regional MeHg availability.
The markedly higher mean blood Hg concen-
trations of thrushes in the Greater Antilles versus
the northeastern North America sampling sites is
counter to expected lower levels. Sampling of birds
in marine (Burger and Gochfeld, 1991) and estua-
rine (Burger et al., 1992) environments in Puerto
Rico in the late 1980s found relatively low body
burdens of Hg. Significant local or regional
industrial sources of Hg are unknown for the
Greater Antilles. Because the global pool of Hg is
increasing (UNEP, 2003), isolated islands and
other areas disconnected from local and regional
emission sources may be increasingly important for
long-term monitoring (Mason et al., 2005). Until
biogeochemical processes can be quantified in the
breeding and wintering habitats of Bicknell’s thrush,
determining differences in MeHg availability
between the two areas will remain problematic.
Interpreting blood-feather Hg relationships
We used two matrices, blood and feathers, to
better understand spatiotemporal pathways of Hg
exposure and potential effects on Bicknell’s thrush.
The lack of a correlation between blood and
feather Hg concentrations and the disordered
patterns in repeated measurements of feather Hg
among individual birds demonstrate the dynamic
complexity of MeHg availability for the Bicknell’s
thrush. Although adult Bicknell’s thrushes under-
go a complete remigial molt in August in their
breeding areas (Rimmer et al., 2001), blood Hg
concentrations measured in June and July are not
predictive of August feather Hg levels (albeit,
representing MeHg depuration 12 months prior).
Confounding factors contributing to a decoupling
of the two tissues are (1) within-summer changes in
MeHg availability, (2) annual differences in Hg
deposition and potentially in MeHg availability,
(3) dietary changes within-summer and among
years, (4) depuration of MeHg in eggs, (5) gender
and (6) age differences in MeHg uptake, and (7)
MeHg bioaccumulation.
Atmospheric deposition of Hg is not consistent
within or between years (VanArsdale et al., 2005).
The relationship of available inorganic Hg and
associated methylation is also inconsistent and
often non-linear, and is therefore difficult to pre-
dict even in well-studied freshwater aquatic sys-
tems (Wiener et al., 2003). Prey availability may be
the most important driving factor in MeHg
availability in montane systems. Precipitation
events and sudden temperature drops can rapidly
alter the composition of the montane forest insect
community (Rimmer and McFarland, unpubl.
data), which may subsequently affect trophic level
representation of MeHg. Because predaceous in-
sects generally have significantly higher MeHg
levels than non-predaceous insects (Tremblay
et al., 1996), rapid change in trophic structure and
therefore MeHg availability is likely. Variations in
the relative abundance of folivores and detritivores
further complicate patterns of MeHg availability.
Eggs provide a short-term pathway of MeHg
sequestration (Thompson, 1996). Depending on
the success of initial nesting attempts, female Bic-
knell’s thrushes may produce up to three clutches
in a single breeding season (Rimmer et al., 2001).
Because a rapid equilibrium between dietary
Mercury Levels in Bicknell’s Thrush 235
ELECTRONIC FILING, RECEIVED, CLERK'S OFFICE, AUGUST 14, 2006
uptake of MeHg and blood MeHg is typical
(Kambamandi-Dimou et al., 1991) and because
egg MeHg primarily reflects blood MeHg levels
(Evers et al., 2003), the influence of egg MeHg
depuration on blood-feather decoupling of Hg
levels is likely not a driving factor. However, loss
of Hg through eggs may at least partly contribute
to gender differences in Hg levels of Bicknell’s
Thrush, particularly because the species exhibits
no significant sexual dimorphism in body mass or
bill size (important metrics for dimorphism)
(Rimmer et al., 2001) that might account for niche
partitioning of prey.
Age responses to MeHg availability are well
quantified with this study. One-year-old (SY)
thrushes had significantly lower feather Hg con-
centrations than adults (ASY) at both intensively
sampled Vermont sites and one of two Quebec
sites (Table 1). Other studies have documented
similarly significant differences in Hg body bur-
dens between unfledged young and adult birds
(Thompson, 1996), including passerines (Evers
et al., 2005). However, differences in Hg levels
among age classes of adult passerines have not
previously been described. In our study, some
known-age adult thrushes exhibited a significant
increase in feather Hg concentrations with
increasing age, while other individuals did not.
Feather Hg concentrations were highly variable
among individual birds examined in multiple
years, likely reflecting the variable dynamics of
MeHg availability in wintering and breeding areas.
Because feathers provide one of the most effective
pathways of MeHg depuration (70–93% of the
body burden; Burger, 1993), it appears that the
elimination of Hg through feathers is greater in
some years than others.
Linking blood Hg levels with litterfall Hg deposition
Greater exposure to MeHg availability in win-
tering versus breeding areas likely contributes to
body burdens of Hg in spring arrivals that ex-
ceed those of late-summer residents. The parallel
decline of blood Hg levels in Bicknell’s thrush
during the breeding season on both Mansfield
and Stratton suggests that much of the Hg blood
and feather concentrations represent dietary
uptake in wintering areas. The half-life of MeHg
in the blood of non-molting adults is 40–60
days in Cory’s shearwater (Calonectris diomedea)
(Monteiro and Furness, 2001) and 84 days in
mallards (Anas platyrhynchos) (Heinz and Hoff-
man, 2004). The retention of MeHg in the blood
of Bicknell’s thrush during its two to four week
spring migration is therefore a potentially
important contributor to blood Hg concentra-
tions documented in the earlier part of the
breeding season. Such a geographically disjunct
influence on blood Hg levels of spring arrivals
assumes that MeHg availability is static over the
breeding season. In freshwater aquatic systems,
MeHg availability increases throughout the
summer
as
the
sulphur-reducing
bacteria
responsible for methylation show a positive
correlation with water temperature; however, the
mechanisms that drive methylation in montane
environments without standing water are poorly
known (Wiener et al., 2003).
While these mechanisms remain uncertain
(atmospheric deposition or bio-methylation), it
appears
that
autotrophs
make
significant
amounts of MeHg directly available to the ter-
restrial food web. Assuming a constant ratio of
MeHg:Hg in leaves, the model for total Hg
accumulation presented by Miller et al. (2005)
suggests that MeHg made available via the leaf
pathway would be lowest in spring and would
increase five-fold (day 20 through day 140)
during the growing season as leaves assimilate
mercury from the atmosphere. Average MeHg
concentrations might range from 0.02 (0.11) to
0.12 (0.54) ng/g in first-year evergreen leaves.
Food webs deriving energy from the detrital leaf
layer representing the previous year’s leaf crop
can be expected to be exposed to MeHg con-
centrations >0.5 ng/g. In Germany, Schwesig
and Matzner (2000) measured MeHg concentra-
tions in the Oi layer of soils of approximately
0.8–1.0 ng/g, in forests where fresh leaf litter
concentrations ranged from 0.07 to 1.49 ng/g.
The availability of MeHg based on this pro-
cess may partly explain the link with metrics
related to atmospheric deposition. Miller et al.
(2005) established deposition and concentration
patterns of leaf, litterfall, precipitation (wet and
dry), and particulate Hg. Regional comparisons
of these patterns and nine geographic clusters of
mean blood Hg concentrations of Bicknell’s
236 Rimmer et al.
ELECTRONIC FILING, RECEIVED, CLERK'S OFFICE, AUGUST 14, 2006
thrush (see Table 1 for how sampling sites were
grouped) demonstrated a significant correlation
with
litterfall
Hg
deposition
(r
2
= 0.49,
p < 0.05) (Fig. 6).
Conservation of Bicknell’s thrush and the montane
bird community
Biogeochemical factors that dictate MeHg avail-
ability in terrestrial montane habitats of north-
eastern North American and in the Greater
Antilles are poorly known and warrant further
investigation. The issue is of particular concern
because the Bicknell’s thrush is the most highly
ranked Nearctic-Neotropical migrant passerine for
conservation priority in the northeastern US
(Pashley et al., 2000), where it is restricted to high
elevation forests for breeding. Unlike migratory
piscivorous birds, such as the common loon (Gavia
immer), that breed on freshwater lakes and winter
in marine systems, where MeHg availability is
three times lower (Evers et al., 1998), the Bicknell’s
thrush is exposed to significantly higher Hg levels
on its wintering grounds. Our finding of elevated
MeHg availability in the Greater Antilles is
unexpected based on previous avian Hg studies in
subtropical areas (Burger and Gochfeld, 1991;
Burger et al., 1992), and it heightens conservation
concerns for the Bicknell’s Thrush, which is also
exposed to elevated Hg levels in its montane forest
breeding areas. Such chronic exposure to Hg
throughout its annual cycle, in combination with
potential synergistic impacts from calcium
deficiencies in areas of northeastern North Amer-
ica (Hames et al., 2002), might exert population
level impacts in Bicknell’s Thrush. Effects-based
research to elucidate the relationship of MeHg
burdens to demographics and reproductive success
in this and other insectivorous migratory passerines
is needed.
Acknowledgements
We thank our outstanding field assistants for
conducting excellent work under difficult field
conditions. The Stratton Mountain Resort and
the Mt. Mansfield Company provided invaluable
logistical support for our work in Vermont, for
which we gratefully acknowledge funding from
the Frank and Brinna Sands Foundation, the
Philanthropic Collaborative, Inc., the Stratton
Foundation, the Stratton Mountain Resort, the
Thomas Marshall Foundation, the USDA Forest
Service Northeast Research Station, the US. Fish
and Wildlife Service, the Vermont Monitoring
Cooperative, and friends and trustees of the Ver-
mont Institute of Natural Science (VINS).
y = 0.0184x + 0.003
R
2
= 0.504
0.00
0.05
0.10
0.15
0.20
0.25
0.30
4
4.5
5
5.5
6
6.5
7
7.5
8
8.5
9
Estimated Litterfall Total Hg flux (ug/m
2
/yr)
Bicknell's
Cluster
thrush
#
blood
1
Hg
3
(ug/g,ww)
4
6
8
2
57
9
Figure 6. Relationship between modeled litterfall Hg flux (ug/m
2
/yr) and the geometric mean +/
)
SE of Bicknell’s thrush blood
Hg concentrations (ug/g, ww). Clusters represent geographical grouping of thrush blood Hg samples from 21 different mountains.
Mercury Levels in Bicknell’s Thrush 237
ELECTRONIC FILING, RECEIVED, CLERK'S OFFICE, AUGUST 14, 2006
VINS’s work on Hispaniola was supported by
Carolyn Foundation, Conservation and Research
Foundation, National Geographic Society, Stew-
art Foundation, The Nature Conservancy, Tho-
mas Marshall Foundation, USDA Forest Service
International Program, the Wendling Founda-
tion, and friends of VINS. Work in Maine was
funded by BioDiversity Research Institute. Field
work in Canada and Cuba was supported by
Environment Canada and its Latin America Pro-
gram, and by Re´serve Faunique des Chic-Chocs,
the Conservation Parks of la Gaspe´sie and des
Monts Valin, the Association Louise-Gosford and
Foreˆt Habite´e du Mont Gosford. Authorization
for work in the Dominican Republic was pro-
vided by the Direccio´n Nacional de Parques and
the Departamento de Vida Silvestre; permission
to work in Haiti was provided by the Haitian
Ministry of the Environment. In Cuba, authoriza-
tion was provided by the Ministerio de Ciencia,
Tecnologı´a y Medio Ambiente, the Agencia de
Medio Ambiente, and the Parque Nacional Tur-
quino administration. Cuban field work was con-
ducted in collaboration with Alejandro Llanes
and the Instituto de Ecologia y Sistematica in La
Havana. We are grateful to staff at the Trace Ele-
ment Research Laboratory of Texas A & M Uni-
versity, the National Wildlife Research Centre of
Environment Canada, and the Sawyer Lab of the
University of Maine for assistance with Hg lab
analyses. We thank Rosalind Renfrew for offering
helpful statistical advice. This paper was greatly
improved by constructive reviews from Marti
Wolf, and Sharri Weech.
References
Adair, B.M., Reynolds, K.D., McMurry, S.T. and Cobb, G.P.
(2003). Mercury occurrence in prothonotary warblers
(Protonotaria citrea) inhabiting a national priorities list site
and reference areas in southern Alabama. Arch. Environ.
Contam. Toxicol. 44, 265–271.
Atwood, J.L., Rimmer, C.C., McFarland, K.P., Tsai, S.H. and
Nagy, L.R. (1996). Distribution of Bicknell’s Thrush in New
England and New York. Wilson Bull. 108, 650–661.
Bank, M.S., Loftin, C.S. and Jung, R.E. (2005). Mercury bio-
accumulation in two-lined salamanders from streams in the
northeastern United States. Ecotoxicology 14, 181–192.
Bishop, C.A., Koster, M.D., Chek, A.A., Hussell, D.J.T. and
Jock, K. (1995). Chlorinated hydrocarbons and mercury in
sediments, red-winged blackbirds (Agelaius phoeniceus) and
tree swallows (Tachycineta bicolor) from wetlands in the
Great Lakes-St. Lawrence River basin. Environ. Toxicol.
Chem. 14, 491–501.
Bowerman, W.W., Roe, A.S., Gilbertson, M.J., Best, D.A.,
Sikarskie, J.G., Mitchell, R.S. and Summer, C.L. (2002).
Using bald eagles to indicate the health of the Great Lakes’
environment. Lakes Reserv. Res. Manage. 7, 183–187.
Burger, J. (1993). Metals in avian feathers: bioindicators of
environmental pollution. Rev. Envrion. Toxicol. 5, 203–311.
Burger, J. and Gochfeld, M. (1991). Lead, mercury, and cad-
mium in feathers of tropical terns in Puerto Rico and
Australia. Arch. Environ. Contam. Toxicol. 21, 311–315.
Burger, J., Cooper, K., Saliva, J., Gochfeld, D., Lipsky, D. and
Gochfeld, M. (1992). Mercury bioaccumulation in organ-
isms from three Puerto Rican estuaries. Environ. Monit.
Assess. 22, 181–197.
Chen, C.Y., Stemberger, R.S., Kamman, N.C., Mayes, B. and
Folt, C. (2005). Patterns of Hg bioaccumulation and
transfer in aquatic food webs across multi-lake studies in the
Northeast US. Ecotoxicology 14, 135–148.
Ericksen, J., Gustin, M.S., Schorran, D., Johnson, D., Lindberg, S.
and Coleman, J. (2003). Accumulation of atmospheric mercury
in forest foliage. Atmos. Environ. 37, 1613–1622.
Evers, D.C., Lane, O.P., Savoy, L. and Goodale, W. (2004).
Assessing the impacts of methylmercury on piscivorous
wildlife using a wildlife criterion value based on the Com-
mon Loon, 1998–2003. Report BRI-2004–2005 submitted to
the Maine Department of Environmental Protection. Bio-
diversity Research Institute, Gorham, ME.
Evers, D.C., Taylor, K.M., Major, A., Taylor, R.J., Poppenga, R.H.
and Scheuhammer, A.M. (2003). Common Loon eggs as
indicators of methylmercury availability in North America.
Ecotoxicology 12, 69–81.
Evers, D.C., Burgess, N.M., Champoux, L., Hoskins, B.,
Major, A., Goodale, W., Taylor, R.J., Poppenga, R. and
Daigle, T. (2005). Patterns and interpretation of mercury
exposure in freshwater avian communities in northeastern
North America. Ecotoxicology 14, 193–222.
Evers, D.C., Kaplan, J.D., Meyer, M.W., Reaman, P.S.,
Brasleton,W.E.,Major,A.,Burgess,N.andSchuehammer,A.M.
(1998). A geographic trend in mercury measured in common Lon
feathers and blood. Environ. Toxicol. Chem. 17, 173–183.
Falls, J.B. and Kopachena, J.G. (1994).
White-throated
Sparrow (Zonotrichia albicollis). In A. Poole and F. Gill
(eds). The Birds of North America, No. 128, Philadelphia,
PA: The Birds of North America, Inc.
Fournier, F., Karasov, W.H., Kenow, K.P., Meyer, M.W. and
Hines, R.K. (2002). The oral bioavailability and toxicoki-
netics of methylmercury in common loon (Gavia immer)
chicks. Comp. Biochem. Physiol. Part A 133 (2002) 703–714.
Furness, R.W. and Greenwood, J.J.D. (1993). Birds as monitors
of environmental change. Chapman and Hall, NY.
Gerrard, P.M. and St. Louis, V.L. (2001). The effects of experi-
mental reservoir creation on the bioaccumulation of meth-
ylmercury and reproductive success of tree swallows
(Tachycineta biciolor). Environ. Sci. Technol. 35, 1329–1338.
Grigal, D.F. (2002). Inputs and outputs of mercury from ter-
restrial watersheds: a review. Environ. Rev. 10, 1–39.
Hames, R.S., Rosenberg, K.V., Lowe, J.D., Barker, S.E. and
Dhondt, A.A. (2002). Adverse effects of acid rain on the
238 Rimmer et al.
ELECTRONIC FILING, RECEIVED, CLERK'S OFFICE, AUGUST 14, 2006
distribution of the wood thrush Hylocichla mustelina in
North America. Proc. Nat. Acad. Sci. 99, 11235–11240.
Heinz, G.H. and Hoffman, D.J. (2004). Mercury accumulation
and loss in mallard eggs. Environ. Toxicol. Chem. 23, 222–224.
Hunt, P.D. and Eliason, B.C. (1999).
Blackpoll Warbler
(Dendroica striata). In A. Poole and F. Gill (eds). The Birds
of North America, No. 431., Philadelphia, PA: The Birds of
North America, Inc.
Hunt, P.D. and Flaspohler, D.J. (1998).
Yellow-rumped
Warbler (Dendroica coronota). In A. Poole and F. Gill
(eds). The Birds of North America, No. 376., Philadelphia,
PA: The Birds of North America, Inc.
Kambamandi-Dimou, A., Kamarianos, A. and Kilikidis, S.
(1991). Transfer of methylmercury to hens’ eggs after oral
administration. Bull. Environ. Contam. Toxicol. 46, 128–133.
Kamman, N.C., Burgess, N.M., Driscoll, C.T., Simonin, H.A.,
Linehan, J., Estabrook, R., Hutcheson, M., Major, A. and
Scheuhammer, A.M. (2005). Mercury in freshwater fish of
northeast North America – a geographic perspective based
on fish tissue monitoring databases. Ecotoxicology 14, 163–
180.
Lawson, S.T. (1999). Cloud water chemistry and mercury depo-
sition in a high elevation spruce-fir forest. Univ. Vermont,
Burlington, Vermont M.S. thesis.
Lee, Y.H., Bishop, K.H. and Munthe, J. (2000). Do concepts
about catchment cycling of methylmercury and mercury in
boreal catchments stand the test of time? Six years of
atmospheric inputs and runoff export at Svartberget,
northern Sweeden. Sci. Total Environ. 260, 11–20.
Mason, R.P., Abbot, M., Bodaly, D., Bullock, O.R., Driscoll, C.,
Evers, D., Lindberg, S., Murray, M. and Swain, E. (2005).
Monitoring the environmental response to changes in mercury
contamination from the atmosphere: a multi-media challenge.
Environ. Sci. Technol. 39, 15A–22A.
Miller, E.K., VanArsdale, A., Keeler, J.G., Chalmers, A., Pois-
sant, L., Kamman, N. and Brulotte, R. (2005). Estimation
and mapping of wet and dry mercury deposition across
northeastern North America. Ecotoxicology 14, 53–70.
Monteiro, L.R. and Furness, R.W. (2001). Kinetics, dose-re-
sponse, and excretion of methylmercury in free-living adult
Cory’s shearwaters. Environ. Sci. Technol. 35, 739–746.
Ouellet, H. (1993). Bicknell’s Thrush: taxonomic status and
distribution. Wilson Bull. 105, 545–572.
Pashley, D.N., Beardmore, C.J., Fitzgerald, J.A., Ford, R.P.,
Hunter, W.C., Morrison, M.S. and Rosenberg, K.V. (2000).
Partners in Flight: Conservation of the land birds of the
United States. American Bird Conservancy, The Plains, VA.
Pennuto, C.M., Lane, O., Evers, D.C., Taylor, R.J. and
Loukmas, J. (2005). Mercury in the northern crayfish,
Orconectes virilis (Hagen), in New England. Ecotoxicology 14,
149–162.
Reynolds, K.D., Rainwater, T.R., Scollon, E.J., Sathe, S.S.,
Adair, B.M. and Dixon, K.R., et al. (2001). Accumulation of
DDT and mercury in prothonotary warblers (Protonotaria
citrea) foraging in a heterogeneously contaminated environ-
ment. Environ. Toxicol. Chem. 12, 2903–2909.
Rimmer, C.C. and McFarland, K.P. (2000). Migrant stopover
and postfledging dispersal at a montane forest site in Ver-
mont. Wilson Bull. 112, 124–136.
Rimmer, C.C., McFarland, K.P., Ellison, W.G. and Goetz, J.E.
(2001). Bicknell’s Thrush (Catharus bicknelli). In A. Poole
and F. Gill (eds). The Birds of North America, No. 592.,
Philadelphia, PA: The Birds of North America, Inc.
Rosenberg, K.V. and Wells, J.V. (2000). Global perspectives on
Neotropical migratory bird conservation in the Northeast:
long-term responsibility versus immediate concern. In Bon-
ney, R., Pashley, D.N., Cooper, R.J. and Niles, L. (eds),
Strategies for Bird Conservation: the Partners in Flight Plan-
ning Process. pp. 32–43. Proceedings of the 3rd Partners in
Flight Workshop; 1995 October 1–5; Cape May, NJ. Pro-
ceedings RMRS-P-16. Ogden, UT. US Department of Agri-
culture, Forest Service, Rocky Mountain Research Station.
Scheuhammer, A.M. (1991). Effects of acidification on the
availability of toxic metals and calcium to wild birds and
mammals. Environ. Pollut. 71, 329–375.
Schwesig, D. and Matzner, E. (2000). Pools and fluxes of
mercury and methylmercury in two forested catchments in
Germany. Sci. Total Environ. 260, 213–223.
Shriver, W.G., Evers, D.C. and Hodgman, T.P. (2002). Mer-
cury exposure profile for Sharp-tailed Sparrows breeding in
coastal Maine salt marshes. Report BRI 2002–2011 sub-
mitted to the Maine Department of Environmental Pro-
tection. Biodiversity Research Institute, Falmouth, ME.
St. Louis, V.L., Rudd, J.W.M., Kelly, C.A., Hall, B.D., Rolfus,
K.R., Scott, K.J., Lindberg, S.E. and Dong, W. (2001).
Importance of the forest canopy to fluxes of methyl mercury
and total mercury to boreal ecosystems. Environ. Sci.
Technol. 35, 3089–3098.
SYSTAT (2002). SYSTAT 10.2. SYSTAT Software, Inc,
Richmond, CA.
Thompson, D.R. (1996). Mercury in birds and terrestrial
mammals. In W.H. Beyer, G.H. Heinz and A.W. Redmond-
Norwood (eds). Environmental Contaminants in Wildlife:
Interpreting Tissue Concentrations, pp. 341–356. Boca Ra-
ton, FL: Lewis Publishers.
Tremblay, A. and Lucotte, M. (1997). Accumulation of total
and methyl mercury in insect larvae of hydroelectric reser-
voirs. Can. J. Fish. Aquat. Sci. 54, 832–841.
Tremblay, A., Lucotte, M. and Rheault, I. (1996). Methyl-
mercury in benthic food web of two hydroelectric reservoirs
and a natural lake of northern Quebec (Canada). Water Air
Soil Pollut. 91, 255–269.
U. S. EPA. 1997. Mercury study report to Congress, Volume
VII: Characterization of human health and wildlife risks
from mercury exposure in the United States. U.S, Environ.
Protection Agency, EPA-452/R-97-009.
VanArsdale, A., Weiss, J., Keeler, G., Miller, E., Boulet, G.,
Brulotte, R., Poissant, L. and Pucket, K. (2005). Patterns of
mercury deposition and concentration in northeastern
North America (1996–2002). Ecotoxicology 14, 37–52.
Welch, L. (1994). Contaminant burdens and reproductive rates of
bald eagles breeding in Maine. Univ. Maine, Orono, Maine
M.S. thesis.
Wiener, J.G. and Spry, D.J. (1996). Toxicological significance of
mercury in freshwater fish. In W.N. Beyer, G.H. Heinz and
A.W. Redon (eds). Environmental contaminants in wildlife –
interpreting tissue concentrations, pp. 299–343. Boca Raton,
Florida: Lewis Publ.
Mercury Levels in Bicknell’s Thrush 239
ELECTRONIC FILING, RECEIVED, CLERK'S OFFICE, AUGUST 14, 2006
Wiener, J.G., Krabbenhoft, D.P., Heinz, G.H. and Scheuhammer,
A.M. (2003). Ecotoxicology of mercury. In D.J. Hoffman, B.A.
Rattner, G.A. Burton Jr and J. Cairns Jr. Handbook of eco-
toxicology, pp. 409–463. Boca Raton, FL: Lewis Publ.
Wolfe, M. and Norman, D. (1998). Effects of waterborne
mercury on terrestrial wildlife at Clear Lake: evaluation and
testing of a predictive model. Environ. Toxicol. Chem. 17,
214–227.
240 Rimmer et al.
ELECTRONIC FILING, RECEIVED, CLERK'S OFFICE, AUGUST 14, 2006
Estimating the Natural Background
Atmospheric Deposition Rate of
Mercury Utilizing Ombrotrophic Bogs
in Southern Sweden
R . BINDLER*
Department of Ecology and Environmental Science,
UmeaÊ University, SE-901 87 UmeaÊ, Sweden
A critical gap in the understanding of the global cycling
of mercury is the limited data describing the natural
background atmospheric deposition rate of mercury before
the advent of pollution. Existing estimates of the natural
deposition rate are typically about 2-5 íg of Hg m
-2
year
-1
(see, for example, Swain et al. Science
1992
, 257, 784-
787), based on studies that generally rely on short,
210
Pb-
dated lake sediment and peat cores that span the past
150 years. Analyses of mercury in long peat cores in
southcentral Sweden indicate that natural mercury deposition
rates in the period 4000-500 BP were lower, about
0.5-1 íg of Hg m
-2
year
-1
. This suggests that recent
mercury accumulation rates in the peat (15-25 íg of Hg
m
-2
year
-1
) and measured atmospheric deposition rates of
mercury in Sweden over the past 3 decades (5-30 íg
of Hg m
-2
year
-1
) (Munthe et al. Water, Air, Soil Pollut.:
Focus
2001
, 1, 299-310) are at least an order of magnitude
greater than the prepollution deposition rate, rather than
representing only a 3-5-fold increase, as has generally been
estimated.
Introduction
In Sweden, as elsewhere, direct measurements of atmo-
spheric deposition rates of mercury (Hg) are limited in terms
of both time and space. Time-series data on Hg deposition
rates usually span less than the past 30 years for direct
instrumental measurements of deposition (
6
,
7
), as well as
for indirect measurements such as biomonitoring programs
based on forest mosses (
8
). The limited data on historical
trends of atmospheric Hg deposition, and especially on the
natural conditions preceding the advent of pollution, rep-
resent an important gap in the understanding of large-scale
Hg pollution and global Hg cycling in general. This is a critical
gap that can only be filled through paleo-studies that examine
natural archives such as peat bogs, lake sediments, or glacial
ice.
Mercury is introduced into the environment primarily
via the atmosphere (
9
); it is emitted naturally via outgassing
of the earth's crust (volcanic and geothermal activity) and
evasion from the terrestrial environment (soils and vegeta-
tion) and water bodies. Estimates for the natural Hg emission
rates vary considerably. Superimposed over these natural
sources is a substantial anthropogenic component derived
from fossil-fuel combustion, waste incineration, metal
production and diffuse sources. In southern Sweden, Hg
deposition is strongly influenced by the long-range transport
of pollutants from emission sources in mainland Europe,
which was evidenced by the 50% decline in Hg deposition
from the late 1980s to the early 1990s, following the
reunification of Germany and economic downturn in Eastern
Europe (
6
)
Because of the continued concerns over Hg contamina-
tion, there is great interest in determining the relative
contribution of natural versus anthropogenic sources. Be-
cause ombrotrophic peat bogs receive their pollutants only
from the atmosphere, they offer the potential of reconstruct-
ing atmospheric deposition rates for nonmobile elements.
Thus far, the consensus is that Hg and also Pb are immobile
in peat (
4
,
10
), because of the strong affinity of these metals
for organic matter; consequently, ombrotrophic peat is
considered to contain a reliable archive for the atmospheric
deposition of these metals (
11
,
12
). Further support for the
viability of peat deposits as an archive is provided indirectly
by the temporal cohesiveness of the Pb pollution record in
Europe over the past few millennia among the different
natural archives, namely, peat, lake sediments, and glacial
ice (
13
-
18
).
The important lesson learned from analyses of the long-
term record of Pb in peat bogs, and the other natural archives,
is that human impacts on the atmospheric transport and
cycling of heavy metals must be viewed from a long-term
perspective. In the case of Pb, preanthropogenic (natural)
values in Europe are only found in layers older than 3500
years. The natural Pb deposition rate in these preanthro-
pogenic layers is 1000-fold lower than the maximum deposi-
tion rates in the 1970s (10
-2
versus 10 mg of Pb m
-2
year
-1
)
(
13
,
18
).
Typically, estimates for the natural background atmo-
spheric deposition rate of Hg are based on analyses of short
cores (ca. 25-30 cm in length) from peat bogs or lake
sediments, records that generally span only the past 200-
300 years. The older layers of these short cores, which were
only deposited just prior to modern industrialization, are
frequently considered to represent natural preanthropogenic
background conditions (
1
,
12
,
19
-
22
).
In the case of Hg, the first unambiguous evidence that a
long-term perspective also needs to be employed comes from
a peat core from an ombrotrophic bog, Penido Vello, in
northwestern Spain (
23
). Spain is home to one of the
historically most important Hg mining regions at AlmadeÂn,
where mining began some 2500 years ago. MartõÂnez-Cortizas
and colleagues found a clear Hg-pollution signal from about
1500 years ago, with potential traces of Hg pollution as early
as 2000-2500 years ago (
23
). Supporting evidence for a
preindustrial anthropogenic impact on atmospheric Hg has
also come from studies of Swiss sites (
24
) and from a few
studies of sediment cores from high-latitude lakes, where a
pre-1800 increase in Hg has also been suggested (
25
-
27
).
Here, the concentrations of Hg in complete peat profiles
from two ombrotrophic bogs in south Sweden and limited
analyses from a third site are presented. In particular, focus
is directed toward deriving a realistic estimate of the natural
background atmospheric deposition rate of Hg.
Materials and Methods
Site Descriptions and Sampling.
Dumme Mosse (57
°
30
′
N,
14
°
02
′
E) and Limbergsmosse (59
°
45
′
N, 15
°
30
′
E) are classic,
ombrotrophic raised bogs that developed initially as
Carex
fens (Figure 1). The individual coring sites were situated in
Sphagnum
hummocks in the raised area of each bog. For the
top approximately 1 m of peat, a Wardenaar box-type corer
* Author phone: (+46) 90-786 9784; fax: (+46) 90-786 6705;
e-mail: richard.bindler@eg.umu.se.
Environ. Sci. Technol.
2003
, 37, 40-46
40
9
ENVIRONMENTAL SCIENCE & TECHNOLOGY / VOL. 37, NO. 1, 2003
10.1021/es020065x CCC: $25.00
2003 American Chemical Society
Published on Web 11/21/2002
ELECTRONIC FILING, RECEIVED, CLERK'S OFFICE, AUGUST 14, 2006
(
28
) was used (length 100 cm, area 10 cm ? 10 cm), and for
deeper layers, a Russian peat corer (length 50 cm, diameter
5 cm) was used. To ensure retrieval of a complete peat profile,
two parallel drives were taken e50 cm apart in alternating
sequence, with an overlap of 25 cm. The cores were wrapped
in plastic and then aluminum foil, transported back to the
laboratory, and stored in the dark at 4
°
C. The cores for the
Hg study were collected in 1998, and a replicate core from
Dumme Mosse was collected in 2000.
Dumme Mosse is a large mire complex encompassing ca.
2000 ha, most of which is currently protected as a nature
reserve. The ontogeny of Dumme Mosse has not been the
subject of specific study, but according to analyses of the
peat (humification, ash content, and other unpublished
analyses) and radiocarbon dating of the replicate core, the
site was fully ombrotrophic by 4100 calibrated-year BP (
29
).
A 2-km-long, 19-core transect of the bog in 1994 indicates
a fairly uniform stratigraphy across the bog plain (
30
): The
top 1-1.5 m of the bog is composed of a low-humified
Sphagnum
peat. Below this lies a more-humified
Sphagnum
peat section about 0.25-0.5 m thick, followed by a ca. 1.5-
m-thick, less-humified
Sphagnum
peat, and finally a more-
humified
Carex
fen peat. The complete peat sequence
collected for the current study was 525 cm thick.
Limbergsmosse is a small bog, 18 ha, with an adjoining
fen of 18 ha. The peat profile extends to a depth of 470 cm.
The coring site on Limbergsmosse was located near the center
of an 8-core transect by Almquist-Jacobson and Foster (
31
),
who examined bog initiation and development at this and
other sites in central Sweden. The initiation of the
Carex
fen
began ca. 9500 BP, and the transition from fen to
Sphagnum
peat is dated in the central area of the bog to ca. 4500-4000
BP, which they suggested was correlated with regional
changes in lake levels in central Sweden. This fen-to-bog
transition also corresponds approximately in time with the
transition in Dumme Mosse.
A smaller number of samples were also included in this
study from Store Mosse (57
°
15
′
N, 13
°
55
′
E), a ca. 8500-ha
bog complex. This 620-cm-long profile was previously
radiocarbon-dated and analyzed for Pb (concentrations and
isotopic composition) (
32
) as well as Sc, Ti, and ash content
in 1996.
Analyses.
The cores from Dumme Mosse and Limbergs-
mosse were subsampled in continuous 5-cm sections for the
uppermost 50 cm and continuous 10-cm sections for the
remainder of each profile. The ash content of the complete
peat profiles (with a few gaps where there was insufficient
quantities of peat) was determined by combusting oven-
dried samples (80
°
C) at 450
°
C for 6 h.
For Hg analyses, all samples from the top 1-m and every
other 10-cm section thereafter were included. After being
freeze-dried, the larger fragments, e.g., twigs, roots, and
woody fragments, were removed. The samples were digested
using strong acids (HNO
3
/H
2
SO
4
) and analyzed for Hg
concentration using cold-vapor atomic fluorescence spec-
trometry (CVAFS) at the Swedish Environmental Research
Institute (IVL) in 1998. All results from analyses of standard
reference material were within the certified range (BCR-142
light sandy soil, certified 104 ( 12.3 ng of Hg g
-1
; measured
99.5 ( 5.5 ng of Hg g
-1
). Analytical uncertainty was e10%,
whereas the actual relative standard error of replicate analyses
was e5%.
For Dumme Mosse, a more-detailed analysis of the same
1998 Wardenaar monolith analyzed for CVAFS (5-cm sec-
tions) was also carried out in 2002. For this analysis, the peat
core was frozen (-18
°
C), the outer few centimeters was cut
away, and the surfaces of the frozen core were hand-planed,
leaving an inner section of the core with a length of 47.5 cm
and a surface dimension of 4 cm ? 4.5 cm. This inner core
was cut into precise 2.5-cm-thick sections, freeze-dried, and
homogenized. These samples were analyzed for Hg using
automated thermal decomposition atomic adsorption spec-
trophotometry (TD-AAS, Leco AMA254), which eliminates
the need for sample pretreatment (modified from U.S. EPA
Method 7473). Results from analyses of standard reference
materials were within the certified ranges (NIST-1515 apple
leaves, certified 44 ( 4 ng of Hg g
-1
, measured 43.6 ( 2.5 ng
of Hg g
-1
,
n
) 8). The relative standard error of replicate
analyses was e5%. All Hg concentrations are reported on a
dry mass basis, nanograms of Hg per gram. Samples
previously analyzed using CVAFS are also included for
comparison.
In addition to the analyses of Dumme Mosse and
Limbergsmosse, a smaller number of freeze-dried peat
samples from Store Mosse were analyzed using either CVAFS
or TD-AAS. The subsamples for CVAFS analyses represented
about a 1-cm-thick section of peat, whereas the samples for
TD-AAS were bulk samples representing a larger section of
peat (the vertical bars in Figure 2c indicate the section of
peat represented by each of these samples).
Dating of the Peat.
The recent peat (the 2.5-cm sections
from the 1998 Waardenaar core) from Dumme Mosse was
210
Pb-dated (Flett Research Ltd., Manitoba, Canada) based
on its granddaughter
210
Po. Samples were digested in a nitric
hydrochloric acid medium, evaporated and converted to the
chloride salt, plated out onto silver, and then counted by
alpha spectroscopy. Recovery was monitored by concurrent
measurement of the activity of a
209
Po spike added at the
beginning of sample processing. Detection limits are ˘0.1
DPM/g (0.0017 Bq/g) for about an 8-h counting period and
a 0.5-g sample mass. Ages were calculated using the CRS
model (
33
), and error bars in the modeled ages are based on
counting-error propagation (
34
).
Dating of the deeper peat from Dumme Mosse is based
on age-depth modeling of the replicate profile collected in
2000 (
29
) and stratigraphic correlation between this radio-
carbon-dated profile and the 1998 core used for Hg analyses.
The age-depth model for Dumme Mosse used in this paper
combines the CRS model for the recent peat from the 1998
profile with the dating results from the 2000 profile, which
includes three radiocarbon ages (a fourth value, shown in
the results, is excluded) and one inferred age, ca. 0 AD for
the Pb concentration peak corresponding to the Roman peak
in lead (
14
) (Table 1). The radiocarbon dates are based on
analyses of
Sphagnum
leaves, which were first rinsed with
distilled water. Radiocarbon dates for Dumme Mosse are
given here as calibrated years BP (1950) (Calib 4.3) (
35
).
FIGURE 1. Locations of the three peat bogs Dumme Mosse,
Limbergsmosse, and Store Mosse, in southern Sweden.
VOL. 37, NO. 1, 2003 / ENVIRONMENTAL SCIENCE & TECHNOLOGY
9
41
ELECTRONIC FILING, RECEIVED, CLERK'S OFFICE, AUGUST 14, 2006
Results
Ash Content.
The ash content and Hg concentration profiles
of Dumme Mosse and Limbergsmosse are quite similar
(Figure 2a,b). The ash content in each profile follows a general
pattern expected for ombrotrophic bogs. For the main part
of the each peat profile, i.e., from about 350 cm depth upward
to about 25 cm depth below the peat surface, the
Sphagnum
bog peat has a very low ash content (e1.5% ash), whereas
the ash content is higher in both the surface peat and the
underlying
Carex
fen peat.
The higher ash content in the fen peat of each bog is the
combined result of a greater degree of decomposition in the
Carex
fen peat [humification grade g 6 in Dumme Mosse
and also Store Mosse (
36
)], the minerogenic character of fen
peat, and the potential for translocation and upward diffusion
of metals from underlying sediments (
37
). In Dumme Mosse,
the decline in ash content at 350 cm depth coincides with
the botanical transition from fen peat to ombrotrophic peat
(
29
). The higher ash content of the surface/near-surface peat
can be attributed to nutrient retention and cycling (
38
,
39
)
and possibly also to an increased atmospheric influx of soil
dust, as indicated by elevated Sc and Ti inputs (in relation
to ash content) in the nearby bog, Store Mosse. In both
FIGURE 2. Depth profiles of mercury concentration and ash content from (a) Dumme Mosse (CVAFS Hg analyses only), (b) Limbergsmosse,
and (c) Store Mosse. The mean background Hg concentration in the ombrotrophic peat is indicated for each bog. Calibrated radiocarbon
ages and inferred ages are indicated on the right axis of each profile.
TABLE 1. Dating Results of the Deeper Peat in the Replicate
Core (2000) from Dumme Mosse (
29
)
depth
(cm)
14
C year
BP
calibrated
year BP
a
notes
130
1950 ( 150 inferred age: Roman Pb peak (14)
220 3070 ( 55 3435-3079 Ua-18824
280 3640 ( 75 4217-3721 Ua-14791; excluded from age
model
343 3700 ( 50 4222-3890 Ua-18454
345 3805 ( 75 4412-3983 Ua-14792
a
Calibrated year BP for the
14
C dates represents the 2ó age range.
42
9
ENVIRONMENTAL SCIENCE & TECHNOLOGY / VOL. 37, NO. 1, 2003
ELECTRONIC FILING, RECEIVED, CLERK'S OFFICE, AUGUST 14, 2006
Dumme Mosse peat profiles, i.e., the 1998 and the 2000
profiles, there is an increase in ash content between 100 and
140 cm depth (Figure 3a) that is related to a zone of increased
humification (humification grade g 6), whereas the peat
above and below is less humified (grade 3-4), which is a
layer found across the entire bog plain (
30
). This zone likely
corresponds approximately with a bog-phase transition in
Store Mosse, also indicated by increased humification and
increased ash content, that is dated to ca. 2500 BP (
40
).
Peat Accumulation Rates.
The age-depth model for
Dumme Mosse (Figure 3b) indicates fairly typical bog
development and peat accumulation rates as compared to
other Swedish bogs. In the surface peat,
210
Pb dating indicates
that the uppermost 15 cm of peat, which includes the living
plant material (top ˘1 cm), represents approximately 160
years of peat accumulation (AD 1835 ( 25 year at 15 cm
depth) (Figure 4b). Although the average peat mass ac-
cumulation rate for this period is 77 g m
-2
year
-1
(0.92 mm
year
-1
), the rapid decomposition of organic material below
the litter deposition layer causes the accumulation rate to
decline sharply from 220 g m
-2
year
-1
in the top 2.5-cm section
to 70 g m
-2
year
-1
in the 10-12.5-cm section. The mass
accumulation rate is estimated to decline even further to ca.
40 g m
-2
year
-1
in the 17.5-20-cm section.
For the peat between 160 and 4100 years old, the average
vertical growth rate is 0.80 mm year
-1
, although the age-
depth model shows that the vertical growth rate has gradually
declined over this period (Figure 3b), from >1 mm year
-1
before 3500 BP to <0.6 mm year
-1
in the past millennium.
Likewise, the modeled mass accumulation rate has gradually
declined from 90 g m
-2
year
-1
before 3500 BP to 40 g m
-2
year
-1
, with the average over the past 4100 years being 50 g
m
-2
year
-1
. These values for the accumulation rate in Dumme
Mosse are within the range of typical accumulation rates
shown for other Swedish ombrotrophic bogs (
18
,
29
,
40
,
41
).
The generally declining peat mass accumulation rate in
Dumme Mosse over the past few thousand years is found in
many Swedish bogs and mires (
39
,
41
). Importantly, the age-
depth model describes only the smoothed, long-term growth
FIGURE 3. (a) Ash content of the 1998 core used for Hg and the 2000 radiocarbon-dated core and (b) age
-
depth modeling of the Dumme
Mosse record. The open circle indicates a radiocarbon date excluded in the model: the
14
C age at 280 cm has a calibrated age similar
to the calibrated ages at 343 and 345 cm depth.
FIGURE 4. (a) Bulk density (g of dry mass cm
-
3
) and cumulative peat mass (g cm
-
2
) (line and filled circles, respectively), (b)
210
Pb activity
(measured as total activity of
210
Po) versus depth, and (c) the CRS age
-
depth modeling of the surface core from Dumme Mosse.
VOL. 37, NO. 1, 2003 / ENVIRONMENTAL SCIENCE & TECHNOLOGY
9
43
ELECTRONIC FILING, RECEIVED, CLERK'S OFFICE, AUGUST 14, 2006
of the bog and does not incorporate significant short-term
variations in bog growth rate that have likely occurred.
Comparison of the 1998 and 2000 profiles from Dumme
Mosse indicates that the ombrotrophic section of the 1998
profile is 15 cm thinner, which indicates that the average
vertical accumulation rate is slightly lower, i.e., 0.77 mm
year
-1
. This small difference (4%) in vertical growth rates
between the two profiles is not likely to introduce a significant
source of error in further calculations. Although the emphasis
here is placed on Dumme Mosse, it is also reasonable to
assume that a comparable average peat mass accumulation
rate can be expected for Limbergsmosse, based on the
similarities in ash content with Dumme Mosse and other
bogs, the thickness of the
Sphagnum
peat, and the ontogeny
of the bog (
31
).
Hg.
CVAFS vs TD-AAS Hg Analyses.
As described in the
Materials and Methods section, the 1998 Wardenaar surface
core from Dumme Mosse was analyzed for Hg using two
separate methods, CVAFS and TD-AAS. A comparison of the
results of the two analyses, along with several samples from
deeper peat layers that were analyzed using both methods,
shows remarkable consistency between the methods (Figure
5).
Hg Profiles in the Peat.
As with the ash content, the
concentration of Hg is higher in the
Carex
fen peat, probably
as a result of the greater decomposition of the fen peat, the
minerogenic nature of fen peat, and the influence of
groundwater (Figure 2). In Dumme Mosse, the maximum
Hg concentration (230 ng of Hg g
-1
) occurs in the deepest
layers of the
Carex
peat (510-525 cm depth), and the
concentration declines continuously upward through the
Carex
peat and into the transition toward
Sphagnum
peat.
In the
Carex
peat from Limbergsmosse, the Hg concentrations
are also elevated, although only to 30-50 ng of Hg g
-1
. For
the bulk of the
Sphagnum
peat in both Dumme Mosse and
Limbergsmosse, i.e., from 350 cm upward to about 50 cm
depth, the concentration of Hg is quite low and varies little,
11 ( 2 ng of Hg g
-1
. There is an excursion away from this low
background value in Dumme Mosse, from 120 to 140 cm
depth, where the Hg concentration increases about 2-fold.
This increase is clearly related to the increase in the degree
of humification; a 2-fold increase in peat decomposition
would cause the observed 2-fold increase in both ash content
and Hg concentration. Similarly, there is a second Hg
concentration excursion in the 50-60-cm section (38 ng g
-1
)
also related to an increase in humification.
The concentration of Hg is elevated about 2-fold (16-28
ng of Hg g
-1
) over background in the peat sections (15-45
cm depth) that are below the ca. 1840 AD horizon (15 cm
depth), and it increases further above 15 cm and reaches the
peak value of 260 ng of Hg g
-1
in the 5-7.5 cm peat section.
In Limbergsmosse, located farther north, Hg concentrations
increase 10-fold in the near-surface peat, with the maximum
value of 100 ng of Hg g
-1
in the 15-20-cm section.
As in the other bogs, the average Hg concentration in the
Sphagnum
peat (from 400 upward to 60 cm depth) in Store
Mosse is low and shows only a small variation; however, the
concentrations are higher than in the other two peat records,
20 ( 2 ng of Hg g
-1
(
n
) 8 samples). Also, similarly to the
other two bogs, the Hg concentration in the deeper
Carex
peat of Store Mosse is elevated as compared to that in the
ombrotrophic peat, 25-50 ng of Hg g
-1
(
n
) 3 samples).
Discussion
Recent Hg Deposition Rates.
Given the calculated peat mass
accumulation rates in the surface peat sections of Dumme
Mosse, the maximum Hg concentrations in the recent peat
correspond to a maximum net Hg accumulation rate of 23-
25 íg of Hg m
-2
year
-1
in the two peat sections dating to AD
1942-1975 and 1975-1991 (Figure 6a). In the surface 2.5-
cm section, AD 1991-1998, the accumulation rate has
declined by about 30% to 17 íg of Hg m
-2
year
-1
. Assuming
that recent peat accumulation rates for Limbergsmosse are
similar to those for other Swedish bogs, 100-200 g peat m
-2
year
-1
, the Hg accumulation rate there would be in the range
of 5-20 íg of Hg m
-2
year
-1
. By comparison, the measured
Hg wet-deposition rates in Sweden in 1987-1989 were 27
and 10 íg of Hg m
-2
year
-1
, for the western (RoÈrvik) and
eastern (Aspvreten) coasts of Sweden, respectively, which
declined to 9 and 6 íg of Hg m
-2
year
-1
during the 1990s (
6
)
(Figure 6b).
Although more detailed dating is necessary to determine
the onset of increased Hg accumulation accurately, the age-
depth model for Dumme Mosse indicates that the Hg
accumulation rate began to increase over background levels
in about the 17th century and has increased continuously
until the most recent decade. This preindustrial (pre-1850)
increase is not as early as indicated by bogs located closer
to preindustrial centers of metallurgy, e.g., the Penido Vello
bog in Spain (
23
) or Etang de la GrueÁre in Switzerland (
24
)
Background Concentrations and Preanthropogenic Hg
Deposition Rates.
The low background Hg concentrations
measured in the three Swedish bogs (10-20 ng of Hg g
-1
) are
similar to reported concentrations in longer peat profiles
from other ombrotrophic bogs, for example, 5-20 ng of Hg
g
-1
for Storelungmose in Denmark (
42
) and 10-30 ng of Hg
g
-1
for Etang de la GrueÁre in Switzerland (
24
). Background
concentrations are slightly higher in the Penido Vello bog in
northwest Spain, 20-40 ng of Hg g
-1
for the period 4000-
1500 BP (
23
). The background Hg concentrations in the above
bogs are lower than those generally reported from other bog
sites in Scandinavia (
21
,
22
)sstudies that have relied on only
short cores (i.e., 35-50 cm in length). Although it is not
expected that all bogs should have equally low background
FIGURE 5. Comparison of the CVAFS analyses of the 5-cm-thick
sections and the TD-AAS analyses of the 2.5-cm-thick sections
from the Wardenaar surface peat core from Dumme Mosse and
additional peat sections measured using both methods.
44
9
ENVIRONMENTAL SCIENCE & TECHNOLOGY / VOL. 37, NO. 1, 2003
ELECTRONIC FILING, RECEIVED, CLERK'S OFFICE, AUGUST 14, 2006
concentrations (for example, the difference between Store
Mosse and both Dumme Mosse and Limbergsmosse),
collection and analysis of longer records are preferable to
ensure that representative background values are captured.
In addition to performing a brilliant demonstration of
the existence of pre-1800 atmospheric Hg pollution, Mar-
tõÂnez-Cortizas and co-workers have suggested that there
might be a climatic influence on the retention of Hg in peat
(
23
). Although this might be important to some degree
(although it has not yet been independently validated),
current evidence from peat and soil studies (
4
,
5
,
12
,
43
-
46
)
indicates that the loss of Hg from peat through revolatilization
or other diagenetic losses is small. A second complicating
factor is the variable temporal response of bogs to climate
changes, which is, in part, site-specific (
31
). Consequently,
it is assumed in this paper that the loss of Hg from the peat
is minor and, therefore, that the net Hg accumulation rate
in the peat corresponds approximately to an open-field
atmospheric deposition rate of Hg. The general agreement
between modern accumulation rates in Dumme Mosse and
recent measured wet-deposition rates of Hg elsewhere in
Sweden suggests that this approximation between peat
accumulation and atmospheric deposition is reasonable.
On the basis of the modeled peat accumulation rate in
Dumme Mosse, the natural background Hg accumulation
rate in Dumme Mosse is estimated to be 0.6 ( 0.2 íg of Hg
m
-2
year
-1
. It is likely that the background range includes
both higher and lower excursions from this average estimate,
as this Hg accumulation rate is based on a smoothed model
of peat growth.
For Store Mosse, where the average peat accumulation
rate is similar to that at Dumme Mosse (50 g m
-2
year
-1
in
Store Mosse for the period ca. 3500-500 BP) but the Hg
concentrations are 20 ng of Hg g
-1
, the estimated background
Hg accumulation rate is slightly higher, about 1 ígofHgm
-2
year
-1
. At present, it is not possible to explain why Store
Mosse has a higher background Hg concentration and
apparently higher Hg accumulation rate than Dumme Mosse.
Other questions would have to be addressed before making
a critical assessment of the specific differences between the
individual bog records, such as how representative a single
peat profile is for the bog as a whole. Factors such as the
microtopography of individual coring sites are known to be
important (
12
,
39
). Therefore, it is possible that the difference
in background concentrations in Store Mosse versus Dumme
Mosse, which are less than 50 km apart, is no greater than
the potential difference within each of the bogs. This is an
important issue for future research to address.
The significance of the current study is that this estimated
range for the natural, background Hg accumulation rate,
0.5-1 íg of Hg m
-2
year
-1
, based on Dumme Mosse and
Store Mosse, and by inference also Limbergsmosse, is at a
level that is less than existing estimates for the background
atmospheric deposition rate, ca. 2-5 íg of Hg m
-2
year
-1
(
1
,
3
-
5
,
23
,
47
,
48
). Similarly to the data from the Swedish bogs,
a study of two adjacent bogs in the Swiss Jura Mountains,
one ombrotrophic and the other minerotrophic, shows
calculated mean background net Hg accumulation rates of
0.7 and 1.6 íg of Hg m
-2
year
-1
, respectively, in the two bogs
(
24
). As with Dumme Mosse, the Swiss sites record ap-
proximately a 30-fold increase in Hg accumulation rates in
recent versus preanthropogenic levels.
Some variation in the natural background deposition rate
of Hg between regions can be expected given differences in
precipitation and geology, and it might be that the low values
derived from the Swedish and Swiss bogs are related to such
factors. The higher estimated value from the Spanish bog
(3.3 ígm
-2
year
-1
)(
23
) is likely related to the presence of
extensive Hg mineral deposits in Spain, for example, whereas
for midcontinental sites in North America (3-4 ígofHgm
-2
year
-1
)(
1
,
4
,
47
), atmospheric chemistry is strongly influenced
by the significantly longer distances that air masses must
travel over land.
Further studies of the long-term records preserved in other
peat bogs and other paleo-archives would strengthen the
estimates of preanthropogenic Hg deposition rates. Other
issues that should be addressed in interpreting reconstruc-
tions from peat include a better understanding of (i) the
potential long-term losses that might affect the quantitative
record in peat in response to decay losses of organic matter
[25-85% of the litter input may be lost in the acrotelm, with
further gradual losses in the catotelm (
40
,
49
)]; (ii) the ways
in which Hg concentrations might vary simply as a function
of bog development, as well as varying as a function of more
complex ecosystem-climate interactions; and (iii) the rep-
resentativity of single cores within a bog for making detailed
reconstructions. However, just as the peat record has
provided new insights into long-term changes in atmospheric
Pb deposition, especially regarding preanthropogenic depo-
sition rates (
13
,
18
), studies of the Hg record in peat are
providing new insights into preanthropogenic Hg cycling
and long-term atmospheric pollution.
Acknowledgments
Thanks to Ingemar Renberg and Tom Korsman for critical
reading of the manuscript; Jonatan Klaminder for discussions
on the ontogeny of Dumme Mosse; John Munthe at IVL;
Wolfgang Frech, Department of Chemistry, Umeå University;
and Bob Flett (Flett Research Ltd.) for
210
Pb dating. This
FIGURE 6. (a) Hg accumulation rate in Dumme Mosse and (b) measured Hg wet-deposition rates at two stations in southern Sweden (Ro
1
rvik
on the west coast and Aspvreten on the southeast coast) (6).
Horizontal bars in the left panel for the flux values of the two most-recent
centuries represent the time period covered by each of the 2.5-cm peat sections.
VOL. 37, NO. 1, 2003 / ENVIRONMENTAL SCIENCE & TECHNOLOGY
9
45
ELECTRONIC FILING, RECEIVED, CLERK'S OFFICE, AUGUST 14, 2006
research was supported by grants from the Swedish Envi-
ronmental Protection Agency and the Swedish Research
Council (formerly NFR). The manuscript also benefited
greatly from the generous and constructive criticism of two
anonymous reviewers.
Literature Cited
(1) Swain, E. B.; Engstrom, D. R.; Brigham, M. E.; Henning, T. A.;
Brezonik, P. L.
Science
1992
,
257
, 784-787.
(2) Johansson, K.; Andersson, A.; Andersson, T.
Sci
.
Total Environ
.
1995
,
160
-
161
, 373-380.
(3) Meili, M.
Water
,
Air
,
Soil Pollut.
1995
,
80
, 637-640.
(4) Benoit, J. M.; Fitzgerald, W. M.; Damman, A. W. H.
Environ
.
Res
.
1998
,
78
, 118-133.
(5) Lamborg, C. H.; Fitzgerald, W. F.; Damman, A. W. H.; Benoit,
J. M.; Balcom, P. H.; Engstrom, D. R. In
11th Annual International
Conference on Heavy Metals in the Environment
; Nriagu, J. O.,
Ed.; University of Michigan: Ann Arbor, MI, 2000 (CD-ROM).
(6) Munthe, J.; Kindbom, K.; Kruger, O.; Petersen, G.; Pacyna, J.;
Iverfeldt, Å.
Water
,
Air
,
Soil Pollut
.:
Focus
2001
,
1
, 299-310.
(7) Iverfeldt, Å.
Water
,
Air
,
Soil Pollut
.
1991
,
56
, 251-265.
(8) RuÈhling, Å.; Tyler, G.
Water
,
Air Soil Pollut
.:
Focus
2001
,
1
, 311-
323.
(9) Schroeder, W. H.; Munthe, J.
Atmos
.
Environ
.
1998
,
32
, 809-
822.
(10) Benoit, J. M.; Fitzgerald, W. M.; Damman, A. W. H. In
Mercury
Pollution
:
Integration and Analysis
; Watras, C. J., Huckabee, J.
W., Eds.; Lewis: Boca Raton, FL, 1994; pp 187-202.
(11) Shotyk, W.; Norton, S. A.; Farmer, J. G.
Water
,
Air
,
Soil Pollut
.
1997
,
100
, 213-219.
(12) Norton, S. A.; Evans, G. C.; Kahl, J. S.
Water
,
Air
,
Soil Pollut
.
1997
,
100
, 271-286.
(13) Shotyk, W.; Weiss, D.; Appleby, P. G.; Cheburkin, A. K.; Frei, R.;
Gloor, M.; Kramers, J. D.; Reese, S.; Van Der Knaap, W. O.
Science
1998
,
281
, 1635-1640.
(14) Renberg, I.; Bindler, R.; BraÈnnvall, M.-L.
Holocene
2001
,
11
, 511-
516.
(15) Rosman, K. J. R.; Chisholm, W.; Hong, S. M.; Candelone, J. P.;
Boutron, C. F.
Environ
.
Sci
.
Technol
.
1997
,
31
, 3413-3416.
(16) MartõÂnez-Cortizas, A.; Garcia-Rodeja, E.; Pontevedra-Pombal,
X.; NoÂvoa MunÄoz, J. C.; Weiss, D.; Cheburkin, A.
Sci
.
Total
Environ
.
2002
,
292
, 33-44.
(17) BraÈnnvall, M.-L.; Bindler, R.; Renberg, I.; Emteryd, O.; Bartnicki,
J.; BillstroÈm, K.
Environ
.
Sci
.
Technol
.
1999
,
33
, 4391-4395.
(18) Bindler, R.; BraÈnnvall, M.-L.; Renberg, I.; Emteryd, O.; Grip, H.
Environ
.
Sci
.
Technol
.
1999
,
33
, 3362-3367.
(19) Pheiffer-Madsen, P.
Nature
1981
,
293
, 127-130.
(20) Johansson, K.
Verh
.
Int
.
Ver
.
Theor. Angew. Limnol
.
1985
,
22
,
2359-2363.
(21) Jensen, A.; Jensen, A.
Water
,
Air
,
Soil Pollut
.
1991
,
56
, 769-777.
(22) Steinnes, E.; Andersson, E. M.
Water
,
Air
,
Soil Pollut
.
1991
,
56
,
391-404.
(23) MartõÂnez-Cortizas, A.; Pontevedra-Pombal, X.; GarcõÂa-Rodeja,
E.; NoÂvoa MunÄos, J. C.; Shotyk, W.
Science
1999
,
284
, 939-942.
(24) Roos-Barraclough, F.; Shotyk, W.
Environ
.
Sci
.
Technol
. (in press).
(25) Lockhart, W. L.; Wilkinson, P.; Billeck, B. N.; Hunt, R. V.;
Wagemann, R.; Brunskill, G. J.
Water
,
Air
,
Soil Pollut
.
1995
,
80
,
603-610.
(26) Bindler, R.; Renberg, I.; Appleby, P. G.; Anderson, N. J.; Rose,
N. L.
Environ
.
Sci
.
Technol
.
2001
,
35
, 1736-1741.
(27) Bindler, R.; Olofsson, C.; Renberg, I.; Frech, W.
Water
,
Air
,
Soil
Pollut
.:
Focus
2001
,
1
, 343-355.
(28) Wardenaar, E. C. P.
Can
.
J
.
Bot.
1987
,
65
, 1772-1773.
(29) Klaminder, J.; Renberg, I.; Bindler, R.; Emteryd, O.
Global
Biogeochem. Cycles
(in press).
(30) Lagerås, P. Borrsektion genom Dumme mosse, vaÈster om
JoÈnkoÈping: paleoekologisk rekognosering. Department of Qua-
ternary Geology, Lund University, Lund, Sweden, 1995.
(31) Almquist-Jacobson, H.; Foster, D. R.
Ecology
1995
,
76
, 2503-
2516.
(32) BraÈnnvall, M.-L.; Bindler, R.; Emteryd, O.; Nilsson, M.; Renberg,
I.
Water
,
Air
,
Soil Pollut
.
1997
,
100
, 243-252.
(33) Appleby, P. G.; Oldfield, F.
Catena
1978
,
5
,1-8.
(34) Binford, M. W.
J
.
Paleolimnol
.
1990
,
3
, 253-267.
(35) Stuiver, M.; Reimer, P. J.
Radiocarbon
1993
,
335
, 215-230.
(36) von Post, L.; Granlund, E.
Sver. Geol. Unders., Ser. C
1926
,
335
,
1-127.
(37) Weiss, D.; Shotyk, W.; Cheburkin, A. K.; Gloor, M.; Reese, S.
Water
,
Air
,
Soil Pollut.
1997
,
100
, 311-323.
(38) Damman, A. W. H.
Oikos
1978
,
30
, 480-495.
(39) Malmer, N.; WalleÂn, B.
Ecography
1999
,
22
, 736-750.
(40) Malmer, N.; Svensson, G.; WalleÂn, B.
Ecography
1997
,
20
, 535-
549.
(41) Klarqvist, M. Ph.D. Thesis. Department of Forest Ecology;
Swedish University of Agricultural Sciences (Silvestria 203),
Umeå, Sweden, 2001.
(42) Goodsite, M.; Lohse, C.; Hansen, T.; Shotyk, W.; Knaap, W.;
Heinemeier, J.; Cheburkin, A.; Frei, R.; Anderson, N.; Appleby,
P.; Asmund, G.; Christensen, N. In
11th Annual International
Conference on Heavy Metals in the Environment
; Nriagu, J. O.,
Ed.; University of Michigan: Ann Arbor, MI, 2000 (CD-ROM).
(43) Aastrup, M.; Johnson, J.; Bringmark, E.; Bringmark, L.; Iverfeldt,
Å.
Water
,
Air
,
Soil Pollut
.
1991
,
56
, 155-167.
(44) Fitzgerald, W. F.; Engstrom, D. R.; Mason, R. P.; Nater, E. A.
Environ
.
Sci
.
Technol
.
1998
,
32
,1-7.
(45) Fitzgerald, W. In
11th Annual International Conference on Heavy
Metals in the Environment
; Nriagu, J. O., Ed.; University of
Michigan: Ann Arbor, MI, 2000 (CD-ROM).
(46) Schwesig, D.; Matzner, E.
Sci
.
Total Environ
.
2000
,
260
, 213-
223.
(47) Nater, E. A.; Grigal, D. F.
Nature
1992
,
358
, 139-141.
(48) Mason, R. P.; Fitzgerald, W. F.; Morel, F. M. M.
Geochim
.
Cosmochim
.
Acta
1994
,
58
, 3191-3198.
(49) Yu, Z.; Turetsky, M. R.; Campbell, I. D.; Vitt, D. H.
Ecol
.
Model
.
2001
,
145
, 159-173.
Received for review March 18, 2002. Revised manuscript
received September 26, 2002. Accepted October 16, 2002.
ES020065X
46
9
ENVIRONMENTAL SCIENCE & TECHNOLOGY / VOL. 37, NO. 1, 2003
ELECTRONIC FILING, RECEIVED, CLERK'S OFFICE, AUGUST 14, 2006
Arch. Environ. Contam. Toxicol. 27, 299-305 (1994)
ARCHIVES
OF
Environmental
Contamination
a n d Toxicology
© 1994 Springer-Vedag
New
York
Inc.
Mercury
in Livers
of Wading
Birds
(Ciconiiformes)
in Southern
Florida
S. F. Sundlof 1'* M. G. Spalding 2, J. D. Wentworth l, C. K. Steible 3
Department of Physiological Sciences, College of Veterinary Medicine, University of Florida, Gainesville, Florida 32611-0925, USA
2 Department of Infectious Diseases, College of Veterinary Medicine, University of Florida, Gainesville, Florida 32611, USA
3 Department of Statistics, Institute of Food and Agricultural Sciences, University of Florida, Gainesville, Florida 32610, USA
Received: 3 November 1993/Revised: 15 March 1994
Abstract.
Mercury was measured in livers from 144 wading
birds representing seven species collected from four different
areas in southern Flordia, including the Everglades National
Park. Significant differences in hepatic mercury concentrations
were identified between birds collected from different geo-
graphic locations, birds of different ages, dietary factors, and
relative amounts of body fat. Birds collected from an area
encompassing the central Everglades and eastern Florida Bay
had significantly greater concentrations of hepatic mercury than
did birds from other collection areas. Livers from fledgling and
young adult birds contained approximately three times the con-
centration of mercury as livers from nestling birds. Bird species
whose prey base consists of larger fish were found to have
approximately four times the hepatic concentration of mercury
as did those species which consume smaller fish or crustaceans.
Birds with minimal to moderate amounts of body fat had two to
three times the concentration of hepatic mercury as birds with
relatively abundant body fat reserves. Four great blue herons
collected from the central Everglades contained liver mercury
at concentrations typically associated with overt neurologic
signs (I>30 Ixg/g). Between 30% and 80% of potential breed-
ing-age birds collected from this area contained hepatic mer-
cury at concentrations associated with reproductive impairment
in ducks and pheasants. These data suggest that declining num-
bers of nesting ciconiiform birds in Florida may be due, in part,
to mecury contamination of their food supply.
Since the early 1980s, mercury has been recognized as a major
contaminant of various watersheds throughout the state of Flor-
ida, especially in certain areas of the Everglades National Park
(Cabbage 1989; Hand and Friedemann 1990). By sampling
Everglades wetland sediments at progressively deeper levels it
has been estimated that rate of mecury accumulation has in-
*Present
address:
FDA Center for Veterinary Medicine, HFV- 1, 7500
Standish Place, Rockville, MD 20855
Correspondence
to:
S. F. Sundlof
creased 6.4-fold since the beginning of the 20th century (Del-
fino
et al.
1993). Although the precise sources of mercury have
not been established, recent studies suggest that 61% of the
mecury in the Everglades is due to atmospheric deposition from
anthropogenic sources. The largest single contributor to envi-
ronmental mercury is municipal solid waste combustion facili-
ties (14.6%), followed by medical waste incinerators (14.0%),
paint manufacturing, and application (11.1%), the electric util-
ity industries through the combustion of fossil fuels (10.7%),
electrical apparatus including fluorescent, mercury vapor,
metal halide, and sodium lights (5.9%), and other fossil fuel
combustion sources including industrial residential sources
(1.7%). All other anthropogenic sources combined including
sugar cane processing, the dental industry, open burning, and
sewage sludge disposal accounted for only 3% of the total
mercury emitted to the environment (KBN, 1993). Natural
sources of mercury were estimated to contribute 39% of the
annual total emitted to the Everglades. Virtually all of the
mercury from natural sources (38.9% of the total emissions
from both anthropogenic and natural sources) is attributed to
release from the soil through natural processes including micro-
bial transformation of inorganic and organic mercury to meth-
ylmercury (KBN 1993).
State health officials have issued advisories to prohibit con-
sumptions of largemouth bass
(Micropterus
salmoides)
in
southern Florida, and the entire Everglades watershed has been
closed to hunting of alligators due to excessive mecury in edible
tissues (Royals and Lange 1990). The imminent threat of mer-
cury to wildlife was recognized in 1989 when an endangered
Florida panther
(Felis concolor
coryi)
was discovered deceased
in the Everglades National Park. Death of the animal was
attributed to mercury intoxication as evidenced by liver mer-
cury concentration of 110 Ixg/g based on wet tissue weight
(Jordan 1990). Since 1989, mercury has been strongly impli-
cated in the deaths of at least two other panthers (Roelke
et al.
1991). The impact of mercury on less intensely studied wildlife
species and populations in southern Florida has not been deter-
mined.
Mercury undergoes bioaccumulation in aquatic food webs
such that species which are long-lived and occupy the upper
trophic levels accumulate the highest concentrations of mercury
and are at greatest risk of intoxication (Clarkson and Marsh
ELECTRONIC FILING, RECEIVED, CLERK'S OFFICE, AUGUST 14, 2006
300
S.F. Sundlof
et al.
Table
1. Numbers and classification of ciconiiform birds by geographic area where collected, relative age, and diet
Numbers of birds collected
Area 1 a
Area 2
Area 3
Area 4
Species
Diet b
SN c
LN c
FA c
FN
LN
FA
SN
LN
FA
SN
LN
FA
Total
Great blue heron
A
5
2
2
2
4
1
0
14
18
0
0
11
59
Great egret
A
4
5
0
5
6
1
0
1
0
0
0
2
25
Little blue heron
B
3
1
0
1
0
2
0
0
0
0
0
0
7
Snowy egret
B
0
3
0
0
7
0
1
0
0
0
0
0
11
Tricolored heron
B
3
1
0
5
1
0
2
2
1
0
0
0
15
Roseate spoonbill
C
0
0
0
1
3
0
1
7
1
0
0
0
13
White ibis
C
9
1
2
0
0
1
2
0
0
0
0
0
15
All species
24
13
4
14
21
5
6
24
20
0
0
13
144
aSee Figure 1 for visual representation of geographic areas 1-4
b Dietary group A consists of those species which consume large fish as a major portion of the diet; group B consists of species which consume small
fish as a major dietary component; group C consists of species which consume small fish, crustacea, and insects as major dietary components
°SN = small nestling birds, LN = large nestlings, FA = fledglings/young adults
NESTLINGS
.t
FLEDGED/ADULTS
<
5ppm
~"
• 6:~. ~,
~
Fig. 1. Geographic location of sites where ciconiiform birds were collected (collection areas 1-4). Each triangle represents an individual bird. The
size of the triangle indicates the approximate concentration of mercury in the liver of each bird. Only fledged or adult birds were collected from Area
4. Map on the right is for orientation. WCA = water conservation area
1982). Wading birds (order Ciconiiformes) including herons,
egrets, ibis, and spoonbills, are upper trophic level aquatic
feeders and may be at potential risk from mecury intoxication in
those watershed areas of Florida with high ambient mercury.
Populations of these birds have been declining in southern
Florida for reasons which are not well understood (Ogden
1994). The purpose of this study was to compare mercury
concentrations in livers of young ciconiiform birds collected
from various geographic locations in southern Florida.
Materials
and
Methods
Collection
of Birds
and Sampling
of Tissues
Wading birds (n = 144) representing seven ciconiiform species and
one subspecies were collected from four geographic areas of southern
Florida from 1987 through 1991 (Table 1). The species included: great
blue heron
(Ardea
herodias)
including a color morph the great white
heron
(A. h. occidentalis),
great egret
(Casmerodius
albus),
snowy
egret
(Egrena
thula),
tricolored heron
(E. tricolor),
little blue heron
(E. caerulea),
white ibis
(Eudocimus
albus),
and roseate spoonbill
(Ajaia ajaja).
Collection Area 1 (Figure 1) encompasses Lake Okeechobee and
Water Conservation Area 1 (WCA 1). Colonies were situated in tree
islands on the shores of Lake Okeechobee, in small willow-heads and
bay islands in fresh-water marsh in WCA 1, and on spoil islands in an
abandoned shell mine in Palm Beach County. Area 2 includes the
estuarine mangrove area of the western portion of the Everglades
National Park including western Florida Bay. All colonies were on
mangrove islands in estuarine or marine areas. Area 3 includes WCA
3, eastern Shark Slough, and eastern Florida Bay. Colonies on the
mainland were on willow-heads and bay islands in freshwater marsh
and on mangrove islands in marine Florida Bay. Area 4 includes the
Big Cypress National Preserve and areas north and west of it. None of
the birds collected from Area 4 were nestlings.
ELECTRONIC FILING, RECEIVED, CLERK'S OFFICE, AUGUST 14, 2006
Mercury in Wading Birds in Southern Florida
301
Table
2. Effects of geographic location on mercury concentrations (txg/g) in livers of ciconiiform birds from south Florida. Values represent the
geometric mean and range (in parentheses)
Liver mercury (vg/g)
Species
Area 1
Area 2
Area 3
Area 4 a
Great blue heron
0.60 (0.32-5.82)
0.80 (0.21-2.70)
4.25 (0.22-74.54)
Great egret
0.50 (0.18-1.60)
1.24 (0.38-4.27)
18.84 d
Little blue heron
0.38 (0.29-0.73)
0.29 (0.23-0.41)
ND c
Snowy egret
0.37 (0.29-0.42)
0.38 (0.15-1.43)
5.38 b
Tricolored heron
0.57 (0.20-4.96)
0.32 (0.12-0.58)
1.93 (0.67-4.70)
Roseate spoonbill
ND
0.27 (0.16-0.35)
0.74 (0.31-5.38)
White ibis
0.34 (0.05-1.15)
1.28 d
1.06 (0.77-1.46)
All species c
0.44 (0.32-0.61)
0.55 (0.40-0.76)
2.63 f (1.96-3.54)
7.62 (2.99-17.51)
1.13 (0.64-2.01)
ND
ND
ND
ND
ND
aArea 4 birds were not included in any statistical analysis because only adult birds of dietary group A were represented
b Geometric mean and range (in parentheses)
c ND = no data available
dValue represents datum from a single bird
eLeast squares mean and 95% confidence interval (in parentheses)
fLeast squares mean from Area 3 birds is significantly different from Area 1 or Area 2 (P < 0.001)
Deceased birds were collected during periodic visits to colonies
during the nesting cycle and when found dead along roadsides. Upon
postmortem examination, the nutritional condition of each bird was
noted and scored such that birds were classified as having abundant
body fat, moderate body fat, or minimal to no observable body fat
relative to the amount of fat expected for a bird of that age. Following
postmortem examination the liver was removed and frozen at -20°C.
Birds were assigned size/age classification based on bill length and
plumage. Nestlings with bill length less than 60% of an average adult
bill length were placed in the small nestling category. Nestlings with
larger bills were placed in the large nestling category. Fledglings
collected away from the nesting colony and adults were placed in the
fledgling/adult category (Table 1).
Bird species were designated to one of three diet groups (Table 1).
Group A consisted of those species which consume large fish as a part
of their diet and included great blue herons and great egrets. Group B
consisted of the following species which consume predominantly small
fish: little blue herons, snowy egrets, and tricolored herons. Group C
included white ibis and roseate spoonbills, which eat both fish and
arthropods (Collopy and Jelks 1989).
Analysis
of Mercury
in Liver
Livers were thawed and the outer exposed layer of tissue removed to
minimize the effects of potential contamination by exogenous mer-
cury, and dehydration due to frozen storage. Samples of liver tissue (1
g) were accurately weighed and transferred to pre-weighed, metal-free,
glass tubes. The sample-containing tubes were heated to dryness and
subsequently digested in 1 ml of concentrated nitric acid until the
solution became clear. Hydrogen peroxide (2 ml) was added to each
tube and the tube heated at 95°C for 2 h after which the volume of the
tube was adjusted to 10 ml with deionized water. After mixing, a 1 mi
aliquot was placed into a hydride reaction tube along with 0.1 ml of 5%
K/~nO4, and the volume adjusted to 10 ml with 1.5% nitric acid.
Mercury was measured by cold vapor atomic absorption spectropho-
tometry on a Perkin Elmer Model 2380 (Perkin Elmer Corp, Norwalk,
CT). All unknowns were compared with commericially available
mecury standards (Fisher Scientific, 7464 Chancellor Drive, Orlando,
Florida 32809). The lower limit of detection was 0.05 ppm, and recov-
ery of mercury from mercury-fortified liver samples was 93%.
Statistical
Analysis
Data from birds collected in Area 4 were excluded from any statistical
analysis because only adult and fledged great blue herons and great
egrets were obtained. Data (mercury concentrations) from all remain-
ing birds were logarithmically transformed to better meet the assump-
tion of homogeneity of variance of the residuals. An analysis of vari-
ance (SAS 6.07) was conducted on the transformed data using a linear
model containing all main effects (area, diet, age, and body fat) and all
first-order interactions. Because none of the first-order interactions
were statistically significant (P > 0.10), a simpler model containing
only the main effects was used. Least square means were calculated
and pairwise t-tests were performed to determine significant differ-
ences between levels of each of the main effects. The reported least
square means and 95% confidence intervals were transformed (antilog-
arithm) to the original scale and reported as txg of mercury per gram of
liver.
Results
The geographic location of the nest site had a significant effect
on mercury concentrations in ciconiiforms (P < 0.0001). Liv-
ers from birds collected in the area south of Lake Okeechobee
and southward to the northern Everglades (Area 1) and birds
collected from the western mangrove and western Florida Bay
region (Area 2) contained significantly lower concentrations of
mercury than livers from birds collected from the central Ever-
glades and eastern Florida Bay region (Area 3) (Table 2). The
highest concentration of mercury (74.54 ~g/g) was observed in
a great blue heron from Area 3. This value was more than 12
times the highest liver mercury value for any bird collected
from Area 1 or Area 2.
Differences in mercury concentrations were also associated
with age of the bird. Although mercury concentrations in birds
from the two nestling age groups were not significantly differ-
ent from one another, birds from the oldest group (fledged/
adult) contained mercury at concentrations averaging approxi-
mately 3 times those of the younger birds (Table 3). Of all
samples analyzed, the five highest in mecury were from
fledged/adult birds.
Ciconiiform species which consume large fish as a major
component of the diet (great blue herons and great egrets) were
found to accumulate greater amounts of mercury than those
species which eat primarily smaller fish or arthropods (Table
4). No differences in liver concentrations of mercury were
observed between those species which consume small fish
ELECTRONIC FILING, RECEIVED, CLERK'S OFFICE, AUGUST 14, 2006
302
S.F. Sundlof
et al.
Table 3. Effects of age on mercury concentrations (p.g/g) in livers of ciconiiform birds from south Florida. Values represent the geometric mean
and range (in parentheses)
Liver mercury (Ixg/g)
Species
Small nestlings
Large nestlings
Fledgling/Young adult
Great blue heron
0.31 (0.21-0.36)
1.53 (0.22-7.33)
6.65 (0.07-74.54)
Great egret
0.77 (0.31-1.85)
1.10 (0.18-18.84)
1.70 a
Little blue heron
0.33 (0.29-0.41)
0.73 a
0.24 (0.23-0.26)
Snowy egret
5.38 a
0.38 (0.15-1.43)
ND b
Tricolored heron
0.73 (0.20--4.96)
0.74 (0.12-2.69)
0.67 a
Roseate spoonbill
0.34 (0.16-0.74)
0.61 (0.26-5.38)
0.84 a
White ibis
0.50 (0.23-1.46)
0.52 ~
0.25 (0.05-1.28)
All species c
0.62 (0.46--0.83)
0.62 (0.47-0.82)
1.68 'i (1.15-2.47)
aValue represents datum from a single bird
bND = not available
c Least squares mean and 95% confidence interval (in parentheses)
dValue is significantly different from small nestling or large nestling birds (P = 0.0001)
Table
4. Effects of diet on mercury concentrations (p,g/g) in livers of ciconiiform birds from south Florida. Values represent the geometric mean
and range (in parentheses)
Liver mercury (~g/g)
Species
Diet A a
Diet B
Diet C
Great blue heron
2.31 (0.21-74.54)
Great egret
0.97 (0.18-18.84)
Little blue heron
0.43 (0.23-0.73)
Snowy egret
0.48 (0.15-5.38)
Tricolored heron
0.72 (0.12--4.96)
Roseate spoonbill
White ibis
All species b
1.39 c (1.10-1.77)
0.73 (0.52-1.01)
0.55 (0.16-5.38)
0.42 (0.05-1.46)
0.64 (0.44-0.92)
aDietary group A consists of those species which consume large fish as a major portion of the diet; group B consists of species which consume small
fish as a dietary component; group C consists of species which consume small fish, crustacea, and insects as major dietary components
bLeast squares mean and 95% confidence interval (in parentheses)
c Value is significantly different from those of dietary groups B (P < 0.004) or C (P < 0.006)
(small herons and egrets) and those which consume both fish
and arthropods (roseate spoonbills and white ibis). On average,
mercury concentrations in the large herons and egrets were two
times those of species feeding at lower trophic levels of the
aquatic food web.
Hepatic mercury concentrations were inversely related to the
relative amount of body fat (Table 5). Birds with only minimal
to moderate amounts of body fat had an average of two to three
times the concentrations of hepatic mercury compared to birds
with abundant amounts of fat (P < 0.007).
Discussion
A relationship was observed between hepatic mercury concen-
trations and geographic location, dietary habits, age, and nutri-
tional condition of wading birds collected from southern Flor-
ida. Birds containing the greatest concentrations of mercury
were collected from the central Everglades and eastern Flordia
Bay. Similar regional patterns of mecury contamination have
been observed by others in other species on mainland southern
Florida, particularly in fish and fish consumers in the area
(Hand and Friedemann 1990; Roelke
et al.
1991). In the
present study, mercury concentrations in nestling ciconiiform
birds reflected regional differences in the degree of contamina-
tion of aquatic food sources. In addition, the data suggest that
mercury contamination may extend into eastern Florida Bay.
When the same species and age groups were compared, mer-
cury concentrations reported in this study were similar to those
in birds collected in Ohio (Hoffman and Curnow 1979) and
South Dakota (Hesse
et al.
1975), but lower than those in birds
collected in the Netherlands (Van der Molen
et al.
1982),
Ontario (Fimreite 1974), Lake St. Clair (Dustman
et al.
1972),
and California (Faber
et al.
1972).
Although most of the ciconiiform species nesting in southern
Florida migrate from distant locations to breed there, concen-
trations of mercury in livers of adult birds had the same regional
relationships as did nestlings. In areas where nestlings had low
hepatic mercury, adult birds also had low levels of mercury
compared to adults collected in regions where nestlings had
higher liver concentrations of mercury. This suggests that con-
centrations in livers may reflect a recent exposure to mercury
rather than long term exposure elsewhere.
Hepatic mercury increased in concentration as a function of
the bird's age. This direct relationship between animal age and
mercury accumulation in tissues is consistent with numerous
ELECTRONIC FILING, RECEIVED, CLERK'S OFFICE, AUGUST 14, 2006
Mercury in Wading Birds in Southern Florida
303
Table 5. Relationship between amount of body fat and mercury concentrations (Ixg/g) in livers of ciconiiform birds from south Florida. Values
represent the geometric mean and range (in parentheses)
Species
Liver mercury (Ixg/g)
Relative amount of body fat present at time of death
Abundant
Moderate
Minimal
Great blue heron
2.76 (0.22-59.41)
4.33 (0.32-74.54)
Great egret
1.48 (1.28-1.70)
1.14 (0.70-1.85)
Little blue heron
0.24 (0.23-0.26)
0.48 (0.32-0.73)
Snowy egret
ND a
ND
Tricolored heron
0.67 (0.22-2.01)
0.32 (0.21-0.58)
Roseate spoonbill
0,68 (0.31-5.38)
ND
White ibis
0.34 (0.05-1.28)
0.24 b
All species
0,47 d (0.34-4).64)
1.21 (0.78-1.90)
1.47 (0.21-52.09)
0.91 (0.18-18.84
0.34 (0.29-0.41)
0.48 (0.15-5.38)
0.95 (0.20-4.96)
0.32 (0.16-0.74)
0.57 (0.27-1.46)
1.14 (0.88-1.46)
aND = no data available
bValue represents datum from a single bird
c Least squares mean and 95% confidence interval (in parentheses)
dValue is significantly different from that of birds with moderate fat (P < 0.0007) or minimal fat (P < 0.0001)
other reports (Burger 1993; Burger
et al.
1992; Frank
et al.
1983; Hoffman and Curnow 1979). Honda
et al.
(1986) have
shown that mercury accumulates rapidly in young stages of the
eastern great white egret downy chick. This accumulation is
partially diluted by growth of the chick, but body burdens are
reduced substantially during the first moult as mercury is lost
through the down. Hepatic mercury concentrations in the east-
ern great white egret undergo a substantial decline shortly after
hatching and remain low for the first 30-40 days of life. After
this time, mercury accumulates in the liver in an age-related
fashion (Honda
et al.
1986). Finding no differences in hepatic
mercury between small and large nestlings is consistent with
observations reported by Honda (1986).
Trophic level is important in the bioaccumulation of mercury
by wading birds. Species which consume larger predatory fish
accumulated greater concentrations of hepatic mercury than did
those species which consume smaller fish and invertebrates.
Hoffman and Curnow (1979) reported a similar relationship
between trophic level of prey species and bioaccumulation of
mercury in egrets and herons.
Birds with subnormal amounts of body fat concentrated he-
patic mercury to a greater degree than did birds with abundant
amounts of body fat. Frank
et al.
(1983) observed a similar
inverse relationship between amount of body fat and brain
concentrations of mercury in common loons. Subnormal body
fat in nestlings can result from poor absorption of nutrients or,
more likely, from the inability of the parents to adequately
provide for the nutritional needs of their offspring. Further-
more, natural stresses including food shortages may enhance
the toxicity of mercury (Wren
et al.
1987). Van der Molen
et
al.
(1982) found an association between high mercury concen-
trations and poor nutritional condition in fledged grey herons.
Inorganic mercury added to the drinking water of chickens
caused decreased growth rate (Grissom and Thaxton 1985).
Anorexia was observed in pigeons fed methylmercury (Evans
and Kostyniak 1972). Mallard ducks fed methylmercury and
their offspring showed both behavioral changes such as laying
eggs outside of the nest and decreased responsiveness to adult
calls by ducklings (Heinz 1979). Such behavioral changes po-
tentially could result in less food delivered to nestling wading
birds. An association between mercury contamination and
chronic disease causing death was determined in some of the
great white herons included in the present study (Spalding
et al.
in press).
All of the birds included in this study were found deceased,
injured, or terminally ill when collected. As a result, it was not
possible to compare these results with those of living birds to
determine whether mercury may have contributed to morbidity
and mortality. Hoffman and Curnow (1979) suggested that
mercury did not contribute to mortality in the great blue heron
nestlings collected in their study because concentrations were
greater in birds collected alive than those found deceased. He-
patic mercury concentrations reported by Hoffman and Curnow
(1979) ranged from 0.56 to 2.31 ixg/g (median = 0.96 p~g/g) in
nestling great blue herons compared to values of 0.21 to 7.33
ixg/g (median = 1.10 Ixg/g) in the present study. However,
mercury concentrations in great egret nestlings were greater in
the present study (0.18-18.84 Ixg/g, median = 0.86 ixg/g)
compared to those reported by Hoffman and Curnow (0.26-
1.13 ixg/g, median = 0.55 ixg/g).
It has been estimated that the wading bird population has
decreased by 90% in southern Florida (Robertson and Kushlan
1984). Although much of this decline can be attributed to loss
of habitat and changing hydroperiods, recent attention has fo-
cused on the impact of mercury on wading birds and other high
level aquatic feeders (Jurczyk 1993). In a risk assessment of the
impact of mercury on five indicator species (largemouth bass,
great egrets, raccoons, panthers, and alligators), great egrets
were placed at the highest risk of adverse health effects (Jurc-
zyk 1993). Scheuhammer (1991) reported that neurologic signs
are typically associated with liver mercury concentrations of
30 Ixg/g in birds in general. He did not indicate whether there
were species differences in susceptibility to the neurotoxic ef-
fects of mercury. In the present study four birds, all great blue
herons and all from Area 3, had hepatic mercury concentrations
at or above 30 Ixg/g. Tissue mercury concentrations associated
with significant reproductive impairment are typically much
lower than those causing overt neurologic impairment (Scheu-
hammer 1991). Reproductive success in captive ducks can de-
crease by 35-50% through dietary ingestion of mercury at
ELECTRONIC FILING, RECEIVED, CLERK'S OFFICE, AUGUST 14, 2006
304
S.F. Sundlof
et al.
concentrations insufficient to cause neurologic signs (Heinz
1974). Hepatic mercury concentrations of 2-12 Ixg/g in adult
pheasants and mallard ducks were associated with egg shell
thinning and decreased hatchability (Fimreite 1971; Heinz
1976). If ciconiiform birds are as sensitive to the reproductive
effects of mercury as are pheasants or ducks, the data presented
in this paper suggest that wading bird populations in southern
Florida are at imminent risk of further declines. However, other
studies have failed to demonstrate an effect of mercury on egg
shell thickness (Eisler 1987). Of the 144 birds in the present
study, 45 (31%) had hepatic mercury in excess of 2 Ixg/g
whereas 11 (7.6%) had liver mercury concentrations greater
than 12 Ixg/g. Considering only those birds of potential breed-
ing age (fledgling and young adults), 67% had liver concentra-
tions above 2 p~g/g, and 24% had concentrations greater than 12
I~g/g. In the central Everglades and eastern Florida Bay (Area
3) where mercury concentrations were significantly greater
than in the other collection areas, 80% of potential breeding-
age birds had hepatic mercury concentrations in excess of 2
~zg/g and 30% had concentrations greater than 12 ptg/g.
It is estimated that the nesting wading bird population in
Florida has declined to 10% of its original size (Runde 1991).
The effects on reproduction of constant low-level exposure of
wading birds to mercury in the diet may be mediated primarily
through changes in reproductive behavior rather than the direct
toxic effects on fertility, embryonic development or hatchling
viability (Scheuhammer 1991). A recent quantitative risk as-
sessment indicates that the great egret population in southern
Florida is suffering a decrease in reproductive success due to
the effects of mercury in the food supply (Jurczyk 1993). The
risk assessment was based on the assumptions that great egrets
weighing 1 kg consume 195 g of prey per day, the diet is
composed of small fish (75%) and crayfish (25%), the average
concentration of mercury in small fish and crayfish in the Ever-
glades is 0.72 p~g/g and 2.4
t~g/g,
respectively, all mercury in
prey items is present as methylmercury, and methylmercury is
100% bioavailable following ingestion. Based on these as-
sumptions, great egrets would be expected to consume a daily
dose of 0.233 mg mercury. For the risk model, Jurczyk (1993)
selected a Lowest Observable Adverse Effect Level (LOAEL)
for mercury of 0.059 mg/kg/day based on the dose required to
produce adverse reproductive effects in loons as reported by
Scheuhammer (1991). Jurczyk concluded that great egrets are
consuming mercury at a daily rate of 3.9 times the LOAEL thus
placing the population at risk of mercury-induced adverse re-
productive effects. Jurczyk performed similar risk assessments
for largemouth bass, raccoons, Florida panthers, and American
alligators inhabiting the Everglades. Great egrets were consid-
ered to be at greatest risk of adverse health effects than any of
the other species studied. The data reported in the present study
provide additional evidence in support of this conclusion.
Acknowledgments.
This work was supported by a grant from the Non-
game Wildlife Program of the Florida Game and Fresh Water Fish
Commission and by National Audubon Society Research Center in
Tavernier, Florida. Thomas Bancroft, Robin Bjork, Alison Brody,
Robin Corcoran, Mary Beth Decker, Peter Frederick, Deborah Jansen,
Howard Jelks, George Powell, Darren Rumbold, Rick Sawicki, John
Simon, Jeff Smith, Allen Strong, Cindy Thompson, and Charlotte
Wilson all assisted in the collection of specimens.
References
Burger J (1993) Metals in feathers of brown noddy
(Anous
stolidus):
Evidence for bioaccumulation or exposure levels? Environ Monit
Assess 24:181-187
Burger J, Parsons K, Benson T, Shukla T, Rothstein D, Gochfeld M
(1992) Heavy metal and selenium levels in young cattle egrets
from nesting colonies in the northeastern United States, Puerto
Rico, and Egypt. Arch Environ Contam Toxicol 23:435-439
Cabbage H (1989) State Scientists Battle Mercury Contamination.
Florida Wild143(3):6-7
Clarkson TW, Marsh DO (1982) Mercury toxicity in man. In: JO
Prasad (ed) Clinical, biochemical and nutritional aspects of trace
elements, Vol. 6. Alan R Liss, Inc, NY, pp 549-568-
Collopy MW, Jelks HL (1989) Distribution and foraging: Wading
birds in relation to the physical and biological characteristics of
freshwater wetlands in Southwest Florida. Final Report Number
GFC-85-003. Florida Game and Freshwater Fish Commission,
Nongame Program, Tallahassee, FL
Delfino JJ, Crisman JF, Gottgens JF, Rood BE, Earle CD (1993)
Spatial and temporal distribution of mercury in Everglades and
Okefenokee wetland sediments. Final project report: April 1,
1991-June 30, 1993. Department of Environmental Engineering
Sciences, University of Florida, Galnesville, FL
Dustman EH, Stickel LF, Elder JB (1972) Mercury in wild animals,
Lake St. Clair, 1970. In: R. Hartung and BB Dinman (eds) Envi-
ronmental mercury contamination. Ann Arbor Science Publishers,
Ann Arbor, MI, pp 46-52
Eisler R (1987) Mercury hazards to fish, wildlife, and invertebrates: A
synoptic review. US Wildl Serv Biol Rep 85(1.10), 90 pp
Evans HL, Kostyniak PJ (1972) Effects of chronic methylmercury on
behavior and tissue mercury levels in the pigeon. Fed Proc
3 I:A 1956, Atlantic City, NJ
Faber RA, Risebrough RW, Pratt HM (1972) Organochlorines and
mercury in common egrets and great blue herons. Environ Pollut
3:111-122
Fimreite N (1971) Effects of dietary methylmercury on ring-necked
pheasants. Can Wildl Serv Occas Pap 9:5-37
Fimreite N (1974) Mercury contamination of aquatic birds in north-
western Ontario. J. Wildl Manage 38:120-131
Frank R, Lumsden H, Barr JF, Braun HE (1983) Residues of organo-
chlorine insecticides, industrial chemicals, and mercury in eggs
and tissues take from healthy and emaciated common loons, On-
tario, Canada, 1968-1980. Arch Environ Contain Toxicol
12:641-654
Grissom RE, Thaxton JP (1985) Onset of mercury toxicity in young
chickens. Arch Environ Contain Toxicol 14:193-196
Hand J, Friedemann M (1990) Mercury, largemouth bass, and water
quality: A preliminary report. Department of Environmental Reg-
ulation, State of Florida, Tallahassee, FL
Heinz GH (1974) Effects of low dietary levels of methyl mercury
mallard reproduction. Bull Environ Contam Toxicol 11:386-392
Heinz GH (1979) Methyl mercury: Reproductive and behavioral ef-
fects in three generations of Mallard ducks. J Wildl Manage
43: 394-401
Hesse LW, Brown RL, Heisinger JF (1975) Mercury contamination of
birds from a polluted watershed. J Wildl Manage 39:299-304
Hoffman RD, Curnow RC (1979) Mercury in herons, egrets, and their
foods. J Wildl Manage 43:85-93
Honda K, Byung YM, Tatsukawa R (1986) Distribution of heavy
metals and their age-related changes in the eastern great white
egret,
Egretta
alba
modesta,
in Korea. Arch Environ Contain
Toxicol 15:185-197
Jordan D (1990) Mercury contamination: Another threat to the Florida
panther. Endangered Species Technical Bulletin, Department of
the Interior, U.S. Fish and Wildlife Service 15(2): 1-2, Washing-
ton, DC
Jurczyk NU (1993) An ecological risk assessment of the impact of
ELECTRONIC FILING, RECEIVED, CLERK'S OFFICE, AUGUST 14, 2006
Mercury in Wading Birds in Southern Florida
305
mercury contanaination in the Florida Everglades. Masters Thesis,
University of Florida, Gainesville, FL
KBN
Engineering
and Applied
Sciences
Inc
(1992) Mercury emis-
sions to the atmosphere in Florida. Final report to the Florida
Department of Environmental Regulation, August 1992, Gaines-
ville, FL
Ogden JC (1994) A comparison of wading bird nesting dynamics,
1931-1946 and 1974-1989, as an indication of ecosystem condi-
tions in the southern Everglades. In: Davis S, Ogden JC, (eds),
Everglades, spatial and temporal patterns as guidelines for ecosys-
tem restoration, University of Horida Press, Gainesville, FL pp
533-570
Robertson WB, Kushlan JA (1984) The southern Florida avifauna. In:
Gleason PJ (ed) Environmentals of south Florida: Past and present
II. Miami Geological Society, Coral Gables, FL, pp 21%257
Roelke ME, Schultz DP, Faeemire CF, Sundlof SF, Royals HE (1991)
Mercury contamination in Florida panthers, Report of the Florida
Panther Technical Subcommittee to the Florida Panther Inter-
agency Committee, Gainesville, FL
Royals H, Lange T (1990) Mercury in Florida fish and wildlife. Florida
Wildlife 44(2):3-6
Runde DE (1991) Trends in wading bird nesting populations in Florida
1976-1978 and 1986-1989. Final Performance Report. Florida
Game and Fresh Water Commission, Nongame Progam, Talla-
hasse, FL Survey #7612, Tallahassee, FL
Scheuhammer AM (1991) Effects of acidification on the availability of
toxic metals and calcium to wild birds and mammals. Environ
Pollut 71:329-375
Spalding MG, Bjork RD, Powell GVN, Sundlof SF (in press) Mercury
contamination and cause of death in free-ranging great white her-
ons.
Van Der Molen EJ, Blok AA, De Graft GJ (1982) Winter starvation
and mercury intoxication in gray herons
Ardea
cinerea
in the
Netherlands. Ardea 70:173-184
Wren CD, Hunter DB, Leatherland JF, Stokes PM (1987) The effects
of polyehlorinated biphenyls and methylmercury, singly and in
combination, on mink: Uptake and toxic responses. Arch Environ
Contam Toxicol 16:441-447
ELECTRONIC FILING, RECEIVED, CLERK'S OFFICE, AUGUST 14, 2006
ELECTRONIC FILING, RECEIVED, CLERK'S OFFICE, AUGUST 14, 2006
ELECTRONIC FILING, RECEIVED, CLERK'S OFFICE, AUGUST 14, 2006
ELECTRONIC FILING, RECEIVED, CLERK'S OFFICE, AUGUST 14, 2006
ELECTRONIC FILING, RECEIVED, CLERK'S OFFICE, AUGUST 14, 2006
ELECTRONIC FILING, RECEIVED, CLERK'S OFFICE, AUGUST 14, 2006
ELECTRONIC FILING, RECEIVED, CLERK'S OFFICE, AUGUST 14, 2006
ELECTRONIC FILING, RECEIVED, CLERK'S OFFICE, AUGUST 14, 2006
ELECTRONIC FILING, RECEIVED, CLERK'S OFFICE, AUGUST 14, 2006
ELECTRONIC FILING, RECEIVED, CLERK'S OFFICE, AUGUST 14, 2006
ELECTRONIC FILING, RECEIVED, CLERK'S OFFICE, AUGUST 14, 2006
ELECTRONIC FILING, RECEIVED, CLERK'S OFFICE, AUGUST 14, 2006
ELECTRONIC FILING, RECEIVED, CLERK'S OFFICE, AUGUST 14, 2006
ELECTRONIC FILING, RECEIVED, CLERK'S OFFICE, AUGUST 14, 2006
ELECTRONIC FILING, RECEIVED, CLERK'S OFFICE, AUGUST 14, 2006
ELECTRONIC FILING, RECEIVED, CLERK'S OFFICE, AUGUST 14, 2006
ELECTRONIC FILING, RECEIVED, CLERK'S OFFICE, AUGUST 14, 2006
ELECTRONIC FILING, RECEIVED, CLERK'S OFFICE, AUGUST 14, 2006
ELECTRONIC FILING, RECEIVED, CLERK'S OFFICE, AUGUST 14, 2006
ELECTRONIC FILING, RECEIVED, CLERK'S OFFICE, AUGUST 14, 2006
ELECTRONIC FILING, RECEIVED, CLERK'S OFFICE, AUGUST 14, 2006
ELECTRONIC FILING, RECEIVED, CLERK'S OFFICE, AUGUST 14, 2006
ELECTRONIC FILING, RECEIVED, CLERK'S OFFICE, AUGUST 14, 2006
ELECTRONIC FILING, RECEIVED, CLERK'S OFFICE, AUGUST 14, 2006
ELECTRONIC FILING, RECEIVED, CLERK'S OFFICE, AUGUST 14, 2006
ELECTRONIC FILING, RECEIVED, CLERK'S OFFICE, AUGUST 14, 2006
ELECTRONIC FILING, RECEIVED, CLERK'S OFFICE, AUGUST 14, 2006
ELECTRONIC FILING, RECEIVED, CLERK'S OFFICE, AUGUST 14, 2006
ELECTRONIC FILING, RECEIVED, CLERK'S OFFICE, AUGUST 14, 2006
ELECTRONIC FILING, RECEIVED, CLERK'S OFFICE, AUGUST 14, 2006
ELECTRONIC FILING, RECEIVED, CLERK'S OFFICE, AUGUST 14, 2006
ELECTRONIC FILING, RECEIVED, CLERK'S OFFICE, AUGUST 14, 2006
ELECTRONIC FILING, RECEIVED, CLERK'S OFFICE, AUGUST 14, 2006
ELECTRONIC FILING, RECEIVED, CLERK'S OFFICE, AUGUST 14, 2006
ELECTRONIC FILING, RECEIVED, CLERK'S OFFICE, AUGUST 14, 2006
ELECTRONIC FILING, RECEIVED, CLERK'S OFFICE, AUGUST 14, 2006
ELECTRONIC FILING, RECEIVED, CLERK'S OFFICE, AUGUST 14, 2006
ELECTRONIC FILING, RECEIVED, CLERK'S OFFICE, AUGUST 14, 2006
ELECTRONIC FILING, RECEIVED, CLERK'S OFFICE, AUGUST 14, 2006
ELECTRONIC FILING, RECEIVED, CLERK'S OFFICE, AUGUST 14, 2006
ELECTRONIC FILING, RECEIVED, CLERK'S OFFICE, AUGUST 14, 2006
146
Environmental Toxicology and Chemistry, Vol. 17, No. 2, pp. 146–160, 1998
Printed in the USA
0730-7268/98 $6.00
1
.00
EFFECTS OF MERCURY ON WILDLIFE: A COMPREHENSIVE REVIEW
MARTI F. WOLFE,*†§ STEVEN SCHWARZBACH,‡ and RINI A. SULAIMAN§
†Institute of Toxicology and Environmental Health, University of California–Davis, Davis, California 95616, USA
‡U.S. Fish and Wildlife Service, 3500 El Camino, Sacramento, California 95825
§Toxicology Task Force, Seattle, Washington 98125, USA
(
Received
28
February
1997;
Accepted
22
August
1997)
Abstract
—Wildlife may be exposed to mercury (Hg) and methylmercury (MeHg) from a variety of environmental sources, including
mine tailings, industrial effluent, agricultural drainwater, impoundments, and atmospheric deposition from electric power generation.
Terrestrial and aquatic wildlife may be at risk from exposure to waterborne Hg and MeHg. The transformation of inorganic Hg by
anaerobic sediment microorganisms in the water column produces MeHg, which bioaccumulates at successive trophic levels in the
food chain. If high trophic level feeders, such as piscivorous birds and mammals, ingest sufficient MeHg in prey and drinking
water, Hg toxicoses, including damage to nervous, excretory and reproductive systems, result. Currently accepted no observed
adverse effect levels (NOAELs) for waterborne Hg in wildlife have been developed from the piscivorous model in which most
dietary Hg is in the methyl form. Such model are not applicable to omnivores, insectivores, and other potentially affected groups,
and have not incorpotated data from other important matrices, such as eggs and muscle. The purpose of this paper is to present a
comprehensive review of the Hg literature as it relates to effects on wildlife, including previously understudied groups. We present
a critique of the current state of knowledge about effects of Hg on wildlife as an aid to identifying missing information and to
planning research needed for conducting a complete assessment of Hg risks to wildlife. This review summarizes the toxicity of
Hg to birds and mammals, the mechanisms of Hg toxicity, the measurement of Hg in biota, and interpretation of residue data.
Keywords
—Review
Wildlife
Methylmercury
Analytical methods
INTRODUCTION
The purpose of this review is to summarize the current state
of knowledge about the effects of mercury (Hg) on wildlife,
to provide an extensive reference list, and to add information
from the literature about the cellular and biochemical mech-
anism of methylmercury (MeHg) toxicity from laboratory an-
imal, aquatic animal, and in vitro work, when such findings
are pertinent to impacts on wildlife. In this way, we hope to
derive useful MeHg toxicologic benchmarks for wildlife, and
to identify areas where adequate information is lacking. The
literature search for this review drew on major computer da-
tabases for references concerning the effects of Hg on wildlife.
The general search criterion was ‘‘effects of MeHg on terres-
trial wildlife.’’ Using this search strategy, more than 800 ref-
erences were retrieved and screened. Because MeHg is the
form relevant to wildlife exposures, inorganic Hg effects have
been included only for comparative or illustrative purposes.
We preferentially selected studies reporting the results of di-
etary exposure, or oral administration at environmentally re-
alistic doses. Residue-type field surveys are useful for docu-
menting the extent of wildlife exposure, but have not been
included here unless they help to provide a quantifiable ex-
posure and effect. Studies conducted on wildlife species rarely
are able to use large sample sizes; therefore, conclusions drawn
from wildlife work are strengthened when supported and sup-
plemented by similar investigations employing domestic or
laboratory animals. Studies with domestic or laboratory spe-
cies, aquatic organisms, or humans have been included if they
* To whom correspondence may be addressed
(mfwolfe@ucdavis.edu).
Presented at the Wildlife Mercury Conference, Fairfax, Virginia,
USA, April 12–13, 1996.
provided information on a relevant toxicity endpoint for which
no data was available from a wildlife species. Acceptable end-
points were those that affect growth, viability, or reproductive
or developmental success, including behavior, immunologic
effects, neurologic impairment and neurohistologic lesions,
and teratology.
Reviews also have been presented recently by Heinz [1],
and Thompson [2]. This review includes a discussion of the
mechanisms of MeHg toxicity, which has not been included
in previous wildlife reviews, and a overview of Hg and MeHg
analysis methods in matrices of interest to wildlife toxicolo-
gists.
MECHANISM
Methylmercury toxicity in mammals is primarily mani-
fested as central nervous system damage; including sensory
and motor deficits and behavioral impairment [3,4] Animals
initially become anorexic and lethargic. Muscle ataxia, motor
control deficits, and visual impairment develop as toxicity pro-
gresses, with convulsions preceding death [5–7]. Smaller car-
nivores are more sensitive to MeHg toxicity than are larger
species, as reflected in shorter time to onset of toxic signs and
time to death. Dietary concentrations of 4.0 to 5.0
m
g/g MeHg
were lethal to mink and ferrets within 26 to 58 d, whereas
otters receiving the same concentration survived an average
of 117 days [3,8].
Methylmercury is readily transferred across the placenta,
and concentrates selectively in the fetal brain. Mercury con-
centrations in the fetal brain were twice as high as in the
maternal brain for rodents fed MeHg [9]. Reproductive effects
of MeHg in mammals range from developmental alterations
in the fetus, which produce physical or behavioral deficits after
birth, to fetal death [10–14]. Sundberg and Oskarsson [15]
ELECTRONIC FILING, RECEIVED, CLERK'S OFFICE, AUGUST 14, 2006
Review of Hg effects on wildlife
Environ. Toxicol. Chem.
17, 1998
147
reported speciation of Hg in the milk and offspring of rats
exposed to dietary MeHg. The lack of comparable data from
mammalian wildlife species certainly constitutes one of the
more glaring gaps in our knowledge.
Neurotoxicity
Methylmercury damages primarily the cerebellum and ce-
rebrum [16]. The neurotoxic effects of MeHg in adult mam-
mals include ataxia, difficulty in locomotion, neurasthenia (a
generalized weakness, impairment of hearing and vision, trem-
or, and finally loss of consciousness and death [1,14,17]. Le-
sions in the cerebral and cerebellar cortex accompany these
clinical signs. Necrosis, lysis, and phagocytosis of neurons
results in progressive destruction of cortical structures and
cerebral edema. O’Connor and Nielsen [5] found necrosis,
astrogliosis, and demyelination in the cerebral and cerebellar
cortex of otters that received 0.09, 0.17, and 0.37 mg/kg/d
MeHg for 45 to 229 d. In adult mammals MeHg is prefer-
entially taken up by glial cells; these seem particularly sus-
ceptible to MeHg damage [18]. Low concentrations (10
2
5
M)
of MeHg inhibit the ability of cultured rat brain astrocytes to
maintain a transmembrane K
1
gradient, resulting in cellular
swelling [19]. These findings support the suggestion of Clark-
son [20] that inhibition of cell membrane Na
1
,K
1
, adenosine
triphosphatase (ATPase) is the primary mechanism of MeHg
toxicity. Aschner and his coworkers [21] further showed that
the particular sensitivity of glial cells to MeHg was due to a
neutral amino acid carrier system that enhances transport of
MeHg into these cells. In an investigation of the protective
effect of glutathione against MeHg toxicity in cultured mouse
neuroblastoma cells, Kromidas et al. [22] proposed that MeHg
causes damage to microtubules by oxidation of tubulin sulf-
hydryls and peroxidative injury.
The behavioral deficits produced by exposure to MeHg are
known mostly from work with nonwildlife species, although
an early article by Burton et al. [23] describes Hg-induced
behavioral changes in
Peromyscus.
The behavioral teratology
of MeHg in rodents was summarized by Shimai and Satoh
[24]. Rats and mice exposed via the diet or by gavage at various
times during gestation period showed retarded righting reflex,
impaired or retarded swimming ability, decrease in sponta-
neous activities, impaired maze and avoidance learning, and
deficits in operant learning [25]. Behavioral effects on a car-
nivorous species are reported only for the domestic cat [26].
The use of primates to study the behavioral teratology of MeHg
has permitted more extensive investigations. Infant crab-eating
macaques (
Macaca fascicularis
) born to females exposed to
50 or 70
m
g/kg/d MeHg had blood MeHg levels of 1.69 ppm
at birth and 1.04 ppm at the time of testing. The exposed
macaques had significant deficits of visual recognition mem-
ory, compared to controls [27]. Cynomolgus monkeys (crab-
eating macaques,
M. fascicularis
) born to females given by
50
m
g/kg/d MeHg showed more nonsocial passive behavior,
and less social play than nonexposed monkeys [28]. Adult
macaques dosed with 0.24 to 1.0 mg/kg MeHg at twice-weekly
intervals for up to 73 weeks first experienced constriction of
the visual field, as has been reported by MeHg-intoxicated
humans, an effect that was reversible if exposure was discon-
tinued. At higher or more prolonged doses visual field con-
striction became permanent, and visual thresholds were al-
tered, reflecting damage to neurons in the visual cortex [29].
Rice [30] exposed female monkeys to 10 to 50
m
g/kg/d MeHg,
bred them, then administered the same doses to the young,
producing both a pre- and postnatal exposure. Infant Hg blood
levels were 0.46 to 2.66 ppm at birth, decreasing to a steady-
state concentration of 0.20 to 0.60 ppm by the time of behav-
ioral assessment (fixed interval and discrimination reversal
performance). Surprisingly, only small differences occurred in
test performance in the young monkeys, even though the mon-
key receiving the highest doses exhibited clear signs of MeHg
toxicity. Rice suggested that discrimination reversal might not
be a sufficiently sensitive test in this species [30]. Cynomolgus
monkeys to which Rice and Gilbert [31] administered 50
mg/kg/d MeHg for the first 7 years of life showed high-fre-
quency hearing loss at 14 years, although no further exposure
to MeHg occurred in the intervening 7 years. Ikeda et al. [32]
reported that 100 to 300
m
g/kg/d for 2 to 6 months was required
to produce neurologic signs in rhesus monkeys (
macaca mu-
latta
). Although MeHg-induced behavioral impairments in
birds have been documented (discussed below) comparable
investigations with mammalian wildlife species have not been
reported. Future effort should be directed to understanding the
effect of low-level chronic MeHg exposure to sensory and
behavioral function in wildlife species.
Biochemical and enzyme effects
Cholinesterase (ChE, acetylcholinesterase [AChE] and bu-
tyrylcholin esterase [BCE]) activities decreased in
Coturnix
quail receiving a diet containing 5 ppm MeHg for 18 weeks.
Dietary concentrations of 0.05 or 0.5 ppm alone did not inhibit
ChE activity, but potentiated the ChE inhibition of coadmin-
istered parathion. Quail receiving the highest concentration of
MeHg had liver total Hg residues of 35.8 ppm, wet weigth
[33,34]. Great blue heron nestlings were fed fish containing
0.31 to 0.87 ppm Hg in fish, resulting in liver Hg concentra-
tions of 1.32 to 1.71 ppm by the end of the nesting period;
however, no depression of brain ChE activity resulted from
this exposure [35]. In rhesus monkeys given 0.4, 4.0, or 50
m
g/kg/d MeHg for 150 d, no significant difference occurred
in ChE activity, even at the highest dose [36].
Glutathione and glutathione enzymes
The MeHg-induced swelling of cultured rat brain astrocytes
reported by Aschner et al. [19] mentioned earlier could be
prevented if the cells were exposed to MeHg as its glutathione
conjugate. Protection from MeHg-induced embryotoxicity in
mice was provided by administering
N
-acetyl-L-cysteine, a
precursor of glutathione, either simultaneously or following
MeHg exposure [37]. Di Simplicio and coworkers [38] mea-
sured the activities of several glutathione enzymes in liver and
kidney against a variety of substrates in mice given MeHg
with or without the protective coadministration of sodium sel-
enite. They described a complex interaction of glutathione in
tissues in which MeHg-induced damage and tissue repair oc-
curred together. Similar results in mice were reported by Ya-
sutake and Hirayama [39]
Immunotoxicity
Mercuric compounds have been demonstrated to be im-
munotoxic in several investigations. In a study in which rat
dams received 3.9
m
g/g diet MeHg during pregnancy, natural
killer cell activity was reduced 42% in offspring exposed in
utero and via lactation. A decline in T-cell activity in some
cell types was also noted [40]. Human peripheral blood cells
exposed in vitro to low concentrations of both Hg and MeHg
showed a dose-dependent reduction in T-cell proliferation, and
ELECTRONIC FILING, RECEIVED, CLERK'S OFFICE, AUGUST 14, 2006
148
Environ. Toxicol. Chem.
17, 1998
M.F. Wolfe et al.
in monocyte and macrophage viability. Cell death was pre-
ceded by disruption of cell membranes and an increase in
intracellular Ca
2
1
. The effect of MeHg was 5 to 10 times
greater than the effect of Hg effect [41,42]. However, even
inorganic Hg administered chronically to mice in drinking wa-
ter as HgCl caused immune cell impairment and disruption of
enzyme activity at doses too low produce kidney damage [43].
Methylmercury is more immunotoxic than Hg because MeHg
exerts a double influence on Ca
2
1
modulation. In rat T lym-
phocytes, the rapid increase in Ca
2
1
concentration caused by
MeHg resulted from both influx of extracellular Ca
2
1
and mo-
bilization of Ca
2
1
from intracellular stores; the HgCl
2
-induced
slow rise in Ca
2
1
was due only to influx [44].
Chronic exposure to MeHg at levels too low to cause overt
signs of toxicity may render an animal susceptible to infection
that it might otherwise resist [43,45]. The finding by Spalding
et al. [46] that great white herons dying of chronic, multiple
diseases had greater body burdens of Hg than those dying of
acute diseases suggests the importance for wildlife of mercurial
compounds’ immunotoxicity.
Genotoxicity
Both Hg and MeHg cause chromosome breakage, an effect
that is mitigated by H
2
SeO
3
[47,48]. In cultured lung and brain
cells from rats, Chinese hamsters, and humans, brain cells were
more susceptible to MeHg DNA strand breakage and cyto-
toxicity than were lung cells [47–50]. De Flora et al. [51]
reported in an extensive review of the genotoxicity of mercury
that Hg compounds often exerted clastogenic effects in eu-
karyotes, especially by binding SII groups and acting as spin-
dle inhibitors, thus causing c-mitosis and resultant aneuploidy
and/or polyploidy. Methylmercury compounds were more ac-
tive than inorganic Hg salts.
MAMMALS
The results of studies of the effects of MeHg on mammals
are summarized in Table 1. Controlled feeding studies em-
ploying wildlife species provide the highest quality data.
O’Connor and Neilsen [5] fed rations with 2, 4, or 8 ppm
MeHg to 11 adult male river otters, 3 per dose level and 2
controls. Actual MeHg consumption was quantified as 0.09,
0.17, and 0.37 mg/kg body weight/d. At the lowest observed
adverse effect level (LOAEL) dose of 0.09 mg/kg/d, two of
three otters developed anorexia and ataxia between day 168
and day 199. Histologic findings included neuronal necrosis
and demyelination, mainly in the neocortex and cerebellum.
Wobeser et al. [6] fed mink feed contaminated with fish con-
taining 0.44 ppm MeHg for 145 days. The fish comprised either
50% (0.22 ppm) or 75% (0.33 ppm) of the diet. No MeHg
toxicosis was observed at these exposures. Using a mink body
weight of 1.3 kg and food ingestion rate of 0.18 kg/d, the no
observed adverse effect level (NOAEL) from this study was
calculated to be 0.046 mg/kg/d. In a follow-up study, Wobeser
and coworkers [52] fed adult female mink rations containing
1.1, 1.8, 4.8, and 8.3 and 15 ppm MeHg for 93 d. Mink re-
ceiving 1.8 ppm and greater concentrations developed the same
signs of Hg toxicosis, irrespective of dose, but the time to
onset of signs was proportional to dose received. Mink re-
ceiving 1.1 ppm did not display clinical signs during the ob-
servation period, but at necropsy were found to have neuro-
logic lesions. The authors maintained that clinical manifes-
tations of MeHg toxicity would have developed at this those
had the exposure period been longer. This argument is sup-
ported by the findings of Wren et al. [14], who fed diets con-
taining 1 ppm MeHg to mink to determine the effects of chron-
ic exposure. The diet was fed daily until a female mink died
at 10 to 12 weeks, after which the diet was fed to the surviving
mink on alternate days, effectively reducing the dose to 0.5
ppm/d. These findings suggest that 1.0 ppm should be regarded
as the dietary LOAEL for mink and that a brain or muscle
concentration of 5.0 ppm is the criterion for MeHg toxicity in
mink. Ronald and coworkers [53] fed fish containg 0.25 or 25
mg/kg MeHg to harp seals. The 0.25 mg/kg exposure produced
lethargy and weight loss in the seals; 25 mg/kg was lethal to
seals exposed for 20 to 26 d.
Toxicokinetics and biotransformation
Ingested Hg may be either inorganic or organic, although
it is usually in the form of MeHg in higher trophic level feed-
ers. Inorganic Hg may be monovalent (mercurous) or divalent
(mercuric). Methylmercury is readily absorbed from the gas-
trointestinal tract (90–95%), whereas inorganic salts of Hg are
less readily absorbed (7–15%). In the liver, Hg binds to glu-
tathione, cysteine, and other sulfhydryl-containing ligands.
These complexes are secreted in the bile, releasing the Hg for
reabsorption from the gut [54]. In blood, MeHg distributes
90% to red blood cells and 10% to plasma. Inorganic Hg
distributes approximately evenly or with a cell : plasma ratio
of
$
2 [55]. O’Connor and Nielsen [5] found that length of
exposure was a better predictor of tissue residue level than
dose in otters, but that higher doses produced an earlier onset
of clinical signs.
Methylmercury readily crosses the blood–brain barrier,
whereas inorganic Hg does so poorly. The transport of MeHg
into the brain is mediated by its affinity for the anionic form
of sulfhydryl groups. This led Aschner and Aschner [56] to
propose a mechanism of molecular mimicry in which the car-
rier was an amino acid. Transport of MeHg across the blood–
brain barrier in the rat as MeHg-
L-cysteine complex has since
been described [57]. Demethylation occurs in brain tissue, as
evidenced by the observation that the longer the time period
between exposure to MeHg and measurement of brain tissue
residue, the greater the proportion of inorganic Hg [58–60].
Methylmercury is converted to mercuric Hg in other tissues,
but the rate of demethylation varies with tissue. In humans
exposed to dietary MeHg for 2 months, inorganic Hg consti-
tuted 16 to 40% of total Hg in lever, 7% in blood, and 22%
in plasma. In monkeys (
M. fascicularis
) given 50
m
g/kg body
weight MeHg for 12 months, the half-life (
t
1/2
) in brain was
35 d. However, the proportion of inorganic Hg increased with
increasing time after exposure [61]. Rice et al. [62] determined
the
t
1/2
of MeHg in macaque blood to be 14 d, and estimated
the brain
t
1/2
to be between 38 and 56 d. Chen et al. [63]
administered MeHg to rhesus monkeys for 3.5 to 12 months.
As the time between dosing and sacrifice increased, liver Hg
declined and kidney Hg increased. Under these exposure con-
ditions, the monkeys of Chen and coworkers did not exhibit
neurologic symptoms, and blood chemistry remained within
normal limits.
Both inorganic and organic Hg are excreted primarily in
feces; 98 d after administration of a radiolabeled dose of MeHg
to rats, 65% of the dose was recovered in the feces as inorganic
Hg and 15% was recovered as organic Hg. Urinary excretion
accounted for less than 5% of the dose, although urinary ex-
cretion of inorganic Hg increased with increasing time after
exposure. Incorporation into fur or hair is also an important
ELECTRONIC FILING, RECEIVED, CLERK'S OFFICE, AUGUST 14, 2006
Review of Hg effects on wildlife
Environ. Toxicol. Chem.
17, 1998
149
route of excretion for both methyl and mercuric Hg [64]. On
an average of species and tissues, the biological half-life of
MeHg in mammals is about 70 d; for inorganic Hg the half-
life is about 40 d.
All forms of Hg cross the placenta, but MeHg concentrates
selectively in the fetal brain. Fetal red blood cells contain 30%
more MeHg than do maternal red blood cells [65]. Methyl-
mercury concentrations in the fetal brain were twice as high
as in the maternal brain in rodents fed MeHg [9]. Reproductive
effects of MeHg in mammals include developmental altera-
tions that produce behavioral deficits after birth, impaired fer-
tility, and fetal death. Chang and Annau [11], Eccles and An-
nau [12], and Shimai and Satoh [24] reviewed the behavioral
toxicology of MeHg in mammals. Swimming ability, operant
learning, avoidance, maze learning, and development of re-
flexes were affected at the lowest dosages, followed by changes
in spontaneous activity, visual function, vocalization, and con-
vulsions at successively higher exposures.
Further exposure may occur after birth. When hamster fe-
males were given 1.6
m
mol/kg/d of radiolabeled MeHg the
day after giving birth to young, 0.12 nmol/g of radiolabeled
Hg was recovered in the milk 1 d later, 80 to 90% as MeHg.
Pups continued to accumulate Hg in the tissues for 10 to 12
days, after which tissue concentrations declined, except in fur
and kidneys, where concentrations increased throughout the
4-week study period. The investigators calculated that 5% of
the dose administered to the dam passed to the young in the
milk [66].
BIRDS
Mercury concentrations in avian eggs and tissues and re-
lated effects are summarized in Table 2. The biokinetics and
toxicology of organomercurials in birds, particularly of MeHg,
have been more extensively studied than those of Hg in the
inorganic form. This is due to the greater toxicity and bioac-
cumulation of the methylated form compared to inorganic
forms. Intestinal absorption of inorganic Hg is limited to a
few percent, whereas absorption of MeHg is nearly complete
[67]. The half-life of Hg in seabirds has been estimated to be
about 60 d [68]. Inorganic Hg exerts its greatest effect on the
kidneys, whereas MeHg is a potent embryo and nervous sys-
tem toxicant. Methylmercury readily penetrates the blood–
brain barrier in birds, as in mammals, producing brain lesions,
spinal cord degeneration, and central nervous system dys-
functions. Symptoms of acute MeHg poisoning in birds include
reduced food intake leading to weight loss; progressive weak-
ness in wings and legs; difficulty flying, walking, and standing;
and an inability to coordinate muscle movements [67]. Brain
residues are most diagnostic for acute Hg poisoning. Kidney
disease and kidney lesions also are strongly associated with
elevated dietary Hg [46, 69–71]. Determination of Hg con-
centrations in brain, liver, and kidney of birds found dead is
desirable if Hg poisoning is suspected. In some species, es-
pecially Procellariformes, demethylation of Hg appears to be
a significant detoxification strategy.
In addition to well-identified acute effects of Hg at high
concentrations, significant adverse effects also occur at lower
tissue Hg concentrations representing chronic Hg exposures.
In great white herons liver Hg contamination
.
6 ppm corre-
lated with mortality from chronic diseases [72]. Reproduction
is one of the most sensitive toxicologic responses, with very
low dietary concentrations causing effects [73–76]. Concen-
trations in the egg are typically most predictive of Hg risk to
avian reproduction, but concentrations in liver have also been
evaluated for predicting reproductive risk. The documented
effects of Hg on reproduction range from embryo lethality to
sublethal behavioral changes in juveniles at low dietary levels:
Effects of Hg include reduced hatchability due to increases in
early mortality of embryos, eggshell thinning, reduced clutch
size, increased numbers of eggs laid outside the nest, and
aberrant behavior of juveniles, and potentially may include
impaired hearing of juveniles [73,77–80].
Hg in avian diets
Barr [75] indicated that reductions in egg laying and ter-
ritorial fidelity were associated with mean prey Hg concen-
trations of 0.3 to 0.4 ppm fresh weight; common loons estab-
lished few territories, laid no eggs, or one egg and raised no
progeny in waters where the mean Hg concentrations of prey
exceeded 0.4 ppm fresh weight. The dietary concentrations of
MeHg that are required to produce significant reproductive
impairment are about 1.5-fold those required to produce overt
toxicity in adult birds of the same species [81]. Overall re-
productive success in birds can decrease by 35 to 50% due to
dietary MeHg exposure insufficient to cause obvious signs of
intoxication in adults. Heinz [73] fed 0.5 mg/kg dry weight
MeHg (0.1 mg/kg wet weight) to three generations of mallards.
Females laid fewer eggs and produced fewer ducklings. Barr
[75] made the same observations in the field study mentioned
previously where reductions in egg laying and in nest-site and
territorial fidelity of the common loon in northwestern Ontario
were associated with maximum Hg residues in eggs of 1.39
mg/kg wet weight. The loon diet contained from 0.2 to 0.3
mg/kg wet weight Hg. Heinz [73] also found that ducklings
in his multigeneration laboratory feeding study were less re-
sponsive to taped maternal warning calls and were hypersen-
sitive to fright stimulus.
Hg in avian liver, brain, and kidney
Correct interpretation of tissue residue data requires char-
acterization of the various species of Hg. The kidney is a major
reservoir of inorganic Hg in birds as well as in mammals. In
renal tissue Hg will bind to metallothionein. Not surprisingly,
the major toxic effects of inorganic Hg are kidney damage
when Hg-induced necrosis of proximal tubular cells occurs
[82]. Spalding et al. [46] found that liver Hg concentrations
.
6 ppm correlated with malnutrition and mortality from chron-
ic disease in great white herons; however, the authors cautioned
against overinterpreting these results because only dead birds
were examined. Zillioux and coauthors [83], in their review
of the literature, found that concentrations in liver between 1
and 2 ppm (wet weight) Hg may be associated with behavioral
effects, whereas liver Hg concentrations of about 11 ppm (wet
weight) and above were associated with high embryo/duckling
mortality and brain lesions. Spalding and Forrester [84] sug-
gested that neurologic effects may be associated with liver Hg
levels in birds as low as 5 ppm (wet weight). Gochfeld [85]
reported abnormal feather loss in the young of common terns
having liver concentrations of 3 to 14 ppm. Zillioux et al. [83]
concluded that a conservative residue threshold for major toxic
effects in waterbirds is 5 ppm (wet weight) in liver. In contrast,
apparently normal seabirds have been found with extraordi-
narily high Hg concentrations in liver, but these concentrations
have been primarily inorganic Hg [86]. In the majority of wild
birds sampled, liver concentrations of Hg are usually higher
than kidney concentrations. However, in Hg poisoning some
ELECTRONIC FILING, RECEIVED, CLERK'S OFFICE, AUGUST 14, 2006
150
Environ. Toxicol. Chem.
17, 1998
M.F. Wolfe et al.
Table1.Effectsofmercuryandmethylmercury(MeHg)onmammalsandassociatedtissueresidues
Species
Tissue
Tissueconcn.
(ppm,wetwt.)
Dose
(mg/kgorppm)
Route/form
Exposure/
duration
Effect/comments
Reference
Dog(
Canisfamiliaris
)
0.1–0.25
mg/kg
Oral,during
pregnancy
Stillbirths
[13]
Cat(
Feliscatus
)
Liver(totalHg)
40.2
0.25mg/kg/d,5of7d
MeHg,incapswith
food
90d
Firstconvulsions68dafter
dosing,meansurvival78d
[17]
Liver(MeHg)
Hair
Liver
Kidney
Brain
Muscle
Heart
Lung
18.1
170
40.2
21.6
11.3
15.1
8.92
10.8
Cat
Brain
0.85
0.55with2.9mg/kg
selenium
Dietary,93.5–154
m
g/d
188d
Nodifferenceinmazelearning
orhandlingresponsebutless
thanhalfobjectcontacton
openfieldtest
[26]
Kidney
Liver
1.27
11.9
Muscle
1.59
[10]
Cat
0.5
Dietary
7–11months
Proliferationofsmooth
endoplasmicreticulum;
degenerationofhepatic
mitochondria
Pig(
Sus
spp.)
0.5
Oral,during
pregnancy
Stillbirths
[13]
Crab-eatingmacaque(
Macaca
fascicularis
)
0.4
m
g/kgbodywt.
MeHg,inapple
juice
150d
Noclinicalsymptoms,no
significantdifferencein
cholinesteraseactivity
[36]
4.0
m
g/kgbodywt.
50
m
g/kgbodywt.
Rhesusmonkey(
Macaca
mulatta
)
0.5mg/kg
Oral,d20to30of
pregnancy
Abortions,maternaltoxicity
[13]
Rhesusmonkey
Liver
Kidney
22.91
21.32
125
m
g/kgbodywt./d
MeHg,inapple
juice
3.5months
Noclearanceperiod;liverand
kidneyhistologicalterations
[62]
Liver
Kidney
26.4
30.32
80
m
g/kgbodywt./d
7months
Noclearanceperiod;liverand
kidneyhistologicalterations
Liver
Kidney
14.45
46.93
80
m
g/kgbodywt./d
12months
Noclearanceperiod;liverand
kidneyhistologicalterations
Liver
Kidney
1.12
10.34
100
m
g/kgbodywt./d
10months
Five-monthclearanceperiod;
livernormal,kidneyeffects
persisted
Liver
Kidney
2.51
29.54
80–100
m
g/kgbodywt./d
15
months
Twoandone-half-month
clearanceperiod;livernormal,
kidneyeffectspersisted
Liver
Kidney
2.73
11.76
90
m
g/kgbodywt./d
10months
Fourandone-half-month
clearanceperiod;livernormal,
kidneyeffectspersisted
ELECTRONIC FILING, RECEIVED, CLERK'S OFFICE, AUGUST 14, 2006
Review of Hg effects on wildlife
Environ. Toxicol. Chem.
17, 1998
151
Table1.Continued
Species
Tissue
Tissueconcn.
(ppm,wetwt.)
Dose
(mg/kgorppm)
Route/form
Exposure/
duration
Effect/comments
Reference
Mink(
Mustelavison
)
Liver
30.1
1
MeHgCl
2
6months
Sublethal,synergisticeffectwith
polychlorinatedbiphenyls
causedreducedkitsurvival
[14]
Brain
8.6
Experimentaldietfed
everyotherdayafter
Kidney
36.2
mortalitiesoccurredat
10–12weeks
Mink
Liver
Brain
Kidney
44.1
15.3
28.4
1
6months
Lethal(femalesonly)
[14]
Mink
Liver
55.6
5
MeHgindiet
Ataxia,anorexia,paralysis,death
betweenday30andday37
[7]
Kidney
Brain
Muscle
Fur
37.7
19.9
25.2
1.22
Spleen
Lung
Heart
24.8
17.1
16.7
Mink
Liver
4.2
0.44
Contaminatedfish
as50%or75%
oftotaldiet(0.33
ppm)
120d
Noclinicalorpathologiceffect
[6]
Kidney
2.6
Noobservedadverse
effectlevel(NOAEL)
Brain
3.4
0.073mg/kg/d(male)
0.046mg/kg/d(female)
Mink
Liver
Kidney
Brain
Muscle
Fur
0.45
0.75
0.1
0.2
0.9
0.1
MeHg,dietary
93d
Noeffect
[6]
Liver
25.3
1.1Lowestobserved
adverseeffectlevel
(LOAEL)
Nervetissuelesions,noclinical
signs
Kidney
22.4
0.24mg/kg/d(male)
Brain
8.2
0.15mg/kg/d(female)
Muscle
Fur
7.8
1.8
Liver
21.3
1.8
Anorexia,ataxiaat50–80d,
deathat59–79d
Kidney
Brain
Muscle
Fur
22.3
18.1
4.9
2.3
Mink
Liver
Kidney
Brain
Muscle
Fur
20.5
22.3
10.5
14.1
1.7
4.8
Anorexia,ataxiaat23–32d;
deathat26–36d
ELECTRONIC FILING, RECEIVED, CLERK'S OFFICE, AUGUST 14, 2006
152
Environ. Toxicol. Chem.
17, 1998
M.F. Wolfe et al.
Table1.Continued
Species
Tissue
Tissueconcn.
(ppm,wetwt.)
Dose
(mg/kgorppm)
Route/form
Exposure/
duration
Effect/comments
Reference
Liver
Kidney
Brain
Muscle
Fur
31.7
21.5
13.3
17.4
1.2
8.3
Anorexia,ataxiaat16–21d;
deathat19–26d
Liver
Kidney
Brain
Muscle
Fur
23.6
26.4
15.6
22
1.2
15
Anorexia,ataxiaat16–18d;
deathat18–20d
Otter(
Lutracanadensis
)
Liver,totalHg
1.85
0ppm
MeHg,dietary
210d
[5]
Liver,organicHg
Kidney,totalHg
Kidney,organicHg
Muscle,totalHg
Muscle,organicHg
1.03
2.1
1.62
0.93
0.77
Brain,totalHg
Brain,organicHg
0.38
0.3
Liver,totalHg
Liver,organicHg
Kidney,totalHg
Kidney,organicHg
Muscle,totalHg
Muscle,organicHg
Brain,totalHg
Brain,organicHg
32.6
17.3
37.6
23.6
13.3
12
13.3
10.3
2ppm(0.09mg/kg)
Average181d
Anorexia,ataxiaintwoofthree,
day168today199
Otter
Liver,totalHg
Liver,organicHg
Kidney,totalHg
Kidney,organicHg
Muscle,totalHg
Muscle,organicHg
Brain,totalHg
Brain,organicHg
35.3
17.3
39.6
31.6
17.3
16.3
21
18.5
4ppm
Average116d
Anorexia,ataxiainthreeof
three,day101today120;
nephroticandneurologic
lesions
Liver,totalHg
Liver,organicHg
Kidney,totalHg
Kidney,organicHg
Muscle,totalHg
Muscle,organicHg
Brain,totalHg
32.3
17.3
40.3
28.5
21.6
15.2
23.7
8ppm
Average50d
Lethal;meantimetodeath,54
d;nephroticandneurologic
lesions
Brain,organicHg
14
Peromyscus
Hair
Hair
10.8
0.31
Impairedswimming,openfield
[23]
Rat,Sprague–Dawley(
Rattus
norvegicus
)
3.9
MeHg,dietary
Fedtodam,11
weekspriorto
mating;during
gestationand
lactation
[15]
ELECTRONIC FILING, RECEIVED, CLERK'S OFFICE, AUGUST 14, 2006
Review of Hg effects on wildlife
Environ. Toxicol. Chem.
17, 1998
153
Table1.Continued
Species
Tissue
Tissueconcn.
(ppm,wetwt.)
Dose
(mg/kgorppm)
Route/form
Exposure/
duration
Effect/comments
Reference
Milk
0.16
Noeffectonmaternalbody
weight,orlittersize
Adultbrain
2.9
Fourpercentlowerbodyweight
inoffspring
Adultblood
32
Noeffectonbehaviorofdams
oroffspring
Pupbrain
0.44
Reducednaturalkillercell
activity
Pupblood
1.52
Slightincreaseincerebellar
noradrenaline
Pupbrain
Pupblood
Pupbrain
Pupblood
0.35
0.98
0.092
0.42
Harpseal(
Pagophilus
groenlandicus
)
Brain
14.8
0.25
Ingelcaps,infish
60d
Declineinappetite,bodyweight
[53]
Kidney
Liver
Blood(MeHg)
Blood(totalHg)
69.5
64
8.85
9.93
Brain
21.8
90d
Reducedactivityafter60d
Kidney
Liver
Blood(MeHg)
50.6
82.5
12.5
Blood(totalHg)
13.1
Brain
33.3
25
Lethargy,weightlossfromday
3;deathonday20today26
Kidney
Liver
Blood(MeHg)
Blood(totalHg)
110
126
21.3
28.5
ELECTRONIC FILING, RECEIVED, CLERK'S OFFICE, AUGUST 14, 2006
154
Environ. Toxicol. Chem.
17, 1998
M.F. Wolfe et al.
Table 2. Mercury concentrations in avian eggs and tissues and related effects
Tissue
Concn.
(ppm)
Wet (w)
or dry (d)
Endpoint
Species
Reference
Liver
Liver
Liver
1.06
22.2
3–13.7
w
w
No effect
Abnormal feather loss in juveniles
Decreased hatchability
Common tern
Common tern
Common loon
[85]
[85]
[75]
Liver
5
w
Conservative threshold for major toxic
effects
Water birds
[83]
Liver
.
6
w
Correlated mortality from chronic disease
Great white heron
[46]
Liver
Liver
Liver
Liver
Liver
Liver
Liver
Liver
Liver
Liver
Liver
7.2
9.08
20.7
27.5
29.7
30
35
51.9
54.5
97.7
103.6
w
w
w
w
w
w
w
w
w
w
w
Increased disease and emaciation
Nesting success
Hatching success
10–12% fledge rate
Reduced nesting success
Neurologic effects
Death
Reduced hatching success
LD33
a
Death
LD33
Great white heron
Common tern
Common tern
Common tern
Common loon
Birds in general
Osprey
Common loon
Common grackle
Gannet
European starling
[84]
[76]
[76]
[46]
[75]
[92]
[96]
[75]
[89]
[89]
Liver
Liver
126.5
306 total/20.4
MeHg
w
d
LD33
No adverse effects observed
Red-winged blackbird
Black-footed albatross
[89]
[86]
Brain
.
2
w
Reduced egg laying, and decreased nest
and territory fidelity
Common loon
[75]
Brain
Brain
4–6
20
w
w
Failure to hatch
25% mortality
Black duck
Zebra finch
[93]
[88]
Egg
1–5/0.2–1.0
d
Reduced productivity in one half of the
population
Merlin
[95]
Egg
Egg
Egg
0.5–1.5
0.86
1.0
w
w
w
Decreased hatchability
Aberrant nesting behavior
Successful reproduction
Pheasant
Common loon
Common tern
[73]
[73]
[76]
Egg
1.0–3.6
w
Residue threshold for significant toxic
effects
Variety of water birds
[83]
Egg
Egg
2–16
3.65
w
w
No decreased hatchability
27% hatching, 10–12% fledging
Herring gull
Common tern
[76]
[76]
Kidney
37.4 total/6.2
MeHg
d
No adverse effect observed
Black-footed albatross
[86]
Kidney
Kidney
Kidney
40.4
74.3
86.4
w
w
w
LD33
LD33
LD33
Grackle
Red-winged blackbird
European starling
[89]
[89]
[89]
a
LD33
5
lethal dose, 33%.
indication exists that kidney concentrations may be elevated
to near the liver concentration [87]. Kidney concentrations of
20 ppm have been found in birds found dead in Hg-contam-
inated environments [87]. It should be noted that birds differ
from mammals in having a renal portal system; venous blood
from the terminal portion of the digestive tract flows to the
kidney rather than the liver, as in mammals. This may make
the avian kidney more vulnerable. Brain Hg as low as 3 to 7
ppm can be lethal to ducklings. Four times these values are
required to cause direct mortality in adults. The lowest con-
centration of Hg in brain found to produce obvious signs of
intoxication in adults was 5 ppm dry weight or 1 to 1.6 ppm
wet weight [88]. Brains of dead mallard ducklings with lesions
in the brain contained an average of 6.17 and 5.19 ppm on 2
successive years [78]. Passerines are poorly represented in Hg
studies; however, Finley et al. [89] found liver Hg concentra-
tions between 50 and 150 ppm in four species of songbirds
exposed to levels of Hg fatal to one third of the test group,
and Scheuhammer [88] reported that Hg exposure lethal to
25% of exposed zebra finches resulted in brain Hg residues
of 20 ppm [88].
Reproductive effects and egg concentrations
Toxic effects of Hg in bird eggs have been documented by
many investigators in both laboratory and field studies
[73,75,76,78,90–96]. Mercury is an extremely potent embryo
toxicant and dietary Hg is dose-dependently transferred to avi-
an eggs. Reproduction is one of the most sensitive endpoints
of Hg toxicity. Mercury accumulates particularly in the egg-
white proteins, which derive from serum proteins; egg con-
centrations thus apparently more closely reflect Hg from recent
dietary uptake than from accumulated tissue stores. According
to Walsh [97], evidence exists that the ovalbumin fraction of
egg white has a specific affinity for dietary Hg, whereas the
globulin fraction tends to accumulate low levels of nondietary
Hg. Because of the strong dietary connection, Walsh suggested
that eggs provide a particularly good indicator of Hg exposure
in the vicinity of the nesting site in the immediate prelaying
season. Methylmercury can be expected to predominate in
eggs, particularly within the albumin fraction. Because Hg is
predominantly deposited in albumin, more intraclutch varia-
tion in Hg content is also to be expected than in contaminants
preferentially distributed to yolk. Becker [98] reported that the
last egg of a clutch in Charadriiformes had lower Hg than the
first egg. The first egg laid contained up to 39% more Hg than
the second or third egg. Becker [98] predicted that the toxic
effects of Hg would be more pronounced in the chick from
the first-laid egg (a-chicks). In elevated Hg environments this
will result in abnormally high losses of a-chicks, a reversal of
ELECTRONIC FILING, RECEIVED, CLERK'S OFFICE, AUGUST 14, 2006
Review of Hg effects on wildlife
Environ. Toxicol. Chem.
17, 1998
155
the normal situation. Barr [75] documented adverse effects on
common loons associated with egg concentrations of 1.39
mg/kg wet weight.
Hoffman and Moore [93] treated mallard eggs with exter-
nally applied MeHg chloride. Effects were dose related and
included decreased embryo weights, developmental abnor-
malities, and embryonic death. With increasing concentrations
abnormalities progressed in severity from mostly minor skel-
etal deformities to gross external ones such as micromelia,
gastroschisis, and eye and brain defects as well as internal
defects such as reduction in liver size. Such laboratory work
is useful because it may efficiently elucidate the types of effects
that can be produced, but an extrapolation of dosages in Hoff-
man and Moore to the field situation would be inappropriate.
External Hg exposures by Hoffman and Moore had more pro-
nounced effects at lower doses than organic Hg incorporated
into the egg from diet [92], presumably because of less binding
to the ovalbumin and ovoglobulin.
Reproductive effects may extend beyond the embryo to
adversely affect juvenile survival rates. Mercury in the eggs
of mallards caused brain lesions in hatched ducklings. Mallards
were fed 3.0 ppm MeHg dicyandiamide over 2 successive
years. Mercury accumulated in the eggs to an average of 7.18
and 5.46 ppm (wet weight) in 2 successive years. Lesions
included demyelination, neuron shrinkage, necrosis, and hem-
orrhage in the meninges overlying the cerebellum [92]. In a
laboratory study with pheasants, Fimreite [77] estimated the
threshold concentration in eggs for adverse effects on hatch-
ability to be between 0.5 and 1.5 ppm. The low end of this
effect range continues to be the LOAEL for Hg in the avian
egg. In a field study of common terns, Fimreite [91] estimated
the threshold level for toxic effects to be between 1.0 and 3.6
ppm. Heinz [92] was able to examine more subtle behavioral
effects in mallard ducklings fed MeHg. Heinz fed ducks 0.5
ppm Hg over three generations and found decreased repro-
ductive success and altered behavior of ducklings. The mean
Hg concentration in eggs associated with these observations
was 0.86 mg/kg (wet weight). Hoffman and Moore applied Hg
externally to mallard eggs and found dose-related effects on
survival, growth, and abnormal development. The lowest dose
applied that affected survival was 27
m
g. Given an average
mallard egg weight of 55 g, this dose corresponds to about
0.5 mg/kg.
Hg in feathers: A potential monitoring tool and avian
route of excretion
Almost all feather Hg is in the organic form [99]. Estab-
lishing effect levels using Hg concentrations in feathers must
be considered with caution. Feathers represent a route of ex-
cretion and not a target organ. Mercury is deposited in feathers
at the time of molt when feathers are actively growing and
have a corresponding blood supply [100–102]. Once Hg is in
feathers it is bound to the sulfide bonds of feather keratin and
is not physiologically available for redistribution to target or-
gans. Mercury content of feathers will vary with time to last
molt, feather type, and age and species of the bird [103]. Feath-
ers have the advantage of being a nondestructive exposure
assessment matrix that may be resampled in the same indi-
vidual, and that may also be compared with museum specimens
[104]. The concentration of Hg in tissues may actually decrease
during molting as Hg is mobilized from tissues into feathers
[101]. In sequential feather loss patterns the first primary feath-
er to be grown back has the greatest Hg concentration, with
decreasing concentrations following [87,102,105]. Becker et
al. [106] found results in three species of larids that implied
that Hg in the first down of chicks was a consequence of Hg
levels in the egg, whereas levels in feathers of chicks were
largely due to Hg ingested in food. Lewis and Furness [107]
found that in laboratory reared black-headed gulls 49% of the
administered Hg was accumulated in the plumage independent
of the dose administered. The percentage of the Hg body bur-
den found in the plumage of different species has been found
to vary. Species that are effective in demethylating Hg, such
as members of the Procellariiformes, will tend to have a lower
percentage of their total Hg body burden partitioned into the
feather compartment as compared to other species. This has
been interpreted as an adaptation to the slow molt of feathers
in Procellariiformes with the consequent reduced opportunity
for sequestration and ultimate excretion of MeHg via feathers
[86]. The molt pattern of any given species will have a sig-
nificant influence on variation in feather Hg concentrations
between different feathers within an individual bird [104].
More variation in Hg with feather type should also be expected
in more contaminated environments [106]. The exposure rel-
ative to season and feather growth may also have an important
influence on Hg accumulation in other tissues if birds expe-
rience significant differences in Hg exposure between winter-
ing and breeding grounds. For meaningful quantitative mon-
itoring of Hg using feathers the feather/Hg pattern for a species
should be established and similarly sampled among those in-
dividuals or populations that are to be compared. For historic
comparisons using older museum specimens determinations of
both total and MeHg in feathers may be prudent to evaluate
the relative contribution of mercurials used in specimen pres-
ervation of avian study skins, if preservation methods are only
vaguely recorded. In a review of effects related to Hg con-
centrations in feathers, Eisler [107] reported that concentra-
tions between 5 and 40 mg/kg in feathers were linked to im-
paired reproduction. Sterility was observed in the Finnish spar-
row hawk (
Accipiter nisus
) at feather Hg concentrations of 40
mg/kg. A great deal of variation is likely in feather Hg con-
centrations associated with adverse effects between species
and between geographic areas due to Hg exposure patterns
related to feather molt. Bowerman et al. [108] found mean Hg
in feathers of bald eagles in the Great Lakes region of 13 to
21 mg/kg but no association between Hg concentrations and
bald eagle reproduction could be made. Scheuhammer [81]
suggests that feather Hg concentrations
.
20 mg/kg can result
from diets containing Hg concentrations
.
1
m
g/g and that
these concentrations should be considered as indicative of a
wetland that poses an Hg risk to birds. Scheuhammer estimated
normal background of Hg in feathers of raptorial birds to be
1 to 5
m
g/g.
REPTILES AND AMPHIBIANS
The toxicity of Hg and MeHg to reptiles and amphibians
is almost unknown. A dose of 50 ppb applied to the embryos
of the frog
Xenopis laevis
reduced survival by 50% after 4 d
of treatment, and to 0% after 7 d. Surviving embryos showed
disruption of morphogenesis, neurophysiology, and neuroim-
mune regulation [109]. Rao and Madhyastha [110] reported
that the median lethal concentration (LC50) of HgCl to the
tadpoles of
Microhyla ornata
ranged from 2.04 ppm (24 h)
to 1.12 ppm (96 h). Wolfe (unpublished data) fed MeHg to
garter snakes (
Thamnophis sirtalis
) in concentrations up to
200
m
g/g food in the range-finding phase of a proposed feeding
ELECTRONIC FILING, RECEIVED, CLERK'S OFFICE, AUGUST 14, 2006
156
Environ. Toxicol. Chem.
17, 1998
M.F. Wolfe et al.
Table 3. Summary of mercury (Hg) and methylmercury (MeHg) analytical methods
Method
Species
Detection
limits
(ng/g)
Advantages
Disadvantages
Cold-vapor atomic fluorescence
spectroscopy (CVAFS)
Total Hg
0.005
Less cross-contamination
concern
MeHg
0.001
Most sensitive
Costly, requires special lab
Ethylation/cold-vapor atomic
absorption spectroscopy
Total Hg
0.05
Sensitive, routine analysis
Not as sensitive as CVAFS
MeHg
0.01
Sensitive, routine analysis
Not as sensitive as CVAFS
Inductively coupled plasma–mass
spectroscopy
Total Hg only
1.0
Low cost
Risk of cross-contamination
with reagents or standards
High-performance liquid
chromatography–atomic absorption
MeHg
0.6
Relatively fast
Fewer steps, higher yield
Gas–liquid chromatography–electron-
capture detection
MeHg
0.001
Direct measurement
Many steps, lower yield
Gas–liquid chromatography–
microwave-induced plasma
detection (GC-MIP)
MeHg
0.001
Hg-specific detector
Many steps, lower yield
Headspace-injected–GC-MIP
MeHg
0.003
Sensitive
Direct atomic absorption spectroscopy
Total Hg
0.005
Simple procedure
Many steps, lower yield
MeHg
0.005
Simple procedure
MeHg determined by
difference
study. The snakes displayed no sign of MeHg toxicity, no
decrease in food consumption, and later gave birth to appar-
ently normal young. Because no effect was seen at these high
doses in the range-finding trials, the study was not completed.
Hg AND MeHg ANALYTICAL METHODS
Sample preparation
A summary of analytical methods for determination of Hg
and MeHG is presented in Table 3. Biological samples such
as muscle and liver tissues, hair or fur, eggshell, and body
feathers have been used to determine the Hg body burden of
wildlife species [111–114]. Most biological samples are ob-
tained from wildlife captured in their habitats. Organ tissues
such as skin, liver, muscle, and brain tissues are excised in
the field and shipped on ice to the laboratory [113]. Normally
the samples are stored in clear glass containers; however, the
use of polyethylene terephthalate containers has proven to be
as suitable as glass bottles [115] for shipping purposes. Eggs
can be collected in the field and the contents stored under
refrigeration for 2 to 3 months before analysis [111,112]. The
samples are usually freeze-dried, ball-milled, and homoge-
nized prior to digestion with a mixture of nitric and sulfuric
acids.
Hair or fur samples may either be unwashed [116], or
washed with acetone to reduce the fat content [117]. Some
investigators have found that washing is not effective in re-
moving naturally occurring Hg from exogenous deposition
[118,119] The digestive process may include submersion of
hair or fur in a mixture of concentrated acid extractive solvents
such as nitric and sulfuric acid or acetonitrile–water and so-
dium pyrrolidinedithiocarbamate. After a period of time the
prepared extracted solvent can be used in Hg analysis.
Feather and eggshell samples
Feathers can be collected from dead or live birds. Feather
and eggshell samples are treated similarly. Some investigators
do not wash the surface to eliminate external contamination
[106], whereas others include washing the feather vigorously
in deionized water alternately with acetone to remove loosely
adherent external contamination [114,120] Without washing,
surface Hg from the use of Hg in the preservation of older
specimens may present a compounding variable. The washing
process is followed by digestion in warm nitric acid with the
addition of 50% hydrogen peroxide. The samples are diluted
in deionized water before analysis.
Fish and shellfish samples
Fish and shellfish samples must be collected and analyzed
when investigating Hg exposure in piscivorous species. His-
torically, high detection limits have caused limitations in mea-
surement of total Hg and MeHg in aqueous and biological
samples. Large amounts of organic matter and other substances
accompanying biological specimens as well as contamination
of samples during handling can potentially interfere with total
Hg determination because of the ubiquitous presence of Hg
in the laboratory environment [121].
Hg determination
The most commonly used technique for total Hg determi-
nation is cold-vapor atomic absorption spectroscopy (CVAAS)
using electrochemical detection [122–126]. The basic ap-
proach of all cold-vapor methods is to convert the Hg in a
small sample to mercuric ion, then reduce it to elemental Hg
with a reductant such as stannous chloride. The Hg vapor is
then measured in a modified atomic absorption spectropho-
tometer. Various acid mixtures have been used for the digestive
process. The use of a high-pressure and high-temperature feed-
back microwave system has reduced the digestion time sig-
nificantly [126]. The CVAAS method is applicable for drinking
water, brackish water, domestic and industrial wastes, and bi-
ological samples. Other detection methods, such as inductively
coupled plasma–mass spectrometry (ICP-MS), become fea-
sible once the Hg has been released to mercuric vapor [127].
The most recent cold-vapor atomic fluorescence spectros-
ELECTRONIC FILING, RECEIVED, CLERK'S OFFICE, AUGUST 14, 2006
Review of Hg effects on wildlife
Environ. Toxicol. Chem.
17, 1998
157
copy (CVAFS) method [128] has become increasingly im-
portant compared to CVAAS, because the instrumental detec-
tion limit of CVAFS is about 1 picogram or less and at least
one order of magnitude better than CVAAS [129]. Total Hg
analysis by this method requires sample digestion by a strong
acid (nitric–sulfuric or nitric–perchloric–hydrofluoric) that re-
sults in conversion of organic Hg to inorganic Hg. The digested
samples are introduced to the cold-vapor generator, at which
point tin (II) chloride is used to effectively reduce inorganic
Hg to its elemental gaseous form prior to detection by atomic
fluorescence. This method can attain 95 to 105% recovery
efficiency for elemental Hg [130].
Several enrichment techniques have been proposed to im-
prove on the sensitivity of the CVAFS method. Some tech-
niques require preconcentration of Hg on copper wire or plat-
inum [131] and preconcentration of volatilized Hg on gold or
silver [132]. Very low detection limits for total Hg in biological
and environmental samples have been successfully determined
by the application of a high-temperature, high-pressure mi-
crowave system combined with Hg amalgamation tube systems
that reduce the amount of time, the amount of acids, and the
sample size required [133].
MeHg determination
Indirect measurement.
The most common indirect mea-
surement technique is a selective digestion that allows for
determination of total Hg and inorganic Hg (II) directly, and
MeHg by difference [134]. The method is based on the rapid
conversion of organomercurials into inorganic Hg and then
followed by conversion into atomic Hg suitable for aspiration
through the gas cell of a Hg vapor concentration meter (atomic
absorption) by a strong alkaline solution (tin (II) chloride–
cadmium chloride). Alternatively, a two-step digestion method
may be performed in which total Hg is determined on nitric
acid–hydrogen sulfate and Hg (II) is determined as above
[128]. These methods are simple but lack species specificity
and are operationally defined.
Direct measurement.
Following one of several isolation
techniques (extraction, ion exchange, volatilization, separa-
tion, distillation, and digestion), final determination of MeHg
is accomplished by various spectrophotometry detectors. The
most common MeHg determination is performed by solvent
extraction combined with separation using gas–liquid chro-
matography followed by electron-capture detection (GC-ECD)
a technique developed by Westo¨o¨ [135]. A variation of this
method replaces the ECD with microwave-induced plasma de-
tection (GC-MIP) because this can be used as an Hg-specific
detector [136,137]. These methods are typically tedious and
complex because the MeHg bound to the tissue sample has to
be extracted and purified into a small volume of solvent suit-
able for GC injection. The multiple steps required can reduce
the yield. In addition, the EC detector, which measures the
halide rather than the Hg atom, is prone to matrix interference
from known and unknown halogen-containing species in the
typical laboratory [138].
To overcome the difficulty with sample preparation prior
to GC separation, the headspace sampling analysis method to
determine MeHg was developed [136] and modified further
[139,140]. These methods involve MeHg extraction from the
biological sample and conversion of the MeHg into the iodide
form, the most volatile MeHg halide salt. These reaction steps
take place in a closed headspace vial where the MeHg iodide
is then headspace-injected into a gas chromatograph equipped
with a microwave-induced plasma detector (HS-GC-MIP).
Quantitation is accomplished by standard addition. This meth-
od is also prone to decreased yield due to matrix interferences.
As discussed previously, the most commonly used tech-
nique for total Hg determination is by CVAAS using electro-
chemical detection [122]. A similar detection method was also
developed by Holak [141] for MeHg determination. Methyl-
mercury is converted into MeHg (II) chloride by hydrochloric
acid treatment and isolated from the sample by elution with
chloroform from a diatomaceous earth column. Prior to high-
performance liquid chromatographic (HPLC) separation, the
sample is back-extracted into aqueous phase as sodium thio-
sulfate complex. Detection is accomplished either electro-
chemically or by atomic absorption (AA) in a specifically con-
structed apparatus [141]. A few methods use CVAAS detection
combined with various isolation techniques [142–145]. Some
of the methods can determine total Hg and MeHg from the
same aliquots. For example, Gutie´rrez et al. [145] conducted
an experiment that utilized a mixed solution of sodium hy-
droxide, sodium chloride, and cysteine to digest fish tissue
followed by a selective reduction with tin (II) chloride–cad-
mium chloride reagent. The inorganic and organic Hg in the
same sample are sequentially reduced, volatilized, and mea-
sured by CVAAS.
All of the above methods have potential problems because
they lack species specificity or because matrix interferences
decrease the yields. In addition, all methods that employ an
acid extraction step convert dimethylmercury to the mono-
methylmercury form, thus diminishing the speciation infor-
mation gained from that analysis [138].
The most current technique being used to determine MeHg
involves aqueous phase ethylation with cryogenic GC sepa-
ration and atomic fluorescence detection [128,146,147]. In this
method sodium tetraethyl borate converts the nonvolatile
monomethyl Hg to gaseous methyl ethyl Hg. The volatile ad-
duct is then thermally desorbed from the column and analyzed
by cryogenic GC with a highly sensitive CVAFS detection.
The detection limit of this method is about 1 picogram or less
and at least one order of magnitude better than for CVAAS
[129,147]. Atomic fluorescence is also less prone to matrix
interferences [147]. Detection limits are less critical in deter-
mination of Hg in animal tissue; however, the use of a more
sensitive detector such as CVAFS allows for smaller sample
size, thereby reducing matrix interference.
REFERENCES
1. Heinz G. 1996. Mercury poisoning in wildlife. In Fairbrother
A, Locke LN, Hoff GL, eds,
Noninfectious Diseases of Wildlife,
2nd ed. Iowa State University Press, Ames, IA, USA, pp 118–
127.
2. Thompson DR. 1996. Mercury in birds and terrestrial mammals.
In Beyer WN, Heinz GH, Redmon-Norwood AW, eds,
Envi-
ronmental Contaminants in Wildlife: Interpreting Tissue Con-
centrations.
Lewis, Boca Raton, FL, USA, pp 341–356.
3. Wren CD, Fischer KL, Stokes PM. 1988. Levels of lead, cad-
mium and other elements in mink and otter from Ontario, Can-
ada.
Environ Pollut
52:193–202.
4. Wren CD, Stokes PM, Fischer KL. 1986. Mercury levels in
Ontario Canada mink and otter relative to food levels and en-
vironmental acidification.
Can J Zool
64:2854–2859.
5. O’Connor DJ, Nielsen SW. 1981. Environmental survey of meth-
ylmercury levels in wild mink (
Mustela vison
) and otter (
Lutra
canadensis
) from the northeastern United States and experi-
mental pathology of methylmercurialism in the otter.
Proceed-
ings,
Worldwide Furbearer Conference, Frostburg, MD, USA,
August 3–11, pp 1728–1745.
6. Wobeser G, Nielsen NO, Schiefer B. 1976. Mercury and mink
ELECTRONIC FILING, RECEIVED, CLERK'S OFFICE, AUGUST 14, 2006
158
Environ. Toxicol. Chem.
17, 1998
M.F. Wolfe et al.
II. Experimental methyl mercury intoxication.
Can J Comp Med
40:34–45.
7. Aulerich RJ, Ringer RK, Iwamoto S. 1974. Effects of dietary
mercury on mink.
Arch Environ Contam Toxicol
2:43–51.
8. Wren CD. 1986. A review of metal accumulation and toxicity
in wild mammals. I. Mercury.
Environ Res
40:1737–1744.
9. Yang MG, Krawford KS, Gareia JD, Wang JHC, Lei KY. 1972.
Deposition of mercury in fetal and maternal brain.
Proc Soc
Exp Biol Med
141:1004–1007.
10. Chang LW, Yamachghi S, Dudley AWJ. 1974. Neurological
changes in cats following long-term diet of mercury contami-
nated tuna.
Acta Neuropathol (Berl)
27:171–176.
11. Chang LW, Annau Z. 1984. Developmental neuropathology and
behavioral teratology of methylmercury. In Yanai J, ed,
Neu-
robehavioral Teratology.
Elsevier, Amsterdam, The Nether-
lands, pp 405–432.
12. Eccles CU, Annau Z. 1987. Prenatal exposure to methylmercury.
In Eccles CU, Annau Z, eds,
The Toxicity of Methylmercury.
Johns Hopkins University Press, Baltimore, MD, USA, pp 114–
130.
13. Khera KS. 1979. Teratogenic and genetic effects of mercury
toxicity. In Nriagu JO, ed,
The Biogeochemistry of Mercury in
the Environment.
Elsevier/North-Holland, Amsterdam, The
Netherlands, pp 503–518.
14. Wren CD, Hunter DB, Leatherland JF, Stokes PM. 1987. The
effects of polychlorinated biphenyls and methylmercury, singly
and in combination, on mink. I: Uptake and toxic responses.
Arch Environ Contam Toxicol
16:441–447.
15. Sundberg J, Oskarsson A. 1992. Placental and lactational trans-
fer of mercury from rats exposed to methylmercury in their diet:
Speciation of mercury in the offspring.
J Trace Elem Exp Med
5:47–56.
16. Nixon T. 1994.
Observations on Breeding Bird Populations in
the Clear Lake Basin.
California State Parks Department, Kel-
seyville, CA, USA.
17. Eaton RDP, Secord DC, Hewitt P. 1980. An experimental as-
sessment of the toxic potential of mercury in ringed-seal liver
for adult laboratory cats.
Toxicol Appl Pharmacol
55:514–521.
18. Albrecht J, Matyja E. 1996. Glutamate: A potential mediator of
inorganic mercury neurotoxicity.
Metab Brain Dis
11:175–184.
19. Aschner M, Eberle NB, Miller K, Kimelberg HK. 1990. Inter-
actions of methylmercury with rat primary astrocyte cultures:
Inhibition of rubidium and glutamate uptake and induction of
swelling.
Brain Res
530:245–250.
20. Clarkson TW. 1987. Metal toxicity in the central nervous system.
Environ Health Perspect
75:59–64.
21. Aschner M, Eberle NB, Goderie S, Kimelberg HK. 1990. Meth-
ylmercury uptake in rat primary astrocyte cultures: The role of
the neutral amino acid transport system.
Brain Res
521:221–
228.
22. Kromidas L, Trombetta LD, Jamall IS. 1990. The protective
effects of glutathione against methylmercury cytotoxicity.
Tox-
icol Lett
51:67–80.
23. Burton GV, Alley RJ, Rassmussen GL, Orton P, Cox V, Jones
P, Graff D. 1977. Mercury and behavior in wild mouse popu-
lations.
Environ Res
14:30–34.
24. Shimai S, Satoh H. 1985. Behavioral teratology of methylmer-
cury.
J Toxicol Sci
10:199–216.
25. Inouye M, Murao K, Kajiwara Y. 1985. Behavioral and neu-
ropathological effects of prenatal methylmercury exposure in
mice.
Neurotoxicol Teratol
7:227–232.
26. Houpt KA, Essick LA, Shaw EB, Alo DK, Gilmartin JE, Gu-
tenmann WH, Littman CB, Lisk DJ. 1988. A tuna fish diet
influences cat behavior.
J Toxicol Environ Health
24:161–172.
27. Gunderson VM, Grant-Webster KS, Burbacher TM, Mottet NK.
1988. Visual recognition memory deficits in methylmercury-
exposed
Macaca fascicularis
infants.
Neurotoxicol Teratol
10:
373–379.
28. Burbacher TM, Sackett GP, Mottet NK. 1990. Methylmercury
effects on the social behavior of
Macaca fascicularis
infants.
Neurotoxicol Teratol
12:65–71.
29. Merigan WH, Maurissen JPJ, Weiss B, Eskin T, Lapham LW.
1983. Neurotoxic actions of methylmercury on the primate vi-
sual system.
Neurobehav Toxicol Teratol
5:649–658.
30. Rice DC. 1992. Effects of pre- plus postnatal exposure to meth-
ylmercury in the monkey on fixed interval and discrimination
reversal performance.
Neurotoxicology
13:443–452.
31. Rice DC, Gilbert SG. 1992. Exposure to methylmercury from
birth to adulthood impairs high-frequency hearing in monkeys.
Toxicol Appl Pharmacol
115:6–10.
32. Ikeda Y, Tobe M, Kobayashi K, Suzuki S, Kawasaki Y, Yone-
maru H. 1973. Long-term toxicity study of methylmercuric chlo-
ride in monkeys.
Toxicology
1:361–375.
33. Dieter MP, Ludke JL. 1975. Studies on the combined effects of
of organophosphates and heavy metals in birds. I. Plasma and
brain cholinesterase in
Coturnix
quail fed methyl mercury and
orally dosed with parathion.
Bull Environ Contam Toxicol
13:
257–262.
34. Dieter MP. 1974. Plasma enzyme activities in
Coturnix
quail fed
graded doses of DDE, polychlorinated biphenyl, malathion and
mercury chloride.
Toxicol Appl Pharmacol
27:86–98.
35. Wolfe M, Norman D. 1998. Effects of waterborne mercury on
terrestrial wildlife at Clear Lake: Evaluation and testing of a
predictive model.
Environ Toxicol Chem
17:214–227.
36. Petruccioli L, Turillazzi P. 1991. Effect of methylmercury on
acetylcholinesterase and serum cholinesterase activity in mon-
keys,
Macaca fascicularis. Bull Environ Contam Toxicol
46:
769–773.
37. Ornaghi F, Ferrini S, Prati M, Giavini E. 1993. The protective
effects of
N
-Acetyl-L-cysteine against methyl mercury embry-
otoxicity in mice.
Fundam Appl Toxicol
20:437–445.
38. Di Simplicio P, Gorelli M, Vignani R, Leonzio C. 1993. The
differential modulation of the enzymes of glutathione metabo-
lism. Indication of overlapping effects of toxicity and repair in
mouse liver and kidney after dietary treatment with methyl mer-
cury and sodium selenite.
Biol Trace Elem Res
36:167–181.
39. Yasutake A, Hirayama K. 1994. Acute effects of methylmercury
on hepatic and renal glutathione metabolisms in mice.
Arch
Toxicol
68:512–516.
40. Ilback N-G, Sundberg J, Oskarsson A. 1991. Methyl mercury
exposure via placenta and milk impairs natural killer (NK) cell
function in newborn rats.
Toxicol Lett
58:149–158.
41. Shenker BJ, Rooney C, Vitale L, Shapiro IM. 1992. Immuno-
toxic effects of mercuric compounds on human lymphocytes and
monocytes. I. Suppression of T-cell activation.
Immunophar-
macol Immunotoxicol
14:539–553.
42. Shenker BJ, Berthold P, Rooney C, Vitale L, DeBolt K, Shapiro
IM. 1993. Immunotoxic effects of mercuric compounds on hu-
man lymphocytes and monocytes. III. Alterations in B-cell func-
tion and viability.
Immunopharmacol Immunotoxicol
15:87–
112.
43. Dieter MP, Luster MI, Boorman GA, Jameson CW, Dean JH,
Cox JW. 1983. Immunological and biochemical responses in
mice treated with mercuric chloride.
Toxicol Appl Pharmacol
68:218–228.
44. Tan XX, Tang C, Castoldi AF, Manzo L, Costa LG. 1993. Effects
of inorganic and organic mercury on intracellular calcium levels
in rat T-lymphocytes.
J Toxicol Environ Health
38:159–170.
45. Nakatsuru S, Oohashi J, Nozaki H, Nakada S, Imura N. 1985.
Effect of mercurials on lymphocyte functions in vitro.
Toxicol-
ogy
36:297–305.
46. Spalding MG, Bjork RD, Powell GVN, Sundlof SF. 1994. Mer-
cury and cause of death in great white herons.
J Wildl Manage
58:735–739.
47. Betti C, Davini T, Barale R. 1992. Genotoxic activity of methyl
mercury chloride and dimethyl mercury in human lymphocytes.
Mutat Res
281:255–260.
48. Das SK, Sharma A, Talukder G. 1982. Effects of mercury on
cellular systems in mammals—A review.
Nucleus
25:193–230.
49. Costa M, Christie NT, Cantoni O, Zelikoff JT, Wang XW, Ross-
man T. 1991. DNA damage by mercury compounds: An over-
view. In Suzuki T, Imura N, Clarkson TW, eds,
Advances in
Mercury Toxicology—Rochester Series on Environmental Tox-
icity.
Plenum, New York, NY, USA, pp 255–273.
50. Omata S, Kasama H, Hasegawa H, Hasegawa K, Ozaki K, Su-
gano H. 1986. Species difference between rat and hamster in
tissue accumulation of mercury after administration of meth-
ylmercury.
Arch Toxicol
59:249–254.
51. De Flora S, Bennicelli C, Bagnasco M. 1994. Genotoxicity of
mercury compounds. A review.
Mutat Res
317:57–79.
52. Wobeser G, Nielsen NO, Schiefer B. 1976. Mercury and mink
I. Use of mercury-contaminated fish as a food for ranch mink
intoxication.
Can J Comp Med
40:30–33.
53. Ronald K, Tessaro SV, Uthe JF, Freeman HC, Frank R. 1977.
ELECTRONIC FILING, RECEIVED, CLERK'S OFFICE, AUGUST 14, 2006
Review of Hg effects on wildlife
Environ. Toxicol. Chem.
17, 1998
159
Methylmercury poisoning in the harp seal (
Pagophilus groen-
landicus
).
Sci Total Environ
8:1–11.
54. Doi R. 1991. Individual difference of methylmercury metabo-
lism in animals and its significance in methylmercury toxicity.
In Suzuki T, Imura N, Clarkson TW, eds,
Advances in Mercury
Toxicology.
Plenum, New York, NY, USA, pp 77–95.
55. Aihara M, Sharma RP. 1986. Effects of endogenous and exog-
enous thiols on the distribution of mercurial compounds in
mouse tissues.
Arch Environ Contam Toxicol
15:629–636.
56. Aschner M, Aschner JL. 1990. Mercury neurotoxicity: Mech-
anisms of blood–brain barrier transport.
Neurosci Biobehav Rev
14:169–176.
57. Kerper LE, Ballatori N, Clarkson TW. 1992. Methylmercury
transport across the blood–brain barrier by an amino acid carrier.
Am J Physiol
262:R761–R765.
58. Lind B, Friberg L, Nylander M. 1988. Preliminary studies on
methylmercury biotransformation and clearance in the brain of
primates: II. Demethylation of mercury in brain.
J Trace Elem
Exp Med
1:49–56.
59. Norseth T, Clarkson TW. 1970. Studies on the biotransformation
of Hg-labeled methylmercuric chloride in rats.
Arch Environ
Health
21:717–727.
60. Davis LE, Kornfeld M, Mooney HS, Fiedler KJ, Haaland KY,
Orrison WW, Cernichiari E, Clarkson TW. 1994. Methylmercury
poisoning: Long-term clinical, radiological, toxicological, and
pathological studies of an affected family.
Ann Neurol
35:680–
688.
61. Vahter M, Mottet NK, Friberg L, Lind B, Shen DD, Burbacher
T. 1994. Speciation of mercury in the primate blood and brain
following long-term exposure to methyl mercury.
Toxicol Appl
Pharmacol
124:221–229.
62. Rice DC, Krewski D, Collins BT, Willes RF. 1989. Pharmaco-
kinetics of methylmercury in the blood of monkeys
Macaca
fascicularis. Fundam Appl Toxicol
12:23–33.
63. Chen WJ, Body RL, Mottet NK. 1983. Biochemical and mor-
phological studies of monkeys chronically exposed to methyl-
mercury.
J Toxicol Environ Health
12:407–416.
64. Farris FF, Dedrick RL, Allen PV, Smith JC. 1994. Physiological
model for the pharmacokinetics of methyl mercury in the grow-
ing rat.
Toxicol Appl Pharmacol
119:74–90.
65. Omata S, Toribara TY, Cernichiari E, Clarkson TW. 1988. Bio-
transformation of methylmercury in-vitro in the tissues of wild
and laboratory animals.
Proceedings,
Fifty-Ninth Annual Meet-
ing of the Zoological Society of Japan, Tokyo, Japan, October
8–10, p 1248.
66. Nordenhall K, Dock L, Vahter M. 1995. Lactational exposure
to methylmercury in the hamster.
Arch Toxicol
69:235–241.
67. Scheuhammer AM. 1987. The chronic toxicity of aluminum,
cadmium, mercury, and lead in birds: A review.
Environ Pollut
46:263–295.
68. Monteiro LR, Furness RW. 1995. Seabirds as monitors of mer-
cury in the marine environment.
Water Air Soil Pollut
80:851–
870.
69. Rao PV, Jordan SA, Bhatnagar MK. 1989. Ultrastructure of kid-
ney of ducks exposed to methylmercury, lead and cadmium in
combination.
J Environ Pathol Toxicol Oncol
9:19–44.
70. Nicholson JK, Osborn D. 1984. Kidney lesions in juvenile star-
lings
Sturnus vulgaris
fed on a mercury-contaminated synthetic
diet.
Environ Pollut Ser A
33:195–206.
71. Snelgrove-Hobson SM, Rao PVV, Bhatnagar MK. 1988. Ultra-
structural alterations in the kidneys of Pekin ducks fed meth-
ylmercury.
Can J Vet Res
52:89–98.
72. Sundlof SF, Spalding MG, Wentworth JD, Steible CK. 1994.
Mercury in livers of wading birds (Ciconiiformes) in southern
Florida.
Arch Environ Contam Toxicol
27:299–305.
73. Heinz GH. 1979. Methylmercury: Reproductive and behavioral
effects on three generations of mallard decks.
J Wildl Manage
43:394–401.
74. Hoffman DJ, Heinz GH. 1998. Effects of mercury and selenium
on glutathione metabolism and oxidative stress in mallard ducks.
Environ Toxicol Chem
17:161–166.
75. Barr JF. 1986. Population dynamics of the common loon (
Gavia
immer
) associated with mercury-contaminated waters in north-
western Ontario. Occasional paper 56. Canadian Wildlife Ser-
vice, Ottawa, ON.
76. Finley MT, Stendall RC. 1978. Survival and reproductive suc-
cess of black ducks fed methylmercury.
Environ Pollut
16:51–
64.
77. Fimreite N. 1971. Effects of methylmercury on ring-necked
pheasants, with special reference to reproduction. Occasional
paper 9. Canadian Wildlife Service, Ottawa, ON.
78. Heinz G. 1975. Effects of methylmercury on approach and
avoidance behavior of mallard ducklings.
Bull Environ Contam
Toxicol
13:554–564.
79. Stoewsand GS, Anderson JL, Gutenmann WH, Bache CA, Lisk
DL. 1971. Eggshell thinning in Japanese quail fed mercuric
chloride.
Science
173:1030–1031.
80. Scott ML. 1977. Effects of PCBs, DDT, and mercury compounds
in chickens and Japanese quail.
Fed Proc
36:1888–1893.
81. Scheuhammer AM. 1991. Effects of acidification on the avail-
ability of toxic metals and calcium to wild birds and mammals.
Environ Pollut
71:329–375.
82. Ware RA, Burkholder PM, Chang LW. 1975. Ultrastructural
changes in renal proximal tubules after chronic and inorganic
mercury intoxication.
Environ Res
10:121–140.
83. Zillioux EJ, Porcella DB, Benoit JM. 1993. Mercury cycling
and effects in freshwater wetland ecosystems.
Environ Toxicol
Chem
12:2245–2264.
84. Spalding MG, Forrester DJ. 1991. Effects of parasitism and
disease on the nesting success of colonial wading birds (Cicon-
iiformes) in southern Florida. NG88-008. Florida Game and
Fresh Water Fish Commission—Nongame Wildlife Program.
Tallahassee, FL.
85. Gochfeld M. 1980. Tissue distribution of mercury in normal and
abnormal young common terns.
Mar Pollut Bull
11:362–366.
86. Kim EY, Murakami T, Saeki K, Tatsukawa R. 1996. Mercury
levels and its chemical form in tissues and organs of seabirds.
Arch Environ Contamin Toxicol
30:259–266.
87. Littrell EE. 1991. Mercury in western grebes at Lake Berryessa
and Clear Lake, California.
Calif Fish Game
77:142–144.
88. Scheuhammer AM. 1988. Chronic dietary toxicity of methyl-
mercury in the zebra finch,
Poephila guttata. Bull Environ Con-
tam Toxicol
40:123–130.
89. Finley MT, Stickel WH, Christensen RE. 1979. Mercury residues
in tissues of dead and surviving birds fed methylmercury.
Bull
Environ Contam Toxicol
21:105–110.
90. Birge WJ, Roberts OW, Black JA. 1976. Toxicity of metal
mixtures to chick embryos.
Bull Environ Contam Toxicol
16:
319–324.
91. Fimreite N. 1974. Mercury contamination of aquatic birds in
northwestern Ontario.
J Wildl Manage
38:120–131.
92. Heinz G. 1974. Effects of low dietary levels of methyl mercury
on mallard reproduction.
Bull Environ Contam Toxicol
11:386–
392.
93. Hoffman DJ, Moore JM. 1979. Teratogenic effects of external
egg applications of methyl mercury in the mallard,
Anas pla-
tyrynchos. Teratology
20:453–461.
94. Tejning S. 1967. Biological effects of methylmercury dicyanide-
treated grain in the domestic fowl
Gallus gallus
L.
Oikos
(Suppl.) 8:1–116.
95. Newton I, Haas MB. 1988. Pollutants in merlin eggs and their
effects on breeding.
Br Birds
81:258–269.
96. Wiemeyer SN, Schmeling SK, Anderson A. 1987. Environmen-
tal pollutant and necropsy data for ospreys from the eastern USA
1975–1982.
J Wildl Dis
23:279–291.
97. Walsh PM. 1990. The use of seabirds as monitors of heavy
metals in the marine environment. In Furness RW, Rainbow PS,
eds,
Heavy Metals in the Marine Environment.
CRC, Boca Ra-
ton, FL, USA.
98. Becker PH. 1992. Egg mercury levels decline with the laying
sequence in Charadriiformes.
Bull Environ Contam Toxicol
48:
762–767.
99. Thompson DR, Furness RW. 1989. The chemical form of mer-
cury stored in South Atlantic seabirds.
Environ Pollut
60:305–
318.
100. Goede AA, de Bruin M. 1984. The use of bird feather parts as
a monitor for metal pollution.
Environ Pollut
8:281–298.
101. Furness RW, Muirhead SJ, Woodburn M. 1986. Using bird feath-
ers to measure mercury in the environment: Relationships be-
tween mercury content and moult.
Mar Pollut Bull
17:27–30.
102. Braune BM. 1987. Comparison of total mercury levels in relation
to diet and molt for nine species of marine birds.
Arch Environ
Contam Toxicol
16:217–224.
ELECTRONIC FILING, RECEIVED, CLERK'S OFFICE, AUGUST 14, 2006
160
Environ. Toxicol. Chem.
17, 1998
M.F. Wolfe et al.
103. Monteiro LR, Furness AJ, del Novo AJ. 1995. Mercury levels
in seabirds from the Azores, mid-North Atlantic Ocean.
Arch
Environ Contam Toxicol
28:304–309.
104. Appelquist H, Asbirk S, Drabaek I. 1984. Mercury monitoring:
Mercury stability in bird feathers.
Mar Pollut Bull
15:22–24.
105. Braune BM, Gaskin DE. 1987. Mercury levels in Bonaparte’s
gulls,
Larus philadelphia
during autumn molt in the Quoddy
Region, New Brunswick, Canada.
Arch Environ Contam Toxicol
16:539–550.
106. Becker PH, Henning D, Furness RW. 1994. Differences in mer-
cury contamination and elimination during feather development
in gull and tern broods.
Arch Environ Contam Toxicol
27:162–
167.
107. Lewis SA, Furness RW. 1991. Mercury accumulation and ex-
cretion in laboratory reared black-headed gull,
Larus ridibundus
chicks.
Arch Environ Contam Toxicol
21:316–320.
108. Bowerman WWI, Evans ED, Giesy JP, Postupalsky S. 1994.
Using feathers to assess risk of mercury and selenium to bald
eagle reproduction in the Great Lakes region.
Arch Environ
Contam Toxicol
27:294–298.
109. Ide C, Jelaso A, Austin C. 1995. Effects of methylmercury chlo-
ride on development of the frog
Xenopus laevis. Proceedings,
Thirteenth International Neurotoxicology Conference on De-
velopmental Neurotoxicity of Endocrine Disrupters, Hot
Springs, AR, USA, October 29–November 1, 1994, pp 763–
764.
110. Rao JI, Madhyastha MN. 1987. Toxicities of some heavy metals
to the tadpoles of frog,
Microhyla ornata
(Dumeril & Bibron).
Toxicol Lett
36:205–208.
111. Lonzarich DG, Harvey TE, Takekawa JE. 1992. Trace element
and organochlorine concentrations in California clapper rail
(
Rallus longirostris obsoletus
) eggs.
Arch Environ Contam Tox-
icol
23:147–153.
112. Ormerod SJ, Tyler SJ. 1992. Patterns of contamination by or-
ganochlorines and mercury in the eggs of two river passerines
in Britain and Ireland with reference to individual PCB con-
geners.
Environ Pollut
76:233–243.
113. Lasorsa B, Allen-Gil S. 1995. The methylmercury to total mer-
cury ratio in selected marine, freshwater, and terrestrial organ-
isms.
Water Air Soil Pollut
80:905–913.
114. Burger J. 1993. Metals in avian feathers.
Rev Environ Toxicol
5:203–311.
115. Copeland DD, Facer M, Newton R, Walker PJ. 1996. Use of
poly(ethylene terepthalate) plastic bottles for sampling, trans-
portation and storage of potable water prior to mercury deter-
mination.
Analyst
121:173–176.
116. Mottet NK, Body RL, Wilkens V, Burbacher TM. 1987. Biologic
variables in the hair uptake of methylmercury from blood in the
macaque monkey.
Environ Res
42:509–523.
117. Falter R, Scholer HF. 1966. A new pyrrolidinedithiocarbamate
screeening method for the determinatino of methylmercury and
inorganic mercury relation in hair samples by HPLC-UV-PC-
CVAAS.
Fresenius J Anal Chem
354:492–493.
118. Cumbie PM. 1975. Mercury in hair of bobcats and raccoons.
J
Wildl Manage
39:419–425.
119. Huckabee JW, Cartam FO, Kennington GS. 1972. Environmental
influences on trace elements in hair of 15 species of mammals.
ORNLTM3747. U.S. Atomic Energy Commission, Washington,
DC.
120. Burger J. 1994. Heavy metals in avian eggshells: Another ex-
cretion method.
J Toxicol Environ Health
41:207–220.
121. Gill GA, Fitzgerald WF. 1988. Vertical mercury distributions in
the oceans.
Geochim Cosmochim Acta
52:1719–1728.
122. Hatch WR, Ott WL. 1968. Determination of sub-microgram
quantities of mercury by atomic absorption spectrophotometry.
Anal Chem
40:2085–2087.
123. Bourcier DR, Sharma RP, Drown DB. 1982. A stationary cold
vapor method for atomic absorption measurement of mercury
in blood and urine used for exposure screening.
Am Ind Hyg
Assoc J
43:329–332.
124. Boitreau HL, Pineau A. 1988. Mercury. In McKenzie HA,
Smythe LE, eds,
Quantitative Trace Analysis of Biological Ma-
terials.
Elsevier, Amsterdam, The Netherlands, pp 553–560.
125. U.S. Environmental Protection Agency. 1983. Methods for
chemical analysis of waters and wastes. Analytical methods,
residue. Environmental Monitoring and Support Laboratory,
Cincinnati, OH.
126. Zhou CY, Wong MK, Koh LL, Wee YC. 1996. Comparison of
acid mixtures in high-pressure microwave digestion methods for
the determination of the total mercury in sediments by cold-
vapor atomic absorption spectrometry.
Anal Sci
12:471–476.
127. Brown R, Gray DJ, Tye D. 1995. Hydride generation ICP-MS
(Hg-ICP-MS) for ultra-low level determination of mercury in
biota.
Water Air Soil Pollut
80:1237–1245.
128. Bloom N. 1989. Determination of picogram levels of methyl-
mercury by aqueous phase ethylation, followed by cryogenic
gas chromatography with cold vapour atomic fluorescence de-
tection.
Can J Fish Aquat Sci
46:1131–1140.
129. Lindqvist O. 1991. Mercury in the Swedish environment 3: Mea-
surements of environmental mercury.
Water Air Soil Pollut
55:
19–22.
130. Jones RD, Jacobson ME, Jaffe R, West-Thomas J, Arfstrom C,
Alli A. 1995. Method development and sample processing of
water, soil and tissue for the analysis of total and organic mer-
cury by cold vapor atomic fluorescence spectrometry.
Water Air
Soil Pollut
80:1285–1294.
131. Welz B, Melcher M. 1985. Decomposition of marine biological
tissues for determination of arsenic, selenium, and mercury using
hydride-generation and cold-vapor atomic absorption spectrom-
etries.
Anal Chem
57:427–431.
132. Schroder HD, Rungby J, Thorlacius-Ussing O, Moller-Madsen
B, Danscher G, Nielsen ER, Gregersen M. 1985. Visualization
of silver and mercury in nervous tissue.
Proceedings,
Annual
Meeting of the Scandinavian Neuropathological Society, Aar-
hus, Denmark, May 17–19, p 95.
133. Ombaba JM. 1996. Total mercury determination in biological
and environmental standard samples by gold amalgamation fol-
lowed by cold vapor atomic aborption spectrometry.
Microchem
J
53:195–200.
134. Magos L. 1971. Selective atomic absorption determination of
inorganic mercury and methylmercury in undigested biological
samples.
Analyst
96:847–853.
135. Westo¨o¨ G. 1967. Determination of methylmercury compounds
in foodstuffs.
Acta Chem Scand
21:1790–1800.
136. Decadt G, Baeyens W, Bradley D, Goeyens L. 1985. Determi-
nation of methylmercury in biological samples by semiauto-
mated headspace analysis.
Anal Chem
57:2788–2791.
137. Chiba K, Yoshida K, Tanabe H, Haraguchi H, Fuwa K. 1983.
Determination of alkylmercury in seawater at the nanogram per
liter level by gas chromatography/atmospheric pressure helium
microwave induced plasma emission spectroscopy.
Anal Chem
55:453–457.
138. Bloom NS. 1992. On the chemical form of mercury in edible
fish and marine invertebrate tissue.
Can J Fish Aquat Sci
49:
1010–1017.
139. Lansens P, Baeyens W. 1990. Improvement of the semiautomated
headspace analysis method for the determination of methyl-
mercury in biological samples.
Anal Chim Acta
228:93–99.
140. Lansens P, Leermakers M, Baeyens W. 1991. Determination of
methylmercury in fish by headspace-gas chromatography with
microwave-induced-plasma-detection.
Water Air Soil Pollut
56:
103–115.
141. Holak W. 1982. Determination of methylmercury in fish by high
performance liquid chromatography.
Analyst
107:1457.
142. Horvat M. 1991. Determination of methylmercury in biological
standard reference materials.
Water Air Soil Pollut
56:95–102.
143. May KL, Stoeppler M, Reisinger K. 1987. Studies in the ratio
total mercury/methyl mercury in the aquatic food chain.
Environ
Toxicol Chem
13:153–159.
144. Schintu M, Jean-Caurant F, Amiard JC. 1992. Organomercury
determination in biological reference materials: Application to
a study on mercury speciation in marine mammals off the Faroe
Islands.
Ecotoxicol Environ Saf
24:95–101.
145. Gutie´rrez J, Travieso AM, Pubillones. 1993. Rapid determina-
tion of inorganic and methylmercury in fish.
Water Air Soil
Pollut
68:315–323.
146. Bloom NS, Crecelius EA. 1983. Determination of mercury in
seawater at sub-nanogram per liter levels.
Mar Chem
14:49–59.
147. Bloom NS, Fitzgerald WF. 1988. Determination of volitile mer-
cury species at picogram levels by low-temperature gas chro-
matography with atomic fluorescence detection.
Anal Chim Acta
208:151–161.
ELECTRONIC FILING, RECEIVED, CLERK'S OFFICE, AUGUST 14, 2006
CERTIFICATE OF SERVICE
I, Faith Bugel, certify that on August 11, 2006, I filed the attached MICHAEL MURRAY
ADDITIONAL REFERENCES IN SUPPORT OF TESTIMONY. An electronic version was
filed with the Illinois Pollution Control Board and copies were served via United States Mail to
those individuals on the included service list.
s/ Faith E. Bugel
Faith E. Bugel
Counsel for Environmental Law and Policy Center
DATED: August 11, 2006
Environmental Law and Policy Center
35 E. Wacker Drive, Suite 1300
Chicago, Illinois 60601
312-673-6500
ELECTRONIC FILING, RECEIVED, CLERK'S OFFICE, AUGUST 14, 2006
SERVICE LIST R06-25
Chicago Legal Clinic, Inc
Keith I. Harley
205 W. Monroe St., 4th Floor
Chicago, IL 60606
Dynegy Midwest Generation, Inc.
James W. Ingram, Senior Corporate Council
1000 Louisiana, Ste. 5800
Houston, TX 77002
Hodge Dwyer Zeman
N. Ladonna Driver
Katherine D. Hodge
3150 Roland Ave.
P.O. Box 5776
Springfield, IL 62705-5776
IEPA
John J. Kim, Assistant Council
Charles E. Matoesan, Assistant Council
Gina Roccaforte
1021 N. Grand Ave. East
P.O. Box 19276
Springfield, IL 62794-9276
Jenner & Block
Bill S. Forcade
Katherine M. Rahill
One IBM Plaza, 40th Floor
Chicago, IL 60611
Karaganis, White & Magel, Ltd.
Christopher W. Newcomb
414 N. Orleans St., Ste. 810
Chicago, IL 60610
McGuire Woods LLP
James T. Harrington
Jeremy R. Hojnicki
David Rieser
77 W. Wacker Dr., Ste. 4100
Chicago, IL 60601
Office of Public Utilities
William A. Murray, Regulatory Affairs
Manager
800 East Monroe
Springfield, IL 62757
Office of Public Utilities, City of Springfield
S. David Farris, Manager, Environmental
Health and Safety
201 E. Lake Shore Dr.
Springfield, IL 62757
Prairie State Generating Company, LLC
Dianna Tickner
701 Market St., Ste. 781
St. Louis, MO 63101
Schiff Hardin, LLP
Kathleen C. Bassi
Stephen J. Bonebrake
Glenna L. Gilbert
Joshua R. More
Sheldon A. Zabel
6600 Sears Tower
233 South Wacker Dr.
Chicago, IL 60606-6473
Sierra Club
Bruce Nilles, Attorney
122 W. Washington Ave., Ste. 830
Madison, WI 53703
ELECTRONIC FILING, RECEIVED, CLERK'S OFFICE, AUGUST 14, 2006