ELECTRONIC FILING, RECEIVED, CLERK'S OFFICE, JULY 11, 2006
* * * **PC #2 * * * *
BEFORE'I'IlE POLLUTION CONTROL BOARD
OF TLIE STATE OF ILLINOIS
IN THE MATTER OF :
)
REVISIONS TO WATER QUALITY
)
S1'ANDARDS FOR TOTAL DISSOLVED
)
R06-24
SOLIDS IN TILE LOWER DES PLAINES RIVER
)
(Site Specific Rule - Water)
EXXONMOBIL OIL CORPORATION
)
PROPOSED 35 ILL. ADM . CODE 303 .445
)
NOTICE OF FILING
ToDorothy
: M
. Gum
Thomas Attdryk
Anand Rao
Division of Legal Counsel
Illinois Pollution Control Board
Illinois EPA
James R . Thompson Center
1021 North Grand Avenue East
100 W . Randolph Street -
Suite 11-500
P.O . Box 19276
ChJohn icago,
KnittleIL60601
Springfield,IL62794-9276
Matthew J, Dunn
Hearing Officer
Division of Chief of Environmental Enforcement
Illinois Pollution Control Board
Office of the Attorney General
2125 South First Street
100 West Randolph Street, 12 °i Floor
Champaign . IL 61820 Chicago 1L 60601
Dennis L. Duffield
William Richardson
Director of Public Works and Utilities
Chief Legal Counsel
City of Joliet
Illinois Department of Natural Resources
Department of Public Works & Utilities
One Natural Resource Way
921 F . Washington Street
Springfield, IL 62702
Joliet, IL 60431
Susan M . Franzetti
Franzetti Law Firm, P .C.
10 S . LaSalle Street - Suite 3600
Chicago,
Please
II . 60603take notice
that on July 11, 2006, we filed with the Office of the Clerk of the Illinois
Pollution Control Board via electronic mail the POST-HEARING COMMENTS OF
EXXONMOBIL OIL CORPORATION, a copy of which is served upon you .
EXXONMOBIL OIL CORPORATION
Jeffrey C . Fort
Letissa Carver Reid
Elizabeth A . Leifel
Sonnenscbein Nath & Rosenthal LLP
7800 Sears Tower
233 S . Wacker Drive
Chicago, IL 60606-6404
B
P'
o I s Attorney
I.
ELECTRONIC FILING, RECEIVED, CLERK'S OFFICE, JULY 11, 2006
* * * **PC #2 * * * * *
BEFORE THE POLLUTION CONTROL, BOARD
OF THE STATE OF ILLINOIS
IN THE MATTER OF :
)
REVISIONS TO WATER QUALITY
)
STANDARDS FOR TOTAL DISSOLVED
)
R06-24
SOLIDS IN TI IF LOWER DES PLAINES RIVER )
(Site Specific Rule - Water)
EXXONMOBIL OIL CORPORATION
)
PROPOSED 35 ILL . ADM . CODE 303 .445
)
POST-REARING COMMENTS OF EXXONMOBIL OIL CORPORATION
On June 14, 2006, the Illinois Pollution Control Board (the "Board") held a hearing
regarding ExxonMobtl Oil Corporation's ("ExxonMobii's") Petition for a Site Specific Rule
Change, which would allow the discharge of Total Dissolved Solids ("'IDS") from
ExxonMobil's Juliet Refinery during the months of\ovemhcr through April in excess of levels
allowed under the exist g
ics. 35 Pl
. Admin . Code ~ ' 0? . 10s( , ) and 302 .407. This
Comment is submitted on hehait of ExxonMohil in further support of he proposed site specific
rule and to address matters raised by the Board during the June 14 .2006 hearing .
INTRODUCTION
ExxonMobil owns and operates the Joliet Refinery, located in Channahon Township on a
1,300 acre tract of land in unincorporated Will County
. The site is adjacent to Interstate 55 at the
Arsenal Road exit, approximately 50 miles southwest of Chicago . On October 11, 2005,
ExxonMobil, together with the United States Environmental Protection Agency ("U
.S. EPA")
and the States of Illinois, Louisiana, and Montana, executed a consent decree (the "Consent
Decree") requiring ExxonMobil, among other things, to make modifications to the Joliet
Refinery that reduce air emissions coming from the Refinery . Specifically, the Consent Decree
1 Citations to the transcript from the June 14, 2006 hearing are noted as "Tr
. at XX :XX") .
ELECTRONIC FILING, RECEIVED, CLERK'S OFFICE,
JULY 11, 2006
* * * * *PC #2
Refinery that reduce air emissions coming from the Refinery
. Specifically, the Consent Decree
calls for the use of a wet gas scrubber and other equipment that will contribute additional sulfate
and TDS to the Refinery's wastewater treatment system.
On February 7, 2006, after consulting with the Illinois Environmental Protection Agency
(the "Agency") as to the proper course of action, ExxonMobil filed with the Board a Petition for
a Site Specific Rule Change ("Petition"), pursuant to Sections 27 and 28 of the Illinois
Environmental Protection Act (the "Act"),
415 ILCS 5/35, and Part 102 of the Illinois
Administrative Code, 35 Ill . Admin. Code § 102 .100 et seq .,
seeking authorization to discharge
Total Dissolved Solids
("TDS") from the Joliet Refinery during the months of November
through April in excess of levels allowed under the existing rules, 35 111
. Admin . Code §§
302.208(g) and 302 .407.
While not a "petitioner," the Agency supports the relief sought . ExxonMobil has
satisfied the requirements of 35 I11 . Admin
. Code § 102 .210; the Agency concurs . Asset forth
more fully in the Petition and in the Testimony of Stacey K
. Ford'' and James E . Iiuff, 3 the
requirements of the existing water quality standards are neither technically feasible nor
economically reasonable as applied to the Refinery in light of the requirements under the
Consent Decree
. Additionally, the evidence developed by the Agency (Exhibits A-F), including
the testimony of Bob Moshur and Scott Twait supports the requested rule as consistent with
federal law and that it will not cause an adverse environmental impact
.4
2
Citations to the Pre-filed Testimony of Stacey K
. Ford are noted as "Ford Test . at p. XX"). The
testimony was entered as Petitioner's Exhibit 11 .
3 Citations to the Pre-filed Testimony of James E
. Huff are noted as "Huff Test, at p . XX"). The
testimony was entered as Petitioner's Exhibit 12.
a The Agency submitted pre-filed testimony for Mr
. Twait, and that testimony was read into the
record at the June 14, 2006 hearing . Citations to Mr
. Twait's testimony are noted as "Twait Test .
at p. XX; Tr
. at XX :XX." The Agency did not submit pre-filed testimony for Mr
. Moshur, and
ELECTRONIC FILING, RECEIVED, CLERKS OFFICE, JULY 11, 2006
* ****PC #2 * * * * *
11. THE UNCONTESTED EVIDENCE IN THE RECORD DEMONSTRATES THAT
THE RULE CHANGE SOUGHT SHOULD BE GRANTED UNDER ILLINOIS LAW
AND IS CONSISTENT WITH FEDERAL LAW
Consent Decree. ExxonMobil recently settled alleged violations of the New Source
Review program. (Ford Test
. at p. 3) . The resulting Consent Decree, among ExxonMobil, U
.S.
EPA, and the States of Illinois, Louisiana, and Montana, requires FxxonMobil to install pollution
control equipment at the Refinery to reduce emissions of sulfur dioxide by over 95%, or over
24,000 tons per year, and to reduce nitrogen oxides by approximately 50%, or over 1800 tons per
year . (1d.).
To meet the requirements under the Consent Decree
. Exxon-Mobil will install a wet gas
scrubber (WGS") in the f;rddved
Catalytie Cracking i" FCC'') writ, ( ld
. at
p . 4)
. It will also
install a DESOX process to rctnore additional sullit' compounds
. The AVGS technology will
cause increases Iecels of sulfate and TDS in the Refinery's treated wastewater stream,
(Id.).
The Agency has challenged neither the existence of ExxonMobil's obligations under the Consent
Decree nor the technology used to satisfy those obligations .
Alternatives Are Not Technically Feasible Nor Economically Reasonable
. ExxonMobil
investigated several alternatives to the WGS technology to avoid releasing wastewater
containing amounts of sulfates and TDS necessitating this site specific rulemaking
. None of
these alternatives are technically feasible, as technologies for removing sodium sulfate from a
dilute aqueous stream are limited
. Further, some alternatives, such as electrodialysis, have never
been applied on the scale required at the Refinery
. (Ford Test. at p
. 7).
-
- ---
his
Mr
.
testimony
Moshur's testimony
was given
--------
is
in
referenced
--
response
-
to
as
specific
a citation
Board
to the
questions
hearing
at
transcriptthe
Tune
.
14,
See2006 FN1,
hearingsupra
.
.
ELECTRONIC FILING, RECEIVED, CLERK'S OFFICE, JULY 11, 2006
*****PC #2
Similarly, the alternatives are not economically feasible
. Installation of an
evaporization/crystallization system would require a capital expenditure of $36 million to $56
million, with an additional S 1 million per year in operating costs
. (Ford Test . at pp. 6-8). Short-
term episodic storage of wastewater prior to discharge would require removal and replacement of
existing tankage, pumps, secondary containment, and associated piping at a capital cost of
approximately 513 .2 million . (Ford Test. at p
. 9). Moreover, there is no room on the refinery site
for such storage .
In addition, although the Department of Commerce and Economic Opportunity
("DCEO") has the right to conduct an economic impact study, the Board had not received a
response to its request that the DCEO do so . (Tr
. at 7:12 - 9 :12)
. The Board concluded that the
DCEO had determined that such a study was unnecessary and declined to perform it
. (1d.).
The Agency has not contested the technical and economic infeasibility of alternatives to
the site-specific relief.
Environmental impact
The increased TDS discharges from the Refinery allowed under
this site specific rule will not have an adverse impact on the aquatic community in the Des
Plaines River. (Huff. Test . at p. 7)
. The Agency also acknowledges that the increase in TDS
standards will not be "of great consequence," (Tr
. at 57:16-22),
finding that toxicity studies have
demonstrated that the proposed level of 1,686 mg/I "is well within the TDS toxicity threshold
."
(Twait Test . at p. 3, Tr. at 34:1 - 35 :10)
. The Agency has also found that toxicity testing has
shown that even the most s s'tive, invertebrate species can "easily tolerate" the levels of TDS in
the receiving waters of the river taking into account the proposed 1,686 mg/l under this
rulemaking . (Twait Test. at p
. 2. Tr. at 33 :10 - 35 :10)
. The Agency states that a TDS level of
3,000 mg/I would still be protective of aquatic life
. (Twait Test . at p. 3
; Tr. at 34:22 - 35 :3).
ELECTRONIC FILING, RECEIVED, CLERK'S OFFICE, JULY 11, 2006
* * ***PC #2 * * * * *
The Agency is indeed planning to petition the Board to change the General Use standards
for sulfates and to eliminate altogether the water quality General Use standards for TDS
. (Twait
Test . at p. 3 ; Tr . at 34 :1-13)
. 7' he Agency's anticipated proposal is based on science that has
developed since the promulgation of the existing standard in 1972
. (Twait Test . at p
. 3 ; Tr. at
34:1 - 35 :10)
. Recent investigations are showing that fish are not sensitive to TDS levels
. (Tr. at
57 :16-22)
. Indeed, the only reason for this proceeding is the fact that the Agency is not be able
to promulgate the new water quality standards on a timeline that would allow LxxonMobil to
make the modifications required under the Consent Decree
. ('I 'r. at 65
:8-22) .
'the Agency is currently conducting a Use Attainability Analysis for the Lower Des
Plaines River to evaluate the
Secondary Contact and Indigenous Aquatic Life water quality
standards . (T- . at b,5 :2'-60 :61
. The change in the secondary w ner uwuity standards would be
justified by the same sciencc 'is
!lie change in General Use standards, namely that toxicity testing
shows that aquatic life would not be harried by TDS levels at or even above the levels requested
here . (Jr . at 74 :12-75
:10) .
The Illinois Department of Natural Resources
(-lDNR")
was contacted to determine the
presence of any threatened or endangered species that may be impacted by this site specific rule
.
(Tr. at 32 :16-23)
. IDNR terminated the consultation process on December 19, 2005 with a
finding that no threatened and endangered species or natural areas are affected
. (Id .).
Federal Approval Appears Likely.
The proposed TDS standard is consistent with federal
law
. [EPA consulted with U .S.EPA
before this proceeding began
; indeed that feedback was a
major reason that a rule
change petition was
submitted . US
. EPA is expected to approve this
rule if adopted by the Board as proposed
. See
Agency Exhibit F .
Ill.
EXXONNIOBIL'S RESPONSE TO BOARD INQUIRIES
ELECTRONIC FILING, RECEIVED, CLERK'S OFFICE, JULY 11, 2006
* * * * * PC #2 * * * *
During the June 14, 2006
hearing, the Board requested additional information and/or
clarification of issues
. ExxonMobil respectfully submits the following responses to specific
Board inquiries during the hearing
.
Latitude/Longitude
. The Board inquired about the proposed language for the site
specific rule regarding the Refinery's latitude and longitude coordinates
. ExxonMobil responds
that the proper coordinates for the principal outfall from the Refinery are
41°25'20" North and
88°11'20"
West
. These coordinates are consistent with those contained in the Refinery's draft
NPDES permit
.
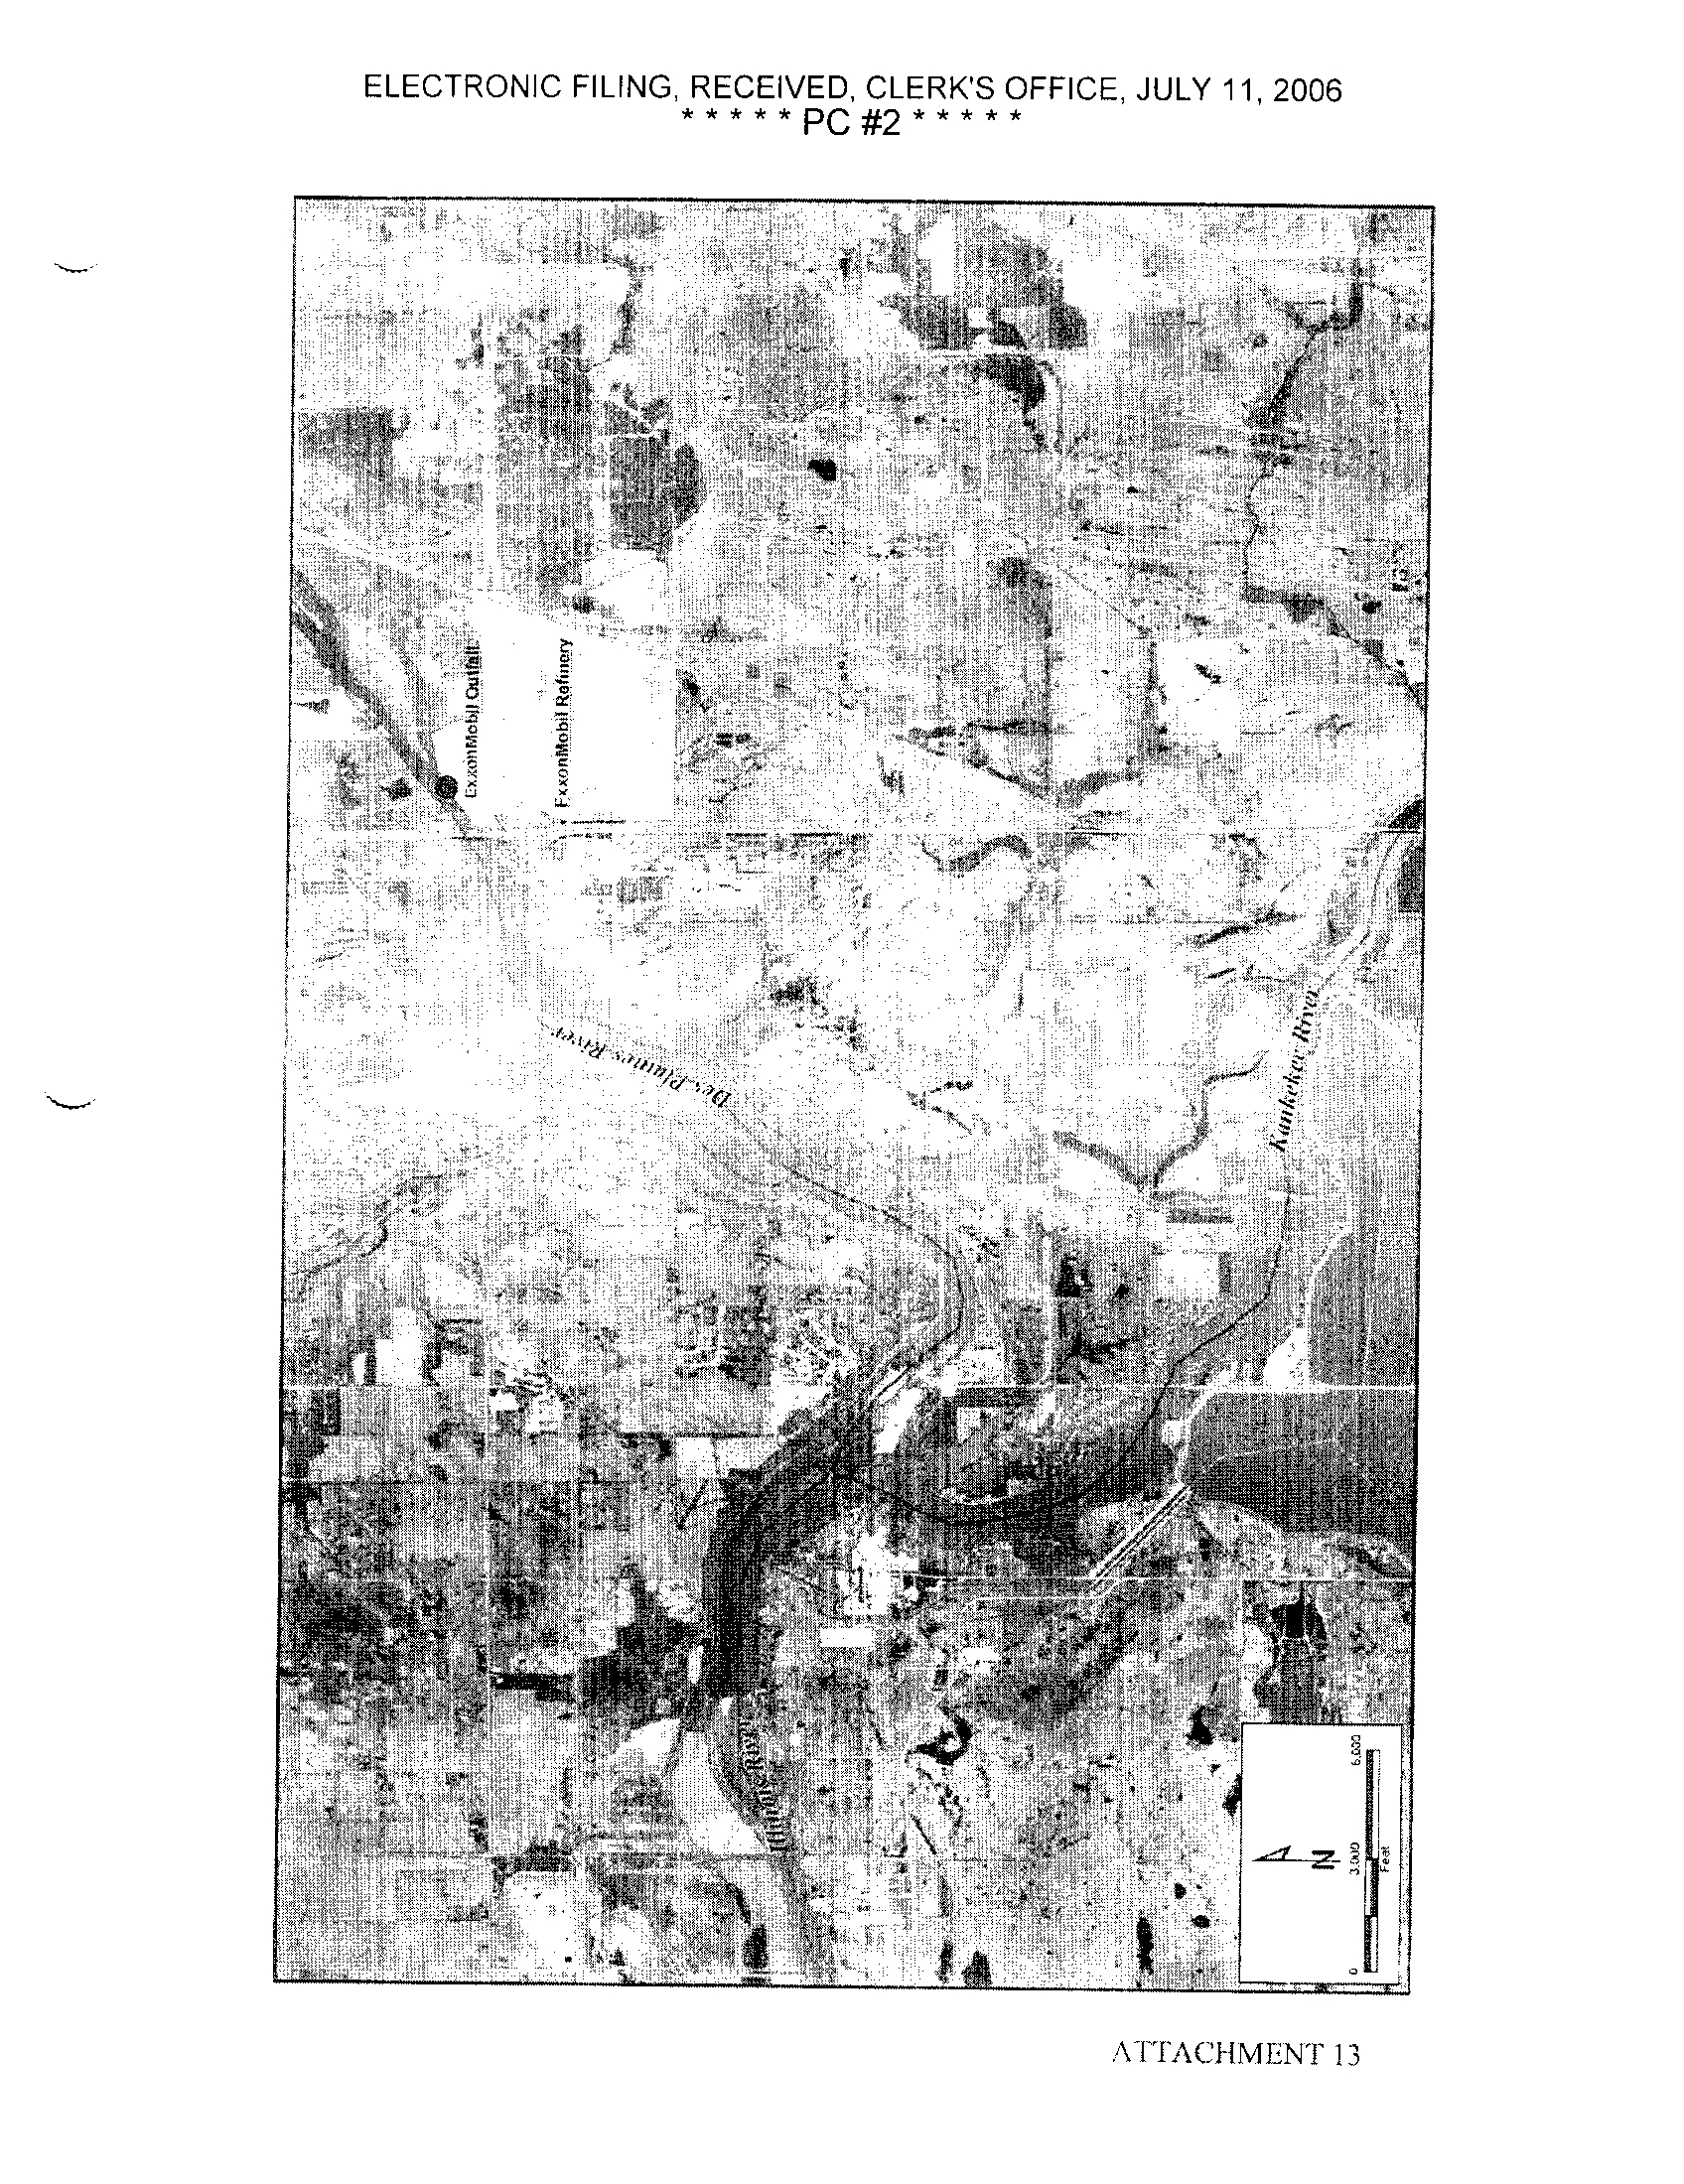
Aerial Map.
The Board requested that ExxonMobil provide a diagram
. map, or
photograph depicting the Des Plaines River and the locations of key points for purposes of this
proceeding (e.g.
the 1-55 Bridge, the point of discharge from the Refinery, and the confluence of
the Des Plaines and Illinois Rivers)
. An aerial photograph of the area surrounding the Refinery
and depicting the key locations is submitted as Attachment 13 hereto
.
Mixing Zone Study. The Board asked ExxonMobil witness James E
. Huff to provide the
mixing zone study entered into the record in a previous, unrelated proceeding
. The mixing zone
study, James E . Huff and Sean D . LaDieu,
Plume Study and Effluent Deviations Report,
April 21, 1997, is submitted as Attachment 14 hereto
.
Incremental Impact.
Another question concerned the incremental impact of just the
ExxonMobil Refinery
. Petitioner factored into its evidence the combined impact of this rule
change with the variance issued by the Board to Citgo in PCB 05-85
(Variance
-
Water) . The
incremental contribution of ExxonMobil will be 11 mg/L sulfate and 16 mgIL TDS during the
7Q10 flow, at the 155
Bridge.
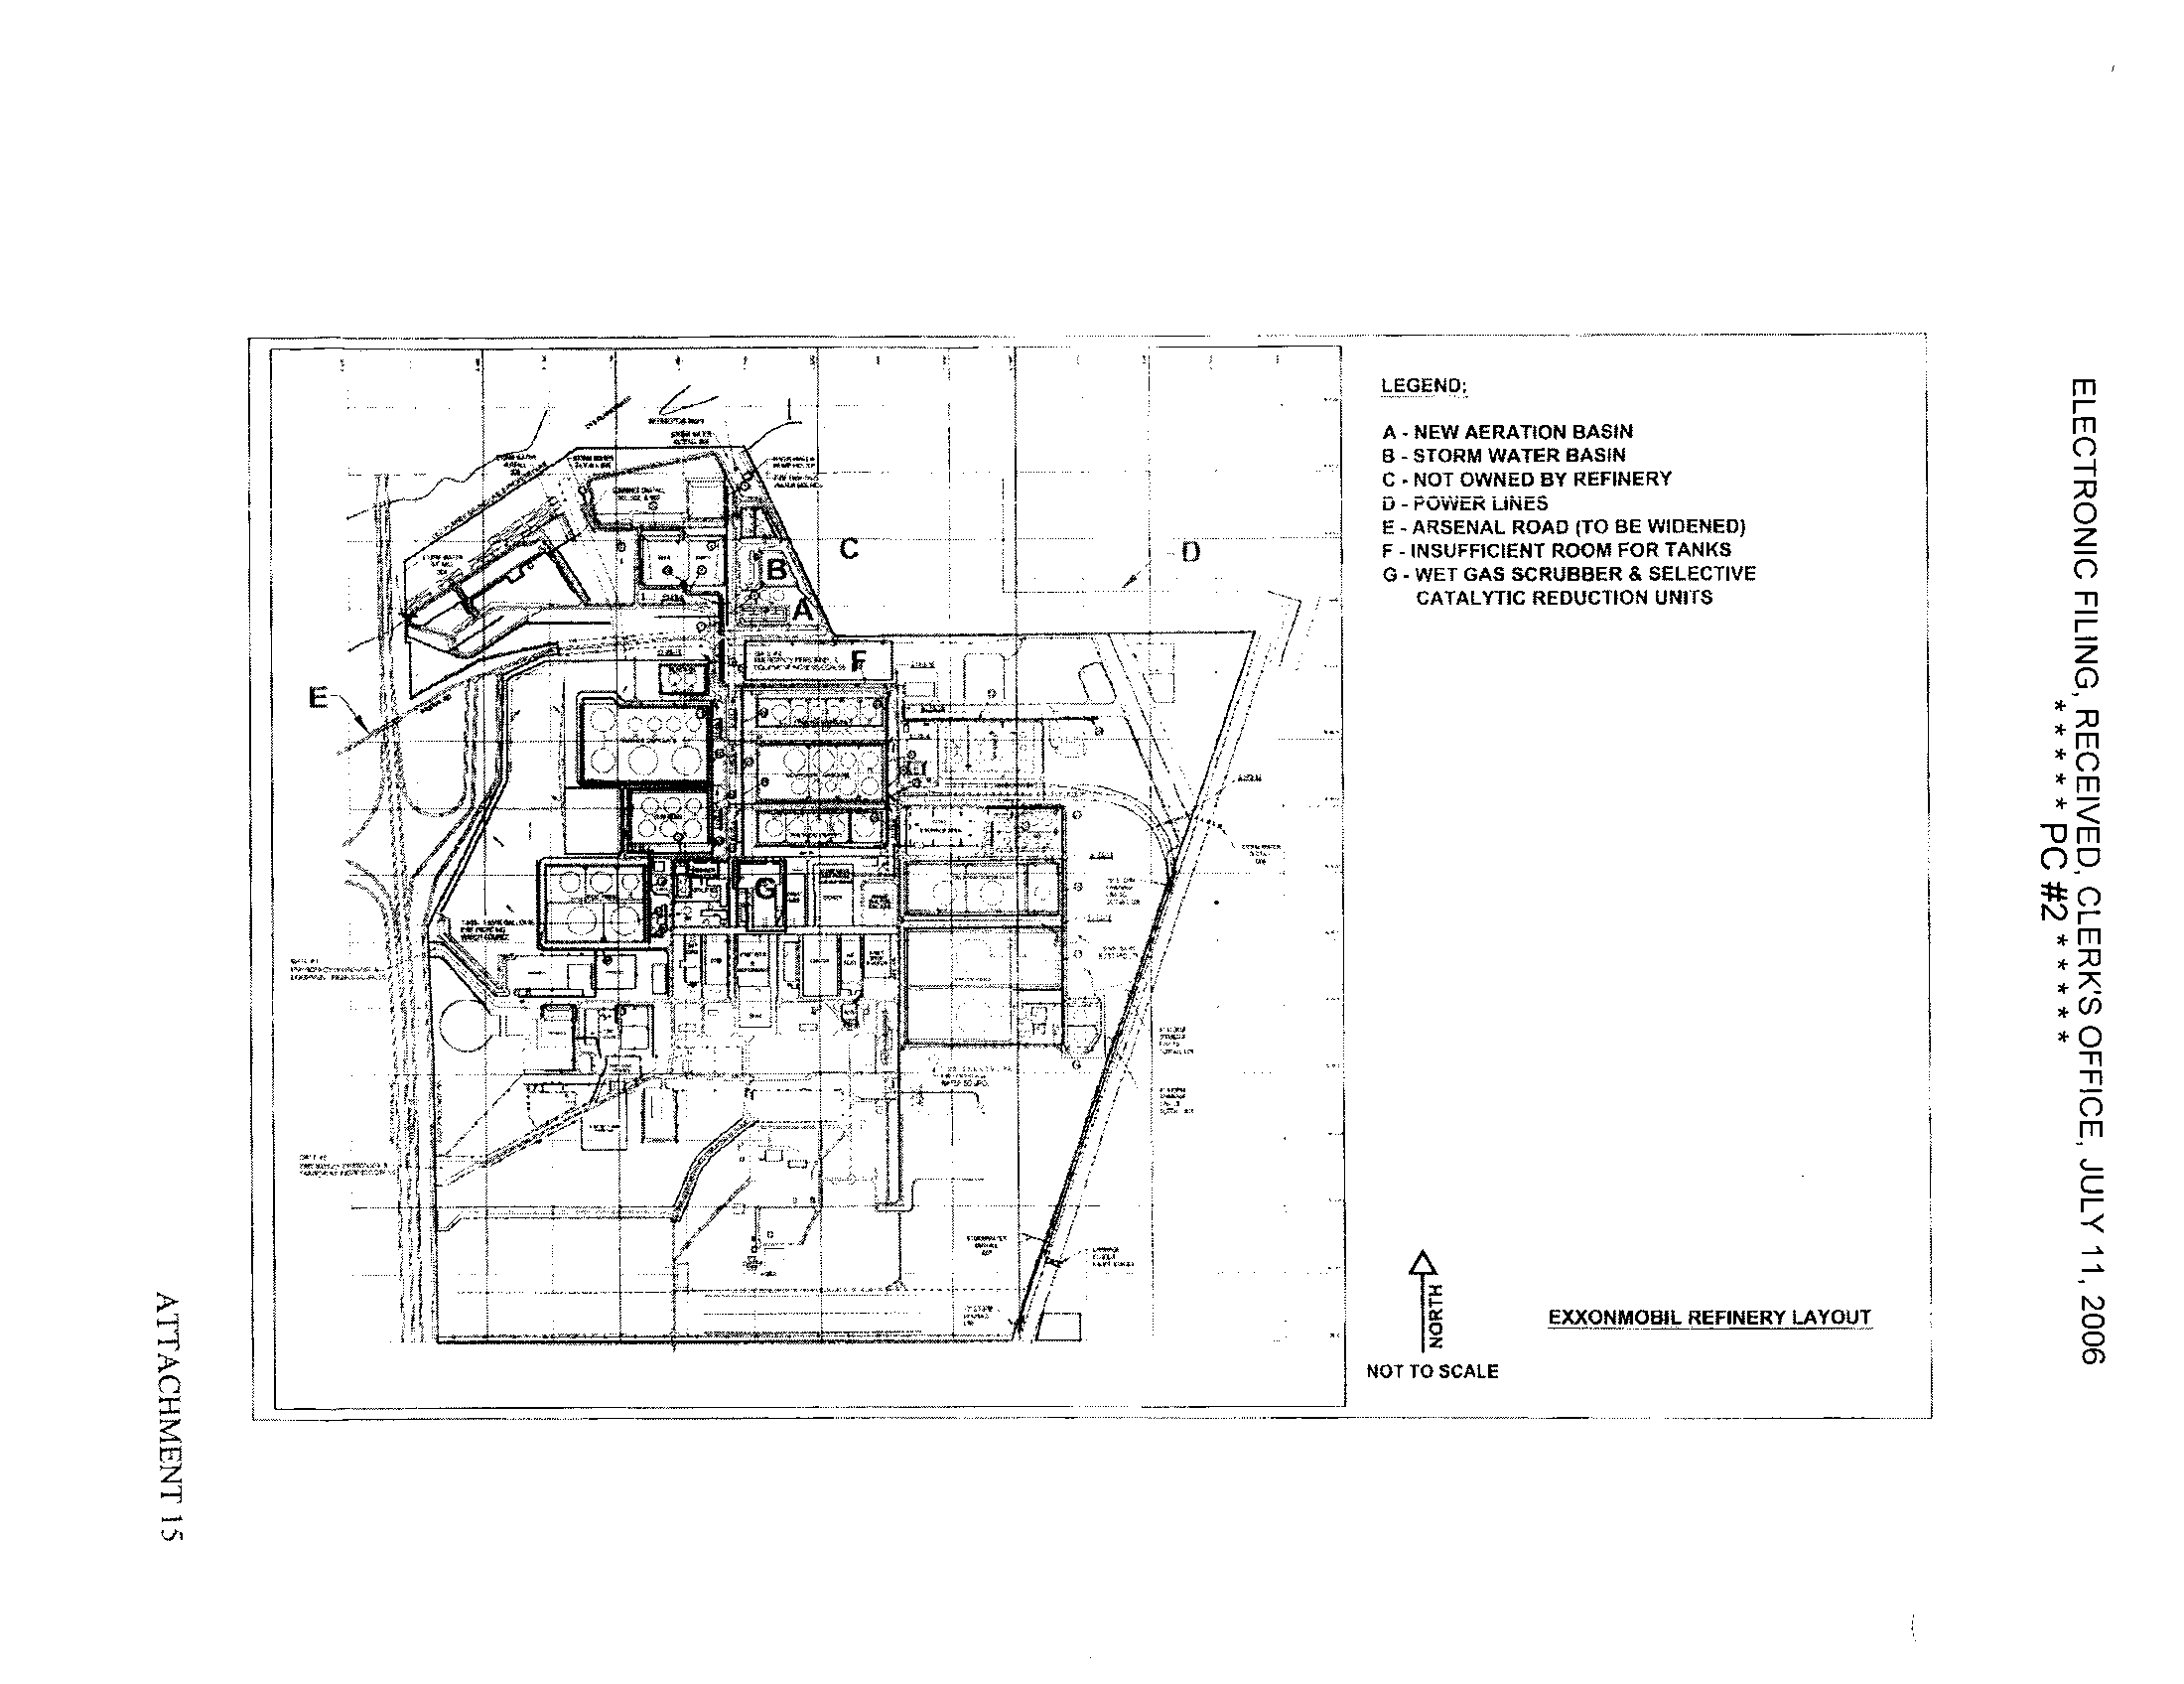
Temporary Storage.
Temporary storage of wastewater containing elevated levels of TDS
is not a viable alternative. (Ford Test . at p. 9 ; Tr. at 71 :21-73
:12). There is insufficient space
ELECTRONIC FILING, RECEIVED, CLERK'S OFFICE, JULY 11, 2006
* * * * *PC #2 * * *
within the refinery or the surrounding property owned by ExxonMobil to construct new storage
tanks large enough to hold the wastewater prior to discharge
. (Id.)
. The Board requested a
schematic diagram or map showing the layout of the refinery and demonstrating the lack of
space to construct or install temporary storage tanks
. An annotated map of the refinery is
submitted as Attachment 15 hereto
.
WHEREFORE
. ExxonNlohil respectfully requests that the Board grant the proposed site
specific rule .
Dated
: July 11, 2006
Respectfully subm
Bv:
I"
One of the Attorn' vs for E XXONMOBIL OIL
CORPORATION
Jeffrey C . Fort
Letissa Carver Reid
Elizabeth A
. Leifel
SONNENSCHE_N NA I'H & ROSENTHAL LU'
7800 Sears Tower
233 South Wacker Drive
Chicago, Illinois 60606-6404
(312) 876-8000
(Phone)
(312) 876-7934
(Facsimile)
12085726
ELECTRONIC FILING, RECEIVED, CLERK'S OFFICE, JULY 11, 2006
* * * * *PC #2 * * * * *
CERTIFICATE OF SERVICE
The undersigned, an attorney, certifies that I have served upon the individuals named on
the attached Notice of Filing true and correct copies of the
POST-HEARING COMMENTS
OF EXXONMOBIL OIL CORPORATION
via Federal Express, on July 11, 2006 .
ELECTRONIC FILING, RECEIVED, CLERK'S OFFICE, JULY 11, 2006
* * * * *PC #2
ATTACHMENT 1 3
ELECTRONIC FILING, RECEIVED, CLERK'S OFFICE, JULY 11, 2006
* * * * * PC #2 * * * * *
PLUME STUDY
and
EFFLUENT LIMIT
DERIVATIONS REPORT
MOBIL OIL CORPORATION
JOLIET REFINERY
JOLIET, ILLINOIS
Prepared by :
James E. Huff, P .E.
Sean D. LaDieu
April 21, 1997
HUFF & HUFF, INC.
ENVIRONMENTAL CONSULTANTS
LaGRANGE, ILLINOIS
ATTACHMENT 1
4
ELECTRONIC FILING, RECEIVED, CLERKS OFFICE, JULY 11, 2006
*
+**+[zC
#2 * ^* * *
TABLE OF CONTENTS
Page
! . INTRODUCTION
~
\
2 . 8/\Cl{GOLKJTD~~~~~~~~~~~
2
2.1 Mobil Oil Refinery \VWTP
2
2.2 Des Plumes kive~
. . . ~ . ~ ~2
2.3 Mixing Zone and Zone of Initial Dilution Regulations and Policies
4
IFIELD RESULTS ~
5
3,1 Y!uoioStvdySomo!iug
~ 5
3 .2 Sampling Method's
. ~ ~
. .
. 5
33 Sampling at Effluent Channel
- . . . ~ ~ . ~
. . ~ 6
l4S :myUzpDdu ~-
~ X
4
. MIXING Z0NC/\}\UliU[`E?2R2NINAT[0>!
~ 12
4
.1 Mixing Zocc ~izc
'lZ
42ZID8i,c
~ ~
~~
.
. . 12
4] /\raiiun!xNlixio,! Di~co~sjoo
}5
5
.
L!}1iTS~~~~~~~~~ ~ ~
. . . 17
5 . )Doir :! :oo/EOiu
:ruLimits
17
5
.2 Y/otcr0uo!itv~Bz~xd2UlornoLiooin ~~ ~
. . . 17
5 .3 Existing \r/coo
:~a L3IoeolBu~edLizuits . . . ~~ ~~ ~ 18
i4E/Jming'.r1rnni!l~innio ~
_ 19
5 .5 Applicable Ammonia Effluent Limits
20
l6Discuorioa . . . .
~ ~
. . . .
. . ~ . . . ~ . ~ ~
20
LIST OF FIG URES
F{6OK22-1 : SITE LOCATION MAP ~ ~
}
FIGURE]-l:
SAMPLE LOCATION M/{y ~ 9
FIGURE 4-1
: CHL08JDEDULCTlON!309LFl}fS ~ 13
FIGD8E4'2 : AREA FOR ZED ~ ~ ~
. . . 14
LIST OF TABLES
TABLE 3-1 : MIXING ZONE AND ZONE OF INITIAL DILUTION
STUDY
FIELD MEASUREMENTS ~
7
TABLE 3-2
: MIXING ZONE AND ZONE OF INITIAL DILUTION
STUDY
RAW DATA
10
TABLE 3'l C8L00D5DILUTION RATIOS
ll
TABLE 5-1 : AMMONIA I-,'H 7I,UEN'I'HISTORICAL QUALITY
21
ELECTRONIC FILING, RECEIVED, CLERK'S OFFICE,
JULY 11, 2006
* * * * *PC #2 * * * *
APPENDICES
APPENDIX A :
AMMONIA DILUTION RATIOS
APPENDIX B :
SCHEMATIC OF WATER FLOW
-MOBIL
JOLIET REFINERY
APPENDIX C :
WATER-QUALITY BASED AMMONIA EFFLUENT CALCULATION
APPENDIX D :
EXISTING EFFLUENT QUALITY BASED EFFLUENT LIMITS
ELECTRONIC FILING, RECEIVED, CLERK'S OFFICE, JULY 11, 2006
* * * * *PC #2
1 . INTRODUCTION
The Mobil Oil Corporation -
Joliet Refinery (Mobil) operates a wastewater treatment plant (WWTP)
for the treatment of process wastewater and in-plant surface run-off
. The WWTP flow-rate on
average is approximately .900 gallons per minute (gpm) or 2
.7 million gallons per day (mgd) and
discharges to the Des Flames River through Outfall 001
. Mobil currently operates the WWTP under
National Pollution Discharge L°_imination System (NPDFS) permit no
. 1L0002861 .
1 he ammonia limits set forth in the NPDES permit are based on a variance for effluent limits
. The
variance allows a monthly average
ammonia
limit of 13 mg/I and
it
daily maximum limit of 26 mg/1 .
'This was granted or, Marchh 3 . 1994
and originally expired on March 3 . 1998
. The variance now
expires on March= . 1999 arc
: a one year extension %tins granted to Mobil
. Unless site specific relief
is adopted hefnre the current v ar
:ance expires, the ammonia effluent limits will he reduced to the
applicable Itliaois effluent Iimrts of 3 .0 mg/I and 6
.0 ng-i for the monthly average and daily
maximum . respecti,clc .
A plume study was conducted at O',tfail 001 in order to determine the extent of mixing that occurs
between the outfall and the Des Plaines River
. The plume study included an evaluation of the
mixing zone and the Zone of Initial Dilution (ZID)
. The report contained herein documents the
procedures used for the study, results, and implications for future limits
.
ELECTRONIC FILING, RECEIVED, CLERK'S OFFICE, JULY 11, 2006
* * * * *PC #2
2. BACKGROUND.
2.1
Mobil -Oil Refinery WWTP
The Mobil refinery is located in Will County approximately 10 miles southwest of Joliet, Illinois,
on the south side of the Des Plaines River just cast of the Interstate 55 bridge . The location of the
refinery is depicted on Figure 2-1 with the WWTP located on the north side of Arsenal Road
. The
WWTP is an activated sludge system that is preceded by an API oil/water separator system, a
dissolved air flotation system, and equalization biological treatment units
.
The existing NPDES permit for the refinery covers nine outfalls numbered as Outfall 001 through
Outfall 009
. Outfall 001 discharges the treated process wastewater to a manmade outfall channel
depicted in Figure 2-I
. Outfall 002 discharges non-contact cooling water from the plant into the
same manmade outfall channel, as does Outfall 003 which discharges stormwater for the west
storage basin
. The remaining outfalls (004 through 009) are all stomtwater runoff discharges
.
2.2 Des Plaines River
The refinery WWTP discharges into the Des Plaines River upstream of the 1-55 bridge at River Mile
278.5 (approximately)
. The Des Plaines River originates near Kenosha, Wisconsin and travels south
and then southwest before merging with the Kankakee River near Channahon, Illinois, where the
combined rivers become the Illinois River
. The width of the Des Plaines River at the point of the
refinery WWTP outfall is approximately 600 feet
.
The Des Plaines River is designated as a Secondary Contact Water under 35 III
. Adm
. Code 303 .441
from the confluence with the Chicago Sanitary and Ship Canal to the Interstate 55 bridge
. The water
quality standards for Secondary Contact Waters are set forth in 35 Ill
. Adm . Code 302 Subpart D .
The ammonia water quality standard for these waters is based upon the un-ionized portion of
ammonia with the established limit being 0 .1 mg/l .
-2-
ELECTRONIC FILING, RECEIVED, CLERKS OFFICE,
JULY 11, 2006
* * * * *PC #2 * * * * *
Mixino Zone and Zone of Initial Dilution Re° ulations and Policies
The mixing zone and Zone of Initial Dilution (ZID) are components of the State's program to protect
water quality within the vicinity of wastewater outfalis
. The mixing /one defines an area within
which the acute toxicity standard is to be met but the water quality standard may be exceeded
. The
water quality standards are to be met at the edge of the mixing zone
. The ZID is a portion of the
mixing zone and
defines
a boundary at which the acute toxicity standards are to he met
. Both of
these components are defined in 3 Ill
. Adm . Code 302 as follows :
"'Mixing Zone' means a portion of the waters of the State identified as a re a ion within which
mixing is allowed pursuant to Section 302
.102(d)."
"'Zlly or 'Zone oft nit in! Dilution means a portion
mixing zone, identified pursuant to
Section 302I02(c) .
~i
n which acute toxicity standards need not be met
."
The concepts of ate
mixing
/one and ZID are used tc derive effluent limits protective of the
receiving stream's water quaun standard
. Section 302
.102 sets the allowable area for the mixing
zone based upon the receiving. stream dimensions
. The area and volume within which mixing occurs
is limited to 25% of the cross-sectional area and volume of the stream
. In no case shall the mixing
zone area be greater than 26 acres
.
Title 35 III
. Adm Code 302 defines the area allowed for the ZID as an area "within which effluent
dispersion is immediate and rapid"
. The Illinois Environmental Protection Agency (IEPA) has
issued a guidance document for mixing zones that states the acute standard (the ZID area) "must be
met within 10% of the distance from the edge of the outfal l to the edge of the regulatory mixing zone
in any spatial direction"
.
The present study for Mobil was conducted to determine the available dilutional mixing available
for Outfall 001
. The study was conducted consistent with the regulations and policies described
above
.
-4-
ELECTRONIC FILING, RECEIVED, CLERKS OFFICE, JULY 11, 2006
*****PC #2 * * * * *
3. FIELD RESULTS
3.1 Plume Study Samnling
Field sampling for the plume study was conducted on October 29, 1996
. Mobil provided the boat
and driver, the necessary sample bottles, and the laboratory analyses for the plume study evaluation
.
Sampling locations were determined using a total station surveying system to measure angle and
distance .
The weather on the day of sampling was cold and rainy
. The temperature during the day was
between 45 and 50 degrees fahrenheit
. The rain was intermittent with periods of heavy downpour .
The rain did not influence the low flow stream conditions that existed during the study period
.
3.2 Samnlinp Methods
Samples were analyzed for conductivity using a YSI Model 33 conductivity meter and temperature
was measured with a Cole-Panner Digi-Sense Type K Digital Thermometer
. These two parameters
were analyzed at the sample location
. Mobil's laboratory analyzed the samples for ammonia,
chlorides, and pll on the same day as collected
. The rationale for the analyses conducted is as
follows :
•
Conductivity and
Temperature - These parameters were analyzed in the field as a method for
tracking the plume
. The plume effluent temperature and conductivity are both normally
higher than the receiving stream's .
•
Chlorides
-
This parameter was chosen because it is a conservative pollutant
. There is
usually a large difference between river and effluent chloride levels and the analysis is fairly
accurate .
-5-
ELECTRONIC FILING,
*
RECEIVED,
* * * *PC
CLERK'S
#2 * * * *
OFFICE,
*
JULY 11, 2006
Ammoni4-'Ihe intent of .he plume study was primarily to determine the available dilution
within rite mixing zone as it relates to the ammonia levels in the effluent .
rFI - This parametcr is easy to measure and is used in calculating un-ionized ammonia
.
3 .3 Satnnling at Effluent:hamtel
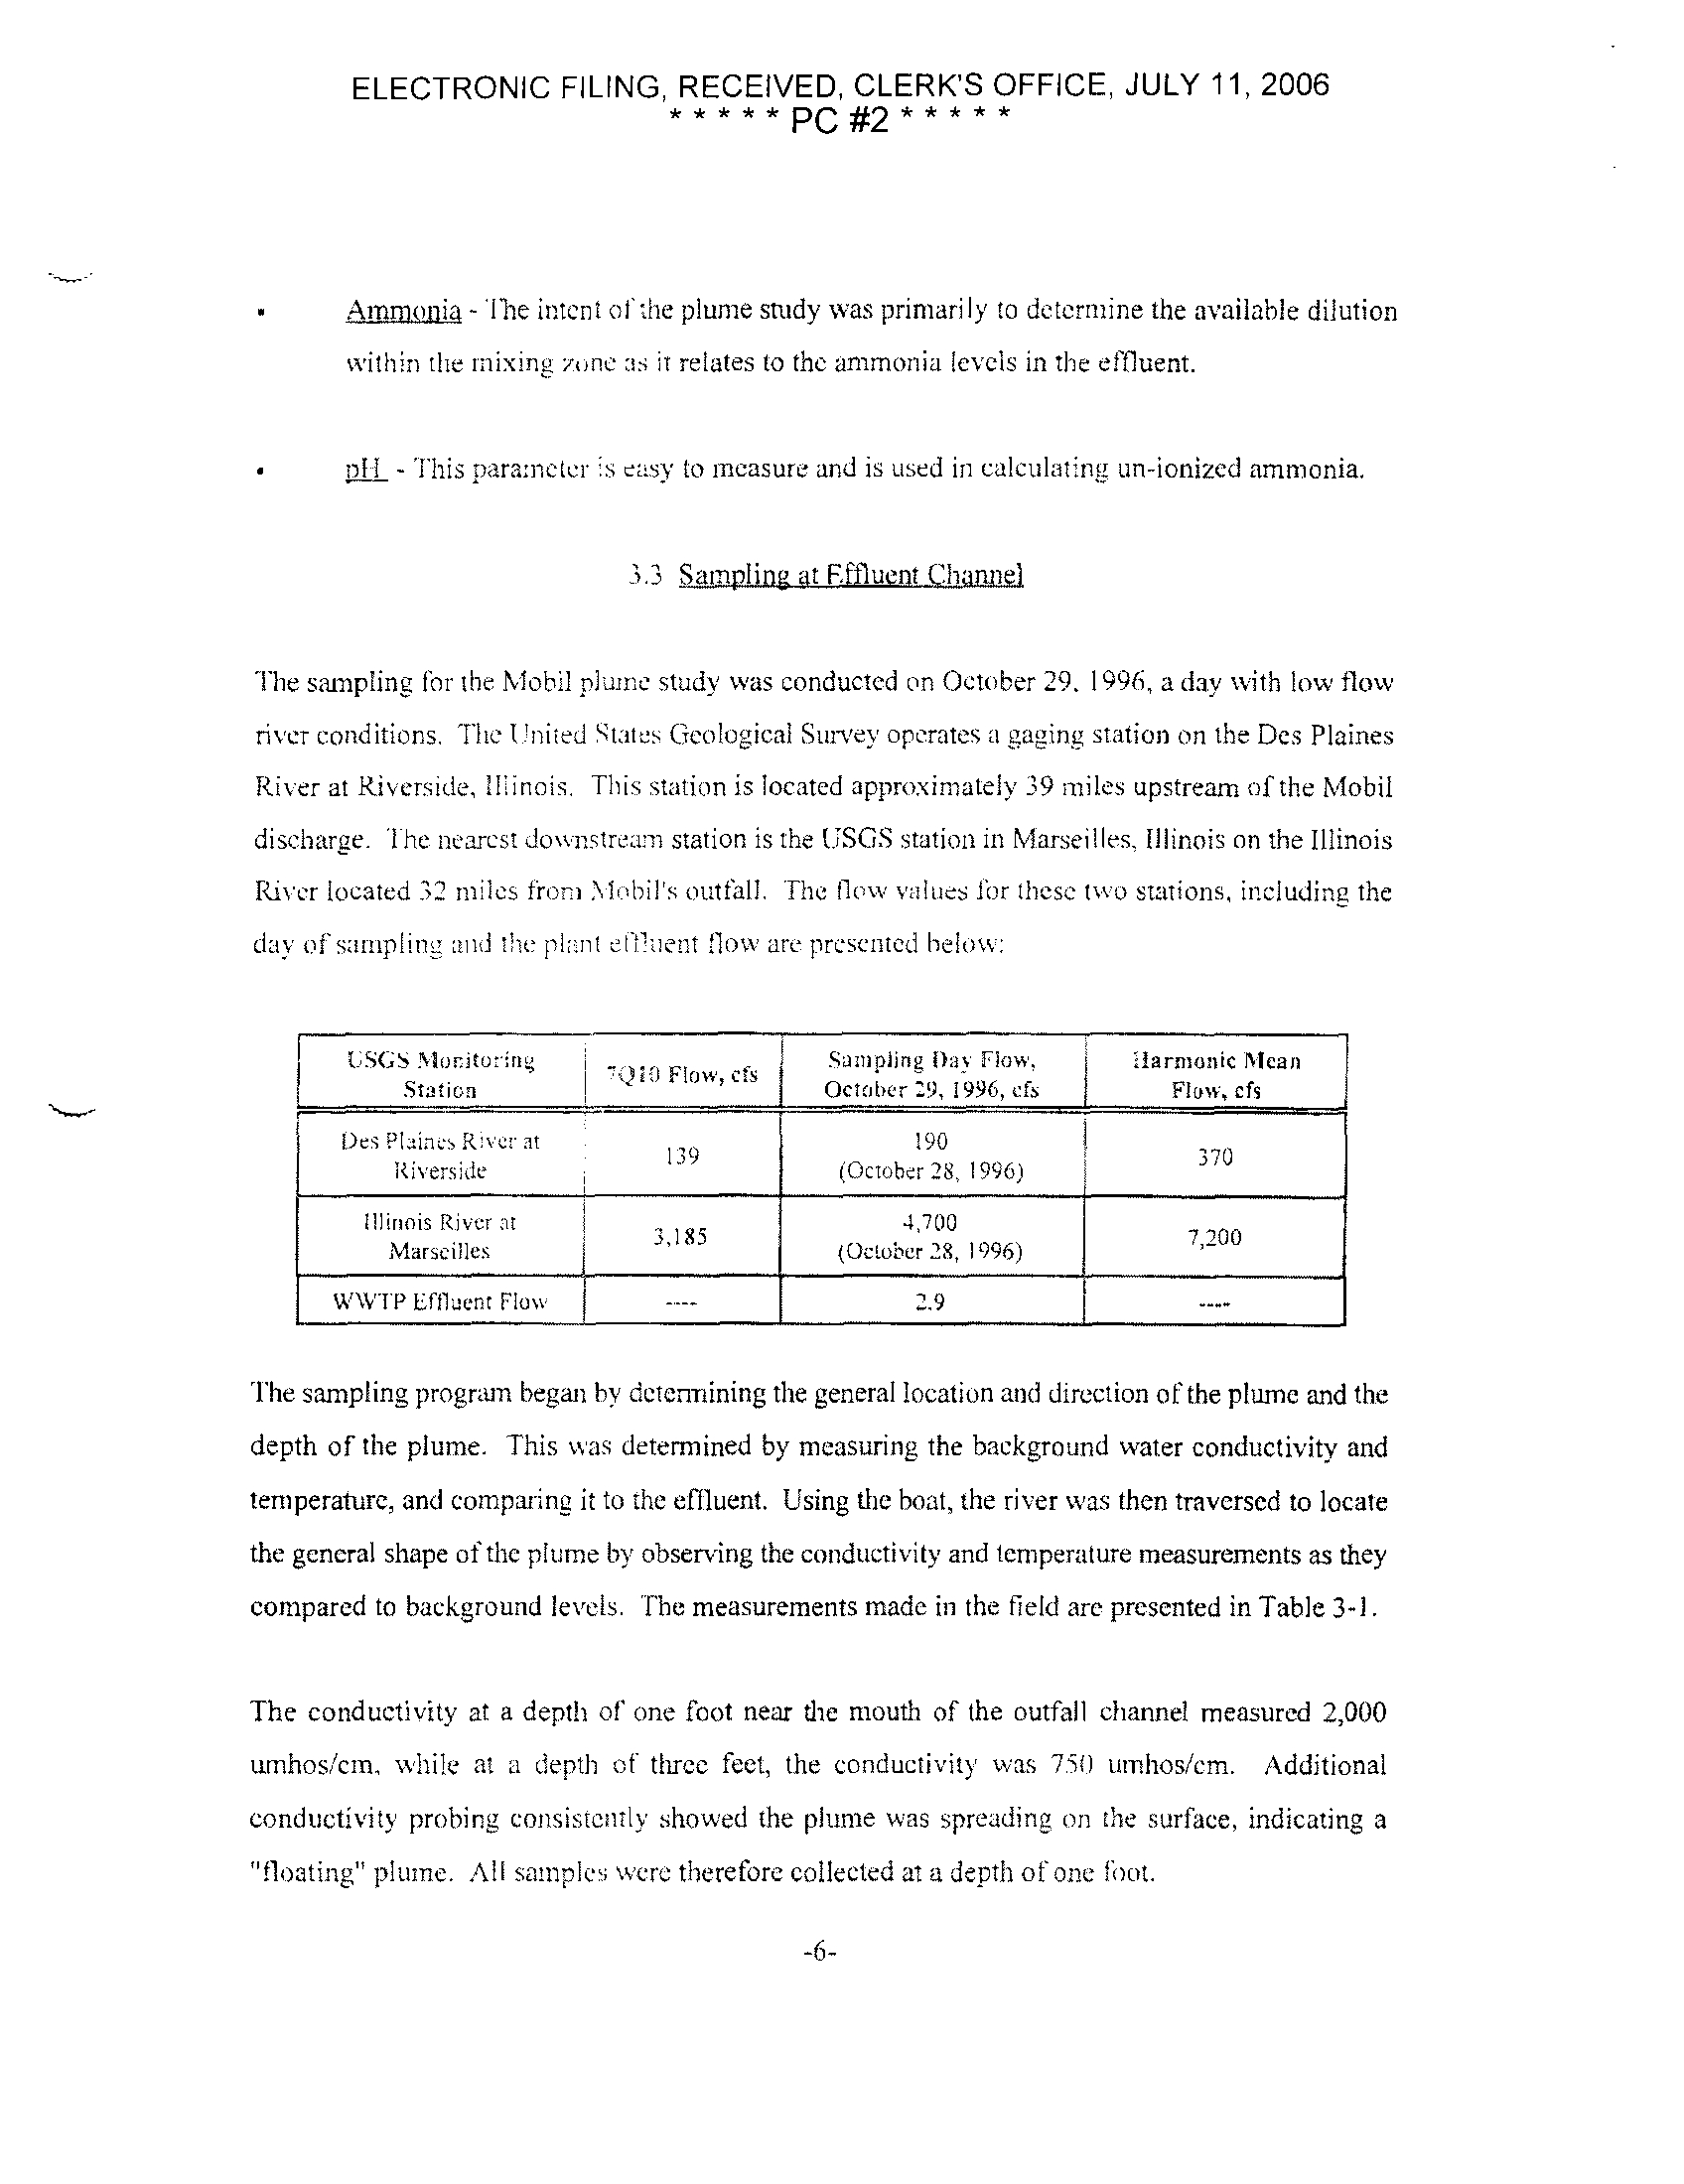
The sampling for the Mobil plume study was conducted on October 29 . 1996, a day with low flow
river conditions . The United states Geological Survey operates a paging station on the Des Plains
River at Riverside, iliinois
. This station is located approximately 39 miles upstream of the Mobil
discharge . the nearest downstream station is the USGS station in Marseilles, Illinois on the Illinois
River located 32 miles frori linbil's outfall
. The flow values ]or these two stations, including the
day of sampling and the plant ellluent flow
are presented below :
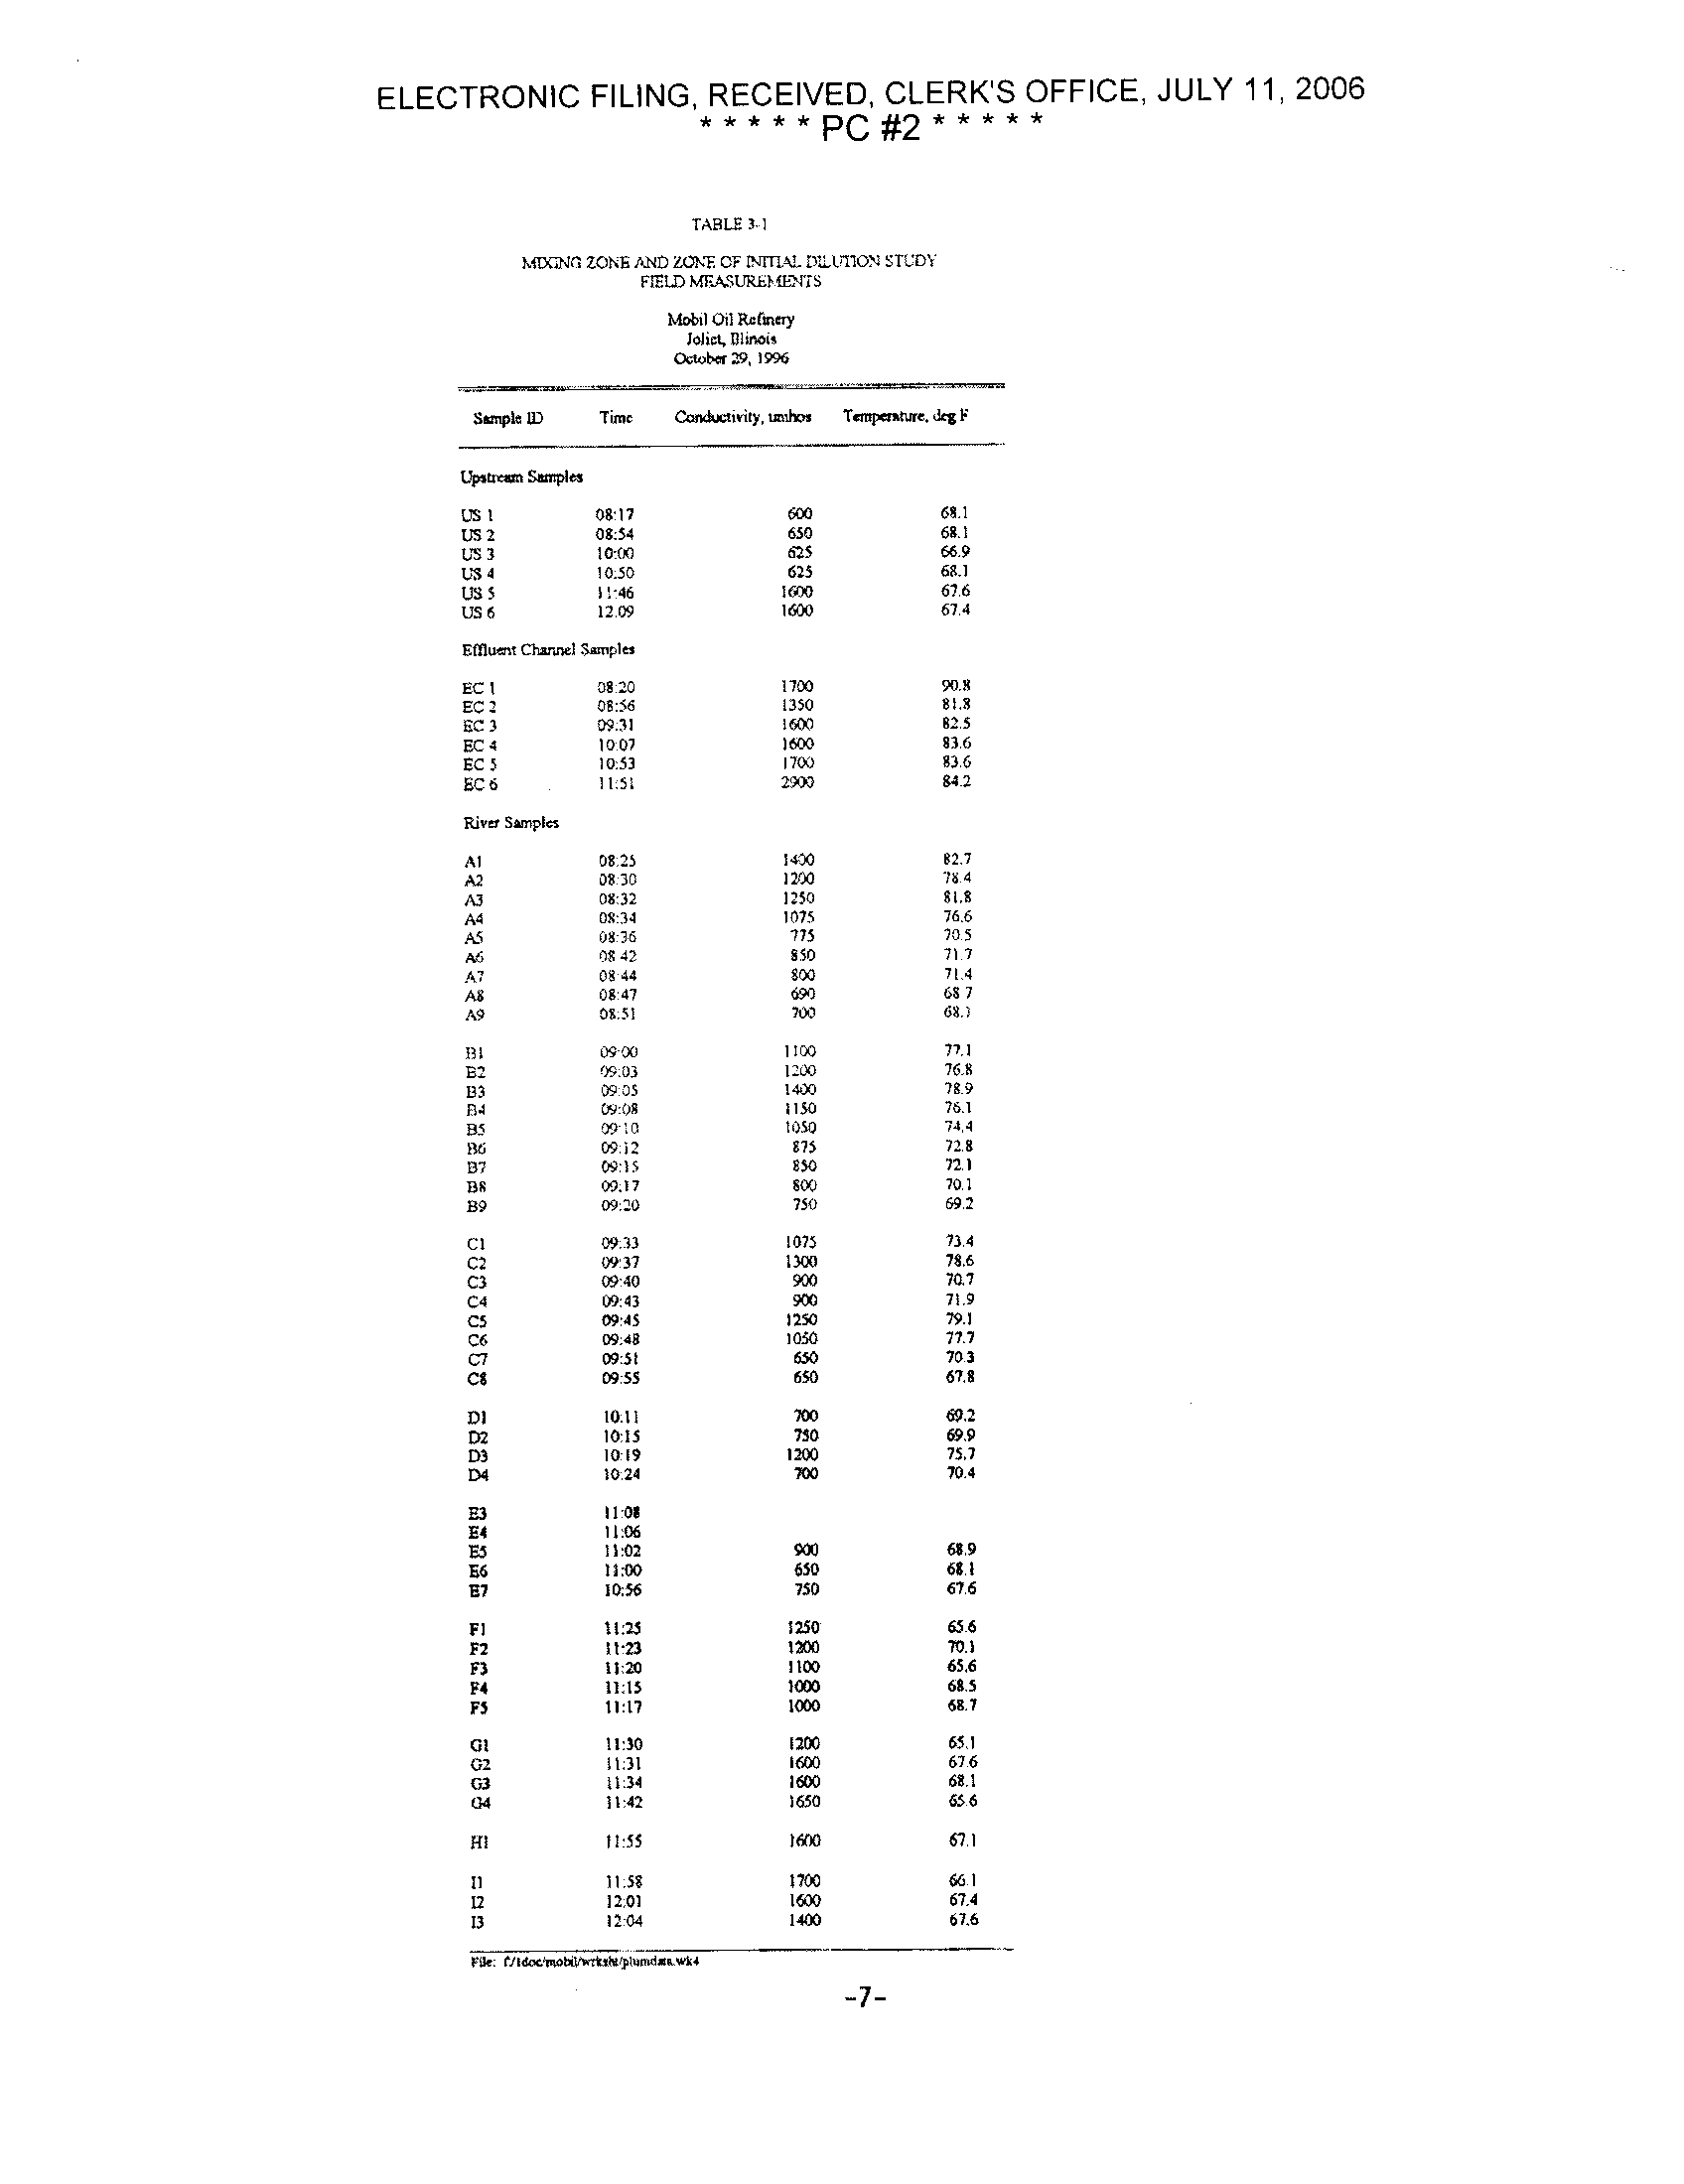
The sampling program began by determining the general location and direction of the plume and the
depth of the plume . This was determined by measuring the background water conductivity and
temperature, and comparing it to the effluent . Using the boat, the river was then traversed to locate
the general shape of the plume by observing the conductivity and temperature measurements as they
compared to background levels . 'The measurements made in the field are presented in Table 3-1 .
The conductivity at a depth of' one foot near the mouth of the outfall channel measured 2,000
umhos/em, while at a depth of three feet, the conductivity was 75() umhos/em
. Additional
conductivity probing consistently showed the plume was spreading on the surface, indicating a
"floating" plume . All samples were therefore collected at a depth of one foot .
-6-
'LS(,S Morato :in ;
S
-ti~i,l Flow, efs
Sampling Day Flow,
O , be 29, 1996, efs
Harmonic Mean
low CA
Des Plumes River et
r
Riverside
13)
190
(October
28, 1996)
370
Illinois River at
Marseilles
3,185
0'700
(October 23, 1996)
7,200
WVVTP Effluent Flow
1 .9
ELECTRONIC FILING, RECEIVED, CLERK'S OFFICE, JULY 11, 2006
*****PC#2*****
TABLE3.1
MDGNG ZONE AND ZONE CF NI' AJ .I)LAMON STUDY
FIELD MFASUREME74TS
Mobil Oil Rn(mey
laid.Olinois
Ocwbm 29, 1996
1k
: NIM ol*Wr*VW/plnmd
Ssmpk ID
Tim=
CanWervily, ,hr Tcmpcmiura 0rg F
Up46um S..plw
U81
08:17
600
68 .1
U52
08:54
650
68.1
US 3
1003
625
66.9
43 4
10.50
625
68.1
US 5
11 .46
1!400
67.6
US 6
12 .09
1630
674
EM ., Cturmd Smnple
EC I
08 :20
1700
90.8
EC 2
08 :56
1350
81 .8
SC 3
09 .31
1607
82 .5
EC 4
007
1600
83 .6
EC 5
70 :53
1700
83 .6
EC 6
11 :51
2900
84 2
Rive Sunpk
Al
08 .25
1400
82,7
A2
08 :30
1200
78 .4
A3
08 :32
1250
61 .8
A4
0894
1075
76 .6
AS
08 :36
775
70.5
A6
0642
850
71 .7
.A7
08 44
600
714
AS
08'.47
693
68 7
A9
08:51
700
68 .)
331
N w
1100
77,1
E2
79 :03
LL
76.8
133
09.05
1400
789
04
(9:08
IM
76.1
85
0990
1050
744
86
04.12
875
72.8
137
09
:15
850
72.1
138
07 :17
800
70.1
89
09 : 2_0
750
69 .2
CI
0933
1075
73 .4
C2
IN 37
1300
78 .6
C3
03:40
900
7a7
C4
09:43
900
71,9
C5
09 :45
1250
79 .1
C6
09:48
1050
77
.7
C7
09 :51
650
70.3
CS
09 :55
650
67.8
D1
10.11
700
69.2
02
10 :15
750
69.9
D3
1019
1200
75 .7
D4
10.24
700
70.4
E3
11 08
E4
11 :06
E5
11 :02
900
68.9
E6
IIUO
650
68.1
E7
10.56
750
67.6
FI
11 :23
1250
656
F2
1173
1200
70.1
F3
11 :20
1100
65,6
F4
11 :15
1000
68.5
F5
1017
1000
68.7
G1
11 :30
1200
650
G2
1101
1600
676
G3
11 :34
1600
68 .1
G4
1142
1650
656
HI
1155
l600
67 .1
11
11 :58
1700
660
12
12,01
1600
67.4
13
1204
1400
67,6
ELECTRONIC FILING, RECEIVED, CLERK'S OFFICE, JULY 11, 2006
* * * **PC #2 * * *
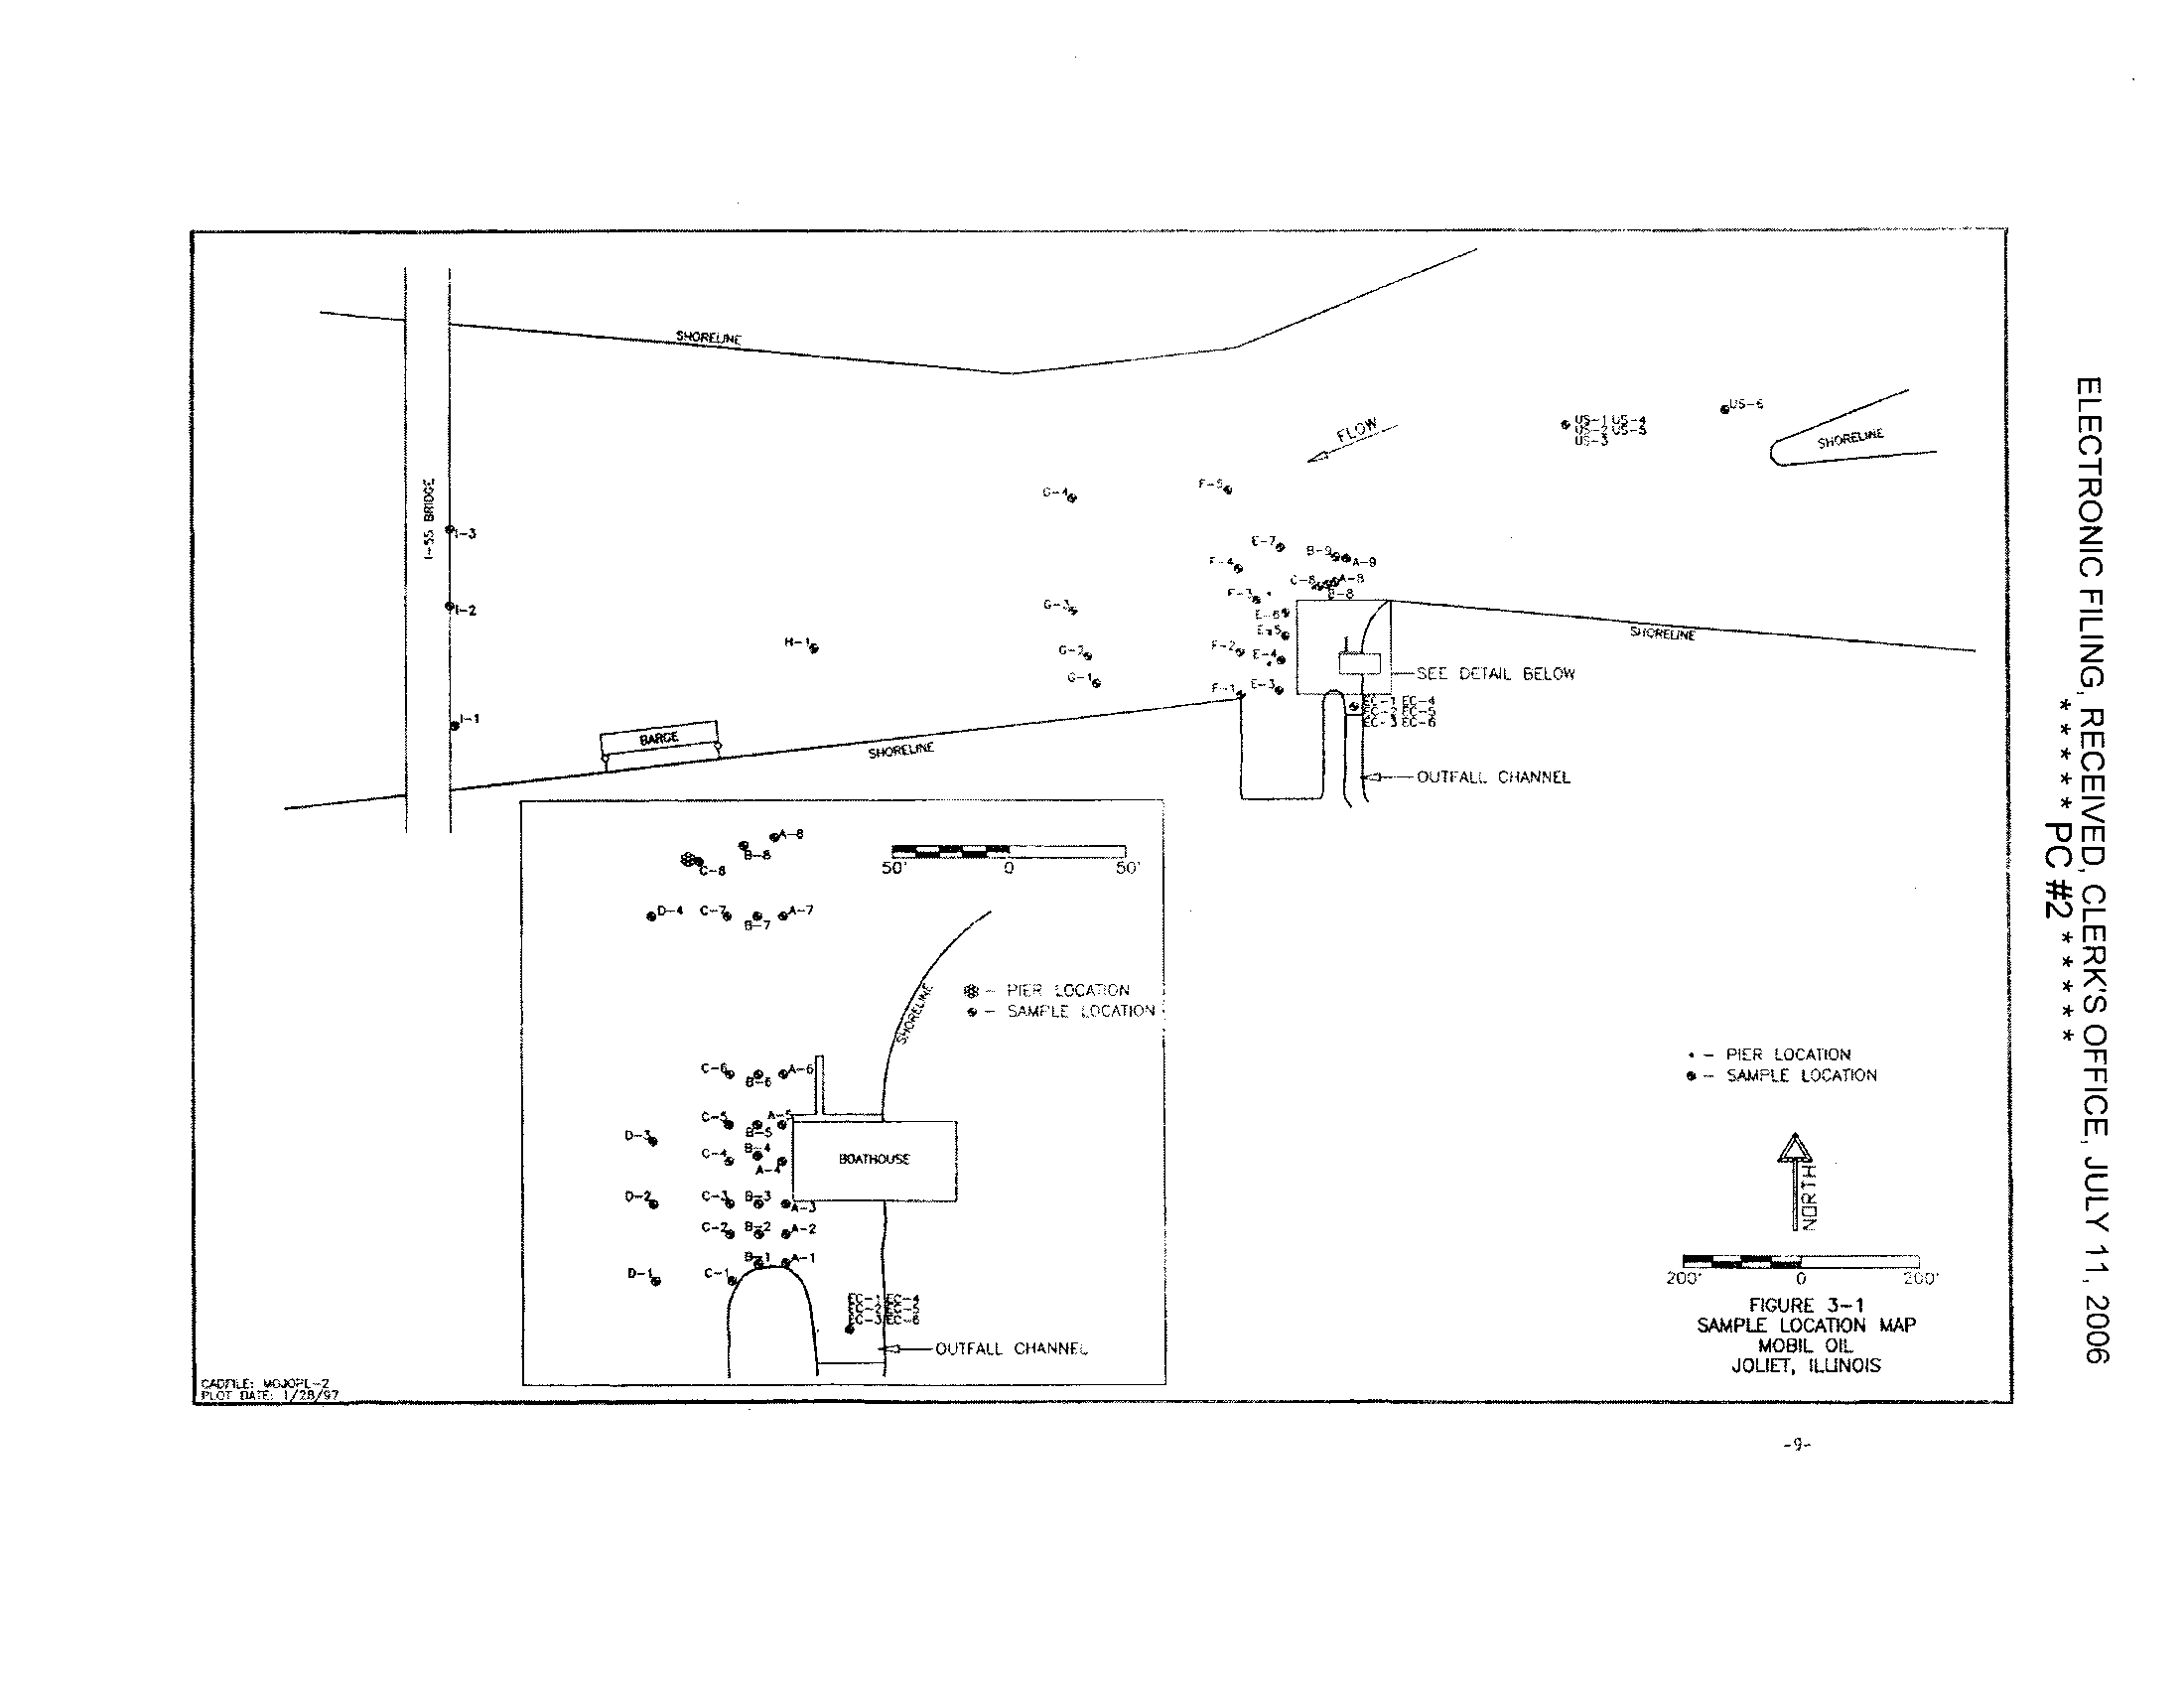
After the general direction and depth of the effluent plume was determined, samples were collected
for analysis . Each sample location was labeled with an alpha-numeric character and then a numeric
character . The alpha-numeric character increased in the downstream direction while the second
numeric character increased with distance from the shoreline
. Figure 3-1 depicts the sample
locations
.
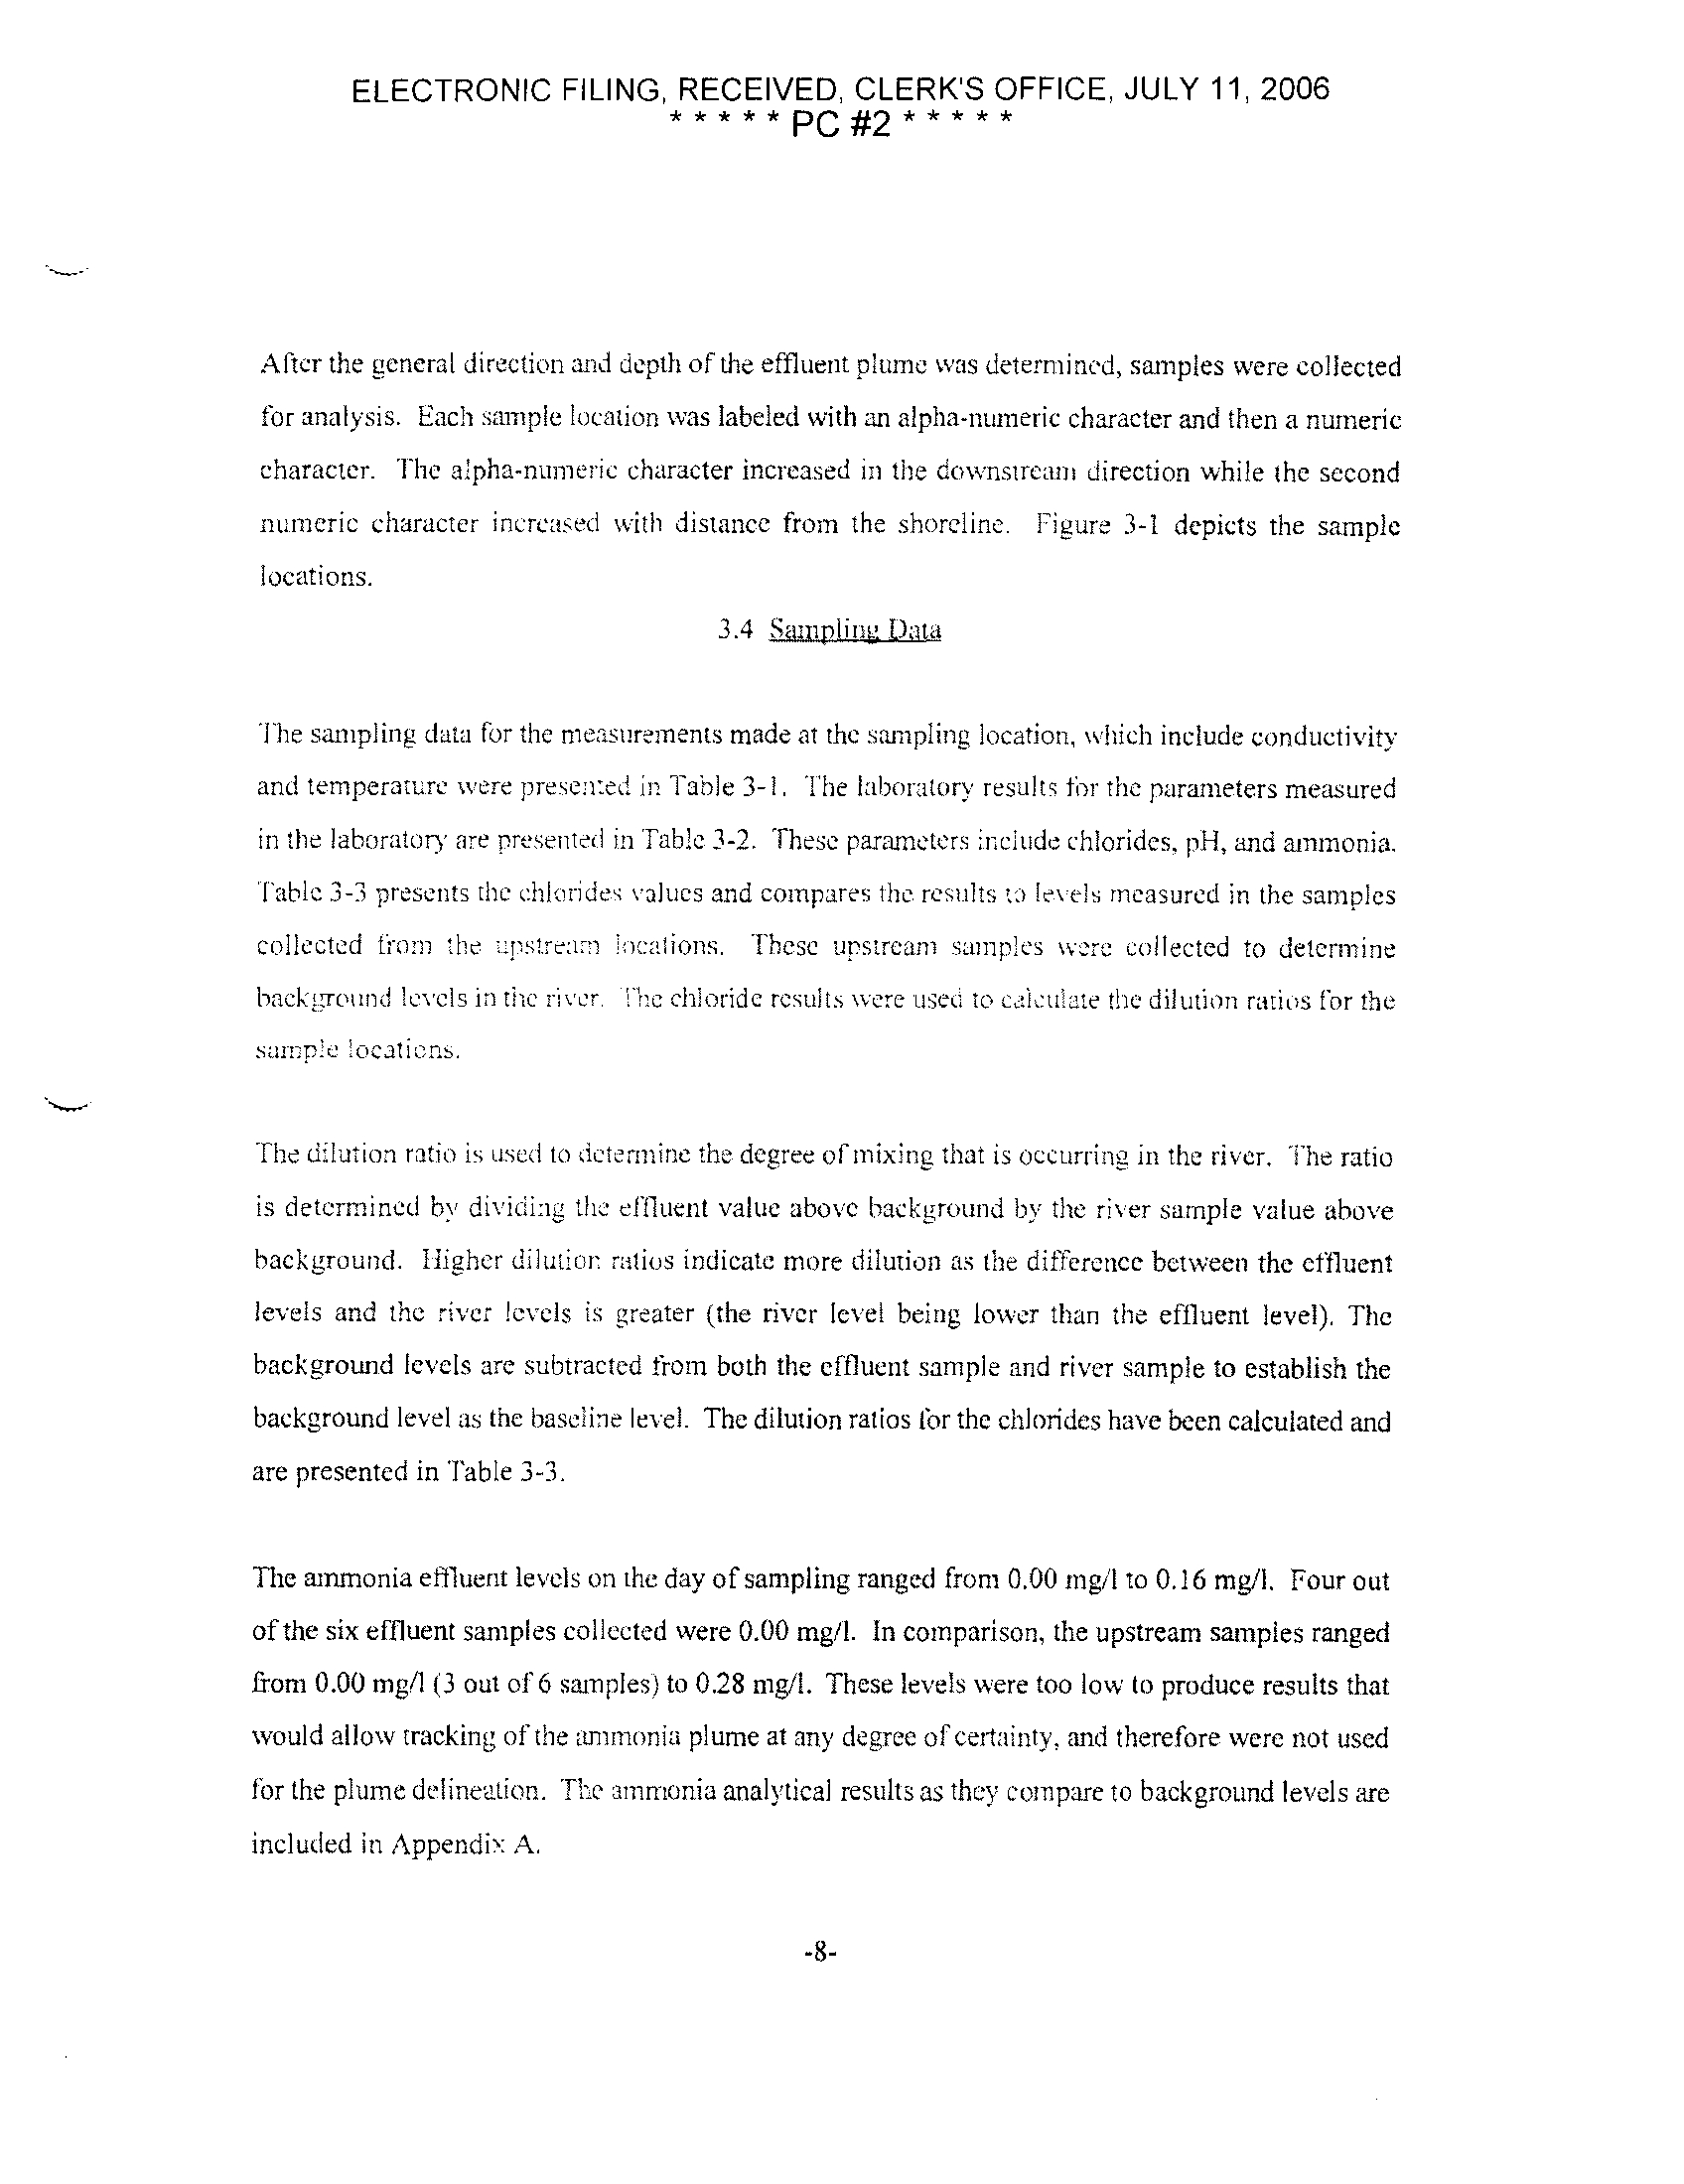
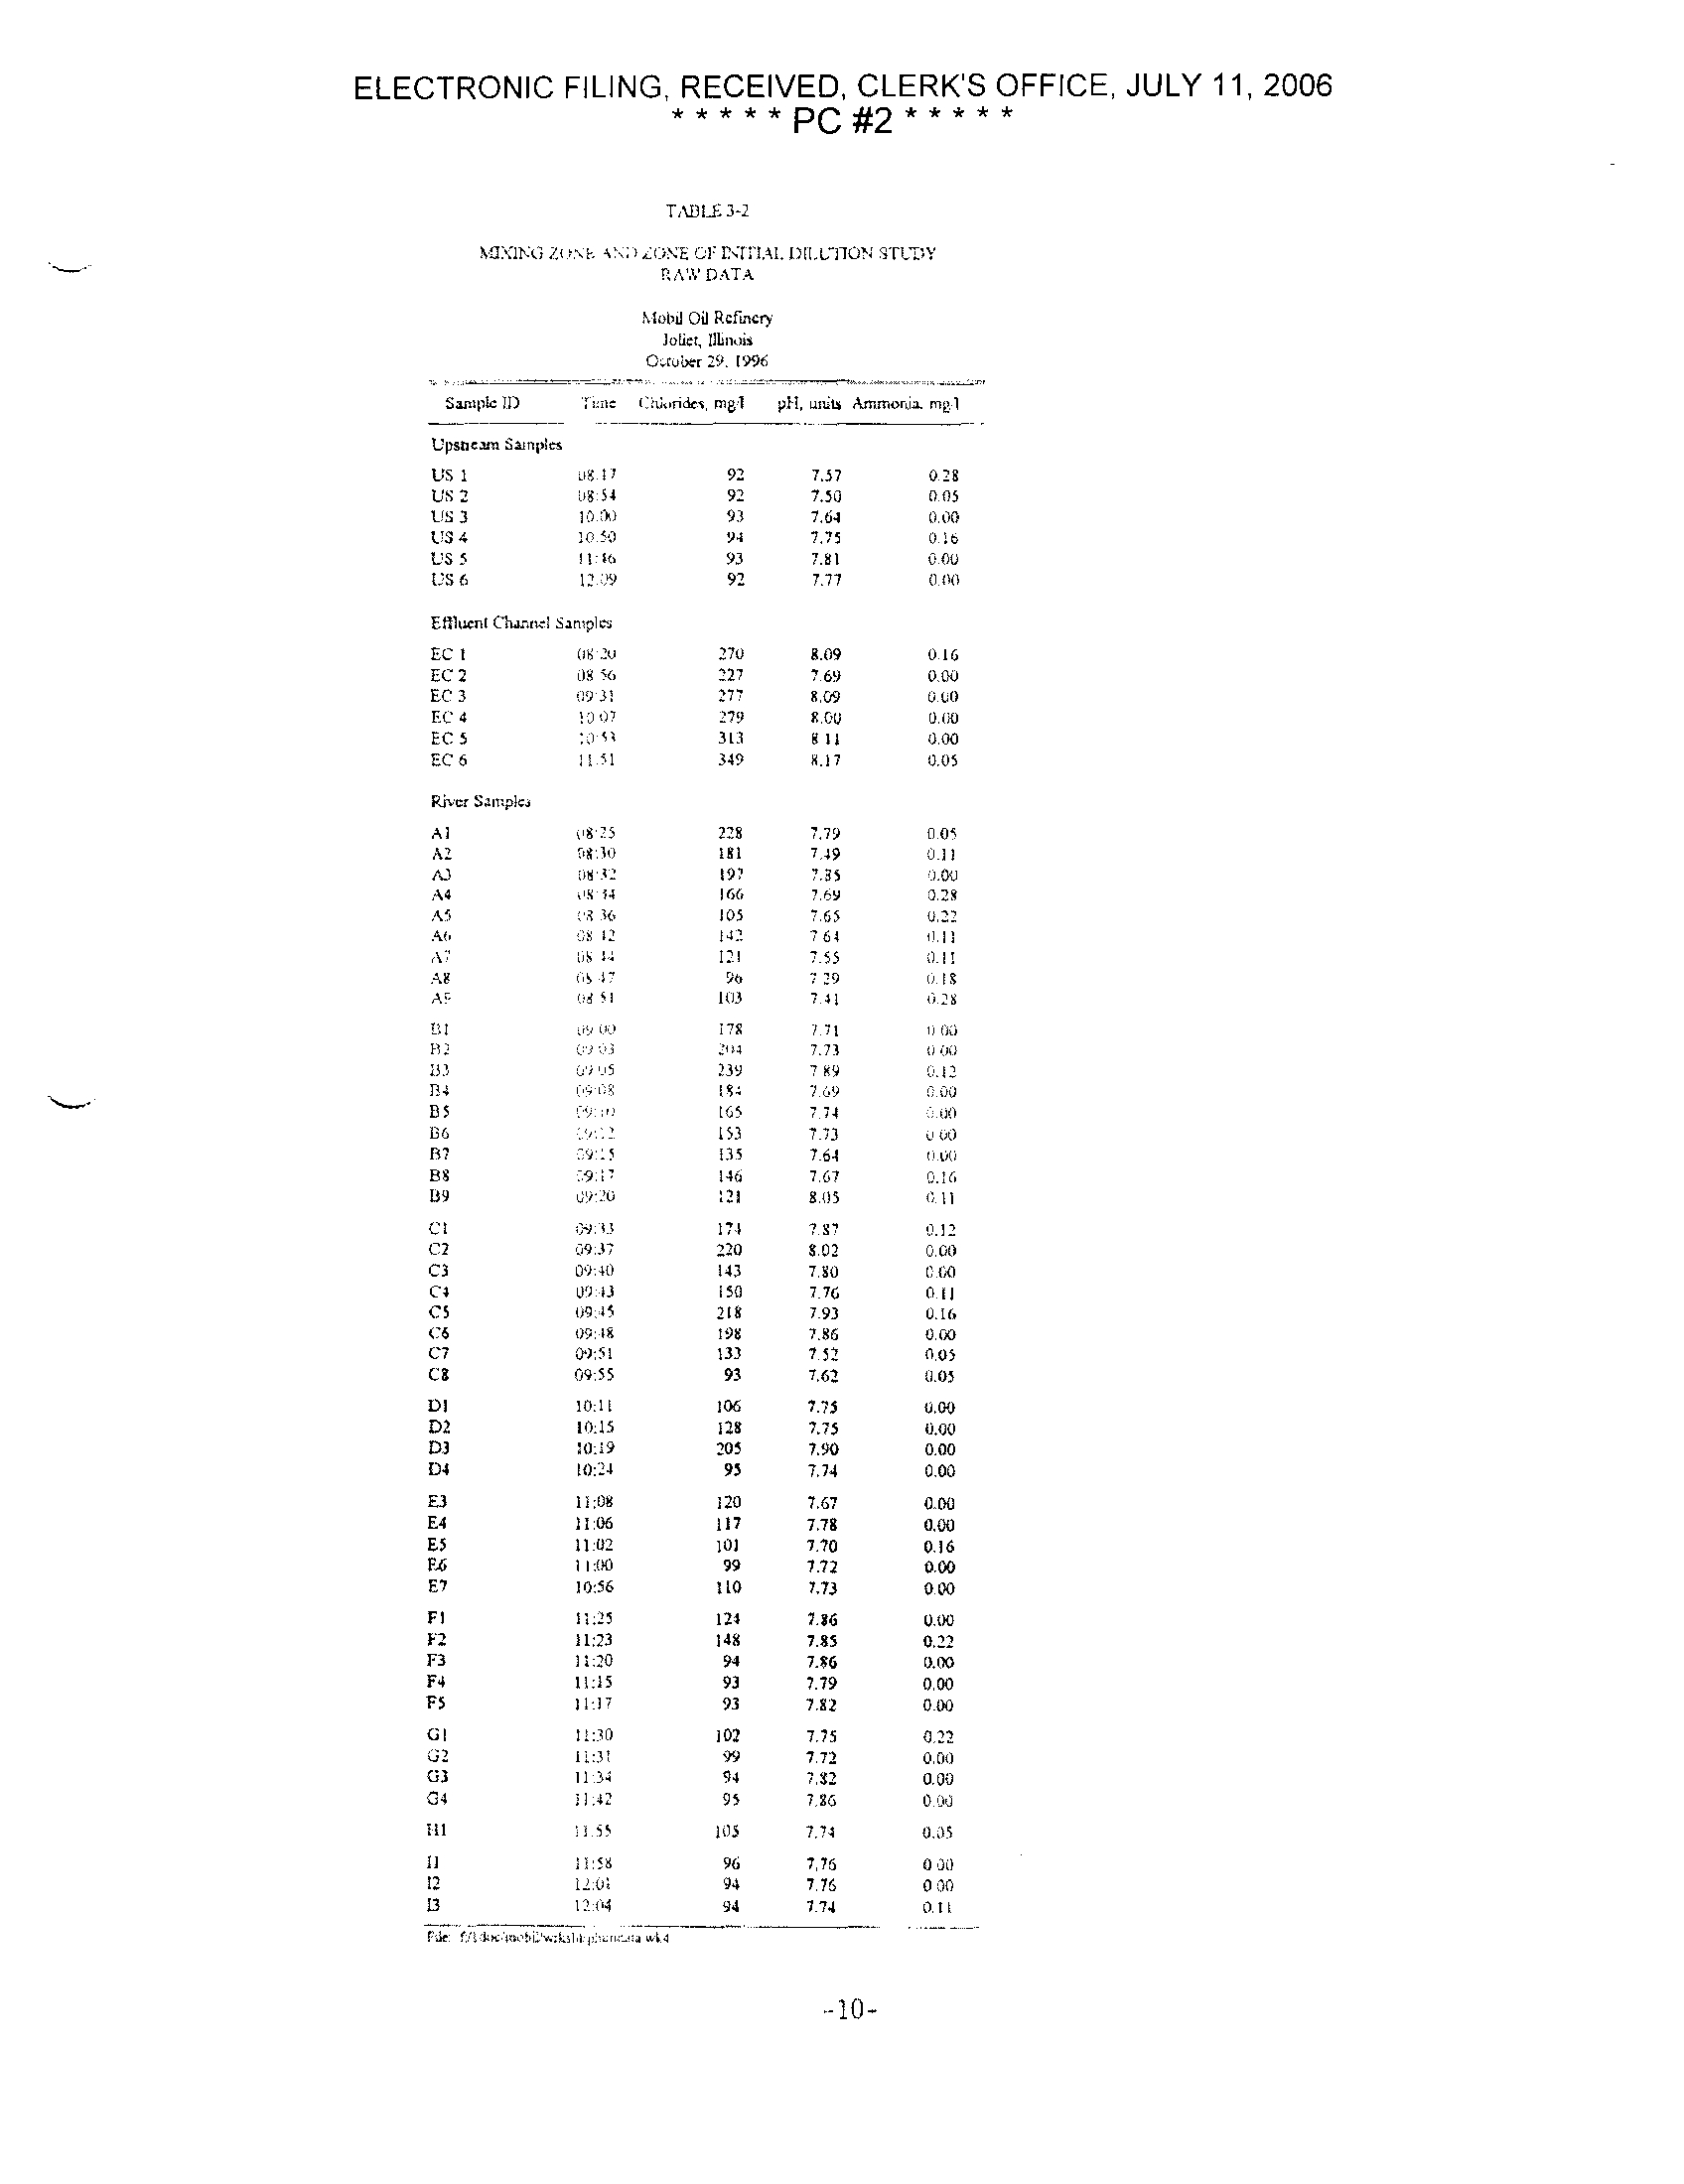
3 .4 Samplmt' Data
The sampling data for the measurements made at the sampling location, which include conductivity
and temperature were presented in Table 3-1
. The laboratory results for the parameters measured
in the laboratory are presented in Table 3-2 . These parameters include chlorides
. pH, and ammonia.
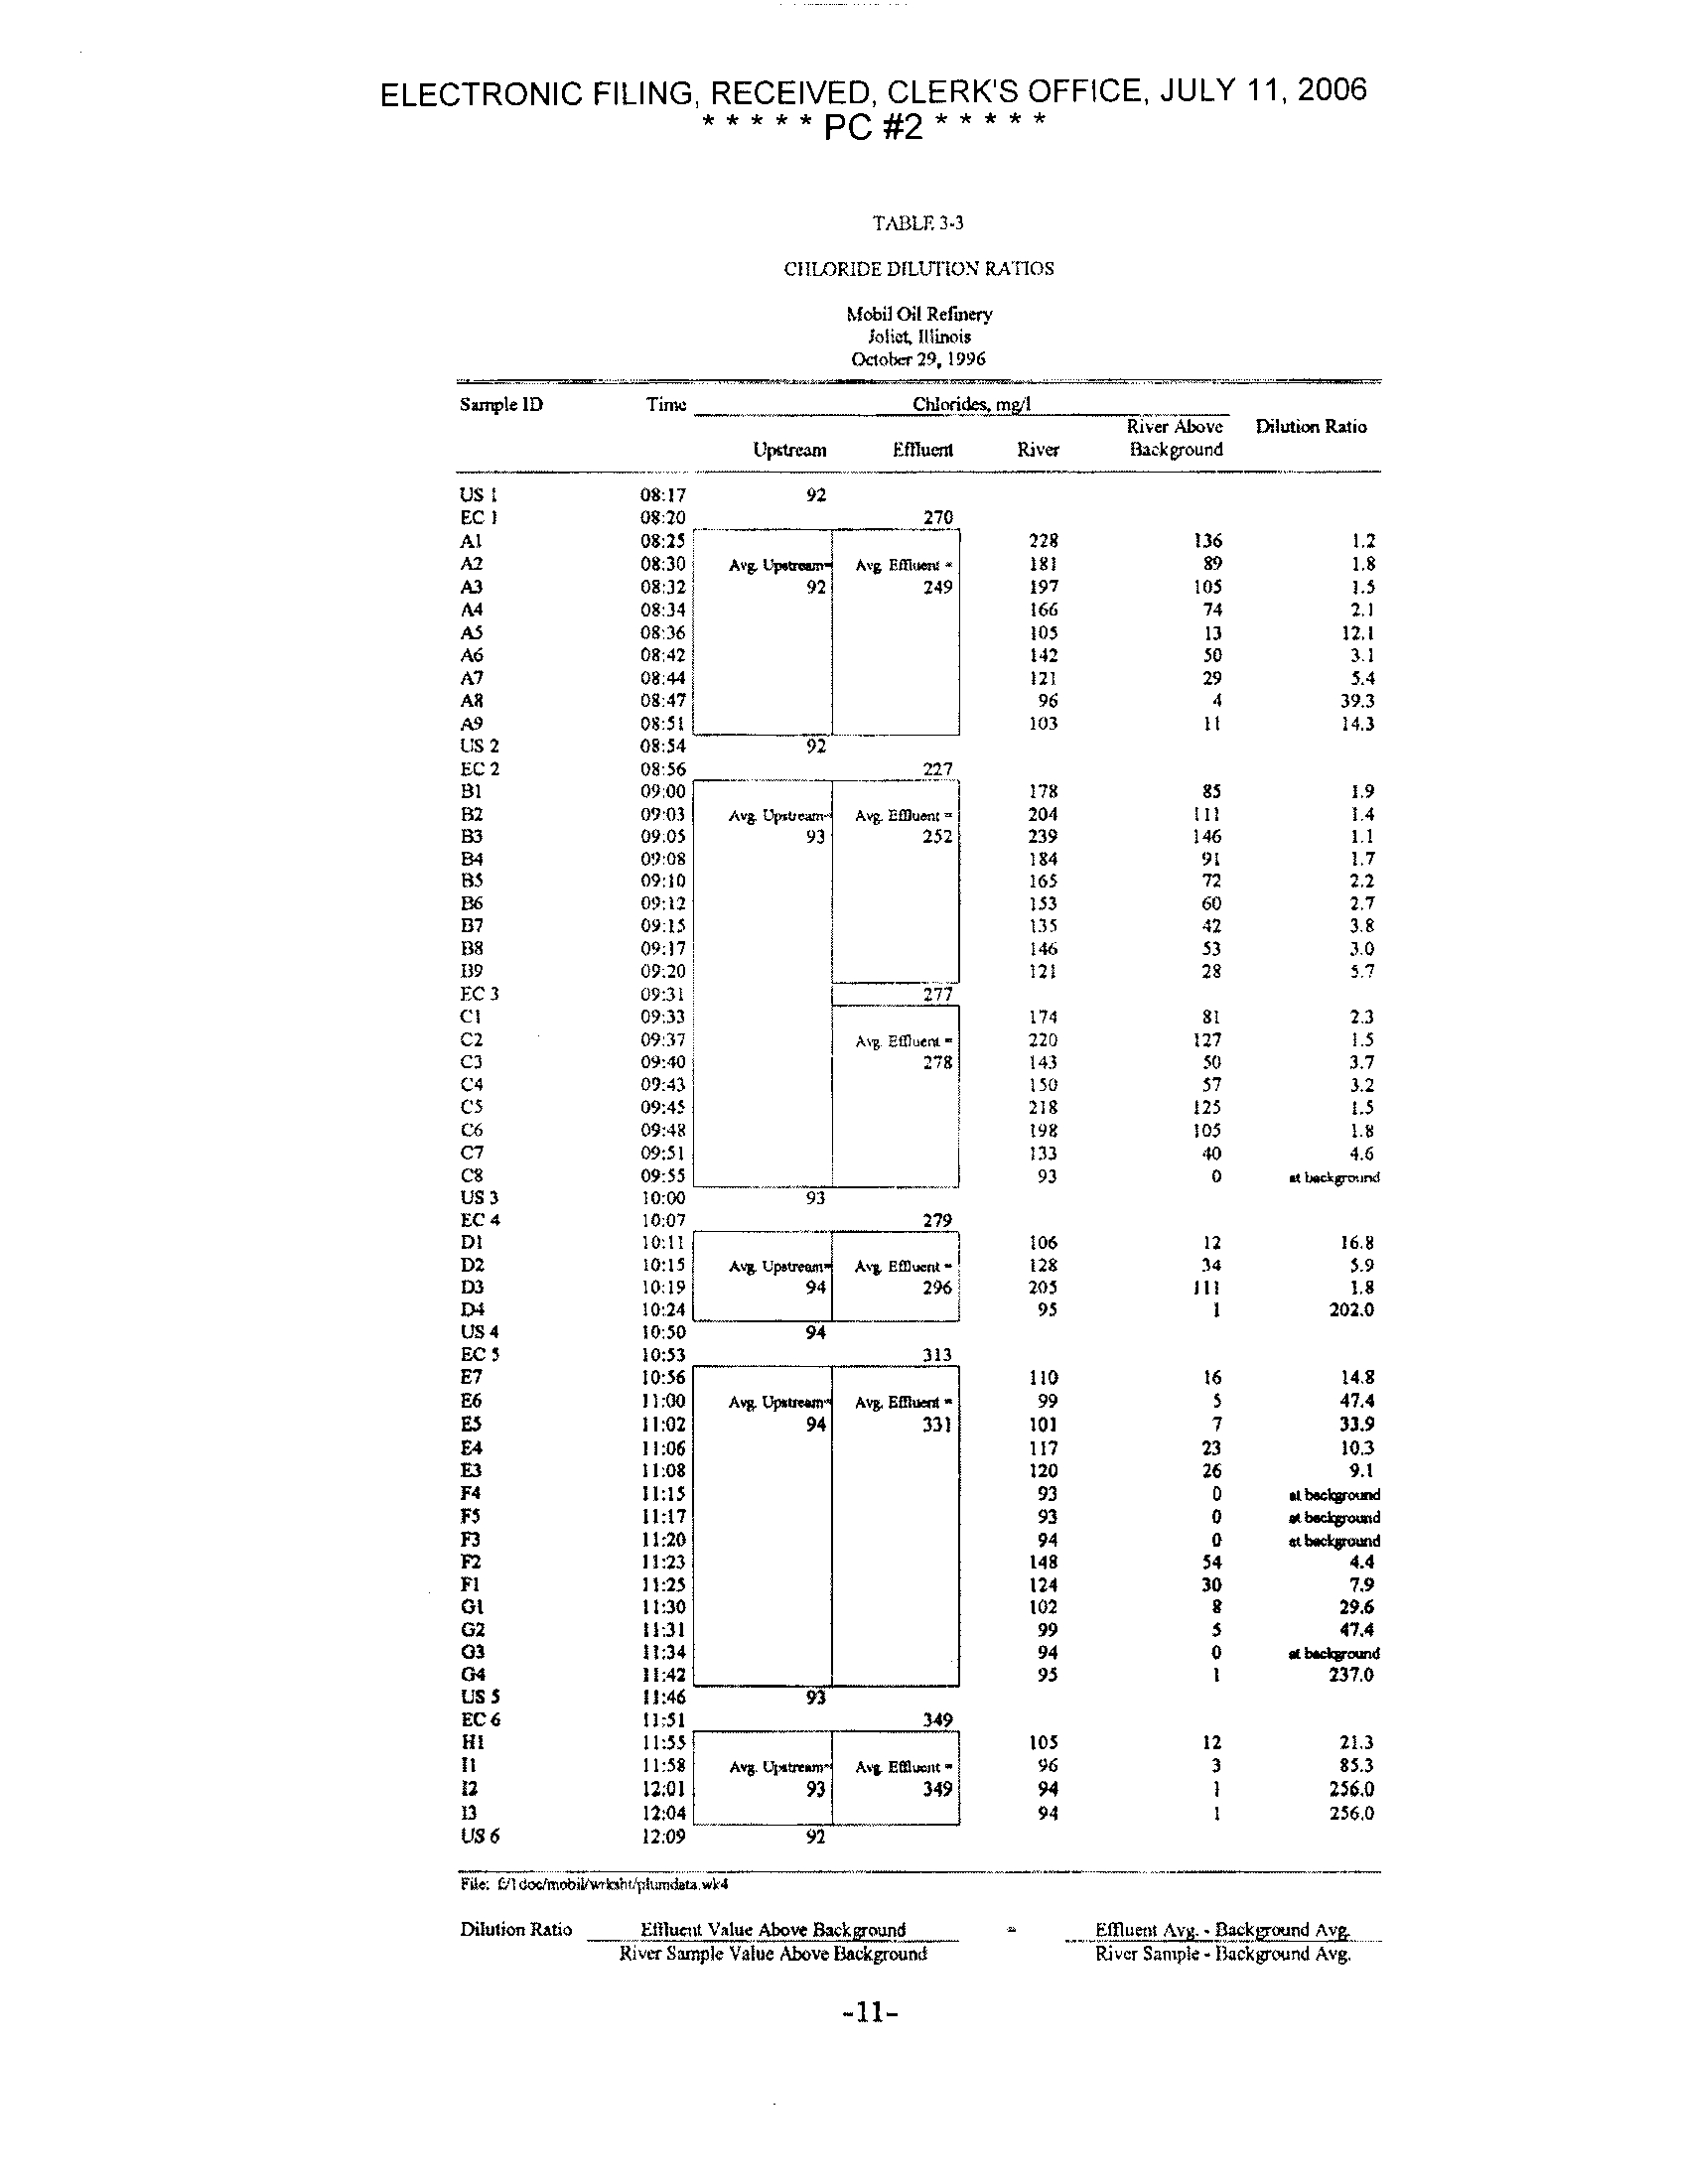
Fable 3-3 presents due chlorides values and compares the results to levels measured in the samples
collected from the upstream locations
. These upstream samples were collected to determine
background levels in the river . '.1
e chloride results were used to calculate the dilution ratios for the
sample locations .
The dilution ratio is used to determine the degree of mixing that is occurring in the river, the ratio
is determined by dividing the effluent value above background by the river sample value above
background
. Higher dilution ratios indicate more dilution as the difference between the effluent
levels and the river levels is greater (the river level being lower than the effluent level)
. The
background levels are subtracted from both the effluent sample and river sample to establish the
background level as the baseline level
. The dilution ratios for the chlorides have been calculated and
are presented in Table 3-3 .
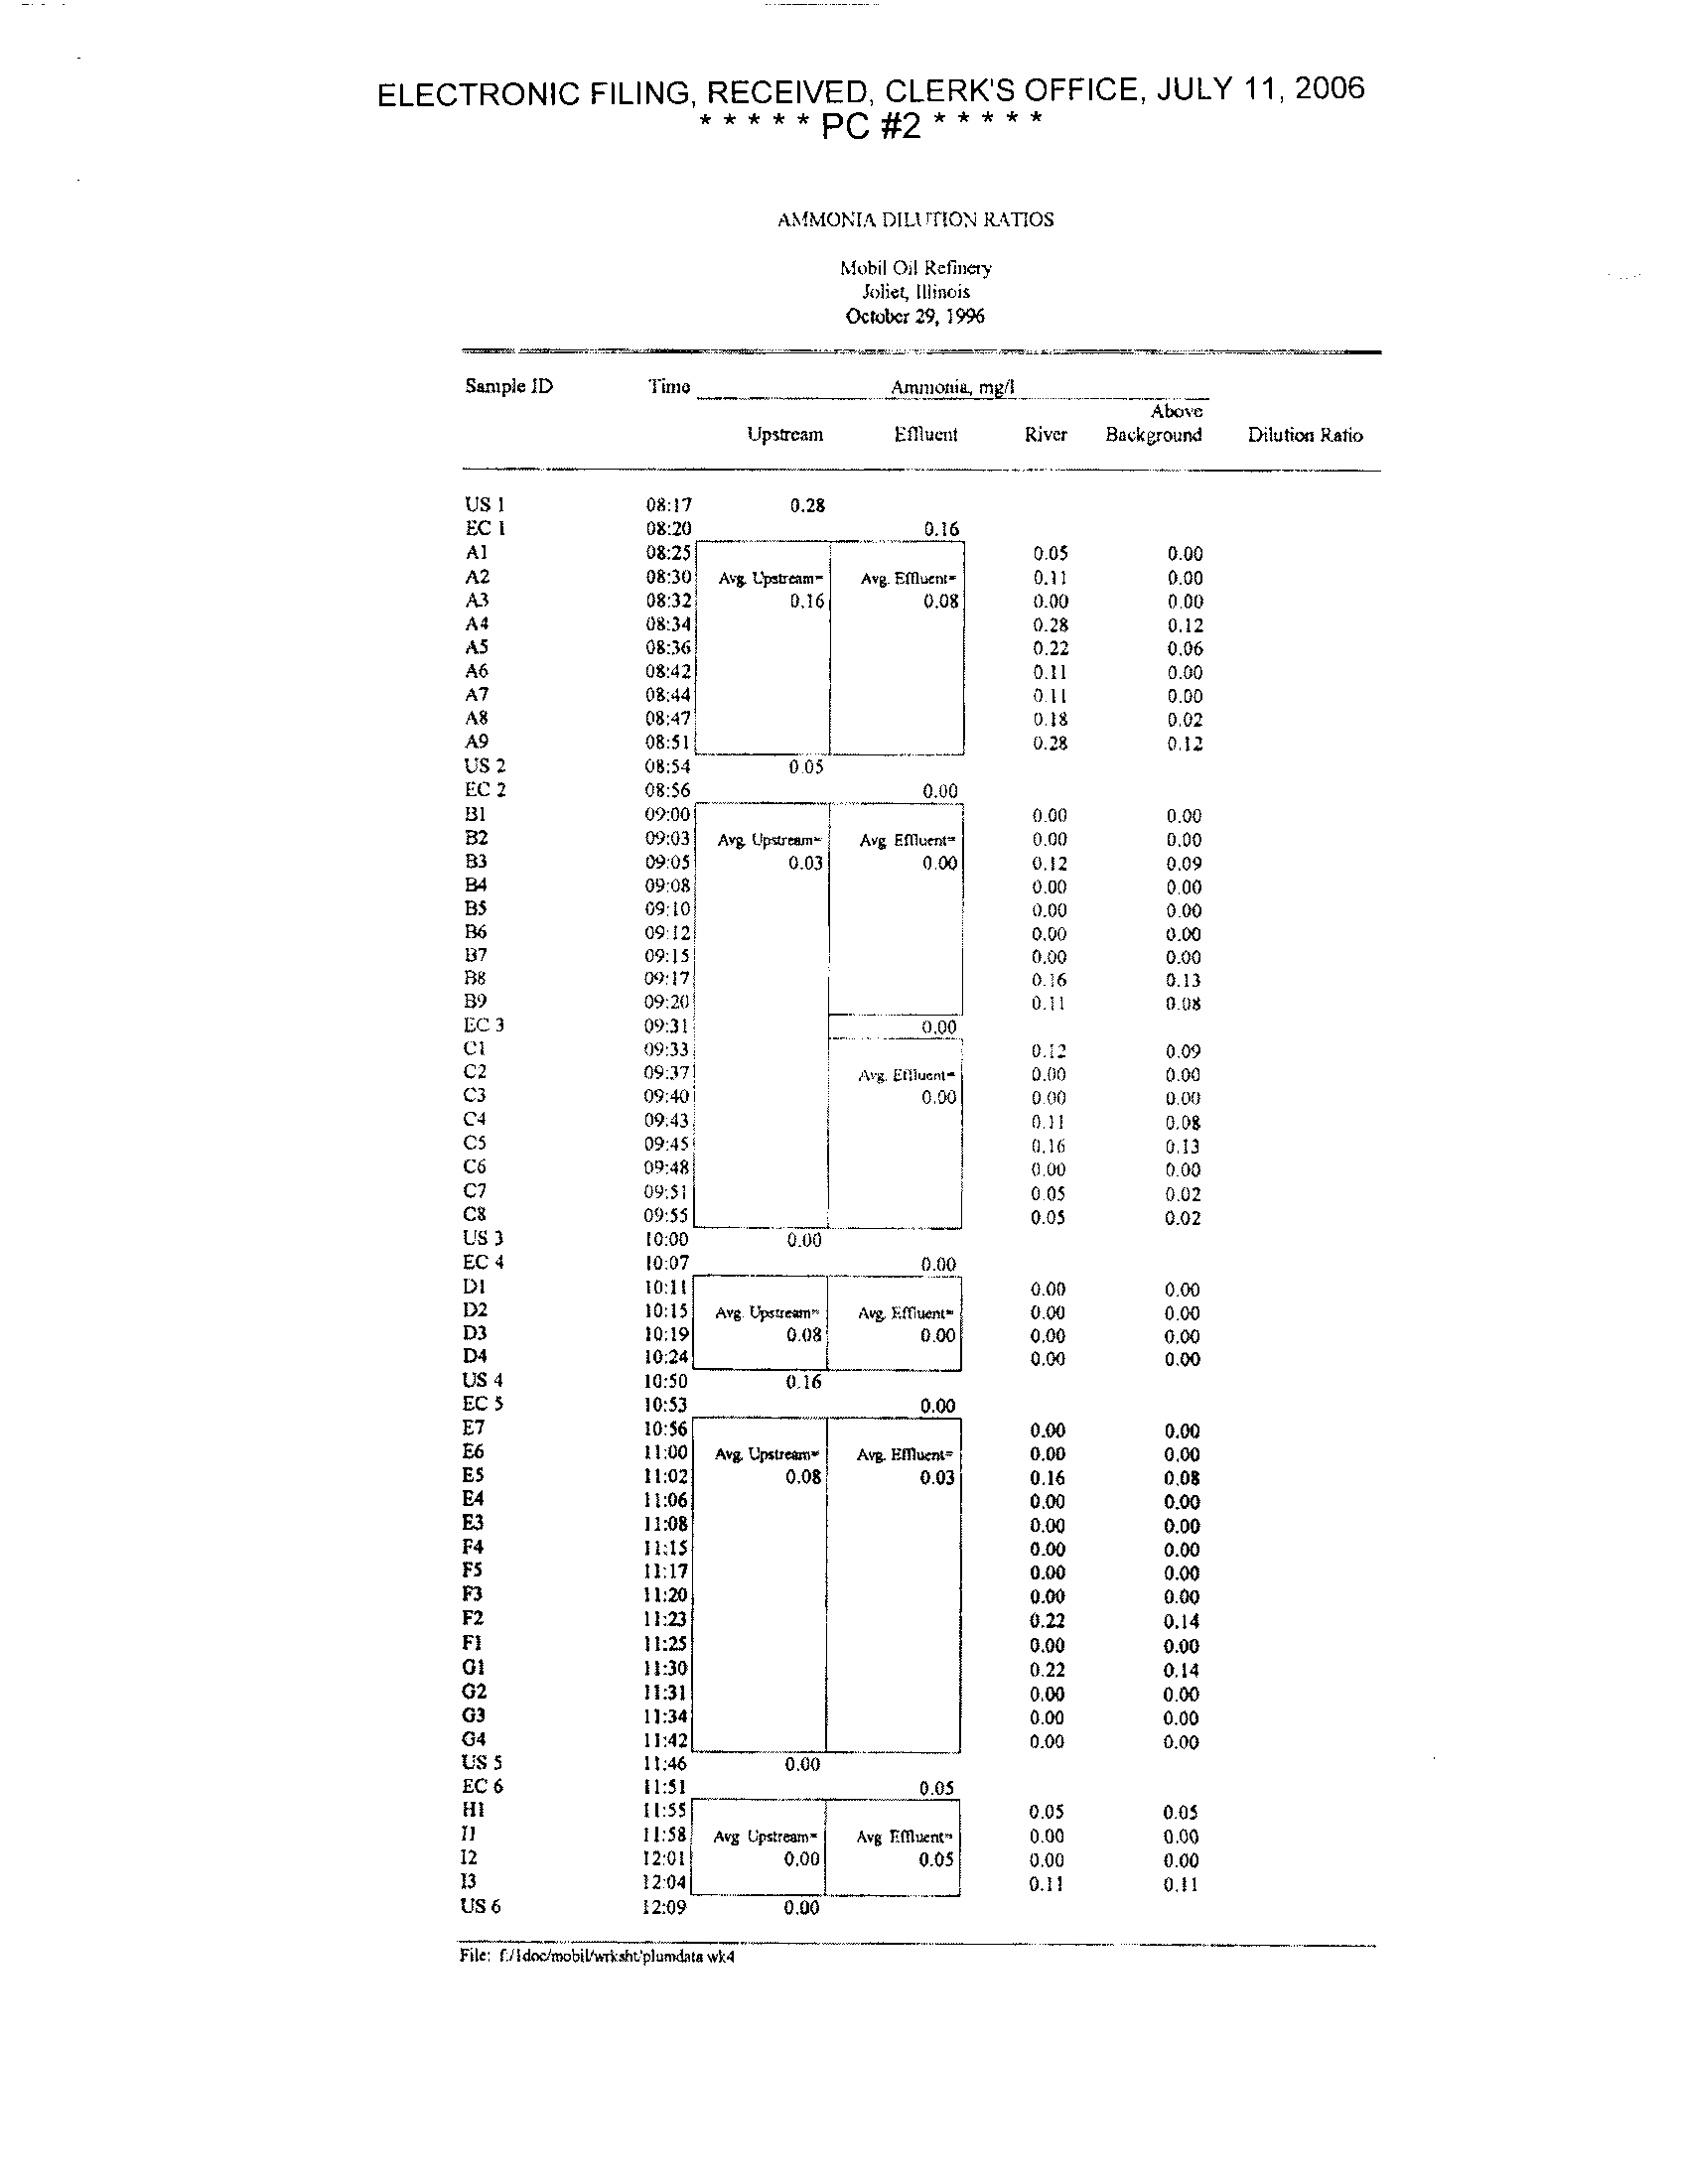
The ammonia effluent levels on the day of sampling ranged from 0 .00 mg/I to 0 .16 mg/I
. Four out
of the six effluent samples collected were 0 .00 mg/l
. In comparison, the upstream samples ranged
from 0 .00 mg/1 (3 out of 6 samples) to 0 .28 mg/l . These levels were too low to produce results that
would allow tracking of the
ammonia
plume at any degree of certainty, and therefore were not used
for the plume delineation . The ammonia analytical results as they compare to background levels are
included in Appendix A .
-8-
PLOTcLDnaO4L
:
LDWL-z(/29/57
D-3,
C4 Dbb
-b
c- ; ~Sr
c- •
s
asA
P
c-z,
e&2 a-2
aoAnuxrsE
3
PF'
-OCATGN
SA
E
LOCATION
f
.OUIFALL CHANNFL
u--3
,L'> 6
•
-
PIER LOCATION
e- SNAPLE LOCATION
dz
4
7
zoo
0
200
FIGURE 3-1
SAMPLE LOCATION MAP
MOBIL OIL
JOLIET, ILLINOIS
ELECTRONIC FILING, RECEIVED, CLERK'S OFFICE, JULY 11, 2006
* * * * *PC #2 * * * * *
-10-
TABLE 3-2
64.CThG z1 '3h A' ; ZONE OF ra1AI.1) UFTOr4 sTL'Lw
RA'.v DATA
Alol'U Oil Rcf cry
IoOCt Illnais
Oz9her29 .1996
Sanlplc ID
~ .v_ CNoddcs,, mgl p19, mdb Ammonia. m01
Upsncam Svnples
US 1
08
.11
92
7.57
0 .28
US 2
0854
92
7.50
005
US 3
10
.0)
93
7,64
0 .00
L794
10.50
94
7.75
0.16
US 5
11 :46
93
7 .81
0 .00
US 6
1207
92
7.77
0 .00
Elil eel Channci Samples
EC I
08°0
270
8 .09
0 .16
E - 2
08w
227
7 .69
0.00
EC 3
09 31
277
8,09
0.00
EC 4
1007
279
8
.00
0 .00
EC5
:05s
313
811
0 .00
EC 6
11 .51
349
0.05
R Lnr San:plu
A7
08"3
228
7 .79
00 ,
AZ
08'.10
181
7
.49
0 .11
N
1,8 0-1
{97
7 .35
0.00
A4
.
Y 14
166
7 .69
0.29
A5
ua 36
105
7
.65
22
09 12
512
7 64
u
121
755
11
.11
A
:1547
96
729
018
103
741
028
171
He
7 .71
153
'5
239
7 89
I9%
7 .69
0.00
175
165
7.74
. .ao
l76
153
i 73
00
B7
135
7.64
B8
146
7.67
149
01, m
12{
8.05
CI
Os 3
1'4
297
0 .13
C2
09 37
,
220
8 .02
0 .00
C3
09,40
143
7 .80
0fA
C4
0913
150
7 .76
0 .11
CS
o9 a5
218
7
.93
0 .16
C6
09
:48
198
7 .86
0,00
C7
07 :51
133
7
.52
005
CB
09,55
93
7,62
15,05
DI
10:11
106
75
0.00
D2
10 :15
129
7 .75
0.00
D3
70
:19
205
7 .90
0.00
04
10 :24
95
7 .74
0.00
E3
11 :08
120
7 .67
0.00
E4
11 :06
117
7 .78
0,00
E5
11 02
101
7.70
0.16
F4
11 (A)
99
7 .72
0.00
E7
10:56
110
7.73
000
Fl
11 :25
124
7.86
0,00
02
11 :23
148
7.35
0.22
F3
Ii 0
94
7.86
0.00
F4
11 :15
93
7 .79
0,00
FS
11 :17
93
7 .82
000
GI
1! 70
102
7.75
022
( 32
191
99
7.72
0,00
G3
11 :3+
94
82
0 .00
04
:1,42
95
786
000
111
1,15
7 .74
0.1)5
II
11 :58
96
7,76
0011
12
1x.01
94
776
0110
13
1? 04
94
774
1)1I
ELECTRONIC FILING, RECEIVED, CLERK'S OFFICE, JULY 11, 2006
*****PC#2*****
TABLE 3
.3
CHLORIDE DfLU tIO1 RATIOS
Mobil Oil Refinery
tolict• Illinois
October 29, 1996
Sample ID
Time __,_,_,
Chlorides, mgj1
Upstream
Effluent
River
River Above
Background
Dilution Ratio
us
I
08 :17
92
EC I
08 :20
270
Al
08 :25! -
'~-
228
136
A2
08:30
1.
M, Uv.o-e.m- A, Emuav •
181
89
A3
08 :32]
92
249
197
105
A4
08 :34
166
74
A5
0806
105
13
12.1
A6
08'A2
142
50
3.1
A7
08
:44
121
29
5.4
A8
08:47
96
4
39.3
A9
08 :51
103
l l
14 .3
US 2
08 :54
92
EC 2
08 :56
227
BI
09':00
--- _
i
178
85
1 .9
B2
0903 A, Upoeam A, Emuenl ^
204
111
1.4
B3
09 .05
93
252
239
146
B4
09 :08
184
91
B5
09 :10
165
72
2 .2
136
09 :12
153
60
27
B7
09
:15
135
42
3.8
B8
09 :17
146
53
3 .0
139
09 :20
121
28
s 7
EC3
09 :31
CI
09 :33'.
174
81
7 .3
C2
09 :37'.
A, ENucra
220
127
1 .5
C3
09:40
278
143
50
3.7
C4
09 :43
150
57
3 .2
CS
09 :45
218
125
1 .5
C6
09 :48
198
105
1 .8
C7
09 :51
133
40
4 .6
C8
09:55
J
93
0
.*bac
qa,,,d
US 3
10 :00
EC 4
10 :07
279
DI
10 :11
106
12
16 .8
D2
10:15
AS Up.tream AS EM-W-!
128
34
5.9
D3
10:19
94
296 :
205
III
1.8
D4
10:24
95
1
202.0
US 4
10 :50
94
EC S
E7
10 :53 10
:56
313
110
16
14 .8
E6
11 :00
AS Uparam Ave . e0lund-
99
5
47 .4
ES
11 :02
94
331
101
7
33 .9
E4
11 :06
117
23
10 .3
E3
11 :08
120
26
9 .1
F4
11:15
93
0
.tbecV;aM
F5
11:17
93
0
mbectgwrd
F3
11:20
94
0
stbxkpmaid
F2
11 :23
148
54
4 .4
F1
11 :25
124
30
7 .9
0l
11 :30
102
8
29 .6
G2
11:31
99
6
47.4
03
11:34
94
0
ab.a cimd
G4
us 5
1111:46:42
95
1
237.0
EC6
11 :51
349
Hl
11 :551
10$
12
21 .3
1t
11 :58
Ave. L4 .". A% emuwn-
96
3
85 .3
12
12 :01
93
349
94
1
256 .0
13
12:04
94
1
256.0
US 6
12 :09
92
file: 6'1doumnbiVwtbhtJpbundara,wk4
Dilution Ratio
River
EtlluctdSample Value
Value
Above
Above
BackgroundBackground
_ElflunnRiver Sample Ave.
•
-Background
Backgrwnd AvgAvg
.
ELECTRONIC FILING, RECEIVED, CLERK'S OFFICE, JULY 11, 2006
*****PC#2*****
4.
It IX7 G ZONE AND ZID DETERMINATION
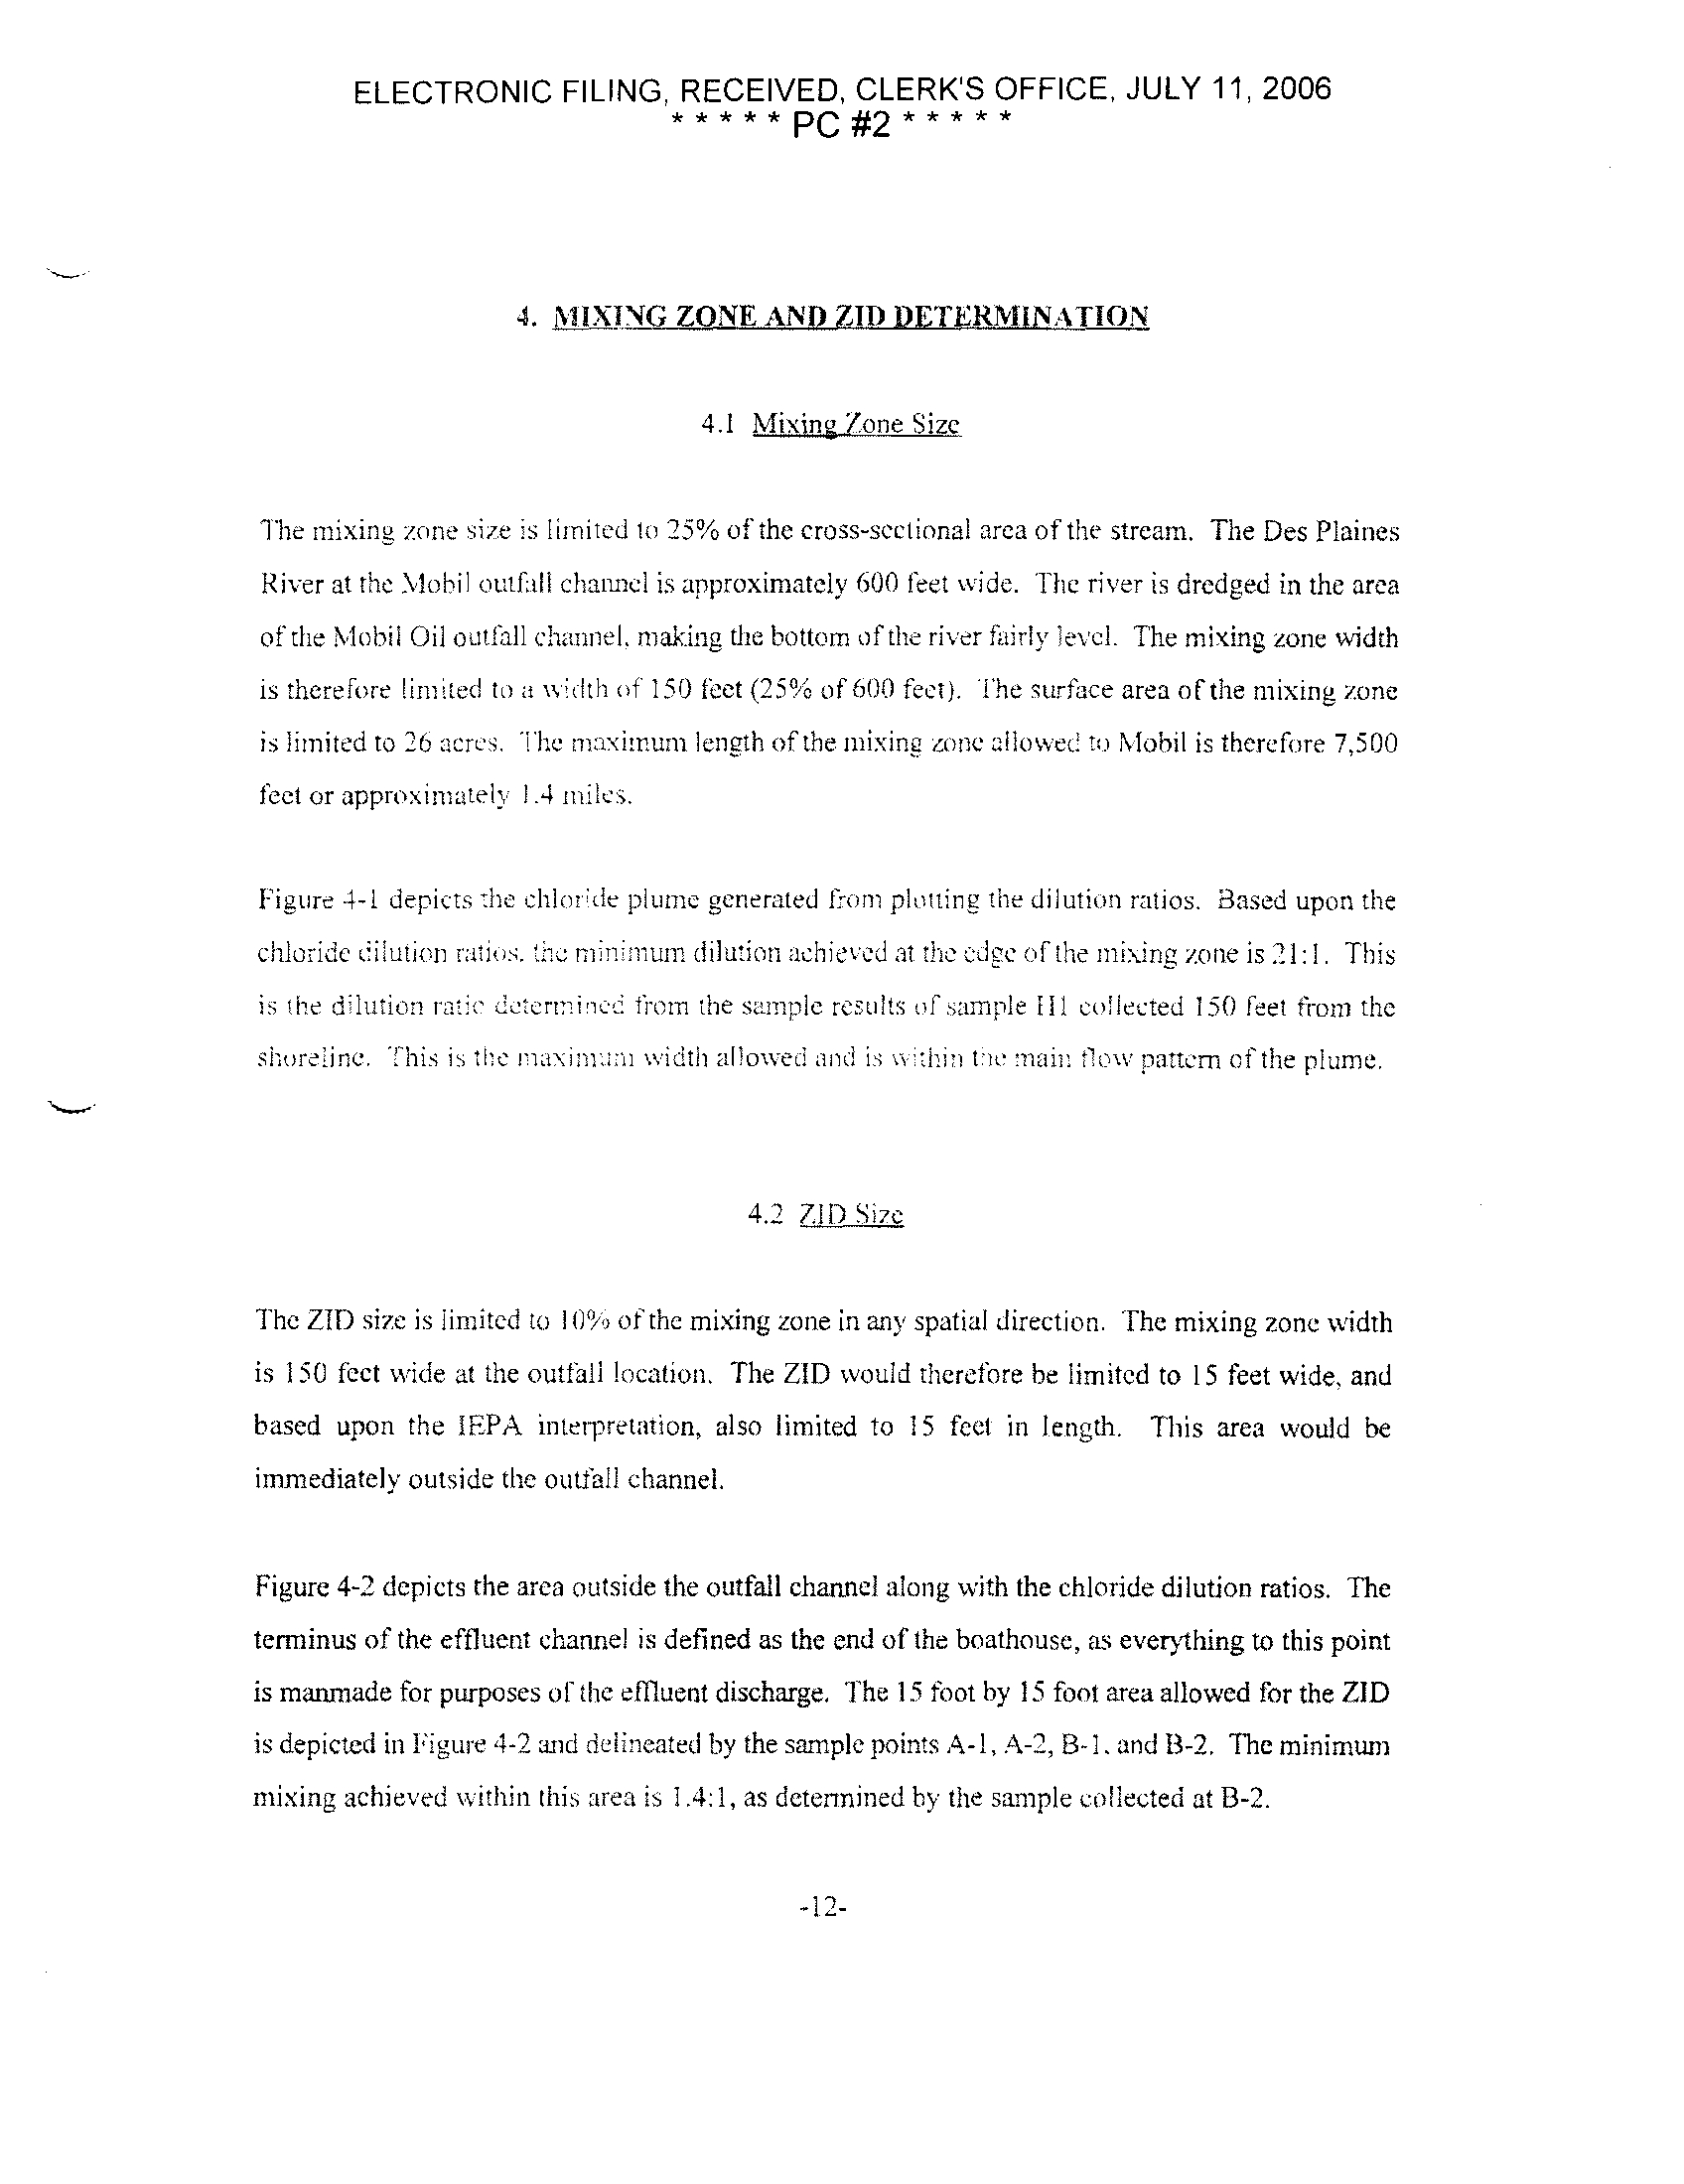
4 .1 Mixing Zone Size
The mixing zone size is limited to 25% of the cross-sectional area of the stream . The Des Plaines
River at the Mobil outfall channel is approximately 600 feet wide . The river is dredged in the area
of the Mobil Oil outfall channel, making the bottom of the river fairly level
. The mixing zone width
is therefore limited to a width of 150 feet (25% of 000 feet) . File surface area of the mixing zone
is limited to 26 acres . The maximum length of the mixing zone allowed to Mobil is therefore 7,500
feet or approximately 1 .4 miles .
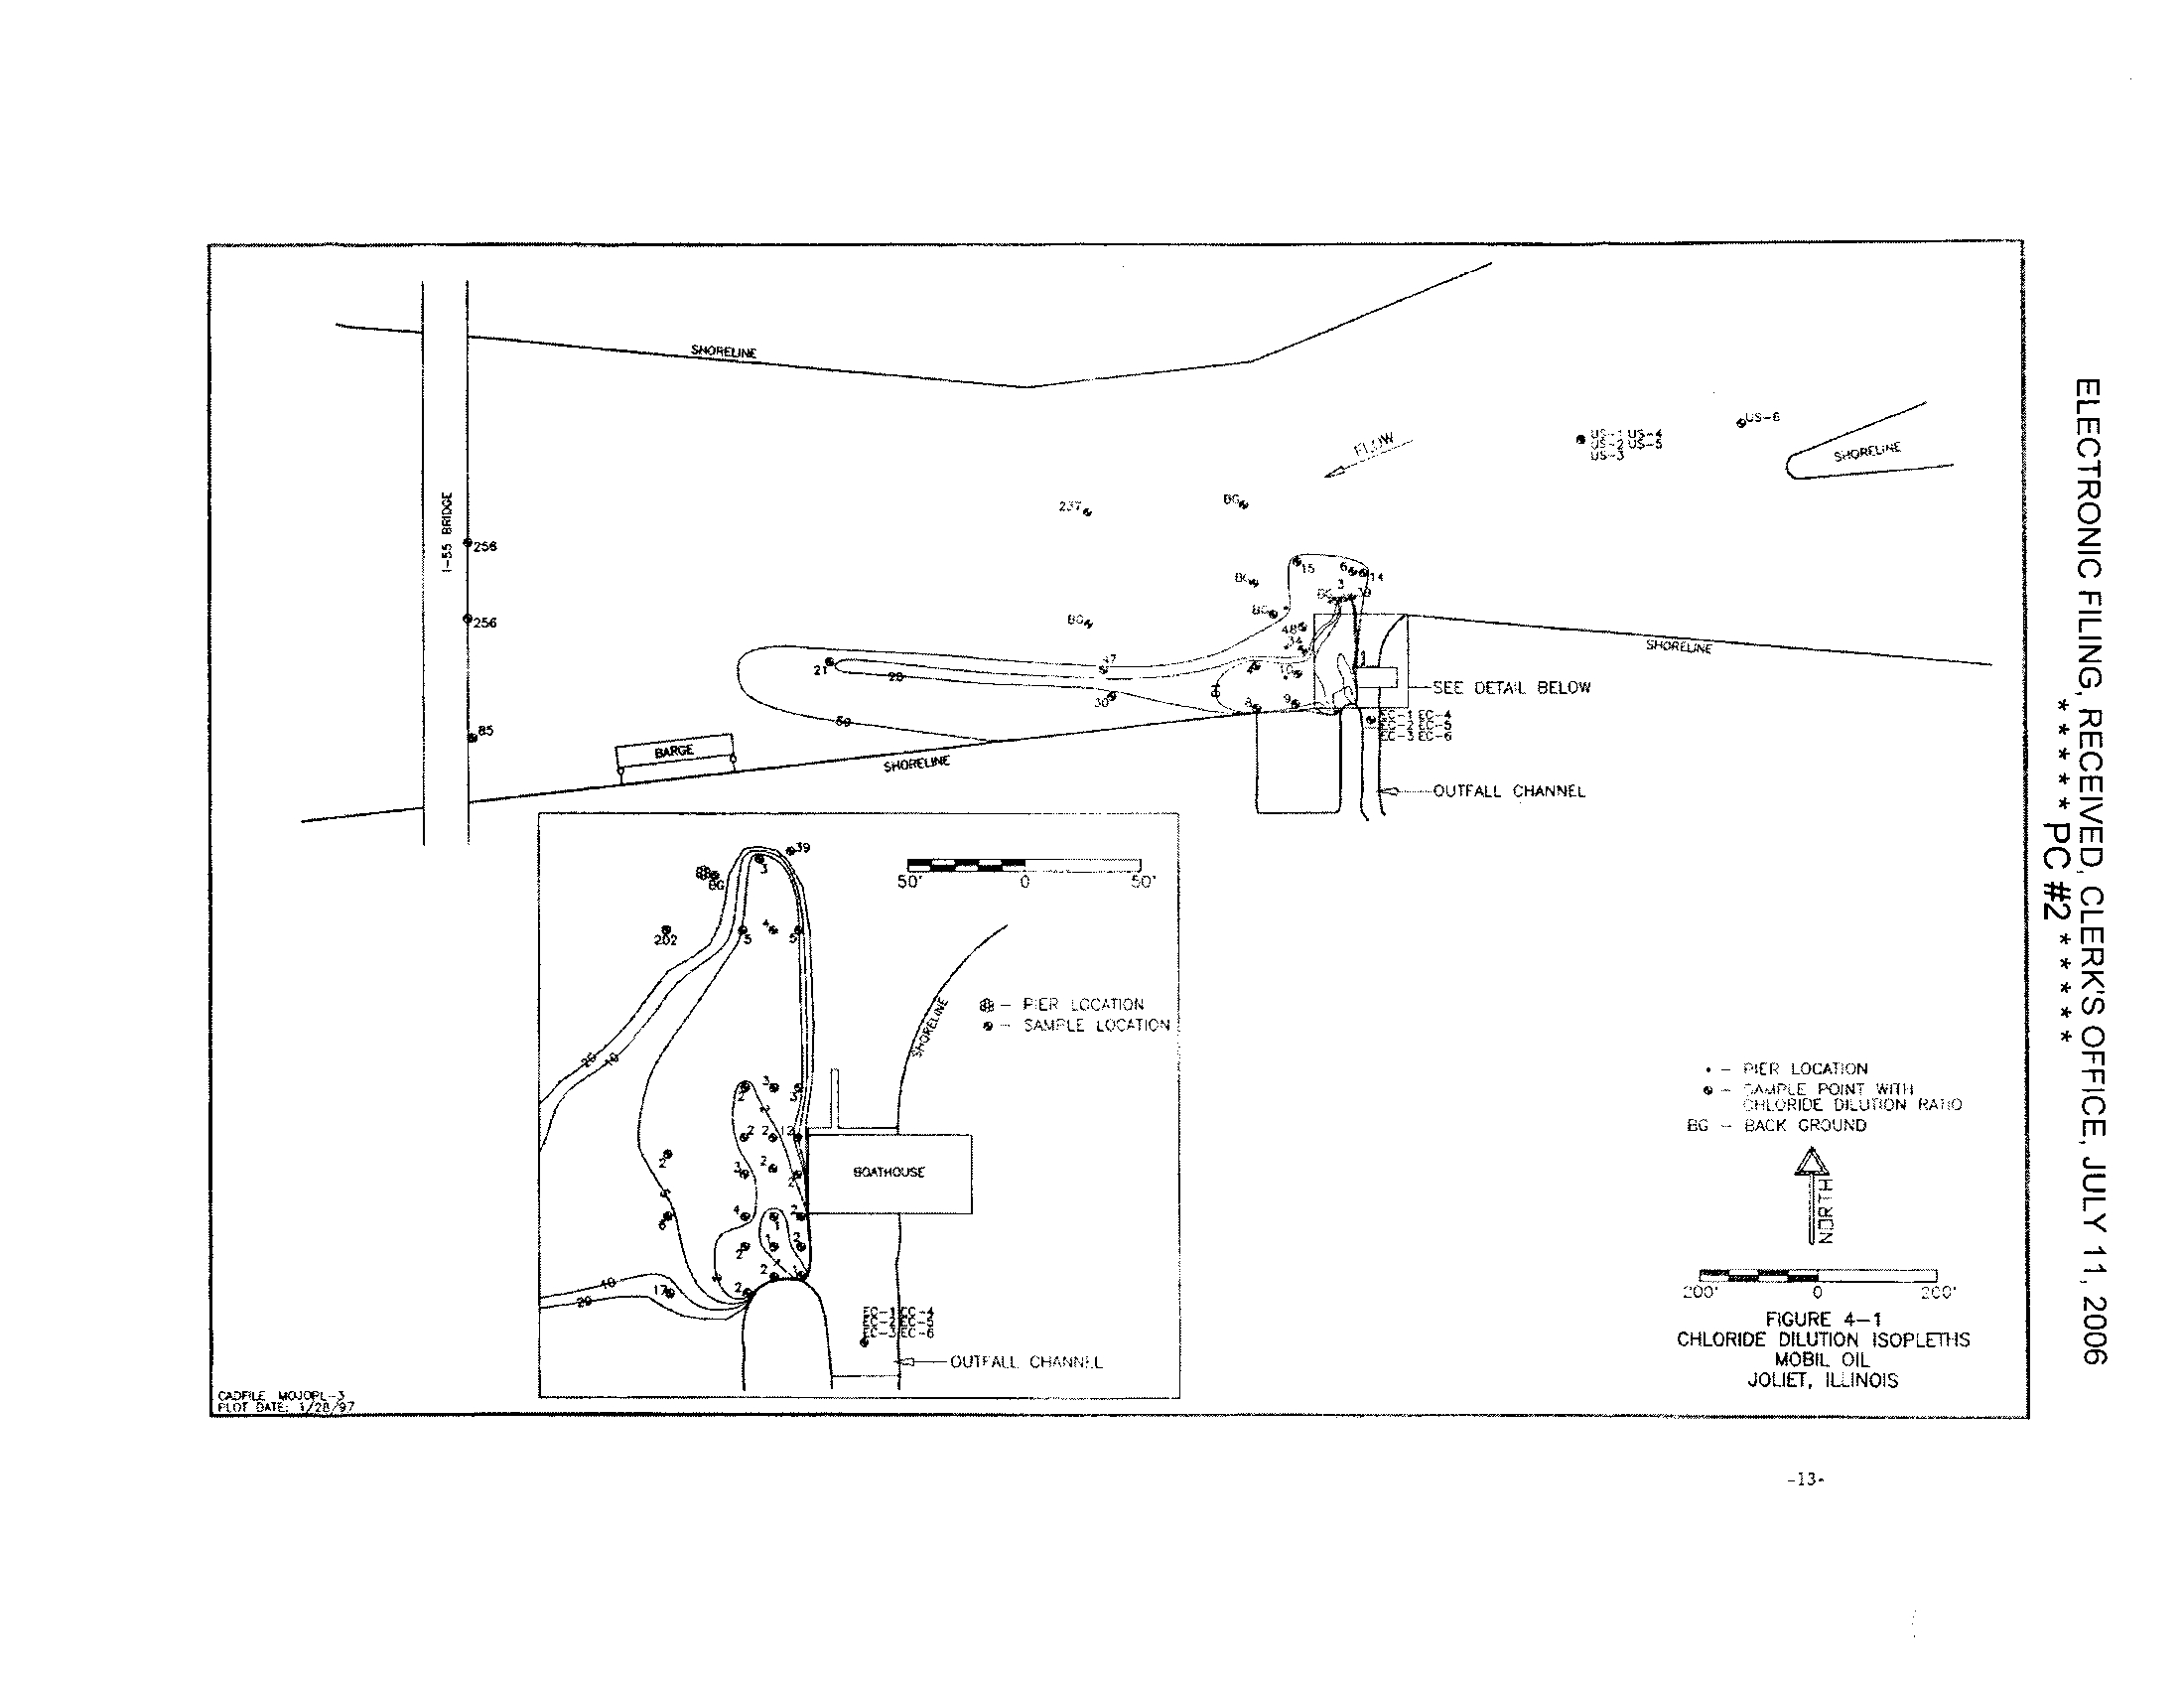
Figure 4-1 depicts ,he chloride plume generated from plotting the dilution ratios . Based upon the
chloride Ciiution ratios . file minimum dilution achieved at the edge of the nixing zone is 21
:1 . This
is the dilution ratio determined from the sample results of sample 111 collected 150 feet from the
si ore'me This is the maxima:u width allowed and is i, hi,t t to man : flow pattern of the plume
.
4.2 71D Size
The ZID size is limited to 10%
of the mixing zone in any spatial direction . The mixing zone width
is 150 feet wide at the outfall location . The ZID would therefore be limited to 15 feet wide, and
based upon the IEPA interpretation, also limited to 15 feet in length . This area would be
immediately outside the outfall channel .
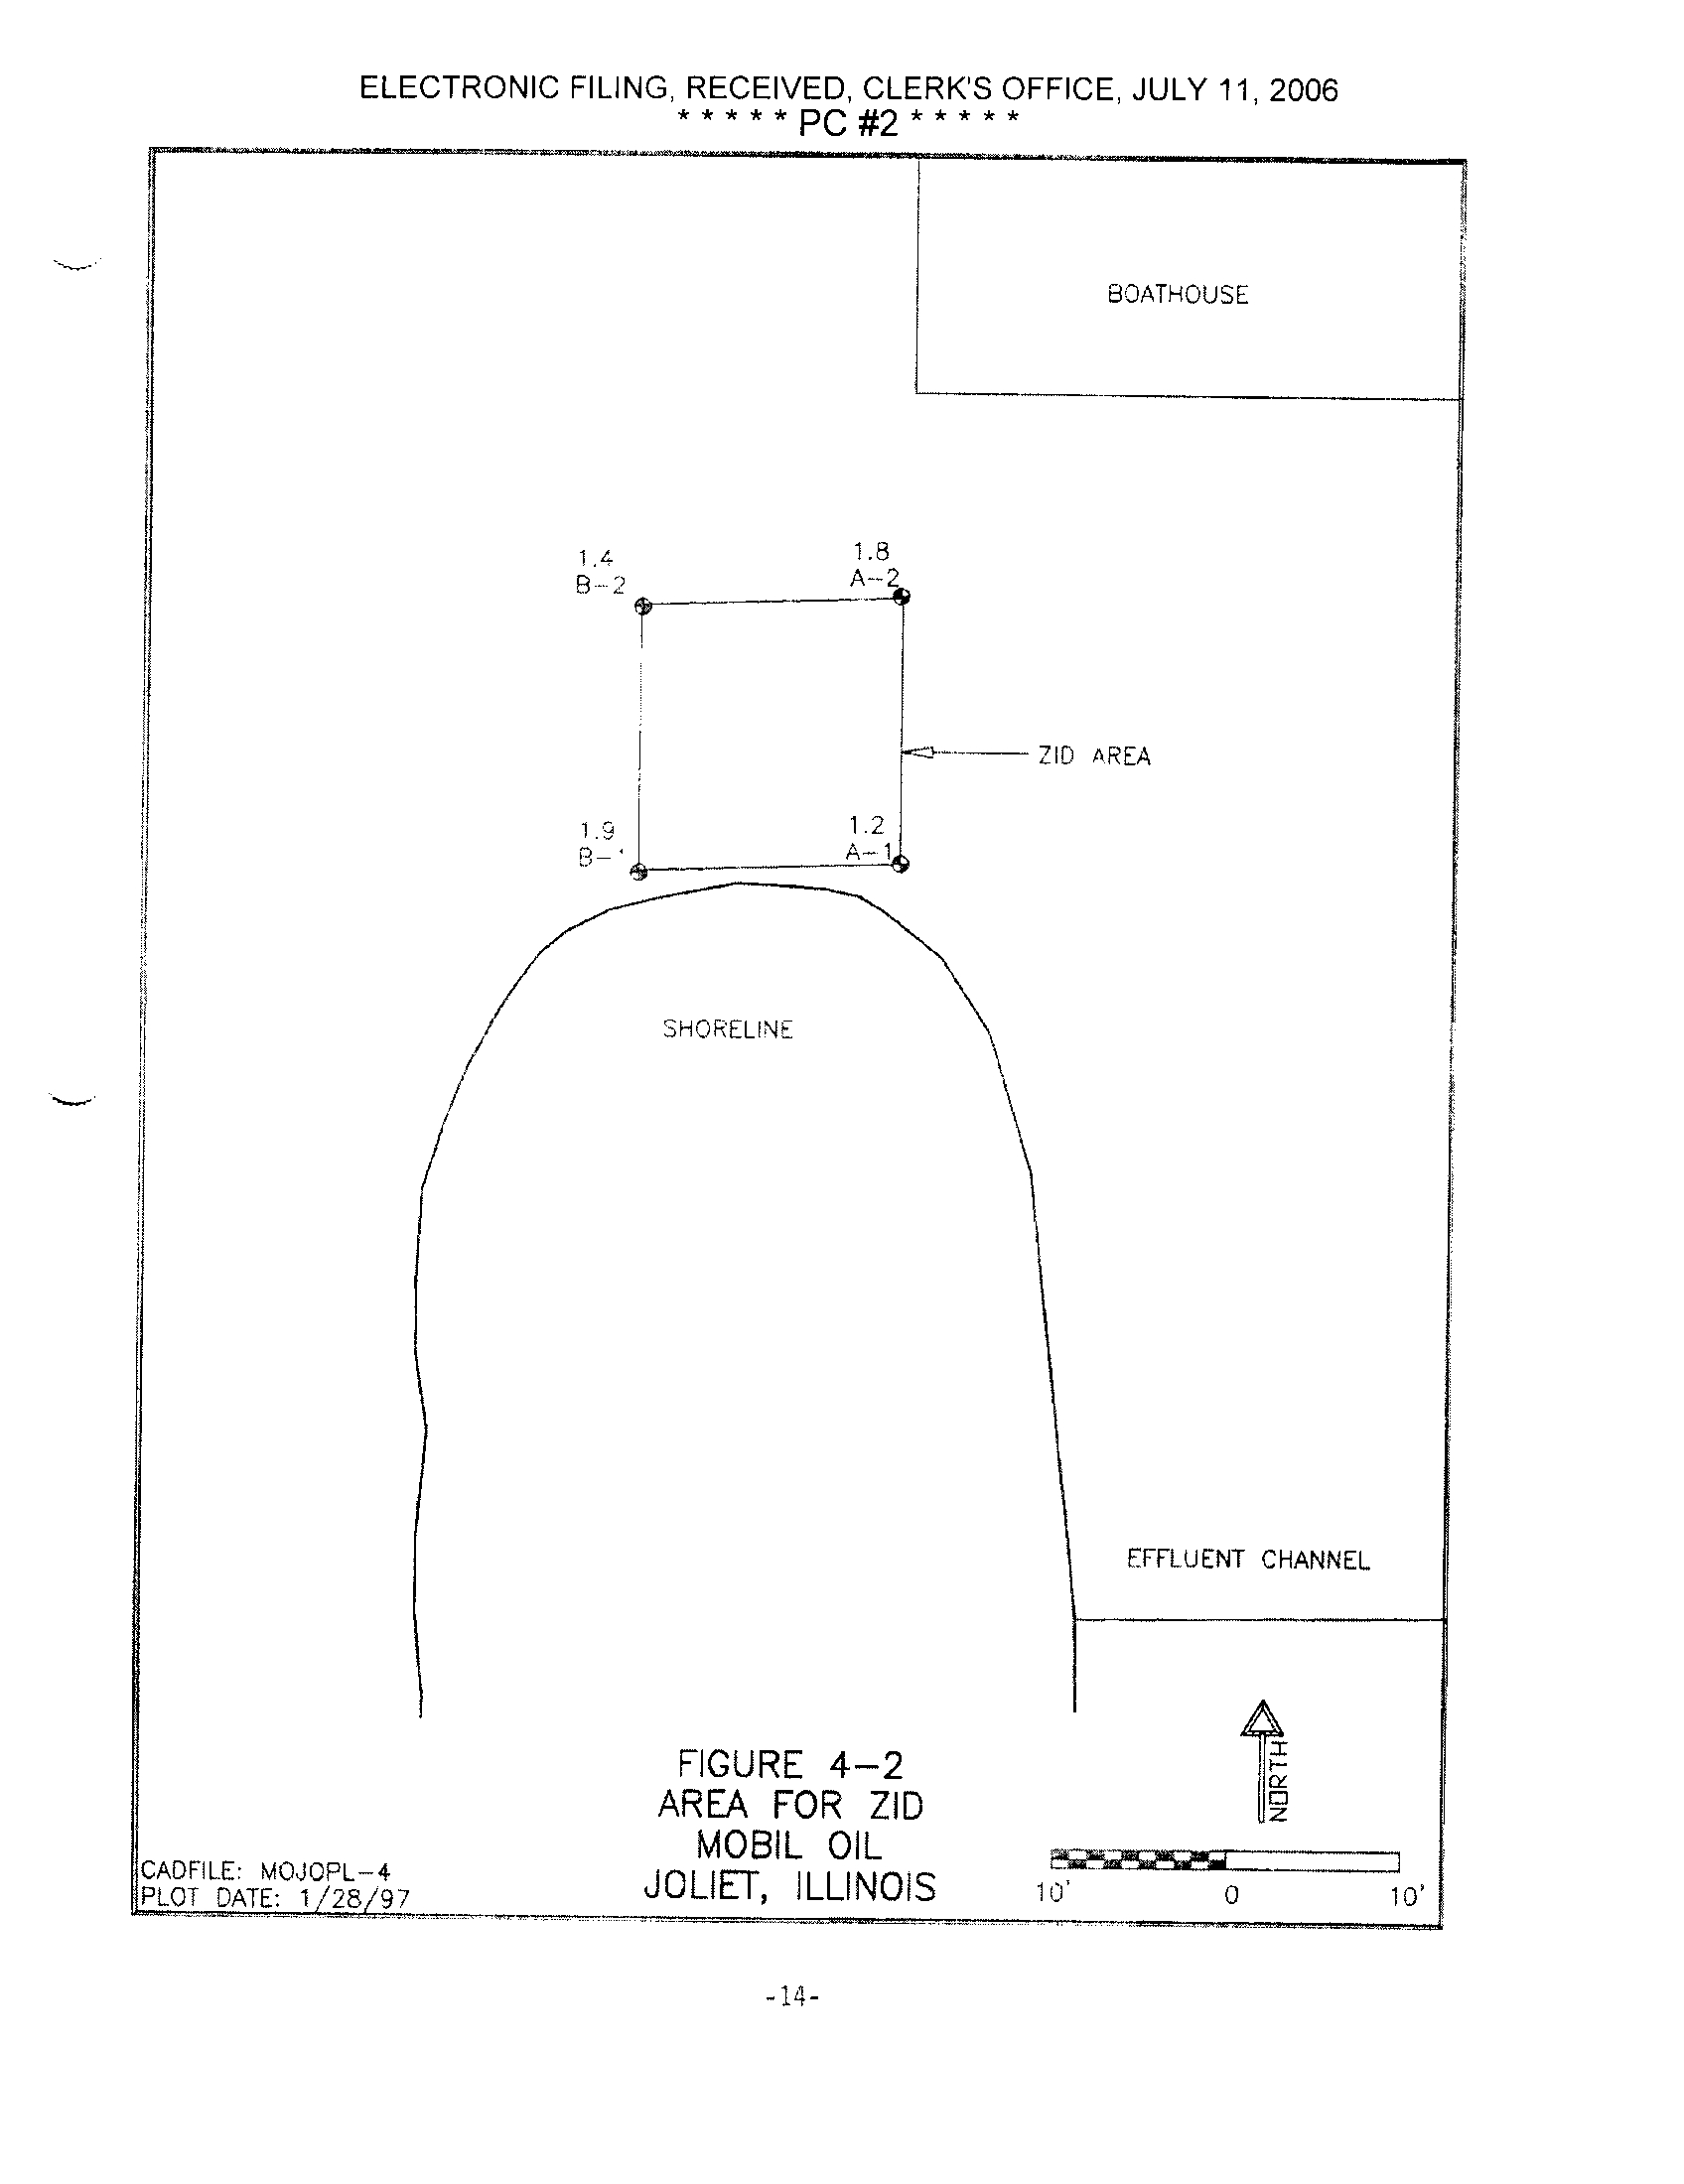
Figure 4-2 depicts the area outside the outfall channel along with the chloride dilution ratios. The
terminus of the effluent channel is defined as the end of the boathouse, as everything to this point
is manmade for purposes of the effluent discharge, The 15 foot by 15 foot area allowed for the ZID
is depicted in Figure 4-2 and delineated by the sample points A-l, A-2, B-1, and B-2
. The minimum
mixing achieved within this area is 1 .4 :1, as determined by the sample collected at B-2
.
-12-
fl8pOn1M 17
358
-
P.EP
OCnnON
>ANOE
LO-TIC
V
•
- PIER LOCA':ON
e - '.ADDLE P01NT 'FU11
/ULOPIDE OLUIION RA 1)
EG - BACK GROUND
code
o
__
FIGURE 4-1
CHLORIDE DILUTION
ISOPLETHS
MOBIL OIL
JOLIET, ILJNOIS
- 13-
m
r
m
-
0z
0
r
G)
z-
*0m
*m
~m00*G
N
*m
r
*
iim0
0m
C-c
r
N
O
O
a)
II
ELECTRONIC FILING, RECEIVED, CLERK'S OFFICE, JULY 11, 2006
* * * * *PC #2 * * * *
CADFILE : MOJOPL-4
PLOTDATE
:1/28/97
1 .4
B-2
I
SHORELINE
FIGURE 4-2
AREA
FOR ZID
MOBIL OIL
JOLIET,
ILLINOIS
-14-
ZID
AREA
BOATHOUSE
EFFLUENT CHANNEL
C
Z
10'
0
10'
ELECTRONIC FILING, RECEIVED, CLERK'S OFFICE, JULY 11, 2006
* * * * *PC #2
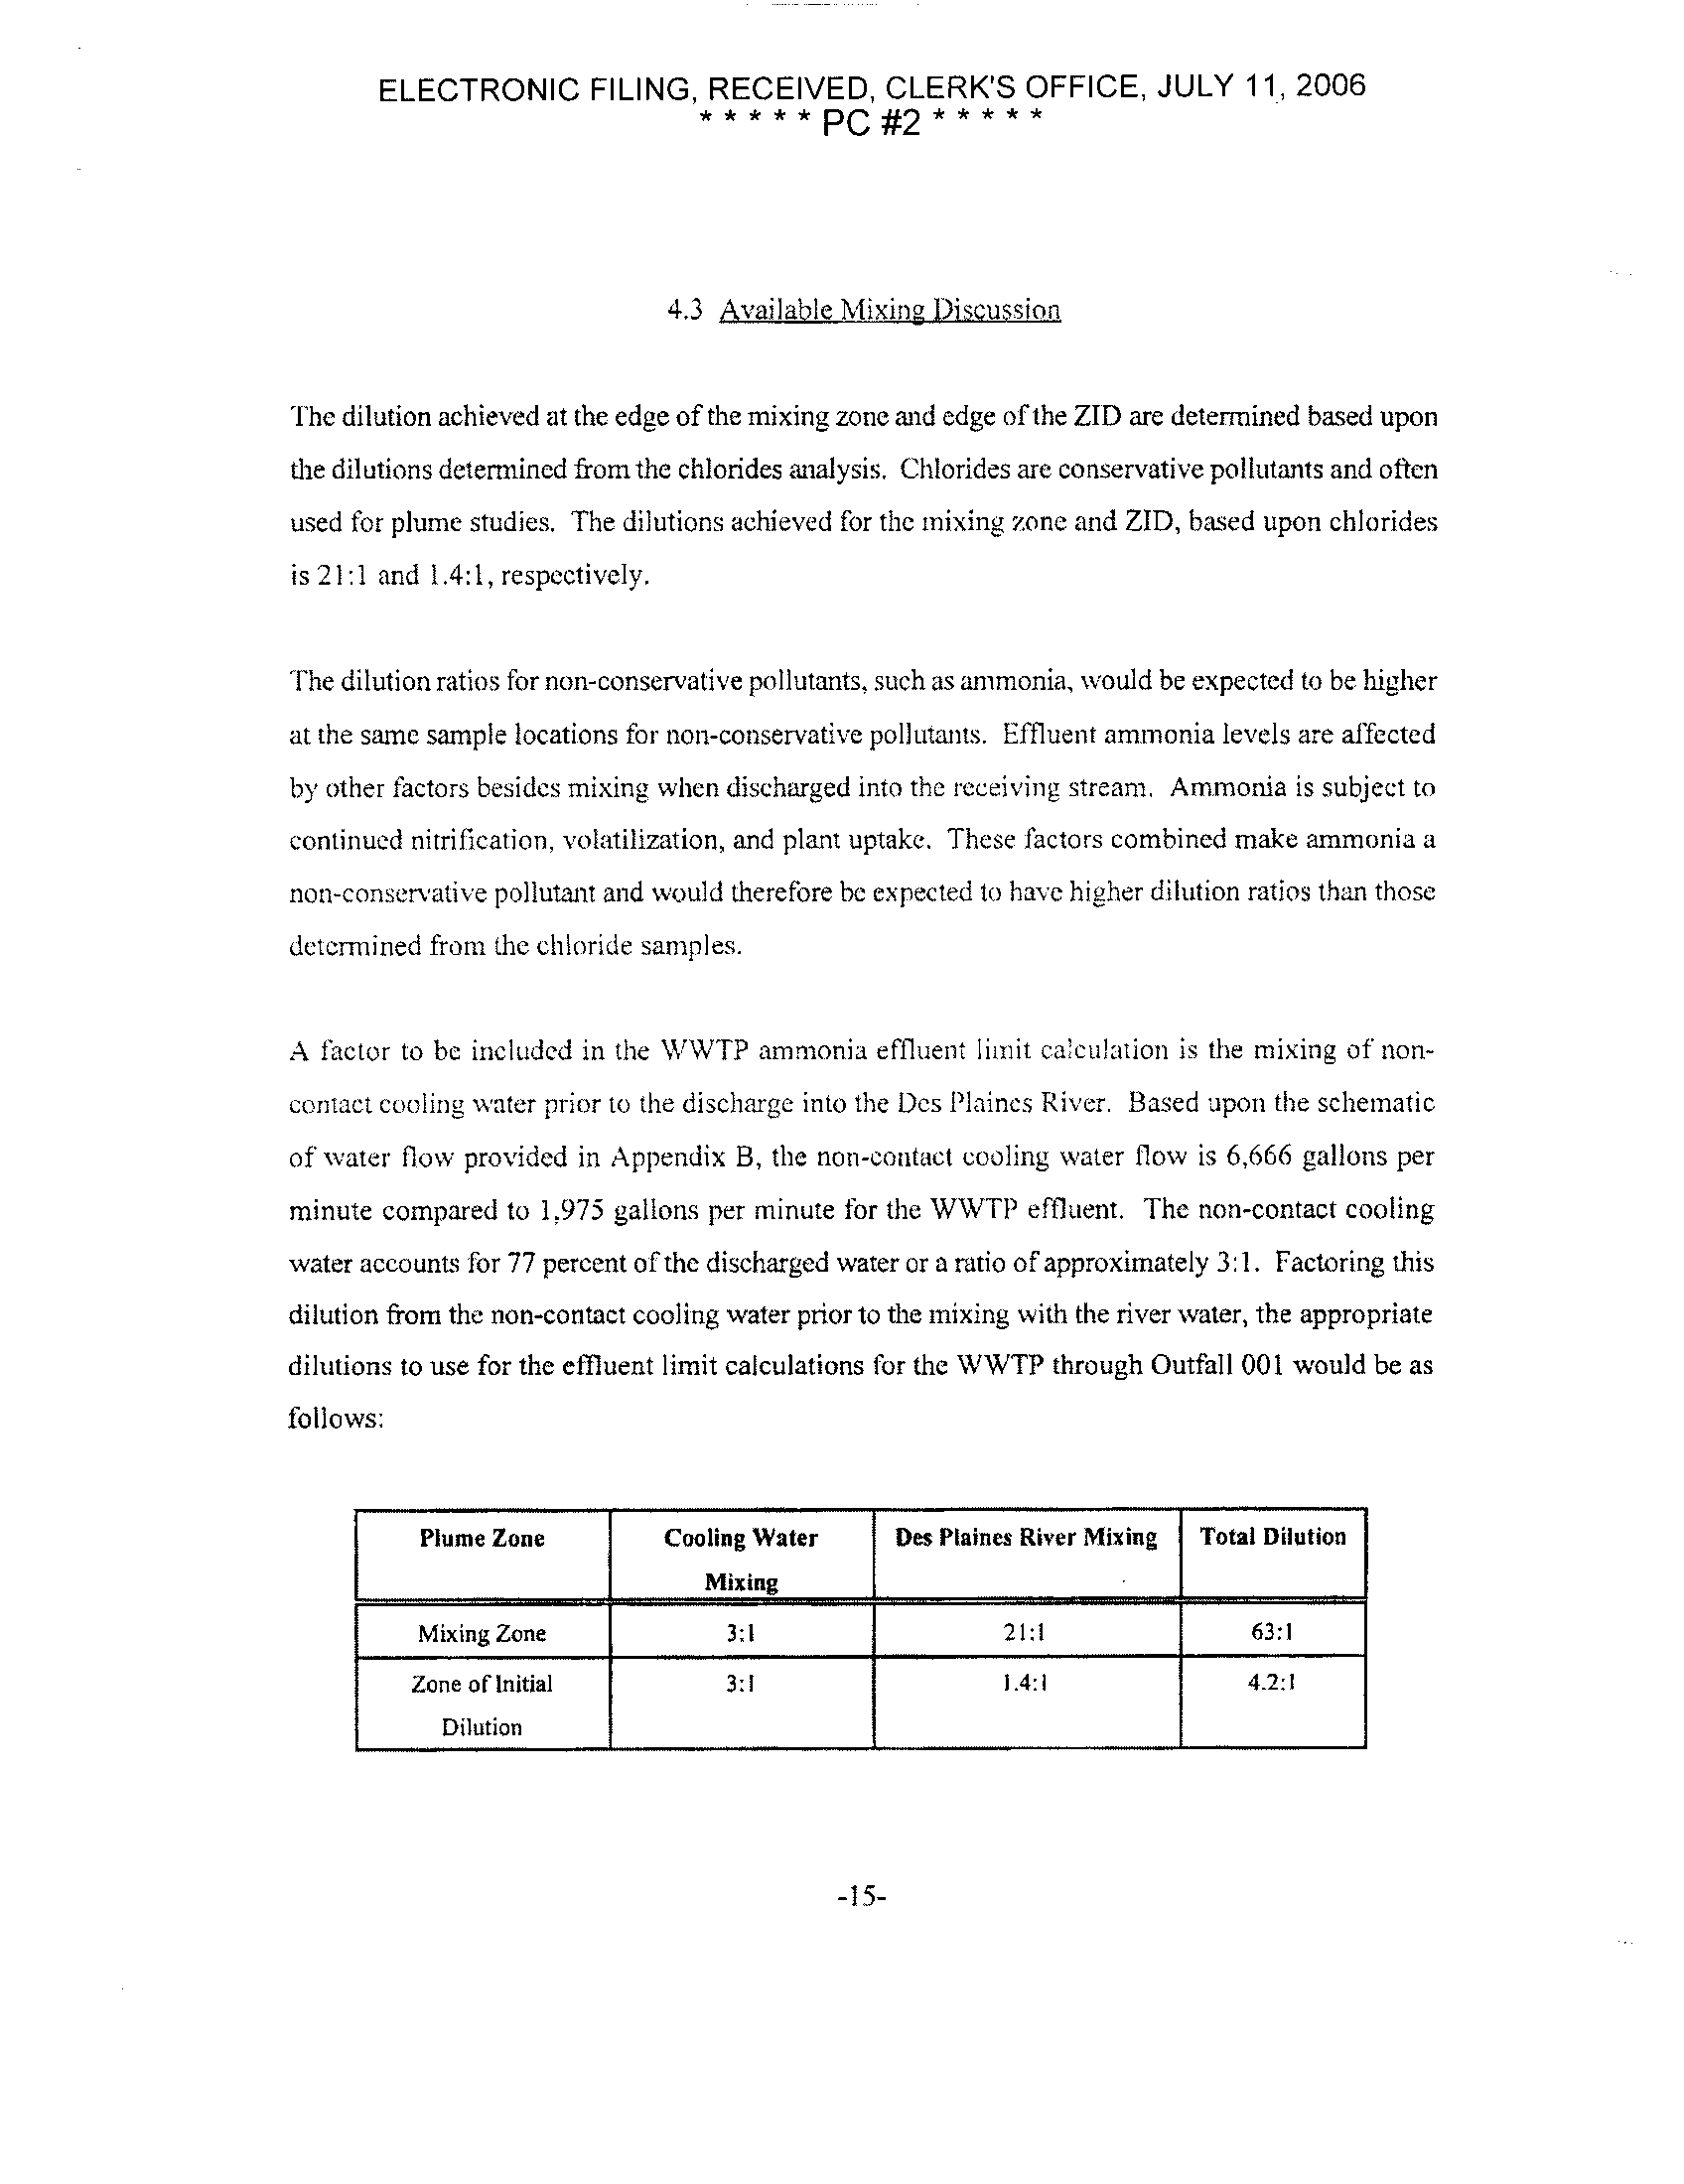
4 .3 Available Mixing Discussion
The dilution achieved at the edge of the mixing zone and edge of the ZID are determined based upon
the dilutions determined from the chlorides analysis . Chlorides are conservative pollutants and often
used for plume studies. The dilutions achieved for the mixing zone and ZID, based upon chlorides
is 21 :1 and 1 .4 :1, respectively .
The dilution ratios for non-conservative pollutants, such as ammonia, would be expected to be higher
at the same sample locations for non-conservative pollutants . Effluent ammonia levels are affected
by other factors besides mixing when discharged into the receiving stream, Ammonia is subject to
continued nitrification, volatilization, and plant uptake . These factors combined make ammonia a
non-conservative pollutant and would therefore be expected to have higher dilution ratios than those
determined from the chloride samples .
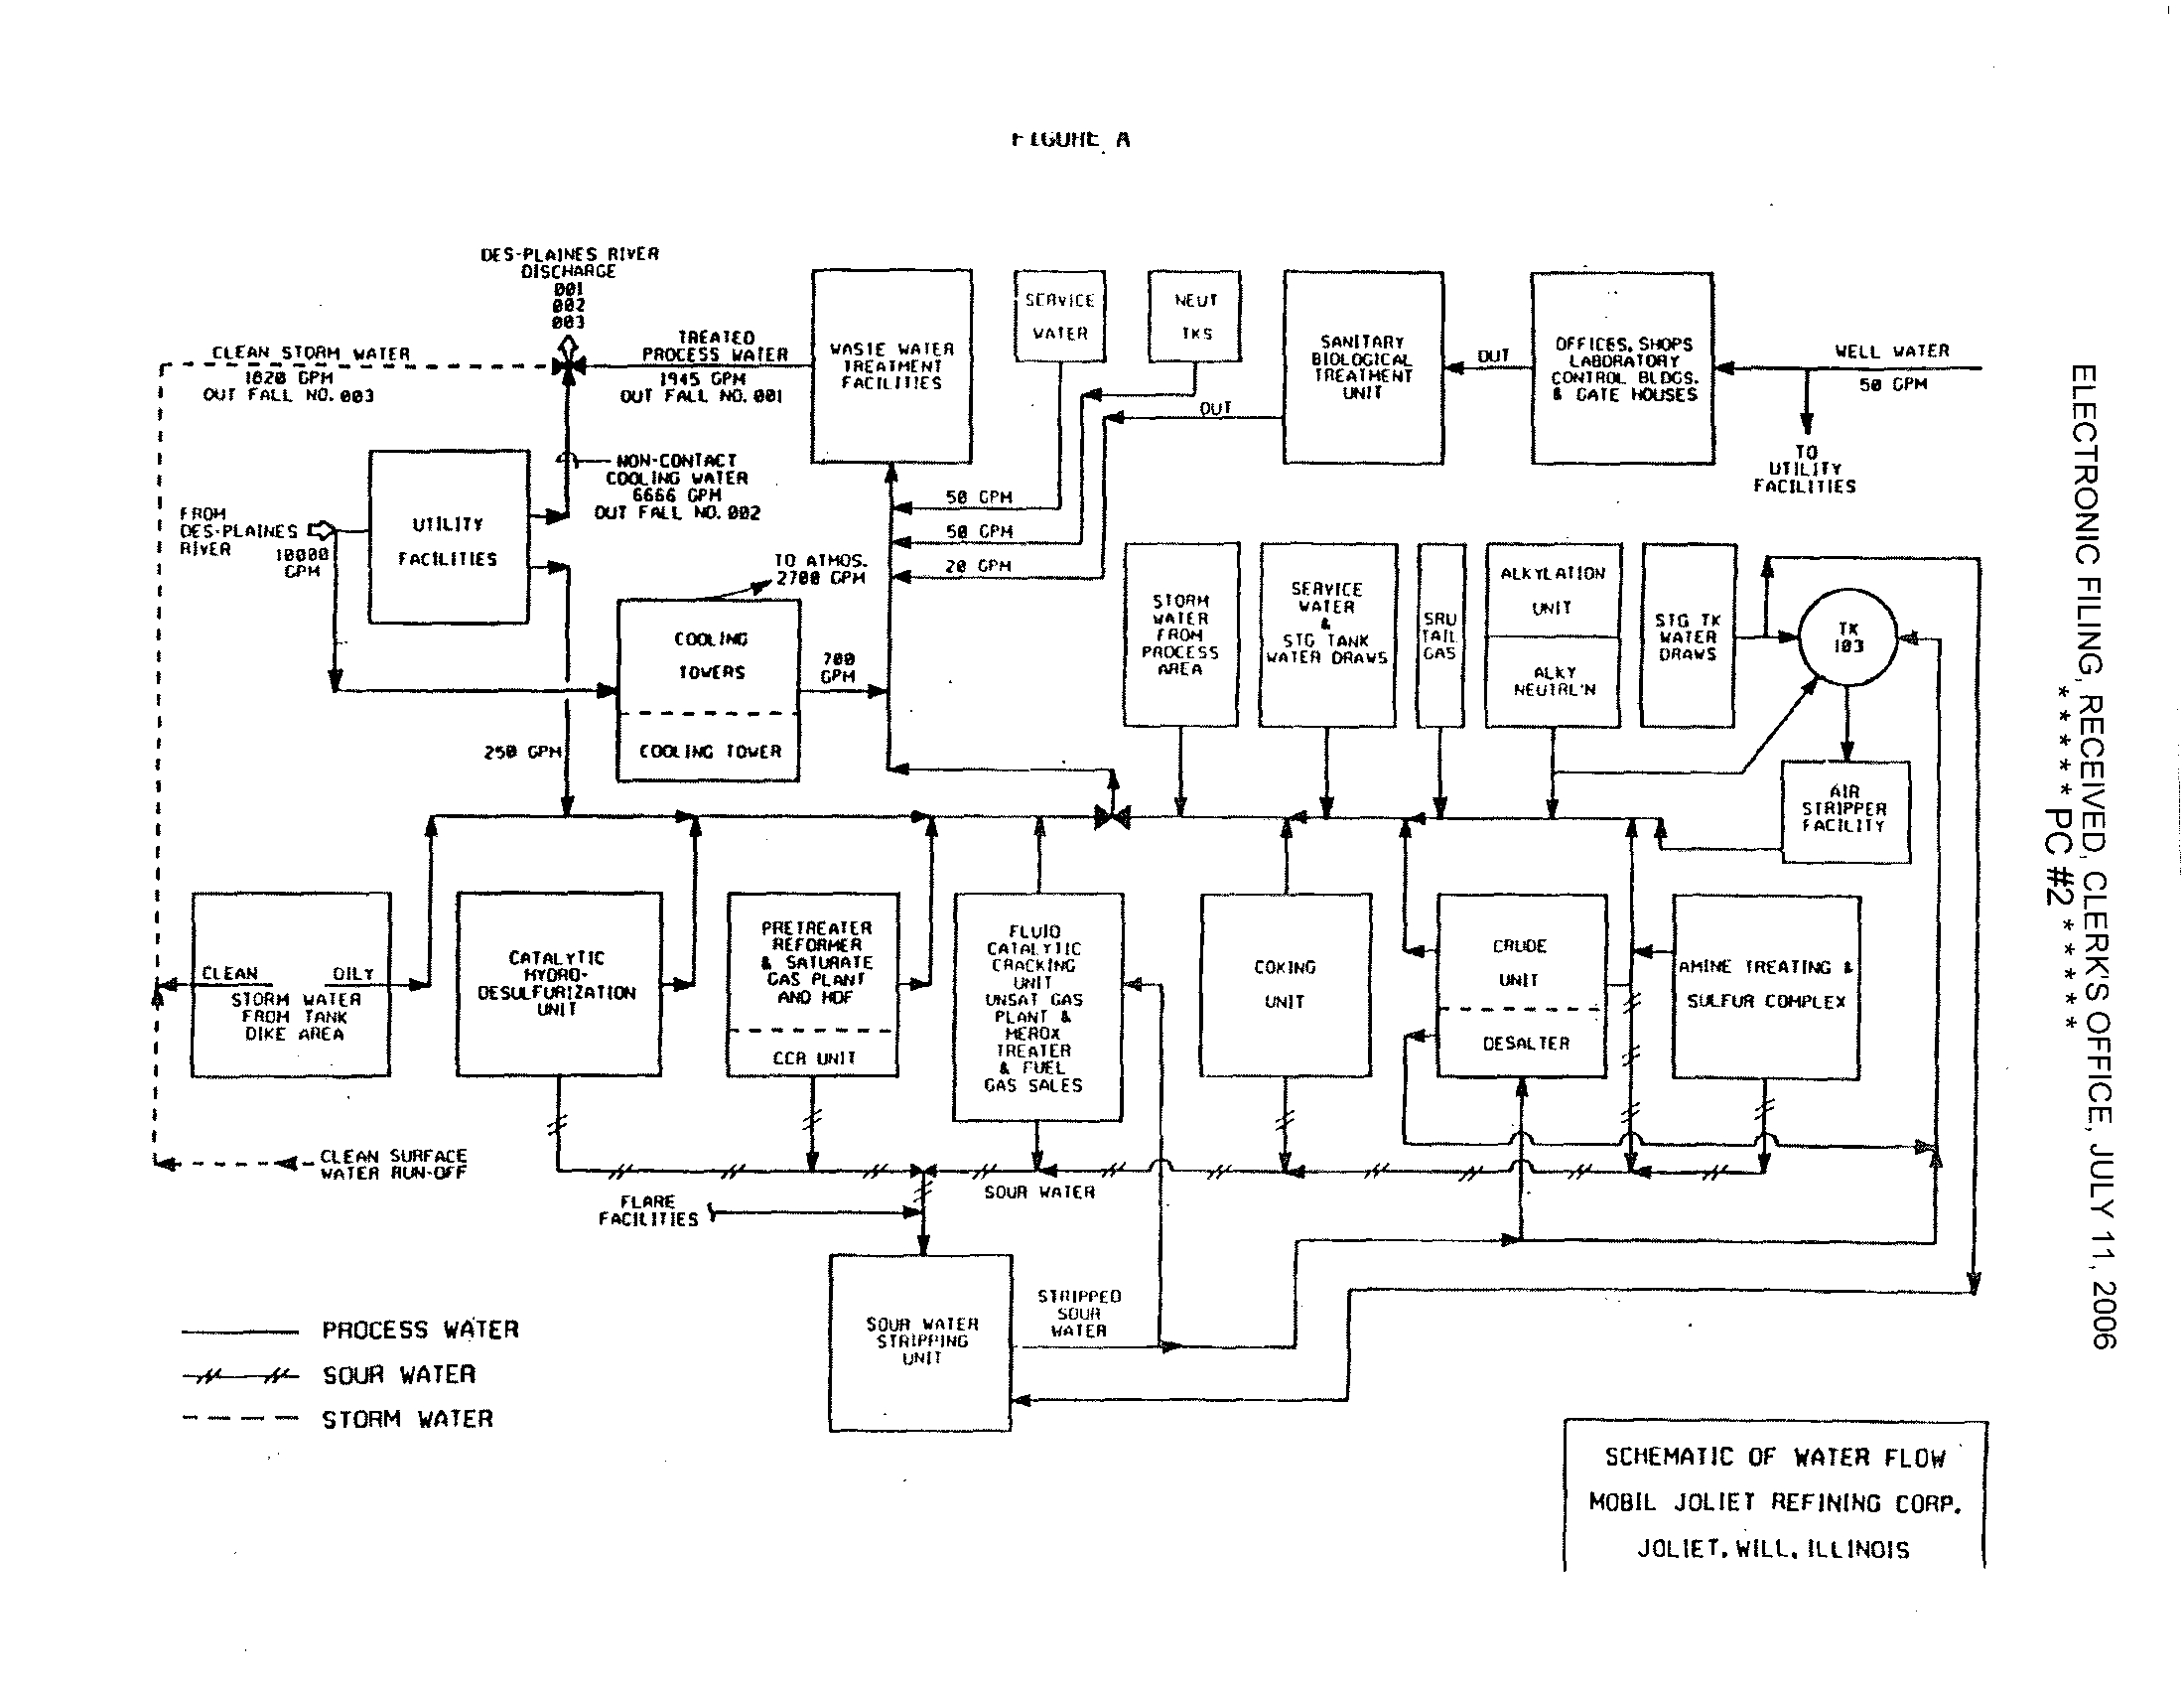
A factor to be included in the WWTP ammonia effluent limit calculation is the mixing of non-
contact cooling water prior to the discharge into the Des Plaines River
. Based upon the schematic
of water flow provided in Appendix B, the non-contact cooling water flow is 6,666 gallons per
minute compared to 1,975 gallons per minute for the WWTP effluent
. The non-contact cooling
water accounts for 77 percent of the discharged water or a ratio of approximately 3
:1 . Factoring this
dilution from the non-contact cooling water prior to the mixing with the river water, the appropriate
dilutions to use for the effluent limit calculations for the WWTP through Outfall 001 would be as
follows :
-1 5-
Plume Zone
Cooling Water
Mi ing
Des Plaines River Mixing
Total Dilution
Mixing Zone
3 :1
21 :1
63 :1
Zone of Initial
Dilution
3 :1
1 .4 :1
4 .2 :1
ELECTRONIC FILING, RECEIVED, CLERK'S OFFICE, JULY 11, 2006
* * * **PC #2 * * * *
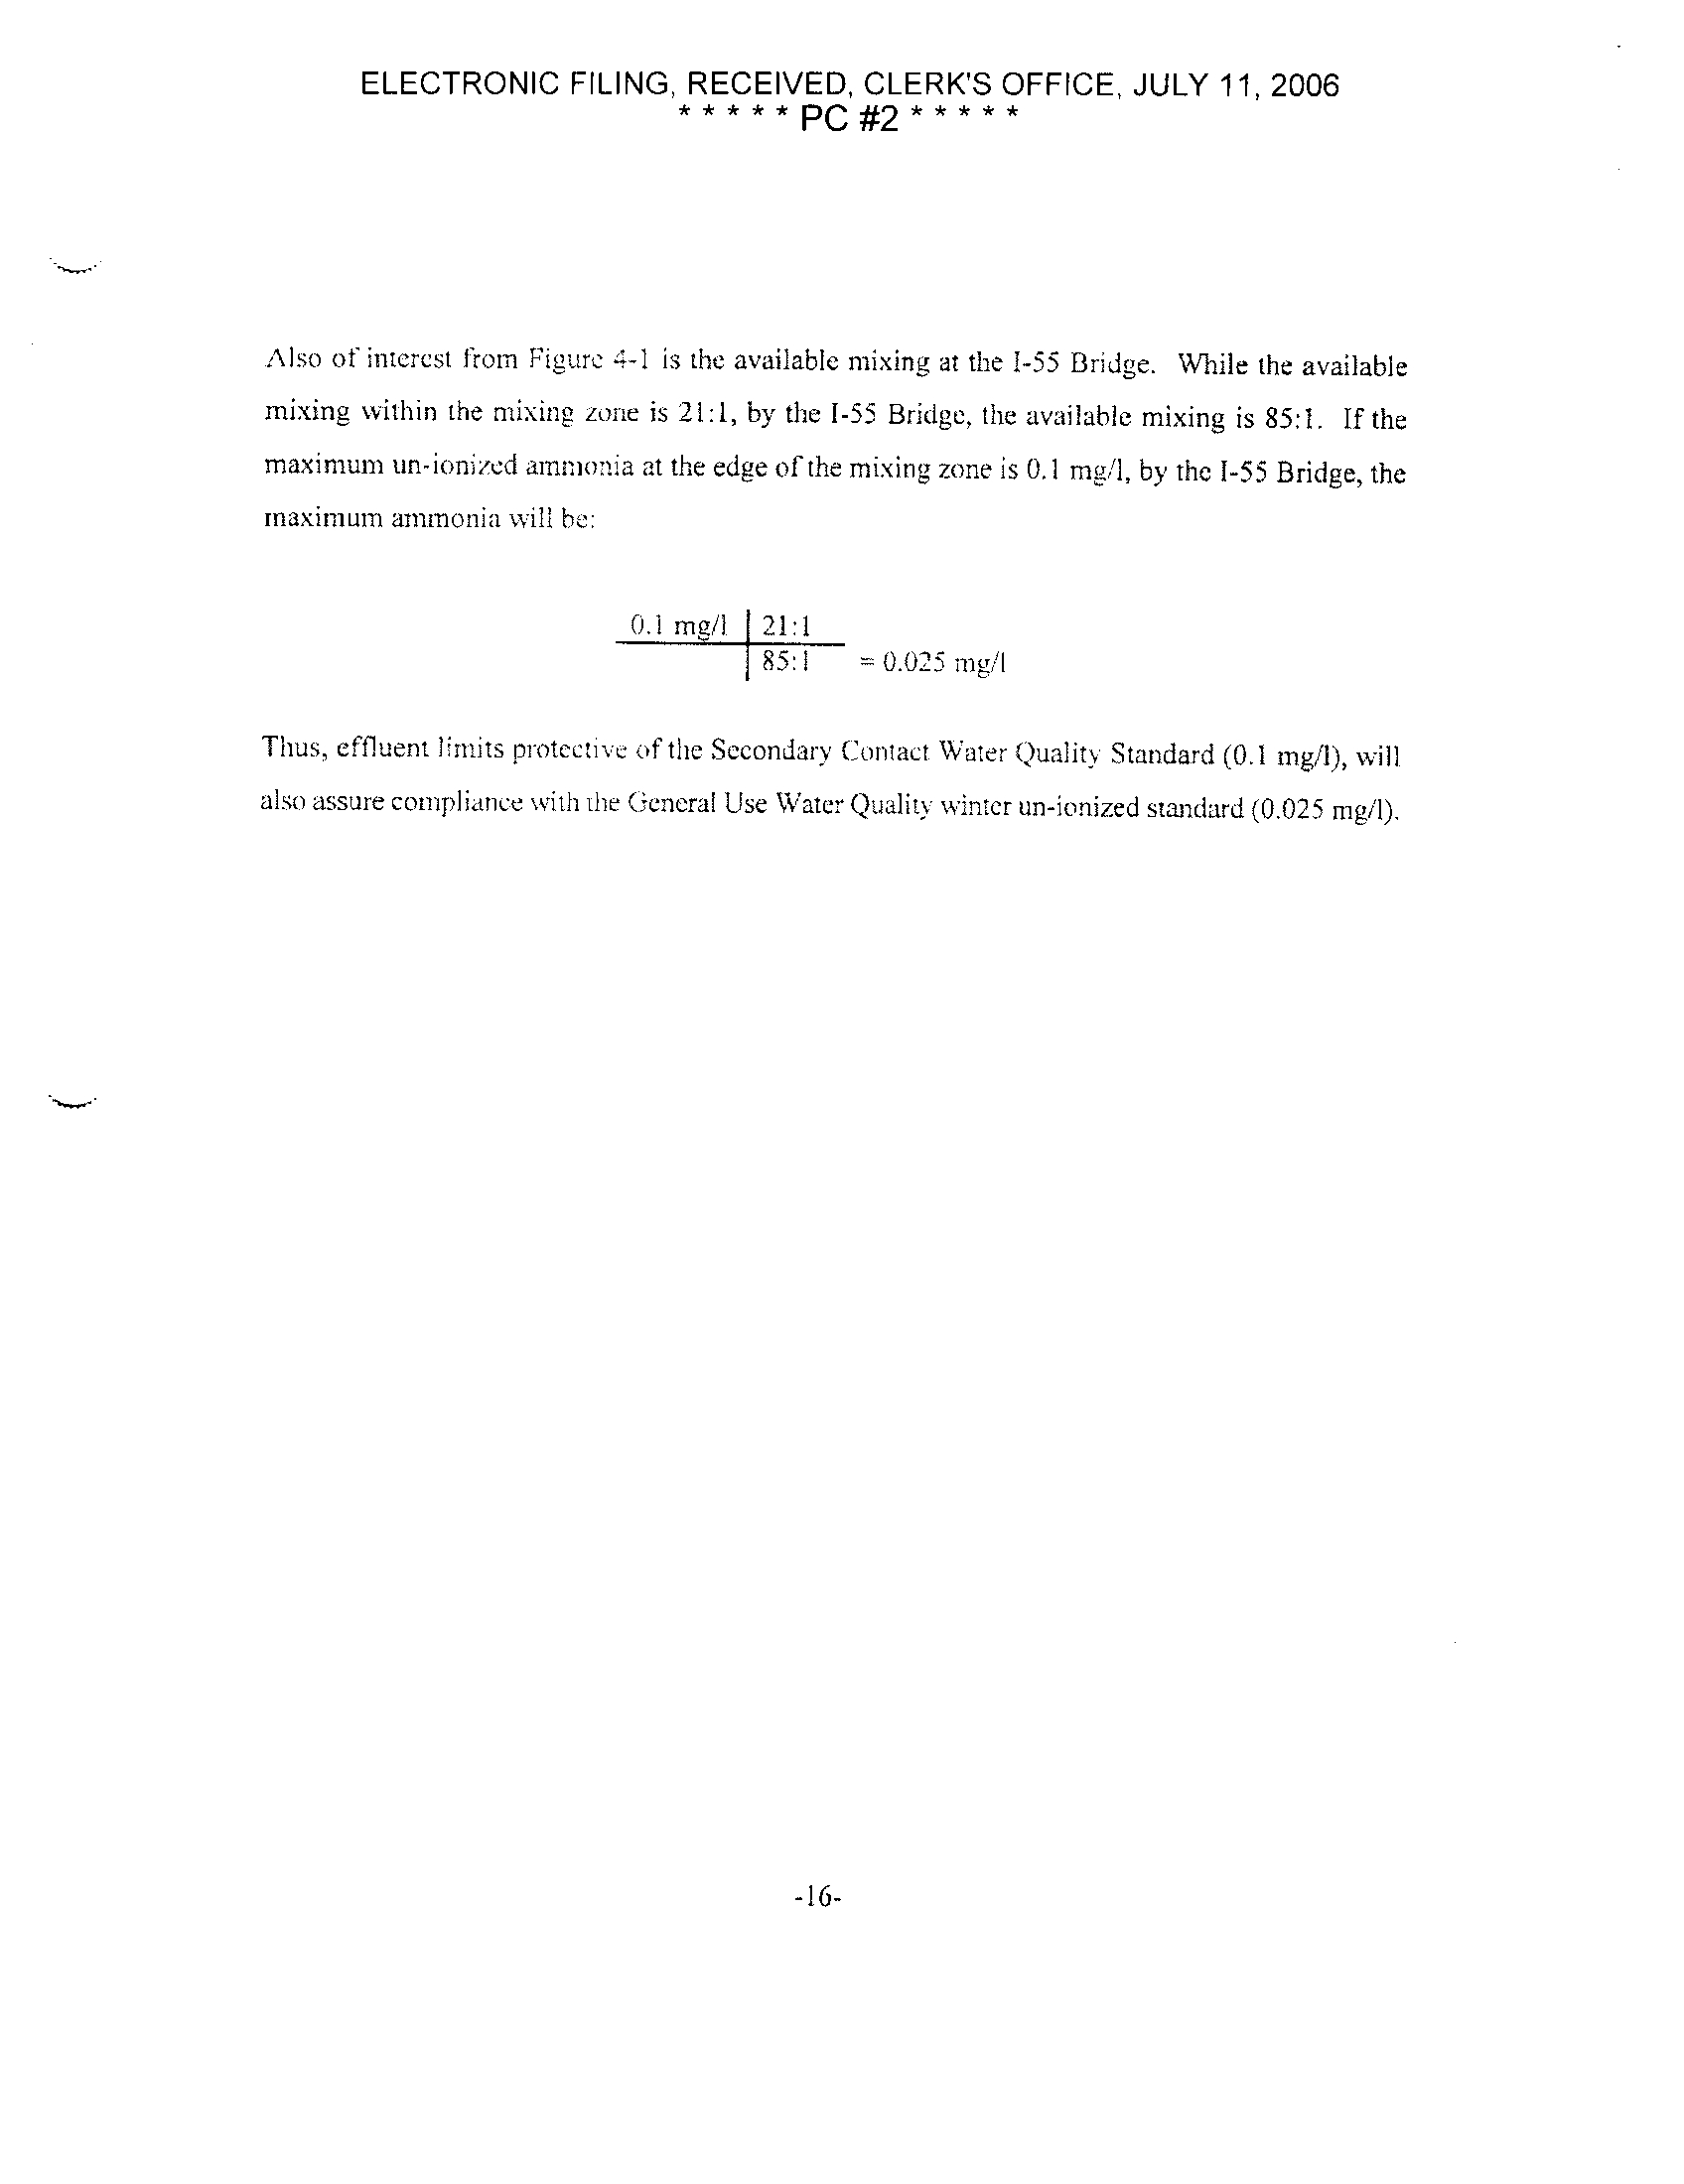
Also of interest from Figure 4-1 is the available mixing at the 1-55 Bridge
. While the available
mixing within the mixing zone is 21
:1, by the 1-55 Bridge, the available mixing is 85
:1 . If the
maximum un-ionized ammonia at the edge of the mixing zone is 0
.1 mg/l, by the 1-55 Bridge, the
maximum ammonia will be
:
0 .1 mg/I 1
2185:1:1
= 0
.025 mg/I
Thus, effluent limits protective of the Secondary Contact Water Quality Standard (0
.1 mg/1), will
also assure compliance with the General Use Water Quality winter un-ionized standard (0
.025 mg/I) .
ELECTRONIC FILING, RECEIVED, CLERK'S OFFICE, JULY 11, 2006
*****PC #2
5 . APPLICABLE PERMIT LIMITS,
5 .1 Derivation of Effluent Limits
Ammonia effluent limits are established based upon treatment technology
. For dischargers to the
Illinois waterway, this treatment technology was established at 3
.0 mg/I ammonia, based upon a
monthly average . Mobil, like other refineries, has not been able to consistently achieve the 3 .0 mg/I
limit, and has previously been granted relief by the Illinois Pollution Control Board .
Alternative ammonia effluent limits have been derived based upon the existing effluent quality . The
derivation of existing effluent quality limits is specified in U .S . EPA's "Technical Support
Document" (1991) . The existing adjusted standard effluent limits were derived using this approach .
In addition to calculating effluent limits based upon existing effluent quality, water quality-based
effluent limits are also appropriately derived, with the lower calculated limits of the two approaches
used for establishing effluent limits .
5 .2 Water Quality-Based Effluent I imits
The mixing zone study and ZID study were conducted to determine the available dilution near the
effluent channel outlet at Mobil
. The water quality-based limits for Mobil were calculated for
ammonia using the un-ionized ammonia water quality standards and the measured available dilution .
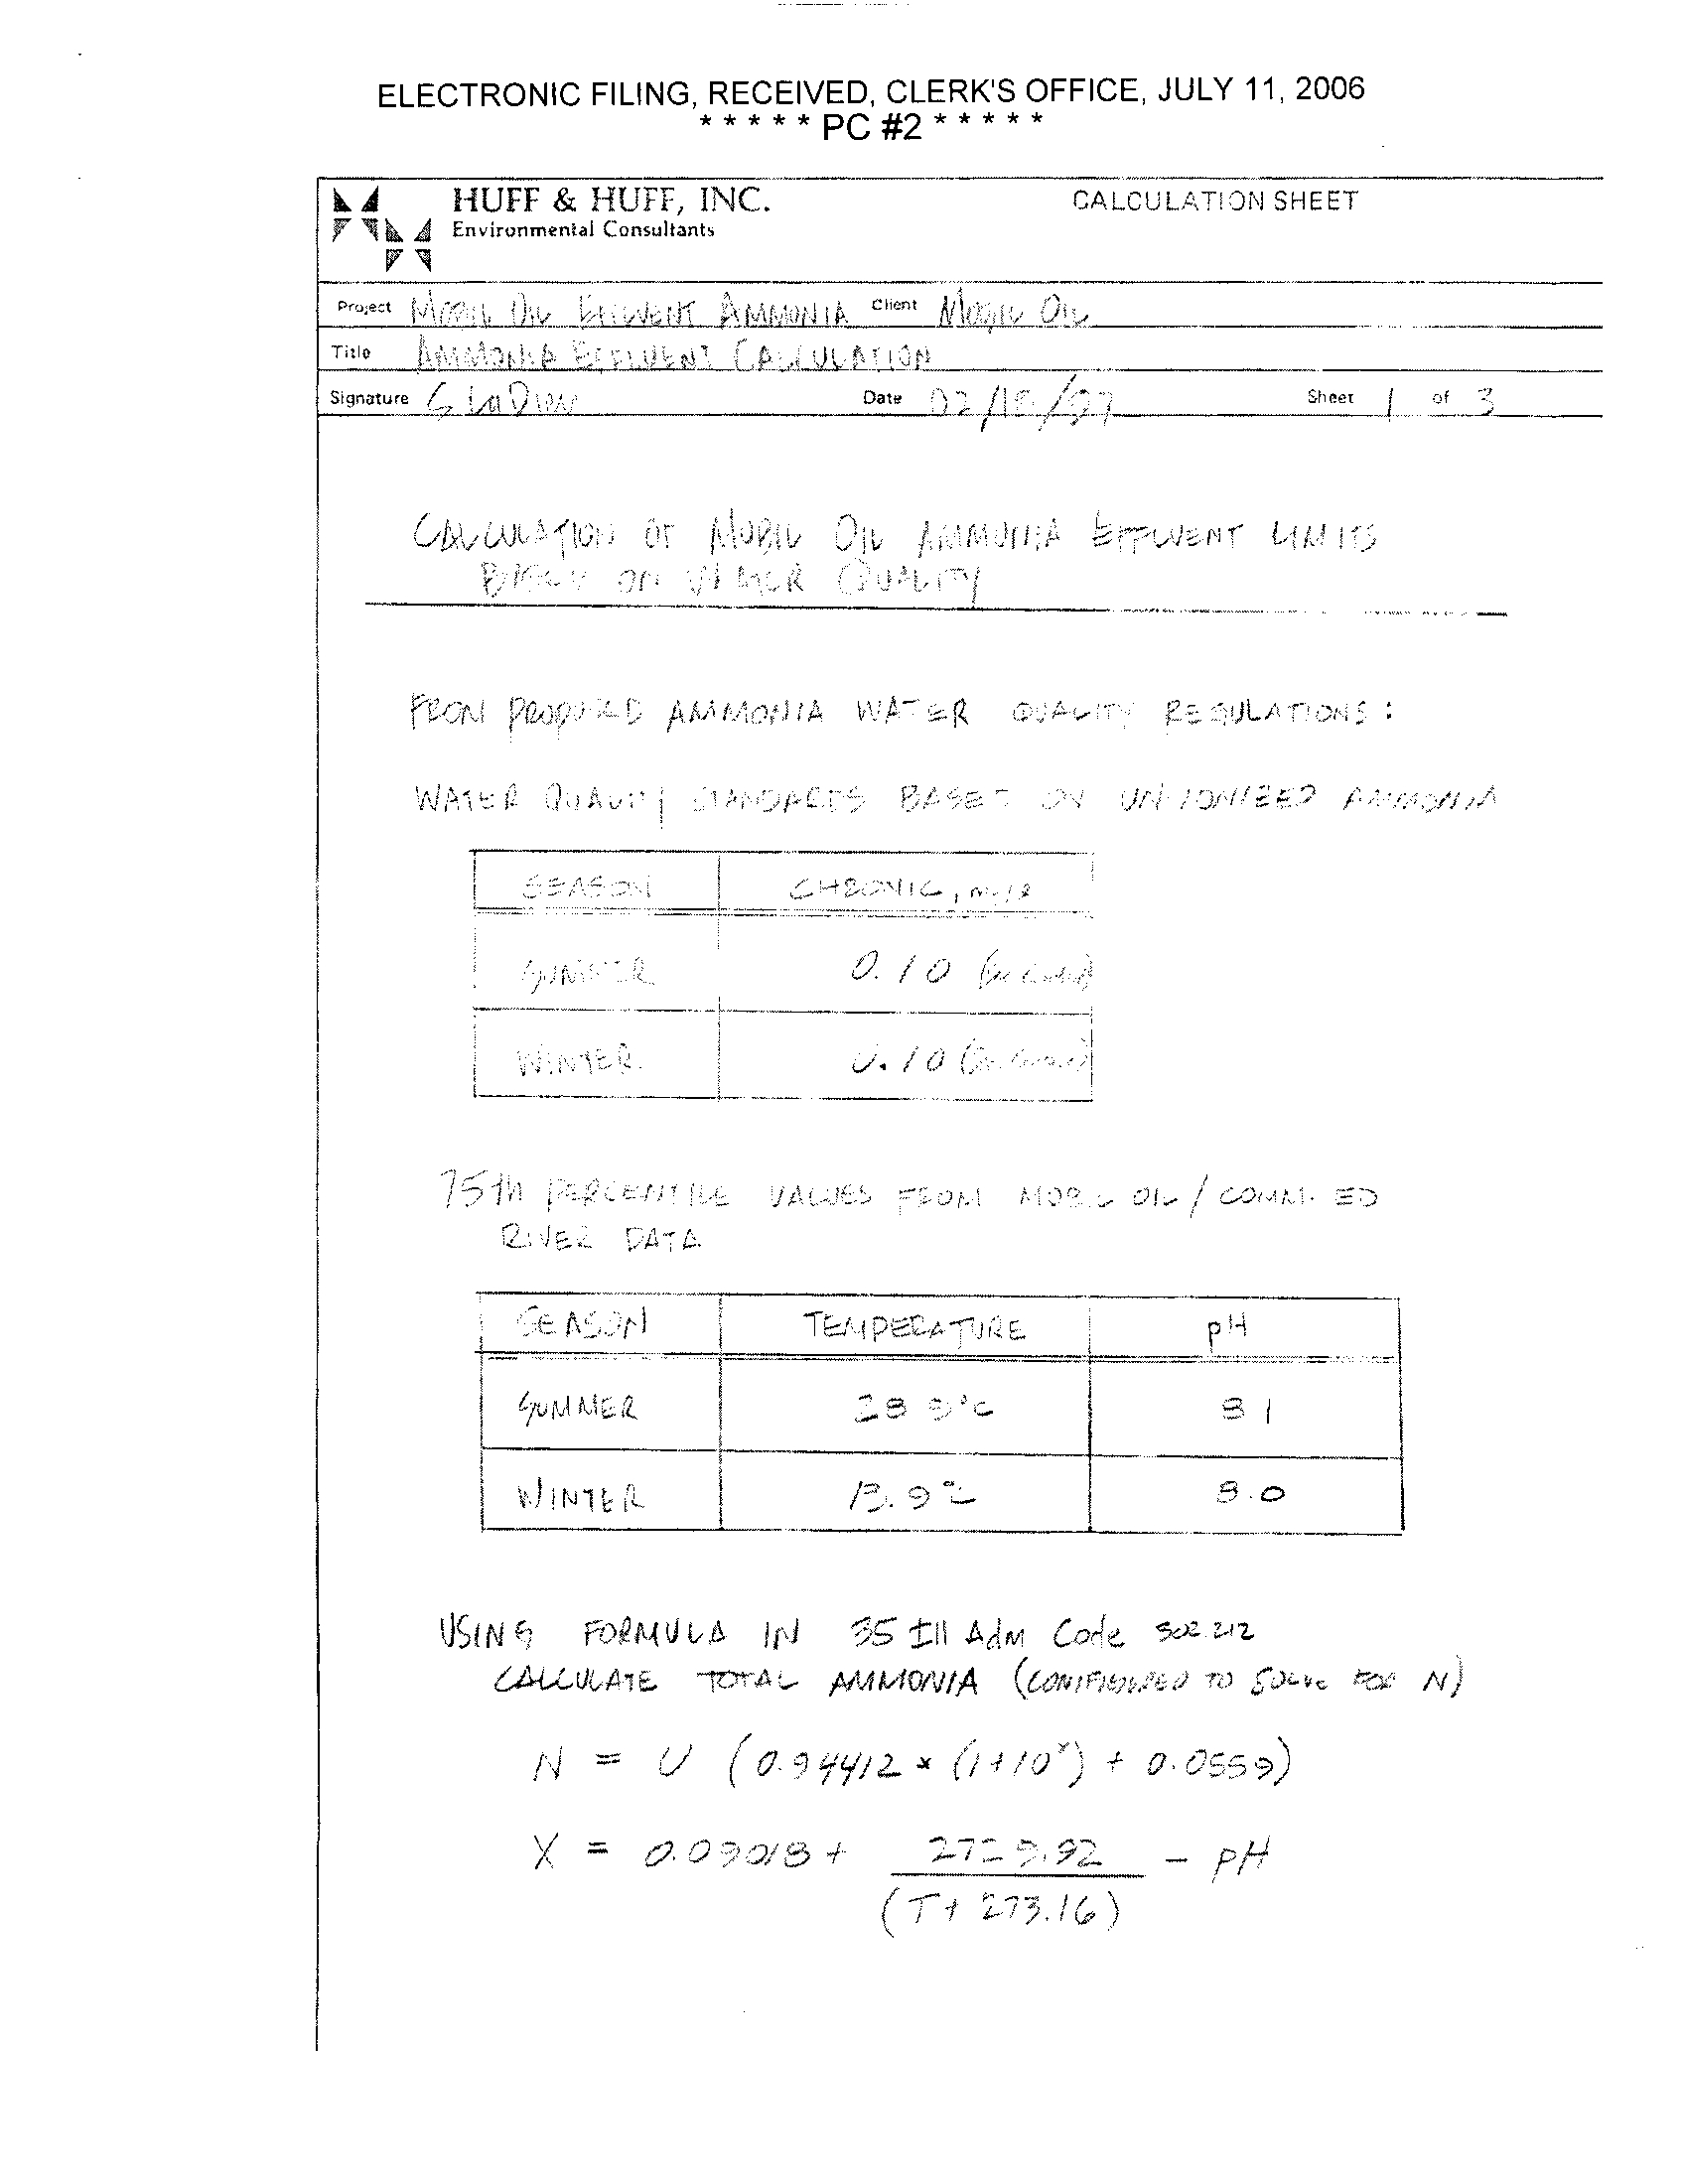
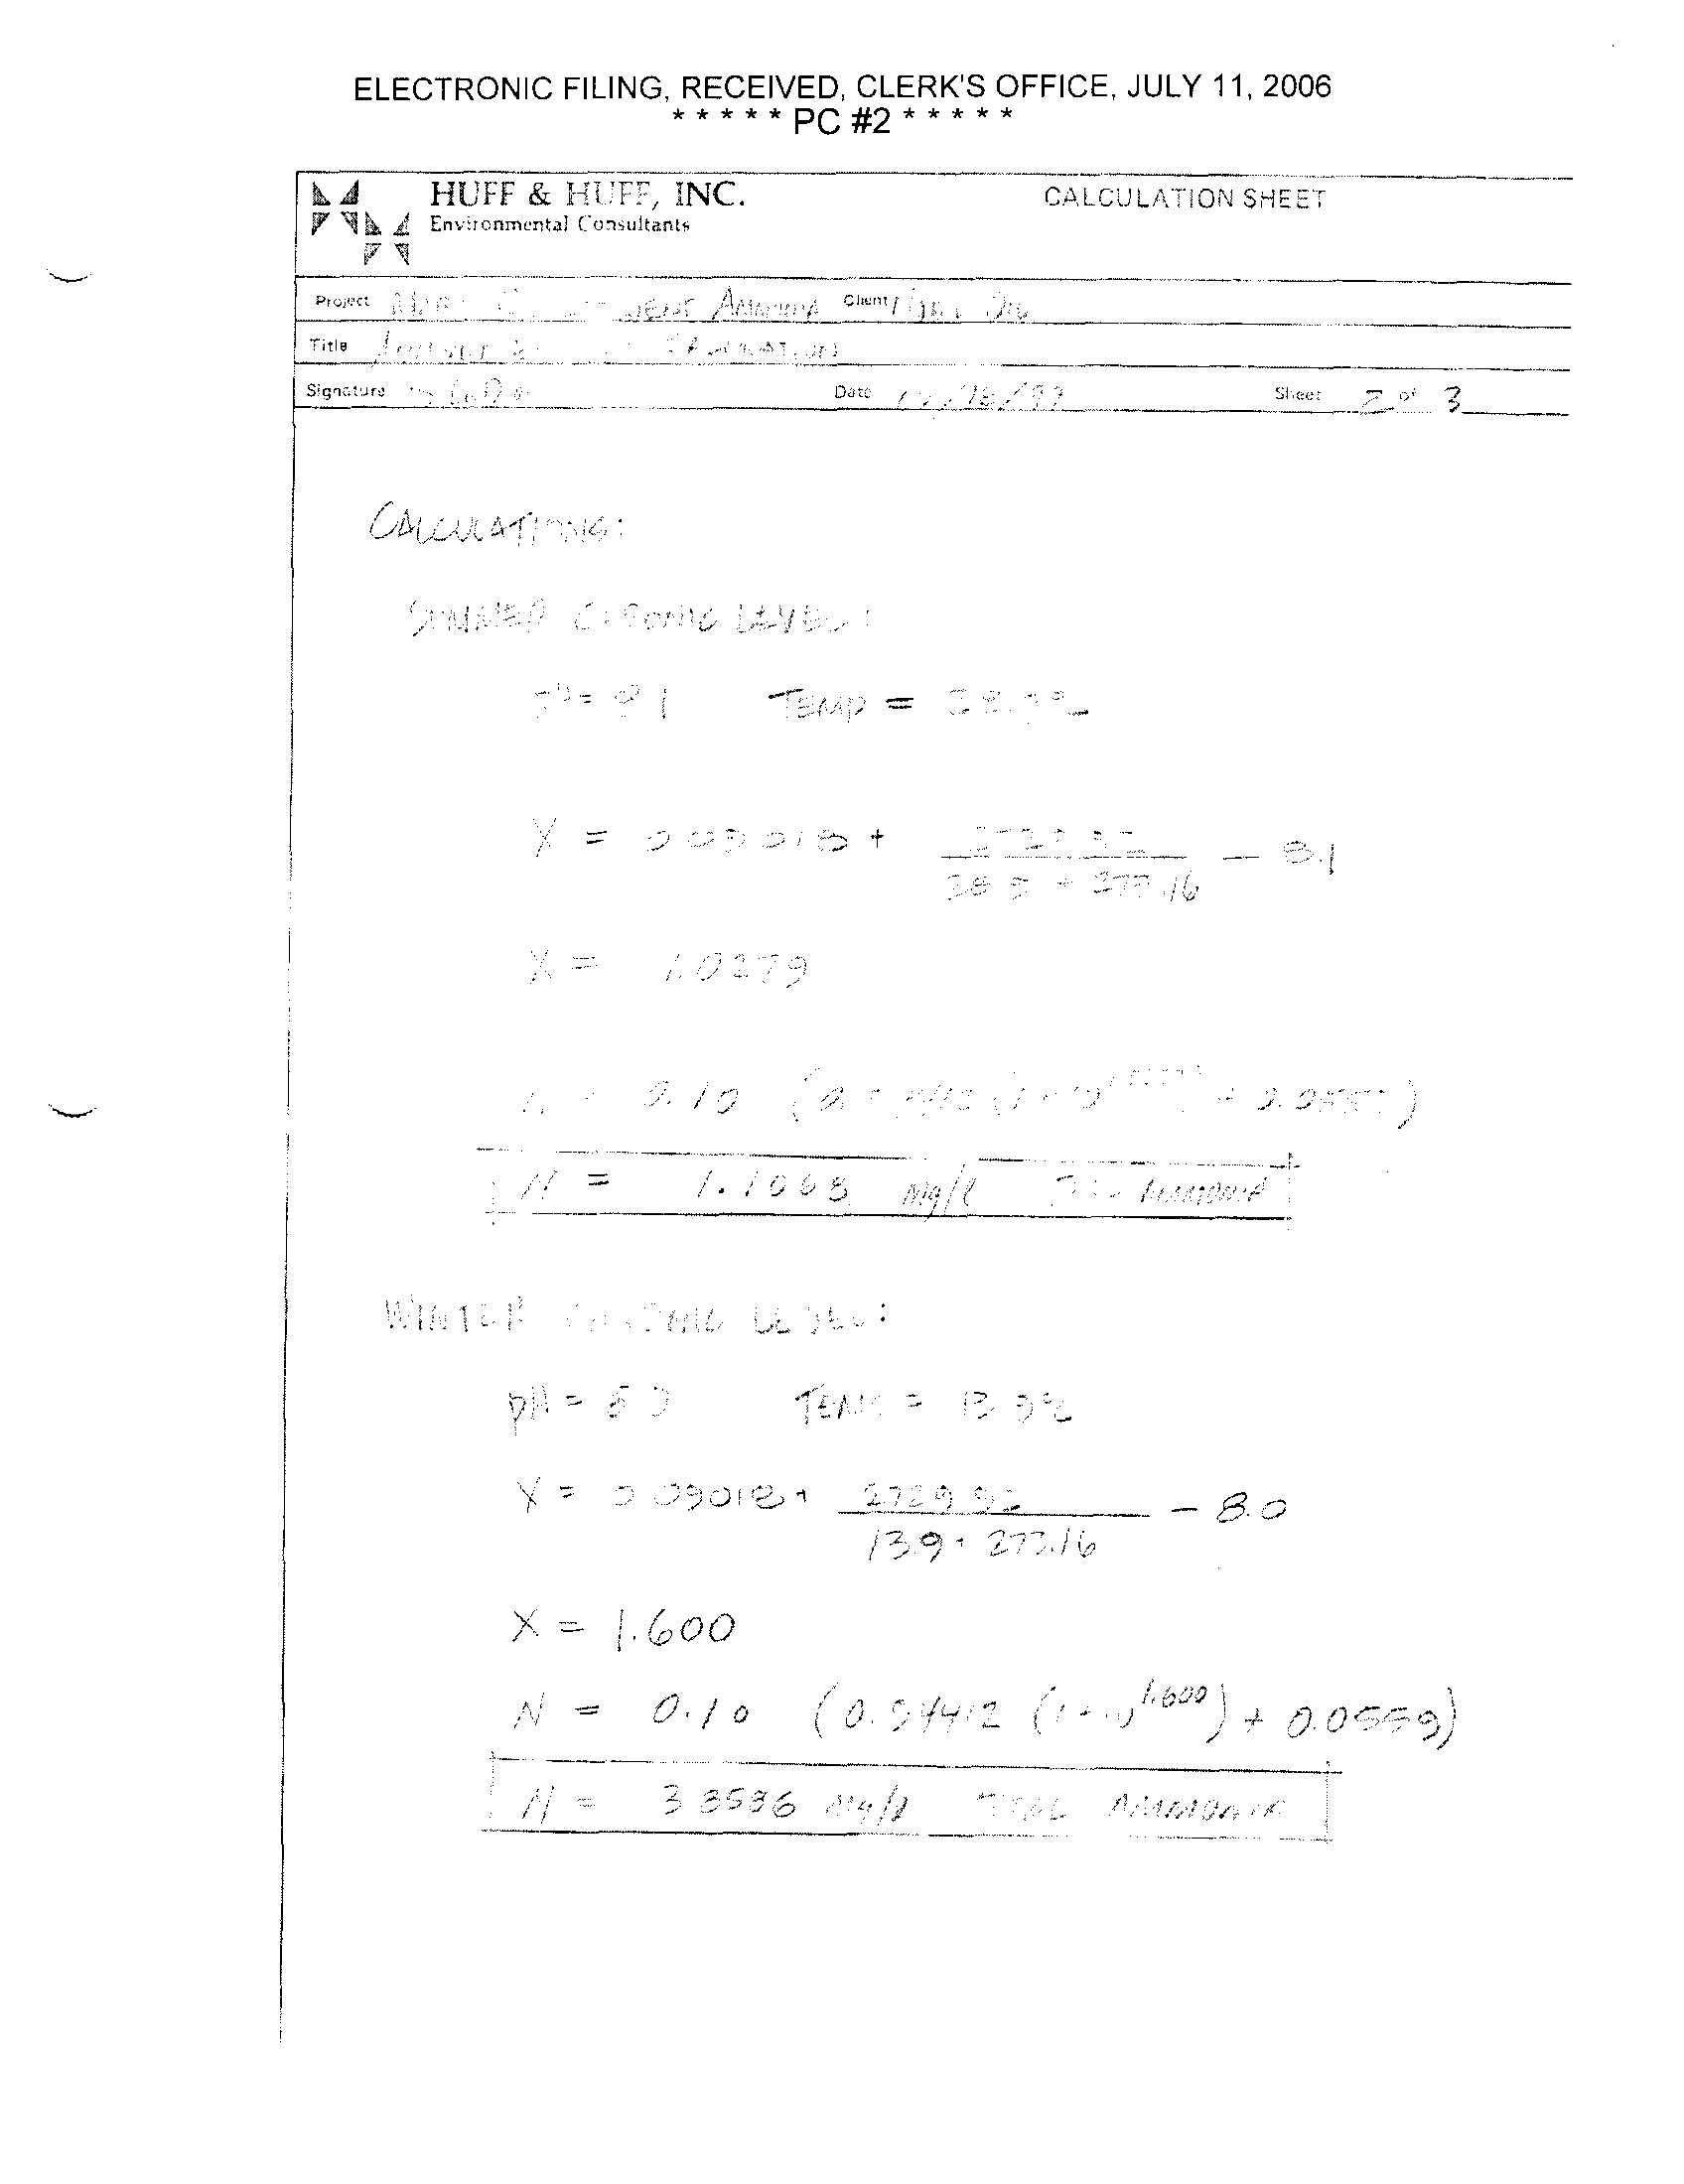
The water quality standard for un-ionized ammonia in secondary contact waters is 0 . 1 mg/i . Using
this water quality limit, the corresponding total ammonia level at the edge of the mixing zone can
be determined using the 75th percentile pH and temperature values for the receiving stream,
consistent with IEPA procedures .
ELECTRONIC FILING, RECEIVED, CLERK'S OFFICE, JULY 11, 2006
* * * **PC #2 * * * * *
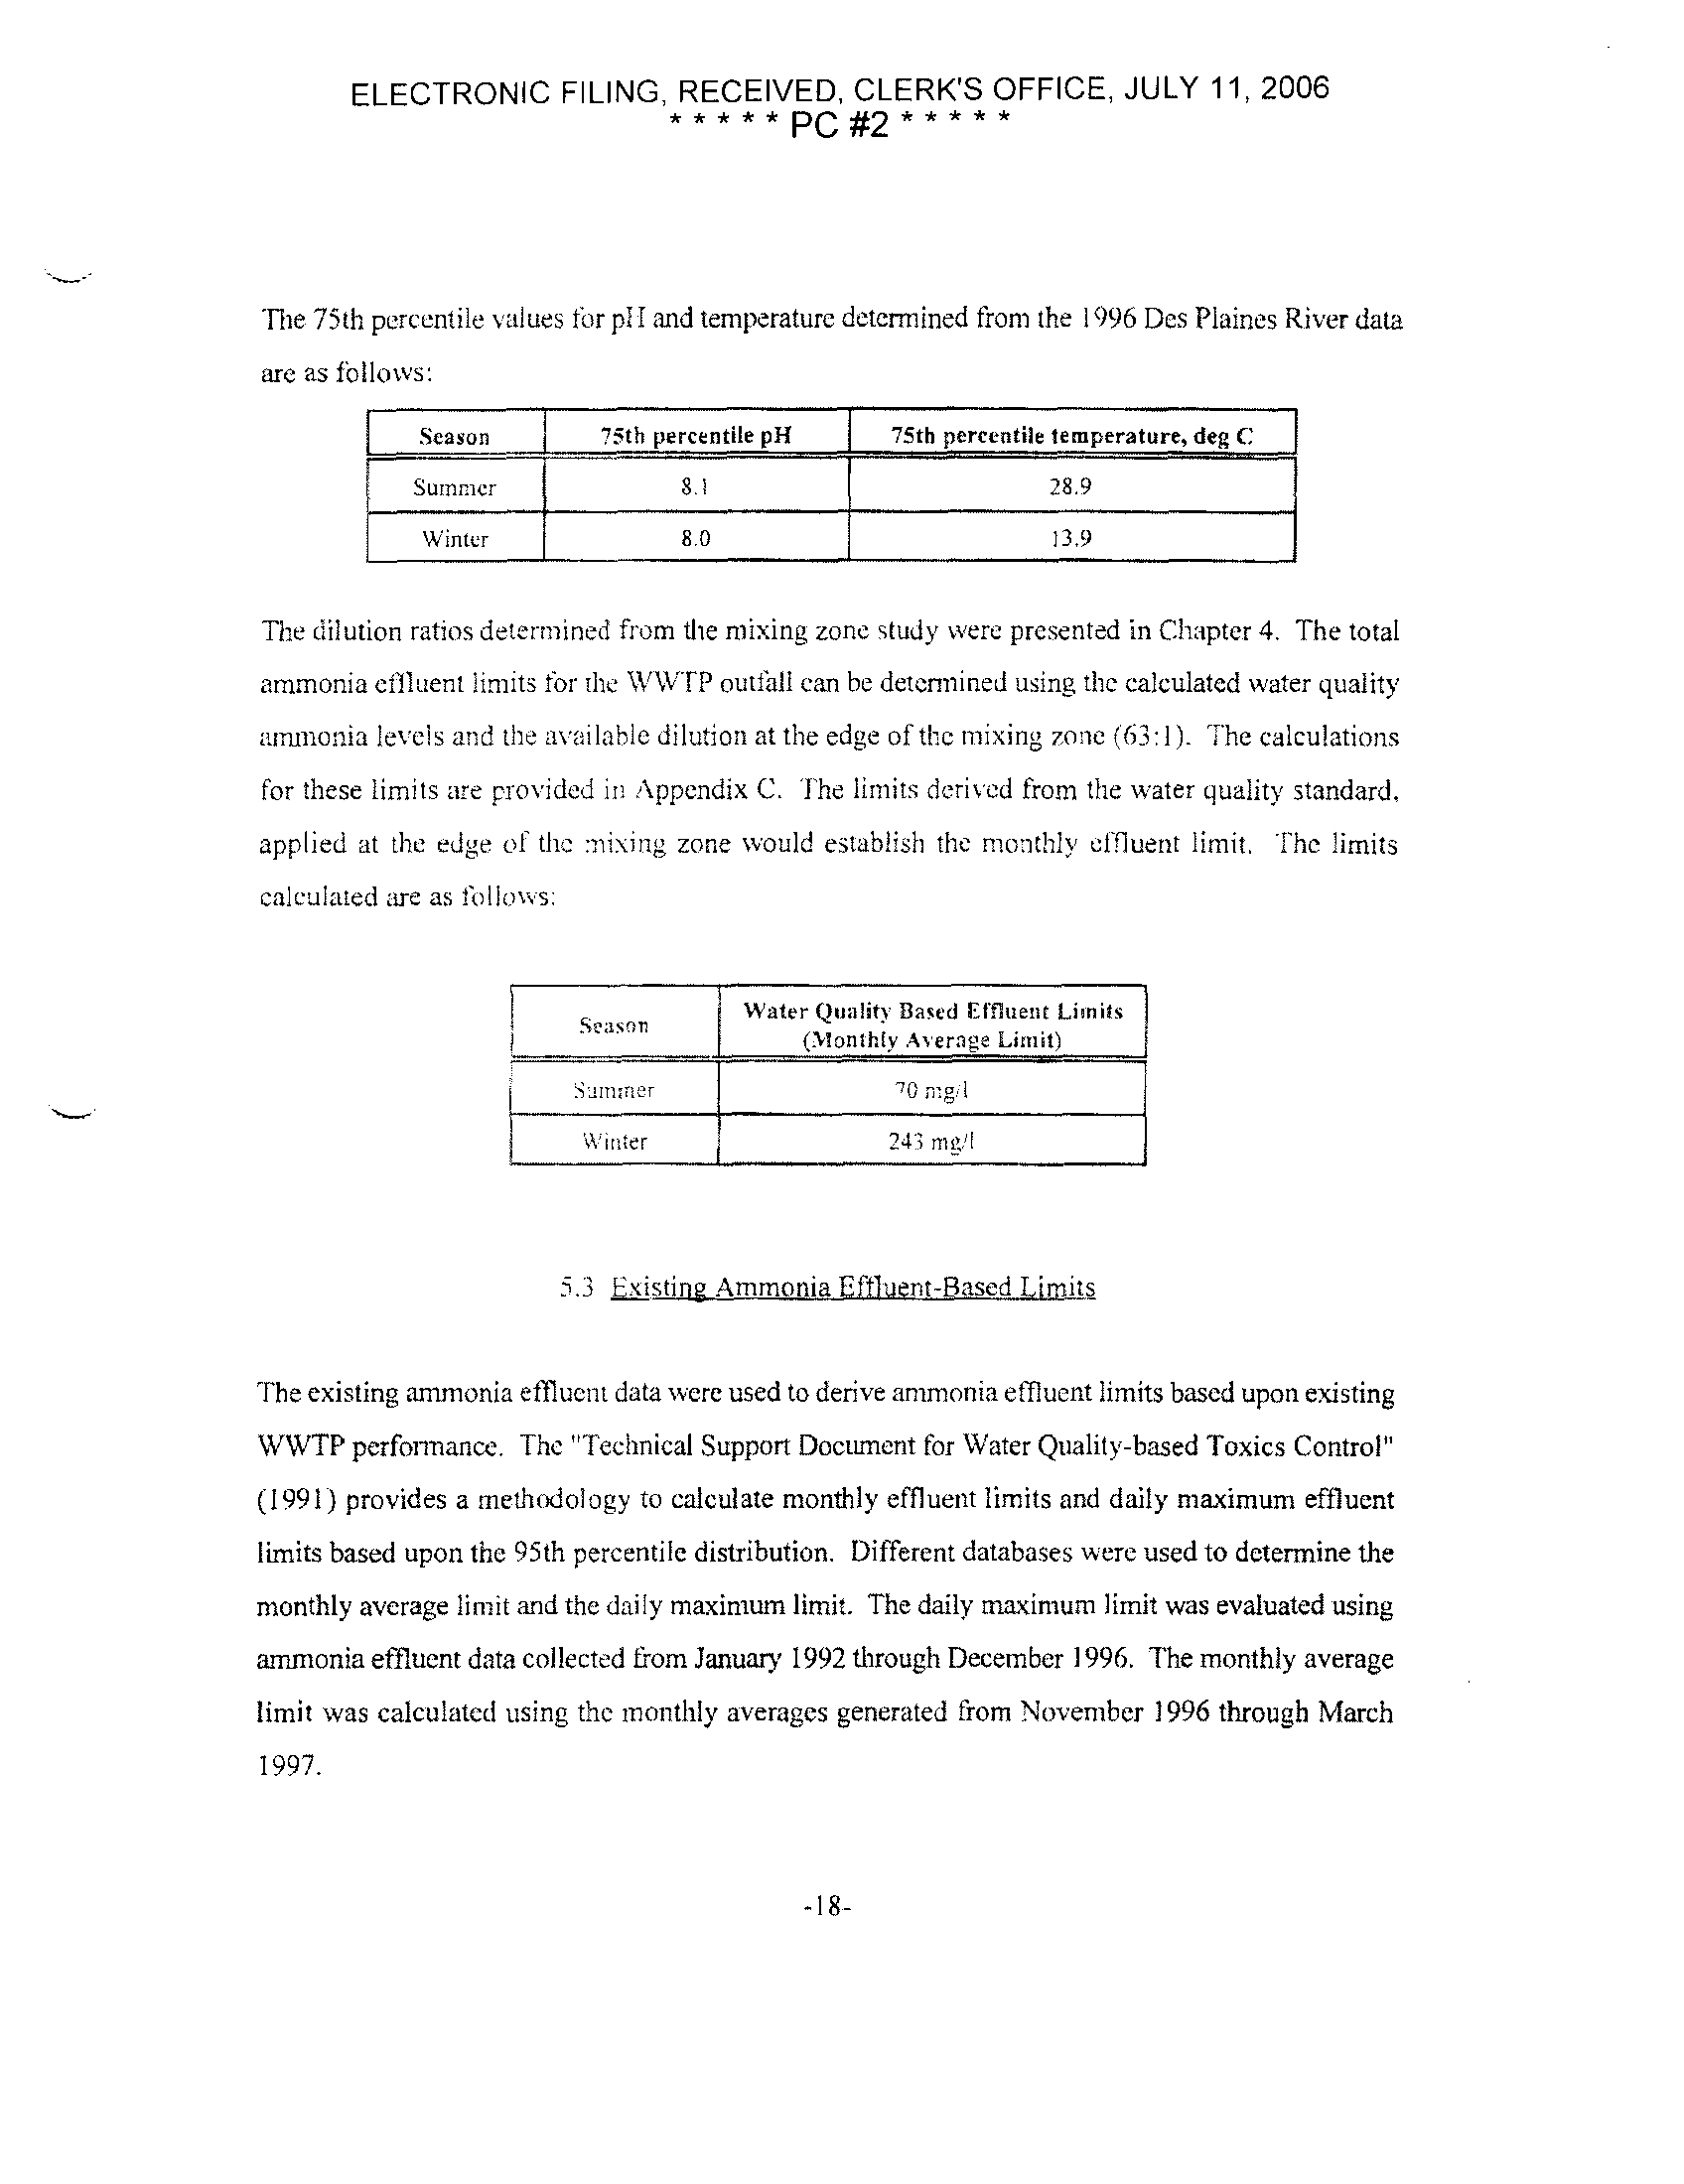
The 75th percentile values for p1I and temperature determined from the 1996 Des Plaines River data
are as follows
:
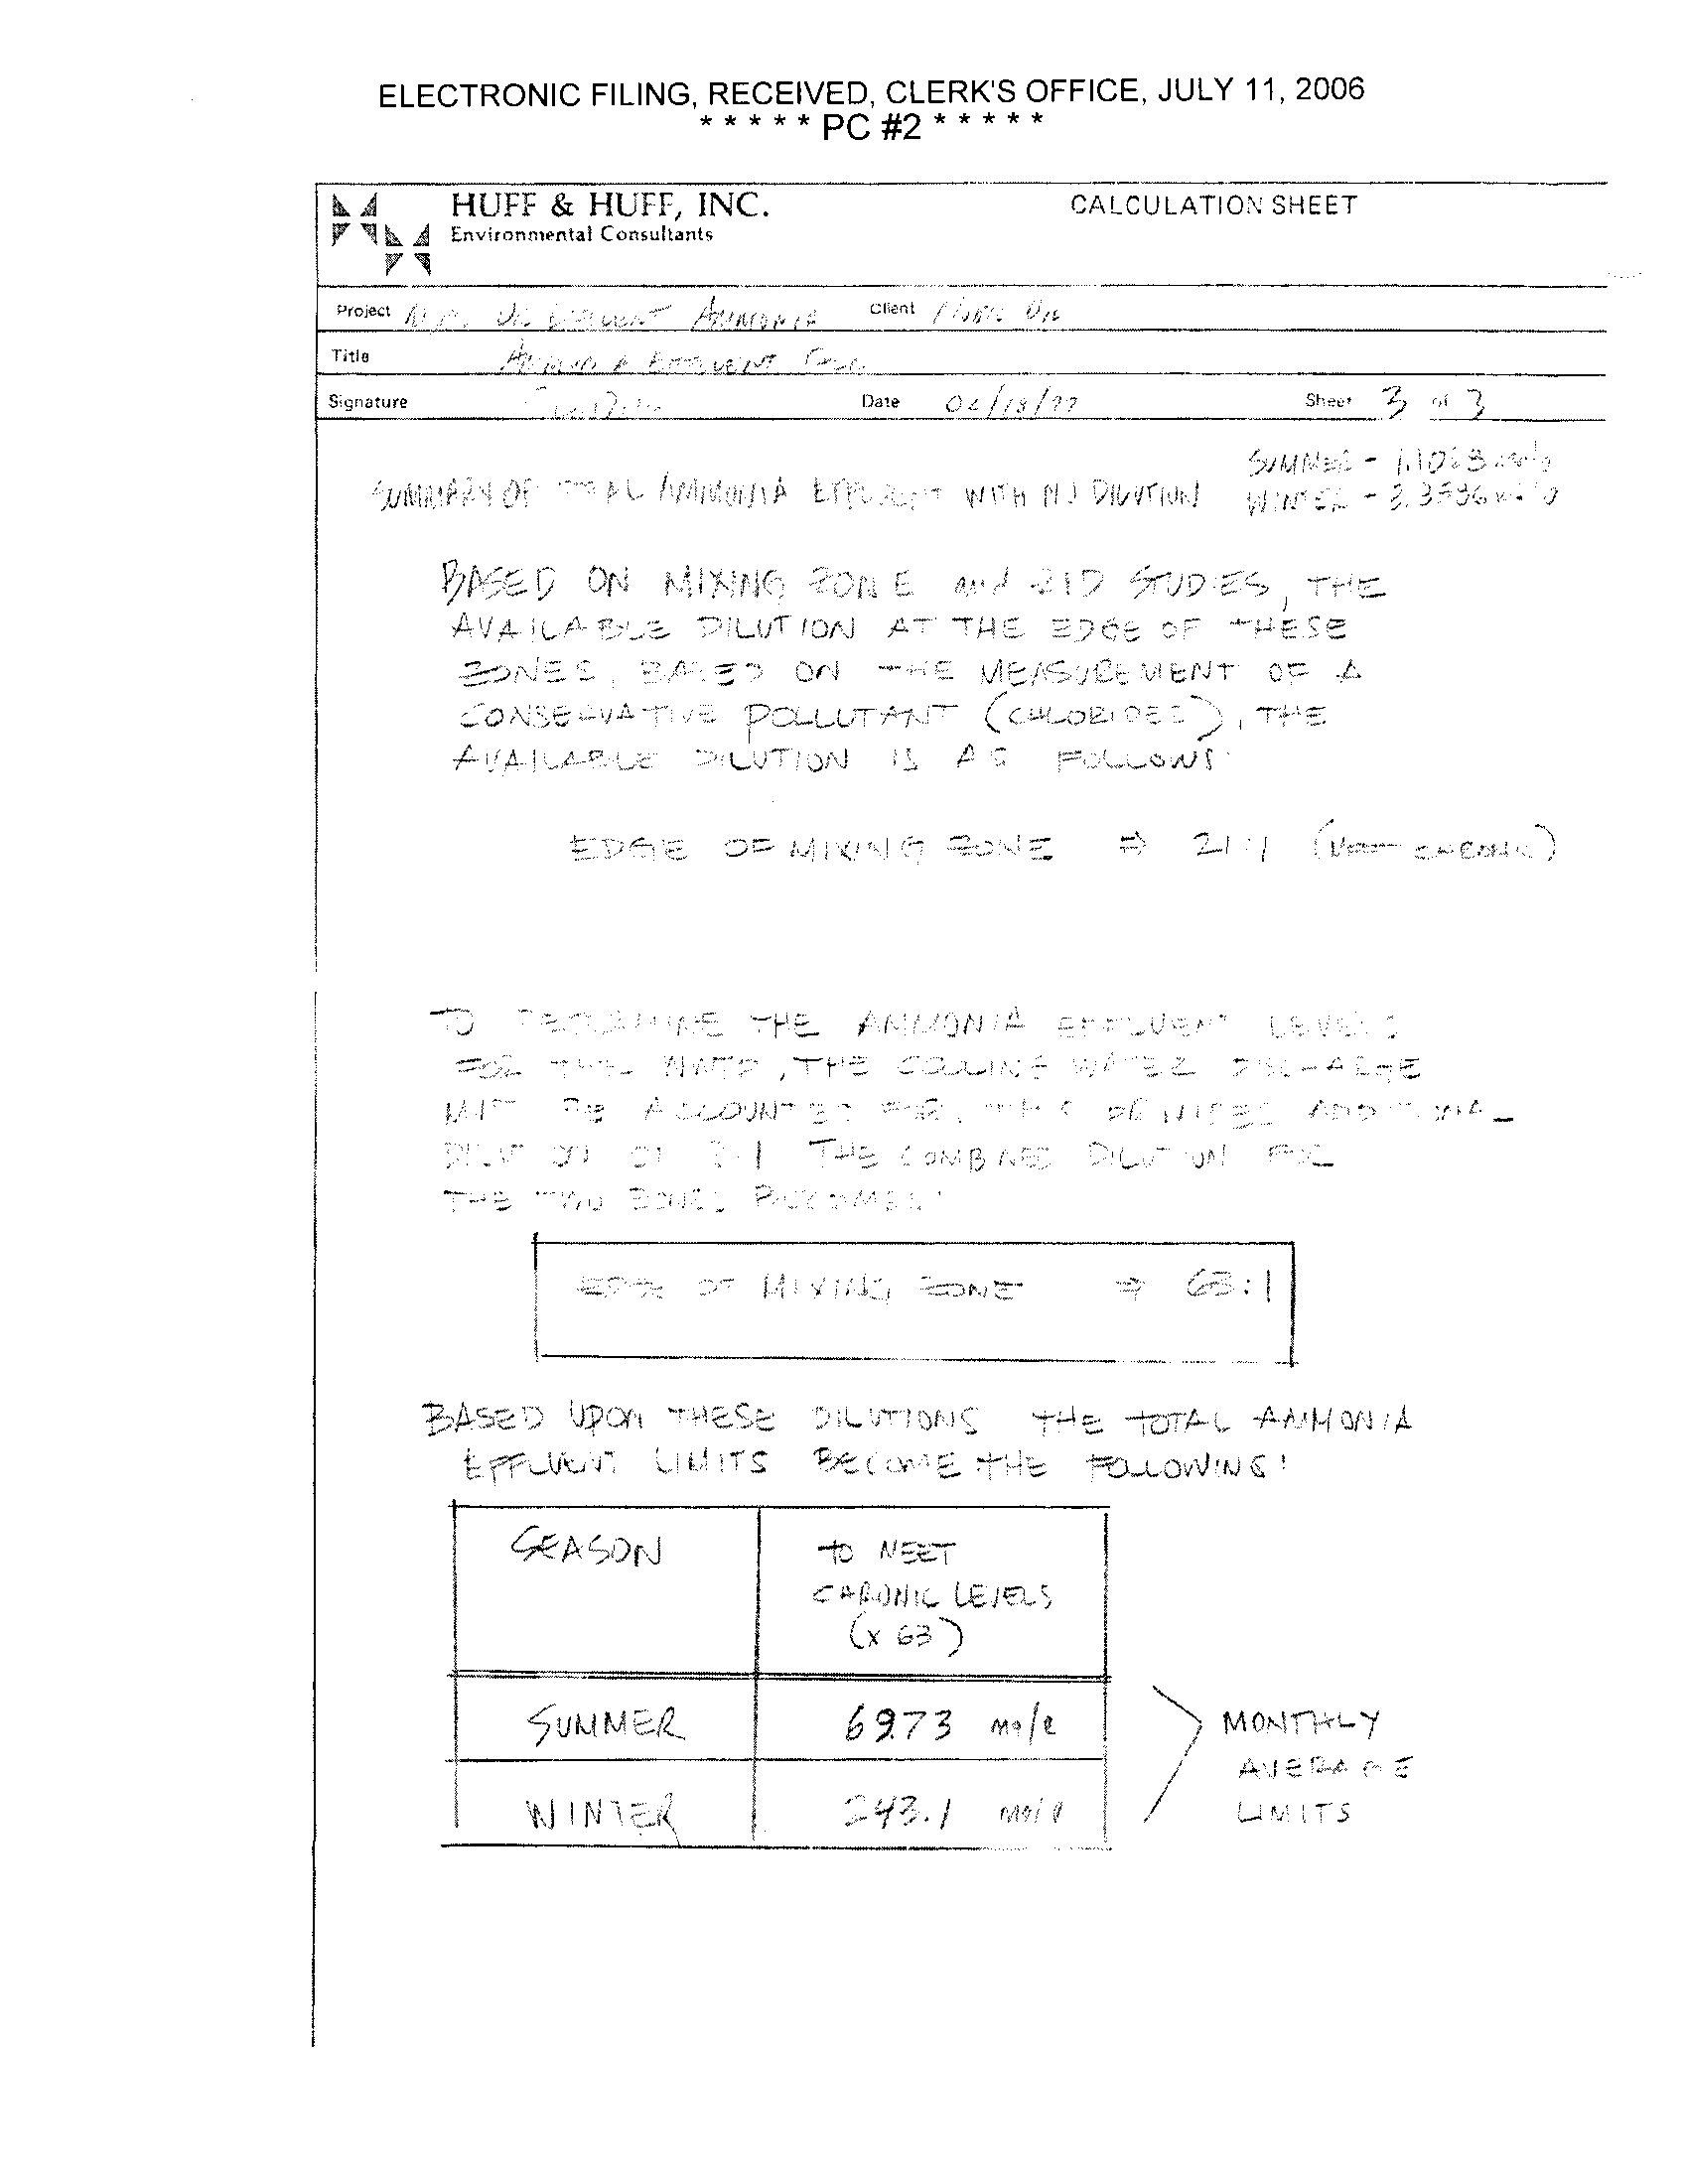
The dilution ratios determined from the mixing zone study were presented in Chapter 4 . The total
ammonia effluent limits for the WW FP outfall can he determined using the calculated water quality
a mnonia levels and the available dilution at the edge of the mixing zone ('63 :1) .
The calculations
for these limits are provided in Appendix C . The limits derived from the water quality standard,
applied at the edge of the mixing zone would establish the monthly effluent limit
. The limits
calculated are as 1itllous
:
W inter
Water Quality Based Effluent Limits
(Monthly .Average Limit)
'1C mg 1
243 ate'I
Season
Sj,n ;ner
5.'s . istine Ammonia Effluent-Based Limits_
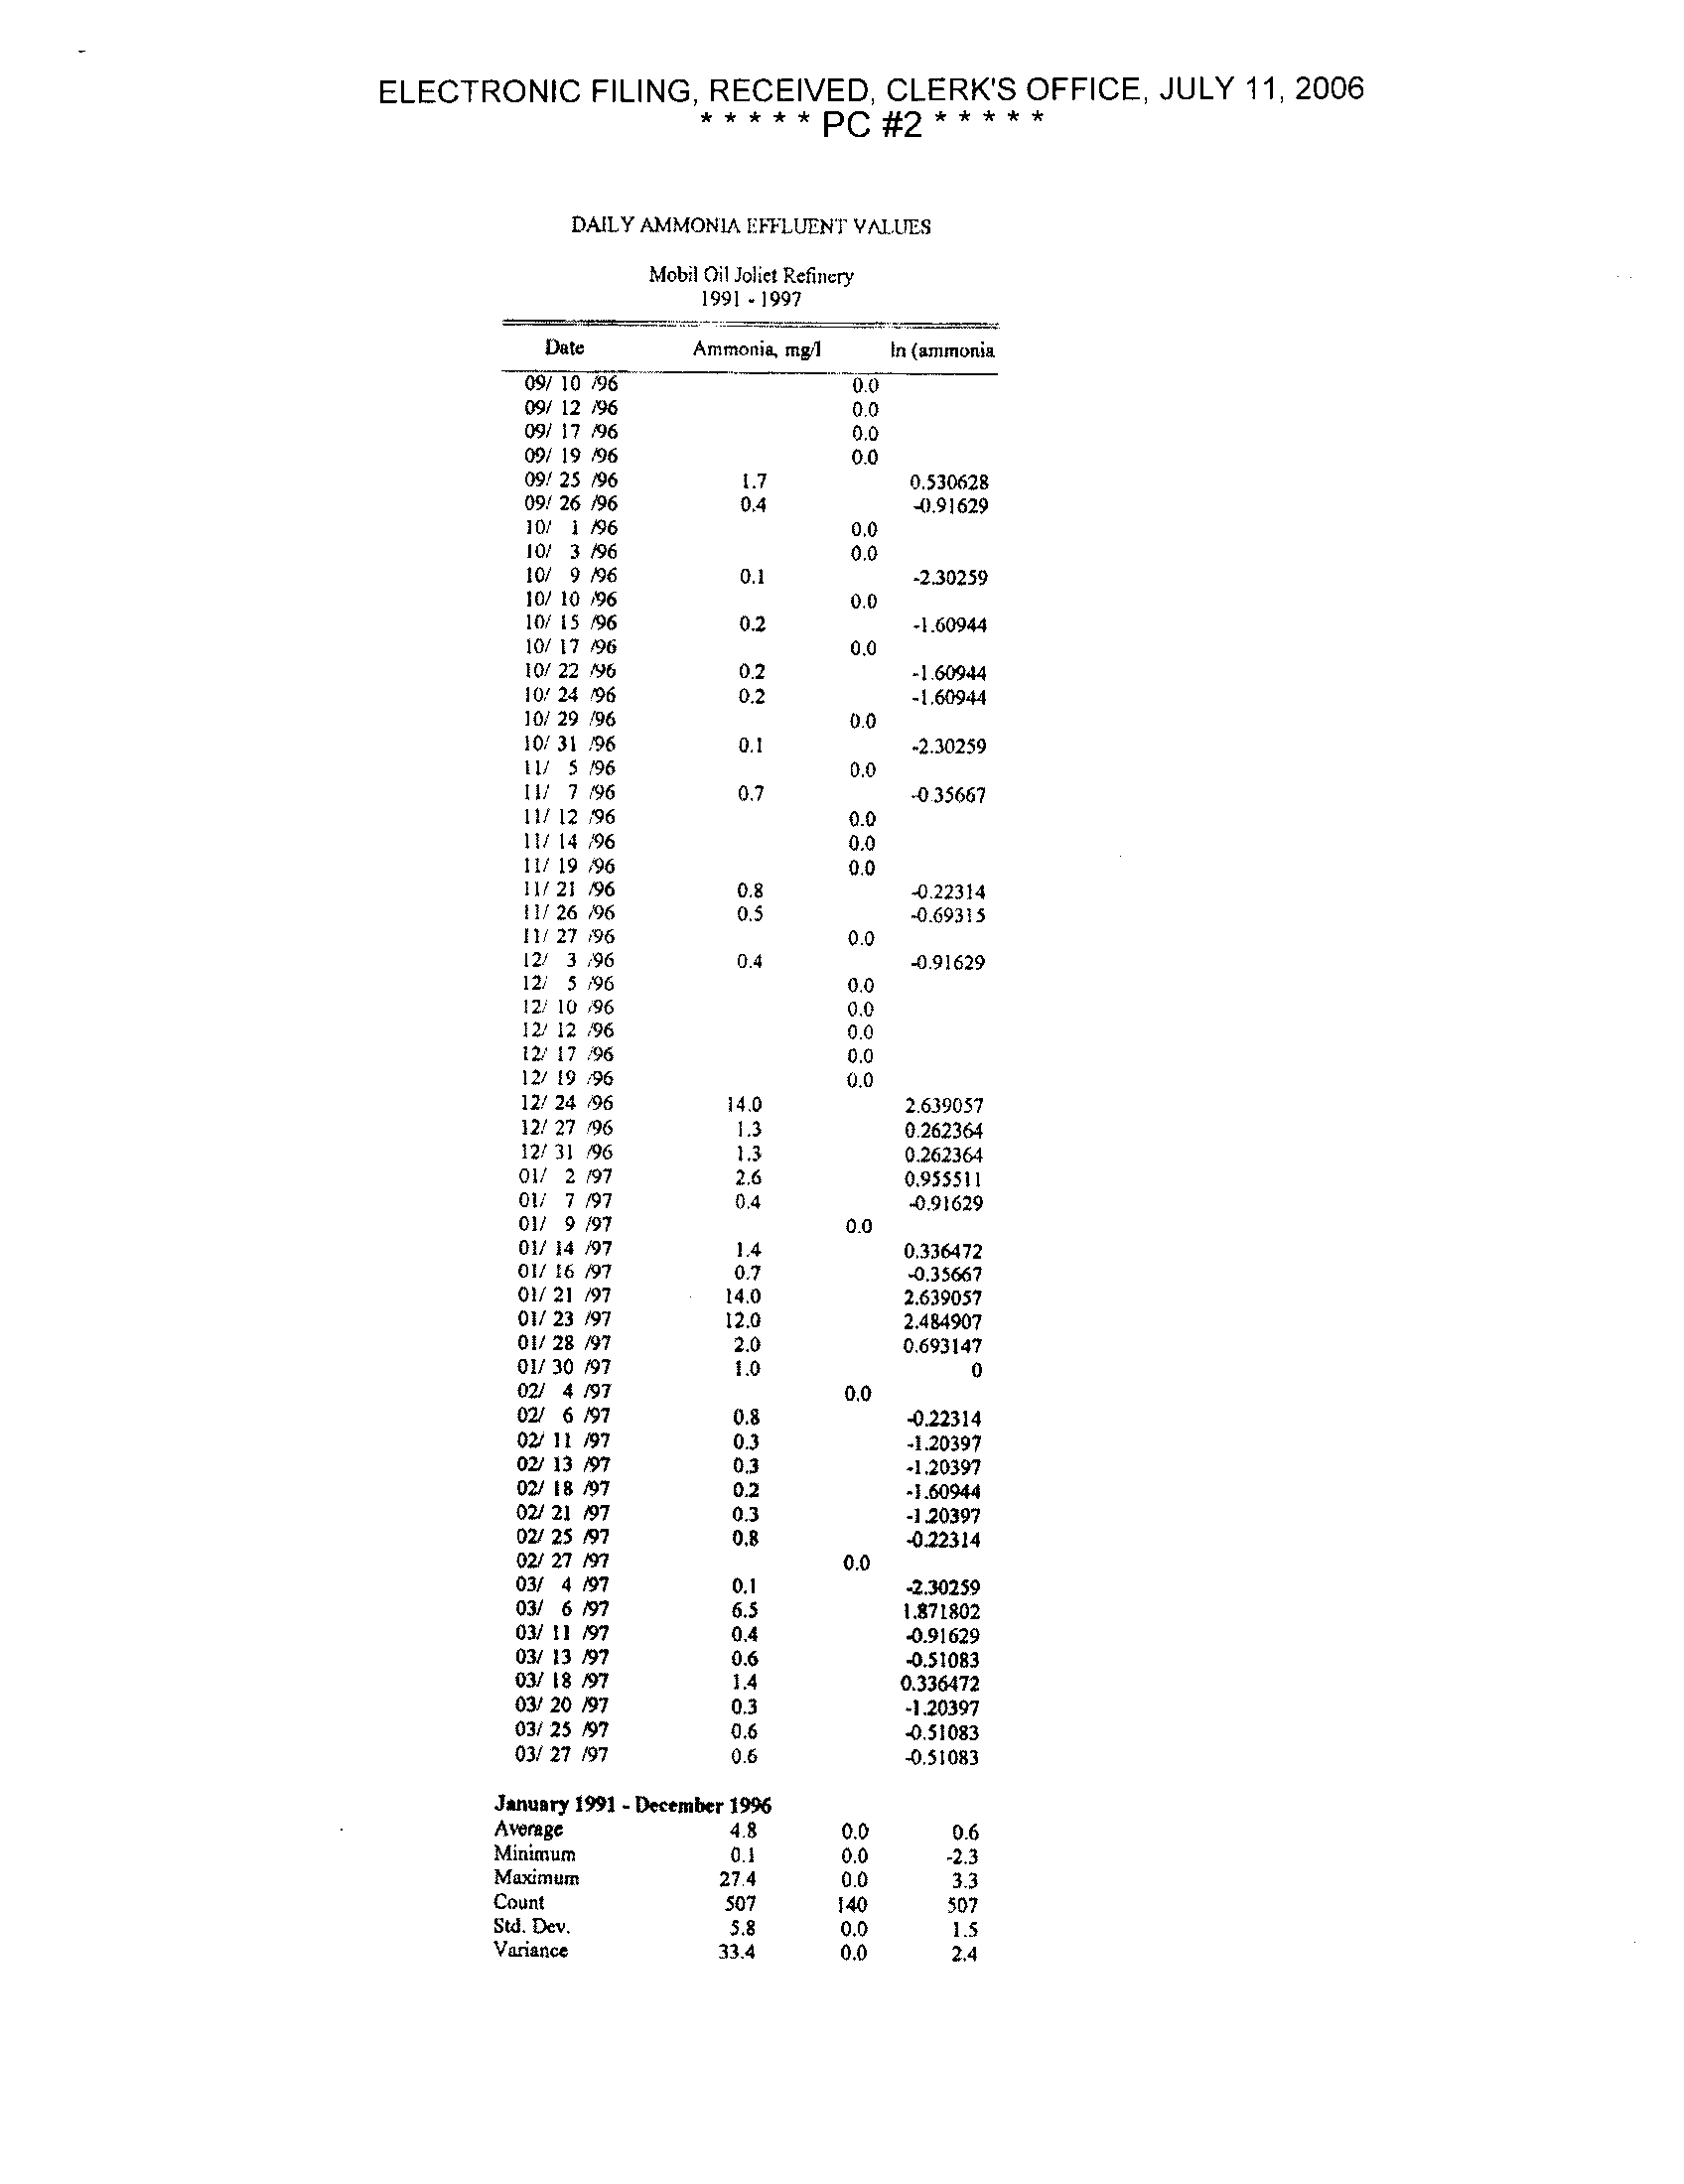
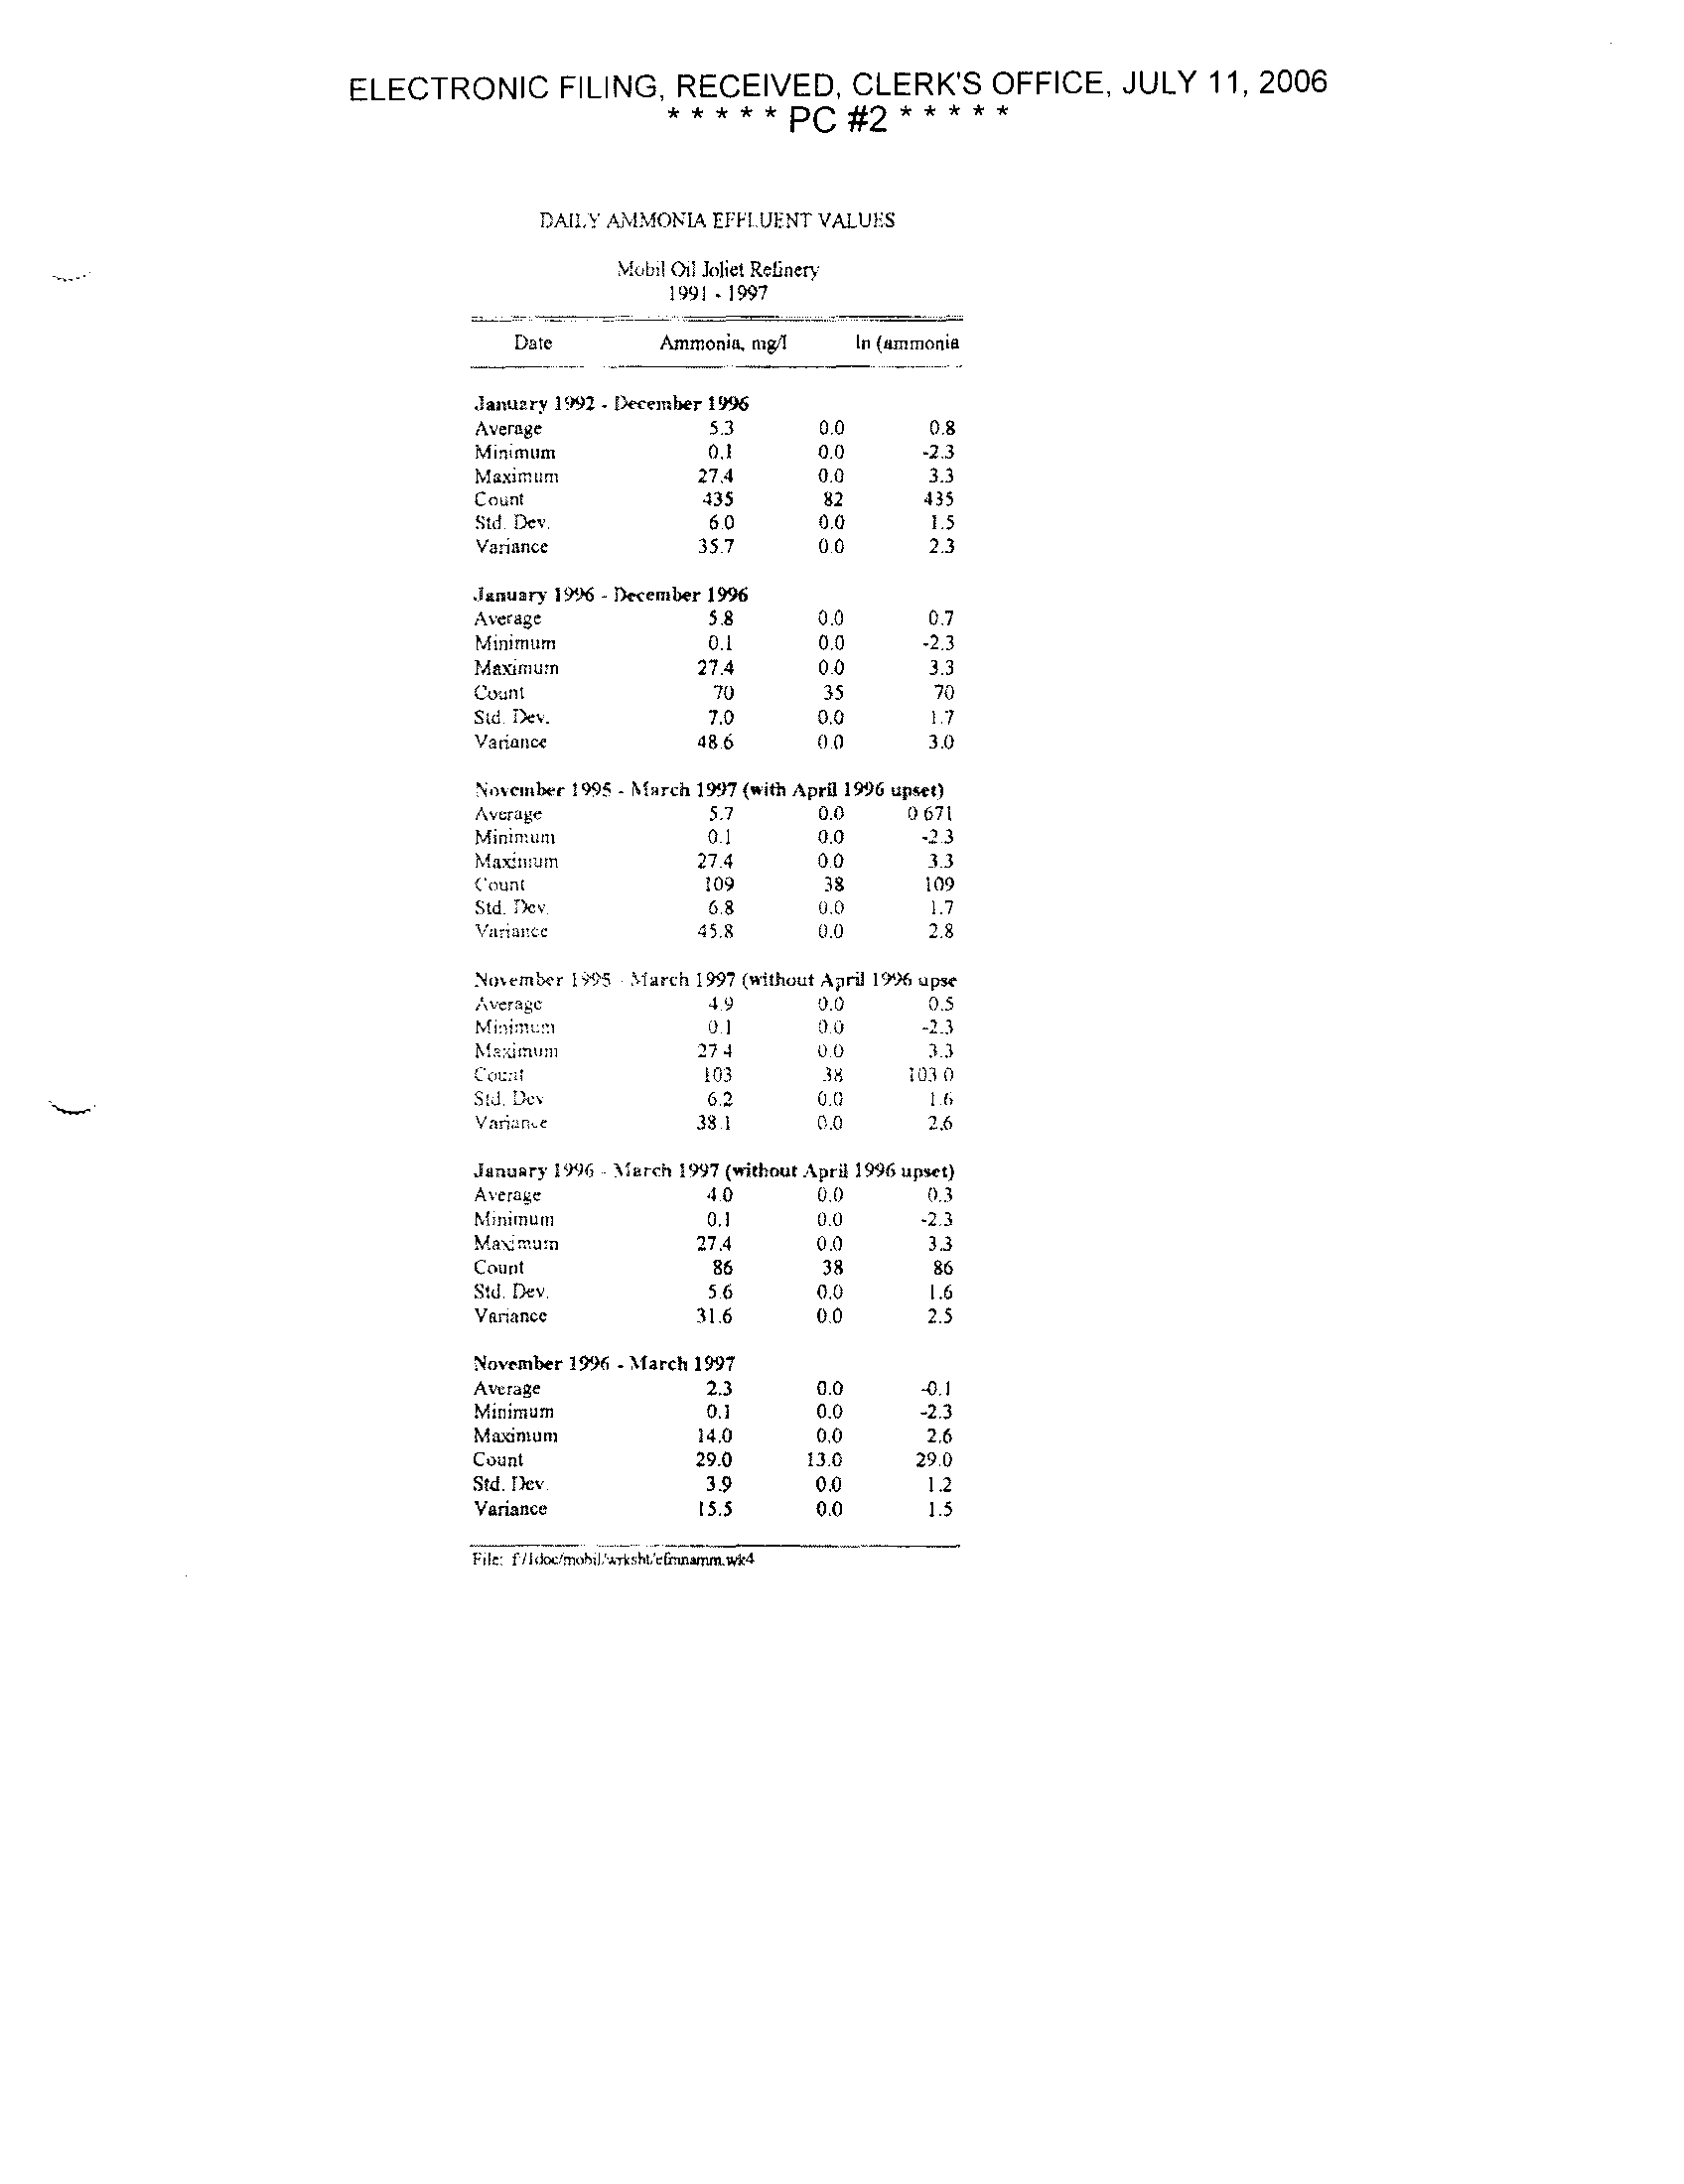
The existing ammonia effluent data were used to derive ammonia effluent limits based upon existing
WWTP performance . The "Technical Support Document for Water Quality-based Toxics Control"
(1991) provides a methodology to calculate monthly effluent limits and daily maximum effluent
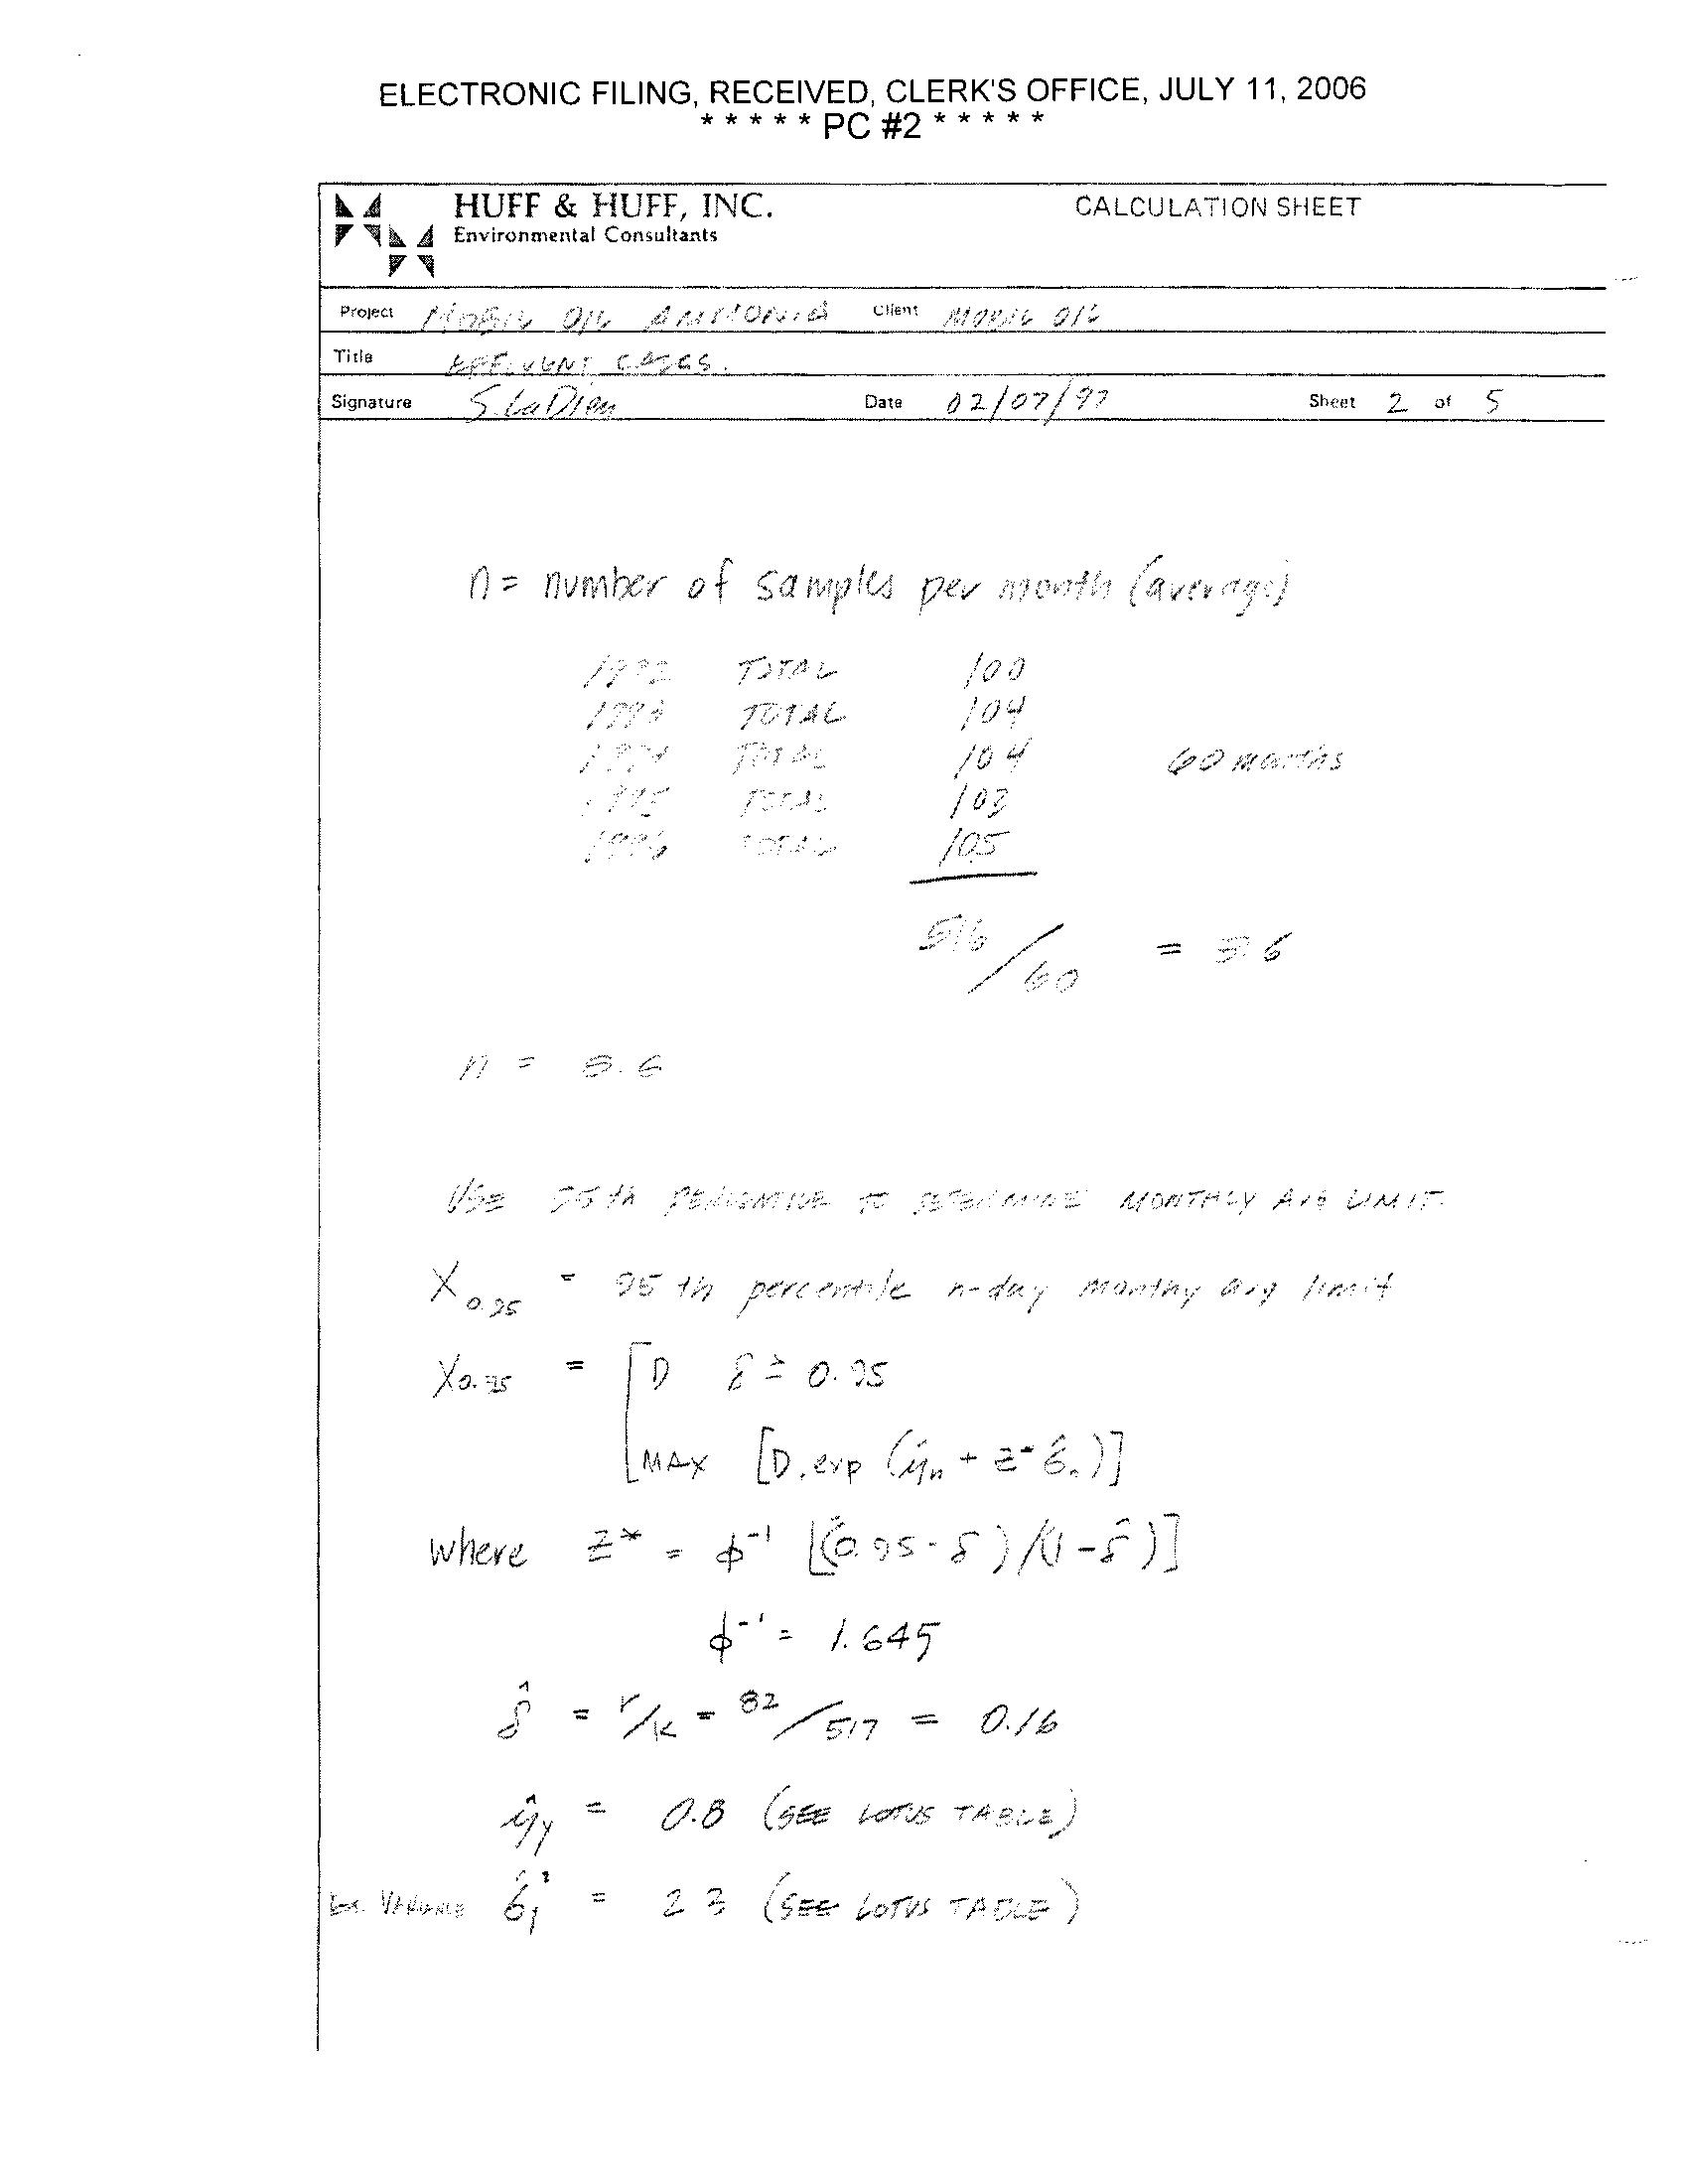
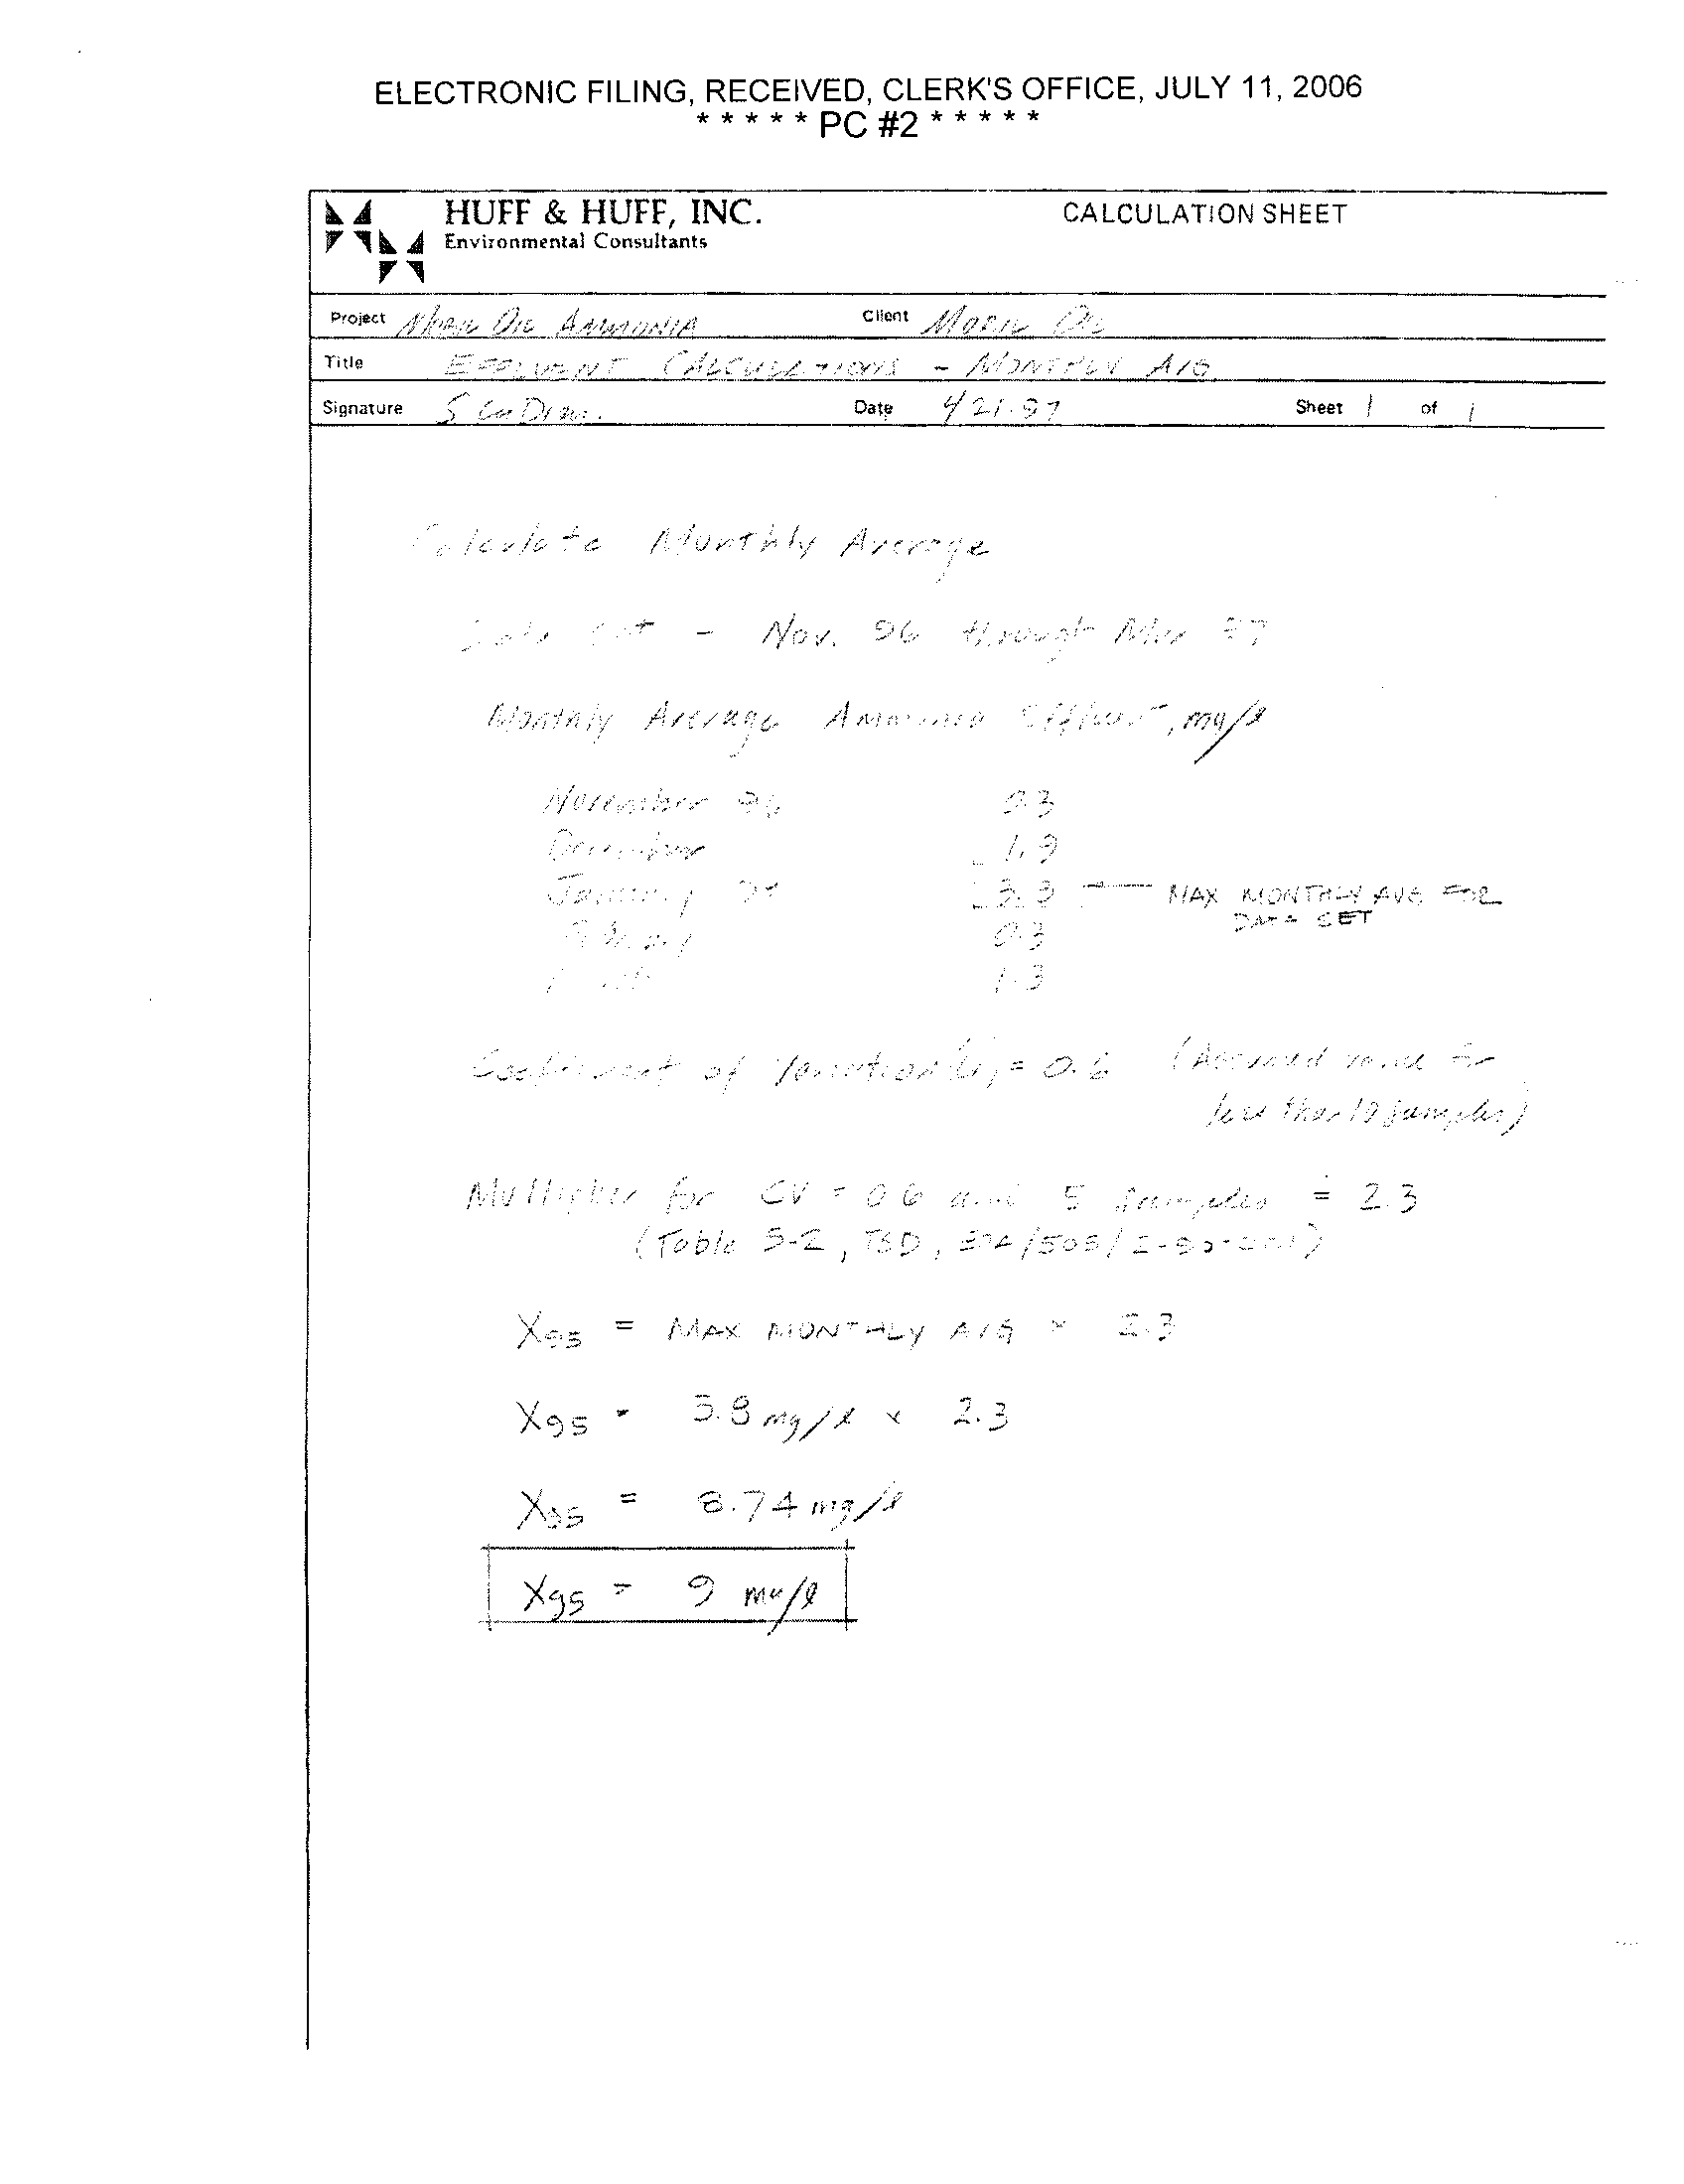
limits based upon the 95th percentile distribution . Different databases were used to determine the
monthly average limit and the daily maximum limit
. The daily maximum limit was evaluated using
ammonia effluent data collected from January 1992 through December 1996 . The monthly average
limit was calculated using the monthly averages generated from November 1996 through March
1997.
-18-
Season
75th percentile pH
75th percentile temperature, deg C
Summer
8 .1
28
.9
Winter
8,0
13 .9
ELECTRONIC FILING, RECEIVED, CLERK'S OFFICE, JULY 11, 2006
* * * * *PC #2 * * * * *
Mobil Oil has recently completed upgrading the WWIP at the refinery
. The upgraded plant was
fully operational starting in November, 1996 . The ammonia effluent quality expected from the
upgraded WWTP can be estimated from the November 1996 to March 1997 data . This limited
database was therefore used for the monthly average limit determination
. Although the upgraded
plant provides better control of ammonia effluent quality, the ammonia spikes generated from the
refinery operation will still occur, and carry through the upgraded WWTP . However, the WWTP
recovery time will be shortened due to the upgrade . The database for determining the daily
maximum includes data from January 1992 to December 1996 . This data set includes periods of
WWTP operation during typical ammonia spikes
.
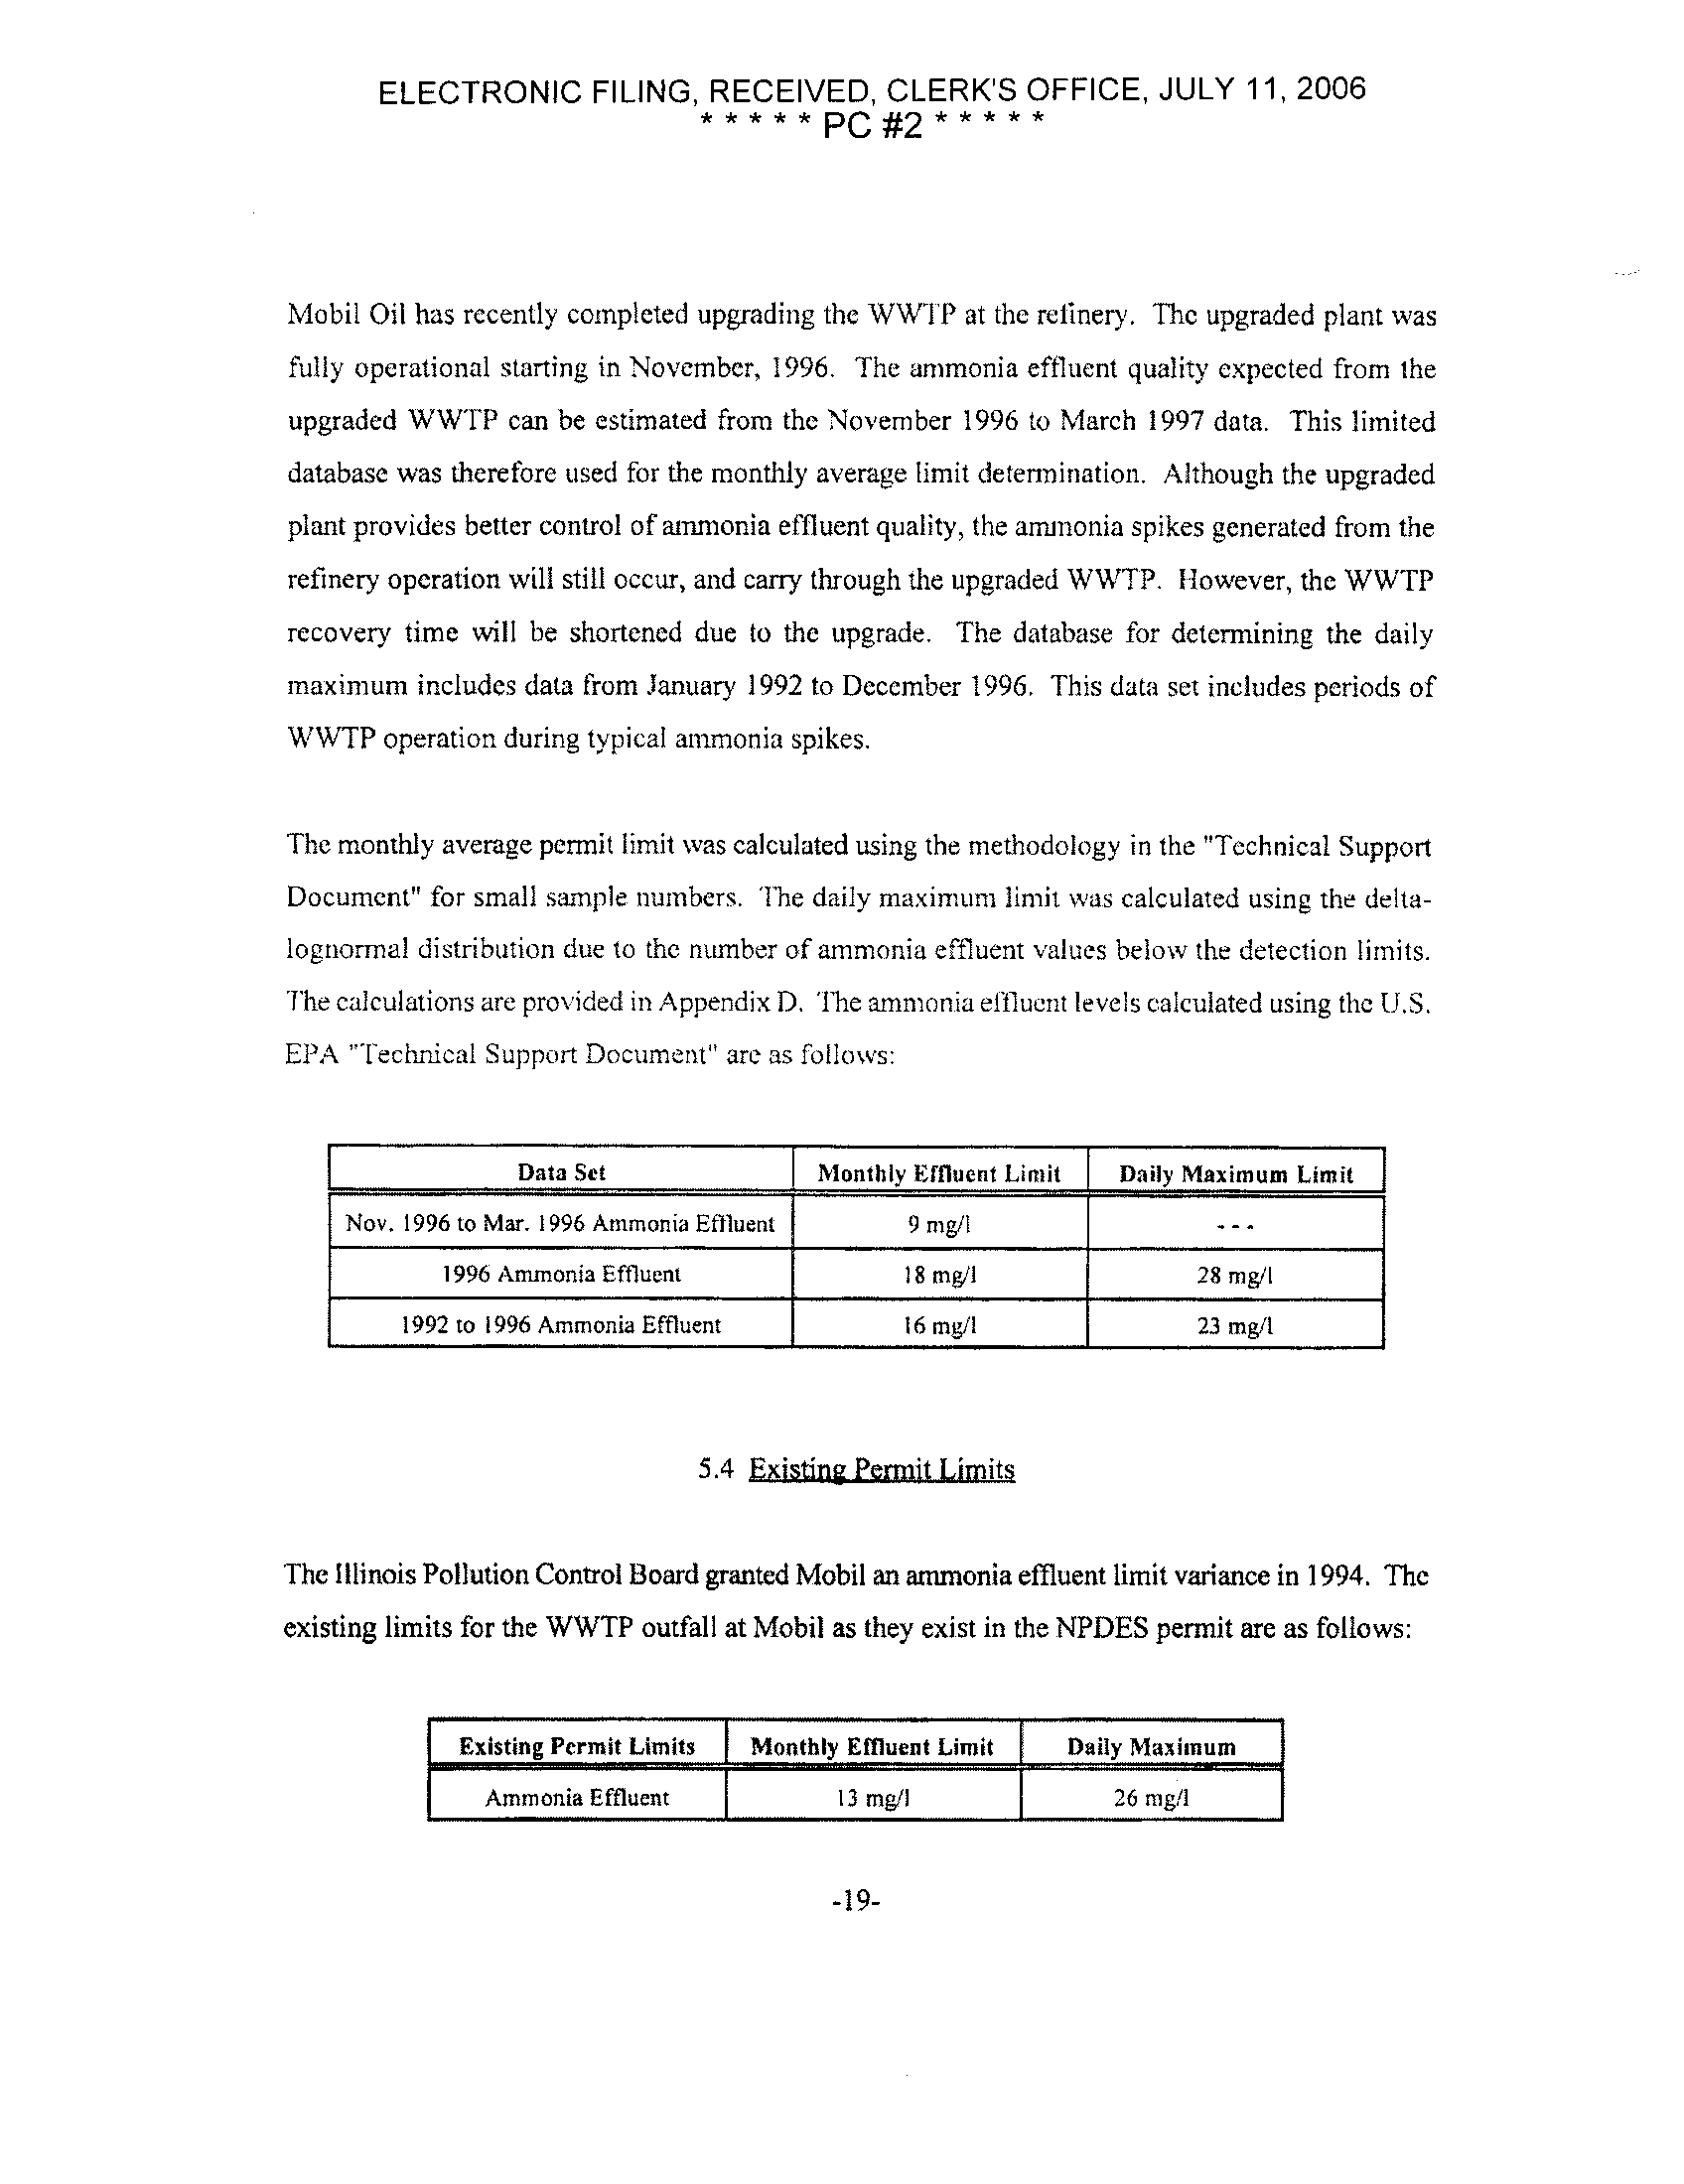
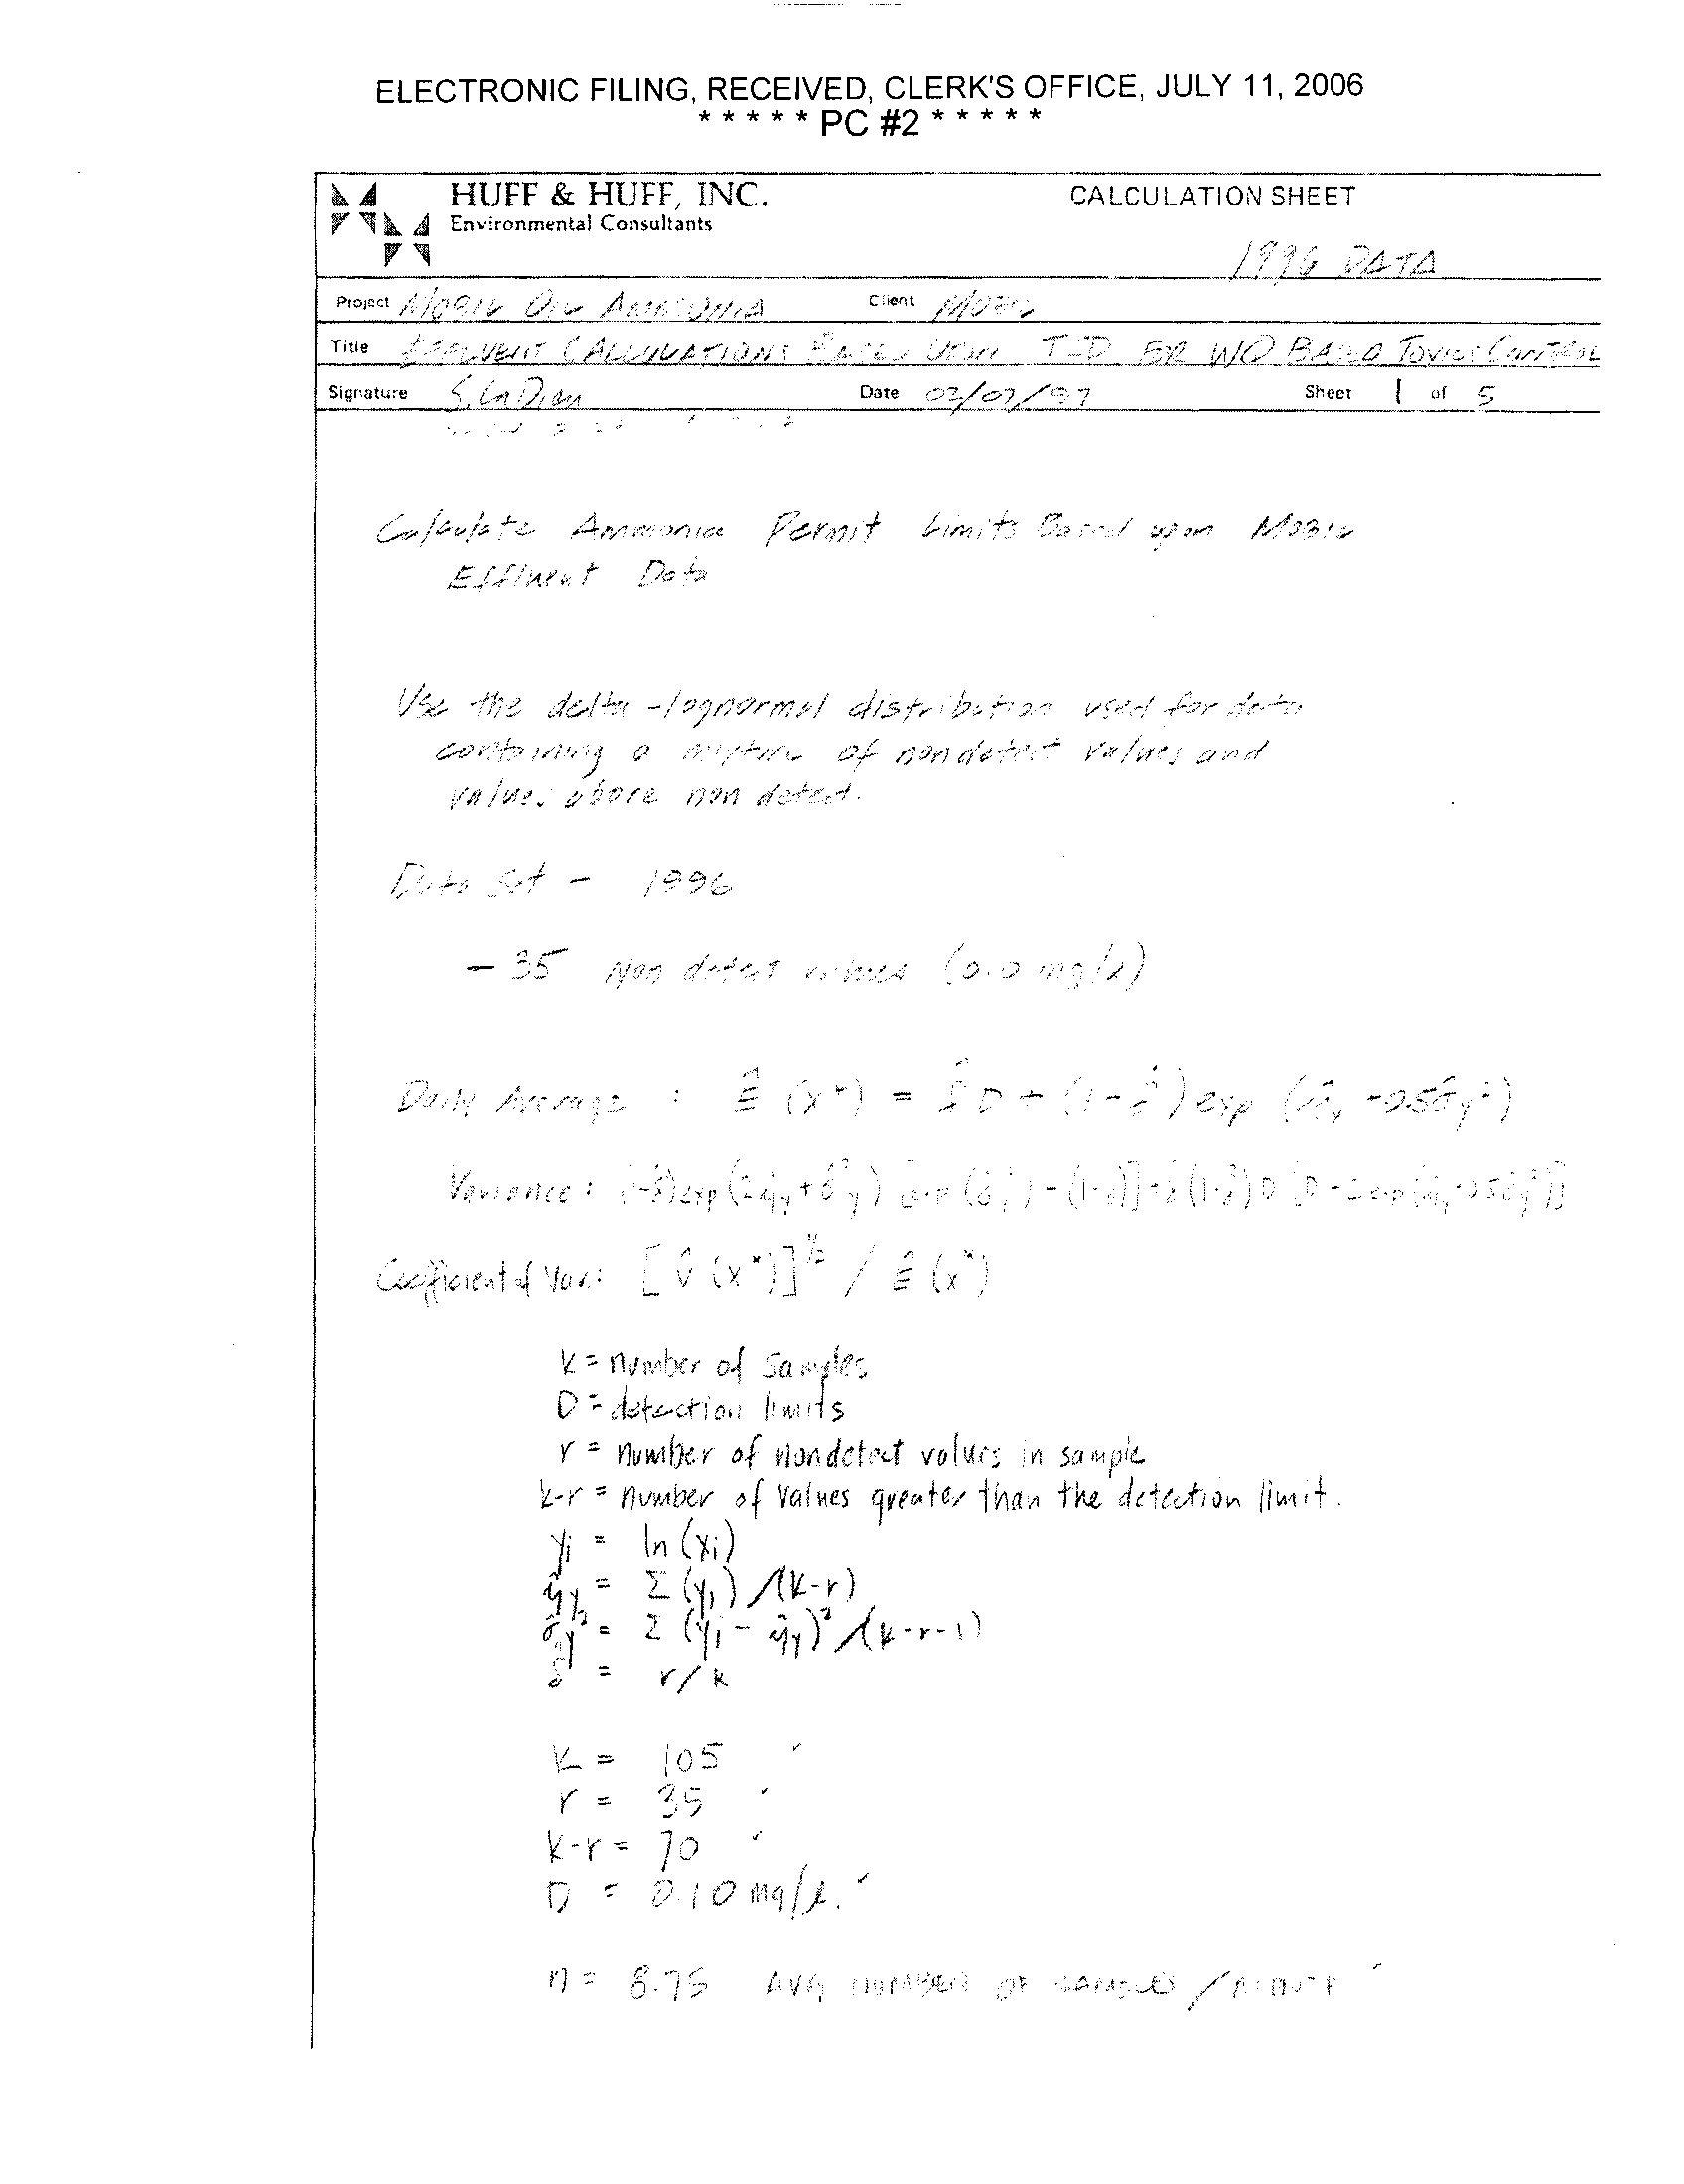
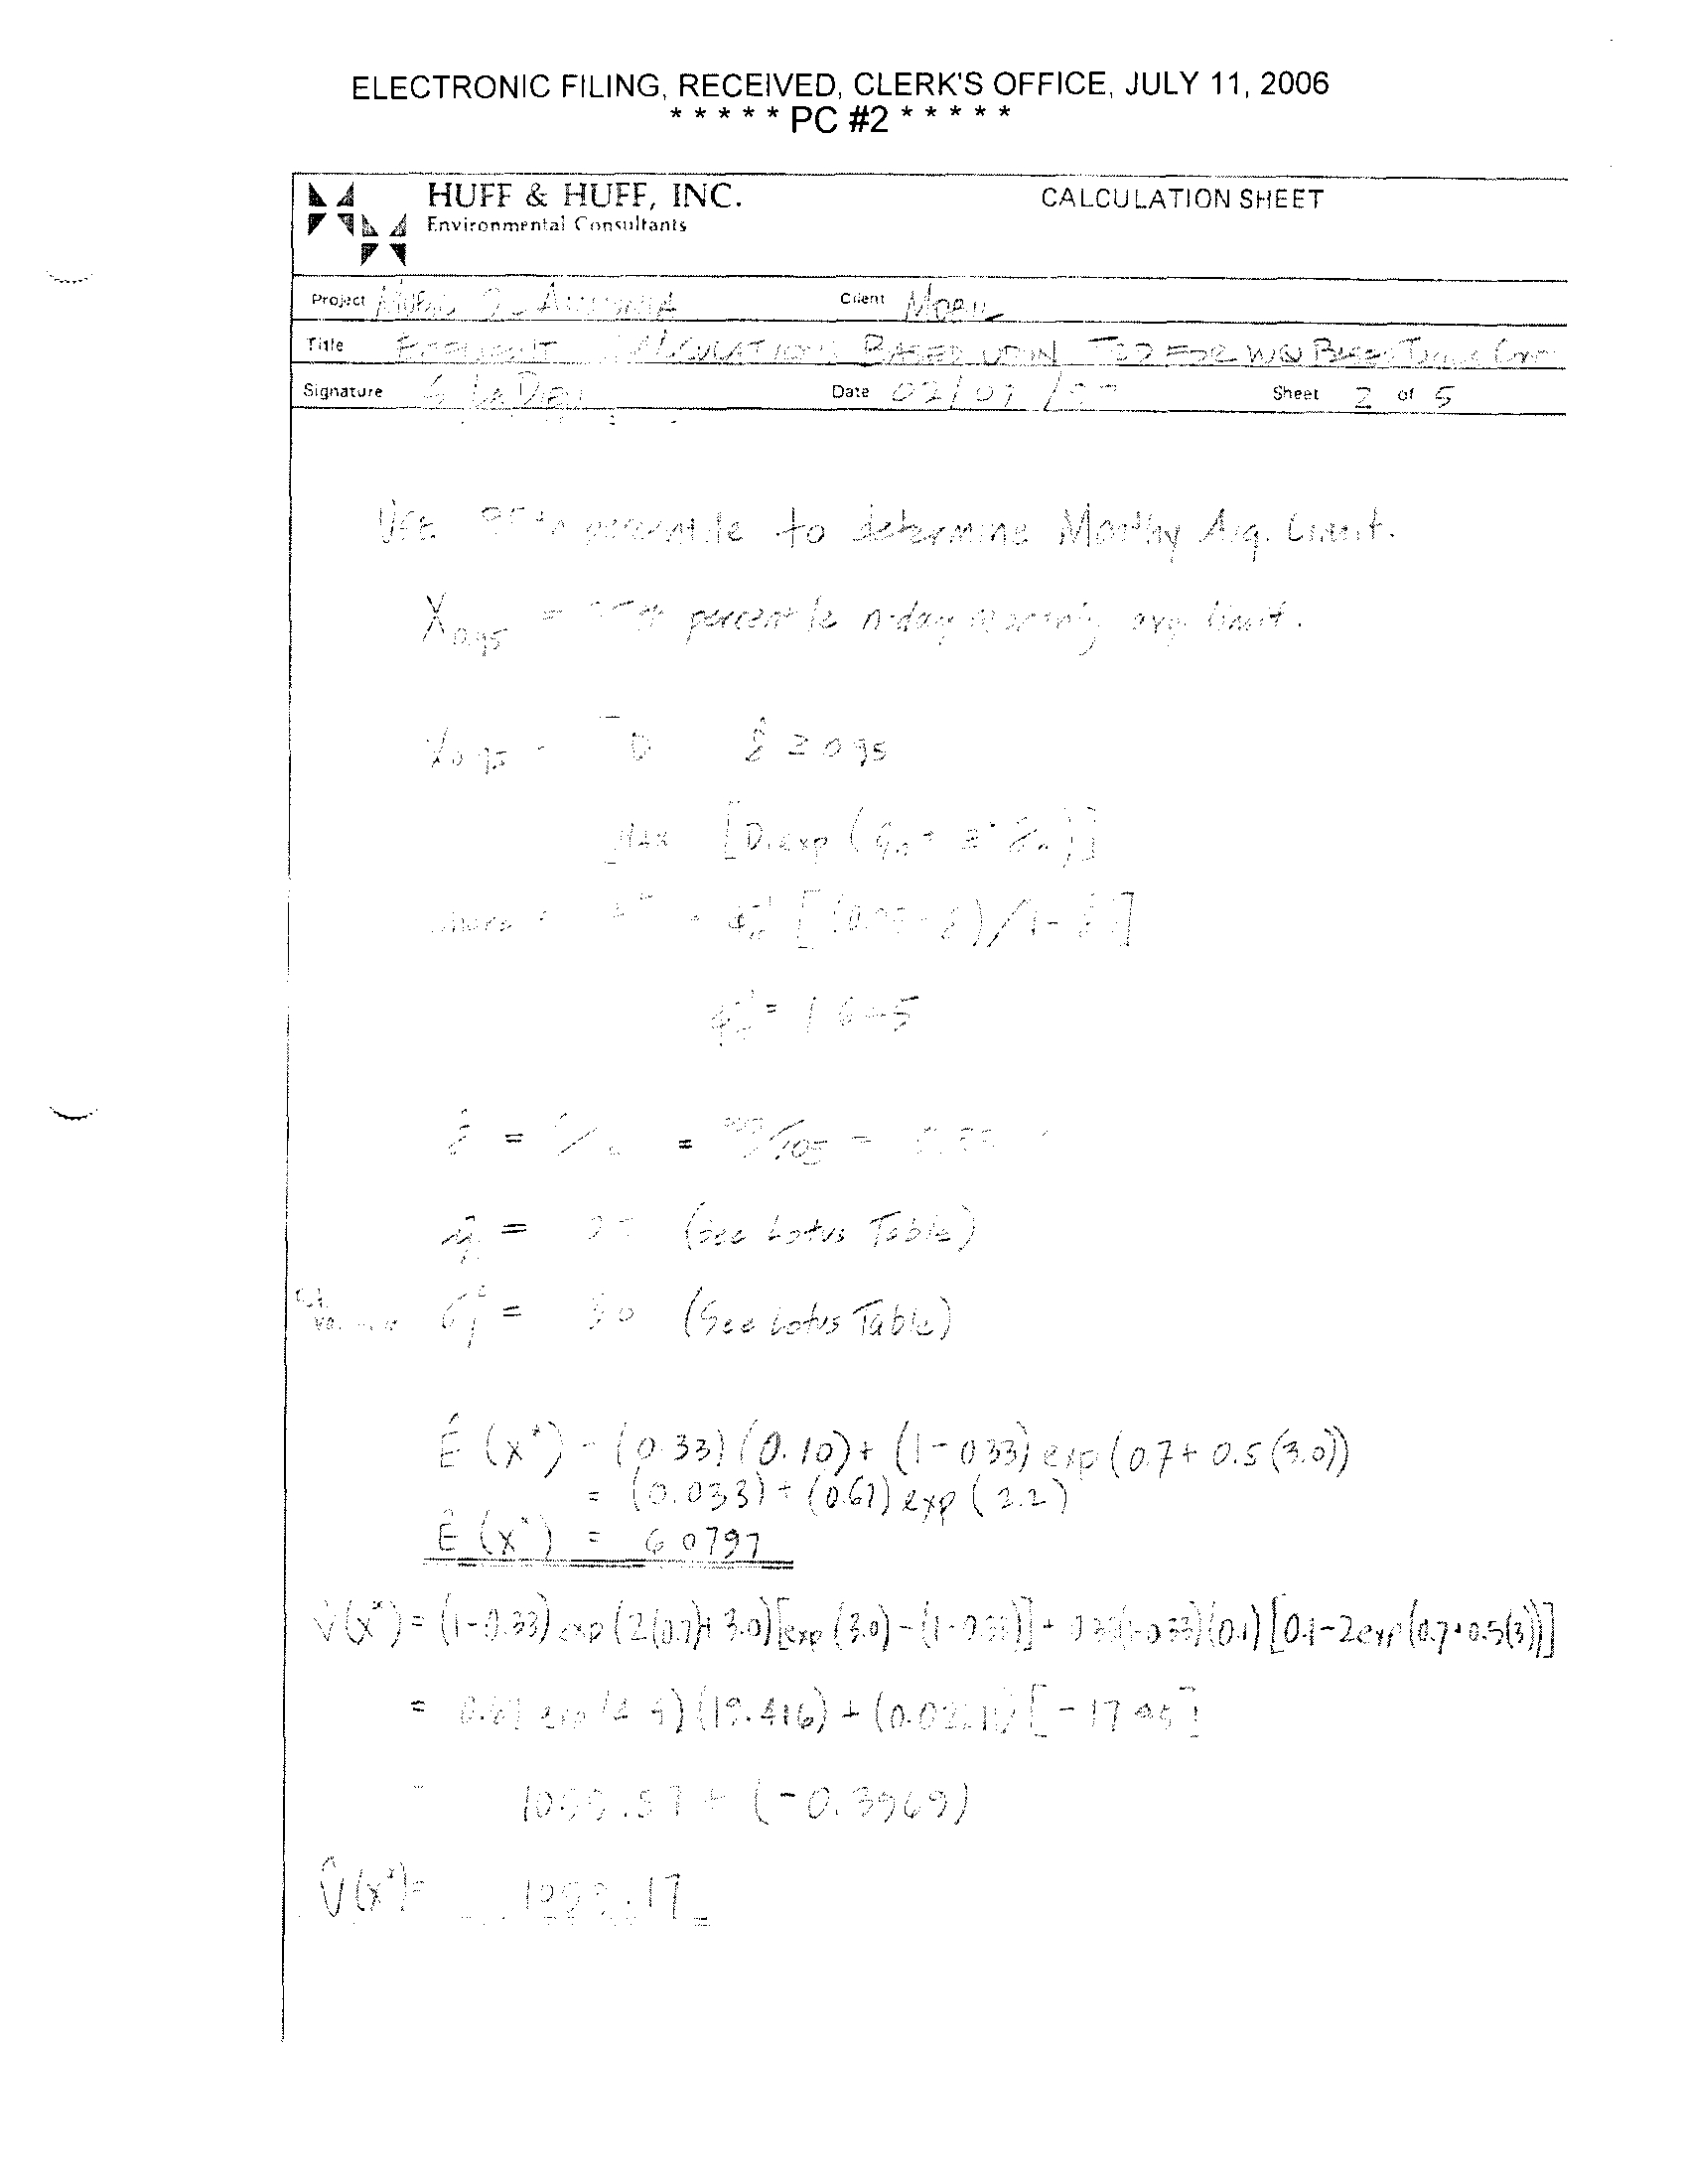
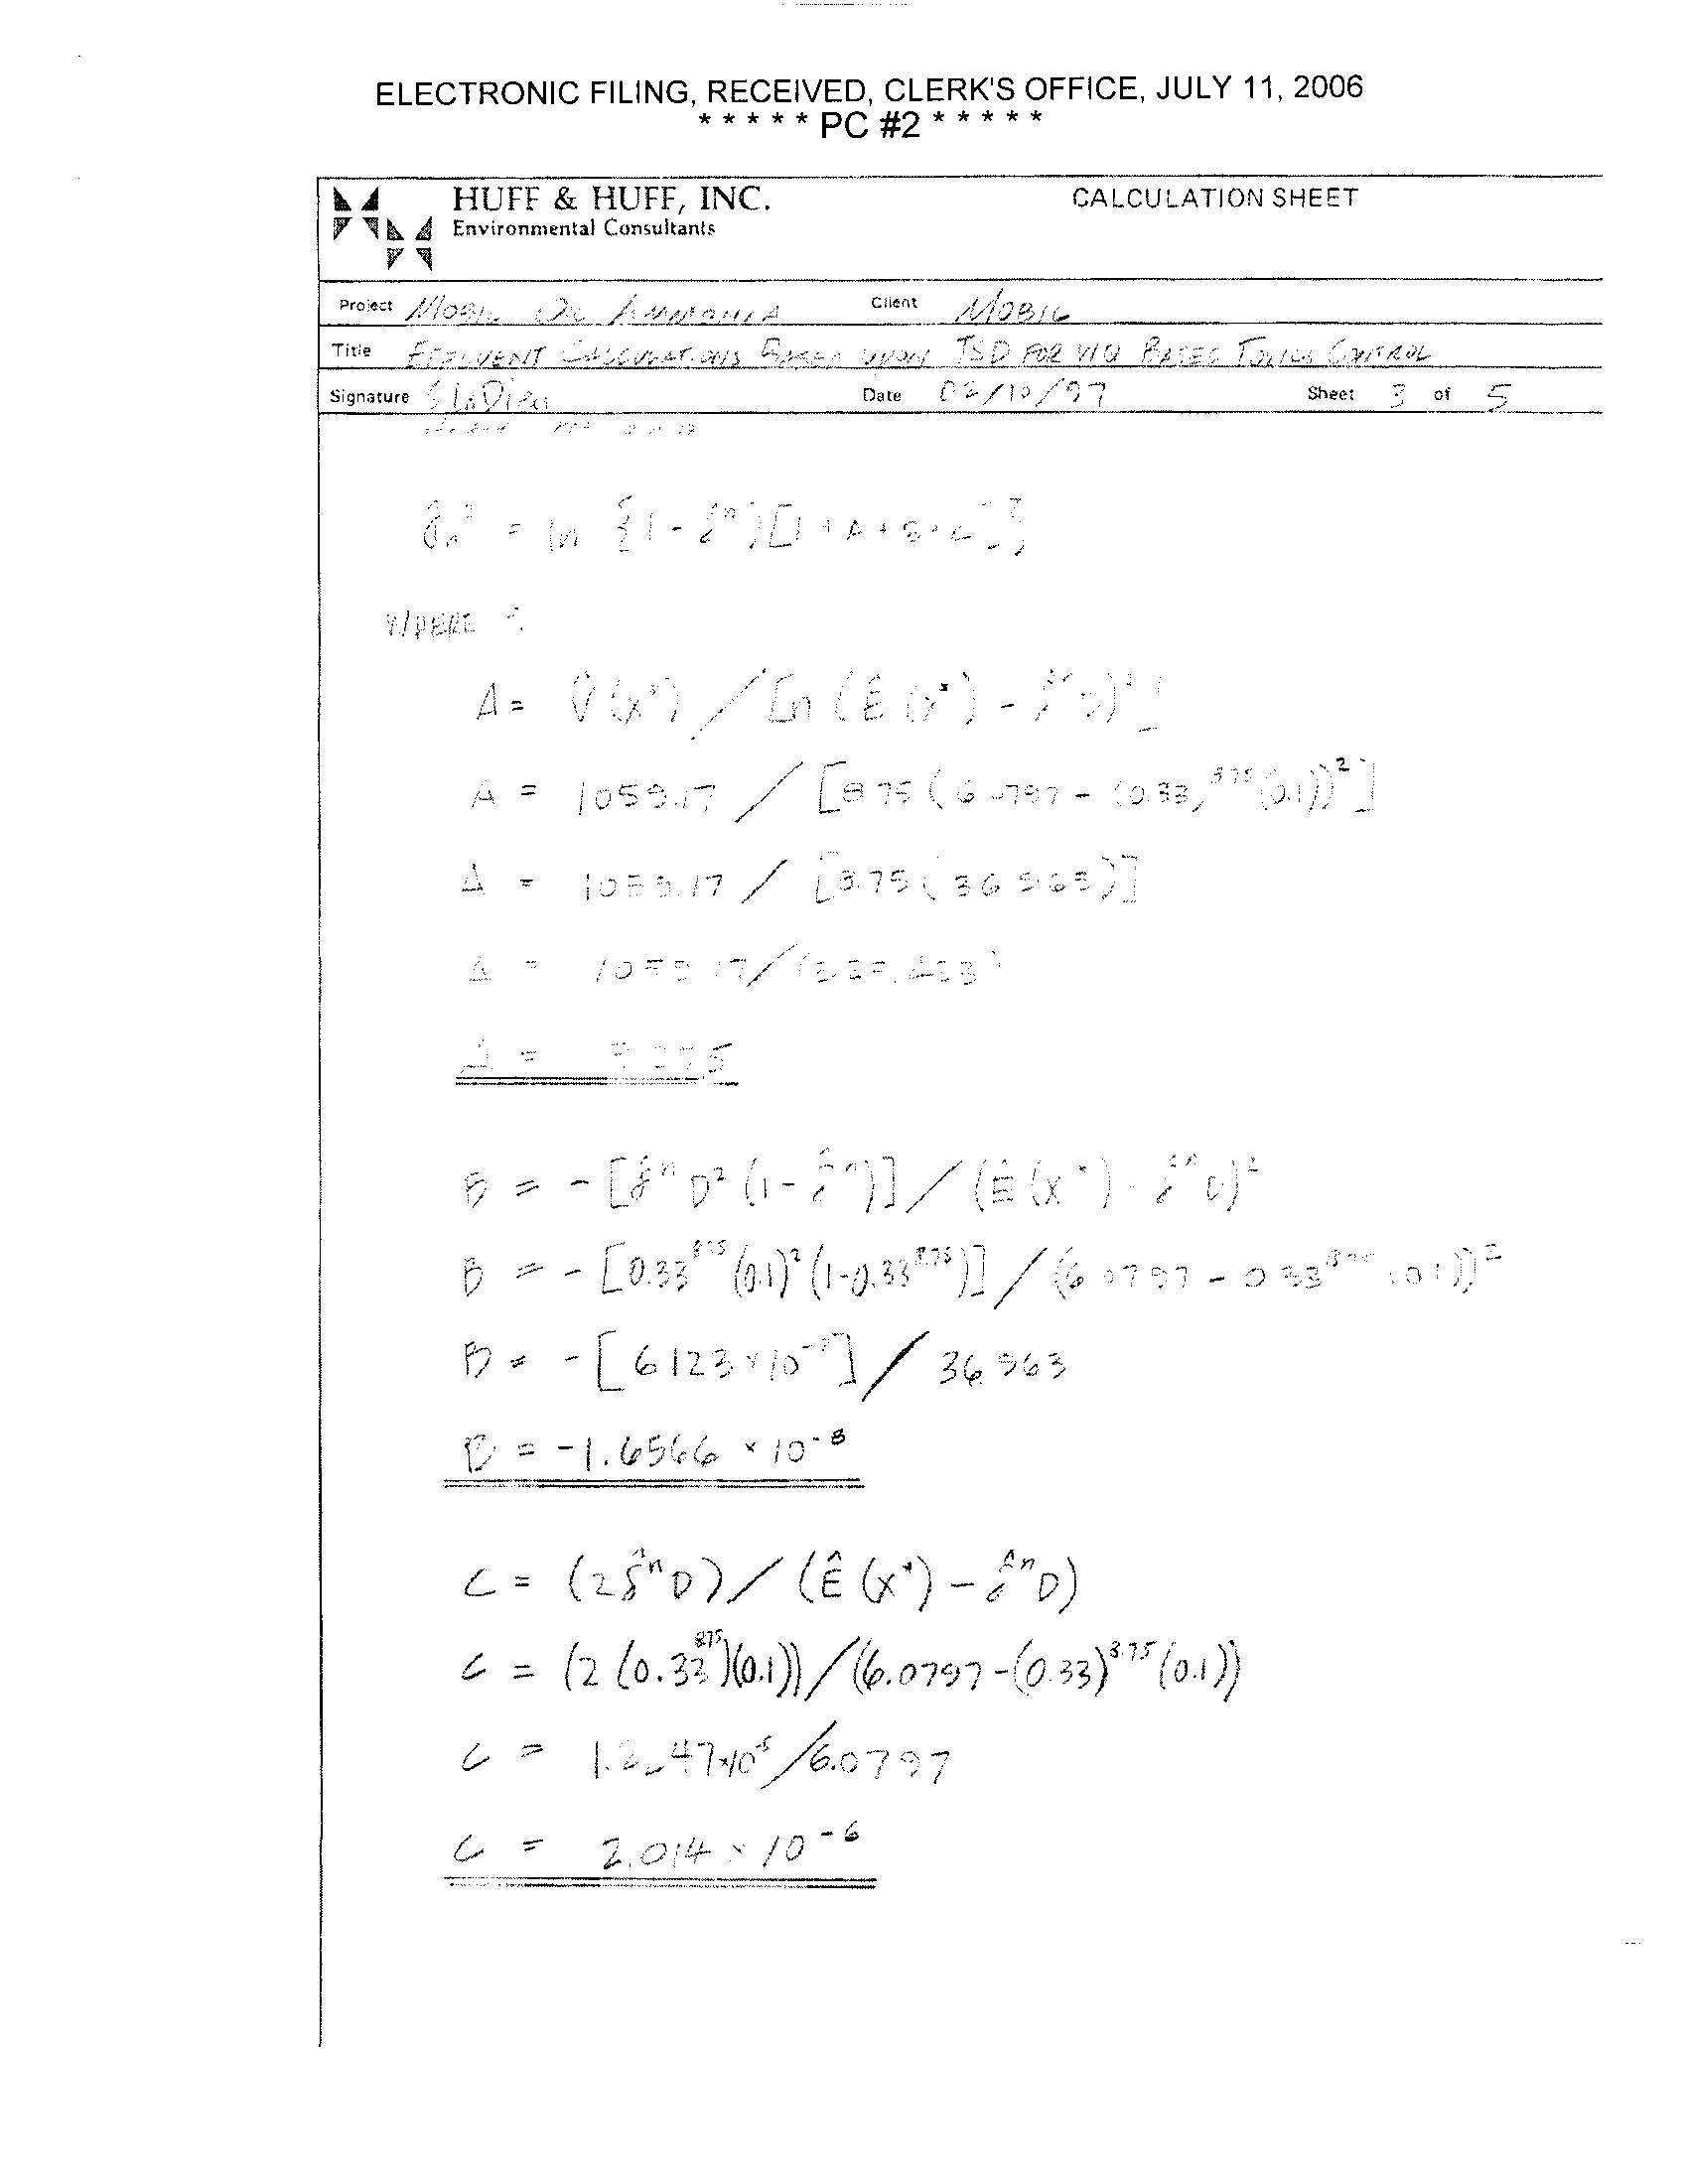
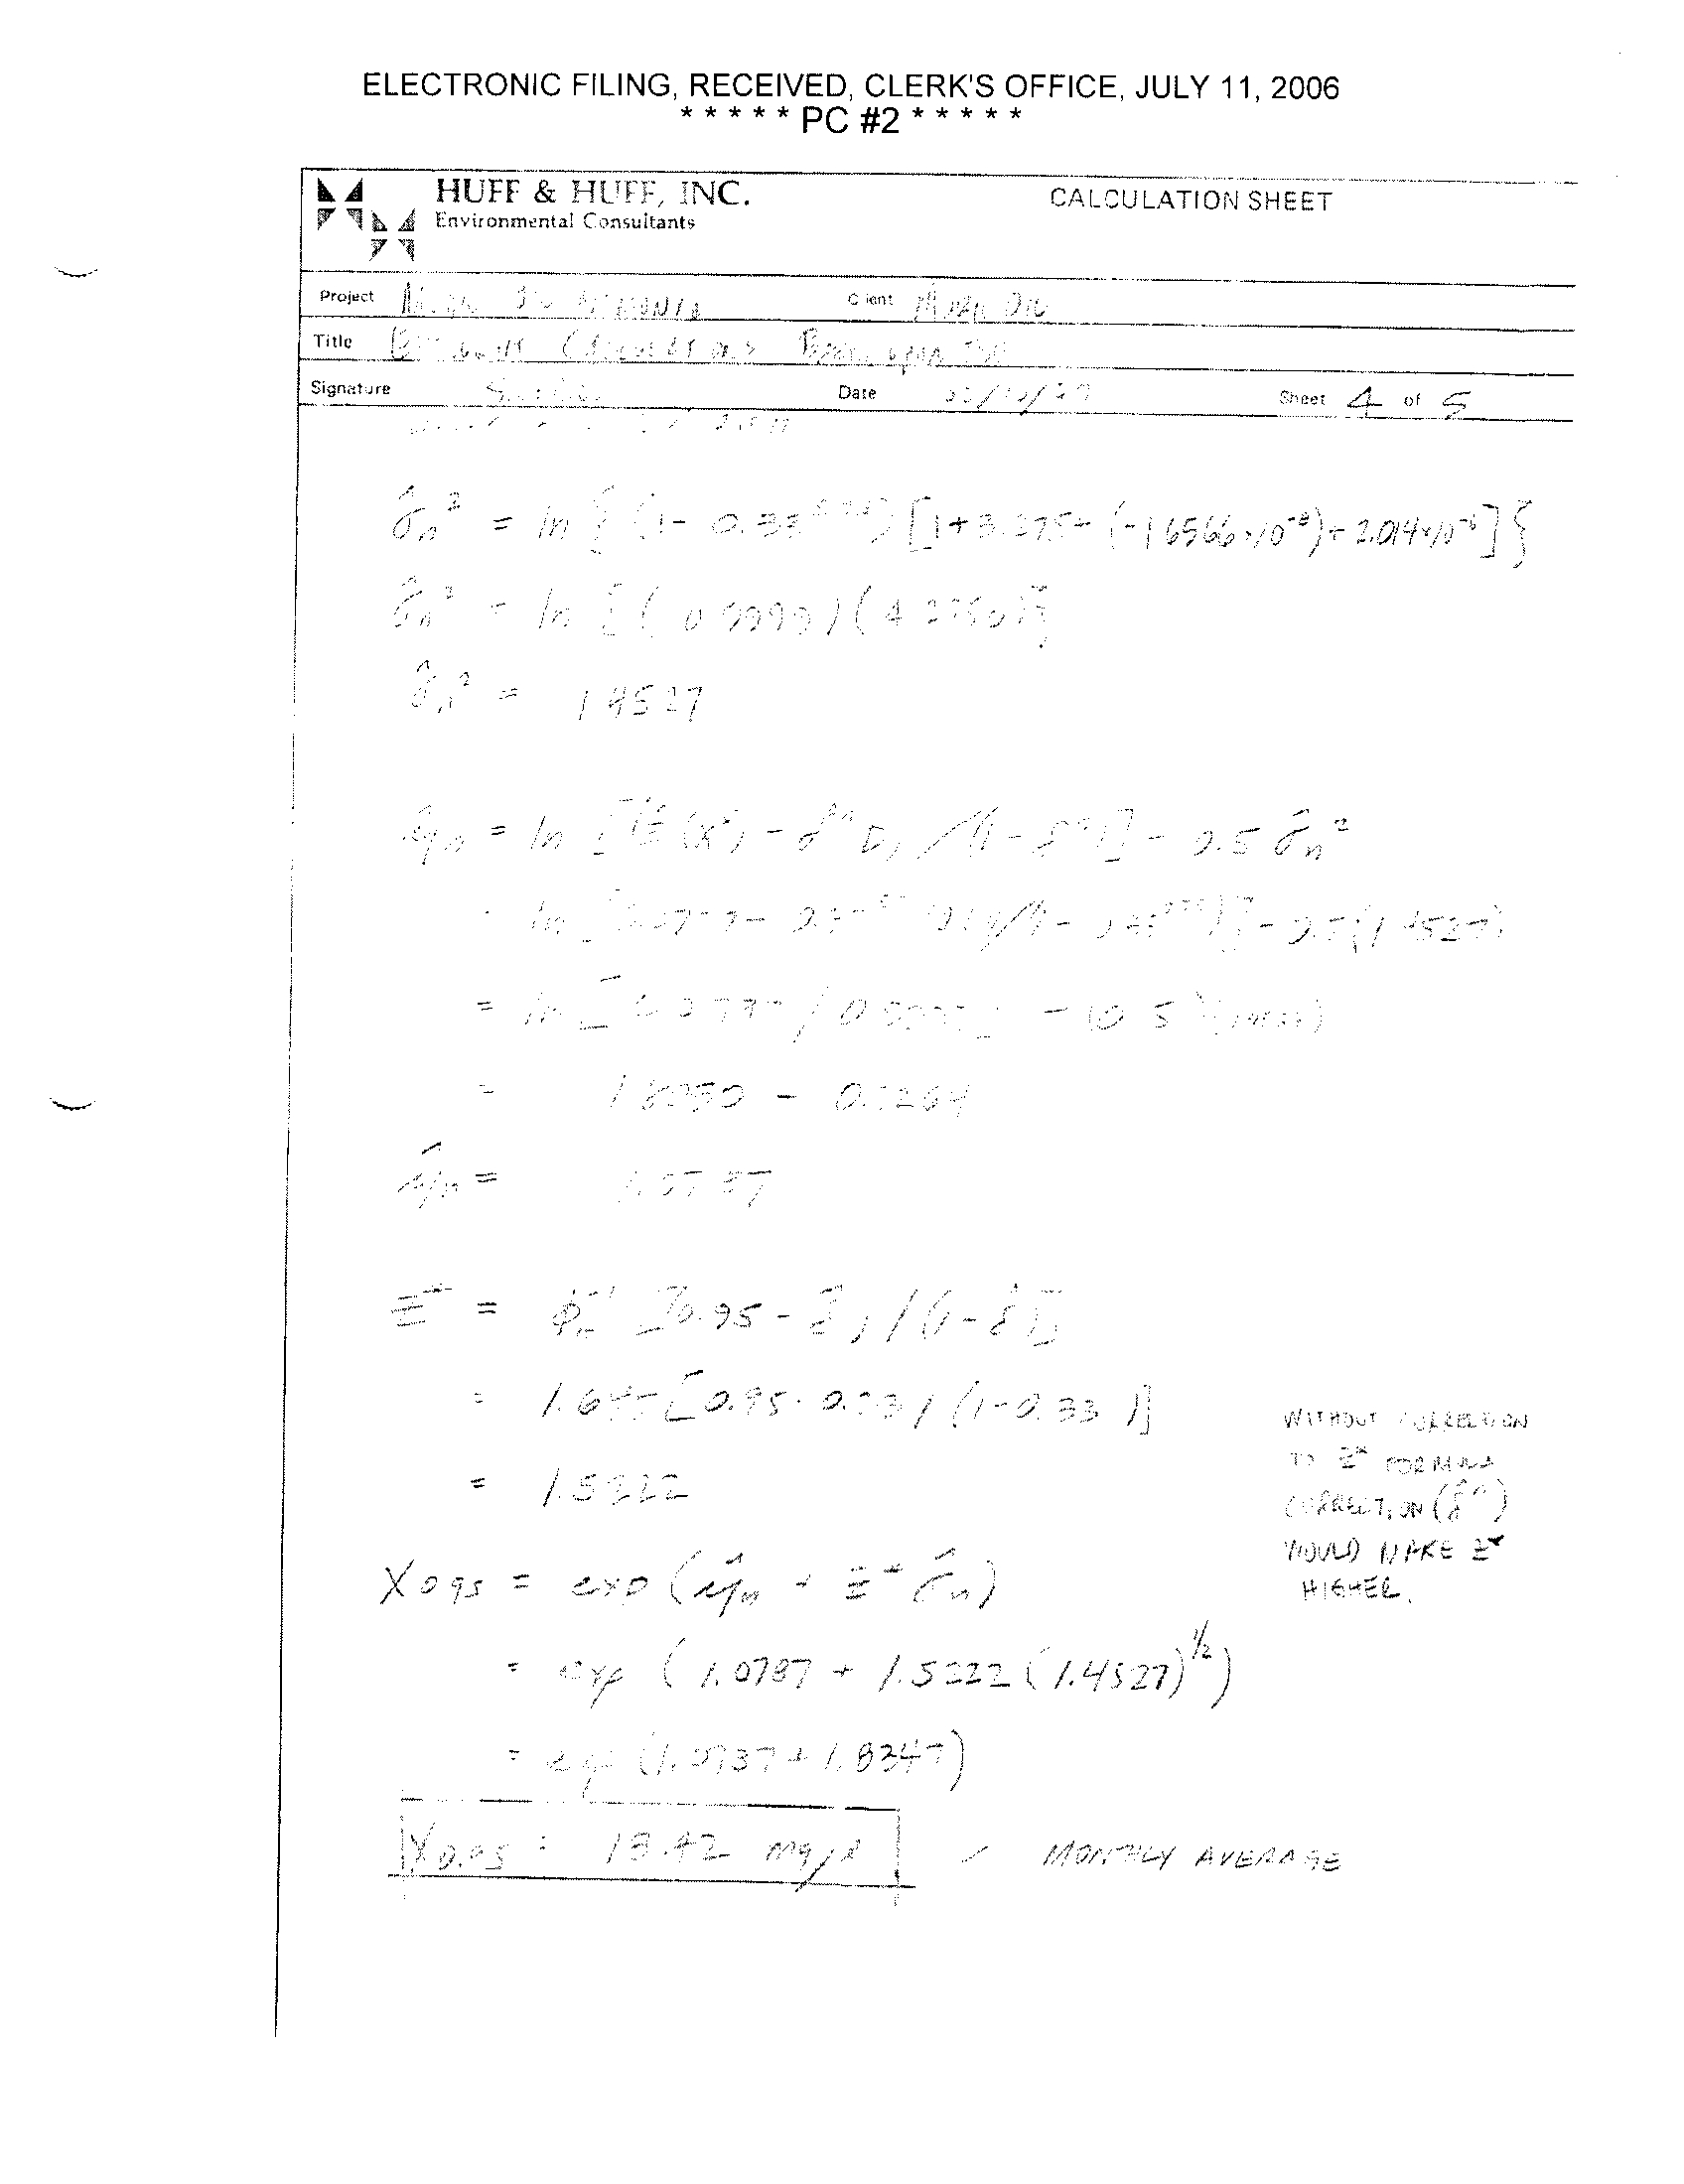
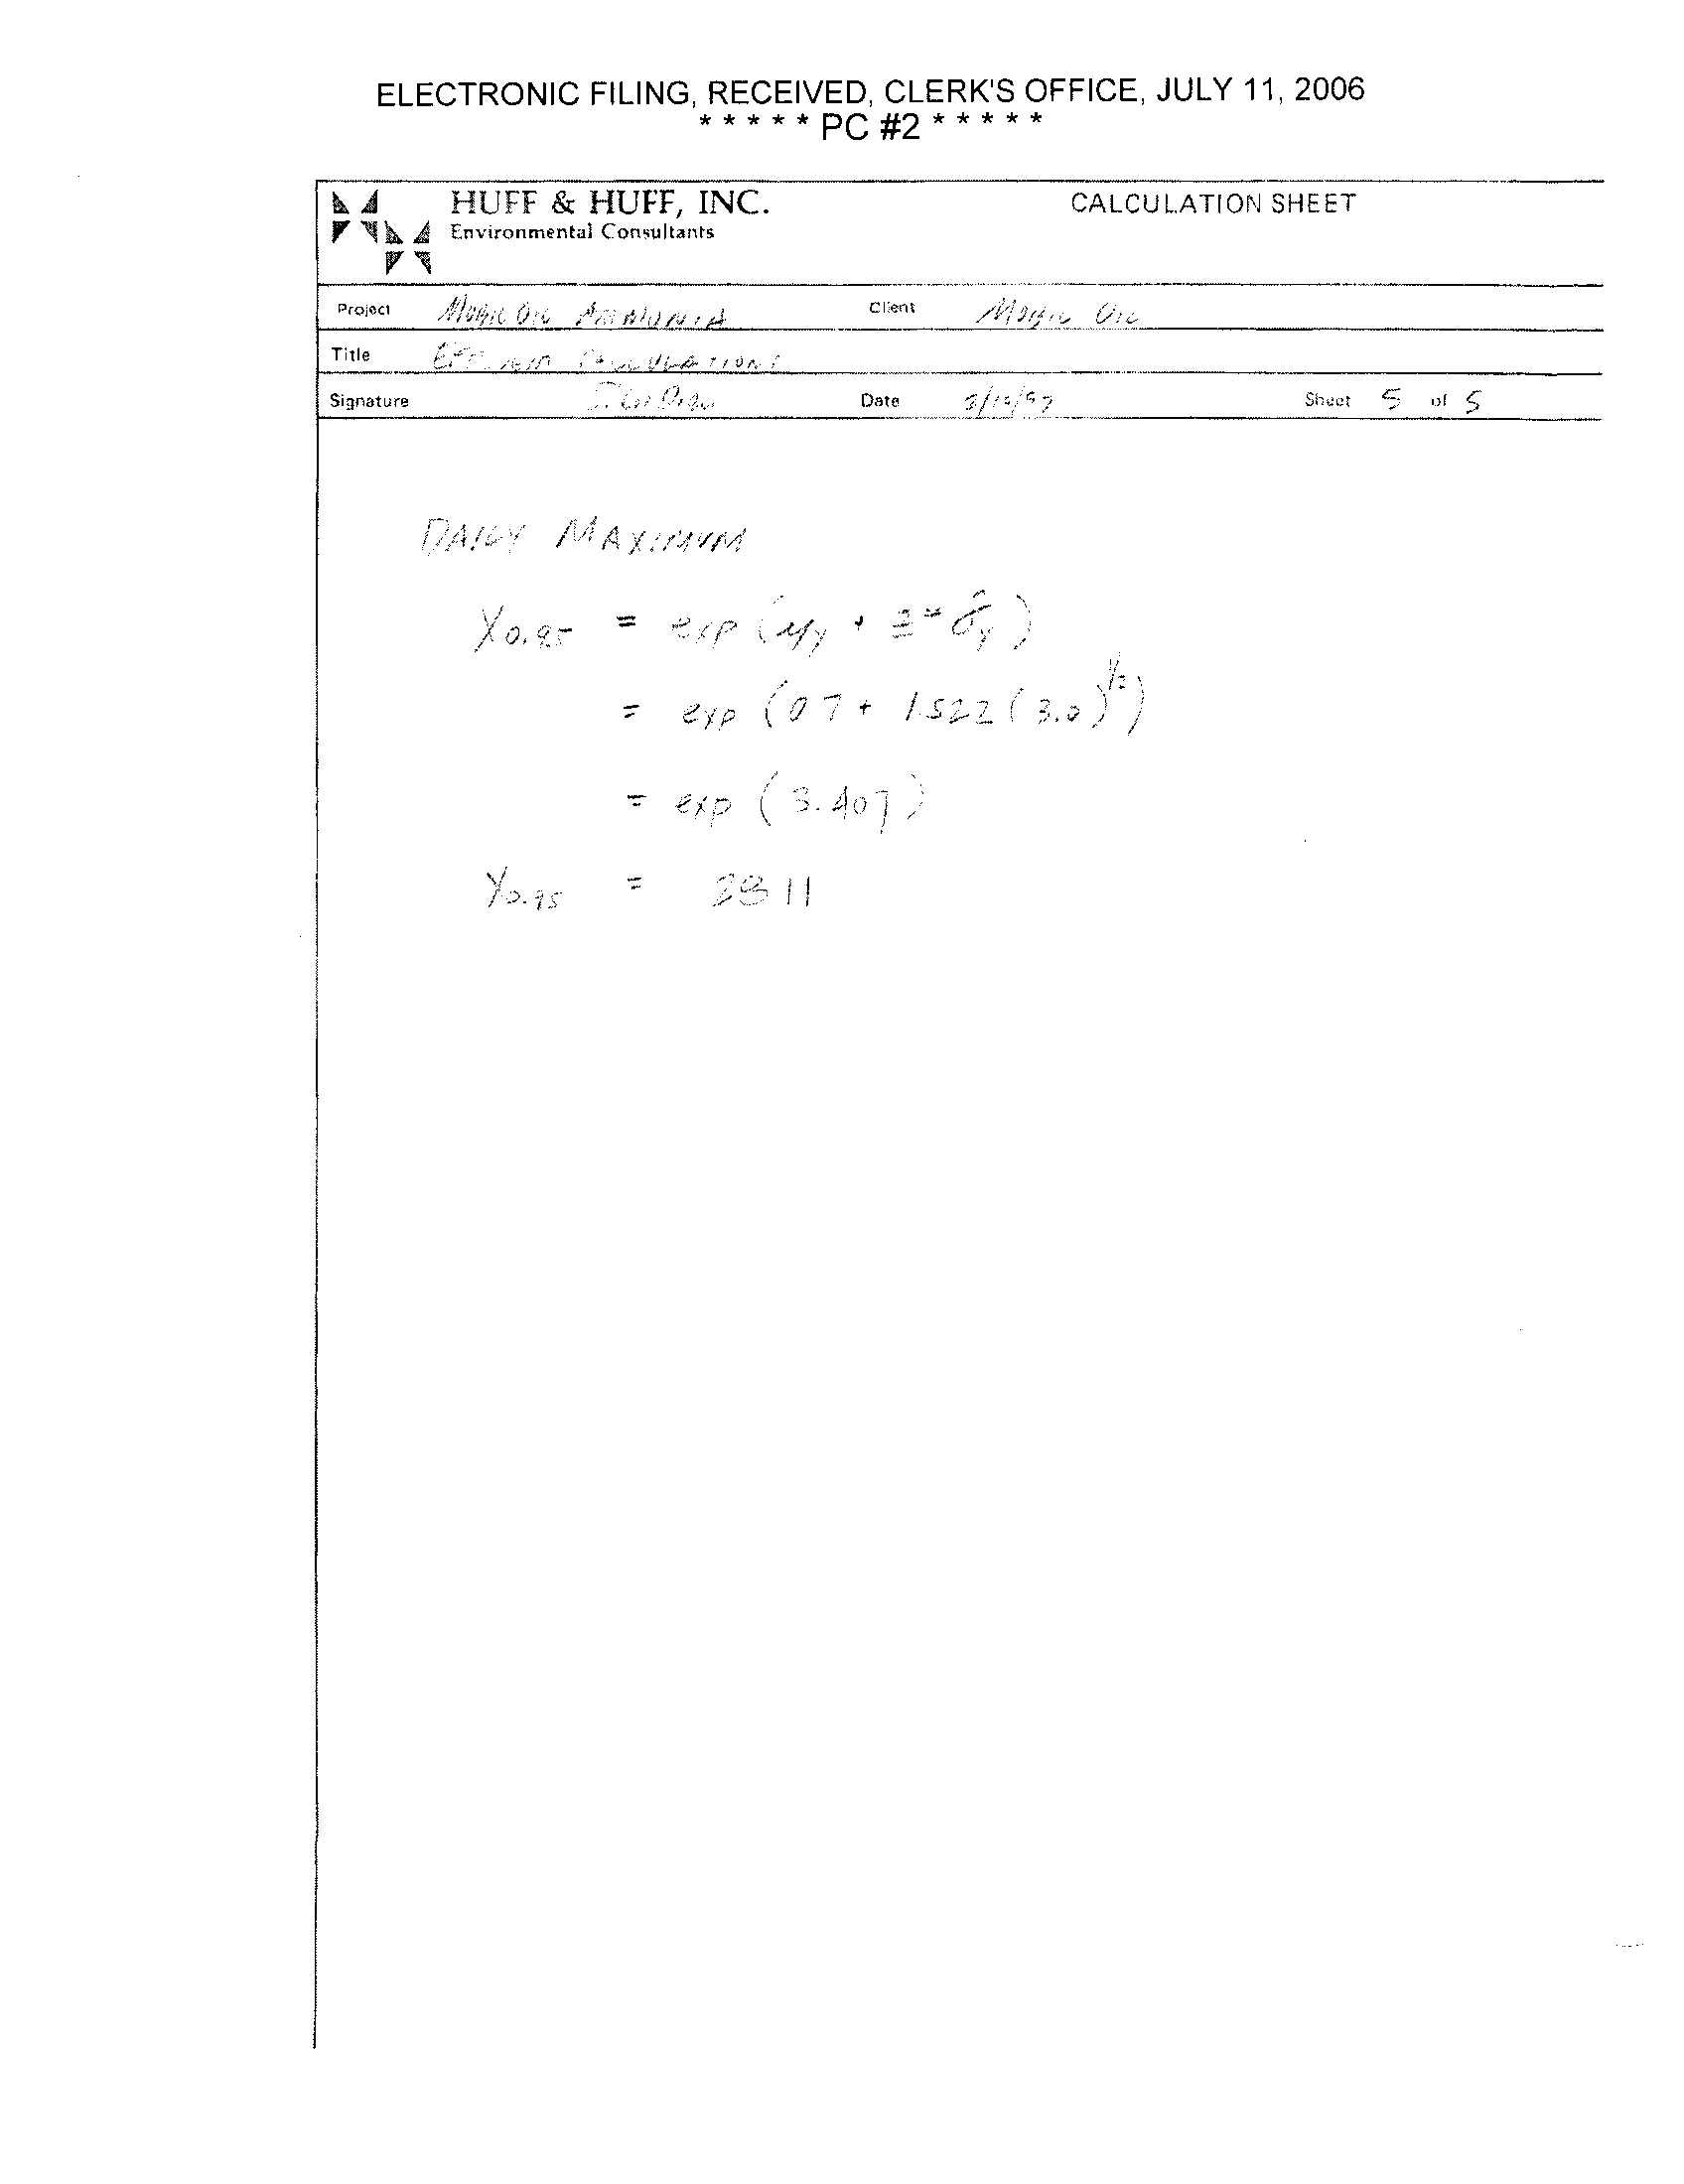
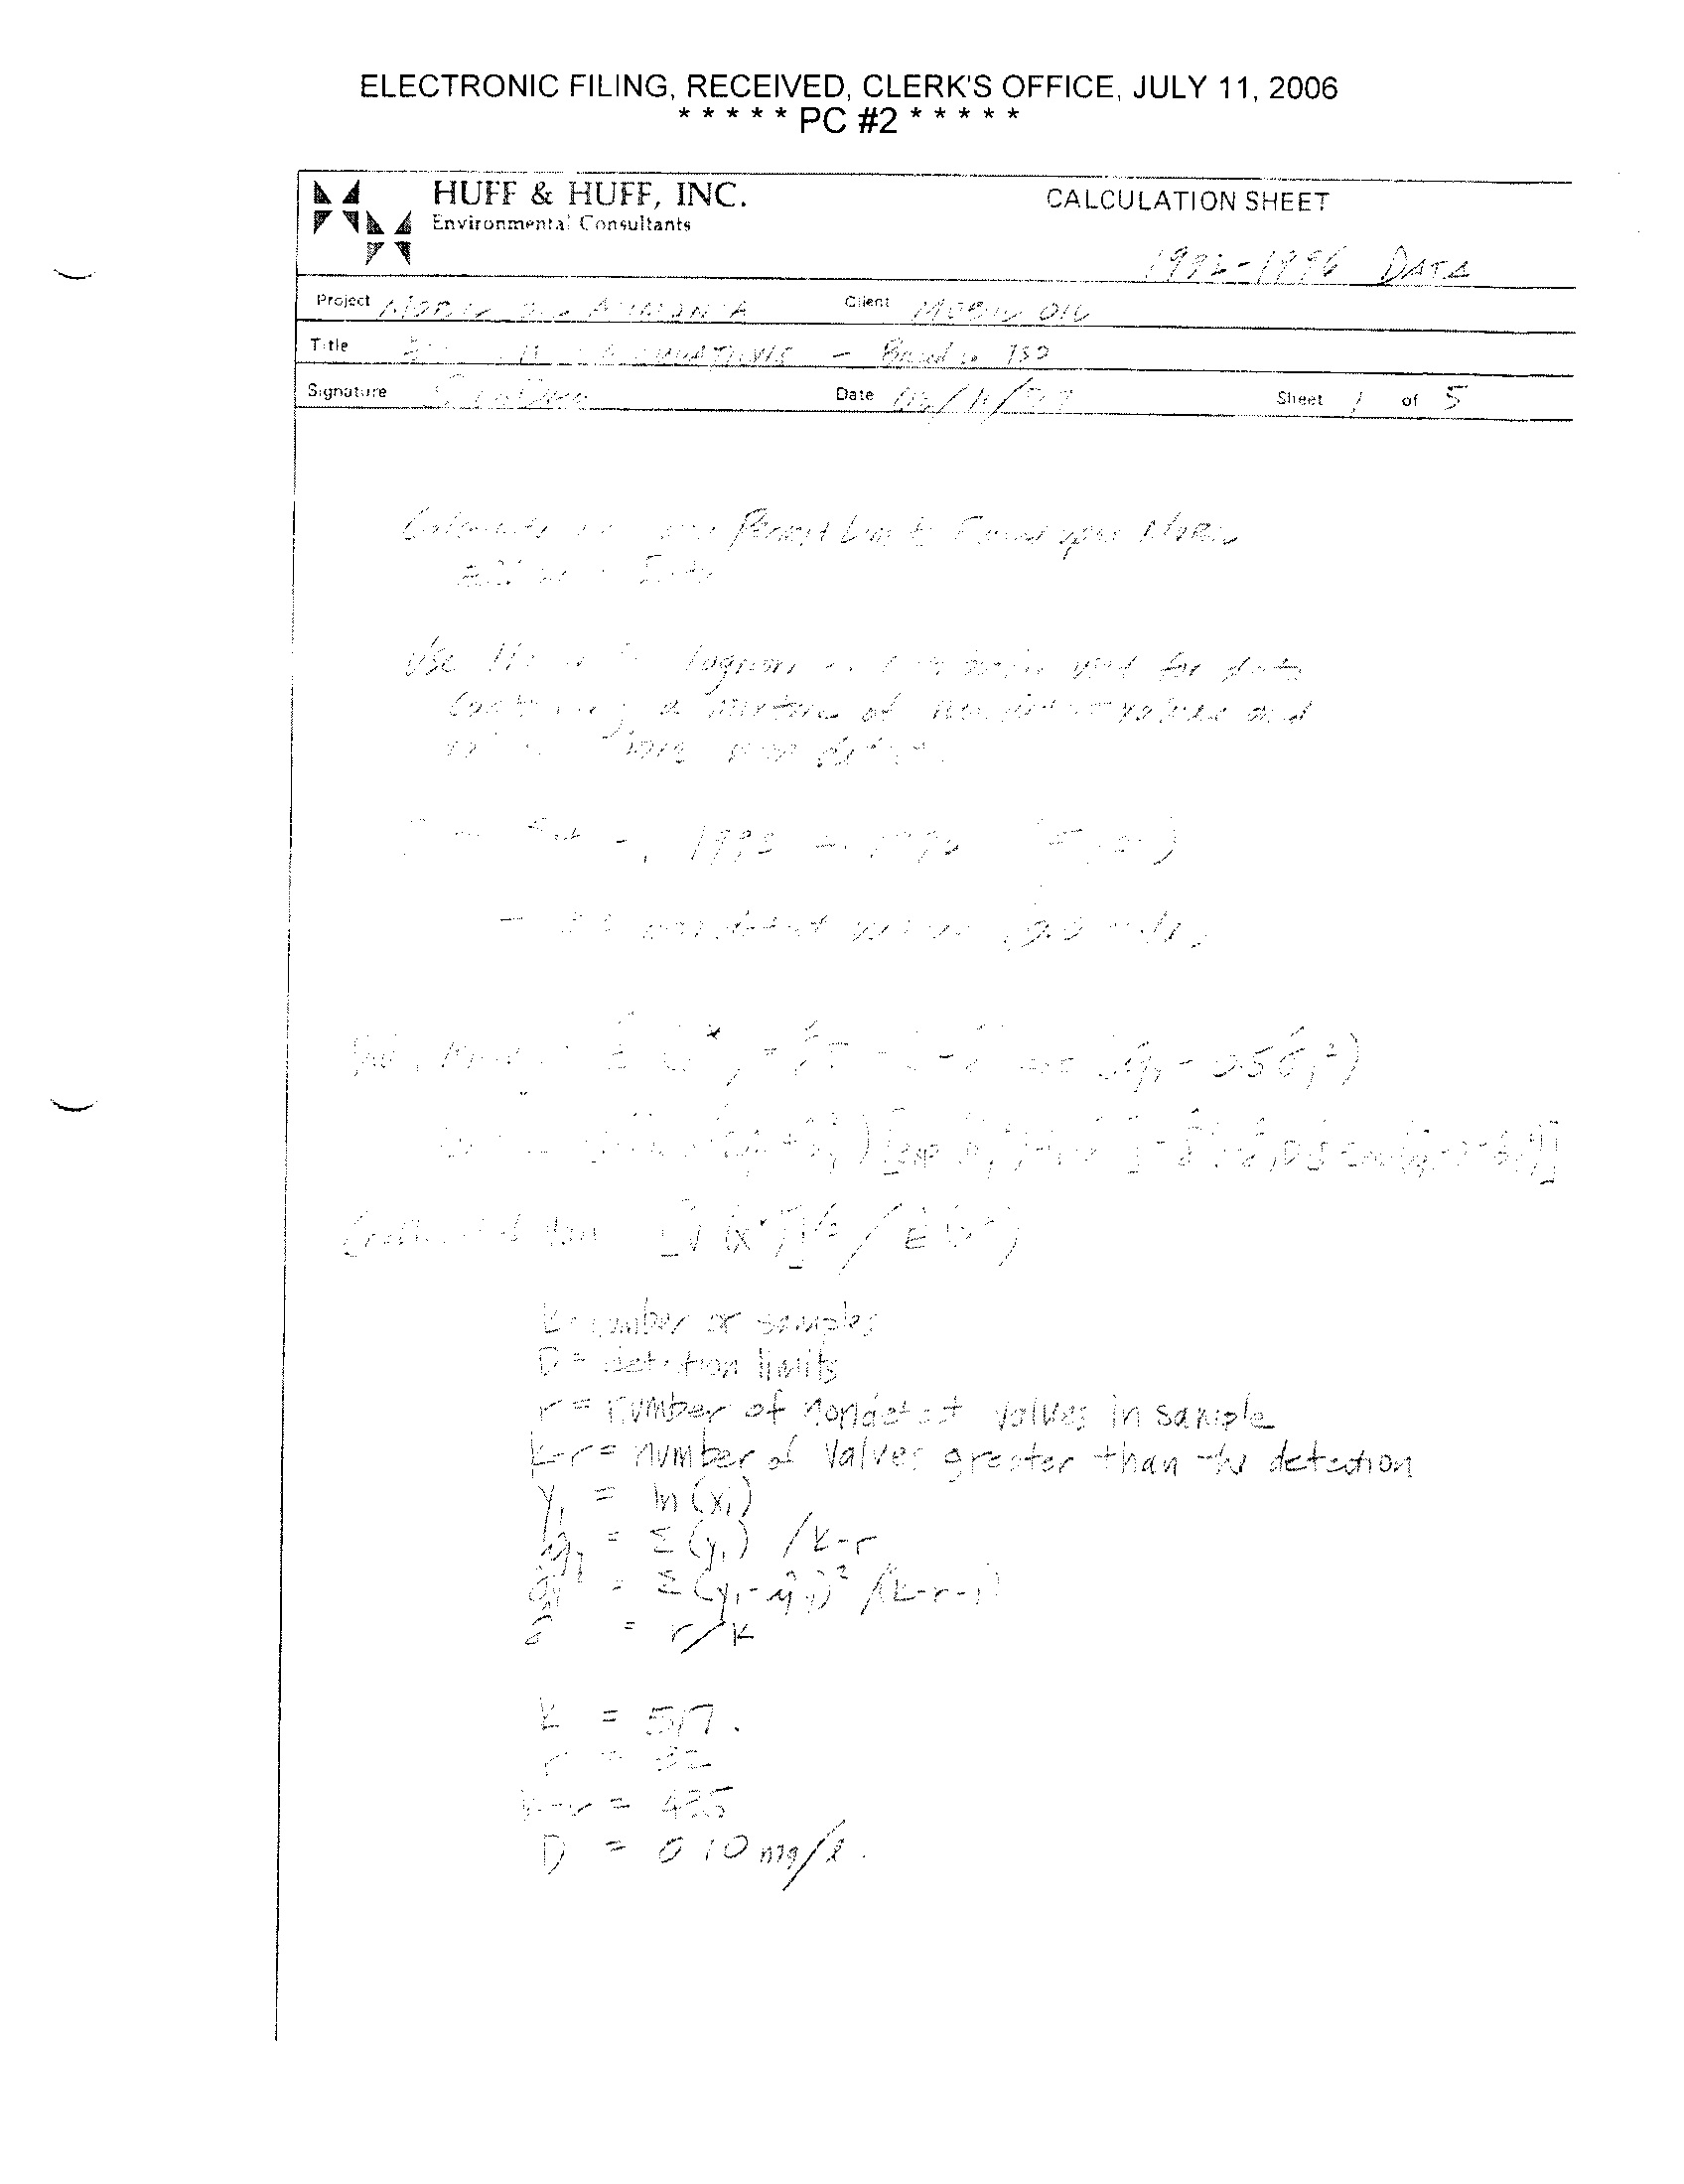
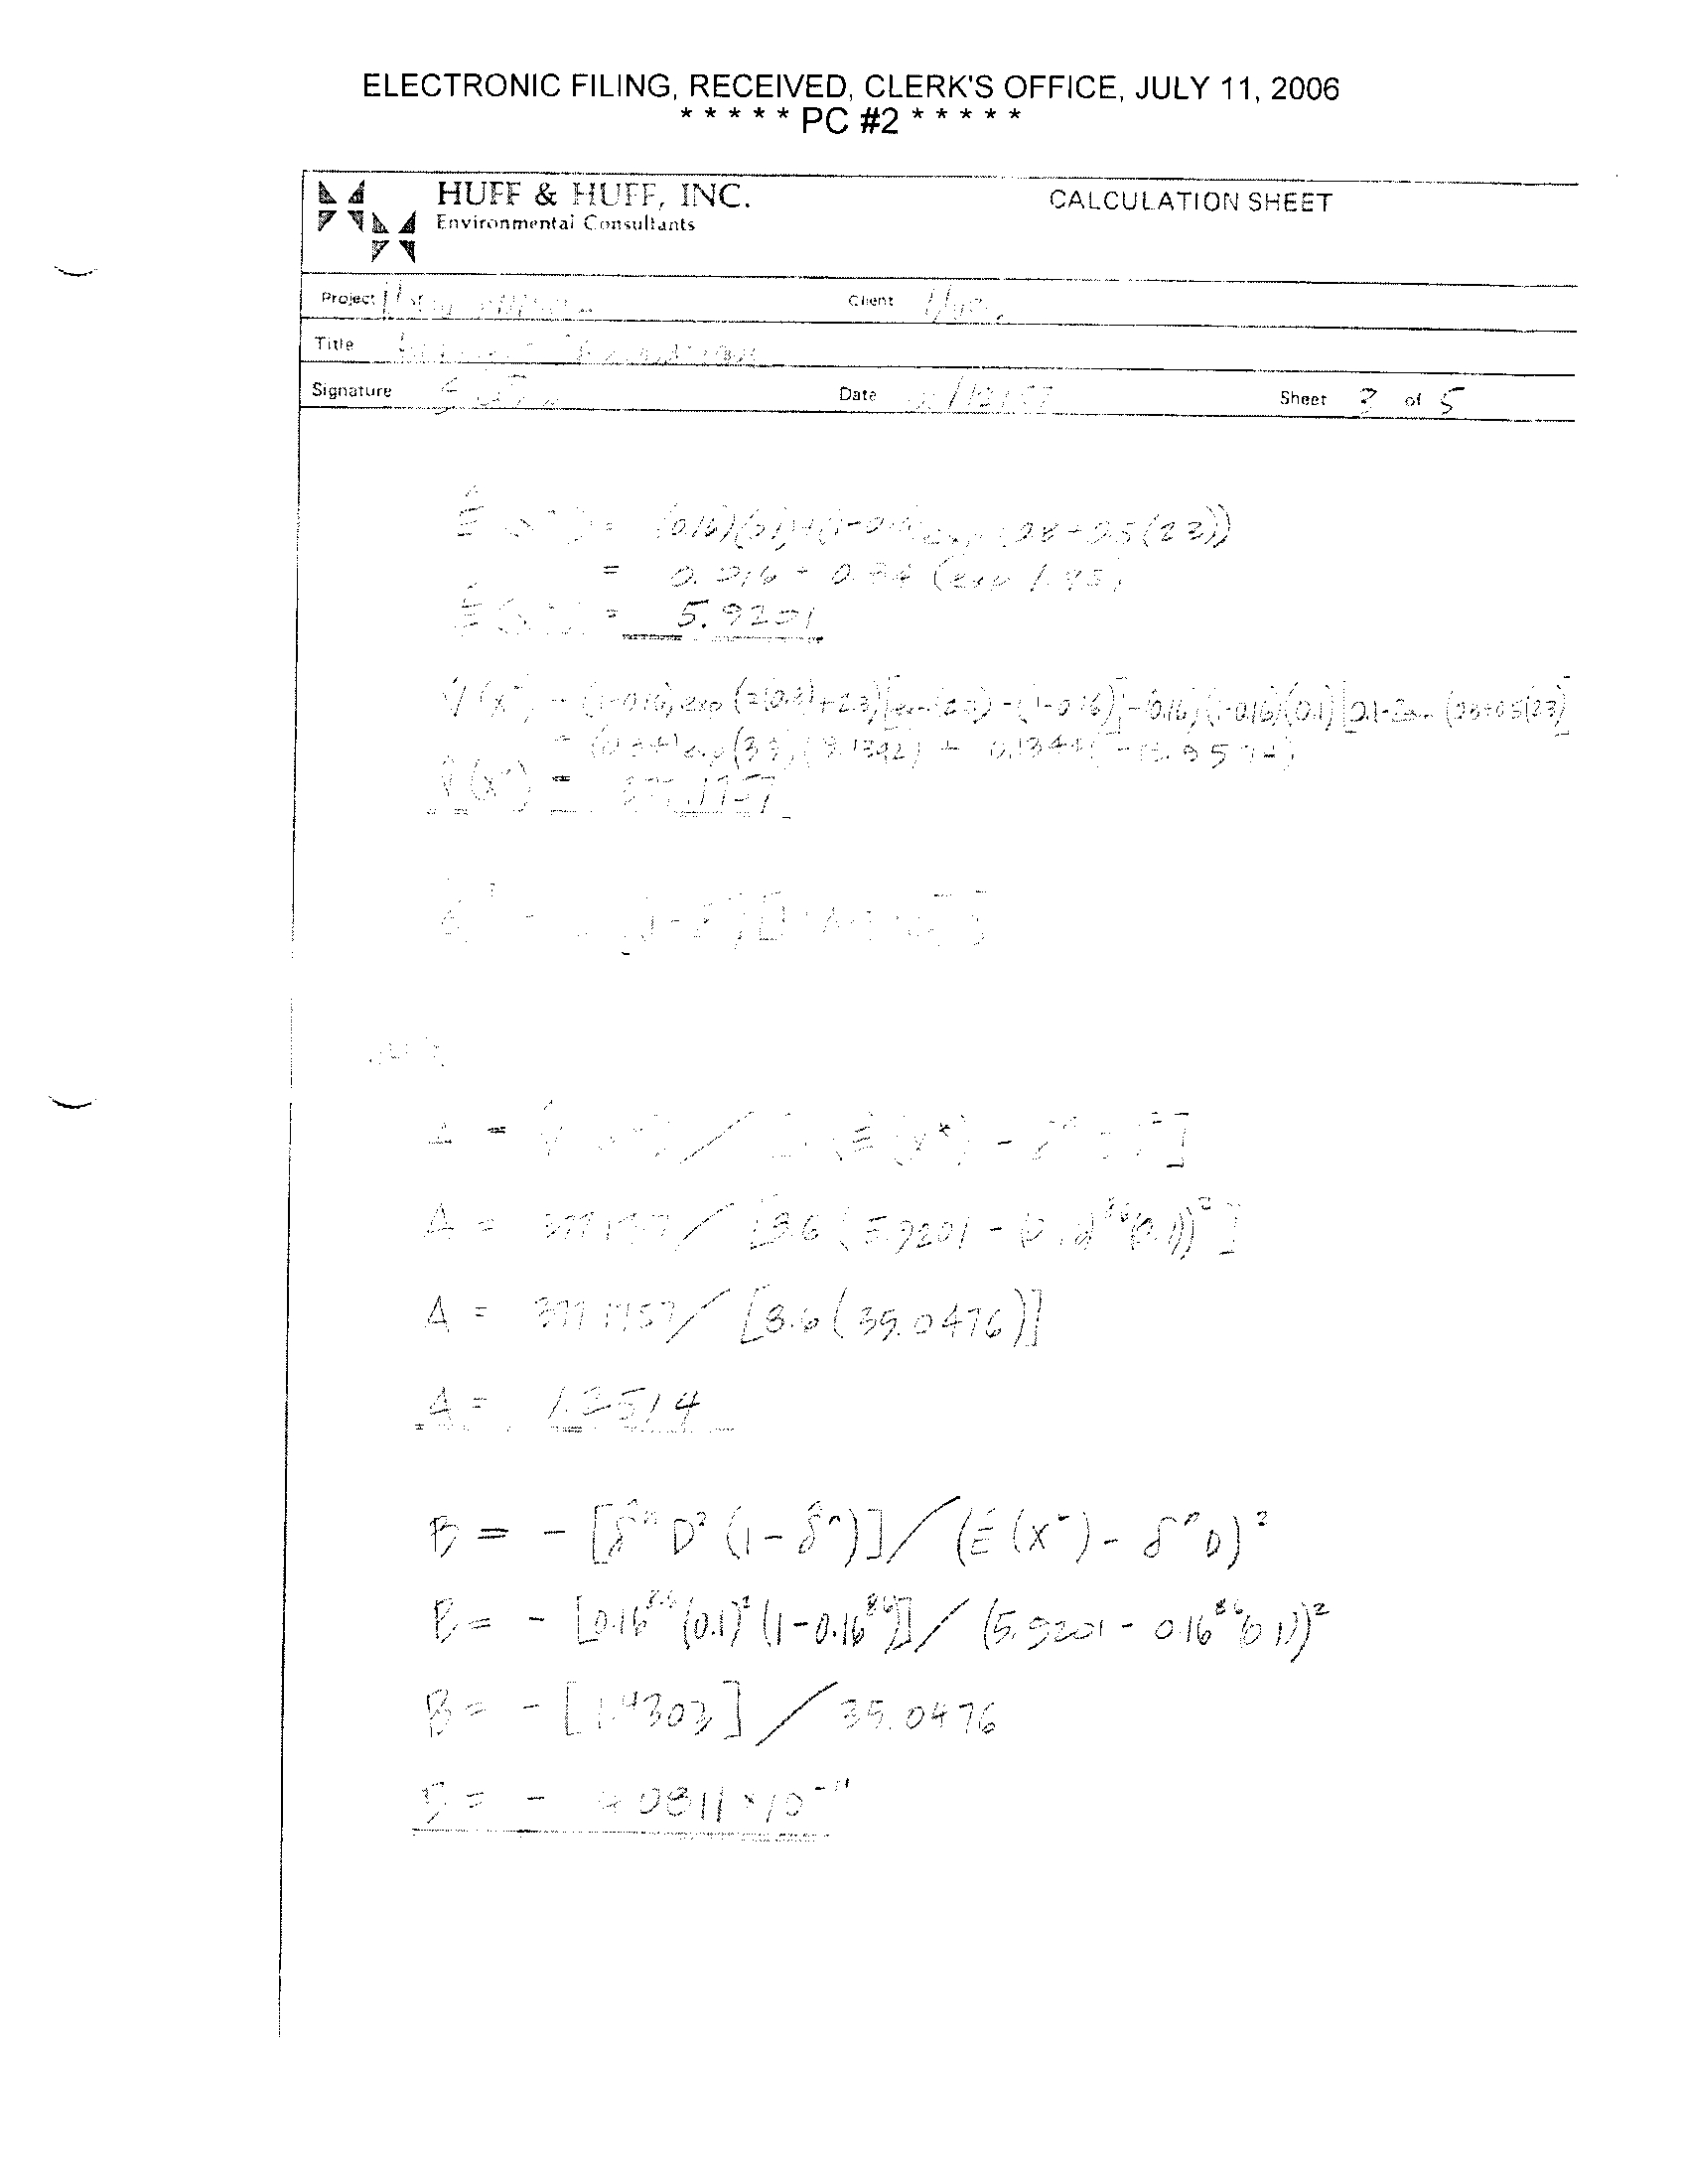
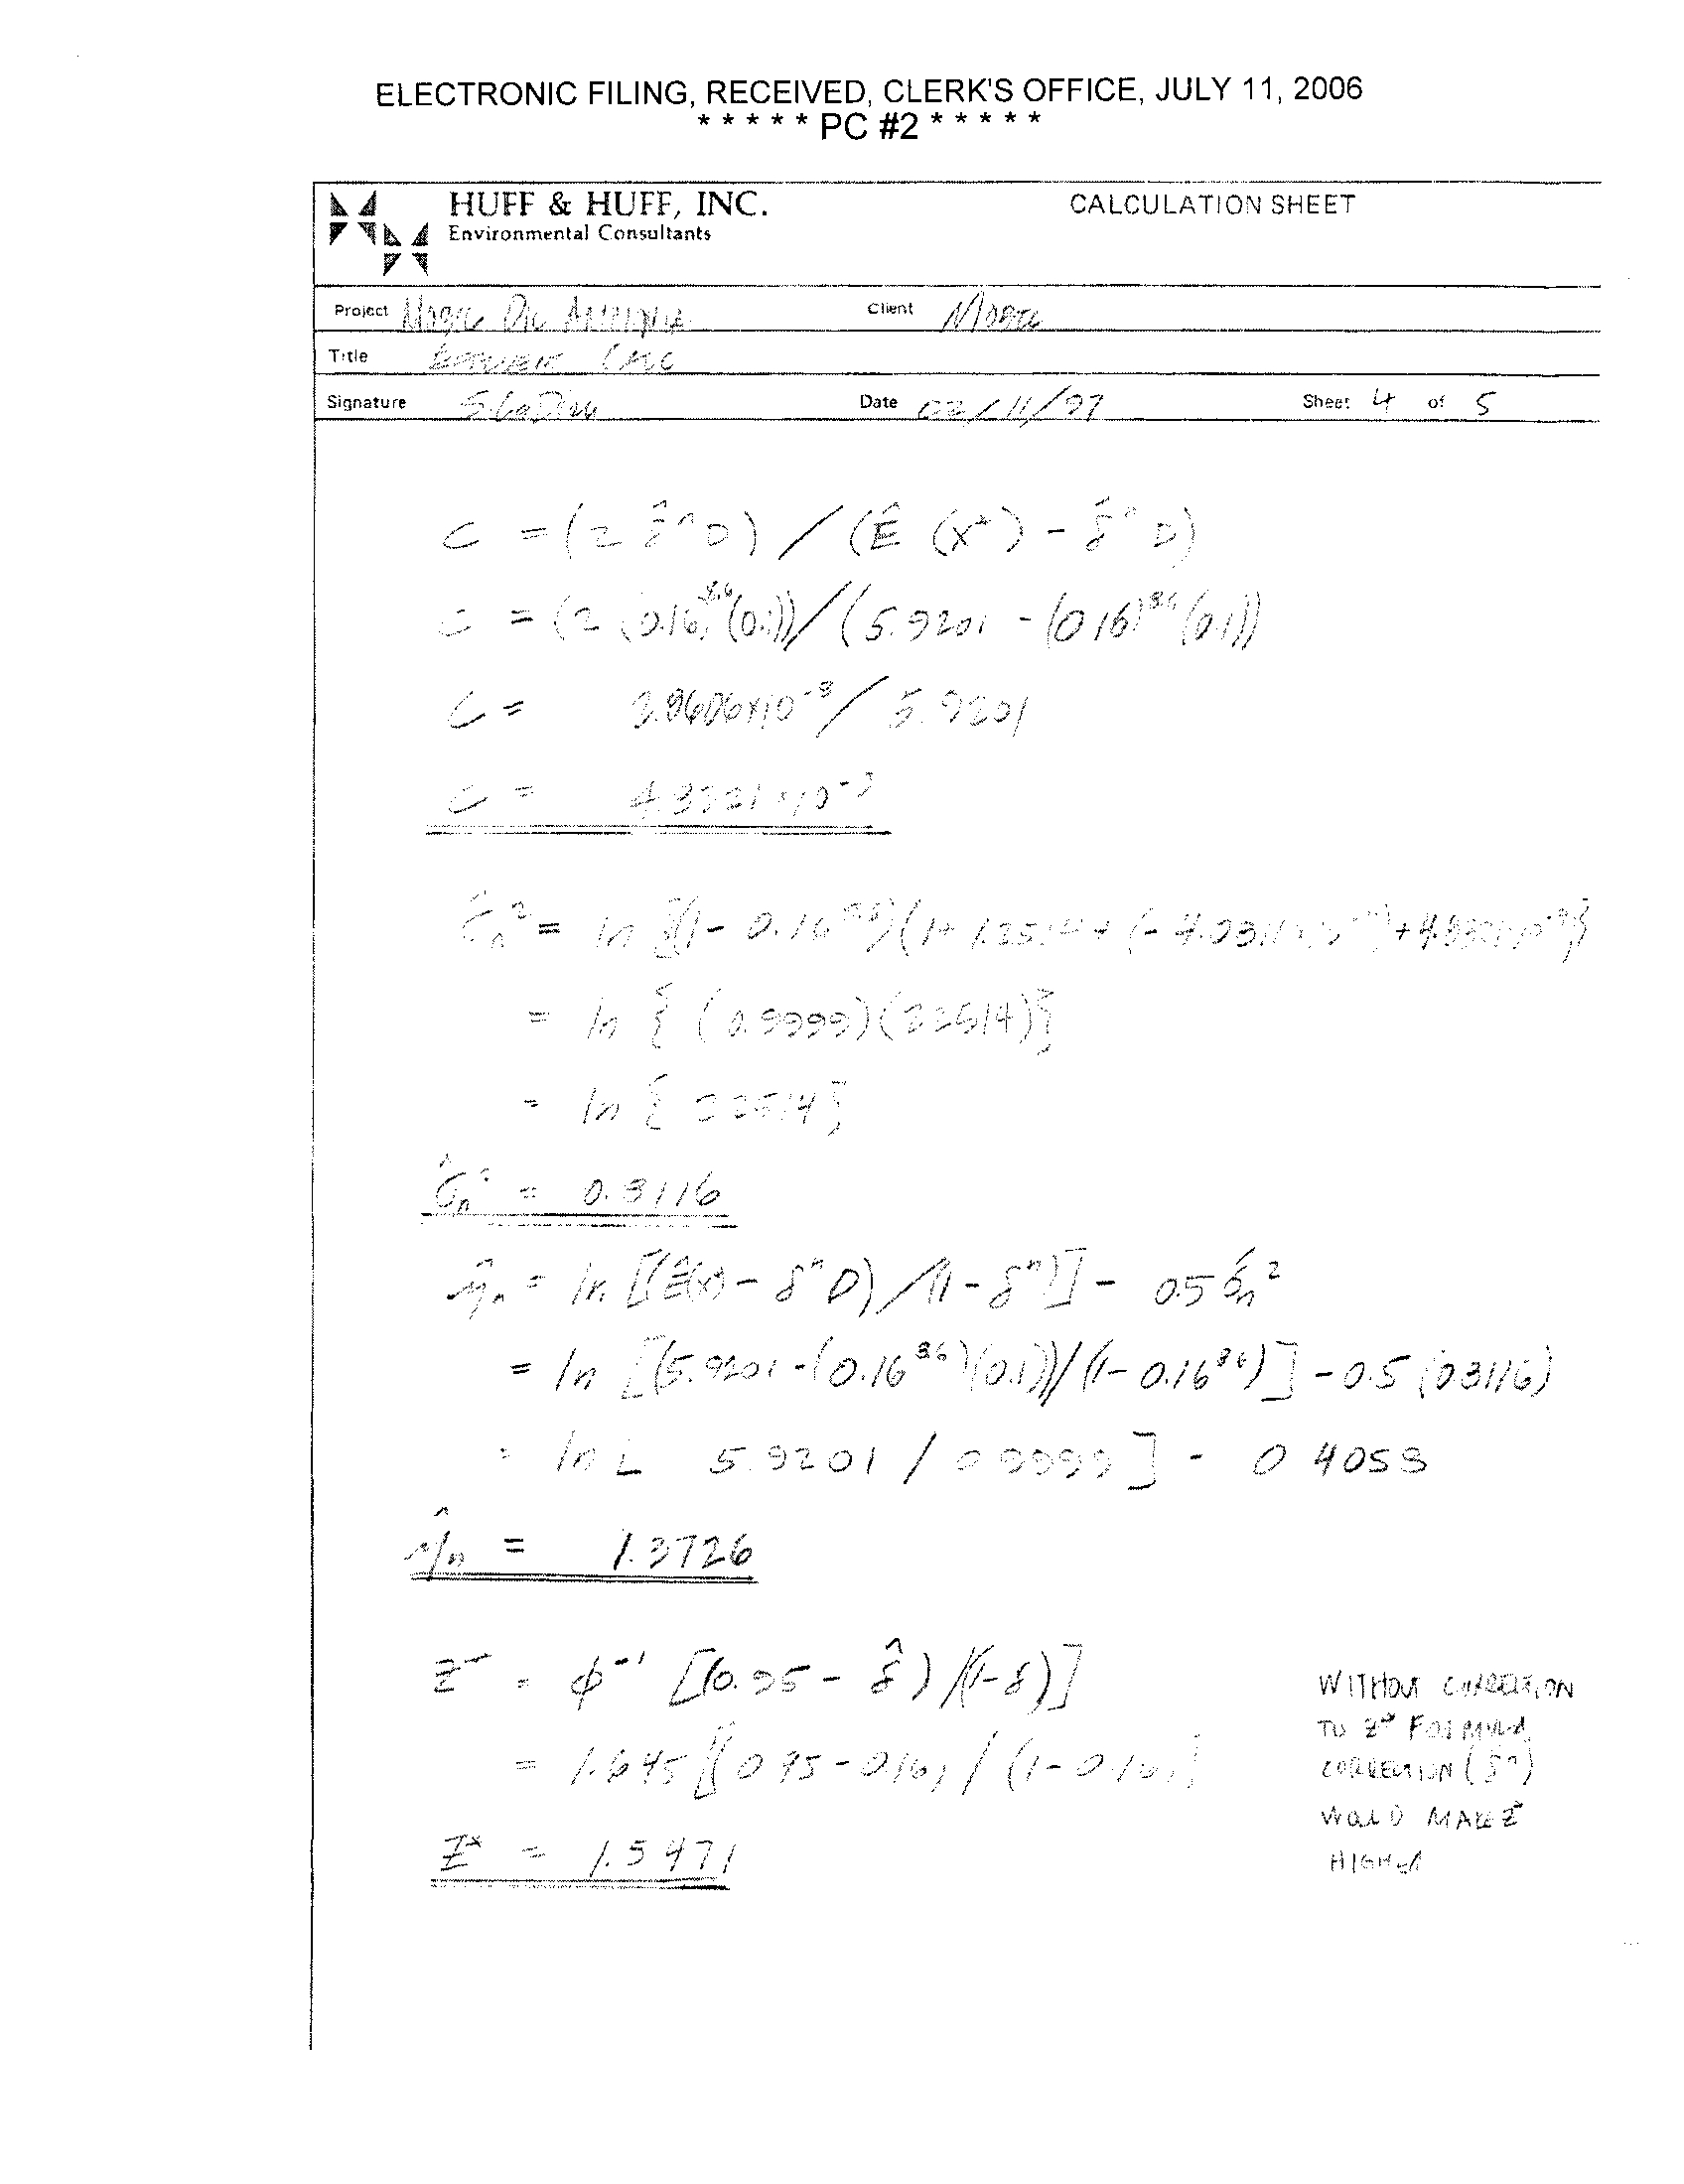
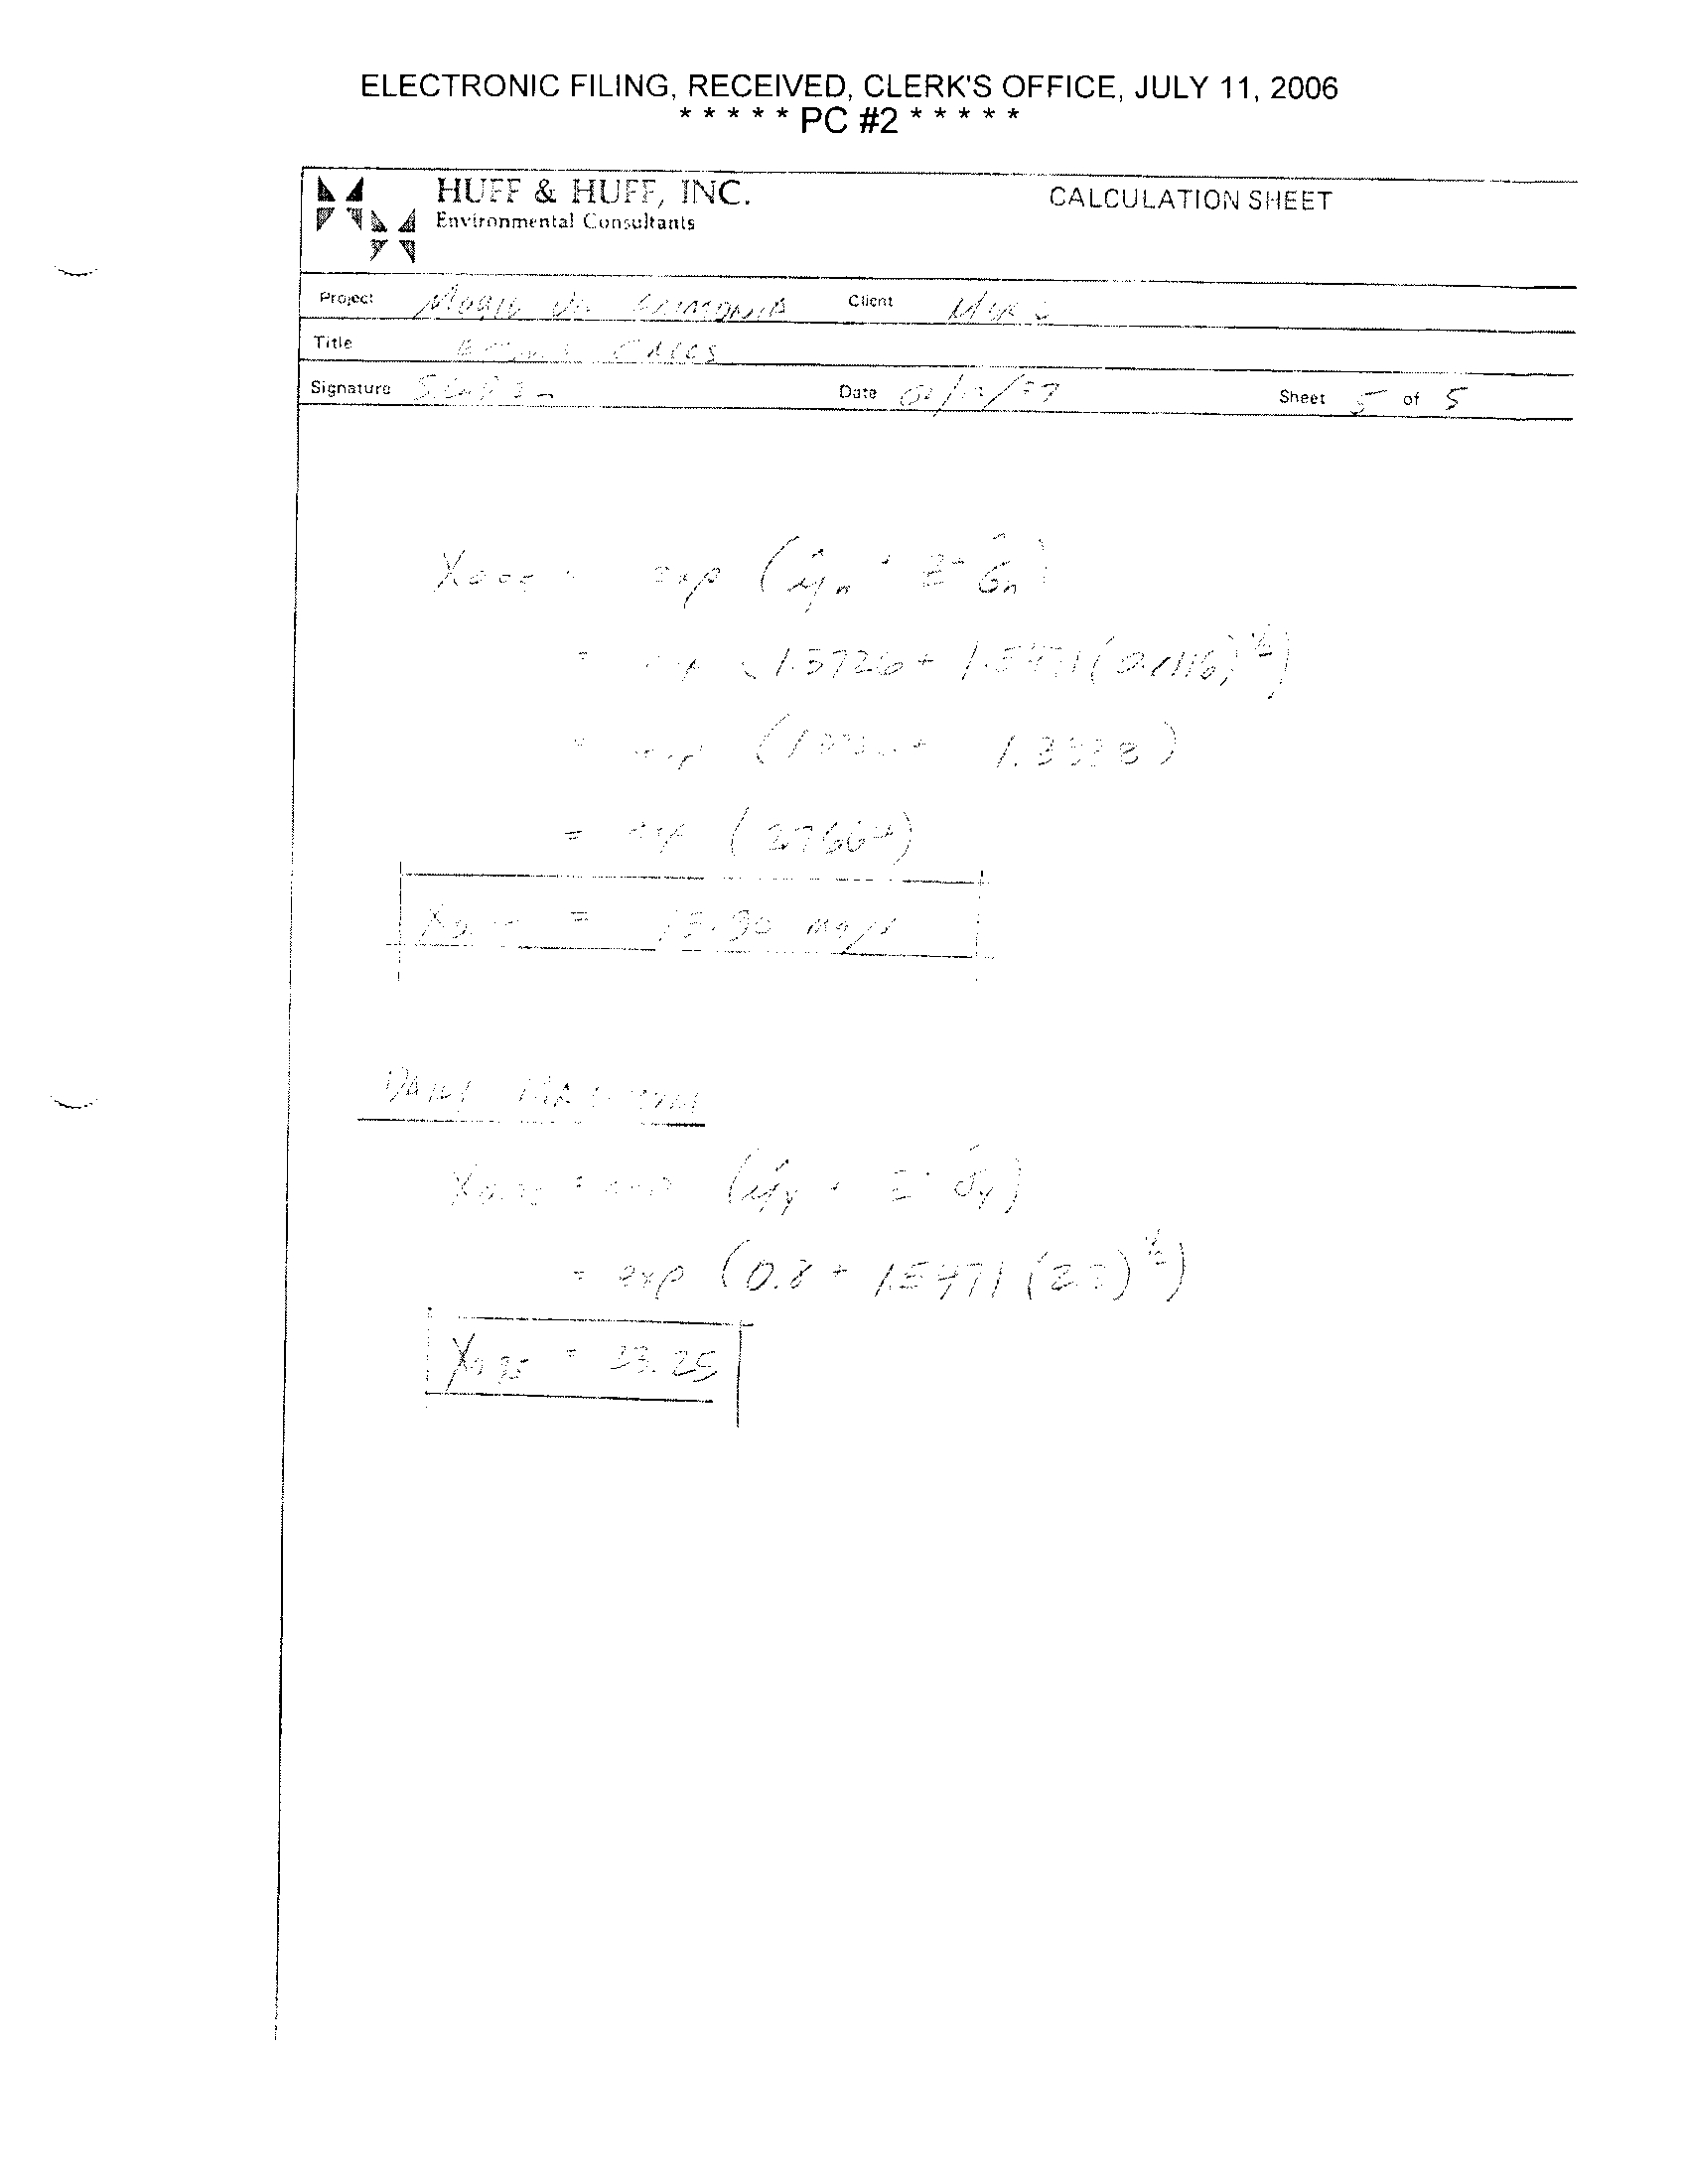
The monthly average permit limit was calculated using the methodology in the "Technical Support
Document" for small sample numbers . The daily maximum limit was calculated using the delta-
lognormal distribution due to the number of ammonia effluent values below the detection limits
.
The calculations are provided in Appendix D . The ammonia effluent levels calculated using the U
.S .
EPA "Technical Support Document" are as follows :
5 .4 Existing
Permit Limits
The Illinois Pollution Control Board granted Mobil an ammonia effluent limit variance in 1994 . The
existing limits for the WWTP outfall at Mobil as they exist in the NPDES permit are as follows :
-19-
Data Set
Monthly Effluent Limit
Daily Maximum Limit
Nov . 1996 to Mar
.
1996 Ammonia Effluent
9
mg/1
1996 Ammonia Effluent
18 mg4
28 mg/I
1992 to 1996 Ammonia Effluent
16 mg/l
23 mg/1
xi ting Permit Lim is
thly Effluent Limit
Daily Maximum
Ammonia Effluent
13 mg/I
26 mg/I
ELECTRONIC FILING, RECEIVED, CLERK'S OFFICE, JULY 11, 2006
*****PC #2 * * * * *
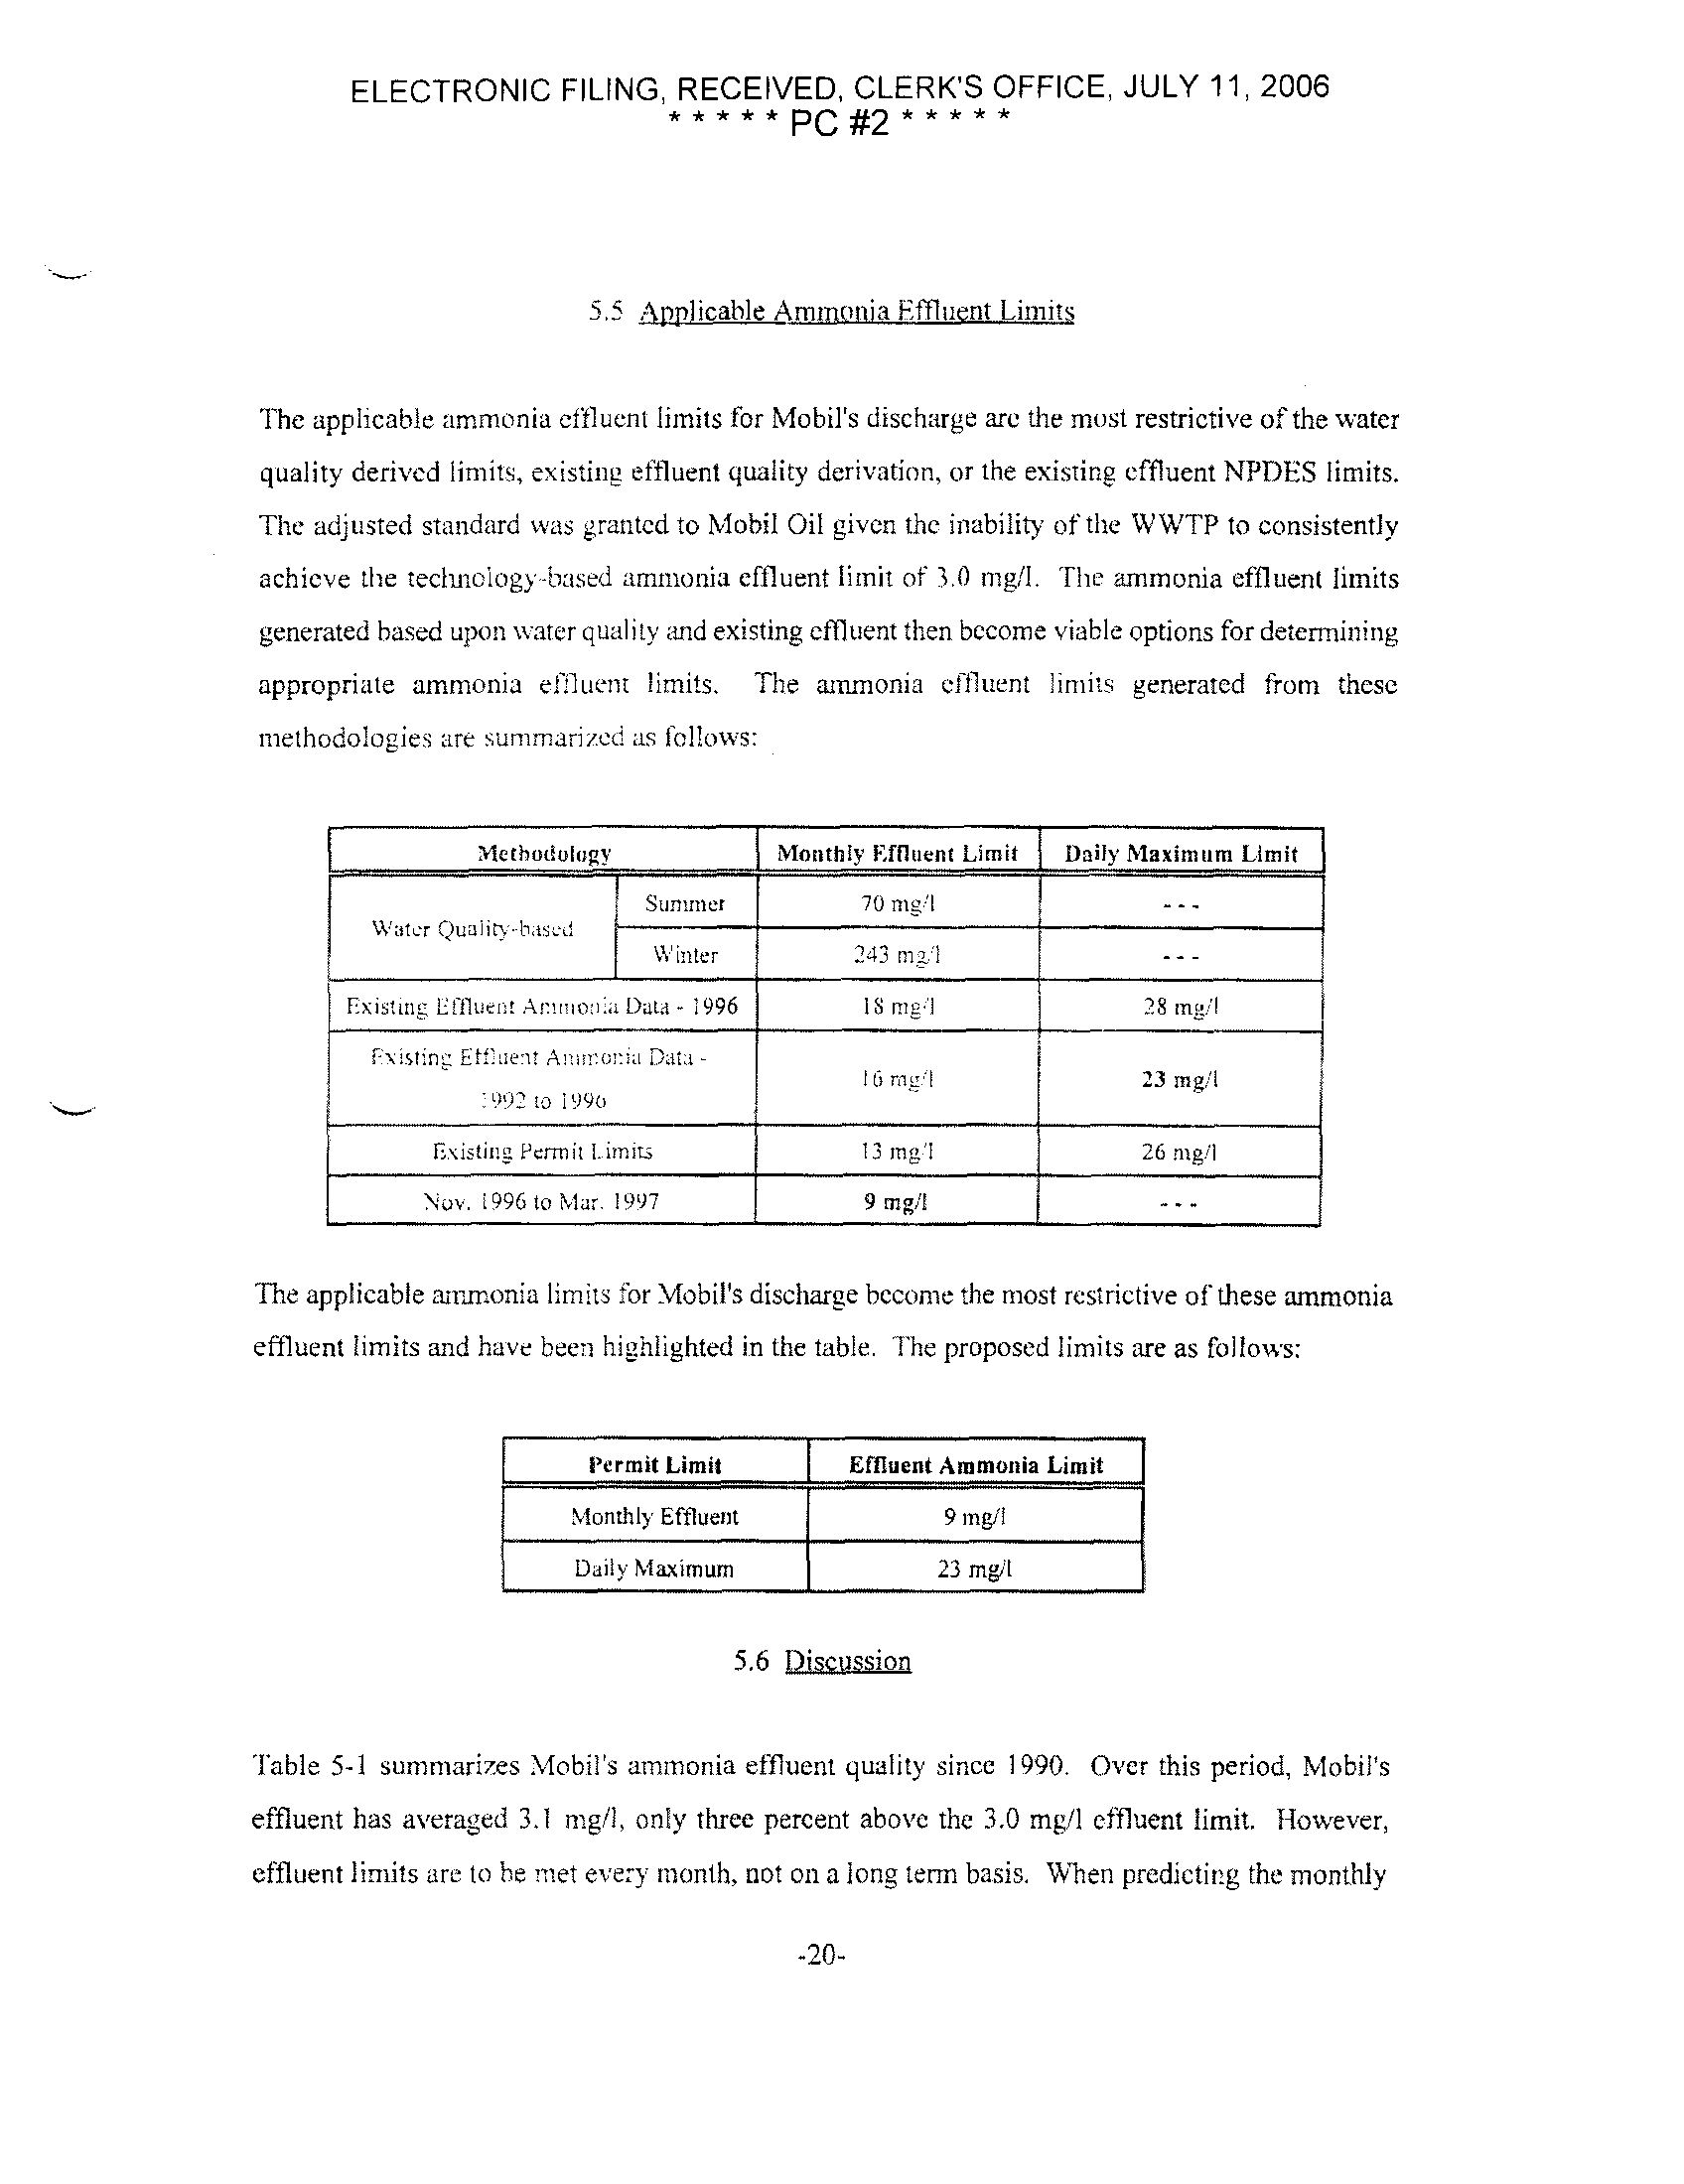
5.5 Applicable Ammonia Effluent Limits
The applicable ammonia effluent limits for Mobil's discharge arc the most restrictive of the water
quality derived limits, existing effluent quality derivation, or the existing effluent NPDES limits .
The adjusted standard was granted to Mobil Oil given the inability of the W WTP to consistently
achieve the technology-based ammonia effluent limit of 3 .0 mg/1 . The ammonia effluent limits
generated based upon water quality and existing effluent then become viable options for determining
appropriate ammonia effluent limits . The ammonia effluent limits generated from these
methodologies are summarized as follow
The applicable ammonia limits for Mobil's discharge become the most restrictive of these ammonia
effluent limits and have been highlighted in the table . The proposed limits are as follows
:
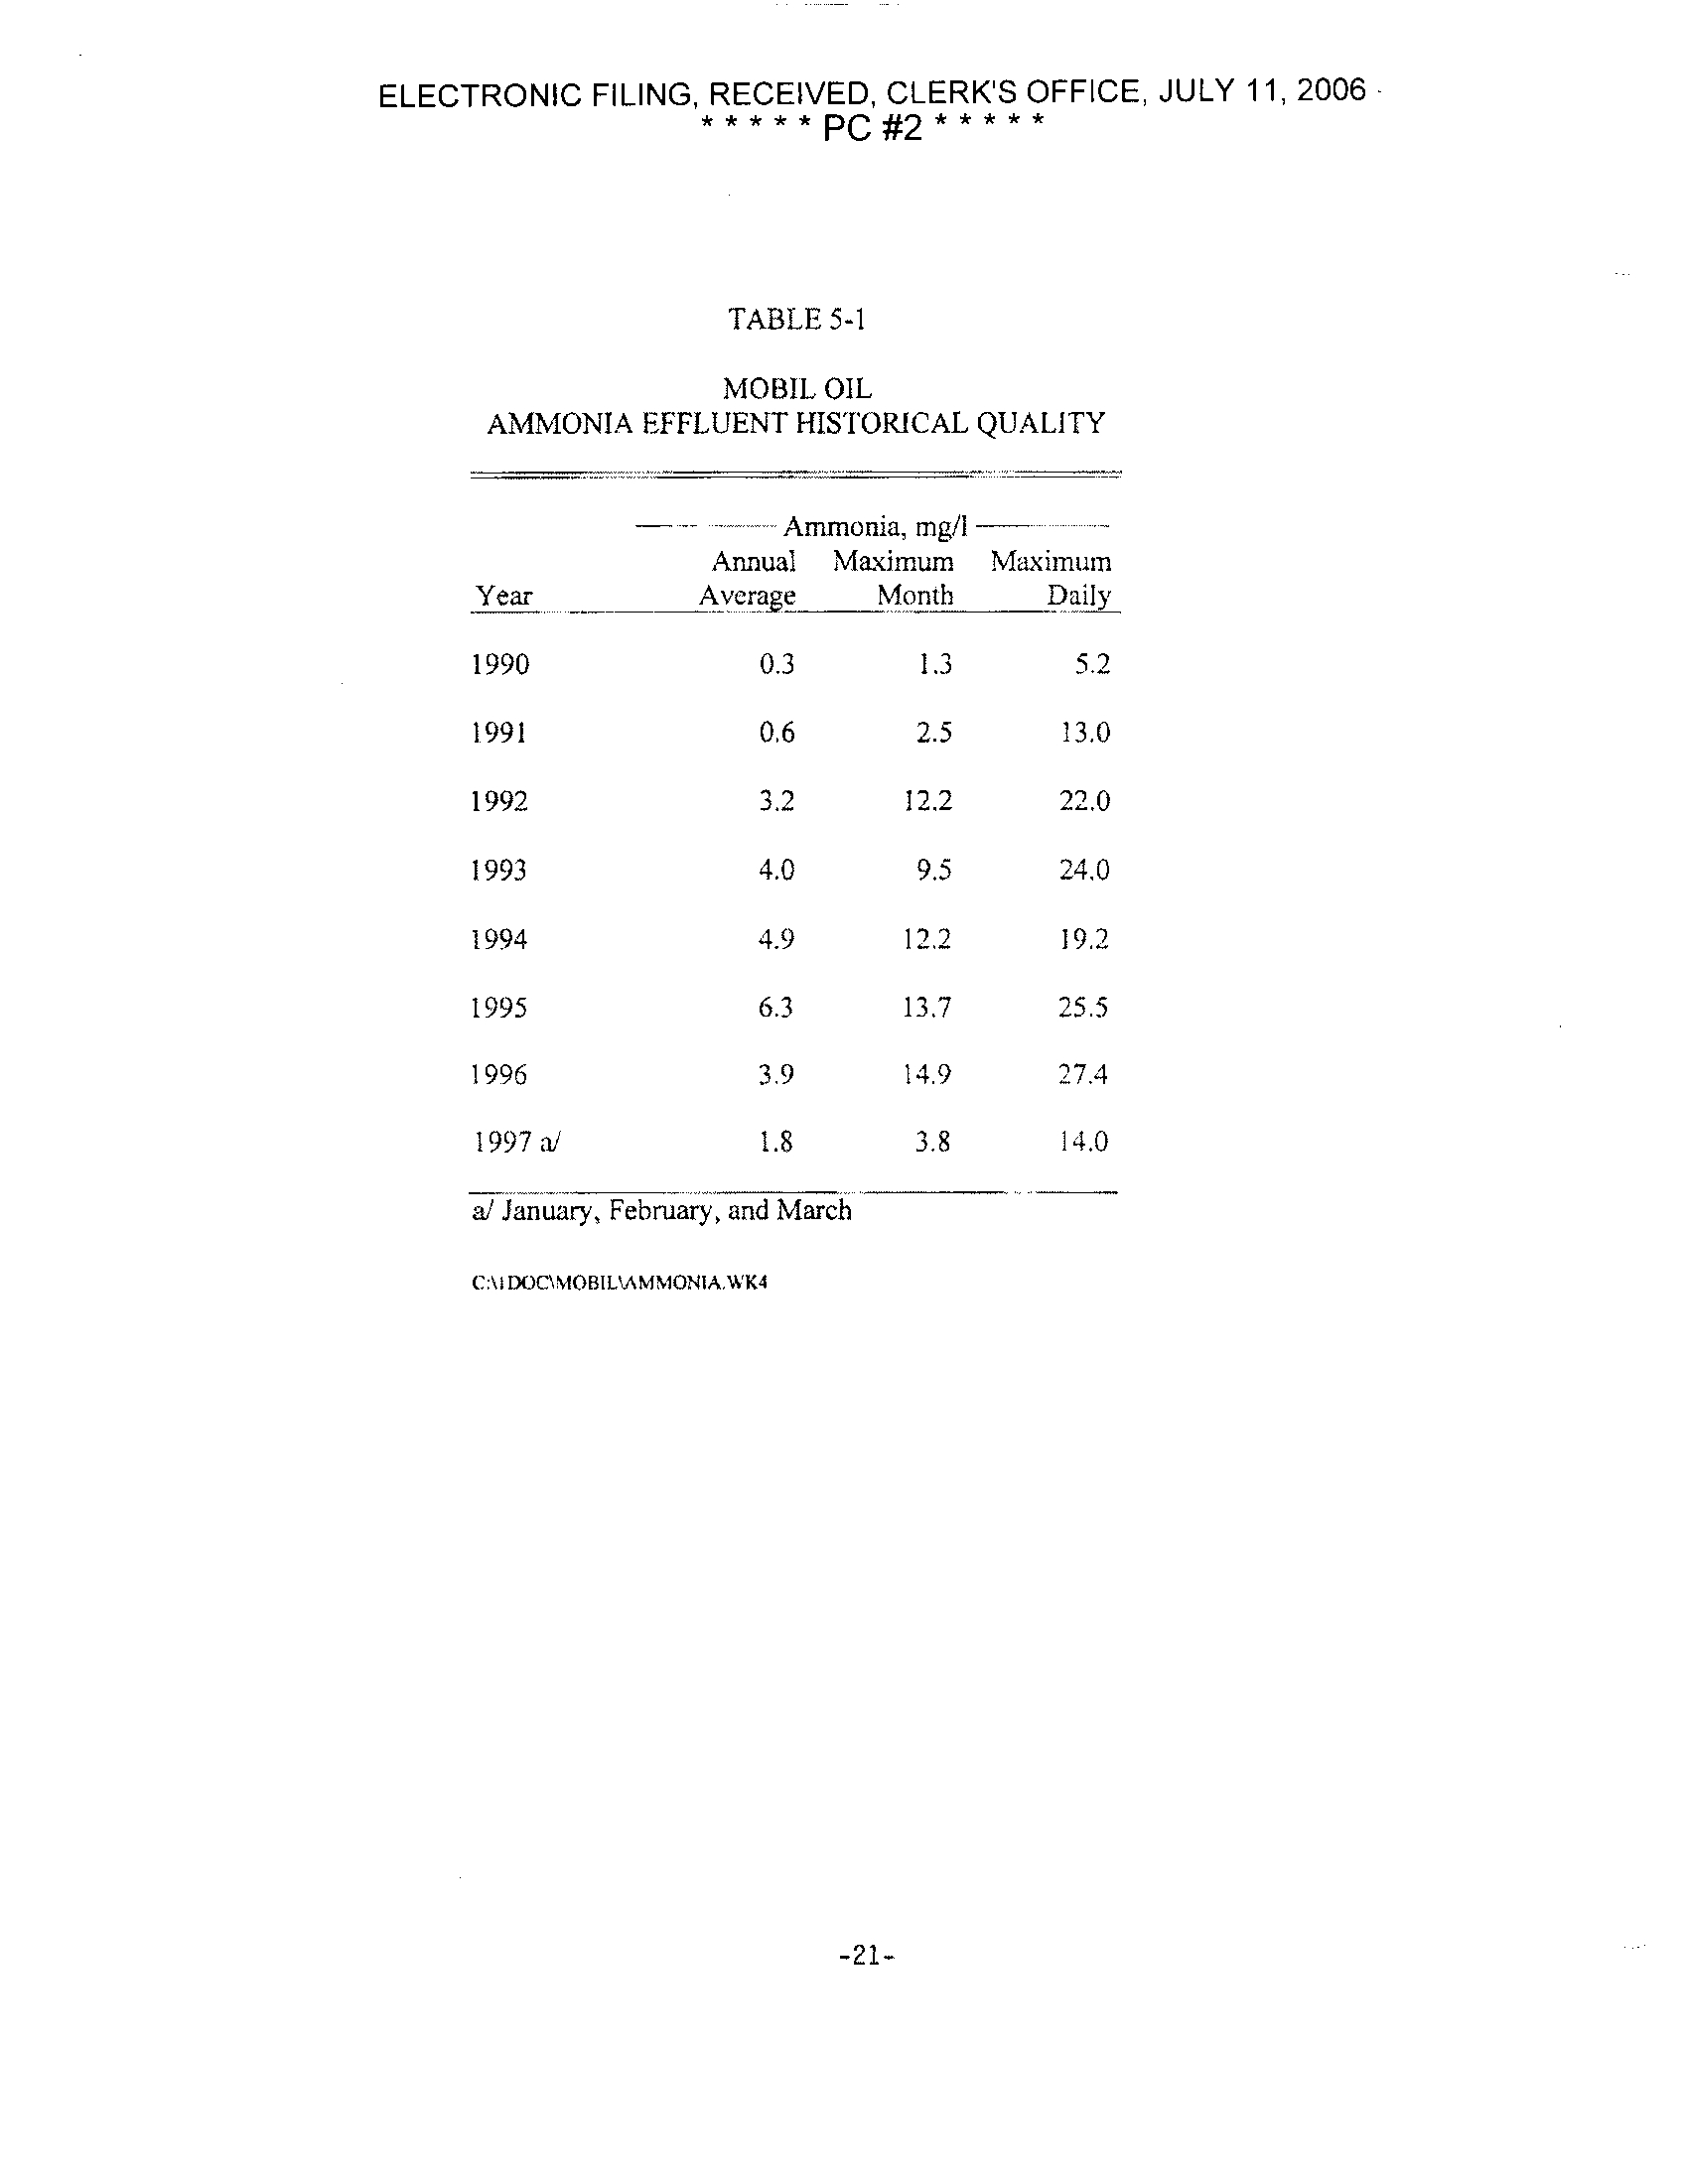
5.6 Discussion
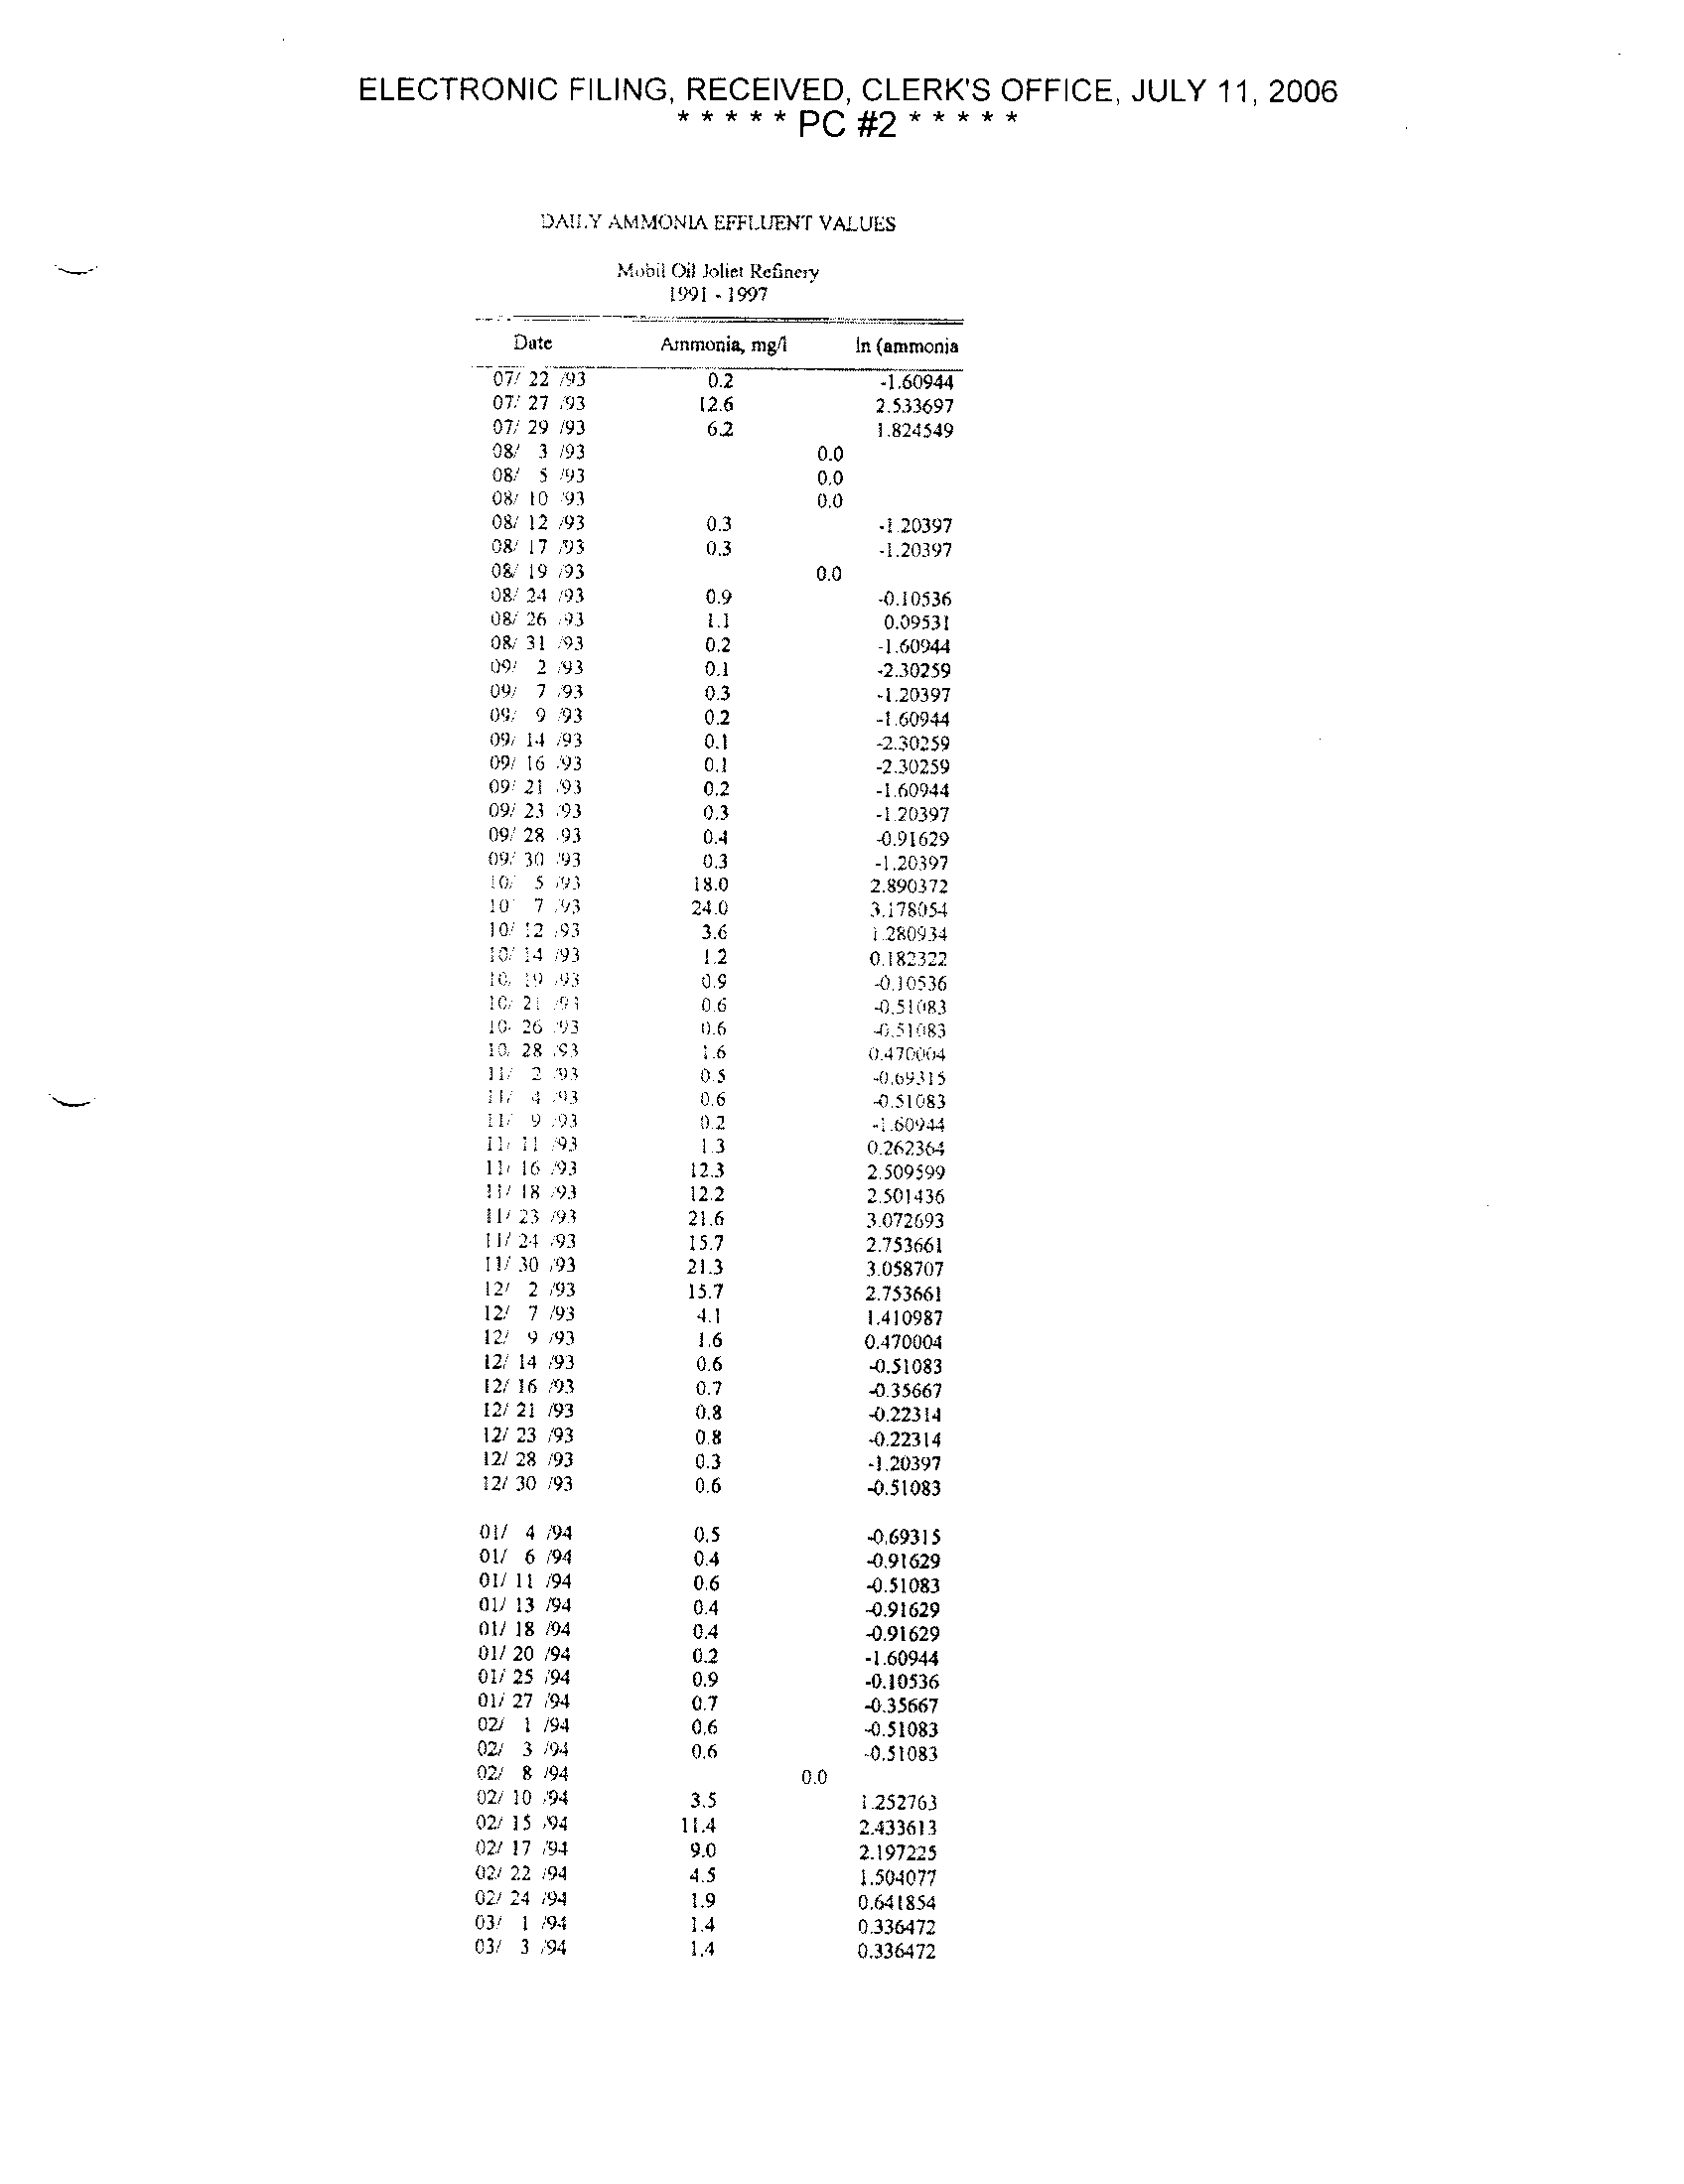
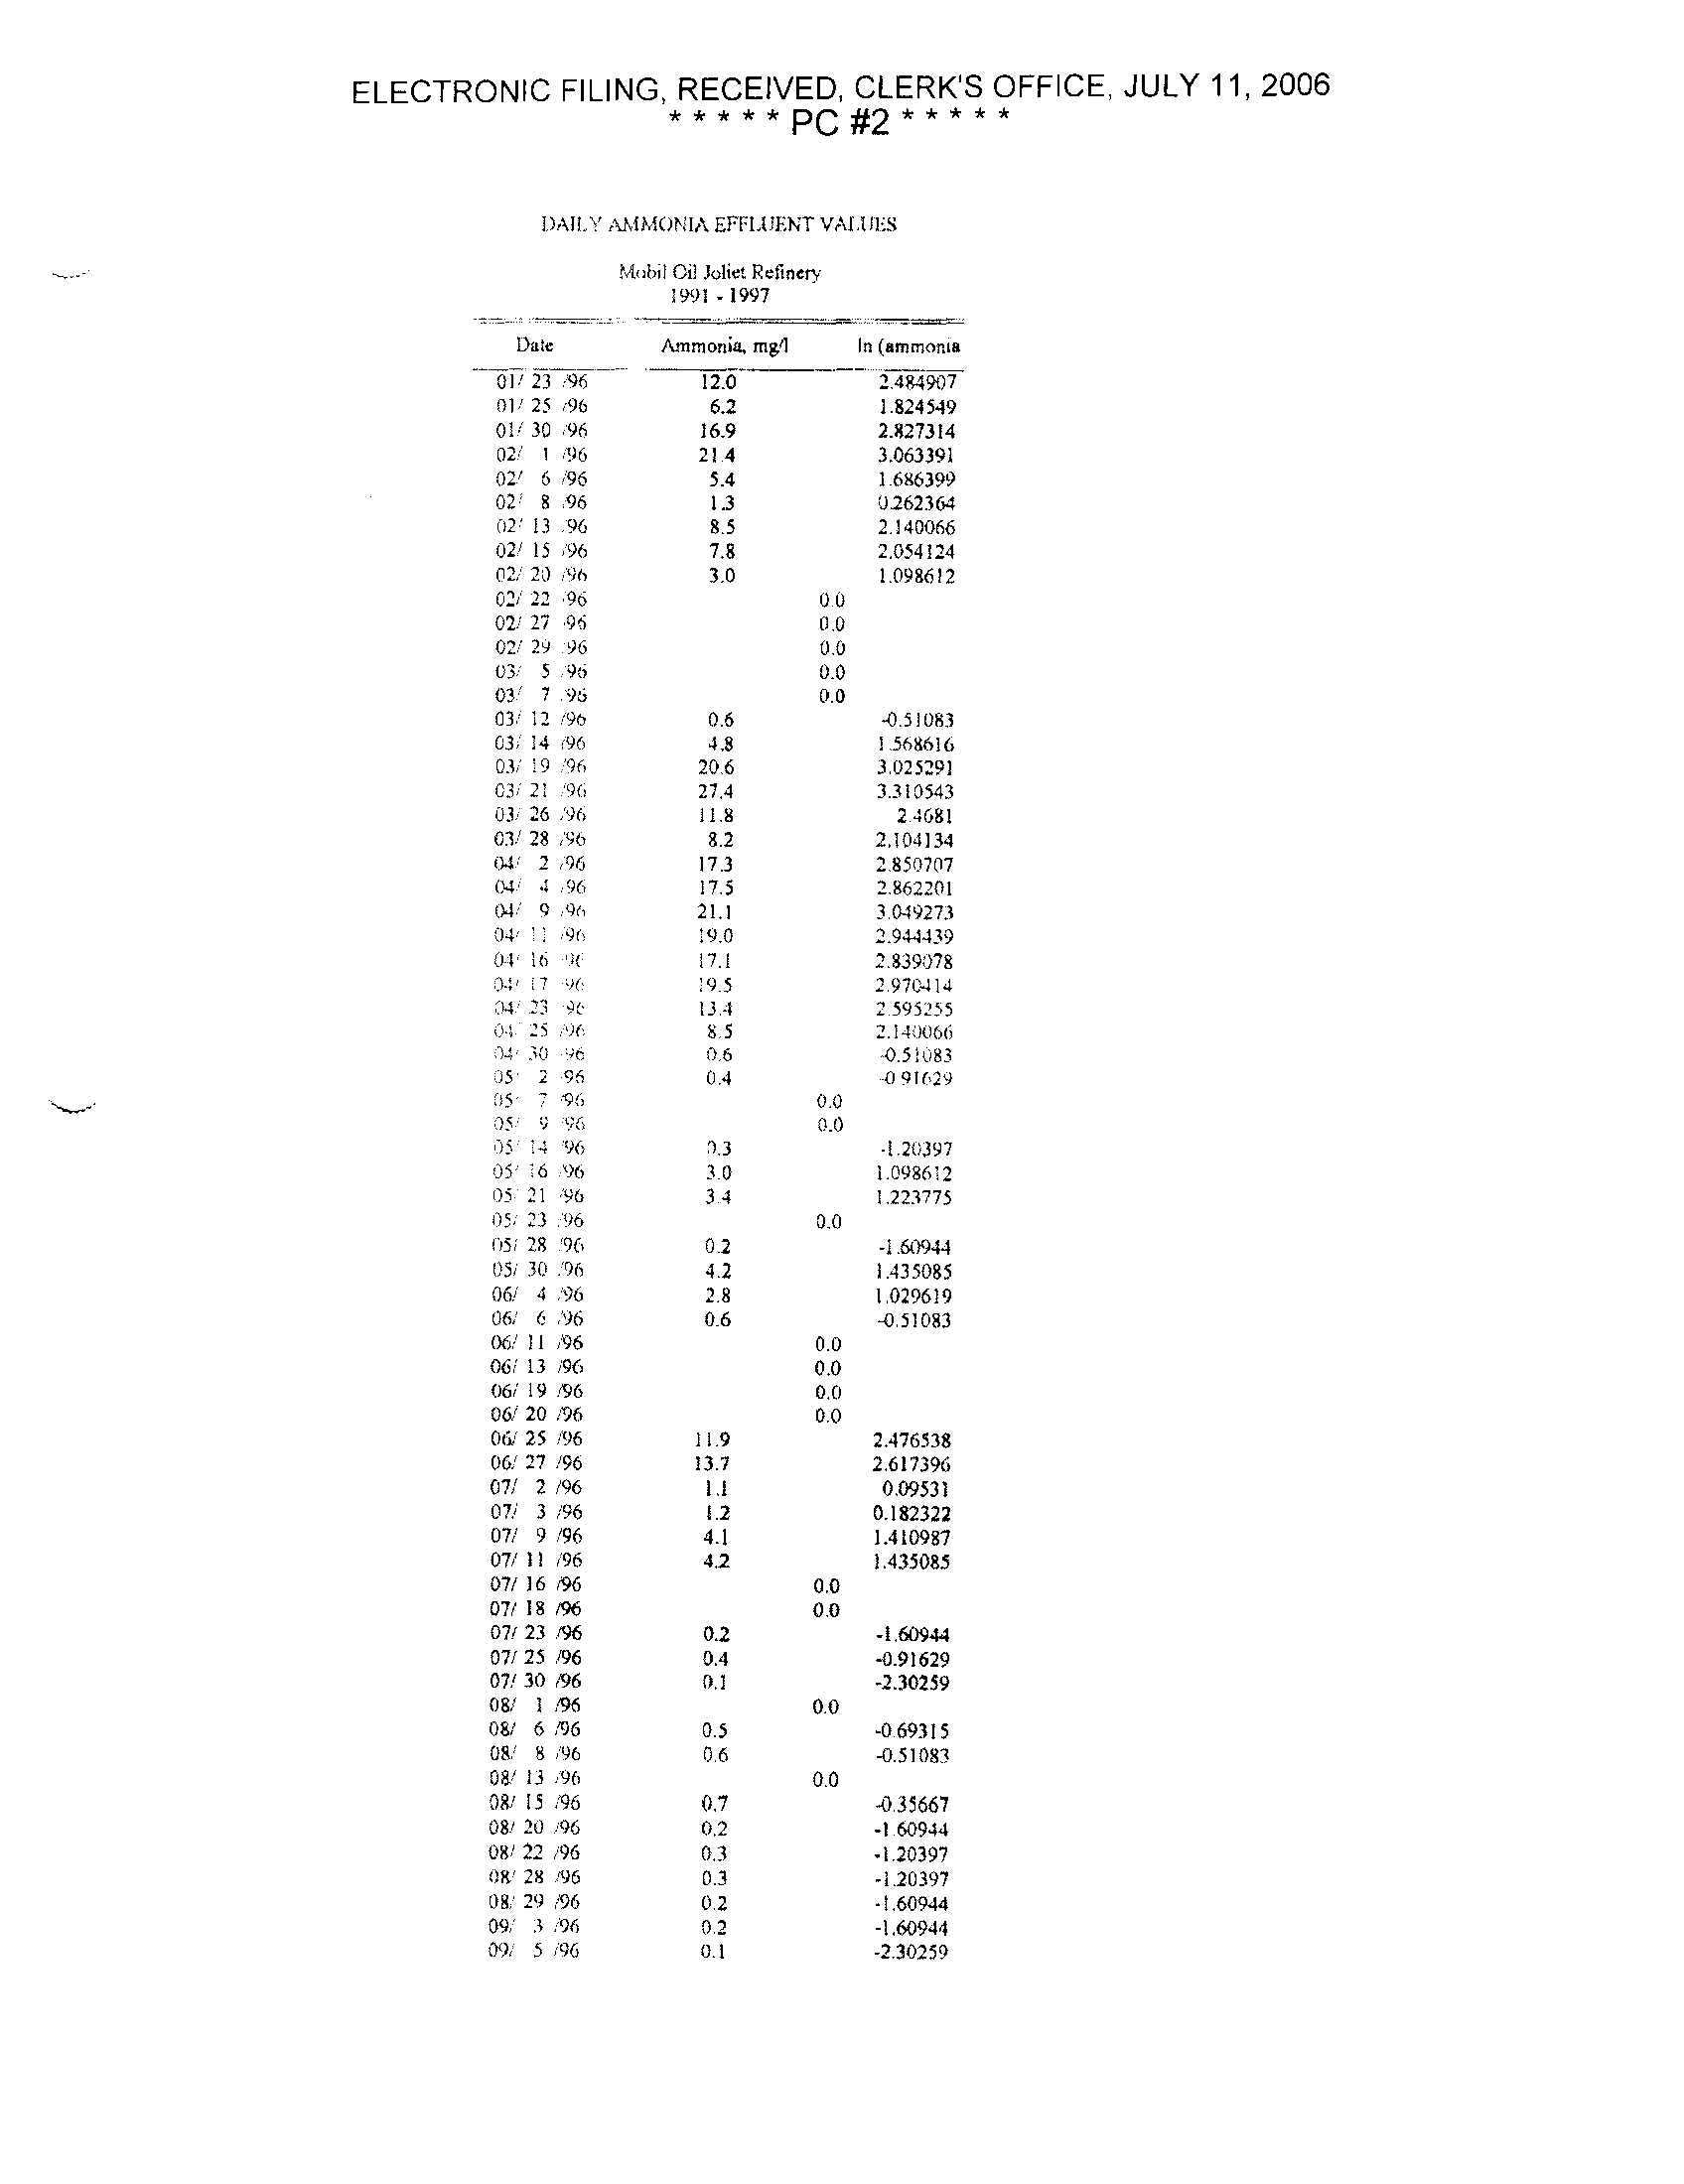
Table 5-1 summarizes Mobil's ammonia effluent quality since 1990 . Over this period, Mobil's
effluent has averaged 3 .1 mg/l, only three percent above the 3
.0 mg/I effluent limit . However,
effluent limits are to he met every month, not on along term basis . When predicting the monthly
-20-
Methodology
Monthly Effluent Limit Daily Maximum Limit
Water Qualin-based
SummerWinter
243
70 mg9me'i
-
Existing Effluent Acimoo!a Data- 1996
IS mg l
_ 28 mg/P
Existing` Etf ue :t Anttcmsi Data -
i 992 to 1990
t ona l
23
mg/1
Existing Permit Limits
13 mg'l
26 mg/1
Nov . 1996 to Mar . 1997
9 mg/f
Permit Limit
E vent Ammonia Limi
Monthly Effluent
9 mg/1
Daily
Maximum
ELECTRONIC FILING, RECEIVED, CLERK'S OFFICE, JULY 11, 2006
*****PC#2*****
TABLE 5-1
MOBIL OIL
AMMONIA EFFLUENT HISTORICAL QUALITY
a/ January, February, and March
CA DOCIMOBIUAMMONIA . W K4
Ammonia, mg/I
Year
Annual
Average
Maximum
Month
Maximum
Daily
1990
0.3
1 .3
5.2
1991
0,6
2.5
13 .0
1992
3 .2
12 .2
22.0
1993
4.0
9.5
24.0
1994
4.9
12 .2
19 .2
1995
6.3
13 .7
25 .5
1996
3 .9
14 .9
27.4
1997a/
1 .8
3.8
14.0
ELECTRONIC FILING, RECEIVED, CLERK'S OFFICE, JULY 11, 2006
*****PC #2 * * * * *
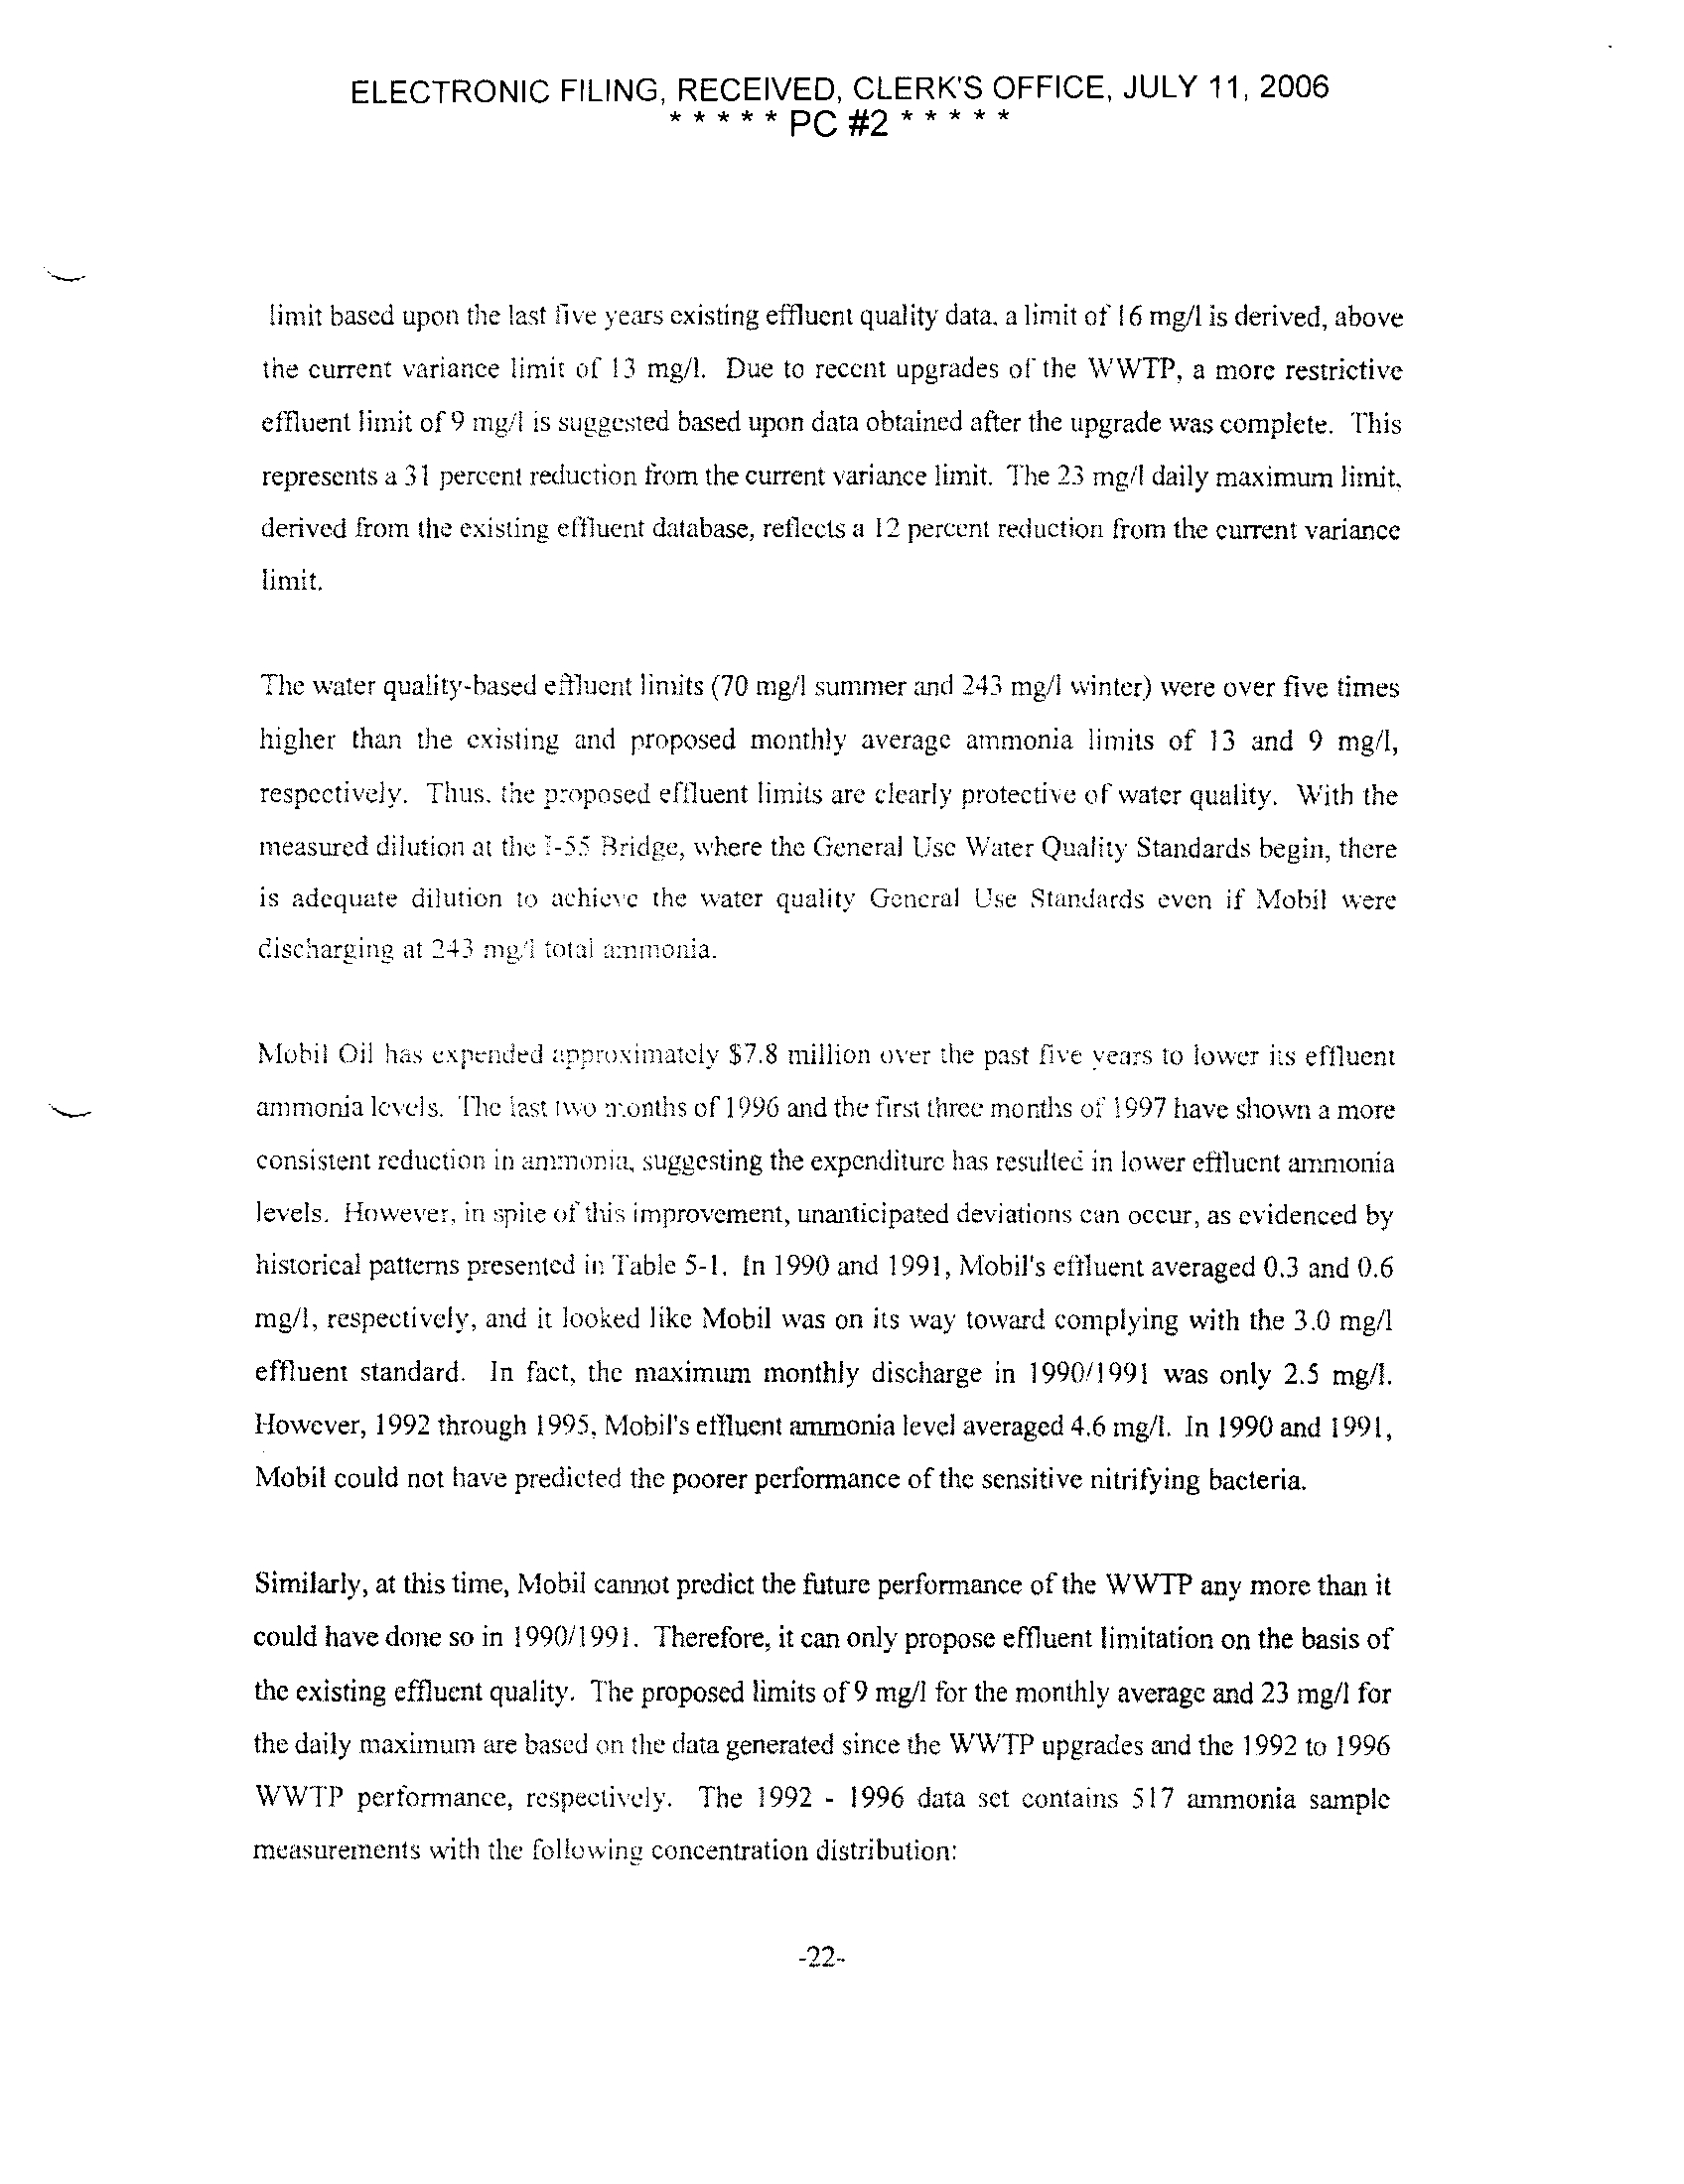
limit based upon the last five years existing effluent quality data a limit of 16 mg/1 is derived, above
the current variance limit of 13 mg/I . Due to recent upgrades of the W WTP, a more restrictive
effluent limit of 9 ntg/I is suggested based upon data obtained after the upgrade was complete . This
represents a 31 percent reduction from the current variance limit
. The 23 mg/I daily maximum limit,
derived from the existing effluent database, reflects a 12 percent reduction from the current variance
limit .
mThe water quality-based e fluent limits (70 mgll summer and 243 mg/I winter) were over five times
higher than the existing and proposed monthly average ammonia limits of 13 and 9 mg/l,
respectively . Thus . the proposed effluent limits are clearly protectiv e of water quality
. With the
easured dilution at the 1
-55 Bridge, where the General Use Water Quality Standards begin, there
is adequate dilation to achieve the water quality General Use Standards even if Mobil were
discharging at 243 mg'i total ammonia .
Mobil Oil has expended apurosirnatcly $7 .8 million over the past five years to lower its effluent
ammonia levels . 'fhe Last nvo months of 1996 and the first three months of 1997 have shown a more
consistent reduction in ammonia, suggesting the expenditure has resulted in lower effluent ammonia
levels, However, in spite of this improvement, unanticipated deviations can occur, as evidenced by
historical patterns presented ir. Table 5-l
. In 1990 and 1991, Mobil's effluent averaged 0 .3 and 0 .6
mg/1, respectively, and it looked like Mobil was on its way toward complying with the 3
.0 mg/I
effluent standard
. In fact, the maximum monthly discharge in 1990/1991 was only 2 .5 mg/I .
However, 1992 through 1995
. Mobil's effluent ammonia level averaged 4 .6 mg/1 . In 1990 and 1991,
Mobil could not have predicted the poorer performance of the sensitive nitrifying bacteria.
Similarly, at this time, Mobil cannot predict the future performance of the W WIT any more than it
could have done so in 1990/1991
. Therefore, it can only propose effluent limitation on the basis of
the existing effluent quality
. The proposed limits of 9 mg/I for the monthly average and 23 mg/I for
the daily maximum are based on the data generated since the WWTP upgrades and the 1992 to 1996
WWTP performance,
respectively.
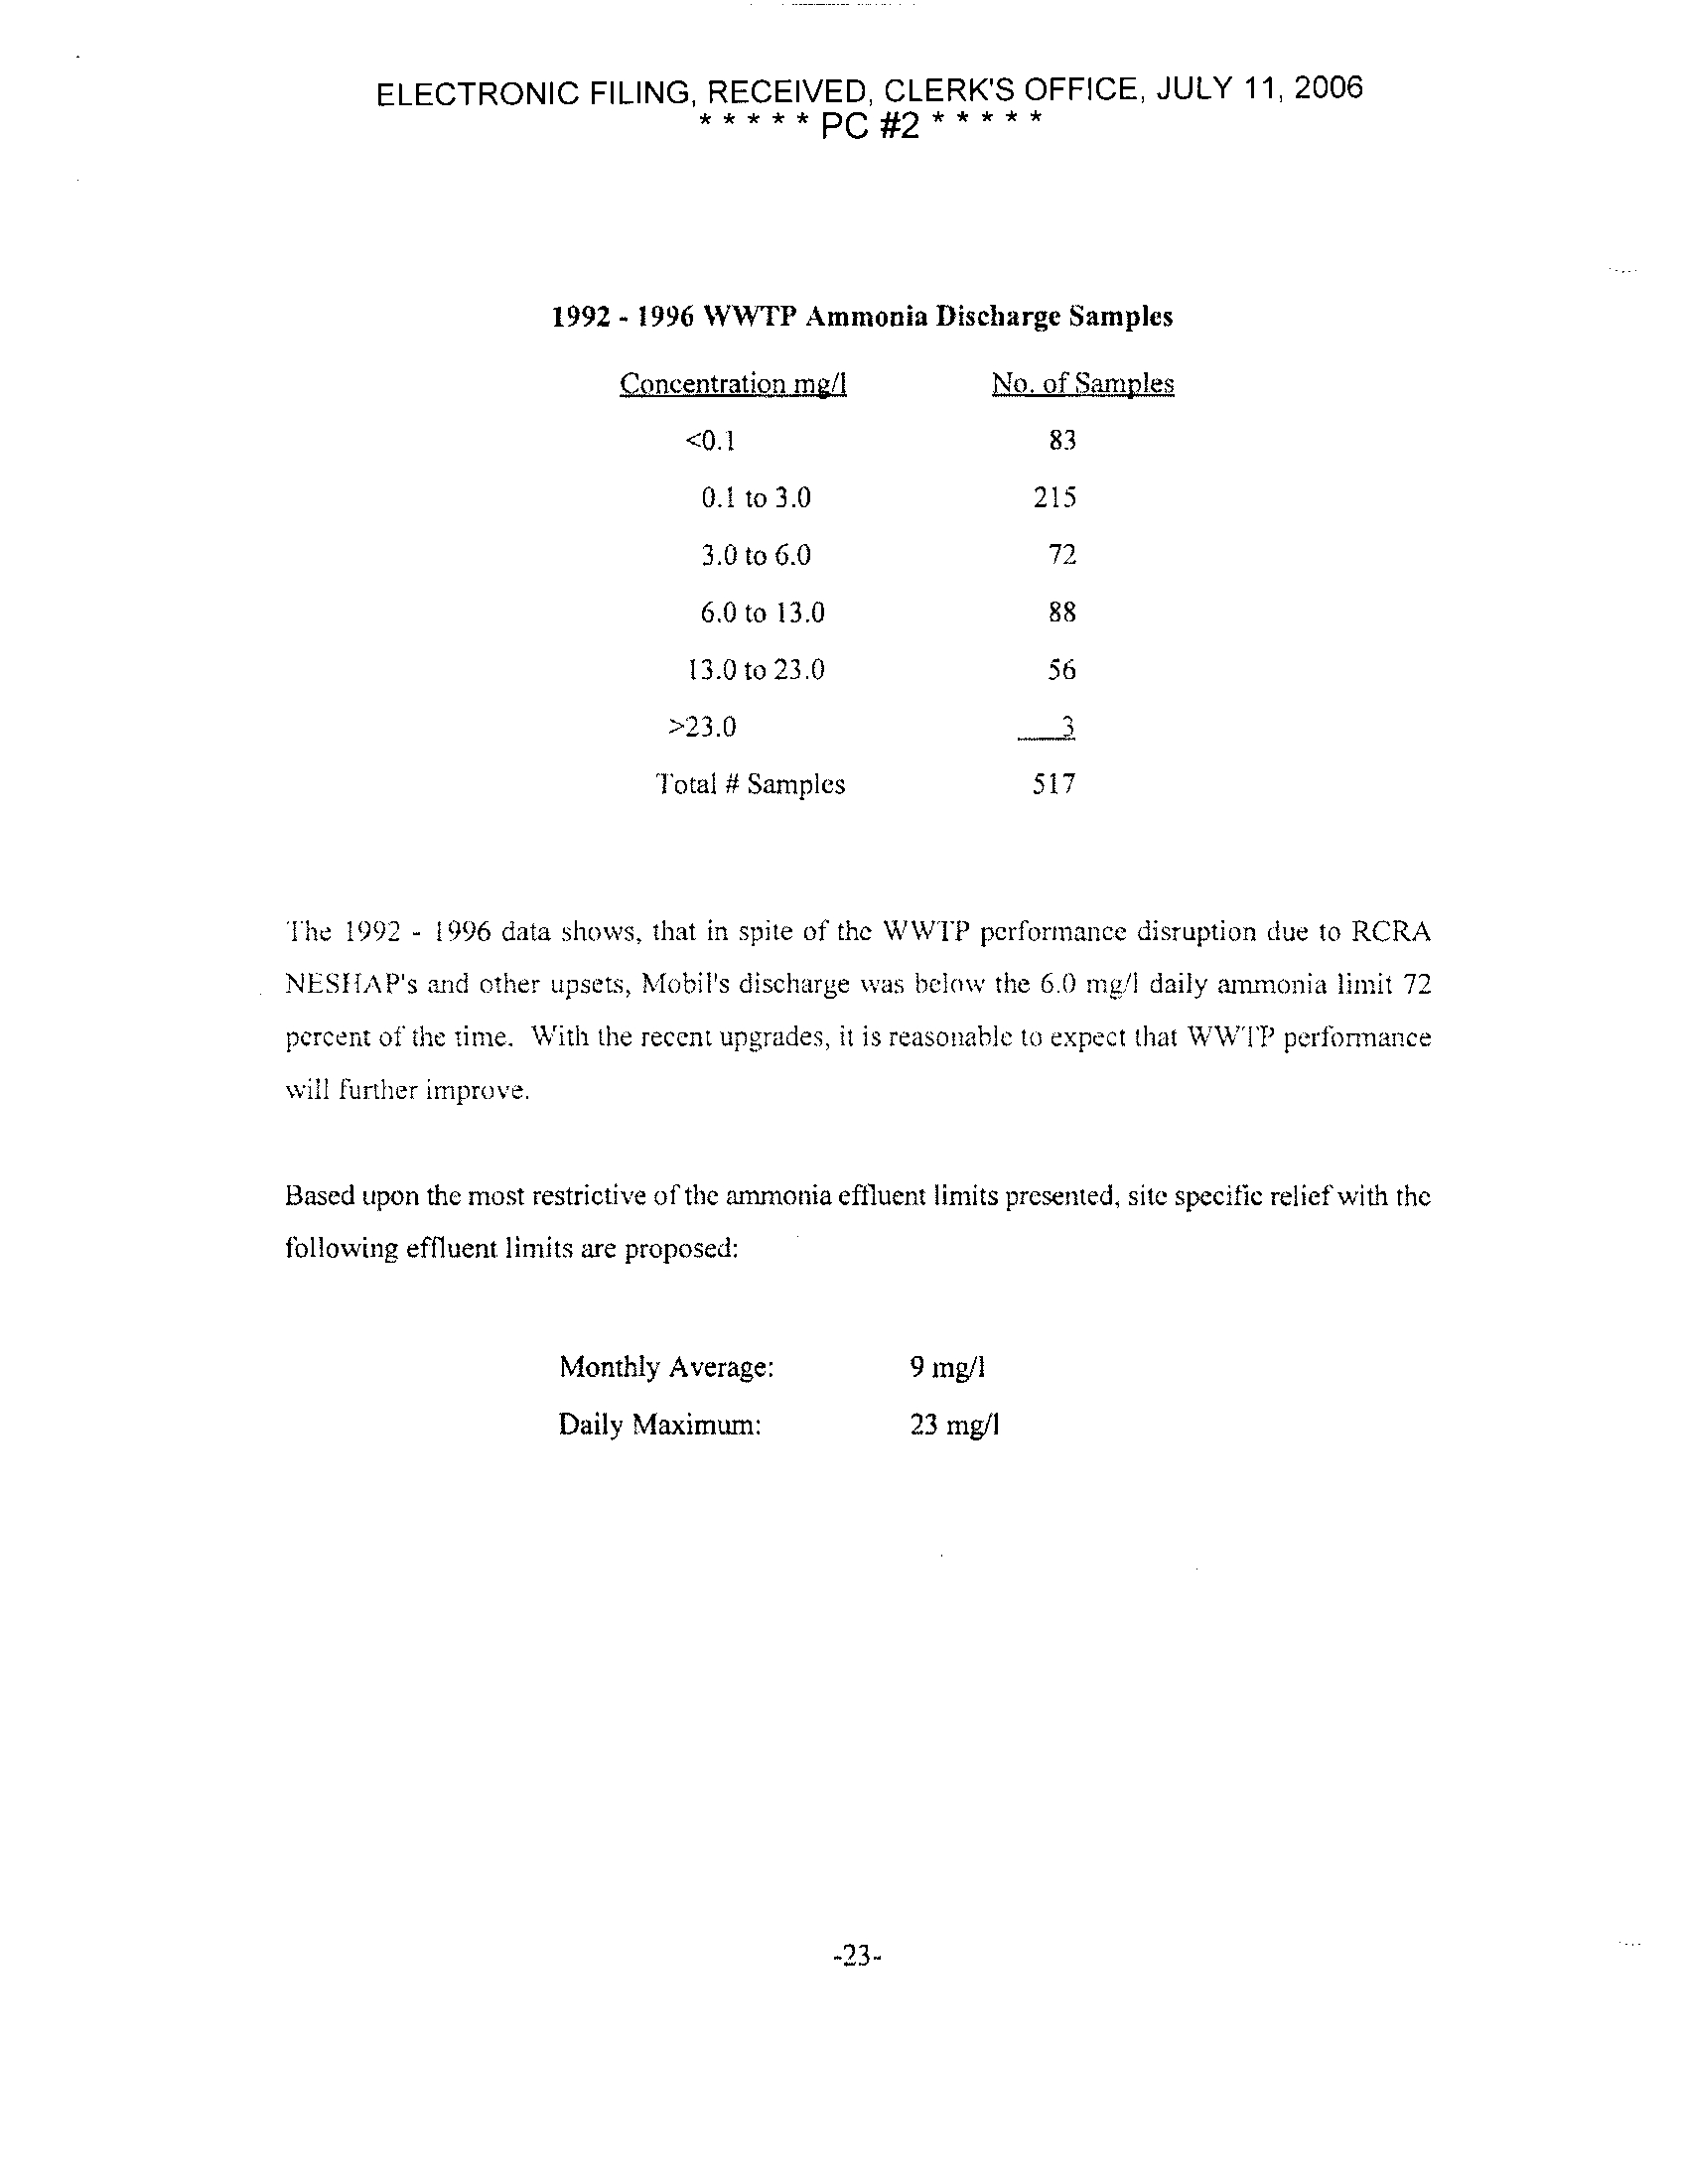
The 1992
-
1996 data set contains 517 ammonia sample
measurements with the following, concentration distribution
:
-22-
ELECTRONIC FILING, RECEIVED, CLERKS OFFICE, JULY 11, 2006
*****PC #2 * * *
1992 -
1996 WWTP Ammonia Discharge Samples
I he 1992 - 1996 data shows, that in spite of the WWTP performance disruption due to RCRA
NES11AP's and other upsets, Mobil's discharge was below the 6 .0 mg/I daily ammonia limit 72
percent of the time . With the recent upgrades, it is reasonable to expect that WW 'I'll performance
will further improve .
Based upon the most restrictive of the ammonia effluent limits presented, site specific relief with the
following effluent limits are proposed :
Monthly Average :
9 mg/I
Daily Maximum :
23 mg/I
-23-
Concentration me/I
No. of Samples
<0.1
83
0.1 to 3 .0
215
3 .0 to 6.0
72
6 .0 to 13.0
88
13.0 to 23 .0
56
>23 .0
Total # Samples
517
ELECTRONIC FILING, RECEIVED, CLERKS OFFICE, JULY 11, 2006
* * * * *PC #2 ** * * *
REFERENCES
U .S . Environmental Protection Agency,
Technical Support Document For Water Quality-based
`l'oxics Control,
EP A'505/2-90-001, PB91-127415, March 1991
.
ELECTRONIC FILING, RECEIVED, CLERK'S OFFICE, JULY 11, 2006
'*"*PC #2 * * * * *
APPENDICES
ELECTRONIC FILING, RECEIVED, CLERK'S OFFICE, JULY 11, 2006
* * ***PC #2 * * * * *
APPENDIX A
ELECTRONIC FILING, RECEIVED, CLERKS OFFICE, JULY 11, 2006
* * * * *PC #2 * * * * *
AMMONIA DILI TION RATIOS
Mobil Oil Refi,.y
Joliet Illinois
October 29, 1996
_.`Ammonia, mS/I
Above
Upstream
Effluent
River Background
Dilution Ratio
File (/ldodmobtLMrahe'plumdatswk4
0 .00
0 .29
0 .16
Avg Upstream-
Avg. E0lucnt-
0 .16
0 .08
0 05
Avg
Opareem-I Avg E01ucm-
0 .03
0 .00
Avg . *t,.• Avg.
W .1 -
0 .08 ;
0 .16
I
000
0 .00
0 .00
0 .00
AV, Ups0eam-
AM Emucnt=
0.00
0 .00
0 .08 .
0 .03 0 .16
0 .08
0 .00
0 .00
0.00
0 .00
0
.00 0.00
0 .00 0.00
0 .00 0.00
0 .22
0 .14
0 .00
0 .00
0 .22
0 .14
0 .00
0 .00
0 .00
0.00
0 .00
0.00
0 .05
0 .05
0.05
-
Avg Efuenw
0
.00
0 .00
10:56
~ ~
0.00
0 .05
0 .00
0
.00
0 .11
0 11
0 .00
0
.05
0 .00
0.11
0 .00
0
.00 0.00
0.28
0 .12
0 .22
0 .06
0 .11
0 .00
011
0 .D0
0 .18
0 .02
0.28
0
.12
0 00
0 .00
0 .00 0.00
0
.12
0 .09
0 .00 0.00
0
.00
0.00
0 .00 0.00
0
.00 0.00
0 .16
0.13
0
.08
0 .00
0 05
0 .05
0
.122
0.09
0 .(10
0
.00
0 00
0.00
0 .08
0 .13
0 .00
0 .02
0 .02
0 .00
0 .00
0 .00
0 .00
00 .00
.00
0
.00
0 .00
Sample ID
us I
08:17
EC I
08 :20
Al
09:25
A2
0830
A3
08 :32
A4
08:34
A5
09:36
A6
09:42
A7
08:44
A9
08 :47
A9
08 :51 L_
Us 2
09 :54
EC 2
08 :56
BI
09:00'
B2
09:03
33
09:05 .
B4
09'08
B5
09 : 101
136
09 121
137
09 :151
B8
09 :171
139
09 :201
LC 3
09 :31'
Cl
09 :33 i
C2
09 :371
C3
09 :401
C4
09 .43'
C5
09 :45
C6
09 :48
C7
09 :51
CS
09
:55
US 3
10 :00
EC 4
10 :07
DI
10 :11
D2
10 :15
D3D4
1010;19:24
US 4
10 :50
EC 5
10:53
E7
E6
11 :00
ES
11 :02
E4
11 :06
E3
111.08
F4
11 :15
FS
11 :17
F3
11 :20
F2
11 :23
F1
11 :25
01
11 :30
02
11
:31
03
11 :34
04
11 :42
U35
11 :46
EC 6
11 :51
HI
11 :55
11
11 :59 .
12
1291
13
1204
US6
12
:09
ELECTRONIC FILING, RECEIVED, CLERKS OFFICE, JULY 11, 2006
* * * **PC #2
APPENDIX B
PROCESS WATER
,f' rY SOUR WATER
- ^ - STORM
WATER
250 GPM
COOLING TOWER
FLARE
FACILITIES S
SOUR
WATER
STNIPPING
UNIT
i
UTILITYTO
FACILITIES
WELL WATER
1
50 GPM
I
SCHEMATIC
OF
WATER
FLOW
MOBIL JOLIET REFINING
CORP
.
JOLIET . WILL . ILLINOIS
-0-
CATALYTIC
MYWO-
OESULFORIZATIONWIT
CLEAN
OILY
PRETREATER
REFORMER
L SATURATE
GAS PLANT
NC HOF
CCR UNIT
UNSAT
TK
&
CATALYTIC
CRACKING
PLANT
FLUID
ROx
EATER
FUEL
UNIT
GAS
&
COKING
$TORN WATER
WIT
FROM TANK
DIKE AREA
TIP
GAS SALES
.CLERK
~- WATERSURFACERUN-OFF
r tUUHt A
DES-PLAINES RIVER
DISCHARGE
'
0fl 1
'SERVICE
TUT
00)
WATER
Tk5
CLEAN STORM WATER
TREATED
PROCESS WATER
WASTE WATER
TREATMENT
SANITARY
BIDLOGICAL
9
W
OFFICESLABORATORY
. SHOPS
1820 GPM
IRCS GPM
FACILITIES
TREATMENT
CONTROL BLOCS .
OUT FALL NO.003
OUT FALL NO. 001
OUT
UNIT
6 GATE HOUSES
')- --WON-CONTACT
COOLING WATER
6666 GPM
50 GPM
FROMDES-PLAINES
C,7--
UTILITY
1- o
OUT FALL IIO.002
4
50 GPM
RIVER
10080
FACILITIES
10 MHOS.
6PM
2/0t GPM f
GPM
ALkTLATIO
`I
_ ,
PM
cvn
STORM
WATERFROM
PROCESS
AREA
SERVICE
WATER
L
SIG TANK
AIER DRAWS
SRO
TAIL
GAS
WIT
SIG TX
WATER
DRAWS
COOLING
TOWERS
ALkY
NEUTRL
ELECTRONIC FILING, RECEIVED, CLERK'S OFFICE, JULY 11, 2006
* * * * *PC #2
APPENDIX C
ELECTRONIC FILING, RECEIVED, CLERK'S OFFICE, JULY 11, 2006
'*"*PC #2***
k A
HUFF & HUFF, INC .
CALCULATION SHEET
F- I L A
Environmental Consultants
-
PF
Title A
I
Signature
On IA AAA
Date
0471.
ppe-
A NJ l ;L
1
it, -
i
c.
0
Sheer
0S IN
ip)
A?fv
uMb WrAw AWKWA QW10avvy 7;)
Own ~:,
ELECTRONIC FILING, RECEIVED, CLERK'S OFFICE, JULY 11, 2006
*****PC #2 * ** **
i
HUFF & lilln, 1"
hg
&
Environmental Consultants
ELT-7 1
--
l
1 .4 e
Tn in f -I
/ 1T
CAL C,) L A7
, 10 N -i
I ."
ELECTRONIC FILING, RECEIVED, CLERK'S OFFICE, JULY 11, 2006
'* * **PC #2 * ****
L A
HUFF & HUFF, INC .
}V
,q
L A Environmental Consultants
F' I
Title
'ture
Date
'An
I
yt Poll 0; cri
A'I ,4 ALA'-?'-''
7, LWF fDi',j A -
-a ~'
-',
r-2
,
-1 orj
-- - I
kti!
! 7
11 10 107
1
:1 f7' / a& v
CALCULATION SHEET
-~-D-L Ovjw C ,
FA Ont,
ELECTRONIC FILING, RECEIVED, CLERK'S OFFICE, JULY 11, 2006
* * * * *PC #2
APPENDIX D
ELECTRONIC FILING, RECEIVED,
*****PC
CLERK'S
#2 *****OFFICE,
JULY 11, 2006
A
HUFF & HUFF, INC .
CALCULATION SHEET
1. j Env
:rnnmental Consultants
Vona
/'
P'
Title
4,
r
signature
Date
o7/+'.=->
Sheet
f
of
race
ago
-mop Wqll
:
:
.fv
'k
~p!
x
j
10 "
6r
V-/ k
0 fill
ELECTRONIC FILING, RECEIVED, CLERK'S OFFICE, JULY 11, 2006
* * * * * PC #2 * * * * *
-
HUFF- & HUFF,
, INC .
V,
CALCU LATION SHEET
I
ELECTRONIC FILING, RECEIVED, CLERK'S OFFICE, JULY 11, 2006
* * * **PC #2 * * * * *
k A
HUFF & HUFF, INC .
V 'q k d Environmental Consultants
M
Pratt
Gim
Title
-~ --- /"~ ~r -~
syawe
ALYA ~
op
2
- I , & '5 ", (V
y
%
j -
6
Date
{'L/I
r,2 // Si !
0
CALCULATION SHEET
ELECTRONIC FILING, RECEIVED, CLERK'S OFFICE, JULY 11, 2006
*****PC #2
*+°++
!m^^m
HUFF,^z/cQ, uW .
!F '1 1, j c:noxm,mi cmsuium
cxMULAT!ON SHEET
Ewe
-
"')jt-0 @~«t ~~
p ~EAL
ELECTRONIC FILING,
*****PC#2*****RECEIVED,
CLERK'S OFFICE, JULY 11, 2006
® J
HUFF & HUFF, INC .
CALCULATION SHEET
Environmental Consultants
® 11
ProjeCi
/~i'lyl~ tl'G i'tlrJ/~
r4
Clent
Tifle
Signature
Date
Sheet
C
/
ELECTRONIC FILING, RECEIVED, CLERK'S OFFICE, JULY 11, 2006
*****PC #2 ** * * *
-kkAV
14
k-
It-
- -
Environnentnl
--H U- FF -& HUFF,
Consultants
INC .
71
A
C "t
I 'Z
CALCULATION SHEET
t
; A Sl J, 1 ~-
of
ELECTRONIC FILING, RECEIVED, CLERK'S OFFICE, JULY 11, 2006
* * * * * PC #2 * * * **
® .4 HUFF & HUFF, INC .
CALCULATION SHEET
F 'N ~, ®
IF
Environmental Consultants
Project f+
"is
"All7.'544, 01
cum
'my"la wx
Tide
xo !! VY&L-Li2cs .-
-_-_-- .
signat .' .
tog 60
2-
of" s-',-nv~'lfcd
pe,
awl"
~d
y
1
ELECTRONIC FILING, RECEIVED, CLERK'S OFFICE, JULY 11, 2006
*****PC #2 *****
hl 14
pr 1
v
1,
Id
E
HUFF
.Wwmw
&
.
HUFF,
;
INC .
Signature
--------------
Mm..
Oats
CALCULATION SHEET
Sheer
k A
P'
I k, I
Environmental
HUFF & HUFF,
Consultants
INC .
F"ll
Project
We
Signature
ELECTRONIC FILING, RECEIVED, CLERKS OFFICE, JULY 11, 2006
* * * * * PC #2 * * * * *
I
t
CALCULATION SHEET
tgheu' L-{'
of
-
'9 /
" ~os -s
WIS. c0uhaN
To i' Q ;,W,
0 I'-'" •:/
I
* * * * *PC #2 * * * * *
1, All
HUFF & 11U.77, INC
.
F
"11. A
Emu-nw .ul Consultants
CALCULATION SHEET
T .6,
Signature
ELECTRONIC FILING, RECEIVED, CLERK'S OFFICE, JULY 11, 2006
cwt
Sheet
- of 5-
ELECTRONIC FILING,
*
RECEIVED,
" " " *PC
CLERK'S
#2 * * * *
OFFICE,
*
JULY 11, 2006
L 19
HUFF & HUFF, INC
.
V I k A Environmental Consultants
Title
Signature
20 OIL Citent
/,
ie
r i j
Date
'
.3
CALCULATION SHEET
Sheet 1
of
ELECTRONIC FILING, RECEIVED, CLERKS OFFICE,
JULY 11, 2006
* * * * *PC #2 * * * *
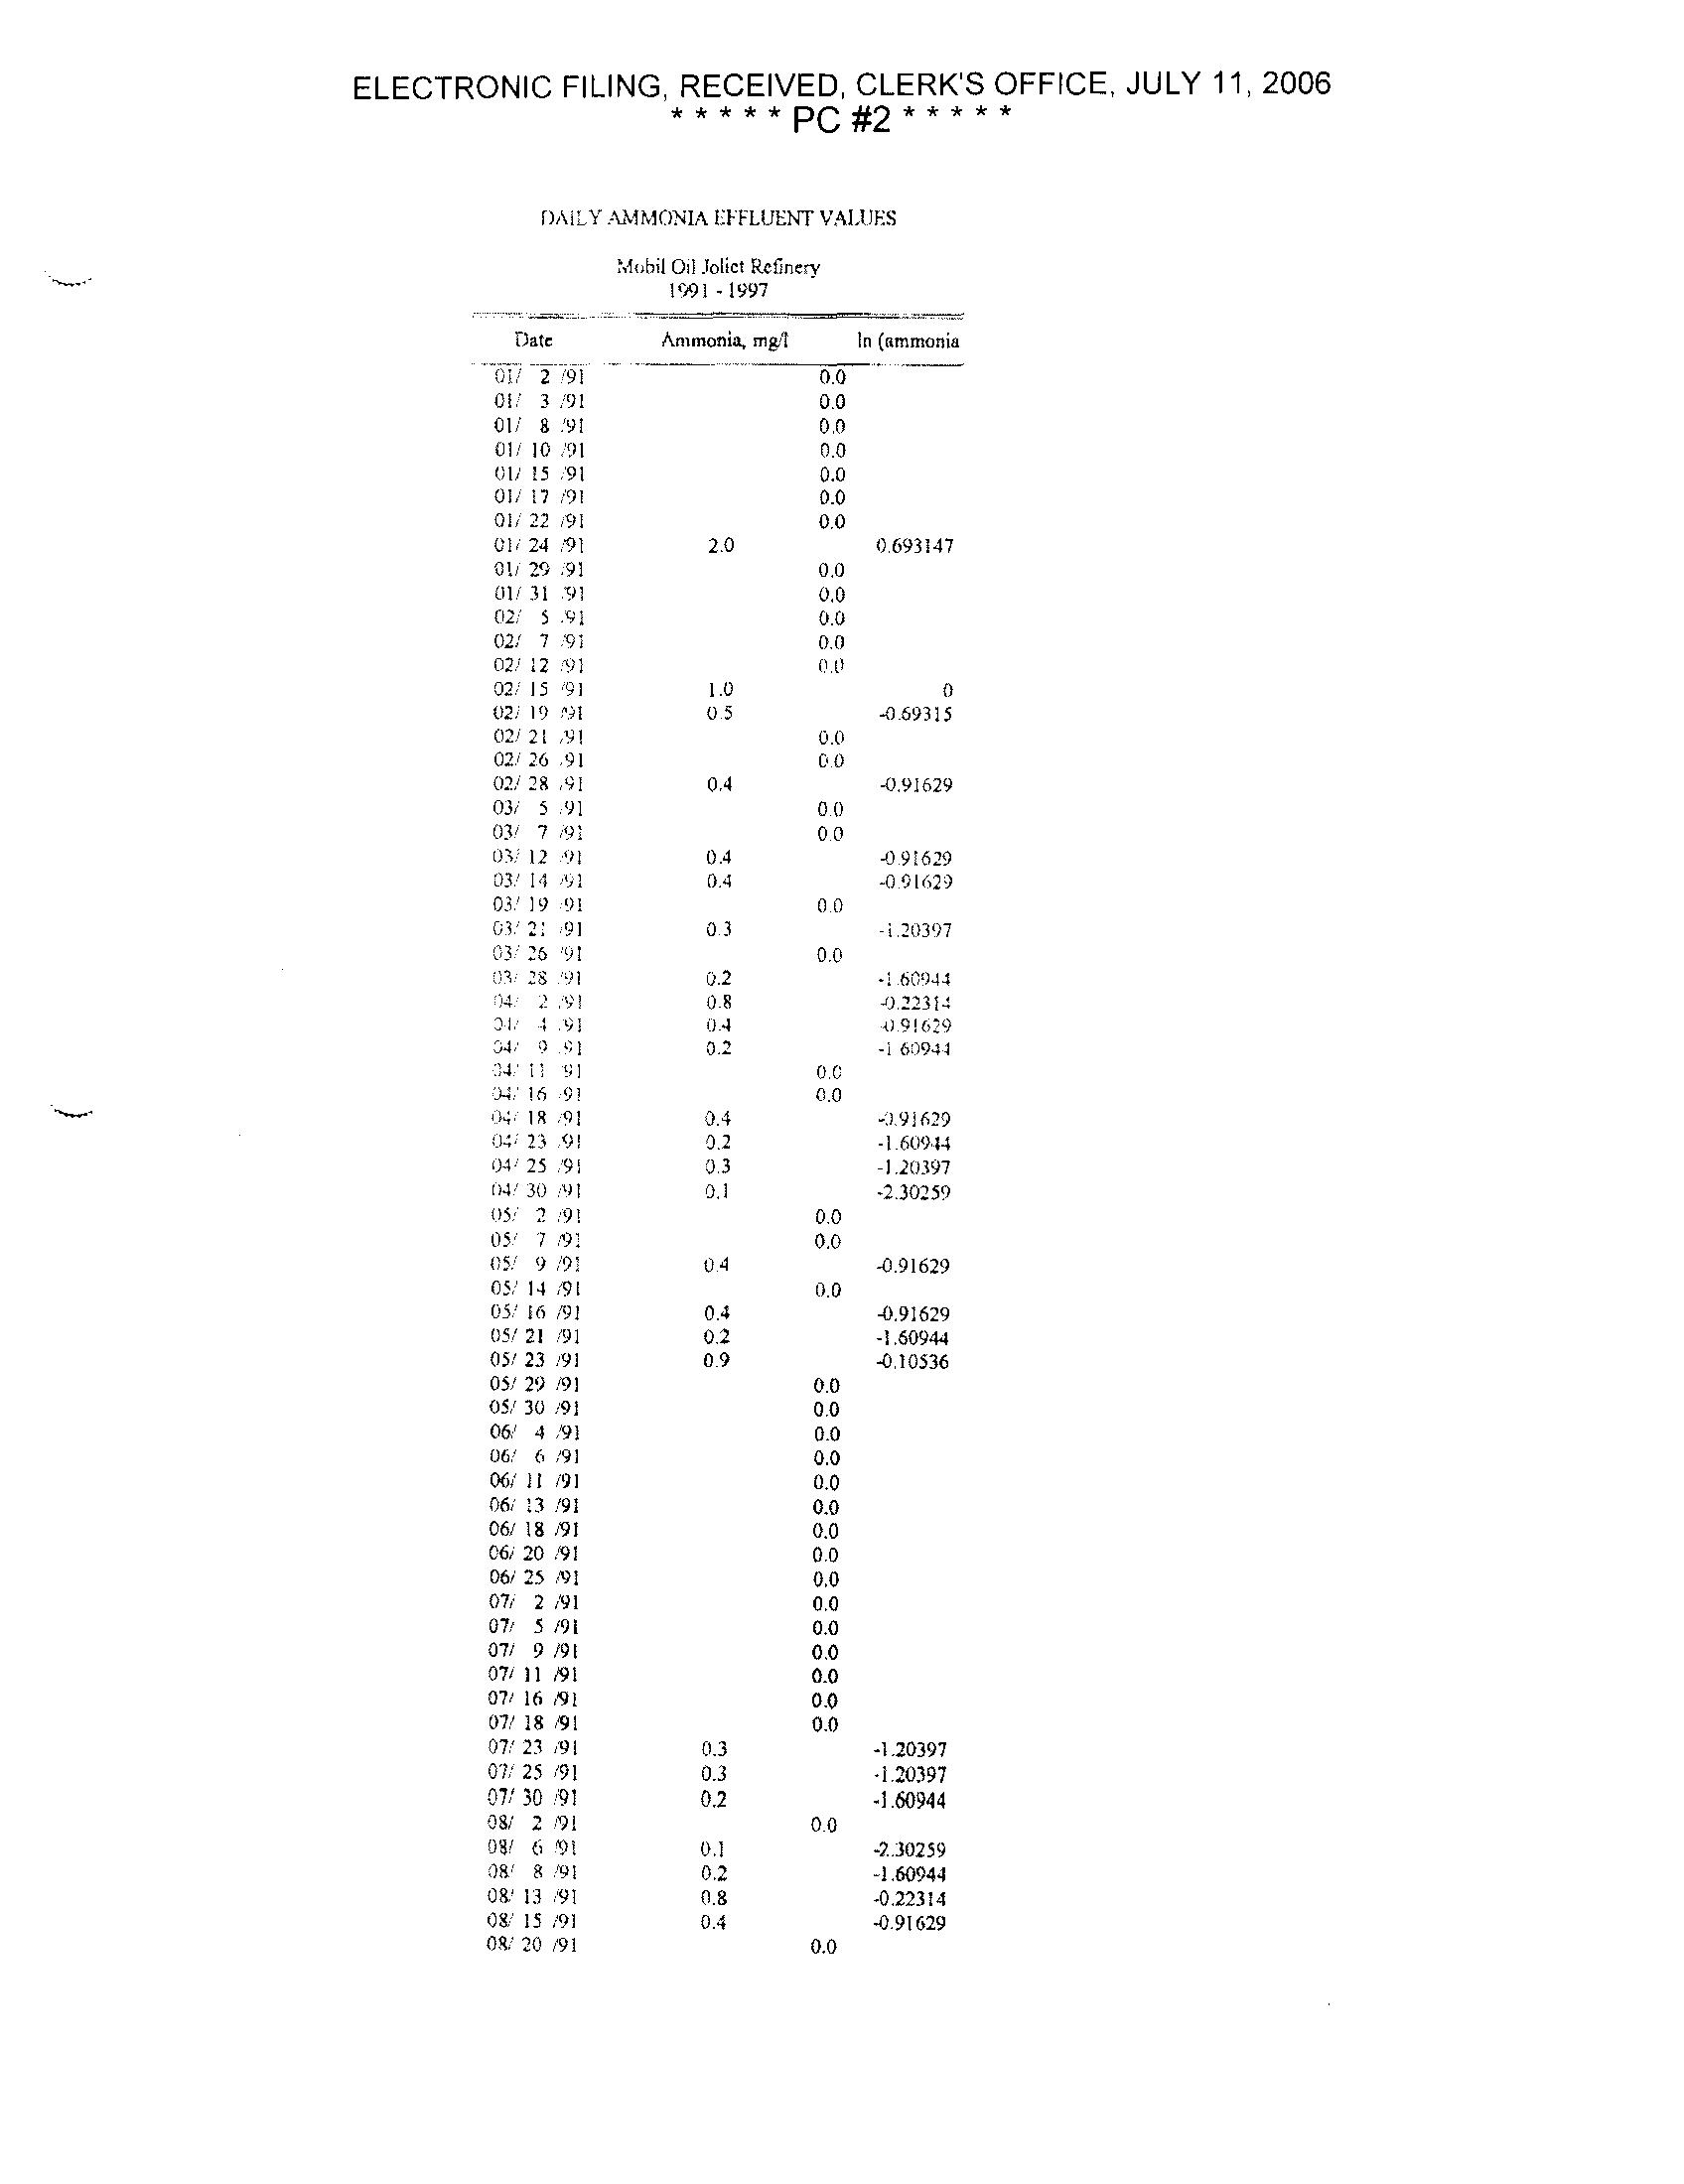
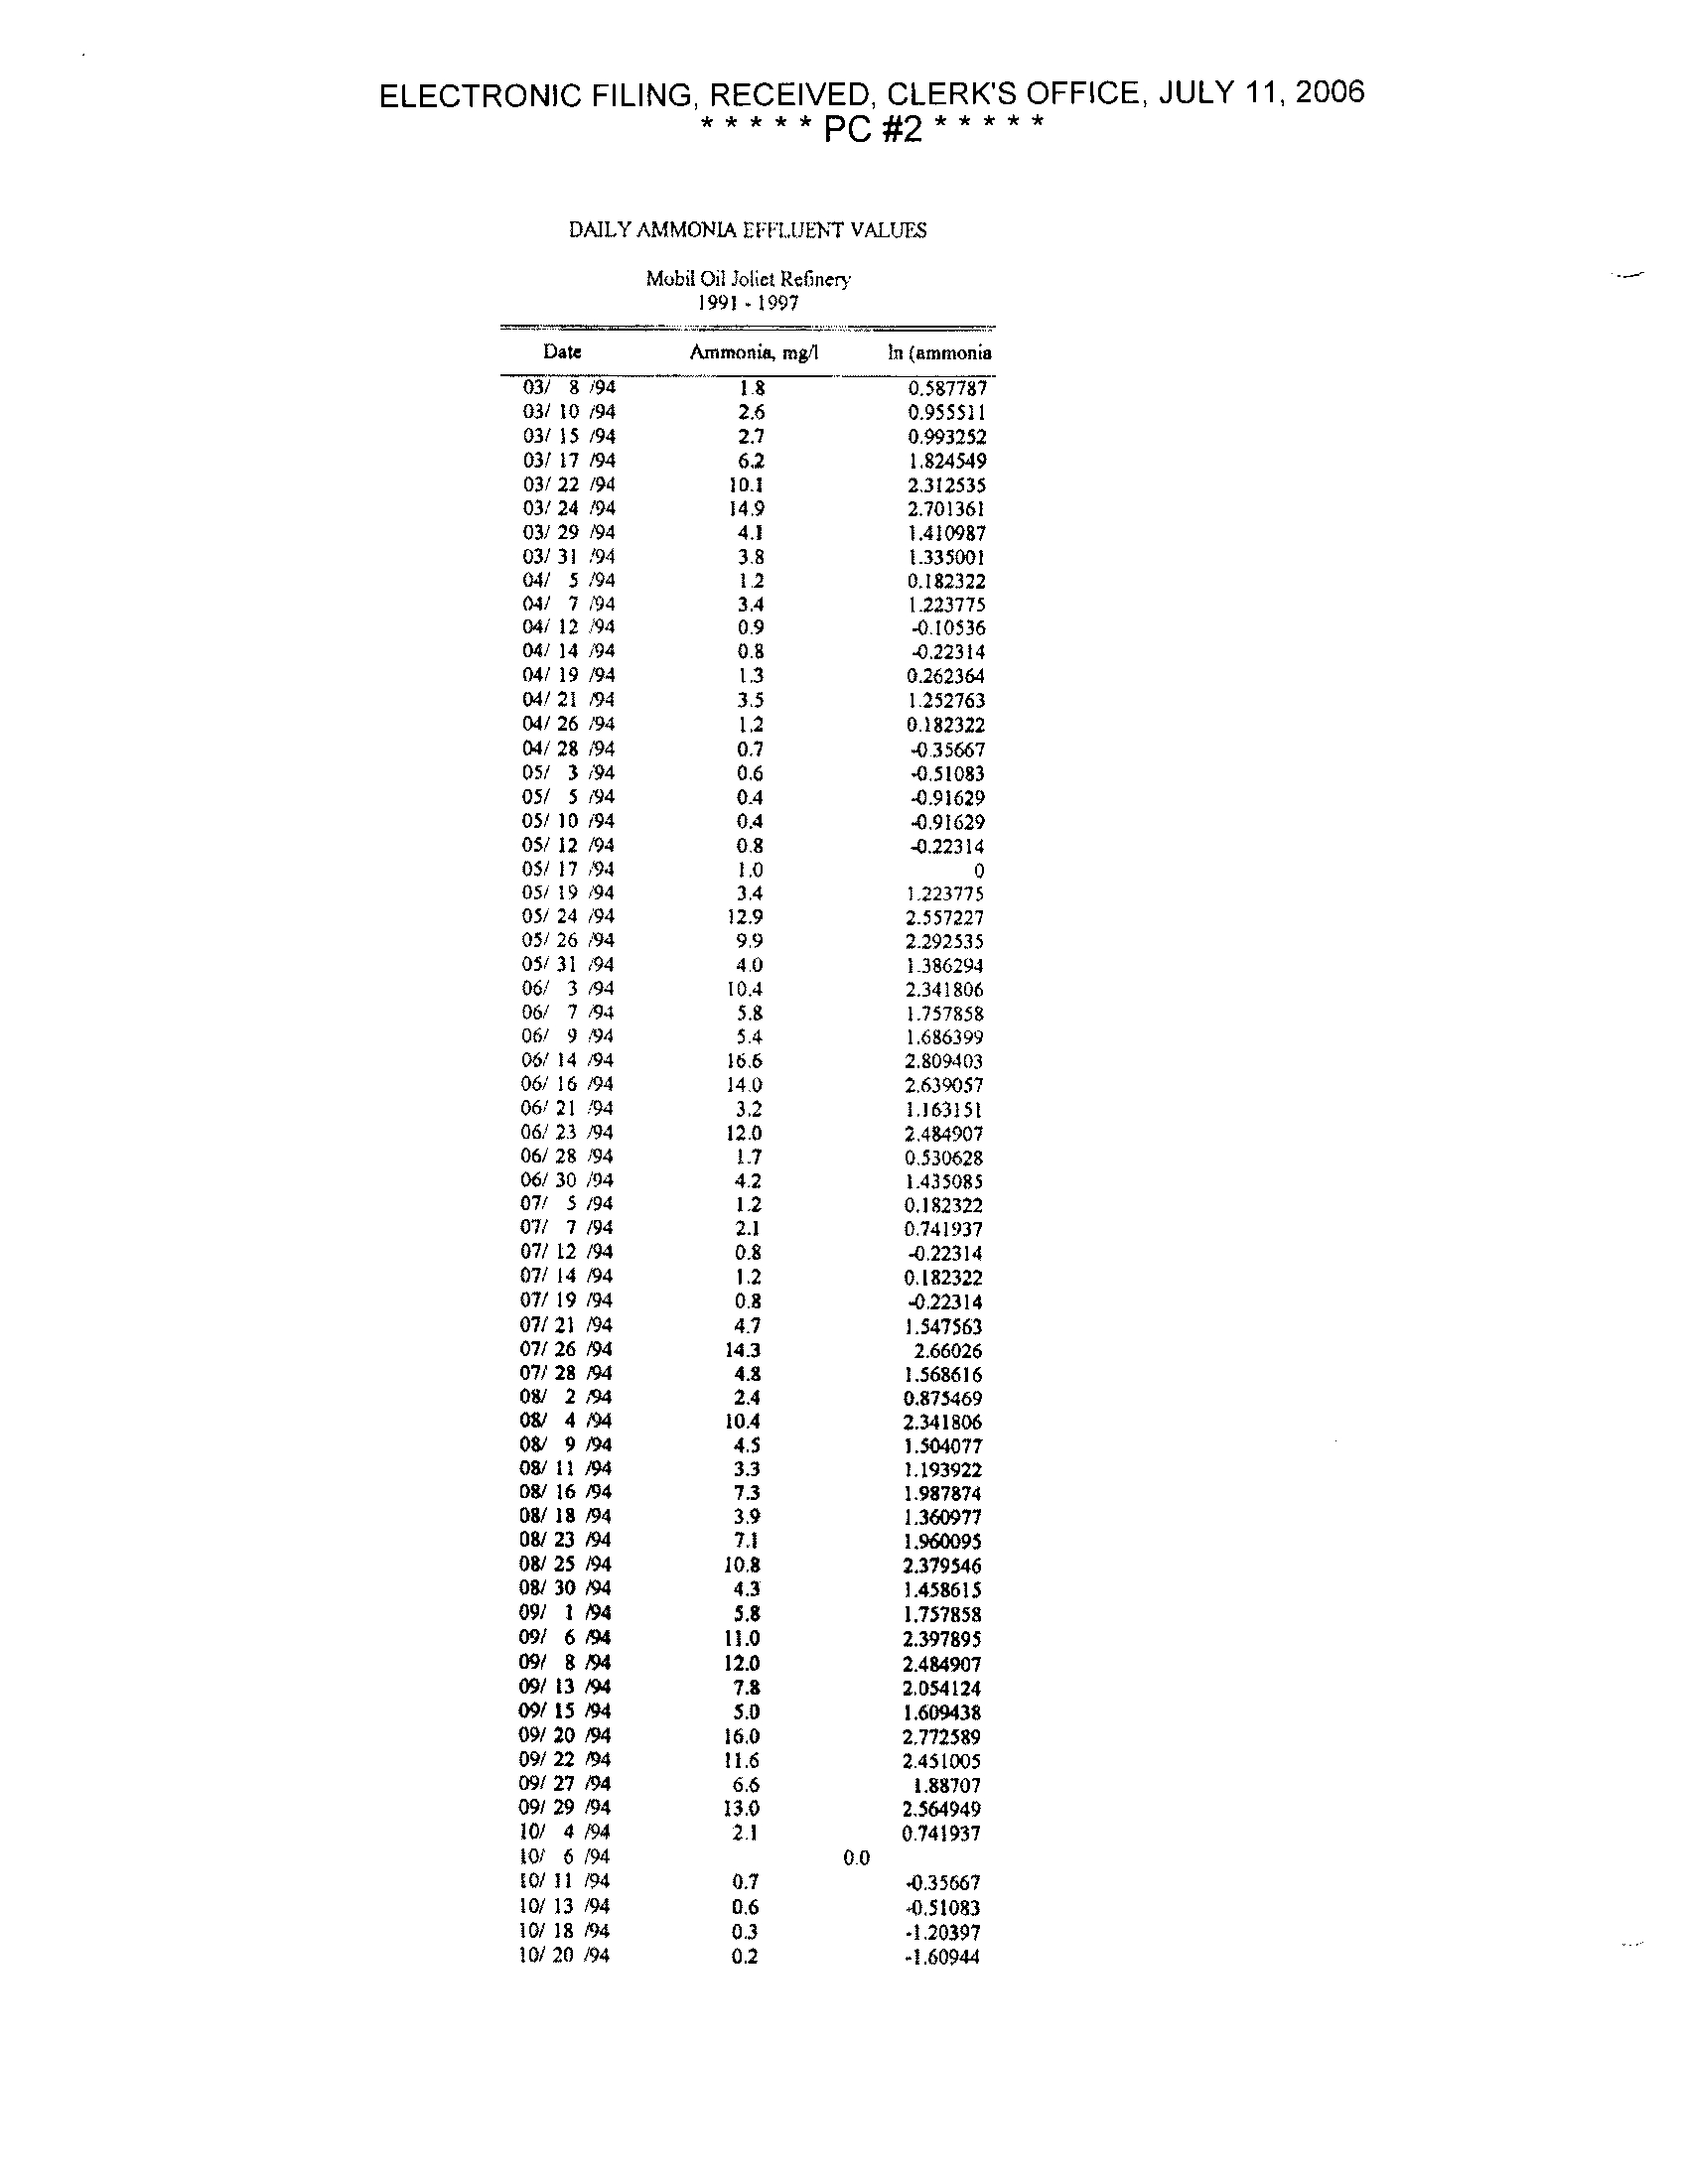
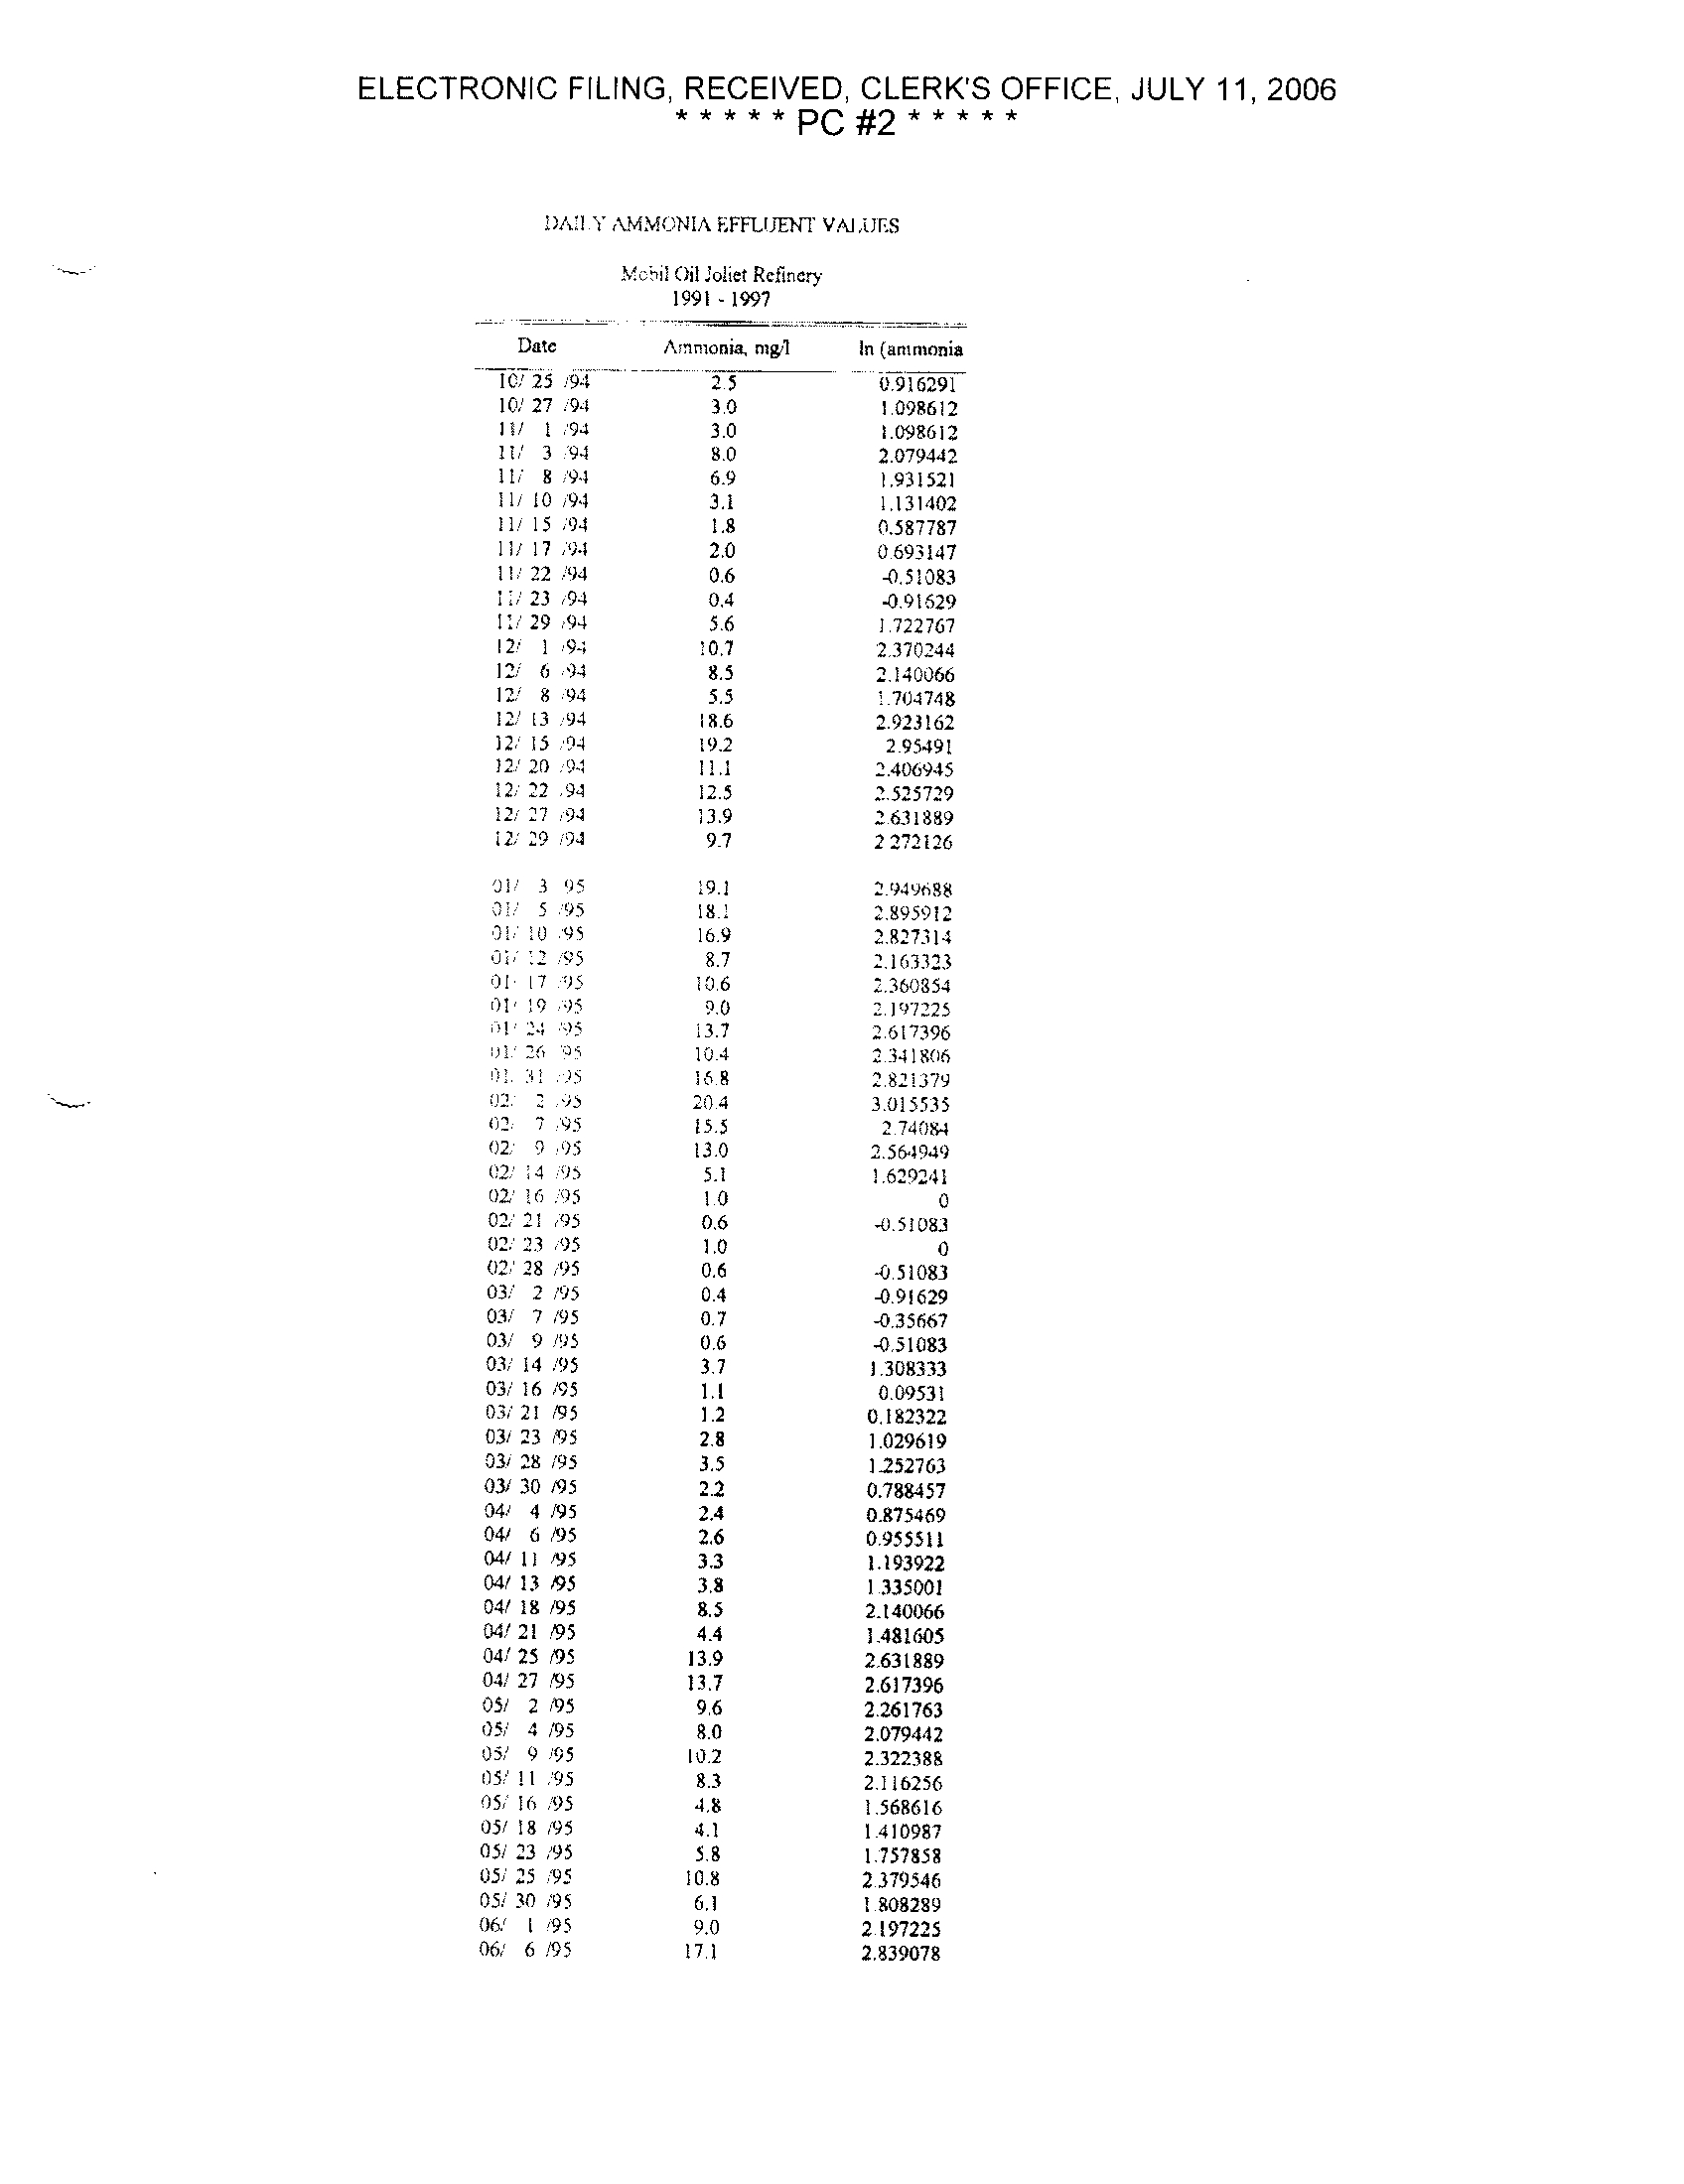
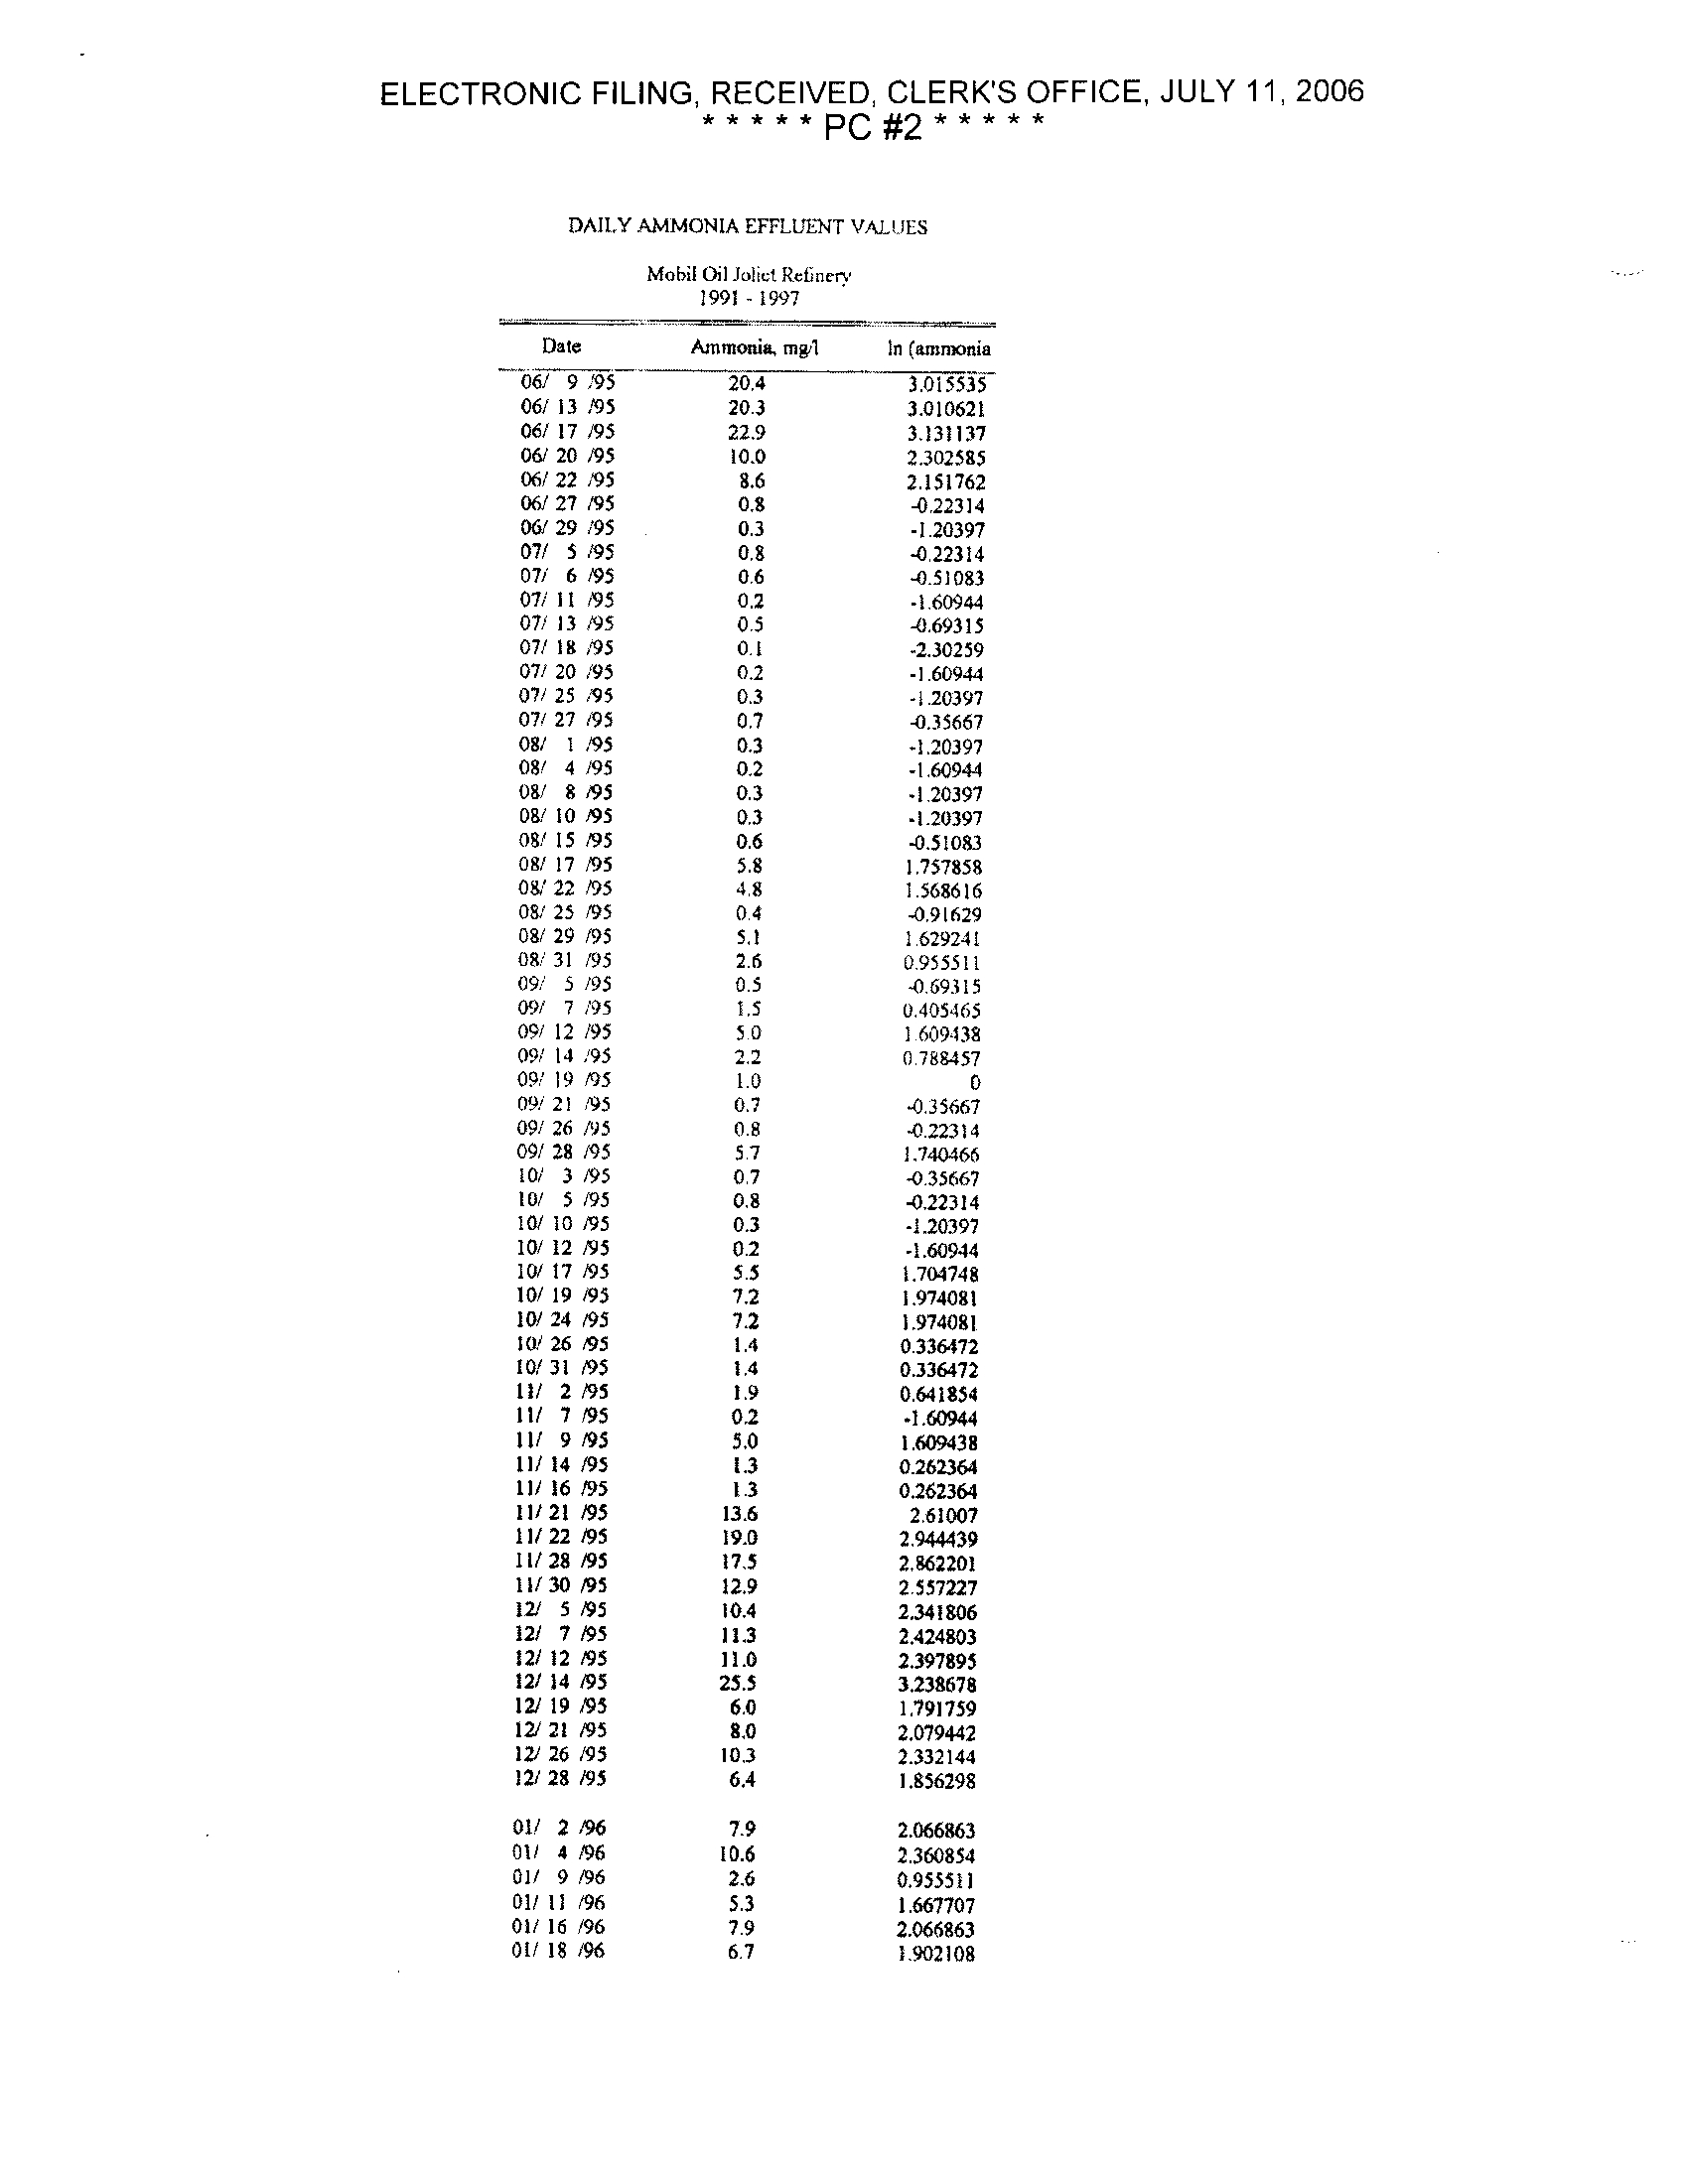
DAILY AMMONIA EFFLUENT VALUES
Mobil Oil Jolict Refinery
Datc
1991-1997
Ammonia, m8/t
In (ammonia
011 2 '91
0.0
01' 3 91
0.0
017 8 /91
0 .0
01! 10 ,'91
0 .0
01) 15 .91
0.0
01/ 17 /91
0.0
01/ 22 91
0.0
01,
24 191
2 .0
0 .693147
011 29 .91
0.0
01/31 111
0
.0
02/ 5
.91
0.0
02/ 7 .91
0.0
02/ 12 ^91
0.0
02/ 15 '91
1 .0
0
02119 ./l
05
-0_69315
02/
21 ,91
0.0
02 , 26 .91
D 0
02128 AI
0 .4
-0 .91629
03/ 5 91
00
03 ,
7 191
00
03112 X91
0
.4
-0 .91629
03,/ 14 '1i1
0A
-091629
03! 19 9!
0.0
G3' 2
: .91
0.3
-1 .20397
03
26 '91
0.0
039 28 'Yl
0 .2
-1 .60944
/9]
0-8
-01231-
0J,
'91
04
+791029
34/ 9 61
0 .2
-160944
24
:' 11
~J I
0 .0
04/ 16 91
0.0
141 1 R
.91
0.4
091629
0.1
23 91
0 2
-1-60914
04 1 25
/91
0 .3
-1 .20397
n4' 30 ,91
0.1
-2 .30259
05' 2
.91
D.0
05' 7 N'
.
0.0
051 9 /91
04
-0 .91629
05/ 14 /91
0.0
05,' 16 /91
0 .4
-0 .91629
05/ 21 /91
0 .2
-1 .60944
05/23191
09
-0,10536
05/ 29
1191
0.0
05/ 30 /91
0,0
06! 4 /91
0.0
06/ 6 /91
0.0
061 I I /91
0.0
06/ 13 /91
0.0
06/ 18 NI
0.0
06/ 20 /91
0.0
06/ 25 NI
0.0
071 2 /91
0.0
071 5 /91
0.0
07/ 9 191
0.0
07/ 11 91
0.0
07/ 16 ,91
0.0
07/ 18 /91
0.0
07/ 23 91
0.3
-1 .20397
02` 25 /91
0 .3
-1
.20397
071 30 .-91
0
.2
-1 .60944
08/ 2 031
00
08/ 6 '91
0
.1
-2.30259
08' 8 /91
0 .2
-1
.60944
0&' 13 /91
0 .8
-0 .22314
08' 15 /91
0 .4
-0.91629
0&/ 20 /91
0.0
ELECTRONIC FILING, RECEIVED, CLERKS OFFICE, JULY 11, 2006
* * * * 'PC #2
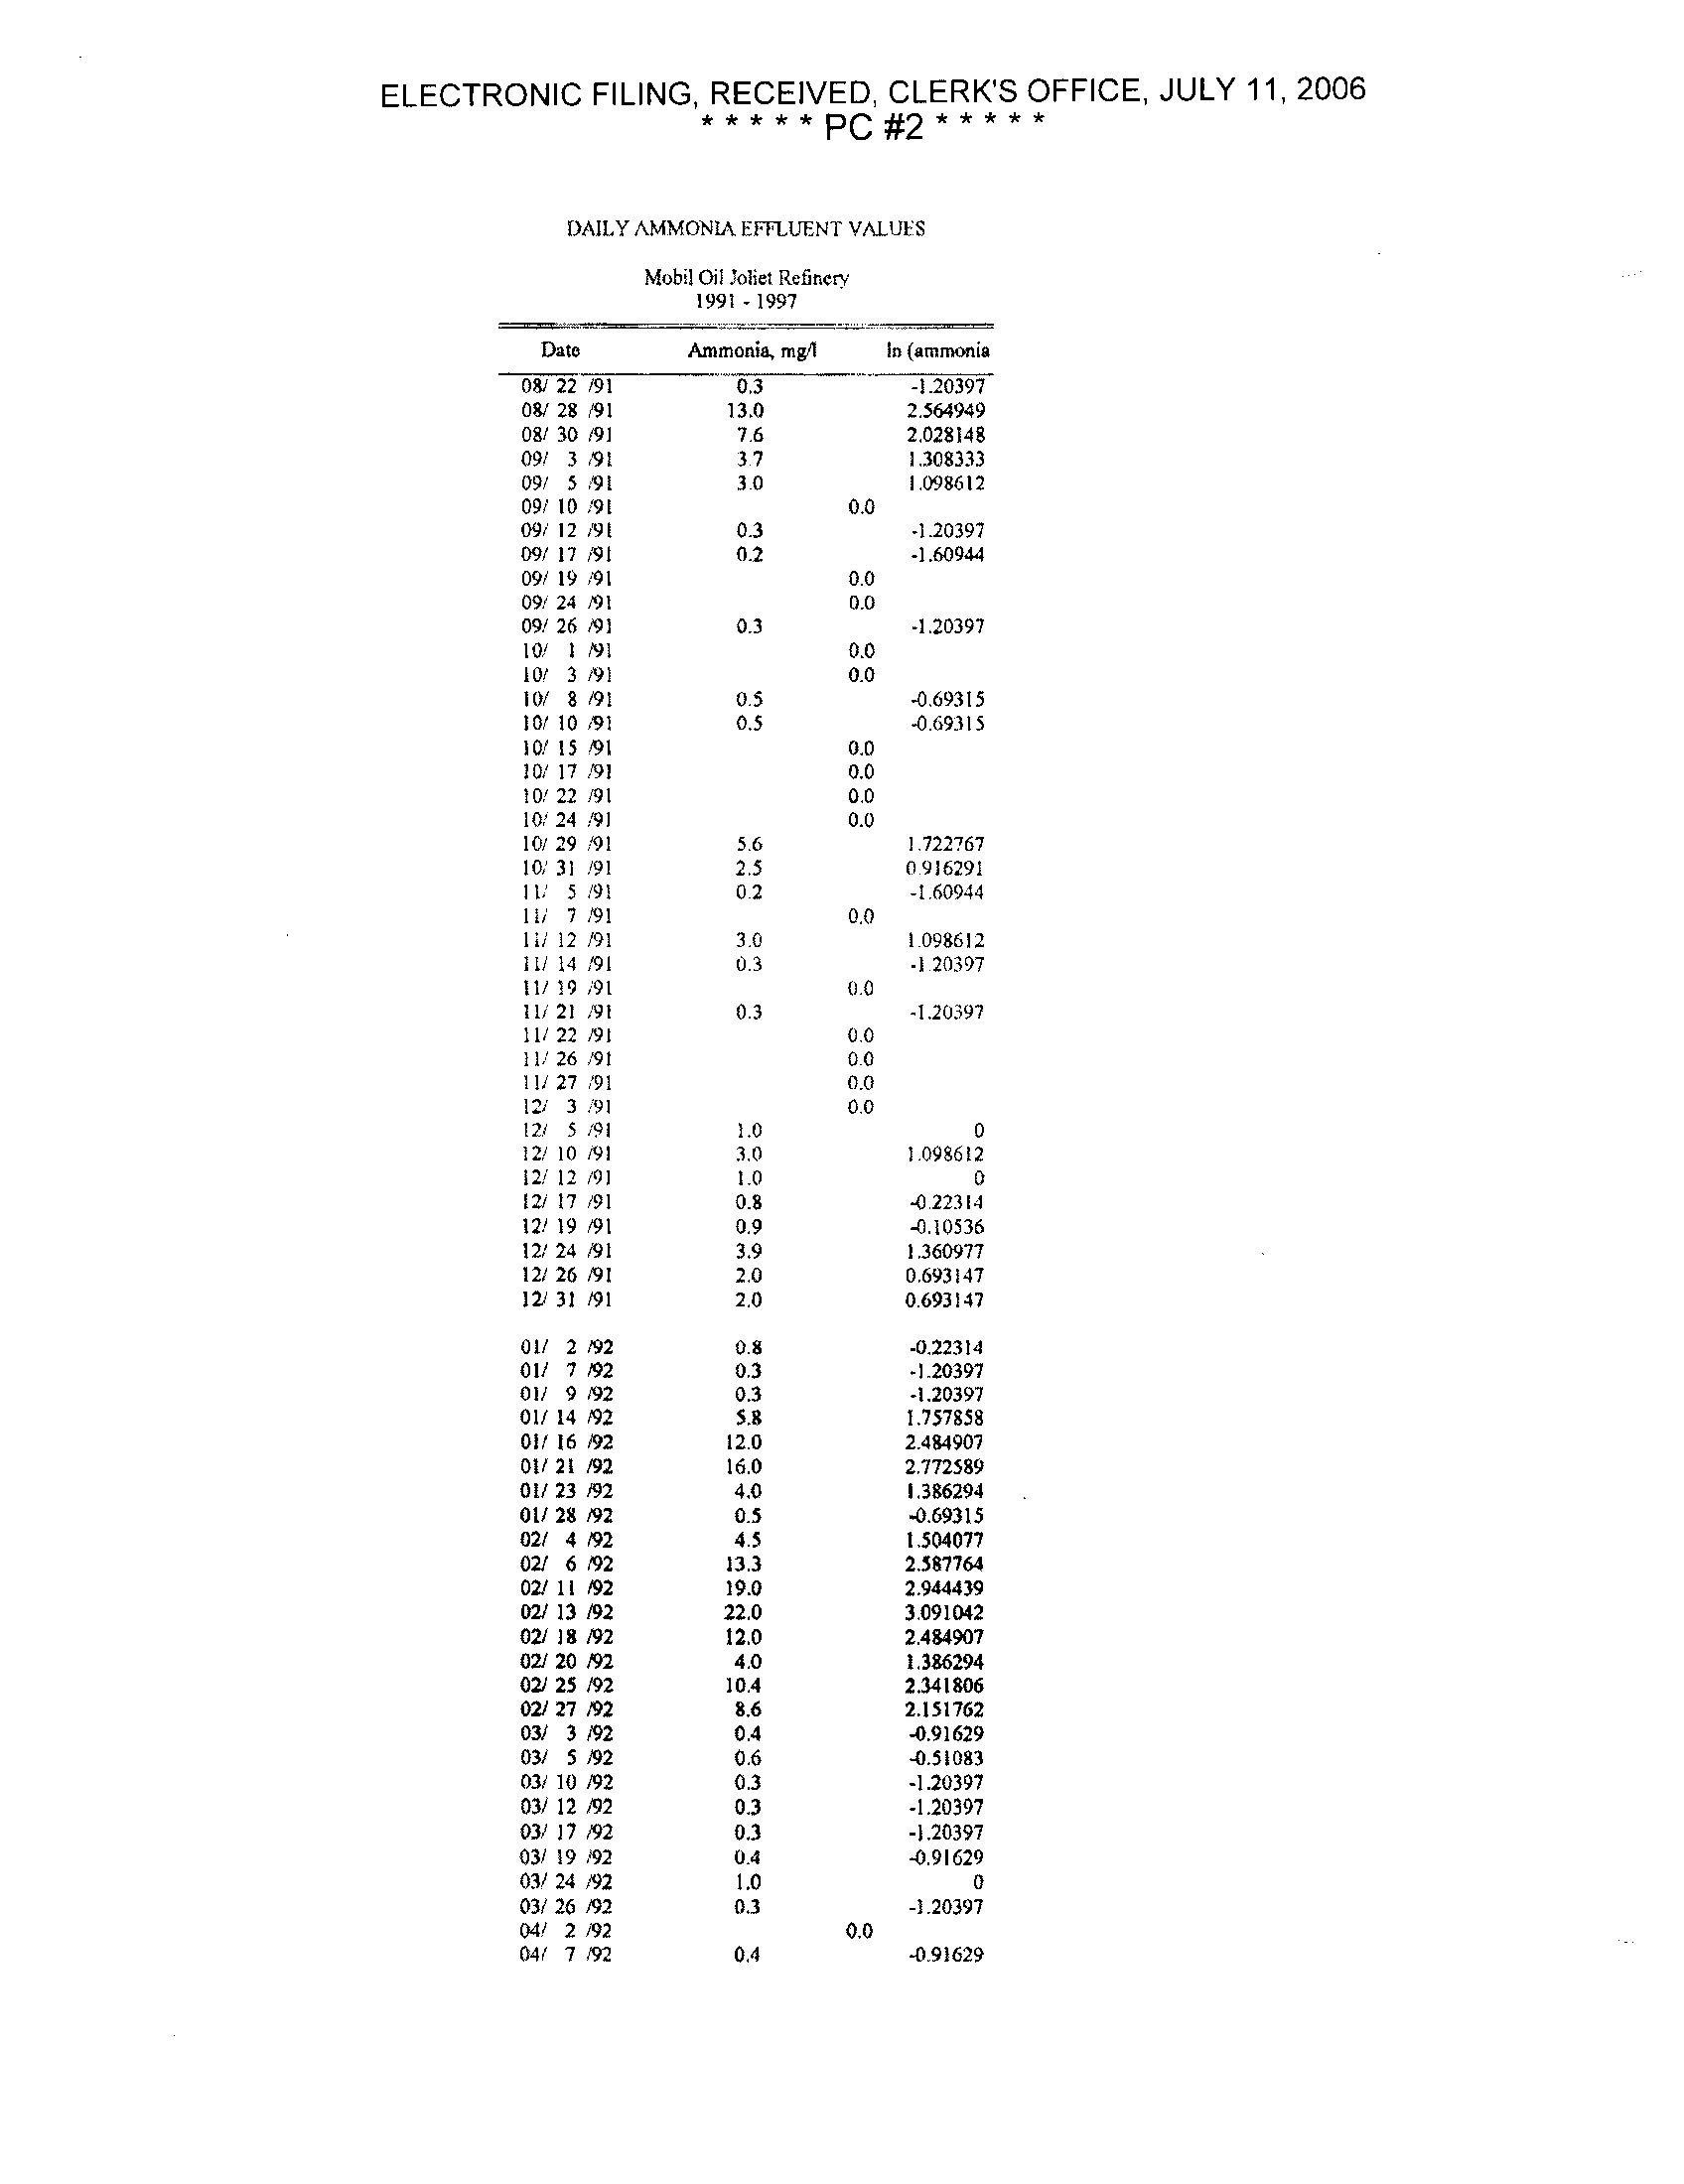
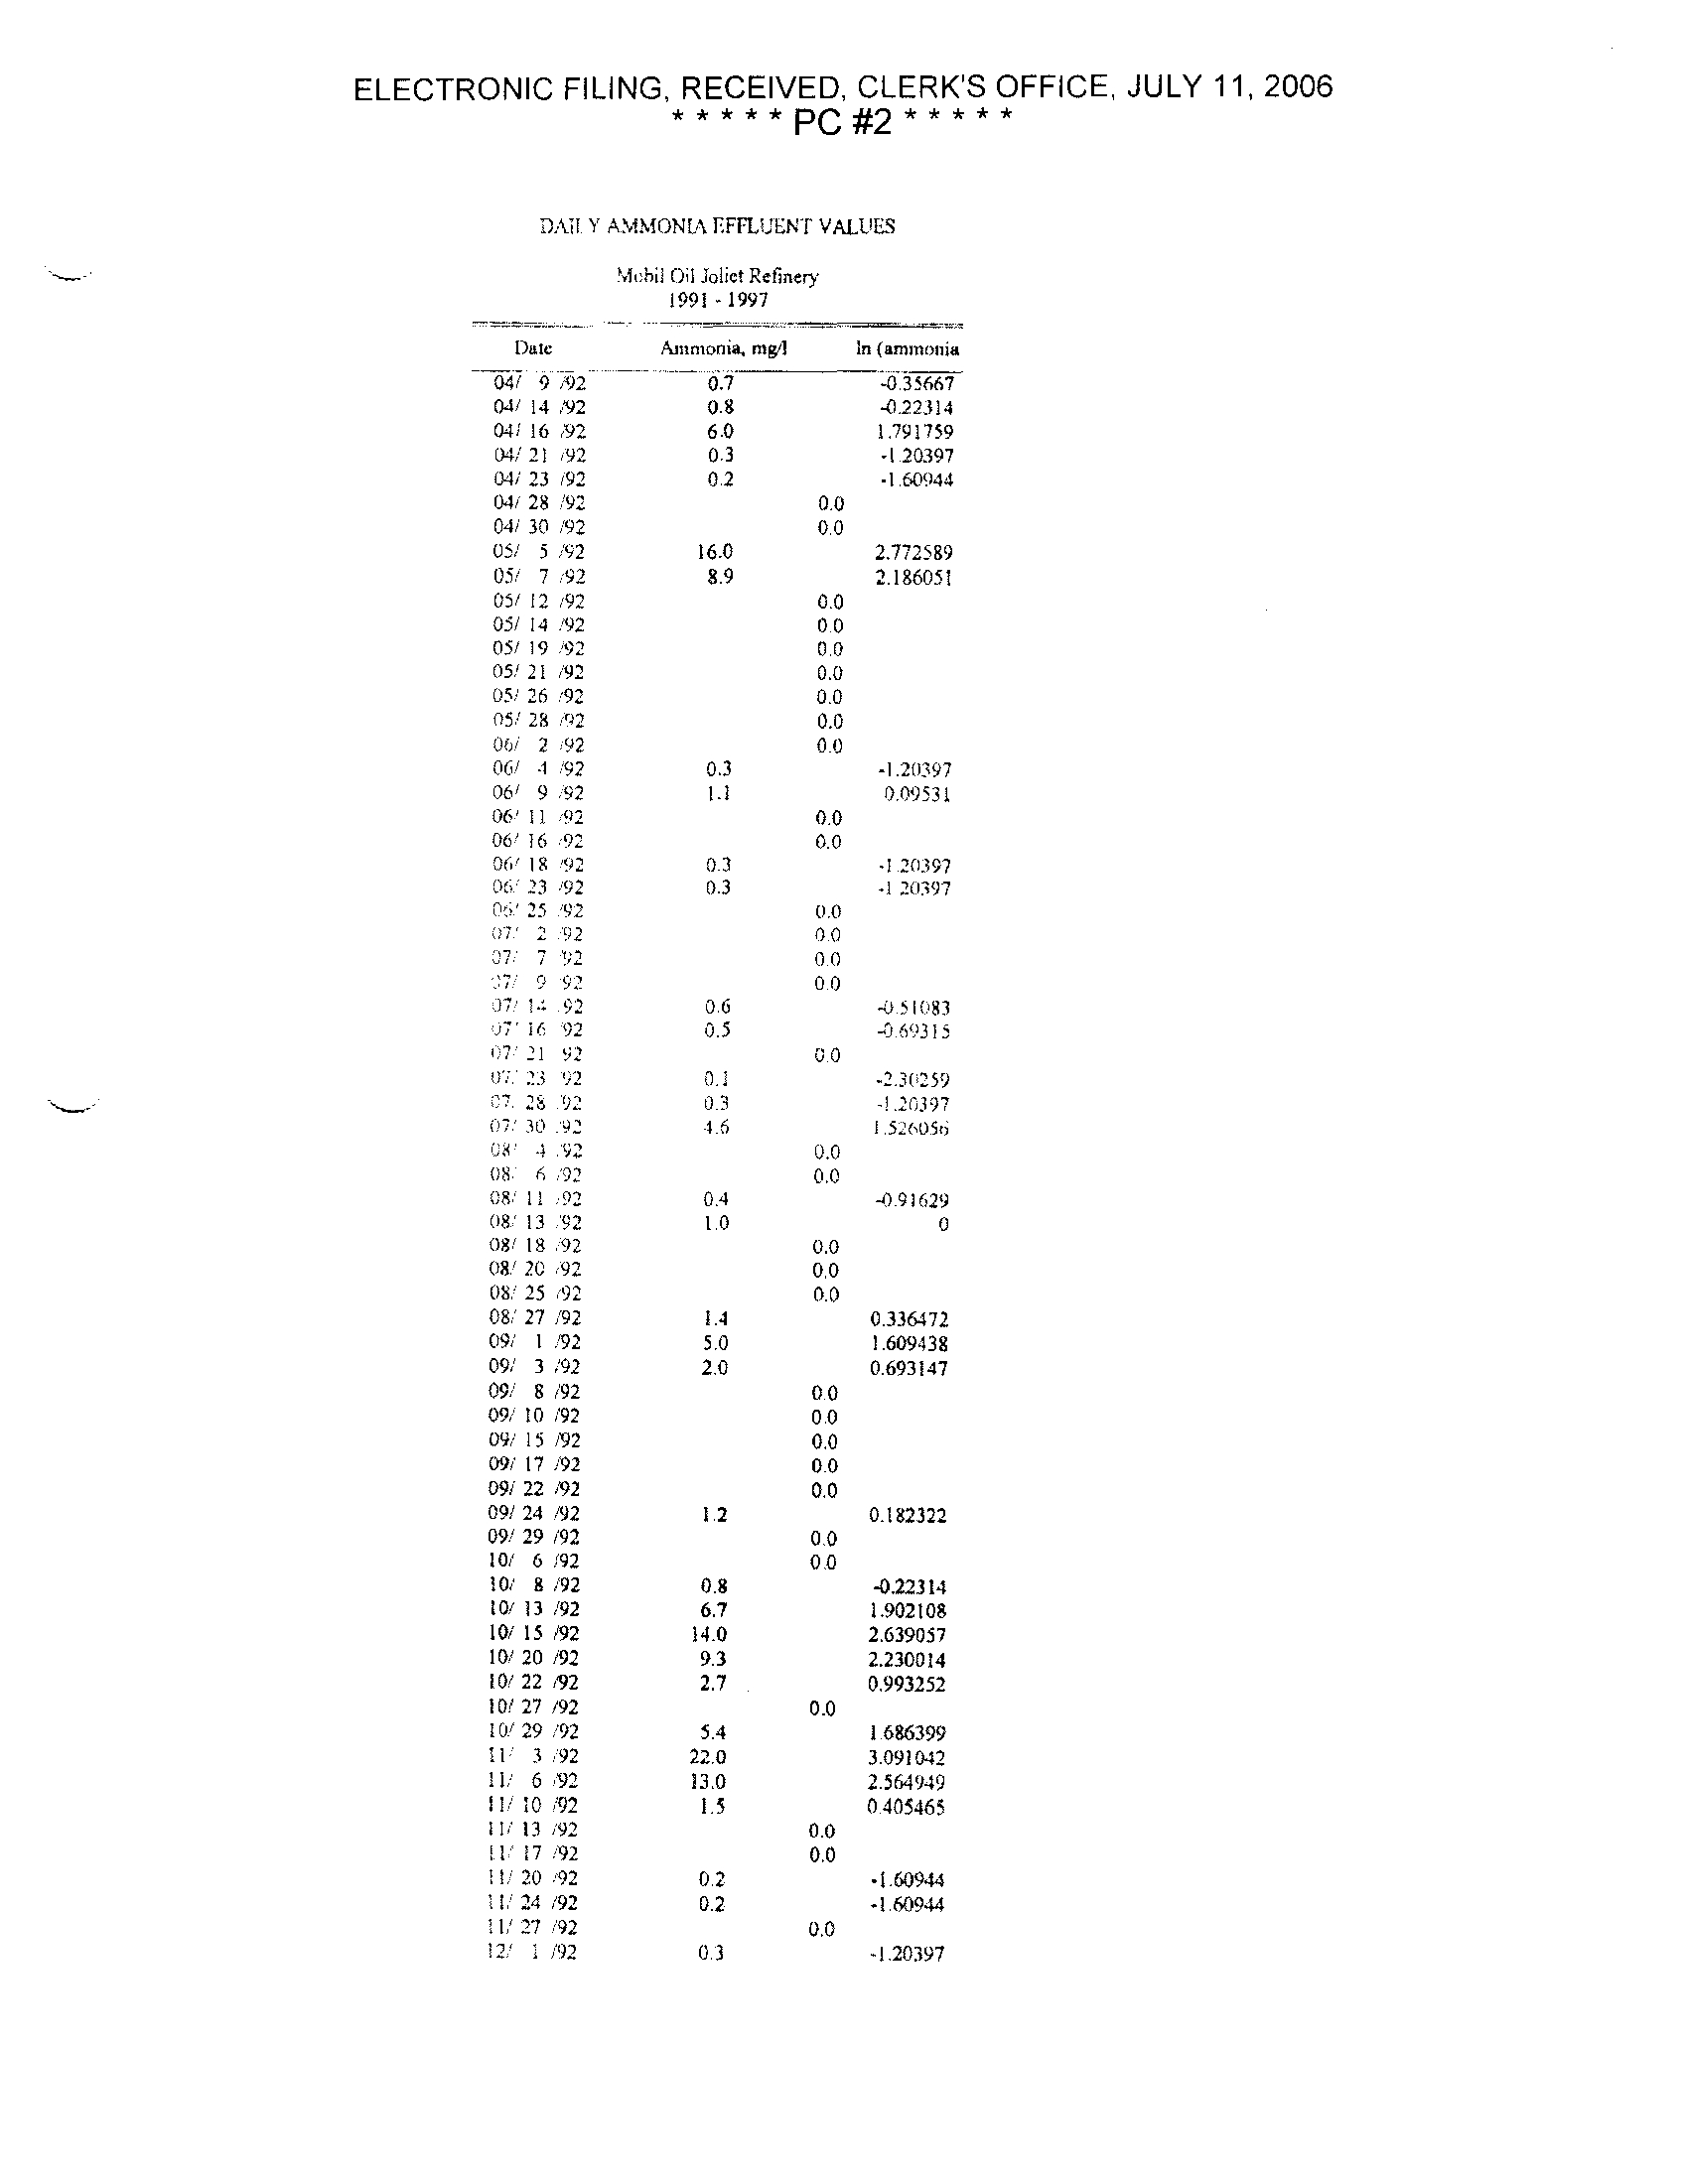
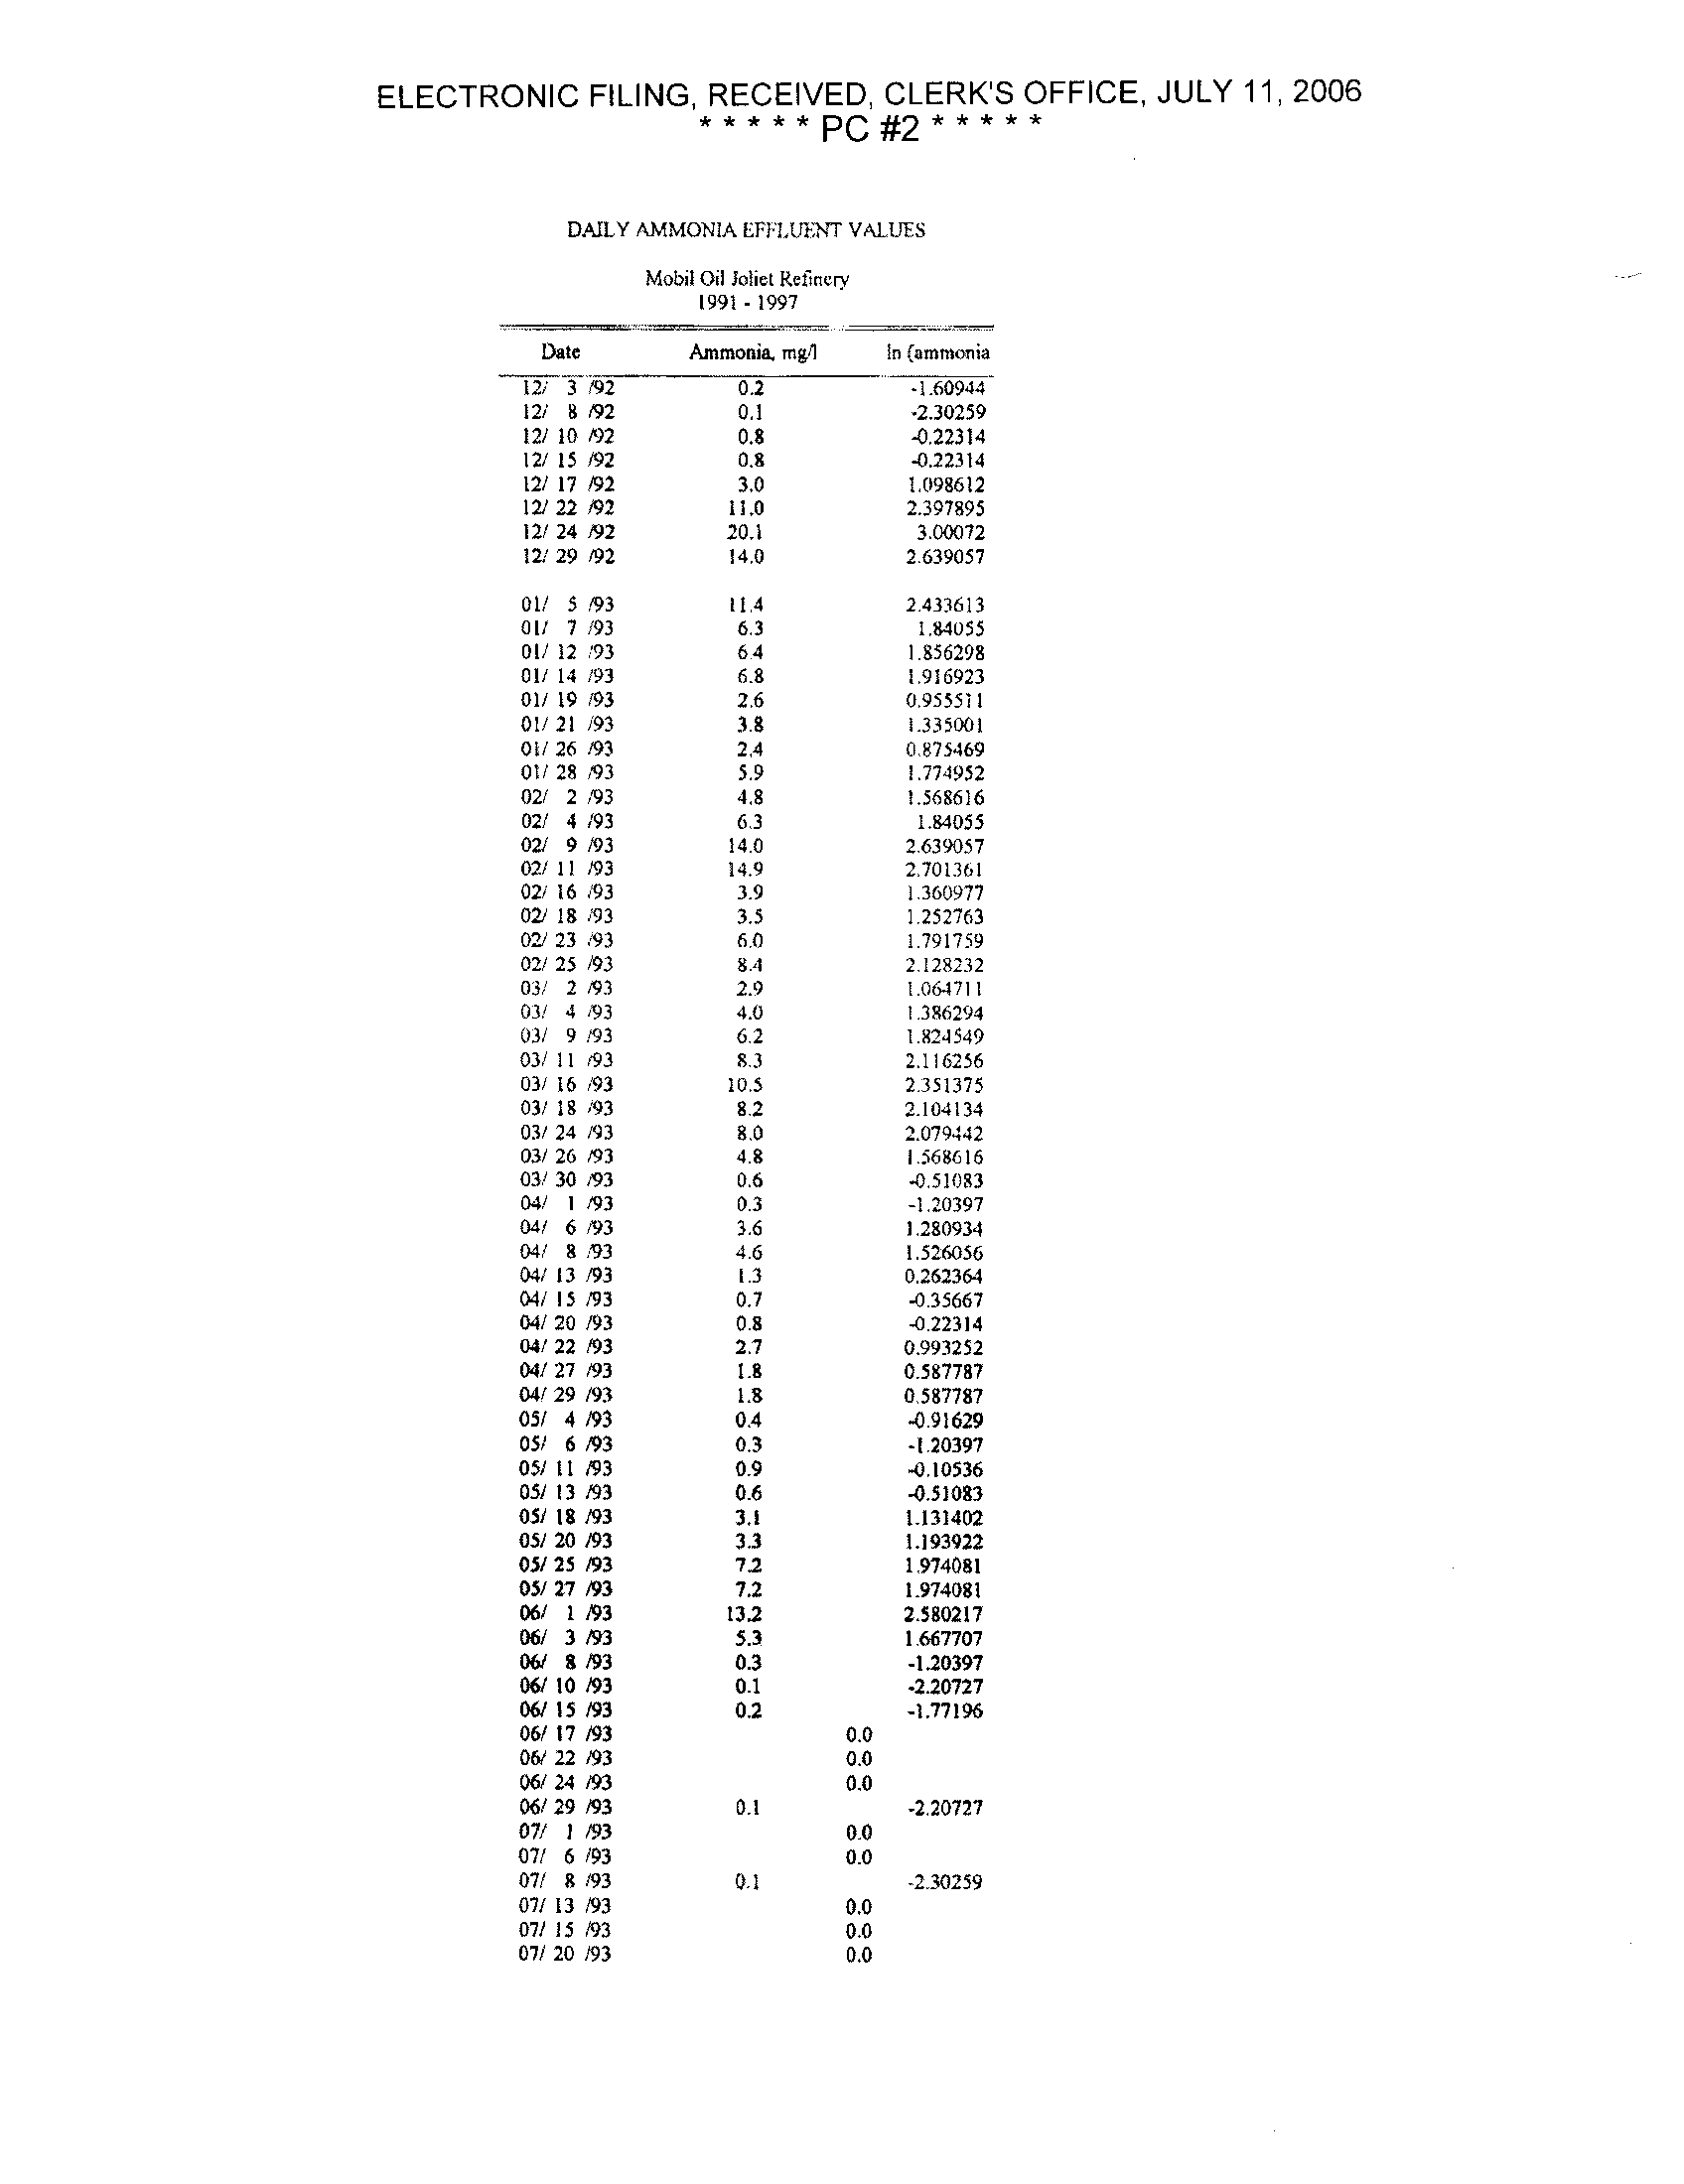
DAILY AMMONIA EFFLUENT VALUES
Mobil Oil 7oliet Refinery
1991 -1997
Date
Ammonia, mg/I
In (ammonia
08/ 22 /91
--
-1 .20397
O8/ 28 /91
13 .0
2 .564949
08/ 30 /91
7 .6
2
.028148
09/ 3 /91
37
1 .308333
09/ 5 :9 t
3 0
1 .098612
09/ IO .'91
0.0
09/ 12 /9l
0 .3
-120397
09/ 17 1191
0 .2
-1 .60944
09/ 19 191
0.0
09.1 24 N I
0.0
09/ 26 NI
0 .3
-1 .20397
10/ 191
0.0
10/ 3 191
0.0
IO/ 8 91
0 .5
-0 .69315
10/ 10 191
0 .5
-0 .69315
10! 15 91
0.0
l0/ 17 91
0.0
to/ 22 /91
0.0
10/ 24 91
0.0
10/ 29 ;91
5b
1,722767
10,1 31 191
2 .5
0916291
I L 5 /91
02
-1.60944
11i 7 /91
0.0
I1/ 12 191
3 .0
1099612
I I/ 14 9I
0.3
.1 20397
11/ 19 /91
0.0
111 21 /91
0 .3
-1 .20397
11/ 22'91
0 .0
11/ 26'91
0.0
11/ 27 /91
0.0
12/ 3 /91
0.0
12/
5 NI
1.0
0
12/ 10 9I
3.0
1 .098612
12/ 12 /91
1.0
0
12/ 17 191
0 .8
-0 .22314
12 19 NI
0 .9
-0 .10536
12/ 24 9I
3.9
1 .360977
12/ 26 91
2 .0
0 .693147
121 31 91
2 .0
0 .693147
01/ 2 /92
0 .8
-0 .22314
oil
O1/ 7
9
/9292
00.3.3
-1-1.20397.20397
01/ 14 /92
5 .8
1 .757858
Off 16 /92
12 .0
2 .484907
01/ 21 /92
16 .0
2 .772589
01/ 23 92
40
1 .386294
01/ 28 92
0.5
-0
.69315
021 4 /92
4.5
1,504077
021 6 /92
13.3
2.587764
02/ 11 /92
19 .0
2 .944439
021
13 /92
22 .0
3 .091042
02/
18 /92
12 .0
2 .484907
02/
20 /92
4 .0
1 .386294
02/ 25 /92
10 .4
2 .341806
02/ 27 92
8.6
2 .151762
03/
3 92
0.4
-0.91629
031 5 92
0.6
-0.51083
03/ 10 /92
0 .3
-1 .20397
03/ 12 /92
0.3
-1
.20397
031 17 /92
0.3
-1 .20397
03/
19 92
0.4
-0 .91629
03/ 24 192
1 .0
0
03/ 26 92
0.3
-1 .20397
04/
2 /92
0.0
04/
7 /92
OA
-0.91629
ELECTRONIC FILING, RECEIVED, CLERK'S OFFICE, JULY 11, 2006
*****PC#2*****
D.lit. Y' AMMONIA EFFLUEN f VALUES
Mobil Oil loliet Refinery
1991 -1997
Dal
Ammonia, mg/I
In (ammonia
047 9 Al2
0 .7
-0.35667
04/
0411614
/92.92
60.0.8
1-0.791759.22314
04/ 21 92
0.3
-1 .20397
21/ 23 '92
0 .2
-160944
04/ 28 192
0.0
04/ 30 /92
0.0
05/
5 /92
16 .0
2 .772589
05/ 7 /92
8 .9
2.186051
05/ 12 /92
0 .0
05/ 14 .92
00
051 19 .92
0.0
05/ 21 /92
0 .0
05/ 26 r92
0 .0
05/ 28 /92
0.0
06/ 2 .92
00
06/
1 /92
0.3
-1 .20397
06/ 9 :92
1 .1
0,09531
06' 11 1) 2
0.0
06' 16 :92
0.0
0606' :
1S
23
592/92
00.3.3
-1
.1 2039720397
0 :Y' 25 '92
00
o7' 2 :92
0.0
;'2
0 .0
00
oT 14 92
0 .6
-051083
u7' 16, 92
0 .5
-0
.69315
117
0'i.'2123
7292
00
223'0259
28 92
0 .
1 .20397
('7' 30 92
1
.526056
A& 4 .'92
0.0
08
: 6 ;92
0.0
08' 11 .92
04
-0_91629
08/
08' 1318 :9292
10
0.0
0
08/ 20 .92
0,0
08' 25 092
0 .0
08' 27 ,92
1A
0 .336472
09/ 1 /92
5 .0
1 .609438
09/ 3 /92
2.0
0 .693147
09/ 8 /92
00
09/ 10 /92
0 0
09/ 15 /92
0.0
09/ 17 /92
0-0
09i 22 '92
0.0
09/ 24 '92
0 .182322
09/ 29 /92
0 .0
10/ 6 192
0.0
10/ 8 /92
0 .8
-0 .22314
10/ 13 /92
6 .7
1 .902108
(0/ 15 /92
14
.0
2 .639057
10/
10/
22
20 /92/92
92.7.3
20.230014.993252
ID!
10/ 29
27
/92/92
5 .4
0
.0
1 .686399
11 3 /92
22,0
3 .091042
11/ 6 X92
13 .0
2 .564949
I I/ 10 192
1 .5
0405465
II/ 13 /92
0
.0
11 17 r92
0.0
(/ 20 '92
0 .2
-1
.60944
11! 24 /92
0.2
-160944
11/ 27 /92
0.0
12' 1 /92
0 3
-1 .20397
ELECTRONIC FILING, RECEIVED, CLERK'S OFFICE, JULY 11, 2006
* * * **PC #2 * * * * *
DAILY AMMONIA EFFLUENT VALUES
Mobil Oil Joliet Refinery
1991-1997
Date
Ammonia .
mg/1
In (ammonia
12/ 3)92
0
.2
-1
.60944
12/ 8 92
0.1
-2.30259
12/ 10 92
0.8
-0.22314
12/ 15 /92
0.8
-0.22314
12/ 17 /92
3.0
1.098612
12/ 22 /92
11 .0
2 .397895
12/ 24 /92
20.1
3 .00072
12' 29 /92
14 .0
2 .639057
Ol/ 5 /93
114
2 .433613
01/ 7 193
6.3
1 .84055
01112 /93
64
1 .856298
01/ 14 193
6 .8
1 .916923
01/ 19 /93
2 .6
0 .955511
01/ 21 193
3 .8
1
.335001
Oil 26 193
2A
0 .875469
OW 28 93
5.9
1 .774952
02/ 2193
4 .8
1 .568616
02/ 4 /93
6 .3
1 .94055
02/ 9 93
14 .0
2 .639057
02/ 11 /93
14 .9
2 .701361
02/ 16 /93
3 .9
1 .360977
021 18 93
3 .5
1 .252763
02/ 23 .93
6,0
1 .791759
02/ 25 /93
8 .4
2,128232
03/ 2 93
2 .9
1 .064711
03/ 4 93
4 .0
1 .386294
03/ 9193
6 .2
1 .824549
03/ 11 t93
8 .3
2 .116256
03/ 16 93
10 .5
2,351375
03/ 18 1)3
8 .2
2 .104134
03/ 24 /93
8 .0
2 .079442
03/ 26 /93
4 .8
1 .568616
03/ 30 93
0 .6
-0 .51083
04/ 193
0 .3
-1 .20397
041 6 /93
3 .6
1 .280934
04/ 8 :93
4 .6
1 .526056
041 13 /93
1 .3
0 .262364
04/ 15 /93
0 .7
-0 .35667
04/ 20 /93
0 .8
-0 .22314
041 22 /93
2 .7
0 .993252
04/ 27 93
1.8
0 .587787
04129 /93
1 .8
0,587787
05/ 4 /93
0 .4
.0 .91629
05/ 6 93
0
.3
-1 .20397
05/ 1193
0 .9
-0 .10536
051 13 93
0 .6
-0.51093
051 IS 193
3 .1
L131402
05/ 20 /93
3 .3
1 .193922
05/ 25 /93
72
1
.974081
05/ 27 /93
7 .2
1974081
06/ 1 /93
131
2 .580217
06/ 3 53
5 .3
1,667707
06/ 8 /93
0 .3
-110397
06/ 10 /93
0 .1
-2.20727
06/ 15 /93
0 .2
-1.77196
061 17 /93
0 .0
06/ 22 93
0.0
06/ 24 /93
0 .0
06129 /93
0 .1
-2.20727
07/ 1 /93
0.0
07/ 6 /93
0.0
07/ 8 93
0.1
-2.30259
07/ 13 /93
0 .0
071 15
/93
0.0
07/ 20 93
0.0
ELECTRONIC FILING, RECEIVED, CLERK'S OFFICE, JULY 11, 2006
* * * **PC #2 * * * * *
DAI1 .
i' AMMONIA EFFLUENT VALUES
Moon Oil Juliet Kc&ae,y
1991 - 1997
Date
Ammonia, mg/i
In (ammonia
07/ 22 ,93
0 .2
-1
.60944
0&'
0708/07/
08'
.'
29
3
10
27
5
/93/93/93/9393
126.6.2
000.0.0.0
21.824549.533697
08/ 12 93
0 .3
-1 .20397
0& 17 1)3
0
.3
-1.20397
08'
0&'
08' 24
2`6
19
/9319343
01.9.1
0.0
-00.09531.10536
09/09'
1010100909090909/
0908131091
.
.
.
.'
1
.
1
23
12
16
21
1428
57729
30
/93'93.93.03:93.93939393.93:939393
2401830000000000.6.1.1.1.3.4.3.3.2.0.2.2
231-160944-1-1-230259-02-1-1-2-1.890372.280934.178054.60944.20397.30259.30259.20397.60944.91629.20397
10 . 14 /91
12
0 .182322
1 . .
1'1
I0 ; 2'.
n3
0 .9
-010536
lii
-7I .
;
262R
2
/93J3^
005
;
.66
0470004-0,69315x7510838.51/83
11/
1111/. 16
1811
49/93.93.93.'1393
1212100.2.3.6.3.2
026236422-0.509599.501436.5109360944
It , 2 3 /93
21 .6
3.072693
11/
I
12'1212~li
1
2l30
92
7
'93/93./93:93,93
1521154J1.6.3.7.7
3
0221.470004.10987.753661.753661058707
12/
12/
12/
12/
12/
12/
28
23
30
21
14
16
/93193/93193/9393
000000.3.6.8.7.6.8
-0-0-1-0-035667-0.20397.51083.22314.51083.22314
01/
01/
O1/
011
01/
Oil I
20
18
13
4
6194I
194/94/94/94/94
0000001.5.4.4.4.6
-0-1-0-0,91629-0-069315.91629.91629.51083.60944
Oli
Oli
021
27
25
1
/94
/94
/94
00J0.9.6
-0-35667-0-0.51083.10536
02,'
021
3
8 194/94
0.6
0 .0
-0 .51083
02l 10 /94
3 .5
1252763
02/ 15 94
11 .4
2.433613
02117
0302/
02,
03/
,
24
22
3
1
/94/94194/94
:94
.414911.9.4.5.0
020,33647201.197225.336472.504077.641854
ELECTRONIC FILING, RECEIVED, CLERK'S OFFICE,
JULY 11, 2006
* * * * *PC #2 * * * * *
DAILY AMMONIA EFFC.UENT
VALUES
Mobil Oil Solici Re6ncry
1991-1997
Dam
Ammonia, mg/I
In (ammonia
03/ 8 /94
1 .8
0.587787
03/ 10 /94
2 .6
0.955511
03/ 15 /94
2 .7
0.993252
03/ 17 /94
6 .2
1 .824549
03/ 22 /94
10 .1
2.312535
03/24194
14 .9
2 .701361
03/ 29 94
4 .1
1 .410987
03131 /94
3 .8
1.335001
04/ 5 194
12
0.182322
04/ 7 94
3 .4
1 .223775
04/ 12 /94
0 .9
-0 .10536
041 14 /94
0 .8
.0 .22314
04/ 19 /94
1.3
0 .262364
04/ 21 /94
3 .5
1 .252763
04/ 26 /94
1.2
0
.182322
04/ 28 94
0.7
-035667
05/ 3 ,94
0 .6
-0.51083
05/ 5 94
0.4
-0 .91629
05/ 10 /94
OA
-0 .91629
OS/ 12 /94
0.8
-0 .22314
05/
05/
19
17
/94;94
31 .4.0
1 .2237750
05/ 24 /94
12 .9
2 .557227
05/ 26 94
9,9
2 .292535
ON 31 /94
4 .0
1 .386294
06/ 3 /94
10 .4
2 .341806
06/ 7 94
5 .8
1
.757858
061 9 94
5 .4
1 .686399
06/ 14 /94
16 .6
2 .809403
06/ 16 /94
14 .0
2 .639057
06/ 21 :94
3 .2
1 .163151
06/ 23 /94
12 .0
2 .484907
06/ 28 '94
1 .7
0
.530628
06/ 30 /94
4 .2
1 .435085
07/ 5 /94
1 .2
0 .182322
071 7 /94
2 .1
0 .741937
07/ 12 /94
0 .8
-0 .22314
071 14 /94
1 .2
0 .182322
07/ 19/94
0 .8
-0 .22314
07121 /94
4.7
1 .547563
07/ 26 /94
14
.3
2.66026
07/ 28 94
4.8
1 .568616
08/ 2 94
2.4
0.875469
08/ 4 /94
10.4
2.341806
08/ 9
/94
4.5
1 .504077
08/ 11 /94
3 .3
1 .193922
08/ 16 /94
7 .3
1 .987874
08/ 18
94
3 .9
1 .360977
O8/ 23 /94
7.1
1 .960095
08/ 25 /94
10.8
2 .379546
O8/ 30 /94
4 .3
1 .458615
091 1 /94
5.8
1.757858
091 6
94
11 .0
2 .397895
09/
8 94
12.0
2.484907
09/ 13 /94
7 .8
2 .D54124
09/ 15 /94
5 .0
1 .609438
09/ 20 /94
16 .0
2 .772589
091
09/2227
9494
116
.6.6
2 .4510051
.88707
09/ 29
/94
13 .0
2 .564949
10/ 4 /94
2 .1
0 .741937
10/ 6 /94
0.0
10/ 11 /94
0 .7
-0 .35667
10/ 13 /94
0
.6
.0 .51083
10/ 18 /94
0 .3
-1 .20397
10/ 20 /94
0 .2
-1 .60944
ELECTRONIC FILING, RECEIVED, CLERK'S OFFICE, JULY 11, 2006
* * * * *PC #2 * * * *
DAlII AMMONIA EFFLUENT VALUES
Nchil Oil loliet Refinery
1991 -1997
Date
Ammonia, mgi
In (ammonia
ICl25 /9+1
.- .5
0 .916291
101
li/
27 /94
3 .0
1 .098612
1 /94
3 .0
1 .098612
1
it,11/
]1/
U1510
8
3
'94/9494
94
361.88.9.1.0
021,9315211,131402.079442.587787
1]/ 17 ;94
2 .0
0693147
11/ 22 !94
0 .6
-0,51083
1
11/
124D
23
29
1
'94'94-94
10,705.4.6
23702441-0.722767.91629
12! 6 , 94
8 .5
2.140066
12,
12!12112!
1
1
J
:2227
1320158 .94.94.9494:994
11121913185,5.9.2.5.6.1
22221704748.631889.525729.4069452_95491.923162
12/ 19 /94
9 7
2272126
9I/OU
:/103 5
.959595
18_11916.9.1
229490882.895912.827314
ul"f
Ol'
6
01-
~!"
.
1%
. 3124
1917
12
'~5X75/95;9575JS
1013103
16
89
.8
.0.7.7.6
223418062360854222,163323.821379.617396.197225
!2 . 2
,-)
204
3 .015535
0202:
:
9
7
1)5-95
4315.5.0
22.564949.74084
0303/
03/
03!
03/
031
02'
02
02'!602,
02121.'
14
2114
28
16237
9
2
/95195/95/95195/95.95
195
:95.9595
0,610300105101.7.6.1.7.2.6.4.1.0
0,1823221-0-01-0-0-00.308333.629241.09531.51083.51083.51083.35667.9162900
03, 23 X95
2.8
1 .029619
03! 28 195
3 .5
1252763
03/ 30 195
2
.2
0 .788457
04 4 N5
2.4
0.875469
04?
0511105/
05051
05/05,'05/
04/
04/
04'
04121
04/
04/
.'
18
23
27
11
18
25
1316
2
41959
6
/95/95/95/95/95195/95/95/95:95!95M95
195
13131085489,644,833,8826.8.0.3.2.1.9.4.5.3.7
21,5686161-41098722212,63t88922011
1335001
.757858.140066.322388.481605.116256.079442.617396.261763.955511.193922
051
05/ 25
30 /9595
106.1.8
23795461.808289
06' 1 '95
9.0
2.197225
06! 6 /95
17
.1
2,839078
ELECTRONIC FILING, RECEIVED, CLERK'S OFFICE, JULY 11, 2006
* * * **PC #2*****
DAILY AMMONIA EFFLUENT VALUES
Mobil Oil Joliet Refinery
1991-1997
Date
Ammonia, mg,l
In (amnwnia
-06/
061 131959,95
2020.3.4
33.010621.0155N5-
06/ 17 /95
22 .9
3 .131137
06/ 20 /95
10 .0
2
.302585
06/ 22 /95
8 .6
2 .151762
06127 195
0 .8
-0 .22314
061 29 /95
0 .3
-1 .20397
07/
07/07/
116
5
/95/95
/95
000.8.6.2
-0,22314-1,60944-0.51083
07/
07/
18
13
,95N5
00.1.5
-2-0.69315.30259
071 20 /95
0.2
-1 .60944
07/ 25 95
0.3
-1 .20397
07/ 27 195
0 .7
-0
.35667
08/
08/
4
1 .9595
00.2.3
-1-1.60944.20397
08/ 8 95
0.3
-1,20397
0&/ 10 95
0.3
-1 .20397
081
08.^ 1
17
S 9595
50.8.6
1-0.757858.51083
08122 95
4,8
1 .568616
08/
0&'
29
25
/95
95
5
0
.1
.4
1-0.629241.91629
09/08)
31
5
195/95
02.5.6
0-0.955511.69.315
09/ 7 /95
0.405465
09/ 12 /95
5 .0
1 .609438
091 14 /95
2.2
0 .788457
09/ 19 05
1.0
0
09/ 21 05
0.7
-0 .35667
09/
09/ 26
28
/9595
50.8.7
1-0.740466.22314
10/ 3 /95
0.7
-0.35667
10/ 5 95
0.8
-0.22314
10/
10/
12
10 0595
00.2.3
-1-1.20397.60944
10/
10/
IU'
10/
24
26
17
19
/95/959595
7751.2.4.2.5
0111.336472.974081.704748.974081
.
10,/31 95
1 .4
0.336472
11/ 2 /95
1 .9
0.641854
11/ 7 95
02
-1 .60944
111 9 95
5 .0
1 .609438
I1/ 14 /95
1,3
0.262364
11/
1l/
21
16 9595
13.31.6
0
.2623642
.61007
11/ 22 95
19 .0
2 .944439
11/2895
175
2 .862201
12/
12/11/30
7
5 /959595
111012.4.3.9
222.341806.557227.424803
12/
12/
12/
12/
12/ 19
21
26
14
12
/9595959595
10112568.0.0.0.3.5
22231.332144.079442.397895.238678.791759
12/ 28 /95
6.4
1
.856298
01/01/
01/
9
4
2
/96/9696
1072.6.9.6
022.955511.360854.066863
01/
01/
01111
16
18
/96/96/96
675.9.7.3
211.066863.667707.902108
ELECTRONIC FILING, RECEIVED, CLERK'S OFFICE, JULY 11, 2006
* * * * *PC #2 * * * * *
DAILY AMMONIA EFFLUENT VALUES
Mobil Oil Joliet Refinery
1991 - 1997
Date
Ammonia. mg'1
In (ammonia
01 / 23 96
12.0
2484907
OV 25 96
6.2
1 .824549
01' 30 96
16.9
2 .827314
02/
1 X96
214
3.063391
02 6 /96
5 .4
1-686399
02' 8 96
1 .3
0262364
02' 13 .96
8 .5
2 .140066
02/ 15 :96
7
.8
2
.054124
02, 20 l96
3 .0
1 .098612
0 2_/ 22 96
0 .0
021 27 96
0.0
02/ 29 96
0.0
03! 5 :96
0.0
03' 7 96
0.0
03' 12 !96
0 .6
-0 .51083
03/ 14 :96
4
.8
1568616
03, i9 '96
20 .6
3 .025291
03/ 21 96
27 .4
3 .310543
03/ 26 196
11 .8
24681
03128 .96
8 .2
2,104134
03' 2 96
17 .3
2.850707
03" 4 96
17.5
2.862201
t9' 9 A6
21.1
3 .049273
04 . I : 96
140
2 .944439
04' 16
0
17.1
2.839078
01'
t 7 96
:9 5
2.970414
23 9c
13 .4
2595255
0 .1 . 25 :06
8 .5
2 .140066
04' 30 96
0 .6
0 .51083
05' 2 96
0A
-091629
y 7 96
0,0
05
1; 'I'll
0.0
05' :4 '96
1
.3
-1.20397
05' s 6 96
3 0
1 .0986 112
05 : 21 '96
3 4
1 .223775
05 . 23 .96
0.0
05/ 28 96
02
-1 .60944
05, 30 .96
4
.2
1 .435085
06! 4 :96
2.8
1 .029619
06' 6 :96
06
-0,51083
06/ I I X96
0.0
06 13 i96
0.0
06/ 19 !96
0.0
06! 20 196
0.0
06' 25 96
11 .9
2 .476538
06' 27 /96
13 .7
2 .617396
07! 2 /96
1.1
0 .09531
071 3 /96
1 .2
0.182322
07! 9 /96
4
.1
1 .410987
07/ 1I /96
4 .2
1 .435085
07/ 16 i96
0.0
07/ 18 /96
0'0
07,23 96
0
.2
-1.60944
07125 /96
0 .4
-0
.91629
07 .' 30 ,96
0
.1
-2 .30259
081 1196
0.0
08/ 6 /96
0.5
-069315
08' 8 /96
0 .6
-0 .51083
08! 13 296
0.0
OR' 15 .96
0.7
-0 .35667
08120196
0.2
-1 .60944
081 22 /96
0.3
.1 .20397
08' 28 96
0 .3
-120397
09, 29 ,96
0 .2
-1 .60944
09, 3196
0 .2
-1 .60944
09/ 5 /96
0 .1
-2
.30259
ELECTRONIC FILING, RECEIVED, CLERK'S OFFICE, JULY 11, 2006
* * ***PC #2 * * * * *
DAILY AMMONIA EFFLUENT VALUES
Mobil Oil Joliet Refinery
1991-1997
Date
Ammonia, mgA
In (ammonia
09/ 10 96
0.0
09/121%
0 .0
09/ 17 /96
0.0
09/ 19 /96
0.0
09! 25 /96
1.7
0 .530628
09! 26 /96
0.4
-0,91629
101 1 /96
0.0
10/ 3 /96
0.0
10/ 9 96
0.1
-230259
10/ 10 /96
0.0
101 15 96
0 .2
-1 .60944
10! 17 '96
0.0
101 22 96
0 .2
-1 .60944
10' 24 '96
0 .2
-1 .60944
10129 /96
0 .0
10/ 31 96
0 .1
-2 .30259
Ill 5 !96
0.0
I1/ 7 96
0.7
-.35667
11/ 12 96
0.0
Ill 14 /96
0.0
II/ 19 1196
0 .0
11/ 21 '96
0.8
-0 .22314
11/ 26 96
0.5
-0.69315
11/ 27 96
0.0
12! 3 ;96
0.4
-0
.91629
121 5 '96
0.0
12/ 10 '96
0.0
12/ 12 96
0.0
121 17 /96
0.0
12/ 19 /96
0.0
12! 24 96
14 .0
2 .639057
12! 27 96
1 .3
0 .262364
12! 31 96
1 .3
0 .262364
01 ; 2 197
2 .6
0 .955511
011 7 /97
0 .4
-0 .91629
Oil 9 /97
0.0
01/
01/ 14
16
/9797
014.7
0-0.336472.35667
01/ 21 /97
14 .0
2.639057
01/ 23 /97
12 .0
2.484907
01/ 28 /97
2 .0
0.693147
01/ 30 97
1 .0
0
02/ 4 97
0.0
02/ 6 /97
0 .8
-0 .22314
02/ 11 97
0 .3
-1 .20397
02/ 13 /97
0
.3
.1,20397
02/ 18 97
0 .2
-1 .60944
02/ 21 97
0 .3
-1
.20397
021 25 97
0 .8
-0 .22314
021 27 /9.7
0.0
03/ 4 97
0.1
-2 .30259
03/ 6 97
6.5
1 .871802
03/ 11 97
0 .4
-0.91629
03/ 13 197
0
.6
-0351083
031 I S /97
I A
0.336472
03120 /97
0 .3
-1
.20397
03125 97
0 .6
-0.51083
03/ 27 97
0 .6
-0.51083
January 1991
Average
-
December 19%
4
.8
0.0
0.6
Minimum
0 .1
0 .0
-2 .3
Maximum
27 .4
0 .0
3 .3
Count
507
140
507
Std . Dew .
5 .8
0 .0
1 .5
Variance
33 .4
0 .0
2 .4
ELECTRONIC FILING, RECEIVED, CLERK'S OFFICE,
JULY 11, 2006
* * * * *PC #2 * * * * *
N ncmber 1995 . March 1997 (with April 1996 upset)
File :
f/IiMc/mohJ,nlcshCetmnatunwk4
Average
5 .7
0.0
0 671
Minimum
00
-23
Maxuum
27 .4
00
33
Count
209
38
109
Sid .k,.
6 .8
0 .0
1 .7
Vmim,cc
45 .8
0 .0
2 .8
November 1s"T5 March 1997 (without April 19`6 apse
Average
4 .9
0.0
0 .5
Minims: .^.t
0 .I
0.0
23
Ma ;umum
274
00
33
smut
t03
38
103 0
SId Dc
6
.2
0.0
1 6
Vnri :m
. .e
38 .1
0 .0
2 .6
January 1996 - March 1997 (without April 1996 upset)
Average
40
0 .0
0
.
.3
Minimum
0 .1
0 .0
-23
Maximum
27
.4
0 .0
3 .3
Count
86
38
86
Sid . Dev .
56
0 .0
1 .6
Variance
31 .6
0 .0
2 .5
November 1996
Average
- March 1997
23
0 .0
-0 .I
Minimum
0 .1
0 .0
-2 .3
Maximum
14 .0
0,0
2,6
Count
29 .0
13 .0
29 .0
Sid . Dev
.
3
.9
0 .0
1 .2
Variance
15 .5
0 .0
1 .5
DAILY AMMONIA EFFLUENT VALUES
Mobil Oil Juliet Refinery
1991 -1997
Date
Ammonia. mgl
In (ammonia
January 1992 . December 1996
Average
5 .3
0 .0
0 .8
Minimum
0 .1
0.0
-2 .3
Maximum
27A
0.0
3.3
Count
435
82
435
Std . Dev .
60
0 .0
1 .5
Variance
357
0 .0
2 .3
January 19'M
Average
- December 1996
5,8
0 .0
0 .7
Minimum
0 .1
0 .0
-2 .3
Maximum
27 .4
00
3 .3
Count
70
35
70
Std . Dc' .
7 .0
0.0
1 .7
Vadmme
486
00
3 .0
A - NEW AERATION BASIN
B - STORM WATER BASIN
C - NOT OWNED BY REFINERY
D -
POWER LINES
E - ARSENAL ROAD (TO BE WIDENED)
F - INSUFFICIENT ROOM FOR TANKS
G- WET GAS SCRUBBER & SELECTIVE
CATALYTIC REDUCTION UNITS
El
xrtt
zO
EXJCONMOBIL REFINERY LAYOUT
NOT TO SCALE