Illinois
Environmental
September 2004
Protection Agency
IEPA/BOA/04-020
Fossil Fuel-Fired
ORIGINAL
Power Plants
-
~
2 C'G
~~
Report to the House and
Senate Environment and
Energy Committees
Illinois Environmental Protection Agency
1021
North Grand Avenue East P0 Box
19276
Springfield, Illinois
62794-9276
Renee Cipriano, Director
Fossil Fuel-Fired Power Plants
Report to the House and Senate
Environment and Energy
Committees
Contents
Preface
11
Executive Summary
11 ,
Chapter 1 - Electric Generating Units in Illinois and Their Emissions of Concern 1
Chapter 2 - Human Health Implications from Air Pollution 2
Chapter 3 - Air Pollution Control Technologies For Reducing Power Plant Emissions 7
Chapter 4 -Overview of National Power Plant Emission Reduction Proposals and Their
Estimated Emission Reductions
17
Chapter 5 - Energy Issues: Federal and State Policies and Programs and Energy
Challenges
25
Chapter 6 - Opportunities Presented Through Renewable Energy, Recycled Energy, and
Demand Side Management
33
Chapter 7 - Greenhouse Gas Emissions: National, and Nongovernmental Policies and
Program, and Challenges
46
Chapter 8 - Overview of Emission Trading Programs
55
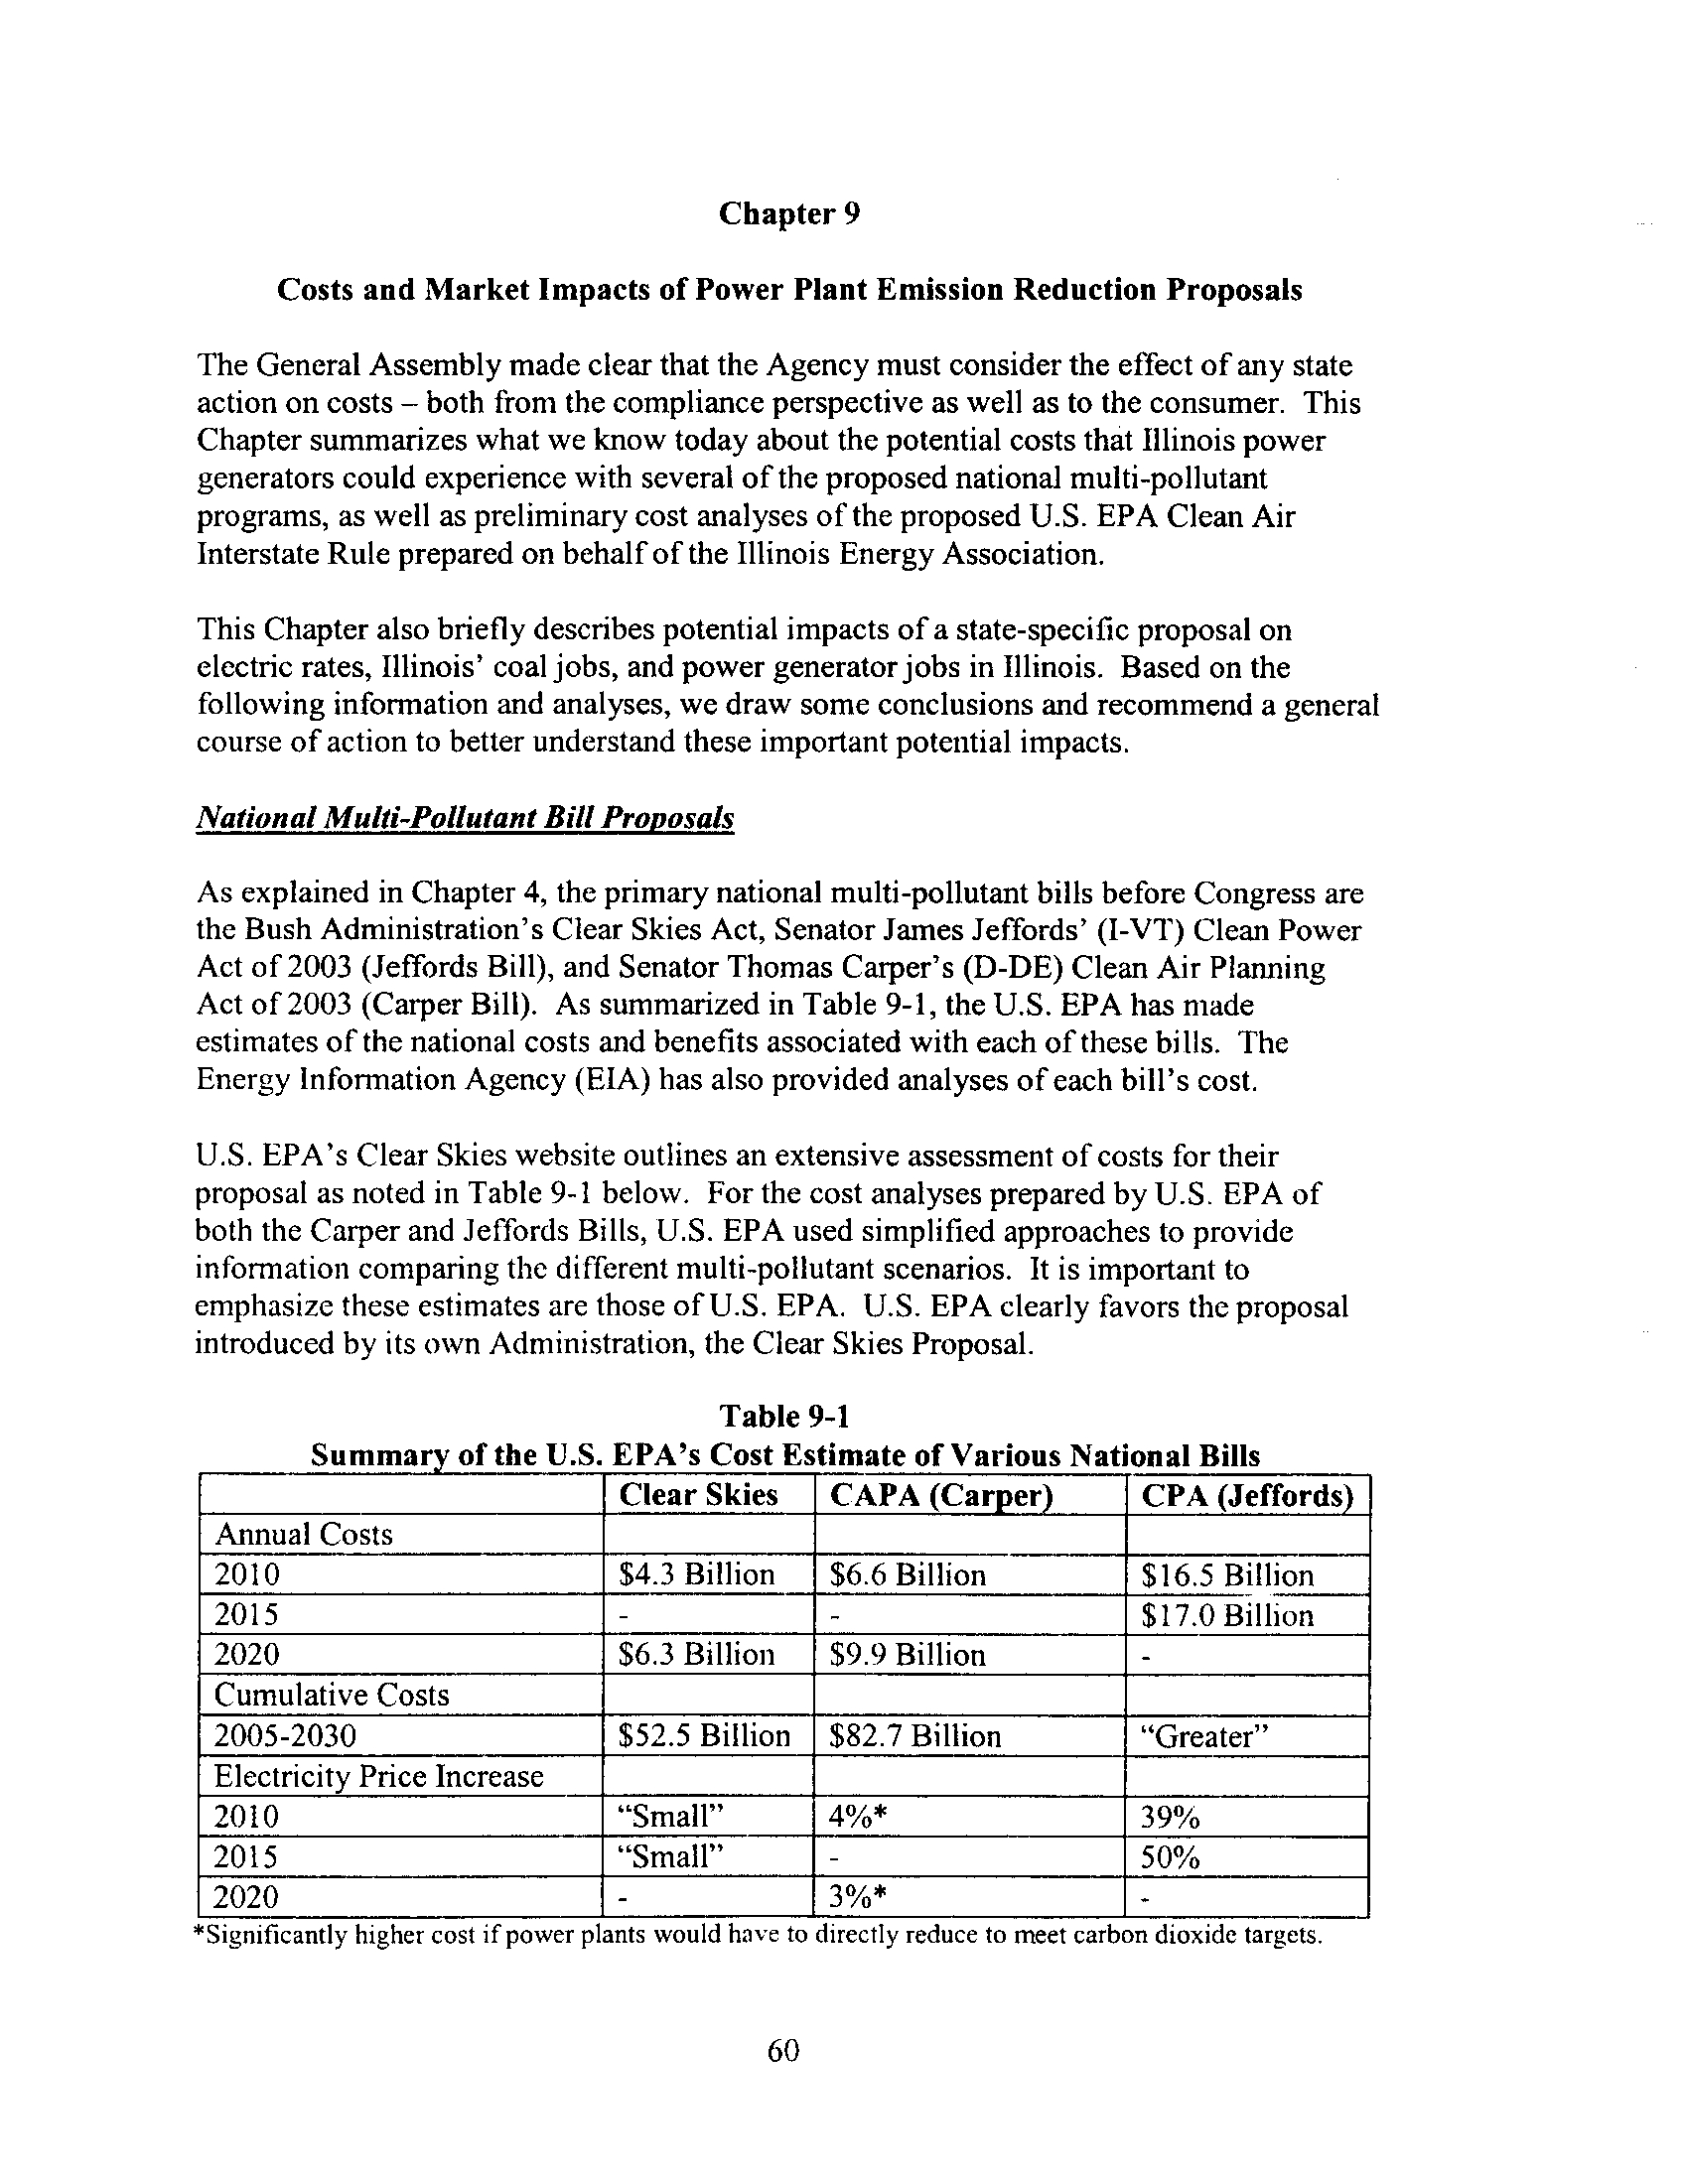
Chapter 9 - Costs and Market Impacts of Power Plant Emission Reduction Proposals 60
List of Appendices, Tables, and Figures
71
Acronyms
73
Endnotes
74
Appendices
A-1
i
Preface
Parts of this report were taken directly from other non-copyrighted resources in the
interest of time and comprehensiveness, particularly reports published by the State of
Illinois, the federal government, and other states . Some of these portions contain only
insignificant wording changes from the original sources. Quotations are not strictly used
to distinguish these sections; however, an attempt has been made to accurately reference
and acknowledge these sources. The intent is not for the Illinois Environmental
Protection Agency to take recognition for the original work of these authors, instead, to
include the maximum amount of essential facts as accurately as possible within a
constrained time frame
.
ii
Executive Summary
The Illinois Environmental Protection Agency (Illinois EPA) was asked by the Illinois
General Assembly to examine whether the State should address further potential
restrictions on power plant pollution. This request was made under Section 9 .10 of the
Environmental Protection Act (Act). This is a report of the Illinois EPA's findings .
The Illinois EPA has prepared this report of its findings to date based on consideration of
a broad spectrum of issues including health benefits, the impact on the reliability of the
power grid, the impact on consumer utility rates and the impact on jobs and Illinois'
economy.
It provides an overview of the principal issues, presents a review of the
information we have gathered that addresses those issues, lists information gaps and
uncertainties and finally, lists the work that remains to develop a solution that does not
create unintended adverse economic consequences for the people of Illinois
.
The information in the report was gathered in a variety of ways including extensive
literature reviews, discussions with peers and experts, and meetings and information
exchanges with the environmental community, power industry, and other interest groups
.
The report reflects the fact that, while many questions have been answered, critical
information gaps remain that must be addressed before any responsible proposal to
reduce power plant emissions can be developed .
Further restricting power plant pollution brings with it four major overarching issues that
must be carefully considered and weighed . First among them is the impact on peoples'
lives resulting from the pollution allowed by the present air pollution standards . Directly
related to this issue are the health and welfare benefits that might accrue with various
pollution control scenarios . Responsible consideration of these important public health
concerns requires a thorough analysis that examines compliance costs and the associated
impacts on employment and related healthcare coverage, electricity system reliability,
and electricity rates on Illinois' economy .
The State of Illinois is committed to providing its citizens with sufficient, reliable and
affordable electricity. The experience of last year's blackout that affected large parts of
the U.S. and Canada clearly demonstrated that the power grid is extremely vulnerable and
that energy reliability cannot be taken for granted. Likewise, affordable power has a
significant and immediate impact on the lives of the people of Illinois . Indeed, impacts of
pollution controls on electricity reliability and rates must be clearly understood before
any responsible and final decision can be made. The General Assembly clearly
understood these important issues in its drafting of Section 9 .10 .
The following sections outline Illinois EPA's major findings to-date in the areas of health
impacts, electricity reliability, electricity costs and jobs impact and presents outstanding
issues that must be addressed before determining the most prudent approach to reducing
power plant emissions in Illinois .
iii
Health Impacts
The Illinois EPA reviewed the existing major studies on the health impacts of the
emissions from power plants, the technology available to mitigate these effects, and the
various pollution control strategies under consideration . We find the following to be
reasonable conclusions :
1. Public health is affected to varying degrees by emissions from fossil-fueled power
plants. According to U .S. EPA, particulate matter and ozone air pollution
resulting from sulfa dioxide and nitrogen oxides emissions are associated with
respiratory problems. Human exposure to methyl mercury from eating
contaminated fish is associated with adverse health effects .
2. Adverse health impacts can be minimized through the use of technology and
renewable energy.
3. Transport of pollutants from other states is a major contributor to the air quality in
Illinois, and Illinois itself impacts downwind states . Due to interstate transport of
air pollution, this is not an issue that can be contained within or to any single
state .
4. While there are numerous proposed emission reduction strategies aimed at
controlling power plant pollution at the national and state level, the U .S. EPA
currently has two formal regulatory proposals undergoing public scrutiny. U. S .
EPA made these proposals in January 2004 and has publicly stated that they
intend to propose final sulfa dioxide and nitrogen oxide rules by December 2004
and final mercury reduction rules by March 2005
.
5. Significant public health and welfare benefits can be derived by reducing power
plant emissions. For example, studies indicate that stricter emission limits would
reduce the frequency and severity of asthma attacks and other cardiovascular and
respiratory ailments. U.S. EPA predicts that its proposed national program will
provide $22 of benefit for every $1 of cost .
What we have not been able to determine is the following
:
1. What will be the health benefits of an Illinois-only approach given the significant
impact of interstate pollution transport?
2. To what extent would an Illinois-specific emission reduction approach achieve air
quality improvements and public health benefits in the absence of a national
emission reduction strategy?
3. Would an Illinois-specific approach result in greater reliance on coal-fired power
plants in bordering states that lack sufficient pollution controls?
4. If new emissions standards lead to lost jobs and higher consumer rates, what
impact would this have on the number of people who lose job-related health
coverage, the amount of income consumers can devote to health care costs, and
how any potential loss of coverage for individuals weighs against potential health
benefits created by new standards?
iv
We need to examine the public health benefits that would accrue from
a state-specific
multi pollutant strategy,
not accompanied by reductions from out-of-state power plants
that are upwind and that contribute to measured air pollutant levels in Illinois . The
important lesson learned from the planning process to meet U .S. EPA's 1-hour ozone
standard is that a state could make very significant emission reduction within its own
boundaries, but still not meet the national health-based standards, unless local reductions
are also accompanied by significant reductions in transported pollution from upwind
sources outside the state . Because power plants have very high stacks, the impact of their
emissions is generally felt far downwind, as much as several hundred miles. Since
Illinois borders six other states, it is important to take these facts into consideration
.
Illinois EPA must consider the above issues to achieve the balanced approach requested
by the General Assembly .
Electric Reliability
In light of heightened concerns over energy reliability, the Illinois EPA reviewed the
major issues that must be addressed when evaluating the impact of power plant emission
reduction strategies on reliability. Illinois EPA recognizes that implementation of any
state-specific emission reduction strategy must not jeopardize electricity reliability
.
We found the following
:
1 . Transmission constraints represent a major challenge to electric reliability. Since
electricity cannot be stored, the transmission system must permit unimpeded
movement of electricity from suppliers to consumers at all times, but especially
when demand for electricity is at or near its peak .
2. The reliability of the transmission system depends upon critical voltage support
and resource capability at key locations in the grid . Actions that lead to
reductions in these critical factors can ultimately cause widespread service
interruptions or exacerbate a failure of the grid as witnessed in the northern
portion of the U .S. and parts of Canada during August 2003 . Following the
August 2003 blackout, the grid was not completely restored for days to weeks
depending on the affected area costing the residents of those eight states an
estimated $6.4 billion .
3. As part of the Eastern Interconnect (the regional transmission interconnection),
Illinois faces the same electric reliability issues that were highlighted by the
August 14, 2003 power outage
.
4. Grid congestion problems can become particularly acute where certain generating
plants must run because their operation is essential to maintaining grid reliability .
Certain of those older power plants would need to remain in operation to maintain
grid reliability principally because they supply needed voltage support . Choices
would have to be made including installing pollution control technologies on such
units, when it might not be economically warranted by the age and efficiency of
the units, or the units would need to be repowered
.
v
5
.
Although several state-sponsored initiatives were launched between 1999 and
2002, no additional base-load generating capacity is under construction . While
construction permits were issued for two projects, one has not been able to secure
financing due to soft power markets and the construction permit for the other
project has been challenged by a number of environmental groups, and the permit
is stayed. As a result, at this time we cannot rely on any new baseload generating
capacity to ease any potential strain placed upon the grid by new standards .
6. No significant construction to address transmission grid reliability issues is
planned within the State or within the MAIN (Mid-America Interconnection
Network) electric transmission region of which most of Illinois is a part
.
The Illinois EPA has not been able to determine the following
:
I . We do not have a firm understanding of how a state-specific emission reduction
program would impact power plant closures and electric reliability. Further
analysis is needed to investigate whether stricter emission standards for Illinois
power generators would put them at a competitive disadvantage relative to out-of-
state generators who would not be required to meet the same emission standards
.
If out-of-state generators can offer their product more competitively, Illinois
could lose generation capacity
.
2. Additional examination is also needed to explore whether strategies to
competitively retain and develop generation capacity and preserve reliability in
Illinois are viable. Options that warrant further study include : repowering of
power plants using highly efficient combined heat and power systems (CHP),
renewable energy, clean coal technologies and energy efficiency
.
3. To estimate the impact of a state-specific emission reduction strategy on
reliability, a comprehensive resource and transmission planning analysis (that
includes detailed production cost information for Illinois and the surrounding
interconnect) must be conducted to determine which generating plants might close
and which might install pollution controls . In the absence of this analysis, the
precise impact of state-specific emission standards on reliability in Illinois is
unknown .
Electricity Costs
In addition to ensuring a reliable energy supply, providing affordable electricity is
essential to the well being of all Illinois residents . The likely impact of pollution controls
on electricity rates must be clearly understood before any responsible emission reduction
approach can be determined in Illinois . The Illinois EPA reviewed the available
information on the impact of the various national proposals on electricity costs . This
effort has been complicated by the state of flux in Illinois' electric supply market due to
the shift from a traditional, utility owned and operated, and highly regulated power
generation system, to an increasingly deregulated power generation market . One of the
major pieces of this shift will occur in January of 2007 when the cap or freeze on retail
rates will be lifted .
vi
We have found the following :
1. Illinois is one of the first states to begin the process to become a deregulated state
for electric power, but restructuring is not yet complete in Illinois, with the freeze
on rates being lifted January 2007. As a result of this market restructuring, most
coal-fired power plants in the state now are owned by independent power
producers, which are not affiliated with Illinois utilities or by non-utility
generation affiliates of Illinois utilities .
2. At the same time as Illinois is going through restructuring, regional transmission
organizations have been formed through which power generators are more easily
and efficiently able to sell their power across state lines. As a result, Illinois'
power generators now compete with generators in several nearby states that have
not deregulated their electricity markets
.
3. Most of the available information on the impact of emission reductions on
electricity costs is based on U .S. EPA's assessment of the Bush Administration's
proposed Clear Skies Act, and U.S. EPA's proposed Clean Air Interstate Rule
(CAIR). U.S. EPA concluded that the costs of its CAIR program to Illinois and
the MAIN (Mid-America Interconnection Network) would increase rates 2 .5%-
3.5% over those that would occur if no additional pollution controls were
implemented .
4. Estimated impacts on electricity rates are based on the assumption of a national
approach to emission reductions applied to all power producers in all 29 affected
states and the District of Columbia . Imposing more stringent rules in just one state
could create further significant upward pressure on rates . However, for Illinois,
this assumes that there is a competitive wholesale market for electricity due to
deregulation. This competition in wholesale markets has not materialized to any
significant degree, such that 2006 power purchase agreements assume no increase
in competition in wholesale market that could also impact rates
.
5. In most states, the cost of complying with Clear Skies, CAR or other national
proposals to reduce power plant emissions would undoubtedly be passed onto
ratepayers by the utilities, whether they still own their power plants or purchase
power through wholesale energy markets .
The Illinois EPA has not been able to determine the following
:
1. We do not know how the costs of these multi-pollutant proposals will affect
competition and consumer rates in a state that is entering full deregulation
.
However, we do know that compliance costs will ultimately be reflected in
electric rates and, very likely, natural gas rates to the extent that coal-fired
generation is replaced by natural gas-fired generation
.
2. Concern exists that if competition among suppliers of electricity is not robust,
then power prices will not remain at reasonable levels . A contributing factor
involving California's experience in 2000 and 2001 was the fact that competition
vii
among electric suppliers had yet to take hold. One result was significant price
spikes and upheaval in the state's economy
.
3. Whether robust competition occurs in 2007 in Illinois will depend on the degree
to which competitive forces create an effectively functioning wholesale and retail
supply market. If Illinois generators must comply with state-specific regulations
that their out-of-state competitors do not, these generators will incur additional
costs that cannot be recovered from utility ratepayers and will face a disadvantage
in competitive regional power markets
.
4. An increase in electric and gas rates may drive greater interest and
implementation of renewable energy and energy efficiency projects, but the
degree to which Illinois is poised to increase its production of renewable energy
and at what cost is not known.
5. The impacts on competition and on rates through a state-specific program have
not been evaluated, and must be as part of the overall review of Illinois'
deregulated market post-2006 . Failure to do so could mean higher rates for
consumers .
Impact on Jobs in Illinois
Information on the effects of a state-specific multi-pollution strategy on jobs and the coal
industry is lacking. At no time in its history, however, has the Illinois coal industry
confronted so many threats to its survival as it now does . Low-priced, lower-sulfur coals,
primarily from the Powder River Basin of Wyoming (known as western coal) continue to
make inroads in Midwestern and eastern power plant markets .
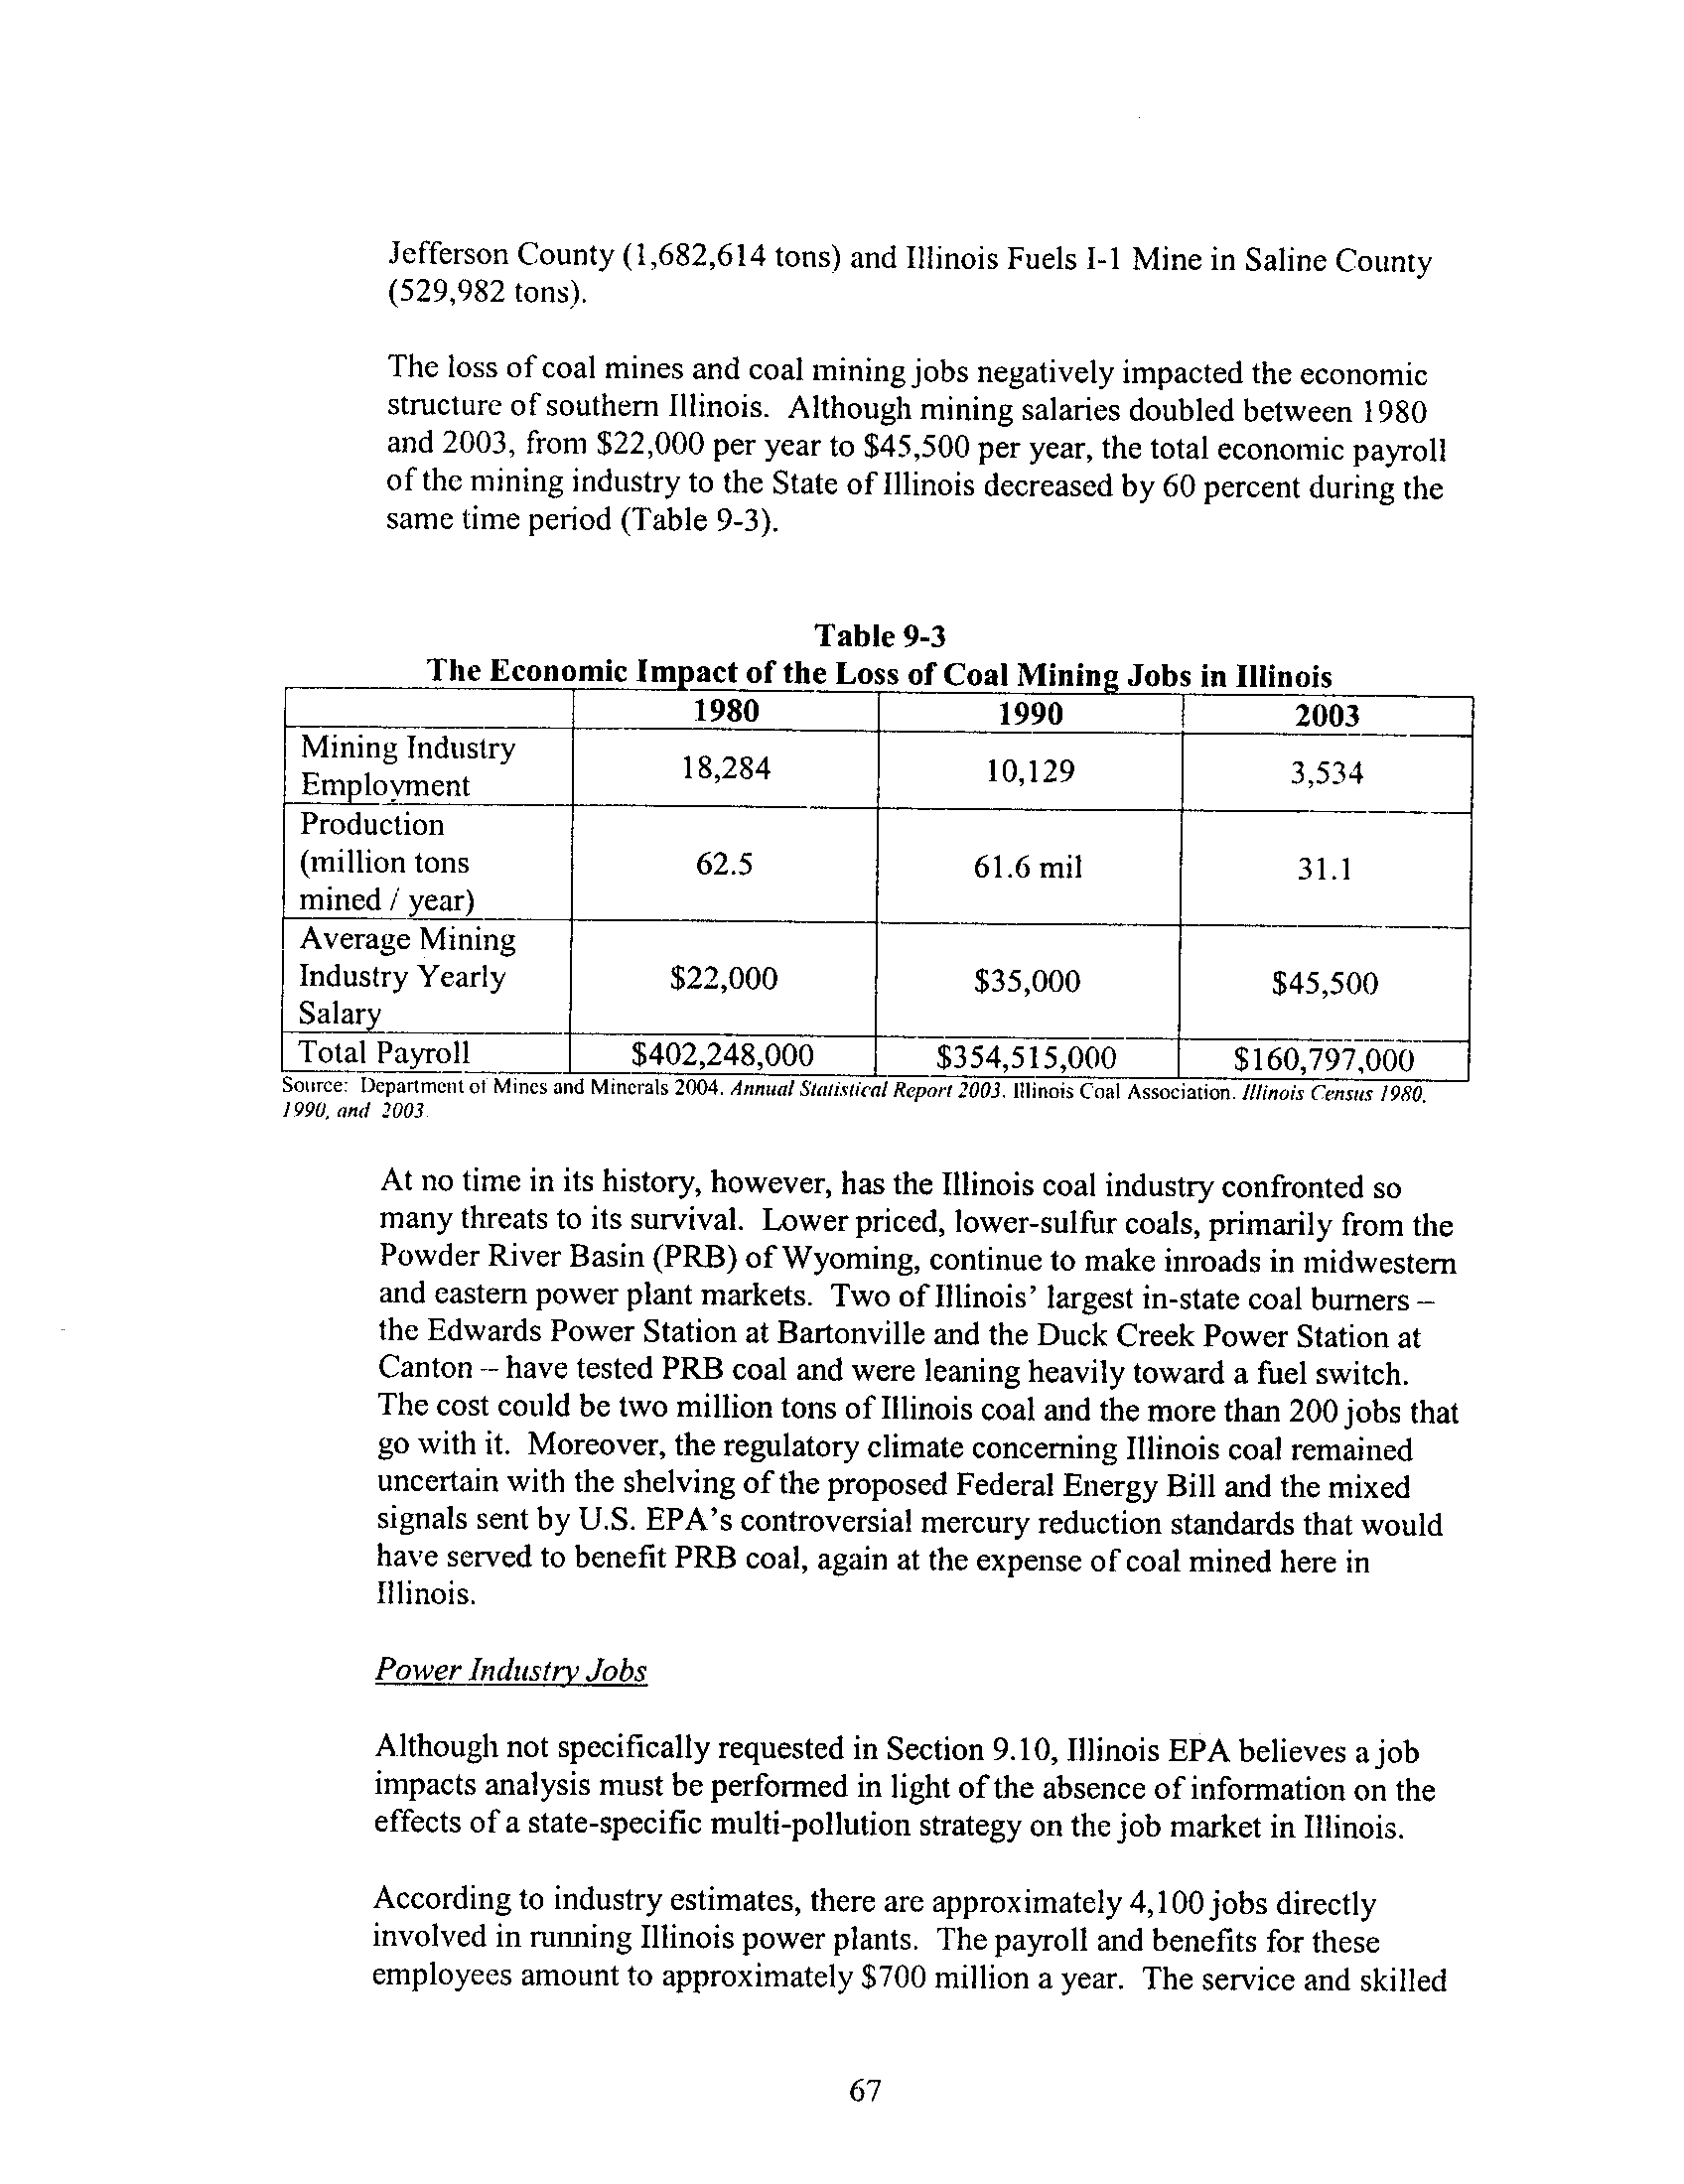
At the end of 2003, coal production in Illinois totaled 31 .1 million tons, down more than
2.3 million tons from 2002. The loss of coal mines and coal mining jobs has negatively
impacted the economic structure of southern Illinois. Although mining salaries doubled
between 1980 and 2003, from $22,000 a year to $45,500 a year, the total economic
payroll of the mining industry in the State of Illinois decreased by 60 percent during the
same time period. Moreover, the regulatory climate concerning Illinois coal remained
uncertain with mixed signals from the federal government over proposed controversial
mercury reduction standards that would serve to benefit western coal, again at the
expense of coal mined here in Illinois
.
According to industry estimates, there are approximately 4,100 jobs directly involved in
running Illinois power plants. In addition, approximately 6,000 more jobs provide skilled
contractual labor and miscellaneous support. These jobs produce a combined payroll and
benefits that amount to over $700 million a year for employees . There are also another
5,500 retirees whose health insurance could be impacted by the financial viability of the
power plants .
Furthermore, the approximate value of goods and services purchased
locally related to these jobs is over $300 million . Illinois' coal-fired power plants pay
nearly $21 million a year in property taxes to local taxing bodies, the majority of which
goes to support local school systems
.
Understanding the impact on the economy - especially the risk of job losses
- is critical
in the process used to analyze new emission standards. It is impossible to determine the
actual effect of new emission standards in the Illinois economy without knowing what the
national standards will ultimately be. It is also worth noting that the potential growth in
the renewable energy industry could provide an economic benefit as well, though it is
very unclear how significant that impact could be compared to what the coal industry
could potentially face. Illinois EPA will work with the Department of Commerce and
Economic Opportunity to retain the experts that can work with us to analyze the impacts
of any further regulation on the economy of Illinois and Illinois jobs once the national
direction is clear.
Other Findings
•
For mercury, the Illinois EPA believes that U .S. EPA should move forward in
March 2005, pursuant to its Consent Decree, and promulgate national mercury
standards for power plants that would not place Illinois at a competitive
disadvantage
.
Although Illinois EPA strongly supports trading programs,
mercury reduction cap and trade programs must be carefully designed so as not to
create hot spots of elevated mercury
.
•
The environmental and health benefits from greater use of energy efficient
technologies and renewable energy, such as wind power, are also recognized . The
pursuit of energy efficient technologies and the use of renewable energy could
result in significant economic benefits for Illinois
.
•
Lastly, a national greenhouse gas registration and trading program under a federal
mandate is the most effective strategy to address climate change, and state
voluntary efforts should continue to be encouraged .
Recommendations:
It is clear that power plants are a considerable source of air pollution and that reducing
emissions will benefit public health .
However, moving forward with a state-specific
regulatory or legislation strategy without fully understanding all of the critical impacts on
jobs and Illinois' economy overall as well as consumer utility rates and reliability of the
power grid would be irresponsible .
Illinois EPA recommends that the Governor continue demanding that the federal
government act nationally to reduce power plant emissions
.
Further, Illinois EPA
recommends that the Governor and General Assembly insist that the competing issues of
health, jobs, electric service reliability and affordable consumer rates be fully and
completely reconciled in light of the many unanswered questions presented in this report
.
While this work is already underway - and will continue - it can ultimately only be
completed once the national emission reduction strategy solidifies and the timing and
features of a national program are known .
ix
Chapter 1
Electric Generating Units in Illinois and Their Emissions of Concern
In
2001,
the Illinois General Assembly passed legislation regarding fossil fuel-fired
electric generating plants. This legislation, found at Section 9.10 of the Illinois
Environmental Protection Act and referred within this report as "Section
9.10,"
requires
the Illinois EPA to issue to the House and Senate Committees on Environment and
Energy findings that address the potential need for control or reduction of emissions from
fossil fuel-fired electric generating units or EGUs . This report presents Illinois EPA's
findings to date and recommendations on this very complex mater
.
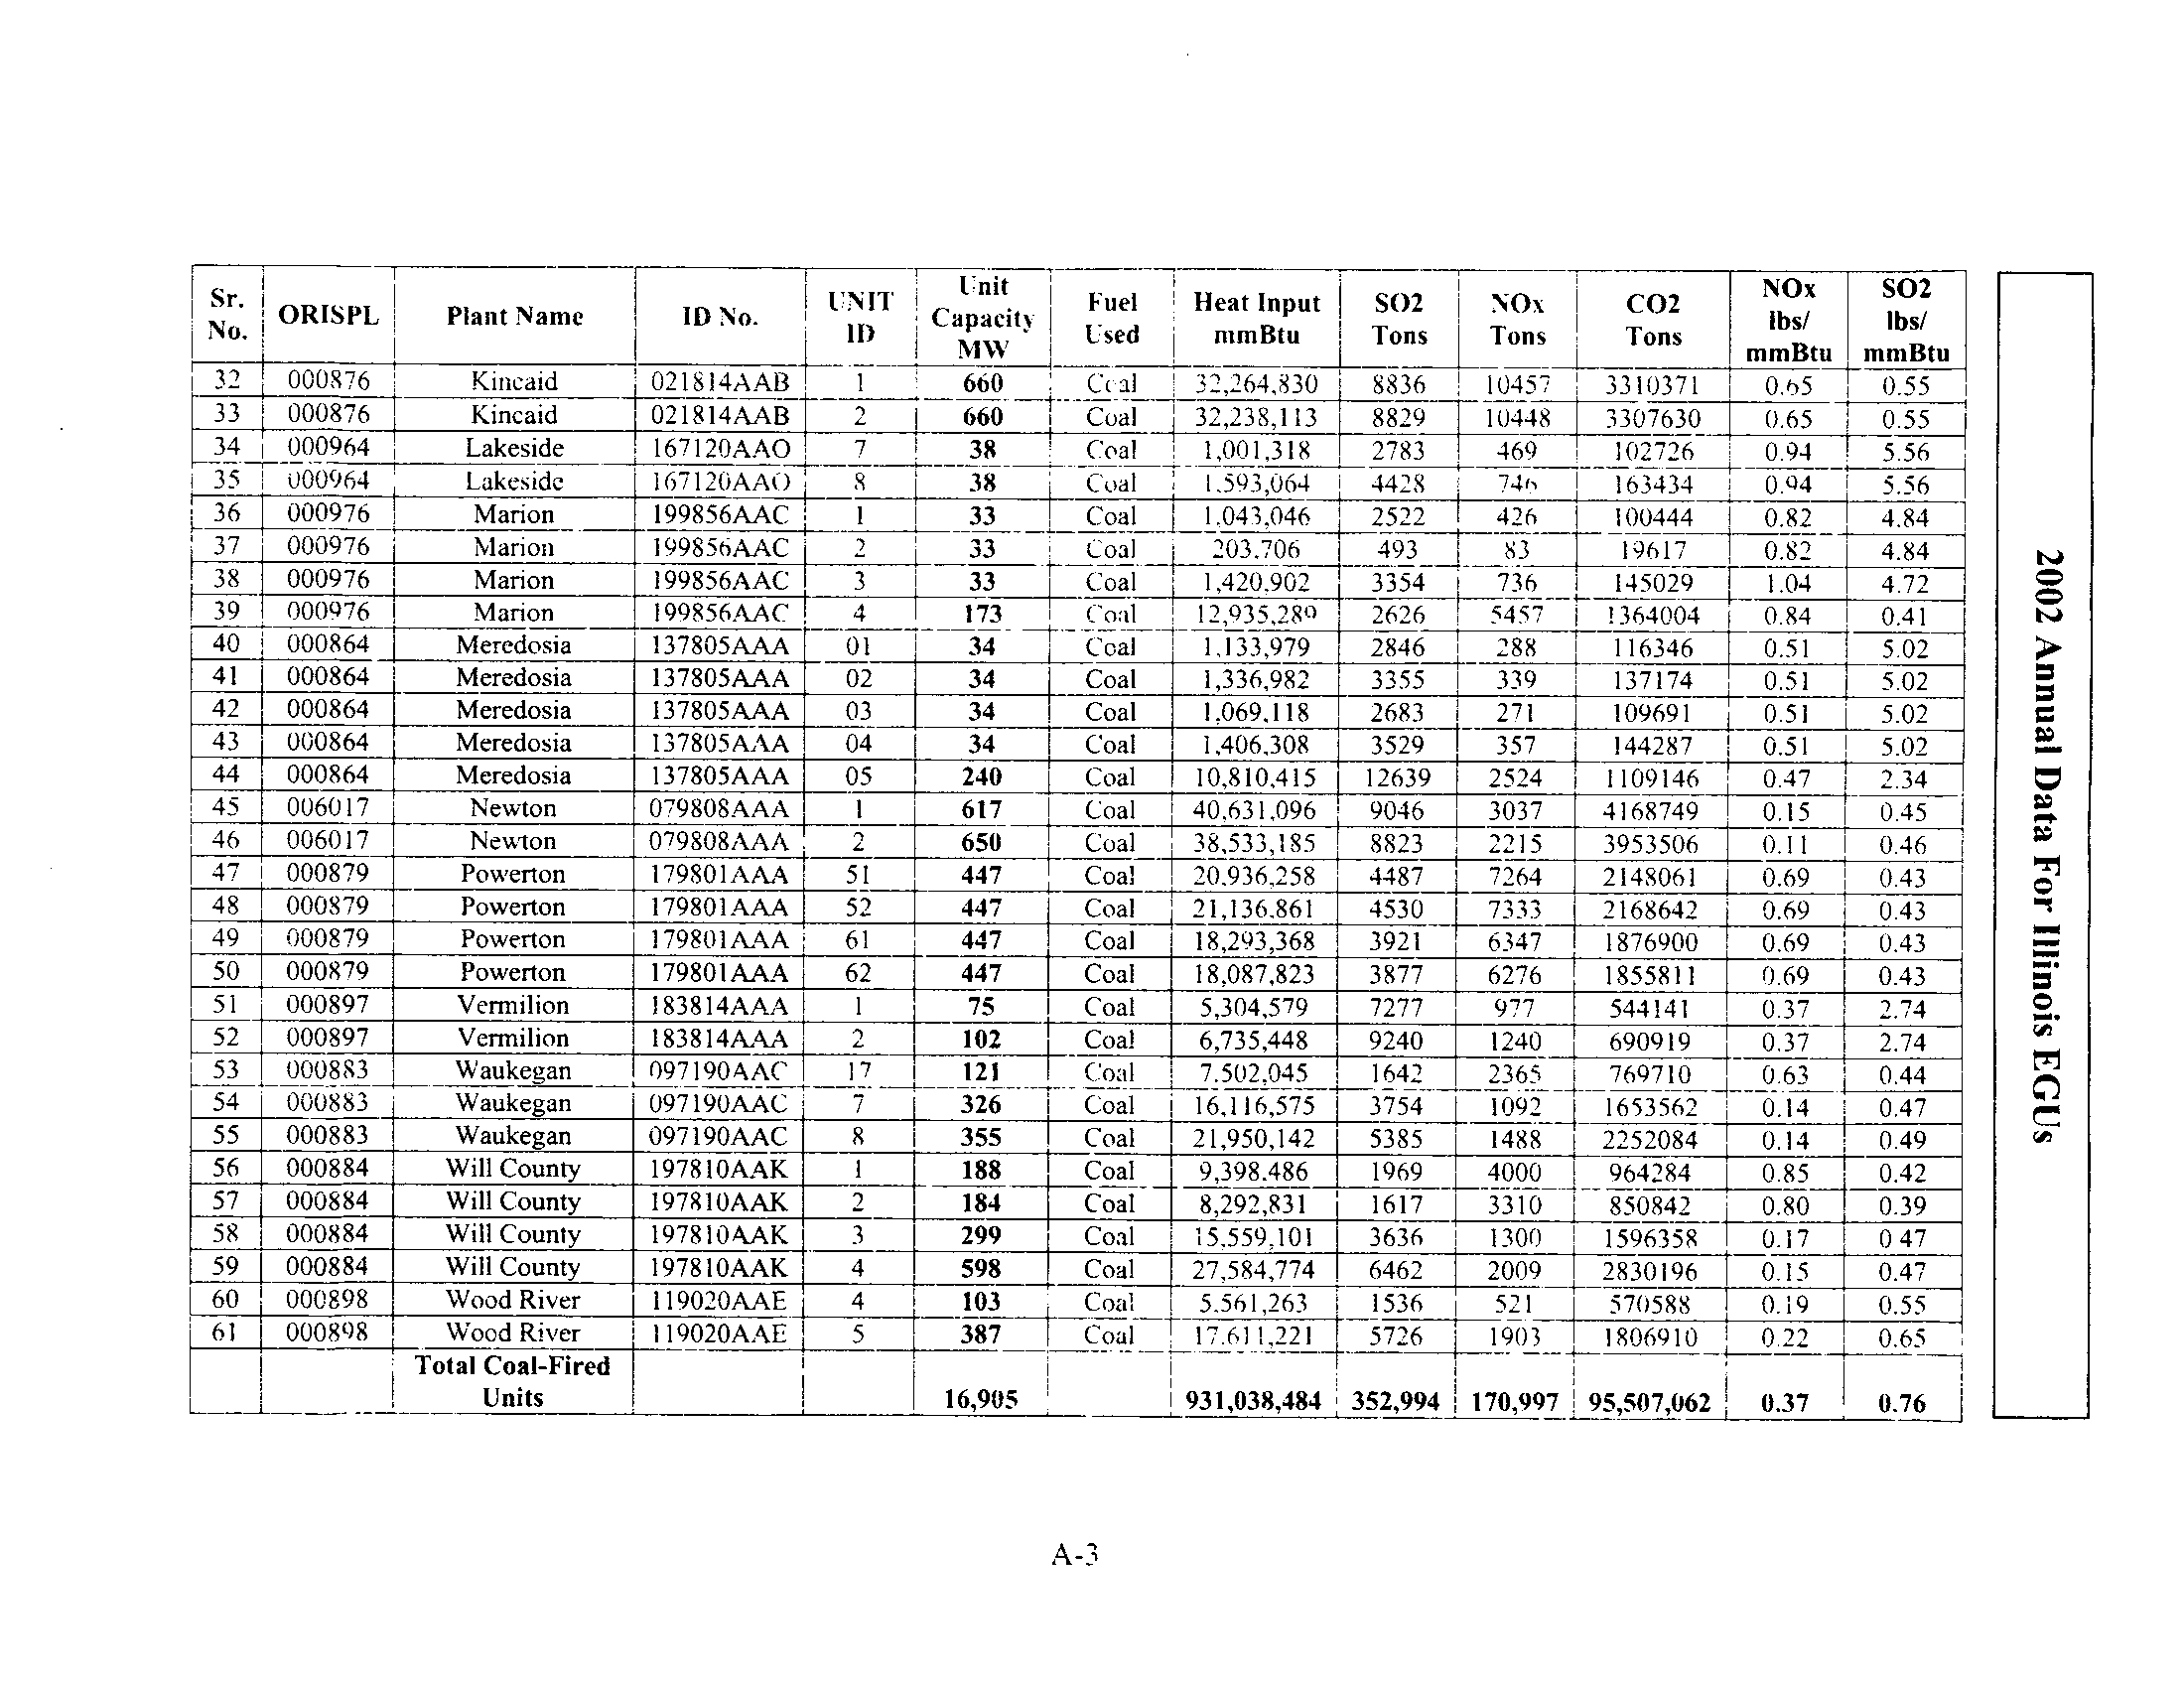
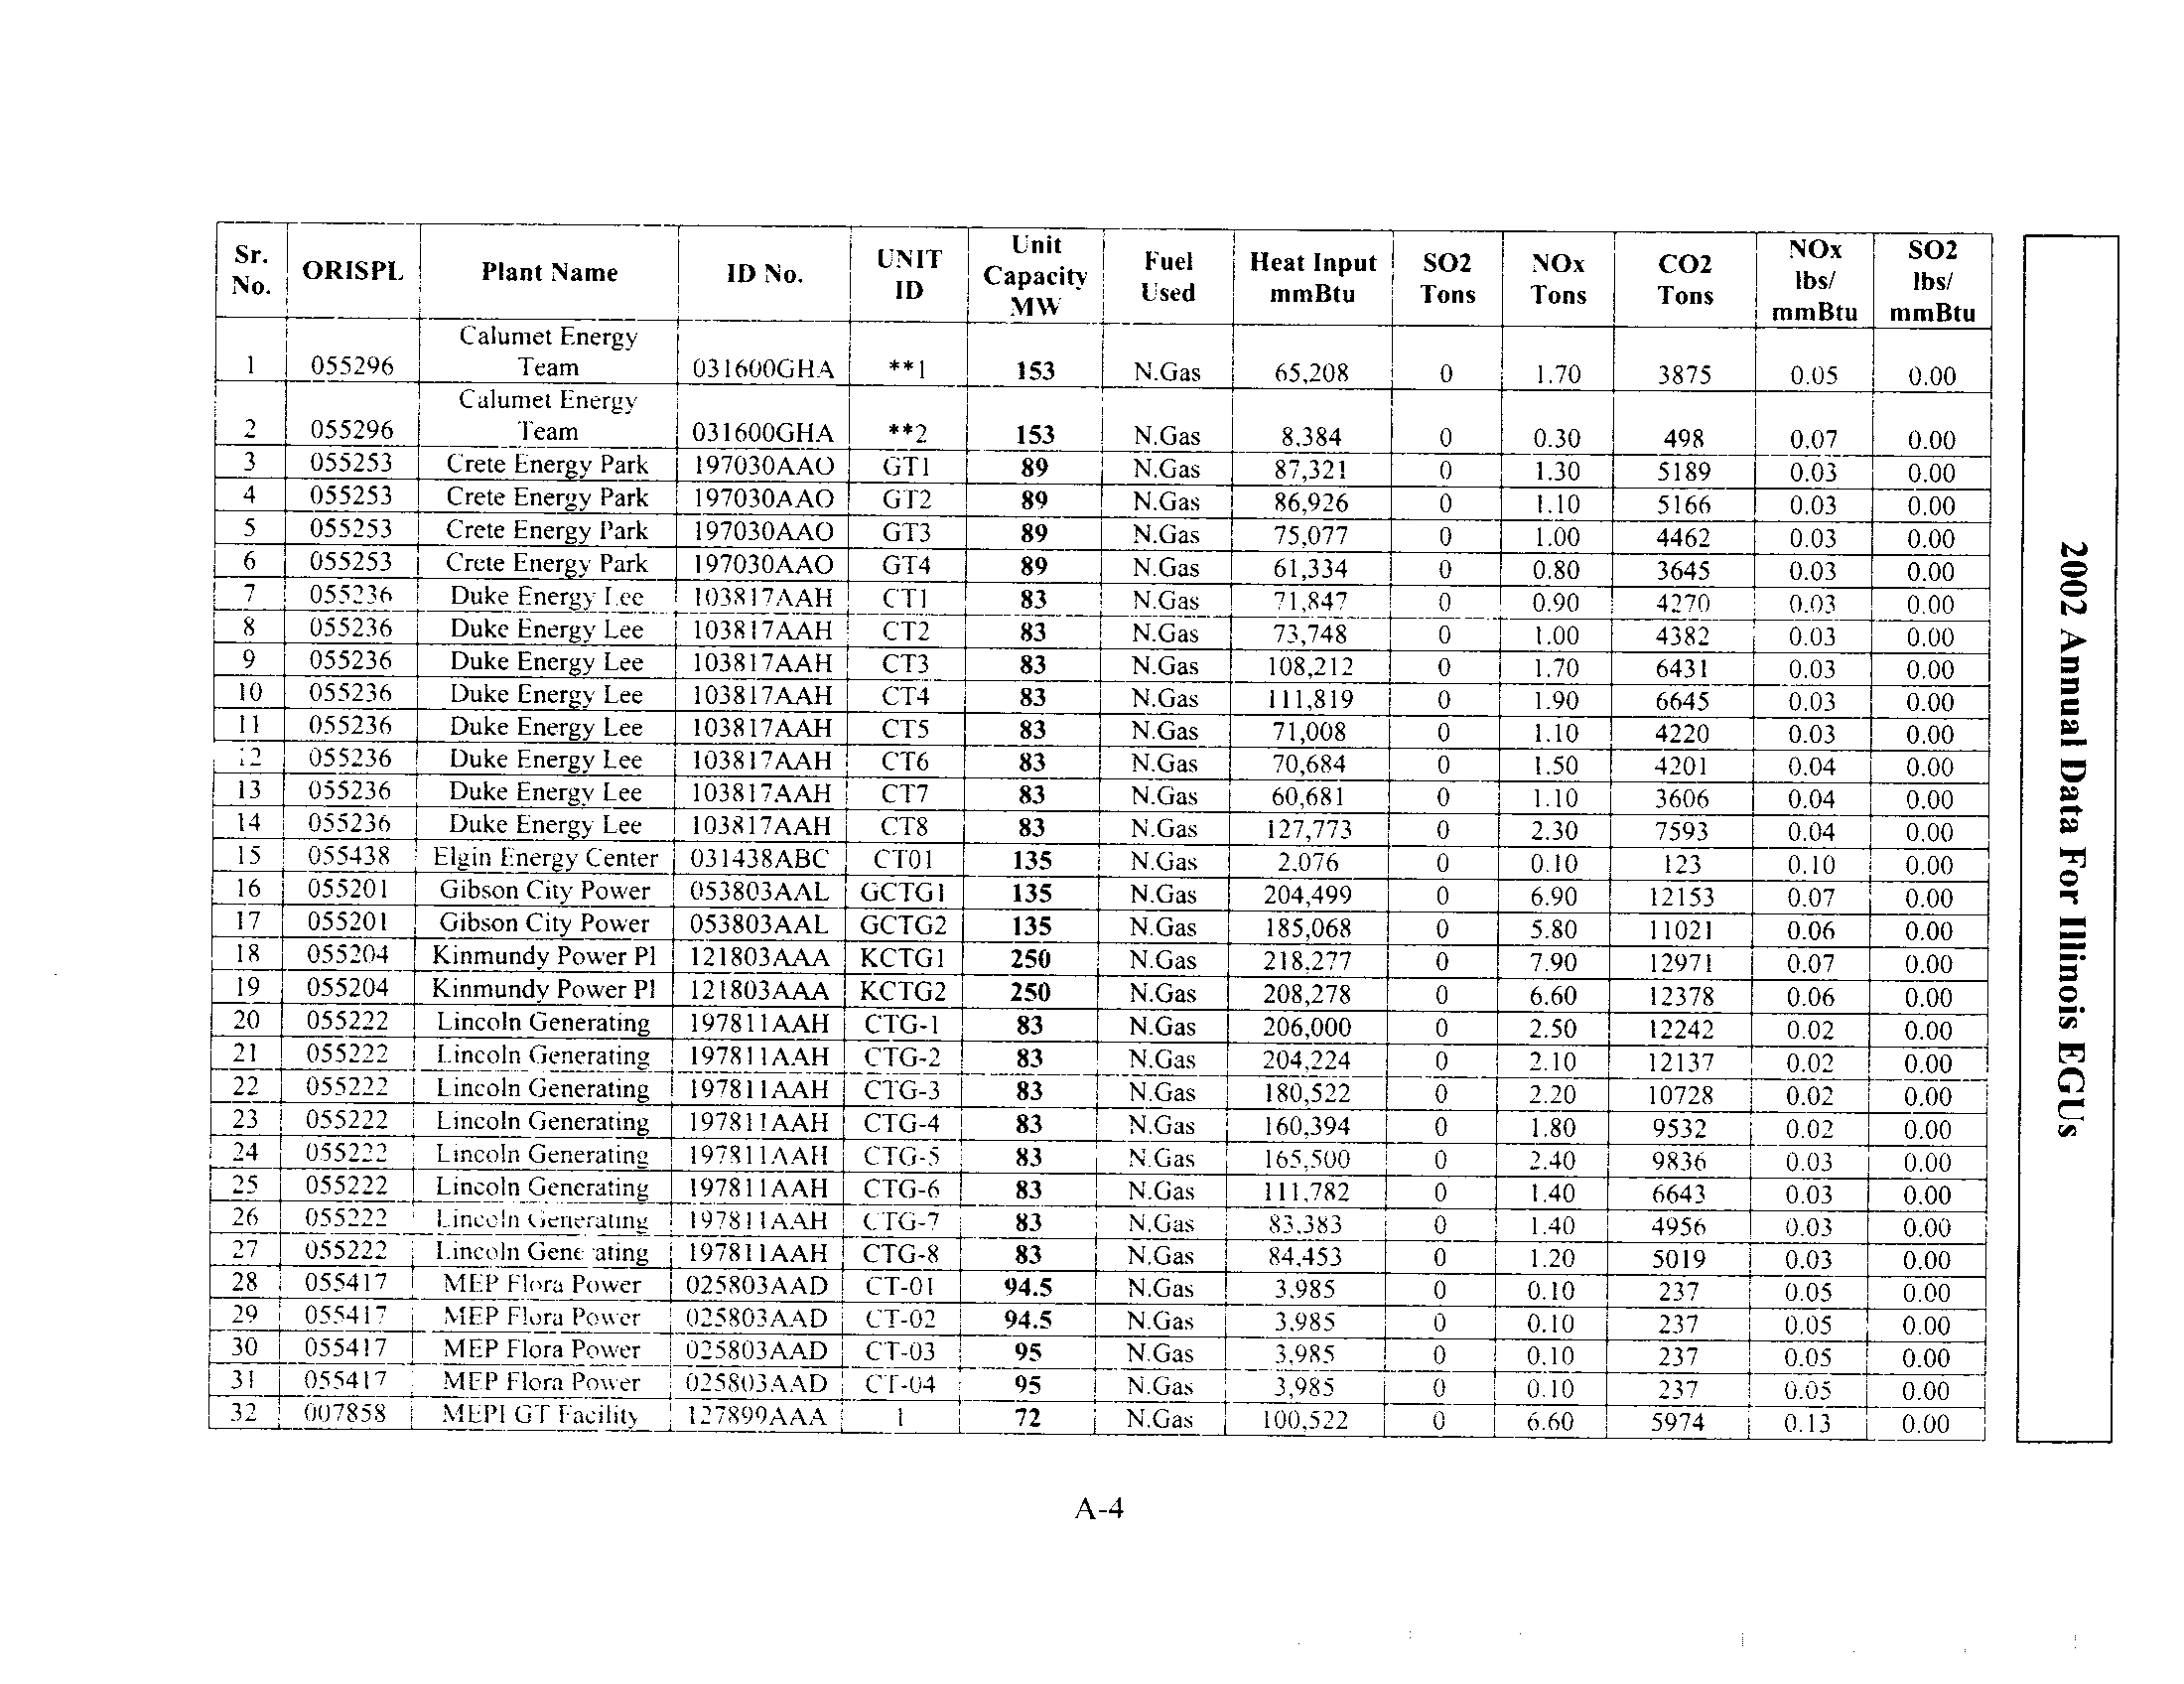
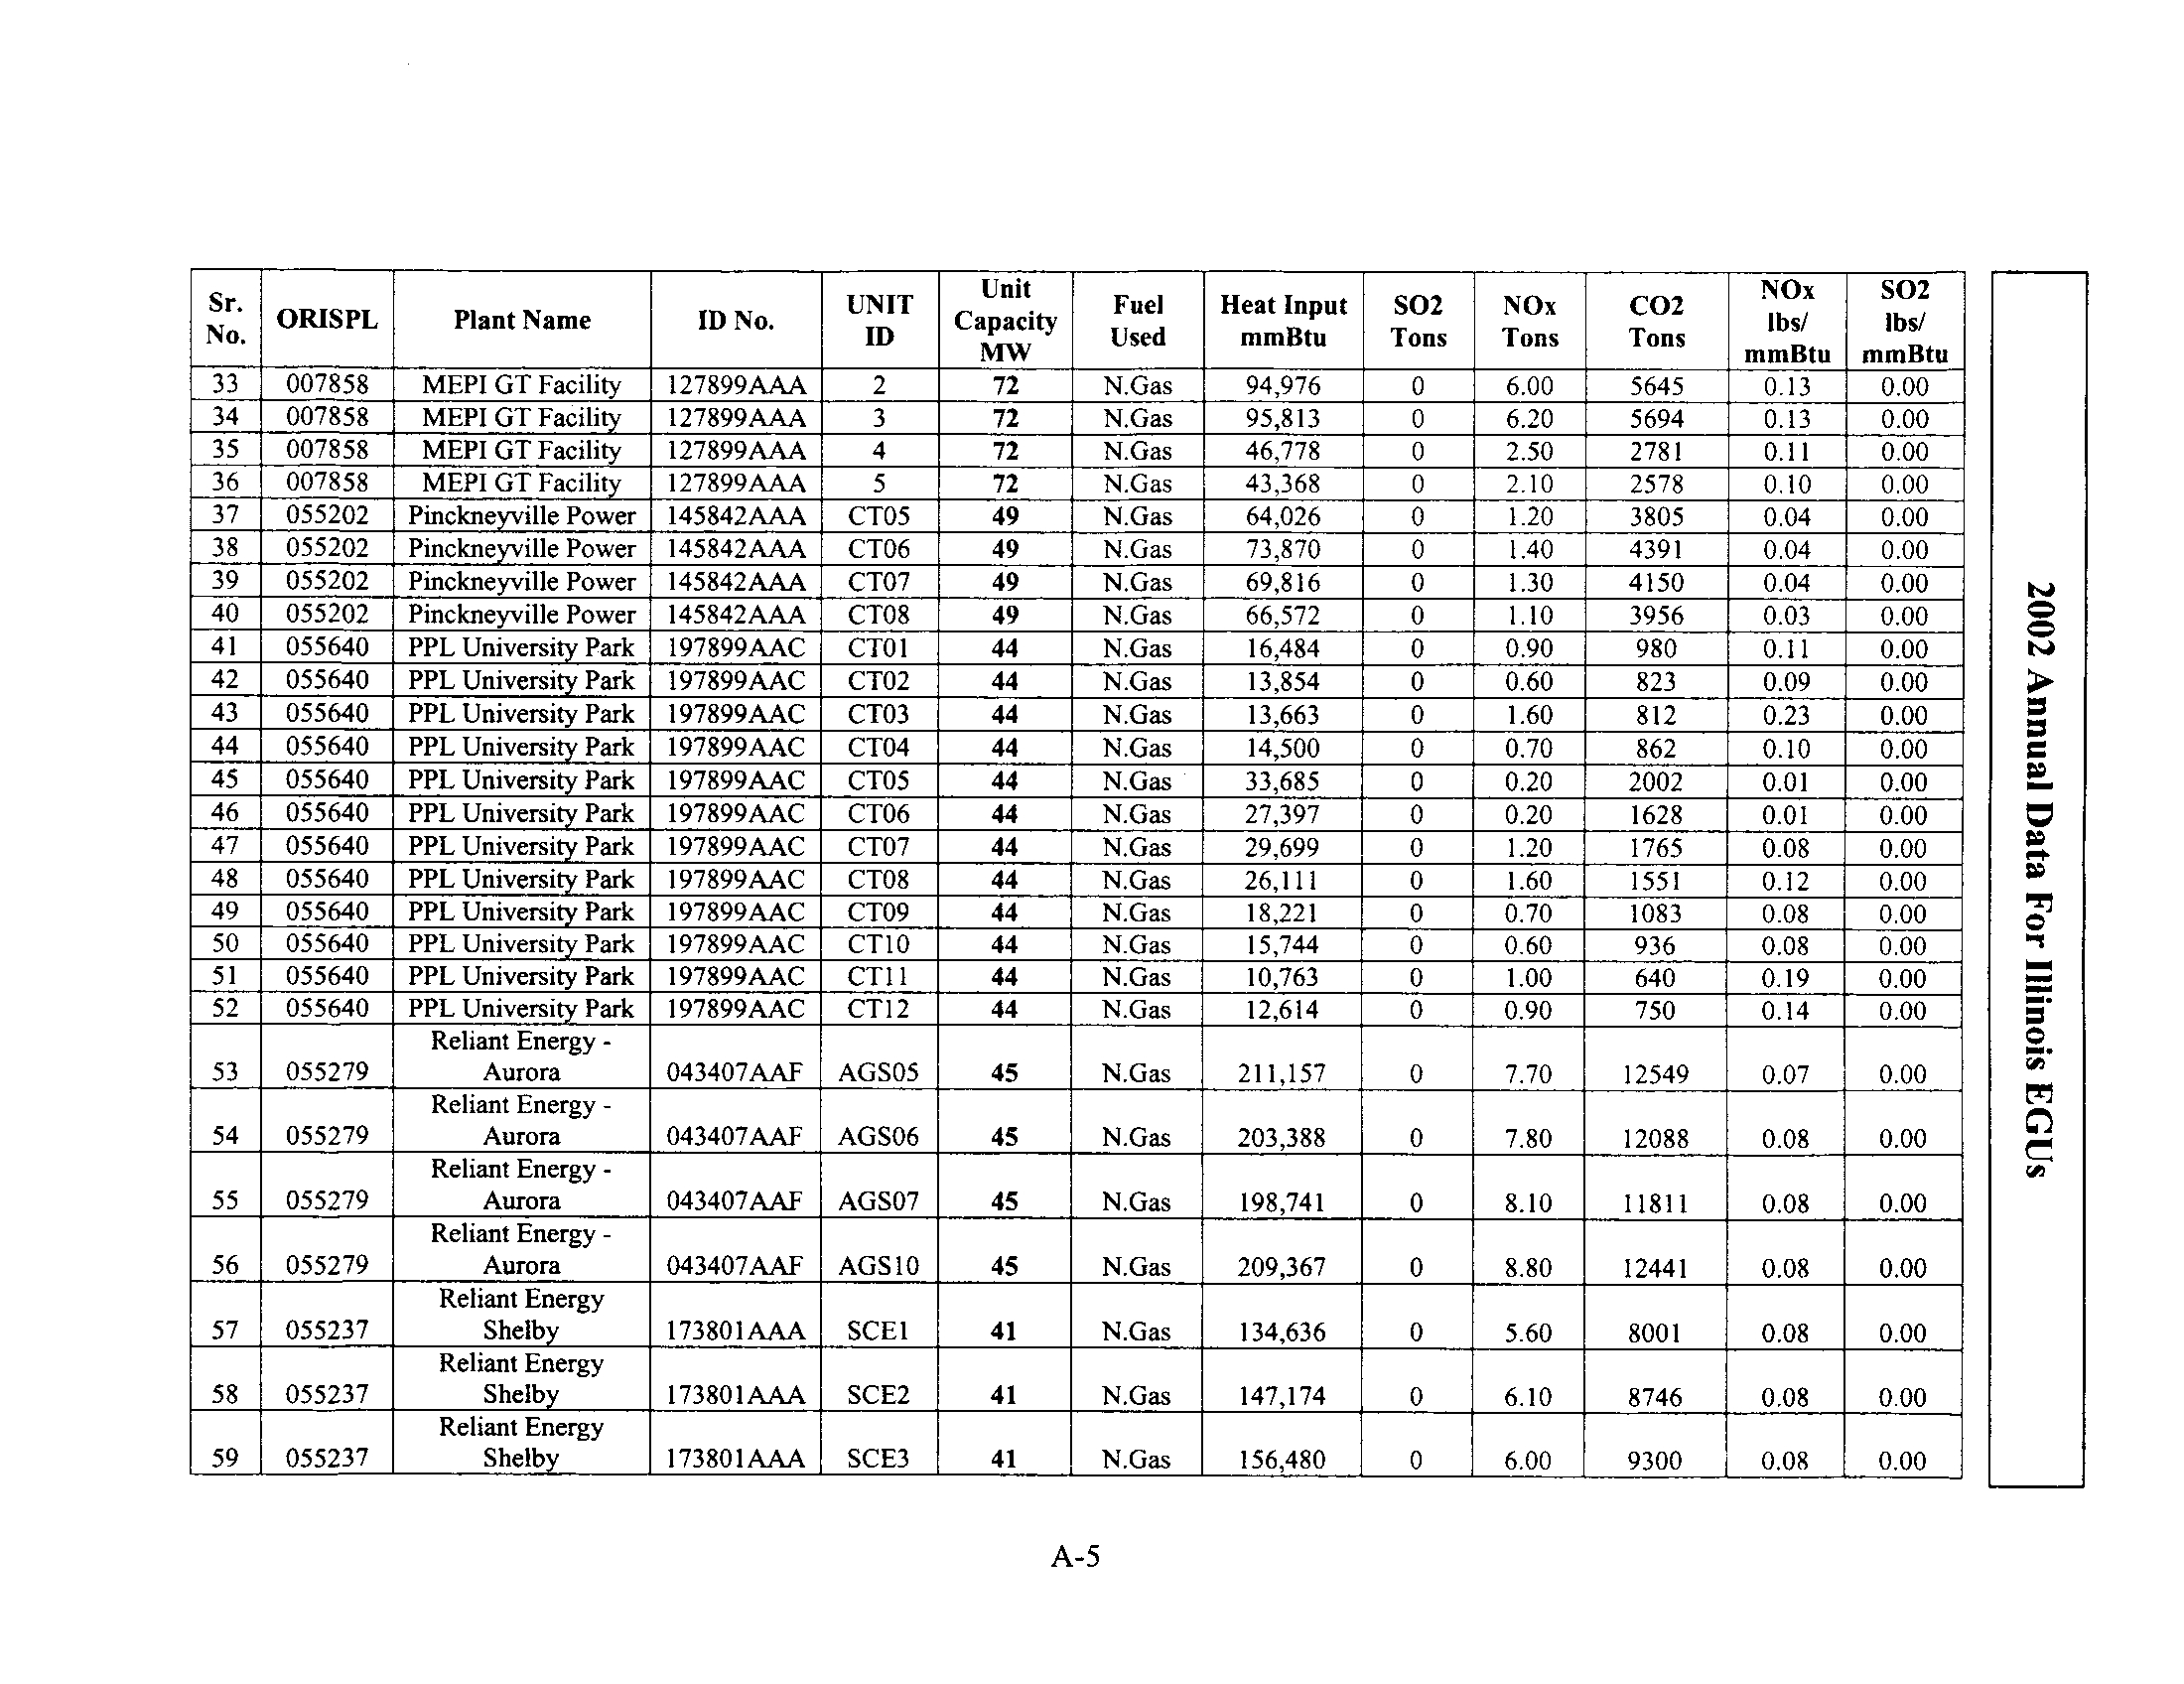
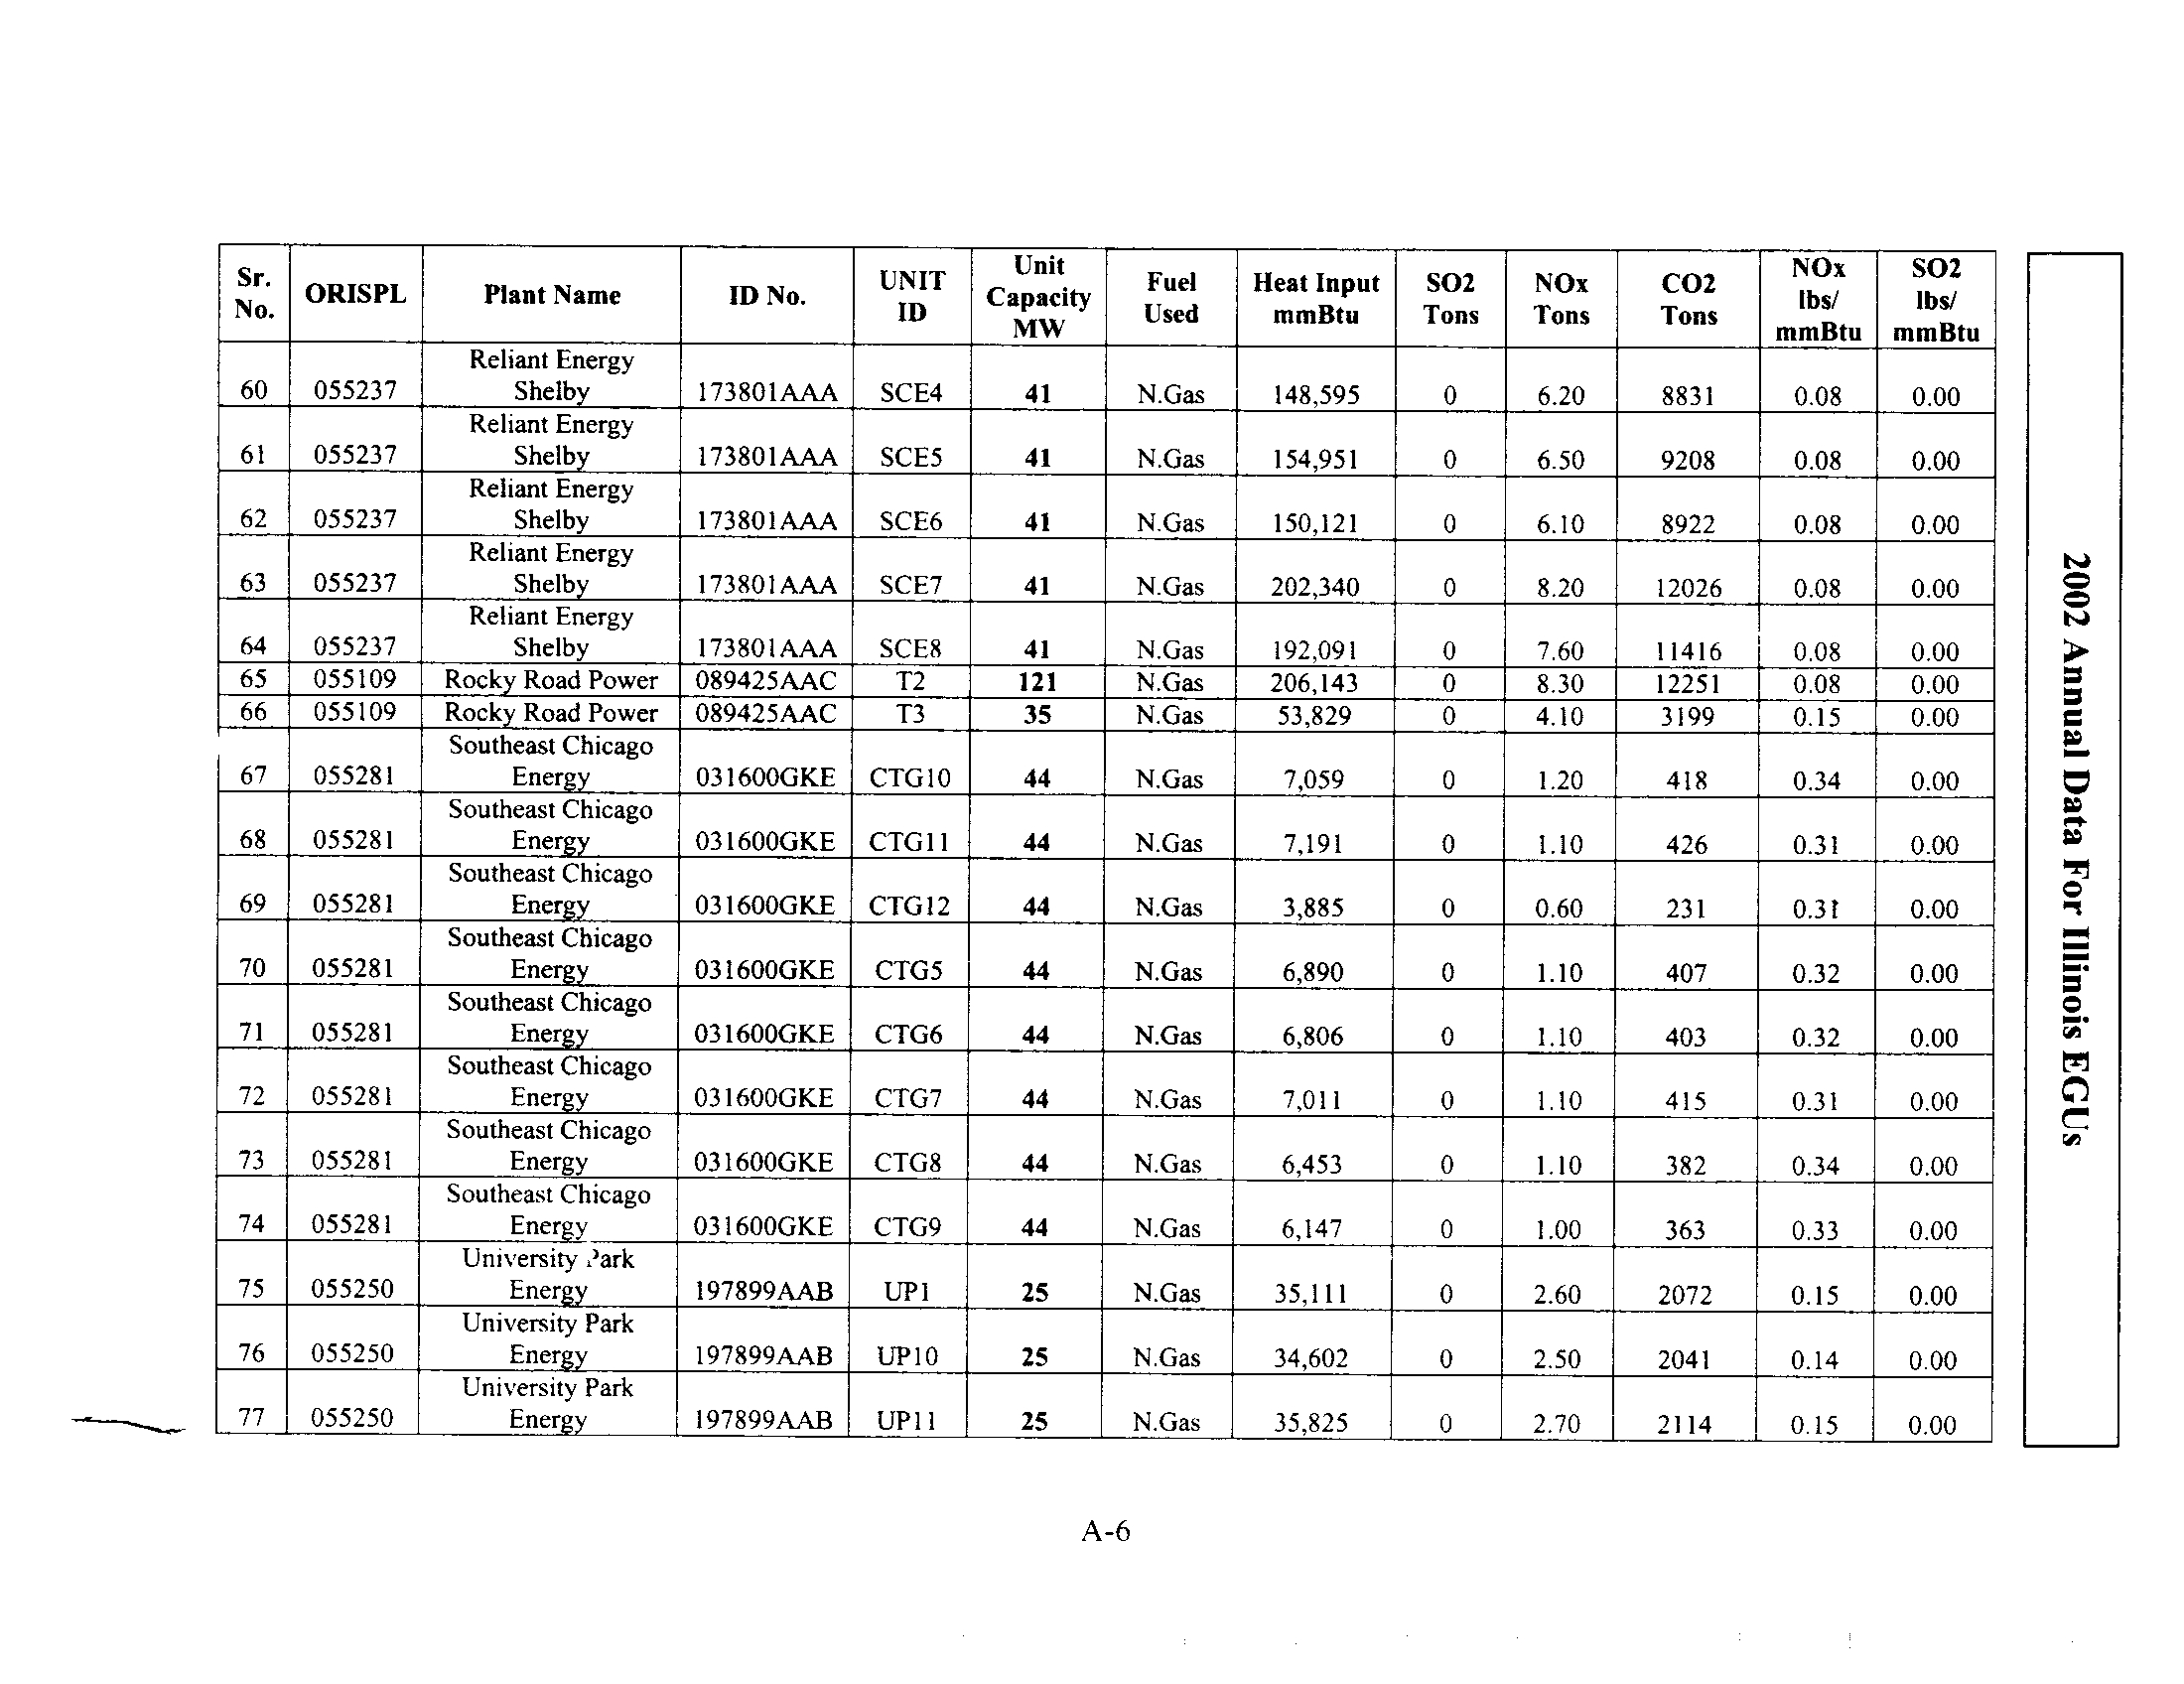
In the State of Illinois, the electric generating units (referred to within this report as
"EGUs" or "power plants") that are the subject of this report are those powered by fossil
fuel, which includes coal, oil and natural gas. Illinois currently has
214
power plant
units,
61
of which are coal-fired boilers .
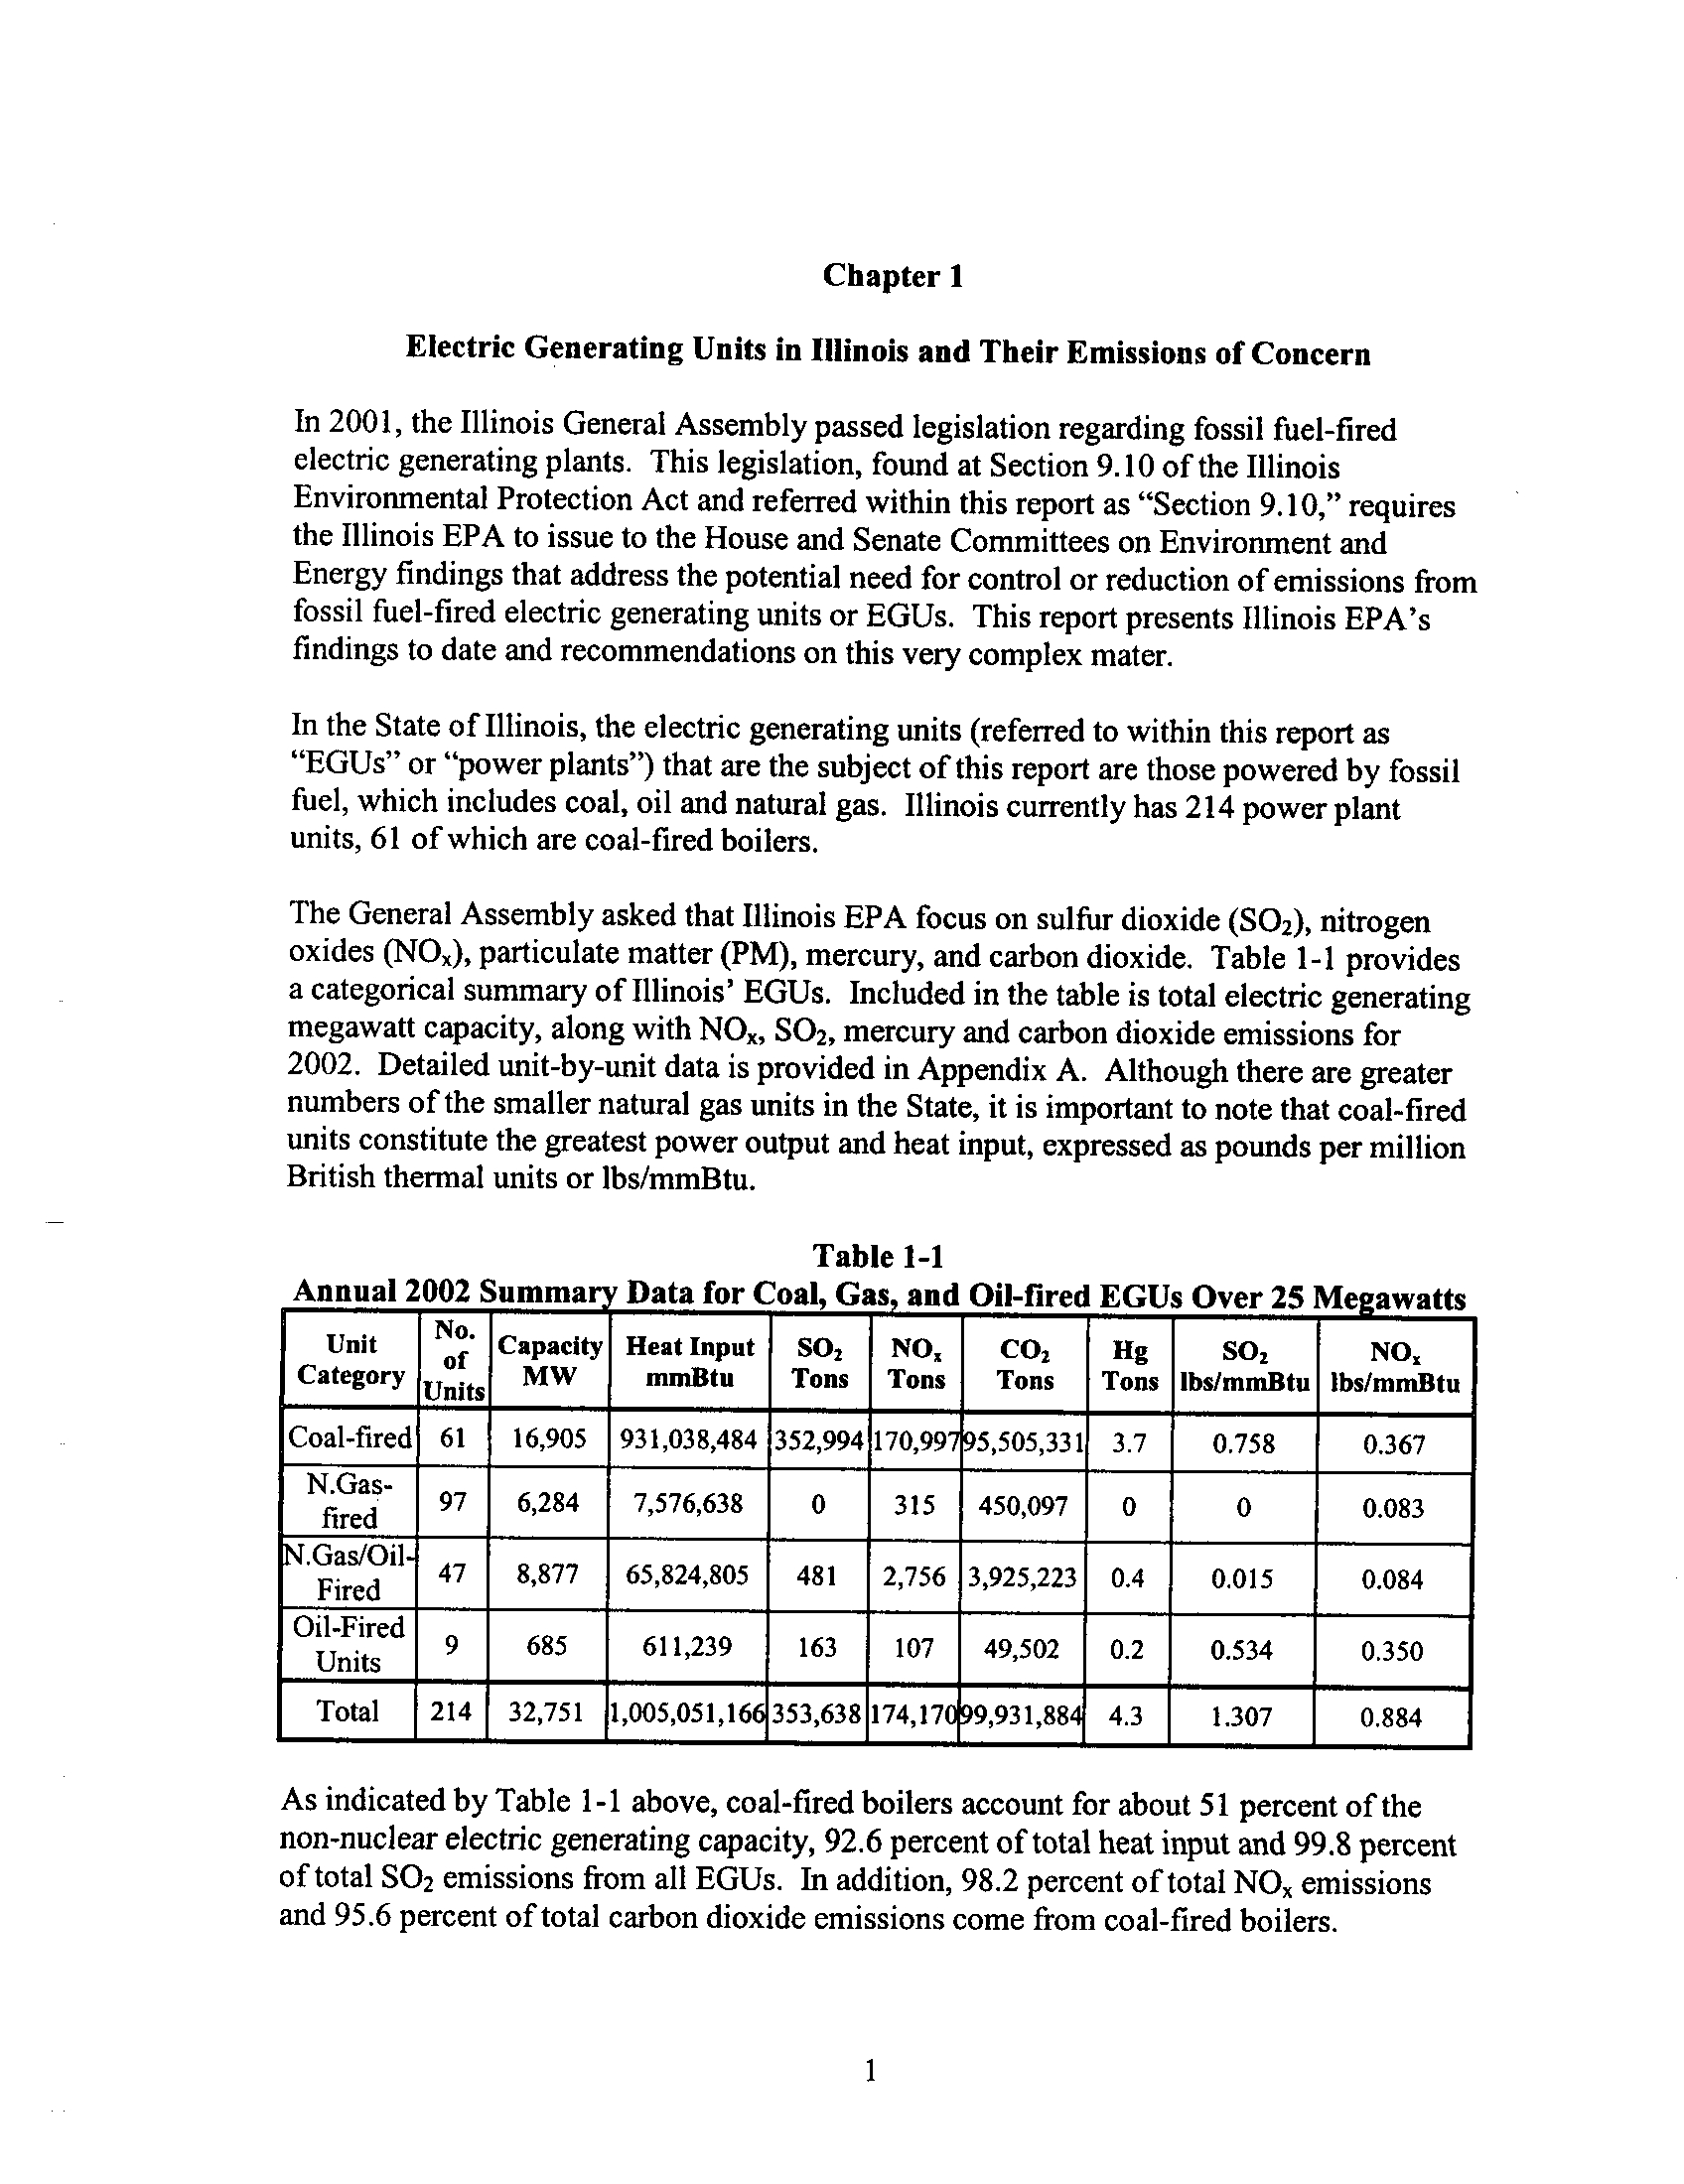
The General Assembly asked that Illinois EPA focus on sulfur dioxide (SO2), nitrogen
oxides (NO r), particulate matter (PM), mercury, and carbon dioxide. Table 1-1 provides
a categorical summary of Illinois' EGUs. Included in the table is total electric generating
megawatt capacity, along with NOR ,
SO2,
mercury and carbon dioxide emissions for
2002 .
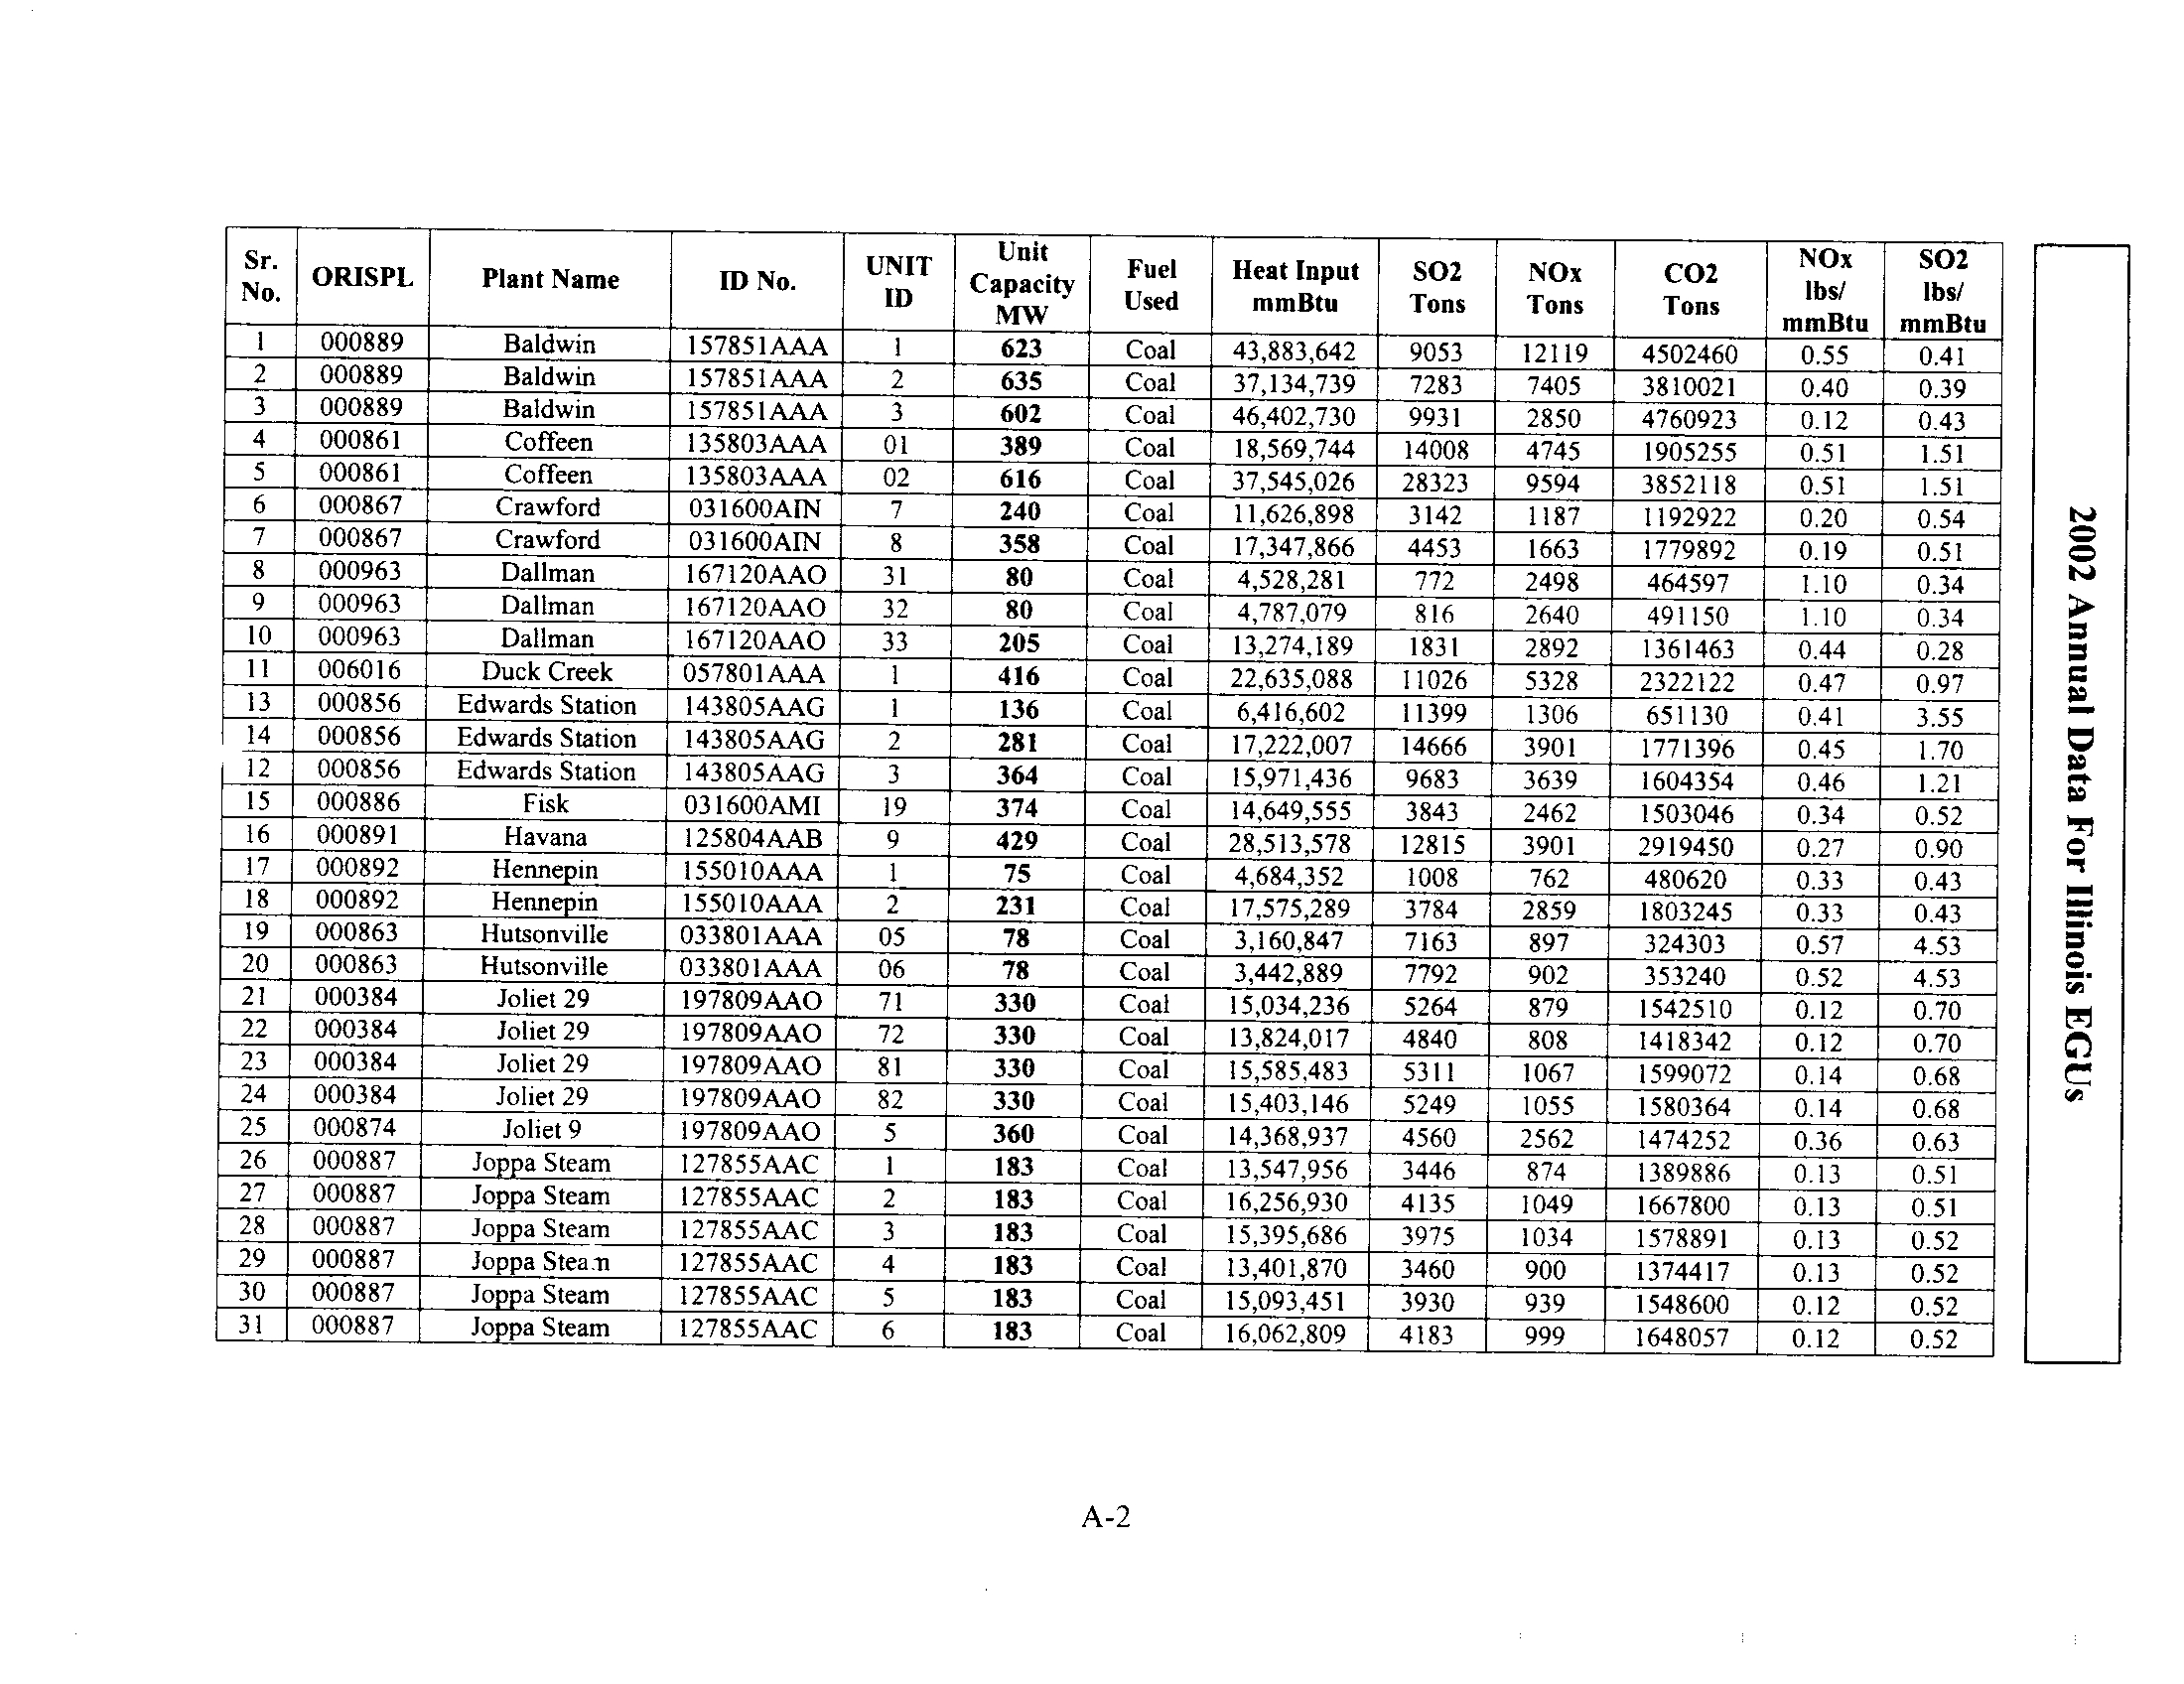
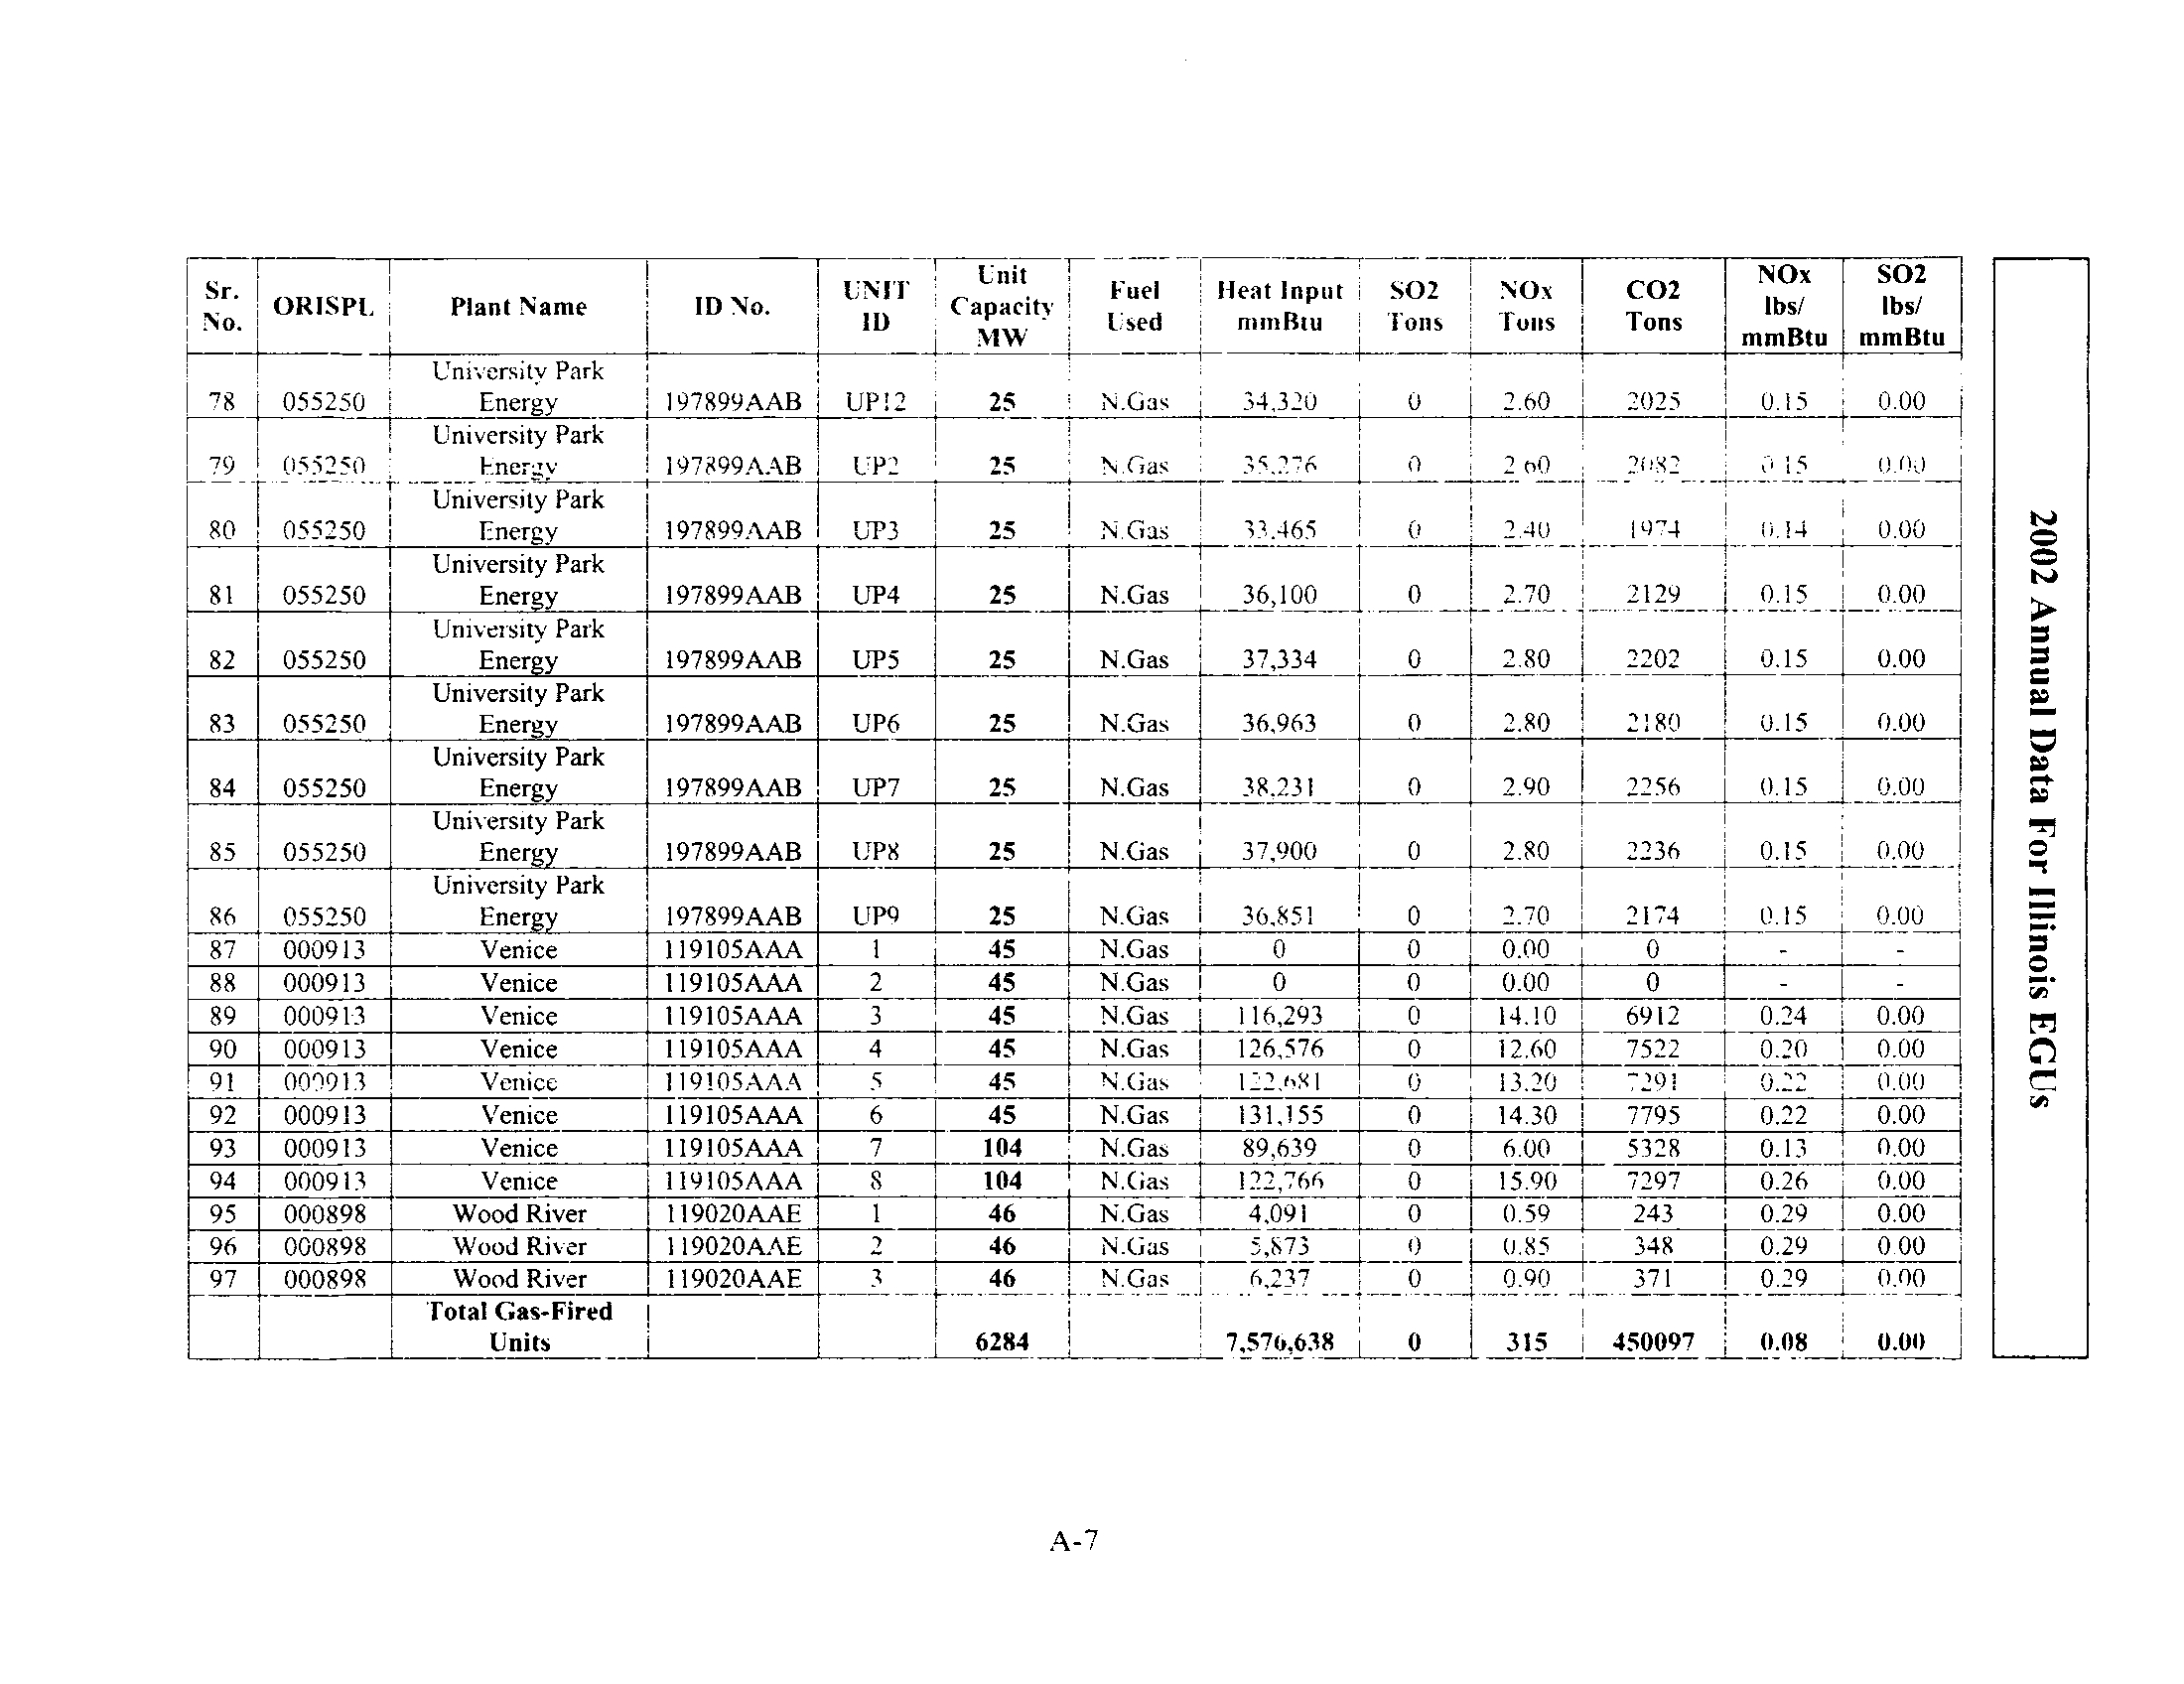
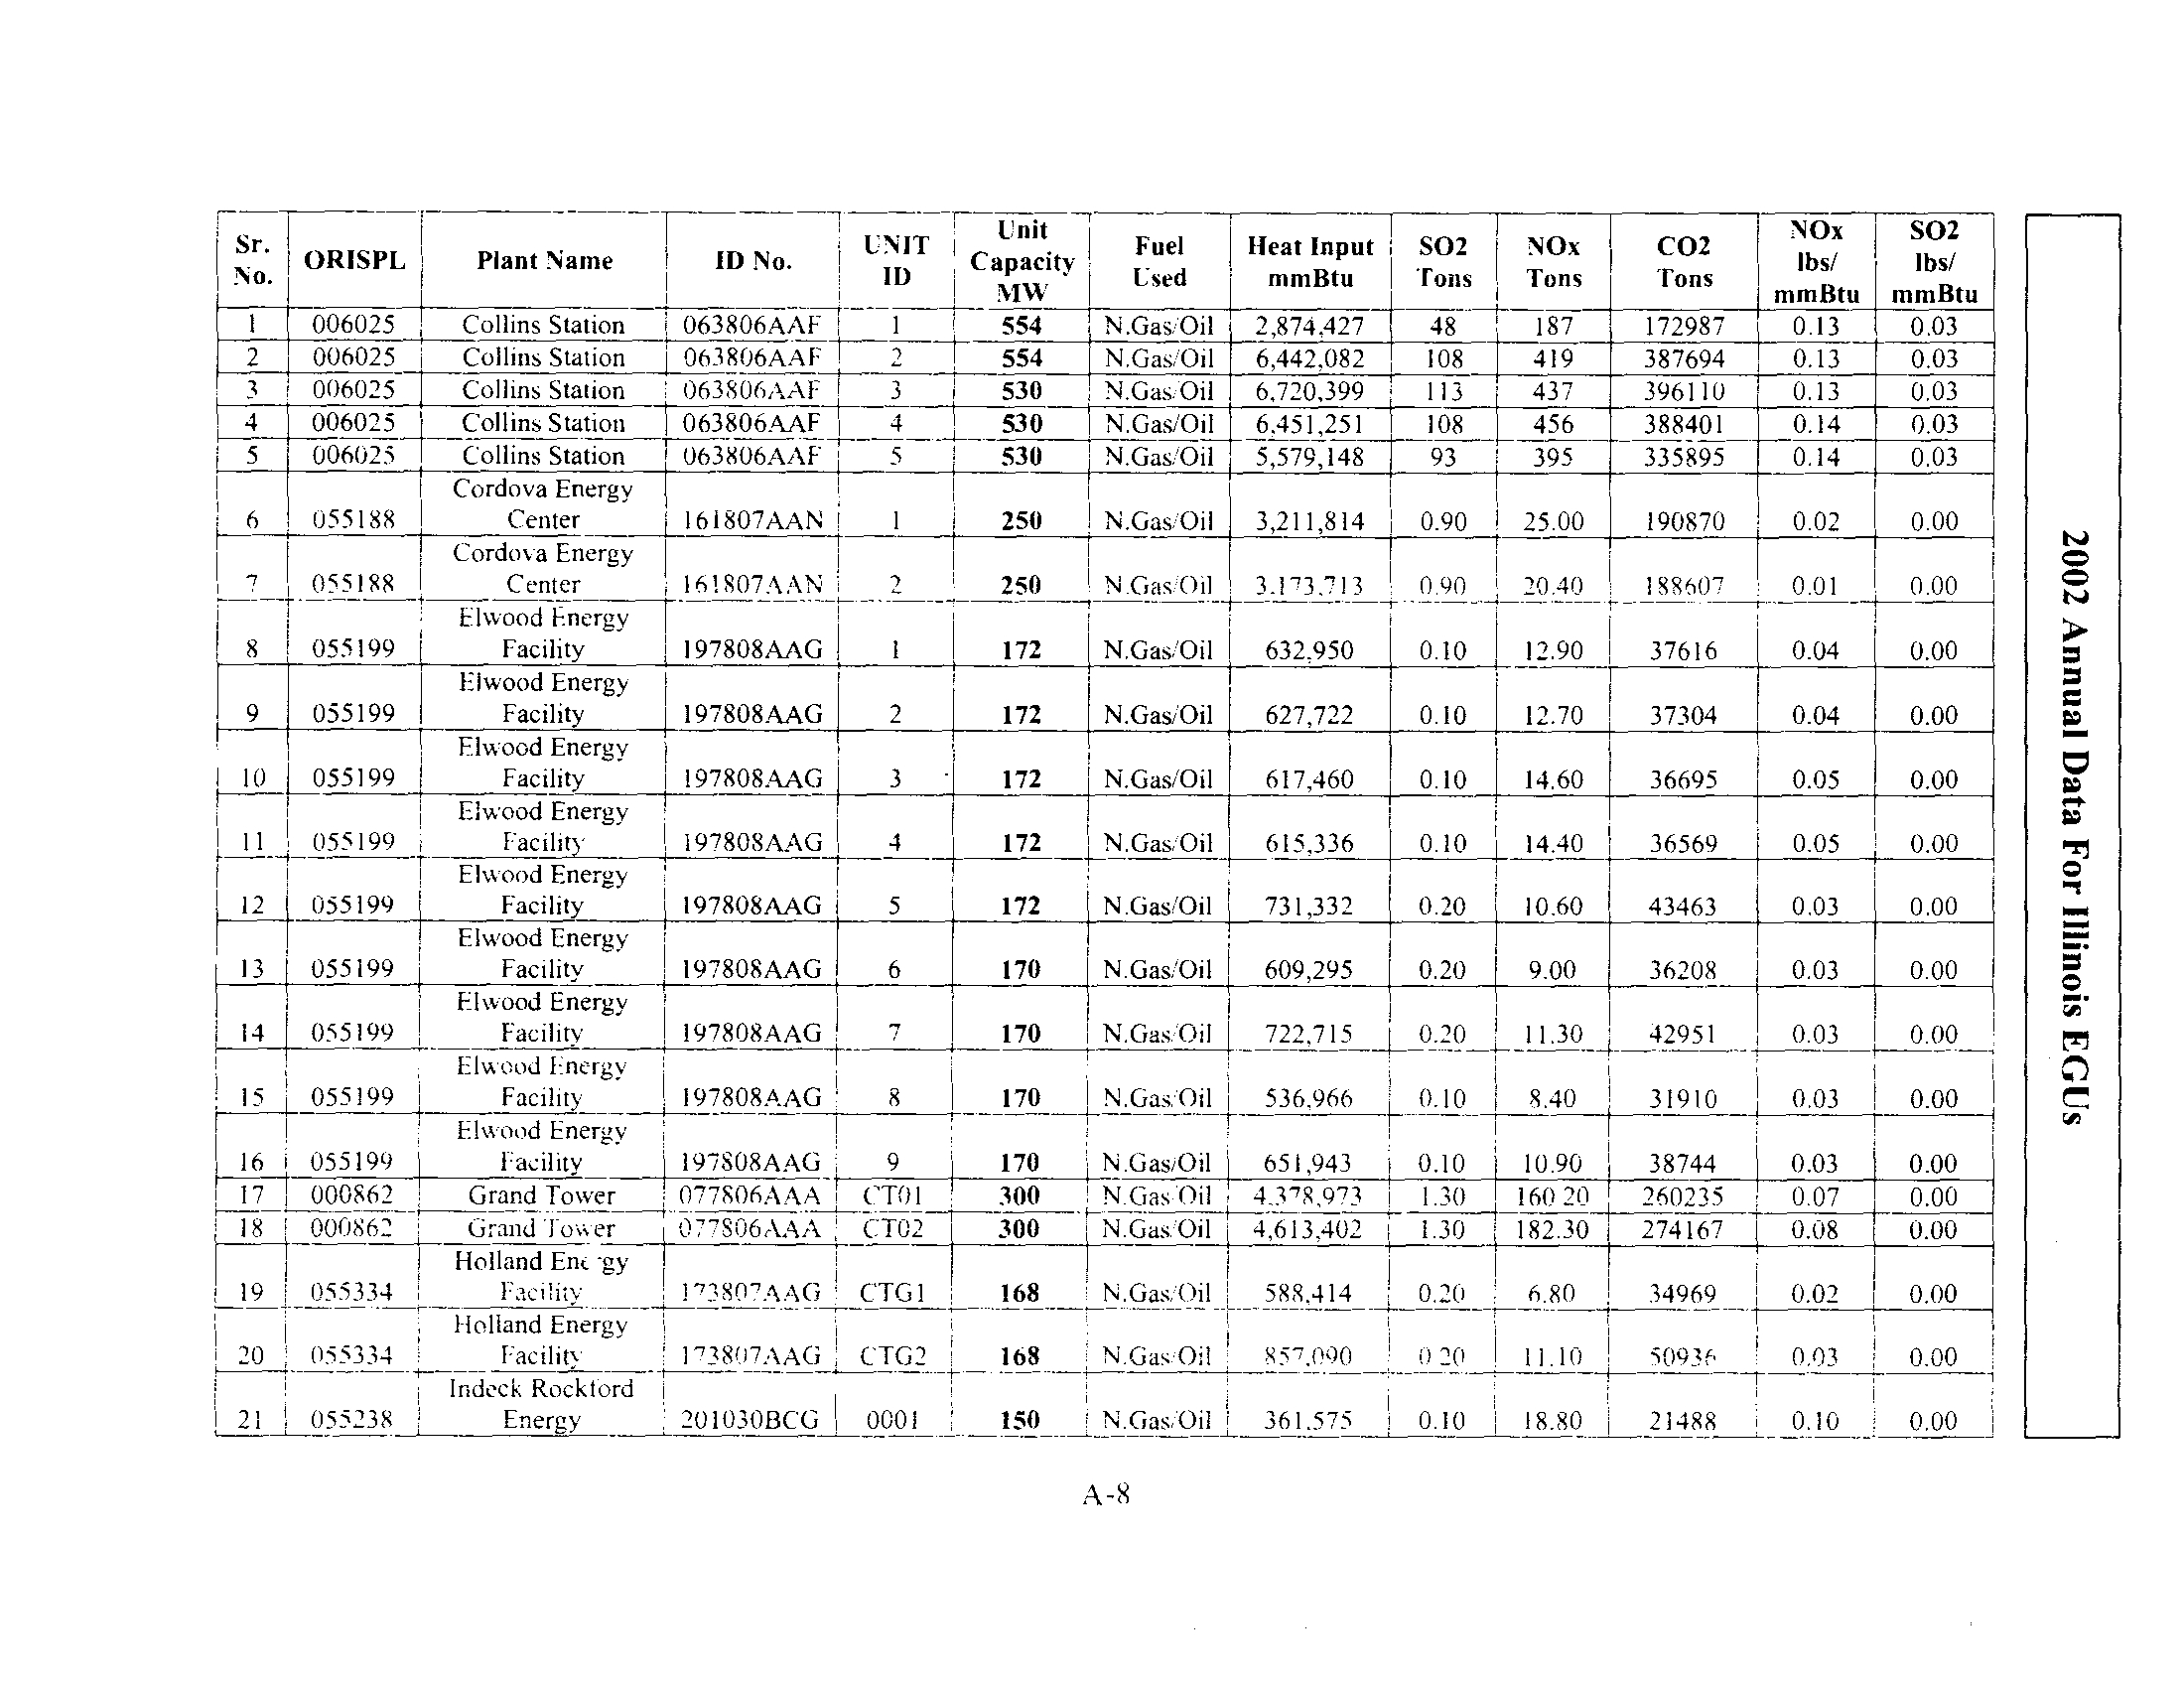
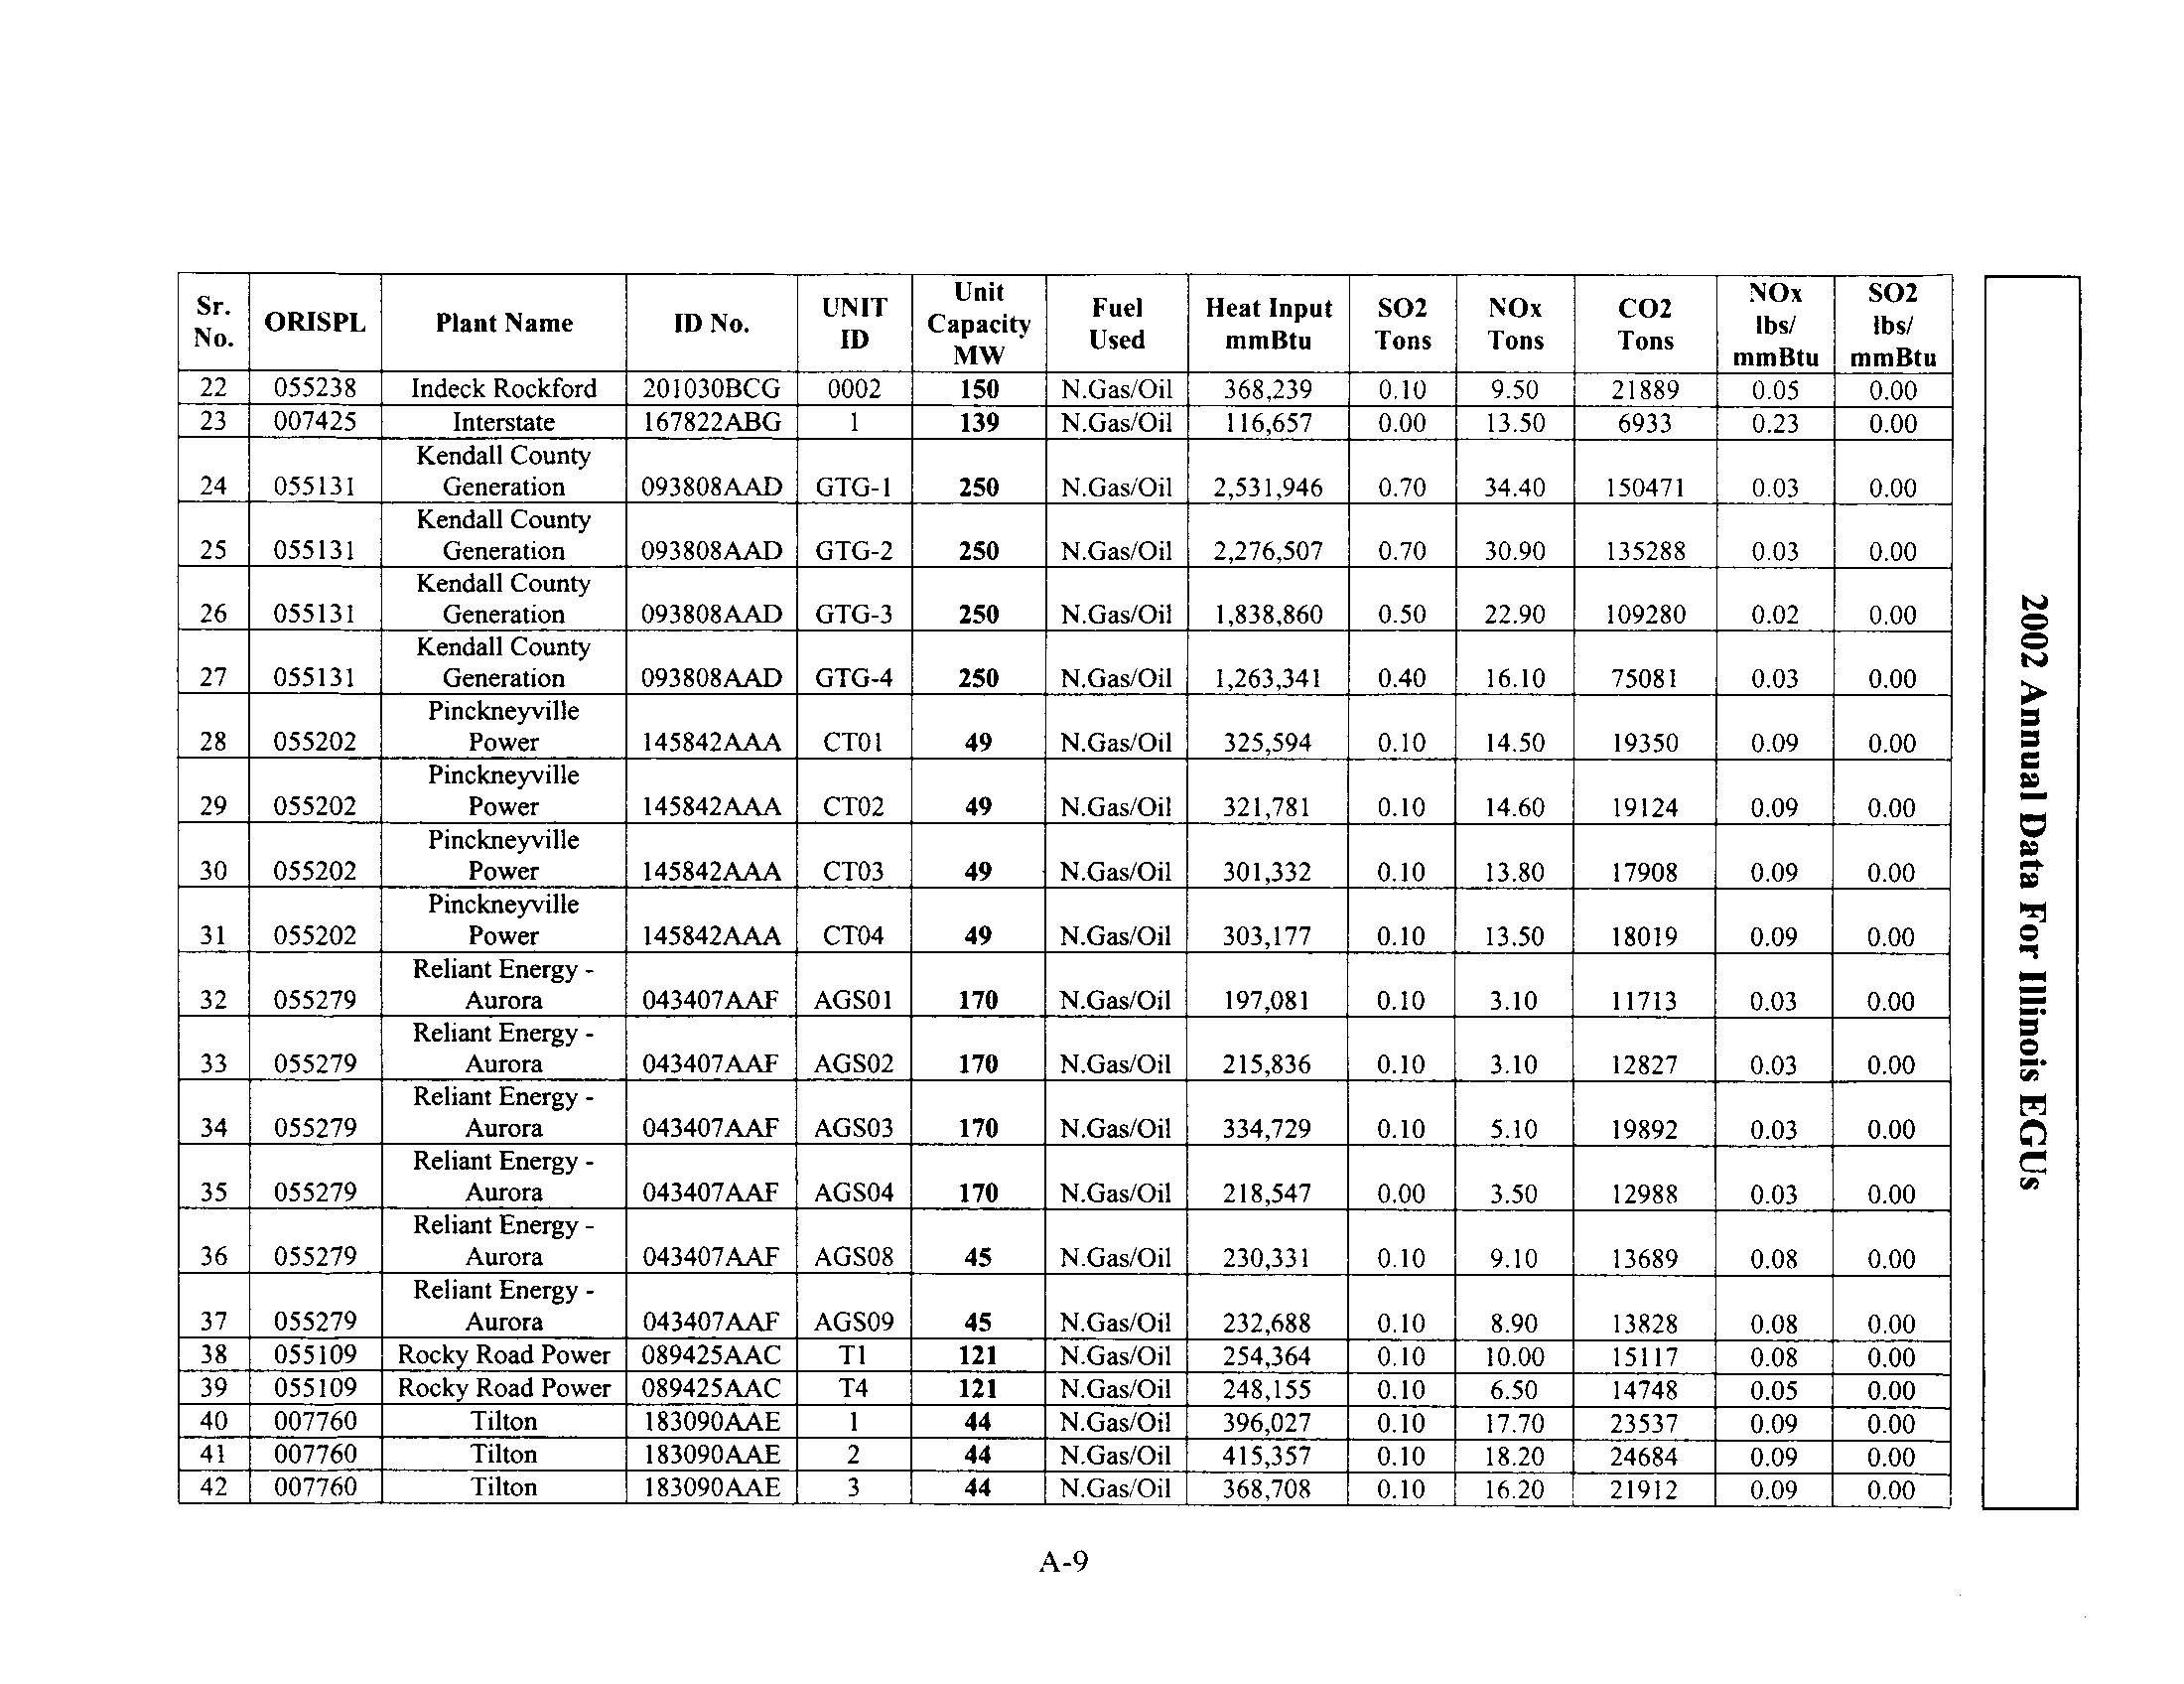
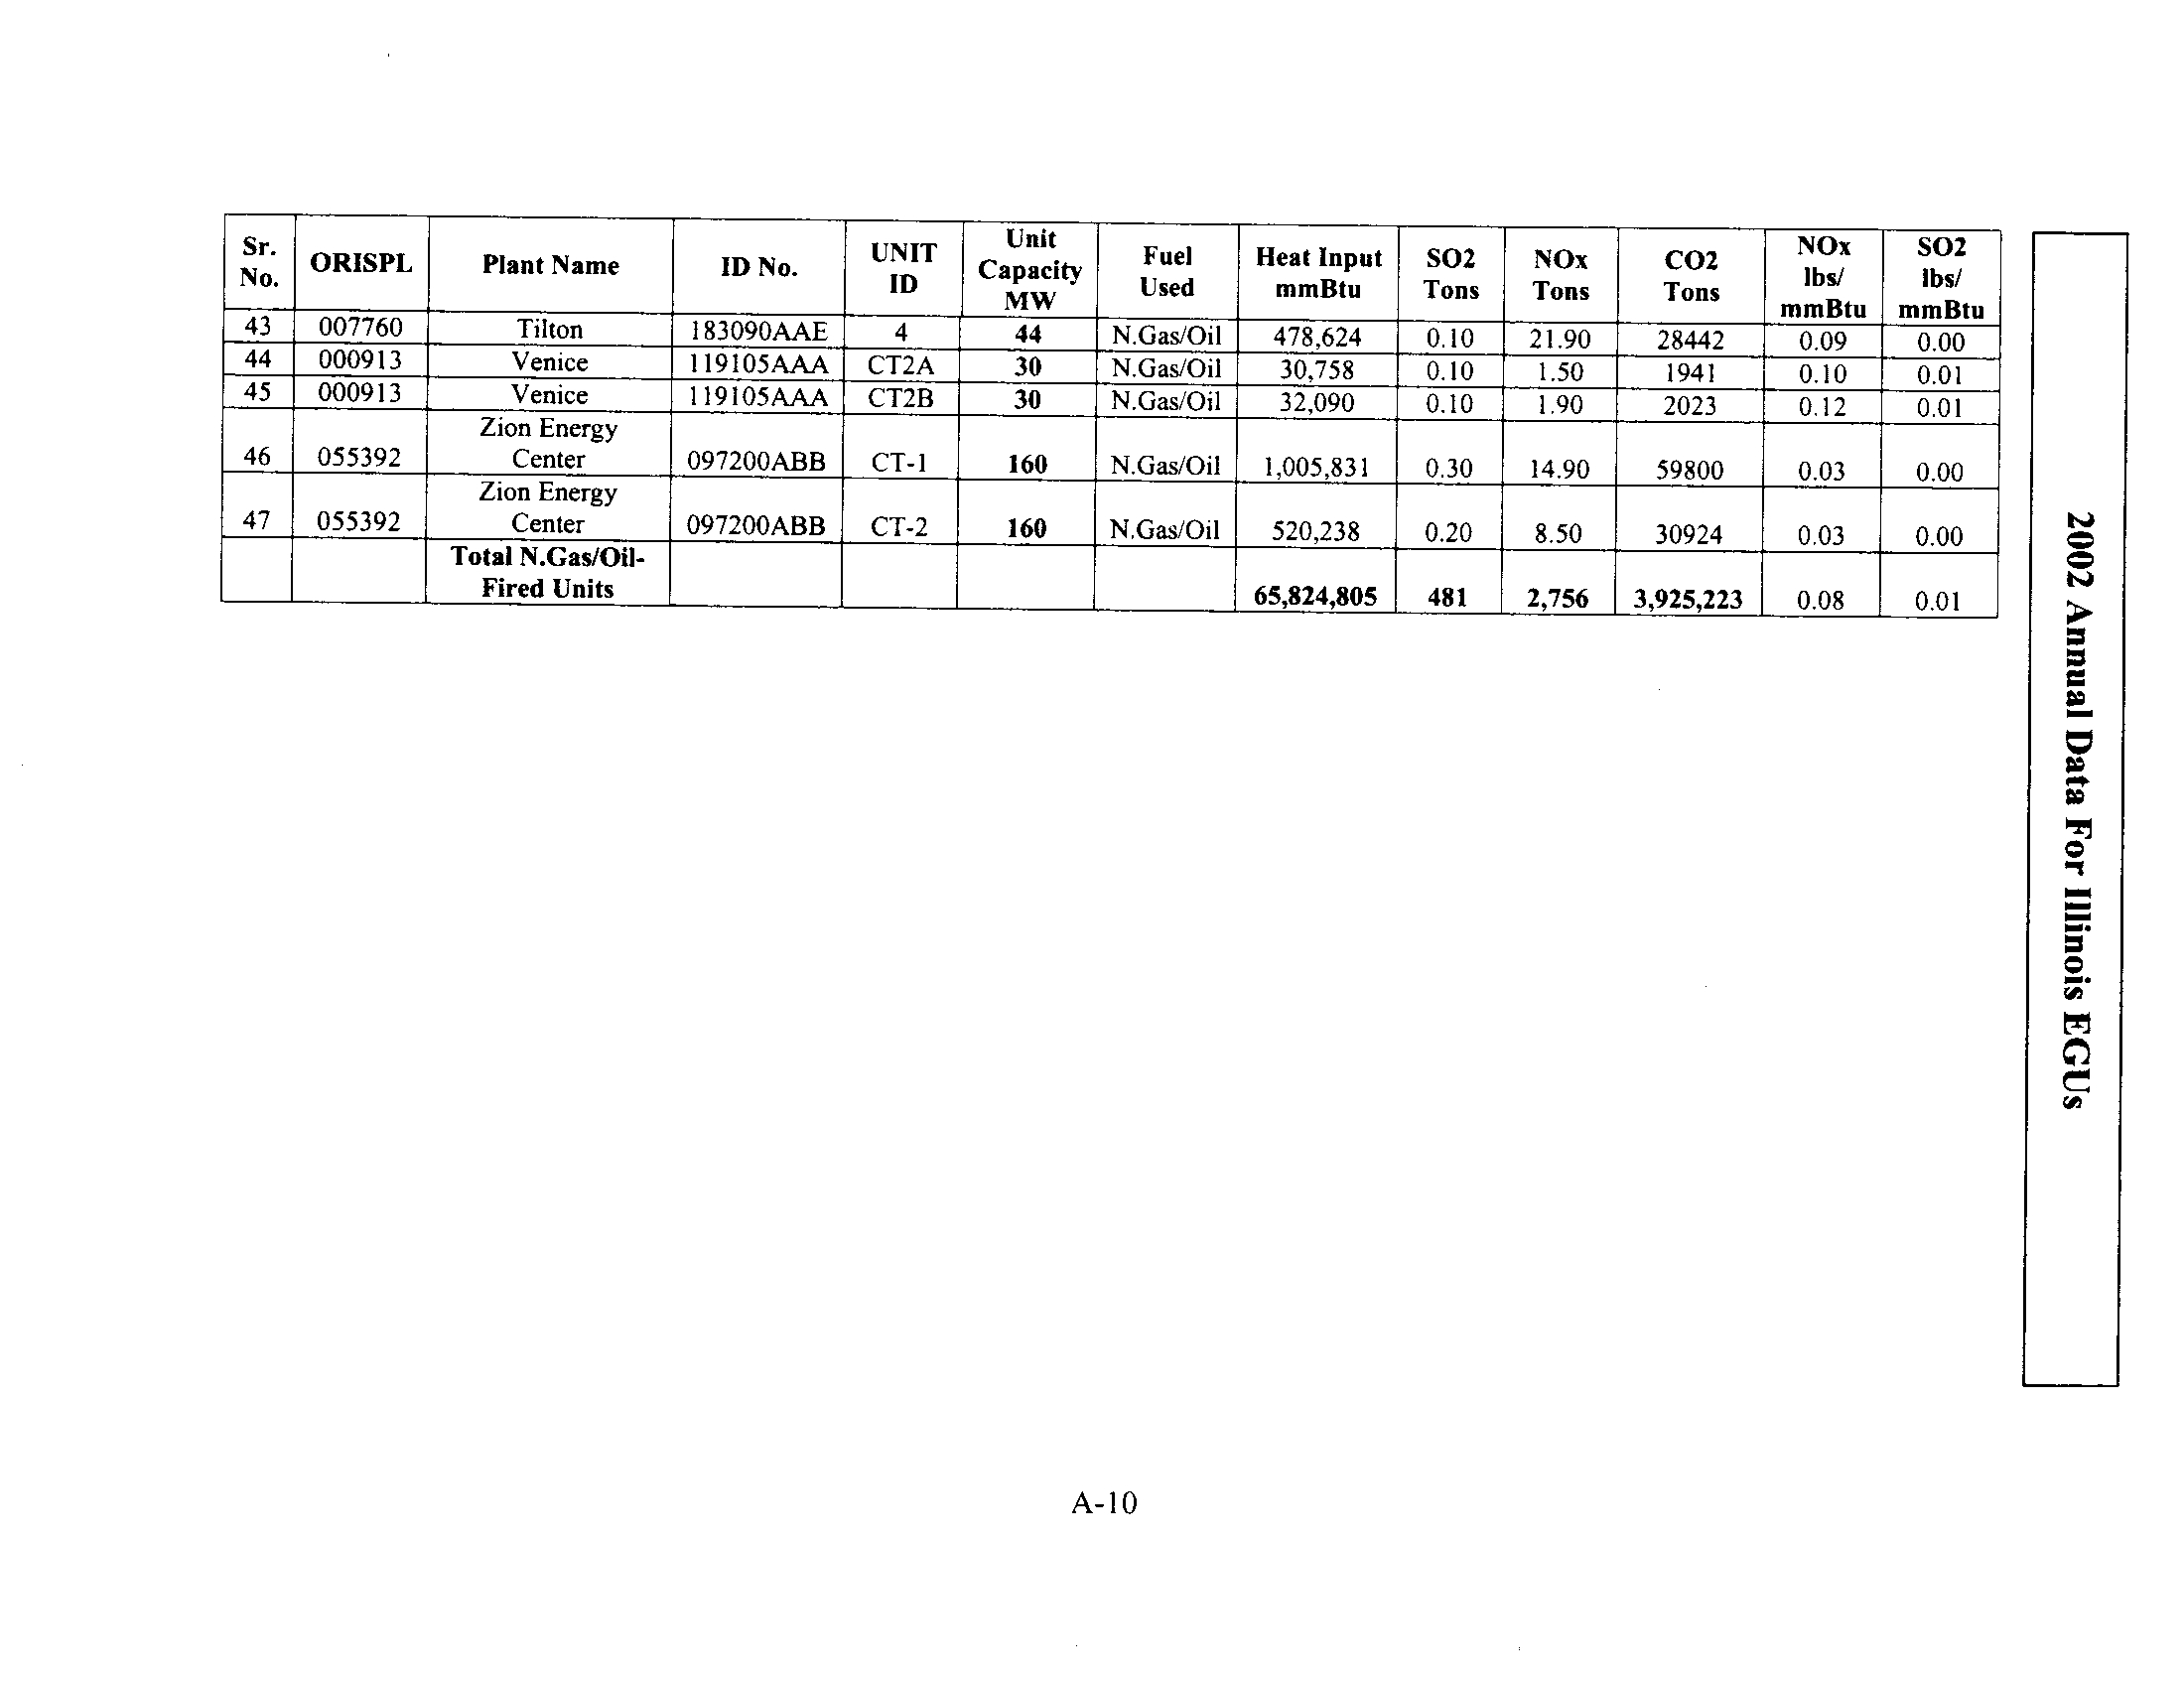
Detailed unit-by-unit data is provided in Appendix A . Although there are greater
numbers of the smaller natural gas units in the State, it is important to note that coal-fired
units constitute the greatest power output and heat input, expressed as pounds per million
British thermal units or lbs/mmBtu.
Table 1-1
Annual 2002 Summa
Data for Coal Gas and Oil-f
As indicated by Table 1-1 above, coal-fired boilers account for about 51 percent of the
non-nuclear electric generating capacity,
92.6
percent of total heat input and
99 .8
percent
of total SO2 emissions from all EGUs. In addition,
98.2
percent of total NO, emissions
and
95.6
percent of total carbon dioxide emissions come from coal-fired boilers
.
1
Unit
Category
No .
Units
Capacity
MW
Heat Input
mmBtu
S02
Tons
NO
Tons
C02
Tons
Hg
Tons
S0
2
Ibs/mmBtu
NO,
Ibs/mmBtu
Coal-fired
61
16,905
931,038,484
352,994 170,99795,505,331
3.7
0.758
0.367
N.Gas-
fired
97
6,284
7,576,638
0
315
450,097
0
0
0.083
N.Gas/Oil-
Fired
47
8,877
65,824,805
481
2,756
3,925,223
0.4
0.015
0.084
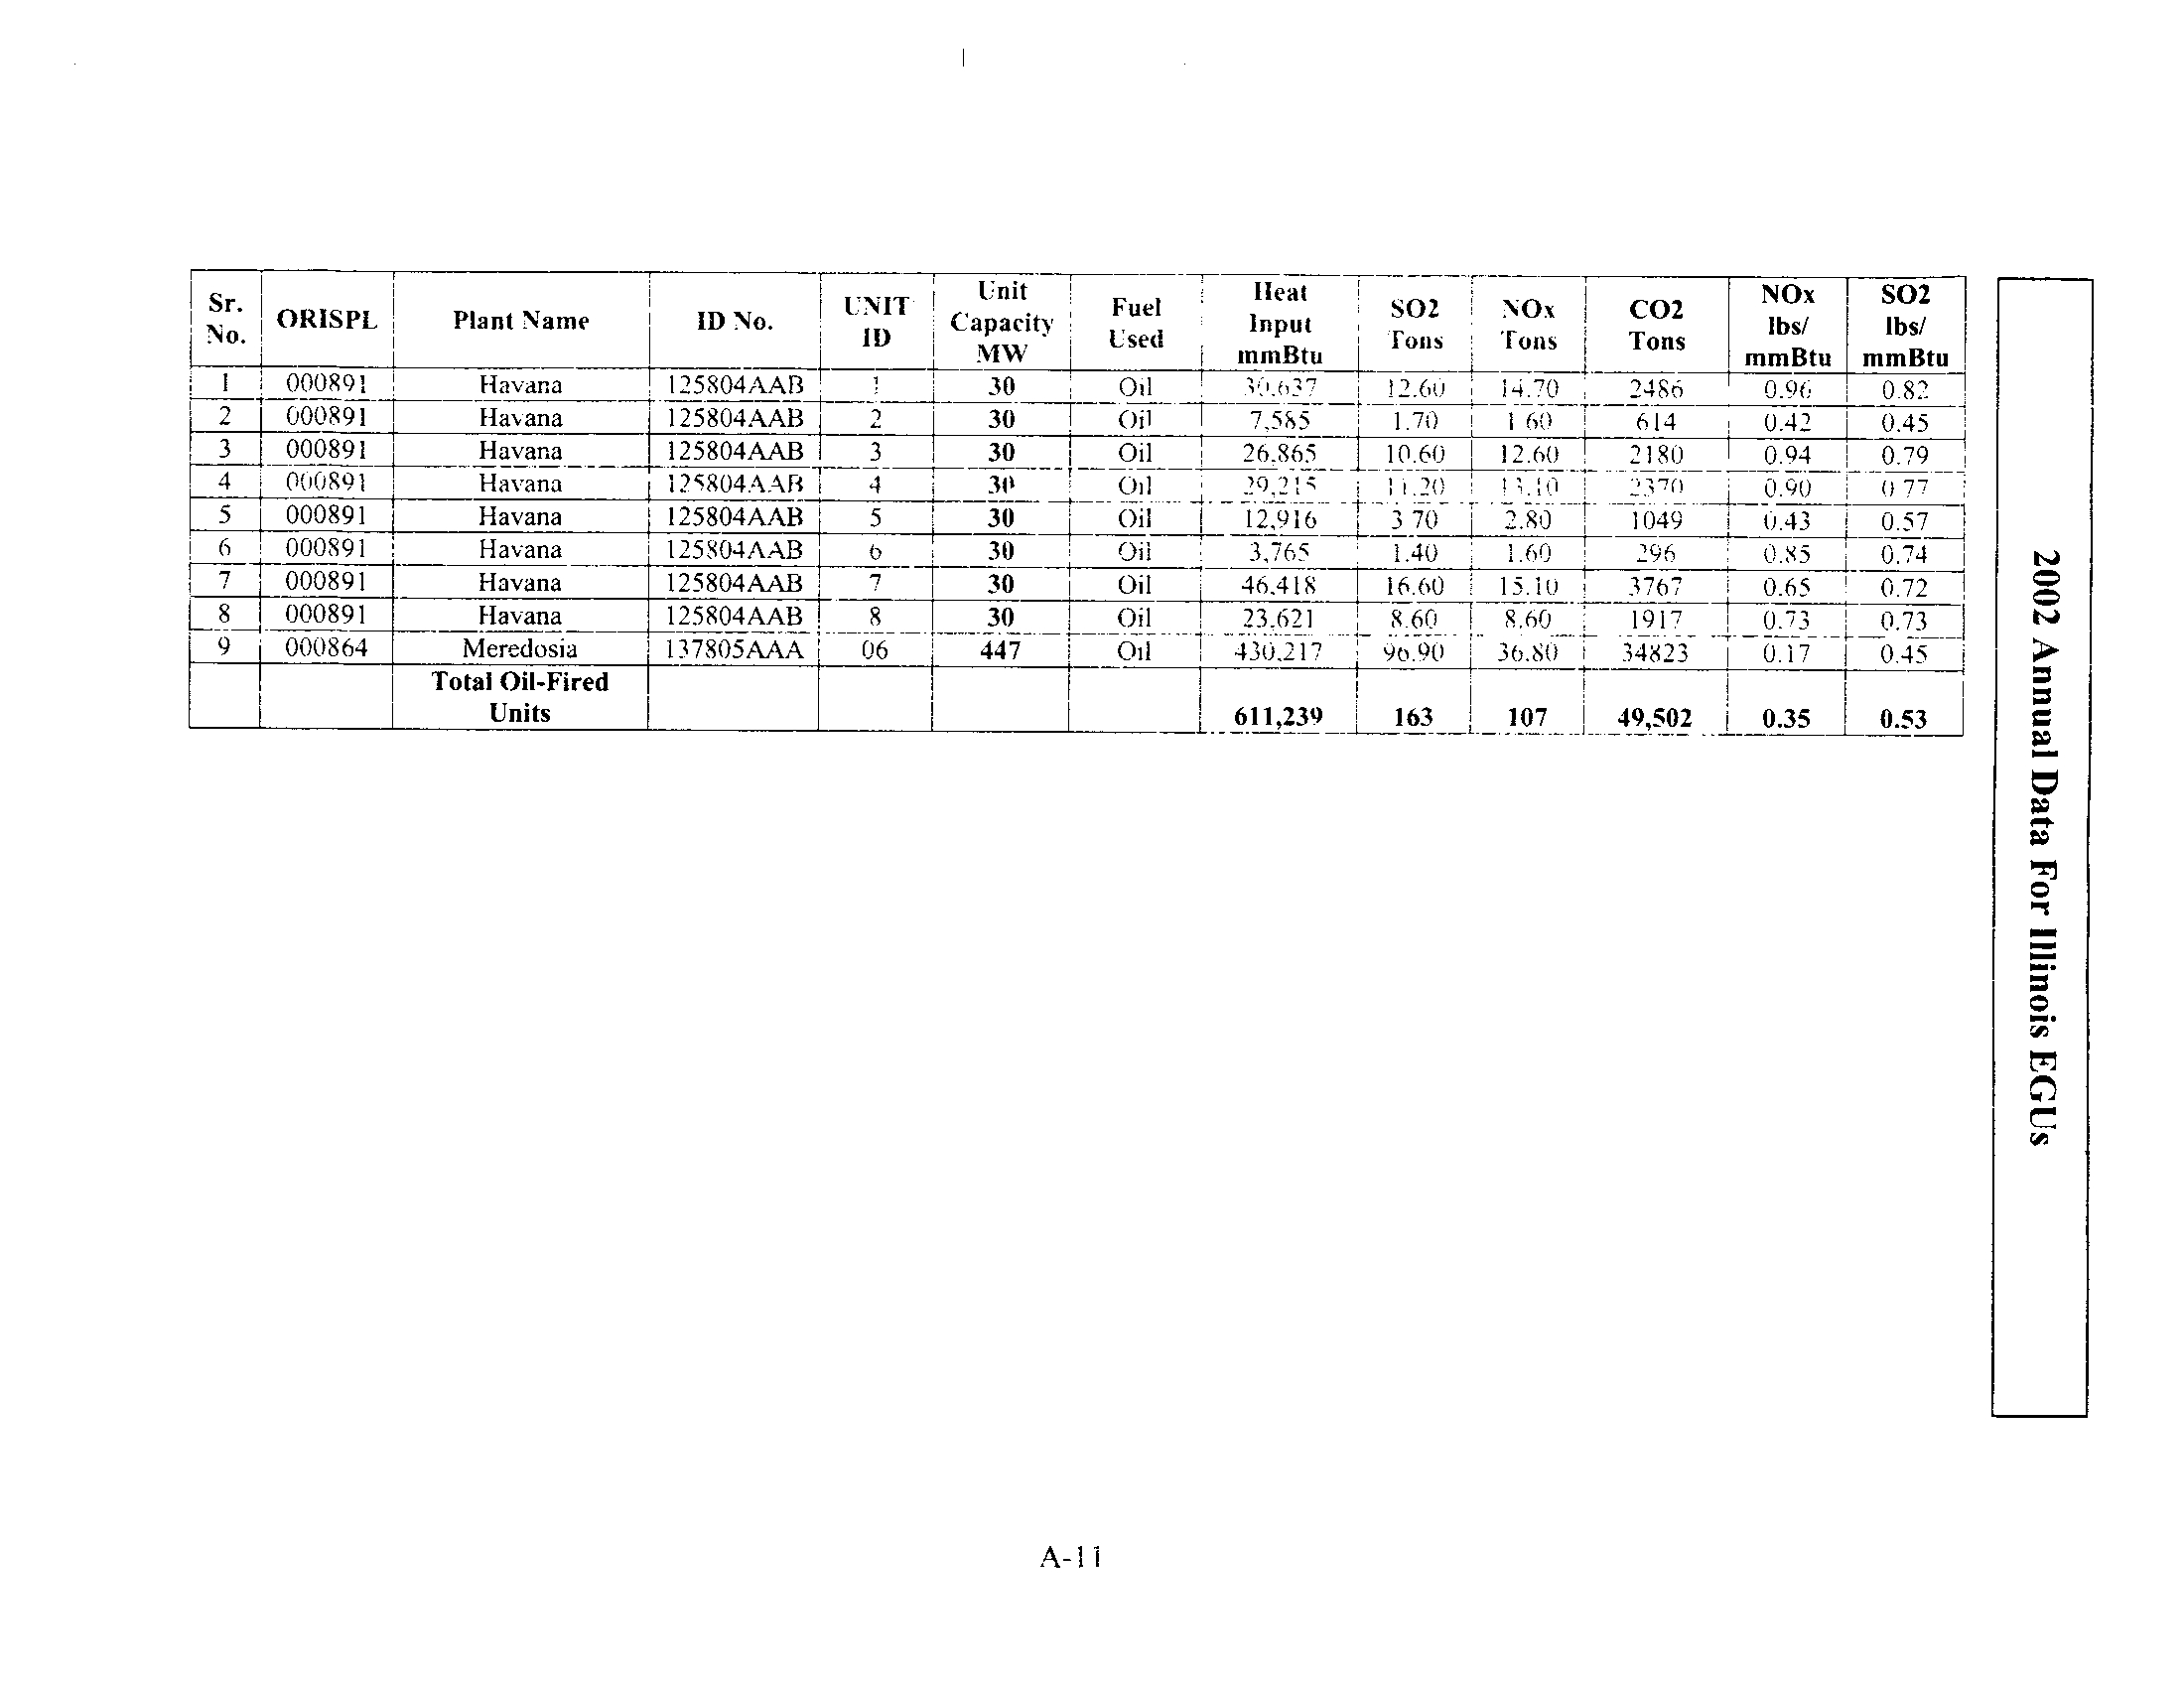
Oil-Fired
Units
9
685
611,239
163
107
49,502
0.2
0.534
0.350
Total
214
32,751
1,005,051,166353,638 174,17009,931,884
4.3
1.307
0.884
Chapter 2
Human Health Implications from Air Pollution
The General Assembly asked that Illinois EPA focus on the EGU's emissions of the
following pollutants: S02, NOR , PM, mercury, and carbon dioxide. This Chapter
describes what we currently know about the health implications associated with these
emissions. It should be noted that NO, and SO 2 emissions from power plants are not a
concern as direct emissions since Illinois currently meets the national air quality
standards for these pollutants . Rather, the concern is the contribution of these emissions
to the formation of fine particulate matter and ozone, for which there are federal health-
based air quality standards, known as National Ambient Air Quality Standards or
NAAQS .
This Chapter briefly explains the pollutants of concern and examines the health
implications based on various assumptions projected by U.S. EPA and ABT Associates
.
Ground-Level Ozone
Ground-level ozone is formed when NO, and volatile organic material (VOMs) from
cars, trucks, power plants and other sources react in the atmosphere in the presence of
sunlight. Ozone levels are highest during the summer months, especially on hot, sunny
days with little wind. Ozone is a major component of smog in our cities and in other
areas of the country . Naturally occurring ozone in the upper atmosphere protects us from
the sun's ultraviolet radiation, while the ozone that we breathe at ground-level can
contribute to respiratory illnesses and other health and environmental problems
.
Some people are more likely to be adversely affected by ground-level ozone air pollution
than others. They include individuals with lung diseases, especially if they are elderly or
children, individuals with respiratory illnesses, and children and people who work
outdoors .
U.S. EPA has adopted health-based air quality standards for ozone, including standards
for 1-hour and 8-hour averages. U.S. EPA has identified metropolitan Chicago and St
.
Louis/Metro-East as areas that do not meet these standards. Illinois is required to meet
the health-based standard for 1-hour ozone by 2007, and the 8-hour ozone standard by
2010 .
In Illinois, EGUs are responsible for 27 percent of NO, emissions and 0 .5 percent of
VOM emissions. NO, from power plants and other sources can contribute to ozone
formation across a large area extending hundreds of miles downwind .
2
Particulate Matter
Particulate matter in the atmosphere consists of solids, liquids and liquids-solids in
combination. Suspended particulate matter generally refers to particles less than 100
microns (or micrometers) in diameter. Note that human hair is typically 100 microns
thick. Particles larger than 100 microns will settle out of the air under the influence of
gravity in a short period of time
.
A number of scientific studies have linked particulate matter to adverse human health
effects. In testimony provided by the U .S. EPA to Congress in 2003 regarding the Clear
Skies Initiative, Administrator Whitman stated : "Hundreds of studies in the peer-
reviewed literature have found that
.
.. exposure to fine [PM] is associated with premature
death, as well as asthma attacks, chronic bronchitis, decreased lung function and
respiratory disease . Exposure is also associated with aggravation of heart and lung
disease, leading to increased hospitalizations, emergency room and doctor visits, and use
of medication."
I
U .S. EPA has adopted health-based standards for fine particulate matter that is 2.5
microns in diameter or less (PM2
.5), and has identified metropolitan Chicago and St
.
Louis/Metro-East as areas that do not meet these standards. Illinois is now required to
develop plans to ensure that the PM2.5 standards are met in these areas by 2010.
EGUs emit particulate matter directly into the air, and they release SO2 and NO, that are
converted into sulfate and nitrate particulate matter in the atmosphere through complex
chemical reactions. These emissions can be transported for hundreds of miles from
Illinois and into Illinois . In Illinois, EGUs are responsible for 21 percent of particulate
matter emissions, 27 percent of the NO, emissions, and 68 percent of SO 2 emissions .
Mercury
Mercury (Hg) is a naturally occurring trace contaminant found in the soil, and it is a
chemical that is emitted by man-made industrial processes. Although mercury is not a
criteria pollutant for which a National Ambient Air Quality Standard exists, it is
considered a hazardous air pollutant that can cause adverse health impacts
.
Human exposure by direct inhalation of mercury in the air is not the predominant public
health concern for this metal. However, the mercury in ambient air eventually can be re-
deposited on land surfaces or directly into rivers, lakes and oceans. More than 50 percent
of the mercury input to many bodies of water, including Lake Michigan, comes from the
air .
Mercury that enters bodies of water by direct deposition from the air or runoff from land
surfaces ultimately is transformed by biological processes into a toxic form of mercury
(methyl mercury) that concentrates in fish and other organisms living in these waters. A
study by the National Academy of Sciences concluded that human exposure to methyl
3
mercury from eating contaminated fish and seafood is associated with adverse health
effects related to neurological and developmental damage . Mercury exposure is of
particular concern for children, pregnant women and women of childbearing age. Other
populations at risk include those who consume a substantial amount of fish
.
The severity of these health effects from mercury varies depending on the concentrations
of mercury in the ingested food .2
Mercury contamination is widespread in Illinois'
waters, and fish consumption advisories have been issued for every body of water in the
State .
In 1999, coal-fired power plants were estimated to have emitted 48 tons of mercury
nationally (approximately 37 percent of the manmade total) .
Carbon Dioxide
Carbon dioxide is not listed as a "pollutant" under the Clean Air Act, as the concern with
carbon dioxide emissions is the relative increase in the so-called greenhouse gases that
impact global climate change
.
National and State Projections
The remainder of this Chapter discusses two studies on the health implications based on
multi-pollutant emission reduction assumptions
.
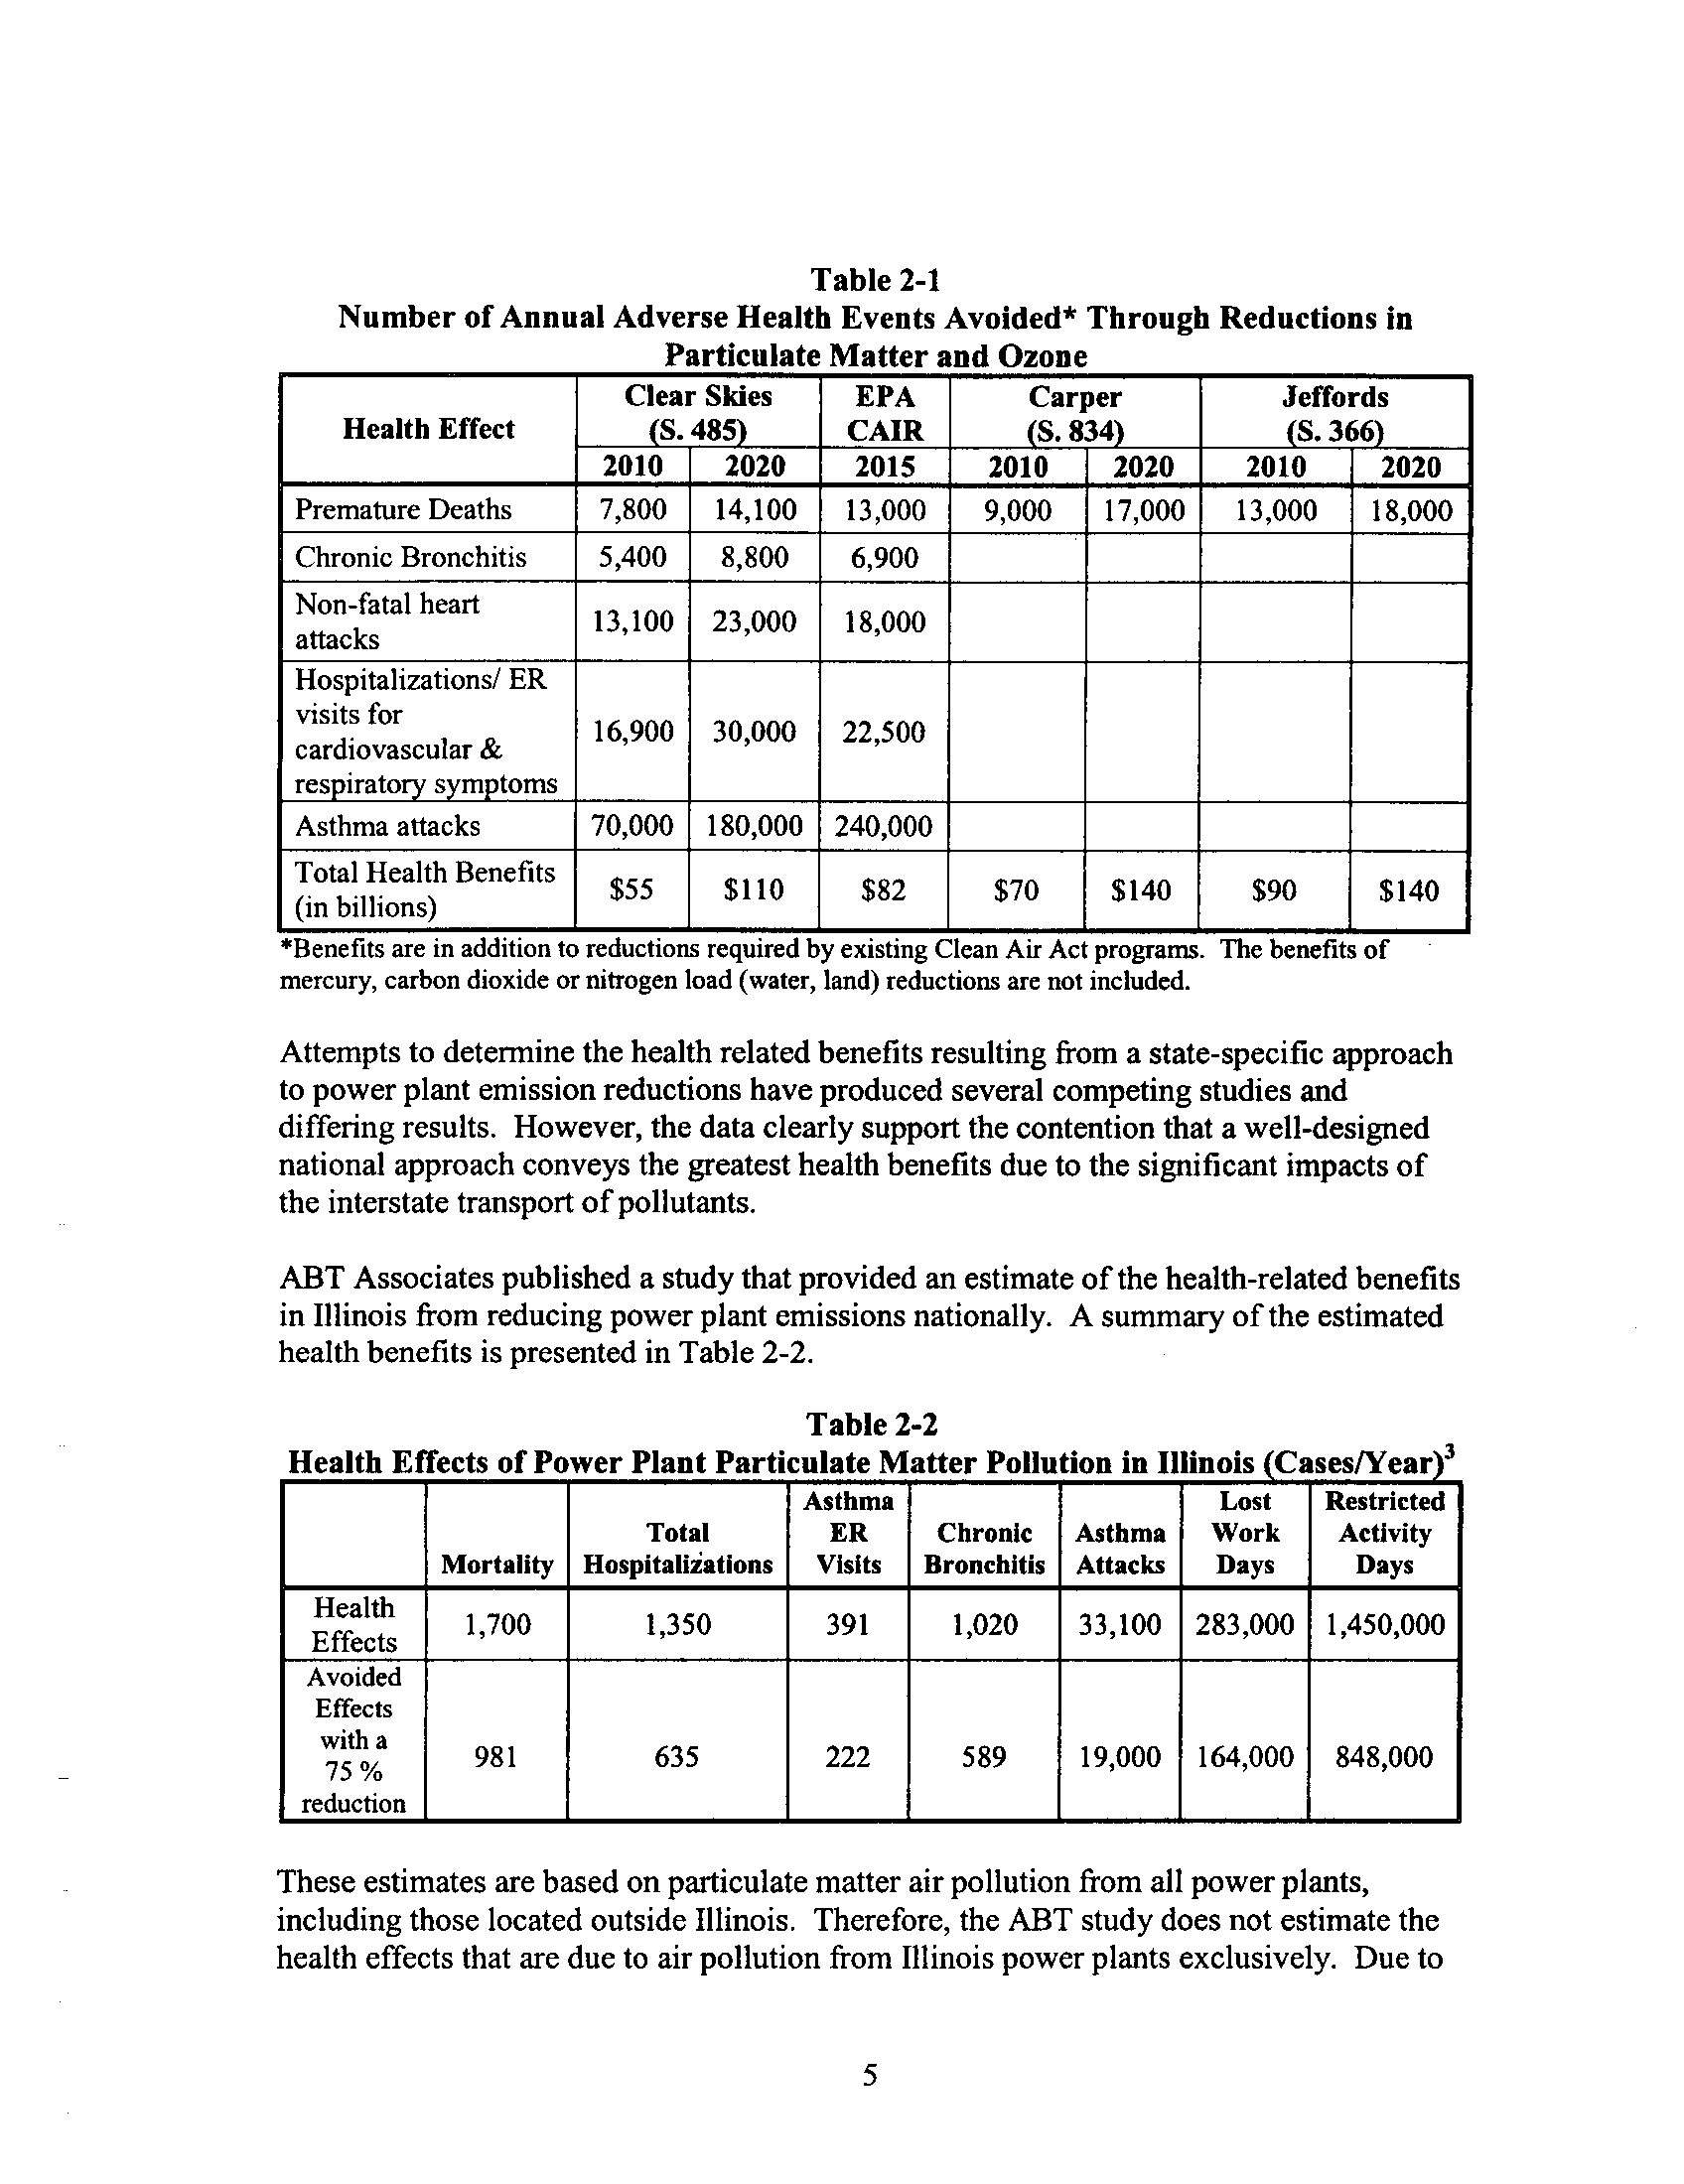
Table 2-1 below summarizes U.S. EPA's estimates of human health benefits for several
multi-pollutant emission reduction strategies, including U .S. EPA's Clean Air Interstate
Rule (CAIR) and the three leading Congressional legislative proposals for reducing
power plant emissions. (These proposals are discussed in more detail in Chapter 4
.)
While there is not complete agreement on the exact numbers within these tables, there is
agreement that reducing air pollution levels will result in health benefits
.
4
Table 2-1
Number of Annual Adverse Health Events Avoided* Through Reductions in
Particulate Matter and Ozone
*Benefits are in addition to reductions required by existing Clean Air Act programs. The benefits of
mercury, carbon dioxide or nitrogen load (water, land) reductions are not included
.
Attempts to determine the health related benefits resulting from a state-specific approach
to power plant emission reductions have produced several competing studies and
differing results. However, the data clearly support the contention that a well-designed
national approach conveys the greatest health benefits due to the significant impacts of
the interstate transport of pollutants
.
ABT Associates published a study that provided an estimate of the health-related benefits
in Illinois from reducing power plant emissions nationally. A summary of the estimated
health benefits is presented in Table 2-2
.
Table 2-2
Health Effects of Power Plant Particulate Matter Pollution in Illinois Cases/Year 3
These estimates are based on particulate matter air pollution from all power plants,
including those located outside Illinois. Therefore, the ABT study does not estimate the
health effects that are due to air pollution from Illinois power plants exclusively . Due to
5
Mortality
Total
Hospitalisations
Asthma
ER
Visits
Chronic
Bronchitis
Asthma
Attacks
Lost
Work
Days
Restricted
Activity
Days
Health
1,700
1,350
391
1,020
33,100
283,000
1,450,000
Effects
Avoided
Effects
with a
75%
981
635
222
589
19,000
164,000
848,000
reduction
Health Effect
Clear Skies
(S.485)
EPA
CAIR
Carper
(S.834)
Jeffords
(S.366)
2010
2020
2015
2010
2020
2010
2020
Premature Deaths
7,800
14,100
13,000
9,000
17,000
13,000
18,000
Chronic Bronchitis
5,400
8,800
6,900
Non-fatal heart
attacks
13,100
23,000
18,000
Hospitalizations/ ER
visits for
cardiovascular &
respiratory symptoms
16,900
30,000
22,500
Asthma attacks
70,000
180,000
240,000
Total Health Benefits
(in billions)
$55
$110
$82
$70
$140
$90
$140
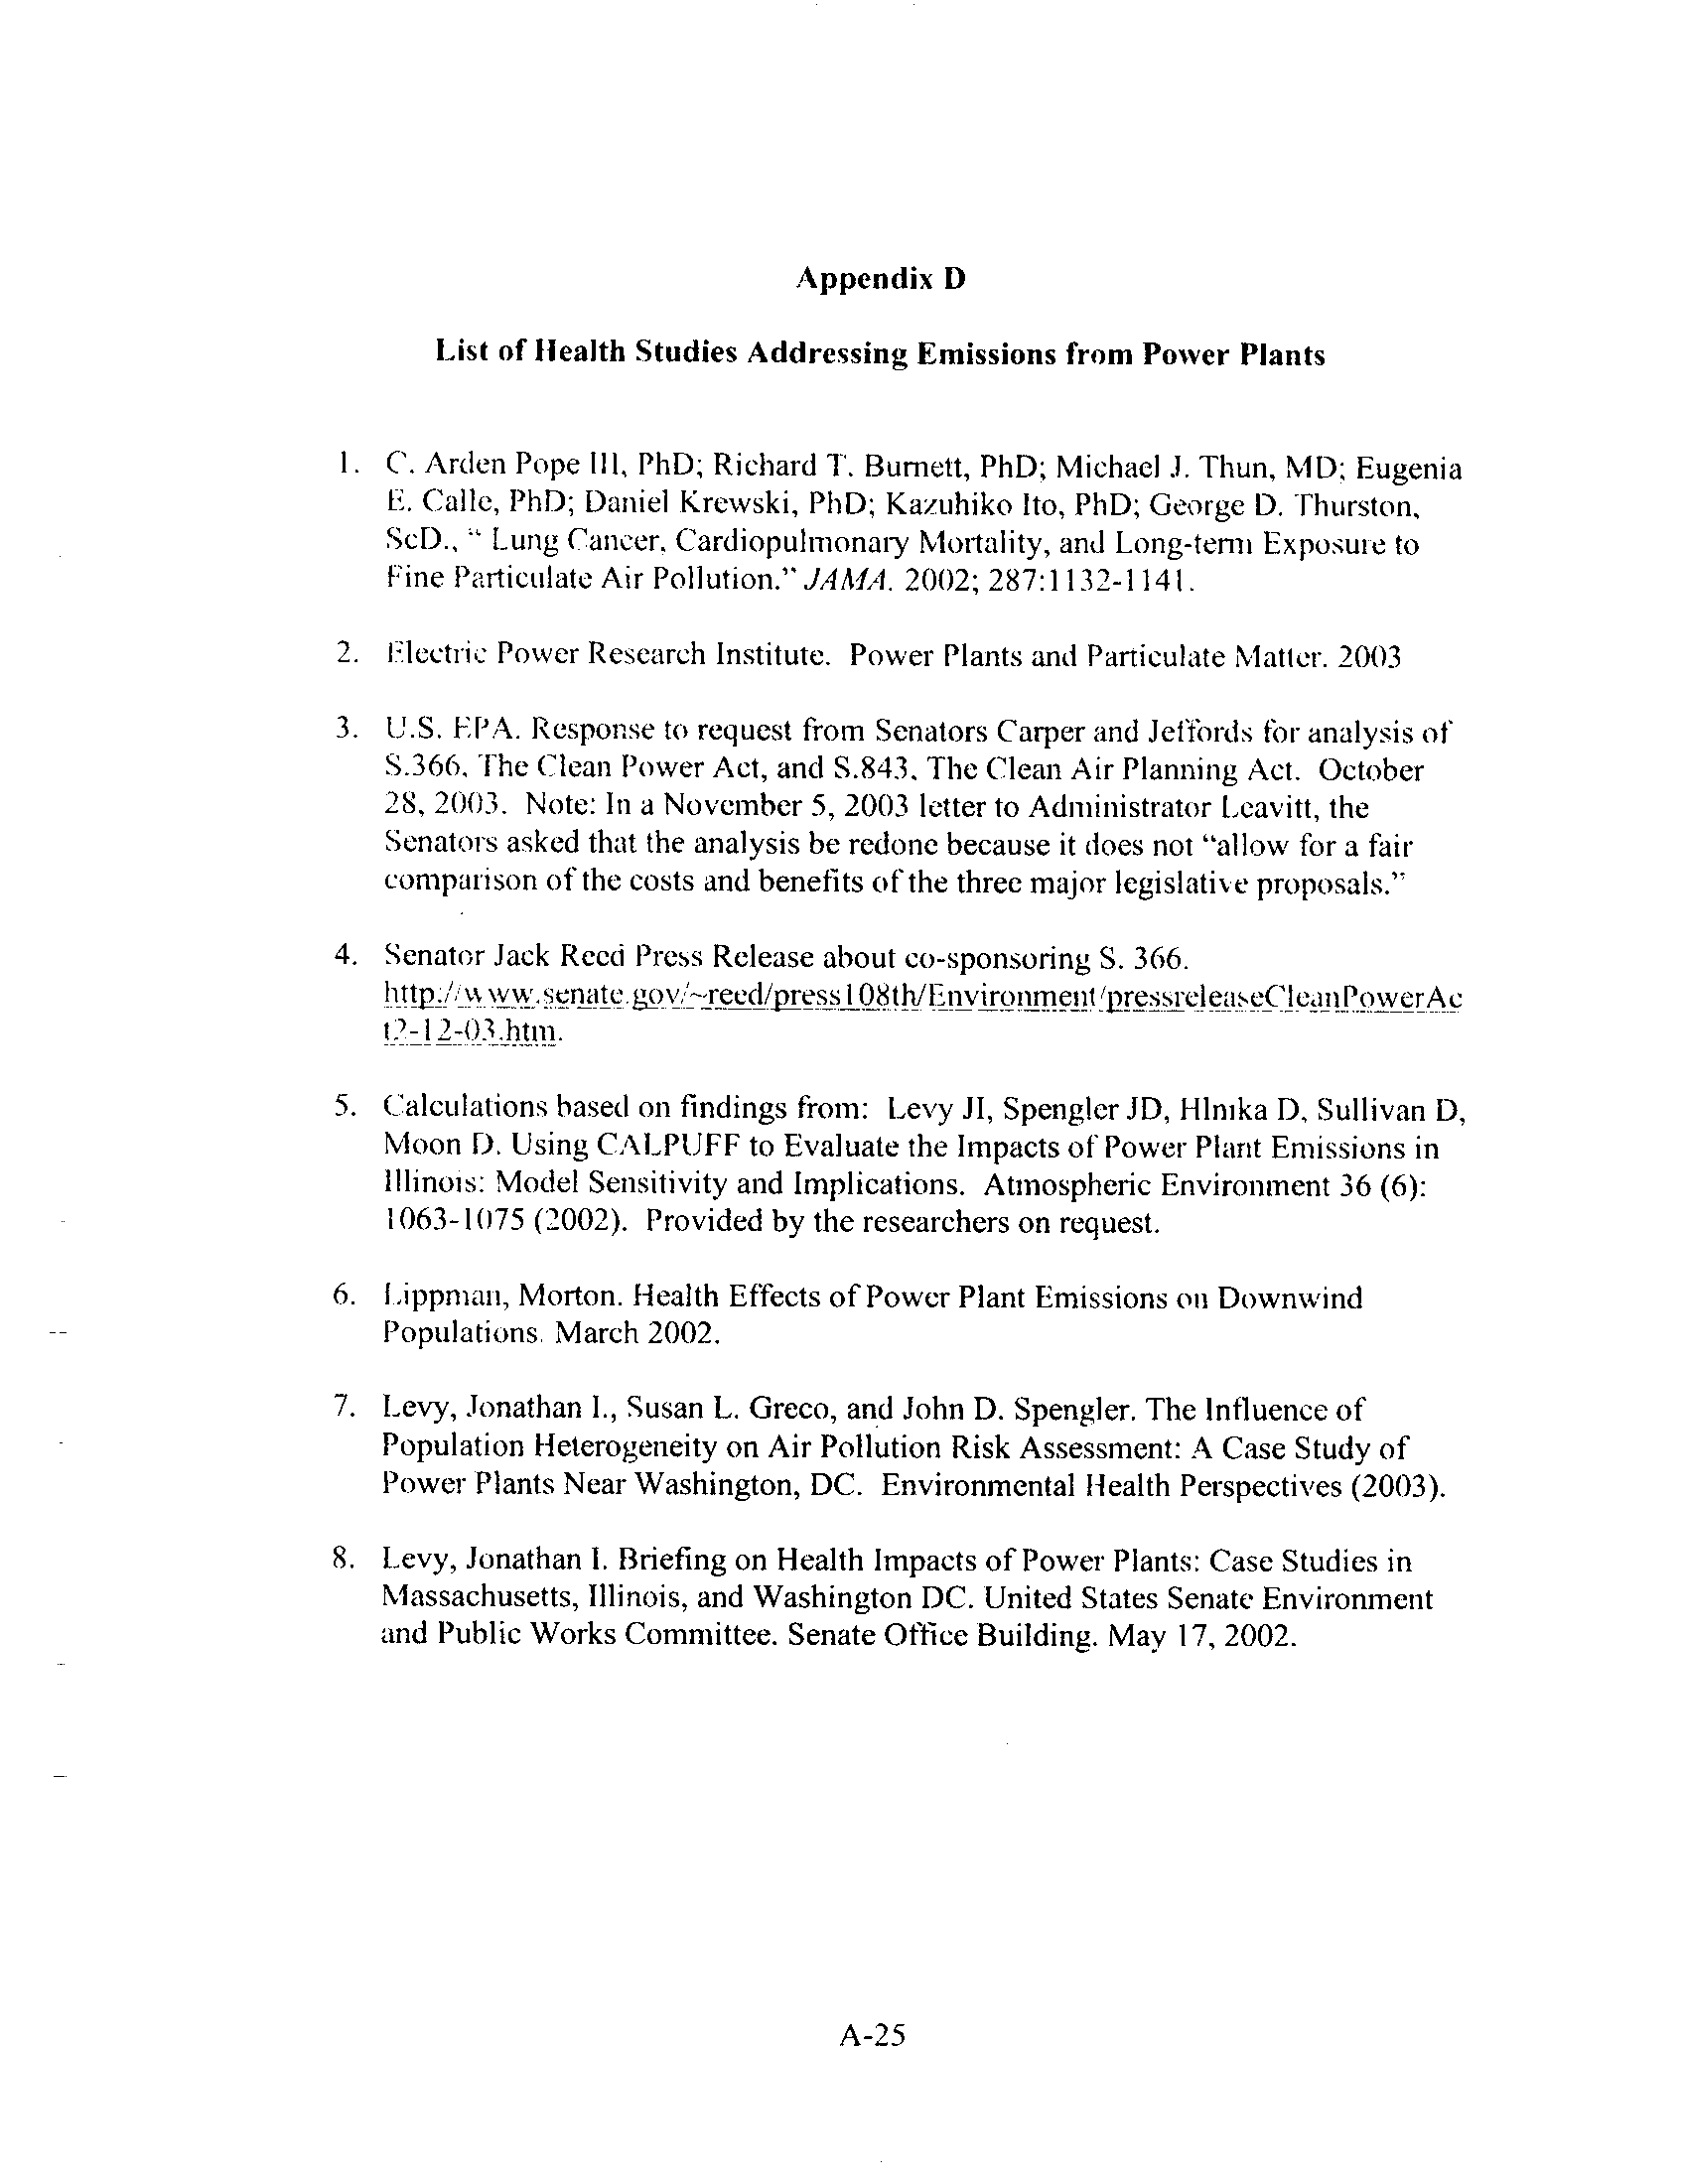
interstate transport of pollutants, a portion of these estimated health benefits would be
due to emissions reductions from out-of-state power plants. Other studies have looked at
human health impacts from specific power plants located in Illinois
.
(See
Appendix D .)
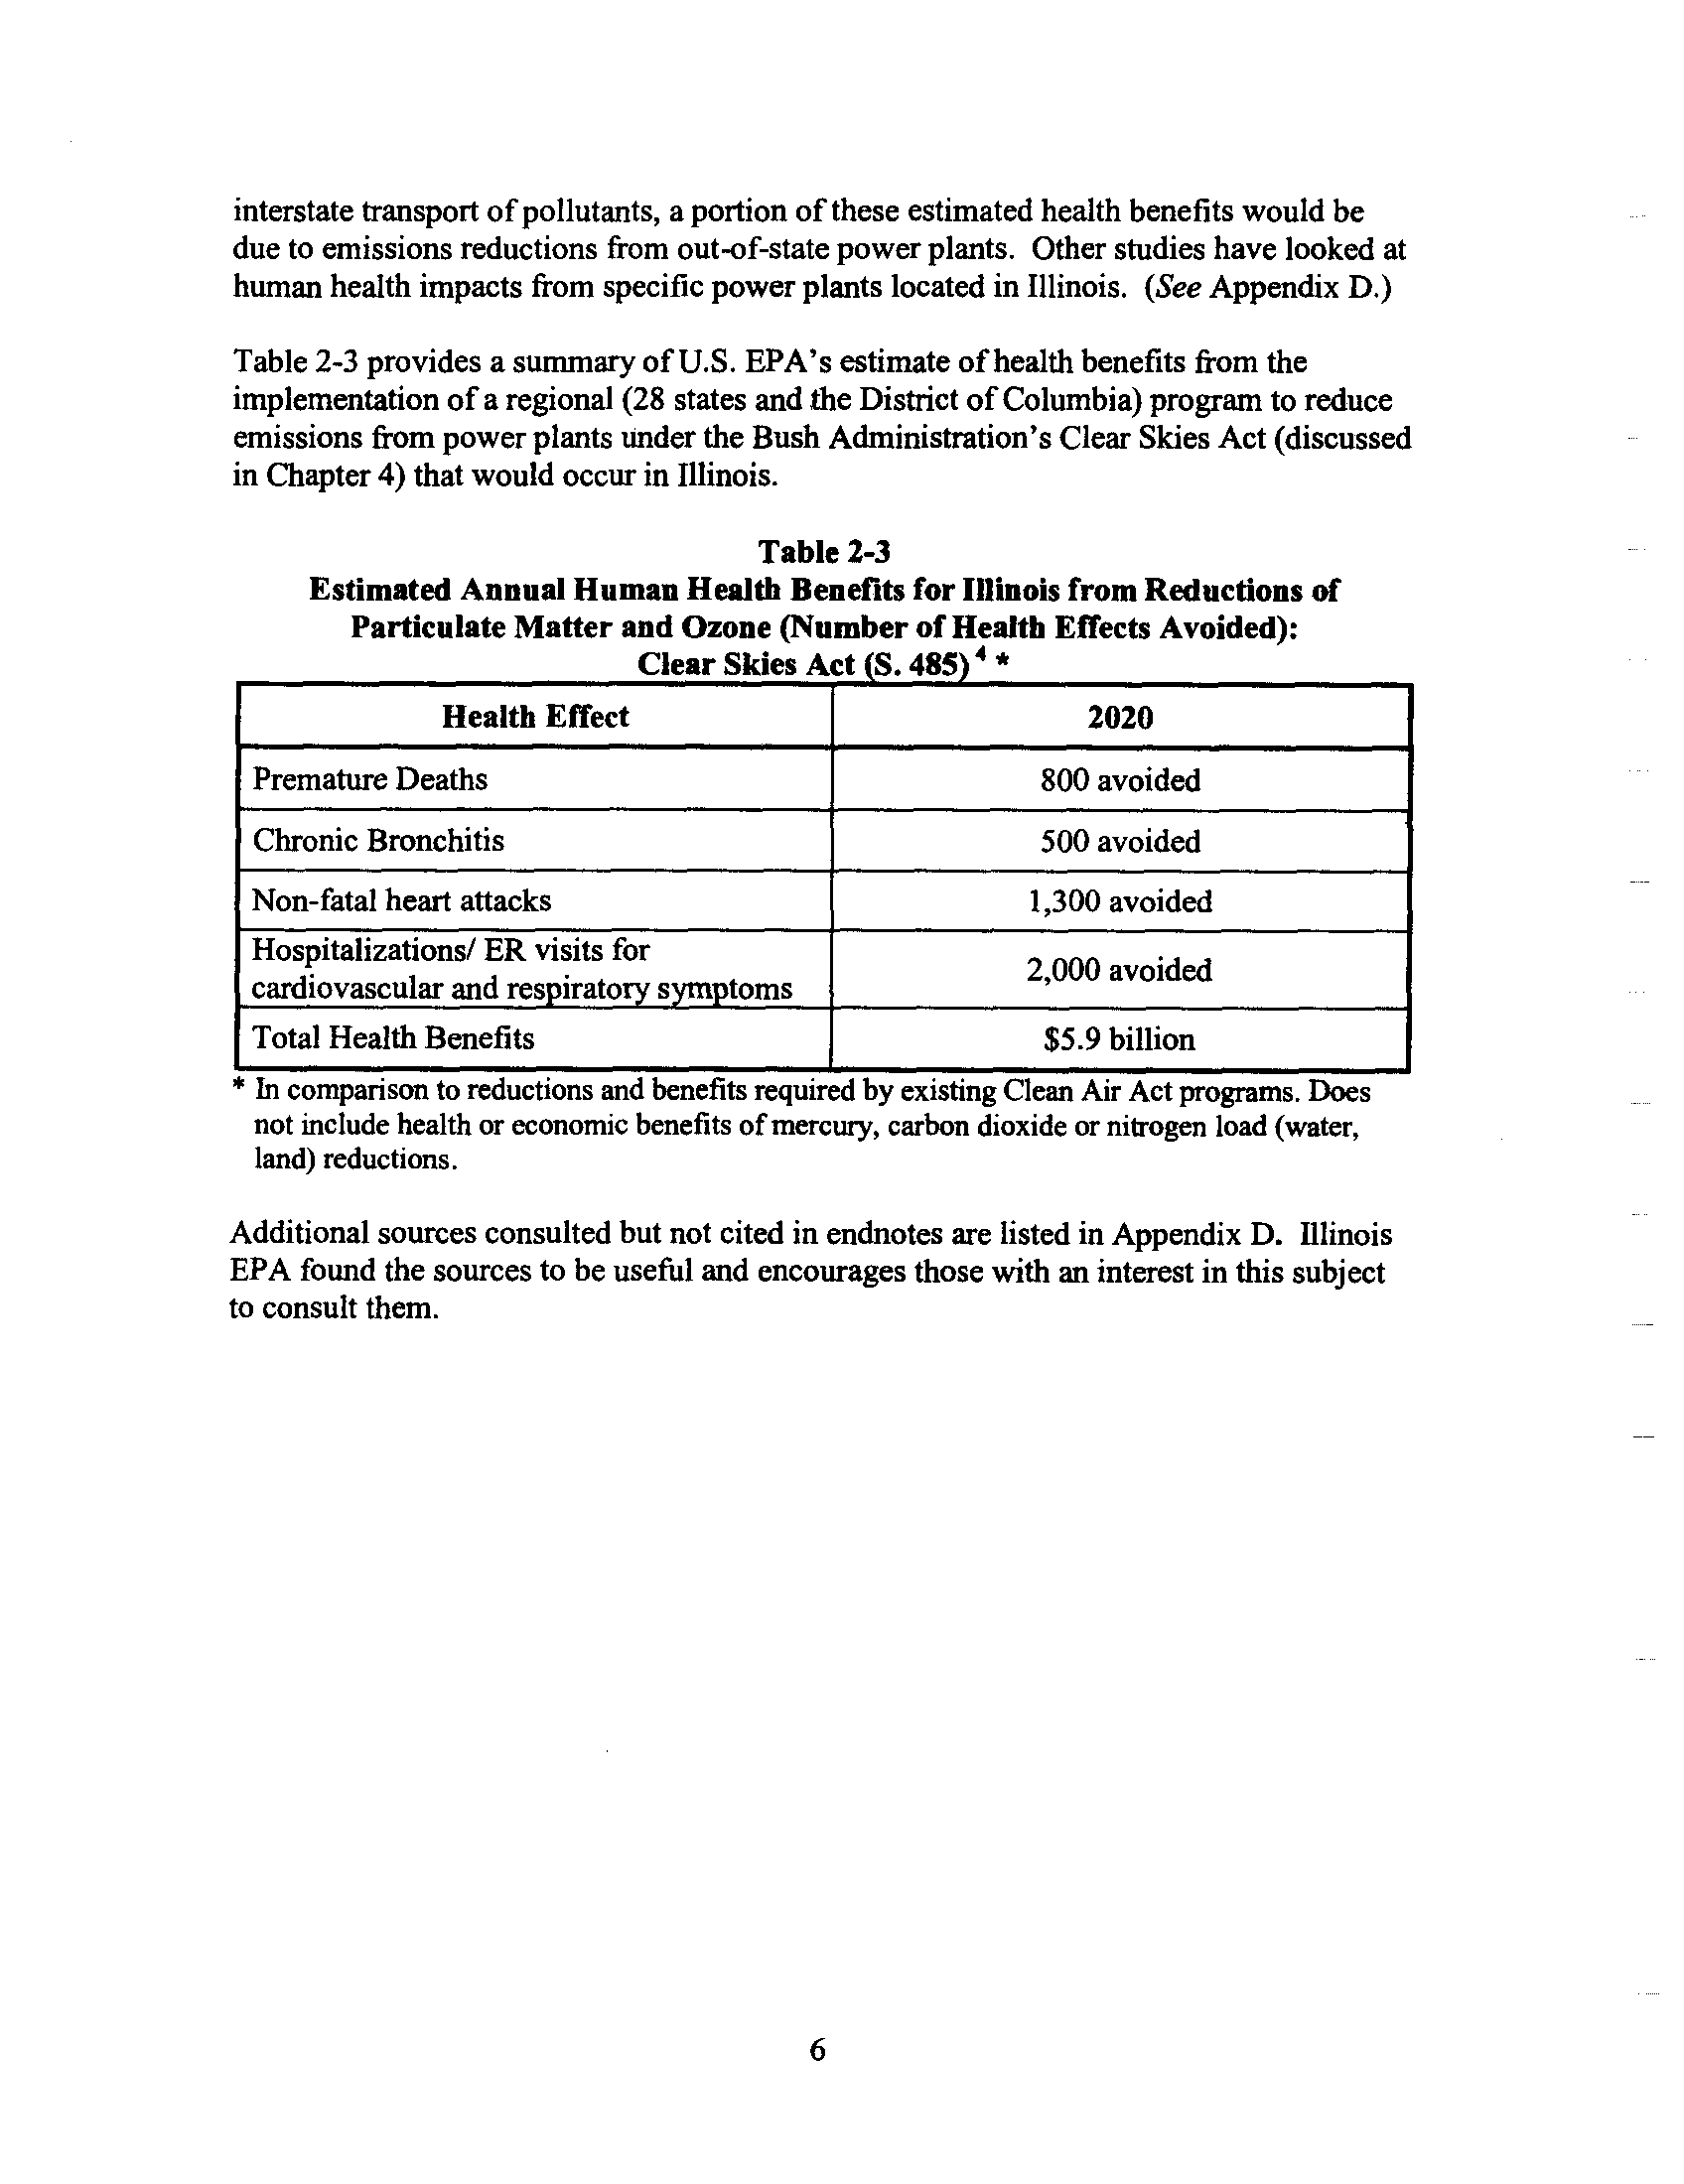
Table 2-3 provides a summary of U .S. EPA's estimate of health benefits from the
implementation of a regional (28 states and the District of Columbia) program to reduce
emissions from power plants under the Bush Administration's Clear Skies Act (discussed
in Chapter 4) that would occur in Illinois
.
Table 2-3
Estimated Annual Human Health Benefits for Illinois from Reductions of
Particulate Matter and Ozone (Number of Health Effects Avoided) :
Clear Skies Act S. 485
4
* In comparison to reductions and benefits required by existing Clean Air Act programs. Does
not include health or economic benefits of mercury, carbon dioxide or nitrogen load (water,
land) reductions
.
Additional sources consulted but not cited in endnotes are listed in Appendix D . Illinois
EPA found the sources to be useful and encourages those with an interest in this subject
to consult them
.
6
Health Effect
2020
Premature Deaths
800 avoided
Chronic Bronchitis
500 avoided
Non-fatal heart attacks
1,300 avoided
Hospitalizations/ ER visits for
cardiovascular and respiratory symptoms
2,000 avoided
Total Health Benefits
$5.9 billion
Chapter 3
Air Pollution Control Technologies For Reducing Power Plant Emissions
Air pollution reduction and control technologies have advanced substantially over the
past 25 years. Many EGUs across the country already employ these technologies to meet
existing regulatory requirements. Additionally, under federal and state preconstruction
permitting programs, any new EGU is required to employ Best Available Control
Technology or BACT before the new unit or units can be constructed
.
The control of mercury and other hazardous air pollutants or HAPs from EGUs has only
recently become a focus for regulators and the regulated community . While in some
instances the control technologies installed for the other pollutants will also help reduce
mercury emissions, mercury is generally more difficult to control directly. A number of
government and industry-sponsored research projects to improve the technologies needed
for mercury reduction from EGUs are under way and Illinois EPA continues to push for
advancements
.
Applicable emission limits are discussed in this Chapter along with the control
technologies available to reduce emissions from EGUs for the pollutants S0 2 ,NON, PM,
and mercury. Several reference documents are noted for those desiring additional
information .
Also, at the end of this Chapter we provide a brief discussion on U.S. EPA's repository of
the most effective air pollution control technologies and methods, and further discussion
of Integrated Gasification Combined-Cycle. Although this latter technology is not an air
pollution control technology, it is a developing combustion process that is cleaner than
traditional coal combustion technologies and holds great promise
.
Sulfur Dioxide(SO;)Controls
The emissions of SO 2 from fuel combustion sources are regulated in Illinois under 35
Ill.
Adm. Code
Part 214. The S02 emissions limits for existing sources vary, depending on
the type of fuel and geographical location of the emission sources. Emission limits range
from 0.3 pounds of SO2 per million British thermal units (a measure of heat input
expressed as lbs/mmBtu) for distillate oil to 6.8 lbs/mmBtu for coal combustion sources
in rural areas. All EGUs located in the urbanized areas and burning solid fuels (e .g.,
coal) are limited to 1 .8 lbs/mmBtu. In 1990, the Clean Air Act's Acid Rain Program
(Title IV of the Clean Air Act, 42
U.S.C.
7651.) imposed much tighter limits. These
limits outlined in 63
Fed. Reg.
51705 (September 1998) are currently in effect .
U.S. EPA published
"Control Techniques for Sulfur Oxide Emissions from Stationary
Sources"
in April 1981, which describes in detail the various control technologies
available to reduce sulfur dioxide emissions from EGUs and from other sources
.'
The
Mega Symposium, SO2 Control Technologies and Continuous Emission Monitors
(August
1997) prepared for a symposium sponsored by the U.S. EPA, the U.S. Department of
7
Energy, and the Electric Power Research Institute, is a good reference on the various
approaches .6 Techniques used by the industry for achieving compliance with SO 2
emissions limitations include the following :
•
Physical coal cleaning to remove pyrites (inorganic sulfur compounds) ;
•
Chemical coal cleaning to remove pyrites and organic sulfur present in coal;
•
Switching to either natural gas or to a low sulfur western coal ;
•
Limestone sorbent injections, or blending coal with limestone before combustion ;
•
Dry scrubbing with limestone or lime slurry; and
•
Flue gas desulfurization, also commonly referred to as scrubbers
.
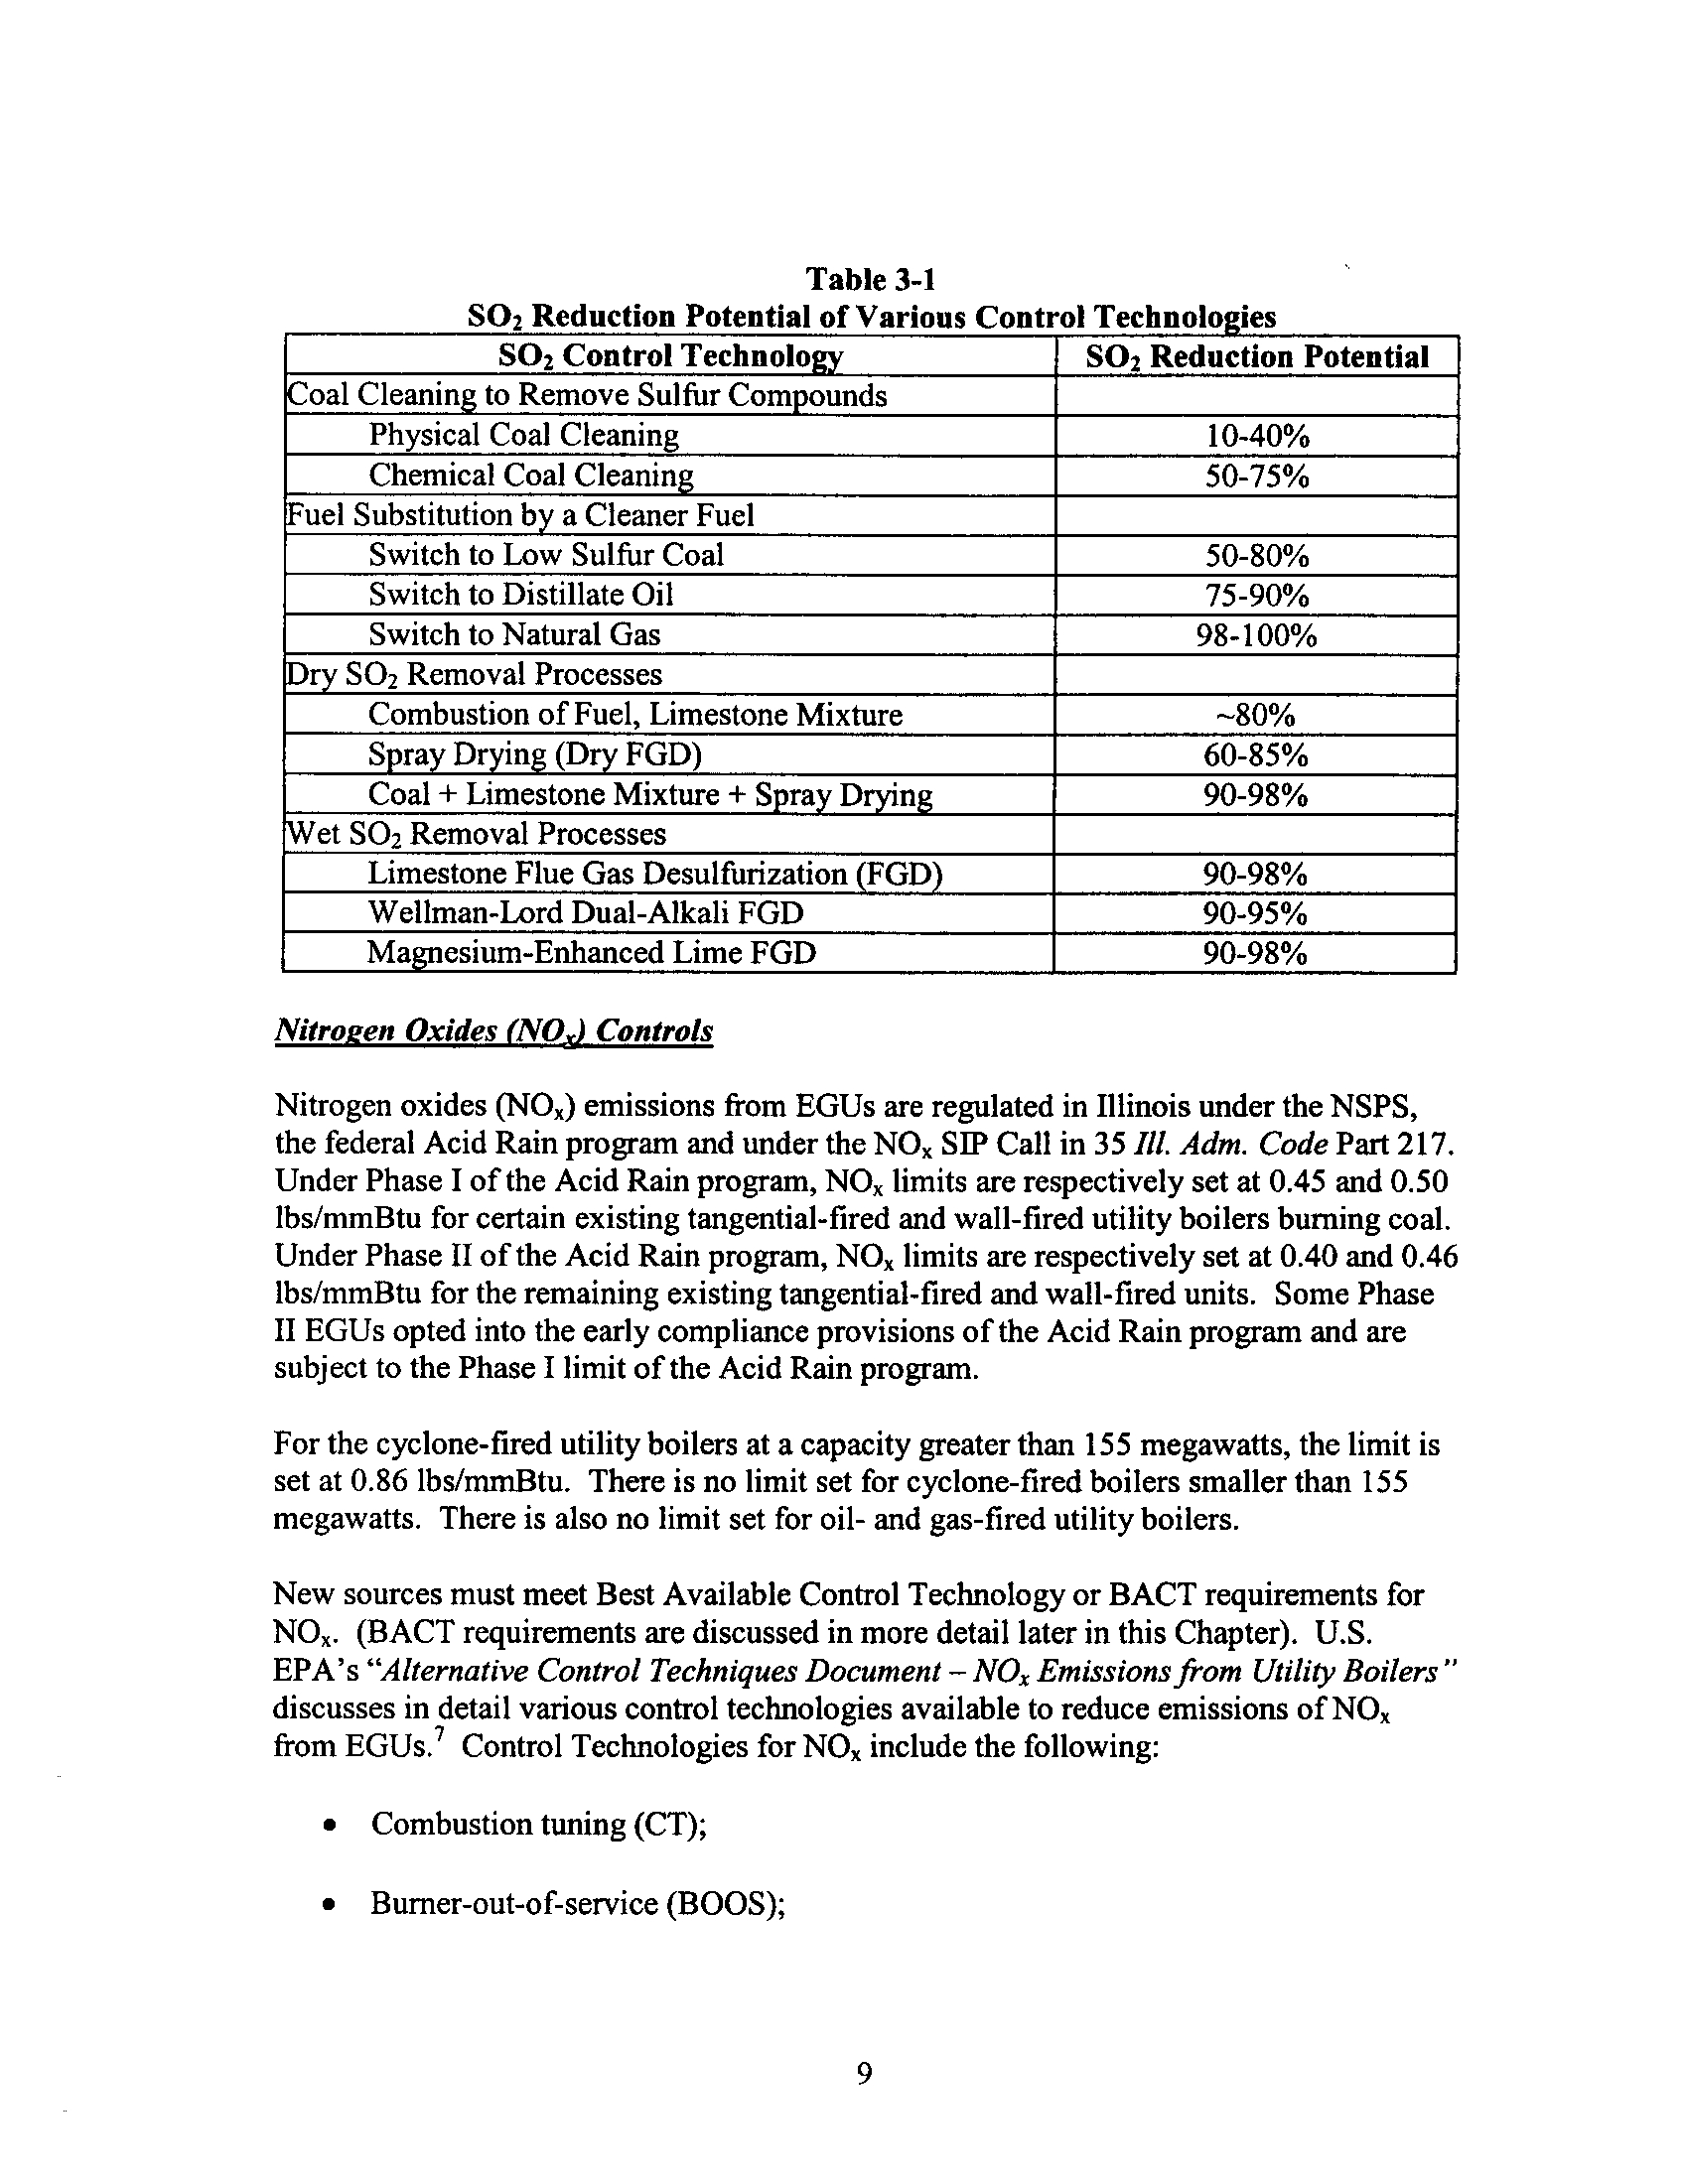
Table 3-1 provides a summary of various SO 2 reduction technologies and the
SO2
reduction potential of each. Illinois' EGUs have employed some of these technologies to
reduce SO2 emissions. Dry scrubber control technology has not been employed on any
existing Illinois units thus far, but there is a potential that it will be used on small coal-
fired boilers in the future . Blending coal or coal waste with limestone has not yet been
used on any existing Illinois source, but permit applications have been received for two
new boilers to use this technology. In the absence of regulatory requirements beyond the
Acid Rain program that would require the use of these control technologies, sources will
not install these technologies because the price of
SO2
allowances is well below the cost
of installing these technologies .
We also note that two types of wet scrubber control technologies have been employed in
Illinois on coal-fired utility boilers subject to the New Source Performance Standard
(NSPS) for Fossil Fuel-Fired Steam Generators, 40 CFR 60, Subpart D. A limestone
scrubber system has been employed at Marion 4, Duck Creek and Dallman Units 1, 2 and
3. A double-alkali scrubber was employed at Newton Units 1 and 2, but due to its higher
operating cost compared to limestone scrubber technology, this scrubber system is no
longer in operation .
The technologies listed in Table 3-1 have been proven to be effective in the removal of
SO2, and some are widely used by the industry . The type or types of SO2 control
appropriate for any individual EGU is dependent upon the type of boiler, type of fuel, and
the types and staging of other air pollution control devices . In summary, emissions
reduction technologies for SO2 are available and are effective in reducing SO2 from the
gas stream of EGUs
.
8
Table 3-1
SO2 Reduction Potential of Various Control Technolo ies
Nitrogen Oxides (NOd Controls
Nitrogen oxides (NO,) emissions from EGUs are regulated in Illinois under the NSPS,
the federal Acid Rain program and under the NO x SIP Call in 35
Ill.
Adm. Code
Part 217 .
Under Phase I of the Acid Rain program, NO, limits are respectively set at 0 .45 and 0.50
lbs/mmBtu for certain existing tangential-fired and wall-fired utility boilers burning coal
.
Under Phase II of the Acid Rain program, NO, limits are respectively set at 0 .40 and 0.46
lbs/mmBtu for the remaining existing tangential-fired and wall-fired units. Some Phase
II EGUs opted into the early compliance provisions of the Acid Rain program and are
subject to the Phase I limit of the Acid Rain program
.
For the cyclone-fired utility boilers at a capacity greater than 155 megawatts, the limit is
set at 0.86 lbs/mmBtu. There is no limit set for cyclone-fired boilers smaller than 155
megawatts. There is also no limit set for oil- and gas-fired utility boilers
.
New sources must meet Best Available Control Technology or BACT requirements for
NON. (BACT requirements are discussed in more detail later in this Chapter) . U.S .
EPA's "Alternative Control Techniques Document -NOOEmissions from Utility Boilers "
discusses in detail various control technologies available to reduce emissions of NO,
from EGUs
.7 Control Technologies for NO, include the following
:
•
Combustion tuning (CT) ;
•
Burner-out-of-service (BOOS) ;
9
SO2 Control Technology
SO2 Reduction Potential
Coal Cleaning to Remove Sulfur Compounds
Physical Coal Cleaning
10-40%
Chemical Coal Cleaning
50-75%
Fuel Substitution by a Cleaner Fuel
Switch to Low Sulfur Coal
50-80%
Switch to Distillate Oil
75-90%
Switch to Natural Gas
98-100%
Dry SO2 Removal Processes
Combustion of Fuel, Limestone Mixture
-80%
Spray Drying (Dry FGD)
60-85%
Coal + Limestone Mixture + Spray Drying
90-98%
Wet SO2 Removal Processes
Limestone Flue Gas Desulfurization (FGD)
90-98%
Wellman-Lord Dual-Alkali FGD
90-95%
Magnesium-Enhanced Lime FGD
90-98%
•
Overfire air (OFA) ;
•
Low NO, burners (LNB) ;
•
Switching to low nitrogen coal;
•
Switching to natural gas
;
•
Flue gas reburn ;
•
Selective non-catalytic reduction (SNCR) with ammonia or urea ; and
•
Selective catalytic reduction (SCR) with ammonia
.
In 2001, Illinois adopted NO, regulations consistent with requirements of the NO, SIP
Call,8 which are more stringent than the current Acid Rain regulations. The NO, SIP Call
regulations have an initial NO, emissions budget based on an emission rate of 0
.15
lbs/mmBtu. The rule has provisions for the trading of NO, emissions among sources in
the participating states affected by the NO, SIP Call . To comply with the NO, emissions
trading rule, many sources have installed or plan to install add-on controls or plan to meet
the requirement with a combination of the above-mentioned combustion controls
.
The NO, SIP Call was promulgated to address the impacts of NO, emissions from power
plants and other large industrial boilers on ozone . Ozone is seasonal in nature. It is
formed by a chemical reaction with other pollution in the presence of sunlight and during
warm weather. As a result, the emission reductions are only required during the period
May 1 through September 30. However, power plants in many states have installed and
are installing control equipment to meet NO, SIP Call standards. Most facilities do not
intend to operate the equipment year-round, especially where they employ selective non-
catalytic reduction (SNCR) technology and selective catalytic reduction (SCR)
technology for NO, removal. In fact, to eliminate the cost of operating the equipment
other than during the ozone season, some companies are installing equipment to bypass
the flue gases before they enter into control equipment . However, annual operation of the
control equipment may only add incrementally to the total cost of controlling NO, .
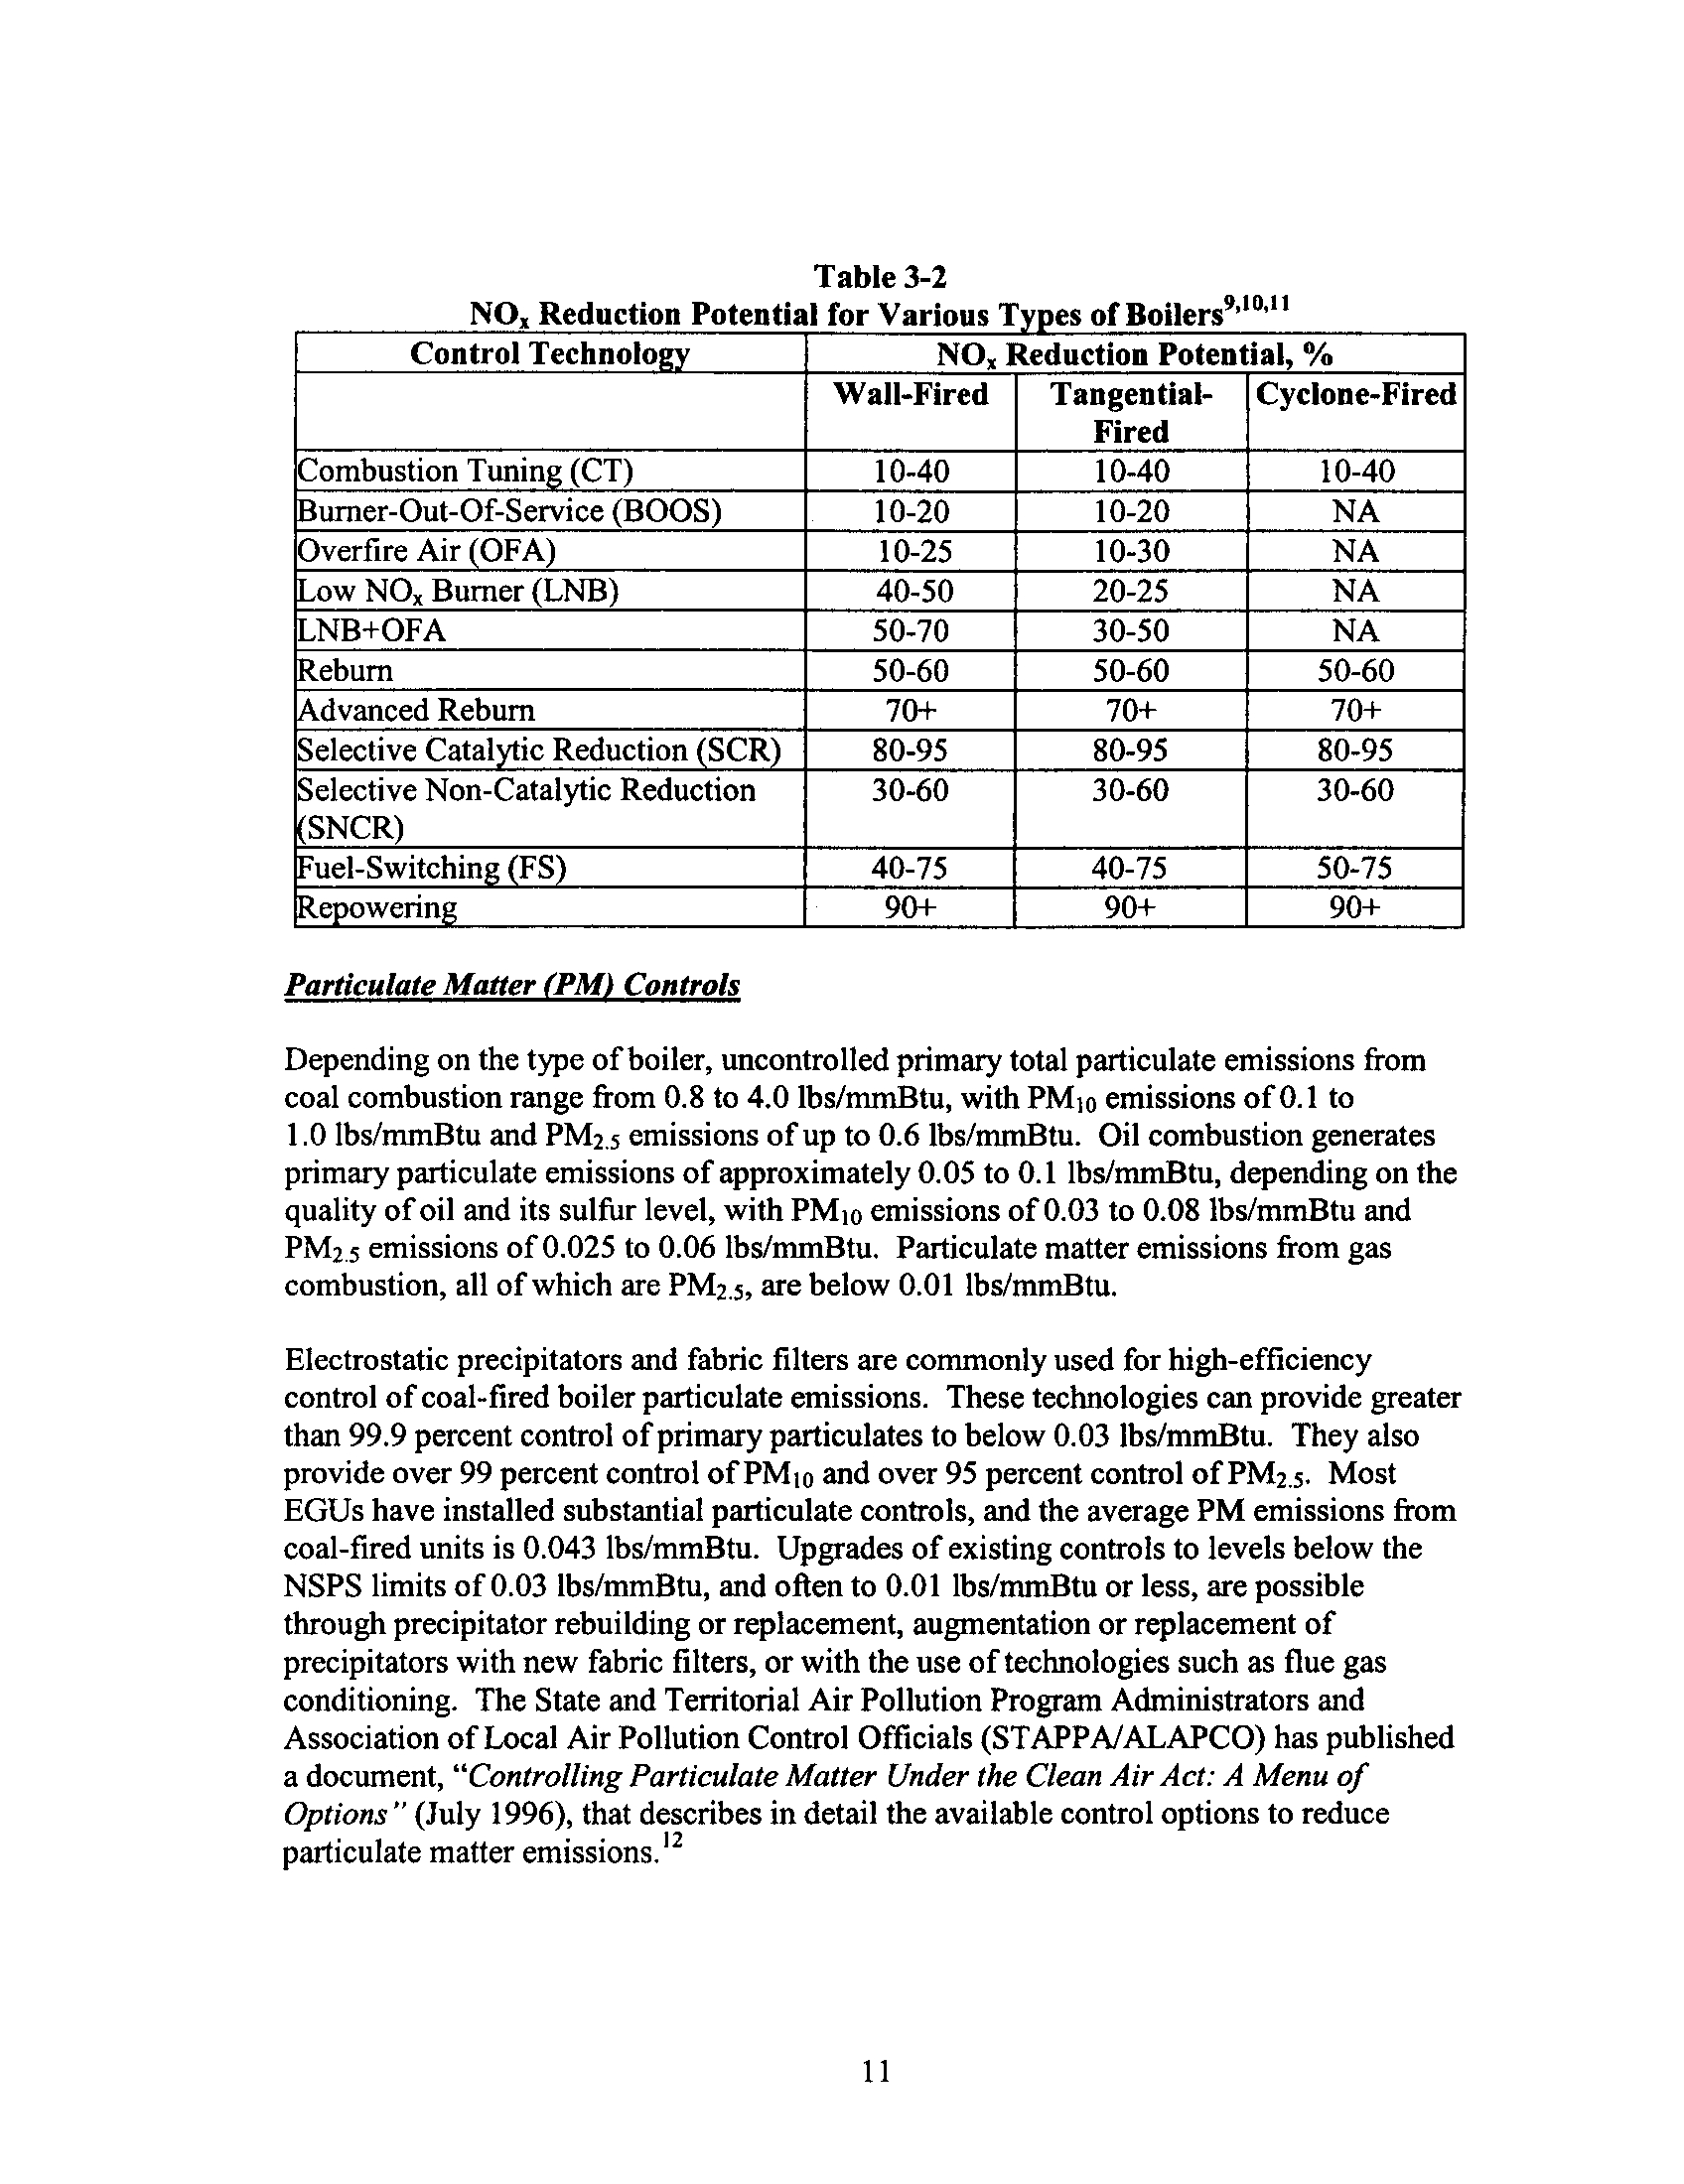
Some of the NO, control technologies and their NO, reduction potentials for coal-fired
boilers are provided in Table 3-2 . As with SO2, effective control technologies are readily
available and are being widely used by the industry
.
10
Table 3-2
NO, Reduction Potential for Various T es of Boilers9" o,ii
Particulate Matter (PM) Controls
Depending on the type of boiler, uncontrolled primary total particulate emissions from
coal combustion range from 0 .8 to 4.0 lbs/mmBtu, with PM10 emissions of 0.1 to
1 .0 lbs/mmBtu and PM2
.5 emissions of up to 0.6 lbs/mmBtu. Oil combustion generates
primary particulate emissions of approximately 0 .05 to 0.1 lbs/mmBtu, depending on the
quality of oil and its sulfur level, with PM 1
0
emissions of 0.03 to 0.08 lbs/mmBtu and
PM2.5 emissions of 0.025 to 0.06 lbs/mmBtu. Particulate matter emissions from gas
combustion, all of which are PM2
.5, are below 0.01 lbs/mmBtu
.
Electrostatic precipitators and fabric filters are commonly used for high-efficiency
control of coal-fired boiler particulate emissions . These technologies can provide greater
than 99.9 percent control of primary particulates to below 0 .03 lbs/mmBtu. They also
provide over 99 percent control of PM10 and over 95 percent control of PM2.5 . Most
EGUs have installed substantial particulate controls, and the average PM emissions from
coal-fired units is 0.043 lbs/mmBtu. Upgrades of existing controls to levels below the
NSPS limits of 0.03 lbs/mmBtu, and often to 0.01 lbs/mmBtu or less, are possible
through precipitator rebuilding or replacement, augmentation or replacement of
precipitators with new fabric filters, or with the use of technologies such as flue gas
conditioning. The State and Territorial Air Pollution Program Administrators and
Association of Local Air Pollution Control Officials (STAPPA/ALAPCO) has published
a document,
"Controlling Particulate Matter Under the Clean Air Act : A Menu of
Options" (July
1996), that describes in detail the available control options to reduce
particulate matter emissions
. 12
11
Control Technology
NO, Reduction Potential,
Wall-Fired
Tangential-
Fired
Cyclone-Fired
Combustion Tuning (CT)
10-40
10-40
10-40
Burner-Out-Of-Service (BOOS)
10-20
10-20
NA
Overfire Air (OFA)
10-25
10-30
NA
Low NO, Burner (LNB)
40-50
20-25
NA
LNB+OFA
50-70
30-50
NA
Reburn
50-60
50-60
50-60
Advanced Reburn
70+
70+
70+
Selective Catalytic Reduction (SCR)
80-95
80-95
80-95
Selective Non-Catalytic Reduction
(SNCR)
30-60
30-60
30-60
Fuel-Switching (FS)
40-75
40-75
50-75
Repowering
90+
90+
90+
Mercury Controls
The removal of mercury from coal combustion sources has become a focus in recent
years. Only in the last 10 years has the removal process been aggressively studied and
advanced technology developed
.
Mercury removal itself is made somewhat more complex because of the different forms
of mercury present in coal. Mercury is present in coal in elemental (Hg°), oxidized
(Hg` `) and organic forms. Relative concentrations of each type of mercury depend on the
kind of coal and its constituents. The elemental form is more prevalent in sub-
bituminous coals (typically called "western" coal) and the oxidized form is more
prevalent in bituminous coals (Illinois and eastern coal) . Mean concentrations of
mercury in bituminous coal and sub-bituminous coals used by electric generators are 0 .12
and 0.07 parts per million (ppm), respectively. Typically, mercury is 25 percent
elemental mercury and 75 percent oxidized mercury in bituminous coals, and it is 75
percent elemental mercury and 25 percent oxidized mercury in sub-bituminous coal
.
Physical coal cleaning processes used for the removal of pyrites can remove an average
of 21 percent of mercury present in bituminous coals . The process removes a much
smaller amount of mercury from sub-bituminous coals
.
The mercury concentration in flue gases is normally 5 to 30 micrograms per dry standard
cubic meter (expressed as ug/dscm), the norm being about 10 ug/dscm . Mercury
concentration in the flue gases from municipal solid waste boilers is about 200 to 1,000
ug/dscm. The presence of S02, moisture, chlorine, hydrogen chloride, and unburned
carbon in the flue gases influences conversion of elemental mercury to oxidized mercury
.
The greater the porosity of fly ash, the higher the adsorption of mercury by the fly ash .
Calcium aids the adsorption of mercury by fly ash. Iron compounds in the coal influence
melting and solidification temperatures of fly ash and hence influence its porosity
.
Hydrogen and oxygen present in coal make it bum faster and make fly ash more porous .
Unburned carbon present in the fly ash adsorbs both oxidized and elemental forms of
mercury. Cooler temperatures cause better adsorption of mercury by fly ash, carbon,
calcium and other materials .
A number of technologies for the removal of mercury are under investigation at the
laboratory and pilot-plant stages . Some of these technologies are being tested at full-
scale plants . These technologies include the following
:
•
Adsorption of mercury by treated and untreated activated carbons ;
•
Oxidation of elemental mercury to oxidized mercury by the use of oxidizing
agents such as chlorine, SO? , aqueous hypochlorite or hydrogen chloride ;
•
Catalytic oxidation of elemental mercury to oxidized mercury by palladium or
iron and with or without the injection of S0 2, NO, and hydrochloric acid ;
12
•
•
Removal of elemental mercury and oxidized mercury by various types of
calcium-based and fly ash sorbents ;
•
Adsorption of elemental mercury by a noble metal such as gold ;
•
Capture of elemental mercury by in-situ generated titanium particles in
conjunction with ultraviolet irradiation; and
•
Addition of activated carbon or fly ash and agglomeration of dust in a circulating
fluidized bed .
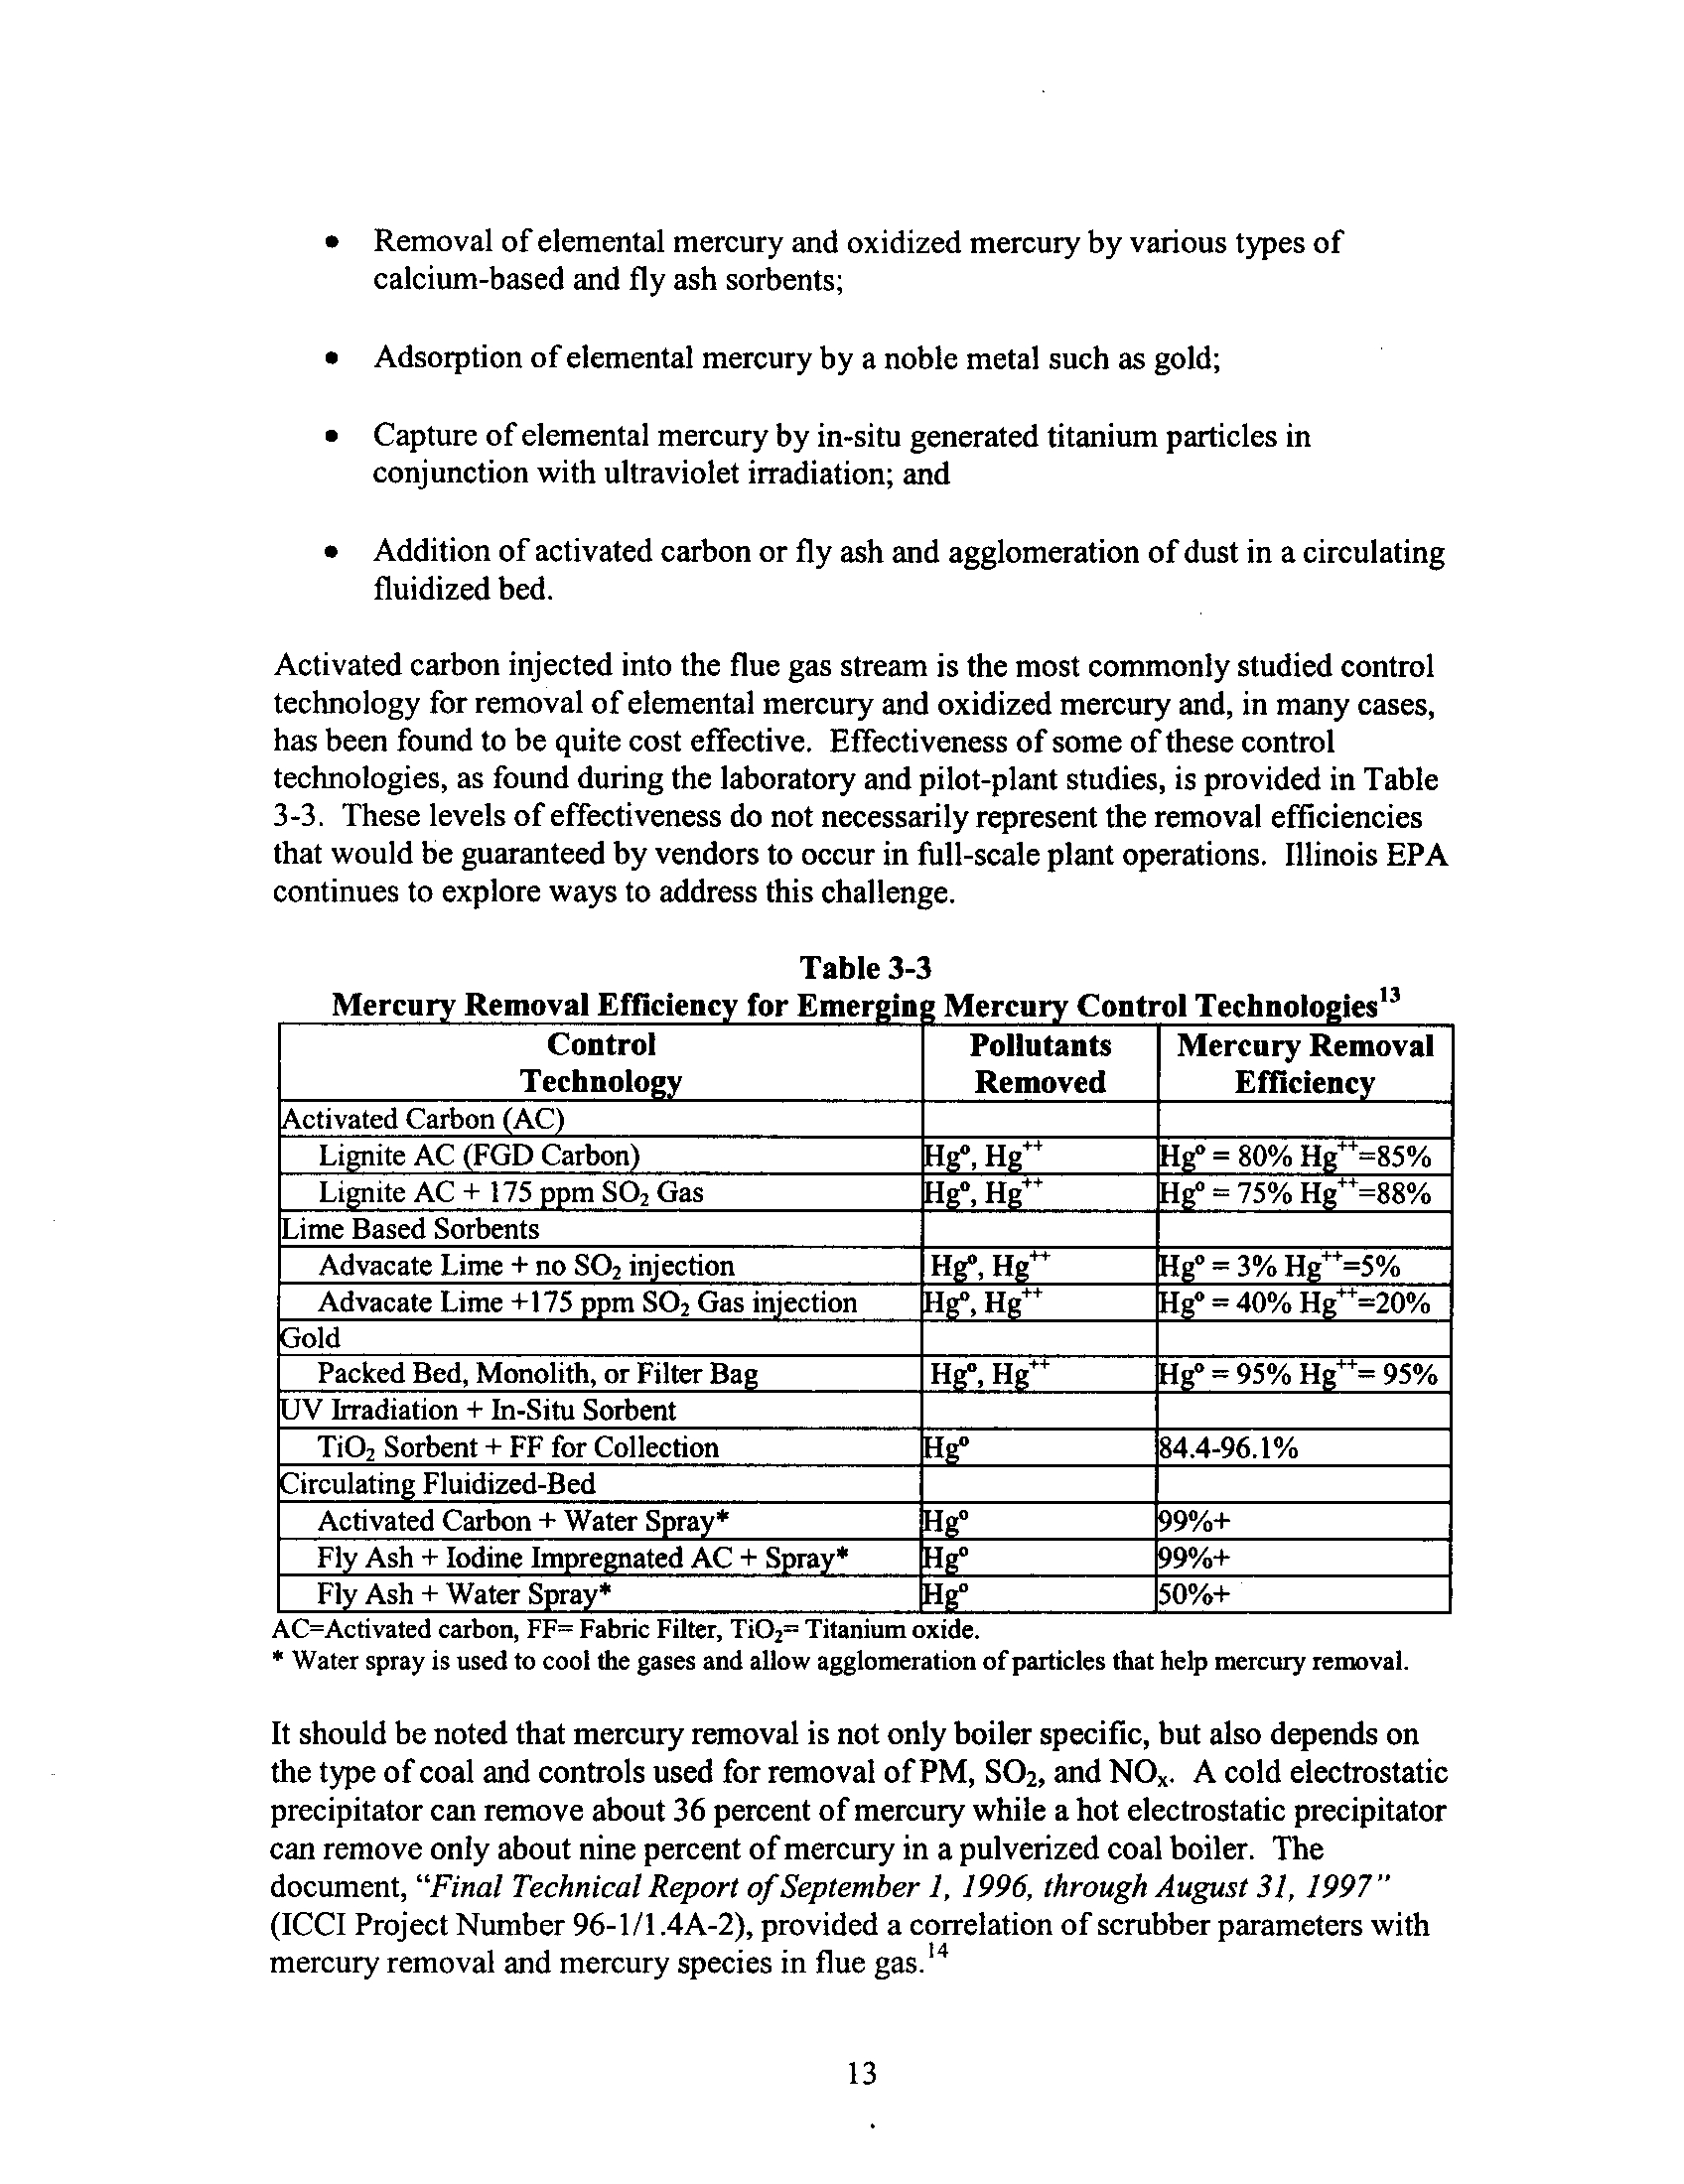
Activated carbon injected into the flue gas stream is the most commonly studied control
technology for removal of elemental mercury and oxidized mercury and, in many cases,
has been found to be quite cost effective. Effectiveness of some of these control
technologies, as found during the laboratory and pilot-plant studies, is provided in Table
3-3. These levels of effectiveness do not necessarily represent the removal efficiencies
that would be guaranteed by vendors to occur in full-scale plant operations . Illinois EPA
continues to explore ways to address this challenge
.
Table 3-3
Mercu
Removal Efficienc
for Emer in Mercu
Control Technolo ies 13
AC=Activated carbon, FF= Fabric Filter, TiO 2
=
Titanium oxide
.
* Water spray is used to cool the gases and allow agglomeration of particles that help mercury removal
.
It should be noted that mercury removal is not only boiler specific, but also depends on
the type of coal and controls used for removal of PM, SO 2 , and NOR .
A cold electrostatic
precipitator can remove about 36 percent of mercury while a hot electrostatic precipitator
can remove only about nine percent of mercury in a pulverized coal boiler
. The
document,
"Final Technical Report of September 1, 1996, through August 31, 1997"
(ICCI Project Number 96-1/1 .4A-2), provided a correlation of scrubber parameters with
mercury removal and mercury species in flue gas
.
14
13
Control
Technology
Pollutants
Removed
Mercury Removal
Efficiency
Activated Carbon (AC)
Lignite AC (FGD Carbon)
Hg°, Hg"
Hg° = 80% Hg"=85%
Lignite AC + 175 ppm SO2 Gas
Hg°, Hg"
Hg° = 75% Hg"=88%
Lime Based Sorbents
Advacate Lime + no SO2 injection
Hg°, Hg"
Hg° = 3% Hg"=5%
Advacate Lime +175 ppm SO2 Gas injection
Hg°, Hg"
Hg° = 40% Hg+ =20%
Gold
Packed Bed, Monolith, or Filter Bag
Hg°, Hg"
Hg° = 95% Hg"= 95%
UV Irradiation + In-Situ Sorbent
Ti02 Sorbent + FF for Collection
Hg°
84.4-96.1%
Circulating Fluidized-Bed
Activated Carbon + Water Spray*
Hg°
99%+
Fly Ash + Iodine Impregnated AC + Spray*
Hg°
99%+
Fly Ash + Water Spray*
Hg°
50%+
In summary, technologies do exist to reduce mercury emissions from EGUs . While the
control of mercury emissions is more complex than S02 or NO, control, emerging
technologies are expected to be effective.
Best Available Control Technology(BACT) for Coal-Fired Boilers
Under the federal and state rules, proposed new and modified EGUs that exceed
particular pollutant threshold emissions values for NO, and SO2 set forth in the
regulations must demonstrate that they will use BACT to minimize the emissions of those
pollutants. BACT generally represents the lowest emission rate achieved in practice by a
similar or comparable unit, taking into account energy impacts, costs, and other
environmental impacts
.
As new units are planned and air quality permits are applied for, the control technologies
proposed for an EGU must be compared to other plants recently constructed or proposed
throughout
the country to determine BACT requirements . In addition to setting a
standard for new plants, a review of these sources can provide useful insight as to the
extent to which Illinois' existing units can and should be controlled in the future
.
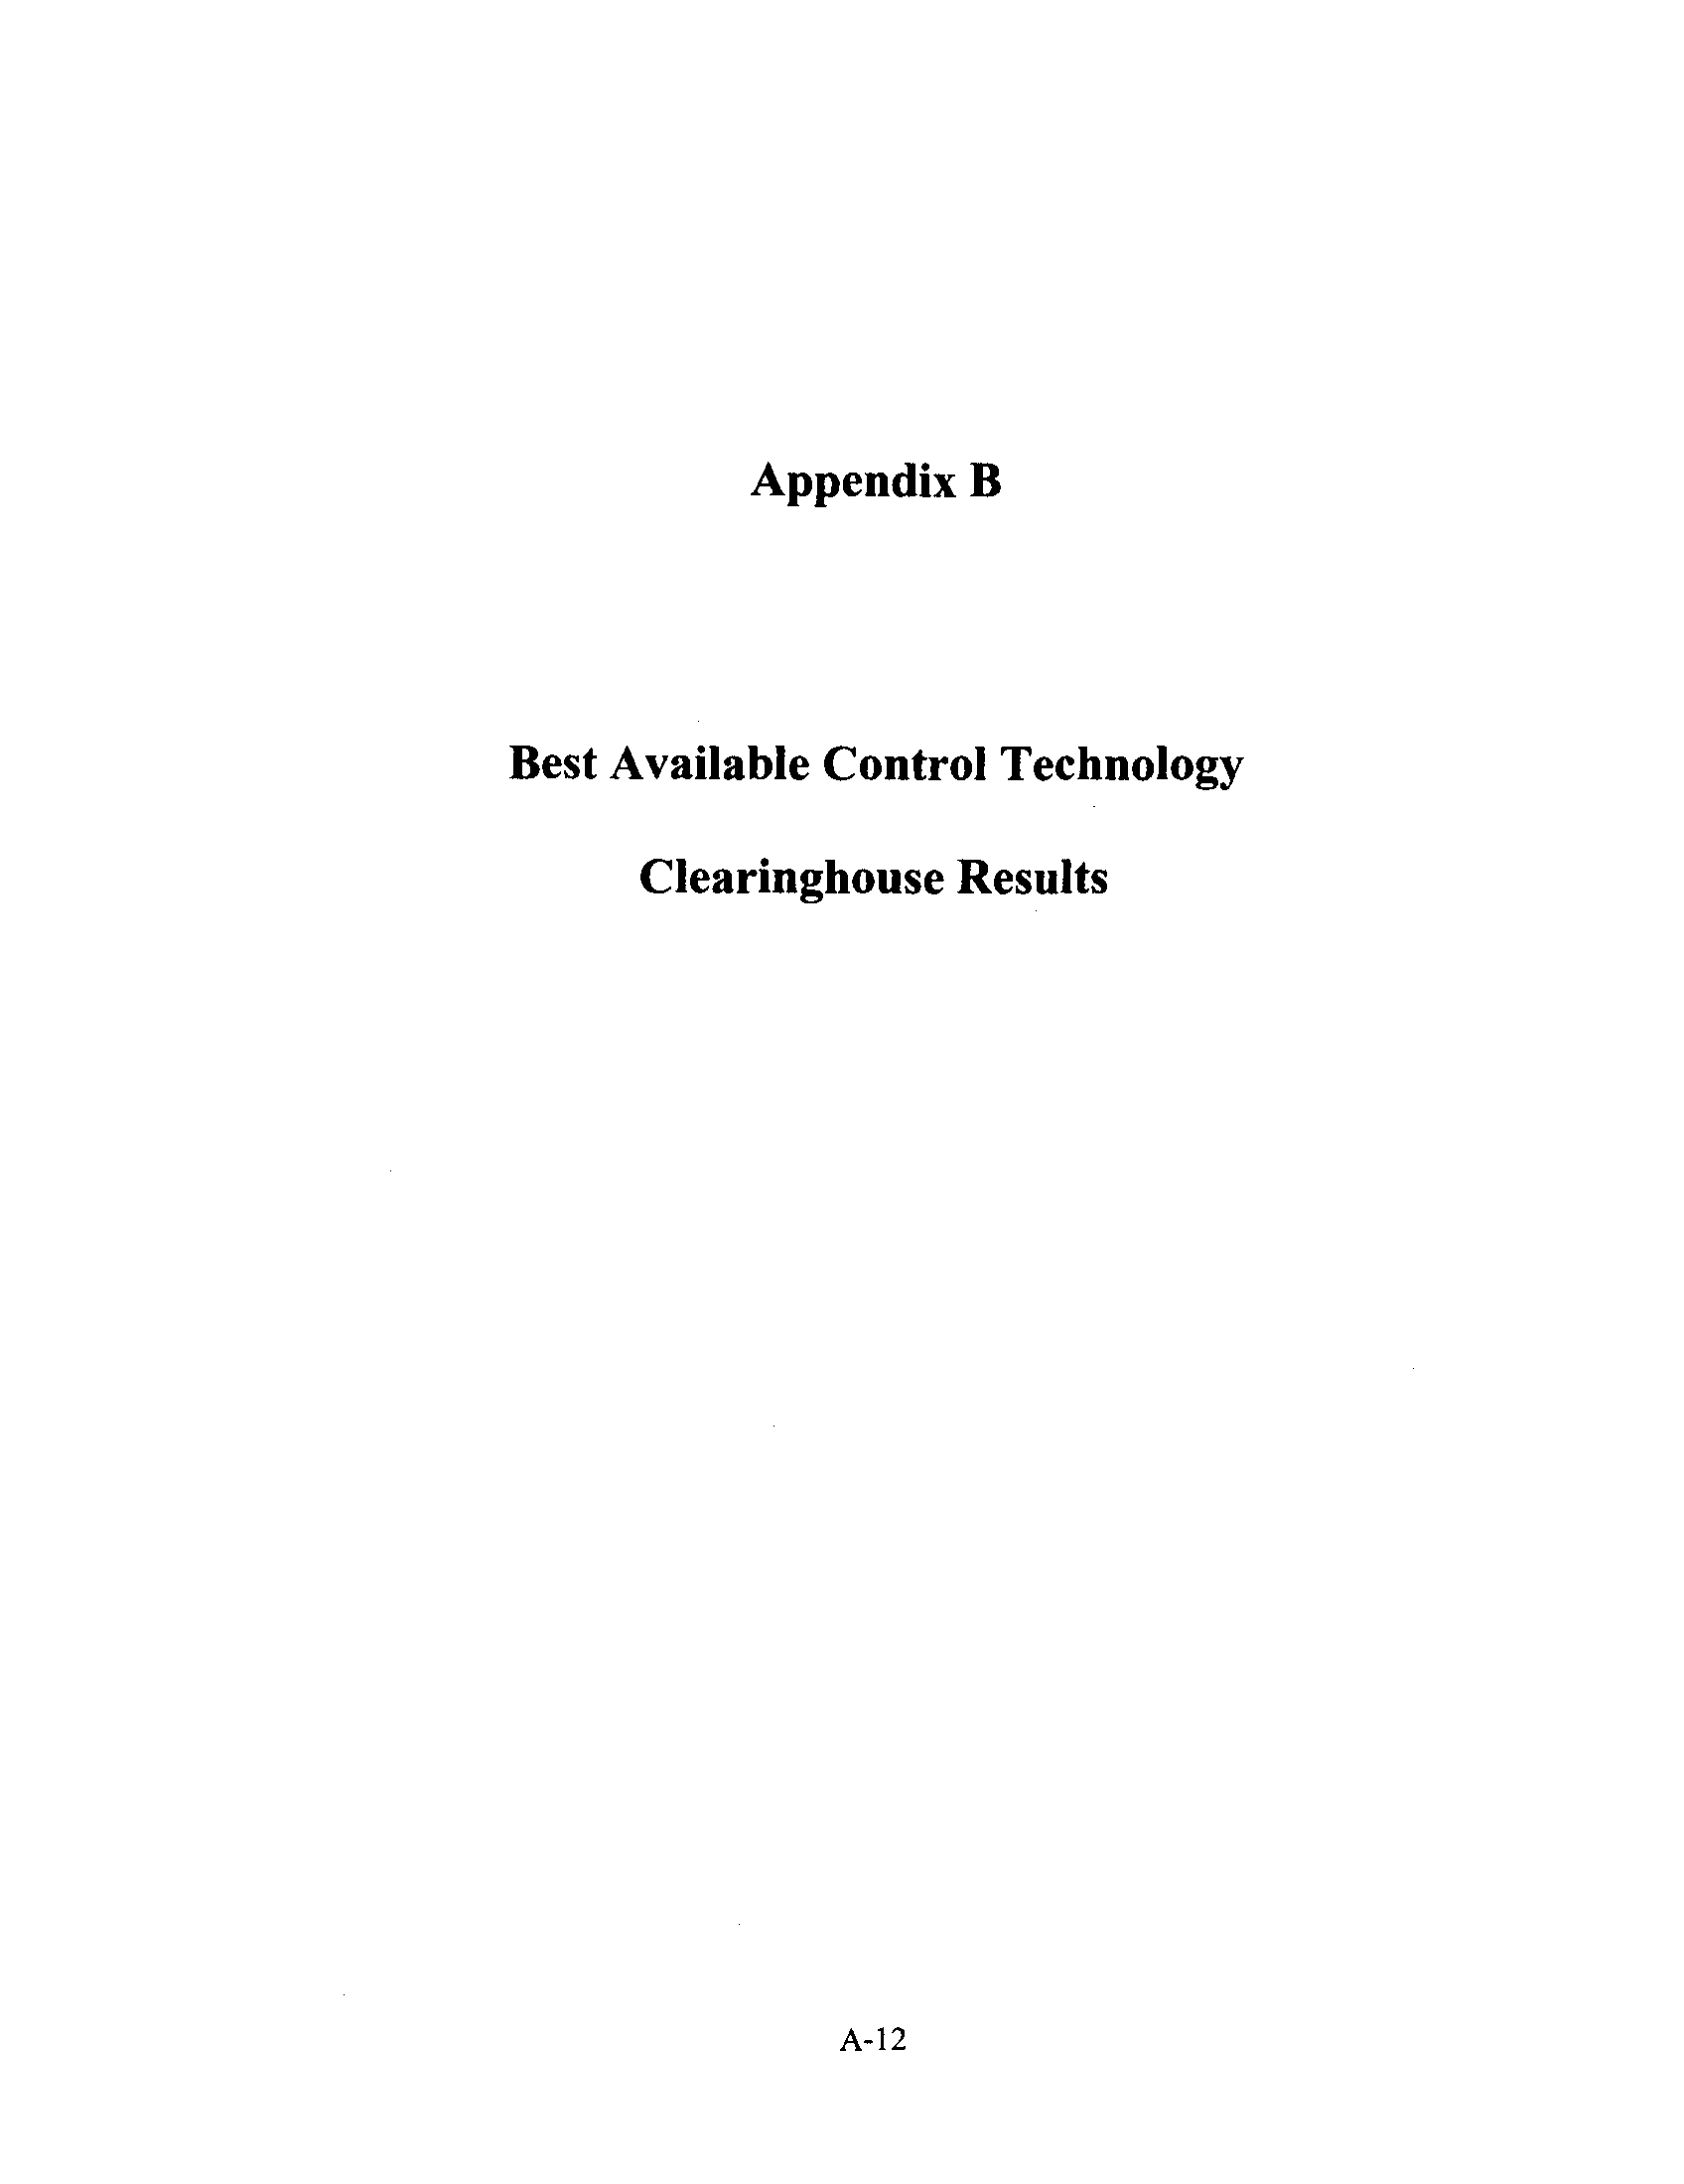
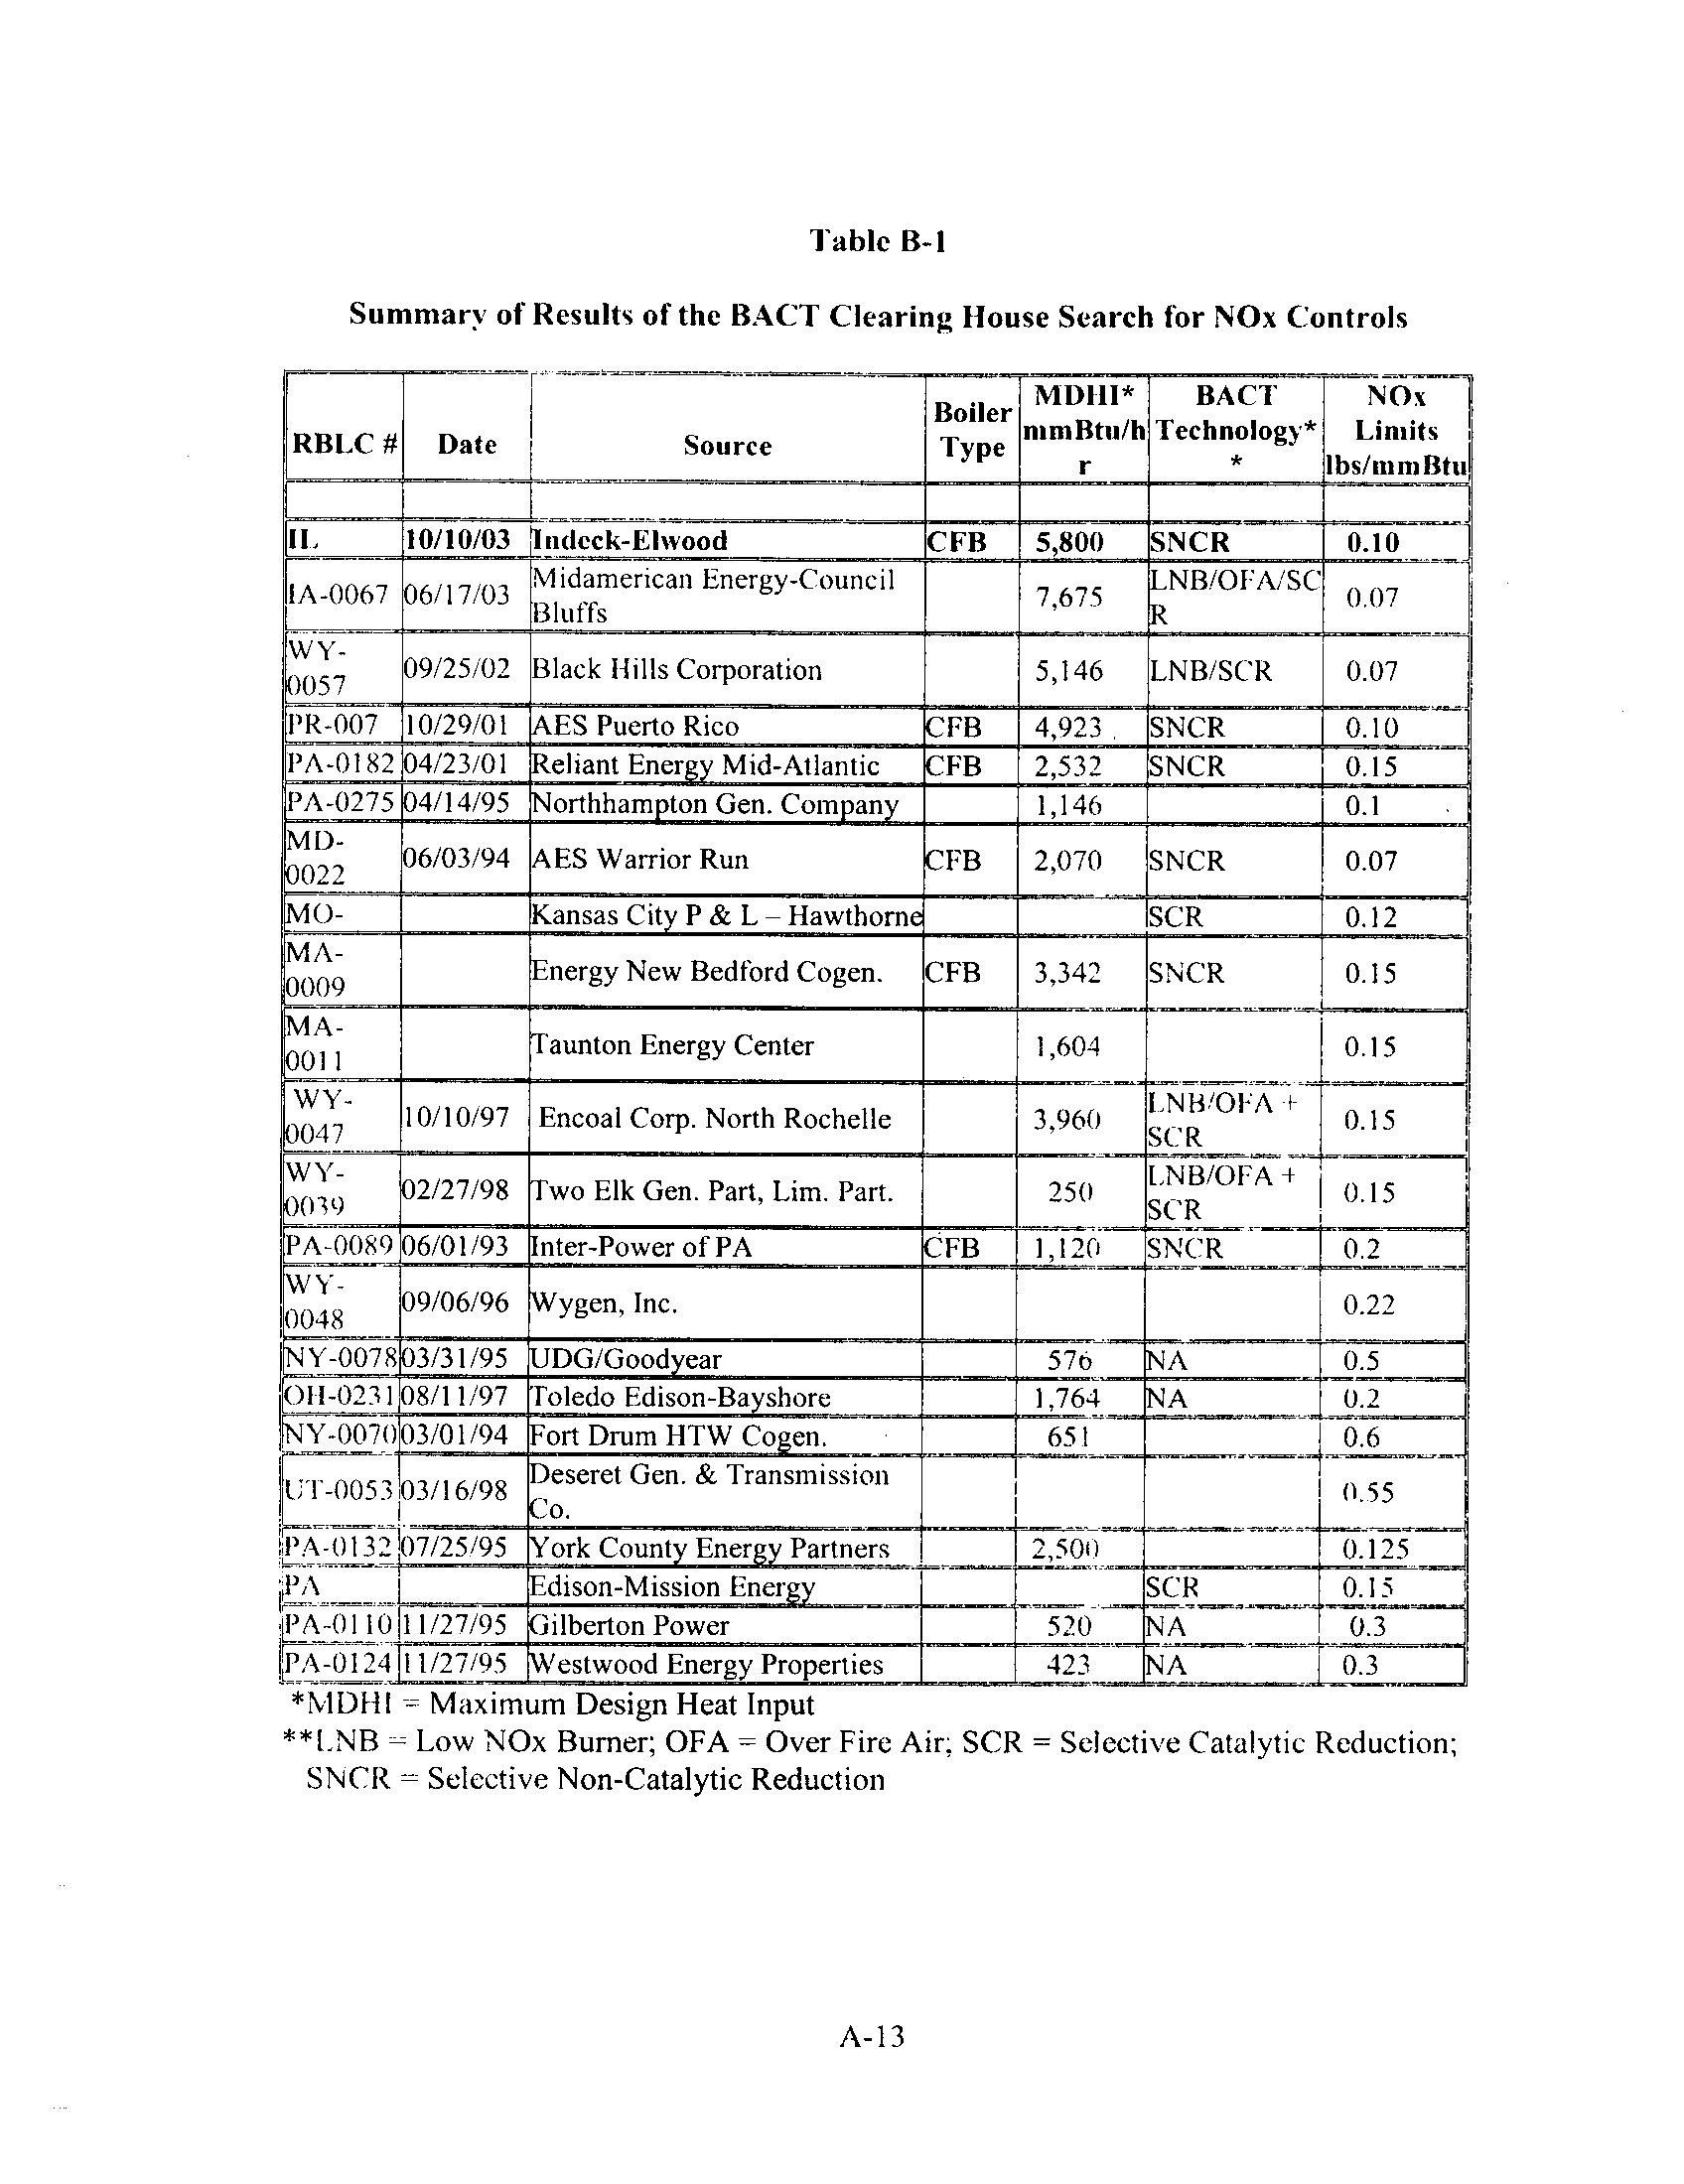
The U.S. EPA's RACT/BACT/LAER Clearinghouse (BACT Clearinghouse) is a
repository of the control technology determinations (e .g., BACT for SO2 emissions from
a pulverized coal boiler) including projects that triggered the requirements of PSD around
the country. For recently constructed coal-fired boilers, all of which were new rather
than retrofitted units, the BACT limits for NO, and SO2 are provided in Appendix B,
Tables B-1 and B-2
.
Control of mercury has only recently been examined on coal-fired units, so the BACT
Clearinghouse has rather incomplete information on the types of technologies that have
been used cost effectively to control mercury . Generally, techniques using various forms
of activated carbon injection are the accepted technology to reduce mercury. Research is
still needed as mercury control technologies are still in their experimental stages, as
discussed earlier in this chapter .
Clean Coal Technology. Integrated Gasification Combined-Cycle (IGCC)
Unlike conventional coal-fired boilers, IGCC, sometimes referred to simply as coal
gasification, is a relatively new technology as applied to the power generation industry
.
While Eastman Chemical has most notably and successfully used IGCC in industrial
processes, its use for power generation purposes continues to be studied and tested. To
provide a reliable alternative to traditional boilers, it must undergo further technical
improvement in its operations and reliability
.
Coal gasification takes place in the presence of a controlled "shortage" of air/oxygen,
thus maintaining reducing conditions . The process is carried out in an enclosed
14
pressurized reactor, and the product is a mixture of carbon monoxide and hydrogen
(called synthetic gas, syngas or fuel gas) . The product gas is cleaned and then burned
with either oxygen or air, generating combustion products at high temperature and
pressure .
IGCC utilizes a combined-cycle format with a gas turbine driven by the combusted
syngas, while the exhaust gases are heat exchanged with water/steam to generate
superheated steam to drive a steam turbine . With an IGCC system typically 60-70
percent of the power is generated by the gas turbine, compared to about 20 percent power
generation using a typical fluidized bed combustion system .
Differences in the IGCC demonstration plants are discussed in the
"IEA Coal Research
Report OECD Coal-Fired Power Generation - Trends in the 1990s,"
IEAPER/33 . Every
IGCC plant is required to have a series of large heat exchangers that become major
components of the system . In such exchangers, solids deposition, fouling and corrosion
may take place. Currently, cooling the syngas to below 100°C is required for
conventional cleaning, and it is subsequently reheated before combustion . Substantial
heat exchange vessels are required.
There are several technical challenges to operating a successful IGCC unit. Highly
integrated plants tend to have long start-up times (compared to pulverized coal
combustion units) and hence may only be suitable for base-load operation
.
With pressurized gasification (as with fluidized bed combustion units), the supply of coal
into the system is considerably more complex than with pulverized coal combustion
units. Some gasifiers use bulky and costly lock hopper systems to inject the coal, while
others have the coal fed in as a water-based slurry. Similarly, by-product streams have to
be depressurized, while heat exchangers and gas cleaning units for the intermediate
product syngas must themselves be pressurized
.
A number of IGCC power plant demonstration units, mainly around 250 megawatts
capacity, are being operated in Europe and the U .S. A 235 megawatt unit at Buggenum
in the Netherlands began operation in 1993. The largest unit being evaluated is at
Puertollano in Spain, with a capacity of 330 megawatts . In theU.S., there are only two
operational plants - Wabash River in Indiana and Polk Power near Tampa, Florida
.
All of the current coal-fueled demonstration plants are subsidized. The European plants
are part of the Thermie programme . The U.S. Department of Energy is funding the
design, construction, and the operating costs for the first few years of the U .S . plants .
Some plants are repowering projects, but
as far as demonstrating the viability of various
systems, they are effectively new plants, even though they are tied to an existing steam
turbine .
As gasifiers are pressure vessels, they cannot be fabricated on-site in the same way that
pulverized coal combustor boilers can . Large gasifiers are difficult to transport, simply
because of their weight and sheer size .
15
The primary incentive for IGCC development has been that units may be able to achieve
higher thermal efficiencies than pulverized coal combustion plants and are able to match
the environmental performance of gas-fired plants. During the developmental phase, the
thermal efficiencies of new pulverized coal combustion plants using superheated steam
have also increased.
When these IGCC units come into general operation, their emissions of particulates, NO,
and SO2 are expected to meet, and most likely exceed, all current emission standards .
Indeed, a major power generator recently pledged to build an IGCC plant within the next
decade. Other IGCC proposals continue to be discussed. This is promising technology,
and its further development must be encouraged .
Currently, there are only two IGCC plants producing electricity in the U .S. Neither of
these plants specifically control mercury emissions . The document
"The Cost of Mercury
Removed in an IGCC Plant, Final Report, September 2002 "
prepared for the U.S .
Department of Energy provides cost estimates for removal of mercury from the IGCC's
syngas
.
' 5
16
Chapter 4
Overview of National Power Plant Emission Reduction Proposals
and Their Estimated Emission Reductions
One of the most prominent national environmental issues during the last two years has
been defining appropriate requirements to regulate multiple air pollutants from electric
power plants. The desire for improved air quality, while providing a degree of regulatory
certainty for the electric power industry, has led to a series of proposals in the U .S .
Congress and two related proposals by U .S. EPA. This chapter will provide a brief
overview of these proposals, four of which are Congressional legislative proposals and
two of which are U .S. EPA proposed rulemakings. This chapter will also discuss the
emission reductions expected to be achieved by these proposals
.
National Multi-Pollutant Legislation
The Bush Administration and several members of Congress have proposed various
versions of "multi-pollutant" legislation for the electric power plant industry. The bills
are consistent in the respect that they address requirements for several pollutants
simultaneously. All include a requirement for setting a national "cap" on emissions of
each pollutant and then add provisions to allow for emissions trading of SO 2 and NO.
allowances between regulated sources . The ability to trade mercury allowances varies
among proposals. The proposals typically differ in the number of pollutants regulated,
the level of the proposed "cap," and the timeframe for implementation . Depending on
each bill's focus, such legislation typically addresses three or four pollutants
.
The 3-pollutant bills would set standards for SO 2 , NO and mercury. The 4-pollutant
bills also include requirements to regulate carbon dioxide . The multi-pollutant legislative
proposals, whether in 3- or 4-pollutant form, are intended to reduce emissions and to
encourage investment in new plants by providing a degree of certainty regarding future
regulatory requirements. Some of the these proposals would replace existing regulatory
programs, including New Source Review (NSR), New Source Performance Standards
(NSPS), Prevention of Significant Deterioration (PSD) of air quality, Lowest Achievable
Emission Rate (LAER) standards, Best Available Retrofit Technology (BART), and
regulations currently under development to control mercury emissions from electric
power plants
.
Bush Administration's Clear Skies Act of 2003
In February 2002, President Bush announced a multi-pollutant strategy called the lear
Skies Initiative. The strategy was put forth as multi-pollutant legislation that was
submitted to the U.S. House of Representatives on July 26, 2002, and to the U.S. Senate
two days later. The Administration reintroduced the legislation to the 108 th Congress on
February 27, 2003, as H.R. 999 and S . 485
.
17
Differences between the 2002 and the 2003 proposals were minimal, inasmuch as the
pollutants regulated, the emissions limits and the time frame to implement the proposed
requirements, remained the same. However, the bill's name was changed to the Clear
Skies Act.
The Clear Skies Act proposes to establish federally enforceable emission limits (caps) for
SO2, NO, and mercury. The NO, and S02 requirements would apply to all fossil fuel-
fired electric generators that sell electricity. The mercury requirements affect only the
subset of these units that are coal-fired
.
The Clear Skies Act of 2003 would establish new annual caps on total SO2 emissions and
new allocation procedures that would begin January 1, 2010, for power plants in the
eastern half of the United States and in 2018 (or later) for power plants in the western
U.S. Annual SO2 emissions for affected power plants would be capped at 4 .5 million
tons starting in 2010 and 3 .0 million tons starting in 2018. During the first year of the
program, 99 percent of the total allowances would be allocated to existing regulated units
with a national auction being held for the remaining one percent . In each of the next 20
years, an additional one percent of the allowances will be auctioned . An additional 2 .5
percent thereafter will be auctioned annually until eventually all the allowances are
auctioned. Allowances will be allocated based on each unit's baseline heat input
multiplied by standard emission rates that vary depending on the fuel combusted by the
units. Standard emission rates are established for three categories of units--coal-fired,
oil-fired, and other units .
The Clear Skies Act proposes a separate SO2 emission limitation and cap-and-trade
program for the states in the Western Regional Air Partnership (WRAP) planning
organization .16 The trading program will go into effect if the WRAP states are unable to
meet the sulfur dioxide cap (271,000 tons) by 2018 . If the 2018 emission cap is
exceeded, the back-stop trading program goes into effect three years after 2018 . This
program is independent of the nationwide cap-and-trade program, and affected emission
units would be subject to both .
The proposal also contains new annual caps for NO, and new allocation procedures
starting January 1, 2008. The Clear Skies Act would retain the NO, requirements in the
existing Acid Rain Program and would also retain the requirements in the NO, SIP Call
through December 31, 2007 . The new NO, trading program would apply to the same
units in the U.S. and its territories as the new SO2 trading program, but there would be
separate cap-and-trade systems established for Zone 1 (eastern and central U .S. states
including the eastern half of Texas) and Zone 2 (western states including the western half
of Texas) .
The annual NO, emissions for affected units in Zone I are capped at 1.562 million tons
starting in 2008 and 1 .162 million tons starting in 2018. Zone 2 annual NO, emissions
are capped at 538,000 tons. Each year, the percentages of allowances allocated and
auctioned are the same as under the new SO2 trading program. The Clear Skies Act
specifies that sources covered by the new SO 2 ,NO., or mercury trading programs would
18
no longer be subject to NO, SIP Call requirements, including a seasonal emissions cap,
beginning in 2008 .
The Clear Skies Act also contains annual caps on total mercury emissions . The
allocation of mercury allowances would begin January 1, 2010 . The annual mercury
emissions would be capped at 34 tons starting in 2010 and 15 tons starting in 2018 . The
percentage of allowances allocated and auctioned are the same as that proposed for the
SO2 and NO, trading programs . The allocations will be set on a one-time basis and
therefore will remain the same each year. Allowances will be allocated based on the
units' baseline heat input, which for units with an operating history is adjusted by a
standard factor to reflect the types of coal that were combusted
.
The Clear Skies Act also contains a "safety valve" provision . Under the safety valve
mechanism, the price of allowances is capped, meaning that if the allowance price
exceeds the "safety valve," EPA will borrow allowances from the following year's
auction to make more allowances available at that price . The Clear Skies Act "safety
valve" provisions for NO. and SO2 are $4,000 a ton and $35,000 per pound for mercury .
Other Federal Multi-Pollutant Lefislative Proposals: The Carper Bill, the Jeffords
Bill and the Waxman Bill
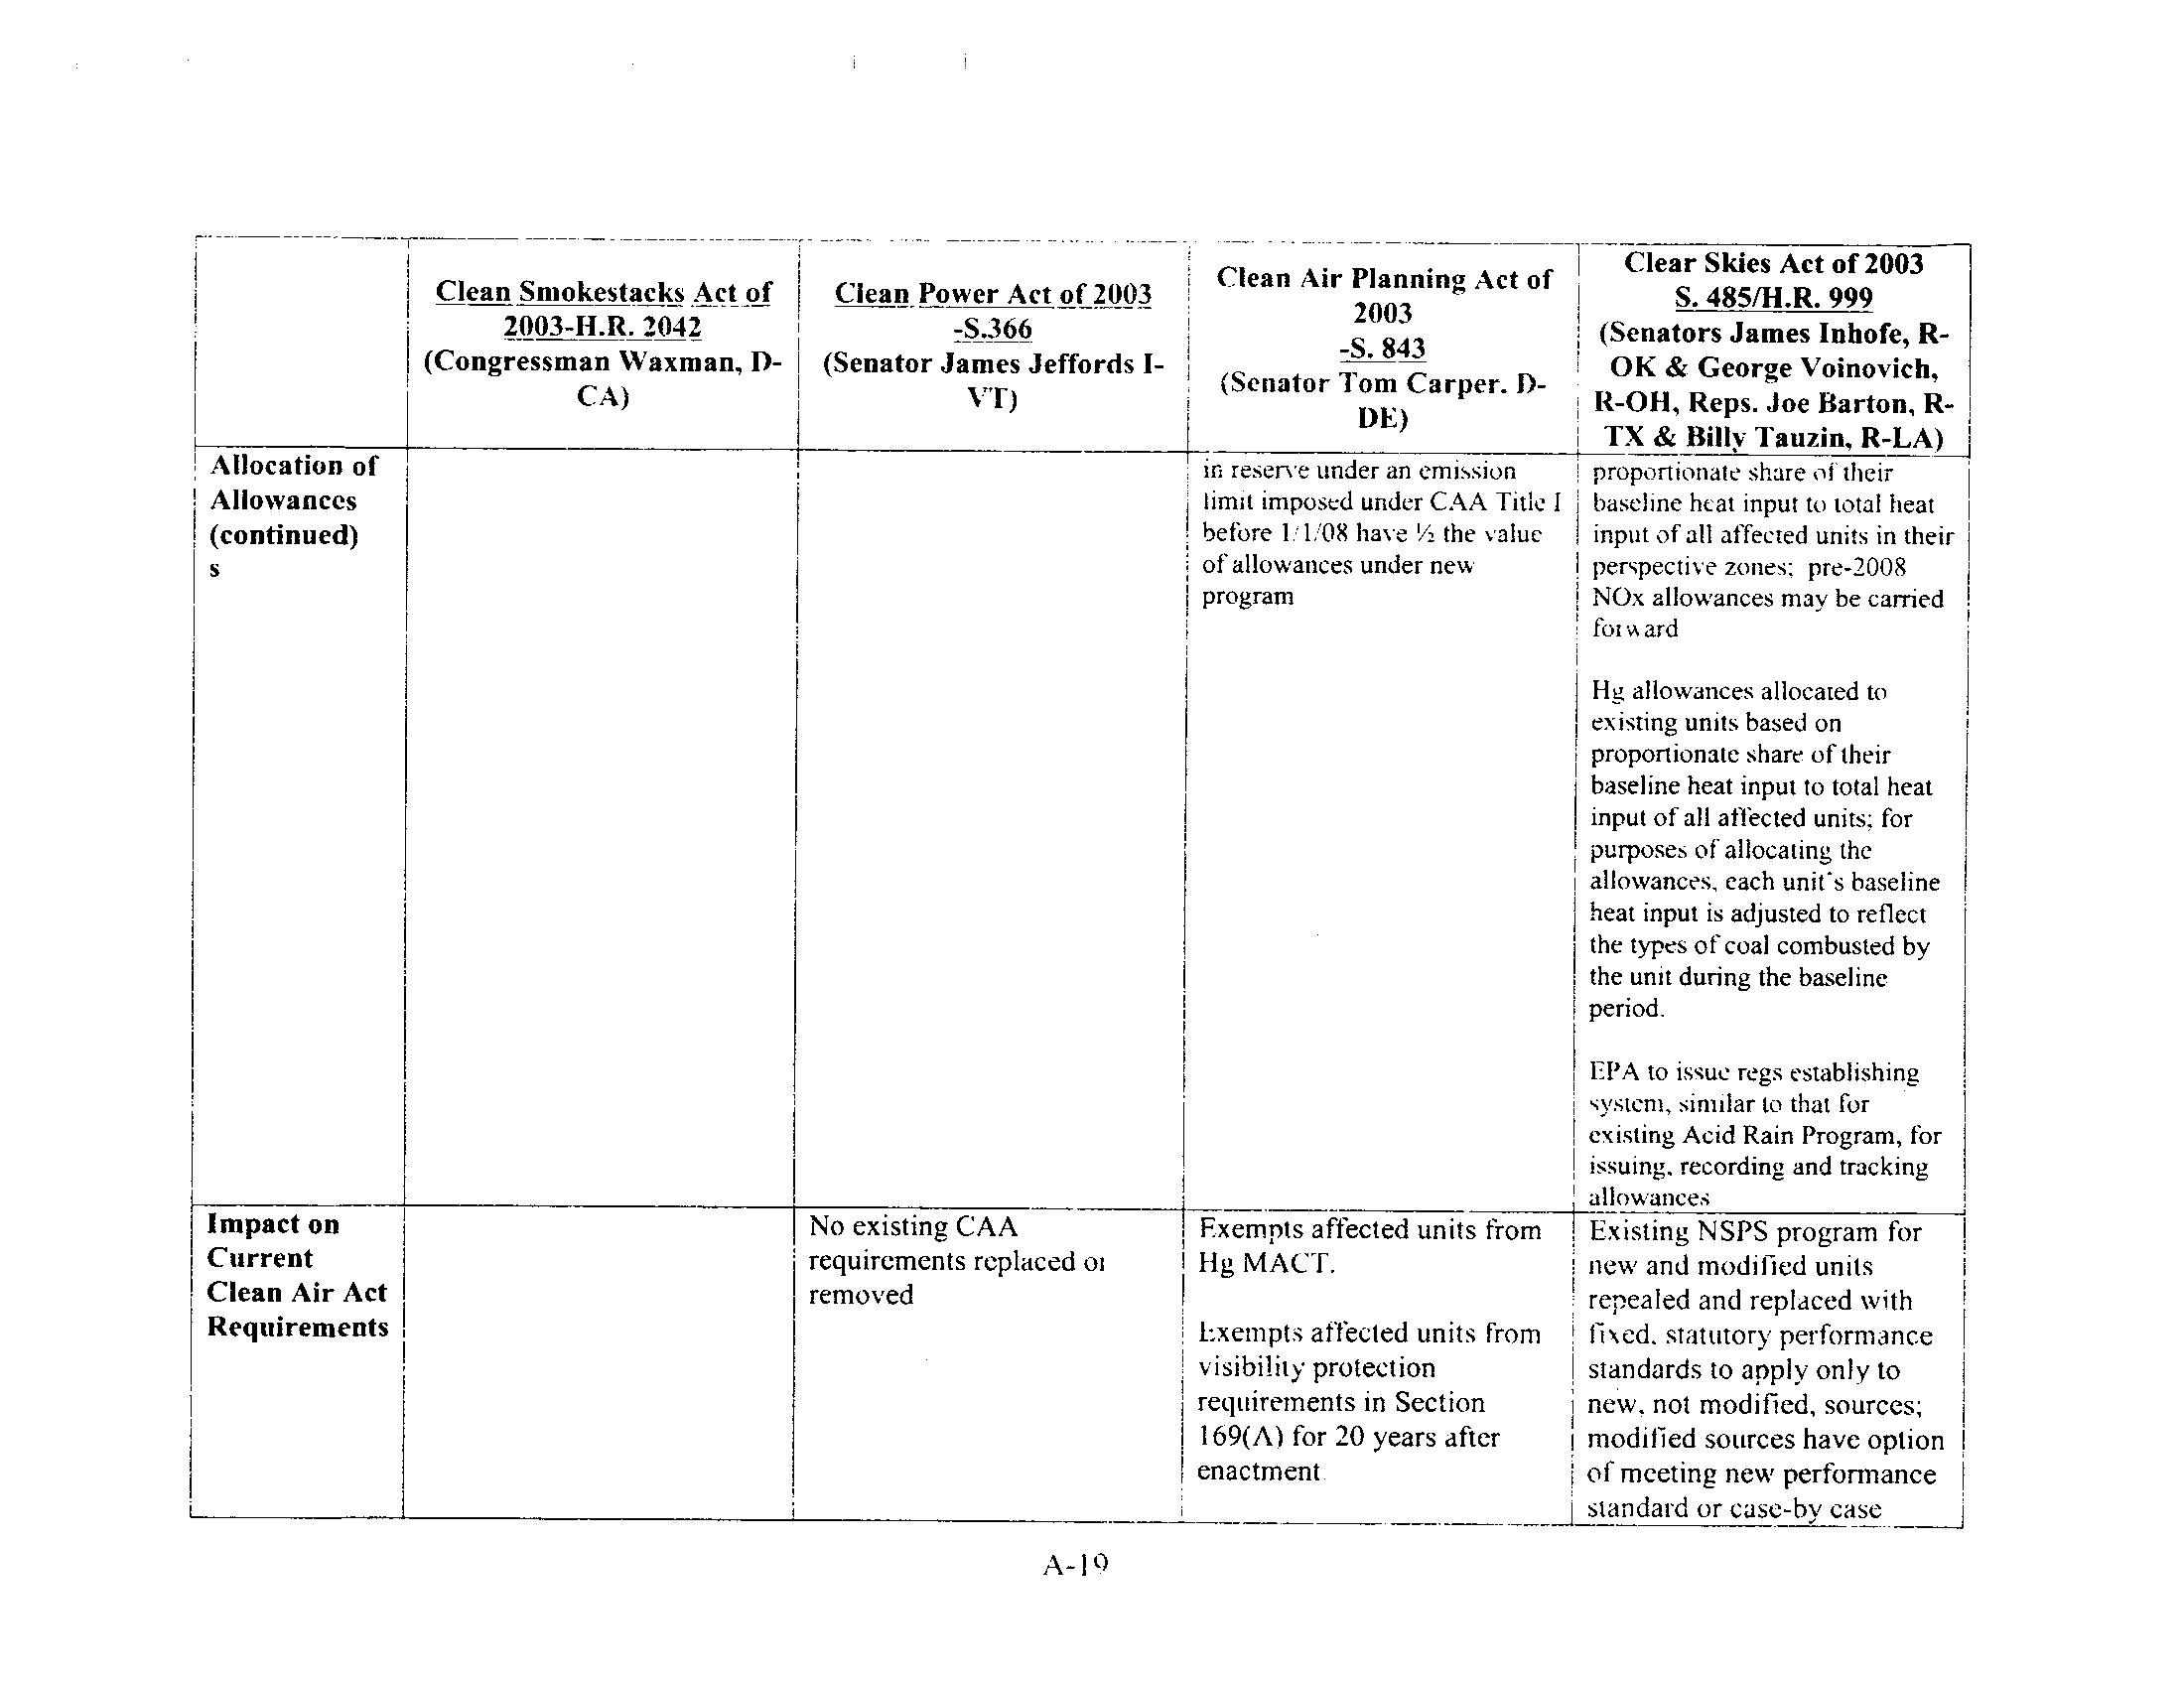
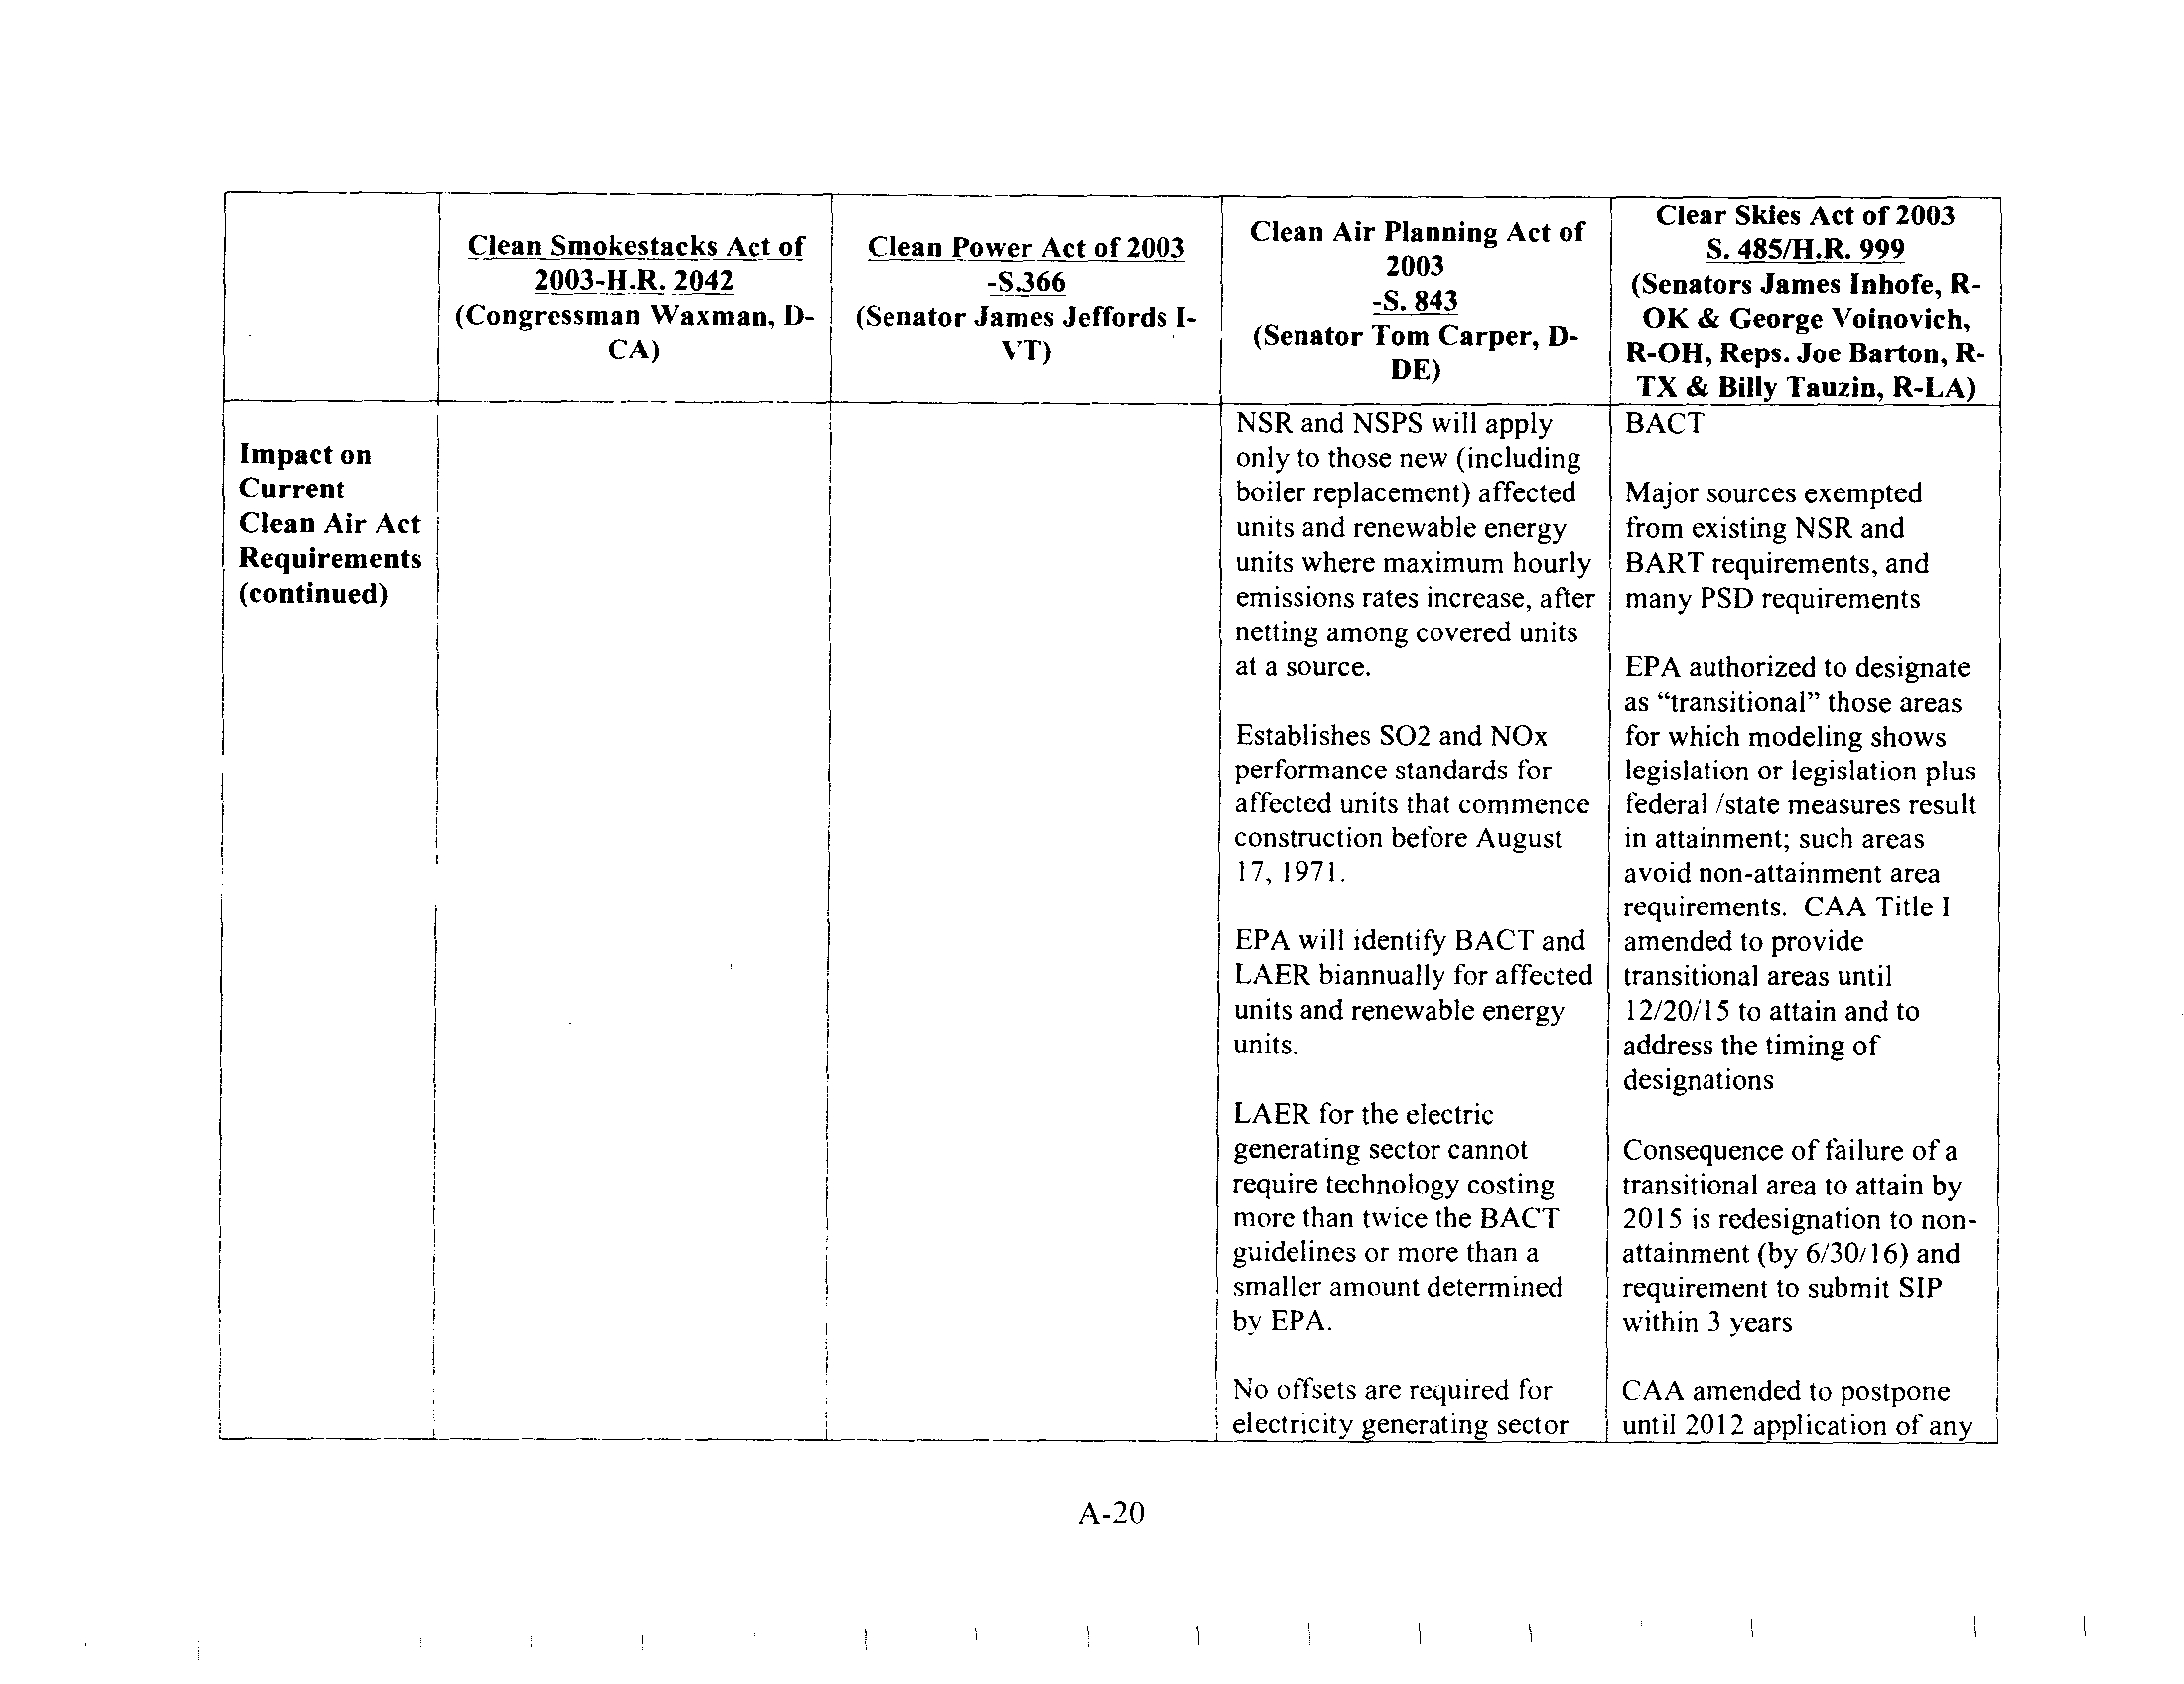
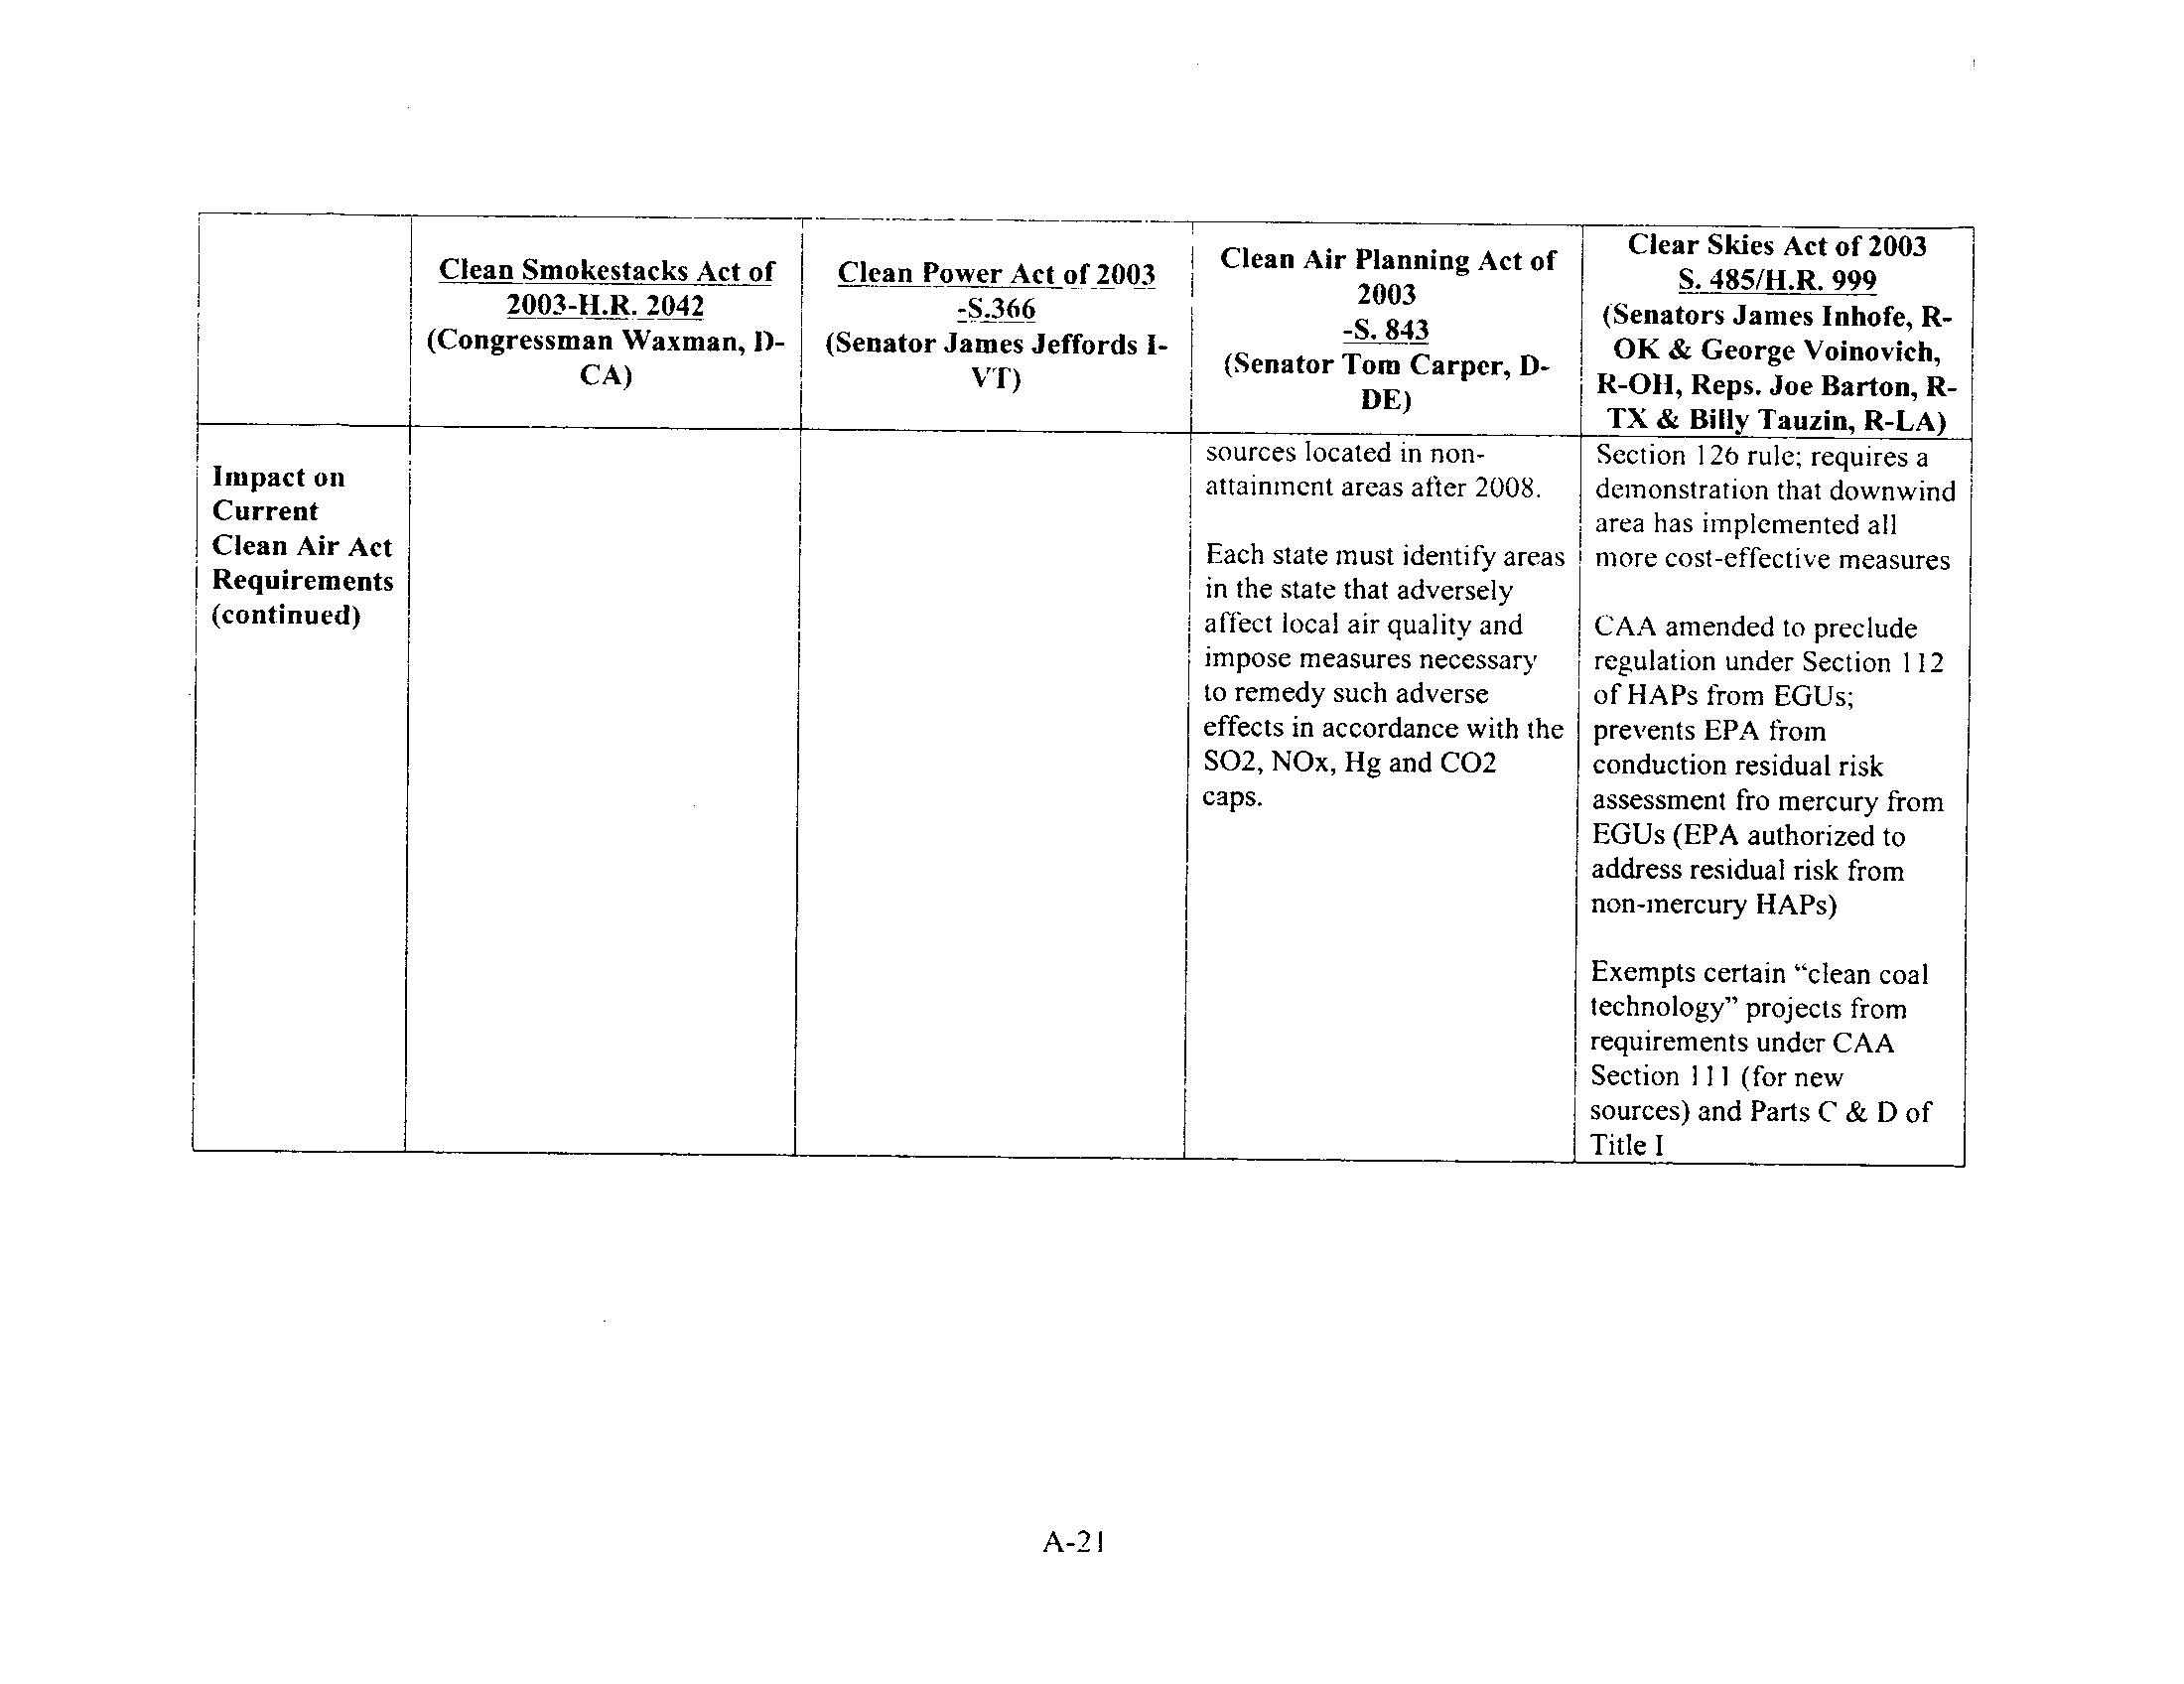
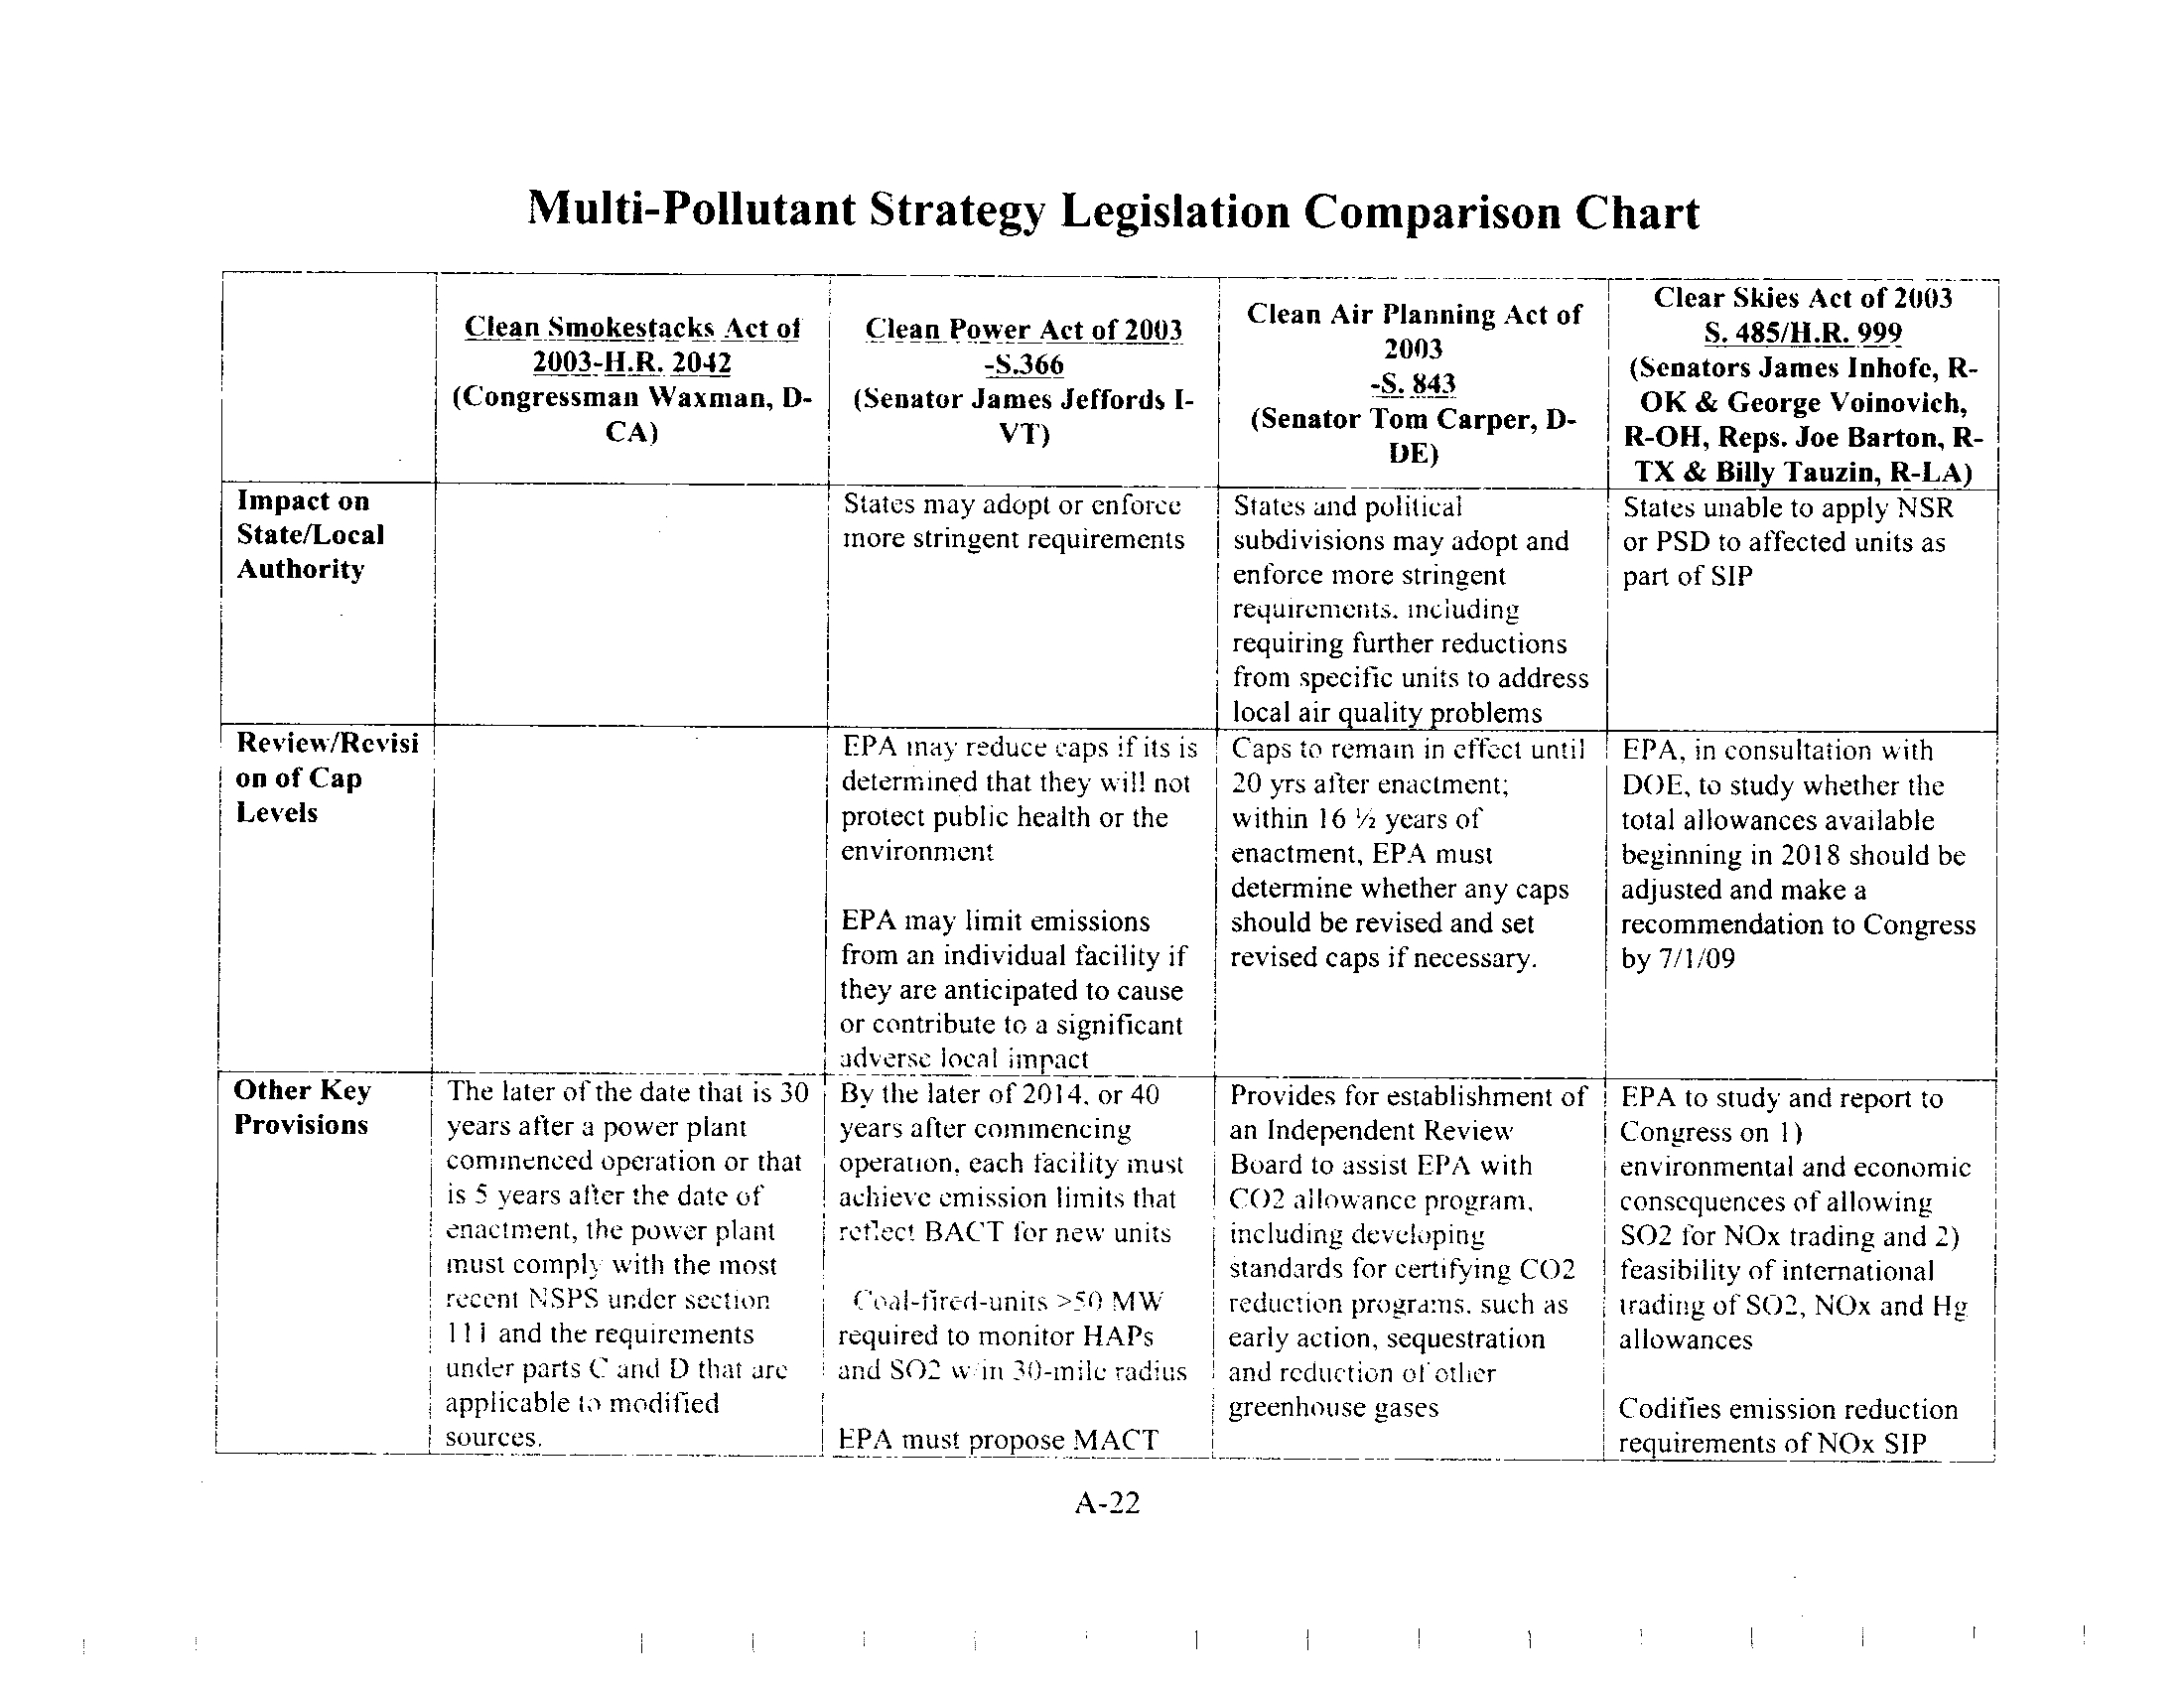
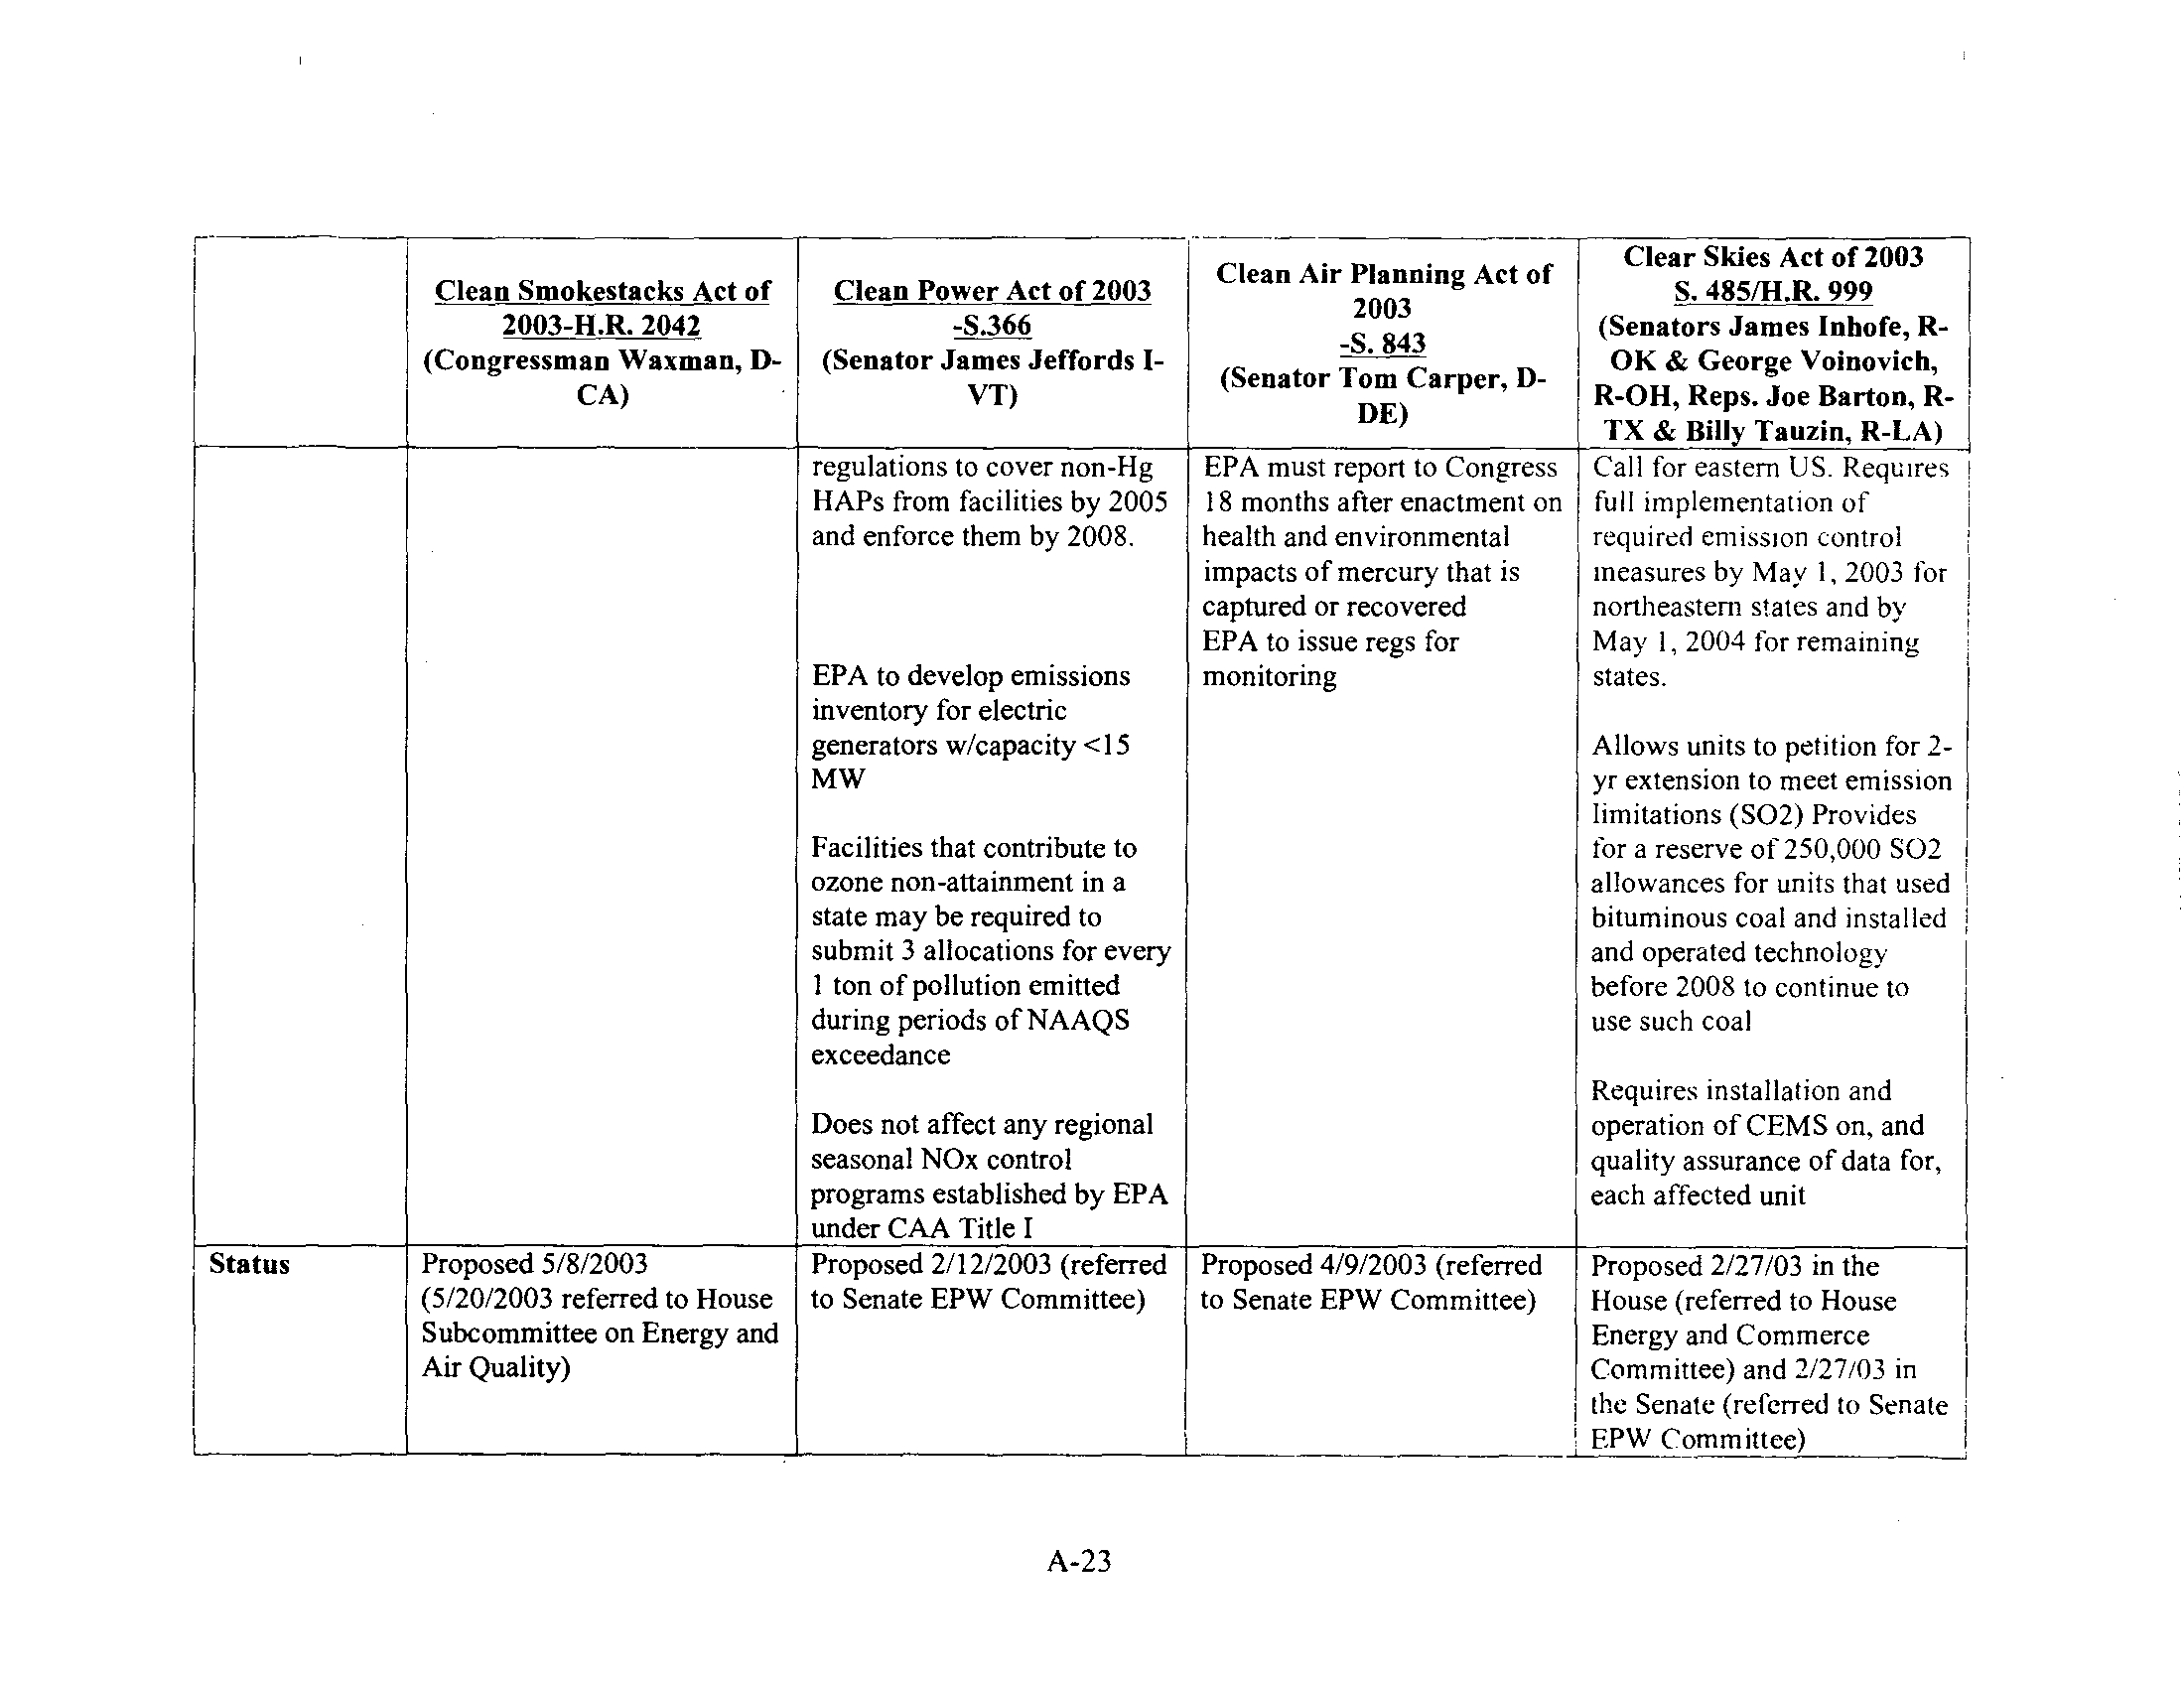
There are three primary legislative proposals in addition to the Clear Skies Act of 2003
for multi-pollutant legislation to regulate emissions from the electric power plants . The
three bills, introduced in the 108`h Congress, are The Clean Air Planning Act of 2003
(CAPA or the Carper Bill)," The Clean Power Act of 2003 (CPA or the Jeffords Bill), 1 s
and the Clean Smokestacks Act of 2003 (Waxman bill)
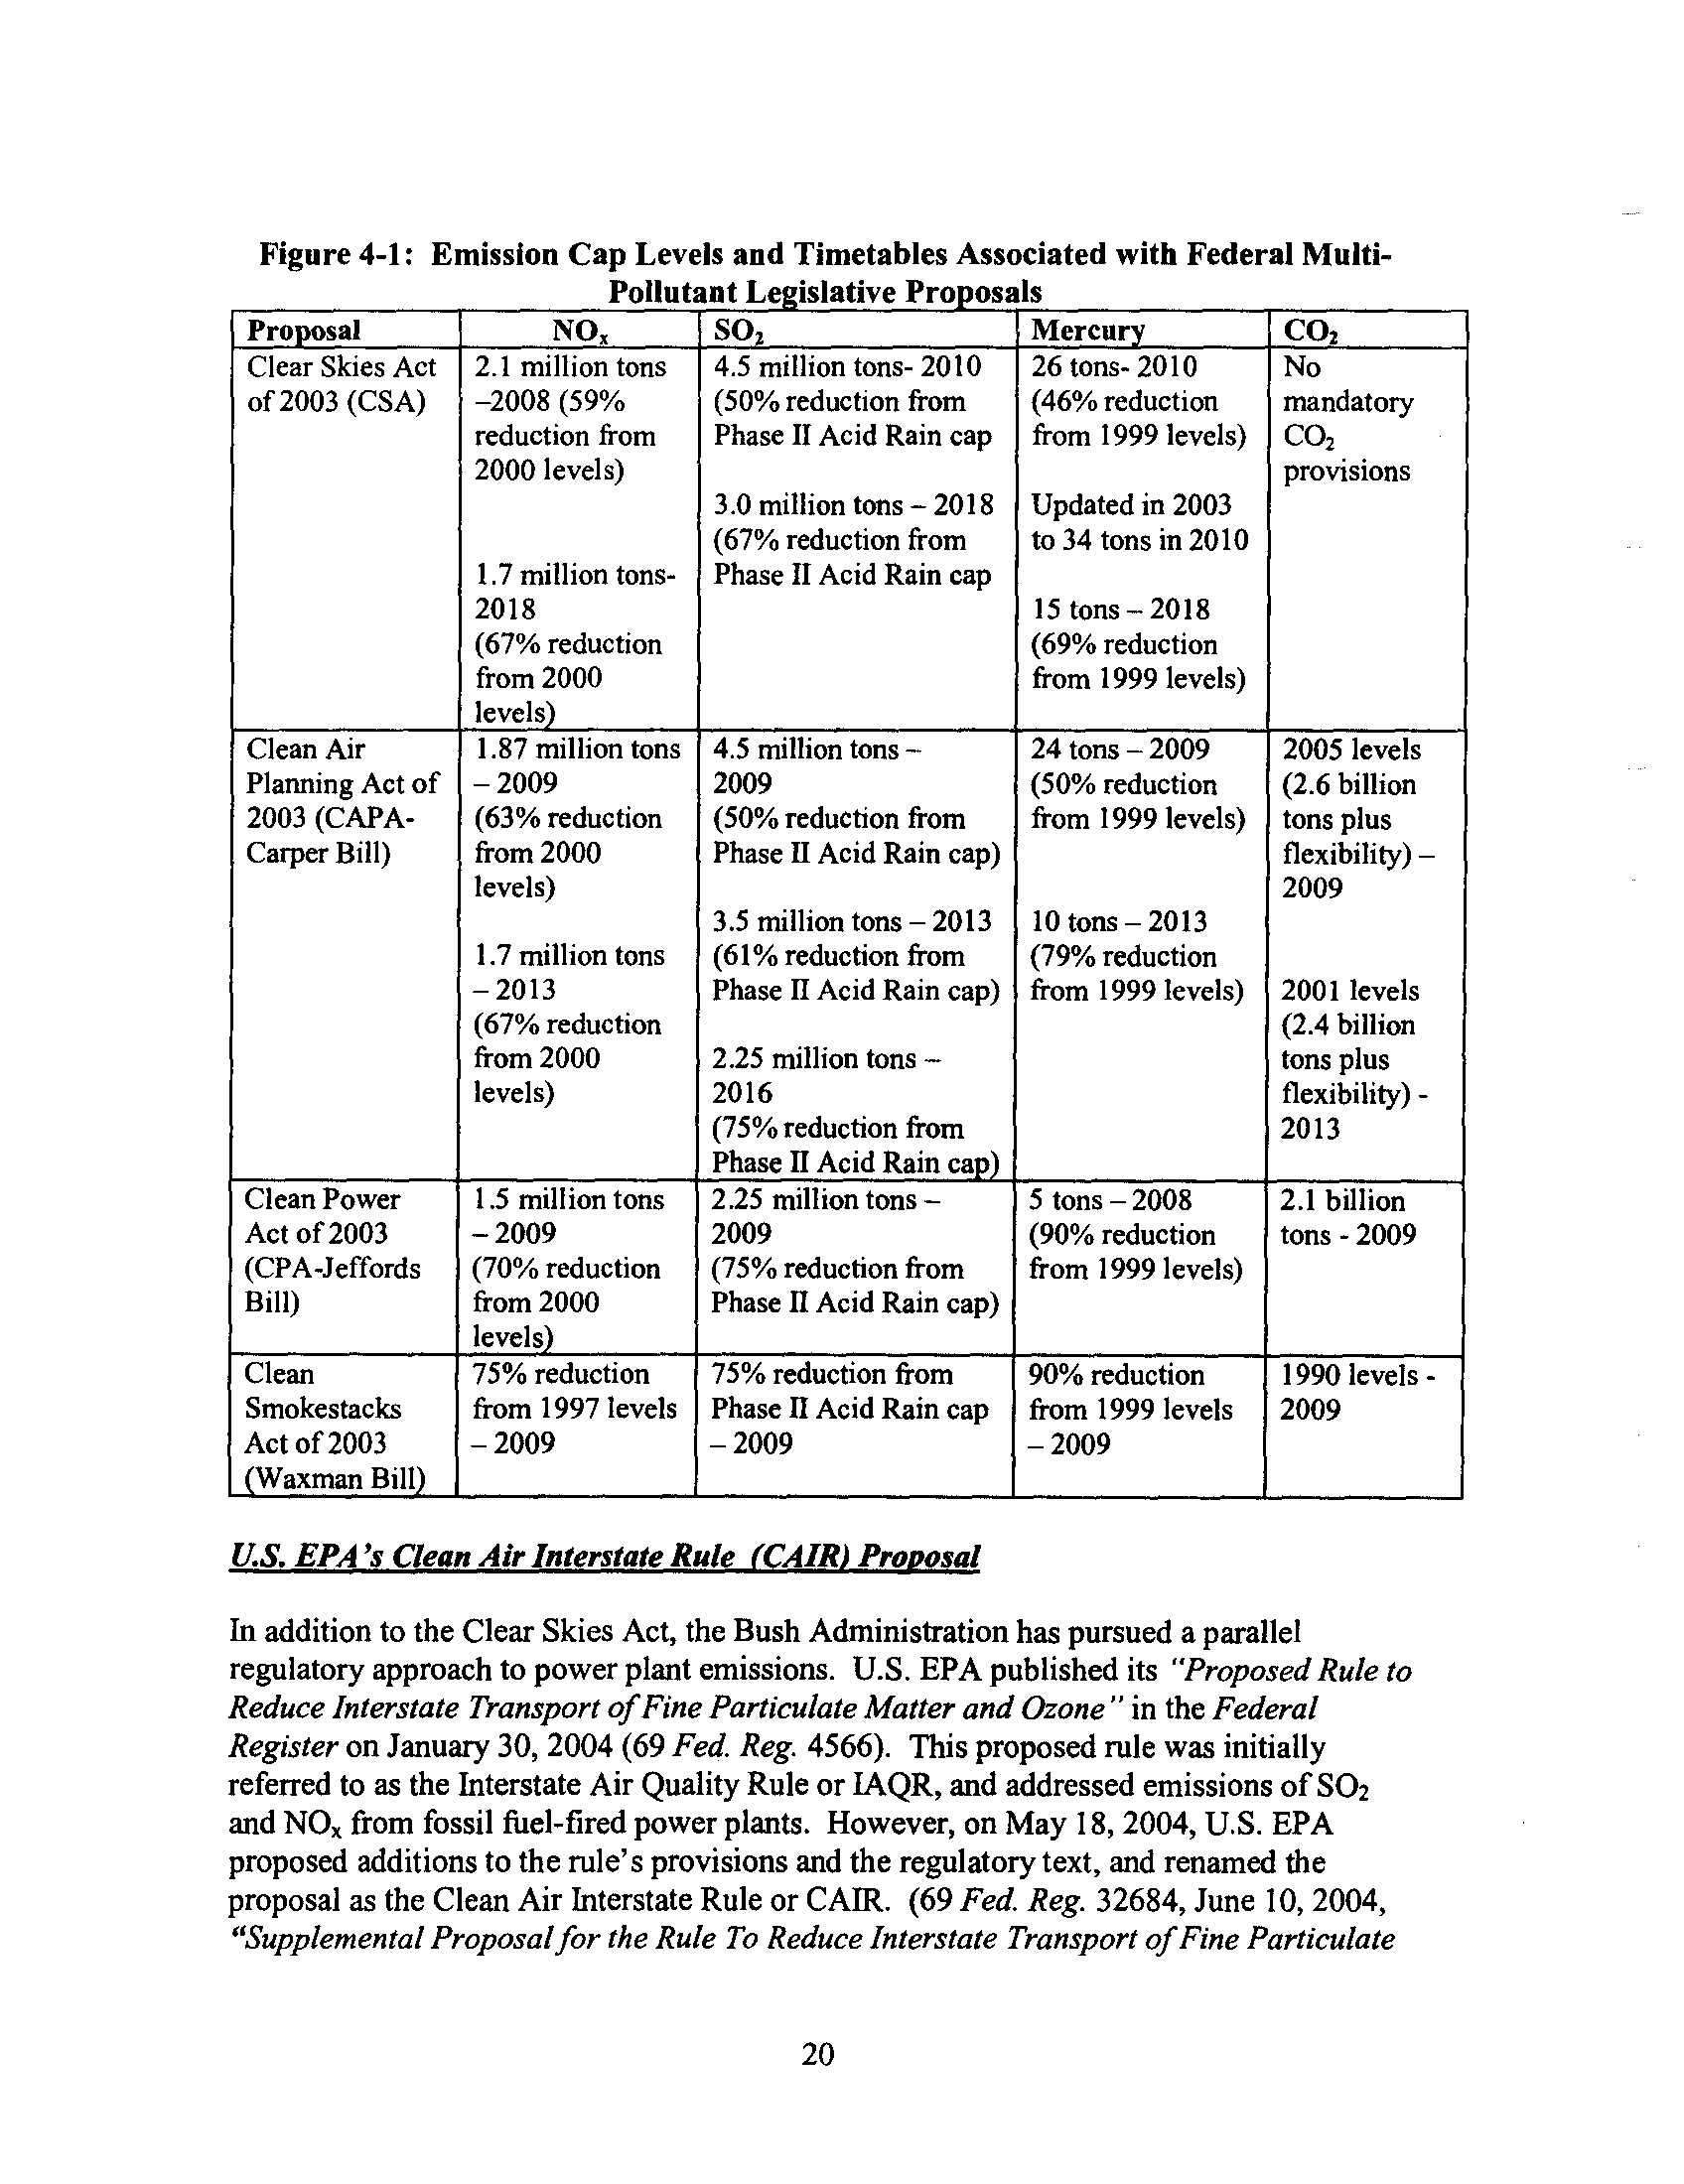
. 19 Figure 4-1 provides a brief
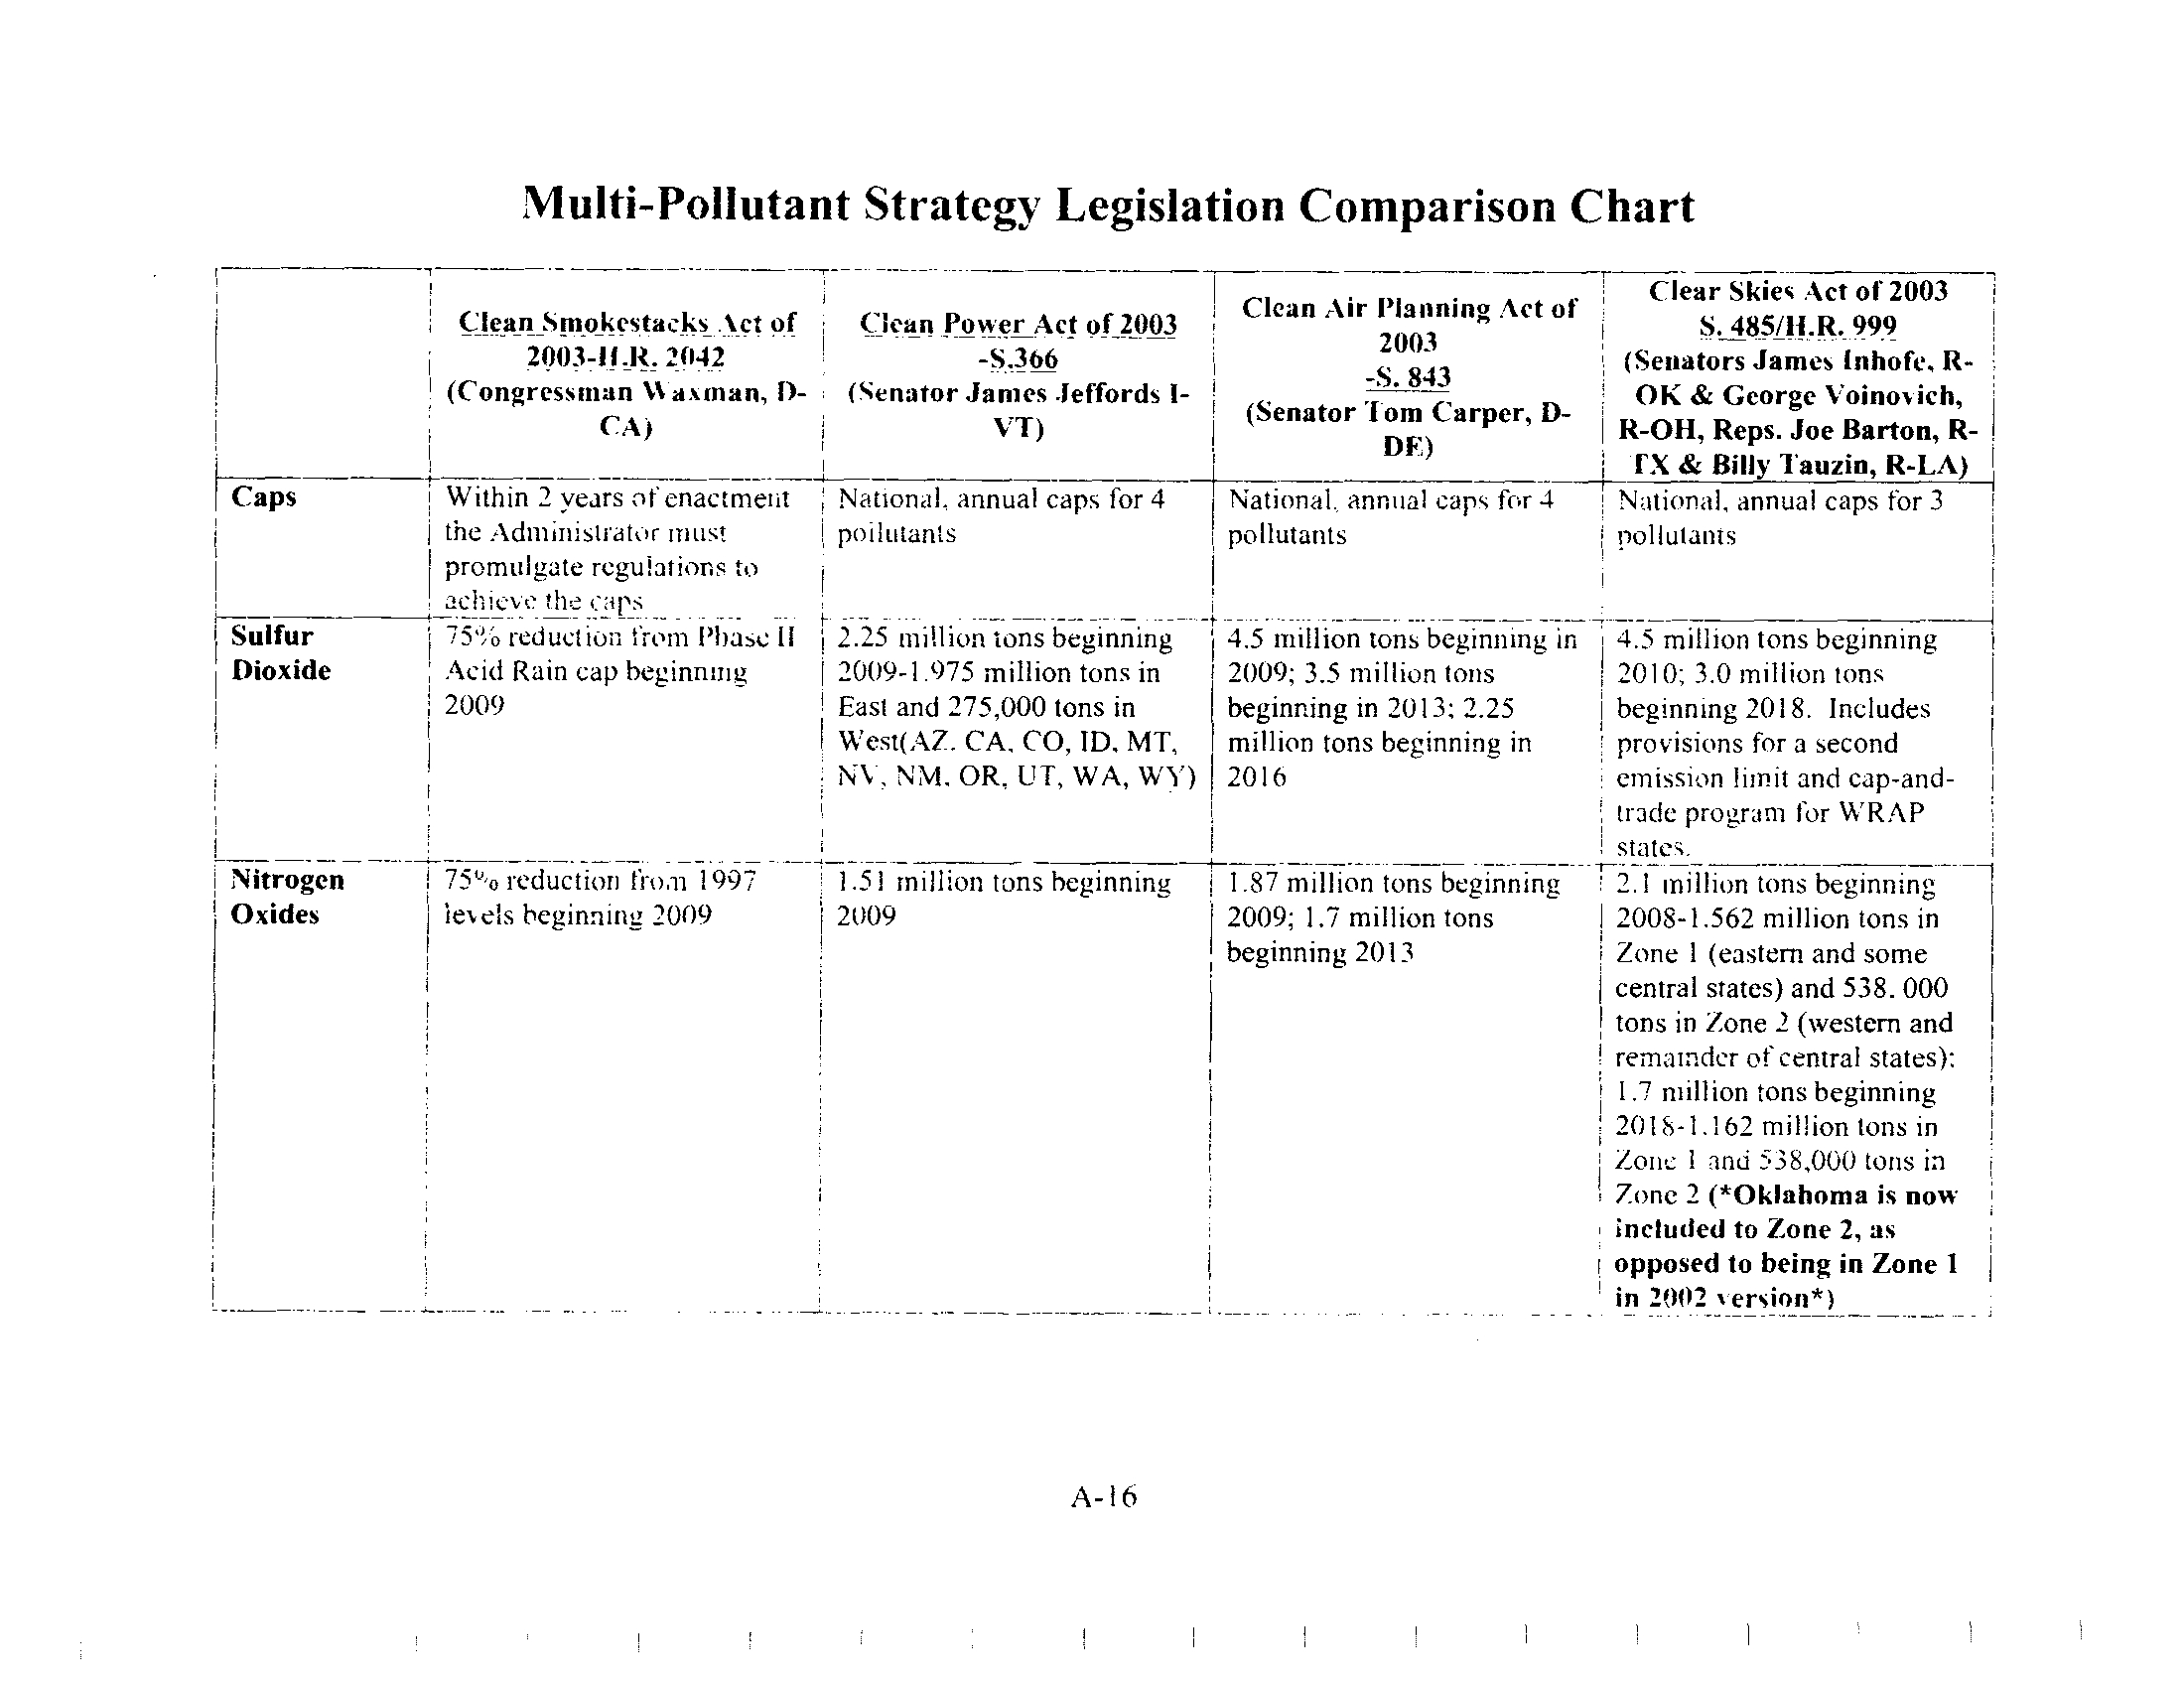
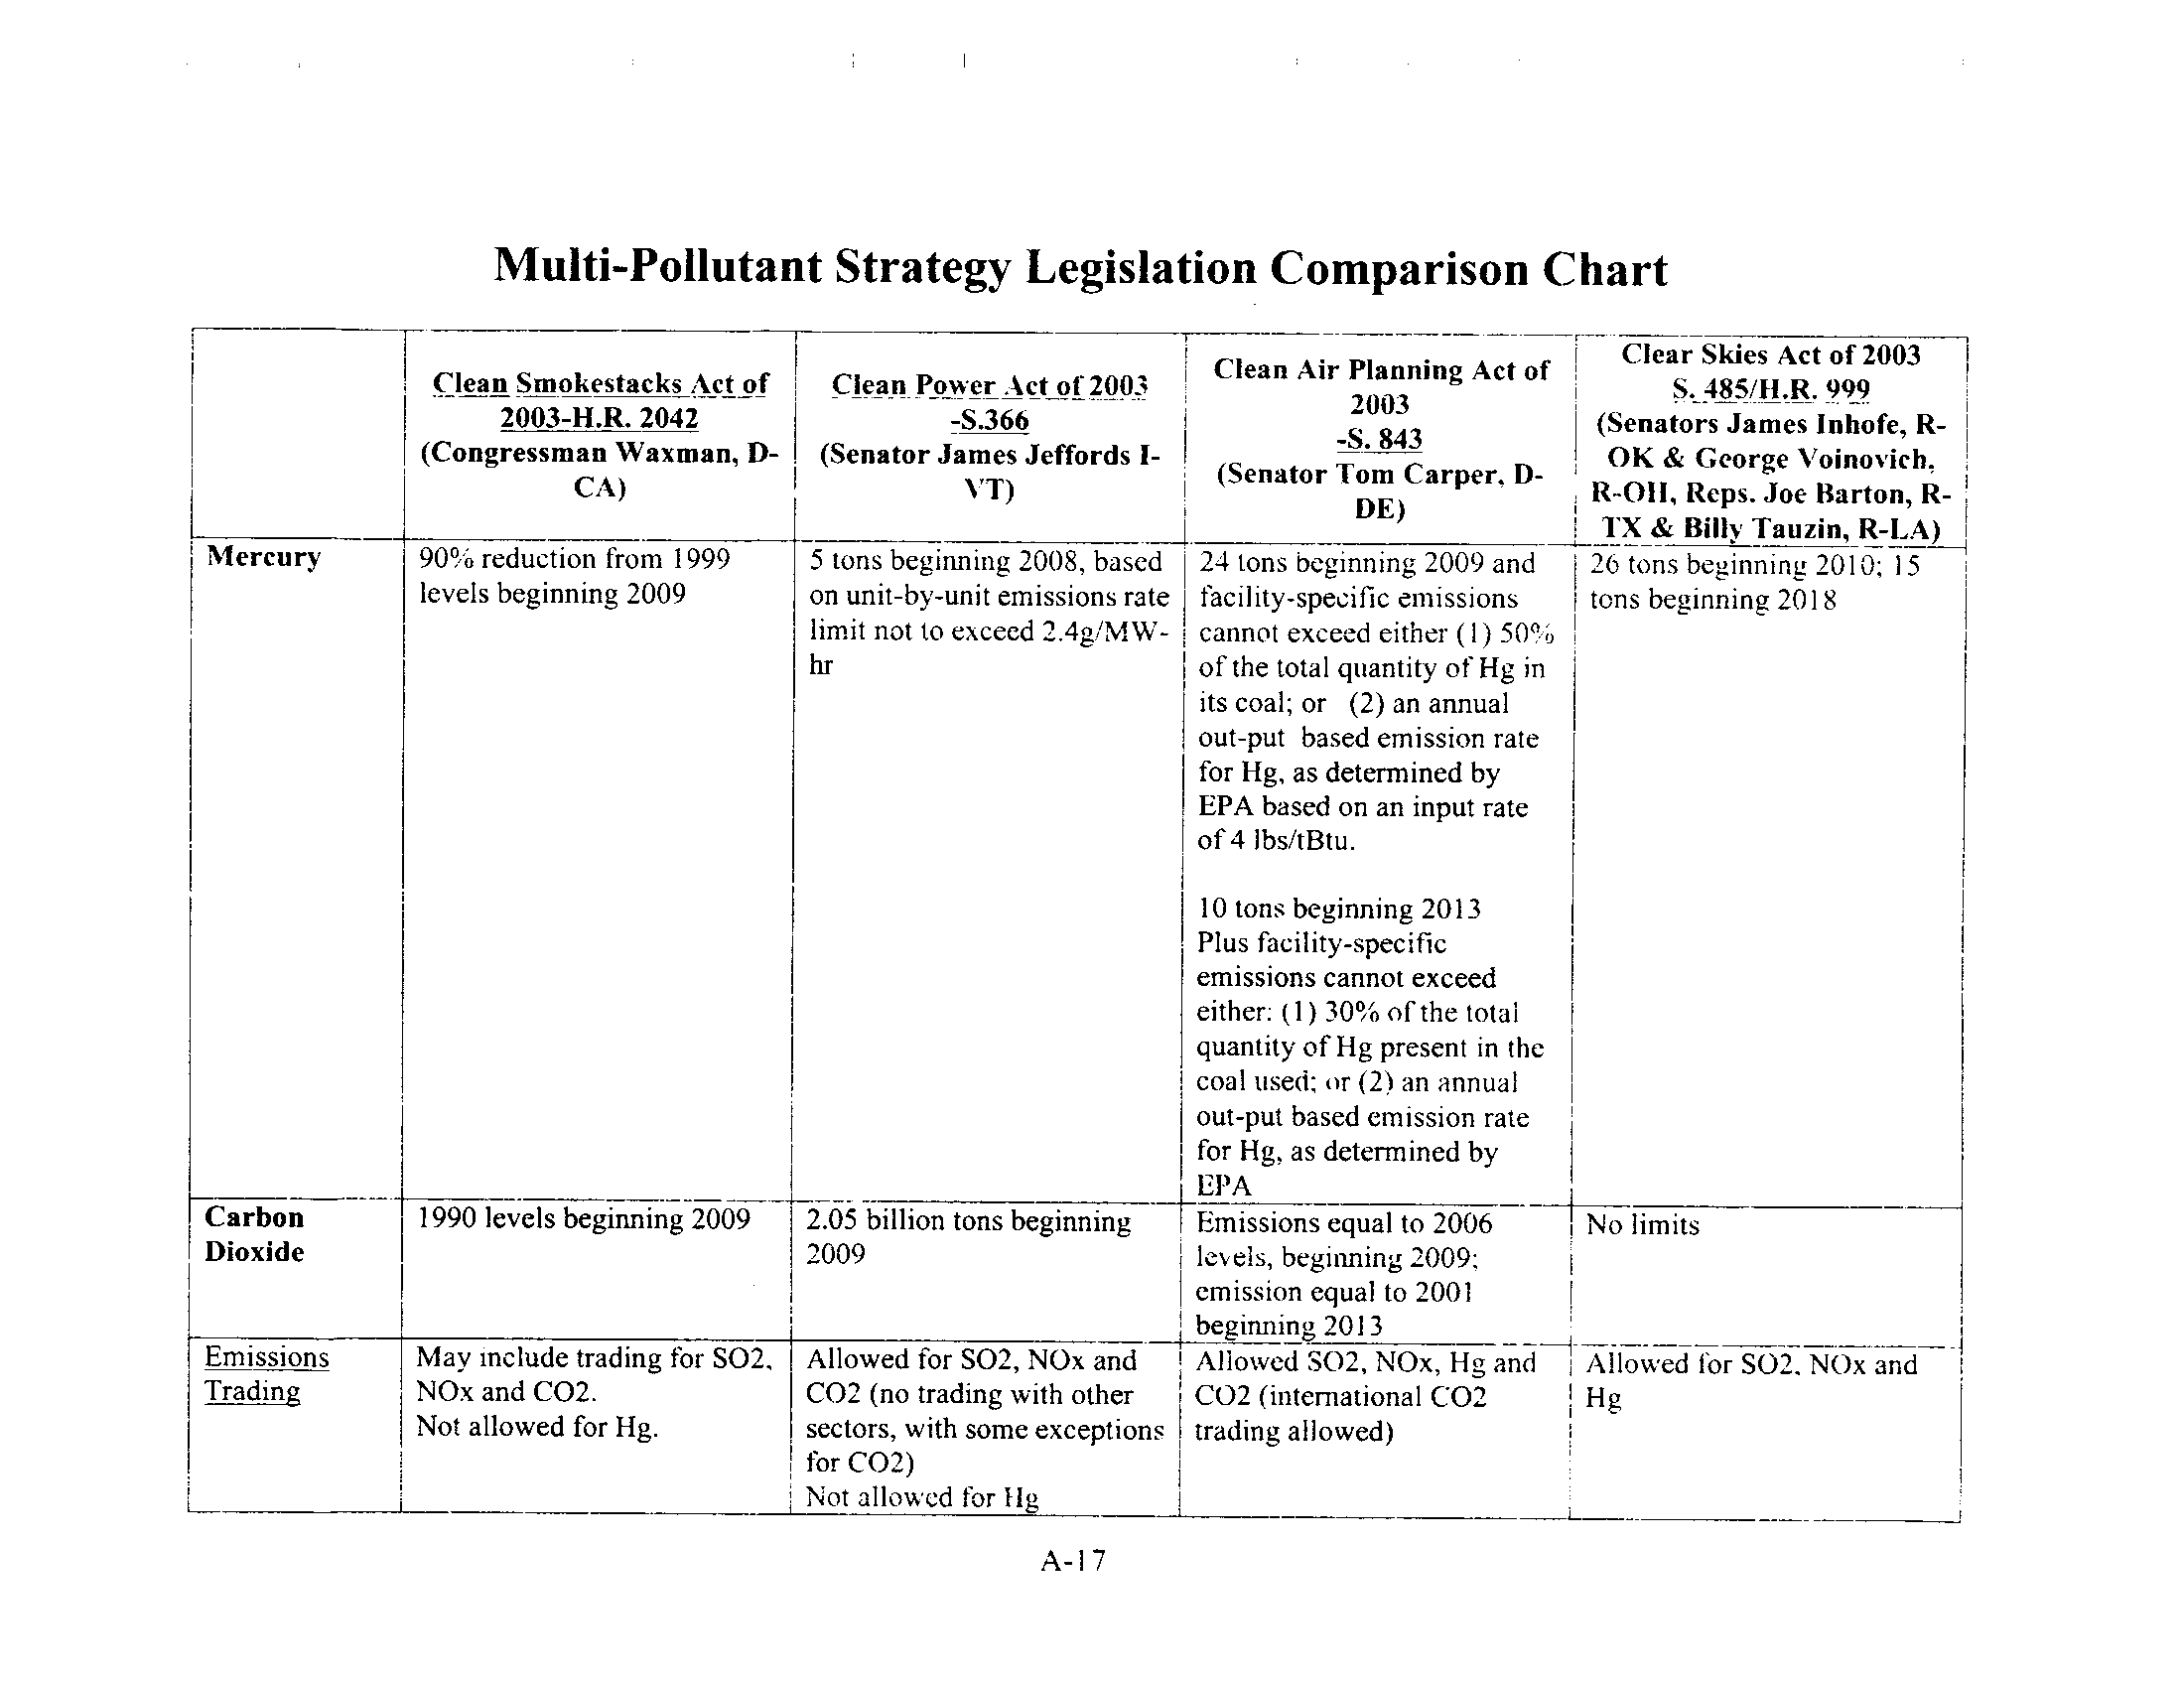
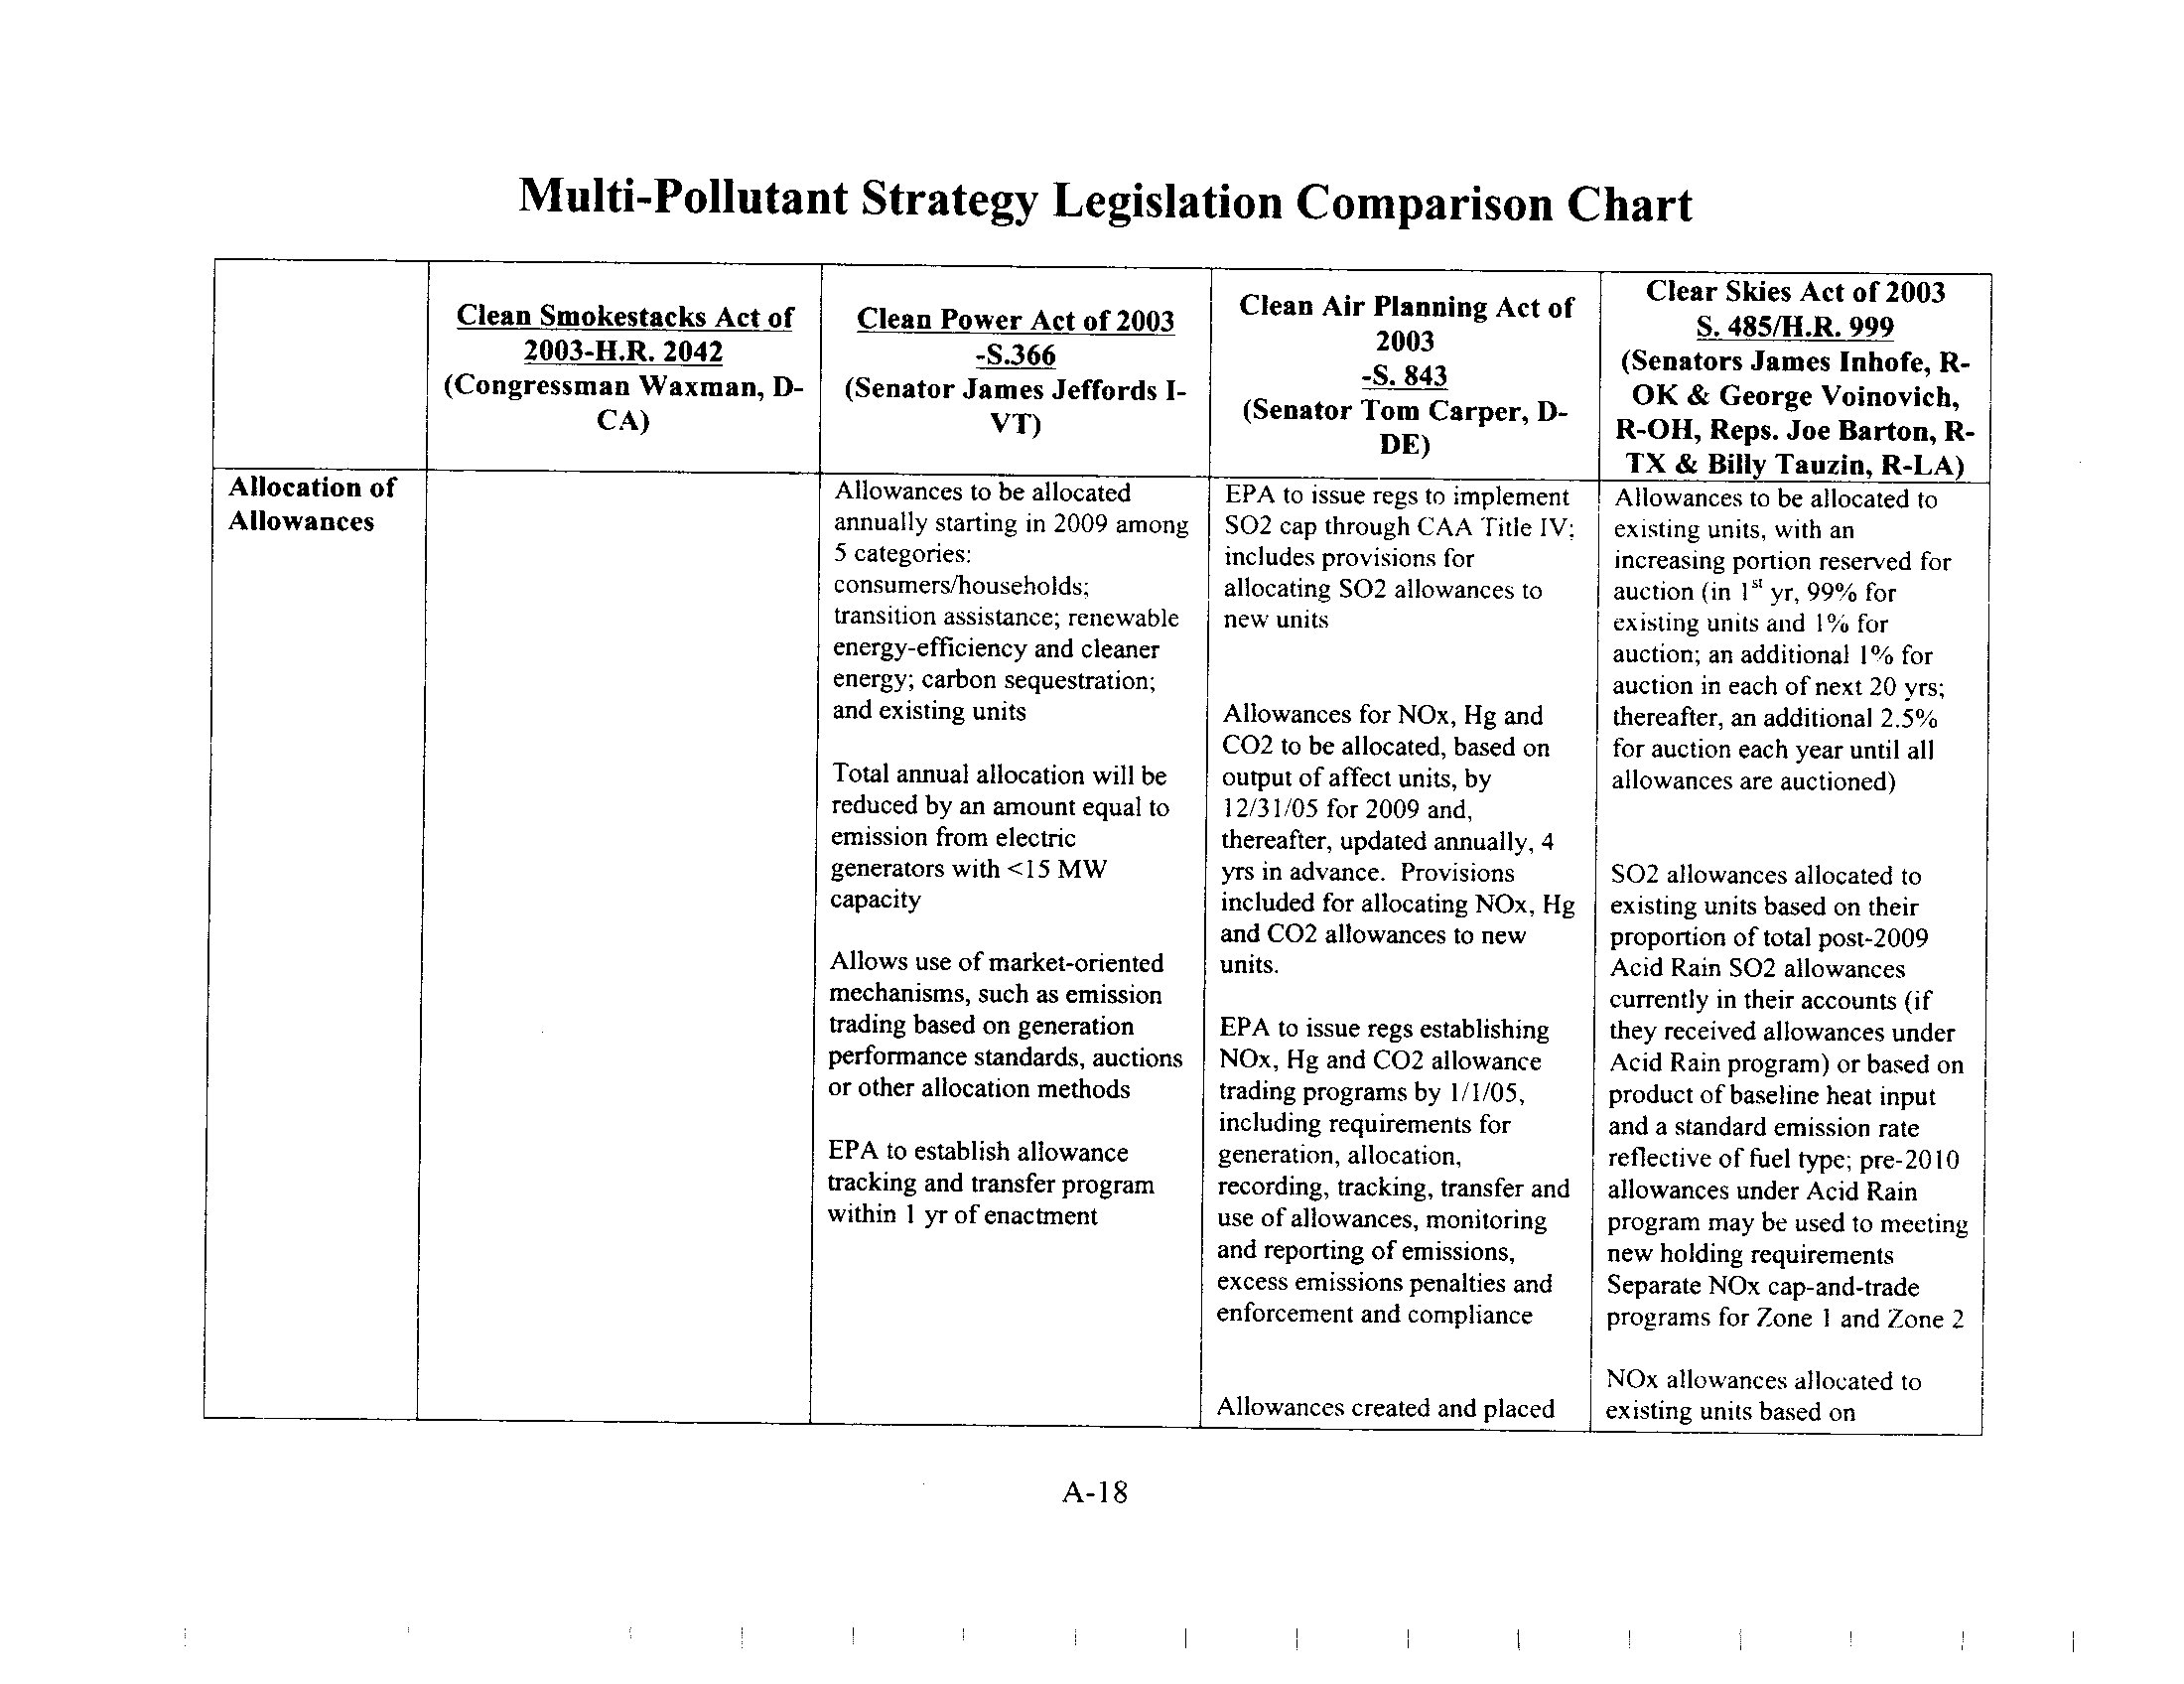
summary comparing the provisions of the various bills. A summary table comparing the
proposals' regulatory requirements is provided in Appendix C
.
While the bills have many elements in common, they also differ substantially . The
degrees to which reductions are needed in order to comply with the allowable levels vary
among these three bills. The bills would require reduction of NO, emissions to 1.5 or 1 .7
million tons per year (i.e., a 67 to 75 percent reduction from 2000 levels) and reduction of
SO2 emissions to 2.25 million tons per year (i.e., a 75 percent reduction from the Phase II
Acid Rain cap). The bills would require mercury reductions of 79 to 90 percent from
1999 levels of emissions (from 48 tons to 10 tons or 5 tons annually, depending on the
bill). Under both the Jeffords and the Waxman bills, these reductions would take place
by 2008 or 2009. When comparing the three bills with the Clear Skies Act, one striking
difference is that the three Congressional bills would establish caps on carbon dioxide
emissions, while the Clear Skies Act is silent on carbon dioxide . The Jeffords bill would
cap carbon dioxide emissions at 2.1 billion tons beginning in 2009. Senator Carper's bill
would cap carbon dioxide's emissions at the 2005 level by 2009 and then at the 2001
level by 2013. The Waxman bill would cap carbon dioxide at 1990 levels by 2009
.
19
Figure 4-1 : Emission Cap Levels and Timetables Associated with Federal Multi-
Pollutant Le islative Pro osals
U.S. EPA's Clean Air Interstate Rule (CAIR) Proposal
In addition to the Clear Skies Act, the Bush Administration has pursued a parallel
regulatory approach to power plant emissions. U.S. EPA published its
"Proposed Rule to
Reduce Interstate Transport of Fine Particulate Matter and Ozone"
in the
Federal
Register
on January
30, 2004 (69 Fed. Reg. 4566) .
This proposed rule was initially
referred to as the Interstate Air Quality Rule or IAQR, and addressed emissions of SO2
and NO, from fossil fuel-fired power plants. However, on May 18,
2004, U.S .
EPA
proposed additions to the rule's provisions and the regulatory text, and renamed the
proposal as the Clean Air Interstate Rule or CAIR
.
(69 Fed. Reg. 32684,
June
10, 2004,
"Supplemental Proposal for the Rule To Reduce Interstate Transport of Fine Particulate
20
Proposal
NO,
SO2
Mercury
CO2
Clear Skies Act
of 2003 (CSA)
2.1 million tons
-2008(59%
reduction from
2000 levels)
1.7 million tons-
2018
(67% reduction
from 2000
levels)
4.5 million tons- 2010
(50% reduction from
Phase II Acid Rain cap
3.0 million tons - 2018
(67% reduction from
Phase II Acid Rain cap
26 tons- 2010
(46% reduction
from 1999 levels)
Updated in 2003
to 34 tons in 2010
15 tons - 2018
(69% reduction
from 1999 levels)
No
mandatory
CO2
provisions
Clean Air
Planning Act of
2003 (CAPA-
Carper Bill)
1.87 million tons
-2009
(63% reduction
from 2000
levels)
1.7 million tons
-2013
(67% reduction
from 2000
levels)
4.5 million tons -
2009
(50% reduction from
Phase II Acid Rain cap)
3.5 million tons - 2013
(61% reduction from
Phase H Acid Rain cap)
2.25 million tons -
2016
(75% reduction from
Phase II Acid Rain cap)
24 tons -2009
(50% reduction
from 1999 levels)
10 tons- 2013
(79% reduction
from 1999 levels)
2005 levels
(2.6 billion
tons plus
flexibility) -
2009
2001 levels
(2.4 billion
tons plus
flexibility) -
2013
Clean Power
Act of 2003
(CPA-Jeffords
Bill)
1.5 million tons
-2009
(70% reduction
from 2000
levels)
2.25 million tons -
2009
(75% reduction from
Phase II Acid Rain cap)
5 tons-2008
(90% reduction
from 1999 levels)
2.1 billion
tons
- 2009
Clean
Smokestacks
Act of 2003
(Waxman Bill)
75% reduction
from 1997 levels
-2009
75% reduction from
Phase 11 Acid Rain cap
-2009
90% reduction
from 1999 levels
-2009
1990 levels -
2009
Matter and Ozone (Clean Air Interstate Rule) ")
.
One of the findings of this proposal is
that emissions of SO2 and NO, from power plants from the affected states significantly
contribute to a downwind state's inability to meet national air quality standards for fine
particle pollution (PM2
.5) and/or 8-hour ozone
.
As noted by U.S. EPA, as many as 175 metropolitan areas currently do not meet the 8-
hour ozone and/or PM2.5 standards, exposing almost 160 million people to unhealthful
levels of air pollution. U.S. EPA stated that
:
What has become increasingly clear is that it will take a significant regional effort
to ameliorate the health and environmental impacts from sources of pollution
contributing to these problems. A multi-state and multi-pollutant approach also
comports with the recommendations in a recent study by the National Academy of
Science, which notes that ozone, PM 2.5 and regional haze `share common
precursor emissions and common pathways for the generation of these pollutants
and are all to greater or lesser extents affected by long-range transport
.'
(U.S
. EPA
Fact Sheet on the Interstate Air Quality Rule,
January 30, 2004) .
The Clean Air Interstate Rule would require 29 eastern states and the District of
Columbia to significantly reduce and permanently cap emissions of
SO2
and/or NON,
depending on whether the power plant emissions from the state impact the ability of a
downwind state to attain the 8-hour ozone or PM 2 .5 standard .
Under the emission
reduction cap, in 2015, NO. emissions from the power sector would be 65 percent below
the base year levels. SO2 emissions from that sector would be 50 percent below base
year levels by 2010 and approximately 65 percent below base year levels when fully
implemented in 2015
.
U.S. EPA notes the following in support of its proposal
:
[SO2 and NO.] contribute to the formation of fine particles and ground-level
ozone, pollutants that, together, are associated with thousands of premature deaths
and illnesses each year. Reducing emissions of these pollutants will significantly
address these health issues, in addition to improving visibility and protecting
sensitive ecosystems . [U.S.) EPA's modeling predicts that when combined with
existing emissions reduction requirements, this rule would [enable] approximately
90 [percent] of "nonattainment areas" meet national air quality standards for
ozone and particle pollution . By addressing air pollutants from electric utilities in
a cost-effective fashion, EPA's Clean Air Interstate Rule proposal would protect
public health and the environment without interfering with the steady flow of
affordable energy for American consumers and businesses .
(See
U.S. EPA web site, http://www.epa.Qov/ interstateairquality/basic)
.
CAIR provides that the 30 affected states or jurisdictions (Alabama, Arkansas,
Connecticut (ozone only), Delaware, Florida (particle pollution only), Georgia, Illinois,
21
Indiana, Iowa, Kansas (particle pollution only), Kentucky, Louisiana, Maryland,
Massachusetts, Michigan, Minnesota (particle pollution only), Mississippi, Missouri,
New Jersey, New York, North Carolina, Ohio, Pennsylvania, South Carolina, Tennessee,
Texas (particle pollution only), Virginia, West Virginia, Wisconsin, District of Columbia)
would be required to submit a plan to U.S. EPA that demonstrates it will meet its
emissions budgets for statewide SO2 and NO R, as applicable. States would then be
permitted, but would not be required, to meet the emission caps through U .S. EPA's
federal cap-and-trade programs for power plants, or achieving reductions through other
state-designed emission control measures
.
U.S. EPA also proposed that the emissions reductions under CAIR would satisfy the best
available retrofit technology (BART) requirements of the Clean Air Act's Regional Haze
program for power plants as a "better than BART" alternative. U.S. EPA's justification
is that its SO2 and NOx model cap-and-trade programs are expected to achieve greater
emission reductions from power plants than would otherwise be achieved under BART
.
For Illinois power plants, CAIR would cap S02 emissions at 192,671 tons per year in
2010, and 134,869 tons per year in 2015. CAIR, as amended by U.S. EPA's "Notice of
Data Availability" (August 6, 2001), would cap NO, emissions at 69,623 tons per year in
2010, and 58,018 tons per year in 2015, for Illinois power plants . However, these caps
are not firm caps because U .S. EPA's proposal allows the affected sources to use banked
allowances from other programs, such as allowances from the federal Acid Rain Program
for compliance with the CAIR. Accordingly, because of banking, affected sources may
not have to meet their ultimate compliance deadlines until several years after U .S. EPA's
2015 overall deadline. Illinois EPA has expressed concern that this proposed approach
may be inconsistent with the deadline for attaining the 8-hour ozone standard
.
U.S.EPA's Mercury Reduction Proposals
In addition to U .S. EPA's CAIR proposal, section 112(n) of the Clean Air Act required
U.S. EPA to study the public health effects of air toxic emissions from fossil fuel-fired
power plants (coal, oil and natural gas) to determine whether it was necessary to regulate
those emissions. Air toxics, also known as hazardous air pollutants, are those pollutants
known or suspected to cause cancer or other serious health problems in humans, such as
birth defects or neurological effects. In late 1997 and early 1998, U.S. EPA published
two reports to Congress : "The Mercury Study Report to Congress," (December 1997),
and the "Study of Hazardous Air Pollutant Emissions from Electric Utility Stream
Generating Units-Final Report to Congress" (February 1998) .
Data presented within those reports identify coal-fired power plants are the largest source
of manmade or anthropogenic mercury emissions in the U.S. -- about 48 tons of mercury
each year -- and identify mercury as a toxic pollutant. As a result of these reports, U .S .
EPA also provided funding for the National Academy of Sciences in 1999 to review the
health effects data associated with methyl mercury and the Agency's "reference dose" for
mercury. A "reference dose" is the level at which most people could be exposed to
methyl mercury without the risk of health problems .
22
All of these studies and data gathered led U.S. EPA to develop a rulemaking proposal
that presented three alternatives for controlling emissions of mercury from coal-fired
power plants. The alternatives presented include
:
•
A proposed rule requiring power plants to install controls known as
"maximum achievable control technologies" (MACT) under section 112 of
the Clean Air Act ;
•
A proposed rule establishing "standards of performance" limiting mercury
emissions from new and existing power plants . This proposal, under section
111 of the Clean Air Act, would create a market based "cap-and-trade"
program that, if implemented, would reduce nationwide power plant
emissions of mercury in two distinct phases . In the first phase, due by 2010,
emissions will be reduced by taking advantage of "co-benefit" controls - that
is, mercury reductions achieved by reducing SO 2 and NO, emissions. The
expected mercury level would be 34 tons per year. When fully implemented
in 2018, mercury emissions will be reduced by 33 tons (69 percent), to a cap
of 15 tons per year; and
•
A proposal under section 112(n) of the Clean Air Act, which mimics the
proposal under section 111
.
Although U.S. EPA specifies a 15-ton final cap to be achieved in 2018, under the section
111 or 112(a) approach the agency acknowledges in its proposal that mercury emissions
could reach 22 tons (or only a 54 percent reduction) in 2020, when banking and trading
credits are utilized .
U.S. EPA makes it clear in its proposal that it does not favor the imposition of a MACT
standard. Illinois EPA believes, however, that U .S. EPA incorrectly applied the Clean
Air Act in setting the MACT standard in such a way as to penalize the use of eastern or
bituminous coal and to favor western coal or sub-bituminous coal . Illinois EPA has
challenged U.S. EPA on this approach and believes that U .S. EPA should establish a
MACT standard that reflects
at least
"the average emission limitation achieved by the
best performing 12 percent of the existing sources" or "the emission control that is
achieved in practice by the best controlled similar source ." We have stated that the same
reduction percentages should be applied to all types of coal, so that fuel switching or
blending is not encouraged in lieu of additional controls
.
Illinois EPA also expressed great concern that the deadlines in U .S. EPA's section 111
proposal are too extended. Illinois EPA acknowledges that the adoption of controls
across this source category may require more time than the traditional three-year
compliance time period for MACT sources. However, Illinois EPA believes that, if
needed, U.S. EPA can provide the extensions of time for compliance that are already
provided in section 112 of the Clean Air Act .
23
Illinois EPA strongly supports trading programs, but the Agency has commented that
there are concerns with the trading of mercury. While mercury emissions can travel great
distances, some mercury can also be deposited near its source . In fact, in November
2003, the State of Florida published a study entitled,
"Integrating Atmospheric Mercury
Deposition with Aquatic Cycling in South Florida ."
This study estimated how quickly
fish tissue levels respond to decreased regional mercury emissions
.
Thus, the Agency believes any mercury trading program would need to be carefully
designed to ensure that it does not have the unintended consequence of creating mercury
hot-spots .
Summary
The debate over a multi-pollutant approach to regulating air emissions from electric
power plants continues at both the national and state levels. The main differences in
competing federal proposals are the pollutants to regulate, the level of the proposed "cap"
and the timeframe for implementation . Of the four prominent proposals, the Clear Skies
Act is the only proposal that does not propose to cap carbon dioxide emissions
.
A well-designed national approach would be superior to a series of diverse individual
state rules because there would be more sources in the trading program and it would
provide consistency between the states
.
24
Chapter 5
Energy Issues :
Federal and State Policies and Programs and Energy Market Challenges
Over the past two years, several critical events have served as reminders that the United
States needs to reinforce its efforts to achieve energy independence, develop alternative
fuel sources, reduce emissions from fossil fuels and upgrade its aging electrical
distribution system. In addition to the extensive consequences of the terrorists' attacks of
September 11, we have the current conflict in Iraq, an unusually cold 2002-2003 winter,
the labor strike in Venezuela in December 2002, civil disturbances in Nigeria, and
particularly, the August 2003 blackout in the Northeast part of the United States to reveal
to us the vulnerabilities of the world energy markets to these wide ranging and disparate
pressures .
Illinois citizens are understandably concerned about matters of electric reliability as a
result of events such as the California energy crisis, and the dramatic collapse of Enron
.
The August 2003 electrical blackout that affected over 50 million people in the Northeast
was a wake-up call regarding the reliability of our power grid, and it clearly sounded the
alarm for change and renovation in our energy policies . In light of these events, policy
developments have occurred at both the state and national level, and Illinois has shown
its leadership by being proactive in policy-making to address the State's energy issues
.
At the national and state level, energy policies have been developed to guide efforts to
manage our energy resources and programs.
In this section, current government energy policies are briefly described .
The National Energy Policy
In his second week in office, President Bush established the National Energy Policy
Development (NEPD) Group, directing it to "develop a national energy policy designed
to help the private sector, and, as necessary and appropriate, to help State and local
governments to promote dependable, affordable and environmentally sound production
and distribution of energy for the future." This overview sets forth the NEPD Group's
findings and key recommendations for the National Energy Policy
.20
The NEPD Group identified the principal energy challenges facing America to be the
following: (1) promoting energy conservation ; (2) repairing and modernizing our energy
infrastructure; and (3) increasing our energy supplies in ways that protect and improve
the environment .
25
The NEPD Group developed several recommendations which included the following
:
•
Direct federal agencies to take appropriate actions to responsibly conserve energy
use at their facilities, especially during periods of peak demand in regions where
electricity shortages are possible, and to report to the President on actions taken
;
•
Provide a tax incentive and streamline permitting to accelerate the development of
clean combined heat and power technology
;
•
Create an income tax credit for the purchase of hybrid and fuel cell vehicles to
promote fuel-efficient vehicles ;
•
Extend the Department of Energy's ENERGY STAR® efficiency program to
include schools, retail buildings, health care facilities and homes, and extend the
ENERGY STAR® labeling program to additional products and appliances
;
•
Issue an Executive Order directing federal agencies to expedite permits and
coordinate federal, state, and local actions necessary for energy-related project
approvals on a national basis in an environmentally sound manner
;
•
Establish an interagency task force chaired by the Council on Environmental
Quality. The task force will ensure that federal agencies set up appropriate
mechanisms to coordinate federal, state and local permitting activity in particular
regions where increased activity is expected
;
•
Grant authority to obtain rights-of-way for electricity transmission lines with the
goal of creating a reliable national transmission grid ;
•
Enact comprehensive electricity legislation that promotes competition, encourages
new generation, protects consumers, enhances reliability and promotes renewable
energy ;
•
Implement administrative and regulatory changes to improve the reliability of the
interstate transmission system and enact legislation to provide for enforcement of
electricity reliability standards ; and
•
Expand the Energy Department's research and development on transmission
reliability and superconductivity
.
A stated goal of the Bush Administration's National Energy Policy is to add to the energy
supply from diverse sources, including domestic oil, gas and coal . It also included
evaluating hydropower and nuclear power, and making greater use of non-hydro
renewable sources that are now available . President Bush has directed all federal
agencies to include a detailed statement on the energy impact of any regulatory action
that could significantly and adversely affect energy supplies .
The Bush Administration's National Energy Policy has several elements, which they
believe could substantially impact the mix of electric energy sources in Illinois,
especially coal. We believe that the federal government must focus attention on efforts to
further promote clean coal technology to better use our valuable coal resources, to greatly
26
expand the use of renewable energy, and to make much needed improvements to the
vulnerable power grid
.
Illinois Energy Policy
The Illinois Energy Cabinet was created in January 2001 to review and coordinate energy
issues facing the State of Illinois and to develop a State energy policy . In March 2001,
the Energy Cabinet issued a white paper, "Preparing an Energy Policy for the State of
Illinois." In February 2002, the Energy Cabinet officially released the
"Illinois Energy
Policy"
that included 56 recommendations for energy policy improvements in the State of
Illinois
. 2 '
The recommendations addressed five major topics : (1) capitalizing on the rich natural
and human resources of Illinois and ensuring that they are used to benefit the State and its
citizens ; (2) ensuring adequate access to traditional sources of power and heat at a fair
price; (3) taking steps toward energy independence by moderating demand and increasing
the use of Illinois-based renewable resources ; (4) preserving, protecting and improving
our environment; and (5) providing that as a major energy consumer, Illinois state
government should lead by example
.
The recommendations also addressed the underlying economics - supply, demand,
affordability and environmental impacts for the energy markets as a whole. While
recognizing the inter-related nature of energy issues, the policy split the various energy
challenges into the following five separate groupings
:
•
Electricity Restructuring ;
•
Coping With Unstable Natural Gas Prices ;
•
Challenges in Transportation;
•
Environmental, Public Health and Safety Challenges ; and
•
Economic Development and Utilization of Illinois Resources
.
The resources of the State are being directed toward achieving the goals outlined in the
Illinois Energy Policy. Among those especially pertinent to this report are the efforts to
promote renewable energy and increase the use of Illinois' abundant coal resources . Both
of these components of the State Energy Policy are the subject of extensive efforts by the
Department of Commerce and Economic Opportunity. More information on these
programs can be found at www.commerce.state .il.us .
27
The Partnership for a New Economy
Governor Blagojevich's 2002 Partnership for a New Economy emphasizes
helping the economy and protecting the environment, while revitalizing the clean
coal industry in Illinois. Recognizing the availability and abundance of coal
resources in Illinois, the goal of the Governor's plan is to re-power power plants
and to promote mine mouth power generation .22
Ultimately, new plants could use new, environmentally friendly technologies such
as Integrated Gasification Combined-Cycle that dramatically reduce air pollution
at each plant. This clean coal burning technology also increases the efficiency at
which coal is burned, emitting 20 percent less carbon dioxide than regular coal-
fired plants .
Governor Blagojevich revised the State's $3 billion Clean Coal Bond Program to
meet his newly established goals
. The Governor's plan, signed into law in July
2003, authorizes a State-backed bonding authority to be created to leverage
financing for the upgrading of outdated coal powered plants with advanced coal
technology. The backing of the bonds by the State will make them more
attractive to financers than the bonding authority available now, giving companies
real incentives to build advanced technology power plants .
Governor's Special Task Force on the Condition and Future of the Illinois Energy
Infrastructure
As a result of the August 14, 2003 power outage affecting major portions of the
northeast United States and southeast Canada, Governor Blagojevich announced
the creation of a Special Task Force on the Condition and Future of the Illinois
Energy Infrastructure
. A committee was formed to analyze the State's existing
energy infrastructure, examine Illinois nuclear power plant safety, and to look at
ways to relieve pressure on the electric supply grid by promoting energy
efficiency and renewable energy
.
The Task Force was comprised of the Lieutenant Governor, the Director of the
Illinois Emergency Management Agency, the Director of the Illinois EPA, the
Governor's Office of Management and Budget, the Governor's Deputy Chief of
Staff for Public Safety, the Chairman of the Illinois Commerce Commission, the
Director of the DCEO, the General Counsel to the Governor, the Chairman of the
Illinois Toll Highway Authority, the Director of Central Management Services,
the Director of the Division of Nuclear Safety.
The results of this effort are presented in the final report of the Special Task
Force, published in June 2004, entitled "Blackout Solutions . " In brief, the
Special Task Force adopted 32 recommendations to improve system reliability,
ensure safety of Illinois' power plants and increase the diversity of Illinois'
28
energy portfolio. While the report focused principally on the immediate need of
ensuring protection from power outages, it also includes findings that stress the
theme of promoting reliability, efficiency, and safety. The report of the Task
Force has helped guide the preparation of this report and helped identify critical
issues .
Energy Market Challenges
The remainder of this Chapter provides an overview of the energy market challenges
Illinois currently faces
.
Restructuring Illinois' Electricity Markets
During the period since restructuring began, Illinois consumers have benefited
from rate reductions and rate freezes, and electricity reliability has been improved
significantly since major problems occurred in the Chicago-area in the late 1990s
.
Generation owners have had to invest shareholder dollars in pollution control
enhancements required to comply with federal Clean Air Act programs
implemented at the state level, most significantly the NO, SIP Call. Another
significant development has been the expansion of regional power transmission
organizations through which generation owners are more easily and efficiently
able to sell their power across state lines. As a result, owners of Illinois
generation facilities are now able to compete with generators in several
surrounding and nearby states and generators located outside of Illinois are more
capable of providing power to Illinois' consumers . These competitors typically
are utilities in states, which have not yet restructured their markets as Illinois has
done .
Utility-owned generation outside Illinois can continue to recover the costs of
environmental controls through rates paid by consumers . However, non-utility
Illinois generators do not have this cost-recovery mechanism. Therefore, if
Illinois businesses are encumbered with state-specific regulations that their out-
of-state competitors do not face, Illinois businesses will incur additional costs that
cannot be recovered directly from utility ratepayers and will face a competitive
disadvantage in regional power transmission organizations
.
The critical date for the electric restructuring process is January 1, 2007, when the
current cap on electricity prices for many Illinois retail customers expires . While
the transmission and distribution components will continue to be subject to
government regulation, beginning with the above date, prices for the power and
electricity portions are expected to be set by the supply and demand conditions of
the generation supply market. Restructuring seeks to ensure a low-cost and
reliable supply of electricity by injecting competition among suppliers into what
has been a highly regulated and vertically integrated industry .
29
If competition among suppliers of electricity is robust, power prices may remain
at reasonable levels . As California's experience in 2000 and 2001 has shown, if
competition among electricity suppliers fails to take hold, the price rise could be
significant. Whether robust competition occurs in Illinois in 2007 will depend on
the degree to which competitive forces create an effectively functioning wholesale
and retail supply markets . Retail competition among electricity suppliers has
achieved mixed results to date in Illinois
.
There have been some encouraging signs of retail market competition in the State
.
However, there was little or no competition among retail suppliers of electricity in
the service territories outside of northern Illinois .
Transmission constraints have a direct impact on the amount of competition
among wholesale and retail suppliers. Owners of the transmission system may be
reticent to construct transmission lines that would disadvantage their unregulated
generation affiliate. Regulatory siting requirements, zoning requirements and
resident opposition also act as deterrents in the initiation of transmission
improvement projects, making it difficult to eliminate constraints . Uncertainty
due to state and federal jurisdiction disputes and shifting federal transmission
policy has suppressed investment in new transmission . Recent actions by the
Federal Energy Regulatory Commission are recognized as an attempt to cut
through the thicket of uncertainty. The task for Illinois legislators, regulators and
industry participants is to ensure that the promises of electricity restructuring are
fulfilled
Challenges to Reliability
The issue of the reliability of the power system is a major issue throughout the
nation, and no less so in Illinois. Ample evidence of the fragility of the grid was
especially prominent after the August 2003 blackout. In the Agency's review and
discussions, we found that transmission constraints represent a major challenge to
electric reliability. Since electricity cannot be stored, the transmission system
must permit unimpeded movement of electricity from suppliers to consumers at
all times, but especially when demand for electricity is at or near its peak .
Likewise, the reliability of the transmission system depends upon critical voltage
support and resource capability at key locations in the grid . Actions that lead to
reductions in these critical factors can ultimately cause widespread service
interruptions or exacerbate a failure of the grid, as witnessed in the northern
portion of the U.S. and parts of Canada during August 2003 . Following the
August 2003 blackout, the grid was not completely restored for days to weeks
depending on the affected area. The economic loss and public impact has
amounted to approximately $6.4 billion dollars covering eight affected states
.24
As part of the Eastern Interconnect (the regional transmission interconnection),
Illinois faces the same electric reliability issues that were highlighted by the
power outage .
30
Grid congestion problems can become particularly acute where the operation of
certain generating plants is needed because their operation is essential to
maintaining grid reliability. Those older power plants would need to remain
operating to maintain grid reliability so they could supply needed voltage support
.
Their loss, without other units to replace them, could have serious impacts on the
reliability of the electric grid. Yet, these same plants may have difficulty meeting
new more stringent standards so this factor must be considered in the
development and implementation of any new pollution control strategy .
Although several state-sponsored initiatives were launched between 1999 and
2002 to promote new power plants, no additional base-load generating capacity is
under construction. Although construction permits were issued for two projects,
one has delayed the start of construction and the construction permit for the other
project has been challenged by a number of environmental groups and the permit
is stayed . No significant construction is planned to address transmission grid
reliability issues within the State or within the MAIN (Mid-America
Interconnected Network) electric transmission region of which most of Illinois is
a part .
Illinois EPA does not yet have adequate information about how a state-specific
program would impact plant closures and electric reliability. It can be generalized
that if out-of-state generators are not required to meet the same emission
standards as Illinois generators, and thus avoid the costs of air pollution control,
they could offer their product more competitively, and presumably, Illinois could
very well lose generation capacity within the State . A resource and transmission
planning model that would include detailed production cost information for
Illinois and the surrounding interconnect is needed to determine with reasonable
certainty which specific Illinois generation plants might be closed due to the costs
of more stringent pollution controls and the effect such closures might have on
electric reliability .
Summary
The National Energy Policy and the Illinois Energy Policy identified the challenges and
opportunities that exist in formulating a comprehensive and coordinated approach to
developing and safeguarding our energy resources . These policies help map the
strategies that will guide and harmonize all of our efforts to collectively contribute to the
achievement of the policy's critical objectives . Even with these efforts, it is plain to see
that our energy future faces significant challenges that are difficult to control or which
require long-term and difficult solutions. Any number of events can impede progress or
confound the best plans to manage our energy resources . This is the situation the Illinois
EPA confronts in its effort to evaluate the benefits of further pollution controls on the
power industry in light of the impacts such controls might have on the continued ability
of the State's electric energy system to provide safe, sufficient, reliable, and affordable
electricity. The Illinois EPA's review of the key issues presented in this Chapter has led
to the conclusion that we do not possess sufficient answers to key questions. Without the
31
answers to those key questions, the Illinois EPA cannot be sure that a state-specific
approach will not result in unacceptable disruptions in the reliability of electricity in
Illinois and that the costs of the plan will not make electricity unaffordable for some. A
comprehensive sensitivity analysis must be conducted to estimate the response of Illinois'
electric power system to various State-specific pollution control scenarios. This would
provide reasonable assurance that all consequences of any proposal could be identified
and evaluated in order to avoid unmanageable problems
.
32
Chapter 6
Opportunities Presented Through Renewable Energy
and Energy Efficiency
There is an increased level of interest and activity in Illinois in the expanded use of
renewable energy sources and energy efficiency, in order to reduce the electrical
demands on the existing power generation system and lessen air emissions. More and
more emphasis is being focused on utilizing alternative energy sources, combined heat
and power, distributed generation, energy conservation, and voluntary initiatives to save
energy. The benefits of using these alternatives in Illinois are the production of electric
power from non-polluting energy sources, increased operating efficiency of existing
power generating equipment, and reduction in current and future demands of
conventional fossil fuel-fired electric generating units. While current alternative energy
sources and activities account for a minimal portion of the State's electrical power output,
Illinois' aggressive approach to creating markets for renewable energy sources could
have a substantial impact on the State's energy production
.
In their 2004 "Annual Energy Outlook, " the U.S. Department of Energy's (U.S
. DOE)
Energy Information Administration (EIA) forecasts that the national growth rate of
energy generation from all renewable energy sources for the 2002 - 2025 timeframe will
be approximately 1 .8 percent per year
.25 Compounding this annual growth rate from a
base year of 2003 equates to a 13 percent increase by 2010, a 35 percent increase by
2020, and a 48 percent increase by 2025 for energy generation from renewable sources
.
Because Illinois is one of the more progressive states in developing and implementing
renewable energy, the growth rate for Illinois is expected to exceed the EIA national
growth rate and these growth projections. The current renewable energy sources in
Illinois include wind, solar, hydropower, and bioenergy .
Illinois citizens and businesses enjoy many benefits from increased utilization of clean
and local energy options, including renewable energy, "recycled energy" (such as
Combined Heat and Power or CHP), and energy efficiency . The potential economic and
environmental benefits associated with these energy options include
:
•
New income streams for farmers and rural areas through the production of
new renewable "energy crops" such as wind and biogas
;
•
Retention of manufacturing jobs in Illinois both by reducing energy costs
(through energy efficiency or recycled energy) and by the creation of new
markets for renewable energy generation in Illinois
;
•
Reduced cost of doing business for all business classes by expanding
customer choice to include distributed energy and energy efficiency ;
•
Hedging the state's risk against volatile and higher prices for traditional
energy sources, especially natural gas ;
33
•
Increased electric reliability through cost-effective measures to reduce electric
grid congestion during periods of peak usage (through increased reliance on
distributed generation and energy efficiency) ;
•
Improved public health and environmental quality by reducing energy waste
and stimulating clean energy development ; and
•
Retention of Illinois dollars in the local economy (instead of exporting dollars
while importing coal or natural gas from out-of-state or foreign sources)
.
This chapter will discuss these energy options and briefly discuss potential policy tools to
increase the utilization of these resources
.
Renewable Energy Resources
The current renewable energy sources in Illinois with significant potential for growth
include wind, solar, and bioenergy. In the following section, each of these various
renewable energy sources is discussed
.
Wind Energy
Illinois' wind energy resource is found to be the most promising renewable
energy resource in the State and can be used to produce electricity at lower cost
than new natural gas-fired power plants. The U.S. Department of Energy's
National Renewable Energy Laboratory (NREL) in 2001, estimates over 9,000
megawatts of commercial wind energy potential in the State
.
(See, "The 2001
Illinois Wind Resource Map, "
prepared by the National Renewable Energy
Laboratory, atwww.eere.energy.gov/windpoweringameiica/.) Wind technology
has improved dramatically over the last twenty years, with costs dropping from
over 20 cents per kilowatt-hour at that time to generally under 4 cents per
kilowatt-hour today. Modem wind generation investments, at current prices, can
be competitive with more traditional sources of new electric generation and
therefore a valuable hedge against higher electric costs that may result from
over-reliance on any of the traditional resources. To date, about 100 megawatts
of wind energy capacity has been developed in the state
.
This first 100 megawatts of wind energy capacity in Illinois, on an average annual
basis, will generate approximately enough power for 30,000 typical homes or
approximately 80,000 residents. Based on information from wind energy
developers available to the Illinois Department of Commerce and Economic
Opportunity (DCEO), approximately 1,500 megawatts of additional wind projects
are under active development around the state . If all of this new wind energy
capacity were to be built, rural landowners could gain up to $4 to $5 million per
year in additional income from wind land-leases and royalty payments, rural
communities could benefit from millions of dollars of property tax revenues, and
34
the wind projects could potentially generate enough power annually for over one
million residents
.
The wind industry indicates that until the federal production tax credit (PTC),
currently valued at 1.8 cents per kilowatt-hour, is renewed for an extended period
of time, sustained growth in wind energy will not occur. Rather, growth in the
industry is likely to experience interval periods of rapid growth and stagnation
.
The current federal PTC, recently renewed through December 2005, creates an
incentive for state policymakers, electric distribution utilities, wind energy
developers, and financial supporters such as the Illinois Clean Energy Community
Foundation, to cooperate on a wind energy strategy that can bring projects to
completion by the end of 2005
.
Solar Energy
Illinois has a significant solar energy resource and is using increasingly diverse
technologies to capture and utilize the resource. The three technologies
experiencing significant market growth in Illinois today include : passive solar
daylighting; photovoltaic (PV) electric generation ; and solar thermal collectors
(both traditional flat-plate collectors as well as compound parabolic collectors)
.
Illinois has been a leader in the Midwest in the development of its solar resource,
and with the partnership of the City of Chicago is the only state in the nation to
host two solar panel production facilities: Spire Solar Chicago and Solargenix .
Spire Solar Chicago, a manufacturer and turnkey provider for PV systems,
provides systems with clear reliability benefits that generate power at periods of
peak summer demand, and has enjoyed considerable success as a supplier for
public and not-for-profit institutions in the City of Chicago, including installations
on the DuSable Museum of African American History, the Reilly School, and the
Chicago Center for Green Technology. Spire is now expanding its product line to
private sector markets
.
Solargenix, a manufacturer and turnkey provider for compound parabolic solar
thermal panels, opened its new production facility in Chicago in 2004 .
Solargenix's products can supply hot water at both traditional domestic hot water
temperature ranges and higher temperature ranges suitable for absorption chilling
and other applications. The broadening range of solar thermal applications
demonstrates its ability to supplement both traditional natural gas loads (domestic
hot water) and electric loads (summer cooling through solar absorption chilling)
.
Illinois is also home to the Midwest's leading retail installer of flat-plate solar
thermal collectors, Solar Service of Niles. Solar Service is a 20-year supplier of
solar thermal applications for homes (domestic hot water), small businesses (such
as commercial laundries), and public facilities (such as heated swimming pools
and other applications) .
35
The solar industry in Illinois has demonstrated the environmental benefits and
economic development potential of the solar industry in Illinois, but continued
financial support will be key to the further stable development of the industry in
Illinois.
Bioenergy
Bioenergy, also called biomass, may have the largest long-term energy potential
in Illinois. Although much of that resource is, for the near-term, highly
cost-constrained, landfill-gas-to-energy systems are cost-effective in Illinois, and
"anaerobic digesters" (which produce and capture natural gas from the
decomposition of municipal wastewater and livestock operations) are
experiencing improving economics . Livestock waste digesters, popularly known
as "cow power" systems, have near-term growth potential in Illinois, and offer
strong parallel environmental benefits such as odor control, local water quality
protection, greenhouse gas capture, and pathogen elimination from the biosolid
residues.
Bioenergy can refer to a broad spectrum of organic material feedstocks including
agricultural crops and agricultural wastes, forest residues, livestock wastes,
municipal wastewater, and any other organic wastes (e .g ., those resulting from
food production and preparation)
.
Bioenergy typically enjoys lower air pollutant emissions (including emissions of
greenhouse gases) than fossil fuel based electricity . Since biomass absorbs
carbon dioxide as it grows, the entire biomass lifecycle of growing, converting to
electricity, and regrowing biomass can actually reduce carbon dioxide emissions
.
Through efficient utilization of biomass resources, through the use of residues and
co-products, and by accounting for greenhouse gas emissions avoided by landfills
and livestock operations, bioenergy systems can have a positive net impact on
Illinois' total greenhouse gas emissions profile
.
Biomass co-firing with coal is one option for large-scale use of biomass for
electric generation in Illinois . While such systems would likely create new
markets for farmers, and reduce pollution levels for all traditional power plant
pollutants, the economic feasibility of the systems, particularly in competition
with other renewable energy resources such as wind energy, will hinge on further
improvements that reduce the costs associated with the collection and delivery of
the feedstocks to the co-firing power plant .
Long-term, new technologies such as biomass gasification, the direct conversion
of biomass to hydrogen, or the conversion of cellulosic biomass feedstocks to
ethanol and then to hydrogen, all offer considerable electric generation
opportunities for Illinois' robust agricultural production capacities . While
adoption of a Renewable Portfolio Standard for Illinois would likely stimulate the
development of further bioenergy development in Illinois, continued financial
36
support, as well as research and development support through the Department of
Agriculture and Illinois' universities, will also play key roles in the stable further
development of bioenergy in Illinois .
Recycled Enemy
"Recycled Energy" refers to the process of recapturing energy that is typically lost in
manufacturing, electric generation, or gas pressure-dropping stations, and most typically
refers to Combined Heat and Power (CHP) applications. Because all energy associated
with the process is used more efficiently, operating efficiencies improve and operating
costs and fuel costs are reduced. This section will provide an overview of recycled
energy opportunities and challenges.
Combined Heat and Power (CHP)
CHP is the most significant and most common potential recycled energy resource
.
CHP utilizes the waste heat generated by electricity production to support heating,
cooling, dehumidifying, manufacturing thermal process loads, compressed air, or
mechanical power. Because the energy streams are produced on-site, electric line
losses are eliminated and transmission and distribution system upgrades can
frequently be avoided. Furthermore, while the national average efficiency of
power generation has remained around 30 to 35 percent for decades, CHP systems
can achieve overall energy efficiencies of 70 to 85 percent
.
According to the Midwest Combined Heat and Power Application Center, an
affiliate of the Energy Resource Center of the University of Illinois at Chicago
(Midwest CHP), 32 CHP systems producing approximately 170 megawatts are
currently known to be in operation in Illinois, and there are 2,400 megawatts to
7,500 megawatts of additional capacity that could be developed
.26'27
With rising concerns about electric reliability among industrial energy users, and
with long production shut-downs and high costs that can result from even brief
electrical outages or voltage reductions, interest in CHP as an electric reliability
enhancer is also on the rise . Key issues such as the availability of and appropriate
rates (or charges) for standby power, and the need for standardized
interconnection procedures for distributed generators, are key policy questions to
be addressed to realize the potential benefits that additional CHP systems can
bring to Illinois .
Energy Efliciencv Efforts
Energy efficiency investments in Illinois' economy brings strong and diverse
benefits, including: protecting consumers and businesses from higher energy
prices, improving electric reliability by reducing congestion on the electric grid,
supporting the retention of manufacturing jobs by reducing manufacturing energy
costs and supporting the manufacture of new high-efficiency products, hedging
37
risk against fuel price volatility, supporting public health and the environmental
quality by reducing energy waste, and helping to keep Illinois' energy dollars in
the local economy .
Illinois has enjoyed considerable success with energy efficiency programs for
residential, commercial, and industrial customer classes . This section will
provide a brief overview of the State's major energy efficiency programs for the
residential, commercial and industrial sectors, as well as the new commercial
building code .
•
Industrial and Manufacturing Energy Efficiency
Noting benefits of energy efficiency, and in particular the enormous
difficulties caused by the declining number of manufacturing jobs in the
State, Governor Blagojevich announced the creation of the new
Manufacturing Energy Efficiency Program . Administered by the Illinois
DCEO, the new program is charged with helping manufacturers manage
their energy costs by making cost-effective efficiency improvements . The
program involves key decision-makers in Illinois' manufacturing facilities
and focuses on measures that can bring high returns with modest
investments. The program helps firms identify best practices in energy
management that can be rapidly incorporated. The program then moves to
coaching services for the implementation of the new management
practices and to operation and maintenance (O&M) improvements
implementation, with the State supporting 50 percent of those costs
.
•
Commercial Sector Energy Efficiency
Again noting benefits of energy efficiency, in 2003 Governor Blagojevich
also announced the creation of a new Small Business $mart Energy
Program, administered by DCEO, to help commercial businesses reduce
their energy costs. The program, currently in a pilot stage, provides
"Design Assistance" to businesses planning on new construction or
considering end-of-life heating, ventilating and air conditioning (HVAC)
replacement for their facilities, and establishes a Building Operator
Certification Program to improve the energy efficiency O&M skills of
Illinois' large building operators .
New construction and reconstruction are key moments when a small
amount of incentive and direction can help businesses save on energy
costs for many years to come . Larger commercial buildings such as new
office buildings, new hotels, and many types of franchise chains that use
one template for most new buildings, provide key opportunities
.
Furthermore, with higher natural gas prices, efficient HVAC technologies
such as Geoexchange systems (or ground source heat pumps) are an
increasingly attractive ortion to control long-term energy costs . In the
38
Small Business $mart Energy pilot program, DCEO provides businesses
with Design Assistance services that include an analysis of the energy
costs of a traditional building design, as submitted by a business, as well
as recommended energy efficiency improvements and an analysis of the
return on investment of those improvements . To compliment the Design
Assistance program, DCEO is also supporting outreach to Illinois
architects, designers, engineers, and contractors, accelerating the market
penetration of more efficient design methods
.
In addition to Design Assistance, the Small Business $mart Energy
program also includes a Building Operator Certification program to
improve the energy efficiency O&M skills for Illinois' building operators
.
The program, in partnership with the Midwest Energy Efficiency Alliance
(MEEA), trains building operators at several different levels . Introductory
level courses focus on appropriate equipment operation in terms of energy
efficiency, air quality, health and safety, and other concerns . Higher-level
trainings are also offered to building operators to help them self-identify
efficiency improvements and look at the relationship between lighting,
HVAC, and the building envelope. DCEO and MEEA have offered the
program for several years to institutional building operators such as
hospitals and universities, and the program is now being offered to
businesses as well
.
•
Residential Energy Efficiency
Illinois' residential energy efficiency programs seek to reduce energy
costs for consumers by working to improve efficiency practices and
products in residential construction, lighting, and appliance markets . In
the case of lighting and appliance programs, which are focused simply on
reducing energy costs for consumers, the cost per kilowatt-hour saved can
be as low as one cent (relative to typical consumer energy costs in Illinois
of 8.5 cents per kilowatt-hour). These programs are funded through
DCEO's Energy Efficiency Trust Fund, which was established in the 1997
deregulation law and provides $3 million per year for residential energy
efficiency programs .
DCEO's residential efficiency programs have also demonstrated strong
parallel benefits in terms of both economic development and economic
assistance to low-income communities. For example, DCEO's Energy
Efficient Affordable Housing Construction Program, for example, provides
assistance to not-for-profit developers of low-income housing
developments. The program is not only a cost-effective energy efficiency
program (reducing energy consumption by over 50 percent in most cases
relative to standard code), but it is also a catalyst for further economic
development in low-income neighborhoods . Many projects are gut rehabs
in under-served neighborhoods and have led to additional private investment
39
in the adjacent properties. Because not-for-profit developers owning the
projects have an affordable housing mission, however, the projects do not
cause gentrification or a decline in the available affordable housing stock
.
Many of these projects occur in low-income neighborhoods across the state,
especially in Chicago and Rockford . The return on investment for the
efficiency improvements is immediate, as the increase in annual financing
costs due to the higher first-costs are less than the annual energy savings
from the first year.
Goals of the Energy Efficient Affordable Housing Construction Program
include using energy efficiency to create and maintain affordable housing
and educating developers, architects and builders on energy efficient
building measures and "green" building products so that they can begin
using these measures and products on all projects . In State Fiscal Years
2003 and 2004, the program supported 1,259 units of efficient affordable
housing, generated over six million dollars in lifetime savings for those
units, and cost just over two million dollars in total program costs
.
•
Energy Efficiency Building Code
On August 12, 2004, to reduce demand for energy in large commercial
buildings, to relieve future strain on the electric distribution grid and to
protect the environment, Governor Blagojevich signed into law the Energy
Efficient Commercial Building Act. The new law requires the State to
draft and enforce the first statewide energy efficient building code
.
Illinois had been the only major industrial state in the nation without a
statewide commercial energy efficiency building code
.
The Energy Efficient Commercial Building Act, requires the Capital
Development Board (CDB) and DCEO to write a statewide energy
efficiency code for all new commercial buildings and all commercial
buildings undergoing significant renovations, alterations, repairs or
construction of an addition . CDB will adopt the International Energy
Conservation Code (IECC) as the new statewide code for Illinois . The
IECC establishes minimum design and installation standards for a
building's lighting, windows, walls, roofs, insulation,
heating/cooling/ventilation and other building systems . DCEO will
provide energy code education programs for local government code
officials and for building designers, engineers, and contractors
.
MeansofPromotinz Energy Conservation
Recognizing that demonstration programs are only a step along the way, future efforts
should focus on harnessing the power of the marketplace, whether it is promoting energy
conservation and efficiency or encouraging renewable and recycled energy efforts
.
40
Illinois has already adopted policies to promote clean power options, but more can be
done in this area
.
This section will describe the possible policy solutions to consider in addressing
constraints to the development of renewable energy and demand side management,
including green pricing programs and renewable portfolio standards .
Policy Consideration for Addressing Barriers
:
As outlined in
"Repowering the Midwest, "
a document published by the Environmental
Law and Policy Center in 2001, key policies for consideration include
:
•
Evaluate and update Illinois' efficiency standards and building codes
;
•
Establish or reinforce monitoring and enforcement practices
;
•
Establish an Illinois Renewable Portfolio Standard that requires all retail
electricity suppliers to provide five percent of their power from renewable
resources by 2010 and 15 percent by 2020 ;
•
Increase the Illinois Renewable Energy Investment Fund investment to 0 .1 ¢
per kilowatt-hour ;
•
Increase the Illinois Energy Efficiency Investment Fund by investing 0 .30 per
kilowatt-hour;
•
Ensure that transmission pricing policies and power pooling practices treat
renewable resources fairly and account for their intermittent nature, remote
locations, or smaller scale ;
•
Remove barriers to clean distributed generation by (1) expanding
Commonwealth Edison's net metering program to be offered statewide by all
utilities; (2) establishing standard business and interconnection terms ; (3)
establishing uniform safety and power quality standards to facilitate safe and
economic interconnection to the electricity system ; and (4) applying clean air
standards to small distributed generation sources, thereby promoting clean
power technologies and discouraging highly polluting ones ; and
•
Encourage markets for "NEGA" watts (an overall reduction in wattage) that
will promote energy efficiency within demand side management .
Green Pricing Programs
According to market research, some utility customers have expressed a
willingness to pay more for renewable energy. "Green pricing" is an option that
allows customers to support investment in renewable energy technologies
.
Participating customers typically agree to pay a premium on their electric bill to
cover the incremental increased cost associated with renewable energy
.
According to a report completed in 2001 by the National Renewable Energy
41
Laboratory, electric utilities in 29 states have implemented green pricing
programs. These green pricing programs were directly responsible for the
development of 110 megawatts of new renewable energy capacity to serve these
programs, with another 172 megawatts planned or already in development
.
Well-designed green pricing programs could also harness the marketplace and
accelerate the implementation of renewable energy in Illinois
.
Renewable Portfolio Standard Issues
Environmentalists and renewable energy developers recommend a mandated State
Renewable Portfolio Standard (RPS) of five percent by 2010 and 15 percent by
2020. Electric utilities indicate that since any cost differential for renewable
energy will have to be borne by utilities they must have the flexibility of a
voluntary approach until 2007, at which point the freeze on base chargeable rates
will be lifted. This issue and its resolution continue to be a point of discussion
among the related parties
.
Renewable Energy and Energy Efficiency Incentives
This section provides a very brief overview of other renewable energy and energy
efficient incentives
.
US. EPA's ENERGYSTAR®Program
in
Illinois
Throughout the nation, U .S. EPA's ENERGY STAR° programs establish energy
efficiency standards that material and equipment suppliers must meet to be
labeled and recognized as energy efficient practices . If merely five percent of the
energy efficiency opportunities in Illinois were annually and cumulatively
implemented, the American Council for an Energy Efficient Economy predicts
that, from 2000 to 2015, businesses could avoid $13.3 billion in utility costs and
reduce smog-forming NO, emissions by about 15 percent
.28
Relating these
savings to the electric generating community in Illinois means that if electricity
costs $0.07 per kilowatt-hour, approximately 1,450 megawatts less generating
capacity would be needed at the five percent implementation level, 2,900
megawatts for a 10 percent implementation level, and 5,800 megawatts for a 20
percent implementation level .
Clean Air Counts and Other Voluntary Initiatives
Voluntary energy conservation programs, such as Clean Air Counts (CAC), also
address the demand side of the energy equation. The Clean Air Counts initiative
was born in 1999 as a result of the Regional Dialogue Forum, to address the
ozone problem in the six county Chicago metropolitan area . The charter of Clean
Air Counts aims to identify and implement voluntary measures that not only
reduce emissions of volatile organic material (VOM), but also NO, emissions
42
while also promoting economic development for the Chicago area. Energy
savings is a secondary benefit of this initiative, that to date has gone
unemphasized
.
Although pollution reduction was the primary goal of Clean Air Counts, energy
savings of 1 .10 million megawatt hours per year by 2007 was also identified in
setting goals of reducing VOM emissions by 5.0 tons per day and NO, by 10.9
tons per day. This energy savings equates to a reduction of nearly 127 megawatts
in demand capacity. When setting this initial goal in 1999, Clean Air Counts also
recognized the potential to be 6.1 million megawatts hours per year, which
translates into approximately 700 megawatts of demand side savings
.29
Energy E
f
ciencv Programs
Many of the mechanisms necessary to expand the use of renewable and recycled
energy, as well as demand side management, have been in place for several years
in Illinois. Through various State actions and programs, funds have been made
available to enable demonstrations of these new technologies, thereby establishing
their feasibility and reliability. The following is a list of some of the existing
State energy efficiency and renewable programs currently available in Illinois .
Illinois Clean Energy Development Fund
The Illinois Clean Energy Community Foundation was created as a result of a
one-time payment of $225 million by Commonwealth Edison as a public
interest environmental condition of its proposed coal plant sale and as part of
legislation approved by the Illinois General Assembly in 1999 . The
Foundation was given $225 million of assets to further its mission of
improving energy efficiency, developing renewable energy resources and
certain other specified environmental measures
.
City of Chicago Clean Energy Development Fund
The City of Chicago Environmental Fund was also created as a result of the
settlement of the city's claims against Commonwealth Edison relating to the
franchise agreement. This fund had $25 million per year for each of four
years beginning in 2000. About half of the funds are devoted to energy
efficiency and the other half to renewables
.
Energy Efficiency Investment Fund
The Illinois Energy Efficiency Trust Fund was enacted by the Illinois General
Assembly and is supported by utility and energy supplier payments that
provide $3 million per year for each of 10 years beginning in 1997 . The
DCEO manages this fund .
43
Renewable Energy Investment Fund
The Illinois General Assembly enacted the Illinois Renewable Energy
Resources Fund in 1997. It has $5 million per year for each of 10 years for
renewable energy development projects, and it is supported by (1) residential
and small commercial customers payment of a flat monthly fee of $0.50, and
(2) by large commercial customers, who have a peak electric demand greater
than 10 megawatts and used more than four million therms of gas in the
previous calendar year, payments of a flat monthly fee of $37 .50 .
Commonwealth Edison Renewable Energy Fund
Commonwealth Edison's Renewables Program, also resulting from the
settlement of the City of Chicago's claims against Edison relating to the
franchise agreement, has $3 million per year for each of four years beginning
in 1998. The principal use is for development of solar photovoltaics
.
State Grants
State grants of $60,000 to $1 million are available for any renewable energy
technology capital projects . Funding is not available for residential projects
.
Tax Relief
Property tax assessment for solar energy systems is not to exceed the value of
conventional energy systems .
Benefits Prom Renewable Energy and Energv Efficiency
This section provides an overview of an analysis conducted by the Regional Economics
Applications Laboratory (REAL) of the potential economic benefits of renewable energy
and energy efficiency in Illinois
.
The REAL study applied the assumptions outlined for Illinois in the Environmental Law
and Policy Center's "Repowering the Midwest, " and found energy efficiency
improvements and renewable energy are expected to produce 35,000 net new jobs and
$3.6 billion in increased economic output by 2010 . By 2020, their study forecasts the
creation of 57,000 net new jobs and $6 .2 billion in increased economic output These
estimates were based on 3,649 megawatts and 8,358 megawatts of new clean energy in
2010 and 2020, respectively
. 30
Table 6-1 shows REAL's predicted economic impacts
from clean energy in Illinois .
44
Regional Economics Applications Laboratory forecast based on the Environmental Law and
Policy
Center's
"Repowering the Midwest . "
According to REAL, these investments in cost-effective energy efficient technologies
will produce an estimated one billion dollars in net electricity cost savings for both
business and residential consumers .
Summary
The pursuit of energy efficiency and development of clean renewable energy can result in
new jobs and economic benefits for Illinois cities and farming communities . These
economic gains could be disseminated to businesses engaged in manufacturing, firms
installing and servicing renewable and clean energy equipment, farmers leasing their land
for wind turbines or growing and harvesting bioenergy crops, businesses engaged in
related marketing and research activities and communities with renewable and clean
energy projects. Most importantly, these technologies bring with them the potential for
significant environmental and public health benefits
.
Table 6-1
Estimated Economic Im acts from Clean Ener in Illinois
45
2010
2020
Forecast of New Clean
Electrical
Net New
Additional Electrical
Net New
Additional
Energy Generation in
Generation
EOuput
Generation
Economic Output
Illinois
MW
)
Jobs
Output
(MW)
Jobs
(Billion)
(Billion)
REAL Estimates'
3,649
35,000
$3 .6
8,358
57,000
$6.2
Chapter 7
Greenhouse Gas Emissions :
National, and Nongovernmental Policies and Program, and Challenges
The General Assembly has also asked Illinois EPA to consider the need to establish a
system to certify credits for voluntary greenhouse gas reductions . Efforts by the federal
government to provide credit for early action on climate change have been considered
inadequate by many. In addition to several state actions, President Bush has ordered the
Secretary of Energy to improve the existing voluntary national registry for greenhouse
gas emission reductions . Based upon these efforts, Illinois has a range of options
including adopting one of the approaches worked out by other states or non-governmental
organizations, developing its own system, referring entities seeking to certify reductions
to one of these other systems, or waiting for and relying on an improved federal system
of emission credits. The following sections describe the main greenhouse gas programs
that are currently active and evaluates them for potential use by the State of Illinois
.
The Federal Energy Policy Act
Section 1605(b) of the Energy Policy Act of 1992 mandated that the U .S. Department of
Energy create a Voluntary Reporting of Greenhouse Gases Program to enable any
company, organization or individual to establish a public record of their greenhouse gas
emissions, reductions or sequestration in a national database . The purpose was to
encourage voluntary reductions in greenhouse gases by providing recognition for those
reporting reductions . Since a major debate on rewarding "early actors" had just occurred
during passage of the Clean Air Act Amendments of 1990, Section 1605(b) was also
intended to track early action on climate issues . A program such as the Department of
Energy's greenhouse gas registry is important for a variety of reasons, including the
following :
•
Encourages greenhouse gas emission reductions
;
•
Ensures credit for those that have made previous reductions if a mandatory
program is imposed ;
•
Provides positive publicity for early participants ;
•
Raises public awareness of potential climate change
;
•
Improves the competitive position of companies who participate
;
•
Provides entities with technical guidance in making and measuring reductions
;
•
Initiates an infrastructure in the states to carry out a future policy such as cap-and-
trade; and
46
•
Facilitates early trading in greenhouse gas credits
.
According to the U.S. Department of Energy, in 2001 a total of 228 entities reported to
the Energy Information Association that they had voluntarily undertaken 1,705 projects
that reduced greenhouse gas emissions by 316 million tons
.
(See
U.S. DOE's web page
at : http://www.eia.doe.gov/oiaf/1605/vrrpt/) Despite this apparent success, the U. S .
Department of Energy's voluntary system was widely criticized for its lack of rigor . The
"quality" of the reductions reported varied dramatically . There was a lack of consistency
in the methods used to measure the reductions, little or no verification that the reductions
actually occurred, and no assurance that emissions reduced in one part of a company
were not replaced by increases elsewhere. In response to the current federal
Administration's call to improve the existing voluntary national registry, the U .S .
Department of Energy has held several public workshops in conjunction with the U .S .
Department of Commerce, U .S. EPA and the U.S. Department of Agriculture to obtain
input on proposed improvements. On December 5, 2003, the U.S. Department of Energy
officially released the proposed revision to the voluntary greenhouse gas reporting
system. The public comment period on the revised guidelines remained open until mid-
February 2004. The U. S. Department of Energy is planning to simultaneously release a
further revision of the greenhouse gas reporting system for public comment and the
Technical Guidelines sometime in 2004 .
Other
Congressional Actions
On the legislative front, numerous bills (nearly 70 bills in 2003) have been introduced in
Congress that would either create a national greenhouse gas registry or directly regulate
greenhouse gases
.
The most notable bill was the Climate Stewardship Act of 2003 (S . 139). U.S. Senators
John McCain (R-AZ) and Joseph Lieberman (D-CT) introduced the bill in January 2003
(which was last co-sponsored by seven other senators, including Senator Dick Durbin of
Illinois). The bill was last debated in the Senate on October 30, 2003, and then referred
again to the Senate Committee on Environment and Public Works, where it currently
resides. The Bush Administration has noted that it "strongly opposes" this bill and
general opinion suggests that it is unlikely to pass in its current form. However, if it were
to be passed in its current state, the bill would mandate the following climate change
actions :
•
U.S. EPA would be mandated to create regulations that limit greenhouse gas
emissions from a number of greenhouse gas source sectors . These sectors
account for 85 percent of the year 2000 greenhouse gas emissions from the United
States. Agricultural and residential sectors would be excluded, as would other
specific sectors where it is deemed too difficult to reduce greenhouse gas
emissions.
•
One of two possible emissions targets would be enacted (and could be applied
according to standard international methodologies)
:
47
- By 2010, U.S. emissions will be reduced to year 2000 emission levels
- By 2016, U.S. emissions will be reduced to year 1990 emission levels
•
All entities that emit greater than 10,000 metric tons of greenhouse gas per year
would be part of the program .
•
Trading Units would be issued for each metric ton of greenhouse gas, with an
exception for the transportation sector, particularly petroleum refiners and
importers. These areas would have units that represent a unit of petroleum
product sold per metric ton of emissions produced. At the end of the trading
period, companies would be required to turn in allowances equal to the tons of
emissions they put out
.
•
Some allowances would be awarded to companies, while others would be
auctioned off. Proceeds from the auctioning of these allowances may be used to
offset any possible increase in energy cost to consumers
.
•
A form of Intersector Trading would be allowed in that companies may satisfy up
to 15 percent of their required reduction (reduced to 10 percent after 2016) by
sequestration, taking credit for reductions by somebody not in the program, or
using tradable allowances from another country's greenhouse gas market system
.
In addition, credits earned under the Corporate Average Fuel Economy program
for passenger vehicles and trucks would be tradable within this system
.
•
Any company that did not provide enough allowances to meet its emissions would
be fined at three times the value of each missing allowance
.
•
The trading aspect would incorporate the Department of Energy's greenhouse gas
registry, discussed above . However, due to the problems already noted, changes
would need to be made and any reductions would need to be verified .
•
Companies could borrow credits against fixture expected reductions, up to five
years in the future, but with a 10 percent "interest rate" attached to it
.
•
The bill would also create certain research programs . Most notably, it would :
- Establish a scholarship program at the National Science Foundation for
students who wish to do research in climate change ;
Require that the Department of Commerce prepare a report on Technology
Transfer and establish an "Abrupt" Climate Change program
;
Require that the Secretary of Commerce submit a report on the effect the
Kyoto Protocol would have on U. S. industries' ability to remain
competitive, and cooperate with worldwide climate efforts;
Alter the structure of the U .S. Global Change Research program ; and
Require that the National Institute of Standards and Technology create a
branch that studies measurement technologies and standards as they relate
to climate change
.
48
The Senate vote on the McCain-Lieberman bill marked the first time ever that a bill
capping U.S. greenhouse gas emissions and establishing a national greenhouse trading
system had been considered. The sponsors intend to put it up for a vote again
.
U.S. EPA's Climate Leaders Program
In addition to the Department of Energy registry, the U .S. EPA has created a voluntary
industry-government partnership to encourage companies to develop long-term
comprehensive strategies to reduce greenhouse gas emissions. The program, called
"Climate Leaders," forms partnerships with companies, who then set corporate-wide
greenhouse gas reduction goals and inventory their emissions to measure progress. They
report this data to the U .S. EPA and thereby create a record of their emissions reductions .
As of this writing, 56 companies covering a wide variety of industries have joined
Climate Leaders. Some of the companies in Climate Leaders have also joined the
Chicago Climate Exchange with the self-determined industry limits being the same for
those who belong to both groups
.
(See
the Climate Leaders website at
http://www.epa.gov/climateleaders/ for more information .)
Greenhouse Gas Effortsin Other States
A few states have decided to undertake climate change action at the state level, with
varying approaches. Specifically, some states have emphasized reduction "projects,"
while others have focused on corporate or company level emissions at a state, national, or
even international level. Some state actions include
:
California :
California's registry is the most well developed state program in the country . California's
Climate Action Registry was launched in October 2002 with the purpose to help companies
and organizations with operations in California to measure their greenhouse gas emissions
and establish baselines against which any future greenhouse gas emissions reduction
requirements may be applied . The registry requires entity-level reporting of emissions
from all facilities in the state, but participants may elect to report all national emissions
.
Entity-level reporting means that a company cannot pick and choose specific operations to
report, but instead must report at the corporate level . General reporting requirements and
certification protocols have been completed . Reporters must verify that they have met all
the general reporting requirements
.
The registry system is managed almost entirely through the web ; reporters use an online
reporting tool known as Climate Action Registry Reporting Online Tool (CARROT)
.
California is offering its system to other states, including its reporting protocols,
certification process, online reporting tools, even its server (for a small cost) - which cost
several hundred thousand dollars to develop and implement. New England states have
49
been working with California to look at the possibility of using or linking to CARROT
.
Additionally, Washington and Oregon have also looked at using CARROT
.
California has also passed a law capping automobile emissions of greenhouse gases
.
However, the law must withstand a court challenge from auto manufacturers, who claim
only the federal government can make laws governing fuel economy and this is
effectively what the California law does .
New Hampshire
:
New Hampshire has adopted rules on a greenhouse gas registry . The state allows
reporting at the corporate, facility or project level. Verification by a third party or state
government is required. New Hampshire also passed a four-pollutant bill. However,
indications are that affected companies are already at or below the carbon dioxide
requirement and thus no trading will be required. There is also a power-related "tag"
system where every megawatt of power has environmental attributes associated with it,
and those certificates can be traded . Thus, a company could buy certificates to show that
it effectively used only wind power. The program is estimated to cost less than a penny
per month for the average home .
Wisconsin :
Wisconsin finalized rules for its registry and started accepting registrants in January
2003 . Entities that emit more than 100,000 tons of carbon dioxide annually, of which
there are only a few, are mandated to report their carbon dioxide emissions . Verification
is encouraged but not required . Reductions can be reported at an entity, facility or project
level .
Massachusetts
:
Massachusetts has adopted a cap on 1997-1999 utility emissions and emission rates
.
Offsite emissions offsets and sequestration are allowed . The rule only applies to the six
largest power plants in the state .
Oregon :
Oregon limits carbon dioxide emissions for new or expanded power plants to a level that
is approximately 17 percent below the most efficient natural gas fired plant in the U .S .
Power plants are thereby required to otherwise obtain offsets, for example by giving
money to the Climate Trust or engaging in other projects. To date all have chosen to give
to the Climate Trust at a specific rate based on the amount of power they will be
producing. The Climate Trust then uses that money to purchase greenhouse gas offsets
elsewhere. Also, Oregon has promulgated a law regarding forestry registration and
reforestry. Oregon's Department of Forestry sells credits under this program, but at last
notification the program was on hold
.
50
Non-Governmental Greenhouse Gas Efforts
Chicago Climate Exchange :
The Chicago Climate Exchange is a voluntary greenhouse gas trading program led by
CEO and Chairman Dr. Richard L. Sander, who previously helped design the Acid Rain
Program and developed the concept of trading financial futures . Companies who join
Chicago Climate Exchange commit to reducing their greenhouse gas emissions by four
percent below their baseline (an average of 1998-2001 emissions) by 2006, which is the
final planned year of the pilot program
.
The gases specifically covered by the Chicago Climate Exchange are carbon dioxide,
methane, nitrous oxide, hydrofluorocarbons, perfluorocarbons, and sulfur hexafluoride
.
These emissions will be converted to carbon dioxide-equivalents using the 100-year
Global Warming Potential values established by the Intergovernmental Panel on Climate
Change. The unit of emissions measurement, reporting, price quotation and trading in the
Chicago Climate Exchange will be metric tons carbon dioxide-equivalent, with each
trading unit representing 100 metric tons of the carbon dioxide equivalent . The first
auction of these trading units was held in September 2003 . The majority of the
allowances were bought by American Electric Power Company for slightly under a dollar
per metric ton. Continuous trading of greenhouse gas emission allowances commenced
on December 12, 2003 . Through April 2004, trading of Carbon Financial Instruments
had increased each month and volumes exceeded expectations . In April, the price per
metric ton of carbon dioxide was approximately $0.80-$0.85 .
Like the SO2 trading program and Illinois' trading program for volatile organic material,
the Emissions Reduction Market System (ERMS) program (discussed in Chapter 8), the
Chicago Climate Exchange expects to operate under a form of cap-and-trade
.
Participants can reduce their emissions beyond their target levels and sell the extra
reductions. Others can avoid having to make reductions at their own facilities by
purchasing credits
.
Offset projects include some that directly reduce greenhouse gas emissions, such as the
capture and use of landfill gas (methane), or that use renewable energy systems like wind
and solar power. Other types of projects keep such gases out of the atmosphere through
projects like forest expansion or no-till agriculture . Thus, a greenhouse gas trading
program would not only provide incentives for industry to reduce emissions, but could
provide a secondary income stream for farmers who adopt conservation methods
.
There are numerous pros and cons involved in such a voluntary program . Dr. Sander has
indicated that companies will be motivated to join the Chicago Climate Exchange
because shareholders and consumers expect them to be more environmentally friendly
.
Also, he believes that companies will join a voluntary program to reduce the chance of a
mandatory one being imposed on them . Currently, several issues are being considered
and addressed as the pilot continues.
51
Other Greenhouse Gas Efforts
The previously discussed federal, state, and private initiatives are the leading greenhouse
gas efforts thus far. On a smaller scale, several other states are considering whether to
create their own registries and the northeastern states and eastern Canadian provinces
have agreed to reduce greenhouse gas emissions on a regional basis, though reports
indicate that the New England states are already lagging behind .
(See, Air Daily
September 8, 2003.) Other private trading efforts exist as well. Eight companies,
including Alcan, BP, DuPont, Entergy, Ontario Power, Pechiney, Shell and Suncor have
set a goal of reducing greenhouse gas emissions by 80 million tons by 2010 and intend to
establish a trading system amongst themselves . Shell and BP have already established
internal trading programs .
In addition, ten northeastern states (Connecticut, Delaware, Maine, Massachusetts, New
Hampshire, New Jersey, New York, Pennsylvania, Rhode Island, and Vermont) have
agreed to engage in a regional trading program for carbon dioxide emissions from power
plants. They hope to have a final agreement in place by April 2005 . No details have yet
been released on how trading might work
.
(See, Daily Environment Report,
September
26, 2003)
.
Internationally, Denmark and Britain have begun some modest greenhouse gas emission
trading. Under the Kyoto Protocol "joint implementation" and the "clean-development
mechanism" are two programs to test efforts to create reductions or offsets. Several U.S .
states and companies have participated in such projects, but such activity has come to a
halt since the Bush Administration's clear rejection of Kyoto . Back in the early 1990s
when Illinois still had a sister-state relationship with Liaoning Province in China, the
State of Illinois and Illinois Power Company outlined several potential joint
implementation projects that never came to fruition .
In more recent international actions, in January 2004, 10 companies announced the start
of a Global Greenhouse Gas Registry. Announced at the World Economic Forum Annual
meeting, these globally active companies made the commitment to disclose their
greenhouse gas emissions from their worldwide operations . Alcoa, Hewlett Packard, the
German Utility RWE and Scottish Power are a few of the companies signing on . The 10
companies combined account for approximately 800 million tons of carbon dioxide
equivalent annually. This registry was developed with the assistance of a number of
environmental and business organizations, most notably the Pew Center on Global
Climate Change, Deloitte Touche Tohmatsu and the World Energy Council . The
technical infrastructure of the system is modeled after the California Climate Action
Registry. The stakeholders of the Registry hope the registry encourages more corporate
climate change actions by creating a global standard for disclosure of greenhouse gas
emissions and reduction goals . Public access to the emissions information is expected to
be available by summer 2004 .
52
Specific Challenges of Greenhouse Gas Trading
Notably, 12 states, three cities, and several environmental groups sued in an attempt to
force U.S. EPA to regulate greenhouse gases . U.S. EPA ruled that they do not have the
authority to regulate carbon dioxide and other greenhouse gases . However, the lawsuit
contends that this ruling contradicts previous statements and testimony from that agency
under the Clinton Administration
.
If any mandatory program were to be developed in the future, it would likely be a
national cap-and-trade program (see Chapter 8 for more information on cap-and-trade
programs and emissions trading in general). However, a cap-and-trade program is not as
simple with carbon dioxide as it is with pollutants such as volatile organic material
(VOM) and NON . As such, any cap-and-trade system would probably differ from Illinois
EPA's VOM trading program (see Chapter 8) in that it would likely have trading units
with an unlimited lifespan. While ozone is a seasonal problem that occurs in specific
areas, greenhouse gas issues are a global problem that occur over the course of years or
decades. Thus, it is not as important to worry about a single-year "spike" in emissions if
everybody should save up all of their credits to use at once. The idea would be to reduce
greenhouse gas emissions over a long period of time
.
One reason for the difficulty in applying a cap-and-trade to greenhouse gases relates to
the difficulty of the possible double counting of emission reductions . One method of
accounting for greenhouse gas emissions would be the imposition of a "carbon tax"
whereby the fuel producers themselves have the obligation for the carbon they produce
.
Authorizations or allowances would be sold or auctioned to producers of coal, oil, gas,
etc., and the cost would be passed down the line giving companies a monetary incentive
to reduce fuel usage and thus greenhouse gas emissions . In such a system, the revenues
from the carbon auction could be returned to taxpayers to make up for additional costs to
their own home energy bills. While the idea may be workable from a theoretical
standpoint, it is unlikely to succeed due to political factors . This is especially true in
Illinois, as coal would need a higher cost than other fuels due to its higher greenhouse gas
emission potential .
Recommendation for Illinois
Illinois has several options of how to focus its efforts in addressing greenhouse gas
emissions. A revised Section 1605(b) registry under the National Energy Policy Act
should be up and running soon. While the existing voluntary reporting program contains
many tons of reductions from questionable projects that may not deserve to receive early
action credit, the improved reporting program should, in theory, be better able to
guarantee credit for projects or reductions that are registered . Companies interested in
participating in the emissions credit markets can also be directed toward the Chicago
Climate Exchange. Finally, for a company wanting to establish their baseline for
emissions in preparation for future mandatory programs, they could report their emissions
to the California registry or even the newly formed Global Greenhouse Gas Registry
.
53
Alternatively, Illinois could create its own system for reporting emissions on an entity
basis. The State could create a voluntary system similar to that being developed by
California or perhaps one that could require mandatory emissions reporting for large
emitters. Given the existence of various pilot efforts around the country, Illinois should
monitor those efforts and learn accordingly.
A final option, which is the option we recommend, is to allow the various ongoing
projects to come to fruition before deciding to develop yet another system
.
Ultimately, a national trading program with a federal mandate appears to be the most
effective way to handle the greenhouse gas issue. While various states have their own
independent registry at this time, many do not mesh with each other and will probably be
superseded should a federal registry be developed . Thus, it is recommended that Illinois
delay development of its own independent registry or greenhouse gas trading program
and lend its support to a federal cap-and-trade system like the one proposed in the
Climate Stewardship Act of 2003 .
54
Chapter 8
Overview of Emission Trading Programs
This Chapter provides an overview of the application and effectiveness of emission
trading programs. During the 1990s, as the need for further control measures became
clear, the concept of allowing sources to trade with one another in order to achieve the
needed emissions reductions was conceived . Traditionally, however, air pollution control
rules and regulations have been written as "command and control" requirements . These
rules typically require that every operating unit comply with the applicable rule at all
times .
One of the first successful emissions trading programs was part of an air pollution control
strategy for the emissions of SO 2 and NO, from power plants, known as the Acid Rain
Program, and implemented by the U .S. EPA pursuant to Title IV of the Clean Air Act
.
The Illinois trading program for volatile organic materials, known as the Emissions
Reduction Market System (referred to as Illinois EPA's VOM trading program), and the
federal NO. SIP Call trading program followed the Acid Rain Program
.
This Chapter will describe the types of emissions trading, the benefits of cap-and-trade
programs, an overview of Illinois' VOM Trading Program, the Acid Rain Program, the
federal NOx Trading Program, and a very brief description of the trading programs in
other states .
Types ofEmission Trading
There are three primary types of emissions trading that have been used or considered by
those interested in providing industry more flexibility in complying with regulatory
requirements . They are Open Market, Cap-and-Trade, and Offset Trading.
Open Market trading, which is the least rigorous of the three, not only allows companies
to trade in order to meet a reduced emissions cap, but also allows them to trade in order
to avoid compliance with existing air pollution control regulations . U.S. EPA and most
environmental groups have opposed the use of open market trading . Therefore, it is not
generally seen as a viable trading option for a multi-pollutant strategy
.
Cap-and-trade programs set a cap on emissions for a defined region or set of emitters
.
This cap is a number that represents reductions from previous emission levels, thus
reducing overall emissions from the participants . Participants must either reduce their
emissions or purchase allowances to meet the overall goal
.
Offset Trading was developed as part of U.S. EPA's New Source Review program in the
late 1990s. Under such programs, new sources or sources with major modifications must,
in addition to installing stringent controls, also obtain offsets at increasing levels of
multipliers in the form of permanent emission reductions from other sources in the area at
55
set ratios (e.g., 1 .1 to 1 .0 , 1 .2 to 1 .0, etc.). While offset trading has been useful in the
preconstruction permitting programs for nonattainment areas, it would not be beneficial
for a multi-pollutant control program .
Benefits of Cap-and-Trade Programs
A substantial amount of emissions are already controlled nationally and in Illinois by
technology-based rules. Further reductions in emissions using such "command and
control" measures are potentially very costly to impose on individual industrial sources .
Cap-and-trade programs place a limit on the amount that each facility can emit and allow
each individual facility to determine how to best achieve those limits . Some companies
will modify their processes, some may add control devices, and others will simply keep
their operations the same but purchase credits . In this way, the overall emissions to the
air from the area are reduced while providing a variety of mechanisms for sources to use
in achieving their individual reductions, presumably at the most cost-effective level . This
type of source-by-source flexibility is the major benefit for using cap-and-trade programs
rather than command and control rulemaking
.
The emissions trading program operates by giving each participating source a baseline
consistent with their actual emissions in previous years, adjusted for the source's
compliance or noncompliance with existing rules . That baseline is then reduced to the
necessary level, and a cap is placed on source-wide emissions. The program allows
trading (buying and selling) among participating sources in order to meet that cap on their
emissions .
Unlike the situation in some open market trading systems, a cap-and-trade system
requires that sources still adhere to all other state and federal emission limitations
.
Illinois' VOM Trading Program
Illinois EPA's VOM cap-and-trade program allows major sources of VOM in the
Chicago ozone nonattainment area to trade "allotment trading units" to ensure that they
meet their specified emissions levels
.
Illinois EPA's VOM trading program contains a number of features that distinguish it
from traditional command and control programs and other market systems
:
•
Since ozone is a problem in Illinois only during the summer season, Illinois
EPA's VOM trading program is seasonal, restricting emissions from May 1
through September 30 when the ground-level ozone problem exists ;
•
Illinois EPA's VOM trading program puts a cap on sources based on their actual
emissions, which provides certainty that it will reduce VOM in the nonattainment
area ;
56
•
Illinois EPA's VOM trading program goes beyond "Reasonably Available
Control Technology" (RACT). Unlike other emissions trading systems across the
country, Illinois does not allow sources to avoid other emission limits by
participating in the trading program . Sources must comply with the trading
program rule and all other applicable limits ;
•
Some trading programs have created trading units with an unlimited life, which
allow them to be accumulated for long periods of time. Illinois EPA's VOM
trading program rule provides that allowances have a limited two-year lifespan
.
This helps to ensure a robust market, allows some saving for companies, but
prevents excessive accumulation of active trading units with unlimited life ;
•
Because Illinois EPA's VOM trading program rule is associated with Illinois'
Title V permitting program for major sources, known as the Clean Air Act Permit
Program (CAAPP), monitoring and record keeping provisions are linked to avoid
duplicative efforts for companies and to ensure the use of standardized methods
for determining emissions ;
•
Illinois has created a specific reduction requirement in the VOM trading program
rule, requiring most units to reduce VOM emissions by at least 12 percent . This
provides Illinois with a specific, creditable VOM reduction in the Chicago ozone
nonattainment area; and
•
Sources that fail to reduce their emissions or obtain the proper number of
allowances are held accountable for their actions as a part of the VOM trading
program rule itself. Indeed, such sources are penalized at a higher rate for
repeated failure to hold the required allowances. This discourages noncompliance
on the part of participating sources and provides Illinois with some certainty that
the VOM reductions will be achieved
.
Illinois EPA's VOM trading program has achieved and exceeded the desired emissions
reductions. In 2002, there was a reduction of 9 .7 percent in the allotment compared to
the baseline. There was a further reduction of 48 .1 percent in emissions compared to
what the allotments would have allowed .
More information about the trading program can be found in the 2002 Illinois Emissions
Reduction Market System Annual Performance Review Report
.
Federal Acid Rain Prozram
The Acid Rain Program created a national emissions trading program for SO
2 emissions
and required reductions in NOx emission rates from power plants pursuant to Title IV of
the 1990 Clean Air Act Amendments . In their report, "Latest Findings on National Air
Quality: 2002 Status and Trends, " the U.S. EPA states that acid rain data demonstrate the
Acid Rain Program's success in reducing harmful SO2 and NO, emissions from power
plants. According to the data, SO2 emissions from power plants were 10.2 million tons in
57
2002, nine percent lower than in 2000 and 41 percent lower than in 1980. NO, emissions
from power plants also continued downward, measuring 4.5 million tons in 2002, a 13
percent reduction from 2000 and a 33 percent reduction from 1990 .
According to the U.S. EPA, the Acid Rain Program is on the way to achieving its goal of
a 50 percent reduction from 1980 SO 2 emission levels. They note that trading under the
program has created financial incentives for electricity generators to look for new and
low-cost ways to reduce emissions. The level of compliance under the program
continues to be extremely high, with U .S. EPA estimating the level to be over 99 percent,
and allowance prices have generally been much lower than originally anticipated . Refer
to http://www.epa.gov/airmarkets/arp/ for additional information on the Acid Rain
Program and allowances .
NO,, Trading Program
To allow for use of the most cost-effective emission reduction alternatives, an emission
budget trading program is an important component of the federal NO, SIP Call, which
was issued by U.S. EPA on October 27, 1998 (63 Fed.Reg.57356) (See endnote 8). Each
of the states subject to the NO, SIP Call are encouraged to participate in the NO . Budget
Trading Program, thereby providing a mechanism for sources to achieve cost-effective
NO, reductions. The trading unit, a NO, allowance, is equal to one ton of emitted NO .
.
Under the NO, Budget Trading Program that began full implementation in May 2004,
each of the participating states determines how its ozone season state trading program
budget is allocated among its sources . Each source is given a certain quantity of NO,
allowances. As with other cap-and-trade programs, if a source's actual NO, emissions
exceed its allocated NO, allowances, the source may purchase additional allowances
.
Conversely, if a source's actual NOx emissions are below its allocated NO, allowances, it
may sell the additional NO x allowances. Such a program creates a competitive market
for NO, allowances and encourages use of the most cost effective and efficient means for
reducing NO, emissions. Trading may occur among any of the sources within the entire
NO, SIP Call region
.
Programs in Other States
Illinois EPA's VOM trading program is the first successful cap-and-trade system in the
United States for VOM and is currently the only existing U .S. EPA-approved cap-and-
trade VOM reduction program in the country . However, there have been several other
attempts made at trading programs by other states
:
Michigan currently has a voluntary open market statewide emissions trading
program that covers VOM, NO, and carbon monoxide. As of the end of 2001, the
Michigan Department of Environmental Quality indicated that creation of
allowances had far outpaced their use, which would be expected in a voluntary
program .
58
The South Coast Air Quality Management District (SCAQMD) of California
began NO, trading in the "RECLAIM" program in 1994 . It covers all sources in
the area with emissions greater than four tons per year . Starting in 1994,
allocations reduced gradually each year until 2003 . Future allocations are
expected to remain stable at the 2003 level. As the number of allocations has
been reduced, the price of allowances has increased
. RECLAIM does not allow
banking and has several complicating features due to the local geography and
weather patterns .
The Houston/Galveston area of Texas has a year-round NO, cap-and-trade
program for all sources in the eight-county area that emit 10 or more tons of NO,
per year. The program is similar to Illinois EPA's VOM trading program in that
allocations were based on previous years of operation, new sources receive no
allocations and allowances can be banked for one year if not used .
Summary
In general, cap-and-trade programs can be effective tools to meet air pollution
requirements if the programs are carefully designed and operated, while also providing
sources with an opportunity to seek the most cost-effective compliance option
. The
federal Acid Rain Program, the NO,, Trading Program and Illinois' VOM trading
program are all examples where cap-and-trade programs were well designed, and provide
sources with a market that allows for them to make the most cost-effective compliance
decisions .
59
Chapter 9
Costs and Market Impacts of Power Plant Emission Reduction Proposals
The General Assembly made clear that the Agency must consider the effect of any state
action on costs - both from the compliance perspective as well as to the consumer. This
Chapter summarizes what we know today about the potential costs that Illinois power
generators could experience with several of the proposed national multi-pollutant
programs, as well as preliminary cost analyses of the proposed U .S. EPA Clean Air
Interstate Rule prepared on behalf of the Illinois Energy Association
.
This Chapter also briefly describes potential impacts of a state-specific proposal on
electric rates, Illinois' coal jobs, and power generator jobs in Illinois. Based on the
following information and analyses, we draw some conclusions and recommend a general
course of action to better understand these important potential impacts
.
National Multi-Pollutant Bill Proposals
As explained in Chapter 4, the primary national multi-pollutant bills before Congress are
the Bush Administration's Clear Skies Act, Senator James Jeffords' (I-VT) Clean Power
Act of 2003 (Jeffords Bill), and Senator Thomas Carper's (D-DE) Clean Air Planning
Act of 2003 (Carper Bill). As summarized in Table 9-1, the U .S. EPA has made
estimates of the national costs and benefits associated with each of these bills . The
Energy Information Agency (EIA) has also provided analyses of each bill's cost .
U .S. EPA's Clear Skies website outlines an extensive assessment of costs for their
proposal as noted in Table 9-1 below . For the cost analyses prepared by U .S. EPA of
both the Carper and Jeffords Bills, U.S. EPA used simplified approaches to provide
information comparing the different multi-pollutant scenarios . It is important to
emphasize these estimates are those of U .S. EPA. U.S. EPA clearly favors the proposal
introduced by its own Administration, the Clear Skies Proposal .
Table 9-1
Summar of the U .S . EPA's Cost Estimate of Various National Bills
*Significantly higher cost if power plants would have to directly reduce to meet carbon dioxide targets
.
60
Clear Skies
CAPA (Carper)
CPA (Jeffords)
Annual Costs
_
2010
$16.5 Billion
$4.3 Billion
$6.6 Billion
2015
_
-
$17.0 Billion
2020
$6.3 Billion
$9.9 Billion
-
Cumulative Costs
2005-2030
$52.5 Billion _ $82 .7 Billion
"Greater"
Electricity Price Increase
2010
"Small"
_
4%*
39%
2015
"Small"
_
50%
2020
-
3%*
According to U.S. EPA, the costs associated with the proposals are very different . U.S
.
EPA's analyses project that both the Carper and the Jeffords Bills would cost
significantly more than the Clear Skies Act .
Clear Skies is the only national bill for which U .S. EPA has made individual state
estimates of the cost and benefits . This assessment for Illinois is that Clear Skies will
cost $496 million per year beginning in 2020
Federal Clean Air Interstate Rule (CAIR)
U.S. EPA performed an economic and energy impact analysis of the proposed CAIR
discussed in Chapter 4. U.S. EPA used the Integrated Planning Model, developed by ICF
Consulting, to conduct their analyses
.
Because U.S. EPA started its economic analyses before it determined which states the
proposed CAIR affected, the final estimates covered a slightly different region than the
region actually covered by the rulemaking. The analysis covers the electric power
industry, which is a major source of SO 2 and NO, emissions nationwide, and the industry
that U.S. EPA proposes to control in the proposed CAR cap-and-trade program. Since
almost all of the SO2 emission reductions occur in the proposed region, the larger
modeling region still provides a very good estimate of the impacts the SO
2 reductions
will have on the smaller proposed region .
For NOx, the caps modeled for this region are very close to those proposed in the CAIR,
and U.S. EPA believes that this modeling provides a very good estimate of the impacts
the NO. reductions will have on the proposed region . For the proposed region, U .S. EPA
projects that the annual incremental costs of the proposed CAIR are $2.9 billion in 2010,
$3.7 billion in 2015 and $4 .9 billion in 2020. This represents a 4.5 percent increase in
production cost in 2010 and a 5 .1 percent increase in 2015 over the base case, which
assumes no further pollution requirements on the industry beyond what exists
as of
March 2002. The cost of electricity production represents roughly 1/3 to 1/2 of total
electricity costs with transmission and distribution costs representing the remaining
portion .
According to U.S. EPA, the proposed CAIR is projected to require the installation of an
additional 63 gigawatts of flue gas desulf irization (scrubbers) on existing capacity for
SO2 control and an additional 46 gigawatts of Selective Catalytic Reduction (SCR) on
existing capacity for NO, control by 2015 . The first phase of the proposed CAIR will
result in 49 gigawatts of additional scrubbers and 24 gigawatts of SCR by 2010 . Most of
the NO, reductions achieved in the first phase of the rule can be attributed to the large
pool of existing SCRs that are used during the ozone season in the NO, SIP Call region
that, for relatively little additional cost, can run year-round
.
Table 9-2 shows U.S. EPA's projected reductions in SO2 and NO, emissions by control
option and the associated costs of those reductions in 2015 . Some reductions are due to
61
switching to western coal; however, the reductions required by the proposed CAIR must
be achieved through the installation of significant pollution controls . For SO2 , most
reductions are achieved through new scrubbers, with a small amount of coal switching to
lower sulfur sub-bituminous coal or shifts in generation . For NO R , existing SCRs account
for a considerable portion of the reductions with most of the remaining reductions
achieved through new SCRs
.
Table 9-2
Approximate Regional Emissions Reductions and Incremental Costs by Control
0 tion for the Pro osed CAIR from the Base Case No Further Controls in 2015
The use of a scrubber and SCR to control emissions of SO 2 and NOR , respectively, can
lead to reductions in mercury emissions . Mercury emissions are projected to decrease to
34 tons in 2010, 22 tons in 2015 and 15 tons in 2020 as a result of the projected scrubber
and SCR controls installed on affected units
.
It is important to note that U.S. EPA31 determined that the $3.7 billion annual total social
cost to reduce SO2 and NO, beginning in 2015 is offset by the $83 .8 billion of annual
social benefits. Stated another way, there is over $22 of benefit for every $1 of cost
.
However, it is necessary to consider that the U .S. EPA clearly stated that they did not
quantify and monetize all benefits or disbenefits
.
U.S.EPA's Mercury Reduction Proposal
R
A similar cost analysis using the Integrated Planning Model was performed by the U .S .
EPA for the Proposed Rule for Fossil fuel-fired Electric Generating Unit (EGU)
Maximum Achievable Control Technology (MACT) Standard (EGU MACT
ulemaking)
.
(See
Chapter 4) This analysis is provided for review in Table
S -5 .
Mercury emissions from coal-fired power generators were estimated by U.S. EPA to be
48 tons in 1999. U.S. EPA has projected under its Base Case that mercury emissions
from the power generation sector will be further reduced in the coming years due to the
NOX SIP Call and Acid Rain Program . U.S. EPA projects that additional SCR (about 90
gigawatts by 2010) and scrubbers (about 14 gigawatts by 2010) will be installed to meet
these program requirements and these installations will also reduce mercury emissions
.
62
SO2
(thousand
tons)
NO,
(thousand
tons)
Cost
(million $1999)
New SCR
-
784
884
New Scrubber
2,958
-
2,370
Annual Use of Existing SCR
-
890
156
Fuel Switching and Generation
Shifts
713
39
332
Total
3,671
1,713
3,742
Total annual costs of the proposed MACT program, according to U .S. EPA, are projected
to be $1 .6 billion in 2010 and $1 .1 billion in 2020. These costs represent about a 1 .9
percent increase in 2010 and 1 .1 percent increase in 2020 of total annual electricity
production costs
.
The lower cost of the MACT program in 2020 stems from total fuel costs being lower
than those in the Base Case . As in 2010, coal use reflects a shift away from bituminous
and toward sub-bituminous and lignite coal, relative to the Base Case . In addition, there
is fuel switching among bituminous coals. Projections for 2010 and 2020 differ in the
sulfur content and cost of the bituminous coals that are being displaced . In 2020, the shift
is projected to be away from less-expensive, high-sulfur bituminous coals . By 2020, the
decrease in bituminous coal use is projected to be toward the more-expensive, lower
sulfur coals, which leads to a decrease in the overall fuel costs . Also, while the proposed
MACT rule is expected to result in a very slight increase in gas prices in 2010, by 2020
this effect is largely attenuated .
According to U.S. EPA's analysis, by 2020, nationwide retail electricity prices are
expected to be 0.2 percent higher with the mercury MACT proposal . In the region that
includes Illinois, electricity prices with the mercury MACT are projected to be 0.5
percent higher in 2020 .
Preliminary Draft of Economic Analysis of LAIR in Illinois
Included in this report in the following section are the preliminary draft results of an
economic analysis, prepared on behalf of the Illinois Energy Association, of the costs of
the U.S. EPA's CAIR proposal on Illinois' power plants and the costs of a state-specific
proposal that mimicked the emission reduction targets and timing of CAIR. Due to the
uncertainty that still exists at the federal level, the only cost analyses performed to
address these considerations to date are preliminary, and were commissioned by the
power generators .
This draft study predicts, for the national CAIR proposal, higher costs than CAIR for
Illinois' power generators, and significantly higher costs for a state-specific CAIR
approach. In most states, the cost of CAIR, Clear Skies or other proposals would likely
be passed onto ratepayers by the utility, which also owns the power plants. Although this
information is being included in this report, Illinois EPA must note again that this is not
its study. The information is being included to present one perspective, that of the power
industry, on possible economic impacts from CAIR and a state-specific application of
CAIR .
The economic assessment is being conducted by James Marchetti, Inc., on behalf of the
Illinois Energy Association, of the compliance costs of the U.S. EPA's proposed CAIR
rule and the mercury cap-and-trade rule for Illinois' power generators
.
(See
Chapter 4 for
more discussion on CAIR.) The stated purpose of this analysis is to determine the costs
for Illinois generators to comply with the U.S. EPA's CAIR rule and their proposed
mercury cap-and-trade requirements . A second analysis is being undertaken to determine
63
the costs for Illinois to comply with the limits of the CAIR rule entirely within Illinois,
without the benefit of a regional trading program
.
According to Marchetti, the initial modeling of the economic impacts to Illinois power
generators of CAIR and the mercury cap-and-trade rule under section 111(d) of the Clean
Air Act focused on determining the compliance costs to Illinois power generators of
meeting the targets and timetables of the U.S. EPA's proposed CAIR and the version of
the Mercury Reduction Rule that allows for a cap-and-trade regime to control mercury
.
Under the preliminary draft of this analysis shared with Illinois EPA, under this proposed
regulatory regime, Illinois power generators would be allowed to trade SO2 and NO,
allowances within a 28-state CAIR region and mercury allowances nationally. This
evaluation used the Emission-Economic Modeling System
(EEMS). EEMS
identifies a
combination of compliance options
(i.e., control technology or allowance trading) that
approximates the least cost solution for a given power generation facility system . The
EEMS database was updated for these analyses using Energy Information Association
data and data provided through interviews with power generators to reflect changes in
operation (e.g ., retire/repowering/fuel switching) and control technology deployments .
Illinois power generation facilities will have to reduce their current SO 2 , NO, and
mercury emissions by more than 60 percent to attain the reduction targets outlined in both
CAIR and the mercury cap-and-trade rule . The CAIR analysis indicates that states will
have a little more flexibility in the allocation of NO, allowances to units within their
borders. Under the current Illinois NO, rules, a "new" unit becomes classified as an
existing unit as control periods move forward . Illinois' NO, budget in the 28-State CAIR
region is 73,622 tons in 2010 through 2014, and 61,352 tons in 2015 and thereafter . The
mercury cap-and-trade rule specifies that the 2010 cap for mercury should be set at a
level that can be achieved through the installation of SCR controls and flue gas
desulfurization devices (scrubbers) needed to meet the 2010 NO, and SO2 caps for the
CAIR. The 2018 national mercury cap of 15 tons per year is the same as the Bush
Administration's Clear Skies proposal. The Base Case SO2 and NO, emission forecast
for all affected units was based on the assumptions that these units would have to comply
with both the federal Acid Rain Program requirements and the NO, SIP Call
requirements
.
The Marchetti simulation also took into account future technology deployment and fuel
switches planned by Illinois power generators to meet the above regulatory regimes
.
Assumptions defining the cost and performance of NO R , SO2 and mercury ce^trol
technologies were adopted by Marchetti that reflect experience from operating units as
well as those extracted from the public literature. Mercury compliance involved the
utilization of EEMS to achieve system-wide NO N , SO2 and mercury emission caps for the
years 2010 - 2020 at the least possible cost. The system caps were a summation of unit
allowances, based upon the allowance allocation system . Under both CAIR and the
mercury regulatory regime, power generators were allowed to trade allowances . In
addition, all banked Acid Rain Program SO2 allowances through 2009 could be carried
forward on a one-to-one basis to meet the reduction targets of the CAIR . By the end of
2003, Illinois power generators had 5 .4 gigawatts of SCR and 1 .0 gigawatt of scrubbers
64
operating on their coal-fired units. However, the model predicted that by 2009, 14.4
gigawatts or 84.1 percent of the State's current coal-fired capacity of 17 .0 gigawatts will
be burning low sulfur sub-bituminous coal, with SO2 emission rates of 0.7 lbs/mmBtu, or
less .
In order for Illinois power generators to meet the CAIR reduction targets for SO2 in 2010
and 2015, the Marchetti model indicated that they would have to install approximately
1.1 gigawatts of scrubbers, while no power generators would switch to a lower sulfur coal
for compliance. The preliminary Marchetti analysis identified three important factors
affecting compliance with CAIR in Illinois between 2010 and 2020
:
•
Sizeable carry-over of banked Acid Rain Program SO2 allowances (through
2009) that would defer technology deployment and/or allowance purchases ;
•
84.1 percent of the state's coal-fired capacity will be burning western, sub-
bituminous coal; and
•
The aging of some of Illinois' existing coal-fired capacity
.
More specifically, Marchetti found that Illinois power generators would carry forward
almost 890,300 Acid Rain Program SO2 allowances, which can be used to meet the CAIR
SO2 caps. To meet the NO, caps, Illinois power generators would have to install 75
megawatts of SCR and 280 megawatts of Selective Non-Catalytic Reduction Technology
(SNCR). However, the 5.4 gigawatts of existing SCR capacity would operate year round
in meeting the NO, reduction targets of CAIR. Unlike CAIR, where SO2 and NO.
compliance is heavily dependent on allowance purchases, Marchetti modeled compliance
under the mercury cap-and-trade program which will result in 10 gigawatts or almost 60
percent of the State's existing coal-fired capacity (17 .0 gigawatts) installing some kind of
mercury removal technology. To comply with CAIR and the mercury cap-and-trade
reduction targets, Marchetti's belief, based on preliminary results, is that Illinois power
generators will have to expend $4 .2 billion in compliance costs between 2010 and 2020,
inclusively. This will equate to an annual cost of approximately $382 million to comply
with CAIR and the mercury MACT .
The second economic analysis being conducted by Marchetti evaluated the implications
to Illinois power generators of meeting the same targets and timetables as the previous
analysis, but with emissions trading being restricted to within the State of Illinois .
Again, under this analysis CAIR/Mercury MACT compliance involved the utilization of
EEMS to evaluate the cost of achieving system-wide NON, SO2 and mercury emission
caps for the years 2010 - 2020 at the least possible cost. Under this regulatory regime,
power generators were allowed to trade allowances only within the State of Illinois . In
addition, all banked Acid Rain Program allowances through 2009 could be carried
forward on a one-to-one basis to meet the reduction targets of the CAIR . This simulation
evaluated a State-specific emission market .
65
The Marchetti model assumed that by the end of 2003, Illinois power generators had 5 .4
gigawatts of SCR and 1 .0 gigawatt of scrubbers operating on their coal-fired units . It
also assumed by 2009, 14 .4 gigawatts or 84.1 percent of the State's current coal-fired
capacity of 17.0 gigawatts will be burning low sulfur sub-bituminous coal with S02
emission rates of 0.7 lbs/mmBtu or less. In addition, Illinois power generators will have
almost 890,300 Acid Rain Program SO 2 allowances banked at the end of 2009, which can
be used to meet the CAIR reduction targets. For Illinois power generators to meet the
SO2
CAR reduction targets in 2010 and 2015, in which allowance trading is restricted to
Illinois-only, the model predicted they would have to install approximately 8 .6 gigawatts
of scrubbers, while 334 megawatts would switch to a lower sulfur coal for compliance .
Of this total incremental scrubber capacity, 6.3 gigawatts or 73.2 percent will not be
installed until 2014 or thereafter .
The primary factor that affects this deferred scrubber deployment, even under this
restrictive trading regime, according to Marchetti at this stage of the analysis, is the
sizeable Acid Rain Program bank, which does not begin to be significantly drawn down
until 2014. Under these same trading restrictions for NO R , Illinois power generators
would install 4.7 gigawatts of SCR technology and 6 .7 gigawatts of SNCR technology .
In addition, the 5.4 gigawatts of existing SCR technology capacity would operate year
round in meeting the NO, reduction targets of CAIR. Compliance under the mercury
MACT cap-and-trade capacity (17 .0 gigawatts) would be achieved by installing some
kind of mercury removal technology
.
According to the preliminary draft of this analysis, the level of coal-fired units requiring
major control technology retrofits increases significantly between the two regulatory
regimes. This increase is precipitated by the restrictive Illinois-only trading regime,
which forces power generators to install technology in order to meet the statewide caps
.
To comply with CAIR and mercury cap-and-trade reduction targets with Illinois-trading
only, Illinois power generators between 2010 and 2020, inclusively, will have to expend
$4.8 billion in compliance costs. This would equate to an annual cost of $480 million or
20 percent greater than the cost of complying with these rules as part of the regional
program for 28 states and District of Columbia .
Potential Impact to Jobs
Coal Mining Jobs
The state's coal producers and miners have struggled for survival despite a
complex series of events that have forestalled a long-awaited revival in the coal
fields of Illinois. At the end of 2003, coal production in Illinois totaled 31 .1
million tons, down more than 2.3 million tons from 2002. Twenty mines
continued to operate in an area stretching south nearly to the tip of Illinois from
Danville on the east and Logan and McDonough counties in central Illinois
.
However, the erosion of employment and tonnage, dating back to the Clean Air
Act Amendments of 1990, continued with the closing of the Rend Lake Mine in
66
Jefferson County (1,682,614 tons) and Illinois Fuels 1-1 Mine in Saline County
(529,982 tons)
.
The loss of coal mines and coal mining jobs negatively impacted the economic
structure of southern Illinois . Although mining salaries doubled between 1980
and 2003, from $22,000 per year to $45,500 per year, the total economic payroll
of the mining industry to the State of Illinois decreased by 60 percent during the
same time period (Table 9-3) .
Table 9-3
The Economic Im act of the Loss of Coal Minin Jobs in Illino
ource:
epartment of roes an
mera s
. Annual Slatistieal Report 2003
. Illinois Coal Association
. I!/mots Census 1980.
1990, and 2003
.
At no time in its history, however, has the Illinois coal industry confronted so
many threats to its survival . Lower priced, lower-sulfur coals, primarily from the
Powder River Basin (PRB) of Wyoming, continue to make inroads in midwestem
and eastern power plant markets . Two of Illinois' largest in-state coal burners -
the Edwards Power Station at Bartonville and the Duck Creek Power Station at
Canton -- have tested PRB coal and were leaning heavily toward a fuel switch
.
The cost could be two million tons of Illinois coal and the more than 200 jobs that
go with it. Moreover, the regulatory climate concerning Illinois coal remained
uncertain with the shelving of the proposed Federal Energy Bill and the mixed
signals sent by U.S. EPA's controversial mercury reduction standards that would
have served to benefit PRB coal, again at the expense of coal mined here in
Illinois
.
Power Industry Jobs
Although not specifically requested in Section 9.10, Illinois EPA believes a job
impacts analysis must be performed in light of the absence of information on the
effects of a state-specific multi-pollution strategy on the job market in Illinois
.
According to industry estimates, there are approximately 4,100 jobs directly
involved in running Illinois power plants. The payroll and benefits for these
employees amount to approximately $700 million a year . The service and skilled
67
1980
1990 ~~
2003
Mining Industry
Employment
18,284
10,129
3,534
Production
(million tons
62 .5
61.6 mil
31 .1
mined / year) _
Average Mining
Industry Yearly
$22,000
$35,000
$45,500
Salary
Total Payroll
$402,248,000
$354,515,000
$160,797,000
labor force associated with the power plants adds approximately 6,000 more jobs
.
The approximate value of goods and services purchased locally and related to
these jobs is over $300 million. Illinois' coal-fired power plants pay nearly $21
million a year in property taxes to local taxing bodies, the majority of which goes
to support local school systems. A further consideration is the impact that would
be felt by the 5,500 or so retirees from these plants whose benefits, including
healthcare, could be affected .
Stricter pollution control requirements will undoubtedly have a ripple effect on
jobs throughout the power industry and on those jobs that depend indirectly on the
viability of the industry. U.S. EPA determined that there would be a vast
improvement in the job market for boilermakers under their Clean Air Interstate
Rule. Likewise, suppliers of pollution control equipment and other related goods
and services will also see an increased demand for their products. The influence
on those jobs directly related to the operation of the power plant is less certain .
The major restructuring of the power industry in Illinois is having a negative
impact on the job market. A critical part of the power industry's response to
restructuring is to reduce the costs of producing electricity in order to allow the
companies to remain competitive in the regional and national power markets
.
This, of course, is part of the purpose of the competitive forces that deregulation
promotes. Already, some Illinois companies have reduced their workforce by 20
percent .
Illinois EPA will work with the Department of Commerce and Economic
Opportunity to retain the experts that can work with the Illinois EPA to analyze
the impacts of any further regulation on the economy of Illinois and Illinois jobs
once the national direction is clear
.
Impact on Electric Rates
The determination of the costs of pollution control programs on retail electric rates is a
difficult process that is made even more difficult by Illinois' transition to a deregulated
power market. The Illinois EPA reviewed the available information on the impact of the
various national proposals on electricity costs, most notably the work of U .S. EPA for the
Clear Skies and Clean Air Interstate Rule as discussed earlier in this Chapter
.
The effort to obtain reliable estimates of the future of rates is difficult even without
adding the complexity of additional pollution control programs . This effort has been
complicated by the state of flux in Illinois' electric supply market due to the shift from a
traditional, utility owned and operated, and highly regulated power generation system, to
an increasingly deregulated power generation market . One of the major pieces of this
shift will occur after December 31, 2006, when the cap or freeze on retail rates will be
lifted .
68
Illinois is undergoing the transition to become a deregulated state for electric power,
although restructuring is not yet complete. As a result of this market restructuring, most
coal-fired power plants in the State now are owned by independent power producers,
which are not affiliated with Illinois utilities or by non-utility, generation affiliates of
Illinois utilities. This deregulation has brought about the expansion of regional power
transmission organizations through which power generators are more easily and
efficiently able to sell their power across state lines . As a result, Illinois' power
generators now compete with generators in several surrounding and nearby states . The
competitors for Illinois generation are typically utilities in states that have not
restructured their markets .
Most of the available information on the impact of new pollution control strategies
electricity costs is based on U .S. EPA's assessment of the Bush Administration's
proposed Clear Skies Act, and U.S. EPA's proposed Clean Air Interstate Rule . U.S. EPA
concluded that the costs of its Clean Air Interstate Rule to Illinois and the MAIN power
region would increase 2010 rates by approximately 2.5 percent to 3.5 percent over the
inflation adjusted rates that would otherwise occur without further pollution controls
.
However, for Illinois, U.S. EPA assumed that there is a competitive wholesale market for
electricity due to deregulation. This competition in wholesale markets has not
materialized to any significant degree, such that 2006 power purchase agreements assume
no increase in competition in wholesale markets
.
Further work needs to be done in this vital area of costs and retail electric rates
.
Currently, how the costs of these multi-pollutant proposals will affect competition and
consumer rates in a state that is entering full deregulation are not known. But we know
that compliance costs will ultimately be reflected in electric and very likely natural gas
rates. Concern exists that if competition among suppliers of electricity is not robust,
power prices will not remain at reasonable levels . As California's experience in 2000
and 2001 has shown, if competition among electric suppliers fails to take hold, the price
rise could be significant .
Whether robust competition occurs in 2007 in Illinois will depend on the degree to which
competitive forces create an effectively functioning wholesale and retail supply market
.
If Illinois generators are encumbered with state-specific regulations that their out-of-state
competitors are not, these generators will incur additional costs that cannot be recovered
from utility ratepayers and these generators will face a competitive disadvantage in
regional power transmission organizations. An increase in electric and gas rates will
drive greater interest in and implementation of renewable energy and energy efficiency
projects. However, the degree to which Illinois is poised to increase its production of
renewable energy and the price points for power generation at which a significant
increase in renewable energy production will occur is not known
.
The impact on competition and on rates through a state-specific program has not been
evaluated. However, this analysis must be a part of the overall review of Illinois'
deregulated market post-2006 . Without a resource and transmission planning model that
would include detailed production cost information for Illinois and the surrounding
69
interconnect, we cannot determine which specific Illinois generation plants might be
closed due to the costs of more stringent pollution controls and how electric rates might
be affected
.
Conclusion
Illinois EPA believes that independent, full and complete economic assessments should
be performed on the full economic impacts in Illinois of the final CAIR proposal, the
Mercury Reduction Rule, the Carper and Jeffords Bills, and any others that surface in the
next several months. The impact to Illinois' coal jobs and power industry jobs must be
fully understood. Certainly, with the deregulated electricity market that exists in Illinois,
the cost impacts on generation and, ultimately, to Illinois citizens and businesses needs to
be fully understood. Such assessments can only be properly performed once certainty
exists at the federal level . These cost analyses will be vital in fully assessing the
appropriate timing and scope of additional emission reductions from power plants in
Illinois .
70
Table 1-1
Table 2-1
Table 2-2
Table 2-3
Table 3-1
Table 3-2
Table 3-3
Table 6-1
Table 9-1
Table 9-2
List of Appendices, Figures and Tables
Appendices
Appendix A - 2002 Annual Data For Fossil Fuel-Fired Illinois Electrical Generating
Units
Appendix B - Best Available Control TechnologyClearinghouse Results
Appendix C
- Multi-Pollutant Strategy, Legislation Comparison Chart
Appendix D - List of Health Studies Addressing Emissions from Power Plants
Tables
Amoral 2002 Summary Data for Coal, Gas, and Oil-fired EGUs Over 25
Megawatts
Number of Annual Adverse Health Events Avoided Through Reductions
in Particulate Matter and Ozone
Health Effects of Power Plant Particulate Matter Pollution In Illinois
(Cases/Year)
Estimated Annual Human Health Benefits for Illinois from Reductions of
Particulate Matter and Ozone (Number of Health Effects Avoided): Clear
Skies Act (S. 485)
SO2 Reduction Potential of Various Control Technologies
NO, Reduction Potential for Various Types of Boilers
Mercury Removal Efficiency for Emerging Mercury Control Technologies
Estimated Economic Impacts from Clean Energy in Illinois
Summary of the U.S. EPA's Cost Estimate Of Various National Bills
Approximate Regional Emissions Reductions and Incremental Costs by
Control Option for the Proposed CAIR from the Base Case (No Further
Controls) in 2015
Table 9-3
The Economic Impact of the Loss of Coal Mining Jobs in Illinois
71
Figures
Figure 4-1
Emission Cap Levels and Timetables Associated with Federal Multi-
Pollutant Legislative Proposals
72
BACT
BART
CAAPP
CHP
CO
CO2
EGU
EIA
ERMS
Hg
HAP
IGCC
Illinois EPA
kV/hr
LAER
MACT
mmBtu
MW
N2
NAAQS
NEPD
NESHAP
NO
NO2
NO,,
NSPS
NSR
PM2.5
PM !0
ppb
ppm
PSD
SNCR
SIP
SNR
SO2
TPD
U. S. DOE
U.S. EPA
VOM
Acronyms
Best Available Control Technology
Best Available Retrofit Technology
Clean Air Act Permit Program
Combined Heat and Power
Carbon Monoxide
Carbon Dioxide
Electric Generating Units
Energy Information Administration
Emissions Reduction Market System
Mercury
Hazardous Air Pollutant
Integrated Gasification Combined-Cycle
Illinois Environmental Protection Agency
Kilowatt-hour
Lowest Achievable Emission Rate
Maximum Achievable Control Technology
Million British Thermal Units
Megawatts
Nitrogen Gas
National Ambient Air Quality Standards
National Energy Policy Development
National Emission Standard for Hazardous Air Pollutants
Nitric Oxide
Nitrogen Dioxide
Nitrogen Oxides
New Source Performance Standard
New Source Review
Particulate Matter 2.5 microns in diameter
Particulate Matter 10 microns in diameter
Parts per billion
Parts per million
Prevention of Significant Deterioration
Selective non-catalytic reduction
State Implementation Plan
Selective non-catalytic reduction
Sulfur Dioxide
Tons Per Day
U.S. Department of Energy
United States Environmental Protection Agency
Volatile Organic Material
73
Christine Todd Whitman, testimony on the Clear Skies Act before the U .S. Senate
Environment and Public Works Committee . April 8, 2003 .
2
National Research Council. "Toxicological Effects of Methyl mercury". Committee on the Toxicological
Effects on Methyl mercury Board and National Academy Press, Washington, D .C ., 2000.
' ABT Associates, Inc . Particulate-Related Health Impacts of Eight Electric Utility Systems . April 2002 .
4U.S. EPA .
The Clear Skies Act of2003 . Illinois and Clear Skies
.
http://www.epa.gov/a r/clearskies/state/il.html .
5 U.S. EPA.
Control Techniques for Sulfur Oxide Emissions from Stationary Sources
(EPA-450/3-81-004)
.
Office of Air Quality Planning and Standards . April 1981 .
6Electric Power Research Institute, U.S> Dept. of Energy and U.S. EPA.
Combined Utility Air Pollutant
Control Symposium, The Mega Symposium SO, Control Technologies and Continuous Emission
Monitors
(TR-108683-V2). August 1997 .
U.S. EPA.
Alternative Control Techniques Document- Nat
Emissions from Utility Boilers
(EPA-453/R-94-023). Office of Air Quality Planning and
Standards. March 1994 .
s In October 1998, U.S. EPA issued a rulemaking that found that EGUs (in 22 states and the District of
Columbia) emit NO, in amounts that significantly contribute to nonattainment of the 1-hour ozone
standard in one or more downwind states, and issued a call for revisions to the state
implementation plans to address these contributions . As part of that rulemaking, U .S. EPA
developed a federal NO, Trading Program that applied to EGUs and certain large industrial boilers
in the affected states to allow for the most cost-effective compliance options to be utilized
.
(See
63
Fed. Reg.57356,
October 27, 1998)
.
STAPPA/ALAPCO Controlling Nitrogen Oxides Under the Clean Air Act : A Menu of Options . July
1994
.
10U.S. EPA.
Cost of Selective Catalytic Reduction (SCR) Application for Nat Control or Coal-Fired
Boilers
(EPA/600/R-01/087). Office of Research and Development. October 2001
.
General Electric Power Systems .
Combustion Modification -An Economic Alternative for Boiler
NOx Control
(GER-4192) .
12 STAPPA/ALAPCO. Controlling Particulate Matter Under the Clean Air Act: A Menu of Options . July
1996 .
Electric Power Research Institute, U.S. Dept. of Energy and U.S. EPA. Combined Utility Air Pollutant
Control Symposium, The Mega Symposium Particulates and Air Toxics (TR-108683-V3) . August
1997 .
14 Illinois Clean Coal Institute. Final Technical Report: Correlate Coal/Scrubber Parameters with Hg
Removal and Hg Species in Flue Gas/96-1/2 .UA-2) . September 1, 1996, through August 31,
1997 .
' Parsons Infrastructure and Technology Group, Inc . "The Cost of Mercury Removal in an IGCC Plant,
Final Report". September 2002
.
6 The WRAP states consist of Arizona, California, Colorado, Idaho, Nevada, New Mexico, Oregon, Utah
and Wyoming
.
n The Clean Planning Act of 2003 (CAPA) was introduced as S . 843 on April 9, 2003 by Senator Thomas
Carper (D-DE) and in the House as H .R. 3093 on September 19, 2003 by Congressman Charles
Bass (R-NH) .
'a The Clean Power Act of 2003 (CPA) was introduced as S . 366 on February 12, 2003 by Senator James
Jeffords (I-VT) .
"The Clean Smokestacks Act of 2003 was introduced as H .R. 2042 on May 8, 2003 by Congressman
Henry Waxman (D-CA) .
20 Report of the National Energy Policy Development Group
.
National Energy
Policy, U.S. Government
Printing Office (ISBN 0-16-050814-2), May 2001
.
httv ://www.whitehouse.gov/energv/National-Energy-Policv .pdf
21
Report of the Illinois Energy Cabinet
.
Illinois Energy Policy,
February 2002 .
httv://www.illinoisbiz.biz/coal/pdf/Illi oisEnergvPolicyReport-Feb02.ptif
74
22
Blagojevich, Rod. The Blagojevich Partnership For a New Economy. Document distributed during
gubernatorial campaign. 2001
.
23
State of Illinois, Office of the Lieutenant Governor.
Special Task
Force
on the Condition and Future of
the Illinois Energy Infrastructure Final
Report, Blackout Solutions. June 2004 .
24
Anderson, Patrick L .. Geckil, Ilhan, Anderson Economic Group .
Northeast Blackout Likely to Reduce
US Earnings by $6.4 Billion
(AEG Working Paper 2003-2) . August 19, 2003
.
2s
Energy Information Administration (EIA)
.
Annual Energy Outlook 2004,
DOE, 'r-IA-0383 (2004)
.
January 2004. h
:Hw_mvweia.doe,
;ov/oiat%ae~/aeoref tab.html .
26
Midwest CUP Application Center,
BCHP Baseline AnalIsis for
lllinors
Market
2002 UPDATE.
University of Illinois at Chicago Energy Resource Center,
Chicago. IL, August 2002
.
27
Environmental Law and Policy Center (ELPC),
Repowering the Midwest,
Chicago, IL, December 2001, www.tcppMtrmidwest .o_rg
2"
American Council for an Energy-Efficient Economy . Energy Efficiency and Economic Development in
Illinois. Report number E982. 1998 .
2~e
Clean Air Counts (CAC) . Clean the Air
.
The Regional Dialogue on Clean Air and Redevelopment
.
March 1999
.
30
Environmental Law and Policy Center . Repowering the Midwest
. 2001
.
kn
//wrvw.renmverrrtirlwestorg .
31
U .S. EPA .
Benefits of the
Proposed
Inter-State Air Quality Rule
(EPA-452/03-001). Office of Air
Quality Planning and Standards, January 2004
.
75
APPENDIX A
2002 Annual Data
For
Fossil Fuel-Fired
Electrical Generating Units
In Illinois
A-2
Sr
.
No
.
ORISPL
Plant Name
ID No
.
UNIT
ID
Unit
Capacity
MW
Fuel
Used
Heat Input
mmBtu
S02Tons
NOx
Tons
C02
Tons
NOx
lbs/
mmBtu
S02
lbs/
mmBtu
1
000889
Baldwin
157851AAA
1
623
Coal
43,883,642
9053
12119
4502460
0
.55
0
.41
2
000889
Baldwin
157851AAA
2
635
Coal
37,134,739
7283
7405
3810021
0.40
0
.39
3
000889
Baldwin
157851AAA
3
602
Coal
46,402,730
9931
2850
4760923
0
.12
0
.43
4
000861
Coffeen
135803AAA
01
389
Coal
18,569,744
14008
4745
1905255
0
.51
1.51
5
000861
Coffeen
135803AAA
02
616
Coal
37,545,026
28323
9594
3852118
0
.51
1.51
6
000867
Crawford
031600AFN
7
240
Coal
11,626,898
3142
1187
1192922
0
.20
0
.54
7
000867
Crawford
031600AfN
8
358
Coal
17,347,866
4453
1663
1779892
0
.19
0
.51
8
000963
Dallman
167120AAO
31
80
Coal
4,528,281
772
2498
464597
1.10
0.34
9
000963
Dallman
167120AAO
32
80
Coal
4,787,079
816
2640
491150
1.10
0.34
10
000963
Dallman
167120AAO
33
205
Coal
13,274,189
1831
2892
1361463
0.44
0
.28
11
006016
Duck Creek
057801AAA
1
416
Coal
22,635,088
11026
5328
2322122
0.47
0.97
13
000856
Edwards Station
143805AAG
1
136
Coal
6,416,602
11399
1306
651130
0
.41
3
.55
14
000856
Edwards Station
143805AAG
2
281
Coal
17,222,007
14666
3901
1771396
0
.45
1.70
12
000856
Edwards Station
143805AAG
3
364
Coal
15,971,436
9683
3639
1604354
0
.46
1.21
15
000886
Fisk
031600AMI
19
374
Coal
14,649,555
3843
2462
1503046
0
.34
0
.52
16
000891
Havana
125804AAB
9
429
Coal
28,513,578
12815
3901
2919450
0
.27
0
.90
000892
Hennepin
155010AAA
75
Coal
4,684,352
1008
762
480620
0
.33
0.43
18
000892
Hennepin
155010AAA
2
231
Coal
17,575,289
3784
2859
1803245
0
.33
0.43
19
000863
Hutsonville
033801AAA
05
78
Coal
3,160,847
7163
897
324303
0
.57
4.53
20
000863
Hutsonville
033801AAA
06
78
Coal
3,442,889
7792
902
353240
0
.52
4
.53
21
000384
Joliet 29
197809AAO
71
330
Coal
15,034,236
5264
879
1542510
0.12
0.70
22
000384
Joliet 29
197809AAO
72
330
Coal
13,824,017
4840
808
1418342
0
.12
0.70
23
000384
Joliet 29
197809AAO
81
330
Coal
15,585,483
5311
1067
1599072
0
.14
0
.68
24
000384
Joliet 29
197809AAO
82
330
Coal
15,403,146
5249
1055
1580364
0
.14
0
.68
25
000874
Joliet 9
197809AAO
5
360
Coal
14,368,937
4560
2562
1474252
0
.36
0
.63
26
000887
Joppa Steam
127855AAC
1
183
Coal
13,547,956
1
3446
874
1389886
0
.13
0
.51
27
000887
Joppa Steam
127855AAC
2
183
Coal
16,256,930
4135
1049
1667800
0.13
0
.51
28
000887
Joppa Steam
127855AAC
3
183
Coal
15,395,686
3975
1034
1578891
0.13
0
.52
29
000887
Joppa Steam
127855AAC
4
183
Coal
13,401,870
3460
900
1374417
0
.13
0
.52
30
000887
Joppa Steam
127855AAC
5
183
Coal
15,093,451
3930
939
1548600
0.12
0
.52
31
000887
Joppa Steam
127855AAC
6
183
Coal
16,062,809
4183
999
1648057
0
.12
0
.52
61
0008
Total Coal-Fired
Units
Wood River
119020AAE
5
387
16,905
Coal
17
,
611 221
5726
1903
1806910
1
0
.22
0.65
931,038,484
352,994 i 170,997
1`95,507,0
62
0
.37
0.76
Sr
.
ORISPL
No
.
---
Plant Name
ID No
.
UNIT
.
II)
1
Unit
Capacity
M
",
Fuel
Used
Heat Input
mmBtu
S02
NOx
C02
NOx
S02
Ibs/
lbs/
Tons
I
Tons
Tons
mmBtu mmBtu
32
000876
'
Kincaid
0? 814AAB
1
660
Cral
32,264,830
8836
10457
3310371
Oh5
1
0
.55
33
000876
Kincaid
021814AAB
2
660
1
Coal
32,238,113
8829
I
10448
I
3307630
0.65
1
1
0
.55
_34
000964
Lakeside
167120AAO
38
Coal
1,001,318
2783
469
102726
0
.94
5
.56
_
000964
3C
Lakeside
167120AA0
-
8
-
38Coal
j
1.593,064
1
4428
74h
.
i--
1634341 0u4
5.56
L
36
000976T
Marion
199856AAC
1
1
33
1
Coal
1.043
.046
2522
42
_
6_
1
100444
1
0
.82
-
4.84
i
37
000976
j
Marion
199856AAC
_j3
Loa]
_03
.,06
1
493
83
r
19617
0
.82
4.84
38
000976
Marion
199856AAC
3
33
Coal
1,420
.902
736
1
145029
4
.72
_
3354
_
1
39
000976
Marion
_
y
199856AAC
17_
3
C
oa
l
12,935,28°
2626
457
1
1364004
I
0
.84
0
.41
1
40
000864)
Meredosia
137805AAA
01
_
34
Coal
1,133,979_
2846
288
116346
I
0
.51
5,02
41
000864
Meredosia
137805AAA
02
34
Coal
1 336 982
3355
1
339
137174 0
.51
l
5
.02
2
000864
Meredosia
137805AAA
03
34
Coal
1,069,118
2683
271
109691
0
.51
I
5
.02
43
000864
Meredosia
137805AAA
04
34
1
Coal
1,406,308
3529
357
144287
1
0
.51
I
5
.02
44
000864
Meredosia
137805AAA
05
240
Coal
10,810,415
12639
2514
I
1109146
_
0
.47
2
.34
45
006017
Ne
on
079808AAA
1
617
1
Coal
1 40,631,096
9046
3037
168749
0
.15 0
.45
1
1
46
006017
Ne ton
079808AAA~
-
2
650
Coal
_
38,533,185
8823
2215
3953506
0.11
1
0
.46
j
47
I
000879
Powerton
179801AAA
51
447
±
Coal
0
.936,258
I
4487
_
7264
2148061
0
.69
~
0
.43
48
I
000879
Powerton_
179801AAA
52
447
Coal
21,136
.861
4530
7333
2168642
0
.69
i
0
.43
9
000879
Powerton
179801AAA
61
4
Coal
1
18,293,368
1
3921
6347
1876900
0
.69
0.43
50
000879
Powerton
179801AAA 1
62
j
447
Coal
18,087 823
3877
6276
1855811
0
.69
0.43
1
000897
Vermilion
183814AA
I
1
75
1
Coal
5,304,579
1
7277
977
I
544141
0
.37
1'
52
000897
Vermilion
1183814AAA
2
102
Coal
6,735,448
1
9240
1240
j
690919
0
.37
2.74
53 54
000883
000883
1
Waukegan
~
Waukegan
-
097190AAC
097190AAC
17 7
1
121326
1
Coal
Coal
7.502
.045
I 16,116,575
1642
2365
769710
0
.63
0
.44
3754
1092__ 165356_
0
.14
-
0
.47
55
000883
I
Waukegan
097190AAC
8
i
355
I
Coal
121950142
5385
1488
I
2252084
0
.14
~
0
.49
I
56
000884
Will County
197810AAK
1
188
Coal
9,398
.486
1969
4000
1
964284
0.85
-t
0.42
57
I
000884
Will County
1978 OAAK
2
184
Coal
8,292,831
1617
3310
1
850842
0
.80
0.39
.)8
1 000884
Will County
197810AAK 1
3
299
Coal
i 15
.559,101
3636
1300
1596358
1_
0_17
I
047
59
I 000884
Will County
197810AAK
4
598
Coal
27,584,774
6462
2009
I
2830196
0
.15
f 0
.47
60
000898
I
Wood River
1I902OAAE j
4
103
Coal
5.561,263
1
1536
521 ±570588
0
.19
0.55
A-4
Sr
.
No
.
ORISP
Plant Name
ID No
.
UNIT
ID
-- ---
-
Unit
Capacity
I
HAS
.
Fuel
Heat
Used
1
Input
mmBtu
I
S02
Tons
NOx
Tons
C02
I
Tons
I
NOx
Ibs/
mmB u
I
SO2
Ibs/
mmBtu
1
t
Calumet Energy
I
055296
Team
0316000HA
**1
153
N Gas
65,208
1.70
3875
0 05
0
.00
Calumet Energy
055296
']'earn
0316000HA
*_*2
t
153
N
.Gas
8.384
0
0.30
498
I
0.07
0.00
3
055253
Crete Energ y
Park"
197030AAO
GTI
I
89
N
.Gas
87,321
0
1.30
5189
---
0.03
0
.00
055253
Crete Enerov Park
197030AAO r
G1'2
89
N
.Gas
I
86,9
16
0
1.10
5166
0
.03
0
.00
5
055253
Crete Energy Park
197030AAO
GT3
89
N
.Gas
75,077
0
1.00
4462
0.03
0
.00
6
055253
Crete Ene
1
Park
197030AAO
GT4
89
N
.Gas
61 334
0
0
.80
3645
0
.03
0
.00
7
055236
Duke Energy Lee
F
103817AAH I
CTI
055236
Duke Energy Lee
1
103917AAH
CT2
83 83
N
.Gas
1
N
.Gas
'1,847
73,748
0
0
.90
4270
0
.0_
3
I
0
.00
1.00
4382
0
.03
0
.00
9
055236
Duke Energy Lee
1
103817AAH
I
CT3
83
N
.Gas
I
108,212
I
0
1
1.70
6431
0
.03
0
.00
0
055236
Du e Energy Lee
103817AAH
I
CT4
83
N
.Gas
111,819
0
1.90
6645
0
.03
0.00
I
I 1
055236
Duke Energ Lee
103817AAH
CT5
83
I
N
.Gas
71,008
I
0
1.10
4220
0
.03
0
.00
;2
j 055236 1
Duke
Energy
Lee
1103817AAH
CT6
1
83
N
.Gas
70,684
0
1.50
4201
1
0
.04
0.00
13
I
055236
1 Duke Energy Lee
1103817
.AAH
CT7
I
83
N
.Gas
j
60,681
0
1.10
1
3606
1
0
.04
I
0.00
14
055236 I
Duke Energy Lee
1103817AAH
CT8
83
N
.Gas
127,773
0
2.30
7593
0
.04
1
0.00
15
!
055438
Elgin
_
Energy Center
4
031438ABC
CT01
135
N
.Gas
I
2-076
0
0.10
I
123
0
.10
0.00
16
055201
1
Gibson City Power
'
053803AAL
GCTG 1
135
I
NGas
204 499
0
6
.90
12153
0.07
0.00
17
05520!
J
Gibson City Power
053803AAL
GCTG2
135
N
.Gas
185 068
0
5 80
11021
0.06
0.00
X
19
055204
Kinmundy Power PI
121803AAA KCTGI
250
N
.Gas
2 8 277
0
7
.90
12971
I
0
.07
0
.00
19
055204
Kinmundy Power PI 121803AAA
I
KCTG2 1
250
N
.Gas
208 278
1
0
6
.60
12378
0.06
0
.00
20
I
055222
I Lincoln Generating
197811 AAH
CTG-1
83
N
.Gas
206,000
0
2
.50
12242
0
.02
0
.00
21
055222
i Lincoln Generating
197811AAH
CTG-2
83
N
.Gas
1
NGas
204,224
(80,522
0
2
.10
r
-
0 T
.20
12137
10728
0
.020
.02
0
.00
0
.00
1
L22
j 055222
i Lincoln Generating
197811AAH
-CTG 3
-
--
83
23
055222
Lincoln Generating 1197811AAH
1
CTG-4
1
83
N
.Gas
160
.39L4 0
1.80
9532
0
.02
0
.00
't4
055" '
Lincoln Generating
197811A
.All
'
CTG-5
83
N Gas
165,500
0
2.40
I
9836
0_03
I
0
.00
2
5
055222 L Lincoln Generating
19781 IAAH
CTG-6
83
N
. Gas
111,782
0
1.40
6643
.
0
.03
0.00
16
27
055L2
I.mcclnGenerattne_19_781IAA~_CTG-7
_ 83
N
.Gas
'
8
.383
0
1.40
4956
0
.03
0.00
r 055222
Lincoln Gene ating
;
19781 IAAH
CTG-8
83
1
N
.Gas
1
84,453
0
1.20
5019
i
0
.03
0.00
28
055417 I
MEP Flora Power
02SS03AAD I CT-01
I
94
.5
N
.Gas
!
3,985
0
0
.10
237
0
.05
0.00
29
05541'
~AiEP Flora Power
025803AAD '
1
CT-02
94
.5
_
N
.Gas
3
.985
0
0
.10
-
237
0
.05
1
0.00
30
055417
MEP Flora Power
025803AAD ! CT 03
95
!
N
.Gas
I
3.985
0
!
0
.10
237
0
.05
0.00
3!
055417
MEP Flora Power 025803 AAD
_C'1-04
95
i
N
. Gas
3,985
0
.10
237
t
0
.0S
000
32
007858
MEPI G
-F Facility
1
127899AAA
1
,_ 72
j
N
.Gas
j
100,522
1
o
.60
5974
0
.13
0
.00
A-5
SrNo
..
Plant Name
ID No
.
UNIT
ID
Unit
Capacity
Fuel
Used
Heat Input
mmBtu
S02
Tons
NOx
Tons
C02
Tons
NOx
lbs/
mmBtu
S02
lbs/
mmBtu
33
007858
MEPI GT Facility
127899AAA
2
72
N
.Gas
94,976
0
6
.00
5645
0
.13
0
.00
34
007858
MEPI GT Facility
127899AAA
3
72
N
.Gas
95,813
0
6
.20
5694
0
.13
0
.00
35
007858
MEPI GT Facility
127899AAA
4
72
N
.Gas
46,778
0
2
.50
2781
0
.11
0
.00
36
007858
MEPI GT Facility
127899AAA
5
72
N
.Gas
43,368
0
2
.10
2578
0
.10
0
.00
37
055202
Pinckneyville Power
145842AAA
CT05
49
N
.Gas
64,026
0
1.20
3805
0
.04
0
.00
38
055202
Pinckneyville Power
145842AAA
CT06
49
N
.Gas
73,870
0
1.40
4391
0
.04
0
.00
39
055202
Pinckneyville Power
145842AAA
CT07
49
N
.Gas
69,816
0
1.30
4150
0
.04
0
.00
40
055202
Pinckneyville Power
145842AAA
CT08
49
N
.Gas
66,572
0
1.10
3956
0
.03
0
.00
41
055640
PPL University Park
197899AAC
CTOI
44
N
.Gas
16,484
0
0
.90
980
0
.11
0
.00
42
055640
PPL University Park
197899AAC
CT02
44
N
.Gas
13,854
0
0
.60
823
0
.09
0
.00
43
055640
PPL University Park
197899AAC
CT03
44
N
.Gas
13,663
0
1.60
812
0
.23
0
.00
44
055640
PPL University Park
197899AAC
CT04
44
N
.Gas
14,500
0
0
.70
862
0
.10
0
.00
45
055640
PPL University
Park
197899AAC
CT05
44
N
.Gas
33,685
0
0
.20
2002
0
.01
0
.00
46
055640
PPL University Park
197899AAC
CT06
44
N
.Gas
27,397
0
0
.20
1628
0
.01
0
.00
47
055640
PPL University Park
197899AAC
CT07
44
N
.Gas
29,699
0
1.20
1765
0
.08
0
.00
48
055640
PPL University Park
197899AAC
CT08
44
N
.Gas
26,111
0
1.60
1551
0
.12
0
.00
49
055640
PPL University Park
197899AAC
CT09
44
N
.Gas
18,221
0
0
.70
1083
0
.08
0
.00
50
055640
PPL University Park
197899AAC
CTI O
44
N
.Gas
15,744
0
0
.60
936
0
.08
0
.00
51
055640
PPL University Park
197899AAC
CT11
44
N
.Gas
10,763
0
1
.00
640
0
.19
0
.00
52
055640
PPL University Park
197899AAC
CT12
44
N
.Gas
12,614
0
0
.90
750
0
.14
0
.00
53
055279
Reliant Energy
-
Aurora
043407AAF
AGS05
45
N
.Gas
211,157
0
7
.70
12549
0
.07
0
.00
54
055279
Reliant Energy
-
Aurora
043407AAF
AGS06
45
N
.Gas
203,388
0
7
.80
12088
0
.08
0
.00
55
055279
Reliant Energy
-
Aurora
043407AAF
AGS07
45
N
.Gas
198,741
0
8
.10
11811
0
.08
0
.00
56
055279
Reliant Energy
-
Aurora
043407AAF
AGSIO
45
N
.Gas
209,367
0
8
.80
12441
0
.08
0
.00
57
055237
Reliant Energy
Shelby
173801AAA
SCEI
41
N
.Gas
134,636
0
5
.60
8001
0
.08
0
.00
58
055237
Reliant Energy
Shelby
173801AAA
SCE2
41
N
.Gas
147,174
0
6
.10
8746
0
.08
0
.00
59
055237
Reliant Energy
Shelby
173801AAA
SCE3
41
N
.Gas
156,480
0
6
.00
9300
j
0
.08
0
.00
A-6
Sr
.
No
.
ORISPL
Plant Name
ID No
.
UNIT
ID
Unit
Capacity
MW
Fuel
Used
Heat Input
mmBtu
S02
Tons
NOx
Tons
C02
Tons
NOx
Ibs/
mmBtu
S02
lbs/
mmBtu
60
055237
Reliant Energy
Shelby
173801AAA
SCE4
41
N
.Gas
148,595
0
6.20
8831
0
.08
0
.00
61
055237
Reliant Energy
Shelby
173801AAA
SCE5
41
N
.Gas
154,951
0
6
.50
9208
0
.08
0
.00
62
055237
Reliant Energy
Shelby
173801AAA
SCE6
41
N
.Gas
150,121
0
6
.10
8922
0
.08
0
.00
63
055237
Reliant Energy
Shelby
173801AAA
SCE7
41
N
.Gas
202,340
0
8
.20
12026
0
.08
0.00
64
055237
Reliant Energy
Shelby
173801AAA
SCE8
41
N
.Gas
192,091
0
7
.60
11416
0
.08
I
0.00
65
055109
Rocky Road Power
089425AAC
T2
121
N
.Gas
206,143
0
8.30
12251
0
.08
0.00
66
055109
Rocky Road Power
089425AAC
T3
35
N
.Gas
53,829
0
4.10
3199
0.15
0.00
67
055281
Southeast Chicago
Energy
0316000KE
CTGIO
44
N
.Gas
7,059
0
1.20
418
0.34
0.00
68
055281
Southeast Chicago
Energy
0316000KE
CTGII
44
N
.Gas
7,191
0
1.10
426
0
.31
0.00
69
055281
Southeast Chicago
Energy
0316000KE
CTG12
44
N
.Gas
3,885
0
0
.60
231
0
.31
0.00
70
055281
Southeast Chicago
Energy
0316000KE
CTGS
44
N
.Gas
6,890
0
1.10
407
0.32
0
.00
71
055281
Southeast Chicago
Energy
031600GKE
CTG6
44
N
.Gas
6,806
0
1.10
403
0.32
0
.00
72
055281
Southeast Chicago
Energy
0316000KE
CTG7
44
N
.Gas
7,011
0
1.10
415
0
.31
0
.00
73
055281
Southeast Chicago
Energy
0316000KE
CTG8
44
N
.Gas
6,453
0
1.10
382
0.34
0
.00
74
055281
Southeast Chicago
Energy
031600GKE
CTG9
44
N
.Gas
6,147
0
1.00
363
0
.33
0
.00
75
055250
University 'ark
Energy
197899AAB
UPI
25
N
.Gas
35,111
0
2.60
2072
0
.15
0
.00
76
055250
University Park
Energy
197899AAB
UPI 0
25
N
.Gas
34,602
0
2.50
2041
0
.14
0
.00
77
055250
University Park
Energy
197899AAB
UPI 1
25
N
.Gas
35,825
0
2.70
~
2114
0
.15
0.00
Sr
.
No
.
r
j
ORISPL
I
Plant Name
ID No
.
UNIT
ID
Capacity
Unit MW
T
-
!
----
I
Fuel
Beat Input i
l
:sed
mniftu
j
S02
'Pmts
NOx
Tuns
NOx
C02
Ibs/
Tons
mmBtu
S02
lbs/
mmBtu
78
I
'
055250 f
University Park
Energy
j 197899AAB
i
UPI2
25
N
.Ga=
34,3_
20
0
2
.60
j
2025
i_
0.15
0
.00
.
79
80
055' 0055250
I
University Park
Ener~v
!
197899AAB
UP2
25
N
. Gas
'
0
_
2__0_0
?0X2
~~
15
U-0
0
10
.4
14
0.00
University Park
Energy
197899AAB
UP3
25
N Gas
31
.465
U
140
2129
0 15
0.00
2202
0
.15
I
0.00
81
055250
University Park
Ener
•
197899AAB
U1`4
25
N
.Gas
i
36,100
0
82
055250
University Park
Energy
197899AAB
UP5
25
N
.Gas X37,334
0
I
2
.80
83
055250
University Park
Ener y
197899AAB
UP6
25
I
N
.Gas
36,963
0
2
.80
!
2180
1
0
.15
0.00
!
84
055250
University Park
Energy
197999AAB
UP7
25
,
!
N
.Gas
38
.231
0
I
2
.90
2256
0
.15
__0,00
1
,
055250
University Park
Ener
197899AAB
UP_8
25
i
N
.Gas j
37,900
0
I
2-80
2236
_j
0
.15
0
.00
-
-
86
055250
Um ersity Park
Energy
197899AAB
UP9
j
I
25
1
N Gas
36 °
0
2
.70
j
I
2174
0
.15
0
.00
87
000913
Venice
119105AAA
1
45
N
.Gas 1
0
0
0
.00
0
-
-
88
000913
Venice
119105AAA
2
I
45
N
.Gas
0
0
0
.00
0
-
89
000913
Venice
119105AAA
3
45
I
N
.Gas
L
116,293
0
14
.10
6912
0
.24
!
0
.00
7522
1
0
.20
90
000913
Venice
1119105AAA
4
~
45
N
.Gas
1 126,576
0
12
.60
I
0
.00
00
:?91
.3
Venice
I19105AAA
5
45
!
N
.Cias
_
I-2hxl
0
13
.20
.
.29
:
0
._
0
.00
2
000913
Venice
1119105AAA
6
45
N
.Gas
131,155
0
1
14
.30
7795
0
.22
0.00
93
I
000913
Venice
119105AAA
7
104
N
.Gas I
89,639
0
6.00
5328
_
1
0
.13
1
0.00
94
000913
Venice
119105AAA
8
104
N
.Gas
I
122,^,66
0
I
15
.90
_
7297 10
.26
0.00
95
000898
Wood River
1119020AAE
1
I
46
N
.Gas
4,091
I -
0
059
243
0
.29
1-
0.00
96
060898
Wood River
1 I9020AAE
2
1
46
N Gas
i
5 873
0
0
.45
348
~
0
.29
000
N
.Gas
6,217
0
0
_
0
.90
315
j
371
0
.'9
OM
-
450097
^
0
.08
0.00
97
000898
Wood River
119020AAE
3
46
--~---
-_-~
-
1_
'total Gas-Fired
Units
-_
1
j
6284
7,570
.638
Lmood I nergy
I
1
1
5
05519
9
1
Fa
li
197808
AG
8
170
N
'Oil
536966
1
40
31916
03
00
}_ _
*
__
_
Ehvood Energy
16
055199
Facility
197808A\G
9
170
N
.GasiOil'I
651,943
i
0
.10
10
.90
38744
I
0
.03
0
.00
C
OO H
7Cw
Sr
.
!
No,
ORISPL
i
I
UNIT
Plant -Name
I
ID No
.
1
-
Unit
Fuel
Capacity
ID
8Iµ
,
Used
Heat Input
mmBtu
S02
Tons
NOx
Tons
C02
Tons
mmBtu
NOx
Ibs/
mmBtu
S02
Ibs/
1
006025
Collins Station
F
063806AAF 1
1
554
N
.GasIOil
2,874,427
48
187
172987
0
.13
0
.03
2
006025
!
Collins Station
063806AAF
I
2
554
N
.Gas'Oil
6,442,082
108
419
387694
I
_
0.13
0
.03
Collins Station
063806A AF!
- 3
3
006025
530
N
.Gas
.Oil
6,720,399
113
437
396110
0
.13
0
.03
4
006025
Collins Station
~
063806AAFt4
_J
530
N,Gas/Oil
6,451,251
08
_
456
388401
0.14
0
.03
5
006025
Collins Station
063806AAF
5
1
530
i N
.Gas/Oil
5,575,148
93
395
335895
0.14
0
.03
!
6
I
055188
Cordova Energy
Center
1
1
1
1
-161807AAN
1
250
I
N
.Gas
.Oil
!
L
3,211 814
0
.90
!
1
25
.00
I
190870
-
0
.02
0
.00
I
~l
055188
Cordova Energy
I
0
.90
-
0
.10
!
18860737616
_
0
.01
I
0.00
!
Center
161807AAN
.i
1
250
F
N- Gas' Oil
-'-
--t-
172
N
.Gas'Oil
1-1 3,713
---
+
F
632,950
1-040
-r-
055199
Ehvood Energy
Facility
197808AAG
1
-
0
.04
0 00
12
.90
055199
Flwood Energy
i
Facility
1197808AAG
2
I
172
N
.Gas/Oil
627,722
r
0
.10
I
12
.70 1
37304
0.04
0
.00
1
10
I
055199
J
Flwood Energy
j
Facility
197808
.AAG
3
I
172
N
.Gas/Oil
617,460
0
.10
I
14
.60
36695
0
.05
0
.00
Il
1,
!
055199 _
Elwood Energy
1-
Facility
F
19780SAAG
t
_4
172
NGas'Oil
636_
_L53
I
0
.10
14
.40
1
36569
I
0-05
!~
0
.00
12
055199
Ehvood Energy
I
0
.20
-
1060
43 63
0
.03
0.00
Facility
1197808446
172
N
.Gas/Oil
731,332
13
I
-
055199
Elwood Energy
Facility
197808AAG
F
170
N
.Gas/Oil
F
609,295
I
0
.20
9-00
36208
i
0
.03
0
.00
I9
llcctoo
Elwood Energy
i
ca
..,n'
to'7R(AAAr
I
1
17A
!
x'r
.,
.J
.II I
71171c
nin
II 1"
.i')nc1
nn1
Ann
17
000862
Grand Tower
077806 AAA
CT01
300
N-Gas Oil 4 3
78,973 1
1.30
160 20
260235
0.07
0
.00
18
1
000862
GrandTo,
.er
07:7S06AAA
CT02
300
N
.Gas
.'Oil I 4,613,402
1.30
182
.30 I
274167
t
:
0
.08
0
.00
Holland Ent
-gy
I
'
I
1
1
~
I
.
055334
Facility
CT6 1
19
F
168
N
.Gas
.Oil
!,
588
.414
0.20
6
.80
1
34969
'
0
.02
I
0
.00
-
- -
-
-
--
-
I
--
~
-
Holland Energy
-
- -~
1
20
I
0'5334
1 acilitl
I'307AAG
CTG2
168
N
. Gas Oil
857
.040
L20
11
.10
~F
~093P
0,03
0-00
21
_
Indeck Rocktord 1
201030BCG I
0001
150
~I N
.Gasr'Oil
361
.575
1I
0
.10
X
18
.80
21488
'
0,10
0,00
1 055238_L
Energy
A-8
A-9
Sr
.
No
.
ORISPL
Plant Name
ID No
.
ID
UNIT
Unit
Capacity
MW
Used
Fuel
Heat Input Input
S02Tons
NOx
Tons
Tons
NOx
tbs/
mmBtu
S02
Ibs/
mmBtu
22
055238
Indeck Rockford
20103013CG
0002
150
N
.Gas/Oil
368,239
0
.10
9.50
21889
0
.05
0.00
23
007425
Interstate
167822ABG
1
139
N
.Gas/Oil
116,657
0
.00
13
.50
6933
0
.23
0.00
24
055131
Kendall County
Generation
093808AAD
GTG-1
250
N
.Gas/Oil
2,531,946
0
.70
34
.40
150471
0
.03
0
.00
25
055131
Kendall County
Generation
093808AAD
GTG-2
250
N
.Gas/Oil
2,276,507
0
.70
30
.90
135288
0
.03
0
.00
26
055131
Kendall County
Generation
093808AAD
GTG-3
250
N
.Gas/Oil
1,838,860
0
.50
22
.90
109280
0
.02
0
.00
27
055131
Kendall County
Generation
093808AAD
GTG-4
250
N
.Gas/Oil
1,263,341
0
.40
16
.10
75081
0
.03
0
.00
28
055202
Pinckneyville
Power
145842AAA
CTO1
49
N
.Gas/Oil
325,594
0
.10
14
.50
19350
0
.09
0
.00
29
055202
Pinckneyville
Power
145842AAA
CT02
49
N
.Gas/Oil
321,781
0
.10
14
.60
19124
0
.09
0.00
30
055202
Pinckneyville
Power
145842AAA
CT03
49
N
.Gas/Oil
301,332
0
.10
13
.80
17908
0
.09
0.00
31
055202
Pinckneyville
Power
145842AAA
CT04
49
N
.Gas/Oil
303,177
0
.10
13
.50
18019
0
.09
0.00
32
055279
Reliant Energy -
Aurora
043407AAF
AGSOI
170
N
.Gas/Oil
197,081
0
.10
3
.10
11713
0
.03
0.00
33
055279
Reliant Energy -
Aurora
043407AAF
AGS02
170
N
.Gas/Oil
215,836
0
.10
3
.10
12827
0
.03
0.00
34
055279
Reliant Energy
-
Aurora
043407AAF
AGS03
170
N
.Gas/Oil
334,729
0
.10
5
.10
19892
0
.03
0.00
35
055279
Reliant Energy
-
Aurora
043407AAF
AGSO4
170
N
.Gas/Oil
218,547
0
.00
3
.50
12988
0
.03
0.00
36
055279
Reliant Energy -
Aurora
043407AAF
AGS08
45
N
.Gas/Oil
230,331
0
.10
9
.10
13689
0
.08
0.00
37
055279
Reliant Energy
-
Aurora
043407AAF
AGS09
45
N
.Gas/Oil
232,688
0
.10
8.90
13828
0
.08
0
.00
38
055109
Rocky Road Power
089425AAC
T1
121
N
.Gas/Oil
254,364
0
.10
10
.00
15117
0
.08
0.00
39
055109
Rocky Road Power
089425AAC
T4
121
N
.Gas/Oil
248,155
0
.10
6
.50
14748
0
.05
0.00
40
007760
Tilton
183090AAE
1
44
N
.Gas/Oil
396,027
0
.10
17
.70
23537
0
.09
0.00
41
007760
Tilton
183090AAE
2
44
N
.Gas/Oil
415,357
0
.10
18
.20
24684
0
.09
0.00
42
007760
Tilton
183090AAE
3
44
N
.Gas/Oil
368,708
0
.10
1
16
.20
21912
0
.09
0.00
A-10
Sr
.
No
.
ORISPI,
Plant Name
ID No
.
UNIT
ID
Unit
Capacity
Fuel
Used
Heat Input
mmBtu
S02
Tons
NOx
Tons
C02
Tons
NOx
lbs/
mmBtu
S02
lbs/
mmBtu
43
007760
Tilton
183090AAE
4
44
N
.GasOil
478,624
0
.10
21
.90
28442
0
.09
0
.00
44
000913
Venice
119105AAA
CT2A
30
N
.Gas/Oil
30,758
0
.10
1.50
1941
0
.10
0
.01
45
000913
Venice
119105AAA
CT2B
30
N
.Gas/Oil
32,090
0
.10
1.90
2023
0
.12
0
.01
46
055392
Zion Energy
Center
097200ABB
CT-1
160
N
.Gas/Oil
1,005,831
0
.30
14
.90
59800
0
.03
0
.00
47
055392
Zion Energy
Center
097200ABB
CT-2
160
N
.Gas/Oil
520,238
0
.20
8
.50
30924
0
.03
0
.00
Total N
.Gas/Oil-
Fired Units
65,824,805
481
2,756
3,925,223
0
.08
0
.01
Sr
.
No
ORISPL
j
Plant Name
UNIT
i
ID No
.
ID
I
'
nit
Capacity
MW
Fuel
Used
heat
input
mmBtu
S02
foils
NOx
'rolls
C02
Tons
mmBtu
NOx
Ibs/
S02
lbs/
mmBtu
~
I
!_
000891
I
_
Havana
~125804AA13
F
30
_
Oil
""j"
,
_
12
.6u ±14
.70
2486
0
.96
082
2
i
000891
I
Havana
125804AAB
t
2
30
Oil
~- 7
.585
1.70
1 60
-'
614
042j
0.45
3
l
000891
I
Havana
125804AAB
I
3
I
30
j
Oil
16-S65
1 Q60
12 60
L
'
180
!
0.Q4
0.79
4
000891
Havana
!
125804
.AAB
1
4
`
_311,
_
Oil
_1
0
.2
'
21'
C)
.9()
0 77
5
000891
!
Havana
125804AAB
5
30
Oil
_
12,916
~
t
3
70
.80
r
1049
1
6
000891
Havana
- -
125804AAB
0
30
-
01 l
3, F_
40
U 43
0
0.57.74
F
_
77
__
00591
Havana
125804AAB
7
I
30
Oil
46418
1660
1S iu
r
370'
065
0
.72
!,
L 8
000891
Havana
125804AAB
8
30
Oil
I
23
671
8 60
¢.60
19I
0_
--~-
--
---
0
.73
9
000864
Meredosia
117805AAA
06
I
447
Oil
430
.1'
t
9o
.90
36
. b0
34823
j
0
.17
0.45
Total Oil-Fired
Units
611,239
i
163
;
107
49,502
0.35
F
0
.53
Appendix B
Best Available Control Technology
Clearinghouse Results
Table B-I
Summary of Results of the BACT Clearing House Search for NOx Controls
*MDHI = Maximum Design Heat Input
**LNB = Low NOx Burner; OFA = Over Fire Air; SCR = Selective Catalytic Reduction
;
SNCR = Selective Non-Catalytic Reduction
RBLC #
-~
-r'
Date
_- -~~
-
Source
Boiler
Type
MDIII
m mBtu/h
mBtu/h
r
BAC1
Technology
*
NON
Limits
lbs/mn)Btr
1 .
10/10/03 hndeck-Elwood
CFB
5,800
SNCR
0.10
IA-0067
6/1 7/03
Midamerican Energy-Council
3luffs
7,675
LNB/OFA/SC
R
0.07
_057
09/25/02
Black Hills Corporation
5,146
LNB/SCR
0.07
1R 007
10/29/01
ES Puerto Rico
FB
4,923
SNCR
0.10
'A 0182
4/23/01
chant Ener
Mid-Atlantic
FB
2 532
SNCR
0.15
PA-0275
4/14/95
orthham ton Gen. Com an
MD
022
6/03/94
AES Warrior Run
O-
Kansas Cit P & L - Hawthorn
0 12
MA-
0009
CFB
3,342
SNCR
0.15
A
Oil
1,604
0.15
WY
047
10/10/97
d
3,960
1,NB/01-A
SCR
0.15
Wl
)03L)
2/27/98
250
LNB/OFA+
SCR
~=
0.15
PA-008906/01/93
F13
1,120
SNCR
0.2
W Y
100 8
09/06/96
~a
0.22
Y 0078
3/31/95
57o
NA
0.5
011-0231
8/11'97
Toledo Edison Ba yshore
1 764
NA
-~ 0.2
KY-007003/01/94
ort Drum HTW Co en
651
0.6
L 1'-00533/16/98
PA-0132107/25/95
eseret Gen . & Transmission
.55
0
.55
- '-0m F
11
ork Coun
Ener
Pa tners
2,500
0.125
Y
s
dison-Mission Ener&,v
P
SCR
NA~~~
0.15 _
0.3
~
rnlbertonPower
520
['A-011011/27/95
~ i
0124 11/2
//95
estwood Energy Properties
423
NA
0.3
Estimated MDHI based en using Lignite
Units in mmBtu/hr
lbs/mmBtu
3-Hour Average
24-Hour Average
12 Month Rolling Average
Table B-2
Summary of Results of the BACT Clearinghouse Search for SO2
RBLC
LD.#
Date
Source
Type
BoiIerMDIII
(1)
BACT
Limit
Technology
(2)
1
10/10/03 ndeck-Elwood
CFB
ed Injection/Polishing
(1.15
Scrubber
-
WY-0057
9/25/02
lack Hills Corporation
5,146
Semi Dry Lim Spray
IO I
bsorber
A-0183
111211/01
ES Beaver Valley,
L (
y'
C'FB
2,155
Hydrated Ash Re-hl ection
0 .14
R-0007
10/29/01
I S Puerto Rico Congen
.ChB
' ,923
ow Sulfur Coal/Dr
~.
Scrubber
y
(' .022
X-0275
12/21/00
liant Ener
6,700
GD
U.3G
0-0050
8/17/99 Kansas City Power &
i
t
5,606*
Low Sulfur Coal//Diy
1 1,1 ,E
Scrubber
L-0178
7/14/99
FA North Side
eneration
FB
764
Bed Injection/Dty
2
Absorber
08.'24/98
hoctaw Generation
Limited
J
MS-0036
1-43
2,476
_
Bed Injection ~c
k1.25
C-0060
03.'16/98
seret Gen. and Trans .
500
MW
Wet Scrubber
10 .15
WY-0030 02i27/98L
Two Elk ("en . Partners
CD_
250
MW
-
line Spray Dry Scrubber 0 .17
PA-0132
2
.500
Lime Injection Sulfur Lt
.JI
07%25/95
,
ork
artners
County Energy
D-0022
06%03/94
I -S Warrior Run, Inc
.
CFB
',070
Bed Injection
0.10
J
A-0213
8/23'93 SI I Birchwood, Inc
.
,200
-
ime S ray Dryink Systemj0 .I O
I
Energy New Bedford
1
MA-0009 )4/30,930
en
.
13,342
Limestone Injection
0.23
Appendix C
Multi-Pollutant Strategy
Legislation Comparison Chart
Multi-Pollutant Strategy Legislation Comparison Chart
Clear Skies Act of 2003
Clean Air Planning Act of
2001
Clean Smokestacks Act
of
!
Clean Power Act of 2803
^'
S
.
485/H
.R
. 999
2001-1f
.R 2042
S
.366
S
.
843
(Senators James Inhofe,
R-
(Congressman %% a
.mnan, D-
(Senator James Jeffords I-
OK & George Voinovich,
j
(Senator I
-om Carper, D-
CA)
VT)
R-OH, Reps
. Joe Barton,
R-
DF,)
T
fX
&
Billy Tauzin, R-LA)
L
C
aps
Within 2 years of enactment
National
. annual caps for 4
N
ational annual caps for 4
National, annual caps for 3
the Adttunistrator must,
pollutants
pollutants
pollutants
promulgate regulations to
I
`
Sulfur
o
reduction from Phase lI
, 2
.25 million tons beginning
4
.5 million tons beginning in
4
.5 million tons beginning
Dioxide
Acid Rain cap beginning
;
j 2009-1
.975 million tons in
2009
; 3
.5 million tons
2010
; 3
.0 million tons
2009
East and 275,000 tons in
beginning in 2013
; 2
.25
beginning 2018
. Includes
j
West(AZ CA, CO, ID, MT,
million tons beginning in
provisions for a second
Na NM
. OR UT, WA, WY)
2016
emission limit and cap-and-
trade program for WRAP
sta
tes
.
I
Nitrogen
o
reduction
trap
1997
1.51 million tons beginning
1.87 million tons beginning
2
.1 million tons beginning
Oxides
eels beginning 2009
2009
i 2009
; 1
.7 million tons
2008-1
.562 million tons in
beginning 2013
Lone I (eastern and some
central states) and 538
.000
tons in Zone 2 (western and
remainder of central states)
:
1
.7 million tons beginning
2018-1
.162 million tons in
Zone I and 538,000 tons in
lone 2 (*Oklahoma is now
included to Zone 2, as
opposed to being
in Zone
I
in 2002 version*)
A-
16
I
Multi-Pollutant Strategy Legislation Comparison Chart
A-
17
Clean Smokestacks Act of
2003-H
.R
. 2042
Clean Air Planning Act of
I
Clear Skies Act of 2003
Clean Power Act of
200
;
S
.985/H
.R
. y99
-S
.366
2003
(Senators James
Inhofe, R-
(Senator James Jeffords
I
S
.843
VT)
- ~
(Senator Tom Carper,
D-
OK
& George Voinovich
.
R-OII, Reps
.Joe Barton, R-
_
.
TX
_
&
Billy Tauzin,
R-LA
)
(Congressman
Waxman,
D-
CA)
Mercury
90°%o reduction from 1999
levels beginning 2009
5 tons beginning 2008, based
24 tons beginning 2009 and
26 tons beginning 2010
; I S
on unit-by-unit emissions rate facility-specific emissions
tons beginning 2018
limit not to exceed
1_
.4g/MW-
cannot exceed either (I) 50%
hr
of the total quantity of Hg in
its coal
; or (2) an annual
out-put based emission rate
for Hg, as determined by
EPA based on an input rate
of 4 lbs/tBtu
.
i
10 tons beginning 2013
Plus facility-specific
emissions cannot exceed
either
: (1) 30% of the total
quantity of Hg present in the
coal used
; or (2) an annual
out-put based emission rate
for Hg, as determined by
EPA
Carbon
1990 levels beginning 2009
2
.05 billion tons beginning
Emissions equal to 2006
,
No limits
Dioxide
2009
;
levels, beginning 2009
:
1
emission equal to 2001
2013
_beginning
Emissions
I
May include trading for S02,
Allowed for S02, NOx and
1
Allowed 502, NOx, Hg andl Allowed for S02
. NOx and
{
Trading
NOx and C02
.
C02 (no trading with other
.
C02 (international C02
Hg
Not allowed for Hg
.
sectors, with some exceptions trading allowed)
for C02)
Not allowed for Hg
Multi-Pollutant Strategy Legislation Comparison Chart
A-
18
Clean Smokestacks Act
of
Clean Power Act of 2003
Clean Air Planning
Act
of
2003
-S
.843
Clear Skies Act
of
2003
S
.485/H
.R
. 999
2003-H
.R
. 2042
5
.366
(Senators James Inhofe, R-
OK
&
George Voinovich,
R-OH, Reps
. Joe Barton, R-
TX &
Billy Tauzin, R-LA)
CA)
Waxman, D-
C
.4)
(Senator James Jeffords
I-
VT)
(Senator Tom Carper, D-
DE)
Allocation
of
Allowances to be allocated
EPA to issue regs to implement
Allowances to be allocated to
Allowances
annually starting in 2009 among
S02 cap through CAA Title IV
:
existing units, with an
5 categories
:
consumers/households
;
transition assistance
; renewable
energy-efficiency and cleaner
includes provisions for
allocating S02 allowances to
new units
increasing portion reserved for
auction (in I" yr, 99% for
existing units and I % for
auction
; an additional 1% for
energy
; carbon sequestration
;
auction in each of next 20 yrs
;
and existing units
Total annual allocation will be
reduced by an amount equal to
Allowances for NOx, Hg and
C02 to be allocated, based on
output of affect units, by
12/31/05 for 2009 and,
thereafter, an additional 2
.5%
for auction each year until all
allowances are auctioned)
emission from electric
generators with <15 MW
capacity
Allows use of market-oriented
mechanisms, such as emission
thereafter, updated annually, 4
yrs in advance
. Provisions
included for allocating NOx, Hg
and C02 allowances to new
units
.
S02 allowances allocated to
existing units based on their
proportion of total post-2009
Acid Rain S02 allowances
currently in their accounts (if
trading based on generation
performance standards, auctions
or other allocation methods
EPA to establish allowance
tracking and transfer program
within 1 yr of enactment
EPA to issue regs establishing
NOx, Hg and C02 allowance
trading programs by I/I/05,
including requirements for
generation, allocation,
recording, tracking, transfer and
use of allowances, monitoring
and reporting of emissions,
excess emissions penalties and
enforcement and compliance
Allowances created and placed
they received allowances under
Acid Rain program) or based on
product of baseline heat input
and a standard emission rate
reflective of fuel type
; pre-2010
allowances under Acid Rain
program may be used to meeting
new holding requirements
Separate NOx cap-and-trade
programs for Zone I and Zone 2
NOx allowances allocated to
existing units based on
fig allowances allocated to
existing units based on
proportionate share of their
baseline heat input to total heat
input of all affected units
; for
purposes of allocating the
allowances, each unit's baseline
heat input is adjusted to reflect
the types of coal combusted by
the unit during the baseline
f
period
.
EPA to issue regs establishing
li system, similar to that for
F
existing Acid Rain Program, for
issuing
. recording and tracking
_
!
allowances
Impact on
No existing CAA
i Fxempts affected units from
Existing NSPS program for
Current
requirements replaced
of
I Hg MACT
.
new and modified units
Clean
Air Act
removed
repealed and replaced with
Requirements
Exempts affected units from
!
feed
. statutory performance
visibility protection
I
standards to apply only to
F
requirements in Section
new, not modified, sources
;
j
169(A) for 20 years after
I
modified sources have option
enactment
of meeting new performance
F
I
standard
or
case-by
case
J
A-I9
Clean Smokestacks Act of
Clean Power Act of 2003
-5,366
_
l (Senator James Jeffords I-
Clean Air Planning Act of
2003
S
.843
11
-
(Senator Torn Carper
. D-
)
Clear Skies Act of 2003
j
S
. 485/H
.R
. 999
2003-H
.R
. 2042
(Congressman Waxman, D-
CA)
(Senators James Inhofe, R-
OK
&
George Voinovich,
R-OH, Reps
.
Joe
Barton, R-
TX &
Billy Tauzin, R-LA)
Allocation of
in reserve under an emission
proportionate share
o
f their
Allowances
limit imposed under CAA Title
I
I
baseline heat input to total heat
(continued)
before 1
:' 1/08 have '/ the value
I
input of all affected units in their
s
of allowances under new
perspective zones
: pre-2008
1 program
!
NOx allowances may be carried
foiAand
Impact on
Current
Clean
Air Act
Requirements
(continued)
A-20
1
BACT
NSR and NSPS will apply
only to those new (including
boiler replacement) affected
units and renewable energy
units where maximum hourly
emissions rates increase, after
netting among covered units
at a source
.
Establishes S02 and NOx
performance standards for
affected units that commence
construction before August
17, 1971
.
EPA will identify BACT and
LAER biannually for affected
units and renewable energy
units
.
LAER for the electric
generating sector cannot
require technology costing
more than twice the BACT
guidelines or more than a
smaller amount determined
by EPA
.
No offsets are required for
electricity
generating
sector
I
Major sources exempted
from existing NSR and
BART requirements, and
many PSD requirements
EPA authorized to designate
as "transitional" those areas
for which modeling shows
legislation or legislation plus
federal /state measures result
in attainment
; such areas
avoid non-attainment area
requirements
. CAA Title I
amended to provide
transitional areas until
12/20/15 to attain and to
j address the timing of
designations
Consequence of failure of a
transitional area to attain by
2015 is redesignation to non-
attainment (by 6/30/16) and
requirement to submit SIP
within 3 years
CAA amended to postpone
I until 2012 application of
any
I
I
Clear Skies Act of 2003
Clean Air Planning Act of
Clean
Smokestacks Act of
Clean Power Act of 2003
S
.485/H
.R
. 999
2003
2003-11
.11
.2042
-5
.366
(Senators James Inhofe, R-
J
-S
.843
(Congressman
Waxman, D-
(Senator James Jeffords
I-
OK
&
George Voinovich
I
(Senator Tom Carper, D-
CA)
VT)
DE)
R-OH, Reps
. Joe Barton, R-
TX
&
Billy Tauzin, R-LA)
Clean Smokestacks Act of
Clean Power Act
of
2003
of
1 Clean Air Planning Act
1
2003
enator
-S
.
Tom
843
Carper, D-
DE)
Clear Skies Act of 2003
S
. 485/H
.R
. 999
2003-H
.R
. 2042
(Con ressman Wazman D-
g
CA)
-5_366
(Senator James Jeffords
I-
VT)
(Senators James Inhofe, R-
OK & George Voinovich,
R-011, Reps
. Joe
Barton, R-
TX & Billy
Tauzin, R-LA)
Impact on
I sources located in non-
1 attainment areas after 2008
.
Section 126 rule
; requires a
demonstration that downwind
Current
area has implemented all
Clean Air Act
Each state must identify areas
more cost-effective measures
Requirements
in the state that adversely
(continued)
affect local air quality and
CAA amended to preclude
impose measures necessary
to remedy such adverse
effects in accordance with the
S02, NOx, Hg and C02
caps
.
I
regulation under Section 112
of HAPs from EGUs
;
prevents EPA from
conduction residual risk
assessment fro mercury from
EGUs (EPA authorized to
address residual risk from
non-mercury HAPs)
Exempts certain "clean coal
technology" projects from
requirements under CAA
Section I I I (for new
sources) and Parts C & D of
Title I
Review/Revisi
on of Cap
Levels
Multi-Pollutant Strategy Legislation Comparison Chart
I
EPA may reduce caps if its is
Caps to remain in effect until
determined that they will not
20 yrs after enactment
;
protect public health or the
within 16
'/2
years of
environment
EPA may limit emissions
from an individual facility
if
they are anticipated to cause
or contribute to a significant
i adverse local impact
_-
I
Other Key
The later of the date that is 30
T
By the later of 2014, or 40
I
Provides for establishment
of EPA
to study and report to
Provisions
years after a power plant
years after commencing
~ an Independent Review
Congress on 1)
commenced operation or that
operation
. each facility must
i Board to assist EPA with
I
environmental and economic
is 5 years after the date of
achieve emission limits that F
C02 allowance program,
consequences
of
allowing
enactment, the power plant
reflect
BACT for new units
including developing
I S02 for NOx trading and 2)
must comply with the most
standards for certifying C02
feasibility
of
international
recent NSPS under section
Coal-fired-units >SO MW
reduction programs, such as
trading of S02, NOx and Hg
111 and the requirements
I
required to monitor HAPs
I early action, sequestration
allowances
under parts C and D that are
and S02 w in 30-mile radius
and reduction of other
I
applicable to modified
greenhouse gases
sources
. -
-- -
EPA must propose MACT
A-
2
2
enactment,
EPA
must
determine whether any caps
should be revised and set
revised caps
if
necessary
.
E
PA
. i
n
consultation with
DOE, to study whether the
total allowances available
1
1
beginning in 2018 should be
adjusted and make a
recommendation to Congress
by 7/1 /09
Codifies emission reduction
requirements
of
NOx
SIP
Clean Smokestacks Act of
I
2003-IH
.R
. 2042
(Congressman Waxman, 13-
CA)
Clean Power Act of 2003
-
-5
.366
(Senator James Jeffords I-
VT)
Clean Air Planning Act of
j
2003
(
-S
. 1343
(Senator Tom Carper, D-
DE)
Clear Skies Act of 20(13
S
. 485/H
.R
. 999
(Senators James Inhofe, R-
OK
&
George Voinovich,
R-OH, Reps
. Joe Barton, R-
TX
&
Billy Tauzin, R-LA)
Impact on
States may adopt or enforce
! States and political
States unable to apply NSR
StatelLocal
more stringent requirements
I
subdivisions may adopt and
or PSD to affected units as
Authority
I
enforce more stringent
part of SIP
I requirements, including
requiring further reductions
' from specific units to address
1
local air quality problems
A-
2
3
I
Status
Proposed 5/8/2003
(5/20/2003 referred to House
Subcommittee on Energy and
Air Quality)
regulations to cover non-Hg
HAPs from facilities by 2005
and enforce them by 2008
.
EPA to develop emissions
inventory for electric
generators w/capacity <15
MW
Facilities that contribute to
ozone non-attainment in a
state may be required to
submit 3 allocations for every
I ton of pollution emitted
during periods of NAAQS
exceedance
Does not affect any regional
seasonal NOx control
programs established by EPA
under CAA Title I
Proposed 2/12/2003 (referred
to Senate EPW Committee)
EPA
must report to Congress
18 months after enactment on
health and environmental
impacts of mercury that is
captured or recovered
EPA
to issue regs for
monitoring
Proposed 4/9/2003 (referred
to Senate EPW Committee)
Call for eastern US
. Requires
full implementation of
required emission control
measures by May 1, 2003 for
northeastern states and by
May l, 2004 for remaining
states
.
Allows units to petition for 2-
yr extension to meet emission
limitations (S02) Provides
for a reserve of 250,000 S02
allowances for units that used
bituminous coal and installed
and operated technology
before 2008 to continue to
use such coal
Requires installation and
operation of CEMS on, and
quality assurance of data for,
each affected unit
Proposed 2/27/03 in the
House (referred to House
Energy and Commerce
Committee) and 2/27/03 in
the Senate (referred to Senate
EPW Committee)
Clean Smokestacks Act of
Clean Power Act of 2003
Clean Air
Planning
Act of
Clear Skies Act
of 2003
S
.485/H
.R
.999
2003-H
.R
.2042
-S
.366
2003
(Senators James Inhofe, R-
-S
.843
(Congressman Waxman, D-
(Senator James Jeffords
I-
OK & George Voinovich,
(Senator Tom Carper, D-
CA)
VT)
R-OH, Reps
. Joe Barton, R-
DE)
TX &
Billy Tauzin, R-LA)
Appendix D
List of Health Studies Addressing Emissions from
Power Plants
Appendix D
List of Health Studies Addressing Emissions from Power Plants
I. C. Arden Pope 111, PhD; Richard T. Burnett, PhD ; Michael J. Thun, MD; Eugenia
E. Calle, PhD ; Daniel Krewski, PhD ; Kazuhiko Ito, PhD; George D. Thurston,
ScD ., " Lung Cancer. Cardiopulmonary Mortality, and Long-term Exposwe to
Fine Particulate Air Pollution ."
JAMA
.
2002; 287:1132-1141
.
2
.
Electric Power Research Institute. Power Plants and Particulate Matter. 2003
3. U .S. EPA. Response to request from Senators Carper and Jetfords for analysis of
5.366, The Clean Power Act, and 5.843, The Clean Air Planning Act. October
28, 2003. Note: In a November 5, 2003 letter to Administrator Leavitt, the
Senators asked that the analysis be redone because it does not "allow for a fair
comparison of the costs and benefits of the three major legislative proposals ."
4. Senator Jack Reed Press Release about co-sponsoring S . 366 .
http.1', etww senatc, ~!ov--recd/ ress108th/l nvirgnmen)!presrclegseCIcmPowerAc
t2-12-03.htm .
5. Calculations based on findings from: Levy JI, Spengler JD, Hlmka D, Sullivan D,
Moon D. Using CAI-PUFF to Evaluate the Impacts of Power Plant Emissions in
Illinois: Model Sensitivity and Implications. Atmospheric Environment 36 (6)
:
1063-1075 (2002). Provided by the researchers on request
.
6. Lippman, Morton . Health Effects of Power Plant Emissions on Downwind
Populations, March 2002
.
7. Levy, Jonathan I., Susan L. Greco, and John D. Spengler. The Influence of
Population Heterogeneity on Air Pollution Risk Assessment : A Case Study of
Power Plants Near Washington, DC . Environmental Health Perspectives (2003)
.
8. Levy, Jonathan 1
. Briefing on Health Impacts of Power Plants : Case Studies in
Massachusetts, Illinois, and Washington DC . United States Senate Environment
and Public Works Committee. Senate Office Building. May 17, 2002
.