| | - STATE OF IWNOIS
- NOTICE OF FILING
- BEFORE THE ILLINOIS POLLUTION CONTROL BOK,~
- POST-HEARING COMMENTS OF ENVIRONMENTAL LAW AND POLICY CENTER.
- PRAIRIE RIVERS NETWORK AND SIERRA CLUB
- Introduction
- Board Should
- Deoxygenating Waste Rule Should Be Protective Of Dissolved Oxygen Levels
- A. The Dissolved Oxygen Standard Continues To Be Violated in Many Illinois
- Waters
- B. The Board Should Not Adopt Rules That Ignore the Nitrogenous
- Component ofBOD.
- CONCLUSION
- ILLINOIS ENVIRONMENTAL PROTECTiON AGENCY
- November 10, 1997
- B. Park
- Chief
- Bureau ofWater
- JBP:RGM:djp/amruldis
- November 7, 1997
- For Discharges to General Use Waters
- November 7, 1997
- November 7, 1997
- conditions.
- be determined as follows:
- factors.
- WQ-16J
- October 25, 2001
- 1021 North Grand Ave. East
- Toby:
- Making Early Life Stage Absent Determinations
- EXHIBIT 2
- waterbody where their early life stages preside,
- Protection of Mussels Species
- Introduction
- Results
- 25 8.1
- 25 8
- 25 8
- 25 8
- Pyganodon
- Utterbackia
- Actinonaias
- Lasmigona
- Villosa
- Lan,psilic
- Fusconaia
- Medionidus
- Paper pondshell 7.86
- Pheasantshell 7.27
- Green floater 6.10
- Rainbow 5.53
- Plain pocketbook 5.26Fatmucket
- Atlantic pigtoe 5.18
- Cumberland moccasinshell 4.24
- Pheasantshell 14.05
- Paper pondshell 9.22
- Giant floater 8.88
- Rainbow 7.63
- Green floater. 6.10
- Plain pocketbook 5.26Fatmucket
- Actinonaias
- Prosopium
- Utterbackia
- Pyganodon
- Villosa
- Lasmigona
- Lampsilis
- Salmonids absent 8.40
- Freshwater Mussel Criteria Maximum Concentration Guideline 2.8
- Fish early lifestages absent 1.71
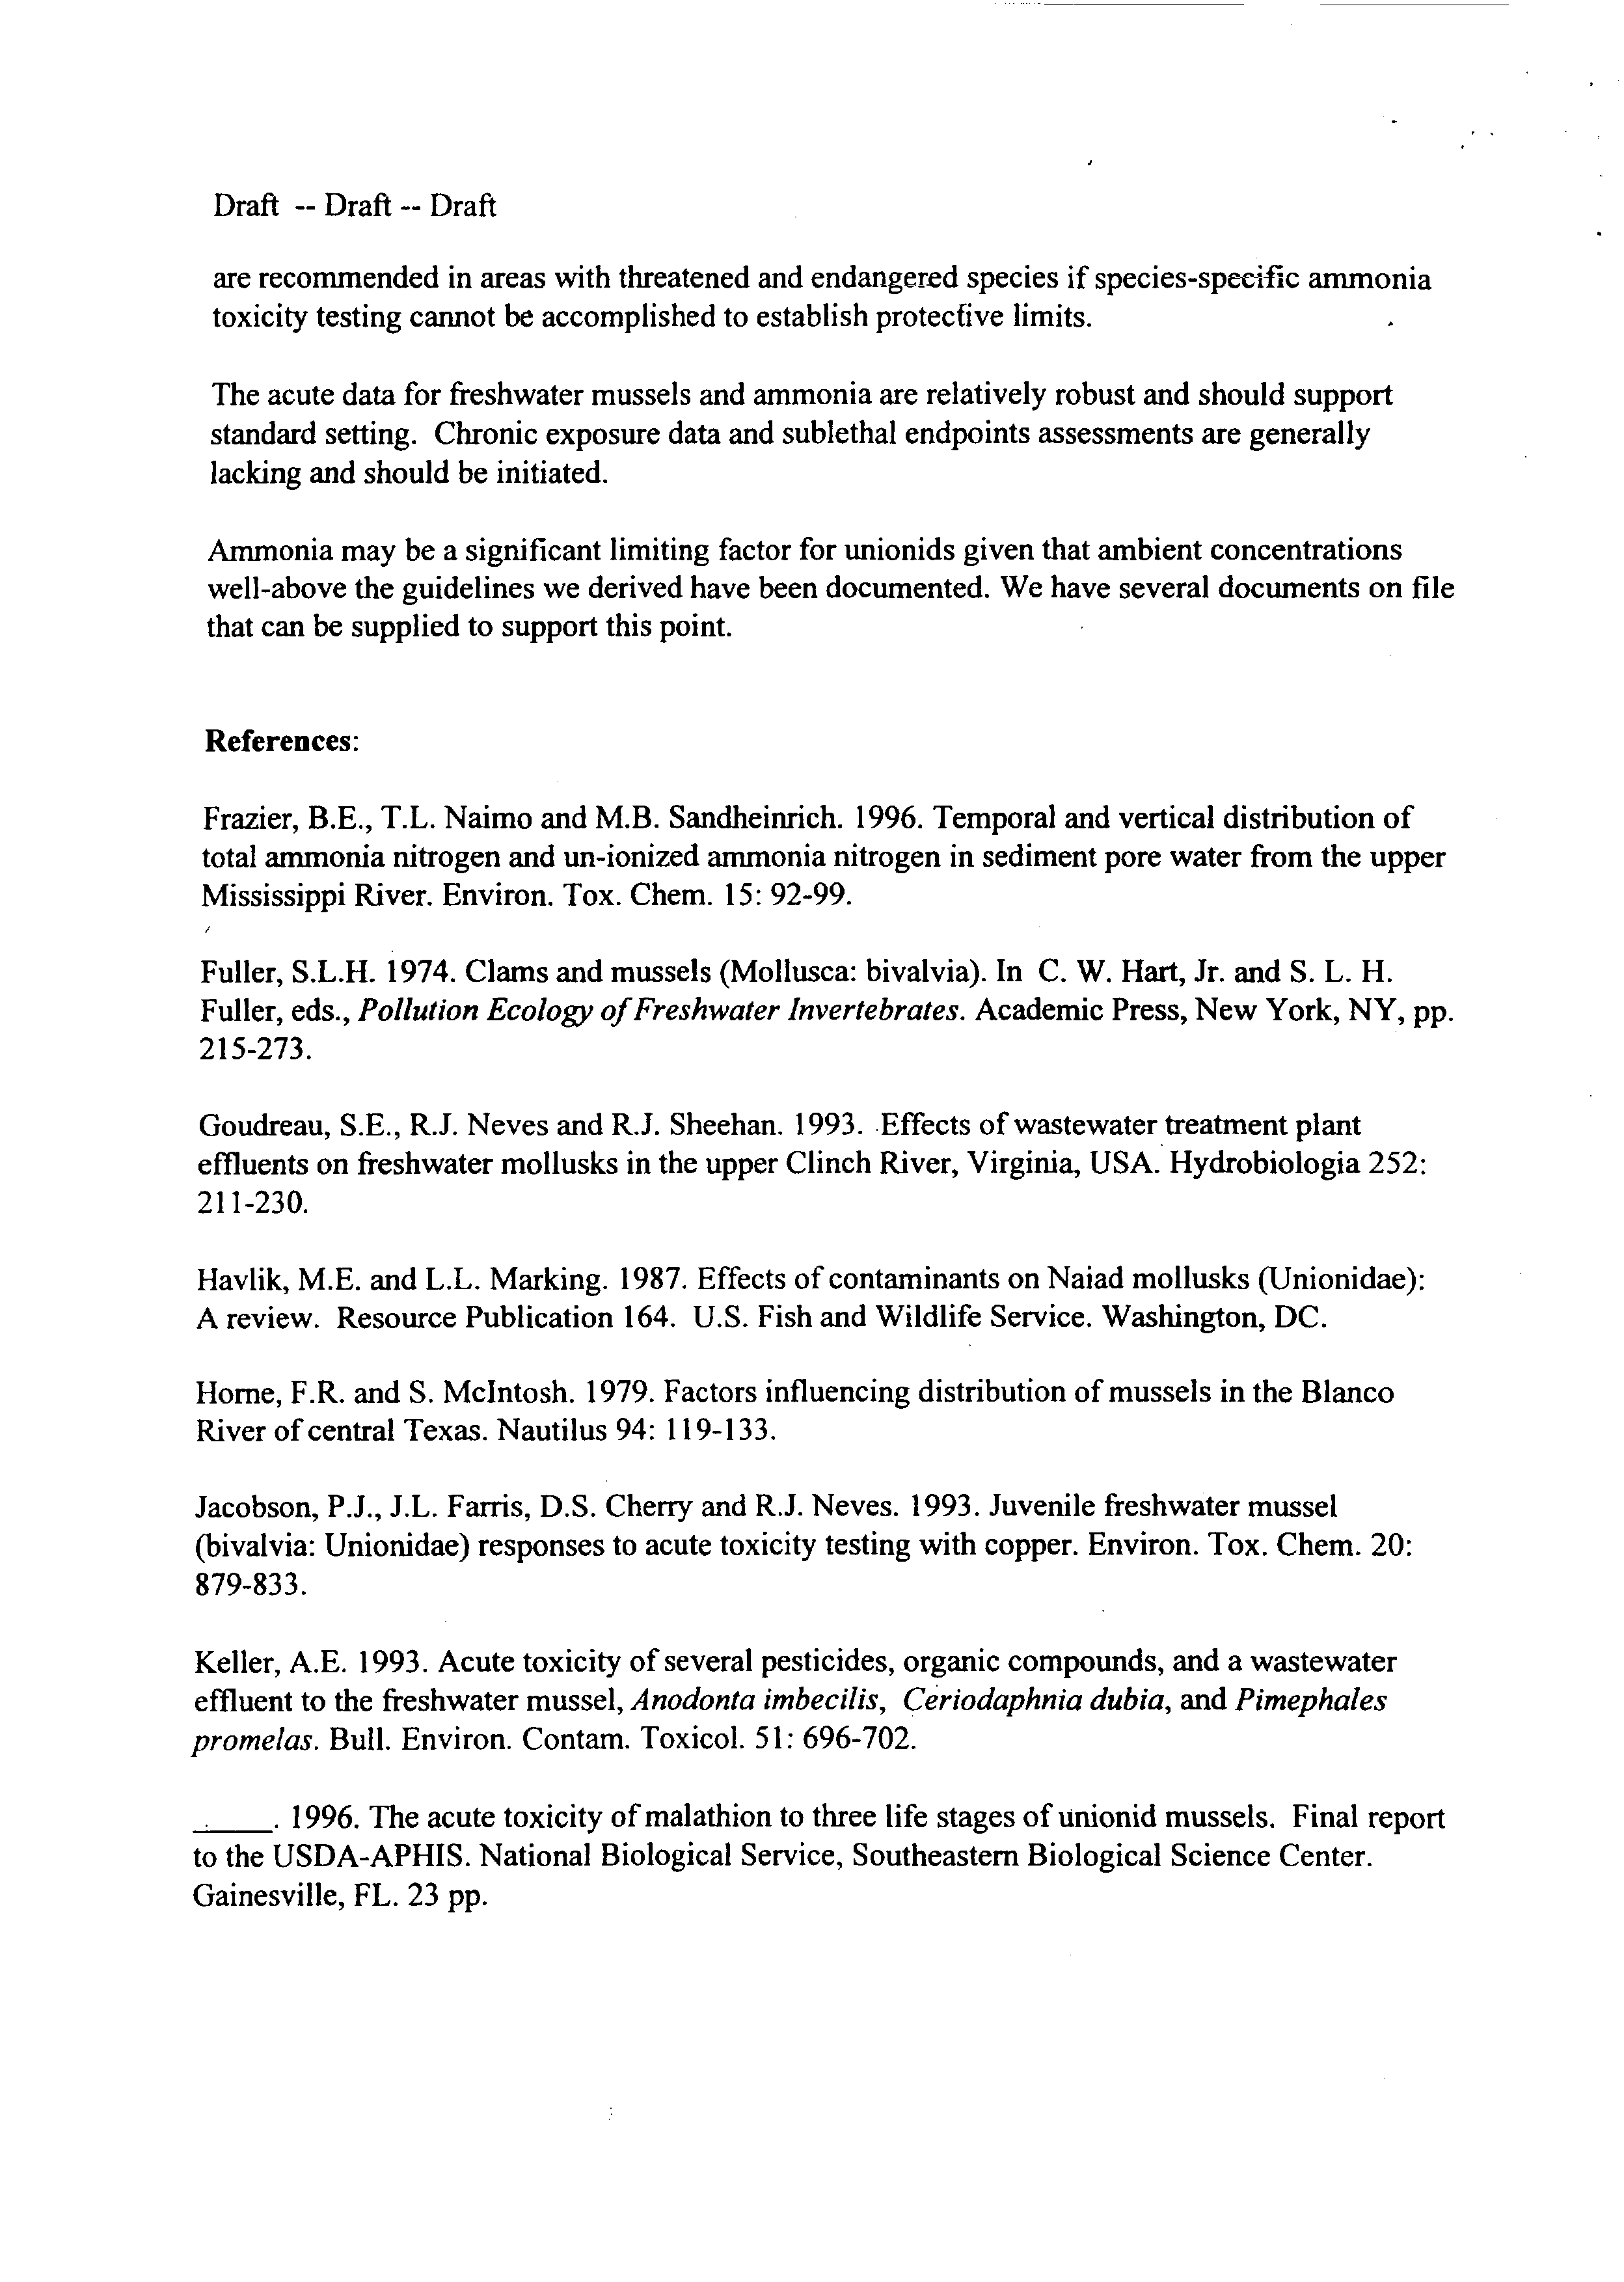
- Summary
- References:
- TO: Bob Mosher, Planning
- FROM: Landon Niedringhaus
- MEMORANDUM
- EXHIBIT 3
- C:\SPREADSH~CALC\METALS1.WBI
- How did it become a state symbol?
- EXHIBIT 4
- About the symbol
- Illinois Environmental Protection Agency
- Bureau of Water
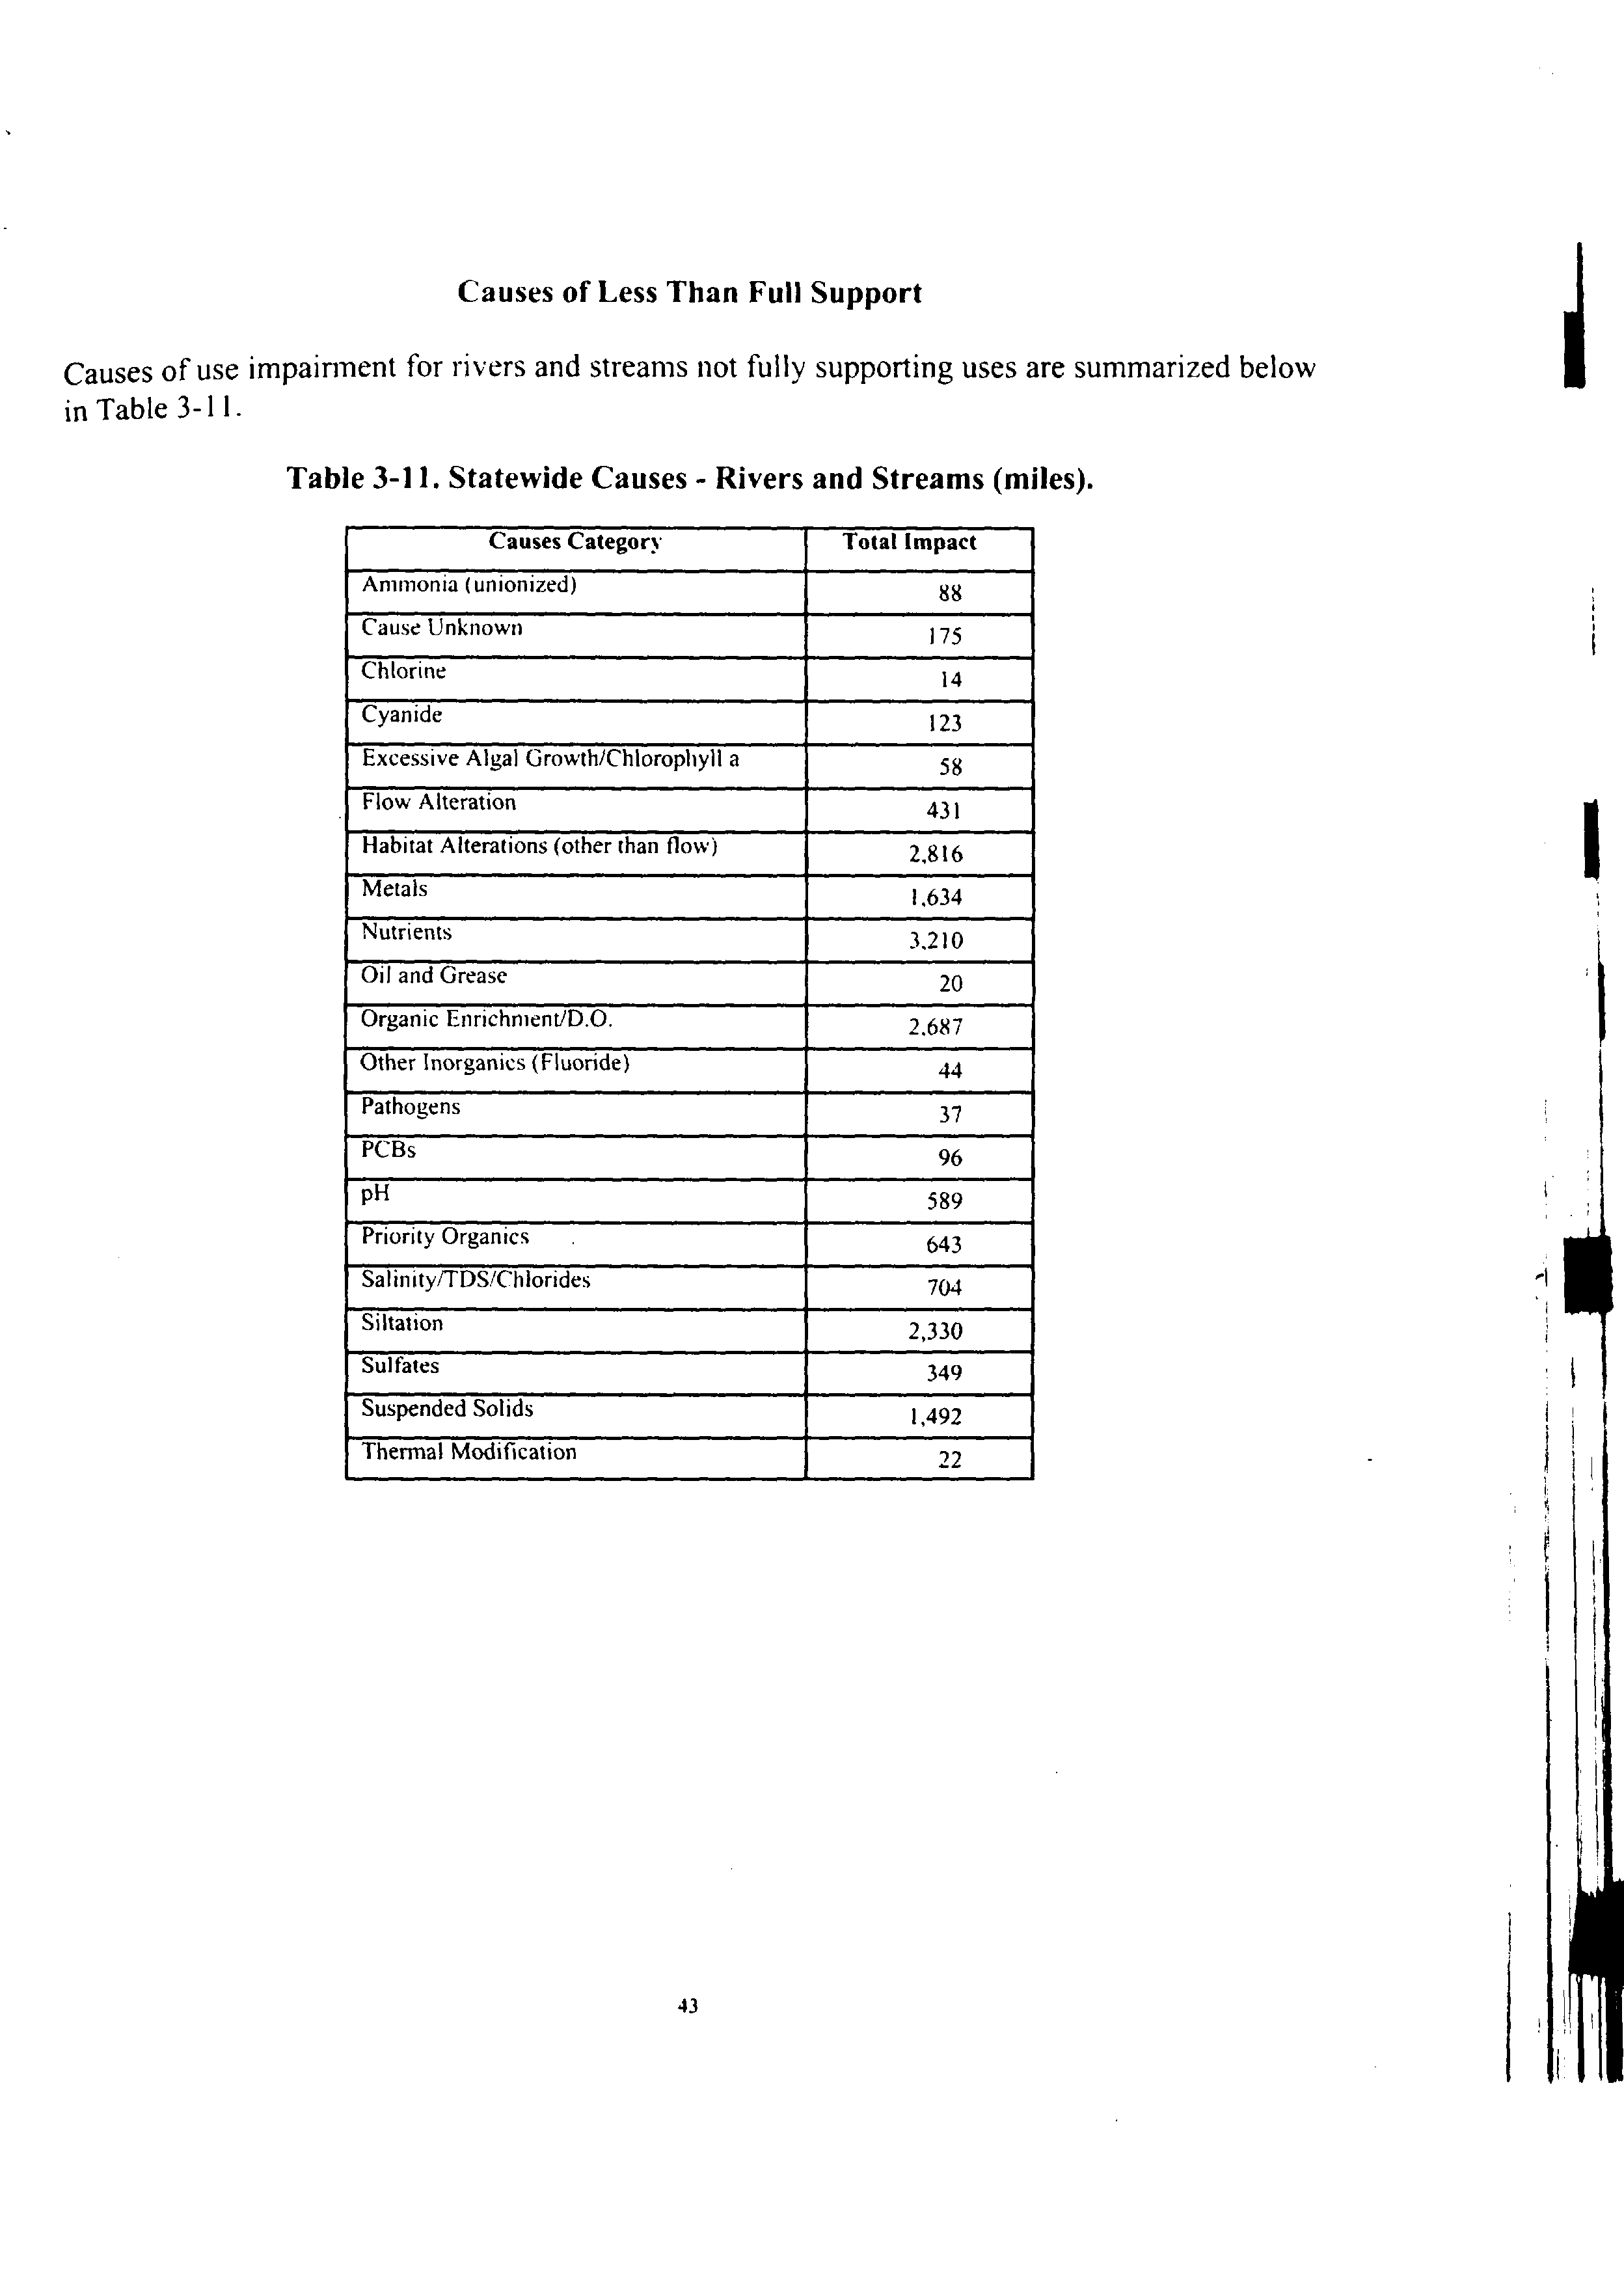
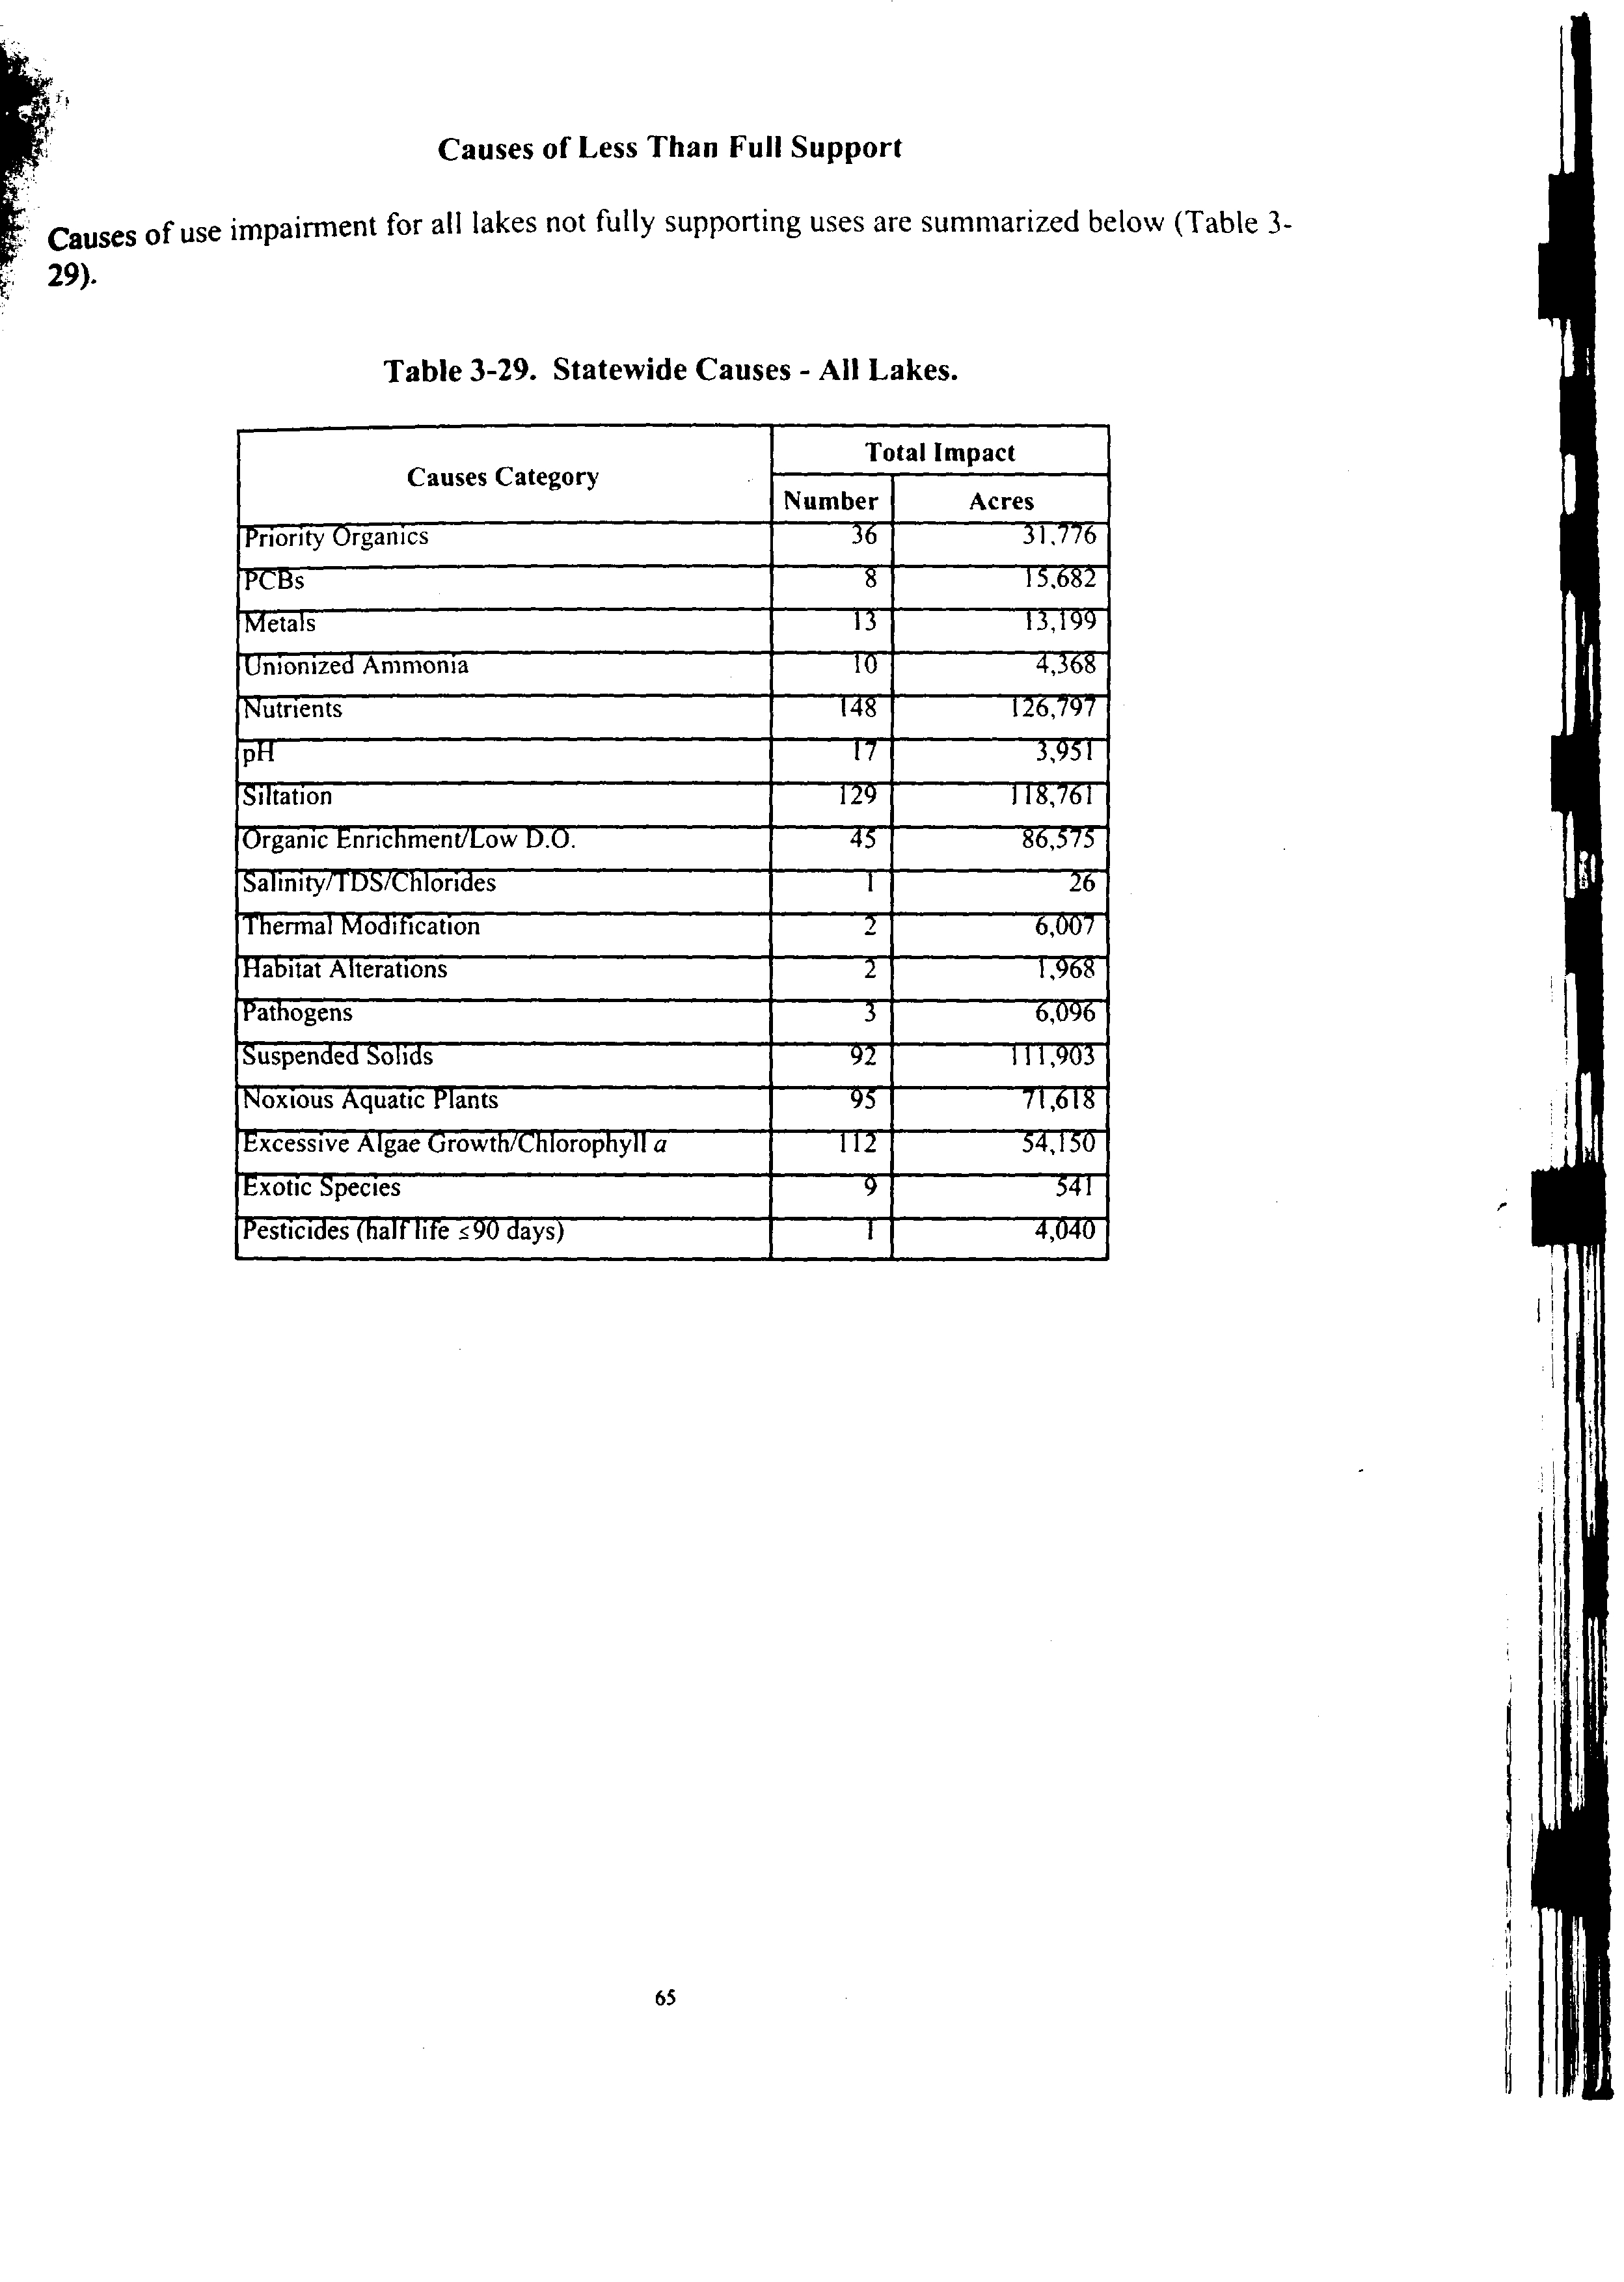
- Causes of Less Than Full Support
- ~~TTTiiITf
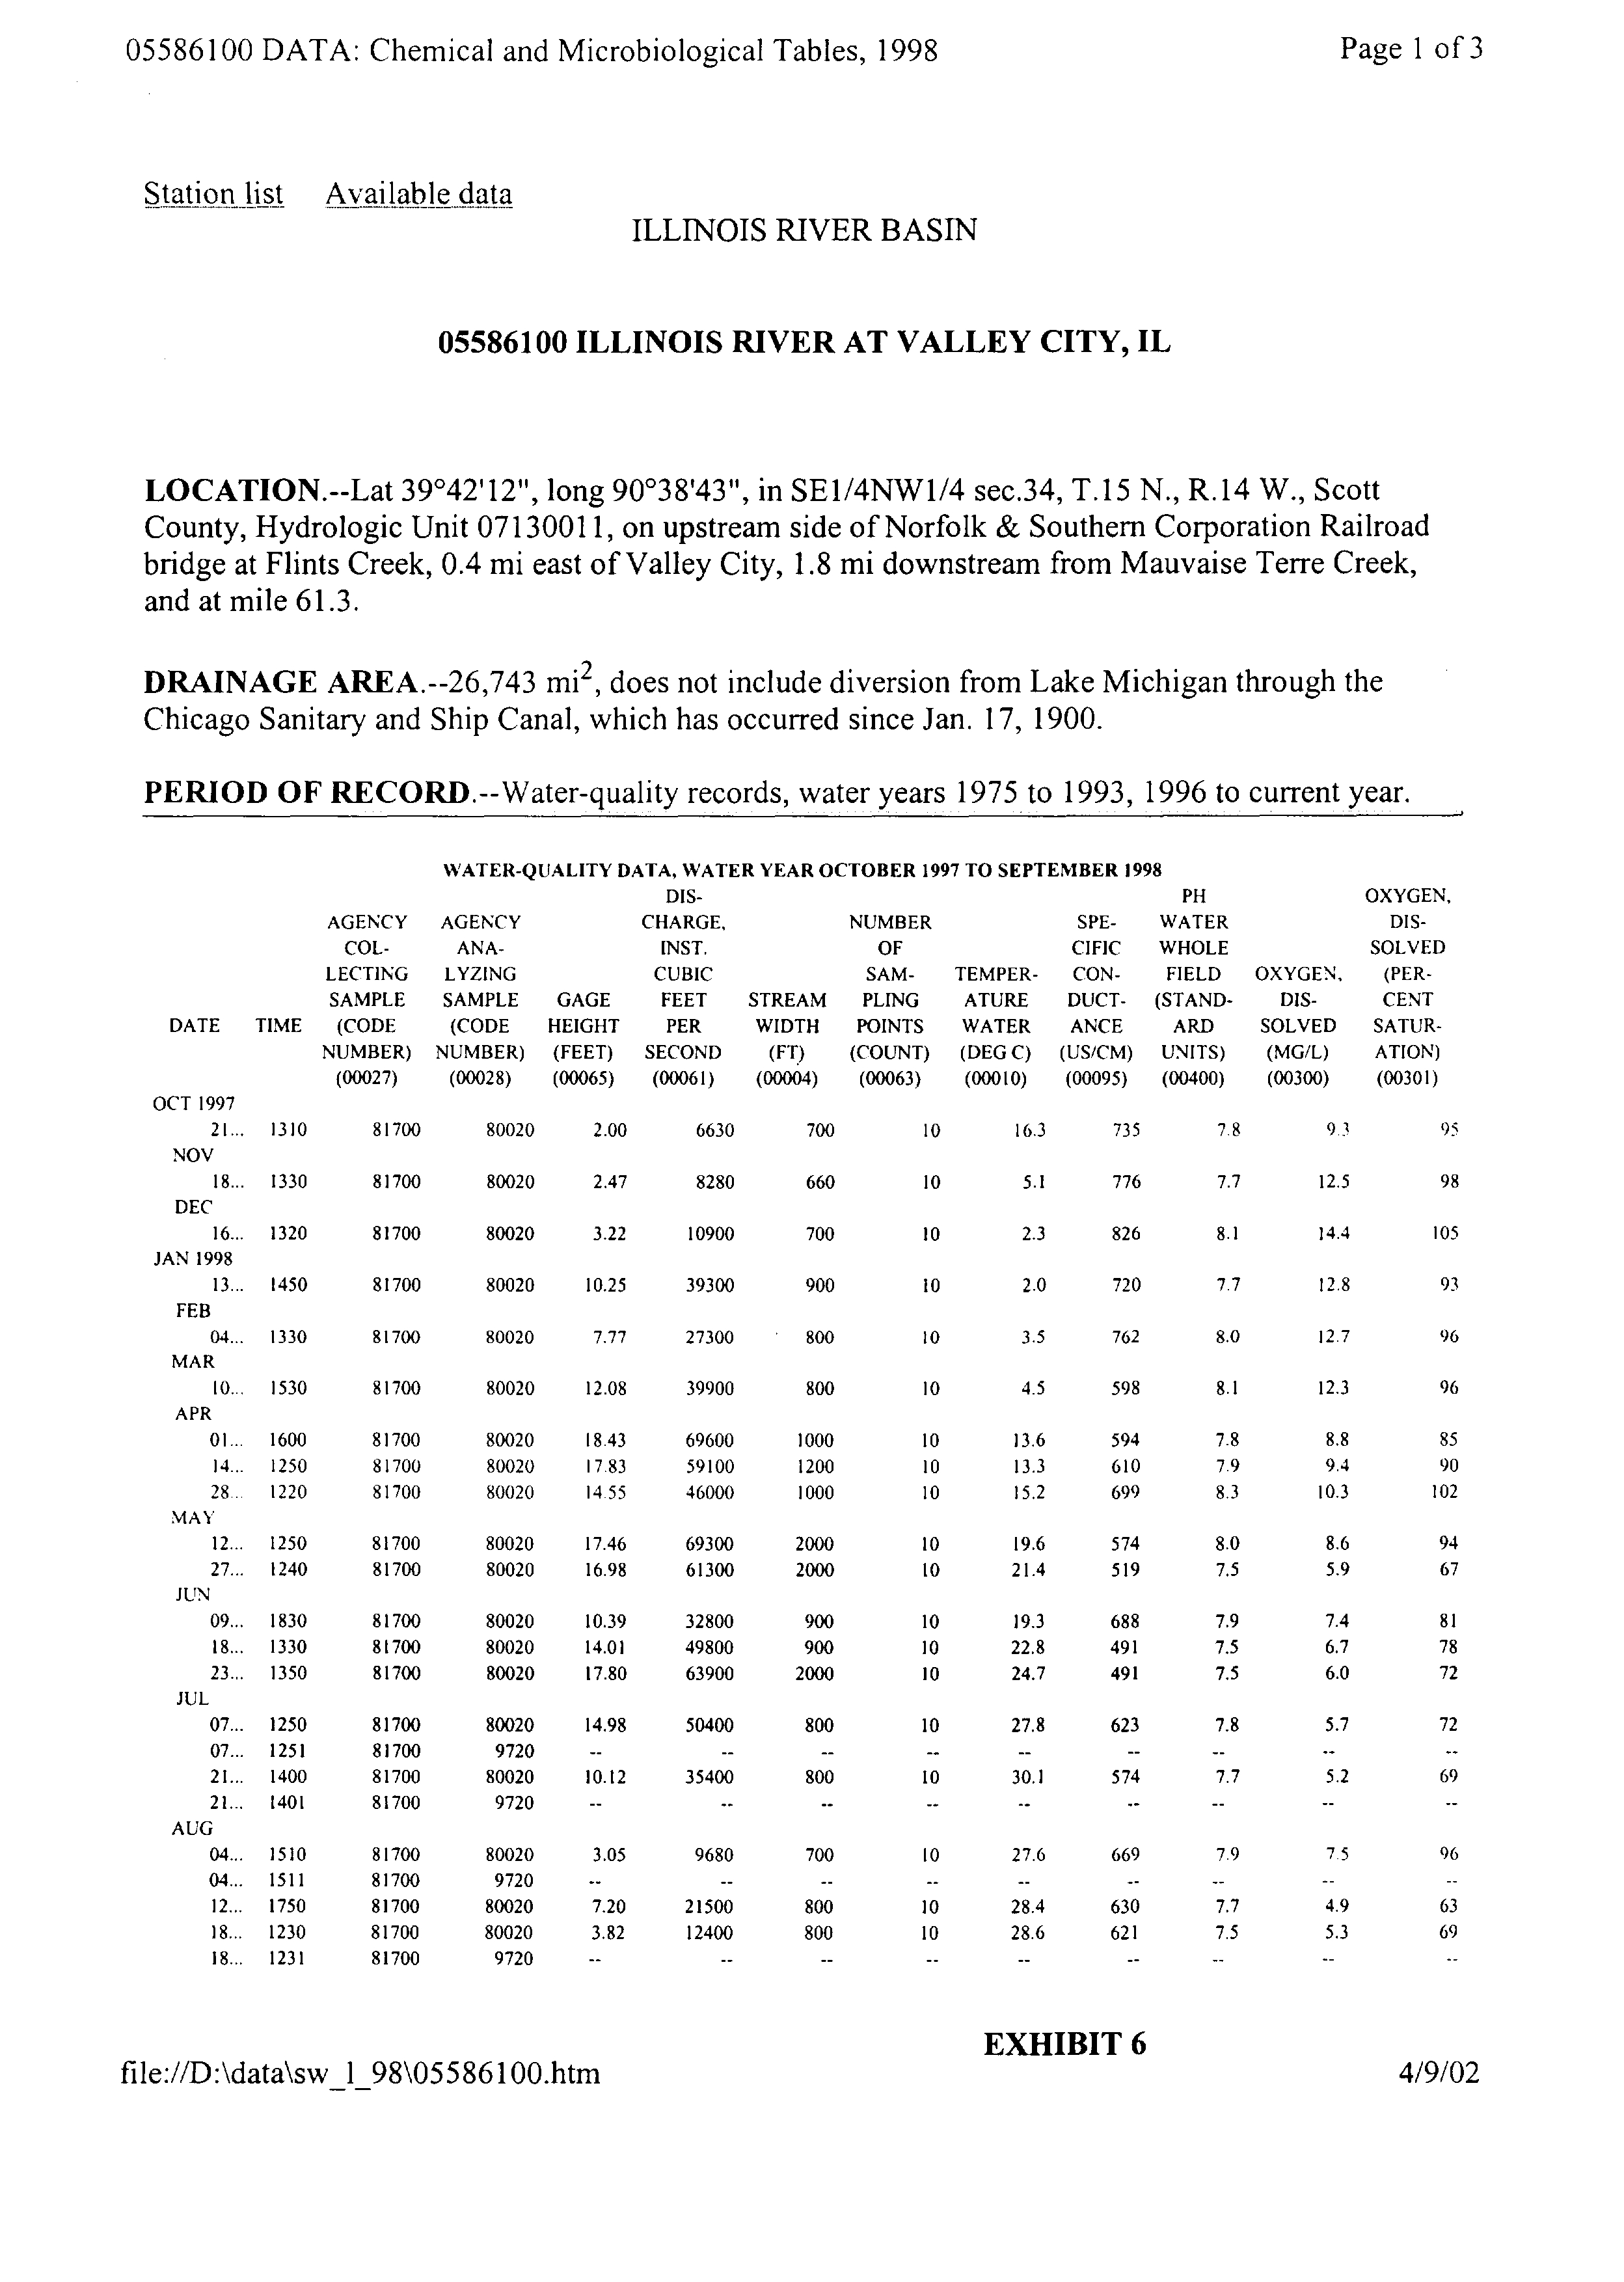
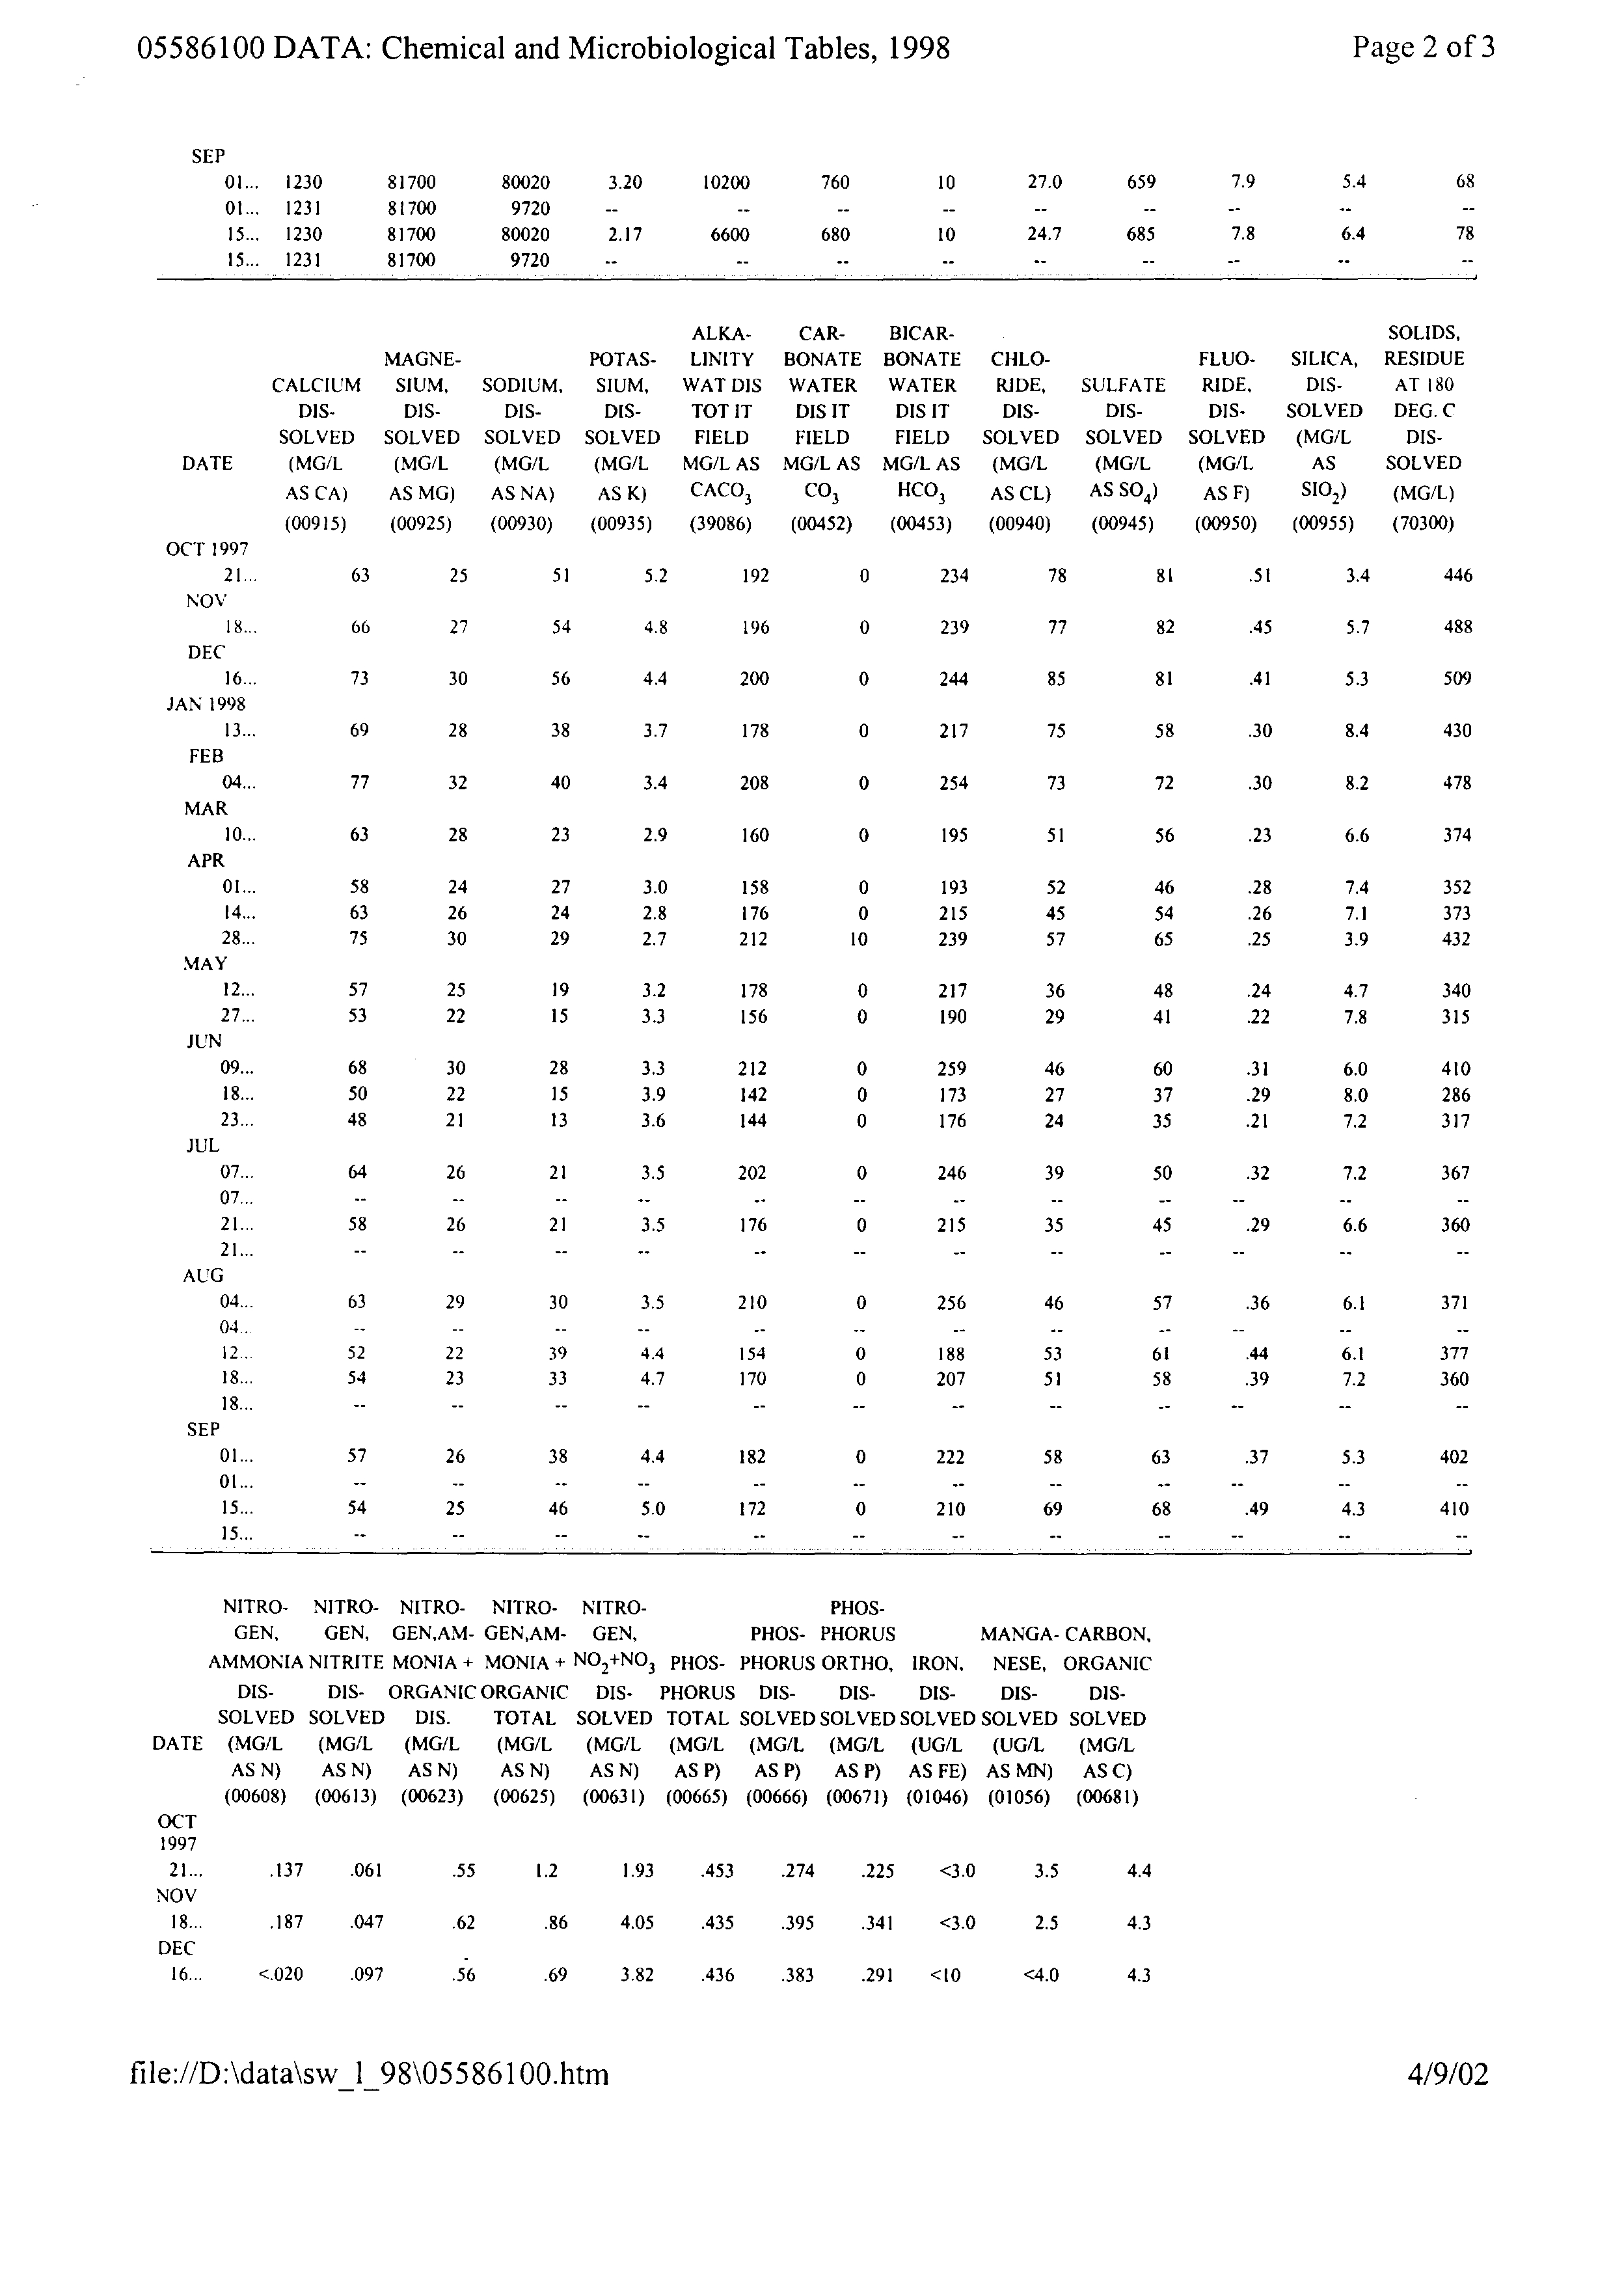
- 05586100 ILLINOIS RIVER AT VALLEY CITY, IL
- EXHIBIT 6
- FOX RIVER NEWJ
- WINTER 2002 Fox River Fish Passage Feasibility Study
- EXHIBIT 8
- “Watérsh~4inIllinois
- To obtain a copy of the Tool Kit:
- EXHIBIT 9
- Clinton, Iowa 52732-5935
- than the 21,400 pounds per day limit previously proposed.
- Jodi Millar, USFWS
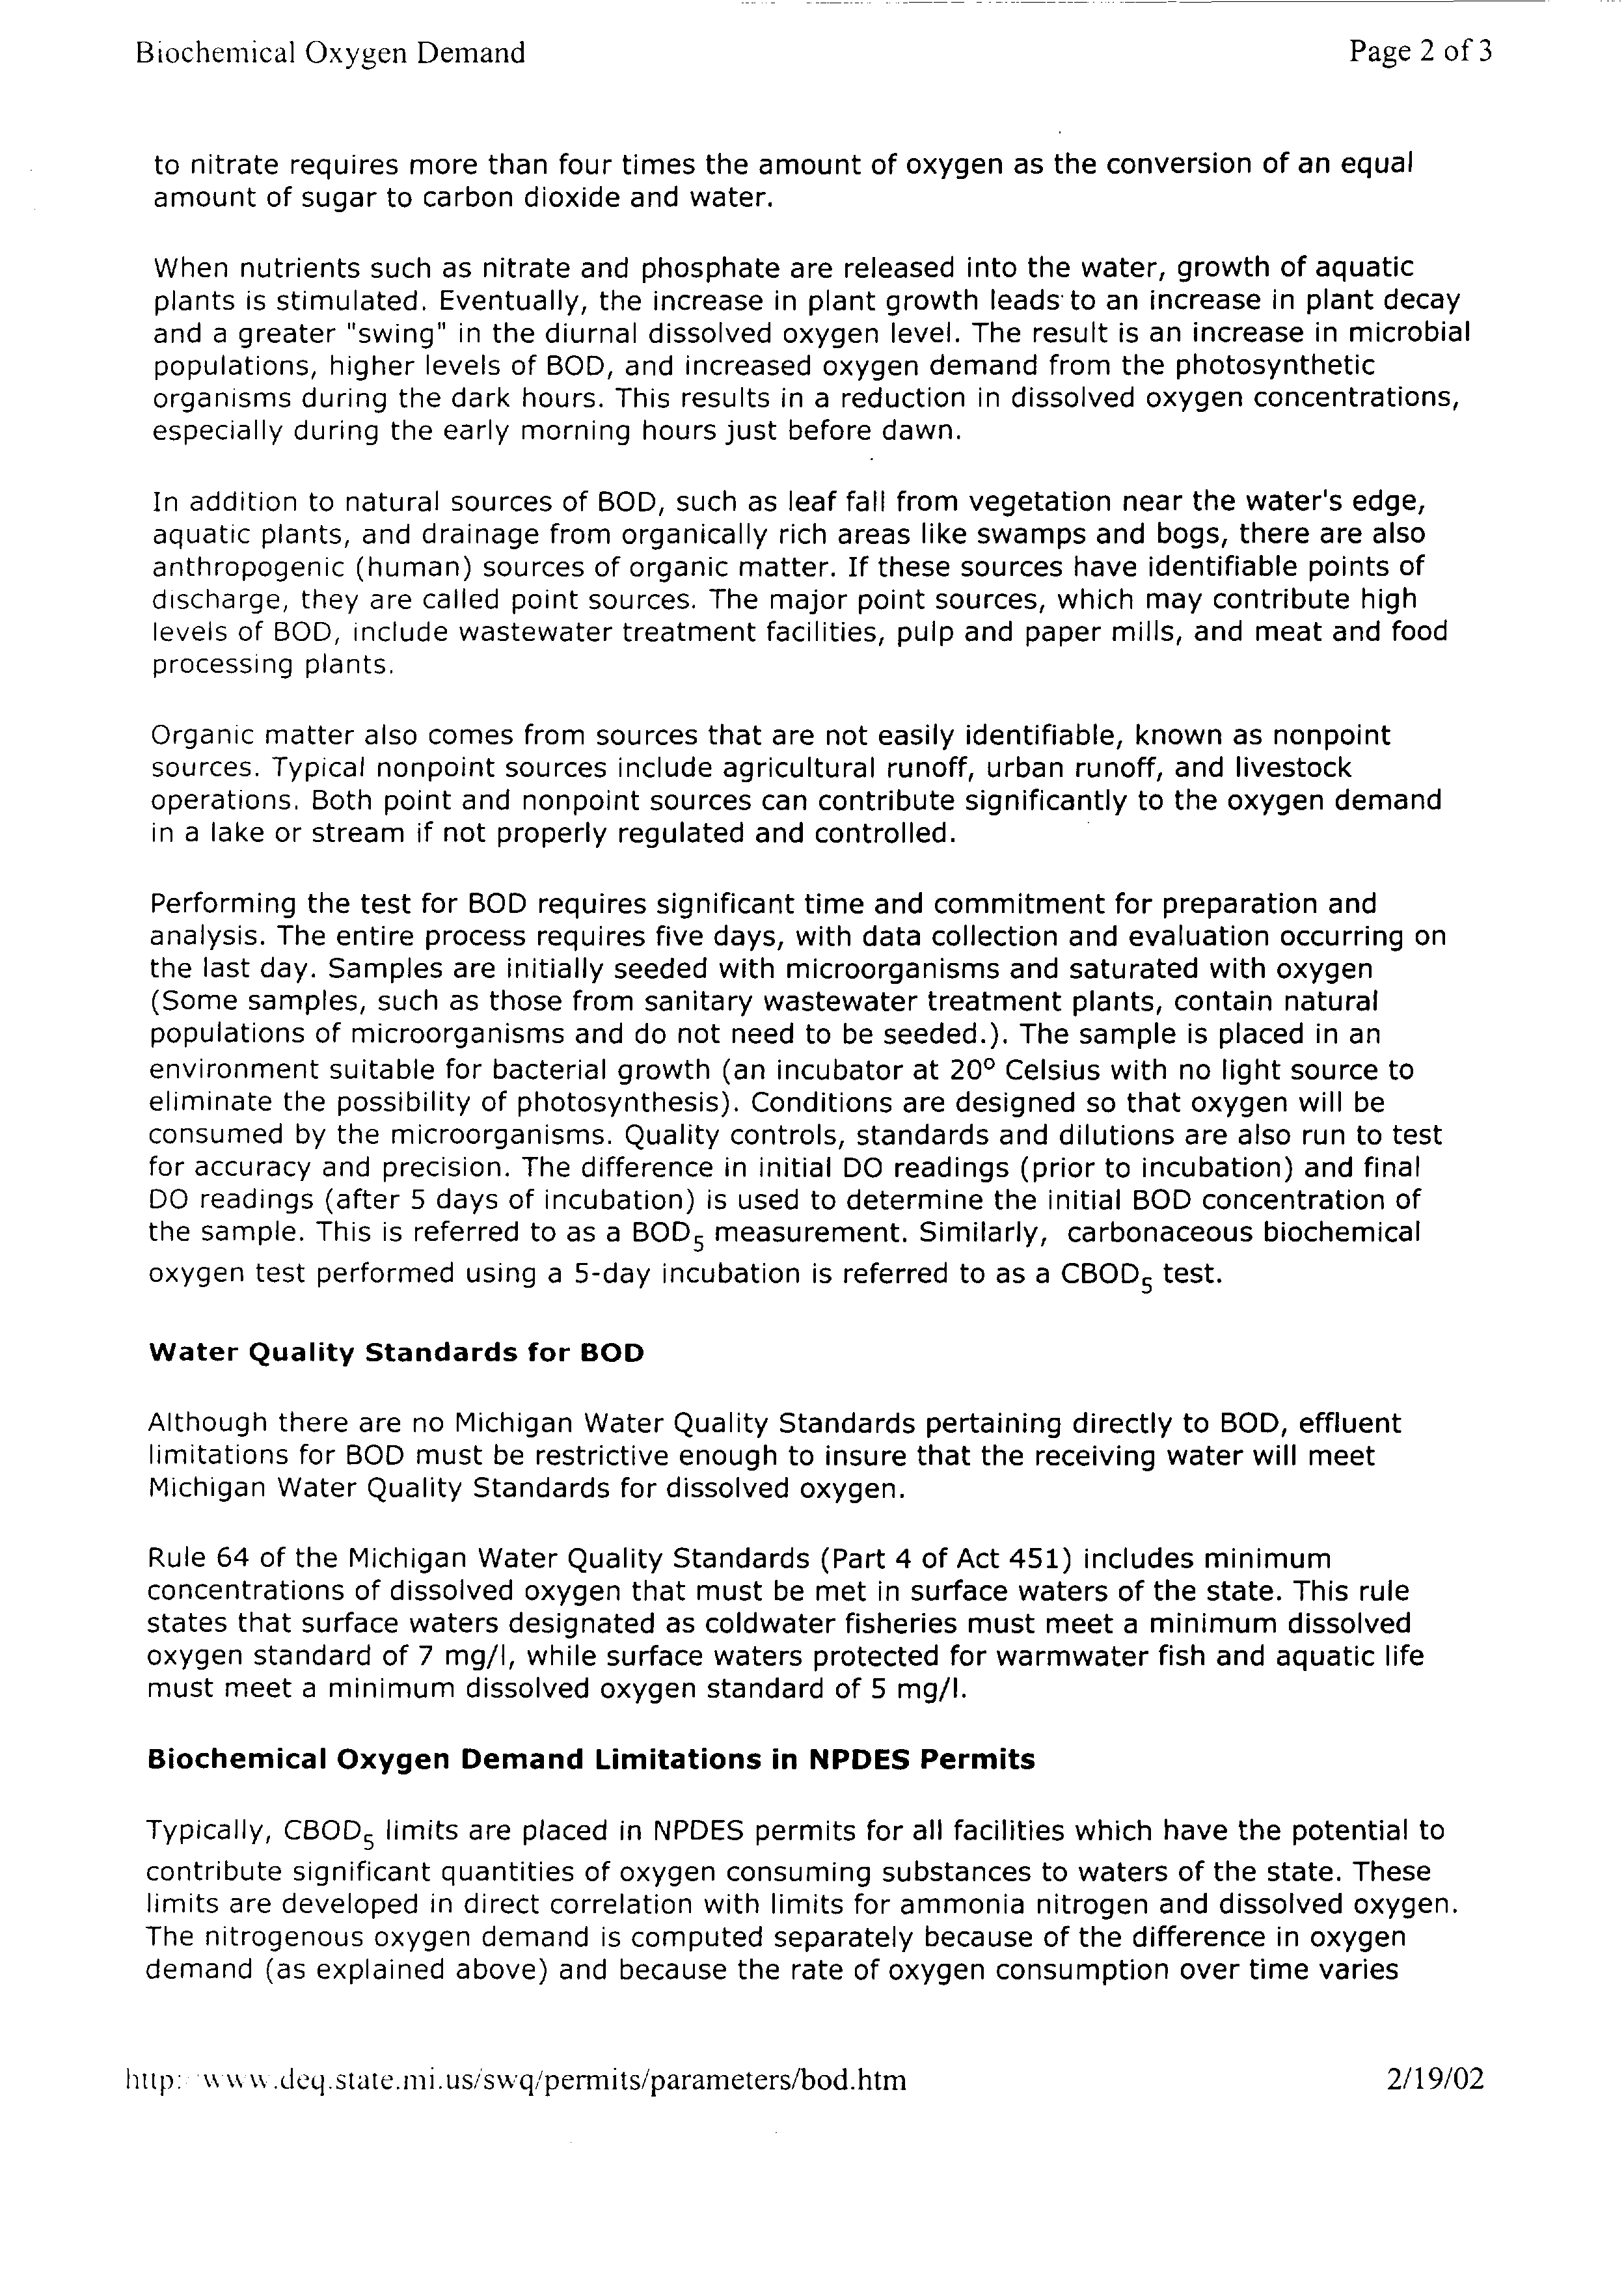
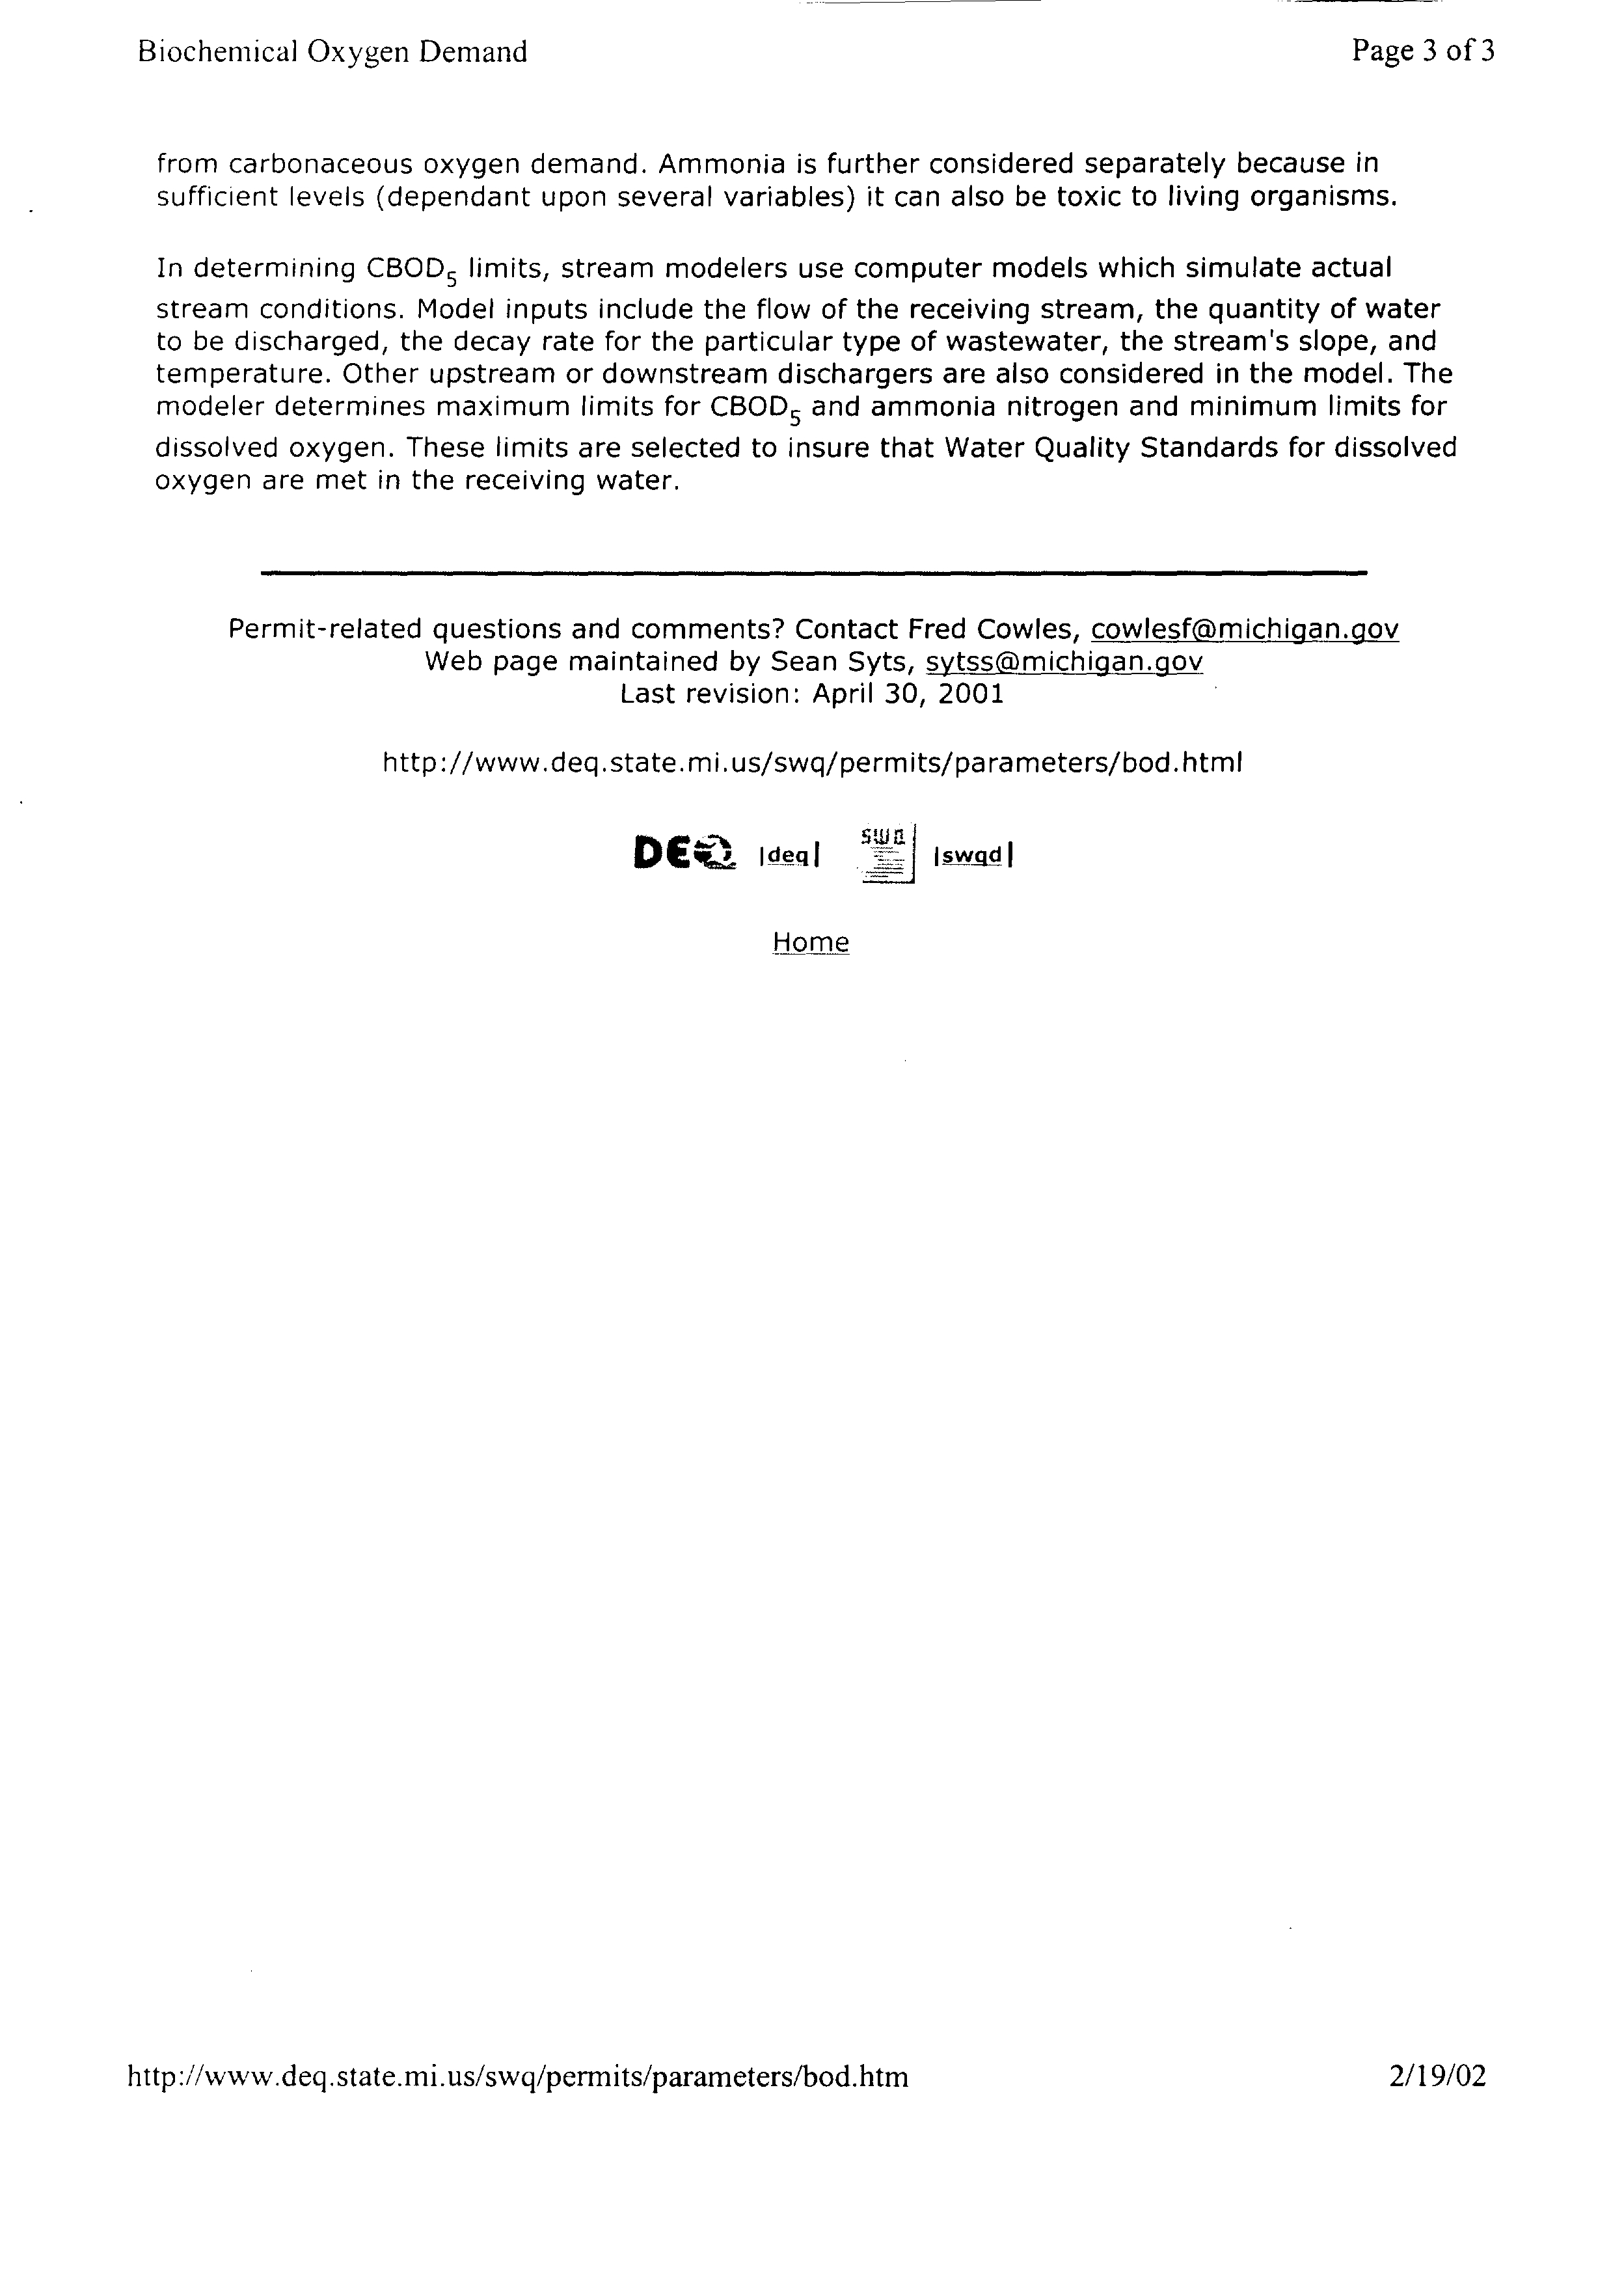
- Biochemical Oxygen Demand (BOD)
- EXHIBIT 10
- Water Quality Standards for BOD
- Biochemical Oxygen Demand Limitations in NPDES Permits
- Chapter NR 210
- SEWAGE TREATMENT WORKS
- EXHIBIT 11
- CERTIFICATE OF SERVICE
|
BEFORE THE ILLINOIS
‘~JU\\
\~)
POLLUTION
I\iln\
CONTROL BOARIS~LERKS
RECEIVED
OFFICE
~\PR1 2 2002
STATE OF IWNOIS
IN THE MATTER OF:
)
Pollution Control Board
)
WATER QUALITY AMENDMENTS TO
)
35
Iii. Adm Code 302.208(e)-(g), 302.504(a),
)
R02-1 1
302.575(d), 303.444, 309.141(h); and
)
(Rulemaking-Water)
PROPOSED
35
Ill. Adm. Code 301.367,
)
301.313,301.413,304.120,and309.157
)
~4,//
cS7
NOTICE OF FILING
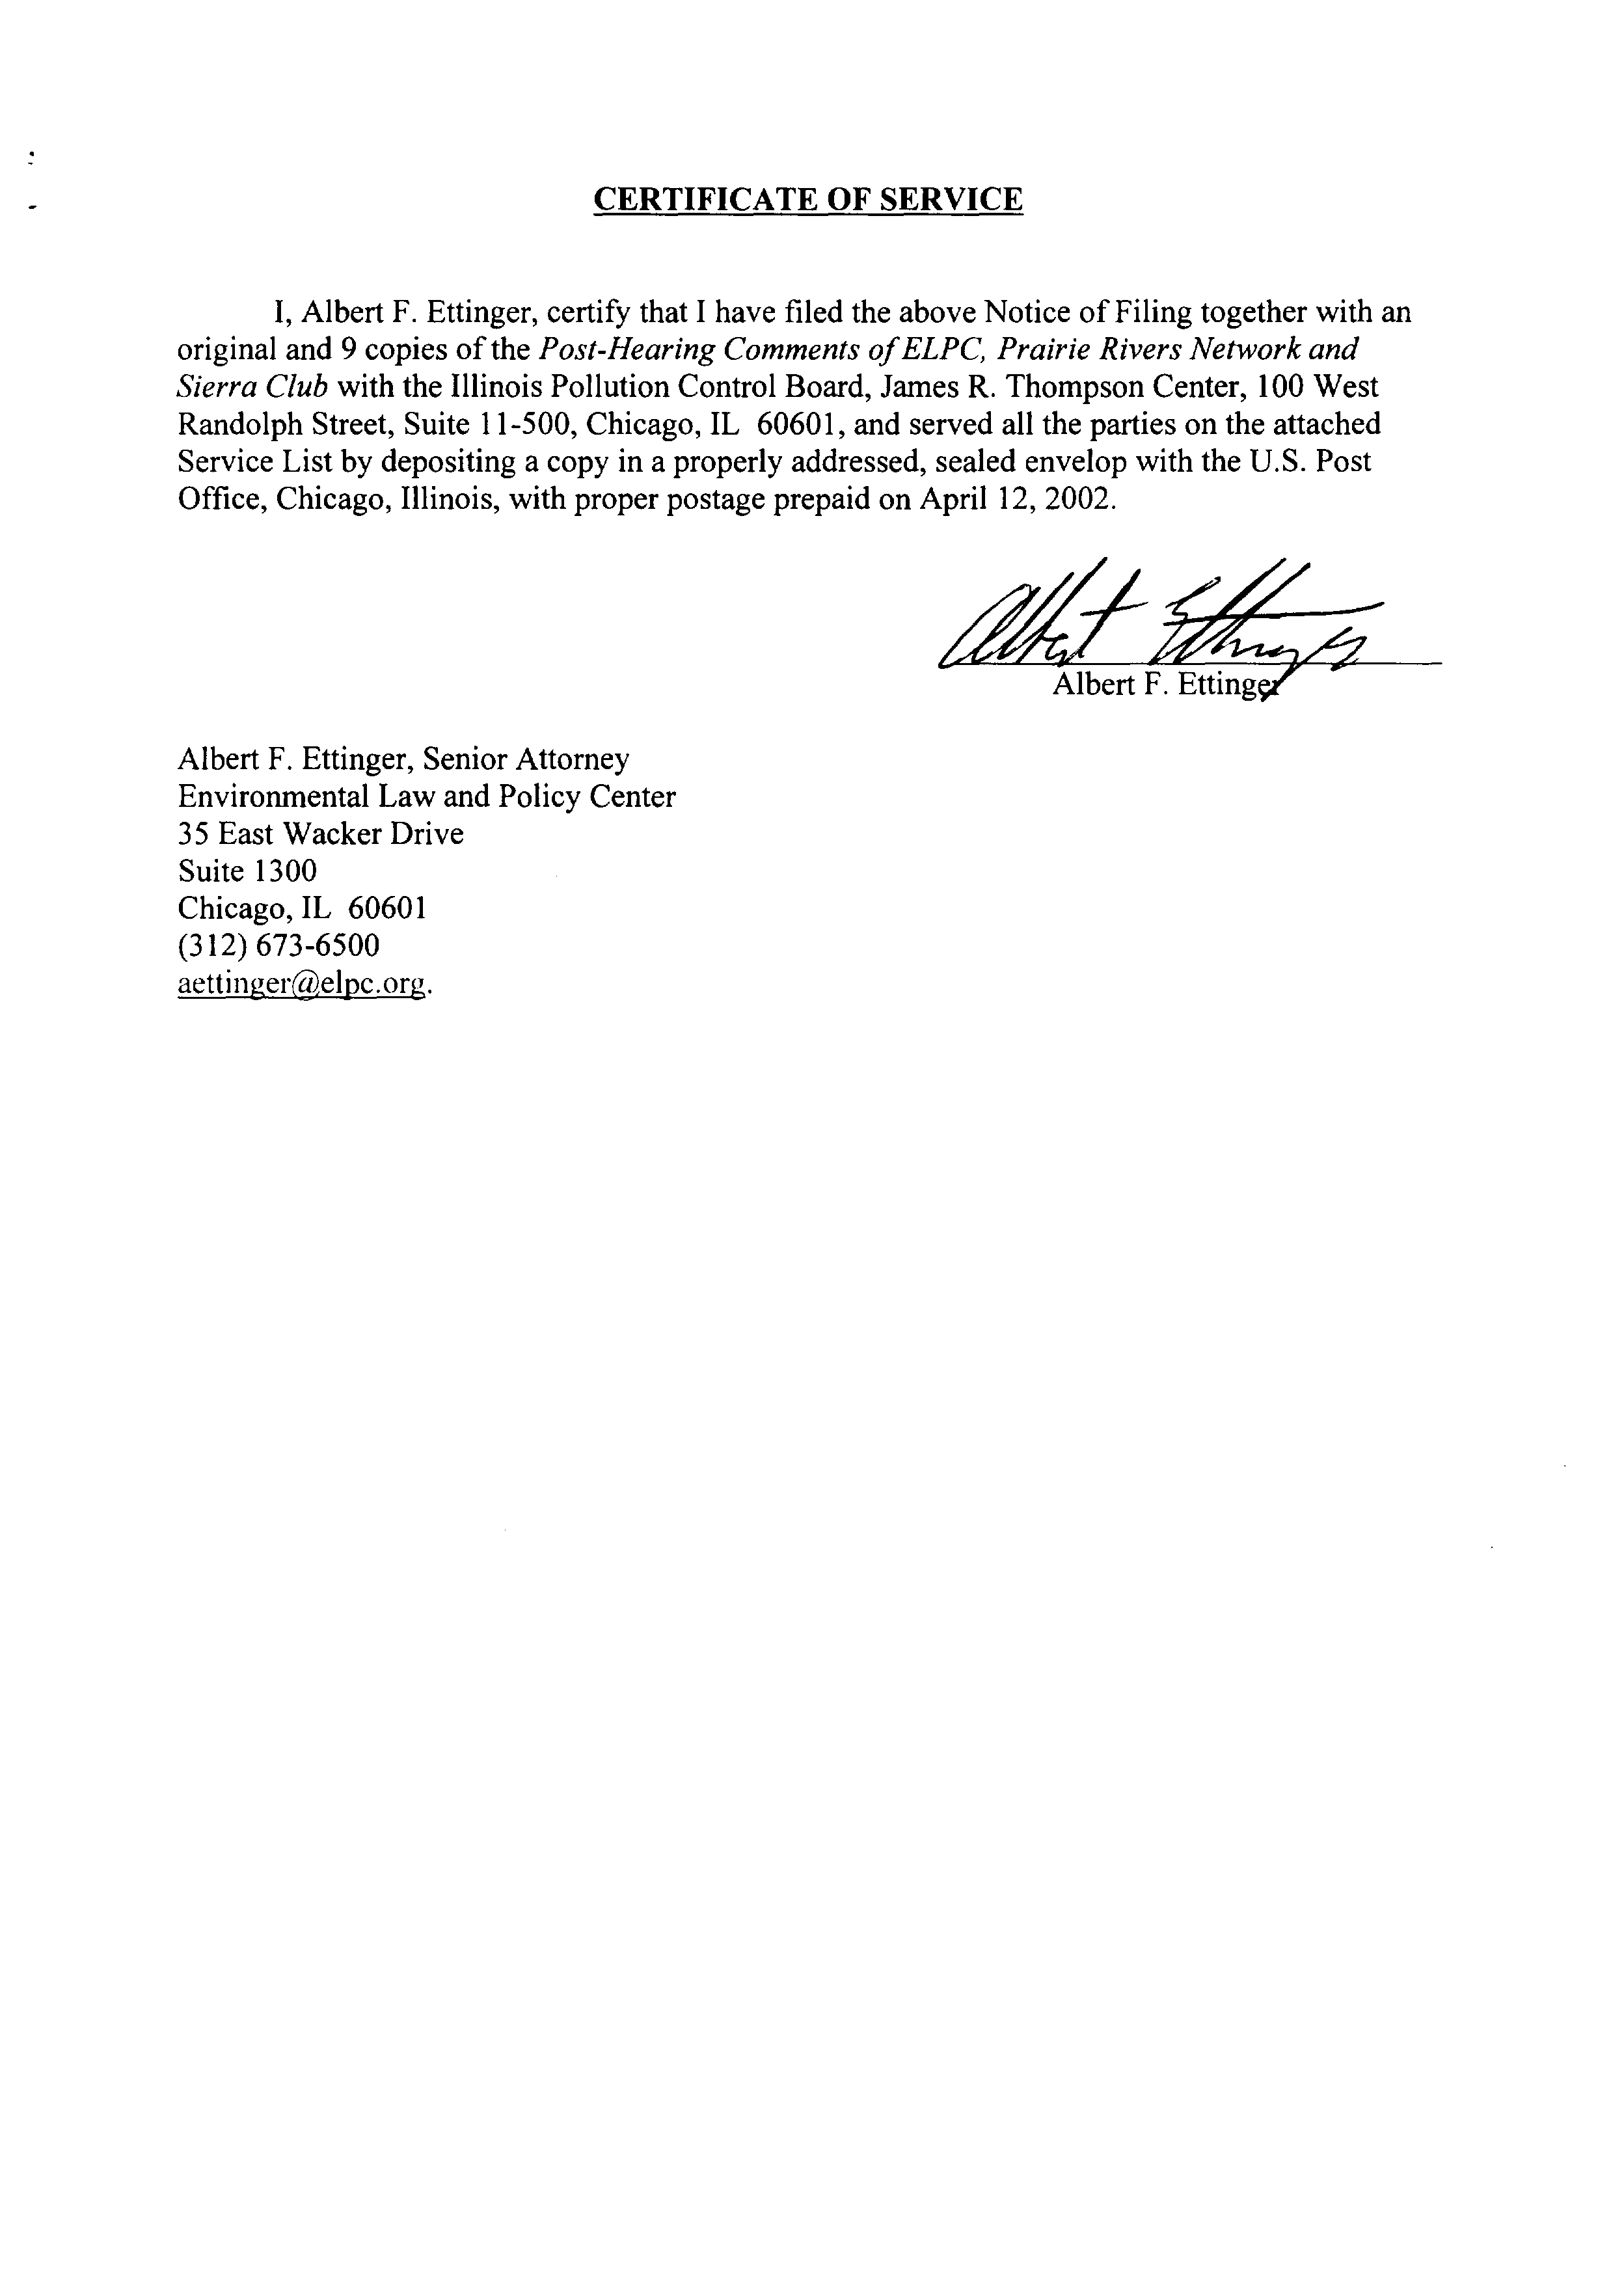
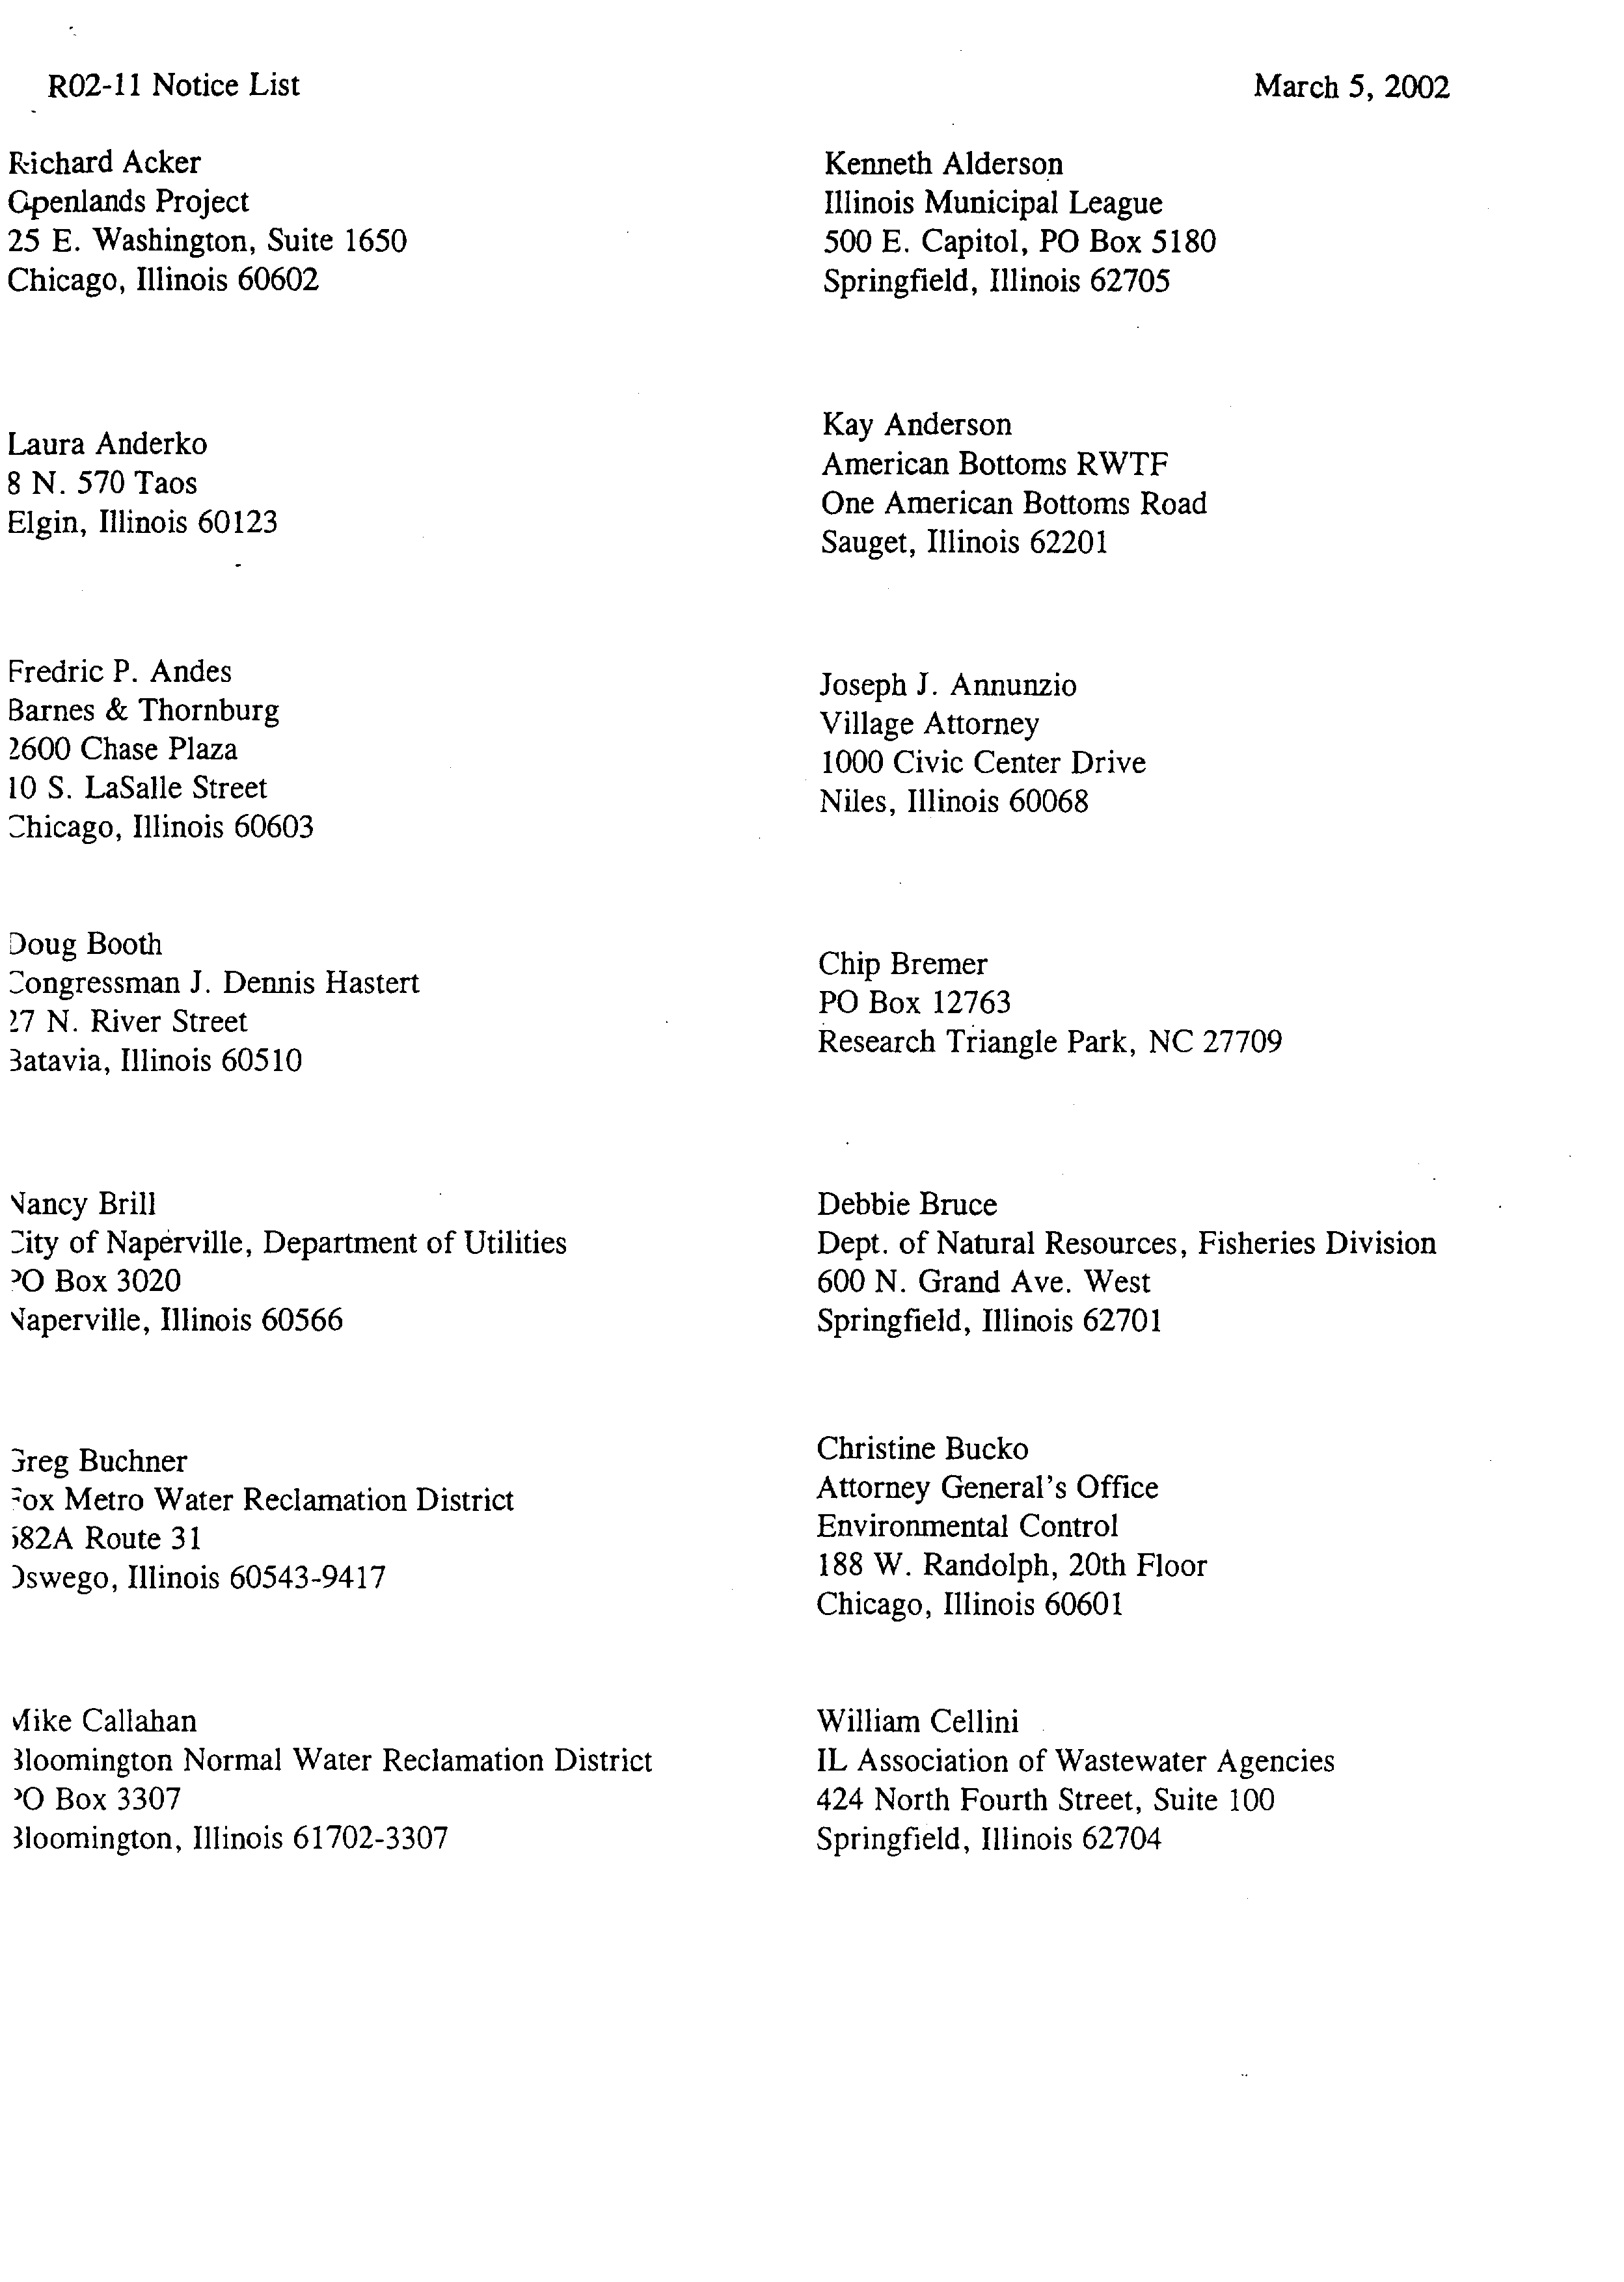
PLEASE TAKE NOTICE that on this date, April 12, 2002, I filed with Dorothy Gunn,
Clerk of the Illinois Pollution Control Board, James R. Thompson Center, 100 West Randolph,
Suite 11-500, Chicago, IL 60601, the enclosed
Post-Hearing Comments of Environmental Law and
Policy Center, PrairieRivers Network and Sierra Club
in the above-captioned proceeding.
Albert F. Etting
Albert F. Ettinger, Senior Attorney
Environmental Law and Policy Center
35
East Wacker Drive, Suite 1300
Chicago, IL 60601
(312) 673-6500
BEFORE THE ILLINOIS POLLUTION CONTROL BOK,~
APR 1 2 2002
PollutionSTATE
OFControlIWNOISBoard
WATER QUALITY AMENDMENTS TO
)
35 Iii. Adm Code 302.208(e)-(g),
302.504(a),
)
R02-1 1
302.575(d),
303.444, 309.141(h); and
)
(Rulemaking-Water)
PROPOSED 35 Ill. Adm. Code 301.367,
)
301.313,301.413,304.120,and3O9.157
)
POST-HEARING COMMENTS OF ENVIRONMENTAL LAW AND POLICY CENTER.
PRAIRIE RIVERS NETWORK AND SIERRA CLUB
Introduction
The Board should not adopt the Illinois Environmental Protection Agency’s proposal to
change the cyanide standards and deoxygenating wastes rules based on the current record. Further,
unless the record is substantially supplemented, the Board should reject most or all ofthe Agency’s
petition outright.
The proposed change in the cyanide standard offers no known benefit and may pose a threat
to highly valued fish populations and mussel species already on the verge ofextirpation. The
proposed change in the deoxygenating waste rule should not be accepted by the Board until the
Agency develops implementation rules that will prevent violations ofthe state dissolved oxygen
standard. The other proposed changes in the standards may be acceptable but that is not clear. As
ofthe date of the filing of these comments, the Agency has not shown the Board or the public its
proposed implementation rules although it has stated repeatedly that draft rules would be available
in this proceeding.
At the end ofthe March 6, 2002 hearing, there was considerable discussion ofwhether there
should be an additional hearing in this case prior to First Notice. At that time, Sierra Club, Prairie
Rivers Network and the Environmental Law and Policy Center ofthe Midwest (“Environmental
Groups”) felt that an additional hearing was warranted before going to First Notice. But there is no
way now to know when, if ever, the Agency will provide draft implementation rules. Accordingly,
we now believe that the better practice would be to reject the Agency petition with the exception of
those portions ofthe proposal which the Board is confident there is sufficient existing guidance in
federal rules or elsewhere that state implementation rules are unnecessary.
I
I.
The Board Should Require that the Agency Produce Draft Implementation Rules
regarding Hardness, Reasonable Potential Testing, Dissolved Oxygen and the Metals
Translator.
In his pre-filed testimony and at the January 29, 2002 hearing, Robert Mosher on behalfof
the Agency testified at length that the Agency would present implementation rules in this
proceeding and testified of the importance to the Board and the public ofknowing how the Agency
would implement the proposed standards. Specifically, we were told to expect draft implementation
rules regarding hardness factors, reasonable potential and the metals translator. (Mosher Testimony,
Jan, 29, 2002, Transcript at 41-44). The most important ofthese rules would clearly be the
reasonable potential rules about which Mosher testified:
One of the main parts ofthis Agency implementation rule will be how the
Agency will do what is called a reasonable potential analysis to determine if a
certain substance needs to be regulated in that NPDES permit. Is there a reasonable
potential for it to exceed the water quality standard. Ifso, we have to put limits in
that permit for that substance. And that involves a statistical procedure. We intend to
spell all that out and it will take many, many pages to do that. (Mosher Testimony,
January 29, 2002, Tr.43)
We do not know the contents of the draft implementation rules that the Agency has not
made public. We do know that draft “reasonable potential” rules, which were circulated in 1997,
were 21 pages long and were designed “to establish procedures for determining the concentrations
of substances that must be regulated in NPDES permits in order to assure that water quality
standards will be met in the general use waters of the State” and covered hardness and other
matters. (Exhibit 1, the cover letter and three pages of the 1997 draft). Logically, the draft
implementation rules should at least cover reasonable potential testing and other matters relating to
implementation ofthe new proposed standards regarding nickel, zinc, cyanide, dissolved oxygen
and dissolved metals.
It is critical for the Board to see the implementation rules in its consideration of water
quality standards. The implementation rules often make all the difference as to whether a standard
is protective ofaquatic life, overly stringent or useless. Just to discuss hardness as one factor, it can
make a very large difference in the NPDES permit limits for many metals where instream hardness
is measured in the stream to receive the discharge (or sometimes another stream thought by the
Agency to have a similar hardness) and what figure for hardness is used in calculating permit limits
given varying hardness measurements and the number ofdata points collected. (See Exhibit 1 and
35 Ill. Adm. Code 302.504)
In the R94-1(B) ammonia water quality standards proceeding, there was discussion of the
implementation rules regarding “effluent modified waters” (See 35 Ill. Adm. Code 302.2 13) and a
number ofother issues regarding implementation, but the Agency never showed the Board or the
public a draft ofthe implementation rules it would propose. This resulted in very serious disputes
that led to delay in consideration ofhundreds of permits and much other acrimony. Although filed
years after the Board completed its consideration of ammonia standards in R94- 1(B), the recent
testimony of Mr. Michael Callahan on behalf of the Illinois Association ofWastewater Agencies in
2
R02-19 is still full of bitterness stemming from the fact that the parties to R94-1(B) came away
from the proceeding without a clear understanding ofthe likely implementation rules to be put in
place by the Agency. (R02-19, Callahan Testimony, March
25,
2002, Tr. 16,
25-8)’
Based on this
bad experience, IAWA properly did not go forward with its new ammonia proposal without being
confident ofthe implementation rules that would be applied by the Agency. (Id.)
Since R94-1(B), the Agency has provided the Board with draft implementation rules in the
only two major water quality standards proceedings of which we are aware, R97-25 (the Great
Lakes standards) and R01-13 (Antidegradation). In both cases, the ability ofthe Board and the
public to understand how the standards would be implemented was critical to the proceeding. In
both cases, the Board saw fit to adopt a portion ofthe draft Agency implementation rules as Board
rules.
Why the Agency has not offered the promised implementation rules in this proceeding is
unclear. Whether the Agency’s failure to provide draft rules is calculated or accidental, the Board
should not
II.
proceed
The
without
Board Should
them.2
Not
Adopt Cyanide Standards That May Not Be Protective
Of Endangered
Species
And Highly-Valued Fish Populations
Among the few things that we know for sure about the proposed change in the cyanide
standard is that there is no reason to adopt it now. The Agency knows of no discharger that would
be helped by the less protective standard. (Mosher Testimony, March 6, 2002, Tr. 61) IEPA knows
ofno mussel data and obtained the new standard by throwing the cold water fish data out of the
mix used by U.S. EPA to establish its criteria. (Mosher Testimony, March 6, 2002, Tr. 68)
Adjusting the national criteria to eliminate protections for species that do not live in Illinois
makes some sense when there is relevant data for all of the more sensitive species in Illinois and
that data shows that the resulting standard would be protective of these species. That is
emphatically not the situation here. The Agency freely admits that there is no data on cyanide
toxicity to mussels and that it is proceeding with this standard without knowing whether it will
protect federal and state endangered mussel species. (Olson Testimony, March 6, 2002, Tr. 59-60)
There is no reason to assume that the endangered mussels are less sensitive to cyanide than the cold
water species that that the Agency tossed out ofits equations. Recent studies cited by the United
States Fish & Wildlife Service indicate that mussels are, if anything, more sensitive to some
pollutants than salmonids. (Exhibit 2)~
To avoid burdening the record in this proceeding with extra paper, the Environmental Groups hereby ask that the
Callahan testimony filed in R02-19 be incorporated by reference into this record. The Environmental Groups will also
spare this record a discussion of what they thought the implementation rules were to be following R94- 1.
2
At the March hearing, there was testimony that the dissolved metals portion of the Agency proposal did not actually
need implementation rules because there exists a detailed federal guidance. Davis Testimony, March 6, 2002 Tr. 80-2.
If this is true, perhaps this portion of the Agency proposal can properly be adopted by the Board.
While perhaps these not yet published studies should not be controlling if there were good reasons to change the
current rule, there are no such reasons.
3
Further, no cool water fish (e.g. sculpin) have been taken into account although they are
known to be present in Illinois waters (Mosher Testimony, March 6, 2002, Tr. 140, see also
Skrukrud Testimony, March 6, 2002, Tr. 86)
The Agency’s answer to concern about weakening a standard without information as to
whether the change will affect numerous highly-valued Illinois species is that Illinois can rely on its
newly adopted antidegradation standard to protect against damage to those species. (Mosher
Testimony, March 6, 2002 Tr. 140) That is not quite true, While proper implementation ofIllinois
antidegradation standard should prevent permitting of new cyanide loadings to any water
containing sensitive species, it may not require limits on current dischargers that are newly found to
have cyanide in their discharge.
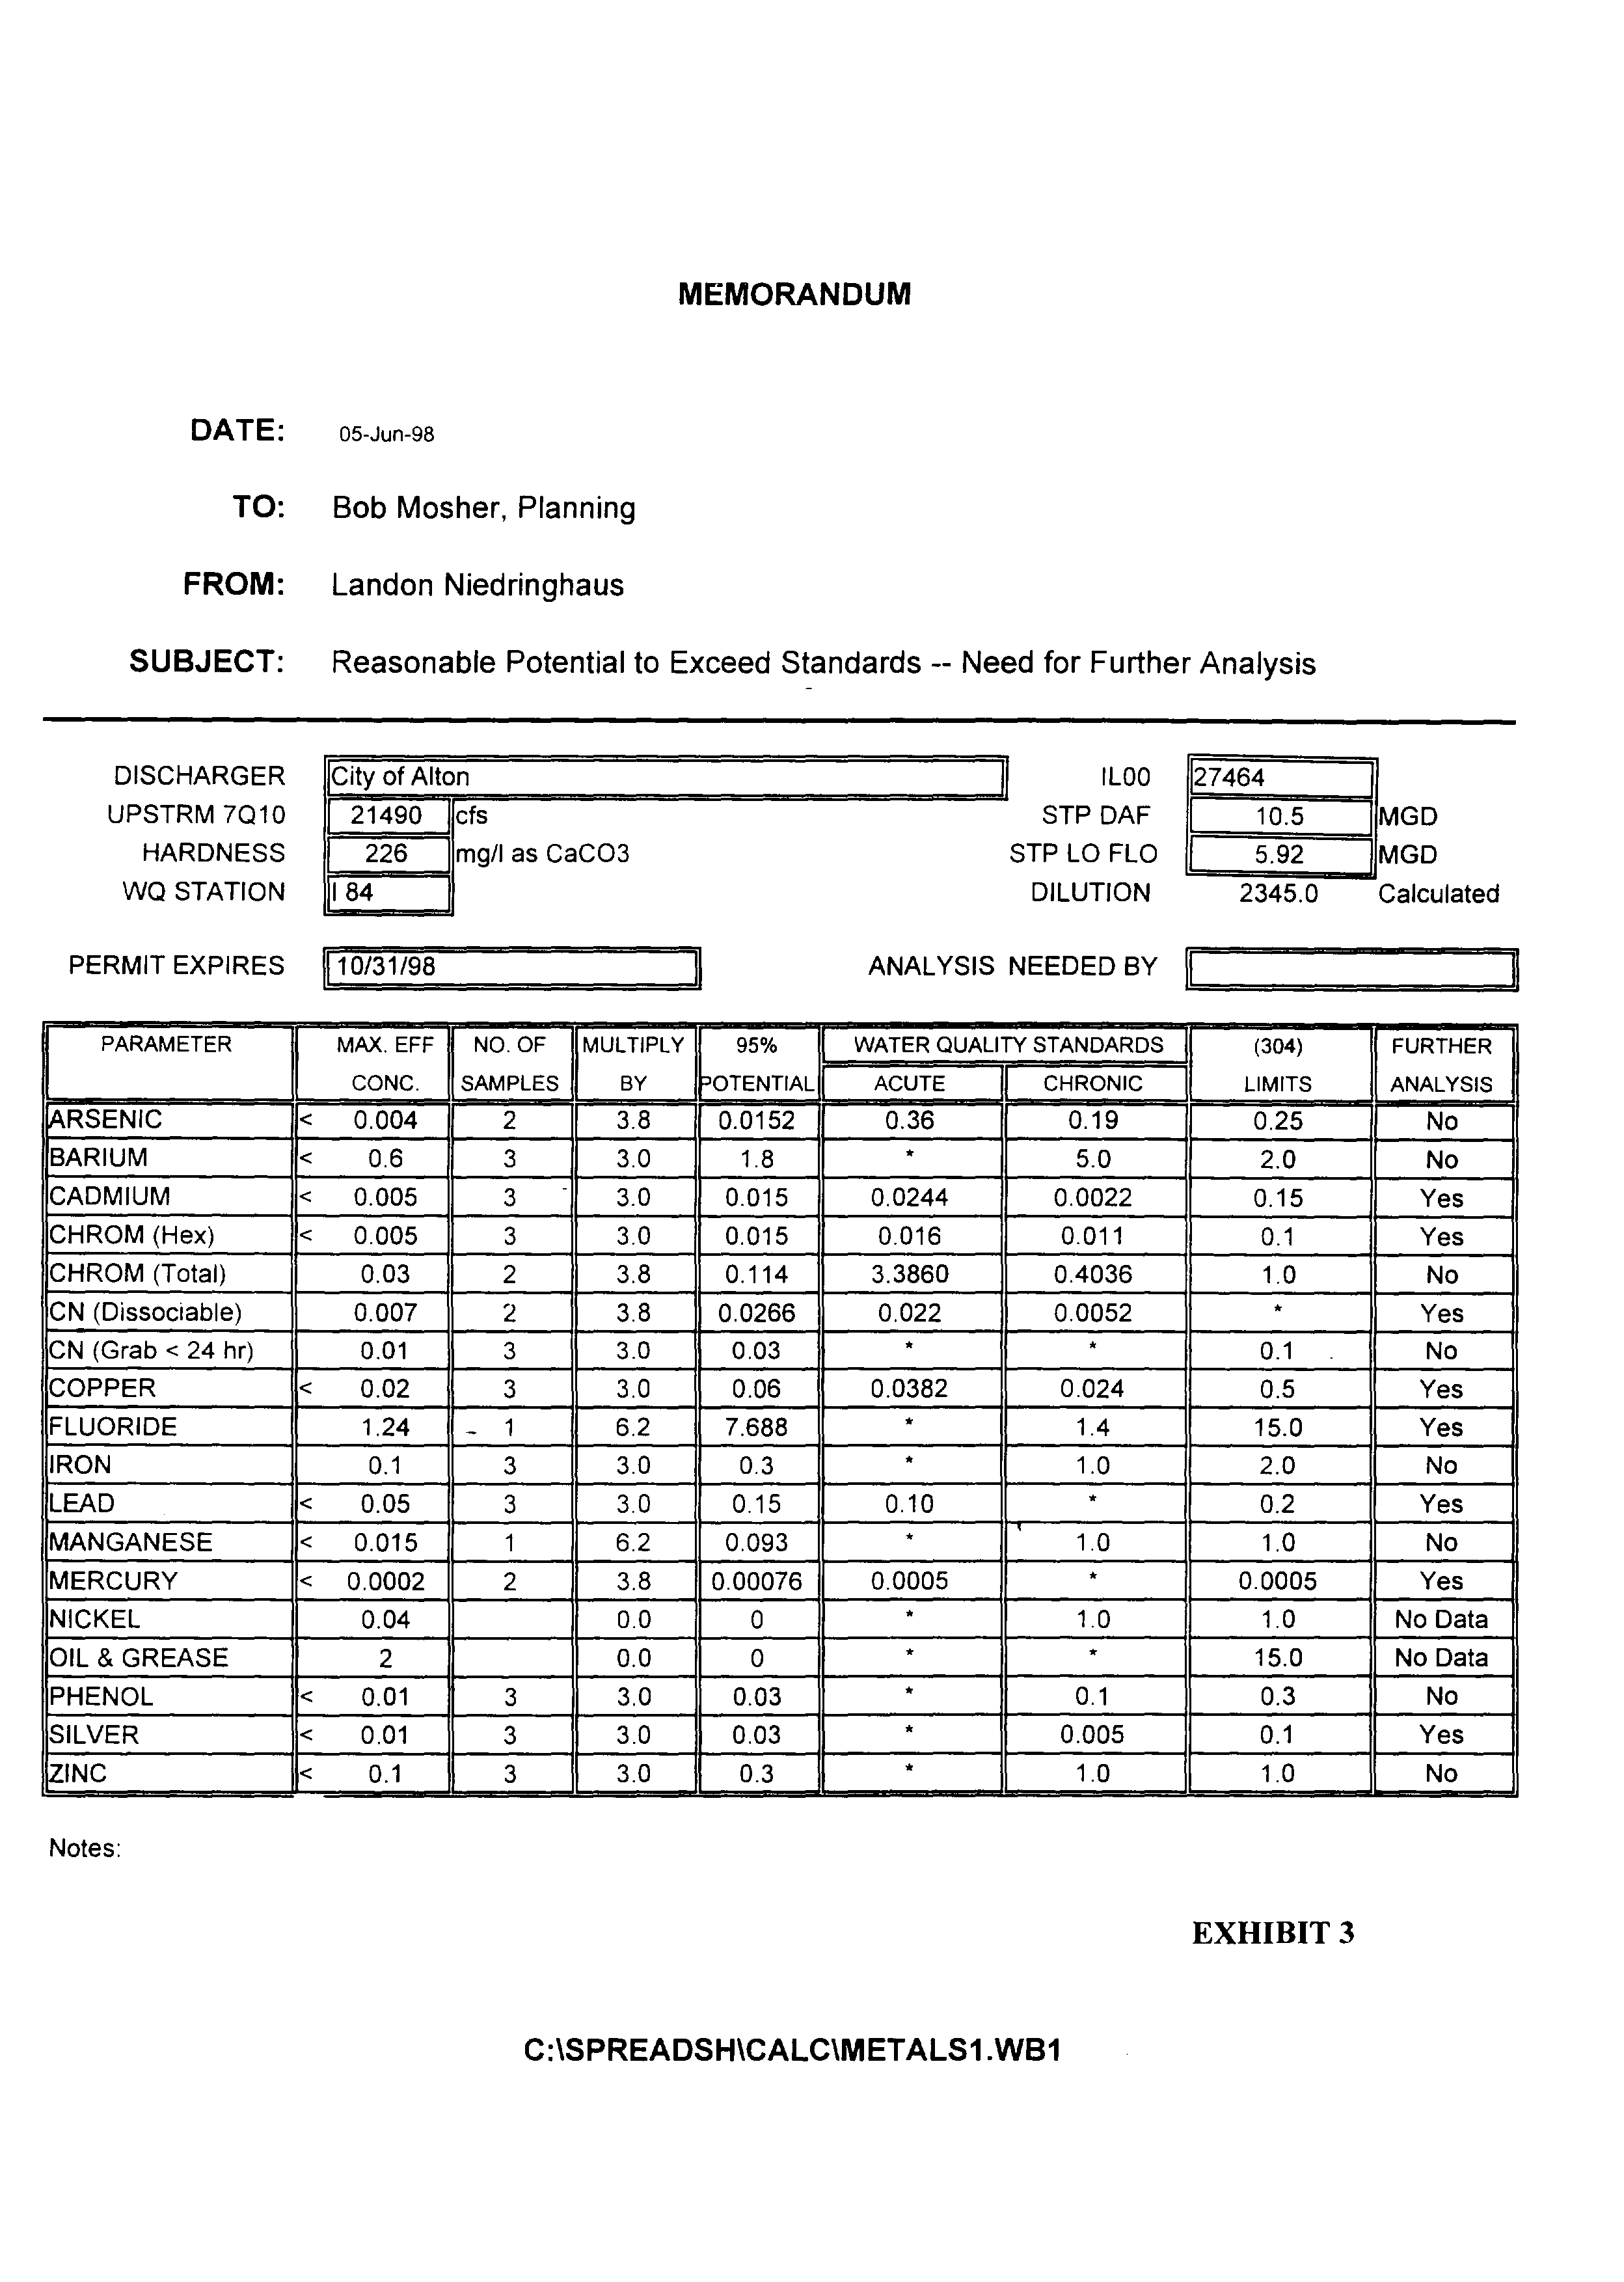
Following federal regulations, IEPA requires Illinois dischargers to periodically test their
discharge for a wide array ofpollutants. For example, cyanide was found in the discharge of the
City ofAlton in 1998 at levels that might have required a permit limit if Alton discharged into a
small stream. (Exhibit 3) Ifthe cyanide standard is weakened, the Agency may fail to establish a
permit limit that is necessary to protect indigenous species.
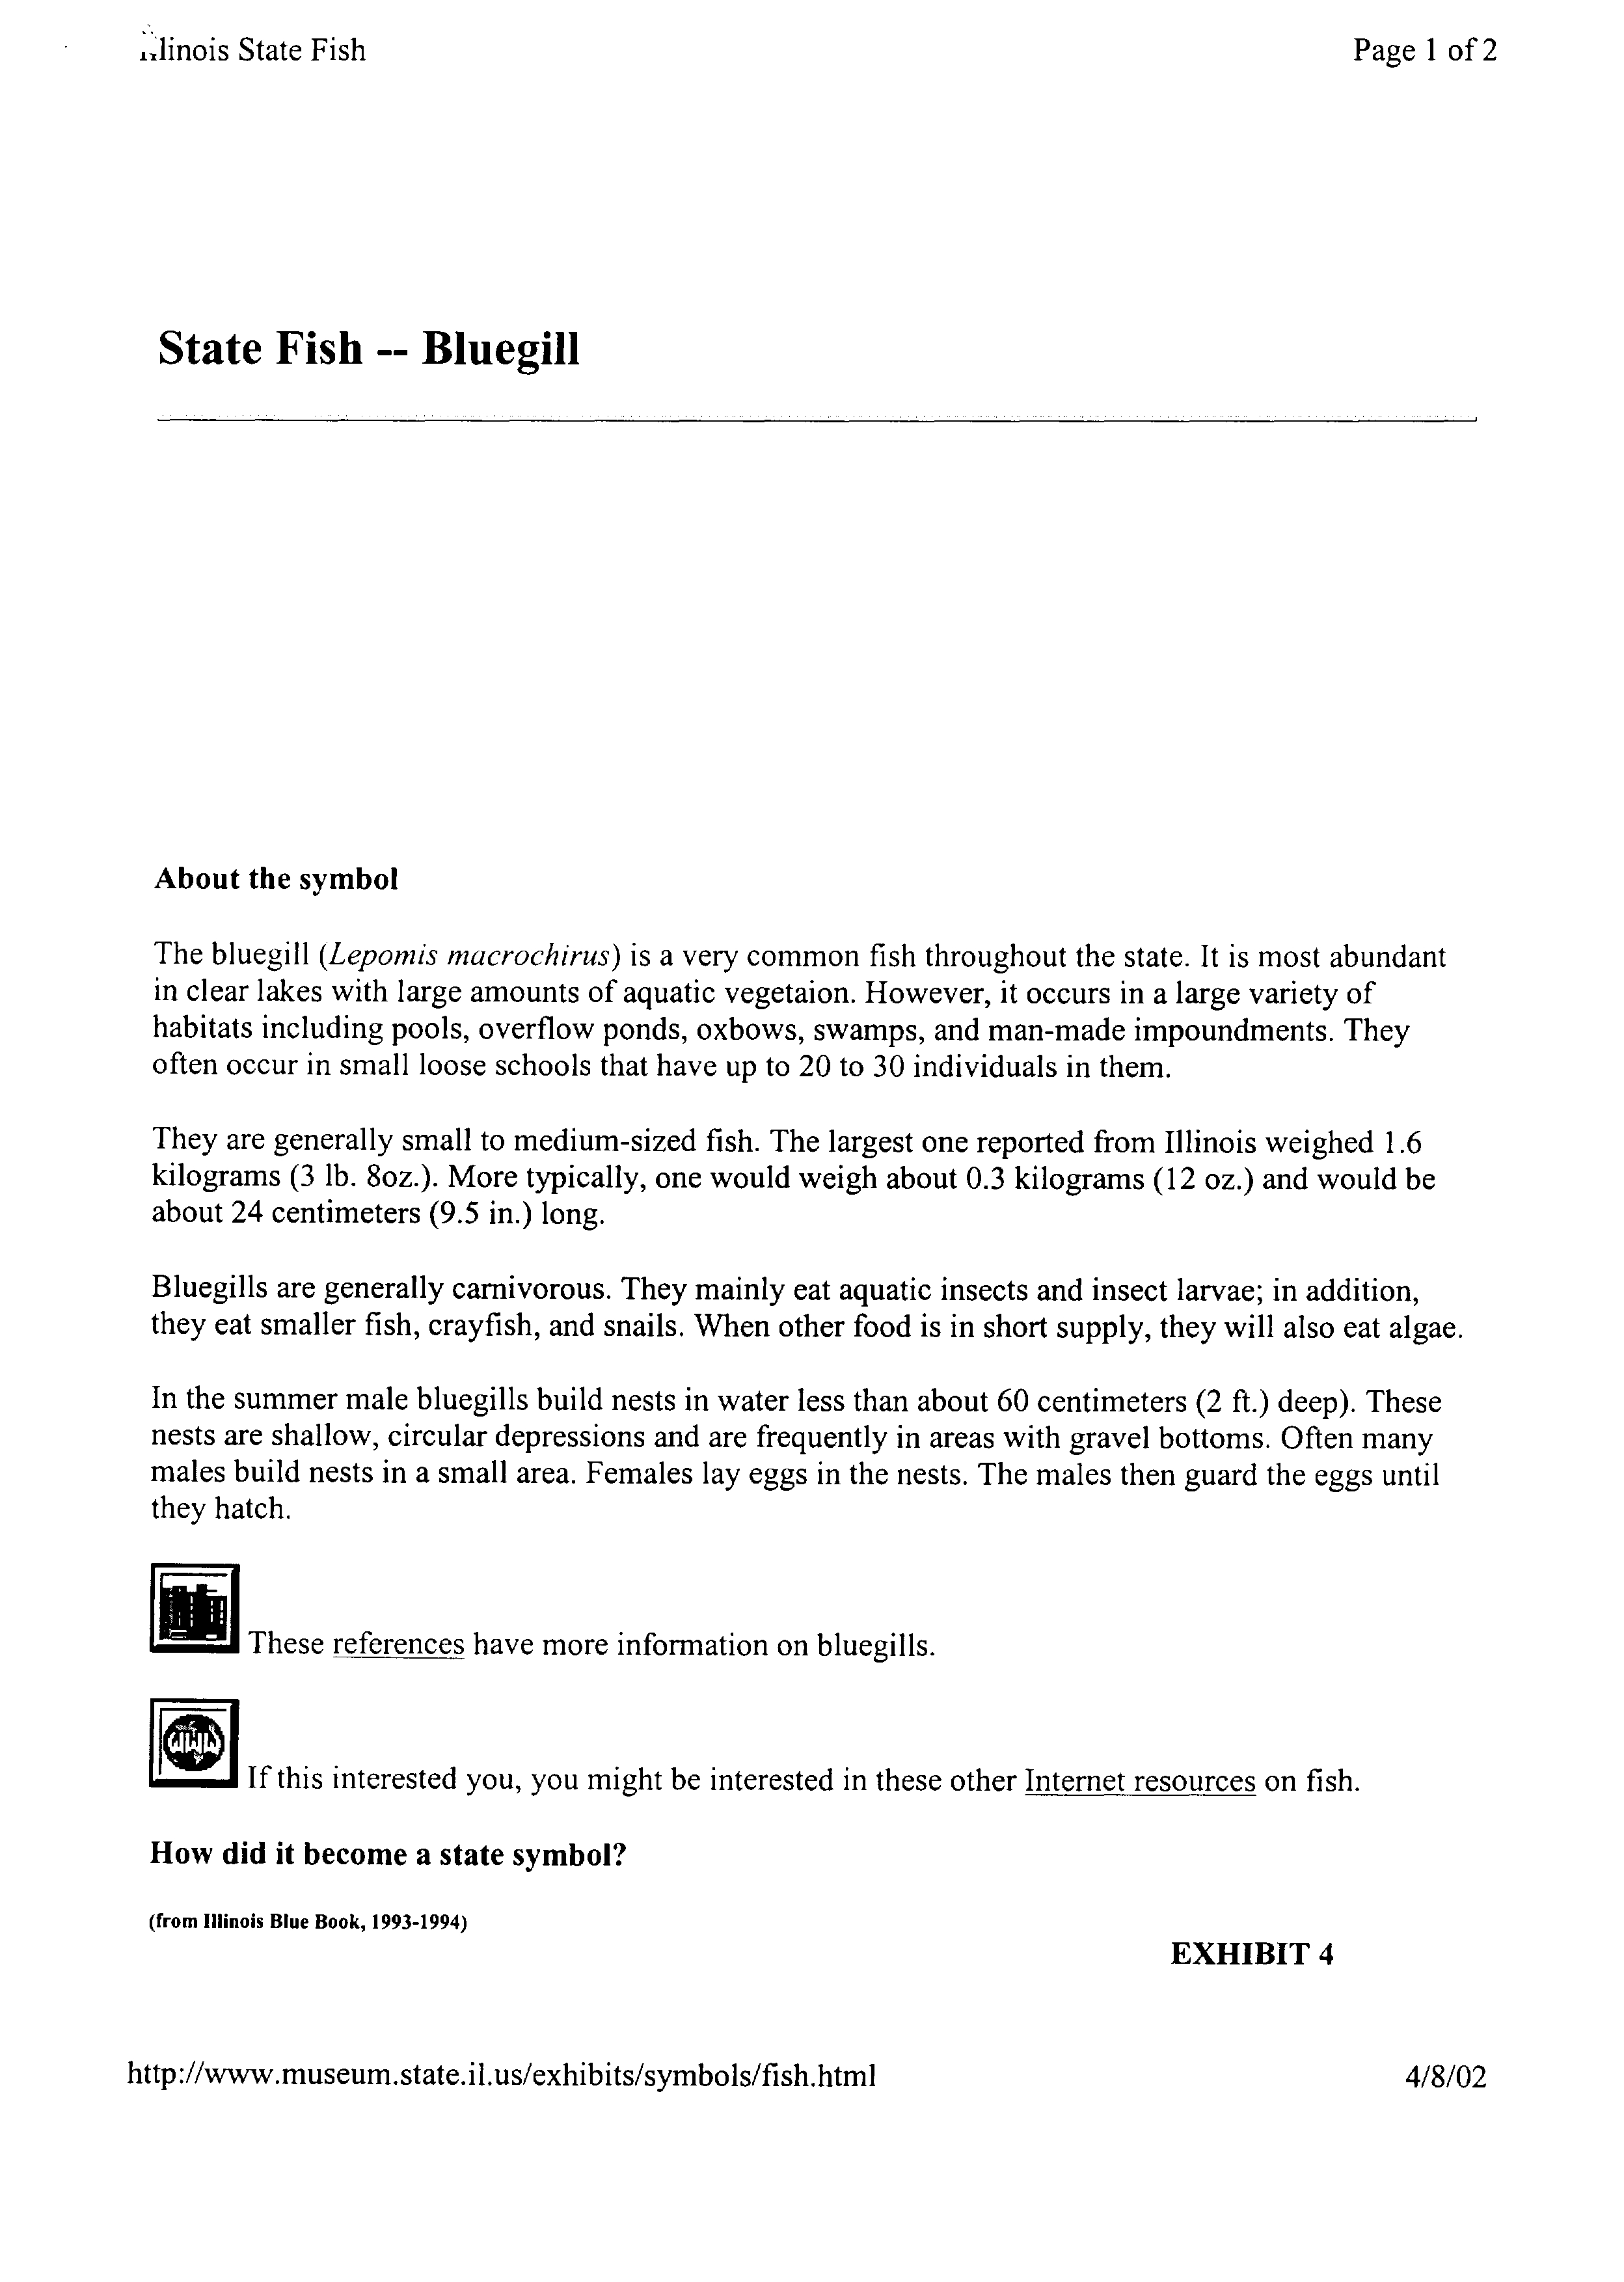
Still further, the 1984 federal criteria document relied on by the Agency cites a “Kimball”
study finding the Bluegill cannot reproduce properly even at the current chronic standard
concentration for cyanide (p.8)4 The Bluegill is Illinois’ State Fish voted as such by the children of
Illinois in 1986. (Exhibit 4) While the validity of the conclusions of the Kimball study are open to
question, the safe thing to do would be to wait until more research is done. The Agency has offered
no reason to proceed in the face ofignorance about the effect ofcyanide on endangered species and
the state
III.
fish.5
Deoxygenating Waste Rule Should Be Protective Of Dissolved Oxygen Levels
Much ofthe discussion at the hearings in this case has focused on what testing is best to
determine whether a sewerage treatment plant is operating properly and whether a Dr. John Pfeffer
meant “BOD5” or
“CBOD5”
in his testimony given to the Board in a proceeding decided over 30
years ago. All of this profoundly misses the point. In this proceeding the Board should focus on the
environmental dangers ofproceeding as the Agency is proceeding with regard to implementation of
Illinois’Todissolvedthe
extentoxygenthat thestandards.history6ofthe deoxygenating waste rule is relevant, it is not Dr.
Pfeffer’s intent that is relevant, but the intent ofthe Board. All we know specifically as to the
‘~
Even ignoring the Kimball reproduction study, the USEPA calculates a safe chronic concentration for Bluegill at
13.56
ug/l, only 2.5 parts per billion higher than the proposed standard.
~ The MWRDGC obtained a site-specific standard proving circumstances that are not generally relevant to the rest of
the state. (See R95-14, Opinion of August 24, 1995) The sensitive species that are of concern here are unlikely to reside
in the degraded streams that receive the MWRDGC effluent.
6
The critical issue for the environment is not what test is used to determine whether sewerage treatment plants have
been run properly. A well-run plant that discharges NBOD at levels that harm the receiving water is not the object
here.
4
Board’s intent is that it used
“BOD5”
even though it knew the difference between BOD and CBOD
(Opinion of the Board, March 7, 1972, Hearing Ex. 10, p. 15) and was specifically urged by at least
one witness to adopt a definition of BOD5 for the standard as being “carbonaceous BOD only.”
(R71-1, Troempe Testimony, Dec. 7, 1971, Tr.8). Certainly, the position taken by some participants
to this proceeding, that the use by the Board of “BUDS” instead of“CBOD5” was some sort of
typo, is hard to square with the Board’s 1972 decision and impossible to reconcile with numerous
subsequent Board opinions that discuss the difference between BOD and CBOD. (see e.g. decisions
cited in note 8 below).
Much more interestingly, we know that the Board in 1972: (i) adopted a standard based on
what it thought was technologically feasible, (ii) was concerned about the effect of ammonia on
dissolved oxygen levels, and (iii) established a rule that would require that the actual effect of the
discharge on dissolved oxygen levels be determined in most cases through use ofmodeling
techniques. (Hearing Ex. 10, pp.15-6) Further, when the Board revised the rule in 1980 to expand
the “Pfeffer exemption,” it conditioned the change on the Agency doing specific dissolved oxygen
studies. In the Matter of: Amendments to the Water Pollution Control Regulations, R77-12,
(Docket C), 1980 Ill. Env. Lexis 427 (February 211980) slip op. pp. 9-10)~
To the extent that this Board feels it should follow the thinking ofthe Board of 1972, the
true lesson from Board decisions from 1972 (and thereafter) is that the Board should:
-
adopt a rule for deoxygenating wastes that protects dissolved oxygen standards, and
-
should not allow discharges ofdeoxygenating wastes unless such discharge is necessary.
The key finding ofthe hearing is that in many cases the Agency is granting NPDES permits
that are not protective ofthe dissolved oxygen water quality standard because the Agency does not
take nitrogenous oxygen demand (“NBOD”) into account. Everyone, from Dr. Pfeffer in 1971 to
Dr. Skrukrud (Tr.87-88) and Mr. Callahan (Tr. 129-30) at the March Hearing in this proceeding,
has testified that CBOD5 does not measure the total oxygen demand ofthe discharge, which may
be much larger than the total CBOD5.8 There is a sizable contribution to BOD from nitrogenous
compounds, but the Agency admits that it essentially never regulates ammonia discharges to
prevent violations ofdissolved oxygen (“DO”) standards. (Mosher Testimony, March 6, 2002, Tr.
34)
Further, the change to the rule proposed by the Agency would allow discharges that are
technically and economically unnecessary.
~ If these studies were ever done, the results have not been presented in this proceeding. And nobody claims that one
can protect dissolved oxygen levels without controlling for nitrogenous oxygen demand in some manner.
~See also, In Matter of: Site Specific Rulemaking for the Sanitary District of Decatur. Illinois, R85-15, 1987 Ill. Env.
Lexis 424 (Jan. 22, 1987); slip op. 7-11, 18, (Board fmds that CBOD5 is only 61 of BOD5 in that case and that
discharge of 1.5 mg/L anm~oniamay cause DO violation); In the Matter of: Site Specific Exception to Effluent
Standards for the Greater Peoria Sanitary and Sewerage Disposal District, R87-21, 1988 Ill. Env. Lexis 470 (Oct. 7,
1988) (Board discusses components of BOD in decision requiring Peoria to continue ammonia treatment because of
effect of ammonia discharge on DO levels in the Illinois River)
5
A. The Dissolved Oxygen Standard Continues To Be Violated in Many Illinois
Waters
A major theme ofthe Agency and the discharger representatives who have testified in this
proceeding is that it is okay that the Agency now generally ignores nitrogenous oxygen demand in
setting limits on deoxygenating waste because the ammonia limits will protect against low
dissolved oxygen. Further, there were many suggestions at the hearings that low dissolved oxygen
levels are just not a problem anymore. We wish this were true. The facts indicate that Illinois needs
more stringent controls on deoxygenating wastes, not weaker controls.
As usual, the data is not as complete as could be wished. Still, the existing data shows that
there are continuing serious violations of the dissolved oxygen standards and that discharges from
sewerage treatment plants and other point sources cause or contribute to these violations. The most
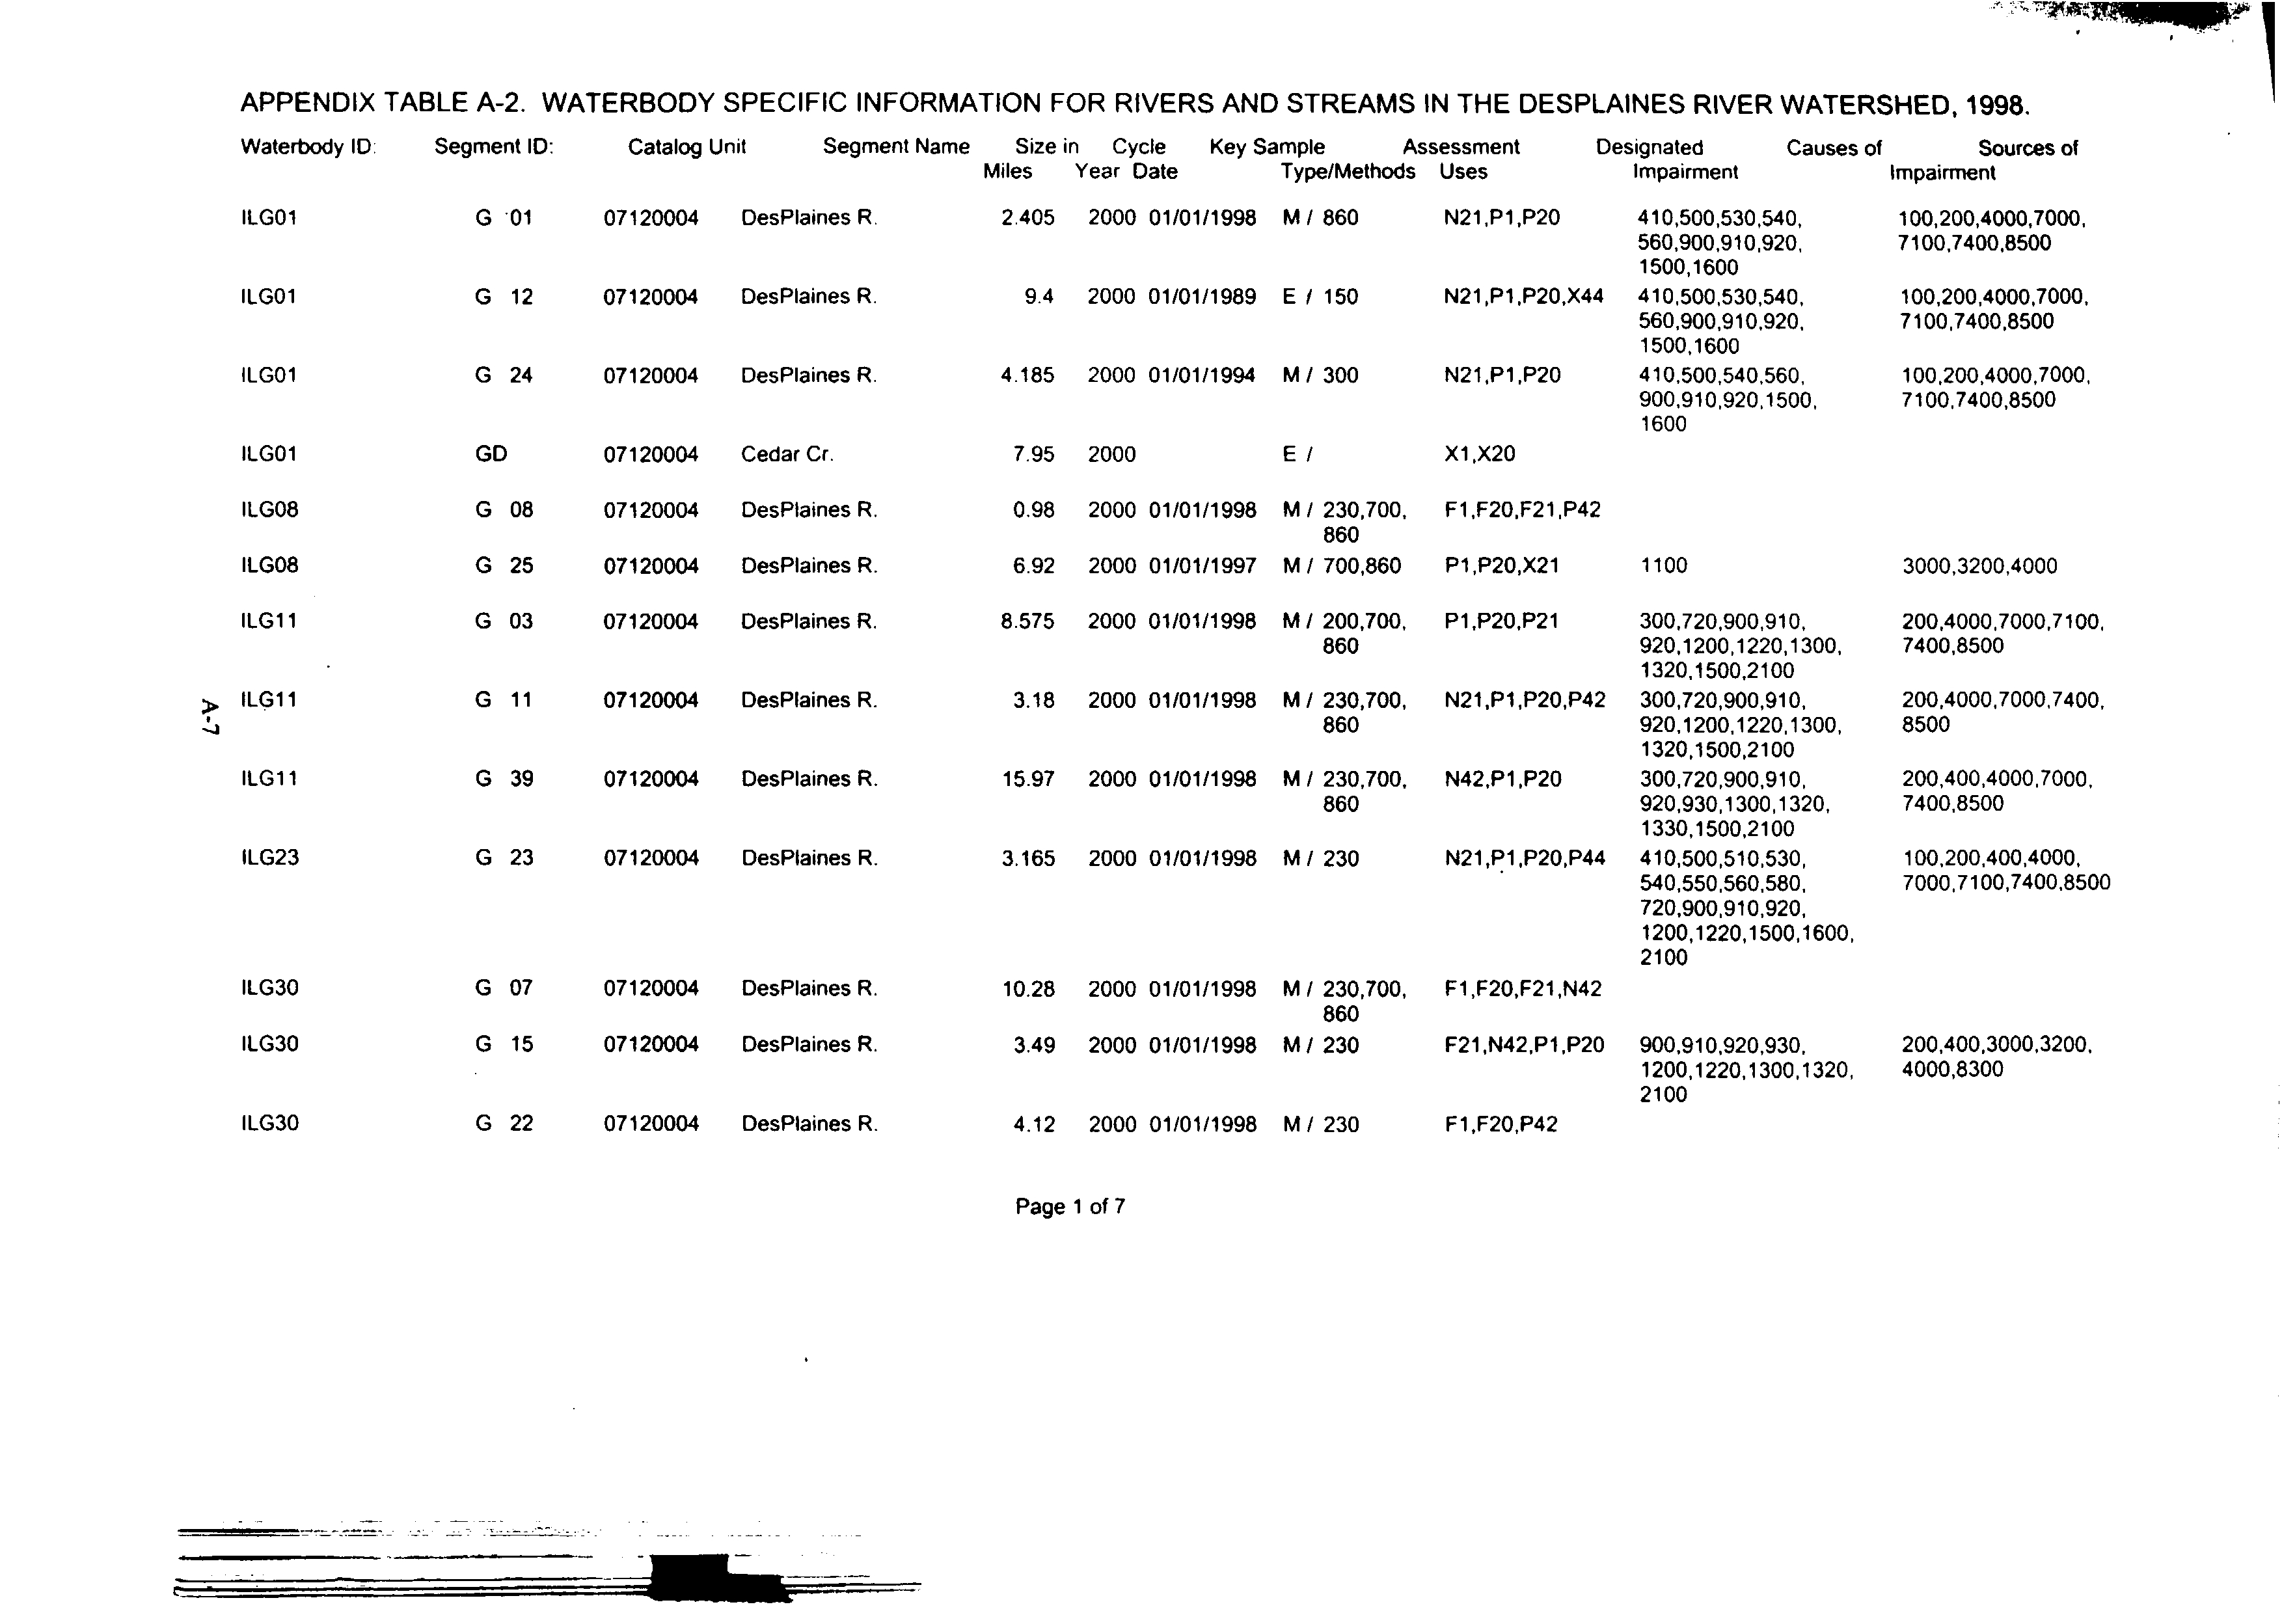
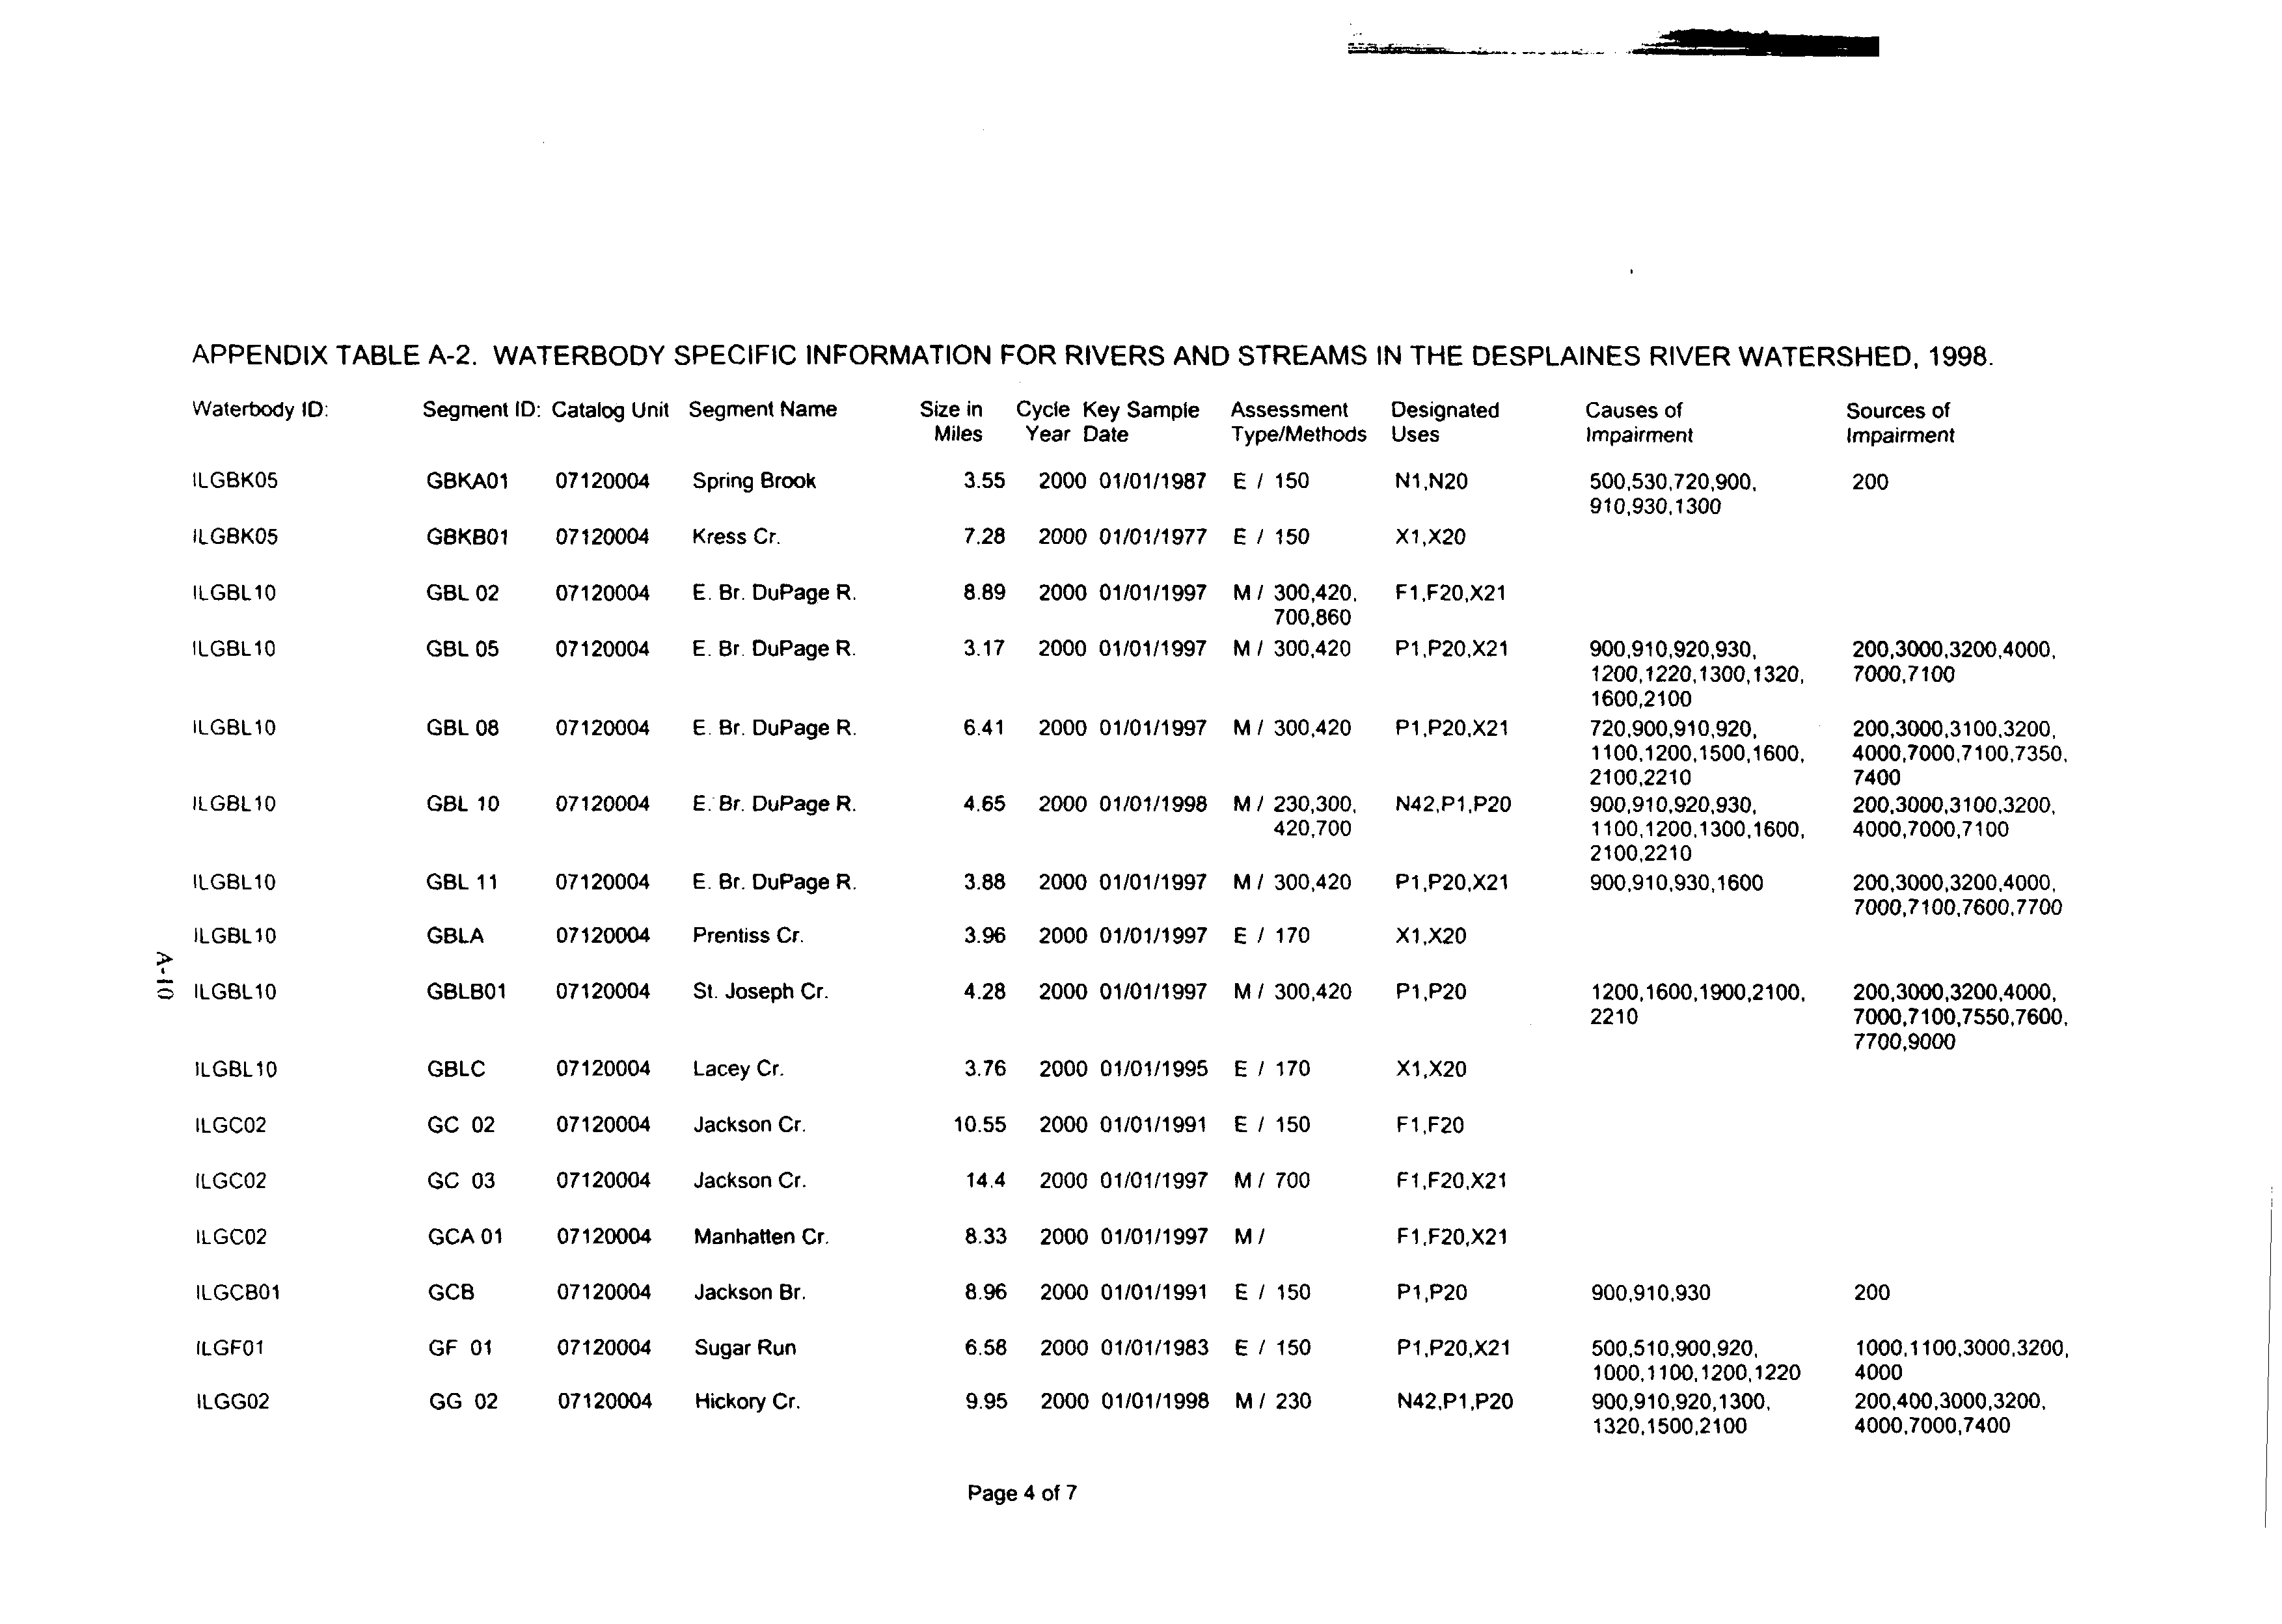
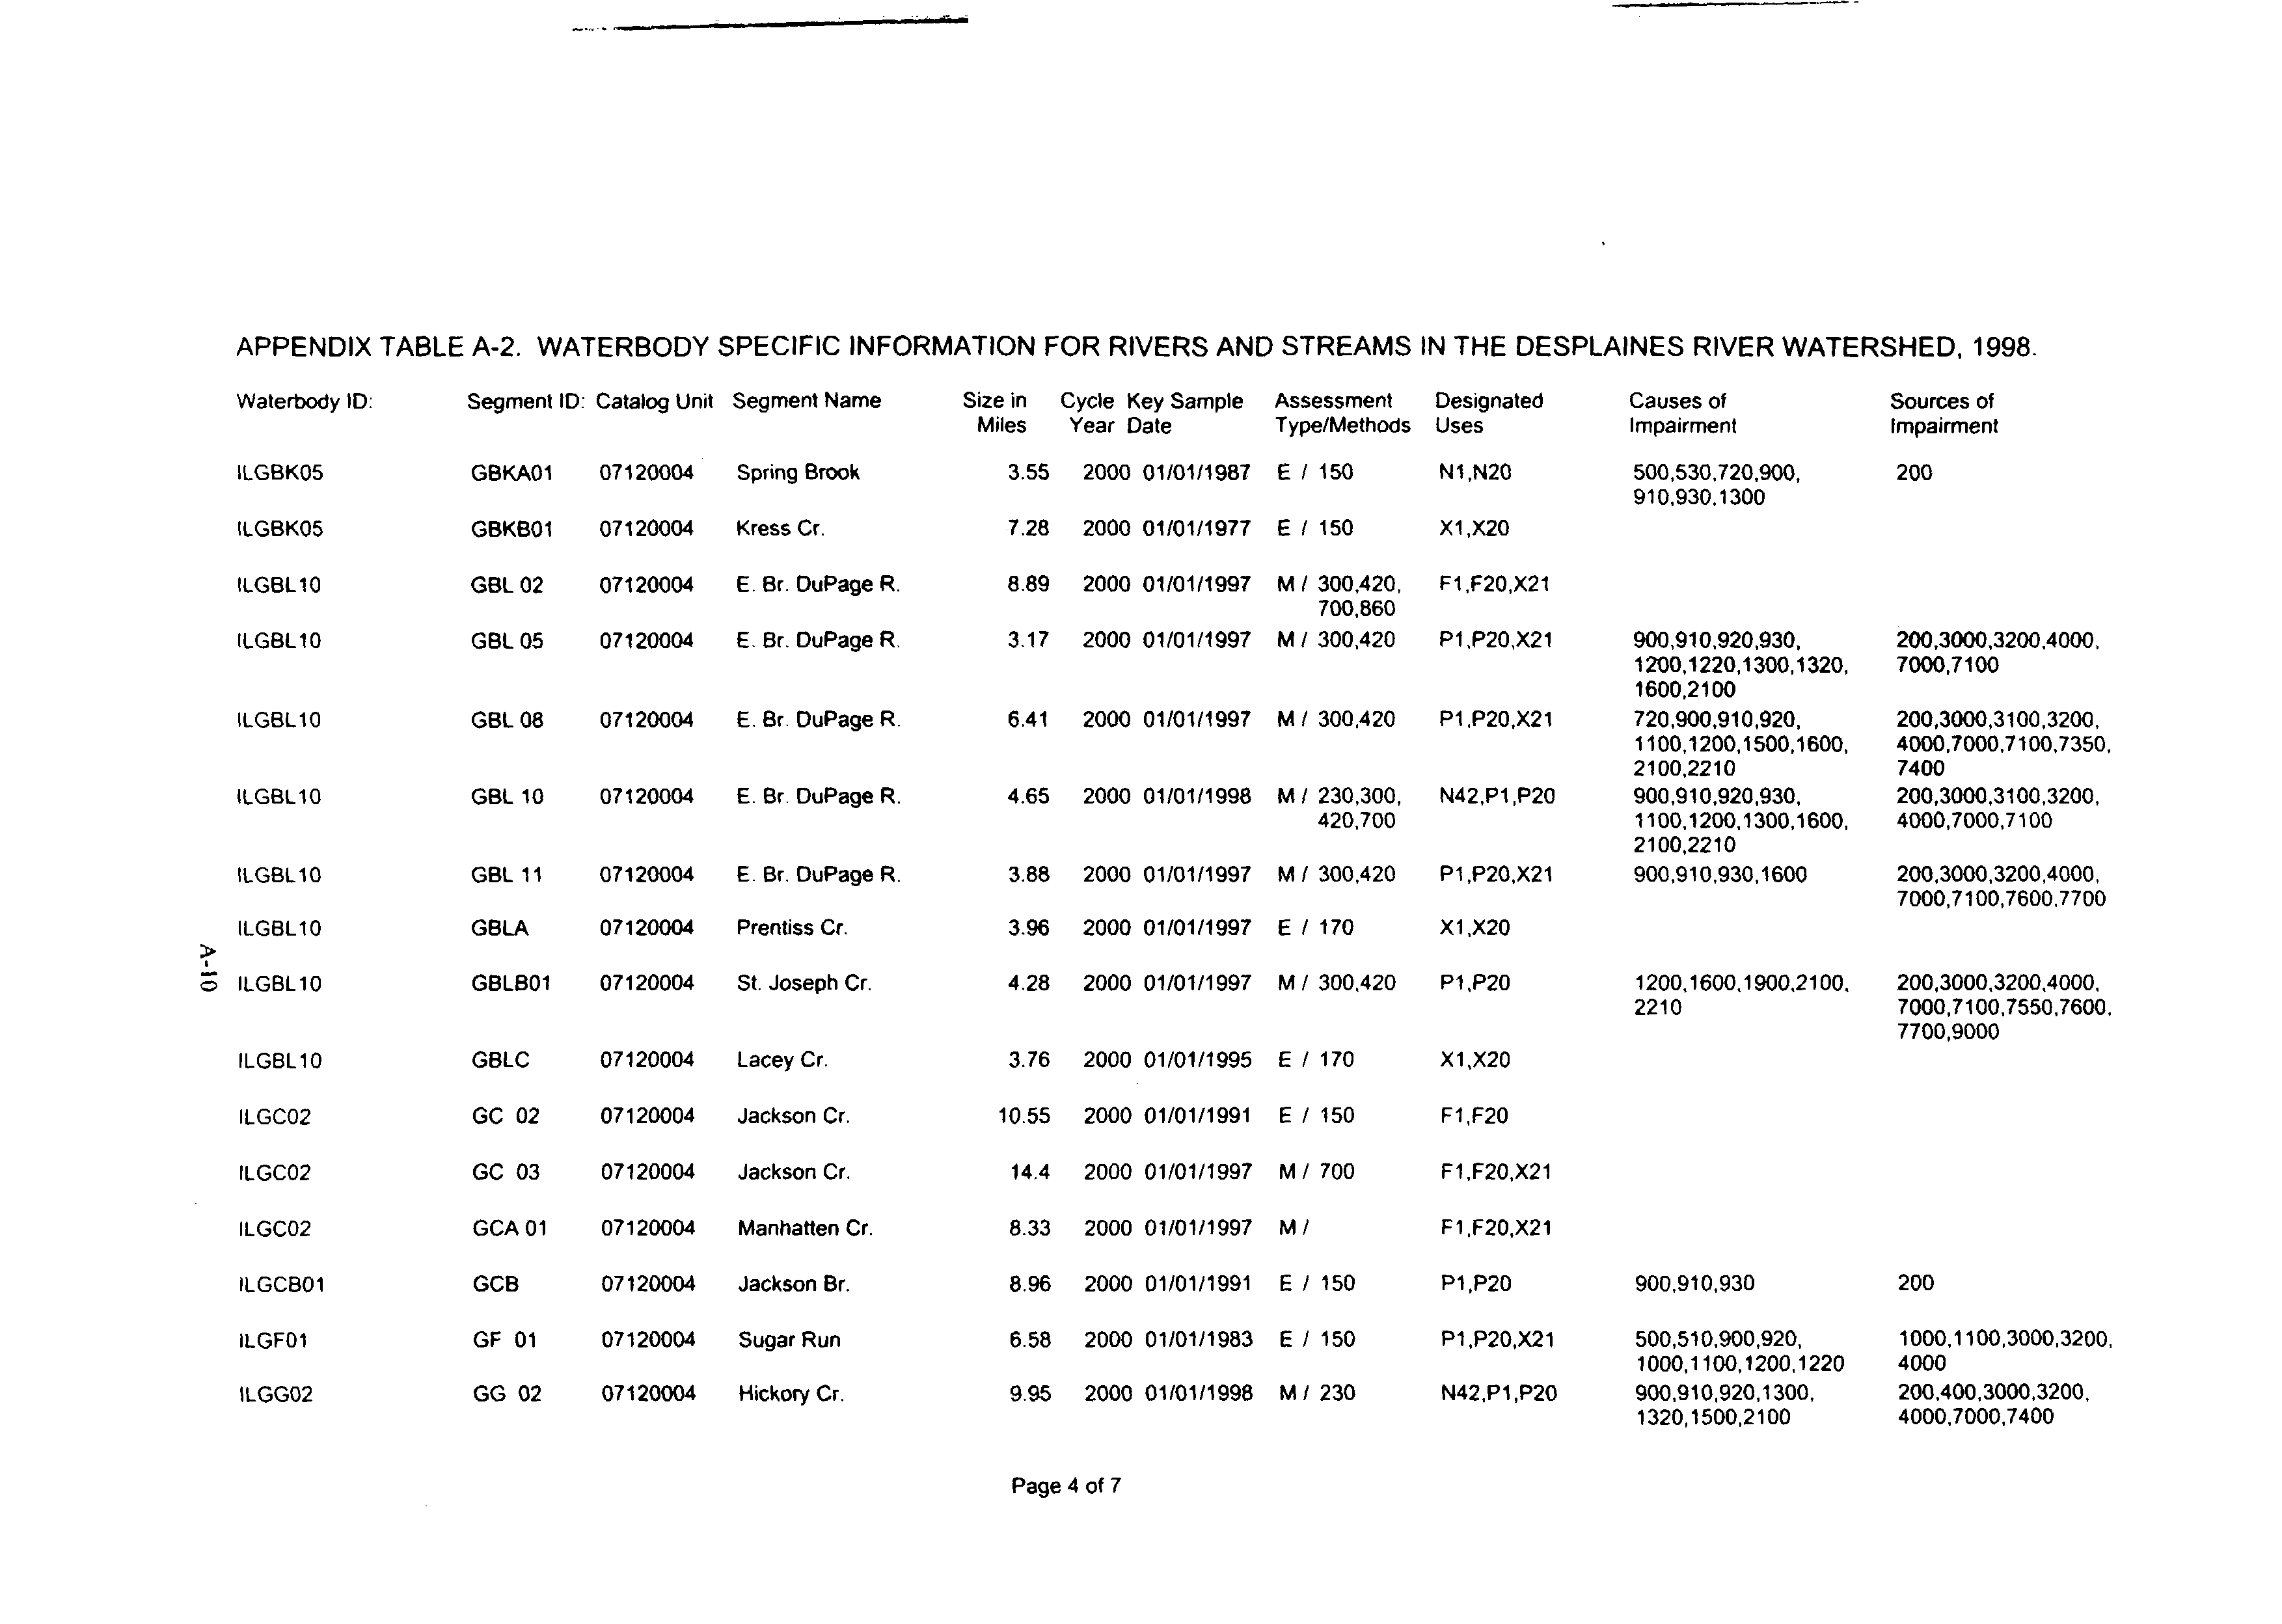
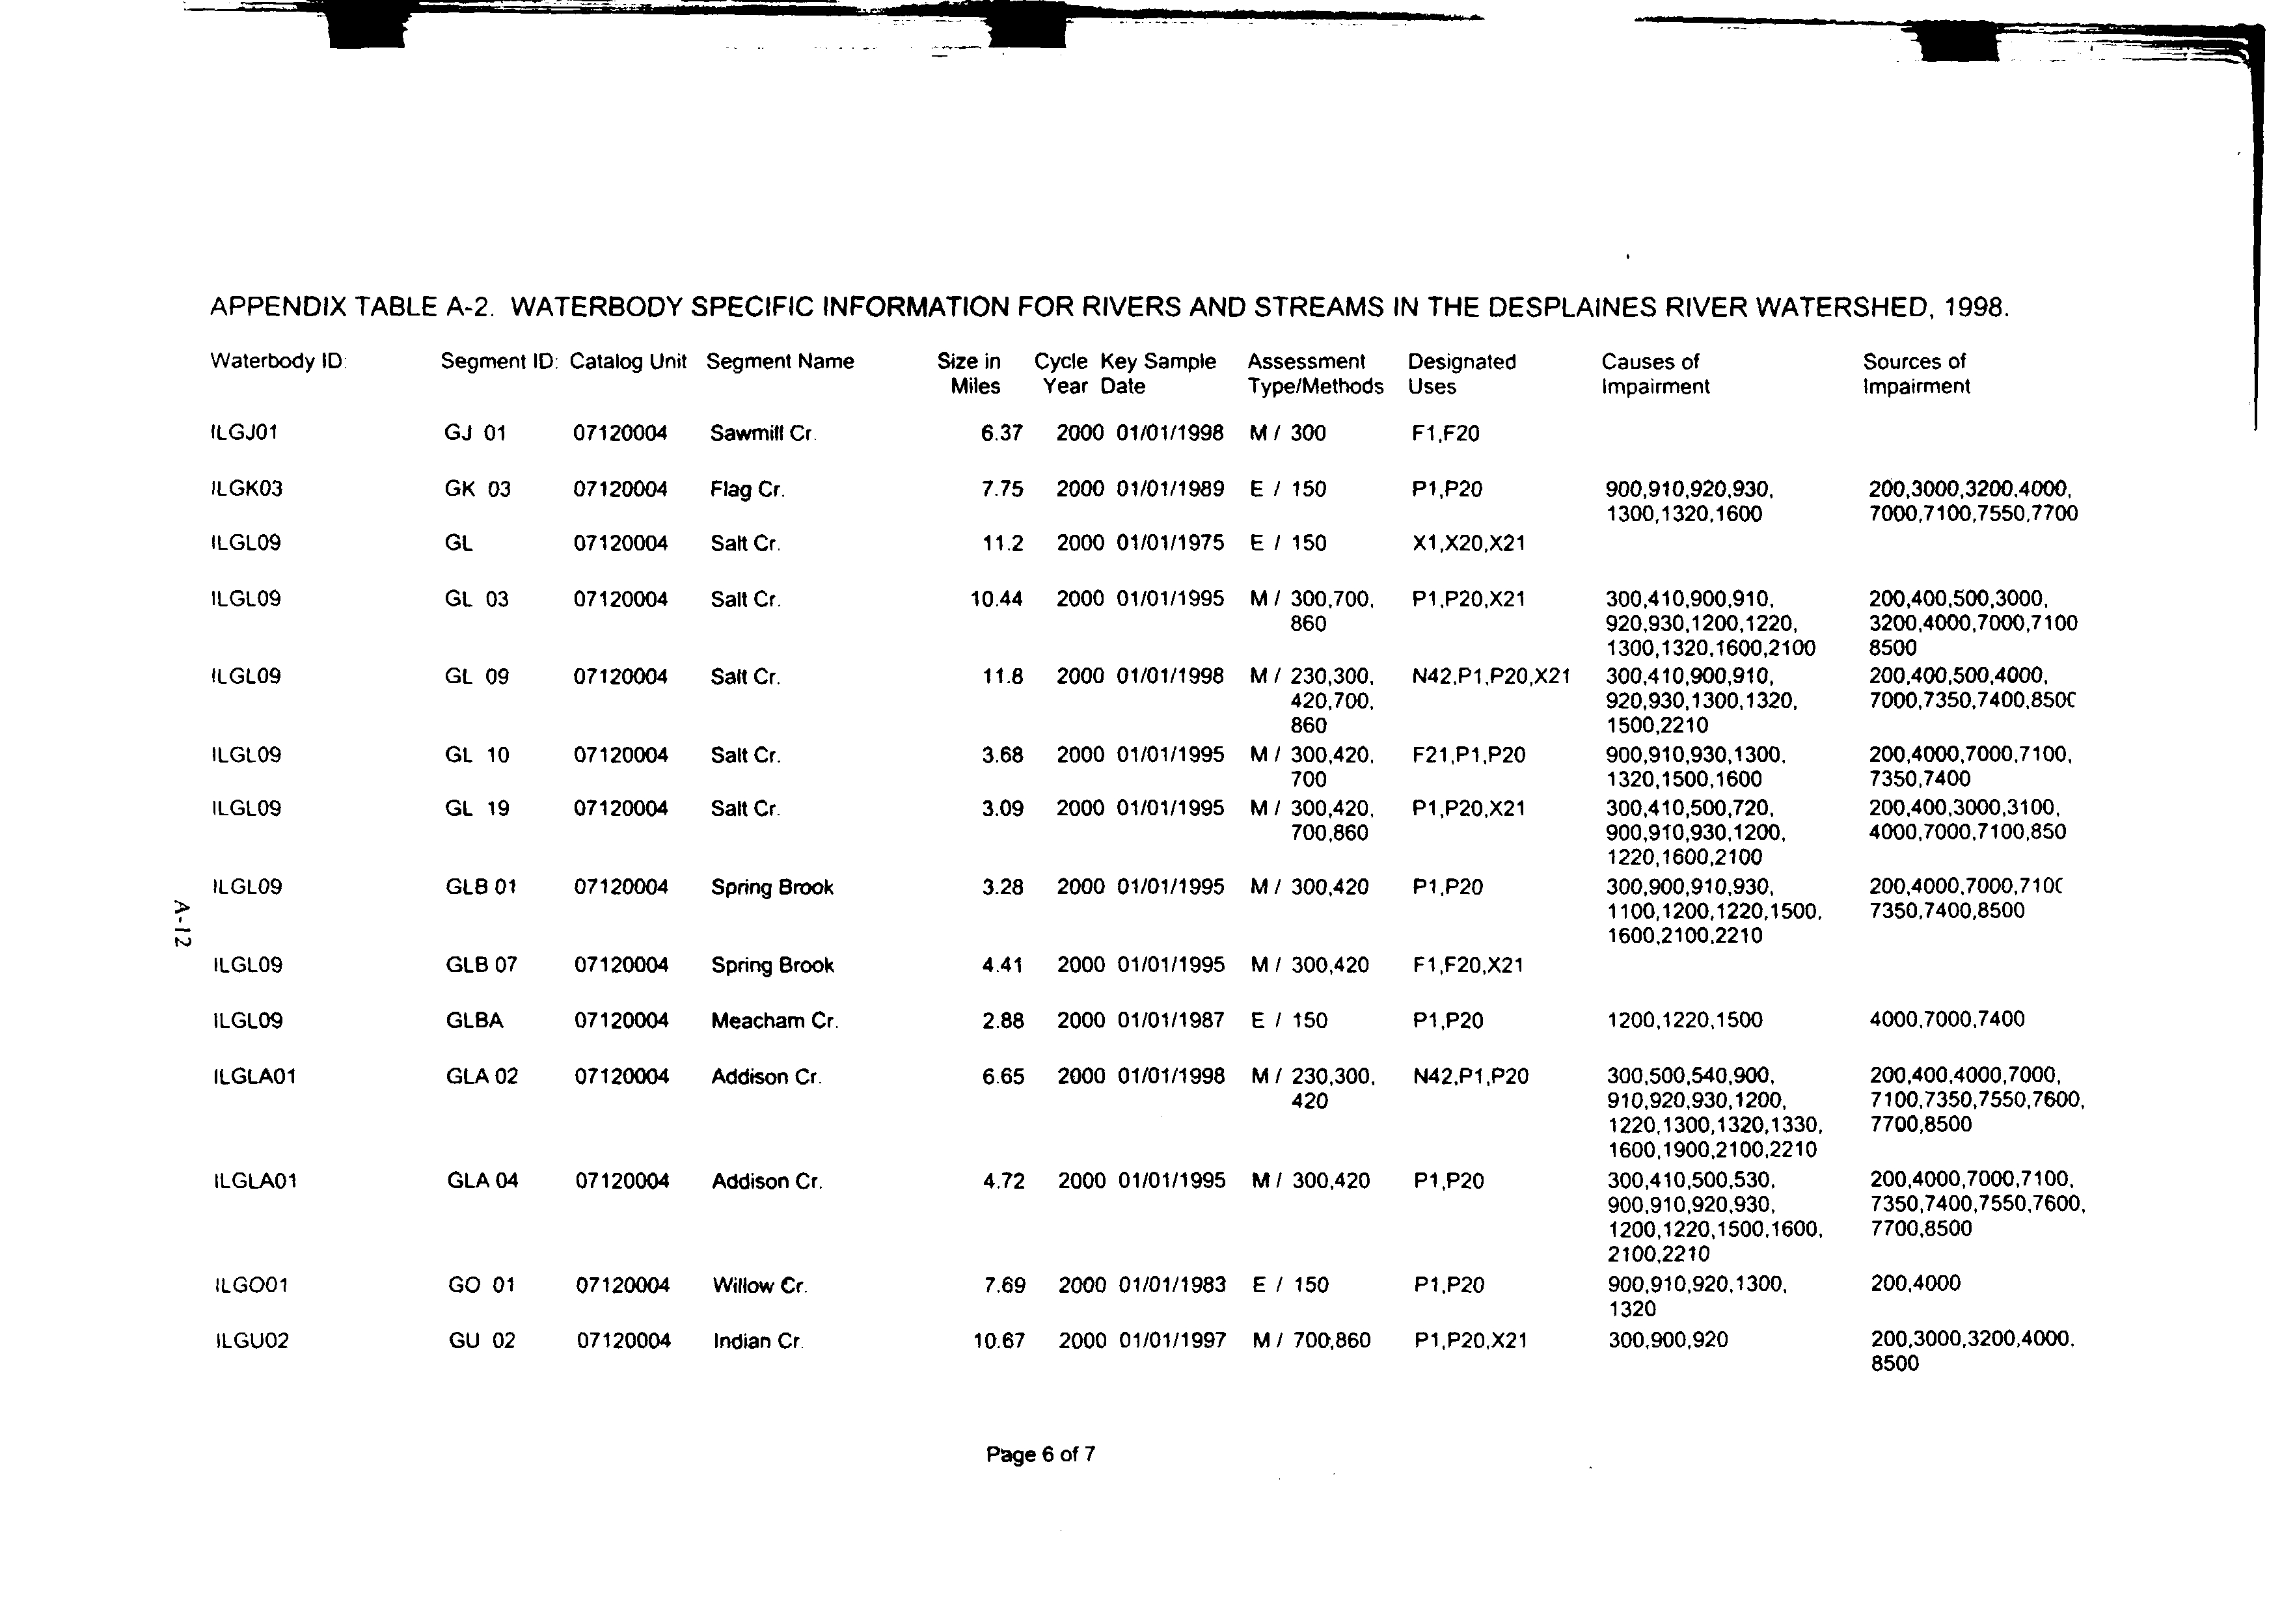
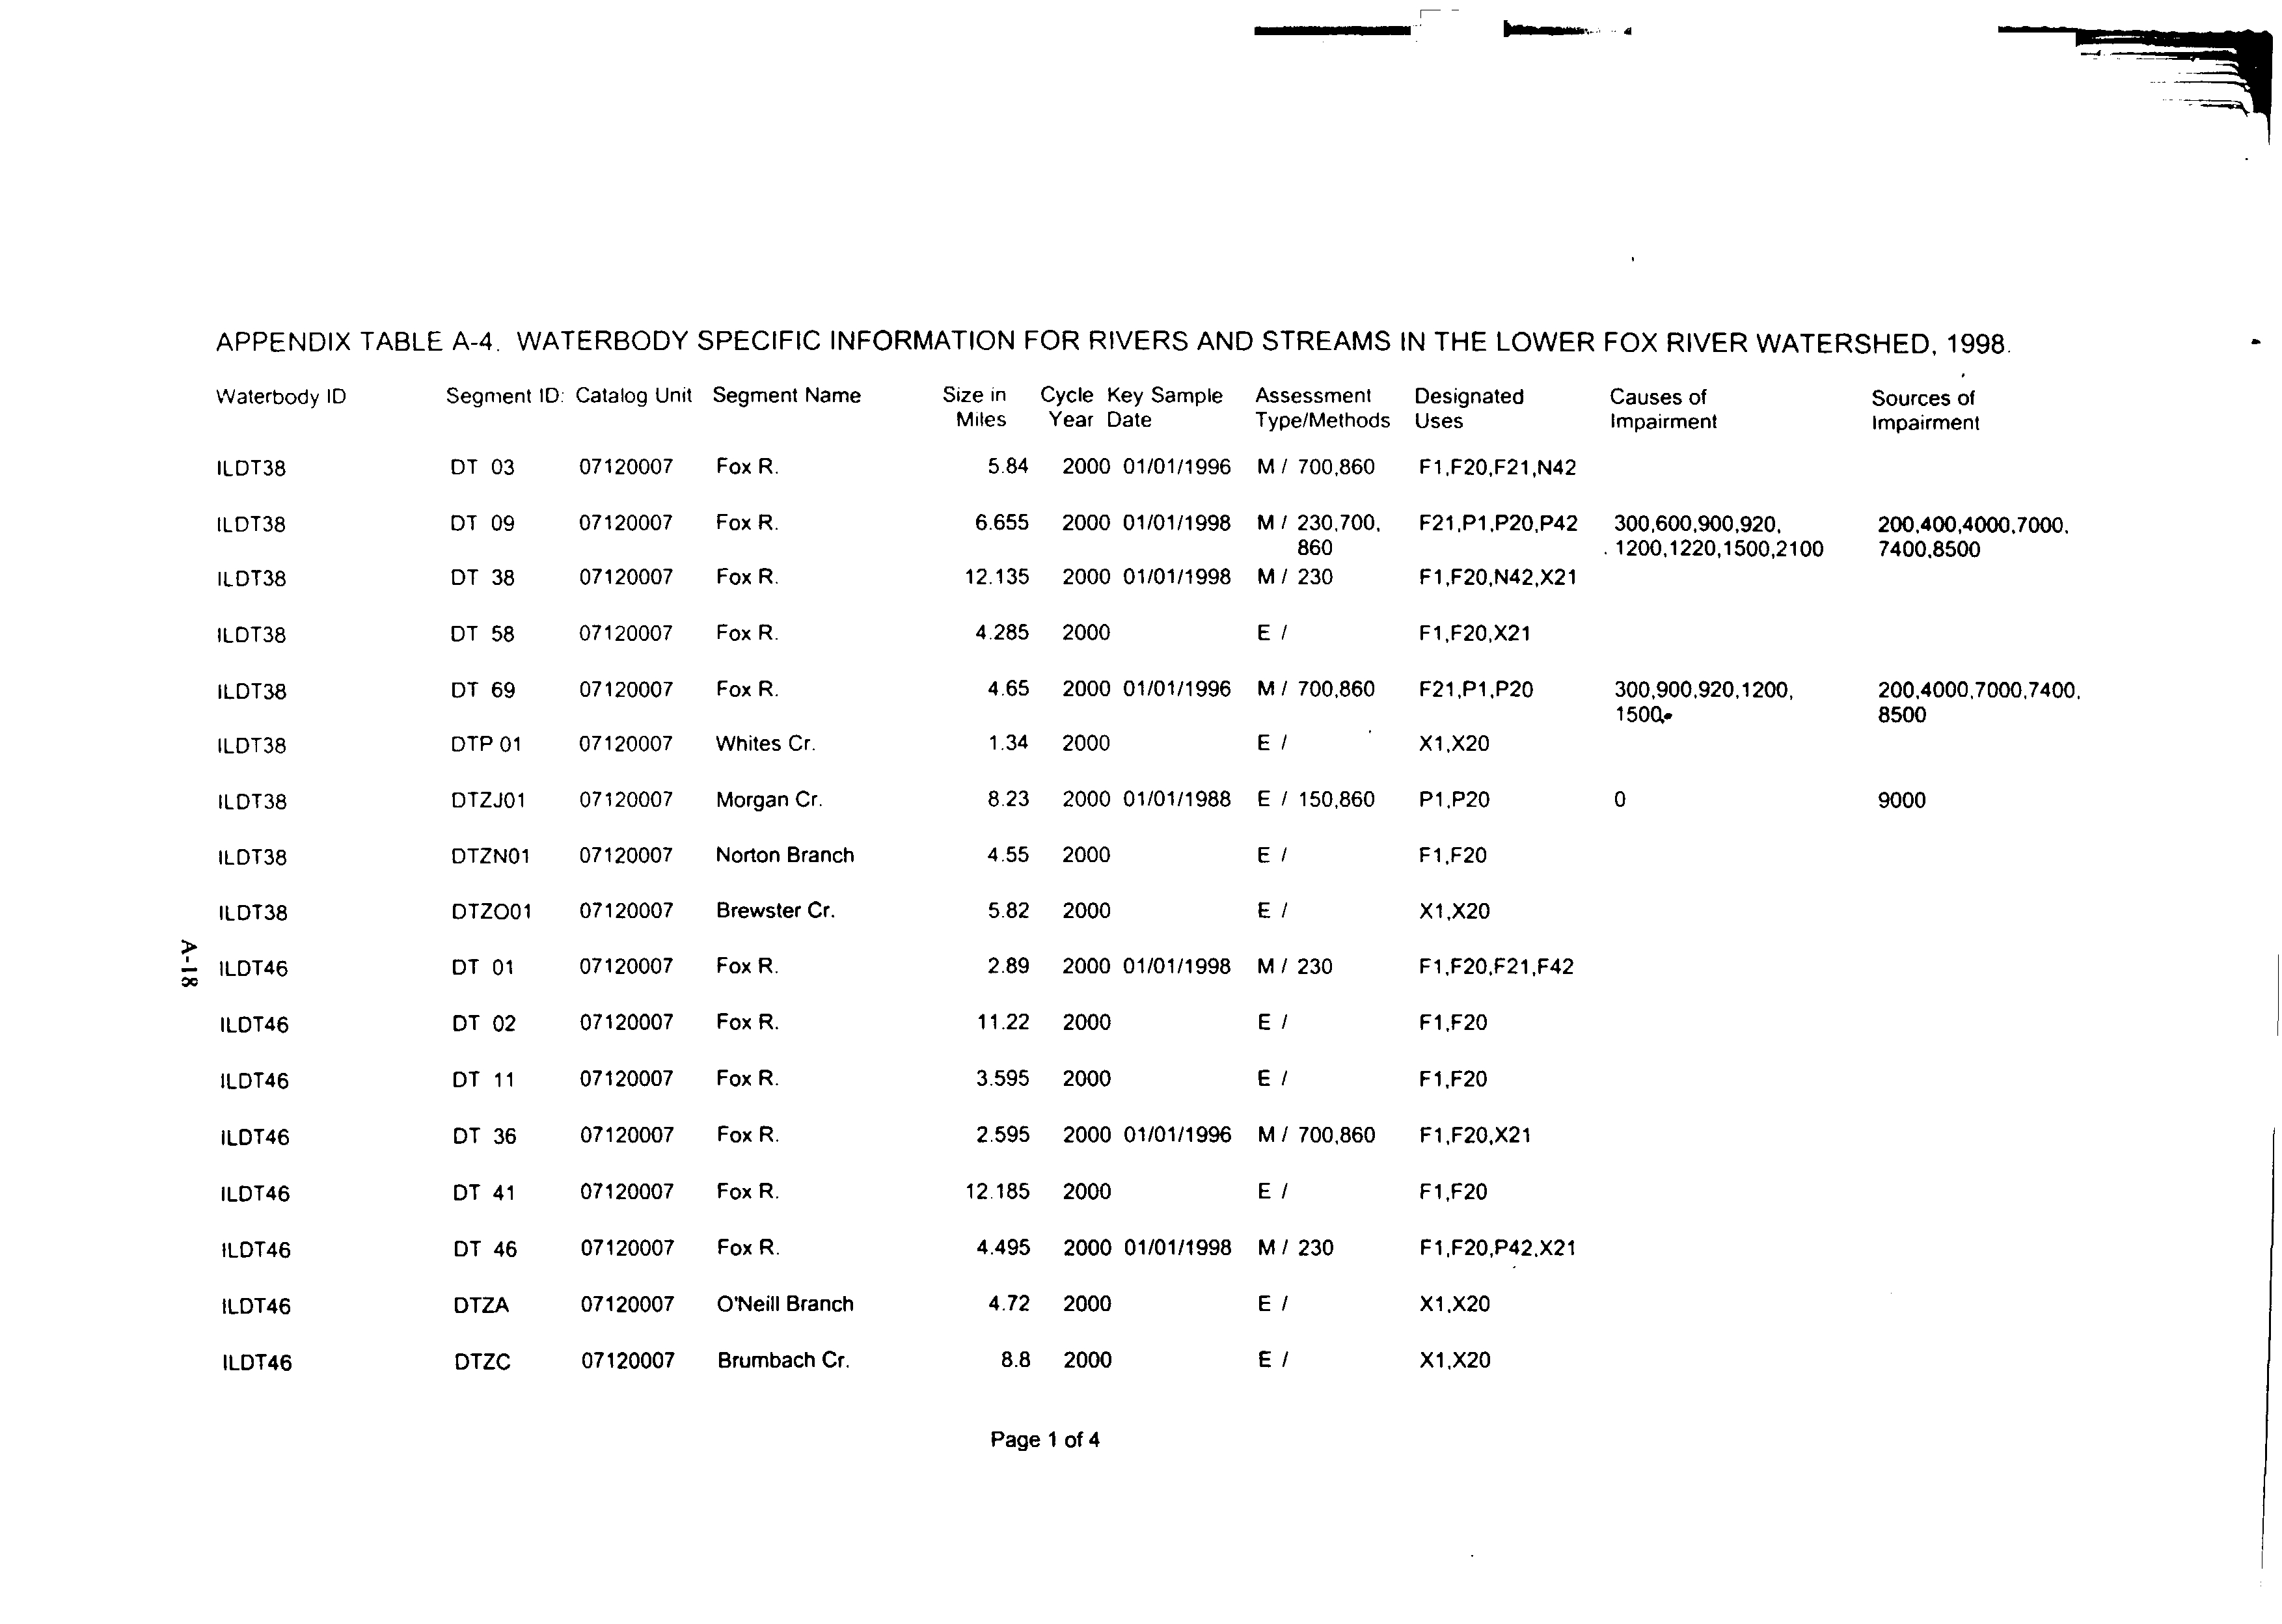
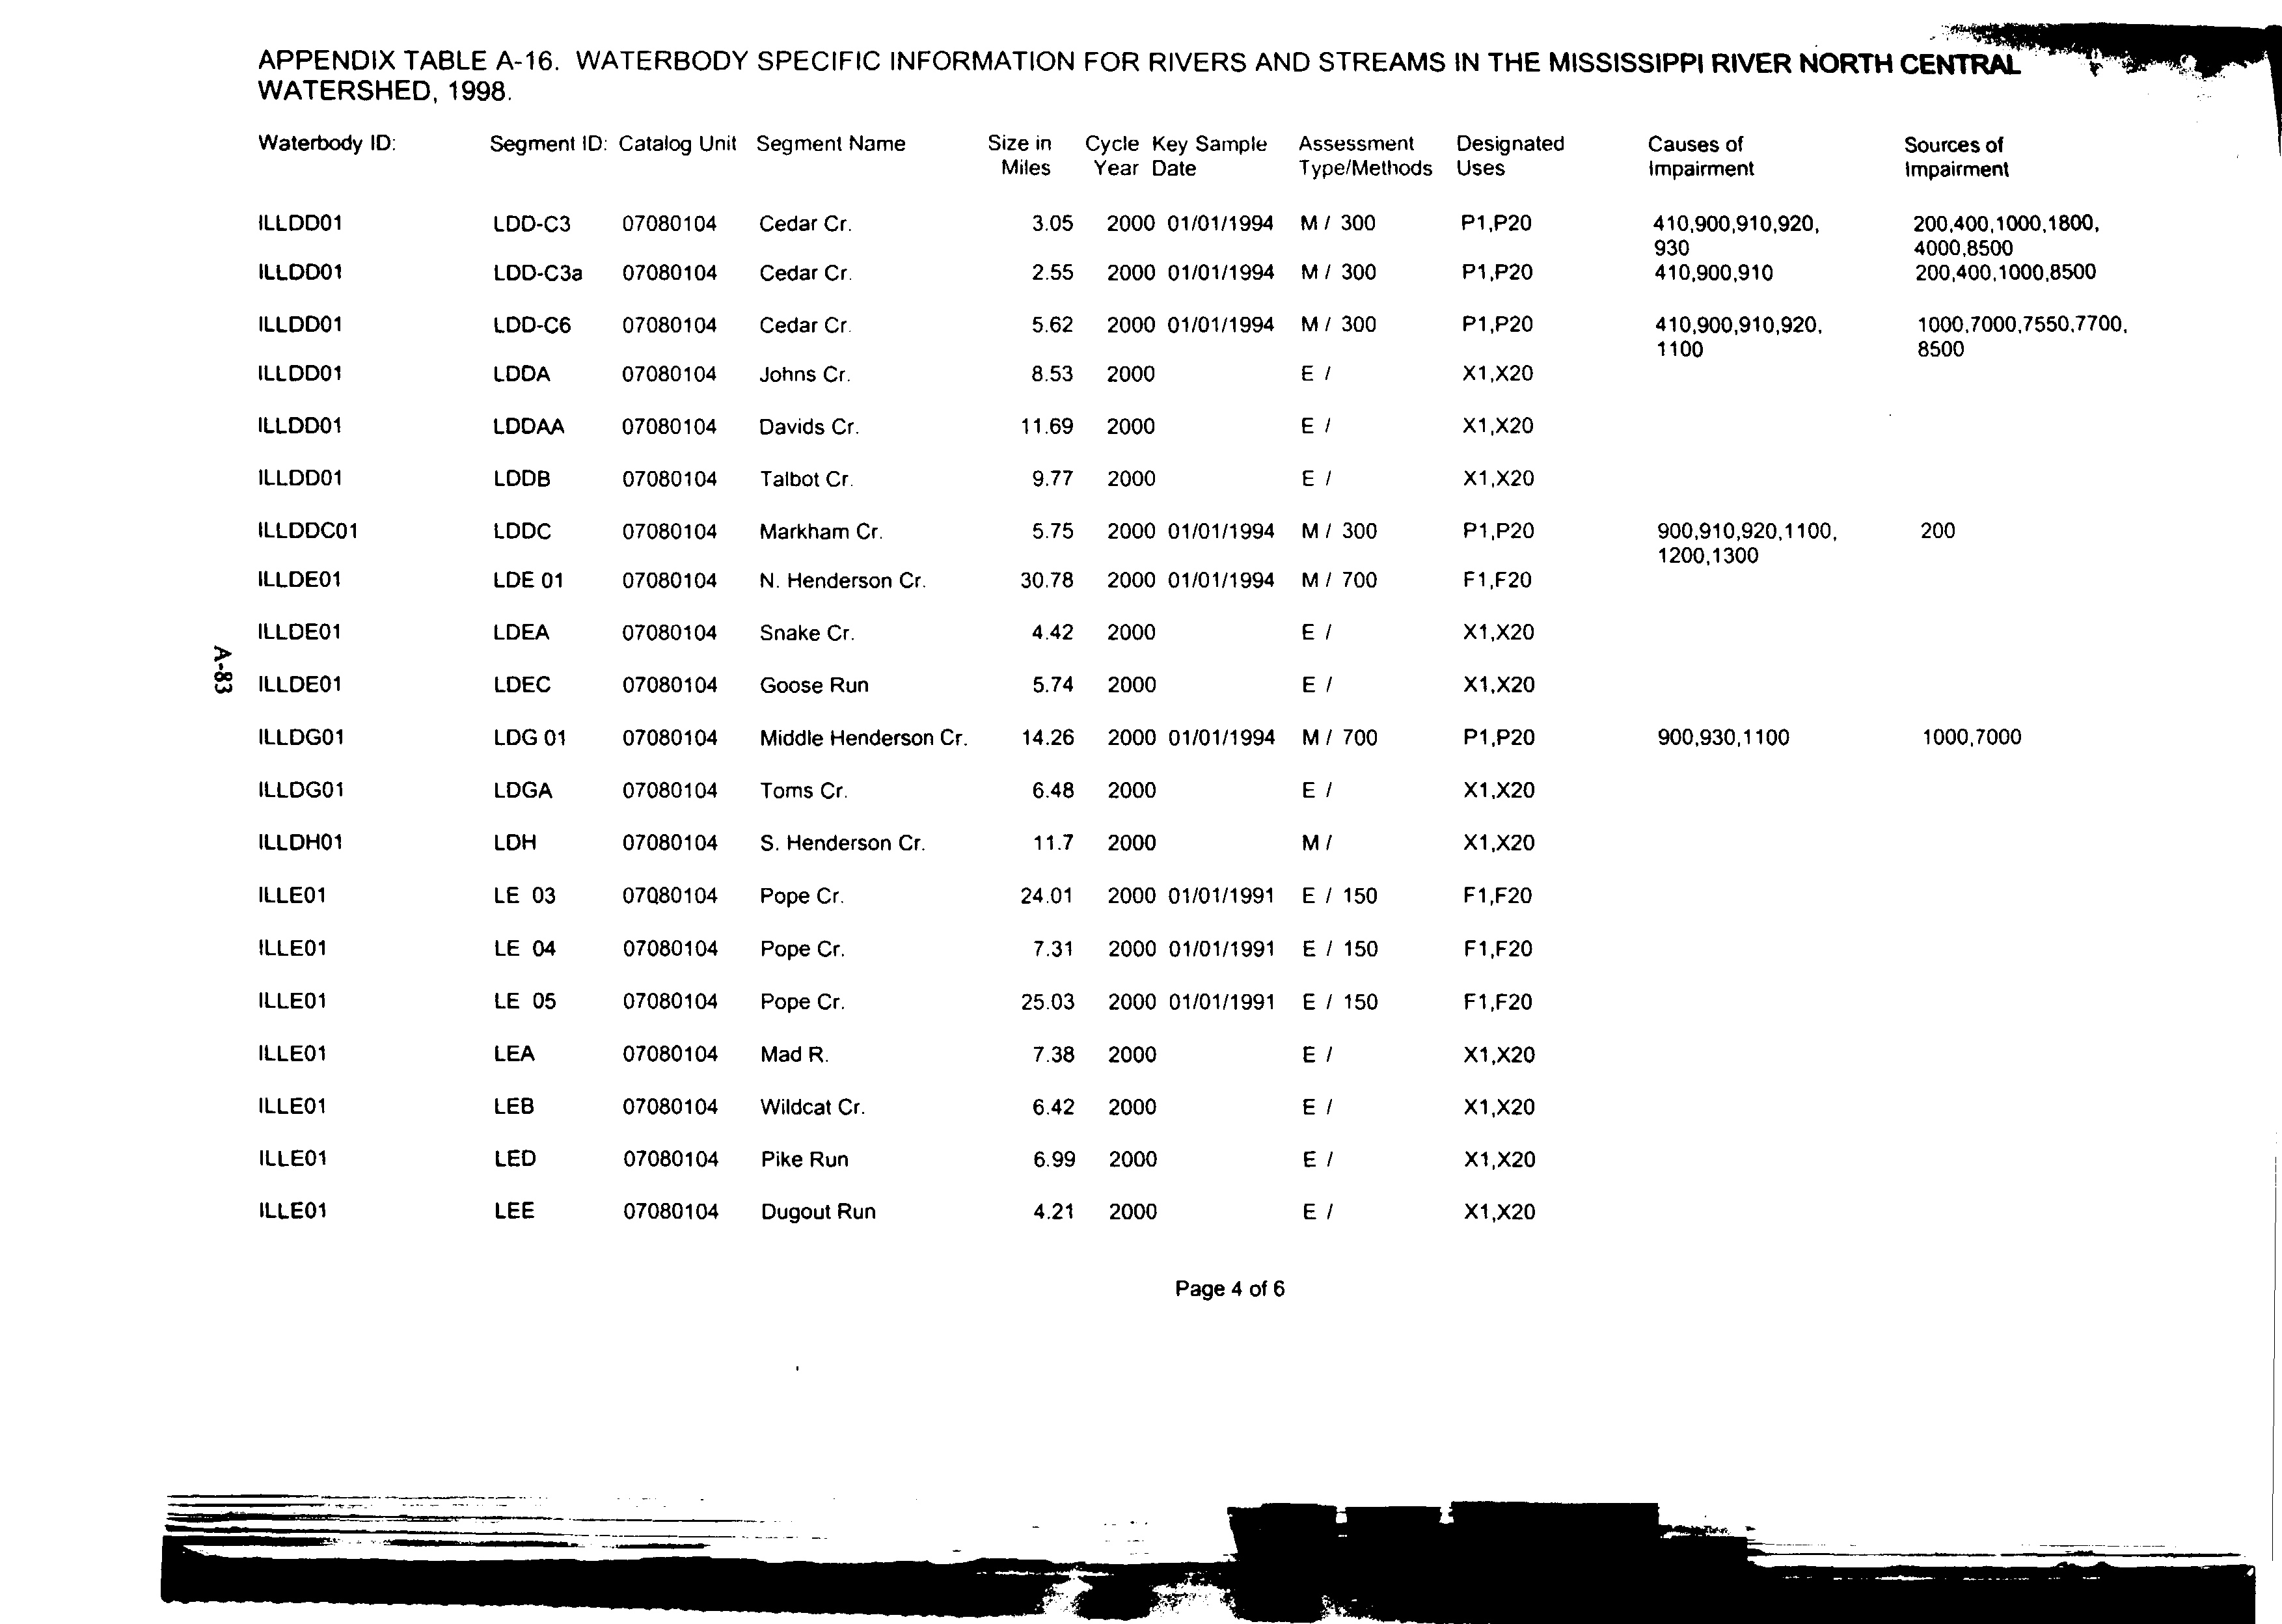
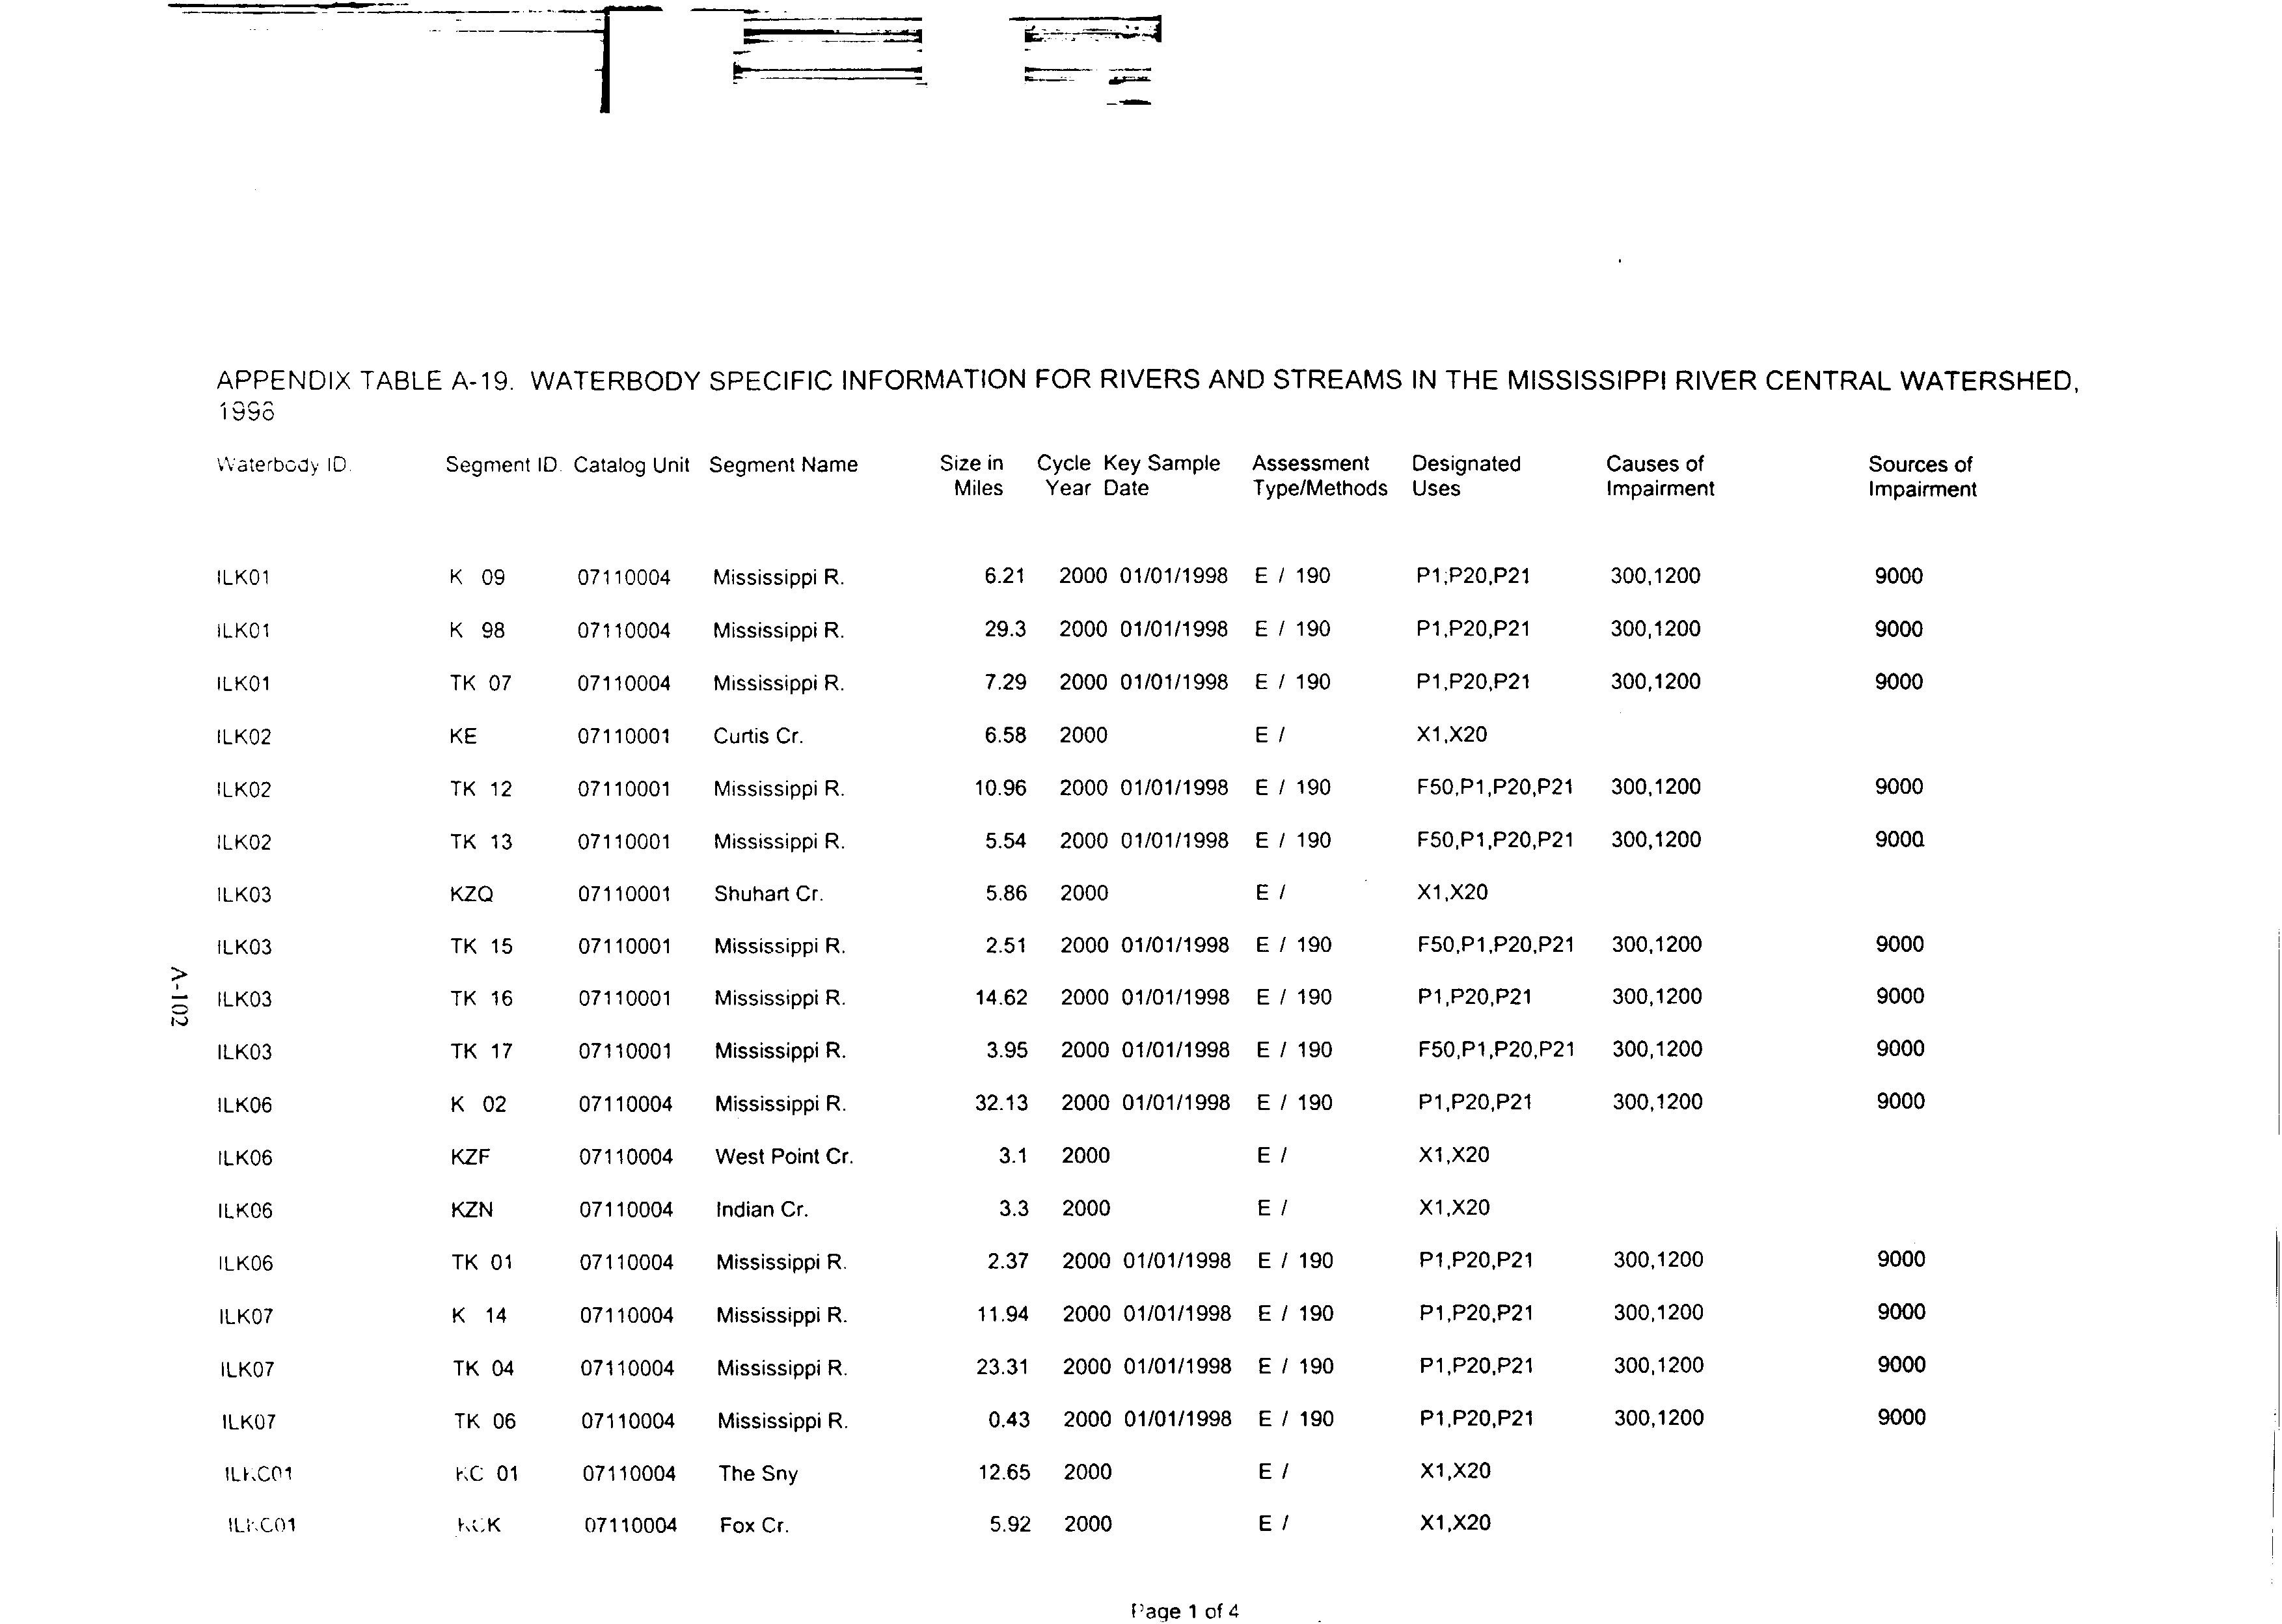
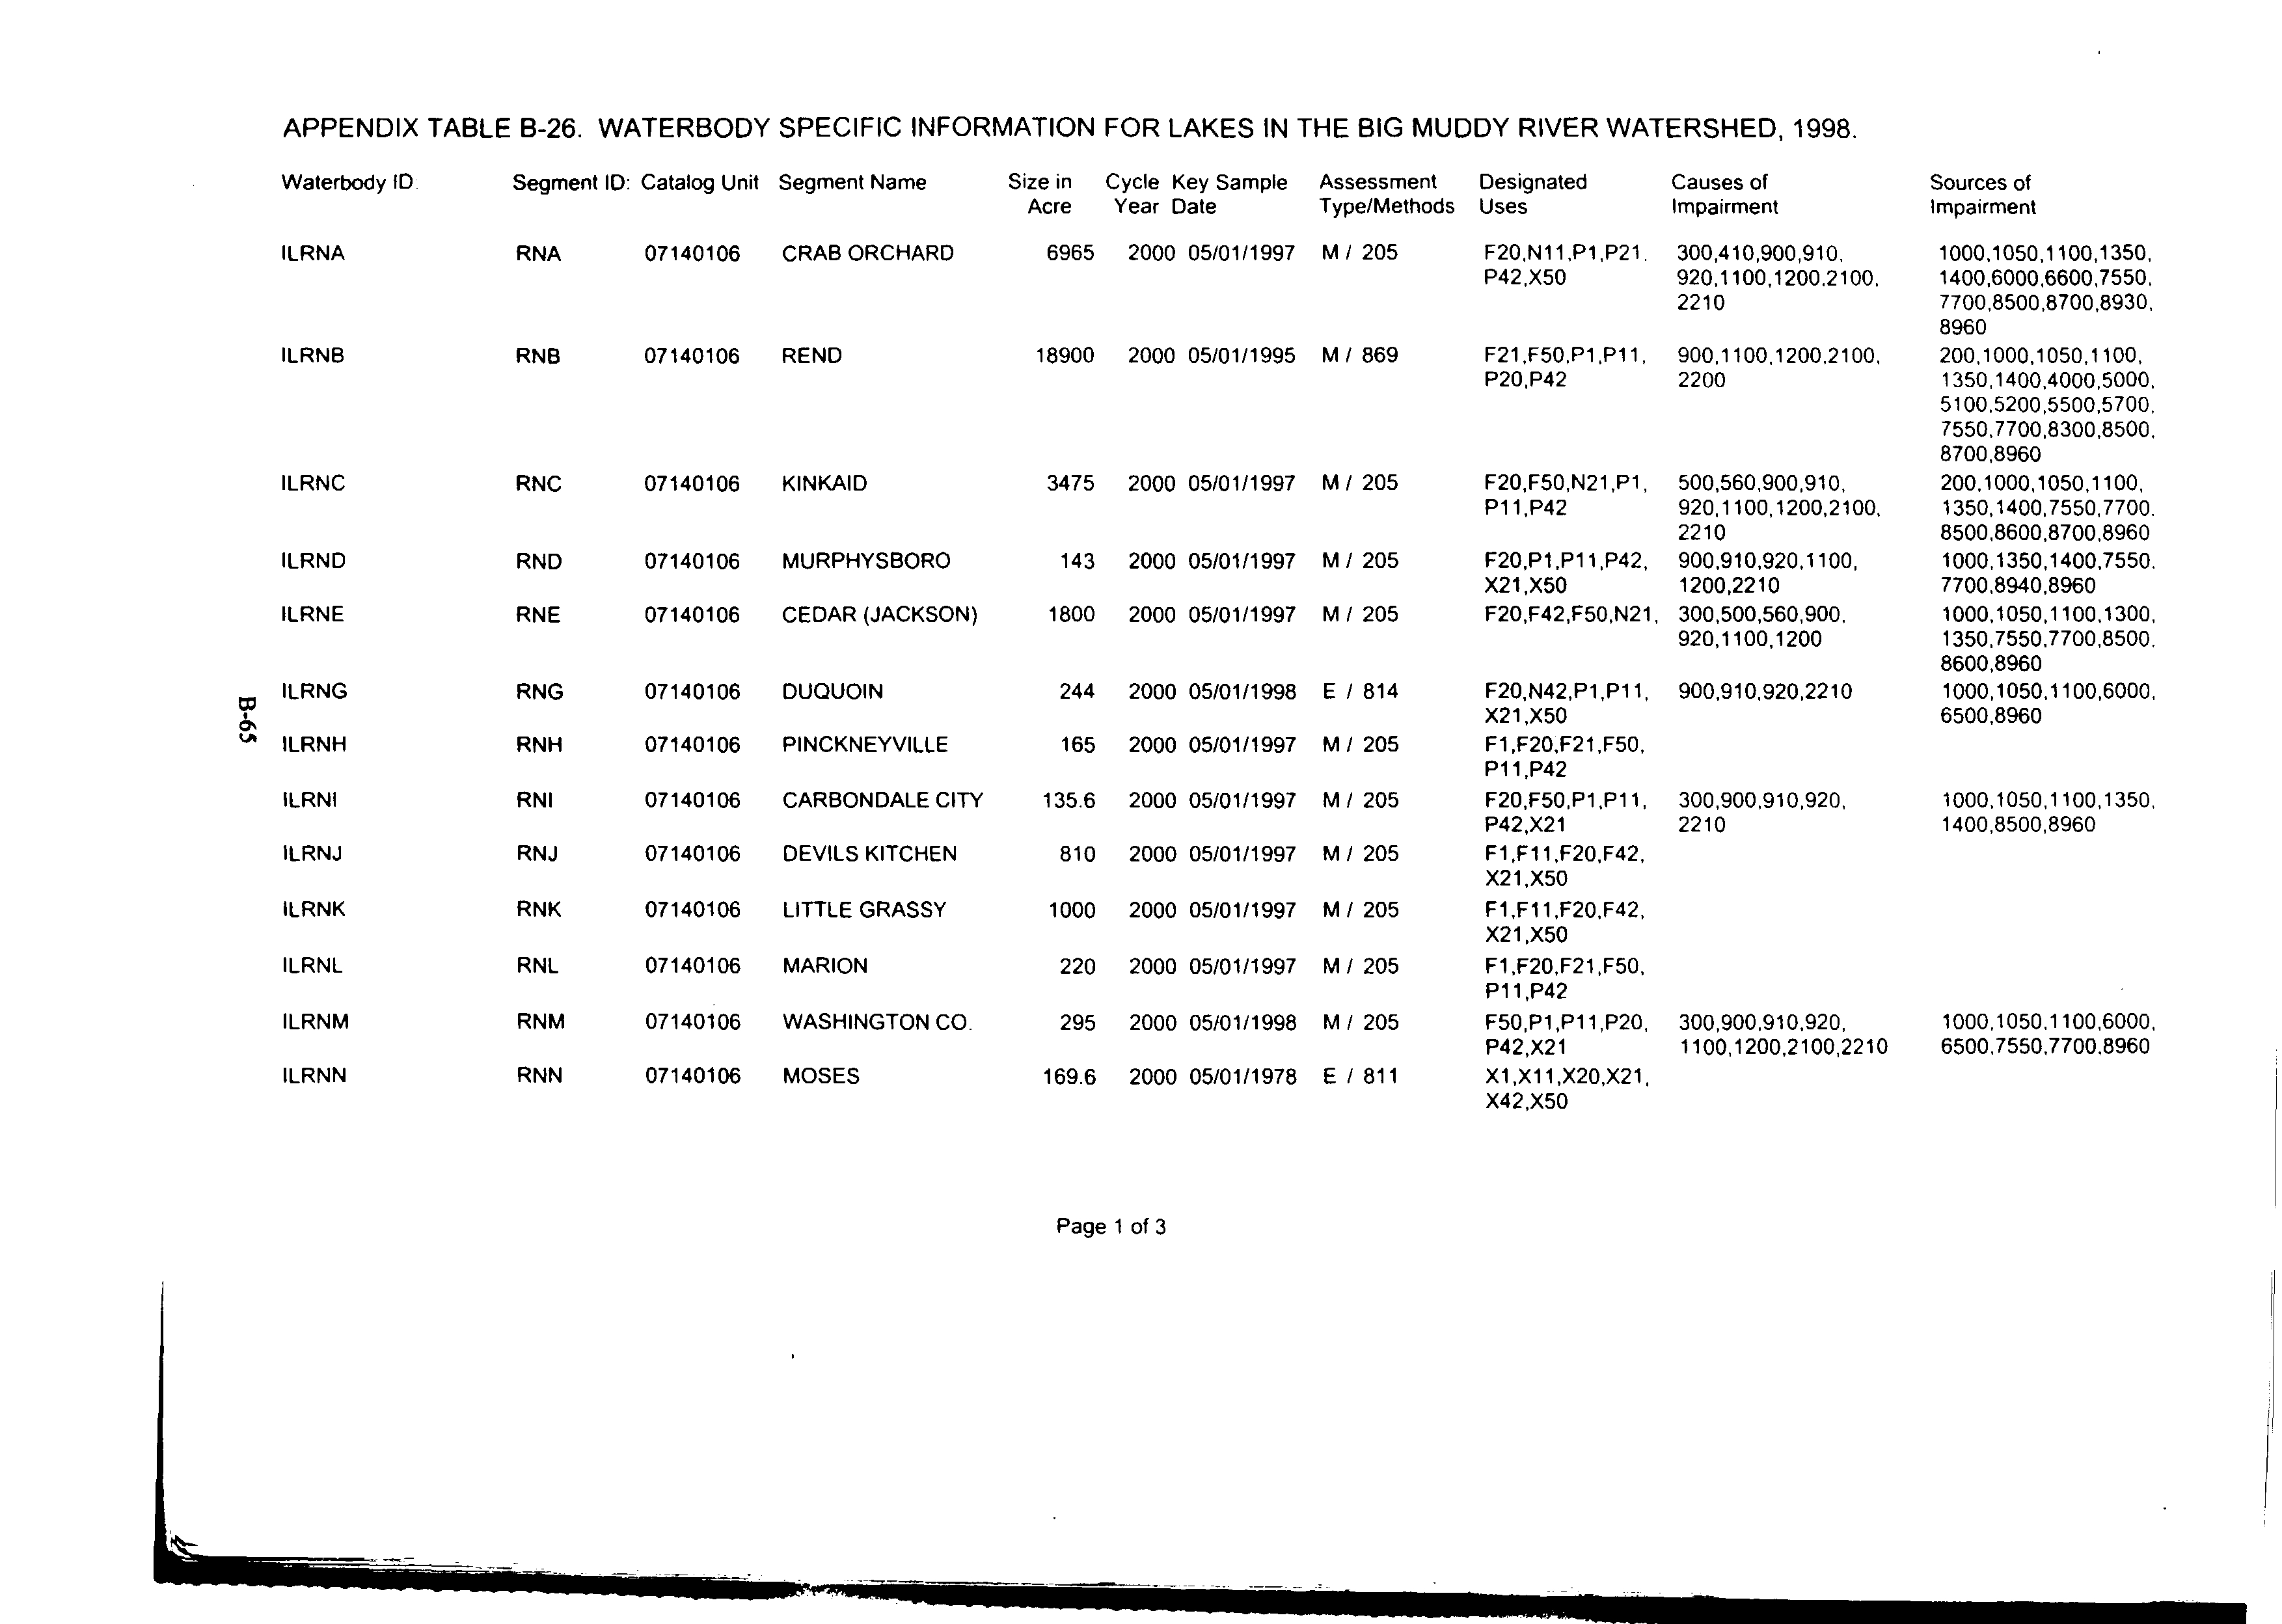
recent IEPA 305(b) report shows impairments caused by “organic enrichment/low DO” for
numerous important Illinois waters including the Des Plaines River, the Du Page River, the Fox
River, Salt Creek (Du Page Co.), Lake Kincaid, the Mississippi River and Rend Lake. (Exhibit 5)9
In fact, the Agency states there are 2,687 miles of streams and 86,575 lake acres impaired by low
DO levels. (Id.)
With regard to the Illinois River, the situation is unclear. Because the numeric data taken in
the main channel ofthe Illinois did not find over 11 violations ofthe standards, the Illinois River
is not listed as impaired in the IEPA 305(b) report. However, it is known that historically the
Illinois River has suffered from low dissolved oxygen as a result ofammonia discharges. See e.g.
In the Matter of: Site Specific Exception to Effluent Standards for the Greater Peoria Sanitary and
Sewerage Disposal District, R87-21 1988 Ill Env. Lexis 470 (Oct. 7, 1988) slip op. 17. Published
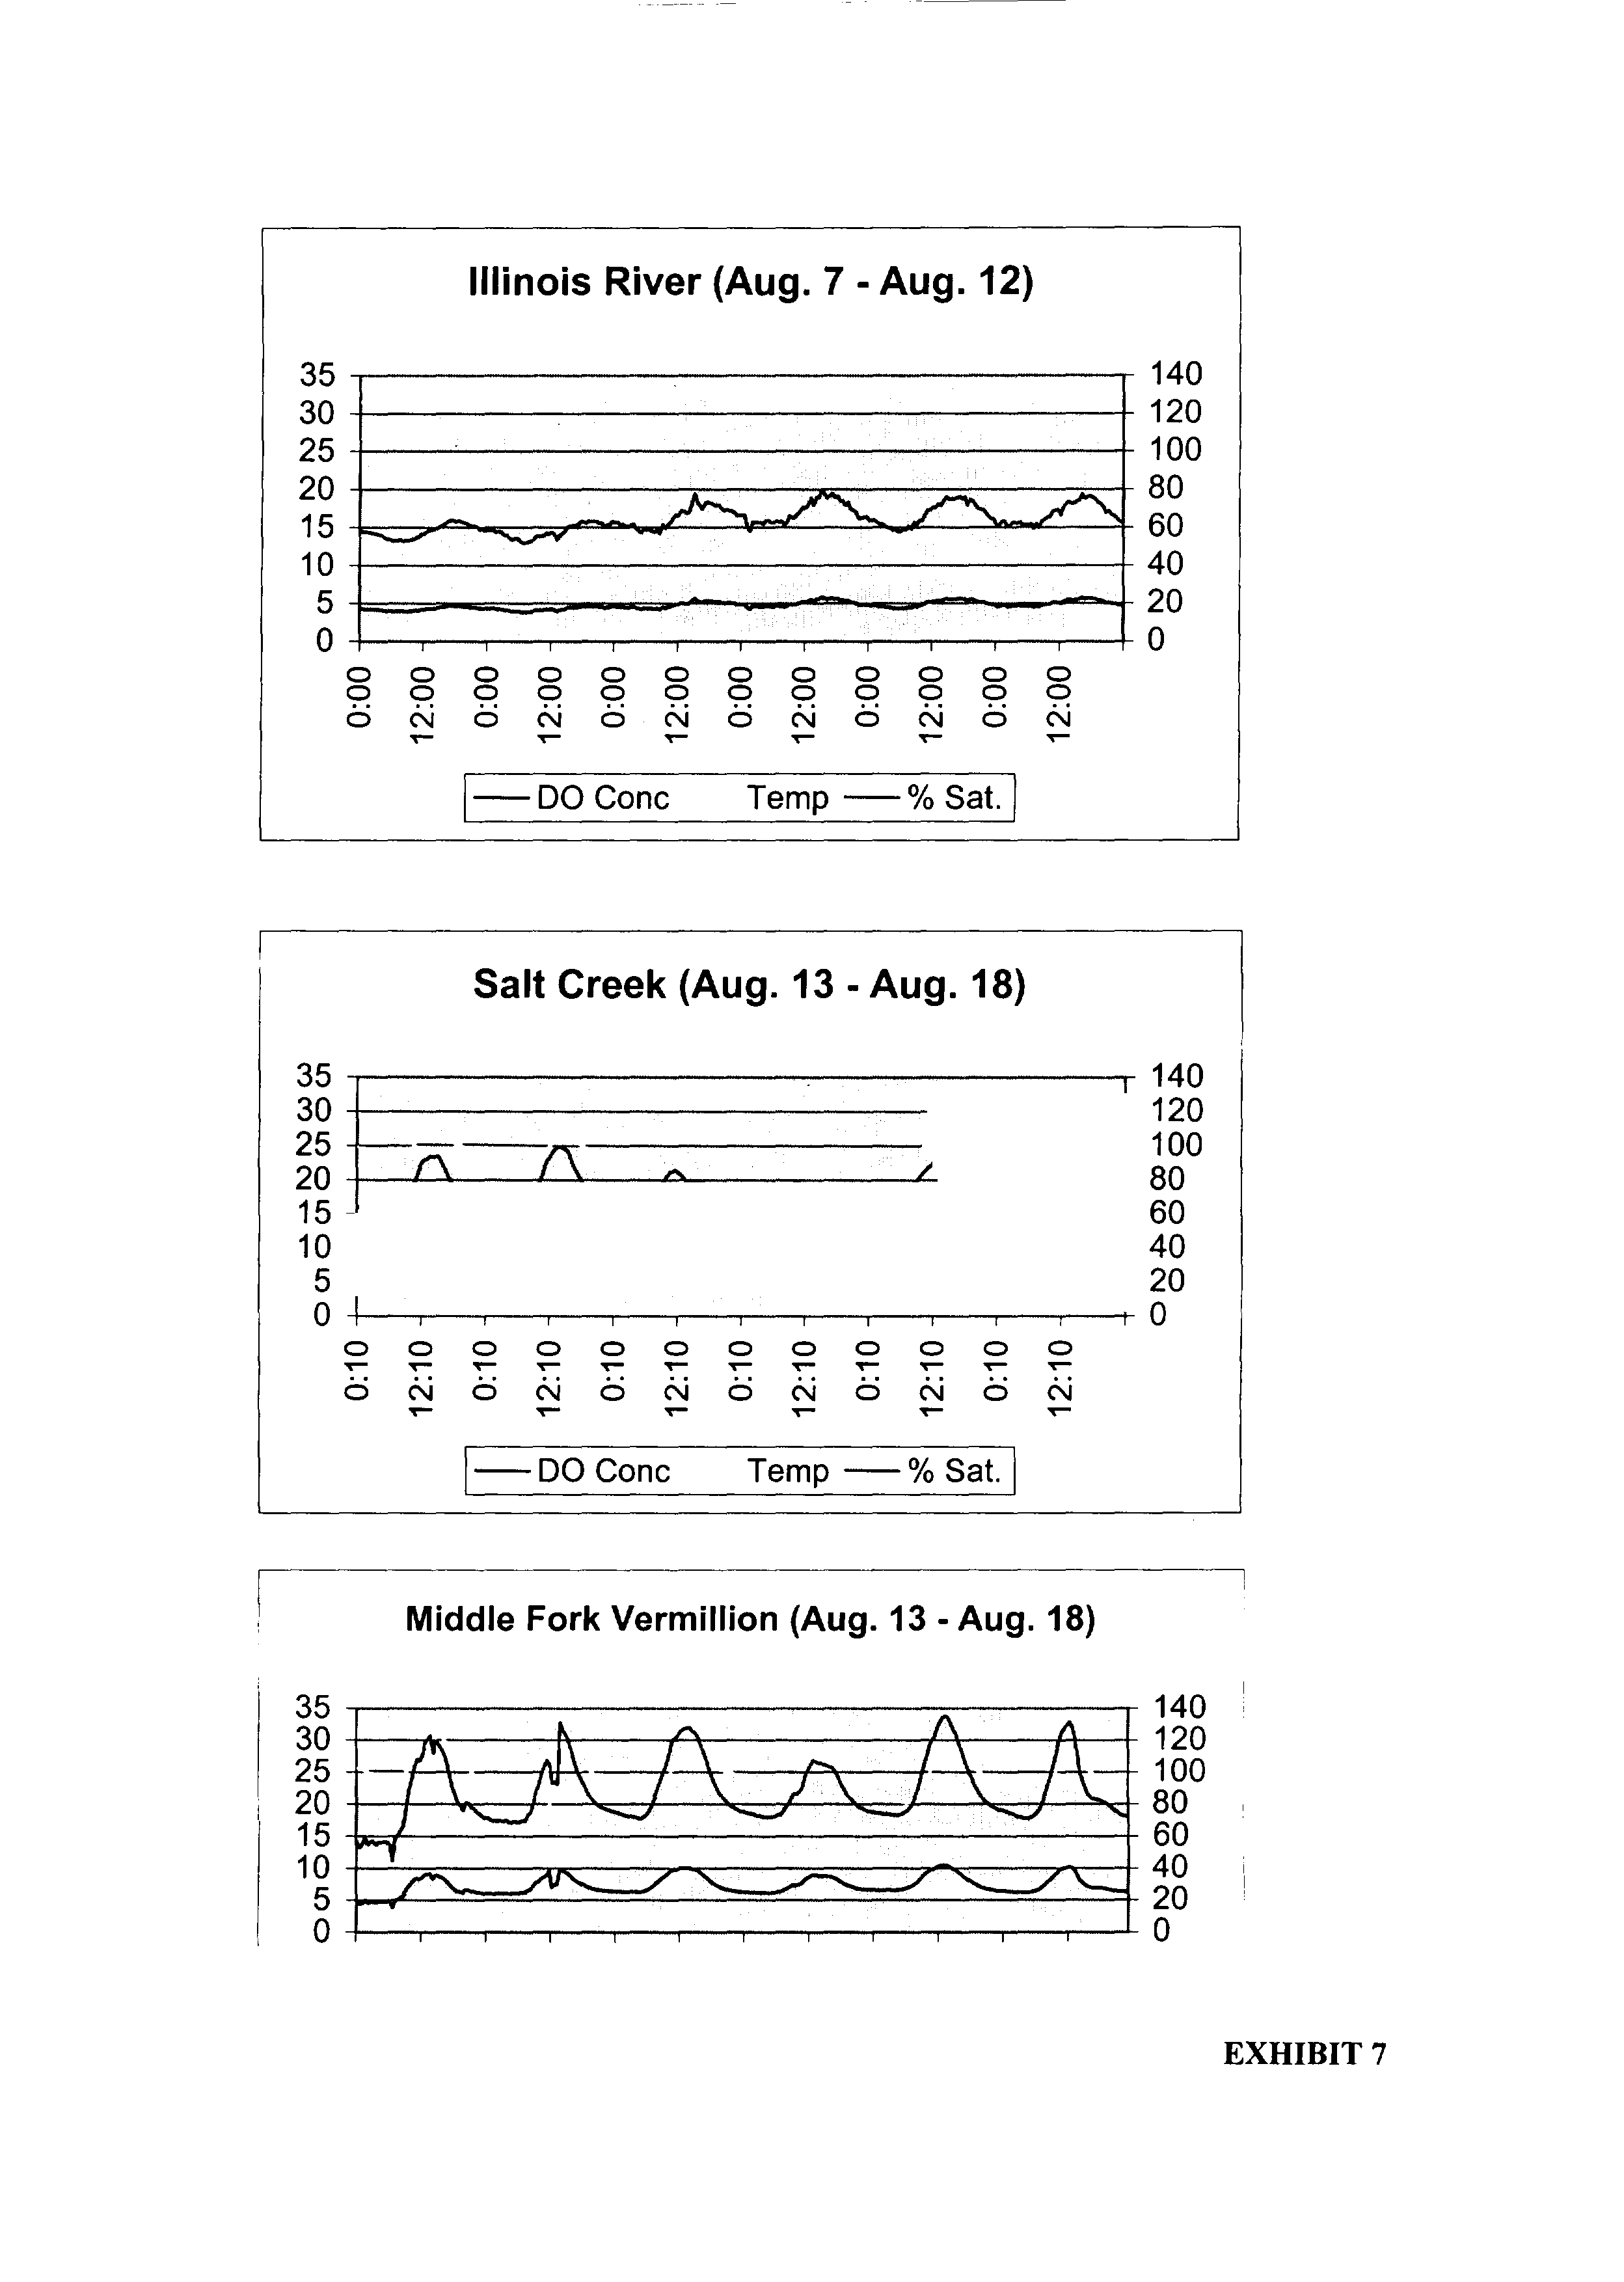
U.S. Geological Survey data shows at least one violation at Valley City in 1998 (Exhibit 6) and
recent unpublished data passed out by IEPA at a meeting last year shows prolonged and continuous
DO violations in August 2001. (Exhibit 7)
The IEPA 305(b) list and the other published numeric data probably greatly understates the
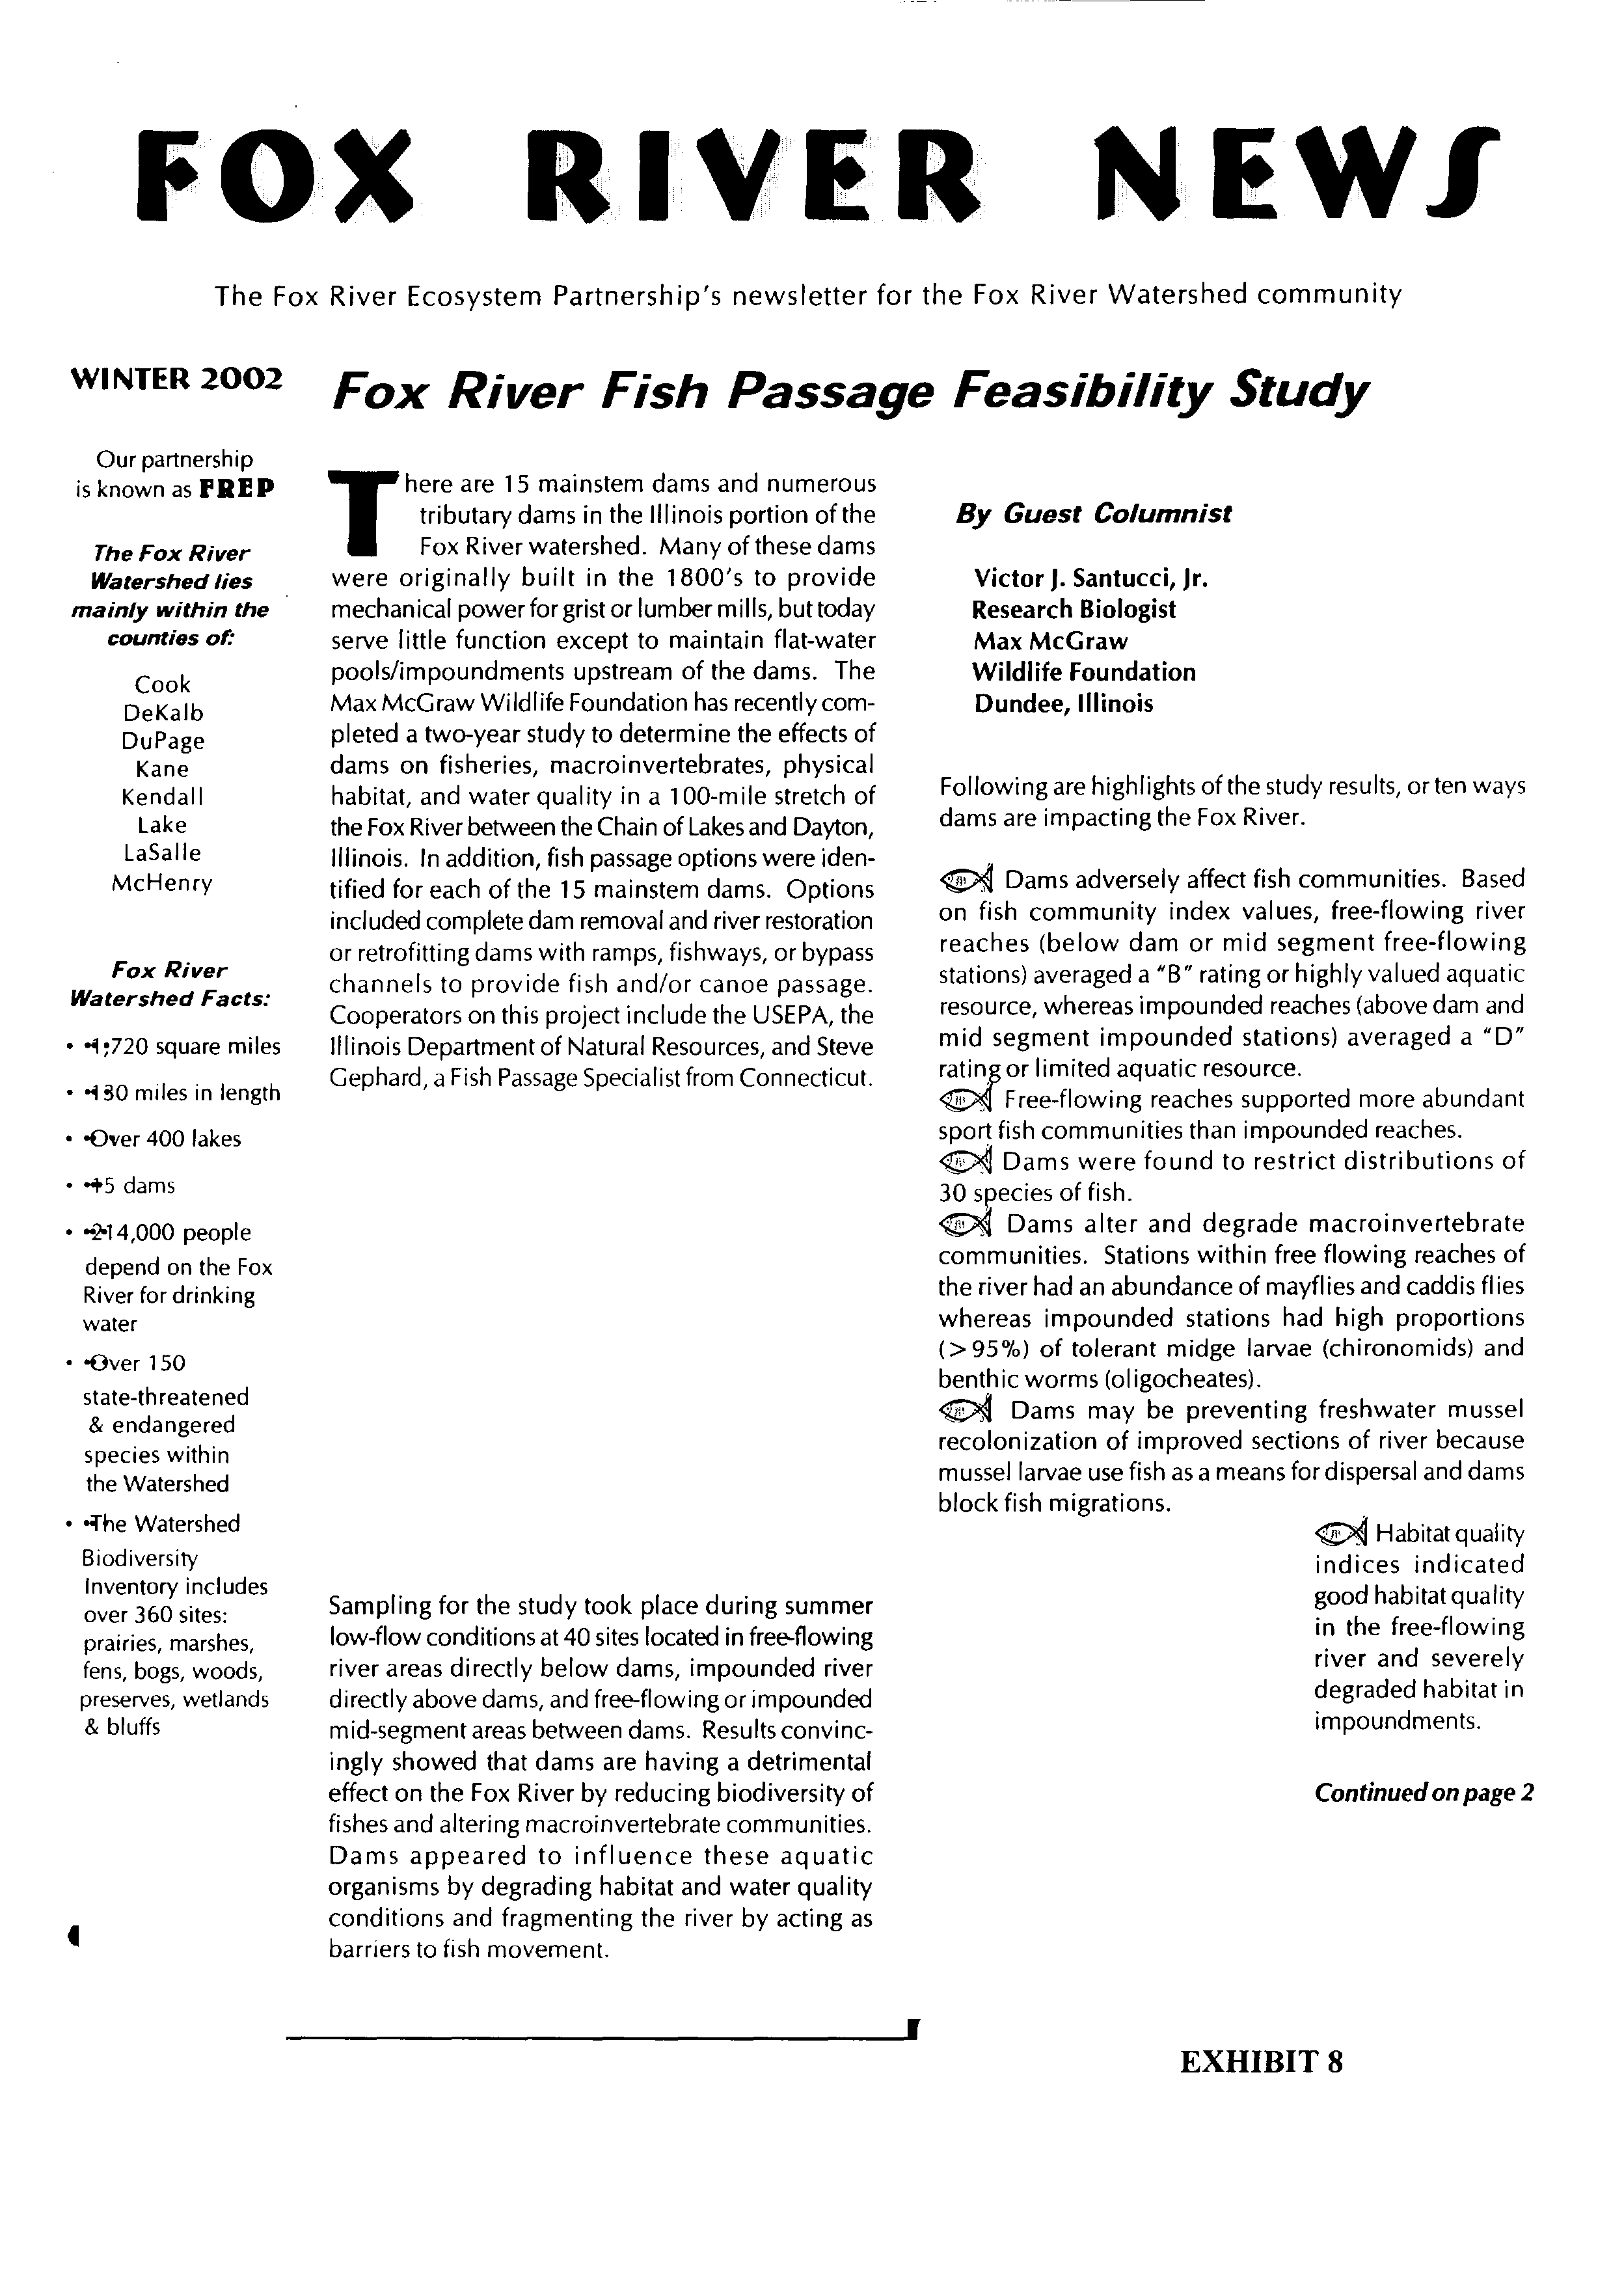
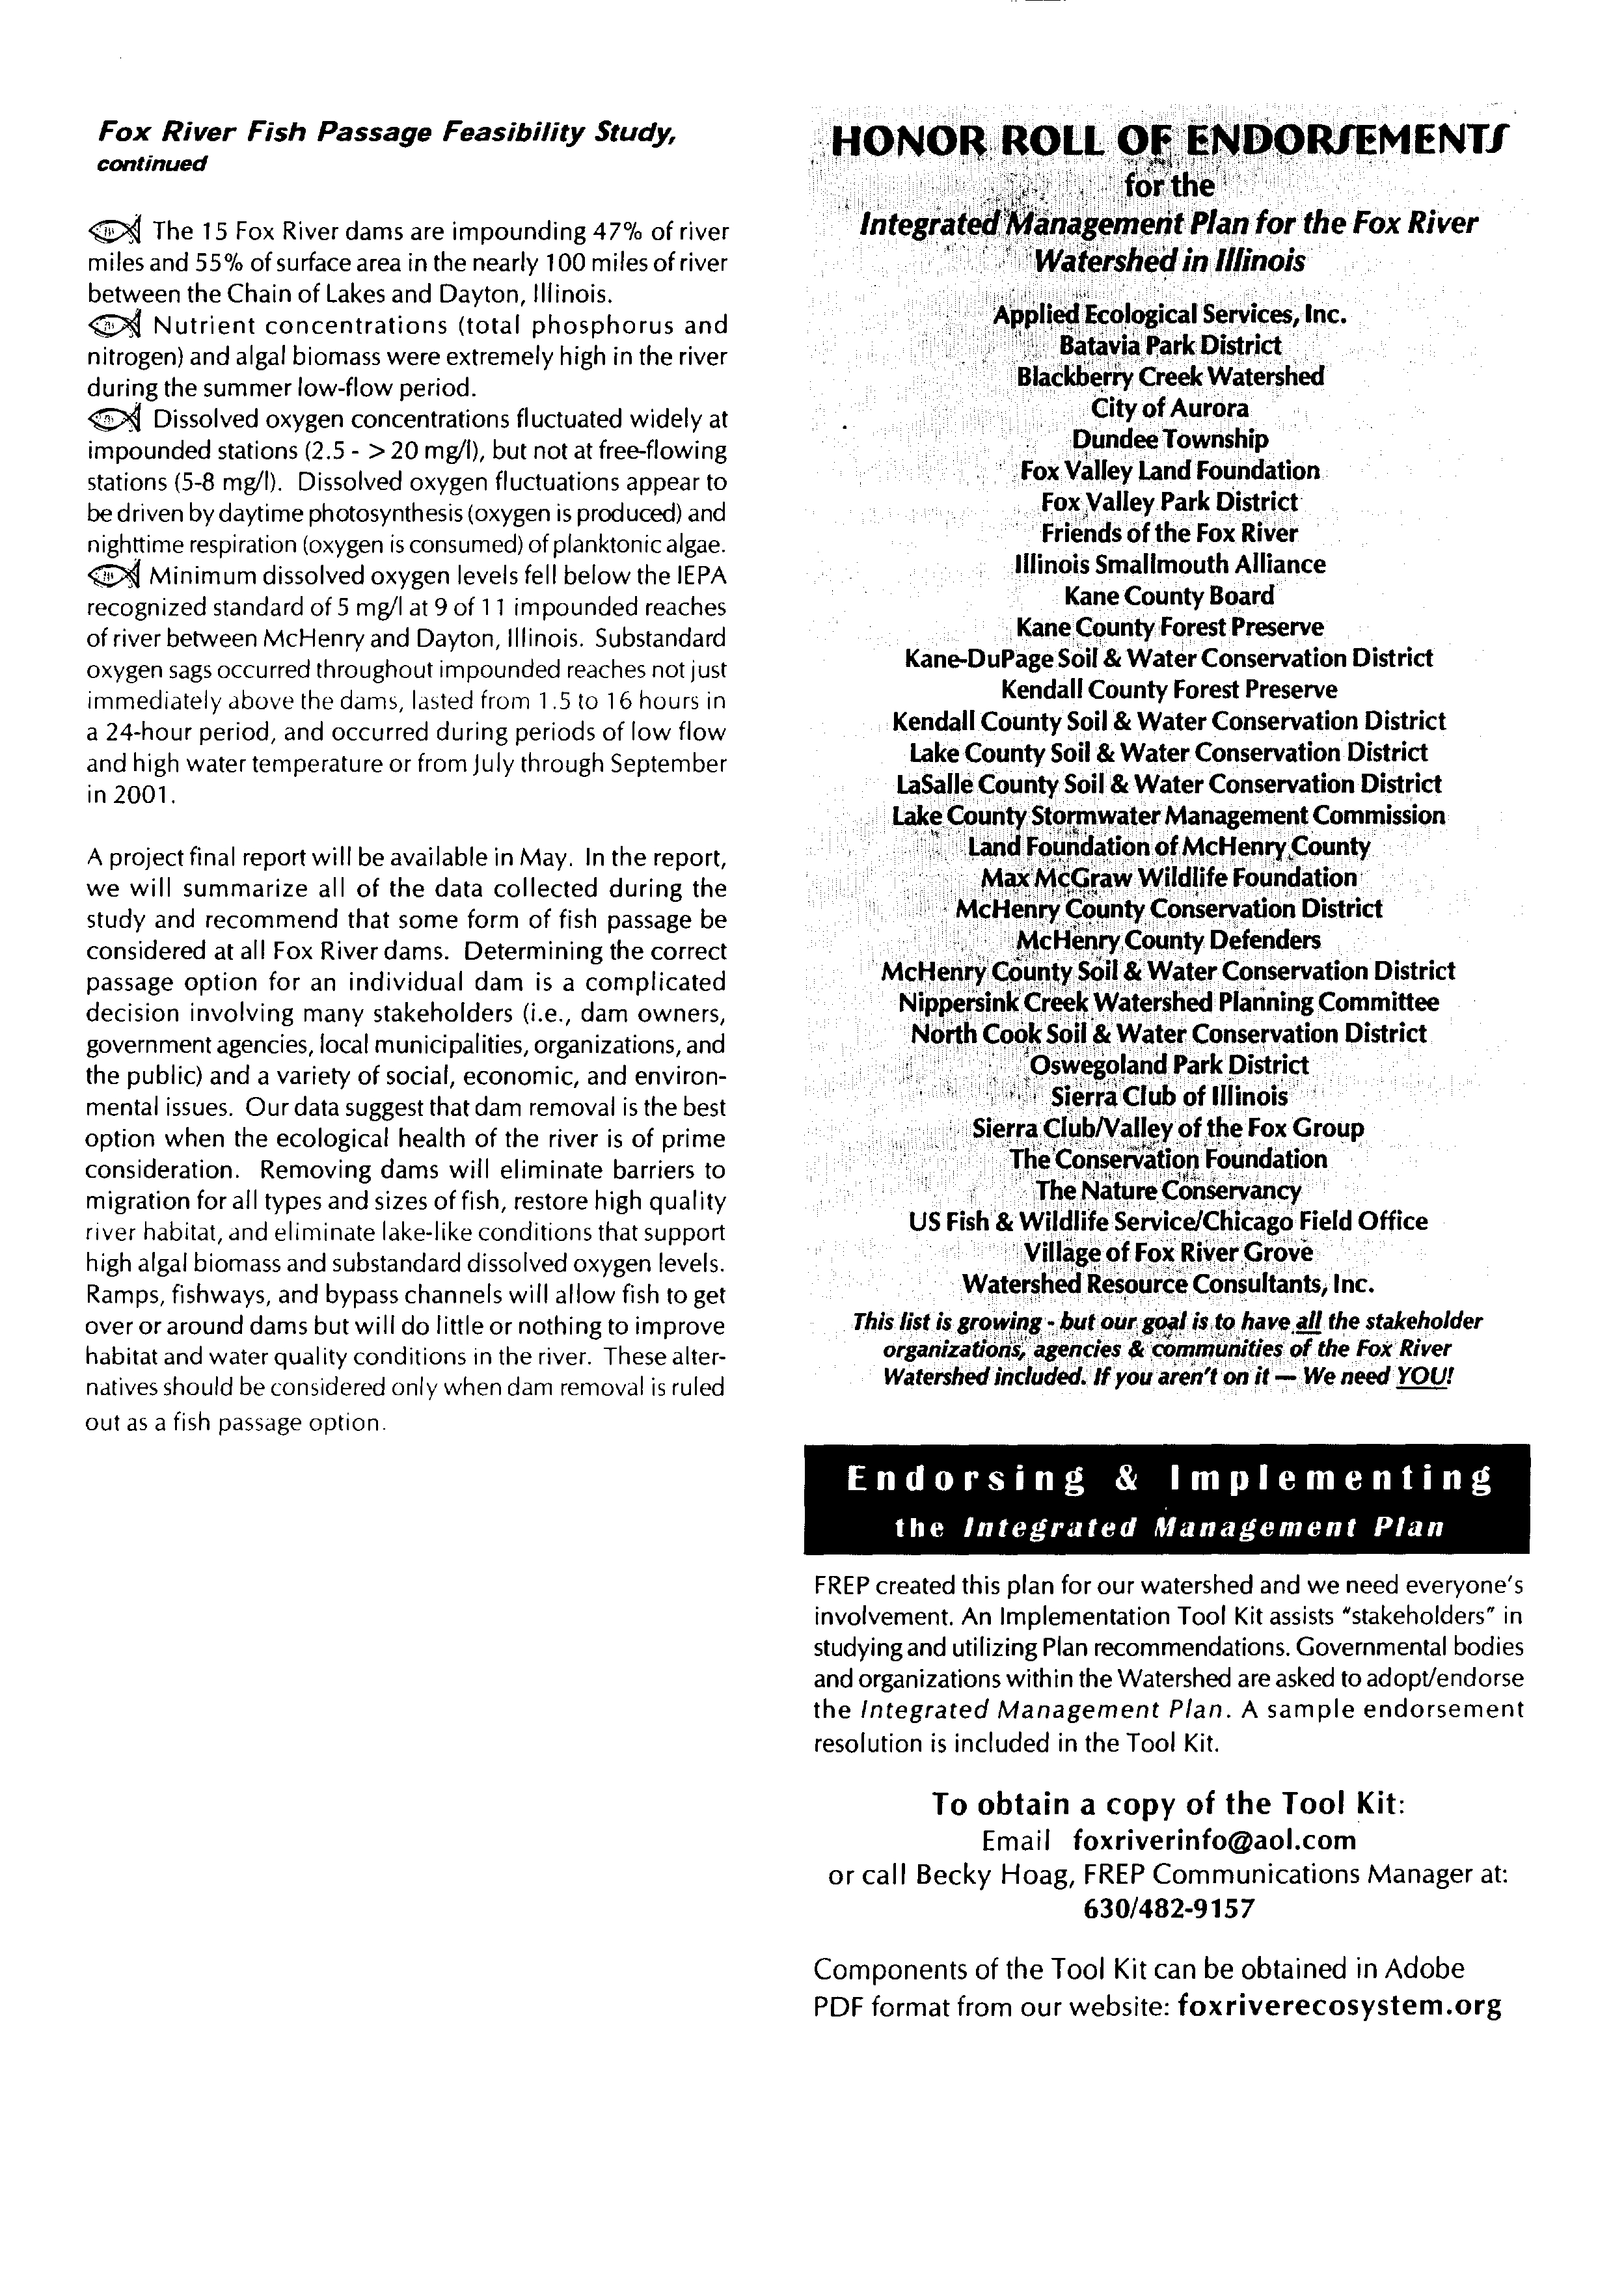
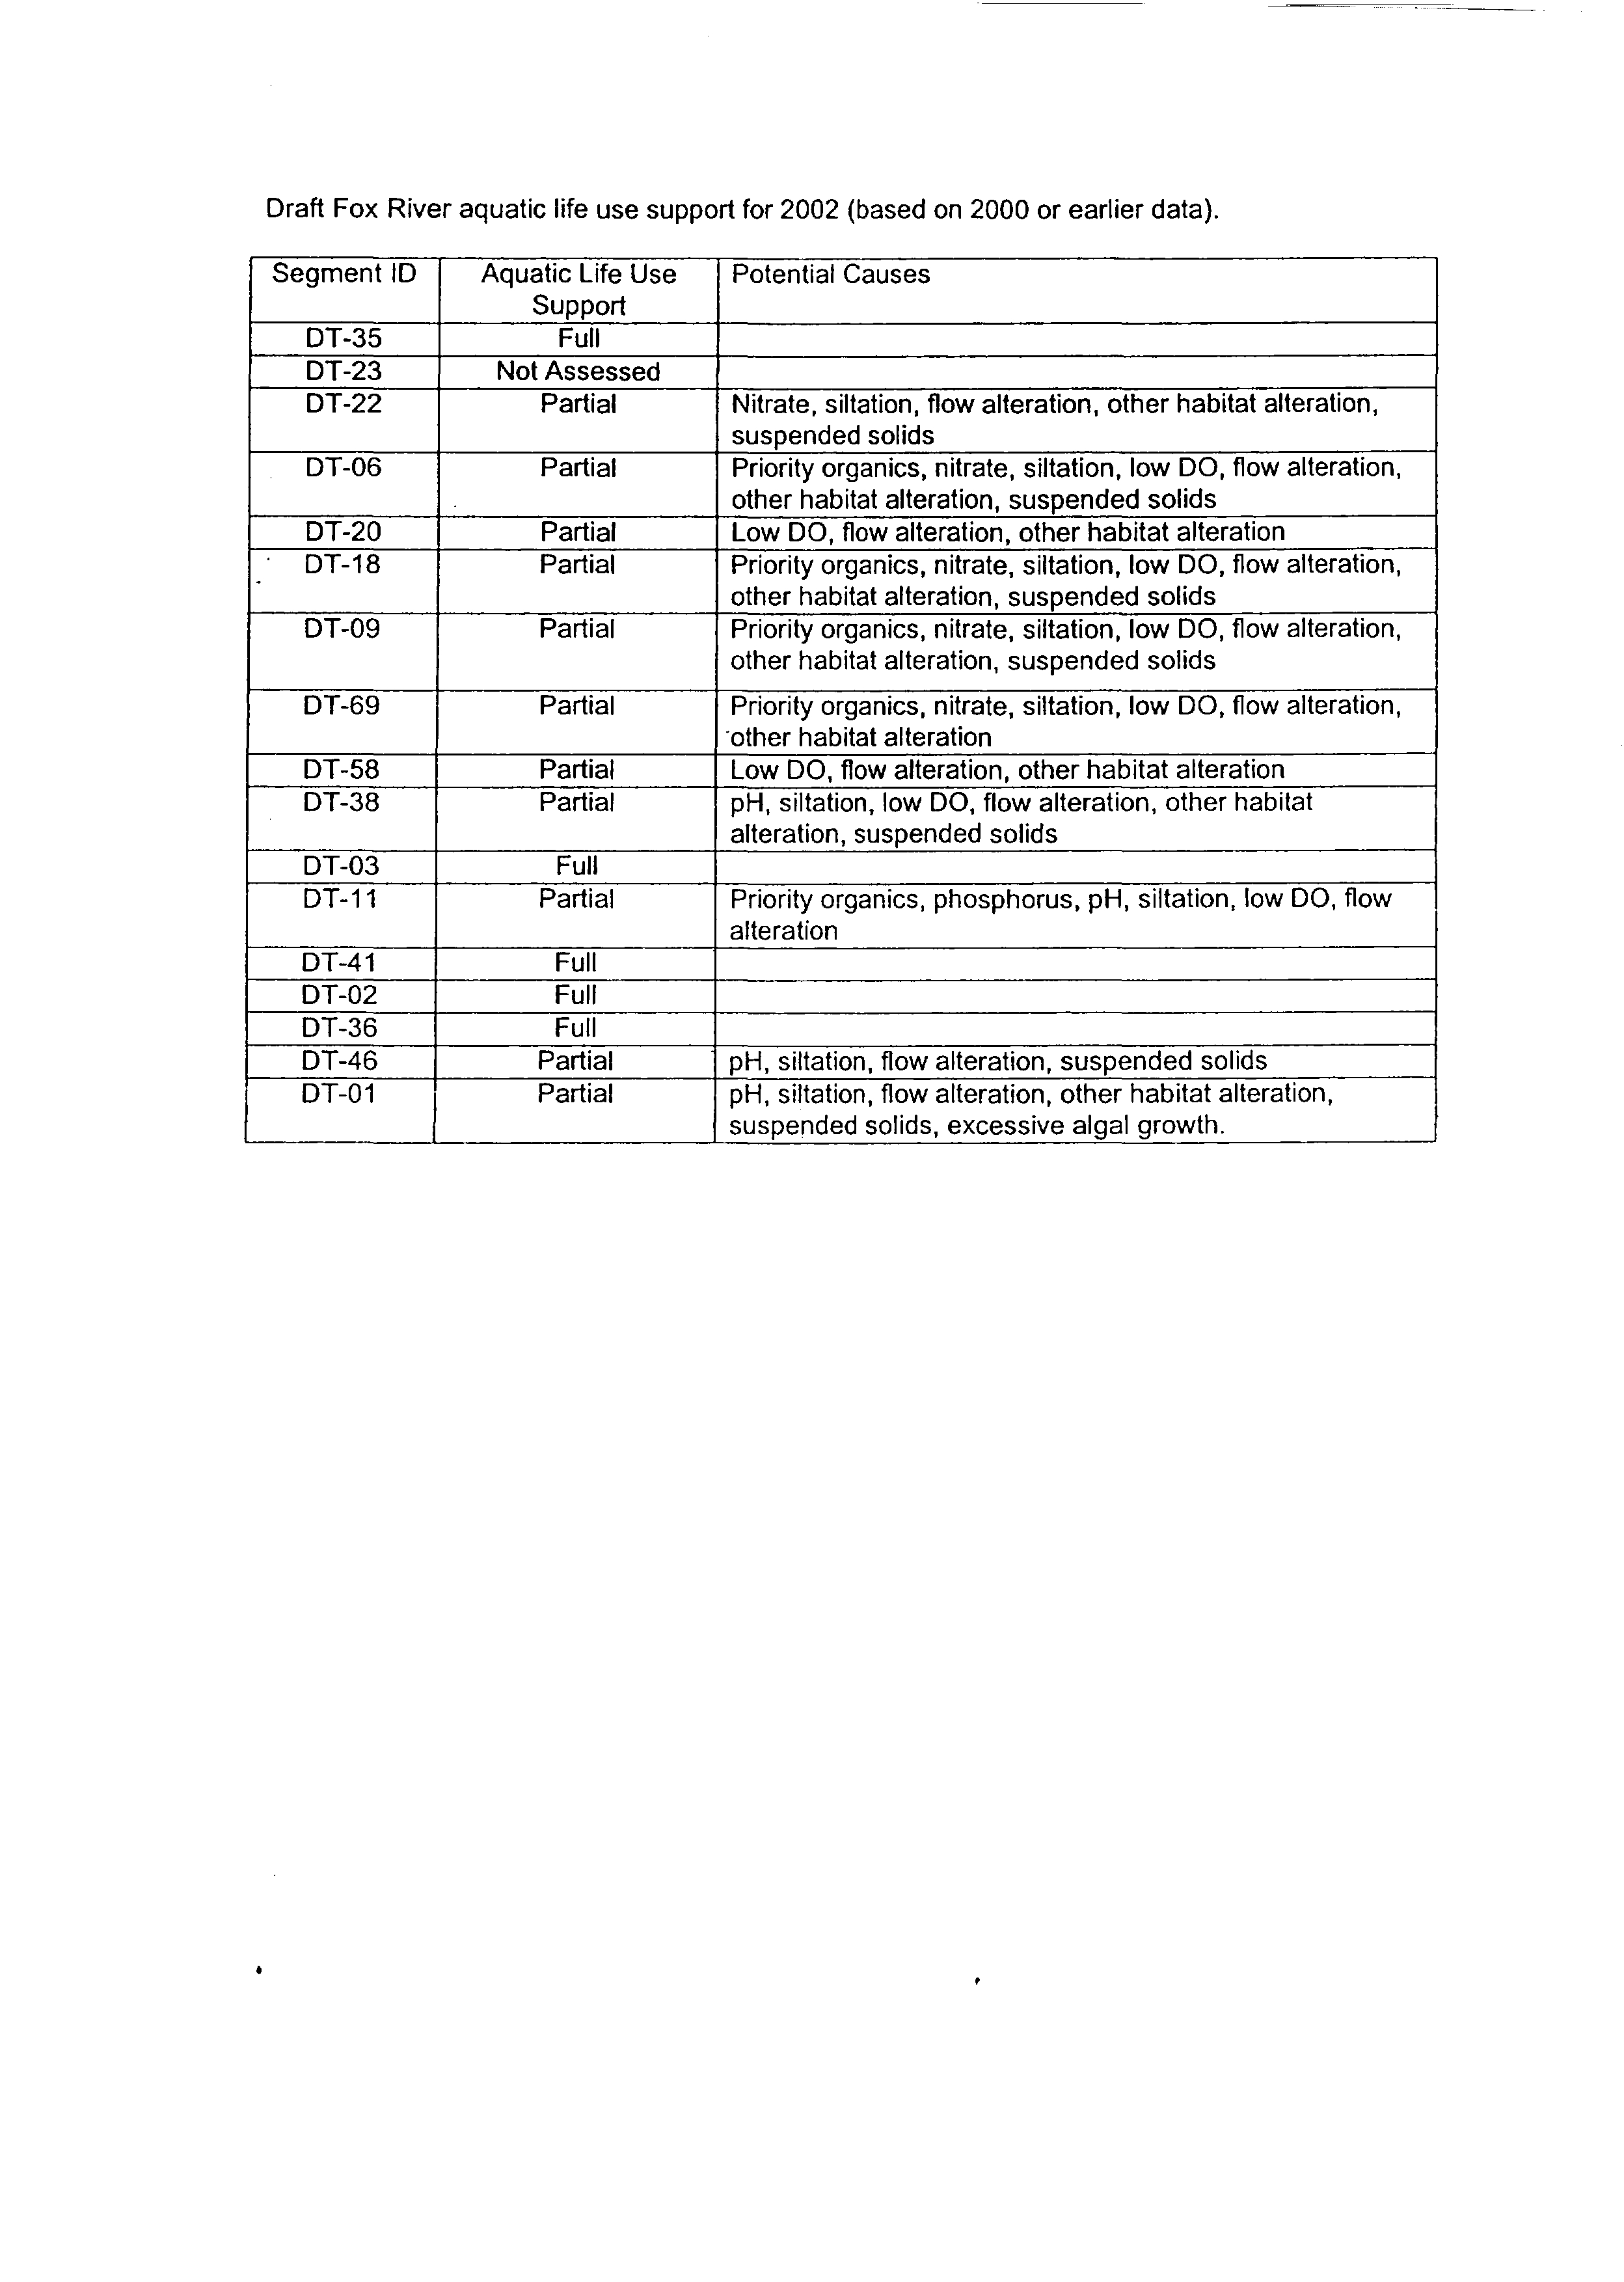
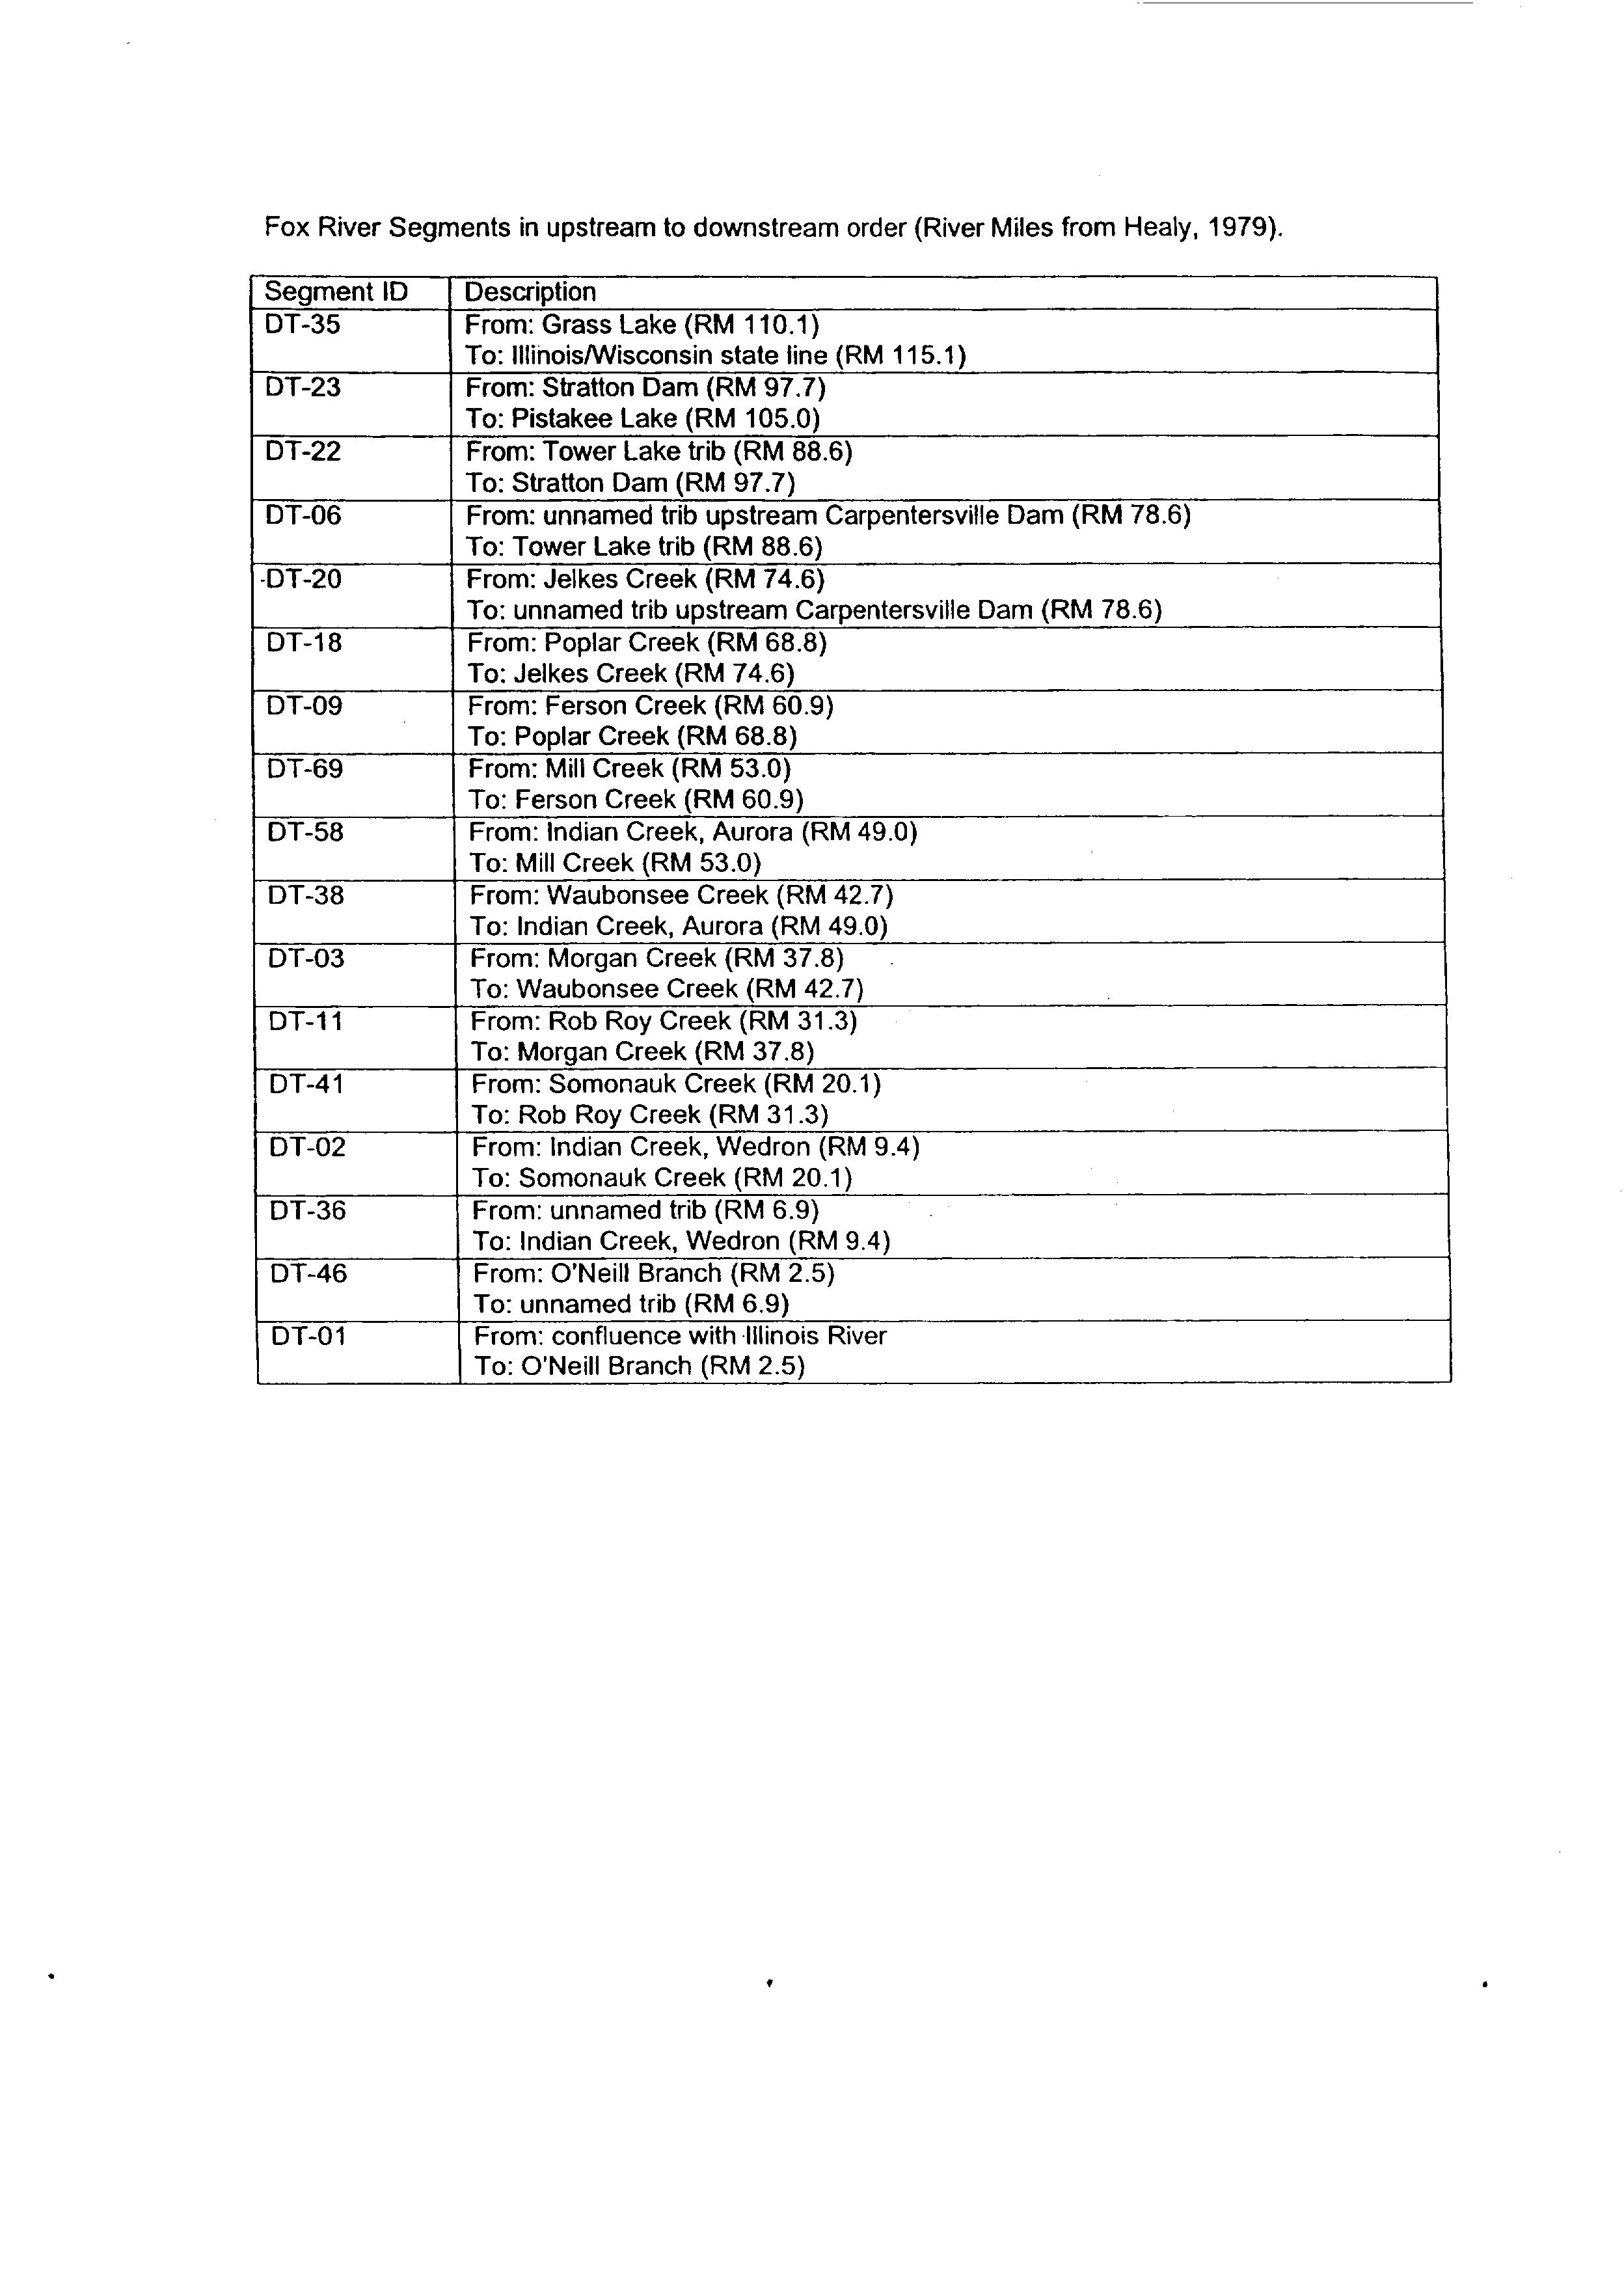
problem. Recent not yet published studies ofthe Fox River, which looked more carefully at
biological and chemical data for a specific water than is generally done through IEPA monitoring,
found many more impairments than had been found through IEPA monitoring. (Exhibit 8)’°
It is true that in many cases an ammonia limit based on ammonia toxicity will incidentally
provide protection against violations ofthe dissolved oxygen standard. But Illinois cannot rely on
that. As the Board rules make clear, ammonia limits depend on pH and temperature factors that
may not correspond to the danger ofviolations ofthe dissolved oxygen standards. See 35 Ill. Adm.
Code 302.212. Further, even the 1.5 mg/L to 4.0 mg/L ammonia limits typically provided in
~As to each of these impairments “municipal” point sources are listed as a source of impairment. (Id.) Long reaches of
the Mississippi River are listed as impaired by low DO levels with the source of the impairment identified only as
“unknown”. (Id.)
10
Researchers from the Max McGraw Wildlife Foundation report measuring DO levels less than
5
mg/l at 9 out of 11
impoundments studied on the Fox River. In some cases, the standard was violated over a period of 16 hours. IEPA’s
discussion of the Illinois River in its 305(b) report acknowledged that its monitoring did not look at biological data for
rivers in which one cannot wade and that it did not cover the biologically critical side channels and wetlands. (Exhibit
5)
6
Illinois NPDES permits may not be protective of DO levels. See In Matter of: Site Specific
Rulemaking for the Sanitary District ofDecatur, Illinois, R85-15, 1987 Ill. Env. Lexis 424 (Jan.
22, 1987); slip op. 7-11, 18 (Board finds that discharge of
1.5
mg/L ammonia may cause DO
violation)
Still further, in many cases, the availability of dilution in the receiving water will cause
there to be no ammonia limit or a very loose one. As the problems ofthe Mississippi River
demonstrate, it is possible to have large dilution and still have a dissolved oxygen problem. This is
because, as is often the case with environmental problems, the cumulative effect of relatively small
sources ofpollution can add up to a big problem. See e.g. Sierra Club v. Penfold, 664 F.Supp.
1299, 1303 (D. Alaska 1987) An example ofthis is the problems of the Mississippi River pool
above the Quad Cities for which U.S. EPA required special BOD limits because ofexisting
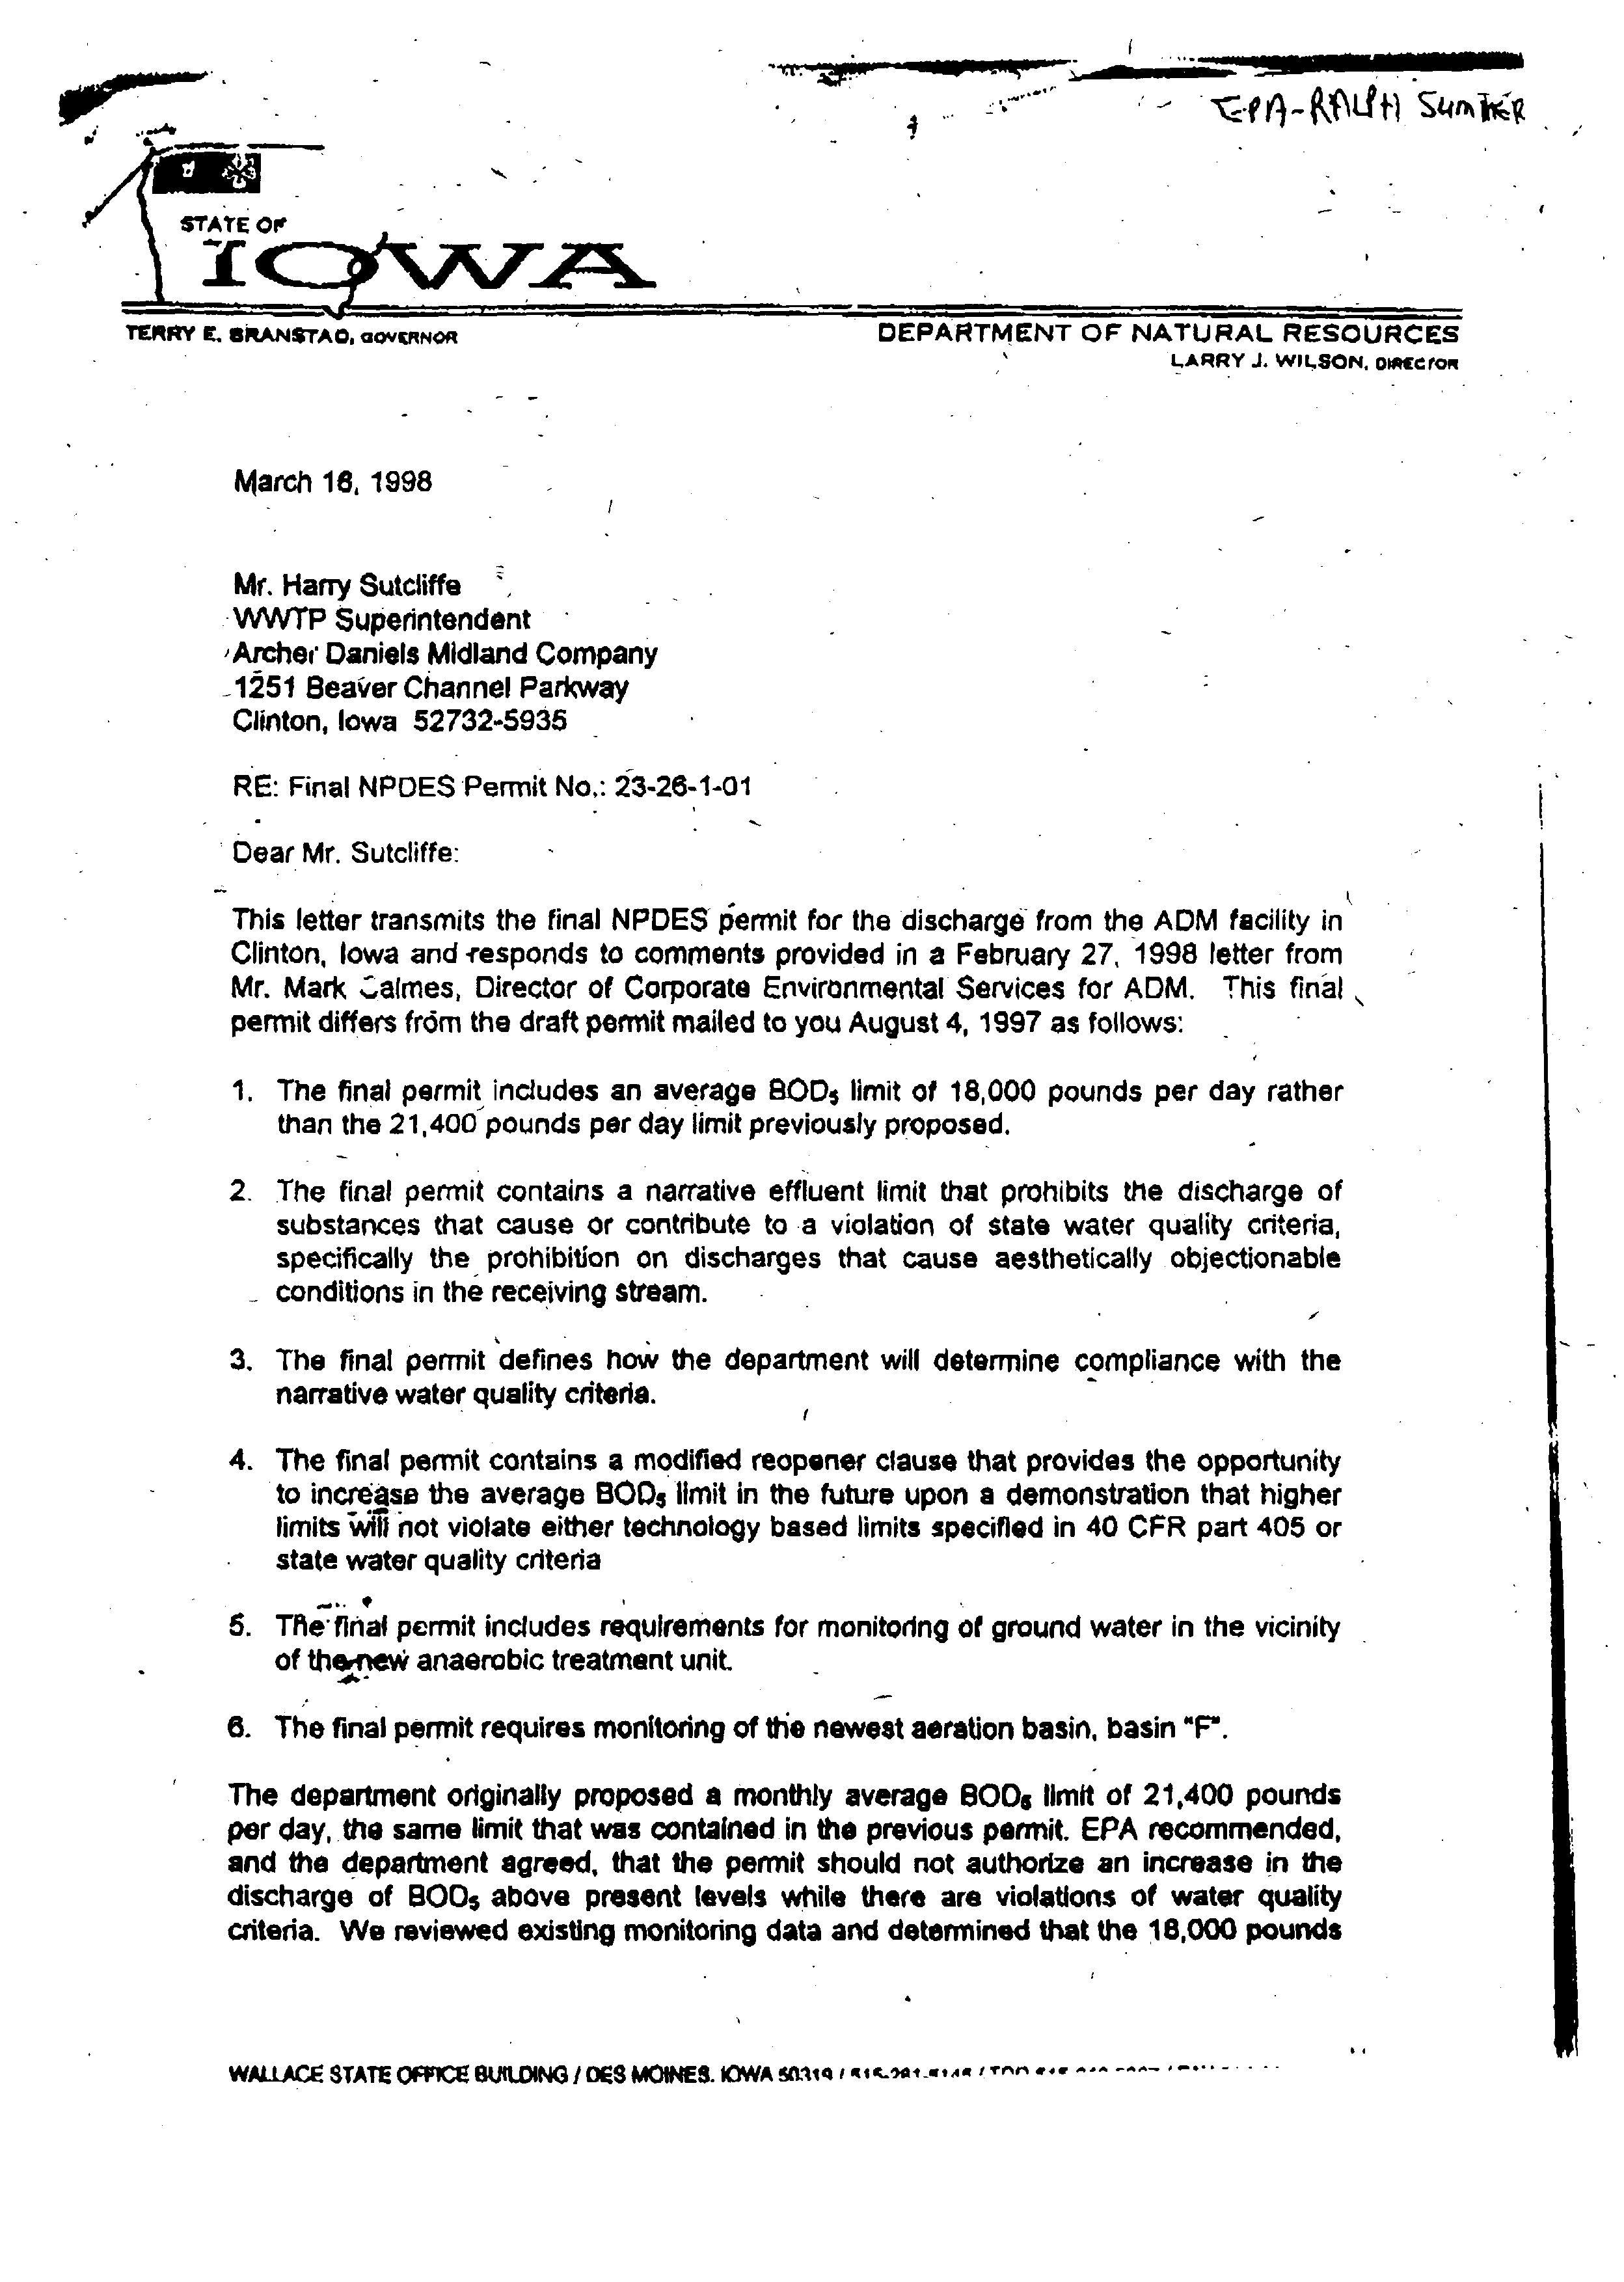
dissolved oxygen problems. (Exhibit 9)
The fact that in many cases toxicity-based ammonia limits are protective ofdissolved
oxygen does not mean that the Agency should ignore the cases where such limits are not protective.
Further, it cannot go without being noted that, to the extent the Board loosens the toxicity-based
ammonia standard in R02- 19, the ammonia standard will be less able to serve as an indirect control
on nitrogenous oxygen demand. Finally, we have no idea what effect the Agency’s casual extension
of its CBOD proposal to industrial dischargers will have on the amount of deoxygenating wastes
discharged into Illinois waters.
B. The Board Should Not Adopt Rules That Ignore the Nitrogenous
Component ofBOD.
The Board should not adopt the proposed change in the Deoxygenating Waste rule. Instead,
it should ask IEPA to develop proper methods for protecting DO levels in Illinois waters. Waiting
to change the standard until there are proper DO protections will not as a practical matter affect
NPDES permit limits because the Agency has already shown its vast willingness to issue permits
that contain only CBOD5 limits although the Board rules currently call for BOD5 limits.
The Environmental Groups have not been able to conduct a broad study of how dissolved
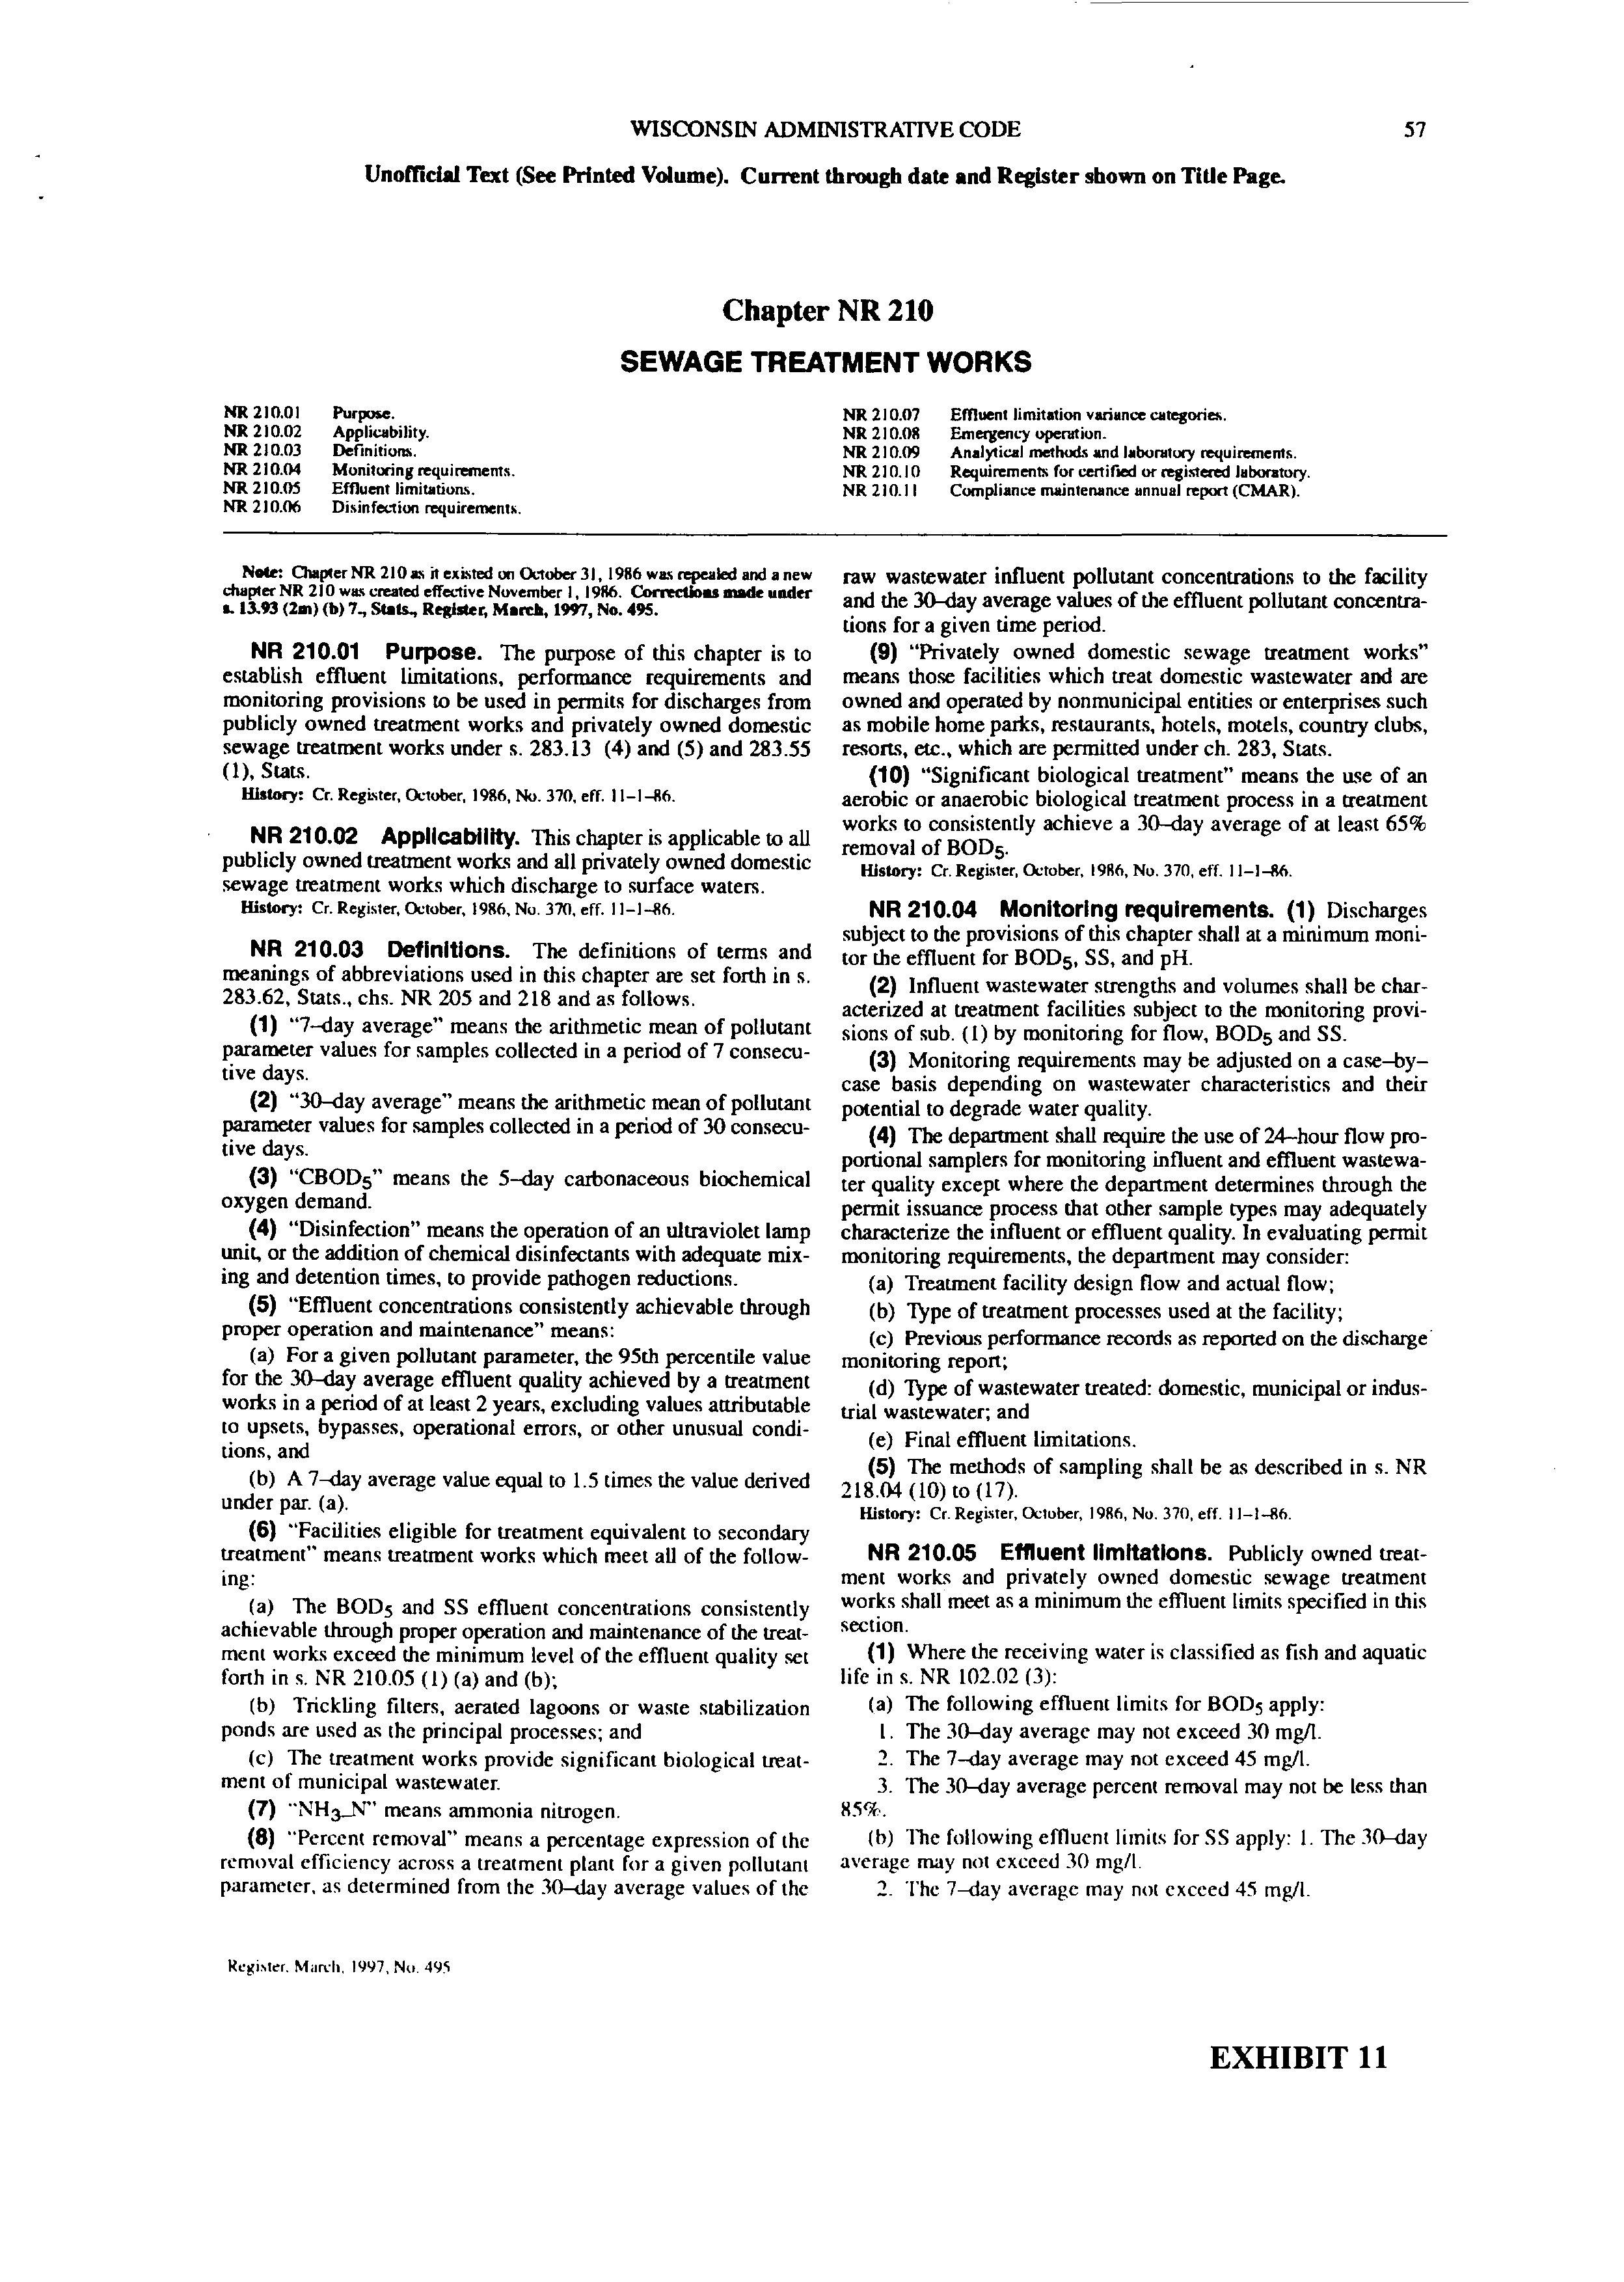
oxygen standards are protected in other states. It is known that Michigan for its permits separately
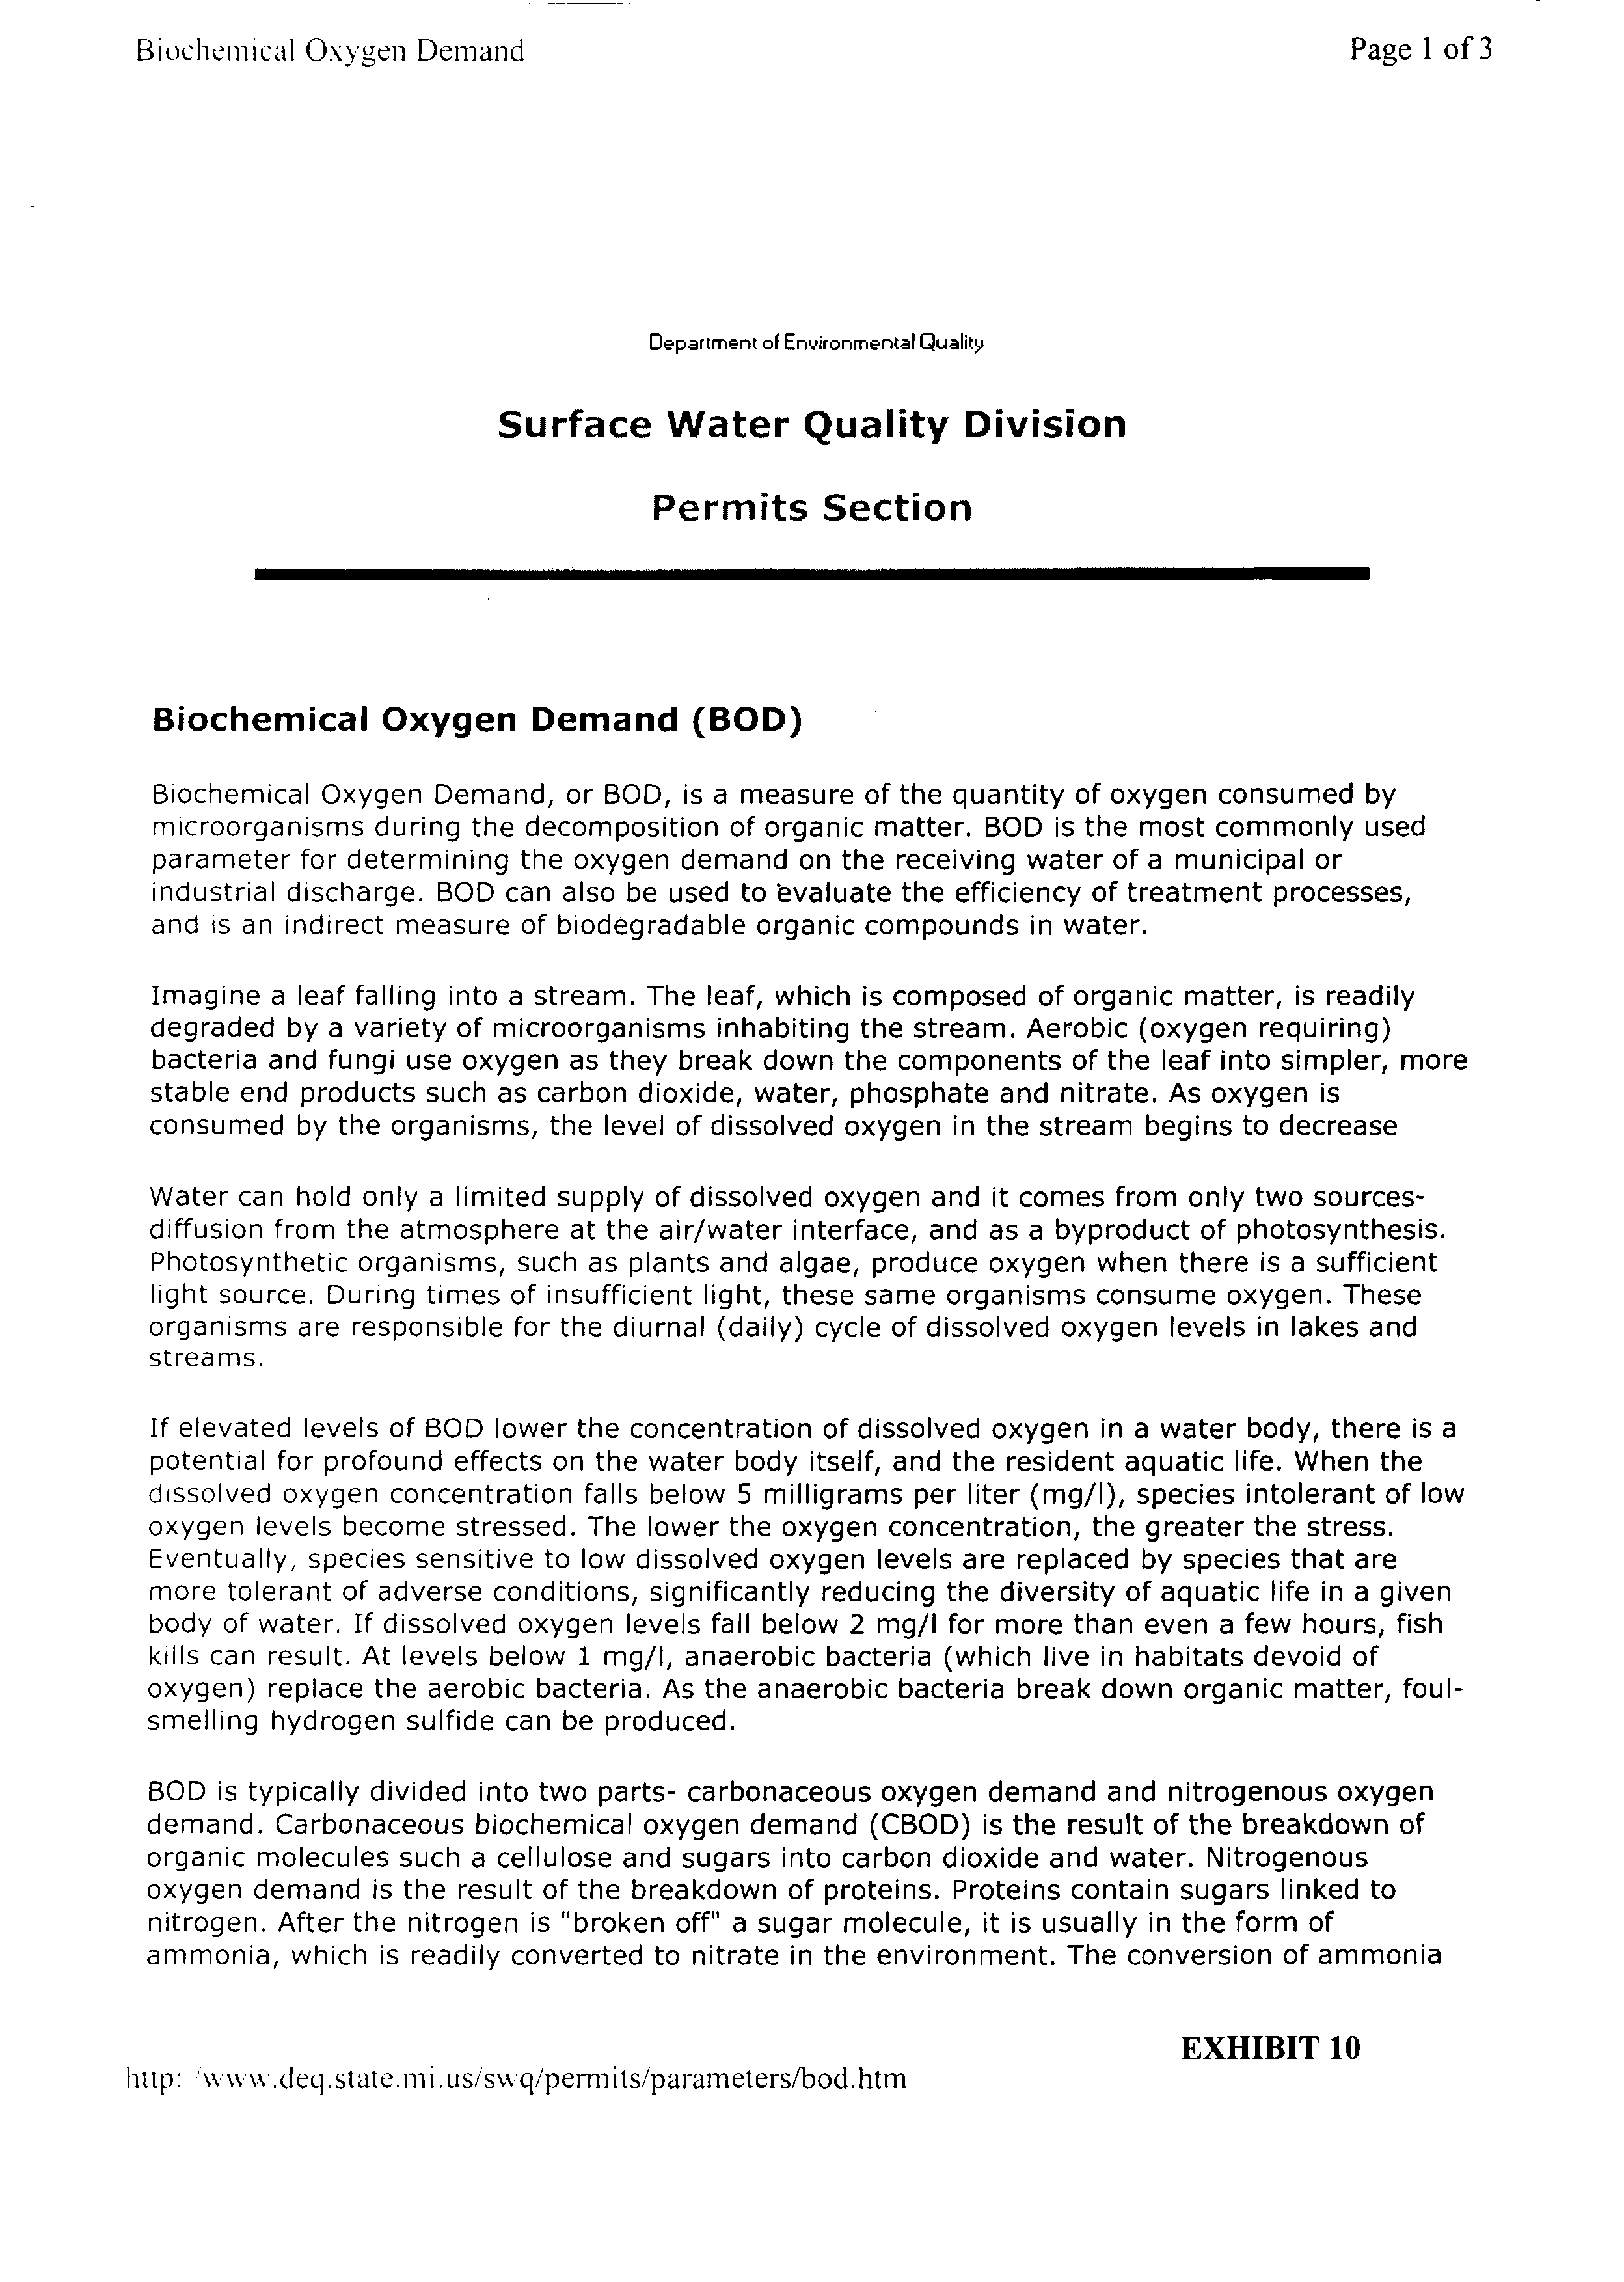
calculates limits on CBOD, nitrogenous oxygen demand and ammonia toxicity. (Exhibit 10)
For most waters, Illinois should use both technology-based limits on BUD that assure
minimum controls
calculate whether any additional requirements are necessary to protect
dissolved oxygen levels. To the extent the Board should allow any change in the minimum control
levels required of dischargers, it should recognize in its rules that CBOD makes up less than all of
the BOD.
In other jurisdictions, in those cases where it is allowed to substitute a CBOD5 limit for a
BOD5 limit, it is not allowed to substitute CBOD5 for BOD5 without recognizing that CBOD is
significantly less than 100 of the BOD. Thus, the federal rule that defines “secondary treatment”
for technology-based limit purposes states that
25
mg/L CBOD5 may be substituted for
30
mg/L
7
BUDS. 40 CFR
§
133.102.” Similarly, while requiring an individual calculation for most waters
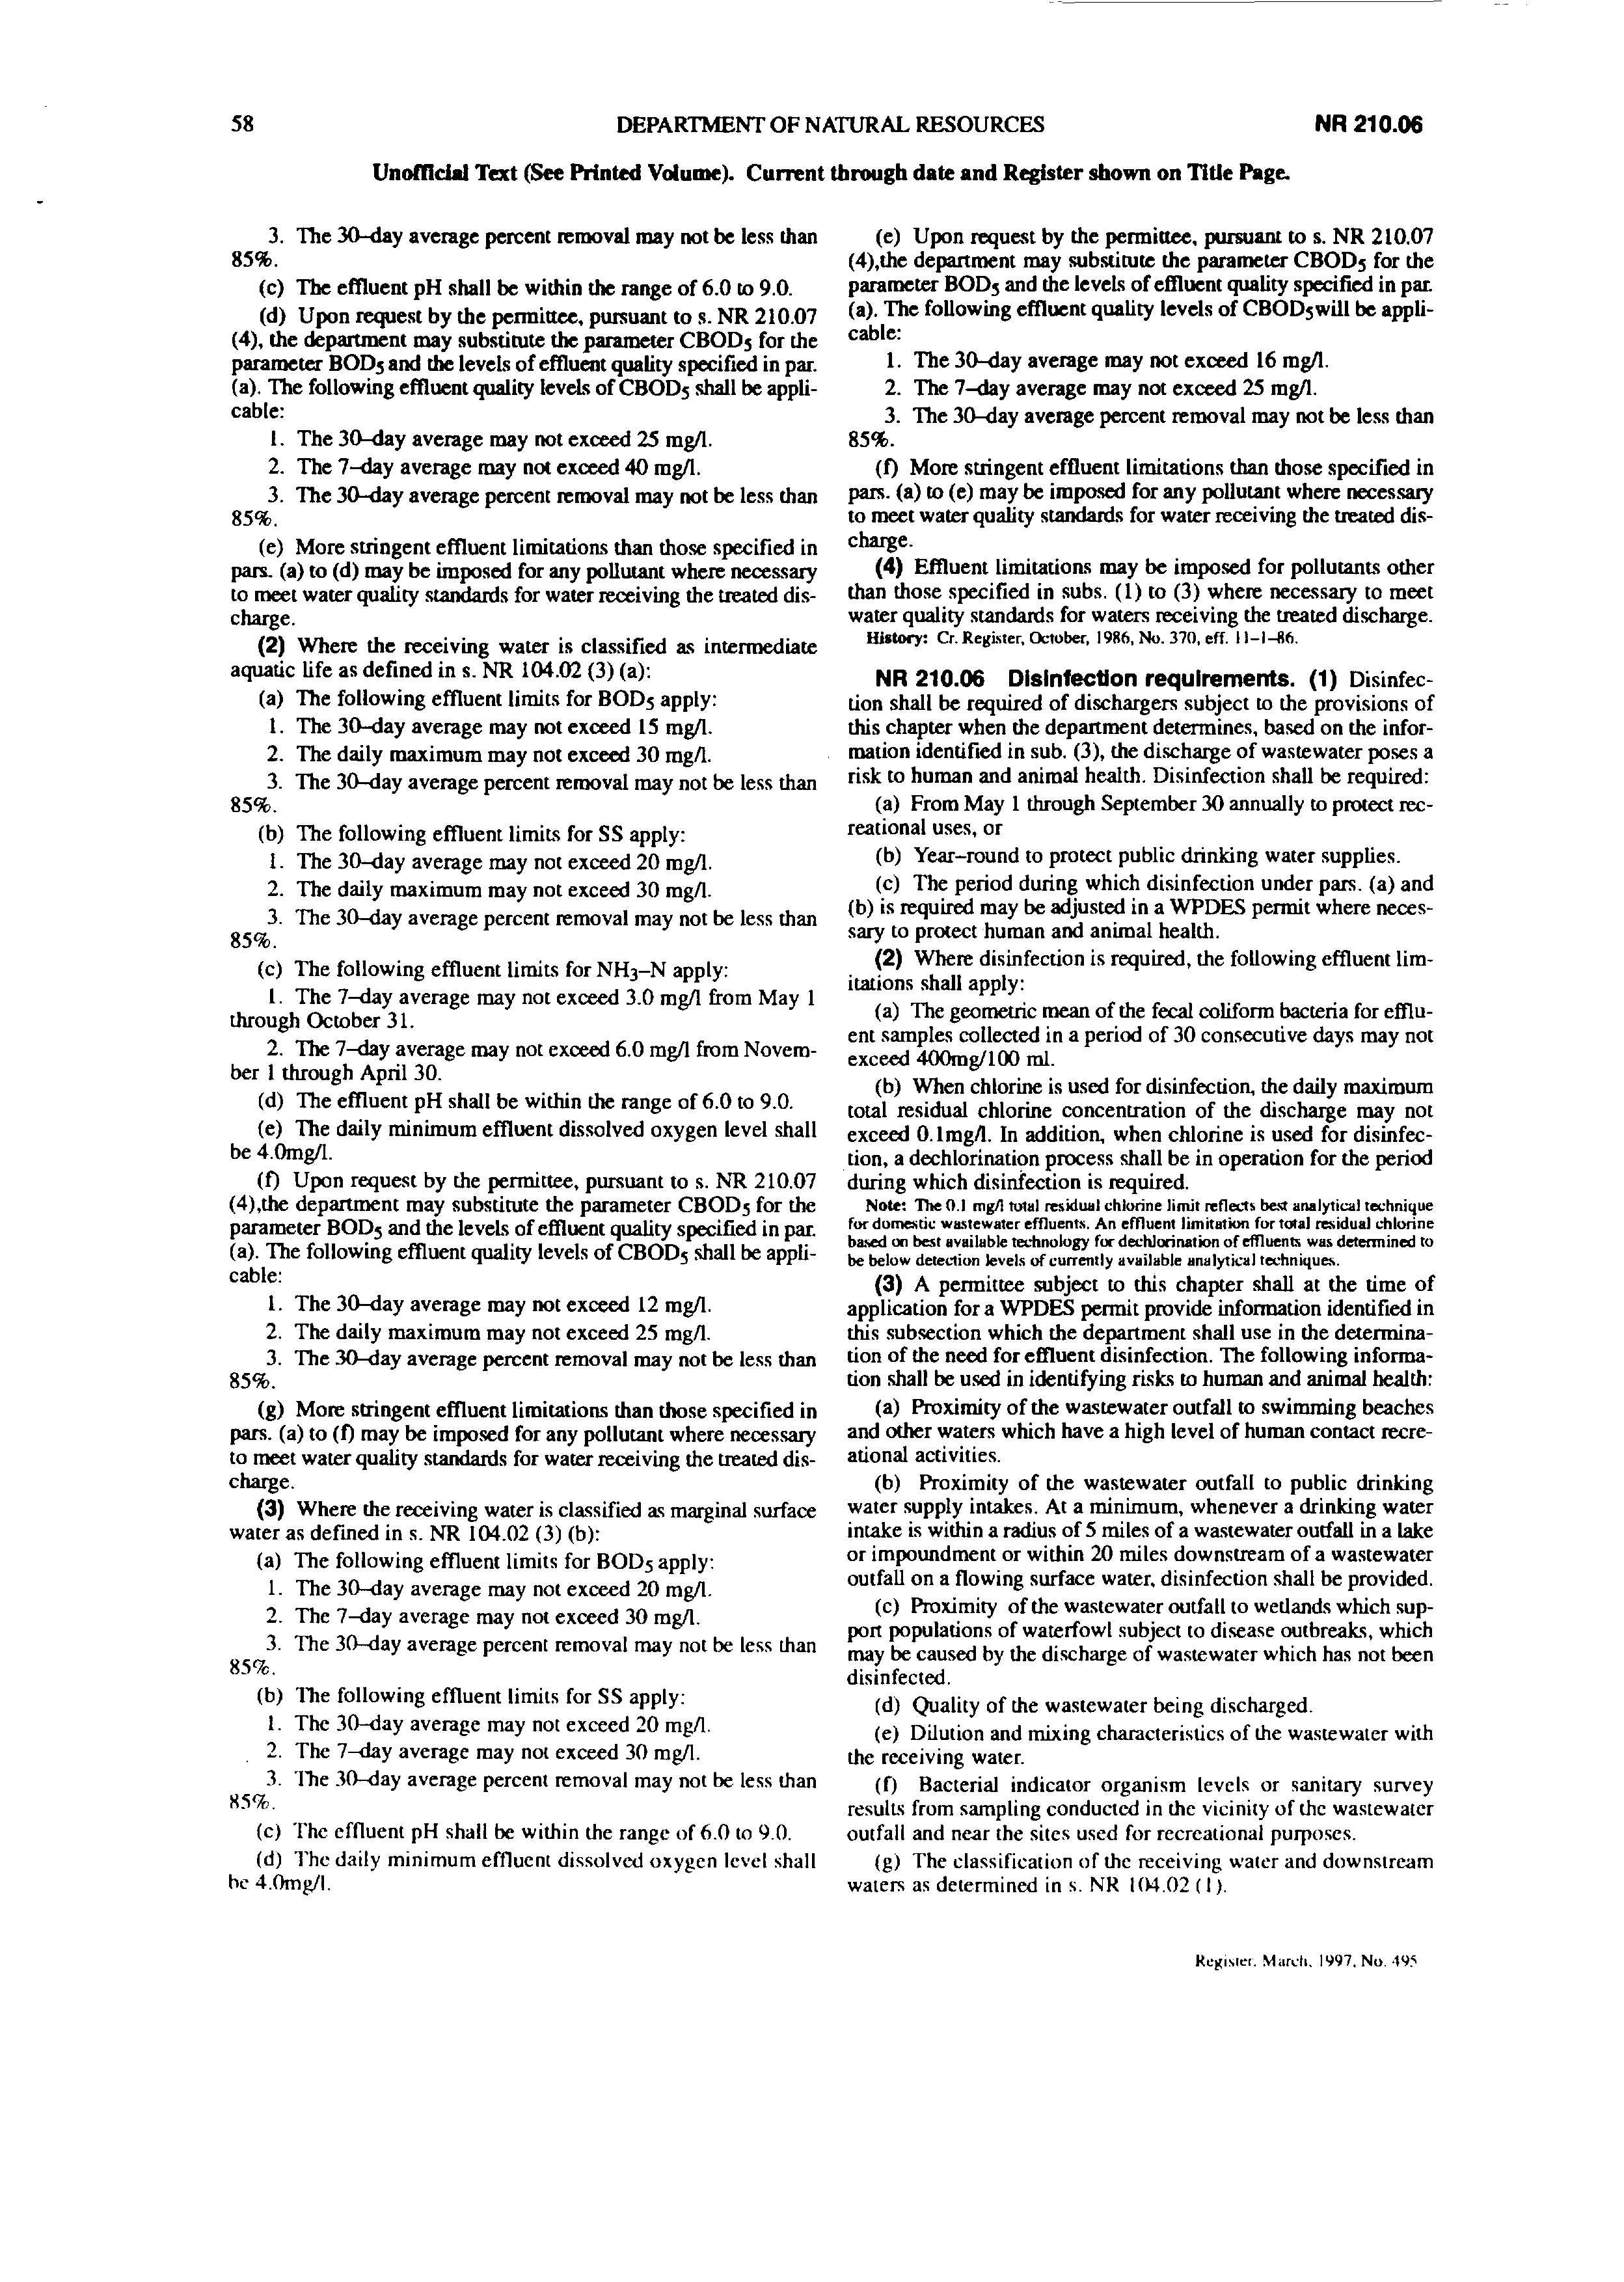
(NR 210.05(1)(e) (Exhibit 11), Wisconsin allows a CBOD5 limit of12 mg/L to be substituted for
waters where a limit of
15
mg/L BUDS is required and allows
16
mg/L CBOD5 to be used in place
ofa BUDS limit requirement of 20 mg/L. (NR 210.05 (2)(f), (3)(e)) (Id.)
Moreover, there is really no reason to allow a CBOD5 limit of20 mg/L on a widespread
basis. Numerous authorities, including witnesses before the Board in numerous proceedings
beginning in 1971 and continuing thereafter, have recognized that CBOD5 limits of 10 mg/L are
readily attainable by almost all dischargers.’2 As was stated by Mr. Callahan at the March hearing
regarding the 10 mg/L BUDS (or CBODS) standard:
I believe it is economically reasonable --It is readily attainable. I think the industry
has a very high compliance rate with that on zero low flow streams across the state
right now and it seems to be done with moderately appropriate user fees and citizen
tax rates. (Tr. 131)
Thus, even were the Board inclined to adopt a portion ofthe Agency’s proposal
regarding deoxygenating wastes, it certainly should not allow CBOD5 limits to be set under
35 Ill. Adm. Code 304.120(b) above 10 mg/L or, following Wisconsin, 16 mg/L.
CONCLUSION
The Board should not grant the petition based on the current record. Ifat some point the
Agency provides the draft implementation rules and biological studies needed to gauge the effect of
the proposal, the Board can revisit the issue.
‘~F.Etting~~125045~
Counselfor Environmental Law & Policy
Center,
Prairie Rivers Network and Sierra Club
April 12, 2002
Environmental Law and Policy Center
35 East Wacker Drive, Suite 1300
Chicago, IL 60601-2110
(312)
795
3707
IL
The Agency recognizes this requirement in its proposal by generally fhrbiddingCBOD5 limits over 25 mg/L.
12
Among the decisions noting that that it is not difficult to meet the 10 BOD5 standard are In the Matter of: ProDosed
Amendments to 35 III. Adm. Code 304.120. Deoxvgenatin~Wastes Standards, R86-l7(B) 1988 III. Env. Lexis 56 (Oct.
20, 1988) slip. op. 9 (10 mg/L BOD5 standard can be met using land treatment) and In the Matter of Proposed Site
Specific Water Pollution Rules and Regulations Applicable to Citizens Utilities Company of Illinois’ Discharge to Lily
CacheCreek, R8l-l9 1983 Ill. Env. Lexis 278 (May
5,
1983) sip op. 14 (“no question about the technical feasibility of
achieving compliance with 10
BOD5”).
8
..J4~CL
&(....‘(.4.
ILLINOIS ENVIRONMENTAL PROTECTiON AGENCY
1021
North
Grand
Avenue East. P.O.
Box
19276, Springfield. Illinois
62794-9276
Mary A. Gade, Director
November 10, 1997
RE:
Draft Rules
for Determination ofWater
Quality
Based Effluent
Limits
for Discharges
to General
Use
Waters
Dear
Sir or
Madam:
Enclosed
is a draft ofAgency procedures to guide the issuance ofwater
quality
based effluent
limits
(WQBELs) in the NPDES
permit
program.
This draft contains
general procedures for establishing
WQBELs in
permits,
a reasonable potential analysis
method that
allows the-Agency to decide when
a
given
chemical
parameter must be regulated in an NPDES permit,
and
a method for
regulating
substances
that
have water
quality standards
or
criteria which are
more stringent
that analytical
methods
can detect. Additionally,
the draft contains methods that
address
the establishment ofthe
recently
nitrogen
adopted(DecemberIllinois19, Pollution1996)
in
permits.
Control Board water
quality and
effluent standards for
ammonia
We
anticipate that
interested parties will have questions
and
comments concerning
this document.
During the next thirty days we invite comments regarding this draft which will help us decide on a
plan for
future
public information meetings. Please contact Toby Frevert at the above
number
or
Bob Mosher at 217-782-3362
with questions or comments on this draft
by December 9, 1997.
I look
forward to working
with
you in
this
rulemaking process.
S~L~
B. Park
Chief
Bureau ofWater
217-782-1654
Sincerely,
JBP:RGM:djp/amruldis
Prlmtad iii ~scyc1sd
Pipir
EXHIBIT 1
November 7, 1997
Environmental Protection
Subtitle C: Water Pollution
Chapter II: Environmental
Protection Agency
Part 353
Determination ofWaterQuality
Based
Effluent Limits
For Discharges to General Use Waters
Subpart A: Introduction
Section 353.101
Purpose,
Scope
and
Applicability
a)
The
purpose
of
this Part
is to
establish procedures
for determining the concentrations
of
substances that must be regulated
in NPDES permits in order to
assure that water
quality
standards
will be met in the general
use waters
ofthe State. These standards
are
established
by the Pollution Control Board at 35 Ill. Adm. Code 302;
Subpart B
and C and
the water quality criteria detennination procedures ofSubpart F.
b)
This Part addresses
the effluent standards of35111. Adm. Code
304.105 and
304.122
which stipulate that effluents must be regulated to assure
that waters
meet water
quality standards
outside ofareas ofallowed mixing,
mixing
zones, zones of
initial
dilution (ZIDs), or areas
designated as
effluent
modified waters (EMWs) as provided
by this Part.
This Part
must
be administered
in accordance
with Part 354,
Determination ofAllowed Mixing, Mixing Zones
and
ZIDs.
c)
All effluents discharged
to
general
use waters
and
public
and
food processing water
supply intakes
are
subject to the
procedures
established in
this
Part. Discharges to
Lake Michigan
or the Lake
Michiganbasin
are subject to the provisions established
at 35111. Adm. Code
Part
352. Site~specificwater
quality
standards of
Part
303 are
to be applied in conjunction
with
the
procedures
of
this Part.
d)
Technology based limits
as required by USEPA or effluent standards found at 35111.
Adm. Code
Part 304 shall
be applied wherever they are more restrictive than the
water quality based
effluent
limits
determined from
this Part.
e)
This Part
provides a methodology to
determine
the
need
for
regulating substances in
an NPDES
permit
when an effluent or
point source
discharge has the
potential to
exceedwater
quality
standards or
criteria. When
a potential to exceed a water
quality
—1—
November 7, 1997
Section 3 53.405 Parameters for the Mass Balance
Calculation
a)
QE
-
Discharge Flowrate
-
The discharge flowrate shall be representative of the
maximum expected discharge
during
the term of the permit that coincides with the
critical
stream flow conditions given at 35 Iii. Adm. Code 353.309. Discharge
flowrates to coincide with these conditions will be determined as follows:
1)
for dischargers of treated domestic wastewater, the discharge flowrate will be
based on the average ofthe
lowest three months of effluent flow for the most
recent full calendar year,
unless
the discharger demonstrates
that this
value
does not accurately represent plant low flow discharge. Adjustments will be
made from this value to reflect
any
major change in flow expected during the
term of the permit
(e.g., major sewer
extensions,
an increase in the Facility
Planning Area,
projected development, etc.);
2)
for
industrial dischargers the discharge flowrate will
be based on the
highest
monthly average flow from the previous 5 year
period
unless the discharger
demonstrates that
this value
does not accurately represent
maximum
predicted
flow discharge. Adjustments will be made from
this
value to reflect
any
major
change
in flow expected during the term ofthe
permit
(e.g., change of
processes,
industrial
plant expansions, non-contaminated stormwater).
b)
Q~5
-
Dilution
Flowrate
-
The allowable dilution flow will be determined consistent
with the Agency
rules
for implementation of allowed
mixing and
mixing zones;
Part
354.
c)
C~
-
Upstream concentration
-
This
is the long term average concentration ofthe
substance present in the dilution flowprior to mixing
with
the discharge (e.g.,
Ambient stream
concentration upstream ofthe discharge). Acceptable sources of
data include the Agency’s ambient water
quality
monitoring program, Agency
conducted facility
and stream surveys and discharger
or
third party
collected data if
adequately quality assured.
d)
Standard
-
This
is the applicable water
quality standard
or criterion contained in or
derived from the Illinois Pollution Control Board Regulations, 35
Illinois
Administrative Code,
Part
302. For
any particular
substance there may be as many
as four applicable
standards
or criterion; e.g., Acute
aquatic
life,
chronic
aquatic life,
human health, and
wildlife. The
mass
balance calculation
and
derivation of a
WQBEL shall be completed for whichever of these criteria “Reasonable Potential”
has
been
established
pursuant
to Subpart B.
—11—
November 7, 1997
Section 353.407 Determining Instream Hardness
The toxicity of
several metals is dependent
on the hardness (as CaCO3) ofthe water investigated.
In
formulae,order
toa determinehardness
factor
numeric
is required.
water quality
The
standard
hardness
values
value
from
used
the
shall
water
reflect
quality
the conditions
standards
present in the
stream
once the effluent mixes
with
the ambient
stream
water. Also, the hardness
value
will beusedmoreshallconcentratedreflect
conditionsin
the
of
stream
hardness
during
presenttheseatperiodslow
stream
thus
flowaffectingbecauselocalthehardnesseffluent
conditions.
Stream hardness values used to compute values for metals standards shall be taken from the
nearestor the nearest
downstream
downstreamAWQMNAWQMNsamplingstationstation.is notWhenrepresentative
no downstream
of the receiving
AWQMN
water,
station
a
exists
value
from a AWQMN station from an adjacent and similar watershed shall be used. When there is no
AWQMNstations in
station
the basin
on
containing
an adjacent
the
and
receivingsimilar
watershed,
water shall
an
be used.
average
The
of
hardness
values from
values
all
AWQMN
used shall
be determined as follows:
a)
where the
stream
flow at the AWQMN station is measured, the tenth percentile
hardness concentration, expressed as
mgfL
CaCO3 hardness, obtained from samples
collected at the lowest ten percent of
stream
flow will be
used
as the value for
hardness;
b)
where the stream flow at the AWQMN station is not measured,
the 25th
percentile
hardness value will be used;
c)
alternatively, a discharger shall have the option to collect hardness data at a point
downstream
of the effluent discharge representative of complete
mixing and
the
resulting
25th percentile hardness value may be used to compute the pertinent metals
standards.
At
least
26 hardness values must be present in the data set
and
these values
must
be representative of all seasons of the year
and
gathered in a
manner
representative of the sampling period.
-
Section
353.409 Receiving Water
Stream
Flow Conditions
a)
Acute and Chronic water
quality standards and
criteria
and
the other
standards
cited at
35 Ill. Adm. Code 353.301(d),
shall
be applied as
permit limits
according to the
provisions of
this Part using
7Q10
stream
flow as the basis of determining dilution
factors.
-12-
UNFTED STATES ENVIRONMENTAL PROTECTION AGENCY
S
~
i~i
~ ‘77
~
77 WEST JACKSON BOULEVARD
CHICAGO. IL 60604-3590
~ p~O~
REPLY TO THE
ATTENTION OF:
WQ-16J
October 25, 2001
Mr. Toby Frevert, Manager
Division ofWater Pollution Control
Illinois Environmental Protection Agency
1021 North Grand Ave. East
Springfield, Illinois 62702
Toby:
Thank you for the opportunity to review
and comment on the Illinois Association of
Wastewater
Agencies’ (IAWA) proposed changes to Illinois’ water quality
standards
for
ammonia.
The
United
States Environmental Protection Agency, Region
5
(USEPA Region 5)
prepared
the following preliminary comments on the
proposed rule revisions. These comments
do not
constitute
final review
and/or
approval or disapproval ofthe
proposed revisions.
USEPA
Region 5 will
take
final action on
any
changes to Illinois’ water quality
standards
if
and
when the
revisions are adopted by the Illinois Pollution Control Board and submitted to USEPA Region
5
for review
and approval.
The comments below fall into four principle
areas:
the determination ofwhen early life
stages are
absent, the determination of
design
flows, the determination ofdesign pH
and
temperature,
and
theprotection of mussels species. Each ofthese
areas
is discussed in
greater
detail below.
Making Early Life Stage Absent Determinations
In its 1999 Update ofAmbient Water
Quality
Criteria for
Ammonia
(1999 Ammonia
Update), the U.S. Environmental Protection Agency (EPA) recommends
two
chronic values: one
value when early life stages offish
are
expected to be present
and a second. value
when early life
stages
offish
are expected to be
absent. This is a departure from EPA’s usual practice in which
it recommends a single chronic value that protects both early life
and
adult stages offish. Since
early life stages could
experience chronic
toxicity wherever they
are exposed to levels that are
above the early life stage value, even where such levels
are
below the value for adults, States
and
Tribes should ensure that early life stages of fish
are
not present where the early life stage absent
values
are
implemented. EPA recommends that States
and Tribes
conduct a thorough assessment
across all locations in the state or reservation in determining where
and
during which periods of
the year early life stage absent values could be applied.
flecyclediRecyclablo .Prlnted with Vegetable
ON
Based
Inks
on
100 Recyded Paper (40
Po~consumer)
EXHIBIT 2
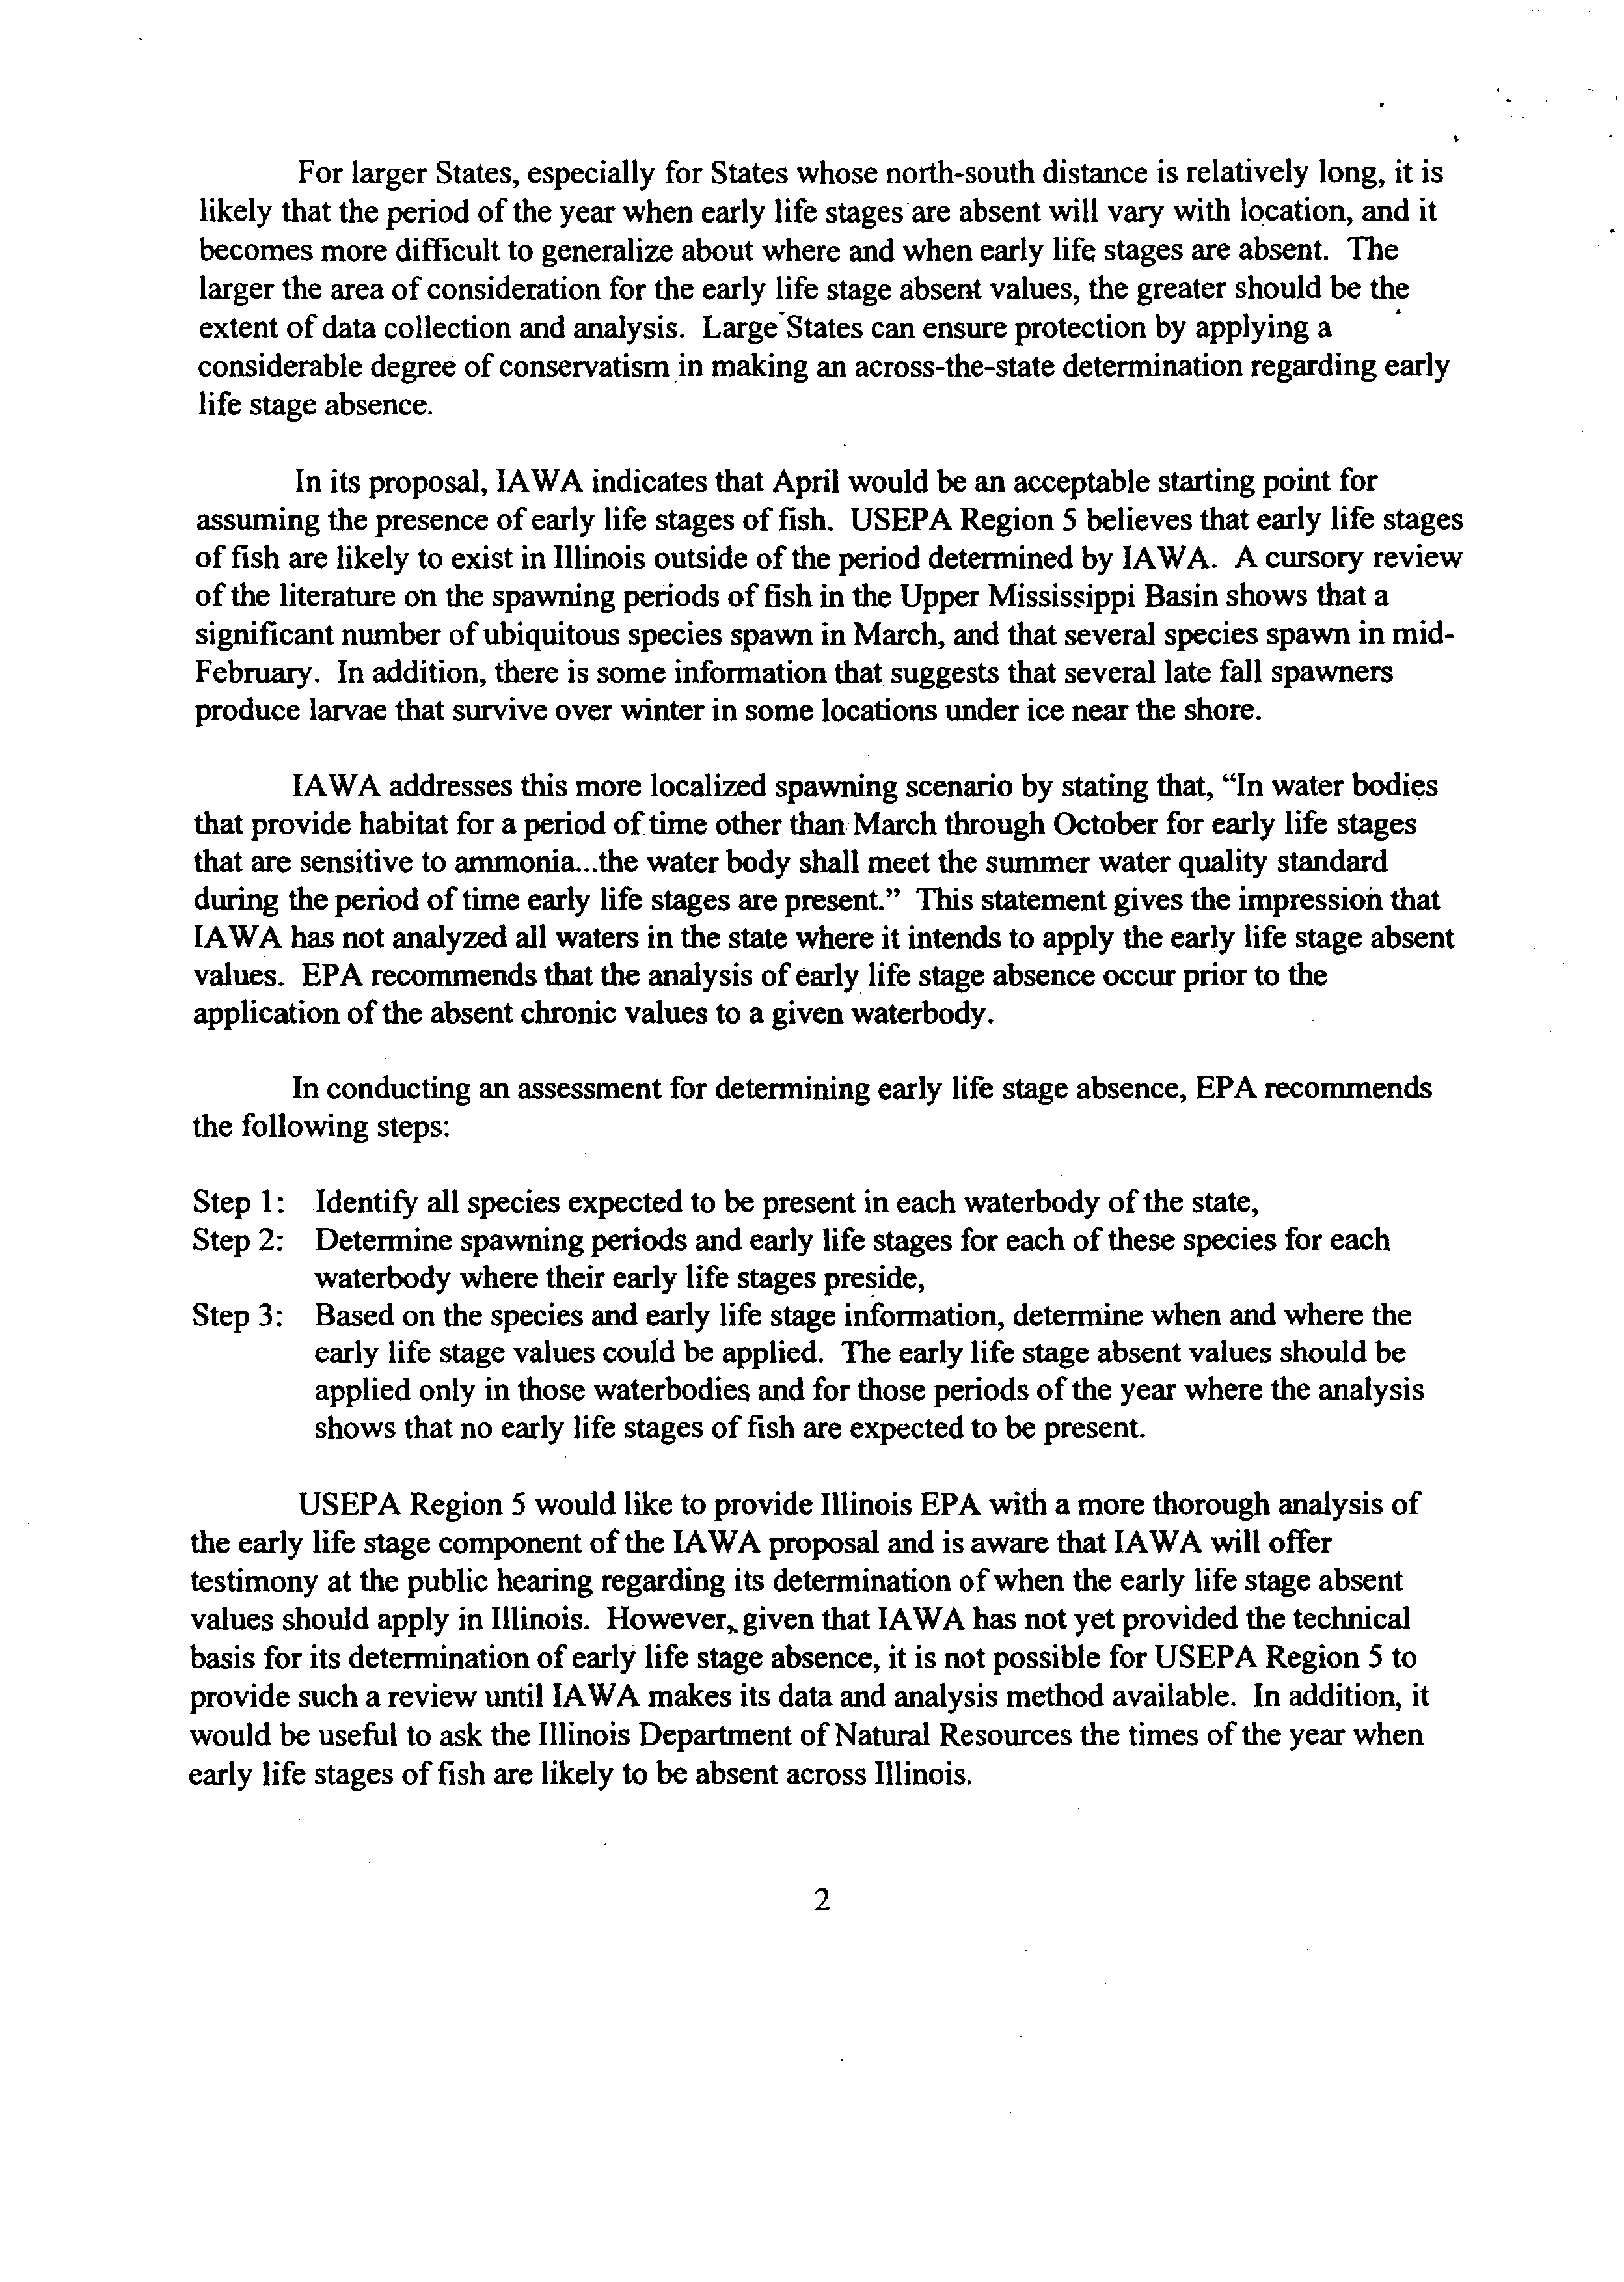
For larger States, especially for States whose north-south distance is relatively long, it is
likely that the
period
of the year when early life stagesare absent will
vary
with location,
and
it
becomes more difficult to
generalize
about where
and
when early life
stages
are absent. The
larger the area ofconsideration for the early life stage absent values, the greater should be the
extent ofdata collection
and analysis. LargeStates can
ensure protection by applying a
considerable degree ofconservatism in making
an across-the-state determination regarding early
life
stage
absence.
In its proposal, IAWA indicates that April would
be an acceptable starting
point for
assuming
the presence ofearly life stages offish. USEPA Region
5
believes that early life stages
offish are likely to exist in Illinois outside ofthe
period determined by IAWA. A cursory review
ofthe literature on the
spawning periods
offish in
the
Upper Mississippi Basin shows that a
significant number
ofubiquitous species spawn in March,
and
that several species spawn in mid-
February. In addition, there is some information that suggests that several late fall spawners
produce larvae that survive over winter in some locations under ice near the shore.
IAWA addresses this
more localized spawning scenario by stating that, “In water
bodies
that provide habitat for a
period
of
time
other
than
March through October for early life stages
that
are sensitive to ammonia..
.the water body shall meet the summer water quality standard
during
the
period
of
time early
life
stages are present.” This statementgives the impression that
IAWA has not
analyzed all waters in
the
state
where it intends to apply the early life
stage
absent
values.
EPA recommends
that
the analysis of
early
life stage absence occur prior to the
application ofthe absent chronic values to a given waterbody.
In conducting an assessment for determining early life
stage
absence, EPA recommends
the following steps:
Step 1: Identify all
species expected to be present in each waterbody ofthe state,
Step 2: Determine spawning
periods and
early life stages for each ofthese species for each
waterbody where their early life stages preside,
Step 3: Based on the species
and early
life
stage information, determine when and
where the
early life stage values could be applied. The early life stage absent values should be
applied only in those waterbodies and
for those periods ofthe year where the analysis
shows that no early life stages offish
are
expected to be present.
USEPA Region
5
would like to provide Illinois EPA
with a
more thorough analysis of
the early life stage component ofthe IAWA proposal
and
is aware that IAWAwill offer
testimony at the public hearing regarding
its determination ofwhen the early life stage absent
values should apply in Illinois. However given that IAWA has
not yet provided the
technical
basis for
its
determination ofearly life stage absence, it is not possible for USEPA Region
5
to
provide such a review until IAWA makes
its data and analysis
method available. In addition, it
would be
useful
to ask the Illinois Department of
Natural
Resources the times of the year when
early life stages offish
are likely to
be absent across Illinois.
2
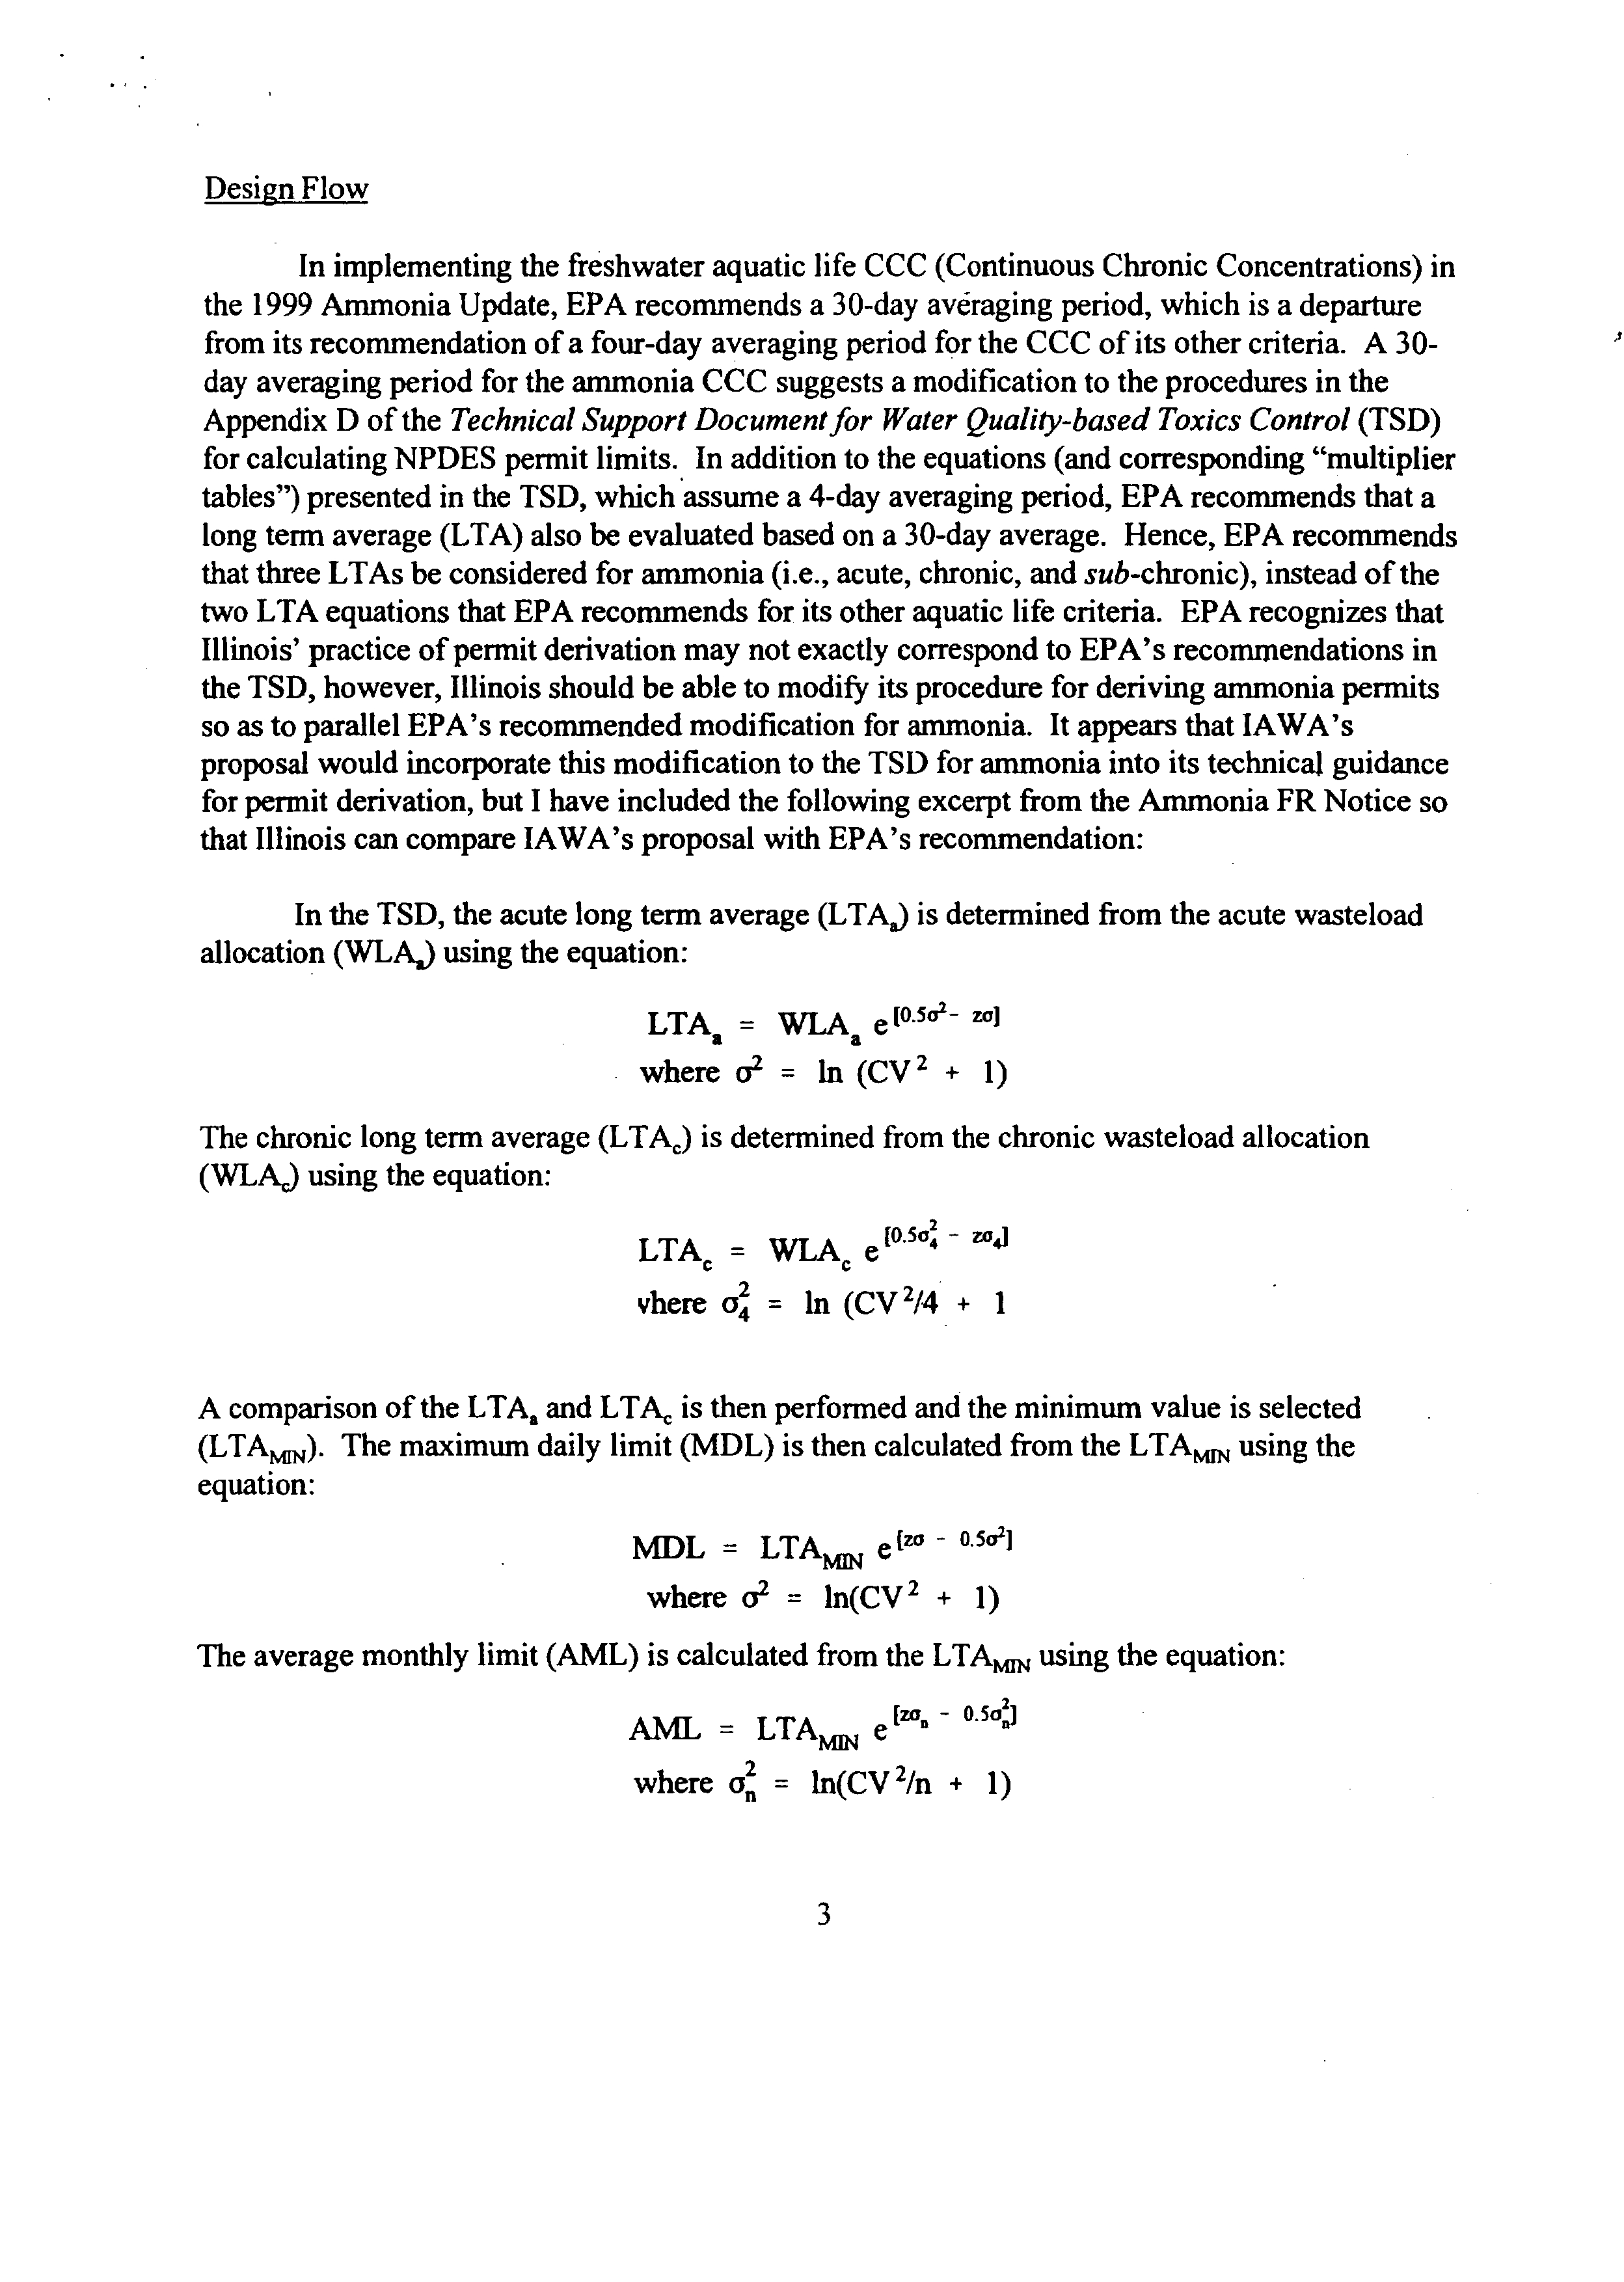
DesignFlow
In implementing the freshwater aquatic life CCC (Continuous Chronic Concentrations) in
the 1999 Ammonia Update, EPA recommends a 30-day averaging period,
which is a
departure
from its recommendation of a four-day averaging period for the CCC of
its
other criteria. A 30-
day averaging
period
for the
ammonia
CCC suggests a modification to the procedures in the
Appendix D ofthe
Technical Support Documentfor Water Quality-based Toxics Control
(TSD)
for calculating NPDES permit limits. In addition to the equations (and corresponding “multiplier
tables”) presented in the TSD, which
assume a 4-day averaging period,
EPA recommends that a
long
term
average (LTA) also be evaluated
based
on a 30-day average. Hence, EPA recommends
that three
LTAs be
considered for ammonia (i.e., acute, chronic, and
sub-chronic), instead ofthe
two LTA equations that EPA recommends for its
other
aquatic
life criteria. EPA recognizes that
Illinois’ practice ofpermit derivation may not exactly correspond to EPA’s recommendations in
the TSD, however, Illinois should be able to modify
its
procedure for deriving
ammonia permits
so as to parallel EPA’s recommended modification for
ammonia.
It
appears
that IAWA’s
proposal
would incorporate
this
modification to the TSD for ammonia into its
technical
guidance
for
pennit
derivation, but I have included the following excerpt from the
Ammonia FR Notice so
that Illinois
can compare IAWA’s proposal with
EPA’s recommendation:
In the TSD, the acute long
term
average (LTAU) is determined from the acute wasteload
allocation (WLA,)
using
the equation:
LTAa
=
WLA e
(0.5a~-
zoj
where a2
=
in (CV2
+
1)
The chronic long term
average
(LTAC)
is determined from the chronic wasteload allocation
(WLAC) using the equation:
LTAC
=
WLA~e
0.5o~
-
Z041
vhere o~
=
hi (CV
2/4
+
A comparison
ofthe LTA~
and LTAC is then performed and
the minimum value is selected
(LTA~).The maximum daily limit (MDL) is then calculated from the LTAMJN using the
equation:
MDL
=
LTA~ e
(w
- 0.502
where a~
=
ln(CV2
+
1)
The average monthly limit
(AML)
is calculated from the LTAMJN
using
the equation:
AML
LTA~ e
~°“ -
where c~
=
1n(CV2/n
+
1)
3
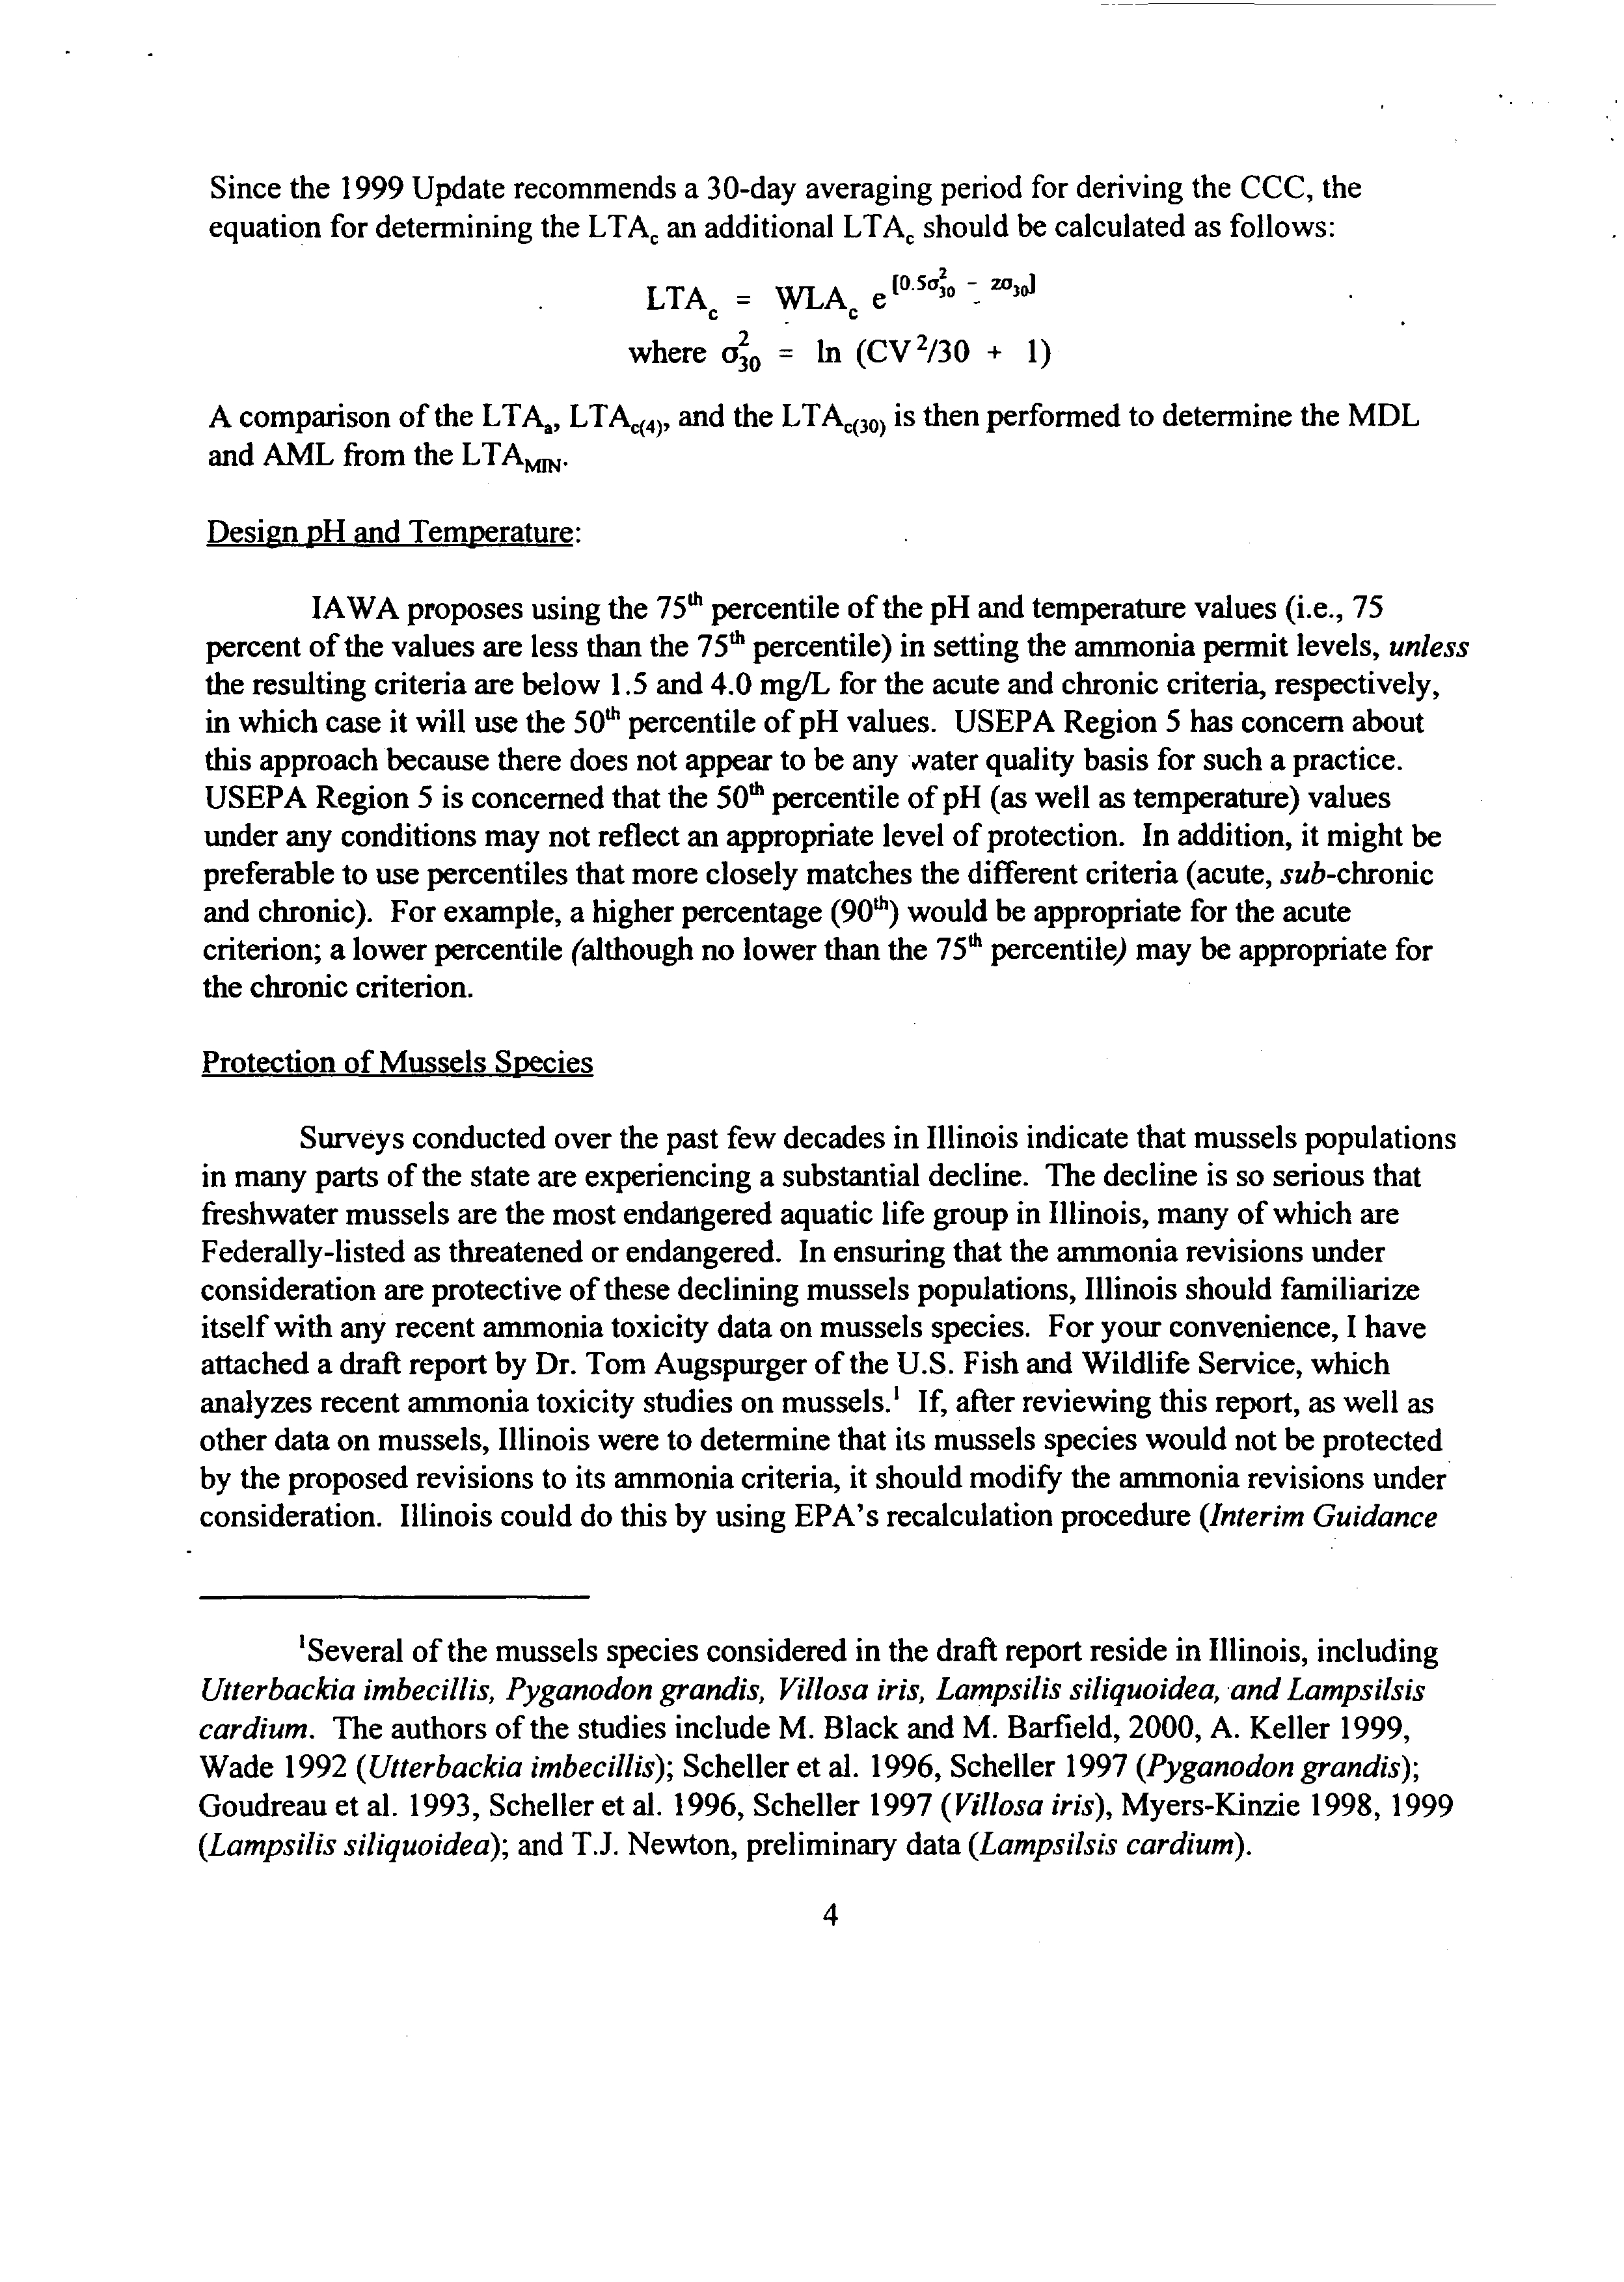
Since the 1999 Update recommends a 30-day averaging period for deriving the CCC, the
equation for determining the LTAC
an additional LTAC should be calculated as follows:
LTA~
=
WLAC e
(0.5a~~
ZO3~J
where o~
=
in (CV
2/30
+
1)
A
comparison ofthe
LTAa,
LTAC(4), and
the LTAC(30)
is then performed to determine the MDL
and AML
from the LTAMJN.
Design pH and Temperature:
JAWA proposes using
the
75th
percentile ofthe pH
and temperature values (i.e., 75
percent ofthe values are less than the
75th
percentile) in setting
the ammonia permit levels,
unless
the resulting criteria are below 1.5 and 4.0 mg/L for the acute and chronic criteria, respectively,
in which case it will use the
50th
percentile ofpH values. USEPA Region
5
has
concern about
this
approach because there does not
appear to be any xater quality basis for such a practice.
USEPA Region
5
is concerned that the
50th
percentile ofpH (as well as temperature) values
under any
conditions may not reflect an appropriate level ofprotection. In addition, it might be
preferable to use
percentiles that more closely matches the different criteria (acute,
sub-chronic
and chronic). For
example, a higher percentage
(90th)
would be appropriate for the acute
criterion; a
lower percentile (although no lower than the
75th
percentile) may be appropriate for
the chronic criterion.
Protection of Mussels Species
Surveys conducted over the past few decades in Illinois indicate that mussels populations
in many parts of the state are experiencing a substantial decline. The decline is so serious that
freshwater mussels are the most endangered aquatic life group in Illinois, many ofwhich are
Federally-listed as threatened or endangered.
In ensuring that the ammonia revisions under
consideration are protective ofthese declining mussels populations,
Illinois should familiarize
itself
with any
recent ammonia toxicity data on mussels species. For your convenience, I have
attached a draft report by Dr.
Tom Augspurger ofthe U.S. Fish
and Wildlife Service, which
analyzes recent ammonia
toxicity studies on mussels.’
If, after reviewing this report, as well as
other data on mussels, Illinois were to determine that its mussels species would not be protected
by the proposed revisions to its ammonia criteria, it should modify the ammonia revisions under
consideration. Illinois could do this by using EPA’s recalculation procedure
(Interim Guidance
‘Several ofthe mussels species
considered in the draft report reside in Illinois, including
Utterbackia imbecillis, Pyganodon grandis, Villosa iris, Lampsilis siliquoidea, and Lampsilsis
cardium.
The authors ofthe studies include M. Black
and M. Barfield, 2000, A. Keller 1999,
Wade 1992
(Utterbackia imbecillis);
Scheller et
al. 1996, Scheller 1997
(Pyganodon grandis);
Goudreau et al. 1993,
Scheller et al. 1996, Scheller 1997
(
Villosa iris),
Myers-Kinzie
1998, 1999
(Lampsilis siliquoidea);
and
T.J.
Newton, preliminary
data
(Lampsilsis cardium).
4
on Determination and Use of Water Effect Ratiosfor Metals,
February 1994, EPA-823-B94-001)
or other scientifically defensible method to reset the criteria in accounting for the presence of a
sensitive
species. Where specific species residing in Illinois
are
not included in the attached
analysis, USEPA Region 5 suggests that Illinois consider dina from the same genera.
Under Section 7 of the Endangered Species Act,
EPA consults with the U.S. Fish
and
Wildlife Service and the National Marine Fisheries Service when approving new and
revised
water quality standards submissions to determine if-such-new or revised standards would likely
jeopardize the continued existence ofany Federally-listed endangered or threatened species or
destroy or adversely modify their critical habitat. Because there are a substantial number of
Federally-listed mussels species in Illinois, EPA recommends that Illinois anticipate the
consultation on the ammonia revisions by reviewing
any toxicity
data on Federally-listed mussels
species prior to the adoption process. Where toxicity data on Federally-listed mussels species are
not available,
Illinois could use, as a surrogate approach, toxicity data from non-listed mussels
species residing in the state.
Thank
you again for the opportunity to comment on this proposal. Ifyou have questions
regarding these comments, please have your staff contact Mr. Brian Thompson ofmy
staff. Mr.
Thompson may be reached at 312-353-8640.
Sincerely,
Mary
Pat Tyson
Acting Chief
Water Quality Branch
ç~ki~B
to~as/oi
5
Draft
--
Draft
--
Draft
Review ofAmmonia Toxicity to Freshwater Mussels
-
January 2001 fwmamm2.wpd
Augspurger, T.P., U.S.
Fish and Wildlife Service, Raleigh, NC; Black, M.C., University of
Georgia, Athens, GA; Keller, A.E., U.S. Environmental Protection Agency, Athens, GA and
Cope, W.G., North Carolina State University, Raleigh, NC.
Abstract:. Published
and unpublished sources ofammonia toxicity data for freshwater mussels
(Unionidae), a significantly imperilled
taxa, are
summarized. Twenty 24-96 hour LC50’s,
covering eight species in seven genera, were used to calculate genus mean acute values (GMAV)
which ranged
from 0.20 to 0.49 mg/i (un-ionized ammonia)
and
from 3.4 to
7.5 mg-N/I (total
anunonia as N, normalized to pH 8, which
is the basis for the new water quality criteria
calculation). All GMAVs
are less than the lowest GMAV in
the criteria document. By pooling
data, a unionid family
mean acute value (FMAV)
was calculated. The FMAV was multiplied by
0.5 (an empirically derived factor which converts from a 50
lethality concentration to a
minimal-lethality
concentration) to approximate a mussel specific criteria
maximum
concentration guidelines of0.18 mg/i (un-ionized ammonia)
and 2.8 mg-N/I (total ammonia as
N, pH 8). No sublethal chronic endpoints were found. An
acute:chronic
ratio of7.2 (from
two
9-15
day
LC501s with unionids)
was multiplied
by a factor of 2 to approximate an acute:chronic
ratio for sublethal effects. This was used to derive a unionid specific criteria continuous
concentration guidelines
of 0.02 mg/i (un-ionized ammonia)
and
0.40
(total ammonia as N, pH
8). Comparison ofthese values with the recently revised national ammonia water
quality criteria
reveals
scenarios
where the criteria may not be protective. The criteria documents outline
approaches for incorporating concerns with particularly sensitive species, including those that
are
threatened or endangered, which allow for additional protection
through
site-specific
standards
or
adjustments
to the
standards.
These options may be
necessary in waters important
for
unionid
conservation.
Introduction
Many factors
are
cited in the decline of freshwater mussel (Family Unionidae) populations in
North America
and for the listing ofgreater than 70
ofnative unionids as endangered,
threatened, or of special concern (Williams et al. 1993, Neves et a!. 1997). Habitat alteration,
introduction ofexotic species, over-utilization, disease, predation,
and pollution are considered
causal or contributing factors in many areas of the United States (Fuller 1974, Havlik and
Marking
1987). Among North
Carolina’s approximately 70
endemic unionids, five
are
federally
listed as endangered and 13 are recognized
as species ofconcern that may merit similar
protection.
Point source discharges to streams supporting these species are permitted under the National
Pollutant Discharge Elimination System (NPDES). Wastes are permitted at levels designed to
maintain water quality at or better than the State’s water quality standards. However, there is
currently no State standard for ammonia. Permit limits are used to control ammonia discharge to
the environment; limits
are based on toxicity information on a variety
of freshwater fauna, but
Draft
--
Draft
--
Draft
few freshwater mussel toxicity data are in the database currently used for calculation of
standards. Hence, the protectiveness of the current approach, relative to native freshwater
mussels, is not known. Compounding the need to address this issue are two
additional factors:
1) Keller (1993, 1996), Masnado et al. (1995),
and Keller and Ruessler (1997) found the
cladocerans
Ceriodaphnia dubia
and
Daphnia magna
to be more sensitive to the acute effects of
organic chemicals (herbicides, organochiorine insecticides, an organophosphate, and solvents)
and a simulated mine effluent than the freshwater mussel
Utterbackia imbecillis.
However,
information from limited toxicity testing indicates a potential for early lifestages ofmussels to be
among the most sensitive aquatic organisms yet tested for impacts of chlorine (Goudreau et a!.
1993), metals (Keller
and Zam
1991, Jacobson et al. 1993),
and paper mill effluent (Wade et a!.
1993, McKinney and Wade 1996).
2)
Ammonia
is a natural biological degradation produ.~tofnitrogenous organic matter,
and as
such, it is a common environmental contaminant. Significant sources of
ammonia
enrichment
include industrial waste, municipal waste water treatment plants, and agricultural run-off (animal
wastes as well
as chemical fertilizers). In the environment, sediment pOre water concentrations
of
ammonia typically
exceed those ofoverlying surface water. The unionids’ anchorage in the
substrate places
them in the environmental
compartment
where
ammonia concentrations are
expected to be among the highest (Frazier
et a!. 1996).
To address this issue, available published
and
unpublished
ammonia
toxicity data for freshwater
mussels were located and summarized. Existing data for ammonia toxicity to early lifestages of
freshwater mussels were retrieved from the literature (Toxline search)
and by contacting those
involved in mussel toxicity testing. The pooled data were used to derive water quality guidelines
protective of most freshwater mussels which are
then compared to the recently updated national
criteria.
The toxicity of ammonia
varies with temperature
and
pH (which determine the fraction of total
ammonia which exists in the ionized and un-ionized states). Recommended water quality criteria
for ammonia have been presented on an un-ionized ammonia basis (NH3) (USEPA 1985) and
total ammonia as nitrogen basis (NH3
+
NH4~
-
N) (USEPA 1999). In this review, we present raw
data and
recommendations
in both formats; because no cited reports present data on a total
ammonia as nitrogen basis, we used the equations in appendix 3 ofthe USEPA (1999) revised
ammonia criteria document with reported or discerned temperature and pH data to derive this
format.
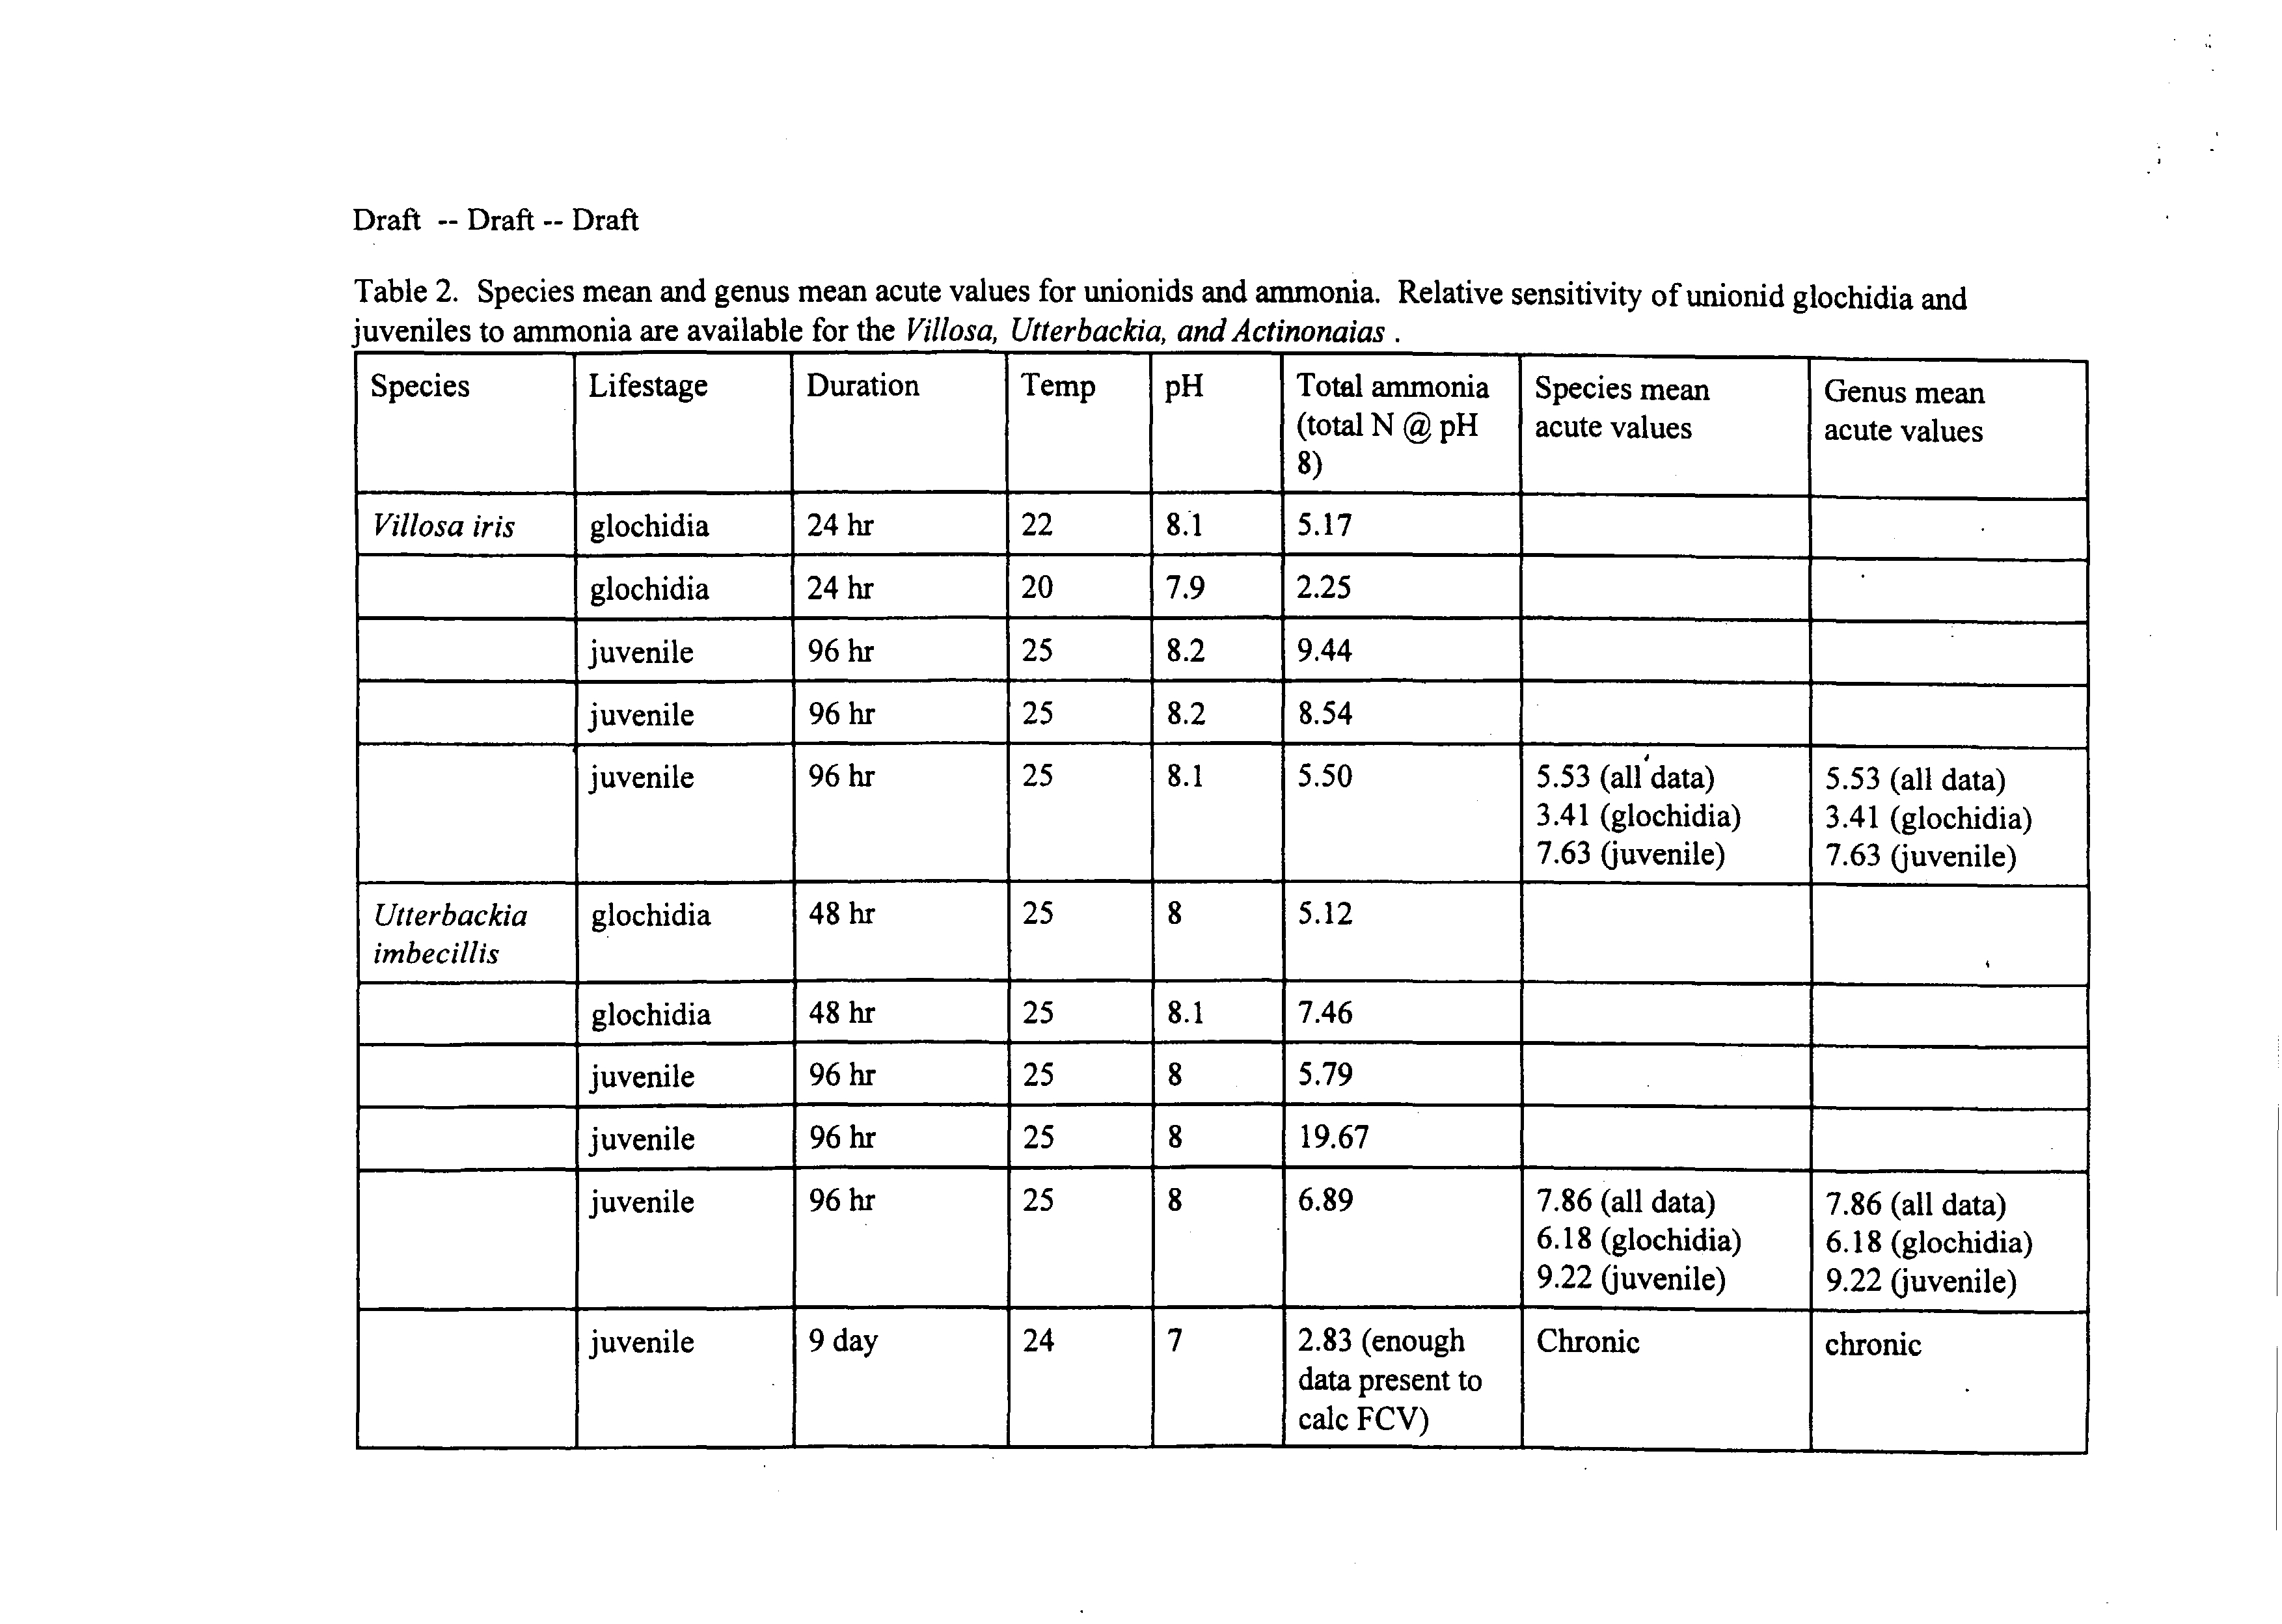
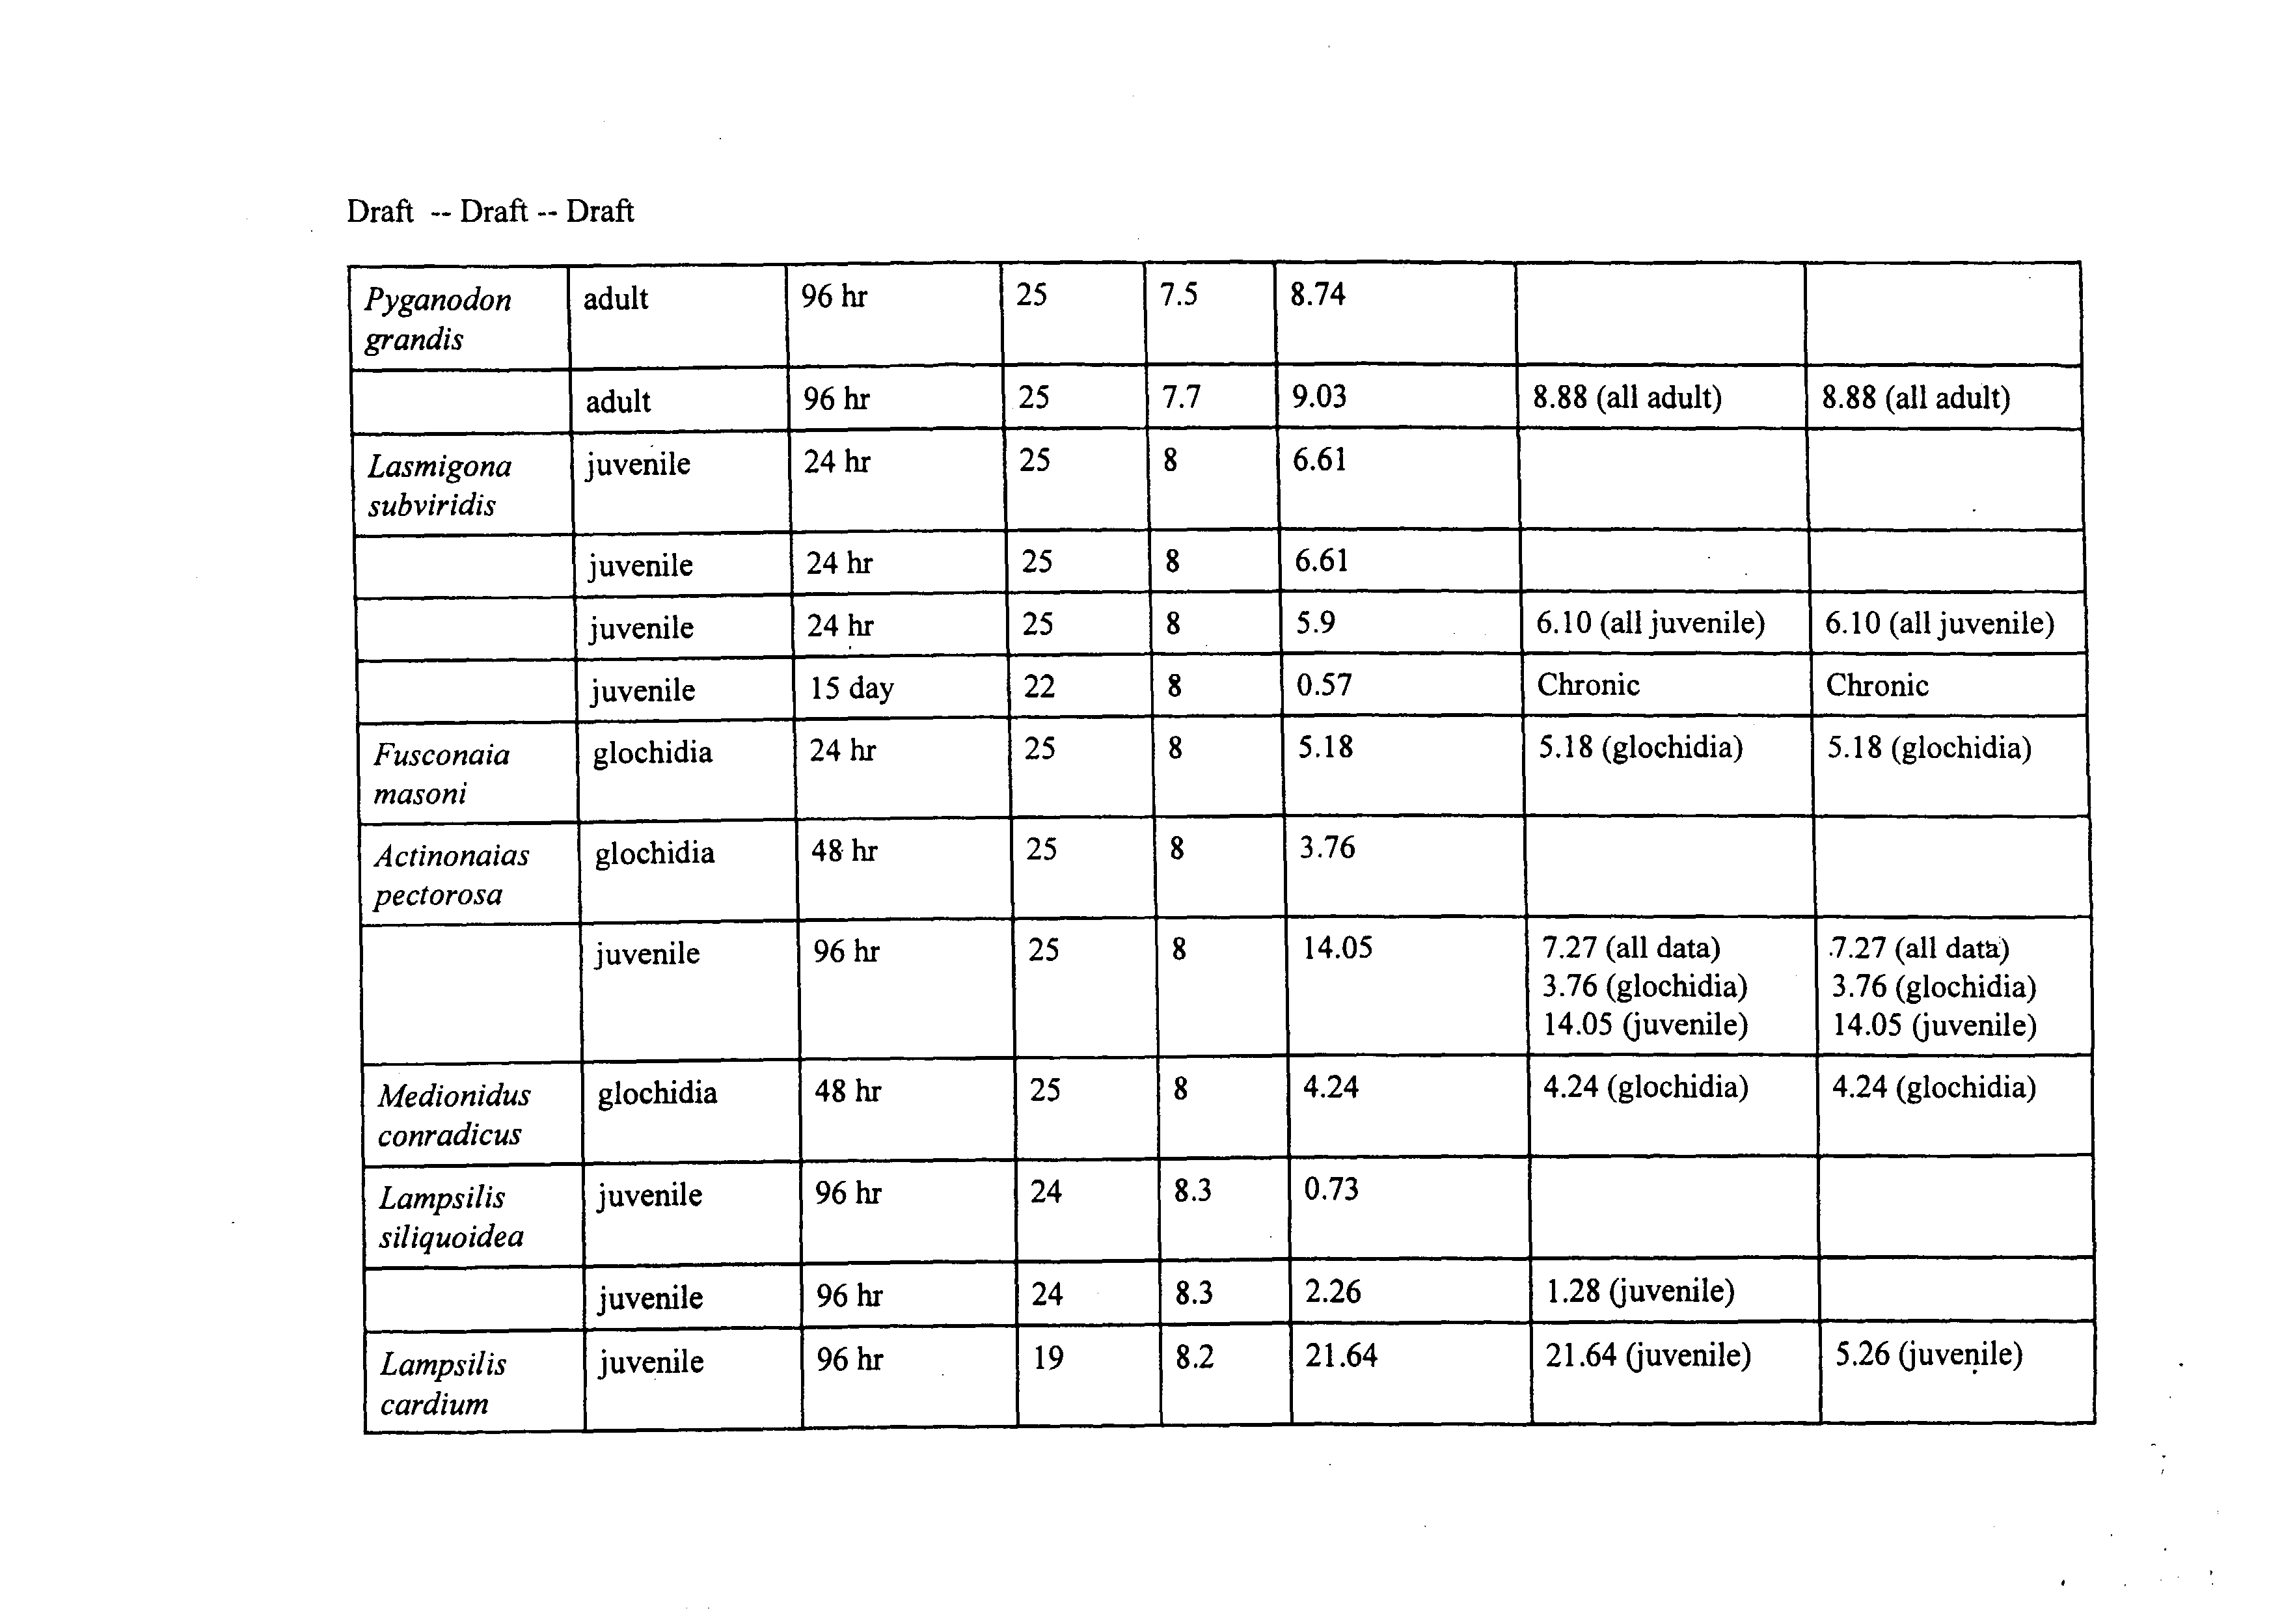
Results
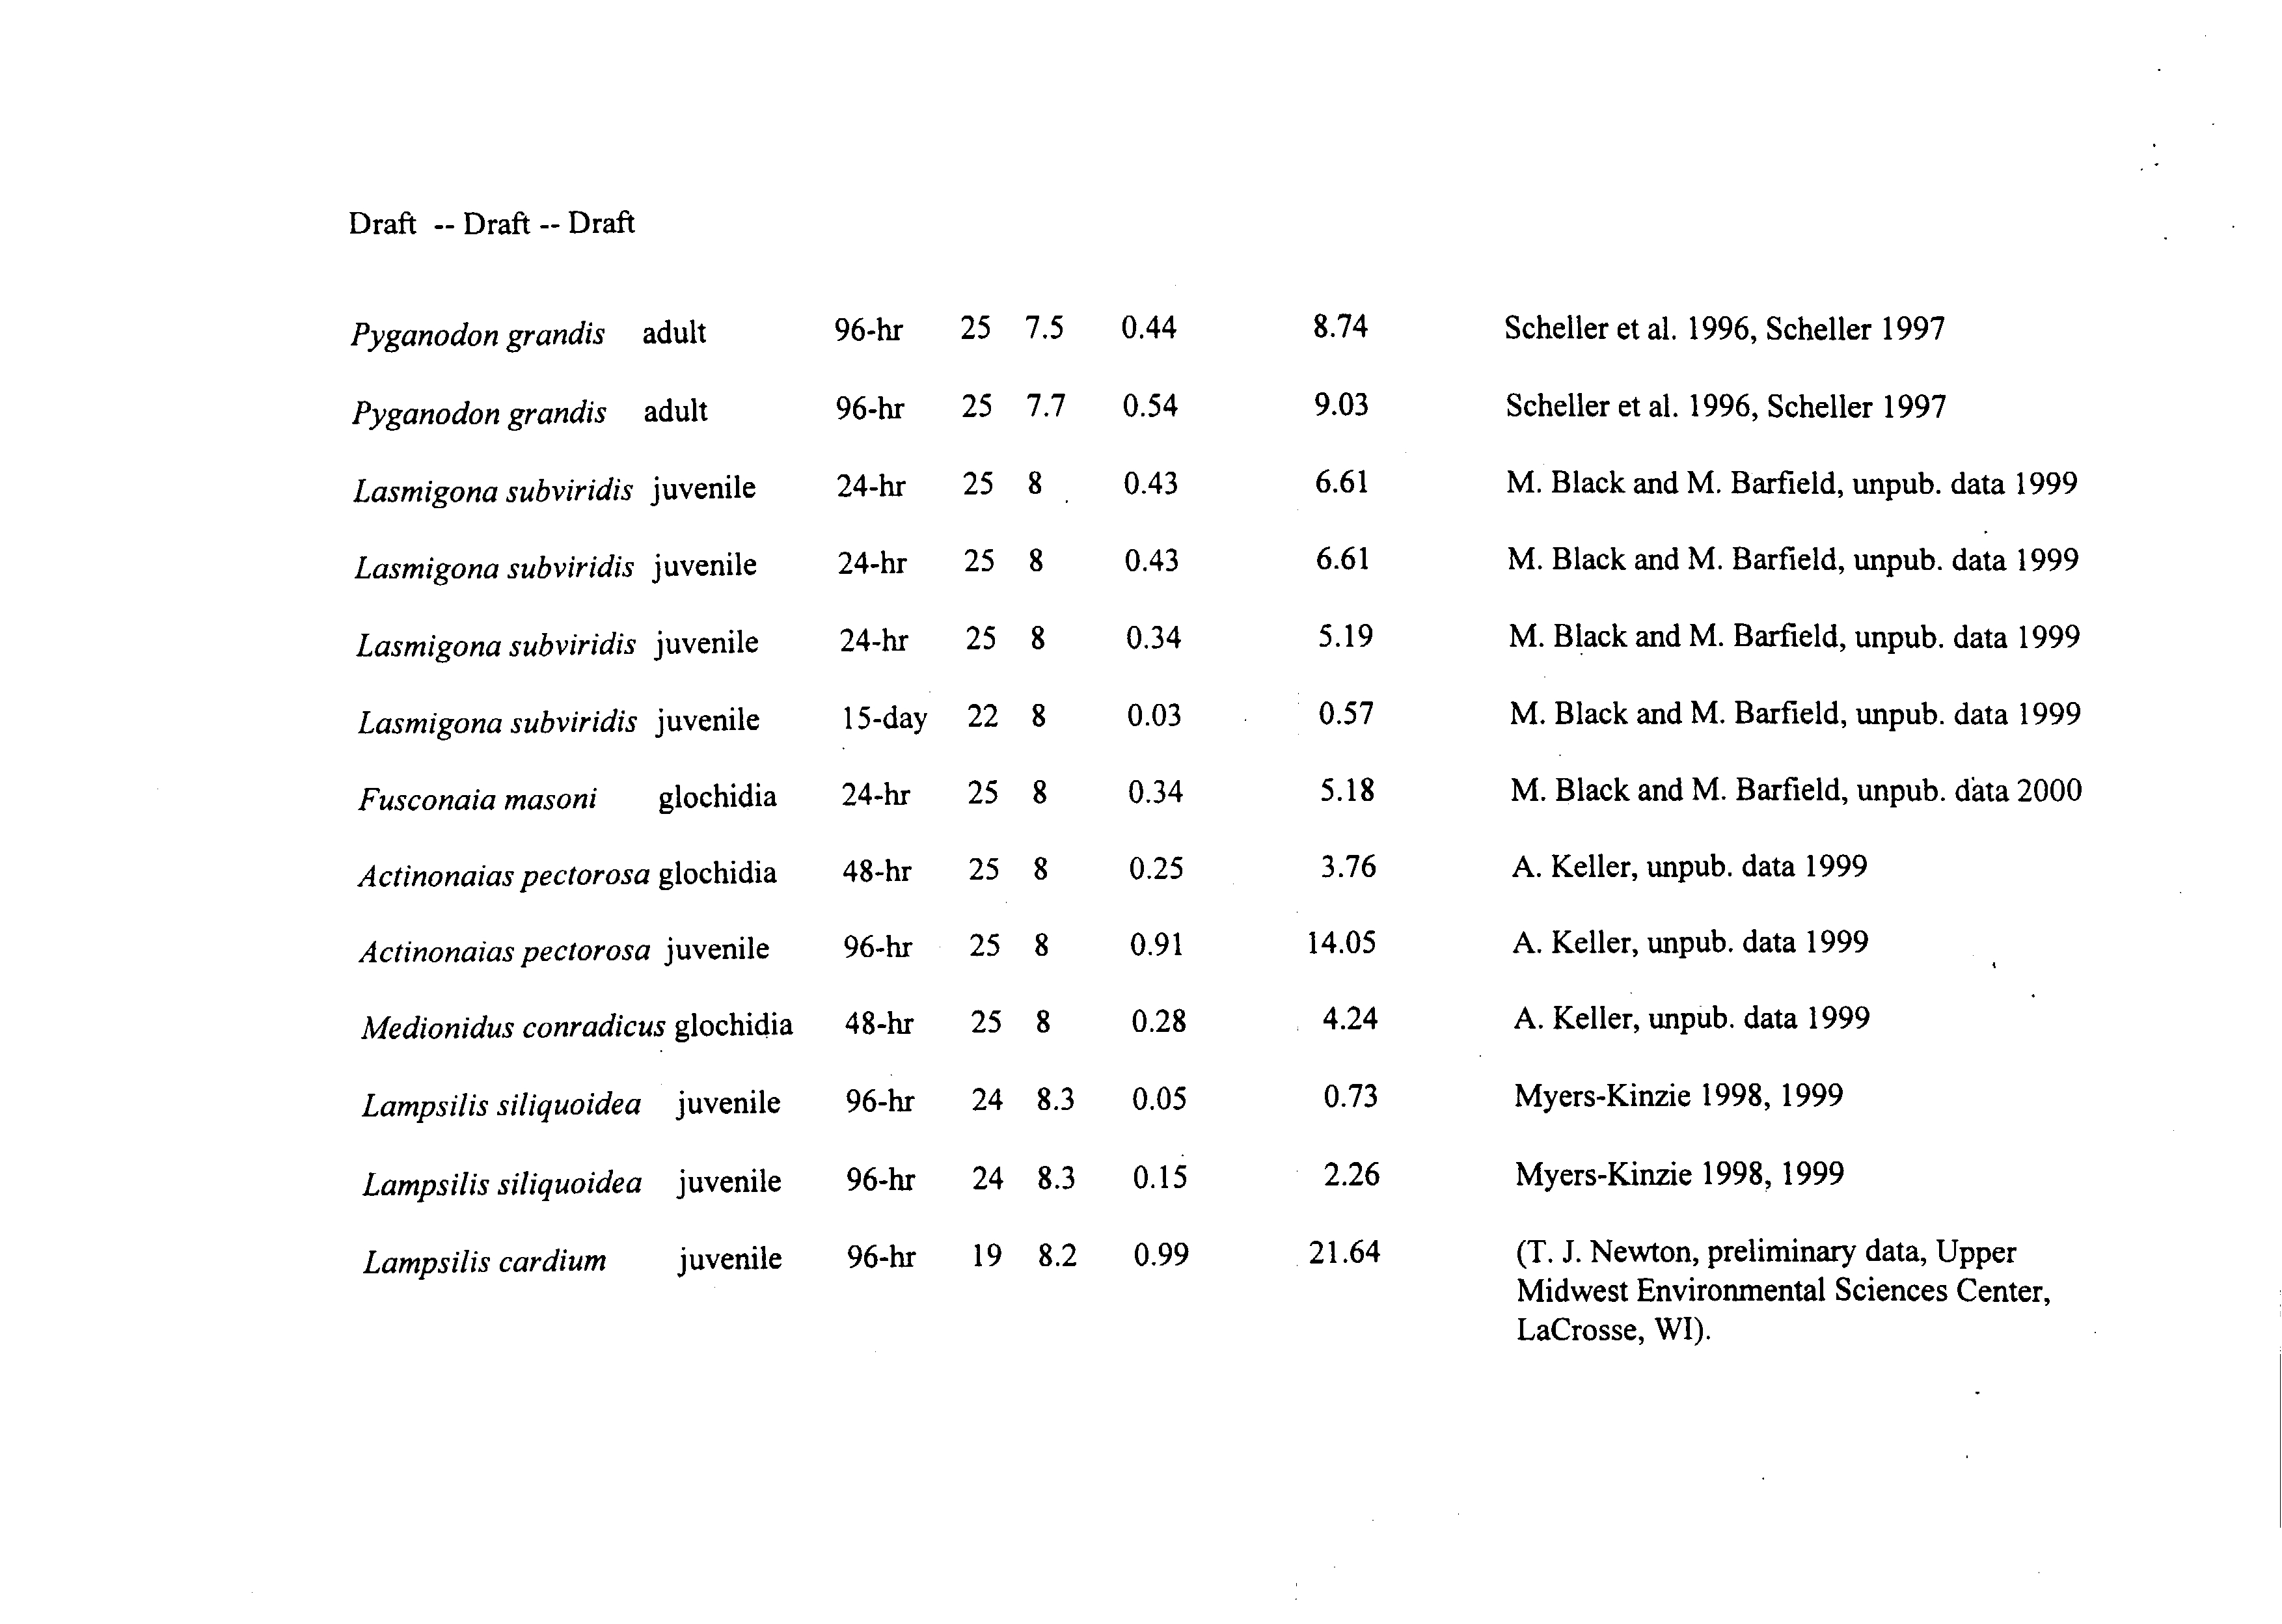
Twenty-four unionid LC50’s were retrieved, covering nine species in eight genera (Table 1). Two
data points were for adult mussels (which may not be the most sensitive lifestage) and two
additional data points were for subchronic exposures (i.e., 96 hours).
Additional relevant data
Draft
--
Draft
--
Draft
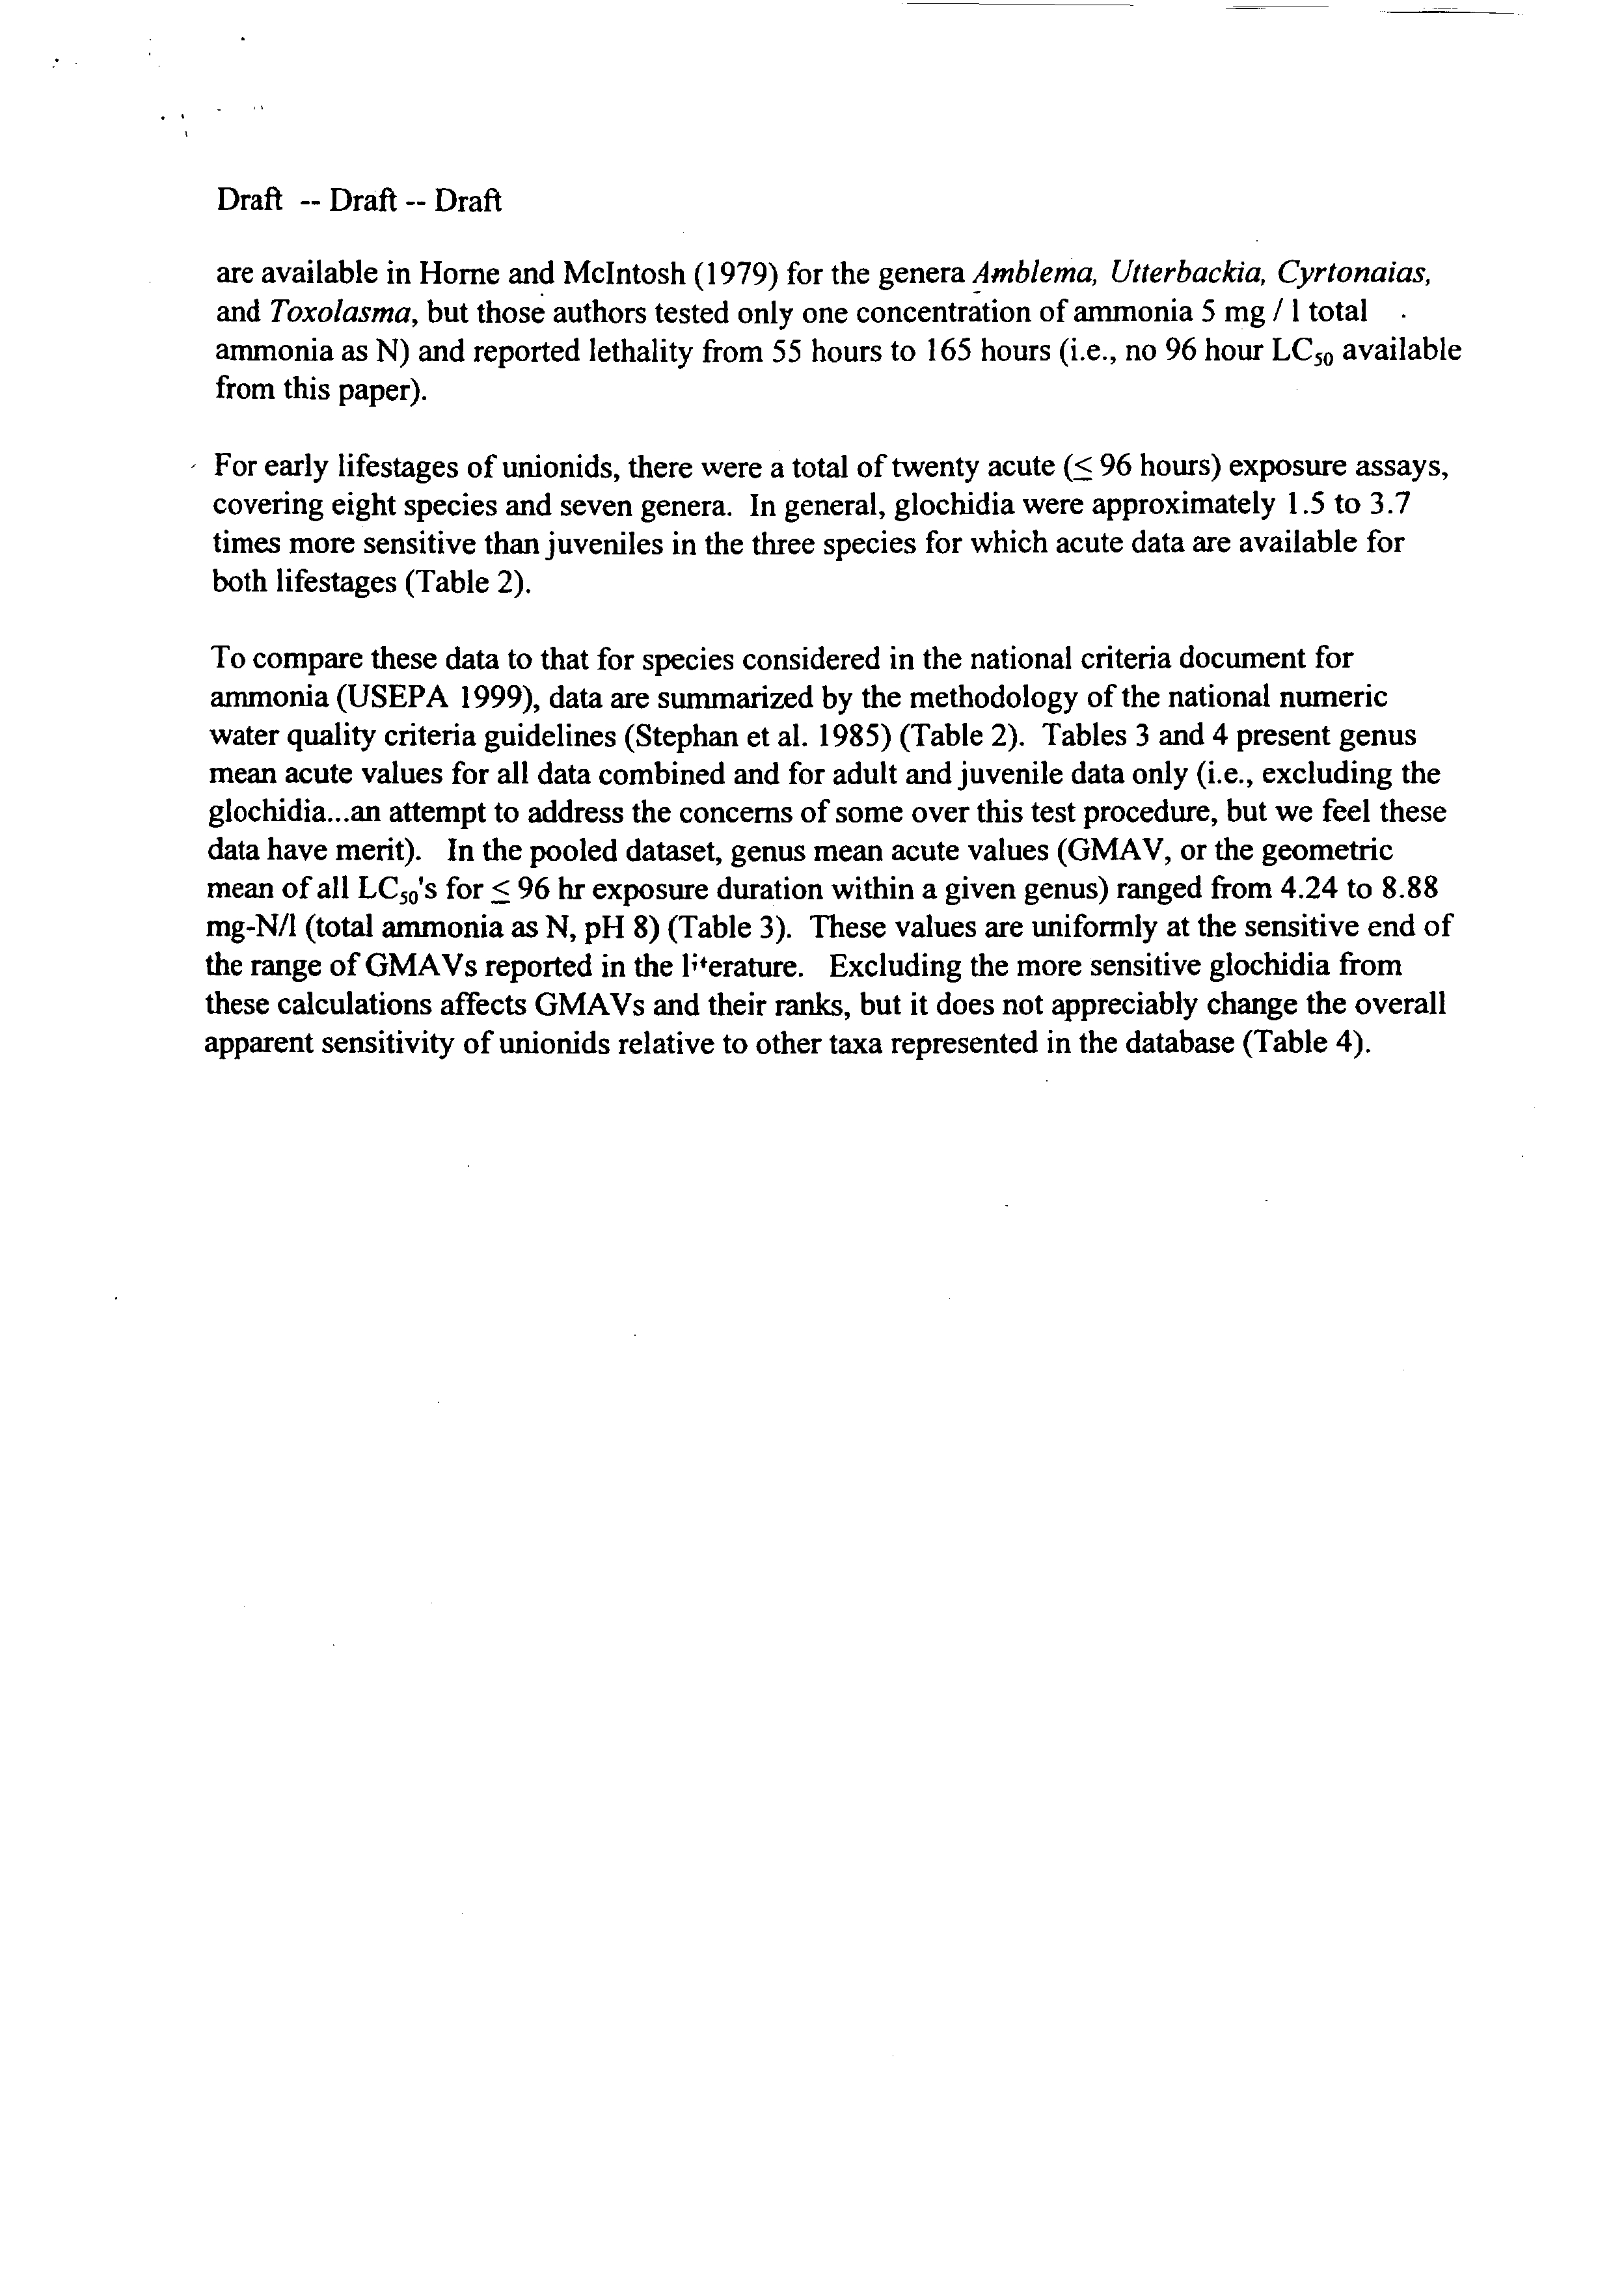
are
available in Home
and McIntosh (1979) for the genera
Amblema, Utterbackia, Cyrtonaias,
and
Toxolasma,
but those authors tested only one concentration ofammonia 5 mg / 1 total
ammonia as N) and reported lethality from
55
hours to 165 hours (i.e., no 96 hour LC50 available
from this paper).
For early lifestages ofunionids, there were a total oftwenty acute
(~
96 hours) exposure assays,
covering eight species
and seven genera. In general, glochidia were approximately
1.5
to 3.7
times more sensitive than juveniles in the three species for which acute data are available for
both lifestages (Table 2).
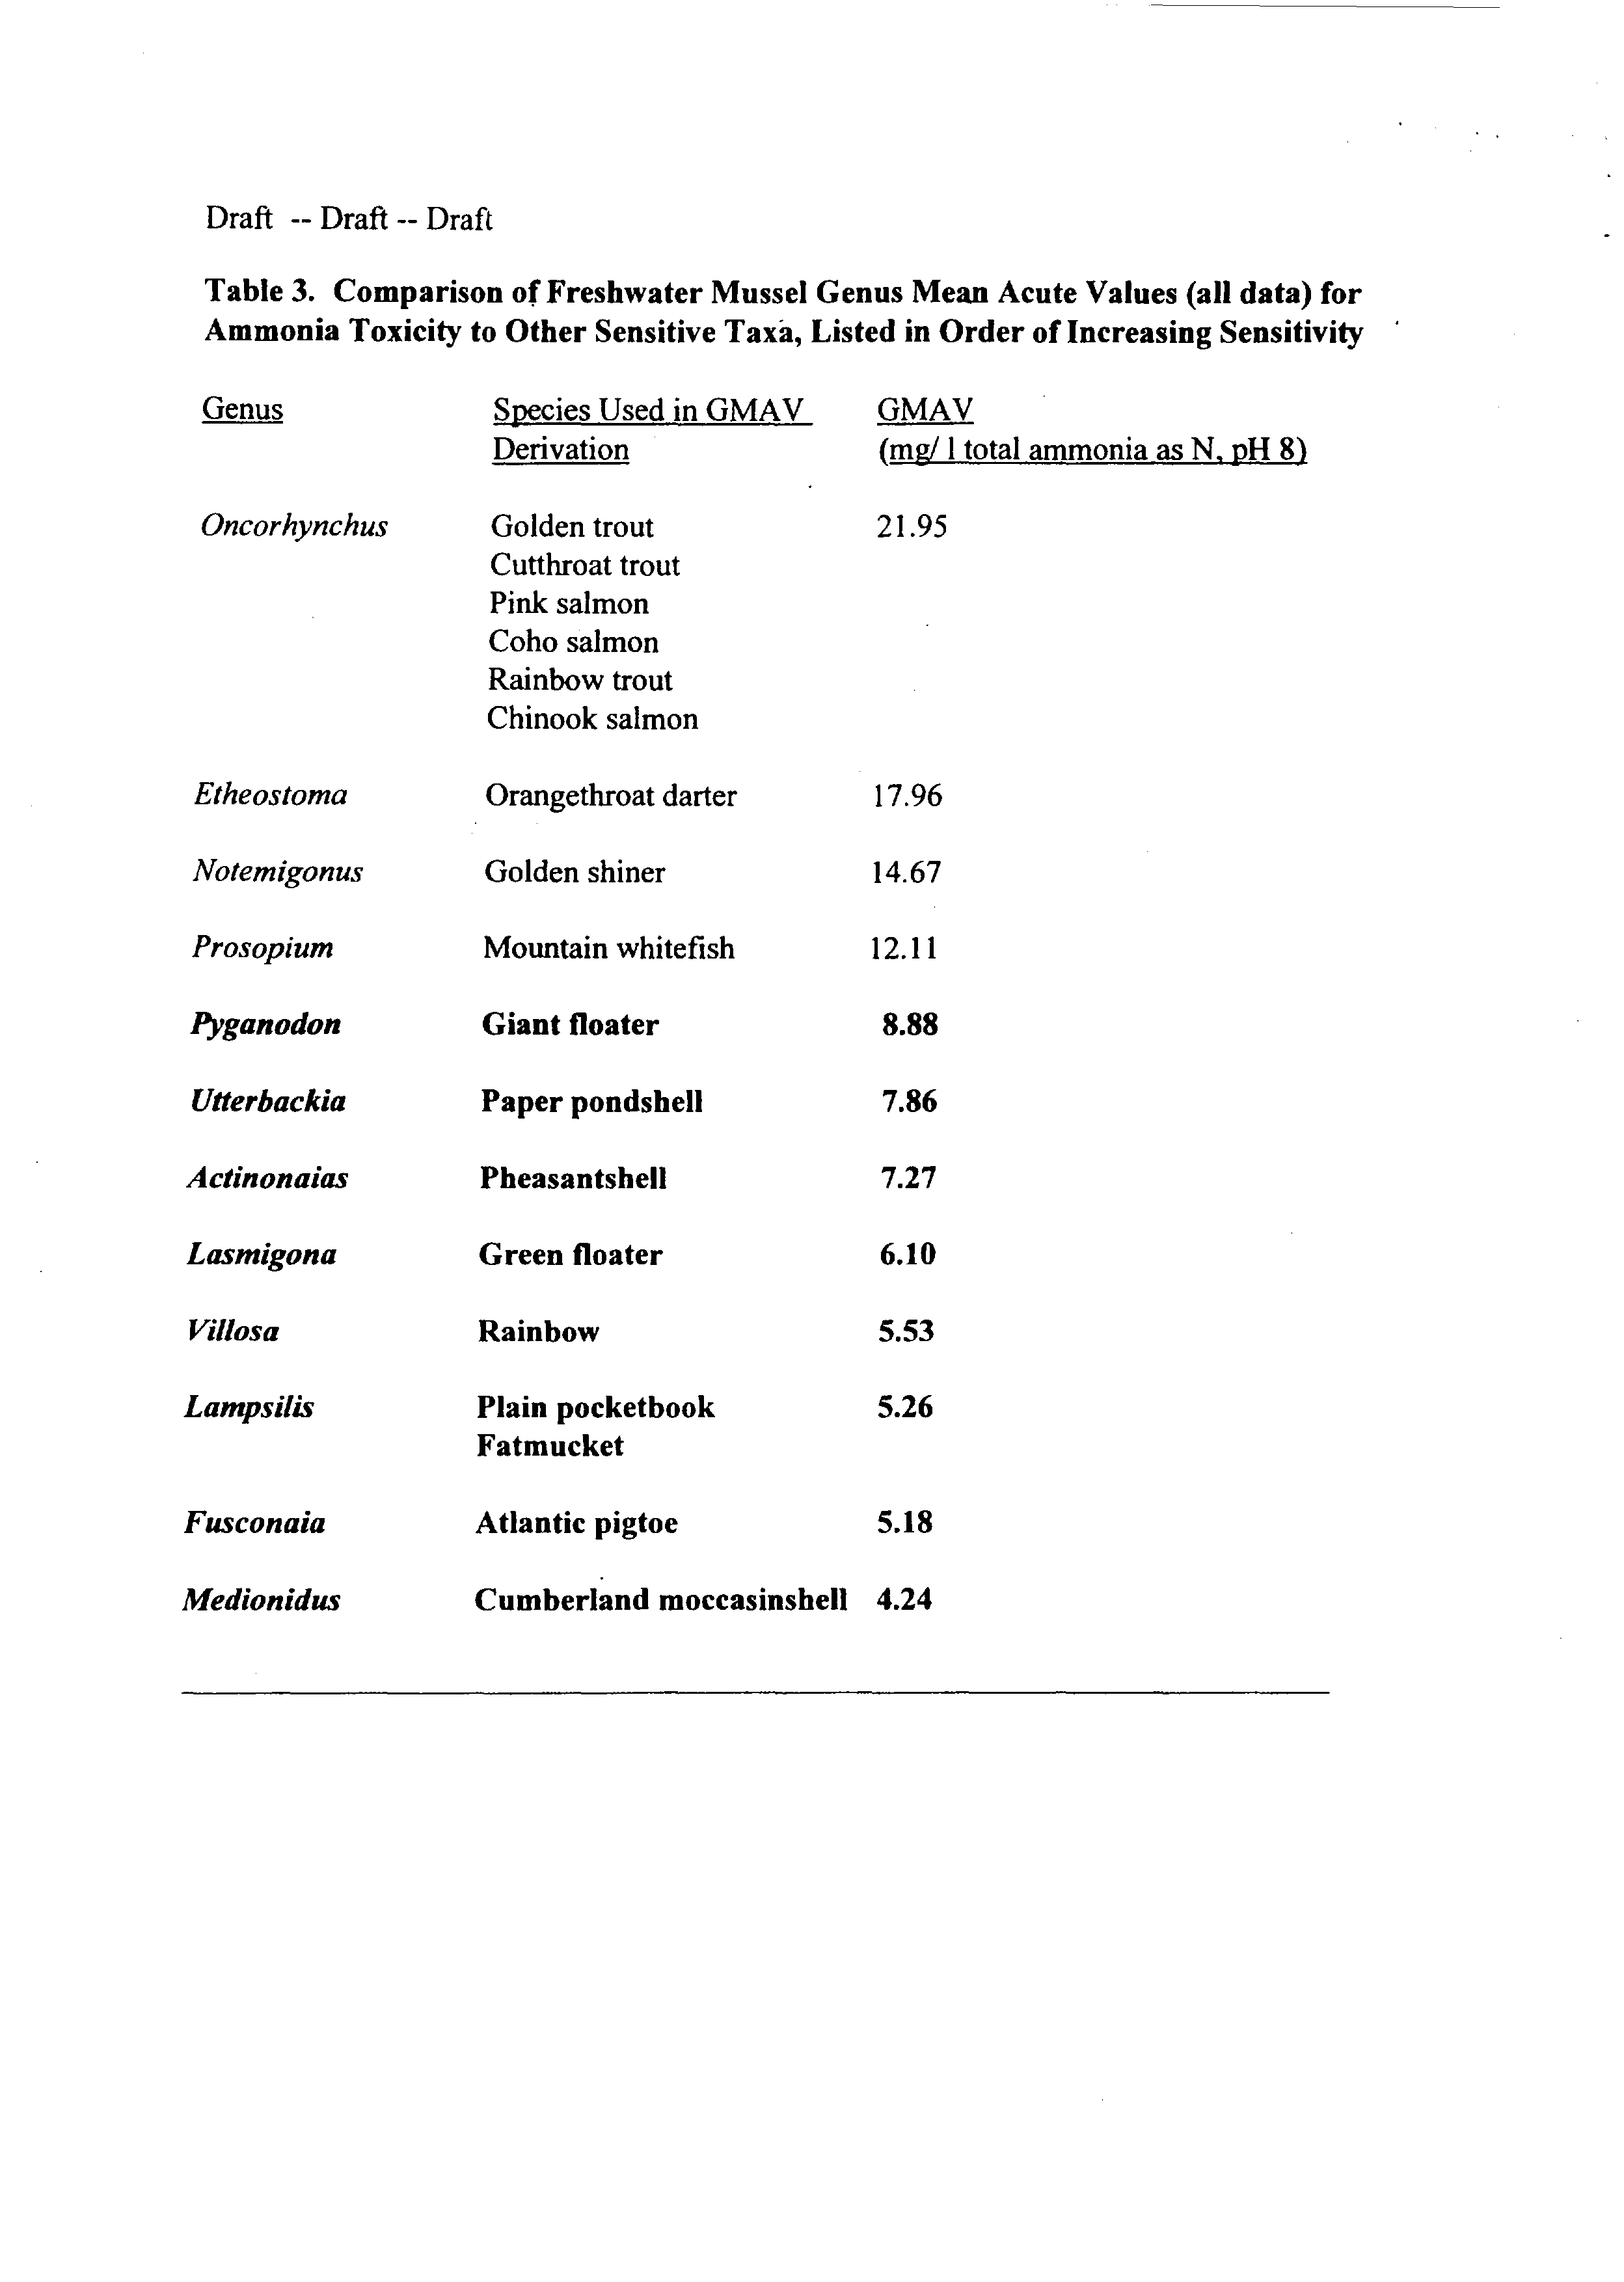
To compare these data to that for species considered in the national criteria document for
ammonia
(USEPA 1999), data
are summarized by the methodology of the national numeric
water quality criteria guidelines (Stephan
Ct al. 1985) (Table 2). Tables 3
and
4 present genus
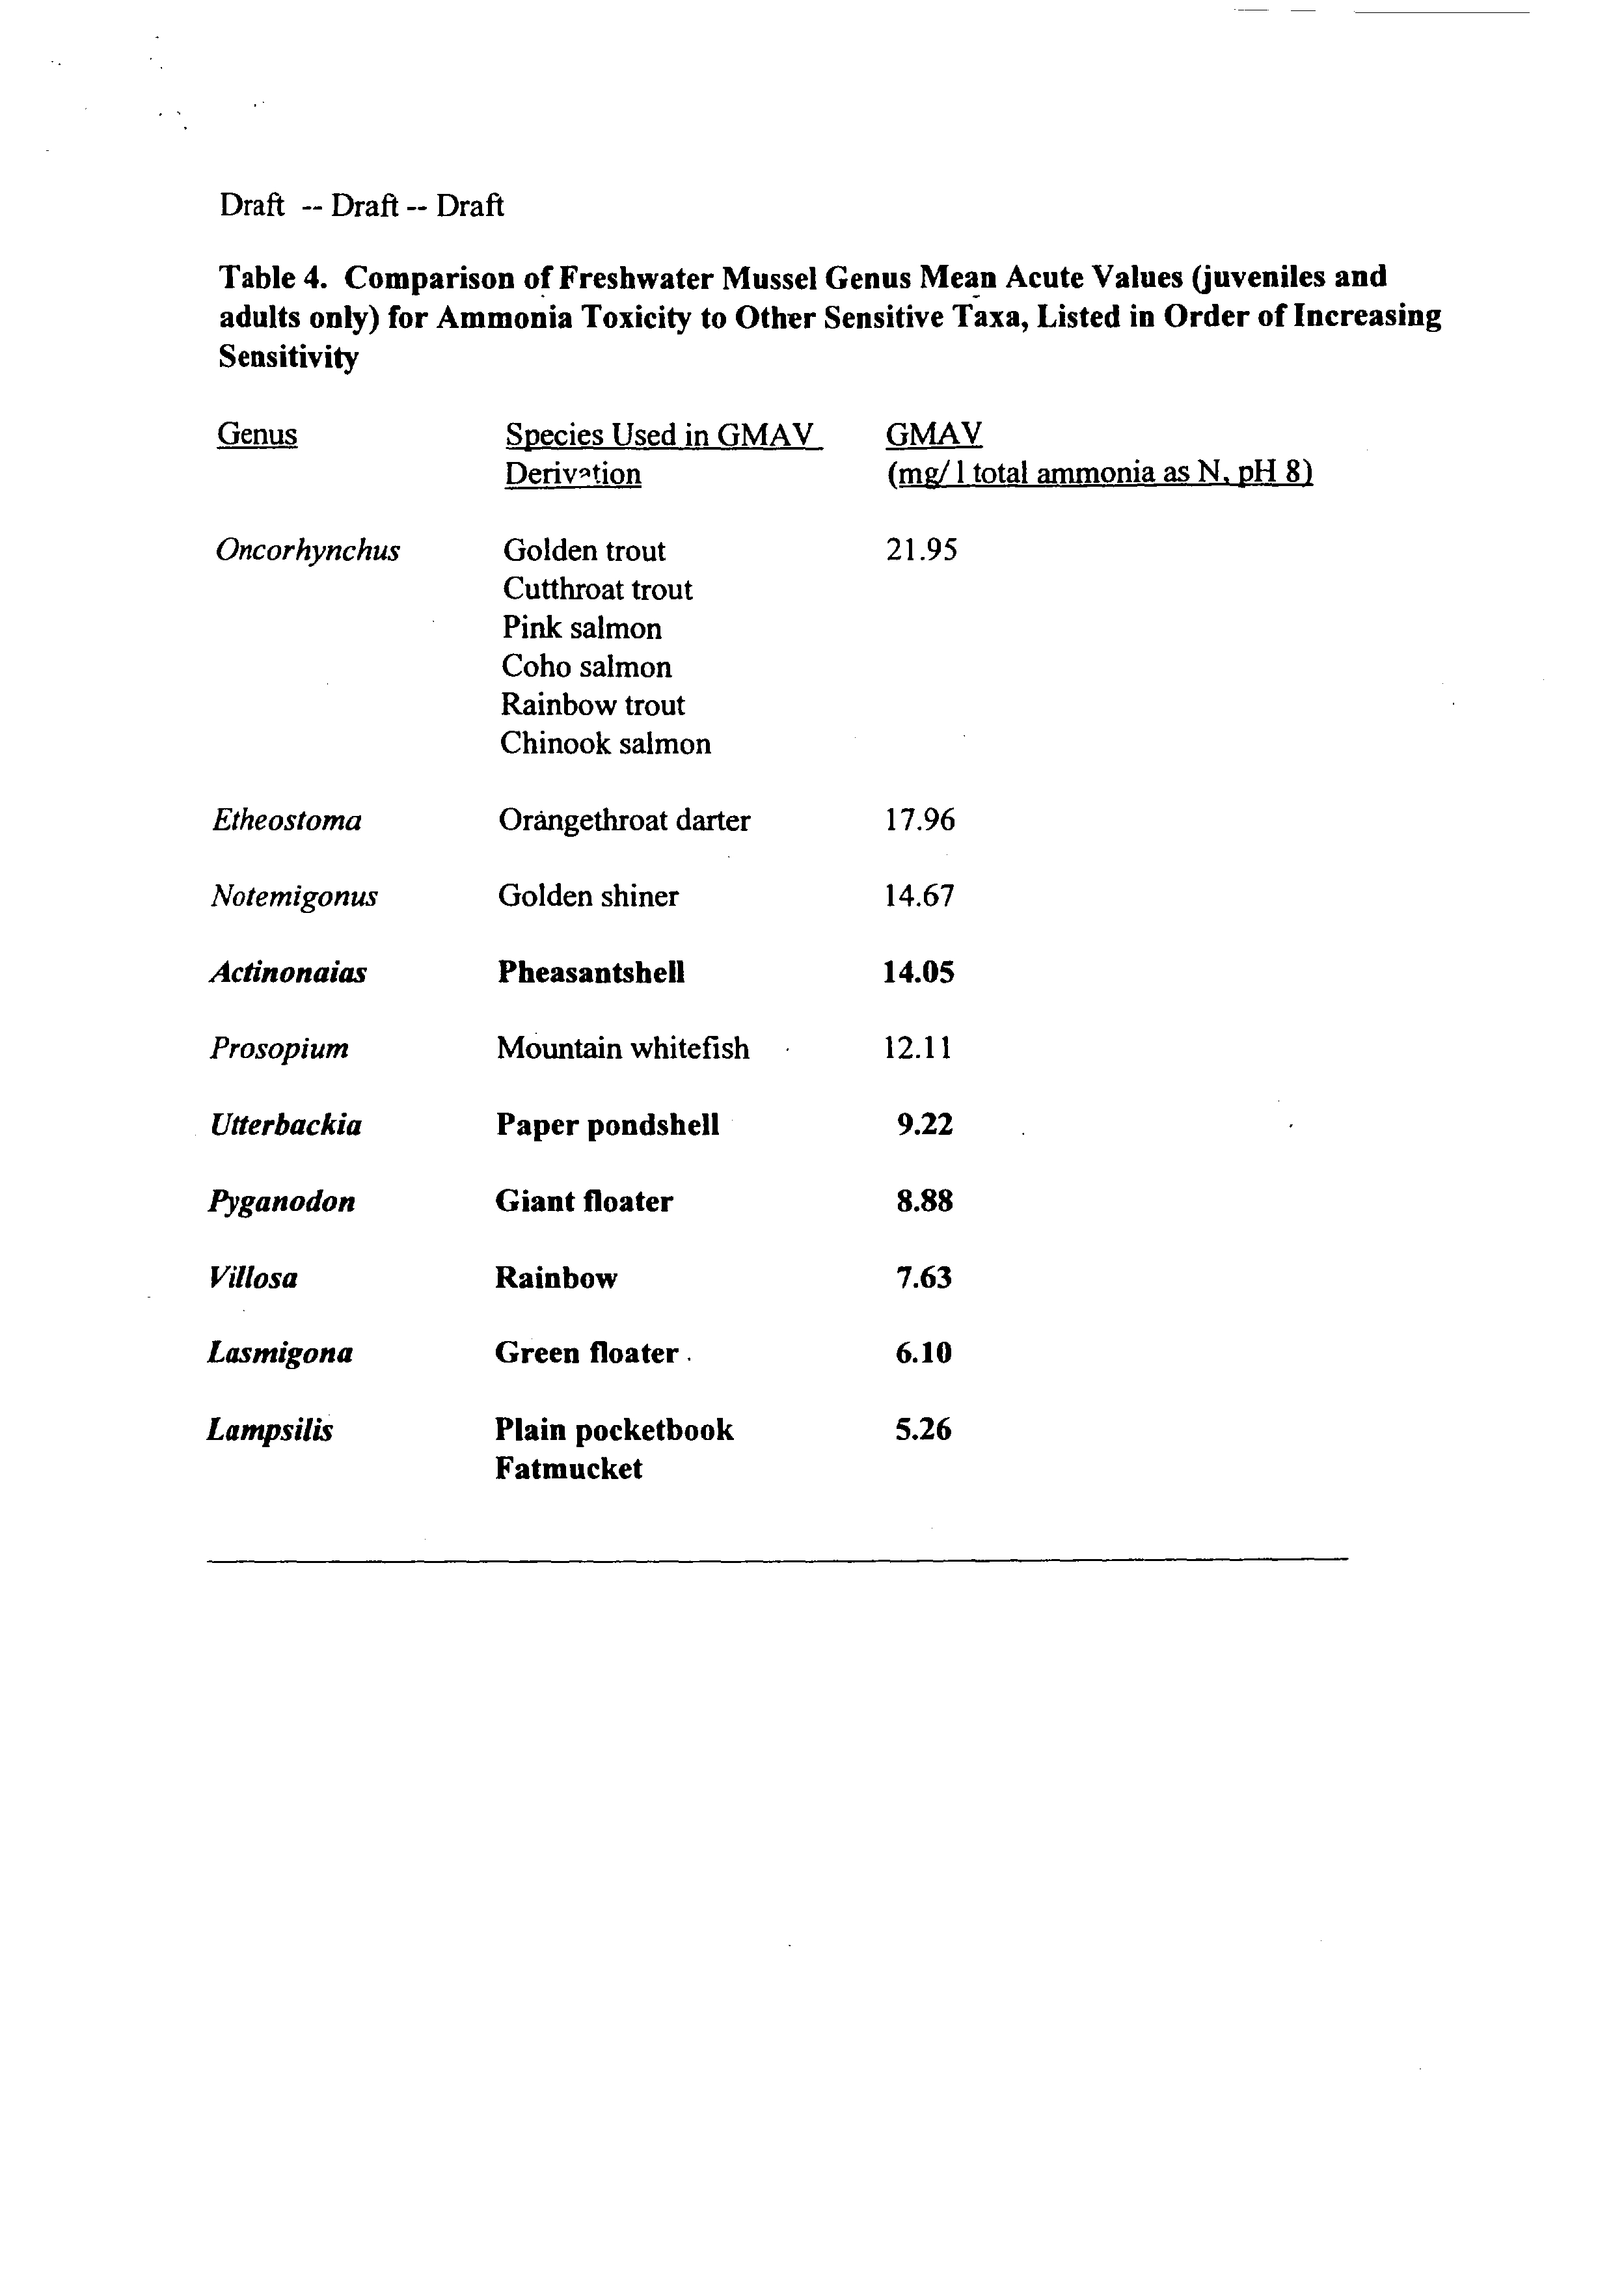
mean acute values for all data combined and for adult and juvenile data only (i.e., excluding the
glochidia.. .an
attempt to address the concerns ofsome over this test procedure, but we feel these
data have merit). In the pooled dataset, genus mean acute values (GMAV, or the geometric
mean ofall LC50’s for ~ 96 hr exposure duration within a given genus) ranged from 4.24 to 8.88
mg-N/i (total ammonia as N,
pH 8) (Table
3). These values are uniformly at the sensitive end of
the range of GMAVs reported in the l~erature. Excluding the more sensitive glochidia from
these calculations affects GMAVs
and
their ranks, but
it does not appreciably change the overall
apparent sensitivity ofunionids relative to other taxa represented in the database (Table 4).
Species
_________
Villosa iris
glochidia
Villosa iris
glochidia
Villosa iris
juvenIle
Villosa iris
juvenile
Villosa iris
juvenile
Utterbackia imbecillis
glochidia
Utterbackia imbecillis
glochidia
Utterbackia imbecillis
juvenile
Utterbackia imbecillis
juvenile
Utterbackia imbecillis
juvenile
Goudreau et a!. 1993
Scheller et a!. 1996, Scheller 1997
Scheller et a!. 1996. Scheller 1997
Scheller et al. 1996. Scheller 1997
Scheller et a!. 1996. Scheller 1997
M. Black and M. Barfield, unpub. data 2000
A. Keller, unpub. data 1999
M. Black and M. Barfield, unpub. data 2000
A. Keller, unpub. data 1999
A. Keller, unpub. data 1999
Draft
--
Draft
--
Draft
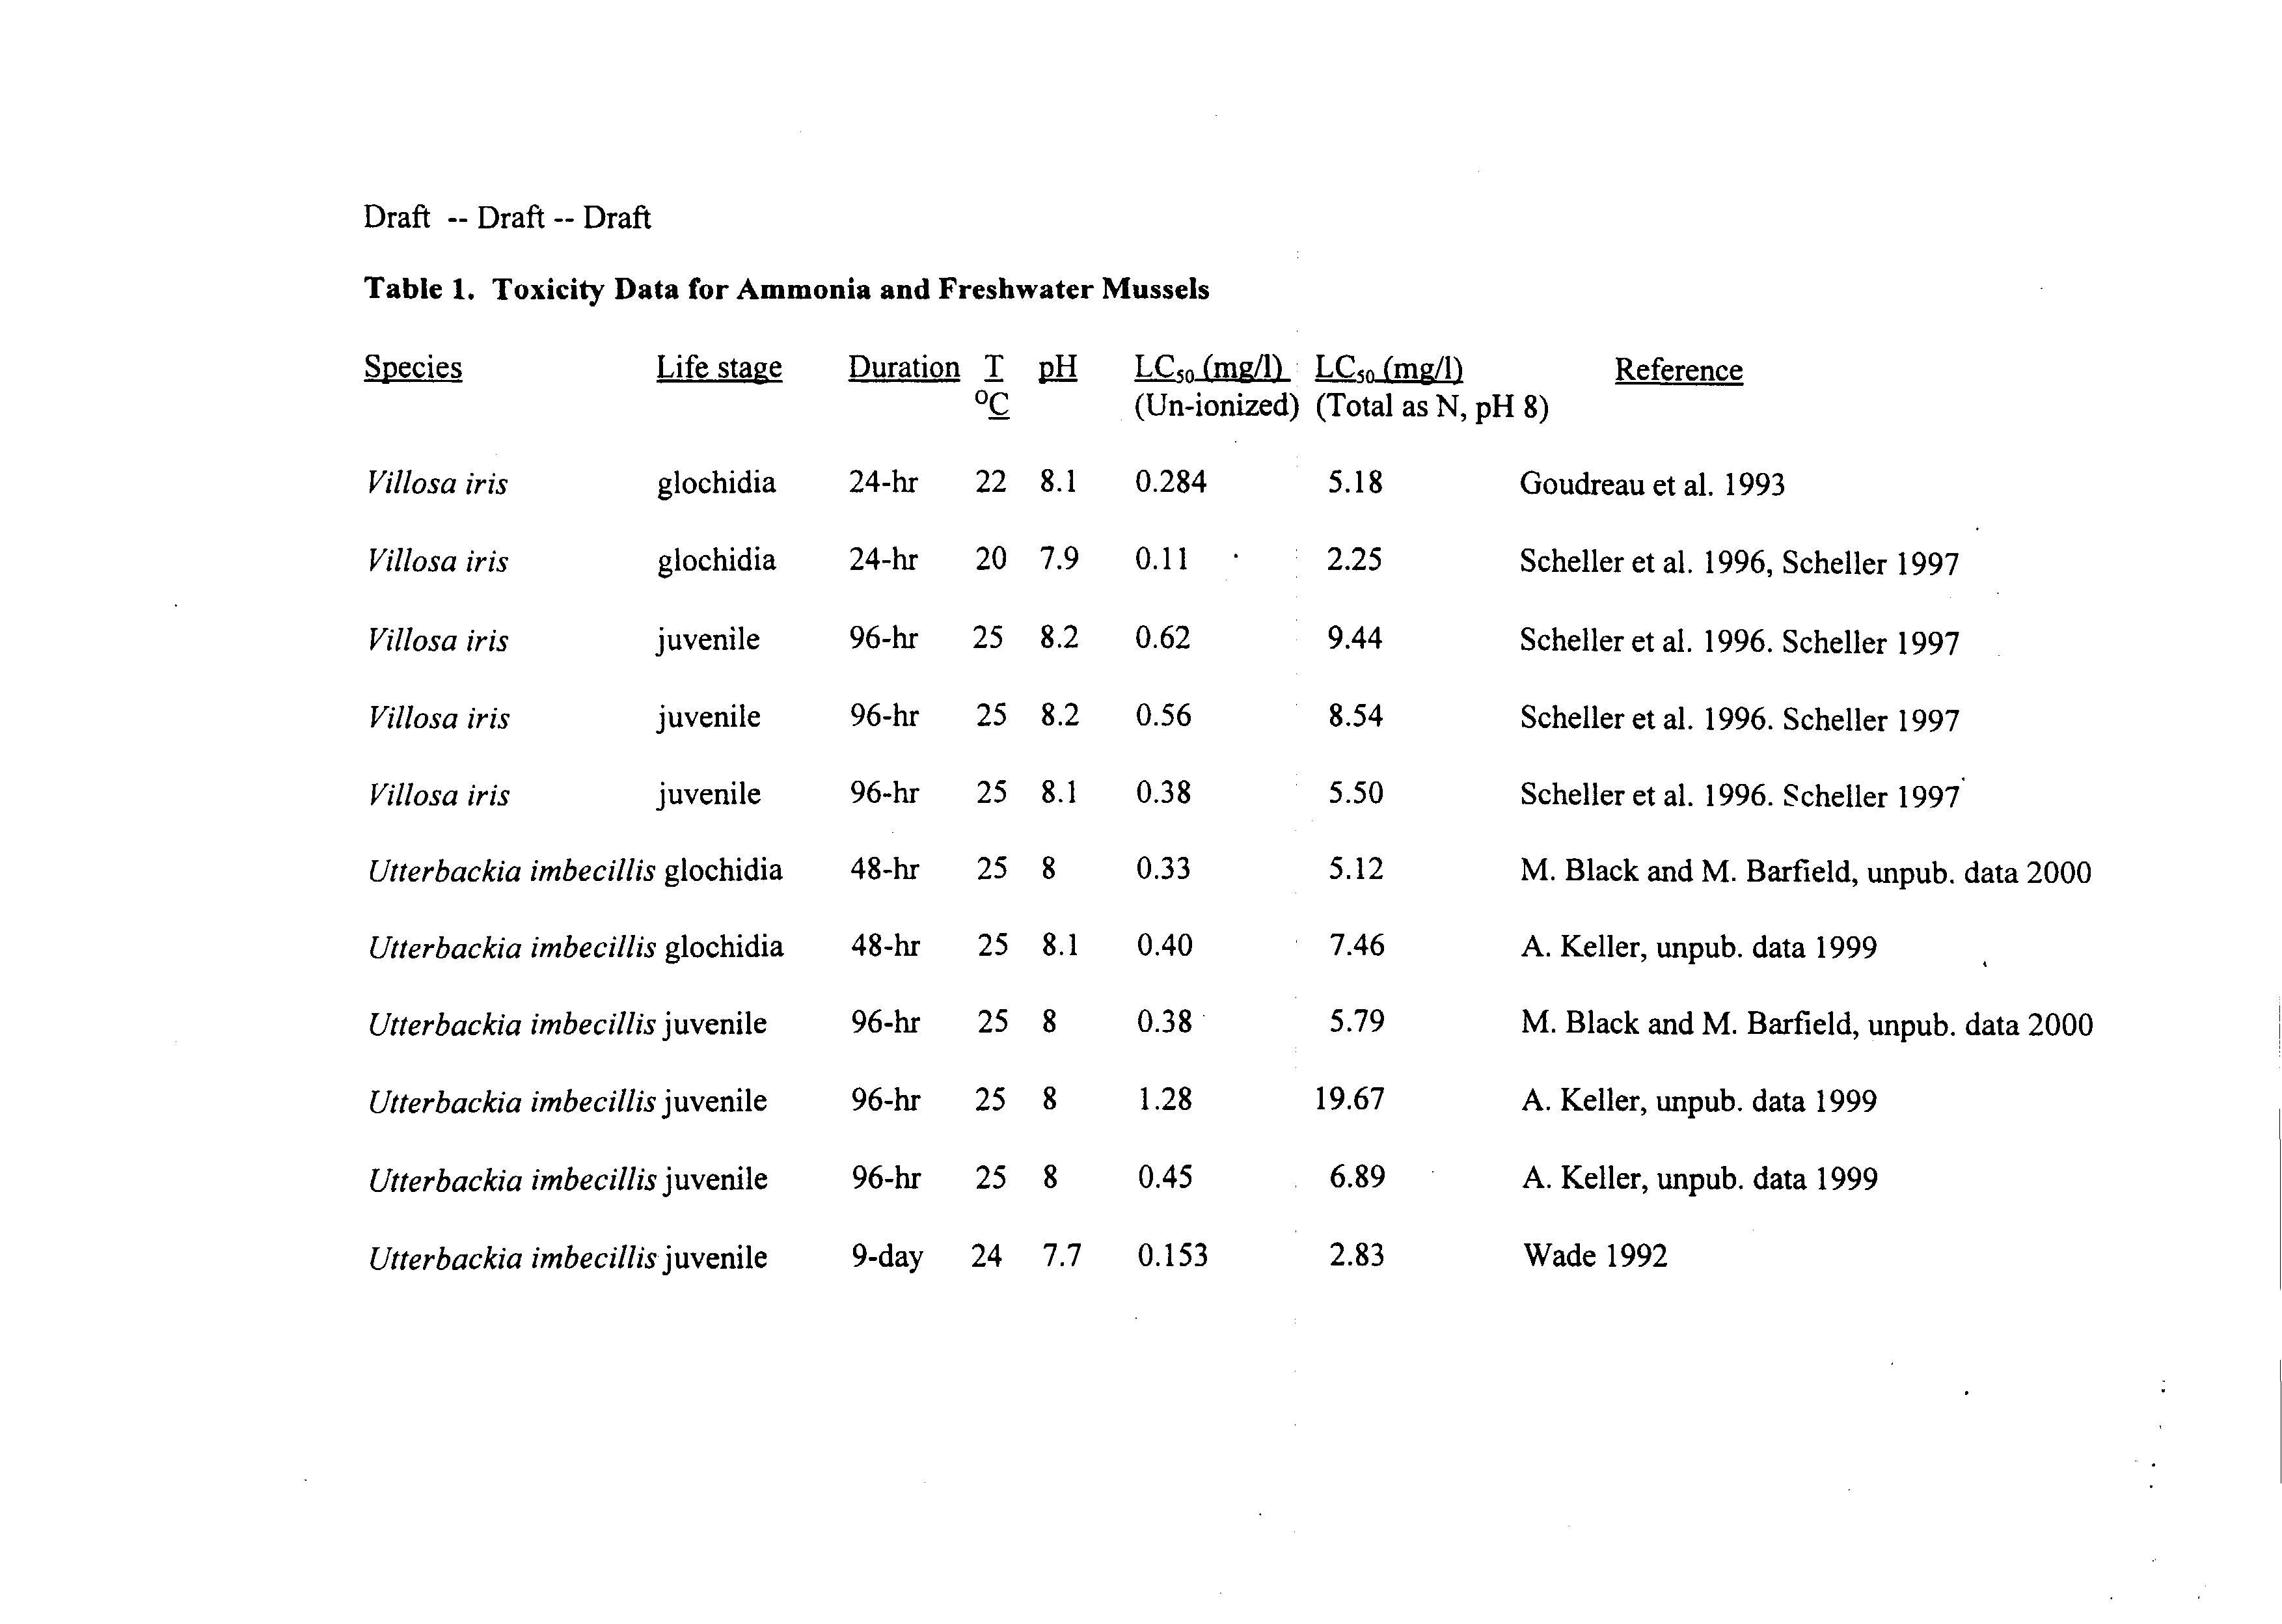
Table
1. Toxicity Data
for Ammonia and Freshwater Mussels
Life stage
Duration
I
Reference
°C
22
8.1
20
7.9
25
8.2
25
8.2
25
8.1
25
8
25
8.1
25
8
25
8
25
8
24-hr
24-hr
96-hr
96-hr
96-hr
48-hr
48-hr
96-hr
96-hr
96-hr
Lc..5o (mg/fl
(Un-ionized)
0.284
0.11
0.62
0.56
0.38
0.33
0.40
0.38
1.28
0.45
k~5o1mg/l)
(Total as N, pH 8)
5.18
2.25
9.44
8.54
5.50
5.12
7.46
5.79
19.67
6.89
Utterbackia imbecillis
juvenile
9-day
24
7.7
0.153
2.83
Wade 1992
Draft --Draft--Draft
Pyganodon grandis
adult
96-hr
25 7.5
0.44
8.74
Scheller et al. 1996, Scheller 1997
Pyganodon grandis
adult
96-hr
25 7.7
0.54
9.03
Scheller et a!. 1996, Scheller 1997
Lasmigona subviridis
juvenile
24-hr
25 8
0.43
6.61
M. Black and M. Barfield, unpub. data 1999
Lasmigona subviridis
juvenile
24-hr
25
8
0.43
6.61
M. Black and M. Barfield, unpub. data 1999
Lasmigona subviridis
juvenile
24-hr
25 8
0.34
5.19
M. Black and M. Barfield, unpub. data 1999
Lasmigona subviridis
juvenile
15-day
22
8
0.03
0.57
M. Black and M. Barfield, unpub. data 1999
Fusconaia masoni
glochidia
24-hr
25
8
0.34
5.18
M. Black and M. Barfield, unpub.
data 2000
Actinonaiaspectorosa
glochidia
48-hr
25 8
0.25
3.76
A. Keller, unpub. data 1999
Actinonaias pectorosa
juvenile
96-hr
25 8
0.91
14.05
A. Keller, unpub. data 1999
Medionidus conradicus
glochidia
48-hr
25 8
0.28
4.24
A. Keller, unpub. data 1999
Lampsilis siliquoidea
juvenile
96-hr
24 8.3
0.05
0.73
Myers-Kinzie 1998, 1999
Lampsilis siliquoidea
juvenile
96-hr
24 8.3
0.15
2.26
Myers-Kinzie 1998, 1999
Lampsilis cardium
juvenile
96-hr
19
8.2
0.99
21.64
(T. J. Newton, preliminary data, Upper
Midwest Environmental Sciences Center,
Etheostoma
Notemigonus
Prosopium
Pyganodon
Utterbackia
Actinonaias
Lasmigona
Villosa
Lan,psilic
Fusconaia
Medionidus
Oncorhynchus
Draft
--
Draft
--
Draft
Table 3. Comparison ofFreshwater Mussel Genus
Mean
Acute Values (all data) for
Ammonia Toxicity to Other Sensitive Taxà, Listed in Order ofIncreasing Sensitivity
Genus
Species Used in GMAV
GMAV
Derivation
(mg/ 1 total ammonia as N. pH 8)
Golden trout
21.95
Cutthroat trout
Pink salmon
Coho salmon
Rainbow trout
Chinook salmon
Orangethroat darter
17.96
Golden shiner
14.67
Mountain whitefish
12.11
Giant floater
8.88
Paper pondshell
7.86
Pheasantshell
7.27
Green floater
6.10
Rainbow
5.53
Plain pocketbook
5.26
Fatmucket
Atlantic pigtoe
5.18
Cumberland moccasinshell 4.24
Species Used in GMAV
______
Derivation
Golden trout
Cutthroat trout
Pink salmon
Coho salmon
Rainbow trout
Chinook salmon
Orangethroat darter
17.96
Golden shiner
14.67
Pheasantshell
14.05
Mountain whitefish
12.11
Paper pondshell
9.22
Giant floater
8.88
Rainbow
7.63
Green floater.
6.10
Plain pocketbook
5.26
Fatmucket
Draft
--
Draft
--
Draft
Table 4. Comparison ofFreshwater Mussel Genus Mean Acute Values (juveniles and
adults only) for Ammonia Toxicity to Otht~rSensitive Taxa, Listed in Order of Increasing
Sensitivity
Genus
____________________
______
GMAY
(mg/ 1 total ammonia as N. pH 8)
Oncorhynchus
21.95
Etheostoma
Notemigonus
Actinonaias
Prosopium
Utterbackia
Pyganodon
Villosa
Lasmigona
Lampsilis
Draft
--
Draft
--
Draft
Derivation ofWater Quality
Guidelines
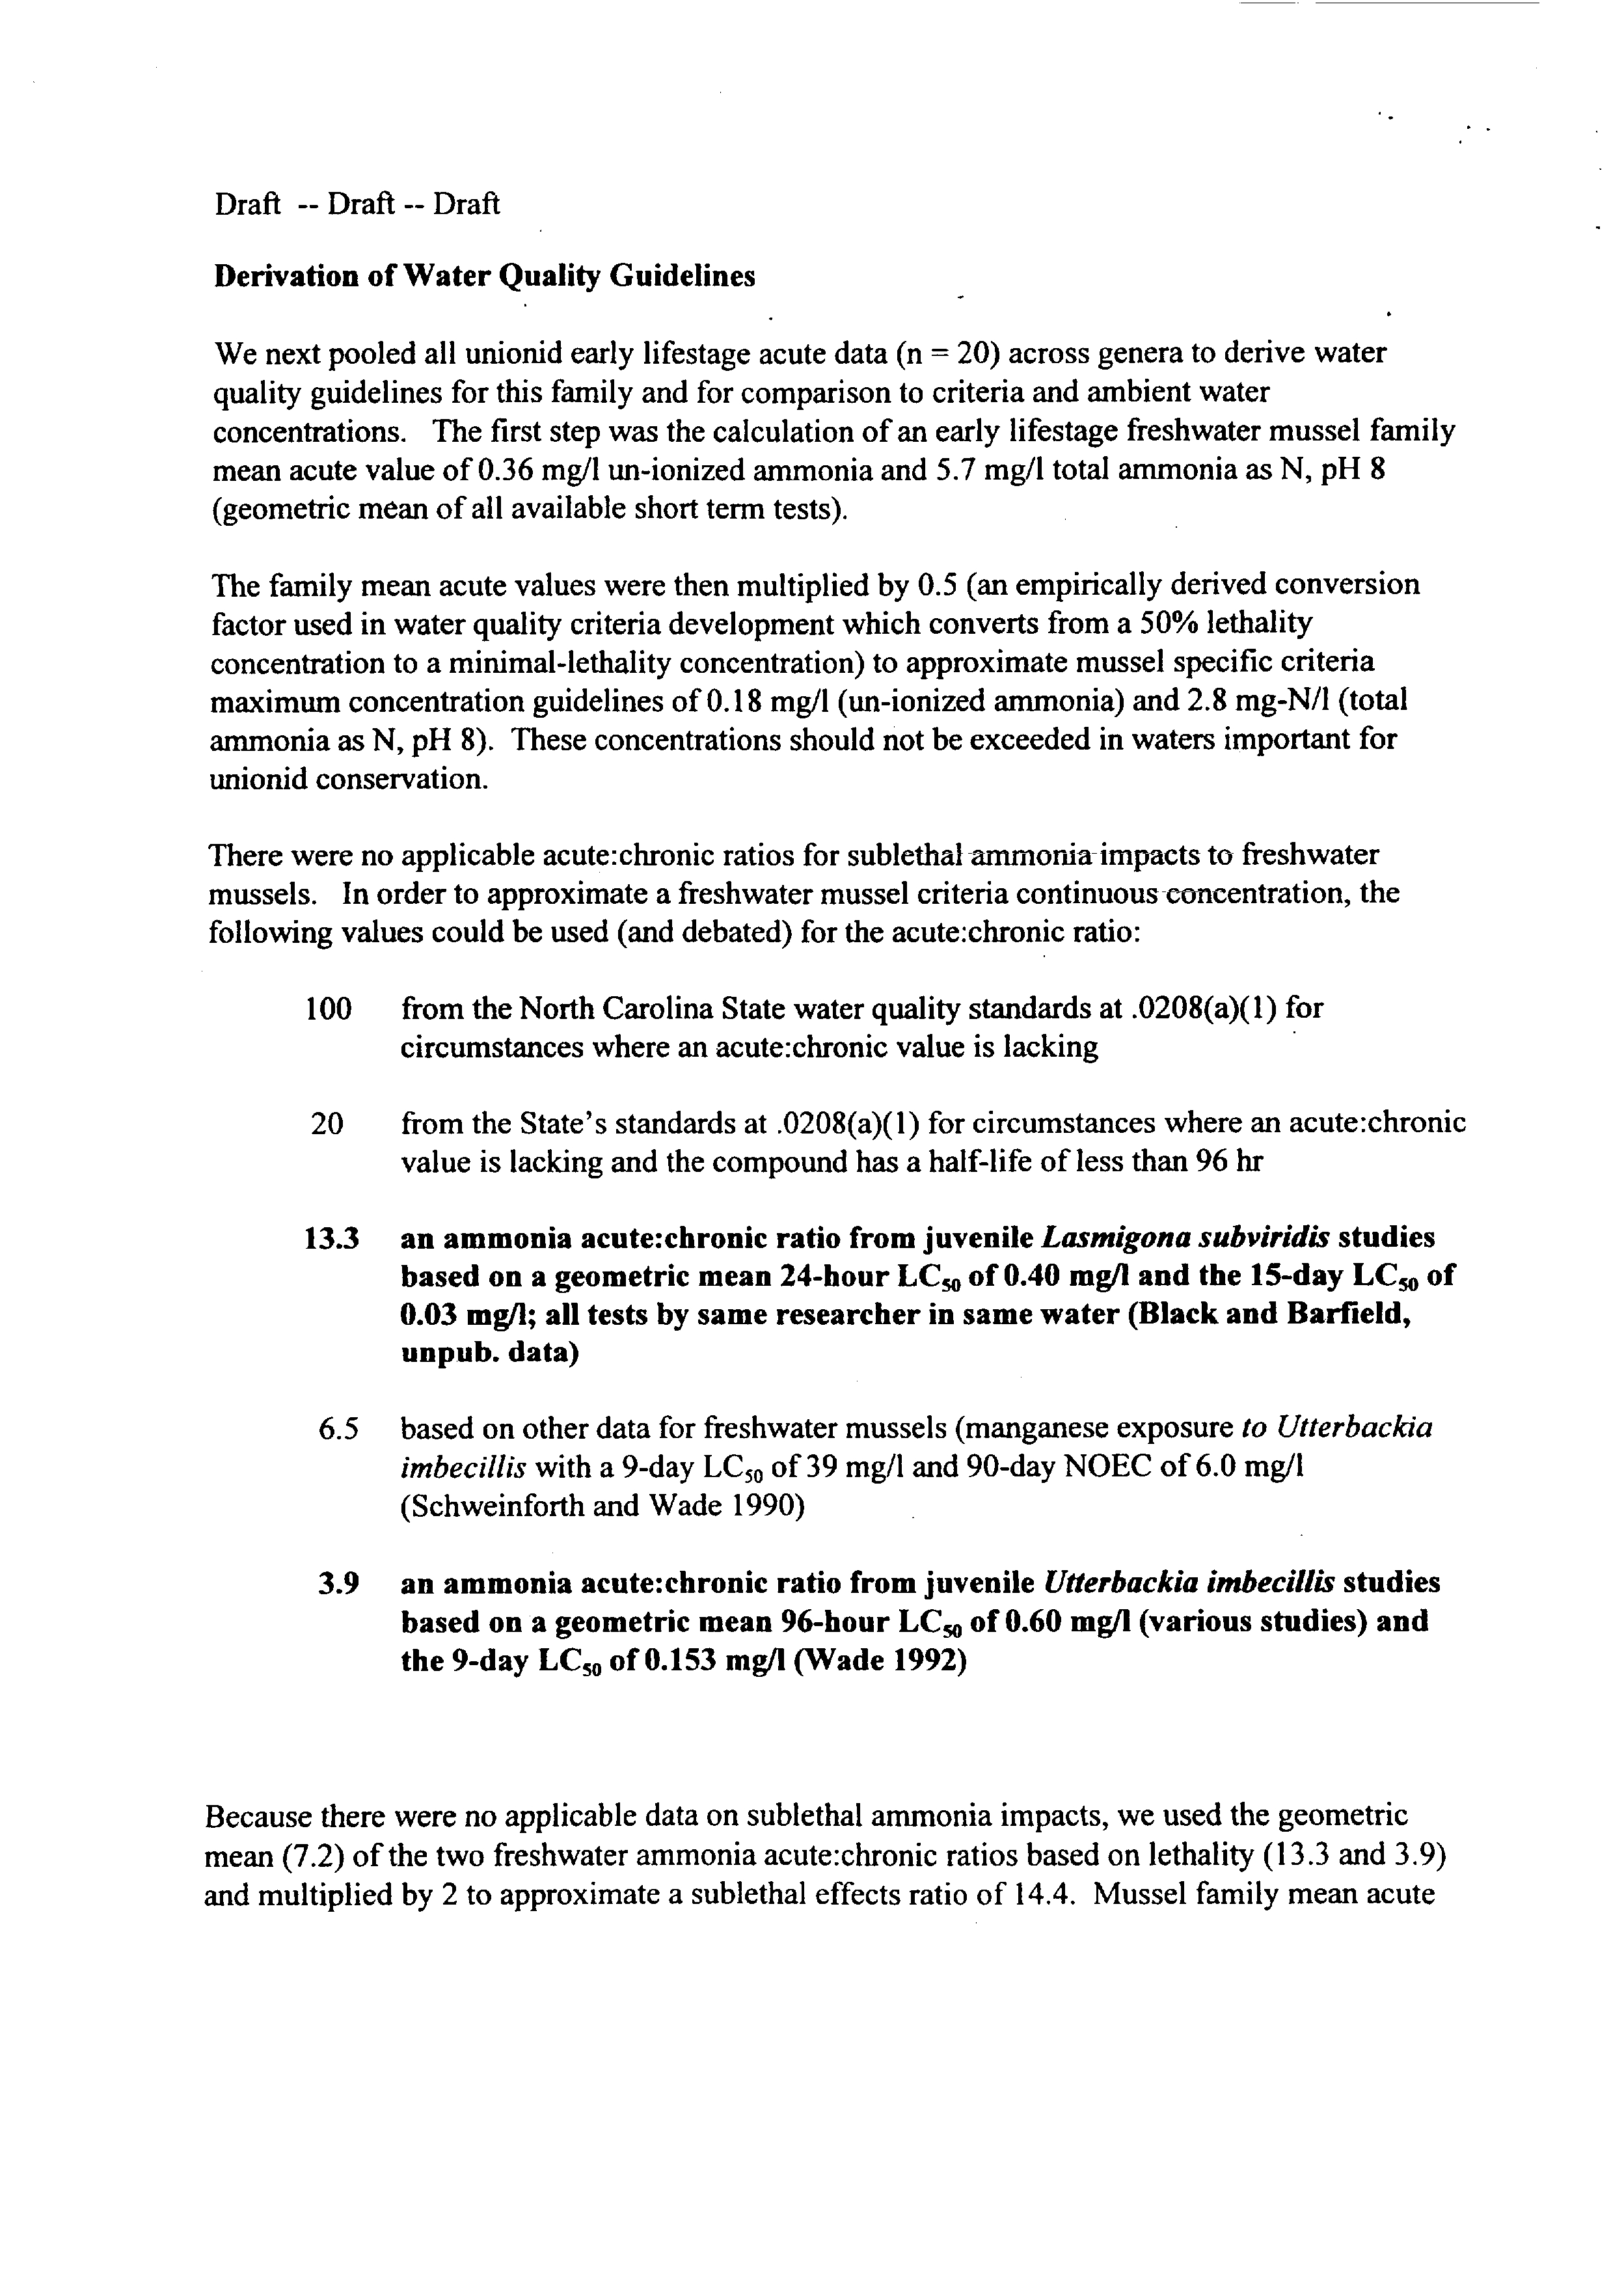
We next pooled all unionid early lifestage acute data (n
=
20) across genera to derive water
quality guidelines for this family and for comparison to criteria and ambient water
concentrations. The first step was the calculation ofan early lifestage freshwater mussel family
mean acute value of0.36 mg/l un-ionized ammonia and
5.7
mg/I total ammonia as N, pH 8
(geometric mean ofall available short term tests).
The family mean acute values were then multiplied by
0.5
(an empirically derived conversion
factor used in water quality criteriadevelopment which converts from a
50
lethality
concentration to a minimal-lethality concentration) to approximate mussel specific criteria
maximum concentration guidelines of 0.18 mg/I (un-ionized ammonia) and 2.8 mg-N/I (total
ammonia as N, pH 8). These concentrations should not be exceeded in waters important for
unionid conservation.
There were no applicable acute:chronic ratios for sublethal -ammonia-impacts to freshwater
mussels. In order to approximate a freshwater mussel criteria continuous-concentration, the
following values could be used (and debated) for the acute:chronic ratio:
100
from the North Carolina State water quality standards at .0208(a)(l) for
circumstances where an acute:chronic value is lacking
20
from the State’s standards at .0208(a)(l) for circumstances where an acute:chronic
value is lacking and the compound has a half-life ofless than 96 hr
13.3
an ammonia acute:chronic ratio from juvenile
Lasmigona subviridis
studies
based on a geometric mean 24-hour LC~of0.40
mg/I
and the 15-day LC~of
0.03 mg/I; all tests by same researcher in same water (Black and Barfield,
unpub. data)
6.5
based on other data
for freshwater mussels (manganese exposure
to Utterbackia
imbecillis
with a 9-day LC50 of39 mg/l
and
90-day NOEC of6.0 mg/I
(Schweinforth and Wade 1990)
3.9
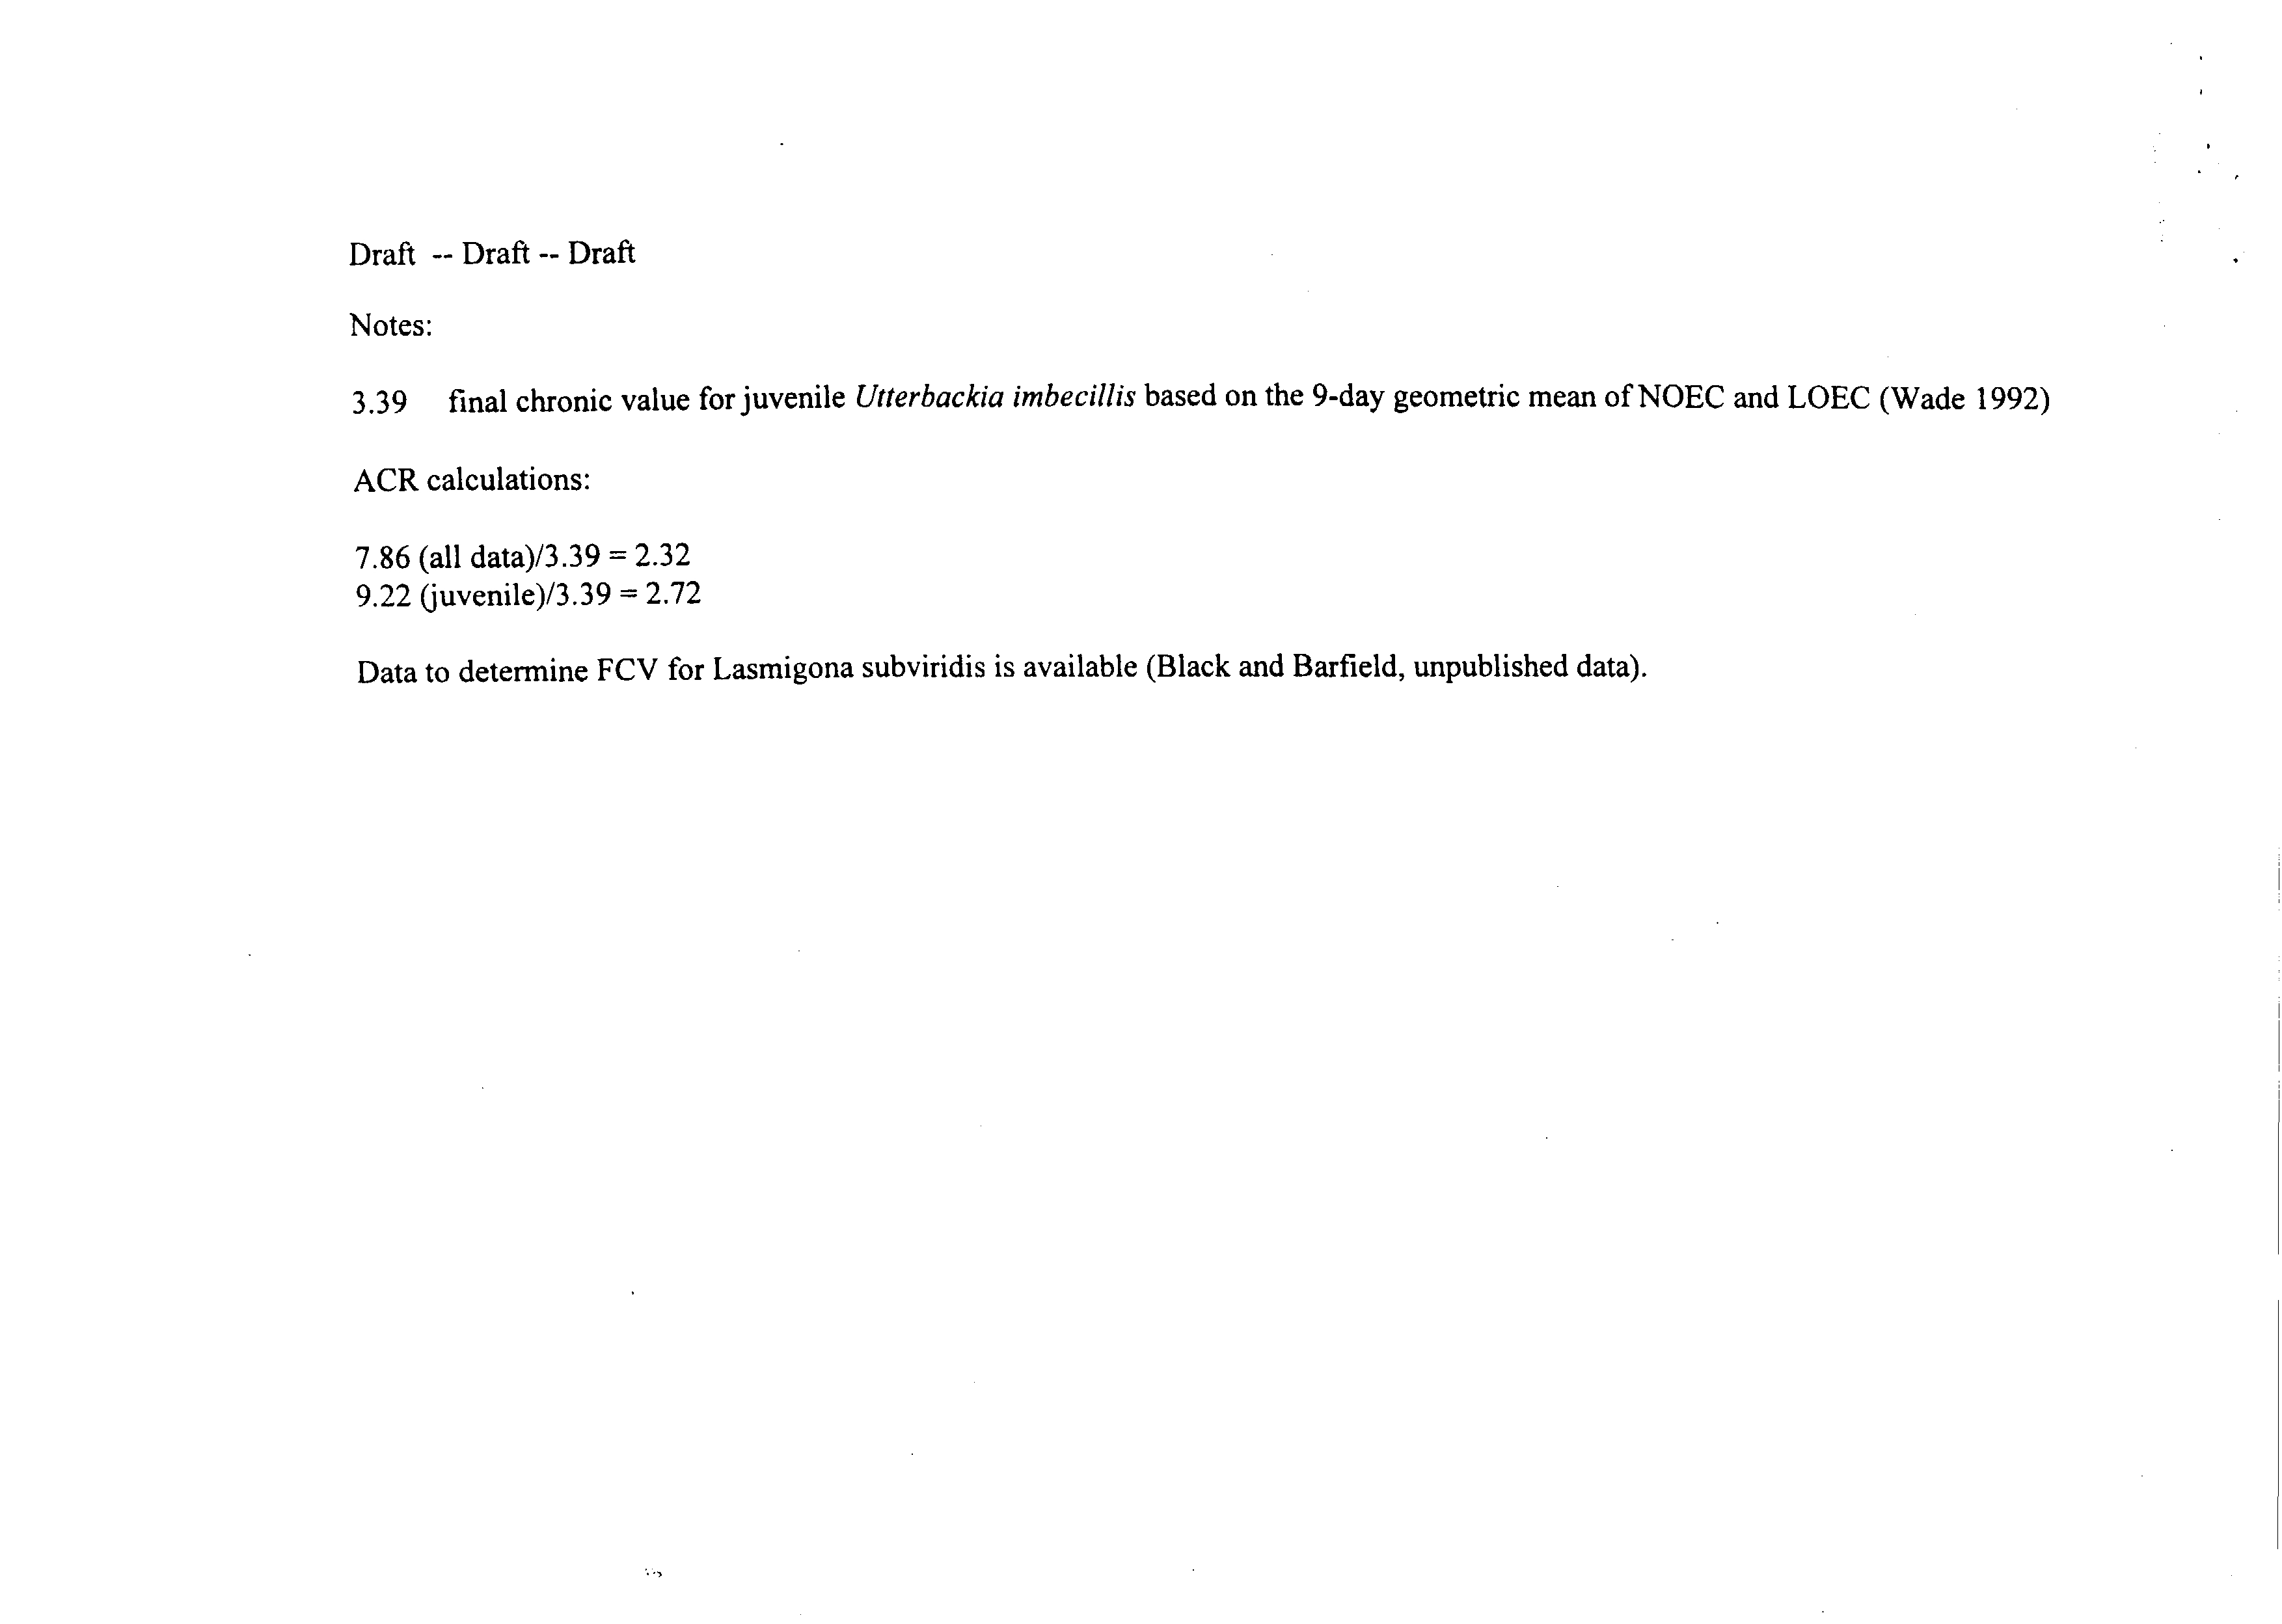
an ammonia acute:chronic ratio from juvenile
Utterbackia
imbecihis
studies
based on a geometric mean 96-hour LC~of 0.60
mg/I
(various studies) and
the 9-day LC50 of 0.153
mg/I
(Wade 1992)
Because there were no applicable data on sublethal ammonia impacts, we used the geometric
mean (7.2) ofthe two freshwater ammonia acute:chronic ratios based on lethality (13.3 and 3.9)
and multiplied by 2 to approximate a sublethal effects ratio of 14.4. Mussel family mean acute
Draft
--
Draft
--
Draft
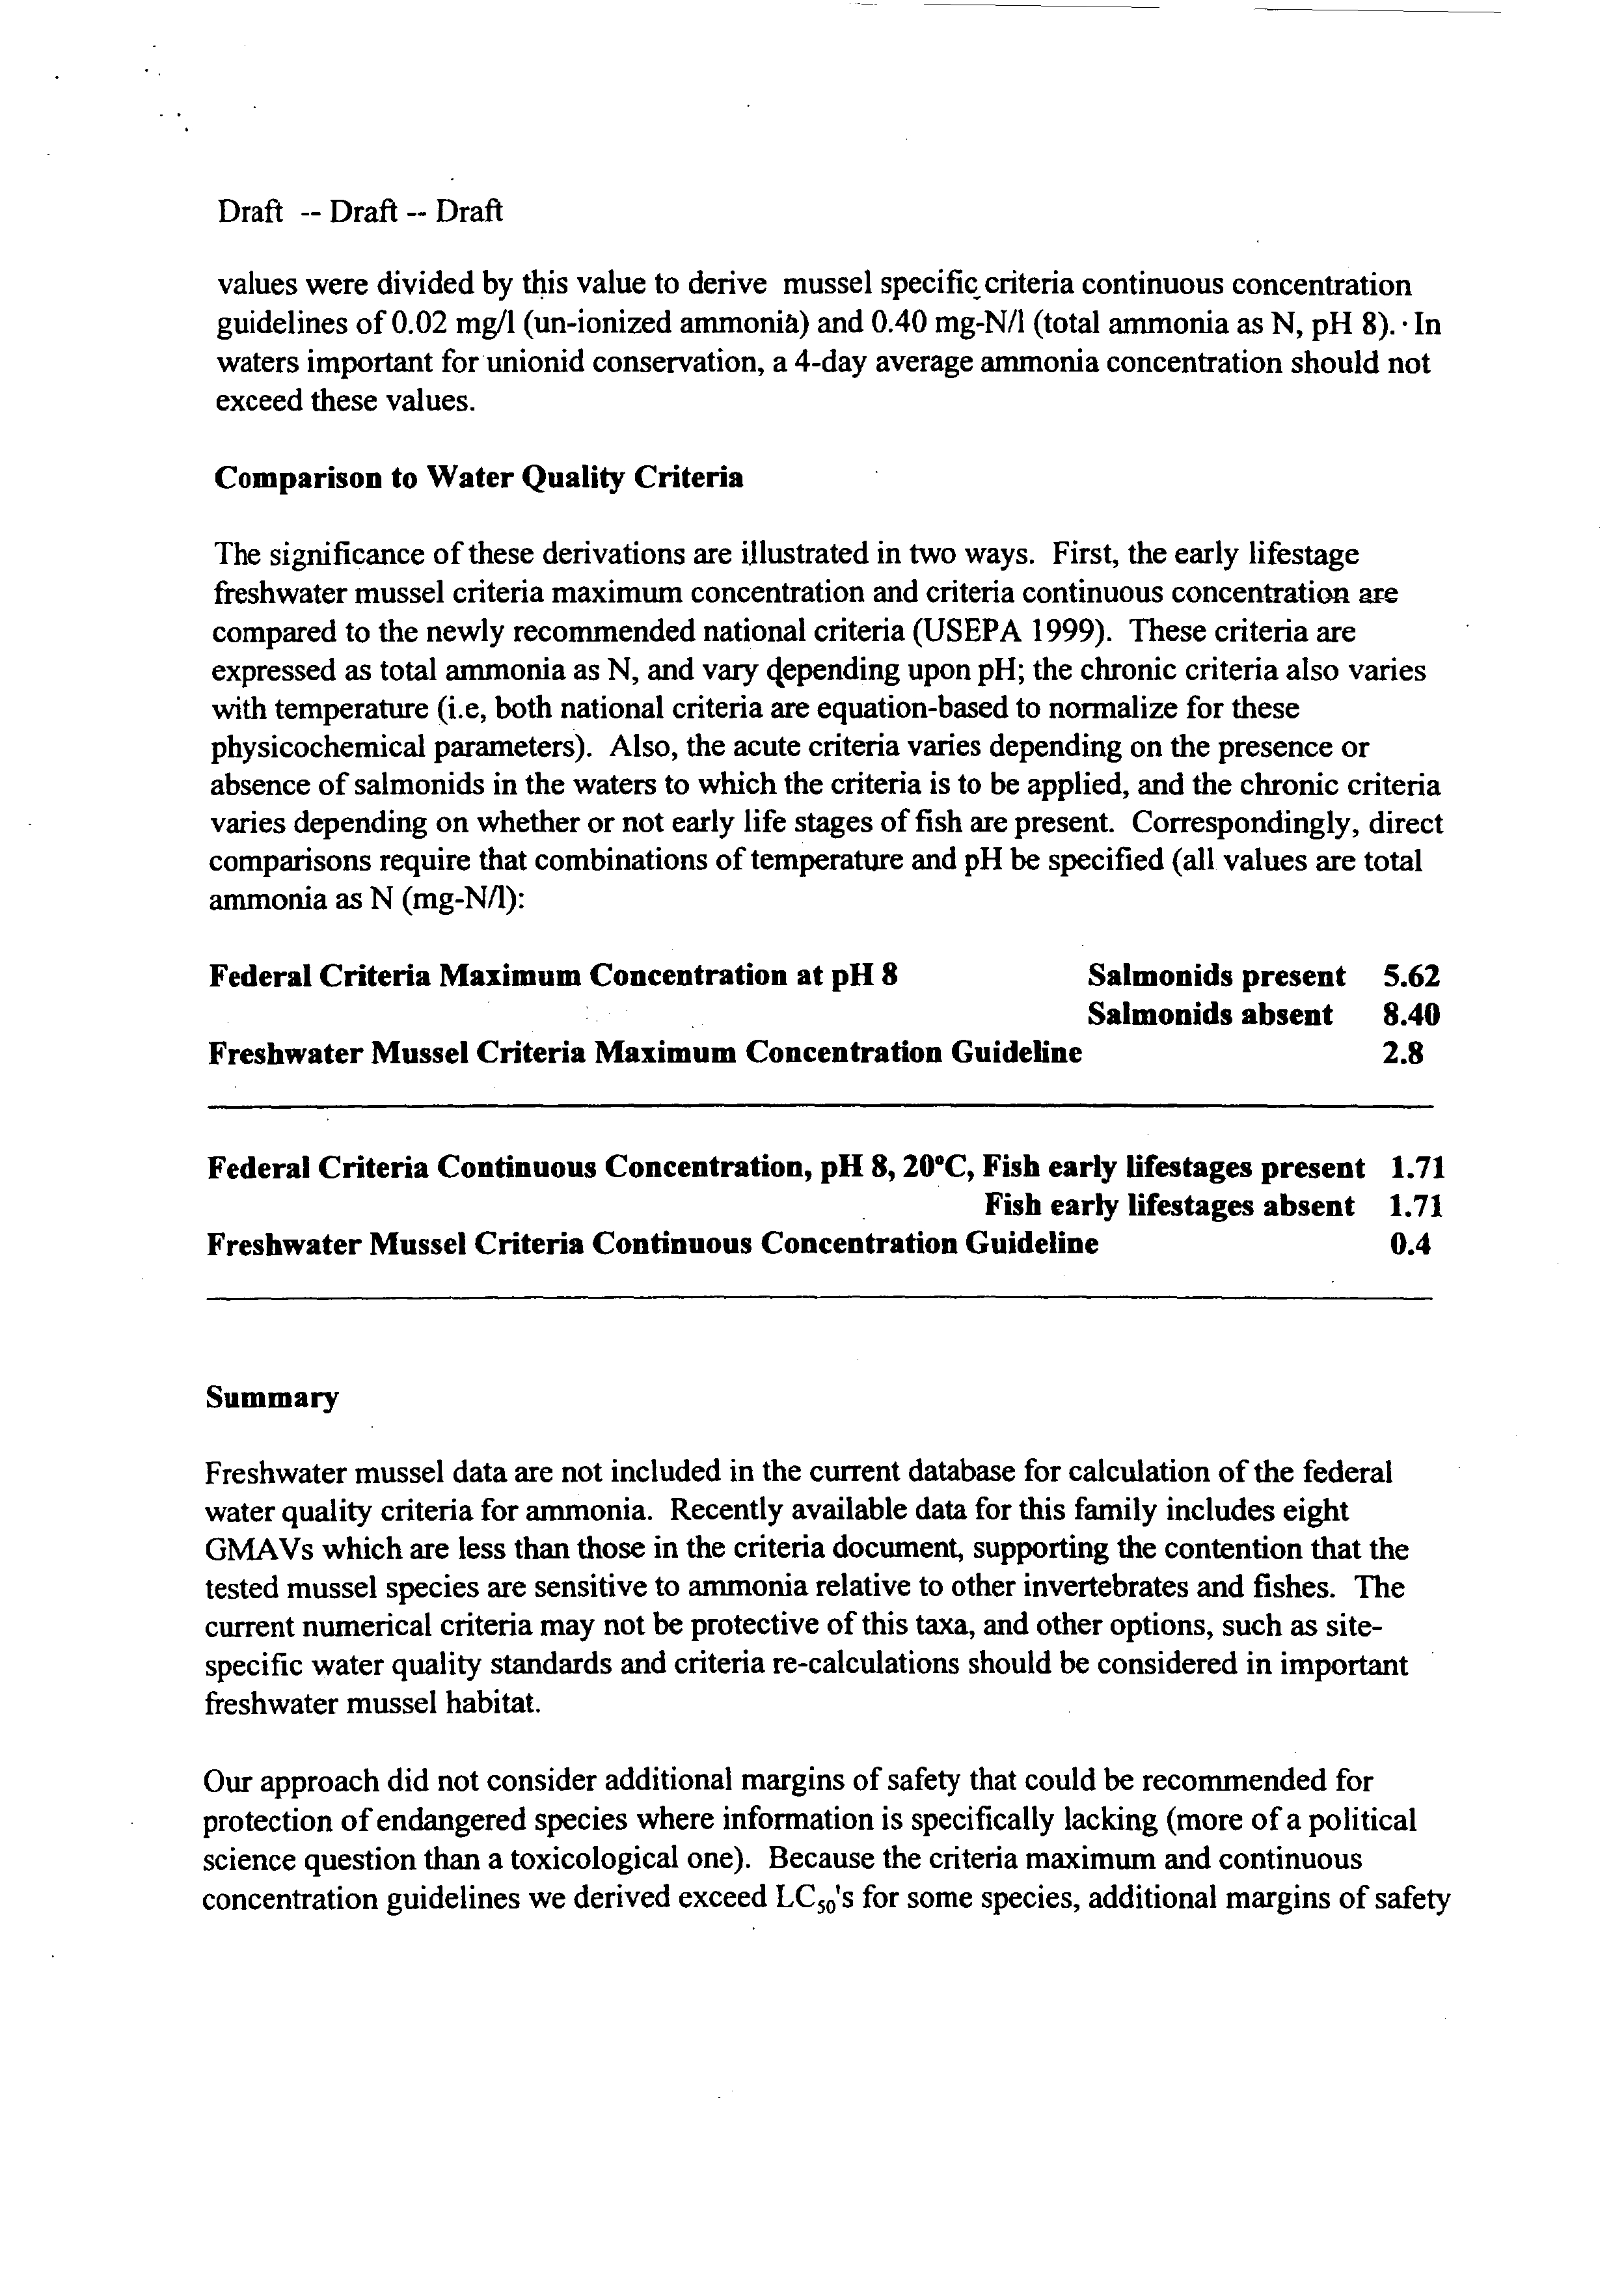
values were divided by this value to derive mussel specifiç~criteria continuous concentration
guidelines of0.02 mg/l (un-ionized ammonia) and 0.40 mg-N/l (total ammonia as N, pH 8). In
waters important for unionid conservation, a 4-day average ammonia concentration should not
exceed these values.
Comparison to Water Quality Criteria
The significance ofthese derivations are illustrated in two ways. First, the early lifestage
freshwater mussel criteria maximum concentration and criteria continuous concentration are
compared to the newly recommendednational criteria (USEPA 1999). These criteria are
expressed as total ammonia as N, and vary 4epending upon PH; the chronic criteria also varies
with temperature (i.e, both national criteria are equation-based to normalize for these
physicochemical parameters). Also, the acute criteria varies depending on the presence or
absence ofsalmonids in the waters to which the criteria is to be applied, and the chronic criteria
varies
depending on whether
ornot early life stages of fish are present. Correspondingly, direct
comparisons require that combinations oftemperature and pH be specified (all values are total
ammonia as N (mg-N/I):
Federal Criteria Maximum Concentration at pH 8
Salmonids present 5.62
Salmonids absent
8.40
Freshwater Mussel Criteria Maximum Concentration Guideline
2.8
Federal Criteria Continuous Concentration, pH 8,20°C,Fish early lifestages present 1.71
Fish early lifestages absent 1.71
Freshwater Mussel Criteria Continuous Concentration Guideline
0.4
Summary
Freshwater mussel data are
not included in
the current database for calculation ofthe federal
water quality criteria for ammonia. Recently available datafor this family includes eight
GMAVs which are less than those
in the criteria
document, supporting
the
contention that the
tested mussel species are sensitive to ammonia relative to other invertebrates and fishes. The
current numerical criteriamay not be protective of this taxa,
and other options, such as site-
specific water quality standards and criteria re-calculations should be considered in important
freshwater mussel habitat.
Our approach did not consider additional margins ofsafety that could be recommended for
protection ofendangered species where information is specifically lacking (more of a political
science question than a toxicological one). Because the criteria maximum and continuous
concentration guidelines we derived exceed LC50ts for some species, additional margins of safety
Draft --Draft--Draft
are recommended in areas with threatened and endangered species if species-specific ammonia
toxicity testing cannot be accomplished to establish protective limits.
The acute data for freshwater mussels and ammonia are relatively robust and should support
standard setting. Chronic exposure data and sublethal endpoints assessments are generally
lacking and should be initiated.
Ammonia may be a significant limiting factor for unionids given that ambient concentrations
well-above the guidelines we derived have been documented. We have several documents on file
that
can
be supplied to
support this point.
References:
Frazier, B.E., T.L. Naimo
and M.B. Sandheinrich.
1996. Temporal
and
vertical distribution of
total
ammonia nitrogen and un-ionized ammonia nitrogen in sediment pore water from the upper
Mississippi River. Environ. Tox. Chem.
15:
92-99.
Fuller, S.L.H. 1974.
Clams and mussels (Mollusca: bivalvia). In C. W. Hart,
Jr. and S. L. H.
Fuller, eds.,
Pollution Ecology ofFreshwater Invertebrates.
Academic Press, New York, NY, pp.
215-273.
Goudreau, S.E., R.J. Neves
and R.J. Sheehan. 1993. .Effects of wastewater treatment plant
effluents on freshwater
mollusks in the upper Clinch River, Virginia, USA. Hydrobiologia 252:
211-230.
Havlik, M.E. and L.L. Marking. 1987. Effects of contaminants on Naiad mollusks (Unionidae):
A review. Resource Publication 164. U.S. Fish and Wildlife Service. Washington,
DC.
Home, F.R. and S. McIntosh. 1979. Factors influencing distribution of mussels in the Blanco
River ofcentral Texas. Nautilus 94: 119-133.
Jacobson, P.J., J.L. Farris, D.S. Cheny and
R.J.
Neves. 1993. Juvenile freshwater mussel
(bivalvia: Unionidae) responses to acute toxicity testing with copper. Environ. Tox. Chem. 20:
879-833.
Keller, A.E. 1993. Acute toxicity ofseveral pesticides, organic compounds, and a wastewater
effluent to the freshwater mussel,
Anodonta imbecilis, Ceriodaphnia dubia,
and
Pimephales
promelas.
Bull. Environ. Contam. Toxicol. 51: 696-702.
_____
1996. The acute toxicity of malathion to three life stages of unionid mussels. Final report
to the USDA-APHIS. National Biological Service, Southeastern Biological Science Center.
Gainesville, FL. 23 pp.
Draft
--
Draft
--
Draft
_____
and D.S. Ruessler. 1997. The toxicity of malathion to unionid mussels: Relationship ~o
expected environmental concentrations. Environ. Tox. Chem. 16: 1028-1033.
_____
and S.G. Zam. 1991. The acute toxicity of selected metals to the freshwater mussel,
Anodonta imbecilis.
Environ. Tox. Chem. 10:
539-546.
Masnado, R.G., S.W. Geis and
W.C.
Sonzognt. 1995. Comparative acute toxicity ofa synthetic
mine effluent to
Ceriodaphnia dubia,
larval fathead minnow and the freshwater mussel
Anodonta
imbecilis.
Environ. Toxicol. Chem. 14: 1913-1920.
McKinney, A.D.
and
D.C. Wade. 1996. Comparative response of
Ceriodaphnia dubia
and
juvenile
Anodonta imbecilis
to pulp
and paper mill effluents discharged to
the Tennessee River
and its
tributaries. Environ. Toxicol. Chem.
15: 5 14-517.
Myers-Kinzie, M.L. 1998. Factors affecting survival and recruitment ofUnionid mussels in
small midwestern streams. Doctoral Thesis, Purdue
University, West Lafayette, IN.
_____
1999.
Factors affecting survival
and recruitment ofUnionid mussels in small midwestern
streams. DissertationAbstracts International Part
B: Science and Engineering 59:6181.
Neves, R.J., A.E. Bogan, J.D. Williams, S.A. Ahlstedt
and
P.W.
Hartfield.
1997.
Status
of
mollusks in the southeastern United States: A downward spiral ofdiversity. In G.W.
Benz and
D.E. Collins, eds.,
Aquatic Fauna in Peril: The Southeastern Perspective.
Special Publication 1,
Southeast Aquatic Research Institute, Lenz Designs and Communications, Decatur,
GA. pp 31-
85.
Scheller, J.L. 1997. The effect ofdieoffs ofAsian clams
(Corbiculafluminea)
on native
freshwater mussels (Unionidae). Masters Thesis, Virginia Polytechnic Institute and State
University, Blacksburg, VA.
_____
M.M. Yeager and D.S. Cherry. 1996. The impact ofammonia produced during die-offs of
the Asian clam
(Corbiculafiuminea)
on freshwater mussels. Poster P0636 presented at 17th
Annual Meeting of SETAC, Washington, DC, November 17-2 1.
Schweinforth, R.L. and
D.C. Wade. 1990. Effects
from sub-chronic 90-day exposure ofan in
vitro transformedjuvenile freshwater mussel
(Anodonta imbecillis)
to manganese. Presented at
11th Annual Meeting ofSETAC, Arlington, VA, November 11-17.
Stephan,
C.E.,
D.I. Mount, D.J. Hansen, J.H. Gentile, G.A. Chapman and W.A. Brungs. 1985.
Guidelines for deriving numerical national water quality criteria for the protection ofaquatic
organisms and their uses. USEPA, ORD, Washington, DC.
Draft
--
Draft
--
Draft
USEPA.
1985.
Ambient water quality criteria for ammonia. Office
ofWater Regulations
and
Standards, Criteria and Standards Division. EPA 44O/5~85:O01.
_____
1999. 1999 Update of
ambient water quality criteria for ammonia. Office of Water. EPA
822-R-99-0 14.
Wade, D.C. 1992. Definitive evaluation of Wheeler Reservoir sediments toxicity using juvenile
freshwater mussels
(Anodonta imbecillis
Say). Tennessee Valley Authority, Water Resources
Division. TVAIWR-92/25.
_____
R.G. Hudson and
A.D.
McKinney.
1993.
Comparative response of
Ceriodaphnia dubia
and juvenile
Anodonta imbecilis
to selected complex industrial whole effluents. In K.S.
Cummings,
A.C. Buchanan
and
L.M. Koch, eds.,
Conservation and Management of Freshwater
Mussels. Proceedings ofa UMRCC Symposium,
12-14 October 1992,
St. Louis, MO. Upper
Mississippi River Conservation Committee, Rock Island, IL. pp. 109-1
12.
Williams, J.D., M.L. Warren, Jr., K.S. Cummings, J.L. Hams and R.J. Neves. 1993.
Conservation
status of freshwater mussels of the United States and
Canada. Fisheries. 18: 6-22.
Draft
--
Draft
--
Draft
Table 2. Species mean and genus mean acute values for unionids and ammonia. Relative sensitivity ofunionid glochidia and
juveniles to ammonia are available for the
Villosa, Utterbackia, and Actinonajas.
Species
Lifestage
Duration
Temp
pH
Total ammonia
(total N ~ pH
8)
Species mean
acute values
Genus mean
acute values
Villosa iris
glochidia
24 hr
22
81
5.17
.
glochidia
24 hr
20
7.9
2.25
.
juvenile
96hr
25
8.2
9.44
.
juvenile
96hr
25
8.2
8.54
juvenile
96 hr
25
8.1
5.50
5.53
(all data)
3.41 (glochidia)
7.63 (juvenile)
5.53
(all data)
3.41 (glochidia)
7.63 (juvenile)
Utterbackia
imbecillis
glochidia
48 hr
25
8
5.12
,
glochidia
48 hr
25
8.1
7.46
juvenile
96hr
25
8
5.79
juvenile
96hr
25
8
19.67
juvenile
96 hr
25
8
.
6.89
7.86 (all data)
6.18 (glochidia)
9.22 (juvenile)
7.86 (all data)
6.18 (glochidia)
9.22 (juvenile)
juvenile
.
9 day
24
7
2.83 (enough
data present to
caic
FCV)
Chronic
chronic
.
Draft
--
Draft
--
Draft
Pyganodon
grandis
adult
96hr
25
7.5
8.74
adult
96 hr
25
7.7
9.03
8.88 (all adult)
8.88 (all adult)
-
Lasmigona
subviridis
juvenile
24hr
25
8
6.61
.
juvenile
24hr
25
8
6.61
.
juvenile
24 hr
25
8
5.9
6.10 (all juvenile)
6.10 (alljuvenile)
juvenile
15 day
22
8
0.57
Chronic
Chronic
Fusconaia
masoni
glochidia
24 hr
25
8
5.18
5.18 (glochidia)
5.18 (glochidia)
Actinonaias
pectorosa
glochidia
48 hr
25
8
3.76
juvenile
96hr
25
8
14.05
7.27 (all data)
3.76 (glochidia)
14.05 (juvenile)
.7.27 (all dath~)
3.76 (glochidia)
14.05 (juvenile)
Medionidus
conradicus
glochidia
48 hr
25
8
4.24
4.24 (glochidia)
4.24 (glochidia)
Lampsilis
siliquoidea
juvenile
96 hr
24
8.3
0.73
juvenile
96 hr
24
8.3
2.26
1.28 (juvenile)
Lampsilis
cardium
juvenile
96 hr
19
8.2
21.64
21.64 (juvenile)
5.26 (juvenile)
Draft
--
Draft
--
Draft
Notes:
3.39
final chronic value forjuvenile
Utterbackia imbecillis
based on the 9-day geometric mean ofNOEC and LOEC (Wade 1992)
ACR calculations:
7.86 (all data)/3.39
=
2.32
9.22 (juvenile)/3.39
=
2.72
Data to determine FCV for Lasmigona subviridis is available (Black and Barfield, unpublished data).
Illinois
Association of Wastewater Agencies
SANGAMON TOWERS 0 SUITE 1000 424 NORTH FOURTH
STREET
SPRINGFIELD, ILLINOIS 627020 217-523-1814 0 FAX: 217-544-0086
WEBSITE: www.ilwastewater.org
President
TN UITI
Fox
Metro
Wat~
Reclamation District
Oswego. Ilioois
Vice President
-
Adninistration
INN $TNT
Urbanaand Chan~ai~
Sanitary
District
Urbana, Illinois
Vice President- Technical
flINT CUVU
Wheiton Sanit~yDistrict
Wheaton, Illinois
Menler-at-Large
NUN U~UR
City
of Ekidttxst
Ein~vxst.~ois
Member.att.arge
lUllS lU~EiI
Cityof
Joket
Joliet, Illinois
Es-Officio
—
UNUNTY
Thorn Creek Basin Sanitary District
Chicago Heights. Illinois
Executive Director
WILMU
F.
ULLJI~
January 18, 2002
Mr David Pfeifer WI-I 5J
Life Scientist
U.S. Environmental Protection Agency
77W. Jackson Blvd.
Chicago, IL 60604
Dear Mr. Puffer,
I am writing you concerning the present effort underway in Illinois by the
Illinois Association ofWastewater Agencies (IAWA) to request that the
Illinois Pollution Control Board (Board) adopt an ammonia nitrogen water
quality standard as prescribed by the USEPA 1999 Ammonia Guidance. I am
the current President ofthe LAWA and as such wish to outline to you and
your staff the present IAWA understanding ofdiscussions to date between
your office and various representatives ofIAWA in this matter. Further, I
wish to thank you and your staff for your consideration ofthe IAWA position
in these proceedings.
During the summer of 2001, the IAWA and the Illinois Environmental
Protection Agency (LEPA) jointly composed a draft ofthe proposed
regulation which was sent to you for review. While this rulemaking effort is
solely undertaken and funded by the IAWA, the IAWA has requested that
IEPA review and comment on all work in the development ofthe regulation
such that the proposal ultimately presented to the Board is a proposal IEPA
can comfortably support. This draft proposal was sent to your office several
months ago. A return comment from your office was received by IEPA and
discussed with IAWA.
Mr. Mike Callahan, Chairman ofthe IAWA Ammonia Water Quality
Subcommittee, met with you in November and discussed the comments made
by USEPA. During the November meeting you suggested that IAWA
representatives contact Mr. Brian Thompson ofyour office to address several
of the technical issues involved with the draft proposal. The IAWA has retained Dr. Robert
Sheehan ofthe Southern Illinois University Fisheries Research Laboratory as a technical
consultant and advisor in this matter. During December, 2001, Dr. Sheehan discussed the
proposal several times with Mr. Thompson, and, upon Mr. Thompson’s recommendation, with
Dr. Brooks Burr also of SIU. The issues discussed and Dr. Sheehan’s interpretation of their
resolution follow.
Early Life Stage Determination: the IAWA proposal considers the month ofMarch to
be the advent of the early life stage season throughout Illinois. This month was selected,
by Dr. Sheehan in consideration oftwo main issues. First, waters in the southern part of
the state obviously warm earlier in the spring than those in the northern portion of the
state. Consequently, many ubiquitous species in Illinois could readily begin the spawning
season earlier in the spring in southern Illinois than in northern Illinois and therefore would
need earlier seasonal protection in that area, Secondly, northern Illinois contains a
significant population ofnorthern pike not found in southern Illinois. The northern pike
begins spawning at colder water temperatures than most other indigenous Illinois species.
These water temperatures favorable to northern pike spawning can be realized in northern
Illinois in March. These two early life stage scenarios involve different considerations but
both indicate that March should be considered as the beginning ofthe early life stage
statewide.
Species Distribution: This consideration was not directly referenced as an issue in the
USEPA comment on the draft proposal, but has been discussed among Mr. Thompson,
Dr. Sheehan and Dr. Burr during their consideration ofthe early life stage timing. Two
species considered indigenous to Illinois were thought to be conceivably not protected by
the early life stage season ofMarch through October. These were the burbot and the
cavefish. Dr. Sheehan is unaware of any spawning populations ofburbort outside ofLake
Michigan in Illinois. The proposed ammonia nitrogen water quality standard does not
affect Lake Michigan and would therefore not impact the burbot. The cavefish is very
limited in distribution in Illinois and is found in areas that are extremely unlikely to realize
elevated concentrations of ammonia nitrogen. However, in consideration of the unlikely
occurrence of either ofthese species in waters which might be affected by the proposed
water quality standard, the IAWA has included an extra degree of protection in the draft
proposal which allows for IEPA to apply early life stage ammonia nitrogen protection
during winter to waters which may contain these species or any others found to need
additional protection.
Dr. Burr indicated he believes he may have observed fry of the redfln shiner, spotfin shiner
and the mottled sculpin through stream ice cover in November. While the possible
presence ofthe early life stages ofthese species is considered by Dr. Sheehan and Dr. Burr
to be minimal, Dr. Burr has indicated he believes some research into the extent ofthe
percentage ofeach ofthese species populations present as fry in November might be
appropriate. Again, as discussed with the burbot and the cavefish in the preceding
paragraph, the special protection afforded by the draft proposal is applicable to these
DATE:
05-Jun-98
TO:
Bob Mosher, Planning
FROM:
Landon Niedringhaus
MEMORANDUM
SUBJECT:
Reasonable Potential to Exceed Standards
--
Need for Further Analysis
DISCHARGER
City otAlton
ILOO
~7464
UPSTRM 7010
J 21490 Jcfs
STP DAF
10.5
JMGD
HARDNESS
226
mg/I as CaCO3
SIP LO FLO ~
5.92
1MGD
WQ STATION
1 84
DILUTION
2345.0
PERMIT EXPIRES
10/31/98
ANALYSIS NEEDED BY
Calculated
PARAMETER
MAX. EFF
CONC.
NO. OF
SAMPLES
MULTIPLY
BY
(
95
WATER QUALI~YSTANDARDS
~OTENTIAL
I
ACUTE
CHRONIC
(304)
LIMITS
FURTHER
ANALYSIS
~RSENIC
0.004
2
3.8
0.0152
0.36
0.19
0.25
No
BARIUM
0.6
3
3.0
1.8
*
5.0
2.0
No
CADMIUM
0.005
3
-
3.0
0.015
0.0244
0.0022
0.15
Yes
CHROM (Hex)
0.005
3
3.0
0.015
0.016
0.011
0.1
Yes
CHROM (Total)
0.03
2
3.8
0.114
3.3860
0.4036
1.0
No
CN (Dissoclable)
0.007
2
3.8
0.0266
0.022
0.0052
Yes
CN (Grab 24 hr)
0.01
3
3.0
0.03
*
*
0.1
.
No
COPPER
0.02
3
3.0
0.06
0.0382
0.024
0.5
Yes
FLUORIDE
1.24
- 1
6.2
7.688
*
1.4
15.0
Yes
IRON
0.1
3
3.0
0.3
1.0
2.0
No
-
LEAD
0.05
3
3.0
0.15
0.10
*
0.2
Yes
MANGANESE
0.015
1
6.2
0.093
*
1.0
1.0
No
MERCURY
0.0002
2
3.8
0.00076
0.0005
0.0005
Yes
NICKEL
0.04
0.0
0
*
1.0
1.0
No Data
OIL & GREASE
2
0.0
0
*
15.0
No Data
PHENOL
0.01
3
3.0
0.03
*
0.1
0.3
No
SILVER
0.01
3
3.0
0.03
*
0.005
0.1
Yes
ZINC
0.1
3
3.0
0.3
*
1.0
1.0
No
Notes:
EXHIBIT 3
C:\SPREADSH~CALC\METALS1.WBI
~linois State Fish
Page 1 of 2
The bluegill
(Lepornis macrochirus)
is a very common fish throughout the state. It is most abundant
in clear lakes with large amounts of aquatic vegetaion. However, it occurs in a large variety of
habitats including pools, overflow ponds, oxbows, swamps, and man-made impoundments. They
often occur in small loose schools that have up to 20 to 30 individuals in them.
They are generally small to medium-sized fish. The largest one reported from Illinois weighed 1.6
kilograms (3 lb. 8oz.). More typically, one would weigh about 0.3 kilograms (12 oz.) and would be
about 24 centimeters
(9.5
in.) long.
Bluegills are generally carnivorous. They mainly eat aquatic insects and insect larvae; in addition,
they eat smaller fish, crayfish, and snails. When other food is in short supply, they will also eat algae.
In the summer male bluegills build nests in water less than about 60 centimeters (2 ft.) deep). These
nests are shallow, circular depressions and are frequently in areas with gravel bottoms. Often many
males build nests in a small area. Females lay eggs in the nests. The males then guard the eggs until
they hatch.
These ~ç~rences have more information on bluegills.
If this interested you, you might be interested in these other Internet resources on fish.
How did it become a state symbol?
(from Illinois Blue Book, 1993-1994)
EXHIBIT 4
State Fish
--
Bluegill
About the symbol
http://www.museum.state. il.us/exhibits/symbols/fish. html
4/8/02
~linois State Fish
The State Fish was selected by schoolchildren in 1986.
Page 2 of2
http ://www. museum.state.il. us/exhibits/symbols/fish.html
4/8/02
Illinois
Environmental
Protection Agency
-
- IEPA/BOW/00-005
Bureau of Water
P.O Box 9276
Spnnglield. Illinois 62794-9276
April 2000
-
Illinois Water Quality Report
2000
Illinois Environmental Protection Agency
Back to top
Bureau of Water
EXHIBIT
5
(not supporting) their designated uses. Overall use, which is equivalent to aquatic life use since
aquatic life is considered to be the best measure of ecosystem health and integrity, was fully or
partially attained on 98.6 percent of all stream miles assessed (Figure 1-1). The major causes
(pollutants or stressors) of less than full support include habitat and flow alterations, nutrients,
organic enrichment/low dissolved oxygen, siltation, metals, and suspended solids. The major
sources include agriculture, habitat modification, point sources, resource extraction and urban
runoff.
Illinois River and Backwater Lakes
The Illinois River and its backwater lakes are an extremely important water resource system,
providing recreation, transportation/navigation, public water supply, flood control, wildlife habitat
and other beneficial uses. The protection and restoration ofthis resource is a complex task, made
more difficult since the Illinois River watershed encompasses nearly one-halfofthe state. Because
ofits importance to the state, this system is the object of numerous local, state, and national efforts
to protect and restore its quality for future generations.
In reviewing Figure 1-1, it should be noted that the vast majority of the mainstem river (from its
origin at the confluence of the Des Plairies and Kankakee Rivers to the Mississippi River) has been
assessed in this report as having “good” overall quality (fully supporting designated uses) based on
chemical water quality parameters measured. Part 3 ofthis report describes the niethodologies used
by the Agency to assess rivers and streams in the state, taking into account the type, quantity and
age of data available. In the case of the Illinois River mainstem, only chemical water quality data
are available forassessment purposes. Data collected over the past three year period were compared
to the general use water quality standards, as required by Section
305(b).
For each parameter
measured,the percentageofviolations ofeachstandard were calculated and compared to established
assessment criteria (see Table 3-2). In summary, standards violation rates were less than 11 for
each parametermeasured. Therefore, from a chemical water quality perspective, the majority ofthe
Illinois River is rated as “good.”
Nearly 30 years ofpoint source pollution control efforts, and more recent efforts to reduce nonpoint
source pollution, have demonstrably improved water quality on the Illinois River mainsteni.
Indicative ofthis success are the professional fishing touniaments being held up and down the river.
By comparison, such events were unthinkable due to poor water quality 25 years ago.
(While
this
is good news, the reviewer and users of this report are cautioned to re~neinber
f/wi
assessment data.
and overall assessment results, can change fromn one reporting period to the next. The ti/ne, place,
tipe. and amount of data collected are ever—changing;
thus,
overall assess/ne/it results (i.e.. good,
fair, poor.~can also change /i~omone reporting cycle to the next.)
Limited data have been collected by the Agency on Illinois River backwater lakes. Data that are
available are now considered too old for proper assessment purposes (i.e.,
15
years). Therefore.
use support attainment assessments have not been made for the vast majority of these resources.
However, excessive sedimentation is known to exist in portions ofthe n1ainstenl river (i.e., Peoria
Lake) and the majority ofthe backwater lakes and tributary streams. Information provided by the
Illinois Department of Natural Resources (IDNR) show that both the rate of sedimentation and
volume lost due to sedimentatioti are severely Impacting the ability of these shallow, nutrient-rich
resources to support recreation, flood control,
aquatic
life and other beneficial uses. Figure 1-2
depicts impairnient due to excessive sedimentatioti in portions of the Illinois River mainstem and
backwater lakes as specifically docUmented by IDNR (Bhowmik and Dcniissie, June 2000).
The Lieutenant Governor’s Office has taken the lead role in recent years to address continuing
concerns over excessive sedimentation in parts of’the Illinois River system. “Illinois Rivers 2020”
is a bold, new, voluntary, incentive-based initiative that builds upon the success ofthe Illinois River
Conservation Reserve Enhancement Program (CREP). Illinois Rivers 2020 utilizes existing
agencies, programs and delivery mechanisms in the federal Farm Bill and Clean Water Act (CWA)
programs, and seeks special consideration under the Water Resources Development Act (WRDA).
This comprehensive program is the next logical step for restoration of the Illinois River Basin and
its backwater lakes.
Lakes
More than 3,000 lakes (six acres or more in size) covering nearly 250,000 acres exist in Illinois.
Like rivers and streams, inland lake resources are a vital component ofthe economic and social
well-being of the state. Some 90 million visitor days of general lake recreation generates an
estimated S 1.78 billion annually to the state’s economy.
Most publicly-owned lakes with 20 or more surface acres were assessed for this report, along with
public and non-public lakes monitored in conjunction with illinois EPA’s Volunteer Lake
Monitoring Program.
As shown iii Table 1-2, like rivers and streams, the monitoring of inland lake resources increased
substantially from the 1986 through the 1988 reporting periods, resulting in a sevenfold increase in
lake acres assessed. Prior to the 1988 report,only monitored assessments were made. Water quality
assessments were based on Agency collected data(Ambient Lake Monitoring Program, Lake Water
Quality Assessment Program and Federal/Illinois Clean Lakes Program) no older than five years.
In 1988, U.S. EPA changed their 305(b) guidance to include evaluated assessments. Evaluated
assessments included those that were based on Agency collected data that is greater than five, but
less than 16. years old, data collected through the Volunteer Monitoring Program or best
professional judgement. Since 1988, total lake acreage assessed for each reporting period has
continued to increase through the 1999 report. Note, however, that totai lake acreage reported in
the 1990 and 1992 reports was falsely elevated. A database counting error resulted in reporting
2 1 ,640 more lake acres thati were actually assessed. The error was subsequently corrected in the
1994 report.
For this 2000 report, a total of 154,795 acres (62.2 percent oftotal lake acreage) were assessed for
degree ofuse support, a reduction of33,689 acres from the 1999 report. The reduction in acreage
is due to eliminating waterbody assessments that were based solely on best professional judgement,
a single sampling event, or on data collected prior to 1983. Because 305(b) information is used to
determine 303(d) list eligibility, evaluated assessments were included in the 2000 report only when
monitoring data to support the assessment were available and no more than I 5 years old.
Causes
of
Less Than Full Support
Causes of use impairment for rivers and streams not fully supporting uses are summarized below
in Table 3-11.
Table 3-11. Statewide Causes
-
Rivers and Streams (miles).
Causes Category
Total Impact
Ammonia
(unionized)
88
Cause Unknown
175
Chlorine
14
Cyanide
123
Excessive Algal Growth/Chlorophyll a
58
Flow Alteration
431
Habitat Alterations
(other than flow)
2.8
16
Metals
1.634
Nutrients
3.2 10
Oil and Grease
20
Organic EnrichnientlD.O.
2.687
Other
Inorganics (Fluoride)
44
Pathogens
37
PCBs
96
pH
589
Priority Organics
643
Salinity/TDS!Chlorides
704
Siltation
2,330
Sulfates
349
Suspended Solids
1,492
Thermal Modification
22
43
Causes of Less Than Full Support
Table 3-29. Statewide Causes
-
All Lakes.
65
I
Causes of use impairment for all lakes not fully supporting uses are summarized below (Table 3-
29).
Causes Category
Total
Impact
Number
Acres
Piiority Organics
36
31.776
PCBs
8
15.682
Metals
13
13,199
Unionized Ammonia
10
4,368
N~utrients
148
126,797
pE-~
17
3,951
Siltation
129
118,761
Organic Enrichment/Low
D.O.
45
86,575
Salinity/TDS/Chlorides
26
Thermal Modification
2
6,007
Habitat Alterations
2
1,968
Pathogens
3
6,096
Suspended Solids
92
111,903
Noxious Aquatic Plants
95
71,618
Excessive Algae Growth/Chlorophyll
a
112
54,150
Exotic Species
9
541
Pesticides (half life ?90days)
I
4,040
(9)
Designated Uses
-
Use Support and Designated Uses are identified by the following numeric codes:
Use Support
is identified by a letter code attached to the corresponding designated use code.
F
=
Full
I
=
Threatened
P
=
Partial Support
N
=
Nonsupport
X
=
Indicates that a particular designated use was not assessed
Designated Uses
are identified by the following numbers:
I (old Code 0l)=Overall Use
20 (old Code 04)
=
Aquatic Life
21 (old Code 02)
=
Fish Consumption
42 (old Code 05)
=
Swimming
44
(old
Code 06)
=
Secondary Contact
50 (old Code 07)
=
Drinking Water Supply
(10)
Causes ofImpairment
-
indicates causes ofimpaired uses from the codes below. Also indicated is
the magnitude to which the cause contributes to the use impairment (H
=
high~M
=
moderate; S
=
slight).
0000
=
cause unknown
0300
=
priority organics
0410= PCBs
0420
=
dioxins
0500
=
metals
0510
=
arsenic
0520
=
cadmium
0530=copper
0540
=
chromium
0550
=
lead
0560
=
mercury
0570
=
selenium
0580
=
zinc
0600
=
ammonia (unionized)
0700
=
chlorine
0720
=
cyanide
0750
=
sulfates
0800
=
other inorganics (fluoride)
0900
=
nutrients
0910
=
phosphorus
0920
=
nitrogen
0930
=
nitrates
1000
=
pH
1100
=
siltation
1200
=
organic enrichment/low DO
1300
=
salinity/TDS/chlorides
1400
=
thermal modification
1500
=
flow alteration
1600
=
habitat alteration (other than flow)
1700
=
pathogens
1900
=
oil and grease
2100
=
suspended solids
2200
=
noxious aquatic.plants
2210
=
excessive algal growth/chlorophyll a
2600
=
exotic species
3000
=
pesticides (half life
?
90 days)
3100
=
atrazine
3200
=
cyanazine
3300
=
alachlor
3400
=
metolachlor
3500
=
metribuzin
3600
=
trifluralin
3700
=
butylate
(Ii)
Sources of Impairment
-
indicates the sources that contribute
to
the causes listed above. Also
indicated is the magnitude to which the source contributes to the use impairment (H
=
high; M
=
moderate, S
=
slight).
POft4T SOURCES
0100 : industrial point sources
0200 : municipal point sources
0400 : combined sewer overflows
0500
: collection system failure
0800 wildcat sewer
0900 : domestic wastewater lagoons
NONPOINT SOURCES
1000
Agriculture
6000
1050 : Crop Related Sources
1100:
nonirrigated crop
production
1200:
irrigated crop production
1300:
specialty crop production
(e.g., truck farming and orchards)
1350 : Grazing Related Sources
1400:
pasture land
1500:
range land
1600: feedlots
-
all types
1700: aquaculture
1 800 : animal holding/management areas
1900 : manure lagoons
7000
2000
Silviculture
3000
Construction
3 100 : highway/road/bridge
3200: land development
Land Disposal
(runoff/leachate from permitted areas)
6100 : sludge
6200 : wastewater
6300 : landfills
6350 : inappropriate disposal/wildcat
dumping
6400: industrial land treatment
6500 : on-site wastewater systems
(septic tanks, etc.)
6600 : hazardous waste
6700 : septage disposal
H ydrologic/Habitat Modification
7100 : channelization
7200 : dredging
7300 : dam construction
7350 : upstream impoundment
7400: flow regulation/modification
7500 : bridge construction
4000
Urban Runoff/Storm Sewers
5000
Resource Extraction
5100: surface mining
5200: subsurface mining
5300 : placer mining
5400 : dredge mining
5500 : petroleum activities
5600 : mill tailings
5700: mine tailings
5800: acid mine drainage
5900 : abandoned mining
7550
Habitat Modification
7600 : removal ofriparian vegetation
7700 : streambank mod ./destabi lization
7800 : draining/filling of wetlands
Atmospheric Deposition
Waste Storage/Storage Tank Leaks
Highway Maintenance and Runoff
Spills (Accidental)
Contaminated Sediments
Natural Sources
Recreation and Tourism Activities
Salt Storage Sites
Source Unknown
8100
8200
8300
8400
8500
8600
8700
8900
9000
-w~.
APPENDIX TABLE A-2. WATERBODY SPECIFIC INFORMATION FOR RIVERS AND STREAMS IN THE DESPLAINES RIVER WATERSHED, 1998.
Waterbody ID,
Segment ID:
Catalog Unit
Segment Name
Size in
Cycle
Key Sample
Assessment
Designated
Causes of
Sources of
Miles
Year Date
Type/Methods Uses
Impairment
Impairment
ILGO1
G 01
07120004
DesPlaines R.
2.405
2000 01/01/1998 M/ 860
N21,P1,P20
410,500,530,540,
100,200,4000,7000,
560,900,910,920,
7100.7400.8500
1500,1600
ILGO1
G 12
07120004
DesPlaines R.
9.4
2000 01/01/1989 E 1150
N21,P1.P20,X44
410,500,530,540,
560,900,910.920,
1500,1600
100,200,4000,7000,
7100,7400.8500
ILGO1
G 24
07120004
DesPlainesR.
4.185
2000 01/01/1994 M/ 300
N21,P1,P20
410,500,540,560,
900,910,920,1500,
1600
100,200,4000,7000,
7100,7400,8500
ILGO1
GD
07120004
Cedar Cr.
7.95
2000
E /
X1,X20
ILGO8
G 08
07120004
DesPlaines R.
0.98
2000 01/01/1998
M/ 230,700,
860
F1,F20,F21,P42
ILGO8
G 25
07120004
DesPlainesR.
6.92
2000 01/01/1997 M/ 700,860
P1,P20,X21
1100
3000,3200,4000
ILG11
G 03
07120004
DesPlainesR.
8.575
2000 01/01/1998 M/ 200,700,
860
P1,P20,P21
300,720,900,910,
920.1200,1220,1300,
200,4000,7000,7100,
7400,8500
.
1320.1500,2100
ILG11
G 11
07120004
DesPlainesR.
3.18
2000 01/01/1998
M/ 230,700,
N21,P1,P20,P42
300,720,900,910,
200,4000,7000,7400,
.~
860
920.1200,1220,1300,
1320,1500,2100
8500
ILG11
G 39
07120004
DesPlainesR.
15.97
2000 01/01/1998 MI 230,700,
860
N42,P1,P20
300,720,900,910,
920,930,1300,1320,
1330,1500,2100
200,400,4000,7000,
7400,8500
1LG23
G 23
07120004
DesPlaines R.
3.165
2000 01/01/1998
M/ 230
N21,P1,P20,P44
.
410,500,510,530,
540,550,560,580,
720.900,910,920,
1200,1220,1500,1600,
2100
100,200,400,4000,
7000,7100,7400,8500
ILG3O
G 07
07120004
DesPlaines R.
10.28
2000 01/01/1998 M/ 230,700,
860
F1,F20,F21,N42
ILG3O
G 15
07120004
DesPlainesR.
3.49
2000 01/01/1998 M/ 230
F21,N42,P1,P20
900,910,920,930,
1200,1220,1300,1320,
2100
200,400.3000,3200.
4000,8300
ILG3O
G 22
07120004
DesPlaines R.
4.12
2000 01/0111998 M / 230
F1,F20,P42
Page 1 of7
GBKAO1
GBKBO1
GBL 02
GBL 05
Sources of
APPENDIX TABLE A-2. WATERBODY SPECIFIC INFORMATION FOR RIVERS AND STREAMS IN THE DESPLAINES RIVER WATERSHED, 1998.
Waterbody
ID:
Segment ID: Catalog Unit
Segment Name
Size
in
Cycle Key Sample
Assessment
Designated
Causes of
Miles
Year Date
Type/Methods
Uses
Impairment
Impairment
ILGBKO5
3.55
2000 01/01/1987
E
I
150
N1,N20
500,530,720,900.
910,930,1300
200
ILGBKO5
7.28
2000 01/01/1977
E / 150
X1,X20
ILGBL1O
8.89
2000 01/01/1997 MI 300,420,
700,860
F1,F20,X21
ILGBL1O
3.17
2000 01/01/1997
M / 300,420
P1,P20,X21
900,910,920,930,
1200,1220,1300,1320,
1600,2100
200,3000,3200,4000,
7000,7100
ILGBL1O
GBL 08
07120004
E Br. DuPage R.
6.41
2000 01/01/1997 MI 300,420
P1,P20.X21
720,900,910,920,
1100,1200,1500,1600,
2100,2210
200,3000,3100,3200,
4000,7000,7100,7350,
7400
ILGBL1O
GBL 10
07120004
E:Br. DuPageR.
4.65
2000 01/01/1998 M/
230,300,
420,700
N42,P1,P20
900,910,920,930,
1100,1200,1300.1600,
2100,2210
200,3000,3100,3200,
4000,7000,7100
GBL 11
07120004
E. Br. DuPage R.
3.88
2000 01/01/1991
MI 300,420
P1,P20,X21
900,910,930,1600
200,3000,3200,4000,
7000,7100.7600,7700
GBLA
07120004
PrentissCr.
3.96
2000 01/01/1997
E / 170
X1,X20
GBLBO1
07120004
St. Joseph Cr.
4.28
2000 01/01/1997 MI 300,420
P1,P20
1200,1600,1900,2100,
2210
200,3000,3200,4000,
7000,7100,7550,7600,
7700,9000
GBLC
07120004
LaceyCr.
3.76
2000 01/01/1995
E / 170
X1,X2ci
GC 02
07120004
Jackson Cr.
10.55
2000 01/0111991 E/ 150
F1,F20
GC 03
07120004
Jackson Cr.
14,4
2000 01/0111997 MI 700
Fl,F20,X21
GCAO1
07120004
ManhattenCr.
8.33
2000 01/01/1997 M/
F1,F20,X21
GCB
07120004
Jackson Br.
8.96
2000 01/01/1991
E / 150
P1,P20
900,910,930
200
GF 01
07120004
Sugar Run
6.58
2000 01/01/1983
E / 150
P1.P20,X21
500,510,900,920,
1000,1100,1200,1220
1000,1100.3000,3200,
4000
GG 02
07120004
Hickory Cr.
9.95
2000 01/01/1998 MI 230
N42,P1.P20
900,910,920,1300,
1320,1500,2100
200,400,3000,3200,
4000.7000,7400
Page
4
of7
900,910,920,930,
1200,1220,1300,1320,
1600,2100
720,900,910,920,
1100,1200,1500,1600,
2100,2210
900,910,920,930,
1100,1200.1300,1600,
2100,2210
900,910,930,1600
1200,1600,1900,2100.
2210
900,910,930
500,510,900,920,
1000,1100,1200,1220
200,3000,3200,4000.
7000.7100,7550.7600.
7700,9000
200
1000,1100,3000,3200,
4000
200.400,3000,3200,
4000,7000,7400
Waterbody ID:
ILGBKO5
GBKAO1
07120004
ILGBKO5
GBKBO1
07120004
ILGBL1O
GBLO2
07120004
ILGBL1O
GBLO5
07120004
Spring Brook
Kress Cr.
E. Br. DuPage R.
E. Br. DuPage R.
Size in
Cycle Key Sample
Miles
Year Date
3.55
2000 01/01/1987
7.28
2000 01/01/1977
8.89
2000 01/01/1997
3.17
2000
01/01/1997
Assessment
Designated
Type/Methods Uses
E
I
150
N1,N20
E 1150
X1,X20
M/ 300,420, F1,F20,X21
700,860
M/ 300,420
P1,P20,X21
Sources of
Impairment
200
GBLO8
07120004
E.Br.DuPageR.
GBL1O 07120004 E.Br DuPageR.
APPENDIX TABLE A-2. WATERBODY SPECIFIC INFORMATION FOR RIVERS AND STREAMS IN THE DESPLAINES RIVER WATERSHED, 1998.
Segment ID: Catalog Unit Segment Name
Causes of
Impairment
500,530,720,900,
910,930.1300
200,3000,3200,4000,
7000,7100
ILGBL1O
200,3000,3100,3200,
4000.7000.7100,7350,
7400
ILGBL1O
200,3000,3100,3200,
4000,7000,7100
LGBL1O
200,3000,3200,4000,
7000,7100,7600,7700
ILGBL1 0
~ ILGBL1O
6.41
2000 01/01/1997 MI 300,420
4.65
2000 01/0111998
GBL 11
GBLA
GBLBO1
GBLC
GC 02
GC 03
GCA 01
GCB
GF 01
07120004
07120004
07120004
07120004
07120004
07120004
07120004
07120004
07120004
ILGBL1O
ILGCO2
ILGCO2
ILGCO2
LGCBO1
ILGFO1
tLGGO2
E. Br. DuPage R.
Prentiss Cr.
St. Joseph Cr.
Lacey Cr.
Jackson Cr.
Jackson Cr.
Manhatten Cr.
Jackson Br.
Sugar Run
3.88
3.96
4.28
3.76
10.55
14.4
8.33
8.96
6.58
2000 01/01/1997
2000
01/01/1997
2000 01/01/1997
2000 01/01/1995
2000 01/01/1991
2000 01/01/1997
2000 01/01/1997
2000 01/01/1991
2000 01/01/1983
M/ 230,300,
420,700
M / 300,420
E / 170
M
I
300,420
E /170
E /150
M / 700
MI
E /150
E / 150
P1 ,P20,X21
N42,P1 P20
P1 ,P20,X21
X1,X20
P1 P20
X1,X20
F1,F20
F1,F20,X21
Fl ,F20,X21
P1,P20
P1 ,P20,X21
GG 02
07120004
Hickory Cr.
9.95 2000 01/01/1998 M/ 230
N42,P1,P20
900.910,920,1300,
1320,1500,2100
Page 4 of 7
APPENDIX TABLE A-2. WATERBODY SPECiFIC INFORMATION FOR RIVERS AND STREAMS IN THE DESPLAINES RIVER WATERSHED, 1998.
Causes of
Impairment
900,910,920,930,
1300,1320,1600
300,410.900,910.
920,930.1200,1220,
1300,1320,1600,2100
300,410,900,910,
920,930,1300,1320.
1500,2210
900,910.930,1300,
1320,1500,1600
300,410,500,720,
900,910,930,1200,
1220, 1600,2100
300,900,910.930,
1100,1200,1220,1500,
1600,2100,2210
1200,1220,1500
300,500,540,900,
910,920,930,1200,
1220,1300,1320,1330,
1600,1900,2100,2210
300,410,500,530.
900,910,920,930,
1200,1220,1500.1600,
2 100,2210
900,910,920,1300,
1320
300,900,920
Sources of
Impairment
200,3000,3200.4000,
7000,7100,7550,7700
200,400.500,3000,
3200,4000,7000,7100
8500
200.400,500,4000,
7000,7350,7400,850C
200,4000,7000,7100,
7350,7400
200,400,3000,3100,
4000,7000.7100,850
200,4000.7000,7 1 OC
7350,7400,8500
4000,7000,7400
200,400,4000,7000,
7100,7350,7550,7600,
7700,8500
200,4000,7000,7100.
7350,7400,7550.7600,
7700,8500
200,4000
200,3000.3200,4000,
8500
Segment ID: Catalog Unit Segment Name
GJ 01
07120004
Sawmill Cr
GK 03
07120004
Flag Cr.
GL
07120004
Salt Cr.
GL 03
07120004
Salt Cr.
Assessment
Designated
GL 09
07120004
Salt Cr.
Size in
Cycle Key Sample
Miles
Year Date
6.37
2000 01/01/1998
7.75
2000 01/01/1989
11.2
2000 01101(1975
10.44
2000 01/01/1995
11.8
2000 01/01/1998
3.68
2000 01/01/1995
3.09
2000 01/01/1995
3.28
2000 01/01/1995
Waterbody D
ILGJOI
ILGKO3
ILGLO9
ILGLO9
ILGLO9
ILGLO9
ILGLOS
)LGLO9
ILGLO9
ILGLO9
ILGLAOI
ILGLAO1
ILGOO1
LGUO2
GL 10
07120004
Salt Cr.
GL 19
07120004
Salt Cr.
GLO 01
07120004
Spring Brook
Type/Methods
M /
300
E / 150
E / 150
M / 300.700,
860
M / 230,300.
420,700.
860
M / 300,420,
700
M / 300,420,
700,860
M/ 300,420
M / 300,420
E
I
150
M / 230,300,
420
GLBO7
07120004
Spring Brook
4.41
2000 01/01/1995
GLBA
07120004
Meacham Cr.
2.88
2000 01/01/1987
GLA 02
07120004
Addison Cr.
6.65
2000 01/01/1998
Uses
F1,F20
P1,P20
Xl ,X20,X21
P1 ,P20,X21
N42,P1 ,P20,X21
F21,P1,P20
P1 ,P20,X21
P1 P20
Fl ,F20,X21
P1,P20
N42.P1 P20
P1,P20
P1 P20
P1 ,P20,X21
GLA 04
07120004
Addison Cr.
GO 01
GU 02
07120004
07120004
4.72
2000 01/0111995 MI 300,420
Willow Cr.
Indian Cr.
7.69
2000 01/01/1983
10.67
2000 01/01/1997
E /150
M/ 700,860
Page 6 of 7
I-
ILDT38
1L0T38
ILDT38
ILDT38
ILDT38
ILDT38
ILDT38
ILDT38
1L0T38
•~- ILDT46
ILDT46
ILDT46
ILOT46
ILDT46
ILDT46
ILDT46
1L0T46
M / 700,860
E/
M / 230
F1,F20
X1,X20
Fl ,F20,F21 ,F42
Fl ,F20,X21
Fl,F20
Fl ,F20,P42,X21
X1,X20
X1,X20
APPENDIX TABLE A-4. WATERBODY SPECIFIC INFORMATION FOR RIVERS AND STREAMS IN THE LOWER FOX RIVER WATERSHED, 1998.
Waterbody ID
Segment
ID Catalog Unit Segment Name
Size
in
Cycle Key Sample
Assessment
Designated
Causes of
Sources of
Miles
Year Date
Type/Methods Uses
Impairment
Impairment
DT 03
07120007
FoxR.
5.84
2000 01/0111996 MI 700,860
F1,F20,F21,N42
DT 09
07120007
Fox R.
6.655
2000 01/0111998 MI 230.700.
F21,P1,P20,P42
300,600.900,920,
200,400,4000,7000,
860
.
1200,1220,1500,2100
7400.8500
DT 38
07120007
FoxR.
12.135
2000 01/01/1998 MI 230
F1,F20,N42,X21
DT 58
07120007
FoxR.
4.285
2000
E/
Fl,F20,X21
DT 69
07120007
Fox R.
4.65
2000 01/01/1996 MI 700,860
F21,P1,P20
300,900,920,1200,
200,4000,7000,7400,
1500,.
8500
DTP 01
07120007
Whites Cr.
1.34
2000
E /
X1,X20
DTZJO1
07120007
Morgan Cr.
8.23
2000 01/01/1988
E 1150,860
P1.P20
0
9000
DTZNO1
07120007
Norton Branch
4.55
2000
E /
DTZOO1
07120007
Brewster Cr.
5.82
2000
E /
DT
01
07120007
Fox R.
2.89
2000 01/01/1998
M
I
230
DT 02
07120007
FoxR.
11.22
2000
E /
F1,F20
DT 11
07120007
FoxR.
3.595
2000
El
F1.F20
DT 36
07120007
FoxR.
2.595
2000 01/01/1996
DT 41
07120007
FoxR.
12185
2000
DT 46
07120007
FoxR.
4.495
2000 01/01/1998
DTZA
07120007
O’Neill Branch
4.72
2000
E
I
DTZC
07120007
Brumbach Cr.
8.8
2000
E /
Page 1 of4
_
4
APPENDIX TABLE A-16. WATERBODY SPECIFIC INFORMATION FOR RIVERS AND STREAMS IN THE MISSISSIPPI RIVER NORTH CENTRAL
WATERSHED, 1998.
Waterbody
ID:
Segmenl ID: Catalog Unit Segment Name
-~ ~
Size in
Miles
Cycle Key Sample
Year Date
Assessment
Type/Methods
Designated
Uses
Causes of
Impairment
Sources of
Impairment
ILLDDO1
ILLDDO1
LDD-C3
LDD-C3a
07080104
07080104
Cedar Cr.
Cedar Cr
3.05
2.55
2000 01101/1994
2000 01/01/1994
M/ 300
M/ 300
Pl,P20
P1,P20
410,900,910,920,
930
410,900,910
200,400,1000,1800,
4000,8500
200,400,1000,8500
ILLDDO1
ILLDDOI
LDO-C6
LODA
07080104
07080104
Cedar Cr
Johns Cr.
5.62
8.53
2000 01/01/1994
2000
MI 300
E
I
Pl,P20
Xl,X20
410,900,910,920.
1100
1000,7000,7550.7700,
8500
ILLDDO1
LOOM
07080104
DavidsCr.
11.69
2000
E /
Xl,X20
ILLODO1
LDDB
07080104
TalbotCr
9.77
2000
E /
X1,X20
ILLOOCO1
ILLDEO1
LDDC
LDEO1
07080104
07080104
Markham Cr.
N. Henderson Cr.
5.75
30.78
2000 0110111994
2000 01/0111994
M/ 300
M/ 700
P1,P20
F1,F20
900,910,920,1100,
1200,1300
200
~
ILLOEO1
ILLDEO1
LDEA
LDEC
07080104
07080104
Snake Cr.
Goose Run
4.42
5.74
2000
2000
EI
E
I
Xl,X20
Xl,X20
ILLDGO1
LOG 01
07080104
Middle Henderson Cr.
14.26
2000 01/01/1994 MI 700
Pl,P20
900,930,1100
1000,7000
ILLDGO1
LDGA
07080104
Toms Cr.
6.48 2000
E
I
X1,X20
ILLDHO1
LDH
07080104
S. Henderson Cr.
11.7
2000
M
I
Xl ,X20
ILLEO1
LE 03
07080104
Pope Cr.
24.01
2000 01/0111991
E/ 150
F1,F20
ILLEO1
LE 04
07080104 Pope Cr.
7.31 2000 0110111991 E / 150
F1,F20
ILLEO1
LE
05
07080104
Pope Cr.
25.03 2000
0110111991 E /150
F1,F20
ILLEO1
LEA
07080104
Mad R.
7.38
2000
E /
X1,X20
ILLEO1
LEB
07080104 Wildcat Cr.
6.42
2000
E /
X1,X20
ILLEO1
LEO
07080104
Pike Run
6.99
2000
El
X1,X20
ILLEO1
LEE
07080104
Dugout Run
4.21
2000
E
I
Xl,X20
Page
4 of6
Causes of
Impairment
Sources of
Impairment
ILKO1
K 09
07110004
Mississippi R.
6.21
2000 01101/1998
E / 190
P1,P20,P21
300,1200
9000
ILKO1
K 98
07110004
Mississippi
R.
29.3
2000 01/01/1998
E / 190
P1,P20,P21
300,1200
9000
ILKO1
TK 07
07110004
Mississippi R.
7.29
2000 01/0111998
E
I
190
P1,P20,P21
300,1200
9000
ILKO2
KE
07110001
Curtis Cr.
6.58
2000
E
I
X1,X20
LKO2
TK 12
07110001
Mississippi R.
10.96
2000 0110111998 E / 190
F50,P1,P20,P21
300,1200
9000
LKO2
TK 13
07110001
Mississippi R.
5.54
2000 01/0111998 E / 190
F50,P1,P20,P21
300,1200
9000
ILKO3
KZQ
07110001
ShuhartCr.
5.86
2000
E /
X1,X20
~
I~)
ILKO3
LKO3
ILKO3
1K 15
TK 16
TK 17
07110001
07110001
07110001
Mississippi R.
Mississippi R.
Mississippi R.
2.51
14.62
3.95
2000
2000
2000
01101/1998
01/01/1998
01/01/1998
E/
E/
EI
190
190
190
F50,Pl,P20,P21
P1,P20,P21
F50,P1,P20,P21
300,1200
300,1200
300,1200
9000
9000
9000
ILKO6
K 02
07110004
Mississippi R.
32.13
2000 01/0111998 E / 190
P1,P20,P21
300,1200
9000
ILKO6
KZF
07110004
West Point Cr.
3.1
2000
E I
Xl,X20
ILKO6
KZN
07110004
Indian Cr.
3.3
2000
E /
X1,X20
ILKO6
1K 01
07110004
Mississippi R.
2.37
2000
01/01/1998
E
I
190
P1,P20,P2l
300,1200
9000
ILKO7
K 14
07110004
Mississippi R.
11.94
2000 01/01/1998
E / 190
P1,P20,P21
300,1200
9000
ILKO7
TK 04
07110004
Mississippi R.
23.31
2000 01/01/1998
E
I
190
P1,P20,P21
300,1200
9000
ILKO7
1K 06
07110004 Mississippi R.
0.43
2000 01/01/1998 E I 190
Pl,P20,P21
300,1200
9000
LI~CO1
l~C01
07110004
The Sny
12.65
2000
E /
Xl,X20
L~’.CO1
F~LK
07110004
Fox Cr.
5.92
2000
E
I
Xl ,X20
~~TTTiiITf
~‘caterbcd~ID
Segment
ID Catalog Unit Segment Name
APPENDIX TABLE A-19. WATERBODY SPECIFIC INFORMATION FOR RIVERS AND STREAMS IN THE MISSISSIPPI RIVER CENTRAL WATERSHED,
Size in
Cycle Key Sample
Assessment
Designated
Miles
Year Date
Type/Methods Uses
Page 1 of 4
APPENDIX TABLE B-26. WATERBODY SPECIFIC INFORMATION FOR LAKES IN THE BIG MUDDY RIVER WATERSHED, 1998.
Assessment
Designated
Type/Methods
Uses
M/
205
F20,N1l,P1,P21.
P42 ,X50
F20,F50,N21 ,P1,
P11,P42
F20,P1 ,P1 1 P42,
X21 ,X50
F20,F42,F50,N21,
F20,N42,Pl P11,
X21 ,X50
Fl ,F20,F21 ,F50,
Pl1,P42
F20,F50,P1 P11,
P42,X21
Fl Fl 1 ,F20,F42,
X21 ,X50
Fl ,F1 1 ,F20,F42,
X21 ,X50
Fl ,F20,F21 ,F50,
P1l,P42
F50,Pl P1 1 P20,
P42,X21
Xl Xli ,X20,X21,
X42,X50
Causes of
Impairment
300,410,900,910,
920,1100,1200.2100,
2210
500,560,900,910,
920,1100,1200,2100,
2210
900.910,920,1100,
1200,22 10
300,500,560,900.
920,1100,1200
900,910,920,2210
300,900,910,920,
2210
300,900,910,920,
1100,1200,2100,2210
Sources of
Impairment
1000,1050,1100,1350,
1400,6000,6600,7550,
7700,8500,8700,8930,
8960
200,1000,1050,1100,
1350,1400,4000,5000,
5100,5200,5500,5700,
7550,7700,8300,8500,
8700,8960
200.1000,1050,1100,
1350,1400,7550,7700.
8500,8600.8700,8960
1000,1350,1400,7550.
7700,8940,8960
1000,l050,1l00,1300,
1350,7550.7700,8500.
8600,8960
1000,1050,1100,6000,
6500,8960
1000,1050,1100,1350,
1400,8500,8960
1000,1050.llOO,6000,
6500.7550,7700,8960
Size in
Acre
6965
Segment ID: Catalog Unit Segment Name
RNA
07140106
CRAB ORCHARD
07140106 REND
07140106
KINK.AID
Cycle Key Sample
Year Date
2000 05101/1997
Waterbody ID
ILRNA
ILRNB
ILRNC
ILRND
ILRNE
ILRNG
‘~
ILRNI
ILRNJ
ILRNK
ILRNL
ILRNM
ILRNN
18900
2000 05/0111995
3475
2000 05/01/1997
143
2000 05/01/1997
1800 2000 0510111997
F21,F50,P1,P1 1,
900,1100,1200.2100,
P20,P42
2200
RNB
RNC
RND
RNE
RNG
RNH
RNI
RNJ
RNK
RNL
RNM
RNN
07140106
07140106
07140106
07140106
07140106
07140106
07140106
07140106
07140106
MURPHYSBORO
CEDAR (JACKSON)
DUQUOIN
PINCKNEYVILLE
CARBONDALE CITY
DEVILS KITCHEN
LITTLE GRASSY
MARION
WASHINGTON CO.
M
I
869
M
I
205
M / 205
M
I
205
E
I
814
M
I
205
M I 205
M / 205
M I 205
M / 205
M
I
205
El 811
244
165
135.6
810
1000
220
295
2000 05101/1998
2000 05/01/1997
2000 0510111997
2000 0510111997
2000 0510111997
2000 0510111997
2000 05/0111998
07140106
MOSES
169.6
2000 05/01/1978
Page 1 of 3
05586100 DATA: Chemical and Microbiological Tables, 1998
Station list
Available data
05586100 ILLINOIS RIVER AT VALLEY CITY, IL
Page 1 of3
DIS-
PH
OXYGEN,
AGENCY
AGENCY
CHARGE,
NUMBER
SPE-
WATER
DIS-
COL-
ANA-
INST.
OF
CIFIC
WHOLE
SOLVED
LECTING
LYZING
CUBIC
SAM-
TEMPER-
CON-
FIELD
OXYGEN,
(PER-
SAMPLE
SAMPLE
GAGE
FEET
STREAM
PLING
ATURE
DUCT-
(STAND-
DIS-
CENT
DATE
TIME
(CODE
(CODE
HEIGHT
PER
WIDTH
POINTS
WATER
ANCE
ARD
SOLVED
SATUR-
NUMBER)
NUMBER)
(FEET)
SECOND
(Fl)
(COUNT)
(DEGC)
(US/CM)
UNITS)
(MG/L)
ATION)
(00027)
(00028)
(00065)
(00061)
(00004)
(00063)
(00010)
(00095)
(00400)
(00300)
(00301)
JUL
07... 1250
81700
80020
14.98
50400
800
07... 1251
81700
9720
--
--
--
21...
1400
81700
80020
10.12
35400
800
21... 1401
81700
9720
--
AVG
04... 1510
81700
80020
3.05
9680
700
04...
1511
81700
9720
--
--
-.
12... 1750
81700
80020
7.20
21500
800
18... 1230
81700
80020
3.82
12400
800
18...
1231
81700
9720
--
--
--
EXHIBIT 6
ILLINOIS RIVER BASIN
LOCATION.--Lat
39°42’12”,long 90°38’43”,in SE1/4NW1/4 sec.34, T.15 N., R.14 W., Scott
County, Hydrologic Unit 07130011, on upstream side of Norfolk & Southern Corporation Railroad
bridge at Flints Creek, 0.4 ml east of Valley City, 1.8 mi downstream from Mauvaise Terre Creek,
and at mile 61.3.
DRAINAGE AREA.--26,743 mi2, does not include diversion from Lake Michigan through the
Chicago Sanitary and Ship Canal, which has occurred since Jan. 17, 1900.
PERIOD
OF
RECORD--Water-quality records, water years
1975
to 1993, 1996 to current year.
WATER-QUALITY DATA,
WATER
YEAR OCTOBER
1997
TO SEPTEMBER
1998
OCT 1997
21... 1310
81700
80020
2.00
6630
700
10
6.3
735
78
93
95
NOV
18... 1330
81700
80020
2.47
8280
660
10
5.!
776
7.7
12.5
98
DEC
16...
1320
81700
80020
3.22
10900
700
tO
2.3
826
8.1
14.4
lOS
JAN 1998
13... 1450
8I700
80020
10.25
39300
900
tO
2.0
720
77
2.8
93
FEB
04... 1330
81700
80020
7.77
27300
800
0
3.5
762
8.0
127
96
MAR
0. .
1530
81700
80020
12.08
39900
800
10
4.5
598
8.1
I2.3
96
APR
MAY
JUN
01..
1600
81700
80020
1843
69600
1000
14...
1250
81700
80020
1783
59100
1200
28 .
1220
81700
80020
1455
46000
1Q00
12...
1250
81700
80020
17.46
69300
2000
27...
1240
81700
80020
16.98
61300
2000
09... 1830
81700
80020
10.39
32800
900
18... 1330
81700
80020
14.01
49800
900
23... 1350
81700
80020
17.80
63900
2000
10
13.6
594
10
13.3
610
10
5.2
699
7.8
8.8
85
7.9
9.4
90
8.3
10.3
102
10
19.6
574
8.0
8.6
94
10
21.4
519
7.5
5.9
67
10
19.3
688
10
22.8
491
10
24.7
491
7.9
7.4
81
7.5
6.7
78
7.5
6.0
72
10
27.8
623
7.8
5.7
72
10
30.1
574
7.7
5.2
69
10
27.6
669
7.9
7.5
96
10
28.4
630
7.7
4.9
63
10
28.6
621
7.5
5.3
69
file://D
:\data\swl98\05 5861 00.htm
4/9/02
05586100 DATA: Chemical and Microbiological Tables, 1998
Page 2 of 3
SEP
01... 1230
81700
80020
3.20
10200
760
01... 1231
81700
9720
--
--
--
IS... 1230
81700
80020
2.17
6600
680
IS... 1231
81700
9720
10
27.0
659
tO
24.7
685
7.9
5.4
68
7.8
6.4
78
ALKA-
CAR-
BICAR-
SOLIDS,
MAGNE-
POTAS-
LINITY
BONATE BONATE
CHLO-
FLUO-
SILICA, RESIDUE
CALCIUM SlUM, SODIUM,
SlUM,
WATDIS WATER WATER
RIDE, SULFATE RIDE.
DIS-
AT 180
DIS-
DIS-
DIS-
DIS-
TOT IT
DIS IT
DIS IT
DIS-
DIS-
DIS.
SOLVED
DEG. C
SOLVED
SOLVED
SOLVED
SOLVED
FIELD
FIELD
FIELD
SOLVED SOLVED SOLVED
(MG/L
DIS-
DATE
(MG/L (MG/L (MG/L (MG/L MG/L AS MG/L AS MG/L AS (MG/L (MG/L (MG/L
AS SOLVED
AS CA)
AS MG) AS NA)
AS K)
CACO3
CO3
HCO3
AS CL)
AS SO4)
AS F)
S102)
(MG/L)
(00915)
(00925)
(00930)
(00935)
(39086)
(00452)
(00453)
(00940)
(00945)
(00950)
(00955)
(70300)
OCT 1997
63
25
51
5.2
192
66
27
54
4.8
196
73
30
56
4.4
200
69
28
38
3.7
178
77
32
40
3.4
208
63
28
23
2.9
160
58
24
27
3.0
158
63
26
24
2.8
176
75
30
29
2.7
212
57
25
19
3.2
178
53
22
15
3.3
156
68
30
28
3.3
212
50
22
15
3.9
142
48
21
13
3.6
144
64
26
2I
3.5
202
58
26
21
3.5
176
0
239
77
82
o
244
85
81
0
217
75
58
0
254
73
72
0
195
51
56
0
193
52
46
0
215
45
54
10
239
57
65
0
217
36
48
0
190
29
41
o
259
46
60
O
173
27
37
0
176
24
35
0
246
39
50
O
215
35
45
.45
5.7
488
.41
5.3
509
.30
8.4
430
.30
8.2
478
.23
6.6
374
.28
7.4
352
.26
7.1
373
.25
3.9
432
.24
4.7
340
.22
7.8
315
.31
6.0
410
.29
8.0
286
.21
7.2
317
.32
7.2
367
.29
6.6
360
.36
6.1
371
.44
6.1
377
.39
7.2
360
.37
5.3
402
.49
4.3
410
NITRO- NITRO- NITRO- NITRO. NITRO-
PHOS-
GEN.
GEN, GEN.AM- GEN,AM- GEN,
PHOS-
PHORUS
MANGA-
CARBON.
AMMONIA NITRITE MONIA + MONIA + NO2+NO3 PHOS- PHORUS ORTHO, IRON.
NESE, ORGANIC
DIS-
DIS-
ORGANIC ORGANIC
DIS-
PHORUS
DIS-
DIS-
DIS-
DIS-
DIS.
SOLVED SOLVED DIS. TOTAL SOLVED TOTAL SOLVEDSOLVEDSOLVED SOLVED SOLVED
DATE (MG/L
(MG/L
(MG/L
(MG/L
(MG/L
(MG/L (MG/L (MG/L
(UG/L
(UG/L
(MG/L
AS N)
AS N)
AS N)
AS N)
AS N)
AS P)
AS P)
AS P)
AS FE) AS MN)
AS C)
(00608)
(00613)
(00623)
(00625)
(00631)
(00665) (00666)
(00671) (01046)
(01056)
(00681)
OCT
1997
21...
.137
.061
.55
1.2
1.93
.453
.274
.225
3.0
3.5
4.4
NOV
8...
.187
.047
.62
.86
4.05
.435
.395
.341
3.0
2.5
4.3
DEC
16...
.020
.097
.56
.69
3.82
.436
.383
.291
tO
4.0
4.3
21...
234
78
81
.51
3.4
446
NOV
I 8...
DEC
16...
JAN 1998
13...
FEB
04...
MAR
10...
APR
0 I...
14...
28...
MAY
2...
27...
JUN
09...
18...
23...
JUL
07...
07,..
21...
21...
AUG
04...
04.
2..
18...
18...
SEP
0I...
01...
IS...
15...
63
29
30
3.5
210
0
256
46
57
52
22
39
4.4
154
0
188
53
61
54
23
33
4.7
170
0
207
51
58
57
26
38
4.4
182
0
222
58
63
54
25
46
5.0
172
0
210
69
68
file://D:\data\sw198\05586 1 00.htm
4/9/02
r—Doconc
Temp
—Sat.1
—~
35
30
25
20
15
-
10
5
0
—DO
Conc
Temp —
Sat.
140
120
-
100
-80
-
60
-40
-
20
-0
Illinois River (Aug. 7
-
Aug. 12)
35-
.
140
30-
120
25
100
5
-~-—-----~--~--
~-
~—~----~--——
-_-
-~-——--
~
20
0
I
III
~ o c
o c o c’~ o c c~
cD
C\J
cI
C\J
c
C\J
c
C’I
C
C\J
0
(“I
Salt Creek (Aug. 13
-
Aug. 18)
35
30
25
20
15
10
5
0
‘-
0
0
‘-
C
‘-
C
‘-
‘-
C
0
‘-
1~
0
~
0
0
~
0
~
~-
0
‘-
0
o
C’J
0
C’J
0
(NO
(NO
(NO
(N
140
120
100
80
60
40
20
U
Middle Fork Vermillion (Aug. 13
-
Aug. 18)
~
EXHIBIT
7
FOX
RIVER
NEWJ
•O~’er400lakes
• +5 dams
• 214,000 people
depend on the Fox
River for drinking
water
Over 150
state-threatened
& endangered
species within
the Watershed
Sampling for
the study took place during summer
low-flow conditions at
40
sites
located
in free-flowing
river areas directly below dams, impounded river
directly above dams, and free-flowing or impounded
mid-segment areas between dams. Results convinc-
ingly showed that dams are having a detrimental
effect on
the
Fox River
by
reducing biodiversity of
fishes and altering macroinvertebrate communities.
Dams appeared to influence these aquatic
organisms by degrading
habitat and water quality
conditions and fragmenting the river
by acting as
barriers to fish movement.
By Guest Columnist
Victor J. Santucci, Jr.
Research Biologist
Max McGraw
Wildlife Foundation
Dundee, Illinois
Following are highlights of the study results, or ten ways
dams are impacting the Fox River.
~tij2~
Dams adversely affect fish communities. Based
on fish community index values, free-flowing river
reaches (below dam or mid segment free-flowing
stations) averaged a “B” rating or highly valued aquatic
resource, whereas impounded reaches (above
dam
and
mid
segment impounded stations) averaged a
“D”
ratin$or
limited
aquatic resource.
~J~j
Free-flowing reaches supported more abundant
sport fish communities than impounded reaches.
?‘
Dams were found to restrict distributions of
30
species of fish.
Dams alter and degrade macroinvertebrate
communities. Stations
within free flowing reaches of
the river
had
an abundance of mayflies and caddis flies
whereas impounded stations
had high
proportions
(95) of tolerant midge larvae (chironomids) and
benthic worms (oligocheates).
~,
Dams may be preventing freshwater mussel
recolonization of improved sections of river because
mussel larvae use fish as a means for dispersal and dams
block fish migrations.
The
Fox
River Ecosystem
Partnership’s newsletter for the Fox River Watershed community
WINTER 2002
Fox River Fish Passage Feasibility Study
Our partnership
is known
as
FREP
The Fox River
Watershed lies
mainly within the
counties of:
Cook
DeKaIb
DuPage
Kane
Kendall
Lake
LaSalle
McHenry
Fox River
Watershed Facts:
• l~720square miles
• 1
~0 miles in length
T
here
are 15 mainstem dams and numerous
tributary dams in the Illinois portion of the
Fox River watershed. Many of these dams
were
originally built in the 1800’s to provide
mechanical power for grist or lumber mills, but today
serve little function except to maintain flat-water
pools/impoundments upstream of the dams.
The
Max McGraw
Wildlife Foundation has recentlycom-
pleted
a two-year study to determine the effects of
dams on fisheries,
macroinvertebrates, physical
habitat,
and water quality in a 100-mile
stretch of
the Fox River between theChain of
Lakes and Dayton,
Illinois. In addition, fish passage options were
iden-
tified for each of the 15 mainstem dams. Options
included complete dam removal and river restoration
or retrofitting dams with ramps, fishways, or bypass
channels to provide fish and/or canoe passage.
Cooperators on this project include the USEPA, the
Illinois Department of Natural Resources, and Steve
Gephard, a Fish Passage Specialist from Connecticut.
•~heWatershed
Biodiversity
Inventory includes
over 360
sites:
prairies, marshes,
fens, bogs, woods,
preserves, wetlands
& bluffs
I
Habitat quality
indices indicated
good
habitat quality
in the free-flowing
river and severely
degraded habitat in
impoundments.
Continued onpage 2
I
EXHIBIT 8
Fox River Fish Passage Feasibility Study,
continued
The 15 Fox River dams are impounding 47 of river
miles and 55 ofsurface area in the nearly 100 miles of river
between the Chain of Lakes and Dayton, Illinois.
Nutrient concentrations (total phosphorus and
nitrogen) and algal biomass were extremely high in the river
during
the summer low-flow period.
4~j74Dissolved
oxygen concentrations fluctuated widely at
impounded stations (2.5 - 20 mg/I), but not at free-flowing
stations (5-8 mg/I). Dissolved oxygen fluctuations appear to
be driven by daytime photosynthesis (oxygen is produced) and
nighttime respiration (oxygen is consumed) of planktonic algae.
Minimum dissolved oxygen levels fell below the IEPA
recognized standard of 5 mg/I at 9 of 11 impounded reaches
of river between McHenry and Dayton, Illinois. Substandard
oxygen sags occurred throughout impounded reaches not just
immediately above
the dams, lasted
from 1 .5 to 16 hours in
a 24-hour period, and occurred during periods of low flow
and high water temperature or from July through September
in 2001.
A project final report will be available in May. In the report,
we will summarize all of the data collected during the
study and recommend that some form of fish passage be
considered at
all
Fox River dams. Determining the correct
passage option for an individual dam is
a complicated
decision involving many stakeholders (i.e., dam owners,
government agencies, local municipalities, organizations, and
the public) and a variety of social, economic, and environ-
mental issues. Our data suggest that dam removal is the best
option when the ecological health of the river is of prime
consideration. Removing dams
will eliminate barriers to
migration for
all
types and sizes of
fish, restore high quality
river habitat, and eliminate
lake-like conditions that
support
high
algal biomass and
substandard dissolved oxygen levels.
Ramps, fishways, and bypass channels
will
allow fish to get
over or around dams but
will do little or nothing to improve
habitat and water
quality conditions in the river. These alter-
natives should be considered only when dam removal is ruled
out as a fish passage option.
HONOR: ROLL
~,EN,DORJEMENTI
:,
~
~.
forthe
Integrated
~i4aAágemeñt
Plan for the Fox
River
“Watérsh~4inIllinois
Applied
Ecological
Services,
Inc.
Batavia
l~ark
District
Blackberry CreekWatershed
City
of Aurora
Dundee
Township
Fox Valley
Land
Foundation
Fox Valley
Park
District
Friends
of
the Fox River
Illinois Smalimouth Alliance
Kane County Board
Kane County Forest Preserve
Kane-DuPage Soil &Water Conservation
District
Kendall County Forest Preserve
Kendall County Soil &Water Conservation District
Lake County Soil & Water Conservation District
LaSalle County Soil &Water Conservation District
Lake County
Stormwater Management Commission
~ Land
Foundation of McHenry,County
Max’MvGraw Wildlife Foundation’
McHenry
C~unty
ConservalionDistrict
McHenryCounty
Defenders
McHenry
County Soil
&Water Conservation District
Nippersink
Creek
Watershed Planning Committee
North Cook Soil &Water Conservation District
~OswegolandPark
District
~
S!~riáClub of Illinois
Sierra ClubNalleyof the Fox Group
The’Conse~tioñFoundation
‘The
Nature
dinservancy
US Fish & Wildlife Service/Chicago Field Office
Village of Fox River Grove
Watersked Resource consultants, Inc.
This
list
is growing
-
but
our goa! is.to have,~jj
the stakeholder
organizatiowt.
agencies &
communities
of the
Fox
River
Watershed included. If you aren’t on it
—
We
need
YOU!
Endorsing & Implementing
the
Integrated 4lanagement Plan
FREP created this plan for our watershed and we need everyone’s
involvement. An Implementation Tool Kit assists “stakeholders” in
studying and utilizing Plan recommendations. Governmental bodies
and organizations within the Watershed are asked to adoptlendorse
the
Integrated Management Plan.
A sample endorsement
resolution is
included in the Tool Kit.
To obtain a copy of the Tool Kit:
Email foxriverinfo@aol.com
or call Becky Hoag, FREP Communications Manager at:
630/482-9157
Components of the Tool Kit can be obtained in Adobe
PDF format from our website:
foxriverecosystem.org
Draft Fox River aquatic life use support for 2002 (based on 2000 or earlier data).
Segment ID
Aquatic Life Use
Support
Potential Causes
DT-35
Full
DT-23
Not Assessed
DT-22
Partial
Nitrate, siltation, flow alteration, other habitat alteration,
suspended solids
DT-06
Partial
‘
Priority organics, nitrate, siltation, low DO, flow alteration,
other habitat alteration, suspended solids
DT-20
Partial
Low DO, flow alteration, other habitat alteration
-.
DT-18
Partial
Priority organics, nitrate, siltation, low DO, flow alteration,
other habitat alteration, suspended solids
DT-09
Partial
Priority organics, nitrate, siltation, low DO, flow alteration,
other habitat alteration, suspended solids
DT-69
Partial
Priority organics, nitrate, siltation, low DO, flow alteration,
~otherhabitat alteration
DT-58
Partial
Low DO, flow alteration, other habitat alteration
DT-38
Partial
pH, siltation, low DO, flow alteration, other habitat
alteration, suspended solids
DT-03
Full
DT-1 I
Partial
Priority organics, phosphorus,
pH, siltation, low DO, flow
alteration
DT-41
Full
DT-02
Full
DT-36
Full
DT-46
Partial
pH, siltation, flow alteration, suspended solids
DT-01
Partial
pH, siltation, flow alteration, other habitat alteration,
suspended solids, excessive algal growth.
Fox River Segments in upstream to downstream order (River Miles from Healy, 1979).
Segment ID
Description
DT-35
From: Grass Lake (RM 110.1)
To: Illinois/Wisconsin state line (RM 115.1)
DT-23
From:
Stratton Dam
(RM 97.7)
To: Pistakee Lake (RM 105.0)
DT-22
From: Tower Lake trib (RM 88.6)
To: Stratton Dam (RM 97.7)
DT-06
From: unnamed trib upstream Carpentersville Dam
(RM 78.6)
To: Tower Lake trib (RM 88.6)
~DT..2O
From: Jelkes Creek (RM 74.6)
To: unnamed trib upstream Carpentersville Dam
(RM 78.6)
DT-18
From: Poplar Creek
(RM 68.8)
To:
Jelkes Creek (RM 74.6)
DT-09
From: Ferson Creek (RM 60.9)
To: Poplar Creek (RM 68.8)
DT-69
From: Mill Creek (RM
53.0)
To: Ferson Creek
(RM 60.9)
DT-58
From: Indian Creek, Aurora (RM 49.0)
To: Mill Creek (RM 53.0)
DT-38
From: Waubonsee Creek (RM 42.7)
To: Indian Creek, Aurora (RM 49.0)
DT-03
From: Morgan Creek (RM 37.8)
To: Waubonsee Creek (RM 42.7)
DT-1 1
From: Rob Roy Creek (RM 31.3)
To: Morgan Creek (RM 37.8)
DT-41
From: Somonauk Creek (RM 20.1)
To: Rob Roy Creek (RM 31 .3)
DT-02
From: Indian Creek, Wedron (RM 9.4)
To: Somonauk Creek (RM 20.1)
DT-36
From: unnamed trib (RM 6.9)
To: Indian Creek, Wedron (RM 9.4)
DT-46
From: O’Neill Branch (RM 2.5)
To: unnamed trib (RM 6.9)
DT-01
From: confluence with ‘Illinois River
To: O’Neill Branch (RM 2.5)
UNITED STATES ENVIRONMEPITAL PROTECTION AGENCY
‘
.
‘
HEGlOt~~ ‘
71
WEST JACKSON BOULEVARD
-
CHICAGO, IL
60604-3590
‘ ‘
REPLY TO,TPF
ATTUNIIOf’~OF:
WN-16J
OC1O6i998
‘
.
Mi; ‘I’homas G. McSwiggin
Manager, Permits Section
Division ofWater Pollution Control
Illinois
Environmental
Protection Agency
Post Office Box 19276
Springfleld, Illinois 62794-9276
Re:
Minnesota Mining &
Manufacturing
Co.
-
Cordova
Plant
Cordova, Illinois
Permit No.: 1L0003 140,
Draft Permit Modification: July 27, 1998
Dear Mr. McSwiggin:’
~‘
In follow up to our September 9, 1998, Iftter related to the subject permit, please find encloseda
March 18, 1998, letter from the Iowa Department ofNatural Resources (IDNR) to the Archer
Daniels Midland Company (ADM) specifying
BOD
limits
in a
reissued permit and the basis for
not iuicreasing the BOD limits as requested
by ADM. In
our discussion related toihe
Septernbsr 9, 1998, letter, you indicated that IDNR.had increased
HOD loading
fbr ADM and the
Illinois Environmental Protection Agency (IEPA) felt that a similar increase for thc subject
facility would be appropriate..
Since this is not the case and water quality standards fordissolved oxygen ar~not being met, this
office firmly believes that BOD increases for the subject facilityare not warranted, and wc would
have to officially object to any permit with
BOD
increases based on regulations
at 40 Code of
Federal Regulations 122.44(d) and
35
Illinois Administrative Code
304.105.
If JEPA
wishes to
pursue this issue, it would be appropriate
that a TMDL
process be initiated or provide us with a
firm basis as to why the BOO increase should be allowed,
EXHIBIT 9
R.cycl.dlR.oyufebl,. Prlr’.Ied *~bVegetable Ott OaSo(J Ir~$On
50 Acc~ded
Paper
120
Poa4COnsurfli~()
-~ Ud3
Sn
3.
2
Please let us know
as
soon as possible
your
decision related to this issue.
USEPA,
reluctantly,
would have to object within90 days to such an increasc without further infçrmation. Please let
me
know
your decision
at
yourearliest convenlence~
-
Sincerely yours,
Eugene I. Chaikcn, Chief
NPDES Support and Technical Assistance ~ranch
Enclosure
-
~wl-.- —
—
..~—
i_____
--~--
___I._. F~~-ET?1 w?489 812 m?505 812 l?S?BT?
-
-
.
-
..—.-.~
—
i~qy~-~.5\Lff)SL4l)~j~
f
,rrrr~
STAtEOr
-
--
--
-
TFRUY F. C~ANSTAO.ao~p~p4oR
DEPARTMENT OF NATURAL
LARRY .1. WPLSON.
RESOURCES
ot~fcro~
March 18,
1998
-
.
Mr.
Harry
Sutcliffe
WVVTP Superintendent
-
-
-
‘Arche,
Daniels Midland Company
.1251 Beaver Channel
Parkway
Clinton, Iowa 52732-5935
RE: Final NPDES
Permit
No,: 23-26-1-01
Dear Mr. Sutcliffe:
-
This
letter
transmits the final NPDES
i~ermit
for the discharge from the ACM facility in
Clinton, Iowa and responds to comments provided in a February 27, 1998 letter from
Mr. Mark ~,atmes,Director of Corporate Environmental Services for ADM.
This final ~
permit differs frdm the draft
permit
mailed to you August 4, 1997 as follows:
-
1. The final permit includes an average
~OD~
limit of 18000 pounds per day rather
than the 21,400 pounds per day limit previously proposed.
2. The final permit contains a
narrative
effluent limit that prohibits
the
discharge of
substances that cause or contribute to a violation of State water
quality criteria,
spedflcally the prohibition on discharges that cause aesthetically objectionable
conditions in the receiving stream.
3. The final permit defines
how
the department will determine compliance with the
narrative water quality
criteria.
4. The
final
permit contains a modified reopener clause that provides the opportunity
to
increase
the average BOD~limit in
the future
upon a demonstration that higher
limits ~NWnot violate either technology based limits specified in 40 CFR part 405 or
state water quality criteria
5.
Tue
final
permit includes requIrements for monitoring of ground water in the
vicinity
of the,c~e*anaerobic treatment unit
-
6. The final permit requires monitoring of the newest
aeration
basin, basin MF~.
The department originally
proposed a
monthly average 8005 lImit of 21,400 pounds
per day,
the same limit that
was contained
in
the
previous permit. EPA recommended,
and the department
agreed,
that the permit should not
authorize
an increase in
the
discharge of BOO5 above present levels while there are violations of
water quality
criteria. We
reviewed
existing monitoring data and determined
that the 18,000 pounds
WALL.AC~STATE O~VICEBUILDING /DES MOINES. IOWA
~(ti4
I
~t~.~*t.a$A1
I
lnri ..
~
per
day
l)mit
is representative of
current
discharges and
Is achievable~withoutadditional
-‘
treatment, The.permit limit
does not
restrict
ADM’s ability h increase production
it only
restricts the
amount of
pollutants that
may be distharged.
The
narrative permit limit reiterates the water quality
criteda
specified in 567 61.3(d)
I.AC.
that
prohibits the discharge of substances—iA
a
wastewater discharge that
wile
create aesthetlcaUy objectionable conditions in the receiving stream~
Rule
567~.
64.7(2)(f)(1)
~iIlowsthe department to include In a
permit
any limitation
.
necessary to
meet water quality standards,
treatment
or pretreatment standards, or schedules of
compliance established pursuant-to any Iowa law or regulition, or to implement the
policy
of
nondegradation in
567-subrule 61.2(2). The permit does not
revise
any water
quabty
standard but rather specifies
how the
department will determine compliance with
the narrativewatar quality
limit. This
is
an appropriate permit condition, was requested
by ACM
staff
on at least
two
occasions, and is no
different than
the requirements in the
permit that describe
how
compliance with
the
temperature limits is $termined.
lurtherrnore,
ACM has not proposed alternative methods that
would
be appropriate for
determining compliance.
-
ADM requested that thti de1.artment issue a permit that: 1) contains an average 8OO~
permit limit of 21,400 pounds per ~day;2) allows ACM to continue and complete the
facillt~Jmprovementscurrently underway, and; 3) allows ACM to design and implement
a sampling plan., The
final
permit, with the exception of the BOO5 limit, fulfills each of
these requests.
You have the right to appeal any of
the
conditions specified
in this
permit by filing a
written
notice
of appeal and request for administrative hearing with the director of the
department
within 30 days of your
receipt
of the permit. Please call me at 515-281-
8884 or contact me by E-mail at swil)iai~max.state.ia,usshould you have questions
about the permit.
You should
call
Diana Hansen
at
515-281-6267
if
you have
questions about appeal procedures.
Sincerely,
-
‘~k~~D.t~J~a~ -
Steven N.
..Wiliams
Environmental Specialist
Wastewater Section
Endoiüte
cc:
Ralphlummers, USEPA, Region VII
Jodi Millar, USFWS
Mark Herwig, lzaak Walton League
Mark Calmes, ACM
Decatur
9~
~
Sn
Biochemical Oxygen Demand
Page 1 of3
Surface
Water
Quality Division
Permits Section
Biochemical Oxygen Demand (BOD)
Biochemical Oxygen Demand, or BOD, is a measure of the quantity of oxygen consumed by
microorganisms during the decomposition of organic matter. BOD is the most commonly used
parameter for determining the oxygen demand on the receiving water of a municipal or
industrial discharge. BOD can also be used to ~vaIuate the efficiency of treatment processes,
and is an indirect measure of biodegradable organic compounds in water.
Imagine a leaf falling into a stream. The leaf, which is composed of organic matter, is readily
degraded by a variety of microorganisms inhabiting the stream. Aerobic (oxygen requiring)
bacteria and fungi use oxygen as they break down the components of the leaf into simpler, more
stable end products such as carbon dioxide, water, phosphate and nitrate. As oxygen is
consumed by the organisms, the level of dissolved oxygen in the stream begins to decrease
Water can hold only a limited supply of dissolved oxygen and it comes from only two sources-
diffusion from the atmosphere at the air/water interface, and as a byproduct of photosynthesis.
Photosynthetic organisms, such as plants and algae, produce oxygen when there is a sufficient
light source. During times of insufficient light, these same organisms consume oxygen. These
organisms are responsible for the diurnal (daily) cycle of dissolved oxygen levels in lakes and
streams.
If elevated levels of BOD lower the concentration of dissolved oxygen in a water body, there is a
potential for profound effects on the water body itself, and the resident aquatic life. When the
dissolved oxygen concentration falls below 5 milligrams per liter (mg/I), species intolerant of low
oxygen levels become stressed. The lower the oxygen concentration, the greater the stress.
Eventually, species sensitive to low dissolved oxygen levels are replaced by species that are
more tolerant of adverse conditions, significantly reducing the diversity of aquatic life in a given
body of water. If dissolved oxygen levels fall below 2 mg/I for more than even a few hours, fish
kills can result. At levels below 1 mg/I, anaerobic bacteria (which live in habitats devoid of
oxygen) replace the aerobic bacteria. As the anaerobic bacteria break down organic matter, foul-
smelling hydrogen sulfide can be produced.
BOD is typically divided into two parts- carbonaceous oxygen demand and nitrogenous oxygen
demand. Carbonaceous biochemical oxygen demand (CBOD) is the result of the breakdown of
organic molecules such a cellulose and sugars into carbon dioxide and water. Nitrogenous
oxygen demand is the result of the breakdown of proteins. Proteins contain sugars linked to
nitrogen. After the nitrogen is broken off’ a sugar molecule, it is usually in the form of
ammonia, which is readily converted to nitrate in the environment. The conversion of ammonia
EXHIBIT 10
Departmer~oF Environmental Quaii~
hup:: www deq state.
iii i
.
us/swq/perrn its/parameters/hod. htm
Biochemical Oxygen Demand
Page 2 of 3
to nitrate requires more than four times the amount of oxygen as the conversion of an equal
amount of sugar to carbon dioxide and water.
When nutrients such as nitrate and phosphate are released into the water, growth of aquatic
plants is stimulated. Eventually, the increase in plant growth leads to an increase in plant decay
and a greater ‘swing” in the diurnal dissolved oxygen level. The result is an increase in microbial
populations, higher levels of BOD, and increased oxygen demand from the photosynthetic
organisms during the dark hours. This results in a reduction in dissolved oxygen concentrations,
especially during the early morning hours just before dawn.
In addition to natural sources of BOD, such as leaf fall from vegetation near the water’s edge,
aquatic plants, and drainage from organically rich areas like swamps and bogs, there are also
anthropogenic (human) sources of organic matter. If these sources have identifiable points of
discharge, they are called point sources. The major point sources, which may contribute high
levels of BOD, include wastewater treatment facilities, pulp and paper mills, and meat and food
processing plants.
Organic matter also comes from sources that are not easily identifiable, known as nonpoint
sources. Typical nonpoint sources include agricultural runoff, urban runoff, and livestock
operations. Both point and nonpoint sources can contribute significantly to the oxygen demand
in a lake or stream if not properly regulated and controlled.
Performing the test for BOD requires significant time and commitment for preparation and
analysis. The entire process requires five days, with data collection and evaluation occurring on
the last day. Samples are initially seeded with microorganisms and saturated with oxygen
(Some samples, such as those from sanitary wastewater treatment plants, contain natural
populations of microorganisms and do not need to be seeded.). The sample is placed in an
environment suitable for bacterial growth (an incubator at 200 Celsius with no light source to
eliminate the possibility of photosynthesis). Conditions are designed so that oxygen will be
consumed by the microorganisms. Quality controls, standards and dilutions are also run to test
for accuracy and precision. The difference in initial DO readings (prior to incubation) and final
DO readings (after 5 days of incubation) is used to determine the initial BOD concentration of
the sample. This is referred to as a BOD5 measurement. Similarly, carbonaceous biochemical
oxygen test performed using a 5-day incubation is referred to as a CBOD5 test.
Water Quality Standards for BOD
Although there are no Michigan Water Quality Standards pertaining directly to BOD, effluent
limitations for BOD must be restrictive enough to insure that the receiving water will meet
Michigan Water Quality Standards for dissolved oxygen.
Rule 64 of the Michigan Water Quality Standards (Part 4 of Act 451) includes minimum
concentrations of dissolved oxygen that must be met in surface waters of the state. This rule
states that surface waters designated as coldwater fisheries must meet a minimum dissolved
oxygen standard of 7 mg/I, while surface waters protected for warmwater fish and aquatic life
must meet a minimum dissolved oxygen standard of 5 mg/I.
Biochemical Oxygen Demand Limitations in NPDES Permits
Typically, CBOD5 limits are placed in NPDES permits for all facilities which have the potential to
contribute significant quantities of oxygen consuming substances to waters of the state. These
limits are developed in direct correlation with limits for ammonia nitrogen and dissolved oxygen.
The nitrogenous oxygen demand is computed separately because of the difference in oxygen
demand (as explained above) and because the rate of oxygen consumption over time varies
‘.~
\\ v~
.deq.state.mi.usiswq/permits/parameters/bod.htm
2/19/02
Biochemical Oxygen Demand
Page 3 of 3
from carbonaceous oxygen demand. Ammonia is further considered separately because in
sufficient levels (dependant upon several variables) it can also be toxic to living organisms.
In determining CBOD5 limits, stream modelers use computer models which simulate actual
stream conditions. Model inputs include the flow of the receiving stream, the quantity of water
to be discharged, the decay rate for the particular type of wastewater, the stream’s slope, and
temperature. Other upstream or downstream dischargers are also considered in the model. The
modeler determines maximum limits for CBOD5 and ammonia nitrogen and minimum limits for
dissolved oxygen. These limits are selected to insure that Water Quality Standards for dissolved
oxygen are met in the receiving water.
Permit-related questions and comments? Contact Fred Cowles, cowlesf@michigan.gov
Web page maintained by Sean Syts, sytss@michigan.gov
Last revision: April 30, 2001
http ://www.deq .state. ml.us/swq/perm its/pa rameters/bod. html
~
ld~qI
l~w~~tI
Home
http ://www. deq
.
state. mi
.
us/swq/permits/parameters/bod. htm
2/19/02
WISCONSIN ADMINISTRATIVE CODE
57
Unornclal Text (See
PrInted
Volume). Current
through date
and
Register shown
on Title
Page.
Chapter NR 210
SEWAGE TREATMENT WORKS
MR 210.07
Effluent limitation vanance ctegones.
NR 2i0.08
Emergency operation.
NR 210.09
AnaI~1icaImethods and laboratory requirennenis.
MR 210.10
Requirements forcertified orregistered laboratory.
NR 210.11
Compliance maintenance annual report (CMAR).
N.(e~OtapierNR 210
as
it existed on October 31,19116 was repealed and
a new
chapterNR 210 was created effective November 1,19116. CorrectIons made under
a. 13.93
(2m) (b)
7.,
Stats., Regldeç March,
1997,
No.
495.
NR 210.01 Purpose. The
purpose of
this chapter is to
establish effluent limitations, performance requirements and
monitoring provisions to be used in permits for discharges from
publicly owned treatment works and privately owned domestic
sewage treatment works under s. 283.13 (4) and (5) and 283.55
(1), Stats.
History:
Cr. Register,
October, 1986, No. 370, elI. 11—1—116.
NR
210.02
Appflcablllty.
This chapter is applicable to all
publicly ownedtreatment works and all privately owned domestic
sewage treatment works which discharge to surface waters.
History:
Cr.
Regi,.ter, October,
1986, No.
370,
elf. Il—I-lb.
NR 210.03 DefinItions.
The
definitions of tenns and
meanings of abbreviations used in this chapter are set forth in s.
283.62, Stats., chs. NR 205 and 218 and as follows.
(1) “7—day average” means the arithmetic mean of pollutant
parameter values for samples collected in a period of 7 consecu-
tive days.
(2)
“30—day average” means the arithmetic mean of pollutant
parameter values for samples collected in a period of 30 consecu-
live days.
(3)
“CBOD5” means the 5—day carbonaceous biochemical
oxygen demand.
(4)
“Disinfection” means the operation of an ultraviolet lamp
unit, or the addition of chemical disinfectants with adequate mix-
ing and detention times, to provide pathogen reductions.
(5)
‘Effluent concentrations consistently achievable through
proper operation and maintenance” means:
(a) For a given pollutant parameter, the 95th percentile value
for the 30—day average effluent quality achieved by a treatment
works in a period of at least 2 years, excluding values attributable
to upsets, bypasses, operational effors, or other unusual condi-
tions, and
(b) A 7—day average value equal to 1.5 times the value derived
under par. (a).
(6) ‘Facilities eligible for treatment equivalent to secondary
treatment” means treatment works which meet all of the follow-
ing:
(a) The BOD5 and
SS
effluent concentrations consistently
achievable through proper operation and maintenance of the treat-
ment works exceed the minimum level of the effluent quality sec
forth in s. NR 210.05 (1) (a) and (b);
(b) Trickling filters, aerated lagoons or waste stabilization
ponds are used as the principal processes; and
(c) The treatment works provide significant biological neat-
rnent of municipal wastewater.
(7)
“NH~...N”means ammonia nitrogen.
(8) “Percent removal” means a percentage expression of the
removal efficiency across a treatment plant for a given pollutant
parameter, as determined from the 30—day average values of the
Rcgister.
March, 997,
No.
495
raw wastewater influent pollutant concentrations to the facility
and the 30—day average values of the effluent pollutant concentra-
tions for a given time period.
(9)
“Privately owned domestic sewage treatment works”
means those facilities which treat domestic wastewater and are
owned and operated by nonmunicipal entities or enterprises such
as mobile home parks, restaurants, hotels, motels, country clubs,
resorts, etc., which are permitted under eh. 283, Stats.
(10)
“Significant biological treatment” means the use of an
aerobic or anaerobic biological treatment process in a treatment
works to consistently achieve a 30—day average of at least 65
removal of BOD5.
History:
Cr.
Register, October, 986, No. 370, elf. 11—146.
NR 210.04 MonItoring requirements. (1)
Discharges
subject to the provisions of this chapter shall at a minimum moni-
tor the effluent for BOD5, SS, and pH.
(2) Influent wastewater strengths and volumes shall be char-
acterized at treatment facilities subject to the monitoring provi-
sions of sub. (I) by monitoring for flow, BOD5 and SS.
(3)
Monitoring requirements may be adjusted on a case—by—
case basis depending on wastewater characteristics and their
potential to degrade water quality.
(4)
The department shall require the use of24—hour flow pro-
portional samplers for monitoring influent and effluent wa.stewa-
ter quality except where the department determines through the
permit issuance process that other sample types may adequately
characterize the influent or effluent quality. In evaluating permit
monitoring requirements, the department may consider:
(a) Treatment facility design flow and actual flow;
(b) T~’peof treatment processes used at the facility;
(c) Previous performance reconis as reported on the discharge
monitoring report;
(d) ‘I~’peof wa.stewater treated: domestic, municipal or indus-
trial wastewater; and
(e) Final effluent limitations.
(5) The
methods of sampling shall be as described in s. NR
218A)4 (10) to (17).
History:
Cr. Register,
~tober, 1986, No.
370,
elf. 11—146.
NR
210.05
Effluent limitations.
Publicly owned
treat-
ment works and privately owned domestic sewage treatment
works shall meet as a minimum the effluent limits specified in this
section.
(1)
Where the receiving water is classified as fish and aquatic
life in s. NR 102.02 (3):
(a) The following effluent limits for BOD5 apply:
I. The 30—day average may not exceed 30 mg/I.
2. The 7—day average may not exceed 45 mg/i.
3. The 30—day average percent removal may not be less than
1(5.
(h) The foliowing effluent iimitt~forSS apply: 1. The 30—day
average may not exceed 30 mg/i.
2. l’hc 7—day average may not exceed 45 mg/I.
MR 210.01
NR 210.02
NR 210.03
MR 210.04
MR 21
MR 210.06
Purpose.
Applicability.
Definitions.
Monitoring
requirements.
Effluent limitations.
Disinfection requirements.
EXHIBIT 11
58
DEPARTMENT OF NATURAL RESOURCES
NR
210.06
Unofficial Text (See Printed Volume). Current through date and Register shown on Title Page.
3. The
30—day average percent removal may not be
less
than
85.
(c) The effluent pH shall be within the range of 6.0 to 9.0.
(d) Upon request by the
permittec, pursuant
to
s.
NR 210.07
(4), the
department may
substitute the
parameter
CBOD5 for the
parameter
BOD5
and
the levels of effluent quality
specified
in par.
(a). The following effluent
quality
levels ofCBOD5
shall be
appli-
cable:
I. The 30—day average
may not
exceed 25 mg/I.
2. The i-day average
may not
exceed 40 mg/I.
3. The 30-day average percent
removal
may not be less than
85.
(e) More stringent effluent limitations than those
specified
in
pars (a) to (d)
may
be imposed for any
pollutant where
necessary
to
meet
water quality
standards
for water receiving
the
treated dis-
charge.
(2)
Where
the receiving water is classified as
intermediate
aquatic life as defined in s. NR
104.02
(3) (a):
(a) The following effluent limits for BOD5 apply:
1. The 30—day average
may
not
exceed
15 mg/I.
2. The daily maximum
may
not exceed 30 mg/I.
3. The 30-day average percent
removal
may not be
less than
85.
(b) The following effluent
limits
for SS apply:
1. The
30—day
average
may
not
exceed
20
mg/I.
2. The
daily
maximum may not exceed 30 mg/I.
3.
The
30—day
average percent removal may not be less
than
85.
(c) The following effluent limits for NH3—N apply:
I. The 7—day average may not exceed 3.0 mg/I from May 1
through October 31.
2. The 7—day average may not exceed 6.0 mg/I from Novem-
ber 1
through April 30.
(d) The effluent pH shall be within the range of 6.0 to 9.0.
(e) The daily minimum effluent dissolved oxygen level shall
be
4.0mg/I.
(f) Upon request by the permittee, pursuant to s. NR 210.07
(4),the department may substitute the parameter CBOD5 for the
parameter BOD5 and the levels ofeffluent quality specified in pat
(a). The following effluent quality levels of CBOD5 shall be appli-
cable:
1. The 30—day average may not exceed 12 mg/I.
2. The daily maximum may not exceed 25 mg/I.
3. The 30-day average percent removal may not be less than
85.
(g) More stringent effluent limitations than those specified in
pars. (a) to (1) may be imposed for
any
pollutant
where
neces.saiy
to
meet water quality standards
for
waterreceiving the treated dis-
charge.
(3) Where the receiving water is classified as marginal surface
water as defined in s. NR 104.02 (3) (b):
(a) The following effluent limits for BOD5 apply:
1. The 30—day average may
not
exceed 20 mg/I.
2. The 7-day average may not exceed 30 mg/I.
3. The 30—day average percent removal may not be less than
85.
(b)
The
following effluent limits for SS apply:
I.
The
30—day average may not exceed 20 mg/I.
2. The 7—day average may not exceed 30 mg/I.
3. The 30—day average percent removal may not
be less than
1(5.
(c) The effluent pH shall be within the
range of 6.0 to 9.0.
(d) l’hc daily minimum effluent dissolved oxygen level shall
he 4.0mg/I.
(e)
Upon request
by the
pennittee, pursuant to
s. NR 210.07
(4),the
department may substitute the parameter
CBOD5
for the
parameter BOD5 and
the levels ofeffluent
quality specified
in
pat
(a). The following effluent quality levels of
CBOD5 will be appli-
cable:
-
The 30—day average
may not exceed
16
mg/I.
2. The i-day average
may not exceed 25 mg/I.
3. The
30—day
average percent removal may not be less
than
85.
(t)
More stringent effluent limitations than those specified
in
pars. (a) to (e) may be imposed
for any
pollutant where necessary
to
meet water quality standards
for water receiving the treated
dis-
charge.
(4) Effluent limitations
may be
imposed
for
pollutants
other
than
those specified
in
subs. (1) to (3) where necessary
to meet
water quality standards
for
waters receiving the treated discharge.
History: Cr. Register, October, 986, No. 370, eff. Il—I —86.
NR
210.06
DisInfection requirements. (1) Disinfec-
tion
shall be required
of
dischargers
subject to the provisions of
this chapter
when the
department determines, based
on the
infor-
mation
identified in sub. (3), the
discharge of wastewater poses a
risk to human and animal health. Disinfection shall be required:
(a) From May 1 through September30 annually to protect rec-
reational uses, or
(b) Year—round to protect public drinking
water supplies.
(c) The period during which disinfection under pars. (a) and
(b) is required may be
adjusted
in a
WPDES permit
where
neces-
sary
to
protect
human and animal health.
(2) Where disinfection is required, the following effluent lim-
itations shall apply:
(a) The
geometric mean
ofthe
fecal coliform bacteria for efflu-
ent samples collected in a period of 30 consecutive days may not
exceed 400mgJlOO ml.
(b) When chlorine is used for
disinfection, the daily maximum
total
residual chlorine concentration
of the
discharge may
not
exceed 0.1mg/i. In addition, when chlorine is used for disinfec-
tion, a dechlorination process shall be in operation for the period
during which disinfection is required.
Note: The
0.1
mg/I total residual
chlorine
limit reflects best analytical technique
for domestic
wastewater effluents. An effluent
limitation
for total
residual chlorine
ba.’,ed on best available technology fur dechlorination
of
effluents
was
deternnined
to
be below
detection
levels of currently available analytical
techniques.
(3) A permittee subject to this chapter shall at the time of
application for a WPDES permit provide information identified in
this subsection which the department shall use in the detennina-
tion of the need
for effluent
disinfection. The following informa-
tion
shall be used in identifying risks to human and animal health:
(a) Proximity of the wastewater outfall to
swimming
beaches
and other waters which have a high level of human contact recre-
ational activities.
(b) Proximity of the wastewater outfall to public drinking
water supply intakes. At a minimum, whenever a drinking water
intake is within a radius of5 miles of a wastewater outfall in a Lake
or
impoundment or within 20 miles downstream of a wastewater
outfall on a flowing surface water, disinfection shall be provided.
(c) Proximity ofthe wastewater outfall to wetlands which sup-
port populations of waterfowl subject to disease outbreaks, which
may be caused by the discharge of wastewater which has not been
disinfected.
(d) Quality of the wastewater being discharged.
(e) Dilution and mixing characteristics of the wastewater with
the receiving water.
(f) Bacterial indicator organism levels or sanitary survey
results from sampling conducted in the vicinity of the wastewater
outfall and near the sites used for recreational purposes.
(g) The classification of the receiving water and downstream
waters as determined in s. NR 104.02 (I).
Rcg~sir~.Marc/i. 997,
No.
495
NR
210.06
WISCONSIN ADMINISTRATIVE CODE
59
Unornelal
Text (See
Printed Volume). Current through date and
Register
shown on TiUe Page.
(h) The detention
time
of the wastewater treatment system.
Except in
extenuating circumstances,
the
discharge
of
wastewater
to
surface water from
a treatment system with a detention time of
180
days or longer
does
not
pose a risk
to human and
animal
health,
(I) Other
factors that are necessary to determine if there is a risk
posed to human and animal health
by
the discharge
of wastewater
that has not been disinfected.
(4)
Permittees shall be
given
a reasonable compliance
sched-
ule
in their
WPDES permit
if
they are unable to meet the
effluent
limits contained
ins. MR
210.06(2) at the time
of
permit issuance.
However, in no case may the date for compliance with sub. (2)
extend
beyond
3
years from the date
of
permit issuance, unless
cir-
cumstances beyond the
permittee’s control, such as
an environ-
mental impact statement, require additional
time forcompliance.
In such circumstances the date for compliance with sub. (2) may
not
extend beyond 5
years
from the date of permit issuance.
(5)
Final determinations made
under subs. (1)
and
(4)
shall he
made at the time of
permit
issuance, reissuance, or in
response to
a request for modification of an existing permit.
(6) The department shall include
in the public notice issued
under s. 283.39, Stats., its
tentative determinations made under
subs. (1) and (4). Those tentative determinations shall be subject
to review under s. 283.49,
Stats.
Final determinations made under
subs. (1) and (4) shall be subject to review under s. 283.63, Stats.
Tentative
determinations
and final determinations made under
subs. (1) and (4)
are
not subject to review under s.
283.15, Stats.
(7) In the absence of a specific determination under sub. (1),
all dischargers which
are required
to disinfect as of the effective
date of this rule shall continue to disinfect and comply with
all
terms
of their WPDES
permit
in effect on that date.
History:
Cr. Register, October, 986, No. 370, eff. 11—1-86.
NA 210.07 Effluent limitation variance categories.
Modifications to limitations specified in s. NR 210.05 (1) to (3)
may be
approved as follows:
(1)
INDusmLsJ. WASTES.
For publicly owned treatment facili-
ties receiving effluent from certain
categories of industries, the
applicable effluent limitations for BOD5 and SS as set
forth in s.
MR 210.05(1) may be modified. The limitations for BOD5
and SS
in s. NR 210.05 (1) may be
adjusted
upwards provided that:
(a) The discharge of such pollutants attributable to the indus-
trial category will not be greater
than
that allowed by applicable
effluent limitations if such industrial
category were to discharge
directly
into the
waters
of
the
state;
and
(b) The flow or loading of such pollutants introduced by the
industrial category exceeds 10 of the design flow or loading of
the
publicly owned
treatment
works. When such an adjustment is
made,
the
limitations forROD5 or SS in s. NR 210.05 (1)
shall be
adjusted proportionally.
(2)
AERATED LAGOONS AND STABilIZATION PONDS.
A variance
for SS
may be made in cases where aerated
lagoons or
waste stabi-
lization ponds are the principal treatment processes. The SS
limi-
tation may be
raised
to a maximum of 60 mg/I for a 30—day aver-
age. This variance is not applicable to polishing or holding ponds
which aie preceded by other biological orphysical/chemical treat-
ment processes.
Note: Sees.
NR 1111.24
for design requirements of aerated luguonr. and stab/I/ca-
tion pond’.
(3) pH. The effluent pH limitations may be adjusted on a
case—
by—case
basis ifthe pertnittee
or the owner can demonstrate that
the
limits need to be adjusted based on the following:
(a) Inorganic chemicals are not added as part
of the treatment
process; and
(h) In
the case
of a publicly
owned treatment works, contribu-
tions from industrial sources do not cause the
pH
of
the effluent
to be less Ihan 6.0 or greater than 9.0.
(4)
CBOD5. Upon request by
the pennittee, the
parameter
CBOD5 may be substituted for the parameter BOD5, provided the
following conditions are met:
(a) For treatment facilities with BUD5 limitations specified in
s. NR 210.05 (1) (a), (2) (a), or (3) (a), the permittee shall provide
paired sampling of the effluent for BOD5 and CBOD5 for the
months of January and July. The sample frequency shall be at the
same frequency as required by the permit for BOD5 sampling.
Additional sampling for nitrogen compounds (NH3-N, N03N)
or other sampling may also be required on a case—by—case basis.
(b) For treatment facilities with BOD5 limitations established
in accordance with those specified in s. NR 210.05 (1) (e), (2) (g),
or (3) (f), the permittee shall provide paired sampling of the efflu-
ent for BOD5, CBOD5, NH3_N and NO~N.At the end of the
BOD5 test, an analysis of that ROD5 sample for N03.N shall also
be conducted.
1. l’his sampling shall be provided for the months ofJanuary.
February,
July, and August at a frequency of 3 times
weekly
for
facilities with a design flow over 0.5 MGD and for
those facilities
which discharge to
trout
waters or may impact
trout
waters.
2.
This
sampling shall be provided for
the months of
January
sampling,and
July atwith
a sample
a maximum
frequency
ofas3 timesrequired
weekly
by the
forpermitfacilities
for BOD
with
5
a design flow less than 0.5 MUD.
(5)
TREATh4EN’r EQUIVALENT It) SECONDARY TREATh4ENT. (a)
Facilities eligible
for treatment equivalent to secondary treatment
as defined in
s. NR 210.03 (6) shall provide the following mini-
mum level of effluent quality in terms of the parameters BOD5,
SS, and pH. All requirements for the
specified parameters
in subd.
1., 2. or 3. shall be achieved except where provided for in sub. (2)
or par. (b), (c), or (d).
1. The following effluent limits for BOD5 apply:
a. The 30—day average may not exceed
45
mg/I.
b. The
7—day average may
not
exceed
65
mg/I.
c. The 30—day
average percent removal may
not be less than
65.
2. The following effluent limits for SS apply: except where
SS
values
have
been adjusted
in
accordance with s. NR 210.07 (2):
a. The 30—day average may
not exceed 45 mg/I.
b. The 7—day average may not exceed 65 mg/I.
c. The 30—day average percent removal
may not be less than
65.
3. The requirements of s.
MR 210.05 (1) (c) shall be met.
(b) Except as limited by par. (d)
and subject in EPA
approval,
the department
may
after notice and opportunity for public com-
ment, adjust the minimum levels of effluentquality set forth in par.
(a) 1. a., 1. b. 2. a, and 2. b. for
trickling
filter facilities
and
in par.
(a) 1. a.
and
I. b. for
waste
stabilization pond facilities to
conform
to the BOD5 and SS effluent concentrations consistently achiev-
able
thmugh proper operation and maintenance by the median
(50th percentile) facility in a representative sample of facilities
within a state or appropriate contiguous geographical
area
that
meet the definition of facilities eligible
for treatment equivalent
to
secondary treatment.
(c) Where data are
available to
establish CBOD5 limitations
for a treatment works subject to this subsection, the department
may substitute the parameter CBOD5 for the parameter
BUD5 in
pars. (a) and (b), on a case—by—case basis.
I. The levels of CBOD5 effluent may not be less stringent
than the following:
a. The 30—day average may not exceed 40 mg/I.
b. The 7-day average may not exceed 60 mg/I.
c. l’he 30—day average percent removal may not he less than
65~.
2. To apply for the CBOl)~variance, the pennittee shall pro-
vide the data outlined in sub. (4).
Kcgustei. Maisli. 997, No. 49.S
60
DEPARTMENT
OF
NATURAL RESOURCES
NR 210.11
Unofficial
Text (See
Printed Volume). Current through date and Register shown
on
Title Page.
(d) Any
permit adjustment made pursuant
to this
section may
not be
any
less stringent than
the limitation
required pursuant
to
sub.
(5) (a). The department shall require more stringent
limita-
tions
when
adjusting pennit.s if:
1. For
existing facilities
the permitting authority
determines
that the 30-day average and 7-day average
BUD5 and SS effluent
values
that could be achievable through
proper operation and
maintenance of the
treatment
works,
based
on an
analysis
of the
past
performance
of the
treatment works, would enable the treat-
ment
works to achieve more
stringent limitations, or
2. For new facilities, the department
determines
that the
30--day average
and
7—day average
BOD5
and
SS effluent values
that could be achievable through
proper operation and mainte-
nance
of the treatment works,considering the design capability of
the treatment process
and
geographical and
climatic conditions,
would
enable the treatment
works
to achieve
more stringent limi-
tations.
(6)
Cor~mDrcn
snwrots.
Treatment works which have a com-
bined
sewer system may not
be capable of
meeting
the
percentage
removal requirements established in sub. (5) (a) 1. c. and 2. c. or
ins. MR 210.05(1) (a) 3. and (b)
3.
during wet
weather where the
treatment works receive
flows from combined sewers. For each
treatment works, the decision shall be made on a case-by-case
basis as to whether any attainable percentage removal level can be
defined, and if so, what the level should
be.
History: Cr. Register,
October. 1986. No. 370, cIT. II—I--86.
NH 210.08 Emergency operation. (1)
All treatment
work.s which are subject to the provisions of this
chapter shall be
equipped for emergency operation. Emergency power shall be
provided
in
accordance with s. MR 110.15 (5) Id). Sufficient emer-
gency power shall be provided so that:
(a) All facilities shall, at a minimum, be able to maintain
pri-
mary settling and effluent disinfection under all
design condi-
tions.
(b) All
facilities discharging
to class I, II, or Ill
trout streams,
or other critical
stream segments as determined by
the
department,
shall be
able to
operate all units critical to meeting
the effluent
lim-
its
as
set forth
in the
WPDES permit
for a minimum emergency
period
of 24
hours
under
all design flow conditions.
(2)
Main lift stations, defmed for the
purpose of this section as
those
lift
stations
which discharge more than20
of the
daily sys-
tem flow, or which
serve more than 100 homes or the equivalent.,
shall be equipped
for
emergency operation
to
prevent the dis-
charge
of
raw
or
partially treated
sewage to a surface water or to
a ground
water
and to prevent sewage backups
into basements.
Main lift stations shall provide emergency operation in accor-
dance with s. NR 110.14 (7).
History: Cr.Registe,October,
1986, No.
370,efT.
11-1-86.
NR 210.09
Analytical
methods and laboratory
requirements. Methods
used
for
analysis
of influent and efflu-
ent
samples
shall be as set
forth
in ch. MR 219 unless
alternative
methods are specified in the WPDES discharge
permit.
History:
Cr. Register,
October,
1986, No. 371). cIT. 11—1-86.
NR 210.10 Requirements for
certified
or
registered
laboratory.
Bacteriological analyses of groundwater
samples,
and all radiological analyses, shall be performed
by the
state labo-
ratory of hygiene or at a laboratory certified or approved by the
department of agriculture, trade
and
consumer protection. Other
laboratory
test results
submitted
to the
department under this
chapter shall be
performed
by a
laboratory certified or registered
under
ch. NR 149. The following tests are
excluded
from the
requirements
of
this
section:
(1) Temperature,
(2) Turbidity,
(3)
(4)
(5)
Chlorine
residual,
(6) Specific conductance,
(7)
Physical properties of soils and sludges.
(8) Nutrient tests of soils
and sludges,
(9) Flow measurements.
History:
Cr. Register,
October,
986, No. 370, eff.
11—1—86.
NA 210.11 Compliance maintenance annual
report
(CMAR).
The CMAR shall be submitted on or before June 30,
1987. Thereafter, the CMAR shall be submitted to the
department
on March 31 of each subsequent year. The content of the CMAR
is described in ch. NR 208. The CMAR shall be completed
and
signed by a duly authorized representative of the owner. In the
case of a publicly owned treatment works, a resolution from the
municipality’s governing body shall accompany the CMAR and
shall include
the information specified in s. NR 208.04 (3).
History:
Cr.
Register.
February, 1987, No. 374,
eff. 3-1-87.
Bacteria tests in wastewater
effluent,
pH,
Rcgrster.
Mardi, 997.
No.
49~
CERTIFICATE OF SERVICE
I, Albert F. Ettinger, certify that I have filed the above Notice ofFiling together with an
original and 9 copies ofthe
Post-Hearing Comments ofELPC, Prairie Rivers Network and
Sierra Club
with the Illinois Pollution Control Board, James R. Thompson Center, 100 West
Randolph Street, Suite 11-500, Chicago, IL 60601, and served all the parties on the attached
Service List by depositing a copy in a properly addressed, sealed envelop with the U.S.
Post
Office, Chicago, Illinois, with proper postage prepaid on
April
12, 2002.
Albert F. Etting
Albert F. Ettinger, Senior Attorney
Environmental Law and Policy Center
35 East Wacker Drive
Suite 1300
Chicago, IL 60601
(312)
673-6500
aettinger(~e1pc.org.
R02-11 Notice
List
March
5,
2002
Kichard Acker
O.penlands Project
25
E. Washington, Suite 1650
Chicago, Illinois 60602
Laura Anderko
8 N.
570
Taos
Elgin, Illinois 60123
Fredric P. Andes
Barnes & Thornburg
Z600 Chase Plaza
10 S. LaSalle Street
Thicago, Illinois 60603
Kenneth Alderson
Illinois Municipal League
500 E. Capitol, P0 Box 5180
Springfield, Illinois
62705
Kay Anderson
American Bottoms RWTF
One American Bottoms Road
Sauget, Illinois 62201
Joseph J. Annunzio
Village Attorney
1000 Civic Center Drive
Niles, Illinois 60068
Doug Booth
ongressman J. Dennis Hastert
~7 N. River Street
3atavia, Illinois 60510
‘lancy Brill
ity of Napérville, Department ofUtilities
~OBox 3020
~aperville, Illinois 60566
3reg Buchner
7ox Metro Water Reclamation District
~82ARoute 31
)swego, Illinois
60543-9417
~1ikeCallahan
lloomington Normal Water Reclamation District
~OBox 3307
3loomington, Illinois 61702-3307
Chip Bremer
P0 Box 12763
Research Triangle Park, NC 27709
Debbie Bruce
Dept. of Natural Resources, Fisheries Division
600 N. Grand Ave. West
Springfield, Illinois 62701
Christine Bucko
Attorney General’s Office
Environmental Control
188 W. Randolph, 20th Floor
Chicago, Illinois 60601
William Cellini
IL Association of Wastewater Agencies
424 North Fourth Street, Suite 100
Springfield, Illinois 62704
R02-1 I Notice List
March
5,
2002
3i11 Compton
aterpillar, Inc.
00 N.E. Adams Street
~eoria, Illinois 61629-3350
)ennis Daffleld
)epartment of Public Works City of Joliet
)21 E. Washington Street
oliet, Illinois 604,33
ames Daugherty
)istrict Manager
lorn Creek Basin Sanitary District
‘00 West End Ave.
licago Heights, IL 60411
ohn Donahue
i’ity of Geneva
800 South Street
ieneva, Illinois 60134
4atthew Dunn
tttorney General’s Office
~nvironmentalControl
88 W. Randolph, 20th Floor
;hicago, Illinois 60601
im Elliot
911 N. Fort Myer Drive, Suite 702
Lrlington, VA 22209
ob Evans
;~t~ofFreeport
30 W. Stephenson Street
reeport, Illinois 61032
Larry Cox
Downers Grove Sanitary District
2710 Curtiss Street
Downers Grove, Illinois 60515
Jack Darin
Sierra Club, Illinois Chapter
200 N. Michigan, Suite 505
Chicago, Illinois 60601
Quentin Davis
Pehr-Graham & Associates
660 W. Stephenson Street
Freeport, Illinois 61032
Michael Doran
Strand and Associates
910 West Wingra Drive
Madison, WI 53715
Tim Dwyer
Kane County ASA
37 W. 777, Rt. 38
St. Charles, Illinois 60175
Albert Ettinger
Environmental Law & Policy Center
35 E. Wacker Drive, Suite 1300
Chicago, Illinois 60601-2110
Richard Ferreira
CCL Custom Manufacturing
One W. Hegler Lane
Danville, Illinois 61832
R02-1 1 Notice List
March
5,
2002
3il1 Forcade
e7mer and Block
IBM Plaza
hicago, Illinois 60611
~isaM. Frede
hemical Industry Council
p801 W. Higgens Rd, Suite 515
~osemont, Illinois 60018
)orothy Gunn
lerk, Pollution Control Board
00 West Randolph, Suite 11-500
licago, Illinois 60601
~ary Hanline
~axter Healthcare Corp.
~.oute120 & Wilson
tound lake, Illinois 60073
~.oyM. Harsch
Iardner, Carton & Douglas
~uaker Tower, 321 North Clark
licago, Illinois 60610-4795
ohn M. Heyde
idley Austin Brown & Wood
‘ank One Plaza
0 So. Dearborn St.
licago, Illinois 60603
ilargaret P. Howard
ledinger & Howard
225 S. Sixth Street
pringfield, Illinois 62703
Susan M. Franzetti
Sonnenschéin Nath & Rosenthal
8000 Sears Tower
233 South Wacker Drive
Chicago, Illinois 60606
Daniel J. Goodwin
Goodwin Environmental Consultants, Inc.
400 Bruns Lane
Springfield, Illinois 62702
Ed Hammer
WQS 16J USEPA
77 West Jackson
Chicago, Illinois 60604
James T. Harrington
Ross & Hardies
150 North Michigan, Suite 2500
Chicago, Illinois 60601
Kyle Harvey
Winston & Strawn
35 W. Wacker Drive
Chicago, Illinois 60601
Katherine Hodge
Hodge Dwyer Zeman
3150 Roland Avenue, P0 Box 5776
Springfield, Illinois 62705-5776
Mark Kennedy
Greeley and Hansen
8905 Presidential Parkway, Suite 230
Upper Marlboro, MD 20772
-
R02- U Notice List
March
5,
2002
Mark Koenen
C~ityof St. Charles
2 East Main Street
St. Charles, Illinois 60174
Daniel Kucera
Chapman and Cutler
111W. Monroe
Chicago, Illinois 60603
Jeff Van Landuyt
Village of Barrington
206 S. Hargh St.
Barrington, Illinois 60018
Robert T. Lawley
Chief Legal Counsel,
Dept of Natural Resources
524 5. Second Street
Springfield, Illinois 62701
William Leja
1634 W. Chase
Chicago, Illinois 60626
Edward L. Michael
Frout Unlimited
Z23 Barberry Road
EIighland Park, IL 60015
Fom Muth
Fox Metro Water Reclamation District
582 State Route 31
Dswego, Illinois 60543
:rwin Polls
‘vletropolitan Water Reclamation, Dist. Of Chicago
5001 West
icero, Illinois 60804
3rett M. Schmidt
~00Shanahan Court
\Taperville, Illinois 60540-8219
Robert A. Messina
Illinois Environmental Regulatory Group
215 East Adams Street
Springfield, Illinois 62701
James Morrin
Wildman, Harrold, Allen, and Dixon
225 W. Wacker Drive, Suite 2810
Chicago, Illinois 60606
Jerry Paulson
McHenry County Defenders
804 Reginact
Woodstock, Illinois 60098
Nancy J. Rich
Katten Muchin Zavis
524 West Monroe Street, Suite 1600
Chicago, Illinois 60661-3693
Cindy Skrudkrud
4209 W. Solon Road
Richmond, Illinois 60071
R.02-lj Notice List
March
5,
2002
&frey Smith
~bott Labs
.401 North Sheridan Dept 072N, Bldg P14
4orth Chicago, IL 60064-6239
laire St. Jean
~eniorLegal Assistant
idley Austin Brown & Wood
0 South Dearborn Street
licago, Illinois 60603
‘homas Talfma
ity of Geneva
800 South Street
Ieneva, Illinois 60134
‘hilip Twomey
~dmiralEnvironmental Services
025 S. Arlington Heights Rd, Suite 103
~rlingtonHeights, IL 60005
)anny Vest
~rowMark
701 Towanda Road, P0 Box 2500
;loomington, IL 61702-2500
ames Warchall
idley and Austin
)ne First National Plaza
‘hicago, Illinois 60603
:harles W. Wesselhoft
.oss and Hardies
50 N. Michigan Avenue, Suite 2500
iiicago, Illinois 60610
Sanjay Sofat
Illinois Environmental Protection Agency
1021 North Grand Ave. East
P.O. Box 19276
Springfield, Illinois 62794-9276
Mary Sullivan
Associate Corporate Council, Ill-Am Water Co
300 N. Water Works Dr.
P0 Box 24040
Belleville, Illinois 62223-9040
Marie Tipsord
Attorney, Pollution Control Board
100 West Randolph, Suite 11-500
Chicago, Illinois 60601
Phillip Van Ness
Webber & Thies, P.C.
202 Lincoln Square, P0 Box 189
Urbana, Illinois 61801
Georgia Vlahos
Dept of the Navy
Naval Training Center
2601A Paul Jones Street
Great Lakes, Illinois 60088-2845
Jack Welsch
Stateside Associates
2300 Clarendon Blvd., Suite 407
Arlington, VA 22201
Stanley Yonkauski
IL Department of Natural Resources
524 South Second Street
Springfield, Illinois 62701
-
R02-i 1 Notice List
March
5,
2002
Melanie Young
l,rS Fish & Wildlife Service
4469 48th Avenue Court
Rock Island, Illinois 61201