RECEIVED
c~
~
r~c~v~
MMH
052002
GLAS
STALL
Ut-
iu..tNOIS
Pollution Control Board
WASHINGTON,
D.C.
MEMBER
WORLD
LAW
GROUP
A GLOBAL
NETWORK
OF
INDEPENDENT
FIRMS
LOCATED
IN
30
COUNTRIES
R02-11
Rulemaking-Water
GARDNE
CHICAGO,
ILLINOIS
60610
(312)
644-3000
FAX:
(312)
644-3381
INTERNET:
gcdIawchgo~gcd.com
WRITER’S
DIRECT
DIAL
NUMBER
SHEILA H. DEELY
(312) 245-8479
sdeely@gcd.com
March
5,
2002
Ms. Dorothy M. Gunn
Clerk
Illinois Pollution Control Board
100 West Randolph St.
Suite 11-500
Chicago, IL
60601
RE:
IN THE MATTER OF:
WATER QUALITY AMENDMENTS TO
35
Ill.
Adm.
Code 302.208(e)-(g),
302.504(a)
302.575(d),
303.444, 309.141(h);
and
PROPOSED
35
Ill. Adm. Code 301.267
301.313, 301.413,
304.120, and 309.157.
Enclosed please find three exhibits
to the written testimony ofMichael Callahan on
behalfofthe Illinois
Association ofWastewater Agencies that were inadvertently omitted from
the filing in the above referenced proceedings.
Verytruly yours,
/IL~L
~
Sheila H. Deely
Enclosures
CHO1/12212127.1
Dear Ms.
Gunn:
)
)
)
)
)
Attachment A
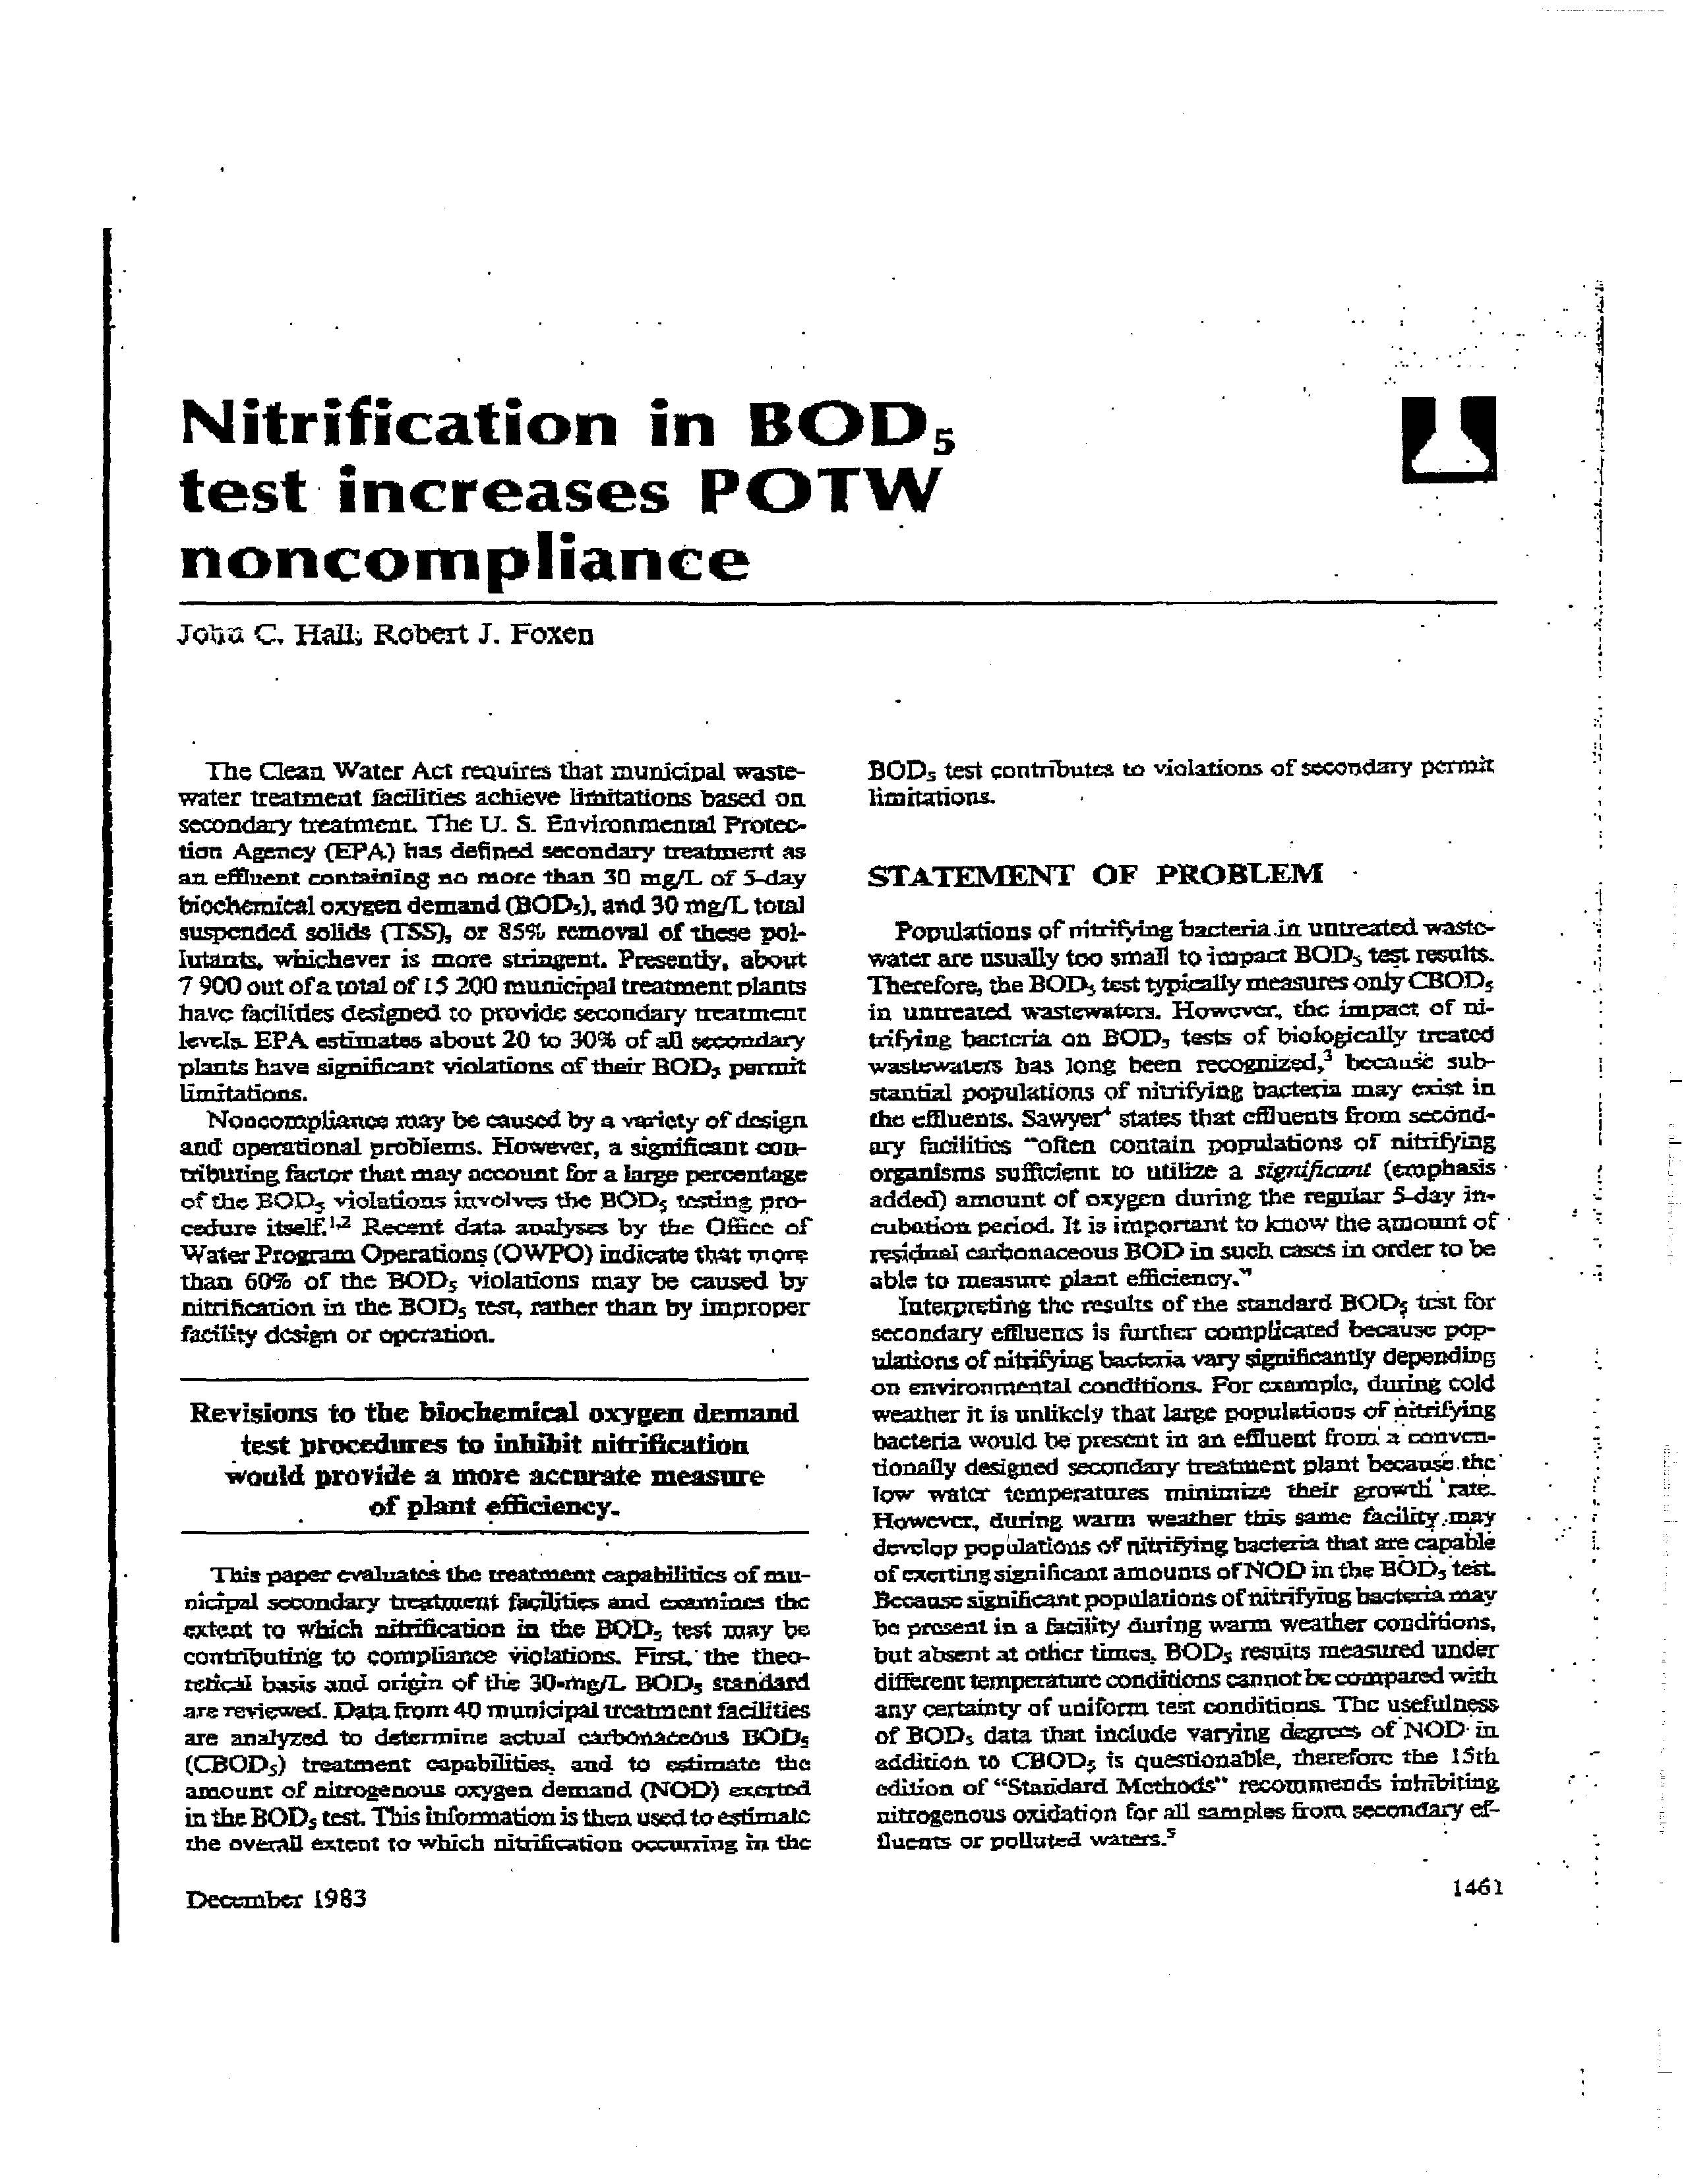
Nitrification
in
DOD5
test
increases
POTW
noncompliance
JQ~14
C, Hall;
Robert
J.
Foxen
The Clean Water Act retiuires
that
municipal
waste-
water treatment Iheffities
achieve
limitations
based
on
secondary treatment.
The
U. & Envlmnmcntal Protec-
tion Agency
(EPA)
has defined
secondary treatment
as
an effluent containing no
more than
30
mg/I. of 5-day
bloebemicaloxygen
demand (DOD5), and
30 mgfL total
suspended
solids
(TSS),
or
85
removal
of these pot-
lutants, whichever
is more
stringent
Presently,
about
7900
outofa
total
of
15200
municipal treatment plants
have
facilities designed
to
provide secondary treatment
lcvt
EPA estimates
about
20 to
30
of all
scccrndasy
plants have sir
if,r~’nt
violations ofththr HOD, permit
limitations.
Noncompliance may be caused by a variety
of
design
and operational problems. However, a significant ant-
tributing fhctor that
may
account fora large percentage
of the BOO,
violations
involve,
the
BOD~
trsthig
pro-
cedure
it~&i1a
Recent data.
analyses
by
the
Office
of
Waler Program Operation
(OWPO) indicate t1*t niors
than
60?h
of
the
HOD,
violations
may be caused by
nitriheation
in
the
BOY)5 test,
rather
than by
improper
facility design
or
operation.
Revisions to the
biochemical
oxygen
dnmnnd
test procedures
to
inhibit
nifrification
would provide a more accurate measure
•
This paper evalnatri the treatment capabilifics of
nan-
0c1p2d secondary
tmcatwcut facilities and cxaanines
rite
ntent
to
which
nibilication
in
the BOL~5test
may be
contributing
to
compliance
‘ilolations.
First
the thea-
reljcSl
jpa~j~
and origin of the 30.xtg,IL HOD5 stan~iard
are
revj~wed.
Dat.afrom 41) mutsicipal treatment facilities
are
analyzed
to
determine
actual
cnibOststcOns
BOO5
(CHOY),)
treatment
capabilities3
and
to
atirnate
the
amount
of nitrogenous
oxygen demand
(NOD) exerted
in the
BOD,
test. This information is
then
used
to
e~fimatt
the overali
extent
to
which
altrification occurring in the
BOD3
test çontribntcs to
violations of seccedary pcrnsIt
limitations.
STATEMENT
OF
PROBLEM
-
Populations
of
purifying bacteria in untreated wasto-
water are usually too small
to
impact HOD3test resuils.
Therefore,
the
BOY), test typicallymeasures only CEOD,
in
untreated
wastewatcra.
Howc-Mcr,
the impact
of ni-
tril5ing
bacteria
on
HOD,
teste
of
biologically
treated
wastewatcxs has
long
been
recognized,3
becanic
sub-
stantial
populations
of
nitrifying
bacteria
may
exist
in
the
auents.
Sawyer’ stairs that effluents from secOnd-
ary
facihhics
Thiten
contain populations
of
nitrifying
organisms
sufficient
to
utilize
a
si~nzficwzt
(ezuphasis-
added)
amount
of
oxygen during
the regular
5-day in-
cubationperiod. It is important to
know
the amount
of
residual carbonaceous BOY)in suck casts in order to be
able
to
measure plant efficiency.”
Interpreting
the
results of the standard BODç
1St for
secondary effluents
is
further complicated
becau3c pop-
ulations ofpitrifjáng bacteria vary
signifleantly depending
on
environmental conditions.
For
example, during cold
weather
it is unlikely
that
large populations of aitrifying
bacteria
would
be present
in an effluent
frot
a
conven-
tionally designed secondary
treatment
plant
because the
low wat~ tempezatores
minimize
their
growth
‘ate.
However,
during
Warm
weather this
same
facliity~rn
develop pop~ilatloasof
nitrifying hactaia that arecapable
of
exerting significantamounts
of
NOD
in the
BOY), test.
Because significantpopulations
of
nitrifyingbacteria
may
be
present in a &ciflty
during
warm weather conditions,
but absent
at other times,
HOD,
results measured undir
difitrent
temperatureconditions
catinotbe comparedwith
any certainty of ucifortu tear
conditions.
The
usefulness
of
BOY)5 data that
include
varying degrv’~
of NOD- in
addition,
to
CBOD5
is
ciuestionable, therefore the
15th
edition
of
“Statidard
Methods”
recommends inhibiting
nitrogenous
oxidation
for
all
mnaples
from
secondary ef-
Cuents
or polluted
waters.5
December
1983
1461
Mall
& Foxen
The typca of’
secondary
facilities most
conducive
to
-
development of
nirilfying bacteria an~
tmderioaded
or
overdrzigrs-ud activated
sludge
facilities
and most tdck-
ling
filters.
During warm
weather, activated sludge 6-
duties with
lower loading
tates may provide
sufficient
mean cell residence time (MCR.T) to develop a signifl-
cant
population
of
nitrifying bacteria. This could occur
irnerxnittenriyor continuously, depending on
the. char-
acterisucs ofa particular facility.
Trickling filters are particularly
conducive to
growth
of nitz-i5ing bacteria during waz~weather beana.se the
filter media provides an ideal
base
for nitrifler growth-
staje~that
nitrification
in
the
DOD,
test
is
a
particularly signiflesnt problem
for
“trickling filter plant
where ainification
takes
place
rapidy
as
compared to
effluents
from
conventional
high-rate
activated dwigt
plants ~terc
nitrificatigu proceeds mote
slowly~Thus,
trickling filter efilueiats may contain
higher couceatra-
tiozis
of nitritjring
bacteria than
effluents
front
conven-.
tional
activated sludge facilities.
ORIGUi
AND
INTENT
OF
THE
DOD5
SECONDARY
TREATMENT
STAI’WARD
Although signthcantnitdflcation
can ccur
in
theDOD,
teat
for
secondary
effluents,
much
debate
ccnters
on
whetherthe 30-milL BOO5 standard, as defined by EPA,
was
lnzendedw
include only carbonaceous
oxidation, or
also any Stregcnous oaidation that might be exerted in
theDOD5 test. This distinction iscritical, because it would
not
be ai,propriatc
to
change the current BOD.~test re-
quirerneat
to
a
COD,
tcst
without
a
corresponding
change in the effluent standard if the
original BOY)5 stan-
dard w~intenclerl
to include
both
COD,
and
NOD.
Onthe other band, ifthe Original 30-ma/L HOD5~andath
W3~
intended
to
include
only
CEOD,.,
the
DOD,
teat
-
could
be modified to measure only
C30D5,without
any
corrawctading change
En the effluent slnndar&
The position that BOY), was intended to.include bath
CEO),
and NOt) is basically as follows:
-
The
30-tngjL BUD5 standard wasbased on an
era-
untion
of
EQ)5
effluent
quality
from a
represerz-
lativepopulation
ofsecondary treatment facililius.
~
the effluents from
these tèeatrnent
plants
would presumably
contain
“typical”
amount
of
NOD5,,
the 30-mg/L
BOO,
standard
based on this
sample populates
also account forthis same
“n’m
lest”
amount
of
NOD.
Use of theCOD,
test with-
-
out
a corresponding
change in the standard would
essentially constitute.a
relaxation ofstandards ‘that
couIØ
in
turn, degrade water quality.
Although anevaluation ofse
darytresintent thcll,i’des
may
indicate
that
30
mg/L
ROD,
is a teasonable
see-
ondary effluentstandard, review
of
EPA documents lead-
ing to the establishment ofthe secondarytreatment stan-
dard indicate thatthe figure of30 mg~twasnot originally
derived through an analysis of’ effluent data. fli~
30-mg/
L SOD, standard wasbased primarily
on an 85
BOb,
removal
requirement
contained in a suaerscdixl regula-
ton.tb
Development documents concentin; theproposed
~
ondat-y treatment regulation (40 CFR Part 133) statethat
EPA
found
“the level
of
effluent
quality
proposed
is
roughly
equivalent
to
the
former
18
CFR
60
t.25
re-S
qeirement
of
85
HOt)5
removaL”7 Other
docunsents
also
indicate
that the
3C1-mg/L ihutintion
was derived
frc,mn
plant ethciancy based on apcceaiaee removal (that
is,~fl
removal assumingatypicalinfluenr
SQTh of 200
mg/L), and wasnot originally based on an.empirical anal-
ysis of effluent data.’ Asdiscussed
previously, the
HOD,
test
for
untreated
wastewainr typically
measures
only
COD5
because
niirif~.-ingpopulations
art
usually
too
cain
to amen any appreciable oxygen demand in the fast
5 days. Because the inftucnt
test typically inenstifes
only
CR01),,
thceffluenttest should also measure only CROP,
to
accurately calculate
percent
removaL
Therefore, the
30-.mgfL effluent standard
should include
only COD,.
Aftermaking thepreliminary detcnnination that
S5
rcmao-ral of HOD5 was an appropriate
measure
of
effi-
ciency for a well-operated
srtondary treatment
facility’
and that
30 rngJL was
roughly its
equivalent
(assuming
a 200 mg/L intluent
concentration),
EPA
completcd a
study of
secondary treatmentfacilities to verify this
find-
ing.
The
unpublished
smdy’°
evaluated
efflucut
data
from
33
secondary activated
sludge and triciding filter
facilitiesthat
were “well operated” and ‘operated at
er
near
design
flow.”
However,
these
selection
eritoria
tended
to minimize
the probability
ofnifrifrattioti
oc-
cnn-hagin
the
nOD, test. The
amount of
NOD,
forthese
plarr~should be significantly lower than
if
a truly
rep-
rsen’iative sample population (thatis,
including under-
loaded
plants)
had
been
selected.
Secondary
facilities
“at or
near design flow” are
less
likely to have sufficient
MCRT
for
signiflcazxt numbers
of
nitrifters
to
develop
compared
to
facilities
that
operate below
their design
flows. Therefore, effluents from the facilitiesin the sam-
ple
population would not er.hibit
NOfl~
concentrations
rcpt-raentative
of all
secopdary
facilities.
This
may be
true
for newer
facilities that are well below their design
flow and thus more lilcelyto have adequate
MCRTs
for
significant nitrifler
development.
The
final
EPA
document defining best practicable waste
treatniefit technology (BPW~~)
for mwnctpal diechargers
published
in
October
1975”
ft’rther clarifies the intent
of the HOD, test and the secondary standard.. This dcc-
‘omont
states that
“the
BUD3
test
essentially
measures
the oxygen
demand
of
only the carbonacona
organic
material
in
t~xenstewater
~ffltieut”
The document also
presents a table summarizing the pofltrtant
removal ca-
1462
Journal
WPCF, Volume
35,
Number
12
t.
C
S
fl.
I
Wastewatcr Analysis
Tblo
1—Typical
miens
of
ultimate
orygen
demand
-
Carte-
Nttrog-
treatment
type
nolan
qno~
Tot.s
Rema,tal
~aw
•
300
KO
400
0
p~j~~’a~y
3ccuar~ay
Q*jthate)
180
96
45
a,
275
135
31
59
Secoflor (wXnven1vna~
(wintaj
23
90
113
74
~wpe()
23
23
46
98
TWOttagn
rt,tec
Mvanceo vesaetrearnent
23
9
23
¶2
46
20
83
-
95
R~pdntqçt
tr~yy~
“Afternativa
Wasta Mngernent
TecJ—ulques tnt
sect
Practicable Waru~
Tr~trnent7
EPA-co/g.75.otS.
16 ~Oa
1975)-
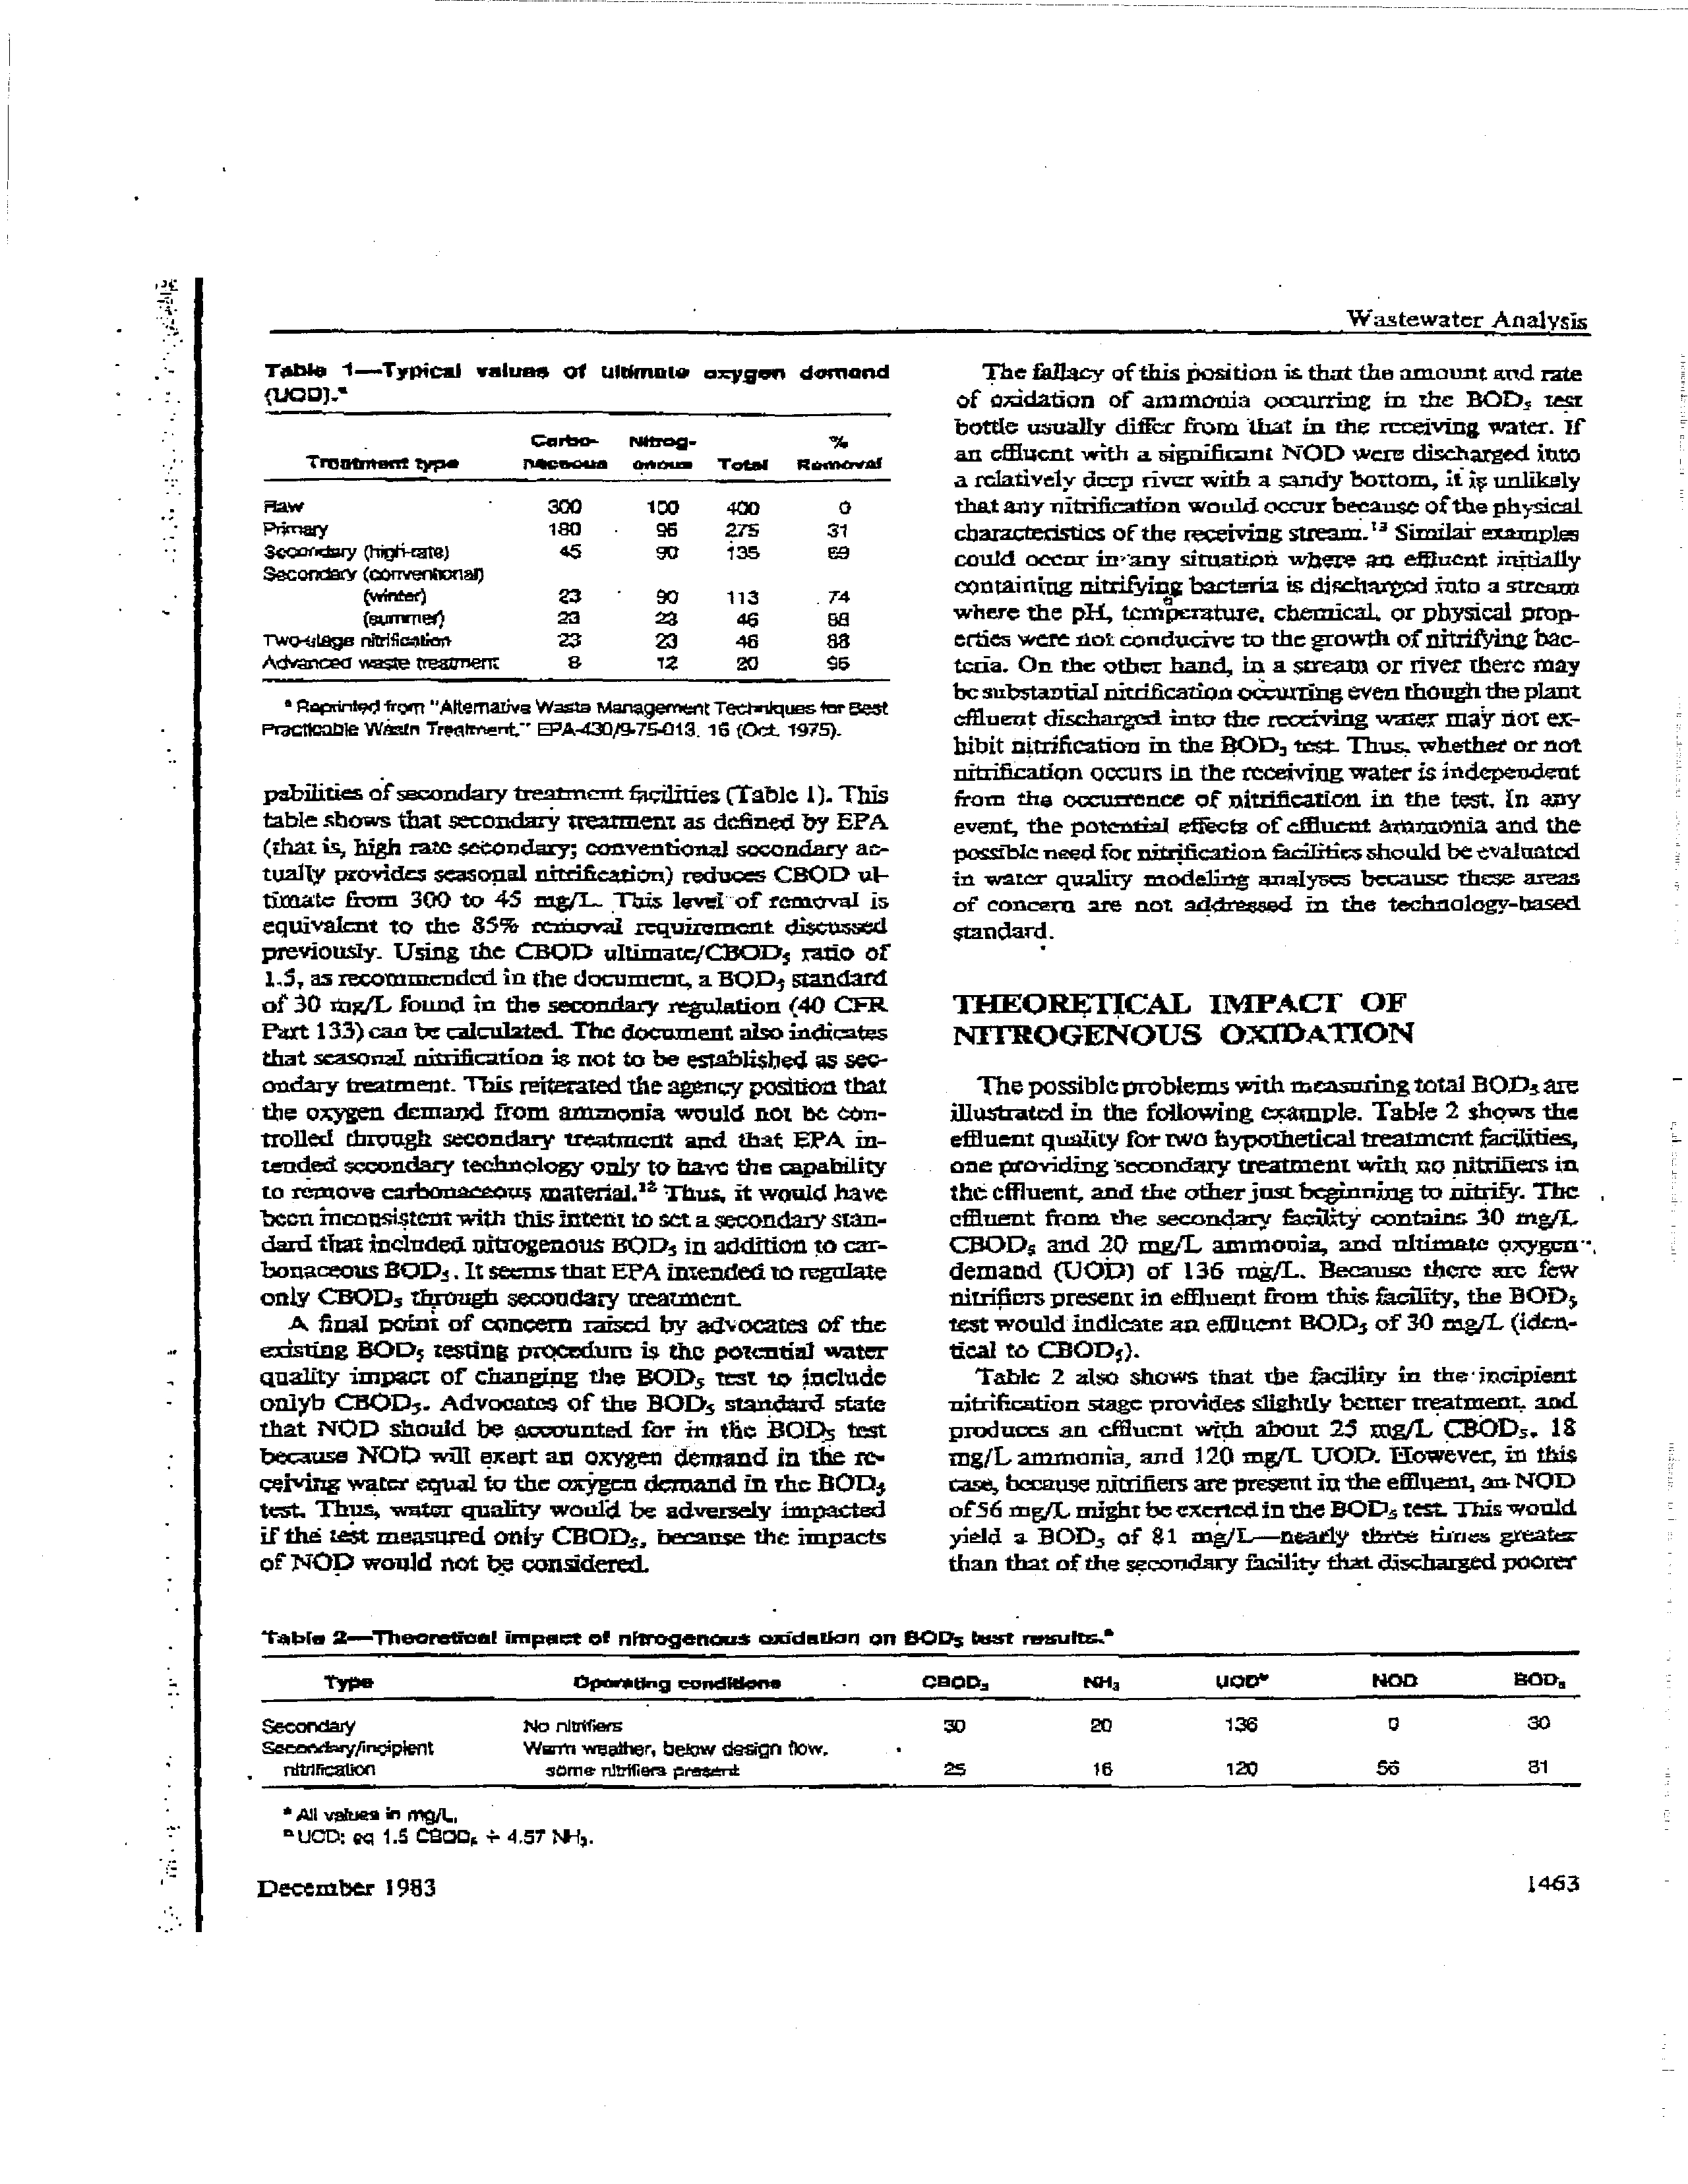
pabilitia ofsecondary treatment ~iqi~rt
(Table 1). This
table stows that secondary treatment as
dthned
by EPA
(that is~high razesetoudary;
conventional socondary ac-
tually
provides seasonal nirrification) reduces
CEOD vi-
timata
from
300 to
45
mg/I-.
This lenl~
of removaL is
equivalent
to
the
35
rethcval
requirement
discussed
previously.
Using the CBOD
ultimate/CHaD5
ra~oot’
1,5, sa recomurcridcd in
the
document, a BQJD5 standard
of
30
itigjL found in
the secondary
regulation (40 CFR
Fiat 133) can be calczilatei The document also indicates
that scasorial nitification
is not to be established
assec-
ondary treatment. This reiterated theagency position that
the
oxygen demand
from ammonia
would
not
bt con-
trolled
through secondary treatment
and
that EPA in-
tended secondary technology only to bay
the
capability
to remove carbonacaou~
xnatenaV~
Thus, it would have
been inconsistent with thisintent to acta secondary stan-
dazd
that included
nitrogenous
BUD,
in addItion to
car-
bonaceous
BUD,. It
seems that EFA intended to regolate
only CBOD, through secondary treatment
A
final point of concern
raised by athocates of the
existing
BOD~testing ptgcadum
is
the potential
water
quality
impact of
changing
the SOD,
test t~
include
onlyb COD,.
Advocates
of the
HOD,
standard
state
that
NOD
should be ow,unted
for in
tile BO~,
test
because
NOD will
~xefl
an
oxygen
demand
in the
i-c-
calving water
equal to the oxygen
demand in
the DOD5
teat.
Thus,
water quality wonl4 be adversely impacted
lithe
test
measured
onLy CR01),, t~ase
the impacts
of
NO!) would
not b.c considered.
Theflullacy
of
this ~osition
is that the amount
and rate
of oxidation
of
ammo-cia
occurring
in
the
BOD~tact
bottle
usually
differ from
that
in
the receiving water. if
an effluent with
a. significant NOD were discharged into
a
relatively deep
river with a sandy
bottom,
it i~t
uniiksly
that any nittifleation would occurbecause ofthe physical
characteristics ofthe receiving stream.’
Similai examples
could occur in’~any
situation
where
an
eWucnt initially
containing nitrifying bacteria is
d
argod
into
a stream
where
the
pH,
temtnnzture,
chemicaL or
physical prop-
erties were not conducive to the growth ofnitrifying bce-
tcria. On the other hand,
in a stream
or river there
may
be substantial thtdulcation oàurring
eventhough theplant
aueat
dischaurgniinter the receiving water
maSt not ex-
hibit nitification
in the BOD~
t~
Thus.
whether
or not
nitrifleation occurs
in
the receiv~gwater isindependent
from
the oceuffence
of
niulfication
in
the
test.
In
any
event, the potential efi~ctrof effluent
asamonla and
the
posetbleneedfor nitxiflcaiion facilitiesshould be evaluated
in
water quality
ntodeling analyses because these areas
of concern
are
not
addressed
in
the
technology-based
standard.
THEORETICAL
IMPACT
OF
NITROGENOUS
OXIDATION
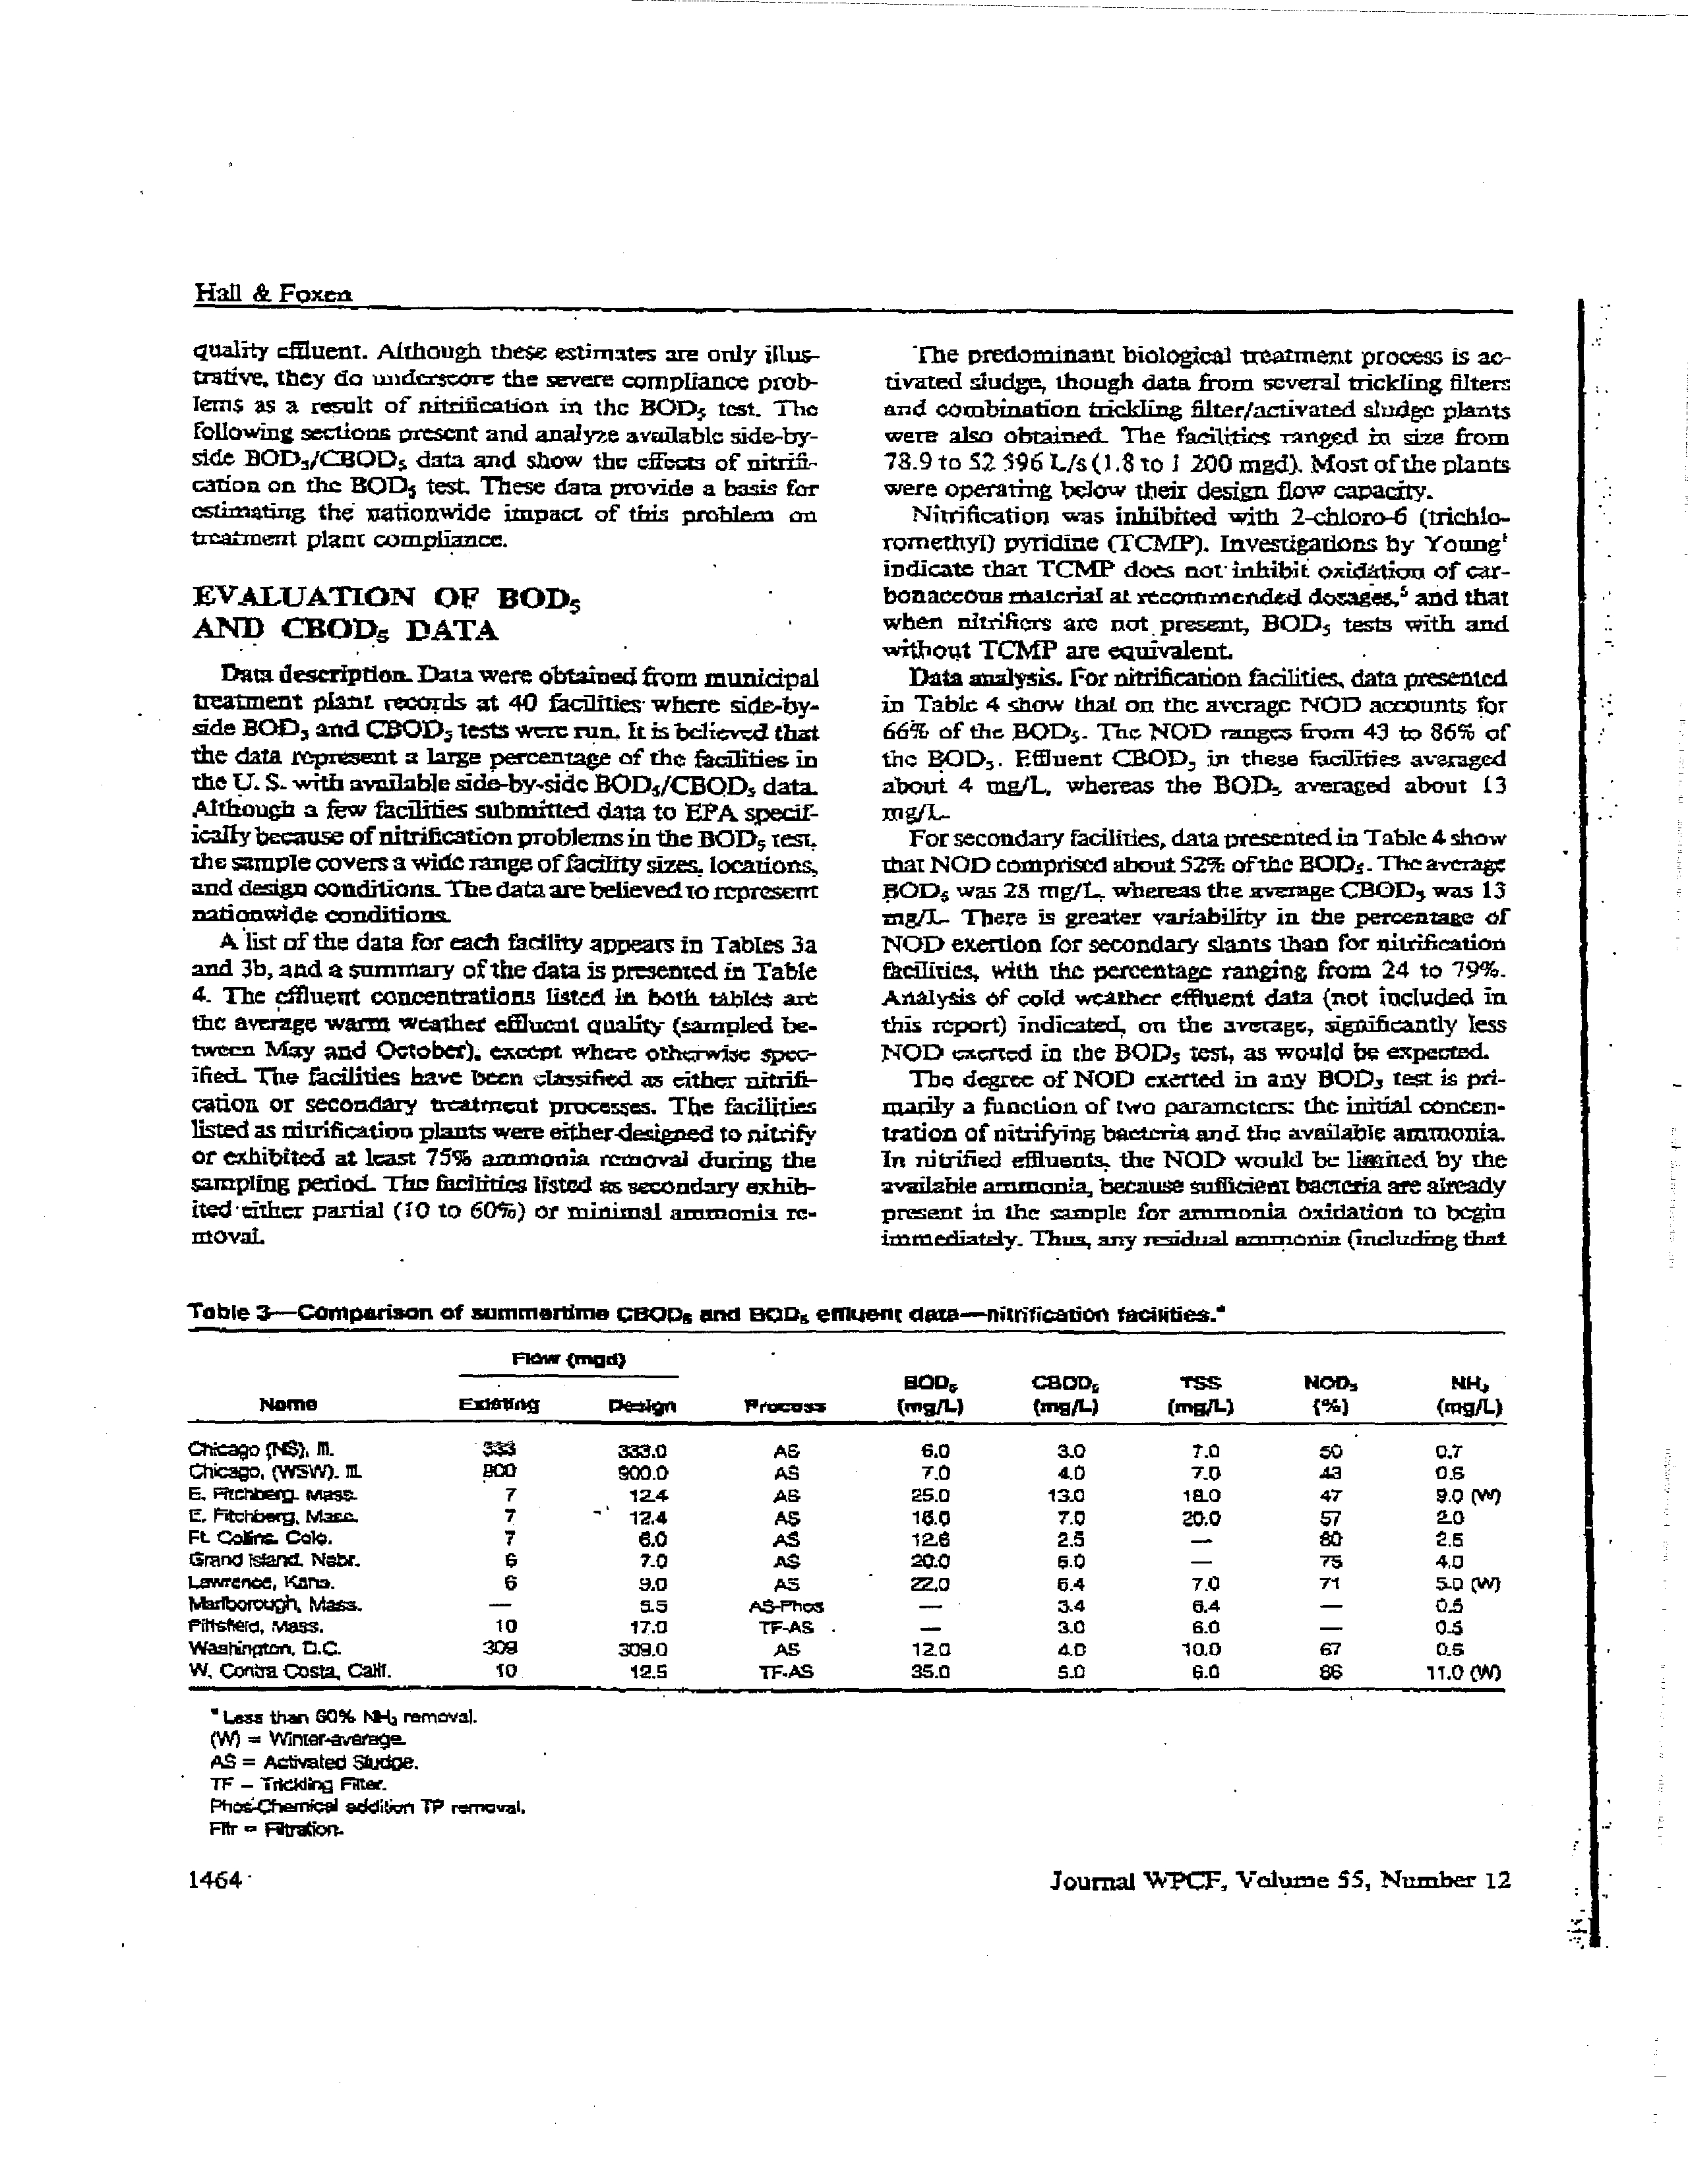
The
possible problems with mcasnringtotal
BOlD,axe
illushatcd in the following
tssample. Table 2 shows the
effluent quality for two hypothetical treatment faculties,
one
providing secondary treatment with
no nitrffiers
in
the
effluent and the otherjust bc~inningto ziltrify. The
-
effluent from the secon4ary acit*tj~contains 30
mg/I,.
COD,
and 20
mg/I,
ammouia,
and ultimate
oxygen”,
demand
(liOn)
of
136
tnE/L.
Because
there arc few
nutrificre present in effluent from this facility, the DOD5
tat would indicate air
eWutent ROD, of 30
ns,gjt (iden-
tical to COD5).
Table 2
also shows that the facility
in
the-incipient
nitrification
stage provides slightly better treatment, and
produces an
effluent
with
about 25
wg/t
CEOD,.
18
mg/I,
ammonia, and
120 mgfL
UOD.
However; in
this
case, because nitrifleis arepresent
in
the efflueni, an-NOD
of56 ing/I, might be exerted
in the DOD,
test. Thewould
yield
a
DOD,
of
81
mgJL—neatly
three
thrice
greatun-
than that
of
the secondary flucilit
that discharged poorer
tabte
2—Theoreticat impact
of
nivogenuzis
oxidatto
n on
SOi’~
turn reautrs
type
Operating eandlS~ne
-
CflQD~
-
POt,
UoOw
NOO
SOD,
Secordaiy
Seeaeck’ayfw.oiplgnt
,
nlt,lfieslion
No nlrflfiers
Wem
‘netter,
bemow design
flow.
some nielSen
~ra~ank
-
•
513
25
20
16
136
120
13
56
30
81
•All
-esiuee
~‘
molt—
~UCD:act
1.5
CSOCw 4
457
M-?~.
December
1983
1463
Hall
& Foxen
quality
effluent.
ALthough these estimates are
only illus-
trative, they do
underscore
the rere
compliance prob-
lem$
as a
result of
nifrilicatiort
1St
the
ROD,
test. Tho
following
sections present
and
anai~e
available side—by-
side BOD1/CROD,
data
and show the
effects
of nitrifi-
cation
on the ROD5
test.
These data provide a basis for
cstinictixrg
the
tration-adde
impact
of
this
problem
on
treatment
plant
compliance.
-
EVALUATION
OF
BOD5
ANTI)
CBOfl~
DATA
-
Data
descriptia
Data
were obtained
from municipal
treatment
plant
records at
40
facilIties- where
side-by-
side BOlD, and COD~
testswere rum
It
is
bdievcd
that
the data reprEsent a
large percentage
of
the facilities in
the U. S.
with available thde-by-.sidc BODS/CBOD, data.
Although a few Ikdilhlies submitted data
to
EPA
specif-
icallybecause
of
nitrification
problemsin the DOD5
test
the
~rpjple
covetsa wide range
offadfttty sizes. locations,
and
design coudilions.
The dataare
believetho represent
nationwi4~conditions.
A
list of
the
data for each
facility appears in
Tables 3a
and
ab,and a
$nmrflai-y
ofthe datais
presented in
Table
4.
The effluent cotieentations
listed In
bath
w,ias
art
the
average warm
wtathet e~zcntqoalit)- (sampled be-
twecn May
and
October). except
wheat othcri~tcspec-
ified.. The facilities have 15cm
ç1a~sifi~4
as
either nitrifi-
cation
or
secondary
treatment pnccz~cs.The facilities
listed as nitrification plants were either4esigned
to nitx-ify
or
exhibited at least
75
ammonia
reaiovai during
the
sampling periocL Thu theilitics listed as secondary etb
ited-eithcr partial
(10
to
60)
or
miaimal
ammonia
re-
movaL
The predominant
biological
-treatment process is ac-
tivated sludge,
though data from several trickling filters
and
combination trickling
filter/activated
sludge plants
were
also
obraine~tThe
facilities ranged
in
size from
73.9
to
52596
tIe (1.8
‘to
1
200 mcd).
Most
ofthe plants
were operating below their
design flow capacity.
Njtrfficajjoe
was
inhibited
with
2—chioro-6
(trichlo-
rometityl)
pyridine
(TCMLP).
Investigations
by Young’
indicate
that
TCMP
does
nor
inhibit
oxidation
of car-
bonaceous material
at rceortriracade4 dosages,5 and that
when
nitriliers
arc
not
-
present,
DOD,
tests
with
and
without TCMP
are
equivalent
-
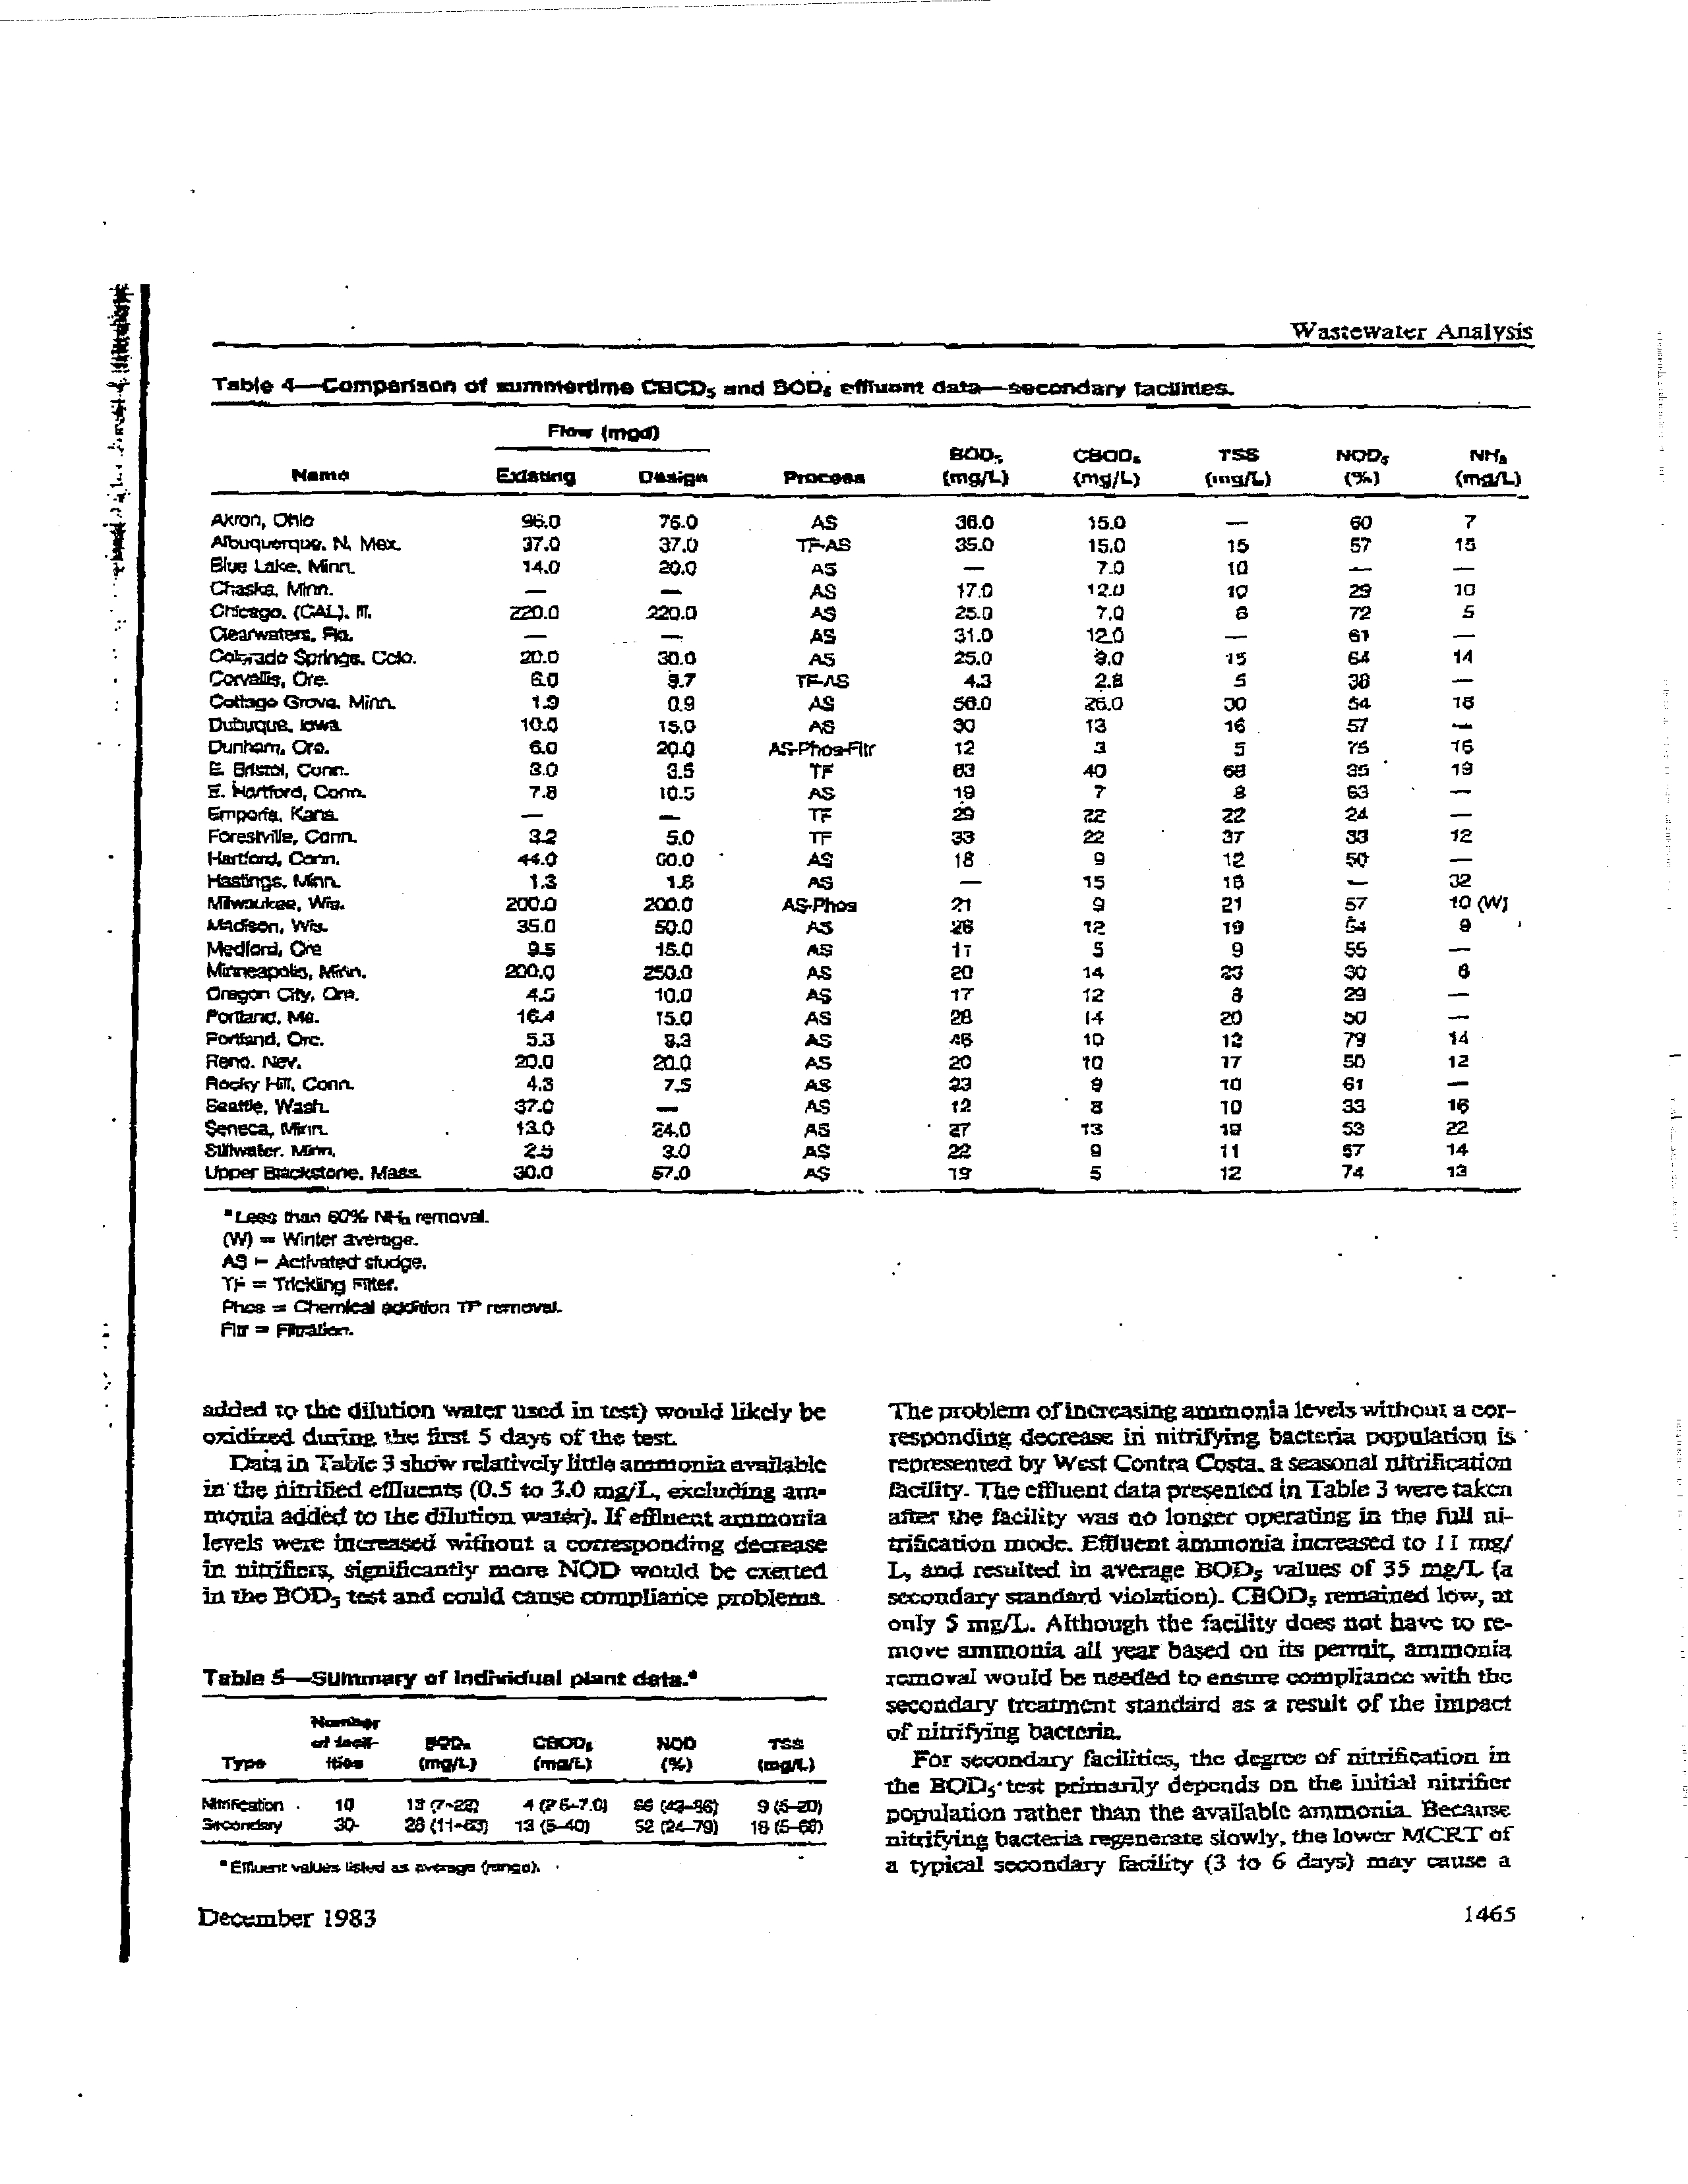
Data analysis. For nitrification facilities, datapresented
in
Table
4
show that on
the average
NOD accounts
for
66)11,
of
the HOD5.
The NOD
ranges
frame
4~te,
86
of
the ROD,.
Effluent
OOD~in
these
facilities averaged
about
4
mg/L,
whereas the DOD5
averaged
about
t3
-
-
For
secondary facilities, data preseated in
Table
4
show
that
NOD
comprised about
52
ofthe
B0D1
The average
DOD, was
23
mng/t. whereas
the averageCBOD,
was
15
rng/L-
There
is
greater variability
in the
percentage of
NOD exertion for secondary slants than
for nitrificatiors
facilities,
with
the percentage ranging
from
24 to
79.
Astalytis
Of
cold
westher
effluent
data
(not
included
in
this
report)
indicated,
on
the
average,
significantly
less
NOD exerted in
the DOD, ‘test, as would
be expected.
Thu
degree
of NOD exerted in
any DOD,
test is
psi-
sadly a
junction
of two parameters:
the
initial
concen-
tration
of
nitrifying bacteria and the aveiiable
ammonia.
In
nitrified
effluents
the NOD would
be limited by the
available ammonia, because suilitheunbact~ia~e
already
present
in
the
sample
for ammonia
oxidation to
begin
irntnediatr.Iy.
Thua,
any
maidnal
ammonia
çnruthxding that
Table 3—Comparison of
summertime coops ana
BoOs
e
nit-tent
date—n
itritioa-tion
facihties.s
new
‘
BO0~
t8OD~
YSS
MOO,,
NM,
-
-
Name
~S1SU4~
Pctign
F?~un
lmgIL)
(rng/L)
(mg/k)
3
(rpajL)
Cbicago (YC),
fl.
3*3
333.0
AS
tO
3.0
7.0
-
a,?
Citago,
(WSW). itt.
at~
500.0
AS
70
40
7C~
4~3
fl5
E.
.
MasS.
I!.
rute-teta
Mn
7
18.4
7
-
-
124
AS
AS
25.0
itO
t8.O
7.0
18.0
20.0
47
57
tO ~W)
2.0
Ft.
Co~rc.
Ct.
7
8.0
aS
18.8
2.3
—
80
ts
Grand tslaruct. Nebr.
6
7-0
eS
SOC
SO
—
75
4-0
Lawrence,
Scare.
Marlborough.
Mass.
6
no
—
5-a
s5
t,5-pu,i,s
~.o
—
5.4
5-4
70
5-4
71
—
5-0
(W)
0.5
rtltsftera,
MaSS.
10
17.0
TF-AS
-
—
ac
at
—
04
Wastinpron.
fl.C.
309
aino
AS
iaa
a&0
-tao
67
as
W,
Contra Costa,
CaNt.
--
-
10
-
-
ias
-was
as.o
s.c
~.0
86
1t0(W)
• Less thw 80t~l+4~removal.
(WI
—
Winter-average.
AS
=
ActtvstS
~idoe.
TF
-
TckSdhj flts’.
Phaichemieal Sdit~n
TP
ren’cv&.
Flit
a
1464
Journal
WPCF,
Volume
55, Number
U
added
to the dilution
water
used
in test)
would
likely be
otdiaetj. dwinz t3se flit
5 days
offlat test
Data inTableS sMw itively
little
ammonia available
in the nirrifled effluen~
(0.5 to 5.0
mgfL
ácluding
am-
mc’ttia added to the dilution waxer). Jtafiluctzi~
ammonia
levels weit
incxtased
without
a
~wcaiponding
deaeese
in
niuifints,
si~xiiflcantlymore NOD wotdd be exerted
In the BOD,
test
and could cause txnnplianbe problems
Table
£—Sulrnmnaryat
lndiwiduat plant dsta.
N
ai’
sen.
casx~1
two
its
Tip.
fit..
çmg~tj
(maJL)
()
twoS)
-
II)
1!
7-a?)
4
(26-703
30-
28
(11-C3)
13(5-40)
SG (0.66)
62
(24-79)
9 (5-a)
18 (5w)
.
Erlkn,t
valuesaled as e.aaq
(‘area).
-
The problem
of
increasing ammonia levels
withoax acor-
responding
decrease iii
nitrirying baetcth p~puladouis
-
reprEsented by
West Contra Costa.a
seasonal nttriflcation
facility. The
effluent data
presented
Table
3 were taken
a1~the
ftcility
~sas
no
longtt
operating in
tue liii!
itti-
trification mode.
Effluent
ammonia
increased
to
11
tug!
I.., and resulted
In average
BOD,
uatues
of
35
mgTL (a
secondary standard violation).
CBOD5
remained low,at
only
S
mg/L. Although
the facility
does
not
bave to
re-
move
ammonia all
year based
on
its permit,
ainnionia
removal would be needbl
to easing
compliance
with the
secondary
treatment
standard
as a result
of
the impact
of ninifring
bacteria.
For
aecondaxy
facilities,
the degree of
nitrification
in
the BOD~çtntprinisrily depends
on
the
initial niu±ñet
population
rather than the available
ararnonia
Seause
nitrifying
bacteria regenerate
slowly,
the
low~
MCE.T of
a
typical secondary
facility
(3 to
6
days)
may
~uze
a
-i
I
~-1~
I
Table
4—Campatison
of
nimniefllmg
ceco,
end
SCDg
efituant
data—escandary
tacrntles.
fln~
—
—
Manic
Existing
gOo~,
flexign
-
Pines
(mg/i.)
CSOO.
(nig/L)
T~
(..ig/t.)
NoD1
(5.)
Nt-f,,
(‘nejt..)
Wastewater
Analysis
Aflofl, Otto
56.0
76.0
AS
36.0
15.0
—
60
7
.tibuquerque. N, Ma
37.0
37.0
ThAS
35.0
15,0
10
57
¶5
ElueLalce.Mnn.
14.0
20.0
A5
—
70
10
—
—
ChasM.
~
—
—
AS
17.0
i(~g)
‘p
29
10
Ortega. (CZ4L~.lit.
~.0
220.0
43
25-1)
7.0
3
72
5
Cisarwatatffia
—
—.
AS
31.0
i2.O
—
61
—
Ookndn 3pth~e.
Cdt.
20.0
30.0
ss
25.0
to
i~
64
14
Ccrmnls,Ore.
ac
tv
IF-AS
4.3
25
5
31)
Cctbgcl3ruva
Mien
1.9
as
AS
56.0
25.0
30
54
16
Outuque.twt
iO.0
i~o
50
13
16
.
57
—
0unMn~.
Ore,
6.0
2Q0
AS-PtloeFltr
12
3
5
76
15
a
Detest,
Caner.
3.0
3.5
7$
03
40
66
Sel
19
eJ4wtfoea, Coon.
7_a
t0.a
AS
-19
7
S
63
-
—
En’porfe.fa~.
—
TF
irE
22
fl
—
FOresThlIe, Coon.
3.2
5.0
17
3~3
22
-
37
33
12
I4atfoed.
Coin.
44.0
00.0
AS
lB
9
1~
54~
—
Hastlngs.tSn.
1.2
iS
see
—
15
-tO
—
32
Mlwadcee, Wig.
200.0
200.0
A5.Phos
21
9
31
57
10 ~~‘J
MAdsen, Wig.
35.0
SQ.O
AS
58
12
19
54
Medlcrd,Cre
9.5
lao
ma
It
5
9
55
—
M~rneaps~,
Mica.
300.Q
250.0
AS
20
14
23
30
6
Oregon City, On.
4.5
10.0
*5
iT
12
8
29
—
Poibnc.
MG.
Itt
15.0
.48
26
4
20
00
—
Fo.ifand. Ore.
5.3
t3
AS
115
10
12
79
14
lIens.
Nay,
no
20.0
AS
ac
to
17
50
12
flacw
Hut, Corn.
4.3
7.5
AS
23
S
in
61
—
Seattle.
Wash.
37.0
—
AS
12
8
10
33
‘6
~eca,
t’&~.
-
tao
ao
~s
-
V
15
19
53
22
Etllweter.M$n
2.0
3.0
AS
22
9
11
57
14
tipper~aatratcne.MaSs
30.0
57.0
a$
iS
5
12
74
iS
•Lest) than
50
Mt
rernovat.
1W)
Winter a’.-erege.
AS
—
Aethratetsfud1)e.
=
Tztcldng
Ftltef.
Pt-ice
=
CheeSes *cfliton
TP reeaovW.
Ftw
Decamber
1983
1465
wasnour
or
wide
fluctuation
In the nitrifviag
population.
As
a
rcsul;
the
initial
Population
of
nlrrifying
bactcria
Ir
In
the test
ssmple may
-vary cétisidseably and
may
not
bç
sedicteirt
tQ
affect
the test xegcjltsimillilae population
-jji
hcrSses.
Stgni6carn nitrificasion, lilt
ocriirs at an, may
be dekiyed
until the IS
days
ot’ the
test
so -that only a
small jiercenmgc
of
the
available ammonia is oxidized.
A
study an the
effects of fluctuating MC~T
on
NOD5
was conducted at to
Colorado
Sfrings
facility
by
Cal-
laway
and
Young.”
Tbç
study verified that reducing xii-
irifying
population thiough
decreased MCRT results
in
‘1
-
losNOD, eaertion
in
the SOD, test.
-
Although
effluent
ammonia
dati
~cxt
tot
always
‘1-
I
availablefort
secondrytheililies, discussions with plant
speStors
Indiested that
waz’y plants
were
partially ni-
j~.
1
th4thig (about
IOta 60
ammonia removal). Other plants
did
not
eXhibit
any
S.TnQnIa
rerdovaL ~seh
a facility
is
~a
lay nitdl~ing.
a sul
den; nftdMxrg
population is
pTCa&ZC
to significantly
inspect
tb&SOD5 test.
However,.
eyed
facilalets where ttinlftcatjon
is
not
occurring
may
have
sufficient
nitr-iflers
-to impact
BOD) results
ir
the
acnky is in the
incipient nitrilimdon
stag0~
(Sac Alber-
quehquc N.
Mcx case
study.)
Incipient
ultrification
(a’
duties
lxzye
loading ratesand
MCaTs
that permit nhtrilier
po&lulatkmzto be
SnNithe4 however, the
trention
time
in
~
lioiegial
~
~
a
~0w
hI
snot ad
equate for detectable anunozzia reduction. During the
S
daYsofihteSODa test,
the seed nitrifying population has
sufficient time to Increase
and begin ammonia
oxidation.
- -
Similady,
seasonally
a~olea-
wastavater teniperetures
it-
dccc
plant-seale ninificadon.
but fuotbation
at2i)tM
‘the
test quickly
activates the nitril~rixig
population.
Theresults &oxn thi$
~Jn
yagr~witi
a similar
swvey
conducted
in
West-C’ermany
~y
Daxuield)’ Typically,
SOD,
Inst result for both Trickling
mte~
ann activated
I.
siw~plants in
that study were si~iEcanflyhigher than
CR0),
test results.
The amount
of’NOD exertS
in
the
50D5 testranged from greatecthan 60
(ccfacilitieswith
high
MCRTs
to abotat2056 fbrfacilities withlow
MCR.Ts.
To
prevent
znisleading
SOD~’iestresults caused
by ni-
trification-in the
t~
West Cen~any-nowusesthe CR005
test
The following case studies
illustrate
how the BOO,
test
can
provide
misleading
and
contradictory
infor-
mation on plant opcairdoa
-
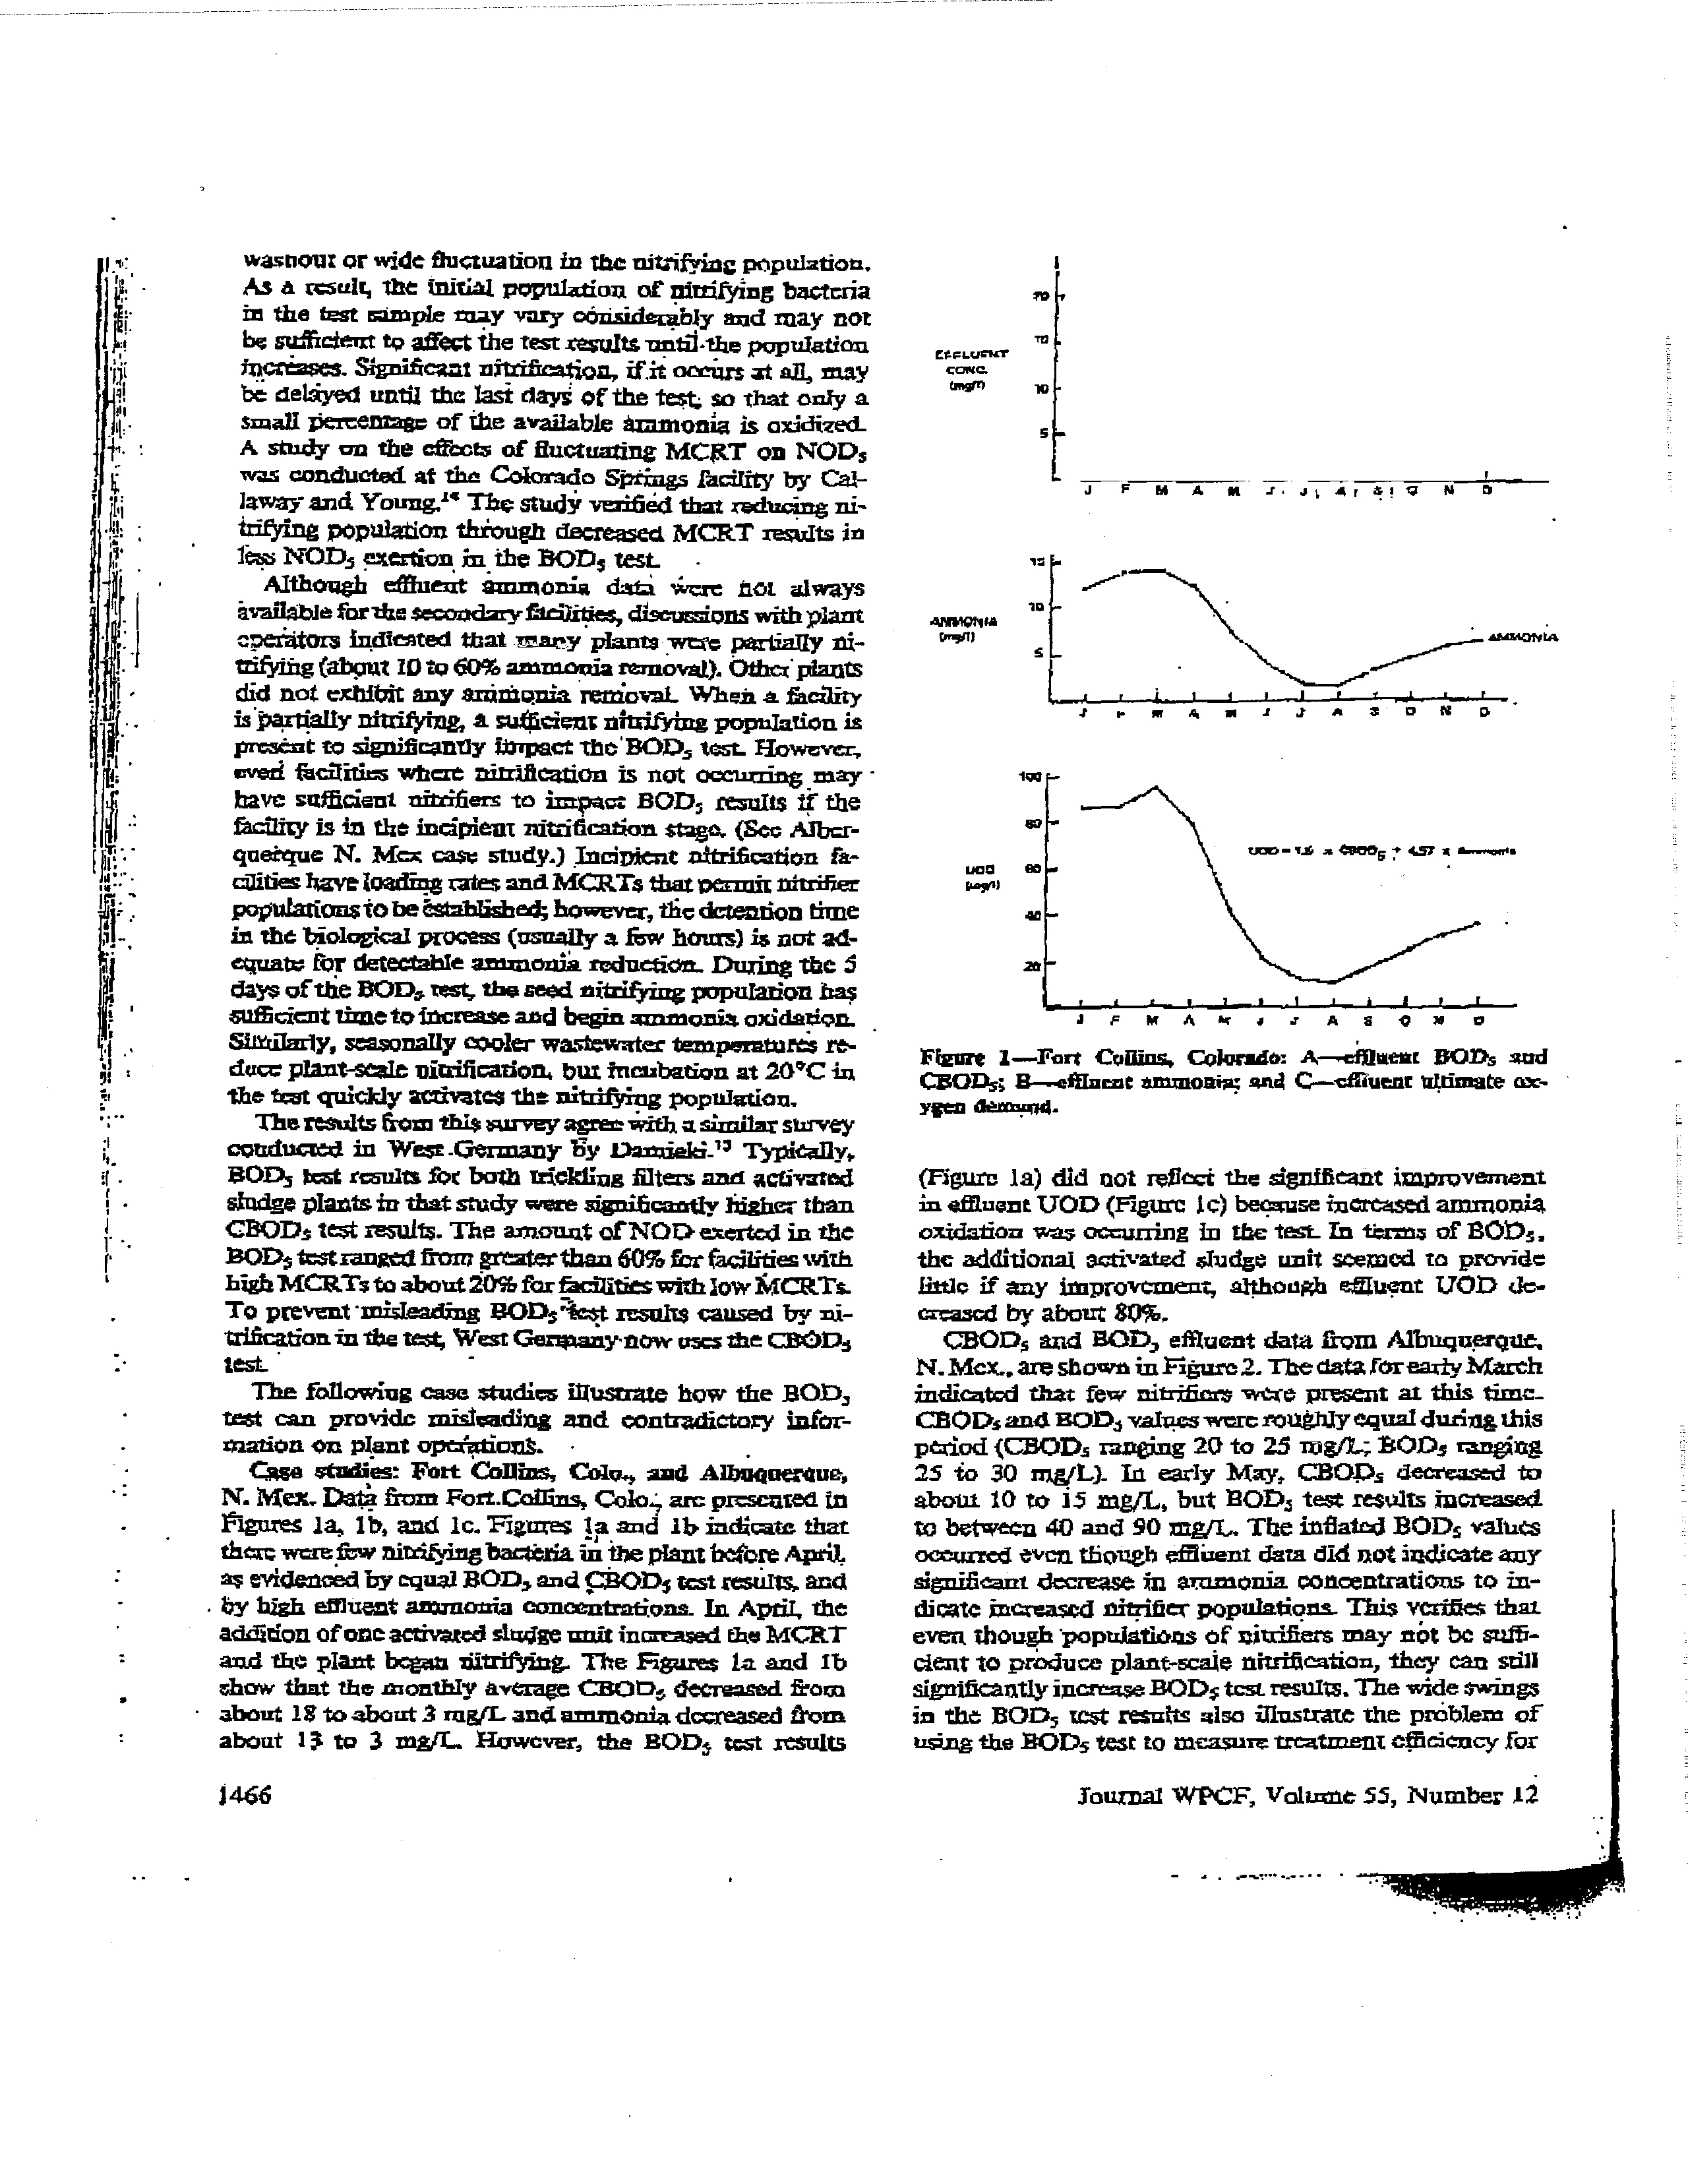
Qrsse studies:
Fort
Collins,
Cotu.,
and
Albn~uer-aue,
N.
Max. Data
from
Fort.Cofllns,
Cola;
arc presented in
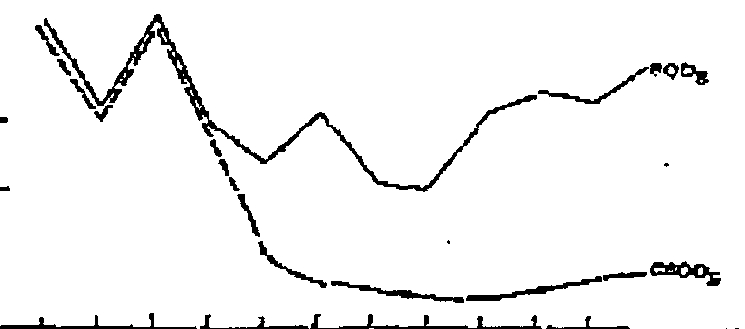
?lgures
Ia, lb. and Ic.Figuz~
Ia
and
lb
indkatst that
there
werelbw ninuffrigbaaöuia in
the plantbetre ApriZ
~
byequal
BOlD,
and
tBODs
test resent and
-
by high effluent ammonia conctntrations.
lxi April.
the
addition
ofone activated
sludge
unit incrrased
the
MCRT
and the plant began titri~ng.
The Figures
Ia
and
lb
show that the monthly average CR005
decreased
from
about
18 totat
S ingfL
and ammonia decreased from
about l~to
3
mg/I..
Xiowcver,
the
EODfr
test results
n
Ti
cone.
J
~
N
A
a
.r-JC4r~!c
N
0
ii
-
41fliQNI~
-
-
S
-
-
-
,
~“~‘—r~
1w
100
~
a
~-4--J-4--’-----------
$
P
UT
A
a
£
7
S
S
0
N
0
~y:~:~:::
Figure
1—Fan
Coffins,
Colorado:
A—.cfthteflt
DOD,
arid
CDOD5 B—effluent smunoalar aM
Q—cfliueat ultimate
ax-
flen
d*-rtu’q4.
(Figure
Ia) did
001
reflect
the signIficant
improvement
in
effluent
UOD (rzgure
Ic)
because increased ammonia
oxidation
vm~
occurring
In
the
test. Zn
terma
of SOb5.
the additional
3cttvated sludge
unit
seemed
to
provide
little if any
iniprovetnen;
although
efilu nt
UOD
de-
creased by abort 80,
CBOD5 and SOD,
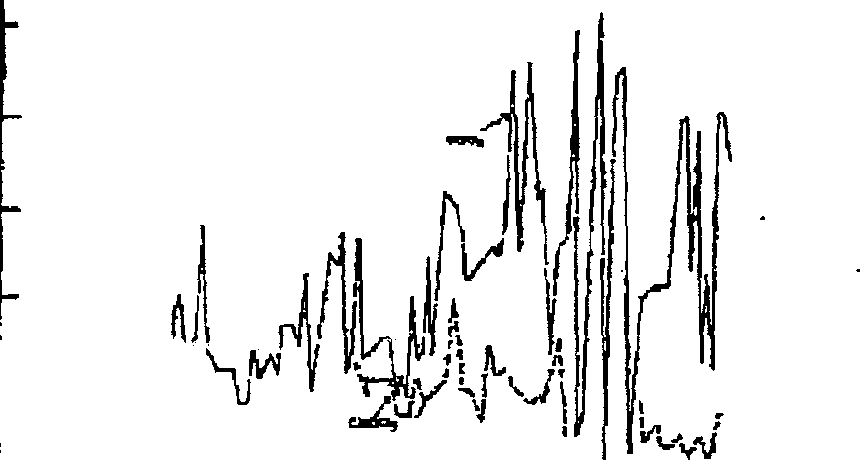
efiiuent data ftwn Albuq~rqne.
N.MeL.are
shown in Piguro2. Thedata forearlyMarch
indicated that few
nitrifinre
were
present at
this time..
CR01), and
nob3
values were
rou~bly
equal during
this
period(CBOD, ranging
2(1 to
25
mug/L; SOD,
ranging
25
-it
30
nigJL).
In
curly May,
CROP,
decreased
to
about
10
to
15
mg/I.,
but
flOD,
test results increased
to
between 40
and 90 nrgfL. The
inflated
501)5
values
occurred avon
though
e~izentdata did not indicate any
significant decrease in
ammonia
concentrations
to in-
dicate increased stifler
populations-
This
verifies thai.
even though
populations
of
ninriflers may not
be sui5-
clear to produce plant-scaie nitrification, they
can
still
significantly increase ROD5 test,results. The wide swings
in
the
SOD,
test results also Lilustrate the problem of
using the
ROD5 test to
measure treatment c~thcncyfor
1466
Journal WPCF, Volunic
55,
Number
12
0
Wasteâiater AnalyS
Figure2—FInal effluent BOD, and CBOi)c(tng/L) Albuquer-
que, NewMexico.
facilities operating
in
the incipient
nitrificatibn
stage.
Because of varying amounts of nittifying bacteria,
sig-
nificant day-to4ay
fluctuations
ocarr in
the degree of
agunonia
oxidIzed
during
the test
In such casc~,the
HOD5 test can not accurately
characteriae plant pcrfor-
mance and operation.
ESTIMATE
OF
DOD5
ViOLATiONS
CAUSED
BY
NrflUPIC4.TION-
NATIONAL
1MPA~
Given rhosignificant effect that nitxi54r~bacteria may
have on BODE trot results, it is apparent that someBOD~
noncompliance may result solely from NOD
exerdota.
Only 7 ofthe 40 plant
surveyed were out ofeonspljancc
wIth the 30-mg/I. ROD,
slandand during the sampling
period.
Of
these seven plants, only East Bristol would.
have beenout ofcompliance with the 30-mgtt. standard
eve-n If the CEOD,
test bad
been
used.
Although
this
sample is small, these findings
suggest that a significant
perwenta~cof BOO,
compliance
problems may
be
dun
to
nitrificatlon
in
the
test.
and
not
due
to
poor plant
perthrmajme,
-
Because than are relatively few Facilities for which
thie-
by-side BODilCBODs
data.
art
avafhthtc,
the tatlonal
significance ett.bis problem Lad to
be estimated by an-
aI~’zing
available data. to
identify 9ndksto&
ofniftifi-
‘cation in the ROD5 test.
From the
available data
it ~
observed that in
nearly all. cases where significantnitri-
Scation otrtrrrnj in the
B0D~
test.
SOD,
concentrations
were grester
than
TSS concentrations (Tables Sn and
4).
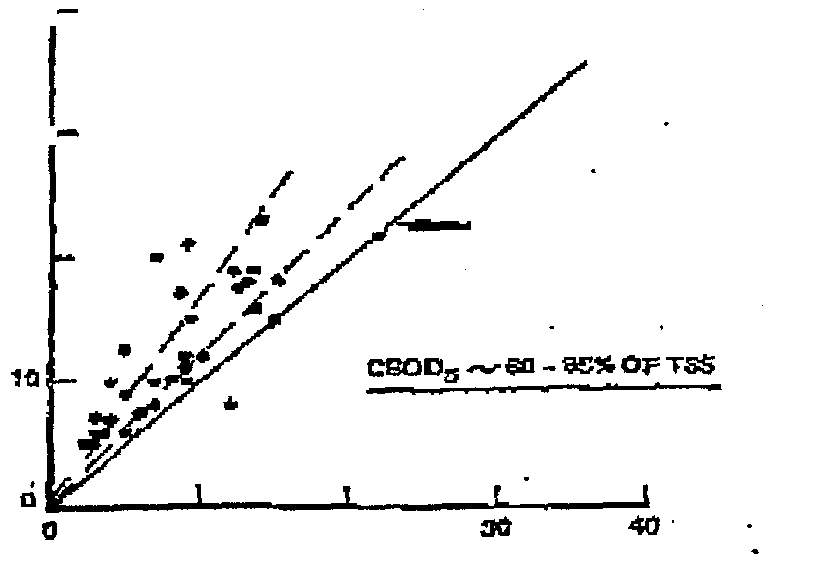
Ineverycasebutone. CR01)5
-was
less~ktn ThS~rcgixdless
of the
degree
of
nitriftastion .occuthng. This
point is
11-
Jusrzated hyP~ure3,wfiithplotstherelationsbipbetweert
CROP, and TSS for the
40 facIlities sampled.
Figure 3
shows that CROD,
was typically
60
to
85
of the TSS
value. Analysis of
wintec
effluent TSS
and
CBOD,
data
(not included
in this report) also
indicated that
CR01),
values are typically
less
than
TSS
values,
when
‘ISS
is
above 20 ing/L. A HOD5
value
greater than the TSS value
would
be
a good
indicator
of significant
nitrifleatton
in
the 301)3 t~.
The empixtal
relationship between CBOD3 and TSS
was -used as a basis for
csliln3ting
the
number
of cases
where noncompliance was caused by
thtrlflcatloa in the
BOD,
restS It
~
assumed
irs
these
estimates
that ci-
trtháadon wq~
tile cause ofnoncompliancc ifDOD5
con-
centration was gitter
than
3(1 rngJL
but
the TSS con-
centurion was less trn
30 mg/fl
Because the data in-
dicate flit CR01),
is
typically about
64) to
35
of
die
TSS value,
it
is
conservative
to assume that
nitrification
is responsibleonlywhen BQQ,
eacect
TSS.
-
fluent
ruonstonug data flora 325 secondarytreatment
ibthlides
in
New York
Mate
were
~s~ed
to
estimate the
national extent of ROD5 test violations caused
by
nitci-
ficntmon. The sample
included.all majorcategories ofIt-
logical treatment processes
(Table 6). Becauseoft
rim
of
the s~xnplc
and the variety of facility types, a
ional
sample is not
likely to produce significantly diBluçnt re-
st
-
The New York data show that
99
ofthe
325 fiwilities
were
in
violation
of their
30-mg/i
SOD5
permit
to-
qufronrent duringthe period
of
recor& However, acom-
parison of BOD~and TSS data revealed that
in ebnost
60
of
thesecasesTSS was less than
30
tng/L. Therefore,
based
on,
available CBQ1), data indicating that
COD5
should
be less than
TS5. It
was concluded
that about
60
of the 301)5 permit
violations may be caused by
nitrificarion
in die test,
rather Than by improper facility
design or
operation,
A detailed breakdown
of the
number
of
UODg
viola-
lions
caused
by
nitrification
for
different
categories
of
facilitiesappears
in tableS. This
table shows thattrickling
a
;~T’4J
an.
,a~5y
—.
.
—
1,7; 1
at.
caog~
~0
so
20
\~I,7’
,,~
sacs
/
en
1.2:1
,5...—Te~
gaoa~
1;t
Cit
I
IL
11.
‘U
10
20
EI’I’LUENT
CzQo5 fsnØI)
Flute 3—Relationship
between
CBOD5
sad
TSS.
December
1983
flhtth
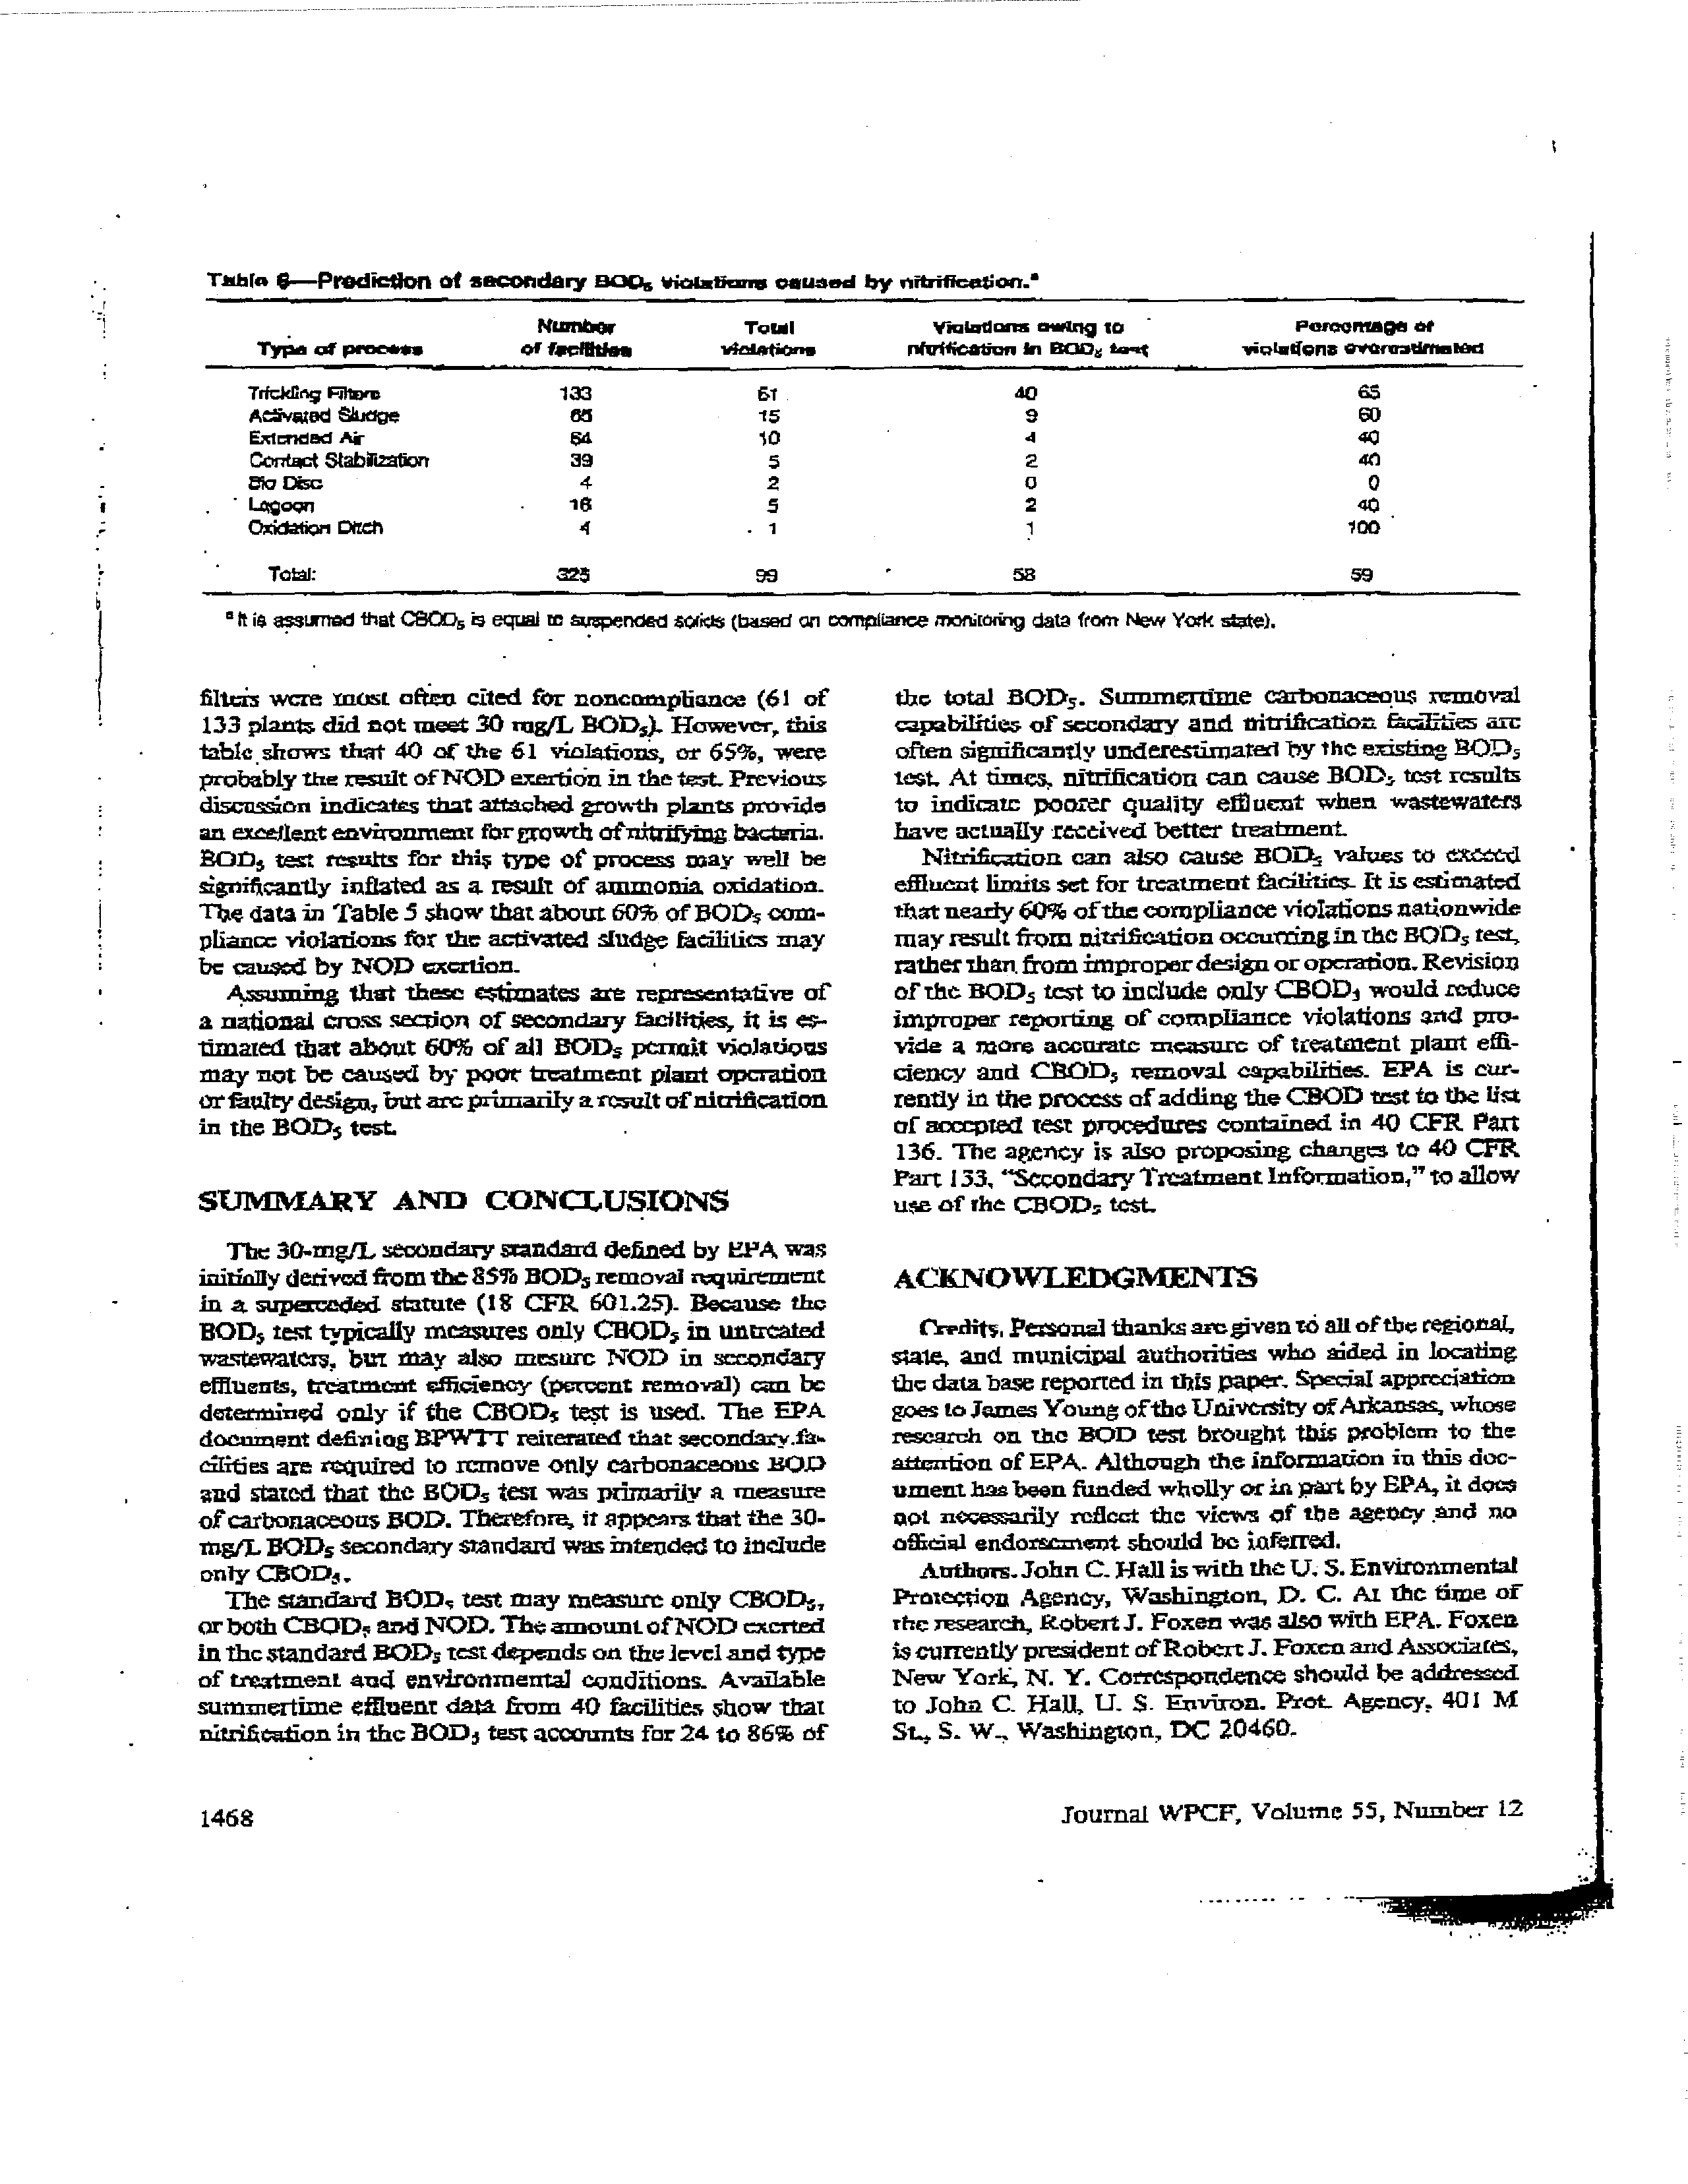
acre
most
often
cited for
noncanspbance
(61
of
133
planb
CM
tot
meet 30 rugfL ROD,).
However,
this
table
shows
that
40
c(
the
61
violations,
or
65,
were
probably
the
result ofNOD exertiOn in
thetest
Previous
discussion
indicates that a.ttacthed growth plants
provide
an excellent environment forgrowth otn*trSfl~tgbacteria.
BOiD, test
results for
thi5
type
of procass may
well
be
significantly inflated
as a. result of ammonia
oxidation.
The
data in TableS
show that about 60
of
DOD,
com-
pliance
violations ftir the acUvated sludge facilities may
be
cars-ted
by NOD
acrilon.
-
•
Assumng
that these
estimates
art
represenialiva
of
a
national
cin~a
section of
secondary (aellfties,
ft
is a-
flmared that
about
60
of all
ROD,
permit
violations
may not be caused
by
poor treatment plant operation
orfisultydesign, hut arc primarily
ainsult ofnicrification
in the BOD~
test.
-
SUMMARY
AN)
CONCZUSIONS
The 30-mg/Lsecondarystandard defined
by
EPA
w~s
initially detived from the 85
DOD,
removal nquiremcnt
in a supaceded
statute
(18 Cfl
601.25).
Because the
BUD,
test typically measures
only
CR01), in
untreated
wastewatces.
but
may also
mesarc
NOD
in
secondary
effluent,
t’edtment efliciency (pcrcont reman)
am be
determined
only
if
the CRUD5 test is
used.
The
EPA
document deflin Log BPWfl
reiterated that secondary.S-
cilities are required
to
remove only
carbonaceous HOD
and stared that the BOO, test
was
primarily a measure
ofcarbonaceous DOD. Therefore,
ft appears that
the
30-
tngj
BODE secondary standani wasintended to Include
only
CROCi,.
The standard
ROD,
test may measure only CBOD,,
or both CBOD, and
NOD.
The
amount
of NOD exerted
in the standard ROD, test depends on thelevel and type
of treatment and
environmental
cc,mtdjtjons.
Available
summer-time effluent data from
40
facilities sbow that
nitmifleationhi the SOD5 test account
for 24 to
86
of
the total
ROD,.
Stnnmnerrtme
crarbonacequs
removal
capabilities
of
secondary ansi nitrihcation
facilities arc
often
significnntlv underesthuarel
by
the
existing
HOD,
test,
At
times. nttriflcaiion can
cause
SODS
test results
to
indicate
poorer
~uaIity
eth
ucrit
when
wastewate-ra
have actually received better treatment
Nitritation
can
also cause
BOO,
v~lucs
to
excc-t-cl
effluent limits set for treatment theilitics~
It
is estimated
tFtat nearly 60
of
the compliance violationsnationwide
may result
from
aitrification occutngin
the BOLD,
rest,
rather than, from improper design or operation. Revision
of
the
SOD,
test to include
only CR01)1 would reduce
improper
reporting
of
compliance
violations
and
pro-
‘wide a more accurate nrcasurc
of
treatment
plant
efR-
ciency
and CRUD,
removal
capabilities.
EPA
is
cur-
rently in the process
of adding the CROD test to the list
of accepted
test
pncaclures
contained
in 40
CFR
Part
136. The
agency
is
also
proposing
changes to
40 CFP..
Part
133,
“Secondary Treatment
lthbrzuation1”
to allow
ue
or
the CR01),
test.
ACKNOWLEDGMENTS
Credits
Pe~onalthanks
ast
&ven
td
eli
of
the regional,
sam,
and municipal
authorilius
who
aided.
in
locating
the
data base
reported
in this paper. Special
appreciation
goes toJames
Young
ofthe Ijniversity ofArkansas,
whose
research on the SOD
test
brought this
problem
to the
ancrrtion
of
EPA.
Although
th.e inforwwicin in this doc-
umenthasbeen funded wholly or in part by EPA,
it
does
net
necessarily reBoot
the
views of the agency snd
no
affidel
endorsent~n,tshould
be inferred.
Anthon. John
C.
Hallis with
the U. S.
Environmental
Protection
Agency,
Washington,
1).
C.
Ax.
the time
of
rho
research, Robert 3.
Foxen was
also
tcith
EPA.
Foxen
is currently president
of
Robert 3.
Foxcn andAssociates,
New
York,
N.
Y.
Correspondence
should
be
addressed
to
John
C
Hail,
TI.
S.
Environ.
Prot
Agency.
40!
ls(
St., S.
w..
Washington. DC
20460.
1468
Journal
WPCF,
Volume
55,
Number
12
Tth(aG
-Prediction of secondary 000s
violatians
caused
by nitrification.?
Nwn~
Tulal
ViuIad~n
ntng
no
-
PercentaGe ci
Twa
&
prncan
-
of feefflujee
vsa$..
riecaean
In soot
*a-.5
yiQI5t~Qfl5 SflnSStRSICCI
Trfckflnç FjItec
133
51
.40
65
AcIvatod Sludge
es
15
a
a)
E2dmdadAi-
54
10
‘I
40
Contact Stabt.zaticn
39
s
2
40
etocho
4
2
C)
0
,
L~oqrj
1G
5
2
40,
Oxidaticri
Otch
4
-
1
1
~0O
‘
Total:
•~$
53
59
It
iS
a
sirnad that
CBW,5 eqtal re
ST
pended sakls (based
en
compliance n~YtiLO&igdata from New Yak state).
Waste-water
Analysis
REFERENCES
S.
You1
S.
C.,
‘flcmical
methods
for nitrificadon
eon-
troL”
.1.
Water Pal
Lw..
Control Fed., 45,
637
(197.3).
2.
Dague, B.. R.,
rnhlblfion
of
nifrogaxsus BOO and
tint-
near
pleat
pcdbcezancc
nahmfioc”
.1.
Water
Fothzt
Control
Fed.
53,
1738
(1981).
3.
Sawyer, C.
N5..
and Bradney,
L,
Modereizatioa
of the
BOO
Test
for
Determining ‘the Efficacy of Sewagc Traar-
m~t
Froeesse~Sew.
Wo,kr
L, 1*,
6
(1Q46).
4.
Sawyer and
Mccarty.,
“ChcmL~rayfor
Environmental
Ebginecrs,”
3rd
F4.,
McGraw-Bill Bofl
Co.. New
York,
M.
Y. (1978).
5.
~
Methoth for
Ecasaination
of
Waterand Waste-
water.’~15th Ed.,
Am.
Public Resith i~ssoe..
Washington,
TX
C,
c1920.
6. I8CPR6Ot.25(197fl.
‘7.
Mcmo~~duqj.~
Trcatment
ln(orrnadon—Ae-
den
Measormthun” Finn ~ktojstafl
Adnünislrator for Air
and
Water Programs
no
the Adminisznzro;
Was~jtjgton,
D.C. CFehnsaq’
7,
1973).
S.
lvlernonnduzn,
“Information on theDegror of
Effluent
Re-
ductios Attainebic Through
the
Application ofSecondary
TrcatncnC
Prom
Assistant
Administrator
for
Ak- and
Water
Programs to the Administaxot
in ørart. Washington,
0.
C.
(January 24,
1973).
9.
Weston,
Roy
F.,
‘Proposal
ror
Development
of EffLuent
Guidelines
fist
the
Discharge of Secondary
Effluesus
from
Muuidtsal
Wastewater
Treatment Plants”
Pcescnal corn-
inunitation
from
Roy
F.
Weston,
Inc.
to
Cf.
S. Environ-
mental
Protection
Agency,
Washington,
0.
C.
(June
13.
19’72).
10.
itoy
F~
Weston. toe..
‘Petfixwsnce ciSecondary Municipal
Ttestmcnt
Works.”
Report
prepar&
for U.
S.
Environ.
Prot. Agency, Water Protnra
Oper.,
Washington.
0.
C.
(1974).
-
I 1.
‘~AfternthPeWaEc Managenucut Techniques for Bract erac-
ticable
Warm
Trcstnsct.*
EPA.430/9-75-013.
Ti.
S. En’
“non. Pitt.
Agency, Washington, 0.
C.
(1975).
12.
Pcnttjoa
on
Resolution
of Secondary Treatment Guide-
linest
Mcnioran4uni
from
Rapruenasrives
of
Working
Group from Office
ofResearch and ~
cuitorins
and Office
or
Wares
Enfcntcrnent
to
haituz
5oiphirt.
Chaletan
of
Working Group
(Dcc.
13,
1972).
13.
Osguc.
B.. a..
Wastcwater
Effluent Oryge’s
Demand and
Sata.rn
Response.”
Papec
presented
at
24
Annul.
Crest
Plains Wastcwatcr Des.
Conf., Omaha.
Ne’S.
(IPSO).
14,
Callaway.
O~
and
Young,
1, C.,
“Impact of
Nitrificasion
in $00,
Test
on Control
of
Acth’ated Sledge
t1an~
Univ.
ofArkansas.
Fayetvflle
(1981)
(Unpublished).
13.
flaiticeki, K.. “The Effect orNhdteaticw
Inhibitors on the
Resultsof
the5-DaySOD
Ott
‘jadon.”
Korren Abwasa
(Cer.), 27,
1132
(1920).
Attachment B
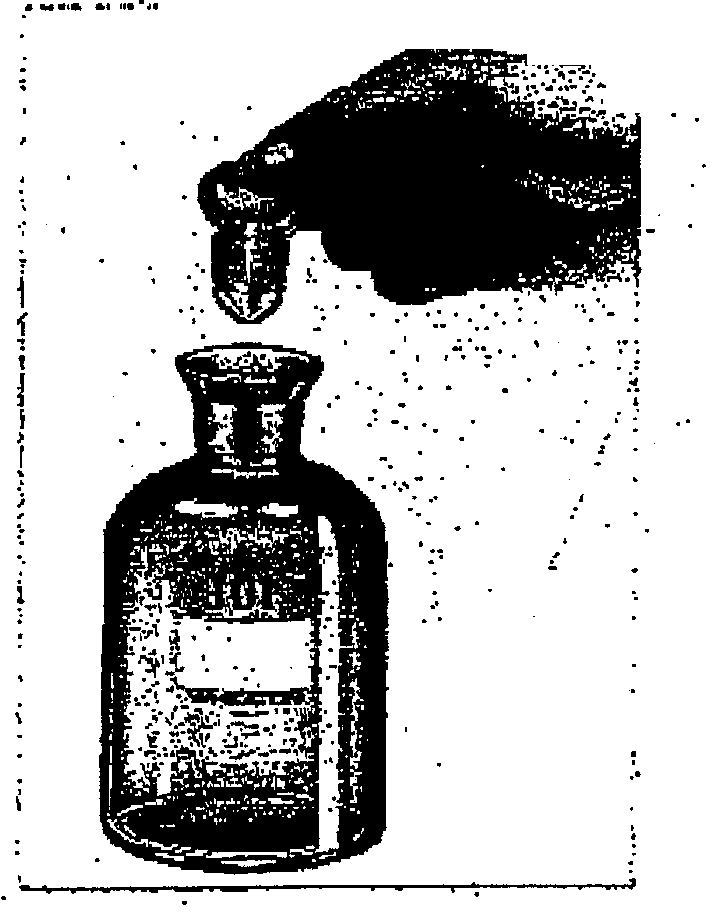
A SOD
bottle
will
certainly
be
included
in
the
environmental
en-
giucexing
dine capsuLe.
BOTh temov-
-
a1
irs measurement,
its
mecTianftni
and
kinetins,
even the
appropriate-
near
of
its
use
in
process
control,
have been the topics
of
more
ens-.
nacriag
research
studies
than
any
other
single charseteStie
of
watt-
water.
SOD
is
care
of
the
fonda.
mental criteria
on
which the design
of
nearly
every
wastewater
teat-
cent plant in the country is
based.
Eien
so,
whether
or
not
it
is
an
accurate
bdicattr
of
the
tiency
of
biological trealnent
pxuce.~eshas
been
the
subject of debate
for years,
apecially
since
the development
of
other rutasuremeab
of organic ma-
serial
in
water
suds
as
chentical
-
oxygen
demand
CCC))
and
total
organic carbon (TOC).
Now
BOTh
has
been
dissected
inta
two
wm-
ponents,
carbonaceous
oxygen
vie—
maud
(CEOD)
and
Difroganotzs
Oay~m.~a
dentaM
(NOD),
tot
still’
another costttaeny.
BOD defined
According to the
15th
edition of
“Standat~ Methods
tor
the
E~-
amination
of
Water
sad
.
Waste..
watcc
ROD
is a measurement of
the
quantity
of
oxygen
utilized
In
the
biochemical
oxidation
of
or-
ganicmatter in wastewaterin a spe-
cific
time
and
at
a
specific
teinp-.
crature..
rt
also measures
the oxygen
used
to
oxidize
inorganic
material
such
as
sulfida
and
ferrous
iron.
It can also
measure the oxygen used
to oxidize reduced nitrogen forms
if
the
organisms-
that
mediate
that
process
(nittiGcation)
are present
A
sample
in
diluted
with
waxer
containing
appropriate
amounts
of
essential nutrients, a culture
of mice
rociganisms
capable
of
degrading
the
àrganic
material
is
added,
the
dissolved
oxygen
(DO)
in
the mix-.
tura
is
measured,
the sample It in-
cp.batedbr~afred
period
(5
days)
at
20°C,
the DO in
the
incubated
sample is
measured,
and the
4lffer-
ettee
between
the
two
measr-
inpgtt
corrected
for
the
dilution,
is
the
5-day
BOTh,
EOfl~.
Simple,
right?
The
analysis
is
aetnafly
fairly
simple
in comparison with some
of
the
Chemical
analyses
for
waste-
wafer,
but
interpreting
the rant
and maintaining the
sthct analytical
quaflty
coufrts! required for a valid
meesarement
era
infinitely
mare
amaplioraed÷
The
analysis
is
an
in-
direct
measure
of
-
organic
material
in
that
it
measures
the oxygen
re-
quite’! for biolosical
stabilizatio.o.
of
that
ciatertal;
as
suds
it
is
easen~-
tially
a
bioassay
procedure.
Ala
though
the
results
indicate
the
amount
of
organic
material
in the
water, they
axe
also a function of the
condition
and
type of
ruicroorgan-
isnis
in
the
sample,
which
are
in
turn s~
-function of
the history of the
sample
itself.
-
The
anct
o~
nitlificatlen
Development
of the
SOD
test be-
gan
around
1270
with
the applica.-
tion
of
the theory
of oxidation to
the
measurement
of
organic
material.
The
teSt was formally
£xttrqduc,d
in
the
3rd edition of “Standard Meth-~
OclS1~iii
1917.
The
ann
major
deaut..
opment
was
she
recowmendadon
of
5
days. as
the standard incubation
period
in
the
7th-
edition
itt
1933.
M®NF~,R
30/30
Hindsight
On
November 16, 1983, the US.
Snvjronmenral Protection Agen-
cy (EPA)
proposed
a
revision
as
the tegatations
governing
secondary
treatnerr
(40
CYR
Part
133)
to
allow,
at
the
discretion
of
the per-
nutting azdhoritiar, substlw.tlort cr125
‘twit
COrUOFWCCOrLY hmor.hgniicaV
wygen
denran.d
(CR00)
JOt the
previous iynit
qf
30
melt
biochemical
oxygen
demand (SOD)
On
effluent
dZscharge
perniitc.
Tire revision is
to
be tetectivety
applied
in
those
cases
what
the
HOD
tat
does
not
vstcuratdy
reflect
the
degree
of
tr~gr~g~
achieved by
th~plant. 41-
though many of the people
who campaigned
for a
regulation cd&vIsthg
this Lance
feel
it
is not erectly
what they had
las ini)yd, the regukrlton has
been so
long in
canting that they are witting
to
settle
for
a
~mronuise.
:71
AprIl
1984
301
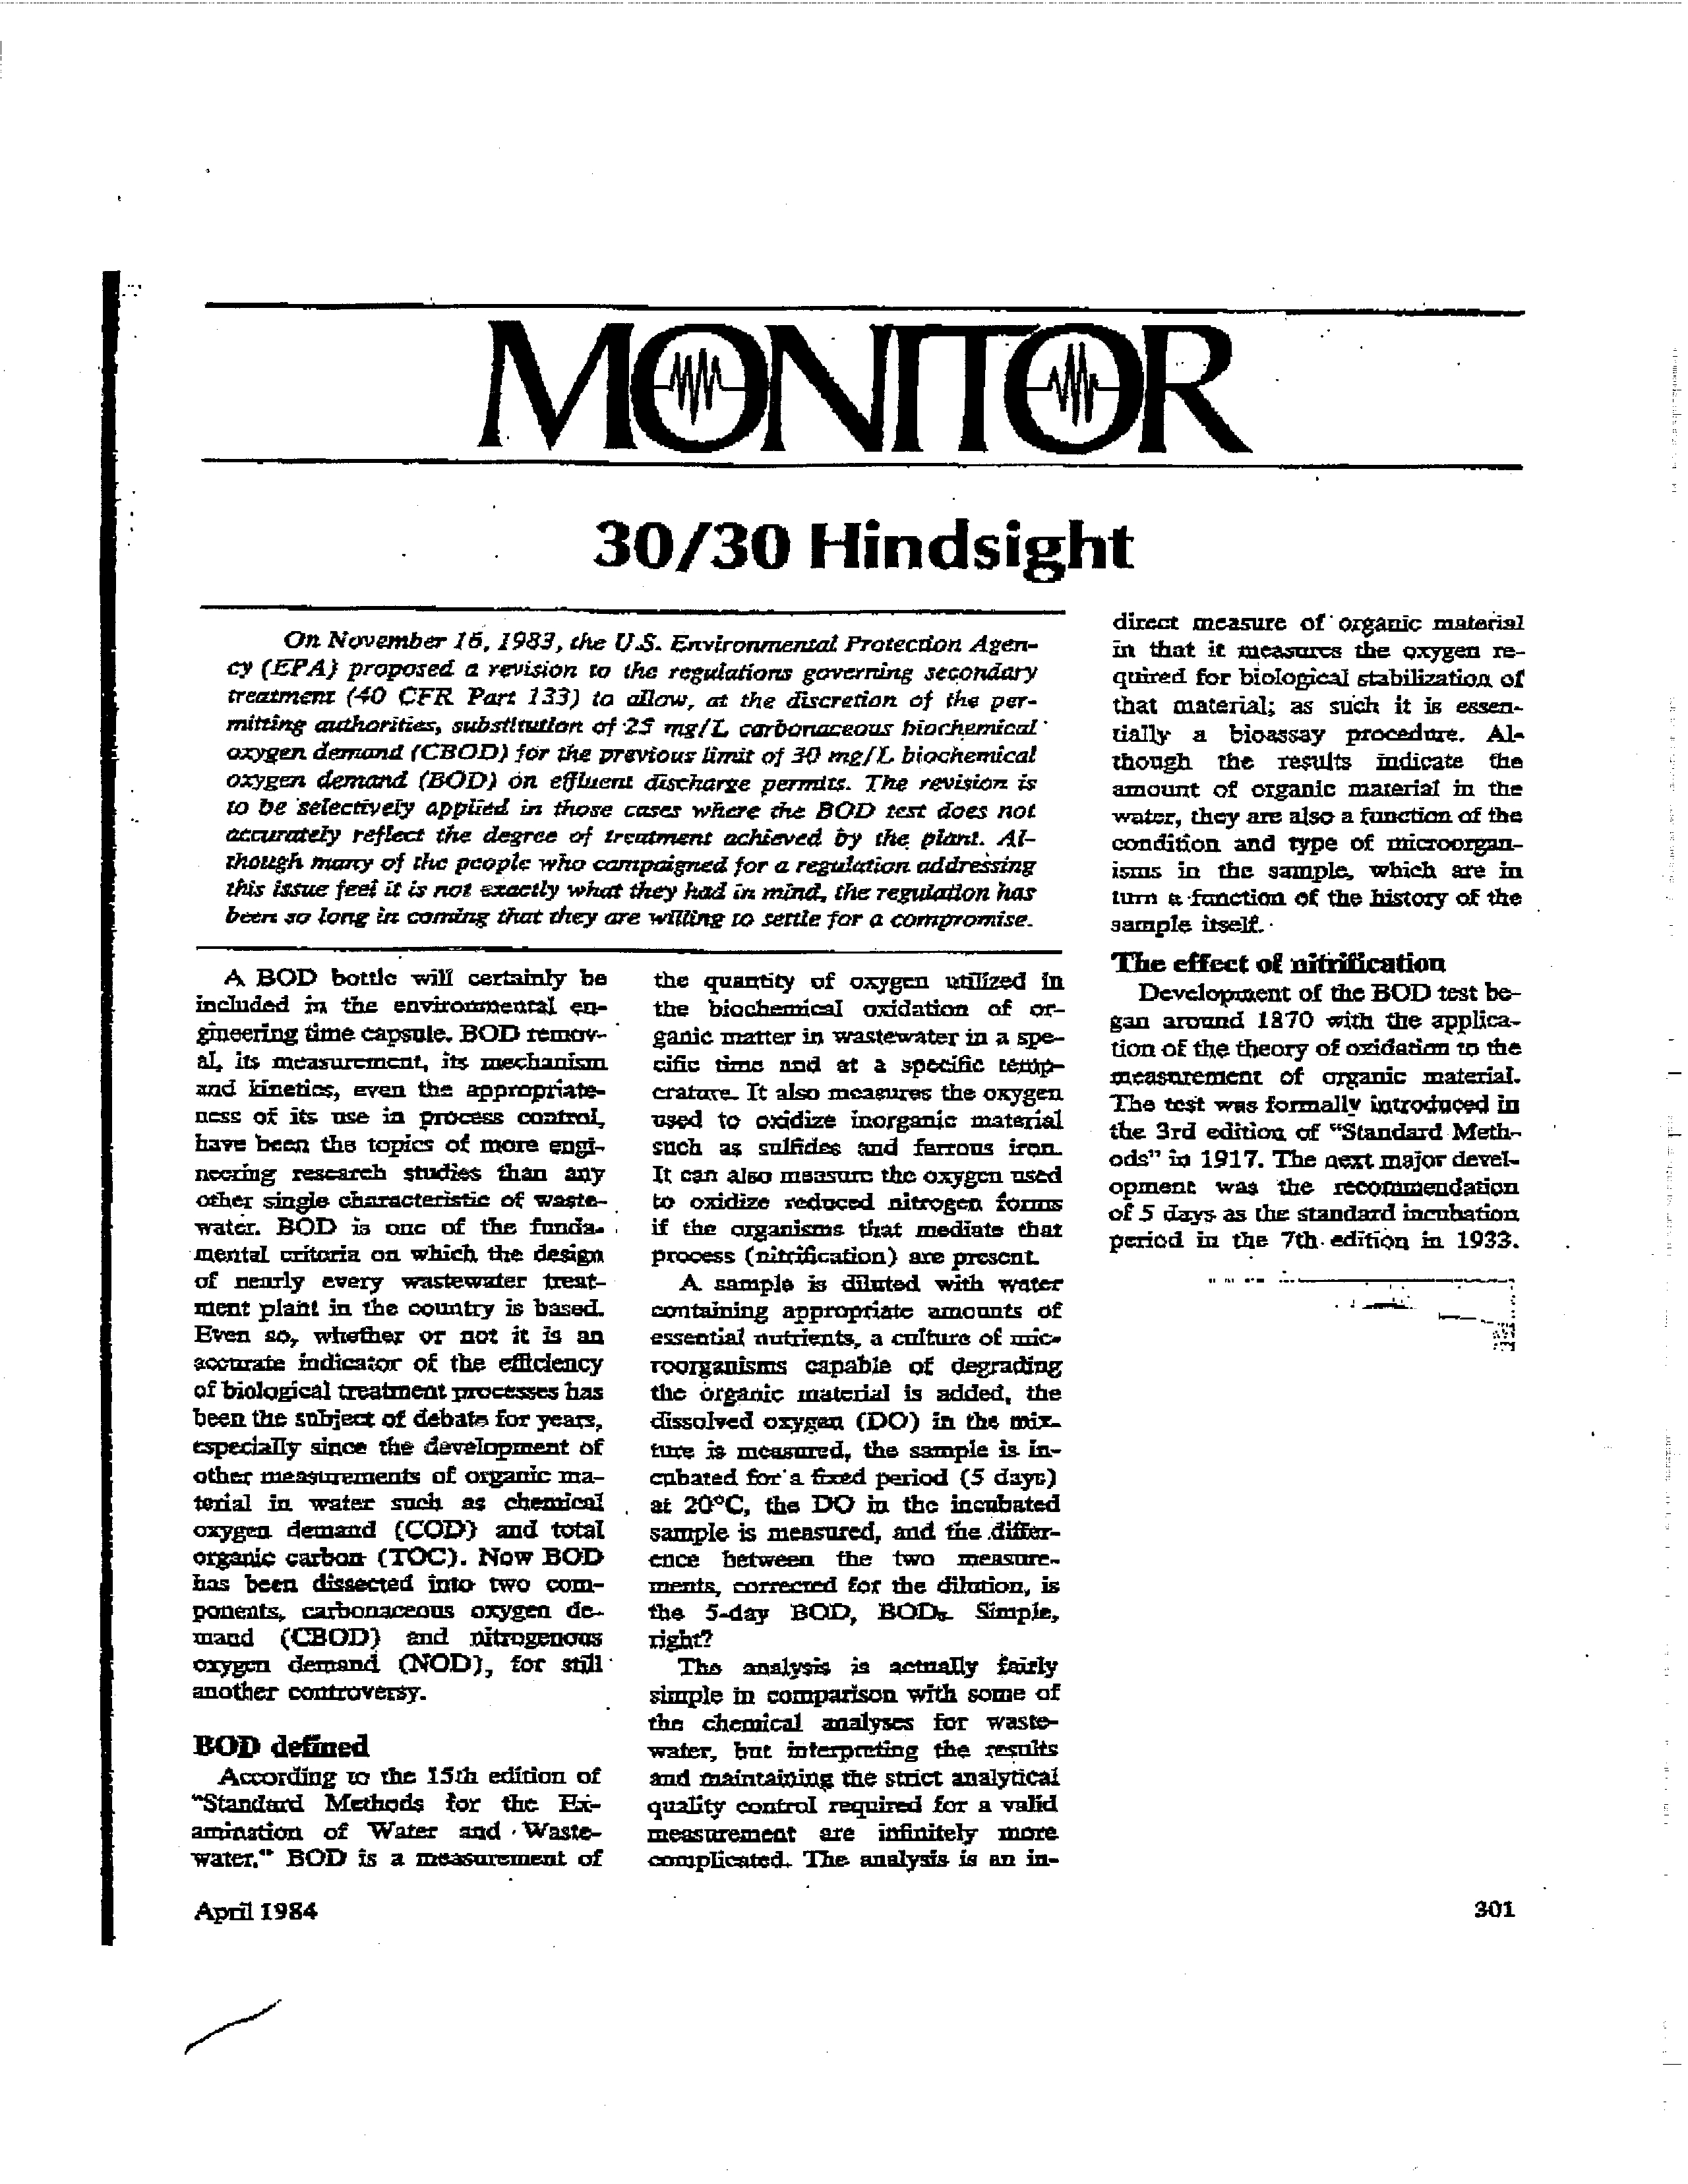
snumy researceere
had demonstrated
thu
two.-ctag
nature
of
BOX)
exet-
Lion—oxidation
of
only
carbonac-
eous material
for
the
Srst
10
or
12
days of in~bation,and
oxygen
up-
take for itituiticarion
(NOD)
by ni-
frifying bacteria
aftrr
that
time. Au
example
of
the
classic
curve
is
town in Figure
1.
Figure
1—The
SOD
carve
sbowleg
die
effect of
uitdfic*Zon,
In
1955,
the
lOttE
edition
of
“Standard
Methods”
rioted
that
some
samples,
particularly
sesx,nd-
ary effluents or natural
waters,
ccn~
-
tamed established populations of ni-
trifiers, and
thus
nirrfficaticn
could
•
easily begin before
the
end
of
the
5-day
incubation
period. Proced-
ures wets suggested
for
nitriSoation
supreasion.
Nitriflcadon has conS
teody bean referred
to in the liters-
tore
as an intcrference
in
the
DOD
Scat,
rather than
as
a thaxactcthtic
of
interest
is
the
w-astewater.
In-
deed,
a
strong
argument
has
been
wade
that
the
test
wan
never
in-
tended
to
neasare
the
oxygen
de-’
maud
of
nitrogenous
substances,,
and that
the’
ROD
refenad to in the
regulations
governing
secondary
treabtant
should
always ban
been
only
carbonaceous.
‘The
15th
edi-
tion
of
‘tStsxtdard
Methods”
expli-
Sly
states
that
“The
inclusion
of
ammonIa in
rite dilution
water
de-
mourn-ares that
there is no intent
to
include
the
oxygen
demand
of
re-
duced
nitrogen
forms
liz
the
ROD
test.”
Normal
operation
of
activated
sludge
processes
does
not
provide
sufficicat
detention
time
to
develop
substantial
populations
of
nitdters.
These
organisms
grow
slowly
and
require more time
to
establish them-
302
selves in
the biological
process than
do
organisms
that
metabolize
cat—
bonaceoua
materiaL
For
this
rea-
son
raw
wastewater
may
contain
very
few thtrciers,
but as
the waste-
water
passes
through
the
various
processes the
detention
time nay
be
sufficient for thena to develop into an
actively
nitrixying
population.
By
the
time
the
treated
wastewater
leaves
the
plant,. ninilicalion
may
be
in full swing. This can be a prob-
lem
in
plants
that
are
tu-ealing
less
than
their
design
flow
so
that
the
actual
detention
time in
the
aeration
basins is
longer than intended.
-M1sk
nwuhu
The impact of uitriflcation
on
the
ROD
test
is
that the
results of the
anab’sis
may
not
accurately repa-
acne teatnent efficiency. White
the
process
nay
indend
be
stabilizing
carbonaceous
material
so
that
CliOD is
quite
low,
and further ha-
prot~ effluent
quality
by
removing
nitrogenous
pollutants
(ammonia),
the
DOD test
could easily
indicate
little
or
no
improvement
in
water
quality. in
an extgme
case,
the
ci—
fluent
DOD
could actually be
higher
than
that in
the
hufineot
because of
the
inSuenee
of uitrticalion.
-
4
-~tC
rn’?
fla
\/
-“~j
s~
tc~ct.cu
WM ø4Si~ ~tSOO~
=
C
P0
fl
C~I,apc.
C)
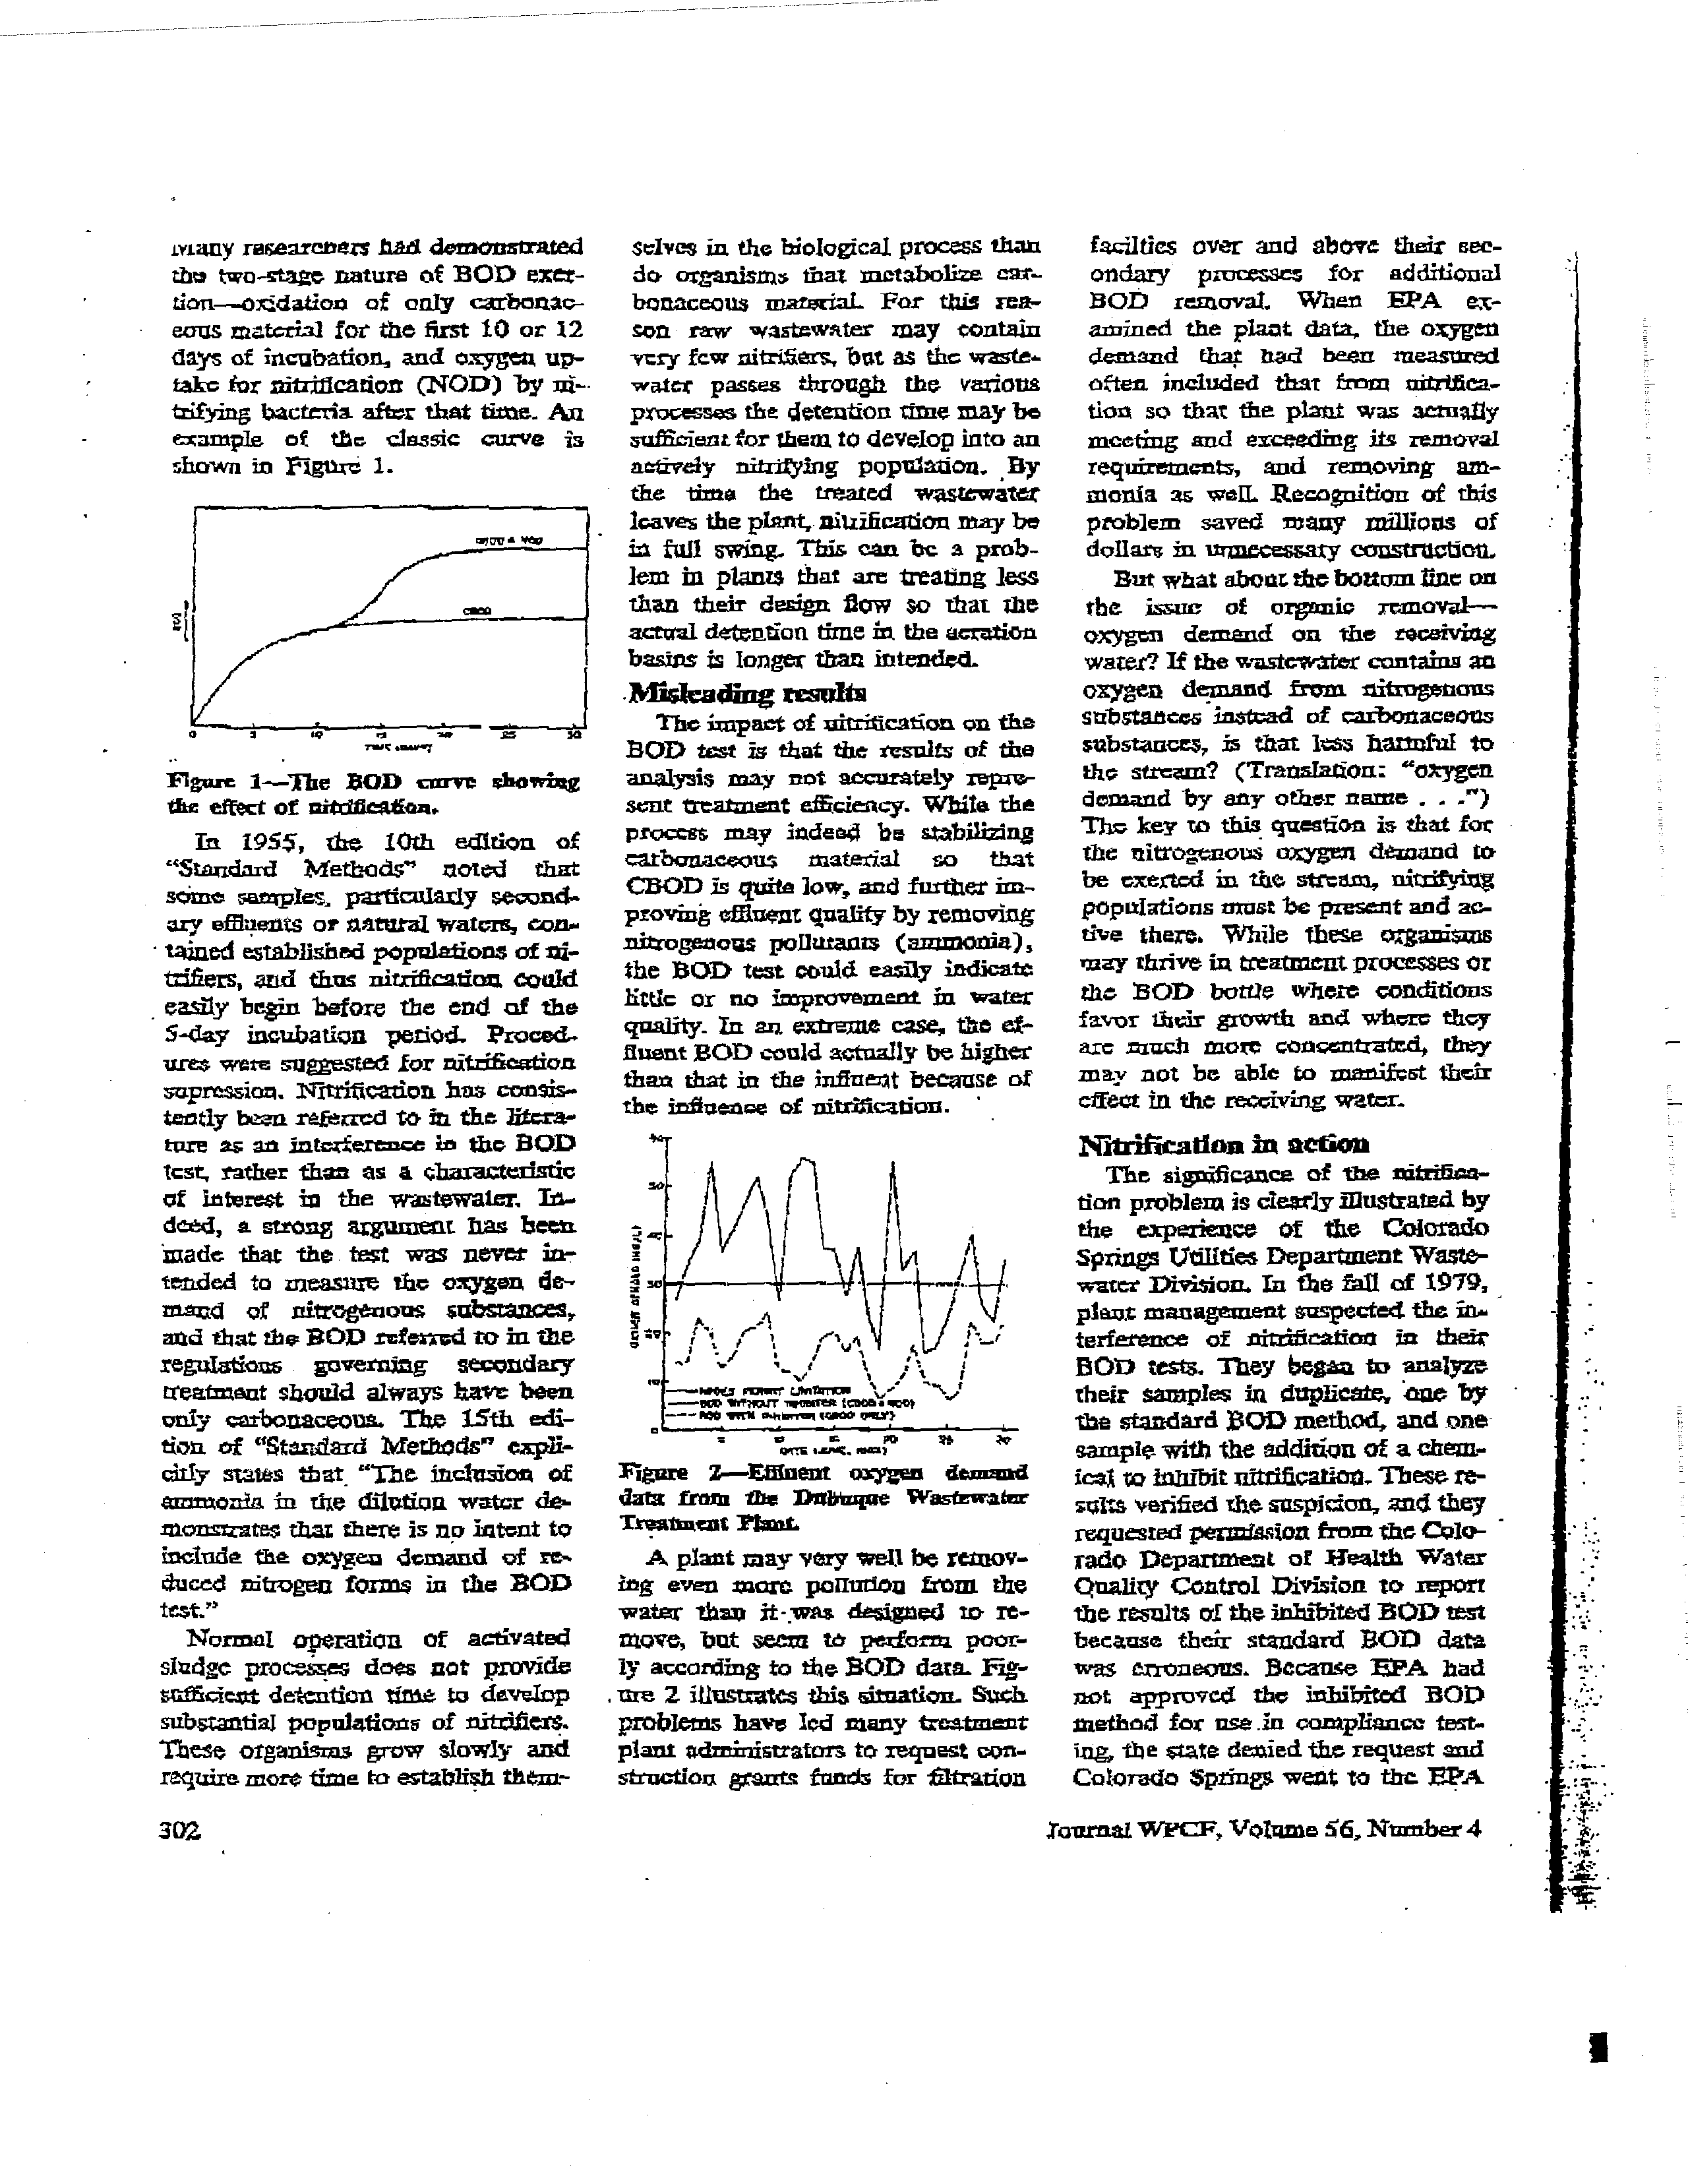
Figure
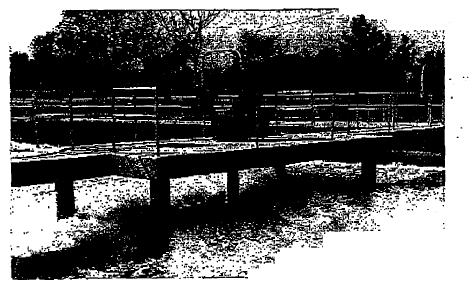
2—Effluent
oxygen
de.uu~sd
data
franz
the
Dnbwzque
Wasftwatar
Ti-salting
Yt~u.
A
plant may very weLt
be rennov-
log even more pclrudou from
the
water
than
it-was
designed
to- xc-
move~
but
seem
to
pedorna
poor-
ly
according
to theSOD
data.
Fig-
urn 2 illustrates
this sitnation~Such
problems
have
led many freeSt
pl~
administrators
to
request con-
struction
&ants
funds
for
Station
faciltics
over
and
above
their
sec-
ondary
processes
for
additional
ROD
removal.
When
EPA
ex-
amined
the
plant
data,
the oxygen
demand
1h4
bad
been
measured
often
included
that
fr°m nitrtilat-
tion
so
that
the plant
was
actually
meeting and
exceeding
its
removal
requirements,
and
removing
am-
nionia
as
welL
Recognition
of
this
problem
saved
many
millions
of
dollars
in
urx~iccessaxyconstruction.
But
what sheet thebottom flue on
the
isain
of
organic
removal—
oxygen
demand
on
the
receiving
water? if the wastcnter
contains an
oxygen
demand
from
nitrugeuous
substances
instead
of
carbonaceous
substances,.
is
that
less
harmful
to
the
stream?
(Translation:
~
demand
by
any
other name.
.
I’)
‘The key to
this
question
is
that
for
the
nitrogenous
oxygen
demand
lo
be
exerted
in
the
attain,
nitrifylug
populations must
be present and ac-
tive
there.
While
these
organisms
way thrive in treatment processes
øt
the
SOD
bottle
where
conditions
favor
their
growth
and
where
they
arc ~nruth
more
concentrated,
they
may
not
be
able
to
manifest
their
effect in the
receiving water.
Nitrilicadon
in
action
The
sigeificanca
of the
ttrt5aa-
lion problem is
clearly
illustrated
by
the
experience
of
the
Colorado
Springs
Utilities
Department Waste-
water Division. In
the
fall
of
1979,
plant management suspected
the in-
terference
of
nirrificatton
in
their
DOD
tests.
They
began to
analyze
their
samples
in
duplicate,
cue
by
the standard DOD method, and
one
sample
with
the
addition of a them-
ical to
lnljlbit ujttlficatlon.
These
xc-
stilts
verified
the suspicion,
and they
-
requested periulacion fromthe
Cole-
ratio Department
of
Health
Water
Quality
Control
Division
to
report
the results
of the inhibited SOD
test
because
their
stanclanl
ROD
data
was
erroneous.
Because
EPA
had
not
approved
the
inhibited
ROD
method far
use in
compliance test-
ing, the state denied the
request and
Colorado
Springs went to the EPA
XomnaL WPcF, VoLume S6,
Ntunber
4
C,,.,.
~
_
-
-
It,-
$
Region
VIII
administrator
to
re-
quest
modification
of
their penuit.
However,
EPA
headijuaslets
maintained
that
the
~1fl/34y’
(30
rug/L
BC),
and
30 ing/L
suspend-
ed
solids)
efflucnt
Thnitation
had
been
intended
to
include
the
inci-
dental
contribution
of ~-NOD,
end
so
a
reddnidon
of
the
parameter
and
a review
of the
numerIcal
limi-
tation
would
be
necessaiy.
This
latmebed Colorado
Springs
on
a
4-
year strug*
with
state sea
federal
regulatory
agencies
that
iuehtdcd
a
campaign
dE
Letters
to their
state
legislators
and
three
difterent
EPA
.Administnton.
They
also
sponsor-
ed
an in-depth
study by
Owen
Cal-
laway
and
lanes
C.
Young,
the
801)
Task
Force
ohainnan for
the
•
“Standard Methods”
Joint
Editorial
Board.
Al-though
the
technical
groups
in
the
various agencies s~-
cd
to
understand
the issue and sup-
port
Culorado Springs’ request,
the
dispute
became
essentially
2
legal
battle.
J~Jab
ioao
Colorado
Springs
solicited
the
help of the
?1ssodafiou
of
Metropolitan
Sewerage Agendeq
(AMSA). AMSA surveyed its
mem—
ben on the
qucstlen
of
compliance
with
EPA
secondary
ueatgreut reg-
ulatons
in
plants
with Seifiad
at-
fluenre.
01
71
plants
surveyed,
41
experienced
incidental
nitrificadon
hi
tha
secondary
systatas. In
41
of
those
plants,
tire
effluent
ROD
was
artificiaily
high
as
a result
of
nittification;
NOD
represented
be—
tween
9 and 86
of the total SOn.
Of the
plants
with
incidental
iii-
trifleatiori,
34
responded that they
had
experienced
compliance
prob-
lem;.
The
survey
concluded
thgt
plants
with
anupliance
problems
“generally
implemented
facUlty
or
operating technique
modifications
at
additional cost it’ an attempt to Con-
trol
the
partial
nitrificafion
or at-
tenuate
Its effects.” In marty cases it
was
not
initially
clear
that rtiwlflea-
lion was
the problem, and remedies
such as
the addition
of gravity flitru-
lion mentioned previously were con-
sidered.
Some
higher-than-expected
Apr11
1984
-
~0D
results were interpreted simply
a~
inadequate
biological
treaunent.
and
measures
such
as
increased
Stratton
were
IriS.
This
served
to
encourage
nithflcntiçtn
arid
Sara-
vaSe the
probleuL
When
nitrificarion
was
identified,
some
plants
de-
creased
their
mixcd-ltqtzor
DO and
wound
up
with
a
sludge
hulking
problem
to
add
to
their
woes. Al-
though a
decrease in mean
cell resi-
dence
time
(MCRT)
Would
help
discourage nitrificatton~
It often
pr0~
dated a sludge
disposal problen
InMim,~,n5a
Paul, theMetro-
politan
Waste Control
Corn
mbcsj~~
(MWCC)
began
struggling
with
the
nitrfficarion
Interference problem in
1975.
tinder summertime conditions,
their
ROD
wà~
any-whoxu from half-
again
to three
times as
high
as
nor-
mal. Once they established that
their
problem
was
not inadequate but ac-
tualLy
excess
treannent
efficiency,
they
began
unsuccessful
efforts
to
have
their
permit
rewritten
far
CHOD.
After trying
such methods as
reduced
aeration
arid
additional
sludge wasting,
they
finally
bit
on
a
reliable way
to
eliminate
the
nitri-
Ears in their effiuent—bvoxchloriaa-
don.
There
was
no
question
that
this
practice
was
not
envimunmen-
tally
sound.
but
it
did
bring
thth
cthrcnt
SOD
with.in
the
lImits
of
their permit. In 1931, adlspute -with
the
Minnesota
Pollution
Control
Agency over
the
practice
of
year-
road
chlorination produced a stand-
nE
of
sotts.
The
MWC’C
discon-
tinned overchiorination
and
now re-
ports data
for both
CEOI)
and
total
-
ROD
to
the
state
to
demonstrate
their
good
faith
eflorts
to
comply
with
their
permit,
but
theoretically
the
state
could
initiate
enforcement
action
at any titus.
E~Lorccment
prerogative
A
much more
heated
battle with
the
regulatory
powers
occurred
ii.
Dubuque,
Iowa.
The city’s
problem
with nittificadon
stemmed
from ef-
-
forts
to
control
a
problem
of
ex-
cessive solids
in
the biological pro-
cess.
Increasing
the
sludge
age
to
facilitate
solids
handling resulted
in
nitrificatiqu,
nor In the plant
but in
the
DOD
bottle.
Their pnhlezn
was
brought to the attention of theIowa
Department of Pnvironmental QnaL.
ity in late
1978- In
a situation situ,
lar to that in Colorado
Springs, they
found
that
the
regional
engineers
wdre
receptive
but the- pniblein was
held
up administratively: Eventually
the
city was
threatened
with retro-
active flne~of
$10000/day
which
would
have amounted to millions of
dollars.
An
out-of~courtsettlement
required
the
city
to
take
several
eaeaures
directed
itt
correcting
their
solids
handling
pro~blonsand
pay
a line
of
$15
000. lb
consent
agreement
provided
for
the
use
of
the inhibited
HOD
teat for a specific
period
Now
The
city reports
both
CECiD
and
ROD
to
the
state, and is
planning
to
take
advantage
of
the
opportunity
to
have
their
permit
modified permanently.
-
Nitriflcation
and
process
mediS-
cations
to
control
£t
can
often
re-
salt in
other problems, not just with
operation
but
with
compliance
as
well.
Partial
nitrifleation
in
a
plant
produces
excess
nitrite
concentra-
tions
which play havoc with the re-
actions
of
chiorhie
disinfection.
A
plant
with
this
problem
may
violate
not
only
its
SOD
staridattl, bat its
limit
for
fecal
colifoim
as
welL In
theso
three cases the discharger has
-
finally
resorted
to
simply
reporting
data
for
both
types
of
HOD
and
relying
on
the judgment
of the
per-
mitting authority with regard to
en—
forceunent
action.
-
BOD
redefined
•
-
EPA
is
now
well
on
its
way
toward promulgating
a. regulation
to
provide
publicly
owned
trátnient
-
works
(POTWa)
the option
of
re-
porting
either
type
of -SOD.
The
controversy
is
not
over
whcthcr
EPA
should Iran addressed the is-
sue.
but
the
way
in
which
it
was
done.
The
debate
goes back through
the
history of
tire
secondary
treat-
ment
regulations
required
In
the
Clean Waxer Act,
and
into
the
his-.
tory
of
the
ROD
method ibelt
The
two
principal
isatca
are;
whether
-
303
-t
t
4
I
I-
I
I
EPA needed to oreven sbould
hen
-
redefined
ROD
to include
NOD
and
introduceda new pazuzncter, COD;
and
whether
the
effluent
standard
-
for
CHOD
should
be
different than
the 30 mg/I.
originally setfor SOD.
CealnI
to
both
questions
is
the
issue of whether
DOD
was intended
to
include
NOD
at
all. It nut, ROD
can
be
considered
to
have
been
COD
all
along.
(Translation:
why
change
the
sxuniheri)
if
it
was
COD
all
along,
then
why
did&t
EPA
just
approve
the
inhibited
method
lot SOD
analysis proposed
in December 1979
(44 PR 69464)
to
amend
the
pollutant
sampling
-
and
analysis
procedure
regulation
(40 CFR
Part 136)?
A review
of
the
regulatory
iris-
tory of DOD was tiradeby Hall
and
Poxca and pablished in the Decem-
ber
1983
low-neZ.
Their condusion
was
that
SPA
did
not
intend
the
B-CD teal results to
reflect the con-
tribution
of
NOD.
An
encccdicgly
detailed review
of the literature
by
Vmtosi Bacon and Jerry Huang far
the
City
of
Dubugn;
Iowa,
con-.
eluded that
in
the
development
of
the
BCYD
procedure,
there ‘seas
no
-
intention
to
include
the.
oxygen It-
mad
of nitrogenous
substances.
-
EPA’s owz~review of the
regain—
tory
history
concludes
that because
they
recoguland
the
potential
con-
tribution
of NOD
to
the
BOD
test
resuLts
at
the
time that they
prom—
ulgatad the
.~33/3Qn
regulation,
they
-
intended to
Include
it.
The tepala-
tions
were
developed
based
on the
results
Of
a
survey
of wastawater
trea~ient
plant
effluents
across
the
country.
The
data
base
that
dine
results represented
was indeed pro-
duced by
the standard uninhibited
SOD
procedure,
whIch
may
well
have
included
an
unquantifiable
amount of NOD.
According
to flA.
the
planis
surveyed
were
“well de-
signed and
operated.” There
are
those
who
ask,
given that
nitrifica-
don
in
a
secondary
process
is
a
product
of
underloaded
or
iXnPTQP-
erly operated facilities,
whether
there
tould
have
been
significant
nitri-
fica±ionin the plants EPA
surveyed
i-n
the early
1970$-
Which
~ins
Qrsf?
Another
question
about
EPA’s
intent
is
that
of
how
the
odgbral
Ut
tether,
30
mg/L,
was
chosen.
Some
maintain
that
E1’A
took an
average
oncontratioti of
ZOO
mgJt
SOD
in
raw
wastewater
(which
would not have signi~cantnitfiCyia~
populations),
required that PC)TWs
-
remove 85
of that, and arrived
at
-
30
nag/fl
If the infineat coneexitra-
don
did
not
represent
any
NOD,
then
by
definition
neither
CUd
the
stUdent hauL
EPA
did include
two
raqairements
in
the
reguladonr-a
-
30
mg/L
effluent
limit,
and
a
to-
quireinent
for
85
~
fluent
SOD.
The
significant
pies.
don
Is:
which
came first?
‘The
ate-
-
tutexy basis
for
the
regulation
re-
quired the Administrator to
publish
“information,
hr terms
of
amoun
-
ci
constituents
end
ckenxhml,
phy-
sical, and biological thnceexfsdca
of pollutants,
on
the
degree
of
ci-
fluent
redaction
otr~hwbie
th_rougb
the
applicntion
of
secondary
tteat~
ment”
Zenpbasis
added). That this
language
spcci~callydirects
attan-.
ton
to removal
efficiency has led
some
to
believe that the nequimemeat
lot
85
removal
came
first
Another interesting point is that the
figure
of
85
removal
was
also
mentioned
in
the
public
works
grants
regulations
that
prw~Ied
the
Clean
Water
Act
(ig
CPR
601.25).
However,
a
close
look
at
the
documentation
1or
EPA’s
decision
indicates
that
they
first selected
30
as the
csfflu~ntquality
aUalu-
able by secondary treataren; and in.-
eluded
the
specified
~5
removal
rtqtdremetit
to
prevent
ditchargea-s
with
inifitration/inflaw
problems
from meeting their
per-mit limits by
dilution.
It
is
difflailt
to
make
an
uncontestable
case
for
either
con—
elusion;
the written recent aswell as
-
the
recollections
of people
involved
in
the decision an
-very ambiguous.
Other
xne~~uren~eu1q
The
secondary
treannent
-
infor-
mation
regulation
as
promulgated
onAugust
17, 1979
(38PR 22298)
included
a provision
that
COD or
roc
analyses,
which
both
measure
only
the oxygen
demand
exerted by
organic material
(no
appreciable in-
terference
from
reduced
nitrogen
forms),
could
he
subs?mted
for
SOD
if
a
significant
correlation
conk! be established
between either
of
those parametefl
and
ROD
for
a
given
wastewater. This
seems
to
in-
dicate
tbst
EPA
intended
to
limit
the
analysis
to
carbonaeeQus
oxy-
gen demand,
without
NOD
304
Journal WFCF, Volume
56,
Wmnbar
4
the
proposed
amendment
tt~
the
regulation
includes
a
discussion
of
the
ultimate
oxygen demand
(COD)
of
wastewator
as it Slats
to
DOD.
The
equation given by EPA is:
ITOT)
(1.5
CR01))
±
(46
NTh—N).
-
The
terms
representing organic oxy-
gen
demand
and
reduced
nitrogen
are
clearly
separate.
Although
the
concept
of
1101)
is
-not
specifically
addressed
in
the 1973
regeladon,
in
1975.
the
EPA
‘Procces
Desiji
Manual
for
Nittogen Control” eon-
tamed a
calculation
far total
oxygen
demand
that included
the
sepants
terms
SOD
and
NOD.
A
afinilar
equation appears
in the
1975
EPA
document aAltcwatha Waste
Man..
agement
Techniques for Best
Prac-
ticable
Waste
Treatment.” the
im-
plication
of
the
sepanto
terms
is
that
LPA
did
not consider
SOD
to
include
the oxygen demand fromxc-
duced
nitrogen
farms.
Na
backsliding
Regardless of whet
EPA
intended
BCE)
to
mean,
the
decision
was
made
that
in
order to
address
the
effect
of
nitrification, the. parameter
*ccnld
have
to
be
redefined-
fl-
though
it
may bays
be-en intitely
simpler
to
approve
the
inhibited
DOD
method
as proposed in
1979,
that action would have undoubtedly
dnwn
criticism
from
those
who
would have regarded
ft
as a relaxa-
tion
of the standard,
EPA
makes a
point that
changes
in
regulations should not have the
effect
of
negating
prior
progress
toward
cleaner water.
The lengthy
language
included in
the proposed
redefinition
of secondary
treanuent
(40 CPA Part
133)
to
prevent
“badkshiding”
is
evidence
of
that.
Likewise,
EA
reconsidered the
~-
merical, standard of
30
mg/L
DOD
when
it- provided the
option
of
ut-.~
porting
CR01).
If
indeed
the
or-i—
sisal
standard
was
intended to ac-
count
for the eoatrthntion of
NOD,
then
because
the
CR01)
procedure
eliminates that
cvnlribudon
so that
the
results
would be
somewhat lower
than those
of
the urtinbibited. test, It
April1984
-
follows
that
the
standard
for
that
parameter
should
be
lower as well.
EPA reviewed the data on which
the
original
standard was
based,
as
well
as more recent data- The aver-
-
age
difference
between
CBOD
and
SOD
in
those
sampics
was
3
to
5
mg/L
under
conditions
that mini-
nuizad
the possibility
of nitrthcation.
Although
the
regulation does not ex-
plicitly
state
whether
CBOD
was
consistently
lower
than
DOD,
EPA
considered it
prudent to establish
the
CBOD
effluent
requirement
-
at
2.5
mgfL
The
limited
accuracy
of
the
SOD
ta~tdoes
not
justify an incre-
mental
change
in
the
standard
of
less
than
5
mgfL.
The
rationale
for
lowering the
standaid
seems
based
more
on
the
need to
eliminate
the
possibility
of
backsliding
than
on
scientific justification. This
is one of
two
principal points brought out by
critics
of
the
regulation.
Admbdsttutivc chaos
The other,
and
perhaps
the
most
significan; aiticisan Is that the regu-
lation
could
easily produce admin-
istrafive
chaos among the penalulag
authorities.
It
effectively
establishes
a
separate
parameter
to
be
toga-
lated
because.
ft
it
net
likely
that
all
pCYIWs
will
request a
revision
o( th&
permits. fle
regulation it
not
required
across4he-bOaId,
and
is no-k
likely
to be applied uniformly.
Even
the
‘various
EPA regional ad-
ministrations
do
not
agree
on
the
issues,
as
illustrated
by
the
differ-
cut
responses
to
the
pmobleilt
hi
Iowa
where
EPA
Region
VI
granted Dabuque permission to use
the inhibited test
and in Minnesota
where EPA Region V refused to ac-
cept
a
permit
written without
ROD.
Perhaps the
official sanction
of EPA
headquarters for
the
substitution
of
CS0D wilt reduce the degree
of
dis-
agreement
-
As is common in any regulatory
decision,
the
proposed
revisian
to
the
secondary
treatoleat
regulation
represents
a
ooinprorthse.
In
the
decade
since
EPA
exercised its best
judgment
in --the form of
the 30/30
effluent hiaxtanons, WaStet~’at~r
teat-
mcnt
practice
has
improved
sub-
stantially
and brought
the problem
of
thtriflcation
in
the
DOD test
to
light.
EPA
looked
back
ted
has
acted
again
on its best judgment. In-
terested
parties -are
almost
-unani-
mous
that
some
regulatory
action
was
nccssary,
although
many
do
not
find
EPA’s
proposal
perfect
Rut
after
years
of
struggling
to
comply
with
an
often
-nurneetable
standard, g~d
negotiating withvary-
ing
a-access -with
the
permitting aa-
therjties for relief, the proposedreg-
ulation
is a
welcome
~ckmpromise.
5
ti
—4
Karen B.
Ctter
I!
305
Attachment
C
S2
AGGREGATE ORGANIC CONSTITUENTS (5OOo~
5210
BIOCHEMICAL OXYGEN
DEMAND
(BOD)t
5210
A.
Introduction
4
I
1.
General Discussion
The
biochemical
oxygen
demand
(ROD)
determination
is
an
empirical
test
in
which
standardized
laboratory procedures
are
used
to
determine the
relative
oxygen
requirements
of
waste-
waters,
effluents, and polluted
waters. Thc
test has
its
widest
ap.
plication
in measuring
waste loadings to
treatment
plants
and
in
evaluating
the
HOD-removal
efficiency
of
such
u-caunenr
sys-
tems.
The
test measures
the molecular
oxygen
utilized
during a
specified
incubation
period for
the
biochemical
degradation
of
organic
material
(carbonaceous
demand)
arid the oxygen
used
to
oxidize
inorganic
material
such
as
sulfides
and
ferrous
iron.
It
also may
measure
the
amount of oxygen
used
to
oxidize
reduced
forms
of nitrogen
(nitrogenous demand)
unless their
oxidation is
prevented by
an
inhibitor.
The seeding
and dilution
procedures
provide an
estimate of the
ROD at
pH
6-5 to
75.
Measurement-s
of
oxygen
consumed
in
a 5-d
test
period
(5—ti
HOD
or SOD5,
52103),
oxygen
consumed
after
60
to
90
d
of
incubation
(ultimate
HOD
or
UROD,
5210C),
and
continuous
oxygen uptake (respirometric method. 52100) are
described here.
Many
other
variations of
oxygen
demand
measurements
exist.
including
using shorterand
longer
incubation
periods
and
teststo
deteratie
rates
of oxygen
uptake.
Alternative
seeding, dilution,
and incubation conditions can be chosen to
mimic
receiving-water
conditions,
thereby providing
an
estimate of the
environmental
effects of
wastewaters and
effluents,
A
-
The
UBOD measures
the oxygen
required for thetotal
degra-
dation
of organic
material
(ultimate
carbonaceous
demand) and!
or
the
oxygen
to
oxidize
reduced
nitrogen compounds
(ultimate
nitrogenous
demand).
UBOD
values
and
appropriate
kinetic de-
scriptions
are needed
in
water quality
modeling
studies
such as
UHOD: ROD5
ratios
for relating
stream assimilative capacity
to
regulatory requirements;
definition
of river,
estuary,
or bite de-
oxygenation
kinctic.s;
and
inst-earn
ultimate
carbonaceous
HOD
(LICE
00)
values for model
calibration.
-
-
2.
C~rbonacenusVersus
Nitrogenous SOD
-
A
number of factors,
for
example.
soluSle
versus paiticulate
organics, settleable and
floatable solids, oxidation of
reduced iron
and sulfur
compounds.
or lack of mixing
may affect
the
accuracy
and
precis(oo of HOD
measurements. Presently,
thereis no
-way
to include
adjustments
or
corrections to
account for
th!
effect of
-
these factors.
-
Oxidation of
reduced forms ofnitrogen,
such as
ammonia
and
organic nitrogen,
can
be mediated
by
microorganisms
and exert
nitrogenous demand. Nifrogenous
demand
historically
has
been
considered
an
interference
in the
determination
of ROD, as
clearly
evidenced by the inclusion of
ammonia
in
the dilution
water. The
interference
from nitrogenous
demand
can now
be
prevented
by
an
inhibitory
chemical.1
If
an inhibiting
chemical
is not
LINed,
the
r
Appmvcd
by
Standard
Methuds
Committee. 1997.
oxygen
demand
measured is
the
sum of
carbonaccous
and
niu-og..
enous
demands.
Measurements
that
include
nitrogenous
demand generally
are
not
useful
for
assessing
the oxygen
demand
associated
with
or-
tame
material.
Nitrogenous
demand
can
be
estimated
direcdy
from
ammonia
nitngen
(Section
4500.NFI3);
and
carbonaceous
demand
can
be
estimated
by
subtracting
the
theoretical
equivalent
of
the
reduced nitrogen
oxidation
from
uninhibited
test results.
However,
this
method
is
cumbersome
and
is
subject
to consul-
erable error.
Chemical
Inhibition of nitrogenous
demand
provides
a more direct
and
morereliable
measure
of
carbonaceous
demand.
The
extent of
oxidation
of nitogenous
compounds
during
the
S.d
incubation
period
depends
on
the concentration
and tyjie of
microorganisms capable of carrying
out
this
o’~idation.Such or-
ganisms usually
are
not present in
raw
or settled
primary
sewage
in
sufficient
numbers
to
oxidize
sufficient
quantities
of reduced
nitrogen forms
in
the 5-d
HOD
test.
Many
bioLogical
ti-caLmcnt
plant effluents contain
sufficient numbers of
nhtrifying
organisms
to
cause niu-ilication
in SOD
tests.
Because
oxidation
of
nitrog—
eoous compounds
can
occur in
such samples,
inhibition of nitri-
ficatioa
as
directed
in
5210HM6)
is
recommended
for
samples
ofsecondary effluent, for samples seeded with
secondary
effluent,
and
for
samples
of polluted waters.
Report
results
as
carbonaceous biochemical
oxygen
demand
(DOD5) when inhibiting the nitrogenous oxygeo
demand. When
ninification
is
not
inhibited,
report
results as HOD,.
-
3.
Dilution
Requirements
The HOD concentration in most wastewaters exceeds the
con-
centration
ofdissolved oxygen
(DO)
available in an
air-saturated
sample.
Therefore, it
is
necessary
to
dIlute the
sample before in-
cubation
to
bring the oxygen demand
and supply into
appropriate
balance,
Because
bacterial
growth
requires
nutrients such as ni-
trogen,
phosphorus,
and trace
metals,
these
are
added
to
the
di-
lution
water,
which
is
buffered to
ensure that
the pM of
the
in-
cubated sample
remains
in a range suitable
for
bacterial growth.
Complete stabilization
of a
sample
may require
a
period
of in-
-
cubaliou too long for
practical purposes;
therefore,
5
d
has
been~
accepted as
the
standaiti
incubation
period.
If the
dilution
wateris of poor
quality, theHOD ofthedilution
water will appeai as
sample
HOD.
This
effect will be
amplthed~
-
by
the dilution
factor. A
positive
bias will
result.
Th5
methods
included
below
(S2lOB
and
5210C)
contain both
a dilution-watef
check
and
a
dilution-waler
blank
Seeded
dilution
watcis
are
-
checked
further for
acceptable quality
by
measuring theifcon-
sumption
of oxygen
from a known
organic
mixture, usually gin-
-
rose
and
glutamic
acid.
The source of dilution
water is
not
restricted
and may
be dis-
tilled, tap, or
receiving-stream water
free of biodegradable
organ-
ics
and bioinfltbitory substances such as chlorine or heavy
metals~
Distilled water may
contain
ammonia
or volatile organics; deion-
ized waters
often
arc contaminated
with
soluble organics
leached
from
the resin bet
Use of copper-lined
stills
ur
copper fillings
3
irs
.:w1;~
CHEMICAL
OXYGEN
DEMAND
(521 0)/5’Day
nov
tear
died to
distilled
water lines
may
produce water containing
Its,
WI.
& MS. Meat.
t937. Influence of
phosphorus and nitrogen
~
ye
amounts
of copper
(see
Section
3500-Cu).
Ott
biocheminsl
oxygen demand.
Sawage
Works, J. 934,
-
-;t*cesst
Ruesmoer, CC~
1941. Report on the cooperative study
of diluilce waters
4
Reference
made
for
the
Standard Methods
Comnilues
of
the
Federation
of
-
-
Sewage
Wodma Associations.
Sewage
Works £
13:669.
j
Yourco.
iC.
1973.
Chemical methods
for
nitdulcation eonuol,j.
Water
Moin~it,
F.W., E. flunwnz
G.L Bsnian it
ILK. R~ci~a
1950. Ex-
pallzst.
Control
Fed.
45:637.
patience
with
modified
methods
for
ROD.
Sewage
IntL
Wastes
-
22:31.
~
Bibliography
-
~-.
-
~isstAuts.
EL, P.O. McNAMua &
CS.
&rrragsltan, 1931.
Selection of
-
-
-
-
-
-.
..:~,
dilution
water
fom- use in
oxygen
demand teats.
F~th.Health
Rep.
-
-
.
-
-
-,
~
46:1084.
-
-
-
--
-
-
-
‘-
:-.
-
-
-
-
-
-.
-
5210
B.
5-DayBOOTest
--
~j~~GsflemI
Discussion
-
ties. Place
apaper or
plastic
cup
or foil
cap over
flaredmoddiof
--
-
bottle to
reduce
evaporation
of
the waxer seal during mcubanoa.
-
a.
Frisciple:
The method
consists
of
filling
with
sanzplc.
to
b.
Air
incubator or
water
ba*
thermostatically controlled at
f&l4rerflowing,
an airtight bottle of
the
specified sizi andincubating
20
±
it
Exclude
all
light
to
prevent possibility
of
phatasyn-
it ai the specified
remperntarc
(orS
d.
Dissolved
oxygen is
meas-
thetic production
of DO-
-
t’it:
used initially and
after
incubation, and
the HOD
is computedfrom
.
-,.
-
~
difference
between initial
and fnal
DO.
Because
the
initial
~
Reagents
~:
-
-
-
p0
Is
determined
shortly
after
the
dilution is made~
all
oxygen
-
-
~:
uptakeoccurring after3hls
measurementis included in
the HOD
Prepare reagents in advance
but
discard if there is anysign
of
precipitation
or biological
growth in the stock bottles. Commcr-
~..
•b.
Sanqt!ing and swragc
Samples
for HOD
S3~5Z5
l~~’
cial
equivalents
of
these
reagents
are
acceptable
and
different
:~~-
gradesignificantlyduring
storage
betweencollection and
analysis,
stock co
nsions
may be
used
if doses
are adjusted proper-
~iia
resulting
in
low
ROD
values.
Mznhrmze reduction
of
BOD
by
tionolly.
-
-
4~W~
analyzing
sample promptly
or
by
cooling
it to
near-freezing tent-
a.
Phosphate
buffer
solustam-
bissolve
8.5
g
KH2PO.~,
21.75
g
~
pasture during storage. However, even at low temperanire,
keep
1(2HP04,
33.4
g
Na2HPO4~7H2O.and
1.7
g
NH4CI in
about
~~V
boldingtimetoammmum.WarmchzlledsampleatnlO ±
3C
500 mLdisrilledwaferanddllucetorl
LflepRshotddbe7i
44’.--
beforeanalysis.
-
-
.
.
-
.
without
Thither
adjustment.
Alternatively,
dissolve
42.5
g
-;
z:.
i)
Grab samples—If analysis
is begun within
2
Si
of
collection,
KHs,Po4or 54.3
g
K1HPO4 in about100 mL distilled water.
Ad—
cold
storage is unnecessary.
If
analysis Is
not
started within 2
b
just pH
to 7.2 with
30
NaOH
and dilute
to
1 L
-
~.-
-.
ofsample collection,
keep
sample
at or
below
4
C from
the
titHe
b
Magnesium
srdjlzre solrztio,t.-
Dissolve 225 g M8SO4-7H20
;z.
collection.
Begin
analysis
within
6
Ii
of
collection;
when
this
~
distilled water and dilute in
1 L.
-
is
not
possible because
the
sanlphtlg
site is
distant
Irons
the lab-
~.
COICIWn thloñtjg solutio’r
Dissolve
27.5
g CaCIs, in distilled
~E:
oratoty, store
at or
below
4
C
and report
length
arid retnperawre
water
and
dilute
to
1
L
-
of
storage
with
the
results. In
no
case
start
analysis
mote ~
~
~
chloride solution.
Dissolve
0.25
g FeCI,-6H20
in
dis-
24
h alter grab
sample collection.
When
samples are
to
be
used
~ed
water and dilute
to
1 L
for reguatozy
purposesmake
every allan
to
deliver samplesfor
~nd alLoT solutions,
iN,
for
neutralization
of caustic
-
analysis within 6
h of collection,
or acidic
waste samples.
trL
2)
Composite samples—Keep
samples
at
or below
4t
during
1)
Add—Slowly
and while stirring, add
28
ml,.
cone
sulfuric
;‘:
Cotilpositing.
Limit
conlpoeiting
period
to
24
ii.
Use the
seine
acid
to
nil
tilled water. Dilute to
1
1...
~
cntena as
for
storage
of
grab samples, starting
the
measurement
2)
~H—DIsSalve
40
a
sodiwn hydroxide in distilled
waxer.
Of hulding
time from
end
of compositing
period.
Scare
storage
Dilute to 1 L.
-
-
X
and conditions as part
of the results.
$
Sodium
sulfite
sohalon:
Dissolve
1,575
g
Nas,503
iii
1000 tnL distilled water. This
solution
is not stable; prepare daily-
2.
Apparatus
g.
Nitrifico.tiôn
inhibitor.
2.chloro.6-(tmcblorornethyl)
pyti-
.w.-i—.-”
dine.
-
a-
Incubation
bottles:
Use
glass
bottles
having
60
niL
or
It.
Glucose-ghaamic
acid solrnion.
Dry reagent-grade
glncose
greater
capacity (300-niL bottles
having
a
ground-glass
stopper
~
reagent-grade gluiasoic
acid
at
103CC
for
I
h.
Add
150
nig
~ fl~ind
mouth
are
preferred). Clean
bottles with a detergent
glucose
and
130
rag glutamIt acid to distilled water and
dilute
to
-
rinse
thoroughly, and
drain before
use.
As a
precaution
against
t
~
Prcpare fresh
immediately beforeuse.
-
..y..;
drawitig air iaro the
dilution bottle timing incubation, usa a water
WaL
Obtain satisfactory water seals by inverting
bottles
ina
waxer
-
~
bath or by
adding
water
to the
flared
mouth p1 special ROD hoc-’
•
Ntetftcation
tshibtot-. Fomnila 2533,
faab
Co..
Lovelazsd.
CO.
or M~1
vatent
-
-ti
—
Ft
— aa