Clei~k,Illinois Pollutidu COntrol Board
State
of
Illinois Center
100 West
Ran~o1phStreet
Suite
11-500
Chicago, Illinois 60601
Re:R01-1Q
To whOm it may concern:
Enclosed for filing
are comments
in the
peake~1ant
proceeding.
RECEJVEI2
CLERIcS
OFPtr1~
~NOV0 2000.
STATE
OF1WNO~
wAukEoM4~OI1UtIon
Contr& Boar’
200 NCounty
Wàükegan,
1160085
847 662-8775
Teic~opic~662-8265
Durmg
the last hearing m Spñiigfield, I submitted excezpts from the
Skygen/Zion
Energy
permit
application I am
concerned
a page ofdata
may
have been missing from thecopy submitjed,
and!
hàveenclësedanother copy of
this
exhibit.
Thank
you
Please
feel free to
contact
me if
there are
questions regarding theenclosed.
VeE~)Bf~youry’~
(~T4f6~1’
‘~arolL.‘Do~ge
CAROL L. .OORGE
Direct dial: 847 295-7031
TeIecopier~847295-6815
•.CaràlL.Dorge ~:
Altonieyat Law
315&ShendanRoad
Lake
Bluft
illinois 60044
Attachment s
the Clerk’s
Note:
are In
file.
• November
5,
2000
RECEIVED
CLERK’S
Nov 0 6
OF~CE
Z000
I -847-662-8775~
p0STAT~BW~IS
LakeFax:
j~n~rnt*ni~Board
1-847-295-6815Bluff
IL 60044
Lake County Conservation Alliance
e mail CarolDorge@AOLcom
IN THE MATTER OF:
NATURAL GAS FIRED PEAK LOAD
)
ELECTRICAL POWER GENERATING
)
ROl-lO
FACILITIES (PEAKER PLANTS)
)
FINAL COMMENTS OF CAROL L. DORGE. ATTORNEY. ON BEHALF OF THE
LAKE COUNTY CONSERVATION ALLIANCE (LCCA). NOVEMBER 3. 2000
Members of the Lake County Conservation Alliance (LCCA or the Alliance) have a great
amount ofpersonal experience with the current regulation of peaker-power plants-in Illinois;
We have tried to convey our knowledge and experiences to the Board in oral testimony and
the written materials we have submitted in the course of these proceedings. At this juncture,
we would like to highlight some of our more compelling concerns and observations,
The “peaker plant” industry.
The peaker plants that have been the subject of these hearings are natur&lgas fired-electric
generating units. Some are also being permitted to use diesel fuel as an alternate fuel. (The
Skygen—Zion Energy draft PSD permit allows diesel to be burned 500 hours per turbine for
a total of 2500 hours). The focus has been on simple cycle units, although combined cycle
facilities have also been discussed. Combined cycle units are more energy efficient and
generate less air pollution in relation to the amount of fuel consumed and energy generated,
although their water demand threatens aquifers and must be addressed somehow.
Since these hearings commenced, in August, the number of peaker plants seeking air pollution
permits from IEPA has grown from around 45 to over 60. Each plant has multiple
turbines—usually three or more (Elwood is the largest, having applied for air permits for 19
turbines). It appears that the turbines are being designed and permitted to operate during
daytime hours, from spring to fall, and to a limited extent during the winter. The number of
operating hours per turbine varies, but is on the order of2000-4000 hours or more. Total
operating hours, per plant (all turbines) is much greater. These plants (which include some
combined cycle facilities) are not truly “peakers,” although wewill continue to refer to them
that way.
We estimate their combined generating capacity to be 27,500 MW and their combined
emissions (NOX) to exceed 20,000 tons.
1
These plants are being permitted and being built in Illinois and around the country, to serve
intermediate and base load demand, as well as peak demand. They have been designed and
built to serve an intermediate and base loaddemandhere, in Wisconsin, New York, California,
Pennsylvania, Connecticut, Massachusetts, Hawaii, Texas, Michigan and other states. This is
a new industry. It is a big industry, and it has arrived, in Illinois, big time.
The Board, and Governor Ryan, needto look at the numbers and recognize the reality. First,
the fact that is a big new industry and a real industry, and is ~ designed to serve only peak
demand as peakers have in the past. Second, the fact that deregulation of the electric power
industry, and relatively lax environmental regulationsand local siting have contributedto-an
explosion in the number of plants choosing Illinois, over other states.
Simple cycle turbines are not “energy efficient” energy producers and they will contribute
significantly to the ozoneproblem in Illinois and Wisconsin. These plants generate fewerjobs
and less tax revenue than other types of industry. They take up large tracts of land. Most of
the electricity they produce will be sold to out-of-state customers, and we can expect higher
electric prices, and higher natural gas prices. There are few discernable benefits. Most of the
municipalities that are approving these facilities are being enticed by financial incentives,
through host agreements, or threatened by lawsuits.
The state is currently issuing permits which would allow these sourcesto emit roughly 20,000
tons of NOX (estimated), when the state’s air regulations and SIP proposals project a NOX
demand for new sources of 1500 tons. Noise is a problem. The transportation and storage of
millions of gallons of diesel fuel through and adjacent to residential areas is a problem. We
are already observing clustering of facilities, with multiple facilities in close proximity, even
across the street from each other. Their combined impact needs to be considered. The state
should be proactive and adopt regulations addressing these environmental impacts before
millions of dollars are invested in the facilities that are being proposed.
Air permit procedures need to be strengthenc~
Almost all of these plants approach or exceed major source thresholds for NOX, CO, VOM
and toxies. We have monitored a great number ofpermitting proceedings and have a number
of observations.
First we note that facilities are being permitted to emit awide range of emissions.
-
Emissions
of NOX range from 2.5 ppm to over 40-55 ppm—even plants that are major and subject to
BACT.
Some ofthese plants are admittedly major, and subject to PSD and BACT. IEPA has accepted
dry low NOX technology as BACT for NOX, with little or no control on emissions during
startup or emissions of other pollutants. The LCCA believes that even the sources being
permitted as major sourcesare being allowed to emit far more air pollution than BACT should
allow.
2
It is wellknown that pollutant emissions from combustion processesarehfgherduringperiorh
of start-up (and possibly shut-down). This is particularly true for carbon monoxide and
unburned hydrocarbons, many of which are air toxics. According to one turbine
manufacturer, this information has been provided to “some” of their Illinois customers.
IEPA has not been requiring applicants to obtain reliable emissions data from the
manufacturers and include the information in their application—including data on emissions
during startup. In fact, IEPA only recently started considering startup emissions, in its
permit review, and IEPA is still relying on assumptions, and not on reliable data. These
applications are being written using performance data provided by turbine salesmen.
Reliable engineeringdata for normal operation and startup is essential, due to the nature of
peaker plant operations.
Modeling has not included emissions during startup. This should also be required.
Many of these plants are being permitted as synthetic minors with emissions of NOX and CO
approaching major source thresholds. VOM and toxics may also be significant. We believe
these sources would be major, if all emissions (including emissions during startup) were
properly accounted for. IEPA should establish standardized procedures for calculating
emissions, using reliable engineering data, and taking into account appropriate operating
parameters.
The Clean Air Act established New Source Review as a means of demonstrating a facility
would be in compliance with the Actand regulations, before itwas constructed. These permits
are notbeing issued based on good engineering data, IEPA has not been taking into account
all of the sources emissions, particularly emiss1ons during startup.
IEPA construction permits are allowing the plants to achieve compliance, ifthey can, through
trial and error. Construction permits allow these plants to operate for a whole season (180
days) before demonstrating an ability to comply with permit limitations, through testing—and
we have heard that many plants are having difficulty achieving emission limitations. IEPA is
allowingthese sourcesto declare an artificial cap on emissions and-to-be-constructed, and then
operate for months and months, while they make adjustments and tinker with their turbines
to bring them into compliance.
We need to bring meaningful New Source Review back to Illinois. The following information
should be apart of every permit application. It is not beingrequired by the IEPA, and should
be expressly required by regulation:
1.
Identity ofthe real operator and ademonstration ofability to operate, maintain
and decommission the facility. Detailed information regarding who will be
responsible for operation of the units and permit compliance, and how
operations will be controlled. If there are computerized controls, who controls
3
the computer and how. To what degree does the manufacturer exercise
operational control. Will the units be turned on and off remotely by anyone
other than the owner/operator identified in the application, i.e. by an ISO.
2.
Information on the duration and expected frequency of~tartupand shutdown,
and emissions ofall pollutants during startup. This should include information
on emissions of NOX, CO, VOM and all air toxics, among other things. It
should include information on startup at variousambient-temperatures. There
should be standardized procedures forcalculating emissions-duringstartup and
shutdown.
3.
Information regarding emissions of toxics during normal operation.
4.
Good operating practices for their units.
5.
Information regarding operating factors affecting emissions (e.g. evaporative
cooling, steam injection) and the impact on emissions at various ambient air
temperatures or other conditions.
6.
Standard procedures for calculating emissions during normai-operktsr,n. This
would include operating assumptions for operation at various ambient
temperatures appropriate for Illinois. (For example, emissions would be
calculated at set temperatures and percentages, e.g.95 degrees with evaporative
cooling-10, 59 degrees with evaporative cooling-80
,
0 degrees without
-
evaporative cooling-10).
Computer programs for calculating emissions
should be made available.
7.
Identification of monitoring procedures available to monitor all conditions
impacting emissions (ambient air temperature, evaporative cooler on or off,
steam injection, fuel usage,operation and effectivenessn-fl-o;v-NOX pilot, other).
8.
Modeling, including a demonstration that the facility will not contribute to the
ozone non-attainment problem. Offsets should be required.
9.
What operator training is required and who sill train the operators.
10.
Contractual warranties.
Some of these plants are being permitted, bought and sold while they are still on the drawing
board. We have also heard the manufacturer exercises some control through a central
computer. The application asks for nothing more than the name of the operator. Many ofthe
operators are small companies—even home based businesses. We would like assurance that
the operator is able to operate the plant, and will have the resources to properly maintain and
4
decommission the facility.
We feel the residents of Illinois and Wisconsin are entitled to air which is as clean as can be
achieved with modern technology. These facilities should install LAER, and every effort
should be taken to prevent backsliding, particularly in the case of NOX and VOM emissions.
The NSPS (at around 75 ppm NOX) is over 20 years old and grossly outdated.
The Board should declare all of these sources “major” for purposes of all air regulations.
These sources will cause non-attainment of the ozone standard.
We have also noted that these plants operate during summer months when the pollution
problem—particularly the ozone problem—is the greatest.
Last August, IEPA showed us, through modeling, that the combined impact of the roughly 45
plants in the pipeline would cause exceedences of the ozone standard, at least at Wisconsin
locations. The number of applications is now over 60, and growing. More regulation is
required, to protect our air.
We also note that the Illinois attainment demonstration for ozone appears to account for
roughly half ofthe plants that are being permitted, and does not account for additional plants
that may be proposed. We know other plants are being considered. The attainment
demonstration is inconsistent with the testimony given in August, and the numbers clearly
suggest wewill have a problem achieving the standard.
There is substantial evidence that new natural gas fired electricgenerating-units-are currently
being proposed and constructed with the poteidal to emit iwexcesx of 20,000 tons of NOX, far
in excess of the approximately 1500 tons available under the proposed NOX budget.
These new sources are not currently securing offsets. Only afew of the proposed sources will
utilize LAER. They are contributing significantly to the state’s NOX problem, while
contributing nothing toward asolution. It will not be technically feasible for these sources to
reduce their emissions to 1500 Tons or to purchase the necessary allowan~esfrom Illinois
sources. They will be purchasing allowances from out-of-state sources, while continuing to
emit high levels of NOX, in Illinois.
Any regulatory initiative should include incentives designed to reduce levels of NOX emitted
within the state. There should be incentives which encourage the purchase of offsets from
Illinois sources.
The NOX waiver should be lifted.
USEPAand the courts havedetermined thatIllinois NOX is contributing-to-the ozoneprobleni
5
and NOX emissions must be reduced. The NOX waiver should be lifted.
Noise.
Susan Zingle provided the Board with expert testimony that was submitted in the Indeck
proceeding (Howard Schacter). She will also be submitting avideotape of aNovember 4,2000
forum in Beach Park, Illinois, with additional testimony. These plants are potentially very
noisy, although the noise can be reduced in various ways. The noise can be irritating,
particularly in a rural, residential setting.
These applicants should be required to hire noise experts and demonstrate noise will be
controlled, before these plants are build.
Water Usage
We believe the state should adopt regulations governing water usage and that this should also
be subject to review in a permit proceeding.
Water discharae.
The NPDES program may adequately address concerns associated with water discharges,
including storm water discharges, however, this should also be made part of the record in the
permitting process proposed below.
~leas~.
Citizens are extremely concerned about the possibility of spills, releases and possible
explosions associated with peaker plant operations, including the storage of diesel fuel near
these largecombustion sources—and near to peoples homes. (Skygen,in Zion, proposes to store
1.5
million gallons of diesel fuel within 500 feet of a residential parcel.)
No state agency has responded to those concerns.
Environmental/Engineering RevicwfPcrmittin~
We recommend a state level environmental/engineering review and peaker plant permitting
processwhichtakes into account all ofthe environmental impacts associatedwititheseplants~,
and imposes requirements to mitigate all environmental impacts.
The permit applicant should identify all impacts and proposemeasures to mitigate allimpacts.
It should demonstrate an ability to operate the facility in compliance with all requirements.
It should also include afinancial demonstration ofsontesort, and a decommissioningplan and
demonstrate an ability (including the financial resources), to properly decommission.
6
This permit process would be an engineering review, taking into account good engineering
practices, good environmental practice, good operating practices, and the applicant’s ability
to perform.
Complete application.
We have already discussed the need for greater specificity as to what constitutes a complete
application. We believe the Board should adopt regulations, or the Agency should adopt
enforceable guidelines, requiring submission of the items on our list, in addition to what is
already required. There should be similar guidelines forthe peaker permit discussed above.
These guidelines should be rigorously enforced. When an application is truly complete, the
agency should issue Notice of Receipt of a Complete Permit Application to all parties to the
permit proceeding, as discussed below with respect to siting.
Siting~
We believe that there is also a need for some state involvement in siting in some, but not all
cases. We also believe there are local issues, and local zoning and other requirements should
apply, in additional to other limitations imposed at the state level.
Siting and Permitting Proposal
We propose:
1. Local siting (zoning) approval is required, as well as compliance with other local
requirements.
2. State siting approval B~Yalso required. See item 7, below.
3. All property owners located within 2500 feet of the property line of a proposed facility
should be provided with notice ofthe air permit application and peaker permit application at
the time of the application.
4. Any person could asked to be placed on the notice list and request service ofall applkation
materials (applicant and agency documents), and could become a party to any permit
proceeding and be provided with those materials at no cost.
5. Hearings will be held upon the request of any party.
6. Any party to a permit proceeding could appeal any permit that was issued.
7. In addition, we feel an “SB 172” type proceeding is warranted. Alternatively, we would
7
support an option giving any person, including any municipality or in the case of
unincorporated area, the county, the right to initiate an “SB 172” type siting proceeding by
filing notice with the Board within a specified number of days of receipt of Notice of a
Complete Application (discussed above) or issuance of the draft permit, or some other
appropriate milestone. The proceeding would take into account the factors relevant to
permitting including the environmental impacts, and needfor and benefits associated withthe
plant, as wellthe plant’s compatibility with surroundingland use, and the impact ofclustering
of these facilities. We would like the Board to hold these hearings. (We feel it is important
that these decisions be made by a specializedBoard with technical competance.) The decision
to grant siting approval would not supercede any local zoning.
Personal Observation
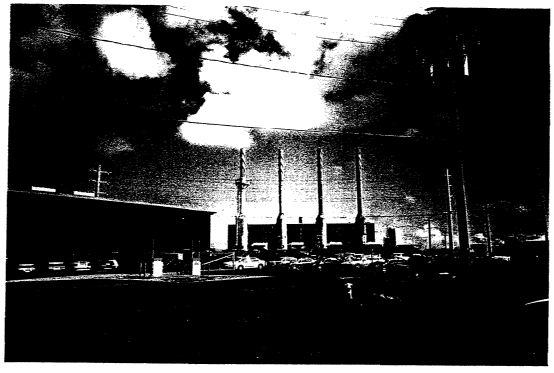
I have visited and photographed a few peaker plants and plants under construction. One of
the plants was an older plant which was operating. Photos are enclosed. It was in an
industrial area, which was appropriate. It was near a Chevron bulk terminal and several
manufacturing operations. There were no residences within one-half mile.
It was very noisy—the noise was loud and irritating 1000 feet away. The pictures show what
it looked like.
There clearly is a need for permitting and siting to assure plants like this are not placed in
inappropriate areas.
-
OUESTIONS POSED BY GOVERNOR RYAN
Finally, we would like to revisit our responses to questions raised by the Governor.
1. Do Deaker plants need to be regulated more strictly than Illinois’ current air quality
statutes and regulations provide?
Answer: The answer is an unequivocal yes. They are major in terms of their impact
during the ozone season and should he declared major sources ofair pollution, by regulation.
They should be subject to LAER, MACT, the ERMs program, and offset requirements.
Existing emission standards—particularly the NSPS—are terribly outdated.
The regulations should also better define permit application requirements, and what
constitutes a complete application. The application should require the submission of backup
documentation. Manufacture’s data should be certified in some manner, by a professional
engineer. (We are told that data used to compute emissions is supplied by the turbine
salesman, not the manufacturer’s engineering department.) The application should also be
certified in some manner by a professional engineer. Procedures from computing emissions
8
should be standardized, and good data for emissions during startup and shutdown isessential.
The application should include detail regarding operation and control, including good
operating practices. It should identify the person or persons in control, including the extent
of control that may be exercised by any non-owner (e.g. remotely by an ISO or by the
manufacturer. We are told the manufacturers monitor operation of these units through a
central computer system.)
Many of these applicants appear to small, poorly capitalized corporations. They are really
seeking permits for a site—more than afacility they will truly operate. The permit and site is
thensold to another entity. There should be some financial assurance the facility will be-built,
operated and decommissioned in a proper manner.
The Agency says it does require modeling for ozone. There must be a way to account for the
combined contribution of these facilities, to the ozone problem.
A noise standard should be adopted which takes into account the chararterof the surrounding
area, and anoise permit required priorto commencing operation. All engineeringinformation
should be certified in some manner by aprofessional engineer.
Siting regulations are needed. Local zoning does not adequately addresssiting considerations.
We will provide more specific recommendations at a later hearing.
The analysis of environmental impact should not begin at the property line. If these sources
are going to occupy large parcels ofland, anyother land use (e.g. farming or other activity on-
site) needs to be taken into account, including the impact of noise and pollution on any
“visitor” to the property.
Storm water permits should also be required.
The combined effect ofthese facilities needs to be considered in all permittingand siting. We
havetwo across the street from each other in Zion (potentially 18 stacks). What is to prevent
us from having 10— or 100 in close proximity. Their combined impact needs to be assessed.
2. Do peaker plants pose a unique threat, or a greater threat than other types of State-
regulated facilities, with respect to air pollution. noise pollution, or groundwater or surface
water pollution?
Yes, based on the shear number of units that have been proposed and their combined
emissions are very significant and will cause continued violations ofthe ozone standard, among
other things. Deregulation and other circumstances in Illinois (NOX Waiver, no siting
requirements) created a friendly environment which is attracting applicants faster than the
State can respond, with appropriate environmental regulations.
9
Deregulation upset our equilibrium, when it comes to these sources, resulting in surprise, and
regulatory gaps. That is not the case with other types of regulated facilities that have come
into existence over the years in a free market where some sort of equilibrium lends more
predictability.
3. Should new or expanding peaker plants be subject to siting requirements beyond applicable
local zoning requirements.
Absolutely. Local zoning is not adequate, particularly where facilities are sited near a
municipality’s boundary and near residential areas.
4. If the Board determines that peaker plant should be more strictly regulated or restricted,
should additional regulations or restrictions apply to currently permitted facilities or only to
new facilities and expansions?
The type of regulations we support would be a “new source review” type approach to noise,
air, siting and other environmental permit requirements. The regulationswill only be effective
if they are retroactive, to cover sources whose applications are pending, who have not
commenced construction as of today. Those facilities are on notice that more stringent
regulations are being discussed, and they should be subjected to those requirements.
5. How do other states regulate or restrict peaker plants?
We have spoken to representatives of many states. Almost all of them have some degree of
state level siting. Some require best available technology for all new plants, major or minor.
Illinois regulation is inadequate, and has contributed to the large volume of applications.
Respectfully submitted,
ALLIANCE
Carol L. Dorge, Attorney,
10
ENCLOSURES
1. Photographs
2. Illinois Attainment Demonstration
11
OZONE ATTAINMENT
DEMONSTRATION
FO-RTHE--
--
--
CHICAGO NONATTAINMENT
AREA
-
Illinois Environmental Protection Agency
Bureau of Air
1021 North Grand Avenue, East
Springfield, Illinois 62794-9276
October 6, 2000
Section
Executive Summary
Table ofContents
Chapter I
Chapter II
- --
-
Chapterill
-~
Attainment Demonstration
Rate-of-Progress and Contingency Measures
Transportation Conformity
—
Chapter IV
Legal Authority and Resource Commitments
EXECUTIVE SUMMARY
This document updates the ozone attainment demonstration previously submitted to the
U.S. Environmental Protection Agency (“U.S. EPA”) by the State of Illinois in April
1998. On December 16, 1999 (64 FR 70496, 64 FR
70514,
64 FR 70531), the U.S. EPA
published notices of proposed rulemaking conditionally approving the 1-hour ozone
attainment demonstration for the severe nonattainment areas (“NAA”) in northeastern
Illinois, northwestern Indiana, and southeastern Wisconsin. The proposed conditional
approval is based, in part, on a commitment by these States to submit an updated ozone
-
attainment demonstration State Implementation Plan (“SIP”) and a post-1999 Rate-of
Progress (“ROP”) Plan by December 31, 2000.
-
Illinois has workedclosely with the U.S. EPA and the States of Indiana, Wisconsin and
Michigan, in cooperation with the Lake Michigan Air Director Consortium (“LADCO”),
to prepare this attainment demonstration. LADCO’s modeling is considered to be an
important element of Illinois’ attainment demonstration SIP submittal, the results of
which are described in the following three documents:
• “Midwest Subregional Modeling: 1 -Hour Attainment Demonstration for Lake
Michigan Area
—
Summary”, LADCO, September 18, 2000.
• “Technical Support Document
—
Midwest Subregional Modeling: Emissions
Inventory”, LADCO, September 27, 2000.
• “Technical SupportDocument
—
Midwest Subregional Modeling: 1 -Hour Attainment
Demonstration forLake Michigan Area”, LADCO, September 27, 2000.
The updated attainment strategy consists of four sets of controls: (1) Federal Clean Air
Act controls, (2) State ROP emission reductions, (3) the Tier IT/Low Sulfur program, and
(4) regional NOx controls required by US. EPA’s oxides of nitrogen (“NOx”) SlIP Call.
These controls are shown to provide for attainment of the 1-hour NAAQS throughout the
Lake Michigan area by 2007, the attainment deadline specified by the Clean Air Act
I
(“CAA”). The modeling has been performed consistent with U.S. EPA guidance. It
should be noted that the NOx reductions specified by the NOx SIP Call do not impact the
NOx waiver, which remains in place for the Lake Michigan area, including Chicago. The
regional NOx reductions that will be obtained by the NOx SIP Call, along with the other
control requirements listed above will provide for attainment of the 1-hour ozone
National Ambient Air Quality Standard (“NAAQS”).
The Illinois Environmental Protection Agency (“IEPA”) has further refined LADCO’s
modeling to address two issues specific to Illinois: incorporation of a transportation
conformity budget for the Chicago nonattainment area and inclusion of emissions
-
-associated with new combustion turbine electrical generating units recently permitted in~
Illinois. The TEPA’s additional modeling is describcd in Chapter I of this document. The
modeling performed by the IEPA demonstrates that these two issues do not alter the
conclusion that the NOx SIP Call and other planned control measures will provide for
attainment of the 1-hour zone NAAQS.
Section 182(b)(l) requires all ozone NAAs classified as moderate and above to submit a
SlIP revision to U.S. EPA which describes, in part, how the area will achieve an actual
volatile organic material (“VOM”) emissions reduction of at least
15
during the first six
years after enactment of the CAA or by November 15, 1996. The portion of the SIP
revision that illustrates the plan for achievement of this emissions reduction is referred to
as the 15 Rate-Of-Progress Plan
(“15
ROP Plan”). The TEPA submitted this plan to
U.S. EPAon November
15,
1993, which the U.S. EPA subsequently approved on
December 18, 1997. Section 182(c)(2) of the CAA requires each serious and above
ozone nonattainment area to submit a SIP revision which provides for an actual reduction
in ozone precursors of at least 3 per year averaged over each consecutive 3-year period,
for a total reduction of 9.
This requirement began in 1997 and continues until the area
attains the 1-hour ozone standard. Illinois’ SIP revisionthat addresses this requirement in
Chicago for the period 1997-1999 is referred to as the 9 Rate-of-Progress Plan (“9
ROP Plan”). The TEPA submitted this plan to the U.S. EPA on December 18, 1997. U.S.
EPA has proposed to approve this plan on March 3, 2000.
7
Chapter II of this document addresses the ROP requirements for the remaining milestone
periods from 2000 through 2007. Chapter II also addresses the requirement for
contingency measures, pursuant to Section 1 72(c)(9) of the CAA. Contingency measures
must be implemented ifthe nonattainment area fails to achieve the required ROP
reductions or fails to attain the NAAQS within the CAA-specified timeframe.
Another component of the attainment demonstration SIP is a motor vehicle emissions
-
budget for transportation conformity purposes. Transportation conformity is a process
T
fofensuriii~that States considefthe ~ffe~s of ~missions iissociated~ithnew or
improved
federally-funded roadway&on attainment of-the standard~As described in
Section 1 76(c)(2)(A) of the Clean Air Act, attainment demonstratioiis necessarily include
the estimates ofmotor vehicle emissions that are consistent with attainment, whichthen
act as abudget or ceiling for the purposes of determining whether transportation plans
and projects conform to the attainment SIP. Each state is responsible for submitting a
transportation conformity budget. In order to demonstrate conformity to the motor
vehicl,e emission budget, emissions from the implementation of atransportation plan or
-
transportation improvement program must be less than or equal to the budget level. The
motor vehicle emissions budgets included at Chapter III of this submittal reflect 1990
levels ofvehicle miles traveled in the region (“VMT”), grown to 2007 levels, and
MOBILE model emissions assumptions appropriate for that year. The motor vehicle
emissions budgets satisfy the criteria contained in the transportation conformity
regulations.
Finally, Chapter IV of this document describes the IEPA’s legal authority to implement
the Attainment Demonstration that is being submitted. In brief, the legal authority for the
State of Illinois to carry out its implementation plan is established in th~Environmental
Protection Act (Act)
415
ILCS
5/1
et seq. The Act is a comprehensive piece of
legislation designed to place the control and enforcement of every type of environmental
problem under one body of law.
Chapter I
-
Attainment Demonstration
4
ATTAINMENT DEMONSTRATION
Introduction
The Illinois Environmental Protection Agency (“IEPA”) has performed a modeling
analysis to be submitted as a supplement to the I-hour ozone attainment demonstration
for the LakeMichigan area prepared by the Lake Michigan Air Directors Consortium
(“LADCO”) dated September 18, 2000. The additional modeling performed by the IEPA
addresses two issues specific to Illinois: incorporation of a transportation conformity
- -
budge~forthe Chicago nonattainment area (“NAA”), and inclusion of emissions from
-
combustion turbine electrical generating units recently permitted in Illinois.
Transportation Conformity
A detailed discussion of transportation conformity, including the establishment of motor
vehicle emissions budgets for the Chicago NAA, is provided in Chapter III of this
document. The attainment demonstration documentation prepared by LADCO
(September 18, 2000) includes the 2007 Chicago link-based transportation network
recen’tly developed and provided to LADCO by the Chicago Area Transportation Study
(“CATS”). The LADCO modeling is based on a volume of approximately 186 million
vehicle miles traveled (“VMT”). Historically, the IEPA has used a higher VMT
estimate for 2007 provided in the early 1990’s by the Illinois Department of
Transportation (“IDOT”) based on their analysis of traffic counts in the Chicago area.
The higher VMT estimates were used in previous Rate-of-Progress (“ROP”)
submittals, including Illinois’ 15 ROP Plan (1993) and the 9 ROP Plan (1997).
The higher VMT estimates were also included in the emissions modeling performed by
the Ozone Transport Assessment Group (“OTAG”) and U.S. EPA’s NOx SIP Call
modeling. The 2007 VMT estimates were generated using the actual 1990 VMT
figures used in the 1990 baseyear Chicago ozone precursor emissions inventory. As
described in the Chicago 15 and 9
ROP Plans, VMT was assumed to grow by
2.7 per year from 1990 to 1996, and then by 2.0 per year thereafter to 2007. The
1990 baseyear inventory included a Chicago NAA VMI estimate of approximately 140
million miles per summer weekday. Using the 2.7 growth factor for the years 1990
to 1996, and the 2.0
per year growth factor for 2000 to 2007, yields an estimate of
approximately 204 million miles per summer weekday for 2007. This VMT estimate is
being used to develop the 2007 motor vehicle emissions budget as described in Chapter
III of this document:
To resolve this inconsistency between previous VMT projections and the data currently
used by LADCO, the IEPA is basing the budget on the results of CATS conformity
analysis conducted !orthe year 2015. The CATS conformity analysis conducted for the
year 2015 resulted in a VMT of 204.2 million miles which closely approximates the
VMT
level assumed in prior budgets and rulemakings. Applying MOBILE model
emission
factors reflecting year 2007 conditions results in a 9.4 increase in volatile
organic compounds (“VOC”) and a 10 4 increase in oxides of nitrogen (“NOx”)
emissions compared to the 2007 transportation network data used by LADCO. The
increased emissions from motor vehicles which reflect the higher VMT levels used to
establish the 2007 conformity budget were included in the present modeling analysis
perfoi~mnedby the IEPA to verify that planned control strategies still provide for
attainment of the 1-hour ozone standard.
Combustion Turbine Electrical Generating Units
The IEPA complied a statewide inventory of recently permitted combustion turbine
electrical generating units and ancillary emission sources to evaluate whether the
potential ozone impacts resulting from the additional NOx, VOC and carbon monoxide
(“CO”) emissions from these sources would affect LADCO’s attainment demonstration.
The location of these sources is illustrated in Figure 1. Sources are indexed by site
identification number to facility electrical output and emission rate information in Table
1.
6
IEFA
Bureau ofAir
Figure 1
Location of combustion Turbine Electrical
Generating Units used in
Ozone
Modeling
JO OAVWSS
I
STEPtIO4SON
r
Legend
I
~
Combustion Turbine
cL
ECU Facility
TABLE 1
TURBINE ELECTRICAL POWER GENERATION SOURCES-~~-SUPPLEMENTALINVENTORY
Electrical
Modeled EmissiOn Rates
Output
(tons/day)
ID County
Geacode
Facility Owner-Operator Site Location
(megawatts)
NOX
CO
ROG
~‘~‘
7
/
I
2
3
4
5
Cook
Cook
Cook
DuPage
DuPage
03 16000GV Peoples Energy/Calumet Power LLC Chicago
O3I600GHA CalumetEnergy LLC Chicago
O3I600GHS Commonwealth Edison/West Tech Turbines Chicago
043407AAF Reliant Energy Aurora
043412AAH ABB Energy Ventures/Grand Prairie Energy Bartlett
276
305
110
950
508
1677
1.788
1.572
1.822
0.51
0654
0.432
0.69
1.508
0.266
0.124
0.108
0.048
0.068
0.03
6 Fayette
O51O3OAAD Spectrum Energy/Central Illinois Power St. Peter
45
0.244
0.178
0.02
7 Fayette
05 I8O8AAK Spectrum Energy/Central Illinois Power St. Elmo
45~
0.244
0.178
0.045
8 Ford
053803AAL Ameren Energy Generating Company Gibson City
270
1.348
0.816
0.072
9 Grundy
063800AAJ Calpine (Morris), LLC Morris
182
0.811
0.225
0.004
10 Jackson
077806AAA Ameren CIPS-Grand Tower Grand Tower
600
5.239
3.439
0.346
11 Kane
089425AAC Dynegy/Rocky Road E.Dundee
398
2.122
1.382
0.118
12 Kendall
093801AAN Kendall New t~enmryDevelopmentlEnron Plano/Yorkville
664
1.434
2.353
0.091
13 Kendall
093808AAD LSP Kendall Energy, LLC Minooka
1100
5.472
5.366
1.387
14 Lee-
103814AAC LSP Nelson Energy, LLC Nelson
I lO~3
-
5.472
5.467
1.456
15 Lee
1038 I7AAH Duke Energy/Lee Generating Station South DIxon
640
2.28
2.208
0.076
16 Logan
107815AAC Spectrum Energy/Logan County Power New Holland
135
,
0.734
0.536
0.136
17
McHenry
1I18O5AAP Reliant Energy Woodstock
510
0.657
0,315
0.031
18 Madison
I 19O9OAAH Reliant Energy Cardinal, L.P. Roxana
634
1.026
3.902
0.529
ic
20
21
22
23
24
25
26
27
28
29
30
31
32
33
Marion
Massac
Peoria
Perry
Rock Island
Sangamon
Scott
Shelby
Shelby
Vermilion
Will
Will
Will
Williamson
Winnebago
121803AAA Ameren Energy Generating Company Patoka
127899AAA Electric Energy/Midwest Electric Power Joppa
1438IOAAG CILCO/Caterpillar (Medina Cogeneration Plant) Mossville
I 45842AAA Ameren Energy GeneratingCompany Pinckneyville
I6I8O7AAN Cordova Energy Co/Mid America Cordova
167822ABG CWLP Springfield
I7I851AAA SoylandPowerAlsey
173801AAA Reliant Energy (Shelby Energy Center) Sigel
173807AAG Constellation Power/Holland EnergyLLC Beecher City
183090AAE Dynegy Midwest Generation, Inc. Tilton
1 97808AAG Peoples Energy Resres Corp. (McDowell Energy Cntr) Elwood
19781 IAAH DesPlaines Greenland/Enron Manhattan
197899AAB Univ Park Energy LLC/Constellation Power University Park
199856AAK Reliant Energy (Williamson Energy Center) Crab Orchard
2OIO3OBCG Indeck-Rockford Rockford
276
318
~0
194
589
126
129
328
680
176
3106
831
300
-
328
306
1.348
2.136
1.081
1.272
0.869
2
3.748
1.92
0.752
0.984
5.235
1.432
1.684
1,92
1.038
0.8 16
0.625
1.178
0.42
2.81
0
1.297
1.872
2.494
0.648
6.08
2.35
1.022
1,872
0.632
0.072
0.043
0.098
0.04 8
0.242
0
0.209
0.004
0.286
0
0.176
0.091
0.129
0.004
0.096
Site
These combustion turbine units include “combined-cycle” installations for providing base
load and intermediate to peak loadproduction, as well as “simple-cycle” installations for
providing peak load generating capacity (so-called “peaker plants”). Some of the
combustion turbine units have been built to replace existing industrial and utility boilers
(Caterpillar (Mossville), Wood River Refinery (Roxana), and Ameren (Grand Tower)),
and others have been constructed to reduce existing boiler usage (Electric Energy
(Joppa) and Calpine/Equistar (Morris)). Boilers replaced by turbineshave been removed
from the inventory~Modeled emission rates were reduced for boilers operating at
reduced
levels so as to avoid double-counting. Ancillary equipment such as fuel gas
-
heater~auxiliary boilers, a~.a~-firëd’ëhilldt,and die~lgen~ratôiswere also included in
the
inventory.
- -
-
-
-
--
--
-
Modeled emission rates and operating parameters (exhaust temperature, velocity, and
flow rate) generally reflect vendor performance specification data for the maximum
ambient temperature (from meteorological records) or an average maximum temperature.
Since peaking units typically operate when ambient temperatures are high this approach
-
is reasonable. Modeled emission rates are based upon the turbines at 100 load. Simple
cycle combustion turbines were assumed to operate for 12 hours (from 7AM to 7PM) and
combined cycle combustion turbines were assumed to operator for 24 hours (uniform
distribution of emissions).
oleling Metho oiogy
The IEPA has performed additional modeling to supplement the 1-hour ozone attainment
demonstration prepared by LADCO to address transportation conformity, and recently
permitted combustion turbines. The LADCO strategy modeling whichreflects the NOx
SIP Call, and other mandated control measures including Tier II motor vehicle standards,
Low Sulfur gasoline requirements, the Enhanced Inspection and Maintenance program,
and Phase II Reformulated Gasoline, is the basis for IBPA’s attainment demonstration.
This scenario is referred to in 1.ADCO’s September 18, 2000 report as “Strategy Run 16”
or “SR16”.
9
The first modification to LADCO’s emissions inventory for SRII6 reflects the increase in
future year VMT levels in the Chicago NAA counties consistent with previous Rate-of-
Progress submittals. Motor vehicle NOx emissions used for modeling were increased
9.4, VOC emissions were increased 10.2, and CO emissions were increased 10.0
from the emissions levels used by LADCO. The increases approximate the increases in
emissions to reflect the transportation conformity budget as described in Chapter III of
this document.
The second modification to LADCO’s emissions inventory for SR16 was to explicitly
-
- - - - -
in~lirdeallcombnstiôn turbine~tectricalgenerating facilities permitted in Illinois. Of all
-
-
-
the peakingunits .currently.permitted, only a. few have actuallybeen built, It is important
-
to note that the combustion turbines will be subject to the NOx emission allowance limits
provided by the NOx SIP Call. It is expected that statewide NOx emissions for sources
subject to the NOx SIP Call generally will not exceed the allocated allowances. To
ensure conservatism of the modeling results, the JEPA has added the projected emissions
from the combustion turbines to the inventory ofemission sources without offsetting
these increases with decreases from other sources. In other words, emissions from
-
peak~rswere modeled
in addition to
the NOx emissions levels represented by the NOx
SIP Call scenario, even though they will have to operate within the emission constraints
provided by the NOx SIP Call.
Other than the inventory adjustments mentioned above, the JEPA’s supplemental
-
modeling used the same modeling approach used by LADCO. The Urban Airshed
Model, Version 1.24 (“UAM-V”) was used for the analysis. The modeling domain,
referred t as Grid M, was used at a grid resolution of 12 kilometers. The IEPA’s
modeling is based on the July 1991 ozone episode, whichproved to be the controlling
episode in LADCO’s modeling analysis.
Modeling Results
The U.S. EPA’s current modeling guidance (1996) allows two attainment tests: a
deterministic test and a statistical test. These tests are applied to the results of the
10
modeling to determine whether the modeled strategy is sufficient to demonstrate
attainment. The deterministic test is passed if the daily maximum concentrations
predicted in each surface grid cell are
125 ppb for all primary episode days. LADCO’s
results show that the deterministic test is not met by any of the tested strategies including
the NOx SIP Call scenario (SR16). Thus, LADCO relied on the statistical test to
demonstrate attainment of the I-hour ozone NAAQS.
The statistical approach permits occasional exceedances and reflects an approach
comparable to the form of the 1-hour NAAQS. The statistical approach includes three
-. -.
- -
1~enchmarksrelated to the~frequencyand magnftude of allowdll exceedancds and the
-
-
minimum level of improvement. The first benchmark limits the-number-of modeled
exceedances in each grid cell (less than 3). The second benchmark limits the magnitude
of the peak concentration of the exceedances, depending on the severity of
meteorological conditions on the exceedance days. The third benchmarkrequires a
minimum level of improvement on the modeled exceedance days. The number of grid
-
cells 125 ppb must be reduced by 80 on each severe day. This benchmark is included
to provide protection in cases where the model underpredicts observed ozone
concentrations.
LADCO has shown that the modeled results for SR 16, the NOx SIP Call, satisf~’U.S.
EPA criteria using the statistical attainment test. The first benchmark is passed since the
maximum number of exceedance days for SR16 is I for any grid cell, and the modeled
exceedances all occur on days considered to be severe in terms of ozone conducive
meteorological conditions. The second benchmark is passed, since the maximum
modeled concentrations on severe days are less than the allowed values. The most
restrictive day, or the episode day which comes closest to the allowed value, was July 20,
1991. The maximum modeled concentration on this day, 128.9 ppb, is less than the
allowed value, 130 ppb, thereby satisfying the second benchmark. LADCO has also
shown that the number of grid cells exceeding 124.9 ppb, the level of the 1-hour ozone
NAAQS, have been reduced by more than 80 on each severe day, which passes the
third benchmark. LADCO concluded that the results from SRI6 satisfy U.S. EPA’s
11
statistical attainment test, and therefore, adequate demonstrate that the modeled strategy
provides for attainment of the I-hour ozone standard in the Lake Michigan region.
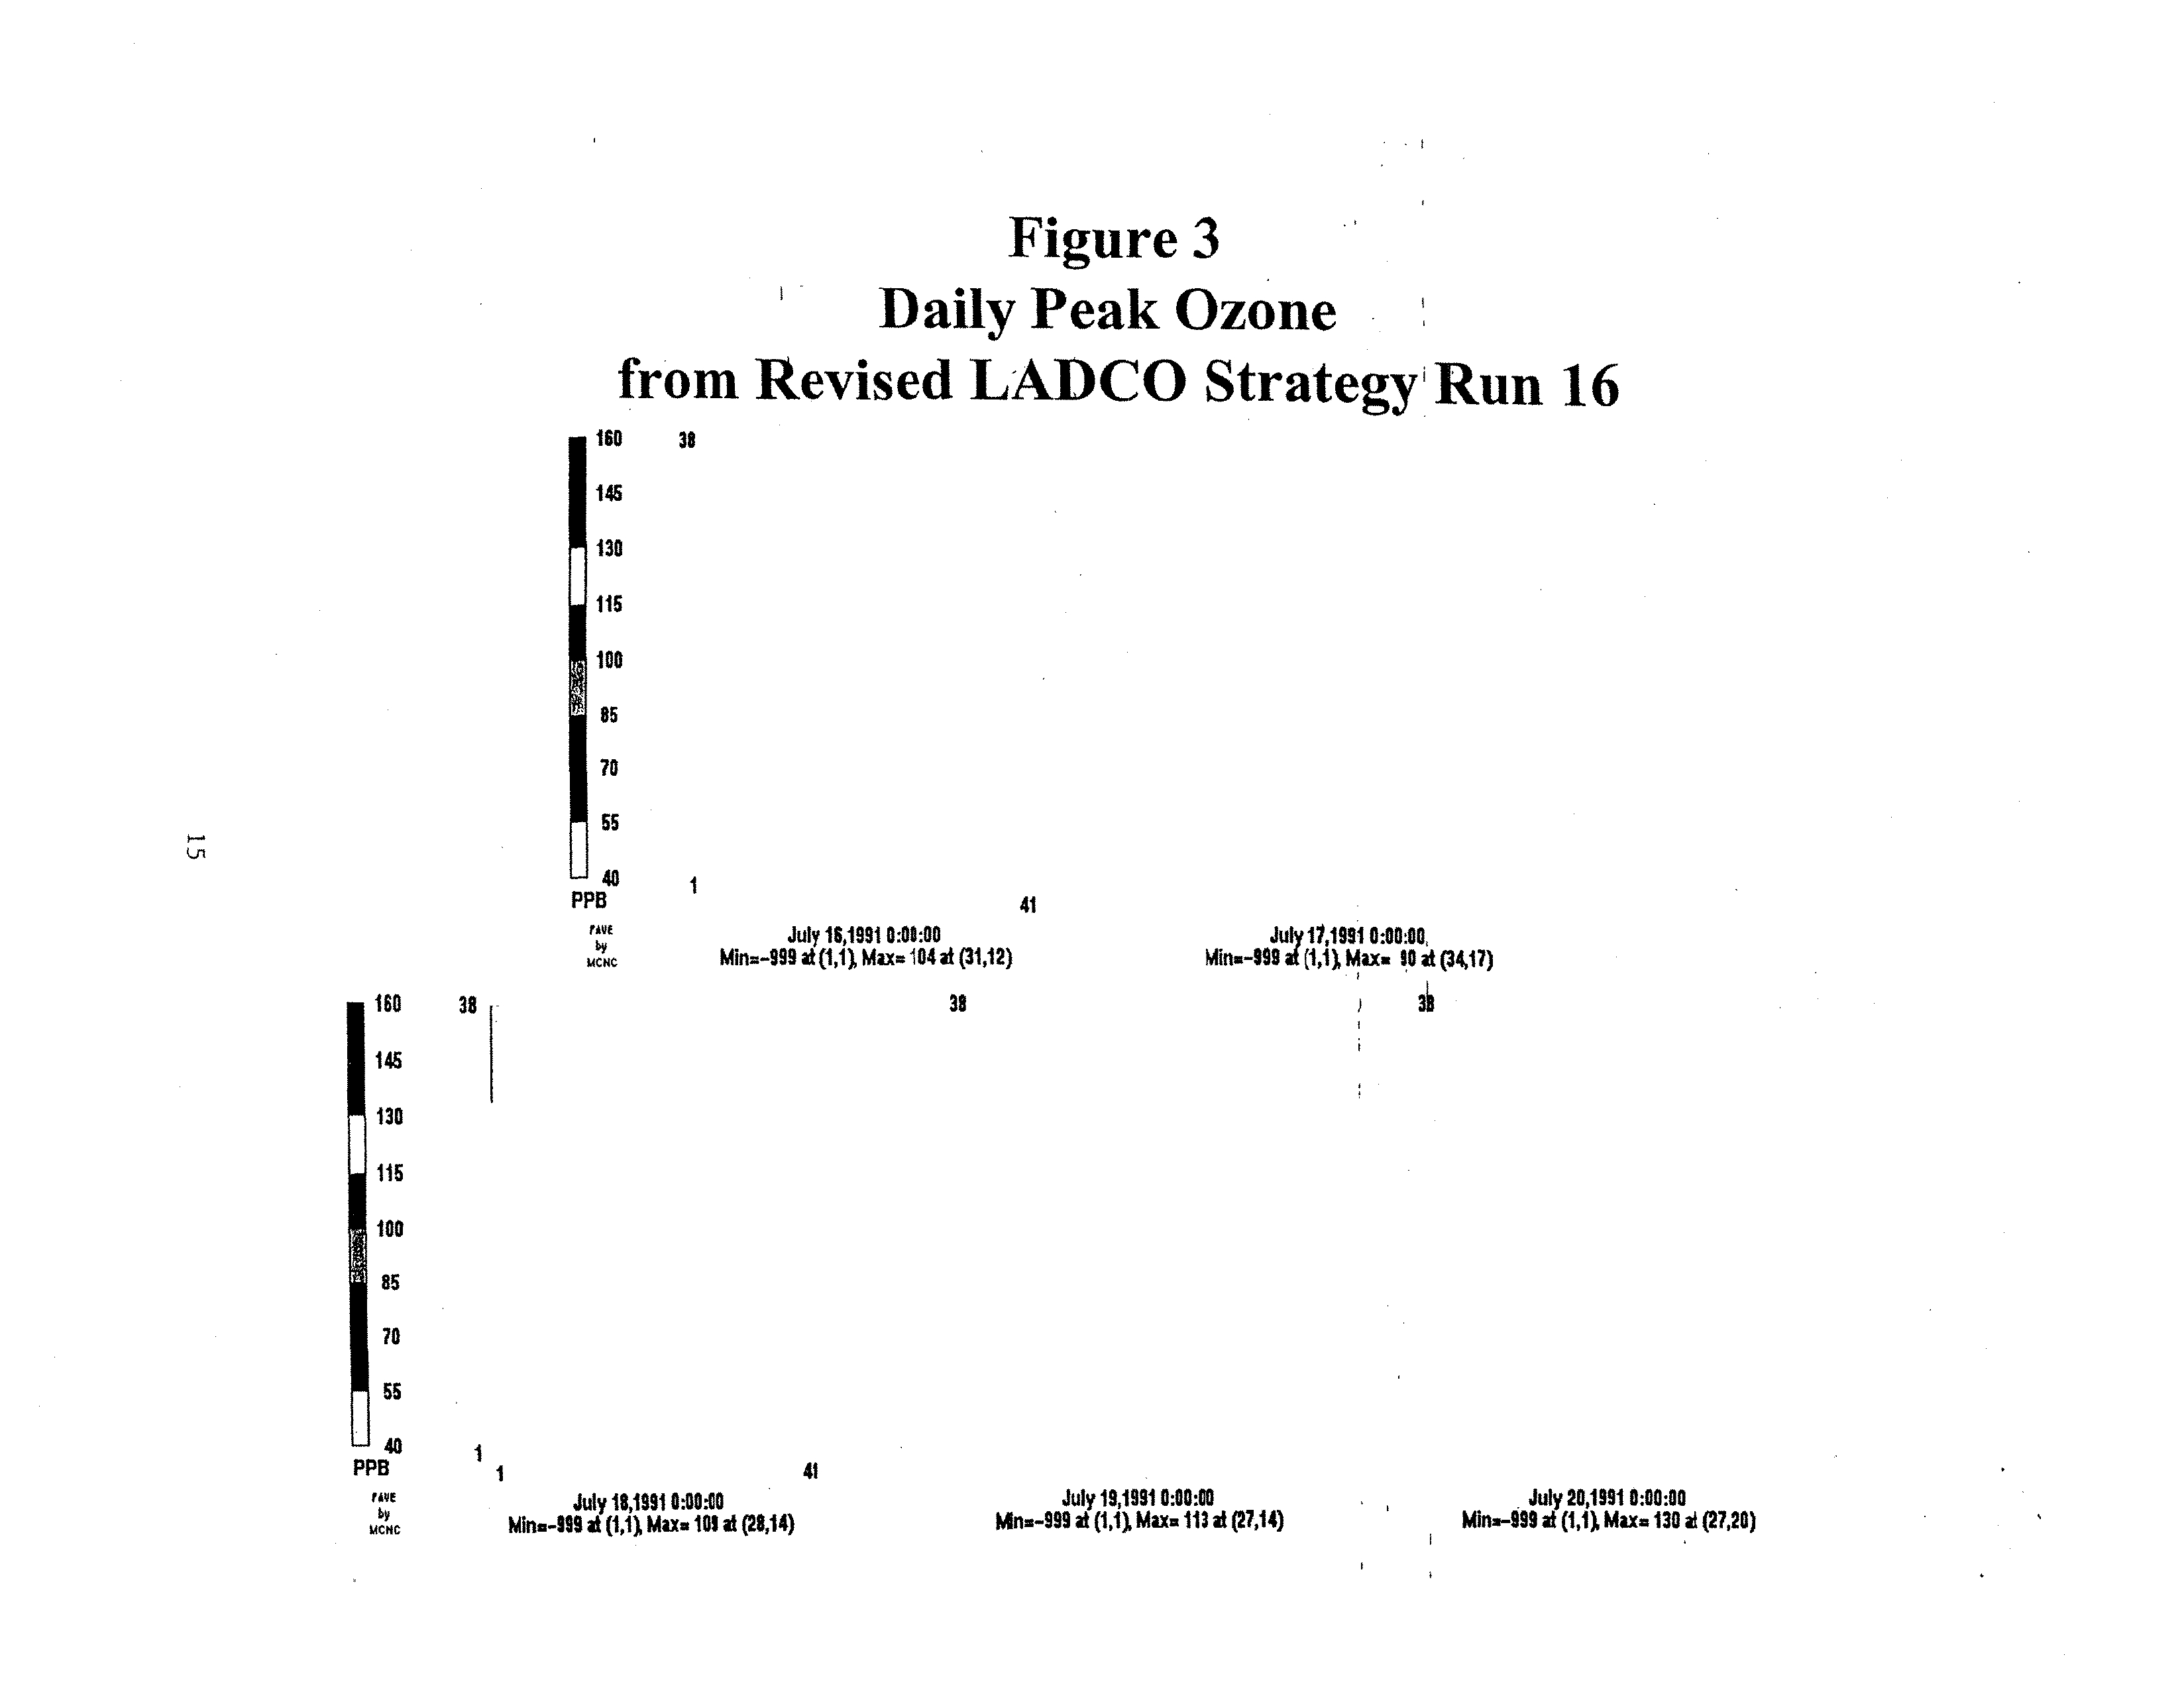
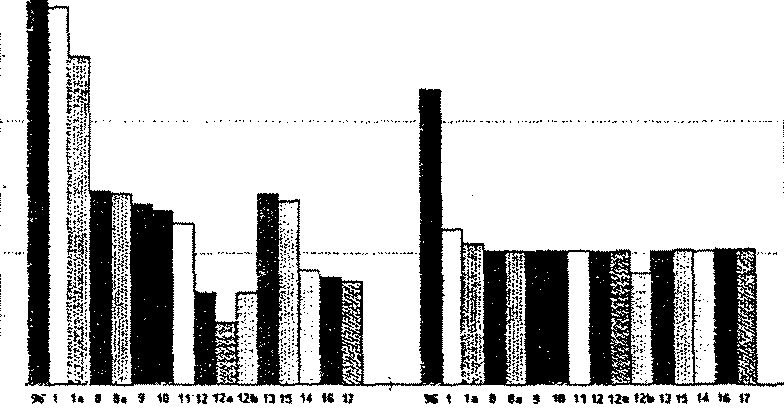
The results ofIEPA’s supplemental modeling are shown in Table 2, and depicted
graphically in Figures 2, 3, and 4. Table 2 compares the daily peak I-hour ozone
concentrations from LADCO’s modeling for SR16 to the results from IEPA’s modeling.
Paily peak 1-hour ozone concentrations are predicted to increase 1-2 ppb as a result of
IEPA’s modifications to LADCO’s emissions inventory for SR16. The peak values are
well below the level of the NAAQS, 124.9 ppb, for 4 ofthe
5
days tested. On July 20th,
both LADCO’s andliEPA’s fiiodelin~predicted an excéedance of the ozone standard. As
- —
discussed previously, the results for this day are still consistent with ademonstration of
-
-
attainment as long as the peak concentration does not exceed 130 ppb. The results from
LADCO’s SR16 scenario is below the allowed value, andjust meets the allowed value
for IEPA’s supplemental modeling. U.S. EPA’s attainment benchmark is therefore
passed forboth model runs.
-
Table 2
-
Comparison of Peak Predicted 1-Hour Ozone Concentrations
—
LADCO “SIP Call Scenario” (SR16) and IEPA Supplemental Modeling
Episode Day
LADCO
SR16
IEPA
Supplement
7-16-91
103
104
7~17-9I
89
~0
7-18-91
109
-
109
7-19-91
ill
113
7-2(3-91
128
130
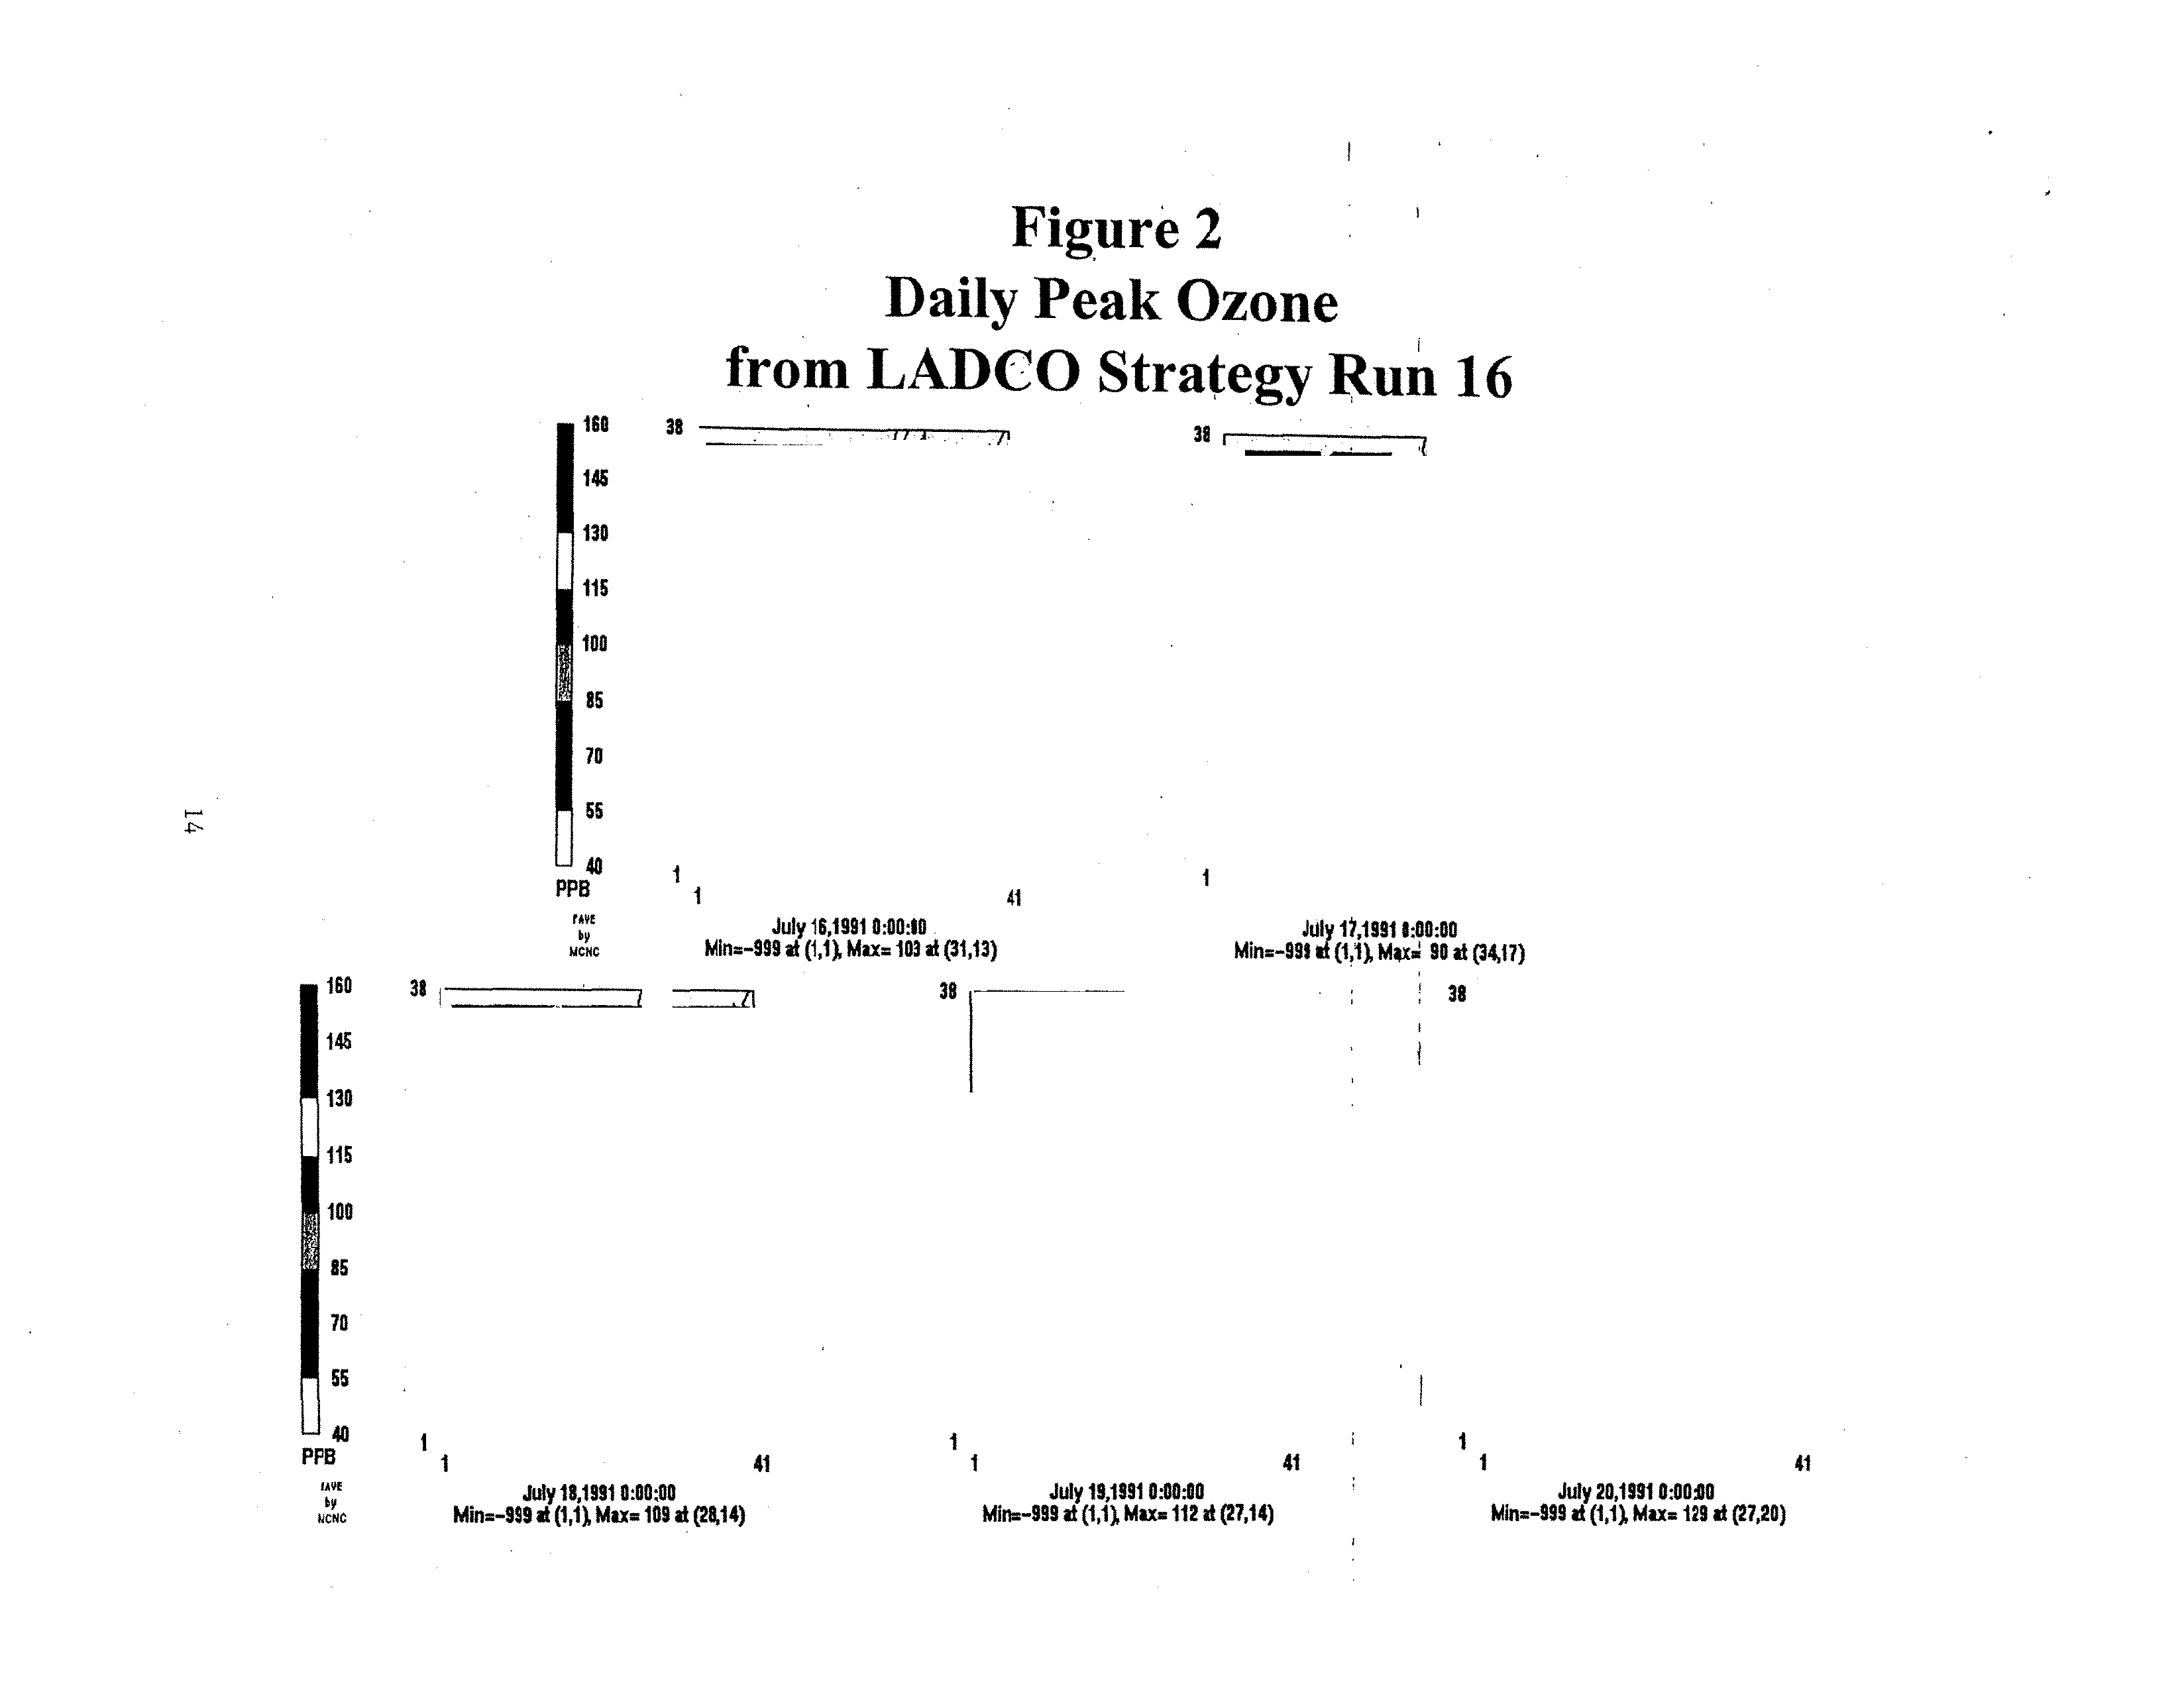
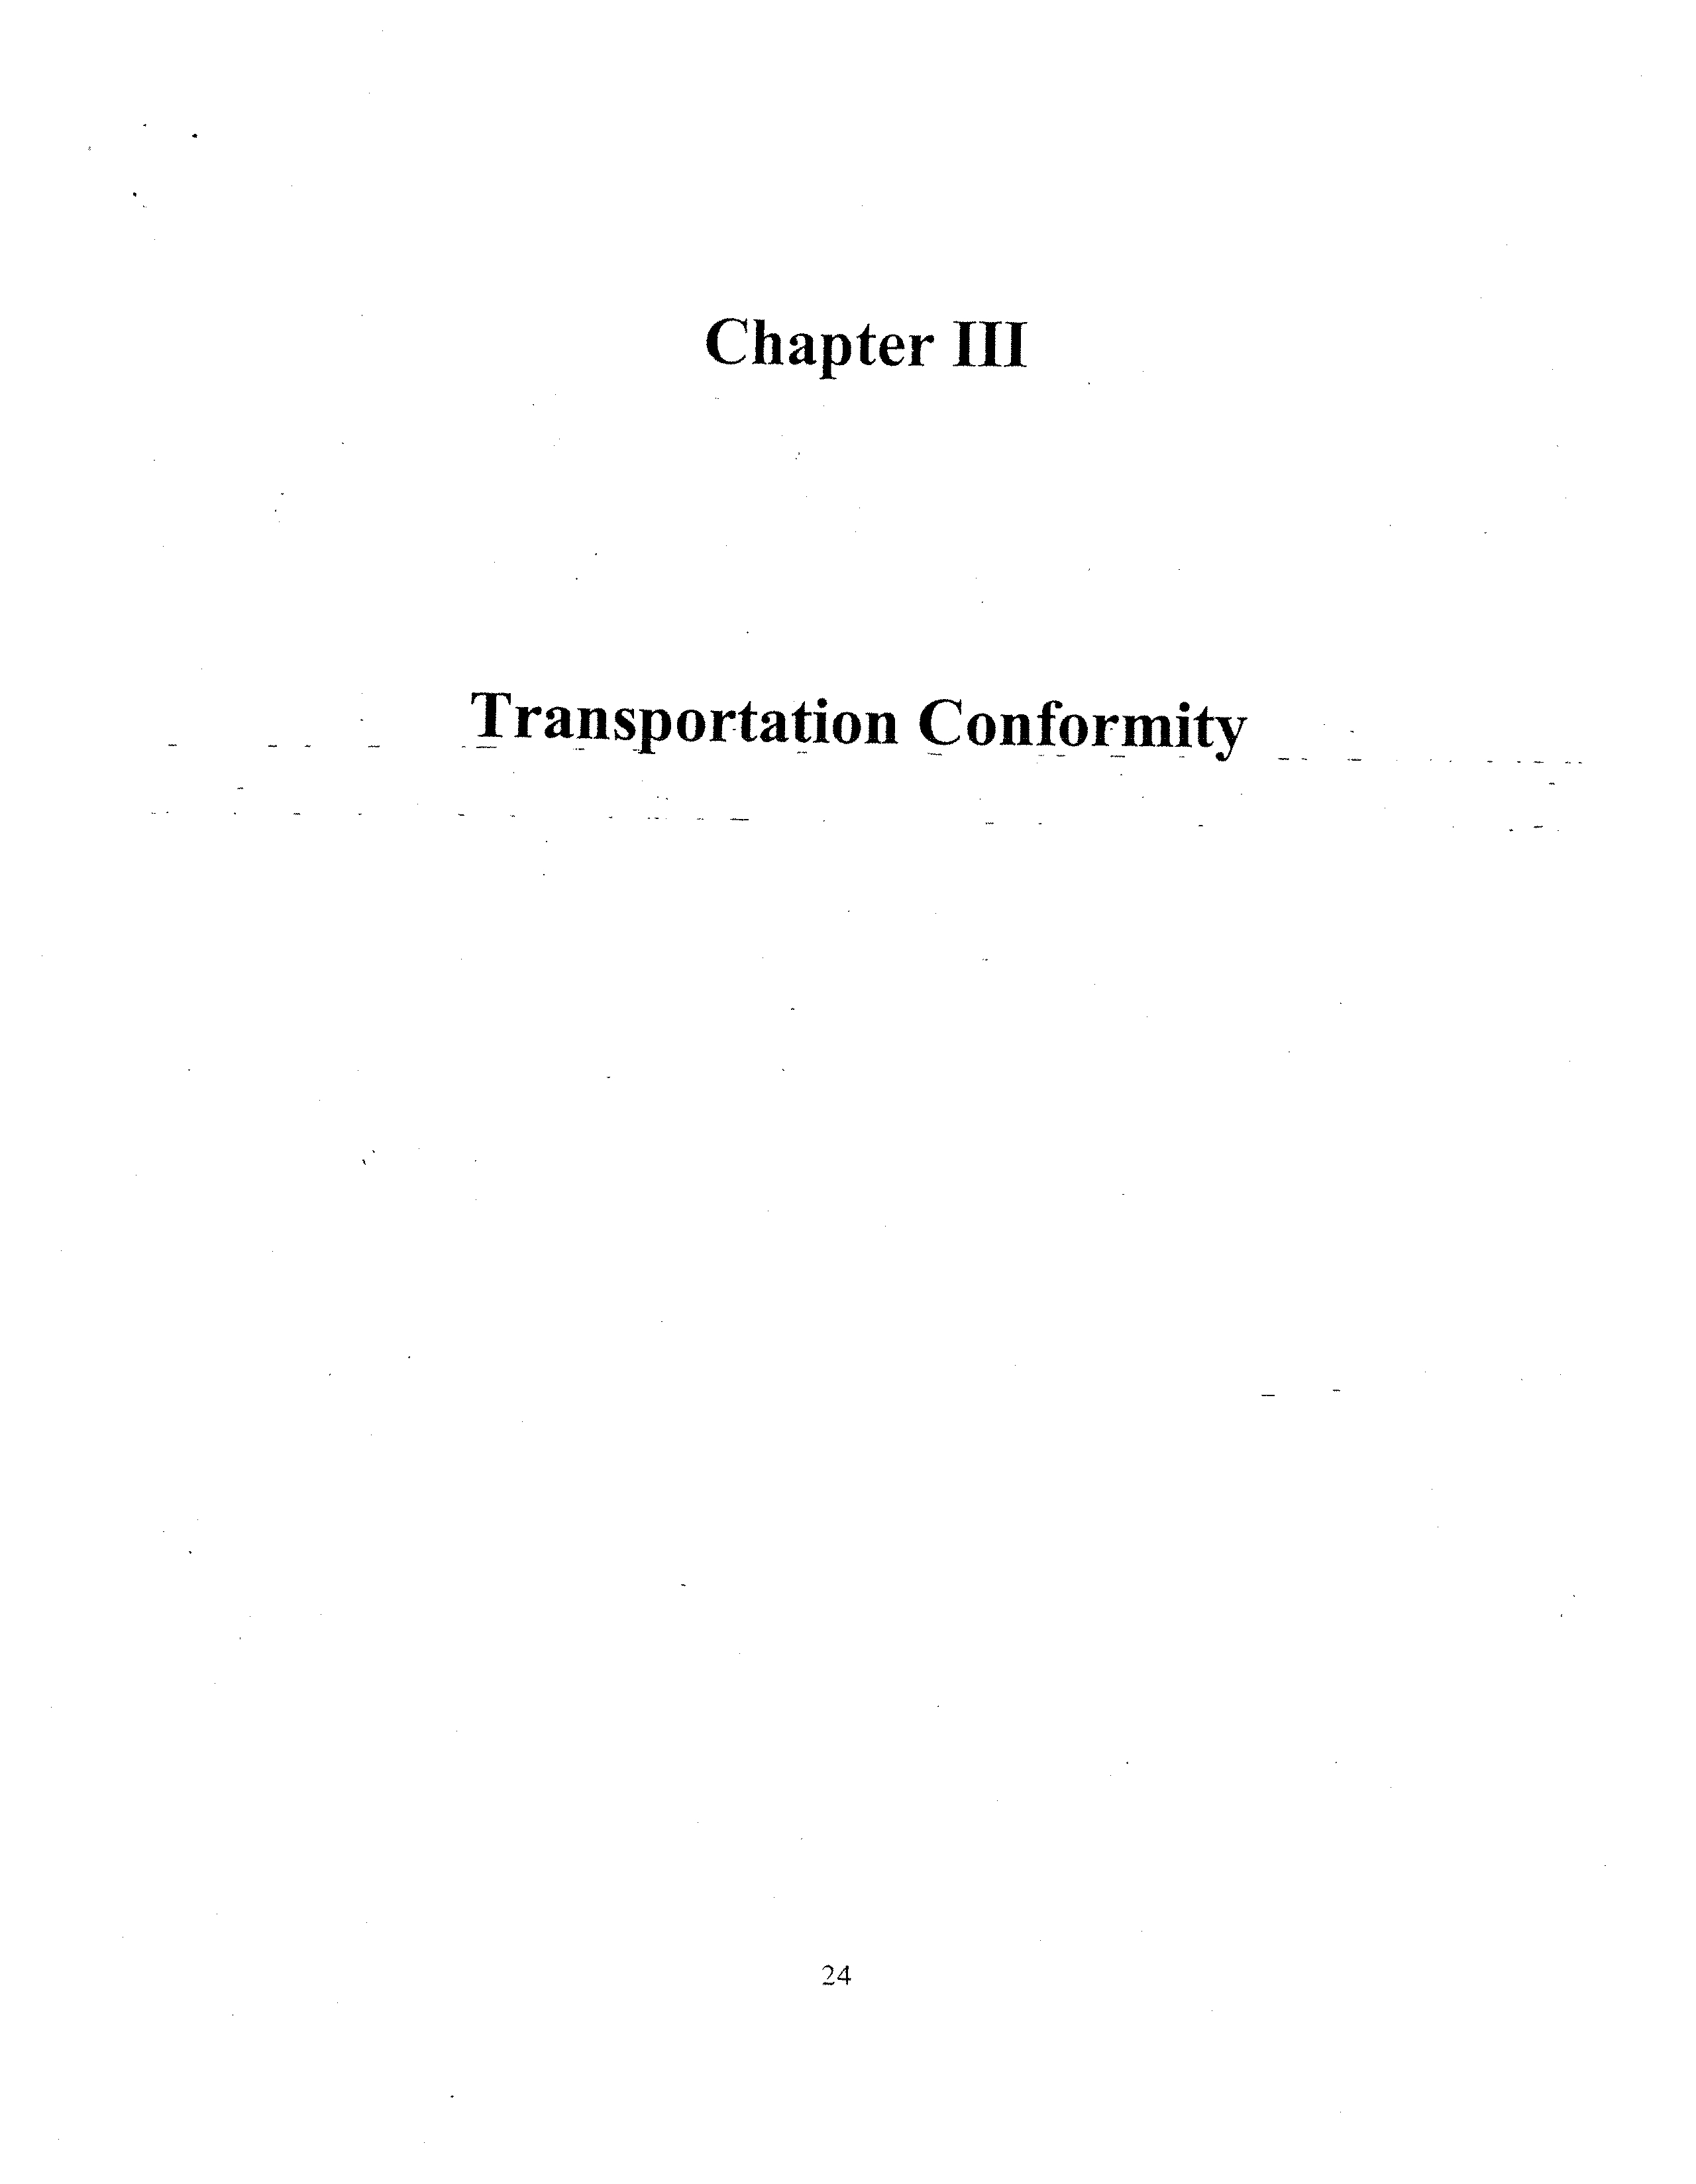
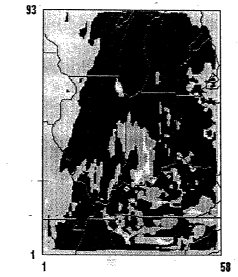
Figure 2 shows the peak daily ozone concentrations projected for each day of the July
1991 ozone episode based on LADCO’s NOx SIP Call (SRI6) scenario for the year
2007. Ozone concentrations exceeding 100 ppb are indicated over Lake Michigan and
some on-shore areas on most of the days examined. Peak concentrations exceeding 115
ppb are indicated on only one episode day, July 20. The modeled peak concentration for
this day is 128.9 ppb, which slightly exceeds the level of the 1-hour ozone standard,
12
124.9 ppb. As discussed previously, the modeled exceedance on this day is within the
limits specified by U.S. EPA’s statistical attainment test.
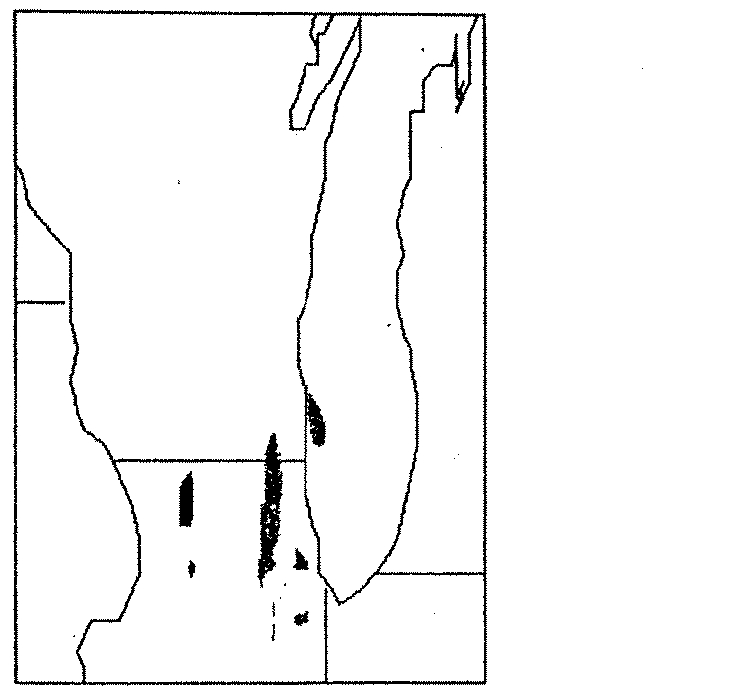
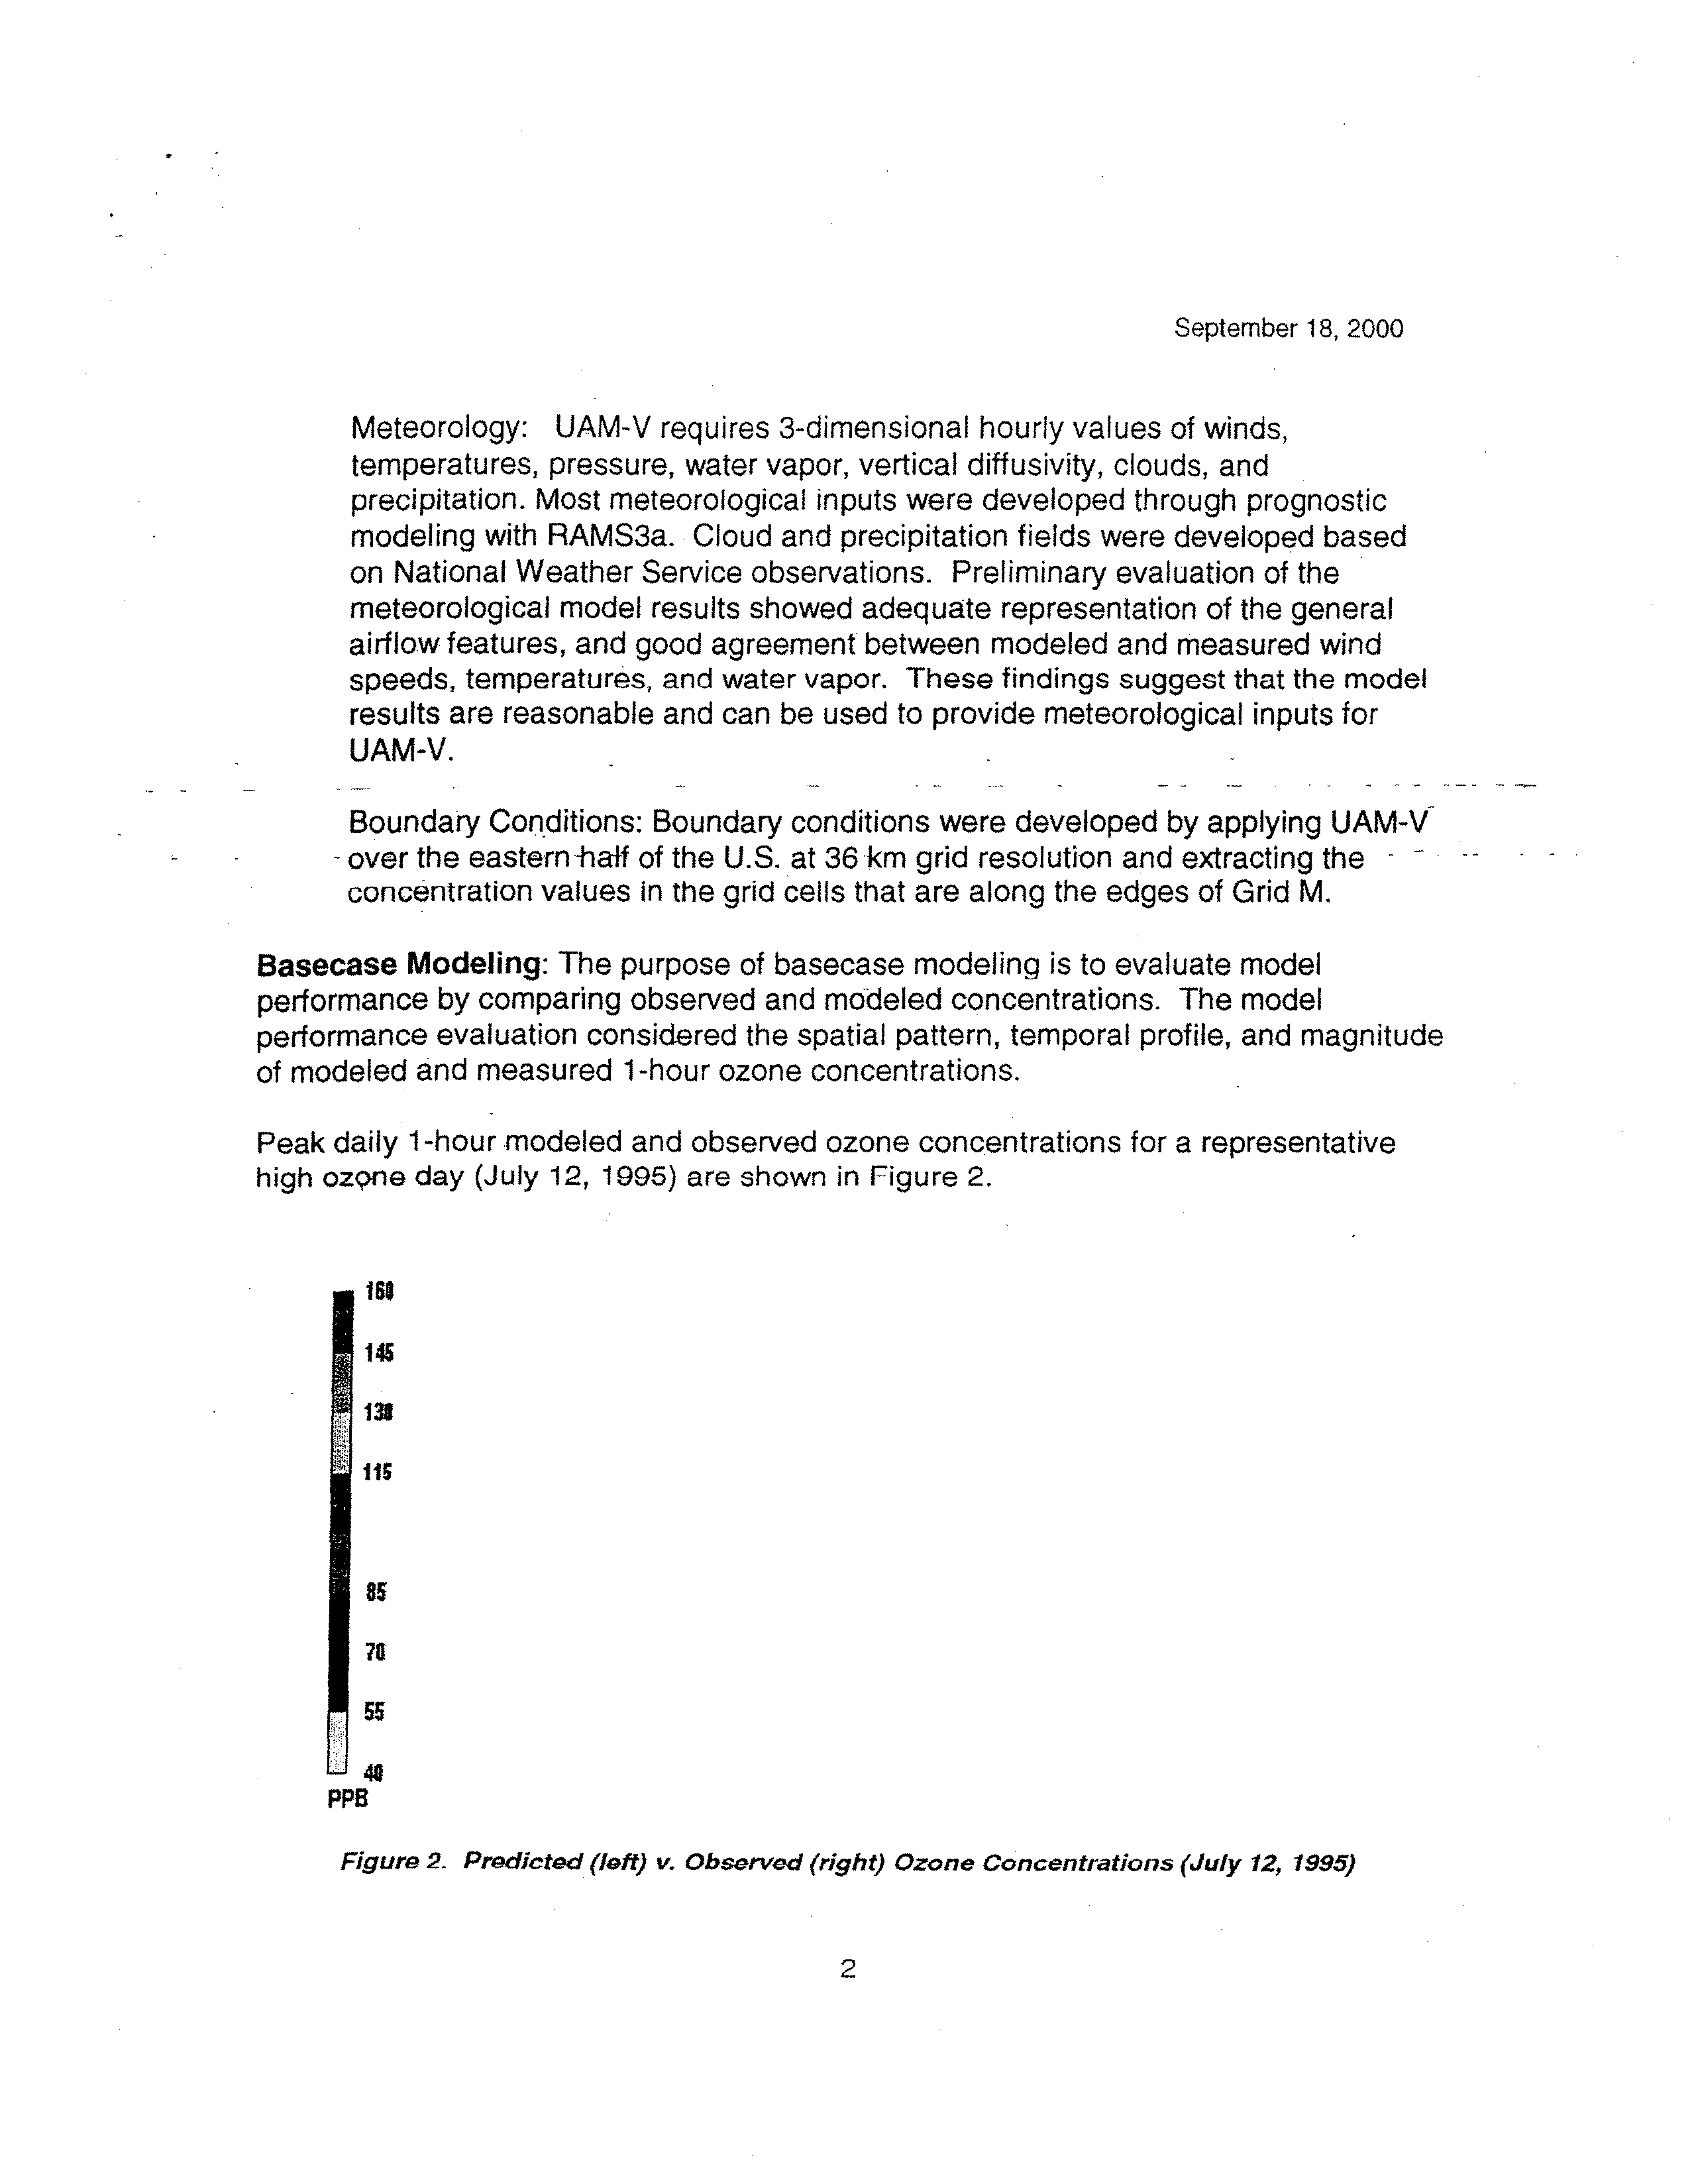
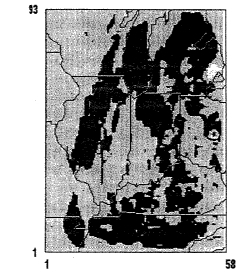
Figure 3 shows the peak daily ozone concentrations projected for the same episode days
based on IEPA’s supplemental modeling results. The spatial patterns for each day are
similar to the results from LADCO’s SR16 modeling (see Figure 2), indicating that there
are not substantial differences in the model’s response for these two scenarios.
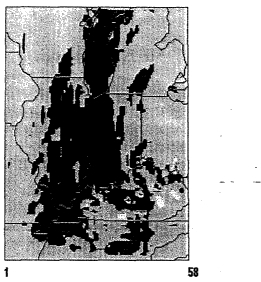
Figure 4 shows the differences in peak daily ozone concentrations resulting from the
-
—
emis~ionschanges in Illinois’ sup~lementálmodéling. Ye1lo~and rid contour~indi.ca~
- —
-ozone increases in—response to the emissions changes, whereas areas shown in blue-
indicate ozone decreases in response to the emissions changes. The results indicate that
the changes in emissions in IEPA’s supplemental modeling cause both ozone increases
and ozone decreases. The ozone decreases in the range of 1-3 ppb occur on afew days in
limited areas. Ozone increases on the order of 2-4 ppb are indicated on all episode days,
andoccur over relatively large areas. The resultant concentrations on these days are still
below the allowed concentration thresholds. It is concluded from this analysis that the
resul’ts of IEPA’s supplemental modeling do not significantly affect LADCO’s SR16
modeling scenario. Both LADCO’s and EPA’s modeling results pass U.S. EPA’s
attainment criteria. The results of this scenario indicate that the control measures
contained in Illinois’ attainment demonstration are adequate to provide for attainment of
the 1-hour ozone standard.
-
13
180
38
145
130
115
100
85
10
55
40
PPB
41
July 16,1991 0:00:80
Mln~—999at
(1,1),
Max=
103
at (31,13)
___________
.11
38 ——
41
July 18,1991 0:00:00
Min=—9$9 at
(1,1),
Max=109 ii (2~14)
Figure 2
-
Daily Peak Ozone
from LADCO Strategy Run 16
38
-
r’v~
by
bACNC
ISO
38
145
130
115
100
- 85
70
55
40
PFB
IAV~
by
‘CNC
July1~,19918:00:00
Min=—99$ if (l,i)~M~xi~
90 at (34~I1)
38
I
1
1
41
July 19,1991 0:00:00
Min=—999 at (1,1), Max~112 at (27,14)
I
July 20,1991 0:0000
Iffn=—999 at (1,1), Max~129 at (27,20)
41
Figure 3
Daily Peak Ozone
-
from Revised LADCO Strategy Run 16
160
38
145
130
115
Ito
85
70
55
Ui
I
41
180
38
145
130
115
100
85
7°
55
40
PPB
fNYN
by
b4CNC
L34~
PPB
by
MCNC
July 16,1991 0:00:00
Min=—999 at(1,I), Max= 104 at (31,12)
38
July 11,1991 0:00:00,
Mirn~—999at (1,1), Max. ~0at (34,17)
3~
1
41
July 19,1991 0:00:80
Mn.—999 at(1,1), Max. 113 at (27,14)
July 18,1891 0:0080
Min.—999 at (1,11 Max. 109 at (28,14)
- July 20,1991 0:00:00
Min.—999 at (1,1), Max= 130 at (27,20)
LADCO
4.5
35
25
I.E
05
-0.5
-1.5
-25
-3.5
-4.5
PPB
by
MCNC
45
35
2$
1.5
3$
-0.5
-15
-2.5
-3.5
-45
ppB
I.4CHC
Strategy Run 16
Back to top
Figure -4
Back to top
Difference between
Back to top
Strategy Run. 16 & Revised
38
38
I
-
I
I
41
July 16,1991 0:00:00
Miii.
—25 at(23,I3~Max. 22 at (16,11)
38
I
41
38
38
1
41
July 19,1991 8:00:00
Mm. —12 at(I4,lO)b Max. 4.0 at
(28,5)
July 19,1991 0:00:00
Mm—OS at (31,24), Max. 2.3at (25,6)
July 20,1991 0:00:30
Mm. —I.E at (34,28), Max. I .Bat (27,19)
1
41
Chapter II
Rate-of-Progress and
Contingency Measures
-
17
RATE-OF-PROGRESS AN) CONTINGENCY MEASURES
Introduction
-
Section 182(b)(1) requires all ozone nonattainment areas (“NAAs”) classified as
moderate and above to submit a State Implementation Plan (“SIP”) revision to U.S.
Environmental Protection Agency (“U.S. EPA”) which describes, in part, how the area
will
achieve an actual volatile organic material (“VOM”) emissions reduction of at least
15
during the first six years after enactment of the Clean Air Act (“CAA”) or by
November 15, 1996. The Chicago ozone nonattainment area is a severe area and is
-
therefore subject to this requirement. The portion of the SIP revision that illustrates the
-
- —
-
plan fcr achievement of this emissions reduction is referred to as the 15 Rate-Of-
Progress Plan (“15 ROP Plan”). Illinois Environmental Protection Agency (“IEPA”)
completed the
15
ROP Plan for Chicago in October 1993 and submitted it to U.S. EPA
on November 15, 1993. U.S. EPA approved the Illinois 15 ROP Plan on December 18,
-
1997.
-
Section 1 82(c)(2) ofthe CAA requires each serious and above ozone nonattainment area
to submit a SIP revision whichprovides for an actual reduction in ozone precursors of at
least 3 per year averaged over each consecutive 3-year period, for a total reduction of
9.
This requirement began in 1997 and continues until the area attains the 1-hour ozone
standard. Illinois’ SIP revision that addresses this requirement in Chicago for the period
1997-1999 is referred to as the 9 Rate-of-Progress Plan (“9 ROP Plan”). The IEPA
prepared the 9 ROP Plan for Chicago in the fall of 1997 and, following an October 24,
1997, public hearing submitted the plan to the U.S. EPA on December 18, 1997, as a
revision to the Illinois SIP.
Since that submittal, a number of actions have occurred which impacted the 9 ROP
Plan and resulted in IEPA supplementing the originally submitted plan. Some of these
actions stemmed from U.S. EPA issuing a revised policy regarding implementation of the
1-hour National Ambient Air Quality Standards (“NAAQS”) for ozone. Other actions
involved changes in VOM emissions reduction credit allowed by U.S. EPA. In addition,
18
delays in the implementation of several federal and state regulatory programs
-
necessitated an adjustment to the reduction credit previously claimed in the 9 ROP
Plan. On January 18, 2000, IEPA held a public hearing in Chicago for the purpose of
gathering public comment on its supplement to the 9 ROP Plan for Chicago to address
these issues. The hearing also addressed the establishment of motor vehicle emissions
budgets for the year 2007 and a commitment that Illinois made with respect to attainment
planning for the Northeastern Illinois ozone nonattainment area. After reviewing the
comments from the hearing, JEPA made adjustments to its draft “Supplement to 9
Rate-of-Progress Plan for the Chicago Ozone Nonattainment Area 1997-1999” document
- —
-
to 7reflect the cotuments rec~ëived,Detailsof the comments r~eiVedandthe iEPA’~
—
response maybe may be foundin its “Response to Comments” document.. The final
9
-
ROP Plan for the 1997-1999 period was submitted to the U.S. EPA on February 17,
2000, and demonstrates that the federal ROP requirements were met. U.S. EPA proposed
approval ofIllinois’ 9 ROP Plait on March
3,
2000.
This section addresses the ROP requirements for the remaining milestone periods through
2007, the year of attainment.
Rate-Of-Progress Analysis
The condition for meeting the rate-of-progress requirement is that the sum of all
creditable VOM and NOx emission reductions must equal 3 per year averaged over
each applicable milestone period. The VOM reduction, is determined from the VOM
rate-of-progress inventory, and the NOx reduction is determined from the NOx rate-of-
progress inventory,
If a State plans to substitute NOx reductions for VOM reductions, separate target level(s)
ofemissions must be calculated for both NOx and VOM. The target levels of emissions
represent the maximum amount of emissions allowed in each post-1996 milestone year in
order to meet the 3 per year rate-of-progress requirement. Illinois’ post-1996 ROP
plans rely on both NOx and VOM reductions to satisf~’its ROP requirements. IEPA
found that a combination of 2 VOM reductions from the Chicago NAA and 7 NOx
19
reductions from the statewide attainment area was sufficient to satisf~’its 1997-1999 9
ROP requirement for Chicago. JEPA has determined that this approach also satisfies the
ROP
requirements for the remaining ROP milestone years of 2002 through 2007. Illinois
is therefore relying on this same combination ofNAA VOM reductions (2) and
attainment area NOx reductions (7) to meet the remaining Chicago NAA
ROP
requirements.
The U.S. EPA prescribed methodology for
determining
the NOx and VOM
target
levels
based on Section 4.0 of its Guidance Document is explained in the IEPA’s 9 ROP SIP
doctimefft. Specificalfy, Section Win the “SUPPLEMENT TO 9RATE~OF~
PROGRESS PLAN FOR THE CHICAGO-OZONE NONATTA11~4MEN1~AREA 1997~
1999” dated February, 2000 (IEPA document AQPSTR 1-00), contains the detailed
information and data necessary to calculate the target levels for both VOM andNOx for
-
each periodic milestone year from 1999 through 2007. Table 1 summarizes these target
levels. As stated above, the VOM target levels are based on the Chicago ozone NAA,
while the NOx target levels are based on the statewide attainment area.
Table
1
-
Chicago ROP Target Levels
Tons per Day (“TPD”)
Pollutant
1999
2002
2005
2007
VOM
807.82
770.11
740.92
-
729.13
NOx
_l820.5l
1657.23
1514.41
1412.76
In
order to
determine whether the ROP requirements are met, an analysis must be
completed to estimate the impact of the emissions reduction strategy on each milestone
period emissions level and compare that to the ROP target level. Illinois’ emissions
reduction strategy, as contained in its attainment demonstration for Chicago, couples
local NAA VOM reductions described in the 9 ROP Plan with statewide NOx emission
reductions per the federal NOx STP Call. Details of the VOM emissions reduction
programs are described in the 9 ROP Plan. In addition to these programs, the
Emissions Reduction Market System (“ERMS”), the enhanced inspection and
20
maintenance system (“El/M”), and the reformulated gasoline (“RFG”) Phase II program
are fuiiy operational in the 2002 milestone year. Reductions from these-programs in the
9
ROP Plan were previously delayed or substantially reduced due to delays in their
implementation. Also, Phase 2 of Illinois’ cold cleaning degreasing rule becomes
effective in 2001, which will provide 11.68 TPD of VOM reductions in the Chicago
NAA.
In regard to NOx emissions reductions, Illinois is complying with the federal NOx SIP
Call and is adopting controls for large electrical generating units (“EGUs”), large non-
- -
--
EGUs, ~nd-large ~effientkilns. Control of N051 emissions from these soiit’ces will b~gin
in 2004. N.Ox reductions in 2007irom application ofthese control req.uirements to those.
sources located in the ozone attainment area have been determined to be 432 TPD from
the EGUs, and 21 TPD from the non-EGUs, including the cemerit kilns. These
reductions were required pursuant to the federal NOx SIP
Call
and are consistent with
U.S. EPA’s NOx control requirements and reduction amounts. These reductions are in
addition to the NOx controls described in the 9 ROP Plan. Details of the NOx SIP Call
controls can be found in the EPA Technical Support Documents (“TSD”) for the large
EGU, non-EGU, and cement kilns rulemakings. Details of the previously relied upon
NOx control programs can be found in EPA’s 9 ROP Plan.
JEPA has relied on its emissions invcntory developed for the OTAG transport project,
and
updated for the NOx SIP Call, to estimate the impact of these emissions control
strategies. This inventory was used in the development of the 9 ROP Plan, and was the
basis for the modeling inventory used in the Chicago NAA attainment demonstration.
The 9 ROP Plan inventory has been updated to include the reductions from the
additional above-mentioned programs to determine compliance with the remaining ROP
milestone target levels. Table 2 summarizes the emissions levels for VOM for the
Chicago ozone NAA and for NOx for the ozone attainment area incorporating the control
strategies included in the attainment demonstration for each milestone year and the
•
associated target levels for that year. The results demonstrate that Illinois’ attainment
strategy satisfies federal ROP requirements.
21
Table 2
Chicago 1999-2007 ROP Assessment
Tons per Day
(“TPD”)
Ozone Nonattainment Area:
VOM
1999
2002
2005
2007
Controlled Level
772.72
678.23
654.33
644.24
ROP Target Level
807.82
770.11
740.92
729.13
Attainment Area:
NOx
1999
2002
2005
2007
Controlled Level
1632.81
1538.77
1067.78
1043.08
ROP Target Level
182051__•
1657.23
1514.41-
1412.76
Contingency Measures
-
As explained in the 9 ROP Plan, an additional 3 reduction in emissions must be
provided per Section 1 82(e)(9) ofthe CA.A as a buffer that must be maintained through
each ROP milestone. Illinois will provide all of the necessary contingency measure
reductions from VOM emissions in the Chicago ozone nonattainment area. As
determined in the 9 ROP Plan analysis, the contingency measure requirement is 31.11
TPDofVOM emissions. As in past ROP Plans, Illinois is including this amount
of
reduction along with the required creditable reduction amount, to determine the total
required ROP VOM reduction amount, Illinois has adopted a single control plan which
includes all necessary measures and which will provide the total reductions needed for
ROP and contingency. U.S. EPA has found this approach to be acceptable in its previous
approval of the Illinois 15 and 9 ROP Plans.
Based on a comparison of the ROP Target Level and the controlled level of VOM
emissions as shown in Table 2, the amount of contingency provided is 35 TPD, 92 TPD,.
87 TPD, and 85 TPD for each of the milestone years from 1999 to 2007. (The 1999
contingency amount has already been proposed for approval by the U.S. EPAin the
-
Illinois 9 ROP Plan). These amounts all exceed the minimum 31 TPD required for
contingency by the CAA.
Therefore, Illinois’ attainment strategy satisfies the contingency requirement of the ROP
provisions. Although not required, Illinois’ attainment strategy also provides for NOx
contingency emissions of 188 TPD, 118 TPD, 446 TPD, and 370 TPD for each of the
milestone years from 1999-2007, respectively. In addition, Illinois expects to also
control large internal combustion engines after the U.S. EPA repromulgates NOx
emissions standards for this category ofNOx sources. The NOx SIP Call control
requirements forthis category were remanded back to U.S. EPA for reconsideration by a
federal court in response to a lawsuit over the NOx SIP Call.
23
Chapter HI
-
- --
Transportation Conformity
- - •
- - - - -
24
TRANSPORTATION CONFORMITY
Introduction
The purpose of this document is to establish and describe the emissions budgets for the
year 2007
for volatile organic compounds (“VOC”) and oxides of nitrogen (“NOx”)
motor
vehicle emissions in the Chicago ozone nonattainment area. These budgets were
developed consistent with the motor vehicle emissions control strategies included in this
attainment demonstration submittal. The budgets reflect an emissions level determined
using
projected vehicle miles
traveled
(“VMT”) for
the attainment year, 2007, derived
-
from
transportation modeling data prepared by the Chicago Area Transportation Study
(“CATS”), in cooperation with the Illinois Department of Transportation (“IDOT”).
The projected VMT levels are consistent with the VMT used in previous attainment
plan
submittal and with -the Chicago “15”
and
“9” Rate-of-Progress State
Implementation Plans (“SIP”) submittals.
Background
A motor vehicle emissions budget is that portion of the total allowable VOC and
NOx
emissions
allocated
to highway and transit vehicle use that are defmed in the SIP for a
certain date. The rules governing
transportation conformity require certain
• transportation activities to be consistent with motor vehicle emissions budgets contained
in control strategy implementation plans (40 CFR § 93.118). Section 93.101 of the
rule
defmes a “control
strategy State implementation plan revision” as a “plan which
contains
specific strategies for controlling the emissions and reducing ambient levels of
pollutants in order to satisfy Clean Air
Act (“CAA”) requirements of reasonable further
progress and attainment.” In order to demonstrate conformity to the motor vehicle
emissions budget, emissions from
the implementation of a transportation plan or a
transportation improvement program must be less than or equal to the budget level (40
CFR § 93.118(a)).
25
Transportation conformity will be
based on these submitted motor vehicle emissions
budgets after the U.S. Environmental Protection Agency (“U.S. EPA”) declares that
the budgets meet the adequacy criteria of the transportation conformity rule under §
93.118(e). The motor vehicle emissions budgets in this submittal are adequate as each
of the six criterion under §
93.118(e)
are satisfied. These six criteria include:
1)
The submitted control strategy implementation plan revision or maintenance
plan was endorsed by the Governor (or his or her designee) and was subject to a
State public hearing.
2) T Before th~conti~olstrategy impleiiiezitaiiou plan or maihtenan~ep1~nwas
• submitted to EPA,. consultation among federal, State, and local agencies
occurred: full implementation plan documentation
was
provided to EPA;
and
-
EPA’s stated
concerns, if any, were addressed;
3)
The motor
vehicle emissions budgets(s) is clearly identified and
precisely
quantified;
4)
The motor vehicle
emissions budget(s), when considered together with all other
emission sources, is
consistent with all applicable requirements for reasonable
further progress, attainment, or maintenance (whichever is relevant to the given
Implementation plan submission);
5)
The motor vehicle emissions budget(s) is consistent
with and clearly related to
the emissions inventory
and
the control measures in
the
submitted control
• strategy implementation plan revision or maintenance plan,
and
6)
Revisions to previously
submitted control strategy implementation plans explain
and document any
changes to previously submitted budgets and
control
measures, impacts on point and area source emissions; any changes to
established safety margins; and reasons for the changes (including the basis for
any changes related to emission factors or estimates of vehicle miles traveled).
The required public hearing to accept public comment on the proposed motor vehicle
emissions inventory is scheduled for 10:00 p.m., November 8, 2000 at the James R.
Thompson Center in downtown Chicago.
Notification of
this hearing was printed in
the “Chicago Sun Times
“
on October 9, 2000 and a copy of that notice will be
included with the final version of this submittal. After the close of the public hearing
26
comment period, a
“Responsiveness Summary” will be prepared addressing any
comments received.
-
In compliance with adequacy criterion #2, a Tier II Interagency Consultation meeting
-
was
held on October 4, 2000. At this
meeting,
the IEPA representative discussed
the
requirements for the attainment demonstration as they relate to transportation
conformity
and
explained the
derivation of the proposed motor vehicle emissions
budgets. Concerns raised by the U.S. EPA regarding the inclusion of Transportation
Control Measures were addressed through an expanded discussion of this program with
this document.
•
•
-
Compliance with
the remaining adequacy criteria is contained within
the narrative of
the attainment demonstration document and this
transportation
conformity section.
The 2007
Attainment Demonstration
In April 1998,
the illinois Environmental Protection Agency (“IEPA”), along with
the
States
of Indiana, Michigan and Wisconsin, submitted a Phase II attainment plan for the
Lake Michigan area. The technical analysis that was included in the submittal indicated
the States will be able to attain the 1-hour
ozone
National Ambient Air Quality Standard
(“NAAQS”) in the region. In November 1999, the U.S. EPA required that motor
vehicle
emissions budgets consistent with the April 1998 Attainment Plan be submitted
by December 31, 1999. These budgets were also required to be determined “adequate”
by U.S. EPA by May 31, 2000.
The motor vehicle
emissions budgets established and described herein were developed
consistent with the methodology and control strategy assumptions used in the Phase II
Attainment Demonstration and both the Chicago
15
Rate of Progress
(“ROP”) Plan
and the 9 ROP Plan submittals. They rely on the mobile source
control measures
included in the ROP plans, and continuing implementation of national control
measures. Emission control measures specific to motor vehicle emissions which have
27
been included
in the respective ROP plans and the Phase II attainment demonstration
include:
• Vehicle emission standards:
the 1990 Federal
Motor Vehicle Control Program.
Tier I engine standards, the National low emission vehicle (“NLEV”) program,
Tier
II engine standards and gasoline sulfur limits, and the U.S. EPA heavy duty
diesel engine emission requirements.
• Vehicle Inspection
and Maintenance
(“I/M”): the 1990 program, the 1992
improvement to the program, and
the
1999 implementation of the enhanced I/M
program.
-
• Fuel requirements: the
Phase
I reformulated gasoline (“RFG”) program in 1995,
•
Pha~eif
RFG
which began
iii
2000~and the CAA-r~quireduse of gasoline
- --
detergent additives.
To maintain consistency, the
2007 Chicago nonattainment area motor vehicle emissions
budgets were determined
using the same inputs and
methodologies used in previous
ROP submittals. These
assumptions were also included in the emissions modeling
performed by the Ozone Transport
Assessment Group (“OTAG”), which were part
of
the
April 1998 attainment demonstration submittal. These inputs include the
methodology for
estimating VMT, use of temperatures and
other appropriate MOBILE
model inputs to reflect Chicago area
conditions and emission control programs. The
2007
VMT estimates were generated
using the actual
1990 vehicle miles traveled
-figures used in the 1990 baseyear Chicago
ozone precursor emissions inventory. As
described in the Chicago 15
and
9 ROP, VMT was assumed to grow by 2.7 per
year from 1990 to 1996, and then by 2.0 per year thereafter to 2007. The 1990
baseyear inventory included a Chicago NAA VMT
estimate of 140,350,076 miles per
summer weekday. Using the
2.7 growth factor for the years 1990 to 1996,
and
the
2.0 per year growth factor for 2000 to 2007, yields an estimate of approximately 204
million miles per summer weekday for 2007. This VMT estimate is being used to
develop the 2007 motor vehicle emissions budget.
28
The attainment demonstration documentation prepared by LADCO includes the 2007
Chicago link-based transportation network provided by CATS. The LADCO modeling
is based on a volume of approximately 186 million VMT-. To resolve this inconsistency
between previous VMT projections and the data currently used by LADCO, the IEPA
is basing the budget oti the results of CATS conformity analysis conducted for the year
2015. The CATS conformity analysis conducted for the year 2015 resulted in a VMT
-
of 204.2 million miles applying MOBILE model emission factors reflecting year 2007
conditions resulting in a 10 increase in both VOC and
NOx emissions compared to
the
2007
transportation
network. This analysis incorporates the increased VMT impact
-
on congestion
and
vehicle speeds. This motor vehicle emissions increase
was
input into
-
the
emfision model
and
included in the ai~tainmentdemonstration.
- -
Motor
Vehicle Emission
Reduction
Program
- -
Consistent with the April 1998
Attainment
Plan submittal, the proposed motor vehicles
emissions budgets assume the presence of several emission control programs the
benefits of which are quantified using the U.S. EPA motor vehicle emissions
model,
MOBILESb. These emission control programs assumed
in the Attainment Plan
included an enhanced vehicle inspection and maintenance program, the use of federal
reformulated gasoline, and the phase-in of the national Tier 1 vehicle
standards, the
national low emission vehicle standards and the national heavy duty diesel engine
emission standards. In addition to these measures the attainment demonstration and the
motor vehicle emissions budgets proposed herein also include benefits from the U.S.
EPA national Tier II motor vehicle emissions program. This program was adopted by
U.S. EPA in December 1999, subsequent to the submittal of the Attainment Plan motor
vehicle emissions budgets. This program establishes more stringent engine emission
standards, especially for NOx emissions, and includes a limit on the sulfur content in
gasoline. According to U.S. EPA guidance, this program will provide approximately a
2.5
reduction in VOCs and a 10.5 reduction in NOx emissions in the year 2007.
These benefits have been incorporated into both the Attainment Demonstration and the
29
proposed motor vehicle emissions budgets. Following is a description and explanation
of the MOBILE model inputs describing these control programs.
Motor Vehicle Emission
Controls:
The primary Chicago area-specific motor
vehicle
emission control programs that will be in place in 2007 are
an enhanced vehicle
JIM program and
the required use of reformulated gasoline.
Inspection and
Maintenance:
The JIM inputs reflect the 2007 JIM program in
Illinois: biennial Enhanced JIM at full
cutpoints for newer vehicles older than 4
years;
biennial
regular
JIM
for older (pre-’81)
vehicles; partial
pressure test credit for gascap
check but no other anti-tampering check and no purge test. Since not 100 of the
- -
-
VMT
in a county
comes from vehicles that-are required to-undergo J/M-testing,
-
estimates
of JIM coverage for each county are used when calculating emissions by
-
county, functional
class and—vehicle type. The I-IM coverage factors are
98 for Cook
and
DuPage Counties, 60 for Kane,
95
for Lake, 50 for McHenry,
and
65 for
Will. The corresponding factors for the nonattainrnent townships of Grundy
and
Kendall Counties
are
25
and
81
,
respectively. These percentages were used to
estimate average countywide emission factors from the
JIM
and
no-JiM outputs.
Reformulated Gasoline: Chicago is one of nine cities required by the Clean
Air
Act to use reformulated gasoline. Phase I of the program began in 1995, with Phase II
starting in January
2000.
U.S. EPA
estimates that the use of Phase
II reformulated
gasoline will reduce summertime VOC
and NOx emissions by
25
and 7,
respectively, from 1990 levels. The emission
reduction benefits from the use of this
cleaner burning fuel
are
accounted for
through
the MOBILE model.
Other Emission Reduction Programs
In addition to these measures, several other programs are in place in the Chicago area
which provide emission reduction benefits which are not calculated by the MOBILE
model. These include the implementation of transportation control measures
(“TCMs”), and the use of clean fuels and vehicles resulting from the implementation of
the Energy Policy Act of 1992 (“EPAct”) and the State Clean Fuel Fleet Program. The
Chicago nonattainment area
15
and 9 ROP SIPs have included a 2,0 ton per day
credit for the implementation of TCMs. However, the effect of individual TCM
projects is not significant enough to be captured by the regional transportation network
model. Therefore, off-model emissions benefits analyses are
performed by project
implementers after such projects have been completed or put into operation. These
30
analyses are compiled by- the
CATS and periodically
submitted to JEPA. These
documents serve as documentation in support of the SIP credit taken in the ROP plans.
Further VOC emission reduction benefits from TCMs are expected to occur within the
2007 attainment demonstration timeframe. The JEPA is relying on an 8.0 ton per day
VOC emission reduction benefit from implemented TCM projects and programs
between 1990 and 2007. The 2007 VOC motor vehicle emission budget reflects this
emission reduction benefit.
Two additional programs which
achieve VOC emission reduCtions from the motor
vehicle fleet and the Clean Fuel Fleet Program
and
Federal Alt~nativeFuel
Usage
requirements of the NEPA. The Clean Fuel
Fleet Program requires motor vehicle fleet
operators to purchase a set percentage of vehicles which, at a minimum, meet the low
emission vehicle emission standards. It is estimated that this program will achieve a
2.8 ton per day reduction
in VOC emission
in
2007.
The NEPA
requires government
agencies to purchase a certain percentage of vehicles which operate on alternative fuels.
The use of
these vehicles and
fuels
is
estimated to result in a 0.2
ton per
day reduction
in VOC emissions
in 2007.
The combination of these programs result
in a VOC
emission reduction of 11.0 tons per day in 2007. The 2007 VOC emission budget
proposed in this attainment demonstration incorporates this benefit. As these emission
reductions are not quantified through the MOBILE model the CATS in conducting
transportation conformity determinations
accounts for these
benefits by subtracting their
total from the emission estimate generated using the re.gional transportation model
VMT estimates and MOBILE model emission factors.
31
Motor Vehicle
Emissions Budgets
Using the above VMT and control program assumptions and methodology, following
are the year 2007 motOr vehicle emissions budgets for the Chicago nonattainment area
for use in determining transportation conformity.
VOC Emissions:
152.91 tons per day
NOx Emissions:
293.92 tons per day
32
Chapter IV
Legal Authority and
Resource Commitments
LEGAL AUTHORITY AND
RESOURCE COMMITMENTS
Intro4uction
As set forth in earlier State Implementation Plain (“SIP”) revisions, the Illinois
Environmental Protection Agency (“JEPA”) has the necessary legal authority to
implement the Attainment Demonstration that is being submitted, In brief, the legal
-
authority for the State of Illinois to carry out its implementation plan is established in the
Environmental
Protection Act (Act) 415 ILCS 5/1 et seq. The Act is a comprehensive
— -
-
piece of legislation designed to place the control and enforcement of every type of
-
environmental-problem under one body of law.
-
-
-
-
-
Pursuant to Section 4(1) of the Act, the IEPA is designated as the air
pollution agency for
the State for all purposes of the Clean Air Act (“CAA”), including developing SIPs
and
proposing regulations. In accordance with and by the authority grantedby the Act, the
IEPA will continue providing adequate funding and personnel to implement the provision
of this plan for meeting the air quality standards.
The Illinois Pollution Control Board (“Board”) has
been designated under the Act as the
agency responsible for adoption of emission control regulations and has the authority
-
necessary to adopt regulations for the control of oxide of nitrogen (“NOx”) emissions
from utility boilers and other industrial sources that are
included in this plan (Section 5 of
the Act).
-
Legal Authority to Enforce Applicable Laws, Regulations and Standards and to
-
Seek Injunctive Relief
The IEPA is empowered to enforce the Act and applicable regulations promulgated
thereunder (Title VIII of the Act). The EPA is directed to investigate alleged violations
upon the request of the Board or upon receipt of information alleging a violation and may
make such other investigations as it shall deem advisable. If such an investigation
34
discloses that a violation may exist, the EPA shall bring an enforcement action against
the violator before the Board in accordance with the Act and applicable State rules.
The Board’s orders may be enforced by the IEPA or the State’s Attorney of the county in
which the violation occurred, or by the Attorney General of Illinois (Sections 33(d) and
42 of the Act). Injunctive relief is specifically authorized under Section 43 and
45(b)
of
the Act.
-
In addition, violation of the Act or of regulations adopted pursuant to the Act or
-
knowingly submittingany fa1s~inforthatioii thereunder Th a criminal misdethé~anof
— -
—(Section 44 of the Act). Section 44 of the Act also provides that it is the
duty of every
--
State and local law enforcement officer to enforce the Act and
regulations
and
authorizes the issuance of citations for that purpose.
35
MIDWEST SUBREGIONAL MODELING:
i-HOUR
ATTAINMENT DEMONSTRATION
FOR
LAKE MICHIGAN AREA
SUMMARY
- -
Illinois Environmental Protection Agency
Indiana Department of Environmental Management
Michigan Department of Environmental Quality
Wisconsin Department of Natural Resources
September 18,
2000
September
18, 2000
The purpose of this document is to summarize the updated 1-hour ozone attainment
demonstration for the Lake Michigan area. The attainment demonstration is based on
a state-of-the-art photochemical modeling analysis plus supplemental weight-of-
evidence information (i.e., air quality data analysis). The final attainment strategy
consists of four sets-of controls: (1) Federal Clean Air Act controls, (2) State rate-of-
progress emission reductions, (3) the Federal Tier Il/Low S program, and (4) a range of
regional point source NOx controls. The modeling shows that these controls provide
for attainment of the 1-hour NAAQS throughout the Lake Michigan area. -
Overview
of
Modeling: The
Urban Airshed
Model, version 1.24 (UAM-V) was used for the
analysis.
The
modeling domain, which is --
shown in Figure 1. includes the areas of high
- -
ozoneconcentrations
-around Lake Michigan -
(the purple shaded area in the figure) and
possible upwind source areas impacting these
high concentration areas. Grid resolution was
12 m for most model runs and 4 km for a few
runs.
Four episodes were modeled: June 22 - 28,
1991; July14 -21, 1991; June13- 15, 1995;
and July 7- 18, 1995. These episodes were
selected because they are representative of
high ozone episodes in the Lake Michigan
area.
There are three key model inputs: emissions, meteorology, and boundary conditions.
The development of these inputs for the current model basecase is discussed briefly
here.
Emissions: UAM-V requires a regional inventory of gridded, hourly emissions
estimates for speciated volatile organic compounds (VOC), oxides of nitrogen
(NOx), and carbon monoxide (CO). The emissions were processes with the
EMS-95 emissions model. Emissions inventories were prepared for a 1996 base
year, a 2007 base year, and several 2007 strategy/sensitivity scenarios. The
inventories include 1996 state periodic inventory data for point and area
sources, updated state transportation data, and updated growth and control
data. Temperatures from the RAMS3a meteorological modeling were used in
the calculation of motor vehicle and biogenic emissions. Biogenic emissions
were based on USEPA’s BEIS2 model, with an adjustment of the isoprene
emissions in the Ozarks based on the OZIE field data.
Figure 1. Map of Ozone Modeling Domain
1
September 18, 2000
Meteorology: UAM-V requires 3-dimensional hourly values of winds,
temperatures, pressure, water vapor, vertical diffusivity, clouds, and
precipitation. Most meteorological inputs were developed through prognostic
modeling with RAMS3a. Cloud and precipitation fields were developed based
on National Weather Service observations. Preliminary evaluation of the
meteorological model results showed adequate representation of the general
airflow features, and good agreement between modeled and measured wind
speeds, temperatures, and water vapor. These findings suggest that the model
results are reasonable and can be used to provide meteorological inputs for
UAM-V.
-
-
-
Boundary Conditions: Boundary conditions were developed by applying UAM-V
- over the eastern-half of the U.S. at 36 km grid resolution and extracting the - -
- -
concentration values in the grid cells that are along the edges of Grid M.
Basecase Modeling:
The purpose of basecase modeling is to evaluate model
performance by comparing observed and modeled concentrations. The model
performance evaluation considered the spatial pattern, temporal profile, and magnitude
of modeled and measured 1-hour ozone concentrations.
-
Peak daily 1-hour -modeled and observed ozone concentrations for a representative
high ozçne day (July 12, 1995) are shown in Figure 2.
65
!?g
46
55
PPB
16
145
136
115
Figure 2.
Predicted
(loft) v.
Observed
(right) Ozone Concentrations (July 12, 1995)
2
September 18,
2000
The areas of high modeled ozone concentrations correspond with the areas of high
measured ozone concentrations (e.g., over Lake Michigan), Also, the regional (rural)
modeled and measured ozone concentrations are comparable (i.e., on the order of 70 -
100 ppb). Peak ozone concentrations over Lake Michigan appear to be -
underestimated on this and many other days.
-
Time series plots of 1-hour modeled and observed ozone concentrations for a high
- ozone site in northeastern Illinois for the July 1995 episode is provided in Figure 3.
• ‘~“~‘•~: s. ,, ~
,~
~
.. ,-, ., J~JZlfl5
M,,,.,flS
,~,
t4~t~~S
.Sfl.IPVS
- .d,i* .‘t~
..~,.n
-
-_
__
-
Figure 3. Time Series Plot of Modeled (line) and Observed (boxes) Ozone Concentrations
The hour-to-hour and day-to-day variation of modeled and measured ozone
concentr~tioflSare comparable, with some overestimation of nighttime concentrations
and soriie underestimation of peak afternoon concentrations.
Ozone statistics (unpaired peak accuracy, average accuracy of peak, normalized bias,
and normalized gross error) are presented in Table 1. The results for the Lake
Michigan area generally comply with USEPA’s criteria and further indicate the tendency
of the model to underestimate measured ozone concentrations. USEPA recommended
that the attainment tests be applied to those days with the best model performance.
Based on the results in Table 1, the following 18 days were determined to be
appropriate for applying the attainment tests:
-
June
25, 1991
July16, 1991
June21, 1995
July 12,1995
June 26, 1991
July 17, 1991
June 22, 1995
July 13, 1995
June
27, 1991
July 18, 1991
June 23, 1995
July 14, 1995
June 28, 1991
July 19, 1991
June 24, 1995
July 15, 1995
July 20, 1991
June 25, 1995
In summary, it is reasonable to conclude that model performance is acceptable and that
the model can be used for regulatory application in th~Lake Michigan area. Given the
model’s tendency to underestimate peak concentrations, however, it should be
understood that the modeled attainment demonstration provides no margin of safety.
3
September
18, 2000
Table 1. Model Performance Statistics
-
Lake Michigan Area (12 km)
Unpaired
Peak Value
Peak Acc
abs
mod
Jul16
Jul17
Jul18
Jul19
Jul20
Jul21
130
129
- 0.8
137
119
-13.1
170
137
-19.4
170
137
- -i9,4’
- -
139
168
20.9
101
142
40.6
-- - -15.9
19.0
-16.8
20.5
- 2.8
15.9
-
9.6
‘20.8 - -
11.7
20.8
18.3
27.9
JulO
Jul10
Jul11
Jul12
Jul13
Jul14
Jul15
Jul16
Jul17
Jul18
122
- 78
-36.1
-106
88
-17.0
118
88 -25.4
146
118
-19.2
178
147
-17.4
150
140
- 6.7
154
156
1.3
92
135
46.7
88
91
3.4
68
55
-19.1
USEPA Criteria
=
15-20
-33.3
-30,6
-29.5
--15,2
-14,6
- 4,3
15.4
23.1
-33.2
-41.3
5 -
15
33,3
30.6
29.8
192
18.9
14.6
22.6
25.9
33.3
41.3
Jun24
Jun25
Jun26
Jun27
Jun28
Normalized
Normalized
Bias
Gross Error
92
101
9.8
104
123
18,3
175
136
-22,3
118
139
17.8
138
124
-10.1
Ave Acc
of Peak
-20.4
-16,8
11.9
10.8
-
5.3
-22.6
-19.3
0.5
4,3
-12.1
23.6
22.9
22.2
17.7
19.0
Jun15
125
83
-33.6
-30.4
-33.6
33.7
Jun16
124
97
-21.8
-30.2
-31.9
32
Jun17
145
110
-24.1
-27.7
-29.0
29.3
Jun18
131
109
-16.8
-16.0
-18.9
20.1
Jun19
118
115
- 2.5
-14.6
-18,0
19.5
Jun20
97
120
23.7
- 8.2
-18.9
21.4
Jun21
112
123
9.8
-212
-23.2
- 25.9
Jun22
119
131
10,1
- 1.7
2,3
16.1
Jun23
123
128
4.1
-11.2
- 6.7
17.9
Jun24
166
136
-18.1
- 5.0
- 1.6
17.1
Jun25
108
125
15.7
14.4
8,3
16.3
(Note: days/values with the best model performance and which wore determined to be appropriate for
applying the attainment tests are identified in red above)
30-35
4
September 18, 2000
Strategy Modeling:
The purpose of strategy modeling is to evaluate the ozone air
quality impact of various control scenarios. For this modeling analysis, the following
strategies were modeled:
-
-
SR1
- CAA
controls
-
SR81
CAA controls + 0.25 utilities +
0.25
utilities + Tier li/Low S
(IL,lN,Wl)
(KY,MO,TN)
-
SR9
CM controls + 0.20 utilities +
0.25
utilities + Tier Il/Low S
(IL,IN,Wl)
(KY,M0,TN)
SR1O CM controls + 0.20 utilities + 0.25 utilities + SIP call non-utilities+ Tier Il/Low S
(IL,IN,Wl)
(KY,MO,TN)
(IL,IN,WI)
SAil CAA controls + 0.15 utilities + 0.25 utilities + SIP Call non-utilities+ Tier 11/Low S
-
-
((L,lN,WI)
(KY,MO,TN)
(R,lNWl) --
-
-
-
- ‘~R12 CM controls
i
0,15 utilities +
SIP Call
non-utilities+ Tier li/Low S
—
--
SR13 SR8
WI
somechanges2- --
‘
-
-
-
SR14 SR12w/somechanqes2
ioooo- -
NOX
VOC
SA15 SR8 w/some new changes3
-
SR165R17
SA12w/someSR12
WI
some
new
new
changes~
changes3
‘~“
The strategy runs assumed CAA boundary
conditions unless otherwise nOted (i.e.,
sources outside of the Grid M modeling
-
domain reflect only CAA controls). The
10000
-
following sensitivity runs were also modeled:
0000
SAla CM controls + Tier Il/Low S
SR8a SR8 + 0.25 utilities (IA)
SR8b SR8 W/ -25 VOC (L.Michigan area)
SR12a SR12 w/ -25 utility NOx
SRI2b SRI2 w/ -25 VOC (L.Micfligan area)
The emissions for the strategy and sensitivity scenarios are shown in Figure 4.
MI @final State rule for utilities (0.25) and non-utilities in Sfl8-SR1 1, SRi 3, SRi 5.
WI © proposed State rule 0.25 utilities in 8 counties, Co credits, 13 TVA units © 0.15,
IN non-utility © proposed State rule (SR13 only), IC engines © CAA (SR14 only), higher
VMT growth for WI, proposed diesel S rule, and updated CM boundary conditions
WI © final State rule 0.28 utilities in 8 counties, CO credits, 13 TVA units © 0.15, IN
non-utility @ proposed State rule (SR15 only), IC engines © CM (SR16, SAl 7only),
MO @ SIP Call (SRI7 only), higher VMT growth for WI, proposed diosol S rule, NOx I/M
cutpoints in WI, corrected VMT for IL, updated MOBILE5 inputs for IL and WI, and
updated CAA boundary conditions
Figure 4. Domain wide Anthropogenic Emissions
(tons per day)
5
September 18, 2000
Effect
of
CAA Controls:
The net effect of growth and CAA control is
a
reduction in VOC arid
NOx emissions
is
14
about 2100 tons and 2400 tons per day,
-
10
respectively, compared to the 1996 base year
emissions. The change in ozone
S
concentrations due to growth and CAA
- -
controls for a hIgh ozone day IS shown in
Figure 5. AS can be seen, there are
-2
widespread ozone decreases and isolated
-~
-
- increases. The ozone decreases occur in
-
areas with high 1996 base year ozone -
-10
-
concentrations (i.e., ozone benefits occur
-
14
where it counts).
‘—18
PPB
Figure 5. Change in Ozone Due to Clean Air
Act Controls (July 12, 1995)
S
Effect of Tier Il/Low S:
-
Tier Il/Low S controls provide a reduction in
VOC and NOx emissions of about 200 and
~ 5
700 tons per day, respectively, compared to
~
-the Clean Air Act (SRi) control level. The
-
change in ozone concentrations due to Tier
1
Il/Low S controls for a high ozone day is
shown in FIgure 6 (note that a finer
concentration difference scale is used in this
-3
figure). As can be seen, there are
widespread ozone decreases on the order of
1-3ppb.
-7
—3
PPB
Figure 6. Change in Ozone Due to Tier
Il/Low
S Controls (July
12,
1995)
-
0
September 18, 2000
18
93
Effect of Regional NOx Controls:
Regional
utility controls (in IL, IN, Ml, WI, KY, -
14
MO, and TN) reflecting 0.25 lb/MMBTU (i.e.,
SR8) provide a reduction in NOx emissions of
about 2000 tons per day compared to-the
6
Clean Air Act (SR1) control level. The
2
change in ozone concentrations for a high
--~ -
ozone day is shown in Figure 7. As can be
-2
seen, there are some areas with ozone
- decreases and a few spotty areas with-ozone
increases.
-
-
--
-in
—14
—18
-
Figure 7. Change in Ozone Due to
Additional 0.25 Utility Controls (July 12,
1995)
-
18
~3
The SIP Call controls provide a reduction in
14
NOx emissions of about 1600 tons per day
compared to the 0.25 Ib/MMBTU utility
10
control strategy (SR8). The change in ozone
6
concentrations for a high ozone day is shown
in Figure 8 As can be seen, there some
2
areas with ozone-decreases and a few spotty
areas with ozone increases. Note that the
ozone decreases in Figure 7 are greater than
~
those
in Figure 8 because the associated
emission reductions are greater (i.e., more
reduction, more benefit).
14
I
PPB
Figure 8. Change in Ozone Due to
Additional SIP Call Controls (July
12,
1995)
7
September 18, 2000
Attainment Demonstration: USEPA’s current
guidance allows two attainment tests: a
deterministic test and a statistical test. To supplement these tests, two additional
analyses are presented: a relative attainment test and air quality data analyses (i.e.,
trends in ozone and
ozone precursor concentrations, and
application of observation-
based methods).
- The deterministic test is a conservative, simple means of assessing attainment. The
deterministic test is passed if-the daily maximum concentrations predicted in each grid
cell
125
are
ppb are125asppbfollows:for
all days. The number of days
-
with maximum
-
concentrations ?
-
—
SRi
SR8
SR9 -- Sf10 Sf11 Sf12 Sf13 - SR14 Sf15 Sf16 Sf17 -
-
-
8.
5~5
5
5
5
4
_4
5
4
4__-
These results show that the deterministic test is not met by any of the strategies.
The statistical approach permits occasional exceedances and reflects an approach
comparable to the form of the i-hour NAAQS. -The statistical approach test is passed if
three benchmarks, which are related to the frequency and magnitude of modeled
exceedances and the minimum level of
improvement,
are
met. The benchmarks are
addressed- below.
Benchmark 1
requires both that the number of days with modeled exceedances
in each grid cell must be less than 3 and that any modeled exceedance occurs
on a usevere~~day. According to USEPA’s criteria, the following 10 modeling
days are considered severe:
Jul 18,1991
Jun
19,1995
Jul 12,1995
Ju119,1991
-
Jun22,1995
Jul i3,l995
Jul 20,1991
Jun 24,1995 —
-
JuIi4,i995
Jul 15,1995
The maximum number
of exceedance days in any grid cell is as
follows:
SRi
SR8
SR9
SRiO Sf11 Sf12 SR13 Sf14 SR15 SR16 SR17
322
11111
11
1
-
For
each strategy except
SRi,
the modeled exceedance days all occur on
severe days. For SRi, there are exceedances on two non-severe days (June
26, 1991; and June 23, i995).
Benchmark 2
requires that the maximum modeled concentration on severe days
shall not exceed 130 - 160 ppb, depending on the ~severity” of the
-
8
September 18, 2000
meteorological conditions. The number of days with modeled concentrations
greater than the allowed value are as follows:
SRi
Sf8
Sf9
Sf10 Sf11 Sf12 Sf13 Sf14 Sf15 Sf16 Sf17
511
11000000
Benchmark 3
requires that
the number of grid cells
? 125 ppb must be reduced
by-80 on each severe day. The number of days the 80 criteria is not met are
as follows:
SRi
Sf8
Sf9
Sf10 Sf11 Sf12 Sf13 Sf14 Sf15 Sf16 Sf17
6
0
- 0
0
0
0
00
0
00
These results indicate that: (i) SRi, which does not pass any of the benchmarks, is not
—
sufficient to provide for attainment; (2)
SR8 - SRi 1 come Olose to
shov~ingattàinn~ei~f,
-- --
but appear to fall just short; and (3)
SR12
- 14, which meet all
three benchmarks, are
sufficient to provide for attainment.
To supplement the model-based attainment tests, two additional analyses are provided:
a relative attainment test and air quality data analyses. The relative attainment test
uses the observed design values in concert with modeling data (i.e., the change in
ozone concentrations between the base year and a given strategy). To show
attainment, the resulting model-adjusted design value must be below the ozone
NAAQS~ For those sites with current observed design values above the NAAQS, the
resulting model-adjusted design values are as follows:
Ohs.
SITE
D.V.
SR1
Sf8
Sf13 Sf14 Sf15 Sf16 Sf17
Pleasant Prairie
131
126
116
115
114
114
113
113
Milwaukee-Bayside 128 123 116 115 114 114 113 113
Harrington Beach
127 123 113 112 111 112 110 109
Sheboygan
l25 121 112 111 110 110 108 108
Manitowoc
127 121 112 111 109 110 108 108
Michigan City
140
132
125
124
121
122
119
119
Holland
133 127 121 120 118 119 117 117
Muskegon
132 126 ~20 118 117 118
- 117 117
Unmonitored(mid-Lake) ‘140
132
126
124
123
124
122
122
These results are consistent with those of the statistical attainment test.
Two air quality data analyses were considered: analysis of air quality trends and
application of observation-based methods. The trends analysis shows that there has
been considerable progress toward attainment of the 1-hour NAAQS in the Lake
9
September 18, 2000
Michigan area. Local ozone levels have declined in recent years, but incoming ozone
levels remain high. The reduction in local ozone levels can be attributed to local VOC
control programs, as evidenced by the decline in ambient VOC concentrations and the
VOC-limited conditions in the severe nonattainment area. To reduce regional ozone.
levels, the observation-based methods indicate that regional NOx
controls
will be
effective. Thus, a strategy of additional local VOC controls and regional NOx
controls is
necessary to provide for attainment in the Lake Michigan area. These findings
corroborate the conclusions of the modeling analysis and support the general direction
of the control strategies in the modeling.
Summary: A state-of-the-art modeling analysis was performed to support the updated
i-hour ozone attainment for the Lake Michigan area. The results of the analysis are
considered to be technically credible. In particular, model performance was determined -
to be reasonable (i.e.,
there
is
good agreement in the
magnitude, spatial pattern, ahd
temporal profile of
rn6del’Od
and the~suredozone conceñtrati’Ons)’and the rii’odeled
- - -
control path was found to be consistent with corroborative air
quality analyses. The
model can, therefore, be used to support regulatory applications for the Lake Michigan
area. Several policy-relevant findings should be noted:
*
Domainwide (principally, urban area) VOC emission reductions decrease
ozone concentrations in urban nonattainment areas. The spatial extent of
the ozone decreases is limited, but do occur in high population and
generally high ozone areas.
*
Domainwide NOx emission reductions decrease ozone concentrations,
but can sometimes increase ozone concentrations. Ozone decreases
occur throughout much of the modeling domain, including areas with high
base year concentrations. Ozone increases are limited mostly to urban
areas, and are most pronounced on days with lower 1-hour
--
-concentrations.
-
*
The modeled attainment tests show that Clean Air Act controls alone will
reduce ozone concentrations, but do not, by themselves, provide for
attainment of the 1-hour NAAQS everywhere in the Lake Michigan area.
The full set of controls (i.e., Federal Clean Air Act controls; State rate-of-
progress emission reductions; Tier Il/Low S program; and a range or
regional point source NOx controls, as reflected by Strategy Runs 12 - 17)
provide for attainment of the i-hour NAAQS throughout the Lake Michigan
area.
-
10