Illinois Environmental Protection Agency
Exhibit List
Title or Description of Exhibit
Exhibit No
.
Simple cycle gas turbine application diagram.
1
"Section 3.1 Stationary Gas Turbines" Supplement F to Compilation of Air Pollutant
2
Emission Factors, Volume 1: Stationary Point and Area Sources Volume 1:
Stationary Point and Area Sources
, July 1993, AP-42.
Letter dated May 16, 2000, to Mr. Francis X. Lyons, Regional Administrator,
3
USEPA Region 5 from Thomas V. Skinner, Director, Illinois EPA.
Letter dated June 15, 2000, to Thomas V. Skinner, Director, Illinois EPA from
Francis S. Lyons, Regional Administrator, USEPA Region 5.
"Alternative Controls Technology Document-NOx Emissions from Stationary Gas
4
Turbines", USEPA Office of Air and Radiation Emission Standards Division,
January 1993, EPA-453/R-93-007.
Existing Power Plants with key (table).
5
Table: Existing Fossil Fuel Fired Boilers.
6
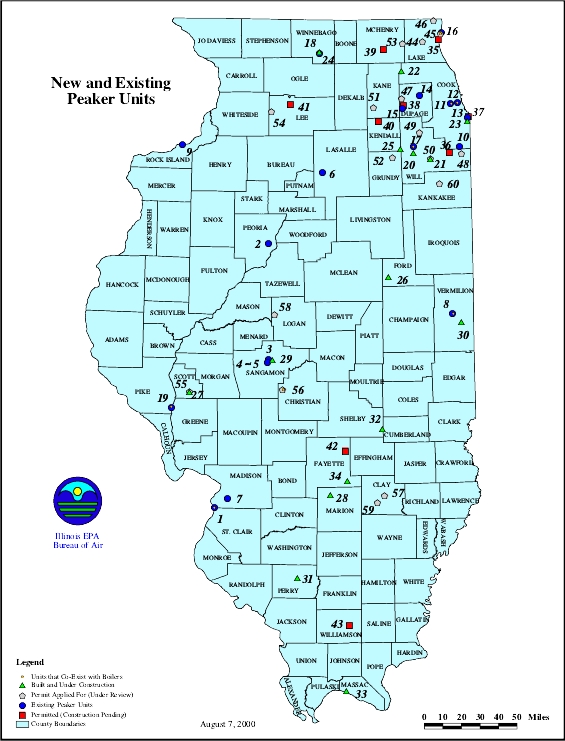
New and Existing Peaker Units map with key (table).
7
Existing Peaker Power Plant table.
8
Table: New Large EGU Peak Units.
9
Table I Natural Ambient Air Quality Standards and PSD Increments
10
Table 2 Maximum impact from Peakers Compared to Class II PSD Increments
Table 3 Maximum impacts from Peakers Compared to the National Ambient Air
Quality Standards.
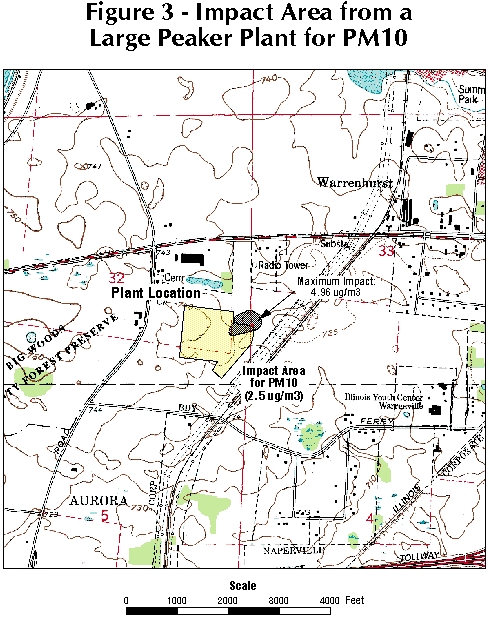
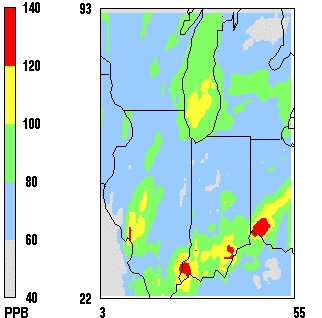
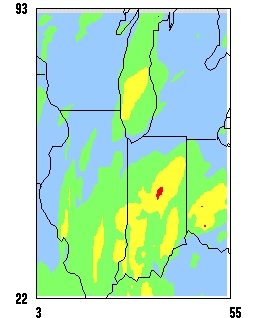
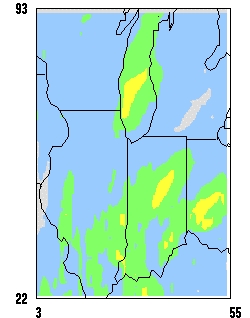
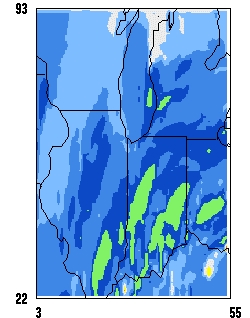
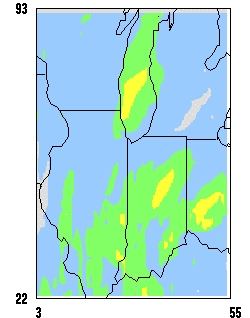
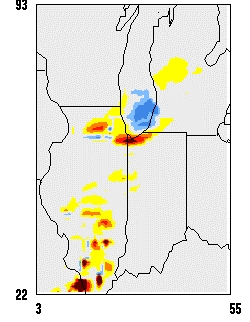
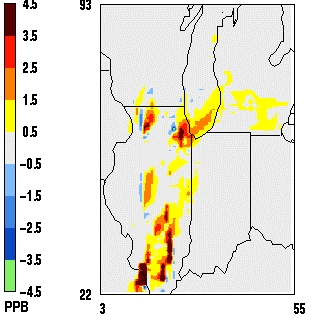
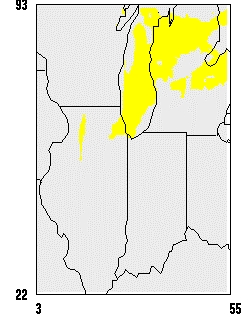
Figure I - Significant Impact Area from a Large Peaker Plant for NOx
11
Figure 2 - Impact Area from a Large Peaker Plant for CO
Figure 3 - Impact Area from a Large Peaker Plant for PM 10
Figure 4 - Impact Area from a Large Peaker Plant for S02.
Figure 5 10 Year Trend of I -Hour Ozone Design Values in the Lake Michigan Area.
12
Peak 1 -Hour Ozone Concentrations Assuming CAA Controls.
13
Title or Description of Exhibit
Exhibit No.
Peak I-Houre Ozone Concentrations Assuming SIP Call Controls.
14
Effect on 2007 CAA Ozone Concentrations due to SIP Call Controls.
15
SIP Call 1 -Hour Ozone Concentrations with "Peakers".
16
Effect on SIP Call 1 -Hour Ozone from Peakers in Illinois.
17
Overview of Applications for Permits Received by the Illinois EPA's Bureau of
18
Water as of July 20, 2000.
Noise Pollution Clearinghouse, "Good Neighbors Keep Their Noise to Themselves".
19
Peaker Plant Fact Sheet of the Illinois Environmental Protection Agency Office of
20
Community Relations.
3.1 Stationary Gas Turbines
3. 1.1 General'
Gas turbines, also called "combustion turbines", are used in a broad scope of applications including electric power generation,
cogeneration, natural gas transmission, and various process applications. Gas turbines are available with power outputs ranging in size
from 300 horsepower (hp) to
2
over 268,000 hp, with an average size of 40,200 hp. The primary fuels used in gas turbines are natural
gas and distillate (No. 2) fuel
oil.3
3.1.2 Process Description,2
A gas turbine is an internal combustion engine that operates with rotary rather than reciprocating motion. Gas turbines are
essentially composed of three major components: compressor, combustor, and power turbine. In the compressor section, ambient air is
drawn in and compressed up to 30 times ambient pressure and directed to the combustor section where fuel is introduced, ignited, and
burned. Combustors can either be annular, can-annular, or silo. An annular combustor is a doughnut-shaped, single, continuous
chamber that encircles the turbine in a plane perpendicular to the air flow. Can-annular combustors are similar to the annular; however,
they incorporate several can-shaped combustion chambers rather than a single continuous chamber. Annular and can-annular
combustors are based on aircraft turbine technology and are typically used for smaller scale applications. A silo (frame-type)
combustor has one or more combustion chambers mounted external to the gas turbine body. Silo combustors are typically larger than
annular or can-annular combustors and are used for larger scale applications.
The combustion process in a gas turbine can be classified as diffusion flame combustion, or lean-premix staged combustion.
In the diffusion flame combustion, the fuel/air mixing and combustion take place simultaneously in the primary combustion zone. This
generates regions of near-stoichiometric fuel/air mixtures where the temperatures are very high. For lean-premix combustors, fuel and
air are thoroughly mixed in an initial stage resulting in a uniform, lean, unburned fuel/air mixture which is delivered to a secondary
stage where the combustion reaction takes place. Manufacturers use different types of fuel/air staging, including fuel staging, air
staging, or both; however, the same staged, lean-premix principle is applied. Gas turbines using staged combustion are also referred to
as Dry Low NOx combustors. The majority of gas turbines currently manufactured are lean-premix staged combustion turbines.
Hot gases from the combustion section are diluted with additional air from the compressor section and directed to the power
turbine section at temperatures up to 2600'F. Energy from the hot exhaust gases, which expand in the power turbine section, are
recovered in the form of shaft horsepower. More than
50 percent of the shaft horsepower is needed to drive the internal compressor
and the balance of recovered shaft horsepower is available to drive an external load.
2
Gas turbines may have one, two, or three shafts
to transmit power between the inlet air compression turbine, the power turbine, and the exhaust turbine. The heat content of the exhaust
gases exiting the turbine can either be discarded without heat recovery (simple cycle); recovered with a heat exchanger to preheat
combustion air entering the combustor (regenerative cycle); recovered in a heat recovery steam generator to raise process steam, with
or without supplementary firing (cogeneration); or recovered, with or without supplementary firing, to raise steam for a steam turbine
Rankine cycle (combined cycle or repowering).
4/00
Stationary Internal Combustion Sources
3.1-1
Illinois EPA
Exhibit No. 2
The simple cycle is the most basic operating cycle of gas turbines with a thermal efficiency ranging from 15 to 42 percent. The
cycle thermal efficiency is defined as the ratio of useful shaft energy to fuel energy input. Simple cycle gas turbines are typically used
for shaft horsepower applications without recovery of exhaust heat. For example, simple cycle gas turbines are used by electric utilities
for generation of electricity during emergencies or during peak demand periods.
A regenerative cycle is a simple cycle gas turbine with an added heat exchanger. The heat exchanger uses the turbine exhaust
gases to heat the combustion air which reduces the amount of fuel required to reach combustor temperatures. The thermal efficiency of
a regenerative cycle is approximately 35 percent. However, the amount of fuel efficiency and saving may not be sufficient to justify the
capital cost of the heat exchanger, rendering the process unattractive.
A cogeneration cycle consists of a simple cycle gas turbine with a heat recovery steam generator (HRSG). The cycle thermal
efficiency can be as 84 percent. In a cogeneration cycle, the steam generated by the HRSG can be delivered at a variety of pressures
and temperatures to other thermal processes at the site. For situations where additional steam is required, a supplementary burner, or
duct burner, can be placed in the exhaust duct stream of the HRSG to meet the site's steam requirements.
A combined cycle gas turbine is a gas turbine with a HRSG applied at electric utility sites. The gas turbine drives an electric
generator, and the steam from the HRSG drives a steam turbine w1iich also drives an electric generator. A supplementary-fired boiler
can be used to increase the steam production. The thermal efficiency of a combined cycle gas turbine is between 38 percent and 60
percent.
Gas turbine applications include gas and oil industry, emergency power generation facilities, independent electric power
producers (IPP), electric utilities, and other industrial applications. The petroleum industry typically uses simple cycle gas turbines
with a size range from 300 hp to 20,000 hp. The gas turbine is used to provide shaft horsepower for oil and gas production and
transmission. Emergency power generation sites also utilize simple cycle gas turbines. Here the gas turbine is used to provide backup
or emergency power to critical networks or equipment. Usually, gas turbines under 5,000 hp are used at emergency power generation
sites.
Independent electrical power producers generate electricity for resale to larger electric utilities. Simple, regenerative, or
combined cycle gas turbines are used at IPP; however, most installations use combined cycle gas turbines. The gas turbines used at IPP
can range from 1,000 hp to over 100,000 hp. The larger electric utilities use gas turbines mostly as peaking units for meeting power
demand peaks imposed by large commercial and industrial users on a daily or seasonal basis. Simple cycle gas turbines ranging from
20,000 hp to over 200,000 hp are used at these installations. Other industrial applications for gas turbines include pulp and paper,
chemical, and food processing. Here, combined cycle gas turbines are used for cogeneration.
3.1.3 Emissions
The primary pollutants from gas turbine engines are nitrogen oxides (NOx), carbon monoxide (CO), and to a lesser extent,
volatile organic compounds (VOC). Particulate matter (PM) is also a primary pollutant for gas turbines using liquid fuels. Nitrogen
oxide formation is strongly dependent on the high temperatures developed in the combustor. Carbon monoxide, VOC, hazardous air
pollutants (HAP), and PM are primarily the result of incomplete combustion. Trace to low amounts of HAP and sulfur dioxide (S02)
are emitted from gas turbines. Ash and metallic additives in the fuel may also contribute to PM in the exhaust. Oxides of sulfur (SOX)
will only appear in a significant quantity if heavy oils are fired
3.1-2
EMSSION FACTORS
in the turbine. Emissions of sulfur compounds, mainly SO2, are directly related to the sulfur content of the fuel.
Available emissions data indicate that the turbine's operating load has a considerable effect on the resulting emission levels.
Gas turbines are typically operated at high loads (greater than or equal to 80 percent of rated capacity) to achieve maximum thermal
efficiency and peak combustor zone flame temperatures. With reduced loads (lower than 80 percent), or during periods of frequent
load changes, the combustor zone flame temperatures are expected to be lower than the high load temperatures, yielding lower thermal
efficiencies and more incomplete combustion. The emission factors for this sections are presented for gas turbines operating under high
load conditions. Section 3.1 background information document and emissions database contain additional emissions data for gas
turbines operating under various load conditions.
Gas turbines firing distillate oil may emit trace metals carried over from the metals content of the fuel. If the fuel analysis is
known, the metals content of the fuel ash should be used for flue gas emission factors assuming all metals pass through the turbine.
If the HRSG is not supplementary fuel fired, the simple cycle input-specific emission factors (pounds per million British
thermal units [lb/MMBtu]) will also apply to cogeneration/combined cycle systems. If the HRSG is supplementary fired, the emissions
attributable to the supplementary firing must also be considered to estimate total stack emissions.
3.1.3.1 Nitrogen Oxides -
Nitrogen oxides formation occurs by three fundamentally different mechanisms. The principal mechanism with turbines firing
gas or distillate fuel is thermal NOX, which arises from the thermal dissociation and subsequent reaction of nitrogen (NO and oxygen
(02)
molecules in the combustion air. Most thermal NOX is formed in high temperature stoichiometric flame pockets downstream of
the fuel injectors where combustion air has mixed sufficiently with the fuel to produce the peak temperature fuel/air interface.
The second mechanisrn, called prompt NOX, is formed from early reactions of nitrogen molecules in the combustion air and
hydrocarbon radicals from the fuel. Prompt NOX forms within the flame and is usually negligible when compared to the amount of
thermal NOX formed. The third mechanism, fuel NOX, stems from the evolution and reaction of fuel-bound nitrogen compounds with
oxygen. Natural gas has negligible chemically-bound fuel nitrogen (although some molecular nitrogen is present). Essentially all NOx
formed from natural gas combustion is thermal NOX. Distillate oils have low levels of fuel-bound nitrogen. Fuel NOX from distillate
oil-fired turbines may become significant in turbines equipped with a high degree of thermal NOX controls. Otherwise, then-nal NOX
is the predominant NOx formation mechanism in distillate oil-fired turbines.
The maximum thermal NOX formation occurs at a slightly fuel-lean mixture because of excess oxygen available for reaction-
The control of stoichiometry is critical in achieving reductions in thermal NOx. Thermal NOx formation also decreases rapidly as the
temperature drops below the adiabatic flame temperature, for a given stoichiometry. Maximum reduction of thermal NOX can be
achieved by control of both the combustion temperature and the stoichiometry. Gas turbines operate with high overall Levels of excess
air, because turbines use combustion air dilution as the means to maintain the turbine inlet temperature below design limits. In older
gas turbine models, where combustion is in the form of a diffusion flame, most of the dilution takes place downstream of the primary
flame, which does not minimize peak temperature in the flam; and suppress thermal NOX formation.
4100
Stationary Internal Combustion Sources
3.1-3
Diffusion flames are characterized by regions of near-stoichiometric fuel/air mixtures where temperatures are very high and
significant thermal NOX is formed. Water vapor in the turbine inlet air contributes to the lowering of the peak temperature in the
flame, and therefore to thermal NOX emissions. Thermal NOX can also be reduced in diffusion type turbines through water or steam
injection. The injected water-steam acts as a heat sink lowering the combustion zone temperature, and therefore thermal NOX. Newer
model gas turbines use lean, premixed combustion where the fuel is typically prernixed with more than 50 percent theoretical air which
results in lower flame temperatures, thus suppressing thermal NOX formation.
Ambient conditions also affect emissions and power output from turbines more than from external combustion systems. The
operation at high excess air levels and at high pressures increases the influence of inlet humidity, temperature, and pressure.
4
Variations of emissions of 30 pe cent or greater have been exhibited with changes in ambient humidity and temperature. Humidity acts
to absorb heat in the primary flame zone due to the conversion of the water content to steam As beat energy is used for water to steam
conversion, the temperature is the flame zone will decrease resulting in a decrease of thermal NOx formation. For a given fuel firing
rate, lower ambient temperatures lower the peak temperature in the flame, lowering thermal NOX significantly. Similarly, the gas
turbine operating loads affect NOX emissions. Higher NOx emissions are expected for high operating loads due to the higher peak
temperature in the flame zone resulting in higher thermal NOX.
3.1.3.2 Carbon Monoxide and Volatile Organic Compounds -
CO and VOC emissions both result from incomplete combustion. CO results when there is insufficient residence time at high
temperature or incomplete mixing to complete the final step in fuel carbon oxidation. The oxidation Of CO to C02 at gas turbine
temperatures is a slow reaction compare
U-1
to most hydrocarbon oxidation reactions. In gas turbines, failure to achieve CO burnout may
result fruit, quenching by dilution air. With liquid fuels, this can be aggravated by carryover of larger droplets from the atomizer at the
fuel injector. Carbon monoxide emissions are also dependent on the loading of the gas turbine. For example, a gas turbine operating
under a full load will experience greater fuel efficiencies which will reduce the formation of carbon monoxide. The opposite is also
true, a gas turbine operating under a light to medium load will experience reduced fuel efficiencies (incomplete combustion) which will
increase the formation of carbon monoxide.
The pollutants commonly classified as VOC can encompass a wide spectrum of volatile organic compounds some of which
are hazardous air pollutants. These compounds are discharged into the atmosphere when some of the fuel remains unburned or is only
partially burned during the combustion process. With natural gas, some organics are carried over as unreacted, trace constituents of the
gas, while others may be pyrolysis products of the heavier hydrocarbon constituents. With liquid fuels, large droplet carryover to the
quench zone accounts for much of the unreacted and partially pyrolized volatile organic emissions.
Similar to CO emissions, VOC emissions are affected by the gas turbine operating load conditions. Volatile organic
compounds emissions are higher for gas turbines operating at low loads as compared to similar gas turbines operating at higher loads.
3.1.3.3 Particulate Matter
13
PM emissions from turbines primarily result from carryover of noncombustible trace constituents in the fuel. PM emissions
are negligible with natural gas firing and marginally significant with distillate oil firing because of the low ash content. PM emissions
can be classified as "filterable" or "condensable" PM. Filterable PM is that portion of the total PM that exists in the stack in either the
solid or liquid state and
3.14
EMISSION FACTORS
4/00
can be measured on a EPA Method 5 filter. Condensable PM is that portion of the total PM that exists as a gas in the stack but
condenses in the cooler ambient air to form particulate matter. Condensable PM exists as a gas in the stack, so it passes through the
Method 5 filter and is typically measured by analyzing the impingers, or "back half'of the sampling train. The collection, recovery,
and analysis of the impingers is described in EPA Method 202 of Appendix M, Part 51 of the Code of Federal Regulations.
Condensable PM is composed of organic and inorganic compounds and is generally considered to be all less than 1.0 micrometers in
aerodynamic diameter.
3.1.3.4 Greenhouse Gases
5-11 -
Carbon dioxide (C02) and nitrous oxide (N20) emissions are all produced during natural gas and distillate oil combustion in
gas turbines. Nearly all of the fuel carbon is converted to C02 during the combustion process. This conversion is relatively independent
of firing configuration. Methane (CH4) is also present in the exhaust gas and is thought to be unburned fuel in the case of natural gas
or a product of combustion in the case of distillate fuel oil.
Although the formation of CO acts to reduce C02 emissions, the amount of CO produced is insignificant compared to the
amount of C02 produced. The majority of the fuel carbon not converted to C02 is due to incomplete combustion.
Formation of N20 during the combustion process is governed by a complex series of reactions and its formation is dependent
upon many factors. However, the formation of N20 is minimized when combustion temperatures are kept high (above 1475*F) and
excess air is kept to a minimum (less than 1 percent).
3.1.3.5 HAP Emissions -
Available data indicate that emission levels of HAP are lower for gas turbines than for other combustion sources. This is due
to the high combustion temperatures reached during normal operation. The emissions data also indicate that formaldehyde is the most
significant HAP emitted from combustion turbines. For natural gas fired turbines, fonnaldehyde accounts for about two-thirds of the
total HAP emissions. Polycyclic aromatic hydrocarbons (PAH), benzene, toluene, xylenes, and others account for the remaining
one-third of HAP emissions. For No. 2 distillate oil-fired turbines, small amount of metallic HAP are present in the turbine's exhaust in
addition to the gaseous HAP identified under gas fired turbines. These metallic HAP are carried over from the fuel constituents. The
formation of carbon monoxide during the combustion process is a good indication of the expected levels of HAP emissions. Similar to
CO emissions, HAP emissions increase with reduced operating loads. Typically, combustion turbines operate under full loads for
greater fuel efficiency, thereby minimizing the amount of CO and HAP emissions.
3.1.4 Control Technologies
12
There are three generic types of emission controls in use for gas turbines, wet controls using steam or water injection to reduce
combustion temperatures for NOX control, dry controls using advanced combustor design to suppress NOX formation and/or promote
CO burnout, and post-combustion catalytic control to selectively reduce NOX and/or oxidize CO emission from the turbine. Other
recently developed technologies promise significantly lower levels of NOX and CO emissions from diffusion combustion type gas
turbines. These technologies are currently being demonstrated in several installations.
Emission factors in this section have been determined from gas turbines with no add-on control devices (uncontrolled
emissions). For NOX and CO emission factors for combustion controls, such as water-steam injection, and lean pre-mix units are
presented. Additional information for controlled
4/00
Stationary Internal Combustion Sources
3.1-5
emissions with various add-on controls can be obtained using the section 3.1 database. Uncontrolled, lean-premix, and water
injection emission factors were presented for NOx and CO to show the effect of combustion modification on emissions.
3.1.4.1 Water Injection -
Water or steam injection is a technology that has been demonstrated to effectively suppress NOX emissions from gas turbines.
The effect of steam and water injection is to increase the thermal mass by dilution and thereby reduce peak temperatures in the flame
zone. With water injection, there is an additional benefit of absorbing the latent heat of vaporization from the flame zone. Water or
steam is typically injected at a water-to-fuel weight ratio of less than one.
Depending on the initial NOX levels, such rates of injection may reduce
NOx
by 60 percent or higher. Water or steam
injection is usually accompanied by an efficiency penalty (typicality 2 to 3 percent) but an increase in power output (typically 5 to 6
percent). The increased power output results from the increased mass Dow required to maintain turbine inlet temperature at
manufacturer's specifications. B-NI, CIO and VOC emissions are increased by water injection, with the level of CO and VOC
increases. dependent on the amount of water injection.
3.1.4.2 Dry Controls -
Since thermal NOx is a function of both temperature (exponentially) and tune (linearly), the
basis
of dry controls are to either
lower the combustor temperature using lean mixtures of air and/or fuel staging or decrease the residence time of the combustor. A
combination of methods may be used to reduce NOX emissions such as lean combustion and staged combustion (two stage lean/lean
combustion or two stage rich/lean combustion).
Lean combustion involves increasing the air-to-fuel ratio of the mixture so that the peak and average temperatures within the
combustor will be less than that of the stoichiometric mixture, thus suppressing thermal NOx formation. Introducing excess air not only
creates a leaner mixture but it also can reduce residence time at peak temperatures.
Two-stage lean/lean combustors are essentially fuel-staged, premixed combustors in which each stage bums lean. The
two-stage lean/lean combustor allows the turbine to operate with an extremely lean mixture while ensuring a stable flame. A small
stoichiometric pilot flame ignites the premixed gas and provides flame stability. The NOx emissions associated with the high
temperature pilot flame are insignificant. Low NOX emission levels are achieved by this combustor design through cooler flame
temperatures associated with lean combustion and avoidance of localized "hot spots" by premixing the fuel and air.
Two stage rich/lean combustors are essentially air-staged, premixed combustors in which the primary zone is operated fuel
which and the secondary zone is operated fuel lean. The rich mixture produces lower temperatures (compared to stoichiometric) and
higher concentrations of CO and H2, because of incomplete combustion. The rich mixture also decreases the amount of oxygen
available for NOX generation. Before entering the secondary zone, the exhaust of the primary zone is quenched (to extinguish the
flame) by large amounts of air and a lean mixture is created. The lean mixture is pre-ignited and the combustion completed in the
secondary zone. NOX formation in the second stage are minimized through combustion in a fuel lean, lower temperature environment.
Staged combustion is identified through a variety of names, including Dry-Low NOx (DLN), Dry-Low Emissions (DLE), or
SoLoNOx.
3.1-6
EMISSION FACTORS
4/00
3.1 A.3 Catalytic Reduction Systems -
. Selective catalytic reduction (SCR) systems selectively reduce NOx emissions by injecting ammonium (NH3) into the exhaust
gas stream upstream of a catalyst. Nitrogen oxides, NH3, and 02 react on the surface of the catalyst to form N2 and H20. The exhaust
gas must contain a minimum amount of 02 and be within a particular temperature range (typically 450OF to 8500F) in order for the
SCR system to operate properly.
The temperature range is dictated by the catalyst material which is typically made from noble metals, including base metal oxides
such as vanadium and titanium, or zeolite-based material. The removal efficiency of an SCR system in good working order is typically
from 65 to 90 percent. Exhaust gas temperatures greater than the upper limit (850*17) cause NOX and NH3 to pass through the catalyst
unreacted. Ammonia emissions, called NH3
Slip,
may be a consideration when specifying an SCR system
Ammonia, either in the form of liquid anhydrous ammonia, or aqueous ammonia hydroxide is stored on site and injected into the
exhaust stream upstream of the catalyst. Although an SCR system can operate alone, it is typically used in conjunction with water-steam
injection systems or lean-premix system to reduce NOx emissions to their lowest levels (less than 10 ppm at 15 percent oxygen for SCR
and wet injection systems). The SCR system for landfill or digester gas-fired turbines requires a substantial fuel gas pretreatment to
remove trace contaminants that can poison the catalyst. Therefore, SCR and other catalytic treatments may be inappropriate control
technologies for landfill or digester gas-fired turbines.
The catalyst and catalyst housing used in SCR systems tend to be very large and dense (in terms of surface area to volume ratio)
because of the high exhaust flow rates and long residence times required for NOx, 02, and NH3, to react on the catalyst. Most catalysts
are configured in a parallel-plate, "honeycomb" design to maximize the surface area-to-volume ratio of the catalyst. Some SCR
installations incorporate CO catalytic oxidation modules along with the NOX reduction catalyst for simultaneous CO/NOX control.
Carbon monoxide oxidation catalysts are typically used on turbines to achieve control of CO emissions, especially turbines that
use steam injection, which can increase the concentrations of CO and unburned hydrocarbons in the exhaust. CO catalysts are also being
used to reduce VOC and organic HAPs emissions. The catalyst is usually made of a precious metal such as platinum, palladium, or
rhodium. Other formulations, such as metal oxides for emission streams containing chlorinated compounds, are also used. The CO
catalyst promotes the oxidation of CO and hydrocarbon compounds to carbon dioxide (COD and water (H20) as the emission stream
passes through the catalyst bed. The oxidation process takes place spontaneously, without the requirement for introducing reactants. The
performance of these oxidation catalyst systems on combustion turbines results in 90-plus percent control of CO and about 85 to 90
percent control of formaldehyde. Similar emission reductions are expected on other HAP pollutants.
3.1.4.4 Other Catalytic Systems
14,15
New catalytic reduction technologies have been developed and are currently being commercially demonstrated for gas turbines.
Such technologies include, but are not limited to, the SCONOX and the XONON systems, both of which are designed to reduce NOx and
CO emissions. The SCONOX system is applicable to natural gas fired gas turbines. It is based on a unique integration of catalytic
oxidation and absorption technology. CO and NO are catalytically oxidized to C02 and N02. The N02 molecules are subsequently
absorbed on the treated surface of the SCONOX catalyst. The system manufacturer guarantees CO emissions of I ppm and NOX
emissions of 2 ppm. The SCONOX system does not require the use of ammonia, eliminating the potential of ammonia slip conditions
evident in existing SCR system. Only limited emissions data were available for a gas turbine equipped with a SCONOX system This data
reflected HAP emissions and was not sufficient to verify the manufacturer's claims.
4/00
Stationary Internal Combustion Sources
3.1-7
The XONON system is applicable to diffusion and lean-premix combustors and is currently being
demonstrated with the assistance of leading gas turbine manufacturers. The system utilizes a flameless
combustion system where fuel and air reacts on a catalyst surface, preventing the formation of NOX while
achieving low CO and unburned hydrocarbon emission levels. The overall combustion process consists of the
partial combustion of the fuel in the catalyst module followed by completion of the combustion downstream
of the catalyst. The partial combustion within the catalyst produces no NOX, and the combustion downstream
of the catalyst occurs in a flameless homogeneous reaction that produces almost no NOX. The system is
totally contained within the combustor of the gas turbine and is not a process for clean-up of the turbine
exhaust. Note that this technology has not been fully demonstrated as of the drafting of this section. The
catalyst manufacturer claims that gas turbines equipped with the XONON Catalyst emit NOx levels below 3
ppm and CO and unburned hydrocarbons levels below 10 ppm. Emissions data from gas turbines equipped
with a XONON Catalyst were not available as of the drafting of this section.
3.1.5 Updates Since the Fifth Edition
The Fifth Edition was released in January 1995. Revisions to this section since that date are
summarized below. For further detail, consult the memoranda describing each supplem
I p
ent or the
background report for
this
section. These and other documents can be found on the new EFIG home page
(http://www.epa.gov/ttn/chief).
Supplement A, February 1996
For the PM factors, a footnote was added to clarify that condensables and all PM from oil and
gas-fired turbines are considered PM-10.
In the table for large uncontrolled gas turbines, a sentence was added to footnote "e" to
indicate that when sulfur content is not available, 0.6 lb/106 ft' (0.0006 lb/MMBtu) can be
used.
Supplement B, October 1996
Text was revised and updated for the general section.
Text was added regarding firing practices and process description.
Text was revised and updated for emissions and controls.
All factors for turbines with SCR-water injection control were corrected.
The C02 factor was revised and a new set of N20 factors were added.
Supplement F, April 2000
Text was revised and updated for the general section.
All emission factors were updated except for the S02 factor for natural gas and distillate oil
turbines.
3.1-8
EMISSION FACTORS
4/00
Turbines using staged (lean-premix) combustors added to this section.
Turbines used for natural gas transmission added to this section.
Details for turbine operating configurations (operating cycles) added to this section.
Information on new emissions control technologies added to this section (SCONOX and
XONON).
HAP emission factors added to this section based on over 400 data points taken from over
60 source tests.
PM condensable and filterable emission factors for natural gas and distillate oil fired
turbines were developed.
NOx and CO emission factors for lean-premix turbines were added.
Emission factors for landfill gas and digester gas were added.
4/00
Stationary Internal Combustion Sources
3.1-9
Table3.1-1. EMISSION FACTORS FOR NITROGEN OXIDES (NOX) AND
CARBON MONOXIDE (CO) FROM STATIONARY GAS TURBINES
Emission Factors'
Turbine Type
Nitrogen Oxides
Carbon Monoxide
Natural Gas-Fired Turbines
b
(lb/MMBtu)
c
Emission Factor
(104MBtu)
c
Emission Factor
(Fuel Input)
Rating
(Fuel Input)
Rating
Uncontrolled
3.2 E-01
A
8.2 E-02
d
A
Water-Steam Injection
1.3 E-01
A
3.0 E-02
A
Lean-premix
9.9 E-02
D
1.5 E-02
D
Distillate Oil-Fired Turbines
c
(lb/MMBtu)
f
Emission Factor
(lb/MMBtu)
F
Emission Factor Rating
(Fuel Input)
Rating
(Fuel Input)
Uncontrolled
8.8 E-01
C
3.3 E-03
C
Water-Steam injection
2.4 E-0 I
B
7.6 E-02
C
Landfill! Gas-Fired Turbines
g
(1b/MM13tu)
h
Emission Factor
(lb/MMbtu)
h
Emission Factor Rating
(Fuel Input)
Rating
(Fuel Input)
Uncontrolled
1.4 E-01
A
4.4 E-01
A
Digester Gas-Fired Turbines
i
(lb/MMBtu)
k
Emission Factor
(lb/MMBtu)
k
Emission Factor Rating
(Fuel Input)
Rating
(Fuel Input)
Uncontrolled
1.6 E-01
D
1.7 E-02
D
a
Factors are derived from units operating at high loads ( 80 percent load) only. For information on units operating at other
loads, consult the background report for tWs chapter (Reference 16), available at " www.epa.gov/ttn/chief
'.
b
Source Classification Codes (SCCs) for natural gas-fired turbines include 2-01-002-01, 2-02-002-01, 2-02-002-03,
2-03-002-02, and 2-03-002-03. The emission factors in this table may be converted to other natural gas heating values by
multiplying the given emission factor by the ratio of the specified heating value to this average heating value.
c
Emission factors based on an average natural gas heating value (HHV) of 1020 Btu/scf at 60'F. To convert from
(lb/MMBtu) to (lb/1 0
6
scf), multiply by 1020.
d
It is recognized that the uncontrolled emission factor for CO is higher than the water-steam injection and lean-premix
emission factors, w1iich is contrary to expectation. The EPA could not identify the reason for this behavior, except that the
data sets used for developing these factors are different.
e
SCCs for distillate oil-fired turbines include 2-01-001-01, 2-02-001-01, 2-02-001-03, and 2-03-001-02.
f
Emission factors based on an average distillate oil heating value of 139 NIMBtu/103 gallons. To convert from
(lb/MMBtu) to (lb/ 103 gallons), multiply by 139. SCC for landfill gas-fired turbines is 2-03-008-01.
h
Emission factors based on an average landfill gas heating value of 400 Btu/scf at 60'F. To convert from lb/MMBtu), to lb/
0
6
SCf) multiply by 400. SCC for digester gas-fired turbine is 2-03-007-01.
k
Emission factors based on an average digester gas heating value of 600 Btu/scf at 60'F. To convert from (lb/MMBtu) to
(lb/1 06
SCf)
multiply by 600.
3.1-10
EMISSION FACTORS
4/00
Table 3.1-2a.
EMISSION FACTORS FOR CRITERIA POLLUTANTS AND GREENHOUSE
GASES FROM STATIONARY GAS TURBINES
Emission Factors
a
- Uncontrolled
Natural Gas-Fired Turbines
b
Distillate Oil-Fired Turbines
d
Pollutant
(lb/MMbtu)c
Emission Factor
(lb/MMBtu)
e
Emission Factor
(Fuel Input)
Rating
(Fuel Input)
Rating
C0
2
f
110
A
157
A
N
2
0
0.0032
E
ND
NA
Lead
ND
NA
1.4 E-05
C
S0
2
0.94S
h
B
1.01S
h
B
Methane
8.6 E-03
C
ND
NA
VOC
2.1 E-03
D
4.1 E-04
j
E
TOC
k
1. 1 E-02
B
4.0 E-03
i
C
PM (condensable)
4.7 E-03
i
C
7.2 E-03
i
C
PM (filterable)
1.9 E-03
i
C
4.3 E-03
i
C
PM (total)
6.6 E-03
i
C
1.2 E-02
i
C
a
Factors are derived from units operating at high loads ( 80 percent load) only. For information on units
operating at other loads, consult the background report for this chapter (Reference 16), available at
"www.epa.gov/ttn/chief'. ND = No Data, NA = Not Applicable.
b
SCCs for natural gas-fired turbines include 2-01-002-01, 2-02-002-01 & 03, and 2-03-002-02 & 03.
c
Emission factors based on an average f e natural gas heating value (HHV) of 1020 Btu/scf at 60'F. To
convert from (lb/NIMBtu) to (lb/10 scf), multiply by 1020. Similarly, these emission factors can be
converted to other natural gas heating values.
d
SCCs for distillate oil-fired turbines are 2-01-001-01, 2-02-001-01, 2-02-001-03, and 2-03-001-02.
e
Emission factors based on an average distillate oil heating value of 139 NlMBtti/103 gallons. To convert
from (lb/MMBtu) to (lb/ 103 gallons), multiply by 139.
f
Based on 99.5% conversion of fuel carbon to C02 for natural gas and 99% conversion of fuel carbon to
C02 for distillate oil. C02 (Natural Gas) [lb/MMBtu] = (0.0036 scf/Btu)(%CON)(Q(D), where %CON
= weight percent conversion of fuel carbon to C02, C = carbon content of fuel by weight, and D =
density of fuel. For natural gas, C is assumed at 75%, and D is assumed at 4.1 E+04 lb/l 06 scf For
distillate oil, C02 (Distillate Oil) [lb/MMBtu] = (26.4 gaVMMBtu) (%CON)(C)(D), where C is assumed
at 87%, and the D is assumed at 6.9 lb/gallon.
Emission factor is carried over from the previous revision to AP-42 (Supplement B, October 1996) and is
based on limited source tests on a single turbine with water-steam injection (Reference 5).
h
All sulfur in the fuel is assumed to be converted to S02. S = percent sulfur in fuel. Example, if sulfur
content in the fuel is 3.4 percent, then S = 3.4. If S is not available, use 3.4 E-03 lb/MMBtu for natural
gas turbines, and 3.3 E-02 lb/MMBtu for distillate oil turbines (the equations are more accurate).
VOC emissions are assumed equal to the sum of organic emissions.
k
Pollutant referenced as THC in the gathered emission tests. It is assumed as TOC, because it is based on
Emission factors are based on combustion turbines using water-steam injection.
4/00
Stationary Internal Combustion Sources
3.1-11
Table 3.1-2b. EMISSION FACTORS FOR CRITERIA POLLUTANTS AND GREENHOUSE
GASES FROM STATIONARY GAS TURBINES
a
Factors are derived from units operating at high loads ( 80 percent load)
only.
For information units operating
at other loads, consult the background report for
this
chapter reference 16), available at www.epa.gov/ttn/chief.
ND = No Data, NA = Not Applicable.
b
SCC for landfill gas-fired turbines is 2-03-008-01.
c
Emission factors based on an averafe landfill gas heating value (HHV) of 400 Btu/scf at 60T. To convert
from (lb/MMBtu) to (lb/ 10
6
scf), multiply by 400.
d
SCC for digester gas-fired turbine include 2-03-007-01.
e
Emission factors based on an average digester gas heating value of 600 Btu/scf at 60'F. To convert from
(lb/MMBtu) to (lb/I 06
SCf),
multiply by 600.
f
For landfill gas and digester gas, C02 is presented in test data as volume percent of the exhaust stream (4.0
percent to 4.5 percent). Compound was not detected. The presented emission value is based on one-half of the
detection limit.
h
Based on adding the formaldehyde emission to the NMHC.
Emission Factors
a
- Uncontrolled
Landfill Gas-Fired Turbines
b
Digester Gas-Fired Turbines
d
Pollutants
(lb/MMBtu)
c
Emission Factor
(lb/MMBtu)
e
Emission Factor
Rating
Rating
C0
2
f
50
D
27
C
Lead
WD
NA
< 3.4 E-06
D
PM-10
2.3 E-02
B
1.2 E-02
C
S0
2
4.5 E-02
C
6.5 E-03
D
VOC
h
1.3 E-02
B
5.8 E-03
D
3.1-12
EMISSION FACTORS
4/00
Emission Factors
b
- Uncontrolled
Pollutant
Emission Factor
Emission Factor Rating
(lb/MMBtu)
c
1,3-Butadiene
d
< 4.3 E-07
D
Acetaldehyde
4.0 E-05
C
Acrolein
6.4 E-06
C
Benzene
e
1.2 E-05
A
Ethylbenzene
3.2 E-05
C
Formaldehyde
f
7.1 E-04
A
Naphthalene
1.3 E-06
C
PAH
2.2 E-06
C
Propylene Oxide
d
< 2.9 E-05
D
Toluene
1.3 E-04
C
Xylenes
6.4 E-05
C
a
SCC for natural gas-fired turbines include 2-01-002-01, 2-02-002-01, 2-02-002-03, 2-03-002-02, and 2-
03-002-03. Hazardous
Air Pollutants as defined in Section 112 (b) of the
Clean.&r.4ct.
b
Factors are derived from units operating at high loads ( 80 percent load) only. For information on units
operating at other loads, consult the background report for this chapter (Reference 16), available at
44
www.epa.gov/ttn/chief'.
c
Emission factors based on an average natural gas heating value (HHV) of 1020 Btu./scf at 60'F. To
convert from (lb/MMBtu) to (lb/l
06
scf), multiply by 1020. These emission factors can be converted to
other natural gas heating values by multiplying the given emission factor by the ratio of the specified
heating value to this heating value.
d
Compound was not detected. The presented emission value is based on one-half of the detection limit. '
e
Benzene with SCONOX catalyst is 9.1 E-07, rating of D.
f
Formaldehyde with SCONOX catalyst is 2.0 E-05, rating of D.
Table 3.1-3. EMISSION FACTORS FOR HAZARDOUS AIR POLLUTANTS
FROM NATURAL GAS-FIRED STATIONARY GAS TURBINES
a
Table 3.14
.
EMISSION FACTORS FOR HAZARDOUS AIR POLLUTANTS
FROM DISTILLATE OIL-FIRED STATIONARY GAS TURBINES
a
Emission Factors
b
- Uncontrolled
Pollutant
Emission Factor
Emission Factor Rating
(lb/MMBtu)
c
1,3-Butadiene
d
< 1.6 E-05
D
Benzene
5.5 E-05
C
Formaldehyde
2.8 E-04
D
Naphthalene
3.5 E-05
C
PAH
4.0 E-35
C
a
SCCs for distillate oil-fired turbines include 2-01-001-Ol-, 2-02-001-01, 2-02-001-03., and 2-03-001-02.
Hazardous Air Pollutants as defined in Section 112 (b) of the
Clean Air Act.
b
Factors are derived fiom units operating at high loads ( 80 percent load) only. For information on units
operating at other loads, consult the background report for this chapter (Reference 16), available at www.
epa.gov/ttn/cheif
c
Emission factors based on an average distillate oil heating value (HIP,/)
of 139
MMMBtu/l0
3
convert from
lb/MMBtu) to (lb/10
3
gallons), multiply by
139.
d
Compound was not detected. The presented emission value is based on one-half of the detection limit.
3.1-14
EMISSION FACTORS
4/00
Table 3.1-6. EMISSION FACTORS FOR HAZARDOUS AIR POLLUTANTS
FROM LANDFILL GAS-FIRED STATIONARY GAS TURBINES
a
Emission Factors
b
- Uncontrolled
Pollutant
Emission Factor (lb/MMBtu)
c
Emission Factor Rating
Acetonitrile
d
< 1.2E-05
D
Benzene
2. 1 E-05
B
Benzyl Chloride
d
< 1.2 E-05
D
Carbon Tetrachioride
d
< 1.8 E-06
D
Chlorobenzene
d
< 2.9 E-06
D
Chioroform
d
< 1.4 E-06
D
Methylene Chloride
2.3 E-06
D
Tetrachloroathylene
d
< 2.5 E-06
D
Toluene
1.1 E-04
B
Trichloroethylene d
< 1.9 E-06
D
Vinyl Chloride d
< 1.6 E-06
D
Xylenes
3.1 E-05
B
a
SCC for landfill gas-fired turbines is 2-03-008-01. Hazardous Air Pollutants as defined in Section 112 (b) of
the Clean Air Act.
b
Factors are derived from units operating at high loads ( 80 percent load) only. For information on units
operating at other loads, consult the background report for this chapter (Reference 16), available at
"www.epa.gov/ttn/chief'.
c
Emission factors based on an average landfill gas heating value (HHV) of 400 Btu/scf at 60'F. To convert
from (lb/MMBtu) to (lb/ 10
6
scf), multiply by 400.
d
Compound was not detected. The presented emission value is based on one-half of the detection limit.
3.1-16
EMISSION FACTORS
4/00
I#1VV
Table 3.1-7. EMISSION FACTORS FOR HAZARDOUS AIR
POLLUTANTS
FROM DIGESTER GAS-FIRED STATIONARY GAS TURBINES'
Emission Factors
b
- Uncontrolled
Pollutant
Emission Factor (lb/MMBtu)
c
Emission Factor Ratings
1,3-Butadiene
d
< 9.8 E-06
D
1,4-Dichlorobenzene
d
< 2.0 E-05
D
Acetaldehyde
5.3 E-05
D
Carbon Tdrachloride
d
< 2.0 E-05
D
Chlorobenzene
d
< 1.6 E-05.
D
Chloroform
d
< 1.7 E-05
D
Ethylene Dichloride
d
< 1.5 E-05
D
Formaldehyde
1.9 E-04
D
Methylene Chloride
d
< 1.3 E-05
D
Tetrachloroethylene
d
< 2.1 E-05
D
Trichloroethylene
d
< 1.8 E-05
D
Vinyl Chloride
d
< 3.6 E-05
D
Vinylidene Chloride
d
< 1.5 E-05
D
a
SCC for digester gas-fired turbines is 2-03-007-01. Hazardous Air Pollutants as defined in Section
112 (b) of the
Clean Air Act.
b
Factors are derived from units operating at high loads ( 80 percent load) only. For information on
units operating at other loads, consult the background report for this chapter (Reference 16),
available at "www.epa.gov/ttn/chief".
c
Emission factors based on an averafe digester gas heating value (HHV) of 600 Btu/scf at 60’f. To
convert from (lb/MMBtu)) to lb/10
6
scf), multiply by 600.
d
Compound was not detected. The presented emission value is based on one-half of the detection
limit.
Table 3.1-8. EMISSION FACTORS FOR METALLIC HAZARDOUS AIR
POLLUTANTS
Emission Factors
b
- Uncontrolled
Pollutant
Emission Factor (lb/MMBtu)
c
Emission Factor Rating
Arsenic
d
< 2.3 E-06
D
Cadmiwn
d
< 5.8 E-07
D
Chromium
d
< 1.2 E-06
D
Lead
d
< 3.4 E-06
D
Nickel
2.0 E-06
D
Selenium
1.1 E-05
D
a
SCC for digester gas-fired turbines is 2-03-007-01. Hazardous Air Pollutants as
defined in Section 112 (b) of the
Clean Air Act.
b
Factors are derived from units operating at high loads (80 percent load) only. For
more information on units operating at other loads, consult the background report for
this chapter (Reference 16), available at “www.epa.gov/ttn/chief”.
c
Emission factor based on an average digester gas heating value (HHV) of 600
Btu/scf at 60
!
F. To convert from (lb/MMBtu) to (lb/10
6
scf), multiply by 600.
d
Compound was not detected. The presented emission value is based on one-half of
the detection
0
3.1-18
EMISSION FACTORS 4/00
References For Section 3.1
1
.
Alternative Control Techniques Document - NOX Emissions from Stationary
Gas Turbines,
EPA 453/R-93-007, January 1993.
2.
C. C. Shih,
et al., Emissions Assessment Of Conventional Stationary Combustion Systems,
Vol. II: Internal Combustion Sources,
EPA-600/7-79-029c, U. S. Environmental Protection
Agency, Cincinnati, OH, February 1979.
1
3.
Final Report - Gas Turbine Emission Measurement Program,
GASLTR787, General Applied
Science Laboratories, Westbury, NY, August 1974.
4.
Standards Support And Enivronmental Impact Statement, Volume 1:
Proposed Standards Of
Performance For Stationary Gas Turbines,
EPA450/2-77-017a, U. S. Environmental Protection
Agency, Research Triangle Park, NC, September 1977.
5.
L. P. Nelson,
et al., Global Combustion Sources Of Nitrous Oxide Emissions,
Research Project
2333-4 Interim Report, Sacramento: Radian Corporation, 1991.
6.
R. L. Peer,
et al., Characterization Of Nitrous Oxide Emission Sources,
U. S
.
Environmental
Protection Agency, Office of Research and Development, Research Triangle Park, NC, 1995.
7.
S. D. Piccot,
el al., Emissions And Cost Estimates For Globally Significant Anthropogenic
Combustion Sources Of NO
X
, N
2
0, CH
4
, CO, And C0
2
,
U. S
.
Environmental Protection Agency,
Office of Research and Development, Research Triangle Park, NC, 1990.
8.
G. Marland and R. M. Rotty,
Carbon Dioxide Emissions From Fossil Fuels: A Procedure For
Estimation And Results For 1951-1981,
DOE/NBB-0036 TR-003, Carbon Dioxide Research
Division, Office of Energy Research, U. S. Departrnent of Energy, Oak Ridge, TN, 1983.
9.
G. Marland and R. M. Rotty,
Carbon Dioxide Emissions From Fossil Fuels: A Procedure For
Estimation And Results For 1950-1982,
Tellus 36B:232-261, 1984.
10
.
Inventory Of U. S. Greenhouse Gas Emissions And Sinks: 1990-1991,
EPA-230-R-96-006,
U. S. Environmental Protection Agency, Washington, DC, November 1995.
11
IPCC Guidelines For National Greenhouse Gas Inventories Workbook,
Intergovernmental Panel
on Climate Change/Organization for Economic Cooperation and Development, Paris, France,
1995.
12.
L. M. Campbell and G. S. Shareef,
Sourcebook- NQ,, Control Technology Data,
Radian Corp.,
EPA-600/2-91-029, Air and Energy Engineering Research Laboratory, U. S. Environmental
Protection Agency, Research Triangle Park, July 199 1.
13.
In-stack Condensible Particulate Matter Measurement and Permitting Issues for Maryland
Power Plants,
Maryland Department of Natural Resource, Prepared by Versar, INC, January
1998.
4/00
Stationary Internal Combustion Sources
3.1-19
14
.Catalysts for Power Generation, The
SCONOX
System.
Goal Line Environmental Technologies,
www.glet.com/gl_prod_SCONOX.htm, March 1998.
15.
Information form Chuck Solt of Catalytica Combustion Systems, Inc., to EPA, XONON Flameless
Combustion, January 1996.
16.
Emission Factor Documentation of AP-42 Section 3. 1, Stationary Combustion Turbines,
EPA.
Contract No. 68-D7-0070, Alpha-Gamma Technologies Inc., Raleigh, North Carolina, April 2000.
3.1-20 EMISSION FACTORS
4/00
ILLINOIS ENVIRONMENTAL PROTECTION AGENCY
1021 North
Grand Avenue East, P.O. Box 19276, SPRINGFIELD, ILLIMNS 62794-9276
THOMAS V. SKINNER, DIRECTOR
217/782-9540
May 16, 2000
Mr. Francis X. Lyons
Regional Administrator
U.S. Environmental Protection Agency, Region 5
R-19J
77 West Jackson Boulevard
Chicago, Illinois 60604-3507
Re:
New Peaker Power Plants in the Chicago Area
Dear Frank:
On behalf of Governor Ryan, 1 am writing to request the assistance of the United
States Environmental Protection Agency (US EPA) with regard to an issue that has
developed recently in Illinois. The Illinois Environmental Protection Agency (Illinois
EPA) has received a number of permit applications (over twenty to date) for new natural
gas-fired electrical generation units (EGUs), commonly referred to as "peaker plants," in
the northern Illinois area. We understand that other states are also receiving an increased
number of permit applications, but it appears that the number coming into Illinois
exceeds those of our neighbors by a. rather significant amount.
A number of members of the Illinois General Assemblv. local environmental
groups, and citizens (some whose homes are near the sites chosen by the new EGU
permit applicants), have raised concerns regarding air quality and health issues associated
with the operation of these new plants, In permitting the new EGU.s, we have followed
the federal new source review rules
for prevention of significant deterioration (PSD),
except in the Metro-East ozone nonattainment area where nonattainment New Source Review
applies.
A number of parties have raised questions regarding the federal PSD rules.
Specifically, they question the applicability of an annual emission threshold of 250 tons,
to peaker plants that will operate primarily during the summer months (the peakers' 250
tons likely will be emitted within a three-month period -- and perhaps within a lesser
period, since peakers operate only when demand is highest, which we estimate to be less
than 20 days during the summer).
Illinois EPA
GEORGE H. RYAN,
GOVERNOR
Exhibit No. 3
Printed on Recycled Paper
Page 2
Letter to: Francis X. Lyons
May 16, 2000
Furthermore, these new EGUs have. been limiting their proposed emissions to just below the
PSD threshold, thus avoiding required application of best available control technology (BACT).
As Illinois implements the federal program only, avoiding PSD means that such plants may be
subject only to the new source performance standards (NSPS), which as you are aware are
somewhat.less stringent.than BACT for these types of sources. This is being characterized as a
“loophole” in the. PSD rules.
Our own air quality analyses of these proposed plants, performed as we receive
the permit applications, indicate that their emissions will not cause violation of any of
the relevant national ambient-air quality standards (NAAQS). While we do not model
for ozone (it would be impossible, both physically and in terms of resources, to perform
the necessary photochemical modeling for each of these permit.applications), we do not
believe that the nitrogen oxides (NOx) emitted by these plants will result in violation of
the ozone standard, particularly with anticipated reductions, of NOx downstate and
regionally.
However, as we continue to analyze the developing peaker situation, we would
appreciate hearing U.S. EPA's perspective, particularly with regard to the federal PSD rules
and the alleged loophole. For example, does U.S. EPA agree with our interpretation of PSD?
Does it agree that these plants should not significantly impact air quality or cause violations?
T'here is some urgency to this request, as we generally must act on applications for new
EGUs within 180 days.
Thank you in advance for your assistance. Please contact either me or Dennis
Lawler of my staff with any questions.
Sincerely,
Thomas V. Skinner
Director
cc: The Honorable George H. Ryan
minor sources in the Clean Air Act or U.S. EPA regulations. Minor
sources subject to Illinois current State Implementation Plan
(SIP) need not apply BACT.
Your letter also raises concerns that these sources will operate
primarily in the summer. We understand that your Agency will soon be
submitting a plan which will demonstrate how selected emissions
management strategies will enable Chicago to attain the ozone
standard within the required time frames. When our office reviews
this demonstration, we will look for evidence that the size of the
total nitrogen oxides (NOx) emissions inventory will not compromise
the effectiveness of these strategies. We hope, as you do, that the
forthcoming restrictions on statewide sources of NOx will make great
strides toward this goal.
Also regarding summertime NOx emissions, the Illinois Environmental
Protection Agency assures protection of the NAAQS by including short
term, hourly emissions limits in its permits. This practice is
consistent with the Illinois SIP, at 35 IAC 201.160, requiring
applicants to submit proof that their project will not cause a
violation of the Illinois Environmental Protection Act. One tool that
applicants may use to submit this proof is dispersion modeling. You
are to be commended for requesting that dispersion modeling be
included for these minor sources as a means to quantify the potential
impacts of NOx
,
and to set suitable hourly and other short term limits
as a result.
We hope this letter addresses your concerns, and we would like to
offer two additional thoughts. First, after applicants receive their
initial permits to operate these peaker plants, some may submit
subsequent applications to construct new units or expand operation
of their existing units. Certain changes may bring potential
emissions above major source thresholds, and consequently may cause
either the new project or the entire source to be subject to PSD,
including any applicable BACT analyses. one example of this type of
change is a request to relax a previously imposed limit such as
operating hours. Another example is a proposal to install additional
capacity, where such expanded operation was anticipated as part of
the original design. We encourage your staff to inform applicants of
these consequences and regularly assess the relationship between
requested changes to an existing plant and the initially permitted
project.
Secondly, we encourage your Agency to continue to solicit public
comments and conduct public hearings on these projects. This valuable
process allows the people of Illinois to gain a full and meaningful
understanding of your analysis of these projects.
We appreciate this opportunity to address your concerns. If you
wish to discuss any of these issues further, feel free to call me,
or Lauren Steele, of my staff, at (312) 353-5069.
Sincerely,
Francis X. Lyons
Regional Administrator
Existing Boiler Power Plants (8/7/00)
MAP NUMBER ID NUMBER
NAME
COUNTY
STREET ADD
CITY TOWN
FUEL
UTM EAST
1
033801AAA
Hutsonville (Ameren)
Crawford
14281 E 1900th Av
Hutsonvill
Coal boilers
442498.9 4
2
077806AAA
Grand Tower (Ameren)
Jackson
Ferry Rd
Grand Towe
Coal boilers
278413.4
3
079808AAA
Newton (Ameren)
Jasper
6725 N 500th Rd
Newton
Coal boilers
395503.4
4
119105AAA
Venice (Ameren)
Madison
701 Main St
Venice
Gas/oil boilers 745681.3
5
135803AAA
Coffeen (Ameren)
Montgomer
134 CIPS Lane
Coffeen
Coal boilers
292044.9
a
137805AAA
Meredosia (Ameren)
Morgan
800 S Washington St.
Meredosia
Coal & oil boilers 708571.3
7
057801AAA
Duck Creek (Central Illinois Light)
Fulton
17751 N Cilco Rd
Canton
Coal boilers
247925.5
a
143805AAG E. D. Edwards (Central Illinois Light)
Peoria
7800 CILCO Lane
Bartonvill
Coal boilers
274651.8
9
167120AAO
Lakeside/Dallman (CWLP)
Sangamon
3100 Stevenson Drive
Springfiel
Coal boilers
277154.9
10
127855AAC
Electric Energy
Massac
2100 Portland
Joppa
Coal boilers
334996.3
11
119020AAE
Wood River (IP)
Madison
I Chessen Lane
East Alton
Coal boilers
748805.5
12
125804AAB
Havana (IP)
Mason
N Highway 78
Havana
Coal & oil boilers 748460.9
13
155010AAA
Hennepin (IP)
Putnam
Rural Route
Hennepin
Coal boilers
305886.4
14
157851AAA
Baldwin (IP)
Randolph
10901 Baldwin Rd
Baldwin
Coal boilers
249933.2
15
183814AAA
Vermilion (IP)
Vermilion
Power Plant Rd
Oakwood
Coal boilers
436712.4
16
021814AAB
Kincaid Generation
Christian
Route 104 West
Kincaid
Coal boilers
285467.4
17
031600AIN
Crawford (Midwest Generation)
Cook
3501 S. Pulaski Rd
Chicago
Coal boilers
439978.8
Is
031600AMI
Fisk (Midwest Generation)
Cook
1111 W Cermak Rd
Chicago
Coal boilers
445750.6
19
063806AAF
Collins (Midwest Generation)
Grundy
4200 E Pine Bluff Rd
Morris
Gas/oil boilers 386926.6
20
097190AAC
Waukegan (Midwest Generation)
Lake
401 E Greenwood Ave.
Waukegan
Coal boilers
433310.2
21
179801AAA
Powerton (Midwest Generation)
Tazewell
13082 E Manito Rd
Pekin
Coal boilers
273149.6
22
197809AAO
Joliet (Midwest Generation)
Will
1601 S Patterson
Joliet
Coal boilers
406601.5
23
197810AAK
Will County (Midwest Generation)
Will
529 E Romeoville Rd
Romeoville
Coal boilers
411386.5
24
199856AAC
Southern Illinois Coop
Williamso 10825 Lake of Egypt Rd
Marion
Coal boilers
3
25
149817AAB
Pearl (Soyland Power Coop)
Pike
South Highway 100
Pearl
Coal boilers
705250.8
Existing Boiler Power Plants (8/7/00)
MAP NUMBER ID NUMBER
NAME
COUNTY
STREET ADD
CITY TOWN
FUEL
UTM EASTING !'UTM NORTHING
1
033801AAA
Hutsonville (Ameren)
Crawford
14281 E 1900th Av
Hutsonvill
Coal boilers
442498.9 4331575.3
2
077806AAA
Grand Tower (Ameren)
Jackson
Ferry Rd
Grand Towe
Coal boilers
278413.4
4170609.6
3
079808AAA
Newton (Ameren)
Jasper
6725 N 500th Rd
Newton
Coal boilers
395503.4
4305976.9
4
119105AAA
Venice (Ameren)
Madison
701 Main St
Venice
Gas/oil boilers 745681.3
4283086.4
5
135803AAA
Coffeen (Ameren)
Montgomer
134 CIPS Lane
Coffeen
Coal boilers
292044.9
4325821.7
a
137805AAA
Meredosia (Ameren)
Morgan
800 S Washington St.
Meredosia
Coal & oil boilers 708571.3
4410688.5
7
057801AAA
Duck Creek (Central Illinois Light)
Fulton
17751 N Cilco Rd
Canton
Coal boilers
247925.5
4482695.1
a
143805AAG E. D. Edwards (Central Illinois Light)
Peoria
7800 CILCO Lane
Bartonvill
Coal boilers
274651.8
4497090.2
9
167120AAO
Lakeside/Dallman (CWLP)
Sangamon
3100 Stevenson Drive
Springfiel
Coal boilers
277154.9
4403468.3
10
127855AAC
Electric Energy
Massac
2100 Portland
Joppa
Coal boilers
334996.3
4119492.0
11
119020AAE
Wood River (IP)
Madison
I Chessen Lane
East Alton
Coal boilers
748805.5
4305373.1
12
125804AAB
Havana (IP)
Mason
N Highway 78
Havana
Coal & oil boilers 748460.9
4462712.1
13
155010AAA
Hennepin (IP)
Putnam
Rural Route
Hennepin
Coal boilers
305886.4
4574644.9
14
157851AAA
Baldwin (IP)
Randolph
10901 Baldwin Rd
Baldwin
Coal boilers
249933.2
4232179.8
15
183814AAA
Vermilion (IP)
Vermilion
Power Plant Rd
Oakwood
Coal boilers
436712.4
4447574.4
16
021814AAB
Kincaid Generation
Christian
Route 104 West
Kincaid
Coal boilers
285467.4
4385488.1
17
031600AIN
Crawford (Midwest Generation)
Cook
3501 S. Pulaski Rd
Chicago
Coal boilers
439978.8
4630755.7
Is
031600AMI
Fisk (Midwest Generation)
Cook
1111 W Cermak Rd
Chicago
Coal boilers
445750.6
4631357.2
19
063806AAF
Collins (Midwest Generation)
Grundy
4200 E Pine Bluff Rd
Morris
Gas/oil boilers 386926.6
4V8588.7
20
097190AAC
Waukegan (Midwest Generation)
Lake
401 E Greenwood Ave.
Waukegan
Coal boilers
433310.2
4692596.0
21
179801AAA
Powerton (Midwest Generation)
Tazewell
13082 E Manito Rd
Pekin
Coal boilers
273149.6
4491024.2
22
197809AAO
Joliet (Midwest Generation)
Will
1601 S Patterson
Joliet
Coal boilers
406601.5
4593915.5
23
197810AAK
Will County (Midwest Generation)
Will
529 E Romeoville Rd
Romeoville
Coal boilers
411386.5
4609585.6
24
199856AAC
Southern Illinois Coop
Williamso 10825 Lake of Egypt Rd
Marion
Coal boilers
3
4165199.7
25
149817AAB
Pearl (Soyland Power Coop)
Pike
South Highway 100
Pearl
Coal boilers
705250.8
4369098.7
Table 1: Existing Fossil-Fuel Fired Electric Utility Boilers
Operation: All Coal-fired boilers are base-loaded except at Havana which is cyclic and all Gas/oil-fired boilers operate as Peakers except Collins 1-5 which are cyclic units
Acid Rain NOx Limits (lb/mmBtu): T-fired Boilers: 0.45 (Ph.
1),
0.40 (Ph.11); W-Fired Units: 0.50 (Ph.
1).
0.46 (Ph.
11).
C-Fired Units >155 MW (0.86). Soyland Power <25 MW and hence no NOx limit.
Abbreviations:
C-
Cyclone;
T-
Tangential;
W-
Wall; Cty - County; A.R - Acid Rain; NAA - Non. Attainment Area
F: qprof EGU-nu-old Peakersl.xls/ 8-15-2000 Original in F:wp/existing power plants2.xis/sheeti/ 8-7-2000
Company Name
UnitName
Street Address
City/
Town
County
ID No.
Area
Designation
Primary
Fuel
No.
of
Boilers
Type
of
Boller
Total
MW
A.Rain
Nox Control
Applicability
1998 Nox
Emissions
TonslYr
Midwest Generation (Com Ed)
Crawford 7,8
3501
S.
Pulaski Rd
Chicago
Cook
031600AIN
Chicago NAA
Coal
2
2-T
542
Yes
4778
Chicago
Cook
031600AMI
Chicago NAA
Coal
I
I-T
321
Yes
3,095
Morris
Grundy
063806AAF
Chicago NAA
Coal
5
&V
2794
Yes
4019
. rw kegan 6,7.8 401 E Greenwood Ave
Waukegan
Lake
097190AAC AA
Chicago NAA
AA
Coal
3
I-C,
2-T
790
Unit 6-No, 7& 8-yes
9627
Joliet
will
197809AAO Chica
goN A
Coal
5
1 -C, 2-T
1328
Yes
18565
4
2-C, 2- T
1094
Yes
12659
Dynegy Midwest Group (1P)
Wood River 4,5
2
2-T
501
Yes
6496
Wood River 1-3
1
Chessen Lane
Cast Alton
M
dison
119020AAE
Metro East NAA
Gas/oil
3
3
153
No
87
[H.l.onville 3,4
14281 E 1900th Ave
Venice
Hutsonville
Madison
Crawford
119105AAA
033801AAA
Metro East NAA
Downstate
Cly
Gas/oil
Coal
a
2
8
2-T
474
150
No
Yes
180
1283
,Grand Tower 7,8
Ferry Rd
Grand Tower
Jackson
077806AAA
Downstate Cty
Coal
3
3-W
177
Yes
2080
lNew1on 1,2
6725 N 500th Rd
~ewton
Jasper
079808AAA
Downstate
Cly
Coal
2
2-T
1267
Yes
8778
Imereclosia 1,2,3
~e2ta 4
M r _
800
S
Washington St
800
S
Washington St
Coffeen
Mereclosia
Meredosia
Morgan
Morgan
Nontgomor
135803AAA
137805AAA
137805AAA
Downstate Cty
Downstate Cty
Downstate Cty
Coal
Coal
Gas/oil
2
5
1
2-C
5-T
1
1005
355
210
Yes-
Yes
No
24813
3248
3
139
1
9
AES
C/o
CILCO
r3l
Canton
Fulton
057801AAA
Downstate Cty
Coal
I
1-W
416
Yes
5
6
7156
7
Peo,
eoria
14380SAAG
Downstate Cty
Coal
3
3-W
786.5
Yes
10003
3
0
0
0
rLakeside 7,8; Dallman 1-2 13100 Stevenson Drive
Spqingfield
Sangamon
167120AAO
Downstate Cty
Coal
4
4-C
235
No
6366
11
11-T
200
Yes
2249
Joppa 1-6
2100 Portland
Joppa
Massac
127855AAC
Downstate Cty
Coal
6
6-T
1086
Yes
9509
Dynegy Midwest Group (1P)
Havana 6
N Highway 78
Havana
Mason
125804AAB
Downstate
Cly
Coal
I
I-W
429
Yes
1
5
4
Havana 1-5
N Highway 78
Havana
Mason
125804AAB
Downstate Cty
Gastoil
a
8
230
No
244
Hennepin 1,2
Rural Route
Hennepin
Putnam
155010AAA
Downstate Cty
Coal
2
2-T
300
Yes
5111
Baldwin
Randolph
157851AAA
Downstate
Cly
Coal
3
2-C,
1-T
1774
Yes
62711
Oakwood
Vermilion
183814AAA
Downstate Cty
Coal
2
2-T
177
Yes
1980
Kincaid
Christian
021814AAB
Downstate Cty
Coal
2
2-C
1108
Yes
32534
Pcywerton 5,6
13082 E Manito Rd
Pekin
Tazewell
179801AAA
Downstate Cty
Coal
4
4-C
1598
Yes
33633
SIPCO
IMarion 1-4
ISoyland Power Coop
10825 Lake of Egypt Rd
Marion
Williamson
199856AAC
Downstate Cty
Coal
4
4-C
272
1.2,3 -No/ 4-yes
11731
Soyland
South Highway
100
Pearl
Pike
149817AAB
Downstate Cty
Coal
I
I-W
24
No
749.9
Total
90
19,797
288,139
Illinois EPA
Exhibit No. 6
New and Existing Peaker Units (8/7/00)
MAP-NUMBER ID-NUMBER
NAME
CITY-TOWN
UTM EASTING UTM NORTHING
1
119105AAA
Venice (Ameren)
745681.3
4283086.4
2
143065AMW
Sterling Ave (Central Illinois Light)
Peoria
277836.4
4513075.8
3
167120AGQ
Factory Street (CWLP)
Springfield
274942.7
4411680.3
4
167120AHJ
Reynolds Street (CWLP)
Springfield
273820.3
4409338.9
5
167120AHJ
Ridgely Road (CWLP)
Springfield
273820.3
4409338.9
6
099816AAB
Oglesby (IP)
Oglesby
326214.2
4573401.9
7
119813AAC
Stallings (IP)
Stallings
756778.1
4290905.2
8
183814AAA
Vermilion (IP)
436712.4
4447574.4
9
161045AAV
Moline (Midamerican Energy)
Rock Island
705879.1
4598058.3
10
031045AAR
Bloom (Midwest Generation)
Chicago Heights
446760.6
4593291.8
11
031600AIN
Crawford (Midwest Generation)
439978.8
4630755.7
12
031600AMI
Fisk (Midwest Generation)
445750.6
4631357.2
13
031600AW
Calumet (Midwest Generation)
Chicago
454662.8
4618156.6
14
043804AAA
Lombard (Midwest Generation)
Lombard
413239.1
4638248.6
15
043805AAM
Electric Junction (Midwest Generation)
Eola
397596.6
4627536.6
16
097190AAC
Waukegan (Midwest Generation)
433310.2
4692596.0
17
197809AAO
Joliet (Midwest Generation)
406601.5
4593915.5
18
201030AXQ
Sabrooke (Midwest Generation)
Rockford
327027.5
4677411.6
19
149817AAB
Pearl (Soyland Power Coop)
705250.8
4369098.7
20
197808AAC
Peoples Gas
Elwood
406200.0
4588200.0
21
197811AAH
Desplaines Greenland/Enron
Manhattan
421000.0
4582750.0
22
089425AAC
Dynegy/Rocky Rd
E.Dundee
397560.0
4660075.0
23
031600GHA
Calumet Energy Team LLC
Chicago
453691.0
4614679.0
24
20103OBCG
Indeck-Rockford
Rockford
326506.0
4678385.0
25
093808AAD
LS Power*
Minooka
394944.0
4592616.0
26
053803AAL
Ameren CIPS/LIE
Gibson
381496.0
"80755.0
27
171851AAA
Soyland Power
Alsey
719900.0
4382989.0
28
121803AAA
Ameren CIPS/LIE
Kinmundy
325046.0
4292354.0
29
167822ABG
CWLP
Springfield
278302.0
4411159.0
30
183090AAE
Illinois Power
Tilton
444268.0
4439513.0
31
145842AAA
Ameren CIPS
Pinckneyville
294242.0
4220599.0
32
173801AAA
Reliant Energy/Shelby Energy Center
Sigel
372581.0
4348630.0
33
127899AAA
Electric Energy/Midwest Electric Power
Joppa
334412.0
4120444.0
34
051030AAD
Spectrum Energy
St. Peters
340901.0
4304193.0
35
097125ABT
Unicom/ComEd
N. Chicago
431000.0
4686200.0
36
197899AAB
Univ. Park Energy/ Constellation Power
Univ. Park
437128.0
4587674.0
37
03160OGGV
People's Energy/Calumet Energy
Chicago
454600.0
4618400.0
38
043407AAF
Reliant Energy
Aurora
398188.0
4629793.0
39
11 1805AAP
Reliant Energy
Woodstock
382200.0
4678700.0
40
093801AAN
Kendall New Gent. Dev./En-ron
Yorkville
376500.0
4616500.0
41
103817AAH
Duke Energy/Lee Generating Station
Lee County
300380.0
4633450.0
42
051808AAK
Cent. Energy S C Power/ S
St. Elmo
339258.0
4329660.0
43
199856AAK
Reliant Energy/ Williamson Energy Center
Crab Orchard
339000.0
4177500.0
44
097090ACD
Indeck
Libertyville
416708.0
4685078.0
45
097190AAC
Midwest Generation
Waukegan
432729.0
4691812.0
46
09781 0AAC
North Shore Power/ Carlton Inc.
Zion
426573.0
4703513.0
47
043090ADB
Standard Energy Venture, LLC
W.Chicago
397430.0
4636100.0
48
197030AAO
Power Energy Partners
Crete
448282.0
4586608.0
49
197810ABS
Rolls-Royce/Lockport Power Gen.
Lockport
411907.0
4606375.5
50
19781 1AAH
Enron/Desplaines Green Land Dev.
Manhattan
421000.0
4582750.0
51
089802AAF
Coastal Power Co./Fox River Pkng
Big Rock
372683.0
4628908.0
New and Existing Peaker Units (8/7/00)
52
063800AAP
Kinder Morgan-Aux Sable Power Pit
Morris 387650.0 4584550.0
53
11 1032AAA
Indeck
McHenry County 399020.0 4683730.0
54
1038-1-4-AAC
LS Power*
Lee County 283698.0 4627859.0
55
56
171851AAA
021814AAG
Soyland Power
Dom. Energy-Lincoln Generation
AJsey 719900.0
Kincaid 286613.0
4382989.0
4385075.0
57
025804AAC
Entergy Power-Flora Peaking Station
Flora 372986.0 4290190.0
58
---
1i07815AAC
Spectrum Energy-Logan County
New Holland 281343.0 4450724.0
59
025803AAD
Aquila Energy/MFP Flora Power
Flora 366035.0 4284314.0
60
091015AAD
Indeck-Bourbonnias Energy Center
Bourbonnias 427760.0 4560799.0
Table 2: Existing Oil/Gas-fired Peaking Power Plants
(DOES NOT INCLUDE MUNICIPAL FACILITIES OTHER THAN CWLP)
F: qpro/ EGU-nu-old Peakersl.xis/ 8-15-2000 Original in F:wp/existing power plants2.xls/sheeti/ 8-7-2000
Emissions are for 1998 reported by the facility
Nox Data as reported by the facilities was provided by Chris Higgins
Company Name
UnitName
Street Address
City/
Town
County
ID No.
Area
Designation
Fossil
Fuel
No. of
Turbines
Type of
Turbines
Total
MW
A. Rain
NOx
Control
1998 Nox
Emissions
Tons[Yr
Midwest Generation
Bloom Peakers
W 135th St
Chicago Heights
Cook
031045AAR
Chicago NAA
Diesel
5
Simple
64
None
22.6
Crawford Peakers
3501 S. Pulaski Rd
Chicago
Cook
031600AIN
Chicago NAA
Oil/Gas
12
Simple
149
None
1.0
Fisk Diesel Peakers
1111 W Cermak Rd
Chicago
Cook
031600AMI
Chicago NAA
Diesel
5
Simple
11
None
0.0
Fisk Peakers
1111 W Cermak Rd
Chicago
Cook
031600AMI
Chicago NAA
Oll/Gas
8
Simple
264
None
172.5
Calumet Peakers
3200 E 100th St
Chicago
Cook
031600AMJ
Chicago NAA
Gas
11
Simple
148
None
81.6
Lombard Peakers
1 N 423 Swift Rd
Lombard
DuPage
043804AAA
Chicago NAA
Oil/Gas
4
Simple
72
None
37.7
Electric Junction Peakers
Diehl & Eola Rds
Eola
DuPage
043805AAM
Chicago NAA
N.Gas
12
Simple
154
None
229.8
Waukegan Peakers
401 E Greenwood Ave
Waukegan
Lake
097190AAC
Chicago NAA
Oil/Gas
4
Simple
144
None
1844.4
Joliet Diesel Peakers
1601 S Patterson
Joliet
Will
197809AAO
Chicago NAA
Diesel
5
Simple
I I
None
12.7
Joliet Peakers
1601 S Patterson
Joliet
Will
197809AAO
Chicago NAA
N.Gas
8
Simple
103
None
1281.9
Ameren
Standby Turbine
701 Main St
Venice
Madison
119105AAA
Metro East NAA
Oil/Gas
I
Simple
38
None
11.6
Dynegy Midwest Group
Stallings
Highway 162
Stallings
Madison
119813AAC
Metro East NAA
Oil/Gas
4
Simple
128
None
224.2
Midwest Generation
Sabrooke Peakers
123 Energy Ave.
Rockford
Winnebago 201030AXQ
Border Area
Oil
7
Simple
143
None
129.6
LaSalle Peakers (Nucl. Plant)
2601 North 21 st Road
Marseiles
LaSalle
099802AAA
Border Area
Oil/Gas
5
Simple
130
None
9.3
AES do CILCO
Sterling Ave Turbine
N Sterling Ave
Peoria
Peoria
143065AMW
Downstate Cty
Oil/Gas
2
Simple
34
None
17.2
CWLP
Factory Street #2 Turbine
Factory & Griffith Sts.
Springfield
Sangamon 167120AGQ
Downstate Cty
Gas
I
Simple
28
None
16.4
Reynolds Street Turbine
10th & Reynolds Sts.
Springfield
Sangamon 167120AHJ
Downstate Cty
Gas
I
Simple
22
None
8.5
Dynegy Midwest Group
Oglesby Turbine
111. Highway 351
Oglesby
LaSalle
099816AAB
Border Area
Gas
I
Simple
18
None
224.6
Vermilion
Power Plant Rd
Oakwood
Vermilion
183814AAA
Downstate Cty
Oil
I
Simple
23
None
3.0
Midamerican Energy
Moline
2811 Fifth Ave
Rock Island
Rock Island 161045AAV
Downstate Cty
Gas
4
Simple
80
None
19.4
Soyland Power Coop
Pearl
South Highway 100
Pearl
Pike
149817AAB
Downstate Cty
Oil
I
Simple
22
None
9.7
Total
102
1786
4358
Illinois EPA
Exhibit No. 8
Table 3: New EGU Peaker Units
F: qpro/ EGU-nu-old Peakers.xist 8.15.2000 Original in Rwiplexisting power plants2.xistsheetl/ B-7-2000
Abbreviations: SCT= Simple Combustion Turbine; PSD z Prevention of Significant Deterioration; PSD Minor means emissions are less than the derninimus value; (u) means used turbine relocated from
another site
SrDr.
y LoNOx = Dry Low NOx Burners; Water Inj. = Water Injection; N. G. = Natural Gas; Non-N PS means NSPS riot applicable because the unit is a used unit told' from another
No.
Company Name
Location
ID #
Area
Designation
No.
of
Units
NOx
Control
Turbine
Manufact.
& Model Number
Total
MW
Fuel
Type
a
Hours of
Operation
PerYear
Per Unit
0 .
Total
Permitted
AnnuaINOx
TonsfYr.
Nox
Rate
pprn
NOx
Rate
lb/mmBtu
Applicable
Rule
Bureau of Water
Permit
1
2
3
4
1
4
7
lo
I
U
13
14
Is
1.
1 Peoples Gas
Elwood
19780SAAC ChlcagoNAA
4
Dry LoNOx
GE Frame 7FA
690
N.GA-
1440
292
15
0.061
PSDIBACT NPOES Under RevI7
Manhattan
197811AAH Chicago NAA
8
Dry LoNOx
GE Frame 7FA
664
N.Gas
3250
318
9
3 [Dynegy/Roc Rd
E.Dundee
08942SAAC Chicago NAA
4
DLN1W.I.
W. Frame 501 D
398
N.-
1300
249
25(G).42(0)
0.037
0.1 (G)
PSDIBACT
NSPS
State 1999-EP-3731
4 Calumet Energy Team LLC
Chicago
031600GHA Chicago NAA
2
DLN/WI
ABB Frame llN2
305
N.G/ #20il
1500
240
25-g/42-oll
PSD Minor
6 LS Po"r*
Rockford
Minooka
20103OBCG
093808AAD
Border County
Border Twnshlp
2
4
Dry LoNOx
SCR
SW Frame V54
300
1,000
N.Gas
N.GJOfl
1176
8760
398
1,604
15
44(0)(SM)
0.0`143
PSD/BACT
PSDIBACT
NPDES IL0073806
LAmeren
CIPS/ UE
Gibson
053803AAL Downstate Cnty
2
Dry LoNOX
270
N.GJDb.
co
No Limit
249
25(G),42(6)
o.i
(G)
PSD Minor State 2000-EE-0680
a
Soyland Power-
Alsey
171851AAA Downstate Cnty
2
Dry LoNOx
W. Fra;; 251 AA (u)
so
WAX! M
23
124
About 175
0.7
Non-NSPS
1 9
10
Ameren CIPS/ UE
CVVLP
Illinois Power
Kinmundy
Springfield
Tifton
121803AAA
167822ABG
183090AAE
Downstate Cnty
Downstate Cnty
Downstate Cnty
2
I
4
Dry LoNOx
Water Inj.
Water Inj.
GE Aero LM6000
270
100
I
N.GJM.
.
ft.o~
G-
No Limit
No Limit
2352
249
249
192
25(G).42(0)
75
25
0.1 (G)
0.1
PSD Minor
NSPS
NSPS
sti9e9+e-3123;2oDo-EE-o7si
12 Anneren CIPS
Pinckneyville 145842AAA Downstate Cnty
4
Water In).
GE Aero LM6000
194
N.Gas
8736
200
35
NSPS
State 2000-EE-0708
t
3
_L_
Reliant Energy/ Shelby Enrgy Cntr
Sigel
173801AAA Downstate Cnty
8
Water Ini.
GE Aero LM6000
328
N.Gas
No Limit
198
25
0.09
NSPS
St-2000-EE-5480; 5480-1
14 Electric EnergyrMidwest Elec. Power Joppa
127""M
2
Danst!j! ~nly
3
Water Ini.
216
N.Gas
5824
251
40
Netted
15 Spectrum Energy
St. Peters
051030
Cnty
I
Water Inj.
45
2890
86
25
0.10
NSPS
Built and Under Construction Total
51 5,006
4,899
UnicornlComEd IN. Chicago 097127BT JChlcago NAA
2
Dry LoNOx
GE Frame OB
78
N.Gas
No Limit
99
25
0.096
NSPS
6
Water Inj.
PW Aero FTS
300
N.Gas
1680
249
-
25
PSD Minor State 2000-EE-0817
2
Water Inj.
ABB Frame llN2
266
N.Gas
2000
233
25
NSPS
4
Dry LoNOx
GE Frame7FA
Sao
N.Gas
1125
124
15
0.036
NSPS
Under Review
6
wl
GE Aero LM6000
270
N.Gas
1125
126
9
0.036
3
Dry LoNOx
GE Frarne7FA
510
N.Gas
2520
248
9
PSD/BACT
Dry LoNOx
Nt.G.10il 32
iloo
00
680
1)
0 117
PSDIBACT
_FSDIBACT
9 Soyland Power**
Alsey
171851
Downstate Cnty
2
Water Inj.
GE Frame LM2500
45
NA V1
560
54
0.7
Non-NSPS
10 Cent. Enrgy S C Po%,J Spectrum
St. Elmo
051809AAK Downstate Cnty
1
Water Inj.
45
N.Gas
2890
86
25
0.10
NSPS
11 Reliant Energy/ Williamson Enrgy Cn Crab Orchard 199856AAK Downstate Cnty
8
Water InJ.
GE Aero LM6000
328
N.Gas
No Limit
198
25
0.09
NSPS
1
Permitted (Construction Pending )Total
49 3,850 2,528
Indeck Libertyville 097090ACD Chicago NAA 2 Dry LoNOx SW Frame V84.3 300
R.~
2000 173 15 0.055 NSPS
2
1 3
Midwest Generation
North Shore P wert Carlton Inc.
Waukegan
Zion
W.Chicago
097190AAC
09781 OAAC
043090AD8
Chicago NAA
Chicago NAA
Chicago NAA
2
3
16
Dry LoNOx
Dry LoNOx
Water Inj.
GE Frame 7FA
GEIABB Frame 7FAIIIN2
PW Aero FTS
292
562
800
N.Gas
N.GastOil
N.Gas
1,307
1180
2500
39
248
1,244
9
25
25
0.091
PSD Minor
PSD Minor
PSDfBACT
5 P r Energy Partners
Crete
197030AAO Chicago NAA
3
Water Inj.
Ass Frame IIIIN2
393
N.Gas
1310
247
25
0.07
PSD Minor
6 Rolls-RoycefLockport Pwr Gen.
Lockport
197810ABS Chicago NAA
6
Dry LoNOx
RR Aero Trent (p)
372
N.Gas
No Limit
245
25
PSD Minor
7 Enron/Desplalnes Green Land Dev.
Manhattan
197511AAH Chicago NAA
I
Dry LoNOx
GE Frame 7EA
167
N.Gas
2750
115
9
PSD Minor
8 Coastal Power Coffox River Pkng
Big Rock
089802AAF Chicago NAA
3
Dry LoNOx
ABB Frames 11N2
345
N.Gas
1425
244
25
PSD Minor
9 Kinder Morgan-Aux Sable Power Pit Morris
063800AAP Chicago NAA
4
Water Inj.
GE Aero LM6000
176
N.Gas
5800
249
25
PSD Minor
Holiday Hills 111032AAA Chicago NAA
2
Dry LoNOx
SW Frame V84
300
N.Gas
2300
log
15
0.0553
NSPS
12 iytand Power-
Lee County
Alsey
103814AAC
171851AAA
Border County
Downstate Cnty
4
1
SCR
Water Inj.
W Frame ACT(u)
1,000
25
N.Gas
N.Gas
8760
goo
632
el
4.5 (G) (SCR)
148
0.0143
PSDIBACT
iZn-NSPS
NPDES IL0074209
E
3
Dom. Energy-Lincoln Generation
Kincaid
021814AAG Downstate Cnty
4
Dry LoNOx
GE Frame 7FA
Gas
N.Gas
2500
287
9
PSD/BACT
Entergy Power-Flora Peaking Stn
Flora
025804AAC Do*mstate Cnty
6
Dry LoNOx
GE Frame 7FA
438
N.Gas
1940
249
9-15
0.081
PSD Minor
1 15 Spectrum Energy-Logan County
New Holland 10781SAAA Downstate Cnty
3
Water Inj.
GE Frame I-MG000
135
N.Gas
1500
92
25
PSD Minor
16 Aquila EnergyrMFP Flora Power
Flora
025803AAD Downstate Cnty
4
Dry LoNOx
378
N.Gas
2100
249
9-15
PSD Minor
17 Indeck-Bourbormlas Energy Center
Bourbormlas 091015AAD Downstate Cnty 4 1
Dry LoNOx
GE Frame 7FA
683
N.Gas
1
2000
232
9
PSD Minor
Permit Applied For (Under Review) Total
68 7,054 4,803
Grand Total 168 15,910 12,230
Permitted to operate as base load as well as peaker mode.
** Soyland Power has a total of 5 turbines (2 are <5 MW each). Total emissions limited to ~2419 tonstyear
Illinois EPA
Exhibit No. 9
Table 1
National Ambient Air Quality Standards
and PSD Increments
Class 11 PSD
Pollutant
Averaging Time
Primary Standard
Increments
Particulate Matter
Annual
50 ug/m'
17 ug/m3
(PMIO)
24-Hour
150 ug/m'
30 ug/m'
Sulfur Dioxide
Annual
80 ug/m'
20 ug/m'
(S02)
24-Hour
365 ug/m'
91 ug/m,
3-Hour (secondary)
1,300 ug/m'
512 Ug/M3
Nitrogen Dioxide
Annual
100 ug/m,
25 ug/m'
(N02)
Ozone (03)
I-Hour
0.12 ppm
-----
Carbon Monoxide
8-Hour
10,000 ug/m,
-----
(CO)
I-Hour
40,000 ug/m'
-----
Illinois EPA
Exhibit No. 10
Table 2
Maximum Impact from
Peakers Compared to Class
II PSD Increments
Class 11 PSD
Significant Impact
Maximum Peaker
Averaging Time
Increments
Threshold
Impact
Annual
17 ug/m'
I Ug/M3
2 ug/m'
24-Hour
30 Ug/M3
5 Ug/M3
12 ug/m'
Sulfur Dioxide
Annual
20 ug/m 3
1 Ug/M3
0.1 Ug/M3
(S02)
24-Hour
91 Ug/M3
5 Ug/M3
5 Ug/M3
3-Hour (secondary)
512 Ug/M3
25 Ug/M3
13 Ug/M3
-Nitrogen Dioxide
Annual
25 Ug/M3
1 Ug/M3
5 Ug/M3
(N02)
Carbon Monoxide
8-Hour
-----
500 Ug/M3
126 Ug/M3
(CO)
I-Hour
-----
2,000 Ug/M3
465 Ug/M3
Table 3
Maximum Impact from Peakers Compared to the
National Ambient Air Quality Standards
Maximum Peaker
Background
Total -
Pollutant
Averaging Time
Primary Standard
Impact
Concentration
Concentration]
Particulate Matter
Annual
50 Ug/M3
2 Ug/M3
40 Ug/M3
42 ug/m'
(PM10)
24-Hour
150 Ug/M3
12 ug/m'
130 Ug/M3
142 ug/m'
Sulfur Dioxide
Annual
80 ug/M3
0.1 Ug/M3
24 ug/in'
24.1 ug/m'
(S02)
24-Hour
365 Ug/M3
5 ug/m'
157 Ug/M3
162 Ug/M3
3-Hour
1,300 Ug/M3
13 Ug/M3
440 Ug/M3
453 Ug/M3
(secondary)
Nitrogen Dioxide
Annual
100 Ug/M3
5 Ug/M3
58 Ug/M3
63 Ug/M3
(N02)
Carbon Monoxide
8-Hour
10,000 Ug/M3
126 Ug/M3
5828 Ug/M3
5954 Ug/M3
(CO)
I -Hour
40,000 Ug/M3
465 Ug/M3
7771 Ug/M3
8236 Ug/M3
July 16, 1991
July 18, 1991
July 19, 1991
July 20, 1991
July 17, 1991
Peak 1-Hour Ozone Concentrations
Back to top
Assuming CAA Controls
IEPA Exhibit 13
Back to top
July 16, 1991
July 18, 1991
July 19, 1991
July 20, 1991
July 17, 1991
Peak 1-Hour Ozone Concentrations
Back to top
Assuming SIP Call Controls
Back to top
IEPA Exhibit 14
Effect on 2007 CAA Ozone Concentrations
due to SIP Call Controls
July 16, 1991
July 18, 1991
July 19, 1991
July 20, 1991
July 17, 1991
Back to top
IEPA Exhibit 15
SIP Call 1-Hour Ozone Concentrations
with “Peakers”
July 16, 1991
July 18, 1991
July 19, 1991
July 20, 1991
July 17, 1991
Back to top
IEPA Exhibit 16
Effect on SIP Call 1-Hour Ozone
from Peakers in Illinois
July 16, 1991
July 18, 1991
July 19, 1991
July 20, 1991
July 17, 1991
Back to top
IEPA Exhibit 17
Overview of Applications for Permits Received by the
Illinois EPA's Bureau of Water as of July 20, 2000
Applications received:
8
No. discharging to surface waters:
2
No. discharging to POTW's:
6
Range of flows (gpd):
25,000 to 361,000
Source Water
No. using surface waters:
1
No. using groundwater only:
1
No. using groundwater and/or city water: 3
No. using city water only:
3
Number of permits issued:
5 (POTW Discharge's)
Of the applications received, one facility is located in Ford county, one in Perry county, one in Madison county, one is Shelby
county, one in DuPage county, one in Vermilion county, and two are in Will county.
Illinois EPA
Exhibit No. 18
Illinois Environmental Protection Agency
Fa ct
Bureau of Air
Peaker Power Plant Fact
May 2000
Back to top
Sheet
Nationwide, including in Illinois, a number of new natural gas burning power plants are being built
and more plants are being proposed. The Illinois EPA has expended significant time and effort
over the past eighteen months on the issue of peaker power plants and carefully considers each
application. This fact sheet addresses some of the basic questions asked about peaker power
plants.
What is a peaker power plant?
New peaker power plants being proposed in Illinois us6 turbines that burn natural gas to produce
electricity. They are called peaker power plants because they are generally run only when there is
a high demand, known as peak demand, for electricity. In Illinois, this occurs during the summer
months when air conditioning load is high, and the nuclear and coal burning power plants cannot
meet the demand for power. Peaker plants generally run only during peak periods when utilities
will pay higher prices for electricity because it is more expensive to produce electricity by burning
natural gas. Peaker power plants cannot compete with the cost of electricity produced by nuclear
and coal burning power plants.
Where are these plants being built?
In general, the plants are being located where large capacity power lines and gas pipelines cross
or are in close proximity to one another.
Are these facifliles regulated bv the Illinois EPAP
Yes, the Illinois EPA administers rules that limit the air emissions and, if present, direct water
discharges from peaker power plants. The Illinois EPA does not have the authority to consider
other issues related to the siting of a proposed facility, (e.g. need for a proposed power plant,
aesthetics, etc.) during permitting.
What will be the health impact
of
a peaker power plant to people
living around the facilltvP
The evaluations of new peaker power plants for which the Illinois EPA has received permit
applications to date have indicated that the plants will not have a measurable impact on air
quality. If a source does not have a measurable impact on air quality, there should not be a
health impact. To confirm that proposed plants would not impact air quality, the Illinois EPA has
been asking all peaker power plants to submit air quality modeling even though this is not
expressly required by the rules for minor sources.
Permit applications are reviewed to determine whether the information presented in the application
shows compliance with applicable rules. Permits are prepared with detailed conditions that identify
applicable rules and require appropriate testing, monitoring and recordkeeping to verify compliance
with applicable rules.
Illinois EPA
Exhibit No.20
These plants will emit almost all of their emissions over a small number of days
during the summer. Why can't they be considered malor sources under the
federal Prevention of Sionificaut Deterioration IPSDI rulesP
The proposed peaker power plants whose potential
annual emissions are below the applicability thresholds
of the federal PSID rules are not subject to PSID because the rules define "major sources" in terms
of annual emissions from a proposed new source, not monthly or daily emissions. However, as noted above,
the Illinois EPA is requiring applicants for "minor' peaker plants to perform air quality impact modeling as if
the plants were subject to PSID. The Illinois EPA also has exercised its discretionary authority and is holding
public comment periods for all proposed plants before taking final action on a permit. In addition, the Illinois
EPA will continue to review the situation.
Can the Illinois EPA place a moratorium on the issuance of permits to Peaker
Power plants?
The Illinois EPA does not have the legal authority to impose a moratorium on the issuance of permits to peaker
plants. In fact, the Illinois EPA is required to process the permit application for a new plant within 180 days.
Does the Illinois EPA have some say In the location of these facilitiesP
The Illinois EPA does not have a role in the local siting process.
Currently there is no state siting
requirement for these types of facilities, in contrast to new pollution control facilities such as landfills or
wastewater treatment plants. However, even the siting provisions for pollution control facilities leave the
decision to the local government in which a proposed facility is to be built.
Can the Illinois EPA issue a permit for a now power plant prior to the company
getting zoning approval from the local municipality?
Yes, the Illinois EPA's decision is totally separate from local zoning decisions. Illinois EPA:s approval of a
permit does not mean that the proposed power plant should be granted local zoning approval, and conversely
local zoning approval does not mean that a plant will be issued a permit by the Illinois EPA. The Illinois EPA:s
decisions are based upon the air (and, in certain instances, water) pollution control regulations. Local zoning is
based upon other factors including impacts on land use, property value and the
local economy.
If a company gets a permit from the Illinois EPA, can the company build even
without local approval?
No, the company must build on a location that is appropriately zoned for a power plant. In some cases, the
location is already zoned for a power plant; in other cases, the company must obtain a special use approval to
build a power plant. In either case, the Illinois EPA's permit does not have any bearing on the local zoning
decisions.
If a proposed plant has a permit from the Illinois EPA, does that mean that the
facillty Is "ok" and the local municipality most give the company approval to
build?
Absolutely not. The role of the municipality is different from the Illinois EPXs role. The local municipality must
decide whether a proposed facility is appropriately planned and sited, given its role in local land
use management.
An issued permit is stating, in effect, that the company's application shows compliance with the state and
federal Air Pollution Control regulations. It is not stating that the facility will comply with other requirements or
standards, including local zoning.
Even though the Illinois EPA is not involved in zoning, doesn't the Illinois EPA take Into
account proximity to residential areas
when issuing a Permit?
As a practical matter, environmental permitting rules assume that all facilities are being built in residential
areas even if an area is currently agricultural or industrial in character. As a result, the Illinois EPA's review of
the permit is independent of local land use.
How can we he sure that these plants will run all year?
Although the
Illinois EPA permits do
not limit the plants to
running only during the summer, they do have limitations on how many hours the
plant may be run during the year or how much fuel they can burn. The Illinois EPA monitors facilities'
compliance with their permit conditions and if violations are found undertakes enforcement actions..
These plants would run when ozone air quality is the worst. How can the Illinois EPA
allow new Peaker plants to locate in the Chicago ozone nonattainment area where air
quality is already “bad” during the summer?
Illinois has made substantial progress in improving
ozone air quality in the greater Chicago area, reducing both the extent and magnitude of exceedances of the
ozone air quality standard. These new peaker power plants should not interfere with continuing reductions in
ambient ozone levels and attainment of the ozone air quality standard. While these plants do emit nitrogen
oxide (NOx) which is a precursor to formation of ozone, reductions in NOx emissions are occurring from
existing sources such that a substantial decrease in overall ambient concentrations of NOx is occurring in the
area. Moreover, the new plants must meet stricter emissions requirements than older plants. In this regard, it
should be noted that because ozone is formed by chemical reaction in the atmosphere, the emissions from the
new plants will participate in ozone formation many miles downwind rather than at the point at which they are
emitted. However, the downwind impacts are being addressed through a national strategy that will include all
power plants. In any case, NOx emissions from the new plants would be contributing only a very small part of
the overall loading of ozone precursors.
Does the permit Issued to a Peaker power plant regulate noise levels?
While the state's
noise regulations establish property-line limitations for
noise levels, they do not require sources to obtain
permits. Nevertheless, we advise facilities such as peaker power plants to utilize noise abatement technology.
While the Illinois EPA does not directly enforce the noise regulations, local authorities are empowered to do so,
and the Illinois EPA provides technical assistance as necessary. The contact person for noise at Illinois EPA is
Greg Zak, who can be reached at 217/782-3397.
What pollutants does a Peaker power plant emit?
The pollutants emitted by peaker plants are the pollutants associated with burning of natural gas for any
purpose. The greatest emissions from peaker plants are nitrogen oxides (NOx). Other pollutants emitted
include carbon monoxide and, in much smaller amounts, particulate matter, volatile organic material, and sulfur
dioxide. These pollutants at proposed levels have no meaningful impact on air quality. NOx emissions from
new peaker power plants are minimized by the use of low-NOx burners or water injection into the burners. The
low rate of NOx emissions, combined with excellent dispersion, means that the plants would generally have no
measurable effect on local NOx air quality.
Will these plans burn any fuels other than Natural gas?
Some of the peaker
power plants are
being
developed with the
ability to burn distillate fuel oil. This will allow these particular plants to operate when
natural gas is not available. This could be especially useful in the winter time, when natural gas supplies are
being used for heating, if a peaker must be called into service as a result of an unexpected outage of an
existing power plant.
Who can
I
contact for more information?
For more information on emissions or permitting status of peaker power plants in Illinois, contact:
Brad Frost
Illinois Environmental Protection Agency
1021 North Grand Avenue East
P.O. Box 19506
Springfield, IL 62794-9506
217/782-7027
217/782-9143 - TDD phone number
1-888/372-1996 (please leave a message)
Printed by Authority
of the State of
Illinois
flay 2000 30431 3 000