UN
A
Department of Animal Sciences
College
ofAgricultural, Consumer
and Environmental Sciences
132 Animal Sciences Laboratory
1207 West Gregory Drive
Urbana, IL 61801
Is
I
RECEIVED
CLFRT=’s
OFFIrE
M/4Y
1
4
2001
STATE
OF ILLINOIS
Pollution
Control BoQrd
May 9, 2001
Dorothy M. Gunn
Clerk ofthe Board
Illinois Pollution Control Board
James R. Thompson Center
100
W. Randolph Street
Suite 11-500
Chicago, IL
60601
Dear Mrs. Gunn:
Enclosed is the original
and nine copies ofmy public comment and research report on the
proposed Livestock Waste Regulations,
Adm.
Code
506,
Construction
Standards.
Please
distribute this to the board members ofthe Illinois Pollution Control Board.
Thank you.
Sincerely,
/(#? /U
/4~e~&4&
Ken W
Koelkebeck
Assoclate Professor
KWK:nj d
Enc.
c:
R 01-28 Service List
Phone:
217-244-0195
Fax: 217-333-7861 E-mail: kkoelkeb@uiuc.edu
RECEIV2D
CLFRK’S(~FF1C’~
MAY
1
4
2001
ILLINOIS POLLUTION CONTROL BOARD
STATE OF
ILUNOIS
Pollution
Control Board
IN THE MATTER OF:
LIVESTOCK WASTE REGULATIONS
35 III. Adm. Code 506
Construction Standards
PUBLIC COMMENT
Members of the Illinois Pollution Control Board, I thank you for allowing me to
give public comment in regards to the proposed changes to the Livestock Waste
Regulations
—
Code
506
—
Construction Standards.
I’mKen Koelkebeck, Poultry
Extension Specialist and Associate Professor in the Department of Animal Sciences,
College ofAgriculture, Consumer, and Environmental Sciences at the University of
Illinois at Urbana-Champaign.
I also serve as an Advisory Board Member for the Illinois
State Turkey Growers Association and Executive-Secretary ofthe Illinois Poultry
Industry Council.
I have been in my current position for 14 years, and during that time, I
have worked closely with the turkey and egg producers on a number of issues of
importance to their industries.
Specifically, I would like to provide comment on the regulations
contained in
SUBPART
C ofAdm. Code
506 “Standards for the Design and Construction of
Livestock Waste Handling Facilities other than Lagoons
—
Sections 506.301 through
506.314 and any other sections that are closely related”.
It is my understanding that any
new facility or addition to
an existing facility which classifies it as a new facility which is
intended to house poultry (specifically turkey raising facilities and possibly laying hens)
has to conform to certain construction standards related to the floors ofthese facilities.
These proposed standards require that new facilities that are built must be constructed on
ground that has the hydrolic conductivity or permeability standards of 11 0~ cm/sec (sec.
506.304a. 1.).
Inthe event that a
1
x
10~ cm/sec cannot be attained the facility would
need to be
constructed with a concrete floor.
In addition, the producer or company must
obtain a soil sample to determine the presence or non-presence of aquafer containing
material within
5
ft.
(sec. 506.302a.l.) of the facility floor.
This regulation in addition to
others not specifically mentioned here would greatly affect producers and companies in
Illinois’ Poultry Industry, specifically the turkey industry and to some extent the laying
hen industry.
These regulations would also negatively affect the possible expansion of
the U.S. broiler industry looking to
expand their operations into the State ofIllinois.
More important to the immediate concern is the effect ofthese rulings on the existing
turkey industry in the state and the negative impactthese rulings would have on any
expansion ofthe current turkey industry.
In regards to these rulings, I was approached by an integrated turkey company
that contracts turkey production in SoutheasternIllinois about a year and a half ago.
This
company had several contractproducers
who were wanting to
expand their current turkey
growout facilities.
They were informed that they had to meet the construction guidelines
set forth in Section
506,
that being needing to demonstrate a
1
x
10~ cm/sec permeability
underneath and within the proposed facility.
The company then talked to the Department
of Agriculture and decided to obtain some scientific data on the permeability ofthe soils
and in
addition wanted to know the extent of leaching ofnutrients from the turkey
manure within the soils.
Therefore, the company contacted me to help them conduct a
field research study.
Thus, a year ago last fall, I helped the company design and conduct a research
study examining the degree of permeability and leaching of nitrogen, phosphorus, and
potassium in soils from earthen floors within several turkey barns in Southeastern
Illinois.
I have included a copy ofthis study.
For this project the company provided
financial support along with some funding from the Illinois Council on Food and
Agriculture Research (C-FAR) and the Department of Animal
Sciences.
We conducted
this study
during the months of December and January,
1999 and submitted a report of
our findings and gave a presentation to the Department of Agriculture on February 14,
2000.
In addition to this report, the findings of this study has been presented at the
Annual Poultry Science Association meeting last summer in Montreal, Canada and the
annual Midwest Poultry Federation meeting in St. Paul, Minnesota last month. A peer-
reviewed manuscript was
sent to
the Journal ofApplied Poultry Research on December
11, 2000 and is currently under review.
For this study, two turkey growout barns and one brooder barn were selected from
three commercial turkey farms in Southeastern Illinois to be sampled for the presence of
soil nutrients and permeability properties at specific depths.
The three barns had been in
existence housing turkeys for the past 10
to
12 years.
For each barn, nine
5
ft.
soil bores
were taken from the inside and three
5
ft. bores were taken from the outside.
The soil
bores taken from the outside ofthe barns served as controls and one of these bores went
an additional depth of28 ft. to determine the type ofsoil near each of the three turkey
barns. The soil bores were divided into five
1-ft. sections representing the top
5
ft. of
depth and sent to a private laboratory for the analysis of total Kjeldahl nitrogen (TKN),
nitrate nitrogen (N03-N), total phosphorus (P2), potassium (K), pH, and percent organic
matter (OM).
In addition, core samples at three depths (1 to 3, 5 to 7, and 9 to
11
in)
were taken to determine soil permeability.
The results ofthis study indicated that significantly greater concentration oftotal
TKN were present in the first
3 ft. of soil depth for the inside vs. outside (control)
samples for all farms.
However, no differences in total TKN concentration were found
between inside and outside samples at the 4- and 5-ft.
depths. Similar results were found
for N03-N and K concentrations as noted fortotal
TKN; however, total P2
concentrations were essentially the same between inside and outside samples for depths 2
to
5
ft.
This indicated that total P2 did not migrate in the soil.
The soil permeability
results indicated that lower permeability occurred for the inside vs. outside samples at the
1 to 3- and
5 to 7-in depths for all farms
averaged together.
The permeability data also
indicated that several inside permeabilities exceeded
1
x
10 minus 7 cm/sec.
Thus, this
study indicated that leaching ofsoil
nutrients essentially stopped at the 4- to
5-ft.
level
within these turkey barns, and in addition, soil permeability was lowered by the pr3sence
ofgrowing turkeys inside these facilities.
Since I’vebeen here at the University of Illinois, I have been actively engaged in
promoting the expansion ofthe poultry industry in the
State.
If the proposed changes
become law, it is my understanding that any further expansion of the turkey and layer
industry in the State will be
negatively affected.
Ifturkey producers are forced to build
new grow-out buildings that have to
have a concrete floor to meet permeability, the
additional cost of $25,000
to $30,000
will make it virtually impossible for the producer to
secure a building loan.
Also, when existing facilities depreciate in value and
can no
longer produce turkeys efficiently, total production volume in the State will decline
because construction of new facilities would be cost prohibitive.
Thus, in the end, the
State will lose
some 35
million dollars in net cash receipts that are generated per year.
In
addition, the money generated by the sale and consumption of nearly 3.5
million bushels
ofcorn per year would be lost.
Also, the State would not be able to receive any monetary
benefits from any broiler companies
looking to expand their production into
Illinois.
Finally, our research findings reported earlier seem to support the contention that
subsurface ground water would not be contaminated by the leaching of nutrients from
within turkey facilities particularly in the area of the State in which we conducted the
research. It is my opinion, based on our research findings, that new poultry (turkey and
layer) facilities be allowed to be constructed without a concrete floor.
Perhaps the
language ofthe permeability values needed for soil within these facilities be modified to
equal that ofexisting soil permeabilities obtained through present soil
geographical
measurements.
In addition, perhaps the language ofthe present documentation on
Livestock Waste Regulations further clarify the distinction between solid, semi-liquid,
and liquid waste handling facilities.
Perhaps some type of an exemption from the current
construction standards, i.e., soil permeability be made for solid or dry livestock waste
handling facilities, i.e., poultry (turkey, layer, and broiler houses).
Thus, as written, the
proposed construction standards would negatively affect expansion of the turkey and
layer industries in the State,
as well as prohibit any newpoultry (i.e., broiler companies)
from expanding into Illinois.
Respectively submitted
Ken W. Koelkebeck
Department of Animal Sciences
University of Illinois
The Degree of Permeability and Leaching ofNitrogen, Phosphorus, and Potassium in Soils
from Earthen Floors Within Turkey Barns in Southeastern Illinois
by
Ken W. Koelkebeck, Ph.D.
Department of Animal Sciences
University ofIllinois
Urbana, IL
61801
and
Scott Nally
Perdue Farms, Inc.
Washington, IN
47501
Financially Supported by:
Illinois Council on Food and Agriculture Research (C-FAR)
and
Perdue Farms, Inc.
Impact
Statement:
The impact ofthis research documents that soil permeability within a turkey
barn can be dramatically lowered by compaction produced by turkeys,
and shallow leaching of
possible harmful soil nutrients from turkey manure should not contaminate subsurface ground
water.
ABSTRACT
A
field study was conducted to determine the degree ofleaching of nitrogen, phosphorus,
and potassium, and permeability of soils from earthen floors within several turkey barns. Two
turkey grow out barns and one brooder barn were selected from three commercial turkey farms in
Southeastern Illinois to be sampled for the presence of soil nutrients and permeability properties
at specific depths.
The three barns had been in existence housing turkeys for the past
10 to
12
years.
For each barn, nine
5
ft.
soil borings were taken from the inside
and three 5
ft. bores were
taken from the outside.
The soil
bores taken from the outside of the barns served as controls and
one ofthese bores went to an additional depth of 28 ft. to determine the type ofsoil near each of
the three turkey barns. The soil bores were
divided into five
1-ft. sections representing the top
5
ft. ofdepth and sent to a private laboratory for the analysis of total Kjeldahl nitrogen (TKiN),
nitrate nitrogen (N0
3-N), total phosphorus
(P2), potassium (K), pH, and percent organic matter
(OM).
In addition to the
5-ft.
nutrient soil bores, a Uhland core sampling device was used to take
15 core samples (3” deep x 3” diameter cylindrical cores) from each barn to determine
permeability. Three core samples at three depths
(1-3”, 5-7”, 9-11
“)
were taken from the inside
and two
samples at the same three depths were taken from the outside of each barn.
Permeability
measurements were then determined on all
45 core samples at the University ofIllinois,
Department ofNatural Resources and
Environmental Sciences Laboratory.
The results ofthis field study indicated that significantly greater concentration of total
Kj eldahl nitrogen (TKN) were present in the first 3 ft. of soil depth for the inside vs outside
(control) samples for all farms.
However, no differences in total Kjeldahl nitrogen (TKN)
2
concentration were found between inside and outside samples for the 4- and 5-ft.
deep samples.
For nitrate nitrogen (N0
3-N), concentrations showed no differences between inside vs outside
samples at any
depth for farm B, however, inside vs outside samples differed at all depths for
farms A and C.
Similar results were found forpotassium (K) concentrations as noted fortotal
Kjeldahl nitrogen (TKN); however, total phosphorus (P2) concentrations were essentially the
same between inside and
outside samples for depths 2-5
ft.
This
indicated that total phosphorus
(P2) did not migrate in the soil.
The soil permeability results indicated that lower permeability
occurred for the inside vs outside samples at the
1-3” and
5-7”
depths for all farms averaged
together.
The permeability data also indicated that several inside permeabilities exceeded
1
x 10~ cm/sec.
In summary, the present study indicated that even though some soil nutrients leached
below the surface of the ground inside a turkey facility, leaching essentially stopped at the four
to five ft.
level.
In addition, the degree of soil permeability may be lowered by the presence of
turkeys inside a turkey grow out facility.
INTRODUCTION
In the past
10-15 years there has been considerable growth and expansion in the turkey
industry in the
State ofIllinois particularly in the counties ofRichland,
Crawford, and Lawrence.
Currently, about 1.3 million turkeys are raised per year in this part ofthe state.
This increased
production has brought about some concern by regulatory agencies over the possibility of
contaminating ground water by leaching ofnitrogen and phosphorus
from within a turkey house.
Studies
conducted previously have reported higher concentrations of nitrogen in soil samples
from beneath the floors ofpoultry houses than in soil samples from outside ofhouses where no
3
birds were raised (Lomax,
1995).
In addition, a report by Haberstroh (1997) found that nitrogen
concentrations were higher in soils under turkey barn floors to a depth offive feetthan in soils
outside the barns. Thus, the present study was conducted to determine the degree of leaching of
nitrogen, phosphorus, and potassium in the soil
from within several turkey barns as compared to
the nitrogen and phosphorus levels in the soil
outside the barns.
In addition, the degree of
permeability or hydrolic conductivity was determined in the first
11
in. ofsoil within the turkey
barns vs outside the barns.
BACKGROUND AND METHODS
Three turkey farms located in Lawrence and Crawford counties were selected for this
study.
On each farm, samples were taken for soil nutrient analysis and soil permeability from
earthen floors from one ofthe turkey barns.
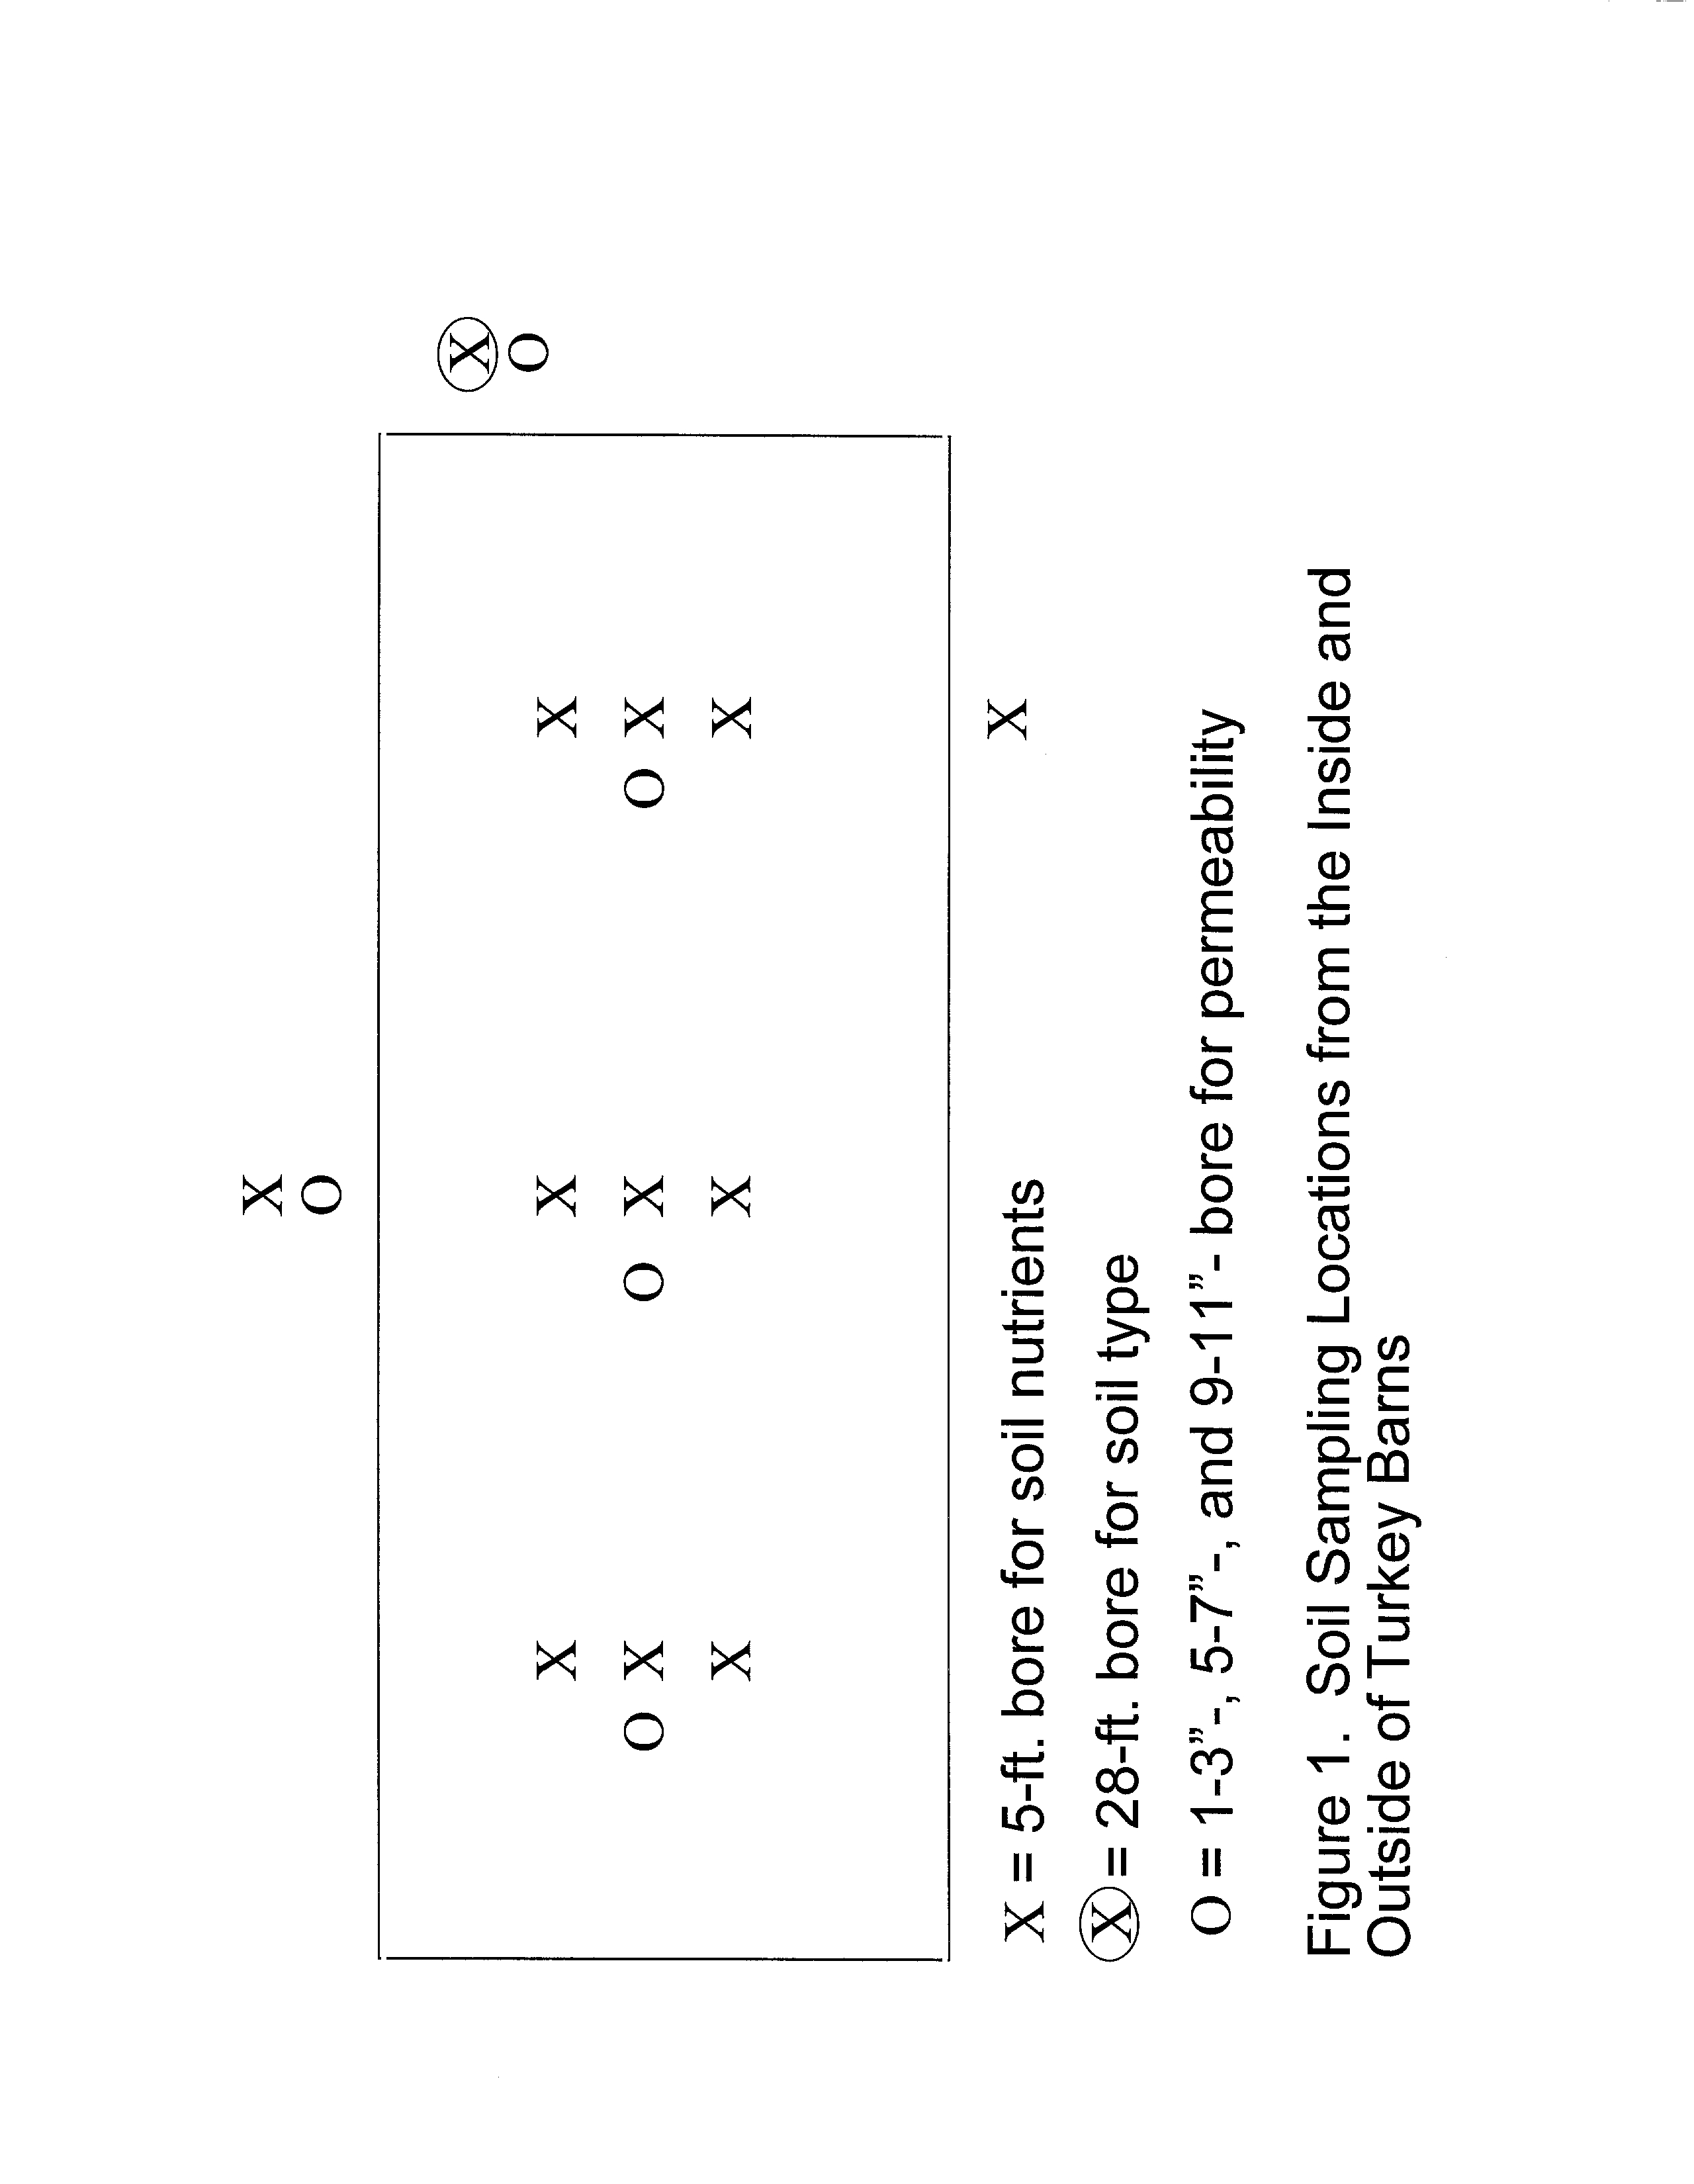
Figure
1
shows the location of soil borings for soil
nutrient analysis and permeability in and outside each barn.
The description ofeach farm
including information on the grow out
system is
described below.
The soil type, percent clay
and expected permeability for each farm is presented in Table
1.
These farms were picked for
sampling because they accurately represented the various sizes ofturkey barns and locations of
the most common soil types that typify those found in these counties in Southeastern Illinois.
Farm A
The first samples were taken from a farm located in Lawrence County, near Bridgeport,
IL.
Samples were taken from brooder barn number
1
(40 x 500 ft.).
The farm housing capacity
is 21,500
hens per flock and has been in existence since June
19,
1987.
Farm B
The second farm was located in Lawrence County, near the Illinois state line and
4
consisted ofthree barns (40 x
500 ft.) which has raised turkeys since July 25,
1987.
Samples
were taken from growout barn number 2.
The farm housing capacity is 21,500 hens per flock.
Farm C
Farm C was location in Crawford County, near Heathsville, IL.
This farm consisted of a
brooder barn built in 1986 and
a growout barn built in December of 1990.
Samples were taken
from growout barn number 2
(50 x
500 ft.).
The farm housing capacity is
13,500 hens per flock.
Soil Sampling Procedures and Technique
For each of the barns sampled on Farms A, B, and C there were a total of 12 soil borings;
nine soil
borings taken from within the barns and three soil borings taken from outside the barns.
For this procedure, an Illinois State Geological Survey Probe truck was used to collect the soil
bores.
Samples were taken from a S
x
10 ft.
rectangular area
1/3,
1/2
,
and 2/3 ofthe distance
from one end ofthe barn.
Samples were collected in this manner due to the ceiling height of
eachbarn.
In addition,
soil borings were taken in three locations
on the outside ofeach barn
approximately 20 ft. from the side and end wall.
For each bore,
the first
5
ft. ofdepth was
separated into five
1-ft. sections.
The initial bore took a 4-ft.
section, thenwent back in the same
bore hole and removed the next
1-ft. section.
Immediately after collecting the five 1-ft.
sections,
the separated soil bore samples were placed into pre-labeled plastic sample bags and transported
in a Styrofoam cooler twice a day to Alvey Laboratories, Belleville, IL
for analysis of soil
nutrients.
After the soil bore samples
were taken from a barn,
core samples for permeability were
taken. For soil permeability or hydrolic conductivity, a three inch diameter x three inch deep
cylindrical soil
core was taken using a Uhland core sampling device.
For each barn,
15
S
individual core samples were
taken at each location inside or outside ofthe barn (Figure
1).
Three core samples were taken at three depths (approximately
1-3”, 5-7”,and 9-11”)from the
inside and two
samples at the same depths were taken from the outside.
All samples were
carefully wrapped in aluminum foil to keep the sample intact and transported to Dr.
Bill
Simmons’ laboratory,Department ofNatural Resources and Environmental Sciences, University
ofIllinois to determine permeability or hydrolic conductivity.
In addition to the
soil bore samples for soil nutrients and core
samples for permeability, a
core sample was taken outside each barn to
a depth of about 28
ft.
Pictures were taken ofthis
core sample for each 4-ft.
section to
determine the type of soil (clay, sand, or clay/sand
combination) present.
Soil Nutrient and PermeabilityLaboratory Analysis
After all soil samples were taken, the soil bore samples were analyzed for several soil
nutrients and soil properties by Alvey Labs.
They analyzed the samples for total
Kjeldahl
nitrogen (TKN), nitrate nitrogen (N0
3-N), total phosphorus
(P2), potassium (K),
soil pH, and
percent organic matter (OM).
The TKN, N03-N, P2
and K values were presented in parts per
million concentration (ppm).
For the permeability or hydrolic conductivity values, the data are reported as cm/sec or
the rate at which water flowed through each core.
For each core sample, water was flushed
through the core three times, then the average permeability was recorded.
StatisticalAnalysis
Forthe
soil nutrient and permeability values presented, the data was analyzed by Analysis
ofVariance procedures consistent for a 3 x
2
x
5
(farm x location x depth) factorial arrangement
6
of treatments. The data is presented for each farm (A, B, or C) and overall for all farms.
The
values for soil nutrients
and permeabilities were compared for the
inside vs the outside for each
farm and all
farms at each depth.
The permeability datawas analyzed on the log of the
permeabilities, then transformed back to
the original values.
RESULTS
Soil Nutrients,pH, and Organic Matter
For the individual farms A, B, and C, the results for soil nutrients, soil pH, and organic
matter is presented in Tables 2, 3, 4,
5, 6, and
7.
For farms A and B, the concentration ofTKN
was significantly greater
(P
K
.05)
for the inside vs outside locations
for the top 3 ft.
For farm C,
the concentration ofTKN was greater for the inside vs outside locations for the top
2 ft.
TKN
was not different between inside and outside locations for the 4- and 5-ft. depths for farms A
and
B, and 3- to 5-ft. depths for farm C.
Significantly greater concentrations ofN0
3-N were found for inside vs outside locations
for depths of 1 to
3 and
5
ft. for farm A (Table 3).
There was an
increase in N03-N concentration
at the
5-ft.
depth compared to the 4-ft. depth for farm A.
Nitrate nitrogen concentration was not
different
(P>
.05) for all inside vs outside depths for farm B, while N03-N concentrations were
greater
(P
K
.05) for inside vs outside locations at all depths for farm C.
The results obtained for P2 show a different trend than that for TKN and N03-N (Table 4).
No significant differences in P2 concentrations between the inside
and outside locations were
found for farm A and C; however, greater
(P
<
.05) P2 concentrations were recorded forthe
inside vs outside locations at the
1-, 3-, and 5-ft.
depths for farm B.
P2 did not differ between
inside vs outside locations
for farm B at the 2- and 4-ft. depths..
7
Table
S
depicts the results for K for farms A, B, and
C.
These results are similar to those
shown for TKN in relation to the concentration of K at each depth for the inside vs outside
samples. The concentration of K was found to be
greater
(P
K
.05) for the top 2-ft. for the inside
vs outside locations
for farms A and
C, while
no difference in K concentration was noted
between the inside and outside locations at the 3- to 5-ft.
depths (Table 5). For farm B,
K
concentrations were greater
(P
K
.05) for the
1- to 3-ft. depths, while no differences in K
concentration was noted at the 4- and
5-ft.
depths for inside vs outside locations.
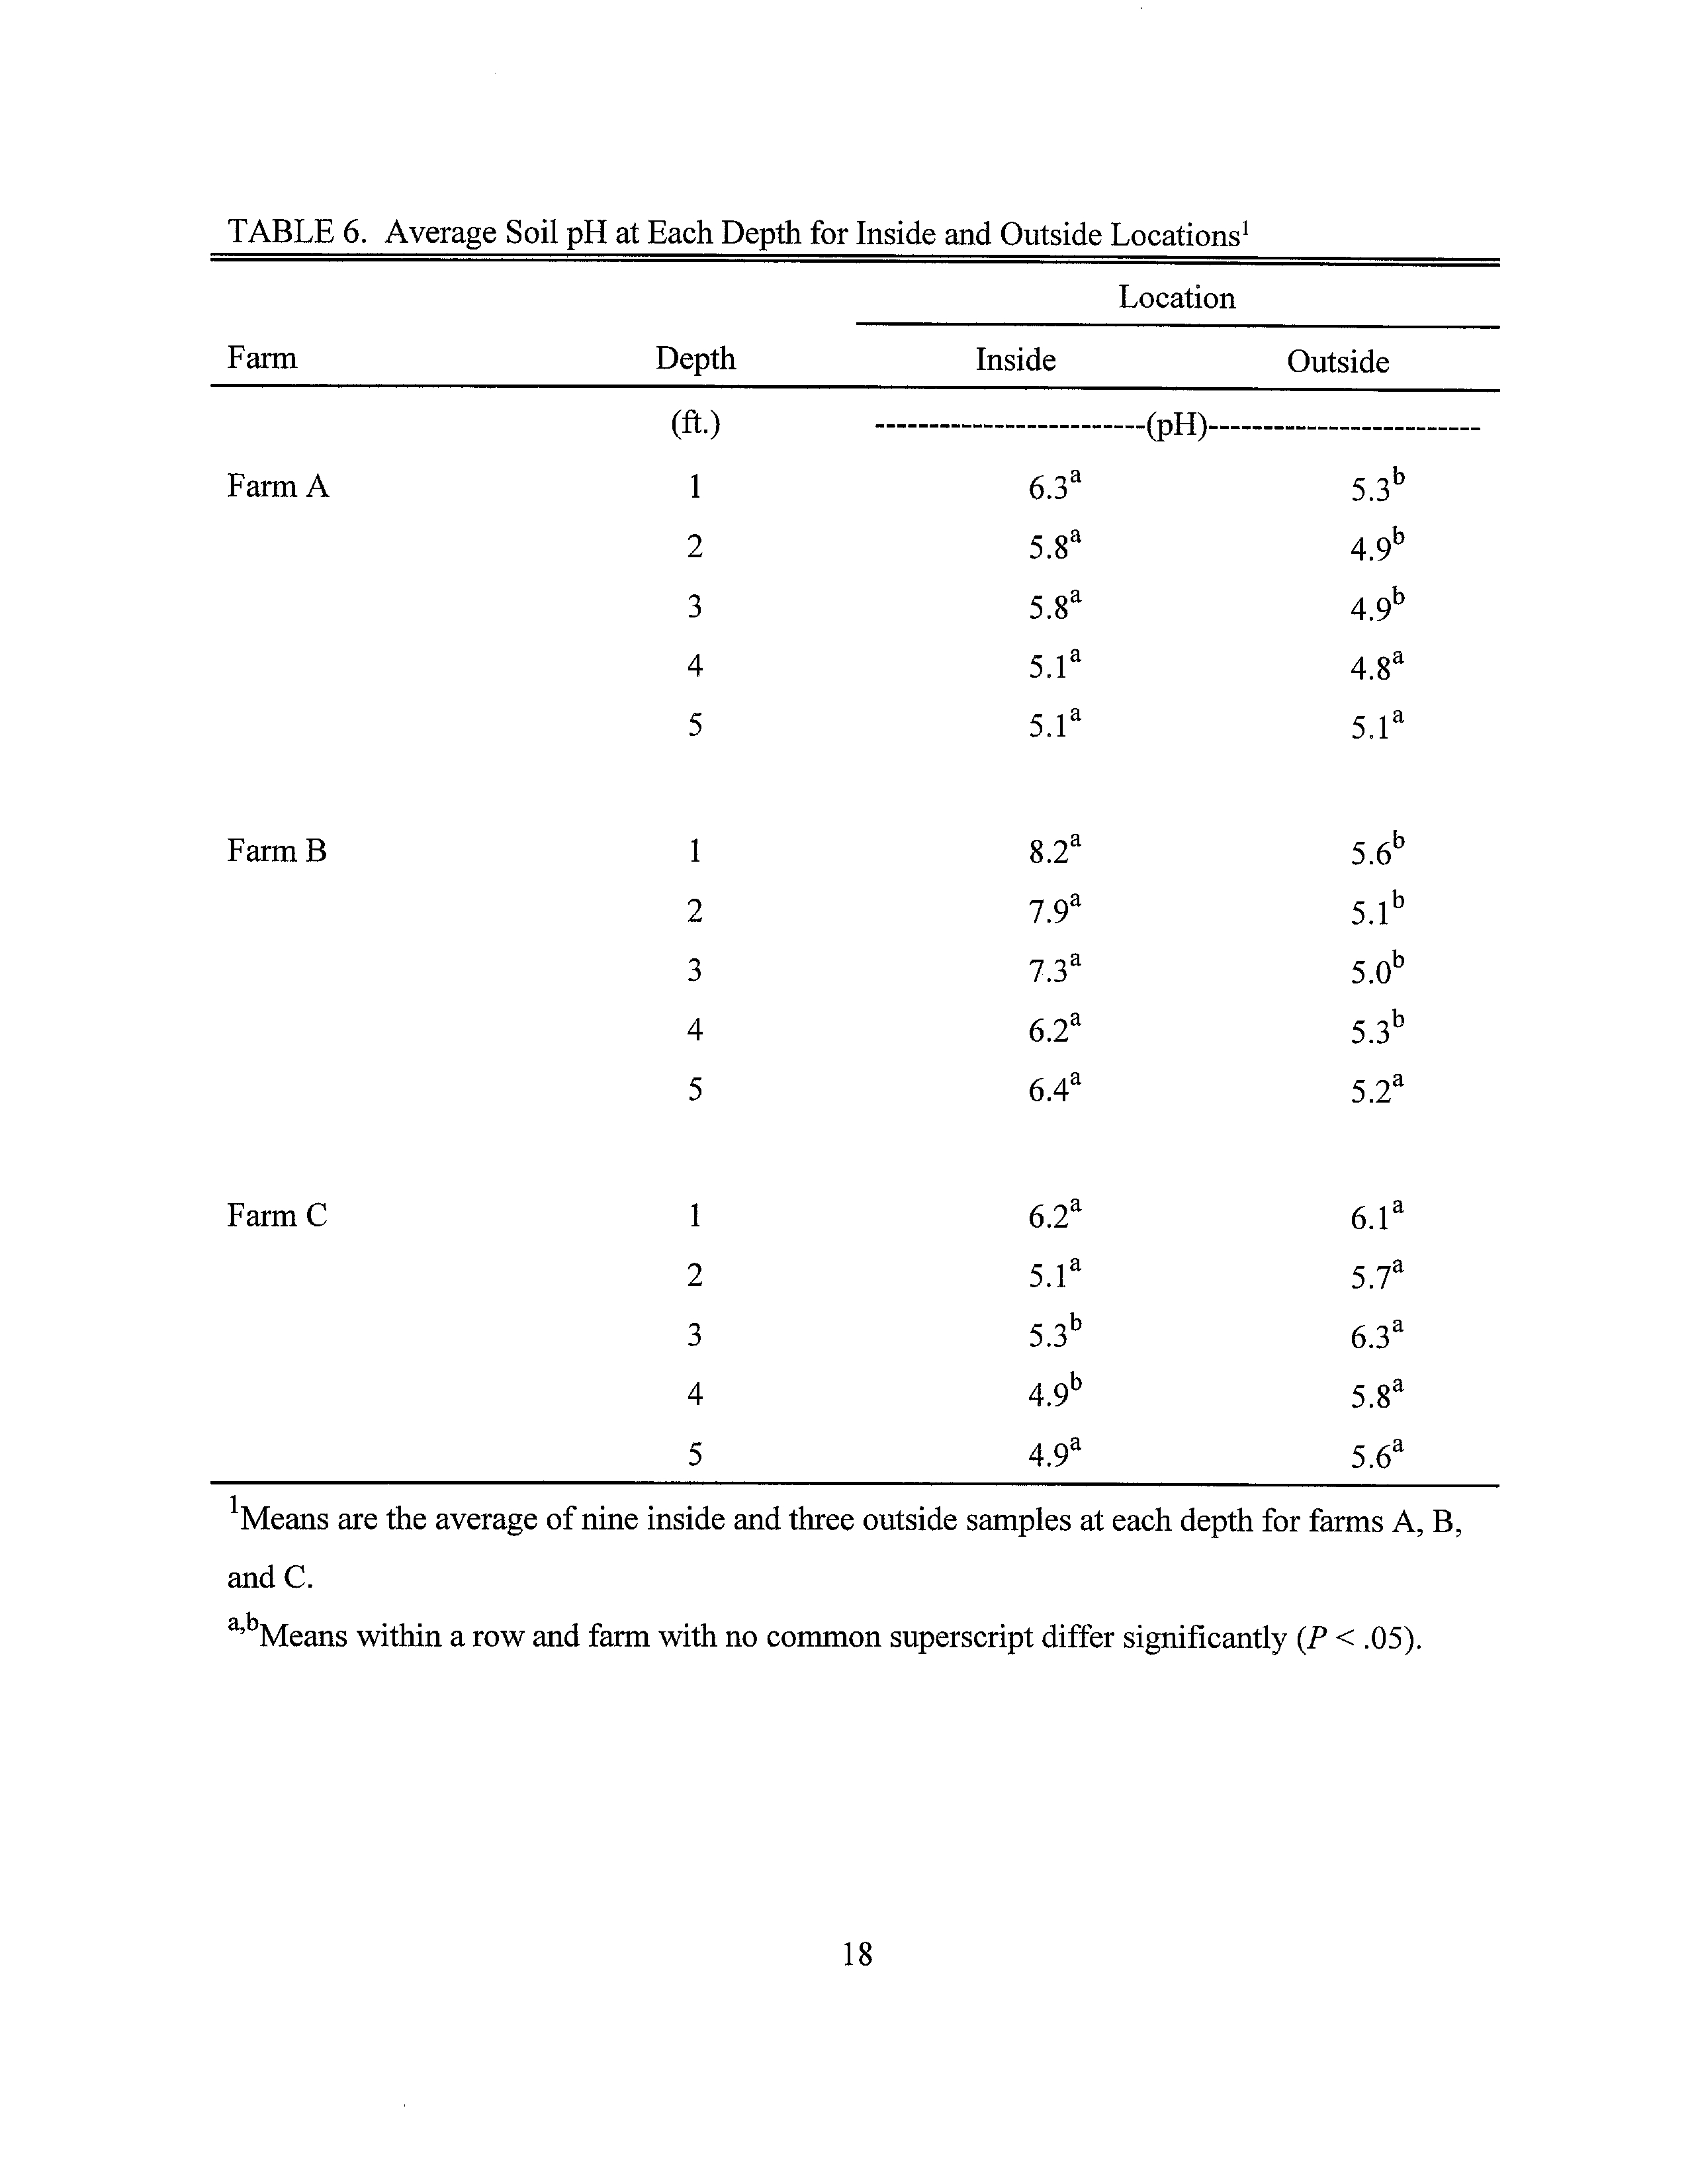
In addition to the soil nutrients measured, soil pH and OM were analyzed and are
depicted for each farm in Tables 6 and 7.
In general, soil pH for farms A and B were higher
(more alkaline) forthe inside vs outside samples at depths
1, 2, 3, and
1, 2, 3, and 4 ft.,
respectively for farm A and B
(Table 6).
For farm C, higher
(P
K
.05) pH soils were recorded at
the 3- and 4-ft. depths on the inside vs outside.
For percent OM, no consistent results were found
forthe inside vs outside samples at all depths for each farm (Table 7).
Figures 2, 3, and
4 and Table
8
depicts the results for soil nutrients, soil pH, and percent
OM for all three farms averaged together by
each soil
sample depth.
For the most part, the
results depicted in these figures and tables are similar to the data presented for the individual
farms.
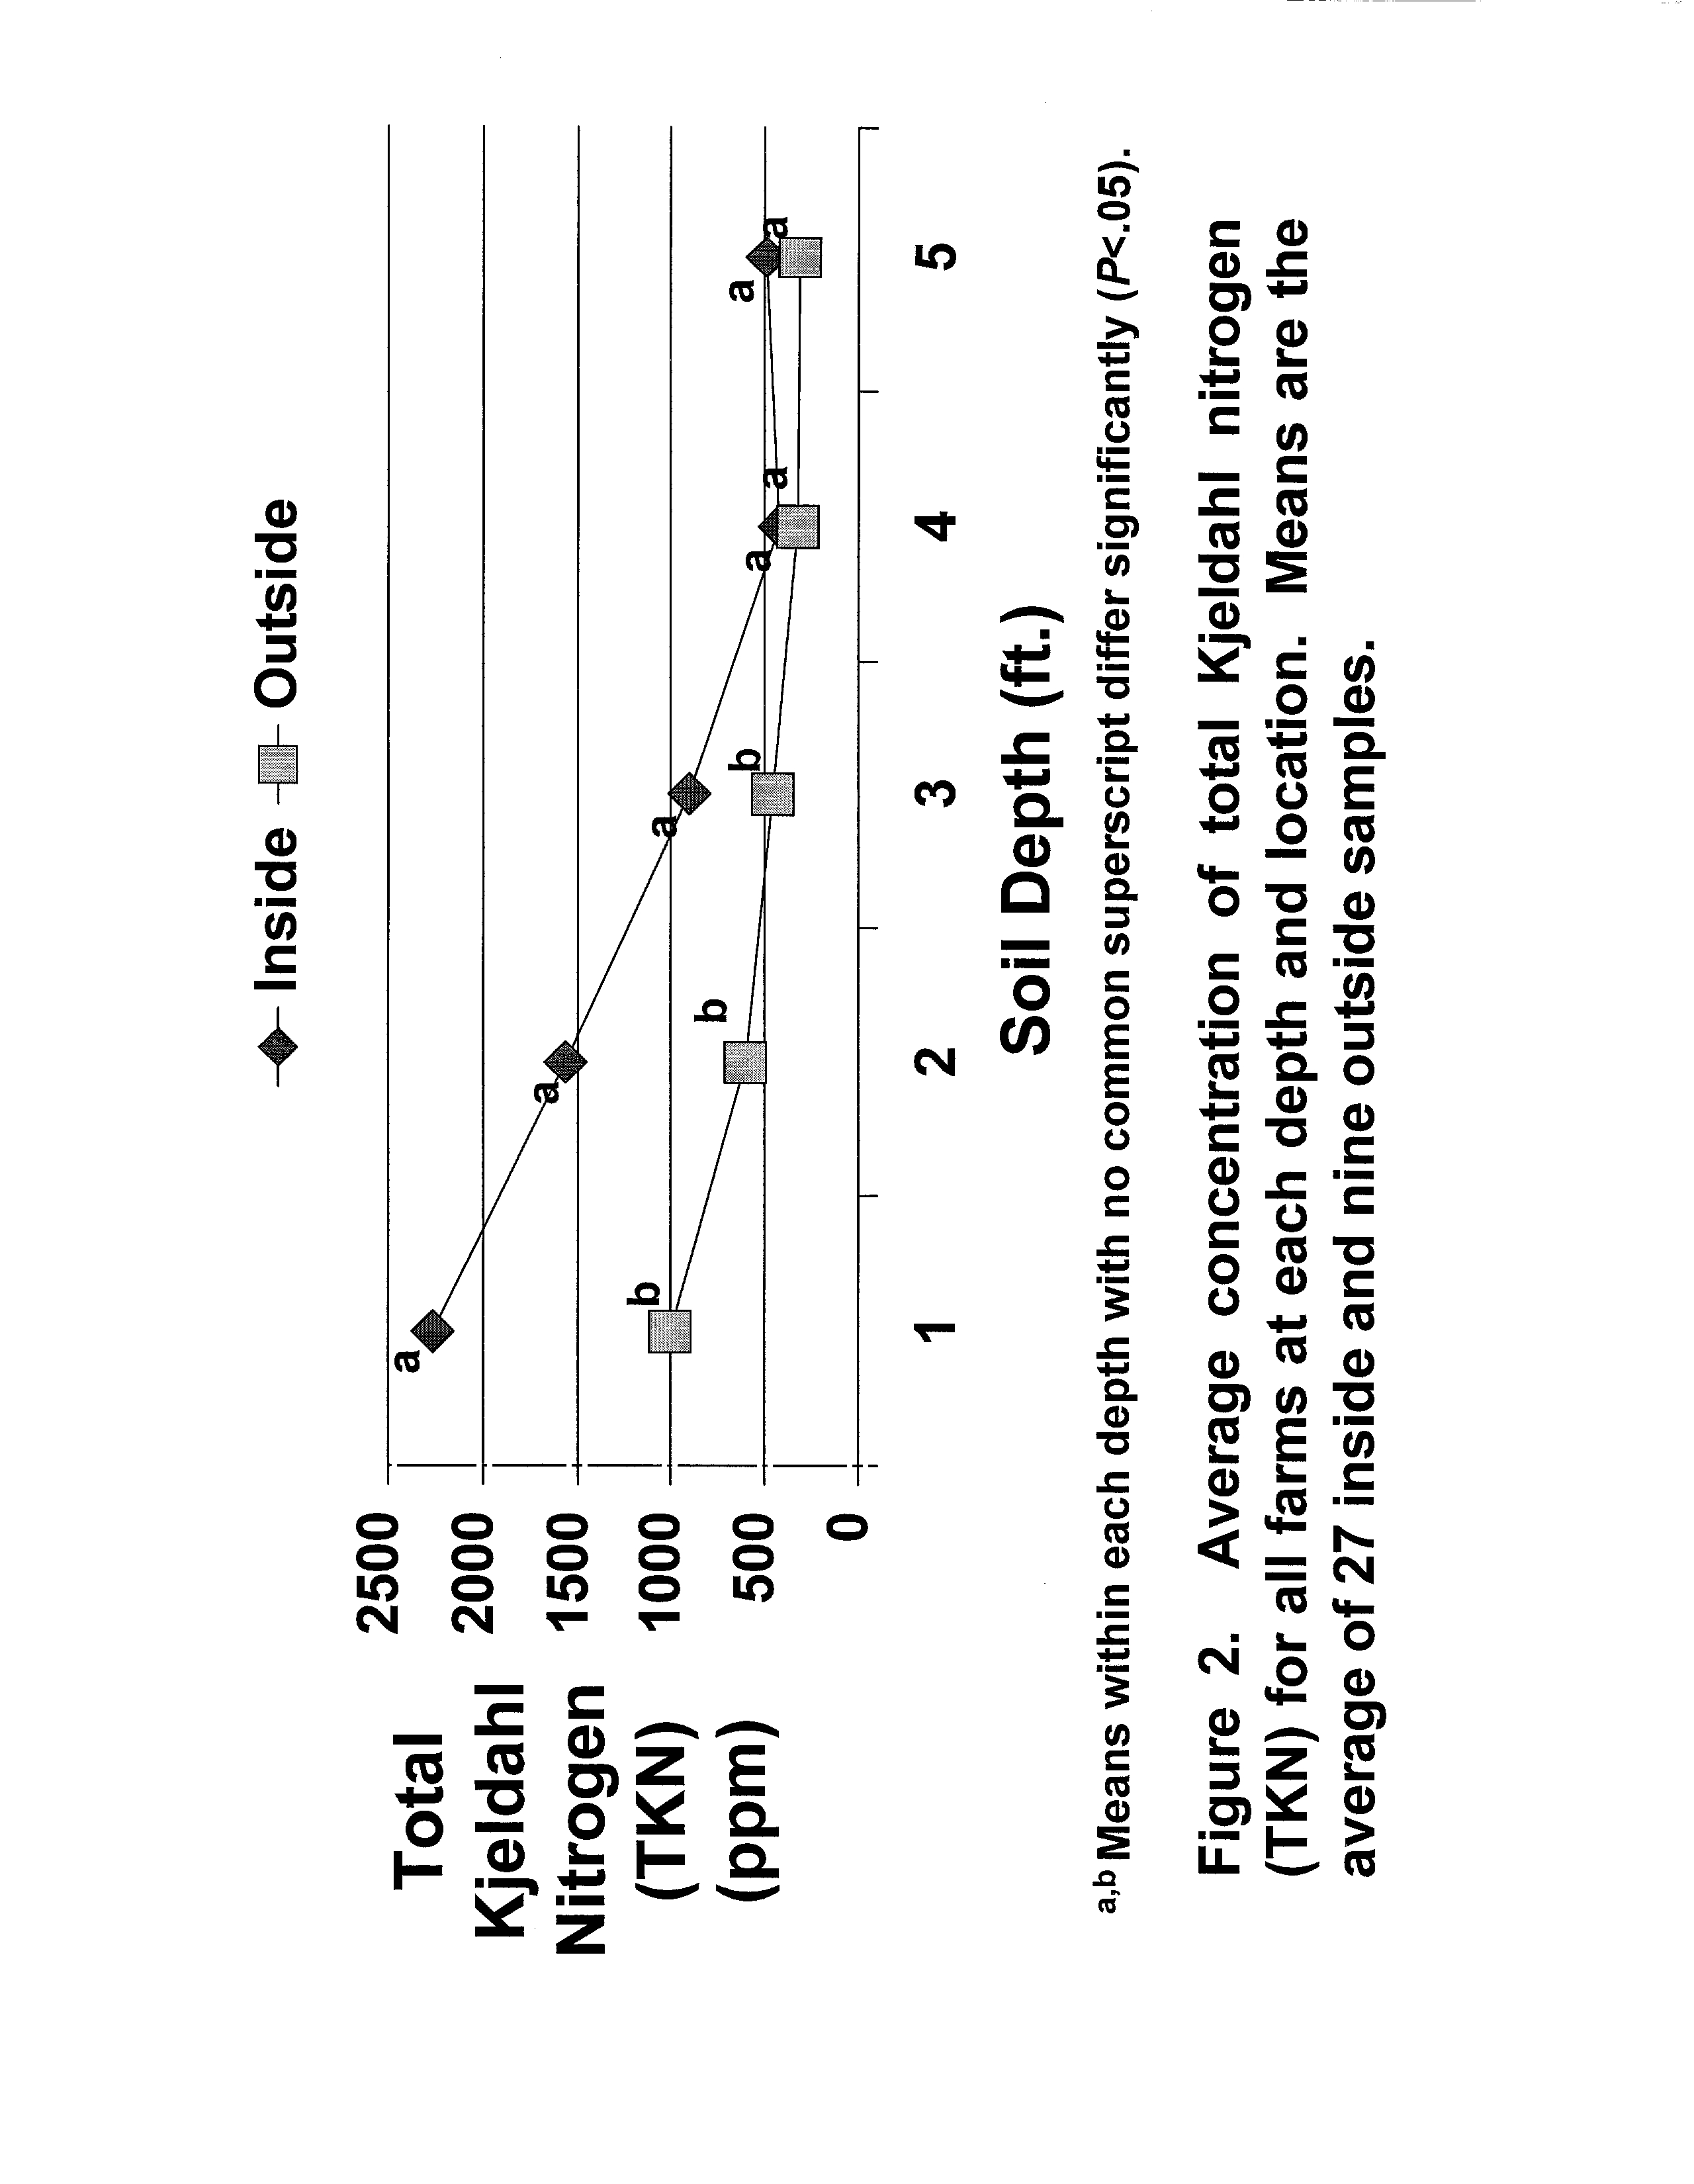
In Figure 2, TKN concentration was greater
(P
K
.OS) for inside vs outside samples of soil
depths of 1, 2, and 3
ft., but not for the 4 and 5
ft. samples
(P>
.05).
In Figure 3, the results for
N0
3-N averaged
over all farms showed that greater
(P
K
.05) concentrations occurring for inside
vs outside samples at all depths (Figure 3).
However, the magnitude of differences was very
small at the 4- and 5-ft. depth compared to depths
1, 2, and
3
ft.
The results
for P2 (Figure 4)
closely follow that shown forthe individual farms.
The data presented in Table
8
for the
8
concentration of K, soil pH, and percent OM shows a similar trend as those presented for the
individual farms.
For all farms averaged together, the concentration ofK was greater for depth
1
to 4 ft. for inside vs outside samples, but not different for the 5-ft. samples.
Higher
(P
K
.05)
soil
pH (more alkaline) was found for the inside vs outside samples at 1, 2, and
3 ft.
Soil Permeability andSoil Type
Table 9 depicts the average soil permeability of the inside vs outside samples at the three
depths measured for each farm.
For farms A and C, average soil permeability was not different
(P>
.05) for inside vs outside samples at any ofthe three depths.
For farm B,
average
permeability was lower
(P
K
.05)
for the first
1-3 “-insidevs outside depth sample.
The data
presented in Table
10 shows that average permeability was significantly lower
(P
K
.05)
for the
inside vs outside samples at the
1-3”- and
5-7”-depths for all farms averaged together.
For the type of soil found for each farm at a depth of28 ft.,
the pictures ofthe 4-ft.
sections revealed a clay base for all three farms.
For farm A,
bore samples were taken to
a depth
of28
ft.,
and at that point the geoprobe hit limestone bedrock and could not penetrate any further.
The samples taken to that point revealed a brownish gray
clay soil type.
The same type of soil
samples were taken at farms B and C; however, at the 24-ft.
depth the geoprobe boring unit hit
aqueous material.
DISCUSSION
The purpose ofthe present study was to determine the degree of leaching ofseveral soil
nutrients and determine the permeability ofsoils from earthen floors within several turkey barns
in comparison to that obtained from outside the bams.
The data presented on the concentration
ofTKN and N0
3-N in particular were similar to that reported by Haberstroh (1997) and Zhu
9
(1999).
In our study, increased concentrations ofTKN were found for inside soil
samples for the
first 3-ft.
depth, but not for the 4- and 5-ft.
depth compared to outside samples.
This indicates
that over a 10 to
12 year period ofgrowing turkeys in these buildings, TKN only migrated about
4 ft. below the surface of the ground within the turkey bams.
The results for K were similar to
the TKN results.
The datapresented forN0
3-N revealed that this nutrient migrated about
5
or
more ft. below the surface of the inside of the turkey bams.
A possible reason that N03-N
seemed to migrate further in the soil
from within the turkey barns was because the sub-floor of
the inside ofthe barns were mixed with backfill (organically enriched) soil at the time ofbuilding
construction.
Further examination ofthe data presented for TKN, N03-N,
P2, and K indicated
that concentrations ofthese
soil nutrients actually tended to
increase from the 4- to
the 5-ft.
depth
both on the inside and outside.
The reason for this can be explained by the sampling method
used. Since the geoprobe truck probe unit could only take a 4-ft.
deep sample, the unit had to
extract that sample then re-enter the same bore to get the 5-ft.
sample.
Thus, some top soil
probably fell in the bore hole and contaminated the 5-ft.
sample.
The data presented for P2
indicated that this nutrient basically does not migrate in the soil like TKN and N03-N does.
In this study, the results presented for soil permeability indicate for the most part that the
compaction produced by the turkeys inside the barns helped to lower the permeability of soil
within the houses. This was particularly
evident for farms B and
C.
For farm B much lower
permeability values were found inside the turkey barn compared to the outside because a
considerable amount ofbackfill dirt was packed onto the turkey barn floor during construction of
the building.
In fact, a majority ofthe houses constructed by Perdue Farms utilizes backfill dirt
as a subbase for the bam floor.
The reason that permeability of soil samples from the inside
10
locations offarm A were the same as the outside may be
due to the fact that the turkey barn on
this farm was used mostly as a brooder, so the lighter birds would not have produced as much
compaction as on farms B and C.
It should also be noted that there were three inside
permeability core samples that did not allow water to penetrate through them while only one
outside sample did not allow the passage of water through it during the laboratory analysis.
Observation ofthe core samples that were taken from the 28-ft. cores showed that no
aqueous material was observed to be present up to 20 ft. or so.
These observations indicate that
the presence of aqueous containing soil seems to be a least 20
ft. below the surface of the ground.
CONCLUSIONS
In summary, the results ofthis study indicated that soil nitrogen (TKN) was shown to
leach below the surface of the ground inside turkey facilities to a depth of 4 ft.
Nitrate nitrogen
levels were found to penetrate a little
further, but were dramatically reduced at
5
ft. vs
1 ft.
inside
the turkey barns. The results for P
2 indicate that the soil nutrient did
not migrate in the
soil like
the results ofTKN and N03-N.
In addition, the raising of turkeys in these facilities seemed to
dramatically lower permeability of soil within the turkey barns.
Finally, since this study showed
that possible harmful nutrients from turkey manure leached below the surface ofthe soil within a
turkey barn just a few feet, it is highly unlikely that subsurface ground water would ever be
contaminated.
REFERENCES
Haberstroh, G.,
1997.
Nitrogen concentrations under turkey barn floors.
Water Quality
Division, North Dakota Department ofHealth, Bismark, ND.
Zhu, J.,
1999.
A preliminary study on seepage from deep bedded and poultry litter systems.
Minnesota Department of Agriculture,
St. Paul, MN.
11
~1)
0~
0
‘4-
ci~
Cl)
0
-Q
a
ci,’
~
—
—
=0w)
Cl)
L.
L
0
~
‘4—
cD
L
0
I
0~LC)
—
I
C~)
‘4-
100
LON~
II II
II
0
0
0
V
V
C/)
ci,
-c
E
0
‘4-
Cl)
0
0
0
-J
~Cl)
E
co~
C/:~2
.0
cDV
t30
TABLE
1.
Description of Soil Type, Percent Clay, and Permeability for Each Farm
1
Soil Type
Depth
Percent Clay
Permeability
(in)
(%) (in/hr)
FarinA
0-10
27-35
.6-2.0
10-24 22-33 .6-2.0
24-34
24-35
34-50
20-30 <.06
50-60 20-30
.2-.6
FarmB
12 Wynoose
silt loam
0-9
9-22
22-45
45-60
15-25
12-18
35-42
25-37
.6-2.0
.06-.2
<.06
.06-.2
14C2 Ava
silt loam
FarmC
214B Hosmer
0-6
siltloam
6-24
24-60
1Data were obtainedfromthe local Illinois State Geological
10-17
24-30
16-20
Survey Office.
.6-2,0
.6-2.0
<.06
13
TABLE 2.
Average Concentration of Total Kjeldahl Nitrogen (TKN) at Each Depth for Inside
and Outside Locations
1
Location
Farm
Inside
Outside
Depth
(ft.)
1
2
3
4
S
(ppm)
FarinA
2974a
1745a
448b
902a
394a 337a
433a 218a
FarmB
1
1663a
799b
2
1315a
3
1147a
4
546a
310a
5
683a 406a
FarmC
1
2172a
2
1628a
3
656a 622a
4
328a 311a
5
355a 319a
1Means are the average ofnine inside and three outside samples at each depth for farms A, B,
andC.
a,bMeans within a row and farm with no common superscript differ significantly
(P
<
.OS).
14
TABLE 3.
Average Concentration ofNitrate Nitrogen (N0
3-N) at Each Depth for Inside and
Outside Locations
1
Location
Farm
Inside
Outside
Depth
(ft.)
1
2
3
4
5
(ppm)
FarmA
425a
403a
153a
34a
7a
87a
FarmB
1
90a
65a
2
45a
57a
3
ha
45a
4
6a 9a
5
lOa
40a
FarmC
1
497a
18b
2
495a
3
431a
8b
4
185a
5
260a
1Means are the average of nine inside and three outside samples at each depth for farms A, B,
and C.
a,bMeans within arowandfarm withno common superscript differ significantly
(P
<
.05).
15
TABLE 4.
Average Concentration of Total Phosphorus
(P
2) at Each Depth for Inside
and
Outside Locations
1
Farm
Depth
Location
Inside
Outside
(ft.)
(ppm)
FarmA
1
108a
66a
2
44a
18a
3
39a
17a
4
14a
isa
5
36a 20a
FarmB
1
155a
2
51a
12a
3
61a
4
30a 17a
5
81a
FarmC
1
98a 64a
2 34a
77a
3
lOa
41a
4
ha
ba
5
29a
14a
1Means are the average of nine inside and three outside samples at each depth for farms A, B,
and C.
a,bMeans within arow andfarm withno common superscript differ significantly
(P
<
.0
5).
16
TABLE
5.
Average Concentration of Potassium (K) at Each Depth for Inside and Outside
Locations’
Farm
Depth
Location
Inside
Outside
(ft.)
(ppm)
FarmA
1
1645a
2
744a
3
217a
71a
4
52a 71a
5
lOla
54a
FarmB
1
2486a
2
1639a
3
563a
4
103a
31a
5
302a
27a
FarmC
92a
85a
57a
1
2203a
2
1157a
3
349a
4
75a
5
148a
1
Means are the average ofnine inside and three outside samples at each depth for farms A, B,
andC.
a,bMeans
within a row and farm with no common superscript differ significantly
(P
<
.05).
17
TABLE 6. Average SoilpH atEachDepth for Inside and Outside Locations
1
Location
Farm
Depth
Inside
Outside
(ft.)
(pH)
FarmA
1
6.3a
2
5.8a
3
5.8a
4
5.la
4.8a
5
5,la
5,la
FarmB
1
8.2a
2
79a
3
73a
4
6.2a
5
6.4a
5.2a
Farm C
1
6.2a
6.la
a
2
5.la
5.7
3
53b
6.3a
4
5.8a
5
49a
5.6a
1Means are the average ofnine inside and three outside samples at each depth for farms A, B,
and C.
a,bMeans within arowand farm withno common superscript differ significantly
(P
<
.05).
18
TABLE 7. Average PercentOrganic Matter (OM)of Soil at Each Depth for Inside and
Outside Locations’
Location
Farm
Inside
Outside
Depth
(ft.)
1
2
3
4
5
(%)
FarmA
1.7a
2.la
l.7a
l.2a
0.7a
0.6a
0.5a
0.5a
0.4a
FarmB
1
0.9a 1.Oa
2
1.6a
3
2.la
4
l.1a
5
0.8a
0.5a
FarmC
1
0.7a 1.5a
2
09b
l.8a
3
1.7a
4
0.4a 0.9a
5
0,4a
0.2a
1Means are theaverage ofnine inside and
three outside samples at each depth for farms
A, B,
andC.
a,bMeans within a row and farm with no common superscript differ significantly
(P
<
.0
5).
19
a)
(UO~ZE
~
Lr~
U
4-I
4-
a)
0
Co
0
V
‘I-I
Cu
C.)
II-
0)
U,
L.
o
II-
•0
0.
C.)
U,
1~
0
U,
0
E
E
0
C.)
0
4-’
0.
0
•0
C.)
Cu
0
4-’
U,
Cu
0
.0
00
I~L~
~cu
~U)
-ecu
Cu0
0
00
—
.
o~E
U)
000
4-14-I
~
Cu
0.0
~00
~.E~u
2
(U,
0Cu0
<N
Back to top
CU4-
L.O
(N0
L.
CU
0
-o
4-1
0
0
+
YE.
Back to top
0
0
00
00
0
0
00
0
0
If,0
If,
(N (N
‘-
t-
0
I-
If,
U
41
4-
a)
0
7
Co
(N
26’a
0
V
•1~
Cu
C.)
0)
U,
1~
a)
SI
II-
‘I-,
0.
C.)
U,
I-
a)
0.
U,
0
E
E
0
C.)
0
.6-I
a’-’
0.
a)
SO
C.)
Cu
a)
U,
Cu
a)
00
4-0
•CU
00
41
CU
Em
~CU
CU0
•
0O~
~CU0.
CU0CU
U)
0CU2
(U,
oo
2cU,~
OCU
LIU)
~
U—
LLCU(N
0
‘I-I
0
0
a)
41
0
•—
z
0
0 0
0
0
0
0 0
0
(N
YE
0
v
4-1
0
0
+
00
C0(D
C,,
o
o
0~
If)
U
‘I-I
‘I
-
4-I
a)
0
Co
(N
I0
0
V
4-’
Cu
C.)
0)
U,
L.
a)
SO
0.
C.)
U,
a)
0.
U,
0
E
E
0
C.)
0
4-’
45~
0.
a)
SO
C.)
Cu
a)
U,
Cu
a)
00
4-0
0CU
%LE
0
U)>
~CU
00
0.4-’
U)
0
L.
0CU
4-
0
“-1
4-1(U)
CUO
4-1
OCU
00.
oO
CU~
CU
~jU)
L.
0)~
S —
—
U-CU
u5
0
0.
E
CU
U)
0
“-1
0
0
CU
0
U)
S—
I~m
(N
Back to top
000
000
Back to top
q~.(N
‘- ‘- ‘-
Back to top
Cu
0
I-
—
—
‘-~
~
~
~0 c~
c~
I1-~
It) It)
It) It)
c~
c~ c~
c~
—
~t
~n
~
~
Li
-~
c~
00
~
00
~
Cl 00
~C ~O ~t
c~
—
0
‘~O
N
~
00
N
N
00
—
—
c~
—
Cl
.-
Cl
~
~r
0
0
0
0
0
-e
0
0
0
-o
0
0
-0
0
C.)
0
0
0
0
0
0
0
-0
0
0
0
0
0
0
-0
0
00
S
0
0
0
1-4
.4-i
0
0
0
0
1=
0
00
C.’
0
A~
0
it)
—
V
Qo
-oH
~
0
C.’)
0
0
—
ri)
CI) CI)
Ii
o
~
0
0
0
.5
~
.~ -~
~
c-I
~.
C~
-e
o
~
0
1~
0
0
~
~zi- C~
0
0
0
c,~
c~
C~
41-i
‘fl
•1-I
—
—
~—
—
r--
—
00
~
CO
CO
CO
—
—
—
0~
Cl
i—
~
~
r—
Li
CO
CO
Cl
m
N
—
—
~-4
z
x
i.0
~0
—
—
~-
00
—
,--4
—
CO CO
CO
N
00
~O
o
o
—
—
—
Q~
Lt)
~r)
It)
Cr) Cr)
Cr)
~—
—
I
I
—
CO
CO
CO
m
00
0
—
— —
z
It)
~r) ~
Cl Cl
—c-c
CO
CO
CO
N
kO
~
0
~
—
—
—
O~
Cr)
Cl
0
0~
it)
It)
—
~
Cr)
t~~-
—
I
I
—
0
.4-’
0
0
CI)
0
0
-0
CI)
,
N
0
0
CI)
‘- -,
0
0
I-
0
-0
CI)
I-
0
.4-’
0
0
0
1-4
0
CI)
0
0
-0
00
4-i
0
0
0
-0
C’)
0
0
0
0
0
0
4~I
0
I-
CI)
0
0
00
0
1-4
0
0
4-
0
4-
0
-0
0
0
C--
00
4-
0
,.-~
-~
It)
4-
0
CI)
-~
0
S
•S
I~
I-
0
0
0
•~
—
0
~)
00
0
00
-0
~
0
0
0
0
•~ •~
00
C.
—-0
0
c~
•-~
0
C~
1-~
00
0
~
-~
0
OLi
Cr)
~
I
I
—
~
—
It)
0
0
00
0
4-i
0
0
4-i
0
0
4-I
0
0
0
0
00
0
C
4-
0
0
0
bfl
1~4
0
H
0
,—~
~
Cl
;-
-0
0
~
-0
~
.4-i
4-1
0
C—
.4~I
~
-0
•~
0
CI)
00
—
0
00
1-4
0
0
5—
c~
0
00
~
0
0
•=
o
00
0
0
00
~
0
0
—
-~
00
4-i
0
4~I
0
0
4-
0
0
j
TABLE 10. Average Permeability of Soils at EachDepth for BothLocations for all Farms’
Depth
Location
Inside
Outside
(in)
1-3 “
2.07x iO~6a
(cmlsec)
6.31 x
5-7”
1.51x10
6a
5.57x10⁴b
9-11”
7.40x iO~6a
139
10-5a
1Mean permeability values are the average ofnine inside
and six outside samples for each
depth for all three
farms averaged together.
For each individual value that makes up the
average value coresamples were flushed withwater three times, and the average permeability
value was calculated. Two coresamples were lost inthe laboratory analysis: 1) farm A, 9-11”
depth, inside; and 2) farmB, 5-7” depth, outside.
Statistical analysis wascomputed on the log
ofthe permeability values then transformed back to the original values.
a,bMeans within arow withno common superscript differ
significantly
(P
<
.05).
25