BEFORE THE
IN THE MATTER OF:
GROUNDWATER QUALITY
STANDARDS AMENDMENTS:
35
ILL.
ADM. CODE 620
Testimony of Craig Curtis. J.D..
PhD.
Craia Curtis hereby Drefiles the attached
TESTIMONY
DATED:
March 6, 2001
Department ofPolitical
Science
Bradley University
1501
WestBradley Avenue
Peoria,
IL
61625
309/677-2492
RECEIVED
BOASb5RKS
OFFJCE
MAR
12
20Q1
STATE OF IWNOIS
Pollution Control Board
)
)
)
)
)
RO 1-14
(RulemakingWater)
TESTIMONY OF CRAIG CURTIS, J,D., Ph.D. FOR TIlEPROPOSED MTBE
GROUNDWATER QUALITY STANDARDS
RO 1-14
INTRODUCTION
My name is Craig Curtis and I am an AssociateProfessor ofPolitical Science at Bradley
University.
Together with my research assistant, C.
J. Neu,
an undergraduate student atBradley
University, I amconducting exploratory research into the rulemaking process in the state of
illinois.
As a part ofour research, we attended the March
1
hearing on PROPOSED MTBE
GROUNDWATERQUALITY STANDARDS, R01-14,
in Springfield, Illinois, at theillinois
Pollution Control Board Hearing Room
at 600
S. 2~Street.
During the course ofthat hearing, I had occasionto aska question concerning the lack of
findings ofcontamination ofCommunity Water Supplies
(“CWS”) in Madison County, illinois.
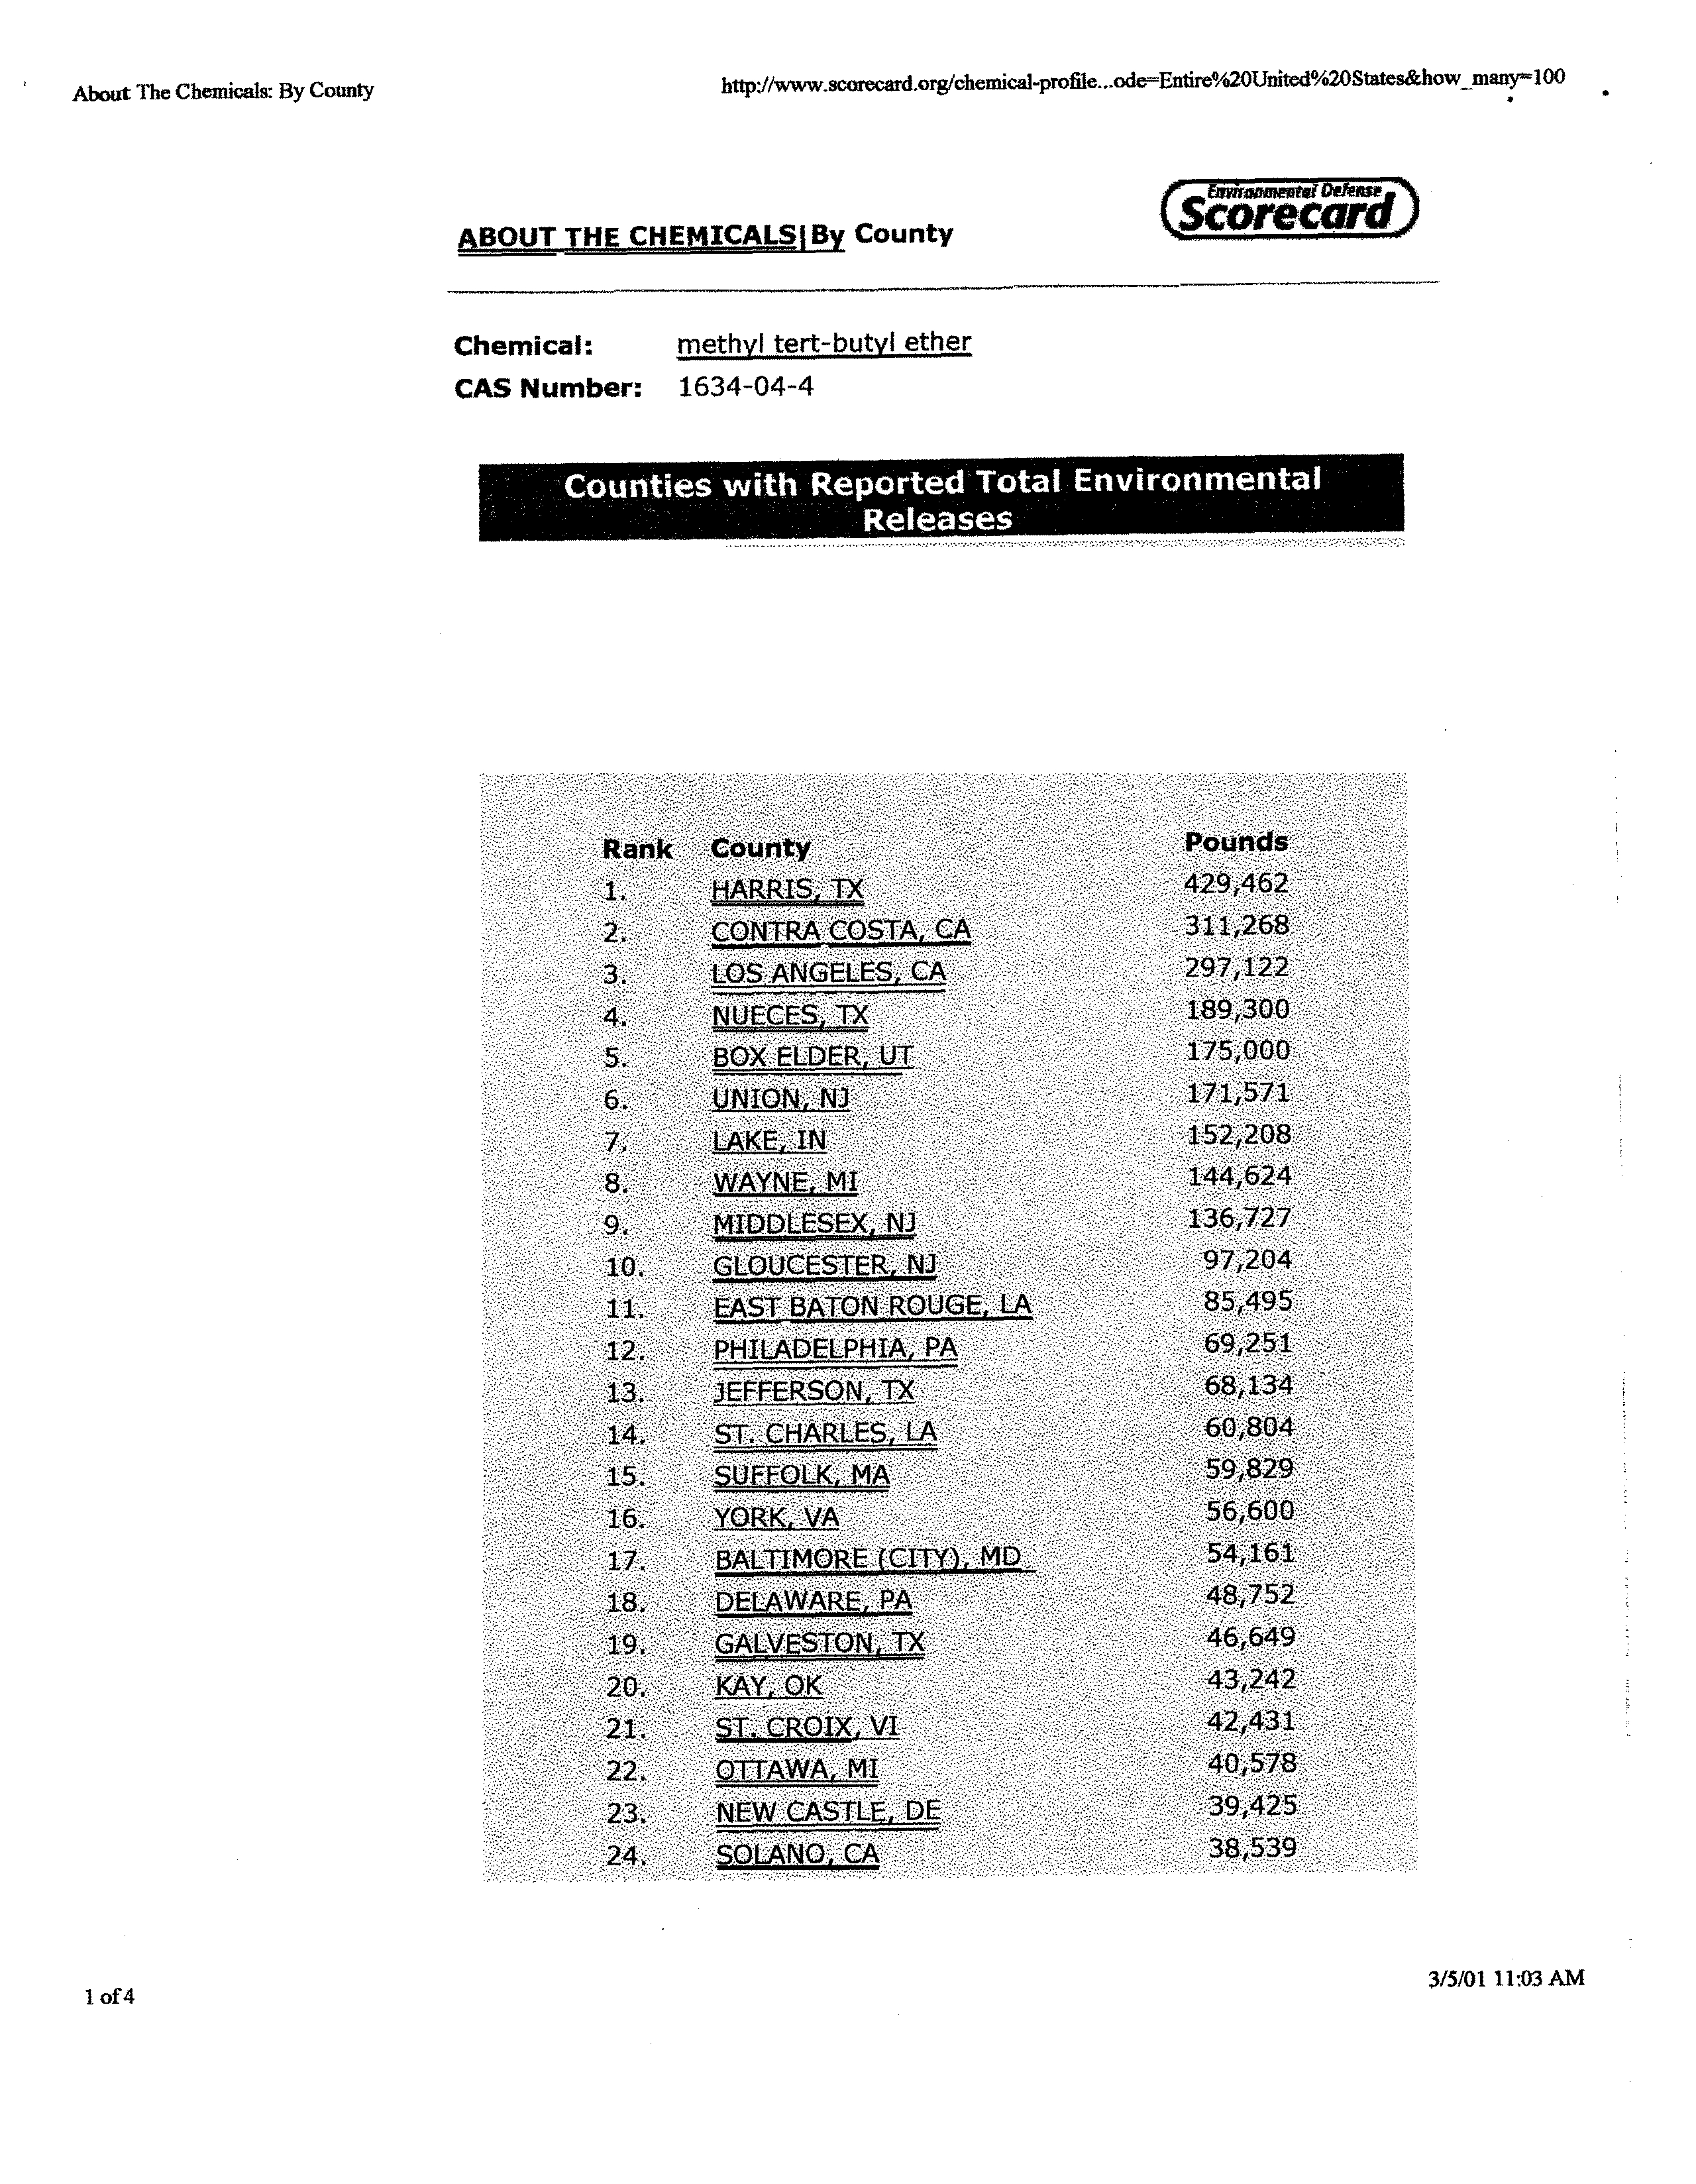
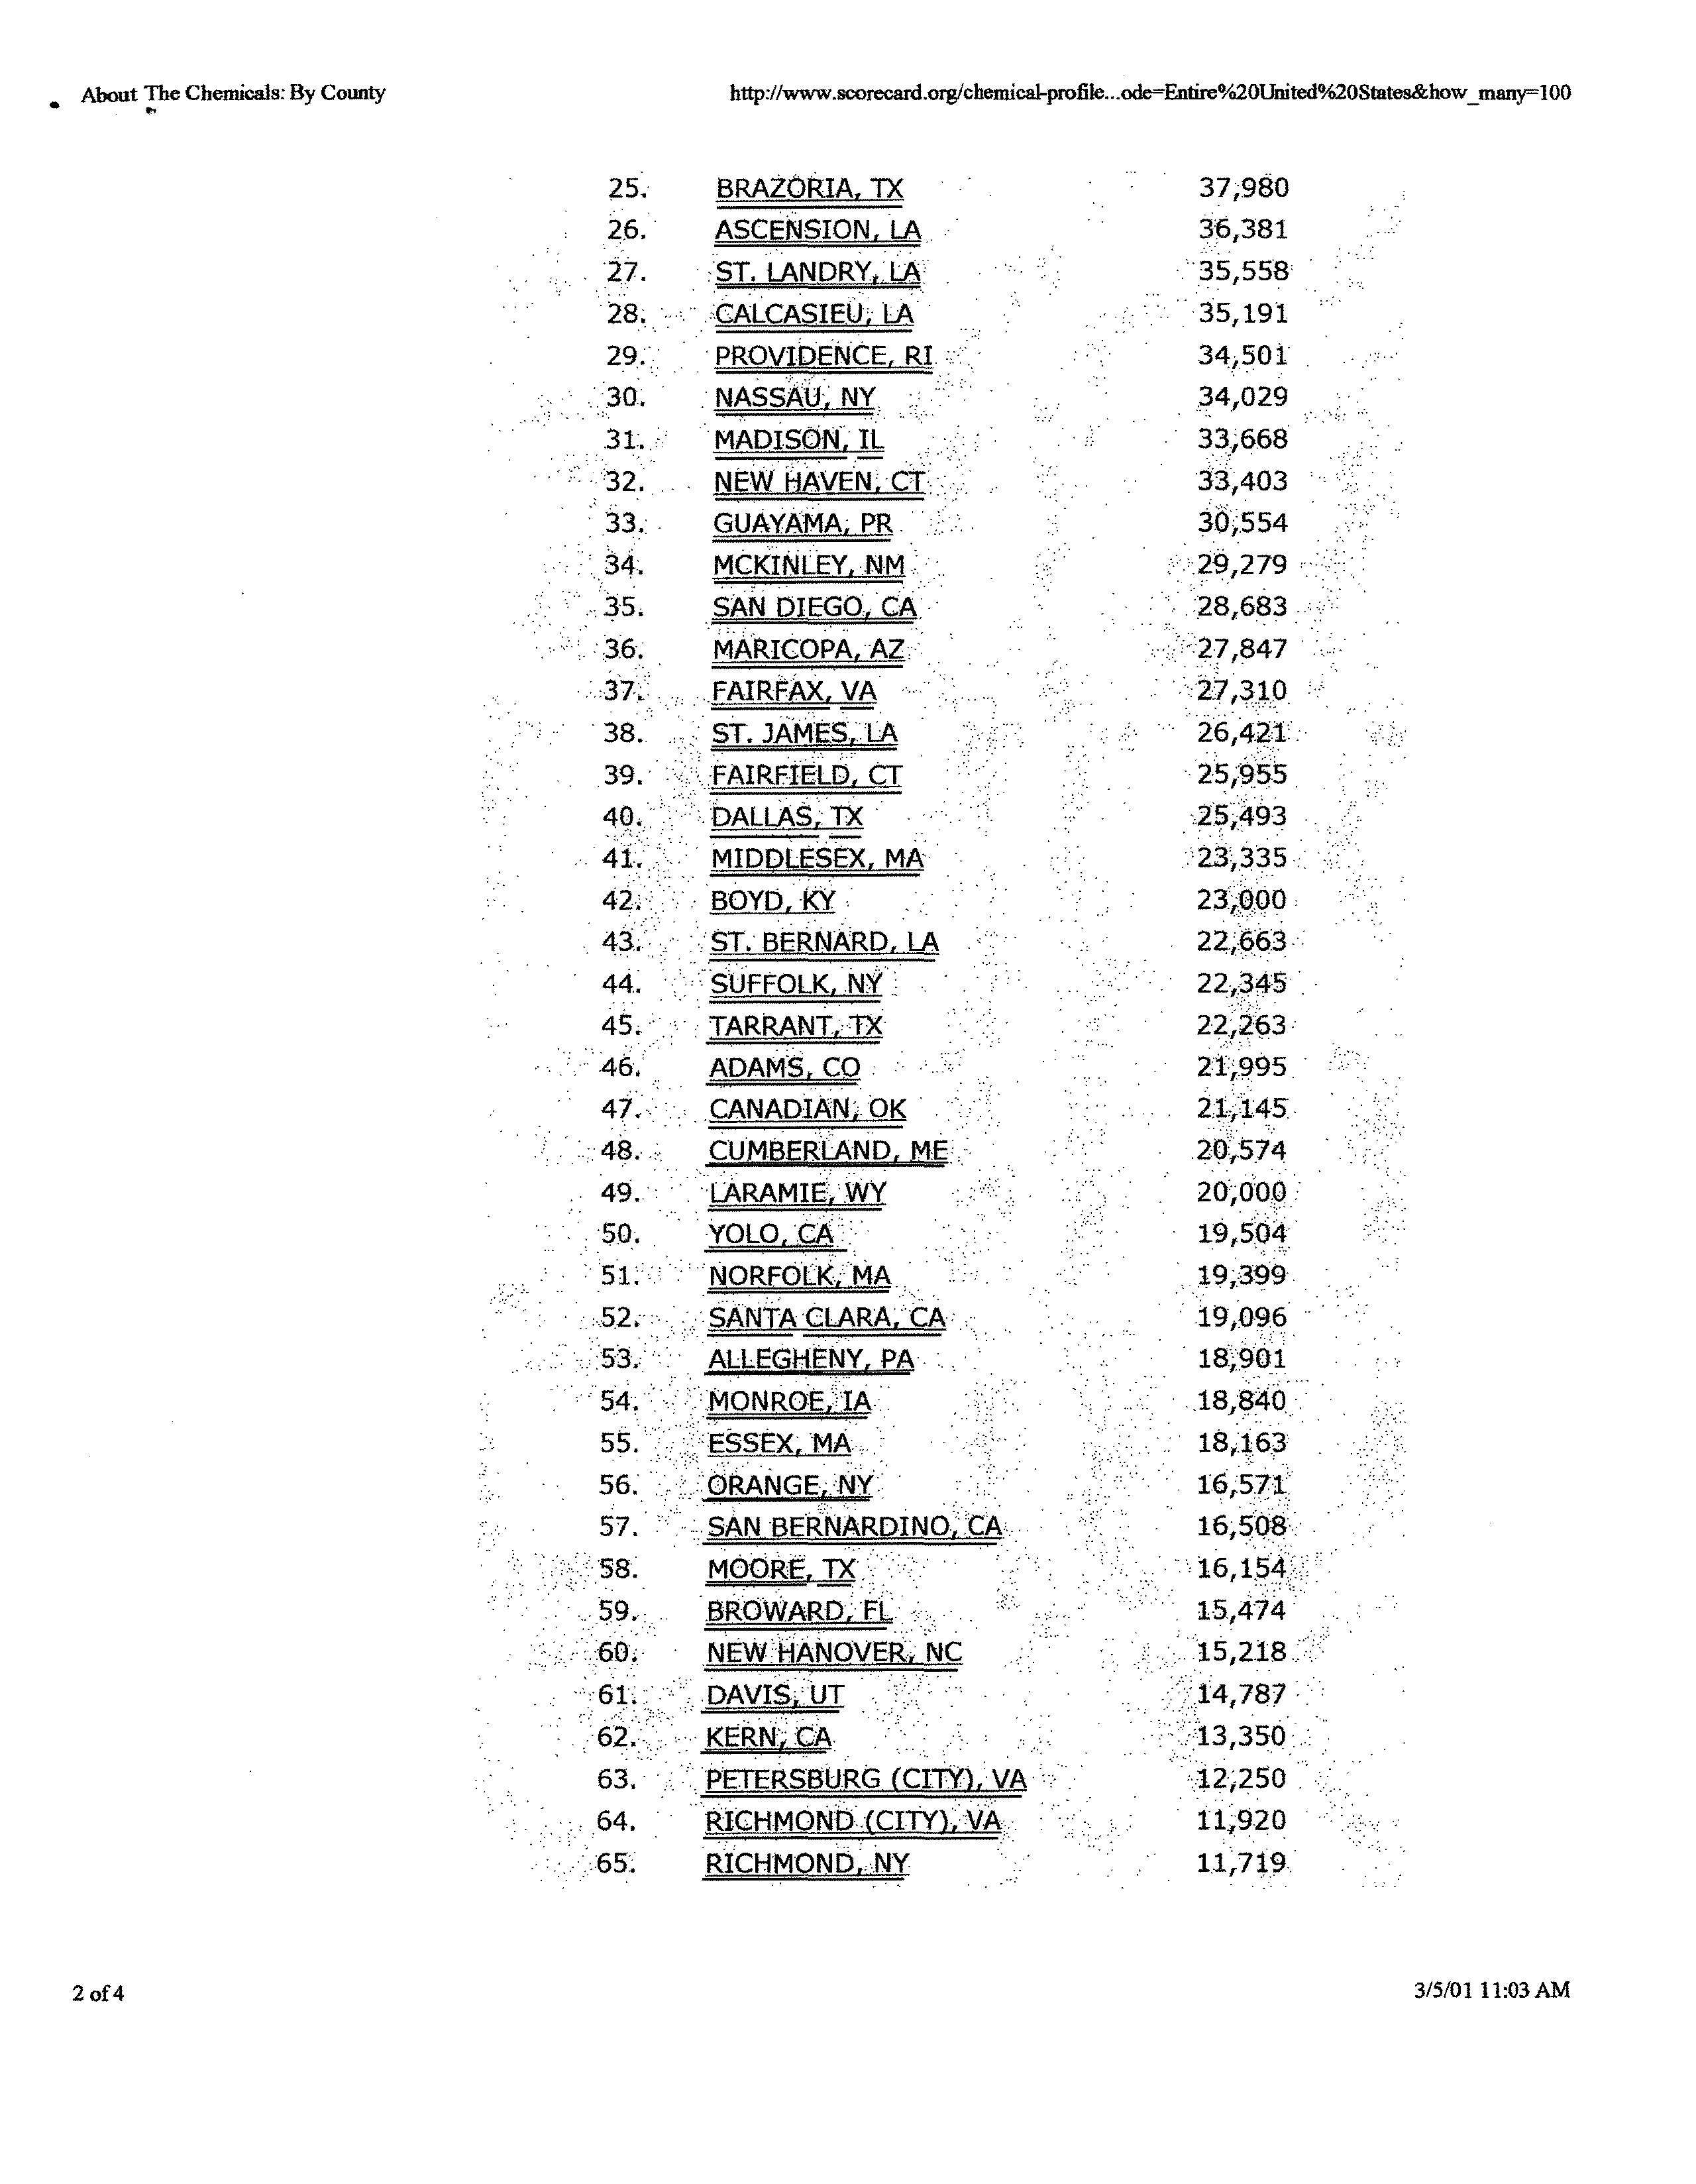
I had obtained information from a World Wide Web site called “Scorecard”
(http://www.scorecard.org/.) that indicated releases ofMTBE into the environment in that county
were much largerthan any otherillinois county.
Despite thesereleases, the testimony ofRichard
P. Cobb, P.G., ofthe illinois Environmental Protection Agency indicatedthat only two sites in
Madison County had been affected by MTBE contamination.
These were Bethalto CWS and E.
Alton CWS.
The answers provided by Mr. Cobb made it very clear that he was not aware ofthese data.
I was
asked to file testimony containingthe data, and do so heretoday.
BRIEF EXPLANATION OF THE DATA SOURCE
The data on releases ofMTBE were obtained during a searchof the World Wide Web.
We
began with the US Environmental Protection Agency (“US EPA”) web site in Fall of2000 (I am
not sure ofthe exact date).
That site, at that time,
contained a link to the “Scorecard” site, which
C.
J. and I followed.
The attached documents are printouts ofweb pages from “Scorecard.”
According to the authors of “Scorecard” their charts are derived from the Toxics Release
Inventory (“TRF’) database collected and maintained by the US EPA.
Although the“Scorecard”
site is not explicit about this point, one is led to believe that the data from which the charts were
compiled are the 1998 TRI reports.
I have included two charts:
1) the first lists the nine Illinois counties with reported releases of
MTBE; and, 2) the second lists the 100 counties in the United States with the most reported
releases ofMTBE.
As one can see, three Illinois counties, Madison,
St. Clair and Cook, appear
on the list ofthe 100 counties with the largest releases ofMTBE.
Page
1 of 1
Attachment I:
Counties with Reported Total Environmental Releases ofMTBE in Illinois
(1
page).
About
The
ChemicaI~
By County
http//www.scorecard.org/chemical-pmfile.
L~t0_C~d~17
E~vk~tifDth~
ABOUT
THE CHEMICALS IBy County
Scorecard
Chemical;
methyl tert-butyl ether
CAS Number:
1634-04-4
Counties with
Reported Total
Environmental
Releases
Ranked
by
(select
your
rankinq
criteria)
Total environmental
release
F:
J~GO
~explain~
Rank
County
Pounds
1.
________
33,668
2.
~
JR
9,905
3.
COOK
6,483
4.
•~OONE
1,386
5.
DUP~GE
1,000
6.
LAKE
500
7.
MCLEAN
340
8.
cw~PRP
109
9.
WILL
5
:~
2300
Environmental
Defense
and
LocusPocus
EmaU
cuesticns regarding
the
data
or
~owto
use
this
inforriation tq prot~F~~.enyirorirnent.
I of
1
3/5/01
11:01AM
Attachment II:
Counties with Reported Total Environmental Releases ofMTBE, nationwide,
ranked, the 100 counties with the
most releases are charted (4 pages).
About
The Cheinienis: By County
f
EavwenmEnt,t
UeNftU
ABOUT THE CHEMICALS! By County
t_SwdJ
Chemical:
methyl tert-butvl ether
CAS Number:
1634-04-4
Counties
with
Reported Total
Environmental
Releases
Rank
County
Pounds
1.
HARRIS, TX
429,462
2.
cONTRAcOSTA,~A
311,268
3.
LOS
ANGELES, ~A
797,122
4.
~
189,300
5.
~
175,000
6.
UNION,
NJ
171,571
7.
LAKE1.
IN
152,208
8.
WAYNE.
MI
144,624
9.
MIDDLESEX1NJ
136,727
10.
GLOUcESTER,J~
97,204
11.
EASI BATON
ROUGE,
LA
85,495
12.
PHILAD1~I?A,
69,251
13.
~
68,134
14.
ST.CRLES,.LA
60,804
15.
Si El
L~L.M~
59,829
1.
YQ~!~/i~
56,600
17.
BALTIpcw~h~
54,161
18.
DELAWARE,
PA
48,752
19.
GALVESTON, TX
46,649
20.
I~i,.Qiç
43,242
21.
ST.
cROIX,yI
42,431
22.
QTP.,W~L.MI
40,578
23.
WcASTLE,
DE
39,425
24.
SOLANO.
CA
38,539
I of4
3/5101
11:03AM
25.
BRAZORIA. TX
2~.
ASCENSION,
LA
27.
ST.
LANDRYEiA
2&•.
~cALcAS1EU,LA
29.:
PROvI.bENCE,
RI.
NASSAU;
NY
.
3~,.
MADISON. ~
32.
.
NEW
HAVEN. ~:1:..
33.:.
GUAYAMA,
PR.
~4.
MCK1N~Y~M
.1
SAN DIEGO~
cA,
36.
MAR1COPA,AZ.
.FAIRFAX,VA
....
38
ST.
JAMES..
LA
‘~
39.
.
.1~FAIRFfELD,
cr
4Q~:.’bALLASr1~
41..
.
.
MIDDLESEX,
MA’
42.
BOY~~
43~
.
ST;
BERNARD,
LA
SIJFFOLK,NY
45
~
TARRANT. ~
46~
.
ADAMS,CO
.
4?~:~
.CANADIAN~.OK
48
CUMBER
AND,
~
.LARAMIE,.WY
50
YOLO
CA
51
NORFOLK
MA
52~.
...
~ANTACLARA.’CA•
53;’
ALLEGHENY, PA
:54..
“•..:
..,1~oNRoE;1IA.
55
ESSEX
MA
56
ORANGE
NY
57.
.
:.5~
BERNARDINO,1CA.
58.
59.
____________
60.
___________
6L
.:
~,
DAVIS..
UT
KERN,
cA.
37,980
36,381
.35,558
35,191
34,50i
.34,029
.
33,668
•33’ 403
:30,554
29,279
.28,683
2~,310
264.21.
25,955
.
.25,493
:23,335
23.,~.O0
22;663
22,345
22,263
2I~995.
21,1:45
20,574
20,00.0
19504
19,399
19,096
18.;901
18,163
1,•
I6~5.7~
16&.
15,474
i5,2.I~L.
.:;~3,35o...
.12;250
11~920
11,719
2 of4
3/5/01
11:03AM
About The Chemicals: By County
http://www,scad.org/chemical-profiIe...odeEntire20United20States&howman~100
MOORE,JTX’
,~
BRO:WARD;.’FL..
NEW
HAN
OVEL
NC
64.
.65,
63.
:
PETERSBURG
(Cli?). VA
RICHMoND
.(Cfl-Y).~
vA
RICHMOND;NY
About The Chemicals: By
County
http://ww~scorecardmg/chomical.profile...ode.=Entife20United20States&howmamp1oo
66.
67.
68.
69~..
70
71..
72.
73.
.74.
75.
.76.
77..
78.
‘79.
80.
.81.
82.
83.
84.
85.
86.
87..
88.
89.
90.
91.
92;.
93..
94.
95.
96.:.
97.
98.
99.
100..
BREVARD,
FL
HAMPOEN,
MA
‘:~pj.,~
JOAOUtN.,:~CA
CHESAPEAKE
(CITY)’,
VA
ESSEX.N3.
ST.
CLAIR,
IL
CAMDEN
‘NJ
‘~EFF SO”
EL’:PASO,
CO.
‘
OUAY~NM
BEAVER.
OK
::‘
DALLAM. iX:
ERIE
NY
MONROE,
NY.
CH~ES1ER,PA
kINGS; NY.’:
.NYE.NV
SUMMtT,OH..
BERKS.
PA’
.
FAIRFAX (Cr).
VA
MONROE. MI
‘H~”
.ELPASO. TX
H
YELLOWSTONE.
MT
SACR\r4ENIO,
CA
CF-IEMUNG.’NY
ANNE
ARUNDEL. MD:
COOK~
IL::’
JON~S...TX
ALLEN
.:
OH
LEHIGH.;
PA
M.ERCER, N)
‘,
PRINCE
WILUAM
~Th’
BER.NAULLO,NM:
:GUILFORD....NC
...
11,000
10,714
10,548
10,423
‘10,354~
‘9,905
9,796
.~66s
9,205
‘H
9;20.5
9,205
9,205
~8,942
8,933
8,774’
8,450::
8,357’
7,553’
7,391
7,247
‘~815
.6,800
6,705..
6,569~
6,5O4’.,.
6,483:’:,
6,090
6,0061:
5,400
5,299..
5,150,1.:,.
5,105’
4,736
3 of4
©
2000
Environmental
Defense and
LocusPocus
Email questions
regarding
the data
or
how to
use this
information to protect the environment.
3/5/01
11:03 AM


