BEFORE THE
ILLINOIS POLLUTION CONTROL BOARD
AMEREN ENERGY GENERATING
COMPANY,
v.
ILLINOIS
ENVIRONMENTAL
PROTECTION AGENCY
Petitioner,
)
)
)
)
)
)
)
)
)
)
Respondent. )
PCB 2009-038
(Thermal Demonstration)
PRE-FILED TESTIMONY OF ANN B. SHORTELLE, PH.D.
A.
BACKGROUND AND QUALIFICATIONS
1.
My name is Ann B. Shortelle, Ph.D. I am a Chief Scientist with MACTEC
Engineering and Consulting, Inc. ("MACTEC"). I have a Bachelor
of Science degree in biology
from Mercer University and a Doctorate degree in limnology from the University
of Notre
Dame.
2.
I have 24 years
of professional experience in limnology and lake and reservoir
management, including surface water quality monitoring and analysis.
My Curriculum Vitae is
attached hereto as Attachment
1.
B.
TESTIMONY
1.
In May 2009, Ameren Energy Generating Company ("Ameren") engaged
MACTEC to prepare a report on the conditions
of Coffeen Lake with regard to phosphorus and
mercury. MACTEC evaluated the conditions in Coffeen Lake and the potential for impacts on
phosphorus and mercury cycling from
Ameren's proposed modification to the current site-
specific thermal standards. The report is entitled "Evaluation
of Effects of Revised Thermal
Electronic Filing - Received, Clerk's Office, May 12, 2009
Standards on Phosphorus and Mercury Cycling in Coffeen Lake" and is provided as Attachment
2. I incorporate the evaluation as if fully set forth herein.
2.
Our report concludes that significant increases in phosphorus loading or mercury
methylation over current lake conditions will not result from higher thermal limits in May and
October under Ameren's proposed modification. In addition, our evaluation indicates that there
is no "dead zone" within Coffeen Lake. Below is a brief summary
of the report's conclusions.
Impact
on Phosphorus
3.
MACTEC evaluated whether prolonged stratification from an increase in water
temperature would result in an increase in phosphorus in Coffeen Lake. Internal phosphorus
release from sediments can serve
as a source of phosphorus in lakes. Seasonal stratification
within the water column
of a lake results in the development of an epilimnion (surface water)
and hypolimnion (bottom water). Seasonal stratification can also result in anoxic conditions in
the lower portions
of the hypolimnion and can promote the dissolution and release of sediment-
bound phosphorus. However, the mere presence
of thermal stratification does not indicate that
significant internal loading will occur. Thermal stratification without anoxia produces no more
phosphorus release from sediments than an unstratified lake. Thermal stratification with anoxia
present over a portion
of the bottom, may result in some phosphorus release from the sediments
into the hypolimnion, but not in quantities sufficient to reach the epilimnion and promote algal
blooms.
4.
Further, water quality measurements within Coffeen Lake indicate that internal
phosphorus loading is not currently contributing appreciable amounts
of total phosphorus to the
epilimnion in Coffeen Lake. Oxygenated hypolimnetic and epilimnetic waters were determined
to always be present over the deeper anoxic waters, significantly limiting internal phosphorus
2
loading. Thus, no observable effect from internal phosphorus loading was observed at Coffeen
Lake.
5.
MACTEC also reviewed the results of Illinois Environmental Protection
Agency's ("Agency") 2007 BATHTUB model used to develop the total maximum daily load
("TMDL") for phosphorus for Coffeen Lake. The Agency's model concluded that internal
phosphorus loading dominates Coffeen Lake.
We believe that significant modeling errors and
misapplications produced a model run that did not match known lake phosphorus concentrations
Thus, the Agency's model increased the amount
of internal phosphorus loading in Coffeen Lake
than is otherwise supported by available monitoring data.
6.
An increase in thermal limits in May and October is unlikely to result in
additional phosphorus loads from sediment release. MACTEC analyzed the potential impacts on
phosphorus loading with the increase in thermal limits in May and October in accordance with
Ameren's proposed modification. Results
of the analysis indicate that the anticipated additional
phosphorus load from the proposed modification is much lower than predicted from the
BATHTUB modeling completed by the Agency for the TMDL. Our analysis shows that any
potential sediment phosphorus release is not mixing into the epilimnion where it would be
available for algal production which could potentially degrade water quality within Coffeen
Lake. Our evaluation concludes that sediment phosphorus release is not a significant component
of total phosphorus concentrations in Coffeen Lake surface water. Rather other phosphorus
loading factors, specifically external phosphorus loading from the surrounding watershed, are
more important factors in water quality within Coffeen Lake.
3
Impact on Mercury
7.
MACTEC also evaluated whether mercury methylation is likely to increase in
Coffeen Lake as a result
of thermal stratification from Ameren' s proposed modification to its
thermal limits. Methylmercury is more readily absorbed into the tissue
of aquatic organisms and
tends to bioaccumulate in aquatic systems. Mercury methylation is affected by multiple
parameters and is not based solely on thermal stratification.
8.
The current fish consumption advisory for Coffeen Lake is based on two
largemouth bass fish samples with mercury concentrations exceeding the Agency's designated
level
of concern. Mercury concentrations in largemouth bass in Coffeen Lake are lower than the
average largemouth bass tissue concentration in Montgomery County and nearly half the level
of
the Illinois Counties average.
9.
Our review of available data indicated that mercury concentrations appear
generally low in Coffeen Lake. In addition, conditions
do not appear favorable for the
methylation
of mercury. Ameren's proposed modification in May and October will not change
lake conditions, apart from potentially lengthening the period
of thermal stratification for a few
days on average, annually. The minor lengthening
of the period of thermal stratification will not
significantly increase hypolimnetic mercury methylation rates, and will not result in increased
mercury in the biota.
10.
In addition, Illinois regulations controlling the release of atmospheric mercury
from electric generating facilities is expected to reduce the amount
of mercury deposited in
Illinois water bodies.
It
is anticipated that fish tissue concentrations will measurably decline as a
result
of the reduction in mercury loading into Illinois water bodies from reductions in
atmospheric mercury deposition.
4
Attachment 1
5
AnnB. ShorteHe, PhD
Lhnnologist
Years of Experience: 24
Education:
• PhD, Limnology, 1985, University of Notre Dame
• BS, Biology, 1975, Mercer University
Dr. Shortelle has
24 years of professional experience in limnology, lake and reservoir management,
surface water modeling, (WASP, Bathtub, SWMM) and environmental assessments. She has managed
numerous lake and reservoir, riverine, estuarine, and wetland assessments related to eutrophication, acid
deposition, toxic effluents, biomonitoring, siting and licensing, mitigation planning, and natural resource
damage assessment. She has managed and conducted field and laboratory bioaccumulation studies and
bioassays, and has developed and verified bioaccumulation models for contaminants
in riverine systems.
Dr. Shortelle
is an experienced leader in surface water quality monitoring and analysis and has served as
an expert witness. She has experience working with both MFLs and TMDLs.
Dr. Shortelle
is currently serving on the North American Lake Management Society Board of Directors
and served on the policy advisory committee to FDEP for designated use and classification refinement for
surface waters.
Representative Experience
Feasibility Study
and Implementation of Restoration of Taum Sauk Reservoir and Associated
Black River and Tributaries, Project Principal - Initiated field and benchscale studies following an
upper reservoir dam break to determine feasible methods for reservoir and downstream restoration based
upon hydraulic calculations and field/ laboratory results. The resulting application allows for the
immediate drawdown
of the reservoir under continuously monitored conditions to prevent further
environmental damage and allow for the initiation
of restoration projects.
Taum Sauk Alum Injection Systems, AmerenUE, Project Principal- As part of the restoration of the
Taum Sauk Reservoir, oversaw the selection
of a water quality treatment, design, installation and
operation
of a system to remove turbidity in the Black River. Due to the regulatory requirements of no
environmental impacts, liquid alum was chosen to treat the water. System parameters included creating a
system with a backup to maintain river flow downstream while the flocculated fines were cleaned from
the holding area. The system included design
of a pumping system for regulated injection and line
cleansing, ease
of access for monitoring and system adjustments and dual detention areas with access for
cleaning.
City of Maitland Stormwater / Lakes Management Plan, FL, Project Manager - MACTEC updated
this central Florida City's plan to enhance water quality
in the City's 22 named lakes, including Impaired
Waters requiring TMDLs. MACTEC estimated loadings from nine urban land uses to more than 250 sub
basins and outfalls contributing runoff to these lakes, incorporating the effects
of in place BMPs, and
evaluated potential nutrient loading reductions achievable with alternative additional BMPs. MACTEC
characterized the status and trends
of water quality in all the lakes, and estimated the water quality
benefits and costs associated with more than 500 potential BMPs.
Wekiva River and Floridan Aquifer Nitrate Sourcing Study, St. Johns River Water Management
District (SJRWMD), Principal Scientist - The Wekiva is a spring-fed river with seven 2
nd
magnitude
springs that have elevated levels
of nitrate. Its basin has relatively low population density including large
natural areas and encroaching development. SJR WMD has been tasked by FDEP to develop an estimate
of the sources of nitrate to ground and surface waters in the Wekiva basin, and develop preliminary load
reduction strategies. MACTEC is responsible for the development
of basin-wide nitrate loading estimates
to groundwater and surface water. Source types that will be evaluated include municipal and industrial
wastewater (point sources), septic tanks, storm water runoff, fertilizer use (agricultural, residential, golf
Page
1
0/6
Ann B. Shortelle, PhD
courses), and atmospheric deposition. Nitrate loads will be partitioned by source types and by land use.
Responsibilities include nitrate loading modeling and budgets.
City of Lakeland, Southwestern Basin of Lake Parker: BMP Alternatives Analysis, FL, Project
Manager - This project's objective is to provide engineering services to determine Lake Parker Water
Quality Improvement Project Best Management Practice (BMP) Identification, Selection, and Ranking
for the Southwestern Basin
of Lake Parker, an impaired waterbody. Tasks include water quality and
hydraulic modeling, nutrient loading estimates, and estimates
of BMP nutrient reductions, prioritization
of BMPs, conceptual design, and recommendations. Phase II includes design, permitting, and
construction management.
Hydraulic and Wetlands Restoration Projects, Pithlachascotee River Wetland Restoration Project,
SWFWMD,
Project Manager - MACTEC is developing the wetland restoration and FDOT mitigation
plans for three areas
of the Pithlachascotee River. This effort will restore hydraulic functions, wetland
functional values, wildlife habitat restoration,
as well as provide mitigation acreage and UMAM is being
used to provide "lift" documentation. Dr. Shortelle
is responsible for the engineering and environmental
monitoring analyses, design, permitting and construction services to accomplish the objectives for the
sites.
Hydraulic and Wetlands Restoration Projects, Serenova Preserve Pond and Associated Wetland
Restoration
Project, SWFWMD, Project Manager - MACTEC is developing the wetland restoration
and FDOT mitigation plans for a pond with associated wetland strands and sloughs at the Serenova
Preserve. Historic modifications
of the pond and drainage of the wetlands have altered site hydrology, and
severely impacted the wetlands. This effort will restore hydraulic functions, wetland functional values,
wildlife habitat restoration, as well as provide mitigation acreage and UWMAM
is being used to provide
"lift" documentation. Dr. Shortelle
is responsible for the engineering and environmental monitoring
analyses, design, permitting and construction services to accomplish the objectives for the sites.
Assessment of Nutrient Management Alternatives, SN Knight North, SJRWMD, FL, Project
Manager - Managing the completion of the data evaluation and review tasks for a series of lab and field
experiments to evaluate the efficacy
of various compounds for possible wide-scale use is a nutrient
management program, to include benthic invertebrate sampling and processing. Field work includes
collection
of water quality data, in situ water quality monitoring and collection of water sample.
Upper Shingle Creek Basin and Western Boggy Creek Basin Water Quality Assessment, Modeling
and Planning, Orange County, FL, Project Manager - MACTEC is developing a nutrient loading and
reduction evaluation for the management and protection
of the Upper Shingle and Western Boggy Creek
Basins. Responsibilities include monitoring and analysis
of significant pollutant inputs in to the surface
and groundwater; revision
of watershed and basin delineations; development of hydrologic and nutrient
budgets; development
of nutrient limitation water quality models; development of alternatives for water
quality improvements.
Seminole Reservation Non-point Source Management Plan, Chief Scientist - MACTEC is revising
the Seminole Reservation Non-point Source Management Plan. This plan includes identifying data gaps,
preparation
of water quality models and comparison to the Tribes Water Quality Code and the Water
Quality Guidelines. Watershed basins and land use were obtained and field verified for use
in the
modeling
of the seven reservations. The water quality models were prepared for each watershed within
the reservation to identify areas
of concern. Recommendations for filling the data gaps within the existing
sampling plan were outlined and new sample points were identified. The list
of recommended BMP's
focused on potential water quality per land use type was revised. The revised Plan focuses specifically on
each area to provide straight forward and cost effective BMP recommendations. Recommendations
in the
Plan also contain ranking BMP projects for implementation, which include cost opinions, schedules, and
community education associated with the BMP.
Seminole Reservation Numeric Nutrient Criteria Development Plan Central and South Florida,
Project
Manager - MACTEC is revising the Seminole Reservation Numeric Nutrient Criteria
Development Plan. Duties include assisting the Tribe with task by analyzing existing and newly collected
Page2of6
Ann B. Shortelle, PhD
data for trends; utilizing statistical analysis between parameters such as total phosphorus, total nitrogen,
chlorophyll
a, total Suspended Solids, and trophic state index. Criteria will be developed to support each
of the waterbodies' designated use classifications within the respective reservations. Recommendations
will be made to the Tribe
in order to meet the EPA requirements.
Lake Conine Watershed Restoration and Stormwater Treatment Project, Principal - Modeled and
designed and permit the South Lake Conine Watershed Restoration Project on a city-owned, 34 acre,
vacant, lakefront parcel. This project includes design
of a regional stormwater pond, and storm water
treatment train to finish with a polishing wetland before cleaner water is discharged to Lake Conine, an
impaired waterbody with a nutrient TMDL. The design also specifically optimizes nutrient load
reductions to improve water quality
in the lake, and satisfy TMDL load reduction targets. MACTEC will
also provide the City with bidding services, construction services and post construction water quality
monitoring.
Limnological
I
Nutrient Investigations, Neponset Reservoir. Technical Expert - Field monitoring and
statistical analyses to evaluate whether or not phosphorus
in the reservoir sediments are above
background. Additionally, analyses were conducted to evaluate the effects
of metals and other
constituents present
in the sediments on ecological receptors. Analyses included bulk sediment and pore
water sampling,
SEMI
A VS evaluations, sediment toxicity testing, ecological risk assessment,
comparisons to other waterbodies, and nutrient loading modeling.
SFWMD Biscayne Bay Coastal Wetlands
I
Basin Restoration, FL, Project Director - Multiple site
project involving site assessments
of thousands of acres in southeast Florida that are part of the
Comprehensive Everglades Restoration Project land acquisition program. Assessments have been
performed on over
45 sites where recognized environmental concerns were noted. Dr. Shortelle is
currently directing basin wide ecological risk assessments on several parcels formerly used for
agricultural purposes
in order to determine potential impacts of pesticides and metals to aquatic organisms
and birds after the lands are re-flooded. These assessments include consultations with USFWS and
SFWMD personnel to ensure compliance with ESA and NEP
A. Remedial recommendations and remedial
costs are provided to the SFWMD to assist
in the acquisition negotiations and planning.
North Shore Restoration Area Feasibility Study SJRWMD, Lake Apopka, FL, Principal Scientist -
Responsible for technical quality and completeness of the feasibility study evaluating alternatives to
restore the NSRA
of Lake Apopka to functioning wetlands. This project focuses on technologies that may
used to mitigate the adverse impacts associated with organochlorine pesticide residues
in surficial muck
soils necessary to accomplish the restoration
of these wetlands.
Water Quality, Hydraulics, and Aquatic Biology; Pee Dee River Electrical Generating Station,
Santee Cooper,
Project Principal- MACTEC was retained by Santee Cooper to review and research a
number
of environmental topics that were needed to update an environmental assessment for a proposed
power plant located on the tidally influenced Pee Dee River. Responsibilities included surface water
assessment, which specifically dealt with establishing a baseline for surface water and sediment quality,
hydraulic and hydrologic conditions, and aquatic biota conditions. Modeling included the potential for a
dissolved oxygen sag, salinity gradient and new plant influence on the baseline salinity regime, and
mercury fate and transport.
Ocklawaha River Basin and Emeralda Marsh Nutrient Control Studies, SJRWMD, Eureka, Ocala
Areas, FL,
Project Manager - Nutrient control and floc distribution studies (including alternative
treatments for restoration
of wetlands) within Ocklawaha River Basin near Sunnyhill Farms and
Ocklawaha Prairie (wetlands), and
in Emeralda Marsh Conservation Area. Responsible as Contract
Manager and Supervising Limnologist for evaluations
of restoration alternatives, such as restoring natural
wetland hydrology to sites including Ocklawaha Prairie, Sunnyhill Long Farm, Eustis Muck Farm and
in
Emeralda Marsh Conservation Area. Sampling and analyses conducted to evaluate potential impacts to
Trustee species from restoration implementation.
Assessment of Nutrient Management Alternatives, SN Knight North, SJRWMD, FL, Project
Manager - Managing the completion of the data evaluation and review tasks for a series of lab and field
experiments to evaluate the efficacy
of various compounds for possible wide-scale use is a nutrient
Page
3
0/6
Ann B. Shortelle, PhD
management program, to include benthic invertebrate sampling and processing. Field work includes
collection
of water quality data, in situ water quality monitoring and collection of water sample.
North Shore Restoration Area Feasibility Study SJRWMD, Lake Apopka, FL, Principal Scientist -
Responsible for technical quality and completeness of the feasibility study evaluating alternatives to
restore the NSRA
of Lake Apopka to functioning wetlands. This project focused on technologies that may
used to mitigate the adverse impacts associated with pesticide residues
in surficial muck soils necessary to
accomplish the restoration
of these wetlands.
Expert Witness, Effects of Construction and Dewatering on Protected Wetland Species - Records
review and depositions to support litigation against a remediation contractor and PRP group for avoidable
impacts to protected wetland species in forested riparian wetland setting. Analysis included identification
of alternative mitigation strategies, and resulted in settlement favorable to the client.
SJRWMD, Ecological Risk Assessments, Land Acquisition and Restorations, Project Manager -
Sampling and analyses to evaluate the potential effects of flooding, water impoundment, and other water
regime manipulations associated with proposed restorations at Eustis Muck Farm, Ocklawaha Prairie,
Sunny
hill. Evaluations included potential effects to aquatic receptors such as aquatic macrophytes, fish,
and invertebrates, and effects on protected species.
Lake Tahoe Master Plan for Erosion Control and Storm Water Management, Lake Tahoe Basin,
Nevada, Senior Technical Review -
The Nevada Department of Transportation (NDOT) is proceeding
with the preparation
of storm drainage and erosion control master planning and final design documents
for roadways within the Lake Tahoe Basin that are owned and maintained by NDOT. The goal
of the
project is to identify regional and local erosion control and water conveyance and quality management
measures that will reduce discharge
of sediments and pollutants into Lake Tahoe. Approximately 38
miles
ofNDOT right-of-way within the Lake Tahoe Basin are included in the effort.
Best Management Practices for Residential Canals, Southwest Florida Water Management District,
Project Manager - Conducted an evaluation of hydrological, limnological and engineering parameters
associated with freshwater and estuarine canals to develop BMPs and design alternatives to enhance water
quality and natural wetland systems.
Watershed Fate and Effects of BTEX in Hall's Brook Pond and Wetlands, Woburn, MA, Project
Manager - Performed biodegradation tests on site sediments to determine the extent of natural processes
mitigating the transport and fate
of BTEX from groundwater to surface water in this flow way. Site
investigations included water budget, flow pathway determinations and potential fate
of benzene and
toluene in this drainage system.
Duck Lake and Tributaries Diagnostic Analysis and Remediation of Sewer Line, Robbins AFB,
Georgia, Supervising Limnologist -
Designed and implemented studies to isolate the source and
location
of high levels of fecal coliforms detected in Duck Lake. A sewer line brake was determined to
be discharging into an upstream tributary. Surface flow was diverted around the source until it could be
restored. Monitoring
of the impoundment and tributary were conducted until a recommendation could be
made to reopen the lake.
Impacts of MGP Residues on Aquatic Resources in the Nashua River, NH, Task Manager -
Conducted riverine investigations into the fate and effects of P AHs and metals on aquatic receptors,
including benthic invertebrates, macrophytes, and fish,
in the river. Investigations included hydrologic
discharges
of groundwater through sediments into the surface waters, determination of porewater
chemistries, and population studies.
Watershed Mercury Investigation, PPG Industries, Inc., Lake Charles, LA, Task Manager -
Conducted field sampling of surface water, sediments, and biological samples to evaluate the occurrence
of mercury in these media and identify approved trends or patterns thorough statistical comparisons.
Ecological and Wetlands Assessment in Big Cypress Swamp, Confidential Client, Task Manager-
Managed and evaluated the potential for adverse effects due to chloride exposure to terrestrial and aquatic
Page
4
0/6
Electronic Filing - Received, Clerk's Office, May 12, 2009
Ann B. Shortelle, PhD
receptors via multi pathway exposure. Activities included determinations of wetland hydroperiods, and
monitoring to determine the extent
of impacts to wetland species.
Marathon Battery NPL Site, Wetlands Assessment, Vincent, Elkins, and Gould - Evaluated the
selected feasible alternative for the tidal marsh including identification
of expert witnesses, potential for
adverse environmental effects associated with dredging, and the efficiency
of the proposed marsh
revegetation in restoring wetland functional values.
Bench Scale Determination of Chemical Dosages for Eustis Muck Farm Nutrient Removal, Project
Manager, SJRWMD - Conducted laboratory experiments with site water to determine the appropriate
dosage and chemical ratio
of alum to sodium aluminate (for aluminum and buffering capacity) to
accomplish optimum nutrient removal without undue stress to the ecosystem. Testing included dosing
experiments, toxicity testing, and laboratory analyses.
UOP, Inc., NPL Site WetlandslEcological Assessment, East Rutherford, New Jersey, Task Manager
- Conducted an environmental risk assessment at a site involving significant exposure pathways,
including potentially contaminated sediments and biota,
in the Hackensack estuary and wetlands. This
work included jurisdictional boundary determinations, field studies
of floral and faunal impacts, and
ecological modeling
of affected both terrestrial and aquatic estuarine species.
Charles George Landfill Wetlands Assessment, EPA - Conducted field investigation of the fourteen
wetlands at this Superfund site to determine wetland boundaries, extent
of contamination, evaluate
potential adverse effects due to proposed remedial alternatives, and design mitigative measures for the
chosen alternative. Studies included flora, benthic invertebrate, and fish investigations.
Clean Lakes Diagnostic and Feasibility Studies, Various Sites, MA, Project Manager and
Limnologist - Developed workplans, and executed diagnostic/feasibility studies for nutrient impaired
lakes and reservoirs. Determined water budgets and sources and sinks
of nutrients, and developed
feasible alternatives for reductions
in nutrient loadings and/or surface water restoration projects.
Bioaccumulation Modeling and Site Assessment, Rocky Spring Lakes, Chambersburg, PA
Limnologist - Responsible for conducting a study of mercury cycling in aquatic plants, fish, water fowl
and abiotic media to identify and quantify the source
of episodic mercury exposure to aquatic receptors.
This evaluation included sampling and analysis
of spring flows and discharges into the Rocky Spring
watershed surface waters, and subsequent fate to the surface water impoundment.
Ripogenus Dam Relicensing Hearings, Bowater/Great Northern Paper Company, Millinocket, ME,
Expert Witness -
Testified at the ME Land Use Regulation Commission hearings in favor of the
Ripogenus Dam Relicensing plan regarding the mercury cycling issues related to plant operations
of the
impoundment and potential for adverse effects to fish and wildlife. Federal procedures for relicensing,
and additional investigations regarding mercury biogeochemical cycling
in impoundments were also
conducted.
Yaworski NPL Site on Quinebaug River, PRP Committee, Senior Scientist - Responsible for
preparing endangerment assessment review comments. Designed and conducted field investigation
of the
site associated wetlands and Quinebaug River to evaluate the potential for adverse environmental effects
and bioaccumulation
of metals and organic compounds in fish.
TCDDITCDF Risk Assessment Manual, National Council for Air and Stream Improvement
(NCASI) - Managed effort to realistically model dioxin bioaccumulation in fish exposed to contaminated
effluent. The model includes fate and transport
of dioxin in rivers, dynamics of bioaccumulation and fish
physiological and behavioral parameters, and estimation
of risk based on fish consumption. The model
was designed for use by the pulp and paper industry.
Estuarine and Riverine Fate and Transport of HCB and HCBD, PPG, Inc., Task Manager -
Conducting field investigations and modeling to determine the fates of HCB and HCBD in the Calcaseieu
estuary. Responsible for conducting the evaluation
of contaminant body burdens in a wide variety of
organisms to determine bioaccumulation factors and the evaluation of the potential risks to human and
nonhuman receptors.
PageS 0/6
Electronic Filing - Received, Clerk's Office, May 12, 2009
Ann B. Shortelle, PhD
Expert Technical Comparison of NOAA Documents Relevant to Shortnose Sturgeon, Confidential
Client, Philadelphia, P A, Technical
Expert - Reviewed both an ecological risk assessment and the
shortnose sturgeon recovery plan for consistency, and technical relevance to existing shortnose sturgeon
resources and potential exposure to PCBs, metals, and other chemicals
in sediments from an NPL site in
the Delaware River. Evaluated watershed sources of PCBs and probable uptake scenarios for tissue
residues.
Floreffe Oil Spill Assessment, Kirkpatrick and Lockhart (Representing Ashland Oil Company),
Task Manager - Conducted field investigation and ongoing analyses of the Ohio and Monongahela
Rivers according to Natural Resource Damage Assessment procedures to determine environmental and
human health effects due to the spilling
of No. 2 diesel fuel. Responsible for directing laboratory and field
investigations, including chemical fate and transport and bioaccumulation analysis, to evaluate the
potential for adverse health effects associated with consumption
of fish possibly contaminated with
inorganic and organic substances.
Representative Publications and Presentations Available upon Request.
Page
6
0/6
Attachment 2
6
Evaluation
of
Effects
of
Revised
Thermal
Standards
on
Phospphorus
and
Mercury
Cycling
in
Coffeen Lake
Prepared
for:
Ameren
St.
Louis,
Missouri
Prepared
by:
MAMACCTTEECC
EngineeringEngineering
andand
ConsultingConsulting,
IncInc.
3199
Riverport Tech
Center
Drive
Maryland
Heights,
Missouri
May
2009
Evaluation of Effects of Revised Thermal
Standards on Phosphorus and Mercury
Cycling in Coffeen Lake
Chief Scientis
t
Prepared for:
Ameren
St. Louis, Missouri
Prepared by:
MACTEC Engineering and Consulting, Inc.
3199
Riverport Tech Center Drive
Maryland Heights, Missouri
6 MACTEC
May 11, 2009
Wi ham Elzinga
Project Manager
Coffeen Lake
Ameren
MACTEC Engineering and Consulting, Inc.
May 2009
i
Table of Contents
Section
Page
Executive Summary .............................................................................................................................. ES-1
1.0 Introduction .......................................................................................................................... 1-1
1.1 Purpose ...................................................................................................................................... 1-1
1.2 Report Organization .................................................................................................................. 1-3
2.0 Internal Phosphorus Loading ............................................................................................. 2-1
2.1 Relationship Between Elevated Temperature and Surface Water Phosphorus in Coffeen
Lake ........................................................................................................................................... 2-1
2.1.1 Seasonal Changes in Phosphorus and Chlorophyll-
a
...................................................... 2-1
2.1.2 Sediment Phosphorus Adsorption .................................................................................... 2-5
2.1.3 Impact of External Phosphorus Loading Seasonal Changes in Phosphorus and
Chlorophyll-
a
.................................................................................................................. 2-6
2.1.4 Internal Loading Assumptions from the TMDL BATHTUB Model ............................... 2-9
2.1.5 Evaluation of the Spatial Extent of Anoxic Sediment and Water .................................. 2-11
2.2 Potential Impacts of Increased Thermal Standard for May and October on Internal
Phosphorus Loading ................................................................................................................ 2-22
2.2.1 Spatial Impacts to Lake Stratification ............................................................................ 2-22
2.2.2 Potential Increase in Phosphorus Loading ..................................................................... 2-25
2.2.3 Limitation of Impacts to Epilimnion Water Quality ...................................................... 2-25
3.0 Mercury Cycling .................................................................................................................. 3-1
3.1 Mercury Load and Bioavailability ............................................................................................. 3-4
3.1.1 Surface Water Data .......................................................................................................... 3-4
3.1.2 Sediment Data .................................................................................................................. 3-4
3.1.3 Fish Tissue Data ............................................................................................................... 3-4
3.2 Additional Parameters Related to Methylation .......................................................................... 3-6
3.2.1 Dissolved Oxygen ............................................................................................................ 3-8
3.2.2 Alkalinity ......................................................................................................................... 3-9
3.2.3 Metals .............................................................................................................................. 3-9
3.2.4 Iron ................................................................................................................................... 3-9
3.2.5 Organic Carbon .............................................................................................................. 3-10
3.2.6 pH .................................................................................................................................. 3-11
3.2.7 Seasonality and Temperature ......................................................................................... 3-11
3.3 Summary .................................................................................................................................. 3-12
4.0 Summary ............................................................................................................................... 4-1
4.1 Introduction ............................................................................................................................... 4-1
4.2 Phosphorus................................................................................................................................. 4-1
4.3 Mercury ..................................................................................................................................... 4-2
5.0 References ............................................................................................................................. 5-1
Coffeen Lake
Ameren
MACTEC Engineering and Consulting, Inc.
May 2009
ii
Table of Contents (continued)
List of Tables
Table 2-1.
Sediment Phosphorus Concentrations Between 1989-2002
Table 2-2.
Average Depth (m) Below Which DO Less Than 1 mg/L (anoxia) by Month
Table 2-4.
Area of Substrate Surface Exposed To Seasonal Anoxia (Hectares) under Existing
Conditions
Table 2-5
.
Current and Predicted Days with Anoxic Sediment Conditions
Table 2-6.
Potential Increase in Lake Substrate Surface Area Exposed To Seasonal Anoxia
(Hectares)
Table 3-1.
Average Fish Tissue Mercury Data from Montgomery and Surrounding Counties
Table 3-2
.
Summary of Various Parameters that may Influence Mercury Methylation Rates
List of Figures
Figure 1-1.
Site Location Map – Coffen Lake, Montgomery County, Illinois
Figure 2-1.
Coffeen Lake Phosphorus Comparison Between 1989 and 2008
Figure 2-2.
Coffeen Lake Seasonal Chlorophyll-
a
Concentrations Between 1989-2002
Figure 2-3.
Seasonal Phosphorus Comparison Between Greenville (a) and Coffeen Lake (b)
Figure 2-4.
Seasonal Chlorophyll-
a
Comparison Between Greenville (a) and Coffeen Lake (b)
Figure 2-6.
Total Phosphorus Concentrations at Coffeen Lake by Sampling Site
Figure 2-7.
Chlorophyll-
a
Concentrations at Coffeen Lake by Sampling Site
Figure 2-8.
Coffeen Lake Watershed Land Use and Surface Water Sampling Locations
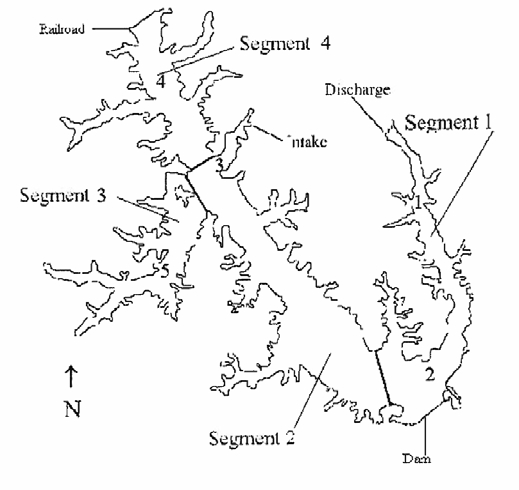
Figure 2-9.
SIUC Depth Profile Segments for Coffeen Lake
Figure 2-10.
Coffeen Lake Anoxic Sediment Zone - May
Figure 2-11.
Coffeen Lake Anoxic Sediment Zone - June
Figure 2-12.
Coffeen Lake Anoxic Sediment Zone - July
Figure 2-13.
Coffeen Lake Anoxic Sediment Zone - August
Figure 2-14.
Coffeen Lake Anoxic Sediment Zone - September
Figure 2-15.
Coffeen Lake Anoxic Sediment Zone - October
Figure 2-16.
Coffeen Lake Cross Section Locations
Figure 2-17.
Cross-Section of Lake Bottom, Average Anoxic Water Depth, and Oxygenated Surface
Water Depth for Segments 1 and 2, May and October
Figure 2-18.
Coffeen Lake Anoxic Sediment Zone Under New Permit Conditions - May
Figure 2-19.
Coffeen Lake Anoxic Sediment Zone Under New Permit Conditions - October
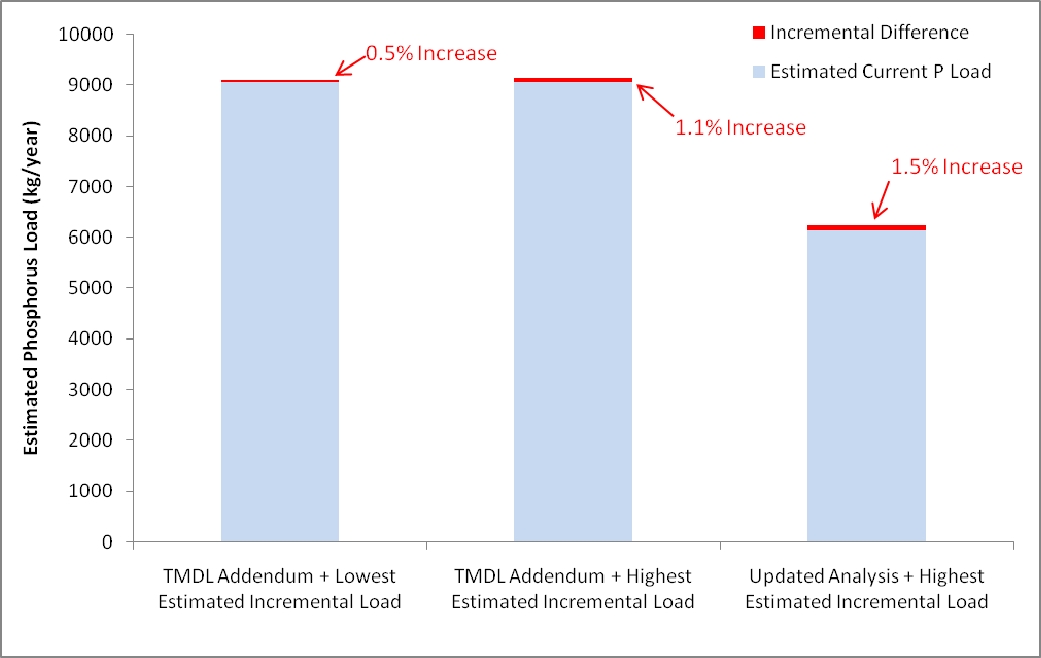
Figure 2-20.
Incremental Loading Differences to Estimated Current Phosphorus Loads
Figure 3-1.
Major Transformations of Mercury in the Environment
Figure 3-2.
Illinois Largemouth Bass Mercury Concentrations
Electronic Filing - Received, Clerk's Office, May 12, 2009
Coffeen Lake
Ameren
MACTEC Engineering and Consulting, Inc.
May 2009
ES-1
Executive Summary
MACTEC Engineering and Consulting, Inc., (MACTEC) evaluated potential for impacts on phosphorus
and mercury cycling from proposed modifications to current site-specific thermal standards in Coffeen
Lake in support that raising the thermal limits for the months of May and October will not result in
significant increases in phosphorus loading or mercury methylation over current lake conditions.
Illinois EPA claimed that Ameren failed to address the impact of the proposed thermal limits on total
phosphorus and mercury levels in Coffeen Lake, in addition to failing to address the impact on Lake
Habitat. Illinois EPA stated a concern that higher temperatures of Coffeen Lake in May and October may
result in prolonged stratification which can increase phosphorus levels and methylmercury levels.
Phosphorus is a limiting nutrient in Coffeen Lake and is therefore an important component of its long-
term water quality. Internal phosphorus release from sediments can serve as an additional source of
phosphorus loading to the lake, yet is ultimately dependent on a number of chemical and physical factors
which occur at the sediment-water interface. The mere presence of thermal stratification does not indicate
that significant internal loading will occur as a result. Despite the potential for seasonal sediment
phosphorus release from the sediments, water quality measurements within Coffeen Lake indicate that
internal phosphorus recycling is currently not contributing appreciable amounts of total phosphorus to
epilimnetic surface water. Oxygenated hypolimnetic water and epilimnetic waters (DO> 1 mg/L) were
always present overlying these deeper anoxic layers as shown by cross section for May and October. The
data and this analysis clearly show that there is no “dead zone” within the lake.
TMDL assessments for Coffeen Lake attribute elevated phosphorus concentrations to external watershed
loading, primarily due to expansive agriculture surrounding the lake. External loading as a driver of water
quality is also apparent in high phosphorus concentrations measured in the shallow northern portions of
the lake. Additionally, seasonal water quality comparisons do not show elevated phosphorus or
chlorophyll-a concentrations during summer stratification of the water column, indicating that phosphorus
is either not being released in large volumes from the sediment or is not being mixed into the epilimnion
where it may be available for algae production.
Review of the original TMDL BATHTUB (2007) model revealed significant modeling errors and
misapplications which led to the erroneous conclusion that internal phosphorus loading dominates
Coffeen Lake. These errors produced a model run which did not match known lake phosphorus
concentrations. To compensate for this “under-prediction of observed phosphorus concentrations”, the
modelers introduced an additional internal phosphorus load (the BATHTUB model already incorporates
internal loading) to force the model to calibrate. The conclusions and load reduction requirements of the
original TMDL were not revised, despite these errors and discrepancies. However, available monitoring
data do not confirm this estimated level of internal loading (see Section 2.1.1).
An evaluation of potential impacts associated with modified thermal discharge during the months of May
and October was also performed to quantify the potential for additional phosphorus release and
Electronic Filing - Received, Clerk's Office, May 12, 2009
Coffeen Lake
Ameren
MACTEC Engineering and Consulting, Inc.
May 2009
ES-2
anticipated impacts to surface water quality. Results of this analysis indicate that the additional
phosphorus load which may be anticipated from the proposed modification ranges from 329.1 kg P/year
to 658.1 kg P/yr under existing permit conditions, which is much lower than predicted from the
BATHTUB modeling completed for the TMDL. Additionally, any phosphorus released from the
sediment is not expected to reach the epilimnion, and is therefore unavailable for biological production
within Coffeen Lake. Based on seasonal water quality comparisons sediment phosphorus release does not
appear to be an important component of surface water phosphorus loading within Coffeen Lake. Future
modifications to thermal discharge limits from the Ameren Power Generating Plant are unlikely to present
additional phosphorus loads from sediment release in the future, and therefore are not a threat to the
existing water quality of Coffeen Lake.
Mercury readily bioaccumulates in living tissues, and thus, fish consumption advisories are common
nationwide. Coffeen Lake is currently included in the Illinois fish consumption advisories based on two
fish tissue samples with mercury concentrations exceeding the Illinois EPA level of concern of 0.06
mg/kg. These samples consist of two composite (5 fish per composite) samples of largemouth bass filet
with concentrations of 0.08 and 0.09 mg/kg of mercury. Because largemouth bass are a top aquatic
predator in the lake, although the sample size is small, the results are conservative for the lake. Illinois
EPA’s concern for Coffeen Lake is that mercury methylation is likely based on thermal stratification
throughout the summer months.
Methylation is affected by multiple parameters and cannot be based solely on thermal stratification. There
are multiple indicator parameters that may predict whether the methylation of mercury is favorable under
certain conditions. While general trends may be observed as these indicator parameters increase or
decrease, the suite of parameters should be evaluated as a whole to predict the potential for methylation of
mercury.
Based on the available Coffeen Lake data, mercury concentrations appear to be generally low and
conditions do not appear to be favorable for methylation. Current sources of methylation may be within
the lake or occurring in the watershed, but appear low. The proposed change in the thermal standard
affecting May and October conditions does not substantially change lake conditions, although thermal
stratification may persist for more days on average, annually. This change is minor, and does not
represent a change that could or would significantly increase hypolimnetic mercury methylation rates. It
is anticipated that the change, if any, would be so small, that it would not result in increased mercury in
the biota. Fish tissue concentrations are anticipated to measurably decline, however, as a result of regional
mercury load reductions.
Coffeen Lake
Ameren
MACTEC Engineering and Consulting, Inc.
May 2009
1-1
1.0 Introduction
1.1
Purpose
This report provides an evaluation of the potential for impacts on phosphorus and mercury cycling from
proposed modifications to current site-specific thermal standards in Coffeen Lake. Coffeen Lake is a
384 hectare reservoir constructed as the source for steam condenser cooling water for the 945-MW
Coffeen Power Station (Coffeen or the "Station"), located in Montgomery County in central Illinois,
approximately 1 mile south of the city of Coffeen, Illinois and 50 miles northeast of St. Louis, Missouri
(Figure 1-1).
Current thermal standards for Coffeen Lake specify that the months of May and October fall within an
8-month “winter” period extending from October through May. During this 8-month period, thermal
discharges from Coffeen Power Station may not result in water temperatures that exceed:
?
89
o
F as a monthly average, or
?
94
o
F as a maximum for greater than 2 percent of the hours during that period, as measured at the
boundary of a 26-acre mixing zone.
Abnormally warm temperatures and low precipitation in recent years have resulted in instances,
particularly during late May and early October, when Coffeen Power Station has had to reduce electric
generation (derate) in order to comply with the above thermal standards. The existing limits of 89
o
F and
94
o
F were not established on the basis of definitive thermal requirements for the aquatic community and
fish populations of Coffeen Lake during these two months. Rather, they were set as assurance that thermal
limits set for the “summer” months of June through September (105
o
F mean or 112
o
F maximum for
greater than 3 percent of the hours) were not applied year-round.
The petitioner, Ameren Energy Generating Company (Ameren), proposed relief in the form of the
following revised standards for the months of May and October:
?
96
o
F as a monthly average, and
?
102
o
F as a maximum for more than 2 percent of the hours during that period.
The Illinois Environmental Protection Agency (EPA) denied the proposed revised standards in April
2009. Specifically, the Illinois EPA claimed that Ameren failed to address the impact of the proposed
thermal limits on total phosphorus and mercury levels in Coffeen Lake, in addition to failing to address
the impact on Lake Habitat. The Illinois EPA stated a concern that higher temperatures of Coffeen Lake
in May and October may result in prolonged stratification which can increase phosphorus levels and
methylmercury levels.
This report presents an evaluation of the conditions in Coffeen Lake with regard to phosphorus and
mercury supporting the conclusion that raising the thermal limits for the months of May and October will
not result in significant increases in phosphorus loading or mercury methylation over current lake
conditions.
Electronic Filing - Received, Clerk's Office, May 12, 2009
Coffeen Lake
Ameren
MACTEC Engineering and Consulting, Inc.
May 2009
1-2
Fi gure 1.1: Site
I
L<~'""
Map.
Coffen Lake,
Montgomery County
, Illinois
I MilltS
0
2.5
5
e
IlIln o l $
0
Area of
/
Interest
t
Coffeen Lake
Ameren
MACTEC Engineering and Consulting, Inc.
May 2009
1-3
1.2
Report Organization
In this report, the effects of phosphorus and mercury cycling of Coffeen Lake are evaluated. MACTEC
evaluated temperature and lake chemistry data collected during the SIUC and Illinois EPA studies to
evaluate the thermal environment of Coffeen Lake, specifically examining the stratification and anoxic
conditions of the lake. A general description of the thermal environment in the lake is explained in
Section 2.
MACTEC evaluated the phosphorus loading of the lake and the potential impacts of revised thermal
standards on phosphorus cycling as further explained in Section 2. Phosphorus is a limiting nutrient in
Coffeen Lake and has been evaluated by the Illinois EPA to ensure the lake meets its designated use
under the Total Maximum Daily Load (TMDL) determination (Illinois EPA, 2007; Illinois EPA, 2009a).
MACTEC evaluated the potential for increased internal loading of phosphorus as a result of increasing
water temperatures.
In Section 3, MACTEC evaluated methylmercury loading of the lake and the potential impacts of the
revised thermal standards on mercury cycling. Increased internal loading of mercury could result from
anoxic conditions. MACTEC evaluated the potential for increased internal loading of mercury as a result
of increasing water temperatures resulting in anoxic conditions.
Finally, Section 4 summarizes and integrates the multiple lines of investigation presented in the previous
sections in order to characterize the actual risk for adverse impact occurring from revisions to the thermal
standards for May and October.
Coffeen Lake
Ameren
MACTEC Engineering and Consulting, Inc.
May 2009
2-1
2.0 Internal Phosphorus Loading
Coffeen Lake was determined to be impaired due to excessive algal growth caused by excess phosphorus.
It has been evaluated by the Illinois EPA to ensure the lake meets its designated use by development of a
Total Maximum Daily Load (TMDL) (Illinois EPA, 2007; Illinois EPA, 2009a). To protect water quality
and provide the designated “aesthetic quality” established for the lake, the Illinois EPA has set a water
quality standard of 0.05 mg P/L as the TMDL endpoint. Concerns regarding degradation of water quality
and trophic status which may result from modification to the existing thermal limits are largely based on
internal cycling processes of phosphorus within Coffeen Lake. The Illinois EPA contends that increasing
water temperatures within the lake will result in enhanced phosphorus release from the sediments into the
water column, thereby providing an additional phosphorus load within the Lake.
2.1
Relationship Between Elevated Temperature and Surface Water Phosphorus in
Coffeen Lake
Seasonal temperature differences in productive (eutrophic) freshwater lakes and reservoirs often lead to
seasonal thermal stratification within the water column, resulting in the development of an epilimnion
(surface water) and hypolimnion (bottom water) which are separated by temperate and density gradients
which prevent mixing within the water column. The mere presence of thermal stratification does not
indicate that significant internal loading will occur as a result. Thermal stratification without anoxia
produces no more phosphorus release from sediments than an unstratified lake. Seasonal stratification can
also result in anoxic conditions in the lower portions of the hypolimnion, a condition which is generally
recognized as promoting dissolution and subsequent release of sediment-bound phosphorus, where
sediment phosphorus is loosely bound. Thermal stratification with anoxia present over a portion of the
bottom, may result in some phosphorus release from the sediments into the hypolimnion, but in
insufficient quantities to actually reach the epilimnion and fuel algal blooms. Although anoxia within the
hypolimnion has the potential to release sediment phosphorus to the water column, water quality
measurements within Coffeen Lake indicate that internal phosphorus recycling is currently not
contributing appreciable amounts of total phosphorus to epilimnetic surface water. The following analysis
also shows that the incremental difference in phosphorus that may result from the revised thermal
standard for May and October will not result in measureable adverse impact to the lake.
2.1.1 Seasonal Changes in Phosphorus and Chlorophyll-
a
Surface water temperature measurements in Coffeen Lake reveal that different segments of the lake
display seasonal stratification for a period of days to months during the months between May and October
(see Section 2.2.1). In its April 2009 Recommendation, the Illinois EPA states that “the amount of
phosphorus released from the sediments is directly related to the period of anoxia during stratification.”
Although seasonal changes in oxygen concentrations can alter the short-term uptake and release of
phosphorus from the sediments, oxygen availability at the sediment-water interface cannot control the
long-term P retention of lake sediments (Hupfer and Lewandowski, 2008), or determine the net effect of
any release on the lake. Numerous physical and chemical processes within the sediment and overlying
water column will determine the exchange capacity of phosphorus from the sediment to surface waters
such that the relationship between anoxia and sediment phosphorus release cannot be universally applied
Electronic Filing - Received, Clerk's Office, May 12, 2009
Coffeen Lake
Ameren
MACTEC Engineering and Consulting, Inc.
May 2009
2-2
to all lakes under varying conditions. In Coffeen Lake, phosphorus release from the sediment is modest,
and does not affect the epilimnion (see discussion below).
An evaluation of seasonal phosphorus concentrations during the warmest portion of the year (April-
October) was performed using data from the 2009 Coffeen Lake TMDL Addendum (Illinois EPA, 2009a)
as well as data used in the 2007 TMDL (Illinois EPA, 2007), which was obtained from the United States
Environmental Protection Agency (USEPA) STORET database (Illinois EPA, 2009b). No statistically
significant trends were observed for water column phosphorus concentrations within Coffeen Lake during
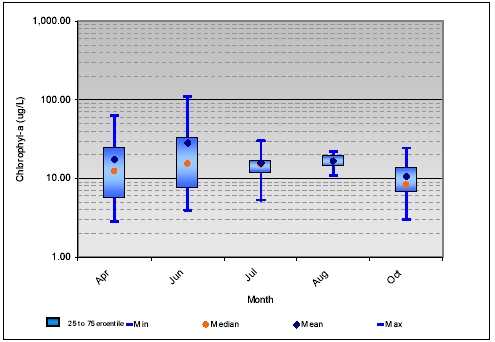
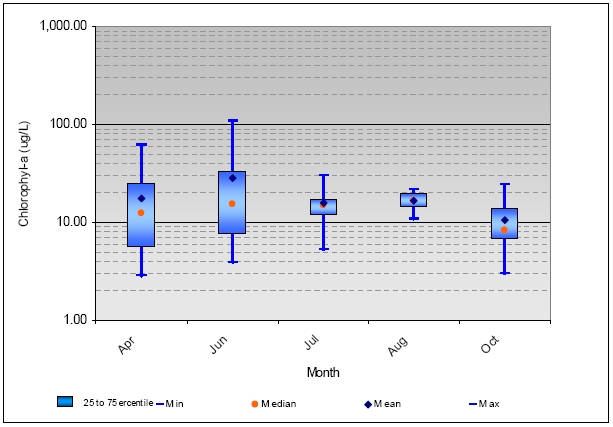
summer months (Figure 2-1). Additionally, chlorophyll-
a
may be used as a surrogate or response analysis
for increased phosphorus loading due to increased biological production that would result from excess
sediment phosphorus release if this phosphorus reached the epilimnion during destratification at fall
turnover. A similar comparison of chlorophyll-
a
concentrations between 1989-2002 (Figure 2-2) show no
significant increase in chlorophyll-
a
concentrations during and following turnover. The lack of a seasonal
component to phosphorus concentrations in Coffeen Lake, and the absence of a chlorophyll-
a
spike or
algal blooms at fall turnover are both strong evidence that internal phosphorus recycling is not currently a
significant contribution of the total lake phosphorus budget. Fluctuations in either phosphorus or
chlorophyll-
a
concentrations during fall turnover at Coffeen Lake would indicate that internal sediment
phosphorus release is a controlling process in seasonal nutrient concentrations within lake surface waters.
However, neither total phosphorus or chlorophyll-
a
reveal correlated trends with warmer surface water
temperatures within the lake. The lack of correlating water quality responses following seasonal
stratification and hypolimnion anoxia suggests that other phosphorus loading factors, including external
phosphorus loading from the surrounding watershed (Section 2.1.3), are more important factors in water
quality within Coffeen Lake.
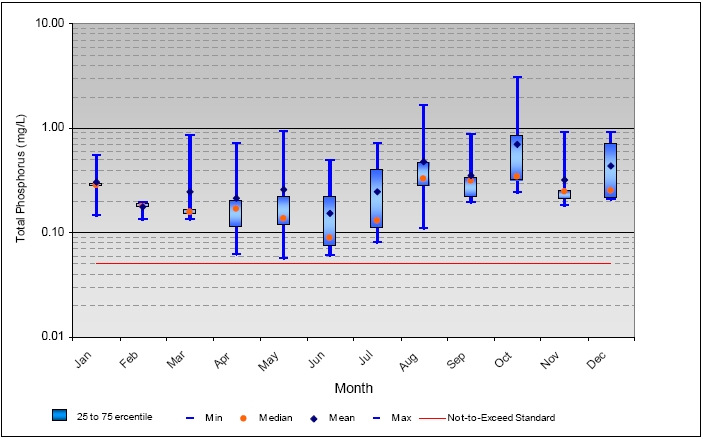
By comparison, Greenville Lake, which was also evaluated under the 2007 TMDL (Illinois EPA, 2007),
shows distinct differences in seasonal phosphorus (Figure 2-3) and chlorophyll-
a
(Figure 2-4)
concentrations resulting from sediment phosphorus release to the water column during fall turnover.
Phosphorus in Greenville Lake shows peak concentrations occurring in the fall, with increasing
phosphorus loads entering surface waters towards the end of the summer. Chlorophyll-
a
concentrations in
Greenville Lake show a similar pattern of increasing concentrations in the late fall, and this seasonal
pattern is typical for a lake or reservoir where internal phosphorus loading is a significant portion of the
loading. Neither phosphorus or chlorophyll-
a
in Coffeen Lake show similar patterns of increasing
concentrations in late summer into fall, indicating that any potential sediment phosphorus release is not
mixing into the epilimnion where it would be available for algae production.
While thermal stratification and some deep water anoxia in the hypolimnion does appear to occur on a
seasonal basis within Coffeen Lake (Section 2.2.1), the lack of phosphorus and chlorophyll-
a
pulse during
fall overturn suggest that that a majority of the sediment phosphorus remains bound in sediments or that
whatever phosphorus is released in not reaching the epilimnion in sufficient quantities to degrade water
quality (see further discussion in Section 2.1.4).
Electronic Filing - Received, Clerk's Office, May 12, 2009
Coffeen Lake
Ameren
MACTEC Engineering and Consulting, Inc.
May 2009
2-3
Figure 2-1.
Coffeen Lake Phosphorus Comparison Between 1989 and 2008
(Data Source: Illinois EPA, 2009a; Illinois EPA, 2009b).
Created by: DRD Checked by: BMJ 5/5/2009
Figure 2-2.
Coffeen Lake Seasonal Chlorophyll-
a
Concentrations Between 1989-2002
(Source: Illinois EPA, 2007)
Coffeen Lake
Ameren
MACTEC Engineering and Consulting, Inc.
May 2009
2-4
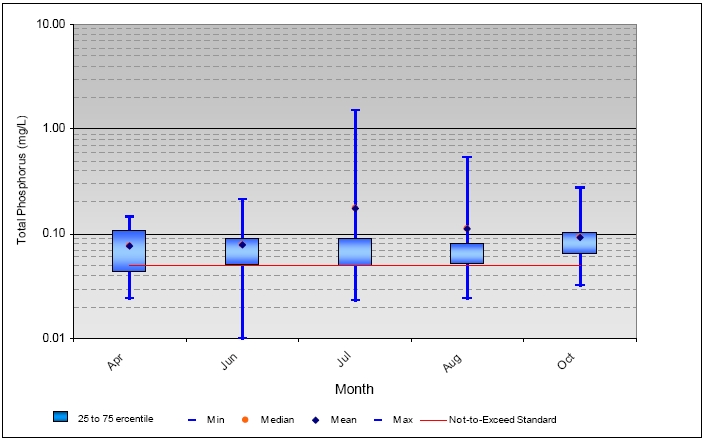
Figure 2-3.
Seasonal Phosphorus Comparison Between Greenville Lake (a) and Coffeen Lake (b)
(Source: Illinois EPA, 2007)
a - Greenville Lake
b - Coffeen Lake
Coffeen Lake
Ameren
MACTEC Engineering and Consulting, Inc.
May 2009
2-5
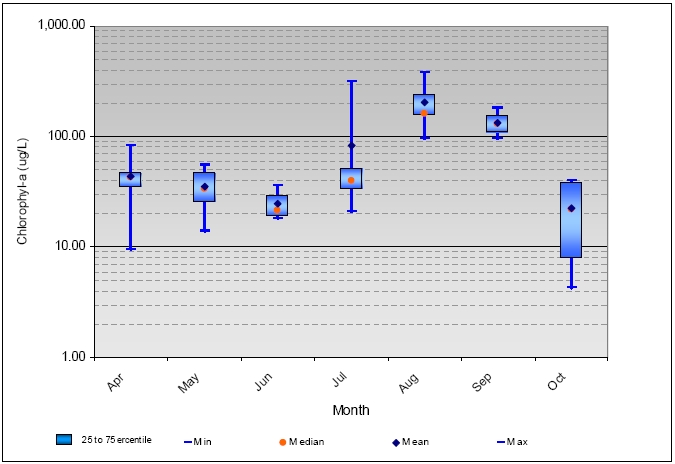
Figure 2-4.
Seasonal Chlorophyll-
a
Comparison Between Greenville Lake (a) and Coffeen Lake (b)
(Source: Illinois EPA, 2007)
2.1.2
Sediment Phosphorus Adsorption
Inorganic phosphorus is highly particle reactive and will vary in its sorption and exchange capacities with
different physical and chemical sediment characteristics, including iron, aluminum, and organic matter
content (Detenbeck and Brezonik, 1991). Speciation of phosphorus into saloid-bound (NH
4
Cl-P
i
), iron-
bound (NaOH-P
i
), and aluminum-bound (NH
4
F-P
i
) phosphorus (Chang and Jackson, 1957) is often
characterized to evaluate the proportion of phosphorus which may be released into the water column
under changing environmental conditions at the sediment-water interface. Saloid-bound phosphorus
a - Greenville Lake
b - Coffeen Lake
Electronic Filing - Received, Clerk's Office, May 12, 2009
Coffeen Lake
Ameren
MACTEC Engineering and Consulting, Inc.
May 2009
2-6
represents the portion of phosphorus which is highly soluble and is therefore considered readily available
for release from the sediments into the water column. Iron-bound phosphorus, however, is generally
considered stable under oxidizing conditions in the sediment, but becomes unstable under anoxic
(reducing) conditions, allowing the iron-bound phosphorus to separate from the sediment for release into
the water column. Phosphorus bound by aluminum in the sediments is considered inert under both
oxidizing and reducing conditions, and is therefore considered unavailable for release back into the water
column.
An analysis of total phosphorus concentrations in Coffeen Lake sediments indicate large variations
between sampling locations and annual sampling events, with an overall mean concentration of
769 mg/kg and a standard deviation of 268 mg/kg (Table 2-1). While no phosphorus speciation data exists
for Coffeen Lake sediments, available iron concentrations (Table 2-1) were determined to have no
correlation to total phosphorus sediment concentrations within the eight individual samples (R
2
=0.328).
Although a portion of available phosphorus within the sediments is likely iron-bound, the lack of
increased surface water phosphorus concentrations suggest that other phosphorus species may remain
permanently bound to sediments despite enhanced redox potential associated with bottom water anoxia.
Table 2-1.
Sediment Phosphorus Concentrations Between 1989-2002
Monitoring
Location
Date Sampled
Iron (mg/kg)
Phosphorus (mg/kg)
ROG-1
4/27/1989
26,500
297
ROG-1
7/8/1993
40,000
1,034
ROG-1
7/1/1997
30,000
1,156
ROG-1
7/22/2002
24,000
814
ROG-3
4/27/1989
23,500
648
ROG-3
7/8/1993
30,000
842
ROG-3
7/1/1997
24,000
780
ROG-3
7/22/2002
17,000
577
Mean Concentration (mg/kg)
26,875
769
(Data Source: Illinois EPA, 2009b).
Created by: BMJ Checked by: KAR 5/5/2009
2.1.3
Impact of External Phosphorus Loading Seasonal Changes in Phosphorus and
Chlorophyll-
a
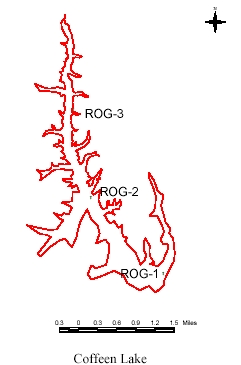
Segmentation of Coffeen Lake for sampling and analysis in the 2007 TMDL (Illinois EPA, 2007)
provided a comparative assessment of deep and shallow portions of the lake, as well as a comparison of
regional watershed characteristics which contribute to the total phosphorus load within the Lake. Sample
locations ROG-1 and ROG-2 (Figure 2-5) were taken closest to the Coffeen Power Generating Station,
and are representative of the deeper locations within the Coffeen reservoir. Sample location ROG-3 is the
northernmost sampling location, and represents the shallowest portion of Coffeen Lake monitored during
both the 2007 (Illinois EPA, 2007) and 2009 (Illinois EPA, 2009a) TMDL evaluations.
Coffeen Lake
Ameren
MACTEC Engineering and Consulting, Inc.
May 2009
2-7
Figure 2-5.
Illinois EPA Sampling Locations at Coffeen Lake
(Source: Illinois EPA, 2007)
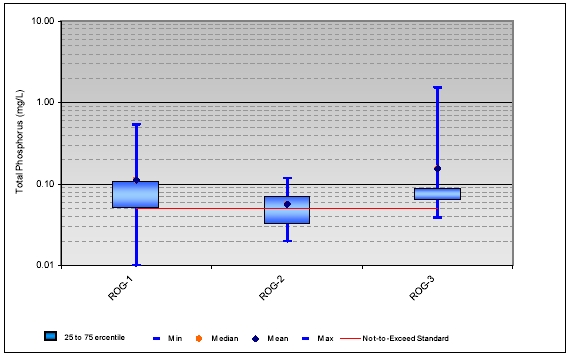
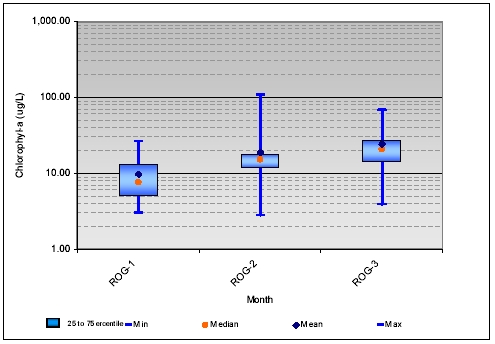
Phosphorus concentrations by sampling location (Figure 2-6) were taken from the Illinois EPA TMDL
assessment for Coffeen Lake (Illinois EPA, 2007). Mean phosphorus concentrations at ROG-3 are
elevated compared to ROG-1 and ROG-2, with a greater maximum range of phosphorus concentrations
sampled. Similarly, Chlorophyll-
a
results (Figure 2-7) show greater mean concentrations at ROG-3 than
the other sampling locations. These data confirm that external loading (from the tributary and watershed)
rather than internal loading are dominant in this reservoir. Further, the shallow depth of this upper region
of the reservoir has been caused by sedimentation, another indicator of the extent to which the watershed
is contributing to the eutrophication and impairment of the lake. Elevated phosphorus and chlorophyll-
a
concentrations at shallow portions of the lake indicate that external loading is the dominant factor in
Coffeen Lake phosphorus concentrations. The Coffeen Lake watershed is largely dominated by
agricultural land use, which accounts for 66.5% of the total watershed area (Illinois EPA, 2007). The
2007 TMDL report (Illinois EPA, 2007) recognizes row crop agriculture as a common source of sediment
and nutrient loads which are prevalent within the Coffeen Lake watershed. Water quality modeling used
in the 2009 Coffeen Lake TMDL addendum (Illinois EPA, 2009a) also attributes elevated phosphorus
concentrations to the dominant agricultural land use found in the watershed. Fertilizers commonly used
within the watershed include anhydrous ammonia, ammonium phosphate, and potash, which are
frequently applied in the fall and spring (Illinois EPA, 2007).
ROG-3 is located in the northernmost portion of Coffeen Lake, where a majority of runoff from
agricultural operations to the north enter the lake (Figure 2-8). The high range of phosphorus
concentrations recorded at this site (Figure 2-6) suggest that period runoff entering the lake, particularly
in the shallower northern portions, is controlling the total available phosphorus load for algae production
in surface waters. Sediment phosphorus release is unlikely to contribute to the total phosphorus load at
ROG-3 due to infrequent occurrences of anoxia in shallow bottom waters (Section 2.2.1), leaving external
phosphorus loads as the primary mechanism for phosphorus loading and water quality within Coffeen
Lake.
Coffeen Lake
Ameren
MACTEC Engineering and Consulting, Inc.
May 2009
2-8
Figure 2-6.
Total Phosphorus Concentrations at Coffeen Lake by Sampling Site
(Source: Illinois EPA, 2007)
Figure 2-7.
Chlorophyll-
a
Concentrations at Coffeen Lake by Sampling Site
(Source: Illinois EPA, 2007)
Electronic Filing - Received, Clerk's Office, May 12, 2009
Coffeen Lake
Ameren
MACTEC Engineering and Consulting, Inc.
May 2009
2-9
Figure 2-8.
Coffeen Lake Watershed Land Use and Surface Water Sampling Locations
(Source: Illinois EPA, 2007)
2.1.4
Internal Loading Assumptions from the TMDL BATHTUB Model
The available phosphorus and chlorophyll-
a
data for Coffeen Lake are indicative of a eutrophic
waterbody with high external (watershed) phosphorus loading. There is no observable effect from internal
phosphorus loading. This contradicts the TMDL BATHTUB model results (Illinois EPA, 2007, Illinois
EPA, 2009a). Review of the original (2007) model revealed significant modeling errors and
misapplications which led to the erroneous conclusion that internal phosphorus loading dominates
Coffeen Lake. A non-exhaustive list of errors includes (but is not limited to):
?
Use of the approximate maximum depth instead of the mean depth, resulting in a gross overestimate
of the lake volume and phosphorus mass,
?
Approximately a four fold increase in hydraulic retention time over either the Stage 1 or TMDL
addendum assumptions,
?
Underestimate of tributary (watershed) phosphorus concentrations.
Coffeen Lake
Ameren
MACTEC Engineering and Consulting, Inc.
May 2009
2-10
These errors produced a model run which did not match known lake phosphorus concentrations. To
compensate for this “under-prediction of observed phosphorus concentrations”, the modelers introduced
an additional internal phosphorus load (the BATHTUB model already incorporates internal loading) to
force the model to calibrate.
The BATHTUB model was produced by the United States Army Corp of Engineers. The guidance for
this model explicitly states (USACE, 2004):
Internal Loading Rates reflect nutrient recycling from bottom sediments. Rates are normally set to
0, since the pre-calibrated nutrient retention models already account for nutrient recycling that
would normally occur (at least in the collection of reservoirs used for model calibration).
Nonzero values should be specified with caution and only if independent estimates or
measurements are available.
In some studies, internal loading rates have been estimated from measured phosphorus
accumulation in the hypolimnion during the stratified period. This procedure should not be
followed unless there is evidence the accumulated phosphorus is transported to the mixed layer
during the growing season.
Specification of a fixed internal loading rate may be unrealistic for evaluating response to
changes in external load. Because they reflect recycling of phosphorus that originally entered the
reservoir from the watershed, internal loading rates would be expected to vary with external load.
This option is included at the request of model users but is not endorsed by the author. In
situations where monitoring data indicate relatively high internal recycling rates to the mixed
layer during the growing season, a preferred approach would generally be to calibrate the
phosphorus sedimentation rate (specify calibration factors< 1). There is some risk that apparent
internal loads actually reflect under-estimation of external loads (USACE, 2004).
The forcing of this model through the use of an internal loading factor, as noted above, is not
recommended or endorsed by the model developers, and may lead to erroneous conclusions about the
phosphorus sources in the waterbody. In this case, the model produced the following estimate of
phosphorus mass sources for Coffeen Lake:
External sources of phosphorus (watershed, precipitation, point sources) (kg/yr):
329.7
Internal phosphorus load (kg/yr):
3,495.8
Total phosphorus load (kg/yr):
3,825.2
Many of the above errors were eliminated in the BATHTUB modeling conducted for the TMDL
addendum, however, this model was assembled in a simpler framework. Based upon discussion with the
modelers, the updated model was kept consistent with the original modeling where possible, except for
the correction of significant errors. The update did include additional data for watershed loading and
Electronic Filing - Received, Clerk's Office, May 12, 2009
Coffeen Lake
Ameren
MACTEC Engineering and Consulting, Inc.
May 2009
2-11
water budget information that led to model improvements, but lake morphometry was not updated.
Sediment transport to the lake from the watershed has reduced the effective lake volume, and this factor,
for example, was not addressed in the modeling. Reduction in lake volume would have resulted in better
agreement between predicted and observed values of phosphorus concentration in the lake without the use
of a “correction factor”. The baseline case for the TMDL addendum modeling estimated 9054.8 kg P/yr
total phosphorus loading, with the majority of this attributable to McDavid Branch (an inflowing tributary
from the watershed). However, an internal loading factor was still applied, and resulted in an estimate of
approximately 39% internal loading. The conclusions and load reduction requirements of the original
TMDL were not revised, despite these errors and discrepancies. However, available monitoring data do
not confirm this estimated level of internal loading (see Section 2.1.1).
2.1.5
Evaluation of the Spatial Extent of Anoxic Sediment and Water
Historic surface water depth profiles of temperature and dissolved oxygen were evaluated from the
Southern Illinois University at Carbondale (SIUC) annual monitoring reports (SIUC, 2006 ; SIUC, 2007,
etc.). Depth profiles used in this analysis were collected between 2001 and 2006; however no data were
available from 2002. Four segments were identified by SIUC for Coffeen Lake Depth profiles
(Figure 2-9). Nearly all depth profiles collected at segments one and two, which represent the deepest
portions of the lake, displayed thermal stratification between the months of May-September. Thermal
stratification of surface water at segments three and four were less consistent during the warm summer
months, showing less frequent stratification and periodic mixing in shallower portions of the lake.
Although stratification is frequently present, the presence of a thermocline and hypolimnion does not
indicate anoxia (DO < 1mg/L) at the surface of the sediments or in the deeper hypolimnetic waters.
Anoxic conditions, if and when they form, develop more slowly, over time, compared to thermal
stratification.
Figure 2-9.
SIUC Depth Profile Segments for Coffeen Lake
(Source: SIUC, 2007)
Electronic Filing - Received, Clerk's Office, May 12, 2009
Coffeen Lake
Ameren
MACTEC Engineering and Consulting, Inc.
May 2009
2-12
In order to determine the depth within each segment of Coffee Lake which experiences seasonal
stratification and anoxia, all vertical profiles provided by SIUC (2007, and others) between 2001 and
2006 were visually analyzed to record the total depth to bottom, depth to the thermocline, if present, and
the depth to anoxic conditions (defined as a dissolved oxygen concentration <1 mg/L). The total depth in
which anoxic conditions were present was calculated by subtracting the depth to anoxia from the depth to
bottom of the lake. Each segment was then separated by month and year to determine an average depth
below which anoxic conditions were observed within the recorded depth profiles. Once an average depth
had been determined by segment for each month and year, a final average of the depth to anoxic
conditions was calculated for each segment between 2001 and 2006 (Table 2-2).
Table 2-2.
Average Depth (m) Below Which DO Less Than 1 mg/L (Anoxia) by Month
MAY
JUN
JUL
AUG
SEP
OCT
Segment 1
8.19
4.97
5.72
5.73
6.33
7.00
Segment 2
9.07
8.31
7.36
7.69
8.07
10.50
Segment 3
7.17
6.58
5.67
5.92
7.25
--
Segment 4
--
6.67
6.33
6.17
7.75
--
-- No anoxia observed within the segment between 2001 and 2006
(Data Source: SIUC, 2007)
Created by: KAR Checked by: BMJ 5/5/2009
The presence and extent of seasonal anoxia within Coffeen Lake due to stratification of the water column
during summer months was also evaluated. Similar to the procedure used to determine the mean depth of
anoxic conditions (Table 2-2), the total number of days during which anoxic conditions were observed
was also determined for each segment and month between 2001 and 2006. The date at which vertical
depth profiles were measured by SIUC (2007, and others) was compared to the dissolved oxygen profiles
to determine the total length of time within each month that anoxic conditions at the sediment water
interface, and the depth of oxygen depleted hypolimnetic waters, were observed. A conservative estimate
of the total length of time anoxia was observed was made between sample events. Each segment was then
separated by month and year to determine an average number of days per month for which anoxic
conditions were observed. Once an average number of days had been determined by segment for each
month and year, a final average of the number of days anoxic conditions were observed was calculated for
each segment between 2001 and 2006 (Table 2-3).
Similar to monthly patterns of thermal stratification, anoxic bottom waters are most frequently observed
during July and August in segments one and two, with decreasing frequency resulting from increased
mixing during the months of May, June, and September (Table 2-3). Less frequent hypolimnion anoxia
was observed in segments three and four, which frequently mix and rarely remain stratified for all
summer months.
Coffeen Lake
Ameren
MACTEC Engineering and Consulting, Inc.
May 2009
2-13
Table 2-3.
Summary of Average Monthly Anoxic Days (Percentage of the Month)
MAY
JUN
JUL
AUG
SEP
OCT
Segment 1
18 (58%)
23 (77%)
31 (100%)
31 (100%)
26 (84%)
1 (3%)
Segment 2
17 (55%)
25 (83%)
31 (100%)
31 (100%)
21 (68%)
1 (3%)
Segment 3
9 (29%)
4 (13%)
5 (16%)
4 (13%)
1 (3%)
0 (0%)
Segment 4
0 (0%)
8 (27%)
4 (13%)
4 (13%)
1 (3%)
0 (0%)
(Data Source: SIUC, 2007, and others)
Created by: BMJ Checked by: KR5/6/2009
The depth to anoxic water (Table 2-2) was used to estimate the area of potential internal phosphorus
loading. Depths in each segment were analyzed spatially (GIS) by applying the depth intervals to existing
bathymetry for the lake (Illinois DNR, 2006). Figures 2-10 through 2-15 depict the areas of anoxic
sediment and deep hypolimnetic waters for existing conditions (May through October). Oxygenated
hypolimnetic water and epilimnetic waters (DO> 1 mg/L) were always present overlying these deeper
anoxic layers as shown by cross section for May and October (Figures 2-16 and 2-17). The data and this
analysis clearly show that there is no “dead zone” within the lake. Anoxic conditions were not present in
other areas, as estimated from the available data. Existing conditions within Coffeen Lake show that the
greatest spatial area exposed to anoxic conditions is found in the deepest portions of the lake at
segments 1 and 2 (Table 2-4). The spatial extent of seasonal anoxia is greatest during the months of July
and August when temperatures are warmest, the same period of time in which segments one and two
exhibit continual stratification and anoxia (Table 2-3).
Table 2-4.
Area of Substrate Surface Exposed To Seasonal Anoxia (Hectares) under Existing Conditions
MAY
JUN
JUL
AUG
SEP
OCT
Segment 1
25.3
41.8
38.2
38.2
29.7
28.1
Segment 2
72.7
77.2
83.4
81.0
78.6
52.3
Segment 3
6.4
6.8
9.6
8.9
6.3
0.0
Segment 4
0.0
13.3
14.0
14.3
11.3
0.0
(Data Source: SIUC, 2007, and others)
Created by: CGS Checked by: BMJ 5/7/2009
Using these areas and representative flux rates (Haggard
et al
, 2005; Illinois EPA, 2009a) estimates of
phosphorus flux into the hypolimnion were made. This estimate ranges from 329.1 kg P/year to 658.1 kg
P/yr under existing permit conditions. This estimate is much lower than predicted from the BATHTUB
modeling completed for the TMDL, but is consistent with available site data.
Coffeen Lake
Ameren
MACTEC Engineering and Consulting, Inc.
May 2009
2-14
-
,,: ,i ~T-'-_
"
.
-
--I
/
-
\'
\
,
,
,
.,
,
,
f
2-10:Coffeen Lake
Anoxic Sediment
Zone -
May
Legend
-
Segment Boundary
10 It Contour
•
Aerobic Sediment
•
Anoxic Sedimen
t
"
0,
25
Created by: CGS
Checked by: WJE
Appmv&d by: ASS
May 5, 2009
I
Mles
"'
Coffeen Lake
Ameren
MACTEC Engineering and Consulting, Inc.
May 2009
2-15
-
,,: ,i ~T-'-_
"
.
-
--I
/
-
\'
\
,
,
,
.,
,
,
f
2-11 :Coffeen Lake
Ano xic Sedi
ment
Zone - June
Legend
-
Segment Boundary
10 It Contour
•
Aerobic Sediment
•
Anoxic Sediment
"
0,
25
Created by: CGS
Checked by: WJE
Appmv&d by: ASS
May 5
, 2009
I
Mles
"'
Electronic Filing - Received, Clerk's Office, May 12, 2009
Coffeen Lake
Ameren
MACTEC Engineering and Consulting, Inc.
May 2009
2-16
-
,,: ,i ~T-'-"'.
-
--I
/
-
\'
\
,
,
,
.,
,
,
f
2-12:Coffeen Lake
Ano xic Sediment
Zone - J uly
Legend
-
Segment Boundary
10 It Contour
•
Aerobic Sediment
•
Anoxic Sediment
"
0,
25
Created by: CGS
Checked by: WJE
Appmv&d by: ASS
May 5, 2009
I Mles
"'
Coffeen Lake
Ameren
MACTEC Engineering and Consulting, Inc.
May 2009
2-17
-
,,: ,i ~T-'-_
"
.
-
--I
/
-
\'
\
,
,
,
.,
,
,
f
2-13:Coffeen Lake
Ano xic Sediment
Zone - August
Legend
-
Segment Boundary
10 It Contour
•
Aerobic Sediment
•
Anoxic Sediment
"
0,
25
Created by: CGS
Checked by: WJE
Appmv&d by: ASS
May 5
, 2009
I Mles
"'
Coffeen Lake
Ameren
MACTEC Engineering and Consulting, Inc.
May 2009
2-18
-
,,: ,i ~T-'-_
"
.
-
--I
/
-
\'
\
,
,
,
.,
,
,
f
2-14:Coffeen Lake
Anoxic Sediment
Zone - September
Legend
-
Segment Boundary
10 It Contour
•
Aerobic Sediment
•
Anoxic Sedimen
t
"
0,
25
Created by: CGS
Checked by: WJE
Appmv&d by: ASS
May 5
, 2009
I Mles
"'
Coffeen Lake
Ameren
MACTEC Engineering and Consulting, Inc.
May 2009
2-19
-
,,: ,i ~T-'-_
"
.
-
--I
/
-
\'
\
,
,
,
.,
,
,
f
2-1S:Coffeen Lake
Anoxic Sediment
Zone - October
Legend
-
Segment Boundary
10 It Contour
•
Aerobic Sediment
•
Anoxic Sediment
"
0,
25
Created by: CGS
Checked
by: WJE
Appmv&d by: ASS
May 5
, 2009
I Mles
"'
Electronic Filing - Received, Clerk's Office, May 12, 2009
Coffeen Lake
Ameren
MACTEC Engineering and Consulting, Inc.
May 2009
2-20
"
" ,
1 ---
,
1/
.I
"
"
,
-
"
,
,
,
,
+
'
,
,
1
,-
,
,
,
1"9W" ;, . ,,, Coffeen lake
Section Locations
l i'; :e 9' ''"'
n' ' ~
U=
L
egend
Segment
1
Cr
oss Secti
on
S
egment 2
-
Cr
oss Secti
on
o
Crea
ted by: CGS
Checked by: WJE
Approvo;d by: A6S
May 5
, 2009
• . >
Coffeen Lake
Ameren
MACTEC Engineering and Consulting, Inc.
May 2009
2-21
Figu r e 2- 17. Cro s s- Section of La ke Bottom , Av erage Ano xic Water Dep t h , and Oxygenated
Su rfac e Wat er Depth fo r Seg ments 1 and 2, Ma y and Oc tob er
Segment 1 Cros
s Section - M aV
m
I
g
!
=
~'T
!
~
53%
-
,
,
,
,
,
,
•
,~
=
=
-
~
~
=
~
~
H.,.~_.!
Oh ..... Ih)
Segment 1 C
ros
s Section - O
ctober
m
I
,
=
rC2~c
,
l
~
~
7.71 0
~
,
•
,=
=
=
~
~
=
=
~
~
--..Dio'_
o lhl
Segment 2 Cross Section - Mav
m
•
~
i
=
!
•
,=
=
=
-
=
=
=
~
=
IIorb ...... Diot.nco jhl
S
egment 2 Cross Section - October
m
g
=
I
~~ , 2!ij§
j
•
I
!
~
14.
04 %
~
,
,
,
,
,
,
,
,
•
,=
=
=
~
=
=
=
~
=
_1ooMaI
Dio
,_o IhJ
_
Su'!
.", [ ... .
1Ian
- -,
,=
,
_w. ",,~!
-
S\>"!.", ! ....
tIon
-
-.
,=
_ w . .. , ..... !
-Su<f_(j ...
~
...
-
,=
-
-
w . ""t .....
-
SUtf_E .... tlotI
- -~
_
W
o""t_
,
=
Coffeen Lake
Ameren
MACTEC Engineering and Consulting, Inc.
May 2009
2-22
2.2
Potential Impacts of Increased Thermal Standard for May and October on Internal
Phosphorus Loading
Although internal phosphorus cycling does not appear to be a primary driver of surface water quality in
Coffeeen Lake, potential impacts to lake water quality following modification of the existing thermal
standard were evaluated. Changes to seasonal temperature and oxygen stratification were estimated for
May and October to evaluate the potential for incremental effect on internal phosphorus loading resulting
from changes to seasonal anoxia in Coffeen Lake bottom waters.
2.2.1
Spatial Impacts to Lake Stratification
The proposed change in the thermal discharge during May and October could potentially result in a small
increase in lake substrate surface area that will experience seasonal anoxia as a result of increased
discharge temperatures. Existing data were reviewed and evaluated to estimate potential changes during
May and October (Table 2-5). These estimates reflect May conditions that are expected to resemble
current June conditions once ambient temperatures sustain stratification, and October conditions that
resemble late September. In October, the plant will be able to operate more frequently, but ambient
conditions will be cooling, and aerated waters from Segments 3 and 4 are likely to contribute to general
contraction of the anoxic areas, although stratification may remain stable through at least a portion of
October.
Table 2-5
. Current and Predicted Days with Anoxic Sediment Conditions
Existing MAY
Proposed MAY
Existing OCT
Proposed Oct
Segment 1
18
23
1
13
Segment 2
17
25
1
11
Segment 3
9
9
0
0
Segment 4
0
0
0
0
Based on Coffeen Lake bathymetry, and existing May and October data, only Segments 1 and 2 will have
additional sediment surface area exposed to potential anoxic conditions during May (Figure 2-18) and
October (Figure 2-19). The resultant increase in exposed surface area for the entire lake is 21.1 hectares in
May and 11.1 hectares in October, resulting in an 8% increase in sediment surface exposed to anoxia
during that time period within Coffeen Lake (Table 2-6). Although increased thermal discharge may
expose additional sediment surface area to seasonal periods of anoxia, the frequency and duration of
stratification and anaerobic activity within the hypolimnion during the months of May and October is
significantly lower than the rest of the summer months, and will likely not expose the additional surface
area to prolonged anaerobic activity such that a measurable increase in surface water phosphorus
concentrations will be observed.
Electronic Filing - Received, Clerk's Office, May 12, 2009
Coffeen Lake
Ameren
MACTEC Engineering and Consulting, Inc.
May 2009
2-23
,
-._j •• -
,
I--~
/-
/'
"
-
"
'(
,
,
,
,
•
c
_
, ,
,
1
,
,
,
2.18:Coffeen Lake
10 fI Contour
Aerobic Sedime
nt
Added Ano
x ic Sediment
~
~~~~~t~
,
0.
25
Created
by:
CGS
Checked by: WJE
Appwvo;d by: ASS
M
ay 5, 2009
I
Miles
"
Electronic Filing - Received, Clerk's Office, May 12, 2009
Coffeen Lake
Ameren
MACTEC Engineering and Consulting, Inc.
May 2009
2-24
:'
r
,
,
,
l
"
-
\
,
\
,
,
+
'
,
,
•
i
,
'.
-
,
,
,
,-
2.19
:Coffeen Lake
i Sediment Zone
Under New Permit
Condilions - October
1
--
'''g , ~ct
Boundary
10
ft
Contour
Aerobic Sedi
ment
Added Anoxic Sedimen
t
1--
-
~""-
.....
~
AJ10xfc Sedimen
t
o
0.
25
Cr"~ted
by: CGS
Check
ed by: WJE
Approv&d by: ASS
May 5, 2009
I
Miles
"
"\
Coffeen Lake
Ameren
MACTEC Engineering and Consulting, Inc.
May 2009
2-25
Table 2-6.
Potential Increase in Lake Substrate Surface Area Exposed To Seasonal Anoxia (Hectares)
May
October
Segment 1
16.5
0.8
Segment 2
4.5
10.3
Total:
21.1
11.1
(O
2
Profile Data Source: SIUC, 2007)
Created by: BMJ Checked by: ABS 5/7/2009
2.2.2
Potential Increase in Phosphorus Loading
Using these areas and representative flux rates (Haggard
et al
, 2005; Illinois EPA, 2009a), estimates of
the incremental difference in phosphorus flux into the hypolimnion were made. This estimate ranges from
48.08 kg P/year to 96.17 kg P/yr under the new permit conditions.
2.2.3
Limitation of Impacts to Epilimnion Water Quality
The incremental difference in phosphorus loading is a 0.5% to 1.1 % increase of the TMDL addendum
predicted internal loading (Illinois EPA, 2009a), and a 1.5% predicted increase if the internal loading
estimate in this analysis (see Section 2.2.1) is accurate (Figure 2-20). In any case, the incremental increase
is
de minimus
, and poses no harm to the lake, as this phosphorus is not expected to reach the epilimnion
or change current in-lake conditions with respect to phosphorus.
Figure 2-20.
Incremental Loading Differences to Estimated Current Phosphorus Loads
(Data Source: Illinois EPA, 2009a).
Created by: BMJ Checked by: KAR 5/11/2009
Coffeen Lake
Ameren
MACTEC Engineering and Consulting, Inc.
May 2009
3-1
3.0 Mercury Cycling
Coffeen Lake is currently listed on the Illinois EPA 303(d) list of impaired water for mercury. Illinois
EPA states their concerns as follows: “During periods of stratification and low dissolved oxygen, more
methylmercury is produced. Methylmercury bioaccumulates and is typically found in predatory fish. If
the temperature of the Lake is higher in May and October, and the period of stratification is lengthened,
the levels of mercury in the fish may also increase.” This chapter discusses the complexity of mercury
methylation, the current understanding of mercury and mercury dynamics in Coffeen Lake, and the
incremental effect of the change in the thermal standard for May and October on mercury cycling in the
lake.
Current Illinois fish consumption advisories include waters containing at least one fish tissue where the
mercury level 0.06 mg/kg (Illinois EPA, 2008). Mercury readily bioaccumulates in living tissues, and
thus, fish consumption advisories are common nationwide. Coffeen Lake is included in this advisory
based on fish tissue samples from collections in 2002. These samples consist of two composite (5 fish per
composite) samples of largemouth bass filet. Because largemouth bass are a top aquatic predator in the
lake, although the sample size is small, the results are conservative for the lake. Illinois EPA’s concern for
Coffeen Lake is that mercury methylation is likely based on thermal stratification throughout the summer
months. Methylation is affected by multiple parameters and cannot be based solely thermal stratification.
Mercury in the environment is constantly cycled through a biogeochemical cycle, and its presence is the
result of natural (e.g., geothermal activity) and anthropogenic activities. Two main types of reactions in
the mercury cycle convert mercury through its various forms: oxidation-reduction and methylation-
demethylation. In oxidation-reduction reactions, mercury is either oxidized to a higher valence state (e.g.,
Hg
0
to Hg
2+
) or reduced to a lower valence state. In methylation-demethylation reactions, mercury is
transformed into methylmercury when the oxidized mercury (i.e., Hg
2+
, or mercuric species) gains a
methyl group (CH
3
) (Environment Canada, 2007). Chemical speciation is an important variable in
determining mercury toxicity (Eisler, 2006). Mercury compounds in aqueous systems are complex, and,
depending on various physical and chemical parameters, a variety of chemical species may be formed
(Figure 3-1) (Eisler, 2006). Methylmercury is the biologically active form of mercury and bioaccumulates
up the food chain.
Mercury may be methylated through biological processes, chemical processes, or both in aquatic systems.
Mercury methylation in ecosystems depends on mercury loadings, nutrient content, pH, oxidation-
reduction conditions, bacterial activity, and other variables (Eisler, 2006). Changes in biological or
chemical parameters can result in increased or decreased methylation and demethylation rates in aquatic
systems (Eisler, 2006), however external mercury loading is a dominant variable in fish tissue mercury
concentrations. This section summarizes available research on the factors that affect methylation of
mercury and how it relates to Coffeen Lake. The parameters discussed in the following subsections are
indicator parameters that may indicate whether the methylation of mercury is favorable or unfavorable
under certain conditions. While general trends may be observed as individual indicator parameters
Electronic Filing - Received, Clerk's Office, May 12, 2009
Figure 3-1 Major transformations of mercury in the environment. (Eisler, 2006
)
CH
4
C
2
H
6
Hg
2+
AIR
CH
3
Hg
+
(CH
3
)
2
Hg
Hg
0
WWAATERTER AND
AND BENTHBENTHICIC REGIONREGION
(CH
3
)
2
Hg
DIMETHYL
Hg
0
.
ELEMENTAL
FISH
CH
3
Hg
+
CH
3
SHgCH
3
METHYL
Hg
2+
MERCURIC
Hg
2
2+
C
OS
METHYL
MERCURIC
Inorganic and Organic Complexes
SHELLFISH
MERCUROUS
HgS
Coffeen Lake
Ameren
MACTEC Engineering and Consulting, Inc.
May 2009
3-3
increase or decrease, the suite of parameters should be evaluated as a whole to indicate the potential for
methylation of mercury.
Mercury may be methylated in a variety of areas and under various conditions throughout the Coffeen
Lake watershed. Within the Coffeen Lake watershed, various land use activities are present, totaling
12,278.4 acres surrounding Coffeen Lake (Illinois EPA, 2007). Certain types of land use may attribute to
methylation of mercury in and around Coffeen Lake and other nearby waterbodies. According to Illinois
EPA (2007) 8,170.70 acres in the Coffeen Lake watershed are used for various forms of agricultural
farming, such as soybeans, corn, grasslands and other small grains and hay. During times of harvest and
planting runoff from various types of agricultural fields can lead to deposition of sediments, suspended
solids and sources of organic carbon into Coffeen Lake and nearby waterbodies. Along with sediment
deposition suspended solids and sources of organic carbon as well as various other contaminants may also
enter the water systems due to runoff. Contaminants may include pesticides, herbicides, large sediment
loads and animal and plant waste materials (as a source of organic carbon). Over 600 acres of the lake’s
watershed are wetlands. Wetlands are another land use type where mercury methylation is commonly
favored. Wetland areas may also be an area of high rates of methylation. This is true because the highest
rates of mercury methylation are often observed in surface sediments where microbial activity is
relatively high due to input of fresh organic matter. As a result, systems with high organic matter
production (e.g., wetlands, reservoirs) may exhibit extremely high rates of methylmercury production
(Benoit
et al
., 2003). Mercury methylation may be occurring in a variety of areas throughout the
watershed, depending upon site-specific conditions. East Fork Shoal Creek Gate Structure project
proposes to pump water from East Fork Shoal Creek in order to provide additional water to Coffeen Lake.
The creation of new floodplain and wetland areas may provide additional areas for potential methylation
of mercury to Coffeen Lake due to inundation of areas not previously covered with water. This
environment may encourage certain bacteria to anaerobically metabolize available mercury, resulting in
methylmercury as a byproduct. However, the annual flooding frequency for the area will not increase, and
thus, methylation rates may not be affected by this action.
Methylation can occur in a variety of situations, most notably in surficial sediments at the oxic-anoxic
interface (Park and Bartha, 1998), however it may also occur in surrounding areas inundated with water
for various amounts of time, forcing bacteria to switch from aerobic respiration to anaerobic respiration.
Runoff from agricultural land use may attribute to the amount of sediment deposition, organic carbon, and
chemical depositions occurring in Coffeen Lake and in surrounding waterbodies. Methylation rates may
increase as sediment loads increase, organic carbon enters a waterbody or dissolved oxygen becomes
depleted as a result of nutrient loading. Along with sediment, organic carbon and DO depletion, pH may
also play a role in changing methylation rates of mercury. As low pH (acidic conditions) may not favor
methylation, higher pHs may favor methylation. Some types of nutrient runoff from agricultural areas
may contain chemicals which can raise or lower pH values.
3,464.2 acres of the Coffeen Lake watershed are forested, wetland areas or urbanized and not used for
agricultural land use activities. Of the 3,464.2 acres not used for agriculture, 343.2 acres are urbanized.
Coffeen Lake
Ameren
MACTEC Engineering and Consulting, Inc.
May 2009
3-4
Due to impervious surface, urbanized areas may also contribute runoff and various forms of potential
pollutants to Coffeen Lake and surrounding waterbodies.
3.1
Mercury Load and Bioavailability
The presence of mercury in environmental media, the availability of that mercury for methylation, and the
bioavailability of methylmercury, are important for understanding potential risks to receptors. The
relationship between mercury load (i.e., mercury concentration) and mercury methylation is logarithmic
so that the rates of mercury load and methylation are proportional at relatively low mercury levels.
Methylation rates become asymptotic at relatively high levels (Krabbenhoft
et al
., 1999). The greatest
potential for mercury methylation occurs in surficial sediment (Korthals and Winfrey, 1987) at the oxic-
anoxic interface in sediments (Pak and Bartha, 1998).
3.1.1
Surface Water Data
In 2007, the USEPA conducted mercury sampling in Illinois lakes as part of the National Lakes Survey.
Survey locations were chosen based on waterbody acreage and included a subset of lakes included in the
1972 USEPA National Lake Eutrophication Study. Approximately 50 Illinois lakes were sampled, the
average total mercury concentration was 2.24 ng/L, and the average methylmercury concentration was
0.07 ng/L (Krabbenhoft,
et al
., 2008).
Based on readily available Illinois EPA data, Coffeen Lake surface water was not analyzed for mercury.
3.1.2
Sediment Data
Mercury concentrations from Segments 1 and 3 in Coffeen Lake (Figure 3.-2) sediments collected in 2002
were below the Illinois EPA detection limit. Sediment mercury concentrations from samples collected
between 1989 and 1997 ranged from 0.03 to 0.51 mg/kg (average 0.21 mg/kg) in Segment 1 and ranged
from 0.0005 to 0.10 mg/kg (average 0.07 mg/kg) in Segment 3 (Illinois EPA, 2009b).
3.1.3
Fish Tissue Data
Coffeen Lake is located in Montgomery County, southwestern Illinois. The Illinois Contaminant
Monitoring Program sampling (1985-2004) and USEPA Lake Fish Tissue Study sampling (1999-2003)
included composite fish tissue analysis for Montgomery County and surrounding counties of Bond,
Christian, Fayette, Macoupin, Madison, Sangamon, and Shelby Counties. A total of 54 fish were sampled
from Montgomery County, including largemouth bass (
Micropterus salmoides
), bluegill (
Lepomis
macrochirus
), and white crappie (
Pomoxis annularis
). The average mercury concentration in
Montgomery County was 0.13 mg/kg with concentrations ranging from 0.08 to 0.22 mg/kg. Fish species
collected from surrounding counties included, largemouth bass, bluegill, carp (
Cyprinus carpio
), channel
catfish (
Ictalurus punctatus
), smallmouth buffalo (
Ictiobus bubalus
), walleye (
Sander vitreus
), black
crappie (
P. nigromaculatus
), and spotted bass (
M. punctulatus
). The average mercury concentration in
fish tissues from the surrounding counties was 0.14 mg/kg, with a sample range from 0.01 mg/kg to
Figure 3-2 Illinois Largemouth Bass Mercury Concentrations
0.90
1.00
Figure 3-2 Illinois Largemouth Bass Mercury Concentrations
Knox County Average
Hg Concentration
2.97 mg/kg
0.70
0.80
)
National Average
Largemouth Bass
Hg Concentration
0.50
0.52 mg/kg
0.60
e
ntration (mg/kg
)
Coffeen Lake
Average Hg Concentration
0.085 mg/kg
0.52 mg/kg
0 30
0.40
Mercury Conc
e
Montgomery
0.20
0.30
Montgomery
County
Average Hg
Concentration
0.13 mg/kg
0.00
0.10
ond
o
wn
oun
t
ian
C
la
y
n
ton
o
les
ook
and
k
alb
W
itt
ag
e
dg
ar
h
am
e
tte
k
lin
l
ton
a
tin
ndy
nry
son
son
se
y
k
ee
nox
a
ke
a
lle
L
ee
s
ton
con
u
pin
son
r
ion
h
all
nry
e
an
r
cer
m
ery
g
an
o
ria
e
rry
P
ike
ope
a
ski
olph
and
and
l
ine
mon
y
ler
e
lb
y
lair
w
ell
l
ion
g
ton
yne
h
ite
s
ide
W
ill
son
f
ord
Bo
Br
o
Calh
o
Chris
t
C
Cli
n
Co
Co
Cumberl
a
De
k
De
W
DuP
a
Ed
Effing
h
Fay
e
Fran
k
Fu
l
Gall
a
Gru
n
He
n
Jack
s
Jeffer
s
Jer
Kanka
k
Kn
La
LaS
a
L
Livin
gs
Ma
c
Maco
u
Madi
s
Ma
r
Mars
h
McHe
n
Mcl
e
Me
r
Montgo
m
Mor
g
Pe
o
Pe
P
Po
Pul
a
Rand
o
Richl
a
Rock Isl
a
Sa
l
Sangam
Schu
y
Sh
e
St.C
Taze
w
Vermi
l
Washin
g
Wa
y
Wh
White
s
W
William
s
Wood
f
Sources: Illinois Fish Contaminant Monitoring Program Database 1985-2004
Prepared by/Date: AES 5/7/09
USEPA National Survey of Cioncentrations in Fish Database 1999-2003
Checked by/Date: MBR 5/7/09
Electronic Filing - Received, Clerk's Office, May 12, 2009
Coffeen Lake
Ameren
MACTEC Engineering and Consulting, Inc.
May 2009
3-6
0.51 mg/kg. Average mercury concentrations from fish collected in Montgomery and surrounding
counties is presented in Table 3-1.
Jenkins (2007) assessed the Illinois Fish Mercury Monitoring Program, which included samples collected
between 1974 and 1998. Sample locations were divided by watersheds. Montgomery County is in the
Kaskaskia watershed, which comprised 77% of Jenkins’ dataset. Other nearby counties in this watershed
are Bond, Fayette, Madison, and Shelby Counties. The median tissue mercury concentration from
Jenkins’ entire fish dataset (>2300 samples, 18 species, 149 lakes) was 0.10 mg/kg.
3.1.3.1 Largemouth Bass
The largemouth bass is the top predatory fish species in Coffeen Lake. Available fish tissue mercury data
for Coffeen Lake is limited to two largemouth bass samples, comprised of 5 composited filets each,
collected October 22, 1990 and October 21, 1991 (Illinois EPA, 2009c; ; USEPA, 2009). Mercury
concentrations of these samples were 0.08 and 0.09 mg/kg, respectively. Using the maximum observed
mercury concentration (0.09 mg/kg) in Coffeen Lake largemouth bass, a 33% reduction in mercury
loading would be necessary to reach 0.06 mg/kg. Over time, this reduction in fish tissue concentration can
be expected to be achieved by regional mercury load reductions. Montgomery County average
largemouth bass tissue concentration (0.13 mg/kg) was nearly half than the Illinois Counties average
(0.22 mg/kg) (Illinois EPA, 2009c). Figure 3-2 presents the average Illinois largemouth bass mercury
concentrations as compared to the national average concentration of 0.52 mg/kg (USEPA, 2001).
3.1.3.2 Wildlife
Some animals, such as bald eagles and wading birds, within the watershed may prey on fish from Coffeen
Lake. Mercury levels in fish of concern to wildlife are higher than the benchmark of 0.06 mg mercury/kg
adopted by Illinois EPA for protection of human health. Given the current and anticipated low levels of
mercury in fish (with the largemouth bass samples representing the upper end of mercury concentrations
in fish), wildlife are not at risk from mercury in fish from Coffeen Lake.
3.2
Additional Parameters Related to Methylation
In addition to the mercury load, acid volatile sulfide (AVS)/simultaneously extracted metals (SEM) ratios,
changes in water levels, dissolved oxygen (DO), hardness and alkalinity, metals, molybdate, organic
carbon, oxidation-reduction potential (ORP), pH, salinity, seasonality and temperature, sulfate and
sulfide, water levels, and the microbial community structure are factors that affect methylation. Readily
available Coffeen Lake analyte data are not available for each of these parameters; however, data are
available for DO, alkalinity, iron, manganese, pH, organic carbon, and temperature. A summary of these
parameters and their expected influence on mercury methylation are listed below. The parameters with
Coffeen Lake data are discussed further in the following sections.
Electronic Filing - Received, Clerk's Office, May 12, 2009
Coffeen Lake
MACTEC Engineering and Consulting, Inc.
Ameren
May 2009
County
Waterbody
No. of
Samples
No. of Fish
Sampled
Species
Ave Hg Conc (mg/kg)
Bond
Greenville New Lake
1
5
LMB
0.100
Bond
Patriots Park Lake
2
10
LMB
0.360
Christian
Sangchris Lake
5
22
LMB
0.118
Christian
Taylorville Lake
3
14
LMB
0.090
Fayette
Kaskaskia river
4
17
C, CC, LMB, SMB, WE
0.125
Fayette
Vandalia Lake
1
5
LMB
0.070
Macoupin
Beaver Dam Lake
1
5
LMB
0.140
Macoupin
Bunn Lake
2
10
BG, LMB
0.140
Macoupin
Mt. Olive New Lake
2
10
LMB
0.215
Macoupin
Mt. Olive Old Lake
1
5
LMB
0.260
Macoupin
Otter Lake¹
5
25
C, LMB
0.166
Macoupin
Staunton City Lake
2
10
LMB
0.175
Madison
Highland-Silver Lake
1
5
LMB
0.240
Madison
Horseshoe Lake
3
15
BG, LMB
0.100
Madison
Mississippi River - S. Central
3
12
LMB, WB
0.110
Madison
Pine Lake
4
13
BC, BG, LMB
0.100
Montgomery
Coffeen Lake
2
10
LMB
0.085
Montgomery
Glenn Shoals Lake
2
10
LMB
0.140
Montgomery
Lou Yaeger Lake
8
34
BG, LMB, WC
0.138
Sangamon
Springfield Lake
5
25
LMB
0.072
Shelby
Kaskaskia river
2
6
LMB, WE
0.100
Shelby
Little Wabash River
4
15
C, LMB, SB
0.238
Shelby
Shelbyville Lake
6
30
LMB, WC, WE
0.085
Notes:
Samples comprised of composite filets collected between 1985 and 2004 as part of the Illionois Contaminant Monitoring Program.
¹Includes four composited filet samples collected in 2001 as part of the US EPA Lake Fish Tissue Study.
Species Codes:
BC = Black Crappie
SB = Spotted Bass
BG = Bluegill
SMB - Smallmouth Buffalo
C = Carp
WB = White Bass
CC = Channel Catfish
WC = White Crappie
Hg = Mercury
WE = Walleye
LMB = Largemouth Bass
Source:
Illinois Fish Contaminent Monitoring Program database (1985-2004);
Prepared by/Date: MBR 5/5/09
USEPA National Survey of Concentrations in Fish database (1999-2003).
Checked by/Date: AES 5/6/09
Table 3-1. Average Fish Tissue Mercury Data from Montgomery and Surrounding Counties
Electronic Filing - Received, Clerk's Office, May 12, 2009
Coffeen Lake
Ameren
MACTEC Engineering and Consulting, Inc.
May 2009
3-8
Table 3-2.
Summary of Various Parameters that may Influence Mercury Methylation Rates
Mercury Methylation
Parameter
General Effect on Methylation of Mercury
AVS/SEM
AVS/SEM ratios greater than 1 tend to inhibit methylation.
DO/ORP
Oxic and oxidizing environments do not favor methylation.
Hardness/Alkalinity
Increased hardness and alkalinity reduce metal toxicity and reduce uptake of metals.
Iron/Manganese
May favor or inhibit methylation depending on concentration and chemistry.
pH
Acidic conditions in sediment may not favor methylation.
Salinity
As salinity increases, methylation of mercury decreases.
Sulfate
Reduction of sulfate by sulfate reducing bacteria (SRB) may enhance methylation of
mercury.
Sulfide
The presence of sulfide may reduce methylation of mercury and bioavailability of
methylmercury.
Temperature
Increasing temperature increases methylation of mercury.
Organic Carbon
DOC in the water column may enhance methylation but may also bind
methylmercury; TOC in sediment may enhance methylation.
3.2.1
Dissolved Oxygen
DO plays a role in mercury methylation. When oxic conditions exist in the water column and in sediments
(i.e., DO >1 milligrams per liter [mg/L]), bacteria respire aerobically, which means that they use oxygen
as the terminal electron receptor during metabolism. When anoxic conditions are present in the water
column or in sediments, bacteria will respire anaerobically, which means they will use another molecule
besides oxygen as the terminal electron receptor during metabolism. The molecule used depends on the
types of bacteria present. Mercury can be methylated to produce methylmercury as a byproduct of these
metabolic reactions. Several studies have concluded that the formation of methylmercury from mercury in
lakes and reservoirs is favored under low DO conditions; the rate of mercury methylation is lower in the
presence of oxygen; and methylmercury may be formed primarily in anoxic waters and sediments but is
demethylated under aerobic conditions (Ramlal
et al
., 1986; Korthals and Winfrey, 1987; Bloom and
Effler, 1990; Oremland
et al
., 1991; Gilmour
et al
., 1992; Watras
et al
., 1995; Herrin
et al
., 1998). Pak
and Bartha (1998) discovered that the most important location of methylation is at the oxic-anoxic
interface in sediments. However, the mere absence of oxygen does not demonstrate that rates of mercury
methylation are high.
Based on Coffeen Lake bottom conditions between 2001 and 2006 (see Section 2), anoxic conditions are
present over a portion of the lake bottom and in the hypolimnion (at depth) in waters overlying these
sediments during a portion of the six month period from May to October. Mercury (whether methylated
or not) is quite low in Coffeen Lake, compared to many other lakes in Illinois, based upon the available
largemouth bass data. Changes to the thermal standard for Coffeen Lake during May and October will not
increase the overall mass of mercury in the lake. The marginal changes in anoxia in these two months
attributable to these changes (see Figures 2-18 and 2-19 in Section 2), compared to the current operating
conditions, leads to the conclusion that any effect on mercury methylation rates that may occur would be
very minor, and likely not result in measureable changes in fish mercury concentrations.
Electronic Filing - Received, Clerk's Office, May 12, 2009
Coffeen Lake
Ameren
MACTEC Engineering and Consulting, Inc.
May 2009
3-9
3.2.2
Alkalinity
Total alkalinity (i.e., carbonate and bicarbonate) can also regulate metal content in surface water by
precipitating toxic metals out of solution. Total alkalinity is also an indication of the buffering capacity of
the surface water system or the ability of a water body to resist changes in pH. The pH level also plays a
role in the methylation of mercury and is discussed in Section 2.10. Buffering capacity of a water body is
geologically dependent, but, in general, total alkalinity levels less than or equal to 10 mg/L indicate a
poorly buffered system that is susceptible to changes in pH (Wilkes University, 2007). Higher alkalinity
levels have also been correlated with reduced bioaccumulation rates (Barkay
et al
., 1997).
Total alkalinity concentrations in Coffeen Lake Segment 1 ranged from 80 to 140 mg/L. Segment 2
concentrations ranged from 50 to 120 mg/L. Segment 3 concentrations ranged from 60 to 110 mg/L.
Based on these results, total alkalinity concentrations indicate potentially reduced bioaccumulation rates
within Coffeen Lake.
3.2.3
Metals
Substrates other than oxygen act as the terminal electron receptor for bacterial metabolism under anoxic
conditions. Depending on the species of bacteria present and the physico-chemical environment, metals
such as iron and manganese can be used as terminal electron receptors. The production of methylmercury
can be a byproduct of these metabolic reactions. In addition, non-microbial methylation of mercury was
documented to be stimulated by the presence of certain metals, such as iron and manganese (Stokes and
Wren, 1987). Iron and manganese can also inhibit the methylation of mercury through mineralization.
Selenium has been shown to decrease bioaccumulation rates of methylmercury. Research on each metal is
presented in the following sections.
3.2.4
Iron
Iron can potentially stimulate or inhibit methylmercury production depending on concentration and
speciation. Iron reduction by bacteria may be responsible for some amount of in situ mercury methylation
(Kerin
et al
., 2006). Depending on iron speciation, iron can stimulate iron-reducing bacteria to methylate
mercury, and these bacteria can do so at a rate equivalent to SRB in some circumstances (Fleming and
Nelson, 2006) (see Section 1.14). As a result, the presence of iron, which can be used as a terminal
electron receptor in metabolism for certain bacterial populations, can increase methylation rates. Warner
et al
. (2003) found measurable methylation in sediments where iron was the dominant terminal electron
acceptor, although methylation rates were lower than those observed in sulfate-reducing or methanogenic
sediments. In sediments from Clear Lake, California, where microbial iron reduction was occurring,
inhibition of sulfate reduction did not result in complete inhibition of mercury methylation, suggesting
that iron reduction may have been responsible for some amount of in situ mercury methylation (Fleming
et al
., 2006). Jackson found that iron-coated clays counter depression of both methylation and
demethylation (Jackson, 1989). Ferric oxyhydroxide addition was documented to increase methylation
rates in certain lacustrine (lake) sediments (Fleming
et al
., 2006).
Electronic Filing - Received, Clerk's Office, May 12, 2009
Coffeen Lake
Ameren
MACTEC Engineering and Consulting, Inc.
May 2009
3-10
While iron may stimulate methylmercury production under certain conditions, it may also inhibit
methylmercury production. In a study of estuarine wetland sediment slurries from San Francisco Bay,
California, Mehrotra and Sedlak (2005) observed decreases in mercury methylation rates with the
addition of 30 millimolar (mM) ferric iron; they believe that this effect was caused by decreases in
dissolved mercury and sulfide due to complexation with iron. The addition of ferrous iron may also
decrease the net rate of methylmercury production by reducing the concentration of dissolved sulfide.
Complexation with iron could also reduce mercury bioavailability.
Coffeen Lake iron concentrations in sediments in Segment 1 ranged from 26,500 to 40,000 mg/kg at
Segment 1 and from 17,000 to 30,000 mg/kg at Segment 3. At these concentrations, the mercury may be
complexed with iron and not available to iron-reducing bacteria for methylation, as noted in research by
Mehrotra and Sedlak above.
3.2.4.1 Manganese
Manganese, like iron, may complex with mercury and reduce bioavailability. The role of clays in
reducing methylation was dependent on their surface coatings in research involving clay minerals and
oxides on methylation and demethylation of mercury (Jackson, 1989). Manganese oxide coatings
sometimes promoted methylation, but larger amounts of manganese oxide suppressed methylation
(Jackson, 1989).
Coffeen Lake manganese concentrations in Segment 1 ranged from 712 to 1,600 mg/kg at Segment 1 and
from 290 to 521 mg/kg at Segment 3. At these concentrations, the mercury present in Lake sediments
may be complexed with manganese and, therefore, may not be bioavailable.
3.2.5
Organic Carbon
Two types of organic carbon, DOC and total organic carbon (TOC), can affect the methylation of
mercury. Both mercury and methylmercury will complex strongly with DOC and, as a result, can both
decrease and increase bioaccumulation (Brumbaugh
et al
., 2001). Organic complexation can increase the
amount of mercury substrate for methylation in the water column, but the binding of methylmercury by
DOC in the water column can result in lower fish bioconcentration factors (Watras
et al.,
1995). DOC
associations may decrease the bioaccumulation of mercury in aquatic food webs by lowering the
bioavailability of mercury to methylating organisms (Barkay
et al.,
1997; Haitzer
et al.,
2003).
TOC has also been shown to have opposing effects on the methylation of mercury and its bioavailability.
TOC can enhance mercury methylation by acting as a food source and thereby increasing the metabolism
of heterotrophic microorganisms (Furutani and Rudd, 1980; Stokes and Wren, 1987); however, mercury
methylation may also be inhibited through formation of mercury complexes with organic ligands
(Robinson and Tuovinen, 1984; Gilmour
et al.,
1992; Macalady
et al.,
2000; Han
et al.,
2007). The
highest rates of mercury methylation are often observed in surface sediments where microbial activity is
greatest due to the input of fresh organic matter. As a result, systems with high organic matter production
Electronic Filing - Received, Clerk's Office, May 12, 2009
Coffeen Lake
Ameren
MACTEC Engineering and Consulting, Inc.
May 2009
3-11
(wetlands, reservoirs) may exhibit extremely high rates of methylmercury production (Benoit
et al
.,
2003).
Illinois EPA 1997 Coffeen Lake samples had concentrations of 0.58 and 0.82 percent TOC, which may
suggest conditions do not appear to favor methylation. Krabbenhoft,
et al.
(2008) correlated DOC levels
with total and methyl mercury, stating “proximity to sources and DOC levels are the most significant
drivers.” Coffeen Lake DOC levels are not available; however, Illinois DOC averaged 7.1 mg/L. As
discussed in Section 2.1.1, total mercury average concentration in Illinois was 2.24 ng/L and methyl
mercury concentrations averaged 0.07 ng/L.
3.2.6
pH
The level of pH also plays a role in the methylation of mercury. Acidic pH generally favors the
methylation of mercury to a point. The pH level may also affect the bioavailability of methylmercury to
higher trophic level organisms. Low pH (usually less than 5) is frequently associated with high mercury
concentrations in fish tissue (Stokes and Wren, 1987; Watras
et al
., 1995; Barkay
et al
., 1997;
Brumbaugh
et al
., 2001). Low pH favors both the direct uptake of methylmercury through the gills of fish
and dietary uptake due to increased mercury accumulation by organisms in lower trophic levels (WHO,
1990). In some systems, surface water pH has been identified as the most important factor controlling
mercury bioaccumulation in fish (Moore
et al
., 2003).
Coffeen Lake surface waters are neutral or circum-neutral, which does not favor methylation. Data for pH
are not available for Coffeen Lake sediment samples, but are also likely to be circum-neutral.
3.2.7
Seasonality and Temperature
Seasonality resulting from temperature changes affects the methylation of mercury. The potential for
mercury methylation varies at different times of the year, with the greatest potential generally occurring in
the summer from mid-July to September (Korthals and Winfrey, 1987). Lacustrine environments (i.e.,
lakes and ponds) with a significant depth profile and low water flows may thermally stratify in the
summer and in the winter. The stratification generally disappears during the spring and fall during what is
known as turnover events. The ratio of methylmercury to mercury in thermally stratified lakes is generally
greater in the hypolimnion (bottom layer), especially if the hypolimnion is anoxic, than in the epilimnion
(upper layer) (Bloom and Effler, 1990; Mason and Sveinsdottir, 2003; Eckley
et al
., 2005). The increase
in methylmercury in the hypolimnion appears to be related to the anaerobic conditions and the inability of
DO to penetrate the thermocline (region between the epilimnion and hypolimnion that exhibits a marked
temperature gradient equal to or exceeding 1
˚
C per meter) until a turnover event. Korthals and Winfrey
(1987) discovered that the seasonal peak in mercury methylation in profundal (deep, bottom-water area
beyond the depth of effective light penetration) surficial sediments coincided with a depletion of DO in
the lower hypolimnion, and the decrease in mercury methylation corresponded with the reaeration of the
hypolimnion during fall turnover. Several mechanisms have been proposed to explain the seasonal
changes of mercury methylation rates in anoxic hypolimnia. These potential mechanisms include the
Electronic Filing - Received, Clerk's Office, May 12, 2009
Coffeen Lake
Ameren
MACTEC Engineering and Consulting, Inc.
May 2009
3-12
diffusion of methylmercury from sediment to surface water during anoxic conditions, methylation
occurring in anoxic water column, and sedimentation of particulate methylmercury (Eckley
et al.,
2005).
Herrin
et al
. (1998) observed pronounced increases in mercury body burdens of zooplankton and juvenile
bass at the time of thermal destratification of a seasonally anoxic reservoir. Methylmercury stored in the
anoxic hypolimnion during the summer stratified period became available to lake biota during the fall
turnover and remained available for a short time after complete turnover (Herrin
et al
., 1998).
Increasing temperature also promotes methylation (Shanley
et al
., 2005). It also appears that mercury
methylation can be stimulated in the late spring by the high supply of fresh organic matter after the spring
plankton bloom (Choe
et al.,
2004). These increases are difficult to isolate, as other parameters, such as
input of fresh organic matter, coincide with temperature changes.
Based on Coffeen Lake bottom conditions between 2001 and 2006 (see Section 2), anoxic conditions are
present over a portion of the lake bottom and in the hypolimnion (at depth) in waters overlying these
sediments during a portion of the six month period from May to October. Mercury (whether methylated
or not) is quite low in Coffeen Lake, compared to many other lakes in Illinois, based upon the available
largemouth bass data. Changes to the thermal standard for Coffeen Lake during May and October will not
increase the overall mass of mercury in the lake. The marginal changes in anoxia in these two months
attributable to these changes (see Figures 2-18 and 2-19 in Section 2), compared to the current operating
conditions, leads to the conclusion that any effect on mercury methylation rates that may occur would be
very minor and likely not result in measureable changes in fish mercury concentrations.
3.3
Summary
Several geochemical factors that may affect the methylation of mercury were discussed in the previous
sections. The parameters discussed in the previous subsections are indicator parameters that may
generally predict whether the methylation of mercury is favorable under certain conditions. While general
trends may be observed as these indicator parameters increase or decrease, the suite of parameters should
be evaluated as a whole to predict the potential for methylation of mercury.
Flooding of terrestrial and wetland environments may or may not play a role in the methylation of
mercury. Current research on flooding or re-wetting of sediments or soils and methylation rates is
contradictory and appears largely dependent on site characteristics. While it may not be possible to
manipulate all parameters to reduce mercury methylation or methylmercury bioavailability, it may be
possible to manipulate some parameters. The effectiveness of manipulating any particular parameter
depends on various site-specific conditions. Recent research indicates that the most important parameter
that affects the methylation of mercury may be its mineralization with various other compounds in the
environment.
Based on the available Coffeen Lake data, mercury concentrations appear to be generally low and
conditions do not appear to be favorable for methylation. Current sources of methylation may be within
Coffeen Lake
Ameren
MACTEC Engineering and Consulting, Inc.
May 2009
3-13
lake or occurring in the watershed, but appear low. The proposed change in the thermal standard affecting
May and October conditions do not substantially change the lake conditions, although thermal
stratification may persist for more days on average, annually. This change is minor, and does not
represent a change that could or would significantly increase hypolimnetic mercury methylation rates. It
is anticipated that the change, if any, would be so small that it would not result in increased mercury in
the biota. Fish tissue concentrations are anticipated to measurably decline, however, as a result of regional
mercury load reductions
Coffeen Lake
Ameren
MACTEC Engineering and Consulting, Inc.
May 2009
4-1
4.0 Summary
4.1
Introduction
MACTEC evaluated potential for impacts on phosphorus and mercury cycling from proposed
modifications to current site-specific thermal standards in Coffeen Lake in support that raising the thermal
limits for the months of May and October will not result in significant increases in phosphorus loading or
mercury methylation over current lake conditions.
Illinois EPA claimed that Ameren failed to address the impact of the proposed thermal limits on total
phosphorus and mercury levels in Coffeen Lake, in addition to failing to address the impact on Lake
Habitat. Illinois EPA stated a concern that higher temperatures of Coffeen Lake in May and October may
result in prolonged stratification which can increase phosphorus levels and methylmercury levels.
4.2
Phosphorus
Phosphorus is a limiting nutrient in Coffeen Lake and is therefore an important component of its long-
term water quality. Internal phosphorus release from sediments can serve as an additional source of
phosphorus loading to the lake, yet is ultimately dependent on a number of chemical and physical factors
which occur at the sediment-water interface. The mere presence of thermal stratification does not indicate
that significant internal loading will occur as a result. Despite the potential for seasonal sediment
phosphorus release from the sediments, water quality measurements within Coffeen Lake indicate that
internal phosphorus recycling is currently not contributing appreciable amounts of total phosphorus to
epilimnetic surface water. Oxygenated hypolimnetic water and epilimnetic waters (DO> 1 mg/L) were
always present overlying these deeper anoxic layers as shown by cross section for May and October. The
data and this analysis clearly show that there is no “dead zone” within the lake.
TMDL assessments for Coffeen Lake attribute elevated phosphorus concentrations to external watershed
loading, primarily due to expansive agriculture surrounding the lake. External loading as a driver of water
quality is also apparent in high phosphorus concentrations measured in the shallow northern portions of
the lake. Additionally, seasonal water quality comparisons do not show elevated phosphorus or
chlorophyll-a concentrations during summer stratification of the water column, indicating that phosphorus
is either not being released in large volumes from the sediment or is not being mixed into the epilimnion
where it may be available for algae production.
Review of the original TMDL BATHTUB (2007) model revealed significant modeling errors and
misapplications which led to the erroneous conclusion that internal phosphorus loading dominates
Coffeen Lake. These errors produced a model run which did not match known lake phosphorus
concentrations. To compensate for this “under-prediction of observed phosphorus concentrations”, the
modelers introduced an additional internal phosphorus load (the BATHTUB model already incorporates
internal loading) to force the model to calibrate. The conclusions and load reduction requirements of the
Coffeen Lake
Ameren
MACTEC Engineering and Consulting, Inc.
May 2009
4-2
original TMDL were not revised, despite these errors and discrepancies. However, available monitoring
data do not confirm this estimated level of internal loading (see Section 2.1.1).
An evaluation of potential impacts associated with modified thermal discharge during the months of May
and October was also performed to quantify the potential for additional phosphorus release and
anticipated impacts to surface water quality. Results of this analysis indicate that the additional
phosphorus load which may be anticipated from the proposed modification ranges from 329.1 kg P/year
to 658.1 kg P/yr under existing permit conditions, which is much lower than predicted from the
BATHTUB modeling completed for the TMDL. Additionally, any phosphorus released from the
sediment is not expected to reach the epilimnion, and is therefore unavailable for biological production
within Coffeen Lake. Based on seasonal water quality comparisons sediment phosphorus release does not
appear to be an important component of surface water phosphorus loading within Coffeen Lake. Future
modifications to thermal discharge limits from the Ameren Power Generating Plant are unlikely to present
additional phosphorus loads from sediment release in the future, and therefore are not a threat to the
existing water quality of Coffeen Lake.
4.3
Mercury
Mercury readily bioaccumulates in living tissues, and thus, fish consumption advisories are common
nationwide. Coffeen Lake is currently included in the Illinois fish consumption advisories based on two
fish tissue samples with mercury concentrations exceeding the Illinois EPA level of concern of 0.06
mg/kg. These samples consist of two composite (5 fish per composite) samples of largemouth bass filet
with concentrations of 0.08 and 0.09 mg/kg of mercury. Because largemouth bass are a top aquatic
predator in the lake, although the sample size is small, the results are conservative for the lake. Illinois
EPA’s concern for Coffeen Lake is that mercury methylation is likely based on thermal stratification
throughout the summer months.
Methylation is affected by multiple parameters and cannot be based solely on thermal stratification. There
are multiple indicator parameters that may predict whether the methylation of mercury is favorable under
certain conditions. While general trends may be observed as these indicator parameters increase or
decrease, the suite of parameters should be evaluated as a whole to predict the potential for methylation of
mercury.
Based on the available Coffeen Lake data, mercury concentrations appear to be generally low and
conditions do not appear to be favorable for methylation. Current sources of methylation may be within
the lake or occurring in the watershed, but appear low. The proposed change in the thermal standard
affecting May and October conditions does not substantially change lake conditions, although thermal
stratification may persist for more days on average, annually. This change is minor, and does not
represent a change that could or would significantly increase hypolimnetic mercury methylation rates. It
is anticipated that the change, if any, would be so small, that it would not result in increased mercury in
the biota. Fish tissue concentrations are anticipated to measurably decline, however, as a result of regional
mercury load reductions.
Coffeen Lake
Ameren
MACTEC Engineering and Consulting, Inc.
May 2009
5-1
5.0 References
Aiken, G., M. Haitzer, J.N. Ryan, and K. Nagy. 2003. Interactions between dissolved organic matter and
mercury in the Florida Everglades. Journal du Physique IV 107:29-32.
Amaren, 2008. Evaluation of Potential Adverse Impacts From Revised Site-Specific Thermal Standards
in May and October for Coffeen Lake. Prepared by ASA Analysis & Communication, Inc. March
2008.
Barkay, T.T., M. Gillman, and R.R. Turner. 1997.
Effects of dissolved organic carbon and salinity on
bioavailability of mercury
. Applied and Environmental Microbiology. 63:4267-4271.
Benoit, J.M., C.C. Gilmour, R.P. Mason, and A. Heyes. 1999.
Sulfide controls on mercury speciation and
bioavailability to methylating bacteria in sediment porewater.
Environ. Sci. Technol. 33:951-957.
Benoit, J.M., C.C. Gilmour, A. Heyes, R.P. Mason, and C.L. Miller. 2003.
Geochemical and Biological
Controls over Methylmercury Production and Degradation in Aquatic Ecosystems.
In:
Biogeochemistry of Environmentally Important Trace Elements, ACS Symposium Series #835,
Chai and Braids, pp. 262-297.
Bloom, N.S., and S.W. Effler, 1990.
Seasonal variability in the mercury speciation of Onondaga Lake
(New York).
Water, Air, and Soil Pollution 53:251-265.
Boszke, L., A. Kowalski, G. Glosinska, R. Szarek, and J. Siepak, 2003.
Environmental factors affecting
speciation of mercury in the bottom sediments; an overview.
Polish Journal of Environmental
Studies 12(1): 5-13.
Brumbaugh, W.G., D.P. Krabbenhoft, D.R. Helsel, J.G. Wiener, and K.R. Echols. 2001.
A national pilot
study of mercury contamination of aquatic ecosystems along multiple gradients: bioaccumulation
in fish.
Biological Science Report USGS/BRD/BSR-2001-0009.
Chang, S.C., and M.L. Jackson. 1957. Fractionation of soil phosphorus. Soil Sci. 84:133–134.
Choe, K., G.A. Gill, R.D. Lehman, and S. Han. 2004.
Sediment-water exchange of total mercury and
monomethyl mercury in the San Francisco Bay-Delta.
Limnol. Oceanogr. 49:1512-1527.
Compeau, G., and R. Bartha, 1984.
Methylation and demethylation of mercury under controlled redox,
pH, and salinity conditions.
Applied and Environmental Microbiology 48:1203-1207.
Compeau, G.C., and R. Bartha, 1985.
Sulfate-reducing bacteria: principal methylators of mercury in
anoxic estuarine sediment.
Applied and Environmental Microbiology 50:498-5020.
Detenbeck, N.E., and Brezonik, P.L., 1991. Phosphorus Sorption by Sediments from a Soft-Water
Seepage Lake. 2. Effects of pH and Sediment Composition. Environ. Sci. Technol., Vol. 25, No. 3,
1991.
Eckley, C.S., C.J. Watras, H. Hintelmann, K. Morrison, A.D. Kent, and O. Regnell. 2005.
Mercury
methylation in the hypolimnetic waters of lakes with and without connection to wetlands in
northern Wisconsin.
Can. J. Fish. Aquat. Sci. 62:400-411.
Eisler, R., 2006.
Mercury Hazards to Living Organisms.
Boca Raton, FL: CRC Press Inc.
Environment Australia, 2002.
National ocean disposal guidelines for dredged material.
May 2002.
http://www.environment.gov.au/coasts/pollution/dumping/guidelines/investigation10.html
Environment
Canada,
2007.
http://www.google.com/search?sourceid=navclient&ie=UTF-
8&rls=GGLR,GGLR:2005-43,GGLR:en&q=mercury+cycle+in+the+environment.
Accessed
November 8, 2007.
Electronic Filing - Received, Clerk's Office, May 12, 2009
Coffeen Lake
Ameren
MACTEC Engineering and Consulting, Inc.
May 2009
5-2
FTN Associates, Ltd (FTN), 2005.
Upper Mississippi River Fish Consumption Advisories: State
Approaches to Issuing and Using Fish Consumption Advisories on the Upper Mississippi River
.
Prepared for the Upper Mississippi River Basin Association. August 2005. 70 pps.
Fleming, E.J., and D.C. Nelson, 2006. Contribution of iron-reducing bacteria to mercury methylation in
marine sediments.
Coastal Environmental Quality Initiative.
Paper 040. December 8, 2006.
http://repositories.cdlib.org/ucmarine/ceqi/040
Fleming, E.J., E.E. Mack, P.G. Green, and D.C. Nelson. 2006. M
ercury Methylation from Unexpected
Sources: Molybdate-Inhibited Freshwater Sediments and Iron-Reducing Bacterium.
Applied and
Environmental Microbiology 72:457-464.
Furutani, A., and J.W.M. Rudd, 1980.
Measurement of mercury methylation in lake water and sediment
samples.
Applied and Environmental Microbiology 40:770-776.
Ganther, H.E., 1978.
Modification of methylmercury toxicity and metabolism by selenium and vitamin E:
possible mechanisms.
Environmental Health Perspectives 25:71-76.
Gilmour, C.C., E.A. Henry, and R. Mitchell. 1992.
Sulfate stimulation of mercury methylation in
freshwater sediments.
Environ. Sci. Technol. 26:2281-2287.
Gustin, M.S., P.V. Chavan, K.E. Dennett, E.A. Marchand, and S. Donaldson. 2006.
Evaluation of
Wetland Methyl Mercury Export as a Function of Experimental Manipulations.
J. Environ. Qual.
35:2352-2359.
Haggard, B.E., DeLaune, P.B., and Moore, P.A., (2005).
Phosphorus Flux from Bottom Sediments in
Lake Eucha, Oklahoma
. J. Environ. Qual. Vol 34. No. 2.
Haitzer, M., G.R. Aiken, and J.N. Ryan, 2003.
Binding of mercury (II) to aquatic humic substances:
influence of pH and source of humic substances.
Environ. Sci. Technol. 37: 2436-2441.
Hall, B.D., D.M. Rosenberg, and A.P. Wiens. 1998.
Methyl Mercury in Aquatic Insects from an
Experimental Reservoir.
Can. J. Fish. Aquat. Sci. 55:2036-2047.
Hammerschmidt, C.R., and W.F. Fitzgerald, 2004.
Geochemical controls on the production and
distribution of methylmercury in near-shore marine sediments.
Environ. Sci. Technol. 38:1487-
1495.
Han, S., A. Obraztsova, P. Pretto, K. Choe, J. Gieskes, D.D. Deheyn, and B.M. Tebo. 2007.
Biogeochemical factors affecting mercury methylation in sediments of the Venice Lagoon, Italy.
Environmental Toxicology and Chemistry 26:655-663.
Herrin, R.T., R.C. Lathrop, P.R. Gorski, A.W. Andren. 1998.
Hypolimnetic methylmercury and its uptake
by plankton during fall destratification: A key entry point of mercury in to food chains?
Limnol.
Oceanogr. 43:1476-1486.
Hupfer, M., and Lewandowski, J., 2008. Oxygen Controls the Phosphorus Release from lake Sediments –
a Long-Lasting Paradigm in Limnology. Internat. Rev. Hydrobiol. Vol. 93. Pgs. 415-432.
Illinois Department of Natural Resources (DNR) 2006. Southern Illinois Fishing Map Guide. Sportsman
Connection. Data collected from the Illinois Department of Natural Resources and USGS.
Illinois EPA, 2009a. Illinois Environmental Protection Agency . Coffeen Lake and East Fork Shoal Creek
TMDL Addendum. Prepared by Hanson Professional Services. April, 2009
Illinois EPA, 2009b. Illinois Environmental Protection Agency STORET database inquiry for Coffeen
Lake. http://www.epa.gov/storet/dbtop.html. Accessed: April 28, 2009.
Illinois EPA, 2009c. Illinois Environmental Protection Agency. Illinois Fish Contaminant Monitoring
Program database.
Coffeen Lake
Ameren
MACTEC Engineering and Consulting, Inc.
May 2009
5-3
Illinois EPA, 2008. Illinois Environmental Protection Agency.
Decision Document for the Partial
Approval/Partial Disapproval of Illinois’ Submission of the State’s Integrated Report with Respect
to Section 303(d) of the Clean Water Act (Category 5 Waters)
. October 22, 2008.
Illinois EPA, 2007. Illinois Environmental Protection Agency Greenville and Coffeen Lake TMDL. Stage
1 Report: Watershed Characterization, Data Analysis, and Methodology Selection. Prepared by
Tetra Tech. March 8, 2006.
Jackson, T.A., 1989.
The influence of clay minerals, oxides and humic matter in the methylation and
demethylation of mercury by micro-organisms in freshwater sediments.
Applied Organometallic
Chemistry 3:1-30.
Jenkins, D.G. 2007.
A Critical Analysis of Illinois’ Fish Mercury Monitoring Program, 1974 – 1988
.
Environ Monit Assess (2007) 131: 177-184.
Kelly, C.A., J.W.M. Rudd, R.A. Bodaly, N.P. Roulet, V.L. St. Louis, A. Heyes, T.R. Moore, S. Schiff, R.
Aravena, K.J. Scott, B. Dyck, R. Harris, B. Warner, and G. Edwards. 1997.
Increases in fluxes of
greenhouse gases and methylmercury following flooding of an experimental reservoir.
Environ.
Sci. Technol. 31:1334-1344.
Kerin, E.J., C.C. Gilmour, E. Roden, M.T. Suzuki, J.D. Coates, and R.P. Mason. 2006.
Mercury
methylation by dissimilatory iron-reducing bacteria.
Applied and Environmental Microbiology.
72:7919-7921.
King, J.K., J.E. Dostka, M.E. Frischer, and F.M. Saunders. 2000.
Sulfate-reducing bacteria methylate
mercury at variable rates in pure cultures and in marine sediments.
Applied and Environmental
Microbiology 66:2430-2437.
Korthals, E.T., and M.R. Winfrey, 1987.
Seasonal and spatial variations in mercury methylation and
demethylation in an oligotrophic lake.
Applied and Environmental Microbiology 53:2397-2404.
Krabbenhoft, D., B Manteufel, J. DeWild, T. Sabin, and J. Ogorek. 2008.
Spatial Patterns of Total and
Methyl
Mercury
in
Lakes
Across
the
Upper
Midwest
(PDF
format).
http://nadp.sws.uiuc.edu/meetings/fall2008/post/session6/krabbenhoft.pdf. Accessed: May 5,
2009.
Krabbenhoft, D.P., J.G. Weiner, W.G. Brumbaugh, M.L. Olson, J.F. DeWild, and T.J. Sabin. 1999.
A
national pilot study of mercury contamination of aquatic ecosystems along multiple gradients.
Macalady, J.L., E.E. Mack, D.C. Nelson, and K.M. Scow. 2000.
Sediment Microbial Community
Structure and Mercury Methylation in Mercury -Polluted Clear Lake, California.
Applied and
Environmental Microbiology. 66:1479-1488.
Mason, R.P., W.F. Fitzgerald, J. Hurley, A.K. Hanson, P.L., Donaghay, and J.M. Sieburth. 1993.
Mercury
biogeochemical cycling in a stratified estuary.
Limnology and Oceanography 38: 1227-41.
Mason, R.P. and A.Y. Sveinsdottir, 2003.
Mercury and methylmercury concentrations in water and
largemouth bass in Maryland reservoirs.
[UMCES] CBL 02-0242. Chesapeake Biological
Laboratory, University of Maryland, Center for Environmental Science. October
Mehrotra, A.S., and D.L. Sedlak, 2005.
Decrease in net mercury methylation rates following iron
amendment to anoxic wetland sediment slurries.
Environmental Science and Technology
39:2564-2570.
Moore, D.R.J., R.S. Teed, and G.M. Richardson. 2003.
Derivation of an Ambient Water Quality Criterion
for Mercury: Taking Account of Site-Specific Conditions.
Environmental Toxicology and
Chemistry 22:3069-3080.
Electronic Filing - Received, Clerk's Office, May 12, 2009
Coffeen Lake
Ameren
MACTEC Engineering and Consulting, Inc.
May 2009
5-4
Oremland, R.S., C.W. Culbertson, and M.R. Winfrey. 1991.
Methylmercury decomposition in sediment
and bacterial cultures-involvement of methanogens and sulfate reducers in oxidative
demethylation.
Applied and Environmental Microbiology 57:130-137.
Pak, K.R., and R. Bartha. 1998.
Mercury methylation and demethylation in anoxic lake sediments by
strictly anaerobic bacteria.
Applied and Environmental Microbiology. 64:1013-1017.
Panutrakul, S., F. Monteny, and W. Baeyens. 2001.
Seasonal variations in sediment sulfur cycling in the
Ballastplaat Mudflat, Belgium.
Estuaries. 24:257-265.
Ramlal, P.S., J.W.M. Rudd, and R.E. Hecky. 1986.
Methods for measuring specific rates of mercury
methylation and degradation and their uses in determining factors controlling net rates of
mercury methylation.
Applied and Environmental Microbiology 51:110-114.
Robinson, J.B., and O.H. Tuovinen, 1984.
Mechanisms of microbial resistance and detoxification of
mercury and organomercury compounds: physiological, biochemical, and genetic analyses.
Microbiological Reviews 48:95-124.
Shanley, J.B., N.C. Kamman, T.A. Clair, and A. Chalmers. 2005.
Physical controls on total and
methylmercury concentrations in streams and lakes of the northeastern USA. Ecotoxicology
14:125-134.
Southern Illinois University at Carbondale (SIUC), 2007. Ameren Newton and Coffeen Lakes Research
and Monitoring Project. Annual Report. March 2007.
SIUC, 2006. Ameren Newton and Coffeen Lakes Research and Monitoring Project. Annual Report.
March 2006.
St. Louis, V.L., J.W.M. Rudd, C.A. Kelly, R.A. Bodaly, M.J. Paterson, K.G. Beaty, R.H. Hesslein, A.
Heyes, and A.R. Majewski. 2004.
The Rise and Fall of Mercury Methylation in an Experimental
Reservoir. Environ. Sci. Technol.
38:1348-1358.
Steffan, R.J., E.T. Korthals, and M.R. Winfrey. 1988.
Effects of acidification on mercury methylation,
demethylation, and volatilization in sediments from an acid-susceptible lake.
Applied and
Environmental Microbiology 54:2003-2009.
Stokes, P.M., and C.D. Wren. 1987.
Bioaccumulation of mercury by aquatic biota in hydroelectric
reservoirs: a review and consideration of mechanisms.
In Lead, Mercury, Cadmium, and Arsenic
in the Environment.
Tetra Tech, 2005.
Determine if water level fluctuations in Lewiston Reservoir increase mercury that is
bioavailable.
Niagara Power Project FERC No. 2216.
USACE, 2004. BATHTUB – Version 6.1. Simplified Techniques for Eutrophication Assessment &
Prediction. Developed by William W. Walker, USACE Waterways Experiment Station,
Vicksburg, Mississippi. April 2004.
USEPA, 2009. US Environmental Protection Agency National Survey of Concentrations in Fish
Database. http://www.epa.gov/waterscience/fish/technical/mercurydata.html. Accessed: May 4,
2009.
USEPA, 2001. US Environmental Protection Agency
Mercury Update: Impact of Fish Advisories Fact
Sheet
. June 2001. EPA-823-F-02-011.
Van Griethuysen, C., H.J. de Lange, M. van den Heuig, S.C. de Bies, F. Gillissen, and A.A. Koelman.
2006.
Temporal dynamics of AVS and SEM in sediment of shallow freshwater floodplain lakes.
Applied Geochemistry. 21:632-642.
Warner, K.A., E.E. Roden, and J.C. Bonzongo. 2003. Microbial mercury transformation in anoxic
freshwater sediments under iron-reducing and other electron-accepting conditions. Environ. Sci.
Technol. 37:2159-2165.
Electronic Filing - Received, Clerk's Office, May 12, 2009
Coffeen Lake
Ameren
MACTEC Engineering and Consulting, Inc.
May 2009
5-5
Watras, C.J., K.A. Morrison, and J.S. Host. 1995. Concentration of mercury species in relationship to
other site-specific factors in the surface waters of northern Wisconsin lakes. Limnol. Oceanogr.
40:556-565.
WHO. Methylmercury.
Environmental Health Criteria 101.
Geneva, Switzerland: World Health
Organization, 1990. http://www.inchem.org/documents/ehc/ehc/ehc101/htm
Wilkes University, 2007. http://www.water-research.net/hardness.htm. Accessed: May 2007.