Sources of Mercury Wet Deposition
in Eastern Ohio, USA
GERALD J . KEELER , *
,²
MATTHEW S . LANDIS ,
³
GARY A . NORRIS ,
³
EMILY M . CHRISTIANSON ,
²
AND
J . TIMOTHY DVONCH
²
The University of Michigan Air Quality Laboratory, Ann
Arbor, Michigan 48109, and U.S. EPA Office of Research and
Development, Research Triangle Park, North Carolina 27709
In the fall of 2002, an enhanced air monitoring site was
established in Steubenville, Ohio as part of a multi-year
comprehensive mercury monitoring and source apportionment
study to investigate the impact of local and regional
coal combustion sources on atmospheric mercury deposition
in the Ohio River Valley. This study deployed advanced
monitoring instrumentation, utilized innovative analytical
techniques, and applied state-of-the-art statistical receptor
models. This paper presents wet deposition data and
source apportionment modeling results from daily event
precipitation samples collected during the calendar years
2003-2004. The volume-weighted mean mercury con-
centrations for 2003 and 2004 were 14.0 and 13.5 ng L
-1
,
respectively, and total annual mercury wet deposition was
13.5 and 19.7 ígm
-2
, respectively. Two new EPA-
implemented multivariate statistical models, positive
matrix factorization (PMF) and Unmix, were applied to the
data set and six sources were identified. The dominant
contributor to the mercury wet deposition was found by both
models to be coal combustion (˘70%). Meteorological
analysis also indicated that a majority of the mercury
deposition found at the Steubenville site was due to local
and regional sources.
Introduction
Mercury (Hg) is a persistent, bioaccumulative toxic pollutant.
Once Hg is released into the environment, it can be converted
to the organic form, methylmercury (MeHg) and then
bioaccumulate in organisms within the food chain, such as
fish, posing a consumption risk to wildlife and humans. In
the Great Lakes Region, atmospheric deposition is widely
considered to be the primary pathway for Hg into aquatic
and terrestrial ecosystems (
1
,
2
). Mercury is emitted into the
atmosphere through both natural and anthropogenic pro-
cesses with 50-75% of global emissions attributed to
anthropogenic sources (
3
,
4
). Major anthropogenic sources
of mercury to the atmosphere include fossil fuel combustion,
waste incineration, iron-steel production, coke and lime
production, hazardous waste recycling, non-ferrous metal
smelting, petroleum refining, and mercury cell chlor-alkali
plants (
5
,
6
).
While natural emissions of Hg are primarily in the gaseous
elemental form (Hg
0
), combustion processes release Hg in
three major forms: Hg
0
, divalent reactive gaseous Hg (RGM),
and particulate Hg (Hg(p)). RGM and Hg(p) are more
efficiently deposited on local and regional scales near major
sources because of their solubility and affinity for surface
reactions, which results in much shorter atmospheric
lifetimes (
4
). Researchers in both the U.S. and Europe have
observed significant mercury deposition gradients with
maximums found near urban and industrial areas (
6
-9)
highlighting the importance of near field deposition en-
hancement in proximity to large anthropogenic sources.
Deposition of atmospheric Hg at any particular location is
therefore a complex combination of local, regional, and global
emissions as well as transport, transformation, and deposition
processes (
4
).
In a 1998 report to Congress, the U.S. Environmental
Protection Agency (EPA) identified coal-fired utility boilers
as the largest source of domestic anthropogenic mercury
emissions to the atmosphere and provided evidence of a
causal link between such releases and the presence of
methylmercury in fish tissue (
9
). At that time, EPA recognized
that the Ohio River Valley contained a high density of coal-
fired utility boilers and that monitoring of atmospheric
mercury deposition was not being conducted in this area. In
1999, EPA initiated planning for a mercury monitoring and
source apportionment study to investigate the impact of local
and regional coal combustion sources on atmospheric
mercury deposition in the Ohio River Valley.
The Clean Air Mercury Rule (CAMR) was subsequently
promulgated by the EPA in 2005 and established the first
U.S. regulation to control mercury emissions from coal-fired
utility boilers (
10
). CAMR uses a cap and trade approach
under which utilities can buy and sell allotments in a national
emissions market. Under CAMR, an interim national cap of
38 tons y
-1
becomes effective in 2010 and a final cap of 15
tons y
-1
becomes effective in 2018. The 2010 interim cap is
based on mercury reductions expected to be achieved as a
co-benefit from the EPA Clean Air Interstate Rule, also
promulgated by EPA in 2005, which requires utilities to install
controls to reduce NO
x
and SO
2
.
The relative importance of domestic coal combustion
sources to atmospheric Hg deposition in the U.S. and the
efficacy of the CAMR cap and trade approach to decrease Hg
in fish is the topic of ongoing debate in the scientific
community. At the center of this debate is the question of
the relative importance of Hg emissions from domestic coal-
fired utility boilers to atmospheric deposition into sensitive
aquatic and terrestrial ecosystems. As part of the CAMR
development process, EPA used the Community Multi-Scale
Air Quality model (CMAQ), an Eulerian dispersion model, to
estimate the impact of domestic mercury sources on
atmospheric deposition for CY2001. While extremely useful,
all contemporary deterministic models (e.g., CMAQ) are
currently limited by the substantial uncertainties in emission
inventories, atmospheric Hg chemistry, and wet and dry
deposition parametrizations. Receptor models differ from
deterministic models in that they only rely upon speciated
wet deposition samples collected at a monitoring location
or receptor. Deterministic and receptor modeling source
apportionment approaches are independent and comple-
mentary.
Multivariate statistical receptor models, such as principal
component analysis (PCA), have been successfully used to
apportion the sources of Hg deposited in South Florida (
11
)
and the sources of other chemical compounds elsewhere
(
12
). More recently, statistical approaches such as Unmix
(
13
) and positive matrix factorization (PMF) have been
* Corresponding author phone: (734) 936-1836; fax: (734) 764-
9424; e-mail: jkeeler@umich.edu.
²
The University of Michigan Air Quality Laboratory.
³
U.S. EPA Office of Research and Development.
10.1021/es060377q CCC: $33.50
xxxx American Chemical Society
VOL. xx, NO. xx, xxxx / ENVIRON. SCI. & TECHNOL.
9
A
Published on Web 09/08/2006
PAGE EST: 7.1
developed, improving upon the earlier techniques by using
uncertainties in the data matrix (
14
,
15
) as well as through
constraining the solutions to non-negative values. Both
techniques have the advantage of not requiring prior
measurements of source profiles or emission inventories. In
this study, PMF and Unmix are applied to the precipitation
chemistry data collected at the Steubenville, Ohio site to
determine the sources contributing to Hg in wet deposition.
In addition, meteorological analysis is performed to provide
insights into the probable sources of Hg deposition.
Methods
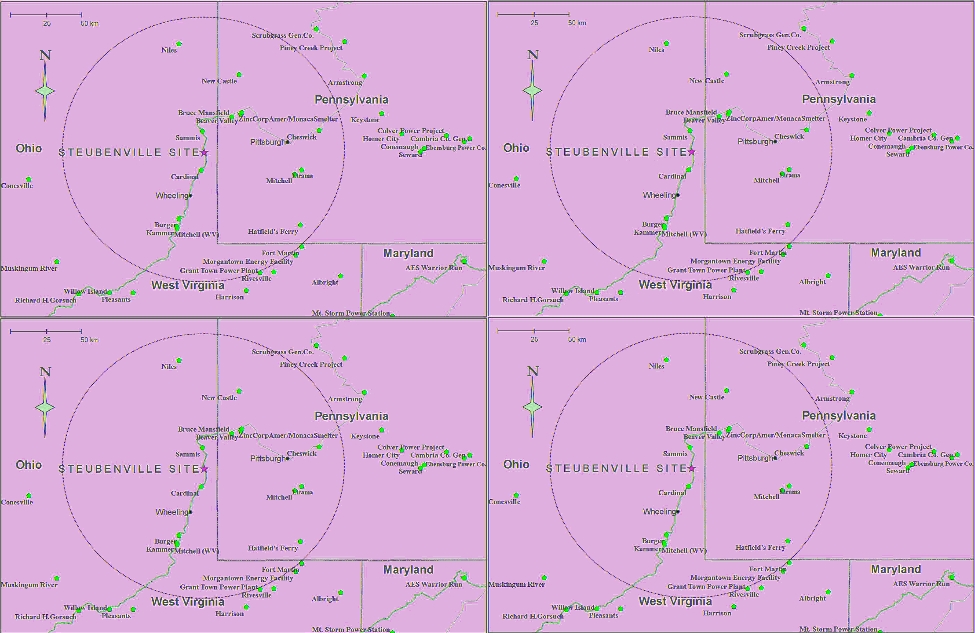
Measurement Site.
An enhanced Hg monitoring site was
established in October 2002, in Steubenville, OH on the
campus of the Franciscan University (40.379 N, 80.620 W;
306 m above mean sea level) overlooking the Ohio River.
This monitoring site was selected because of its proximity
to numerous anthropogenic air pollution sources in the Ohio
River Valley and because of the human health impacts shown
to be caused by these sources during the Harvard Six-City
study (
16
). There are five large coal-fired utility boilers within
a 50 km radius of the site and seventeen within 100 km.
Figure 1 shows the location of the site as well the location
of coal-fired utility boilers in the area.
Event Deposition Sampling.
Collection of wet deposition
on a daily event basis rather than longer duration integrated
sampling (e.g., weekly, monthly) is essential for receptor
modeling and meteorological analysis (
8
,
11
,
17
,
18
). The
automatic wet-only event precipitation sampling system used
for this study is described in detail by Landis and Keeler (
19
),
and has been successfully deployed in the field for more
than a decade (
8
,
20
,
21
). Precipitation sampling for this study
began in October 2002 and will continue through December
2006. Results are reported here for samples collected in
CY2003 and CY2004.
For this study, the volume of each precipitation sample
was determined gravimetrically, the precipitation depth was
calculated by dividing the precipitation volume by the funnel
area, and all events g0.1 cm provided sufficient volume for
analysis. A heated tipping-bucket precipitation gauge pro-
vided a continuous record of the precipitation received at
the site and was used to calculate precipitation depths when
the 1 L sample bottles were insufficient for containing the
entire event and sample overflow occurred (six events).
All field and analytical supplies used in the collection and
analysis of Hg and trace element samples were prepared
using an 11-day acid-cleaning procedure (
18
,
19
). The Teflon
sample bottles were further prepared by an internal 1% BrCl
solution (v/v) soak for a minimum of 24-hours. Standard
operating procedures included bottle blank determinations
for each batch of cleaned bottles to ensure that sampling
bottles were essentially Hg-free before they were deployed
into the field (median < MDL; 5 ( 14 pg bottle
-1
(mean ( std
dev);
n
) 151).
Analytical Methods.
Precipitation samples were sent back
to the University of Michigan within 24-hours of collection
and were processed and analyzed in a Class 100 clean room
to avoid potential contamination. Clean room suits and
particle-free gloves were worn at all times during preparation
and analysis of samples.
Mercury.
Mercury samples were oxidized with concen-
trated BrCl to a 1% solution (v/v) and stored in the dark in
a cold room for at least 24 h (
19
). Mercury in precipitation
was purged from solution in a Hg-free nitrogen stream after
reduction of BrCl with NH
2
OH and reduction of divalent Hg
by SnCl
2
to Hg
0
, and concentrated onto a gold-coated bead
trap. Total Hg was then quantified using a dual amalgamation
technique followed by cold-vapor atomic fluorescence
spectrometry (CVAFS) (
19
,
22
). In a previous study, collocated
total Hg samples collected using identical samplers and
protocols as those used at Steubenville gave an absolute mean
difference in the samples of 8.1% (
19
). The Method Detection
Limit (MDL) for total Hg during this study was determined
to be 0.23 ng L
-1
; determined using EPA method 200.8 (
23
).
FIGURE 1. Location of the Steubenville, OH monitoring site and surrounding coal-fired utility boilers (circle with 100 km radius centered
on site).
B
9
ENVIRON. SCI. & TECHNOL. / VOL. xx, NO. xx, xxxx
Analytical precision of laboratory replicate Hg analysis during
this study was 97.3% (
n
) 51).
Trace Elements.
Precipitation samples for trace element
analysis were acidified with concentrated HNO
3
to a 0.2%
solution (v/v) in the sample bottle and stored in a dark cold
room for a minimum of 14 days before analysis to provide
adequate time for optimal leaching (
24
). Precipitation
samples were then analyzed for a suite of trace elements
using a Finnigan MAT Element magnetic sector field high-
resolution inductively coupled plasma mass spectrometer
using a method similar to that previously described (
25
).
Trace element isotopes were analyzed in low, medium, or
high-resolution depending on the potential of impact of
isobaric and/or polyatomic interferences (
25
). The sensitivity
of the element decreases approximately by a factor of 10
with each successive increase in resolution so elements
quantified in high-resolution had significantly higher MDLs
(See Table S1, Supporting Information).
Ion Chromatography.
Precipitation samples were analyzed
for major anions using a Dionex (Sunnyvale, CA) model DX-
600 ion chromatography system equipped with an IonPac
AS14 Analytical and AG14 Guard and running a 1.8 mM Na
2
-
CO
3
/1.7 mM NaHCO
3
eluent solution. Precision based on
replicate analyses was 95.5 and 93.2%, for nitrate and chloride,
respectively.
Multivariate Statistical Receptor Models.
In this work,
two fairly new multivariate receptor modeling approaches
were employed: EPA PMF 1.1 (
26
) and EPA Unmix 5.0 (
27
).
Both PMF and Unmix provide the source compositions,
source composition uncertainties, and source contributions
to each sample based only on the measured data. These two
models use different algorithms and input data with PMF
using a combination of concentration and uncertainty data
and Unmix using only concentration data. For both models,
the sample Hg source contributions were calculated by
multiplying the Hg profile value by its source contribution
estimate. All samples with sufficient volume from October
2002 through December 2004 were included in the PMF and
Unmix analysis (
n
) 162).
EPA PMF couples a graphical user interface with analysis
software that implements the PMF 2 model through the multi-
linear engine 2 (ME-2), and provides block bootstrap
uncertainty estimates (
26
). All analyses were conducted using
the default model specifications, and the results are reported
for the run with the lowest Q robust value from 20 random
starting points, with random seeds. One hundred bootstrap
runs were used to calculate the uncertainty distribution.
EPA Unmix 5.0 includes both a graphical user interface
and analysis tools. All analyses were run using the default
model specifications and one hundred feasible solutions from
a blocked bootstrap were used to calculate the uncertainty
distribution (
27
).
One potential advantage of the PMF model is the ability
to weight individual data points using measurement un-
certainties and other analytical details such as the elemental
MDLs. Here, an objective approach was used to calculate a
total deposition uncertainty (U) associated with each data
point (each analyte in every sample) for use in PMF by
propagating the uncertainty of sample collection (SC),
analytical measurement (AM), and precipitation depth (PD)
measurement uncertainties (eq 1).
where, MDL ) method detection limit; SC ) 10%; AM )
standard deviation of three replicate analysis; and PD ) 5%.
Meteorological and Trajectory Analysis.
Air mass trans-
port to the Steubenville site was estimated using the hybrid
single-particle lagrangian integrated trajectory (HYSPLIT)
model version 4.6 (
28
). HYSPLIT 72-h back trajectories were
calculated using input data from the National Weather
Service. The hour of maximum precipitation intensity from
each event was used as the start time for the trajectory
calculation, and the starting height for each trajectory was
calculated as one-half the mixing height, as determined from
upper-air soundings. Surface and upper air meteorological
maps obtained from the National Weather Service were used
to explore the validity of the calculated trajectories and to
better understand the type of precipitation and meteorologi-
cal patterns that influenced the deposition events.
Results and Discussion
Concentrations and Deposition.
The 2-year record of Hg in
event precipitation at Steubenville is the only such record
collected in Ohio to date. The volume-weighted mean (VWM)
Hg concentration was 13.7 ng L
-1
for the 2-year period, with
little difference between the years (14.0 and 13.5 ng L
-1
for
2003 and 2004, respectively). The range in the event Hg
concentrations recorded over the 2-year period in Steuben-
ville was 4.0-78.9 ng L
-1
, similar to the range of Hg
concentrations observed in a highly industrialized area in
southeast Michigan during the same time period (
21
).
However, the distribution of the Hg concentrations observed
in Steubenville was quite different than those measured at
rural sites in Michigan and Vermont using identical samplers
(
20
,
21
). The minimum or baseline Hg concentration observed
at Steubenville was ˘4 ng L
-1
; about 4 times higher than the
baseline concentrations recorded during the same period at
rural sites in Michigan and at Underhill, VT.
The Hg wet deposition recorded at the Steubenville site
was 13.5 and 19.7 ígm
-2
y
-1
in 2003 and 2004, respectively.
Table 1 shows a comparison of the 2003 VWM concentrations
and the annual deposition reported for three sites in Michigan
with that at Steubenville (
21
). The Hg wet deposition observed
at Steubenville in 2003 was ˘25% greater than that received
at Dexter, MI and ˘2.5 times that recorded at the northern
most site located in Eagle Harbor, MI. The pattern observed
in 2003, with a south to north Hg deposition gradient across
Michigan, has been observed consistently over the past
decade through collection of event precipitation samples at
several sites in Michigan (
8
,
18
,
21
). The higher Hg deposition
observed at the Steubenville site was not unexpected, because
of the density of Hg sources in the upwind region such as
coal-fired utility boilers, iron-steel manufacturing, incinera-
tors, and other non-ferrous metal processing industries (
9
).
The Hg deposition recorded at the Steubenville site in 2004
was 19.7 ígm
-2
year
-1
, 46% greater than the previous year.
The VWM concentrations for the 2003-2004 period for the
trace elements used for source apportionment are provided
in the Supporting Information (Table S1).
PMF Model Results.
PMF solutions with six and seven
sources were evaluated, and species contributions to sources
were considered significant if the fifth percentile of the
bootstrap uncertainty distribution was greater than 0. The
results from the six-source solution are presented based on
U
Dep
)
MDL
+
x
(
SC
)
2
+ (
AM
)
2
+ (
PD
)
2
(1)
TABLE 1. Volume-weighted Mean (VWM) Hg Concentrations
and Total Deposition Calculated from Event Samples Collected
Using Identical U of M Samplers in 2003
site
N
precipitation
depth (cm)
VWM Hg
(ng L
-
1
)
deposition
(
í
gm
-
2
y
-
1
)
Eagle Harbor, MI
a
58
64.5
8.3
5.2
Pellston, MI
a
43
78.7
9.4
7.4
Dexter, MI
a
60
89.6
11.9
10.7
Steubenville, OH 77
94.8
14.0
13.5
a
Keeler and Dvonch (21).
VOL. xx, NO. xx, xxxx / ENVIRON. SCI. & TECHNOL.
9 C
the ability to identify the sources and the bootstrap uncer-
tainty results. The six-source solution was composed of iron/
steel production (V, Cr, Mn, Fe), oil and incineration (V, Ni,
Zn, Cd, Pb), crustal (Mg, Al, Sr, La, Ce), coal combustion (S,
Se, NO
3
-
), phosphorus (P, Mg, Mn, Fe, Sr), and molybdenum
(Mo, Cu). The seven-source solution separated out one
additional crustal source (La, Ce, Mg), and the Hg contribu-
tions from coal for the six- and seven-source solutions were
similar with 73 and 70%, respectively. Three sources con-
tributed significant amounts of Hg: iron/steel production
(6%), coal combustion (73%), and phosphorus (2%). The
results determined from the six-source solution are presented
in Table 2.
While PMF was able to separate out six sources, the source
identified as coal combustion was clearly dominant in terms
of explaining the Hg deposition. Atmospheric Se is often
associated with the burning of fossil fuels such as coal (
29
,
30
), and Se in the absence of significant Ni and V was
determined to be an appropriate tracer of coal combustion
in Steubenville (
31
). There are several large steel manufac-
turing facilities in the Steubenville, OH-Wheeling, WV area
as well as plants to the east in Pittsburgh, and iron-steel
production was found to be a minor contributor to Hg
deposition in this study. An unidentified phosphorus source
was also found to be significant small contributors to Hg
deposition. The elements Zn, Pb, Cu, and Cl have been used
to identify municipal waste incinerator emissions (
11
,
32
),
and the elements Ni and V are commonly used tracers to
identify oil combustion (
33
,
34
). Two other sources of trace
elements were identified in the event deposition data using
PMF: a crustal source (
24
,
35
) and a molybdenum source.
The molybdenum source may be production of Mo which
is used in the steel industry. However, neither was found to
be a significant contributor to Hg wet deposition during the
study period.
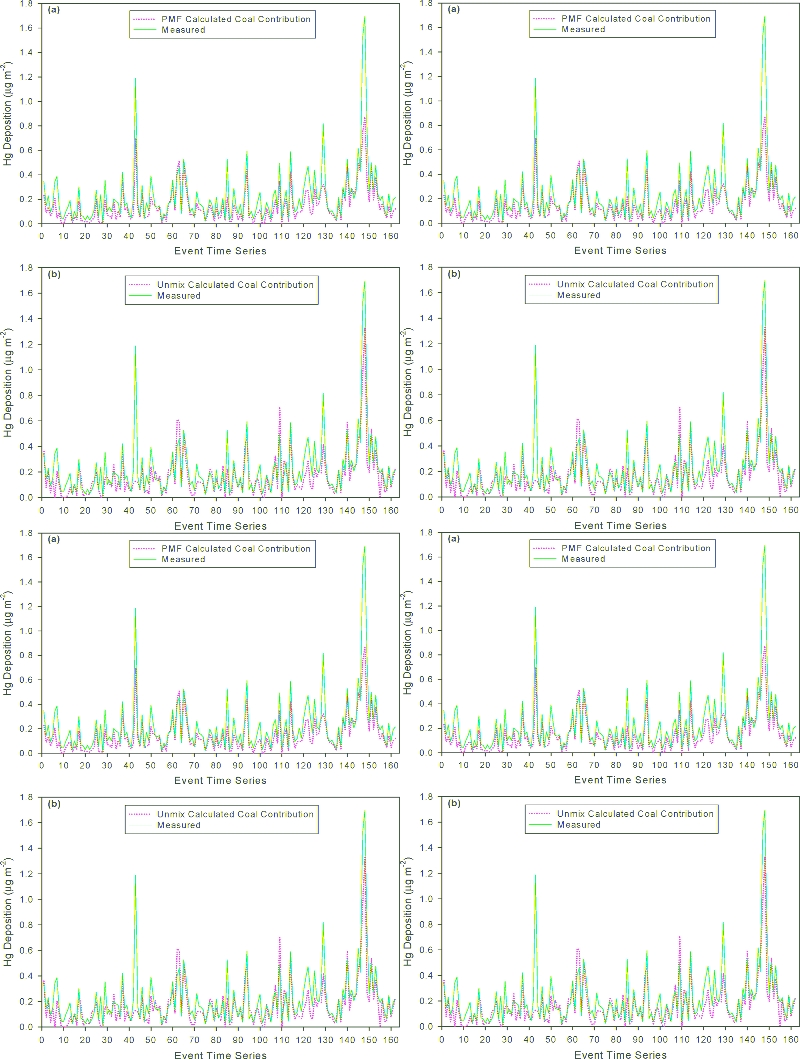
The model (sum of the calculated source contributions)
does an excellent job of reproducing the observations except
for several of the top deposition events over the 2 years of
record. The regression results of the PMF predicted versus
measured Hg had a slope of 0.70, an intercept of 0.05, and
a coefficient of determination of 0.85 (
n
) 162). Figure 2a
depicts the time series of the predicted deposition from coal
combustion versus observed Hg wet deposition at Steuben-
ville using the PMF six-source model solution, showing the
clearly dominant impact of coal combustion.
Unmix Results.
Unmix identified one influential Ni data
point and its value was replaced using the missing data
algorithm (Ni on 04-07-2003, measured ) 364.15 ng m
-2
,
replaced ) 8.44 ng m
-2
). A reduced number of species was
used in the Unmix run: Hg, Cd, La, Ce, Mg, Al, P, S, V, Cr,
Mn, Fe, Ni, Se, and NO
3
-
because using less species improved
the stability of the uncertainty estimate. The source profiles
for a feasible six source solution produced by Unmix are
given in Table 3, and species contributions to each source
were considered significant if the fifth percentile of the
bootstrap uncertainty distribution was greater than 0.
Identification of the sources was performed in a similar way
to that with the PMF solutions. The Unmix model found six
sources which were identified as phosphorus, incinerator,
nickel, iron/steel production, crustal, and coal combustion
sources. Only three sources contributed significant amounts
of Hg including incinerator (12%), nickel (12%), and coal
combustion (69%). The regression results of the Unmix
predicted versus measured Hg had a slope of 1.00, an intercept
of -0.02, and a coefficient of determination of 0.86 (
n
) 162).
Comparison of Unmix and PMF.
Both models tracked
the measured values closely but under-predicted the peak
depositions. Two high deposition Hg events occurred on 08/
29/2004 (1.53 ígm
-2
) and 09/08/2004 (1.69 ígm
-2
) shown
in Figures 2a and b as events 146 and 147 in the time series.
The Unmix and PMF Hg results for these two events were
1.08 and 1.40 ígm
-2
, and 0.85 and 1.08 ígm
-2
respectively.
Table 4 shows that Unmix over-predicted the total measured
Hg deposition by 13 and 5%, while PMF under-predicted by
7 and 11% in 2003 and 2004, respectively.
Confidence intervals (CI) were calculated for those sources
identified by Unmix and PMF as a measure of the uncertainty
associated with their contribution to Hg deposition. The 95%
confidence interval (CI) was calculated using the fifth and
95th percentiles of the source profile uncertainty distribu-
tions. Total coal Hg contributions were 23.7 ígm
-2
, with a
CI of 16.7-38.4 ígm
-2
for PMF, and 26.8 ígm
-2
, with a CI
TABLE 2. PMF Source Profiles for Steubenville Event Precipitation Data
a
analyte
source 1
iron/steel production
source 2
oil and incineration
source 3
crustal
source 4
coal combustion
source 5
phosphorous
source 6
molybdenum
Mg
187
*
558
*
101
*
Al
51
80
355
37
*
52
P
7.8
*
*
*
63.8
*
S
*
*
642
11299
197
*
Cl
267
20480
*
584
*
771
V
2.9
1.1
*
*
*
*
Cr
2.5
*
*
*
*
*
Mn
54.4
*
34.1
*
15.4
*
Fe
344
102
17
37
27
*
Ni
*
3.19
*
*
0.68
*
Cu
1.8
14.0
*
18.4
2.7
7.0
Zn
4.0
44.1
6.1
10.7
5.3
15.6
As
*
0.81
0.10
0.49
0.05
0.27
Se
*
0.97
*
1.73
*
1.30
Rb
*
0.25
0.15
0.20
0.29
0.08
Sr
0.48
3.30
5.64
0.95
1.61
*
Mo
*
*
*
*
*
4.02
Cd
0.09
0.27
*
0.31
0.02
0.23
La
*
0.13
0.63
*
*
0.04
Ce
0.02
*
1.23
*
*
*
Hg
0.01
*
*
0.15
< 0.01
*
Pb
1.10
6.59
0.59
3.62
0.36
1.13
NO
3
-
*
8639
1501
4532
314
*
%Hg
6
*
*
73
2
*
a
* means not significant at 95% confidence interval.
D
9
ENVIRON. SCI. & TECHNOL. / VOL. xx, NO. xx, xxxx
of 16.4-39.1 ígm
-2
for Unmix during the study period. Two
additional PMF sources had significant Hg contributions:
phosphorus total of 0.6 ígm
-2
with a CI 0.3-1.5 ígm
-2
,
iron/steel production total of 1.9 ígm
-2
with a CI 0.1-3.4
ígm
-2
. Unmix also had two additional sources with
significant Hg contributions: incinerator total of 4.6 ígm
-2
with a CI 0.1-10.2; and nickel total of 4.5 ígm
-2
with a CI
0.4-7.1. The lack of agreement between Unmix and PMF for
these small Hg sources may indicate that these sources
contribute too little to be accurately quantified. Average
results from both PMF and Unmix are well within the
confidence intervals stated for both model estimates, and
this wide range of uncertainties will be reduced as additional
samples are included in the analysis at the conclusion of this
study (CY2006).
As clearly stated in Poirot et al. (
35
), receptor models,
such as PMF and Unmix, start with the assumption that the
source compositions are constant and unique, and that
source contributions vary over time. These assumptions may
not be well met when attempting to apportion sources that
emit species that undergo atmospheric transformations and
form secondary species such as sulfate aerosols. Mercury
chemistry may be even more complicated than that of sulfur
as a larger fraction of the emissions are emitted in the oxidized
forms that deposits more quickly than the Hg
0
form that is
emitted concurrently. While this limitation is also acknowl-
edged here, the use of multiple receptor models together
with the meteorological analysis provided below offer
independently consistent results and findings.
FIGURE 2. (a) PMF predicted deposition from coal combustion versus measured deposition of Hg at Steubenville, OH (2003
-
2004). (2b)
Unmix predicted deposition from coal combustion versus measured deposition of Hg at Steubenville, OH (2003
-
2004).
VOL. xx, NO. xx, xxxx / ENVIRON. SCI. & TECHNOL.
9 E
Climatology, Meteorology, and Sample Variability.
Investigations using relatively short meteorological records,
e.g., 2-years, need to place the shorter record into a larger
climatologically relevant context. While significant differences
in the Steubenville wind speed and direction were not
expected nor observed, for the CY2003-2004 period from
the long-term norm, differences in temperature and pre-
cipitation were thought to be more likely. In fact, while the
CY 2003 rainfall total was representative of the Steubenville
climatological norm, significantly more rain than normal fell
in CY 2004, with 10 of 12 months above average and the
majority of the excess rainfall occurring in September. CY
2003 was a unique year for eastern Ohio in terms of frozen
precipitation; snowfall totals were well over twice the
climatologically expected amount. These facts help explain
the large deviation between the annual deposition totals (13.5
and 19.7 g m
-2
) despite annual VWA Hg concentration
similarities, because snow in temperate latitudes appears to
be much less efficient at capturing Hg via wet deposition (
8
).
In addition, the long-term study of event precipitation
collected in Vermont over 11-years found average surface
temperatures were highly correlated with the monthly total
deposition at that site (
20
). However, the average surface
temperatures for CY 2003 and 2004, did not significantly
deviate from the climatological norm.
Individual precipitation events can contribute significantly
to the annual Hg deposition total at individual sites (
20
,
21
).
This was clearly seen in the Steubenville record as the top
five Hg deposition events (1.69, 1.53, 1.19, 0.82, and 0.77 íg
m
-2
seen in Figures 2a and b as events 147, 146, 42, 128, and
148, respectively) all had above average Hg concentrations
as well as precipitation depths. While one of these (sample
43) contained precipitation from more than one distinct event
and, therefore, cannot be clearly categorized meteorologi-
cally, the other four samples corresponded to discrete
summer-time events. Two of the discrete events were
associated with remnants of September hurricanes (Frances
and Ivan; samples 147 and 148), one was associated with a
warm sector squall line (sample 47) and the fourth (sample
148) occurred in a series of intense precipitation events
associated with outflow boundary cells preceding a stationary
front. The origin of feed air for these types of precipitating
systems is fairly unique; the vertical structure of a strong
mid-latitude cyclone dynamically allows exceptional local
entrainment and wet deposition, cleaning out the atmo-
spheric boundary layer as the storm sweeps through. Sample
128 was associated with a squall line that formed in the warm
sector of a low-pressure system only hours before it reached
Steubenville, indicating that the entrained air was from within
a relatively short distance of the site, as outflow boundaries
force lift and condensation on a local scale. Surface winds
associated with the two hurricane events were primarily from
the northeast, while the other events experienced weak
surface winds primarily from the south-southwest which
are both areas that contain a high density of coal-fired utility
boilers. Three-day back trajectories also indicated air masses
with origins northeast or south-southwest of the Steubenville
site for these four events (See Figures S3a-e, Supporting
Information). The observation of local stagnation prior to
large Hg deposition events in Steubenville was also observed
at a site in Chicago, IL during the Lake Michigan Mass Balance
Study (
8
). Weak surface winds prior to the precipitation events
in Chicago lead to higher observed Hg deposition at that
site, but at rural sites in South Haven and Sleeping Bear
Dunes, MI, local stagnation did not lead to elevated deposi-
tion. At these rural sites, the highest Hg concentrations and
wet deposition, were observed after relatively fast transport
from the Chicago/Gary area.
The average rainfall rates for these high deposition events
were approximately three times the 2-year average (5.7 and
1.7 mm h
-1
, respectively) and four of the top five events had
maximum rainfall occurring in late night/early morning hours
when the boundary layer is relatively shallow. Maximum
rainfall times for the 2-year period did not, on average, show
a preference to any particular time of day.
The influence of local and regional sources is also evident
when comparing the Hg concentrations of event samples
collected at different sites following the path of hurricane
Frances, Steubenville's highest deposition event of the 2-year
record. The center of the low for this system moved northward
into the Mid-Atlantic states and then toward the northeast,
while winds prior to and during the precipitation period at
Steubenville were out of the northeast. The Hg concentration
at Steubenville for this event was 18.7 ng L
-1
, the concentra-
tion found in samples with similar volume collected during
TABLE 3. Unmix Source Profiles for Steubenville Precipitation Data
a
analyte
source 1
phosphorous
source 2
incinerator
source 3
Ni
source 4
iron/steel production
source 5
crustal
source 6
coal combustion
Mg
103
*
*
120
869
*
Al
*
*
37
*
482
*
P
73.0
*
*
5.4
*
*
S
*
1069
1754
*
*
10494
V
*
*
0.85
3.16
*
1.35
Cr
*
*
*
3.2
*
0.4
Mn
18.5
*
*
50.9
50.3
*
Fe
33
*
55
356
70
93
Ni
*
*
11.75
0.74
*
*
Se
*
*
*
0.87
*
4.26
Cd
*
0.93
0.08
*
*
0.23
La
*
*
0.07
*
0.76
*
Ce
*
*
0.15
*
1.44
*
Hg
*
0.03
0.03
*
*
0.16
NO
3
*
*
*
1860
7518
% Hg
*
12
12
*
*
69
a
* means not significant at 95% confidence interval
TABLE 4. Comparison of Measured Total Hg Wet Deposition
(
í
gm
-
2
) at Steubenville, OH Site to PMF and Unmix Coal
Combustion Contribution Estimates
year
total measured Hg
wet deposition
PMF estimated Hg Unmix estimated Hg
coal
total
coal
total
2003
13.5
9.1
12.2
9.9
14.8
2004
19.7
13.1
17.6
15.5
21.1
F
9
ENVIRON. SCI. & TECHNOL. / VOL. xx, NO. xx, xxxx
Hurricane Frances at a site in Underhill, Vermont was less
than half that at Steubenville (9.1 ng L
-1
) and that collected
at a site in Tampa where the feed air was primarily of oceanic
origin was 4.1 ng L
-1
.
The large temporal variability and range of concentrations
among the event samples in Steubenville during this study
(4.0-78.9 ng L
-1
) also indicates a strong local and regional
source influence. Only 9.5% of the variability in concentration
could be accounted for by precipitation amount alone. In
addition, a large range was found in Hg concentrations among
samples with a similar precipitation depth: 4.3-78.9 ng L
-1
for low precipitation depth samples (<1 cm) and 4.2-22.1
ng L
-1
for high precipitation depth samples (>5 cm). Previous
studies have shown that a large range in concentration for
similar rainfall amounts can be attributed to variability in
impacts by local sources and to the variation in distance
between the sources and the receptor site (
8
,
36
,
37
).
The results of the multivariate statistical analysis (˘70%
of the Hg in the wet deposition at Steubenville coal
combustion sources), and meteorological analysis (high-
lighting the importance of local regional sources), consistently
point toward the dominant influence by local and regional
coal-burning sources.
Acknowledgments
The United States Environmental Protection Agency through
its Office of Research and Development funded the research
described here through cooperative agreement R-82971601
with the University of Michigan. It has been subjected to
Agency review and approved for publication. We thank Jim
Barres and Ali Kamal (UMAQL) for managing laboratory
support operations and data processing; Minghao Zhou and
Julie Peterson for the precipitation analysis; Dr. Khalid Al-
Wali for trajectory calculation and plotting; Dr. Frank Marsik
for meteorological measurements and interpretation; Dr.
James Slater (Franciscan University) for on-site logistical
support; and Dr. Ron Henry (USC) and Shelly Eberly (EPA)
for receptor modeling support. We also thank the reviewers
for their insightful comments and suggestions.
Supporting Information Available
MDLs and volume-weighted mean concentrations for all of
the trace elements in Table S1. Scatter plots of PMF and
Unmix modeled versus observed Hg deposition in Figures
S2a-b. Three day back trajectory plots for high deposition
events in Figures S3a-d. This material is available free of
charge via the Internet at http://pubs.acs.org.
Literature Cited
(1) Landis, M. S.; Keeler, G. J. Atmospheric mercury deposition to
Lake Michigan during the Lake Michigan mass balance study.
Environ. Sci. Technol.
2002
,
36
, 4518-4524.
(2) Rolfhus, K. R.; Sakamoto, H. E.; Cleckner, L. B.; Stoor, R. W.;
Babiarz, C. L.; Back, R. C.; Manolopoulos, H.; Hurley, J. P.
Distribution and fluxes of total and methylmercury in Lake
Superior.
Environ. Sci. Technol.
2003
,
37
, 865-872.
(3) Nriagu, J. Global metal pollution: poisoning the biosphere.
Environment
1990
,
32
, 28-32.
(4) EPMAP.
Mercury Atmospheric Processes: A Synthesis Report.
EPRI/TR-104214; Expert Panel on Mercury Atmospheric Pro-
cesses: Palo Alto, CA, 1994.
(5) Keeler, G.; Glinsorn, G.; Pirrone, N. Particulate mercury in the
atmosphere: its significance, transport, transformation and
sources.
Water Air Soil Pollut.
1995
,
80
, 159-168.
(6) Landis, M. S.; Keeler G. J.; Al-Wali, K. I.; Stevens, R. K. Divalent
inorganic reactive gaseous mercury emissions from a mercury
cell chlor-alkali plant and its impact on near-field atmospheric
dry deposition.
Atmos. Environ.
2004
,
38
, 613-622.
(7) Iverfeldt, A. Occurrence and turnover of atmospheric mercury
over the Nordic countries.
Water, Air, Soil Pollut.
1991
,
56
, 251-
265.
(8) Landis, M. S.; Vette, A. F.; Keeler, G. J. Atmospheric Mercury in
the Lake Michigan Basin: Influence of the Chicago/Gary Urban
Area.
Environ. Sci. Technol.
2002
,
36
, 4508-4517.
(9) U.S. Environmental Protection Agency.
Mercury Study Report
to Congress
, EPA-452/R-97-005; Office of Air Quality Planning
and Standards, Office of Research and Development: Wash-
ington, DC, 1997.
(10) U.S. Environmental Protection Agency. Standards of perfor-
mance for new and existing stationary sources: Electric utility
steam generating units; Final Rule.
Fed. Regist
.
2005,
70
, 95.
(11) Dvonch, J. T.; Graney, J. R.; Keeler, G. J.; Stevens, R. K. Use of
elemental tracers to source apportion mercury in south Florida
precipitation.
Environ. Sci. Technol.
1999
,
33
, 4522-4527.
(12) Anderson, M. J.; Daly, E. P.; Miller, S. L.; Milford, J. B. Source
apportionment of exposures to volatile organic compounds. I.
Evaluation of receptor models using simulated exposure data.
Atmos. Environ.
2002
,
36
, 3643-3658.
(13) Lewis, C. W.; Norris, G.; Henry, R. Source apportionment of
Phoenix PM2.5 aerosol with the Unmix receptor model.
J. Air
Waste Manage. Assoc.
2003
,
53
, 325-338.
(14) Paatero, P; Tapper, U. Positive matrix factorizationsa nonne-
gative factor model with optimal utilization of error estimates
of data values.
Environmetrics
1994
,
5
, 111-126.
(15) Anttila, P.; Paatero, P.; Tapper, U.; Jarvinen, O. Source iden-
tification of bulk wet deposition in Finland by positive matrix
factorization.
Atmos. Environ.
1995
,
14
, 1705-1718.
(16) Dockery, D. W.; Pope, C.; Xu, X.; Spengler, J.; Ware, J.; Fay, M.;
Ferris, B.; Speizer, F. An association between air pollution and
mortality in six U.S. cities.
N. Engl. J. Med.
1993
,
329
, 1753-
1759.
(17) Ross, H. B. Trace metal wet deposition in Sweden: insight gained
from daily wet only collection.
Atmos. Environ.
1990
,
24A
, 1929.
(18) Hoyer, M. E.; Burke, J. B.; Keeler, G. J. Atmospheric sources,
transport and deposition of mercury in Michigan: two years of
event precipitation.
Water, Air, Soil Pollut.
1995
,
80
, 199-208.
(19) Landis, M. S.; Keeler, G. J. Critical evaluation of a modified
automatic wet-only precipitation collector for mercury and trace
element determinations.
Environ. Sci. Technol.
1997
,
31
, 2610-
2615.
(20) Keeler, G. J.; Gratz, L.; Al-Wali, K. Influences on the long-term
atmospheric mercury wet deposition at Underhill, Vermont.
Ecotoxicology
2005
,
14
, 71-83.
(21) Keeler, G. J.; Dvonch, J. T. Atmospheric mercury: A decade of
observations in the Great Lakes. In
Dynamics of Mercury
Pollution on Regional and Global Scales: Atmospheric Processes
and Human Exposures around the World
; Pirrone, N., Mahaffey,
K., Eds.; Kluwer Ltd: Norwell, MA, 2005.
(22) Fitzgerald, W. F.; Gill, G. A. Subnanogram determination of
mercury by two-stage gold amalgamation and gas phase
detection applied to atmospheric analysis.
Anal. Chem.
1979
,
51
, 1714-1720.
(23) U.S. Environmental Protection Agency, Office of Research and
Development, Environmental Monitoring Systems Laboratory.
Methods for the Determination of Metals in Environmental
Samples;
CRC Press: Boca Raton, FL, 1992; pp 95-137.
(24) Graney, J. R.; Landis, M. S.; Norris, G. A. Concentrations and
solubilities of metals from indoor and personal exposure PM
2.5
samples.
Atmos. Environ.
2004
,
38
, 237-247.
(25) Montaser, A.
Inductively Coupled Plasma Mass Spectrometry
;
Wiley-VCH Inc.: New York, 1998.
(26) Eberly, S.
EPA PMF 1.1 User's Guide
; U.S. Environmental
Protection Agency: Washington, DC, 2005.
(27) Norris, G.; Henry, R.; Vedantham, R.
EPA Unmix 5.0 User Guide
;
U.S. Environmental Protection Agency: Washington, DC, 2006.
(28) Draxler, R. R; Hess, G. D. D
escription of the HYSPLIT_4 Modeling
System
. NOAA Technical Memorandum ERL ARL-224; NOAA:
Washington, DC, 1997.
(29) Biegalski, S. R.; Landsberger, S.; Hoff, R. M. Source-receptor
modeling using trace metals in aerosols collected at three rural
Canadian Great Lakes sampling stations
J. Air Waste Manage.
Assoc.
1998
,
48
, p227.
(30) Gordon, G. E. Receptor models.
Environ. Sci. Technol.
1988
,
22
,
1132-1142.
(31) Grahame, T.; Hidy, G. Using factor analysis to attribute health
impacts of particulate pollution sources.
Inhalation Toxicol.
2004
,
16
, 143-152.
(32) Greenberg, R. R.; Gordon, G. E.; Zoller, W. H.; Jacko, R. B.;
Neuendorf, D. W.; York, K. J. Composition of particles emitted
from the Nicosia municipal incinerator.
Environ. Sci. Technol.
1978
,
12
, 1329-1332.
VOL. xx, NO. xx, xxxx / ENVIRON. SCI. & TECHNOL.
9 G
(33) Kitto, M. E. Trace-element patterns in fuel oils and gasolines
for use in source apportionment.
J. Air Waste Manage. Assoc.
1993
,
43
, 1381-1388.
(34) Suarez, A. E.; Ondov, J. M. Ambient aerosol concentrations of
elements resolved by size and by source: contributions of some
cytokine-active metals from coal- and oil-fired power plants.
Energy Fuels
2002
,
16
, 562-568.
(35) Poirot, R. L.; Wishinski, P. R.; Hopke, P. K.; Polissar, A. V.
Comparative application of multiple receptor methods to
identify aerosol sources in northern Vermont.
Environ. Sci.
Technol.
2001
,
35
, 4622-4636.
(36) Moody, J. L.; Samson, P. J. The influence of atmospheric transport
on precipitation chemistry at two sites in the Midwestern United
States.
Atmos. Environ.
1989
,
23
, 2117-2132.
(37) Dvonch, J. T.; Keeler, G. J.; Marsik, F. J. The influence of
meterological conditions on the wet deposition of mercury in
southern Florida.
J. Appl. Meteor.
2005
,
44
, 1421-1435.
Received for review February 16, 2006. Revised manuscript
received July 13, 2006. Accepted July 28, 2006.
ES060377Q
H
9
ENVIRON. SCI. & TECHNOL. / VOL. xx, NO. xx, xxxx
PAGE EST: 7.1