Sorbent
Technologies
Corporation
Subject
: Corrected Exhibit in Mercury Hearings with Docket R06-25
(fuf(-h C--
b)
Dear Board Members
:
Sorbent Technologies' data quality-control procedures just discovered a problem with three of the data
points on one of the Exhibits that was entered into evidence in the recent Illinois power plant mercury
regulation hearings, the exhibit with the preliminary test results from the U
.S. DOE "concrete-friendly"
C-PAC injection trial at Midwest Generation's Crawford Station in Chicago
.
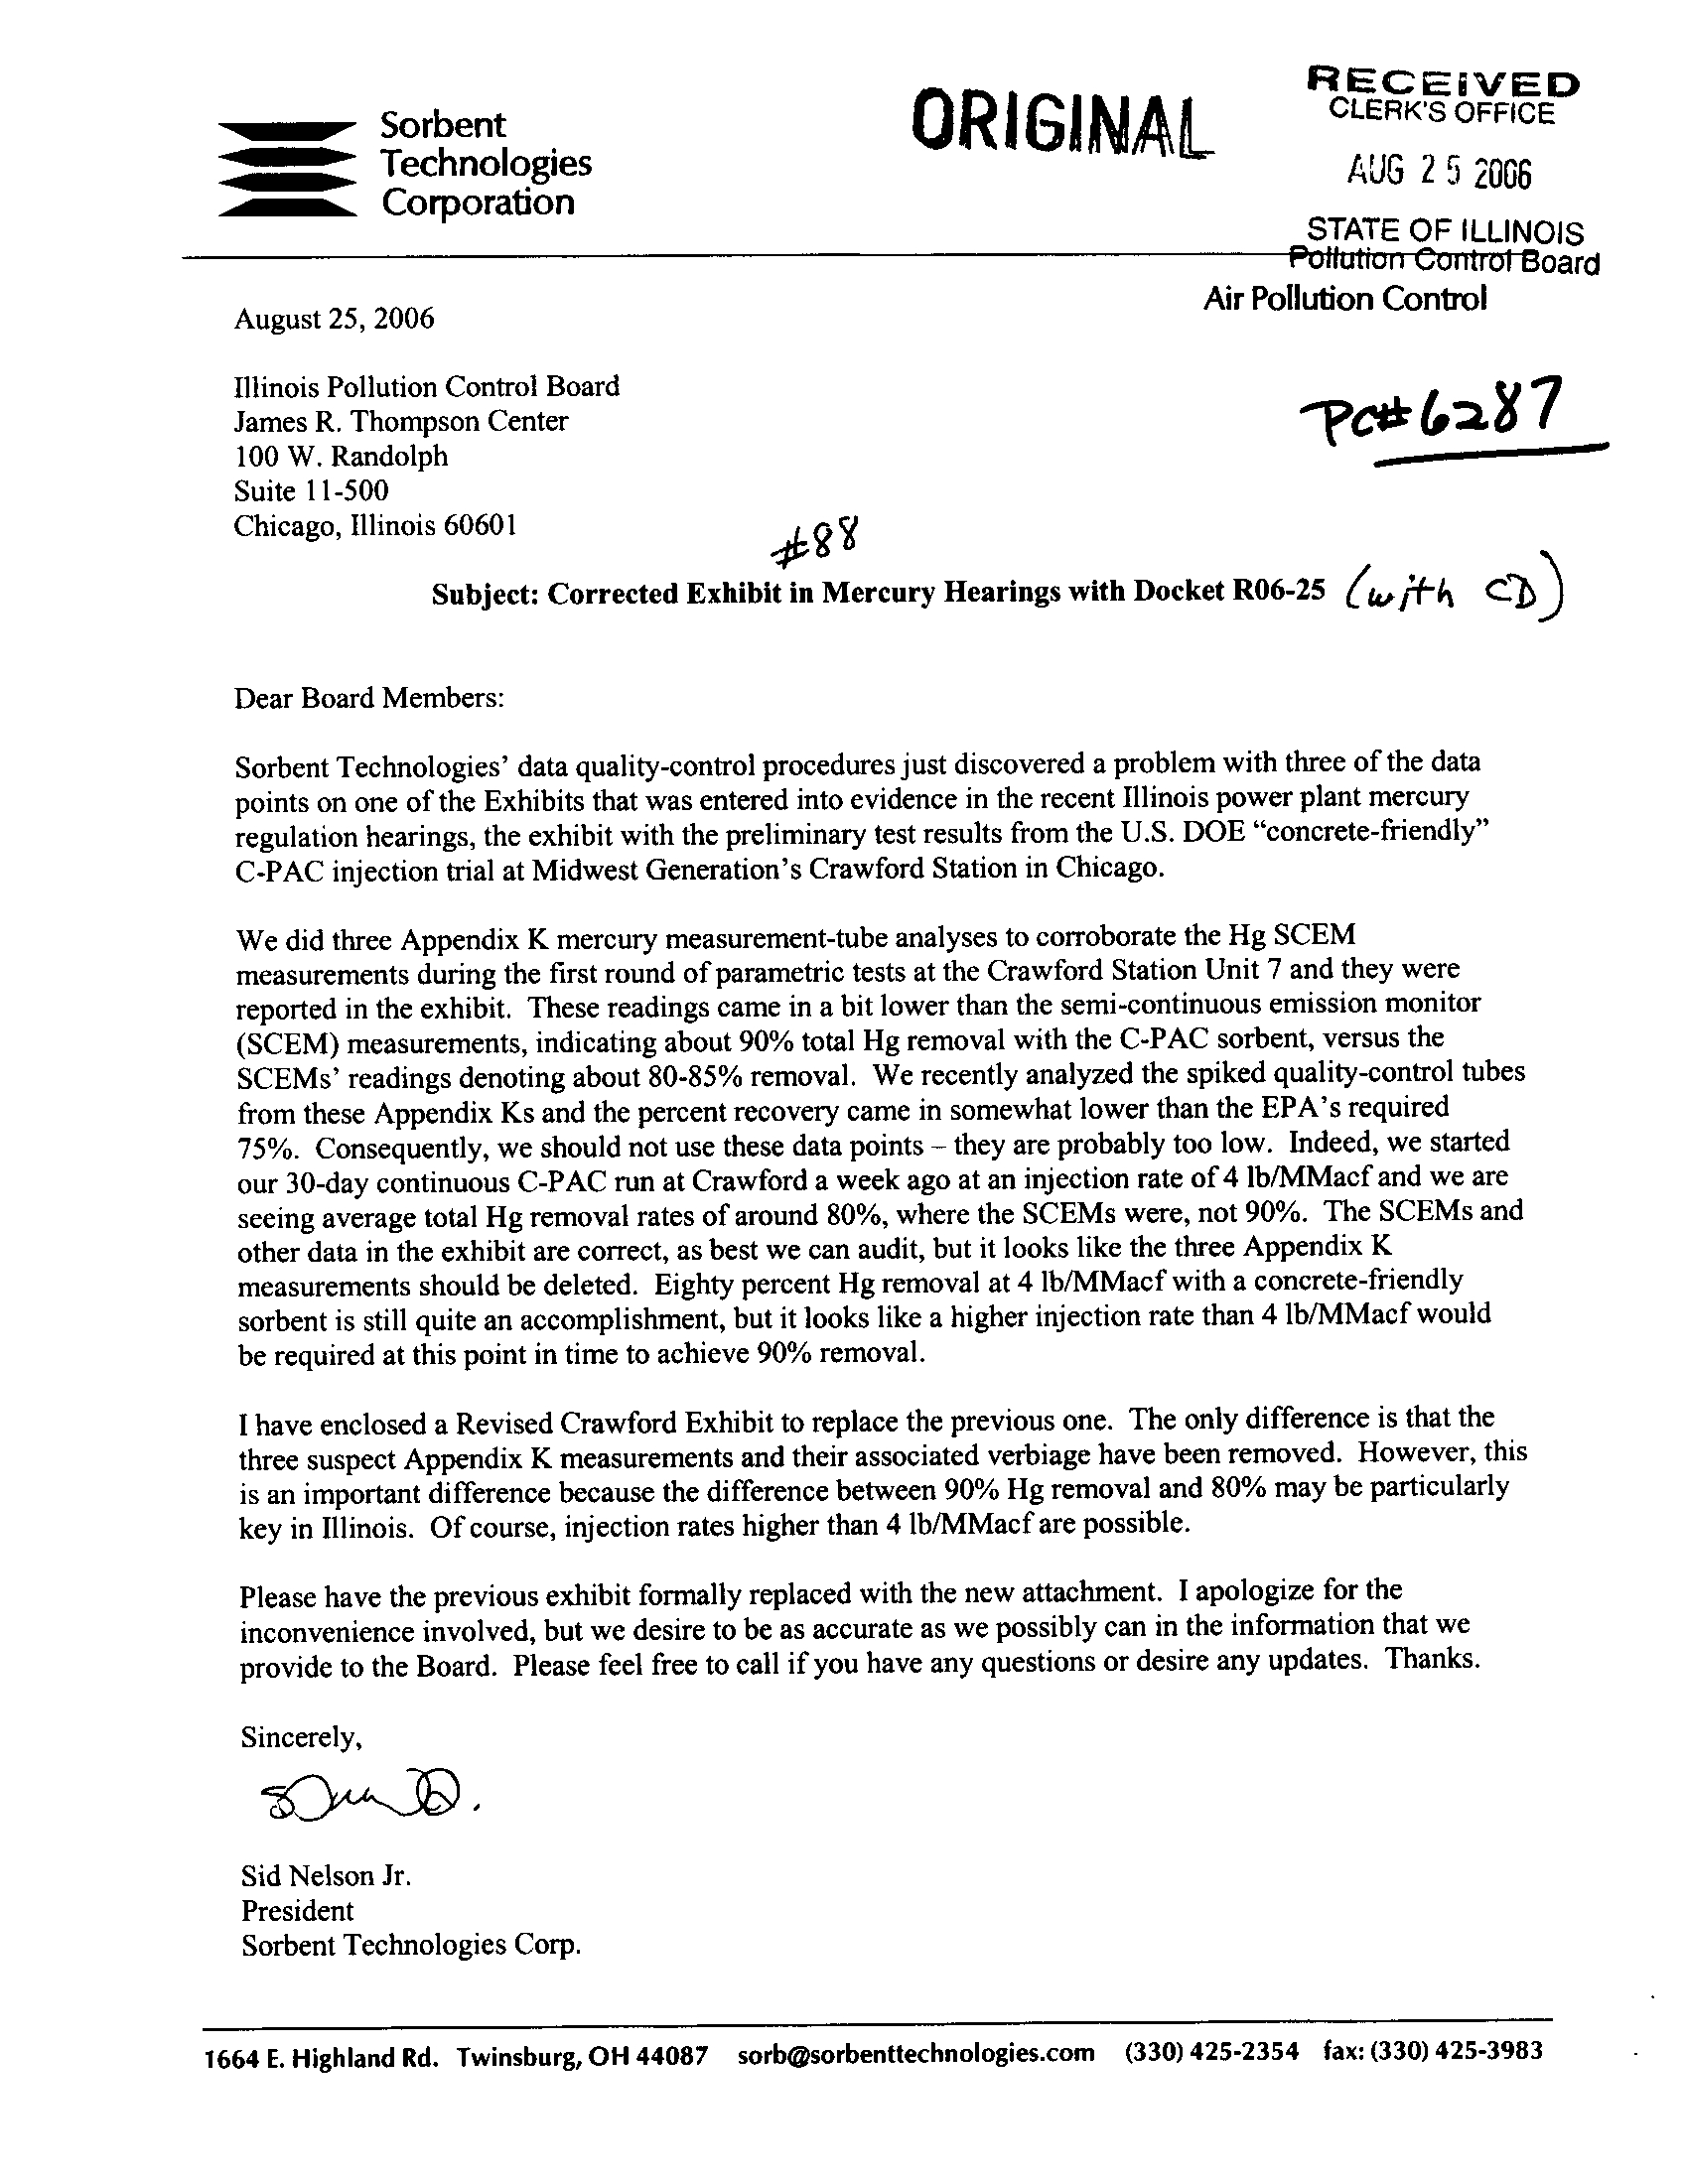
We did three Appendix K mercury measurement-tube analyses to corroborate the Hg SCEM
measurements during the first round of parametric tests at the Crawford Station Unit 7 and they were
reported in the exhibit
. These readings came in a bit lower than the semi-continuous emission monitor
(SCEM) measurements, indicating about 90% total Hg removal with the C-PAC sorbent, versus the
SCEMs' readings denoting about 80-85% removal
. We recently analyzed the spiked quality-control tubes
from these Appendix Ks and the percent recovery came in somewhat lower than the EPA's required
75%
. Consequently, we should not use these data points
-
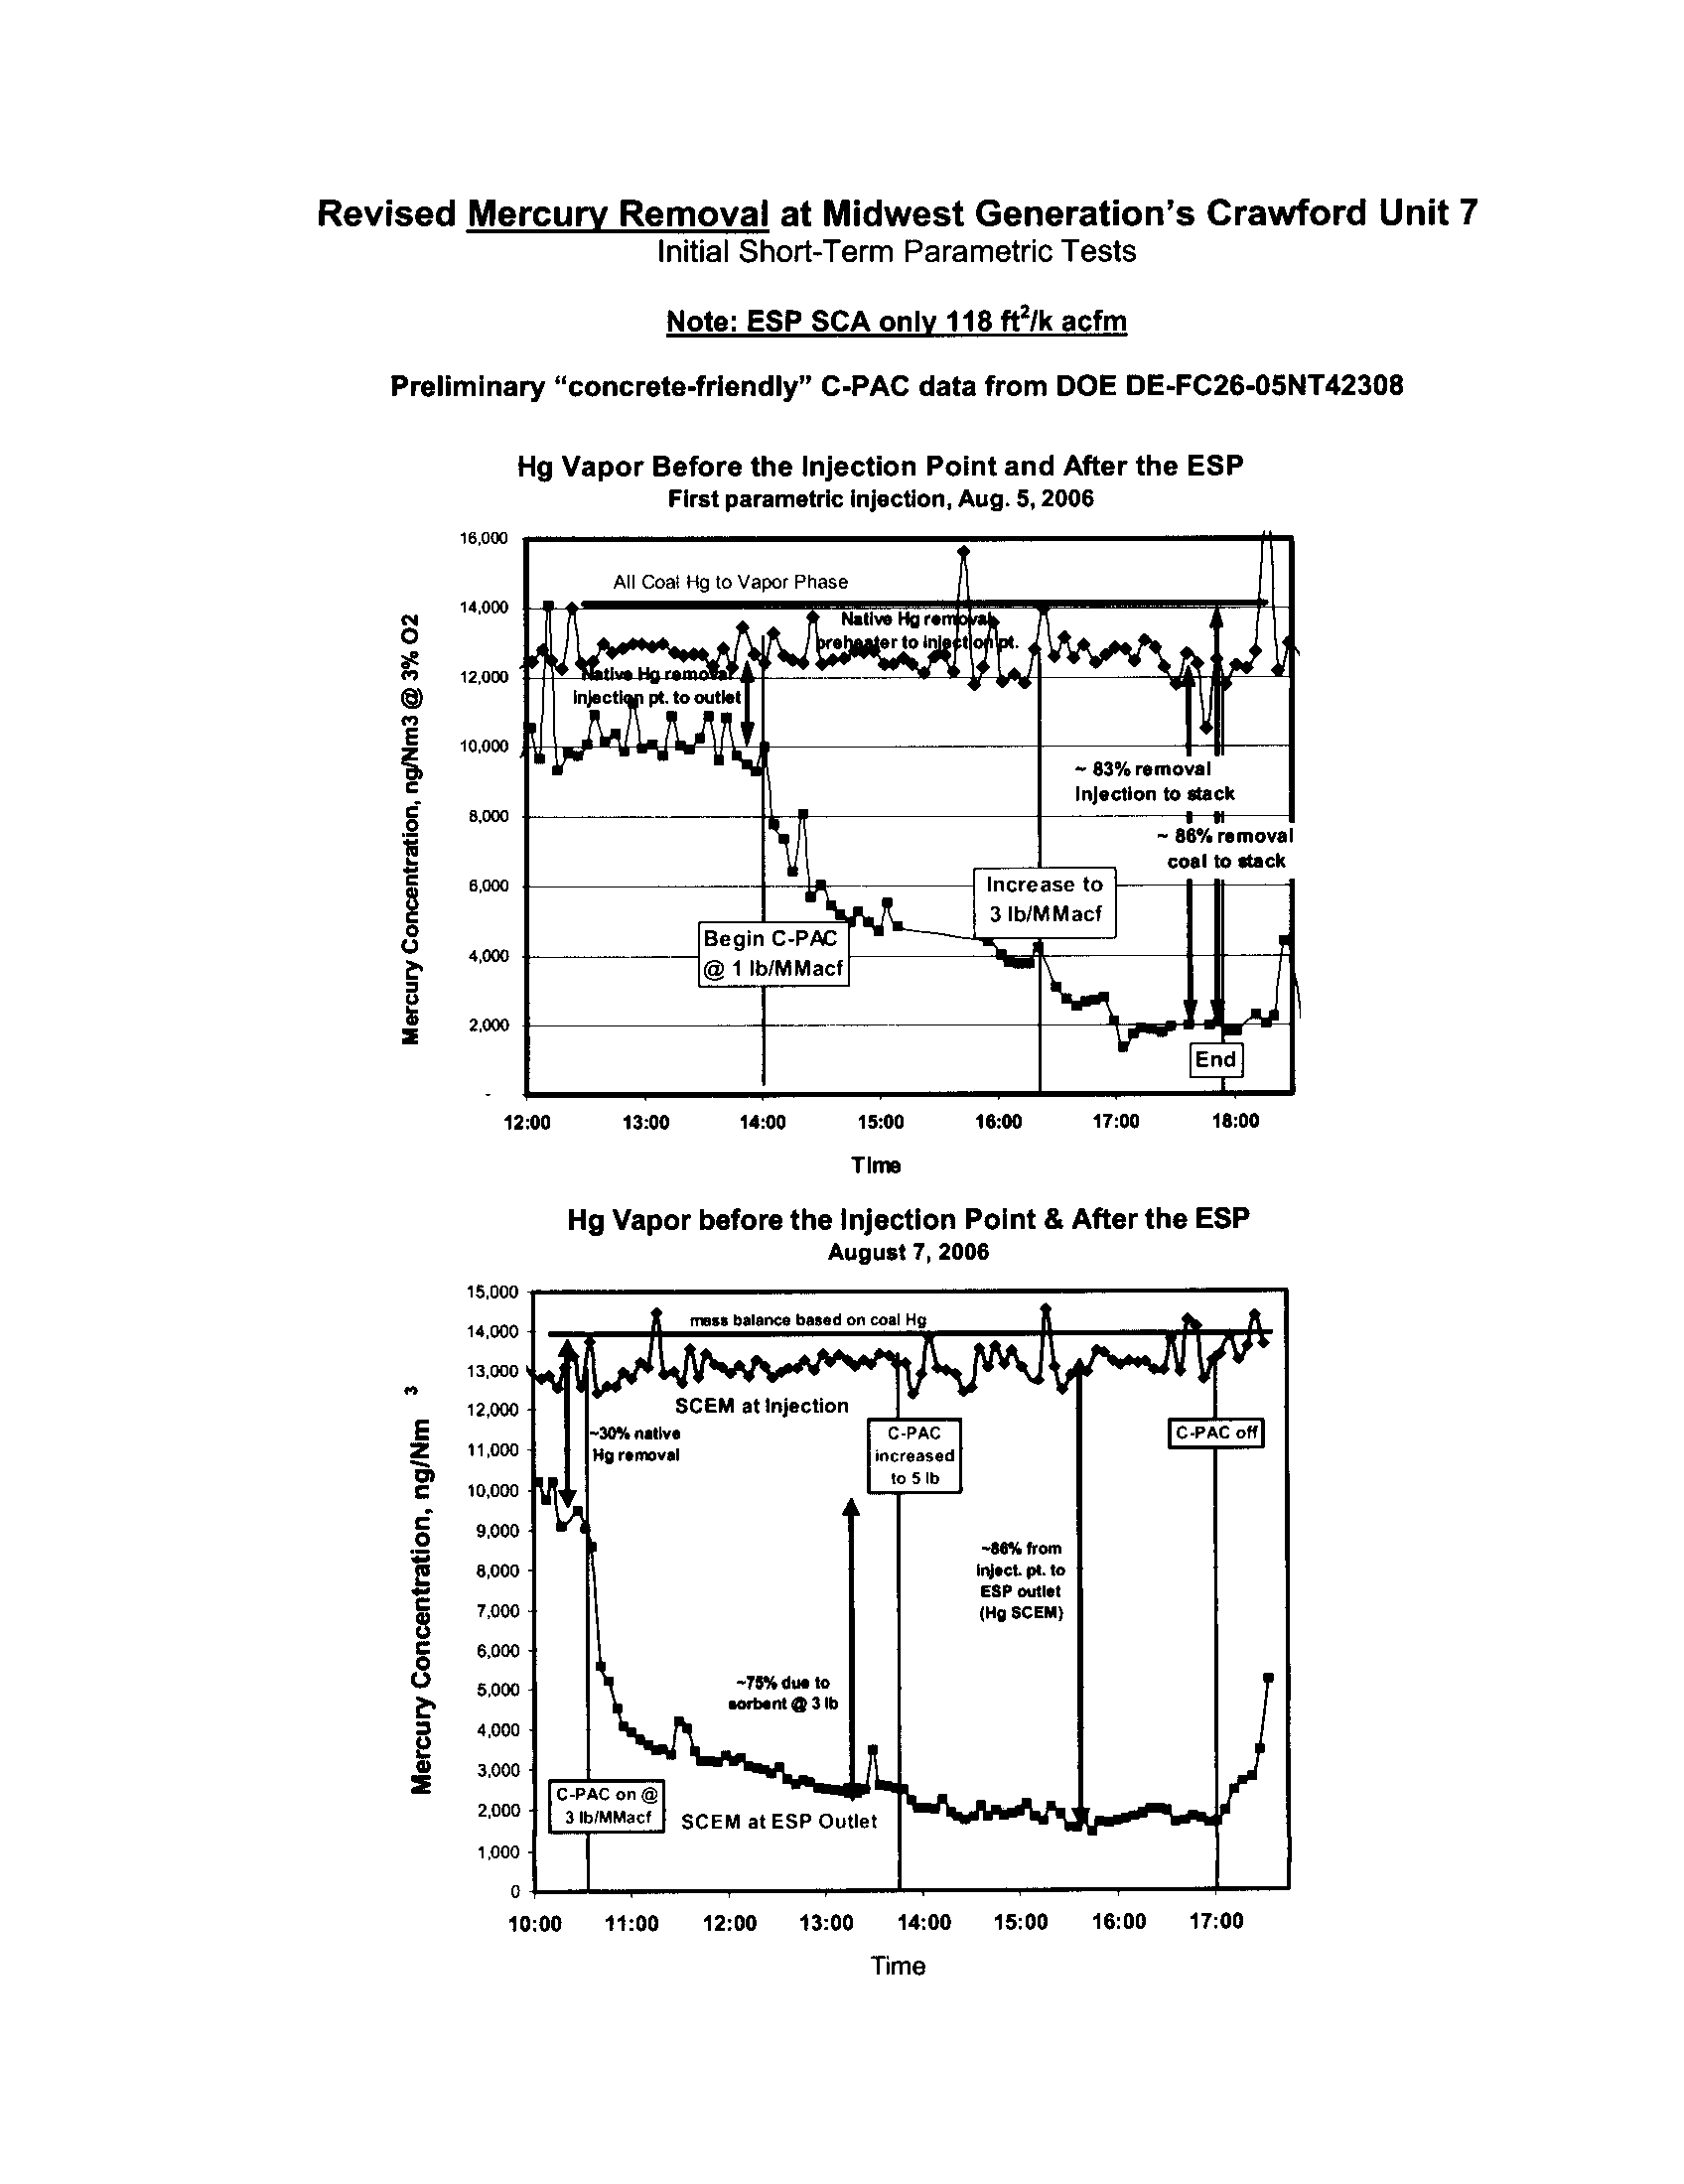
they are probably too low . Indeed, we started
our 30-day continuous C-PAC run at Crawford a week ago at an injection rate of 4 lb/MMacf and we are
seeing average total Hg removal rates of around 80%, where the SCEMs were, not 90%
. The SCEMs and
other data in the exhibit are correct, as best we can audit, but it looks like the three Appendix K
measurements should be deleted
. Eighty percent Hg removal at 4 lb/MMacf with a concrete-friendly
sorbent is still quite an accomplishment, but it looks like a higher injection rate than 4 lb/MMacf would
be required at this point in time to achieve 90% removal
.
I have enclosed a Revised Crawford Exhibit to replace the previous one
. The only difference is that the
three suspect Appendix K measurements and their associated verbiage have been removed
. However, this
is an important difference because the difference between 90% Hg removal and 80% may be particularly
key in Illinois
. Of course, injection rates higher than 4 lb/MMacf are possible
.
Please have the previous exhibit formally replaced with the new attachment
. I apologize for the
inconvenience involved, but we desire to be as accurate as we possibly can in the information that we
provide to the Board
. Please feel free to call if you have any questions or desire any updates
. Thanks .
Sincerely,
ORIGINAL
RECEIVEDCLERK'S
OFFICE
AUG 2 5 2006
STATE OF ILLINOIS
Sid Nelson Jr .
President
Sorbent Technologies Corp .
1664 E . Highland Rd
. Twinsburg, OH 44087 sorb(g?sorbenttechnologies
.com
(330) 425-2354 fax: (330) 425-3983
u run nno
Board
August 25, 2006
Air Pollution
Control
Illinois
James R
.
Pollution
Thompson
Control
CenterBoard
~
7
~p,,,~ C Lr
&a
(J
100 W . Randolph
Suite 11-500
Chicago, Illinois 60601
c~
Revised Mercury Removal at Midwest Generation's Crawford Unit 7
Initial Short-Term Parametric Tests
Note : ESP SCA only 118ft2Ik acfm
Preliminary "concrete-friendly" C-PAC data from DOE DE-FC26-05NT42308
Hg Vapor Before the Injection Point and After the ESP
First parametric Injection, Aug . 5, 2006
0
E
cc
12 :00
13 :00
14
:00
15:00
Time
16:00
17 :00
Hg Vapor before the Injection Point & After the ESP
August 7, 2006
W
ness balance based on coal Hg
SCEM at Injection
-30% native
Hg removal
C-PAC on @
31b/MMacf
-75% dw to
sarbent @ 31b
C-PAC
..creased
5lb
-88% from
hsect pt . to
ESP Mist
(HgSCEM)
10 :00
11
:00
12 :00
13:00
14 :00
Time
18 :00
15 :00
16 :00
17 :00
~o,ow
All Coal Hg to Vapor Phase
I
T
7
14
.000
e
12,000
111
~~~,~~r~
uTIR1!!RTL~ .'S)1i
Nether 110 ra
i
ertal
10 .0001IMR
- 83% removal
Injection to stack
8,000
e,0o0
-
-
L
-86% removal
coal to stack
Increase
4.000
cf
3 Ib/MMacfcf
Begin l
@ 1 Ib/MMacf
•
x.ooo
--
F l
~
0
E
12,000
2
11,000
I
c
c
0)
10,0009.000
2
8,000
7,000
VCC0
6,0006,000
37
0)S
4,0003.000
2,000
1,000
14
0
C-PAC at 4 Ib/M Macf -Aug
. 8, 2006
Injection begun at 14:00 - Preliminary Data
Total Native
Hg Removal
Mass Balance Inlect
.Pt
. CBI Outlet CBI
(All
He
In Coal) 1490.16:15
1490
Measurement
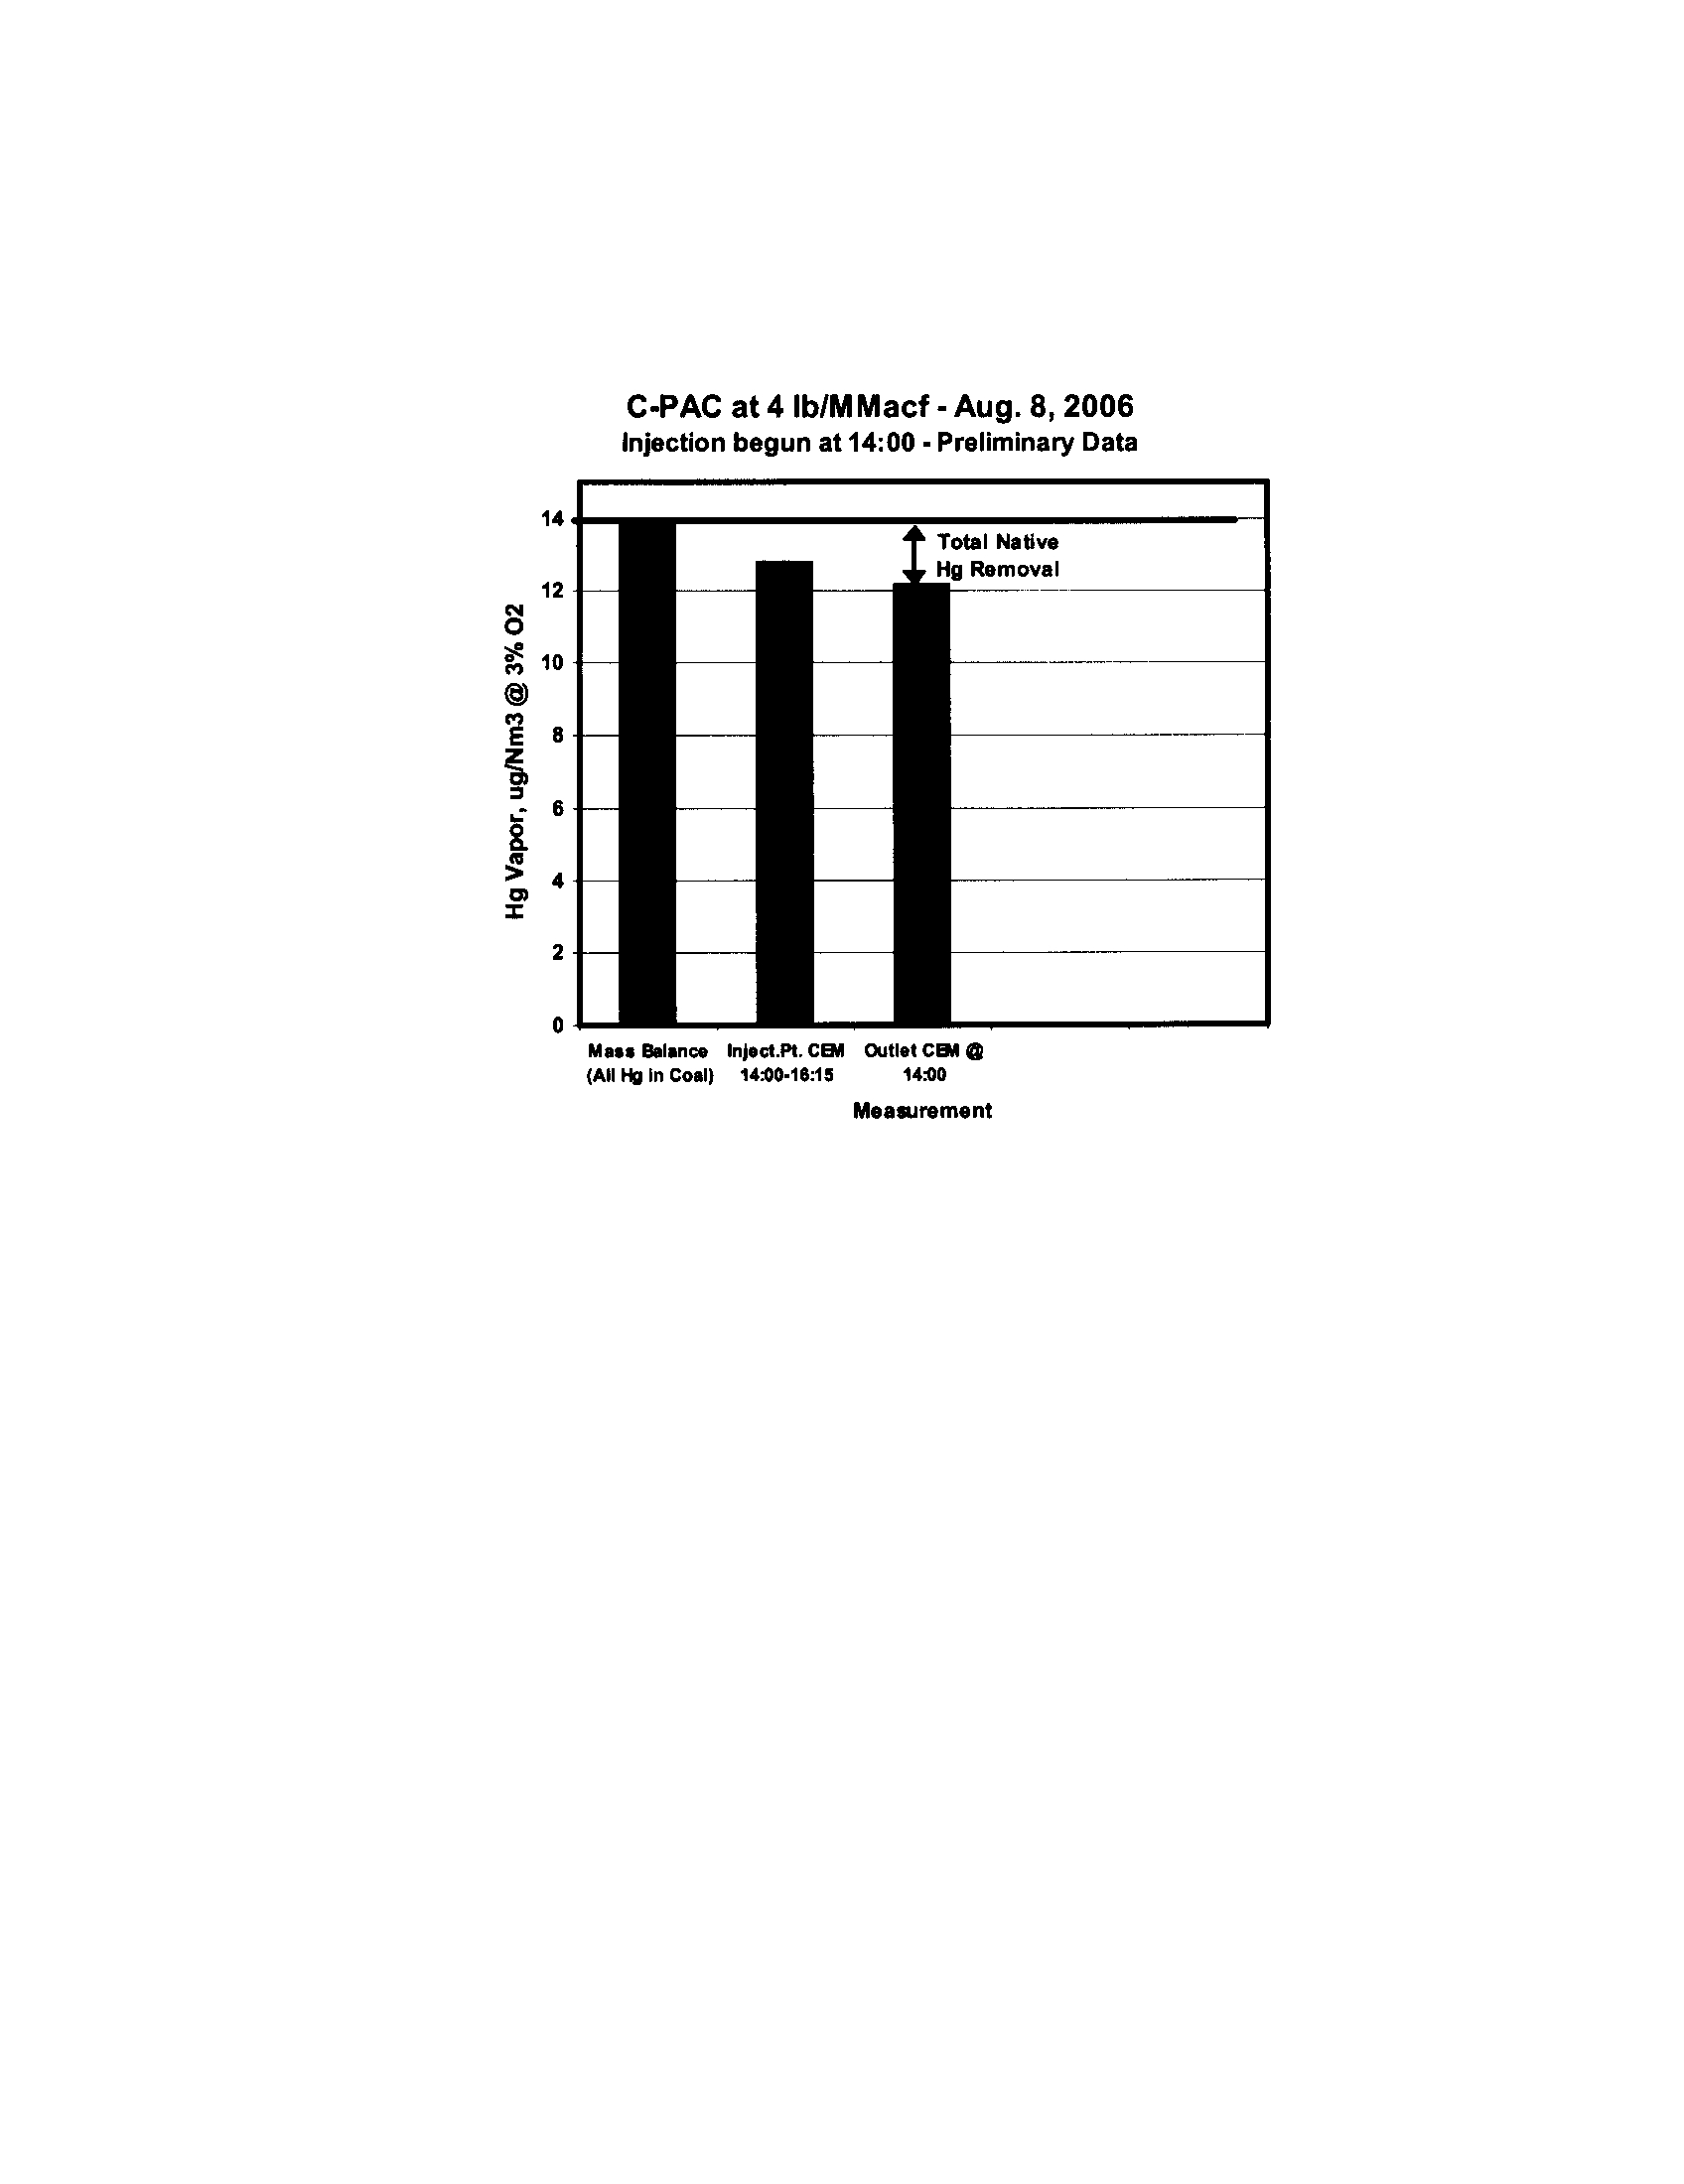
Opacity
at Midwest Generation's Crawford Unit 7 in Chicago, Illinois
Note: ESP SCA only 118 ft2lk
acfm
PAC Injection into reheat boiler ESP, with opacity on the combined superheat & reheat flows
Preliminary "concrete-friendly" C-PAC data from DOE DE-FC26-05NT42308
40
35
30
25
Om
20
A
c
15
10
5
8/1
e
40
35
Oam20
A
5
d
c
15
€
10
b
5
0
7/25
8/2
8/3
Opacity vs Load, Last Week of July, Before Any Injection
Opacity rising with time at full load
7/26
8 /4
7/27
8 /5
7/28
7/29
onto
Opacity vs Load, Week of Parametric Injection Tests
Opacity stable with time at full load
8/6
8/7
Date
8/8
7/30
8 /9
7/31
8/10
250
200
150 3
s
a
100 J
-50
0
8/1
0
0
8/11
8/12
250
200
150 3
s
100
a
J
50
C-PAC
leltover
C-PAC
C-PAC
C-PAC
V
~ba~c a~to
~,
~ I
"?=e
e s
I
Recall Ion
'
e'
J
= ?
. B
e
9
0
-,a`
--- '
wfpM~F
wed ewrn ?%s1
. l
.to
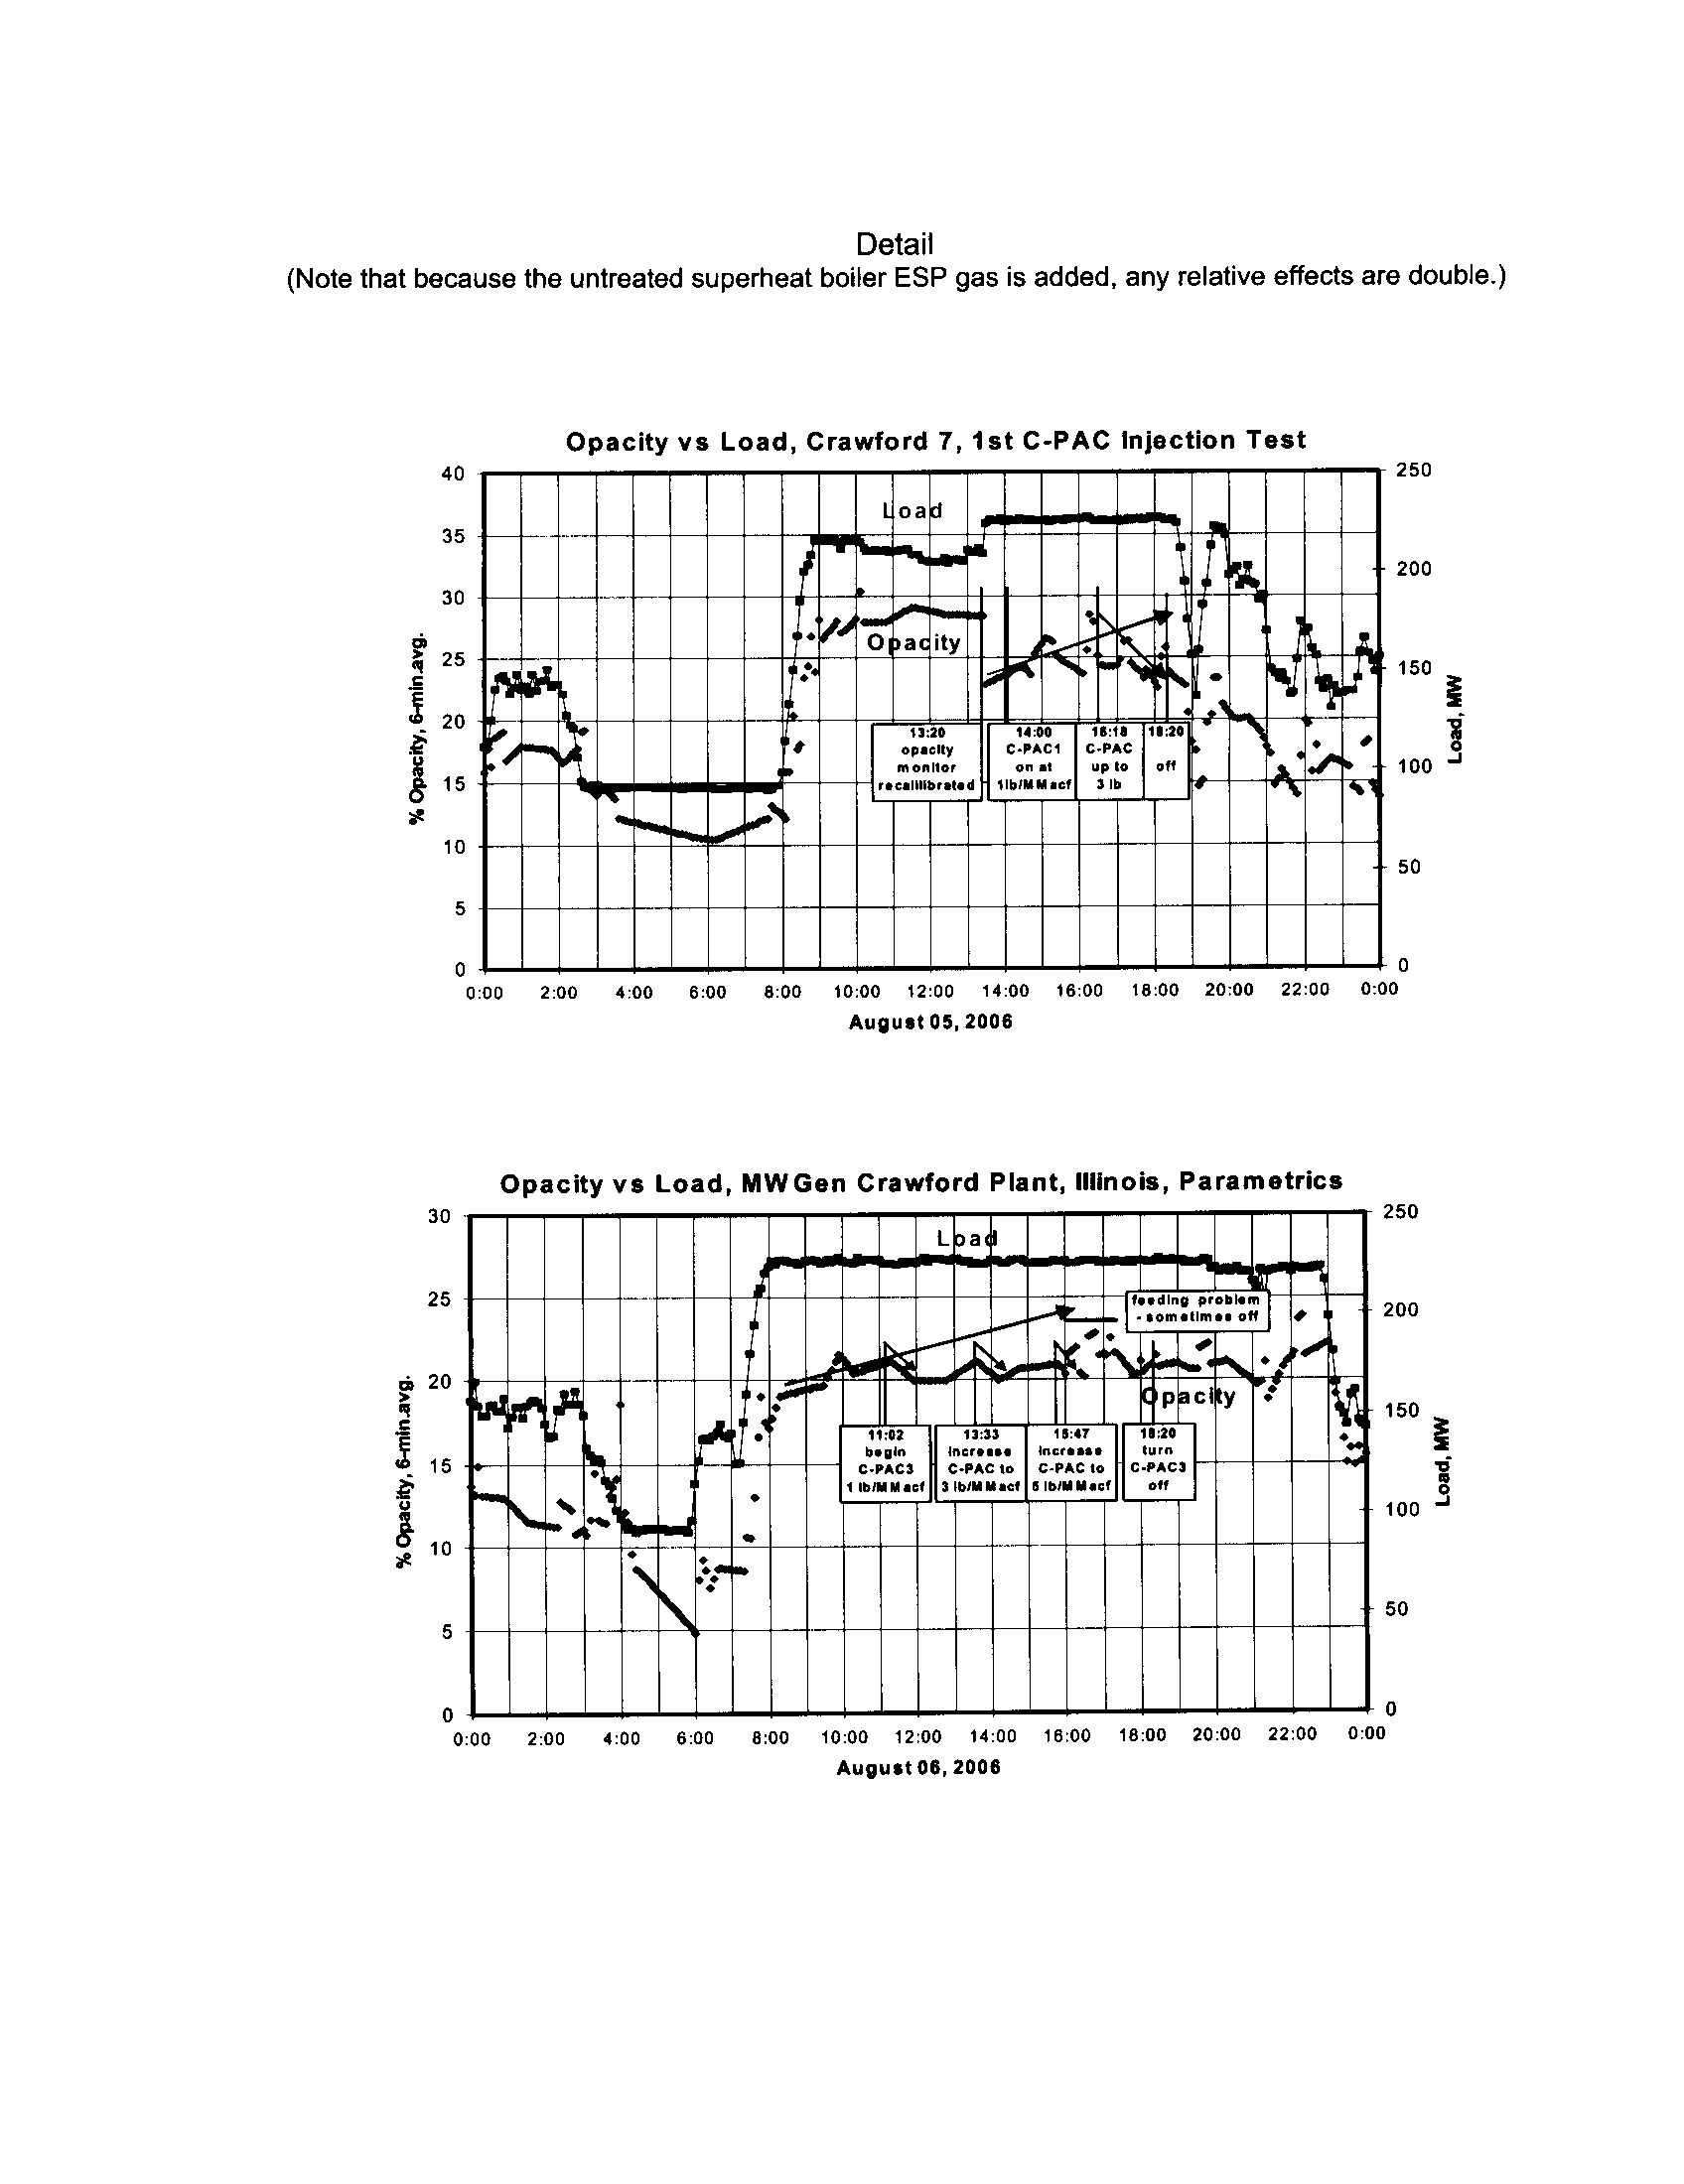
Detail
(Note that because the untreated superheat boiler ESP gas is added, any relative effects are double
.)
25
Opacity vs Load, Crawford 7, 1st C-PAC Injection Test
40
250
35
30
ca
25
20
15
X
10
5
5
0
0
0 :00
2 :00
4 :00
6 :00
8 :00
10 :00
12 :00
14 :00
16 :00
18 :00 20
:00
22 :00
0 :00
August 05, 2006
200
50
Opacity vs Load, MWGen Crawford Plant, Illinois, Parametrics
30
250
0
0
0 :00
2 :00
4 :00
6 :00
8 :00
10 :00
12 :00
14 :00
16 :00
18 :00
20
:00
22 :00
0 :00
August
00,2006
150
9
O
100
50
∎n
- ! „A as
200
pis
*PAC7
bMM •
to
1
1
Load
~~
~ I
`A
1129MI
aORRfi I IN
1 "
011,
`_
,
S.1f1
I
1
r 0lb
$1820
is
011
d lb .
c
1400PAC C PAC
~~~
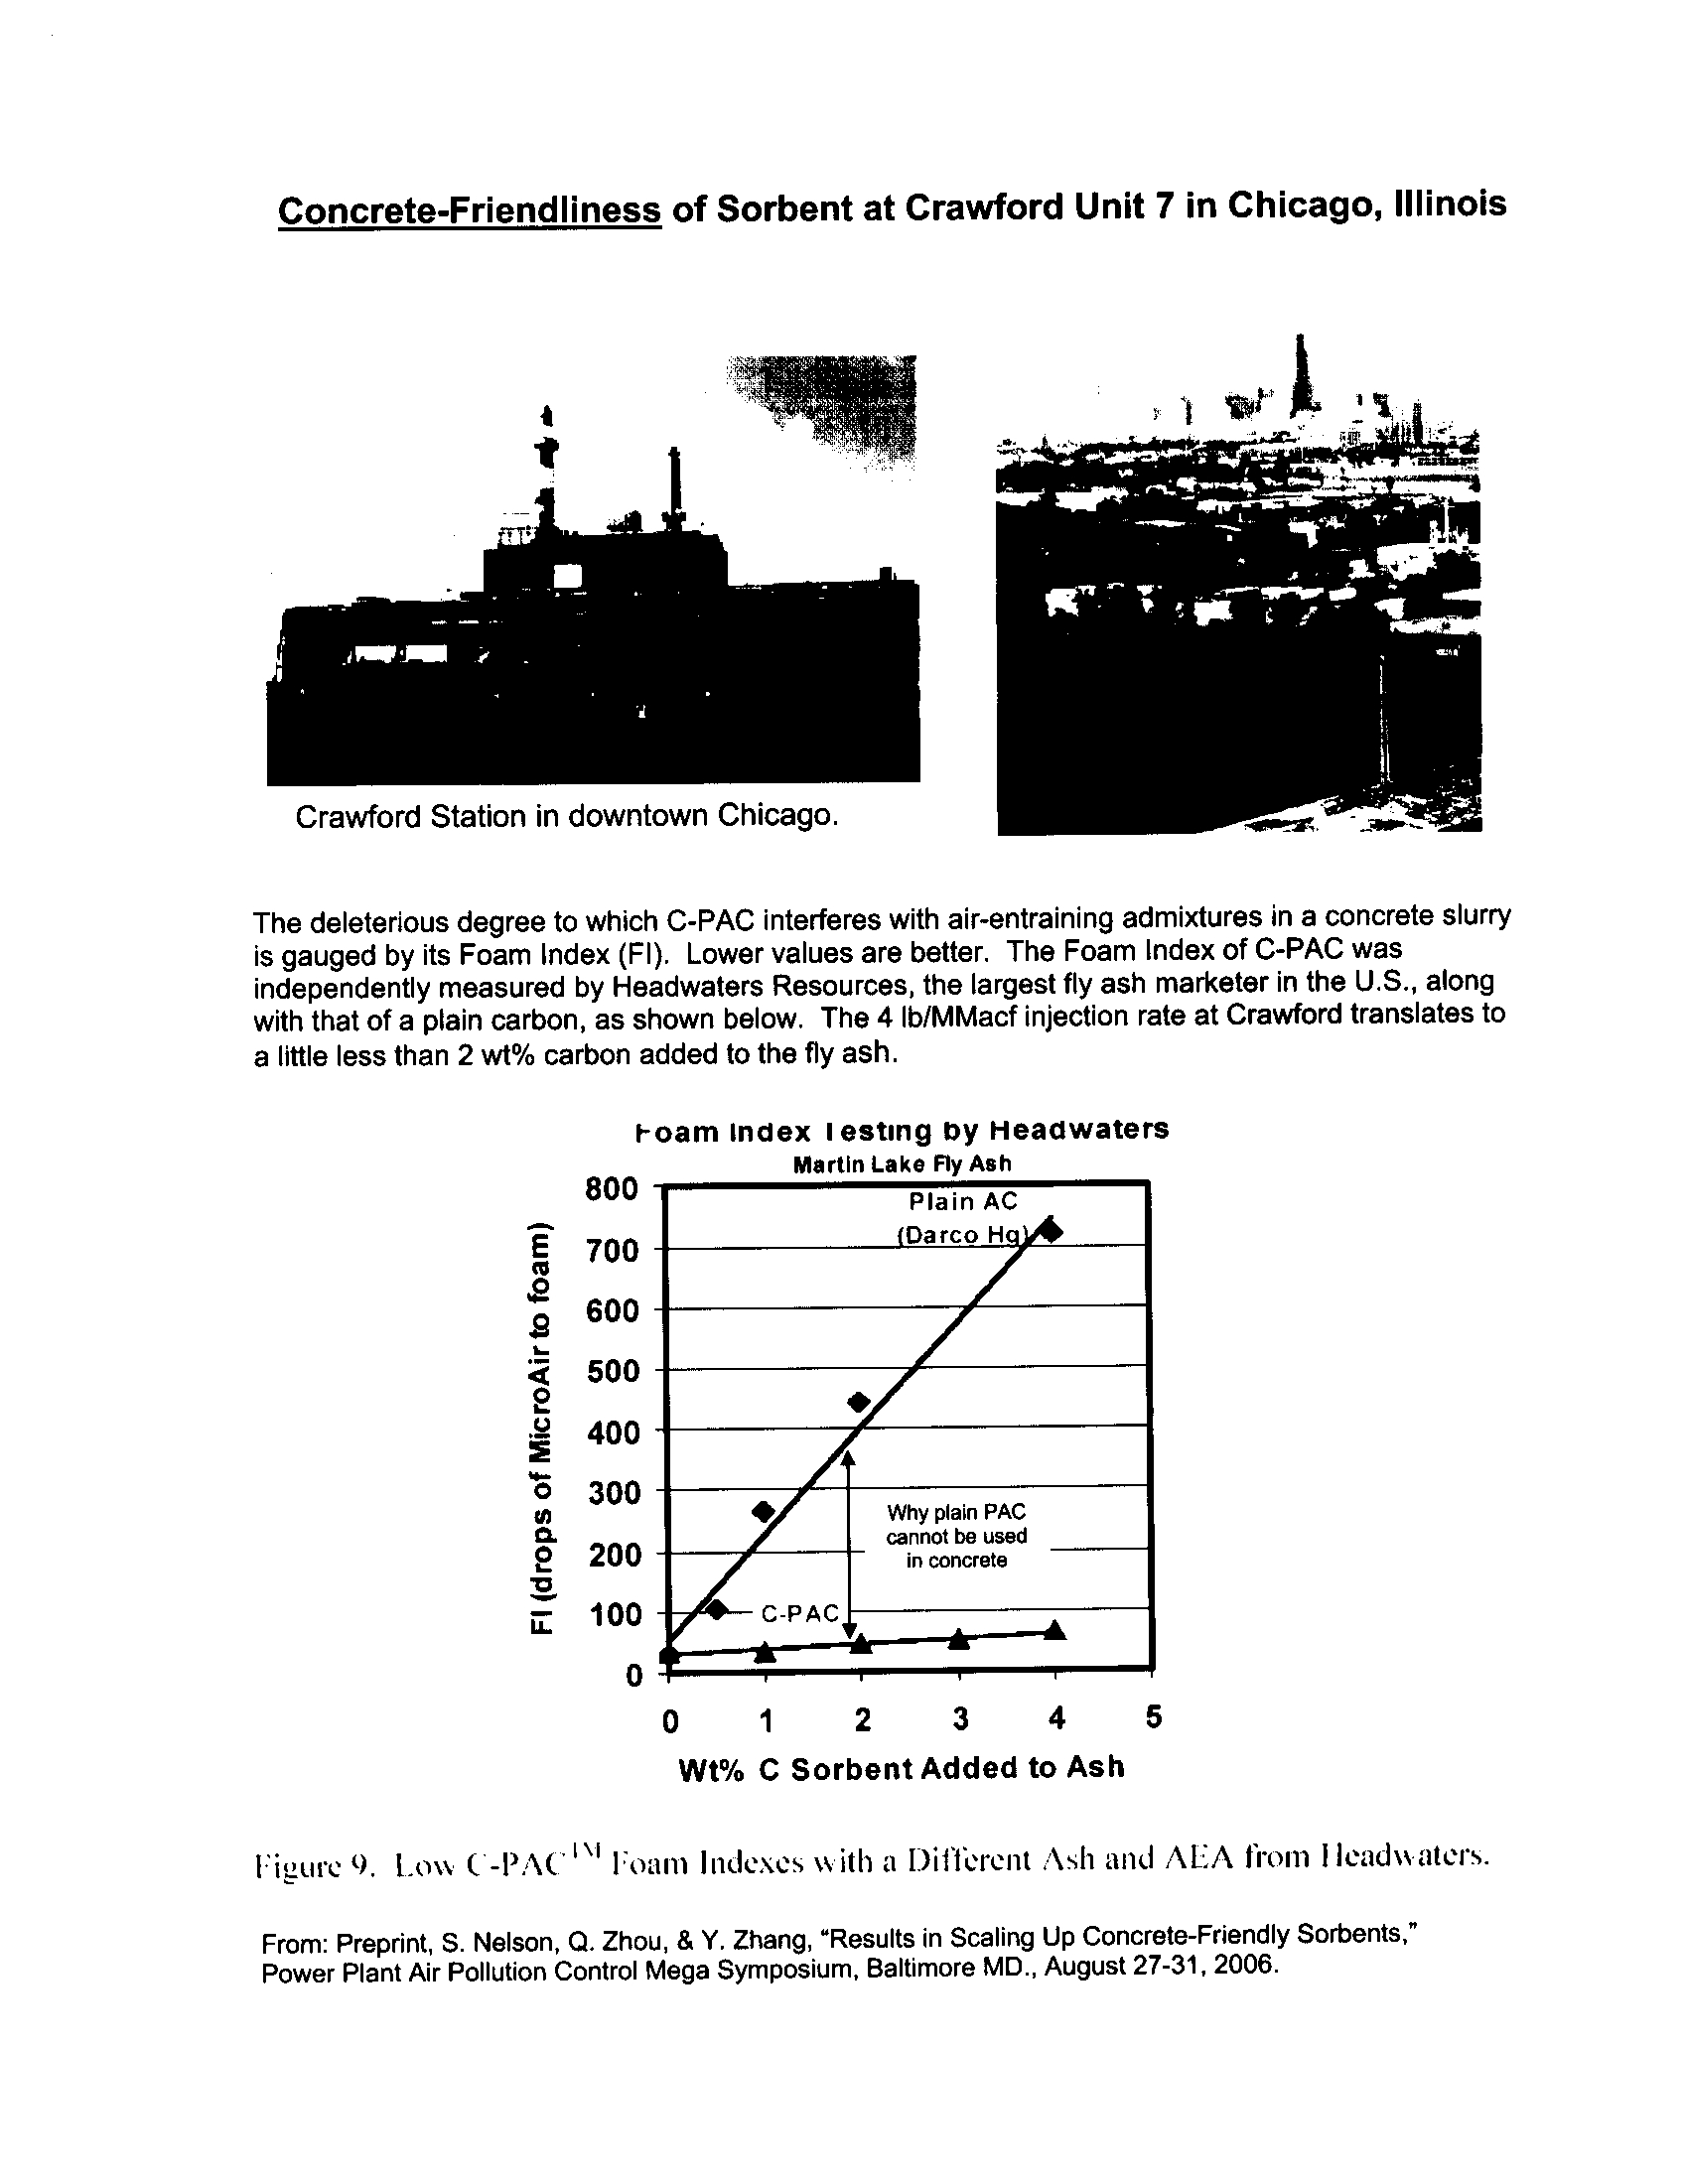
Concrete-Friendliness
of Sorbent at Crawford Unit 7 in Chicago, Illinois
Crawford Station in downtown Chicago
.
The deleterious degree to which C-PAC interferes with air-entraining admixtures in a concrete slurry
is gauged by its Foam Index (FI) .
Lower values are better
. The Foam Index of C-PAC was
independently measured by Headwaters Resources, the largest fly ash marketer in the
U .S
., along
with that of a plain carbon, as shown below
. The 4 lb/MMacf injection rate at Crawford translates to
a little less than 2 wt% carbon added to the fly ash
.
Foam Index i estmg by Headwaters
Martin Lake
Fly Ash
Why plain PAC
cannot be used
in concrete
0
1
2
3
4
5
Wt% C Sorbent Added to Ash
Figure 9 . Low C-PAC
I%I
Foam Indexes with a Different Ash and ALA from IIeadttaters
.
From
: Preprint, S . Nelson, Q. Zhou, & Y
. Zhang, "Results in Scaling Up Concrete-Friendly Sorbents,"
Power Plant Air Pollution Control Mega Symposium, Baltimore MD
., August 27-31, 2006.
800
E
700
600
4
0
500
V
400
0
.=C
a2
300200
U.
100
0