t -
BEFORE THE ILLINOIS POLLUTION CONTROL BOARD
IN THE MATTER OF :
)
PROPOSED AMENDMENTS TO
)
R 04-25
DISSOLVED OXYGEN STANDARD )
35111. Adm. Code 302.206
)
NOTICE OF FILING
TO: See Attached Service List
PLEASE TAKE NOTICE that I have today filed with the Office of the Clerk of the
Pollution Control Board the following documents :
WRITTEN TESTIMONY OF DR JAMES E. GARVEY
a copy of which is served upon you .
Dated: October 4, 2006
Roy M . Harsch
GARDNER CARTON & DOUGLAS LLP
191 Wacker Drive - Suite 3700
Chicago, Illinois 60606
(312) 569-1000
ENC
of Its
ASSOCIATIO 0 WASTEWATER
S,
r
THIS FILING PRINTED ON RECYCLED PAPER
CERTIFICATE OF SERVICE
The undersigned certifies that a copy of the foregoing :
WRITTEN TESTIMONY OF DR. JAMES E. GARVEY
was filed electronically with the Clerk of the Illinois Pollution Control Board and served upon
the parties to whom said Notice is directed by electro
'
Ily on Wednesday, October 04, 2006
.
41
Fred L. Hubbard
16 West Madison
P
.O. Box 12
Danville, IL 61834-0012
Bernard Sawyer
Metropolitan Water Reclamation District
6001 W
. Pershing Rd .
Cicero, IL 60650-4112
Claire A. Manning
Posegate & Denes, P.C.
I i I N. Sixth Street
Springfield, IL 62705
Deborah J . Williams
Stefanie N . Diers, Assistant Counsel
Illinois EPA
1021 North Grand Avenue
P.O. Box 19276
Springfield, IL 62794-9276
Dorothy M. Gunn
Illinois Pollution Control Board
100 W. Randolph Street - Suite 11-500
Chicago, IL 60601
Frederick D . Keady
Vermilion Coal
1979 Johns Drive
Glenview, IL 60025
James T. Harrington
Ross & Hardies
150 North Michigan Avenue - Suite 2500
Chicago, IL 60601-7567
John Donahue
City of Geneva
22 South First Street
Geneva, IL 60134-2203
Service List
R2004-025
Alex Messina
Illinois Environmental Regulatory Group
3150 Roland Avenue
Springfield, IL 62703
Charles W
. Wesselhoft
Ross & Hardies
150 North Michigan Avenue - Suite 2500
Chicago, IL 60601-7567
Connie L. Tonsor
Illinois EPA
1021 North Grand Avenue
P
.O
. Box 19276
Springfield, IL 62794-9276
Dennis L Duffield
City of Joliet
Department of Public Works and Utilities
921 E. Washington Street
Joliet, IL 60431
Erika K
. Powers
Barnes & Thornburg
I N. Wacker - Suite 4400
Chicago, IL 60606
James L
. Daugherty
Thom Creek Basin Sanitary District
700 West End Avenue
Chicago Heights, IL 60411
Joel J. Sternstein
Office of the Attorney General
188 West Randolph Street - 20th Floor
Chicago, IL 60601
Stanley Yonkauski
Illinois Department of Natural Resources
One Natural Resources Way
Springfield, IL 62702-1271
Katherine D . Hodge
Hodge Dwyer Zeman
3150 Roland Avenue
P.O. Box 5776
Springfield, IL 62705-5776
Lisa Frede
Chemical Industry Council of Illinois
2250 E. Devon Avenue - Suite 239
Des Plaines, IL 60018-4509
Matthew J. Dunn
Office of the Attorney General
188 West Randolph - 20a' Floor
Chicago, IL 60601
Mike Callahan
Bloomington Normal Water Reclamation Dist.
PO Box 3307
Bloomington, IL 61702-3307
Richard McGill
Illinois Pollution Control Board
100 W. Randolph Street
-
Suite 11-500
Chicago, IL 60601
Stephanie N . Diers
IEPA
1021 North Grand Avenue East
P.O. Box 19276
Springfield, IL 62794-9276
Susan M . Franzetti
10 South LaSalle Street
- Suite 3600
Chicago, IL 60603
V icky McKinley
Evanston Environment Board
233 Grey Avenue
Evanston, IL 60202
Edward Hammer
Larry Cox
Downers Grove Sanitary District
2710 Curtiss Street
Downers Grove, IL 60515
Margaret P
. Howard
2601 South Fifth Street
Springfield, IL 62703
Michael G. Rosenberg, Esq .
Metropolitan Water Reclamation District
100 East Erie Street
Chicago, IL 60611
Richard Lanyon
Metropolitan Water Reclamation District
100 East Erie Street
Chicago, IL 60611
Sanjay K . Sofat
Illinois EPA
1021 North Grand Avenue East
P.O. Box 19276
Springfield, IL 62794-9276
Sue Schultz
Illinois American Water Company
300 North Water Works Drive
P.O. Box 24040
Belleville, IL 62223-9040
Tom Muth
Fox Metro Water Reclamation District
682 State Route 31
Oswego, IL 60543
W
.C
. Blanton
Blackwell Sanders Peper Martin LLP
2300 Main Street -
Suite 1000
Kansas City, MO 64108
Albert Ettinger
U.S. Environmental Protection Agency
WQ-16J
77 West Jackson Boulevard
Chicago, IL 60604
Todd Main
Director of Policy and Planning
Friends of the Chicago River
407 S. Dearborn - Suite 1580
Chicago, IL 60605
N
. LaDonner Driver
Illinois Environmental Regulatory Group
3150 Roland Avenue
Springfield, IL 62703
Marc Miller, Senior Policy Advisor
Michael J. Fischer, Policy Advisor
Office of Lt . Governor Pat Quinn
Room 214 State House
Springfield, IL 62706
CHOU 12490125 .1
Senior Staff Attorney
Environmental & Law Policy Center
35 E. Wacker-Suite 1300
Chicago, IL 60601
Irwin Polls
Ecological Monitoring and Assessment
3206 Maple Leaf Drive
Glenview, IL 60025
Tracy Elzemeyer
General Counsel
American Water Company
727 Craig Road
St. Louis, MO 63141
Dr. Thomas J . Murphy
2325 N. Clifton Street
Chicago, IL 60614
BEFORE THE ILLINOIS POLLUTION CONTROL BOARD
IN THE MATTER OF :
)
PROPOSED AMENDMENTS TO
)
R 04-25
DISSOLVED OXYGEN STANDARD
)
35 111. Adm. Code 302.206
)
Written Testimony of James E
. Garvey
I thank the Illinois Pollution Control Board (Board) for allowing me to present my
testimony. My name is Dr. James E
. Garvey, Associate Professor of Zoology and
Associate Director of the Fisheries and Illinois Aquaculture Center at Southern Illinois
University Carbondale (SIUC)
. I also hold several other appointments such as Chair of
the American Fisheries Society (AFS) Farm Bill Advisory Task Force, Executive Officer
of the Illinois Chapter of the AFS, Member of the US Army Corps of Engineers
Environmental Management Program - Project Sequencing Team, and North Central
Representative of the Early Life History Section of the AFS . As you know, I am an
aquatic ecologist with an active research program that revolves around environmental and
human-induced factors influencing the abundance and distribution of fishes in lakes and
rivers. I have published well over forty publications that are widely cited in the discipline
of fisheries, aquatic ecology, and general ecology .
I also have an active graduate training
program . My graduate students often join natural resource agencies such as the Illinois
EPA, the US Fish and Wildlife Service, and the Missouri Department of Conservation .
My participation in this process began over two years ago when the Illinois
Association of Wastewater Agencies (IAWA) asked Dr. Matt Whiles and me to evaluate
the current dissolved oxygen standard in Illinois . After an extensive literature review,
we
generated a report that stated that the current standard is too simplistic for the diverse
I
waters of Illinois . We supported many of the recommendations that were developed in
the US EPA National Criteria Document (NCD) for dissolved oxygen .
Review
Over the course of two years, much data collection, literature review, and
discourse among stakeholders have occurred
. I have attended all the stakeholder
meetings and hearings before the Board
; I have had the opportunity to review all the
technical information and data presented in this rulemaking process thanks to the
cooperation of the stakeholders . The end result of this process is that the
recommendations that Dr . Whiles and I set forth largely have been supported
. I have
appeared before the Board on several occasions to present my findings . Recall, we
recommended that a two-season standard be adopted throughout the state.
During March
through June, when the majority of early life stages of many fishes and other aquatic
organisms are produced, we recommended a standard dissolved oxygen concentration be
met that provides sufficient oxygen to support the metabolic needs of eggs and larvae .
During this time of year, streams are typically flowing, primary productivity is
accelerating but not peaking, and temperatures are cool to moderate . Thus, high
dissolved oxygen concentrations are expected to be available to young aquatic organisms ;
this expectation has been well supported by my findings described in previous testimony
.
The literature and growing state-wide oxygen data set demonstrate that, for warm-water,
low gradient systems common in Illinois, concentrations should not decline below 5
mg/L and weekly averages should not decline below 6 mg/L . We also suggested a 30-
day running average of 5.5mg/L, which has little biological support in my view, but is
recommended in the NCD.
2
As temperatures increase during summer, increased biological activity and
water's reduced oxygen capacity should reduce dissolved oxygen concentrations,
particularly during night. Evidence is mounting that the majority of reproduction of
aquatic organisms in Illinois either occurs before July 1 (see Csoboth 2006 thesis, SIUC
;
Exhibit 1) or late-spawning organisms have early life stages that are tolerant to low
dissolved oxygen concentrations (e.g.,
freshwater mussels) . Thus, we recommended that
during July through February, Illinois adopt a daily acute minimum of 3
.5 mg/L and a
seven-day average of daily minima of 4 mg/L . In previous testimony before the Board, I
have demonstrated that streams that meet these dissolved oxygen conditions appear to
contain diverse, robust biological assemblages . Those that do not are typically impaired
.
During the past year, the Illinois Department of Natural Resources (IDNR) and
the Illinois Environmental Protection Agency (IEPA) have proposed an alternative, two-
tier oxygen standard for the state and have expended much energy to develop it .
The
"general use" tier is very similar to the IAWA state-wide recommendation with slightly
higher concentrations . Also, the criteria for early life stages are extended through July .
In addition, the agencies recommended an "enhanced oxygen" tier for streams that
contain fishes and invertebrates that were found by Ohio Environmental Protection
Agency to occur in Ohio waters with high average oxygen concentrations
. My concern
about this approach is that the selection of streams based solely on associations between
aquatic organisms and average oxygen concentrations ignores other potential causal
factors such as habitat quality, gradient, and temperature .
Thus, coining these organisms
as "oxygen sensitive" and then using them to select enhanced tier waters may by
completely spurious
. Only through experiments that establish causality between oxygen
3
tolerance and fish life processes can tolerance be assessed . Again, these issues have been
addressed in previous testimony when I described the research by Smale and Rabeni
published in the Transactions ofthe American Fisheries Society .
Recall, these
investigators used a combination of lab assays and surveys to develop an index of oxygen
sensitivity in Missouri streams .
Overview of Testimony
I present results that continue to support the recommendations in the Garvey and Whiles
report . First, I review the results of recent peer-reviewed papers that show that dissolved
oxygen concentrations in Illinois streams are difficult to predict and largely influenced by
characteristics of stream habitat and morphology. I then explore the implications of the
two-tier oxygen standard for Illinois using data that were collected both by the IDNR and
JEPA as well as data that were collected by IAWA members. In my view, the most
compelling results derive from stream segments slated for enhanced dissolved oxygen
protection by the proposed IDNR/IEPA two-tier approach . As I analyzed these data, it
became apparent that many of these segments likely violate both the IDNR/IEPA and
perhaps the IAWA proposed standards, even though "enhanced oxygen" taxa are present
in the streams
. Further, daily discharge (i
.e., volume of water moving per second through
the stream) explained as much as 50% of the variation in daily median and minimum
dissolved oxygen concentrations in several of these systems . Thus, the physical
characteristics of streams interacting with flow largely drove much of the oxygen
dynamics. In my view, this further complicates any attempts to fit a single standard to
any stream in the State and renews the urgent need to develop tiered, habitat-based
criteria that incorporate how discharge affects aquatic communities and water quality .
4
Literature Review
Several papers that were generated by Dr
. Mark David and colleagues at the
University of Illinois Urbana-Champaign through support by the C-FAR program
recently have been published (Exhibit 2)
. Although the general expectation was for
dissolved oxygen dynamics in their research streams in Illinois to be affected by nutrient
loading, they found that stream physical characteristics, primarily basin shape and its
propensity to hold organic matter and intercept light, were more important in influencing
oxygen concentrations
. As I have argued throughout this process and in the original
IAWA-sponsored report, these results indicate that stream physical characteristics
trump
water quality and need to be the primary focus of standard development
.
Analysis of Historical Grab Data and 2004-2005 Continuous Data
Illinois DNR/EPA provided me with "grab" dissolved oxygen data collected
during 1994 through 2003 in streams that have fully met their aquatic use designation
. In
addition, they provided data from 2004 and 2005 collected with semi-continuous data
logging probes in streams that have been tapped for inclusion in the "enhanced oxygen"
tier. I sent the results I present below to Mr
. Matt Short and Mr
. Joel Cross for their
review
. As of the date I am drafting this testimony, they have not responded
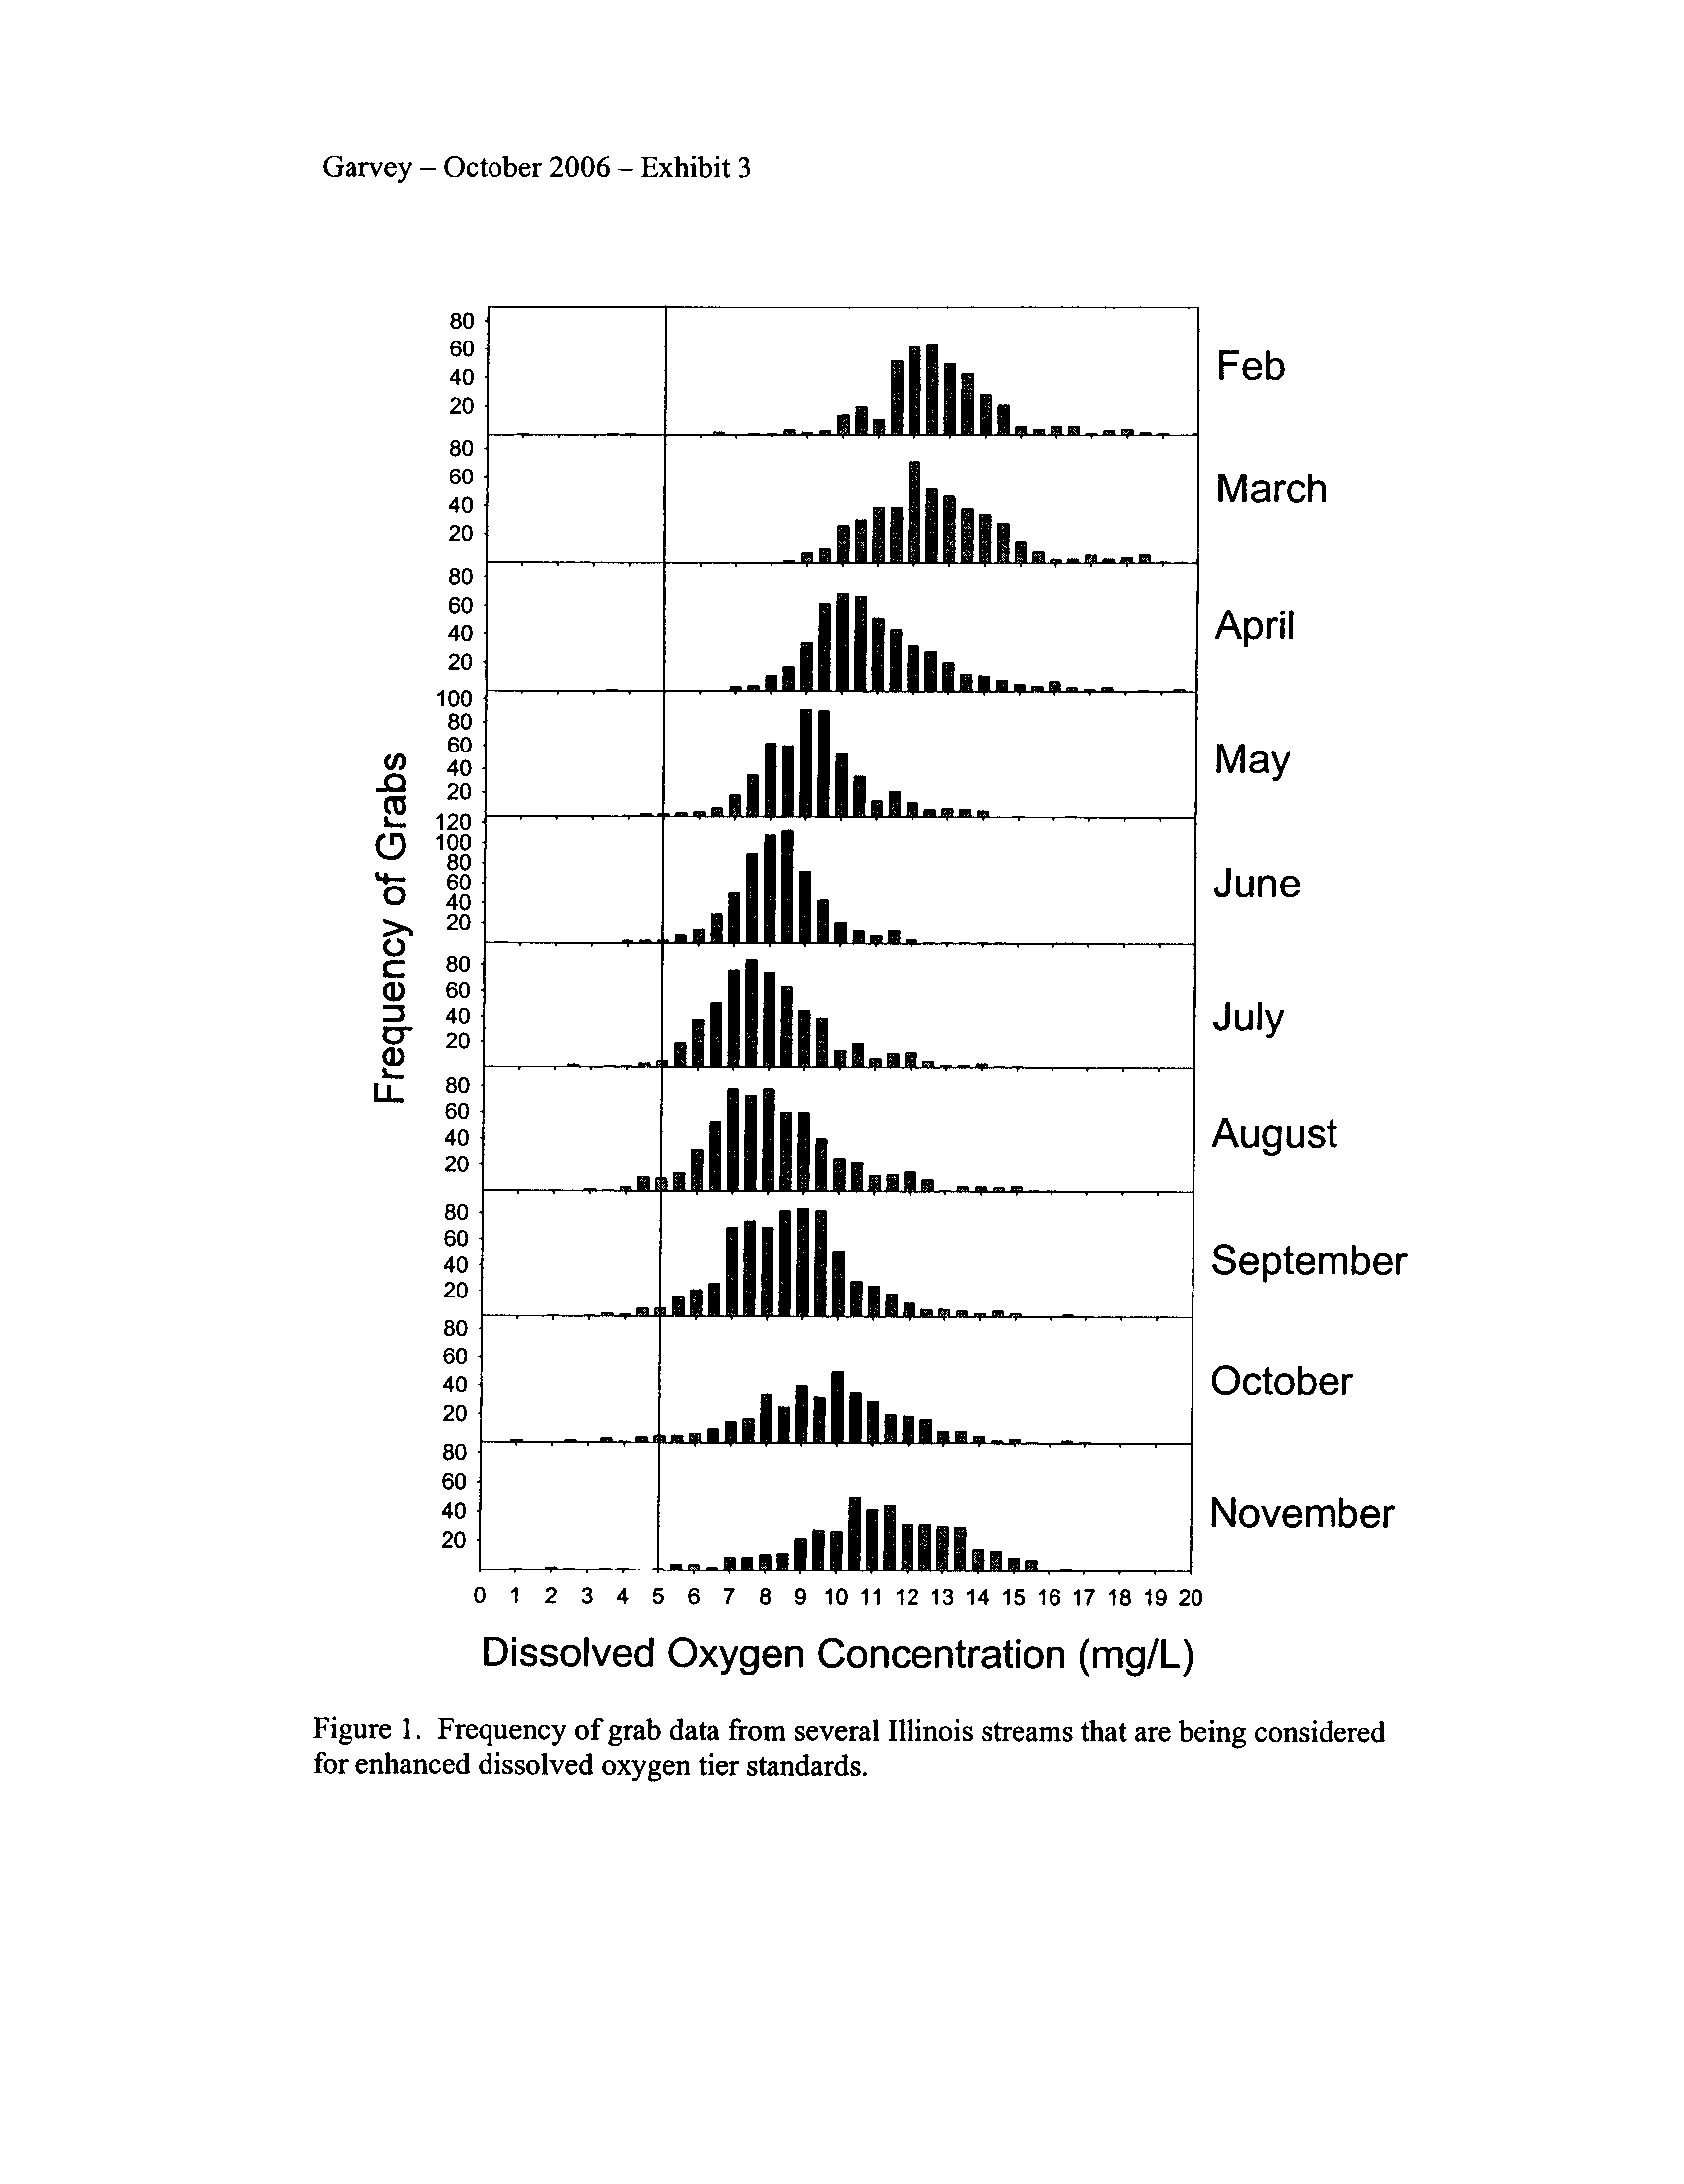
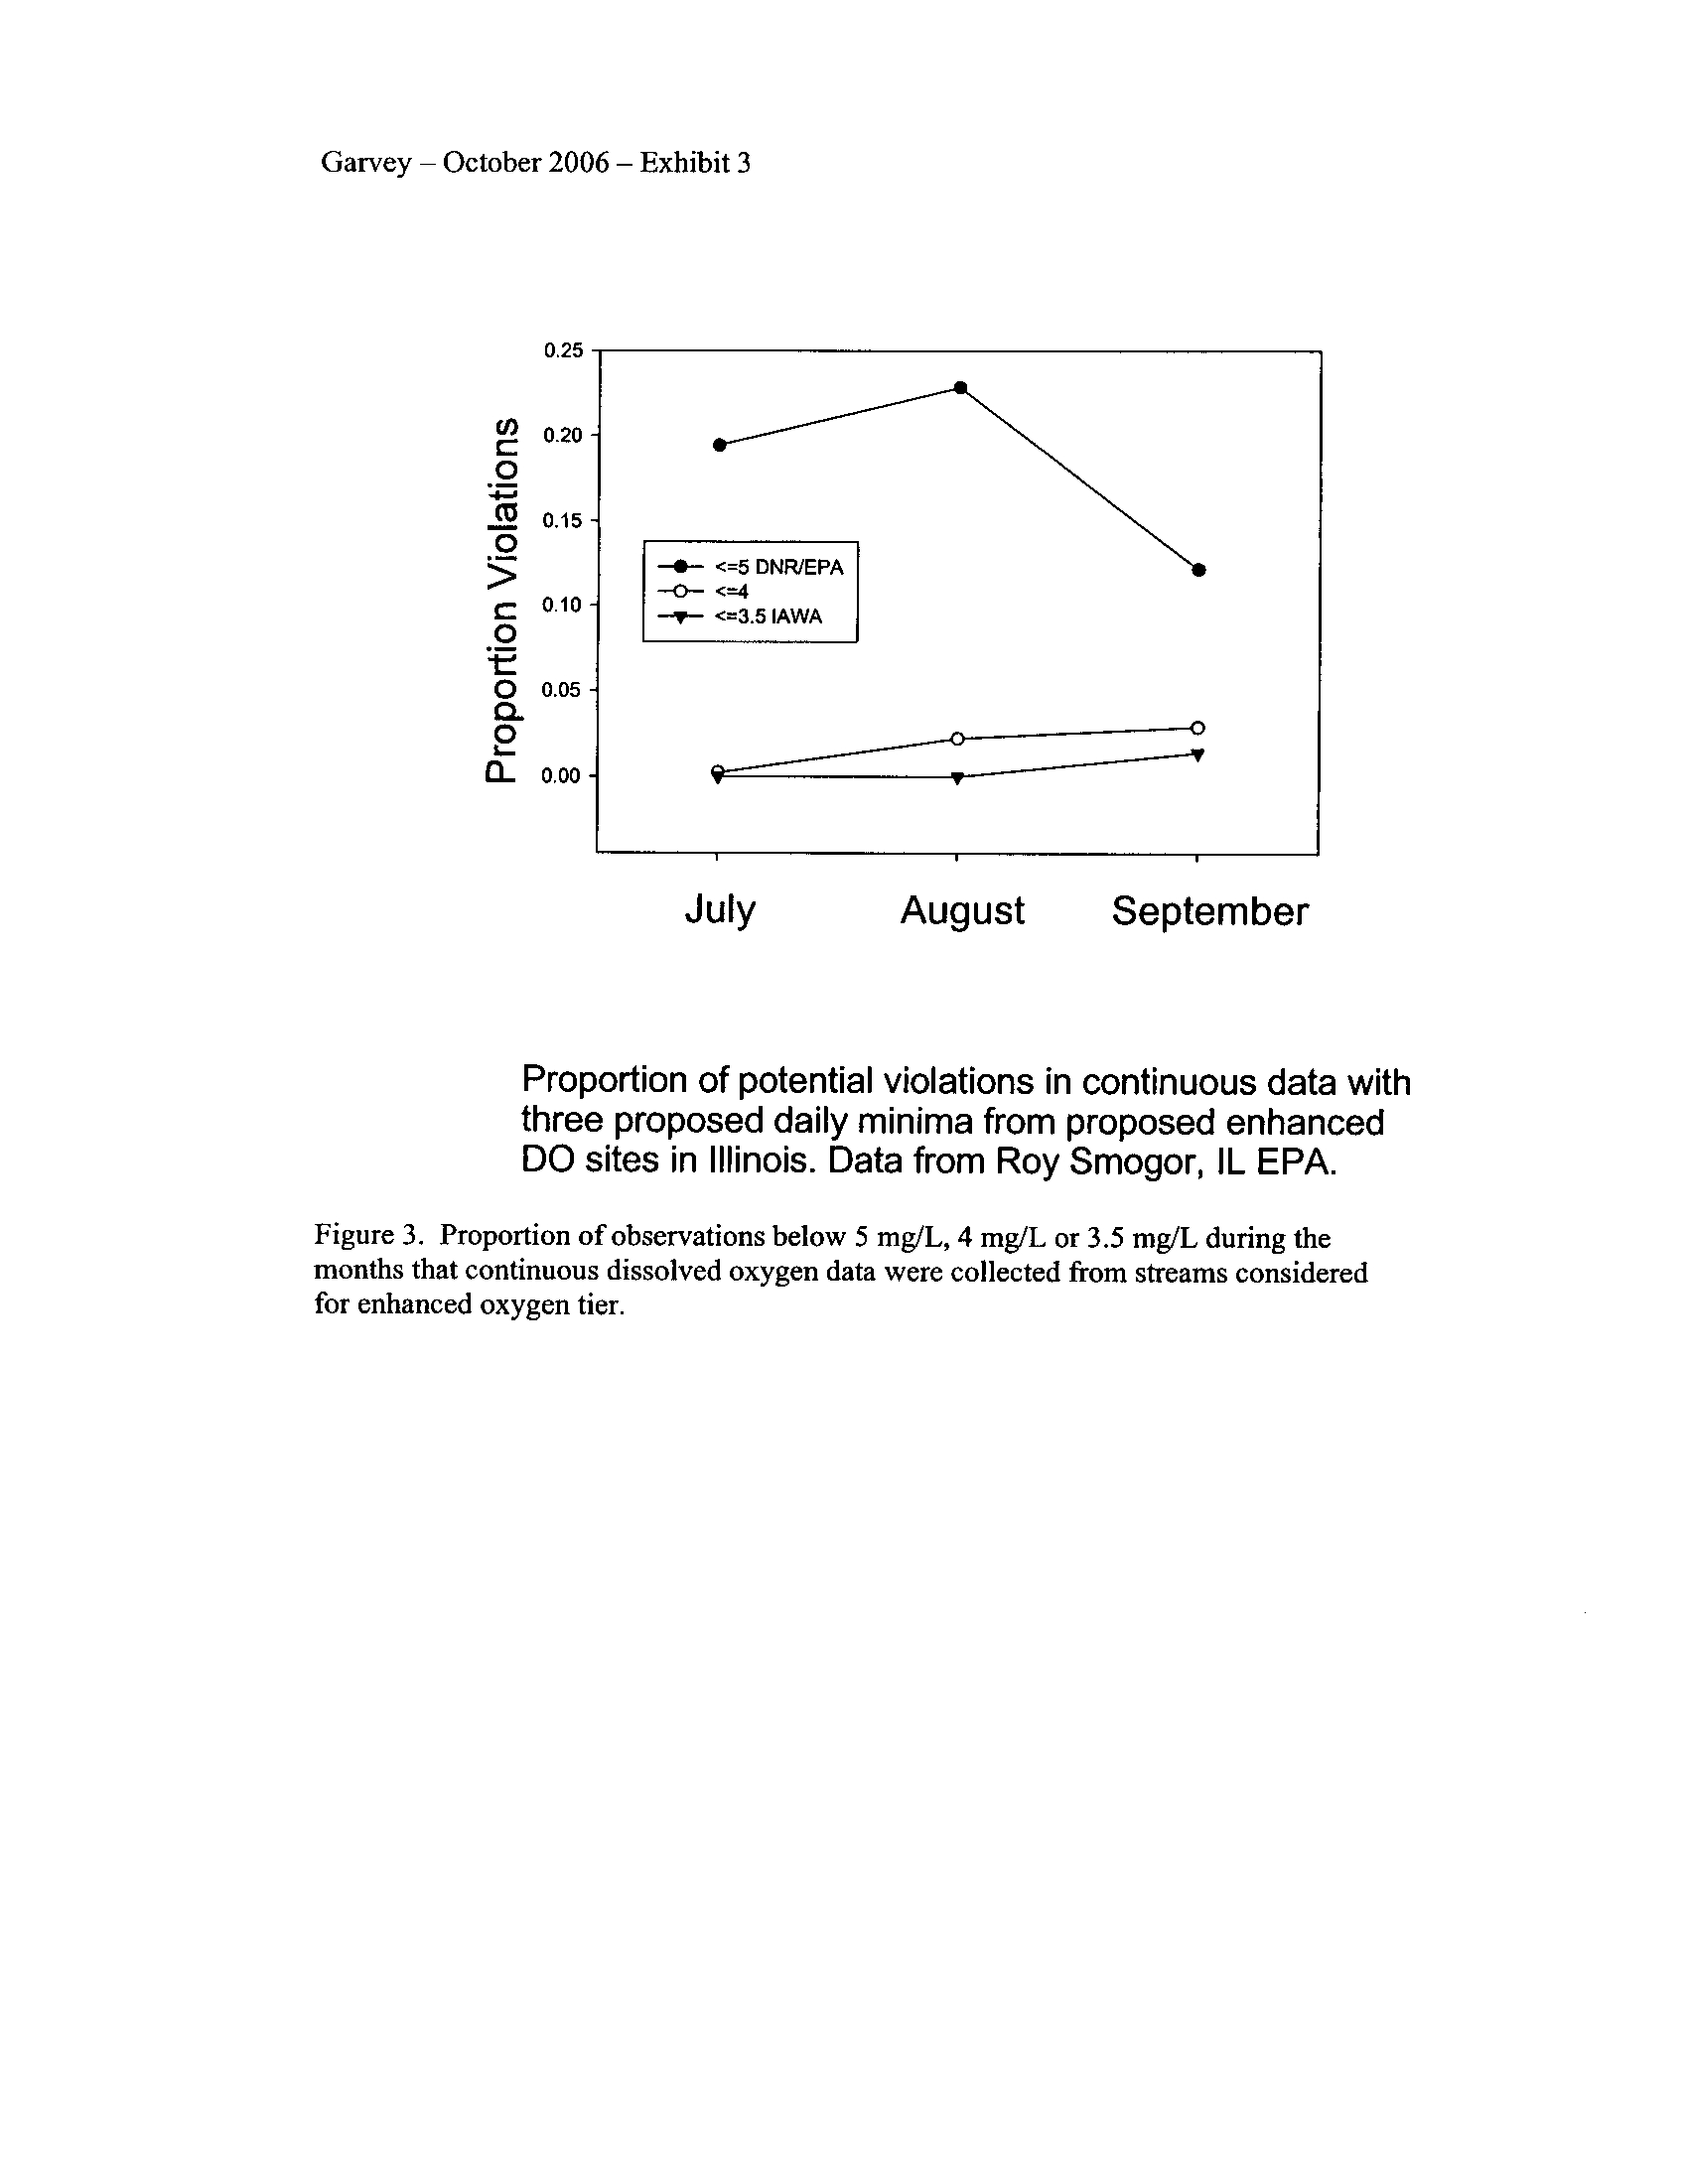
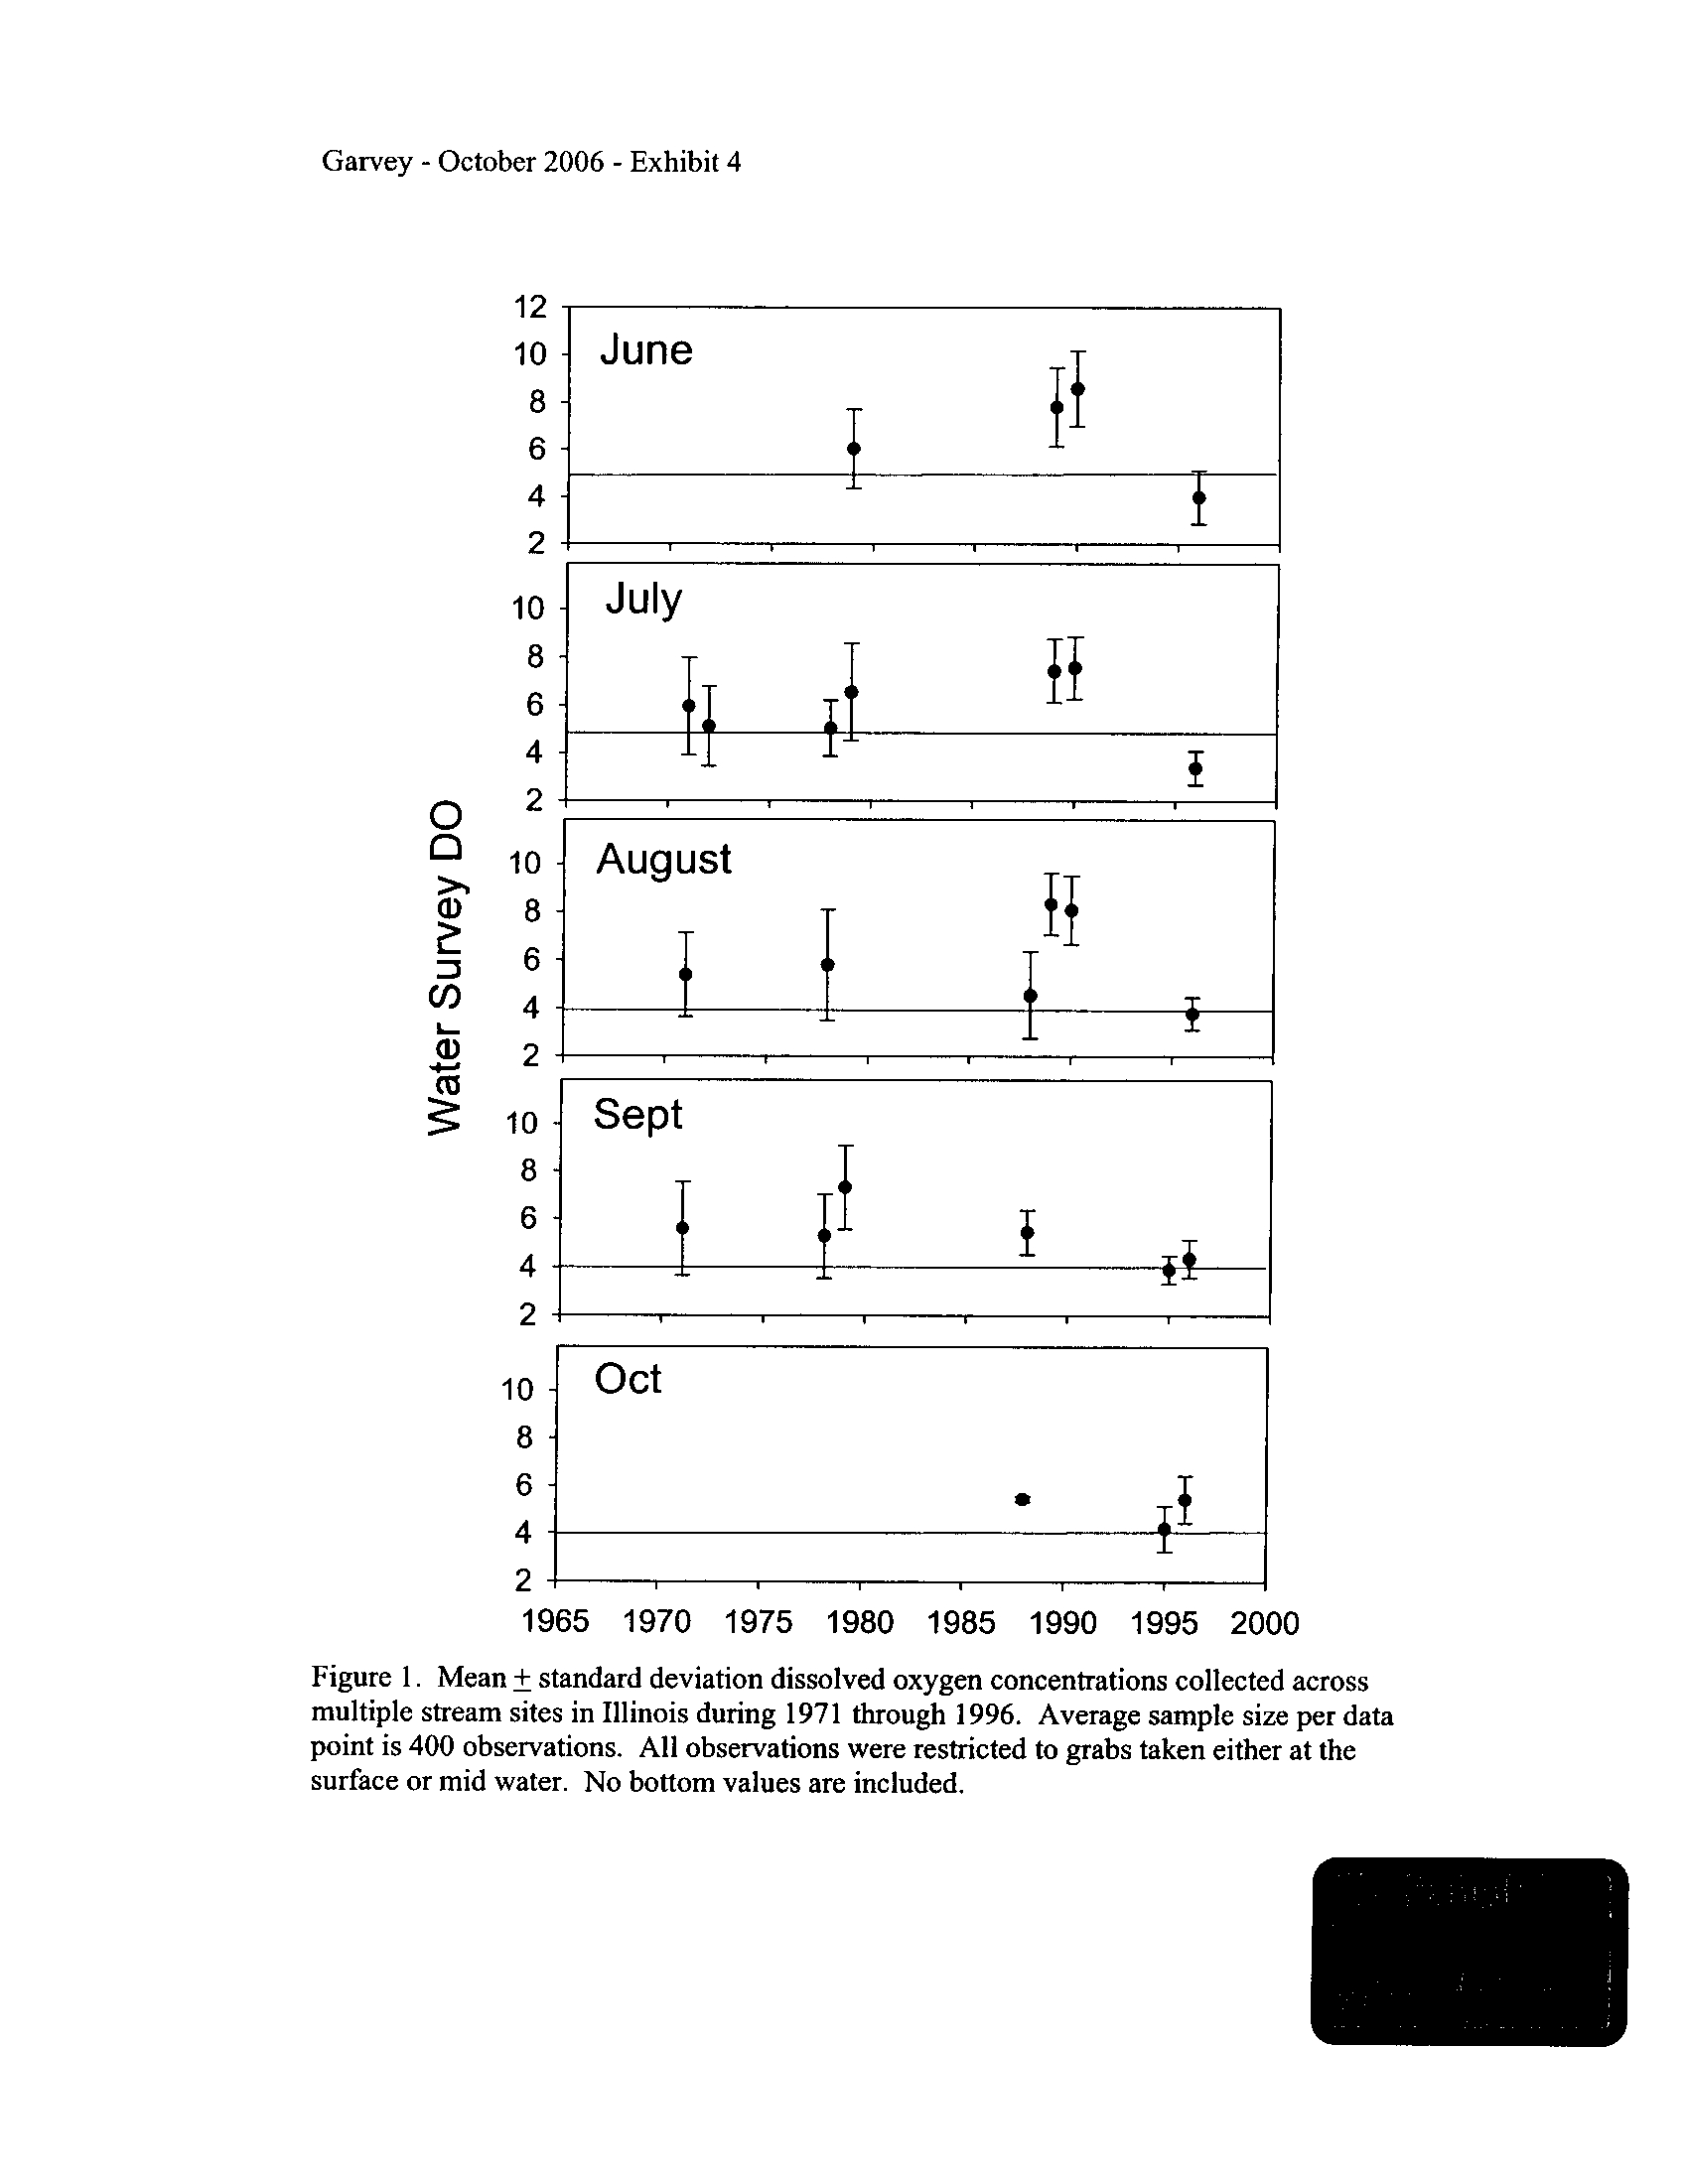
. The grab
data demonstrate that median dissolved oxygen concentration declines during June
through August relative to other months (Exhibit 3)
. Concentrations did decline below a
benchmark of 5 mg/L during the summer months, although rarely
. Given that these grabs
were typically taken during the day, it is not surprising that relatively low dissolved
oxygen concentrations were not frequently encountered.
5
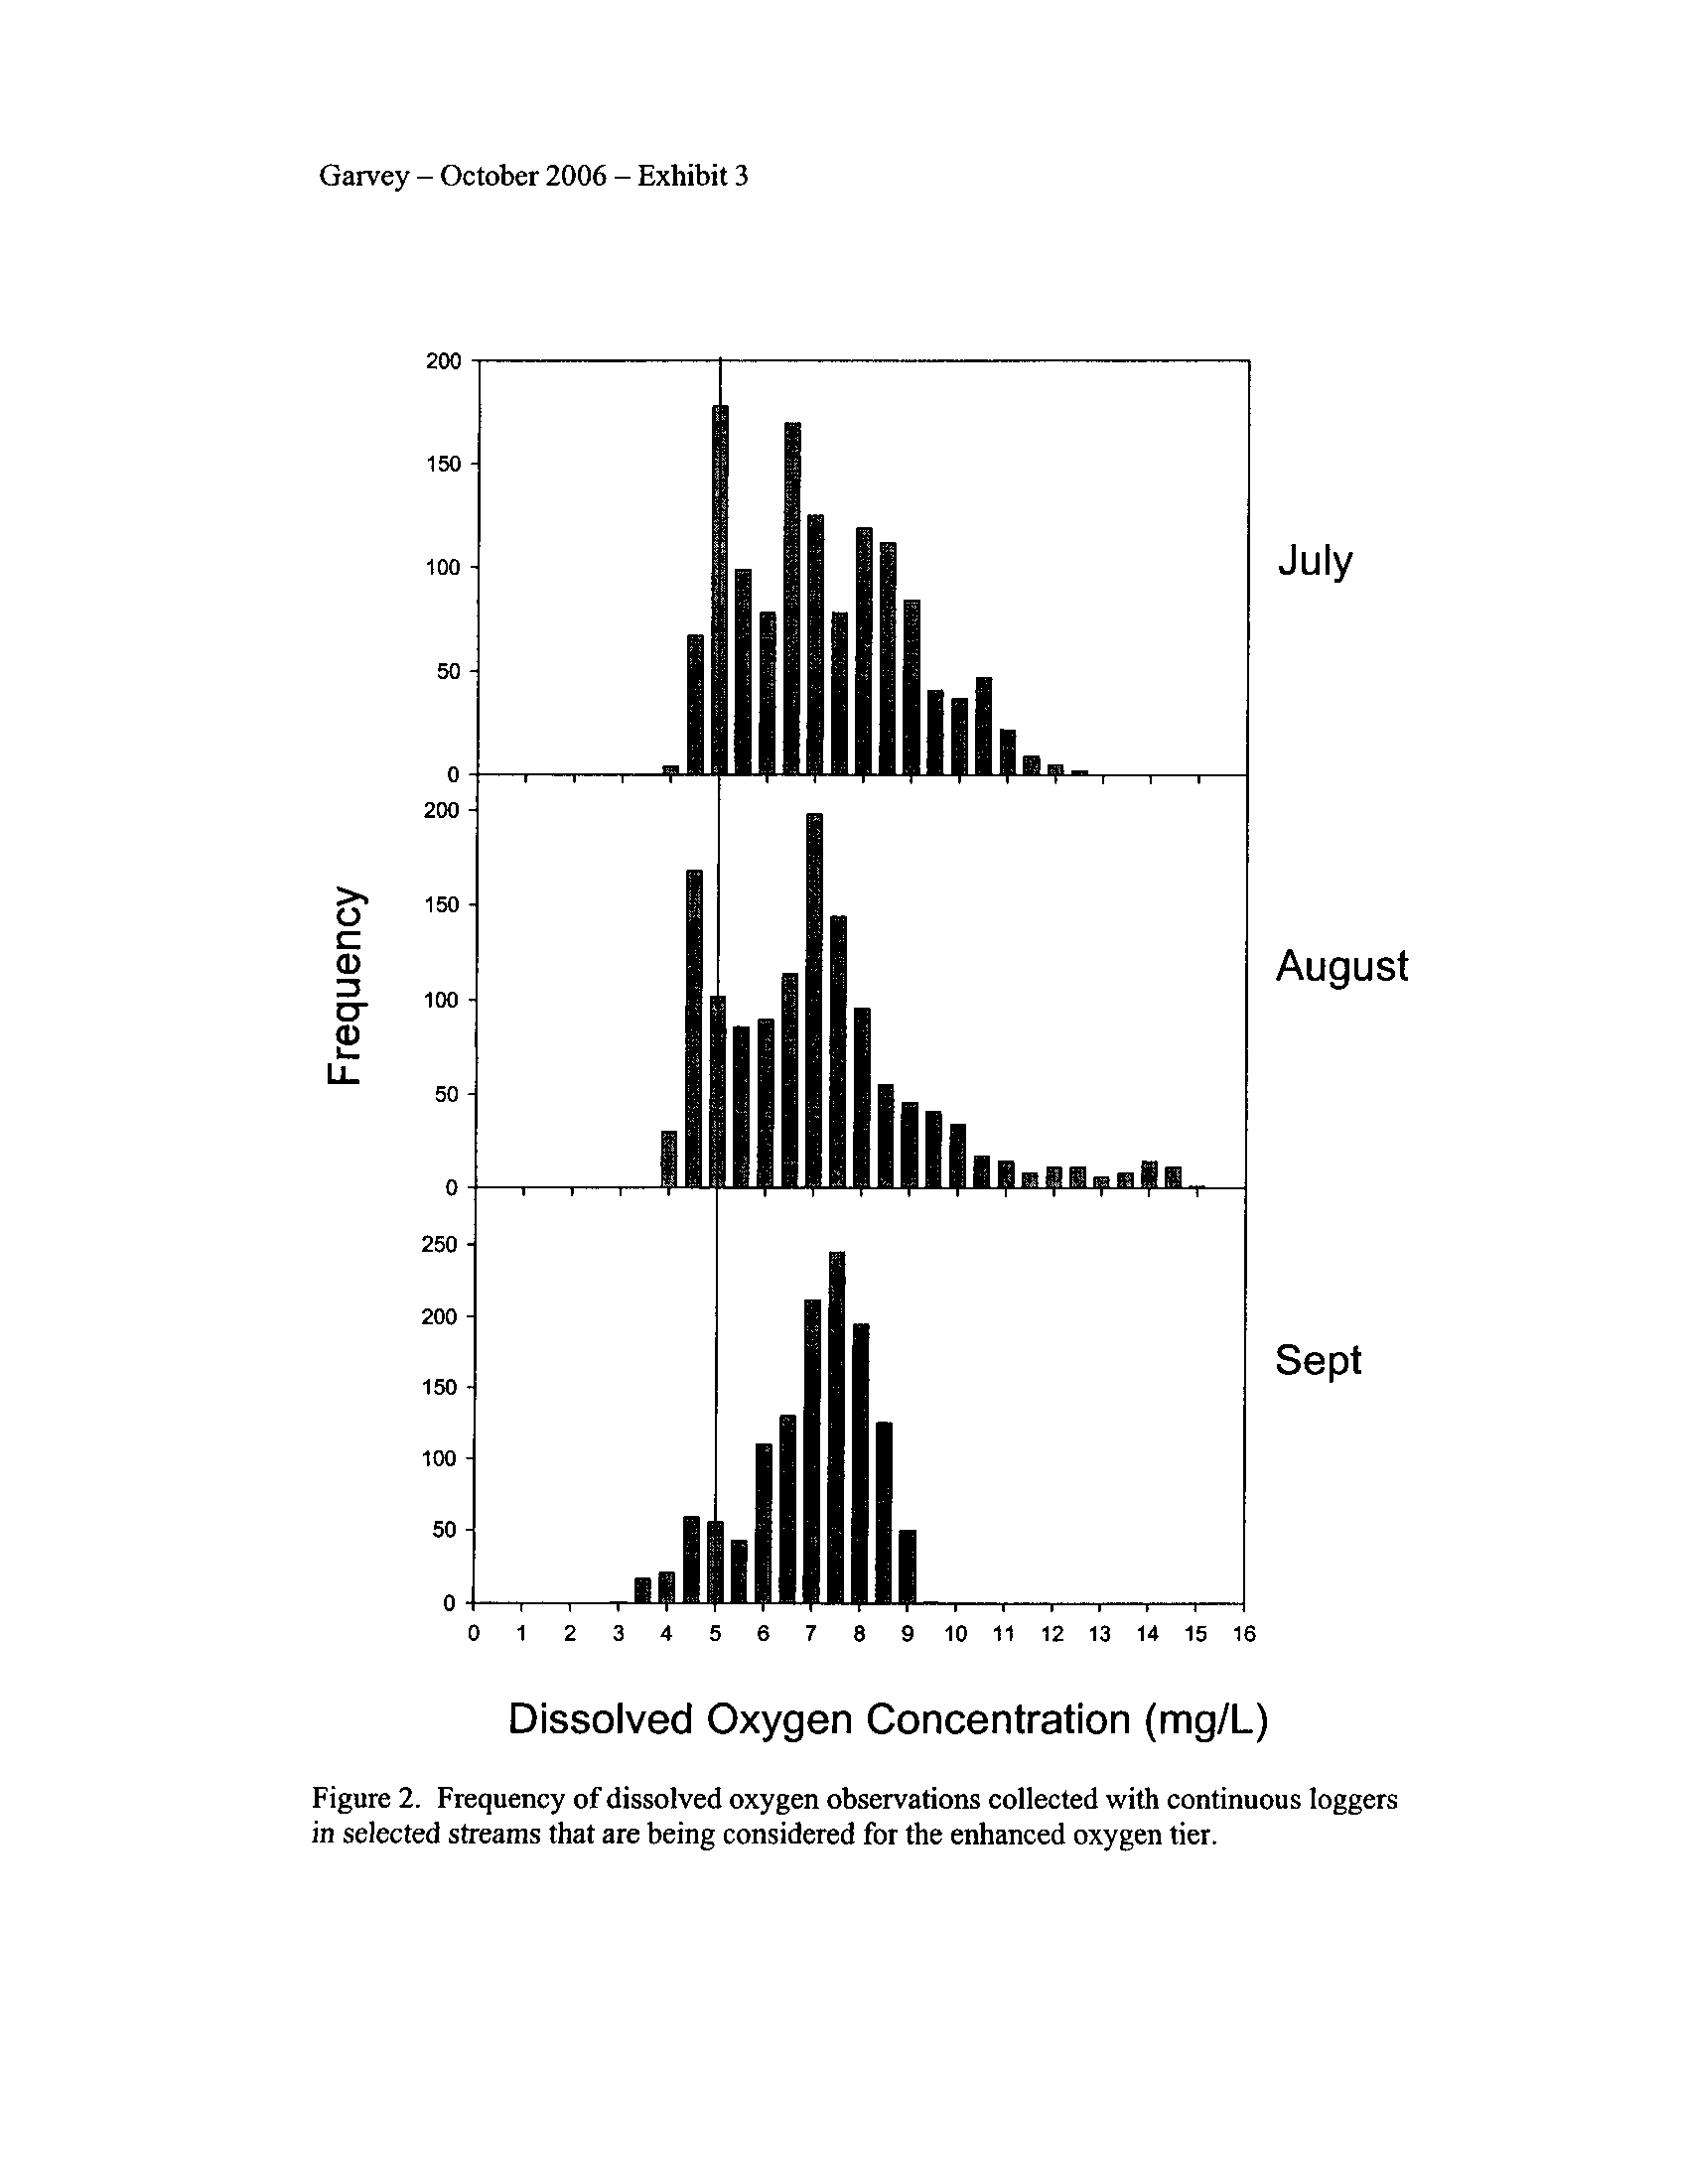
The continuous data demonstrated that dissolved oxygen in "enhanced" segments
more frequently declined below 5 mg/L and even occasionally below 3
.5 mg/L (Exhibit
3). These low concentrations which often exceeded both the IAWA and DNR/EPA
proposed standards typically occurred during the night through dawn
. Interestingly, these
enhanced-tier segments more frequently (up to 20% of observations) exceeded the
DNR/EPA minimum of 5 mg/L during July than the IAWA proposed standard of 3 .5
mg/L during that month (Exhibit 3)
. The streams that contained "oxygen sensitive"
species failed to meet the standard set for them by the IDNR/EPA proposal .
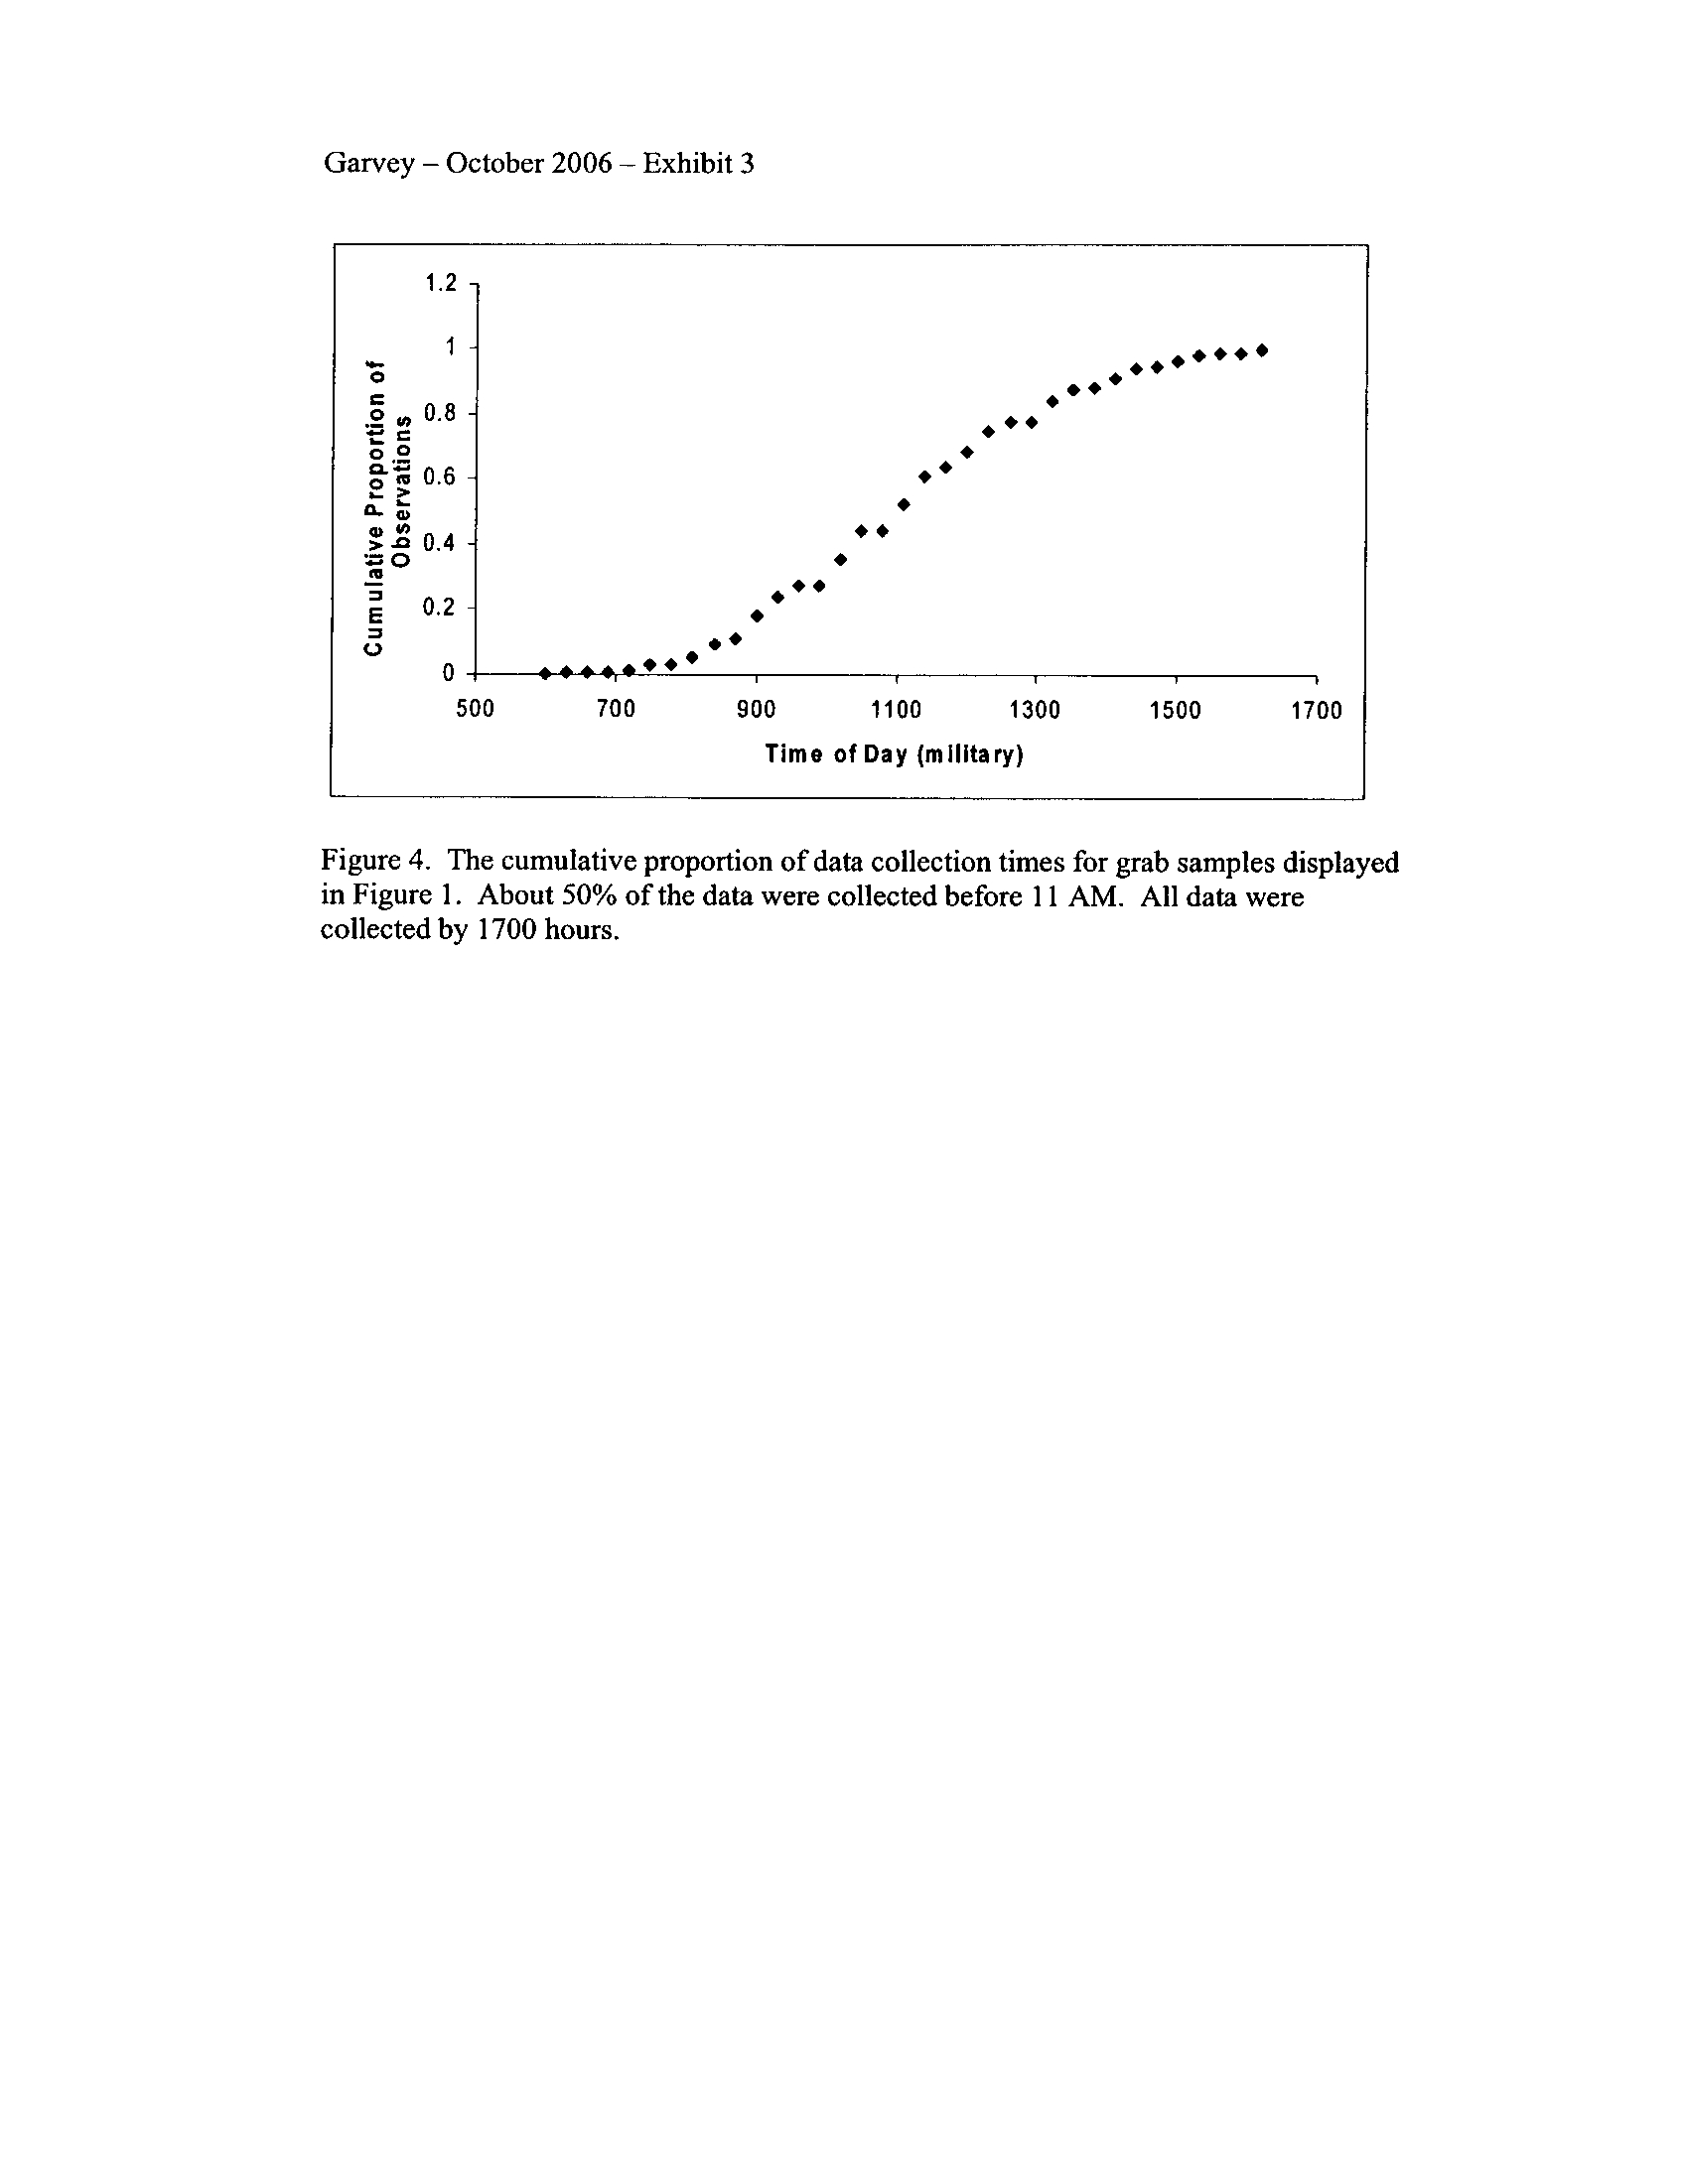
On 24 April 2006, Mr
. Toby Frevert sent a letter to Mr. Dennis Streicher
including several disclaimers about the above data set .
He indicated that the grab data
were a worst case scenario, including only data collected in the early morning hours. On
the contrary, the data set I received from the agencies and recently sent back to them for
confirmation included grab data that were collected during morning through afternoon
(median collection time was 1100 hours, with times as late as 1700 ; Exhibit 3) . Thus, it
appears to me that the data represent the range of daily conditions that affect oxygen
concentrations. Time of day was positively related to DO concentration in this data set,
but explained less than 1 % of the variation . Although the continuous data show that the
enhanced streams cannot meet the IDNR/IEPA expected standard, Mr
. Frevert noted that
these data included results from 2005 when a drought gripped much of the state
. Because
these results were collected under extreme conditions, he argued they should be
discounted. I respectfully disagree
.
Few laws exist in the tangled and complex discipline of ecology. However, one
of the most commonly agreed tenets in our discipline is Liebig's Law of the Minimum,
6
taught in every general ecology course, including my own at SIUC
. Liebig aptly noted
that the distribution of all living organisms will not be dictated by the average conditions,
but rather the availability of the most limiting condi ion . This condition does not always
have to be limiting, but only when organisms are ex eriencing some critical period such
as reproduction or growth
. The condition could be an occasionally limited nutrient, or in
our case, oxygen. In other words, the occasional "worst case" scenario which limits the
oxygen available to the local fauna will determine the species composition and
abundance present at all times . Only by identifying the limiting conditions, in other
words the acute minimum oxygen concentration, can we determine what should be
present through time. The extreme drought conditions in the enhanced streams likely
provided the worst case scenario and thereby insight into what the acute minimum should
be to support a diverse aquatic assemblage . The proposed minimum standard of 3 .5
mg/L was rarely exceeded in these streams (Exhibit 3) and likely is near that extreme
lower limit.
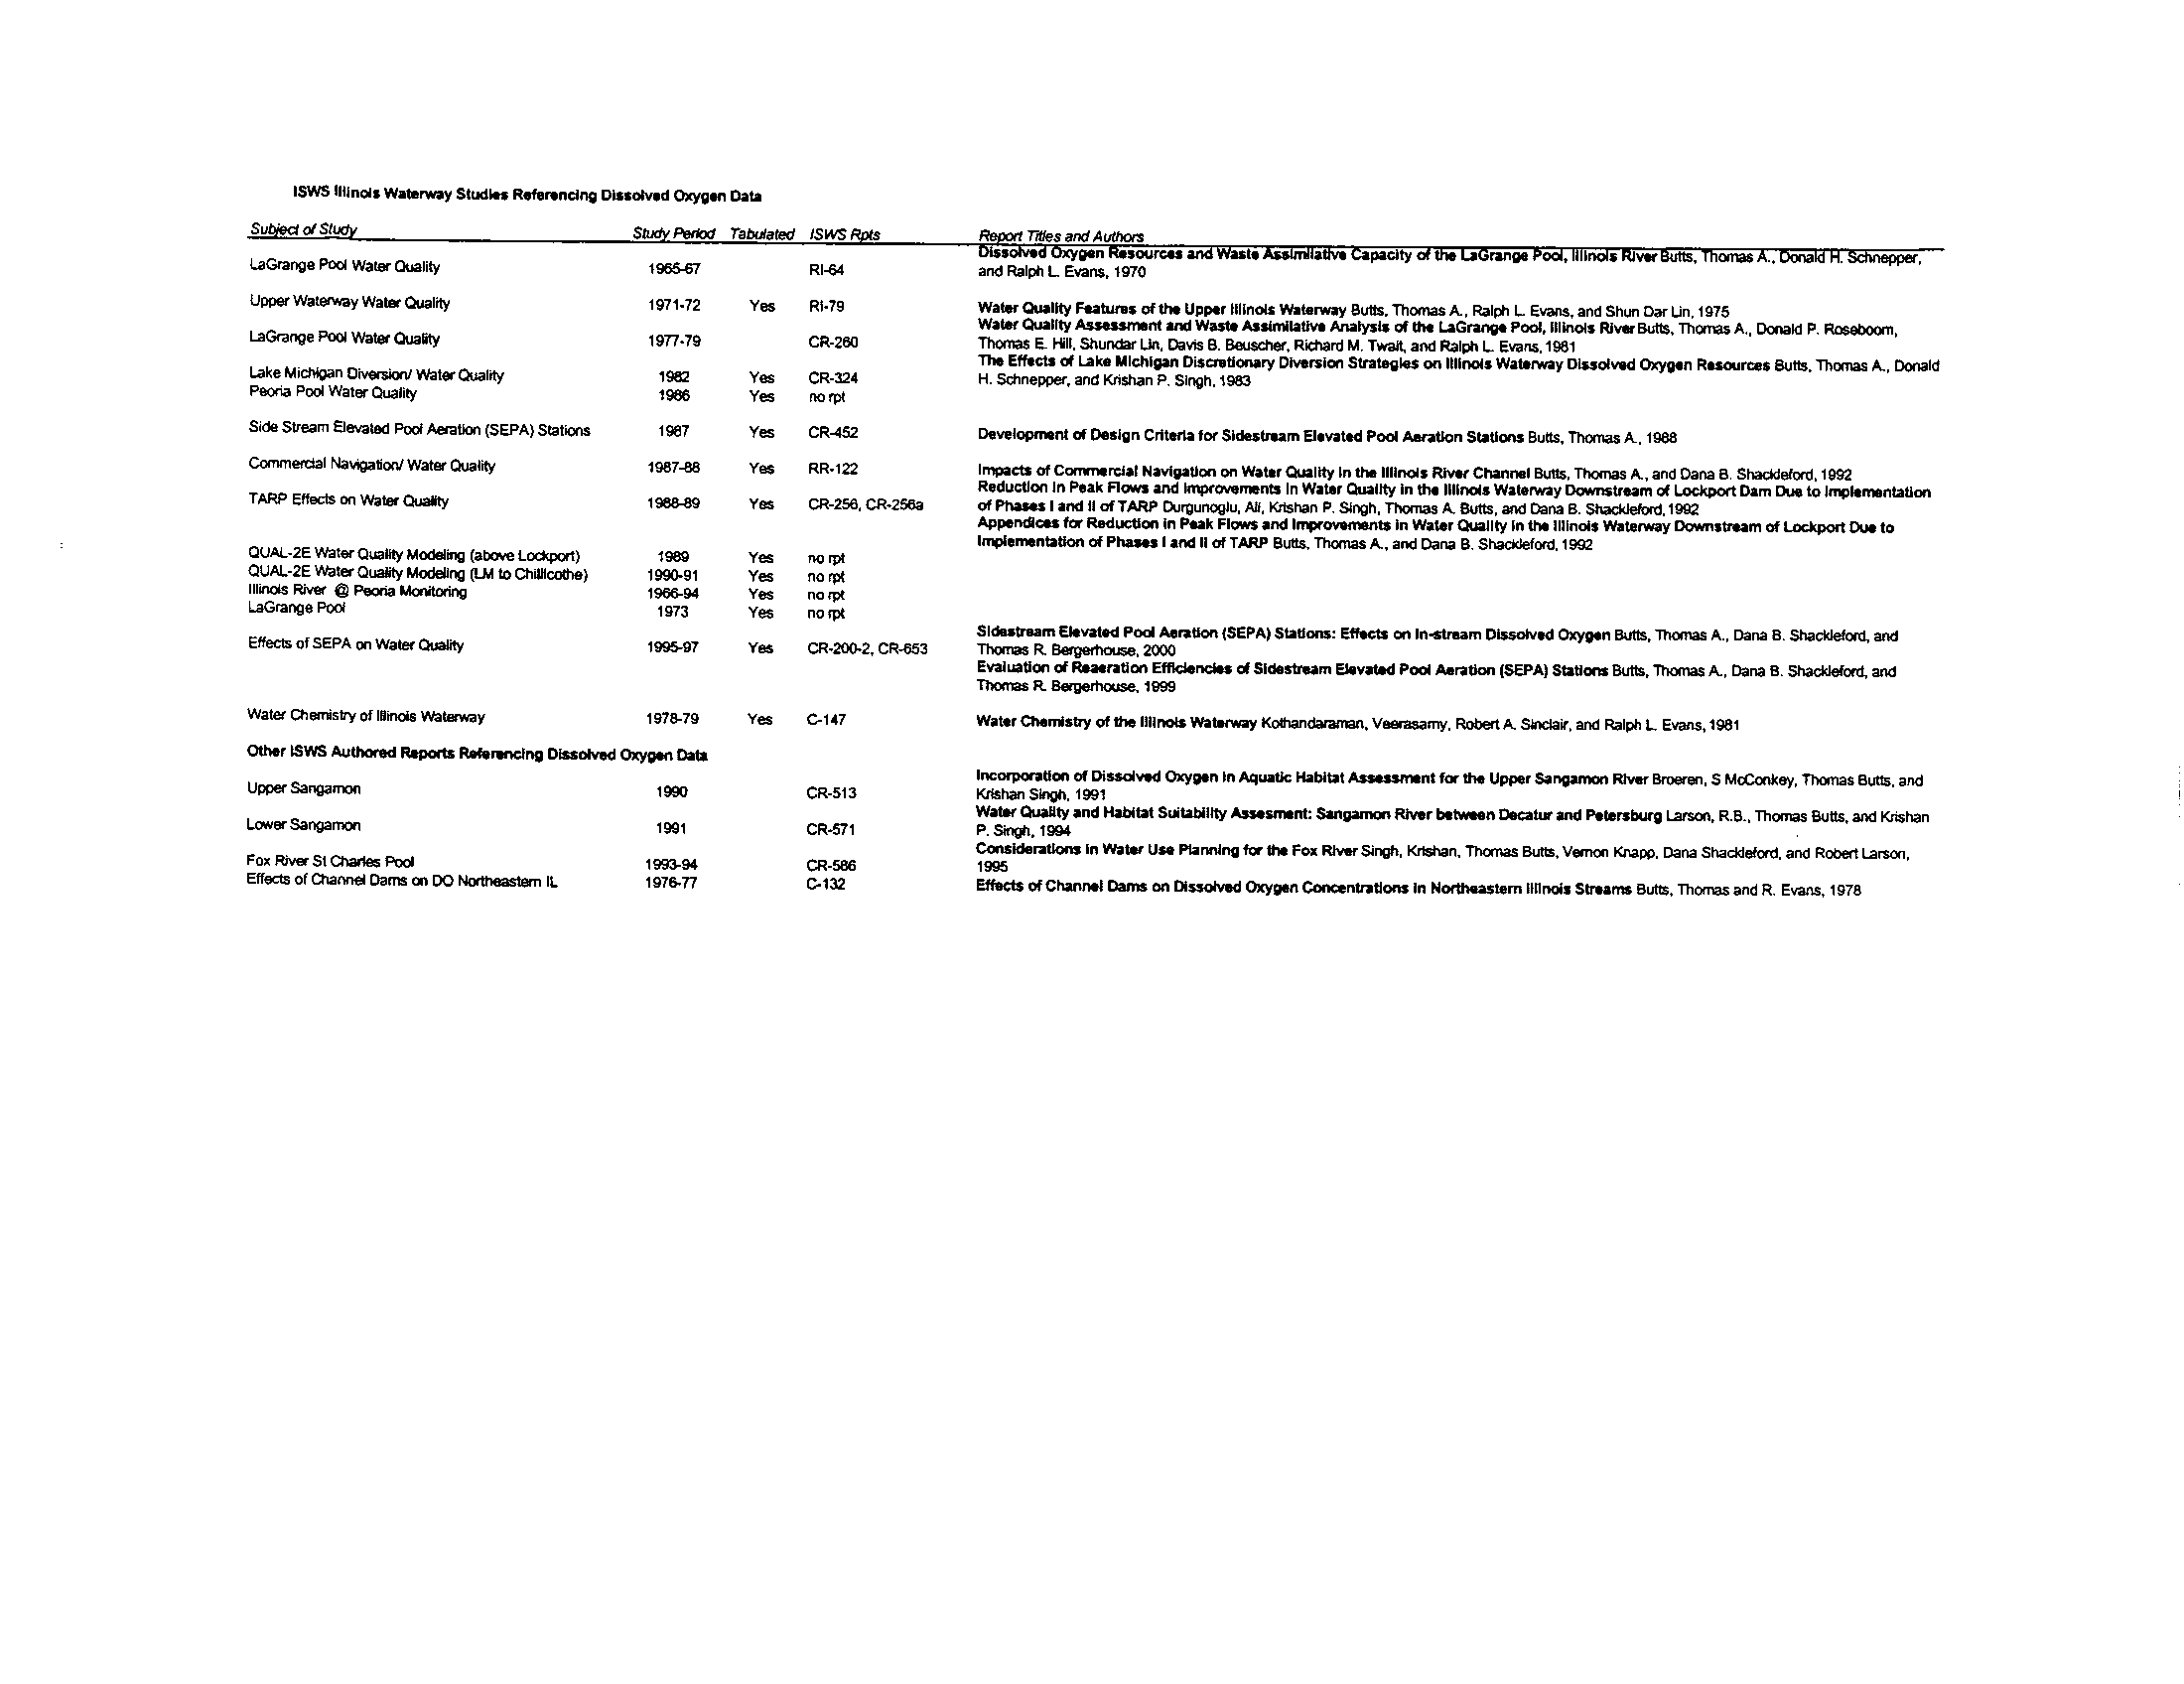
Illinois Water Survey Data
Illinois DNR via Ms . Ann Holtrop provided me with grab dissolved oxygen data from
various studies compiled through the Illinois State Water Survey . These data extend
from the early 1970s through the 1990s . After reviewing the reports from which these
data were collected (see Exhibit 4), it was clear that the 20,101 individual observations
that I analyzed were collected in many ways. Even given this caveat, I thought it might
be interesting to determine whether average dissolved oxygen concentrations "improved"
in Illinois surface waters through time as nutrient loading abated during the past thirty
years as a function of the Clean Water Act . I was rather surprised to find that no real
7
pattern occurred through the decades, with concentrations varying widely among sites
and years for which data were available
. As per the results emerging from Dr
. David's
laboratory as well as the results I will present below, it appears that oxygen
concentrations in streams are likely influenced by habitat and its interactions with many
other factors, of which nutrient loading is but one component
.
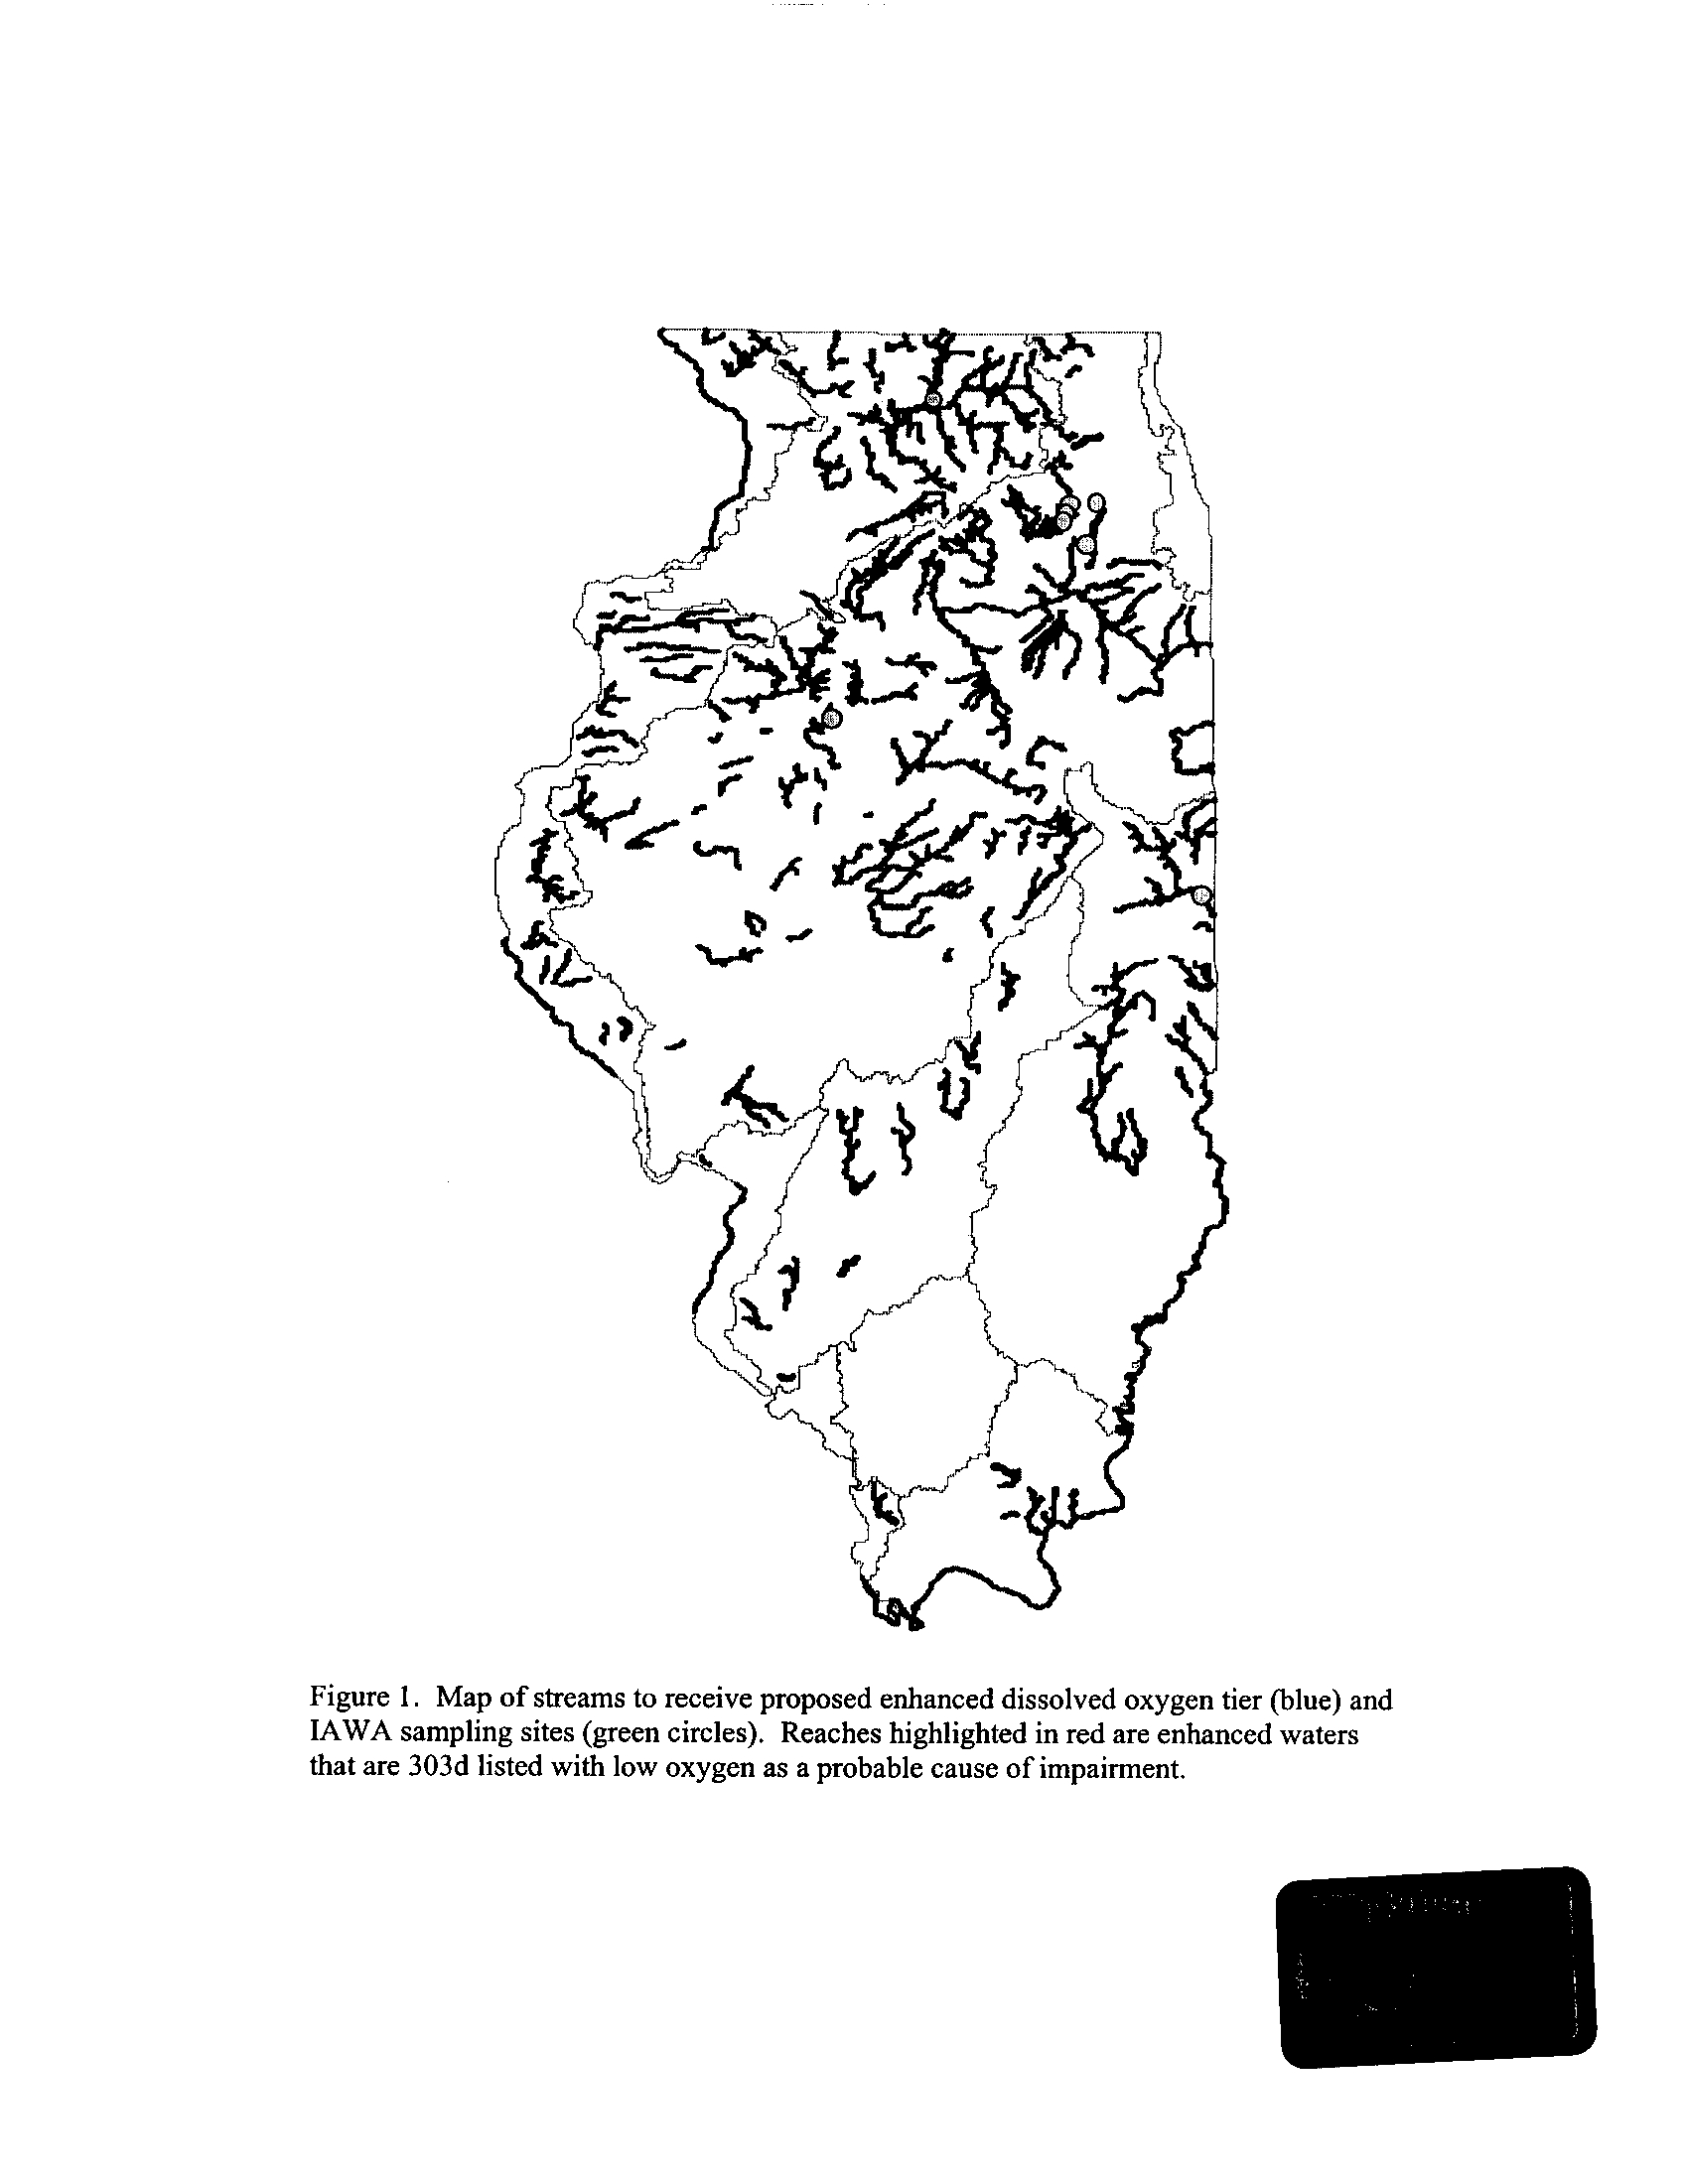
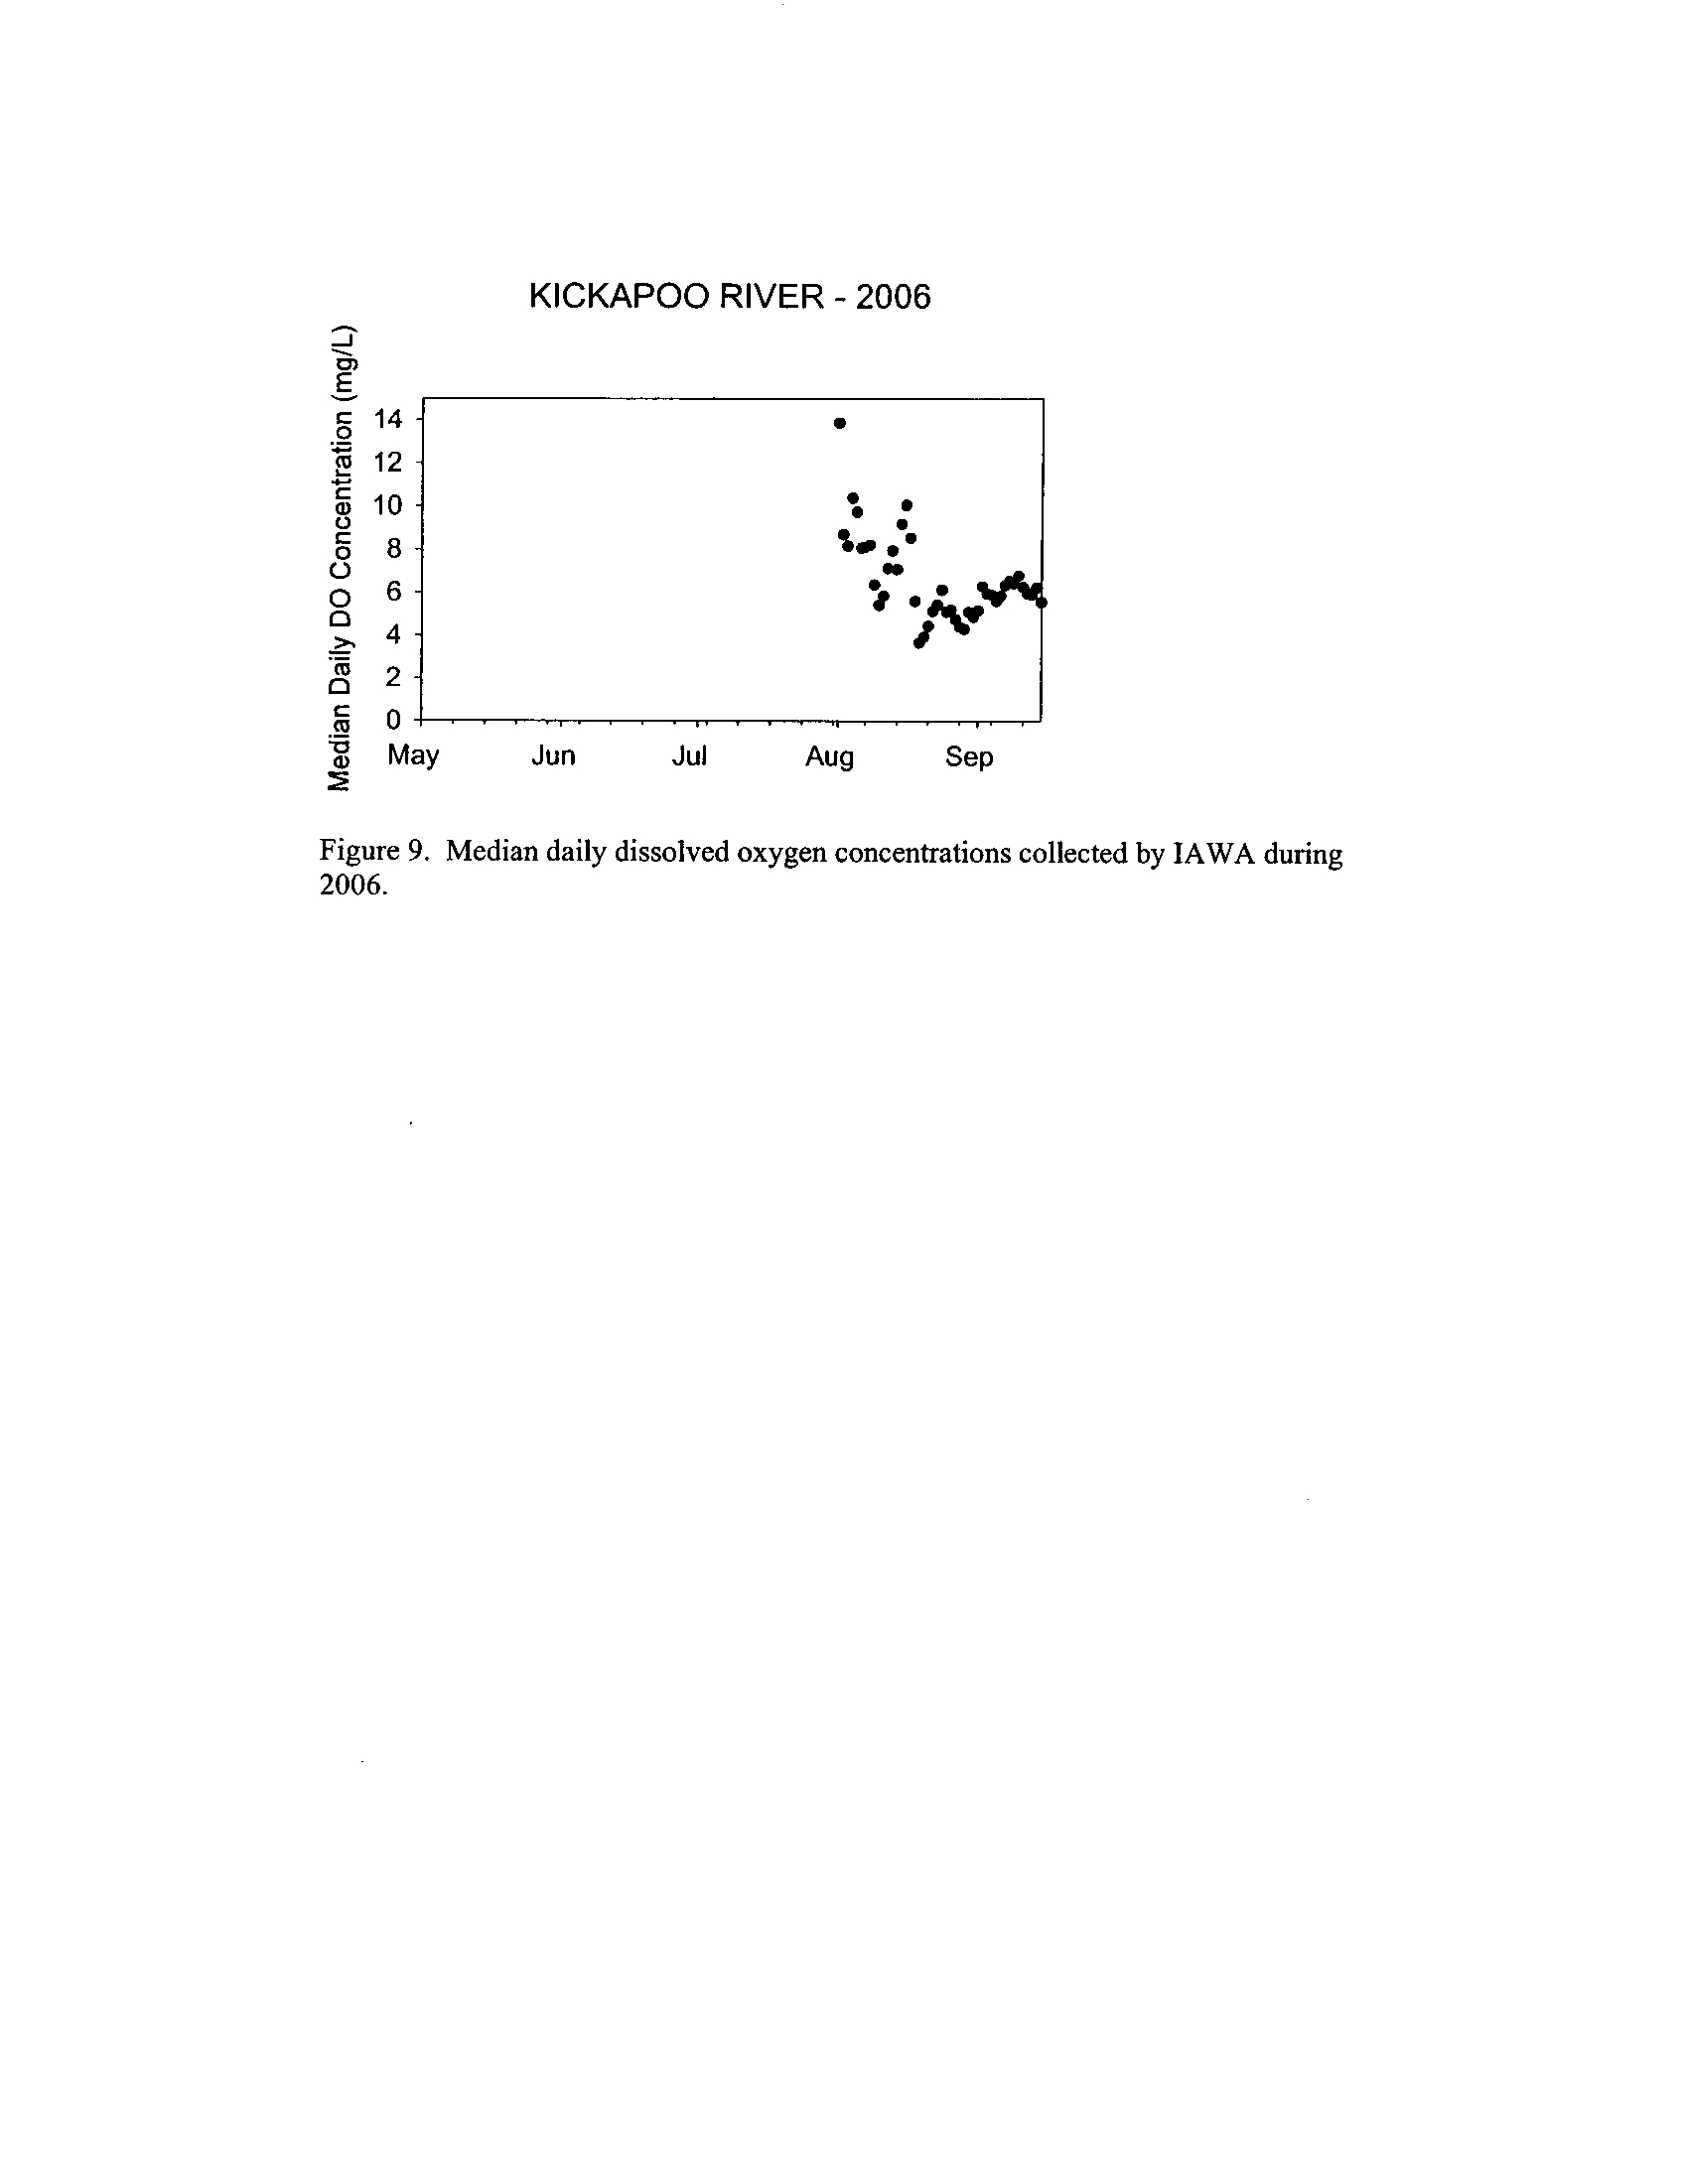
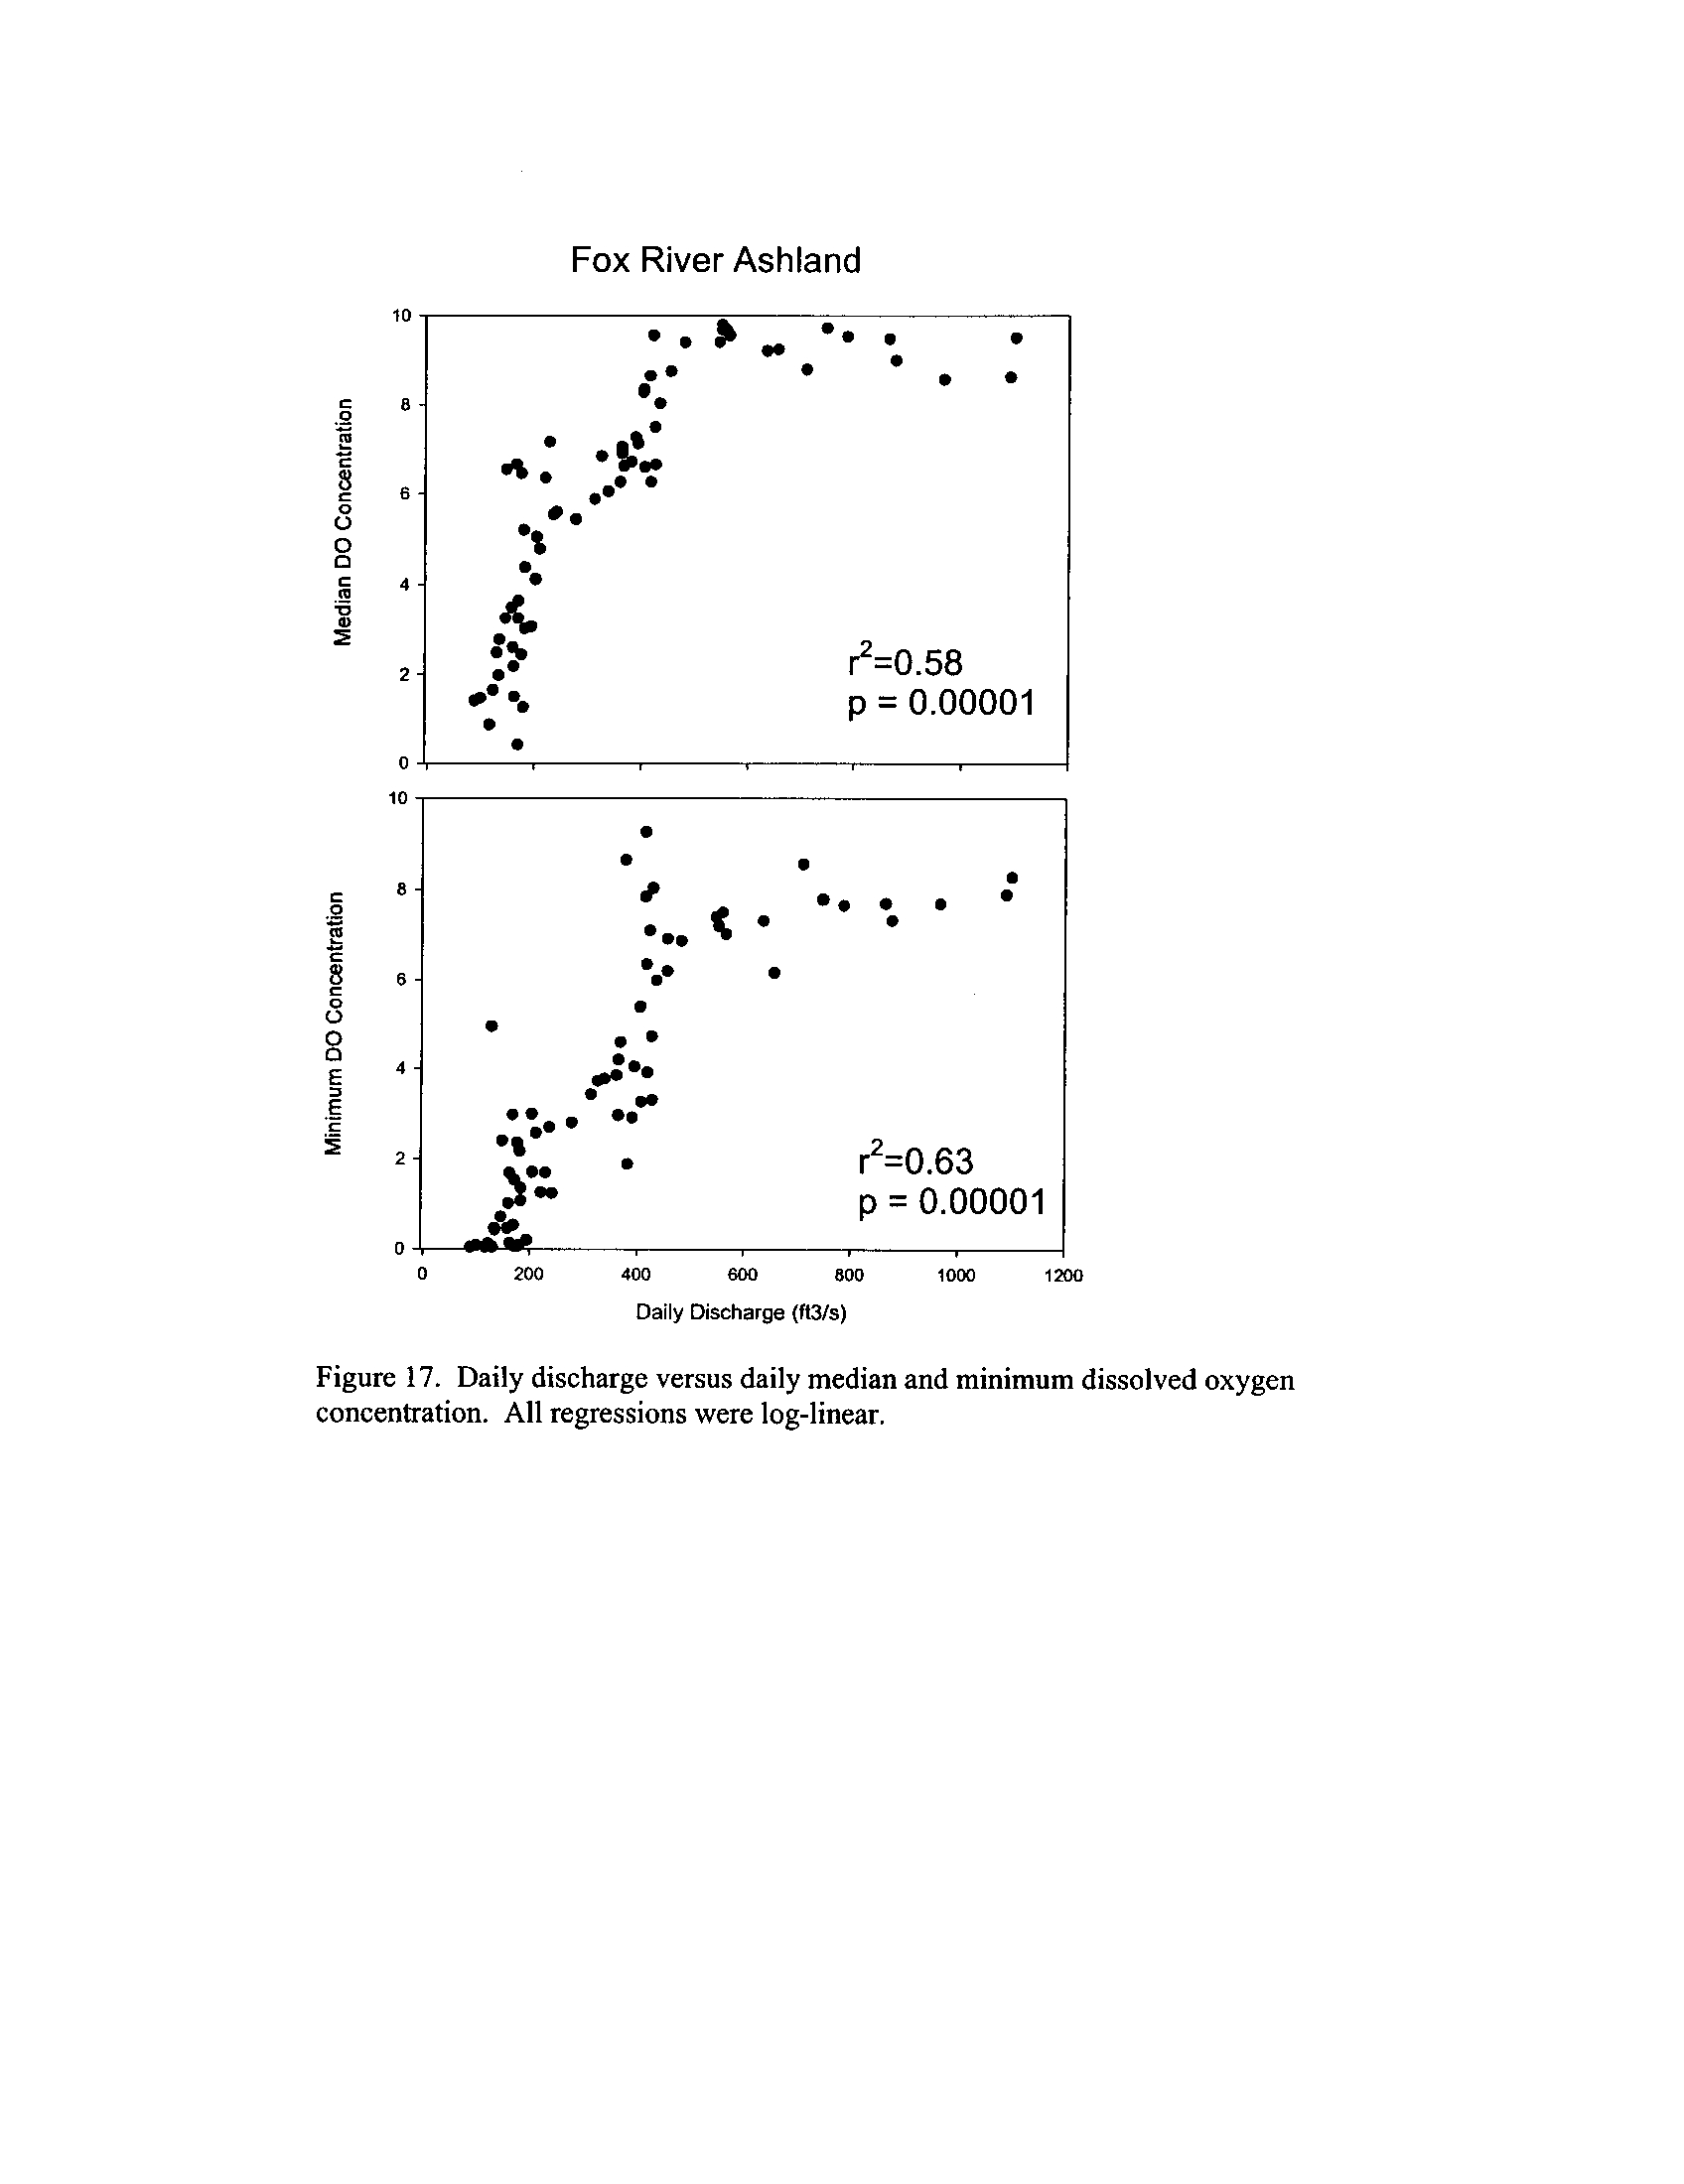
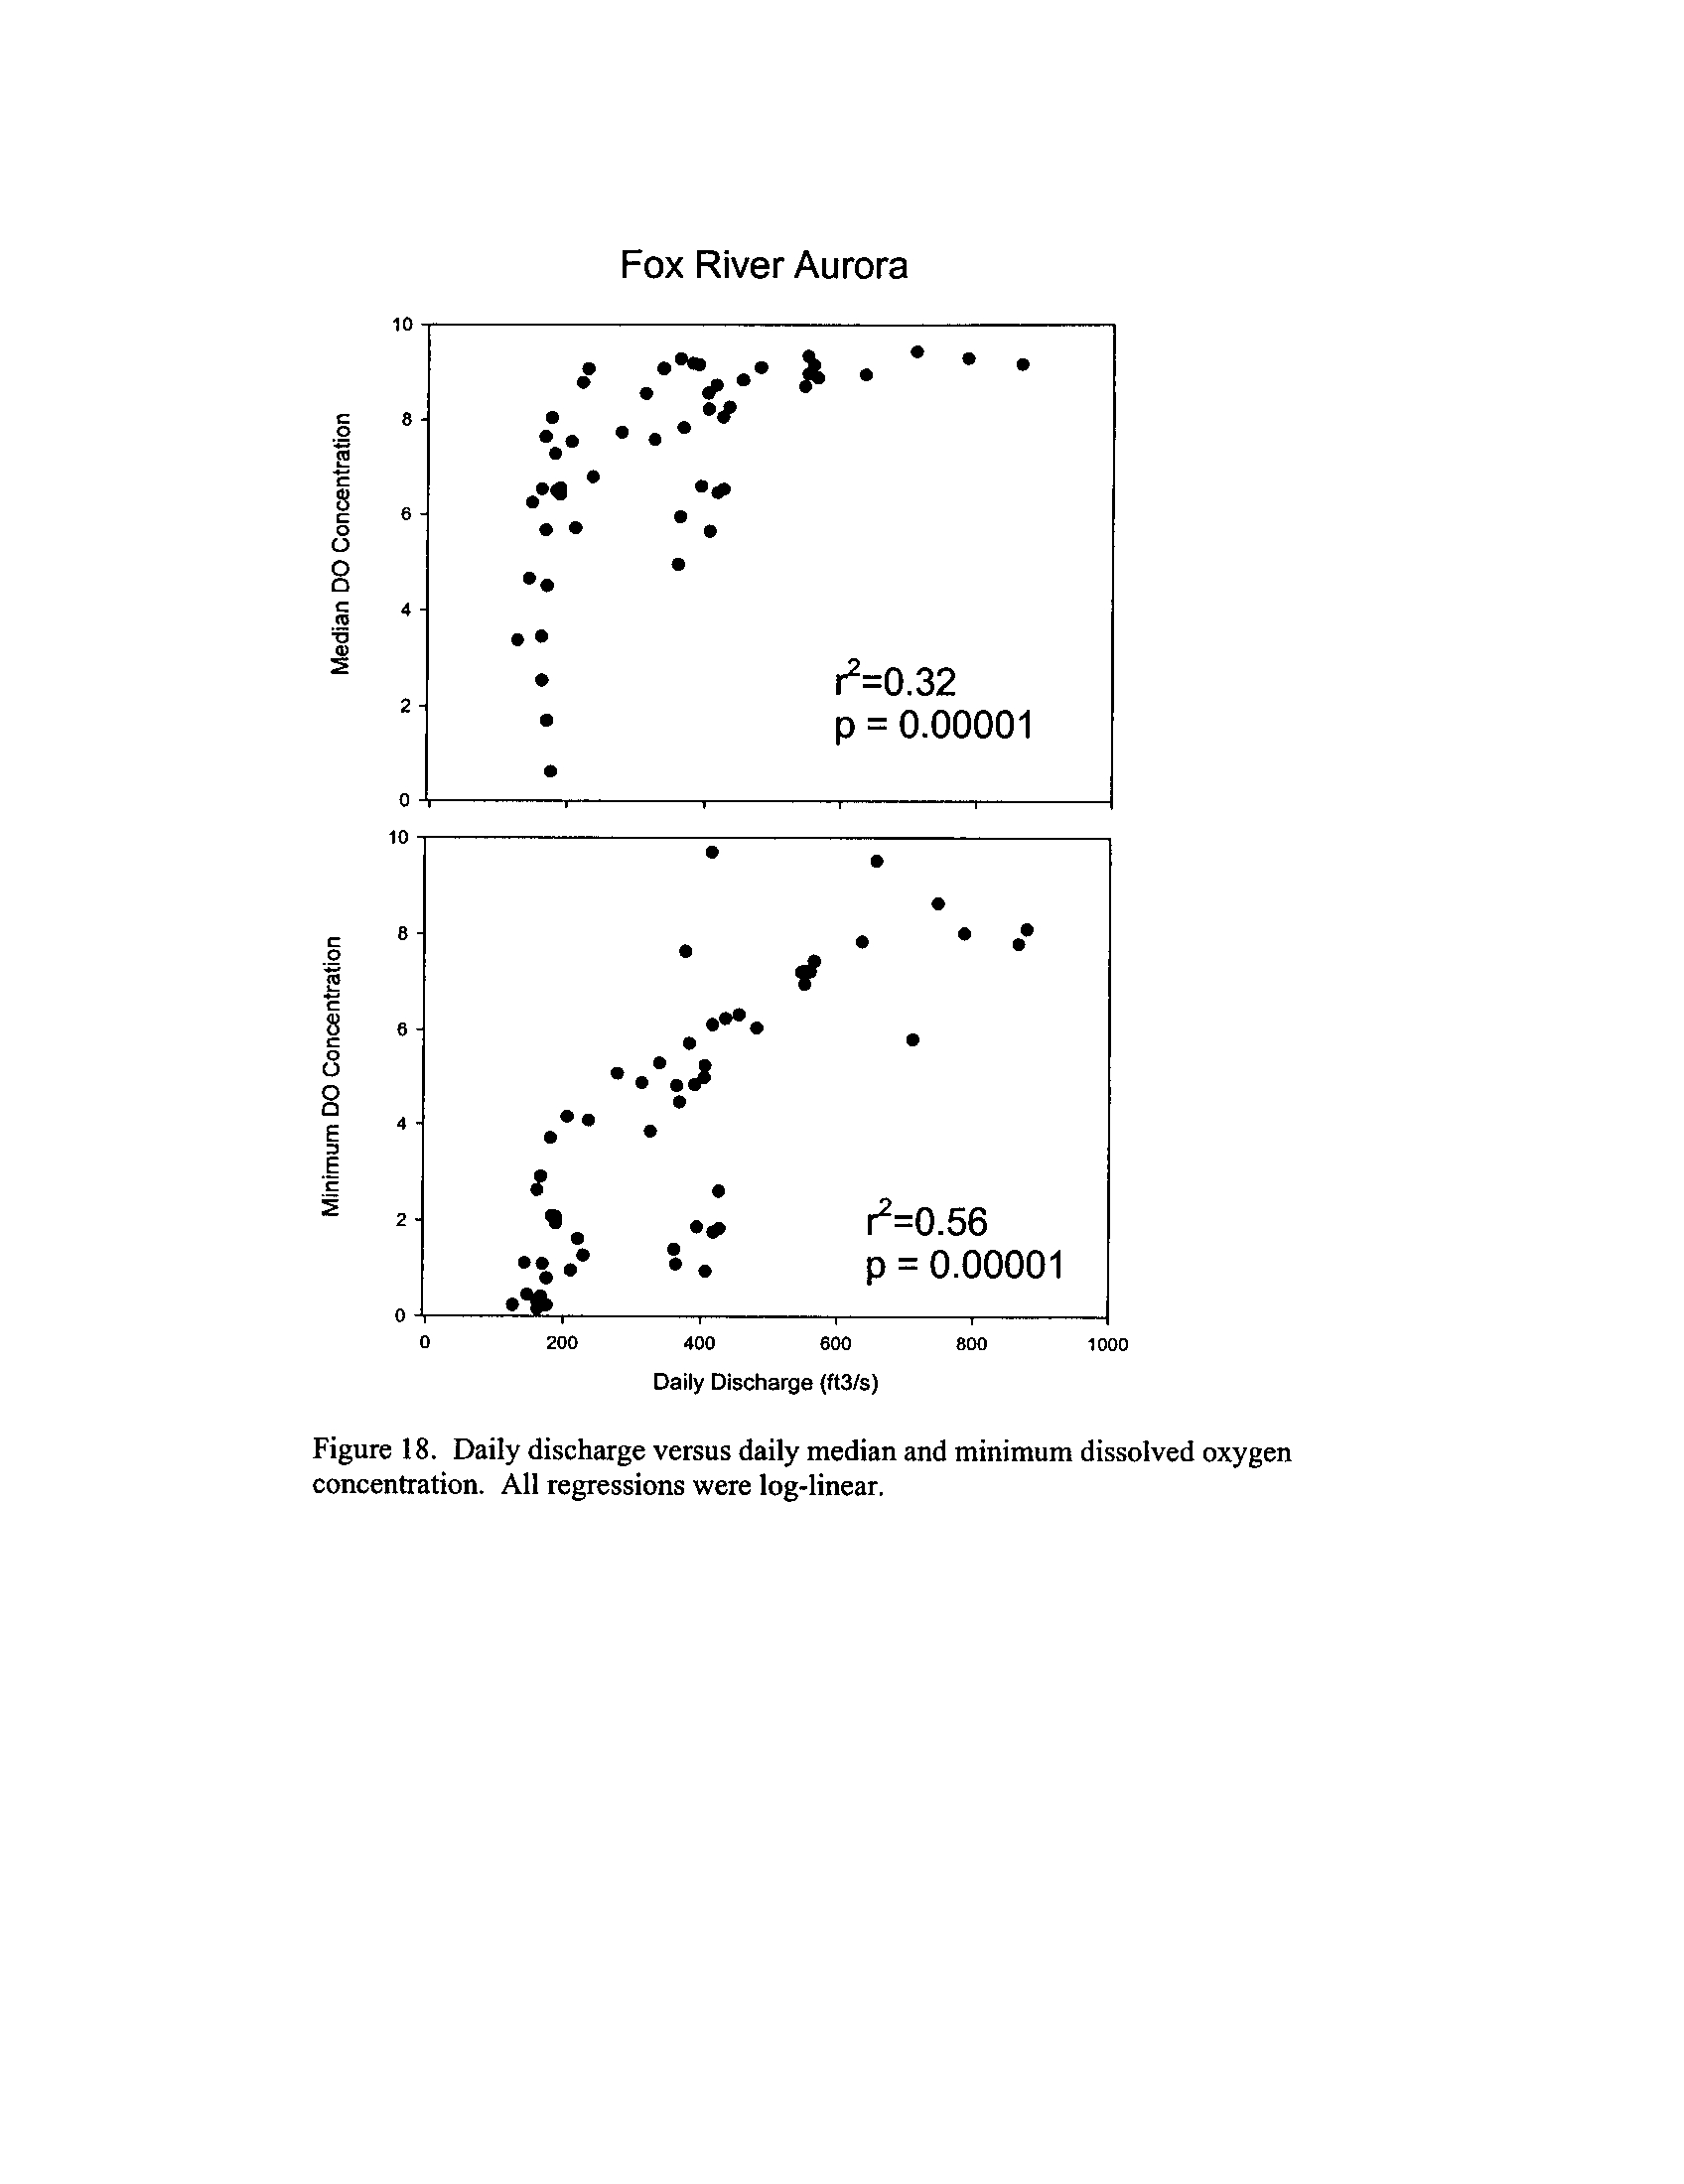
IAWA 2005 and 2006 Semi-Continuous Monitoring
Several IAWA members have installed semi-continuous dissolved oxygen loggers (15-60
minute intervals depending on the source) in streams that are in segments slated for
enhanced tier standards by the agencies
. Segments for which I have received data are on
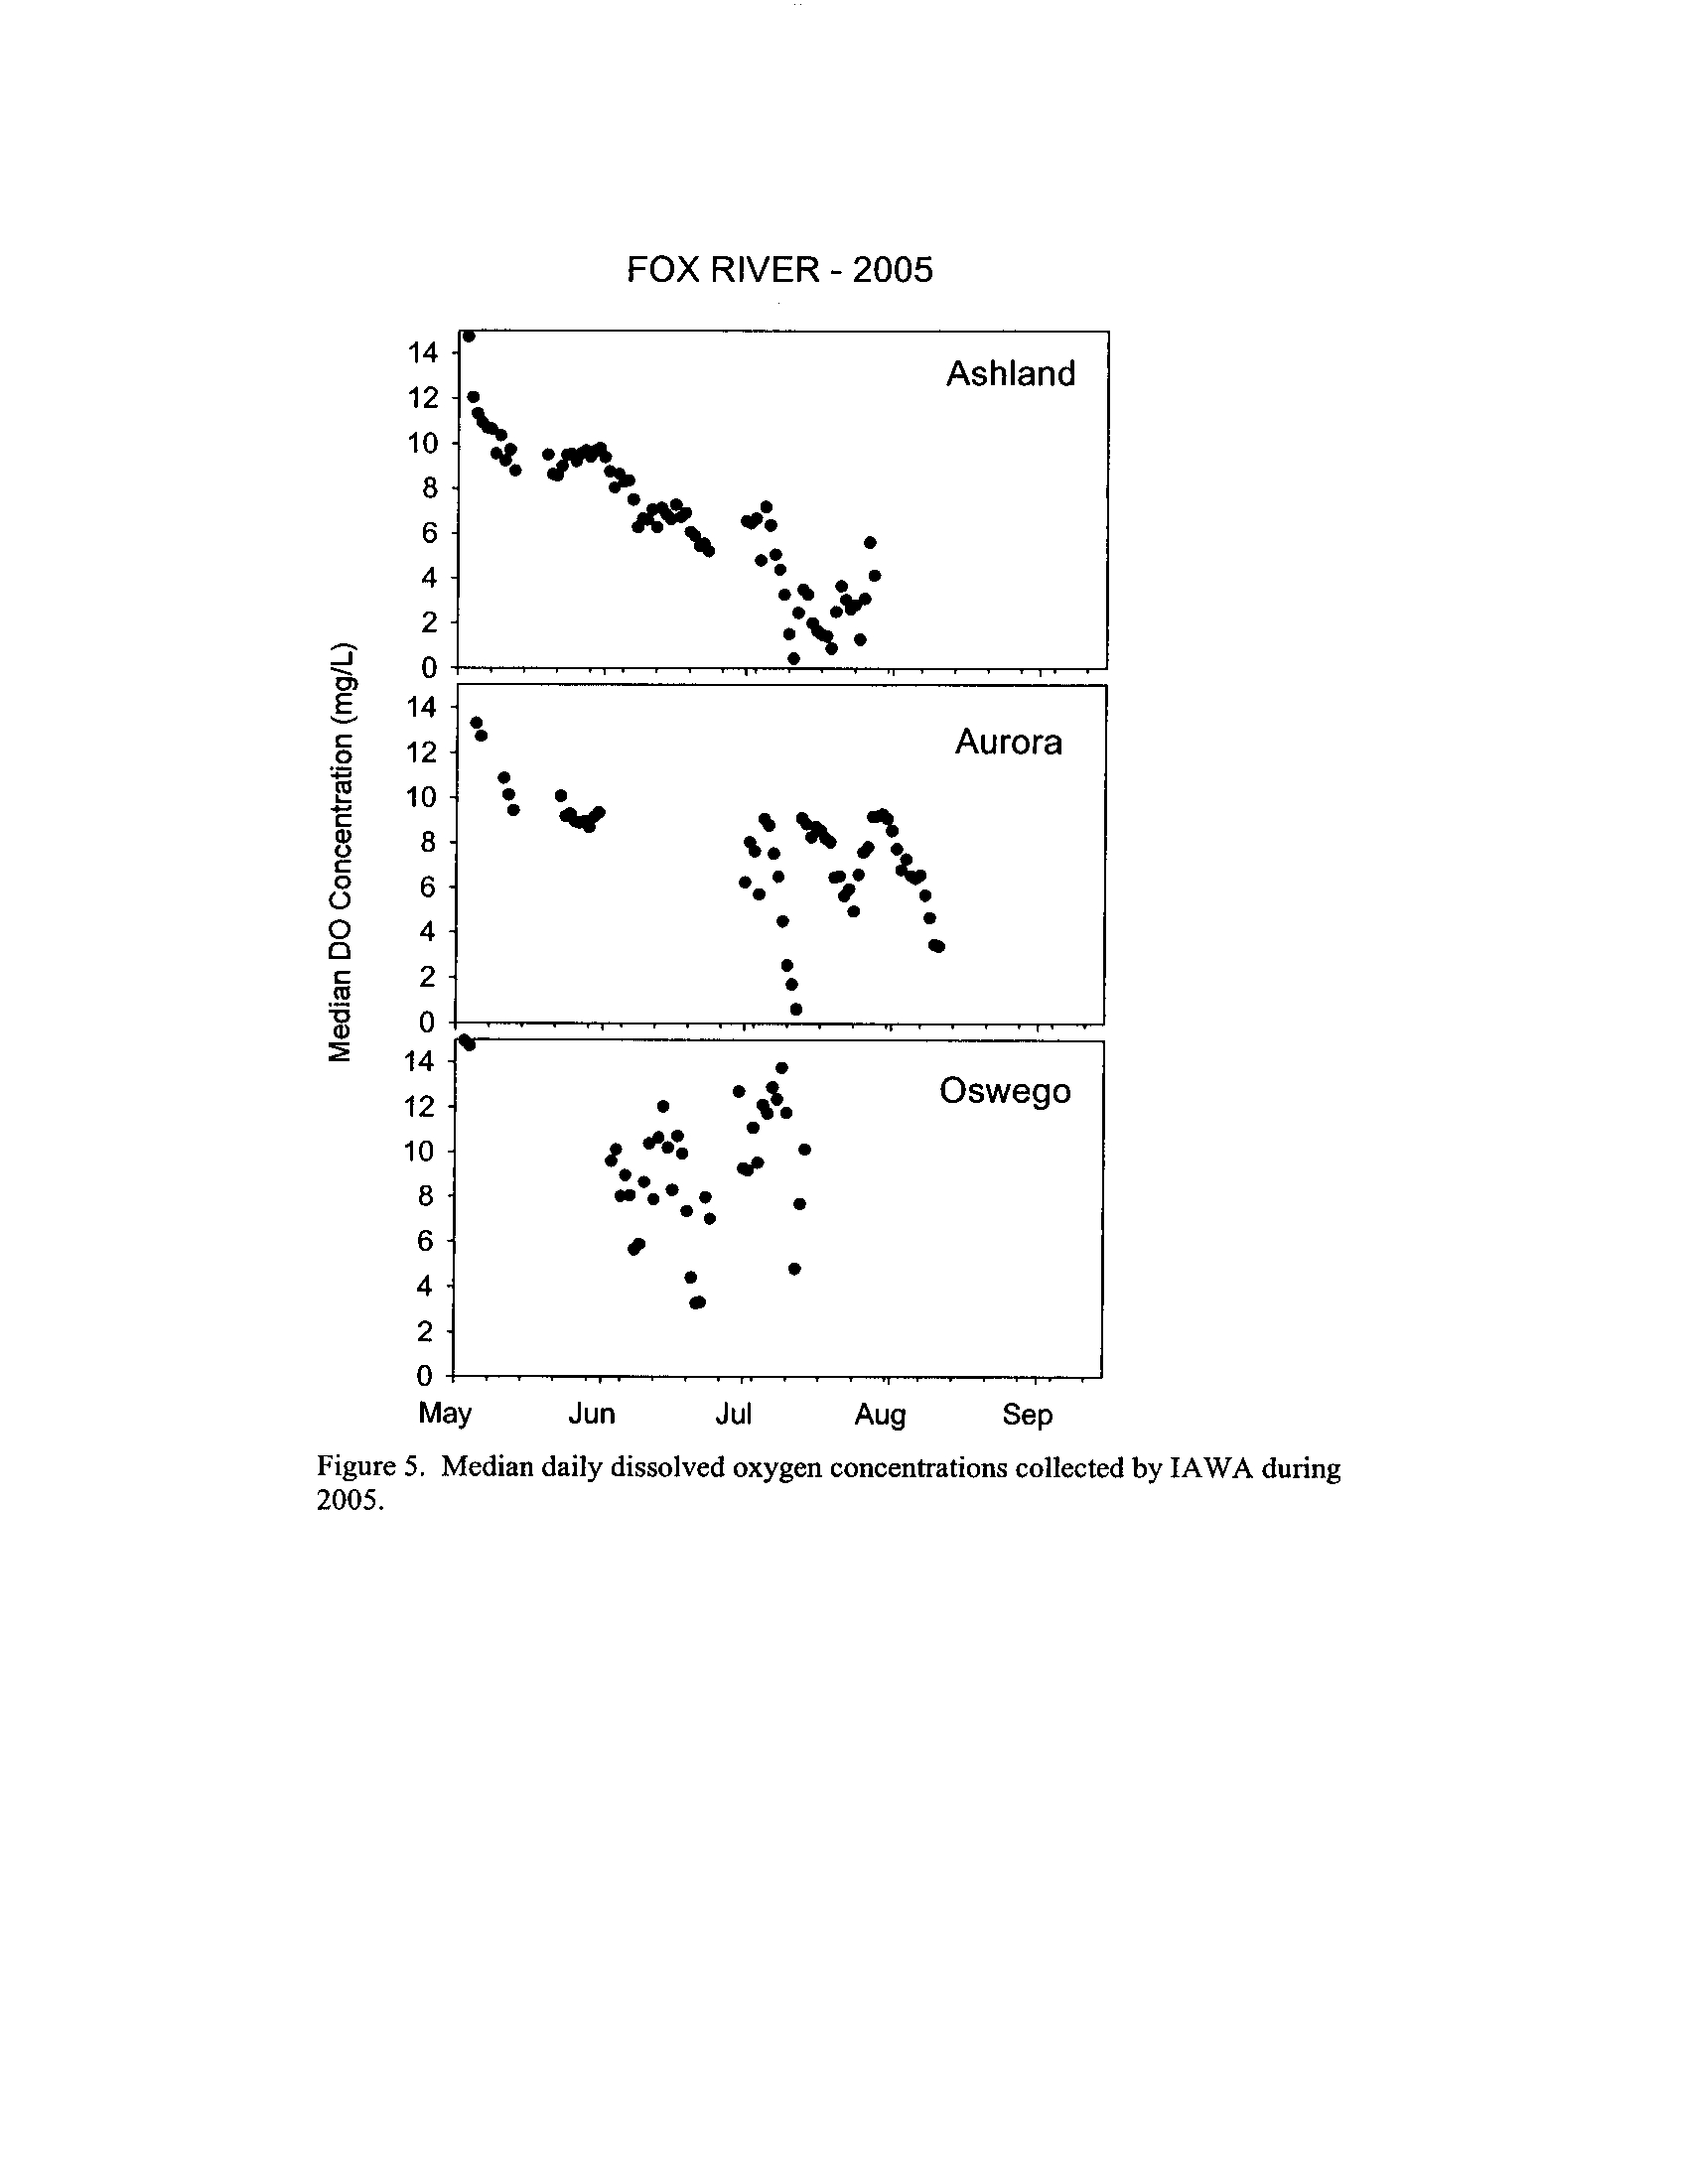
the Fox, DuPage, Kickapoo, Rock, and Vermilion Rivers (Exhibit 5
; 24,575 individual
observations)
. With the exception of the Fox River where the data derive from 2005, the
remainder of the data derives from summer 2006
. I also procured USGS daily
monitoring data for discharge from gauging stations near the river segments to test the
hypothesis that discharge drives much of the variation in dissolved oxygen concentrations
in low-gradient Illinois streams . The IAWA members who collected the data have
reviewed these summary results.
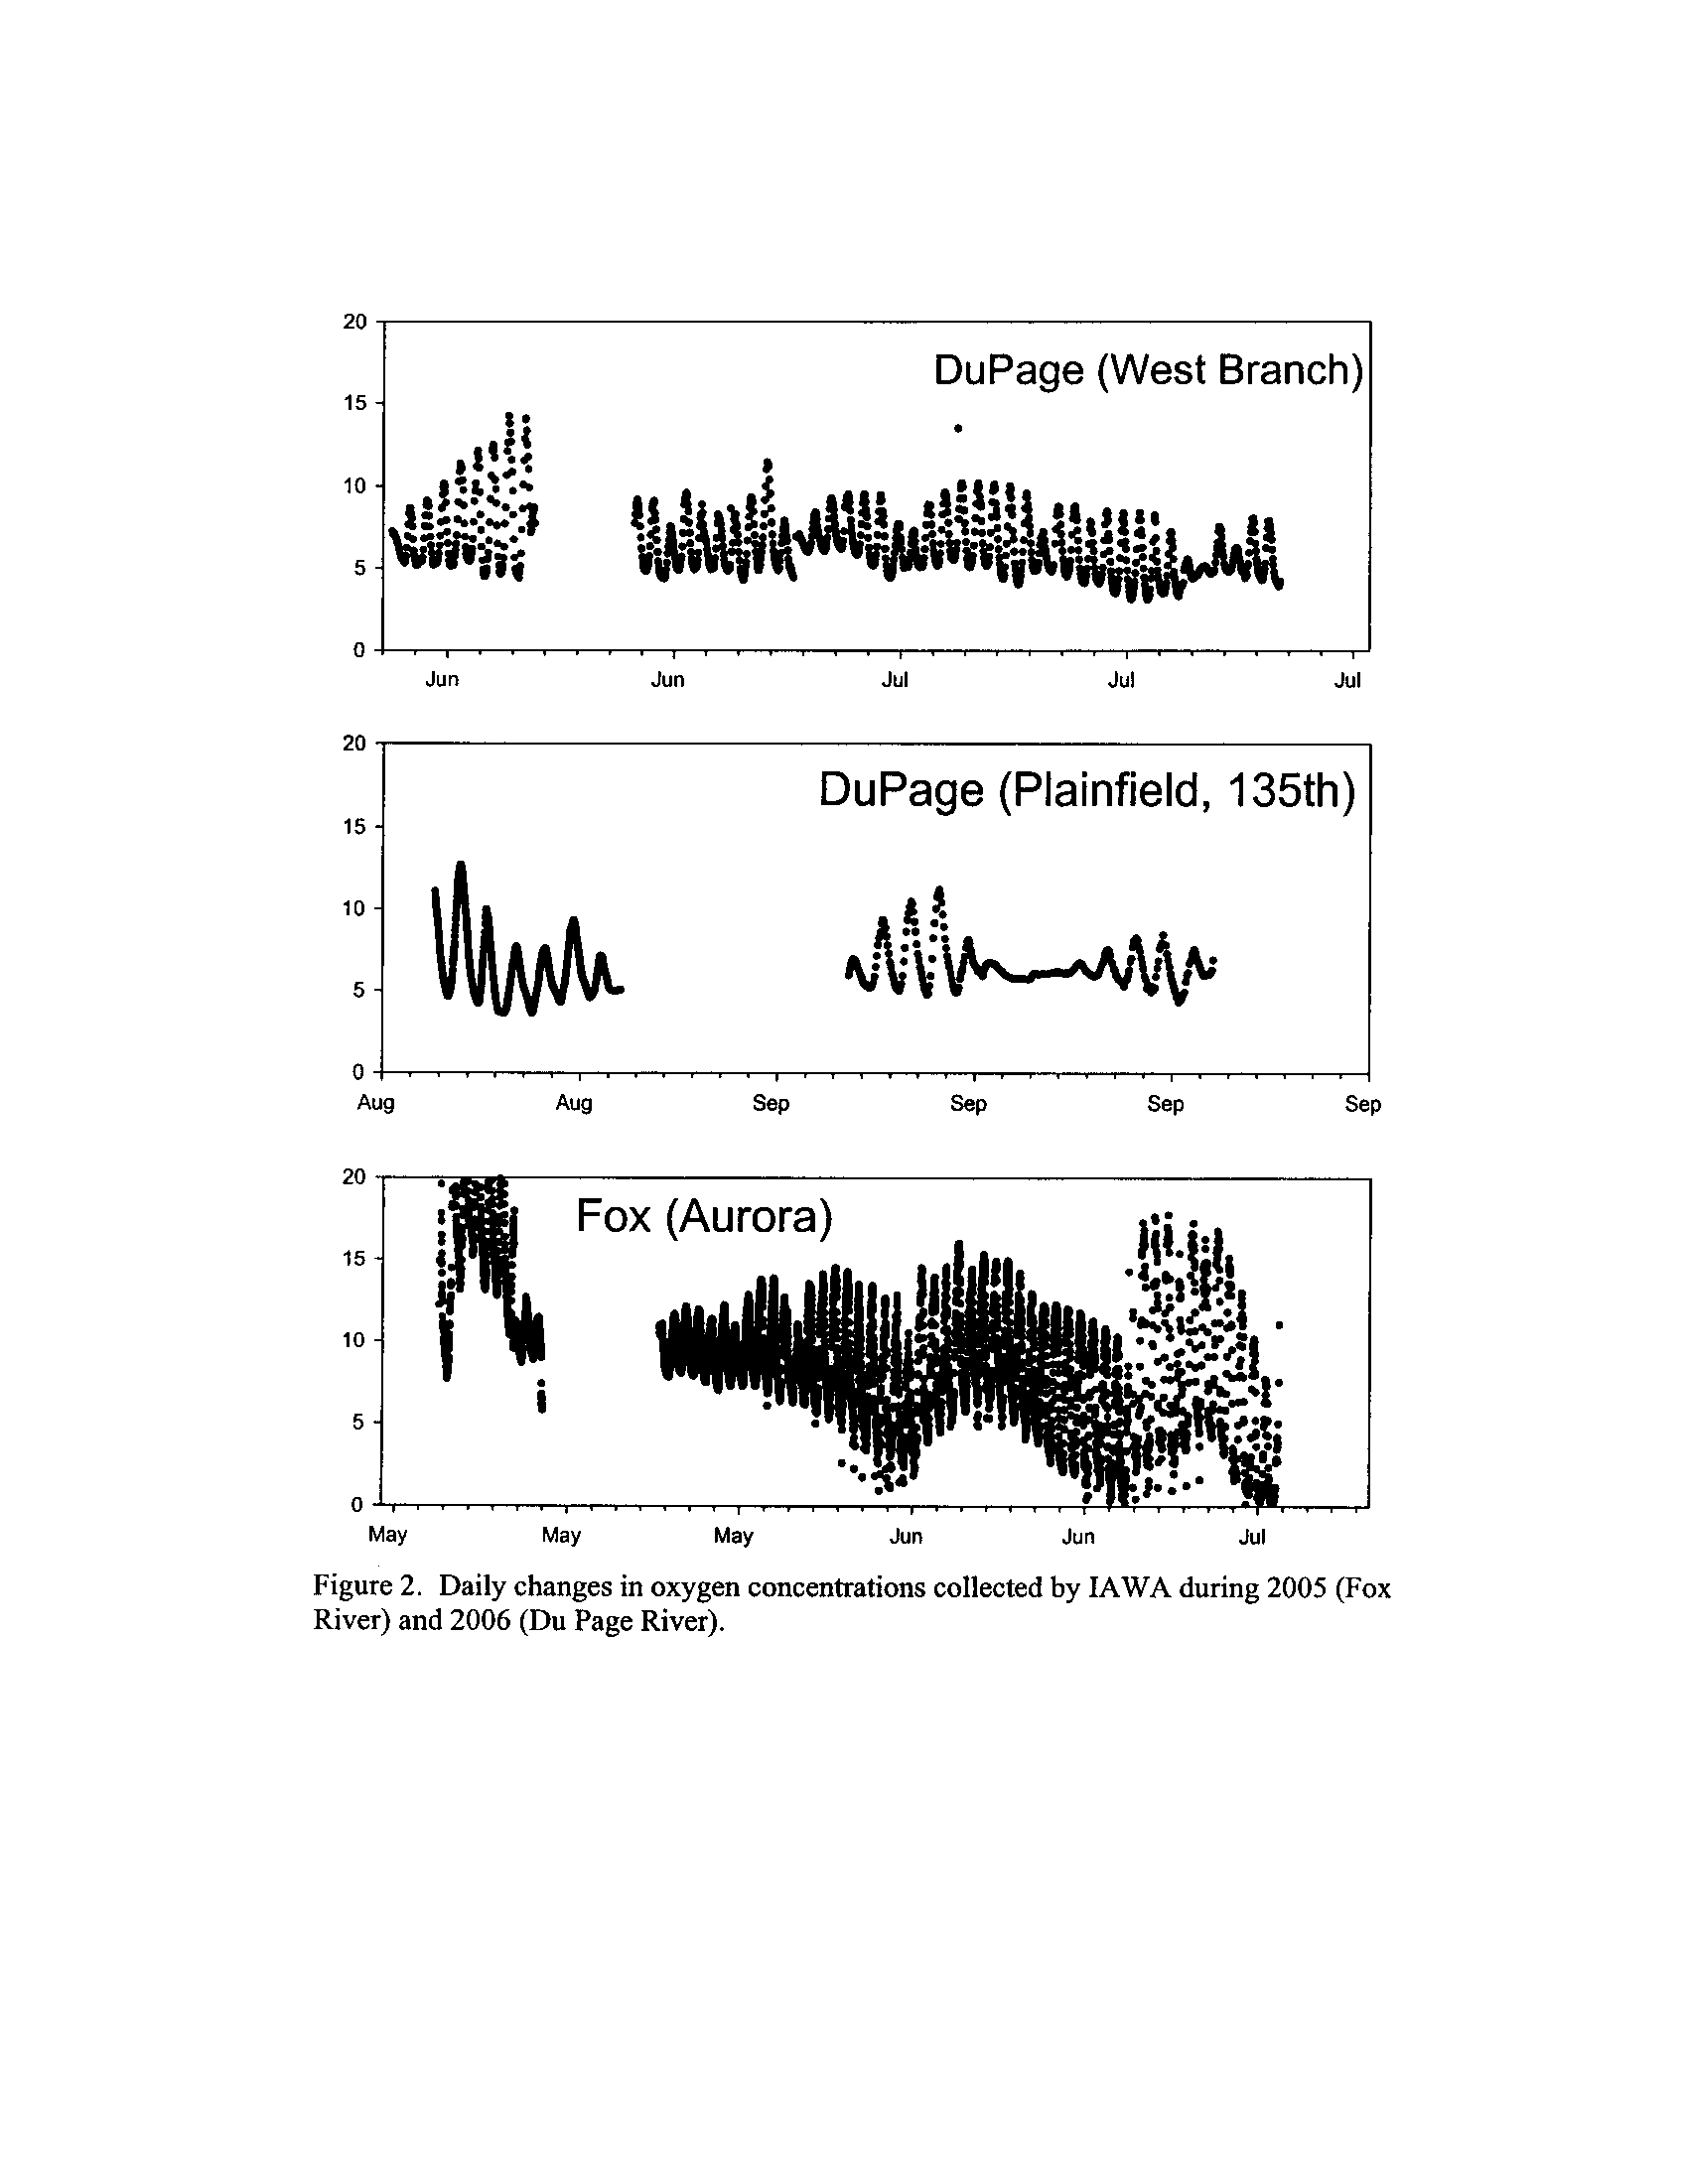
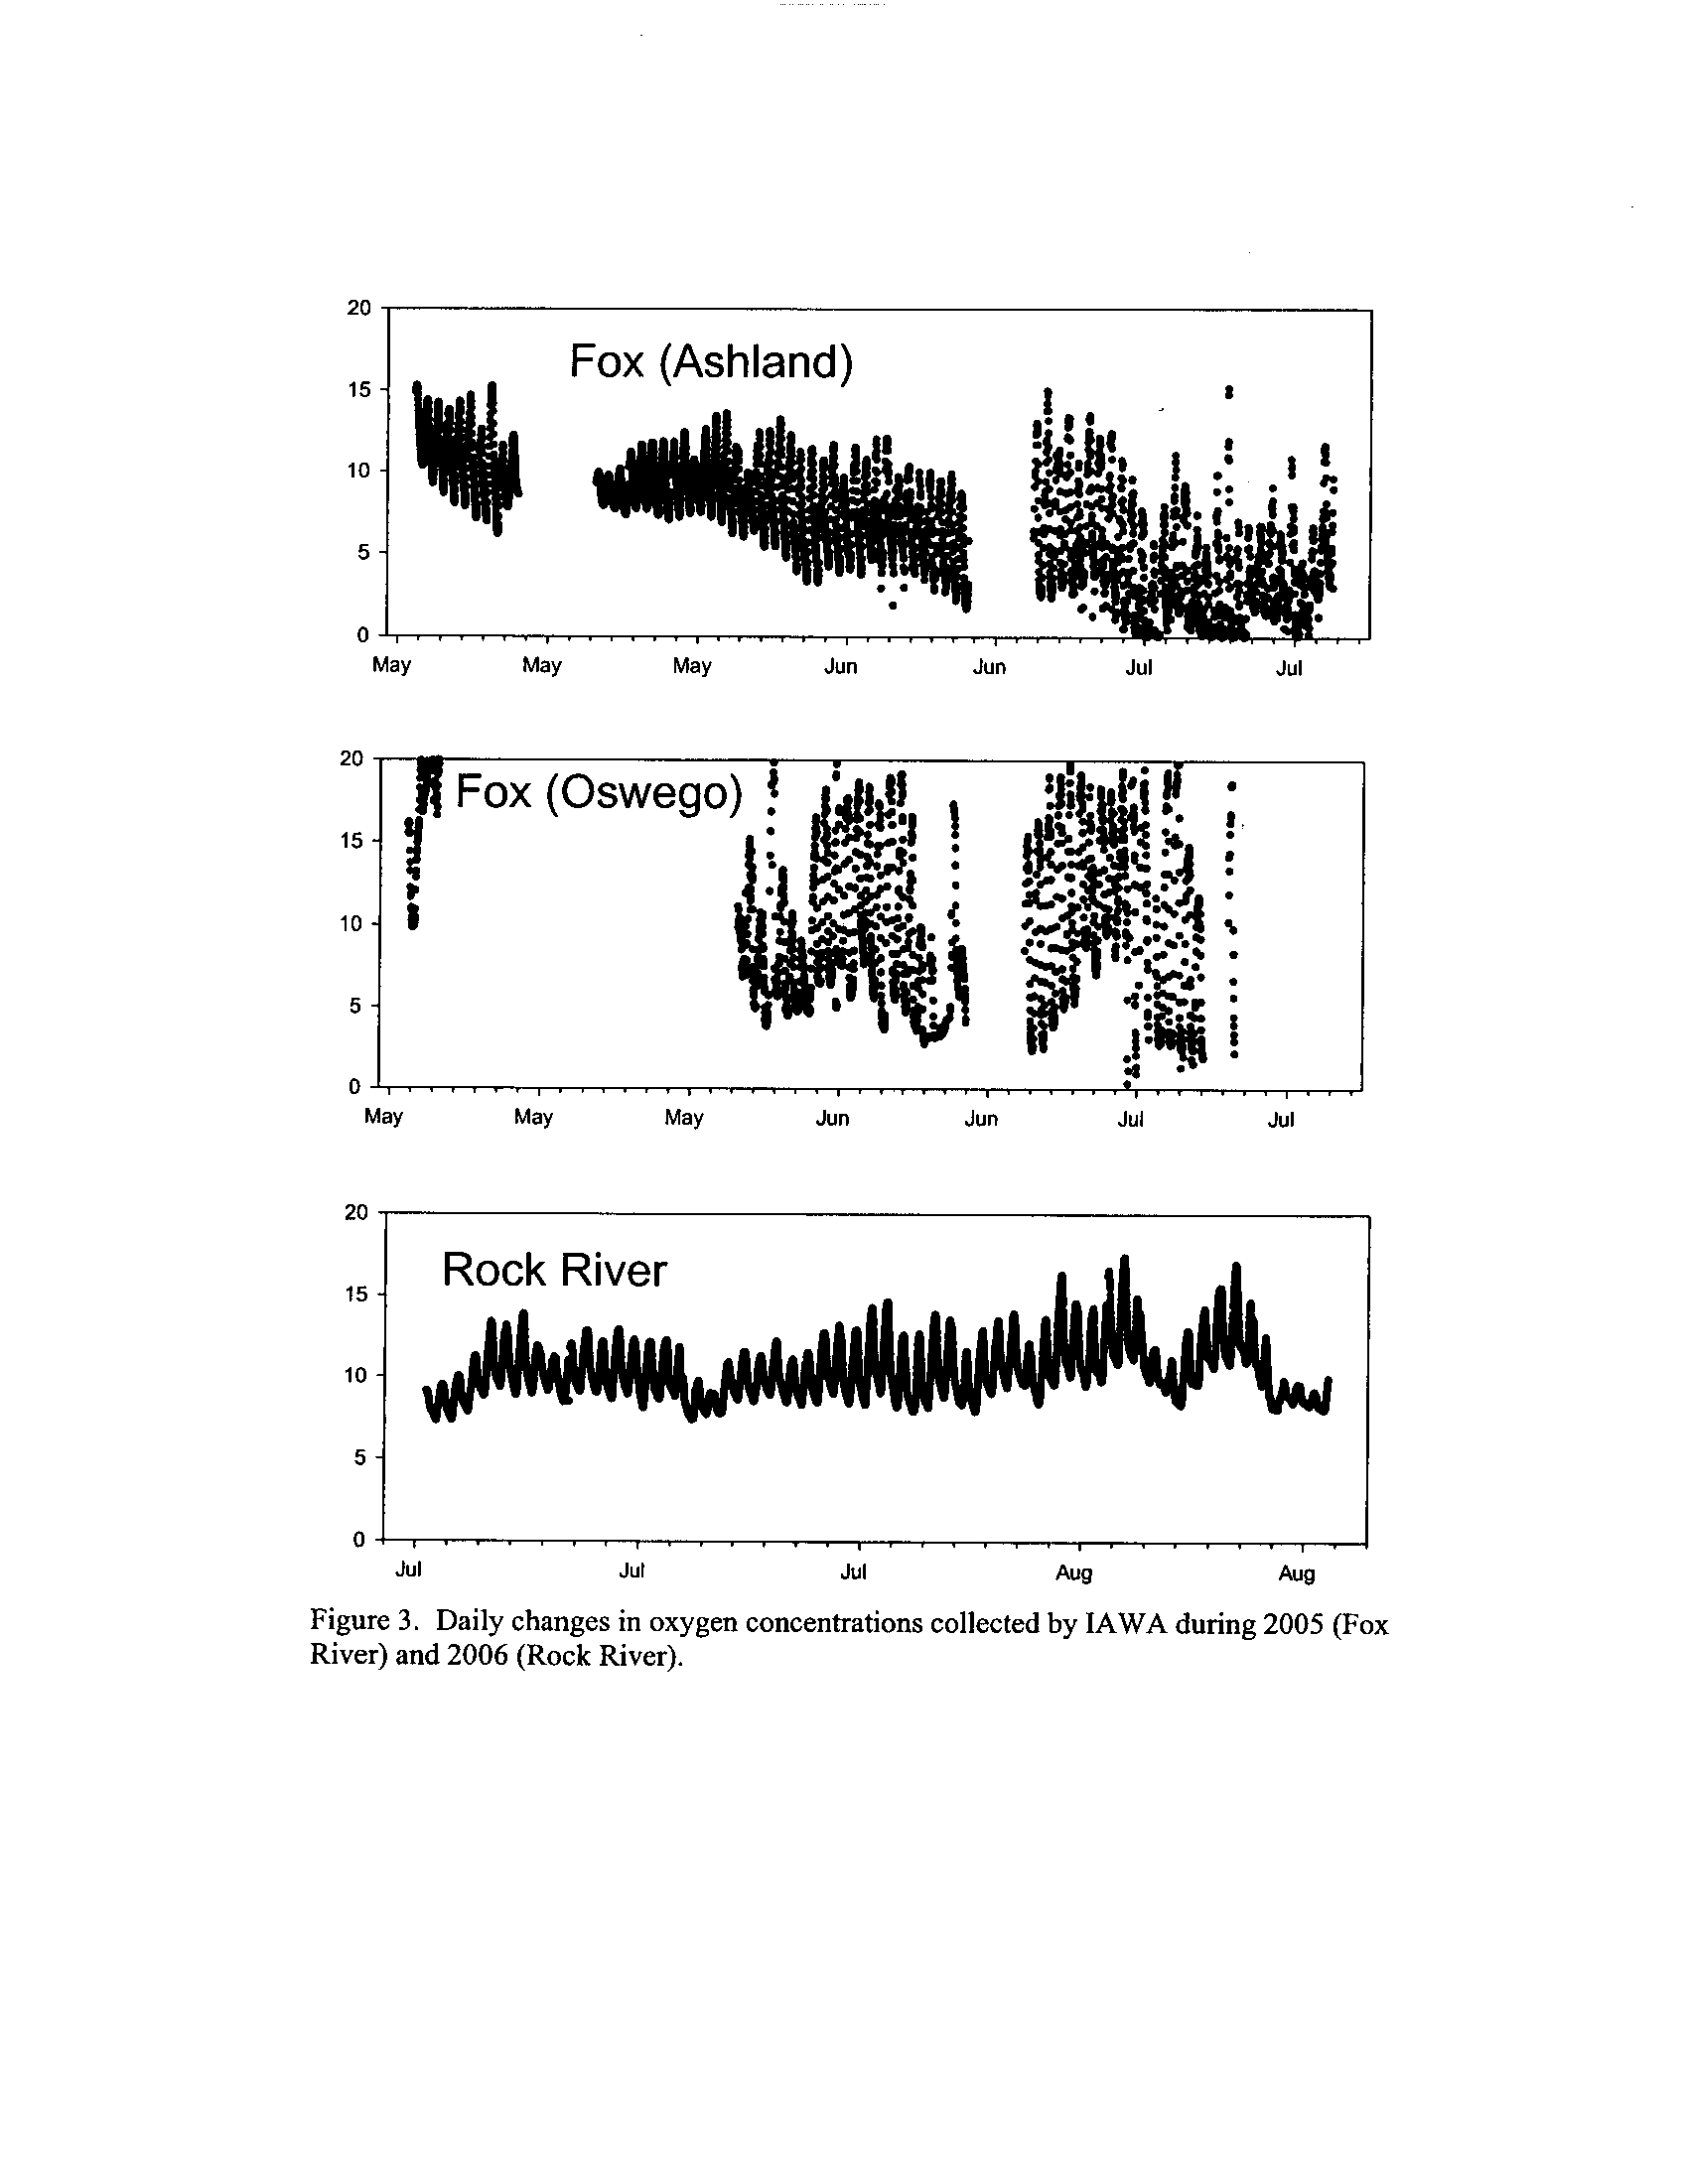
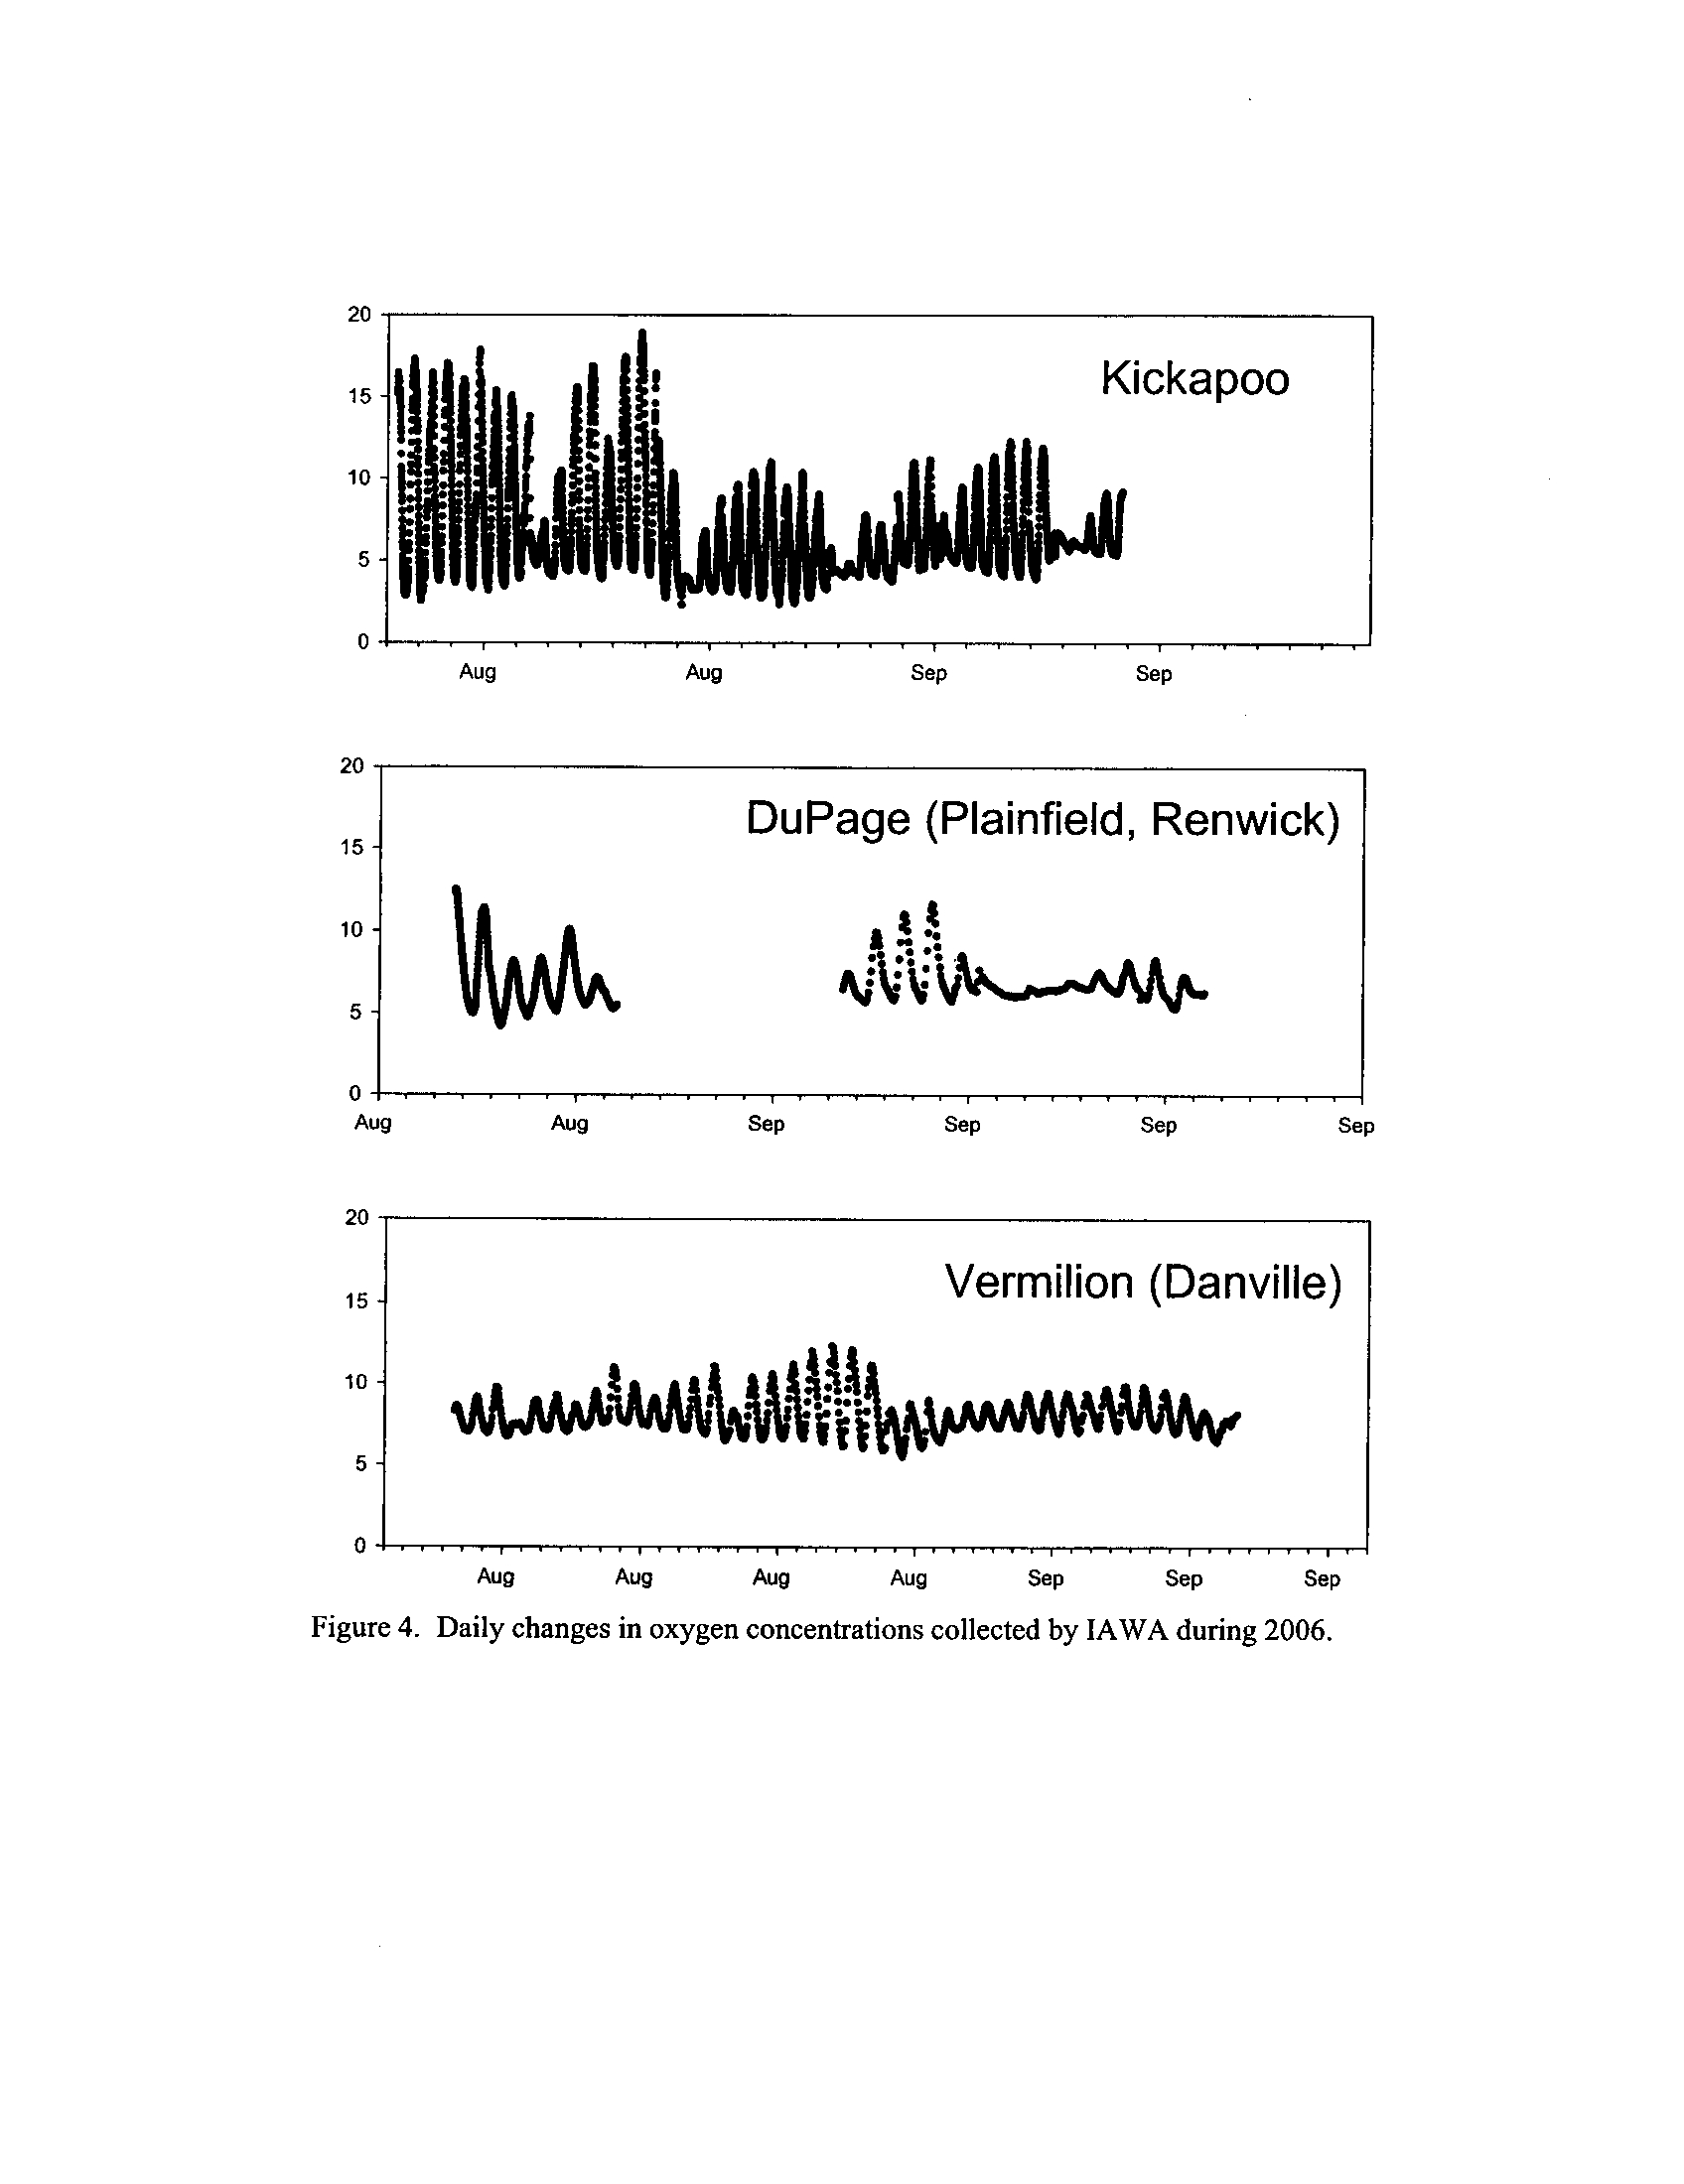
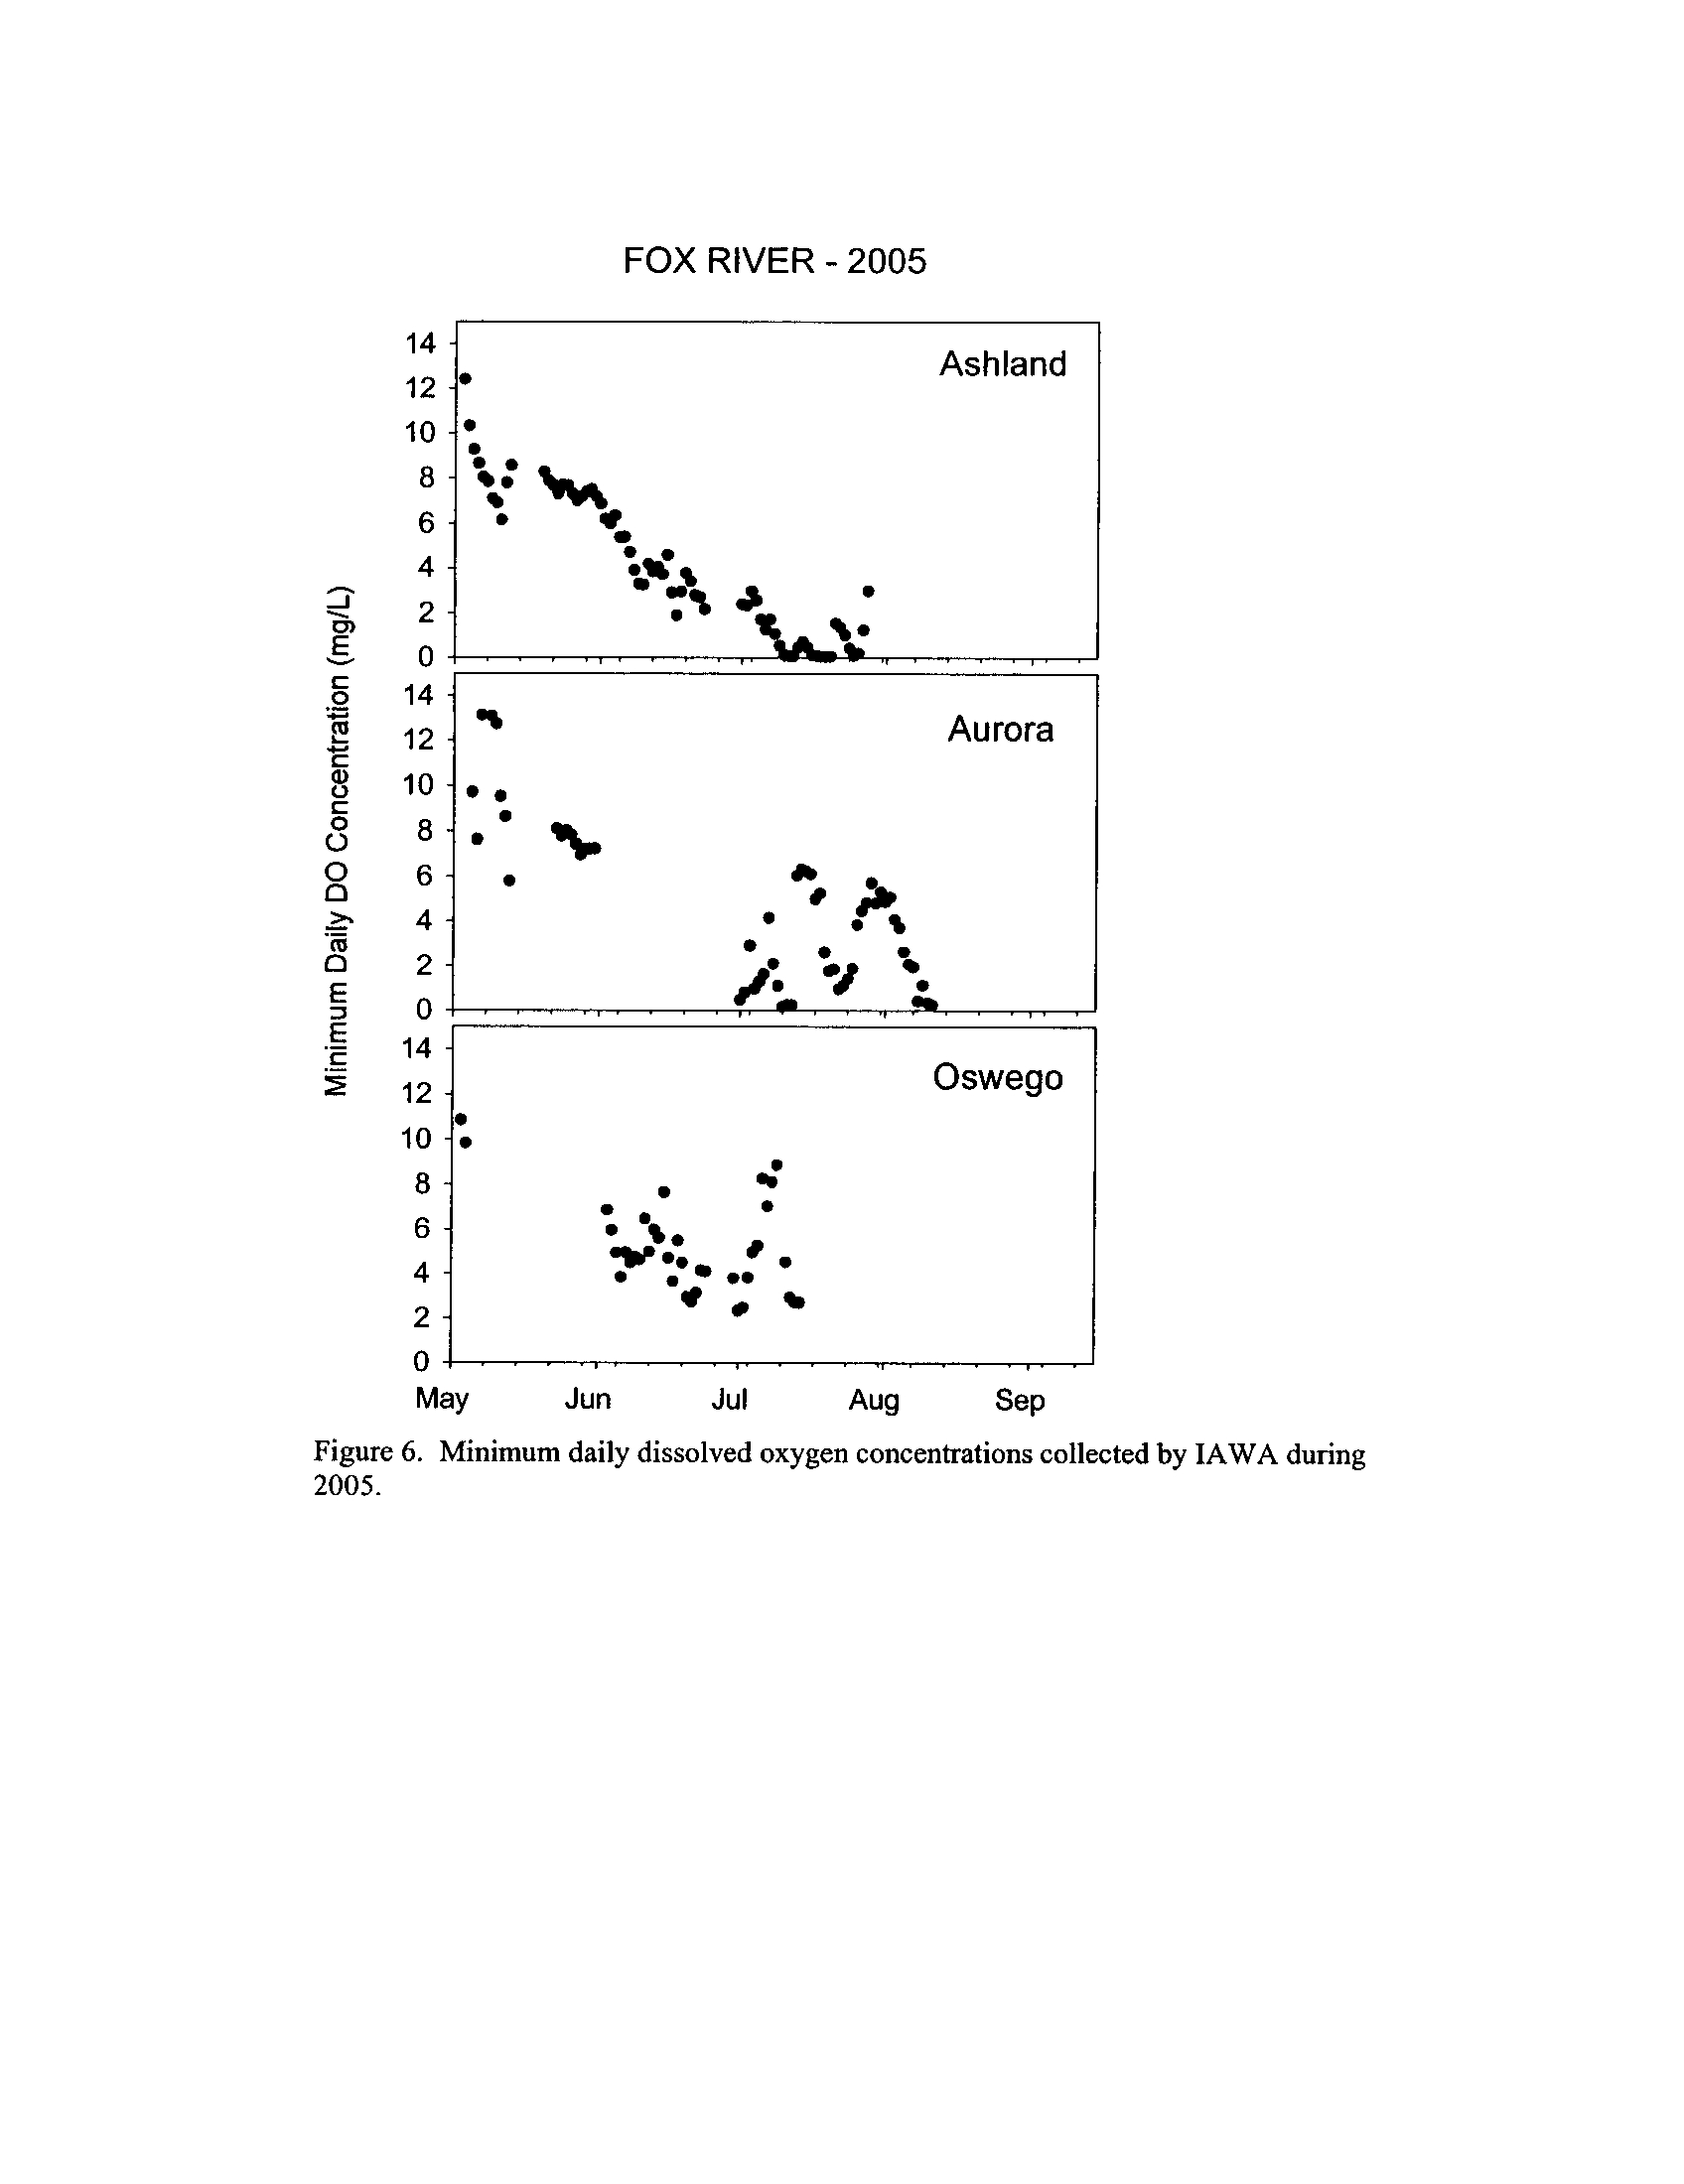
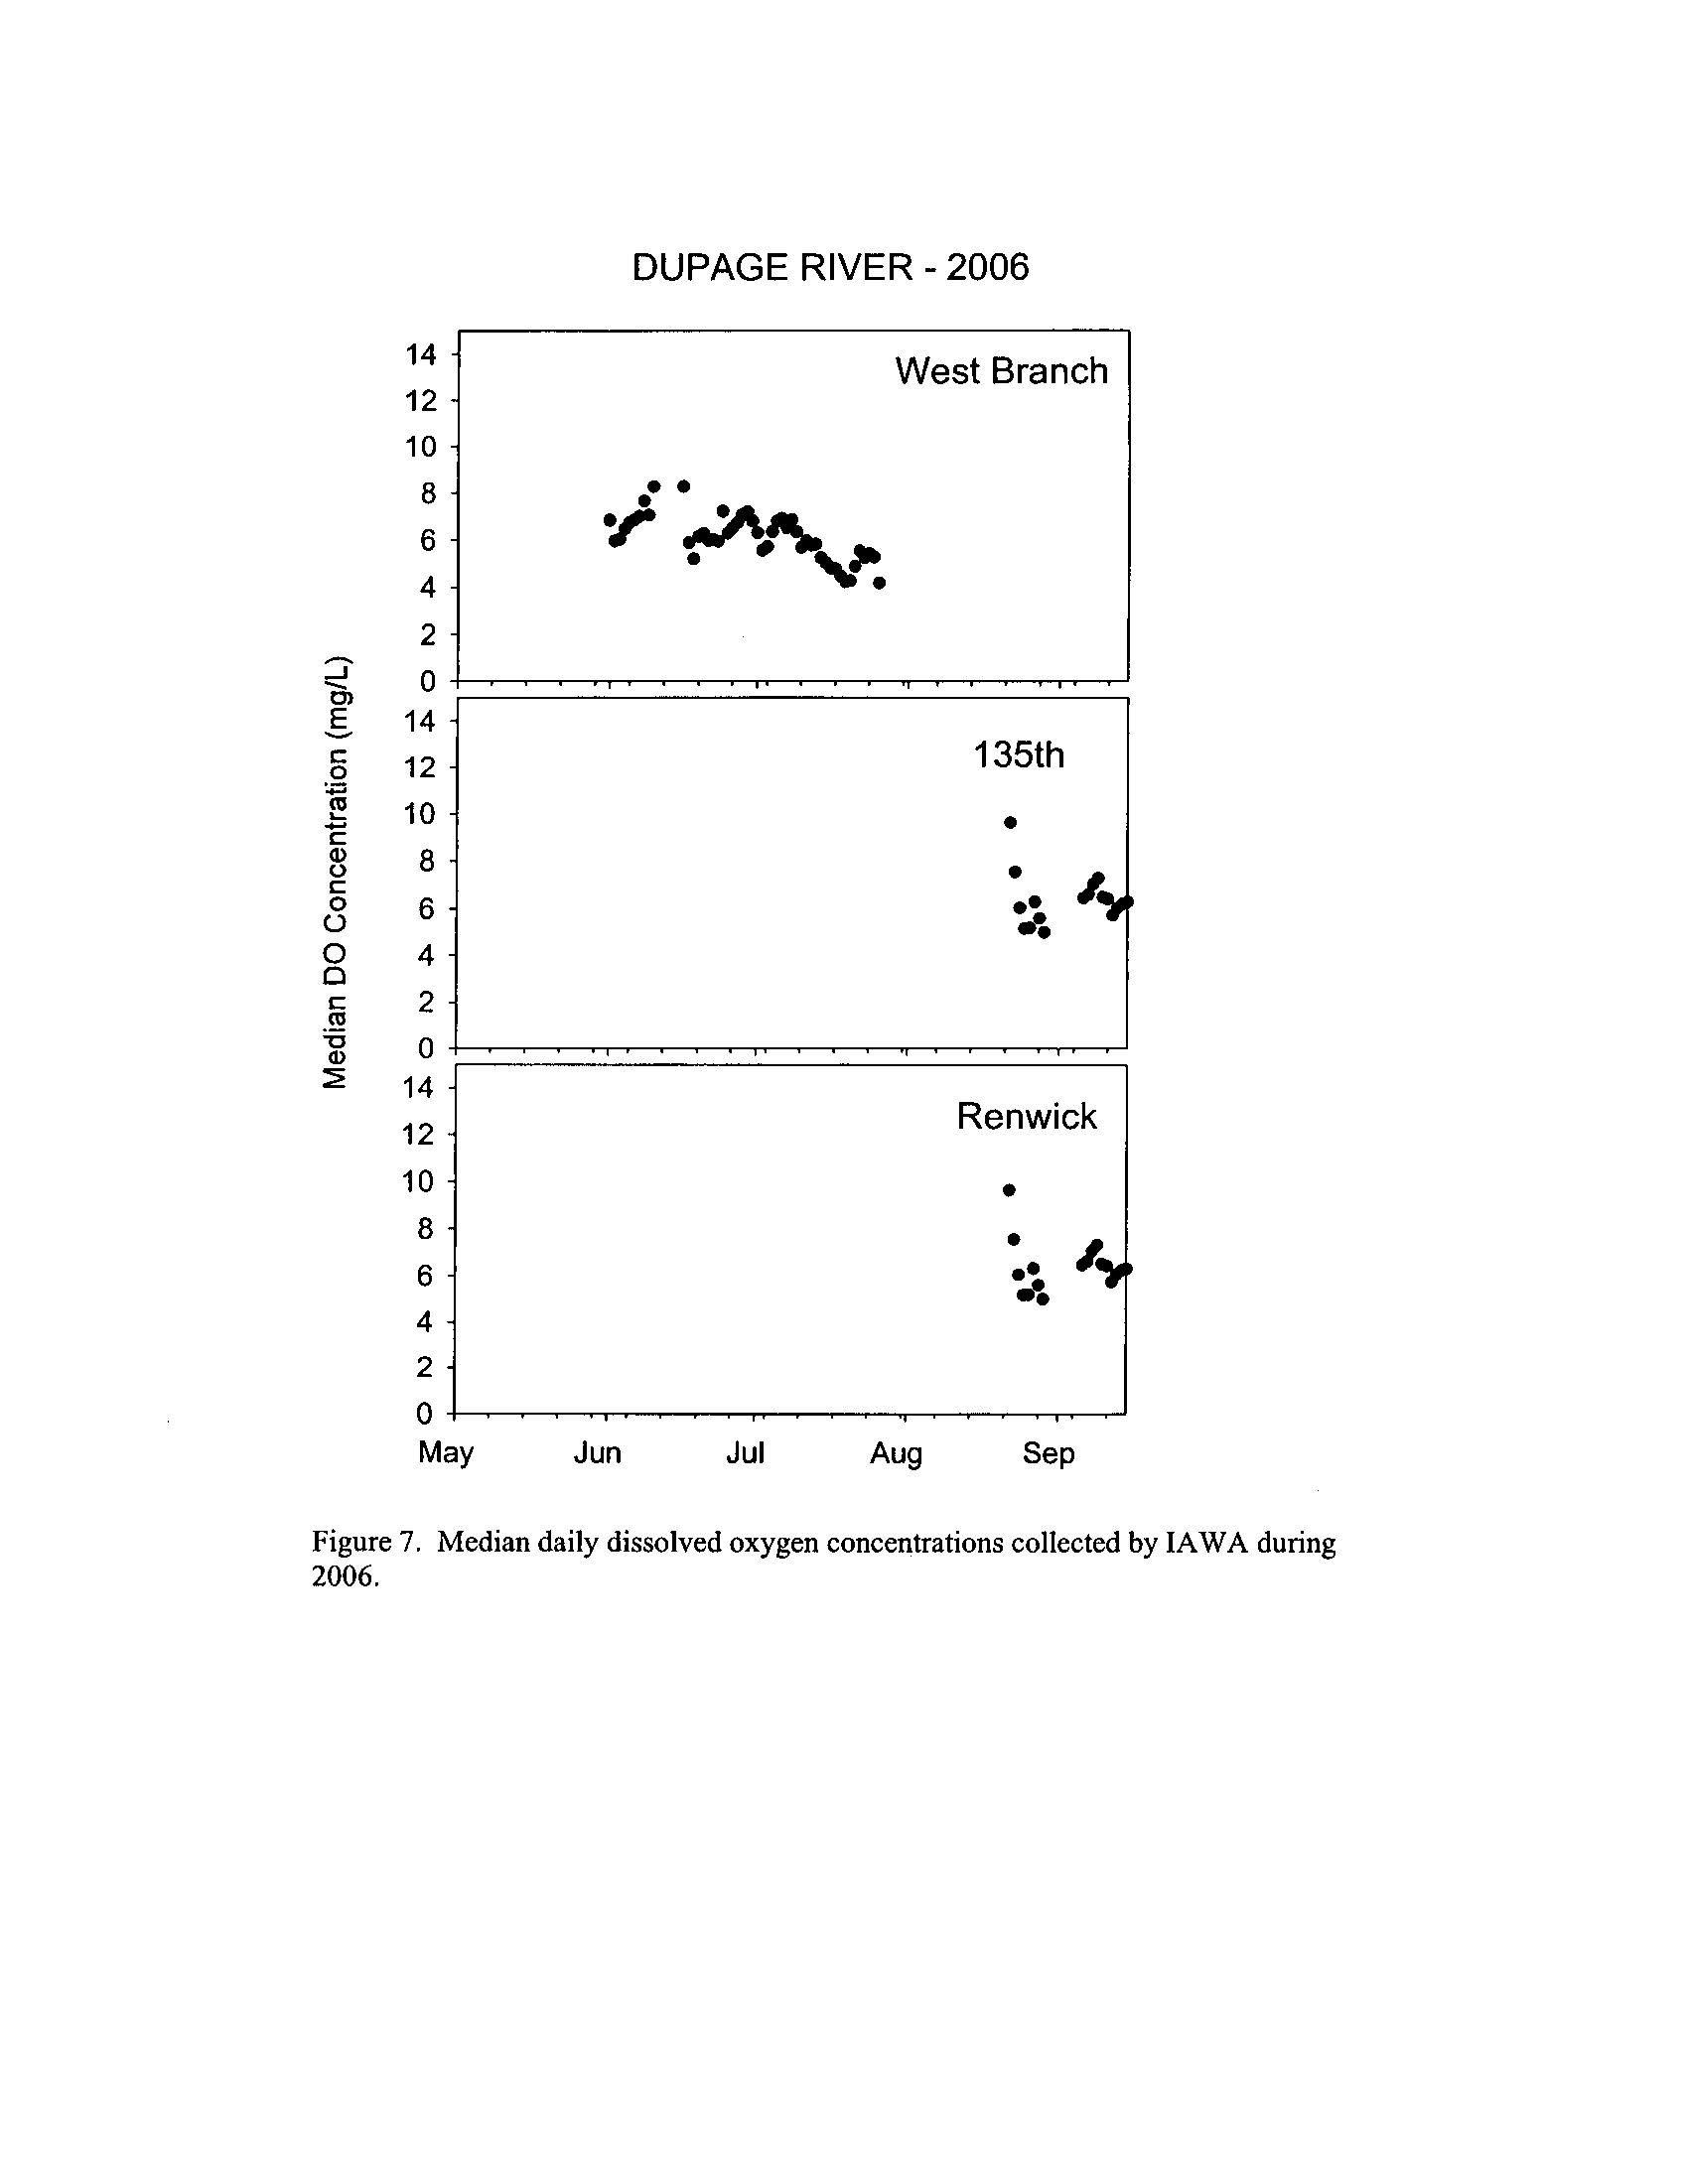
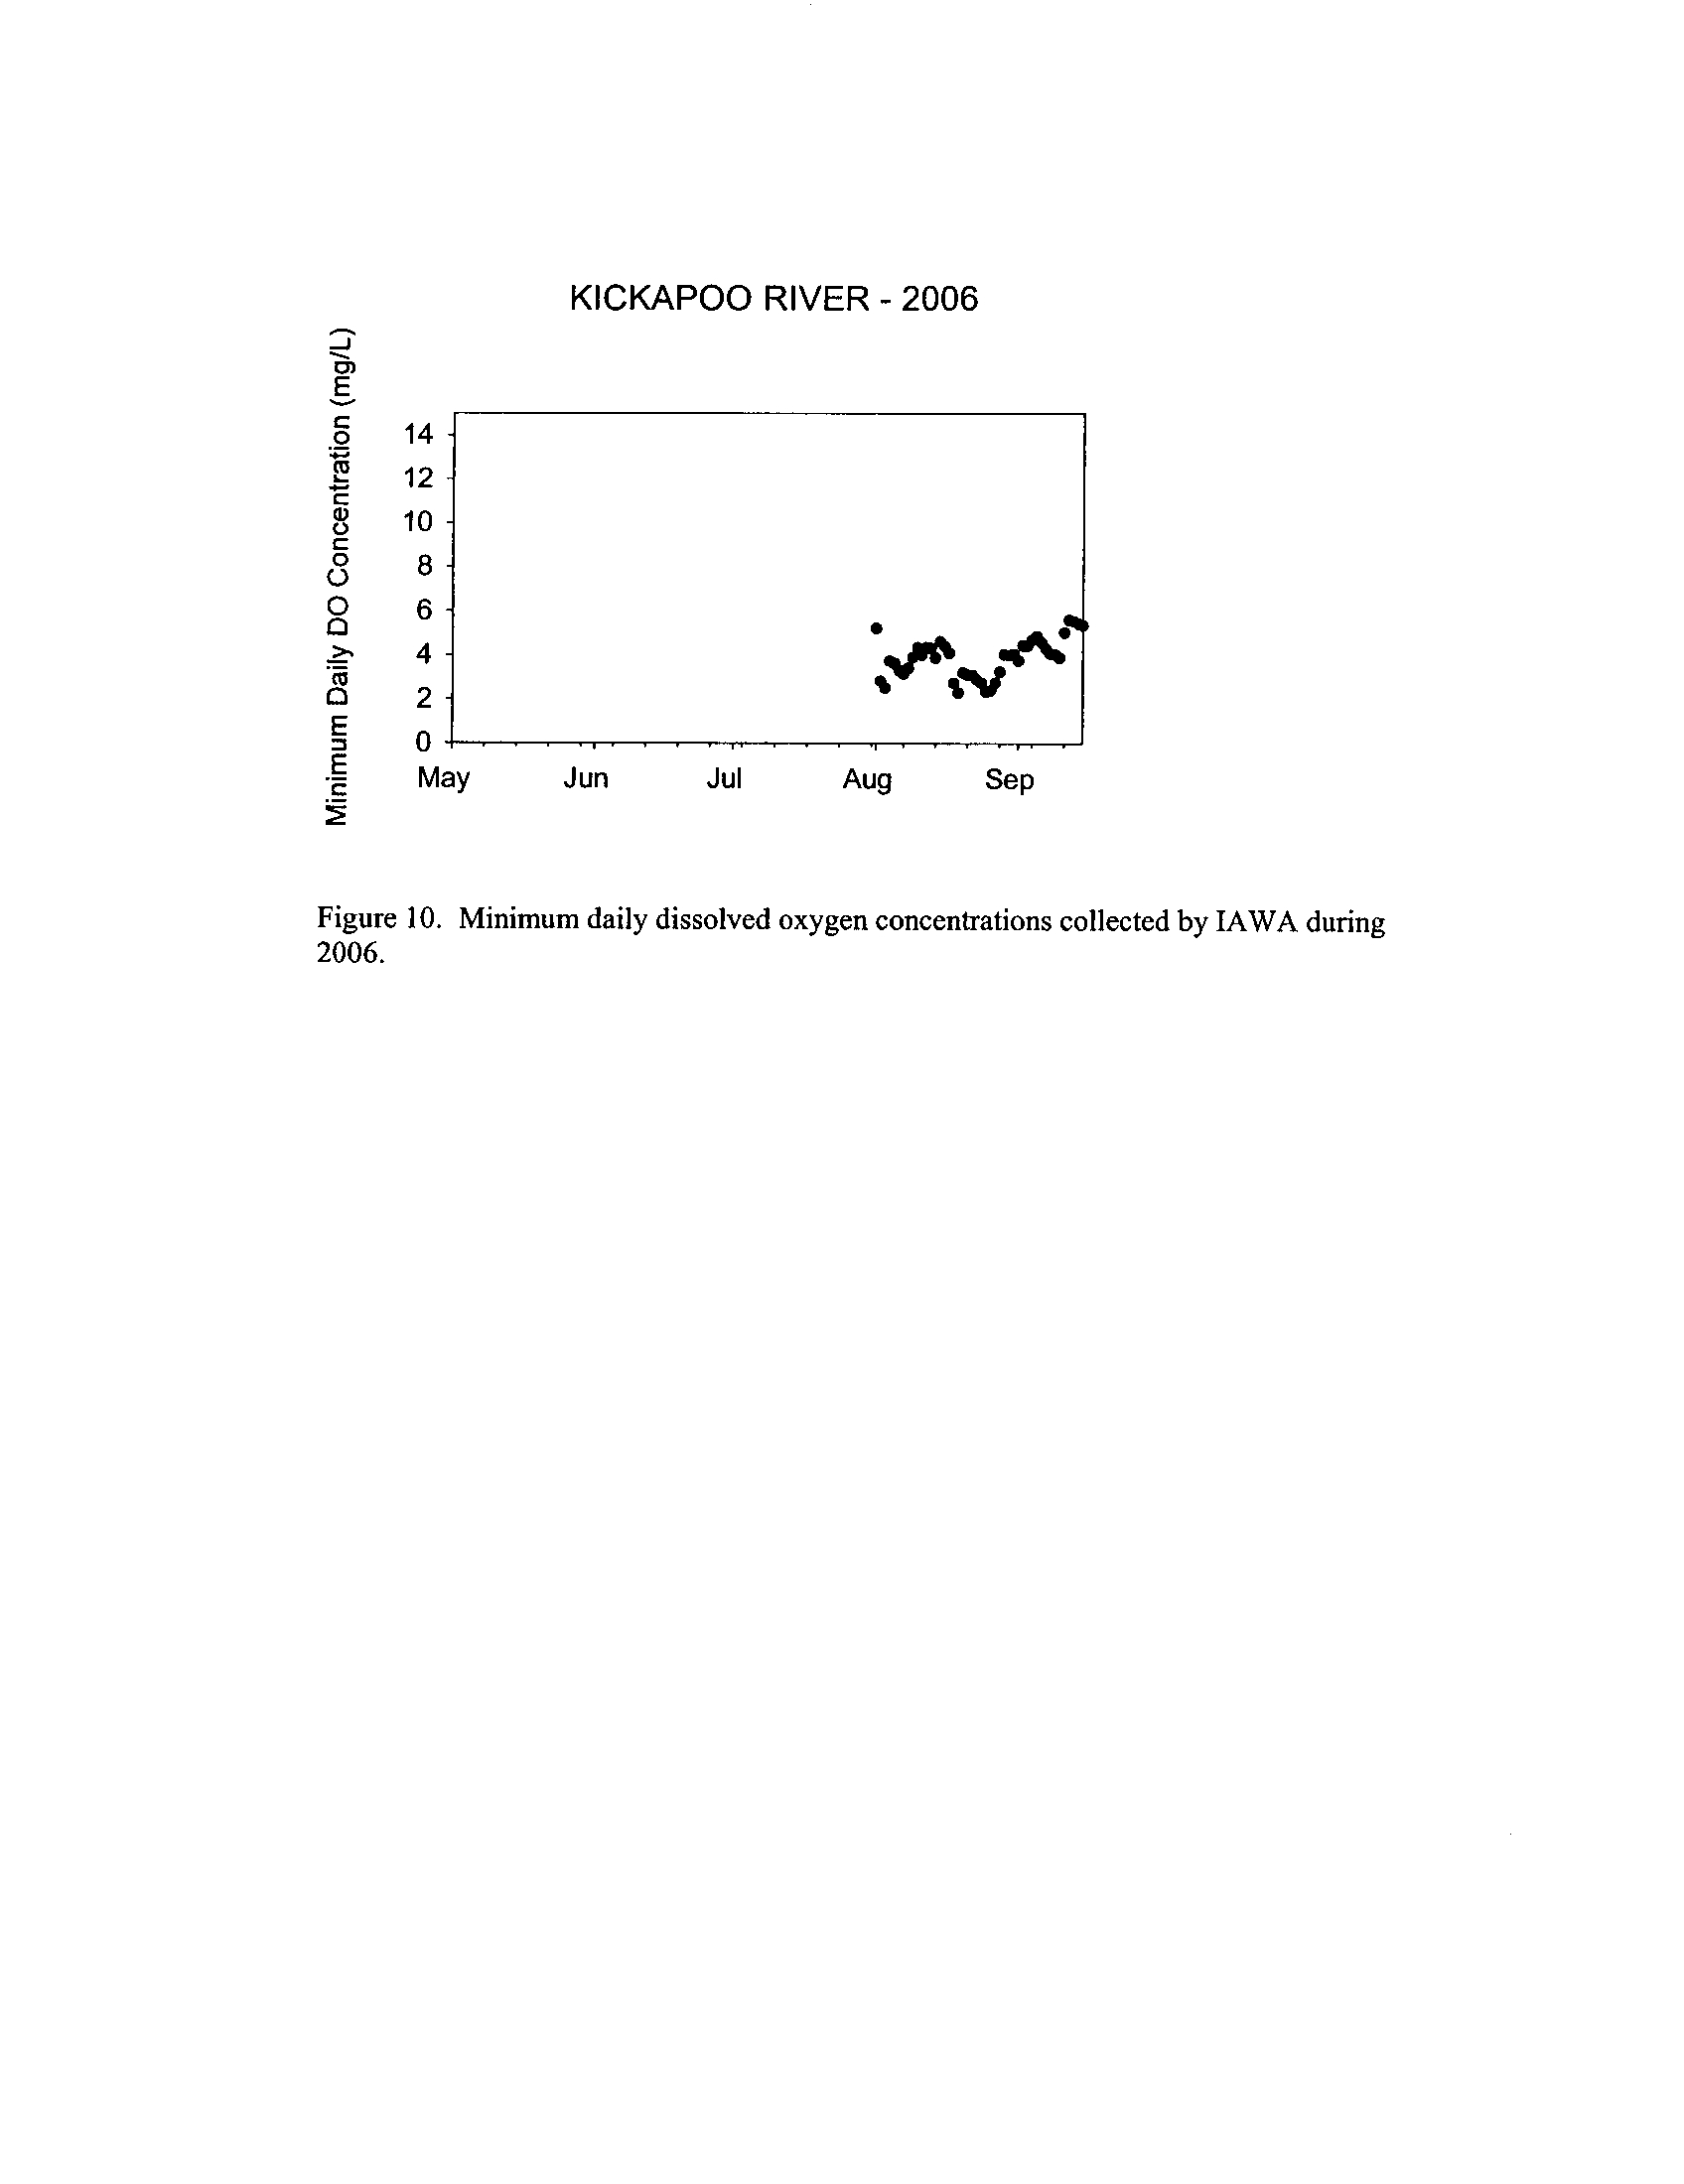
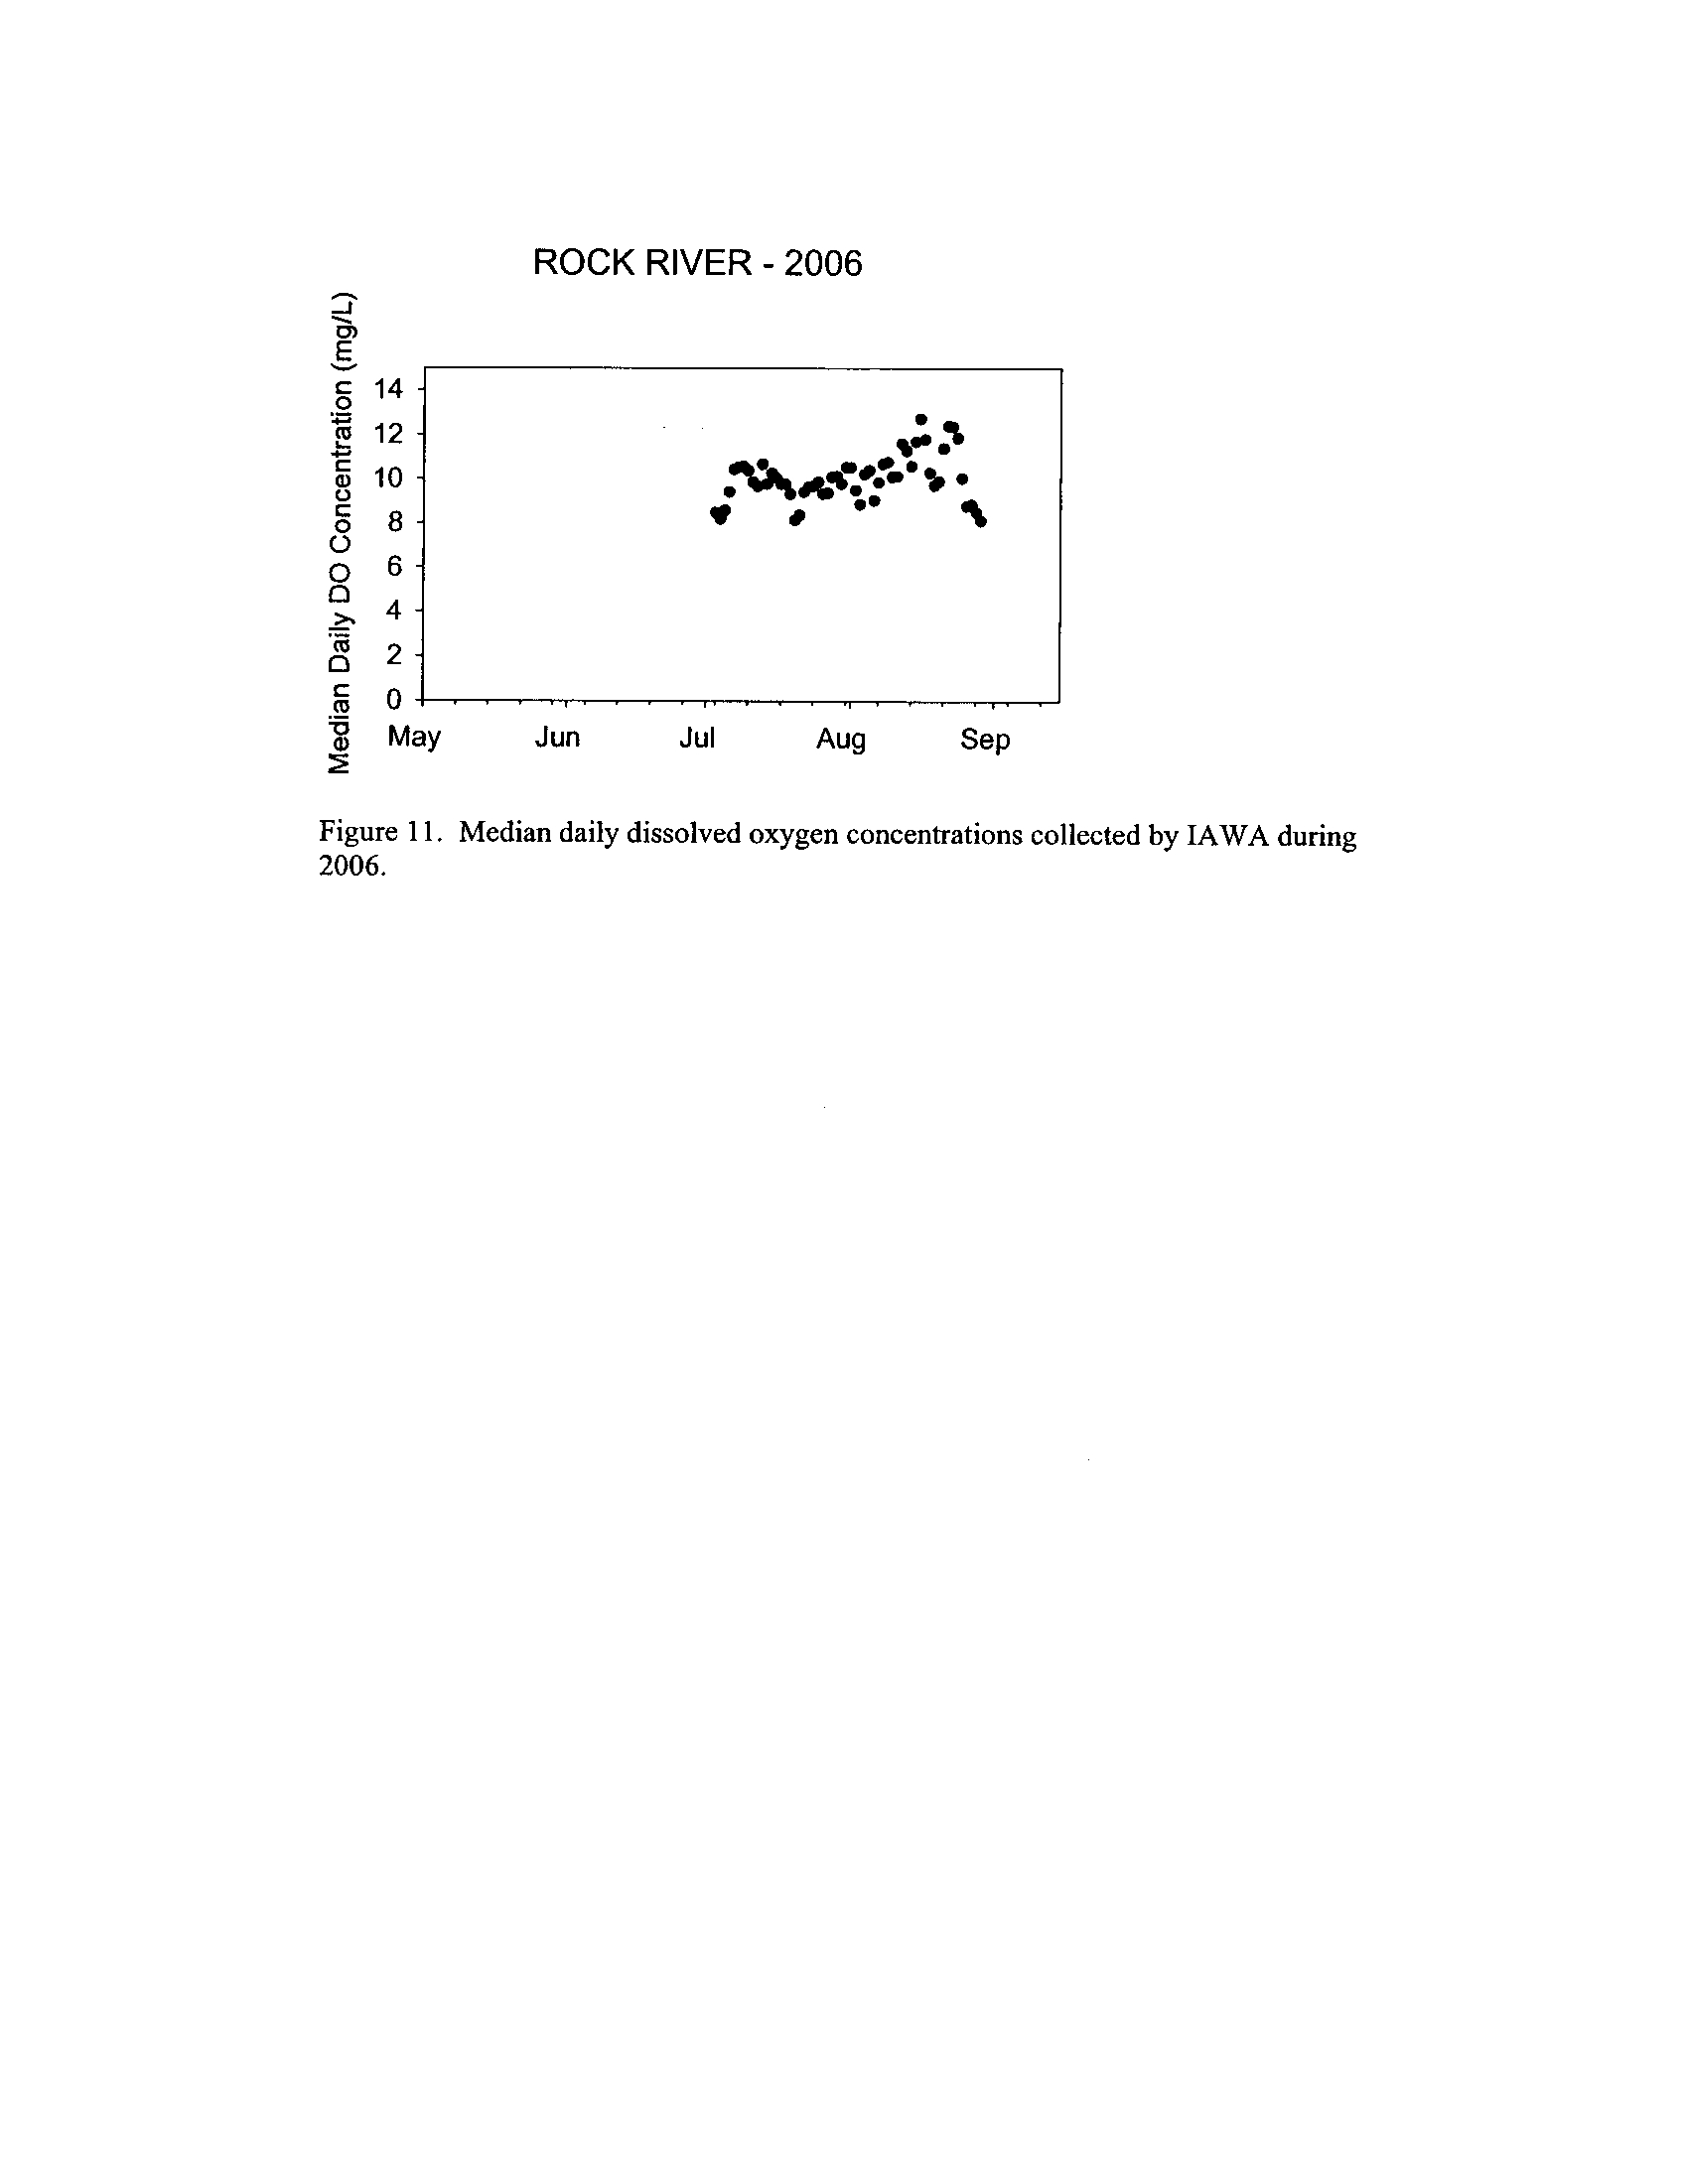
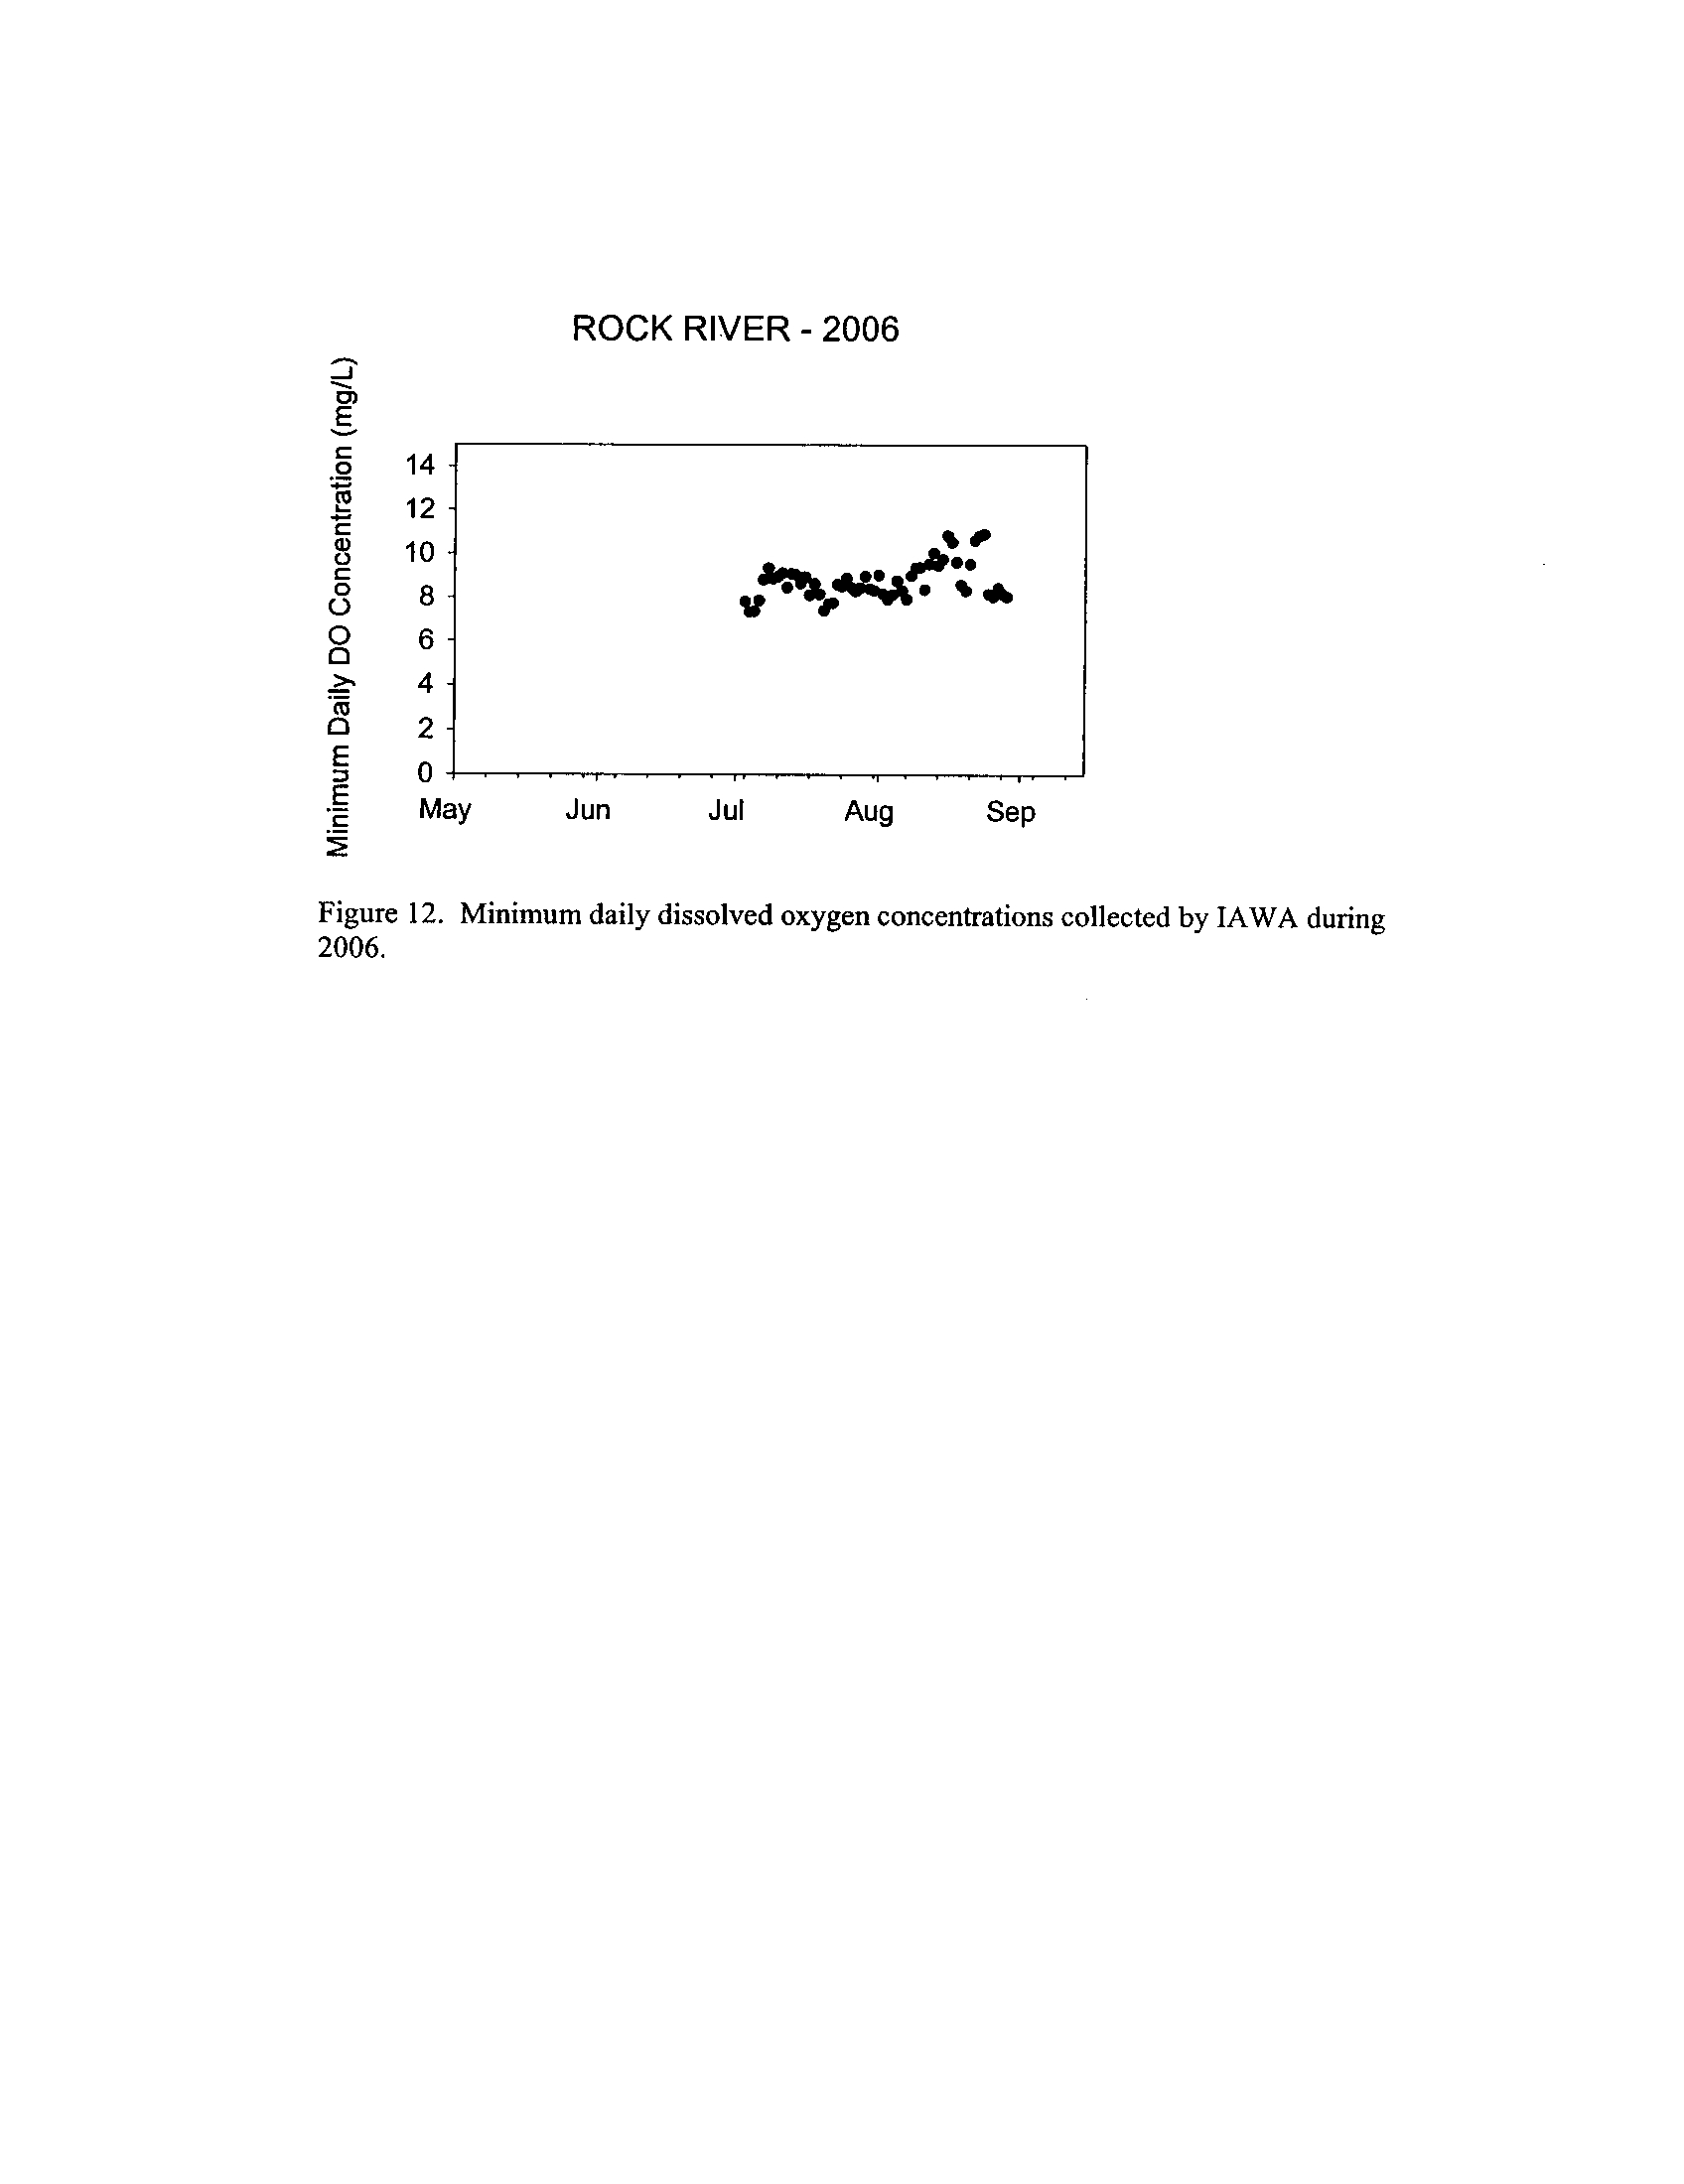
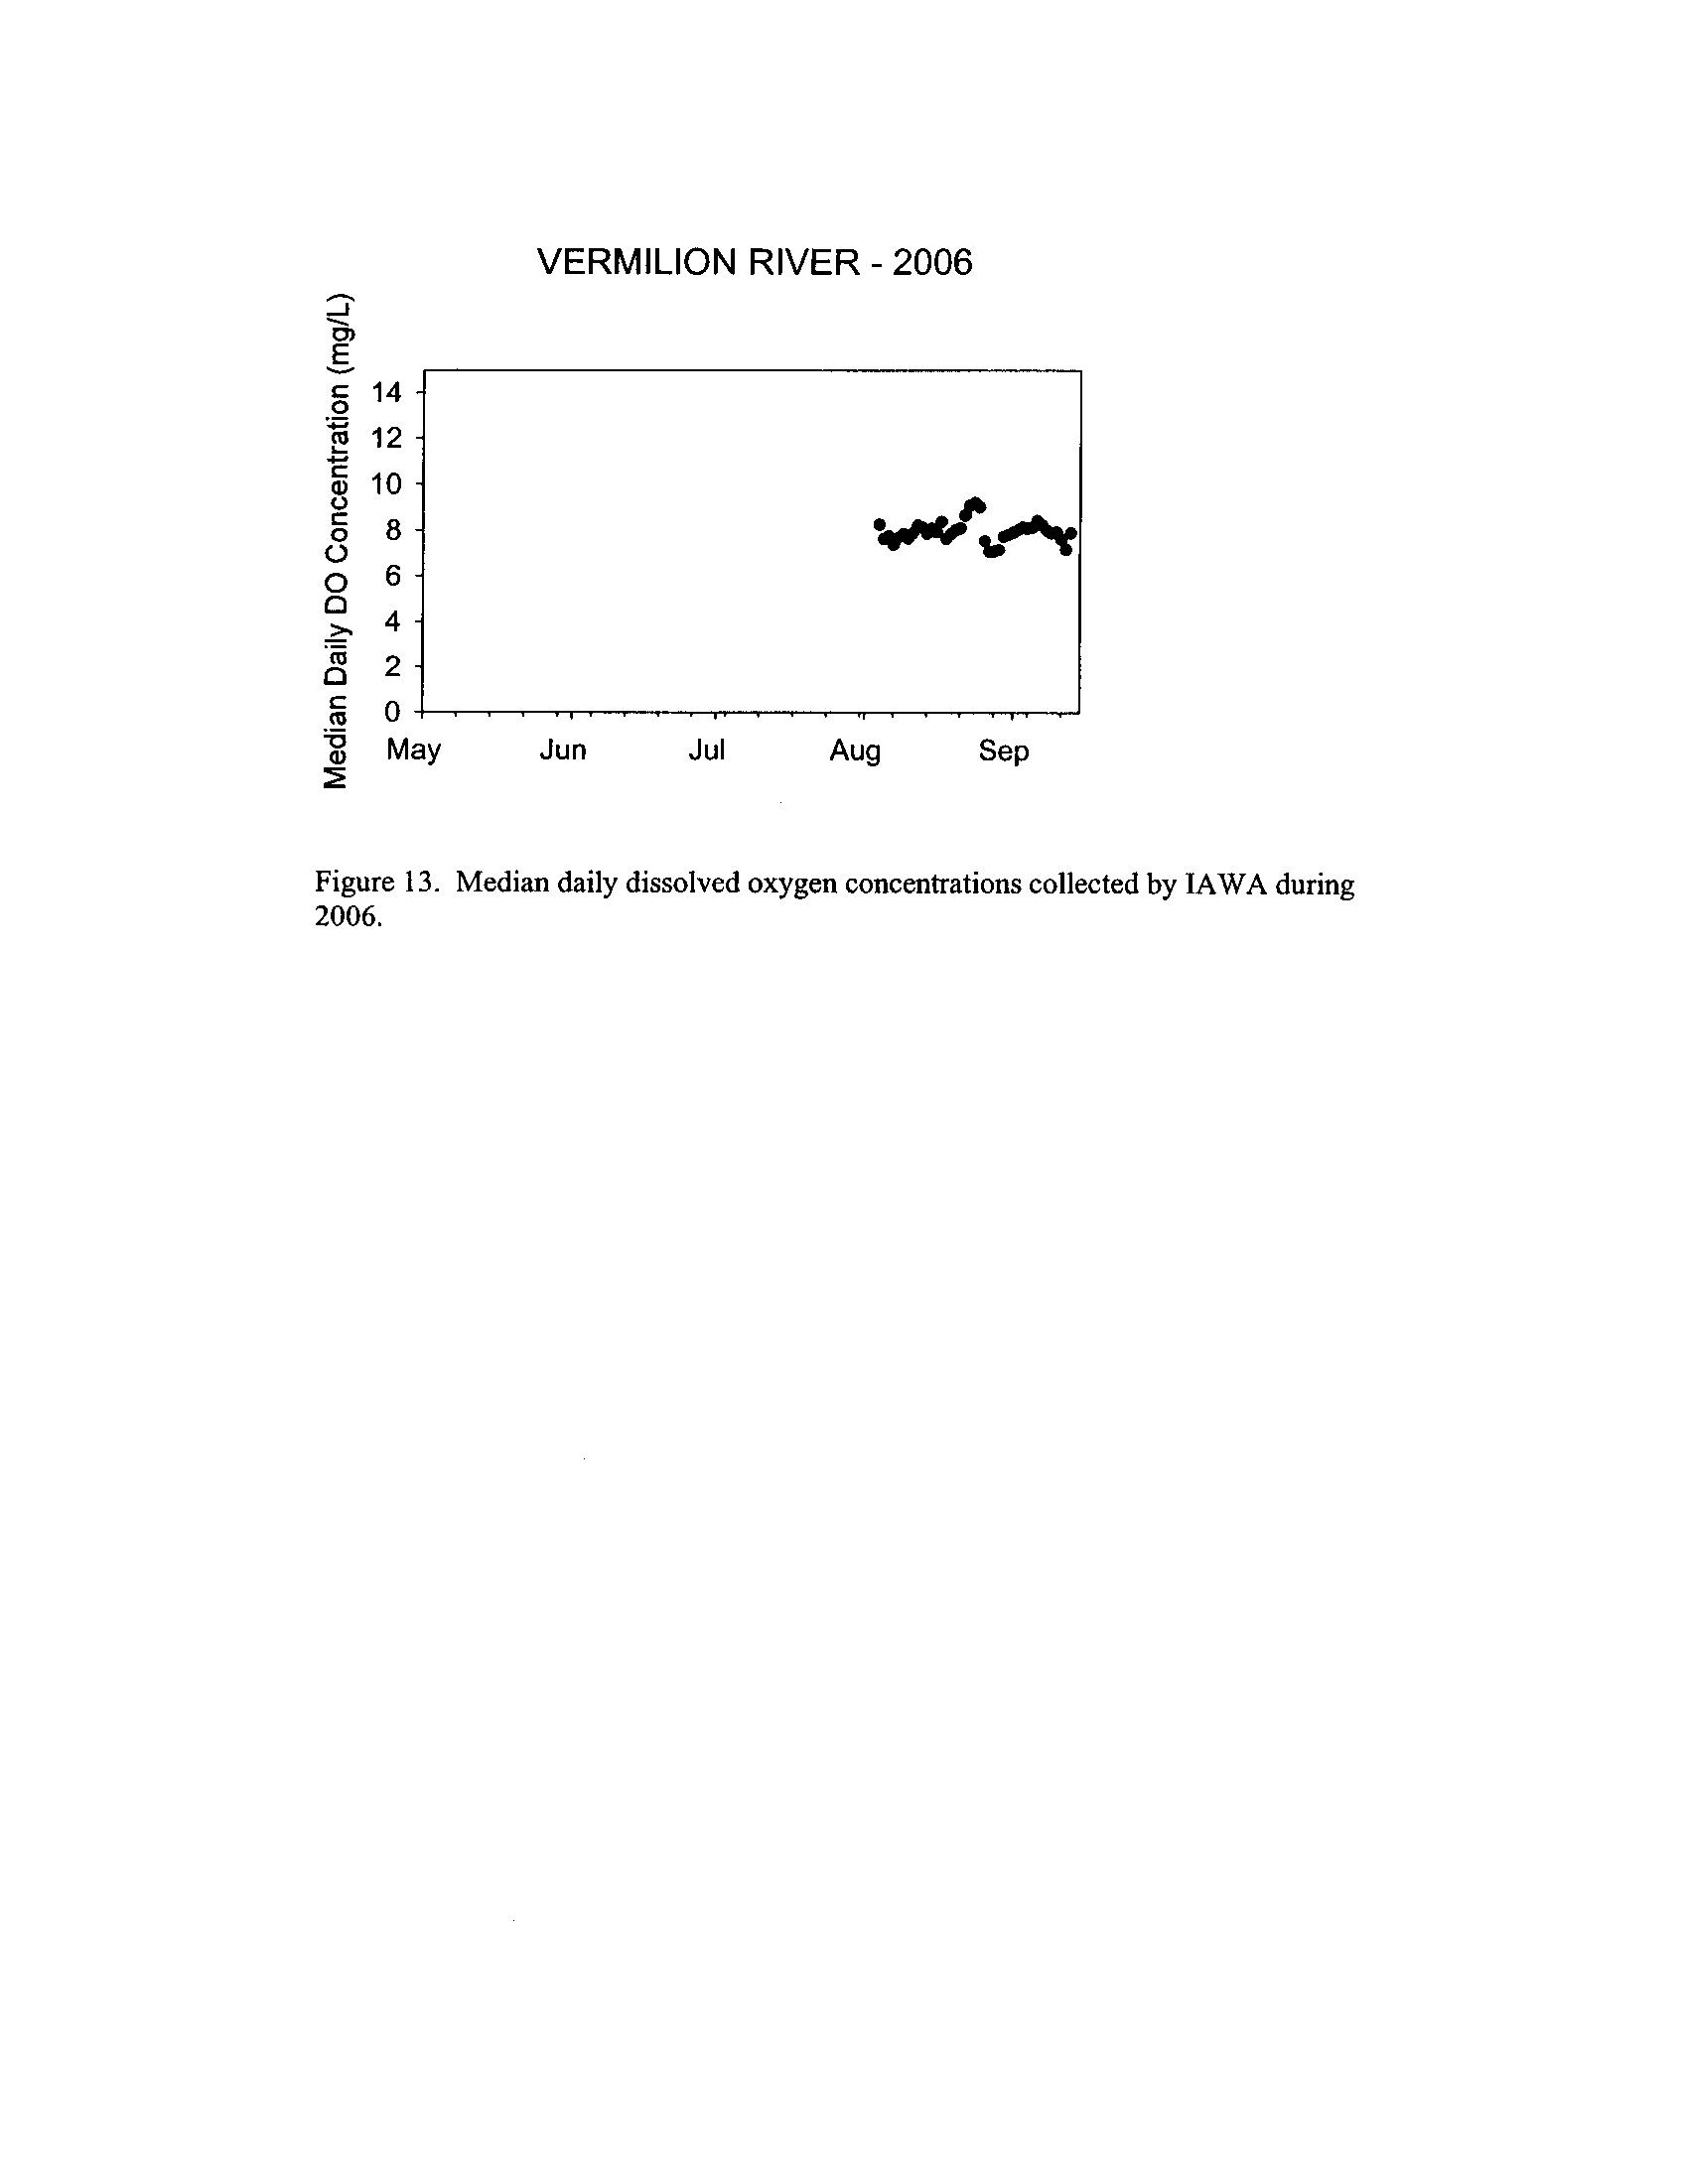
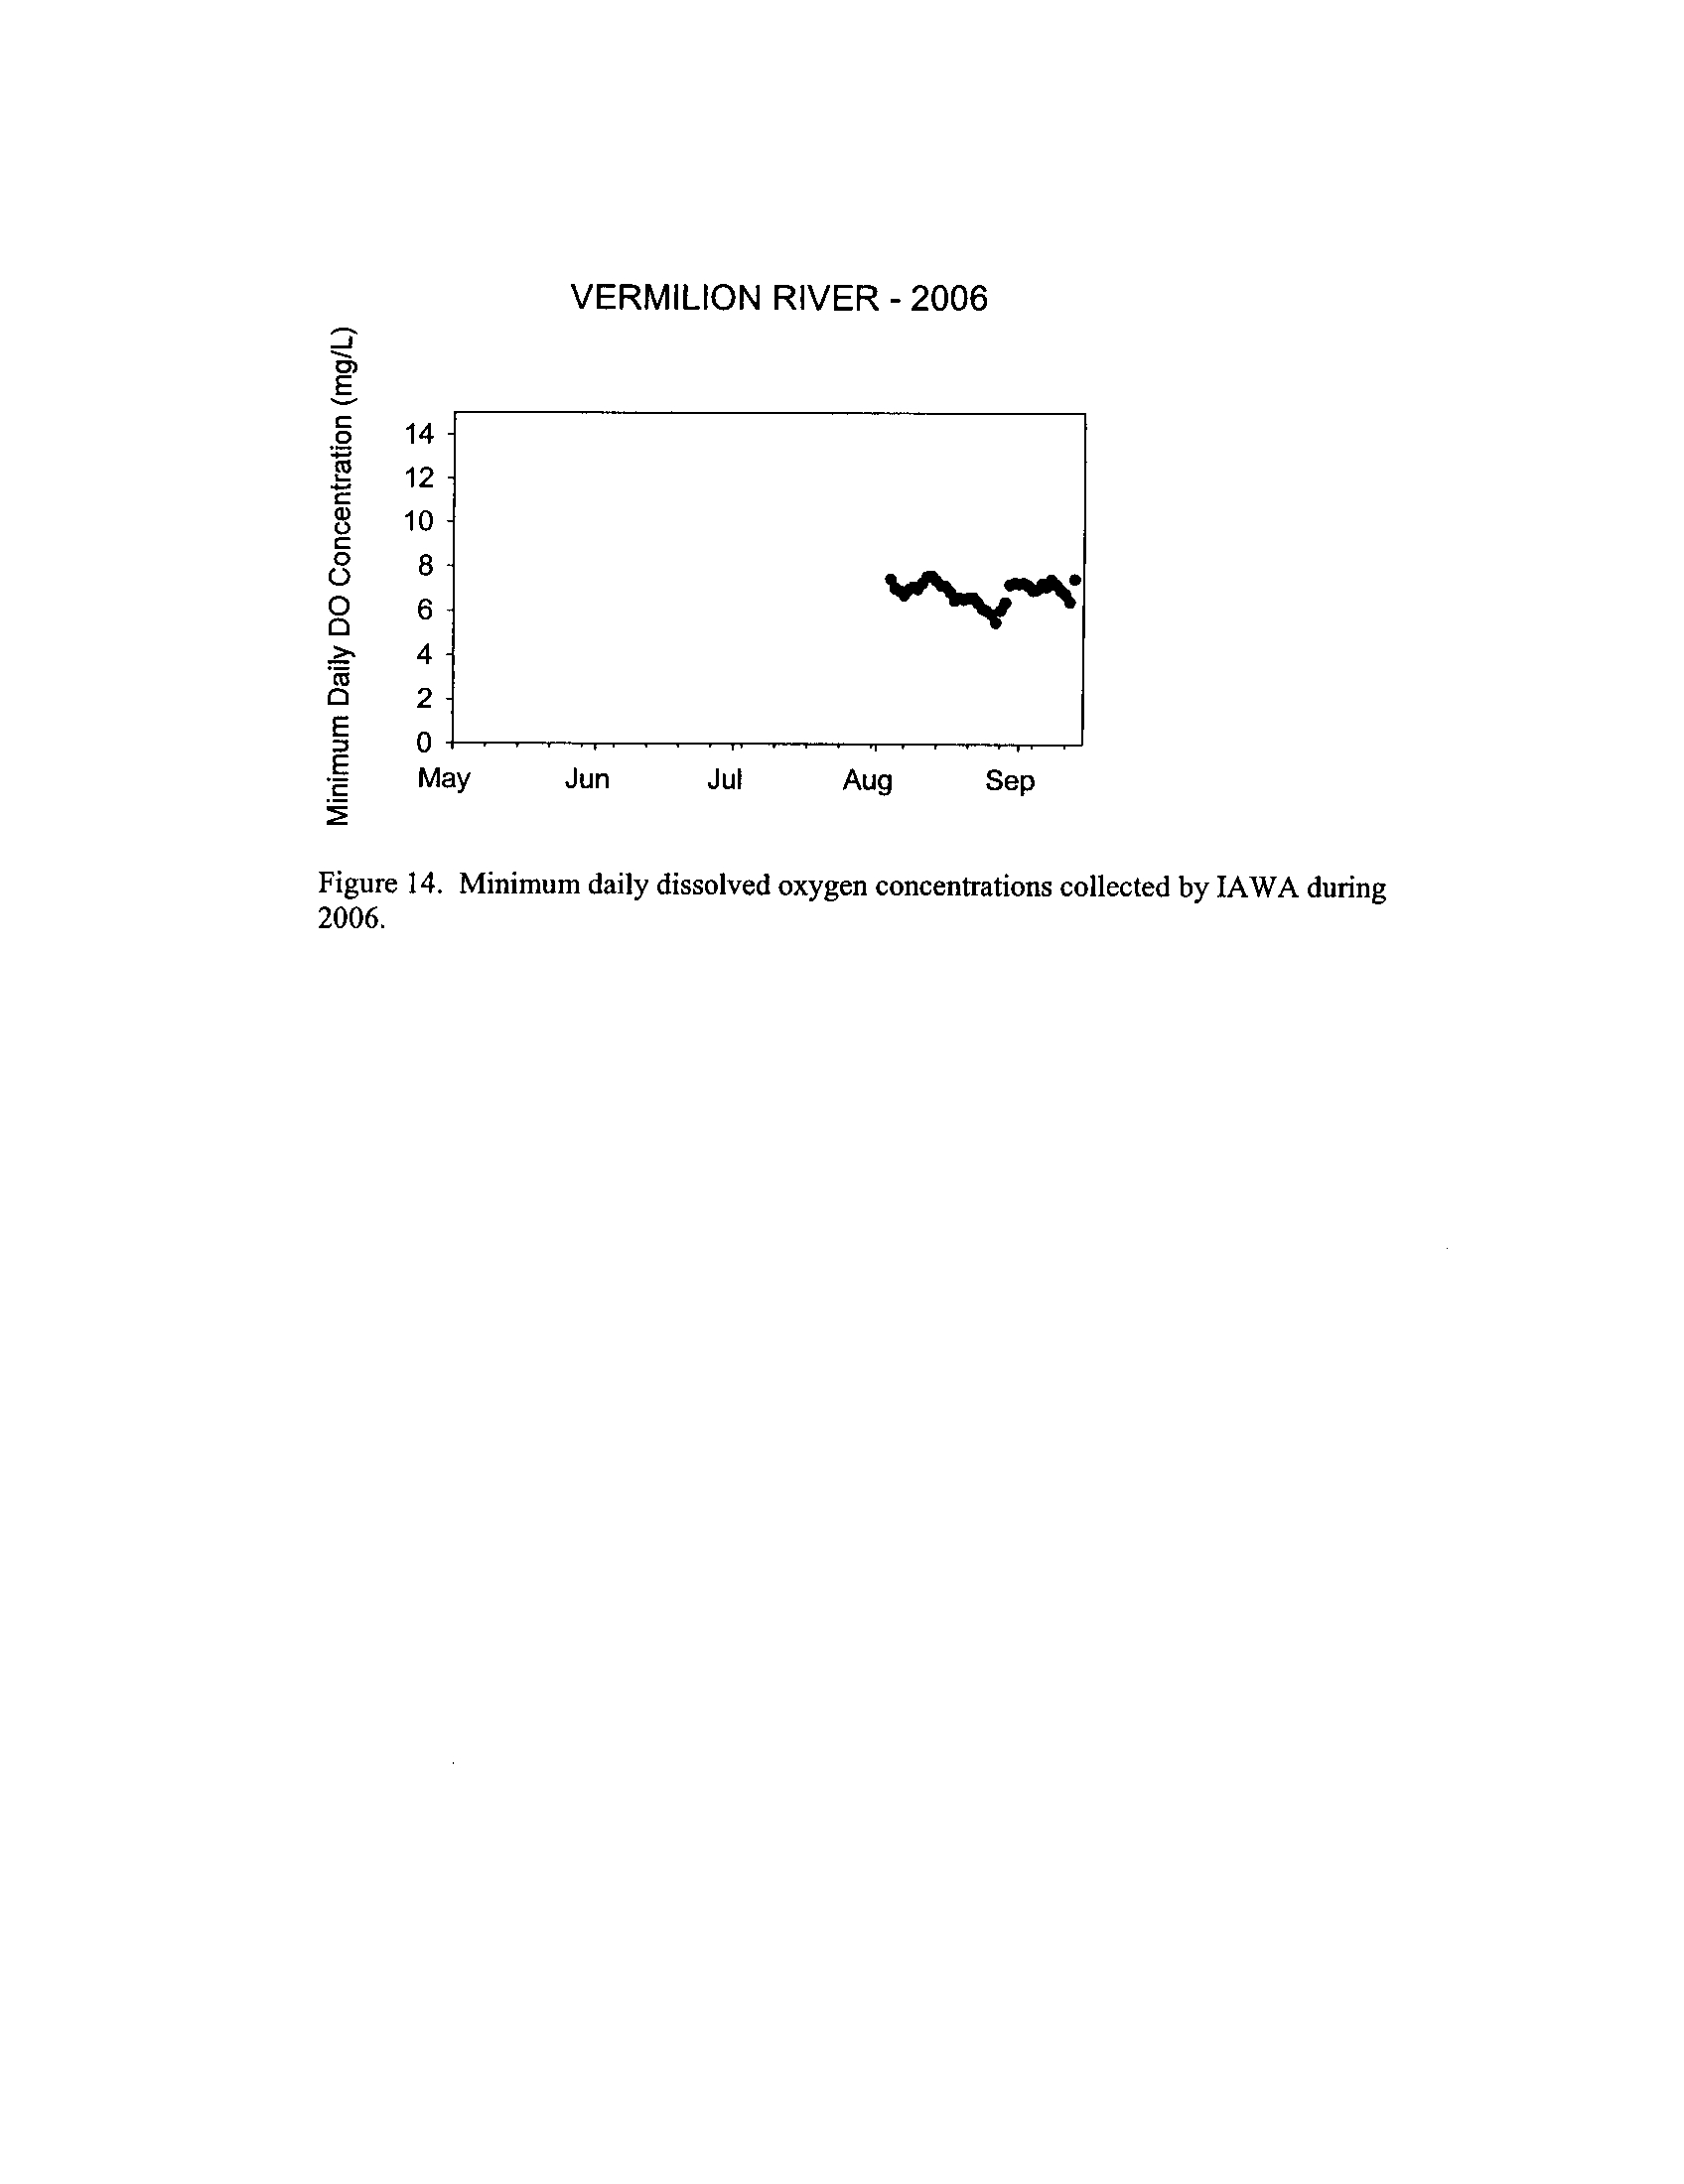
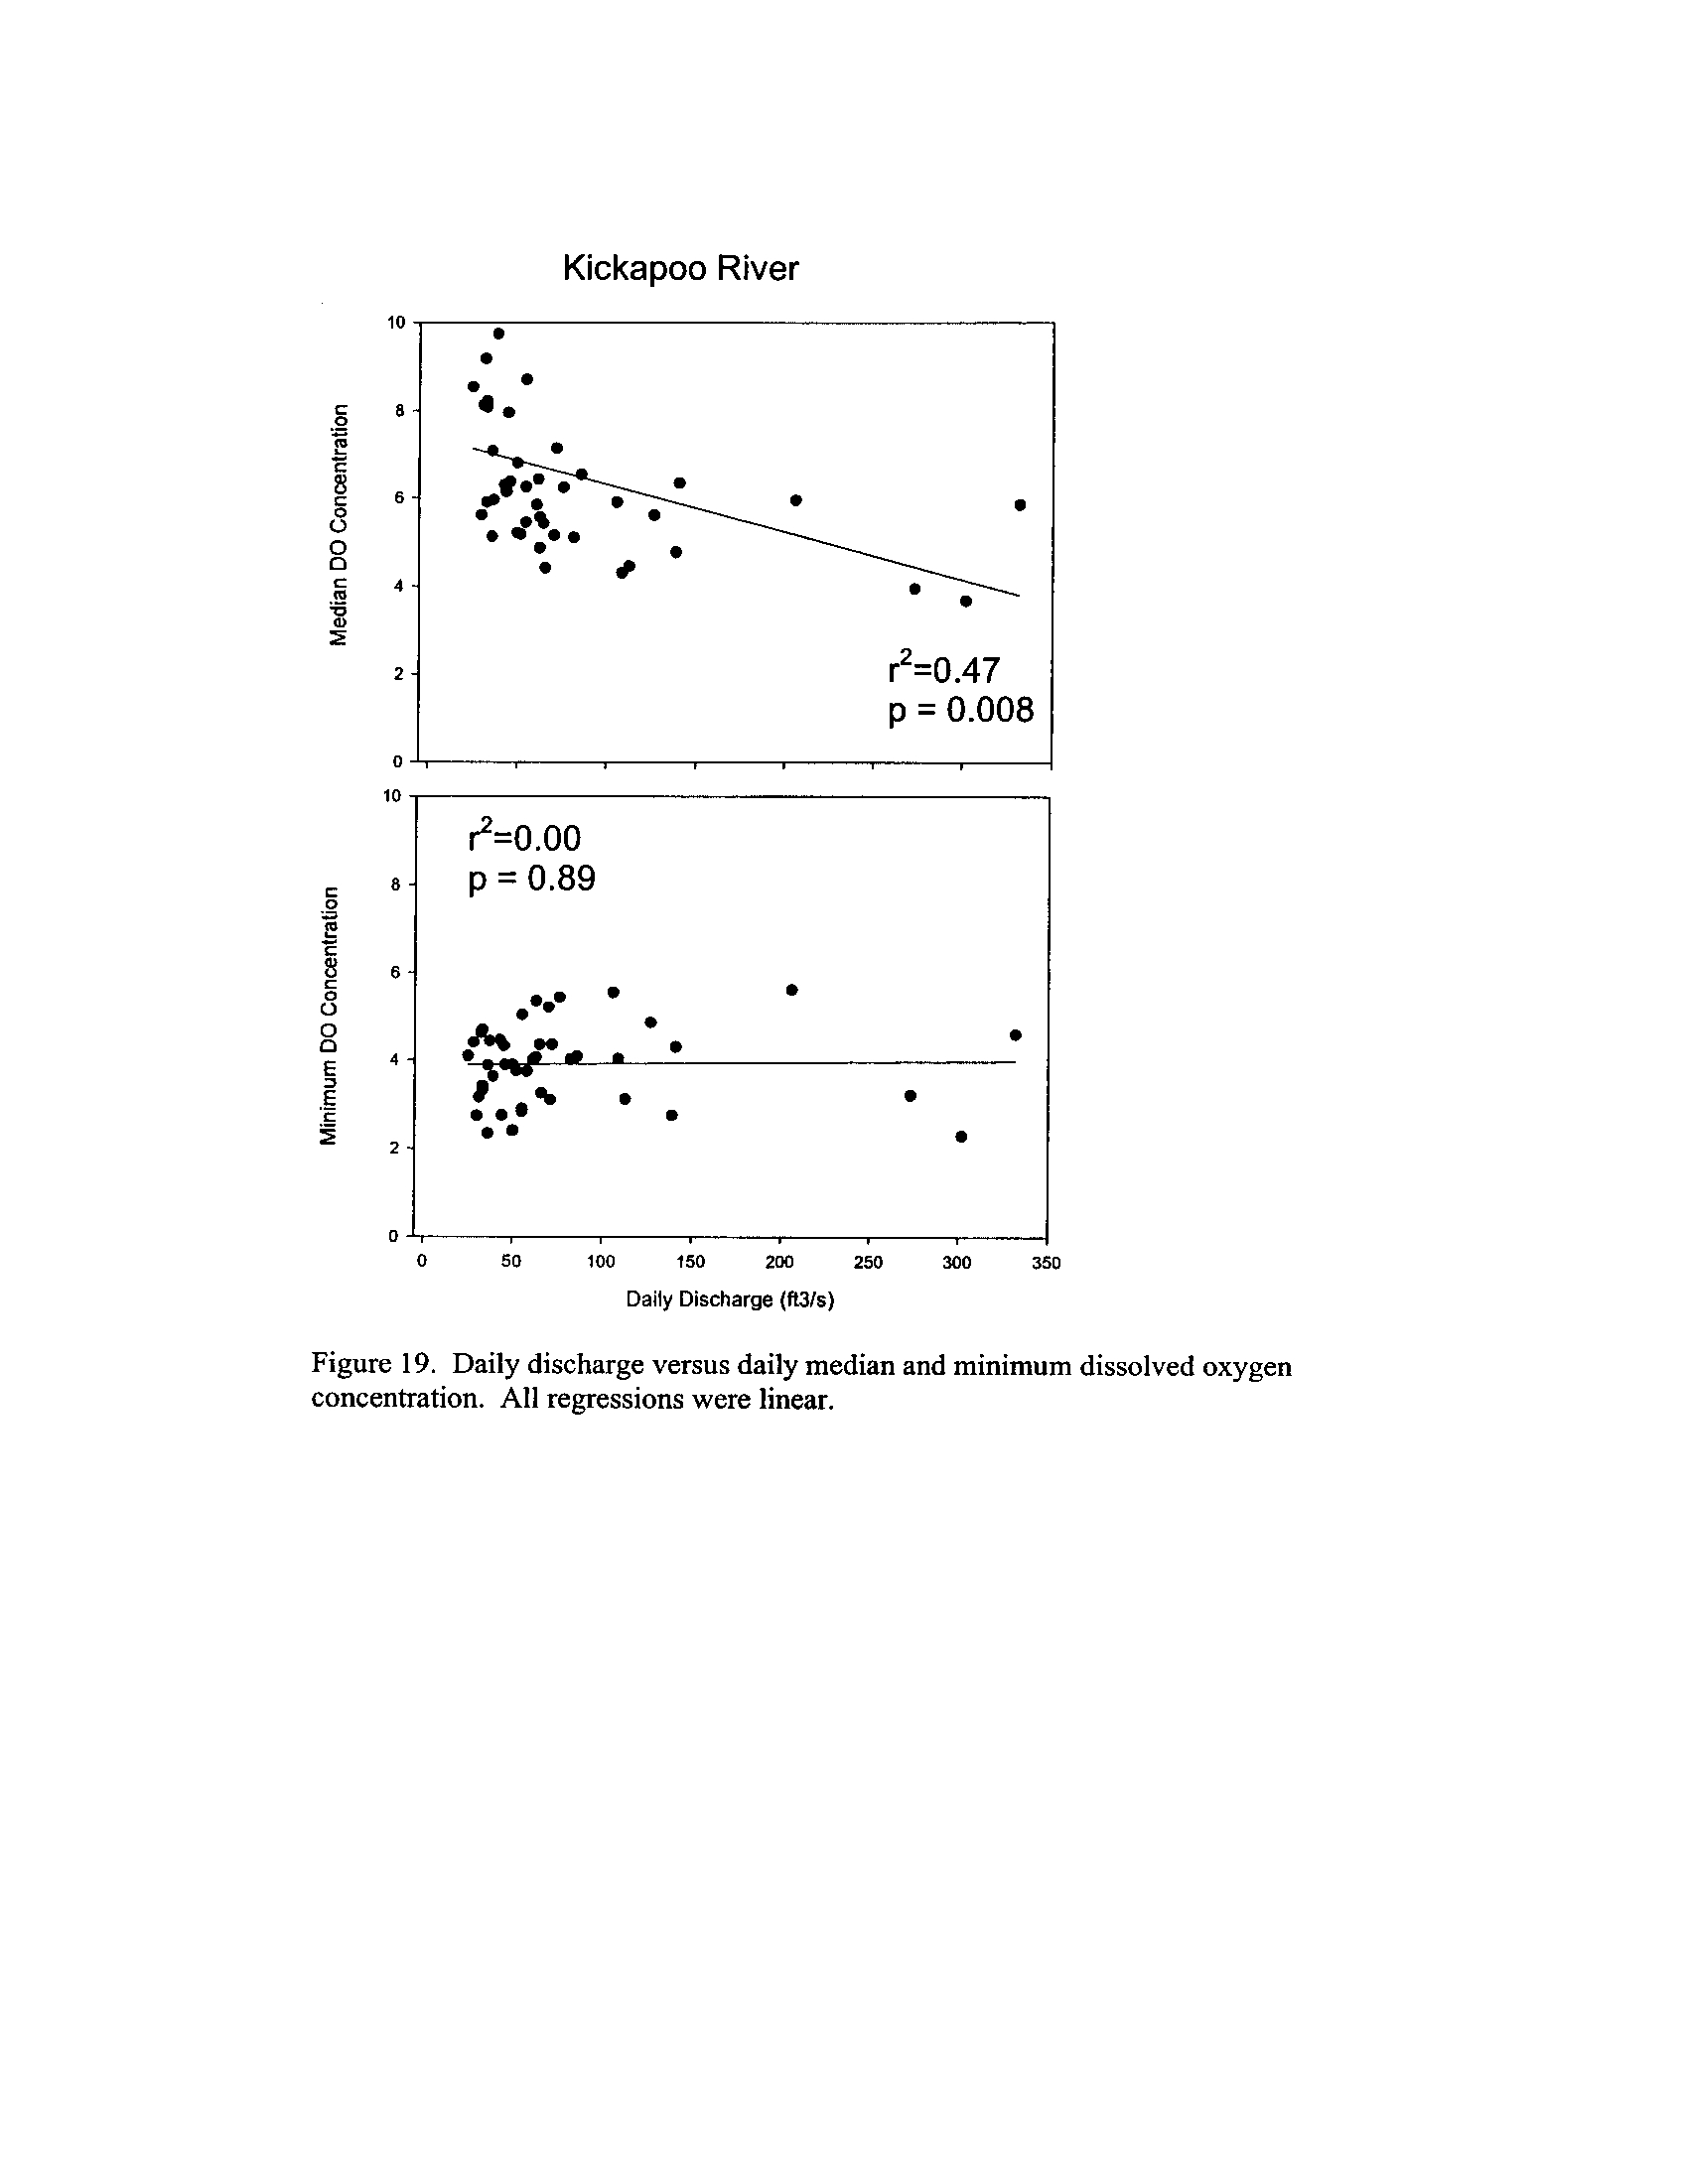
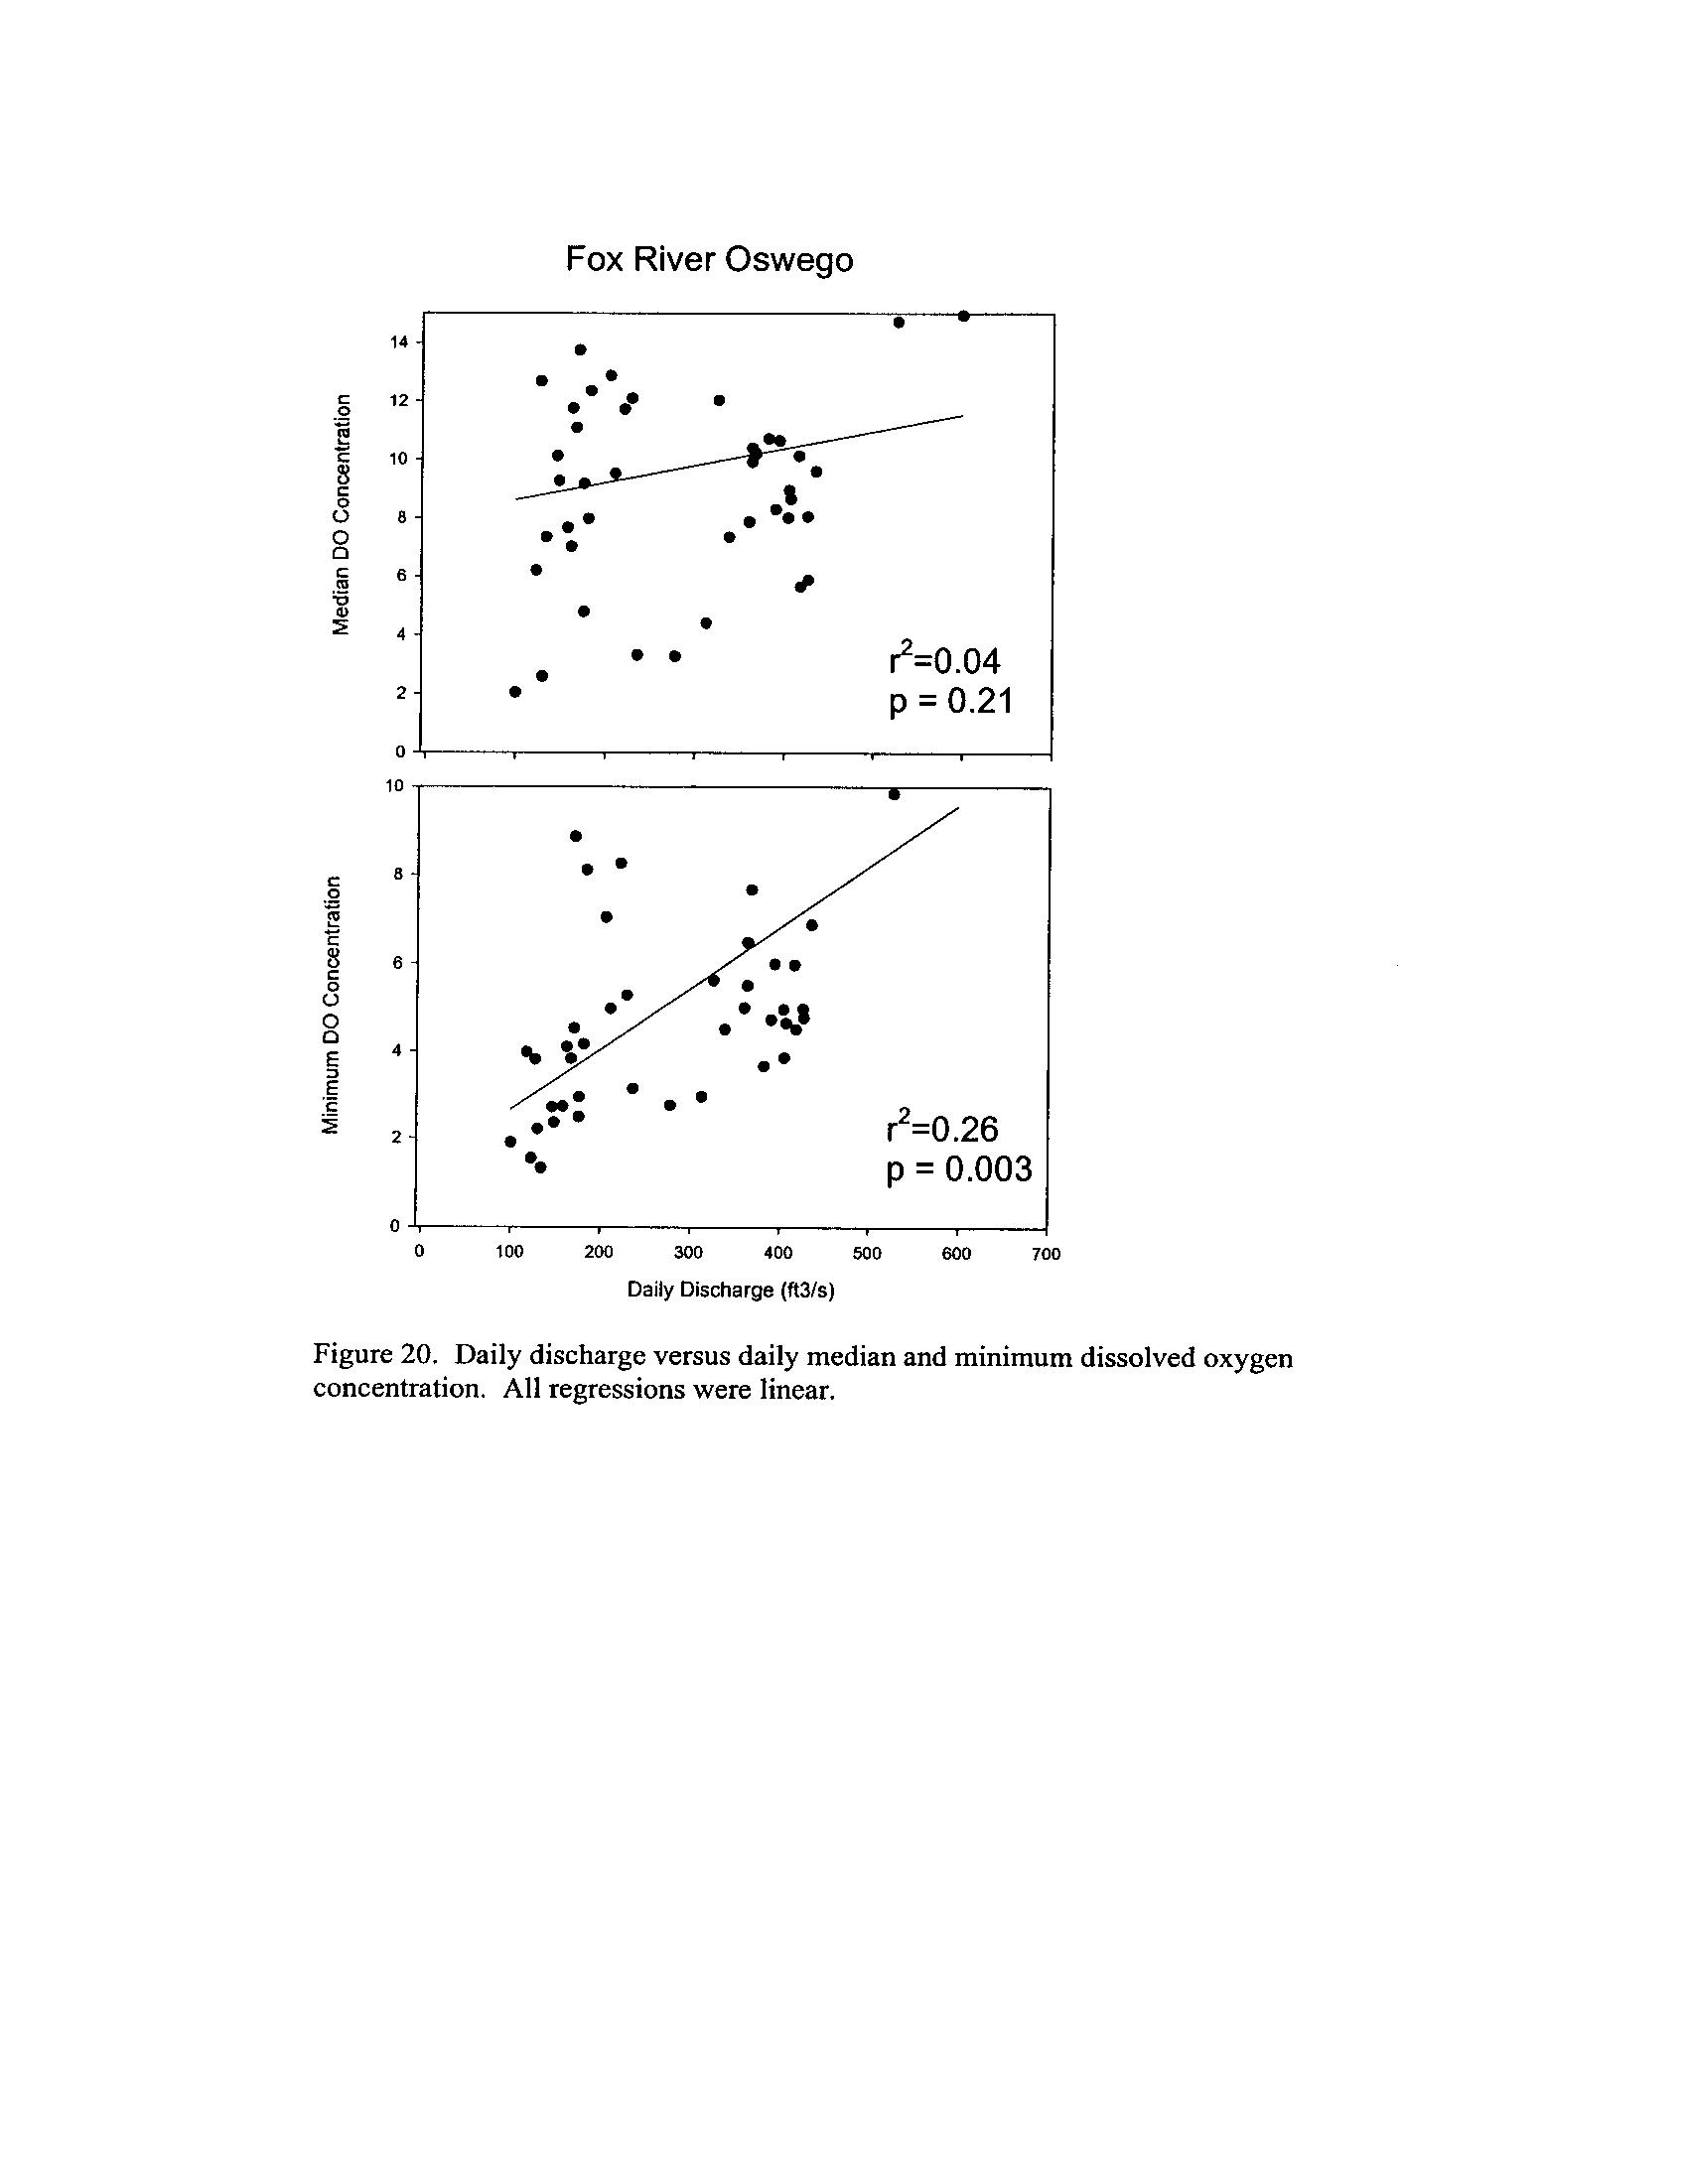
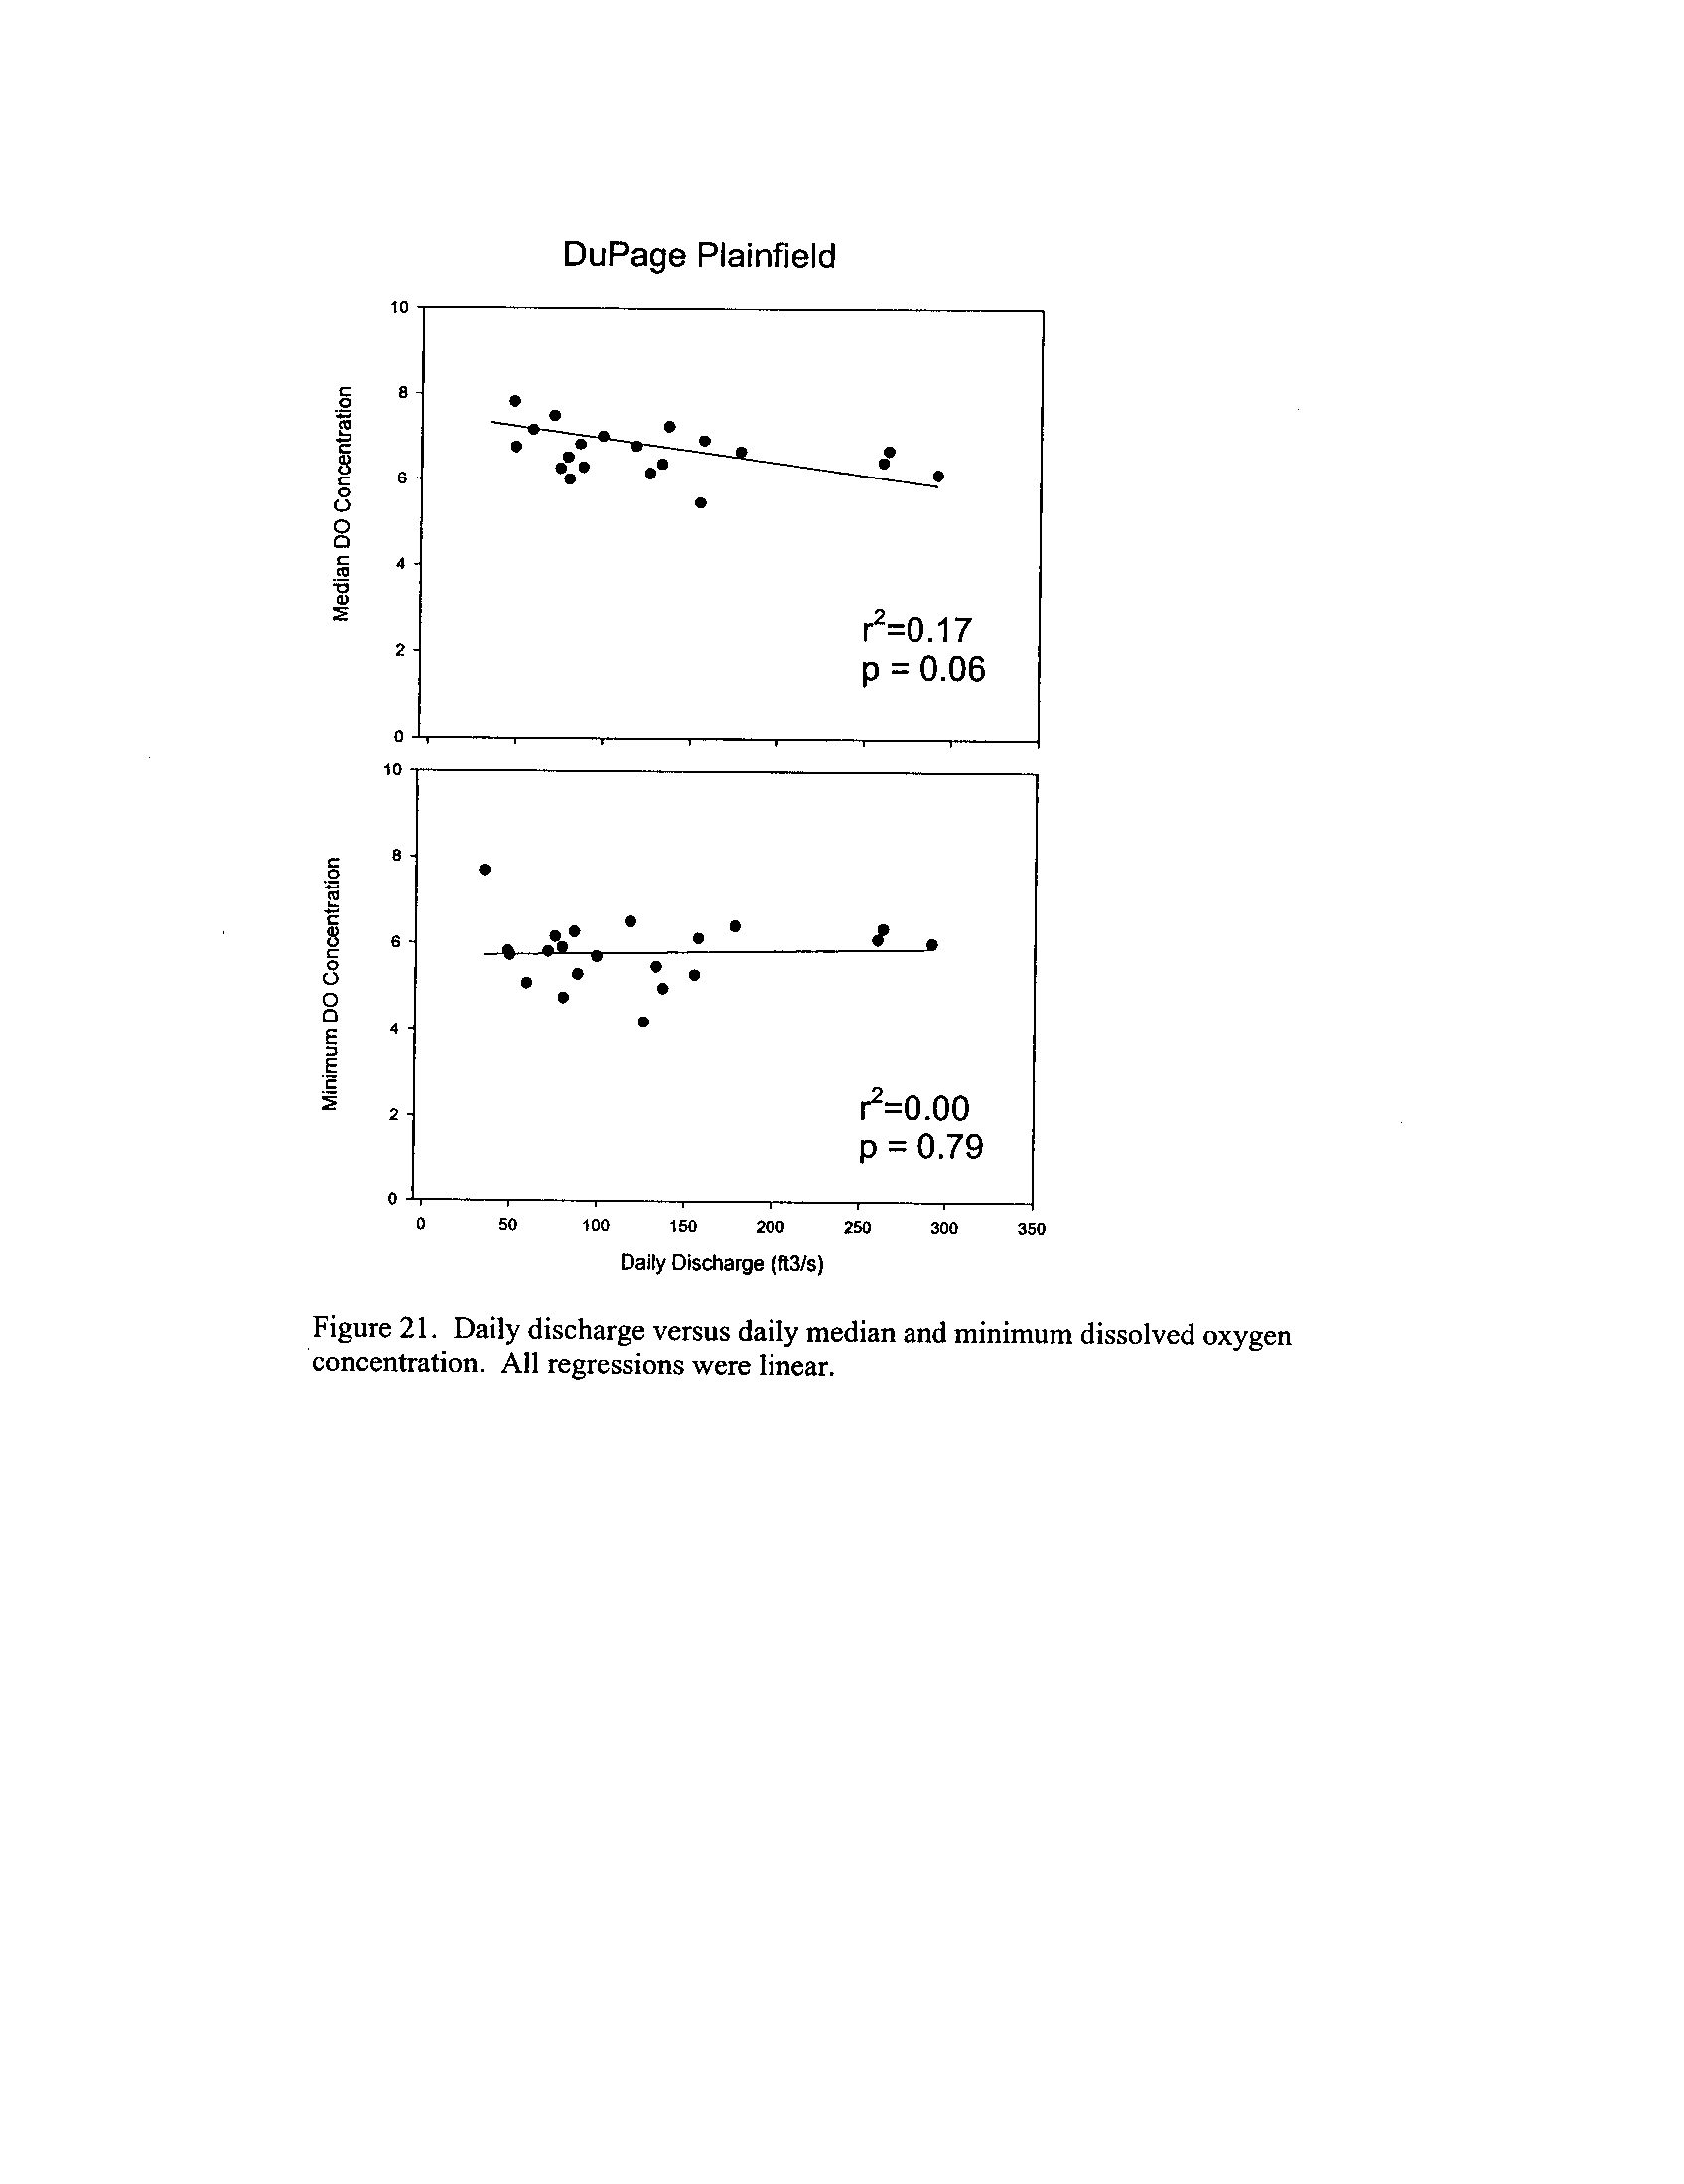
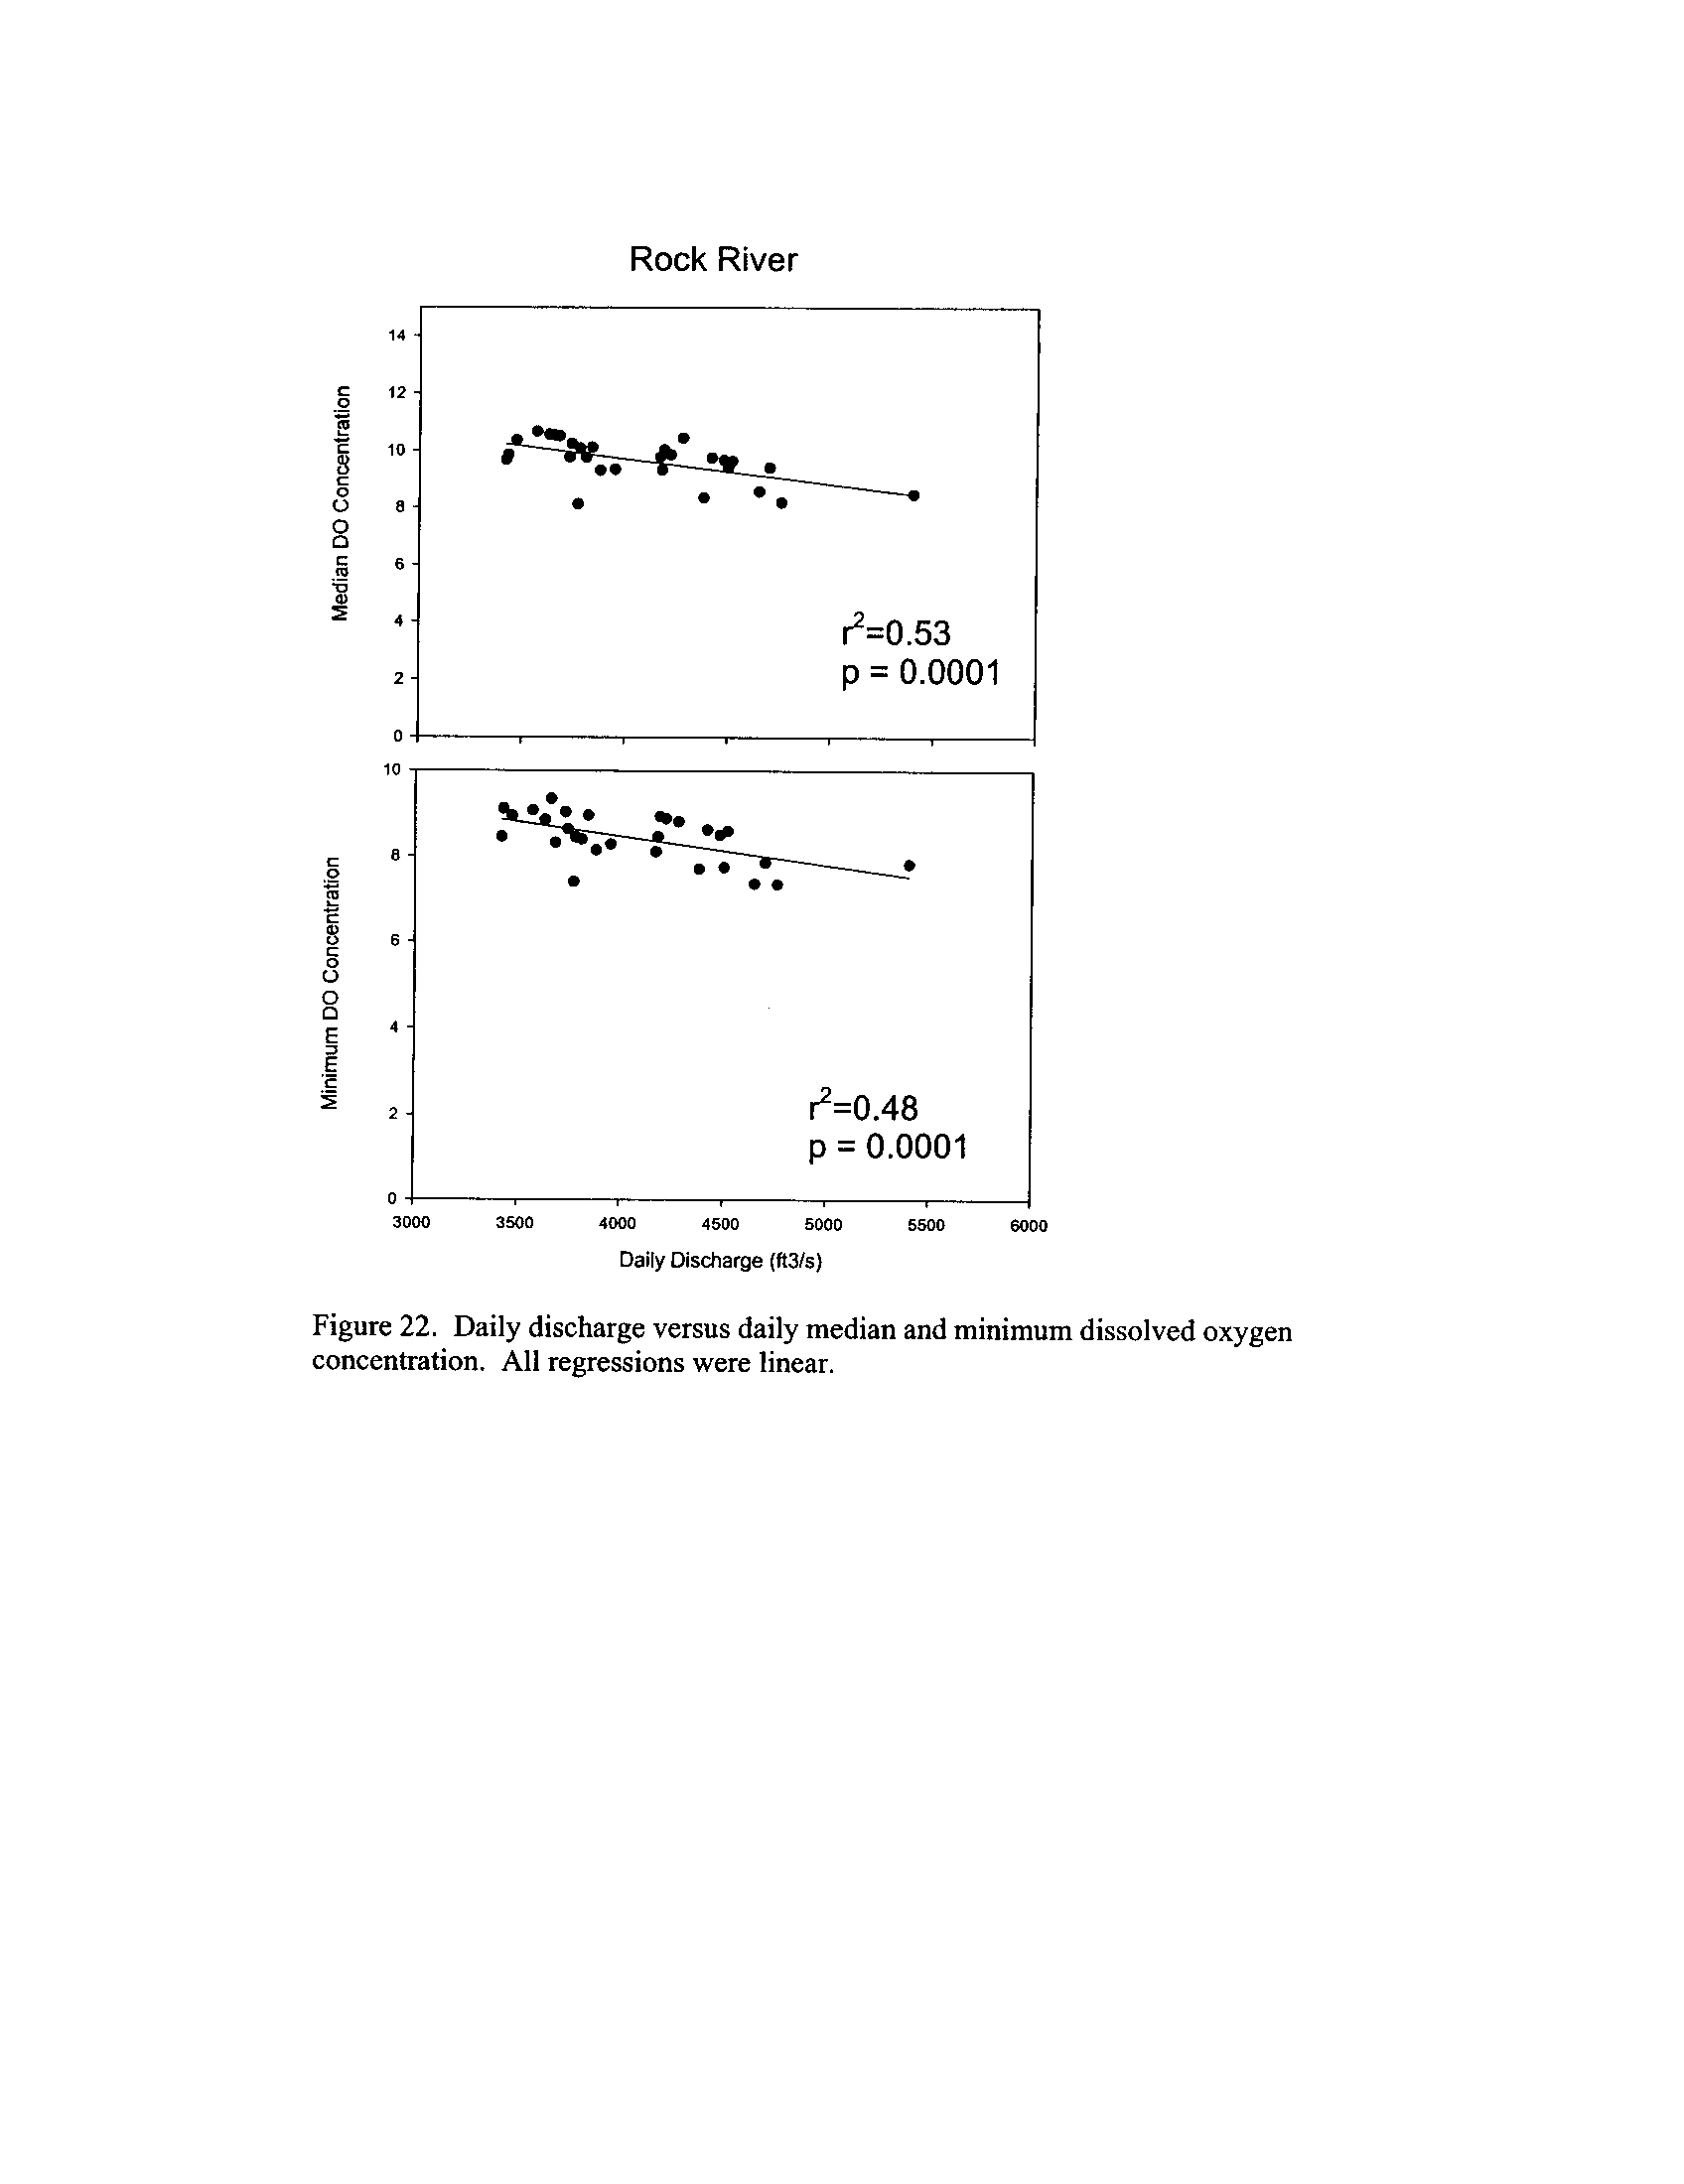
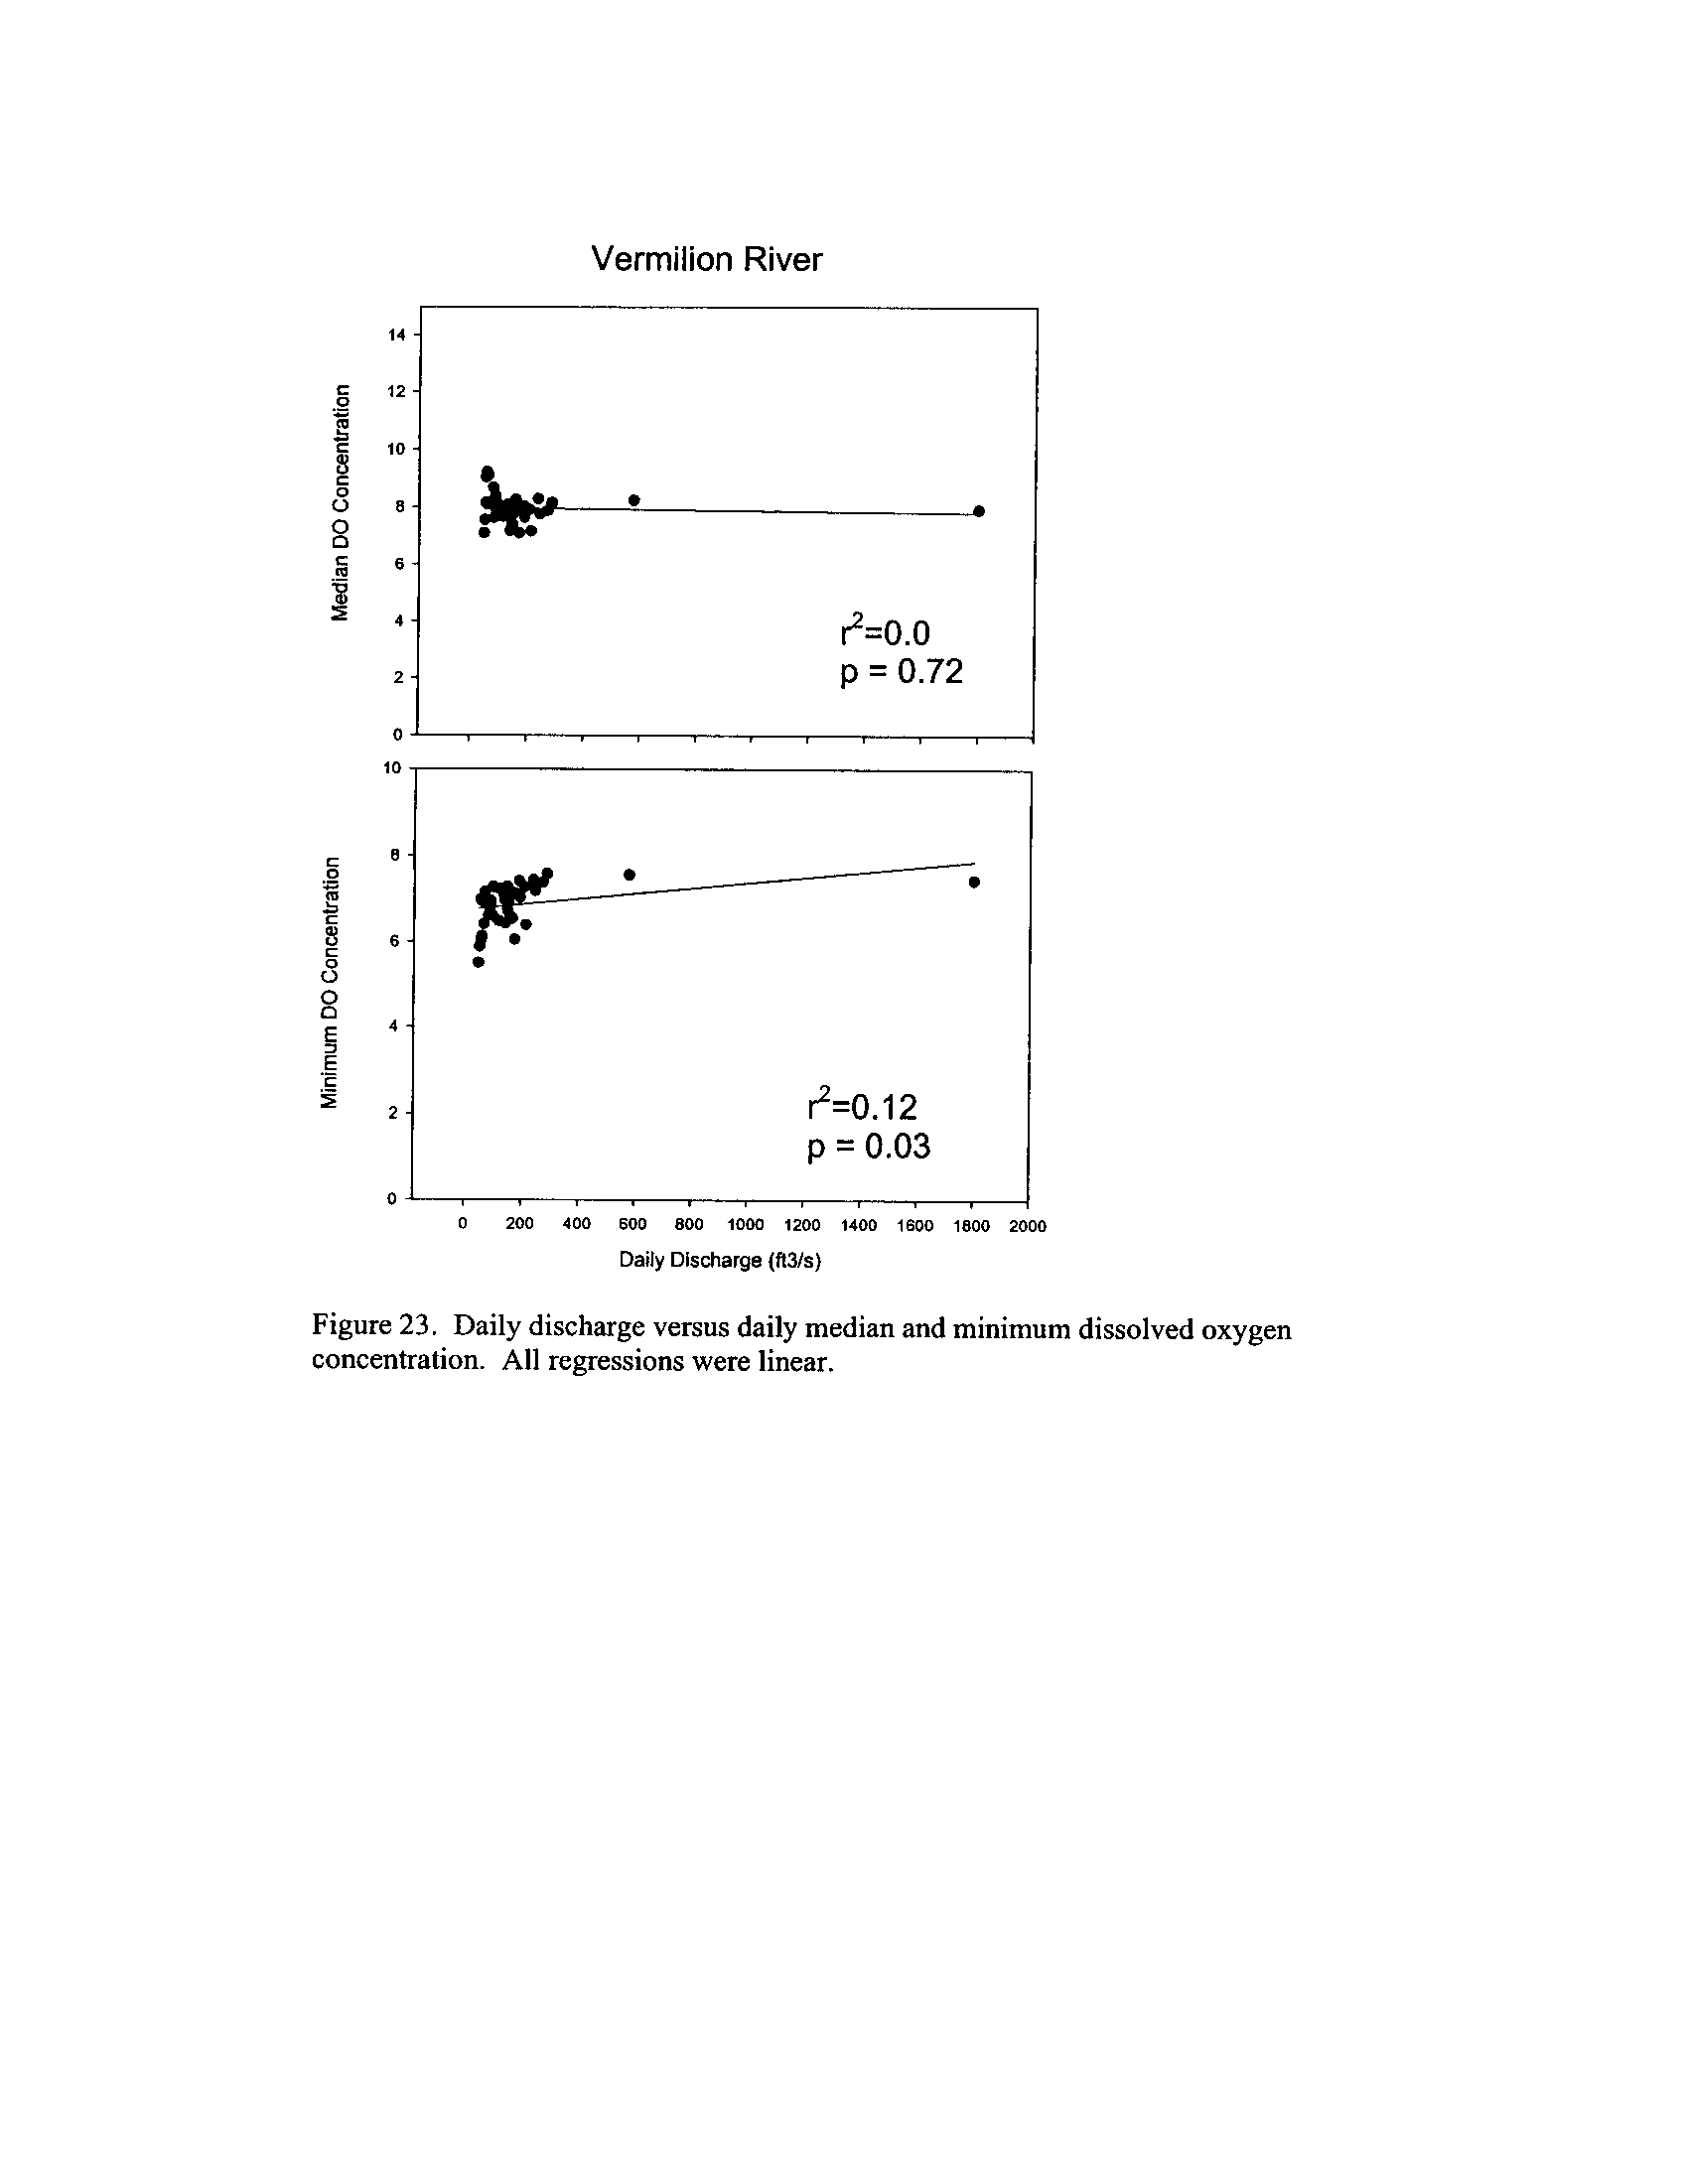
Dynamics of dissolved oxygen vary widely among the enhanced tier stream
segments (Exhibit 5), from daily concentrations varying widely in the Fox River to less
so in the Vermilion River
. Both median and minimum daily dissolved oxygen
concentrations typically declined as the summer progressed in the Fox, DuPage,
and
Kickapoo Rivers, but not the others (Exhibit 5)
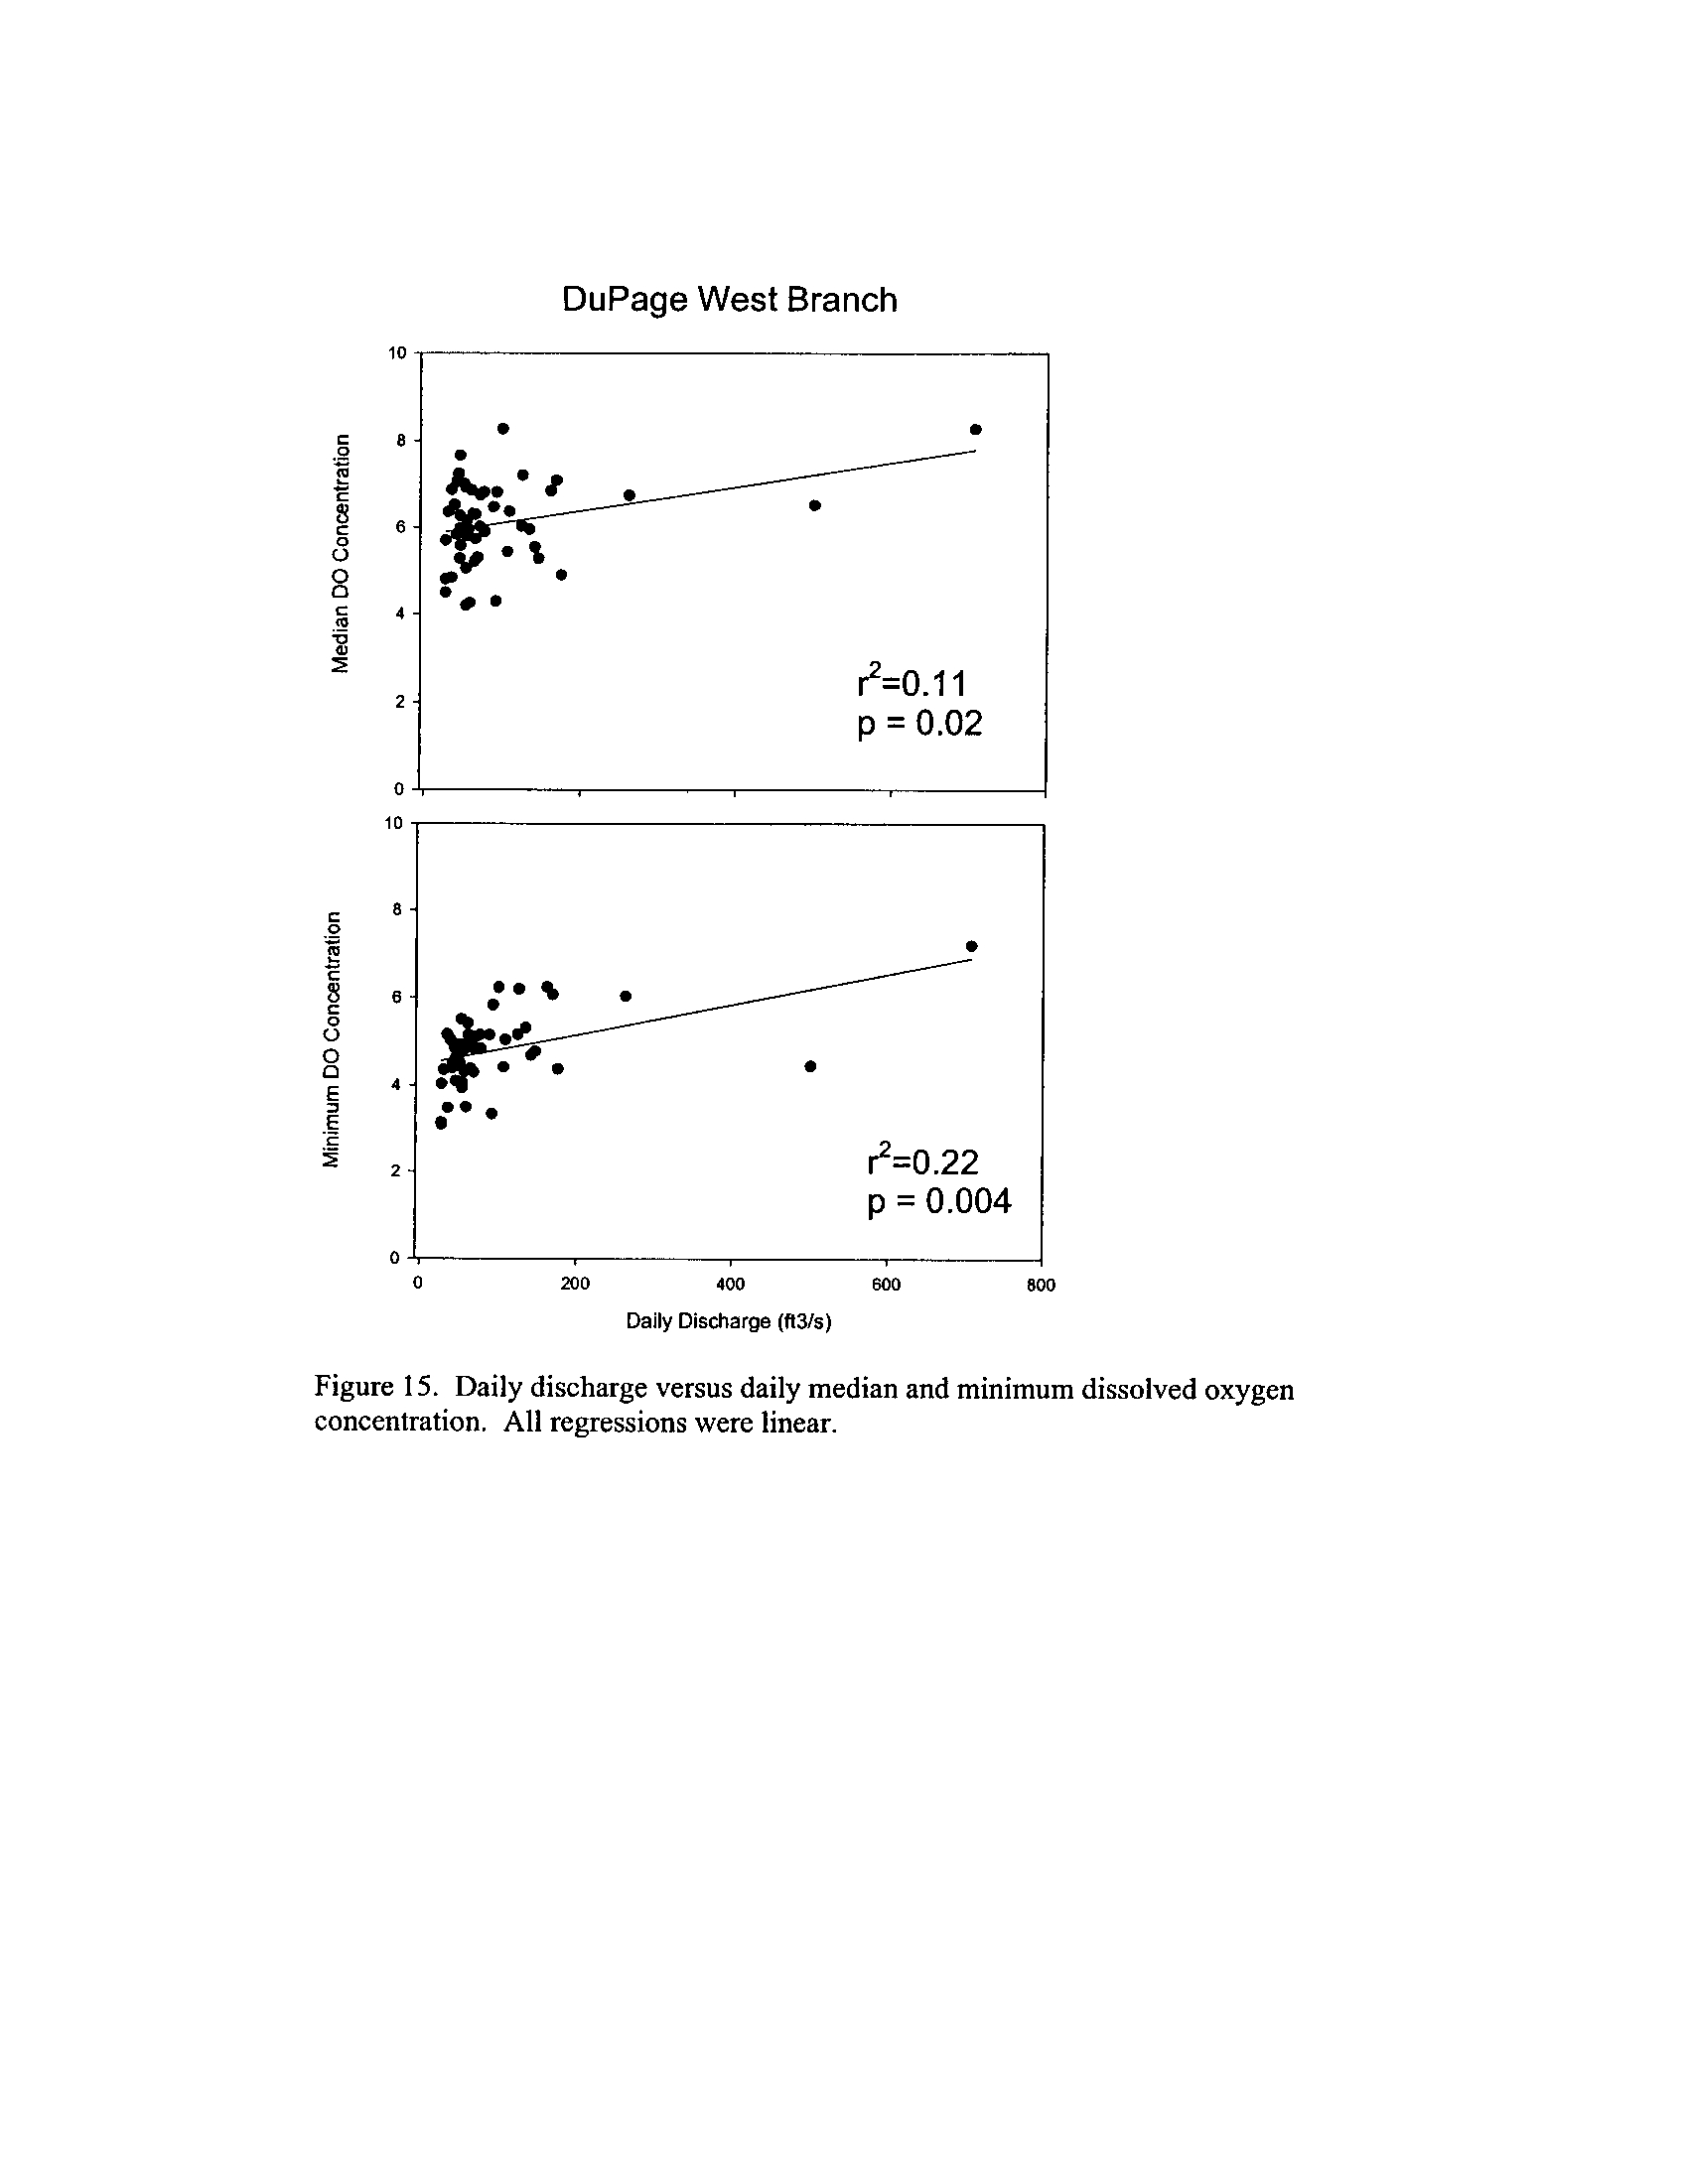
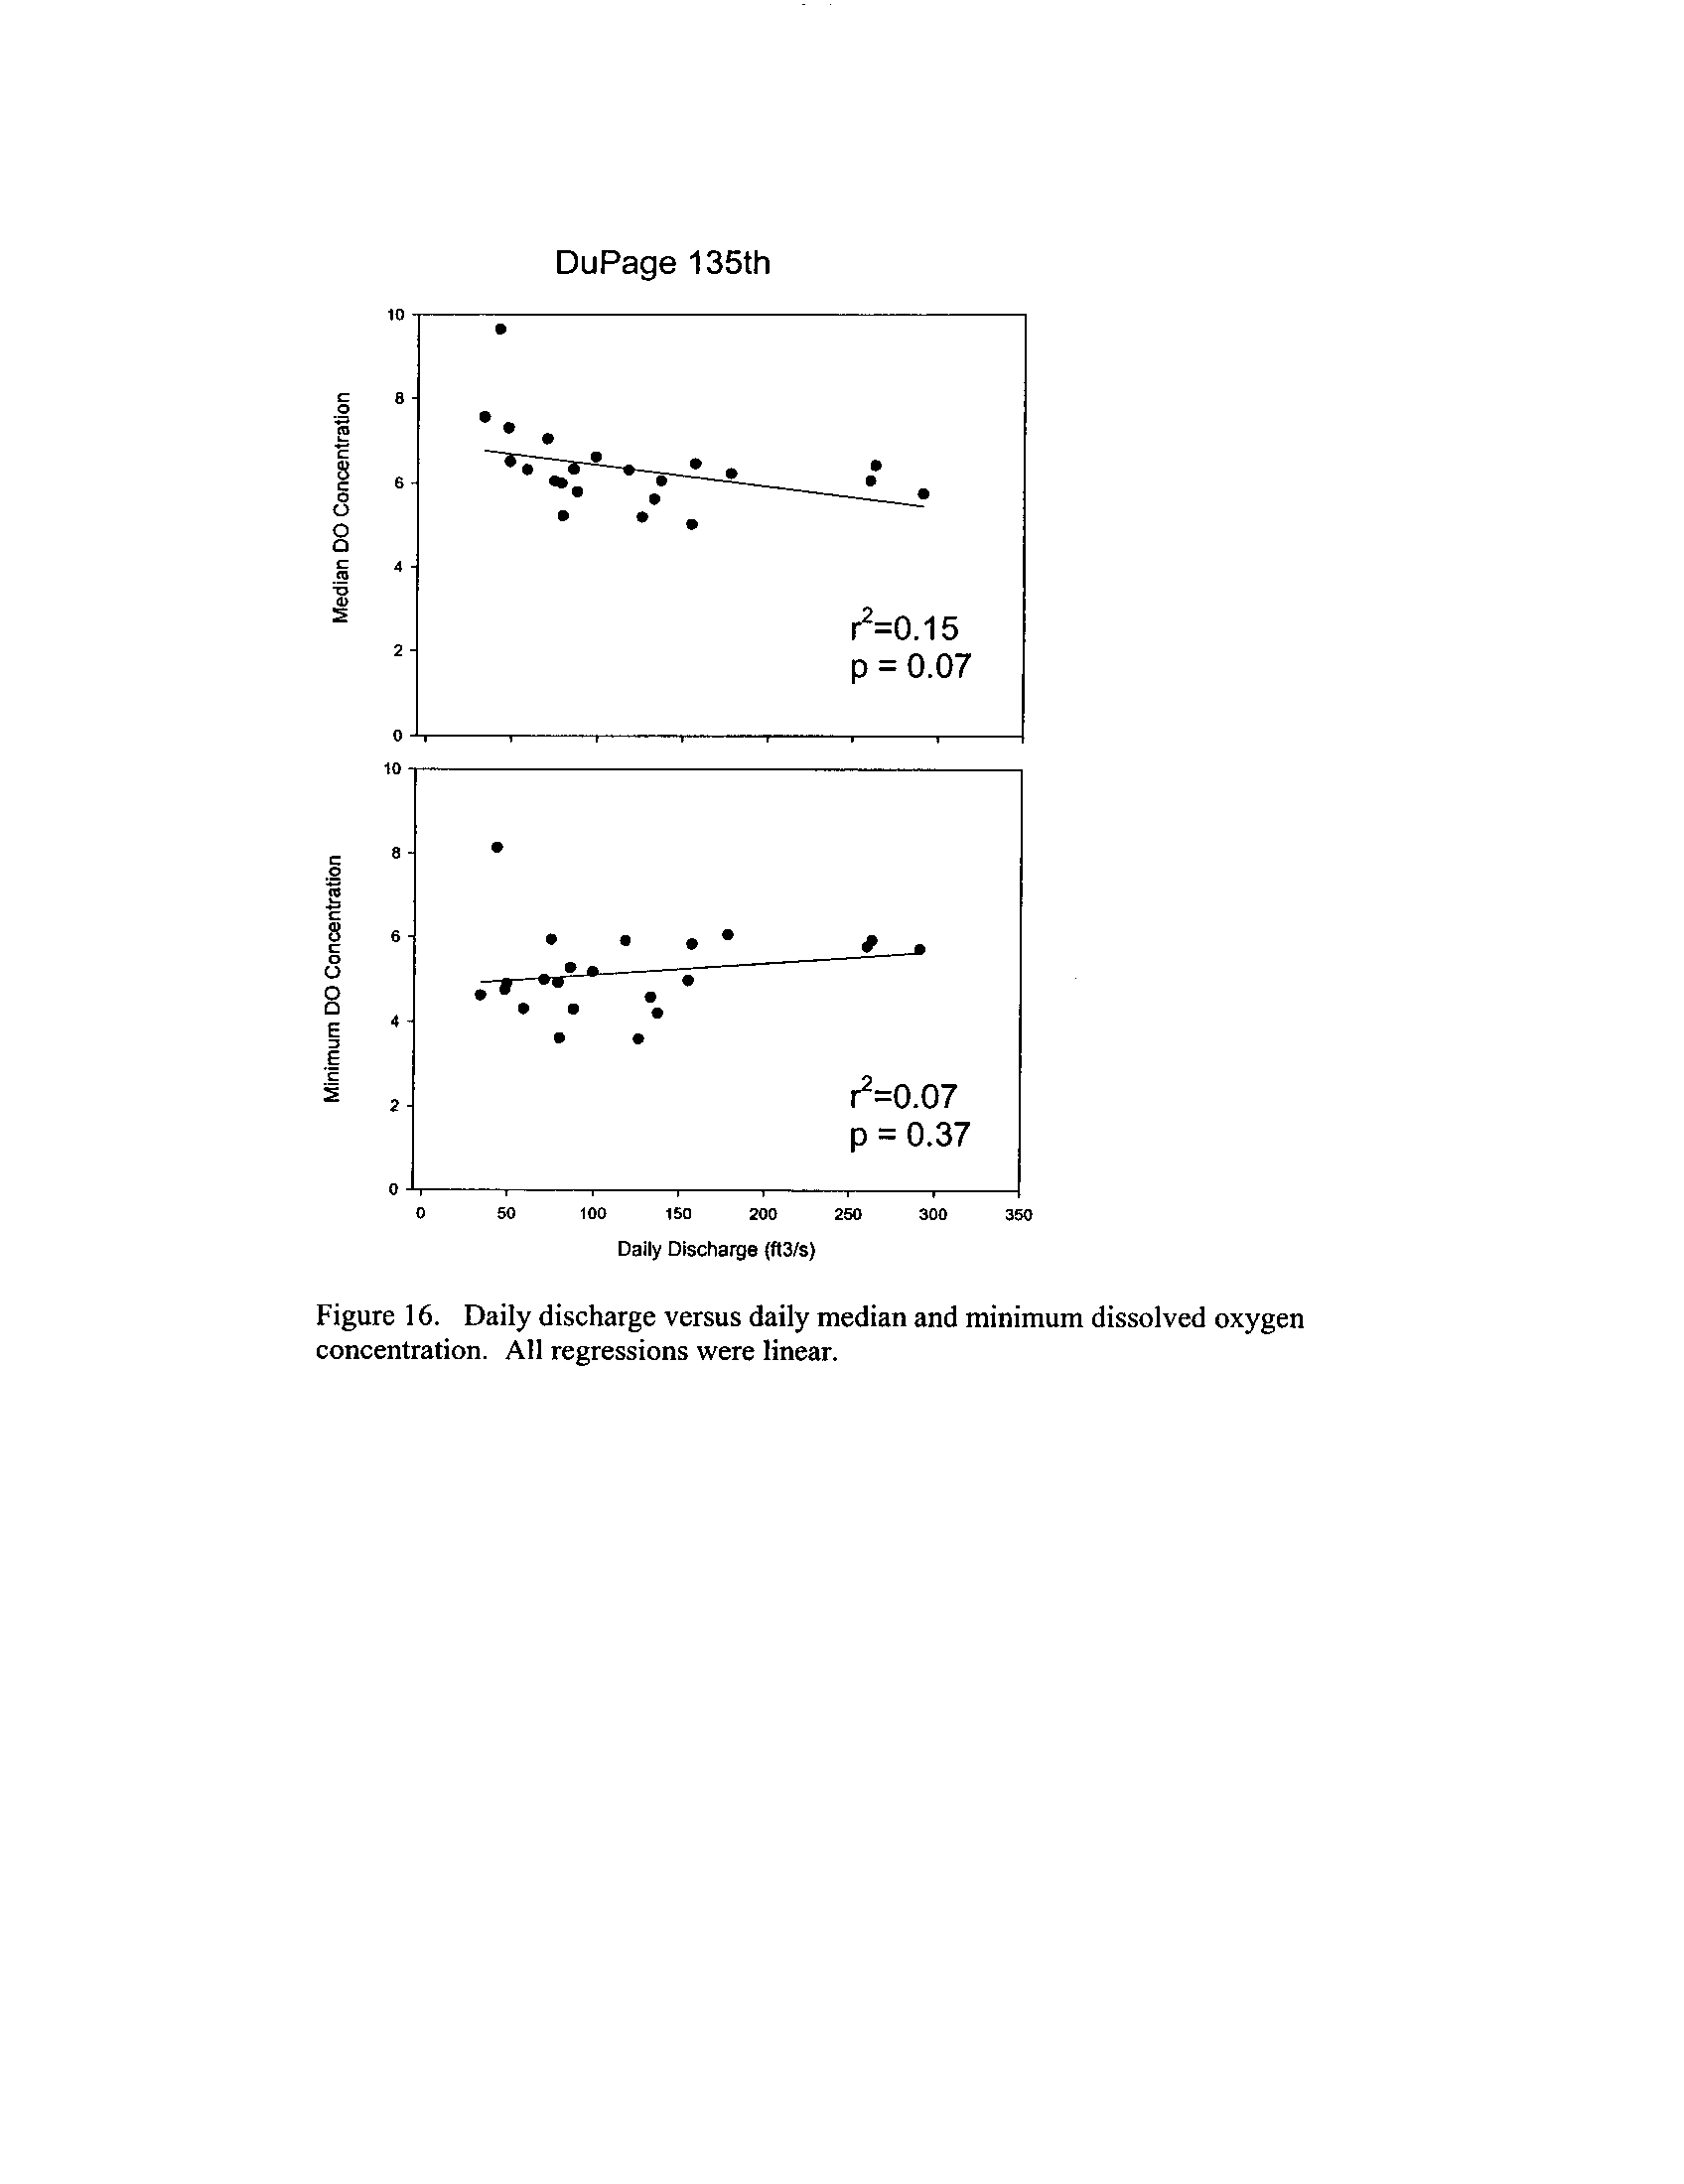
. Probably the most compelling result is
the linear or log-linear relationship between daily discharge and median and minimum
daily dissolved oxygen concentrations in the streams (Exhibit 5)
. In 2005 for the Fox
8
River, dissolved oxygen concentrations declined sharply with declining daily discharge
(Exhibit 5)
. Conversely, in the other streams during 2006, dissolved oxygen
concentrations were either unrelated to discharge or negatively related (Exhibit 5)
. I
could speculate broadly about the underlying mechanisms including flow-related
biochemical oxygen demand, hypoxic groundwater intrusion, and changes in water
quality due to run-off
. Regardless of the underlying causes, given that discharge can
explain up to 50% of the variation in dissolved oxygen concentrations during both severe
drought (2005) and non-drought years, this issue needs to be incorporated into standard
development and interpretation
.
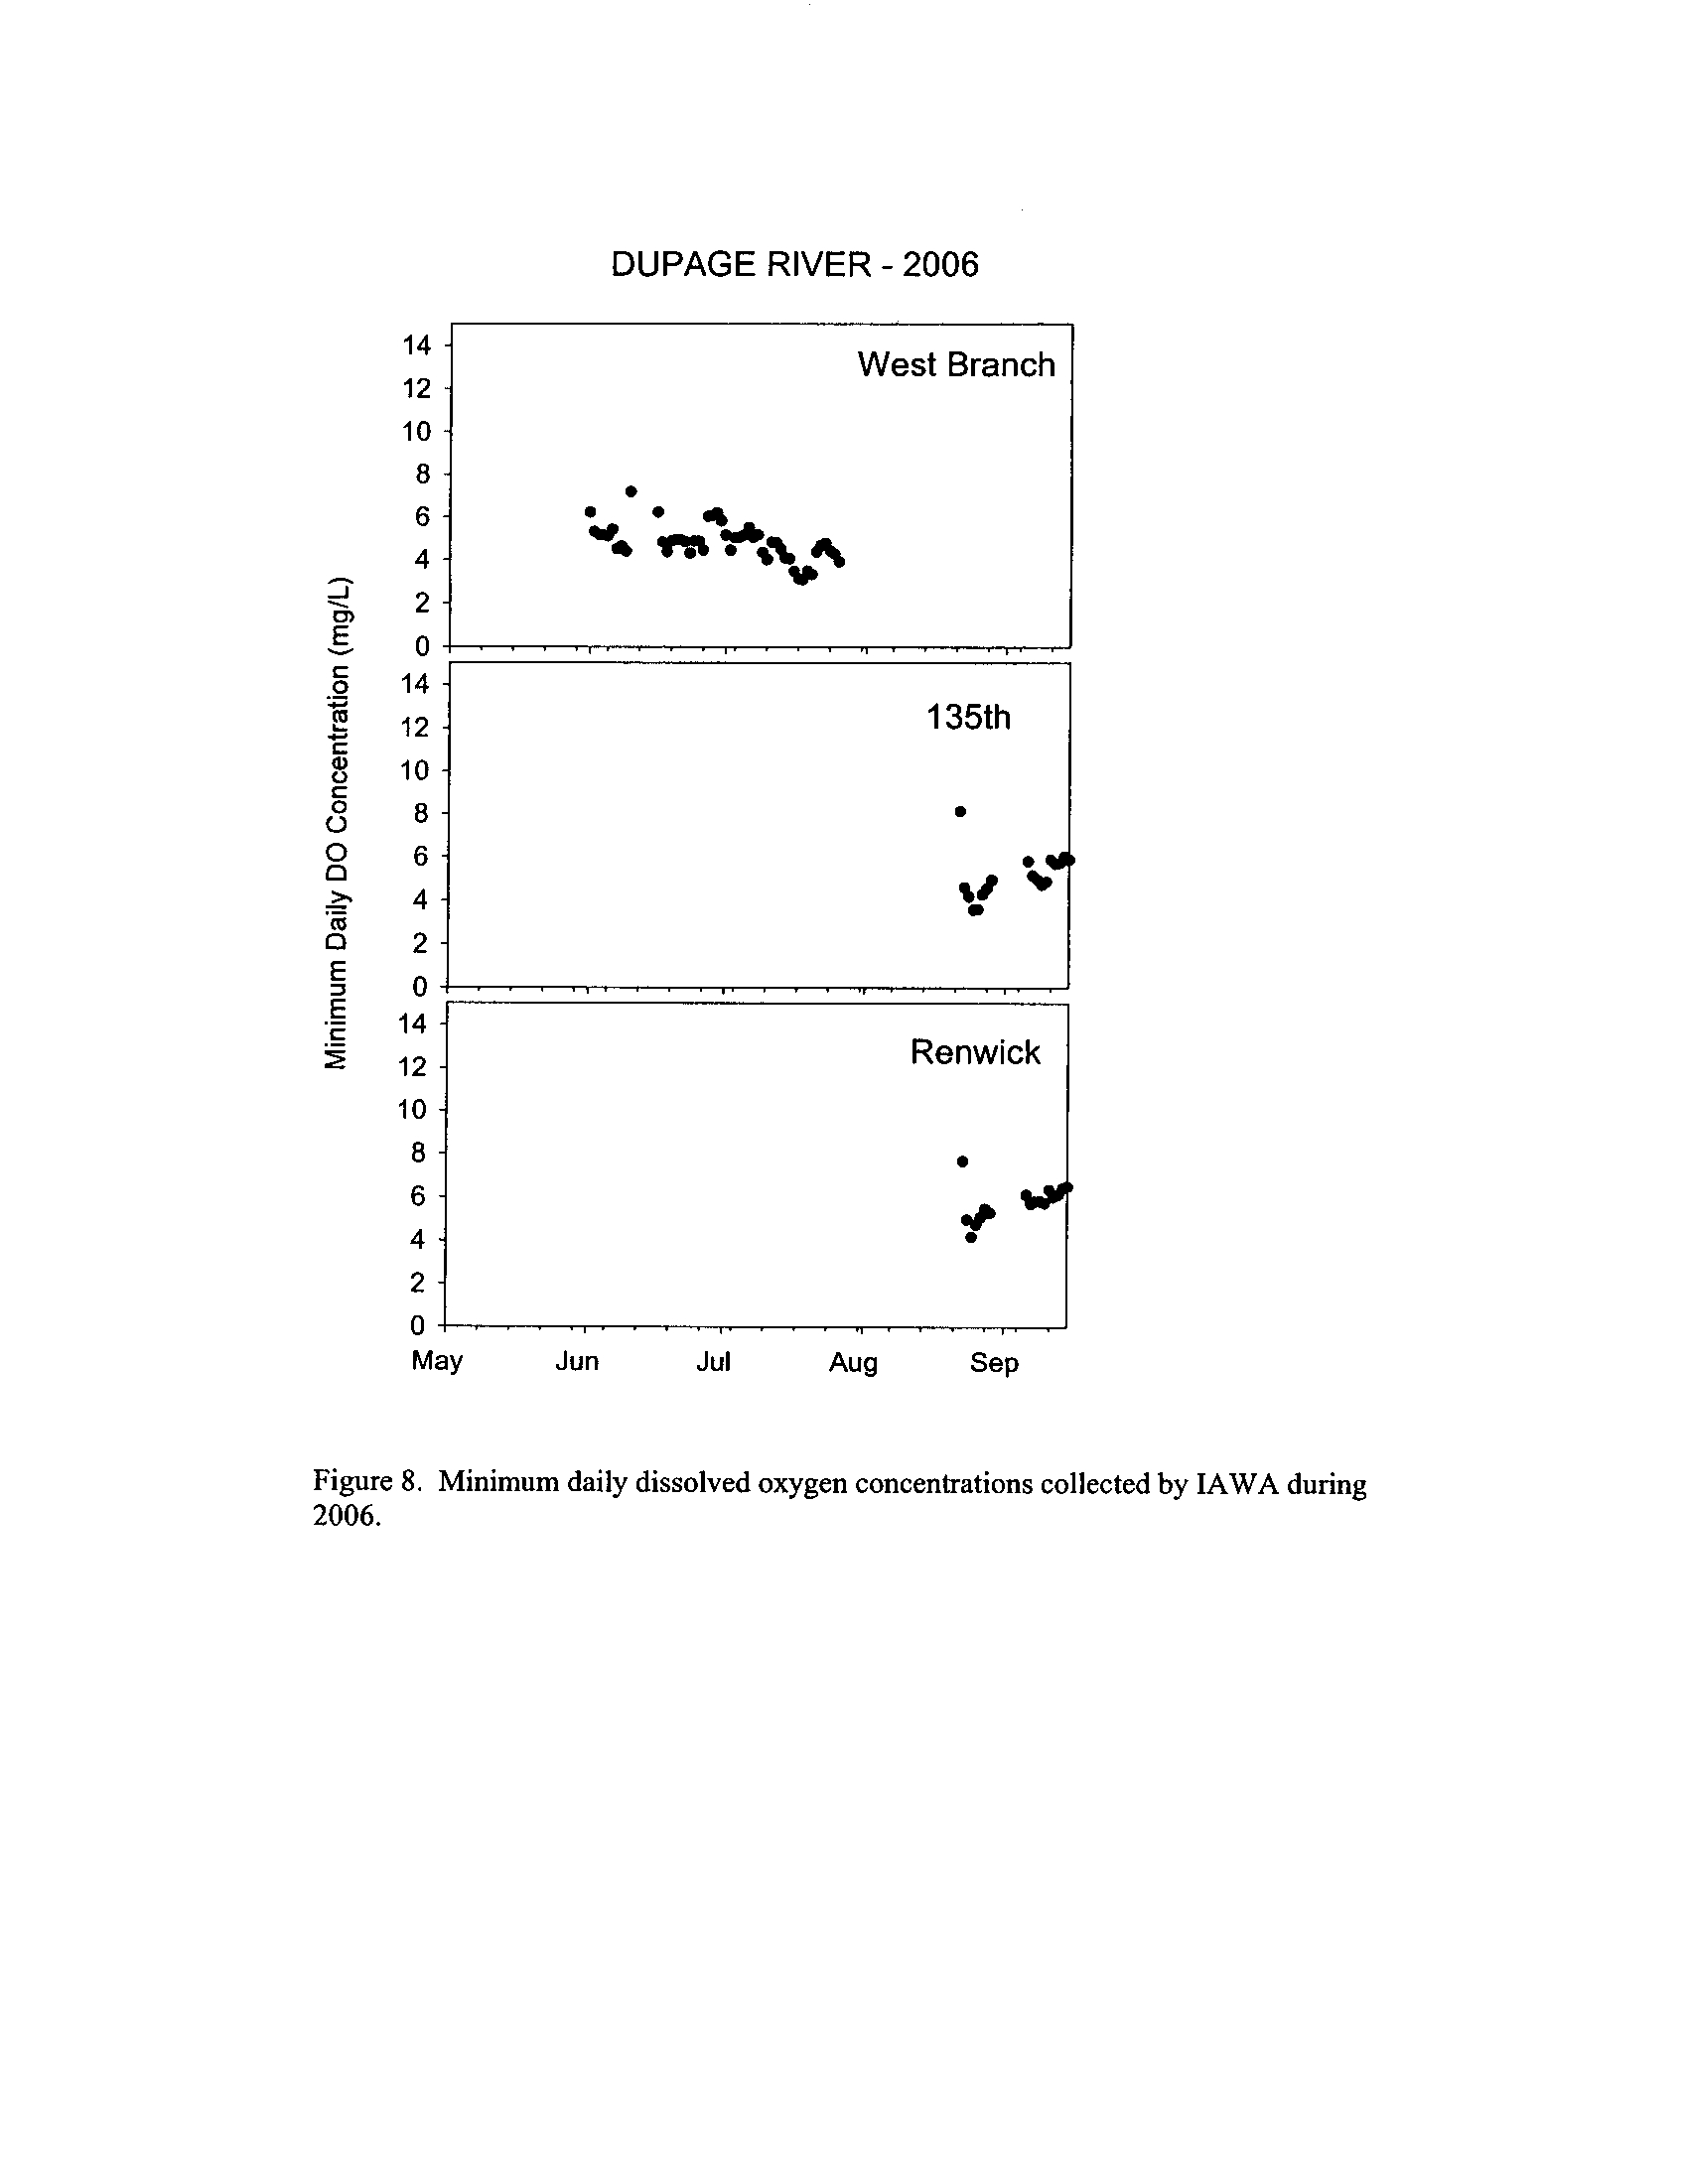
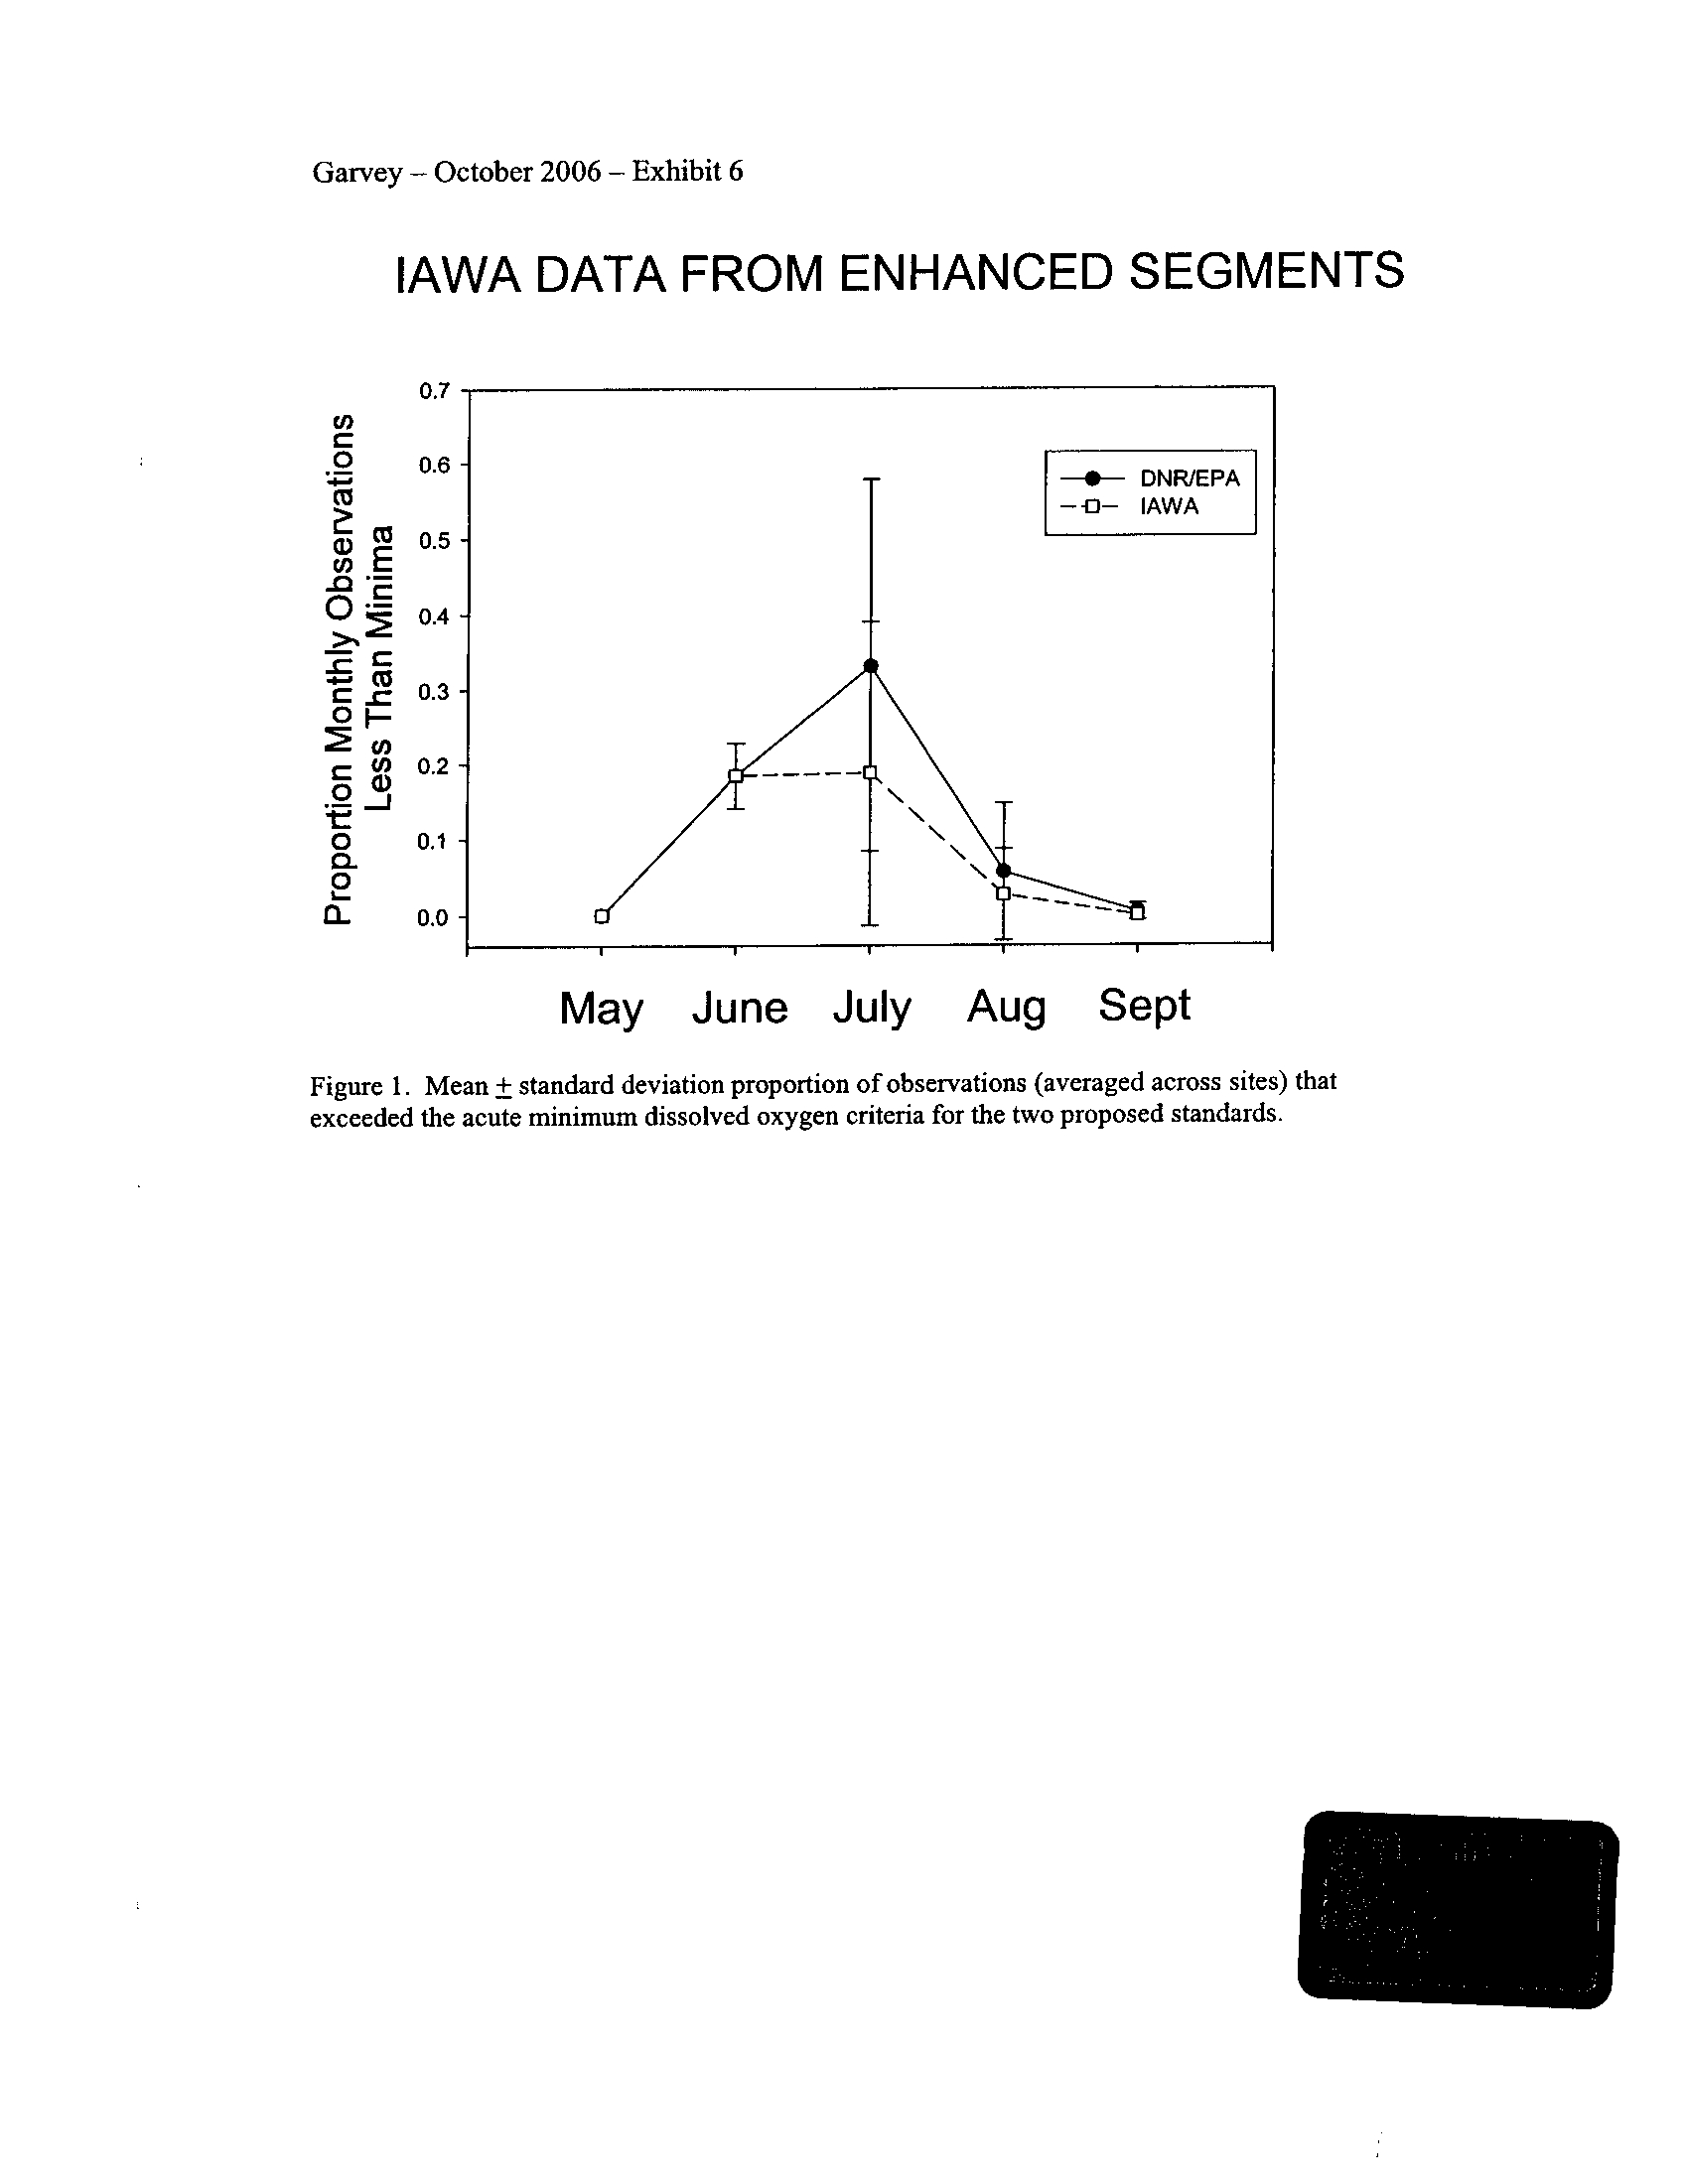
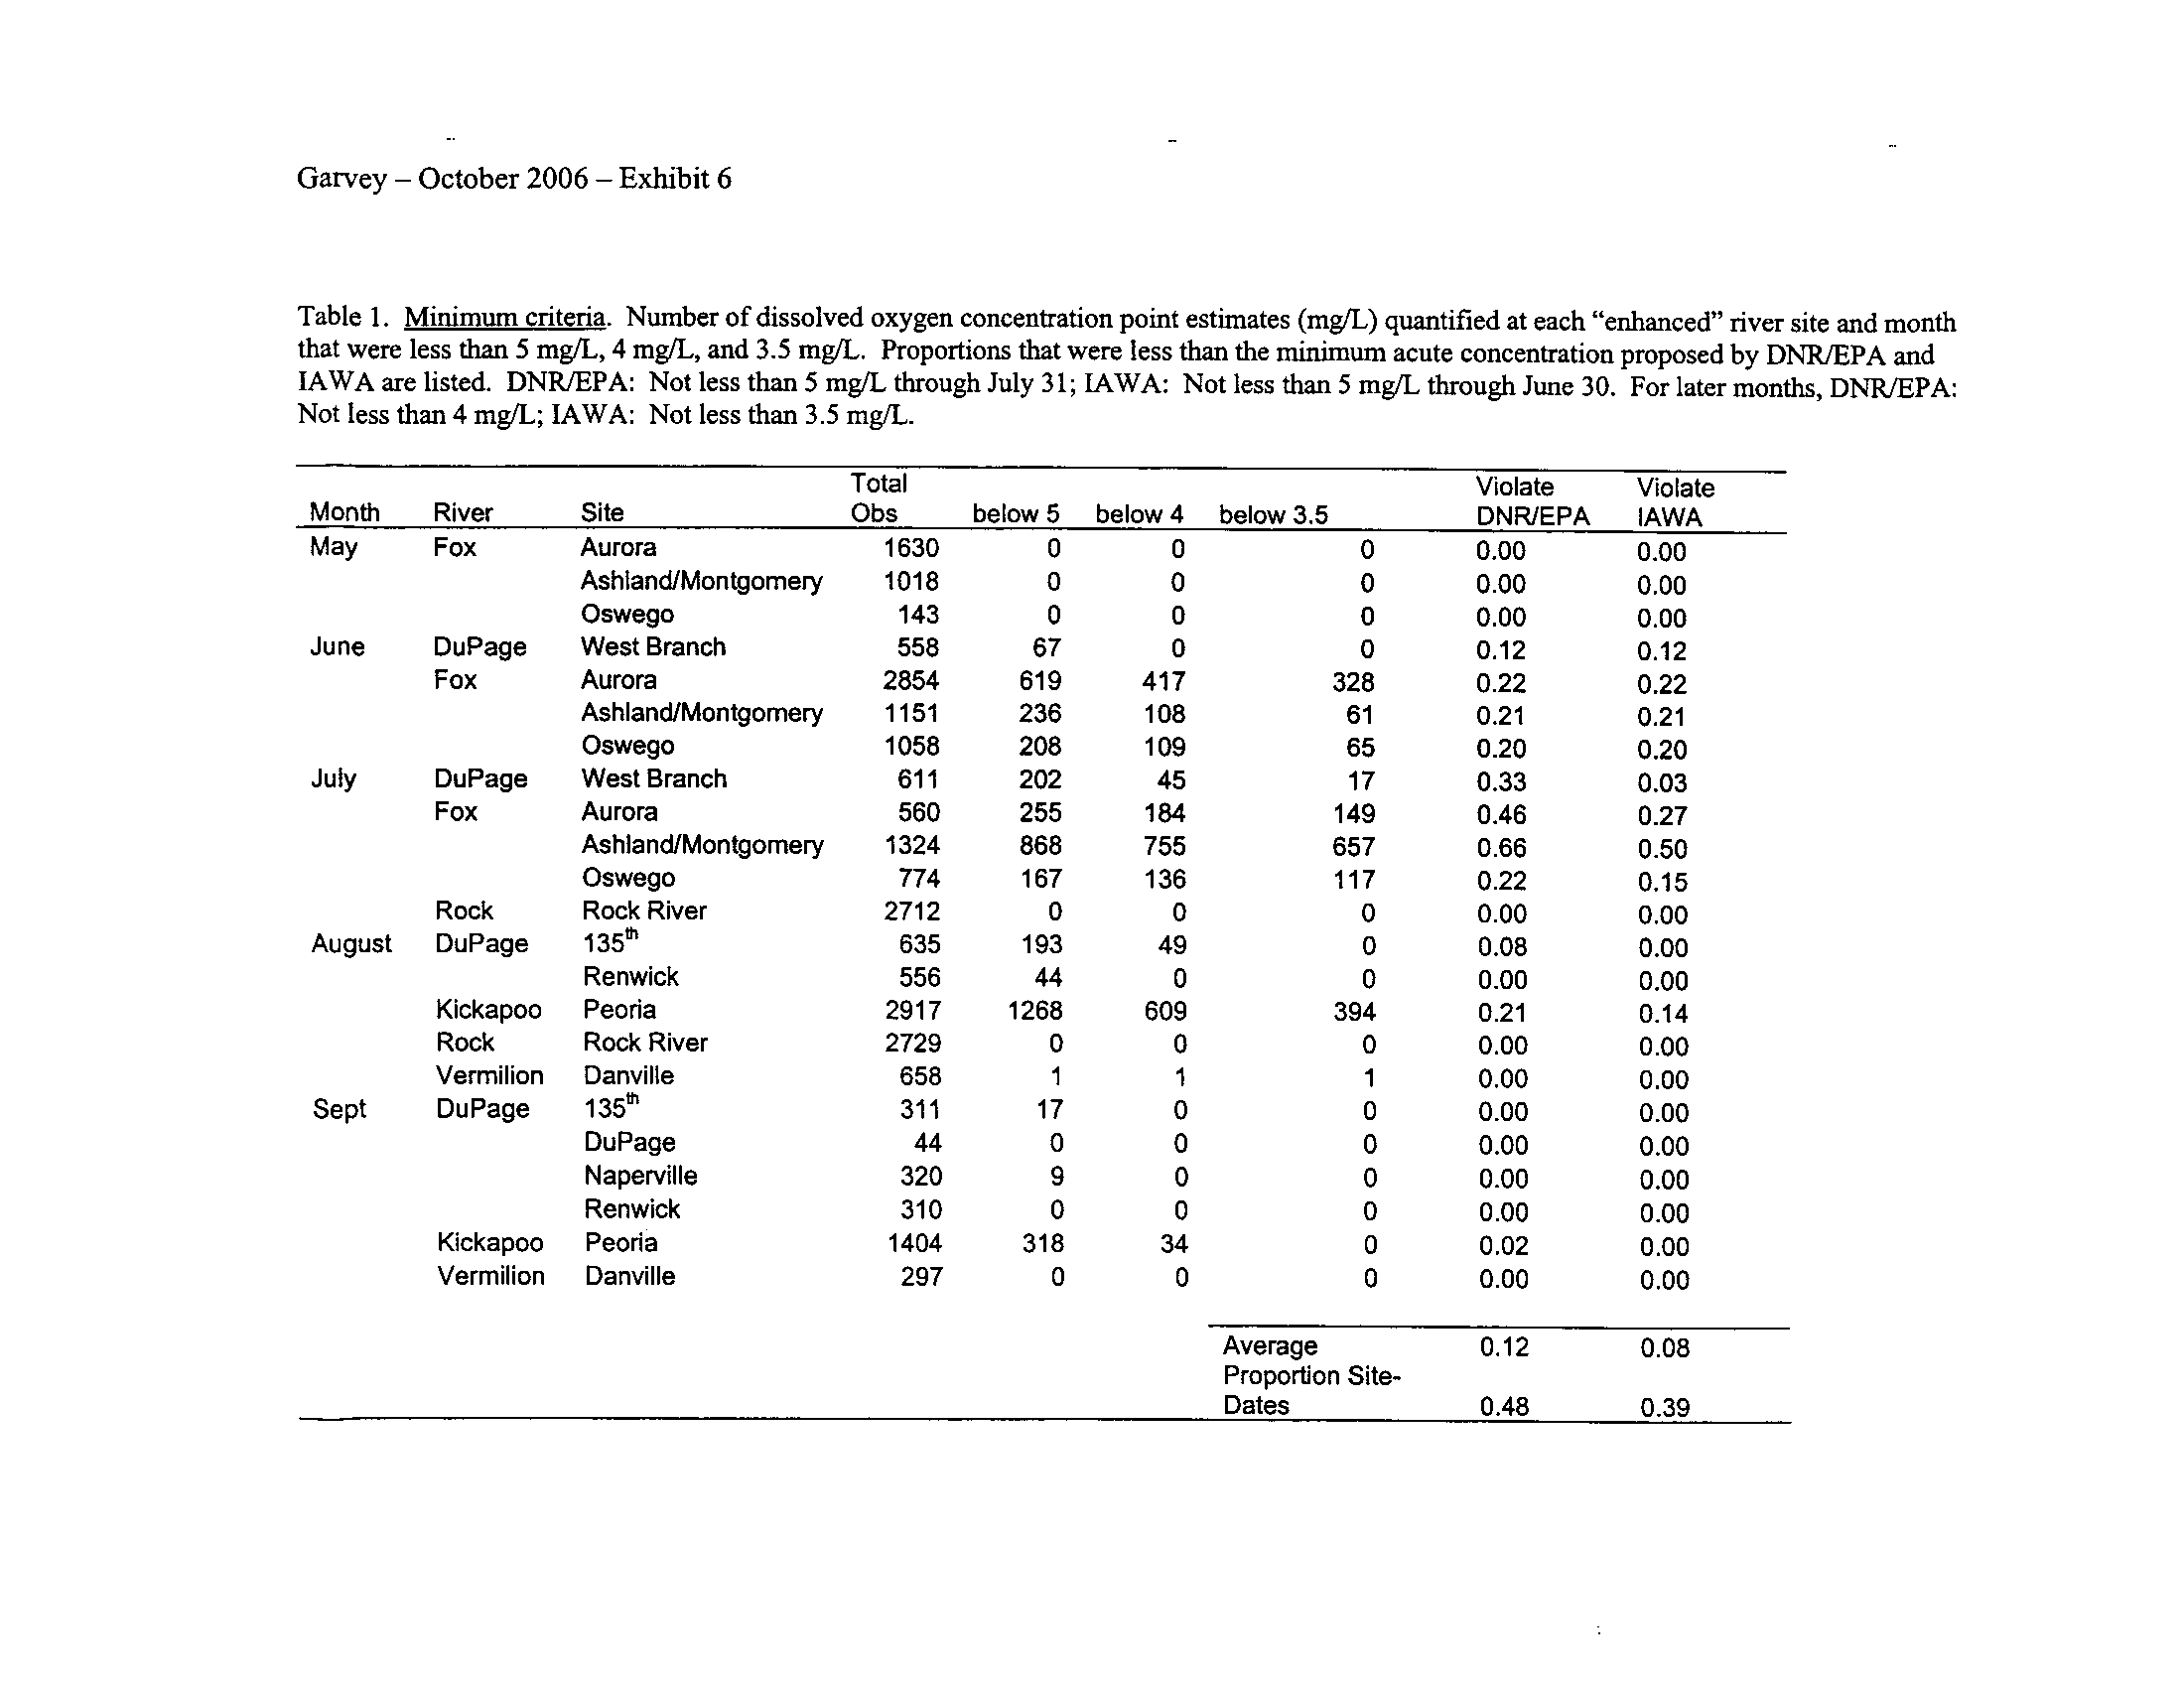
I applied both the enhanced tier standard and the proposed IAWA standard to the
semi-continuous data
. Typically, both standards demonstrate that several of the stream
segments including those in the DuPage, Fox, and Kickapoo Rivers fail to meet the
season-dependent acute minima, even given the proposed enhanced status of these
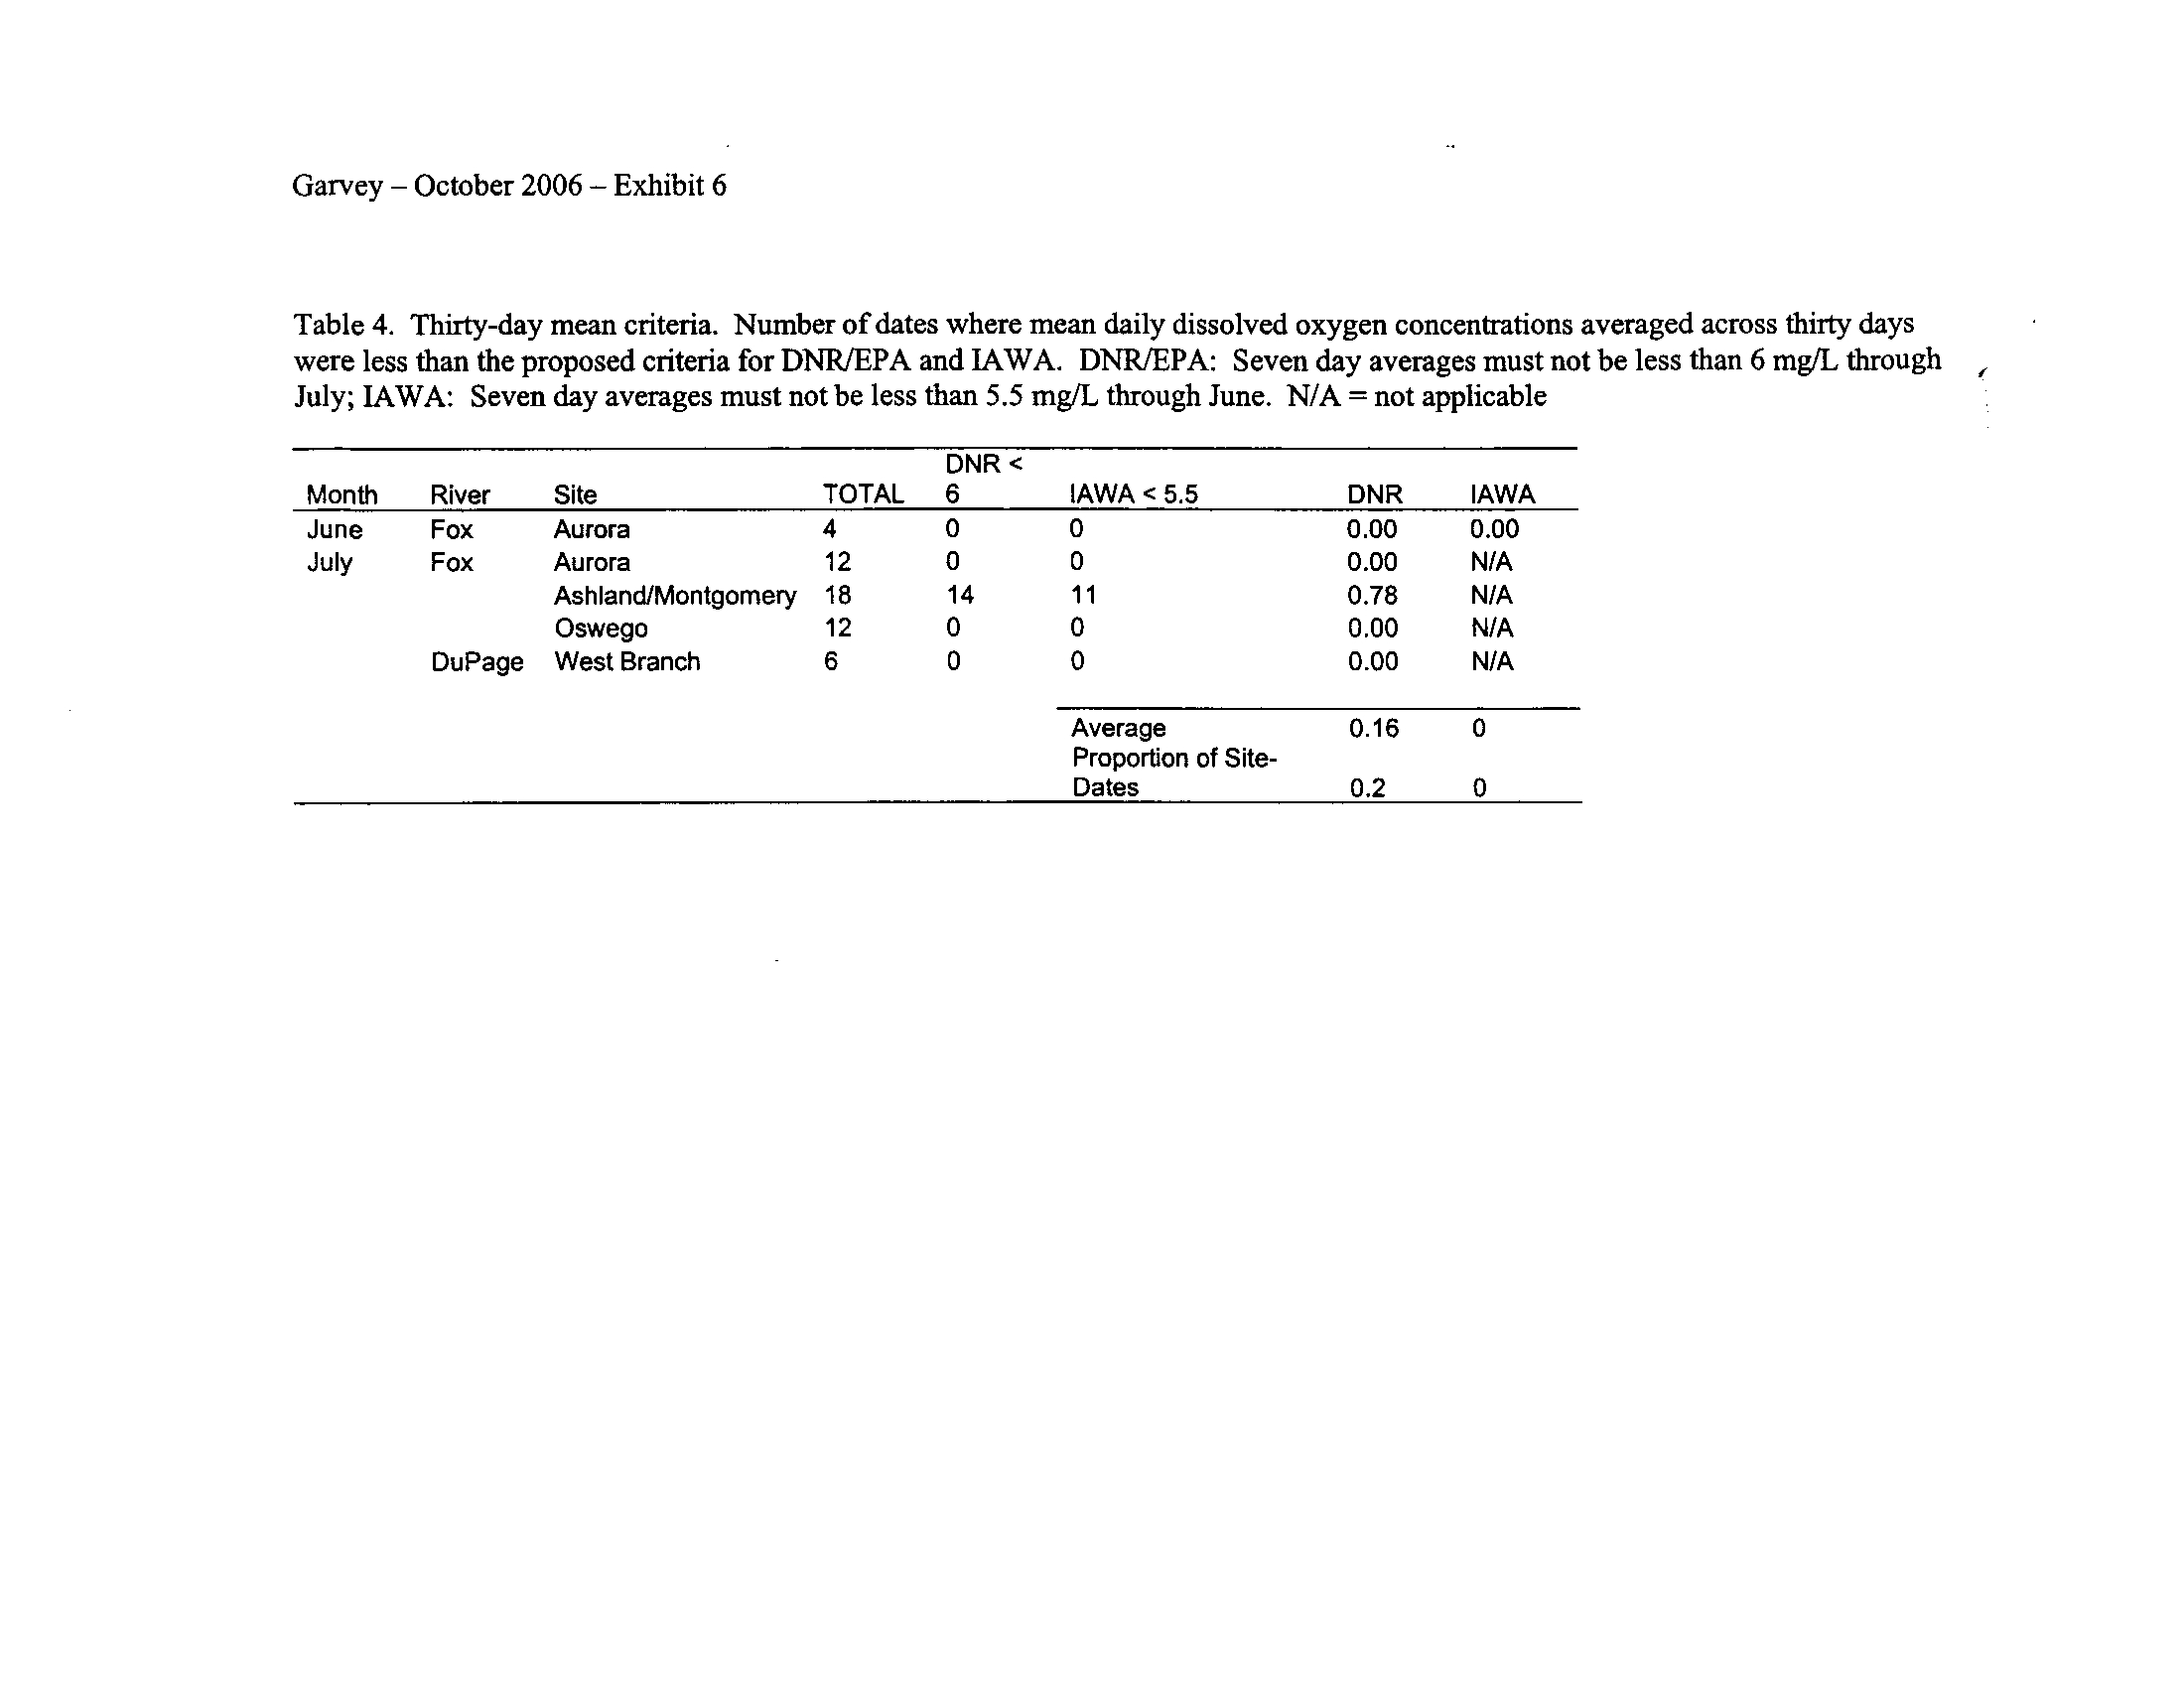
systems (Exhibit 6) . This is not surprising given that some portions of the DuPage and
Fox Rivers are currently listed with low dissolved oxygen as a probable cause for
impairment (see map in Exhibit 5)
. However, the Rock River which is listed as impaired
due to low oxygen did not fail to meet any of the minimum criteria (Exhibit 6)
.
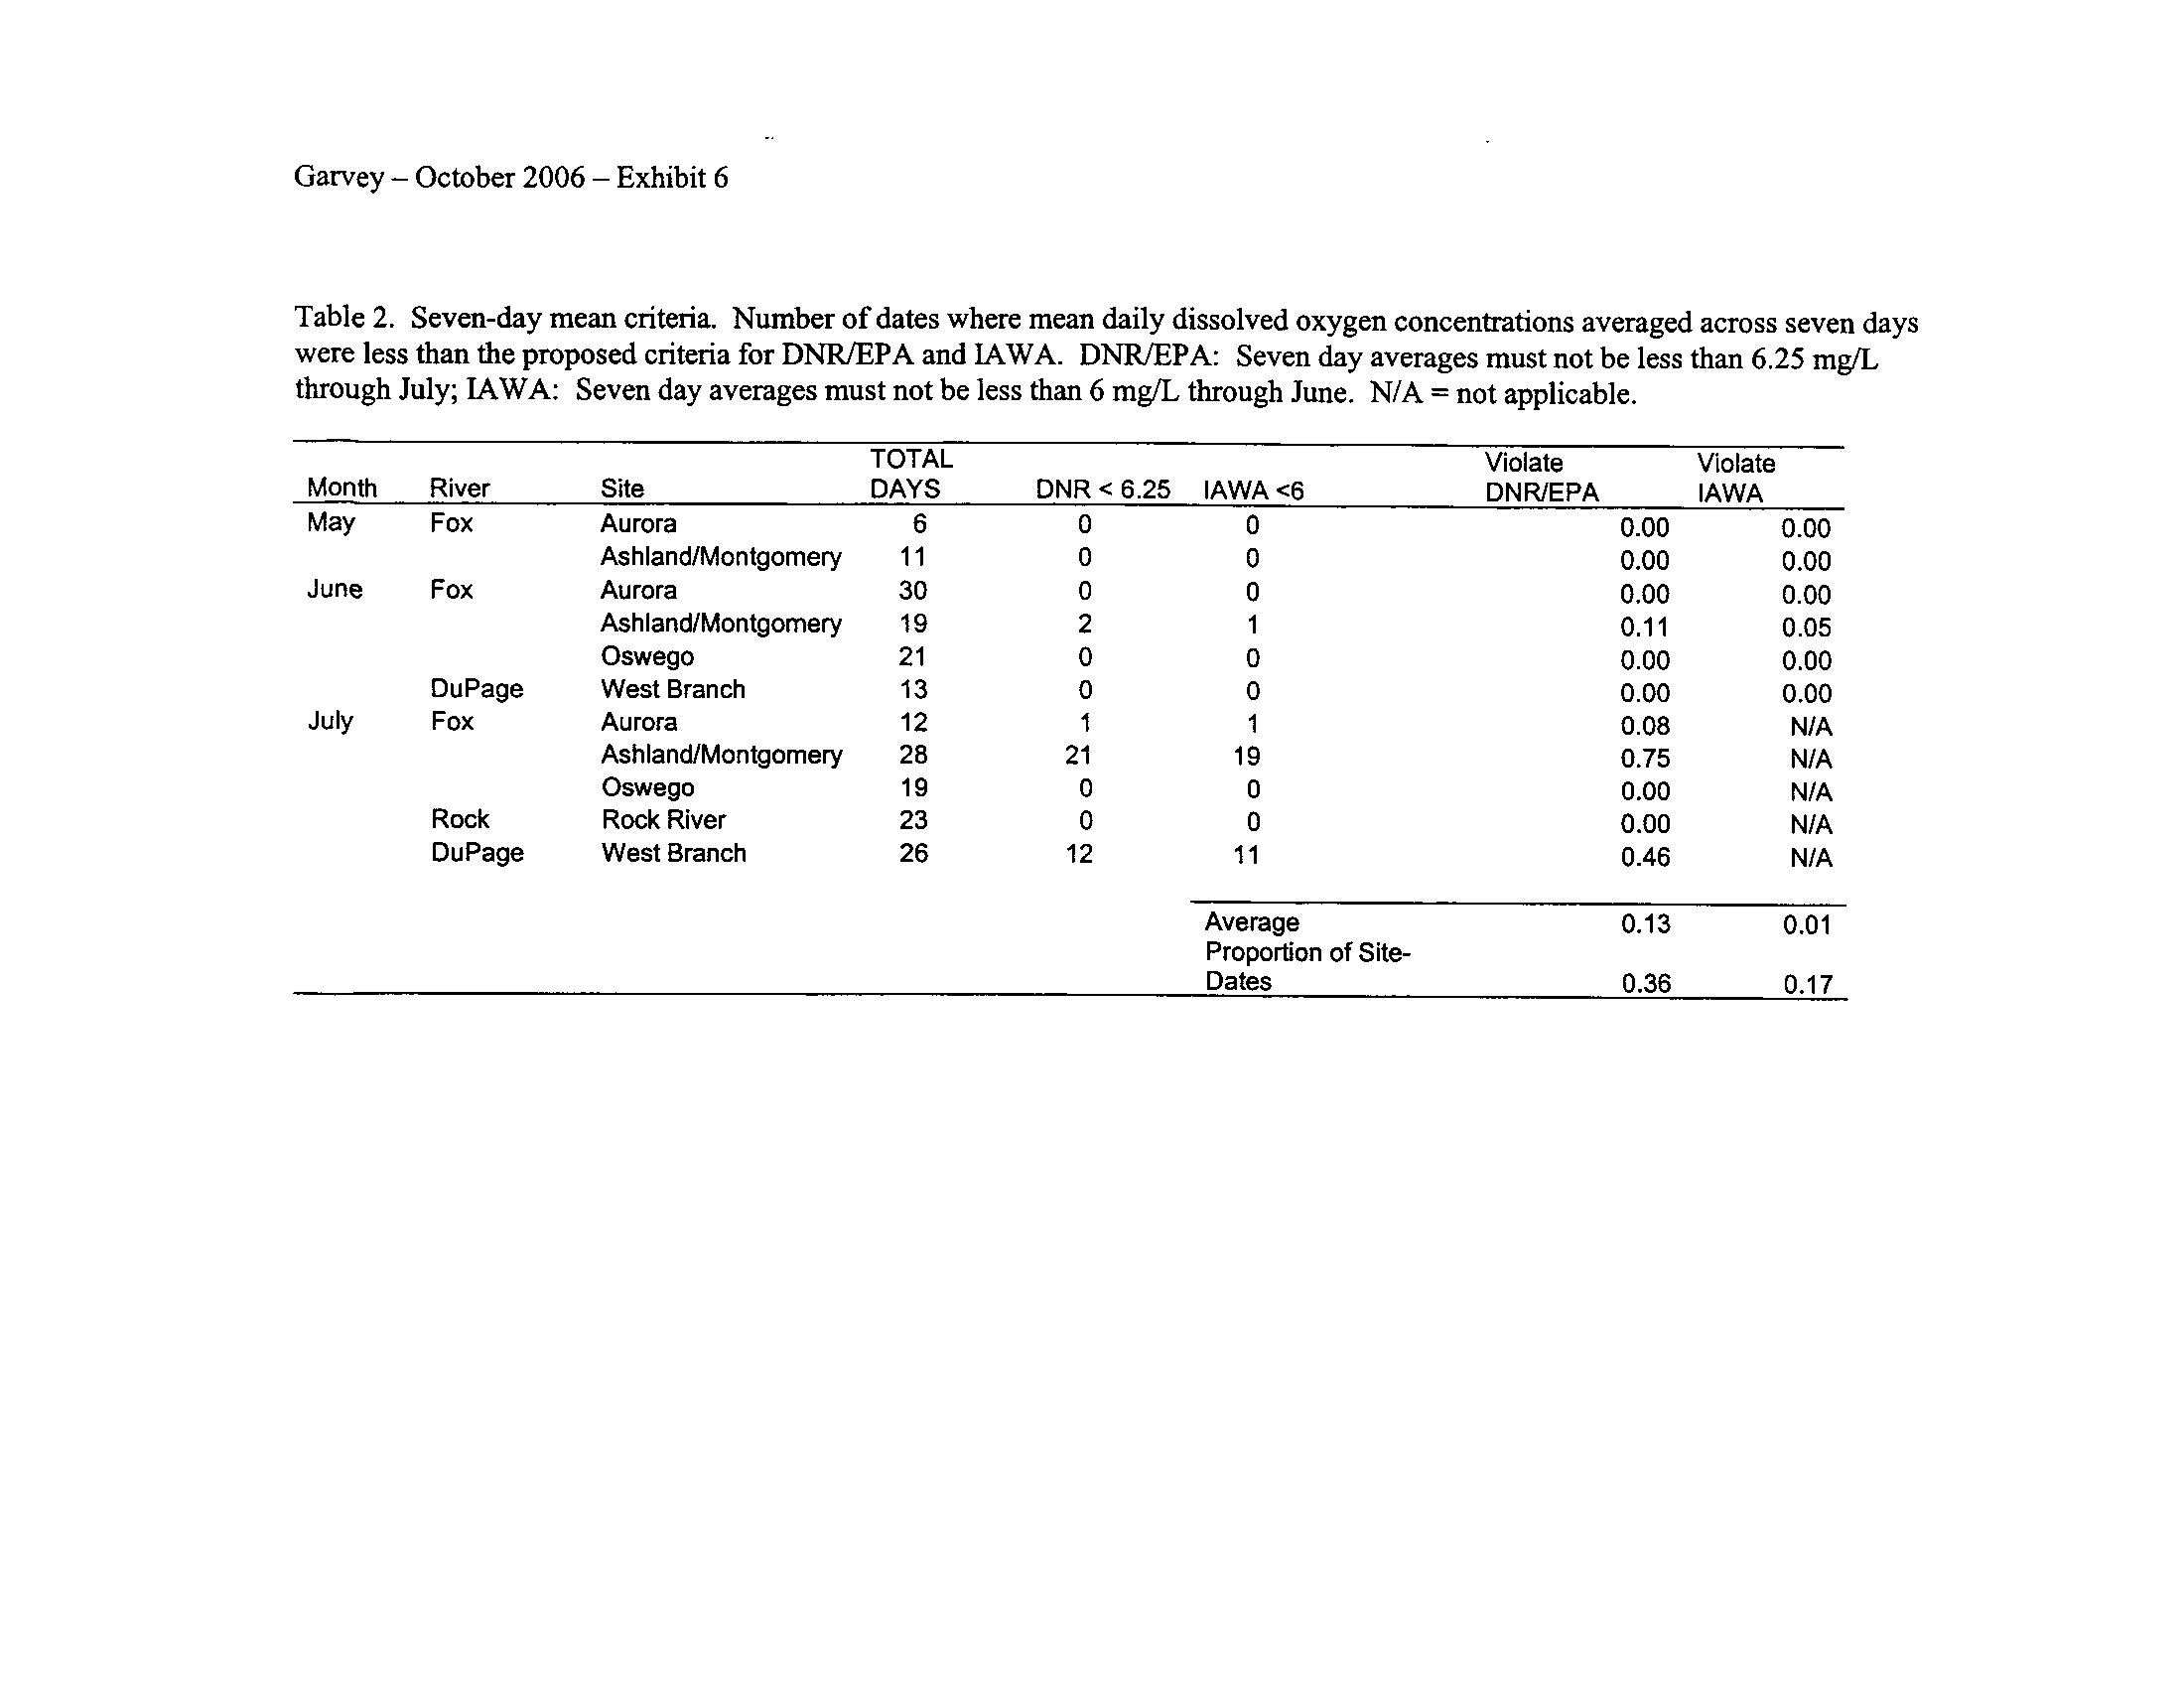
Seven-day means ending in July for IAWA and August for the IDNR/IEPA
proposals were generally insensitive (Exhibit 6)
.
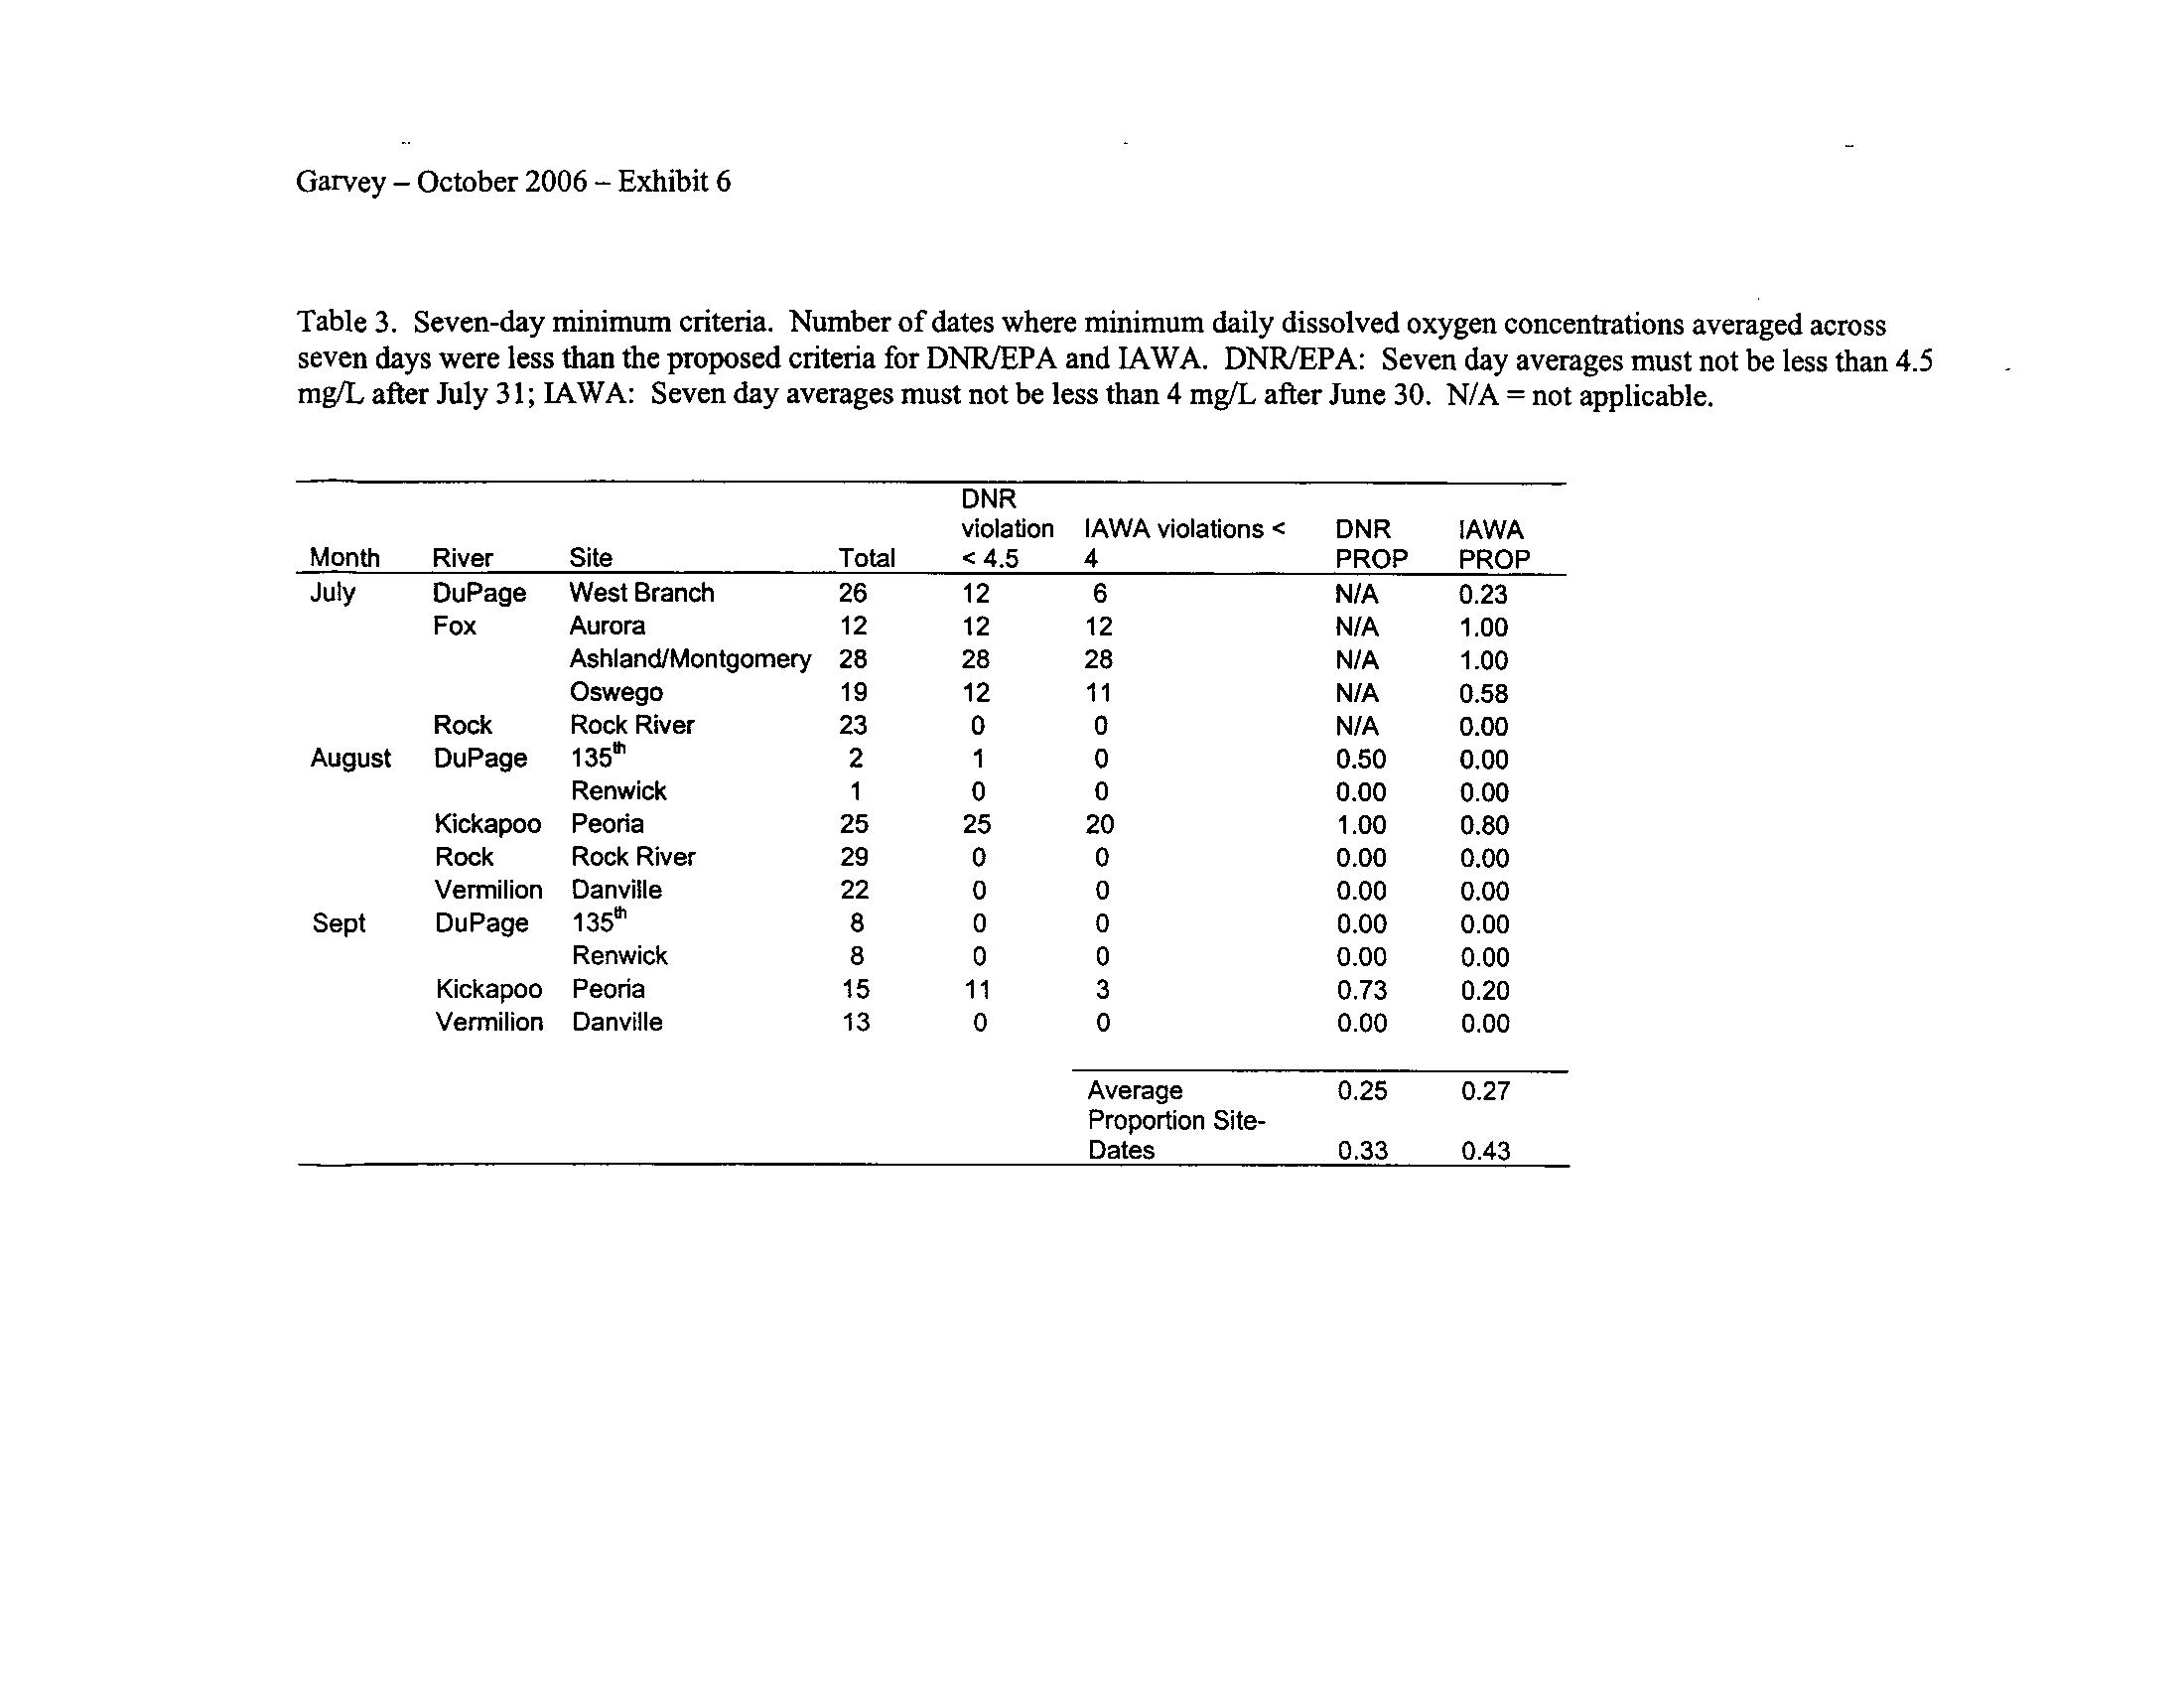
Interestingly, the IAWA proposed 7-
day minimum standard of 4 mg/L which applies during July through February generated
more violations than the IDNR/IEPA 7-day mean minimum of 4
.5 mg/L which starts in
August (Exhibit 6)
. Although I did not expect this to occur, apparently applying the
mean minimum criterion during July as per the IAWA proposal is more sensitive
.
9
Because the daily variation in dissolved oxygen concentrations differs more than the
daily average (i .e., it is the variation not the mean that is sensitive), it appears that the
mean-minimum criterion is more sensitive to frequent declines in oxygen during the
summer. In my view, it appears that many of these streams, particularly the Fox River,
fail to provide adequate oxygen for aquatic life during part of the summer
. This causes
me to question the linkage between the aquatic assemblages used to select the sites for
enhanced status and oxygen needs of the resident organisms
.
Summary
One of the major conclusions of the Garvey and Whiles report was that we have
much to learn about associations between aquatic organisms and spatial and temporal
heterogeneity in dissolved concentrations of warm surface waters in the US .
Since that
report was completed, I have had the privilege of exploring this issue in depth and
receiving some unprecedented (and fun) data sets
. As Liebig stated generally for all
ecology, it is clear that oxygen can become a limiting dissolved gas for aquatic organisms
and, below some threshold concentration, we should expect to see deleterious effects
and
reductions in species composition and abundance. To this date, all the data I have
reviewed suggest that a threshold does exist and that it occurs during the summer when
concentrations are less than or equal to 3 mg/L as stated in the NCD and the Garvey and
Whiles report . If a stream remains consistently above this level (i .e., never violates a 3 .5
mg/L minimum), oxygen is no longer limiting for life and some other factor then limits
organisms . . . .probably habitat
. All of the stream data and the literature (see Dr
. David's
research) support this view .
10
I favor scrapping dissolved oxygen as a standard altogether
. Although under
extreme conditions it can become limiting
(e.g.,
in the Gulf of Mexico hypoxic zone),
variable or low concentrations are largely a symptom of habitat problems and their
interactions with other factors such as chemical and biological pollutants
. .
. and, as this
testimony suggests, discharge
. However, given that this is not currently a possibility,
it
appears that the set of standards proposed in the Garvey and Whiles report stand the test
of the data and should be adopted in the interim
. I do urge the stakeholders to move
rapidly toward a habitat-based tier designation where oxygen is but one of a suite of
physical and chemical parameters used to diagnose root causes and develop sound
solutions .
CH02/ 22464211
.1
II
EARLY LIFE HISTORY OF FISHES IN RESTORED AND UNRESTORED
BACKWATERS
by
Laura A
. Csoboth
B.S ., University of Delaware, 2002
A Thesis
Submitted in Partial Fulfillment of the Requirements for the
Master of Science Degree
Department of Zoology
in the Graduate School
Southern Illinois University Carbondale
December 2006
THESIS APPROVAL
EARLY LIFE HISTORY OF FISHES IN RESTORED AND UNRESTORED
BACKWATERS
By
Laura A
. Csoboth
A Thesis Submitted in Partial
Fulfillment of the Requirements
for the Degree of
Master of Science Degree
in the field of Zoology
Approved by :
Dr James E
. Garvey, Chair
Dr
. Frank M. Wilhelm
Dr. Matthew R. Whiles
Graduate School
Southern Illinois University Carbondale
August 25, 2006
AN ABSTRACT OF THE THESIS OF
LAURA A
. CSOBOTH, for the Master of Science degree in ZOOLOGY, presented on
AUGUST 25, 2006, at Southern Illinois University Carbondale
.
TITLE : EARLY LIFE HISTORY OF FISHES IN RESTORED AND UNRESTORED
BACKWATERS
MAJOR PROFESSOR : Dr. James E. Garvey
River modifications have degraded backwaters, reducing critical habitat for larval
fishes
. Restoration projects, such as on the Illinois River's Swan Lake backwater, may
be improving fish spawning and nursery areas
. During 2004 and 2005,1 (1) assessed
restored and unrestored backwaters as fish nurseries by quantifying the density of larval
fishes and their zooplankton prey and (2) investigated movement of larval fish between
the river and Swan Lake by setting drift nets on a diel and seasonal basis .
A flood pulse occurred during June 2004, but no spring or summer flood event
during 2005
. When restored and unrestored backwater sites were compared to the
Illinois River, families of fish changed between years, with fluvial-dependent taxa
present during the flood pulse of 2004 and relatively absent during the drought of 2005
.
Higher fish densities and larger fish larvae were collected in backwaters as compared to
the Illinois River during both years, probably due to abundant zooplankton and warmer
temperatures
. Larval drift was positively related to water velocity during 2004, and an
estimated 32 .3 million larvae drifted into Swan Lake
. No other relationships between
drift direction and abiotic variables occurred
. In 2005, drift was related to larval density,
probably due to the lack of a flood pulse.
I
Backwater-river connectivity in the Swan Lake HREP was preserved through the
construction of water control stop-log structures, which allowed continual access by all
fishes
. The backwater management plans at Swan Lake enhanced habitat diversity and
realized beneficial effects by creating a diverse and abundant age-O fish community
.
ii
ACKNOWLEDGMENTS
I thank my advisor, Dr
. Jim Garvey, for his continual support and guidance
.
Funding was provided by the U .S
. Army Corps of Engineers, St . Louis District .
Technical and logistical support was provided by the Two Rivers National Wildlife
Refuge, Chad Dolan of the Illinois Natural History Survey, and Neil Booth of the Illinois
Department of Natural Resources . I thank countless individuals within the Department of
Zoology, Southern Illinois University Carbondale, particularly my committee members
Dr. Matt Whiles and Dr
. Frank Wilhelm
. I want to recognize students, faculty, and staff
of the Fisheries and Illinois Aquaculture Center and particularly
: R. Brooks, K.
DeGrandchamp, and D
. Schultz for their assistance throughout all phases of this project
;
Dr. Burr, D. Knuth, A . Lohmeyer, and S
. Tripp for their help with larval fish
identification; R. Colombo, R. Lane, and Q
. Phelps for their assistance with the analysis
and review of my manuscripts
. I am grateful for the diligent patience of many
undergraduate students and, particularly two extra help employees, Michielle Lyman and
Kristal Derr, who processed countless larval fish and zooplankton samples
. Finally,
many grateful thanks go to my family for their endless support and encouragement and
my friends, both new and old .
iii
Chapter
ABSTRACT
i
ACKNOWLEDGMENTS
iii
LIST OF TABLES
v
LIST OF FIGURES
vii
CHAPTER I
-
OVERVIEW
I
CHAPTER2 -°L'
V
CHAPTERS
OLEOFBA'CKWATERS . ...a 27
CHAPTER4- NOIN
TABLE OF CONTENTS
iv
Page
88
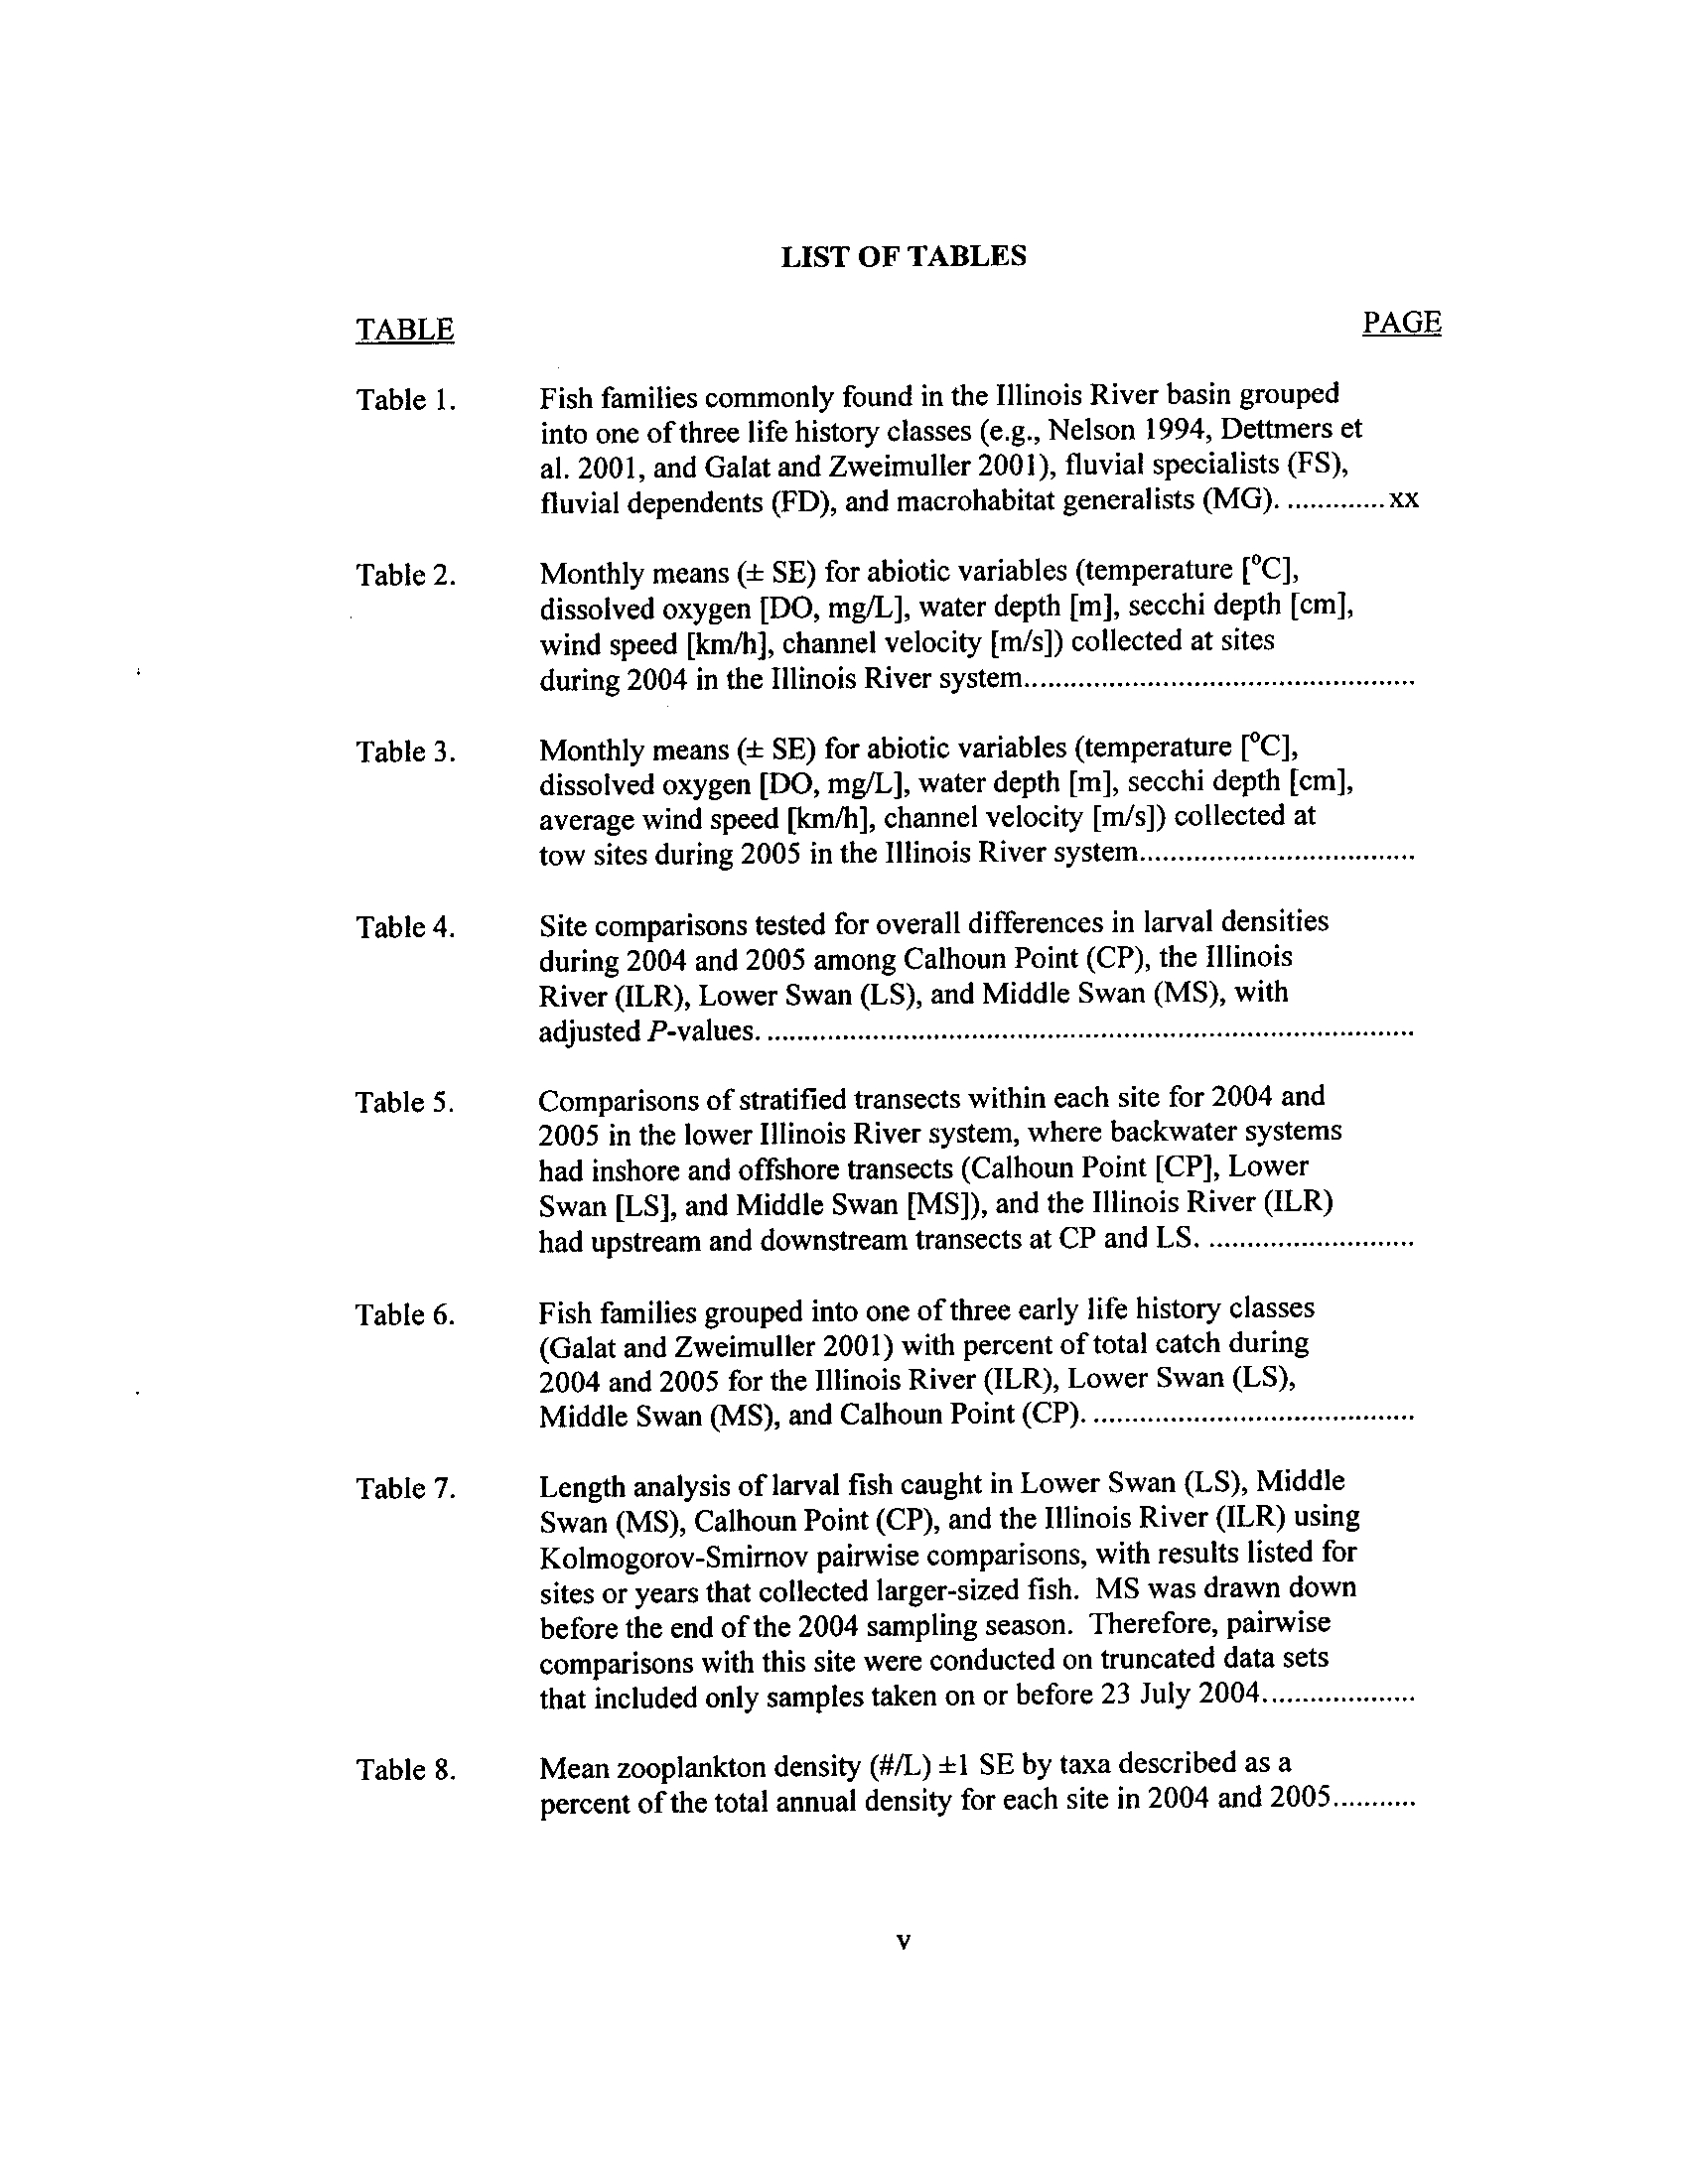
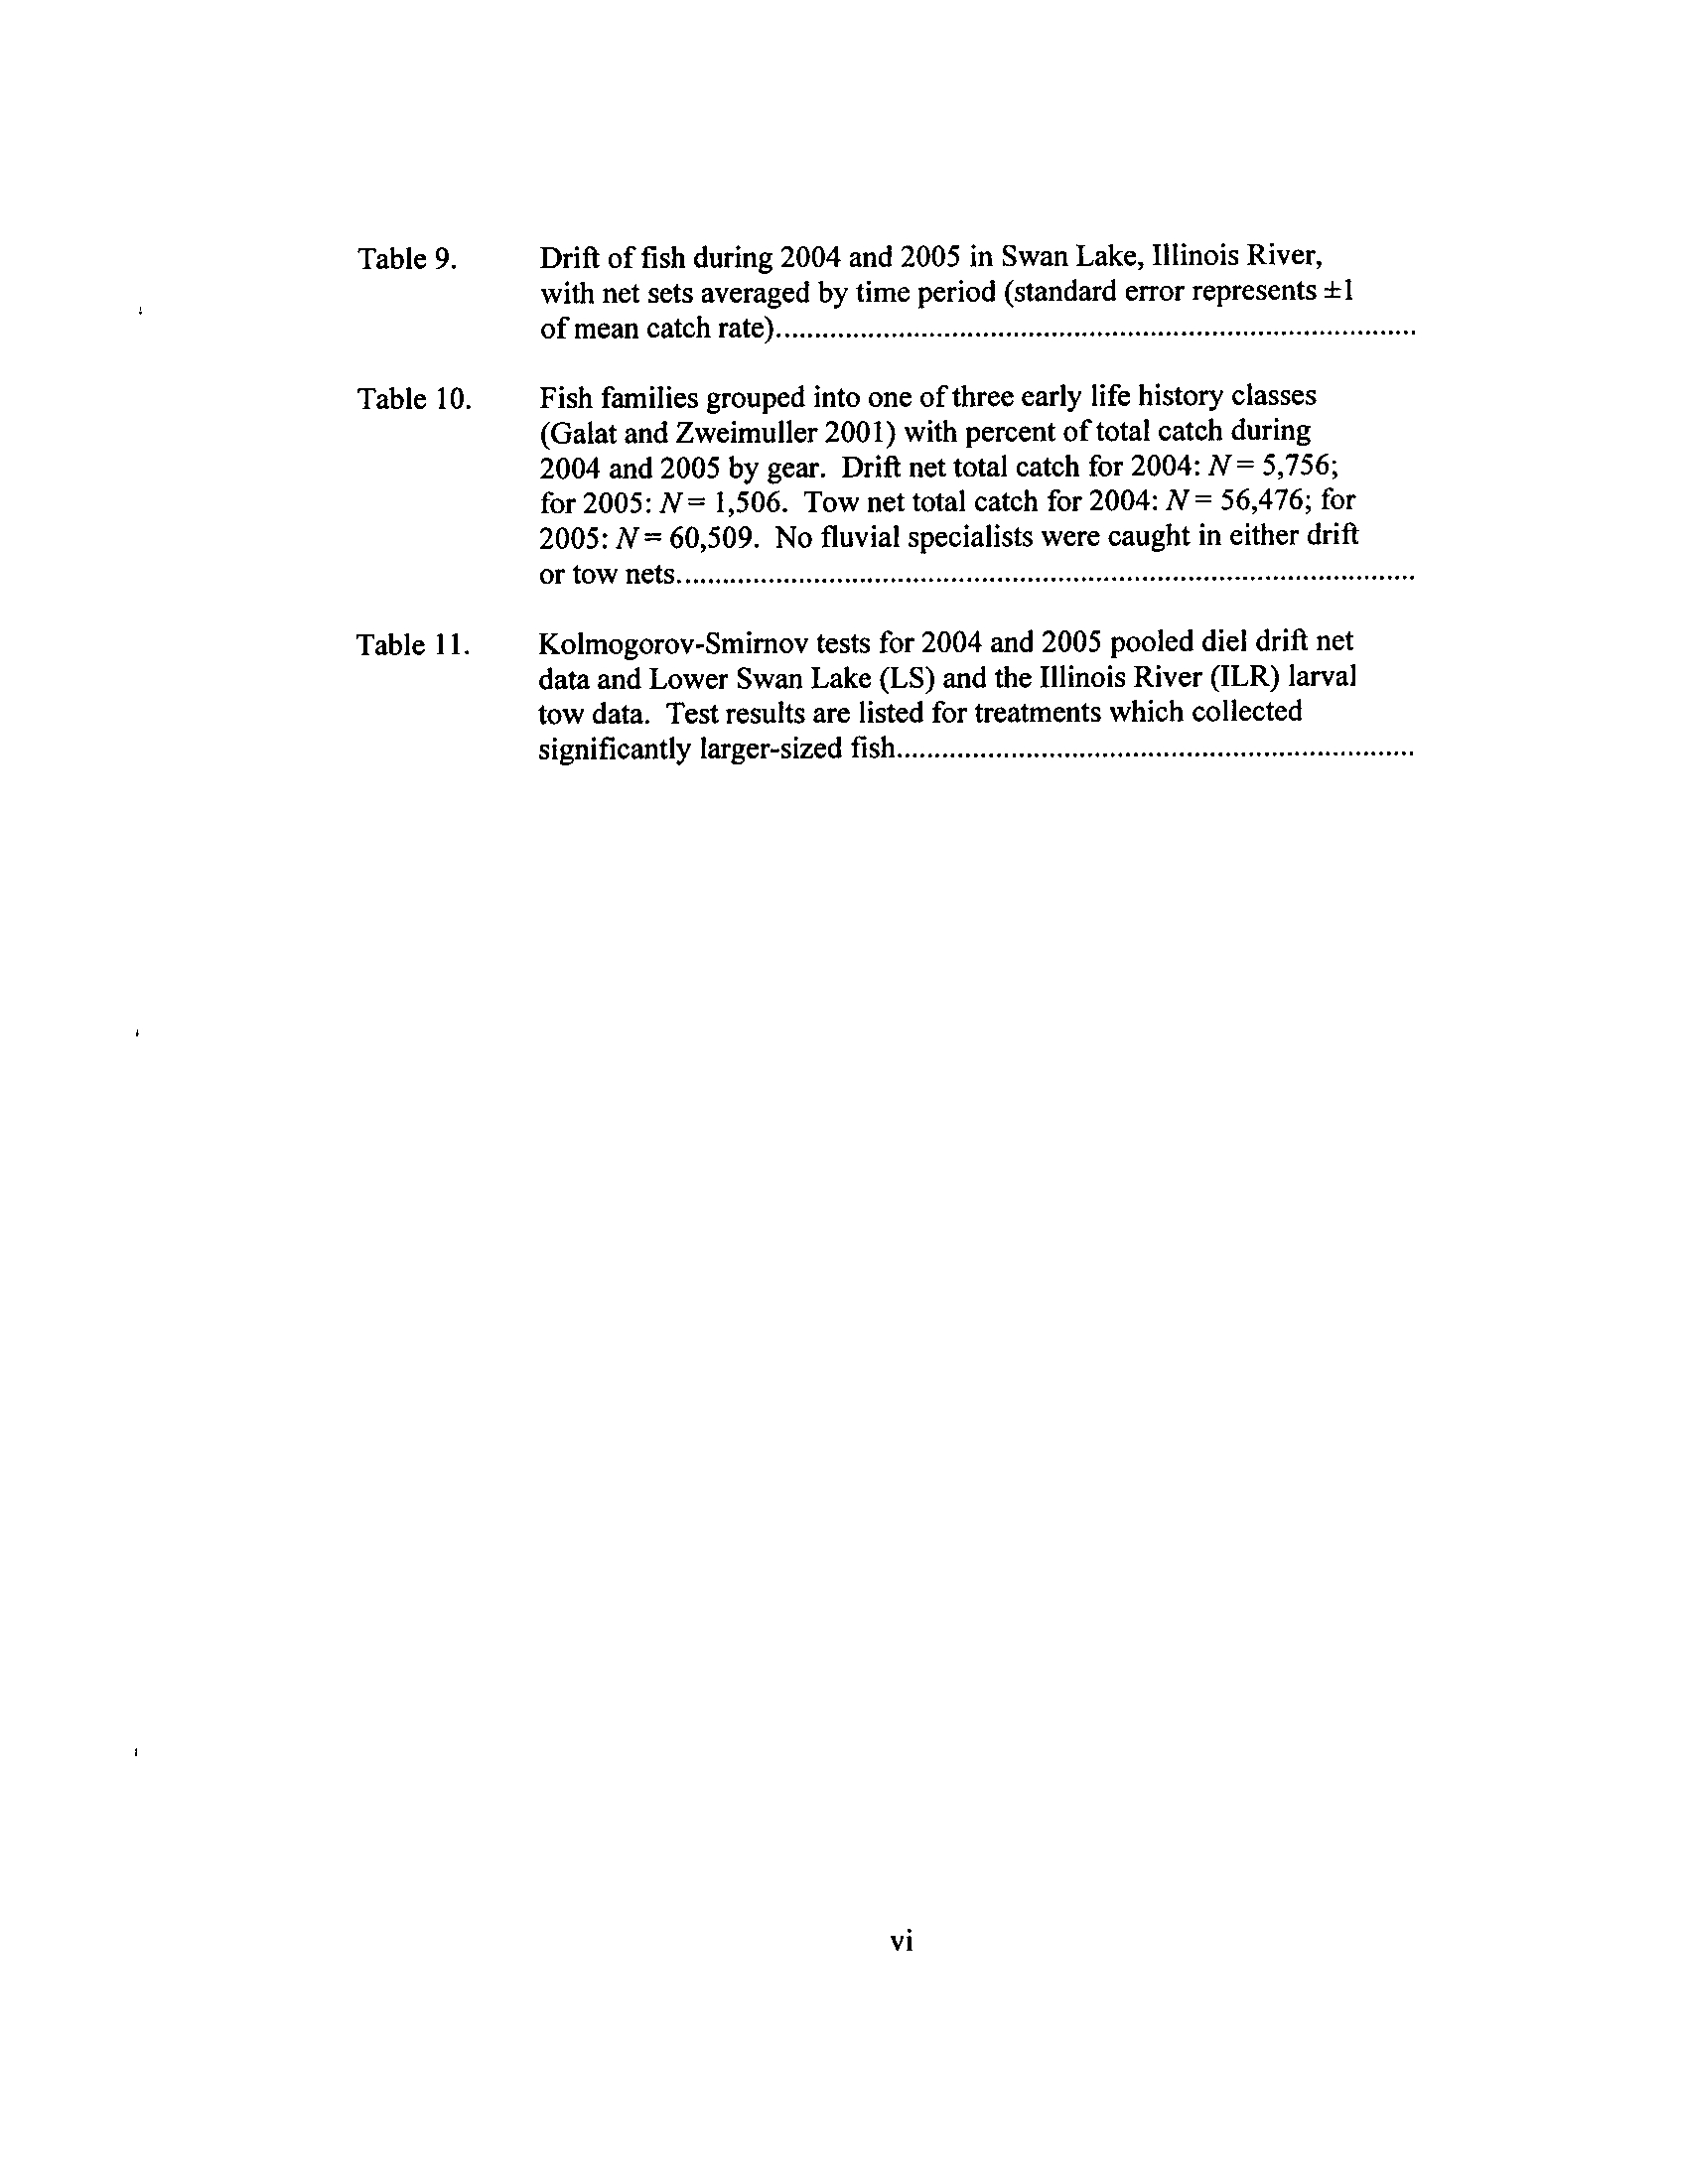
LIST OF TABLES
TABLE
PAGE
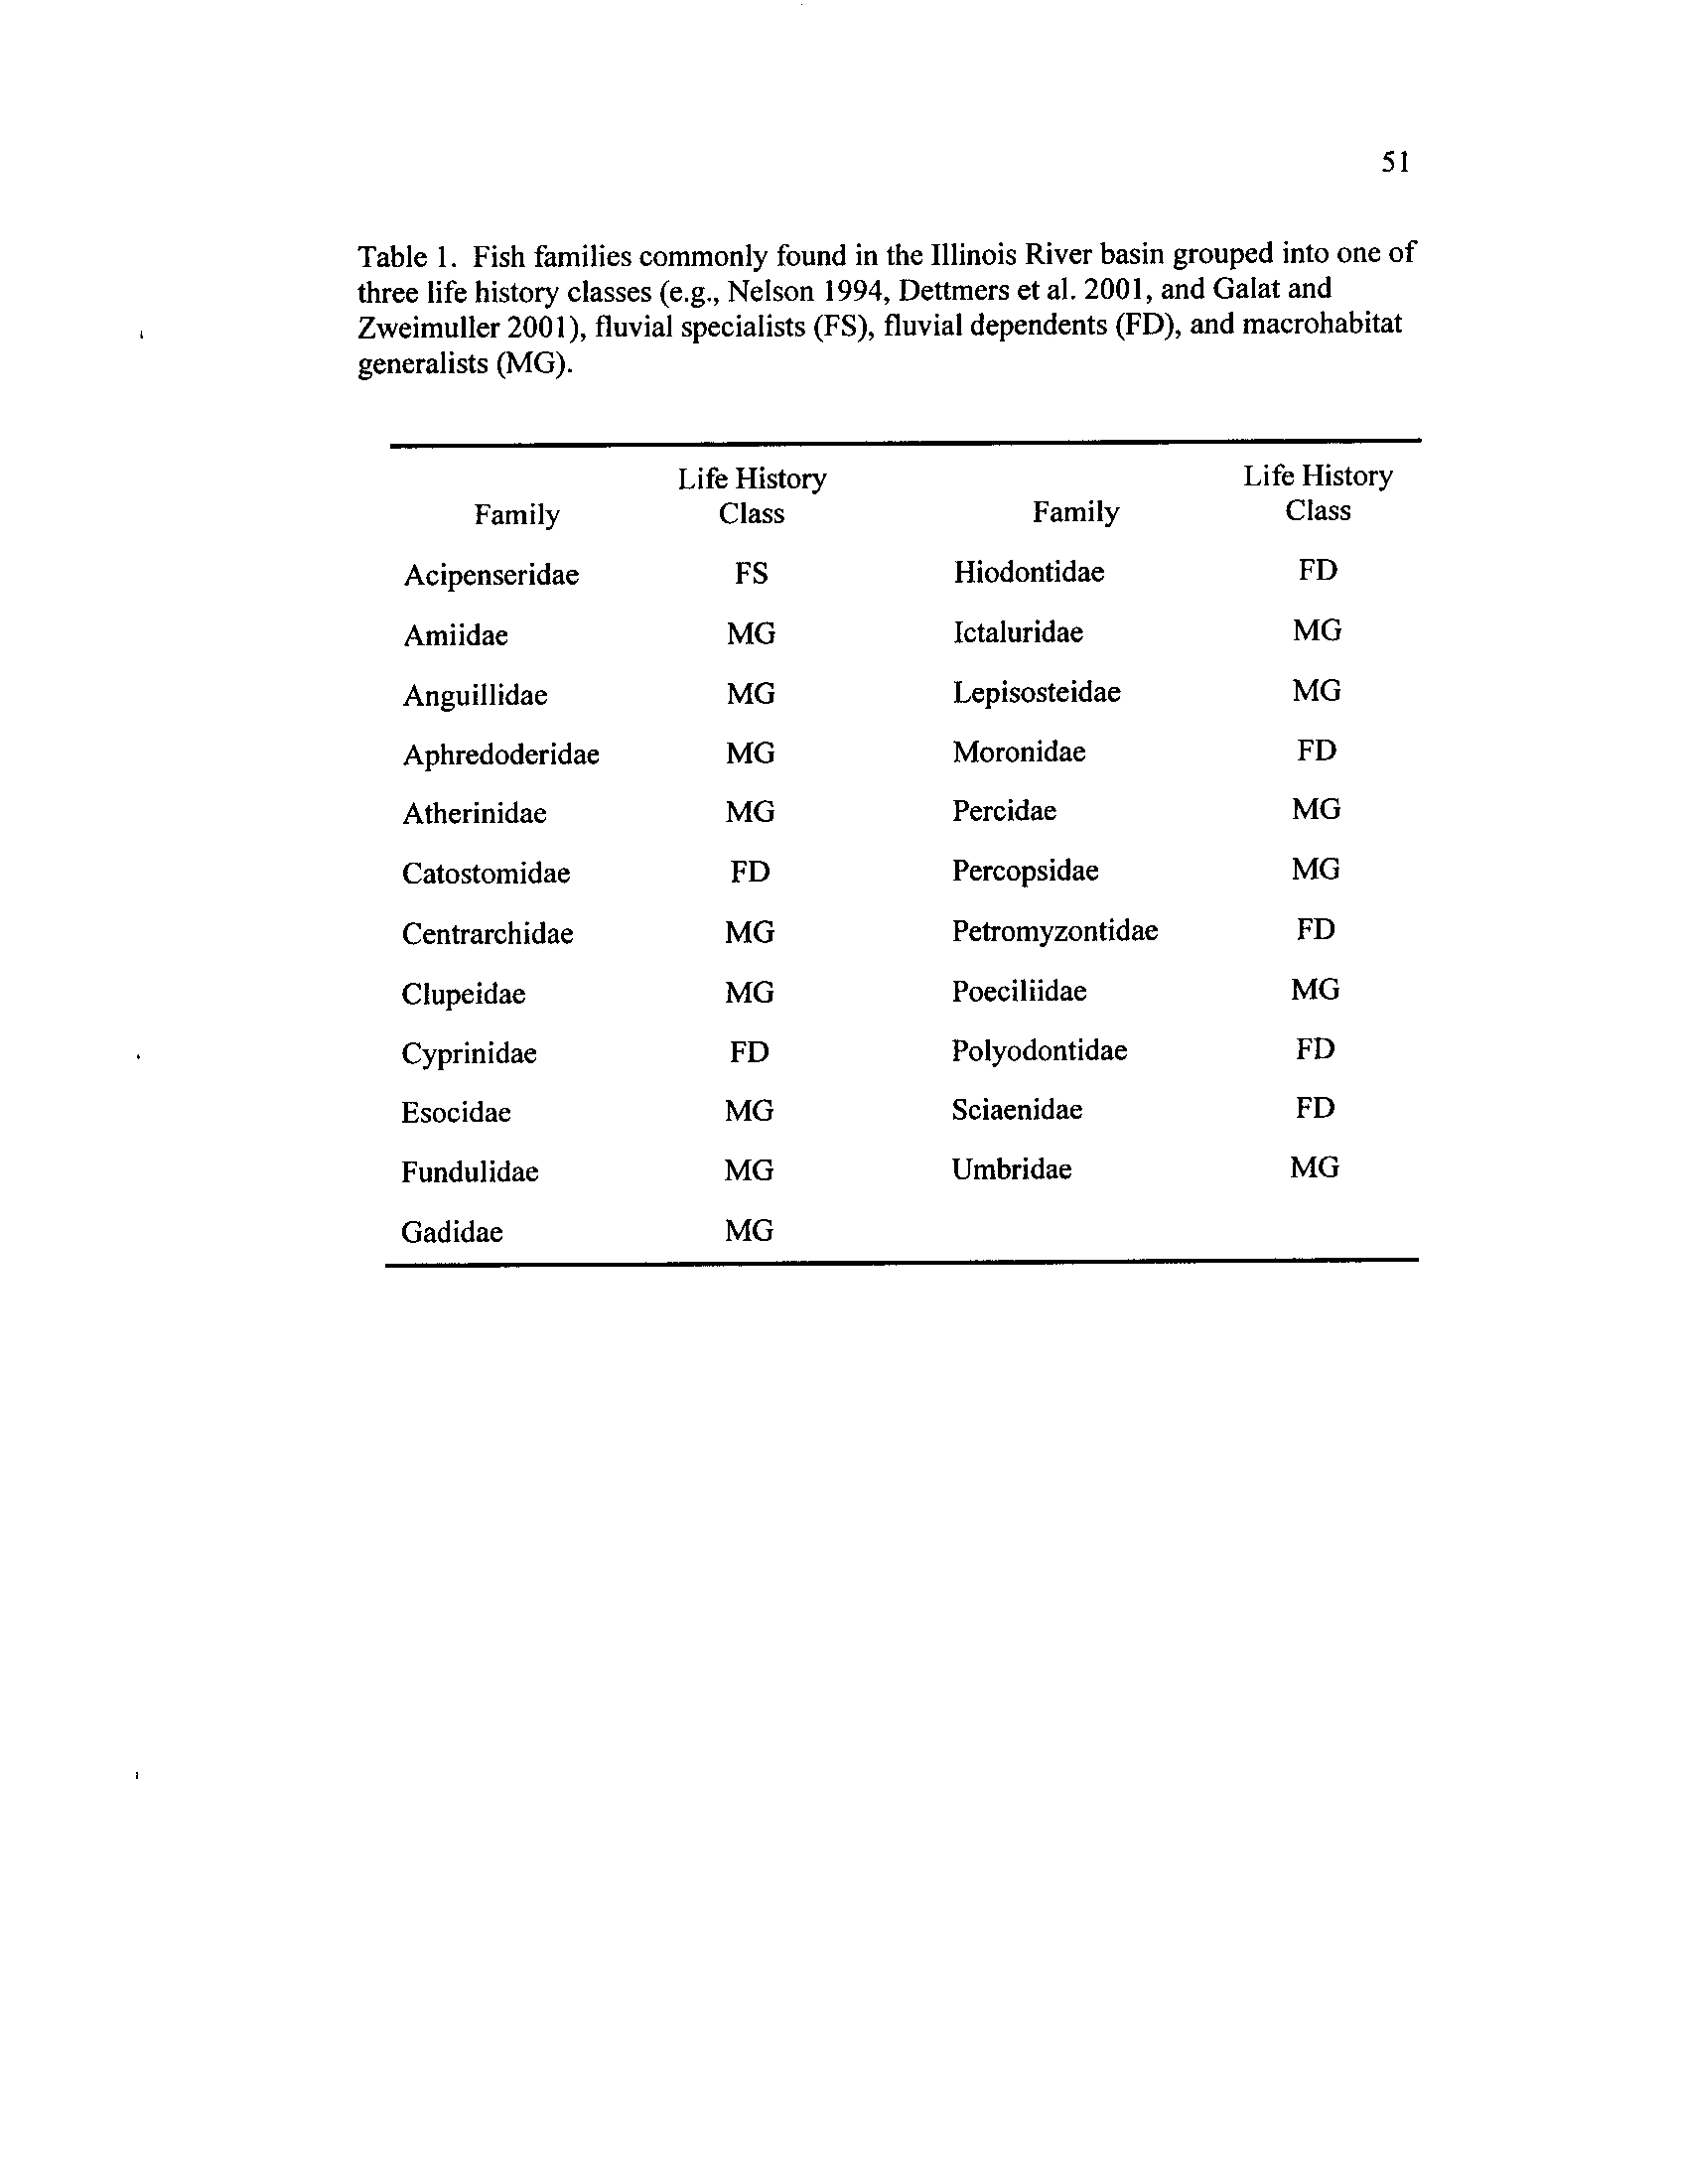
Table 1 .
Fish families commonly found in the Illinois River basin grouped
into one of three life history classes (e.g.,
Nelson 1994, Dettmers et
al
. 2001, and Galat and Zweimuller 2001), fluvial specialists
(FS),
fluvial dependents (FD),
and macrohabitat generalists (MG) xx
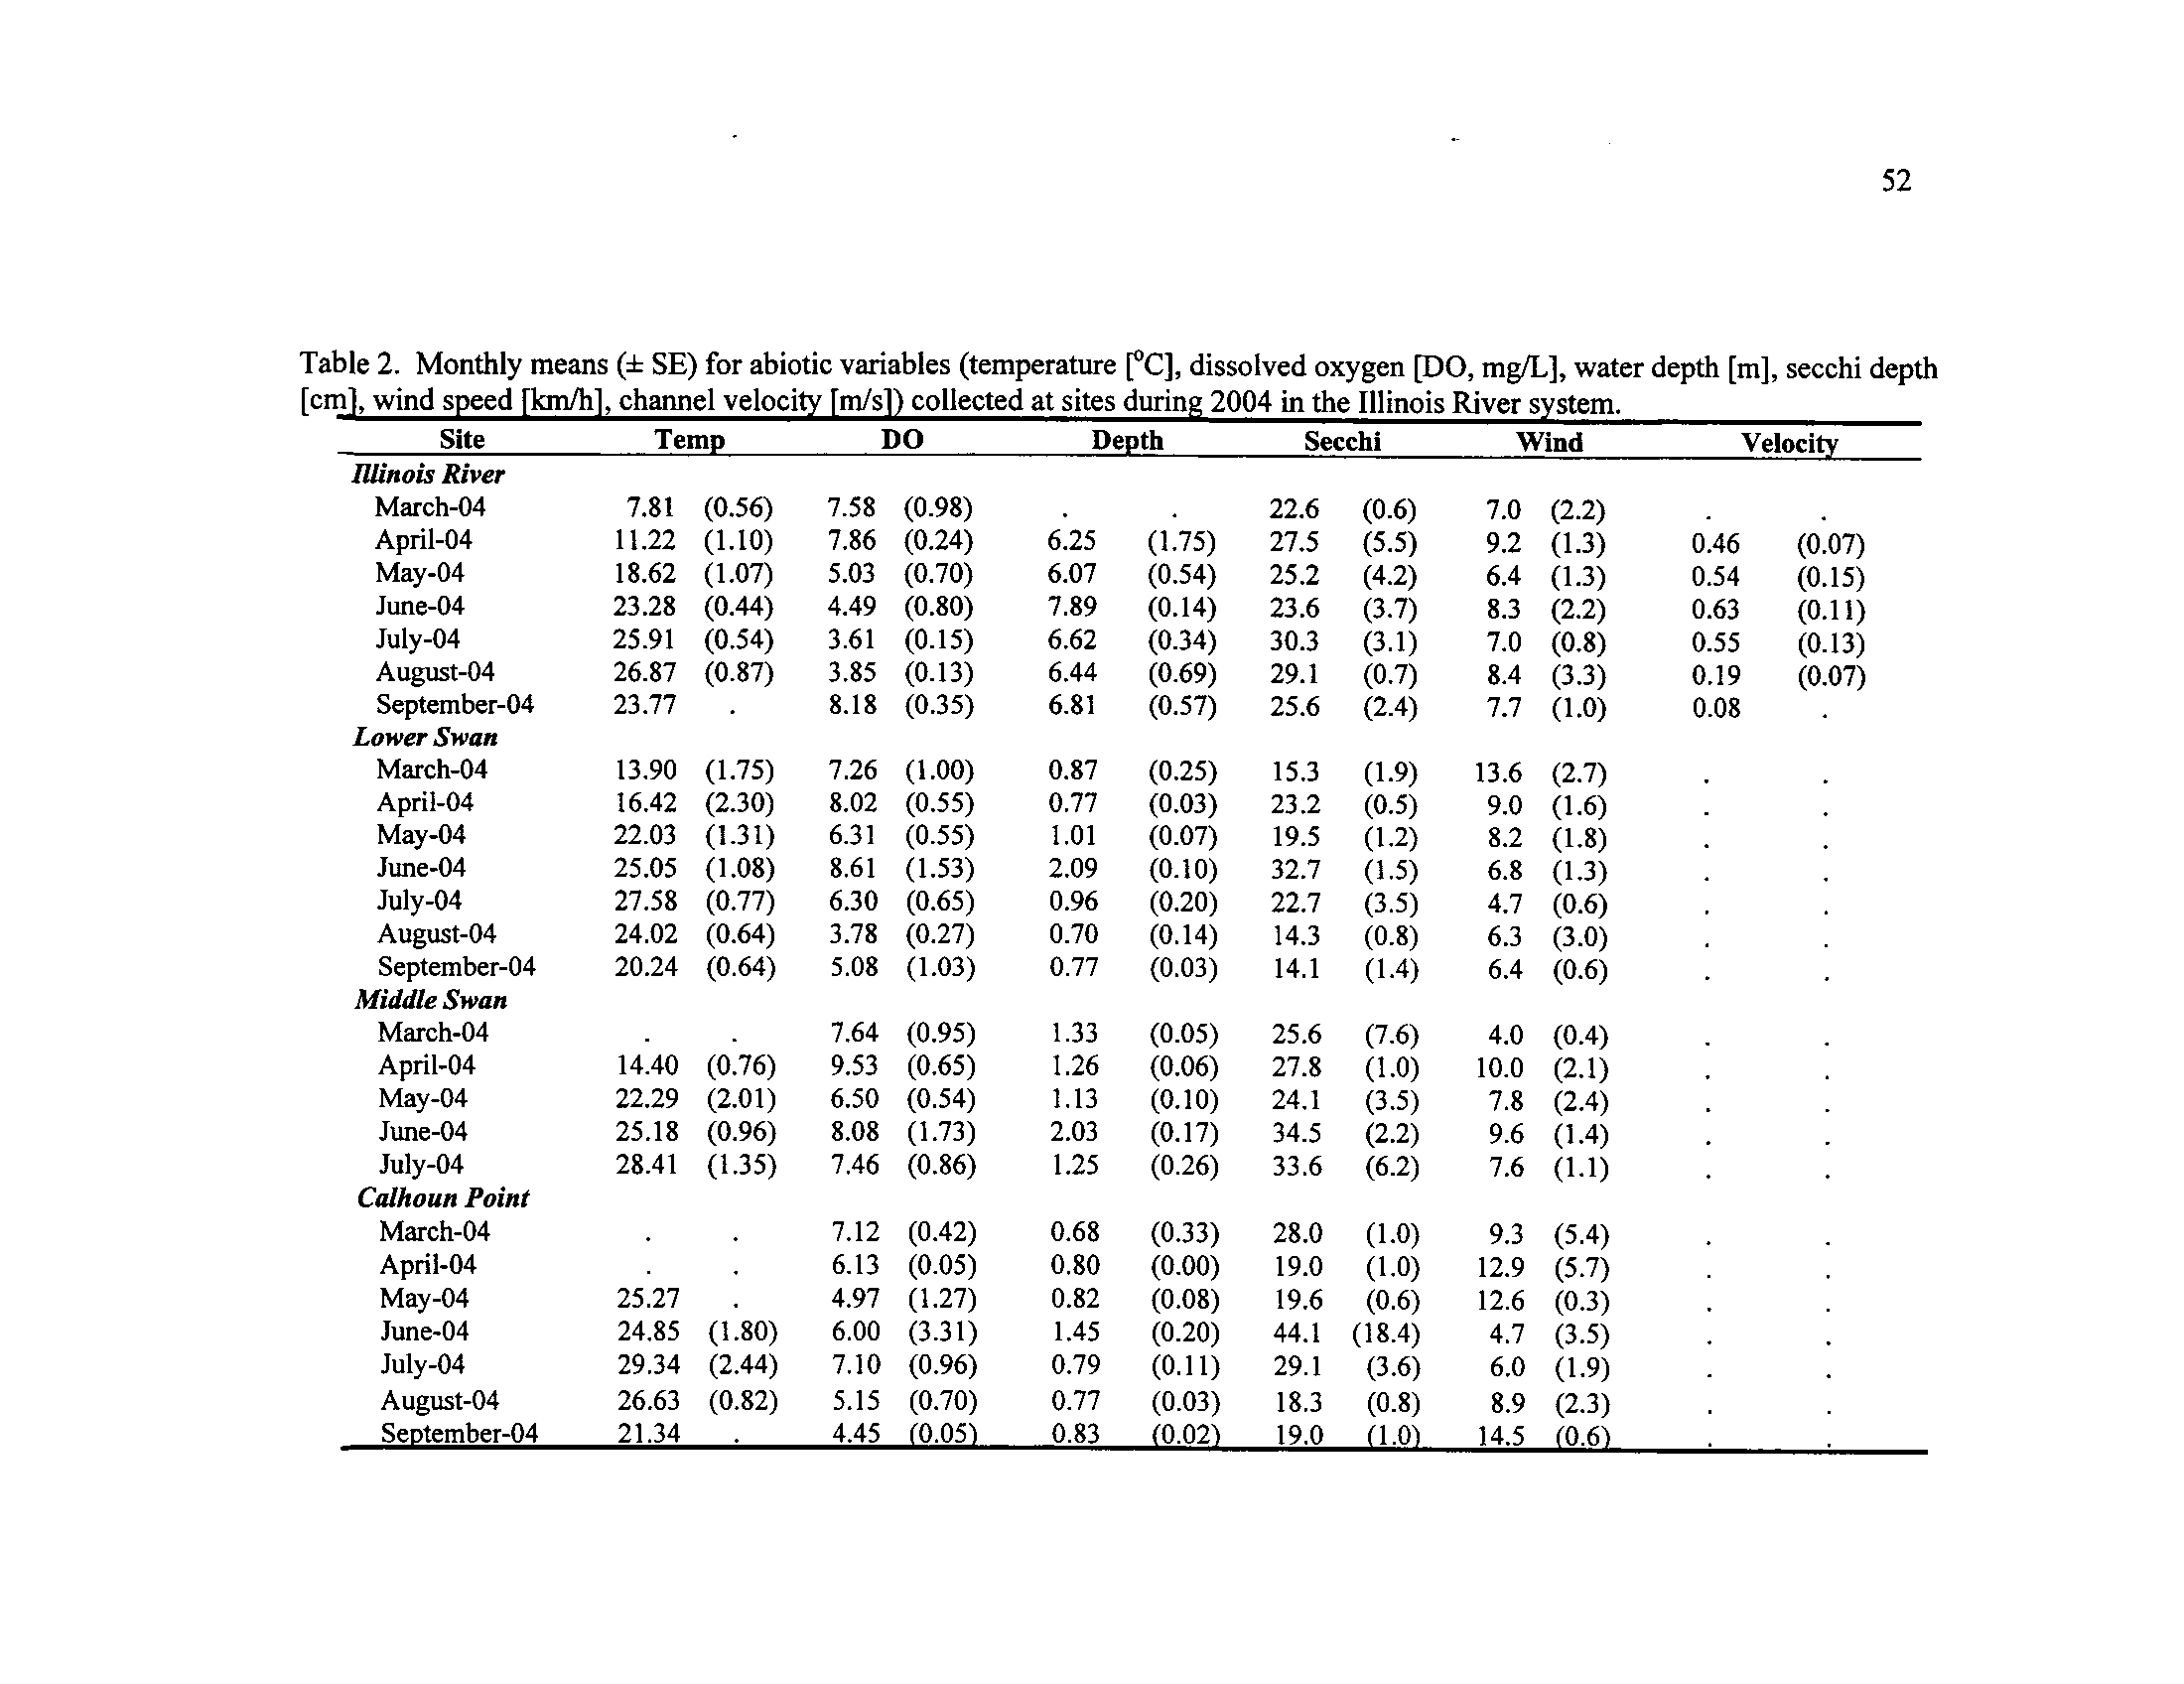
Table 2
.
Monthly means (± SE) for abiotic variables (temperature
[°C],
dissolved oxygen [DO, mg/L], water depth
[m], secchi depth [cm],
wind speed [km/h], channel velocity [m/s]) collected at sites
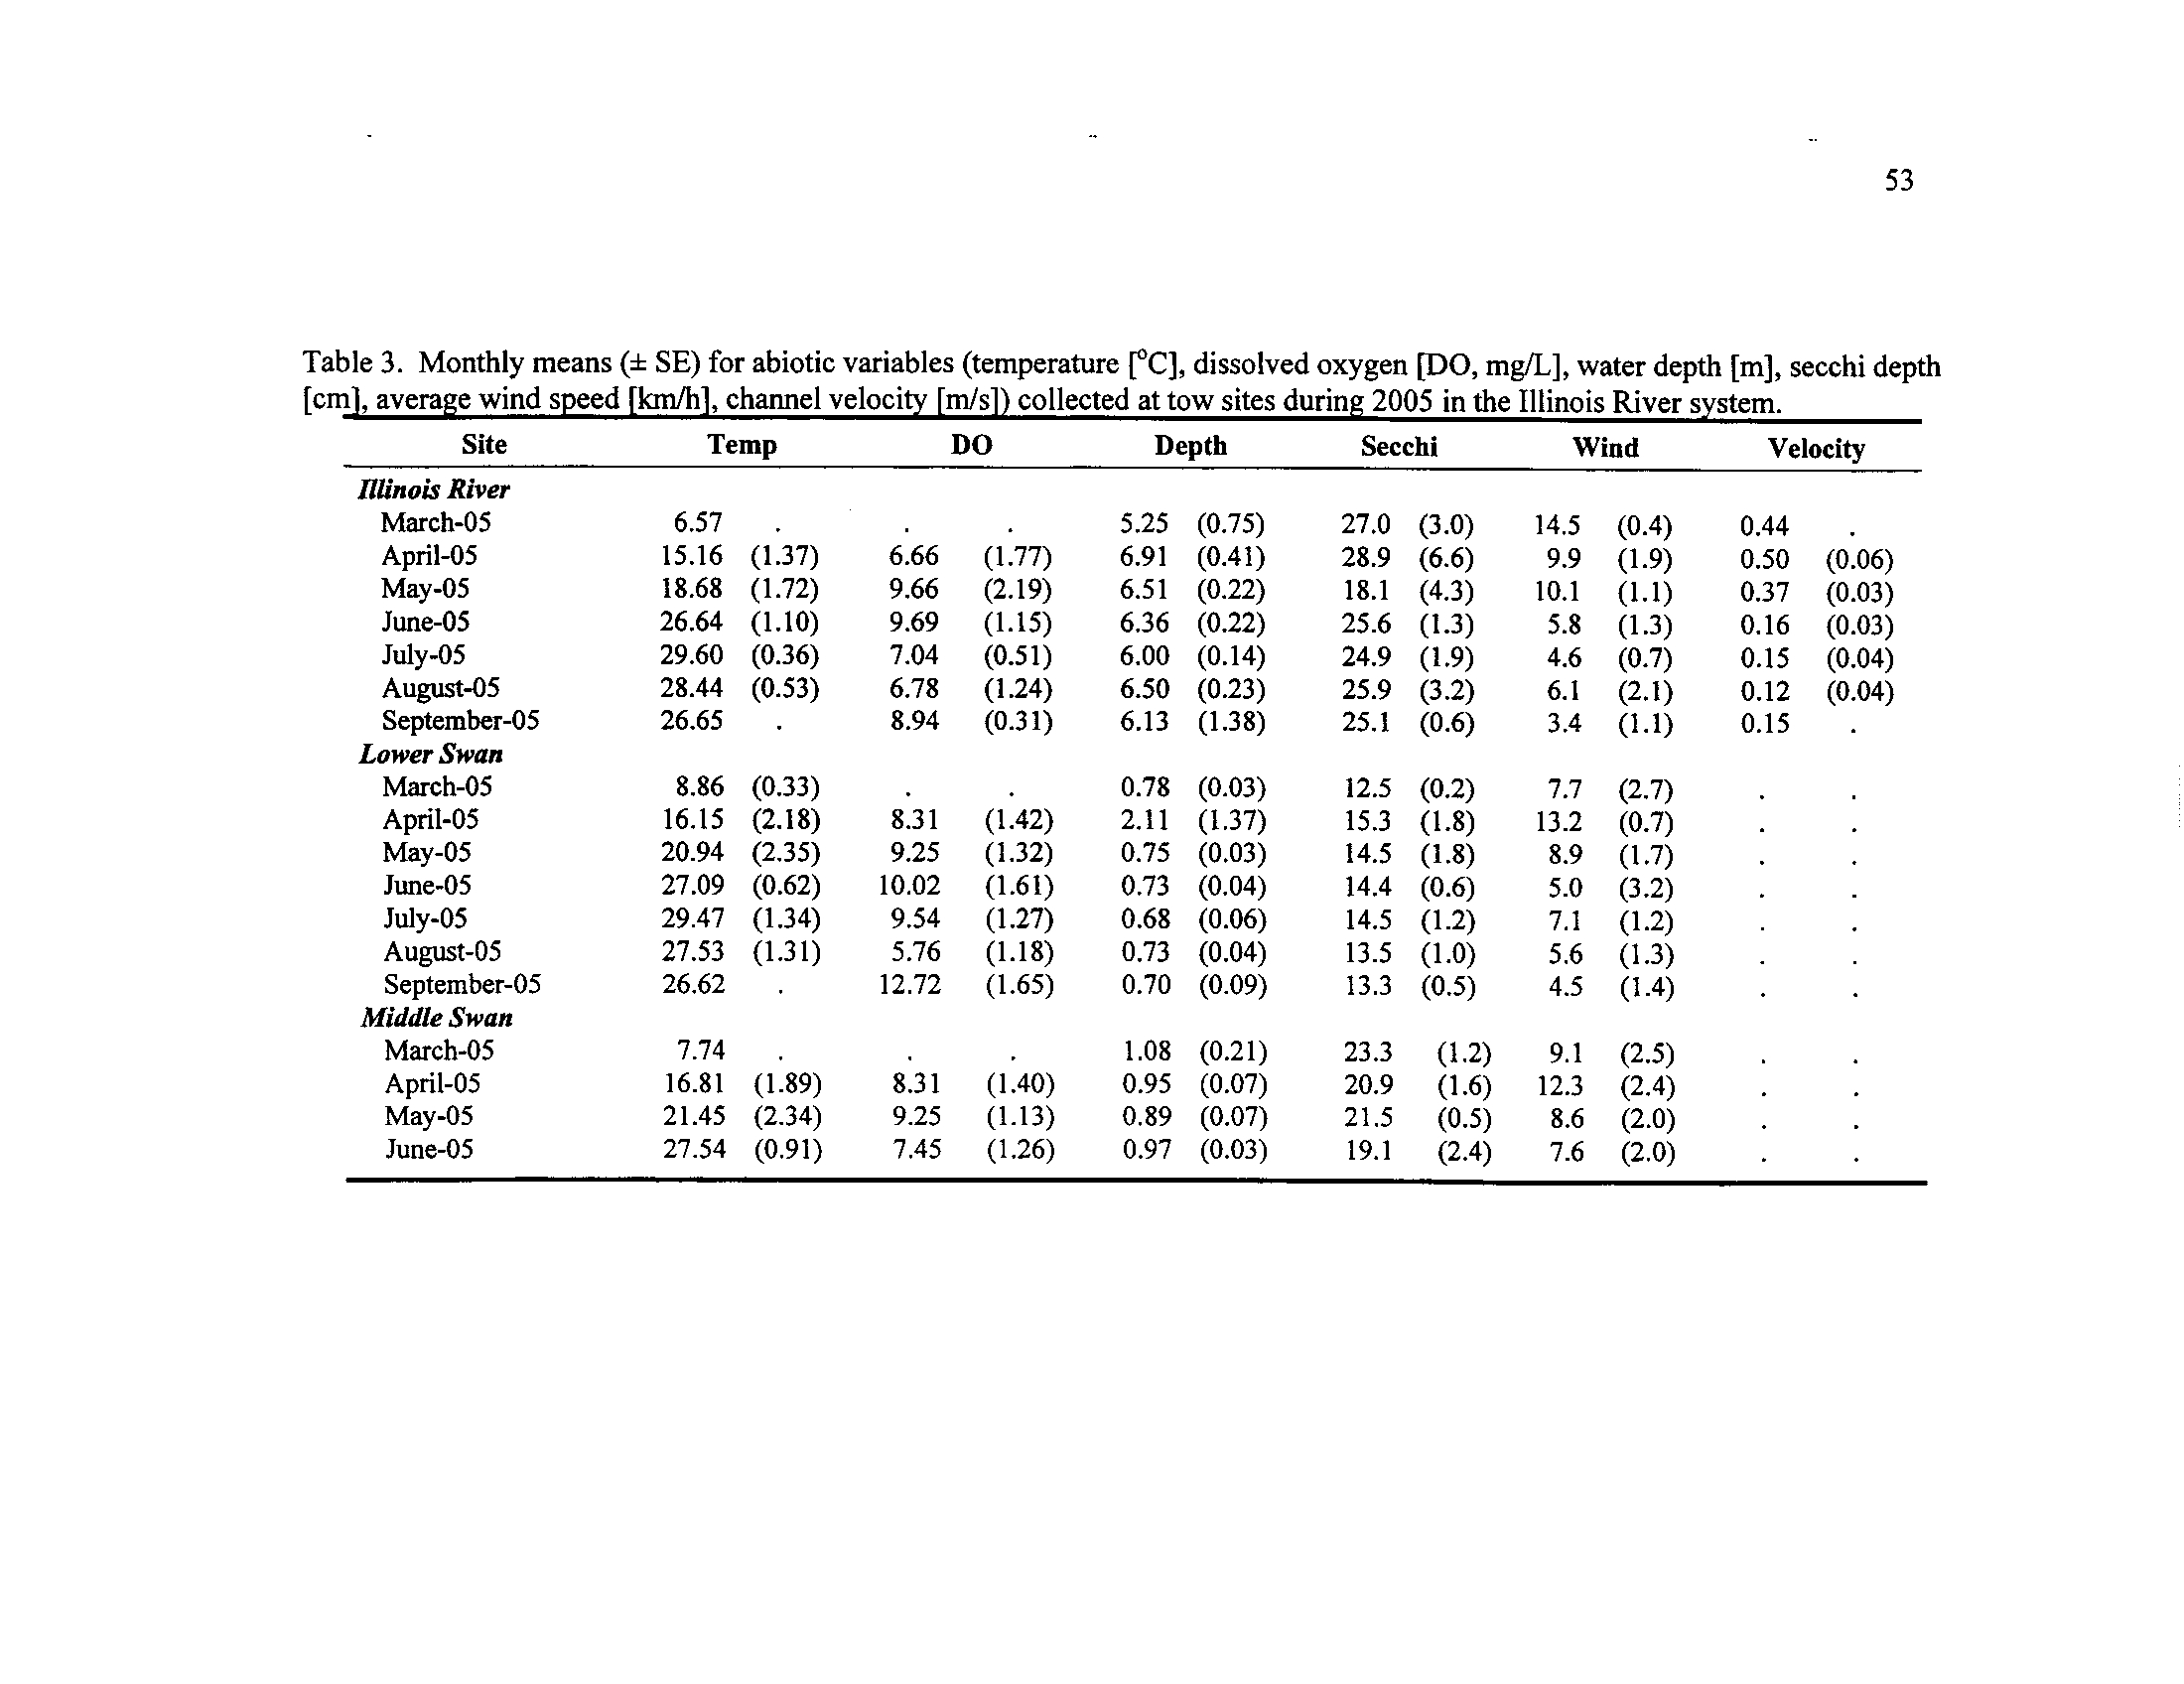
Table 3
.
during 2004 in the Illinois River system
Monthly means (± SE) for abiotic variables (temperature
[°C],
dissolved oxygen [DO, mg/L], water depth
[m], secchi depth [cm],
average wind speed [km/h], channel velocity [m/s]) collected at
Table 4.
tow sites during 2005 in the Illinois River system
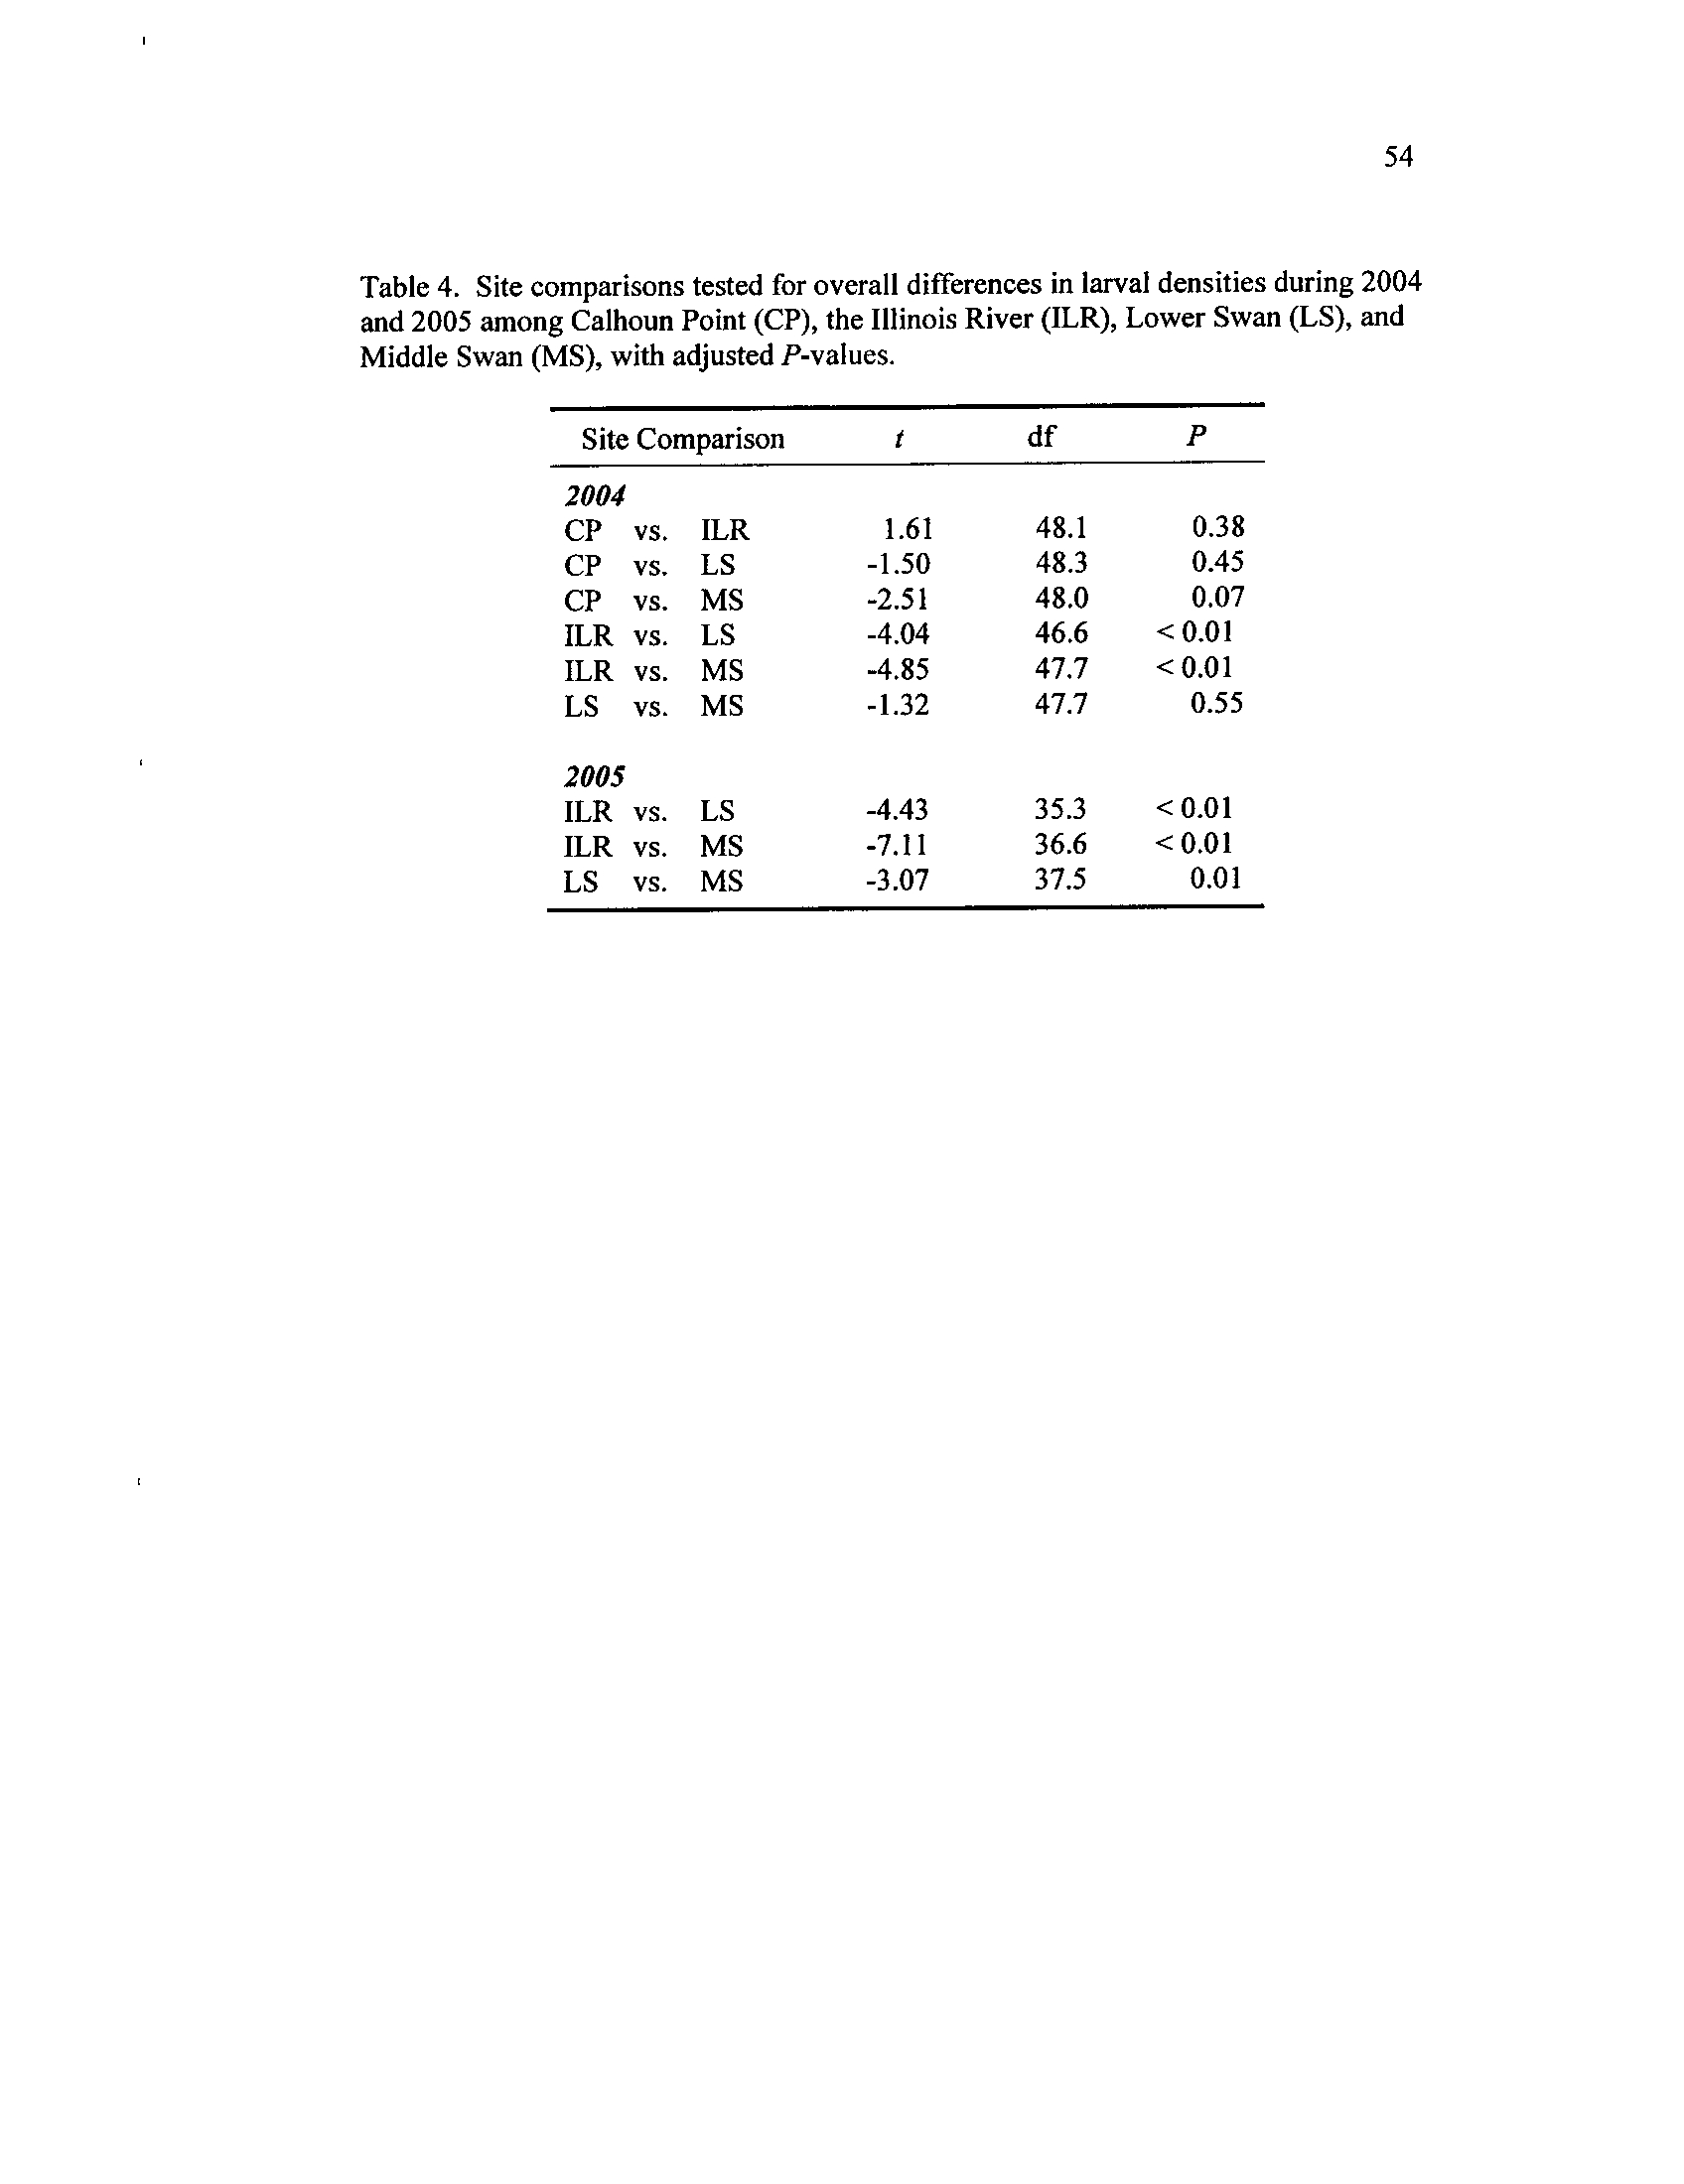
Site comparisons tested for overall differences in larval densities
during 2004 and 2005 among Calhoun Point (CP),
the Illinois
River (ILR), Lower Swan
(LS), and Middle Swan (MS), with
Table 5
.
adjusted P-values
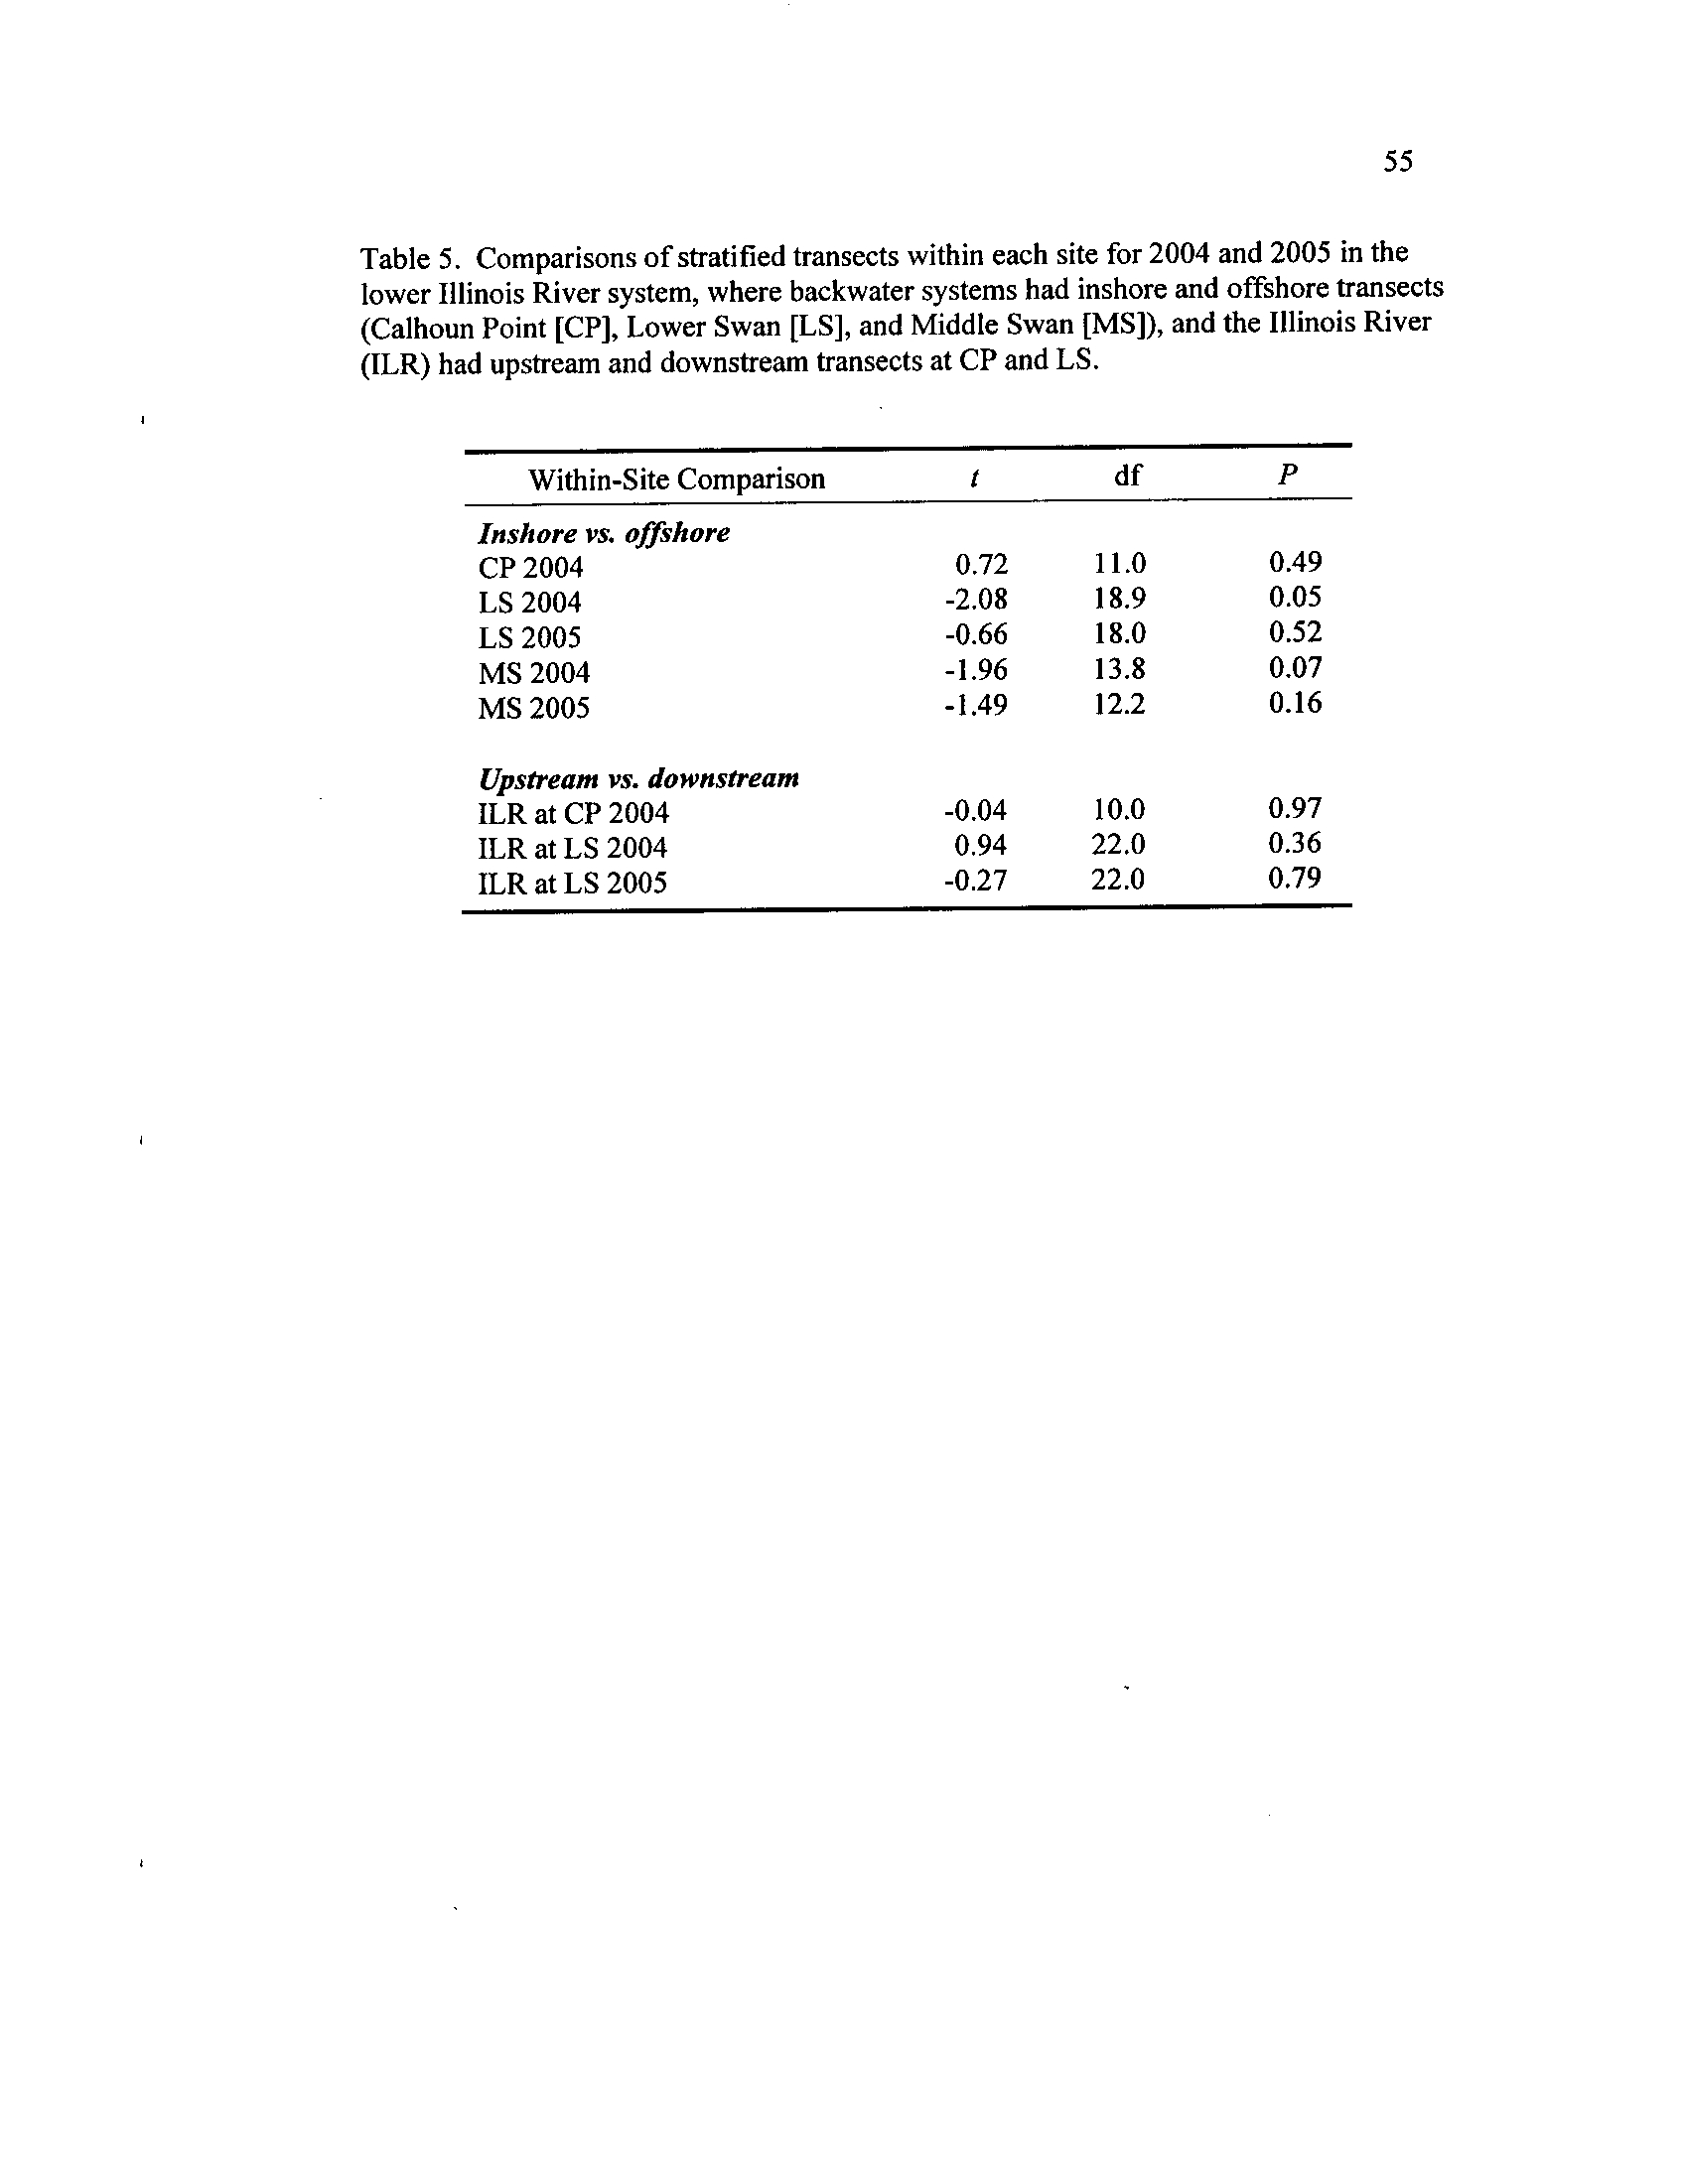
Comparisons of stratified transects within each site for 2004 and
2005 in the lower Illinois River system, where backwater systems
had inshore and offshore transects (Calhoun Point
[CP], Lower
Swan [LS], and Middle Swan
[MS]), and the Illinois River (ILR)
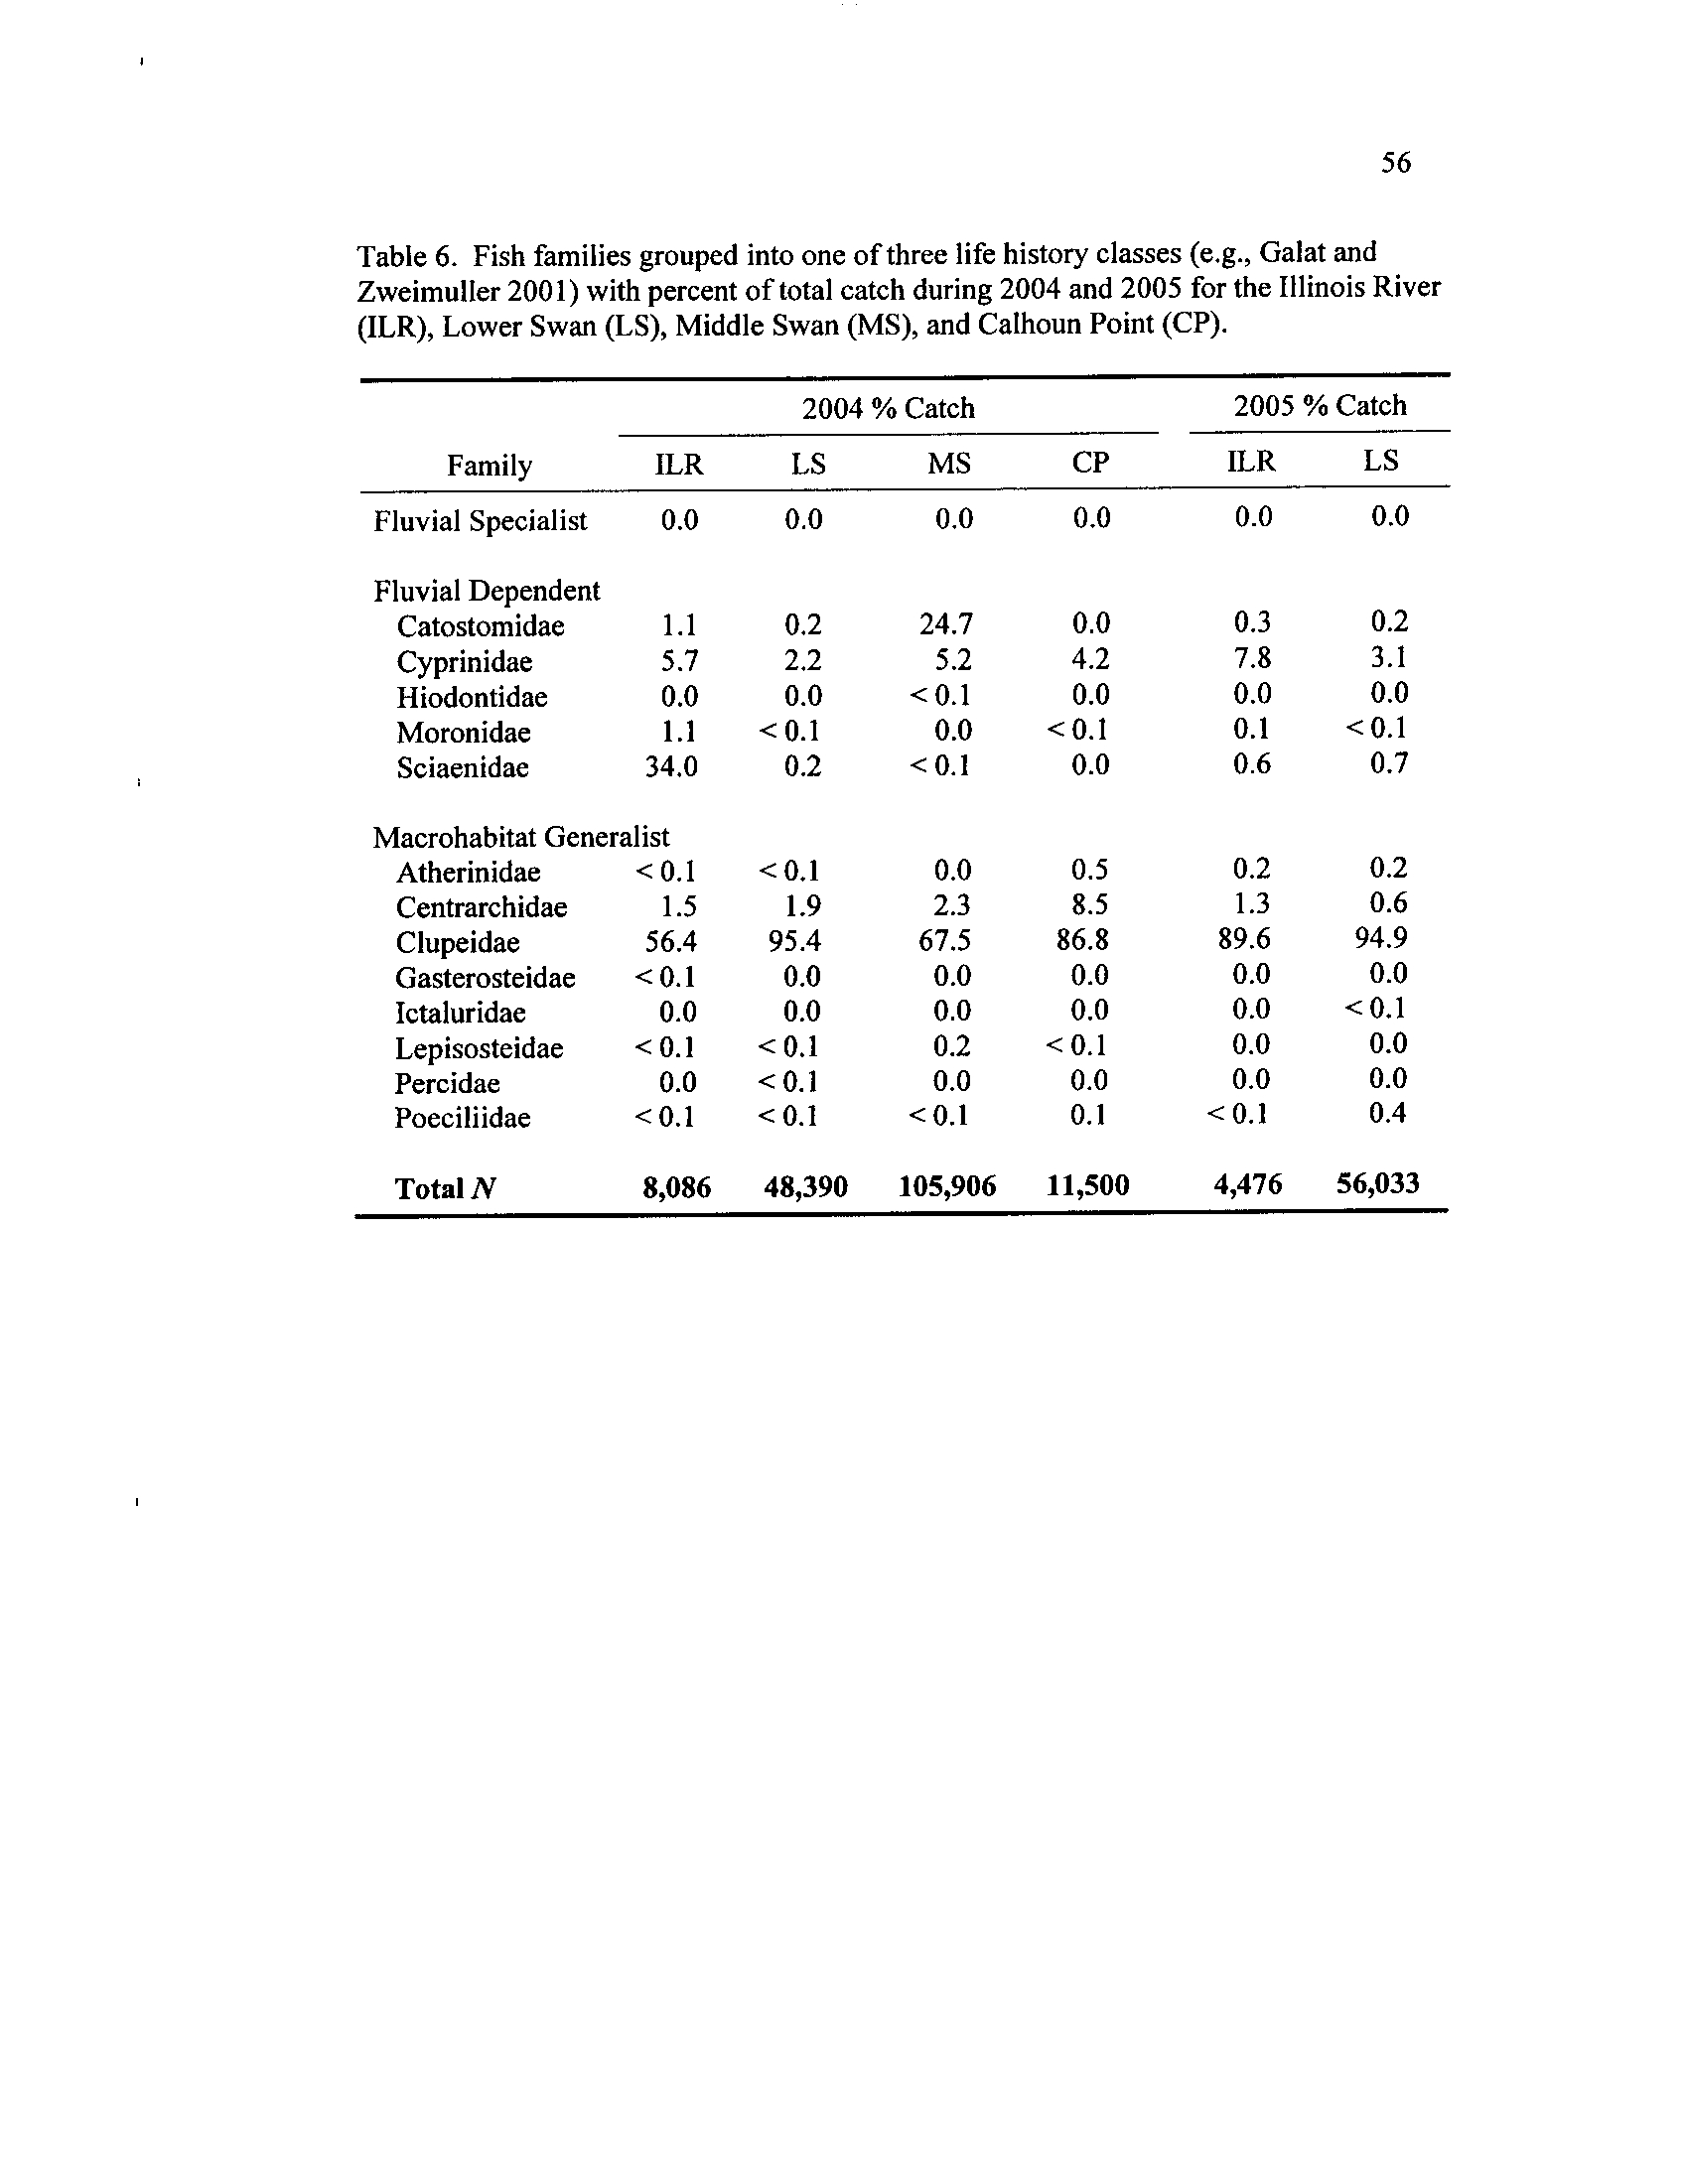
Table 6
. Fish families
had upstream
grouped
and
into
downstream
one of
transects
three early
at
life
CP and
history
LS classes
(Galat and Zweimuller 2001) with percent of total catch during
2004 and 2005 for the Illinois River (ILR), Lower Swan
(LS),
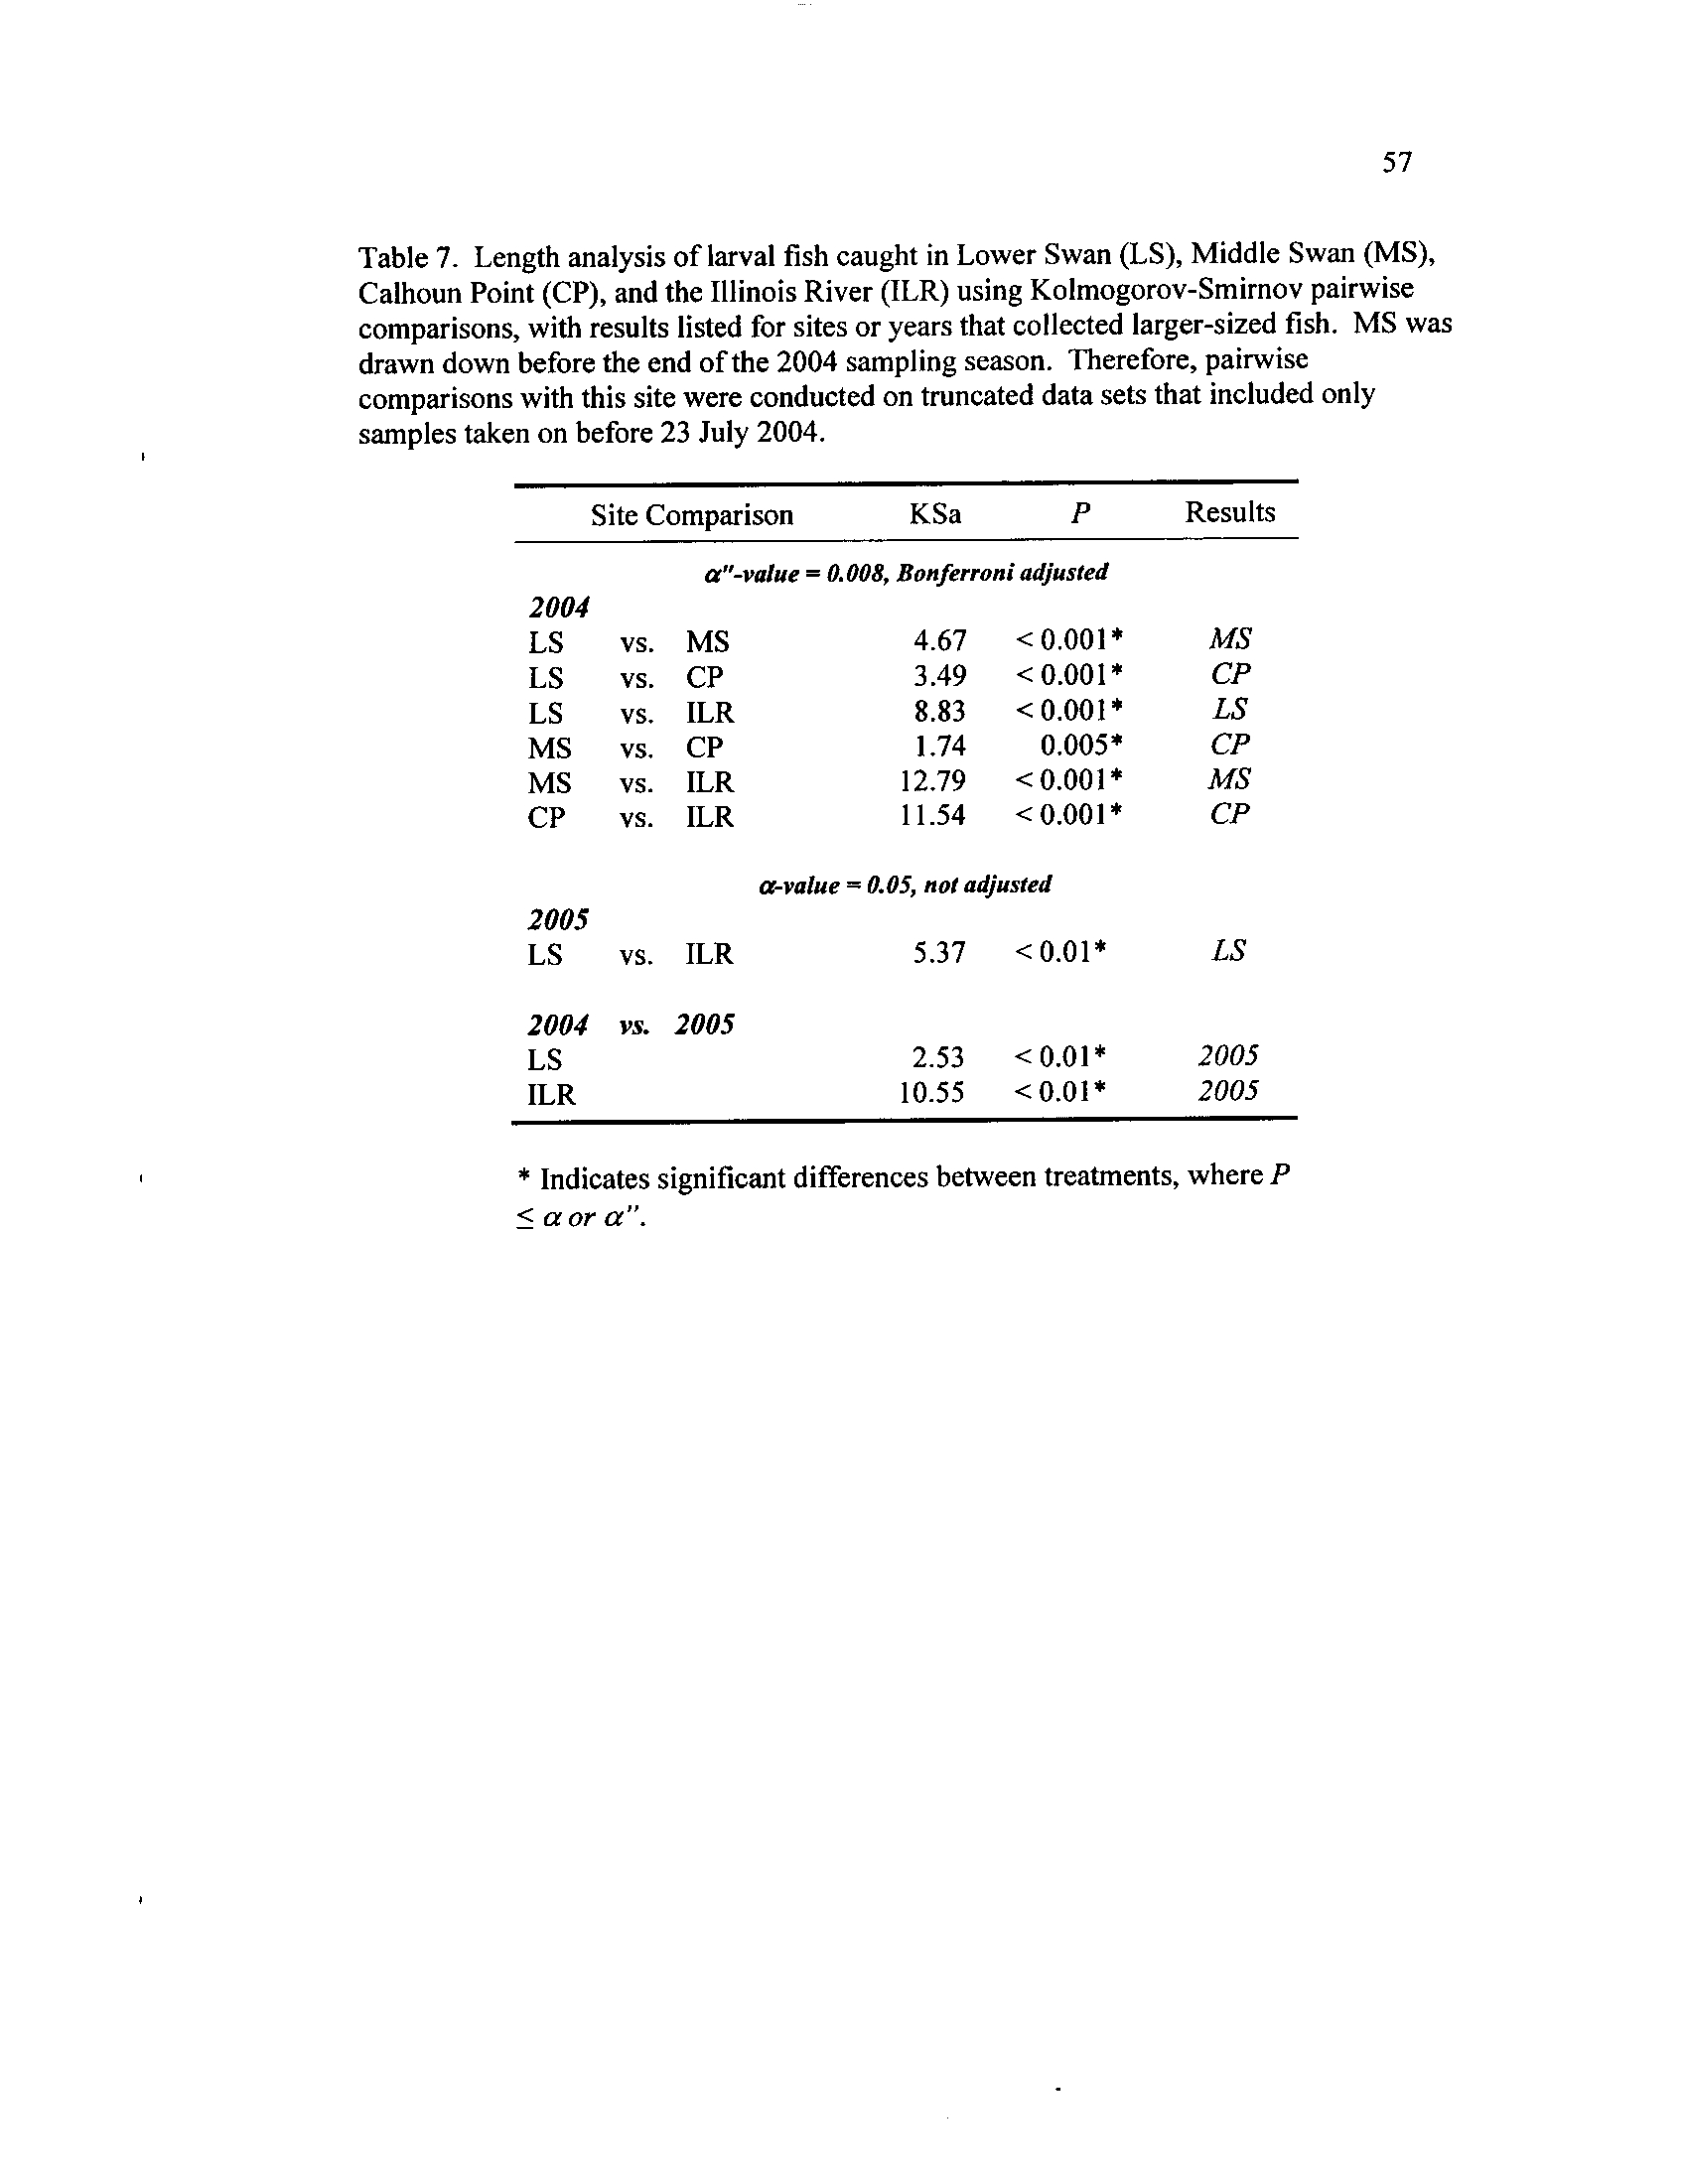
Table 7
. Length
Middle
analysis
Swanof (MS),larval
and
fish
Calhoun
caught
Point
in
(CP)Lower Swan(LS),Middle
Swan (MS),
Calhoun Point (CP),
and the Illinois River (ILR) using
Kolmogorov-Smimov pairwise comparisons, with results listed for
sites or years that collected larger-sized
fish. MS
was drawn down
before the end of the 2004 sampling season
. Therefore, pairwise
comparisons with this site were conducted on truncated data sets
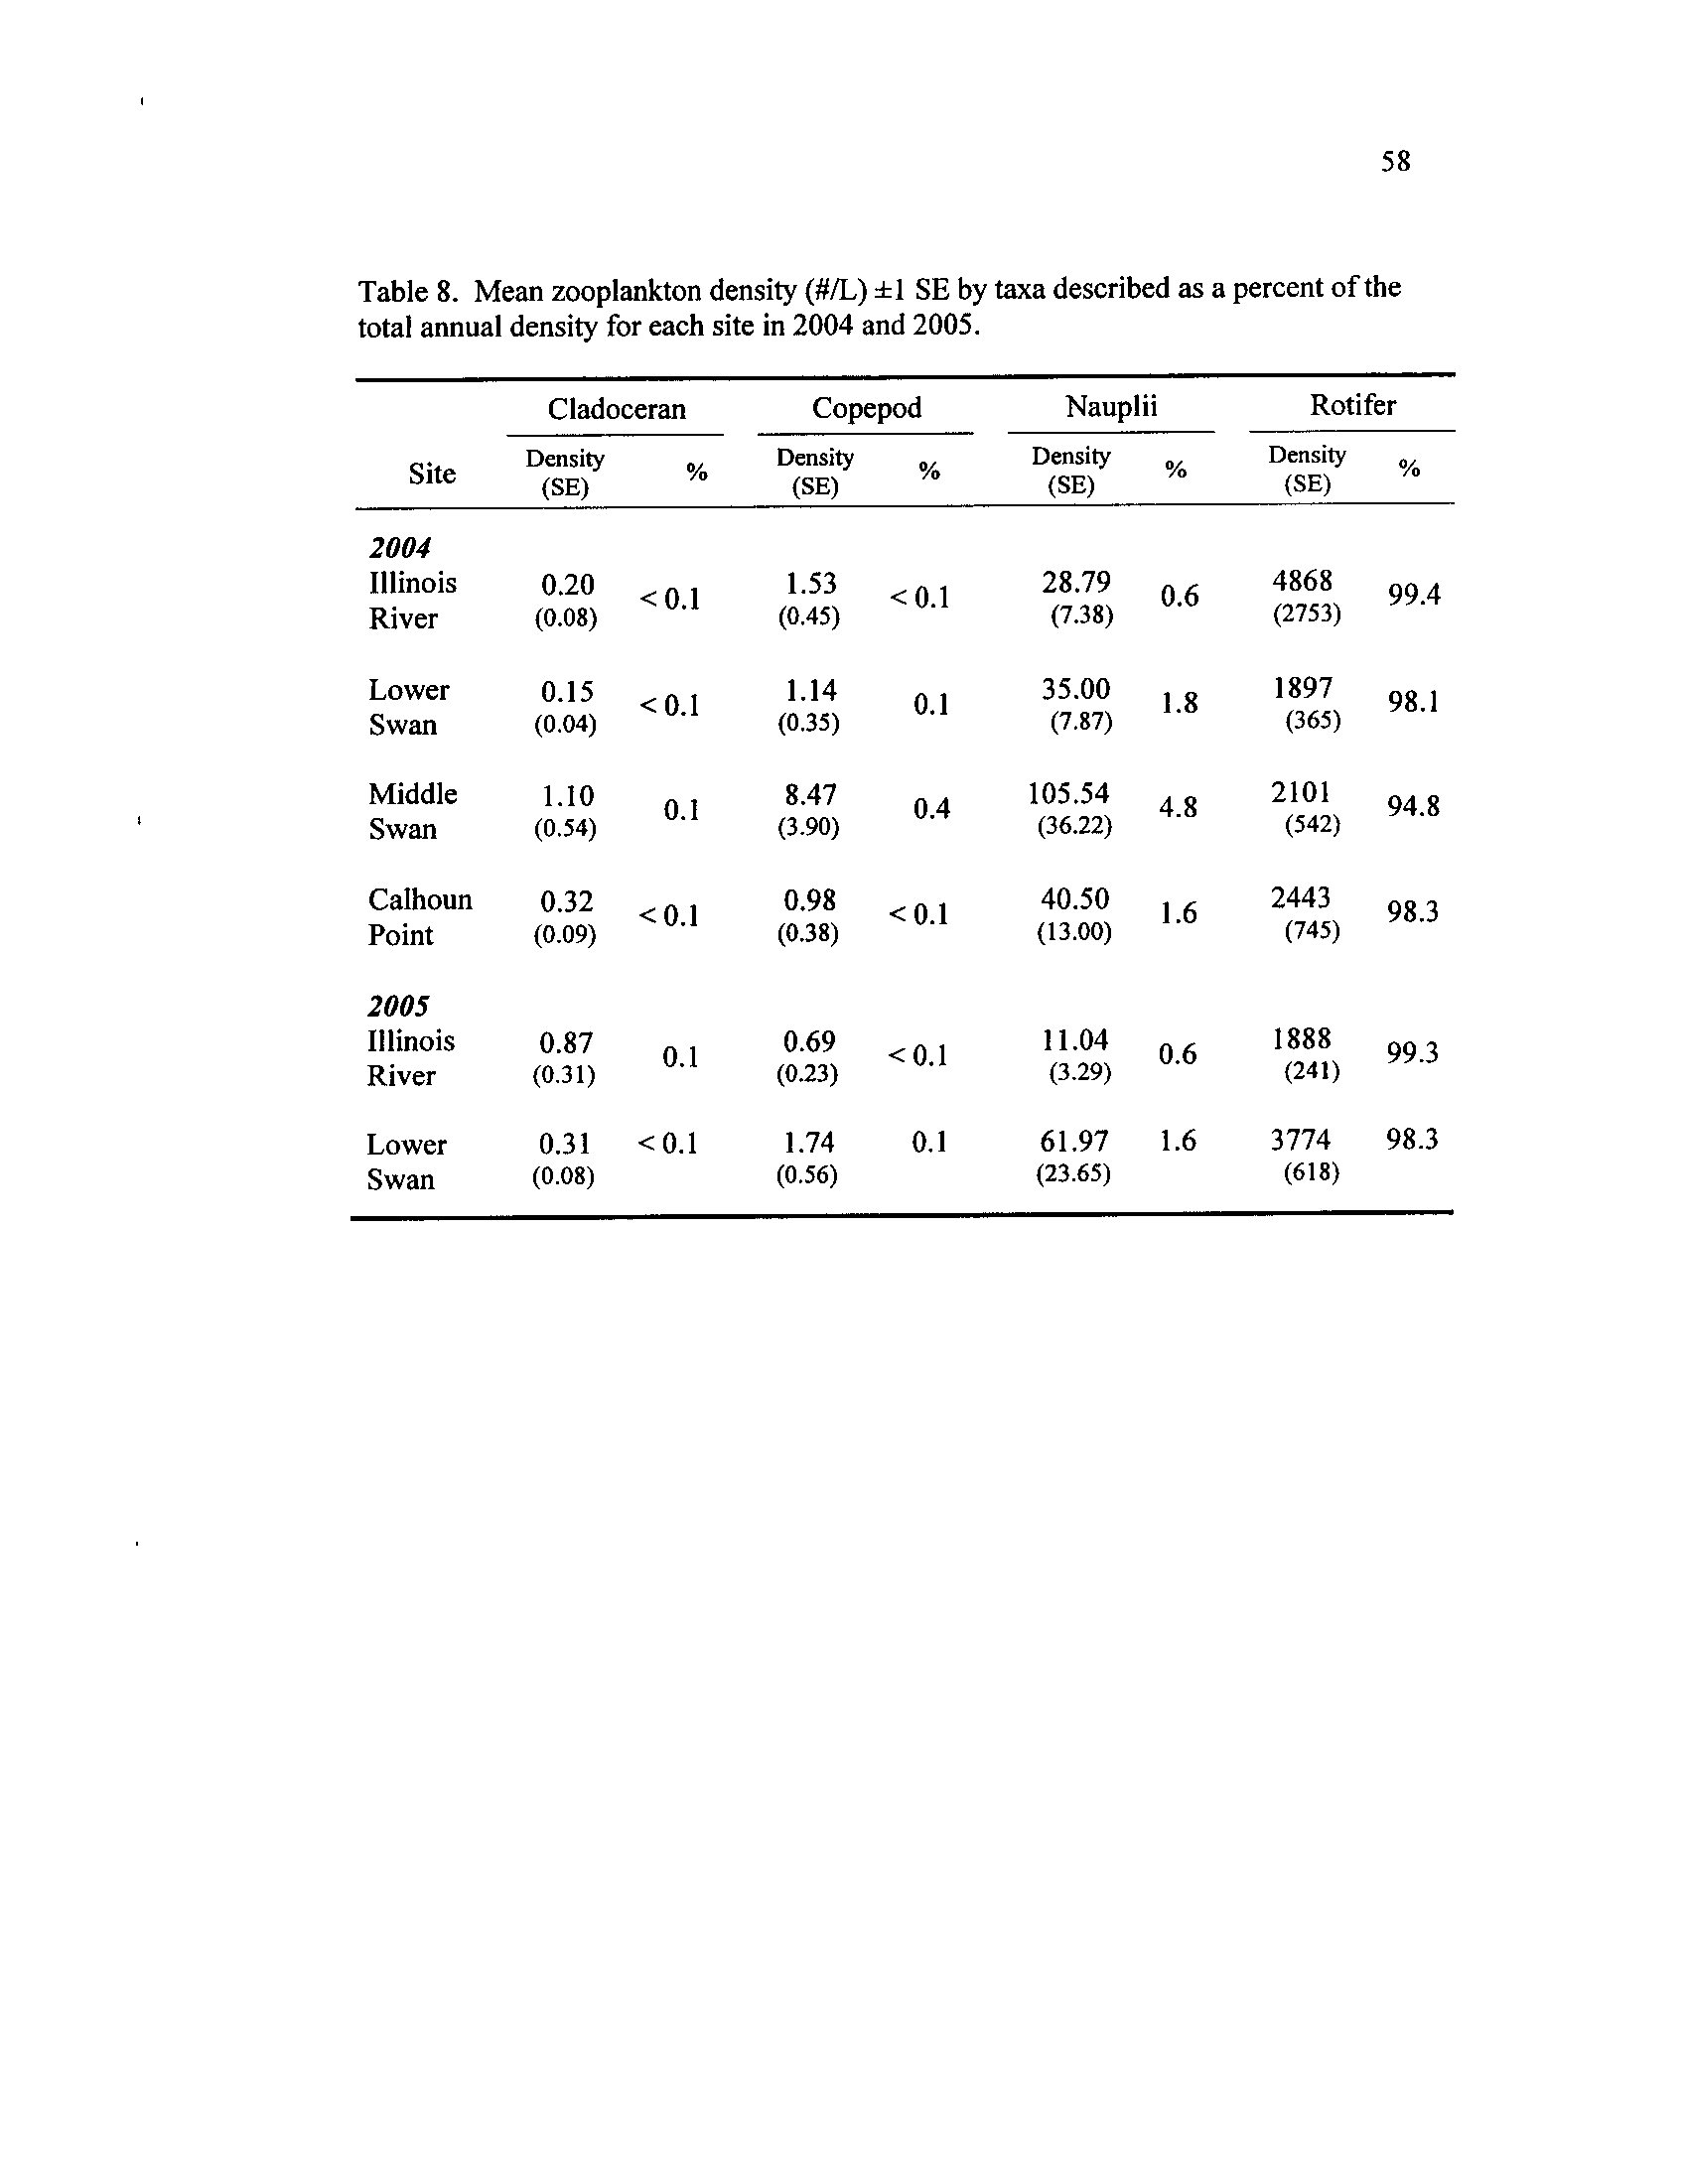
Table 8.
that included only samples taken on or before 23 July 2004
Mean zooplankton density (#/L) f1 SE by taxa described as a
percent of the total annual density for each site in 2004 and 2005
v
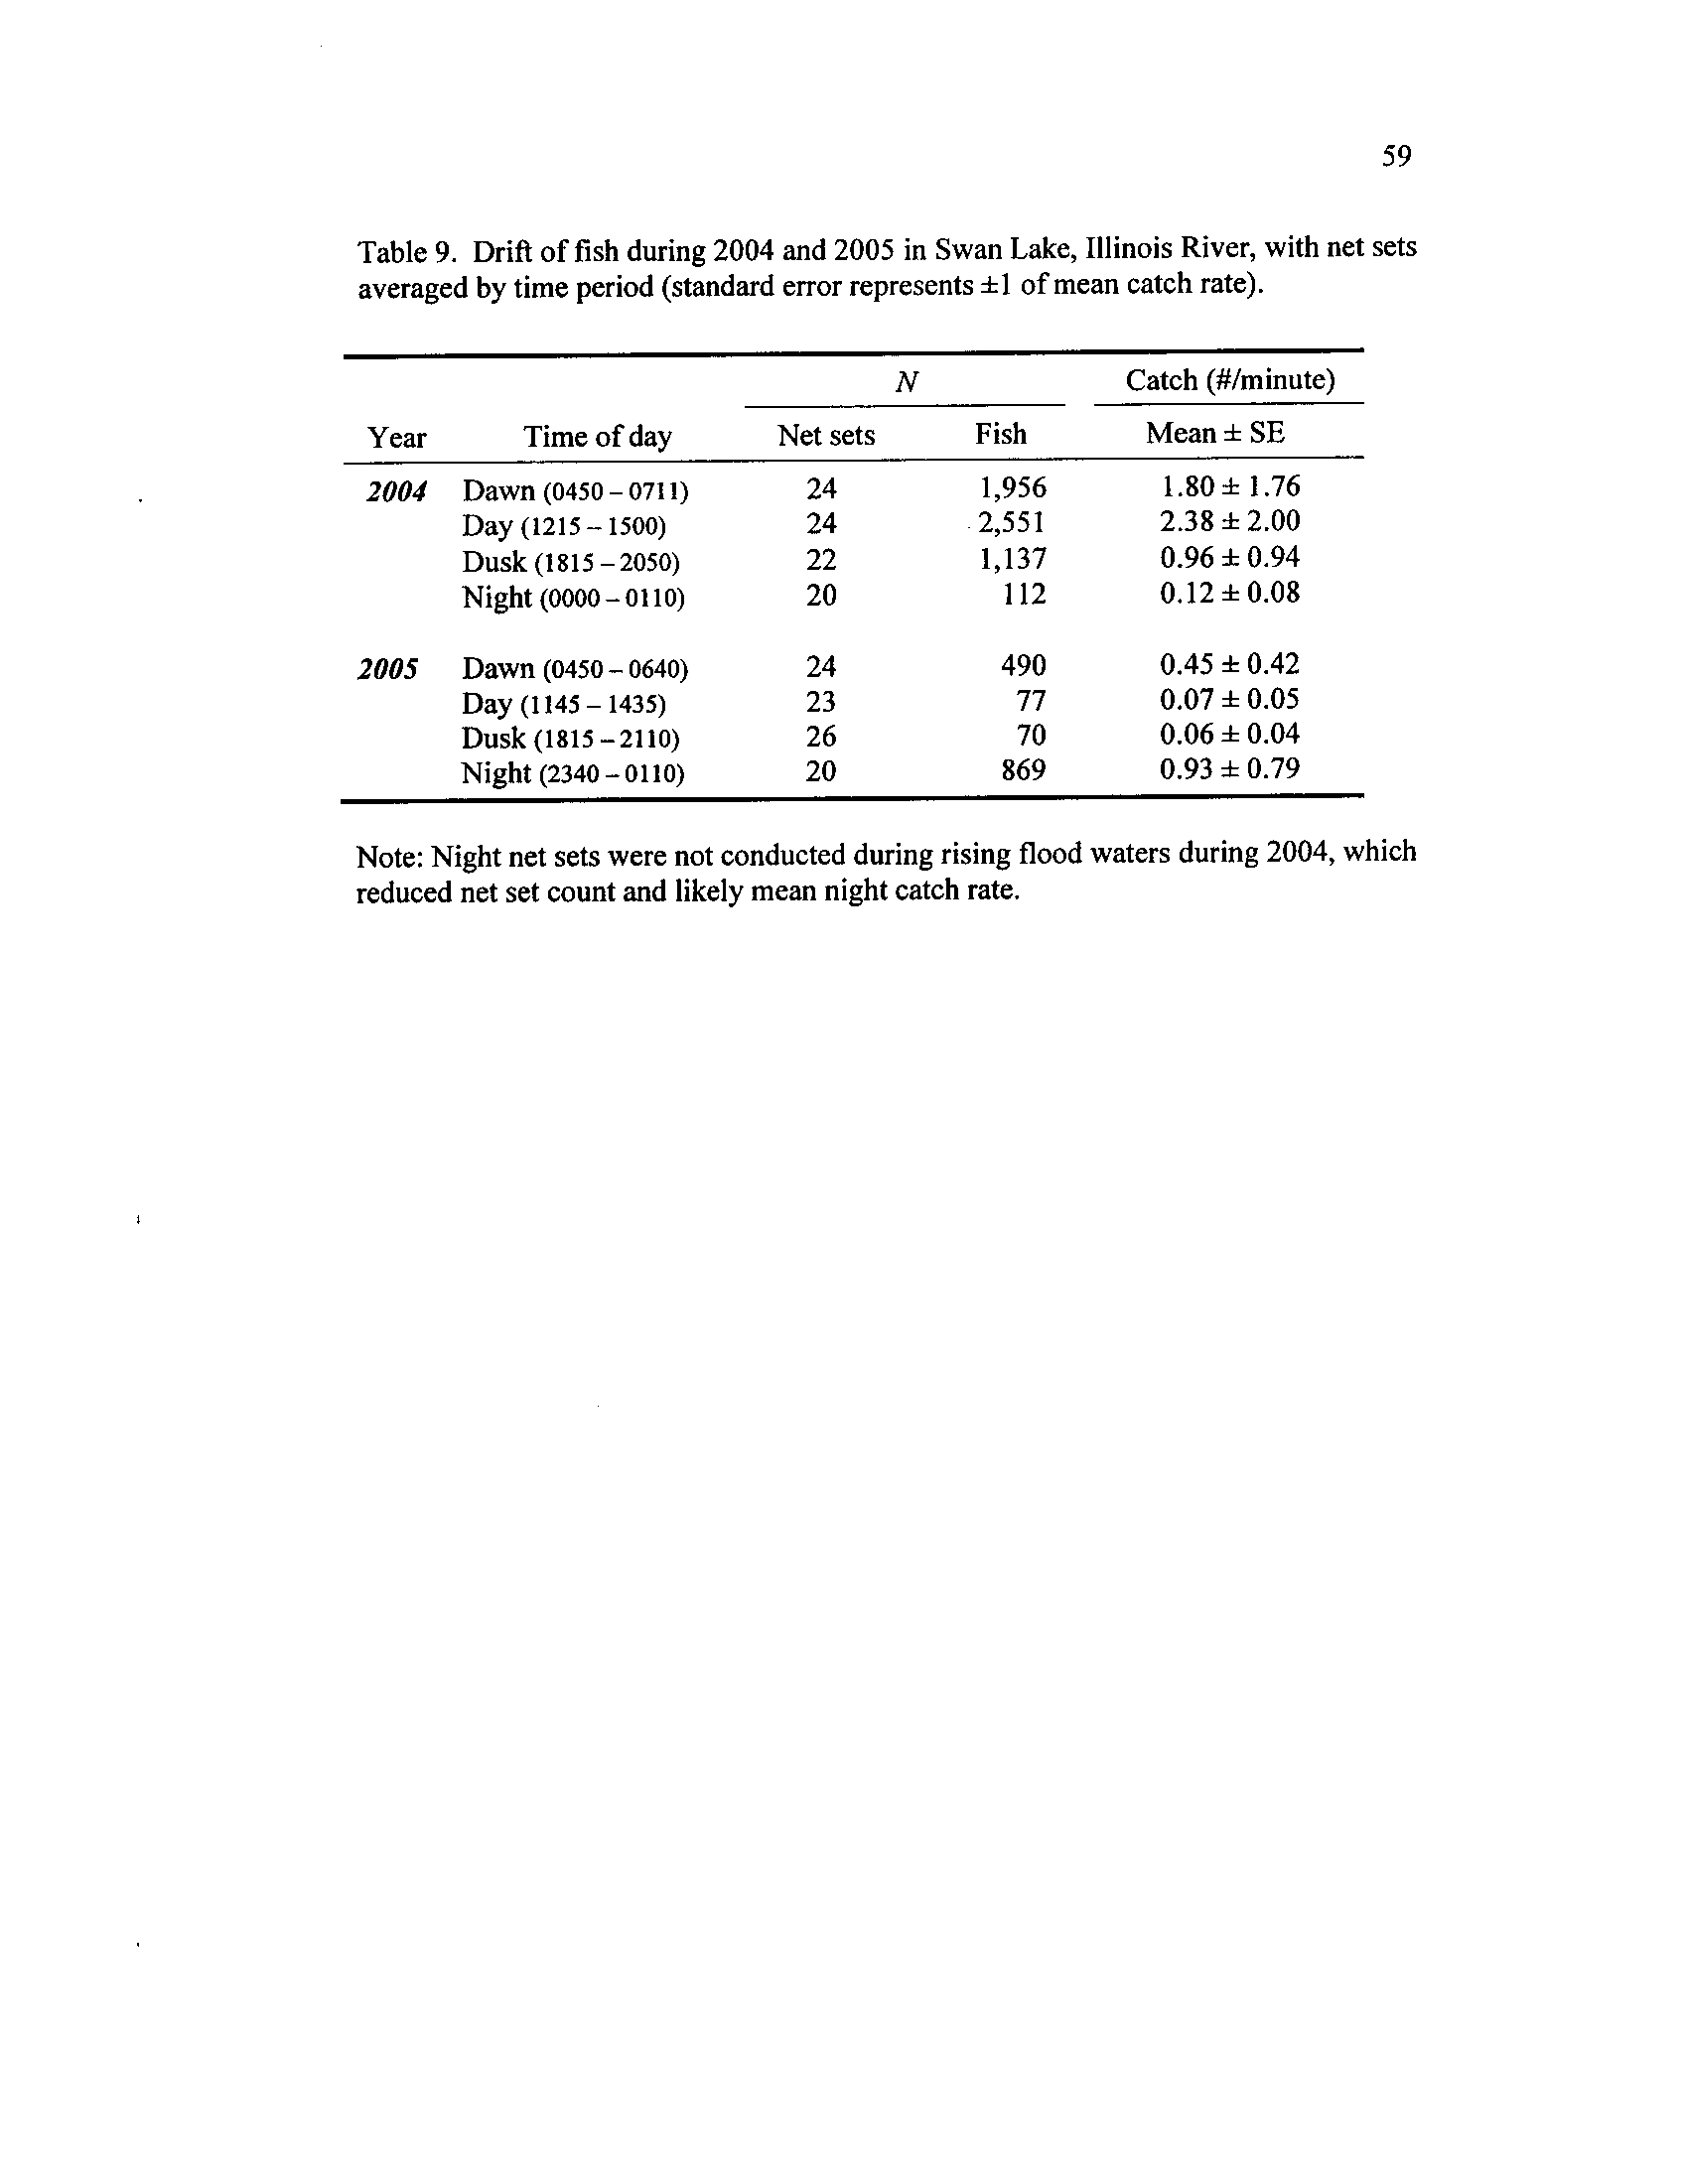
Table 9.
Drift of fish during 2004 and 2005 in Swan Lake, Illinois River,
with net sets averaged by time period (standard error represents ±1
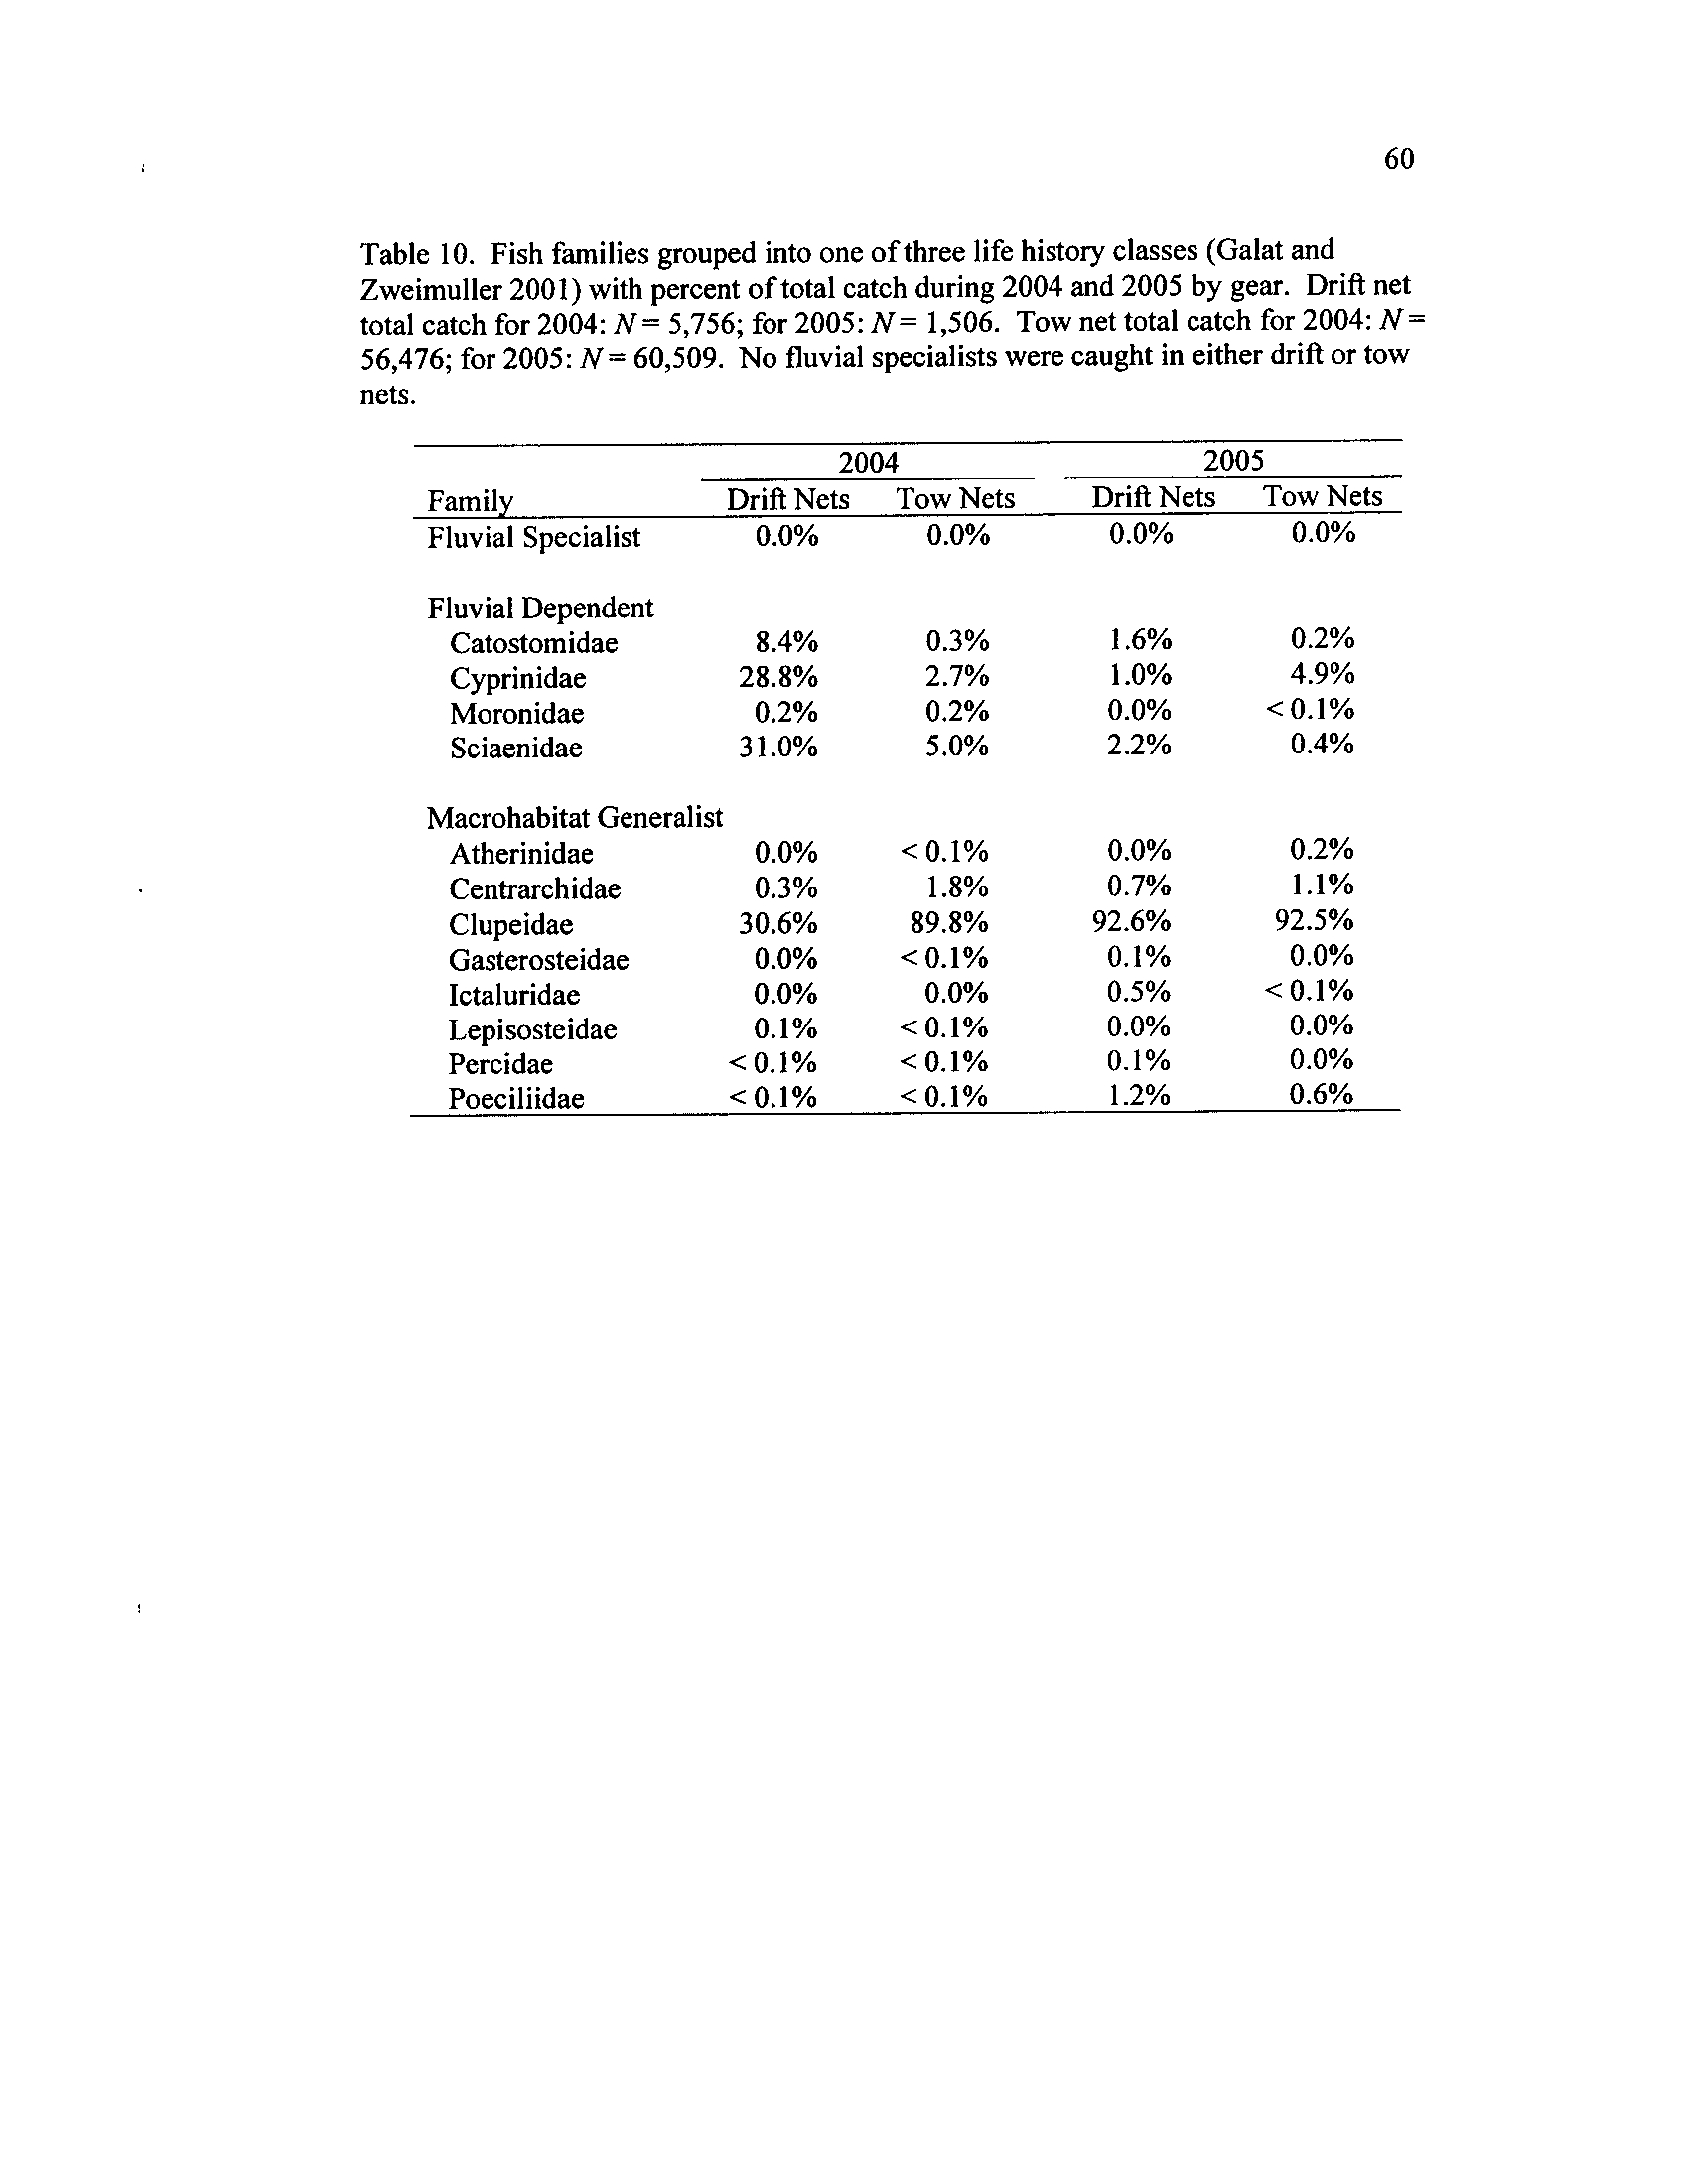
Table 10 .
of mean catch rate)
Fish families grouped into one of three early life history classes
(Galat and Zweimuller 2001) with percent of total catch during
2004 and 2005 by gear
. Drift net total catch for 2004 : N= 5,756
;
for 2005 : N= 1,506. Tow net total catch for 2004
: N= 56,476; for
2005: N= 60,509
. No fluvial specialists were caught in either drift
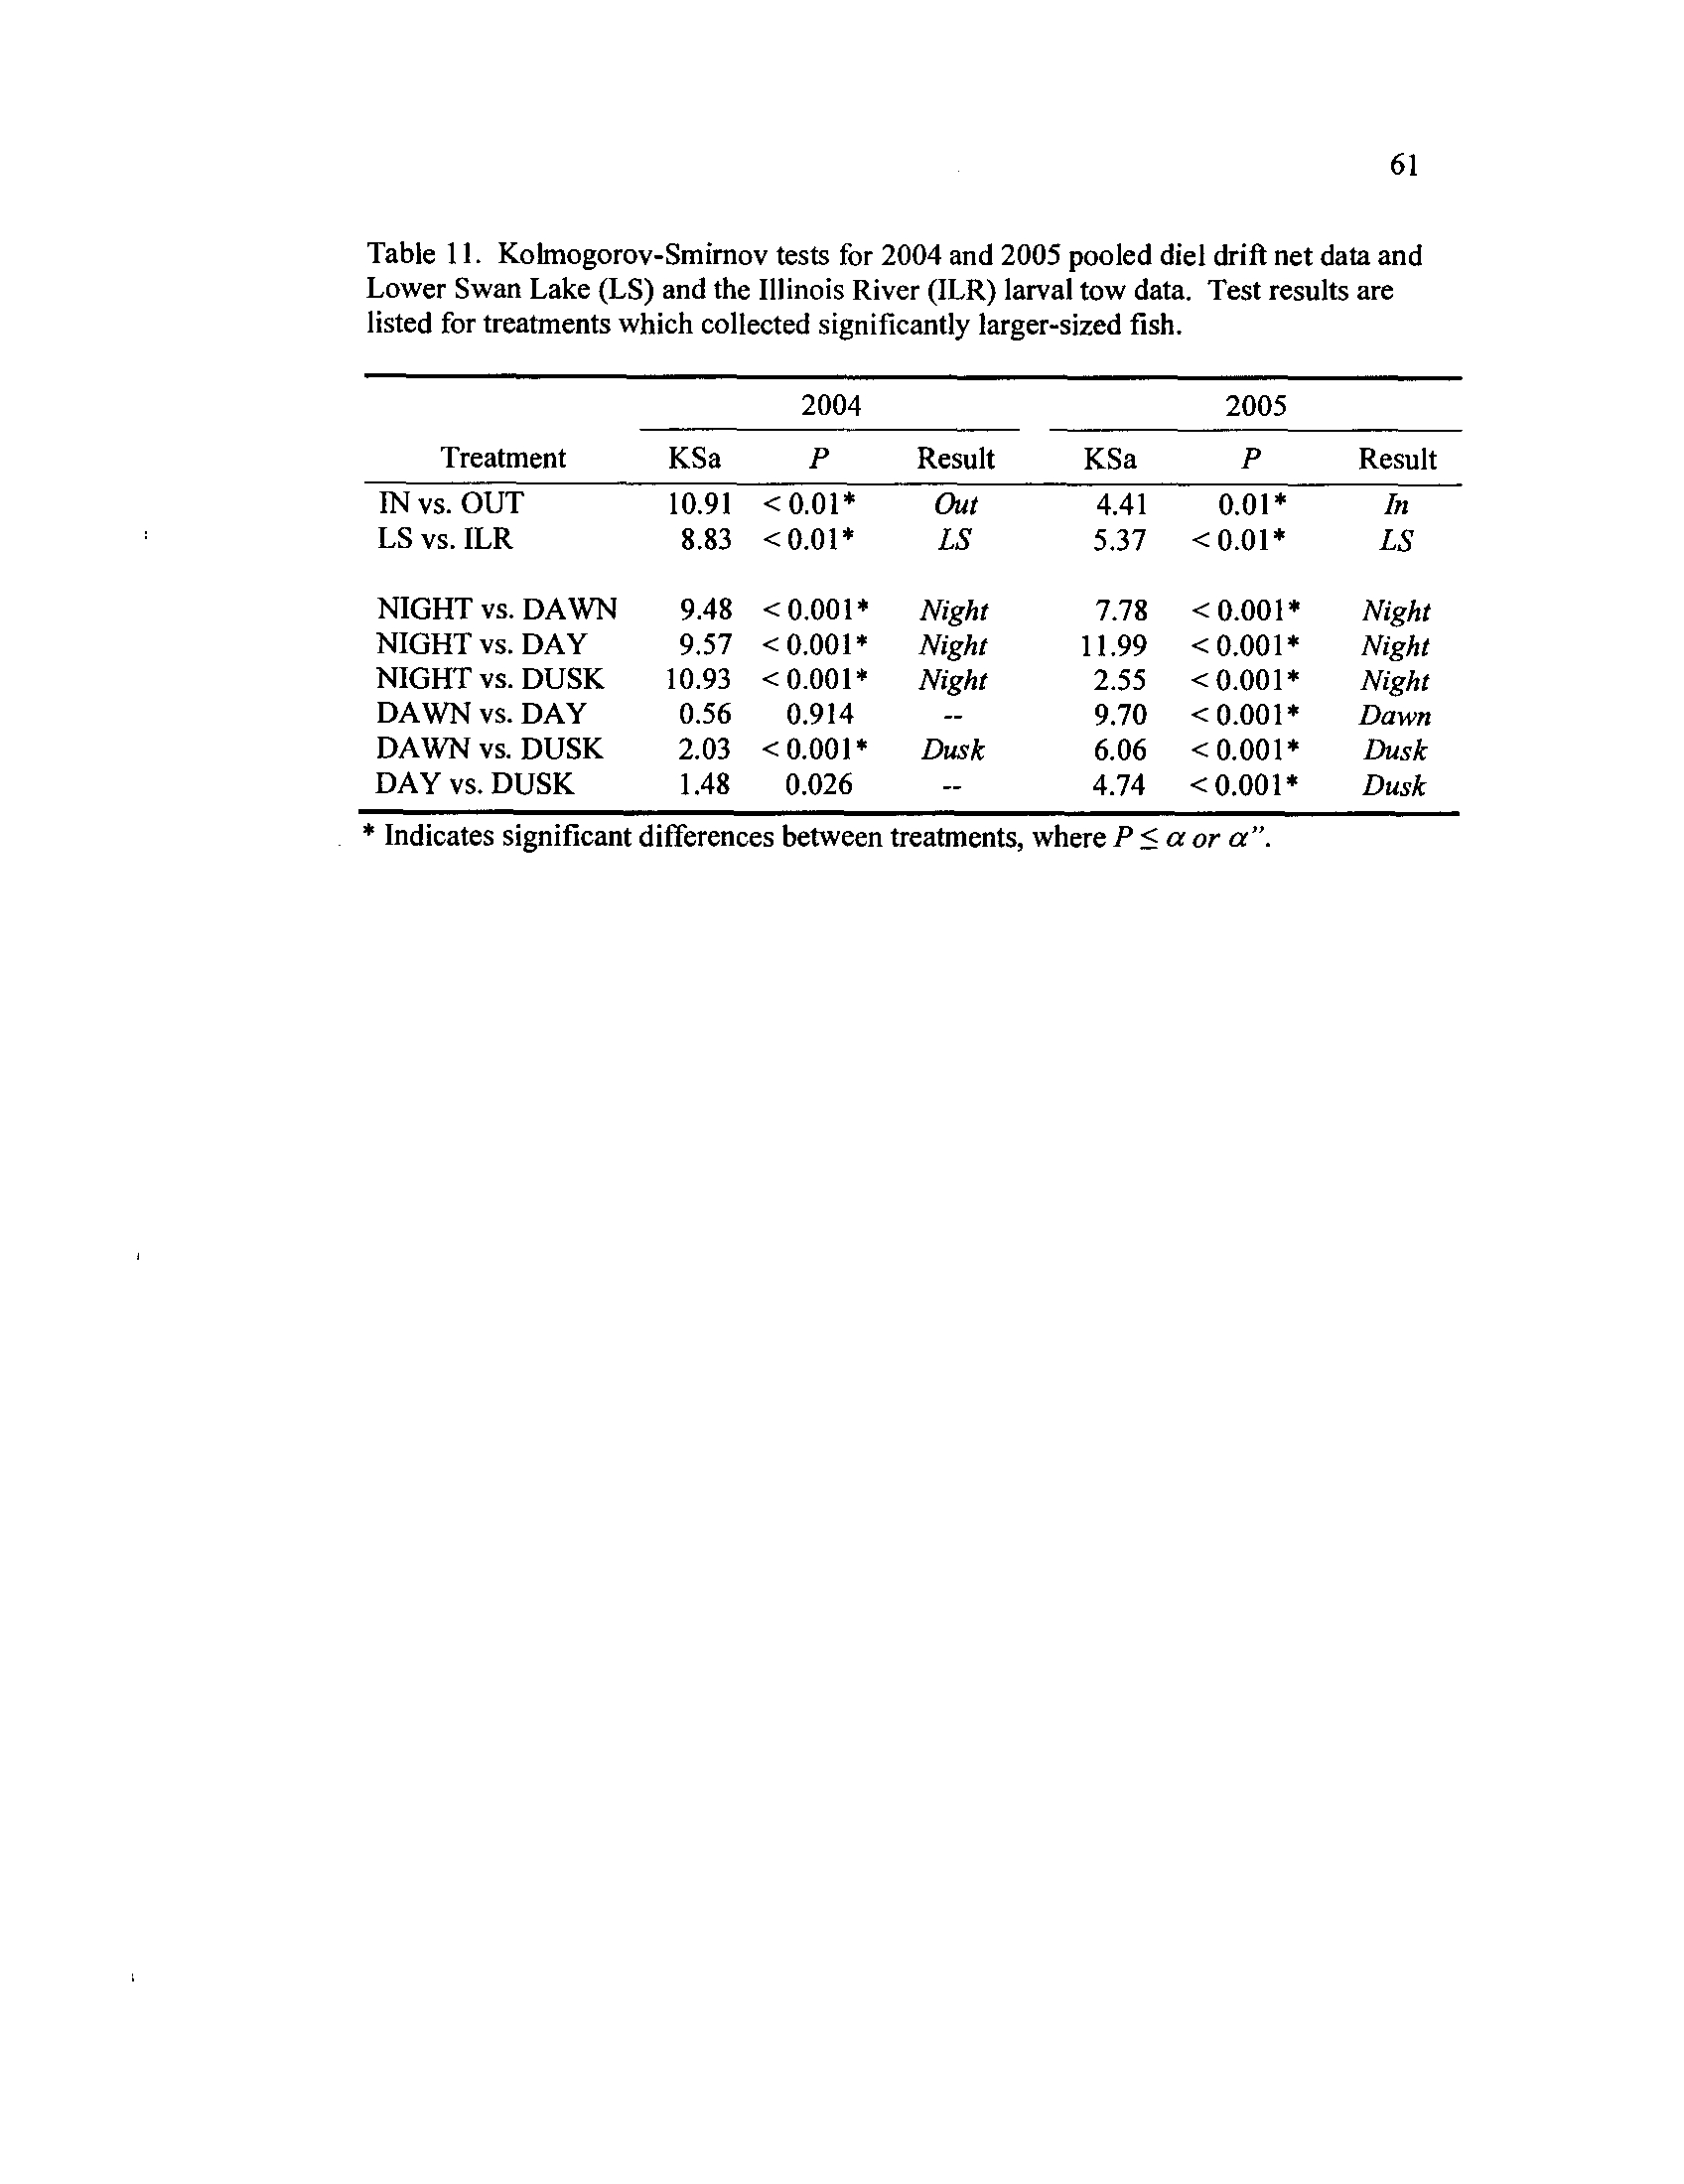
Table 11
. Kolmogorov-Smirnov
or tow nets tests
for 2004 and 2005 pooled diet drift net
data and Lower Swan Lake (LS) and the Illinois River (ILR) larval
tow data
. Test results are listed for treatments which collected
significantly larger-sized fish
vi
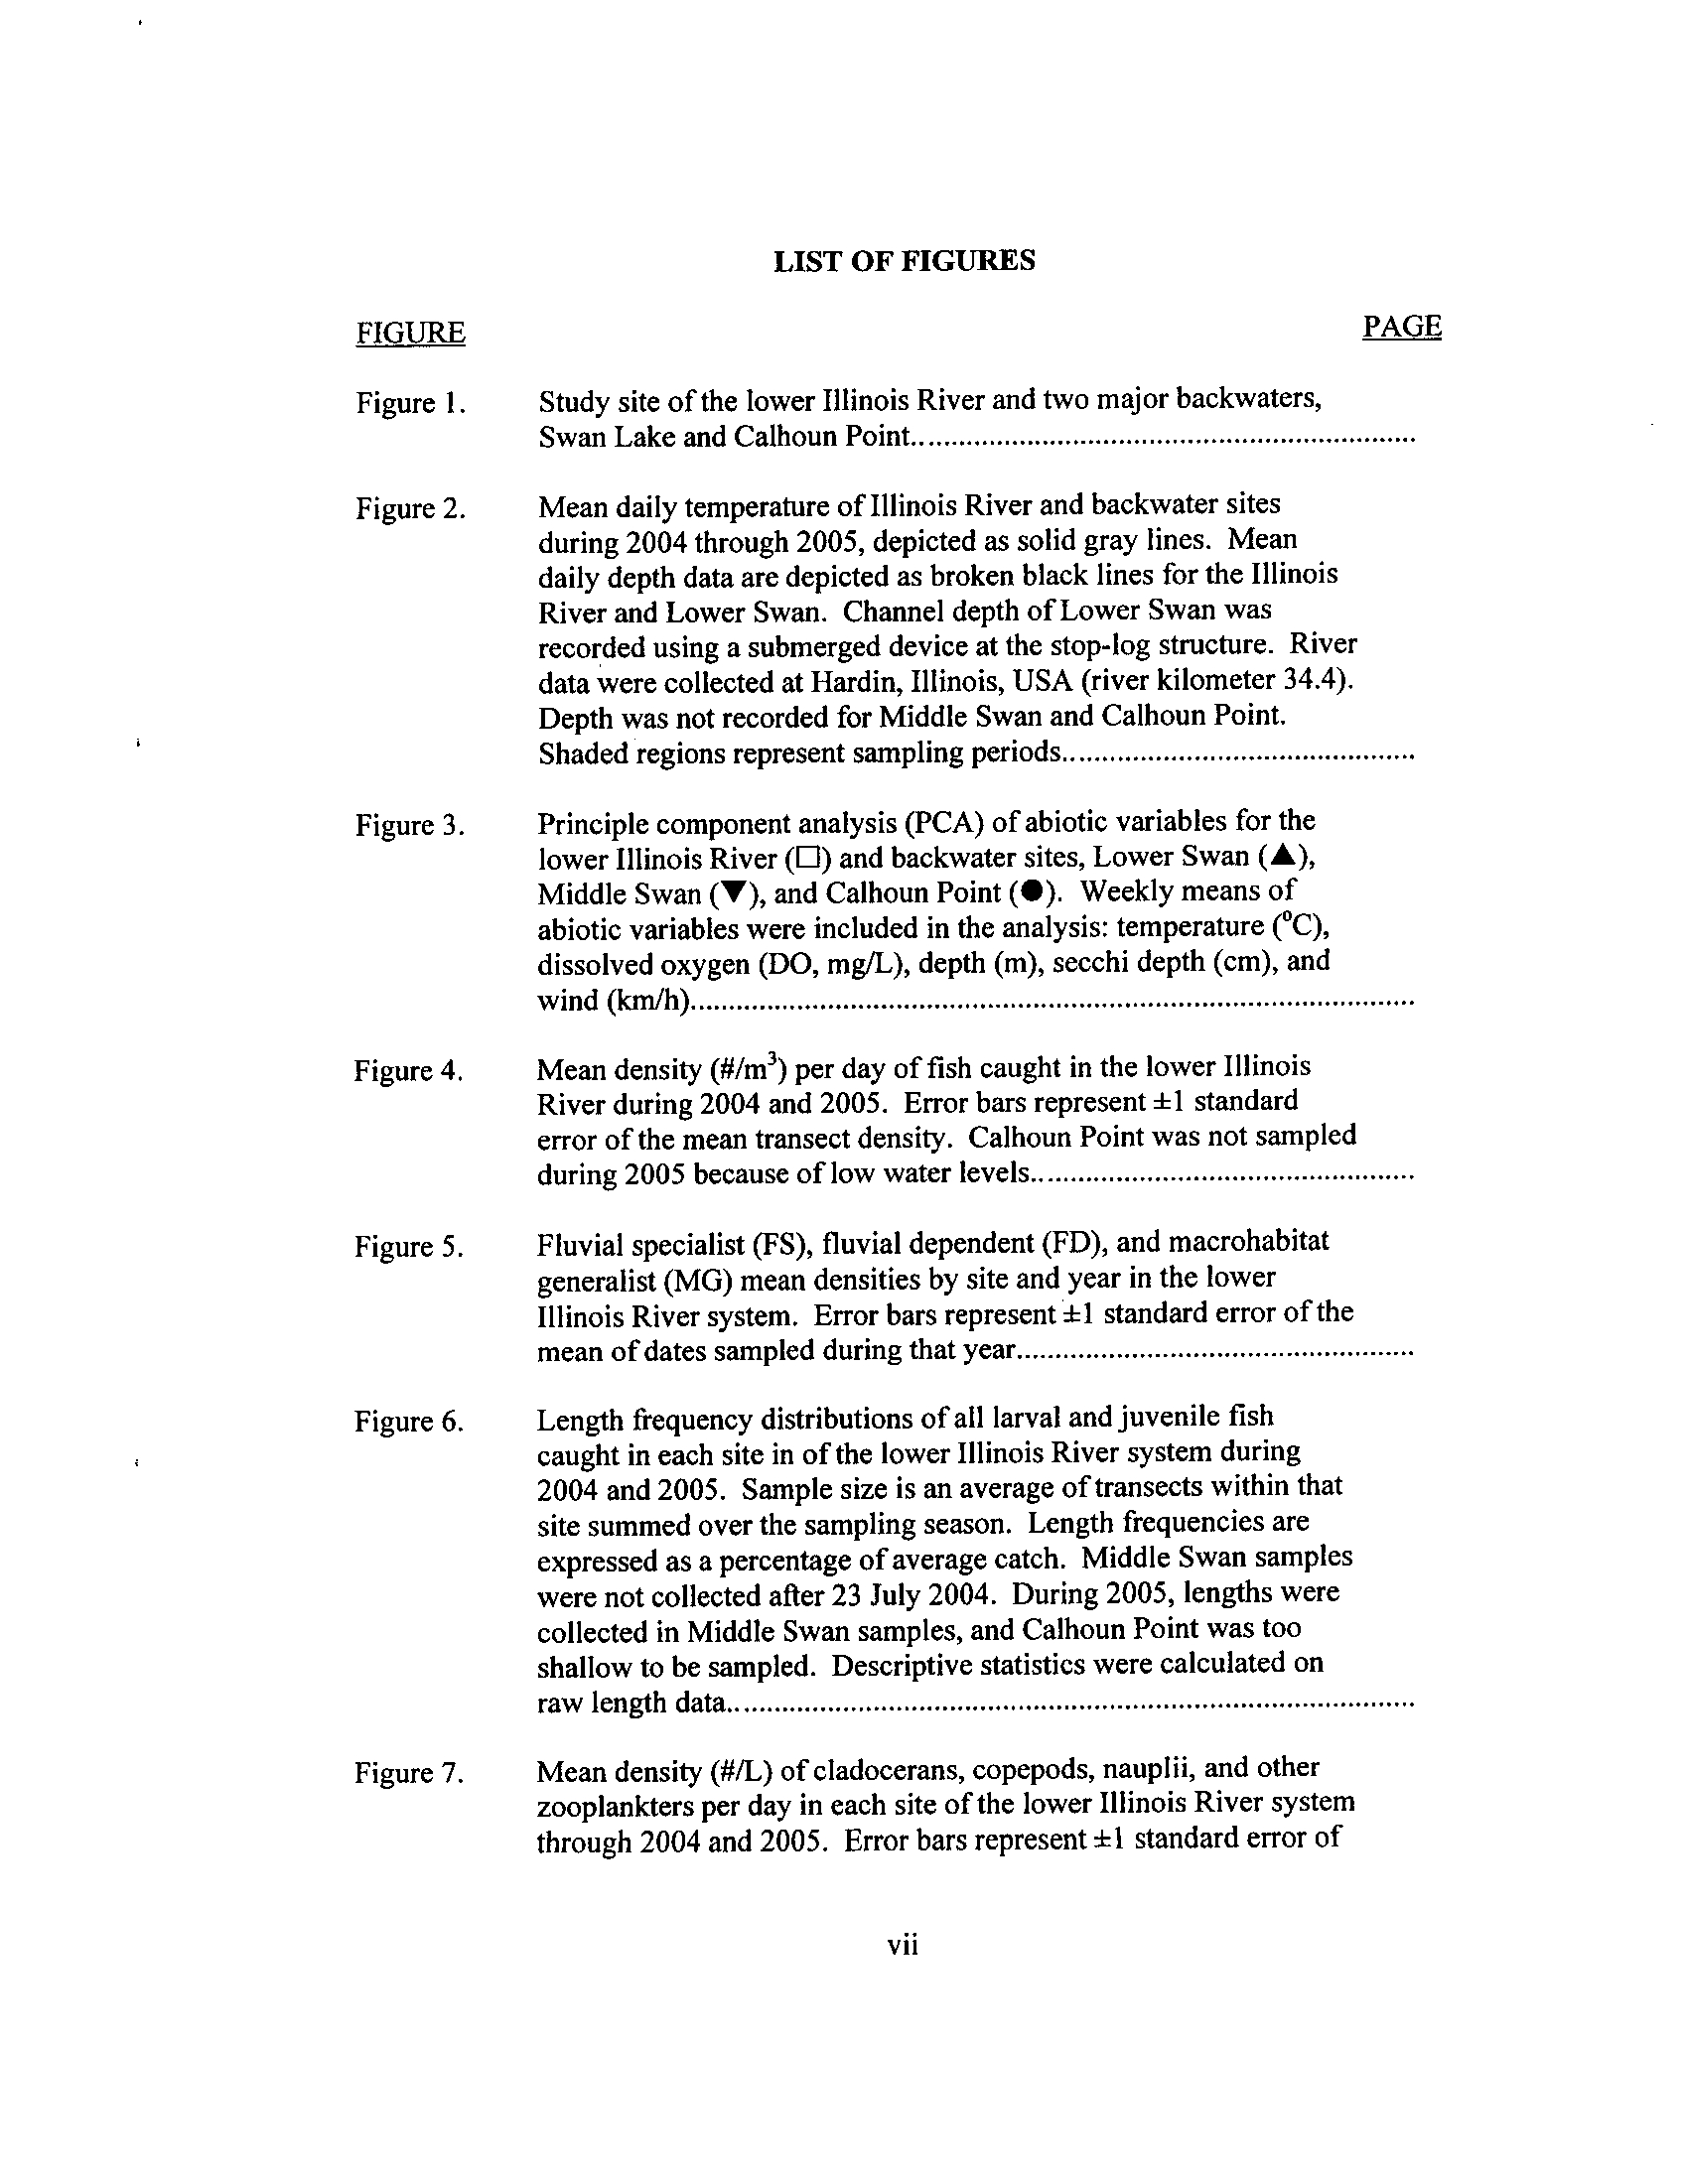
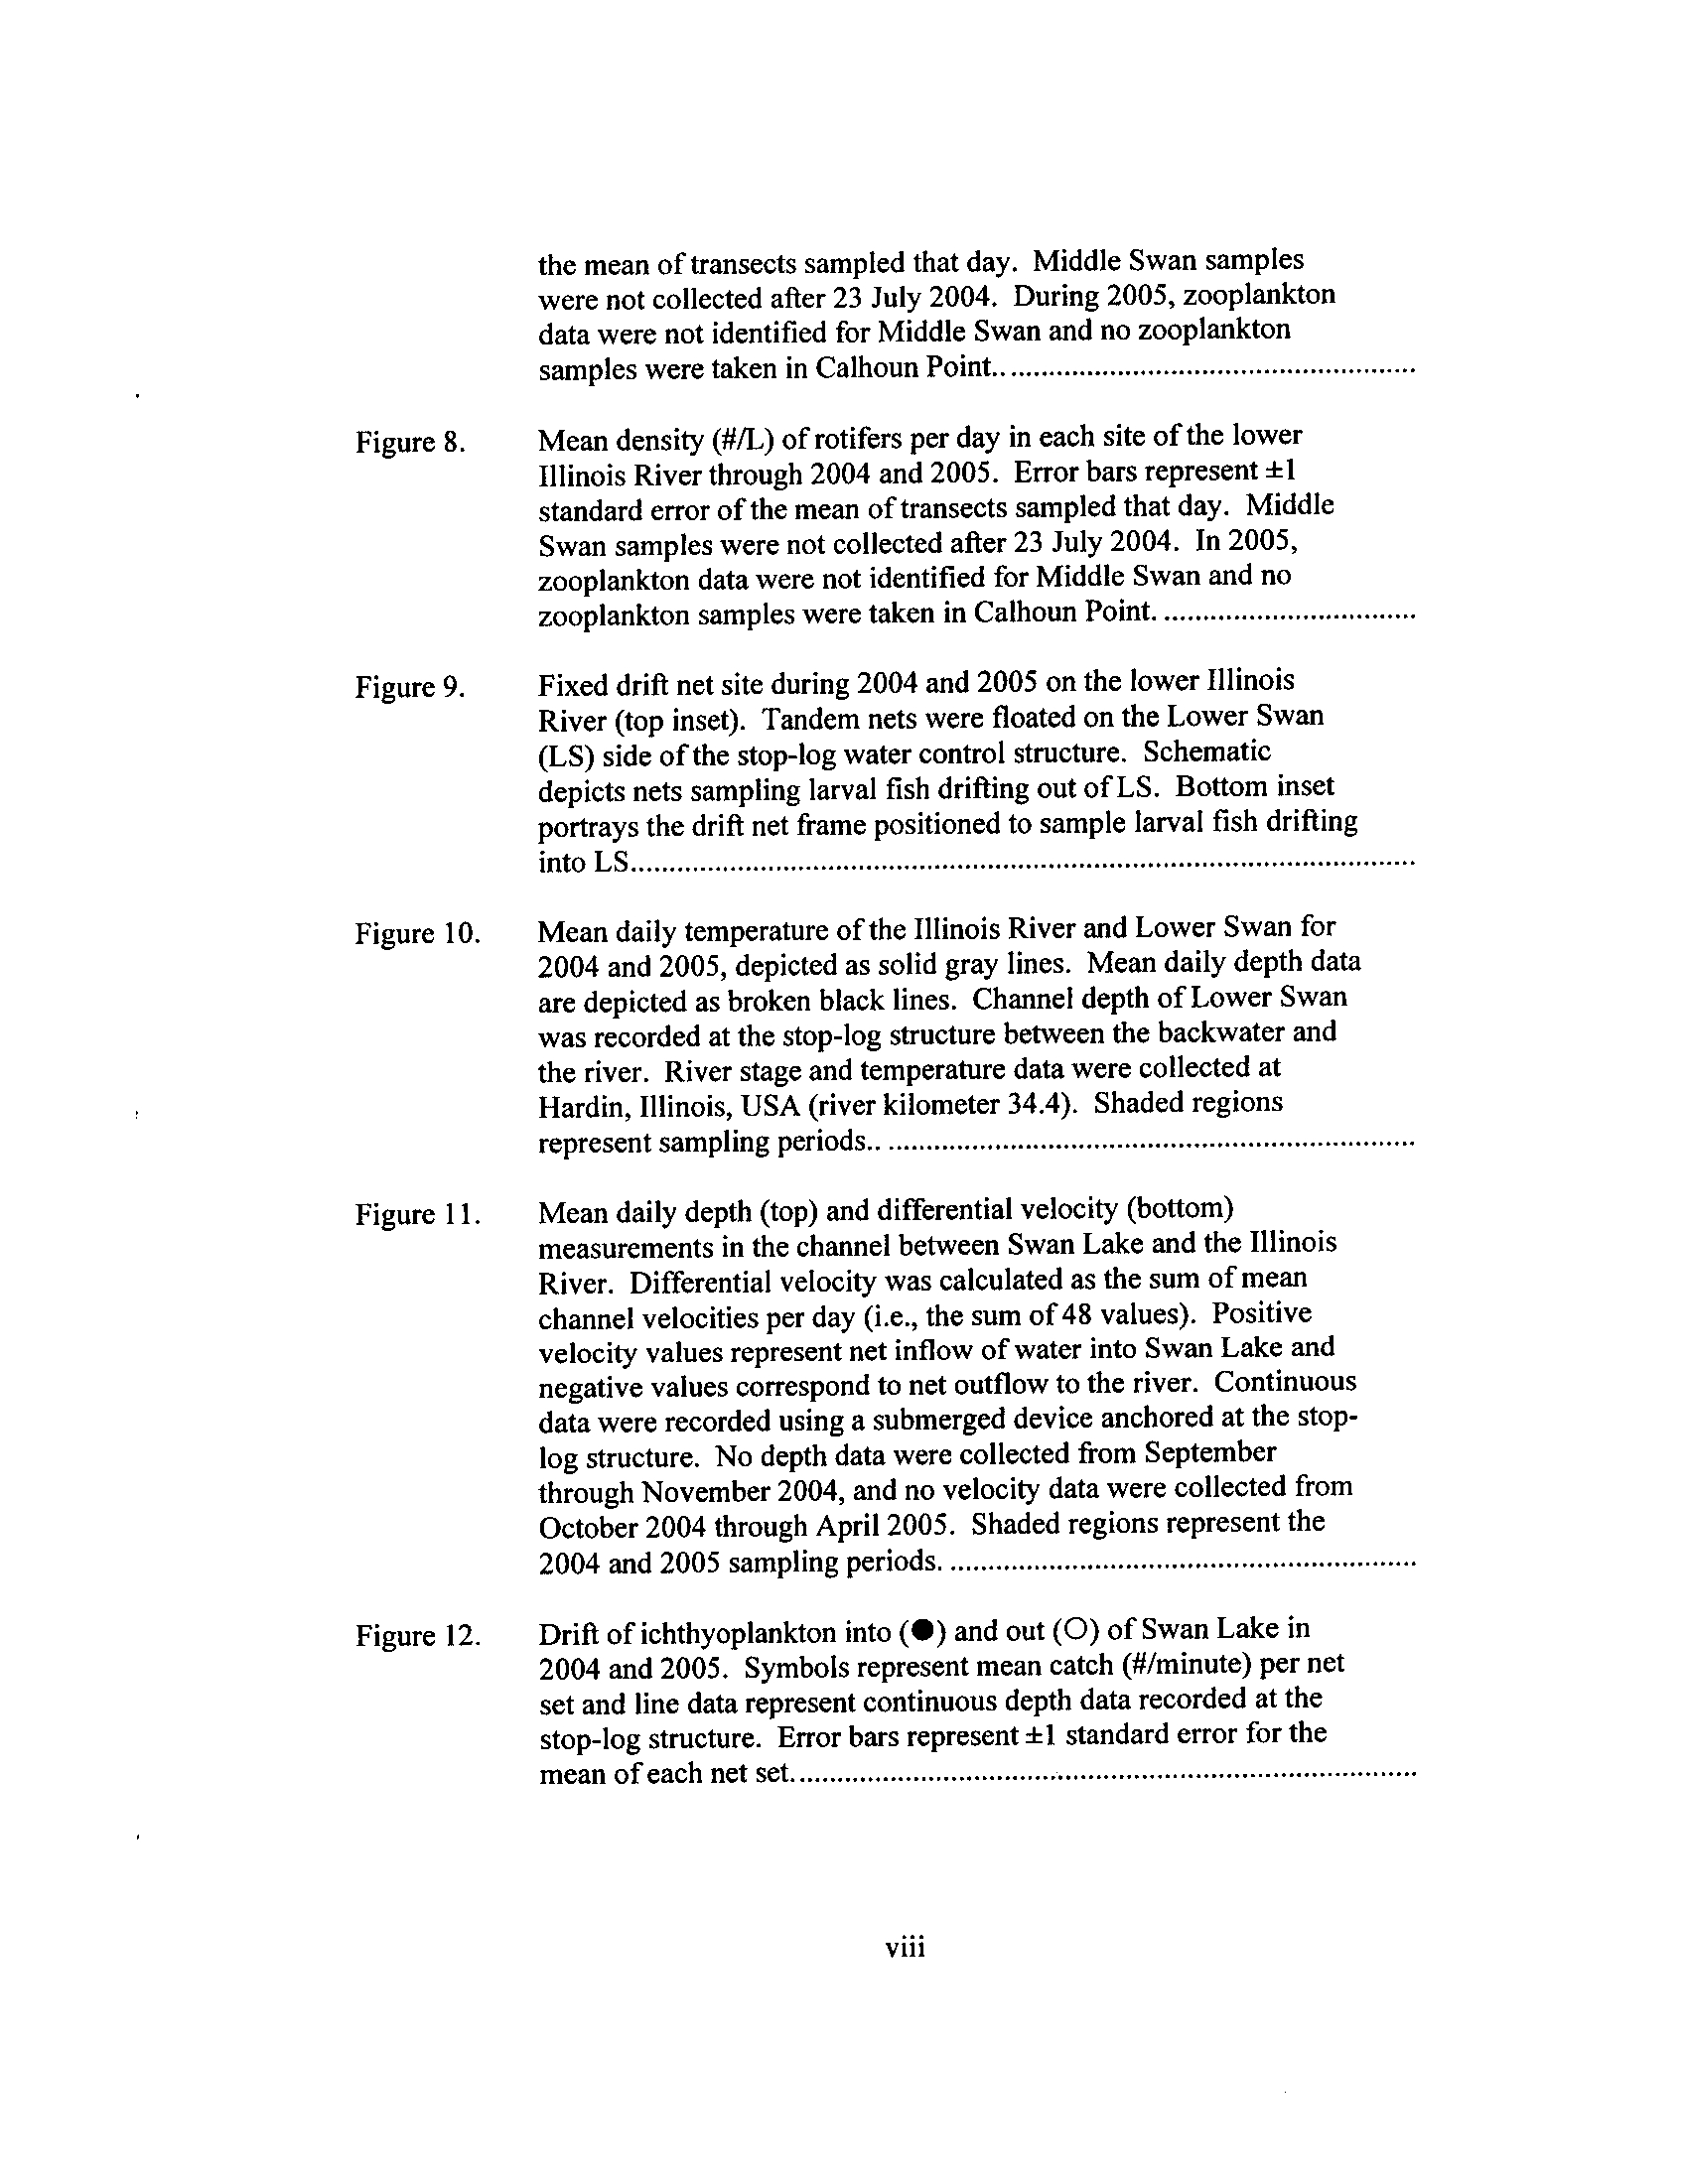
LIST OF FIGURES
FIGURE
PAGE
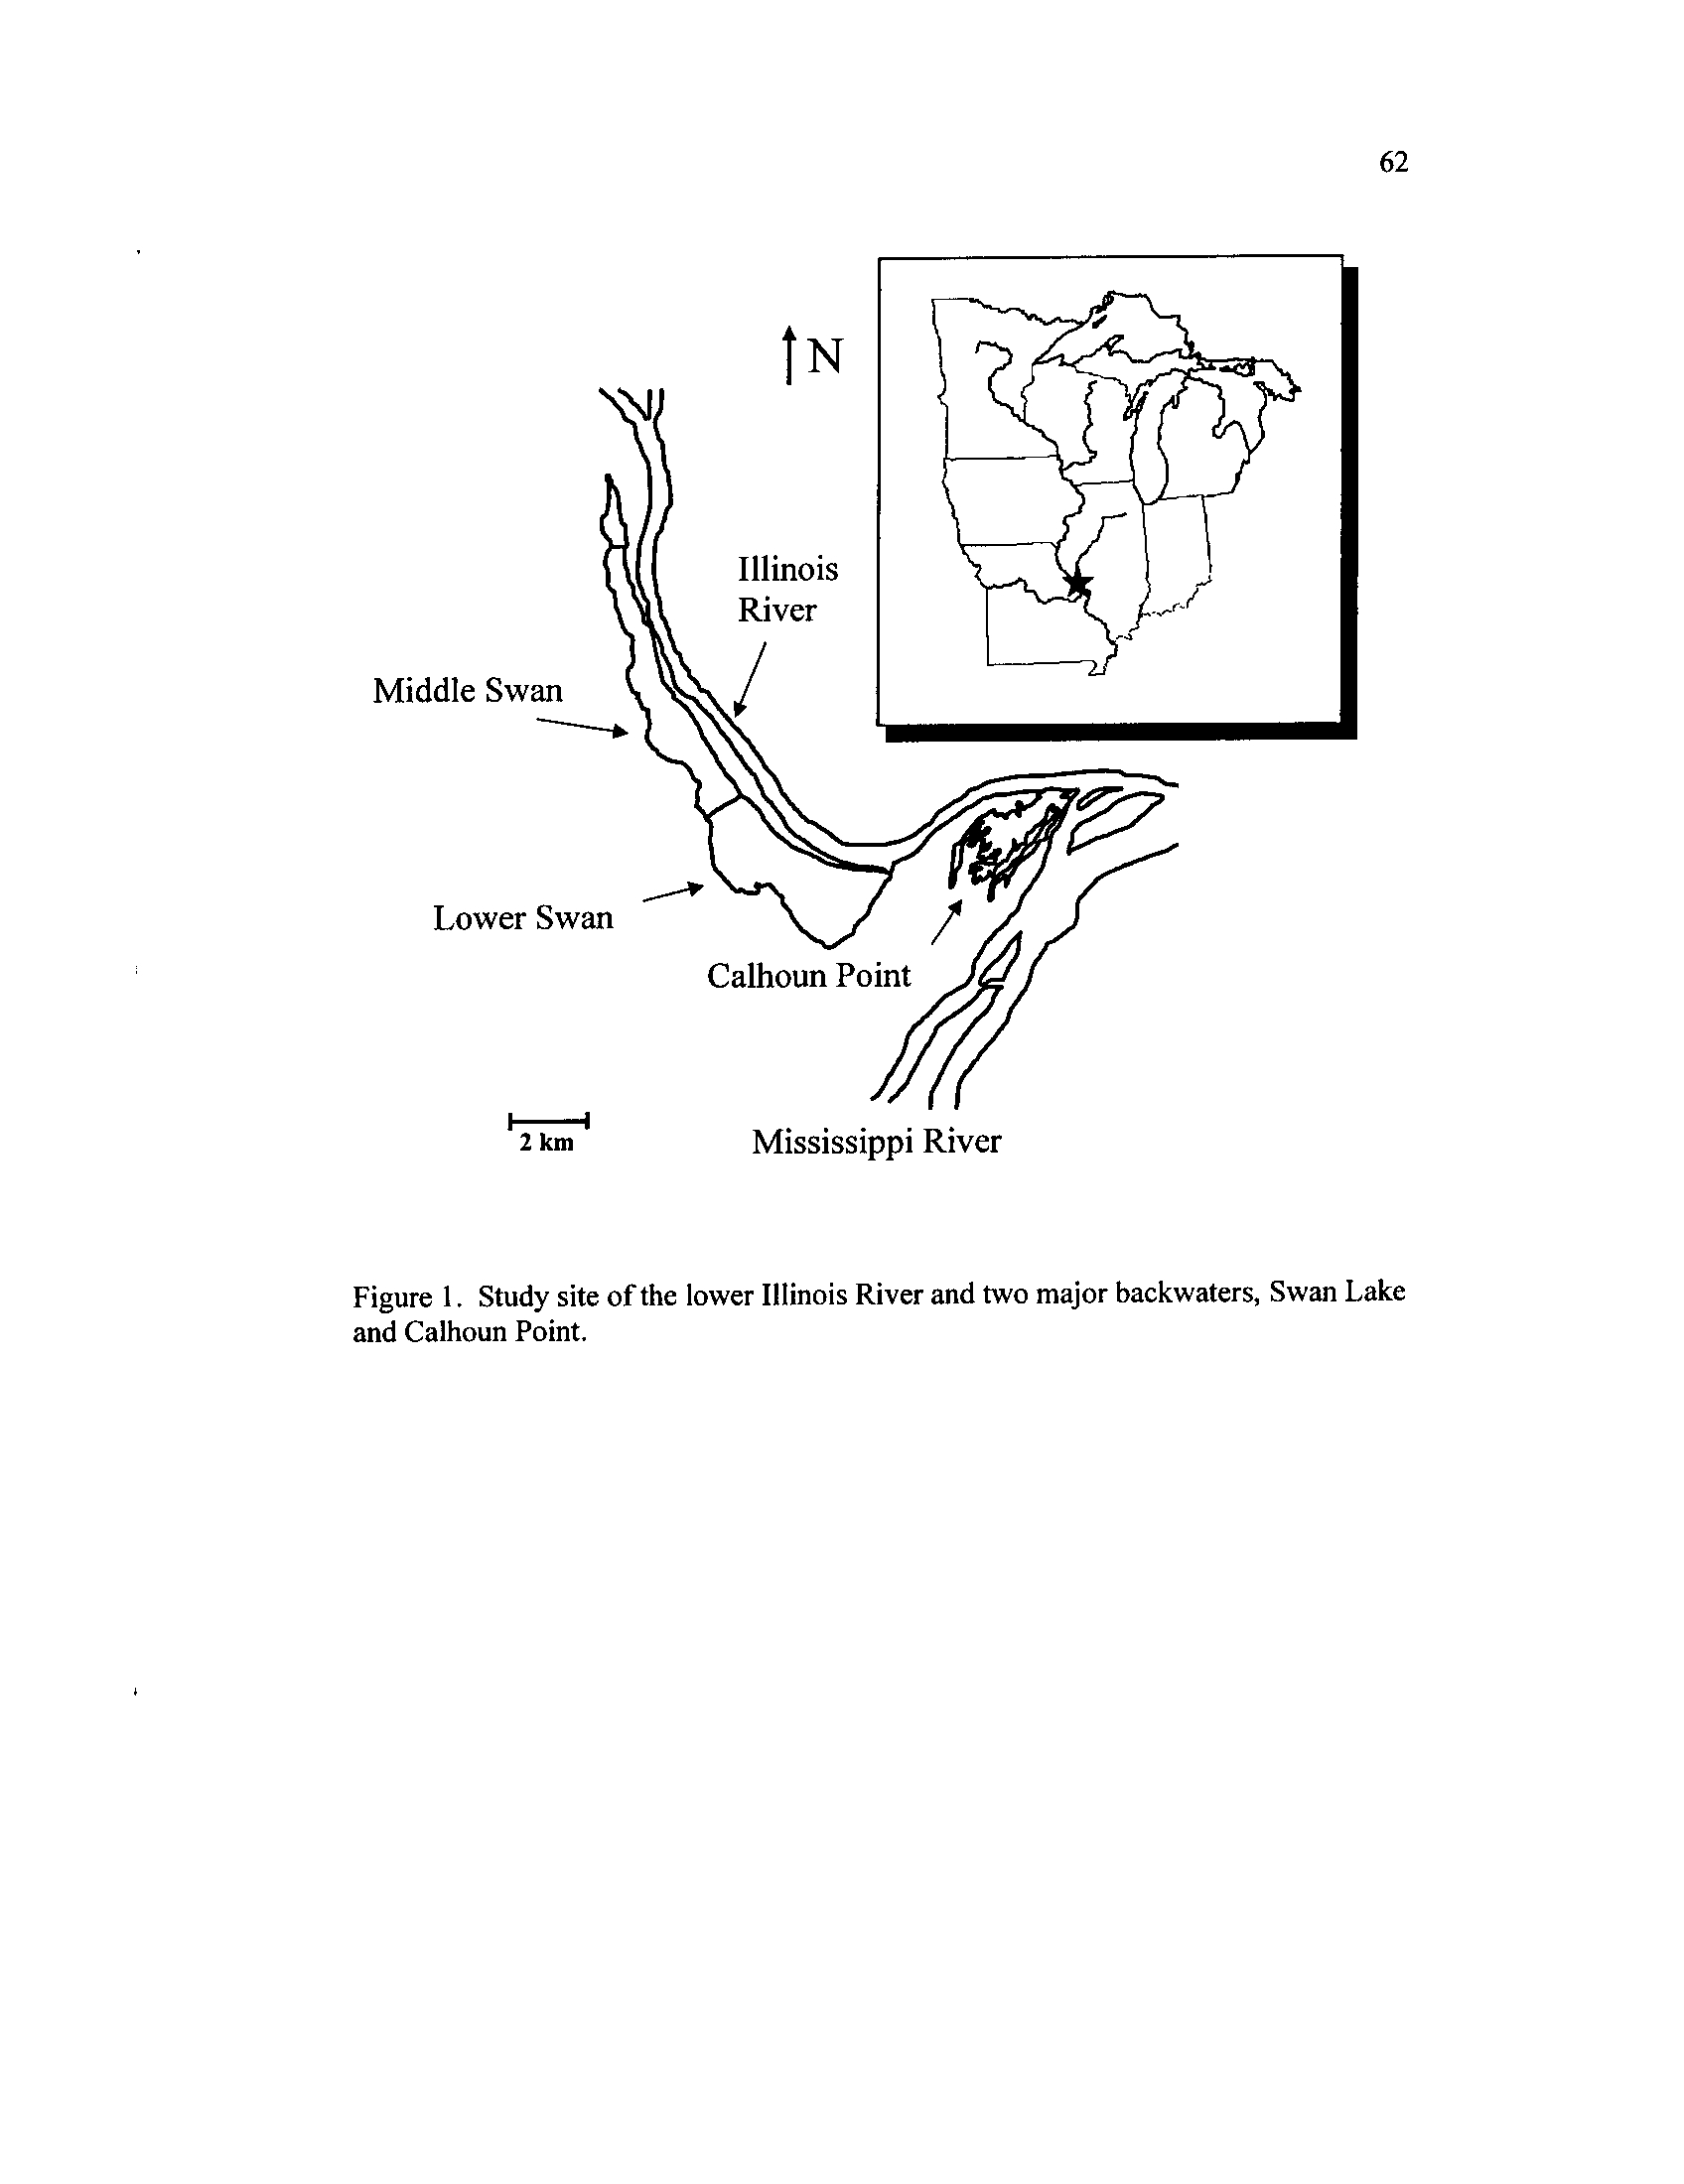
Figure 1 .
Study site of the lower Illinois River and two major backwaters,
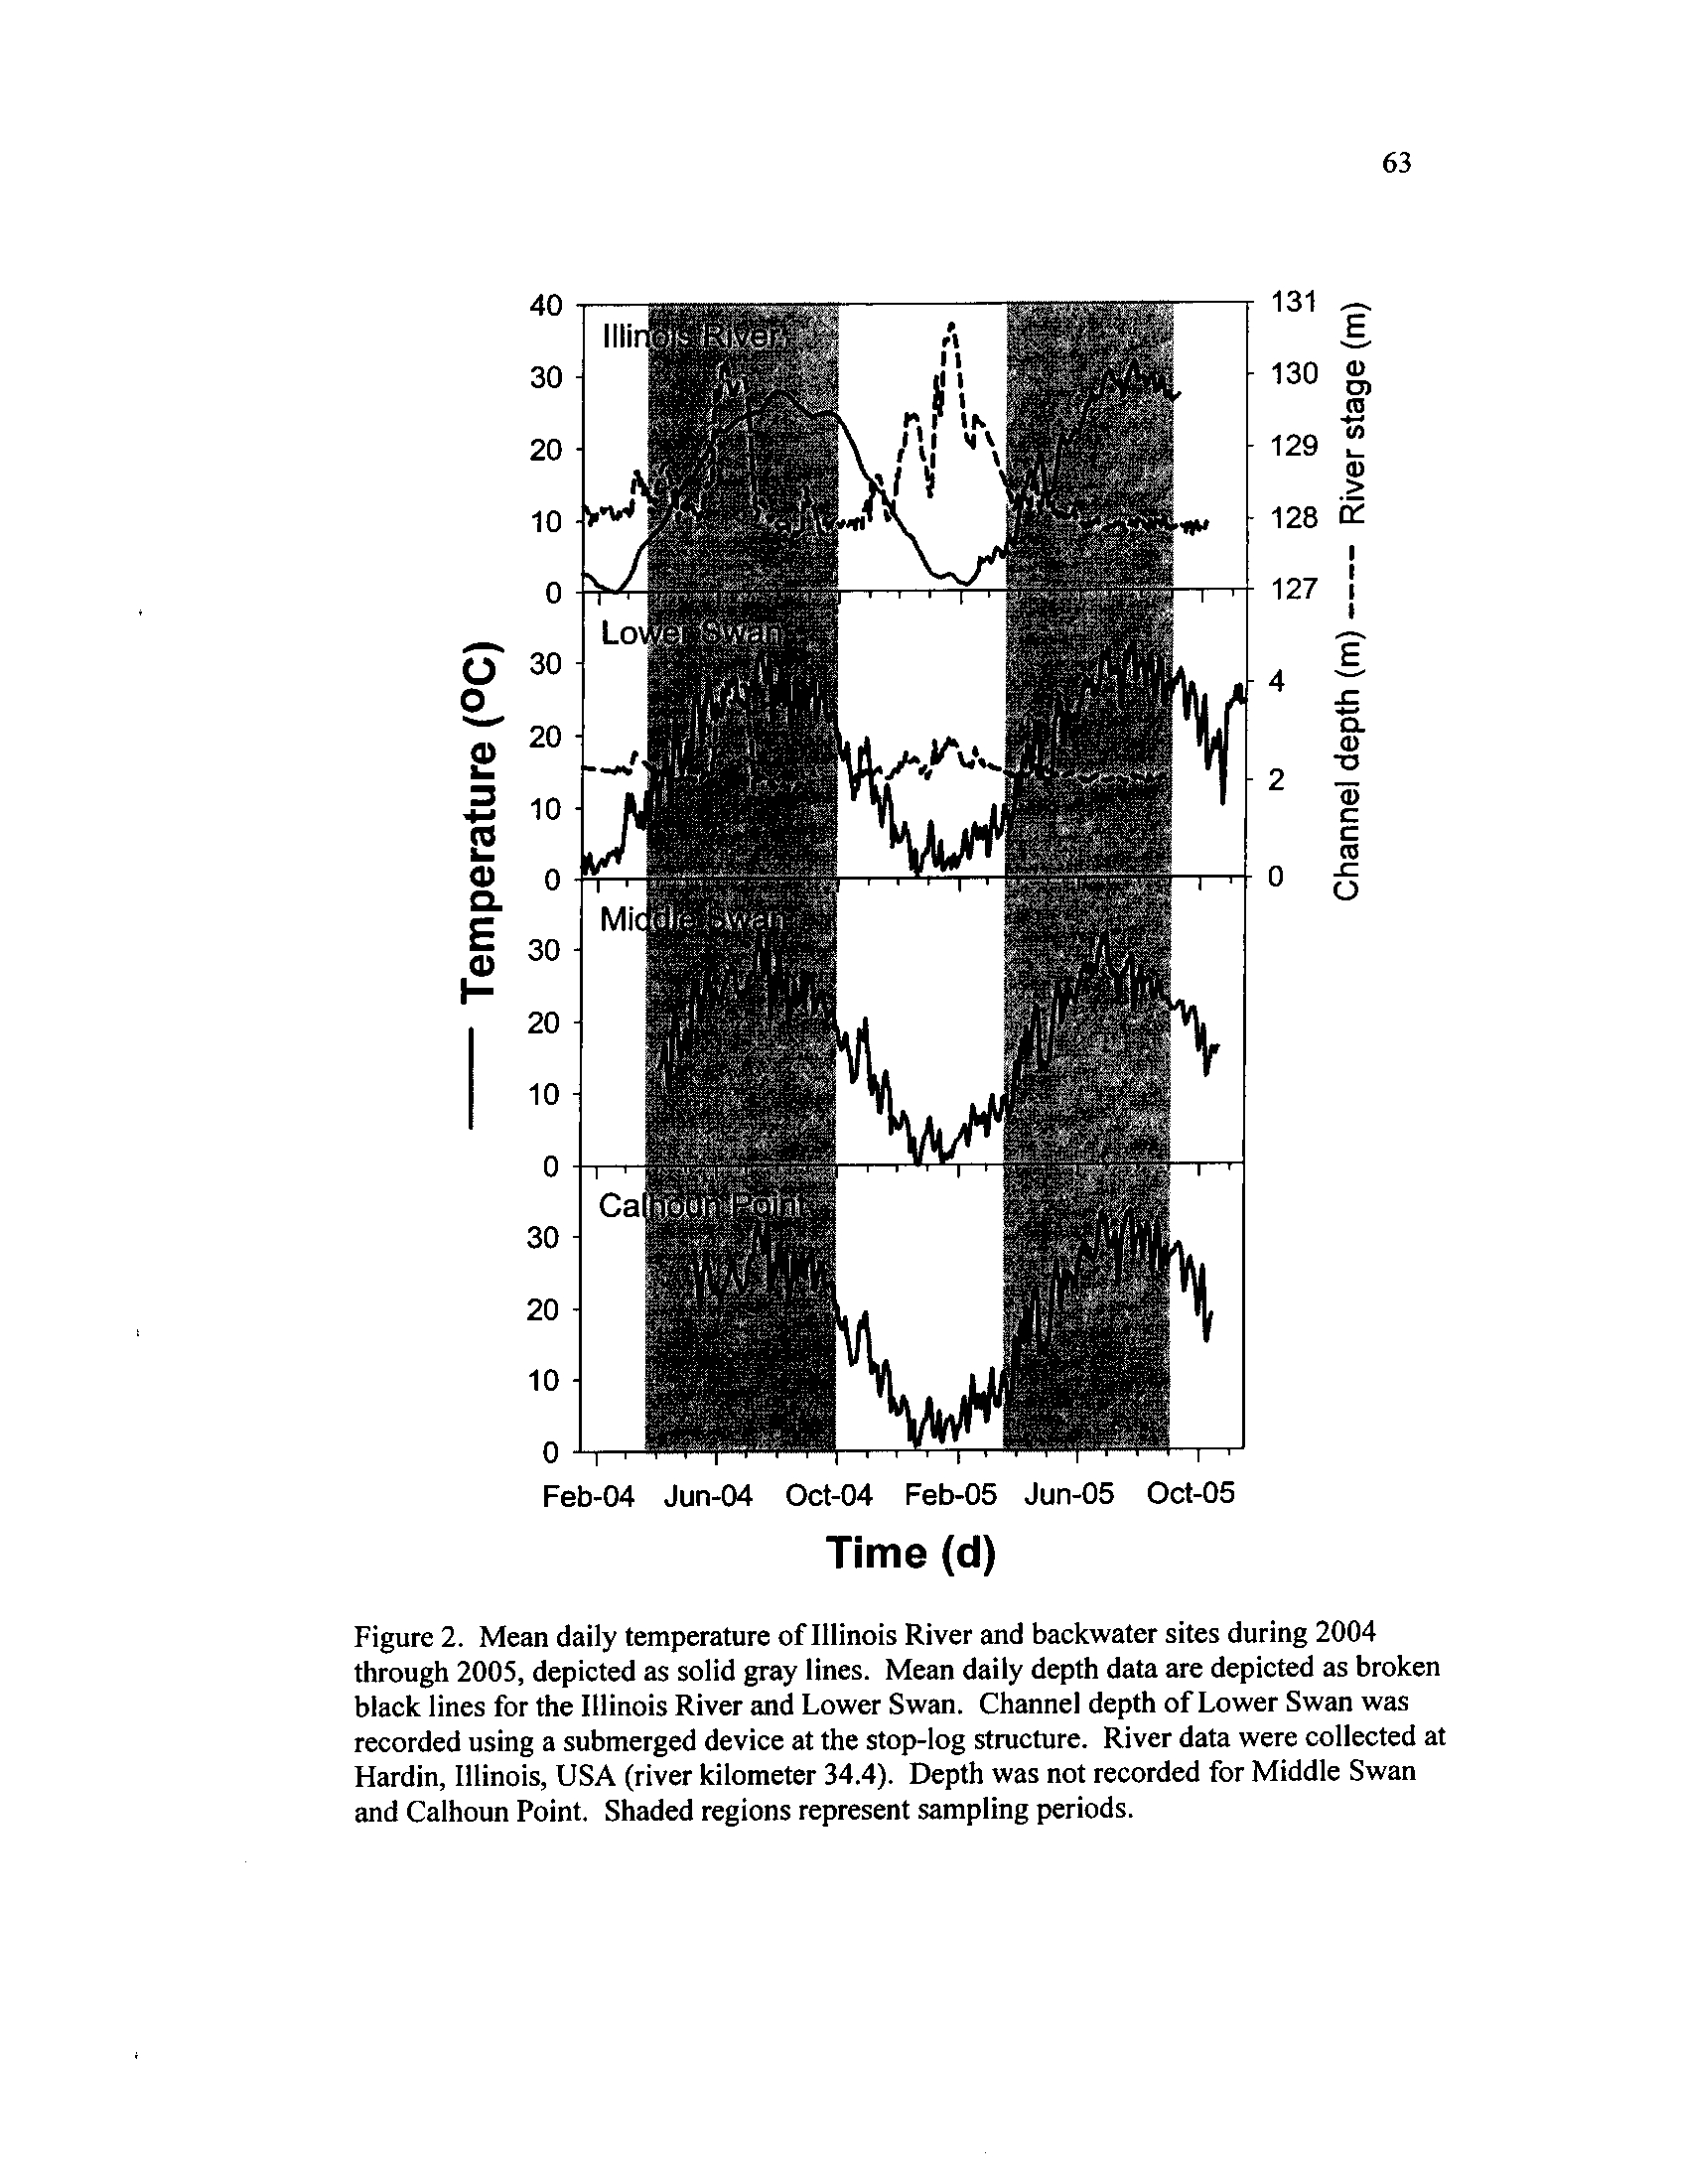
Figure 2 .
Swan Lake and Calhoun Point
Mean daily temperature of Illinois River and backwater sites
during 2004 through 2005, depicted
as solid gray lines
. Mean
daily depth data are depicted as broken black lines for the Illinois
River and Lower Swan
. Channel depth of Lower Swan was
recorded using a submerged device at the stop-log structure
. River
data were collected at Hardin, Illinois, USA (river kilometer 34
.4).
Depth was not recorded for Middle Swan and Calhoun Point
.
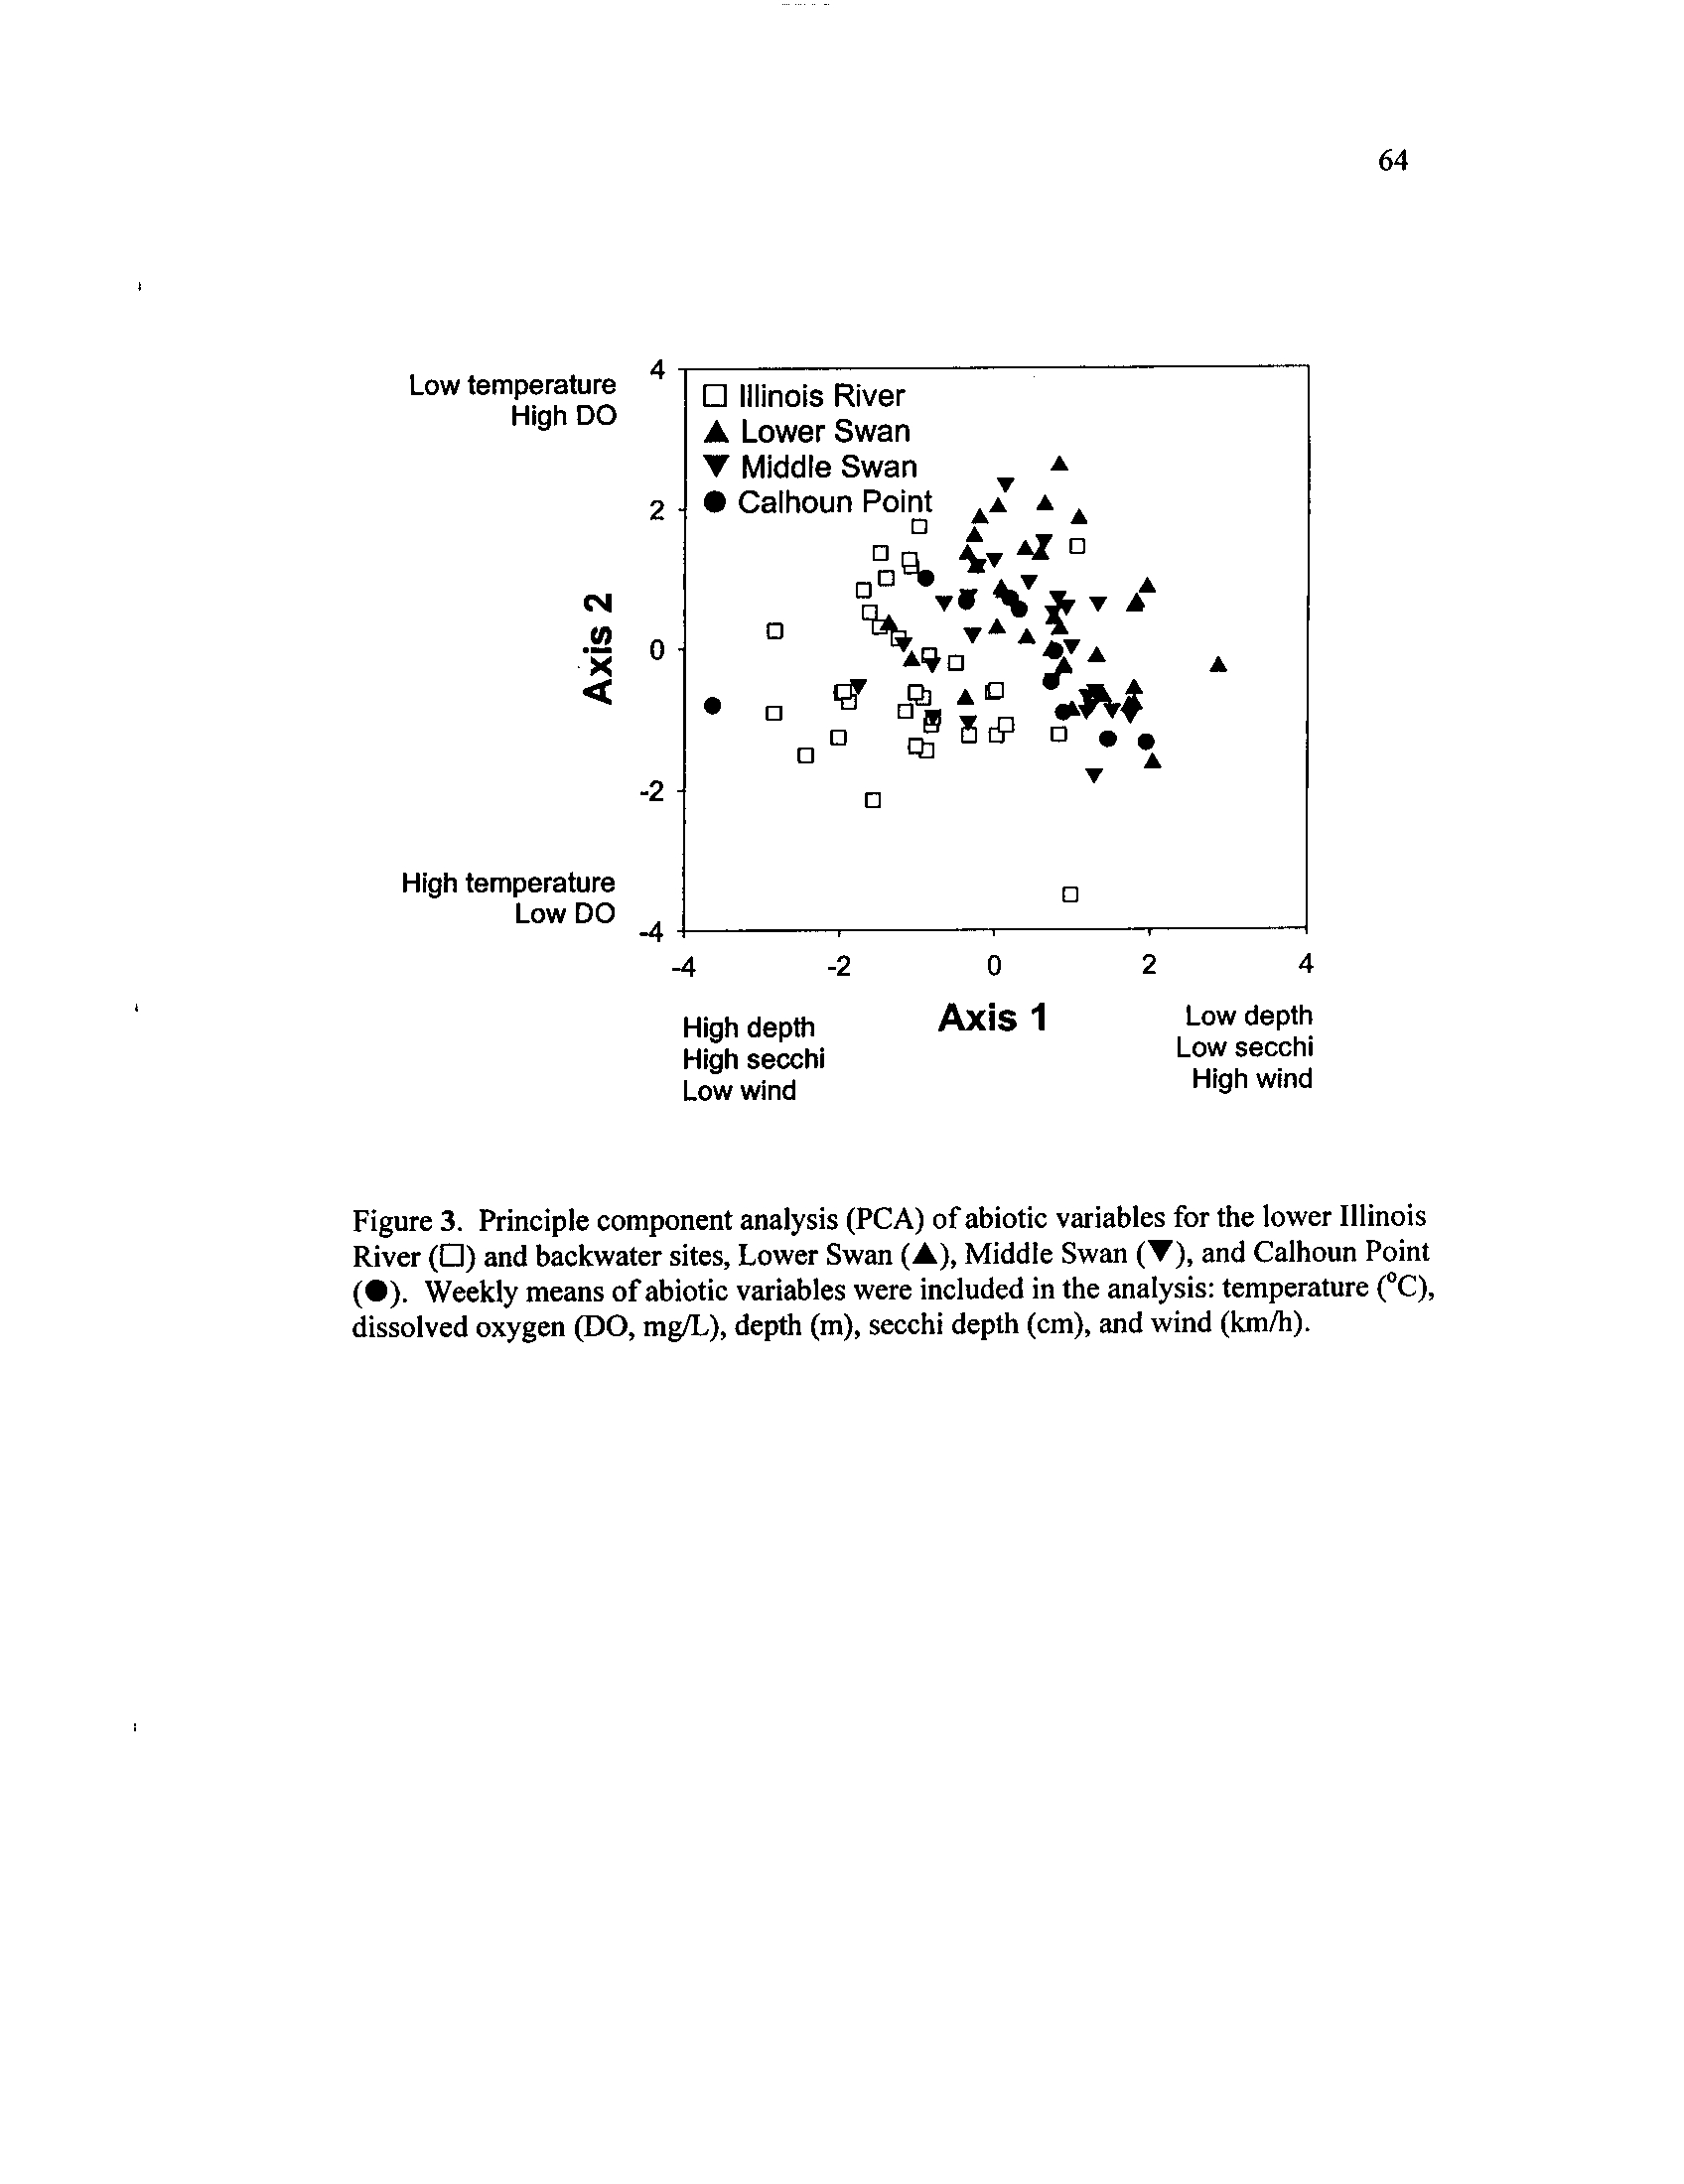
Figure 3 .
Principle
Shaded regions
component
represent
analysis
sampling
(PCA) of
periodsabiotic
variables
for the
lower Illinois River (D) and backwater sites, Lower Swan
(A),
Middle Swan (Y), and Calhoun Point
(•). Weekly means of
abiotic variables were included in the analysis : temperature
(°C),
dissolved oxygen (DO, mg/L), depth (m), secchi depth
(cm), and
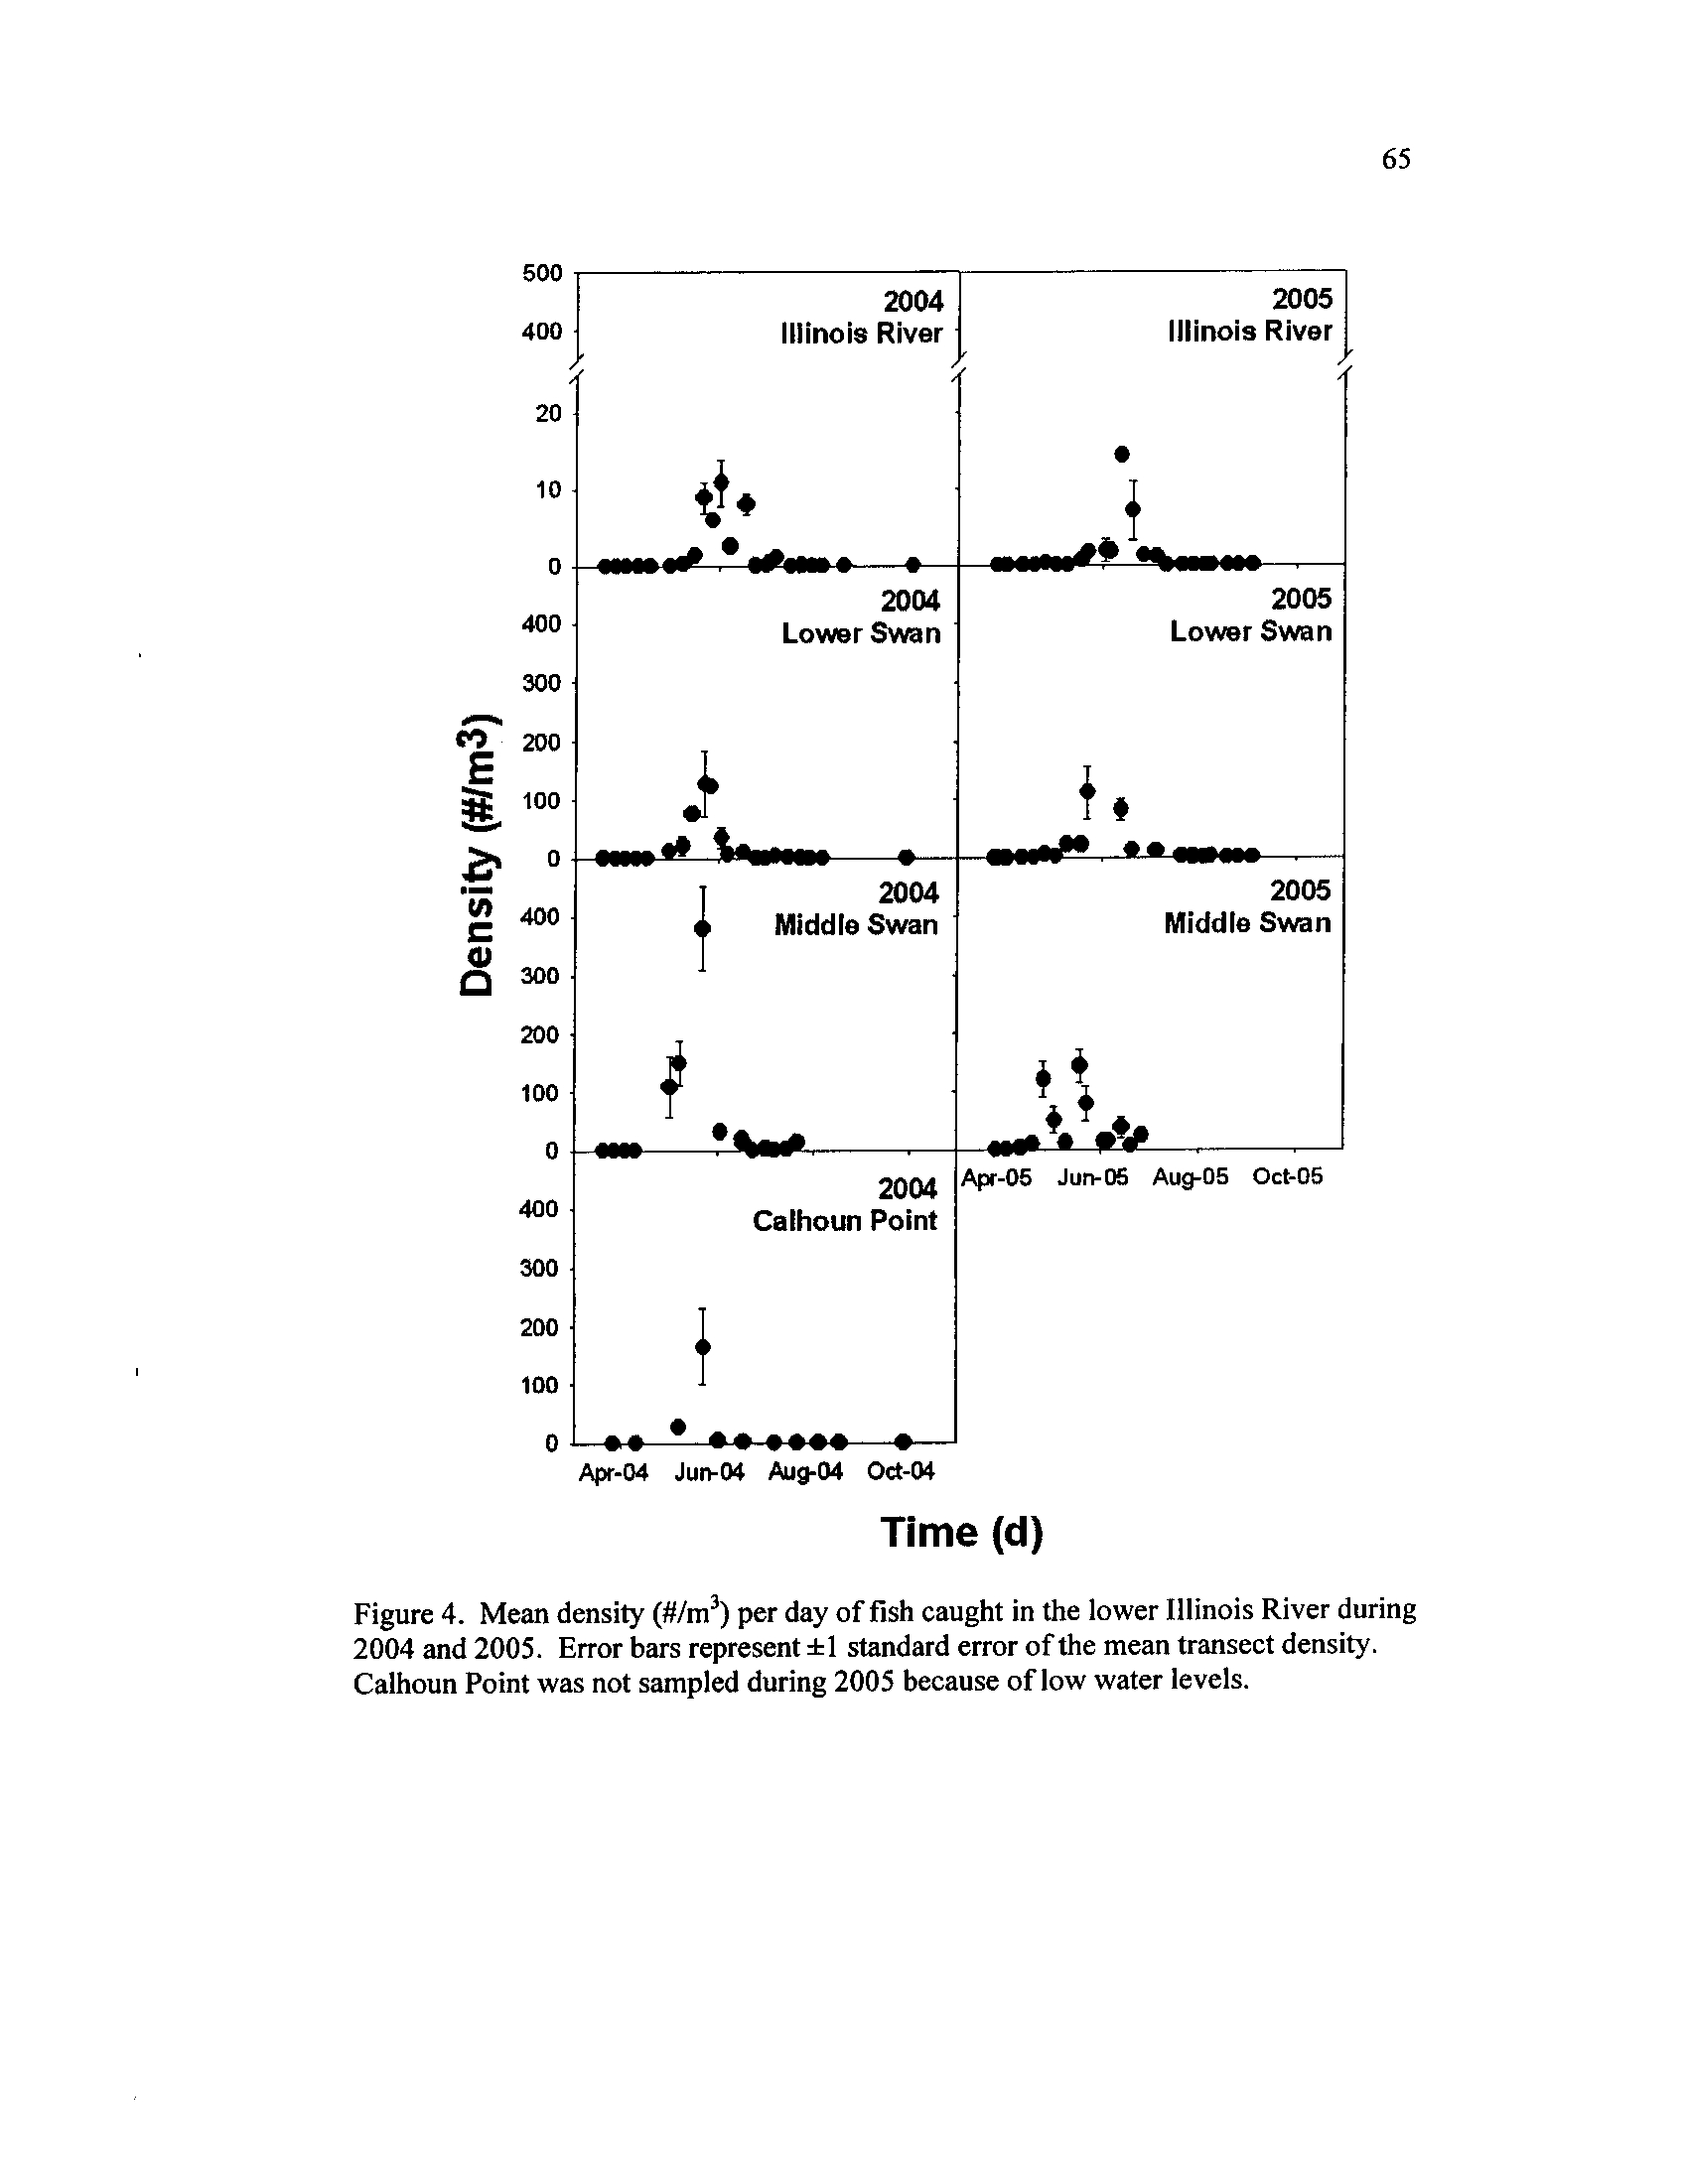
Figure 4 .
wind (km/h)
Mean density (#/m
3) per day of fish caught in the lower Illinois
River during 2004 and 2005
. Error bars represent =1:1 standard
error of the mean transect density
. Calhoun Point was not sampled
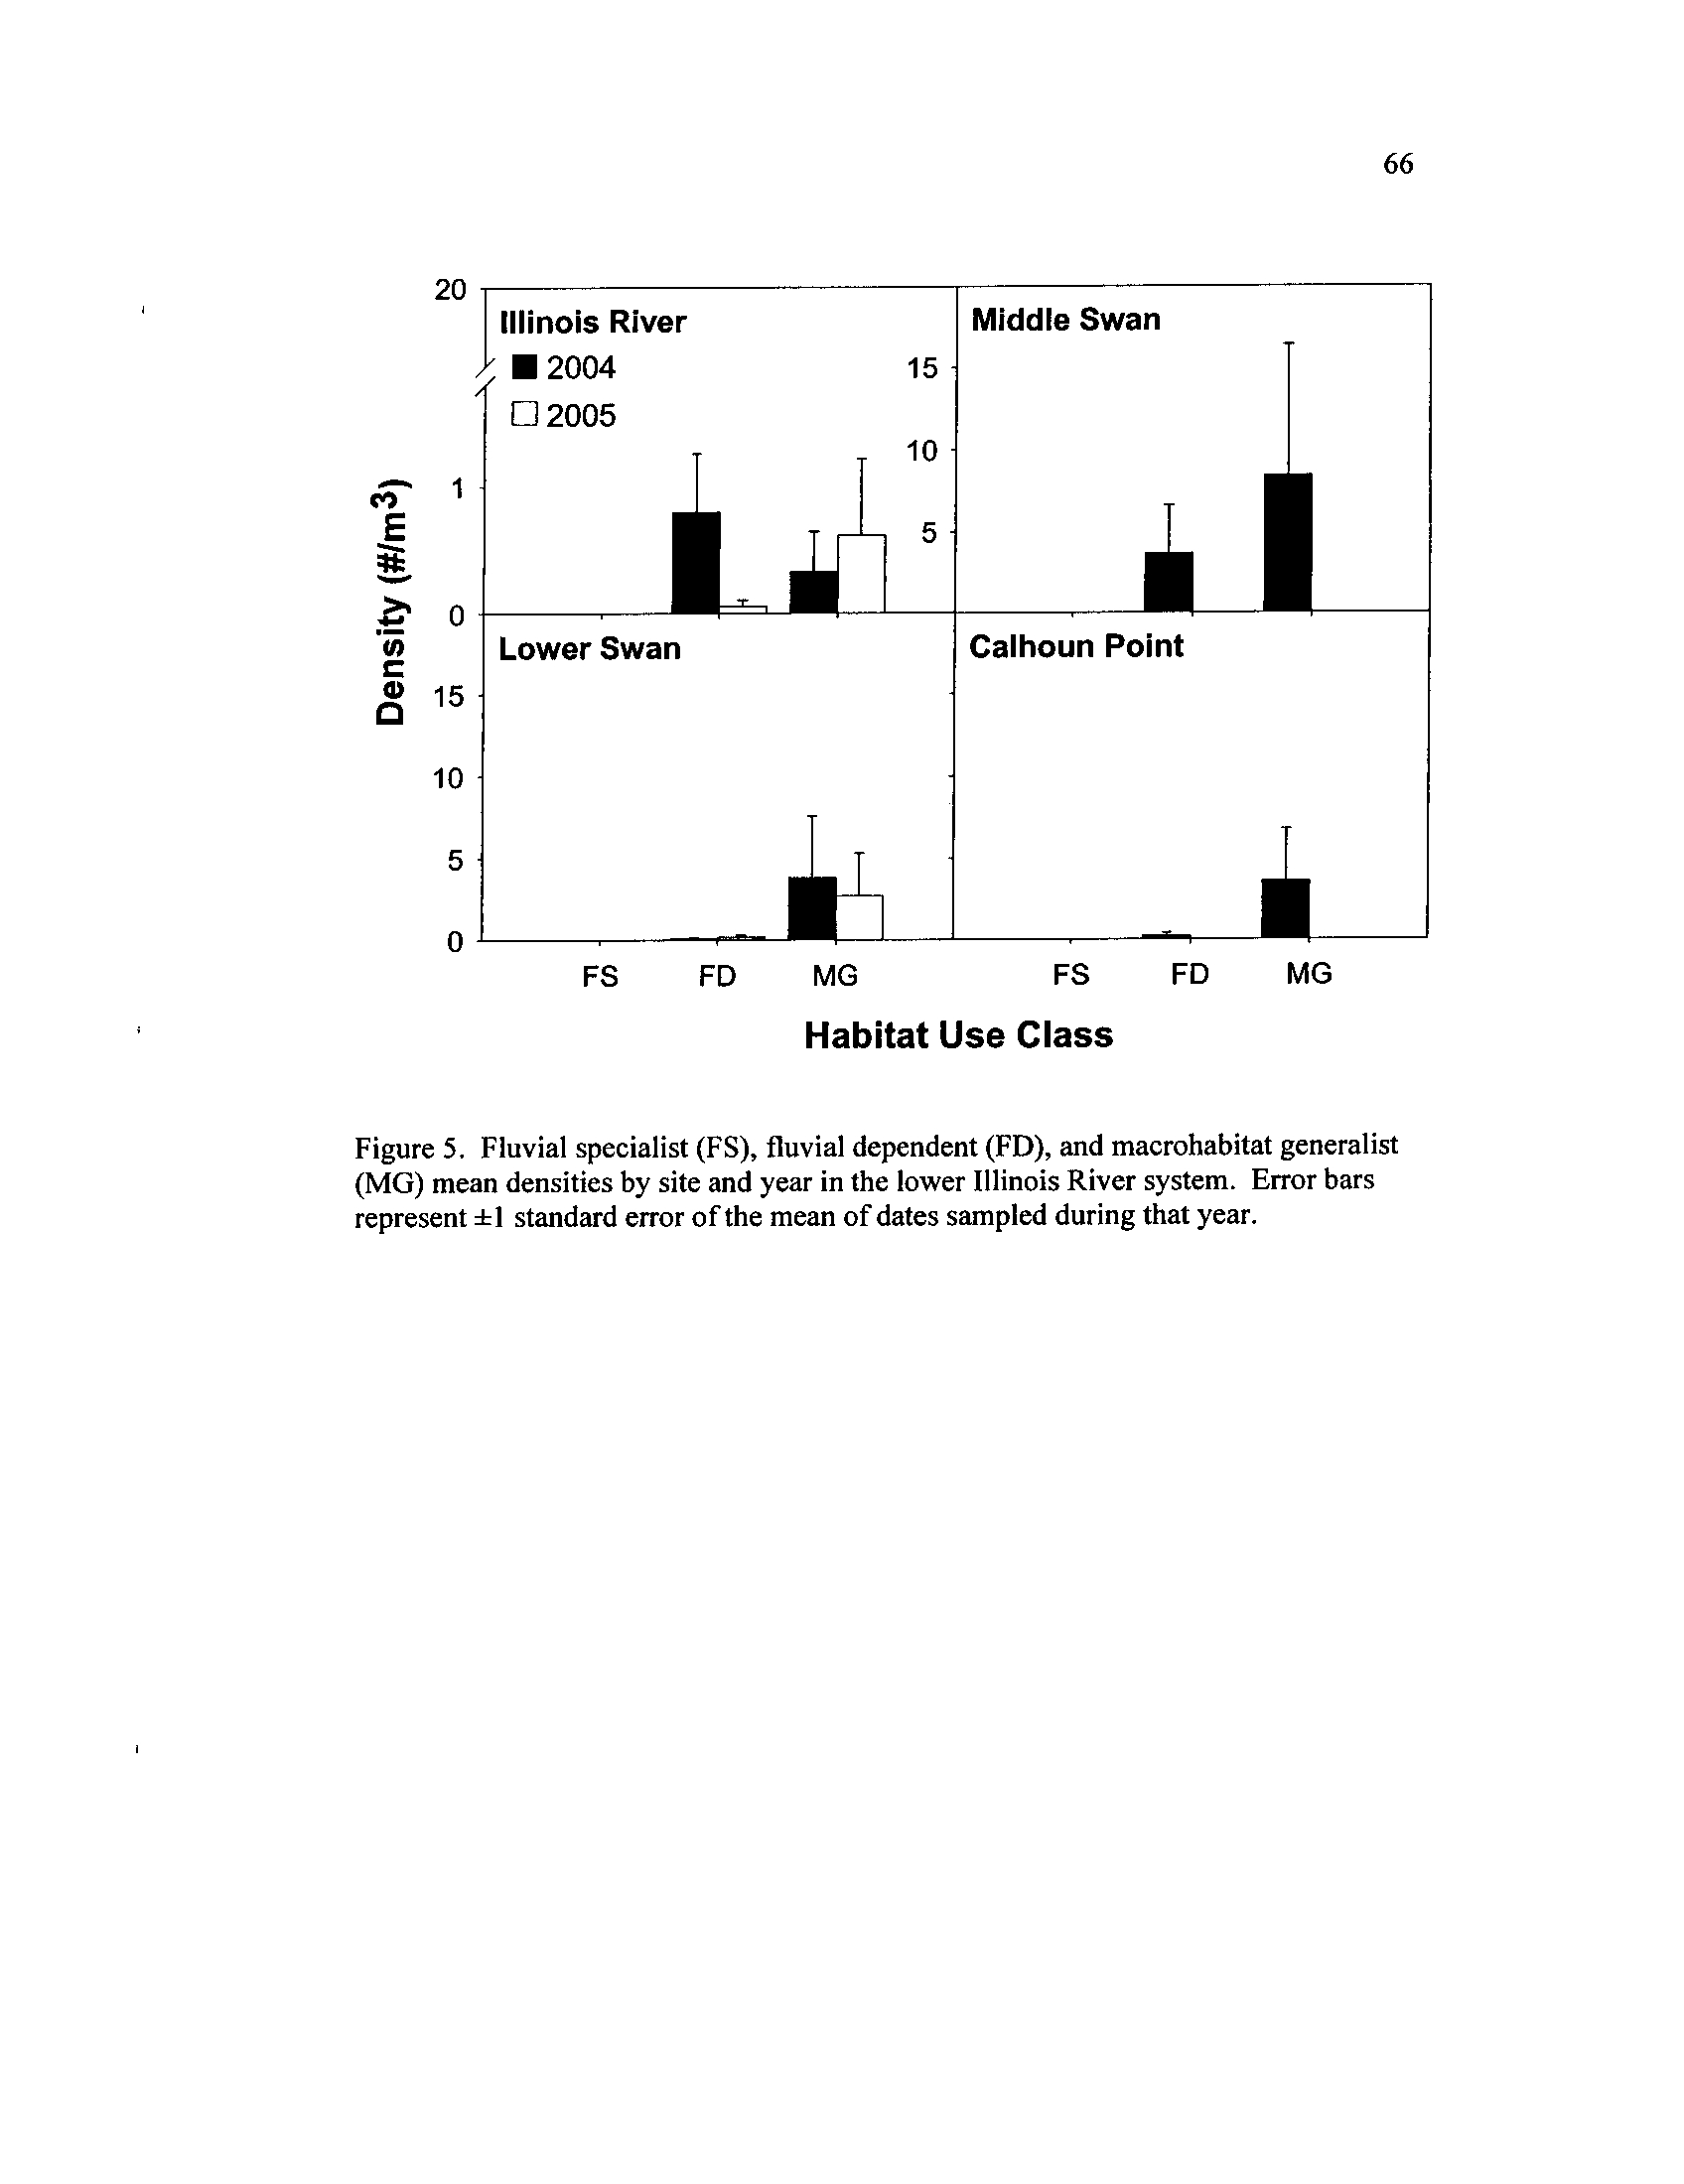
Figure 5 .
during 2005 because of low water levels
Fluvial specialist (FS), fluvial dependent
(FD), and macrohabitat
generalist (MG) mean densities by site and year in the lower
Illinois River system
. Error bars represent ±1 standard error of the
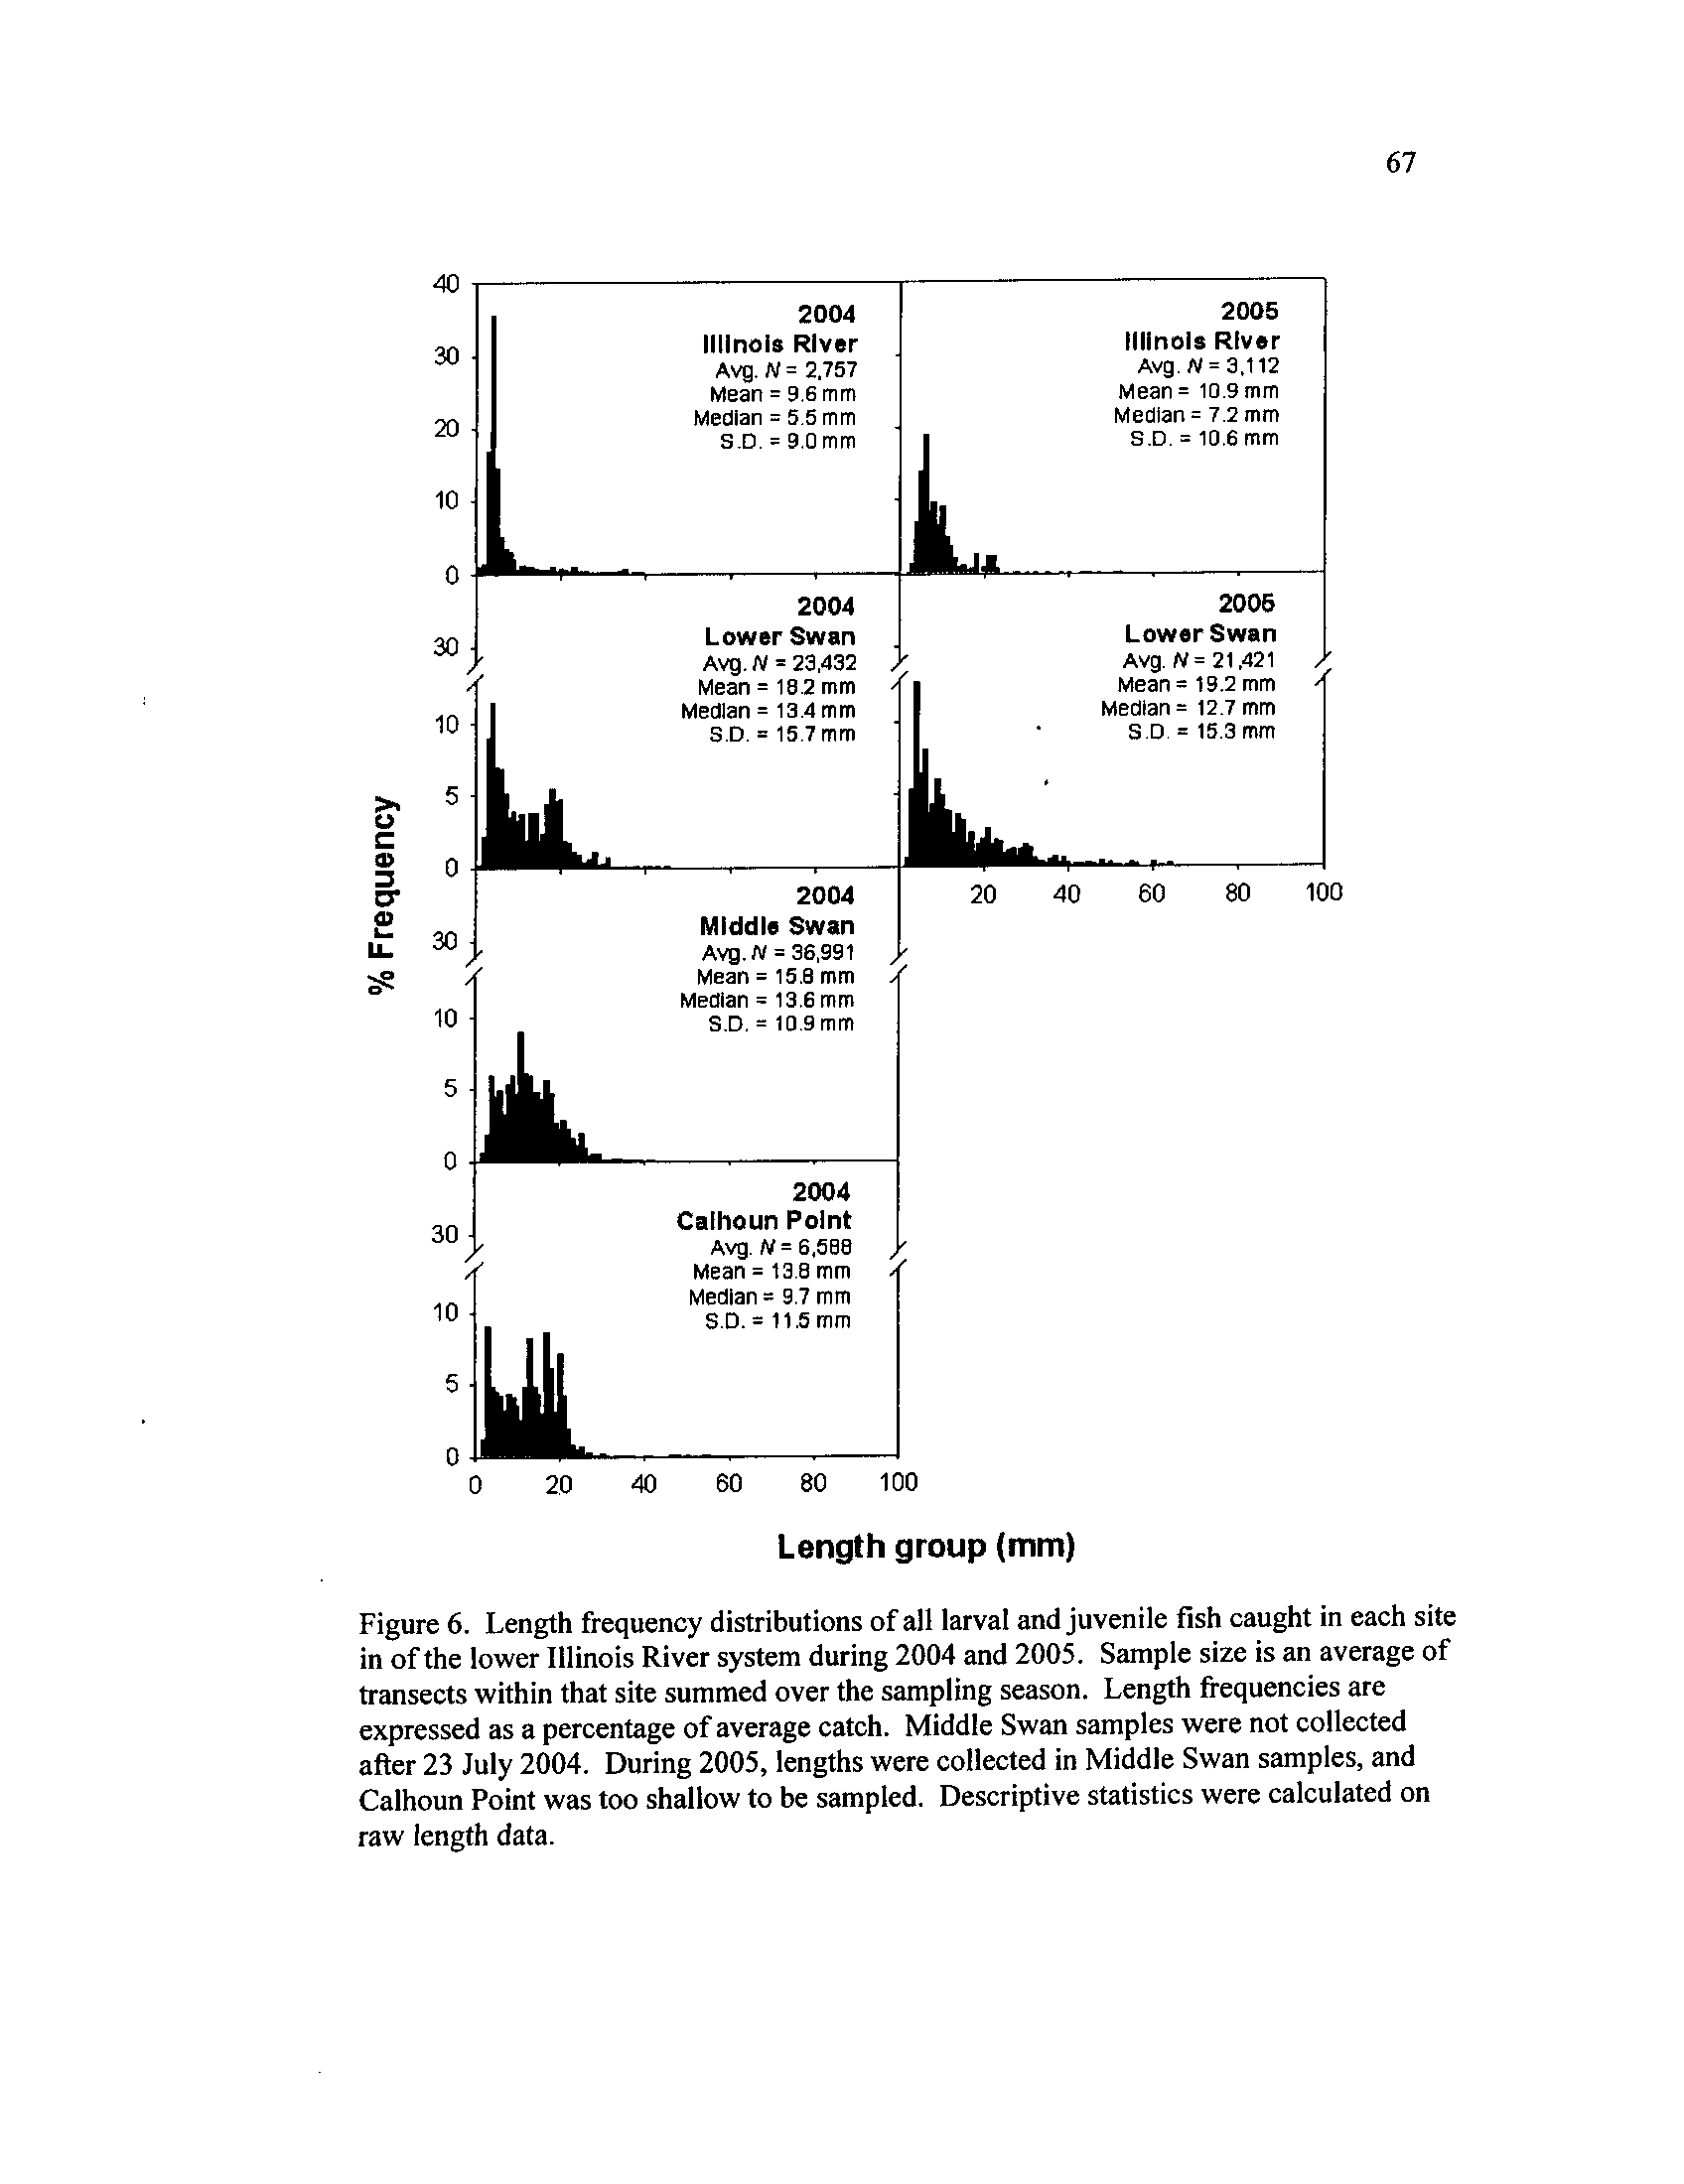
Figure 6.
mean of dates sampled during that year
Length frequency distributions of all larval and juvenile fish
caught in each site in of the lower Illinois River system during
2004 and 2005 . Sample size is an
average of transects within that
site summed over the sampling season
. Length frequencies are
expressed as a percentage of average catch
. Middle Swan samples
were not collected after 23 July 2004
. During 2005, lengths were
collected in Middle Swan samples, and Calhoun Point was too
shallow to be sampled
. Descriptive statistics were calculated on
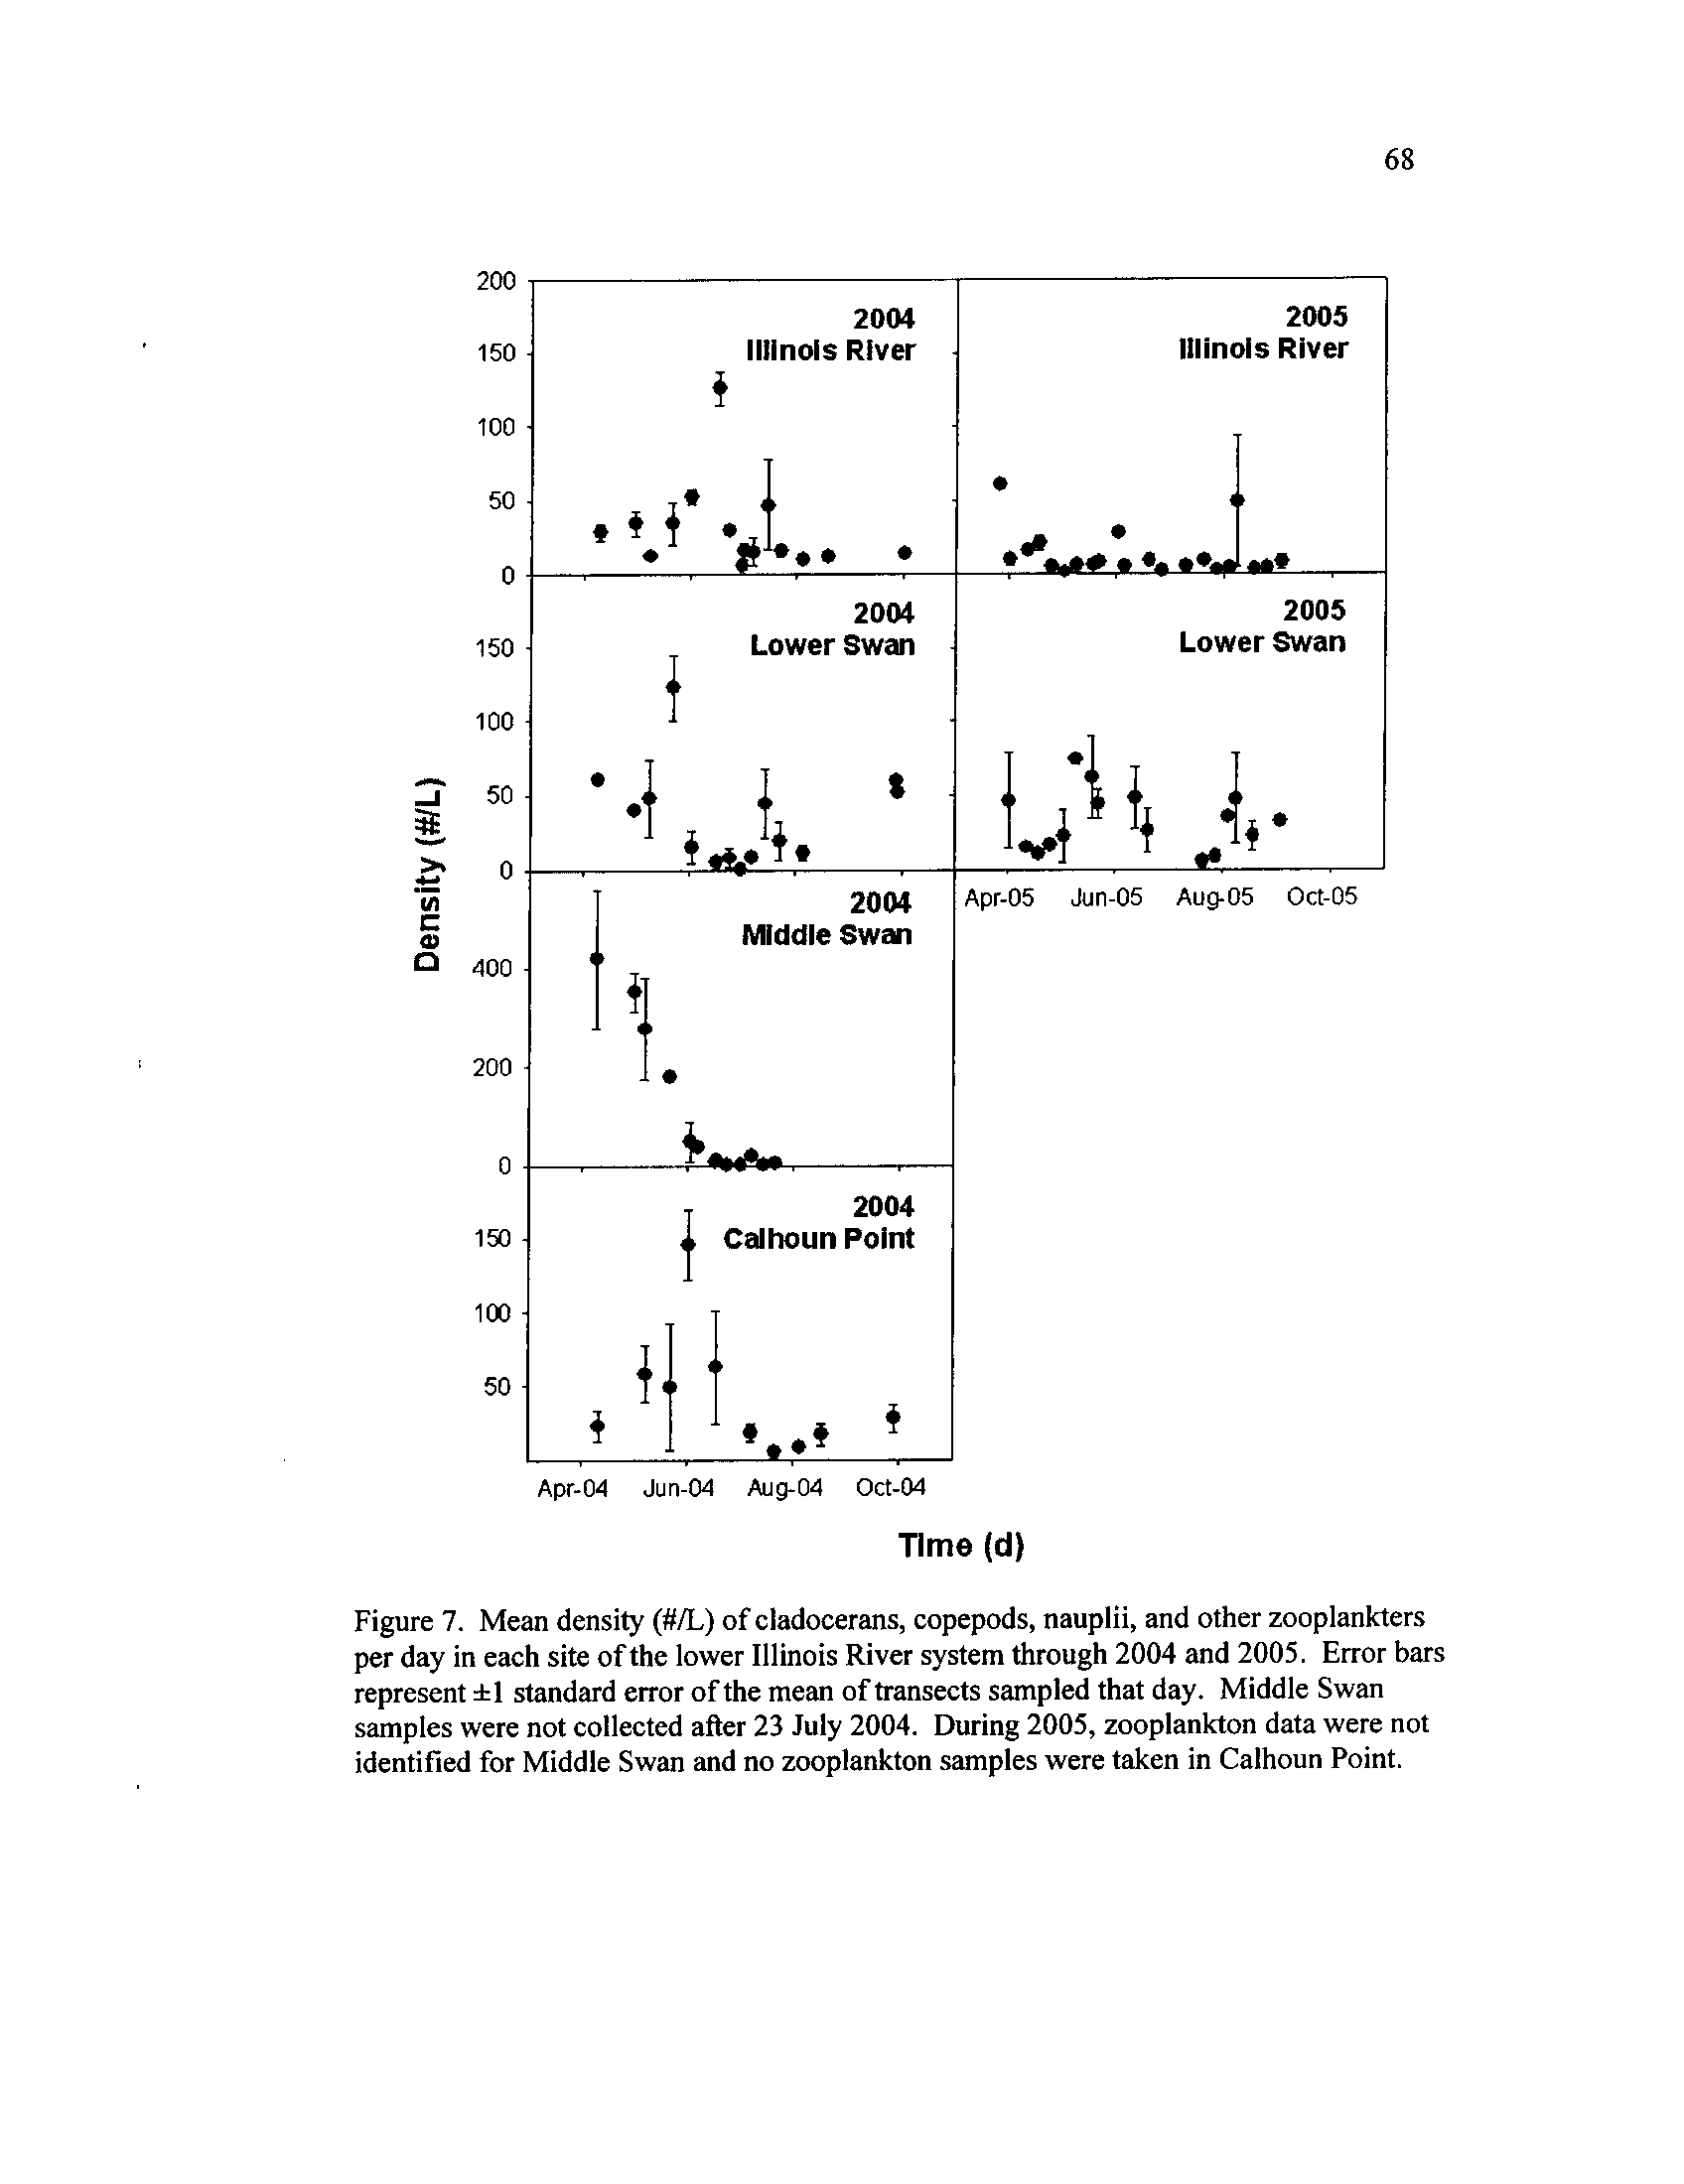
Figure 7.
raw length data
Mean density (#/L) of cladocerans, copepods, nauplii, and other
zooplankters per day in each site of the lower Illinois River system
through 2004 and 2005
. Error bars represent ±1 standard error of
vii
the mean of transects sampled that day
. Middle Swan samples
were not collected after 23 July 2004
. During 2005, zooplankton
data were not identified for Middle Swan and no zooplankton
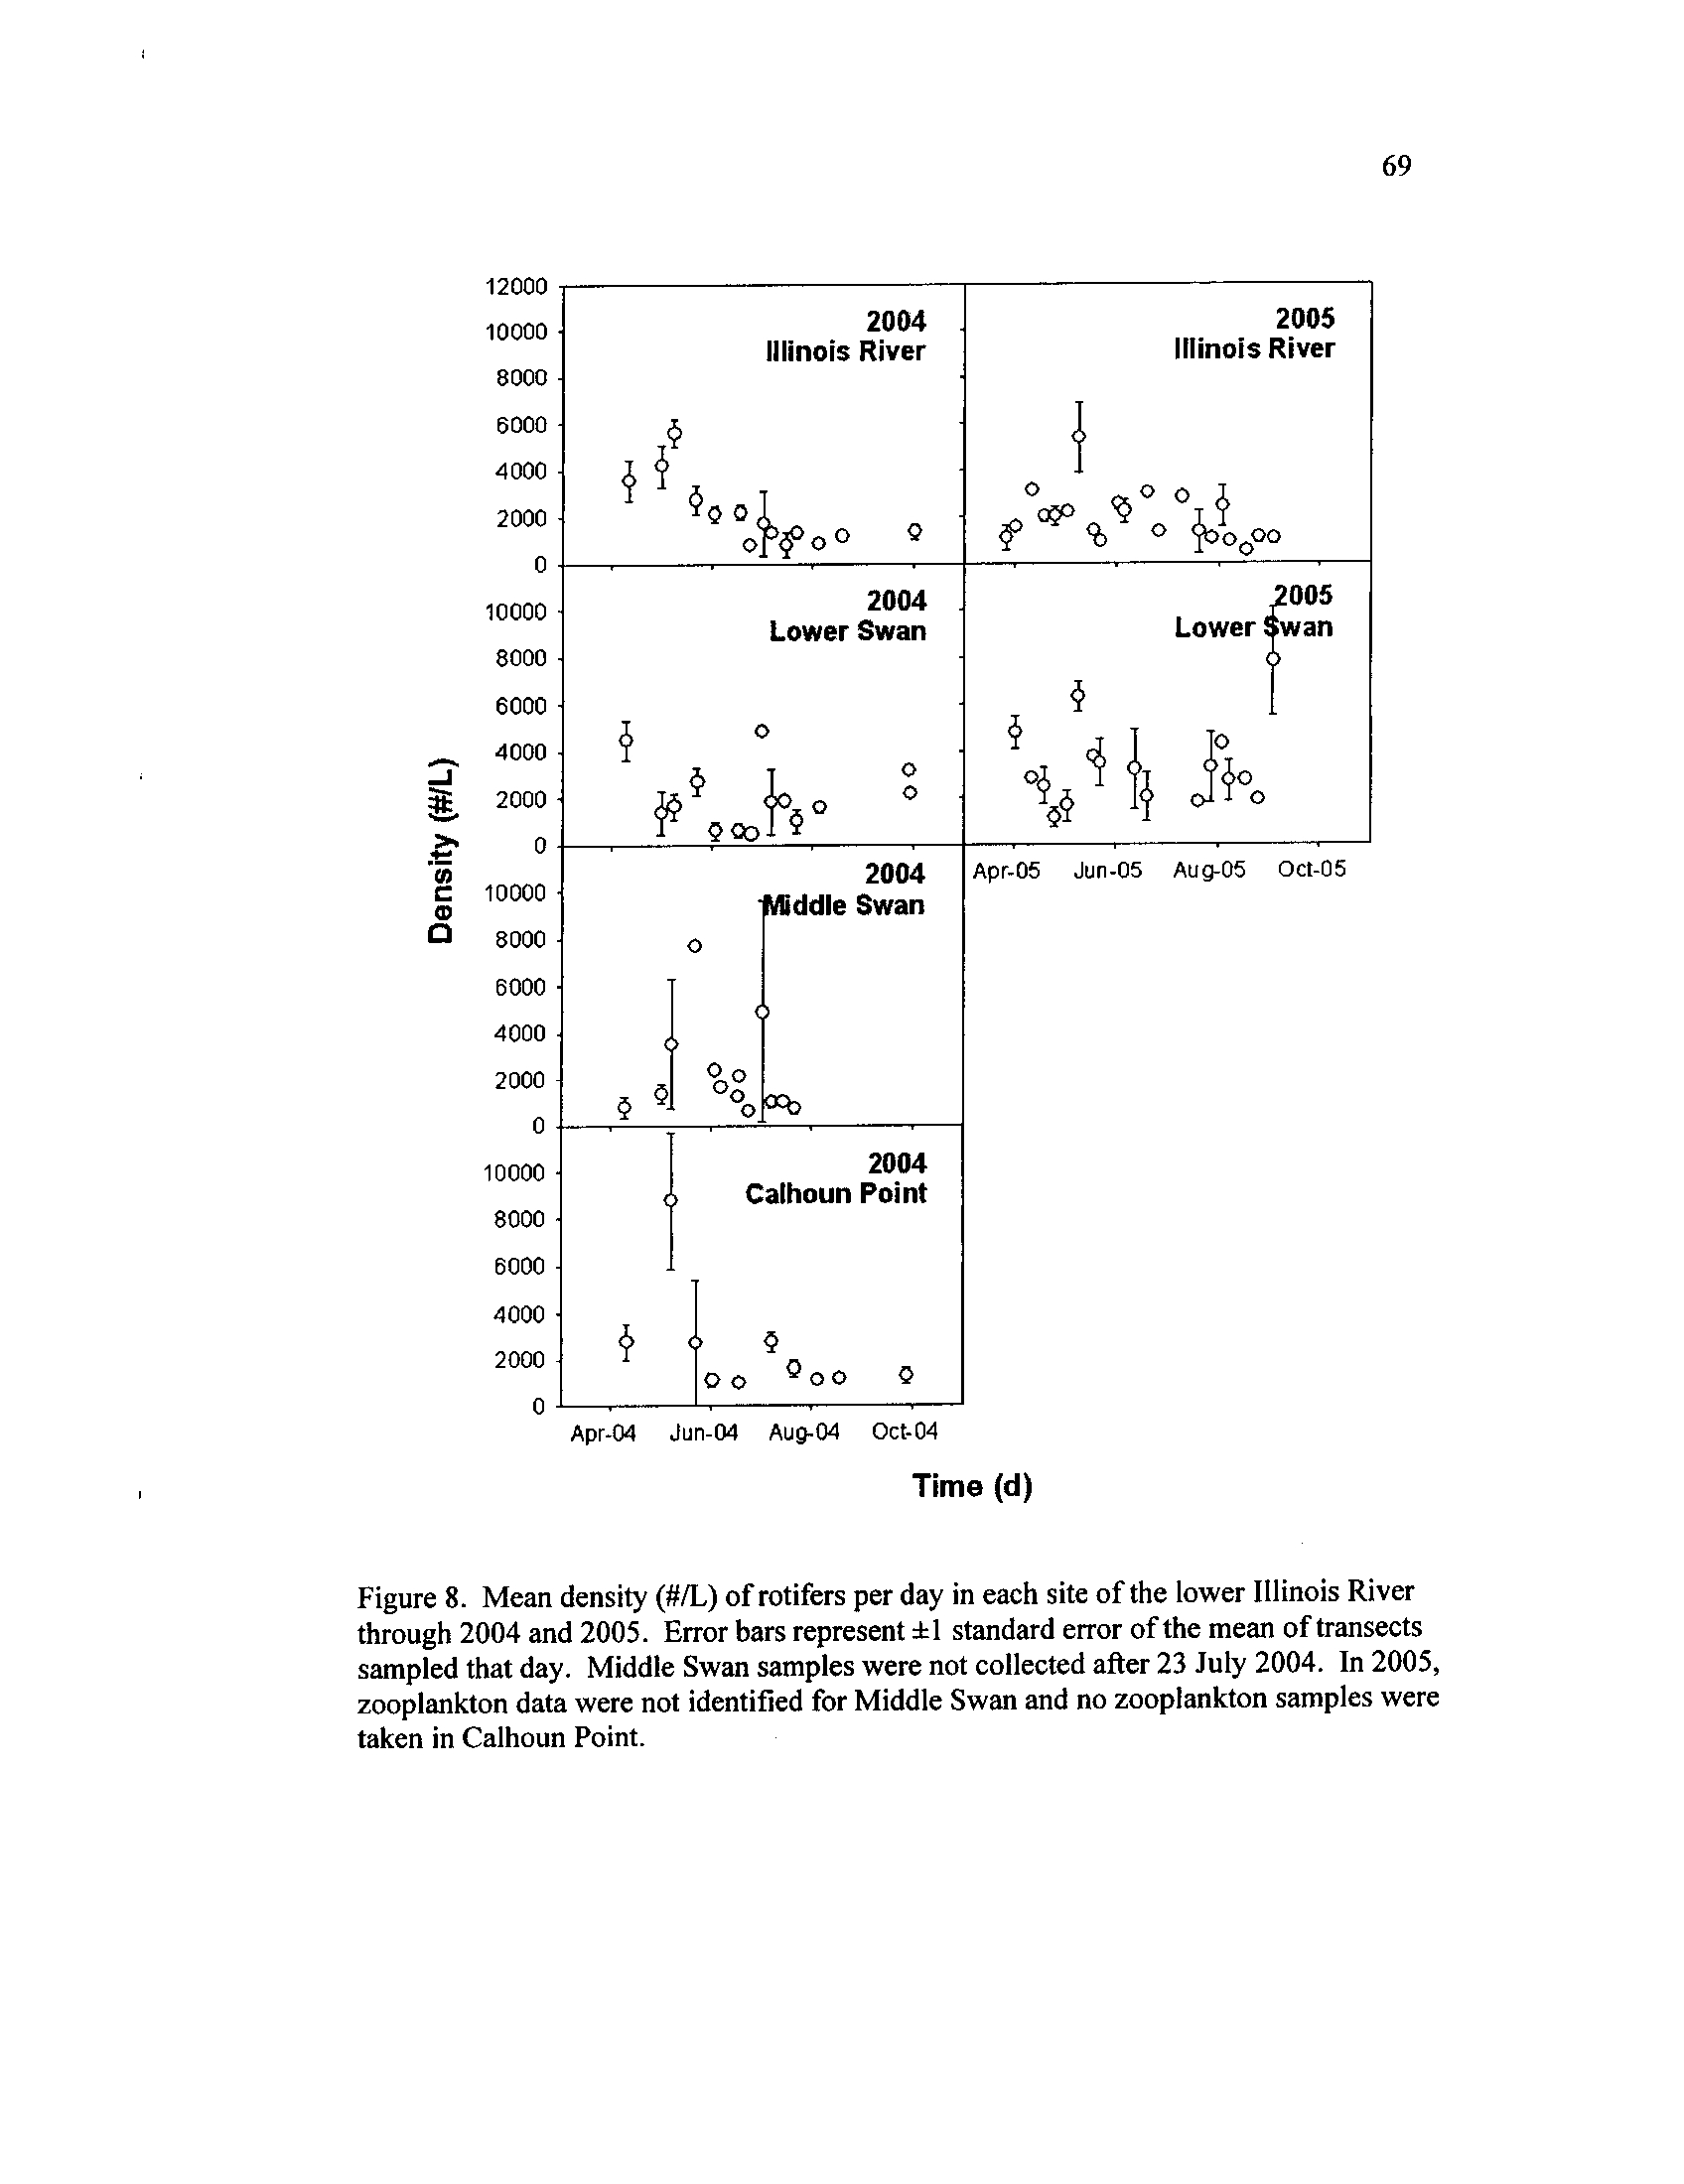
Figure 8 .
samples were taken in Calhoun Point
Mean density (#/L) of rotifers per day in each site of the lower
Illinois River through 2004 and 2005
. Error bars represent
f 1
standard error of the mean of transects sampled that day
. Middle
Swan samples were not collected after 23 July 2004
. In 2005,
zooplankton data were not identified for Middle Swan and no
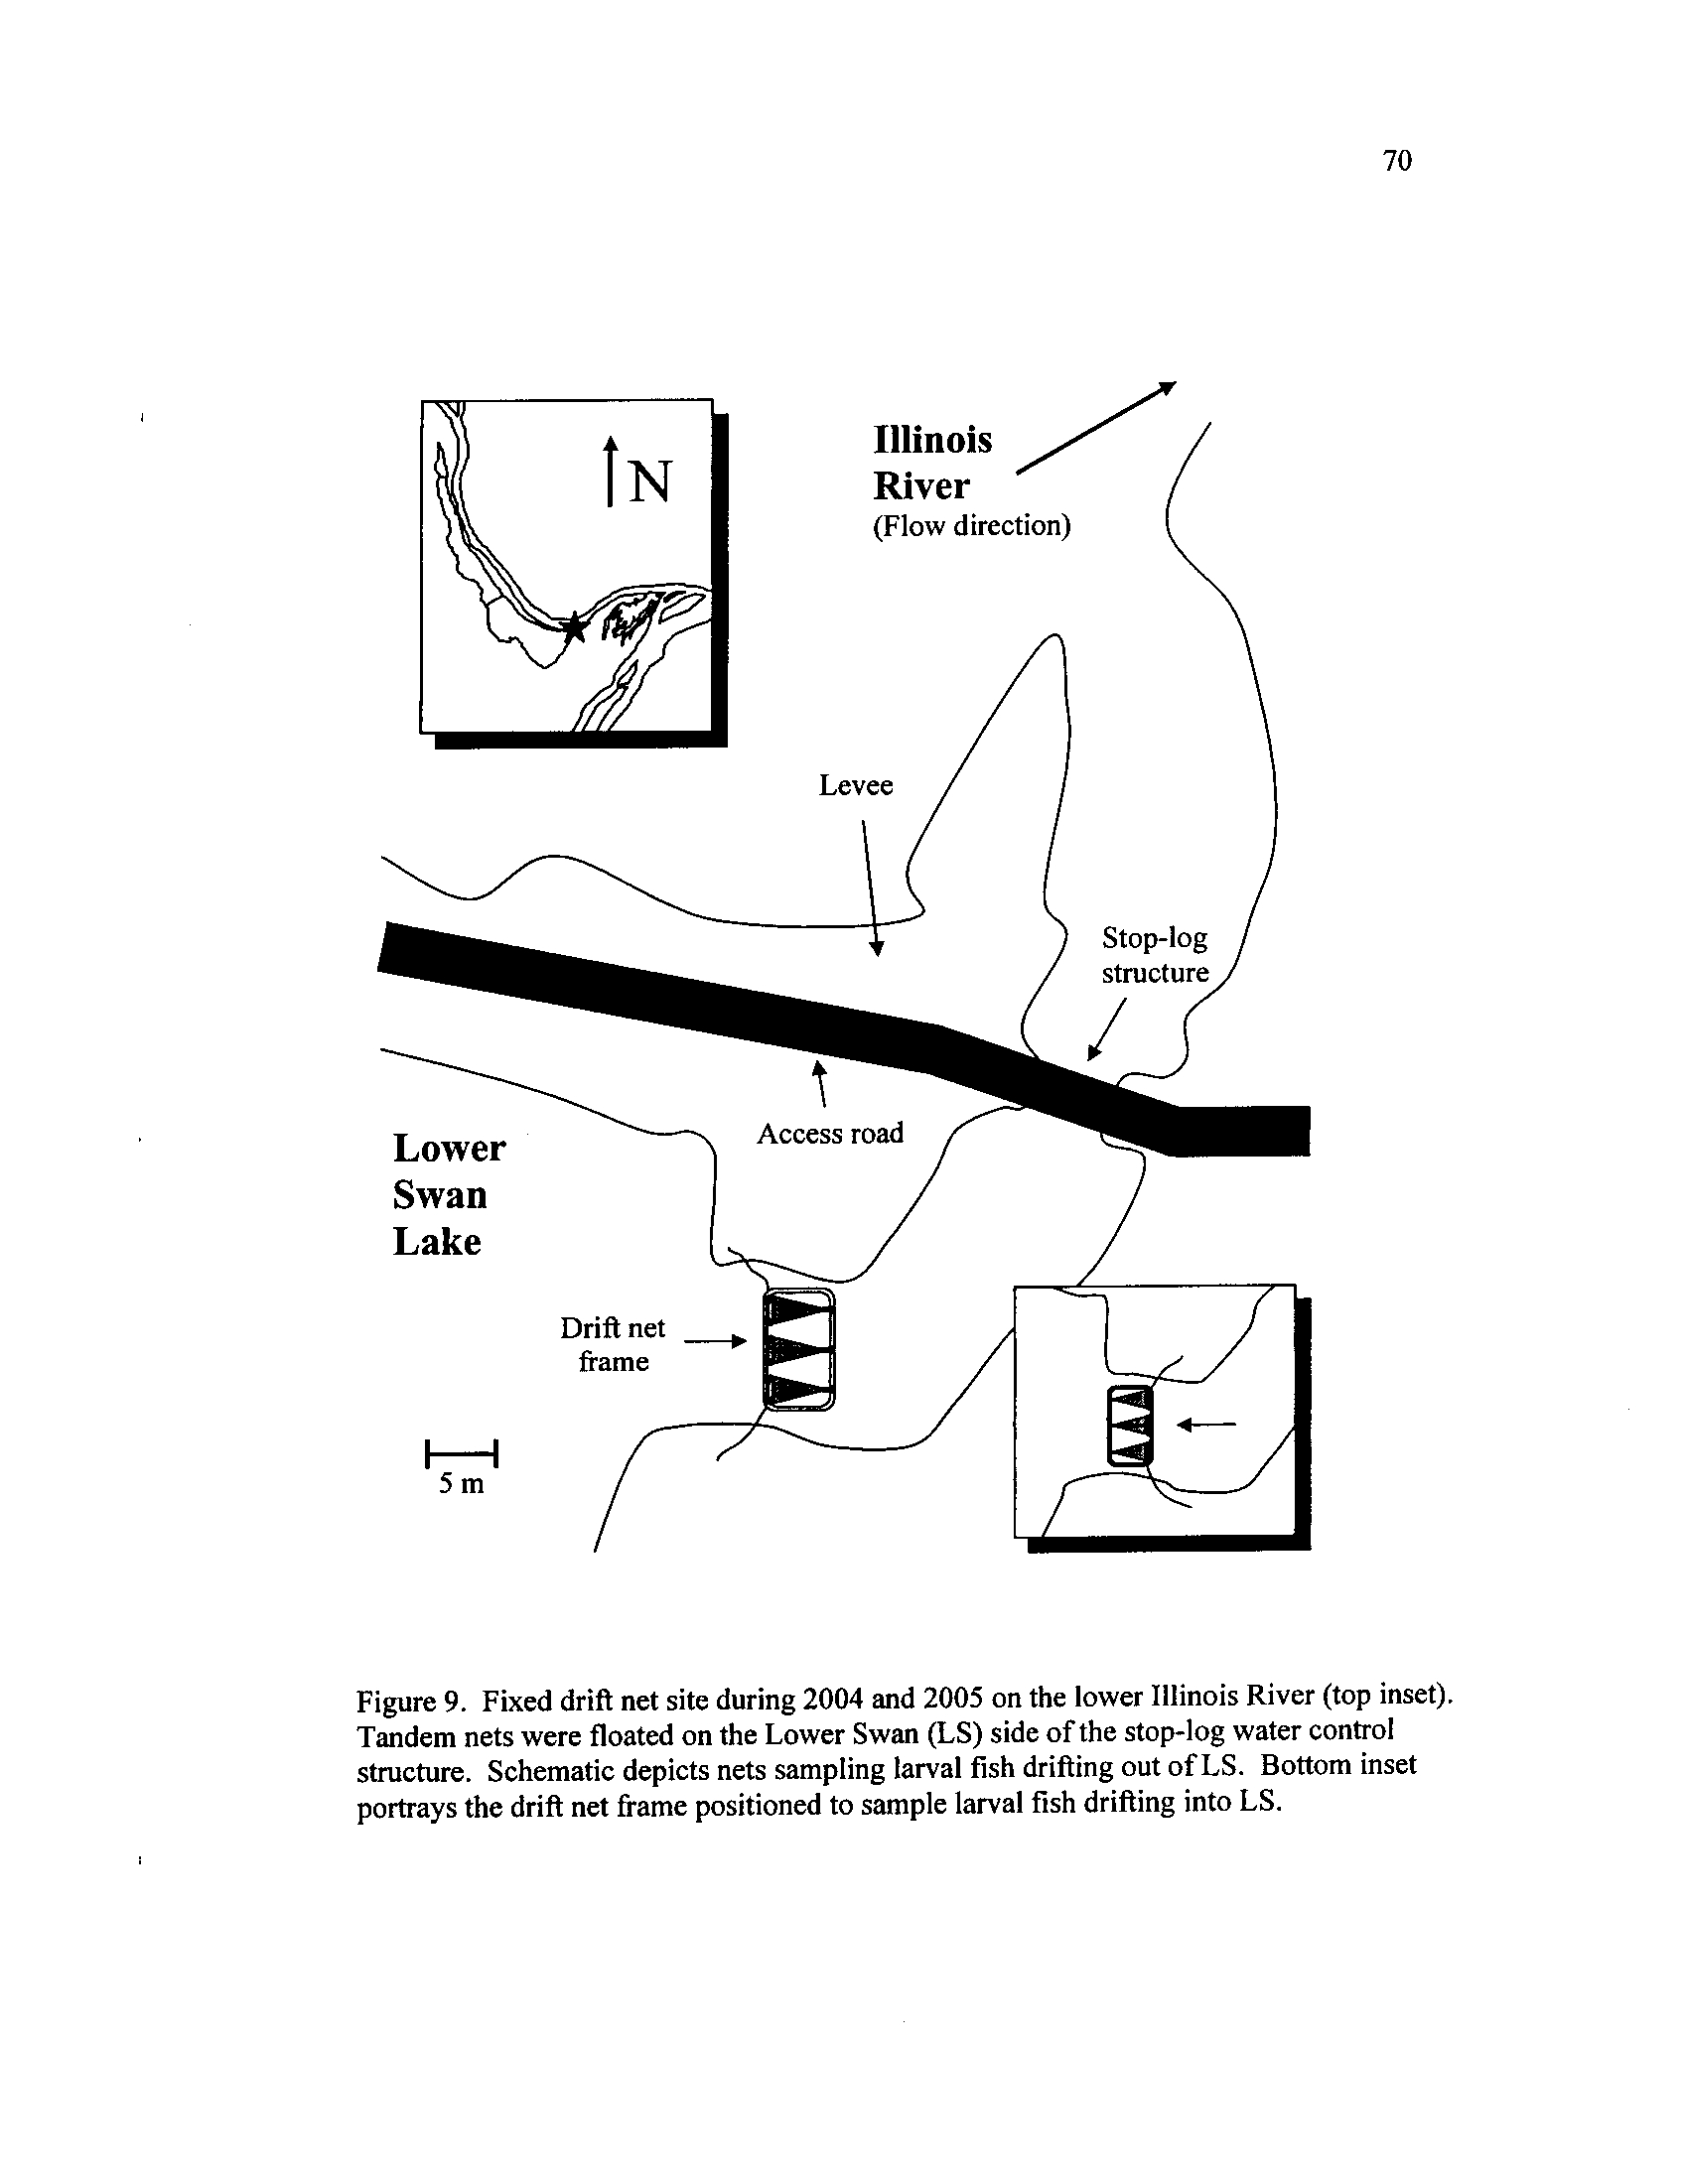
Figure 9.
zooplankton samples were taken in Calhoun Point
Fixed drift net site during 2004 and 2005 on the lower Illinois
River (top inset)
. Tandem nets were floated on the Lower Swan
(LS) side of the stop-log water control structure
. Schematic
depicts nets sampling larval fish drifting out of LS
. Bottom inset
portrays the drift net frame positioned to sample larval fish drifting
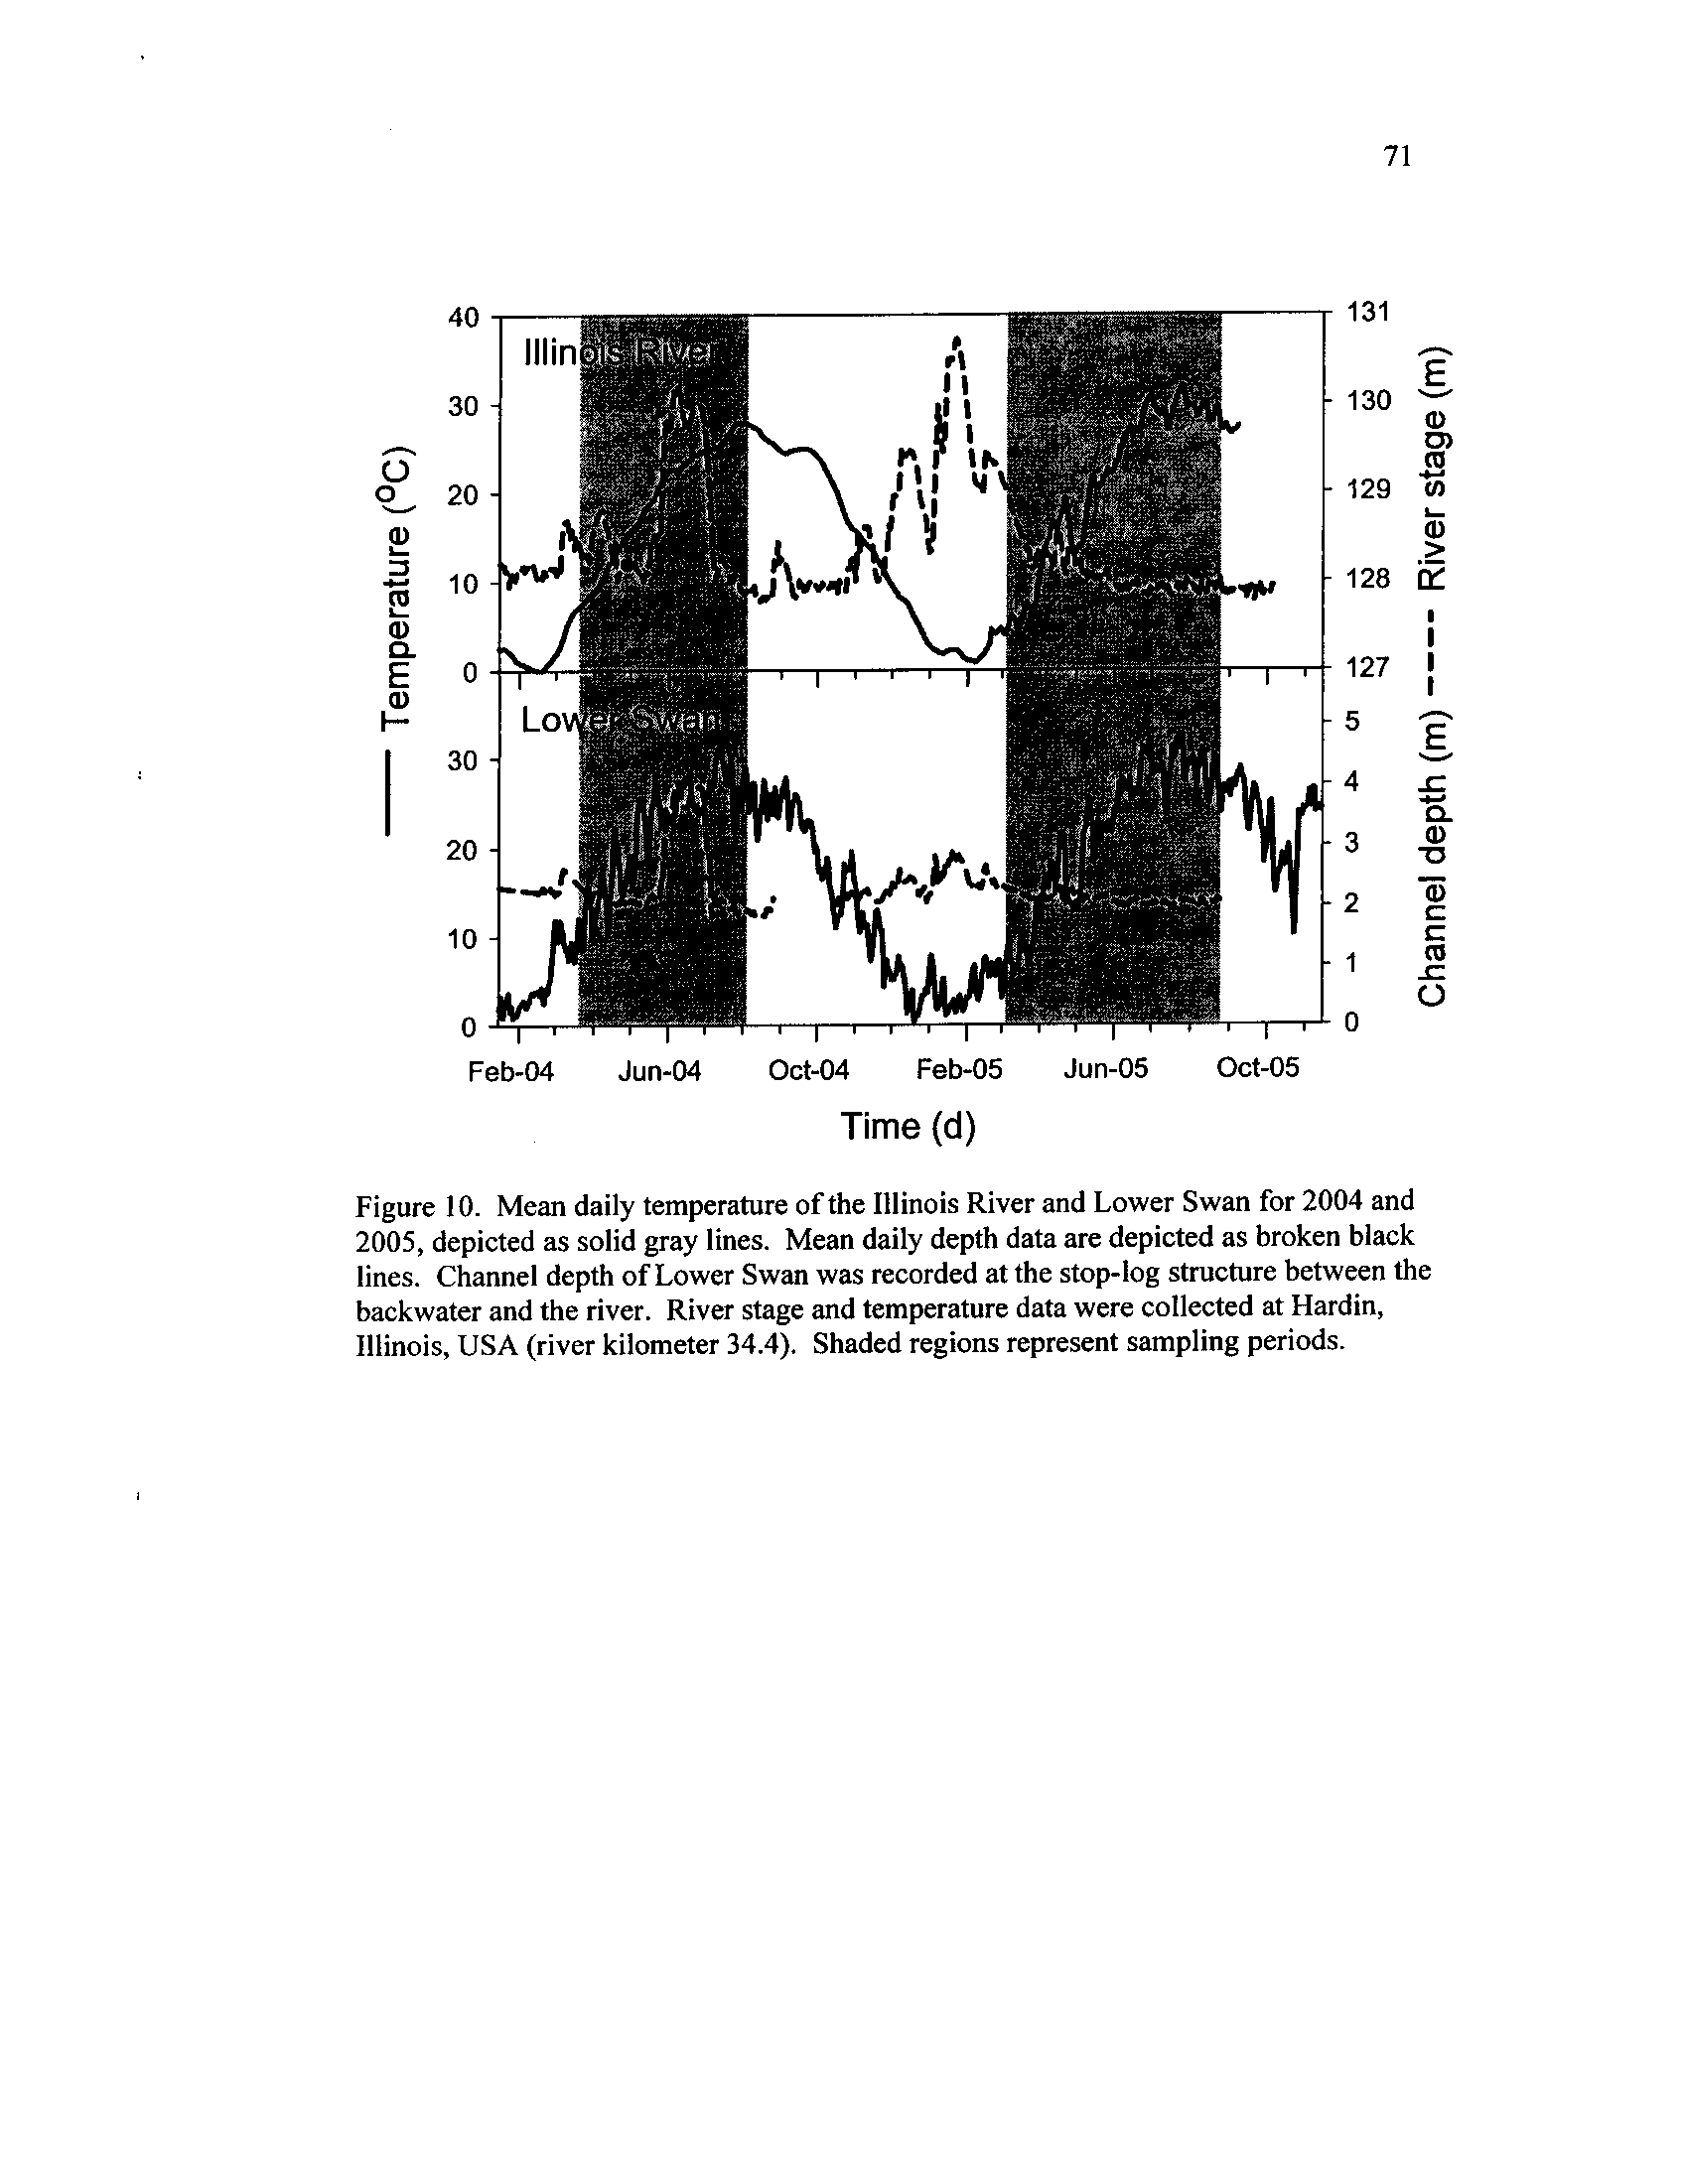
Figure 10.
into LS
Mean daily temperature of the Illinois River and Lower Swan for
2004 and 2005, depicted as solid gray lines
. Mean daily depth data
are depicted as broken black lines
. Channel depth of Lower Swan
was recorded at the stop-log structure between the backwater and
the river
. River stage and temperature data were collected at
Hardin, Illinois, USA (river kilometer 34
.4)
. Shaded regions
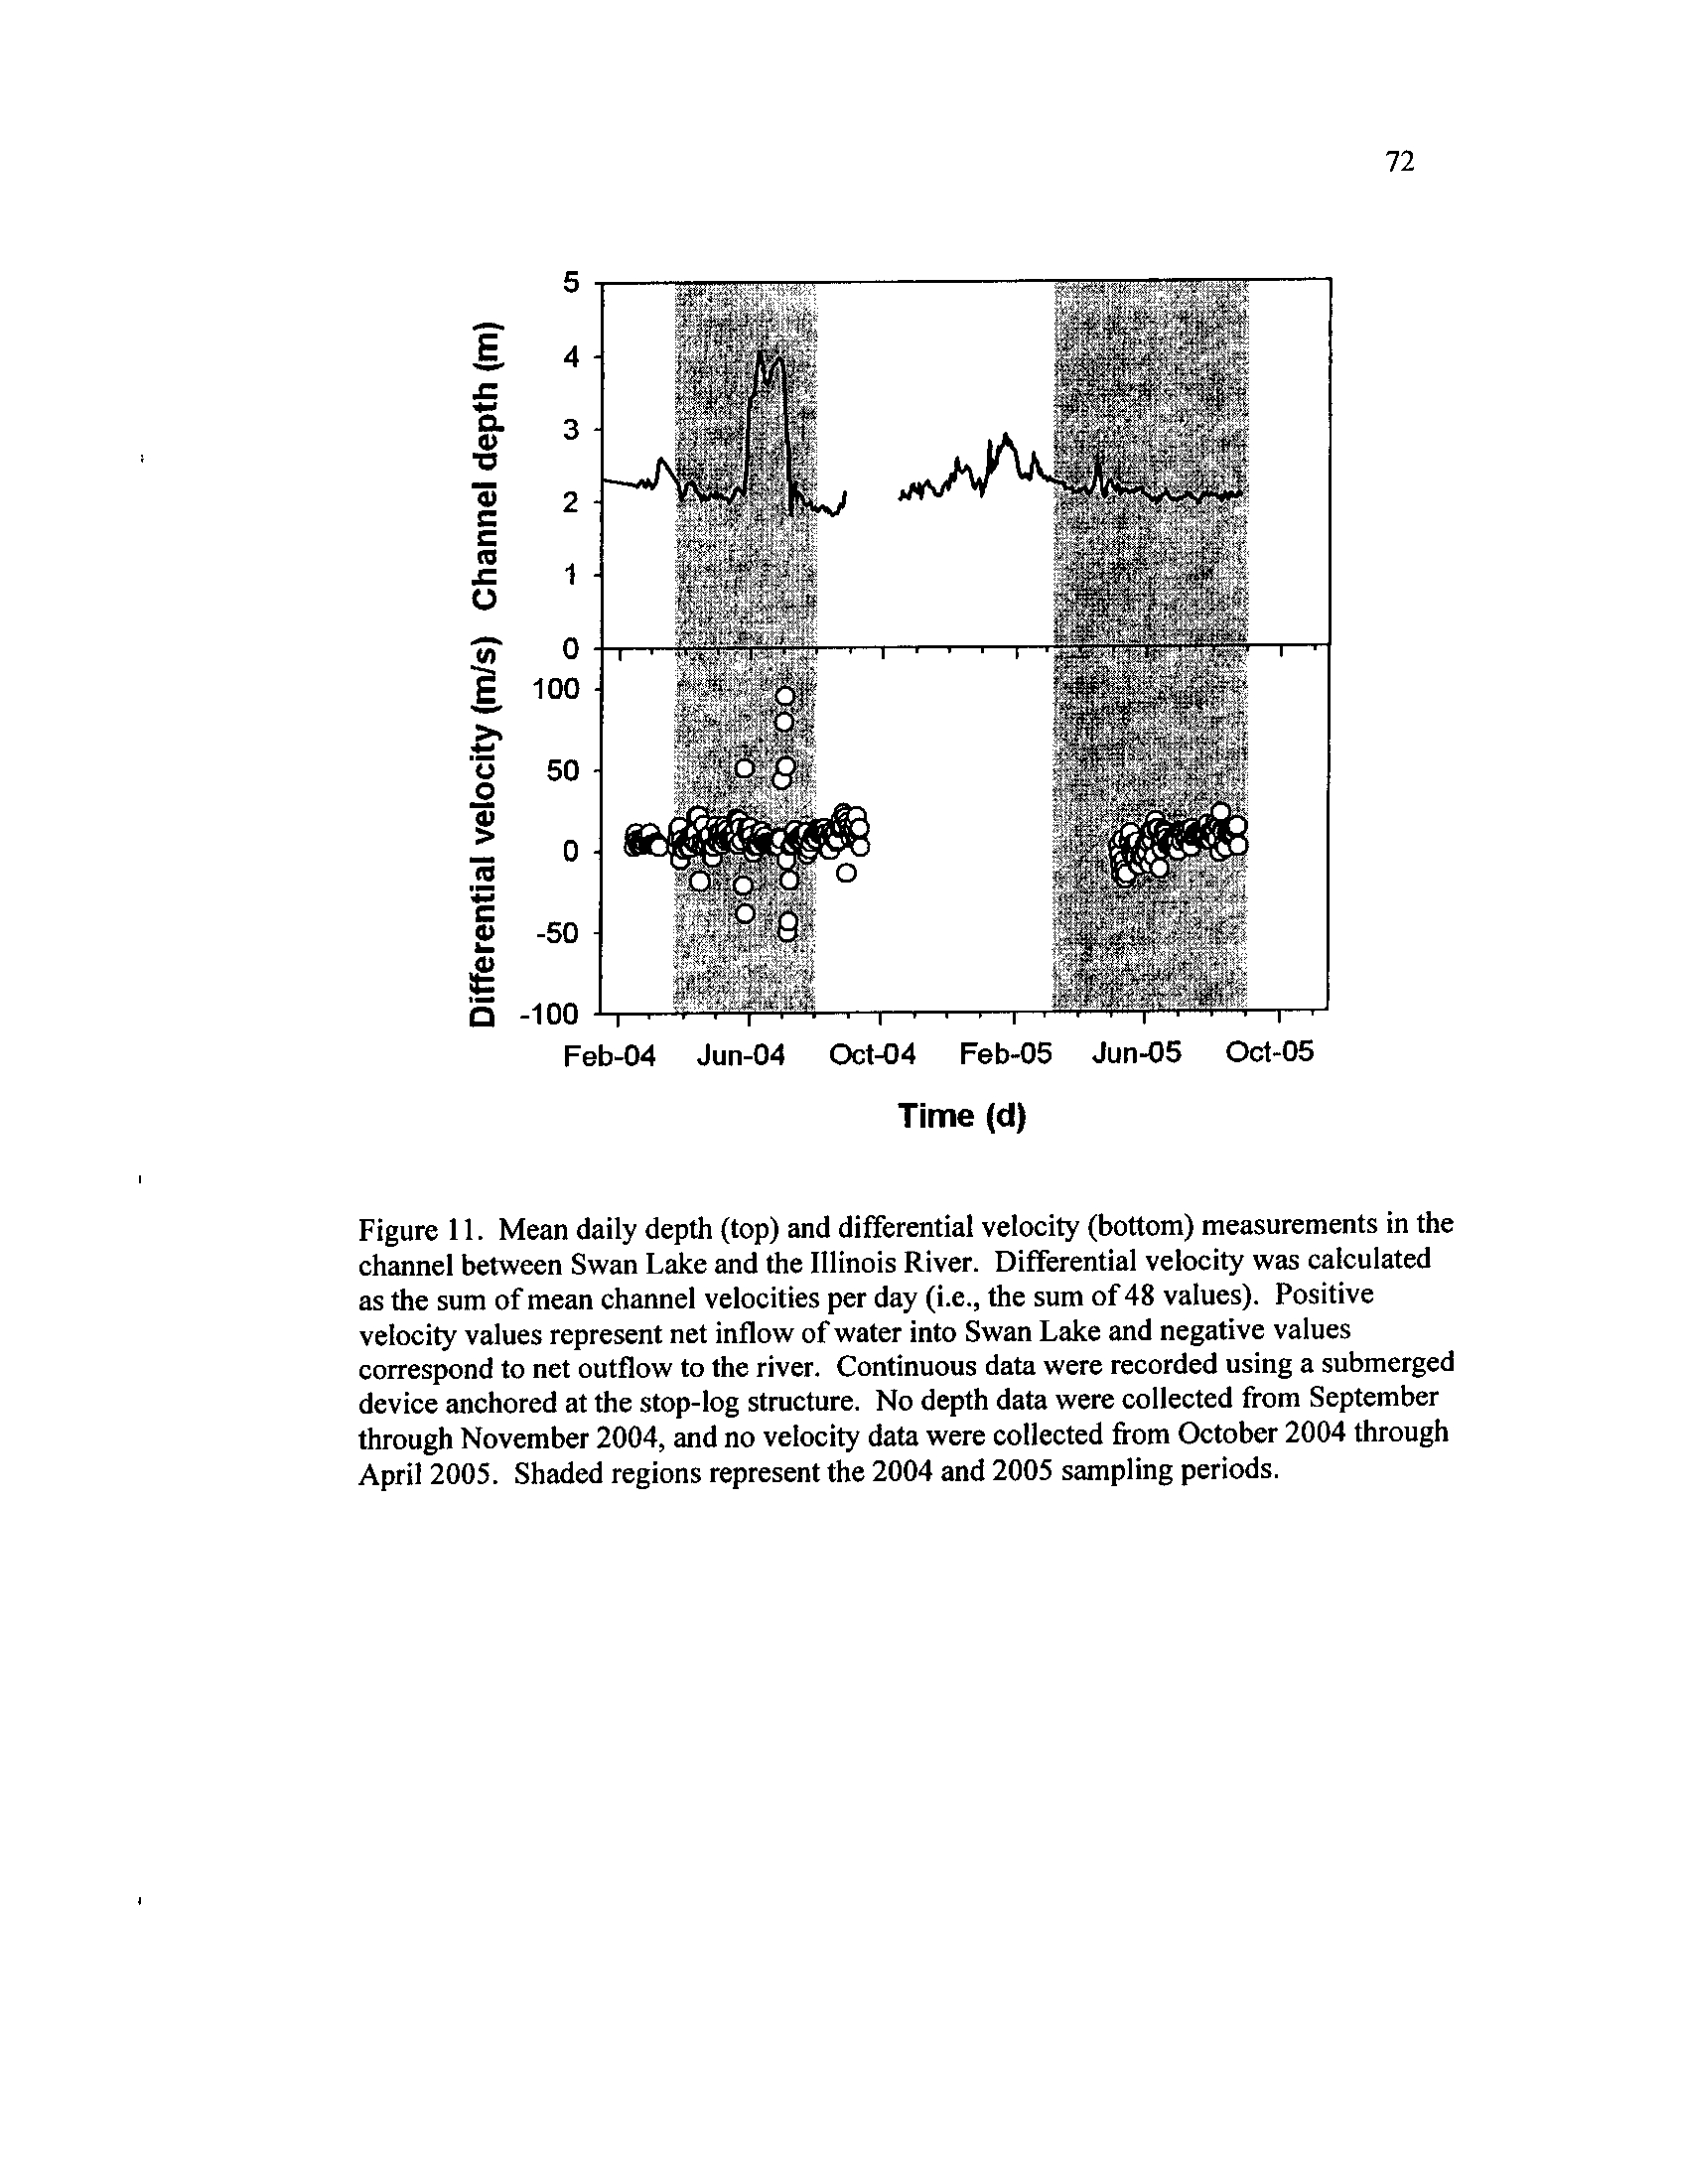
Figure 11 .
represent sampling periods
Mean daily depth (top) and differential velocity (bottom)
measurements in the channel between Swan Lake and the Illinois
River
. Differential velocity was calculated as the sum of mean
channel velocities per day
(i.e.,
the sum of 48 values) . Positive
velocity values represent net inflow of water into Swan Lake and
negative values correspond to net outflow to the river
. Continuous
data were recorded using a submerged device anchored at the stop-
log structure
. No depth data were collected from September
through November 2004, and no velocity data were collected from
October 2004 through April 2005
. Shaded regions represent the
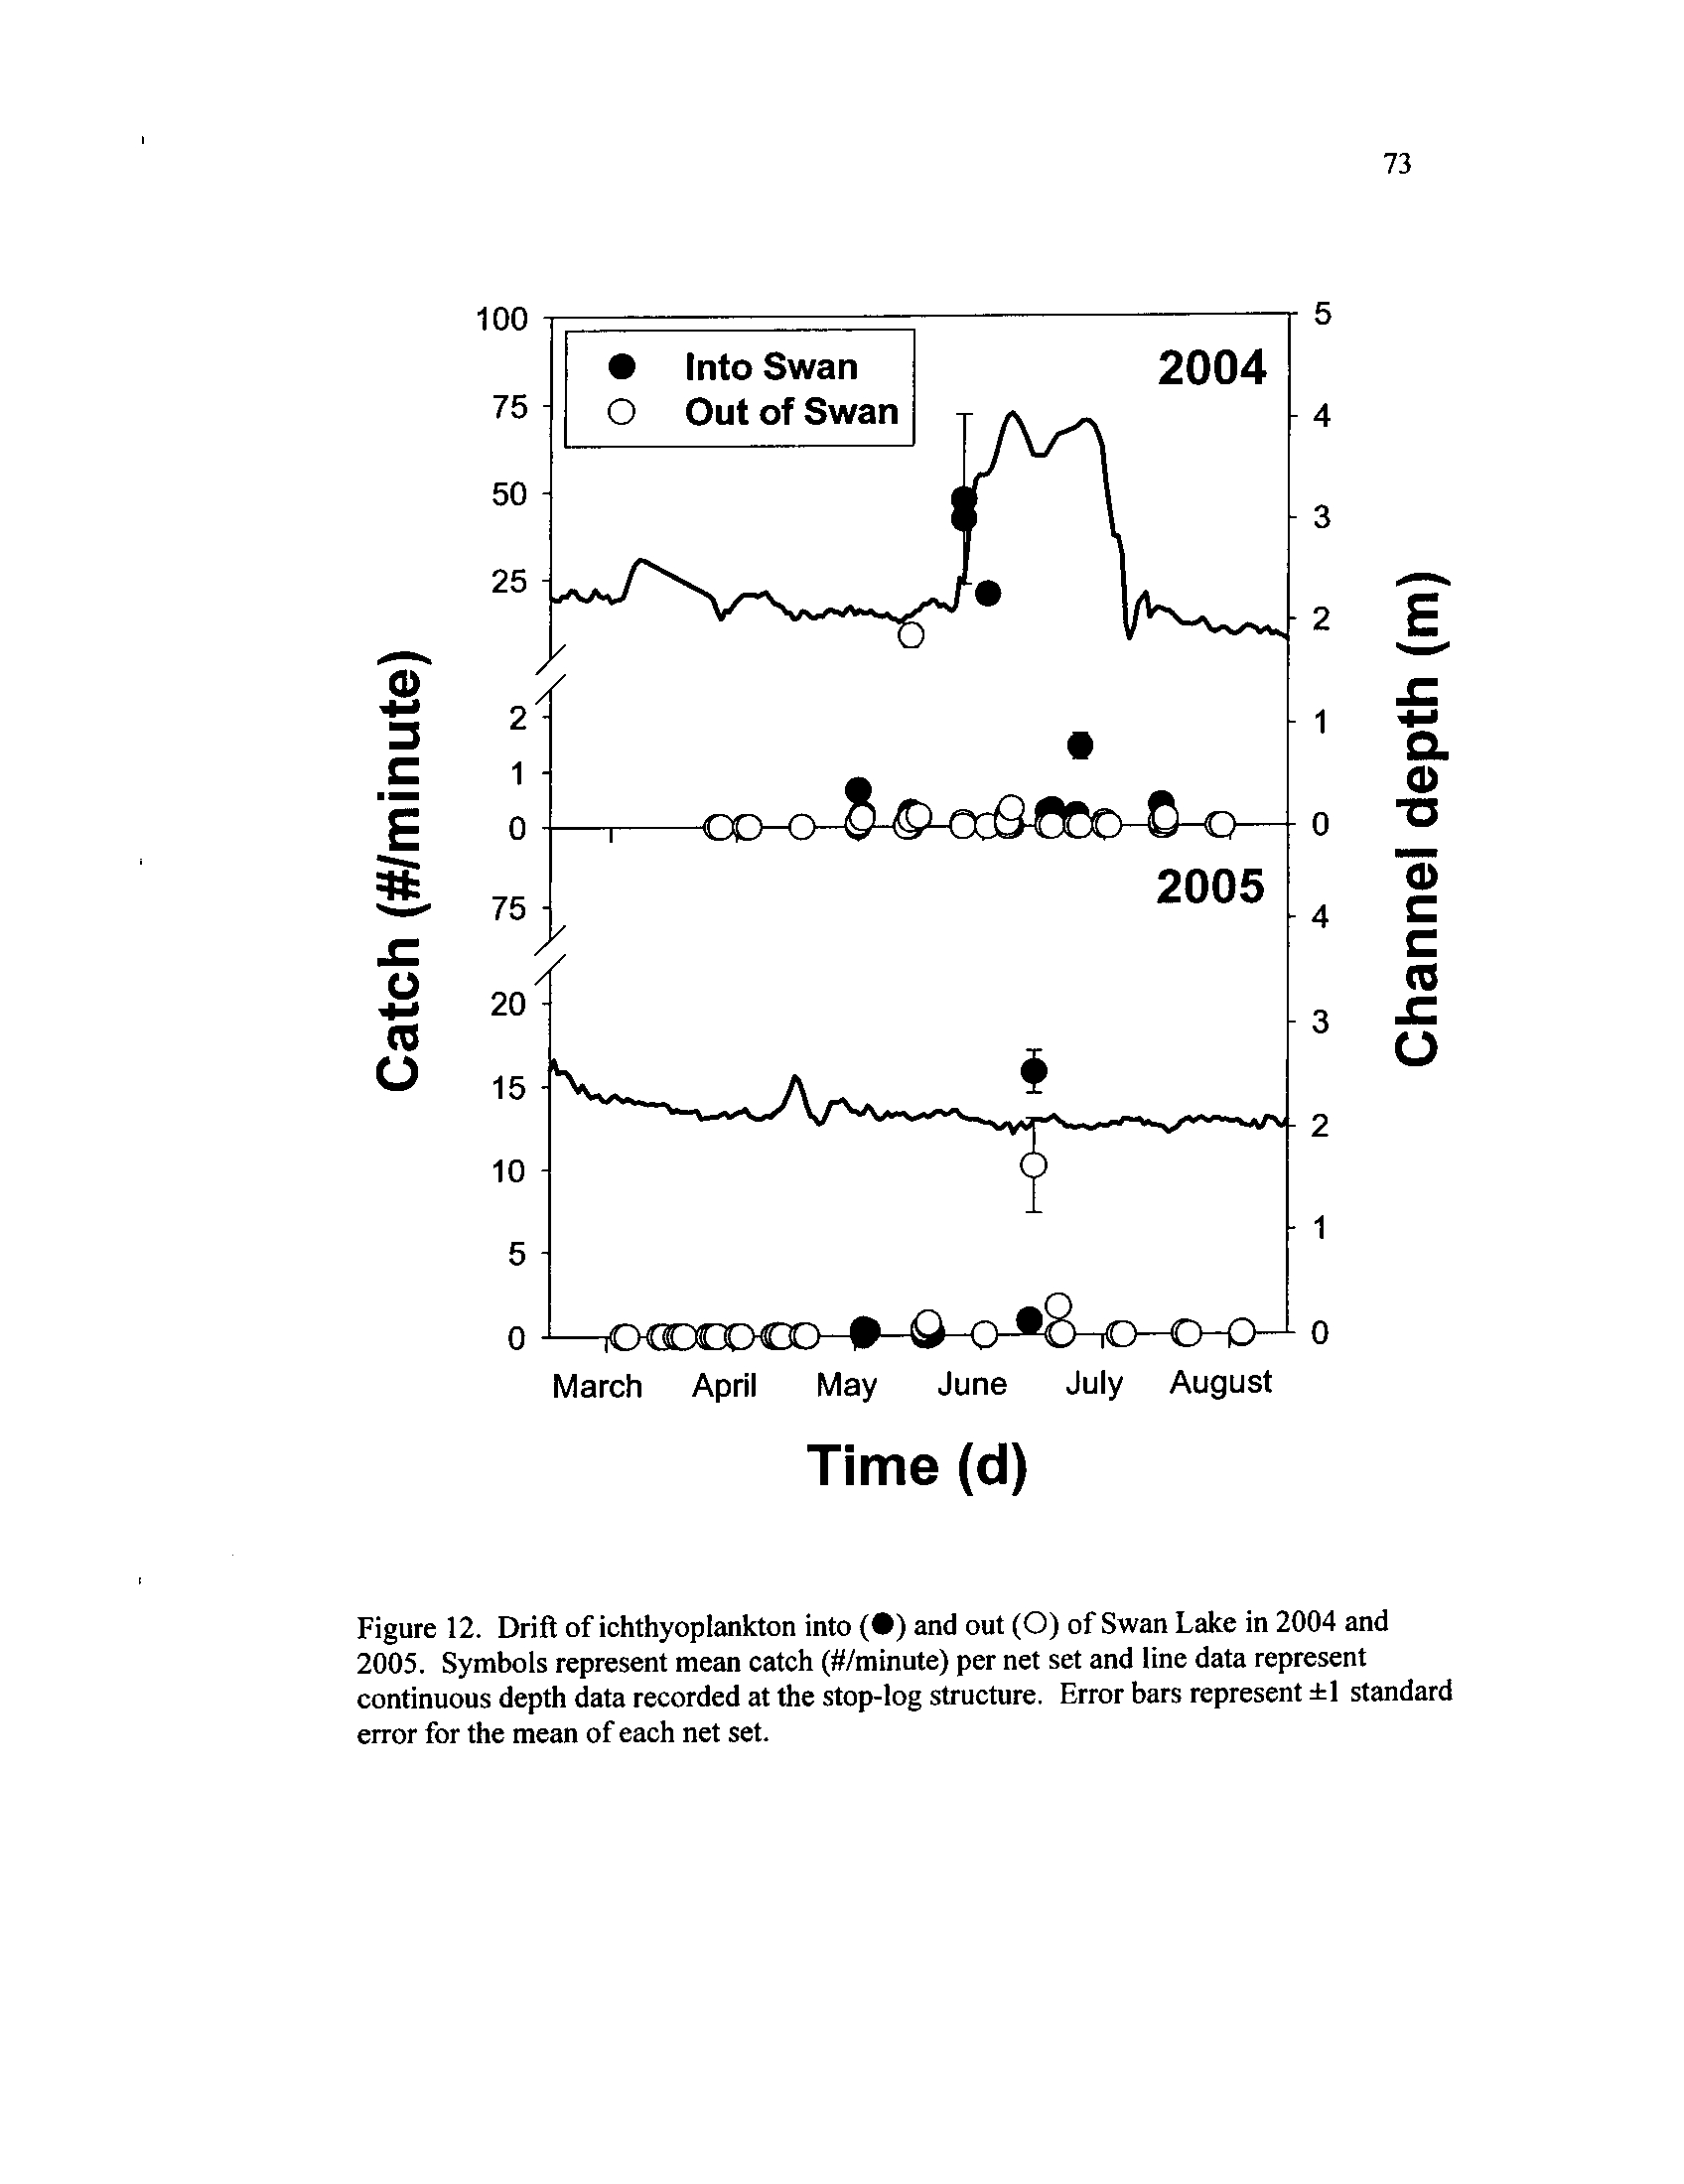
Figure 12 .
2004
Drift
and
of ichthyoplankton
2005 sampling
intoperiods(•)
and
out (0) of Swan Lake in
2004 and 2005
. Symbols represent mean catch (4/minute) per net
set and line data represent continuous depth data recorded at the
stop-log structure
. Error bars represent ±1 standard error for the
mean of each net set
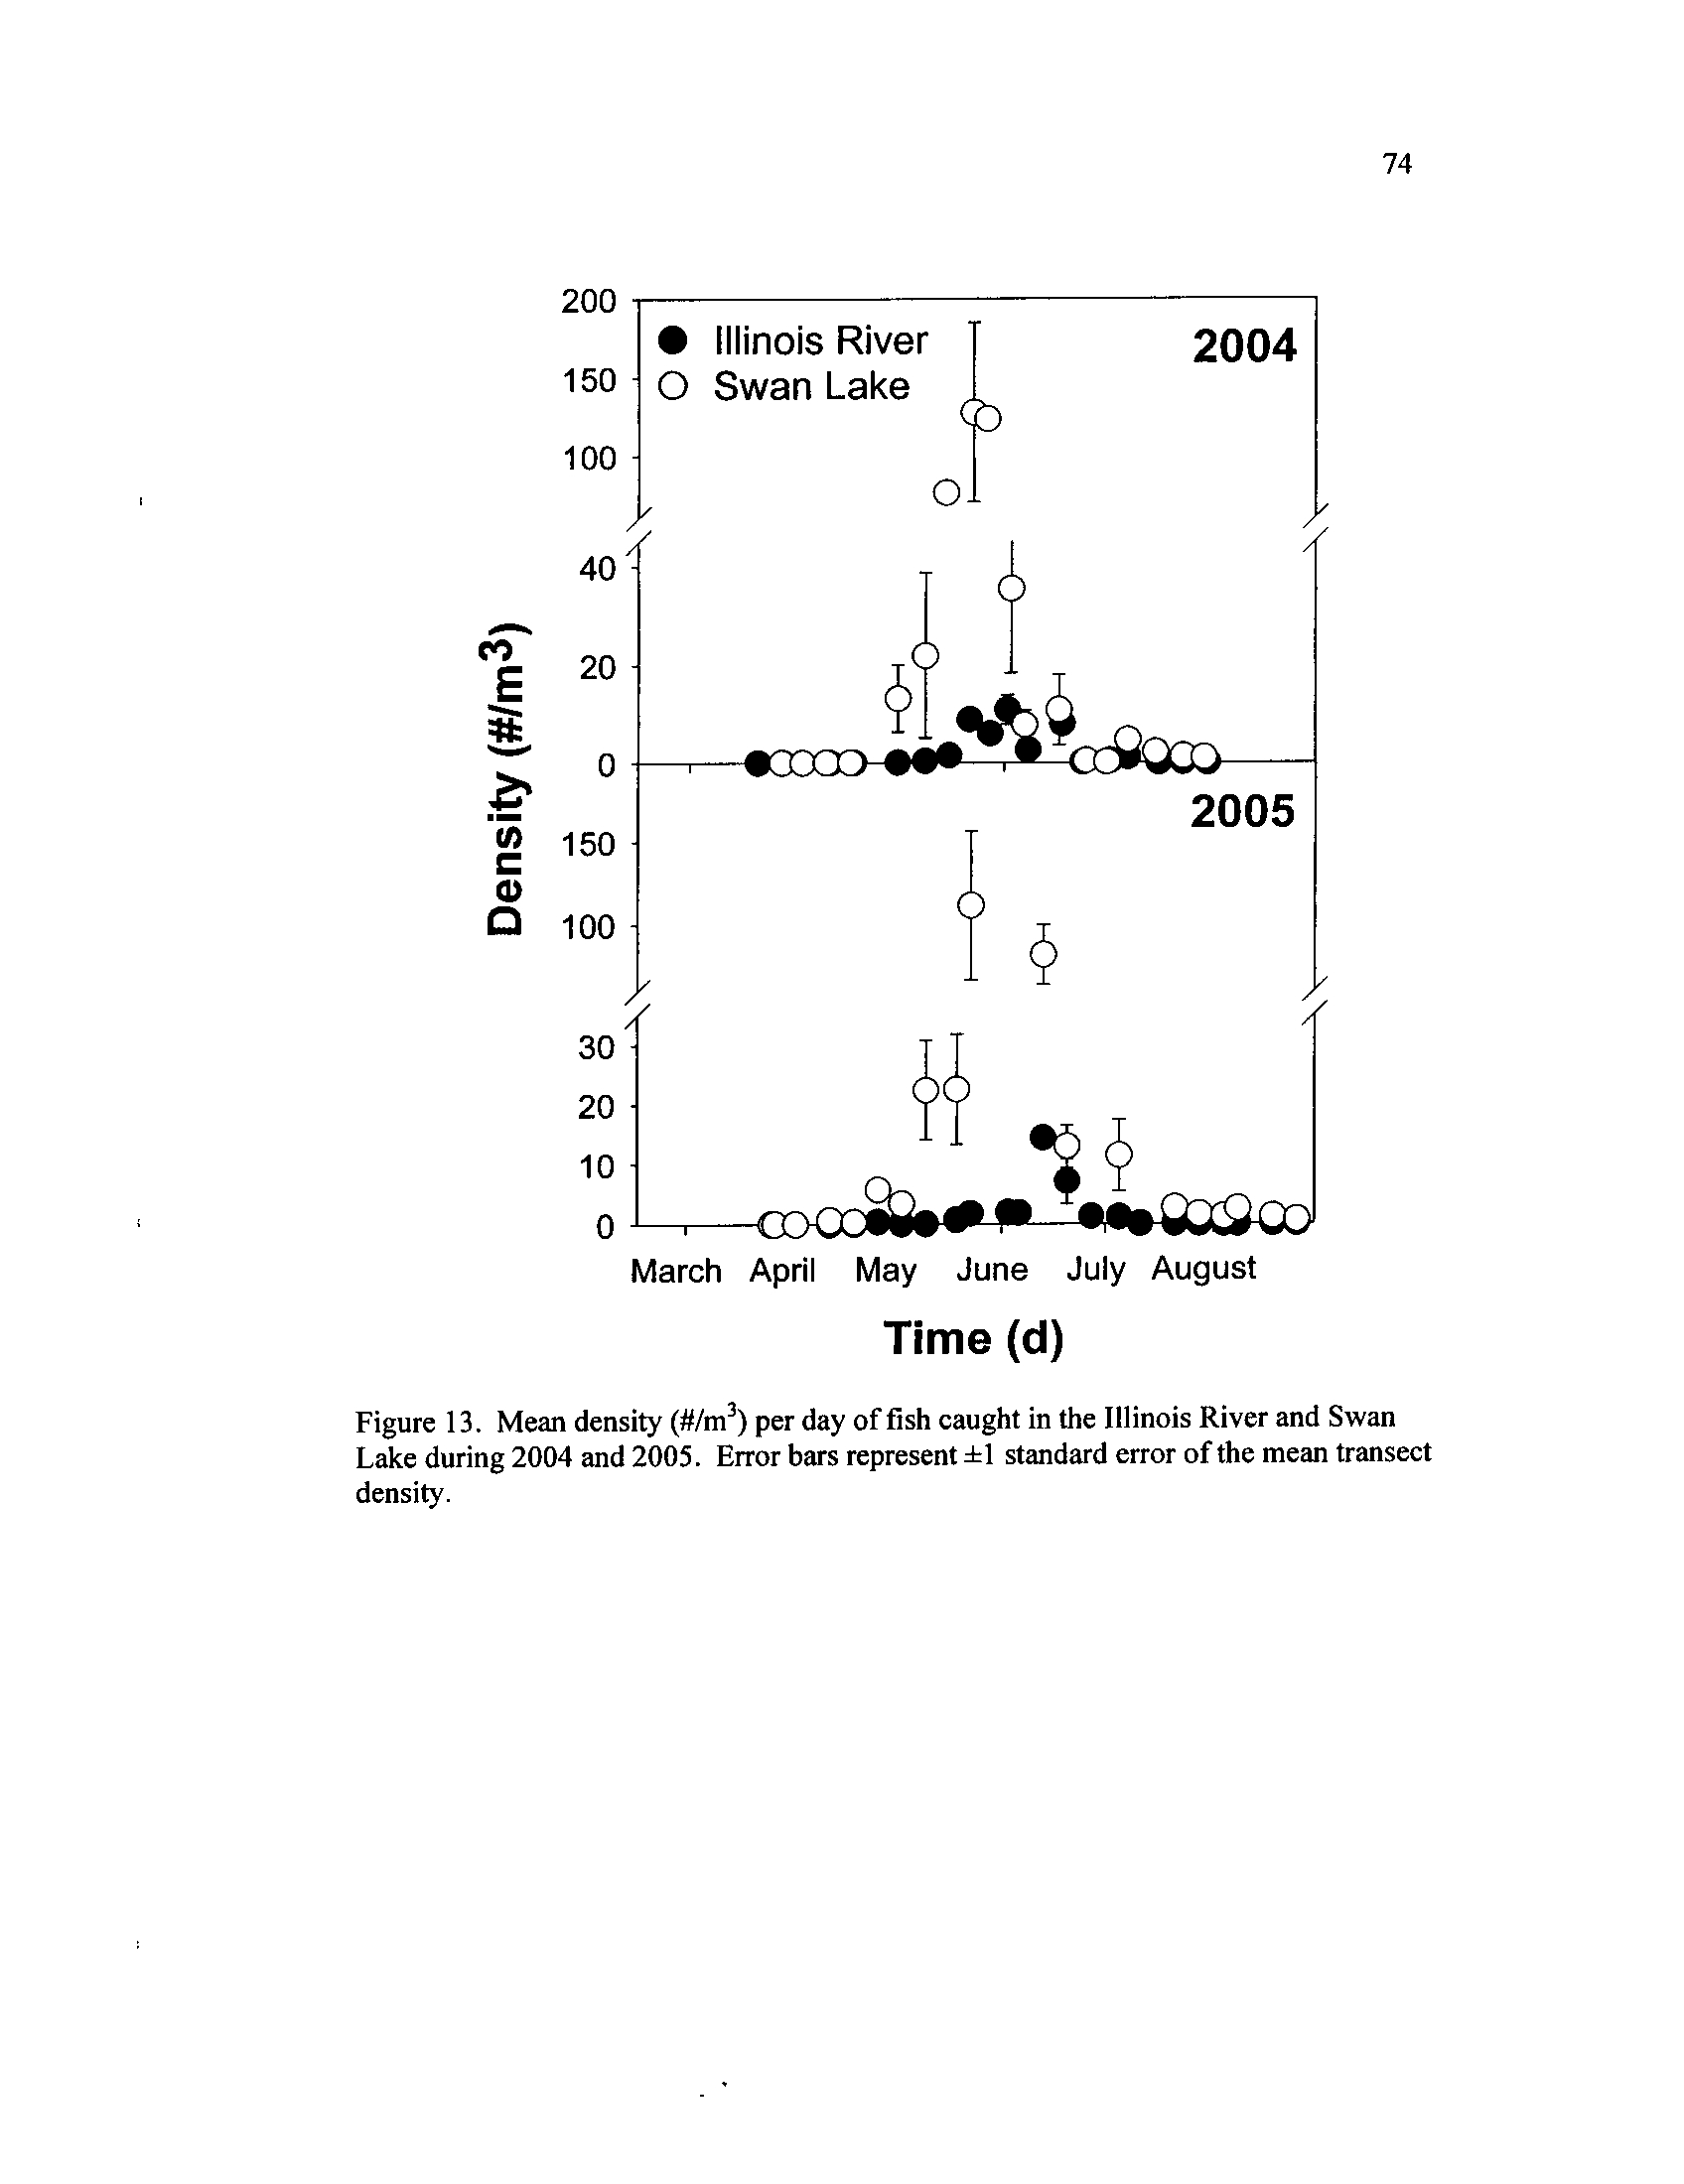
Figure 13 .
Mean density (#/m3)
per day of fish caught in the Illinois River and
Swan Lake during 2004 and 2005
. Error bars represent ±1
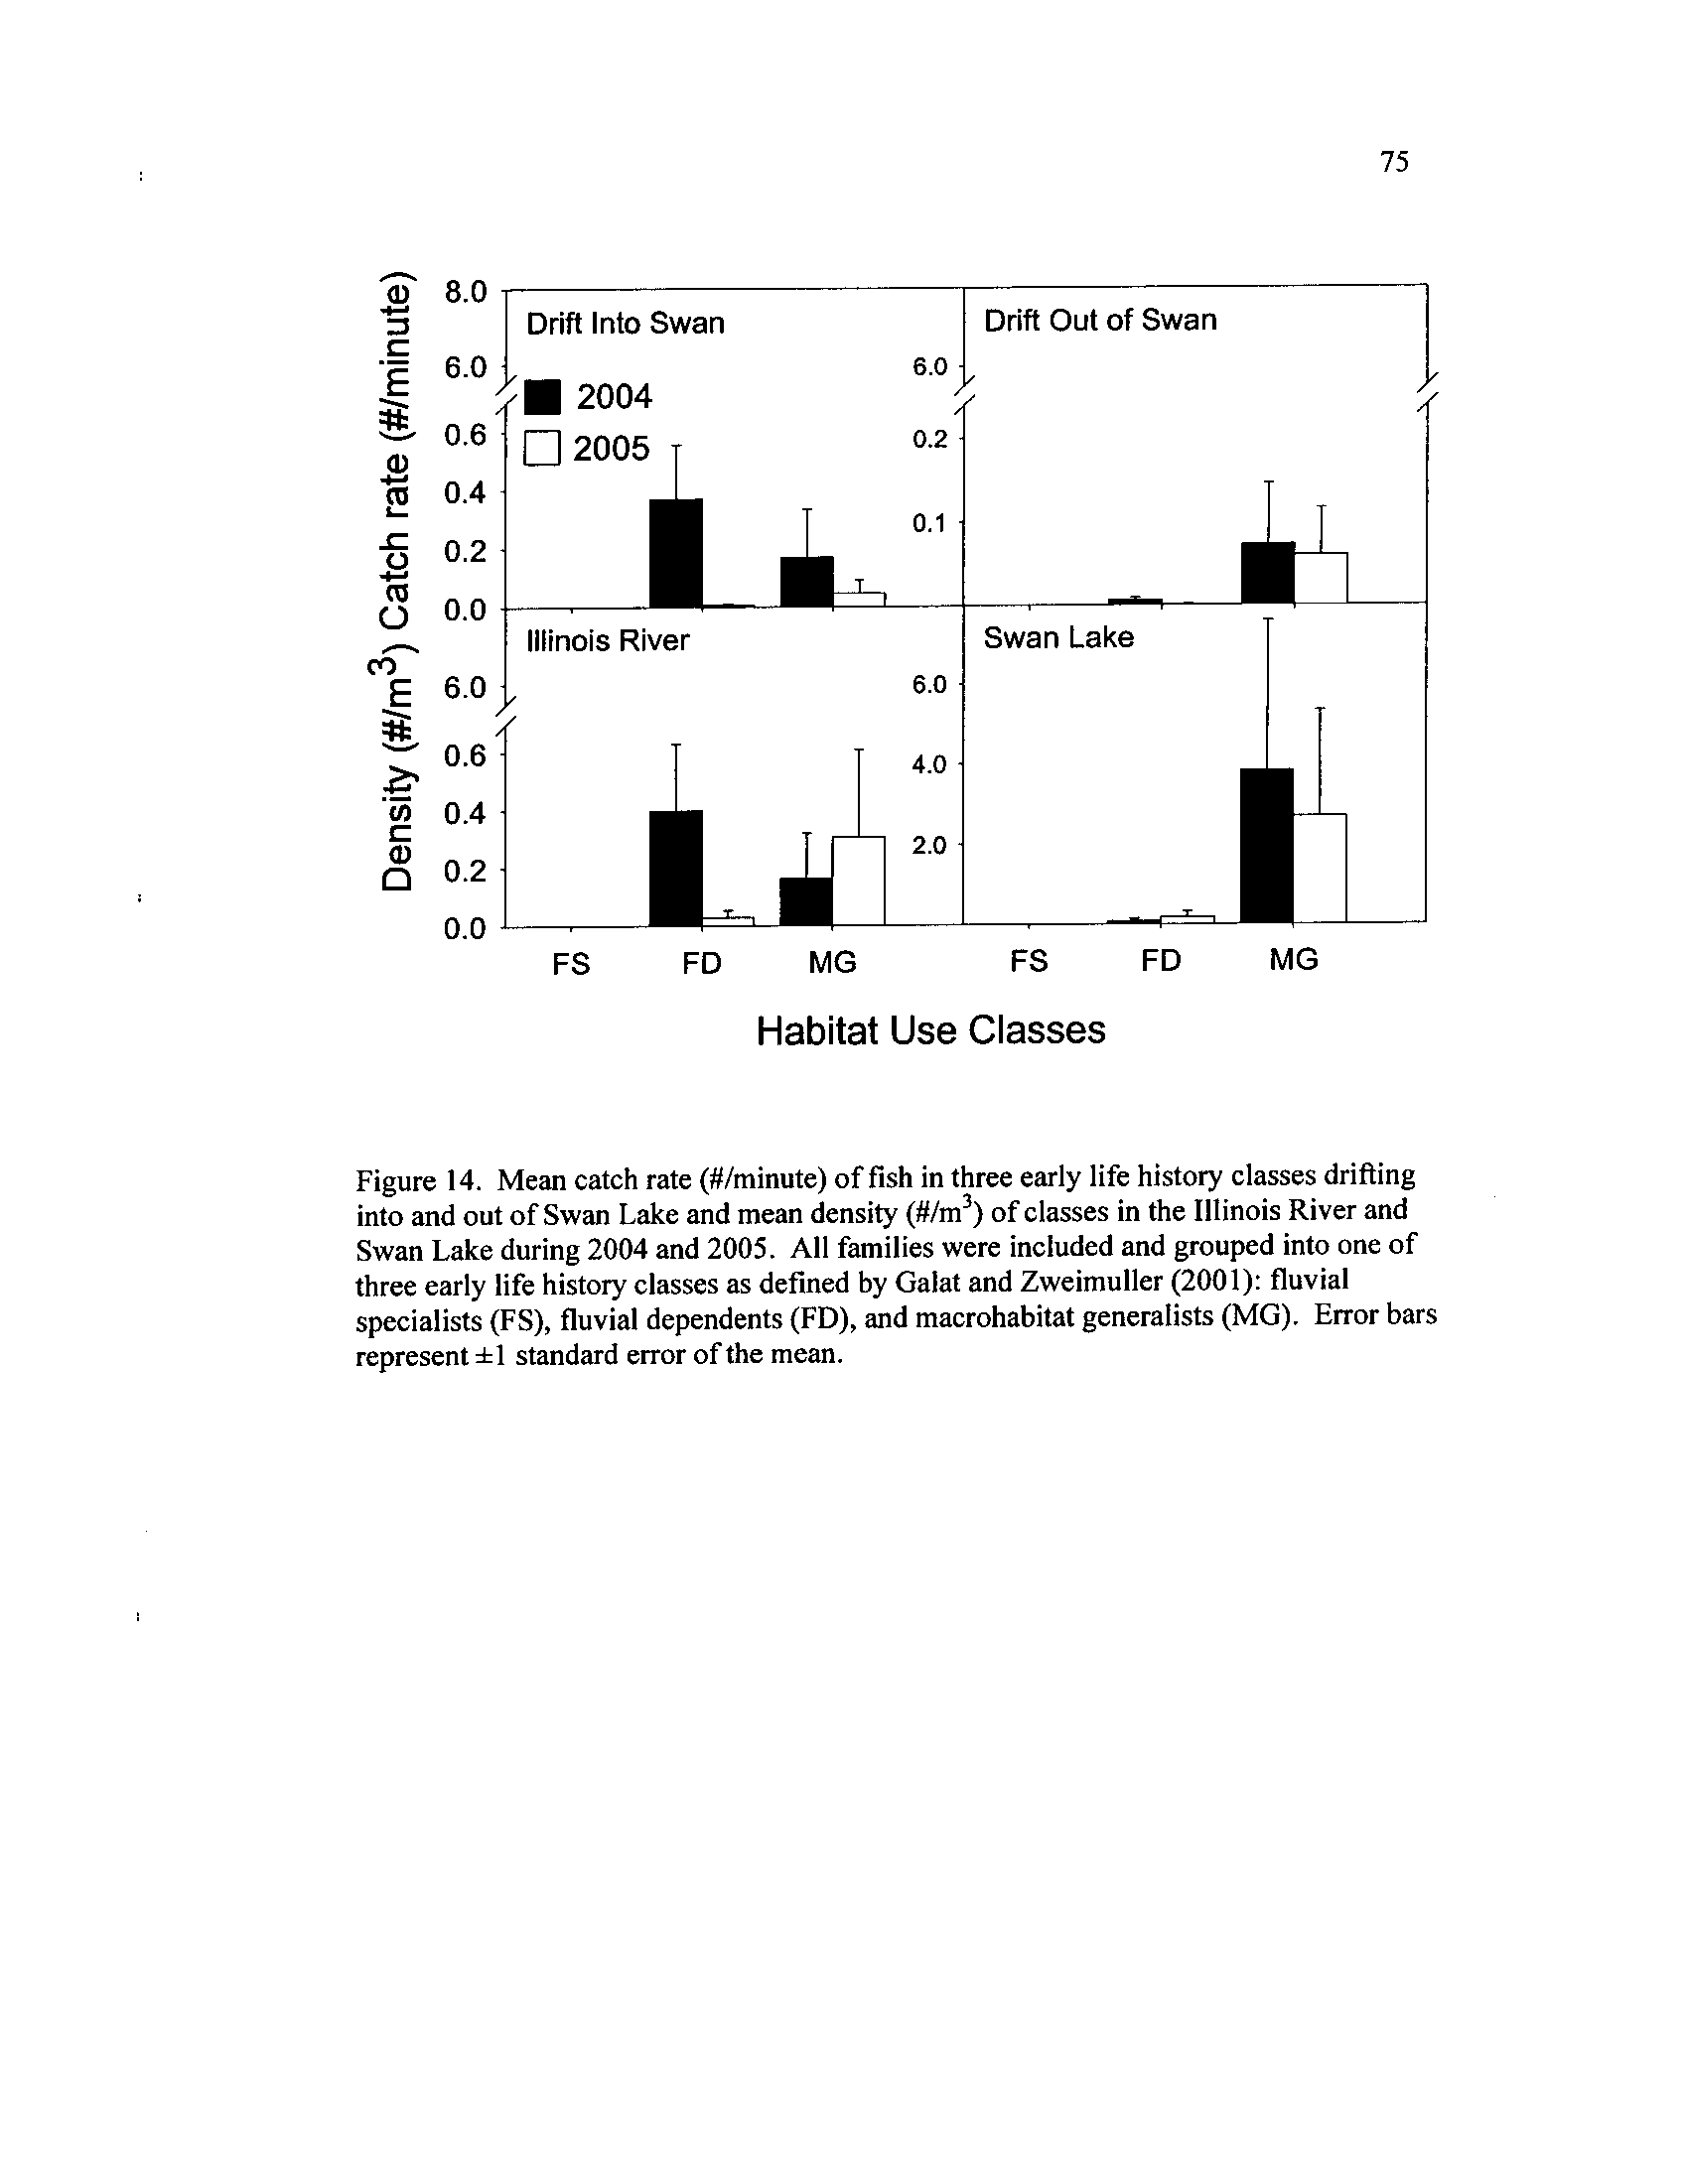
Figure 14 .
standard error of the mean transect density
Mean catch rate (#/minute) of fish in three early life histo7 classes
drifting into and out of Swan Lake and mean density (#/m
) of
classes in the Illinois River and Swan Lake during 2004 and 2005
.
All families were included and grouped into one of three early life
history classes as defined by Galat and Zweimuller (2001)
: fluvial
specialists (FS), fluvial dependents
(FD), and macrohabitat
generalists (MG).
Error bars represent ±1 standard error of the
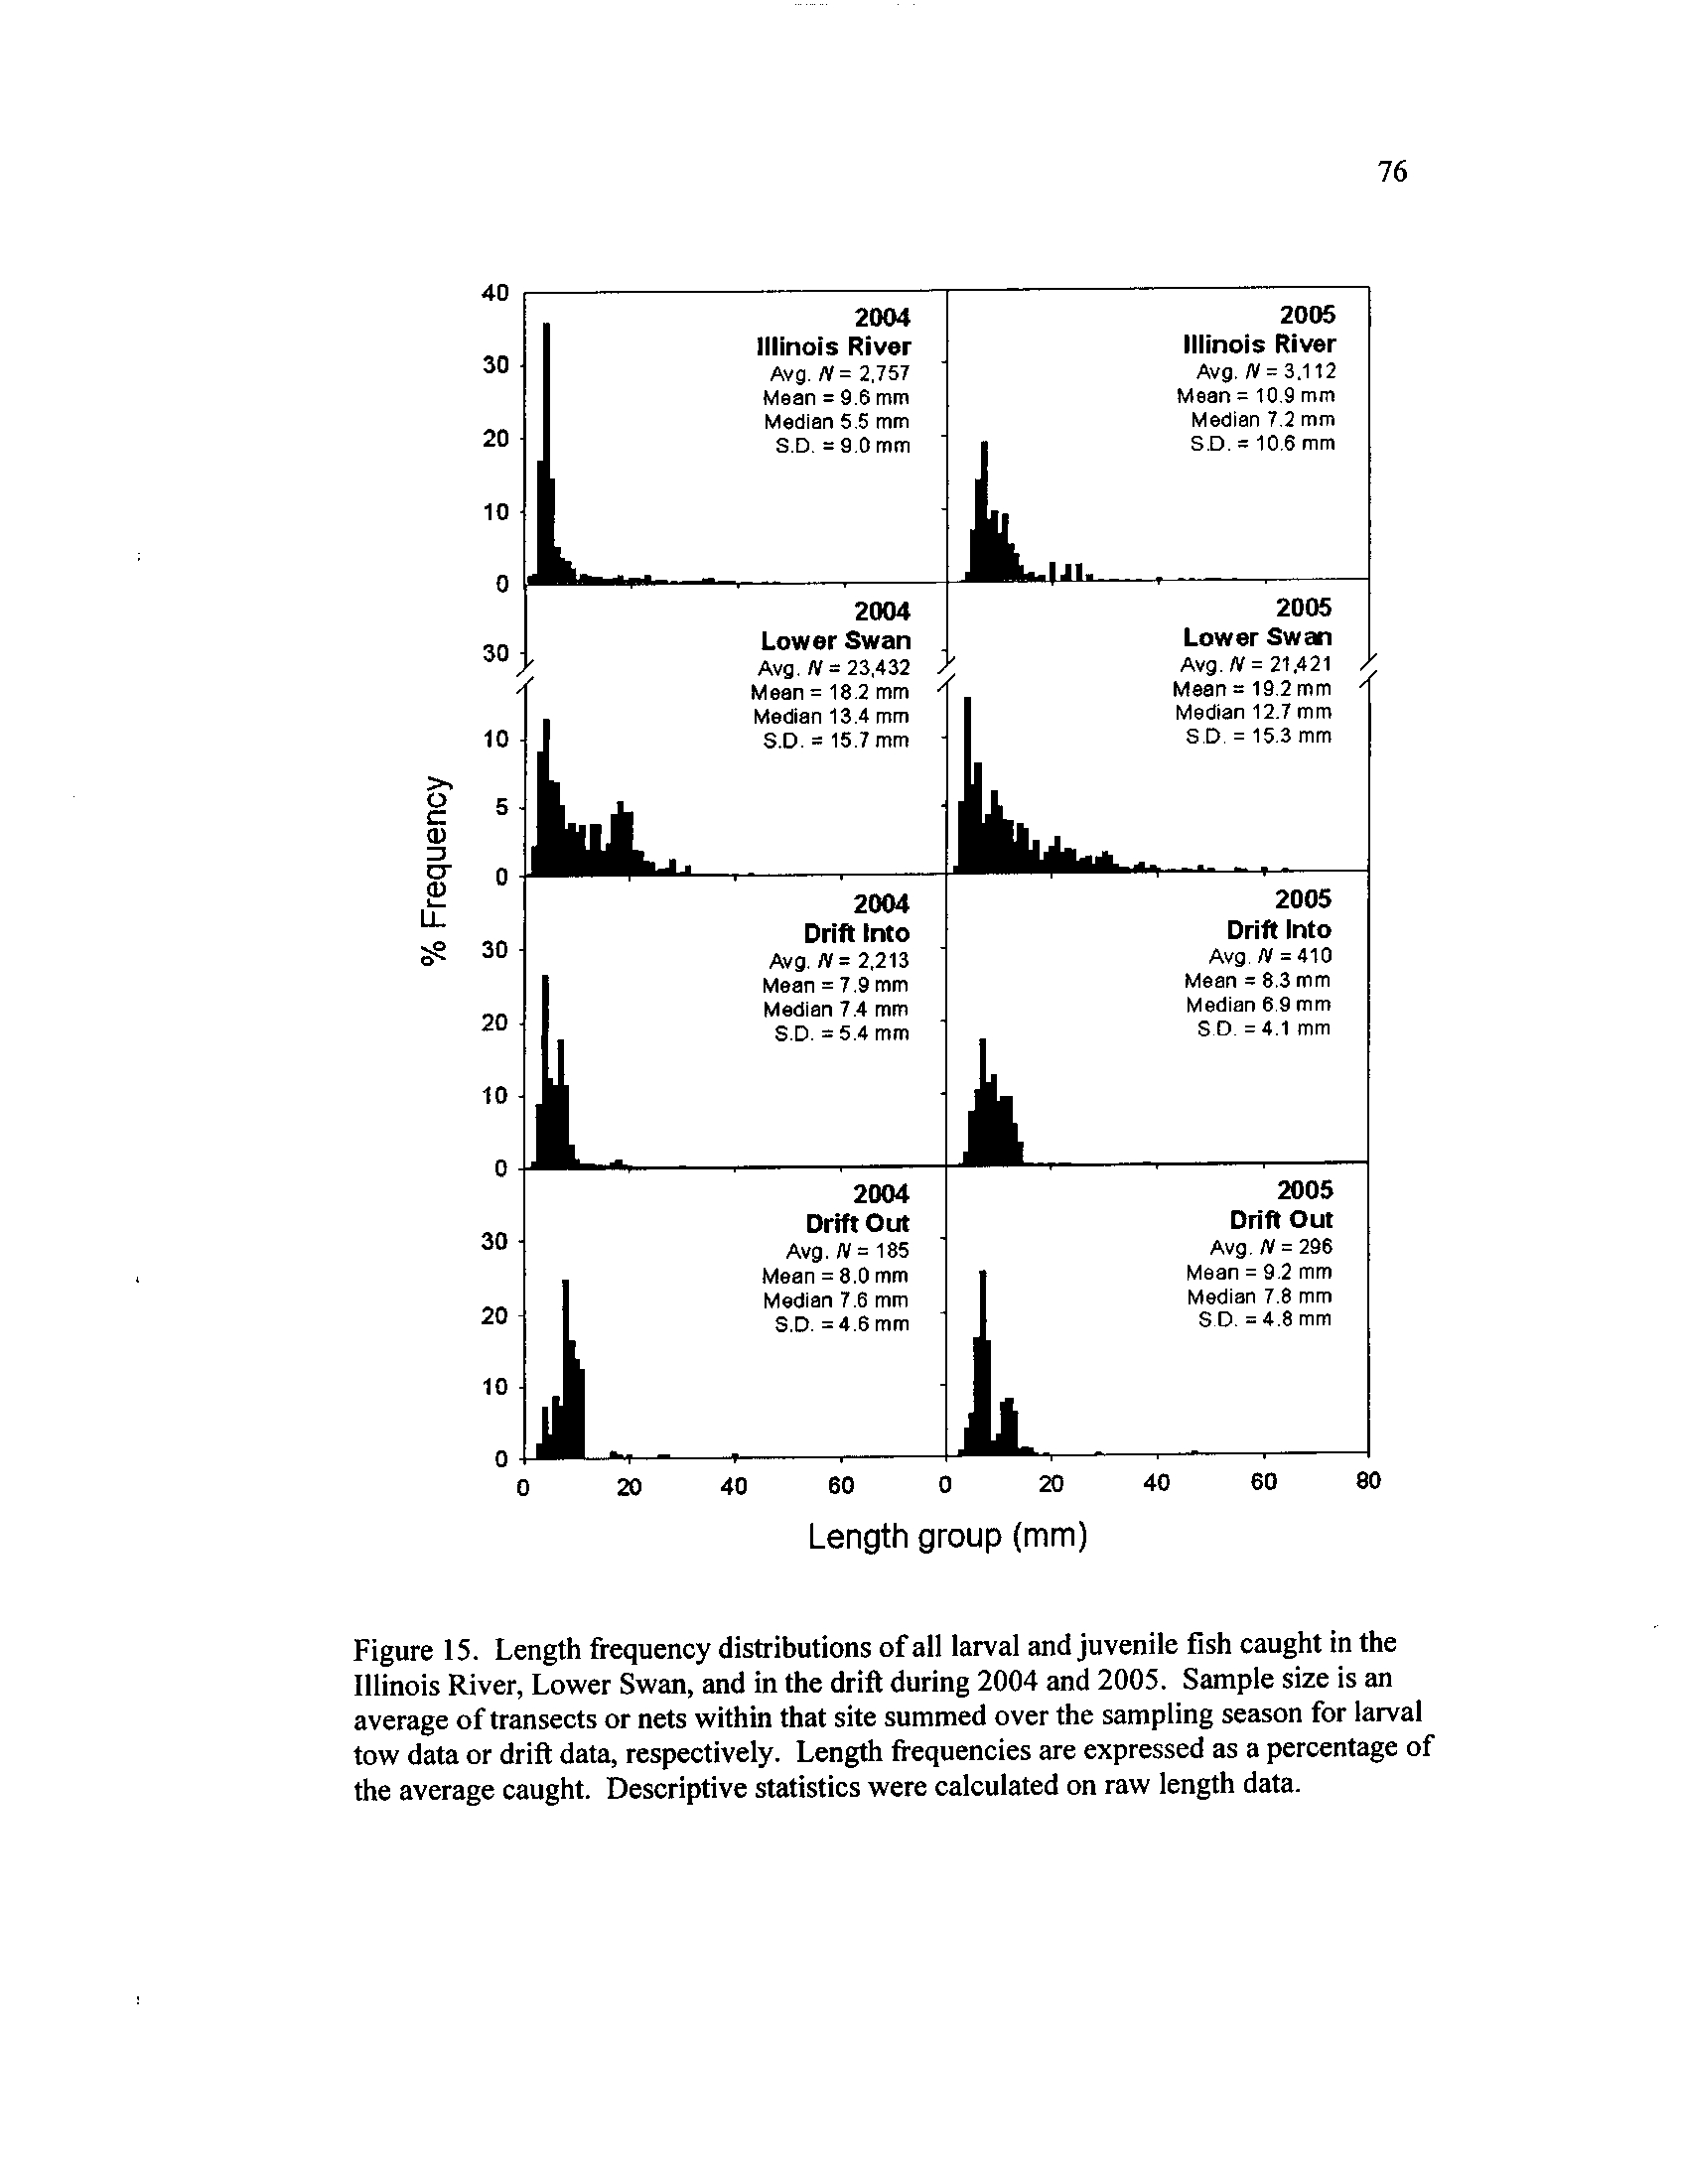
Figure 15 .
mean
Length frequency distributions of all larval and juvenile fish
caught in the Illinois River, Lower Swan, and in the drift during
2004 and 2005
. Sample size is an average of transects or nets
within that site summed over the sampling season for larval tow
data or drift data, respectively
. Length frequencies are expressed
as a percentage of the average caught
. Descriptive statistics were
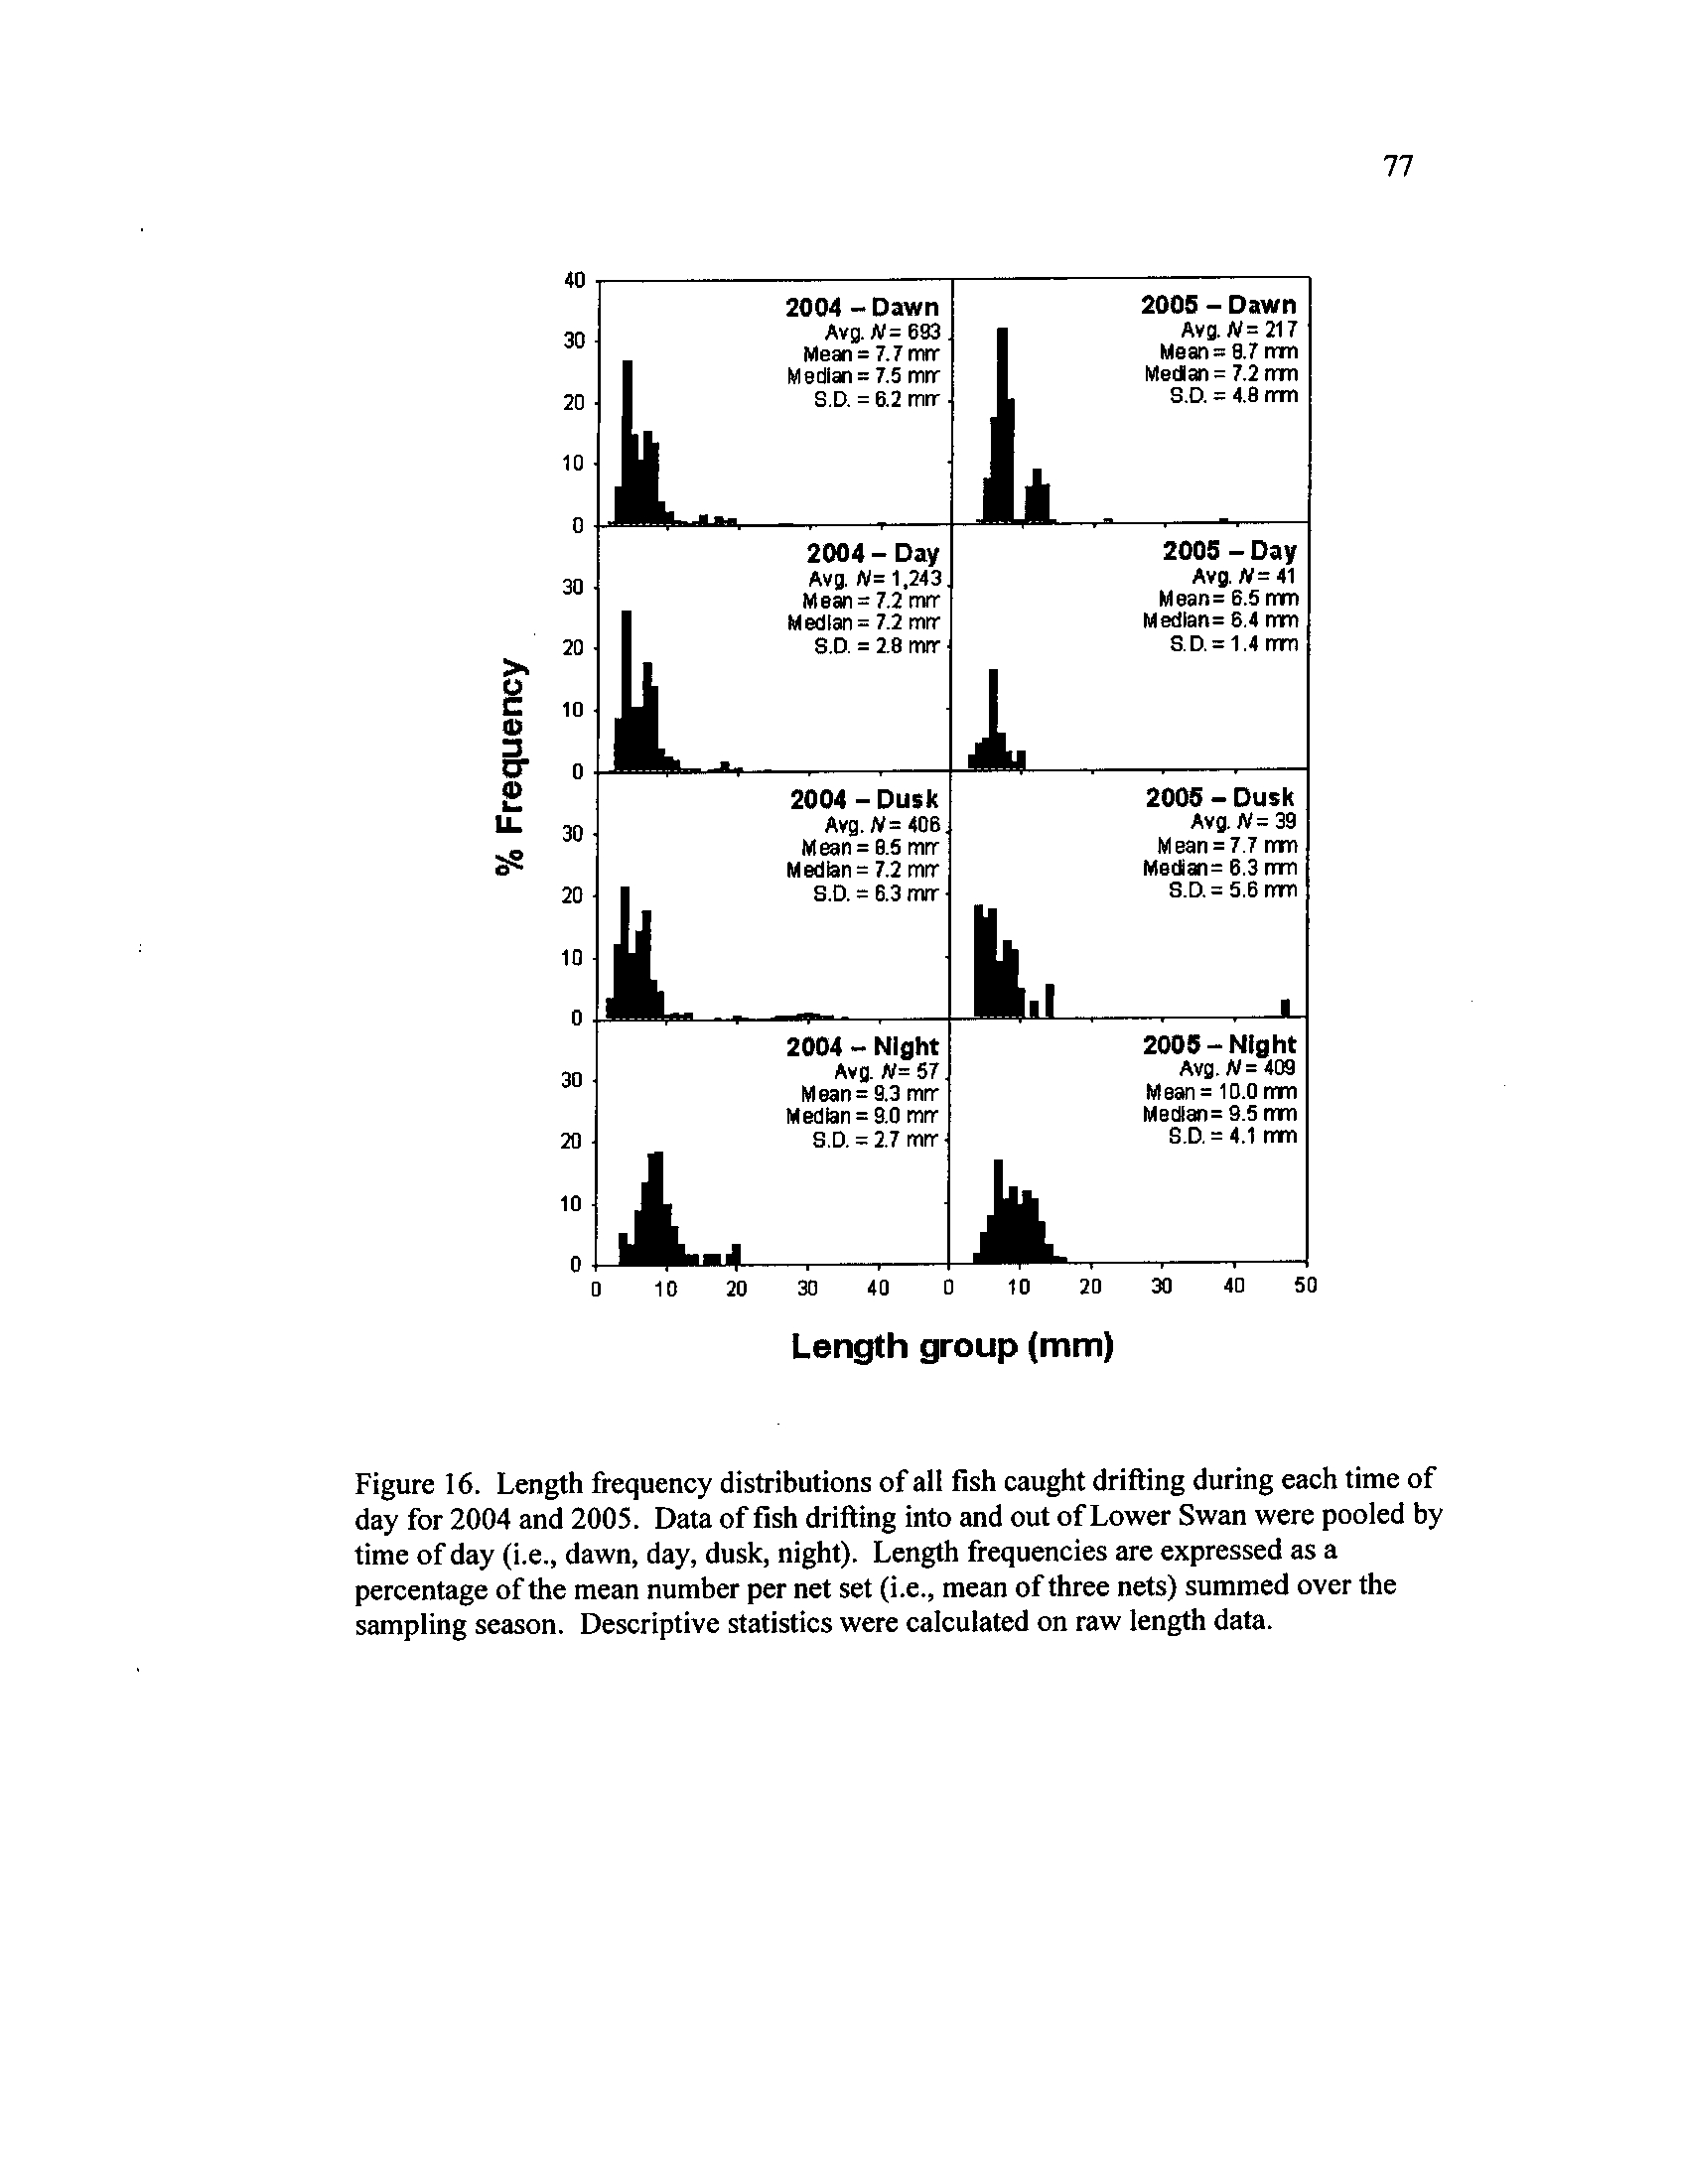
Figure 16 .
calculated on raw length data
Length frequency distributions of all fish caught drifting during
each time of day for 2004 and 2005
. Data of fish drifting into and
out of Lower Swan were pooled by time of day (i.e.,
dawn, day,
dusk, night)
. Length frequencies are expressed as a percentage of
the mean number per net set
(i.e., mean of three nets) summed over
the sampling season
. Descriptive statistics were calculated on raw
length data
ix
CHAPTER 1
OVERVIEW
River floodplain habitats are an endangered landscape (Tockner and Stanford
2002), which is a concern because they function as a critical component in the early life
history of fishes by providing rich food resources and structural refuge (Junk et al
. 1989) .
In their natural state, rivers are dynamic systems where flood pulses cue biological
processes, increase productivity, and maintain diversity (Junk et al
. 1989) . These flood
pulses also alter the river's course, where meanders become backwaters, and backwaters
become marshland or low-land forests (Lusk et al
. 2003) . Continued meandering of the
river continually creates and alters new backwaters habitats
. The degree of connectivity
between a river and backwater affects the backwater's ability to function as a spawning
and nursery habitat (Grift et al
. 2003) . The higher the connectivity, the more available
the backwater is for fish use
.
In backwater habitats, congregations of larval fishes vary in species composition
and abundance through time (Holland 1986)
. To explain this, I adopted a generalized life
history classification based on fishes' relative dependence to flowing water (adapted
from Galat and Zweimuller 2001)
. The first early life history class is classified as fluvial
specialists which spend most of their life in flowing water and rarely use backwater
habitats . Examples of these fishes are sturgeon Acipenseridae spp
. and perches
Stizostedion spp
. The second category, fluvial dependents, have only a portion of its life
history
I
2
requiring flowing water (Galat and Zweimuller 2001)
. These fishes, like temperate
basses Morone spp.,
paddlefish Polyodon spathula,
and freshwater drum Aplodinotus
grunniens,
either spawn in the river and their larvae move laterally into backwaters or
spawn in the backwaters and their larvae move into rivers at some point during their first
year (Dettmers et al
. 2001, Galat and Zweimuller 2001)
. The extent of this larval fish
movement between rivers and adjacent, connected backwaters is currently
undocumented . Finally, macrohabitat generalists, such as sunfishes
Lepomis spp., shads
Dorosoma spp.,
and gars Lepisosteus spp.,
conduct most of their life in backwater areas .
When macrohabitat generalists are found in the river, they typically use it as a corridor to
access other backwater areas (Junk et al
. 1989). Based on these life history classes, many
riverine fishes rely on semi- or permanently-connected backwaters
.
Backwater habitat and river connectivity have been reduced because of high
sedimentation rates (Havera and Bellrose 1985)
. In a natural floodplain system,
sedimentation of some backwaters would be counteracted by the creation of other
backwater areas (Miranda 2005)
. Unfortunately, because rivers have become
immobilized due to levee construction and floodplain settlement, existing backwaters are
becoming terrestrialized without new backwaters being created
(, Lusk et al
. 2003,
Miranda 2005) .
Spurred by backwater research in the 1980s, the Habitat Restoration and
Enhancement Program (FIREP) was initiated as a partnership between state and federal
agencies to fund large-scale restoration projects in the Upper Mississippi River (USACE
1993)
. The continuing goal of the HREPs is to improve habitat for waterfowl and fish by
reducing sedimentation and enhancing backwater-river connectivity
. Few studies have
3
documented the effects of these HREPs and their subsequent management regimes on
river fishes
. Fewer still have documented the effect of these improvements on spawning
and nursery habitats .
This study was conducted on the lower Illinois River (ILR) and contained two
backwater complexes, the HREP-managed Swan Lake (river kilometer [RKM] 8
.0) and
natural Calhoun Point (CP, RKM
1 .6),
and two adjacent river segments, RKM 1
.6 and
RKM 8.0
(measuring from its confluence with the Mississippi River
; Figure 1) .
Historically, Swan Lake was only connected to the river at its downstream end where a
0
.5 km-wide opening to the river existed
. To reduce sediment loading, this opening was
restricted to the width of a stop-log water control structure during restoration, about 5 m
wide
. Additionally, the backwater was compartmentalized by constructing cross-levees,
creating a lower compartment (Lower Swan
[LS]),
which was managed to be
continuously connected to the river, and a middle compartment (Middle Swan
[MS]),
which was drawn down each year during this study to consolidate sediments and promote
moist-soil vegetation
. The CP backwater complex (466 ha), at the confluence of the
Illinois and Mississippi Rivers, had a low-lying levee, isolating the backwater and
maintaining water levels during non-flood periods (Figure 1)
. Thus, LS was a restored,
unmanipulated backwater, MS was a restored and manipulated counterpart, and CP was
an unrestored off-channel backwater
.
Therefore the objectives of this study were two-fold
. First, I assessed the benefit
of a restored HREP-supported backwater system relative to an unrestored, manipulated
backwater by quantifying the response of larval fish communities
. Secondly, I
4
investigated the interplay of life history strategies with lateral drift dynamics on a diel
and seasonal basis within a restored backwater system
. I tested the hypotheses that :
i) Backwater sites, whether restored or unrestored, would be used as
spawning and nursery habitat in higher densities than river segments
sampled (Holland 1986, Junk et al . 1989).
ii) Seasonal abundances of larval fishes would be different among sites based
on their river connectivity, with the site being the most connected
(i.e.,
LS) to the river yielding the highest larval abundance
.
iii) Family composition, described by the life history classification, would
also vary among sites, where sites with the lowest river connectivity
would contain relatively higher densities of macrohabitat generalists
(Miranda 2005)
.
iv) Larval exchange would occur between the restored backwater, LS, and the
lower ILR, such that an
influx of larvae into the backwater would be
related to rising water temperatures and river stage (Junk et al
. 1989).
v) Because Swan Lake is a major backwater of the lower ILR, ingress or
egress of larvae between LS and the ILR would result in density
differences between river segments upstream and downstream of the
backwater-river confluence (Sheaffer and Nickum 1986)
. However,
restriction of the LS-ILR confluence may affect the magnitude of larval
movement between the river and backwater
.
5
vi) Diel periodicity in larval drift patterns may occur where drift rates and
sizes of larvae differ among sampling times (Gale and Mohr 1978,
Gadomski and Barfoot 1998)
.
These are ecological and management-oriented questions regarding backwater
function and the influence backwater restoration may have in the early life history of
fishes
. Understanding larval dynamics and production within backwater systems,
especially within restored habitats, will enable researchers to determine the quality of
backwaters as larval fish nurseries and to address the influence of habitat alterations on
larval fish assemblages among backwater lakes and river reaches
.
CHAPTER
2
THE ROLE OF BACKWATER RESTORATION IN LARVAL FISH ECOLOGY
ABSTRACT
Large river modifications have widely degraded backwaters, reducing critical
habitat for larval fishes
. During 2004 and 2005, 1 assessed how river backwaters function
as fish nurseries by quantifying the response of larval fish communities to restoration of
Swan Lake, a major (>1,000 ha) backwater complex on the lower Illinois River
. The
response was compared to a nearby unrestored backwater complex and to adjacent river
segments
. The densities of zooplankton prey in each site also were quantified
. Families
of fish changed between years, with fluvial-dependent taxa present during the flood pulse
of 2004 and relatively absent during the drought of 2005
. During both years, tenfold
greater larval densities were produced in backwaters than the river
. Larvae were larger in
backwaters and during the non-flood year, probably due to abundant zooplankton
. All
backwaters produced similar larval densities regardless of restoration
. Growth was
highest in the most isolated and regulated backwater portion of Swan Lake
. Predictable
flood pulses coupled with habitat heterogeneity in the backwaters may be important for
larval abundance, assemblage composition, and recruitment
. Current site-specific
restoration efforts constructed with the built-in flexibility to adapt to other management
regimes will likely be most beneficial to all early life history strategies of fishes, while
also providing widespread benefits and supporting the move towards system-wide
management programs on large rivers
.
6
7
INTRODUCTION
Natural river ecosystems support abundant and diverse species assemblages due
to high habitat diversity and physical complexity (Junk et al
. 1989, Dettmers et al . 2001).
Off-channel aquatic habitats, such as backwater lakes and sloughs, provide productive
habitat and a lentic-lotic gradient whereby fishes find structural refuge, food resources,
and spawning and nursery grounds (Junk et al
. 1989)
. For many riverine fish species,
floodplains are optimal spawning and nursery habitats and are actively sought out via
lateral spring spawning migrations of adults (Molls 1999)
. However, river regulation and
degradation have reduced backwater habitat quality and river connectivity, jeopardizing
larval fish abundance and success (Havera and Bellrose 1985, Tockner and Standford
2002)
. Larval fish diversity and recruitment are likely related to river-backwater
connectivity, such that reduced access could alter riverine fish communities (Pezold
1988, Turner et al . 1994)
. Although this association with the river is critical to backwater
health (Gore and Shields 1995), few studies have related connectivity to early life history
requirements and larval fish communities (Miranda 2005) .
Despite the important links between backwaters and larval fish abundance,
floodplain habitat has become severely degraded and is among the most endangered
landscape in the world (Tockner and Stanford 2002)
. Dam and levee construction
coupled with high sediment loads from agricultural lands extensively modified large river
hydrology, altered the flood-pulse, reduced backwater habitat quality and river
connectivity, and decreased system productivity (Havera and Bellrose 1985)
. In the
1980s, the loss of backwater habitat along the Illinois River spurred research and the
development of projects aimed to restore essential fish and waterfowl habitat (Sheehan et
8
al. 1990)
. A Habitat Restoration and Enhancement Project (HREP), through the federally
supported Environmental Management Program (EMP), was initiated on Swan Lake, a
major backwater of the Illinois and Mississippi Rivers
. One goal of the Swan Lake
HREP, to improve spawning and nursery habitat for fishes, was addressed by controlling
river connectivity of the backwater and increasing habitat heterogeneity (USACE 1991)
.
HREP techniques must be evaluated because current paradigms that influence
river management and serve as the basis for these restorations will continue to be
implemented in future programs
. However, a paucity of information about life histories
and habitat needs of larval and juvenile fishes in large river ecosystems, which may
hinder restoration efforts and effectual progress (Galat and Zweimuller 2001)
. All
riverine fishes exhibit certain life history strategies based on their relative dependence on
flowing water
; some are specialized for riverine environments, while others require
flowing water for only a portion of their life history
. Lastly, generalist fishes reside
mostly in lentic backwater areas, especially during their first year of life
. Therefore,
understanding larval dynamics and abundance within restored habitats will enable
researchers and managers to determine the influence of habitat alterations on larval fish
assemblages, where alterations that increase connectivity may produce more diverse and
abundant assemblages
. I quantified the response of larval fish communities within a
restored HREP-supported backwater system relative to an
unmanipulated of-channel
complex to assess the benefit of this HREP restoration program
. I tested the hypotheses
that (1) fish and zooplankton densities differed among sites and between years and that
(2) life history classes (i
.e.,
family composition) varied among sites or between years
. I
also evaluated how flood regimes and backwater habitat heterogeneity affected larval
abundance and composition within managed and natural backwater habitats
.
METHODS
STUDY AREA
The study area was located on the lower Illinois River (ILR) and contained two
backwater complexes, HREP-managed Swan Lake (river kilometer [RKM] 8
.0) and
natural Calhoun Point (CP, RKM
1 .6), and two adjacent river segments, RKM 1.6
and
RKM 8.0
(measuring from its confluence with the Mississippi River ; Figure 1)
.
Historically, Swan Lake was only connected to the river at its downstream end
where a 0.5 km-wide opening to the river existed
. During restoration, a cross-levee was
constructed to create a lower compartment (Lower Swan [LS],
567 ha) and middle
compartment (Middle Swan
[MS], 485 ha; Figure 1), and the historic LS connection was
restricted to the width of a stop-log water control structure, about 5 m wide
. An
additional river connection was created in MS via a stop-log structure
. During normal
pool stage, the stop-log water control structures at LS and MS were the only avenue
through which backwater-river movement of larval fish could occur
. The cross-levee and
stop-log connections allowed the compartments to be managed independently (Figure 1)
.
Lower Swan was managed to be continuously connected to the Illinois River, while the
MS water control structure was opened in early winter, allowing spawning fish to access
the lake before it was disconnected from the river in early spring and pumped a meter or
two below pool level each June
. Moderate flooding could top the MS stop-logs in the
water control structure and the cross-levee, which would serve to connect MS to the river
9
and LS during additional times of the year
. Thus, LS was a restored, unmanipulated
backwater, while MS was a restored and manipulated counterpart
.
The CP backwater complex (466 ha), at the confluence of the Illinois and
Mississippi Rivers, was unrestored and regularly connected to the rivers during floods via
low-lying levees (Figure 1)
. These levees provided limited flood control, and functioned
more to isolate the backwater from the river and maintain water levels during non-flood
periods
. This backwater system was dendritic and contained many vegetated islands
.
However CP was also shallow and had an
unconsolidated lakebed . This system
represented an unrestored, unmanipulated backwater
.
LARVAL ABUNDANCE
To understand drift patterns and compare the outcome of management practices
on study sites, I quantified seasonal larval abundance using paired, bow-mounted
ichthyoplankton nets (0
.5 m diameter x 2 m long, 500-µm mesh)
. River and backwater
habitats were sampled during late March through September 2004 and 2005
. Each week,
four stratified transects were randomly chosen within each Swan Lake compartment and
two transects were randomly chosen in the ILR (RKM
8 .0).
Every two weeks, I sampled
CP and its adjacent segment of the ILR (RKM
1 .6).
1 stratified backwater transects into
inshore and offshore tows, with two inshore plus two offshore transects per Swan Lake
compartment, and one inshore plus one offshore tow within CP (N = 10 backwater
transects)
. River tows were conducted within one km upstream and one km downstream
of each backwater-river confluence (N = four river transects)
. In MS, sampling ended on
22 July 2004, and on 27 June 2005, because the summer drawdown made the lake too
10
11
shallow to sample (i.e., water level management program)
. Calhoun Point was not
sampled during 2005 due to low water levels
.
At each transect, tows were conducted at the surface for five minutes at a constant
speed, with a calibrated mechanical flow meter (Model 2030R, General Oceanics, Inc
.,
Miami, Florida, USA) mounted in the mouth of one net to estimate volume sampled and
standardize samples
. Inshore backwater tows followed the shoreline, offshore backwater
tows were straight transects, and river tows were straight transects conducted
perpendicular to flow direction. River tows started at the main channel border and
continued across to the opposite main channel border
. If five minutes had not passed by
the time the opposite side was reached, the direction was reversed with nets still in the
water, and sampling continued until five minutes had elapsed
.
Upon completion of each transect, net contents were flushed into the cod end and
preserved in 95% ethanol
. Samples were split to approximately 200 fish using a Folsom
plankton splitter (Aquatic Research Instruments, Hope, Idaho, USA)
. All age-0 fish in
the subsample were counted, identified to the lowest possible taxon, typically genus, and
classified to a developmental stage
(i.e.,
yolk-sac, larval, juvenile) using descriptions and
keys in Soin and Sukhanova (1972), Auer (1982), Murty et al
. (1986), Tweb et al. (1990)
and voucher specimens from Southern Illinois University's Fluid Vertebrate Collection
(Brooks Burr, Carbondale, Illinois, USA) and Colorado State University's Larval Fish
Laboratory (Darrel Snyder, Fort Collins, Colorado, USA)
. A subsample of fish from
each taxon and stage identified was measured (total length
[TL] ;
mm) using Scion
Image® software or metric calipers (N = 10 per net)
. During 2005, MS samples were
counted, but not identified .
12
At the start of each transect, I sampled water chemistry parameters that could
affect the density of larval fish, including temperature
(°C), dissolved oxygen (mg/L [YSI
Model 52 Dissolved Oxygen Meter
; Yellow Springs Instruments, Yellow Springs, Ohio,
USA]), water depth, secchi depth, and average wind speed (km/h [Kestrel 1000, NFS
-
Radiation Protection Systems, Inc
., Groton, Connecticut, USA]) . Surface water velocity
(cm/s) was measured in the main channel at river transects with an electronic (Flo-Mate
Model 2000, Marsh McBirney, Inc
., Frederick, Maryland, USA) or mechanical flow
meter (Model 2030R Flowmeter, General Oceanics, Inc
., Miami, Florida, USA)
.
Continuous monitoring temperature loggers (8-bit Minilog-TR, Vemco Ltd
., Nova
Scotia, Canada) were located in each backwater and the river to supplement the water
temperature data taken at each transect
. River stage data were recorded at Hardin,
Illinois by the St
. Louis District U.S
. Army Corps of Engineers (river kilometer 34.4)
.
Swan Lake channel depth data were recorded using a Doppler unit (Model 6526-51
Starflow Ultrasonic Doppler Flow Meter
; Unidata America, Lake Oswega, Oregon,
USA)
. This unit was anchored to the bottom of the water control structure and
continuously recorded temperature (°C)
and depth
(mm) .
Depth data were not available
for MS and CP .
LIFE HISTORY CLASSIFICATION
Larval and juvenile fish collected were grouped by family into one of three
generalized classes to better explain trends between years and treatment groups (Galat
and Zweimuller 2001 ; Table I)
. The classes were
: fluvial specialists, fluvial dependent,
and macrohabitat generalists
. Fluvial specialists inhabit streams and rivers throughout
13
their entire life and rarely enter floodplain habitats (Galat and Zweimuller 2001)
. Fluvial
dependent species regularly use lentic backwater or reservoir habitats, but certain life
stages depend on lotic environments (Galat and Zweimuller 2001)
. These species are
typically broadcast spawners, where developing eggs and larvae are semi-buoyant and
passively drift in wind-induced or downstream currents (Holland 1986)
. Adult fluvial
dependent fishes also may make lateral migrations into slow-flowing lentic areas to
spawn-activities likely corresponding with increasing temperatures and rising water
levels (Junk et al . 1989)
. Macrohabitat generalists include species commonly found in
reservoirs and off-channel habitats that do not depend on lotic systems (Galat and
Zweimuller 2001)
. When these fishes use the river, it is as a corridor to move among
backwaters (Junk et al
. 1989, Dettmers et al . 2001)
. Spawning usually occurs in off-
channel habitats and offspring generally do not leave this habitat until the juvenile stage
(Holland 1986)
. I grouped families based on Galat and Zweimuller (2001
; taxonomy
from Nelson [1994]), and the only deviation from their groupings was Sciaenidae, which
I classified as fluvial dependent based on life history descriptions from Dettmers et al
.
(2001) and Koel and Sparks (2002) .
ZOOPLANKTON DENSITY
Because zooplankton abundance and composition affect growth and survival of
exogenous feeding larvae (Miller et al . 1988, Miller et al
. 1990), zooplankton were
sampled in each backwater and river segment
. Similar to larval tows, I randomly
stratified samples between inshore/offshore and upstream/downstream habitats
.
Backwaters were sampled before a corresponding inshore and offshore larval tow (N=
14
two samples/backwater), and river sites were sampled in the thalweg at each upstream
and downstream transect (N= two samples/river segment)
. Samples consisted of four, 1-
m vertical hauls from the boat using a conical net (0
.5 m x 2 m, 64 µm mesh)
. If depth
was less than 1 m, the entire water column was sampled four times, with the depth noted
to adjust volume sampled
. During 2005, neither MS nor CP were sampled
.
After each haul, net contents were flushed into a removable collecting bucket and
rinsed into a 64 µm sieve
. All four hauls from one site were preserved with 10%
buffered sugar-formalin in a single container (Haney and Hall 1973), and returned to the
laboratory for processing
. Copepods including cyclopoids, calanoids, and nauplii,
cladocerans including Bosmina spp.,
Chydorus spp ., Daphnia spp
., Diaphanosoma spp .,
and Moina spp.,
and other zooplankters including ostracods were identified and counted
.
Rotifers were dyed with Rose Bengal and counted, but not identified
. Using a Henson-
Stempel Pipette, each sample was processed until two taxa reached counts of 200 or until
10% of the sample volume had been processed
. Due to the high density of rotifers, they
were counted until approximately 100 individuals had been processed
. Densities were
calculated by dividing number of taxa in a subsample by the fraction of subsample
counted, then dividing that amount by the total volume of water filtered in the field
.
Zooplankton were grouped as rotifers and macro-crustaceans (i
.e.,
copepods,
cladocerans, nauplii, etc
.) for data analysis due to large differences in density
.
DATA ANALYSIS
To examine environmental relationships among sites and between years, weekly
means of abiotic variables were analyzed using principle component analysis (PCA)
. The
15
abiotic matrix, containing temperature
(°C),
dissolved oxygen (mg/L), depth (m), secchi
(cm), and wind (km/h) data, was analyzed using PC-ORD with the correlation option to
center and standardize parameters (McCune and Medford 1999)
.
To standardize samples by volume, densities for larval tow and zooplankton data
were calculated as fish/m 3
and zooplankton/L
. Total larval abundance at each site was
conservatively calculated as the sum of weekly densities
. For the abundance estimate,
when a site was not sampled or processed during a week, the larval density from the
previous weeks was substituted for the missing value
. All data were log-transformed to
meet assumptions of normality
. Two-way repeated measures ANOVA (proc MIXED,
SAS Institute 1999) was used to test for differences among sites and between years that
were sampled over time (Hurlbert 1984)
. For tow and zooplankton data, mean densities
among sites were compared over time
.
Fish length data were analyzed to determine whether sizes differed among tow
and drift samples
. Proportions of fish per I-mm length group were calculated and used to
make pairwise comparisons
. Kolmogorov-Smirnov tests were used to compare size
structure of fish collected from tows and between year differences for LS and ILR tow
data
. Size structure among tow sites was compared using Bonferroni adjusted a-values
.
Because MS was drawn down before the end of the 2004 sampling season, pairwise
comparisons within this site only included samples collected on or before 23 July
.
I determined overall trends within and between years for larval and zooplankton
densities
. A one-way ANOVA design tested density differences between years for larvae
and zooplankton
. I investigated larval and zooplankton density differences within each
16
year using a two-way ANOVA randomized block design
. The randomized block design
test assessed hypotheses about overall lake effects
: (1) stratified habitats differed in
density (i .e., inshore v
. offshore), (2) sites differed in density (i.e.,
LS v. CP), and (3) fish
families and zooplankton groups varied among sites
. To control for experimentwise error
rates, Tukey-Kramer post-hoc (Sokal and Rohlf 1995)
. Pearson correlation coefficients
were calculated for untransformed larval and zooplankton densities to reveal any
association between larvae and their food source
.
RESULTS
ENVIRONMENTAL FACTORS
A moderate flood pulse occurred in 2004, during which water levels in the lower
Illinois River were above flood stage for approximately five weeks during June (Figure
2)
. In contrast, water levels remained at or below normal pool level of 128 m during the
2005 sampling season .
Water temperatures in the river gradually rose and fell during 2004, peaking in
late July at 28 °C,
and varied in 2005, exceeding 30 °C
twice (Figure 2) . Lower Swan
conditions varied in a manner similar to the ILR, although water temperatures were
higher and more variable and depths fluctuated less (Figure 2)
. The 2004 flood pulse
topped the water control structure at MS and the low-lying levee at CP, causing water
levels in these backwaters to rise rapidly and connecting all the backwaters to the river
.
Middle Swan and CP remained isolated during 2005
.
From the PCA output, two axes, which had broken-stick eigenvalues less than the
actual eigenvalues, were used to graphically represent the data (Jackson 1993)
. River
17
and backwater sites were spatially separated by water and secchi depths, while water
temperatures and other abiotic parameters were similar among all sites (Figure 2 & 3,
Table 2 & 3)
.
LARVAL ABUNDANCE
During both years, fish larvae in the backwaters first appeared in low densities
during late March and early April, whereas larvae were not collected in river sites until
late April (Figure 4)
. Backwaters consistently produced higher densities of larvae than
the ILR (P < 0.01,
Table 4), with 2004 and 2005 ILR densities peaking at means of 11
and 14 fish/m3
(Figure 4), and seasonal abundance was estimated at 41 and 31 fish/m
3,
respectively
. A peak of larvae occurred in all backwaters and the river during June 2004,
the period of floodwater inundation (Figure 4)
. During that time, Lower Swan and CP
experienced a larval pulse of similar size (Figure 4, Table 4), and had similar total
seasonal abundance estimates of 435 and 409 fish/m 3,
respectively. Middle Swan larvae
peaked at the highest density of 400 larvae/m 3,
though they were not statistically higher
than LS (Table 4), and total seasonal abundance was estimated at 1,276 fish/m
3.
These
among site differences (two-way repeated measures ANOVA
; 2004:
F3,1o
= 55 .37, P <
0.01) differed across time (2004
:
F21,133
= 55
.06, P < 0
.01) and also interacted (2004 :
F43,133 = 8.07,
P < 0 .01)
. During 2005, sites also differed (two-way repeated measures
ANOVA : F2,9 = 53
.37, P < 0 .01) across time (2005
:
F22,115
= 15.05, P < 0.01)
and
interacted (2005 :
F31,11s =
5 .00,P<0
.01).
Larval pulses did not occur in synchrony
among sites, but occurred in MS during May, LS during late May, and the ILR during
June 2005 (Figure 4)
. My estimation of MS larval abundance during 2005, at 516
18
fish/m3,
was less than LS' estimated total larval abundance
. However, during the same
time interval, of late-March through 23 July 2005, MS had a higher estimated larval
abundance than LS
. Seasonal abundance in LS increased between years to 531 fish/m
3
during 2005 .
Each site had homogeneous larval distributions, with no differences between
inshore and offshore or upstream and downstream stratified transects (P > 0
.05, Table 5) .
During 2004, offshore transects in Swan Lake had slightly higher densities than inshore
transects, although they were not significantly higher (Table 5)
.
The larval fish assemblage in the backwaters was comprised predominantly of
macrohabitat generalists during both years, but changed between years in the river
(Figure 5)
. In the ILR, fluvial dependent taxa, consisting mostly of sciaenidae,
catostomidae, and cyprinidae, occurred at higher densities during 2004, but were
relatively absent during the low water year of 2005 (Figure 5)
. Macrohabitat generalists
dominated the ILR during 2005 (Figure 5)
. MS contained higher densities of fluvial
dependents (i.e.,
catostomids, cyprinids) compared to other backwaters during 2004
(Table 6, Figure 5)
. Clupeids, the most abundant family, drove macrohabitat generalist
patterns in all sites and heavily influenced system-wide trends in total density (Table 6)
.
Despite being continuously connected to the ILR, LS had substantially higher densities of
every family sampled except sciaenidae and moronidae during 2004
. During 2005,
higher densities of these families were collected in LS compared to the ILR, though these
larval densities in LS were lower than during 2004
.
Larval sizes were larger in backwater systems than the ILR, regardless of year
(Figure 6)
. During 2004, Calhoun Point had larger fish than MS and LS, possibly
19
indicating this backwater provided better fish nursery habitat (P < 0
.001, Table 7, Figure
6)
. Progressively smaller sized fish occurred in MS, LS, and the smallest were collected
in the ILR (Table 7)
. The size structure of fishes in LS and ILR were significantly larger
during 2005, though larger fish again occurred in the backwater (all P < 0.001,
Table 7).
ZOOPLANKTON DENSITY
Patterns in zooplankton and rotifer density differed by site and exhibited temporal
patterns
. During 2004, macro-crustaceans, consisting mostly of cladocerans, copepods,
and nauplii, peaked during late May and June in the ILR, LS, and CP, while MS densities
steadily declined during April through June (Figure 7)
. The opposite occurred for rotifer
densities, with the ILR, LS, and CP showing declining densities during late May and a
pulse of rotifers occurring in MS during 2004 (Figure 8)
.
Although rotifers dominated the zooplankton assemblage during both years, 2005
rotifer densities appeared greater while macro-crustaceans occurred in lower densities
than 2004
. In the ILR, while there was no between-year difference in rotifer density
(F1 ,34 = 1 .28, P = 0 .27
; Figure 8), higher densities of macro-crustaceans occurred during
2004 (F1,34 = 12.43, P < 0.01
; Figure 7)
. In LS, the opposite occurred, with higher rotifer
densities during 2005 (F1,34
= 8.46,
P < 0 .01
; Figure 8) and no difference of macro-
crustacean densities between years (F1,34
= 1
.43, P = 0 .24
; Figure 7) . The repeated
measures analyses for 2004 revealed temporal variation in density, but no difference
among sites for rotifers (site :
F3,63 = 0.80,
P = 0 .50; week :
F15,63 = 2.61,
P < 0.01
;
lake*week :
F32,63 = 1
.20, P = 0.27)
or macro-crustaceans (site
:
F3,64 = 1
.63, P = 0.19 ;
week
:
F15,64
= 11 .92, P < 0.01 ; lake*week
:
F3,64 = 5
.37, P = 0.01)
. During 2005, all
20
effects were significant for both rotifer densities (site
: F,,2 = 91 .56, P = 0.01
; week:
F21,33
= 2 .74, P < 0 .01 ; lake*week
:
F,6,33 = 3
.70, P < 0
.01) and macro-crustaceans (site
: F 1,2 =
93.56, P = 0.01 ; week : F21
,33 = 3.69, P < 0.01 ; lake*week
:
F16,33 = 2.89,
P < 0.01).
Macro-crustaceans in LS and the ILR were positively correlated to larval fish
density during 2004 (LS
: r = 0.71, P < 0.01 ; ILR
: r = 0.63, P = 0.01)
. Only rotifer
densities in MS correlated with larval densities (r = 0
.80, P < 0.01)
. No other patterns
occurred during 2004, and no correlations occurred during 2005 for either rotifers or
macro-crustacean densities and fish larvae
.
DISCUSSION
Connectivity is a critical feature of floodplain habitats, and likely influenced
larval abundance patterns in the lower ILR and its backwaters
. Larval abundance during
the flood year was synchronized among all sites
; well-timed to the period of inundation
where all sites were connected
. More families in greater evenness also occurred during
the flood year
. Although typically isolated from the river, a large variety of families
occurred in MS during 2004, most notably a large proportion of catostomids and
cyprinids that likely were entrained in the backwater when floodwaters topped its levee
.
This restored and manipulated site also produced more larvae during both years than any
other site in the same time frame, which hints towards the benefits garnered from regular
periods of connectivity and increased aquatic vegetation
.
During the non-flood year I saw a lack of fluvial dependent taxa in all sites, which
was more pronounced in the riverine habitat than the backwaters
. Moreover,
21
macrohabitat generalists tended to have higher densities during the non-flood year,
apparently capitalizing on the stable water levels and low flows
. Similarly, Brown and
Coon (1994) showed a decreased number of taxa during a non-flood year, with lower
densities of fluvial dependent species (i.e., goldeye
Hiodon alosoides, buffalo
Ictiobus
spp., and carpsuckers Carpiodes spp.)
and an increased abundance of macrohabitat
generalists (i.e.,
centrarchids) in most tributaries
. Changes in family composition
between years emphasize the importance of a predictable flood pulse in larval fish
ecology where rising waters cue spawning activity and permit access to floodplain habitat
(Junket al . 1989).
In accordance with other studies that have found lower or no reproduction in
rivers during non-flood years (Brown and Coon 1994, Agostinho et al
. 2004), I expected
significantly lower densities and larval abundance estimates during 2005
. However,
seasonal abundance of macrohabitat generalists in LS was higher than the year before,
and only MS abundance and peak densities were markedly lower
. Moreover, the ILR,
which functioned nearly exclusively as spawning habitat during 2004, as indicated by the
larval lengths, had a larger size structure during 2005, suggesting these segments of the
river provided relatively better nursery habitat for larvae during the non-flood year
.
Lower velocities during summer 2005, often below 0
.1 m/s, transformed the ILR into
habitat suitable for larvae
. This compensatory pattern in larval abundance occurred due
to certain species, mainly gizzard shad
Dorosoma cepedianum,
mosquitofish Gambusia
affinis, brook silversides Labidesthes sicculus,
and emerald shiners Notropis
atherinoides,
exploiting the low flow conditions, a concept dubbed the `low flow
recruitment hypothesis' (Humphries et al
. 1999, King 2004). The hypothesis postulates
22
that during low flow periods in the river, appropriately sized prey is concentrated, and
under these conditions, some species spawn and can easily make the transition from
endogenous to exogenous feeding, thereby having high recruitment (Humphries et al
.
1999)
. I do not know whether recruitment differences occurred between years, but the
significantly higher rotifer densities in LS during the low-flow period likely supported
the increased rates of larval abundance (Aoyagui and Bonecker 2004)
.
Limited information exists on the interaction between larval fishes and
zooplankton densities in large rivers
. The positive correlations between plankton and
larvae may be due to mutually favorable abiotic conditions, such as warm temperatures
(Wetzel 2001)
. However, it has been speculated that biotic factors, such as top-down
effects of larvae, may play an
important role in riverine foodwebs (Jack and Thorp 2002)
.
During the flood year, plankton and fish densities were positively related
; ILR and LS
zooplankton to fish densities in those sites, and MS larvae to rotifer densities
. The
positive relationship may be due to autochthonous inputs that increased seasonal
abundance in backwaters during inundation, allowing for large pulses of larvae and
plankton (Junk et al . 1989)
. The drastic summer decline in zooplankton densities may be
due to increased foraging from larger larvae or simply summer declines often observed in
large rivers (Gosselain et al . 1998)
. Whether temperature related or not, these patterns of
summer declines remain unexplained (Gosselain et al
. 1998). Although significant
patterns were not found in either CP during 2004, or in LS and the ILR during 2005, total
plankton densities increased with larval abundance and decreased after mid-summer,
indicating the use of plankton as a prey source by larval fishes
.
23
Promoting vegetation growth in backwaters through annual drawdowns may have
positive effects for these restored systems
. Vegetation could have provided food and
cover for larvae, possibly promoting invertebrate populations in densely vegetated areas
and affording protection from predation (Dewey et al
. 1997, Flinn et al . 2005)
. However,
fish survival in MS was likely low due to the drawdowns
. High mortality often occurs
through bird and fish predation (Crowder et al
. 1997) and anoxic conditions in shallower
waters
. The true potential of MS for larval abundance may only be realized if the
compartment is managed in a rotating fashion, whereby drawdowns would be conducted
every few years to maintain vegetation growth and during other years, it would be
continuously connected to the river .
Floodwater stability (gradual rise and fall) coupled with habitat heterogeneity in
the backwaters may be important
. The unrestored backwater, CP, had the largest larval
sizes during 2004, which may have been due to more stable water levels where larvae
were not stranded on lake banks and fish nests were not desiccated due to rapidly
receding waters (Adams et al
. 1999, Brown and Coon 1994)
. In many species, larval
survival and eventual recruitment of the adult population has been show to directly relate
to larval (Miller et al . 1988)
. Progressively smaller larvae were collected in MS and LS,
a pattern which corresponds to the degree of emergent structure available in each site,
with CP having the most emergent vegetation and LS having none
.
To enhance the complex biotic and abiotic interactions so valued in riverine-
floodplain habitats, restoration projects must have a built-in flexibility to either create or
sustain different habitat types
. This approach will likely be most beneficial to all life
history strategies by offering a wide variety of habitat characteristics to meet specific
24
early life history environmental and habitat requirements (Grift et al
. 2003)
. Restoration
projects similar to the Swan Lake HREP offer the added benefit of flexibility
. The
compartmentalization allows managers the option of rotating management regimes
between the two lower compartments to promote habitat diversity while maintaining river
connectivity
. One or both compartments may be left open to the river at any one time,
ensuring backwater access to riverine fishes
. Given the widespread benefits of these
management practices and the move towards system-wide management programs on
large rivers (Theiling 1995, Flinn et al
. 2005), current site-specific restoration projects
should be constructed with the flexibility to adapt to other management regimes
.
25
CHAPTER 3
LATERAL EXCHANGE OF LARVAL FISH BETWEEN A RESTORED
BACKWATER AND A LARGE RIVER IN
THE EAST-CENTRAL U.S.
ABSTRACT
The lateral exchange of larval fish between a river's main channel and its
floodplain waters may be compromised by the widespread degradation of backwaters
.
During 2004 and 2005, drift nets were set bi-directionally within a constructed channel
between the Illinois River and an adjacent, restored backwater, Swan Lake, to investigate
movement between these sites on a diel and seasonal basis
. Larval density and
composition data within the river and backwater were also collected
. Drift was positively
related with water velocity during 2004, and an estimated 32
.3 million larvae drifted into
Swan Lake that season
. No other relationships with drift direction and abiotic variables
occurred
. Lateral drift patterns were strongly related to the flood pulse during 2004, but
in the absence of a flood, as during 2005, the ambient biotic assemblage influenced drift
timing, magnitude, and composition
. Swan Lake's restoration appears to have
successfully altered the backwater for multiple-use management while maintaining river
connectivity and allowing exchange between the backwater and river to occur
.
26
INTRODUCTION
Propensity to drift in streams and rivers is an adaptive response in aquatic
organisms (Eckblad et al . 1984, Kennedy and Vinyard 1997)
. In fishes,
drift is usually restricted to early life stages, such as seasonal larval fish drift in lotic
systems and largely influences spatiotemporal patterns in larval density (Holland 1986)
.
Drift in riverine larval fishes is typically downstream, but can also be lateral, where larval
fishes may be exchanged between river and slackwater habitats (Humphries et al
. 1999).
This exchange has been hypothesized due to ichthyoplankton (hereafter termed larvae)
density differences among slackwater and river habitats (Sheaffer and Nickum 1986,
Brown and Coon 1994, King 2004) and due to downstream larval drift from tributaries to
main channel areas (Eckblad et al
. 1984, Muth and Schmulbach 1984)
. However, the
extent of lateral larval drift into and out of backwaters relative to downstream drift in
rivers is currently undocumented and would be useful to determine origins and
destinations of larval fishes .
I defined lateral drift as the movement of organisms between a river's main
channel and its adjacent floodplain waters
. When connected to the river, these
backwaters provide a lentic-lotic gradient along which fish and other aquatic organisms
find spawning grounds, structural refuge, food resources, and overwinter habitat (Junk et
al. 1989)
. Slackwater areas have been recognized as a critical component in the early life
history of fishes (Holland 1986)
. These areas may be a productive source of age-0 fishes
given the higher larval densities downstream of backwater outflow (Sheaffer and Nickum
1986) and large migrations of juveniles to the main channel from backwaters (Molls
1999)
. However, the contribution of river larvae to backwaters may also be significant
27
and a vital process bringing riverine spawned larvae to productive nurseries (de Graaf et
al. 1999)
. Due to the nature of these backwater-river confluences, with periods of inflow
to the backwater, outflow to the river, and stagnant waters following high water events,
larval exchange is likely complex (Brown and Coon 1994)
. These flow patterns at the
confluence are apt to drive the ability of backwaters to function as nursery habitat for
larval and juvenile fishes, potentially affecting the diversity and abundance of fishes
(Brown and Coon 1994)
.
Most investigators have focused on patterns of downstream drift in rivers (Gale
and Mohr 1978, Muth and Schmulbach 1984, Johnston et al
. 1995), but not in the context
of how timing and behavior may shape trends in lateral exchange
. Fish spawning
behavior dictates temporal patterns in larval drift, where drift duration increases with the
duration of spawning (Reichard et al
. 2001), and rising water temperatures and spring
flood events that cue spawning often result in peak larval drift densities (Carter et al
.
1986, de Graaf et al .1999, Auer and Baker 2002)
. Because feeding may influence the
presence of absence of larvae in the drift, larval metamorphosis into exogenously feeding
fish can either initiate or cease drift behavior (Carter et al
. 1986, Dudley and Platania
2000), or have no influence on the species' presence or absence in the drift (Auer and
Baker 2002), depending on the species
. Downstream drift probably allows access to
nursery habitats with amenable growing conditions, and scatters the cohort, which may
reduce competition for food and space as well as reduce conspicuousness to predators
(Bardonnet 2001)
. Thus, the interplay of abiotic and biotic factors determines the timing,
duration, and taxa of fish drifting, but their influence on lateral exchange is unknown
.
28
Larvae have diurnal, nocturnal, or crepuscular drift patterns that depend on
species developmental stage (Gale and Mohr 1978, Muth and Schmulbach 1984,
Gadomski and Barfoot 1998)
. These photokinetic responses may change in some species
as larvae age (Bulkowski and Meade 1983), possibly a result of ontogenetic changes in
diet or susceptibility to or avoidance of predation
. However, diet patterns in drift are
contradictory, where fish species of the same life stage exhibit significant nocturnal drift
in some water bodies and diurnal drift in others (Muth and Schmulbach 1984, Smith and
Brown 2002) .
Therefore, management decisions to improve nursery and spawning habitats and
survival of early life stages of fish may be ineffective due to gaps in our understanding of
the timing and behavior of lateral larval drift
. All riverine fishes exhibit certain life
history strategies based on their relative dependence on flowing water
. Some are
specialized for riverine environments and adapted for downstream drift, others require
flowing water for a portion of their life history where habitat changes likely entail lateral
movement
; and finally generalists reside mostly in lentic areas and should be less prone
to enter the drift
. I investigated the interplay of life history strategies with lateral drift
dynamics on a diel and seasonal basis within a restored system, which will assess the
success of the restoration and the backwater's use as a productive fish nursery
.
Quantifying lateral movement will enable researchers to determine the role of backwaters
as larval fish nurseries in large rivers and to address the influence of habitat alterations on
larval fish assemblages among backwater lakes and river reaches
. I hypothesized lateral
movement at the restored connection between Swan Lake and the lower Illinois River to
be influenced by abiotic factors that cue spawning, such as temperature and river stage,
and that drift composition would be linked to life history strategy, where taxa requiring
flowing water would comprise a majority of the drift
.
METHODS
STUDY AREA
Swan Lake, a 1,100-ha Illinois River (ILR) backwater located between river
kilometer 8 and 21, is vitally important for fishes of the Illinois and Mississippi Rivers
(USACE 1991)
. A Habitat Restoration and Enhancement Project (HREP) through the
federal Environmental Management Program (EMP) was initiated in the 1980s
. One goal
of the Swan Lake HREP was to improve spawning and nursery habitat for fishes by
improving river connectivity of the backwater and increasing habitat heterogeneity
(USACE 1991). The downstream portion of the backwater (Lower Swan
[LS], 567 ha)
was managed to be continuously connected to the ILR through a water control structure
.
Historically, Swan Lake was connected to the ILR through a 0
.5-km wide opening .
Restoration of the backwater complex restricted the river connection to the width of a
stop-log water control structure, about 5-m wide, which was nested within a rip-rap lined
channel (c . 50 m long x 12 m wide)
. During normal pool stage, the stop-log structure at
LS is the only avenue through which larval fish movement between the backwater and
river occurs, making the stop-log structure the focal point of this study site
.
FISH SAMPLING
To quantify bidirectional larval drift between LS and the ILR, three conical drift
nets (0.5
m x 2 m, 500-pm mesh) were attached to a floating, anchored PVC frame and
29
fished during late March through July 2004, and March through August 2005 (Figure 9)
.
I sampled larvae for 15 minutes at the surface (approximately one-third channel depth)
every two weeks on the lake-side of the LS stop-log structure (Figure 9)
. Two directional
net sets, one sampling larvae potentially moving into LS and one set sampling larvae
leaving LS, were conducted at dawn, mid-day, dusk, and mid-night within 36 hours
.
During flood events, sampling frequency was increased to weekly, but fewer night sets
occurred
.
At each sampling time (e.g.,
dawn, mid-day, dusk, mid-night), surface water
temperature (°C)
and dissolved oxygen (mg/L [YSI Model 52 Dissolved Oxygen Meter
;
Yellow Springs Instruments, Yellow Springs, Ohio, USA]), secchi depth
(cm), surface
water velocity (cm/s [Flo-Mate Model 2000, Marsh McBimey, Inc
., Frederick, Maryland,
USA]), and average wind speed and direction (km/h [Kestrel 1000, NFS
- Radiation
Protection Systems, Inc
., Groton, Connecticut, USA]) were quantified
. A Doppler bi-
directional velocity meter (Model 6526-51 Starflow
; Unidata America, Lake Oswega,
Oregon, USA), anchored to the bottom of the water control structure, recorded
temperature ( °C), depth (mm),
and mean velocity (mm/s) twice an hour
. River stage data
from Hardin, Illinois (river kilometer 34
.4) were obtained from the U .S
. Army Corps of
Engineers
. No Swan Lake depth data were collected during September through
November 2004, and no velocity data were collected during October 2004 through April
2005.
Upon completion of each drift net set, contents were flushed into the cod end and
preserved in 95% ethanol
. Each sample was split to approximately 200 fish using a
Folsom plankton splitter (Aquatic Research Instruments, Hope, Idaho, USA)
. All age-0
30
fish in the subsample were counted, identified to the lowest possible taxon, typically
genus, and classified to a developmental stage
(i.e.,
yolk-sac, larval, juvenile) using
descriptions and keys in Soin and Sukhanova (1972), Auer (1982), Murty et al
. (1986),
Tweb et al
. (1990) and voucher specimens from Southern Illinois University's Fluid
Vertebrate Collection (B
. Burr, Carbondale, Illinois, USA) and Colorado State
University's Larval Fish Laboratory (D
. Snyder, Fort Collins, Colorado, USA)
. A
subsample of fish from each taxon and stage identified was measured (total length
[TL];
mm) using Scion Image® software, which was calibrated to 0
.5 mm, or metric calipers
(N = 10 per net)
.
Larval samples also were collected in LS and the ILR to characterize the taxa and
abundance within each site and compare larval densities to drift composition at the water
control structure
. I used paired, bow-mounted ichthyoplankton nets (0
.5 m diameter x 2
m long, 500-µm mesh) to sample these habitats on the same dates as drift nets were set
.
Four stratified transects randomly chosen within LS and two in the ILR (river kilometer
7.0 to 9
.0) were sampled weekly
. I stratified backwater transects into two inshore and
two offshore tows, while tows in the ILR were conducted within 1 km up- and
downstream of the LS-ILR confluence .
At each transect, nets were towed at the surface for 5 minutes at a constant speed,
with a calibrated mechanical flow meter (Model 2030R, General Oceanics, Inc
., Miami,
Florida, USA) mounted in the mouth of one net to standardize sampling effort (i
.e.,
volume sampled)
. Inshore backwater tows followed the shoreline
; offshore backwater
tows were straight transects
; and river tows were straight transects taken perpendicular to
flow direction
. River tows started at the main channel border and continued to the main
31
32
channel border on the opposite side of the river
. If 5 minutes had not passed during river
transects, the direction was reversed with nets still in the water, and sampling continued
until 5 minutes was reached
. All tow samples were preserved, processed, and identified
as with drift net samples .
LIFE HISTORY CLASSIFICATION
The collected fish were grouped by family into one of three generalized classes to
better explain trends observed between years and treatment groups (e.g.,
Galat and
Zweimuller 2001)
. The classes were as follows
: fluvial specialists, fluvial dependent,
and macrohabitat generalists (Table 1)
. Fluvial specialists are fish that inhabit streams
and rivers throughout their entire life and rarely enter floodplain habitats (Galat and
Zweimuller 2001)
. Fluvial dependent species regularly use lentic backwater or reservoir
habitats, but certain life history traits depend on lotic environments (Galat and
Zweimuller 2001)
. These species are typically broadcast spawners, where developing
eggs and larvae are semi-boyant and passively drift in wind-induced or downstream
currents (Holland 1986)
. Adult fluvial dependent fishes also may make lateral migrations
into slow-flowing lentic areas to spawn-activities likely corresponding with increasing
temperatures and rising water levels (Junk et al
. 1989)
. Macrohabitat generalists include
species commonly found in reservoirs and off-channel habitats that do not depend on
lotic systems (Galat and Zweimuller 2001)
. When these fishes use the river, it is either as
a corridor to move among backwaters (Junk et al
. 1989, Dettmers et al . 2001)
. Spawning
usually occurs in off-channel habitats and offspring generally do not leave this habitat
until the juvenile stage (Holland 1986)
. 1 grouped families based on Galat and
Zweimuller (2001
; taxonomy from Nelson [1994]), and the only deviation from their
'
groupings was Sciaenidae, which I classified as fluvial dependent (Dettmers et al
. 2001,
Koel and Sparks 2002) .
DATA ANALYSIS
Larval tow data at each site were standardized as
fish per m 3. Larval drift
represented larval exchange between the backwater and river and was calculated
as
number of fish per minute
. Some fish were caught in nets set opposite to the direction of
flowing water when velocities were 0
.1 m/s or greater (e.g., frame positioned to catch
fish drifting out of LS while water flowed into LS at 0
.11 m/s; Scheidegger and Bain
1995)
. This was not considered drift and thus was removed from data sets before
analyzing
. Total larval abundance from tow data was calculated as the sum of weekly
densities during each sampling season
. All data were logio(x+l) transformed to meet
assumptions of normality
.
Two-way repeated measures ANOVA (proc MIXED, SAS Institute 1999) was
used to test for differences among treatments sampled over time (Hurlbert 1984)
: (1) bi-
weekly drift catch rates into and out of the backwater, with catch rates as the response
variable and week and direction as
predictors, (2) bi-weekly drift catch rates at dawn,
day, dusk, and night, where week and time of day are predictor variables, and (3) weekly
mean densities of tow data between sites were compared, with density as a response
variable and week and site as predictors .
I estimated total number of larvae drifting for each season and determined overall
trends within and between years for larval densities
. Non-zero catch rates of drift data
33
for each direction and year were regressed (Type I regression, proc REG, SAS Institute
1999, Sokal and Rohlf 1995) as a function of environmental parameters collected from
the Doppler device corresponding to the time and date of drift
(e.g., depth, temperature,
velocity)
. For significant relationships, these environmental data were used to estimate
the total amount of larval drift for each season
. A one-way ANOVA design tested how
larval density and catch rates differed between years
. To control for experimentwise
error rates, I used Tukey-Kramer post-hoc (Sokal and Rohlf 1995)
. Relationships
between larval densities and lateral drift were examined using linear regression on
untransformed data
.
Proportions of fish per 1-mm total length group were used to compare sizes of
fish between tow sites, drift direction, year, and among diel time points
. Kolmogorov-
Smirnov tests were used to compare (1) size distribution of fish drifting into versus out of
LS in each year, (2) total size structure (into and out combined) of fish drifting during
2004 and 2005, (3) size structure of fish collected from tows, and (4) between-year
differences for LS and ILR tow data
. Multiple pairwise comparisons were used to
examine size structure differences among the times of day sampled (e
.g., dawn vs . night,
dawn vs . day, dawn vs . dusk, etc
.), with Bonferroni adjusted a-values (a"= 0
.05/6).
RESULTS
ABIOTIC PATTERNS
A moderate flood pulse occurred in 2004, during which water levels in the lower
Illinois River were above flood stage for approximately five weeks during June (Figure
34
35
10). In contrast, water levels remained at or below normal pool level
(i.e.,
128 m) during
the entire 2005 sampling season
. Water temperatures in the river gradually rose and fell
during 2004, peaking in late July at 28
°C (Figure 10)
. However, during 2005, water
temperatures were more variable and rose over 30
°C twice. In general, water
temperatures in LS varied in a manner similar to those in the ILR, where the amplitude
and daily variation was larger because of the shallower water depths
. Lower Swan depth
fluctuations were slightly dampened compared to the river (Figure 10)
.
Movement of water through the LS water control structure was bi-directional,
often changing direction multiple times a day likely due to river boat traffic and wind,
and velocities varied greatly
. Aside from the 2004 flood pulse which increased water
depth in the channel to 3
.98 m, channel depth remained above 2 m for most of 2004 and
averaged 2
.04 m after May 2005 (Figure 11)
. The bi-directional movement of water into
and out of Swan Lake typically occurred daily, but on average water was moving into LS,
with 86% of differential velocity values being positive (Figure 11)
. Mean channel
velocities were typically less than I m/s during the two sampling seasons, and only three
percent of data points equaled or exceeded this amount
. In 2004, velocities flowing into
LS peaked at 2
.2 m/s during the rise in flood waters, dropped to near zero at flood crest,
and flowed out at peak velocities of 1
.5 m/s during the rapid recession of flood waters .
Near-zero velocities occurred during low water periods, particularly those occurring
during summer 2005, where differential velocity values were clustered around zero
(Figure 11) .
SEASONAL PATTERNS OF LARVAL FISHES
36
Larval drift patterns varied between years, while larval fish densities and timing
in LS and the ILR were similar between years
. Fish recruited to drift nets during 1 May
through mid-July 2004, with a major pulse of fish drifting into LS during late May 2004,
timed with the rising flood waters (Figure 12)
. During 2005, a smaller, discrete peak of
larvae was exchanged between LS and the ILR
; three weeks later and at less than half the
magnitude of catch rates (Figure 12)
. Larval fish appeared (garnered from tow data) in
the ILR during mid-April and during late-March 2004 in LS, and there was a
synchronous pulse of larvae in tows during June 2004, the period of floodwater
inundation (Figure 13)
. During 2005, larval fish appeared in both LS and the ILR during
mid-April, and the larval pulses were asynchronous, peaking two weeks later in the ILR
than in LS (Figure 13) .
Higher rates (#/minute) of fish drifted into and not out of LS during 2004,
although differences over time and an interaction between drift direction and time
occurred (Figure 12
; all P < 0 .01 ; direction : F1,6 = 18
.53 ; week : F,1,6o = 7.67
;
direction*week
: F11,60
= 8
.2)
. Ingress and egress of ichthyoplankton were similar in 2005
(Figure 12 ; F1,6 = 3 .8, P = 0 .10)
. However, larval densities in LS were 10 times higher
than the ILR during both years (Figure 13
; two-way repeated measures ANOVA
: P <
0.01
; 2004: F1,6 = 66.97; 2005: F,,6
= 109.78),
although they differed over time (P < 0
.01 ;
2004: F21,91 = 23
.27; 2005 :
F22,76
= 15
.11) and also interacted (P < 0 .01
; 2004:
F20,91 =
4.43 ; 2005: F,8,76 = 3.74)
. Total annual larval abundance estimates were similar between
years in the ILR, 42 and 31 larvae/m3, and LS, 435 and 531 larvae/m3, during 2004 and
2005, respectively
. Mean daily drift rates of larvae by direction did not differ between
years (two-way ANOVA :
F3,,32 = 1
.6, P = 0.21)
despite an almost eight-fold difference
37
in rates of larvae drifting into Swan Lake during 2004 and 2005, with means of 4
.2
fish/minute and 0
.5 fish/minute, respectively
. The non-significant between-year result
was due to high variance within year and similar rates of larvae drifting out of the
backwater between years, at 0 .4 fish/minute each year (Figure 12)
.
Both LS and the ILR had homogeneous larval distributions, with no differences in
LS between inshore and offshore (2004 : tj,,9 = -2.08,
P = 0 .05 ; 2005: t,,,s
= -0.66,
P =
0
.52) or in the ILR between upstream and downstream stratified transects (2004
: 11,21 _
0.94, P = 0 .36; 2005 :
11,22 = -0.27, P = 0.79),
though there was a propensity for higher
densities to occur downstream of LS during 2004 .
No diel patterns in catch rates occurred during 2004 (Table 9
;
F3,4 = 0
.1, P >
0
.05), though a diel drift pattern occurred during 2005, where more fish larvae drifted at
night than during other times of the day (F3,4
=
15 .9, P = 0 .01).
Grouping families by life history class revealed that drift composition varied
between years (Table 10, Figure 14)
. Fluvial dependents were most abundant drifting
into Lower Swan during 2004, where sciaenids and cyprinids represented 60% of the fish
exchange (Table 10, Figure 14)
. Macrohabitat generalists were collected in the drift
during 2004 and 2005 without much directional difference, making these taxa some of
the only that drifted out of LS (Figure 14)
.
Temporal drift patterns varied by life history class
. Drift of fluvial dependent
taxa was initiated and peaked in a discrete pulse during rising flood waters
. Macrohabitat
generalists, comprised mostly of clupeids, also drifted in peak rates during the rising
flood waters, beginning in May before the pulse and continuing for two months
. During
38
2005, neither timing nor peak drift between fluvial dependents and macrohabitat
generalists varied .
Macrohabitat generalists dominated the ambient larval composition during both
years in tows conducted in LS, but not the ILR
. During 2004, fluvial dependent taxa
dominated the composition in the ILR, and were five times higher than densities of those
taxa in LS
. Regardless of year, fluvial dependent taxa were relatively absent in LS
compared to the densities of macrohabitat generalists (Table 10, Figure 14)
. As with drift
rates during the non-flood year, densities of fluvial dependents were lower in the ILR
(Table 10, Figure 14)
. No fluvial specialists were sampled during either year
. There
were no differences in family composition in tows conducted upstream or downstream of
LS.
Drift rates at LS were related to abiotic and biotic factors
. Non-zero catch rates of
fish drifting into the backwater during 2004 was positively related to velocity, but not
temperature or channel depth (multiple regression model
: adj . ? = 0.92,
F3,13 = 61 .83, P
< 0.01 ; Temperature
: t = 0.64, P = 0.53
; Velocity: t = 13.19, P < 0.01
; Depth: t = 1.23,
P
= 0.24)
. Using the regression model and continuous velocity data, I extrapolated catch
rates to the seasonal duration of drift
(i .e.,
1 May through 15 July) and channel volume
.
An estimated 32
.3 million fish drifted into LS during the 2004 sampling season (mean
catch = [33 .86 * velocity]
- 2 .91)
. Drift catch rates into LS were weakly but positively
correlated with ILR tow-derived densities during 2004 (P = 0
.02, r 2 = 0.36)
. During
2005, although drift was unrelated to abiotic variables, it was related to ambient larval
densities
. Drift into LS was positively related to ILR larval densities (P < 0
.
01
, ? =
0
.78), while LS larval tow-derived densities likely influenced catch rates of drift to the
river (P < 0 .01, r2 = 0.94)
. Therefore, abiotic factors influenced 2004 larval drift and
density affected 2005 drift
.
SIZE STRUCTURE OF LARVAL FISHES
Larval fish sizes differed between years and among sites
. Larger fish drifted out
of LS during 2004, while during 2005, larger fish drifted into LS (Table 11, Figure 15)
.
However, there were no differences in the size distribution of larvae caught in tows
upstream and downstream of LS in either year
. Higher river and channel velocities
during the flood pulse (2004) did not entrain larger fish into LS, and, regardless of net
direction (i.e.,
in versus out), larger fish occurred in drift nets during 2005 (KSa = 8
.01, P
< 0.01)
. Despite this change in size structure, larval sizes remained larger in the
backwater than the ILR regardless of year (Table 11, Figure 15)
. Furthermore, both
backwater and river yielded larger larval sizes during 2005 (LS
: KSa = 2 .53, P < 0.01 ;
ILR
: KSa = 10.55, P < 0.01) than 2004.
Lengths of fish drifting at the LS water control structure also varied among times
of day sampled (i.e.,
dawn, day, dusk, night) . Multiple pair-wise Kolmogorov-Smirnov
comparisons revealed a propensity for larger fish to drift at night than at other times
(Table 11)
. In 2004, fish were similarly sized during dawn, day, and dusk (Table 11,
Figure 16)
. Stronger diel patterns occurred during 2005, with night catch collecting the
largest fish and dusk, dawn, and day catches each sampling progressively smaller fish
(Table 11)
. Regardless of year, ichthyoplankton drifting at dawn, day, and dusk were
predominantly less than 8 mm TL, with cumulative percent frequencies between 74
-
80% for each time period in 2004, and between 56
- 82% in 2005
. Almost 70% of larvae
39
caught at night were 8 mm or greater (Figure 16)
. Therefore, during 2004 and 2005,
larger fish drifted at night between LS and the ILR
.
DISCUSSION
Seasonal lateral drift occurred at the restored connection between LS and the
lower ILR, with patterns shaped by the annual flood pulse and the fishes' life history
strategies
. The flood pulse concept specifies the importance of coupling increasing water
levels and temperatures to cue spawning and yield high recruitment of riverine fishes
(Junk et al
. 1989, Harvey 1987) . In this study, fish abundance in LS was similar
throughout two physically contrasting seasons, a flood and a non-flood year
. Fish
abundance estimates for the ILR were also similar between years
. Yet these abiotic
conditions induced a change in ambient family densities
(i.e.,
life history classes)
between 2004 and 2005, which may have influenced between-year variation in
magnitude, direction, and composition of lateral larval exchange
. During 2004, the large
pulse of larvae drifting into LS occurred with the rising flood waters, and exchange
between the river and backwater was temporally isolated to the flood event
. Similarly,
peak richness and lateral drift was synchronized, but not correlated, with peak densities
in the river and backwater during rising flood waters
. In contrast, drift had no net
directionality during 2005, and peak drift rates were less than half that of 2004
. Only
during 2005 were ambient larval densities positively correlated to drift rates,
demonstrating a strong biotic influence in the absence of the spring flood
.
The change in life history classes also conveys the significance of abiotic cues to
initiate and influence larval drift
. The propensity for fluvial dependents to drift into
40
41
backwaters during the flood year was likely related to the coupling of temperature and
flooding, while the relative absence of these species in the drift and the larval assemblage
was related to their decoupling during the non-flood year
. A lack of a spring flood pulse,
as seen during 2005, may have resulted in poor reproductive or recruitment of fluvial
dependents, where many of those taxa either did not reproduce or their eggs did not hatch
or develop successfully (Humphries and Lake 2000)
. Some between-year differences in
life history classes may be related to the strong reliance of fluvial dependents on annual
flood pulses.
Aside from the influence of abiotic cues on floodplain habitat use by fluvial
dependents, the ecological role of the restored LS, as it contributes to fish reproduction in
the river-floodplain, needs to be identified and evaluated
. In other large river systems,
slackwater areas contribute larvae and juveniles to the river such that densities
downstream of the backwater-river confluence become higher (Muth and Schmulbach
1984, Sheaffer and Nickum 1986)
. However, I did not find any difference in larval fish
densities in the river upstream or downstream of the backwater
. Substantial movement
between the backwater and river occurred, even though Swan Lake seemed to neither
function as
a major sink nor source of larvae
. Despite this, I believe LS to be a vital
component of the lower ILR, with potential benefits to the Mississippi River due to its
close proximity (USACE 1991) .
The low drift rates of macrohabitat generalists denote a behavioral component to
lateral drift, thereby discounting suspicions of LS acting solely as a sink
. The dominant
taxa in the larval assemblage were found in the drift (Jurajda 1995, Reichard et al
. 2001);
yet clupeids were less abundant in the 2004 drift than their ambient densities would have
42
warranted
. During 2005, macrohabitat generalists drifted in lower rates despite their
higher densities within the river and LS
. This under-representation of macrohabitat
generalists in the drift may be indicative of drift avoidance (Brown and Armstrong 1985,
Reichard et al. 2001)
. Ultimately, these findings imply a purposeful lateral drift pattern,
where some families avoid or are less prone to drift
.
Additional behavioral components of larval drift were reflected by diel and size
structure patterns
. Nocturnal lateral movement of larger individuals occurred during both
years, while higher catch rates at night only occurred during 2005
. Larvae, particularly
larger fish, may innately drift at the bottom during the day and move to the surface at
night to feed or evade predation (Gale and Mohr 1978, Muth and Schmulbach 1984,
Johnston et al. 1995). Carter et al
. (1986) captured larvae drifting in densities in the
Colorado River almost four times higher at night than during the day
. Other abiotic
factors, such as water clarity, likely drove interannual diel variations, where catch rates
showed no diel patterns during the flood year and were more apparent during low flow
when water transparency was likely higher (Reichard et al
. 2001, Araujo-Lima et al .
2001)
. Therefore, the diel patterns quantified in LS probably resulted from phototaxic
responses and changes in water clarity between years
.
Larger fish drifted out of LS during 2004 than 2005, which supports conventional
larval drift hypotheses, where backwaters function as nursery habitat, provide ideal
conditions for growth, and later become a source for age-0 fish (Sheaffer and Nickum
1986)
. Lateral drift during 2005 was not necessary as a life history strategy given that
the ILR offered amenable habitat similar to backwaters, with slow flows, warm habitat,
and high plankton densities (see Chapter 3)
. Furthermore, additional research on the
43
Swan Lake backwater complex showed that a large abundance of juvenile clupeids
emigrated from LS into the ILR during summer 2004, and juvenile sciaenid and moronid
fish during fall 2004 (Schultz 2006)
. Thus, it is my thought that larvae entering the
backwater or spawned in the backwater were able to feed and grow throughout the
season, eventually making an ontogenetic habitat shift by exiting the backwater sometime
that fall and recruiting to the river fishery (King 2004)
.
In restored systems, continuous connectivity should be maintained where
possible, as species use the floodplain throughout the spring and summer
. Limiting
backwater access or reducing river access could impair the recruitment potential of
certain species, such as fluvial dependents, eventually leading to a less diverse riverine
fish community (Turner et al
. 1994)
. Historically, the LS connection to the ILR was
about 99% wider than its post-restoration state, and likely permitted gradual changes in
water level, direction, and velocity
. Currently, water levels lag behind the river, and
typically flow directions and velocities change multiple times per day
. Velocities are
most likely higher through the restricted channel, especially during flood pulses
. It is
possible that the narrowed connection has negatively altered lateral movement of fishes
through the stop-log structure, and that changes in water patterns since the stop-log
structure construction have altered exchange patterns
.
Although I have no larval exchange information from natural systems, the
restricted channel connection between LS and the ILR did not seem to hinder fish
movement (Schultz 2006)
. Instead, one effect of the narrowed channel connection
between LS and the ILR on larval fishes may be to concentrate larvae as they are
transported
; however it is unknown whether this concentration of fishes would have a
44
compensatory or depensatory effect on survival, if any
. Few studies have evaluated
restoration techniques and their influence on fish early life stages
. A marine study
demonstrated the efficacy of artificial channels in permitting larval exchange between
estuarine and ocean habitats, showing a similar number of species and concentration
between an artificial and natural estuary-ocean channel, despite a large difference in the
topography and volume of water passing through the channels (Young and Potter 2003)
.
Further research efforts should focus on the effects of interannual variability on drift
patterns (Johnston et al
. 1995), as well as investigate exchange between natural
backwaters and riverine habitat
. Although potentially tedious, studies investigating
lateral movement of ichthyoplankton to backwaters or tributaries should be conducted to
improve energy exchange estimates of river-floodplain systems and enable us to estimate
contribution and productivity of backwater systems to the river
.
This study was unique, as no other study has quantified lateral larval drift in a
river-floodplain system
. Lateral drift is an important component of fishes' life history in
lotic systems, but these strategies and ontogenetic habitat changes may not withstand the
anthropogenic disturbances in our streams and rivers, such as levees and impoundments
.
Altered hydrology may affect larval drift ecology and influence recruitment of fishes
.
This study has shown that lateral drift patterns may be related to the flood pulse, but in
the absence of a flood, the ambient biotic assemblage could influence drift timing,
magnitude, and composition
. Generally, Swan Lake's restoration appears to have
successfully altered the backwater for multiple-use management while maintaining river
connectivity and allowing exchange between the backwater and river to occur
.
Ultimately, future conservation efforts aimed at restoring hydrology should not focus on
one particular habitat, but should equally consider main channel, floodplain, and tributary
habitats (Galat and Zweimuller 2001)
.
45
CHAPTER 4
MANAGEMENT IMPLICATIONS
I completed two objectives in this study
: (1) to assess the benefit of a restored
backwater system relative to an unrestored, manipulated backwater by quantifying the
response of larval fish communities, and (2) to investigate the interplay of life history
strategies with lateral drift dynamics on a diet and seasonal basis within a restored
backwater system
. The following evaluations were made on tested hypotheses
:
i) Backwater sites, whether restored or unrestored, were used as spawning
and nursery habitats in higher densities during both years than river
segments sampled
. During 2004, the Illinois River (ILR) was used almost
exclusively as spawning habitat, based on the larval size structures
.
However, during 2005, the non-flood year, size structures in the ILR
indicated those river segments were being used as both spawning and
nursery habitat .
ii) Seasonal abundances of larval fishes varied among sites, but this variation
was not solely due to backwater-river connectivity
. Middle Swan (MS)
experienced the highest larval fish densities during both years, but had
limited river connectivity
. I believe high larval fish densities can be
attributed to the annual drawdowns that promoted aquatic vegetation as
well as the brief periods of connectivity
.
iii) Family composition, described by the life history classification, varied
among sites and between years
. During 2004, the ILR and
46
47
MS had high densities of fluvial dependent larval fishes compared to
Lower Swan (LS) and Calhoun Point
(CP), which were dominated by
macrohabitat generalists
. Despite LS having the highest river
connectivity, macrohabitat generalists dominated the assemblage during
both years
. Fluvial dependent taxa were relatively absent in all sites
during 2005, the non-flood year
.
iv) Larval exchange occurred between the restored backwater, LS, and the
lower ILR
. However, the influx of larvae into the backwater occurred
only during 2004 and was more related to velocity than to water
temperatures or river stage
. Although drift rates were not different
between years, timing and composition seemed more related to ambient
larval densities in the ILR and LS than abiotic conditions
(i .e.,
water
temperature, water depth, velocity) .
v) Although Swan Lake is a major backwater of the lower ILR, density
differences between river segments upstream and downstream of the
backwater-river confluence did not occur
. It is unclear whether restriction
of the LS-ILR confluence affected the magnitude of larval movement
between the river and backwater
. It may have reduced larval movement or
may have concentrated larvae moving through the connection
.
vi) Diel periodicity in larval drift patterns occurred at the LS-ILR confluence
.
During both years, larval fish drifting at night were larger than those
drifting at other times of day
. During the non-flood year, larval fishes also
drifted in higher rates at night
.
48
The results from this study were intended to provide researchers and managers
with information on the role restored backwaters play in the life history strategies of
larval fishes and to help guide the development of future backwater management and
restoration programs
.
In restored systems, continuous connectivity should be maintained where
possible, as species use the floodplain throughout the spring and summer
. Limiting
backwater access could impair the survival of some families, such as fluvial dependents
that require multiple habitat types to complete their life history, eventually leading to a
less diverse river fish community
. Connectivity in the Swan Lake HREP was preserved
through the construction of water control stop-log structures
. These fixed structures
either created new river connections or severely restricted original river confluences
.
The effect of the narrowed channels on larval movement between the river and
backwaters cannot be assessed due to the lack of information on natural systems
. Despite
this, the Swan Lake HREP appears to have successfully restored the backwater while still
maintaining its river connectivity.
In addition to reconnecting the floodplain to the river, natural flood pulses serve
an important biological role in river ecosystems
.
The flood pulse concept specifies
the importance of coupling increasing water levels with rising temperatures during spring
to cue spawning and yield high recruitment of fishes
. In this study, fish production in LS
and the ILR was similar throughout two physically contrasting seasons, a flood and a
non-flood year
. These abiotic conditions induced a change in ambient family densities
between 2004 and 2005, which may have influenced between-year variation in
magnitude, direction and composition of lateral larval exchange
. A lack of a spring flood
49
pulse, as seen during 2004, may have reduced reproduction or recruitment of fluvial
dependents.
Although river connectivity is an important attribute of backwaters and should not
be overlooked, maintaining this connectivity might not be enough to ensure successful
habitat restoration
. Increasing the habitat heterogeneity through system-wide
management regimes can positively influence larval fishes and other target organisms by
directly impacting organic matter and macroinvertebrate and zooplankton densities (Flinn
et al. 2005)
. Often, natural backwaters go through an annual succession from lotic to
lentic conditions, thereby accommodating several life history strategies and promoting
species richness (Aarts et al . 2004)
. Restored systems that are drawn down to consolidate
sediments and promote vegetation growth also have greater water clarity and will likely
be productive areas for aquatic vegetation and zooplankton (Flinn et al
. 2005)
. By
increasing food resources and offering protective refuge, river restoration schemes aimed
at enhancing habitat diversity in off-channel areas can have similar beneficial effects by
creating a stable, diverse, and abundant age-0 fish community (Pezold 1998, Langler and
Smith 2001) .
However, research conducted to establish the role of off-channel habitat in fish
recruitment (Langler and Smith 2001) and to determine the function of connectivity in
recruitment models is still necessary
. Schultz (2006) showed that because LS was
continuously connected to the ILR, mass emigrations of juvenile fishes could occur
during the late summer and fall
. Additionally, restoration projects should not be viewed
as sustainable once completed
. Natural floodplain succession is stifled by an
immobilized main channel, so restored and unrestored backwater systems must be
50
actively managed to prevent sedimentation from degrading the habitat (Lusk et al
. 2003,
Aarts et al
. 2004) .
Therefore, human restoration and management of floodplain habitat can
potentially create valuable spawning and nursery areas for many fish species, and offer
the necessary habitat diversity lost since the degradation of natural floodplain regions
(Grift et al
. 2003). These alterations can restore fragmented areas, providing
macrohabitats in proximity, thereby meeting specific requirements of riverine species
early life stages (e.g.,
fluvial specialists, fluvial dependents
; Aarts et al . 2004). Also, the
important interplay among hydrologic patterns, habitat quality and availability, and the
ontogeny of larval fish in river-floodplain systems should be noted, where flood regimes
influence family composition and production improves with habitat diversity
. Our
continued attention to river connectivity is paramount, but the importance of habitat
heterogeneity in larval production and assemblage structure should not be neglected
.
Table 1
. Fish families commonly found in the Illinois River basin grouped into one of
three life history classes (e.g.,
Nelson 1994, Dettmers et al
. 2001, and Galat and
Zweimuller 2001), fluvial specialists
(FS), fluvial dependents (FD),
and macrohabitat
generalists (MG) .
51
Life History
Life History
Family
Class
Family
Class
Acipenseridae
FS
Hiodontidae
FD
Amiidae
MG
Ictaluridae
MG
Anguillidae
MG
Lepisosteidae
MG
Aphredoderidae
MG
Moronidae
FD
Atherinidae
MG
Percidae
MG
Catostomidae
FD
Percopsidae
MG
Centrarchidae
MG
Petromyzontidae
FD
Clupeidae
MG
Poeciliidae
MG
Cyprinidae
FD
Polyodontidae
FD
Esocidae
MG
Sciaenidae
FD
Fundulidae
MG
Umbridae
MG
Gadidae
MG
52
Table 2. Monthly means (± SE) for abiotic variables (temperature [°C],
dissolved oxygen [DO, mg/L], water depth [m], secchi depth
[cm], wind speed [km/h], channel velocity [m/s]) collected at sites during 2004 in the Illinois River system
.
Site
Temp
DO
Depth
Secchi
Wind
Velocity
Illinois River
March-04
7.81 (0.56)
7.58
(0.98)
22.6 (0.6)
7.0 (2.2)
April-04
11.22 (1 .10)
7.86 (0.24)
6.25 (1 .75)
27.5 (5.5)
9.2 (1 .3)
0.46
(0.07)
May-04
18.62 (1 .07) 5.03 (0.70)
6.07
(0.54) 25.2 (4.2)
6.4 (1 .3)
0.54
(0.15)
June-04
23 .28 (0.44)
4.49 (0.80)
7.89
(0.14) 23.6 (3.7)
8.3 (2.2)
0.63
(0.11)
July-04
25 .91 (0.54)
3 .61 (0.15)
6.62 (0.34) 30.3 (3.1)
7.0
(0.8)
0.55
(0.13)
August-04
26.87 (0.87)
3 .85 (0.13)
6.44 (0.69)
29.1 (0.7)
8.4 (3 .3)
0.19
(0.07)
September-04
23 .77
8 .18 (0.35)
6.81 (0.57)
25.6 (2.4)
7.7 (1 .0)
0.08
Lower
Swan
March-04
13.90 (1.75)
7.26 (1 .00)
0.87 (0.25)
15.3 (1 .9)
13 .6 (2.7)
April-04
16.42 (2.30)
8.02 (0.55)
0.77 (0.03)
23.2 (0.5)
9.0 (1 .6)
May-04
22.03 (1.31)
6.31 (0.55)
1 .01 (0.07)
19.5 (1 .2)
8 .2 (1
.8)
June-04
25.05 (1 .08)
8.61 (1 .53)
2.09 (0.10)
32.7 (1 .5)
6.8 (1 .3)
July-04
27.58 (0.77)
6.30 (0.65)
0.96
(0.20)
22.7 (3 .5)
4.7 (0.6)
August-04
24 .02 (0.64)
3 .78 (0.27)
0.70 (0.14)
14.3 (0 .8)
6.3 (3 .0)
September-04
20 .24 (0.64)
5.08 (1 .03)
0.77 (0.03)
14.1 (1 .4)
6.4 (0.6)
Middle Swan
March-04
7.64 (0 .95)
1 .33
(0.05)
25 .6 (7.6)
4.0 (0.4)
April-04
14.40 (0.76)
9.53 (0.65)
1 .26 (0.06)
27.8
(1 .0)
10.0 (2.1)
May-04
22.29 (2.01)
6.50 (0.54)
1 .13
(0.10)
24.1
(3 .5)
7.8 (2.4)
June-04
25 .18 (0.96)
8.08 (1 .73)
2.03
(0.17)
34.5 (2.2)
9.6 (1 .4)
July-04
28.41 (1 .35)
7.46 (0.86)
1 .25 (0.26)
33 .6 (6.2)
7.6 (1 .1)
Calhoun Point
March-04
7.12 (0.42)
0.68 (0.33)
28.0 (1 .0)
9.3 (5 .4)
April-04
6.13 (0.05)
0 .80 (0.00)
19.0 (1 .0)
12.9 (5 .7)
May-04
25.27
4.97 (1 .27)
0 .82
(0.08)
19.6 (0.6)
12.6 (0.3)
June-04
24.85 (1 .80)
6.00 (3.31)
1 .45 (0.20)
44.1 (18 .4)
4.7
(3
.5)
July-04
29 .34 (2.44)
7.10 (0.96)
0.79
(0.11)
29 .1 (3.6)
6.0 (1 .9)
August-04
26.63 (0.82)
5.15 (0.70)
0.77 (0.03)
18 .3 (0.8)
8.9 (2.3)
September-04
21 .34
4.45 (0.05)
0.83
(0.02)
19 .0 (1 .0)
14.5 (0.6)
53
Table 3 . Monthly means (± SE) for abiotic variables (temperature [°C],
dissolved oxygen [DO, mg/L], water depth
[m], secchi depth
[cm],
average wind speed [km/h], channel velocity [m/s]) collected at tow sites during 2005 in the Illinois River system
.
Site
Temp
DO
Depth
Secchi
Wind
Velocity
Illinois River
March-05
6.57
5.25 (0.75)
27.0
(3.0)
14.5 (0.4)
0.44
April-05
15 .16 (1 .37)
6.66 (1 .77)
6.91 (0.41)
28.9 (6.6)
9.9 (1.9)
0.50 (0.06)
May-05
18 .68 (1 .72)
9.66 (2.19)
6.51 (0.22)
18 .1 (4.3)
10.1 (1.1)
0.37 (0.03)
June-05
26.64 (1 .10)
9.69 (1 .15)
6.36 (0.22)
25.6 (1.3)
5.8 (1 .3)
0.16 (0.03)
July-05
29.60 (0.36)
7.04 (0.51)
6.00 (0.14)
24.9 (1 .9)
4.6 (0.7)
0.15 (0.04)
August-05
28.44 (0.53)
6.78 (1 .24)
6.50
(0.23)
25 .9 (3 .2)
6.1 (2.1)
0.12 (0.04)
September-05
26.65
8.94 (0.31)
6.13 (1 .38)
25 .1 (0.6)
3 .4 (1 .1)
0.15
Lower Swan
March-05
8.86 (0.33)
0.78 (0.03)
12.5
(0.2)
7 .7 (2.7)
April-05
16 .15 (2.18)
8.31 (1 .42)
2.11 (1.37)
15.3 (1 .8)
13 .2 (0.7)
May-05
20 .94
(2.35)
9.25 (1 .32)
0.75 (0.03)
14.5 (1 .8)
8 .9
(1 .7)
June-05
27 .09 (0.62)
10 .02 (1 .61)
0.73 (0.04)
14.4 (0.6)
5 .0 (3 .2)
July-05
29
.47 (1 .34)
9 .54 (1 .27)
0.68 (0.06)
14.5 (1 .2)
7.1 (1 .2)
August-05
27 .53 (1 .31)
5 .76 (1 .18)
0.73 (0.04)
13.5 (1 .0)
5 .6 (1 .3)
September-05
26.62
12 .72 (1 .65)
0.70 (0.09)
13 .3 (0.5)
4.5
(1
.4)
Middle Swan
March-05
7.74
1 .08 (0.21)
23 .3 (1 .2)
9.1
(2.5)
April-05
16 .81 (1 .89)
8.31 (1 .40)
0.95 (0.07)
20.9 (1 .6) 12.3
(2.4)
May-05
21 .45 (2.34)
9.25 (1.13)
0.89 (0.07)
21 .5 (0.5)
8.6 (2.0)
June-05
27.54 (0.91)
7.45 (1.26)
0.97 (0.03)
19 .1 (2.4)
7.6 (2.0)
54
Table 4
. Site comparisons tested for overall differences in larval densities during 2004
and 2005 among Calhoun Point (CP),
the Illinois River (ILR), Lower Swan (LS), and
Middle Swan (MS), with adjusted P-values .
Site Comparison
t
df
P
2004
CP vs. ILR
1 .61
48.1
0.38
CP vs. LS
-1
.50
48.3
0.45
CP vs. MS
-2.51
48.0
0.07
ILR vs. LS
-4.04
46.6
< 0.01
ILR vs. MS
-4.85
47.7
< 0.01
LS vs. MS
-1
.32
47.7
0.55
2005
ILR vs. LS
-4
.43
35 .3
< 0.01
ILR vs. MS
-7
.11
36 .6
< 0.01
LS
vs. MS
-3.07
37.5
0.01
Table 5
. Comparisons of stratified transects within each site for 2004 and 2005
in the
lower Illinois River system, where backwater systems had inshore and offshore transects
(Calhoun Point [CP],
Lower Swan [LS],
and Middle Swan [MS]), and the Illinois River
(ILR) had upstream and downstream transects at CP and LS
.
55
Within-Site Comparison
t
df
P
Inshore vs. offshore
CP 2004
0.72
11 .0
0.49
LS 2004
-2.08
18.9
0.05
LS 2005
-0.66
18.0
0.52
MS 2004
-1 .96
13.8
0.07
MS 2005
-1 .49
12.2
0.16
Upstream vs. downstream
ILR at CP 2004
-0.04
10.0
0.97
ILR at LS 2004
0.94
22.0
0.36
ILR at LS 2005
-0.27
22.0
0.79
56
Table 6
. Fish families grouped into one of three life history classes (e .g.,
Galat and
Zweimuller 2001) with percent of total catch during 2004 and 2005 for the Illinois River
(ILR), Lower Swan (LS), Middle Swan
(MS), and Calhoun Point (CP).
2004 % Catch
2005 % Catch
Family
ILR
LS
MS
CP
ILR
LS
Fluvial Specialist
0.0
0.0
0.0
0.0
0.0
0.0
Fluvial Dependent
Catostomidae
1 .1
0.2
24.7
0.0
0.3
0.2
Cyprinidae
5.7
2.2
5 .2
4.2
7.8
3 .1
Hiodontidae
0.0
0.0
< 0.1
0.0
0.0
0.0
Moronidae
1 .1
< 0.1
0.0
< 0.1
0.1
< 0.1
Sciaenidae
34.0
0.2
< 0.1
0.0
0.6
0.7
Macrohabitat Generalist
Atherinidae
< 0.1
< 0.1
0.0
0.5
0.2
0.2
Centrarchidae
1
.5
1 .9
2.3
8.5
1 .3
0.6
Clupeidae
56.4
95 .4
67.5
86.8
89.6
94.9
Gasterosteidae
< 0.1
0.0
0.0
0.0
0.0
0.0
Ictaluridae
0.0
0.0
0.0
0.0
0.0
< 0.1
Lepisosteidae
< 0.1
< 0.1
0.2
< 0.1
0.0
0.0
Percidae
0.0
< 0.1
0.0
0.0
0.0
0.0
Poeciliidae
< 0.1
< 0.1
< 0.1
0.1
< 0.1
0.4
Total N
8,086
48,390 105,906 11,500
4,476 56,033
57
Table 7. Length analysis of larval fish caught in Lower Swan
(LS), Middle Swan
(MS),
Calhoun Point
(CP), and the Illinois River (ILR) using Kolmogorov-Smirnov pairwise
comparisons, with results listed for sites or years that collected larger-sized
fish. MS was
drawn down before the end of the 2004 sampling season
. Therefore, pairwise
comparisons with this site were conducted on truncated data sets that included only
samples taken on before 23 July 2004
.
* Indicates significant differences between treatments, where P
< a or a".
Site Comparison
KSa
P
Results
2004
a"-value = 0.008, Bonferroni adjusted
LS
vs. MS
4.67
< 0.001 *
MS
LS
vs. CP
3 .49
< 0.001 *
CP
LS
vs.
ILR
8.83
< 0.001
*
LS
MS vs. CP
1.74
0.005*
CP
MS vs.
ILR
12.79
< 0.001 *
MS
CP
vs. ILR
11 .54
< 0.001 *
CP
2005
ce-value = 0.05, not adjusted
LS
vs. ILR
5 .37
<0 .01*
LS
2004
vs. 2005
LS
2.53
< 0.01 *
2005
ILR
10.55
<0 .01*
2005
58
Table 8
. Mean zooplankton density (#/L) ±1
SE by taxa described as a percent of the
total annual density for each site in 2004 and 2005
.
Cladoceran
Copepod
Nauplii
Rotifer
Site
Density
(SE)
o
/o
Density
(SE)
o/o
Density
(SE)
o o
Density
(SE)
o o
2004
Illinois
0.20
< 0.1
1 .53
< 0.1
28.79
0'6
River
(0
.08)
(0 .45)
(7 .38)
(2753)
4868
99.4
LowerSwan
(0
0
.04)
.15
< 0.1
(0
1.14
.35)
0.1
35
(7.87)
.00 1.8
1897
(365)
98.1
MiddleSwan
(0
1 .10
.54)
0.1
(3
8
.90)
.47
0.4
105
(36.22)
.54
4.8
2101
(542)
94.8
CalhounPoint
(0
0
.09)
.32
< 0.1
(0
0
.38)
.98
< 0.1
(13
40
.00)
.50
1 .6
2443
(745)
98.3
2005
Illinois
0.87
0.69
11 .04
1888
River
(0 .31)
0 ' 1
(0.23)
<0.1
(3 .29) 0 '6
(241)
99.3
Lower
0.31
< 0.1
1 .74
0.1
61 .97
1 .6
3774 98.3
Swan
(0 .08)
(0
.56)
(23.65)
(618)
N
Catch (#/minute)
59
Table 9
. Drift of fish during 2004 and 2005 in Swan Lake, Illinois River, with net sets
averaged by time period (standard error represents ±1 of mean catch rate)
.
Note
: Night net sets were not conducted during rising flood waters during 2004, which
reduced net set count and likely mean night catch rate
.
Year
Time of day
Net sets
Fish
Mean ± SE
2004 Dawn (0450-0711)
24
1,956
1 .80± 1 .76
Day
(1215-1500)
24
2,551
2 .38±2.00
Dusk (1815-2050)
22
1,137
0.96 ± 0.94
Night (0000-0110)
20
112
0.12 ± 0.08
2005 Dawn (0450 - 0640)
24
490
0.45 ± 0.42
Day (1145 -1435)
23
77
0.07 ± 0.05
Dusk
(1815-2110)
26
70
0.06±0.04
Night (2340-0110)
20
869
0.93+0.79
Table 10
. Fish families grouped into one of three life history classes (Galat and
Zweimuller 2001) with percent of total catch during 2004 and 2005 by gear
. Drift net
total catch for 2004 : N= 5,756; for 2005 : N= 1,506
. Tow net total catch for 2004 : N=
56,476; for 2005 : N= 60,509
. No fluvial specialists were caught in either drift or tow
nets .
60
2004
2005
Family
Drift Nets Tow Nets
Drift Nets Tow Nets
Fluvial Specialist
0.0%
0.0%
0.0%
0.0%
Fluvial Dependent
Catostomidae
8 .4%
0 .3%
1 .6%
0.2%
Cyprinidae
28.8%
2 .7%
1 .0%
4.9%
Moronidae
0.2%
0.2%
0.0%
<0.1%
Sciaenidae
31
.0%
5.0%
2.2%
0.4%
Macrohabitat Generalist
Atherinidae
0.0%
< 0.1%
0.0%
0.2%
Centrarchidae
0.3%
1 .8%
0.7%
1 .1%
Clupeidae
30.6%
89.8%
92.6%
92.5%
Gasterosteidae
0.0%
<0.1%
0.1%
0 .0%
Ictaluridae
0.0%
0.0%
0.5%
< 0.1%
Lepisosteidae
0.1%
< 0.1%
0.0%
0.0%
Percidae
< 0.1%
< 0.1%
0.1%
0.0%
Poeciliidae
< 0.1%
< 0.1%
1 .2%
0.6%
61
Table 11 . Kolmogorov-Smimov tests for 2004 and 2005 pooled diel drift net data and
Lower Swan Lake (LS) and the Illinois River (ILR) larval tow data . Test results are
listed for treatments which collected significantly larger-sized fish .
* Indicates significant differences between treatments, where
P :5 a or a"
.
Treatment
2004
2005
KSa
P
Result
KSa
P
Result
IN vs
. OUT
10.91 <0.01*
Out
4.41
0.01*
In
LS vs. ILR
8 .83 <0.01*
LS
5.37 < 0.01*
LS
NIGHT vs
. DAWN 9.48 < 0.001* Night
7.78 < 0.001* Night
NIGHT vs. DAY
9.57 < 0.001
Night
11 .99 < 0.001* Night
NIGHT vs. DUSK 10.93 <0.001* Night
2.55
< 0.001
*
Night
DAWN vs. DAY
0.56 0.914
9.70 < 0.001* Dawn
DAWN vs
. DUSK
2.03 < 0.001 Dusk
6.06 < 0.001* Dusk
DAY vs . DUSK
1 .48 0.026
4.74
< 0.001* Dusk
2 km
Mississippi River
62
Figure 1
. Study site of the lower Illinois River and two major backwaters, Swan Lake
and Calhoun Point.
Oct-04 Feb-05 Jun-05
Oct-05
Time (d)
Figure 2 . Mean daily temperature of Illinois River and backwater sites during 2004
through 2005, depicted as solid gray lines
. Mean daily depth data are depicted as broken
black lines for the Illinois River and Lower Swan
. Channel depth of Lower Swan was
recorded using a submerged device at the stop-log structure
. River data were collected at
Hardin, Illinois, USA (river kilometer 34
.4)
. Depth was not recorded for Middle Swan
and Calhoun Point
. Shaded regions represent sampling periods
.
63
40
131
E
30
130
wa7
20
129
a)
10
128
i
0
127
Low temperature 4
High DO
High temperature
Low DO
2
-2 -
-4
-4
O Illinois River
A Lower Swan
V Middle Swan
A
•
Calhoun Point
0
:A
0
4V
AZ 0
0o% it ct
, I
0 L,
VAA+--
A4
0
El
f
00
V
0
0 0
High depth
High secchi
Low wind
-2
0
Axis 1
2
4
Low depth
Low secchi
High wind
64
Figure 3
. Principle component analysis (PCA) of abiotic variables for the lower Illinois
River (0) and backwater sites, Lower Swan (A),
Middle Swan (V), and Calhoun Point
( •). Weekly means of abiotic variables were included in the analysis
: temperature
(°C),
dissolved oxygen (DO, mg/L), depth (m),
secchi depth (cm),
and wind (km/h) .
500
400
300
200
100
0
Apr-04
Jun-04 Aug-04 Oct-04
65
Time (d)
Figure 4 . Mean density (#/m3 )
per day of fish caught in the lower Illinois River during
2004 and 2005
. Error bars represent ±1 standard error of the mean transect density
.
Calhoun Point was not sampled during 2005 because of low water levels
.
20041
Illinois River
22005J
Illinois River
2004
Lower Swan
2005
Lower Swan
5*
4 }
2004
2005
Middle Swan
Middle Swan
4
2004
Calhoun Point
Apr-05 Jun-05 Aug-05 Oct-05
400
20
10
0
400
300
M
200
100
1'
0
N
dJ
C
400
C
300
200
100
0
20
M1
E
5
0
FS FD MG
FS
Habitat Use Class
FD MG
66
Figure 5. Fluvial specialist (FS), fluvial dependent (FD),
and macrohabitat generalist
(MG) mean densities by site and year in the lower Illinois River system
. Error bars
represent t1 standard error of the mean of dates sampled during that year
.
Illinois River
Middle Swan
2004
15
∎
2005
10
Lower Swan
Calhoun Point
IL,
LL
CC4f7
a
0
40
30
20
10
0
30
2004
Illinois River
Avg . N = 2.757
Mean = 9.6 m m
Median = 5.5
mm
S .O . = 9.0 MM
k
A
2005
Illinois River
Avg . N = 3,112
Mean= 10.9
mm
Median = 7.2 mm
S .D . = 10.6 mm
2004
Lower Swan
Avg . N = 23,432
Mean = 18.2 mm
Median = 13.4
mm
S .D . = 15.7 mm
2005
Lower Swan
Avg . N = 21,421
Mean = 19.2 mm
Median= 12
.7 mm
S .D . = 15.3 mm
20 40
2004
Calhoun Point
Avg. N = 6,588
Mean = 13.8 mm
Median = 9.7
mm
S .D . = 11 .5 mm
60
80
100
67
Length group (mm)
Figure 6 .
Length frequency distributions of all larval and juvenile fish caught in each site
in of the lower Illinois River system during 2004 and 2005
. Sample size is an average of
transects within that site summed over the sampling season
. Length frequencies are
expressed as a percentage of average catch
. Middle Swan samples were not collected
after 23 July 2004
. During 2005, lengths were collected in Middle Swan samples, and
Calhoun Point was too shallow to be sampled
. Descriptive statistics were calculated on
raw length data .
2004
20
40
60
80
100
Middle Swan
Avg
. N = 36,991
Mean = 15 .8 mm /
Median = 13
.6 mm
S .D . = 10 .9 mm
200
150
100
50
0
150
100 -
200
0
150 -
100
50 -
Time (d)
68
Figure 7
. Mean density (#/L) of cladocerans, copepods, nauplii, and other zooplankters
per day in each site of the lower Illinois River system through 2004 and 2005
. Error bars
represent ±1 standard error of the mean of transects sampled that day
. Middle Swan
samples were not collected after 23 July 2004
. During 2005, zooplankton data were not
identified for Middle Swan and no zooplankton samples were taken in Calhoun Point
.
-
Illinois
2004
River -
Illinois
•
2005
River
2004
2005
Lower Swan
f
Lower Swan
f,**,* 1 }+
to
.+•+
+ •
f
f+
2004
Apr-05 Jun-05 Aug-05
Oct-05
j
Middle Swan
~j
T
.-.
j
2004
j 1
Calhoun Point
7
4 ••}
Apr-04 Jun-04 Au g04 Oct-04
12000
10000
8000
6000
4000
2000
8000
6000
4000
2000
0
0
9
00
0
00
0
Apr-04
Jun-04
Aug-04
Oct-04
Time (d)
Figure 8
. Mean density (#/L) of rotifers per day in each site of the lower Illinois River
through 2004 and 2005
. Error bars represent tl standard error of the mean of transects
sampled that day
. Middle Swan samples were not collected after 23 July 2004
. In 2005,
zooplankton data were not identified for Middle Swan and no zooplankton samples were
taken in Calhoun Point
.
69
2004
Illinois River
2005
Illinois River
I
0
0
0
4
060
0
4
41
0
00 000
00
2004
.
Lower
Swan
2005
Lower wan
4,
00
f
o
~
00
o
0
~~
J o
O 0
2004
Apr-05 Jun-05 Aug-05
Oct-05
0
Middle Swan
0000
$§
0
2004
Calhoun Point
0
10000
8000
6000
J
40002000
Yy
0
CCD 10000
O
8000
6000
4000
2000
0
10000
Access road
H5m
Illinois
River
(Flow direction)
70
Figure 9
. Fixed drift net site during 2004 and 2005 on the lower Illinois River (top inset)
.
Tandem nets were floated on the Lower Swan (LS) side of the stop-log water control
structure
. Schematic depicts nets sampling larval fish drifting out of LS
.
Bottom inset
portrays the drift net frame positioned to sample larval fish drifting into LS
.
oU
20
a)
N
10
CL
)
1
0
127
I-a)
I
5 ^
30
4 ta
20
3 a
2
C
10
1C
N
00
0
Feb-04
Jun-04
Oct-04
Feb-05 Jun-05
Oct-05
71
^
Time (d)
Figure 10 . Mean daily temperature of the Illinois
River and Lower Swan for 2004 and
2005, depicted as solid gray lines
. Mean daily depth data are depicted as broken black
lines
. Channel depth of Lower Swan was recorded
at the stop-log structure between the
backwater and the river . River stage and temperature
data were collected at Hardin,
Illinois, USA (river kilometer 34
.4).
Shaded regions represent sampling periods .
Time (d)
Figure 11
. Mean daily depth (top) and differential velocity (bottom) measurements in the
channel between Swan Lake and the Illinois River
. Differential velocity was calculated
as the sum of mean channel velocities per day
(i.e., the sum of 48 values)
. Positive
velocity values represent net inflow of water into Swan Lake and negative values
correspond to net outflow to the river
. Continuous data were recorded using a submerged
device anchored at the stop-log structure
. No depth data were collected from September
through November 2004, and no velocity data were collected from October 2004 through
April 2005 . Shaded regions represent the 2004 and 2005 sampling periods
.
72
3
G)
2-
*
1
C
1-
0
0
75 -
2005
4
s
20 -
3
V
15-
5-
1
0
0
March April
May
June
July August
Time (d)
73
Figure 12 . Drift of ichthyoplankton into
(•) and out (0) of Swan Lake in
2004 and
2005 . Symbols represent
mean catch (#/minute) per
net set and line data represent
continuous depth data recorded at the stop-log structure
. Error bars represent ±1
standard
error for the mean of each net set.
200
150 -
•
Illinois River
O Swan Lake
0
2004
30 -
20 -
10-
0
March April May
June
July
August
Time (d)
Figure 13
. Mean density (#/m3)
per day of fish caught in the Illinois River and Swan
Lake during 2004 and 2005
. Error bars represent ±1 standard error of the mean transect
density .
74
.~
C
E
M
8 .0
6 .0
0 .6
0 .4
0 .2
6 .0
0 .6
0 .4
0 .2
0 .0
75
FS
FD
MG
FS
Habitat Use Classes
FD MG
Figure 14
. Mean catch rate (#/minute) of fish in three early life history classes drifting
into and out of Swan Lake and mean density (#/m3)
of classes in the Illinois River and
Swan Lake during 2004 and 2005
. All families were included and grouped into one of
three early life history classes as defined by Galat and Zweimuller (2001)
: fluvial
specialists (FS),
fluvial dependents (FD),
and macrohabitat generalists (MG) .
Error bars
represent f 1 standard error of the mean
.
Drift Into Swan
2004
2005
6.0
0 .2
Drift Out of Swan
~
0.1
Illinois River
Swan Lake
6.0
4.0-
2.0-
UC0)0Q
N
U ..
0
40
30
20
10
0
30
10
5
30
20
10
0
30
20
10
0
0
20
40
60
0
20
Length group (mm)
40
60
80
76
Figure 15
. Length frequency distributions of all larval and juvenile fish caught in the
Illinois River, Lower Swan, and in the drift during 2004 and 2005
. Sample size is an
average of transects or nets within that site summed over the sampling season for larval
tow data or drift data, respectively
. Length frequencies are expressed as a percentage of
the average caught
. Descriptive statistics were calculated on raw length data
.
Illinois
2004
River
Avg . N=2 .757
Mean =9.6 mm
Median 5.5 mm
S .D . = 9.0 mm
2005
Illinois River
Avg
. N=3,112
Mean = 10.9 mm
Median 7 .2 mm
S .D . = 10.6 mm
2004
Lower Swan
Avg . N = 23,432
Mean = 18,2 MM
Median 13 .4 mm
S .D . = 15.7
mm
Lower Swan
2005
Avg
. N = 21,421
Mean= 19,2 MM
Median 12 .7 mm
S .D . = 15.3
mm
2004
Drift Into
Avg . N = 2,213
Mean = 7.9 mm
Median 7.4 mm
S .D . = 5.4
mm
2005
Drift Into
Avg . N
= 410
Mean = 8.3 m m
Median 6.9 mm
S .D . = 4.1 mm
2004
2005
Drift Out
Drift Out
Avg . N =
185
Avg . N = 296
Mean =8.0 mm
Mean = 9 .2 mm
Median 7.6 mm
Median 7.8 mm
S .D . =4.6 mm
S.D . =4 .8 mm
10 20
30
40
0
10
20
Length group (mm)
40 50
77
Figure 16
. Length frequency distributions of all fish caught drifting during each time of
day for 2004 and 2005
. Data of fish drifting into and out of Lower Swan were pooled by
time of day (i.e., dawn, day, dusk, night)
. Length frequencies are expressed as a
percentage of the mean number per net set (i
.e., mean of three nets) summed over the
sampling season
. Descriptive statistics were calculated on raw length data
.
2004-Dawn
Avg . N= 693
Mew =7.7mm
Median=7.5mrr
S .D. =6.2mm
.
2005-Dawn
Avg. N= 217
Mean=9.7rrm
Medan=7.2nm
S .D. =4.8rrm
2004-Day
Avg. N=1,243,
Mean= 7.2rrr
Median=7.2mrr
S .D. =2.8mrr
2005 - Day
Avg. N=41
Mean= 6 .5nm
Median= 6 .4nm
S .D.=1 .4mn
2004 - Dusk
Avg . N= 406 .
Mean= 8 .5mrr
Median= 7
.2mrr
k~~_
10_63mw
.
. .S.D.=5.6mn
2005-Dusk
Avg. N= 39
Mean=7
.7mn
Medan=6 .3mm
k
1l
1
2004-Night
2005-Night
Avg. N= 57
Avg . N= 409
Mean= 9.3mrr
Mew= 10 .0rrm
Median =9.Omrr
Medan=9 .5mn
L
S .D. = 2.7 mrr
A
S .D. =4 .1am
40
30
20
10
0
30
20
V
C 10
N
0I4)
.
o
L
0
2030
10
30
20
10
0
LITERATURE CITED
Adams, S . R., T
. M. Keevin, K . J. Killgore, and J
. J. Hoover. 1999 . Stranding potential
of young fishes subjected to simulated vessel-induced drawdown
. Transactions of
the American Fisheries Society 128 :1230-1234 .
Auer, N. A
. 1982
. Identification of larval and juvenile fishes of the Great Lakes Basin
with emphasis on the Lake Michigan drainage
. Great Lakes Fishery Commission,
Special Publication 82-3, Ann Arbor, Michigan .
Auer, N . A., and E . A. Baker. 2002
. Duration and drift of larval lake sturgeon in the
Sturgeon River, Michigan
. Journal of Applied Ichthyology 18 :557-564 .
Agostinho, A . A., L. C. Genies, S
. Verissimo, and E . K. Okada
. 2004. Flood regime,
dam regulation, and fish in the Upper Parana River
: effects on assemblage
attributes, reproduction and recruitment
. Reviews in Fish Biology and Fisheries
14(1): 11-19.
Aoyagui, A. S ., and C . C. Bonecker. 2004
. Rotifers in different environments of the
Upper Parana River floodplain (Brazil)
: richness, abundance and the relationship
with connectivity
. Hydrobiologia. 522(1-3) : 281-290 .
Araujo-Lima, C . A. R
. M., V. V. daSilva, P . Petry, E . C
. Oliveira, and S . M. L. Moura.
2001
. Diel variation of larval fish abundance in the Amazon and Rio Negro
.
Brazilian Journal of Biology 61 :357-362 .
Bardonnet, A . 2001
. Spawning in swift water currents : implications for eggs and larvae
.
Archiv fir Hydrobiologie (Supplementband) 135
:271-291 .
Brown, A . V ., and M. L
. Armstrong . 1985
. Propensity to drift downstream among
various species of fish
. Journal of Freshwater Ecology 3(1)
:3-17.
78
79
Brown, D . J., and T . G. Coon. 1994
. Abundance and assemblage structure of fish larvae
in the lower Missouri River and its tributaries
. Transactions of the American
Fisheries Society 123 :718-732
.
Bulkowski, L., and J. W
. Meade. 1983
. Changes in phototaxis during early development
of walleye
. Transactions of the American Fisheries Society 112
:445-447 .
Carter, J . G., V. A
. Lamarra, and R. J. Ryel . 1986
. Drift of larval fishes in the Upper
Colorado River
. Journal of Freshwater Ecology 3 :567-577 .
Crowder, L . B.,
D. D. Squires, and J . A. Rice. 1997
. Nonadditive effects of terrestrial
and aquatic predators on juvenile estuarine fish
. Ecology 78(6)
: 1796-1804 .
de Graaf, G. J., A. F
. Born, A . M. K. Uddin, and S. Huda
. 1999. Larval fish movement
in the River Lohajang, Tangail, Bangladesh
. Fisheries Management and Ecology
6:109-120
.
Dettmers, J . M., D. H
. Wahl, D . A. Soluk, and S. Gutreuter
. 2001 . Life in the fast lane
:
fish and foodweb structure in the main channel of large rivers
. Journal of the
North American Benthological Society 20
:255-265 .
Dewey, M. R., W. B. Richardson, and S
. J. Zigler . 1997
. Patterns of foraging and
distribution of bluegill sunfish in a Mississippi River backwater
: influence of
macrophytes and predation
. Ecology of Freshwater Fish 6
: 8-15 .
Dudley, R. K., and S
. P. Platania . 2000
. Downstream transport rates of passively drifting
particles and larval Colorado pikeminnow in the San Juan River in 1999
.
Division of Fishes, Museum of Southwestern Biology.
Flinn, M . B ., M. R. Whites, S . R. Adams, and J. E. Garvey
. 2005 . Macroinvertebrate
and zooplankton responses to emergent plant production in upper Mississippi
River floodplain wetlands . Archiv fir Hydrobiologia 162(2)
: 187-210 .
Eckblad, J . W., C. S
. Volden, and L . S. Weilgart . 1984
. Allochthonous drift from
backwaters to the main channel of the Mississippi River . American Midland
Naturalist 111(1) :16-22.
Gadomski, D. M., and C . A. Barfoot
. 1998. Diel and distributional abundance patterns
of fish embryos and larvae in the lower Columbia and Deschutes rivers
.
Environmental Biology of Fishes 51
:353-368 .
Galat, D. L., and J. Zweimuller
. 2001 . Conserving large-river fishes: is the highway
analogy an appropriate paradigm? Journal of the North American Benthological
Society 20 :266-279 .
Gale, W . F., and H . W. Mohr, Jr. 1978
. Larval fish drift in a large river with a
comparison of sampling methods
. Transactions of the American Fisheries
Society 107 :46-55 .
Grift, R . E., A. D. Buijse, W . L. T. Van Densen, M . A . M
. Machiels, J . Kranenbarg, J . G.
P
. Klein Breteler, and J. J. G. M. Backx. 2003
. Suitable habitats for 0-group fish
in rehabilitated floodplains along the lower River Rhine
. River Research and
Applications 19
: 353-374 .
Gore, J . A., and F . D
. Shields, Jr . 1995
. Can large rivers be restored? BioScience
45(3):142-152 .
80
81
Gosselain, V ., J. Descy, L
. Viroux, C. Joaquim-Justo, A
. Hammer, A . Metens, and S .
Schweitzer. 1998
. Grazing by large river zooplankton
: a key to summer
potamoplankton decline? The case of the Meuse and Moselle rivers in 1994 and
1995. Hydrobiologia 367/370
: 199-216 .
Haney, J . F ., and D . J. Hall
. 1973 . Sugar-coated Daphnia :
A preservation technique for
Cladocera
. Limnology and Oceanography 18 :331-333 .
Harvey, B . C. 1987
. Susceptibility of young-of-the-year fishes to downstream
displacement by flooding
. Transactions of the American Fisheries Society
116:851-855 .
Havera, S. P.,
and F . C. Bellrose . 1985
. The Illinois River: A lesson to be learned
.
Wetlands 4:29-41 .
Holland, L. E. 1986
. Distribution of early life history stages of fishes in selected pools
of the Upper Mississippi River
. Hydrobiologia 136 :121-130 .
Humphries, P
., A . J. King, and J . D. Koehn. 1999
. Fish, flows and floodplains
: links
between freshwater fishes and their environment in the Murray-Darling River
system, Australia
. Environmental Biology of Fishes 56 :129-151
.
Humphries, P ., and P . S. Lake
. 2000
. Fish larvae and the management of regulated
rivers. Regulated Rivers
: Research and Management 16
:421-432 .
Hurlbert, S
. H. 1984
. Pseudoreplication and the design of ecological field experiments
.
Ecological Monographs 54(2)
:187-211 .
Jack, J. D., and J. H. Thorp
. 2002
. Impacts of fish predation on an Ohio River
zooplankton community
. Journal of Plankton Research 24(2)
:119-127 .
82
Jackson, D . A. 1993 . Stopping rules in principal components analysis
: a comparison of
heuristical and statistical approaches
. Ecology 74: 2204-2214 .
Johnston, T
. A., M. N. Gaboury, R . A
. Janusz, and L . R. Janusz . 1995
. Larval fish drift
in the Valley River, Manitoba
: influence of abiotic and biotic factors, and
relationships with future year-class strengths
. Canadian Journal of Fisheries and
Aquatic Sciences 52 :2423-243 1 .
Junk, W . J., P. B . Bayley, and R . E. Sparks. 1989
. The flood pulse concept in river-
floodplain systems, p . 110-127
. In D. P. Dodge (ed.) Proceedings of the
International Large River Symposium
. Canadian Special Publication of Fisheries
and Aquatic Sciences 106 .
Jurajda, P. 1995
. Effect of channelization and regulation on fish recruitment in a
floodplain river. Regulated River
: Research and Management 10 :207-215 .
Kennedy, T. B., and G
. L . Vinyard . 1997
. Drift ecology of western catostomid larvae
with emphasis on Warner suckers,
Catostomus warnerensis
(Teleostei).
Environmental Biology of Fishes 49
:187-195 .
King, A. J . 2004
. Ontogenetic patterns of habitat use by fishes within the main channel
of an Australian floodplain river
. Journal of Fish Biology 65
:1582-1603 .
Koel, T. M., and R. E. Sparks
. 2002. Historical patterns of river stage and fish
communities as criteria for operations of dams on the Illinois River
. River
Research and Applications 18 :3-19
.
McCune, B., and M. J. Mefford . 1999
. Multivariate analysis of ecological data, version
4
. MjM Software Design, Gleneden Beach, Oregon, USA
.
83
Miller, T . J., L . B. Crowder, J. A. Rice, and E . A. Marshall . 1988
. Larval size and
recruitment mechanisms in fishes: Towards a conceptual framework . Canadian
Journal of Fisheries and Aquatic Sciences 45(9)
: 1657-1670 .
Miller, T. J., L. B . Crowder, and F. P. Binkowski . 1990. Effects of changes in the
zooplankton assemblage of growth of bloater and implications for recruitment
success
. Transactions of the American Fisheries Society 119(3) :483-491 .
Miranda, L. E . 2005
. Fish assemblages in oxbow lakes relative to connectivity with the
Mississippi River . Transactions of the American Fisheries Society 134
: 1480-
1489.
Molls, F. 1999. New insights into the migration and habitat use by bream and white
bream in the floodplain of the River Rhine
. Journal of Fish Biology 55 :1187-
1200.
Murty, D. S., K . K
. Sukmaran, P. V. G. K. Reddy, and R. K. Dey . 1986. Observations
on the life history of silver carp Hypophthalmichthys molitrix
(Valenciennes) .
Journal of the Inland Fisheries Society of India 18 :4-14 .
Muth, R. T., and J . C . Schmulbach. 1984
. Downstream transport of fish larvae in a
shallow prairie river. Transactions of the American Fisheries Society 113
:224-
230.
Nelson, J. S. 1994. Fishes of the world
. John Wiley and Sons, New York, N .Y.
Pezold, F . 1998
. Fish diversity in an isolated artificial wetland
. Journal of Freshwater
Ecology 13 :171-179 .
84
Reichard, M ., P. Jurajda, and R
. Vaclavik. 2001 . Drift of larval and juvenile fishes
: a
comparison between small and large lowland rivers
. Archiv fur Hydrobiologie
(Supplementband) 135 :373-389 .
SAS Institute Inc . 1999. SAS Version 8 .1
. Cary, North Carolina, 27513 .
Sheehan, R . J., W. M
. Lewis, L . R. Bodensteiner, D . King, D . E
. Logsdon, S . D. Scherck,
and P. S. Wills. 1990
. Winter habitat requirements and overwintering of riverine
fishes
. Southern Illinois University, Federal Aid in Sport Fish Restoration,
Project F-79-R, Project Completion Report, Carbondale
.
Scheidegger, K . J., and M
. B. Bain . 1995
. Larval fish distribution and microhabitat use
in free-flowing and regulated rivers
. Copeia :125-135 .
Schultz, D . W. 2006
. Quantifying fish movement between the Illinois River and an
associated backwater
. Master's thesis. Southern Illinois University, Carbondale,
Illinois .
Sheaffer, W . A. and J . G
. Nickum . 1986 . Backwater areas as nursery habitats for fishes
in Pool 13 of the Upper Mississippi River
. Hydrobologia 136 :131-140 .
Smith, K . A. and M. L . Brown. 2002
. Seasonal composition and abundance of
ichthyoplankton entrained through Big Bend Dam, South Dakota
. Journal of
Freshwater Ecology 17(2) :199-207 .
Soin, S . G., and A . I. Sukhanova
. 1972. Comparative morphological analysis of the
development of the grass carp, the black carp, the silver carp and the bighead
(Cyprinidae) . Journal of Ichthyology 12(1)
:61-71 .
Sokal, R
. R. and F. J. Rohlf. 1995. Biometry
: the principles and practice of statistics in
biological research. W. H
. Freeman and Co ., NY.
85
Theiling, C
. H
. 1995. Habitat rehabilitation on the Upper Mississippi River. Regulated
Rivers Research and Management . 11 : 227-238.
Tockner, K ., and J. A. Stanford . 2002
. Riverine flood plains : present state and future
trends. Environmental Conservation 29(3) : 308-330 .
Turner, T . F., J. C . Trexler, G . L. Miller, and K . E. Toyer. 1994
. Temporal and spatial
dynamics of larval and juvenile fish abundance in a temperate floodplain river .
Copeia (1) :174-183 .
Tweb, A ., A. Ahmed, P . Baroi, and G. Mustafa. 1990
. Studies on the development of
the silver carp,
Hypophthalmichthys molitrix (Val .). Bangladesh Journal of
Zoology 18(2):139-145
.
Young, G . C., and I. C. Potter. 2003
. Do the characteristics of the ichthyoplankton in an
artificial and a natural entrance channel of a large estuary differ? Estuarine,
Coastal, and Shelf Science 56 :765-779 .
U.S
. Army Corps of Engineers . 1993. Upper Mississippi River system
Environmental Management Program definite project report (SL-5) with
integrated environmental assessment
. Swan Lake rehabilitation and
enhancement : main report. Pool 26, Illinois River, USACE, St
. Louis
District, St . Louis, Missouri .
Wetzel, R . G. 2001 . Limnology
: lake and river ecosystems . Third edition . Academic
Press. San Diego, C .A.
VITA
Graduate School
Southern Illinois University
Laura A . Csoboth
Date of Birth
: November 6, 1979
215 Arizona Rd ., Carbondale, Illinois 62903
University of Delaware
Bachelor of Science, Natural Resource Management, May 2002
Special Honors and Awards :
Travel award to the Illinois Chapter of the American Fisheries Society Meeting
Travel award to the Annual Larval Fish Conference
Thesis Title :
Early Life History of Fishes in Restored and Unrestored Systems
Major Professor : Dr
. James E. Garvey
Publications :
Duke, J. M . and L. A. Csoboth. 2003
. Increased Scientific Capacity and Endangered
Species Management : Lessons from the Red Wolf Conflict
. Drake Journal of
Agricultural Law 8 :539-590 .
86
Timing of Riverine Export of Nitrate
and Phosphorus from Agricultural
Watersheds in Illinois : Implications
for Reducing Nutrient Loading to the
Mississippi River
MARKTODD BV
.
.
ROYER,'DAVID,* .tAND
LOWELL E . GENTRY*
School of Public
and Environmental Affairs, Indiana
University, 1315 E. Tenth
Street, Bloomington, Indiana 47405,
and Department of Natural Resources and Environmental
Sciences, University of Illinois
at Urbana-Champaign,
1102 S. Goodwin Avenue, Urbana, Illinois 61801
Agricultural watersheds in the upper Midwest are the
major source of nutrients to the Mississippi River and Gulf
of Mexico, but temporal patterns in nutrient export and
the role of hydrology in controlling export remain unclear .
Here we report on N03-N, dissolved reactive phosphorus
(DRP), and total P export from three watersheds in Illinois
during the past 8-12 yea rs
. Our program of intensive, long-
term monitoring allowed us to assess how nutrient export
was distributed across the range of discharge that
occurred ateach site andto examine mechanistic differences
between N03 -N and DRP export from the watersheds .
Last, we used simple simulations to evaluate how nutrient
load reductions might affect N03 -N and P export to
the Mississippi River from the Illinois watersheds . Artificial
drainage through under-field tiles was the primary
mechanism for N03 - - N export from the watersheds . Tile
drainage and overland flow contributed to DRP export,
whereas export of particulate P was almost exclusively from
overland flow . The analyses revealed that nearly all
nutrient export occurred when discharge was a median
discharge, and extreme discharges (>_ 90th percentile) were
responsible for >50% of the N03-
-N export and >80%
of the P export
. Additionally, the export occurred annually
during a period beginning in mid-January and continuing
through June
. These patterns characterized all sites, which
spanned a 4-fold range in watershed area . The simulations
showed that reducing in-stream nutrient loads by as
much as 50% during periods of low discharge would not
affect annual nutrient export from the watersheds .
Introduction
Nitrogen and P enrichment from nonpoint sources and
resulting eutrophication is a main cause of poorwater quality
and biotic impairment in many streams and rivers in the
United States (1) .
To address nutrient inputs from nonpoint
sources, states currently are developing nutrient criteria,
email'Correspondingauthorphone
: troyer@indiana.edu .
: (812)855-0563;fax(812)855-7802 ;
1 Indiana University .
t University of Illinois at Urbana-Champaign .
10 .1021/es052573n CCC : $X150
Published on Web 05/24/2006
a xxxx American Chemical Society
PAGE EST : 5.6
numeric standards, and total maximum daily loads (I'MDLs)
for nutrient-impaired streams and rivers. ATMDLrepresents
the maximum load (kg d-1 ) of a nutrient that a stream can
receive and still maintain water quality sufficient to meet its
designated uses
. Determination of the TMDL is based on the
assimilative capacity of the stream for that nutrient, natural
or background sources, point and nonpoint inputs, and a
specified margin of safety (2) . Because the assimilative
capacity, discharge, and magnitude of inputs can vary
throughout a year, the approach allows for seasonal variation
in the TMDL. In streams of the midwestern United States,
the effects of eutrophication are most pronounced during
periods of low discharge and warm water temperatures in
summer and autumn
. Nutrient TMDLs tend to focus on
critical periods of summer low discharge, while allowing
increased nutrient loads during times of high discharge . For
example, the Stillwater River drains an agricultural watershed
in western Ohio and the approved TMDL for N02 + NO3
increases from 3122 kg N d - ' in October and November to
load
>6700
is
kg
needed
Nd_Ito for
accommodate
December through
the increased
June(3)discharge
. The higherand
nonpoint
spring.
source runoff that occur from late winter through
In addition to degrading local water quality, nutrient
enrichment of midwestem streams has increased N and P
loading to the Mississippi River and Gulf of Mexico (4-6) .
Rivers draining agricultural regions of the upper Midwest
(i .e., the cornbelt) export large quantities of P and N
(predominantly as N03 -
-N)
as a result of extensive fertiliza-
hectares
tion and artificial
of cropland
drainage
in the
(5,
Mississippi
7,11)
. Approximately
River basin
20 million(MRB)
are artificially drained by under-field (tile) systems, particu-
larly in intensively farmed and fertilized areas such as Iowa,
Illinois, Indiana, and Ohio (5, 9) . Tile drainage provides a
bypass
mechanism
groundwater
by which water
flow paths
and dissolved
and move
nutrientsrapidly
fromcan
fertilized cropland to streams and rivers
(10, 11) . Because of
channel and hydrological modifications, streams in agri-
cultural watersheds are not efficient at nutrient removal by
processes such as denitrification, and a large fraction of the
nutrient load in such streams is transported to downstream
water bodies (12, 13) .
Nutrient export to the Mississippi River and eutrophi-
cation of midwestem streams both result from nutrient inputs
to surface waters but are associated with different hydrologi-
cal conditions . Eutrophication of streams is a primarily
biological process driven by nutrient uptake when local
conditions favor rapid growth of nuisance algae, such
as
during extended periods of low discharge . Conversely,
nutrient export from the Midwest to the Mississippi River is
a primarily hydrological process driven by precipitation and
drainage of the agricultural landscape (14) . To address water
quality in the Midwest, it is critical to gain a mechanistic
understanding of how N and P enter, and are exported from,
midwestem streams . There is a particular need for long-
term data to address (i) the temporal patterns in nutrient
loads and export, (ii) the role of hydrology in controlling
export, and (iii) the implications of these patterns for efforts,
such asTMDLs, to reduce eutrophication and nutrient export
from the agricultural Midwest .
A robust analysis of these issues requires long-term data
on NO3-N and P concentrations and river discharge, and
a sampling scheme that targets periods of high discharge
and rapidly changing nutrient loads . In this paper we use
long-term, intensive monitoring data from three agricultural
watersheds in Illinois to examine the above issues in relation
VOL . xx, NO . xx, xxxx / ENVIRON. SCI. & TECHNOL. • A
Analysis'TABLE
1 . Location, Watershed Characteristics . Period of Record, and Discharge Statistics for the River Sites Used in the
a Discharge statistics based on average daily discharge values from the period of record .
to nutrient management scenarios
. Usingsimple simulations
of
might
nutrient
affect
load
N03
-reductions,
- N and DRP
we
export
evaluate
to the
how
Mississippi
such reductionsRiver
from areas such as Illinois . Last, we discuss the implications
of our results for designing programs to reduce riverine export
of nutrients from agricultural regions of the upper Midwest .
Site Descriptions . We used long-term data on discharge
and nutrient concentrations from sites in the Embarras,
Kaskaskia,
Illinois
. The
and
sites
Sangamon
range in
river
drainage
systems
area and
inpeak
east-centraldischarge
but have similar land use dominated by row-crop agriculture,
mainly corn and soybean (Table 1) . East-central Illinois soils
are poorly drained Moflisols and the landscape was mostly
wetland
landscape
and
is
mesic
now tile-drained,
prairie prior
with
to
tile
settlementdensities
. Much
of 3-5
of thekm
km' (15),
and headwater streams have been extensively
channelized and dredged to accommodate high discharges
(16)
.
Nitrogen losses from the watersheds typically range
from 20 to 50 kg N ha- ' yr ', depending on precipitation,
and
streams,
The land
are among
use
inorganic
and
the
drainage
highest
N loads
modifications
in
are
the
90%
MRB
or
(5,
more
at
7,
the
NO17)sites
3-
.
-N
In
(7)arethe.
representative of tile-drained and intensively farmed areas
of the upper Midwest, and patterns in these streams likely
characterize much of the combelt region.
Methods
Stream discharge was monitored at the Embarras River and
Kaskaskia River sites by the U .S . Geological Survey (stations
Sangamon
03343400
Riversite
and 05590800,
was monitored
respectively)by
the Illinois
.
Discharge
State
at
Waterthe
determined
Water
Survey
Survey
(station
from
provided
106)hourly
. For
precipitation
or
each
15-min
site,
readingsmean
data
daily
.
(Champaign
The
discharge
Illinois Statesta-was
tion) and NO3 - - N concentrations for the Sangamon River
site for 1994-1999. All other nutrient concentrations were
determined from sampleswecollected approximatelyweekly,
either manually or with automated samplers
. Streams and
small rivers in the Midwest have flashy hydrology, and
discharge during floods represents a significant fraction of
annual discharge (18) . To account for this, we collected
additional samples when discharge was changing rapidly .
During most floods samples were collected daily, but in some
cases 2-4 samples were collected in a 24-hr period . In total,
our analysis is based on >4000 nutrient concentrations
determined from >2000 individual water samples collected
from October 1993 through September 2005 .
Nitrate was determined, after filtration through a 0 .45µm
membrane, on an ion chromatograph (Dionex, Inc . model
DX- 120 or model 2000i) . Dissolved reactive phosphorus (DRP)
was determined colorimetrically on filtered samples using a
spectrophotometer or (after 2001) a Lachat QuikChem8000
flow injection analyzer
. Total P was determined as described
for DRP except that samples were unfiltered and digested
with sulfuric acid and ammonium persulfate prior to analysis
.
B
• ENVIRON
. SCI, & TECHNOL . / VOL. xx . NO, xx, xxxx
Particulate P is defined as the difference between total P and
DRP . Internal and external standards for each nutrient were
analyzed routinely throughout the study as part of a quality
assurance plan . Daily in-stream nutrient loads were deter-
mined
nutrient
by
concentration
multiplying
(kg
mean
m-daily
') . Linear
discharge
interpolation
(m3din
-')SASby
(19) was used to estimate nutrient concentrations between
sampling dates . Annual and total nutrient export were
determined by summing the daily nutrient loads for each
kmwater
2 agricultural
year or the period
watershed
of record,
in Illinois,respectivelyweekly
. For
NO3-Na
1406
error
sampling
of
resulted
<4%
(20) .
in
We
a load
examined
estimate
smaller
with
watersheds
a root-mean-square(Table
1), but with a greater sampling frequency, and believe our
load estimates have similarly small error .
For the period of record at each site, we ranked the daily
discharge values and calculated the fraction of the
total
nutrient export attributable to each day, and the fraction
that occurred between various discharge percentiles . This
allowed us to assess how NO3-N, DRP, and total P export
were distributed across the range of discharge that occurred
at each site . The mass of nutrients exported each year from
the MRR is controlled to a large extent by precipitation (14) .
To examine patterns across years and account for inter-
annual differences in precipitation and export, we con-
smarted graphs of cumulative NO3 - - N and DRP export based
on percentage of the total for each water year .
To examine how reduced NO 3 - - N and DRP loads during
different hydrological conditions might affect export of these
nutrients to downstream water bodies, we performed three
simple simulations for each site . The first simulation reduced
in-stream N03-- N and DRP loads by 50% on all days with
discharge <50th percentile ; this simulation represented the
effect of focusing nutrient reductions on periods of low
discharge only . The second simulation reduced in-stream
loads
this represented
by 25% on all
a smaller
days with
reduction
discharge
in nutrient
<75th percentileloads
but
;
year)applied
. The
to a
final
larger
simulation
range of discharge
focused on
(ihigh
.e .,
more
flow
days
periods
of
andthe
reduced in-stream loads of NO3-N and DRP by 25% on all
days with discharge 2:75th percentile. For all simulations,
NO,- -N and DRP export during the period of record was
recalculated based on the adjusted loads and expressed as
a
simulations
percent of
were
the
selected
original exportto
evaluate
. The
the
reductions
interaction
used
betweenin
the
hydrology and nutrient export and do not necessarily reflect
management goals, although N load reductions of 20-30%
in the Mississippi River will be required to reduce hypoxia
in the Gulf of Mexico (21) .
Results
The volume of water and mass of N03- -N, DRP, and total
P exported from the watersheds varied considerably during
the study (Table 2), mainly as a consequence of variable
precipitation among years . In wet years, such as 1998 and
systemriver
site
coordinates
watershedarea
(km')
raw-crop
(%
agricultureland
cover)
period of
(water
recordyears)
maximum
discharge(m's
')
median
discharge(m's')
discharge(m'3mean-1)
EmbarrasSangamonKaskaskia
88'19'35"W39°50'09"N,40°16'06"N,39°47'29"N,88°11'08"W88°29'18"W
386101481
918691
1998-20051994-20031994-2005
10819871
011.0.6.3
035.0.6.8
Watersheds
TABLE 2
. Annual
during
Water
the
and
StudyNutrient
Export from the Three
the
2002
N
2003
yields
sites
(82
(117
cm
there
ranged
and
of
108
precipitation)
was
from
cm
a clear
of
45
precipitation,
to
pattern
55
yields
kg
of
hanutrient
were
1 .
respectively),
In
<
dry
15
export
years,
kgha'occurring
.
such
N0Across3-as-
predominantly
1)
. During the
at
period
the high
of record,
end of the
days
discharge
with discharge?
range (Figuremedian
discharge accounted for 97-98% of the NO3-N export and
98-99% of the DRP export (Table 3)
. Extremes in discharge
total
(>90th
NO,percentile)
-
-N export
accounted
and 84%
for
of the
an average
DRP exportof
56%
.
of the
The temporal distribution of N0
3 - - N export indicated
that the majority of the annual export occurred during a 5 .5
month
and years
period
(Figure
from
2)mid-January
. Within a water
through
year,
June
the
across
first 3 .5
all
monthssites
(October-mid-January) and the last 3 months Uuly-
September) together typically accounted for <30% of the
annual N03-N export. Within the January-June period,
N03- -N export often occurred in discrete events, as evi-
denced by the abrupt increases in the slopes of the lines in
Figure 2
. The watersheds spanned a 4-fold range in size, but
consistent
the pattern
across
in temporal
sites
.
distribution
For P, we focus
of N03on
DRP
-
-N
rather
export
thanwas
total P because we have longer records for DRP and it
represents the immediately available P . As with NO3-N,
DRP export occurred mainly from January to June in most
years, although substantial export occasionalyoccurred later
with
in the
individual
summer (Figure
floods
3)and
. Export
in several
of DRP
years
was often
40-80%
associatedof
the
annual DRP export occurred during a period of < 1 month
.
Mechanistically, NO3-N, DRP, and total P responded
differently to the occurrence of overland flowandwe illustrate
these differences with the 2002 and 2003 water years (wet
K
80
100
1
100
EmWnastie
--- Kaskasklasite
- --- sangamon sae
H
i
/
100
80
60
40
i
20
010ti410
.
I
101'
10°
10'
102
10'
Discharge (m' s')
FIGURE 1 . Cumulative nutrient export as a function of discharge
during the period of record for each site .
TABLEduring
Occurred
3
the
. Percentage
at
Periods
or above
of
of
Various
Recordthe
Total
DischargeNutrient(Q)
Export
Percentilesthat
% of export
river
a >- 98th
a >- 75th
system
a >-5M
percentile
percentile
percentile
and dry years, respectively) at the Embarras River site (Figure
4) . In 2002 a series of precipitation events from February
through mid-April initiated flow through agricultural tile
drains, increased discharge, and resulted in a steady export
of NO3 -N, with that period accounting for approximately
55% of the total 2002 N0
3 - - N export . During that same
of
period,
2002
DRP
annual
and total
exportP
.
exports
From April
were 33
8 through
and 17%,
May
respectively,17,
2002,
total precipitation was 21 cm and much of that water entered
the Embarras River as overland flow and caused sustained
flooding
. There also were several periods of high discharge
through tile drains throughout the Embarras River watershed .
During these floods and high tile discharge periods, DRIP
and total P export increased substantially from the previous
months, whereas NO, - -N export continued at approximately
the
for
same
N03-rate
- N export
(Figure
from
4) .
the
Overland
watershed,
flow was
but
not
during
important2002
overland flow was important for export of DRP and total P
(with particulate P accounting for a large fraction of total P)
.
We cannot assign precise values to the fraction of the
DRP and total P export originating from tile drainage versus
V OL. xx. N O. xx, xxxx
/ ENVIRON. SCI. & TECHNOL a C
water
year
discharge
410° m')
Mg
kg ha - '
N03-N DRP total P ND3-N DRP total P
200519992004200220011998200020031995199619971994
228290186180137132235125170539252
139615062728137222191599199911401081962490426
Embarras2421352429314321121154
10216515197 56312029284623104133228.5.0.7.3.9.5.1.0.5.2.7.3
000000000000.1.2.5.4.2.1.7.6.6.5.4.9
020101.1.1.2.3.1.2
1998 179
2223
Kaskaskia
20001999
9646
1389514
2138
3657.0.6
00.2.5
2001
100
1164
10
6
13 .3
0 .1 0.2
2002
187
2129 13
14 30 .2
0 .3 0.4
2003
31
292 2
38 55.2
0.3 1 .0
4
7 .6
2004 130
1382 11
<
0.1 0.1
2005 150
1288 22
45 35 .8
0.3
1 .2
40
33 .4
0.6 1 .1
1994
38
262
Sangamon
2001200019991998199519971996
3629313519198
21631833736932819391
4
2631362132339.6.5.0.3.4.5.0
2002
34
473
3
7
19.1
0.4 0.7
2003
16
146
1
8 46.8
0.3
0.8
3
14 .5
0 .1 0 .3
SangamonEmbarrasKaskaskiamean
57545856
N03-N
848281
989797
DRP
82
97
SangamonEmbarrasKaskaskiamean
86848580
94969495
99989898
0
Oct Nov Dec Jan FebMar Apr May Jun Jut Aug Sep
Water Year
FIGURE2the
period
.
of
Cumulative
record for
NO,--N
each
export
site
.
during each wateryear during
during
overland
peak
flow,
tile
because
flows
DRP
but
export
then
through
decreases
tiles
rapidly
is greatestand
This
drainageP
and
floods
two
a
disproportionately
drainage
contrasts
discharge
flow
and
dry
and
flow
total
total
pattern
year
event
total
and
.
approximately
events,
and
with
P
P
not
with
P
both
inputs
in
is
tile
export
associated
small
evident
May,
NO3--N
but
increased
flow
as
to
N
these
increased
but
declined
and
in
tile
the
in
export
proportion
with
then
the
P
river
were
along
discharge
export
dry
surface
(Figure
discretely
diverged
which
much
appeared
with
2003
(Table
to
smaller
4)declines
continues
NO3--N
runoffwater
tile
.
2),
from
Dissolved
during
to
discharge
.
year,
nearly
than
in
be
Therefore,
(11)N03--N
the
from
the
via
the
when
reactiveall
.
firstothertile(10)tile2002ThisasDRPDRPin
.
N
<median
and
The
DRP
simulations
discharge)
loads during
showed
would
periods
that
reduce
a
of
509
total
low
reduction
export
discharge
of
in
theseNO3--(i.e.,
an
nutrients
in
discharge
(Table
reduction
nonetheless
Conversely,
of DRP
average
discharge
('Fable
4)
.
in
(>_75th
by
decline
disproportional,
total
reducing
(<75th
<2%
4) .
in
export
percentile)
Reducing
of
percentile)
the
13loads
.0%
of
case
loads
N03
reduction
for
25%
of
gave
-N
N03--N
resulted
25%
during
N03
(20a
across
nearly
in
.7%)andDRP(23-N
and
total
and
periods
in
4a
a
proportional<
.2%
wider
export,
larger,
1%
of
for
in
rangehighcase.6%)withDRPbut
.
Discussion
In midwestern agricultural watersheds, in-stream nutrient
concentrations
time
because
in the
(22,
streams
of
23)the . This
we
increase
are
examined
pattern
greatest
in
(7,
runoff
has
during
12,
been
that
24)
winter
previously
and
occurs
we
through
believe
during
documentedspringthatthat
D • ENVIRON
. SO
. & TECNNOL
. / VOL. xx, NO . xx, xxxx
m 100
m 80
60
r 40
20
0- 0
100
80
60
40
20
0
100
80
60
40
20
Embarras , -
(
I
(r
(
( I(
I I
(r-l
~ rTi
l
11
..1
Y1==~
Kaskaskia
Sangamon
I
rJ I
r
rI
I
r
1
_J
I
Oct Nov Dec Jan FebMar Apr May Jun Jul Aug Sep
Water Year
FIGURE
the period
3 .
of
Cumulative
record for
DRP
each
export
site .
during each water year during
Oct Dec Feb Apr Jun Aug Od Dec Feb Apr Jun Aug Od
2002 -
2003 --
Water Year
discharge
2003
FIGURE4water
.
(lower)
Cumulative
years.
from
nutrient
the Embarras
export
River
(upper)
site
and
during
precipitation
the 2002 andand
watersheds
ourstudysites,
>-
First,
important
from
Illinois,
median
the
nearlyall
agricultural
are
characteristics
discharge,
of
representative
although
the
nutrient
upper
Midwest
and
limited
Midwestexport
regarding
extreme
of
geographically
intensively
during
occurred
. Our
discharges
the
the
analyses
export
when
drained
past
to
discharge
of
revealed
east-central8-12
(Q
and
nutrients>_
yearsfarmed90thwastwo
.
N
percentile)
and
mid-January
exchange
and
As
>80%
discharge
P from
of
of
the
were
nutrients
through
the
increases,
P
responsible
exportwatersheds
Junebetween
. Second,
there
.
for
occurred
is
the
the
>
less
50%
water
annual
of
consistently
opportunity
the
column
export
NO3-N
of
and
for
exportNO3--fromthethe
Simulated
TABLE 4 . Decrease
Load Reductions
in Total
during
Nutrient
Various
Export
Hydrological(%)
as a Result of
Conditions
simulated reduction in nutrient loads
loads
50% on
reduceddays loads reduced loads reduced
25% on days
river
25% on days
with 0 < 500,
with 0 < 75th
with 0 >- 75th
system
percentile
percentile
percentile
11103-111
benthic sediments where biological uptake and denitrification
occur (12) . Streams can switch from a nutrient retention and
processing mode at low discharge, to a through-put mode
at high discharge in which nutrient inputs from the landscape
are transported downstream without biological processing
(25) . For the streams we examined, median discharge
appeared to be the approximate transition point at which
the streams switched from a state of nutrient retention to a
export
state of
occurred
nutrient
above
exportmedian
. For
discharge
example,
when
97%
denitrificationof
the NO3-
-N
in these streams has little effect on NO3 -N retention
(12,
26) . The hydrology of the agricultural landscape in the upper
Midwest has been greatly altered during the last 125 years
by welland drainage, stream channelization, and installation
of under-field (tile) drainage systems (16) . Thus the patterns
we observed, although characteristic of the upper Midwest,
may not represent landscapes with less altered hydrological
regimes.
In addition to the association with high discharge, nutrient
export from our sites occurred mainly during late winter
through spring of each year . Elevated nutrient concentrations
during spring are common in agricultural streams, and the
present analysis clearly documents the extent to which
nutrient export is generally confined to this time period
. These
patterns in the timing of nutrient export likely result from
of
the
tile
seasonality
drainage
of
within
fertilizer
thewatersheds,
application
both
and
ofwhich
the prevalenceinfluence
the timing and magnitude of nutrient loads
(23) .
From 1994
to 2003, an average of 55% of the annual N fertilizer used in
east-central Illinois was applied during autumn
(27) . This
fertilizer is susceptible to nitrification and loss during late
winterandspring asNO3 -N in drainagewater . In intensively
farmed areas, fertilizer use and disturbance from tillage
appear to interact to produce large losses of NO3-N through
tiles
concentrations
(7), and evidence
in the lower
suggests
Mississippi
that spring
River
peaks
are a
in
result
NO
3- -Nof
increased fertilizer use in the MRB during the past 50 years
(6) . Our analysis of watersheds in Illinois supports these
conclusions .
Water entering the Embarras River through tile drains
can at times have NO3
-
N concentrations >30 mg L - ' and
N input to the river from tiles can exceed 45 kg he -' yr' (7) .
Artificial drainage through under-field tiles is clearly a
mechanism by which NO3 - -N entered the streams we
examined . Phosphorus also can enter streams through tile
drainage in the Midwest
(11), although this mechanism
appears relatively more important in dry years with limited
or no overland flow (Figure 4)
. Phosphorus transport
processes are more difficult to separate in tile drained
watersheds, because DRP inputs occur by either mechanism .
The ratio of total P to DRP can be used to examine these flow
paths, with larger ratios indicating more surface transport of
particulate P (Table 2) . This ratio was 2 .9 in 2002, a wet year
with significant overland flow and particulate P export, but
only 1 .8 in 2003, a dry year with no overland flow and much
less particulate P export . However, regardless of the mech-
anism or the form of the P, extreme discharges were the
driving factor for P export from the watersheds . For example,
extreme discharges (> 90th percentile) accounted for > 80%
oftheDRPand total P export, compared to 56% of the NOr-
N export.
Implications for Nutrient Loading to the Mississippi
River. Reducing riverine export of NO3
-
-N from the Midwest
is a key component to addressing hypoxia in the Gulf of
trations
Mexico(6)is .
an
Likewise,
important
reducing
step toward
in-stream
protecting
nutrient
water
concen-quality
and aquatic life in the streams and rivers of the Midwest. In
east-central Illinois, peak algal productivity and associated
dissolved 02 depletion occurmost commonlyduring summer
and early autumn when discharge is low (26, 28) . These same
time periods, however, account for little of the annual NO3-
N or DRP export (Figures 2 and 3) due to low discharge and
high nutrient uptake in the streams . There is therefore a
temporal separation between periods of poor water quality
and periods of high nutrient loads and export . Nutrient export
from other areas of the Midwest also occurs mainly during
high discharge (22,29) and we conclude that concerns about
nutrient loading to the Mississippi River and Gulf of Mexico
(6) must be addressed by reducing nutrient export from the
Midwest during times of high discharge. The simulations
support this conclusion, showing that nutrient export from
the watersheds could be reduced only by reducing in-stream
loads during high discharge (Table 4) .
Efforts are underway to restore and protect local water
quality using the TMDL approach and the development of
nutrient criteria (30) . Local water quality in the Midwest and
nutrient loading to the Gulf of Mexico are both nutrient-
related problems, but the TMDL approach, with its current
focus on periods of low discharge, is not conducive to
reducing nutrient loads at times relevant to affecting water
quality in the Mississippi River and hypoxia in the Gulf of
Mexico . However, our analysis indicates that if TMDLs in
the Midwest are directed at reducing nutrient loads during
periods of high discharge in late winter and spring, such
efforts could reduce nutrient export from agricultural wa-
tersheds to the Mississippi River.
Acknowledgments
We thank Karen Starks for laboratory assistance and main-
taining the long-term data records . Discharge, precipitation,
and partial chemistry records were provided by the Illinois
State Water Survey and the United States Geological Survey .
Funding was provided in part by the state of Illinois through
the Council on Food andAgricultural Research (WaterQuality
SRI), the USDA-CSREES 406 Water Quality Program, and the
Illinois Water Resources Center.
Literature Cited
(1)
Polluted
Environmental
U.S. Environmental
WatersProtection
; EPA
Protection
840-B00-002AgencyAgency
: Washington,
; Office
. Atlasof of
DC,
Water,
America's2000U
.
.S .
(2)
tionoftheComprehensiveStare
ofWater,
DC,
U .S .
1997Environmental
.
U .S . Environmental
Protection
Protection
WaterQualiryAssessmentr
Agency. Guidelines
Agency
: Washington,
for Prepara-
Office
(3) Ohio Environmental Protection Agency . Total Maximum Daily
Loads
Ohio Environmental
for the Stillwater
Protection
River Basin
Agency
; Division
: Columbus,
of Surface
Oli,
Water,2004
.
VOL. xx, NO, xx
. xxxx / ENVIRON . SCI. & TECHNOL . •
E
KaskaskiaEmbarras
01.7.9
1411.8.2
2021.3.1
Sangamonmean
(1 SD)
11
.3.4 (0 .4)
1313
.2.0
(1 .2)
2020.6.7
(0 .4)
Embarras
1 .0
DRP
Sangamonmean
Kaskaskia(1
SD)
000.8.9.5(0.2)
4434.3.2.6.6(0.8)
23232323.5.5.9.6(0.3)
(4) Turner, R . E. ; Rabalais, N . N
. Changes in Mississippi River water
quality this century. BioScience 1991, 41, 140-147 .
(5) Goolsby, D. A. ; Battaglin, W. A . ; Lawrence, G . B. ; Ariz, R. S . ;
Aulenbach, B . T .
; Hooper, R . P .; Keeney, D . R. ; Stensland, G.1 .
Flux and Sources of Nutrients
in the Mississippi-Atchafalaya
River Basin ; Topic 3 report for the integrated assessment on
hypoxia in the Gulf of Mexico
; NOAA Coastal Ocean Office :
Silver Spring, MD, 1999 .
(6) Rabalais, N . N . ; Turner, R. E . ; Wiseman, W.).,
)r . Gulf of Mexico
hypoxia, AKA "The dead zone" . Annu . Rev. Ecol. Syst. 2002, 33,
235-263 .
(7) David, M . B.
; Gentry, L E .; Kovacic, D . A. ; Smith, K M . Nitrogen
balance in and expon front an agricultural watershed
. J
. Environ.
Qua!. 1997, 26, 1038-1048.
(8) David, M . B.; Gentry, L. F. Anthropogenic inputs of nitrogen
and phosphorus and riverine export forlllino(s, USA . J. Environ.
Qua! .
2000, 29, 494-508 .
(9) Fausey, N. R
.
; Brown, L. C .; Belcher, H . W.; Kanwar, R. S . Drainage
and water quality in Great Lakes and cornball states
. J. Irrig.
Drain. Bog. 1995, 121, 283-288 .
(10) Gentry, L E .; David, M . B. ; Smith, K . M . ; Kovacic, D
. A . Nitrogen
cycling and tile drainage nitrate loss in a corn/soybean
watershed. Agric. Ecosyst
. Environ . 1998, 68, 85-97 .
(11) Xue, Y. ; David, M . B .
; Gentry, L. E .; Kovacic, D . A . Kinetics and
modeling of dissolved phosphorus export from a tile-drained
agricultural watershed. J. Environ . Qual
. 1998, 27, 917-922
.
(12) Royer, T. V.; Tank, ) . L . ; David, M . B . Transport and fate of
nitrate in headwater agricultural streams in Illinois . J. Environ.
Quad. 2004, 33, 1296-1304 .
(13) David, M . B .; Wall, L
. G.; Royer, T. V. ; Tank, 1 . L Denitrlfcation
and the nitrogen budget of a reservoir in
an agricultural
landscape . Ecol. Applic. 2006, in press
.
(14)
ADonner,
. Modeling
S . Dthe
. ; Coe,
impact
M. T.
of
; Letters,
hydrological
1 . D
.
; Twine,
changes
1'.
on
E. ;
nitrateFoley,
) .
transport in the Mississippi Riverbasin from 1955 to 1994 . Global
Biogeochem . Cycles 2002, 16, 1-19 .
(15) David, M . B. ; Gentry, L . E .
; Starks, K. M.; Cooke, R . A. Stream
transport of herbicides and metabolites in a tile-drained
agricultural watershed . J. Environ. Qual. 2003,32,1790-1801 .
(16) Rhoads, B. L. ; Herricks, E . E
. Naturalization ofheadwaterstreams
in
RestorationIllinois
:
:
challenges
GuidingPn'nciplesforSustainableProjects,Brookes,and
possibilities . In River
Channel
A, Shields, F. D., )r., Eds . ; John Wiley & Sons
: New York, 1996.
(17) Mitchell, 3
. K . ; Mclsaac, C . F. ; Walker, S. B . ; Hirschi, M . C. Nitrate
in river and subsurface drainage flow from an east central Illinois
watershed . Tmrts. Am
. Soc. Agric. Eng. 2000, 43, 337-342 .
(18) Baker, D. B. ; Richards, R
. P. ; Loftus, T. T. ; Kramer, J. W . A new
flashiness index
: characteristics and applications to midivestem
F • ENVIRON . SCI . & TECHNOL
. / VOL . xx, NO. xx, xxxx
PAGE EST
: 5 .
6
rivers and streams. J. Am . Water Resour. Assoc. 2004, 40, 503-
522 .
(19) SAS Institute, SAS/STAT
Users
Guide, Version 6, 4th ed
. ; SAS
Institute: Cary, NC, 1990.
(20) Guo,Y. ;Markus,M .;Demissie,M .Uncertainty ofnitrate-N load
computations for agricultural watersheds . Water Resour. Res .
2002, 38 (10), 1185
; did
: 10 .1029/2001WR001149
.
(21) Mississippi River/GulfofMexicoWatershedNutrientTask Force .
Action Plan
for Reducing, Mitigating. and Controlling Hypoxia
in the Northern GuLfofMexico ;
Office of Wetlands, Oceans, and
Watersheds, U .S . Environmental Protection Agency: Wash-
ington, DC, 2001 .
(22) Varied, M.1
. ;Renwick,W.FI .
;Headworth,) .L . ;Auch,1.D. ;Schaus,
M. H
. Dissolved and particulate nutrient flux from three adjacent
agriculturalwatersheds: Afive-yearstudy.Biogeochemisnyzool,
54,85-114 .
(23) Richards, R. P . ; Baker, D
. B . Trends in water quality in LEASEQ
rivers and streams (Northwestern Ohio), 1975-1995
.)
.
Environ .
Qutl. 2002, 31, 90-96.
(24) Borah, D. K. ; Bera, M . ; Shaw, S. Water, sediment, nutrient, and
pesticide measurements in an agricultural watershed in Illinois
during storm events . Traps . Am. Soc. Agric. Eng
. 2003, 46, 657-
674.
(25) Meyer, 1 . L .; Likens, G . E . Transport and transformation of
phosphorus in a forest stream ecosystem. Ecology 1979, 60,
1255-1269 .
(26) Schaller,
) .
L; Royer, T . V. ; David, M . B. ;1 ank,)
. L. Denitrification
Jassociated
. N. Am
. Bentholwith
plants
. 2004,
and
23,
sediments
667-676in
.
an agricultural stream
.
(27) Illinois Department ofAgriculture .IllinoisCommercialF'ertilizer
Tonnage Report;
Illinois Agricultural Statistics Service, Illinois
(28)
structureDepartment
Wiley, M
.
of
)of
.
an
;
Osborne,
agricultural
AgricultureL,
prairie
:
L .
Springfield,
; Larimore,
river system
RIL .
and
1993-2003W
.
its
Longitudinalrelation-
.
ship to current stream ecosystem theory
. Can . ). Fish. Aquat.
Set. 1990,47,373-383
.
(29)
of
Turner,
nitrate
M
.Dnitrogen
.
;Meek,
fluxes
D .W.
from
;)aynes,Da
tile-drained
.B . ;Hatfield,
watershed
J.LEvaluationin
central
Iowa . J. Environ. Qual
. 2003, 32, 642-653 .
(30) Reckhow, K. H .; Arhonditsis, G
. B .; Kenney, M . A
.
; Hauser, L;
Tribo, 3 . ; Wu, C .; Elcock, K . ) .; Steinberg, L J. ; Stow, C. A. ; McBribe,
S . ) .; A predictive approach to nutrient criteria. Environ. Set.
Technol
. 2005, 39, 2913-2919 .
Received for review December 22, 2005. Revised manuscript
received March 21, 2006.
Accepted April 20, 2006.
ES052573N
Relationships among Nutrients, Chlorophyll-a, and Dissolved Oxygen in
Agricultural Streams in Illinois
Allyson M . Morgan, Todd V. Royer,* Mark B . David, and Lowell E . Gentry
ABSTRACT
A better understanding of the controls on algae and dissolved
0 2
in agricultural streams of Illinois is needed to aid in development of
nutrient standards. We investigated the relationships between dis.
solved nutrients, algal abundance, and dissolved 02 in five streams in
east-central Illinois from March through November 2004. The streams
drained watersheds from 25 to 777 km2 that were dominated by row
•
crop agriculture. Three sites had open canopies and two were bordered
by a narrow forest of deciduous frees. Algal abundance was measured
as chlorophyll-a (chl-a) concentration in the water column (sestonic)
and on the streambed (periphytic) . Mean NO3-N concentrations
ranged from 55 to 8.8 mg N L_' and did not relate to algal abundance.
Sestonic chl-a values ranged from nearly zero to >15
mg m_ 3
with
•
correlation
no differences
with dissolved
between open
reactiveand Pshaded
(mean
streams
concentrations
and only
werea
weak44-
479 jig L_'). The results suggest that sestonic ctrl-a is a poor criterion
for assessing nutrient-related problems In these streanss . Greatest
periphytic rhl-a occurred during low flow from August through
October, but periphyton occurred consistently in only two of the five
•
streams
. The abundance of filamentous algae explained
64% of the
variation in diel 0 2 saturation, but was not correlated with nutrients
.
Currently it appears that hydrology and light, rather than nutrients,
control algal abundance in these streams, and in the agricultural
landscape of east-central Illinois, it may not be possible to reduce nu-
trient concentrations sufficiently to limit filamentous algal blooms.
DEQUATE
dissolved 0, is vital for the survival of
aquatic organisms and is therefore an important
•
variable in the assessment and monitoring of water qual-
ity
. Short periods of anoxia can be fatal to aquatic
•
organisms, and prolonged exposure to low 0, concen-
trations can increase susceptibility to other environmen-
•
tal stressors (Horne and Goldman, 1994)
. Although 02
concentrations in streams can vary naturally over diel
and seasonal time scales, large fluctuations in 0 2 con-
centrations often indicate excessive productivity result-
•
•
ing from nutrient enrichment (Walling and Webb, 1992) .
As algal biomass increases, respiration during nighttime
can deplete 02 concentrations to values that kill suscep-
•
tible organisms and result in generally impaired biotic
•
integrity (Portielje and Lijklema, 1995
; Milt er and
Rankin, 1998)
. In eutrophic streams and rivers, dis-
solved
02
can range from supersaturated during day-
light to nearly anoxic at night. Less productive, and
presumably less impaired, streams are generally char-
acterized by dissolved 0 2 concentrations near satura-
A .M. Morgan, M .B. David, and L .E . Gentry, Department of Natural
Resources and Environmental Sciences, University of Illinois at
•
Urbana-Champaign,
Royer, School of Public
1102and S.
Environmental
Goodwin Ave,
Affairs,
Urbana,
Indiana
IL 61801Univer-
. TV.
sity, 1315 E
. Tenth St.,
Bloomington, IN 47405 . Received 17 Nov . 2005 .
Corresponding author ( troyer@indiana.ed u ) .
∎Published
in 3. Environ . Qual. N : •-•
(2006) .
doi:10.2134/jeg2005.0433
© ASA, CSSA, SSSA
677 S . Segoe Rd ., Madison, WI 53711 USA
1
Galley Proof JEQ q05-0433
tion, with some moderate diurnal fluctuation caused by
temperature and metabolism (Walling and Webb, 1992) .
In freshwater systems, increased inputs of P are of
particular concern because it commonly is the limiting
nutrient for productivity in freshwater ecosystems . Phos-
phorus loading to streams can increase the biomass of
periphyton, macroalgae, and sestonic algae, as measured
by chl-a (Welch et al., 1989; Van Nieuwenhuyse and
Jones, 1996 ; Dodds et al., 1998) ; however, identifying
strong relationships between nutrient enrichment, chl-a
concentrations, and biotic integrity in streams has been
difficult because of confounding environmental factors
such as shading, turbidity, scouring of biomass during
floods, substrate characteristics, and herbivory (Miltner
and Rankin, 1998
; Dodds and Welch, 2000) . Therefore,
establishing defensible nutrient criteria for streams, as
mandated by the USEPA for all states and tribes, re-
quires an understanding of how environmental factors
can influence the relationship between nutrients, chl-a,
and dissolved 02 .
Nutrient enrichment and eutrophication are linked
to a variety of human activities that can decrease water
quality, such as agriculture, sewage effluent discharge,
and urbanization (Biggs, 2000 ; Dodds and Welch, 2000)
.
Major inputs of N and P to surface waters in the USA
are from nonpoint sources, such as agricultural and
urban activities (Carpenter et al., 1998) . In the mid-
western USA, N and P concentrations in streams tend
to be high due to the dominance of fertilized agriculture
and extensive artificial drainage (e .g ., David and Gentry,
2000). The purpose of this study was to examine the
relationships between nutrient concentrations, algal bio-
mass, and dissolved 02
patterns in streams draining
agricultural watersheds in east-central Illinois
. Algae in
these streams occur as sestonic cells in the water column,
as periphyton attached to hard surfaces, and as mats of
the filamentous algae, Cladophora . Our first objective
was to determine how these different groups varied in
abundance through time and if that variation could be
explained by P availability . Our second objective was to
examine the role of physical factors, such as light and
discharge, in controlling algal biomass in streams of this
region . Our final objective was to determine the extent
to which patterns in dissolved 02 were related to the
abundance of sestonic, periphytic, and filamentous mats
of algae .
MATERIALS AND METHODS
Study Sites
This study was conducted in three watersheds in east-central
Illinois: the Embarras, Vermilion, and Upper Kaskaskia riven ;.
These low-gradient river systems drain a flat landscape dom-
Abbreviations : chi-a, chlorophyll-a ; DRP, dissolved reactive phos-
phorus.
a
mZ
N
L
M
2
v
Table 1 . Site names, coordinates, and watershed descriptors for each of the east-central Blinois stream sites used in the study.
Q
cc
D
N
.
2
inated by row-crop agriculture of corn (Zea 'nays L .) and
soybean [Glycine max (L.) Merr .] . Most agricultural fields in
the region are artificially drained with subterranean tiles to
maintain unsaturated soil for farming . Tile flow occurs pri-
marily from late winter through early summer and during this
period in-stream NO, concentrations are typically >8' mg N
L-' and occasionally exceed 15 mg N L- ' (David et al., 1997 ;
Royer et al ., 2004). Streams in headwater areas are extensively
channelized and incised to facilitate drainage of water received
•
banks
from the
(Rhoads
subterranean
and Henicks,
tiles without
1996)overtopping
. The sites
of
we
the
examinedstream
ranged in drainage area from 25 to 777 km2 and all are inten-
sively farmed (Table 1) . The Black Slough (BLS), upstream
Embarras River (EMU), and Lake Fork Kaskaskia River
(LFK) sites (see Table 1) had riparian vegetation of only
grasses and thus had open canopies throughout the water-
sheds . The downstream Embarras River (EMD) and Salt Fork
Vermilion River (SFV) sites had a narrow zone of deciduous
•
trees that extended several river kilometers upstream of our
sampling sites and provided a closed canopy during the grow-
ing season . Dissolved and total N and P concentrations tend to
be high in east-central Illinois streams due to fertilization of
••
cropland
et al ., 1997and ; Royer
the intensity
et al ., 2004)of
agricultural
. Streambeds
productionconsist
mainly
(Davidof
silt, sand, and gravel (Royer et al ., 2004), and large streams are
•
often turbid much of the year whereas headwater streams tend
to be clear except during floods (Wiley et al ., 1990) .
Physical and Chemical Variables
Sampling occurred from March through November 2004,
except for Site LEK, where sampling began in May 2004 . We
focused our sampling on the growing season because problems
associated with algal blooms and low dissolved 0 2 occur mainly
during this period in Illinois. At each site, five equidistant
•
transects were established in a 40-m reach of stream . Water
•
samples were collected weekly or biweekly, based on base flow
conditions, with additional samples during high flows . During
•
each sampling trip, water samples were collected before other
collections and measurements to avoid disturbance of sedi-
ments on the streambed . Water samples were stored on ice and
••
the
taken
left,
to the
center,
laboratory
and right
for
portions
analysisof
. Turbidity
the wetted
was
channel
measured
with
ata
portable turbidimeter (Model 966, Orbeco-Hellige, Farming-
dale, NY) and the values averaged. Water temperature was
recorded with a portable meter (Digi-Sense Thermocouple,
•
Cole-Parmer, Vernon Hills, IL). If the stream could be waded,
•
mean water depth was determined from the five transects
Water samples were analyzed for NO,-N, NH 4-N, and dis-
solved reactive phosphorus (DRP) after filtration through a
0.45-µm membrane. Nitrate concentrations were determined
•
using an ion chromatograph (DX-120, Dienex, Sunnyvale, CA),
with a detection limit of 0 .1 mg NQ, -N L - ' . Ammonium and
J. ENVIRON. QUAL ., VOL . •, ∎-• 2006
Galley Proof JEQ q05-0433
DRP concentrations were analyzed colorimetrically by flow
injection analysis with a QuikChem 8000 (Lachat, Loveland,
CO) using the automated sodium salicylate and automated
ascorbic acid methods, respectively. Method detection
limits
were 10 µg NH4-N L-'and 5 pg P L-' . Water samples for total
P were digested with H,,SO, and (NH,)2S2Oa, which converts
all forms of P into DRP, and then analyzed as above. Samples
for total N were digested with H,SO 4 , CuSO4
,
and K,SO, in
an aluminum block digestor (BD-46, Lachat) that converted
organic N compounds to NH,, which was then analyzed as
described above . Water samples were processed, stored, and
analyzed in accordance with standard methods (American
Public Health Administration, 1998) .
Discharge was monitored by the U.S. Geological Survey at
sites LFK (station no. 05590800) and EMD (station no.
03343400) . Sites BLS and EMU are located upstream of site
EMD. Discharge at sites BLS and EMU was calculated by
scaling the discharge at site EMD by the proportion of the
watershed represented by Site BLS and Site EMU. Because of
the consistent topography and land use within the EMD
watershed, we believe this method gave reliable estimates of
discharge patterns at sites BLS and EMU . Discharge at Site
SFV was determined in a similar manner using discharge
records from USGS station no . 03339000 located downstream
of Site SFV on the Vermilion River.
Algal Sampling and Chlorophyll-a Analysis
Sestonic Chlorophyll-a
Samples for sestonic chl-a were collected in opaque bottles
from Tansects 1, 3, and 5 and stored on ice for transport to the
laboratory. Sestonic chl-a was assessed biweekly initially, then
weekly from July through November. In the laboratory, water
samples for sestonic chl-a were filtered on the same day as
collection . All processing and analysis was performed in sub-
dued light to prevent the degradation of photosynthetic pig-
ments . A measured volume of water was passed through a
Whatman GF/F (0 .7-µm) glass fiber filter using a vacuum fil-
tration apparatus. Filtered samples were stored in a petri dish
wrapped in aluminum foil at -20°C for no more than 4 wk
until analysis (USEPA, 1997)
. For analysis, each filter was
placed in a 15-mL screw-wp centrifuge tube to which 10 mL
of 90% acetone was added. A high-intensity ultrasonic liquid
processor was used for extraction by sonication . Each sample
was sonicated for two pulses of 15 s each . All samples were
then shaken and allowed to steep in the dark at 4°C for 24 h .
Following steeping, samples were centrifuged for 15 to
20 min at 675g. Three milliliters of the supernatant were trans-
ferred to a cuvette (1 cm cell length) and absorbance was read
for each sample at 664 and 750 not on an UVVIS spectre-
photometer (Aquamate, ThermoElectron, Waltham, MA) . To
correct for pheophytin (a degradation pigment of chl-a that
Site name
Site ID
Coordinates
Stream order
Drainage area
Row crop
Strearummpling type
siteeaefit
km2
%
Black Slough (Embarras tributary)
BLS
39°57'09" N
1
25
85
open
Embarras River upstream site
EMU
88°10'00"
39°58'53" NW
2
57
85
open
Embarras River downstream site
EMD
88°12'22"
39°47'30" NW
3
473
85
shaded
Lake Fork Kaskaskin River
LIFE
88%1'09"
39°48'27" NW
3
386
91
open
Sao Fork Vermilion River
SFV
4088°28'34"
°03'04' NW
4
777
74
shaded
88°01'44" W
MORGAN ET AL.
; NUTRIENTS & CHLOROPHYLL IN AGRICULTURAL STREAMS
absorbs near the same wavelength), samples were acidified
using 0.1 mL of 0.1 M HCI added to each cuvette . After 90 s,
absorbance was measured at 665 and 750 run . Samples with
high concentrations of chl-a were diluted to be within the ac-
ceptable range for the instrument
. The concentration of chl-a
in each sample was calculated and expressed as milligrams per
cubic meter (USEPA, 1997) .
Periphytic Chlorophyll-a
At sites BLS and EMU, a representative rock of 5 to 10 cm
in diameter was collected at Transects 1, 3, and 5, placed in
•
individual plastic freezer bags, and kept on ice for transport to
the laboratory for analysis of periphytic chl-a
. We considered
periphyton to be the immediate biofilm attached to the rocks,
thus long tufts of filamentous algae were not included in the
periphytic chl-a measurements. Periphyton sampling was
••
laboratory
conducted biweekly
was done
throughout
on the same
the
day
studyas
collection
. Processing
and
in
underthe
subdued light . An area of each rock was scraped clean of
periphyton using a stiff-bristled brush and distilled water
.
The resulting slurry was collected and processed as described
above for sestonic chl-a samples with the following modifica-
•
tions : 90% ethanol was used as the solvent, initial absorbency
•
readings were taken at 665 and 750 min, then the sample was
acidified with 0.06 mL of 0.3 M
HCI for 5 min, and absorbency
•
recorded again at the same wavelengths (Marker and Jinks,
•
1982)
. The concentration of chl-a was calculated using the
•
equation
expressed
presented
as milligrams
by
per
Steinman
square
and
meterLamberti
. The surface
(1996)
area
andof
rock from which periphyton was scraped was determined using
the aluminum foil method (Steinman and Lamberti, 1996)
.
•
The scraped area was covered completely with a single layer of
•
aluminum foil, which was then removed and weighed
. The
•
weight of the foil was converted to surface area using a re-
gression equation established following the procedure of
•
Steinman and Lamberti (1996) .
Filamentous Algae
When filamentous macroalgae were present, the wetted
width at each transect was measured and the percentage of the
•
streambed covered by macroalgae determined as described by
Schaller et al
. (2004) . Cover was converted to biomass by
collecting, at each transect, all filamentous algae in a 314-cm
2
area that was completely covered by algae . This material was
•
grams
rinsed
per
in the
square
laboratory,
meter
. The
dried,
percentage
weighed,
cover
and
values
expressed
for eachas
transect were scaled by this conversion to estimate mean
biomass (grams per square meter) of filamentous algae for the
stream reach
.
Dissolved Oxygen Monitoring
Dissolved 02
was monitored continuously during the study
period at Site BLS using a datalogger (CR10, Campbell
Scientific, Logan, UT) and dissolved 0, probe (CS511-L,
Campbell Scientific)
. Water temperature was monitored con-
tinuously with a HOBO temperature logger (Onset Computer,
Bourne, MA)
. At the other sites, dissolved 0
2 and water tem-
perature were measured approximately once a month for a 48-
or 72-h time period using a YSI (Yellow Springs, OH) 600XLM
probe, a Hydrolab (Loveland, CO) MiniSonde, or a Hydrolab
Datasonde (Model 4a)
. Regardless of the instrument, data
were recorded every 15 min and averaged hourly. All probes
were calibrated according to manufacturers' instructions be-
fore deployment . To account for variation between instru-
ments and possible instrument drift, all probes were checked
Galley Proof JEQ q05-0433
3
routinely against Winkler titrations (American Public Health
Administration, 1998) . The dissolved 0, patterns we measured
at the downstream transect of each site were presumed to be a
reflection of conditions in the study reach, but productivity
occurring further upstream could have influenced 0 2 patterns
at the monitoring site . Light intensity was measured contin-
uously at Site BLS using a datalogger (CR10, Campbell Sci-
entific) and pyranometer (LI-200SA, LI-COR, Lincoln, NE)
.
Because Site BLS has an open canopy, the light measurements
indicate incoming solar radiation and do not account for re-
ductions by the canopy at the shaded sites
.
Statistical Analyses
Variables were tested for normality using the univariate
procedure (SAS Institute, 1990) . No variable was normally dis-
tributed
. Therefore, Spearman rank order correlation was used
to examine relationships among the variables and the Spear-
man rank correlation coefficient (r,) is reported (Zar, 1999)
.
Rank order correlations do not require normally distributed
data but lack the predictive power of linear regression
. Never-
theless, we believe this analysis can provide insight into the
relationships between nutrients, chl-a, and dissolved 0
2.
The diet range in dissolved 0 2
saturation was determined by
subtracting the minimum saturation percentage value from the
maximum value for that day
. 'llventy-one values of diet range
in saturation percentage were collected across the sites, of
which two values appeared to be outliers with extremely large
ranges. The outliers were from opencanopy
, sites (EMU and
BLS) and, based on our observations, we believe these outliers
were not related to productivity in the study reach but instead
resulted from 0 2
patterns that originated upstream of the
study reach . With these two values removed, the data
were
normally distributed with constant variance, and we regressed
diet range in saturation percentage against both periphytic chl-a
and the biomass of filamentous algae
.
RESULTS
The streams ranged in mean depth from 32 to 93 cm
when they could be waded, although discharge (and
hence depth) varied considerably during the study period
(Table 2)
. Turbidity ranged from <10 nephelometric
turbidity units (NTU) in all sites during periods of low
flow to 80 NTU or greater in the larger streams during
high discharge . Mean N0 3-N concentrations were sim-
ilar among the sites, ranging from 5.5 to 8.8 mg N L-t .
The maximum and minimum values were also compa-
rable among sites and ranged from 0.1 to 16.1 mg N L'
.
Although NH4-N concentrations were often high
(>100 .g
p L -I ), N0 3-N typically accounted for 90% or
more of water column total N at all sites
. At each site,
total P and DRP varied by at least an order of magnitude
during the study, with the maximum concentration of
DRP exceeding 190 jig L
-t at all sites (Table 2) . Site SFV
had particularly high P concentrations due to sewage
effluent from Urbana, IL, approximately 40 km upstream
of our sampling site .
m
Sestonic
3 with no
chl-a
apparent
values ranged
differences
from nearly
between
zero to
open
>15
andmg
shaded streams (Fig . 1) . Although chl-a in the water
column could occasionally be high, the median value for
both open and shaded streams was <3 mg
m-3
and the
mean values were <5 mg m-3
. In streams, the source of
sestonic algae is generally thought to be sloughed algal
4
1 ENVIRON
. QUAL., VOL .
Ir,
-•
2006
Table 2. Physical and chemical characteristics for the stream study sites during March to December 2004 . Mean values are reported, with
the range shown in parentheses . Depth measurements were taken only when streams were able to be waded (n = 6-14) ; for all other
variables, n = 26.
cells from the periphyton (Swanson and Bachmann,
1976) . We found no correlation between sestonic chl-a
and periphytic chl-a values at the open sites (BLS and
EMU), and the shaded sites had little or no periphyton
but often had measurable amounts of sestonic chi-a .
•
averageSite
SFV
P concentrations
had relatively
three
low sestonic
to
10 times
chl-a
greater
values
thanbut
the other sites because of the upstream sewage effluent .
•
With Site SFV included, no meaningful relationship was
found between DRPor total P and sestonic chl-a, but with
Site SFV removed, there was a moderate but significant
(r, = 0 .52, P < 0 .005) correlation between total
P and
sestonic chl-a, and a weaker correlation with DRP (r, =
0.21, P < 0 .03). The scatter suggests that factors other
•
(Figthan.
2)P; however,
were important
of the
in
other
controlling
variables
sestonicexamined, chl-aonly
turbidity showed a positive correlation (r, = 0.51, P <
•
0.005) with sestonic chl-a, but this probably represented
20
N
N
0
0
m
5
0-
1
f
t
Kaskmkia
Dissolved
BLS, Black
River,
reactive
Slough
SFV,
P(Embarras
.
Salt Fork
River
or the
tributary)Vermillion ; EMU,
Riverupstream
.
Embarras River site ; EMD, downstream Embarras River site; LFK, Lake Fork of the
•
5 Nephelometric turbidity units .
I
Below detection limits
.
an autocorrelation because algal cells in the water col-
umn contributed to the measured turbidity .
Periphyton only occurred consistently at the open
sites (BLS and EMU) and the amount of periphytic chl-a
varied during the study from 0 to 40 mg m-' (Fig . 3). The
greatest values of periphytic chl-a occurred during ex-
tended periods of low flow from August through Octo-
ber . Periphytic chl-a declined during July, possibly as a
result of scouring, although similar discharge peaks
during June did not affect abundance (Fig . 3). Depth
was inversely correlated with periphytic chl-a (Fig . 4)
and this relationship probably reflected light attenua-
tion through the water column . On the dates when pe-
riphyton was sampled, the concentration of
DRP ranged
from about 5 to 70
.gp
P
and was positively correlated
with
P, and
periphytic
turbidity
chl-ashowed
(r,
no
= 0
relationship
.43, P
< 0.01)
with
. Nitrate,
periphytictotal
chl-a .
•
Values > 90th percentile
T
90th
75th
percentilepercentile
Mean
Median
25th percentile
10th percentile
•
Values c 10th percentile
Open
Shaded
Figcentral
. 1
. Box
Illinois
plot of
agricultural
seslonic chl-a
streamsconcentrations
.
from March through November 2004 in three open-canopy (n = 75) and two shaded (n = 51) east-
Galley Proof JEQ q05-0433
Stet
Depth
Temperature
Discharge
7brbidity
NOrN
Total N
NH 4-N
DRPt
Total P
m
°C
m3 9-1
NTU{
mgh
t
Pg~ 1
BLS
(0032.17-0A8)
(7-24)16
(00.11.002-OA4)
(1-25)5
(073.1-11.3)
(07.4-11.5 .6)
24(7-56)
44(BDy-293)
(10-430)60
LFKSFVEMUEMD
(0(0(0(031-053)033000.93.55.90-0.43.23-0.20-0.49).94).94)
(6-27)(7-25)(7-24)(6-24)17181718
(0(0(0(049d0.01-57).005-1.9.26.3.8.6-140).04-67).01)
(9-111)462421(6-41)(5-86)(1-41)8
(1(0(0(05586&8.8.0-113).0.7-13.2-16.6-10.8).1).1)
(0(1(2(185795.1-10.6-17.2-13.2-12.4.8.8 .0).9).2).1)
(19-330)(13-127)32315155(8-72)(5-180)
479(5-194)(142-1790)467450(3-274)(13-342)
(200-2750)630130240(10-1660)(10-400)(30-500)80
E0rnN
0
10
1
20
15
10
rE
E
5
E
m
0
u
u
20
O
w 15
10
5
0
0.0
0.1
0.2
0.3
0.4
0.5
P concentration (mg L-1)
•
Fig(lower)
2004
. L Correlation
in agricultural
DRIP (dissolved
between
streams,
reactive
sestonic
excluding
P)
chl-a
from
Site
and
March
SFV(upper)
through
total
NovemberP
and
Only the open sites had substantive amounts of fila-
mentous algae and, at times, coverage of the streambed
exceeded 40% in sites with biomass >30 g dry mass M-2
(Fig
. 5). The abundance of filamentous algae was not
•
correlated with discharge, turbidity, or any measure
of water chemistry. There was considerable temporal
MORGAN ET AL.: NUTRIENTS & CHLOROPHYLL IN AGRICULTURAL STREAMS
50
Total
r,=0.52P
40-
P<0.005
•
•%
DRPr,=0.21
p=0
.03
- Discharge
Chl-a
site EMU - 60
50
40
Mar Apr May Jun Jul Aug Sep Oct Nov Dec
o
30
site BLS - 60
50
40
30
t- 20
-10
2004
Figscale
terns
.3. Estimated
for
for
dischargetwo
open-canopy
discharge
.
and
agricultural
mean periphytic
streamschl-a
. Note
(±1
difference
SE) pat-in
30
20-
qE
10-
E 0
QCmn5
Up
.
50400.00
30
20
10
Galley Proof JEQ q05-0433
010
•
r,=0.43
P<0.01
•
,
r•
0.02
0.04
0
.06
DRP (mg L I)
0.08
r,=0.47
p=0.o1
M
60
5
20
30
40
50
Depth (cm)
Figand
. 4.
(lower)
Correlations
stream
between
depth for
periphytic
two open-canopy
chlorophyll-a
agricultural
and (upper)
streamsDRP
(sites EMU and BLS) from March through November 2004
.
•
-y
•
0
•
•
variation in the abundance of filamentous algae at both
sites and high discharge periods probably reduced the
abundance of filamentous algae, as reported from other
streams in Illinois (Schaller et al ., 2004), but this was not
easily discernable from the data we collected .
Example dissolved 02 curves from open (BLS and
EMU) and shaded (EMD and SFV) sites from May and
November are shown in Fig . 6 . The diel range in dis-
solved 02 saturation was several-fold greater in the
open sites than the shaded sites. The open sites were
routinely supersaturated (up to 160-180%) in dissolved
02 during daylight, whereas the shaded sites were con-
sistently undersaturated . The diet range in 02 saturation
however,
was not related
the biomass
to the
of
abundance
filamentous
of periphytic
algae explainedchl-a
;
64% of the variation in diet ranges of 02 saturation
(Fig
. 7) . Thus, diel patterns in dissolved 02 appeared to
be influenced by the abundance of filamentous algae
but insensitive to the abundance of periphyton in these
open, agricultural streams.
From April through December 2004 at Site BLS,
dissolved 02 concentrations were below the Illinois Pol-
lution Control Board standard of 5 mg L-t on a total of
57 d, including each night from 17 August through 26
September (Fig. 8) . From 24 August through 29 August,
dissolved 02 declined to <3 .5 mg L-1 and remained
below this value for 8 to 14 h . The August to September
centrations
period with consistently
corresponded
low
with
nighttime
a period
dissolved
of low filamen-02
con-
tous algae at Site BLS but the highest measured values
of periphytic chl-a
.
6
60
50
~E
40
c
'o
E vE
2030
u
Mar Apr May
Jun Jul Aug Sep Oct Nov Dec
2004
Figmass
cultural
. 5. Meanand
streams(lower)
(± I SE)
.
streambed
abundancecoverage
of filamentous
in two
algae
open-canopy
as (upper)
agri-bio
.
DISCUSSION
Agricultural streams in east-central Illinois are char-
acterized by flashy hydrology and generally high but
seasonally variable concentrations of dissolved nutrients
(Royer et al ., 2004 ; Schaller et al.,
2004) . No measure of
N was positively correlated with the abundance of ses-
tonic, periphytic, or filamentous algae and N was
unlikely to have limited algal growth, as the minimum
NOs-N concentrations were >100 µg L -1 and mean
concentrations exceeded 5 mg L
- t (Table 2) . Although
excessive N in streams is an environmental concern, our
findings support previous work suggesting that N gen-
erally is not limiting for algal growth in many agricul-
tural streams in the Midwest (Bushong and Bachmann,
1989; Munn et al ., 1989 ; Wiley et al.,
1990) .
Total P was correlated to the concentration of sestonic
chl-a, but the relationship was not strong and probably
arose because both variables were directly related to the
density of algal cells in the water column
. The rela-
tionship between sestonic chl-a and turbidity is similarly
confounded
. Sestonic chl-a was not related to DRP,
suggesting sestonic chl-a levels were determined by fac-
tors other than nutrients, although our analysis did not
reveal which factors were important in this regard .
Swanson and Bachmann (1976) presented evidence that
sestonic algae in agricultural streams originates from
sloughing of periphyton on the stream bed
. We believe
that this probably was true for the streams we examined,
but the lack of correlation between periphytic and
sestonic chl-a suggests that the mechanism was more
complex than a simple displacement of cells from the
streambed to the water column
. Overall, sestonic chl-a
J. ENVIRON QUAL ., VOL. •,
- •
2006
0
a
N
Oy
0N
26 May
150
140-
1j0 -
120-
110-
100 ,
90
80
70
60
09 Nov
Galley Proof JEQ q05-0433
23 MJ rri
2
a site EMU (open)
o site SFV
(shaded)
v site EMD (shaded)
n site
BLS (open)
29MJm 2
27 May
28 May
29 May
10 Nov
11 Nov
2004
FigNovember
. 6 . Dissolved200402in
patterns
two open-canopy
during (upper)
and
late
two shaded
May and
agricultural(lower)
early
streams. Daily solar radiation values were measured at Site BLS
(open canopy) and do not reflect available light at the water surface
for the shaded sites .
was low despite high N and P concentrations through-
out most of the study, and these streams would be clas-
sified as oligotrophic using the trophic scale presented by
Dodds et al
. (1998) . Sestonic chl-a must be a reliable
predictor of water quality if it is to be used as an indica-
tor of nutrient-related impairment in streams (Reckhow
et al., 2005)
. Because the abundance of sestonic chl-a was
not related in any simple way with nutrients or perip-
hyton, we suggest that chl-a in the water column is not a
good criterion for assessing eutrophication-related prob-
lems in these low-order, agricultural streams .
The abundance of periphyton in streams is strongly
affected by light, nutrients, and flow regime
(e.g .,
Lohman et al ., 1992; Biggs, 1995, 2000) and the expected
direct relationship between periphyton biomass and nu-
trients may not be realized if light limitation or scouring
occurs (Dodds et al ., 2002) . Periphytic chl-a in our study
was greatest during periods of low stable flow in summer
and autumn, but periphyton occurred consistently in
only two of the five streams . The shaded sites (EMD and
SFV) had N and P concentrations similar to or greater
than the other streams but supported no periphyton,
probably because insufficient light reached the stream-
bed
. The role of light was particularly evident at Site
SFV, which had consistently high N and P concentra-
tions but had no periphyton and <3.5 mg
m-3
of ses-
tonic chl-a throughout the study
. Site LFK was not
shaded but lacked hard substrata and contained peri-
12 Nov
150
--9--- sitesite BLSEMU
140130
120
110
100
c
a
0
8090
70
60
120
°-
q
100
9
N
60
F
40
Z
E!
20
in
0
80
10
20
30
40
Periphytic chl-a (mg m-2)
Fig. 7. Relationship between the diet range in dissolved 0 2 saturation
and the biomass or (upper) filamentous algae or (lower) periphytic
chlorophyll-a in two open-canopy agricultural streams during
March through November 2004.
phyton on only two dates throughout the study. In those
streams where it occurred, periphytic chl-a was corre-
lated positively with DRP and inversely with depth, with
depth
tant
water
both
probably
columnin
determining
.
indicating
Canopy cover
if
light
periphyton
and
attenuation
turbidity
could occur
were
through
impor-at
theall
and in affecting temporal patterns in periphyton abun-
dance within the streams where it occurred . The effects of
nutrient enrichment will be observable as a response in
periphyton biomass only in streams with the habitat
conditions that allow for periphyton development (Biggs,
1995) . For many nutrient-rich agricultural streams, light,
Apr May
0
10
20
30
40
Filamentous algal (g dry mass m
-2)
.
.
0
Jun Jul
MORGAN ET AL.
: NUTRIENTS & CHLOROPHYLL IN AGRICULTURAL STREAMS
Aug
Sep
Oct
2004
Fig. & Continuous dissolved 02 concentration in an open-canopy
agricultural stream (Site BLS) from late April through early
December 2004 . Horizontal line indicates the 5 mg L Illinois
dissolved 0 2 standard at the time of the study.
Nov Dec
Galley Proof JEQ q05-0433
7
temperature, flow regime, and substrata may be the con-
trolling factors for periphyton accrual (Moore, 1977 ;
Bushong and Bachmann, 1989; Munn et al ., 1989),
meaning that such streams may not show a consistent
and generalized response in periphyton abundance to
changes in nutrient loads .
The biomass of filamentous algae (Cladophora)
during this study reached a maximum of 40 g dry mass
m-2 (Fig. 5), which was considerably less than the
maximum of 200 g dry mass m_2 reported by Schaller
et al . (2004) during 2002 for a similar type of stream in
east-central Illinois. The occurrence and abundance of
filamentous algae were sporadic and unrelated to nu-
trient concentrations or any of the measured physical
variables. Dodds et al. (1997) suggested that preventing
nuisance levels of Cladophora in the Clark Fork River in
western Montana would require an average concentra-
tion of total P below 30 pg L-1 and an average con-
centration of total N below 350 tLg L -I. In east-central
Illinois, average total P was at least twofold greater than
total
the value
N was
proposed
more than
by Dodds
an order
et alof .
magnitude
(1997) and
greateraverage
these
(Table
agricultural
2) . Given the
streams,
high
we
nutrient
suggest
concentrationsthat
flow regime,in
light, and temperature had greater influences on fila-
mentous algal biomass than did nutrients
. Based on our
observations, the timing and density of mats of filamen-
tous algae in these streams can vary significantly among
years and between streams. Although we cannot yet
explain the spatial and temporal patterns in filamentous
algae, this variable did appear to have a significant in-
fluence on dissolved 02 patterns (Fig . 7) whereas sestonic
and periphytic chl-a did not . The spatial distribution of
likely
mats of
to
filamentous
be an important
algae
factor
within
affecting
a stream
dissolved
network
0is2
patterns, and algal blooms in upstream reaches or trib-
utaries may create unexpected 02
patterns at a moni-
toring site .
Temporal patterns in dissolved 0 2 , such as we present
for Site BLS (Fig . 8), are influenced by multiple and
often interacting factors that include temperature,
physical aeration, ground water exchange, heterotrophic
respiration, and algal metabolism. In general, low night-
are
time
thought
02 concentrations
to result from
in eutrophic
respiration
streams
by primary
and riverspro-
and
ducers
Webb,
and
1992)the
decay
. The
of
low
excess
nighttime
biomass
02 concentrations(e
.g ., Walling
that occurred during late August at Site BLS corre-
sponded to a time of high periphytic chl-a, but the diel
range in saturation percentage was not large and it is
uncertain if respiration by periphyton was responsible
for the low dissolved 0 2 at that time . The abundance of
filamentous algae influenced the diel range in saturation
percentage, but not the minimum dissolved 0 2 concen-
tration . Welch et al . (1988) similarly found that the bio-
dissolved
mass of filamentous
02 concentrations
algae was
in streamsnot
related
. Shading
to
stronglyminimum
influences algae photosynthesis in streams (e.g ., Hill,
1996) and thus dissolved 02 patterns. We found that
open-canopy streams contained filamentous algae,
whereas shaded streams did not, and this appeared to
8
explain the differences in dissolved 02 patterns between
the two stream types (see Fig .
6).
Streams in east-central Illinois, and throughout the
Midwest, are highly modified ecosystems (e.g .,
Rhoads
and Herricks, 1996) and strongly affected by agricultural
activities and, in some cases, sewage effluent
. Under-
standing the relationships between nutrients, algae, and
dissolved 02 in these streams is complicated by land use
and hydrological modifications
. Because of agricultural
drainage, the highest N and P concentrations occur
during periods of high flow (Royer et al ., 2004),
when
depth and turbidity also are high but algal biomass is low .
Headwater channels tend to be open, whereas canopy
shading and turbidity increase as one moves from head-
waters to larger streams (Wiley et al
., 1990) .
In the shaded
sites, dissolved 02 patterns appeared to be unrelated to
nutrient concentrations . For the open-canopy streams,
we suggest that hydrology, through effects on depth,
turbidity, and biomass scouring or accrual (Biggs,
2000),
is the key factor for explaining variation in algal bio-
mass (and 02 patterns) in these nutrient-rich systems,
but this remains to be examined mechanistically
. Our
results indicate that reducing the biomass of filamentous
algae in the open-canopy streams may lead to improved
habitat conditions . Controlling
Cladophora is difficult
(Dodds, 1991), however, and in an agricultural landscape
•
such as east-central Illinois, it may not be possible to
reduce nutrient concentrations sufficiently to limit the
occurrence of blooms of filamentous algae .
ACKNOWLEDGMENTS
We thank Corey Mitchell, Karen Starks, D€bora Figueroa-
•
Nieves, Tessa Marusarz, Josh Burke, Marshall McDaniel, and
Kate VonHolle for help with various aspects of the study.
•
Funding for the project was provided by the State of Illinois
through the Council on Food and Agricultural Research (C-
FAR) Water Quality SRI.
REFERENCES
American Public Health Administration . 1998, Standard methods
for the examination of water and wastewater . 18th ed . APHA,
Washington, DC.
Biggs, B .LE 1995 . The contribution of flood disturbance, catchment
geology and land use to the habitat template of periphyton in
stream ecosystems . Freshwater Biol
. 33 :419-438.
Biggs, BJ.F 2000
. Eutrophication of streams and rivers : Dissolved
•
nutrient-chlorophyll relationships for benthic algae. 1. N. Am .
Benthol. Soc . 19 :17-31
.
Bushong, S.1., and R .W. Bachmann. 1989 . In situ nutrient enrichment
experiments with periphyton in agricultural streams . Hydrobiologia
178 :1-10.
Carpenter,
S .R
., N
.F. Carson, D.L . Correll, R .W. Howarth, A .N .
Sharpley, and V H. Smith . 1998 . Nonpoint pollution of surface wa-
ters with phosphorus and nitrogen
. Ecol. Appl . 8:559-568 .
David, M .B ., and L.E. Gentry. 2000
. Anthropogenic inputs of nitrogen
and phosphorus and riverine export for Illinois, USA . J. Environ.
Qual . 29:494-508 .
David, M .B ., D.A . Kovacic, LE. Gentry, and K .M
. Smith
. 1997
.
Nitrogen balance in and export from an agricultural watershed
. I.
Environ . Qual . 26:1038-1048 .
Dodds, W.K. 1991 . Factors associated with dominance of the filamen-
tous green alga Cladophora glomerata. Water Res . 25:1325-1332.
Dodds, W.K., 1.R . Jones, and E .B. Welch . 1998
. Suggested classifies-
1 . ENVIRON QUAL., VOL. U, WE 2006
Galley Proof JEQ q05-0433
lion of stream trophic state: Distributions of temperate stream
types by chlorophyll, total nitrogen, and phosphorus Water Res . 32 :
1455-1462 .
Dodds, W.K ., VH. Smith, and K. Lohman. 2002. Nitrogen and phos-
phorus relationships to benthic algal biomass in temperate streams .
Can . J. Fish. Aquat . Sci . 59:865-874 .
Dodds, W.K ., VH. Smith, and B. Zander. 1997 . Developing nutrient
targets to control benthic chlorophyll levels in streams : A case study
of the Clark Fork River. Water Res. 31 :1738-1750 .
Dodds, W.K ., and E.B. Welch . 2000
. Establishing nutrient criteria in
streams. 1. N. Am. Benthol . Soc . 19:186-196 .
Hill, W.R . 1996 . Effects of light . p. 121-148. In R .J. Stevenson et al .
fed .) Algal ecology: Freshwater benthic ecosystems. Academic
Press, San Diego, CA .
Horne, A
.1., and C
.R
. Goldman . 1994. Limnology. 2nd ed. McGraw-
Hill, New York .
Lohman, K ., JR . Jones, and B.D . Perkins. 1992 . Effects of nutrient
enrichment and flood frequency on periphyton biomass in northern
Ozark streams. Can . J. Fish . Aquat . Sci . 49:1198-1205.
Marker, A .F.H., and S
. Jinks 1982. The spectrophotometric analysis of
chlorophyll a and phaeopigments in acetone, ethanol and methanol
.
Arch . Hydrobiol . Beth . Ergebn. Limnol. 16:3-17 .
Miltner, R .l., and E.T. Rankin. 1998 . Primary nutrients and the biotic
integrity of rivers and streams
. Freshwater Biol . 40:145-158 .
Moore, J.W. 1977 . Some factors affecting algal densities in a eutrophic
farmland stream . Oecologia 29 :257-267.
Munn, M .D., L.L . Osborne, and M
.J
. Wiley. 1989
. Factors influenc-
ing periphyton growth in agricultural streams of central Illinois
.
Hydrobiologia 174 :89-97 .
Portielje, R ., and L. Lijklema
. 1995 . The effect of reaeration and
benthic algae on the oxygen balance of an artificial ditch . Ecol .
Modell . 79:35-48.
Reckhow, K .H ., G .B. Arhonditsis, M .A . Kenney, L. Hauser,l. nibo, C.
Wit, K.J. Elcock, L.1. Steinberg, CA . Stow, and S
.J. McBride. 2005 .
A predictive approach to nutrient criteria. Environ. Sci . Technol .
39:2913-2918.
Rhoads, B.L ., and E .E
. Herricks
. 1996. Naturalization of headwater
streams in Illinois
: Challenges and possibilities. p. 331-367 . In A
.
Brookes and F.D. Shields fed .) River channel restoration
: Guiding
principles for sustainable projects
. John Wiley & Sons, New York .
Royer, T. V, IL. Tank, and M.B . David . 2004 . Transport and fate of
nitrate in headwater agricultural streams in Illinois . J. Environ.
Qual. 33 :1296-1304.
SAS Institute. 1990. SAS/STAT user's guide . Version 6 . 4th ed. SAS
Inst., Cary, NC.
Schaller, 1.L.,
TV
. Royer, and M .B. David . 2004
. Denitrification as-
sociated with plants and sediments in an agricultural stream . J. N.
Am. Benthol . Soc. 23 :667-676 .
Steinman, A .D., and G.A . Lamberti
. 1996. Biomass and pigments of
benthic algae. p . 295-313. In F.R. Hauer and G
.A. Lamberti fed .)
Methods in stream ecology . Academic Press, San Diego, CA.
Swanson, C.D., and R.W. Bachmann . 1976 . A model of algal exports in
some Iowa streams . Ecology 57 :1076-1080 .
USEPA . 1997 . Method 446.0 : In vitro determination of chlorophylls a,
b, cl, +c2 and pheopigments in marine and freshwater algae by
visible spectrophotometry . USEPA, Cincinnati, OH .
Van Nieuwenhuyse, E.E., and J.R . Jones 1996. Phosphorus-chloro-
phyll relationship in temperate streams and its variation with
stream catchment area . Can . J. Fish. Aquat . Sci . 53:99-105 .
Walling, D.E., and B.W. Webb . 1992. Water quality : 1 . Physical
characteristics . p. 48-72. /n P Calow and G.E . Pelts fed .) The rivers
handbook. Vol . 1
. Blackwell Scientific, Oxford, UK .
Welch, E.B., R .R . Horner, and C. Patmont. 1989. Prediction of
nuisance periphytic biomass : A management approach . Water Res.
23:401-405 .
Welch, E.B ., 1.M. Jacoby, R .R . Horner, and MR . Seeley
. 1988 .
Nuisance biomass levels of periphytic algae in streams Hydrobio-
logia 157:162-168 .
Wiley, M .1., L.L . Osborne. and R.W Larimore. 1990 . Longitudinal struc-
ture of an agricultural prairie river system and its relationship to cur-
rent stream ecosystem theory. Can
. J
. Fish . Aquat . Sci . 47
:373-383
.
Zar, J
.H
. 1999. Biostatistical analysis
. 4th ed . Prentice Hall, Upper
Saddle River, NJ..
Hydrobiologia (2006)
O Springer 2006
DOI 10.1007/sIo750-006-0114-3
Primary Research Paper
Controls on chlorophyll-a in nutrient-rich agricultural streams in Illinois, USA
Debora Figueroa-Nieves', Todd V . Royer2, * & Mark B . David'
'Department of Natural Resources and Environmental Sciences, University of Illinois at Urbana-Champaign, W-503
Turner Hall, 1102 S. Goodwin Av ., Urbana, IL 61801, USA
2 School of Public and Environmental Affairs, Indiana University, 1315 East 10th Street, Bloomington, IN 47405, USA
(*Author for correspondence : Tel. : +812-855-0971; Fax: +812-855-7802 ; E-mail: troyer@indiana .edu)
Received 29 August 2005 ; in revised form 6 February 2006; accepted 05 March 2006
Key words: nitrogen, phosphorus, chlorophyll-a, periphyton, agricultural streams, Illinois
Abstract
Nitrogen and phosphorus are the primary nutrients that affect water quality in streams in the midwestern
USA and high concentrations of these nutrients tend to increase algal biomass
. However, how nutrients
interact with physical controls in regulating algal biomass is not well known in agricultural streams
.
Eighteen streams in east-central Illinois (USA) were sampled during June and September 2003 to analyze
factors possibly regulating algal biomass . Additionally, two shaded and two non-shaded sites in the
Embarras River in east-central Illinois were sampled intensively from June to December 2003 . Both ses-
tonic and periphytic chlorophyll-a (chl-a) were analyzed, and periphytic chl-a was assessed on natural
substrata and unglazed ceramic tiles . Although high concentrations of nutrients were found in these
streams (mean total P=0 .09-0 .122 mg 1- ' and mean N03 -N=4.4-8 .4 mg 1 -'), concentrations of sestonic
chl-a were low among all sites and both sampling periods (< 18 mg m-3
,
median values of 5 and 3 in June
and September, respectively)
. Filamentous algae were an important component of the algal communities in
streams with stable substrata
. Periphytic chl-a was generally not related to the concentration of N or P in
the water column, and in non-shaded streams periphyton appeared at times to be light-limited due to turbid
water
. Turbidity was found to be an important factor controlling chl-a on ceramic tiles across the 18 sites
and for the Embarras River sites ; chl-a decreased exponentially in concentration (132-0 mg m
-2) as tur-
bidity increased from 4 to 39 NTU (r2 =0 .80) . In general, the interaction between hydrology and light
(turbidity) likely controlled algal biomass in these nutrient-rich, agricultural streams .
Introduction
Factors such as nutrients, turbidity, temperature,
light, and hydrological regime can control sestonic
algae and periphyton in streams (Bothwell, 1988
;
Bushong & Bachmann, 1989 ; Rosemond, 1993
;
Biggs, 1995 ; Van Nieuwenhuyse & Jones, 1996 ; Hill
& Dimick, 2002) . Midwestern streams tend to have
high concentrations of N and P due to the appli-
cation of fertilizers used in agricultural fields to
enhance the productivity of crops (Fausey et al .,
1995; David et al ., 1997 ; David & Gentry, 2000) .
Nitrogen and P reach these streams via subterra-
nean tiles that discharge shallow ground water and
associated solutes directly into the streams (David
et al ., 1997 ; Mclsaac & Hu, 2004) ; surface runoff
can also contribute nutrients, particularly P . Sew-
age effluent is also another source of N and P in
streams, although generally more limited in effects
in agricultural watersheds due to low population
densities (David & Gentry, 2000) . A major concern
is that agricultural drainage contributes to adverse
changes in stream water quality by increasing
concentrations of nutrients and generally leading to
eutrophication
. The United States Environmental
Protection Agency currently is directing states to
develop nutrient criteria as a step towards reducing
stream N and P concentrations and improving
biotic integrity
. However, it is not known if nutri-
ents are the critical factor controlling algal produc-
tion in agricultural streams of the midwestern USA
.
The concentration of sestonic chlorophyll-a
(chl-a) has been related to total P across a range of
streams (Van Nieuwenhuyse & Jones, 1996) and
periphytic chl-a is often controlled by dissolved
nutrients (e .g ., Lowe et al ., 1986) . Although N and
P can limit algae, these nutrients do not always
relate strongly to the abundance of chl-a, partic-
ularly in P-enriched streams (Van Nieuwenhuyse
& Jones, 1996) . Bushong & Bachmann (1989)
found that P enrichment never stimulated periph-
yton growth in agriculturally influenced streams in
Iowa and concluded that background N and P
concentrations were sufficient for algal demands
.
Similarly, Munn et al
. (1989) and Wiley et al .
(1990) suggested that periphyton growth was lim-
ited by temperature and turbidity in east-central
Illinois, although neither study measured chl-a on
naturally occurring substrata or included a direct
evaluation of physical controls on chl-a . In gen-
eral, algal biomass in streams depends upon the
interaction of many factors, which can operate
simultaneously, such as light, nutrients, and graz-
ing (Rosemond, 1993) . Discharge can also influ-
ence benthic chl-a by tumbling rocks on the
streambed and scouring algae from substrata
during floods (e .g .,
Lohman et al ., 1992 ; Biggs,
1995, 2000).
Chlorophyll-a is often a central aspect of water
quality programs and an indicator of eutrophica-
tion . Management and regulatory efforts aimed at
reducing eutrophication in streams and rivers
often focus on dissolved nutrients, although in
agricultural regions the relationship between chl-a
and dissolved nutrients is not always strong (e .g .,
Moore, 1977 ; Welch et al ., 1988)
. Thus it is
important to examine abiotic factors thought to
regulate algal biomass (as indexed by chl-a) in
addition to dissolved nutrients. We studied abiotic
controls on chl-a abundance in shaded and non-
shaded agricultural streams in east-central Illinois,
USA . Our specific objectives were to
: (1) investigate
relationships between algal chl-a and abiotic fac-
tors (nutrients, turbidity, shading, and discharge
related variables), (2) compare the relative abun-
dance of sestonic versus benthic chl-a, and (3)
examine periphyton growth on a common sub-
strate across a series of nutrient-rich streams
.
Methods
Site description
This study was conducted in the five watersheds
that originate in east-central Illinois (Fig . 1) . The
landscape in these watersheds is relatively flat
with organic matter rich Mollisols, creating an
excellent environment for crops, especially corn
and soybean production
. Due to the flat topog-
raphy the agricultural fields are drained with
subterranean tiles to facilitate drainage and
farming (David et al ., 1997)
. Headwater streams
in the region are extensively channelized and
incised to facilitate drainage of water received
from the subterranean tiles (Rhoads & Herricks,
1996) . Additionally, riparian vegetation along
most headwater streams is limited to grasses and
the streams have open canopies . Larger streams
often have a narrow riparian zone of deciduous
trees that provide a closed canopy after leaf out
(Munn et al ., 1989) .
Eighteen stream sites were used in the study, all
of which drained watersheds dominated by row-
crop agriculture (Table 1)
. The sites spanned a
range of sizes and substrata conditions, and seven
sites were shaded whereas II were non-shaded
(Table I) . Three of the sites received sewage efflu-
ent upstream of our study locations : North Fork
Salt Creek, Copper Slough, and the Salt Fork
Vermilion River. All 18 sites were sampled during
June and September 2003 to examine the range of
benthic and sestonic chl-a that occurs in midwest-
ern agricultural streams and to determine the
factors controlling algal biomass . From the 18
sites, four sites on the Embarras River (Fig . I) were
monitored intensively (bi-weekly) from June to
December 2003 . Two of the Embarras River sites
were non-shaded (EM I and EM2) and the other
two were shaded (EM3 and EM4) .
Physical and chemical characteristics
Streams were sampled for periphytic and sestonic
chl-a, dissolved nutrients, temperature, turbidity,
and dissolved oxygen
. Three transects were estab-
lished at each stream site, 15 m apart for a total
study reach of 30 m . Water temperatures were
recorded hourly during the study period for three
sites (EMI, EM2, and EM4) using HOBO tem-
perature loggers (Onset Computer, Bourne, MA) .
Turbidity was measured with a portable turbidim-
eter (Orbecco-Hellige Model 966) . Instantaneous
measures of dissolved oxygen and temperature
were collected with a portable meter (Orion Model
835A or 830A) . The study sites were located in
proximity to existing gaging stations operated
by the US Geological Survey to monitor stream
discharge .
Water samples were analyzed following stan-
dard methods (APHA, 1998) for N0 3-N, using a
Dionex DX-120 ion chromatograph . Ammonium
and soluble reactive P (SRP) were determined
colorimetrically by flow injection analysis (Lachat
QuikChem 8000) . Total P was measured using a
sulfuric acid and ammonium persulfate digestion
followed by colorimetric detection (Lachat Quik-
Chem ® 8000) . Internal and external standards for
all solutes were analyzed routinely .
Periphytic chl-a
Two rocks were collected from each transect at
each site for analysis of chl-a and ash free dry mass
(AFDM) to estimate algal biomass in the stream
reach
. At some locations, the streambed was
composed primarily of sand and fine sediments,
but rocks were collected if present
. Individual
rocks were placed in plastic bags, wetted with
stream water, and transported on ice to the labo-
ratory (Steinman & Lamberti, 1996)
. Rocks were
stored in the laboratory at 4 °C in the dark and
were processed within 48 h of collection
. Periph-
yton was removed from each rock by vigorous
brushing with a plastic brush . The resulting slurry
was collected onto a Whatman GF/F (0 .7 poll
glass fiber filter, placed in a small petri dish, and
kept in the dark at -20 °C for no longer than
4 weeks until analysis of chl-a (APHA, 1998) .
Chlorophyll-a was extracted by placing filters
in a test tube with 100% HPLC-grade methanol
and steeping for 24 h at 4 °C in the dark (Stein-
man & Lamberti, 1996) . After steeping, the sam-
ples were centrifuged for 20 min at 500 g . The
absorbance of the chlorophyll was determined
with a spectrophotometer (Thermo Spectronic,
Inc.)
and corrected for pheophytin (APHA, 1998) .
All procedures in the laboratory were conducted
Figure 1 . (a) Map showing the major river basins of east-central Illinois, USA
. Study sites were located throughout the headwaters of
these basins (see Table I for sites and basin names) . (b) Detail of the locations of the intensively sampled sites in the headwaters of the
Embarras River.
Table 1 .
Site names, locations, and watershed and channel characteristics for the agricultural streams used in the study
. All are located in east-central Illinois, USA
•
1, Salt Creek ; 2, Sangamon River
; 3, Vermilion/Little Vermilion ; 4, Kaskaskia River; 5, Embarras River; see Figure 1 .
Site
name
Coordinates
River
basin-
Stream
order
Watershed
area (km2)
Row
crop (%)
Dominant
substrata
Stream
type
North Fork Salt Creek
40°15'12" N, 88°47'43" W
1
2
264
68
Sand/gravel
Shaded
South Branch Salt Creek
40°14'04" N, 88°36'34" W
1
2
60
78
Sand/gravel
Non-shaded
Salt Creek
40°15'03" N, 88°36'59" W
1
2
130
78
Sand/gravel
Non-shaded
Big Ditch
40°16'03" N, 88°19'39" W
2
2
99
90
Gravel/cobble
Non-shaded
Sangamon River site I
40°18'39" N, 88°19'21" W
2
4
668
84
Gravel/cobble
Shaded
Sangamon River site 2
40°21'24" N, 88°19'42" W
2
4
559
84
Sand/gravel
Shaded
Jordan Creek
40°02'27" N, 87°50'48" W
3
1
29
74
Sand/gravel
Non-shaded
Little Vermilion River site I
39'57'09" N, 87°56'18" W
3
1
67
83
Silt/sand
Non-shaded
Little Vermilion River site 2
39°54'08" N, 87°46'12" W
3
2
231
83
Silt/sand
Non-shaded
Stony Creek
40°09'l2" N, 87°52'23" W
3
2
85
86
Sand/gravel
Non-shaded
North Fork Vermilion River
40°14'57" N, 87°37'43" W
3
3
680
66
Gravel/cobble
Shaded
Salt Fork Vermilion River
40°03'44" N, 87-56'2T' W
3
4
839
74
Sand/gravel
Shaded
Copper Slough
40°05'03" N, 88°20'17" W
4
52
81
Gravel/cobble
Non-shaded
Lake Fork Kaskaskia River
39'53'50" N, 88°32'16" W
4
3
80
91
Silt/sand
Non-shaded
Black Slough (EMI)
39°57'09" N, 88°10'08" W
5
1
25
85
Sand/gravel
Non-shaded
Embarras River site 2 (EM2)
39°58'53" N, 88°12'22" W
5
2
57
85
Sand/gravel
Non-shaded
Embarras River site 3 (EM3)
39'52'47" N, 88°10'36" W
5
3
293
85
Sand/gravel
Shaded
Embarras River site 4 (EM4)
39°47'30" N, 88°11'09" W
5
4
473
85
Silt/sand
Shaded
under subdued light . Chl-a concentration was
calculated from the equation of Marker et a] .
(1980) using coefficients appropriate for methanol
extraction . Chl-a concentrations were expressed on
an areal basis by determining the surface area on
each rock from which the periphyton was scrap-
ped . Surface areas were calculated using the alu-
minum foil method, which involves developing a
mass-area relationship with pieces of aluminum
foil (Steinman & Lamberti, 1996). After removal
of the periphyton from a rock, the portion of the
rock originally covered by biofilm was wrapped in
a single layer of aluminum foil
. The piece of foil
was then weighed and the mass converted to area
.
Sestonic chl-a
Before collection of periphyton, one water sample
for sestonic algae was collected from the center of
the stream at each of the three transects . Opaque
Nalgene bottles were used and samples were
placed on ice and taken to the laboratory for fil-
tration and analysis of chl-a
. Filtration was done
immediately upon return to the laboratory . Ses-
tonic chl-a was determined by filtering 475 ml
through a GF/F (0.7 Jim) filter . All filtration,
storage and extraction procedures for the analysis
of sestonic algae were conducted using the same
techniques as described above for the periphyton
analysis
. Sestonic chl-a concentrations were cal-
culated using the equation of Marker et al . (1980) .
Artificial substrata
During late July and early August, 20 cmx20 cm
unglazed ceramic tiles were placed in the center of
the streambed in each transect at each of the 18
sites to determine periphyton growth . A small hole
was drilled on the top right corner of each tile to
hold the tile to the streambed with a reinforcing
bar
. Within each stream, an effort was made to
place the tiles at similar depths, and water depth
was recorded at each transect when the tiles were
placed and retrieved (Table 2)
. Water samples
were collected for nutrients and turbidity was
measured at the time of tile placement
. Tiles were
left in the stream for 4 weeks to allow sufficient
time for colonization and growth (Cattaneo &
Amireault, 1992) and then retrieved in early Sep-
tember . Tiles were gently rinsed with stream water,
Table 2 . Mean depth of the artificial substrata in the 18 sites at
the time of placement (July) and retrieval (September) . Missing
data indicate sites at which the artificial substrata were lost or
buried under sediment
placed in plastic bags, and transported to the
laboratory for processing as described above for
periphyton . Several tiles were lost or buried in
sediments following a spate that occurred in Sep-
tember (see Table 2) and sites with lost or buried
tiles were not included in the analysis .
At the Embarras River sites, 2 .5 cmx2 .5 cm
unglazed tiles were anchored on the streambed in
early July, These tiles were used to examine algal
growth on a common substrate among sites .
Twenty-five tiles were placed at left and right sides
of each transect at each site and were sampled
approximately bi-weekly from late July through
December 2003 . On each collection date, water
depth was measured and water samples taken for
measurement of dissolved nutrients (see above) .
Collection involved removing one individual tile
from each side of the transect, rinsing it gently and
placing it in an individual plastic bag for transport
on ice to the laboratory . Processing was done as
described above for periphyton . For the small tiles,
filamentous algae were included in the analysis
because it was not possible to separate the filaments
Site name
Mean depth (cm)
July
September
Big Ditch
28
28
North Fork Salt Creek
17
9
South Branch Salt Creek
34
35
Salt Creek
44
38
Sangamon River site I
100
76
Sangamon River site 2
88
63
Black Slough (EMI)
22
27
Embarras River site 2 (EM2)
21
35
Embarras River site 3 (EM3)
31
47
Embarras River site 4 (EM4)
41
72
Copper Slough
44
Lake Fork Kaskaskia River
22
28
Jordan Creek
33
67
Little Vermilion River site I
77
46
Little Vermilion River site 2
49
46
Stony Creek
59
North Fork Vermilion River
50
Salt Fork Vermilion River
>100
from the periphyton present
on the tile . When
required, samples
were diluted before the absor-
bance was measured because of high concentration
of chl-a . The equation for chl-a was then adjusted
according to the dilution factors used for those
samples .
Data analysis
All variables were tested for the assumption of
normality by the Shapiro-Wilk statistic using the
UNIVARIATE procedure (SAS, 1990) . Only
nitrate concentrations were normally distributed,
therefore the Wilcoxon-Mann-Whitney non-
parametric test was used to examine variability in
sestonic and periphytic chl-a, SRP, total P, and
turbidity among the Embarras River sites . The
classification variable used in the test was shaded
versus non-shaded .
A Spearman rank order
correlation (rs ; Zar, 1999) was used to examine
relationships among all variables for both the 18
sites and the Embarras River sites .
Following log transformation
of the data,
simple and multiple linear regression were used to
examine the controls on sestonic and periphytic
chl-a from the June and September samplings of
the 18 sites . Independent variables included dis-
solved nutrients, turbidity, temperature, streams
width, watershed area, and dummy variables (Zar,
1999) for sewage effluent, substrata, and shading.
Results
Physical and
chemical characteristics
During 2003, several major rainstorms led to rapid
and high stream discharge, which is typical for
east-central Illinois
. Figure 2 shows data from
EM4 and the pattern is representative of streams
throughout the region
. Compared to historical
monthly average discharge, the timing of the high
discharge was atypical
; lower than average dis-
charge generally was observed during January
through June and higher than average flow
occurred from July through December .
Mean turbidity during June and September
2003 for the 18 sites was 17 and 14 nephelometric
turbidity units
(NTU), respectively (Table 3) .
Most of these sites did not show a substantial
(a) 16
14
J
z
0
zcn
10
m
E
4
z
0
(b)()5
0 .4
rr
E 0.3
2
0
n0.2
a
0
0 .1
0 .0
4
0
Sa~~ e'e~(,et pQt
lpi
5oc
SwOblbgpCZ`Xo4
pe°
Month (2003)
Figure 2 . Stream water concentrations of (a) N0 3 -N, (b) SRP
and total P, and (c) daily discharge for the Embarras River at
the EM4 site during 2003 .
increase in turbidity during September but some
sites did increase due to the high discharge that
occurred in some of the watersheds
. Mean NO3 -N
concentrations were 8 .4, 5 .4, and 4
.4 mg I -t during
June, July, and September 2003 (Table 3) . Mean
concentrations of total P concentrations
were
0 .12, 0.09, and 0.10 mg 1-t for these streams dur-
ing June, July, and September 2003, respectively
Table 3 .
Mean turbidity and nutrient concentrations for all sites during the June, July, and September 2003 algal sampling . Values in
parentheses are one standard deviation
(Table 3) . The Salt Fork Vermilion River had high
concentrations of P throughout the study due to a
sewage treatment plant that discharges to that
river approximately 40 km upstream of our study
reach . Concentrations of total P were as high as
0.64, 0.72 and 0.49 mg I-I during June, July and
September, respectively
. High concentrations of
total P also were recorded in Copper Slough,
which is located downstream of a sewage treat-
ment plant that removes P to < I mg I
-I . There-
fore, total P concentrations for Copper Slough
were lower than Salt Fork Vermilion River but
higher than the other streams studied .
The mean turbidity for EMI and EM2 during
2003 was 4 and 8 NTU, respectively
. Higher val-
ues of turbidity were observed in the shaded
streams, EM3 and EM4 with means of 16 and
19 NTU, respectively . Among the Embarras River
sites, turbidity was significantly higher in the sha-
ded streams compared to the non-shaded streams
(p<0 .001)
. Dissolved nutrients in the Embarras
sites were temporally variable and often high
(Table 4), but did not differ statistically among the
sites . At EM4, the most downstream site on the
Embarras River, nitrate concentrations were
,highest during early summer, decreased through
late summer and increased substantially in late fall
(Fig. 2). In contrast, SRP concentrations were
more variable throughout the year with distinct
peaks during periods of high discharge (Fig . 2).
Sestonic chl-a
Concentrations of sestonic chl-a were low among
the 18 sites (<20 mg m-3
at all sites and sampling
times) and slightly more variable in September
compared to July (Fig. 3) . A multiple regression
failed to identify any meaningful relationships
between sestonic chl-a and the environmental
variables for either the June or September sam-
plings . At intensively sampled sites on the Emb-
arras River, concentrations of sestonic chl-a were
less than 1 .2 mg m -3 throughout the study period .
Spearman rank order correlation indicated a sig-
nificant but weak relationship between sestonic
chl-a and total P (r,=0 .19, p=0 .003) and nitrate
(r,=0 .16,
p = 0.007) . Sestonic chl-a concentrations
were not statistically different between shaded and
non-shaded sites on the Embarras River (p=0
.19).
Periphytic chba
Chlorophyll-a in periphyton varied by more than 2
orders of magnitude among the 18 sites (Fig. 3).
During June, concentrations of chl-a were higher
(reaching up to 131 mg m -
')
than during Sep-
tember when chl-a was below 50 mg m - ' for most
of the sites due to a rainstorm and subsequent
scouring that occurred at the beginning of Sep-
tember (median values of 26 and 9 mg m
-2 for
June and September, respectively) . Multiple
Table 4.
Mean turbidity and nutrient concentrations from sampling of the Embarras River sites during June through December 2003
.
Values in parentheses are one standard deviation . See Table I for site descriptions
Location
n
Turbidity (NTU)
N0
3-N
(mg I - ')
NH 4-N (mg I - ')
SRP (mg I - ')
Total P (mg I - ')
EMI
47
4 (3)
5 .5 (2 .8)
0.024 (0
.03)
0 .048 (0.05)
0 .07 (0 .07)
EM2
21
8 (5)
5 .0 (2 .0)
0.132 (0 .26)
0 .048 (0 .06)
0 .09 (0 .10)
EM3
21
16(11)
6.3(3.1)
0.036 (0 .03)
0 .065 (0 .09)
0 .10 (0 .12)
EM4
46
19 (11)
5 .9 (3 .3)
0 .032 (0.02)
0.077 (0 .07)
0 .14 (0 .10)
Month
n
Turbidity
(NTU)
NO3-N
(mg 1')
NH4 -N
(mg I-')
SRP
(mg l')
Total P
(mg 1-')
June
18
17 (15)
8 .4 (2 .3)
0 .054
(0 .04)
0 .056 (0.10)
0.12 (0.16)
July
18
13 (12)
5 .4 (1 .8)
0 .027 (0.02)
0.060 (0
.11)
0.09 (0 .17)
Sept
18
14 (13)
4.4(l .6)
0 .041 (0.03)
0.067 (0 .11)
0.10 (0
.13)
0.1
T
June
,00
50
E
M
0#
E
m
80
U
60
40
20
T
1
1
100
•
Era
10 E
r
OU
L
a
Sept
a
June
Sept
Month (2003)
Figure 3. Box plots of sestonic and periphytic chl-a from
18
sites in east-central Illinois, USA, during June and September
2003 . Box plots show 10th, 25th, 50th, 75th, and 90th percen-
tiles as horizontal lines
; values outside the I0th and 90th per-
centiles are shown as solid circles
.
regression showed no meaningful relationships
between periphytic chl-a and environmental vari-
ables during June
. However, in September the
model indicated that turbidity was a significant
factor (p<0.001), and explained 64% of the vari-
ability in periphytic chl-a among the I S sites
. In no
case did a regression model with two or more
factors perform better than single factor models at
explaining patterns in chl-a .
Non-shaded sites on the Embarras River had
significantly (p=0 .009) more periphytic chl-a than
did the shaded sites during the June-December
200
150
EM1
liii, iiii
EM3
f
isiii ii h
Jun Jul Aug Sep Oct Nov
Dec Jun Jul Aug Sep Oct Nov Dec
Month (2003)
Figure 4 . Mean (+1 standard error) periphytic
chl-a
concentrations on natural substrata at the Embarras River sites from June to
December 2003 . Note difference in
scale between upper and lower graphs
. EM I and EM2 are non-shaded sites, EM3 and EM4 arc
shaded sites (see Table
I for full description) .
study period (Fig . 4)
. The abundance of periphytic
chl-a on natural substrata in the Embarras River
was not related to dissolved nutrients or turbidity
.
Densities of periphytic chl-a in the Embarras River
were generally between 20 and 50 mg
m-2
except
at EM4, which showed almost no occurrence of
benthic chl-a
. At EMI there was an inverse rela-
tionship between discharge and periphytic chl-a,
but the other Embarras sites showed no such
relationship (data not shown) .
Artificial substrata
Chlorophyll-a on tiles was not related to NO 3 ,
NH4,
SRP, or total P among the 18 sites, but dis-
played a curvilinear relationship with turbidity
(Fig. 5) . In the Embarras River, chl-a was greater
on tiles in the non-shaded sites compared to shaded
sites, with values as high as 1460 and 1960 mg chl-a
m_2 in EM I and EM2, respectively (Fig . 6) . Con-
centrations of chl-a on the 2 .5 cmx2.5 cm tiles
used in the Embarras were much higher than on
natural substrata because filamentous algae were
included in the analysis due to the difficulty of
removing it without dislodging periphyton from
the small tiles
. During late autumn there was an
increase in chl-a on tiles in the shaded streams
(Fig
. 6) possibly due to increased light reaching the
streams following leaf abscission . Data were not
EM2
Jill
il .i i
I
•
01
EM4
160
140
120
r
Um
E
rnE
10080400
20
log
r2=ochl-a
.eo
=-2 .0127 (log turbidity) + 3 .0943
p <0 .0001
10
20
30
40
50
Turbidity (NTU)
Figure 5 . Relationship between mean (+1 standard
error) chl-a
on unglazed ceramic tiles and stream water turbidity for 14 sites
in east-central Illinois, USA, during September 2003
. The
equation is based on a log-log relationship between periphytic
chl-a and turbidity.
available for EM3 and EM4 during December
because most tiles were lost during a flood .
Combining all Embarras River sites, there was
a significant correlation between chl-a on the tiles
and SRP (p=0 .01), total P (p=0.02), and ammo-
nium (p<0.0001) . However, the Spearman rank
order correlations were weak (r,<0.25 for each
variable) suggesting these variables were not the
main factors controlling the abundance of benthic
2500-
2000
1500
1000
EMI
Dec
Aug Sep Oct Nov
Dec
Month (2003)
Figure 6.
Mean (+1 standard error) chl-a concentrations on unglazed ceramic tiles at the Embarras River sites from August to
December 2003
. Note difference in scale between upper and lower graphs
. EMI and EM2 are non-shaded sites, EM3 and EM4 are
shaded sites (see Table I for full description) .
Sep Oct Nov
chl-a . Turbidity explained over 50% of the varia-
tion in chl-a on tiles in the Embarras River, if both
variables were log-transformed (Fig . 7) .
Discussion
Sestonic chl-a
In general, concentrations of sestonic chl-a were
not controlled by nutrients or water turbidity in
the agricultural streams we examined . Low con-
centrations of sestonic chl-a were observed even
though high concentrations of total P were mea-
sured . For instance, the Salt Fork Vermilion River
and Copper Slough had the highest concentrations
of total P, but relatively low concentrations of
sestonic chl-a
. The Salt Fork Vermilion River had
5 and 3 mg m-3 of sestonic chl-a during June and
September, respectively
. Moreover, Copper
Slough is a non-shaded stream with abundant P
and sestonic chl-a was low (7-9 mg m
-') despite
apparently good conditions for algal growth . Van
Nieuwenhuyse & Jones (1996) examined streams
with a wide range in total P concentrations and
found that variability in sestonic chl-a was
explained by total P . However, for streams in east-
central Illinois this relationship was not observed,
EM2
EM4
E
r
1000
v
500
0
log chl-a = -1 .1663 (log turbidity) +3 .4701
p
P-0<0.57.0001
20
30
Turbidity (NTU)
Figure 7
. Relationship between mean (+ I standard error) chl-a
on unglazed ceramic tiles and stream water turbidity for the
Embarras River sites during August to December 2003
. The
equation is based on a log-log relationship between periphytic
chl-a and turbidity .
probably because drainage from agricultural fields
supplied the streams with excess nutrients
(i .e .,
there were no streams with low total P concen-
trations) . It has been suggested that in streams
enriched with P the concentration of sestonic chl-a
likely is controlled by factors other than nutrients
(Van Nieuwenhuyse & Jones, 1996 ; Dodds et al .,
1998) and our results support this conclusion
.
Dodds et al
. (1998) proposed that eutrophic
streams could be expected to have more than
30 mg m
-3 of sestonic chl-a, but also noted that
this expectation might vary among stream types .
We examined nutrient-rich agricultural streams
and found sestonic chl-a concentrations in the
range of only 2-20 mg m-3
,
suggesting that the
nutrient-rich condition of east-central Illinois
streams is not leading to excessive amounts of
sestonic chl-a
. Alternatively, it may be that the
classification scheme developed by Dodds et al .
(1998) is not applicable to the heavily modified
streams of Illinois or that sestonic algae is not the
appropriate indicator of eutrophication for such
streams
. During our study, several rainstorms and
subsequent spates likely limited the establishment
of suspended algal populations in the streams we
investigated . Additionally, the primary source of
sestonic algae in agricultural streams is dislodged
cells from periphyton (Swanson & Bachmann,
1976), suggesting periphytic chl-a may be the more
appropriate measurement for examining nutrient-
chlorophyll relationships
. Overall, we believe ses-
tonic chl-a is not a reliable indicator for identifying
40
eutrophication in the hydrologically variable and
periodically turbid streams of east-central Illinois .
Periphytic chb a
In the streams we examined, the abundance of
periphytic chl-a was generally not related to the
concentration of N or P in the water column
. In
shaded streams, light limitation may have pre-
vented the development of dense periphyton
communities despite the high concentrations of
nutrients and warm water temperatures (Hill et al .,
1995 ; Hill 1996)
. The generally low amounts of
periphytic chl-a in the non-shaded streams sug-
gests periphyton in non-shaded streams may at
times be light-limited due to turbid water . This
conclusion is supported by the significant rela-
tionship in September between turbidity and
periphytic chl-a . However, no such relationship
was observed in June, indicating that factors other
than turbidity can be important in controlling
chl-a . For example, some of the streams had beds
composed primarily of small gravel, sand, and fine
sediments, suggesting well-developed periphyton
communities may have been precluded by lack of
stable substrata
. The placement of unglazed cera-
mic tiles in the streams provided a common sub-
strate for periphyton growth that allowed us to
further examine the role of turbidity . When pro-
vided with a common substrate, 80% of the
among-stream variability in periphytic chl-a was
explained by turbidity (Fig . 5) . Turbidity also
explained 57% of the variability in periphytic chl-a
on ceramic tiles in the Embarras River sites
(Fig . 7)
. Because fine sediments and clay are
common in the streams of east-central Illinois, we
suggest turbidity in the water column is creating
light-limited conditions on the streambeds of many
streams and rivers .
The majority of the streams from east-central
Illinois had densities of benthic chl-a < 50 mg m -2
on natural substrata, suggesting they were not
eutrophic based on the Dodds et al
. (1998) classi-
fication . However, our observations suggest that
filamentous algae, rather than epilithic periphyton,
show the greatest response to nutrient enrichment
in east-central Illinois streams
. Mats of Clado-
phora can exceed 200 g m-2
of dry mass in these
streams when discharge is low and stable (Schaller
et al ., 2004) . The importance of filamentous algae
is particularly evident in the results from the non-
shaded sites on the Embarras River (EM I and
EM2) . On the artificial substrata, from which fila-
ments were not removed, chl-a concentrations were
an order of magnitude greater than on natural
substrata that did not have attached filamentous
algae or that had filaments removed prior to
analysis (see Figs . 4 and 6) . Coverage by filamen-
tous algae is expected to be approximately 20% or
more when total benthic chl-a exceeds 100 mg m -2
(Welch et al
., 1988) . We did not examine this
relationship directly, but our visual observations
support the notion that there is a direct relationship
between coverage by filamentous algae and exces-
sive chl-a .
There is good evidence that multiple factors can
act to control the biomass of algae, both epilithic
and filamentous, in streams (e .g ., Biggs & Close,
1989 ; Lohman et al ., 1992 ; Rosemond, 1993 ;
Biggs, 2000) . In the streams of east-central Illinois,
hydrology and light are likely to be the main con-
trols on algal biomass
. We found that nutrient
concentrations were poor predictors of chl-a and
unlikely to be a limiting factor, a result that agrees
with Munn et al
. (1989) who used nutrient-diffus-
ing substrata to examine nutrient-chlorophyll
relationships in some of the same streams used in
the present study . During periods of stable dis-
charge, water clarity tends to increase with corre-
sponding increases in periphytic chl-a (if hard
substrata are available) and filamentous algae .
Other work in these streams indicates that scouring
during floods can substantially reduce the abun-
dance of filamentous algae (Schaller et al ., 2004).
Time of accrual is an important factor that can
determine whether or not nutrient enrichment leads
to excessive algal biomass in streams
(e .g., Lohman
et al ., 1992 ; Biggs, 2000) . For agricultural streams
with hard substrata, days of accrual might provide
good explanatory power for periphytic chl-a, but
this remains to be examined empirically in Illinois .
In general, light appeared to be the constrain-
ing factor for periphytic chl-a in streams of east-
central Illinois . With the abundant nutrients in
these streams, post-flood recovery should occur
rapidly if light is available (Grimm & Fisher,
1986)
. There also appeared to be a seasonal effect
of light, as the shaded sites on the Embarras River
showed some increase in periphytic chl-a following
leaf abscission . Although light (as indicated by
turbidity) and hydrology appeared to be the main
controlling factors for periphyton development in
these streams, regulatory and management efforts
aimed at reducing nuisance algal biomass will
likely focus on dissolved nutrients . Unless nutrient
loads in theses streams are reduced to the point
that they become limiting for algal growth, we
suggest that hydrology and light will continue to
control algal biomass in streams of east-central
Illinois
.
Acknowledgements
We thank Karen Starks, Corey Mitchell, Allen Bec-
ker, and Allyson Morgan for their help with field and
laboratory work . This study was partially funded by
the State of Illinois through the Illinois Council on
Food and Agricultural Research (C-FAR) Water
Quality SRI .
References
APHA, 1998 . Standard Methods for the Examination of Water
and Wastewater, (20th edn) . American Public Health
Administration, Washington, DC .
Biggs, B. J . F ., 1995 . The contribution of flood disturbance,
catchment geology and land use to the habitat template of
periphyton in stream ecosystems
. Freshwater Biology 33 :
Biggs,
dissolved
419-438B
. J
.
.
nutrient-chlorophyll
F ., 2000 . Eutrophication
relationships
of streams
for
and
benthicrivers
:
algae . Journal of the North American Benthological Society
19 : 17-31 .
Biggs, B . J . F . & M . E . Close, 1989. Periphyton biomass
dynamics in gravel bed rivers : the relative effects of flow and
nutrients. Freshwater Biology 22: 209-231 .
Bothwell, M . L ., 1988 . Growth rate responses of lotic periphytic
diatoms to experimental phosphorus enrichment : the influ-
ence of temperature and light . Canadian Journal of Fisheries
and Aquatic Sciences 45 : 261-270 .
Bushong, S . J . & R. W . Bachmann, 1989 . In situ nutrient
enrichment experiments with periphyton in agricultural
streams . Hydrobiologia 178 : 1-10 .
Cattaneo, A . & M . C . Amireault, 1992. How artificial are
substrata for periphyton? Journal of the North American
Benthological Society It : 244-256.
David, M . B . & L . E. Gentry, 2000 . Anthropogenic inputs of
nitrogen and phosphorus and riverine export for Illinois,
USA . Journal of Environmental Quality 29: 494-508
.
David, M . B ., D . A . Kovacic, L . E. Gentry & K . M . Smith,
1997 . Nitrogen balance in and export from an agricultural
watershed . Journal of Environmental Quality 26 : 1038-1048 .
Dodds, W. K ., J. R . Jones & E. B . Welch, 1998 . Suggested
classification of stream trophic state : distributions of tem-
perate stream types by chlorophyll, total nitrogen, and
phosphorus. Water Research 32 :1455-1462
.
Fausey, N. R ., L. C. Brown, H . W
. Belcher & R . S . Kanwar,
1995
. Drainage and water quality in Great Lakes cornbelt
states
. Journal of Irrigation and Drainage Engineering 121 :
283-288 .
Grimm, N . B
. & S. G . Fisher, 1986. Nitrogen limitation in a
Sonoran Desert stream . Journal of the North American
Benthological Society 5 : 2-15 .
Hill, W . R ., 1996. Effects of light . In Stevenson, R
. J., M . L.
Bothwell & R . L. Lowe (eds), Algal Ecology
: Freshwater
Benthic Ecosystems
. Academic Press, San Diego, California,
121-148.
Hill, W . R . & S. M
. Dimick, 2002 . Effects of riparian leaf
dynamics on periphyton photosynthesis and light utilization
efficiency
. Freshwater Biology 47 : 1245-1256 .
Hill, W . R ., M . G . Ryon & E. M . Schilling, 1995
. Light limi-
tation in a stream ecosystem
: responses by primary pro-
ducers and consumers
. Ecology 76: 1297-1309.
Lohman, K ., 1
. R . Jones & B. D . Perkins, 1992 . Effects of
nutrient enrichment and flood frequency on periphyton
biomass in northern Ozark streams . Canadian Journal of
Fisheries and Aquatic Sciences 49: 1198-1205 .
Lowe, R . L., S. W . Golladay & J . R . Webster, 1986
. Periphyton
response to nutrient manipulation in streams draining
clearcut and forested watersheds . Journal
of the North
American Benthological Society 5 : 221-229.
Marker, A . F. H., E . A . Nusch, H . Rai & B
. Riemann, 1980 .
The measurement of photosynthetic pigments in freshwaters
and standardization of methods
: conclusions and recom-
mendations
. Archiv Fur Hydrobiologie Beiheft Ergebnisse
Limnologie 14 : 91-106.
Mclsaac, 0 . F. & X . Hu, 2004
. Net N input and riverine
N export from Illinois
agricultural watersheds with
and without extensive tile drainage
. Biogeochemistry 70 :
251-271 .
Moore, 1 . W
., 1977 . Some factors effecting algal densities in a
eutrophic farmland stream . Oecologia 29 : 257-267 .
Munn, M . D ., L. L. Osborne & M . 1 . Wiley, 1989 . Factors
influencing periphyton growth in agricultural streams of
Central Illinois . Hydrobiologia 174 : 89-97 .
Rhoads, B . L . & E. E. Herricks, 1996
. Naturalization of
headwater streams in Illinois
: challenges and possibilities . In
Brookes, A . & F . D
. Shields (eds), River Channel Restora-
tion
: Guiding Principles for Sustainable Projects . John
Wiley and Sons, New York, 331-367 .
Rosemond, A . D., 1993 . Interactions among irradiance, nutri-
ents, and herbivores constrain a stream algal community
.
Oecologia 94 : 585-594.
SAS Institute, 1990
. SAS/STAT User's Guide, Version 6, 4th
edn
. SAS Institute, Cary, North Carolina .
Schaller, J . L ., T. V . Royer, M . B . David & J . L . Tank, 2004 .
Denitrification associated with plants and sediments in an
agricultural stream. Journal of the North American Ben-
thological Society 23 : 667-676.
Steinman, A . D . & G . A . Lamberti, 1996
. Biomass and pig.
ments of benthic algae
. In Hauer, F. R . & G. A . la mberti
(eds), Methods in Stream Ecology . Academic Press, San
Diego, California, 295-313 .
Swanson, C . D . & R . W. Bachmann, 1976 . A model of algal
exports in some Iowa streams . Ecology 57: 1076-1080.
Van Nieuwenhuyse, E . E . & 1 . R . Jones, 1996. Phosphorus-
chlorophyll relationship in temperate streams and its varia-
tion with stream catchment area . Canadian Journal of
Fisheries and Aquatic Sciences 53 : 99-105 .
Welch, E . B ., J . M . Jacoby, R . R . Horner & M . R . Seeley, 1988
.
Nuisance biomass levels of periphytic algae in streams
.
Hydrobiologia 157 : 162-168 .
Wiley, M . J ., L
. L. Osborne & R . W. Larimore, 1990 . Longi-
tudinal structure of an agricultural prairie river system and
its relationship to current stream ecosystem theory
. Cana-
dian Journal of Fisheries and Aquatic Sciences 47
: 373-383 .
Zar, J . H ., 1999 . Biostatistical Analysis (4th edn)
. Prentice Hall,
Upper Saddle River, New Jersey .
Garvey - October 2006 - Exhibit 3
Analysis of Grab and Continuous Data
.
Analyzed
: September 2006 by Jim Garvey
Data were procured from IDNR and IEPA during spring 2006 .
1994-2003 grab data derive from :
APPLE RIVER
AUXSABLE CREEK
BAKER CREEK
BEAR CREEK
BEAVER CREEK
BECK CREEK
BIG BUREAU CREEK
BIG CREEK
BIG GRAND PIERRE
CREEK
BIG ROCK CREEK
BLACKBERRY CREEK
BLUEGRASS CREEK
BOONE CREEK
BROUILLETTS CREEK
BRUSHY FORK
BUCK CREEK
BUFFALO CREEK
BURTON CREEK
CAMP CREEK
CAMP RUN
CARROLLCREEK
CEDAR CREEK
CLEAR CREEK
COAL CREEK
COON CREEK
COOPERS DEFEAT
CR
COPPERAS CREEK
COURT CREEK
COXCREEK
CRABAPPLE CREEK
CRANE CREEK
CRANE GROVE
CREEK
CROOKED CREEK
DEER CREEK
DES PLAINES RIVER
HAW CREEK
HAYES CREEK
HENDERSON
CREEK
HENLINE CREEK
HERMON CREEK
HICKORY CREEK
HICKORY GROVE
DITCH
HORSE CREEK
HURRICANE CREEK POLECAT CREEK
HUTCHINS CREEK POPE CREEK
ILLINOIS RIVER
POPLAR CREEK
INDIAN CREEK
IROQUOIS RIVER
JACK CREEK
JACKSON CREEK
JOES CREEK
JOHNNY RUN
JORDAN CREEK
KANKAKEE RIVER
KICKAPOO CREEK
KILLBUCK CREEK
KISHWAUKEE
RIVER
KYTE RIVER
LAHARPE CREEK
LAKE FORK
LAMOINE RIVER
LANGAN CREEK
LEAF RIVER
LITTLE EMBARRAS
R
LITTLE INDIAN
CREEK
LITTLE KICKAPOO
CREEK NORTH
LITTLE MACKINAW
R
LITTLE ROCK
CREEK
LITTLE SALINE
RIVER
LITTLE VERMILION
RIVER
NINEMILE CREEK
NIPPERSINK CREEK
NORTH BRANCH
NORTH HENDERSON
CREEK
OPOSSUM CREEK
OTTER CREEK
PANTHER CREEK
PINE CREEK
PRAIRIE CREEK
PRAIRIE DULONG
CREEK
RACCOON CREEK
RICHLAND CREEK
RILEY CREEK
ROBINSON CREEK
ROCK CREEK
ROCK RIVER
ROCK RUN
ROOKS CREEK
RUSH CREEK
S BR KISHWAUKEE R
S FK APPLE RIVER
S FK BEAR CREEK
S FK SALINE RIVER
S FK VERMILION RIVER
S KINNIKINNIK CREEK
SALT CREEK
SALT FORK VERMILION
R
SANGAMON RIVER
SHOAL CREEK
SILVER CREEK
SIX MILE CREEK
SMITH CREEK
WALNUT CREEK
WEST BUREAU
CREEK
WEST OKAW RIVER
WILLOW CREEK
YELLOW CREEK
Garvey -
October 2006 - Exhibit 3
2004-2005 continuous data derive from :
Big Creek, Big Grand Pierre Creek, Edwards River, Exline Slough, Hickory Grove Ditch,
Indian Creek, Lake Fork, Rock Creek, Sangamon River, South Henderson Creek, Spoon
River, Sugar Creek
LONG POINT
DICKERSON SLOUGH CREEK
SOUTH BRANCH-EAST
SOUTH HENDERSON
DRUMMER CREEK LUSK CREEK
CREEK
DUPAGE RIVER
MACKINAW RIVER
SPOON RIVER
DUTCH CREEK
MACOUPIN CREEK
SPRING BROOK
E BR S BR
KISHWAUKEE RIVER MADDEN CREEK
STEVENS CREEK
MANHATTAN
E FK GALENA RIVER CREEK
STILLMAN CREEK
E FK LA MOINE RIVER
MAZON RIVER
SUGAR CREEK
E FK MAZON RIVER
MCCRANEY CREEK SUGAR CREEK-NORTH
E FK SHOAL CREEK MIDDLE BRANCH
SUGAR RIVER
MIDDLE FORK
E FK SPOON RIVER
SHOALCR
SUMNER CREEK
MIDDLE FORK
EAGLE CREEK
SUGAR CR
SWAB RUN
MIDDLE FORK
EDWARDS RIVER
VERMILION R
TEN MILE CREEK
ELKHORN CREEK
MILL CREEK
TIMBER CREEK
MISSISSIPPI RIVER
EMBARRAS RIVER
N
TRIM CREEK
MISSISSIPPI RIVER
EXLINE SLOUGH
SC
TURKEY CREEK
FERSON CREEK
MITCHELL CREEK TYLER CREEK
FORKED CREEK
MOSQUITO CREEK
U-TRIB
BRAY CREEKMACKINAW
R
FOX RIVER
MUDDY
MUD CREEK
CREEK-EAST
U-TRIB
FROG ALLEYMACKINAW
R
FRANKLIN CREEK
NORTH
VERMILION RIVER
N FK EMBARRAS
FRIENDS CREEK
RIVER
W BR DUPAGE RIVER
FURNACE CREEK
N FK KENT CREEK W BR LAMARSH CREEK
GALENA RIVER
N FK LAKE FORK
W BR PANTHER CREEK
GREEN RIVER
N FK SALT CREEK
W FK MAZON RIVER
N FK VERMILION
GRINDSTONE CREEK RIVER
W FK SHOAL CREEK
HADLEY CREEK
NETTLE CREEK
WABASH RIVER
Garvey - October 2006 - Exhibit 3
0
1n
m
0
TUC
a)
mL
80
60
April
20
100
806020
May
120100
40
80
June
20
0
60
3 4 5 6 7 8 9 10 11 12 13 14
July
August
September
October
November
Dissolved Oxygen Concentration (mg/L)
Figure 1 . Frequency of grab data from several Illinois
streams that are being considered
for enhanced dissolved oxygen tier standards.
Garvey - October 2006 - Exhibit 3
200
150
100
July
50
0
200
U
150
C
-
August
100
a)
L -
LL
50
0
250
200
150
100
50
0
012345678910111213141516
Dissolved Oxygen Concentration (mg/L)
Figure 2 . Frequency of dissolved oxygen observations collected with continuous loggers
in selected streams that are being considered for the enhanced oxygen tier .
Sept
Garvey - October 2006 -
Exhibit 3
0.25
0 .20 -
0
Ca 0.15 -
\0
0 .10-
V-
00
0.
0.05-
LLS
.
0
0,00-
July
August
September
Proportion of potential violations in continuous data with
three proposed daily minima from proposed enhanced
DO sites in Illinois
. Data from Roy Smogor, IL EPA .
Figure 3
. Proportion of observations below 5 mg/L, 4 mg/L or 3
.5 mg/L during the
months that continuous dissolved oxygen data were
collected from streams considered
for enhanced oxygen tier .
Garvey - October 2006 - Exhibit 3
7
1 .2
`0
I
••••••••
0
o
.2
No
0.8-
•
A 0.6 -
o. „
-0
A
m
N
0.4 -
E
0 .2 -
V
500
700
900
1100
1300
1500
1700
Time of Day (military)
Figure 4
. The cumulative proportion of data collection times for grab samples displayed
in Figure 1 . About 50% of the data were collected before 11 AM
. All data were
collected by 1700 hours .
Garvey - October 2006 - Exhibit 4
0in
a)
U)
4)
CU
10
8
6
4
2
10
8
6
4
2
10
8
6
4
2
1965
June
f}
July
August
t
f
Sept
f
f f
f
f
f
Oct
If
1970 1975
1980 1985 1990 1995 2000
Figure 1 . Mean ± standard deviation dissolved oxygen
concentrations collected across
multiple stream sites in Illinois during 1971 through 1996
. Average sample size per data
point is 400 observations
. All observations were restricted to grabs taken either at the
surface or mid water . No bottom values are included .
M
ISWS Illinois Waterway Studies Referencing Dteadvad Oxygen Date
S
dS
Penod mode ISWS
a A
LGarpe Pod Wafer Quality
198557
RI-84
Ipn ourua
and Ra
L Eran5,1970
UpprWatrwyWatesoudily
1971-72
Yes RI-79
Water Quality Feahuee 0the Upper Illinois Waterway Bulls
. Thomas A, Ralph L Evans, and Shun Dar Un,1975
LaGmrpePool WatrQasly
1977.79
CR-260
Thomas
Water Qullty
E Hit
.
Assessment
Shurldar LM,
and
Davs
Waste
B. BeusUer,
AsaiMIalve
Rkdard
AnalystsM
. Tea
ofand
tin
Ralph
LaGrange
L EvansPod,
Illinois
.1961
River
Butts, Thomas A„ Donald P
. Roseboan,
Lake Mic igan Divoeiru mtwowlify
1982
Yes CR-324
Peona Pod Water Quality
196
Yes norpl
The
H
. Schnepper,
Effects of
Lake
and Wishan
Michigan
P. Slngh,1983Discretionary
Diversion Simples on Illinois Waterway Dissolved Oxygen Resources Butts
. Thomas A, Donald
Side Stream Elevated Pod Aeraton (SEPA) Status
Canmerdal NavgaaoJ Water Quality
1987
1987-88
Yes
Yes
CR-452
RR-122
Development of Design Crltada for Sidestnam Elevated Pod Aration Stations Buds, Thomas A,1968
Ihhpacte of Co snercial Navigation on Water Q ality In gr Illinois River Channel Buts, Thomas A, and Dana B
. Sladdefod,1992
TARP Eiacs on Wear Qhaly
198859
Yes CR-258, CR-256a
Reduction In Peak Flows and knprovemenu In Water Qualhy in One Illinois Waterway Downstream d Lockport Dam Due to Irnylnuntetien
of Phases I and 11 °f TARP Wrgunoglu, Ate, Ksblan P
. Slngh, Thetas A Bums, and Dana B . SkxMeMd .1992
QUAL-21E WatrQualityModdkp(stoveLockpot)
1989
Yea no pt
ImplementationAppendces
for Reduction
of
Phases
in
I
Peak
and II
Flows
of TARP
and Improvements
Bull& Thomas
In
A,
Water
and Dana
Quallty
B
. SIUCMefodin
t e Illinois
.1992
Waterway
Downstream of Lockpot Due to
QUAL-2EWatrQuaky
LaGnngePodIllinois
Ri'W ® Peons
Modaiing(LMtoChltctte)Molilrin9
198&9019901973.91
YesYesYea
no
no
no notnotpt
EffecsofSEPAoWaterQaliy
199597
Yes CR-20&2, CR-853
Sldestream
T omas R Begerhouse,
Elevated Pool
2000Aeration
(SEPA) Stations
: Enact on Instream Dissolved Oxygen Bu1Lq Tomes A., Dana B
. Shadefrd, and
WalerO,wrsgdlIlirMeWafreaY
1978-79
Yes 0-147
EvaluationTipnaa
R Beegehotu,1999of
ReaanGOn EMdendes
of Sidasbeam Elevated Pod "Moon (SEPA) Stations Butte, Thomas k, Dana B
. Shaderod and
Water CMMSq of the Illinok Waterwy Ko andarsns7n, Verasamy, RobeitA SYldak, and Ralph L Evans,1961
OIMr ISW Authored Repota Refer ndng Dksdved Oxygen Dale
CR-513
UpperSanganco
1990
11
Kdshan
0 Dissolved
Skph . 1991
Oxygen In Aquatic Hanna
Assessment for tin Upper Sripanlon Rhw Broeren, S MccOnkey, Thomas Buts . and
LovrSarpamon
1991
CRS7l
Water
P. Si
Quality
igh,1994and
Habitat Suitability Assesnlent: Sanganvn River bes.en
Decatur and Petersburg Larsol, R.B ., Tiaras Bulls, and Knshan
Effects
FoxRivrSICladeePodof
Channel Darn an DO NMheasteen IL
197&771993.94
CR-5890-132
Consideration,
1995Effects
oClannel
In
Dams
Water
on
UseDissolved
PlanningOxygen
for tie
Concentrations
Fox RMrSingh, Nineteen,
In Northeastern
Thomas Bulls,
lends
Vernon
Streams
14appBuda, . Dana
Thomas
Stadefodand
R
.
.
Evus,1978and
Robed Larsen,
Figure 1
. Map of streams to receive proposed enhanced dissolved oxygen tier (blue) and
IAWA sampling sites (green circles). Reaches highlighted in red are enhanced waters
that are 303d listed with low oxygen as a probable cause of impairment .
20
15-
10-
5-
0
20
15-
10-
5
0
Aug
20
15
10
5
0
DuPage (West Branch)
. s it
pts p
IWAVOAN
Jun
DuPage (Plainfield, 135th)
a
ti 'N
~'~f~,.k-
Aug
Jun
Sep
Jul
Sep
Jul
Sep
Jul
Sep
May
May
May
Jun
Jun
Jul
Figure 2. Daily changes in oxygen concentrations collected by IAWA during 2005 (Fox
River) and 2006 (Du Page River)
.
20
is
10
5
0
May
20
15-
10-
May
May
Jun
Jun
Jul
Jul
Rock River
5-
0
Jul
Jul
Jul
Aug
Aug
Figure 3
. Daily changes in oxygen concentrations collected by IAWA during 2005 (Fox
River) and 2006 (Rock River) .
20
15
10
10
5
5
0
20
15
20
15-
10-
5-
V4A
DuPage (Plainfield, Renwick)
0
Aug
Aug
Sep
0 Aug
Aug
Aug
Aug
Sep
Sep
Sep
Vermilion (Danville)
Sep
Sep
Figure 4 . Daily changes in oxygen concentrations collected by IAWA during 2006
.
Sep
FOX RIVER - 2005
Figure 5
. Median daily dissolved oxygen concentrations collected by IAWA during
2005 .
14
12
10
8
6
4
2
J0
Ashland
V •~IIM
•
.i
O1
14
C0
12-
Aurora
C
U
10-8-
•
UCO
6-
Y
• •
0
4-
a
cm
2-0
%
14- 12-
•
.
Oswego
10-
8-
6-
S
4-
2-
0
May
Jun
Jul
Aug
Sep
FOX RIVER - 2005
Figure 6. Minimum daily dissolved
oxygen concentrations collected by IAWA during
2005
.
14-
12-
Ashland
10-
•
8-
6-
4-
2-
0
14-
12-
Aurora
10-
8-
6-
4-
2-
0
FFJ
14 -
12
Oswego
10 .
8
6
4
2
0
May
Jun
Jul
Aug
Sep
14
12
10
8
6
4
2
0
14-
12-
10-
8-
6-
4-
2-
0
14-
12-
10-
8-
6-
4-
2-
0
May
Jun
DUPAGE RIVER - 2006
West Branch
135th
Renwick
•
f
• Y
Jul
Aug
Sep
Figure 7 . Median daily dissolved oxygen concentrations collected by IAWA during
2006 .
14
12
10
8
6
4
2
0
14
12
10-
8 -
6-
4-
2-
0
14-
12-
10-
8-
6
4
2
0
May
DUPAGE RIVER
- 2006
West Branch
135th
Renwick
St
Jun
Jul
Aug
Sep
Figure 8
. Minimum daily dissolved oxygen concentrations collected by IAWA during
2006 .
KICKAPOO RIVER - 2006
Figure 9
. Median daily dissolved oxygen concentrations collected by IAWA during
2006.
JO)E
CO
14 -
12 -
C
C
U
10-
U
0
8-
w
0
0
64
0
C
al
CU
2
0
a)
May
Jun
Jul
Aug
Sep
14 -
12-
10-
8-
6
4
2
0
May
KICKAPOO RIVER - 2006
Jun
Jul
Aug
Sep
Figure 10 . Minimum daily dissolved oxygen concentrations collected by IAWA during
2006.
ROCK RIVER - 2006
Jun
Jul
Aug
Sep
Figure 11
. Median daily dissolved oxygen concentrations collected by IAWA during
2006 .
.EC
May
Jun
Jul
Aug
Sep
Figure 12
. Minimum daily dissolved oxygen concentrations collected by IAWA during
2006 .
ROCK RIVER - 2006
J
E
C0
14-
C
12-
C
10-
S
.
U
00
0
8-
6-
VVr''~'~
Cu
0
T
4-
0
7
E
2-0
VERMILION RIVER - 2006
Jun
Jul
Aug
Sep
Figure 13
. Median daily dissolved oxygen concentrations collected by IAWA during
2006.
2
Figure 14
. Minimum daily dissolved oxygen concentrations collected
by IAWA during
2006 .
VERMILION RIVER
- 2006
J0)E
C0
14-
C
d
12-
0
CC
10 -
0
8-
0
0
T
64
0
2
EE
0
May
Jun
Jul
Aug
'C
Sep
DuPage West Branch
0
200
400
Daily Discharge (fl3ls)
600
800
Figure 15
. Daily discharge versus daily median and minimum dissolved oxygen
concentration
. All regressions were linear.
C
000E
fE
c
r2=0.15
p = 0.07
DuPage 135th
Daily Discharge (flats)
Figure 16 . Daily discharge versus daily median and minimum dissolved oxygen
concentration . All regressions were linear
.
C
0
0
0
c
d
10
0
10
4-
2-
0
1110
00
•
•
.
0
r2=0 .58
p = 0.00001
Ilt
.
.
.
r2=0 .63
p = 0.00001
0
200
Fox River Ashland
400
600
800
Daily Discharge (ft3/s)
1000
1200
Figure 17
. Daily discharge versus daily median and minimum dissolved oxygen
concentration . All regressions were log-linear
.
E
2
10
2
2-
0
0
r2=0 .32
p = 0.00001
.
•
•
.,
r2=0 .56
•
0 0
00 o
p = 0.00001
•1$
0
200
Fox River Aurora
400
600
Daily Discharge (ft3/s)
800
1000
Figure 18
. Daily discharge versus daily median and minimum dissolved oxygen
concentration. All regressions were log-linear.
10
a
6
4
2
0
10
Kickapoo River
0
100
150
200
250
Daily Discharge (ft3ls)
300
350
Figure 19
. Daily discharge versus daily median and minimum dissolved oxygen
concentration. All regressions were linear.
C
a-
J0
CC
S
U
0O
a-
r2=0 .00
p = 0.89
00E
4
Ec
•
2-
•
0
.
.
.
.
.
r
r2=0 .04
p = 0.21
0
100
Fox River Oswego
200
300
400
500
Daily Discharge (ft3/s)
600
700
Figure 20
. Daily discharge versus daily median and minimum dissolved oxygen
concentration . All regressions were linear
.
10
4
2
a-
2-
0
0 49
r2=0 .17
p = 0.06
r2=0
.00
p = 0.79
0
DuPage Plainfield
100
150
20o
250
Daily Discharge (ft3/s)
300
350
Figure
concentration21
. Daily
. All
discharge
regressions
versus
were
daily
linear
.
median and minimum dissolved oxygen
UC0
a
00
m
6
a
2
4I
4
2
0
10
14 -
a-
r2
=0.48
p = 0.0001
0
3000
r2=0 .53
p = 0.0001
3500
Rock River
4000
4500
5000
Daily Discharge (ft3/s)
5500
6000
Figure
concentration22
. Daily
. All
discharge
regressions
versus
were
daily
linear.
median and minimum dissolved oxygen
U
0n
E
EE
r2=0 .0
p = 0.72
Vermilion River
0
200 400 600 800 1000
1200 1400 1600 1800 2000
Daily Discharge (ft3/s)
Figure 23
. Daily discharge versus daily median and minimum dissolved oxygen
concentration . All regressions were linear
.
Garvey - October 2006 - Exhibit 6
IAWA DATA FROM ENHANCED SEGMENTS
May June July Aug
Sept
Figure 1
. Mean ± standard deviation proportion of observations (averaged across sites) that
exceeded the acute minimum dissolved oxygen criteria for the two proposed standards
.
0.7
U)C
s
0.6-
M
N
t0 0.5
-
f DNR/EPA
U- IAWA
~
C
0
_T C
0.4 -
C
O
t
0.3
iEO
_
OJto
N
0.2
.
\
n0
CL
0.1
\
0.0
.
Garvey - October 2006 - Exhibit 6
Table 1
. Minimum criteria
.
Number of dissolved oxygen concentration point estimates (mg/L) quantified at each "enhanced" river site and month
that were less than 5 mg/L, 4 mg/L, and 3 .5 mg/L
. Proportions that were less than the minimum acute concentration proposed by DNR/EPA and
IAWA are listed. DNR/EPA : Not less than 5 mg/L through July 31 ; IAWA
: Not less than 5 mg/L through June 30
. For later months, DNR/EPA :
Not less than 4 mg/L ; IAWA : Not less than 3.5 mg/L.
Month River
Site
Total
Obs
below 5
below 4 below 3 .5
Violate
DNR/EPA
Violate
IAWA
May
Fox
Aurora
1630
0
0
0
0.00
0.00
Ashland/Montgomery
1018
0
0
0
0 .00
0 .00
Oswego
143
0
0
0
0 .00
0 .00
June
DuPage West Branch
558
67
0
0
0 .12
0 .12
Fox
Aurora
2854
619
417
328
0 .22
0 .22
Ashland/Montgomery
1151
236
108
61
0 .21
0
.21
Oswego
1058
208
109
65
0 .20
0 .20
July
DuPage West Branch
611
202
45
17
0 .33
0 .03
Fox
Aurora
560
255
184
149
0 .46
0 .27
Ashland/Montgomery
1324
868
755
657
0 .66
0 .50
Oswego
774
167
136
117
0 .22
0.15
Rock
Rock River
2712
0
0
0
0 .00
0 .00
August
DuPage 135'
635
193
49
0
0.08
0.00
Renwick
556
44
0
0
0 .00
0 .00
Kickapoo Peoria
2917
1268
609
394
0 .21
0 .14
Rock
Rock River
2729
0
0
0
0 .00
0 .00
Vermilion Danville
658
1
1
1
0 .00
0 .00
Sept
DuPage 135'"
311
17
0
0
0.00
0.00
DuPage
44
0
0
0
0 .00
0 .00
Naperville
320
9
0
0
0 .00
0 .00
Renwick
310
0
0
0
0 .00
0
.00
Kickapoo Peoria
1404
318
34
0
0 .02
0 .00
Vermilion Danville
297
0
0
0
0 .00
0 .00
Average
0 .12
0 .08
Proportion Site-
Dates
0 .48
0 .39
Garvey - October 2006 - Exhibit 6
Table 2. Seven-day mean criteria
. Number of dates where mean daily dissolved oxygen concentrations averaged across seven days
were less than the proposed criteria for DNR/EPA and IAWA
. DNR/EPA
: Seven day averages must not be less than 6 .25 mg/L
through July; IAWA: Seven day averages must not be less than 6 mg/L through June
. N/A = not applicable .
Month River
Site
TOTAL
DAYS
DNR < 6 .25
Violate
IAWA
<6
DNR/EPA
Violate
IAWA
May
Fox
Aurora
6
0
0
0.00
0.00
Ashland/Montgomery 11
0
0
0.00
0.00
June
Fox
Aurora
30
0
0
0.00
0.00
Ashland/Montgomery 19
2
1
0.11
0 .05
Oswego
21
0
0
0.00
0.00
DuPage
West Branch
13
0
0
0.00
0.00
July
Fox
Aurora
12
1
1
0.08
N/A
Ashland/Montgomery 28
21
19
0.75
N/A
Rock
Rock
OswegoRiver
2319
00
00
00.00.00
N/AN/A
DuPage
West Branch
26
12
11
0.46
N/A
Average
0.13
0.01
Proportion of Site-
Dates
0 .36
0.17
Garvey - October 2006 - Exhibit 6
Table 3 . Seven-day minimum criteria
. Number of dates where minimum daily dissolved oxygen concentrations averaged across
seven days were less than the proposed criteria for DNR/EPA and IAWA . DNR/EPA
: Seven day averages must not be less than 4.5
mgt after July 31
; IAWA
: Seven day averages must not be less than 4 mg/L after June 30 . N/A = not applicable .
Month River
Site
Total
DNR
violation
< 4.5
IAWA violations <
4
DNR
PROP
IAWA
PROP
July
DuPage West Branch
26
12
6
N/A
0.23
Fox
Aurora
12
12
12
N/A
1 .00
Ashland/Montgomery 28
28
28
N/A
1 .00
Oswego
19
12
11
N/A
0.58
Rock
Rock River
23
0
0
N/A
0.00
August DuPage 135'
2
1
0
0.50
0.00
Renwick
1
0
0
0.00
0.00
Kickapoo Peoria
25
25
20
1 .00
0.80
Rock
Rock River
29
0
0
0.00
0.00
Vermilion Danville
22
0
0
0.00
0.00
Sept
DuPage 135"
8
0
0
0.00
0.00
Renwick
8
0
0
0.00
0.00
Kickapoo Peoria
15
11
3
0 .73
0.20
Vermilion Danville
13
0
0
0
.00
0.00
Average
0 .25
0.27
Proportion Site-
Dates
0 .33
0 .43
Garvey - October 2006 - Exhibit 6
Table 4. Thirty-day mean criteria. Number of dates where mean daily dissolved oxygen concentrations averaged across thirty days
were less than the proposed criteria for DNR/EPA and IAWA
. DNR/EPA: Seven day averages must not be less than 6 mg/L through
July; IAWA
: Seven day averages must not be less than 5 .5 mg/L through June . N/A = not applicable
DNR <
Month River Site
TOTAL 6
IAWA < 5 .5
DNR
IAWA
June
Fox
Aurora
4
0
0
0.00
0.00
July
Fox
Aurora
12
0
0
0.00
N/A
Ashland/Montgomery 18
14
11
0.78
N/A
Oswego
12
0
0
0.00
N/A
DuPage West Branch
6
0
0
0 .00
N/A
Average
0.16
0
Proportion of Site-
Dates
0.2
0