| | - Pollutton Control Board
- Re: R 02-Oh/Rulemaking/Water/Comments ofDeKalb Sanitary District
- FROST BROWN TODD LLC
- ORIGINAL RECEIVED
- BEFORE THE ILLINOIS POLLUTION CONTROL BOARMAR 282002
- STATE OP IWNOIS
- Comments OfDeKalb Sanitary District
- In Support OfIEPA ‘s ProposedWater Quality Standards Rulemaking
- A. BACKGROUND.
- E. CONCLUSION.
- DEKALB SANITARY DISTRICT
- SERVICE LIST OF “PARTICIPANTS” AS OF MARCH 25, 2002
- THE PHYSICOCHEMICAL SPECIATION OF Cd,
- EFFLUENT OF A SEWAGE TREATMENTWORKS AND ITS IMPACT ON SPECIATION
- IN THE RECEIVING RIVER
- TO: Water Management Division Duectors
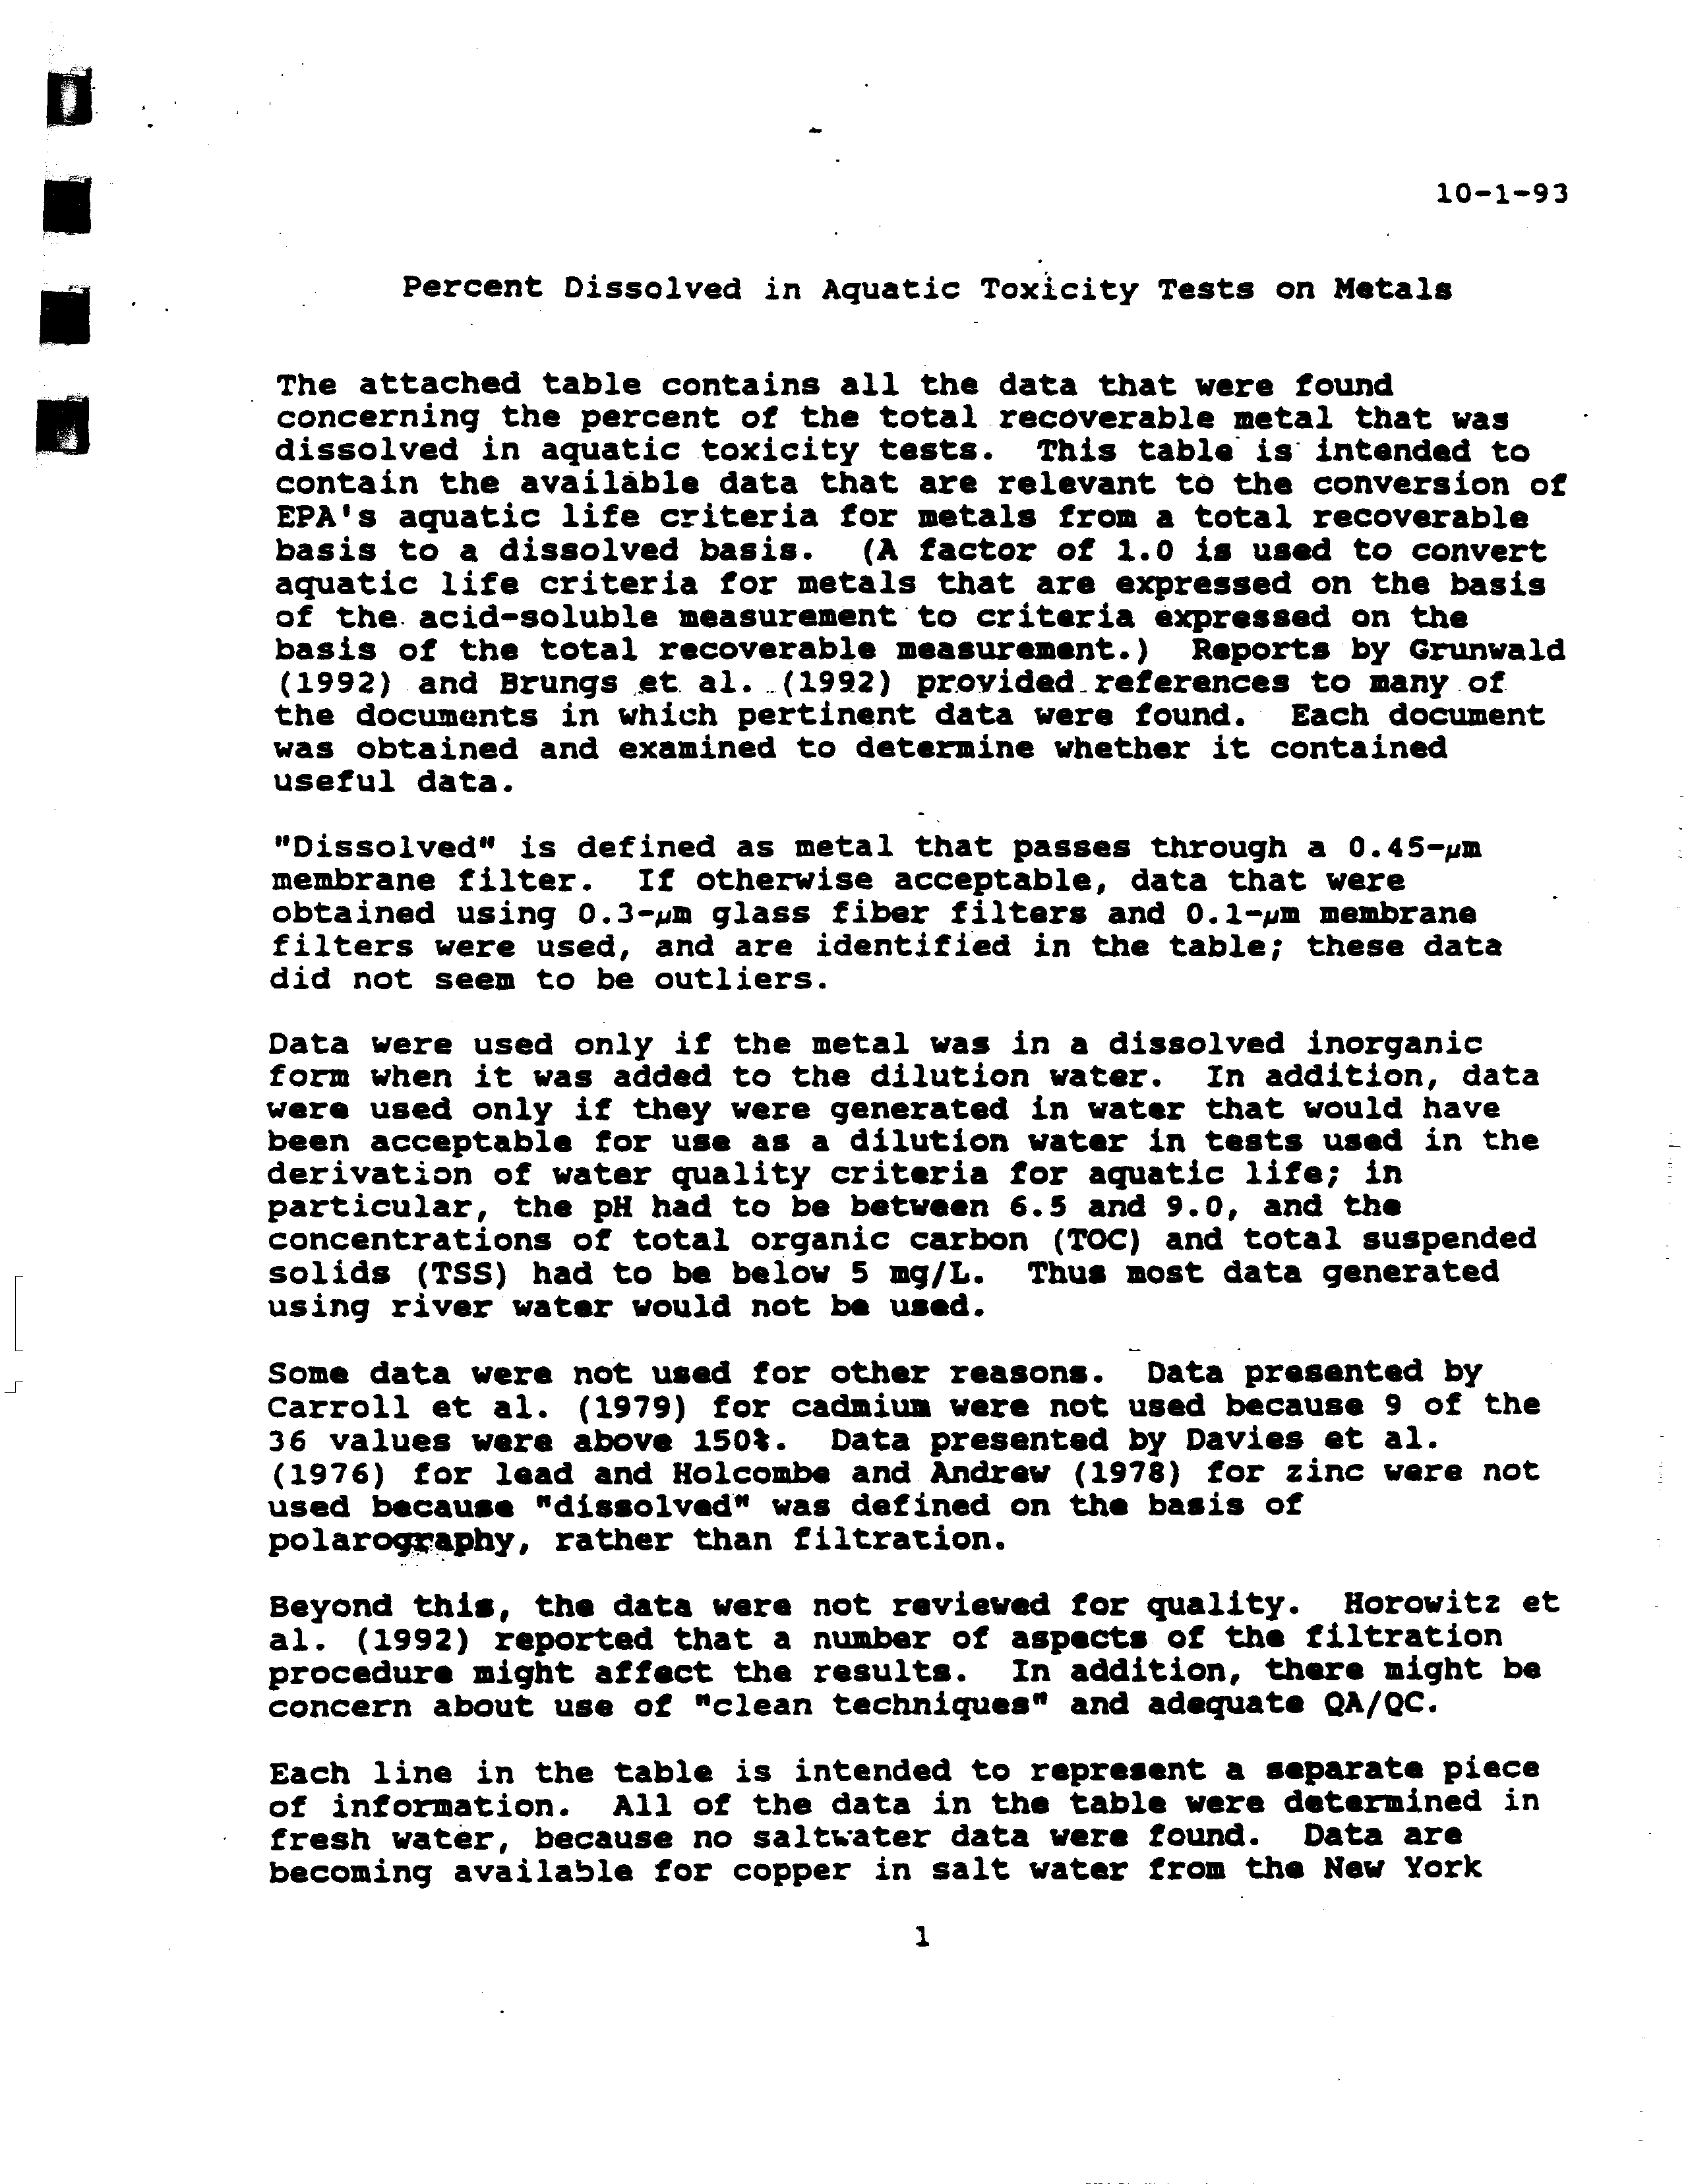
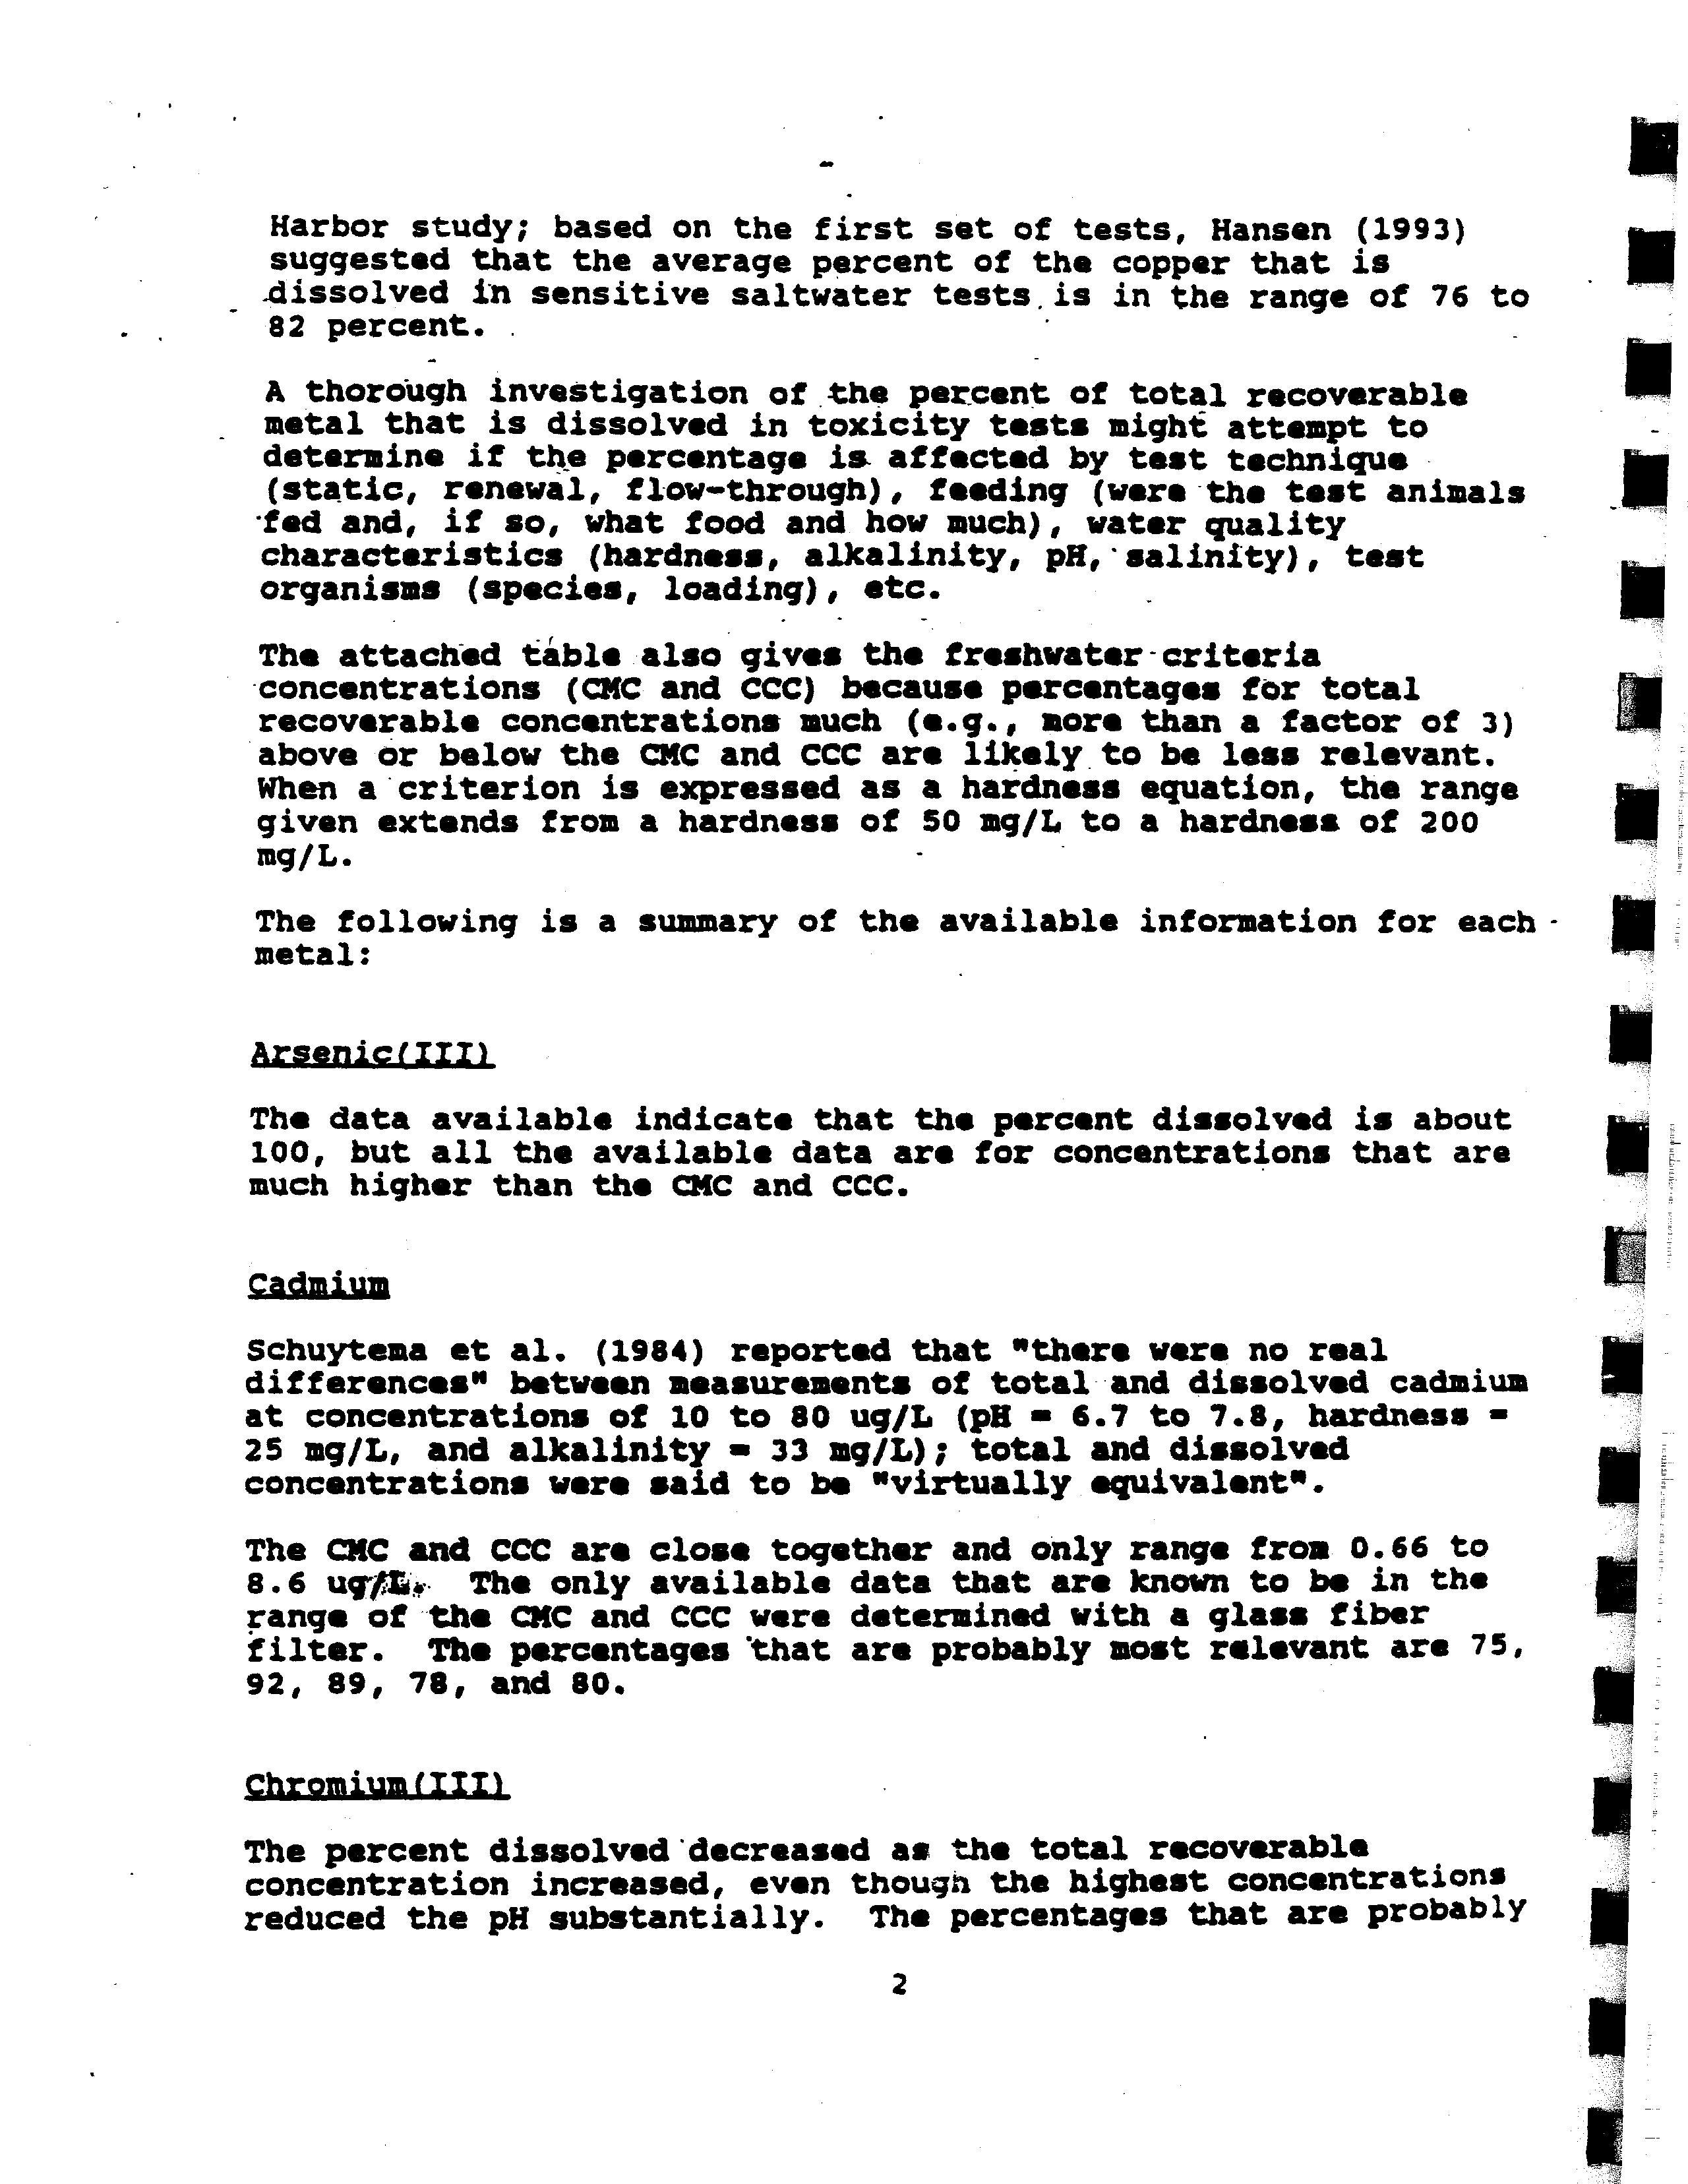
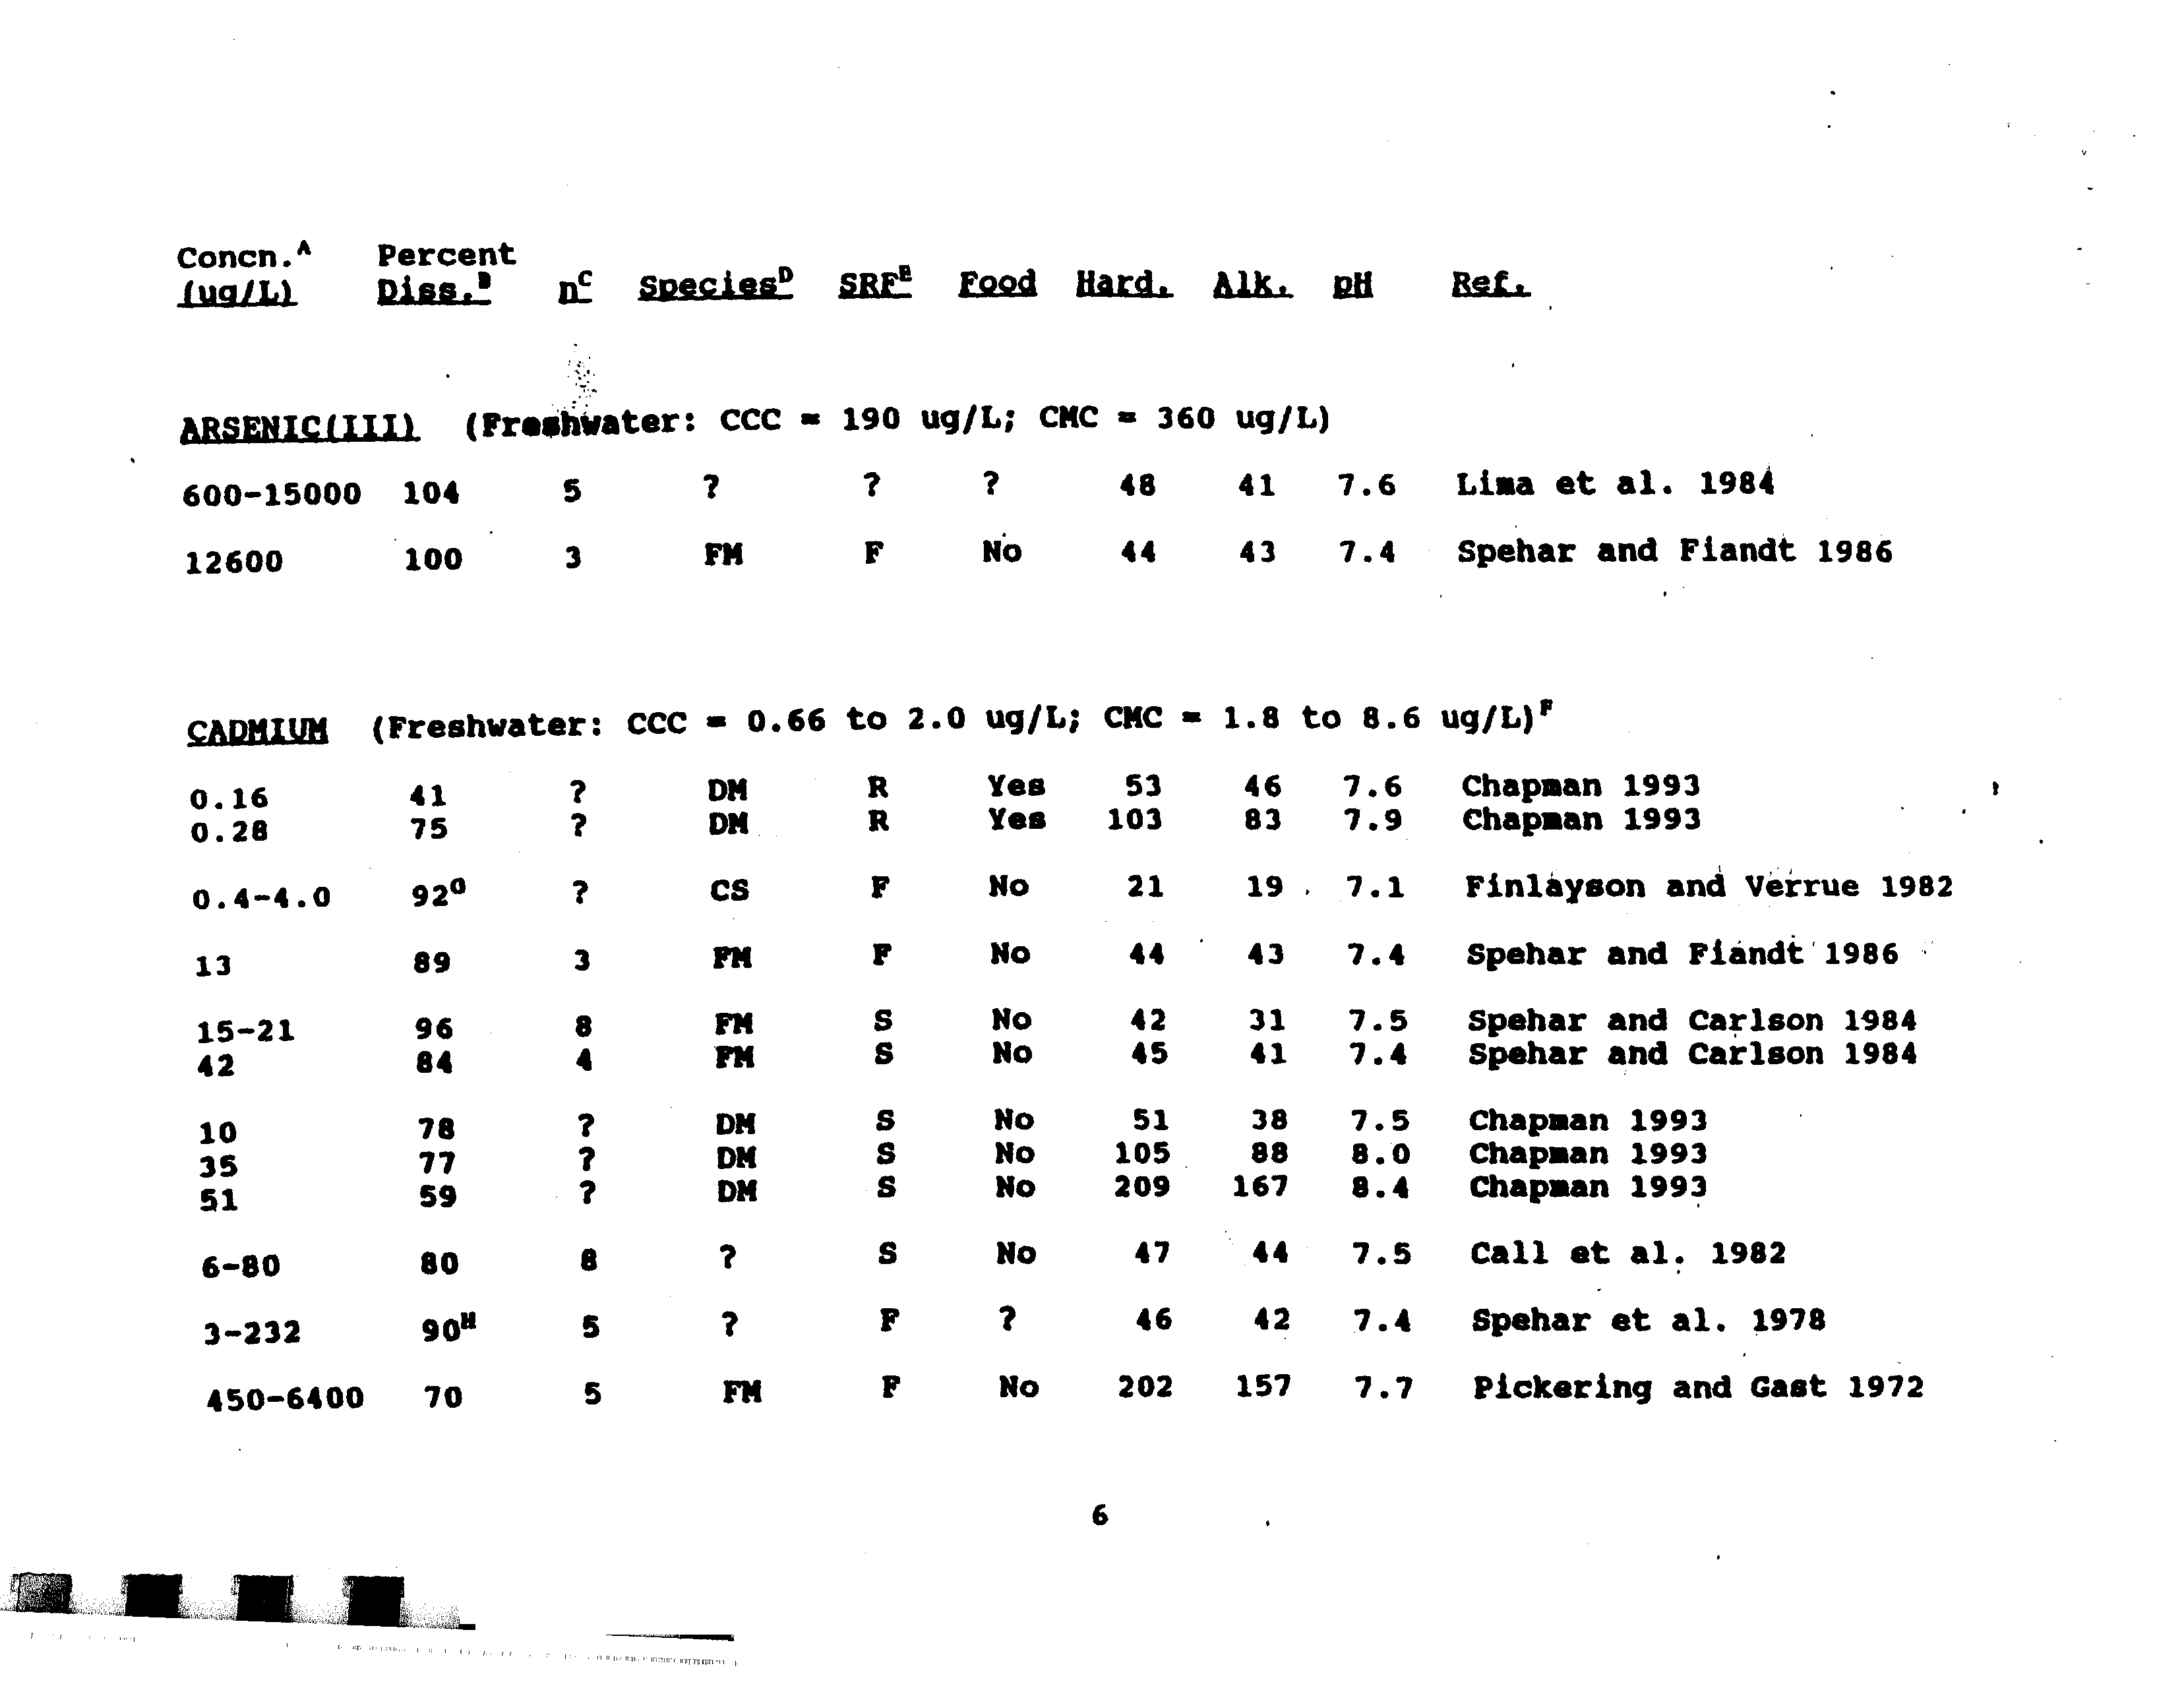
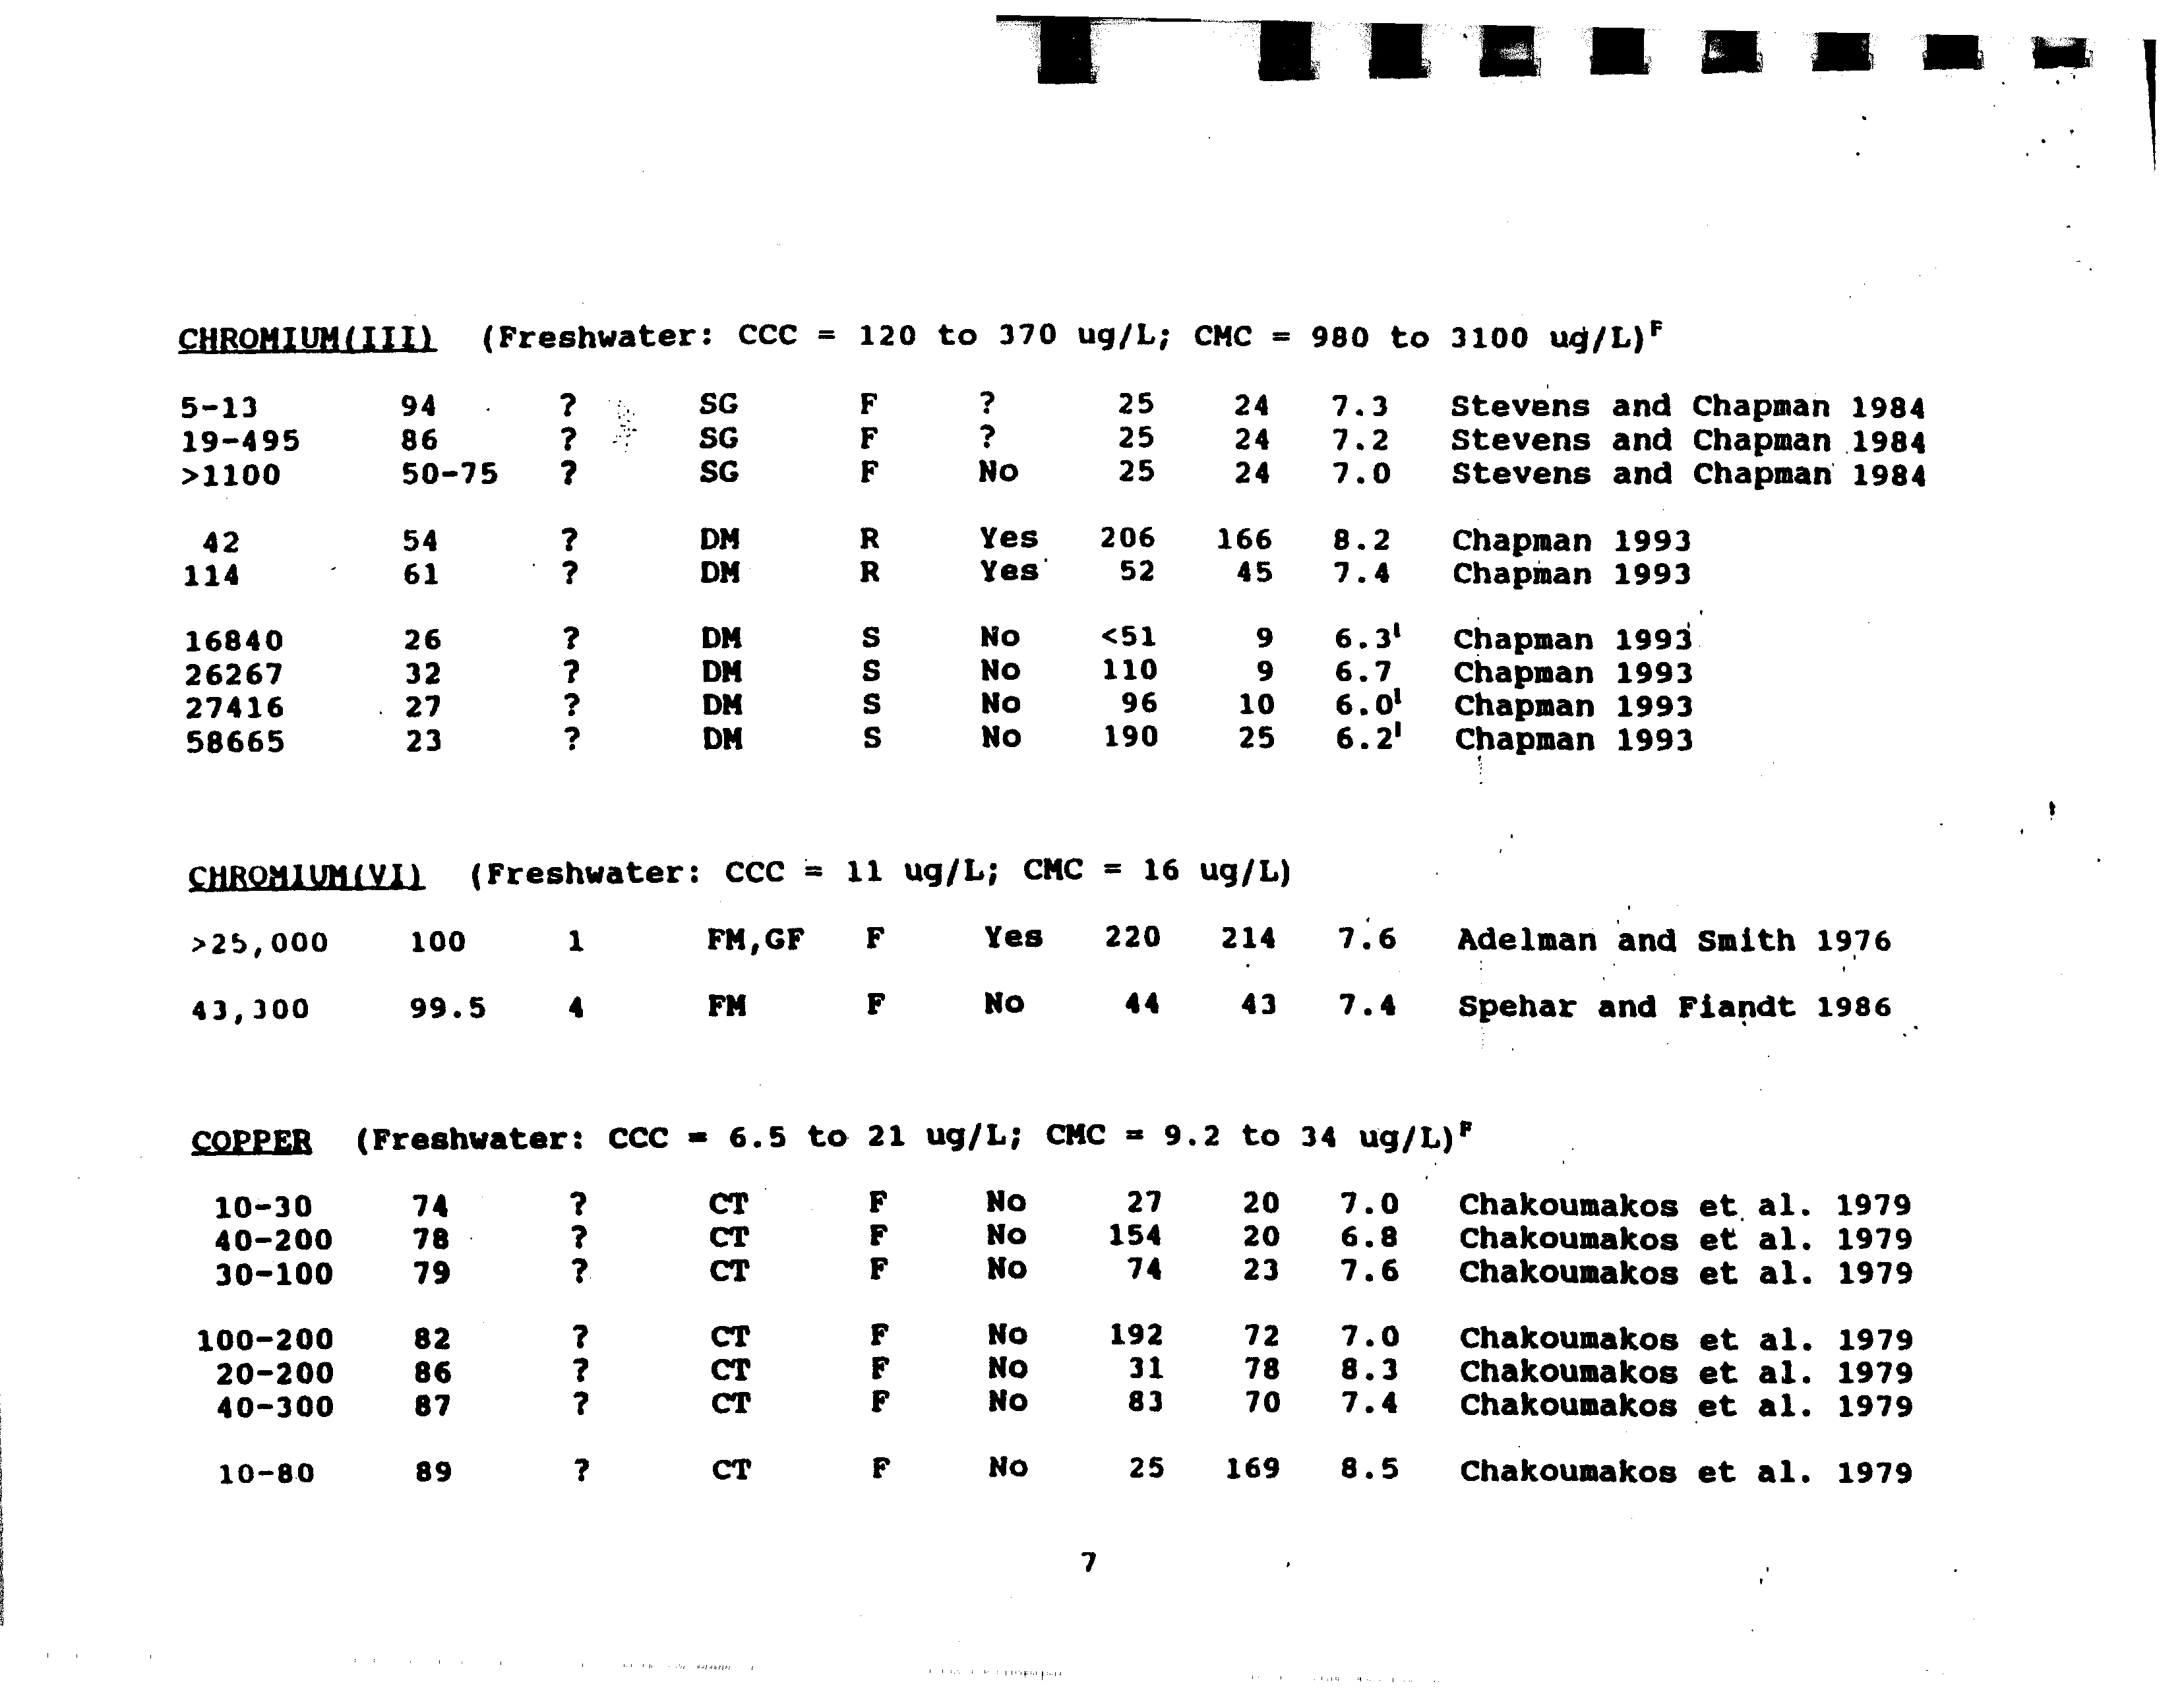
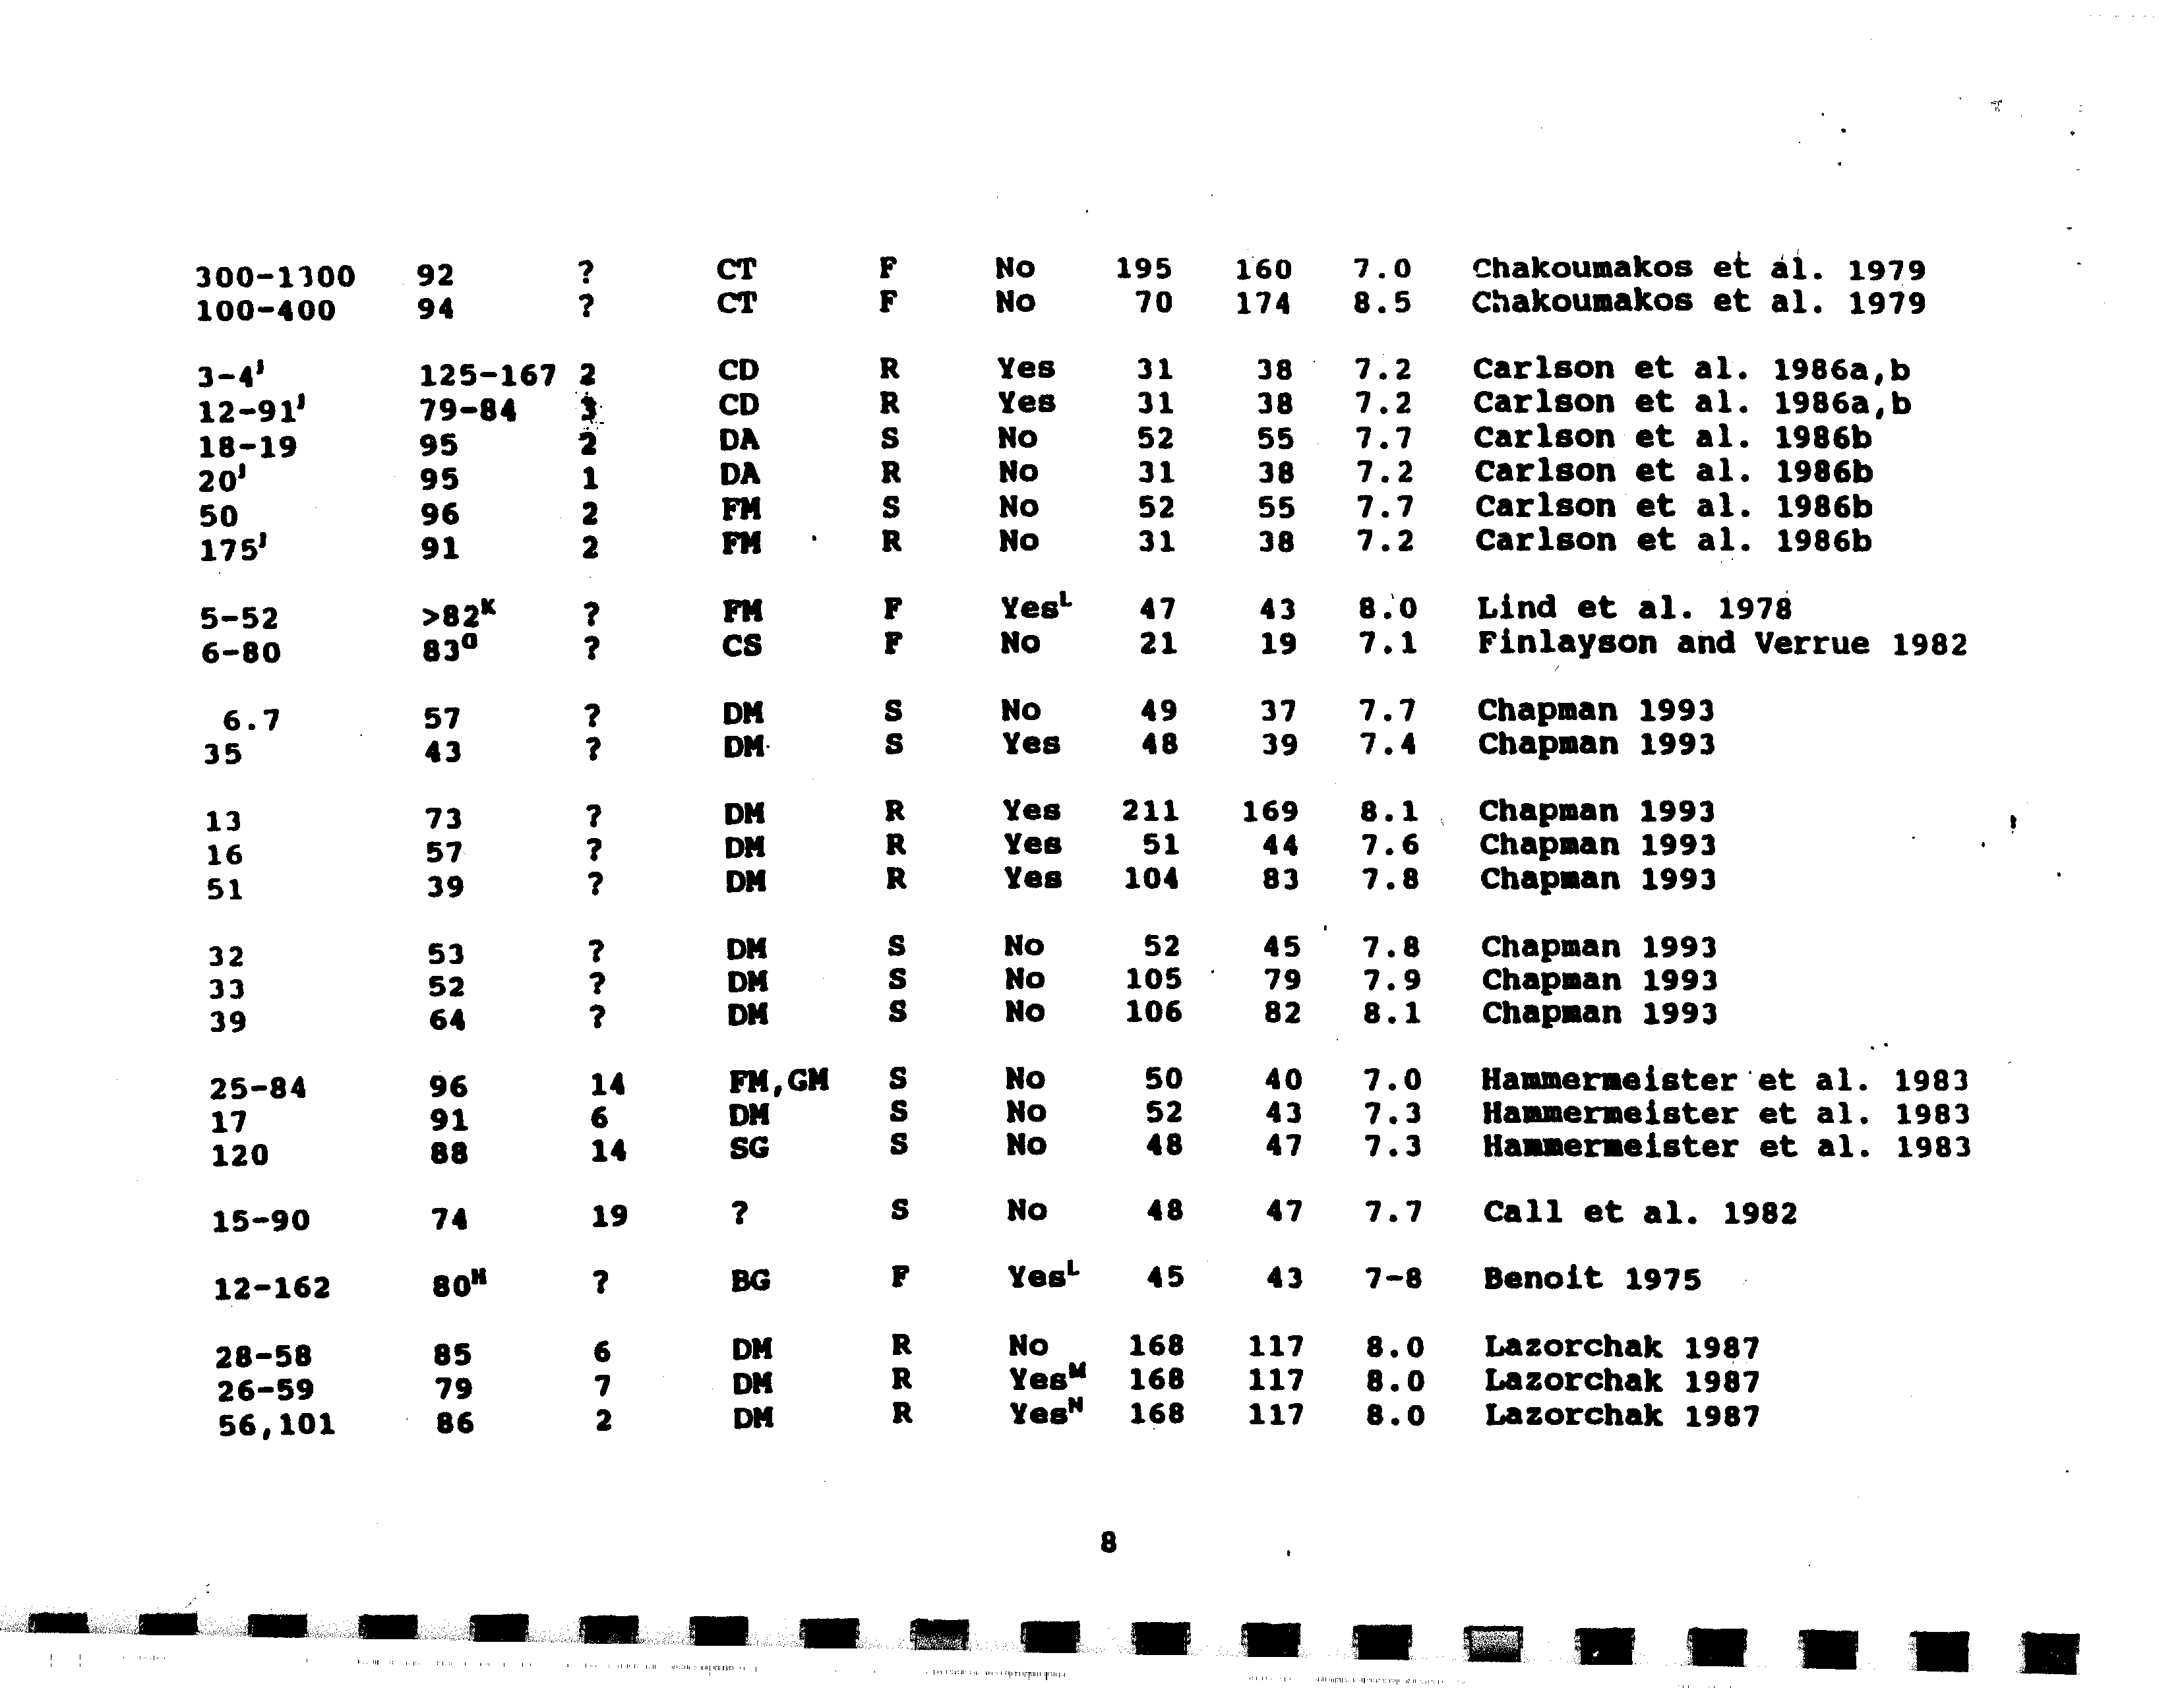
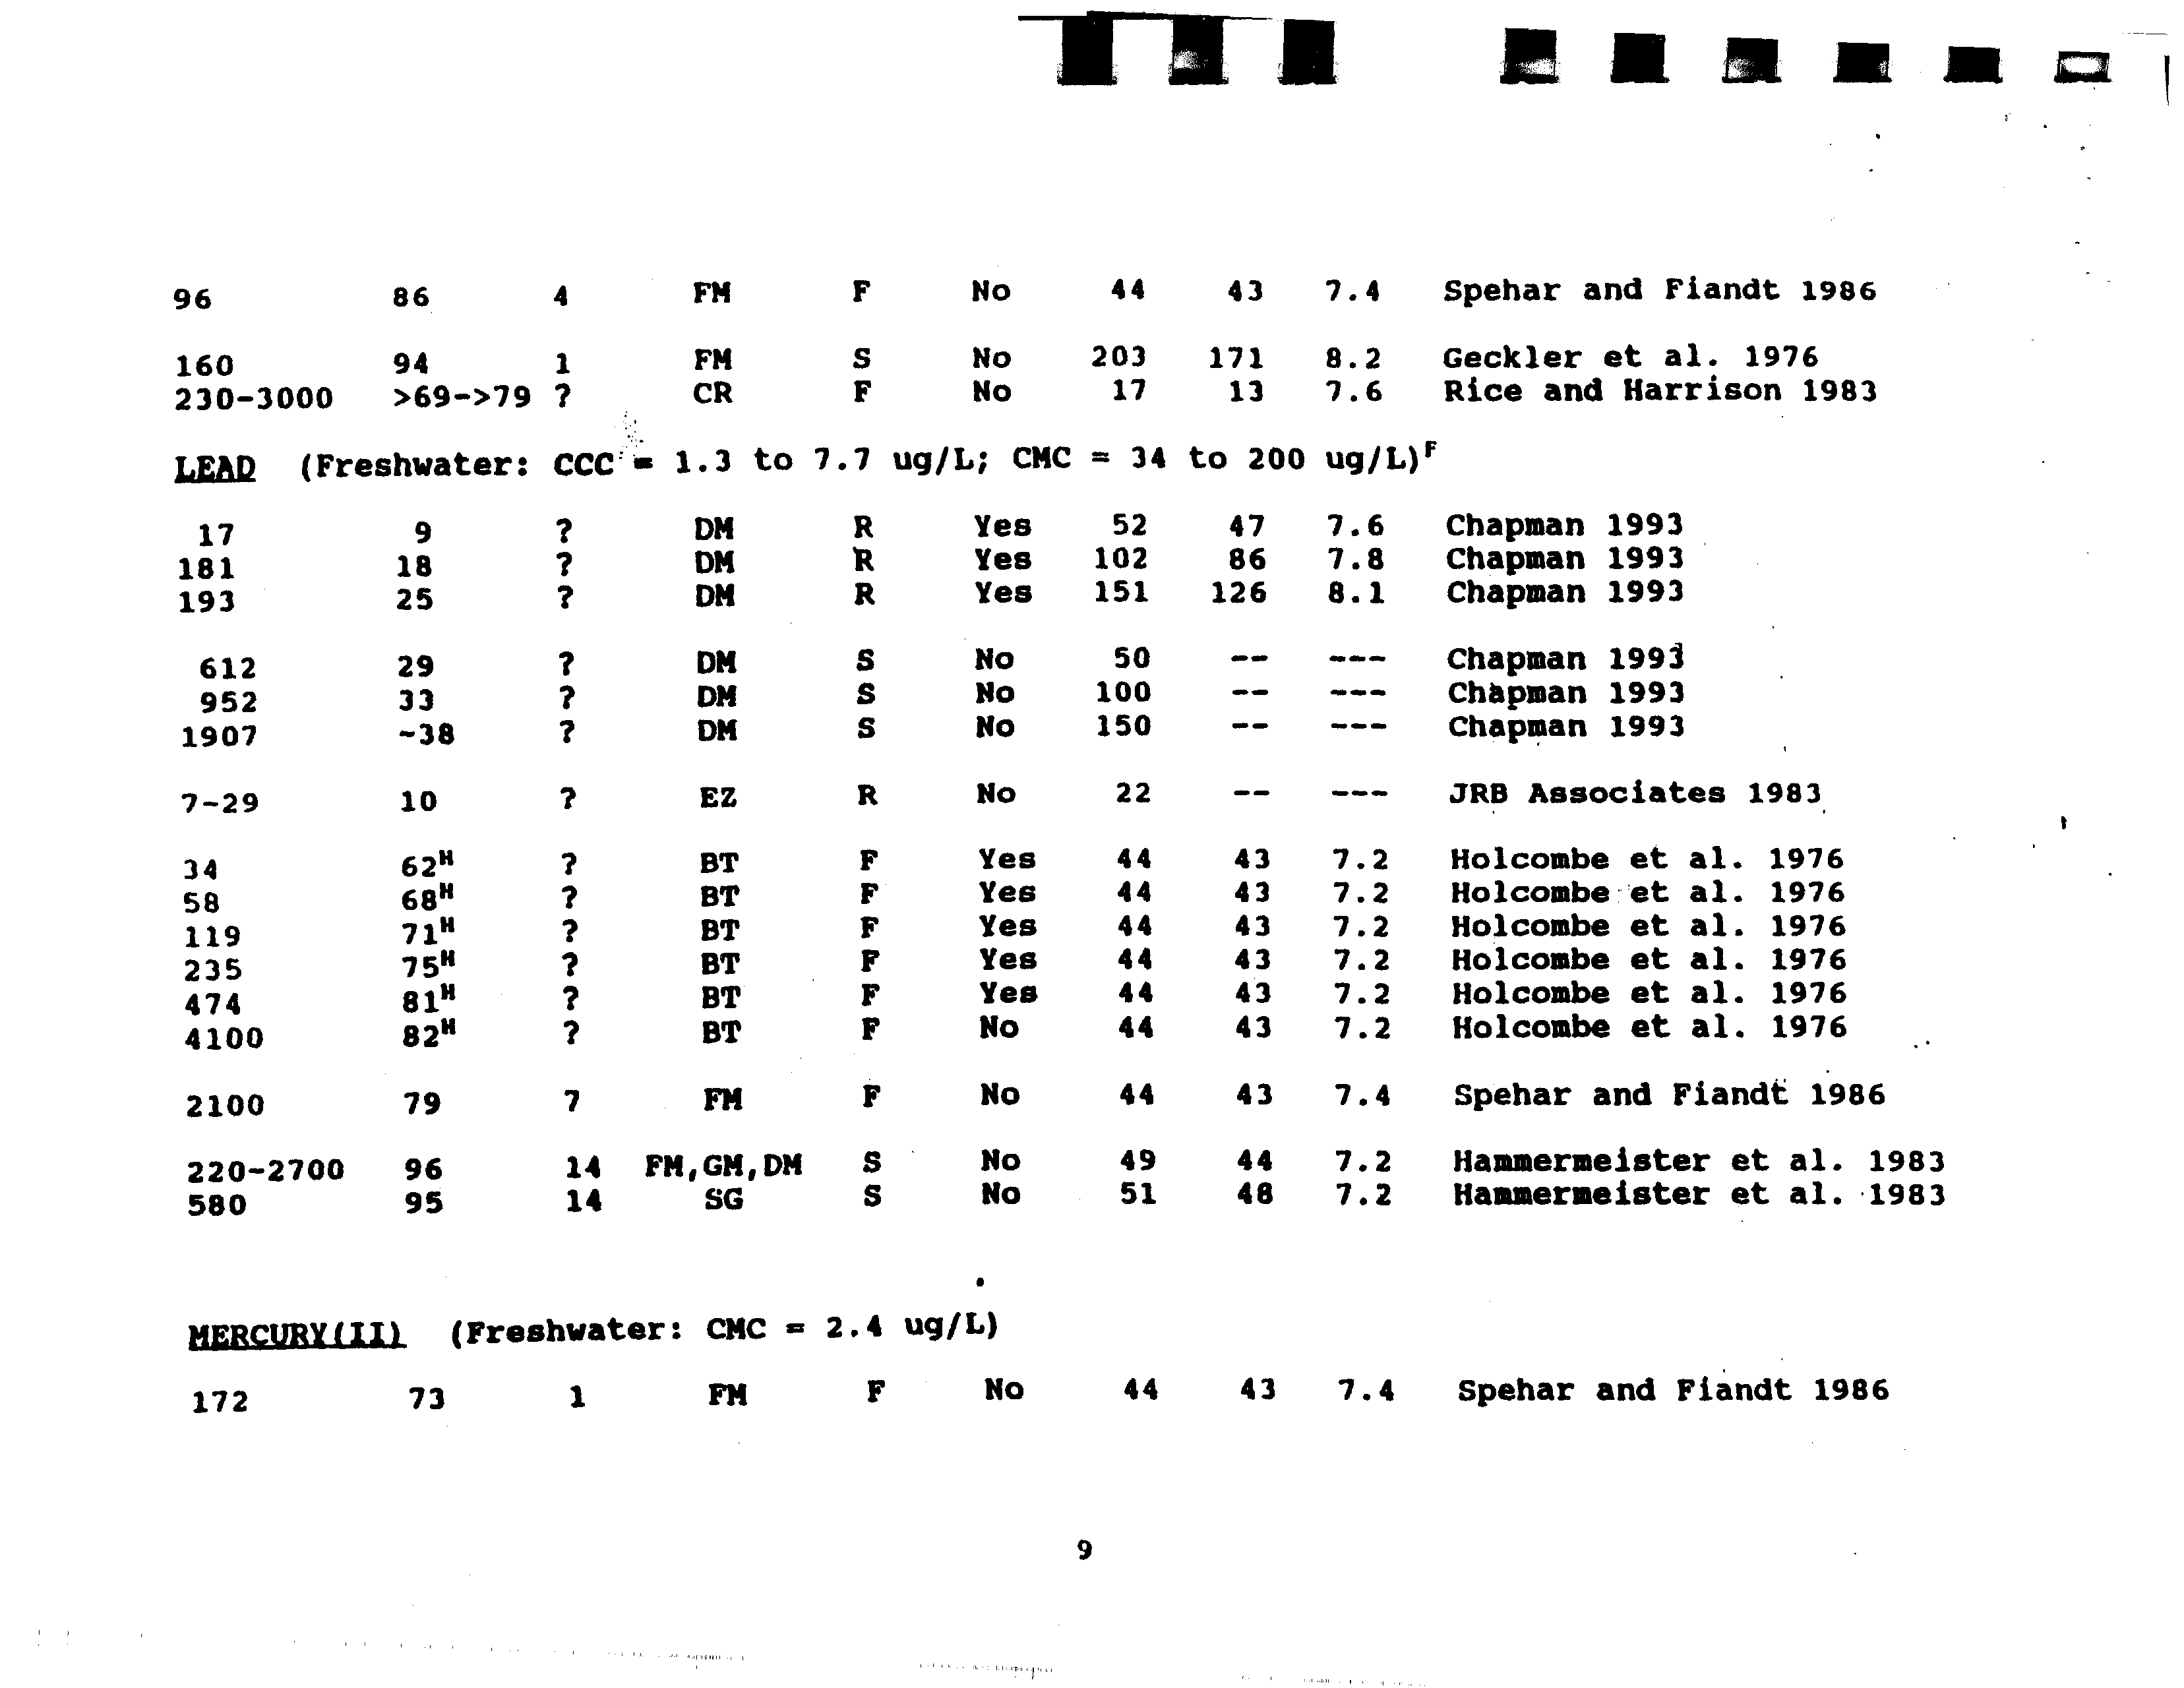
- Percent Dissolved in Aquatic Toxicity Tests on Metals
- TheorganismsattachSd(species,table alsoloading),gives
- etc.th.
- freshwater - criteriaI
- Cadmium
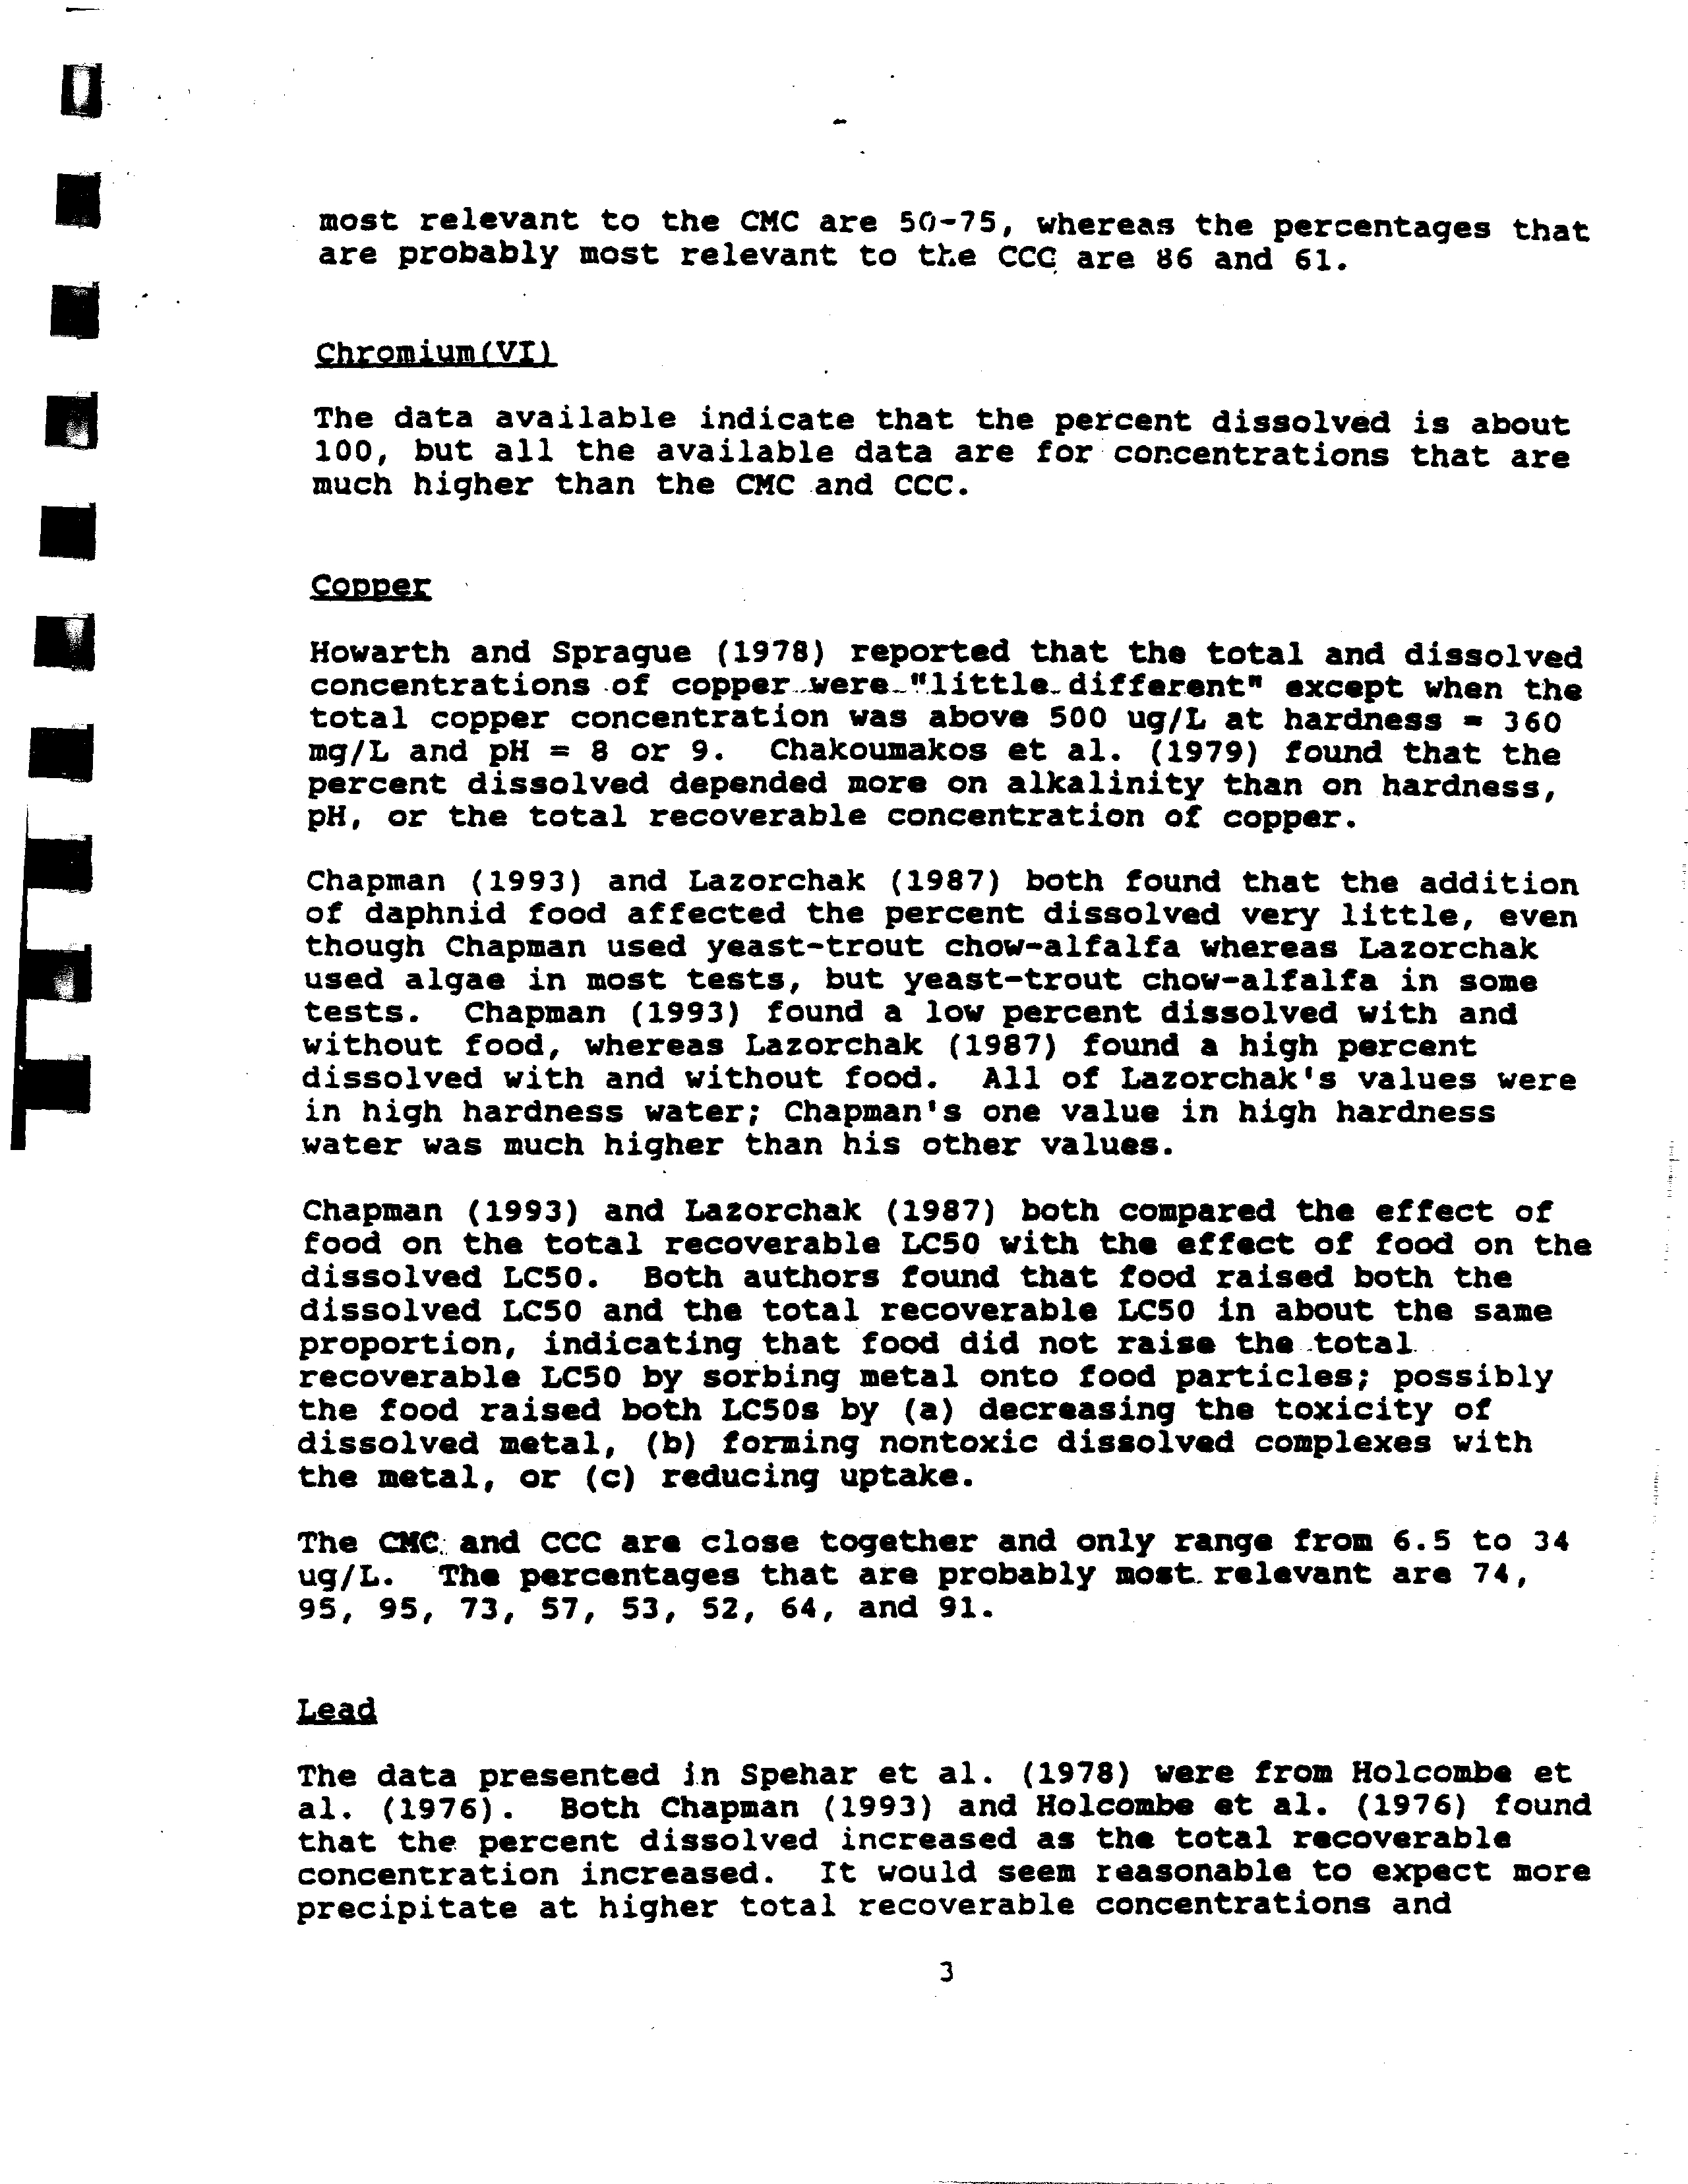
- CoDDer
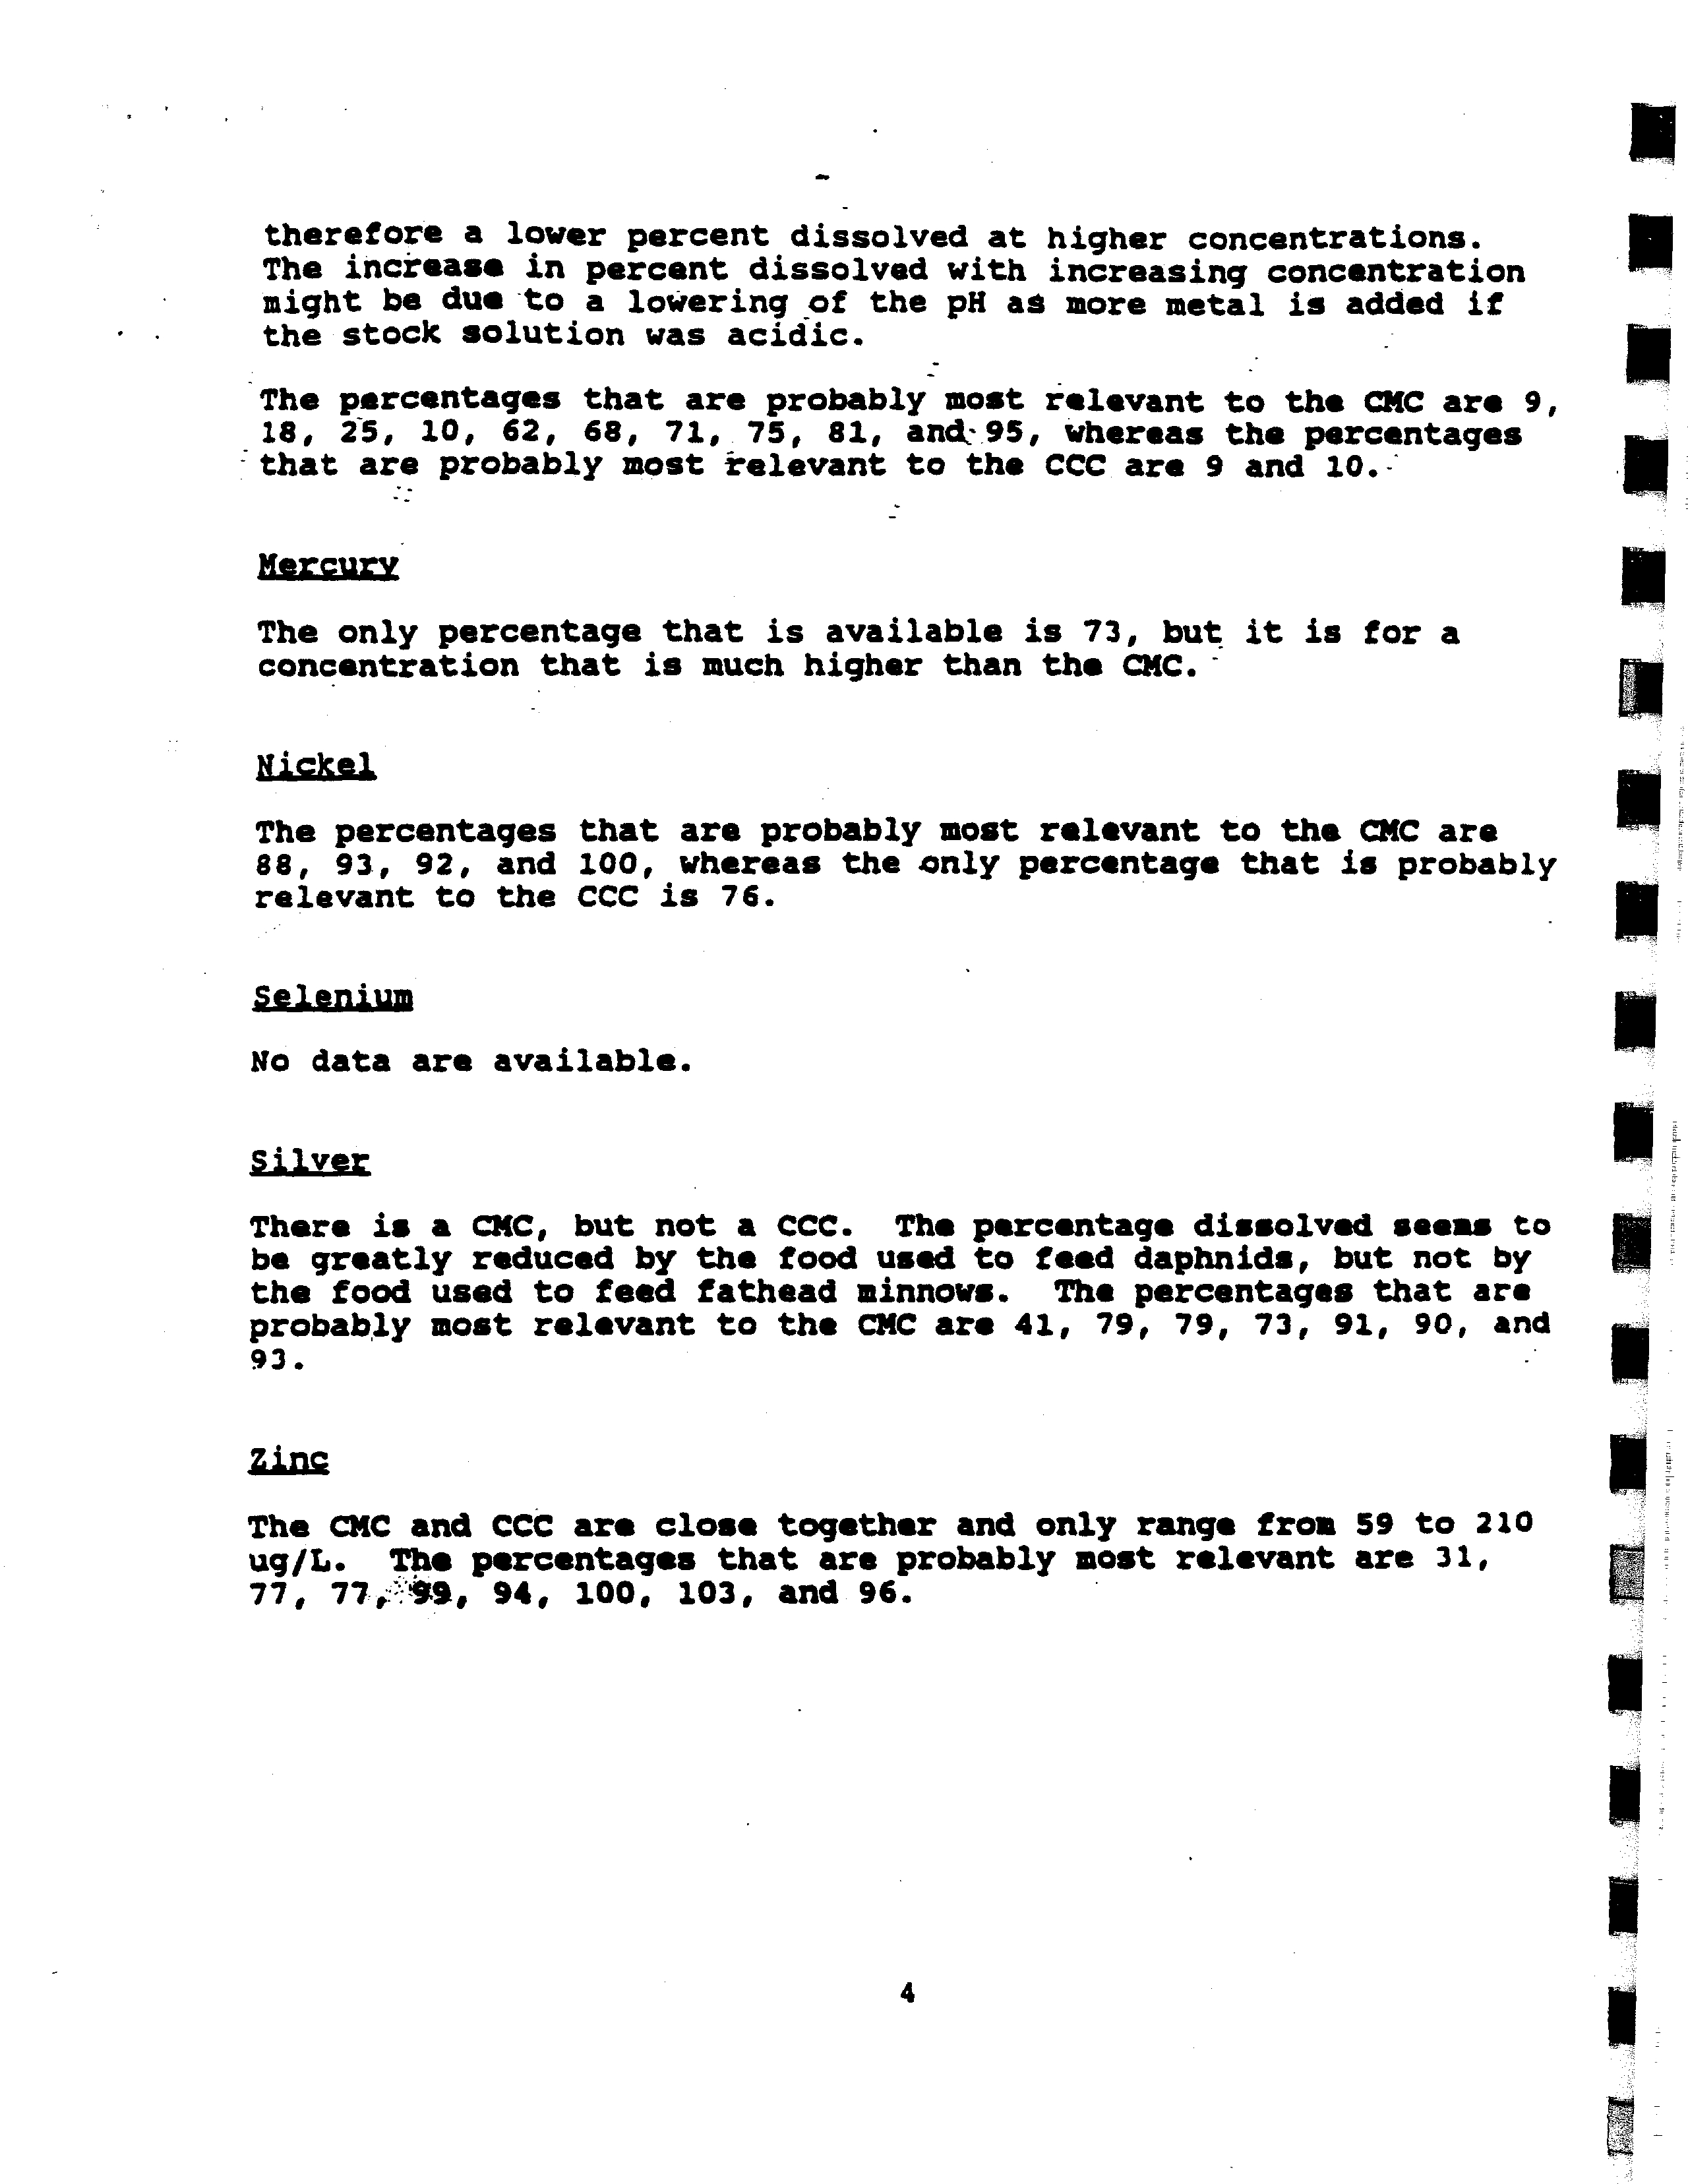
- - that are probably most relevant to the CCC are 9 and 10.:
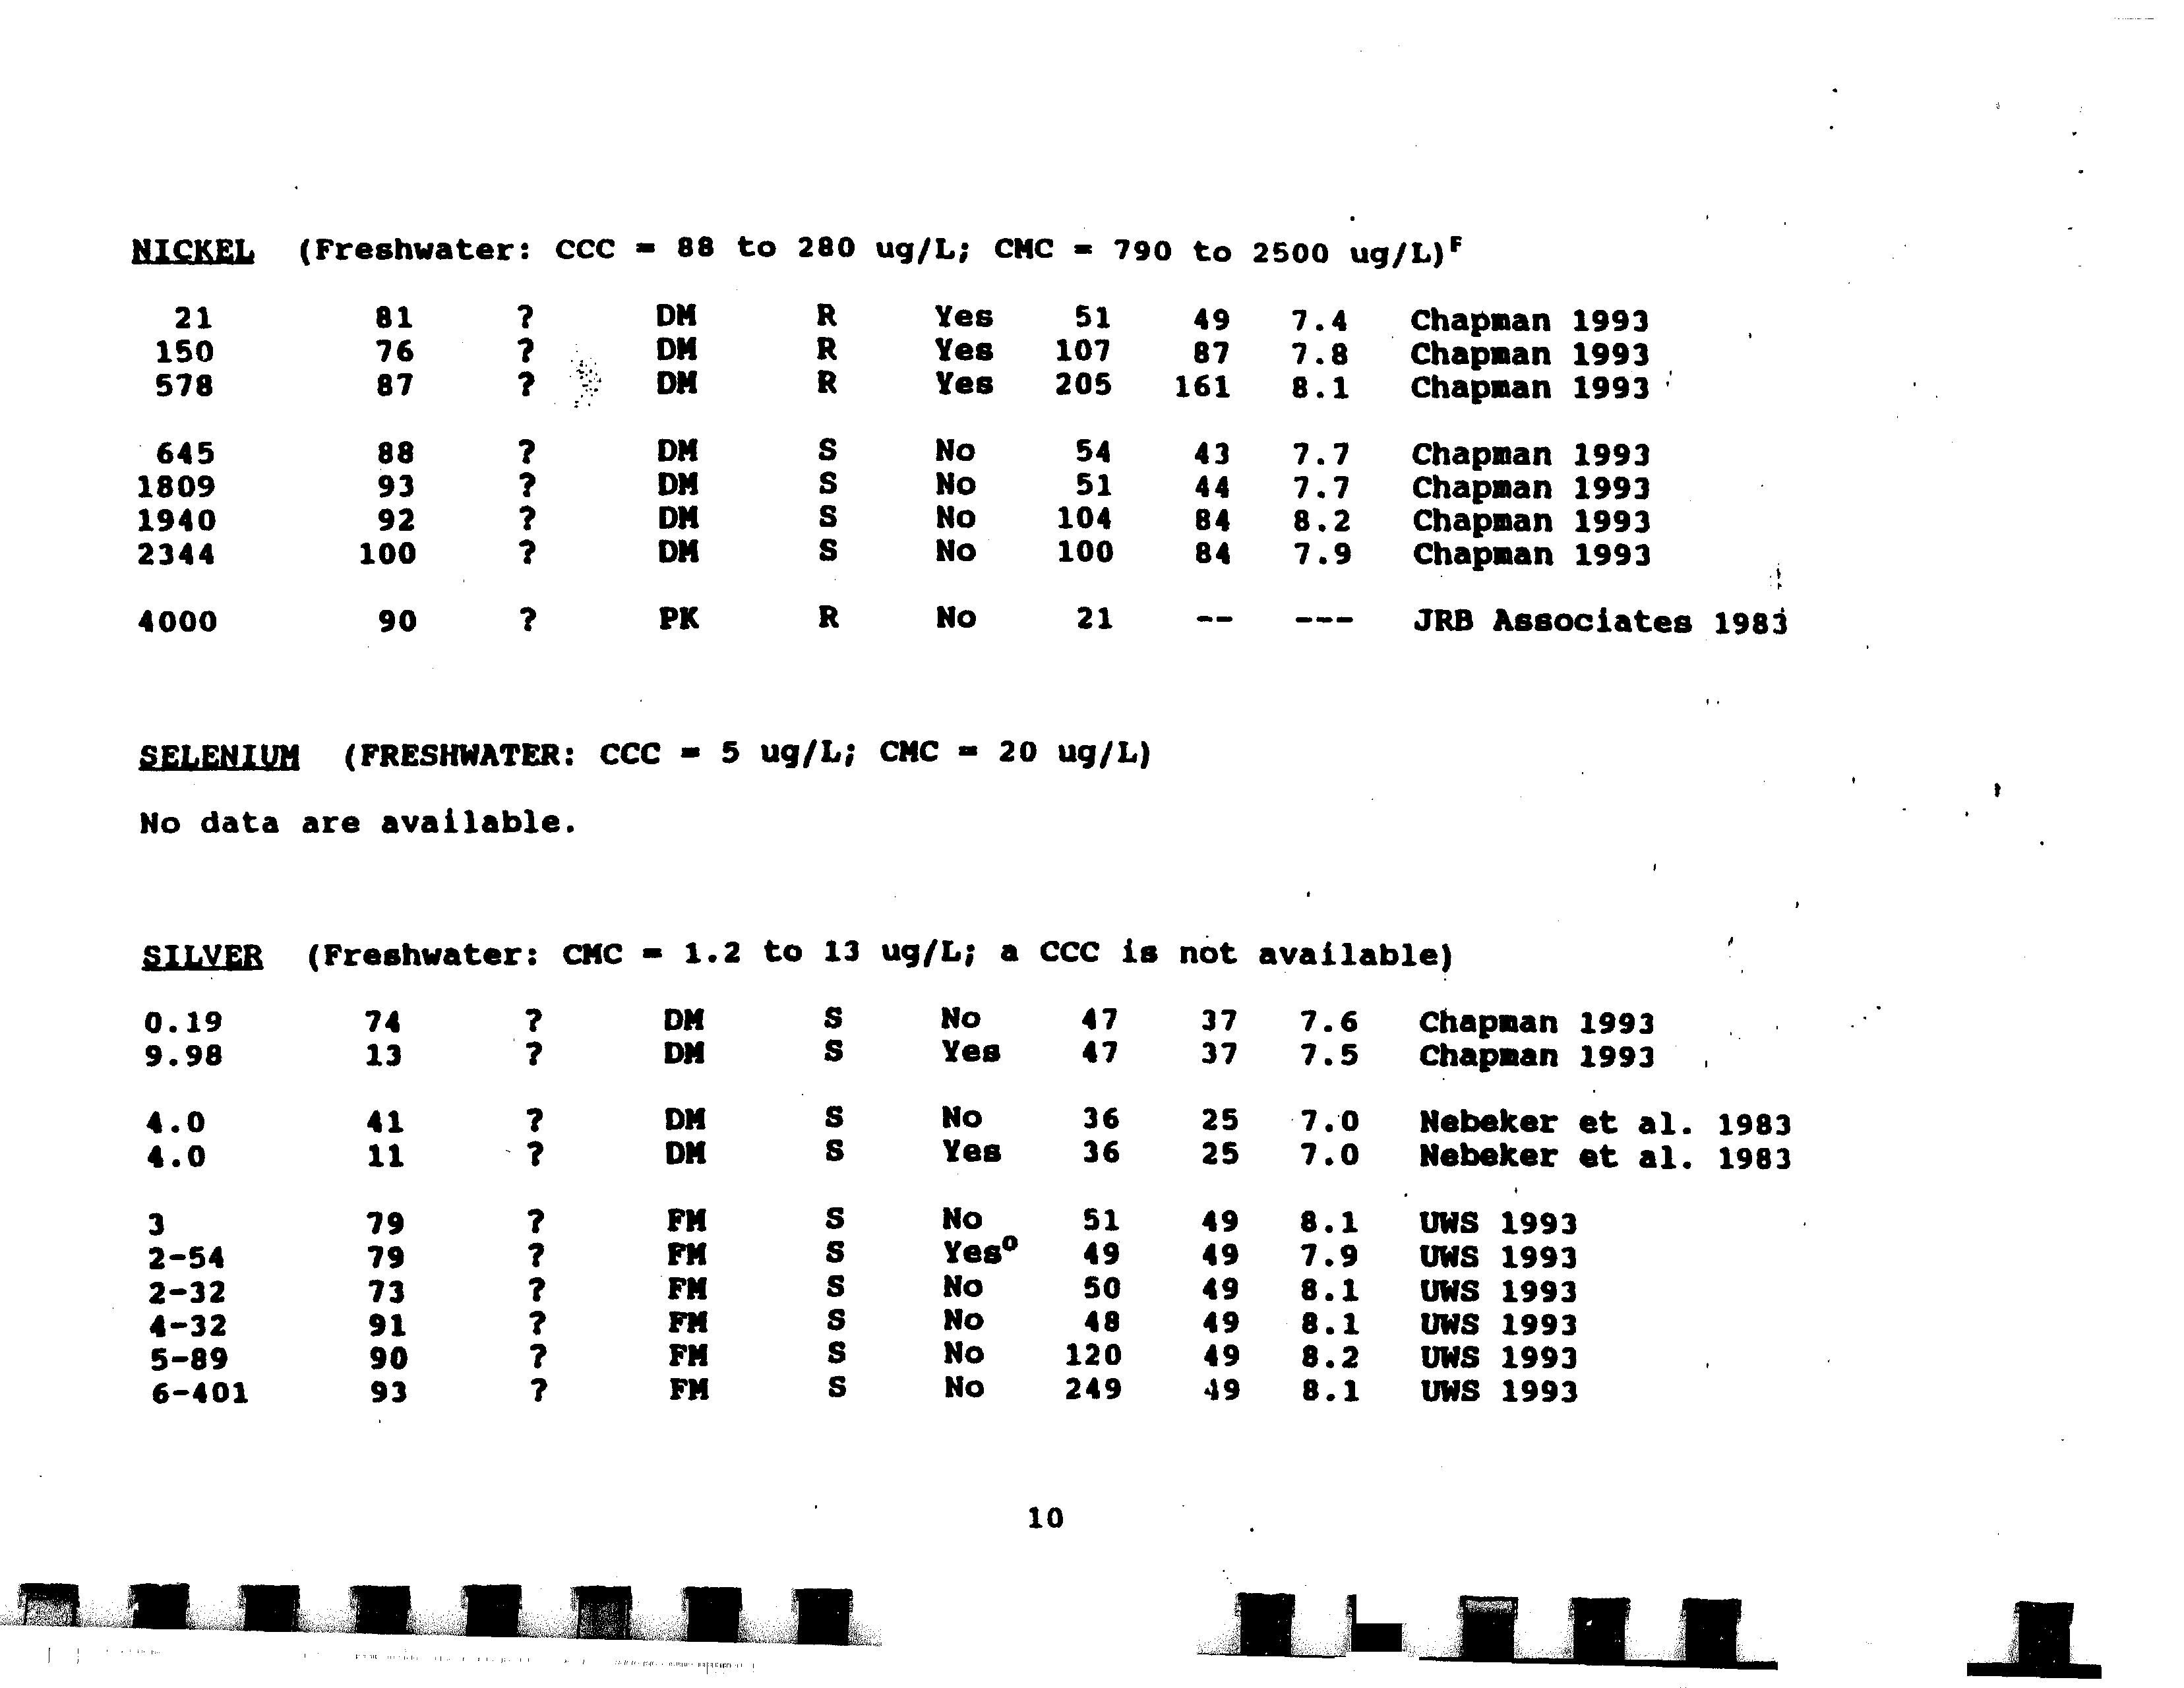
- Selenium
- No data are available.
- Arsenic (III)
- Chromium (VI)
- Copper
- Mercury
- Nickel
- Selenium
- Silver
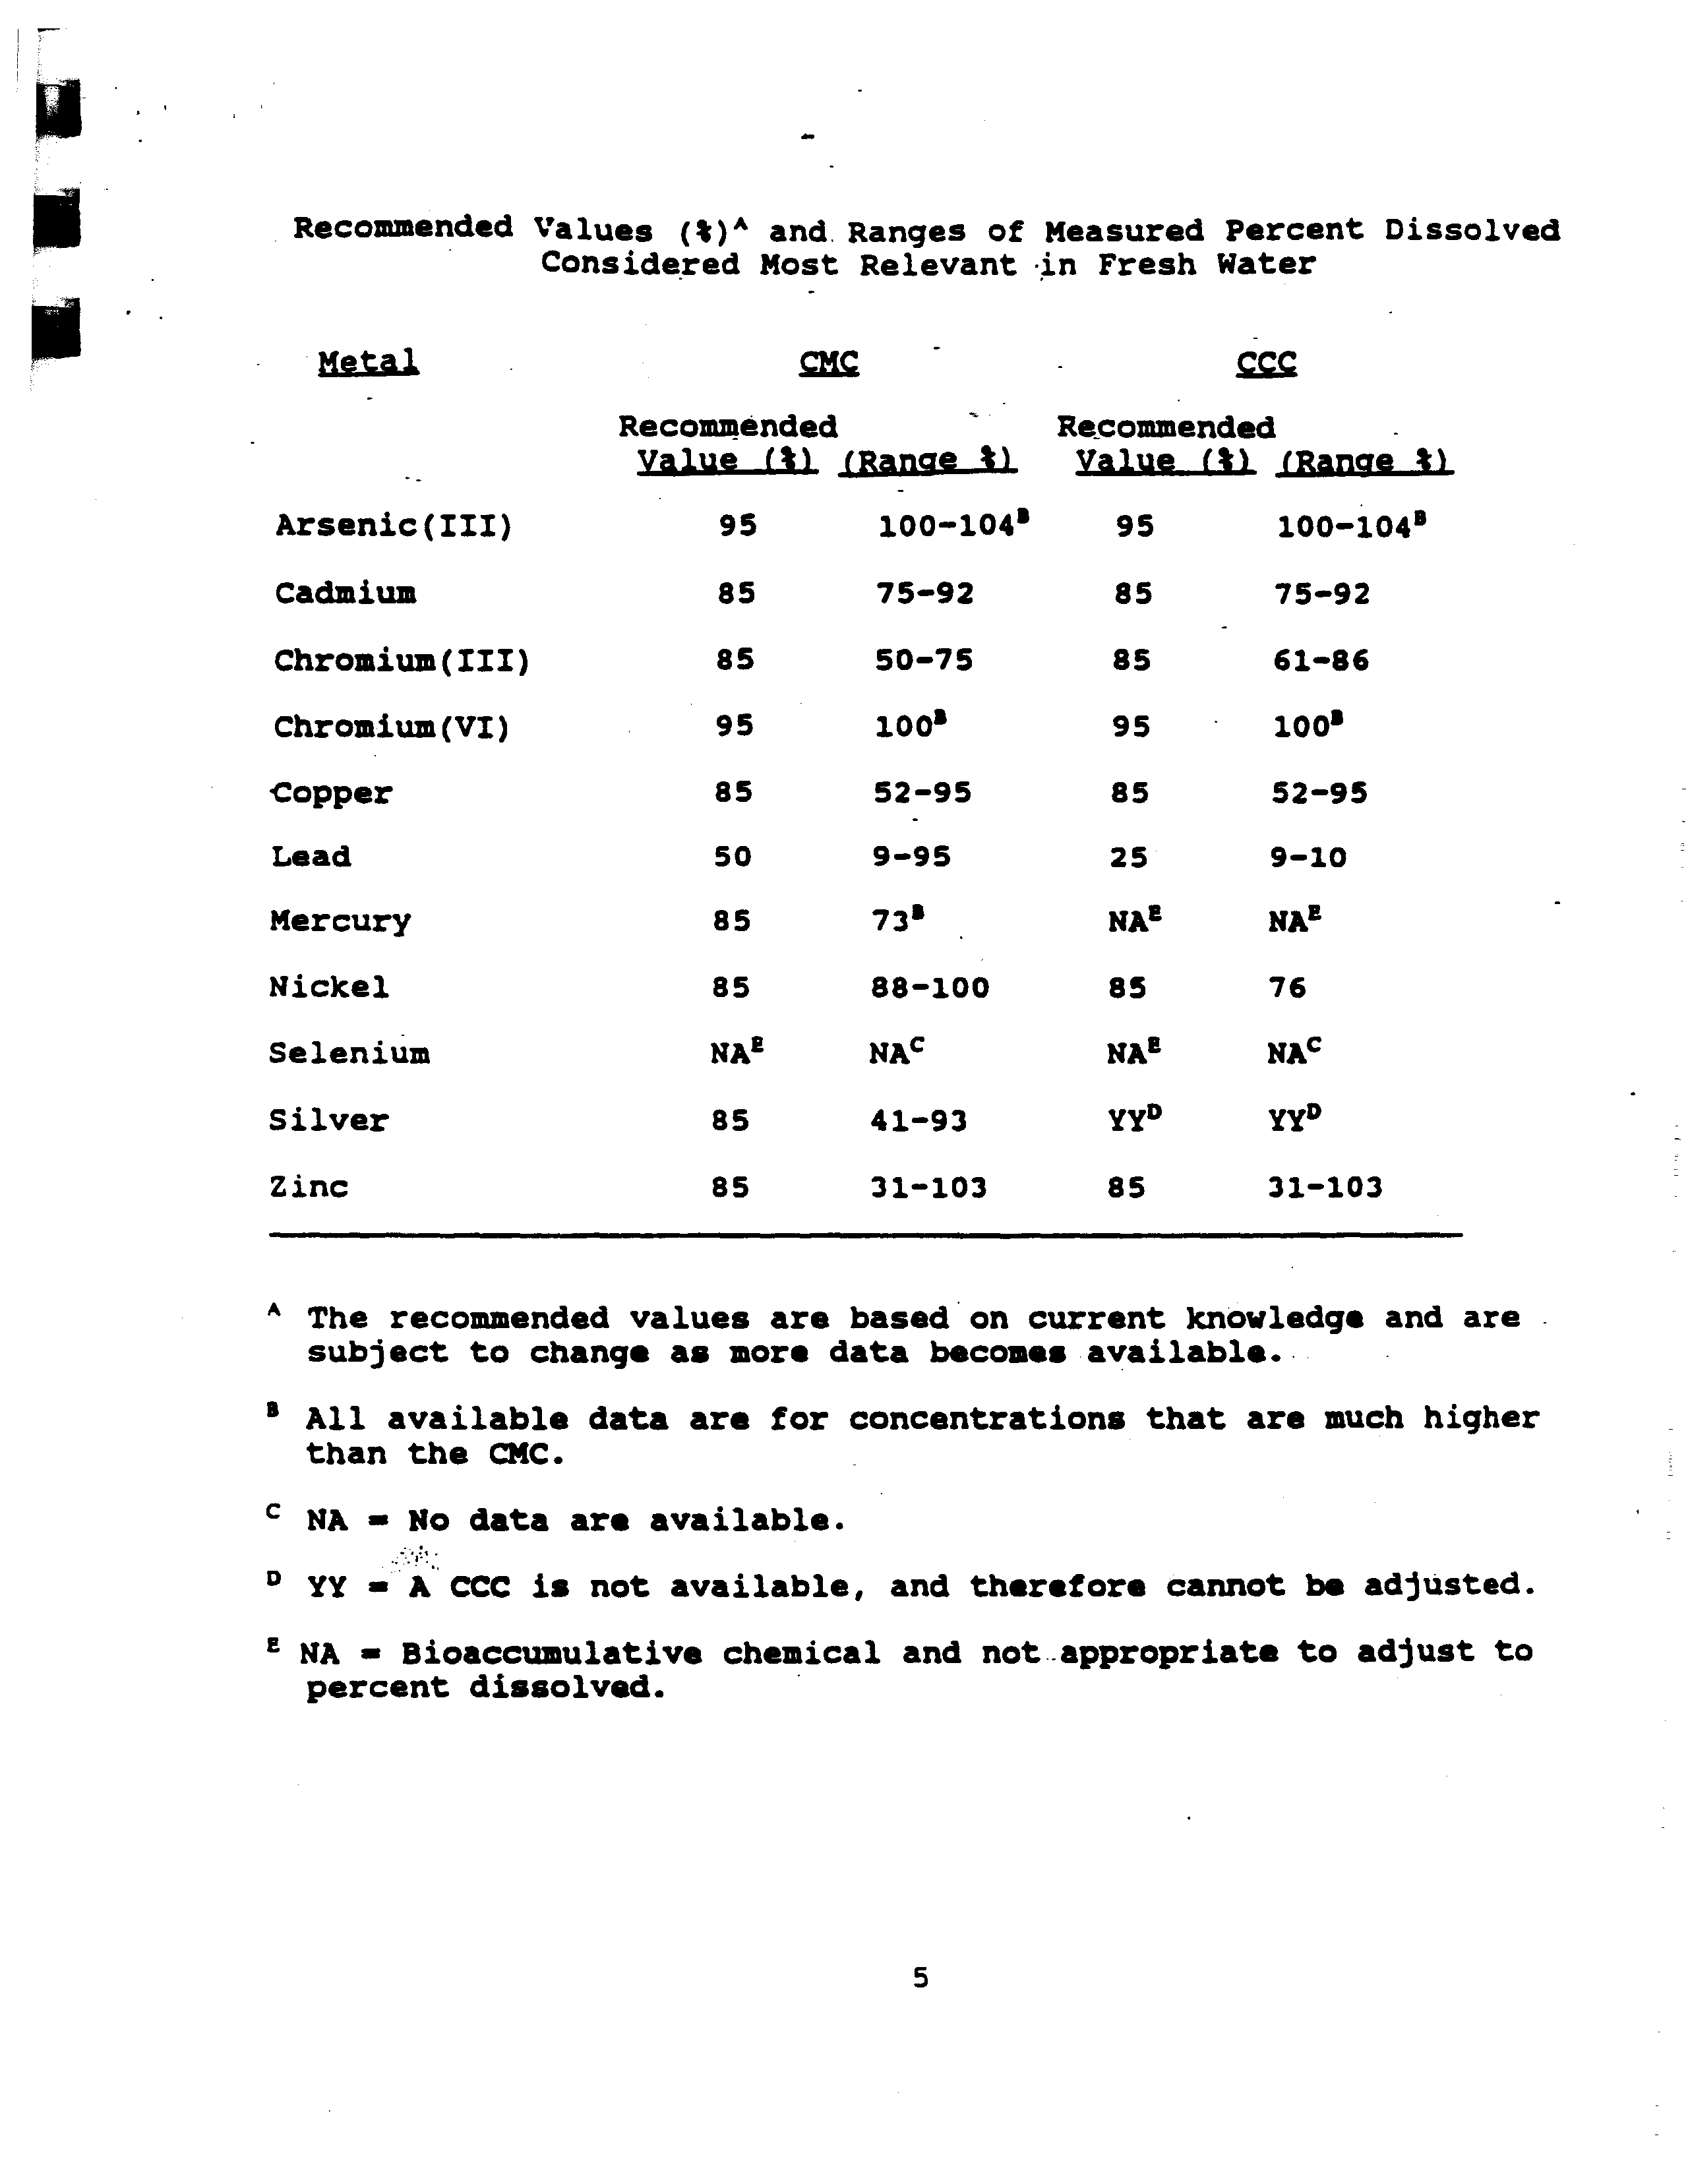
- Recommended
- Value (~ j~anae~
- 95 100—104’
- 85 75—92
- 85 50—75
- 95 100’
- 85 52—95
- 50 9—95
- 85 88—100
- NA’ NAC
- 85 41—93
- 85 31—103
- Recommended
- Value (1 (Ranae ~
- 95 100—104’
- 85 75—92
- 85 - 61—86
- 85 52—95
- 25 9—10
- 85 76
- 85 31—103
- Recommended Values ()‘~ and, Ranges of Measured Percent Dissolved
- Considered Most Relevant in Fresh Water
- F No
- 48 41 7.6 Lisa et al. 1984
- 44 43 7.4 Spehar and Fiandt 1986
- 600—15000 104 5
- 12600 100 - 3
- YesYes
- 7.67.9
- 15—21
- 7.57.4
- 787759
- ONONDM
- NoNoNo
- 51105209
- 167
- 7.58.08.4
- Chapman 1993Chapman 1993Chapman 1993
- 3—232
- 450—6400
- Call et *1. 1982
- Speharet al. 1978
- Pickering and Cast 1972
- 24 7.0 Stevens and Chapman’ 1984
- 42 54 DN R Yes 206 166 8.2 Chapman 1993
- 114 61 DM R Yes 5245 7.4 Chapman 1993
- 16840 26 ? ON S No 51 9 6.3’ Chapman 1993
- 262672741658665
- - 2723
- 014ONOH
- NoNoNo
- 11096
- 6.760’6.2’
- ChapmanChapmanChapman
- 19931993
- 25,000 100 1
- 43,300 99.5 4
- FM,GF F Yes 220 214 7.6 Adelman and Smith 1976
- FM F No 44 43 7.4 Spehar and Fiandt 1986
- 25 169 8.5 Chakoumakos et al. 1979
- 10-30 74 ? CT F No 27 20 7.0 Chakoumakos etal. 1979
- 40200 78 ? CT F No 154 20 6.8 Chakoumakos et al. 1979
- 30—100 79 ?CT F No 74 23 7.6 Chakoumakos et al. 1979
- 300—200 82 CT F No 192 72 7.0 Chakoumakos et al. 1979
- 20200 86 CT F NO 31 78 8.3 Chakoumakos et a.. 1979
- 40-300 87 CT F No 83 70 7.4 Chakoumakos ,et al. 1979
- 7.0 Chakoumakos e~i~. 19798.5 C~akousakos et a.. 1979
- 300—1300 92
- 100—400 94
- 195 160
- 70 174
- F NoF No
- 52 55 7.7 Carison et a.. 1986b31 38 7.2 Carlson et al. 1986b
- 12—91’18—19
- 50175’
- 5—526—80
- 131651
- 323339
- 25—8417
- 15—90
- 12—162
- 28—5826—5956,101
- F Yes’ 47 43 8.0 Lind et al. 1978
- F No 21 19 7.1 Finlayson and Verrue 1982
- 1 Ok
- 2 FM
- 6 DM
- 7 DPI
- 2 DII
- 125—167
- 79—84
- 959691
- 735739
- 535264
- 969188
- S No
- S Yes
- R YesR YesR Yes
- S NoS NoS No
- S No
- 49 37 7.7 Chapman 1993
- 48 39 7.4 Chapman 1993
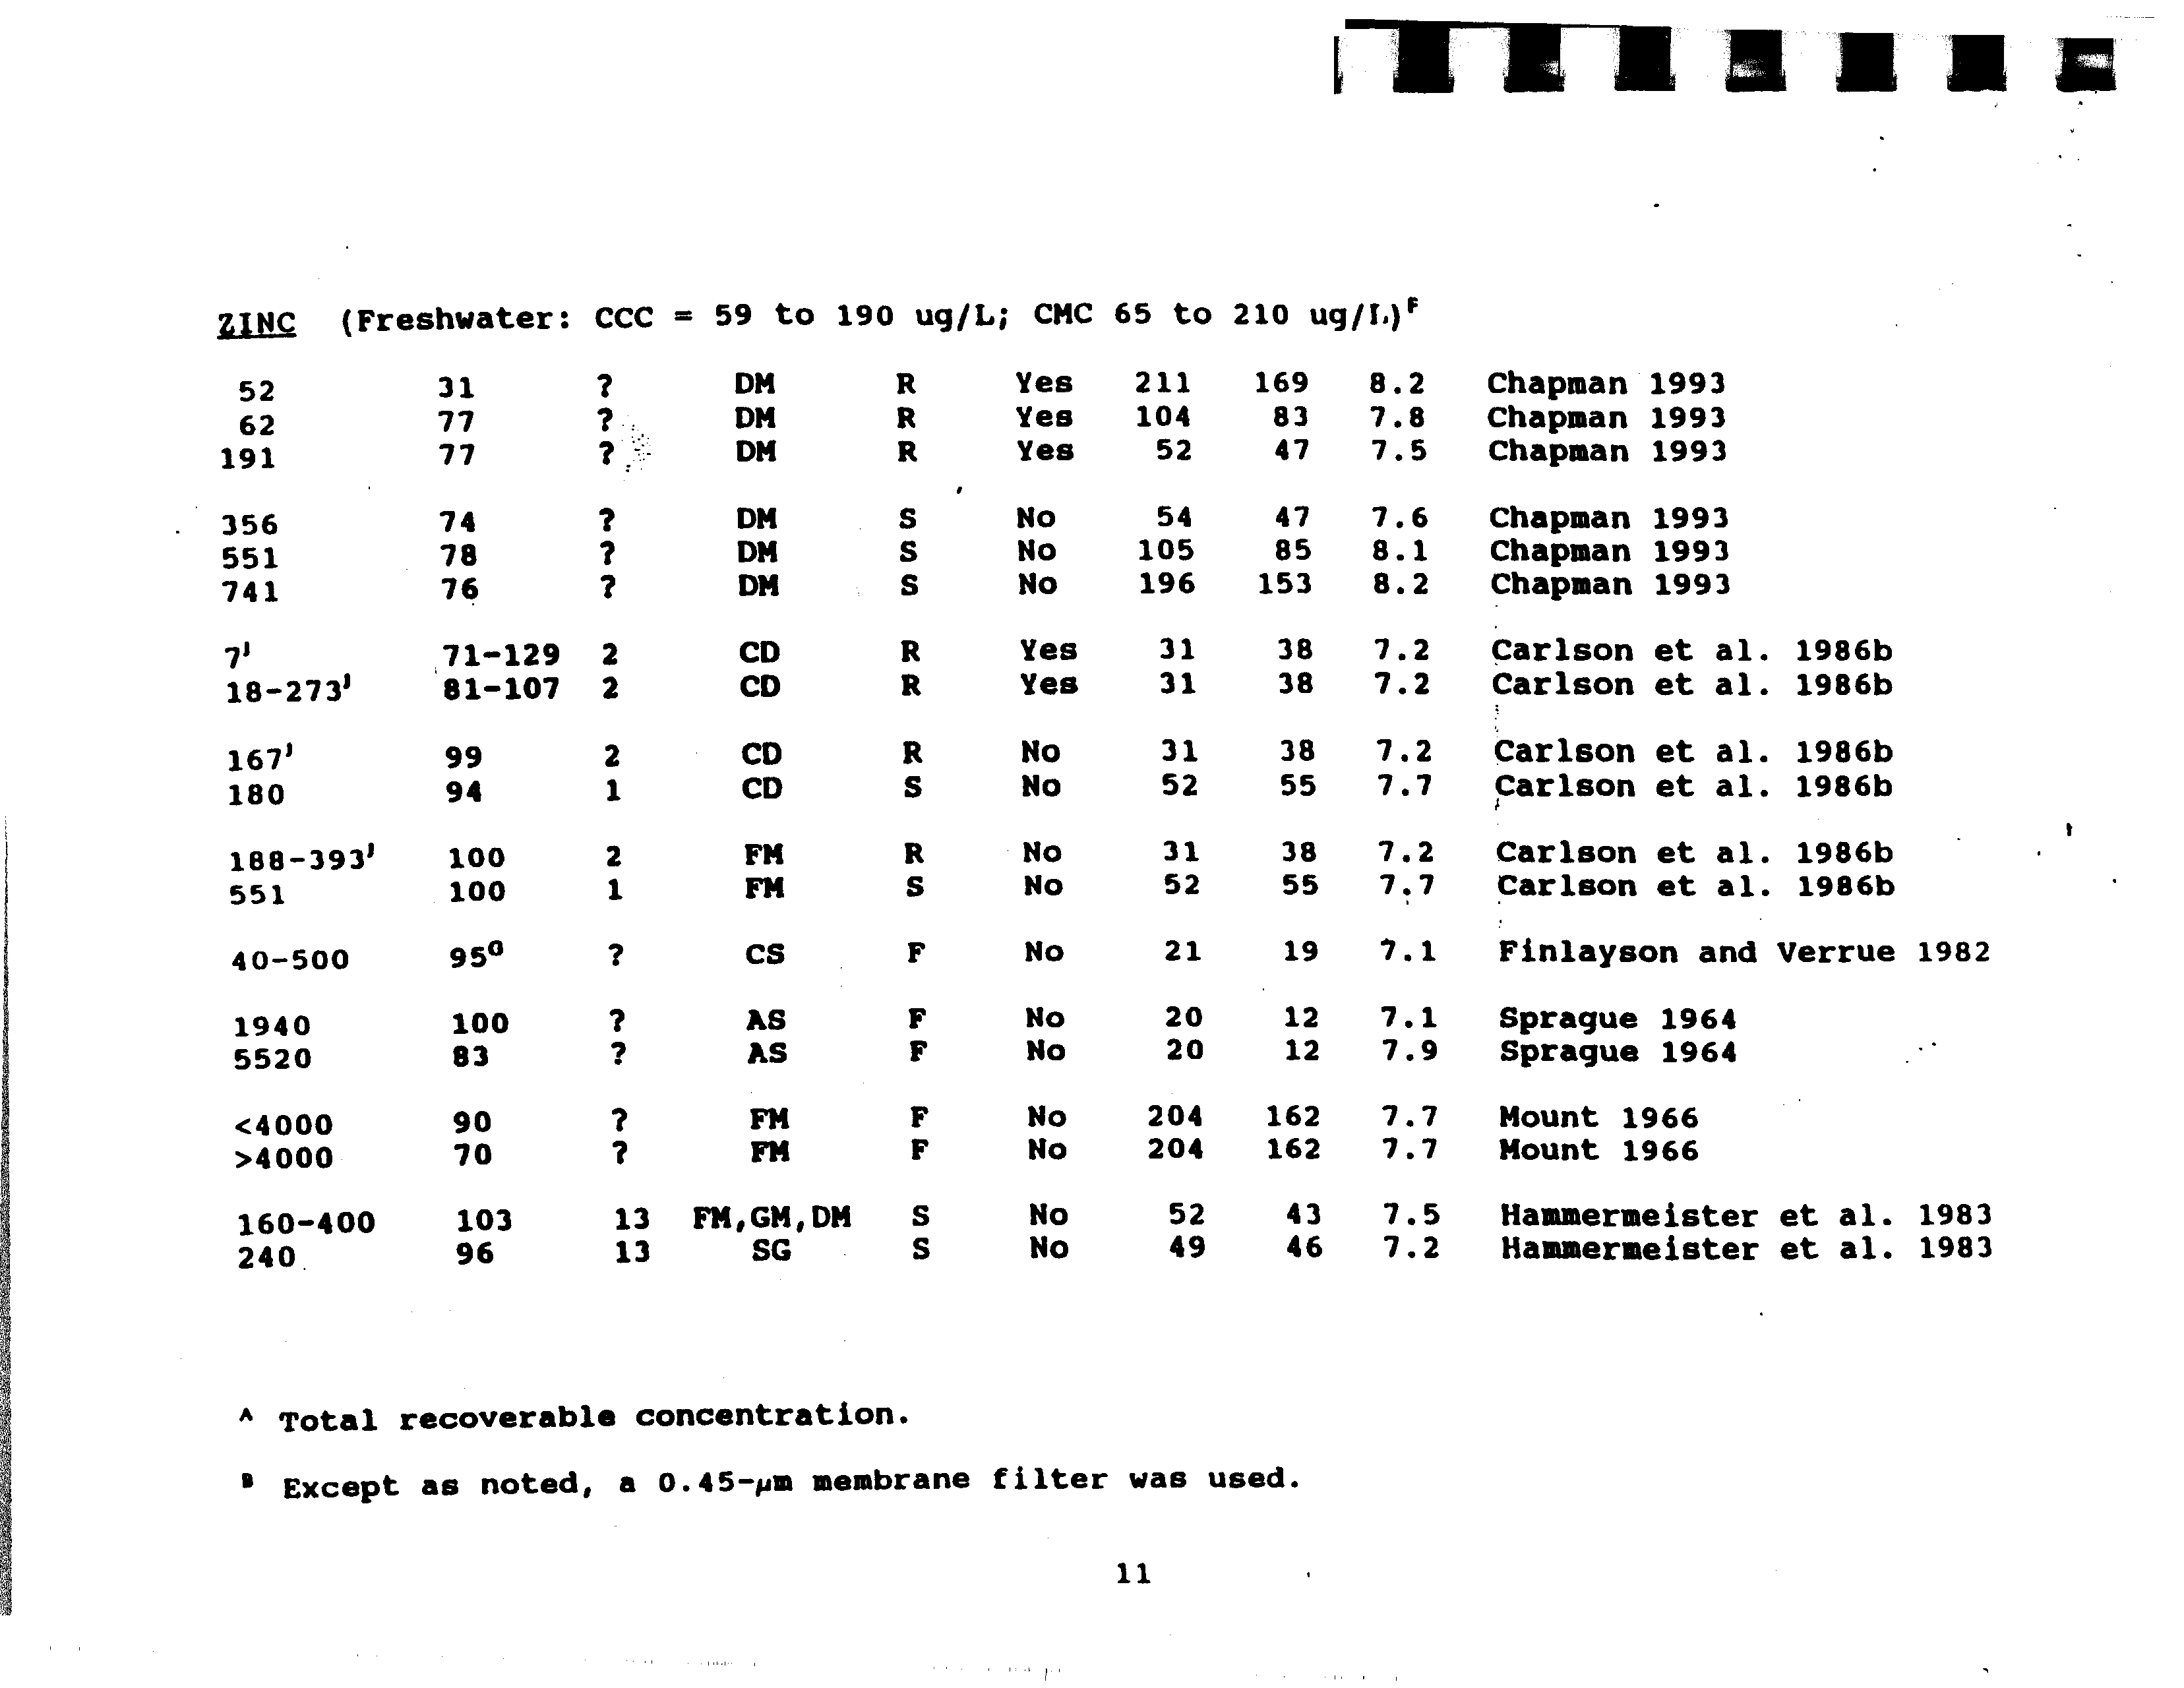
- 211 169 8.1 Chapman 1993
- 51 44 7.6 Chapman 1993104 83 7.8 Chapman 1993
- 52 45 7.8 Chapman 1993
- 105 79 7.9 Chapman 1993
- 106 82 8.1 Chapman 1993
- 50 40 7.0
- 52 43 7.348 47 7.3
- F Yes’ 45
- Hammermaisteret a.. 1983Hammermeister et a.. 1983Hasmermeister et a.. 1983
- 43 7—8 Benoit 1975
- YesTM
- 117117
- 8.08.0
- LazorchakLazorchak
- Ry55N168 117 8.0 Lazorchak 1987
- FM F NoFM S No
- CR F No
- DPI R Yes
- DPI S No
- EZ R No
- F YesF YesF YesF YesF YeaF No
- F No
- S NoS No
- ? BT
- 7 FM
- 44 43 7.4 Spehar and Fiandt 1986203 17. 8.2 Geckler et a.. 1976
- 17 13 7.6 Rice and Harrison 1983
- 102151
- 86126
- 7.67.88.1
- chapmanChapmanChapman
- 19931993
- 100150
- ChapmanChapmanChapman
- 19931993
- 44 43 7.2 Holcombe et al. 1976
- 44 43 7.2 Holcombe et al. 197644 43 7.2 Holcombe et a.. 1976
- MERCURYIIfl (Freshwater: CMC 2.4 ug/L)
- 73 1 FM F No44 43 7.4 Spehar and Fiandt 1986
- 96 86 4
- 160 94 1230—3000 69—79 ?
- LEAD (Freshwater:
- 181193
- 6129521907
- 581192354744100
- 2933—38
- 62”68~71”
- 75081”82”
- 220—2700 96 14 FM,GM,DM
- 580 95 14 SC
- 44 43 7.4 Spehar and Fiand? 1986
- 49 44 7.2 Hammermeister et al. 198351 48 7.2 Hasmermeister et a.. -1983
- 21 81 DPI R Yes 51 49 7.4 Chapman 1993
- YesYes
- 107205
- 7.88.1
- ChapmanChapman
- 645 88 ? DPI S No54 43 7.7 Chapman 1993
- 1809 93 ? 014 S No 51 44 7.7 Chapman 1993
- 2344 100 ? DII S No 100 84 7.9 Chapman 1993
- No data are available.
- 0.19 74 DPI S No 47 37 7.6 Chapman 1993
- 9.98 13 DII S Yea47 37 7.5 Chapman 1993
- 4.0 itDPIS Yes 36 25 7.0 Nebeker et al. 1983
- NoYes°
- 8.17.9
- 10452
- 54105196
- 71—129 2 CD R Yes81—107 2 CD R Yes
- 99 2 CD R No94 1 CD S No
- 100 2 FM R No100 1 FM S No
- 950 CS F No
- 100 AS F No83 AS F No
- 90 ? FM F No 20470 FM F No 204
- 103 13 FMGM,DM S No 5296 13 SG S No 49
- A Total recoverable concentration.
- Chapman 1993
- Chapman 1993Chapman 1993
- Chapman 1993Chapman 1993Chapman 1993
- Except as noted, a 0.45—pm membrane filter was used.
- 169 8.2
- 83 7.847 7.5
- 85153
- 62191
- 356551741
- 18—273’
- 18 8—393’551
- 40—500
- 40004000
- 160—400240,
- 7.68.18.2
- 38 7.2 Carlson et a..
- 52 55 7.7 Carison et a..
- 31 38 7.2 Carison et al. 1986b31 38 7.2 Canaan et al. 1986b
- 3. 38 7.2 Carison et al. 1986b52 55 7.7 Carison et a.. 1986b
- 1986b
- 1986b
- 21 19 7.1 Finlayson and Verrue 1982
- 20 12 7.1 Sprague 1964
- 20 12 7.9 Sprague 1964
- 162 7.7 Mount 1966
- 162 7.7 Mount 1966
- 43 7.5 Hammermeister et a.. 198346 7.2 Hammermeister et a.. 1983
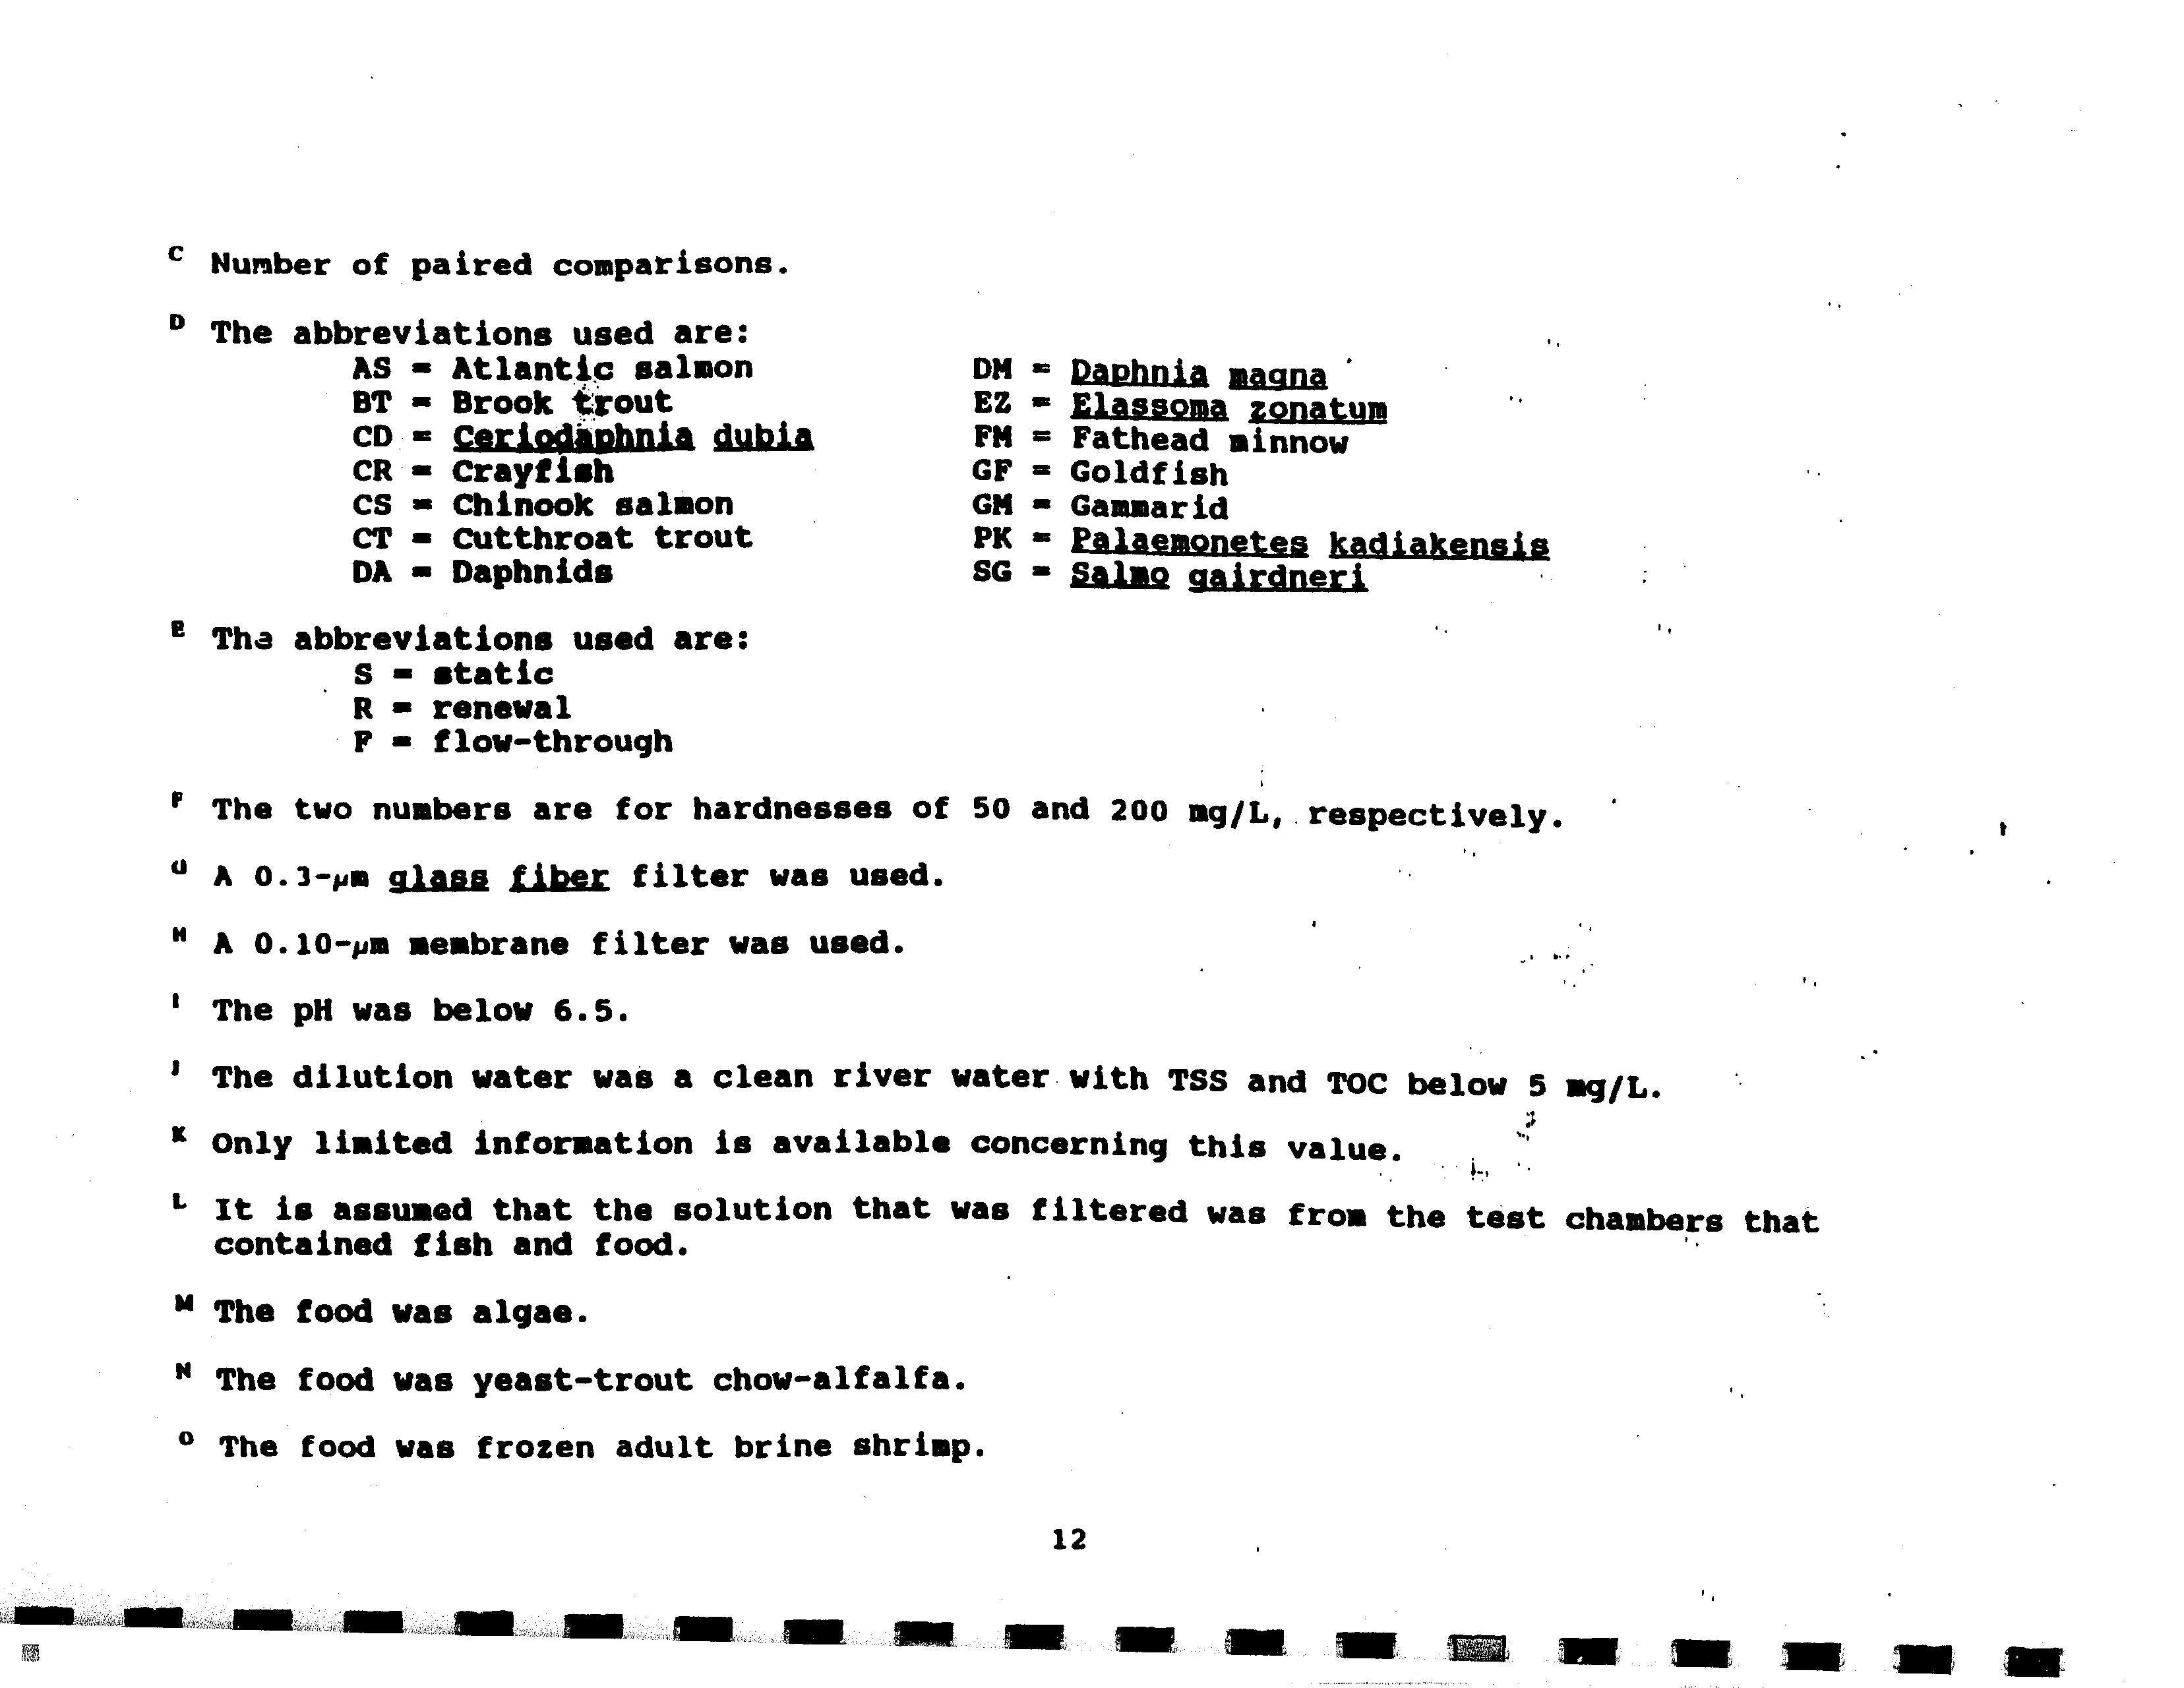
- C Number of paired comparisons.
- D The abbreviations used are:
- ~ The two numbers are for hardnesses of 50 and 200 mg/L,.respectjvely.
- The pH was below 6.5.
- 3.14.Straus1987.
- TheAcuteSignificanc.
- Toxicity
- TestsWeight
- Northcott,
- Brook..
- 1984.
- Hammeraeister,
- Acute and ChronicT.P.
- Mark.s,ToxicitiesC.E.
|
STEPHEN N. HAUGHEY
shaughey©fbttaw.com
(513) 651-6127
FROST ROWN TODD
LLC
2200 PNC Center
201 E. Fifth Street
Cincinnati, Ohio 45202-41 82
(513) 651-6800
Facsimile (513) 651-6981
www.frostbrowntodd .com
RECEIVED
ci n~’c
~
MAR 2 8 2002
SlATE
Oi~IWNOIS
Pollutton Control Board
March 25, 2002
Dorothy Gunn, Clerk
Illinois Pollution Control Board
100 W. Randolph Street, Suite 11-500
Chicago, Illinois 60601
Re:
R 02-Oh/Rulemaking/Water/Comments ofDeKalb Sanitary District
Dear Ms. Dunn:
Enclosed please find for filing in the above-referenced docket the original and ten copies
of the comments of DeKaib Sanitary District in support of IEPA’s proposed triennial review
rulemaking. Please stamp the original and all copies and return the extra copy to me in the
enclosed, self-addressed, postage-prepaid envelope for our files. Thank you for your assistance
in this matter. Please contact me if there are any questions about this filing.
Very truly yours,
FROST BROWN TODD LLC
cc:
Marie E. Tipsord, Hearing Officer (w/encl.)
Mathew Dunn, Illinois Attorney General’s Office (w/encl.)
Office ofLegal Services, IDNR (w/encl.)
IEPA, Division ofLegal Counsel
Service List ofParticipants (w/encl.)
ClNlibrary/1
162595.1
Enclosures
)IZ9~4f~f
Stephen N. Haughey
Outside Counsel to the District
OHIO
•
KENTUCKY
•
INDIANA
•
TENNESSEE
ORIGINAL
RECEIVED
CLERK’S OFF!(’~
BEFORE THE ILLINOIS POLLUTION CONTROL BOARMAR 282002
In the matter ofi
)
)
WATER QUALITY TRIENNIAL REVIEW:
Amendments to
35
Ill. Adm. Code 302.208(e)-(g),
302.504(a), 302.575(d),
303 .444, 309.14 1(h), and
Proposed 35 Ill. Adm. Code 301.267, 301.3 13,
301.413, 304.120, and
309.157
)
STATE OP IWNOIS
R
02~011!OIlUtIOndontroi Board
(Rulemaking
—
Water)
Comments OfDeKalb Sanitary District
In Support OfIEPA ‘s Proposed
Water Quality Standards Rulemaking
TO:
Dorothy Gunn
Clerk
Illinois Pollution Control Board
100 W. Randolph Street, Suite 11-500
Chicago, Illinois 60601
Mathew Dunn
Illinois Attorney General’s Office
Environmental Control Division
James R. Thompson Center
100 W. Randolph Street
Chicago, Illinois 60601
Marie E. Tipsord
Hearing Officer
Illinois Pollution Control Board
100 W. Randolph Street, Suite 11-500
Chicago, Illinois 60601
Office ofLegal Services
Illinois Department ofNatural Resources
524
5. Second Street
Springfield, Illinois 62701-1787
Illinois Environmental Protection Agency
do Division of Legal Counsel
1021 N. Grand Avenue East
P.O. Box 19276
Springfield, Illinois 62794-9276
Please take notice that the DeKaib Sanitary District (hereinafter “DeKaib” or the
“District”) hereby offers the following comments in support of IEPA’s proposed revisions to
Illinois’ water quality standards. The proposed revisions are part of the State’s triennial review
)
)
)
)
)
of its water quality standards as required by the federal Clean Water Act.
Comments ofLIeKalb Sanitary District
R 02-011 (Rulemaking
—
Water)
March 25, 2002
Page
2
A.
BACKGROUND.
Among the revisions proposed by the JEPA to Illinois’ water quality standards and
implementing rules is the proposed conversion of Illinois’ water quality criteria for certain
hardness-based metals, including copper, from the present total recoverable form ofthe metal to
a dissolved form ofthe metal, and proposed rules establishing a procedure for developing water
quality based permit limits for these metals in the federally-required total recoverable form using
default or site-specific conversion factors for the proposed dissolved metals criteria. IEPA’s
rules presently allow the use of default or site-specific conversion factors from total recoverable
to dissolved form of the metals only in the Lake Michigan basin.
See
35 Ill. Adm. Code
309.141(h)(3). The proposed revisions would expand the use of these factors statewide. The
proposed revisions are set forth in Title
35,
Subtitle C, Chapter I, Parts 301, 302, 304, and 309 of
the Illinois Administrative Code. The specific sections affected are 301.267, 301.313, 301.413,
302.208, 302.504, 309.141, and 309.157.
B.
NATURE
OF DEKALB’S INTEREST.
The DeKaib Sanitary District was incorporated in 1928. Its service area is a population
of approximately 45,000 people in the City of DeKaib, the Town of Cortland, nearby Northern
Illinois University, and a small group of commercial and industrial customers. The District
employees 15 people. The District owns and operates a medium-sized, trickling filter, activated
sludge biological publicly-owned treatment works (“POTW”) that has a mean annual average
daily flow ofapproximately
5.95
mgd and a design average daily flow capacity of8.63 mgd.
Treated effluent from the POTW is discharged into the South Branch of the Kishwaukee
River pursuant to the terms and conditions of an NPDES permit issued in 1995 by the Division
of Water Pollution Control for IEPA, which permit was renewed in November 2000. The
2
Comments ofDeKaib Sanitary District
R 02-011 (Rulemaking
—
Water)
March 25, 2002
Page
3
renewal permit contains daily maximum and 30-day monthly average, water quality-based
effluent limitations (“WQBELs”) for copper of 0.056 mg/i
56
parts per billion (“ppb”) and
0.034 mg/i 34 ppb, respectively.
In early 2000 the District undertook an evaluation of the sources of copper in its
collection system and determined that more than
95
of the copper coming to the POTW for
treatment was from leaching of residential copper plumbing lines due in part to water softening
systems used to offset exceptionally hard water found in the area. Because of the aesthetic
problems associated with hard water, a substantial percentage of homes in the service area have
private water softeners. These softeners tend to increase the corrosivity of the treated water
during the removal of calcium, magnesium, and sodium-based minerals that contribute to the
hardness of the water and its aesthetic problems. The historic use of private water softeners in
the service area makes it very difficult for the District to limit copper from entering the sanitary
collection system for transport to the District’s POTW.
As part of its efforts to consistently achieve its stringent copper WQBELs, the District
engaged its engineering consultants to investigate the potential costs of modifying the
wastewatertreatment processes at the POTW to remove additional copper from the influent. The
District’s engineering consultants estimated that the costs to modify the POTW in order to
remove additional low ppb levels of copper from the influent would be more than $500,000 in
capital cost, with annual O&M costs ofmore than $600,000.
Based on the primary source of the copper and the substantial expense to consistently
remove low ppb levels of copper from the effluent produced by a conventional biological
trickling filter, activated sludge plant, the District and its engineers decided, with the support of
representatives for JEPA’s Division of Water Pollution Control, to submit a petition to the IPCB
3
Comments ofDeKalb Sanitary District
R 02-011 (Rulemaking
—
Water)
March 25, 2002
Page
4
for a site-specific, adjusted water quality standard for copper using U.S. EPA’s dissolved metals
translator guidance entitled: “The Metals Translator: Guidance for Calculating a Total
Recoverable Permit Limit from a Dissolved Criterion,” EPA 823-B-96-007, June 1996
(hereinafter “U.S. EPA’s Metals Translator Guidance”). Thatpetition was filed with the IPCB in
mid August 2000, and is captioned as
“In the matter of Petition of DeKaib Sanitary Districtfor
an Adjusted Standard from 35 Iii. Adm. Code 302.208(E),
Docket No. AS 01-3 (Adjusted
Standard
—
Water).” The petition is pending before the IPCB.
The portion ofIEPA’s proposed rulemaking relating to dissolved metals is premised upon
the same U.S. EPA guidance document that was used by the District to support its petition for
adjusted standard. If the IEPA’s proposed rulemaking is approved by the IPCB, it would moot
DeKaib’ s petition in that the District would no longer need to complete a formal petition process
before the 1PCB in order to obtain adjusted WQBEL5 for copper based on the total to dissolved
ratio of copper in its treated effluent, but would instead, after the IPCB approves the proposed
revisions, file a request with the IEPA to modify the District’s permit based on the new rules.
Thus, DeKaib has a substantial interest in the outcome ofthe IEPA’s proposedrulemaking.
C.
THE APPROVAL OF IEPA’S PROPOSED
RULEMAKING
IS IN THE BEST
INTEREST
OF ILLINOIS’
SEWER AUTHORITIES GENERALLY.
As a general rule, biological activated sludge wastewater treatment works are designed
primarily to remove the conventional pollutants found in domestic sewage,
i.e.,
ammonia,
organic loading in the form of CBOD, suspended solids, and fecal coliform bacteria. A well-
designed and operated POTW with at least secondary treatment technology typically removes
greater than
90-95
ofthe influent loadings for these parameters. On the other hand, biological
wastewater treatment works typically remove no more than an average of 60-70 ofthe influent
4
Comments ofDeKaIb Sanitary District
R 02-011 (Rulemaking
—
Water)
March 25, 2002
Page
5
loadings of most metals, including copper, and the removals thereof are almost exclusively
through adsorption or uptake by the biomass of the metals and transfer thereof into the sludge
generated at the works, rather than through direct treatment processes.
See
Exhibit A hereto.
The District’s average removal rate for copper is higher than the average at 78, but even at that
level the District has difficulty consistently meeting the current WQBEL5 for copper in its
permit.
In order to meet low ppb WQBEL5 for metals, including copper, a POTW will typically
look first to the possibility of reducing the influent loadings by imposing pretreatment limits on
the largest categories ofcustomers discharging copper into the collection system. Such step can
often be successful in reducing influent copper loadings when the primary sources ofcopper are
industrial and commercial dischargers. These sources can usually be retrofitted cost-effectively
with small treatment systems such as dissolved air floatation (DAF) units, chemical
additionlprecipitationlsettling units, and ion exchange colunms. However, the area served by
many POTWs, including DeKaib, often has a very small industrial and commercial base,
typically contributing less than
5
of the copper influent loading to the POTW. Where the
predominant source of copper is leaching from residential plumbing, enhanced by water
softening units used to combat naturally occurring hard water, as is the case in DeKalb, the sewer
authority cannot readily impose pretreatment limits and control systems on its local residents.
Without a readily available means to significantly reduce the influent loadings ofcopper,
many POTWs in the same situation as DeKalb face the unpleasant alternative of incurring
substantial capital expenditures and large annual O&M costs to modify existing wastewater
treatment equipment in order to remove additional low ppb levels of copper from the final
effluent. The District believes that such additional costs are unnecessary and unjustified to
5
Comments ofDeKaIb Sanitary District
R 02-011 (Rulemaking
—
Water)
March 25, 2002
Page 6
remove such low concentrations of copper that are already well below applicable state and
federal drinking water standards and that, for the reasons demonstrated below, do not present a
threat to aquatic species.
D.
U.S. EPA’S
DISSOLVED METALS
TRANSLATOR GUIDANCE
OR ITS
EQUIVALENT IS WIDELY ACCEPTED
IN
THE SCIENTIFIC COMMUNITY,
HAS BEEN ADOPTED BY ALL NEIGHBORING STATES,
AND
CURRENTLY
IS IN USE IN ILLINOIS AS PART OF THE EXISTING NPDES PERMIT RULES
FOR POINT SOURCE DISCHARGES INTO THE LAKE MICHIGAN BASIN.
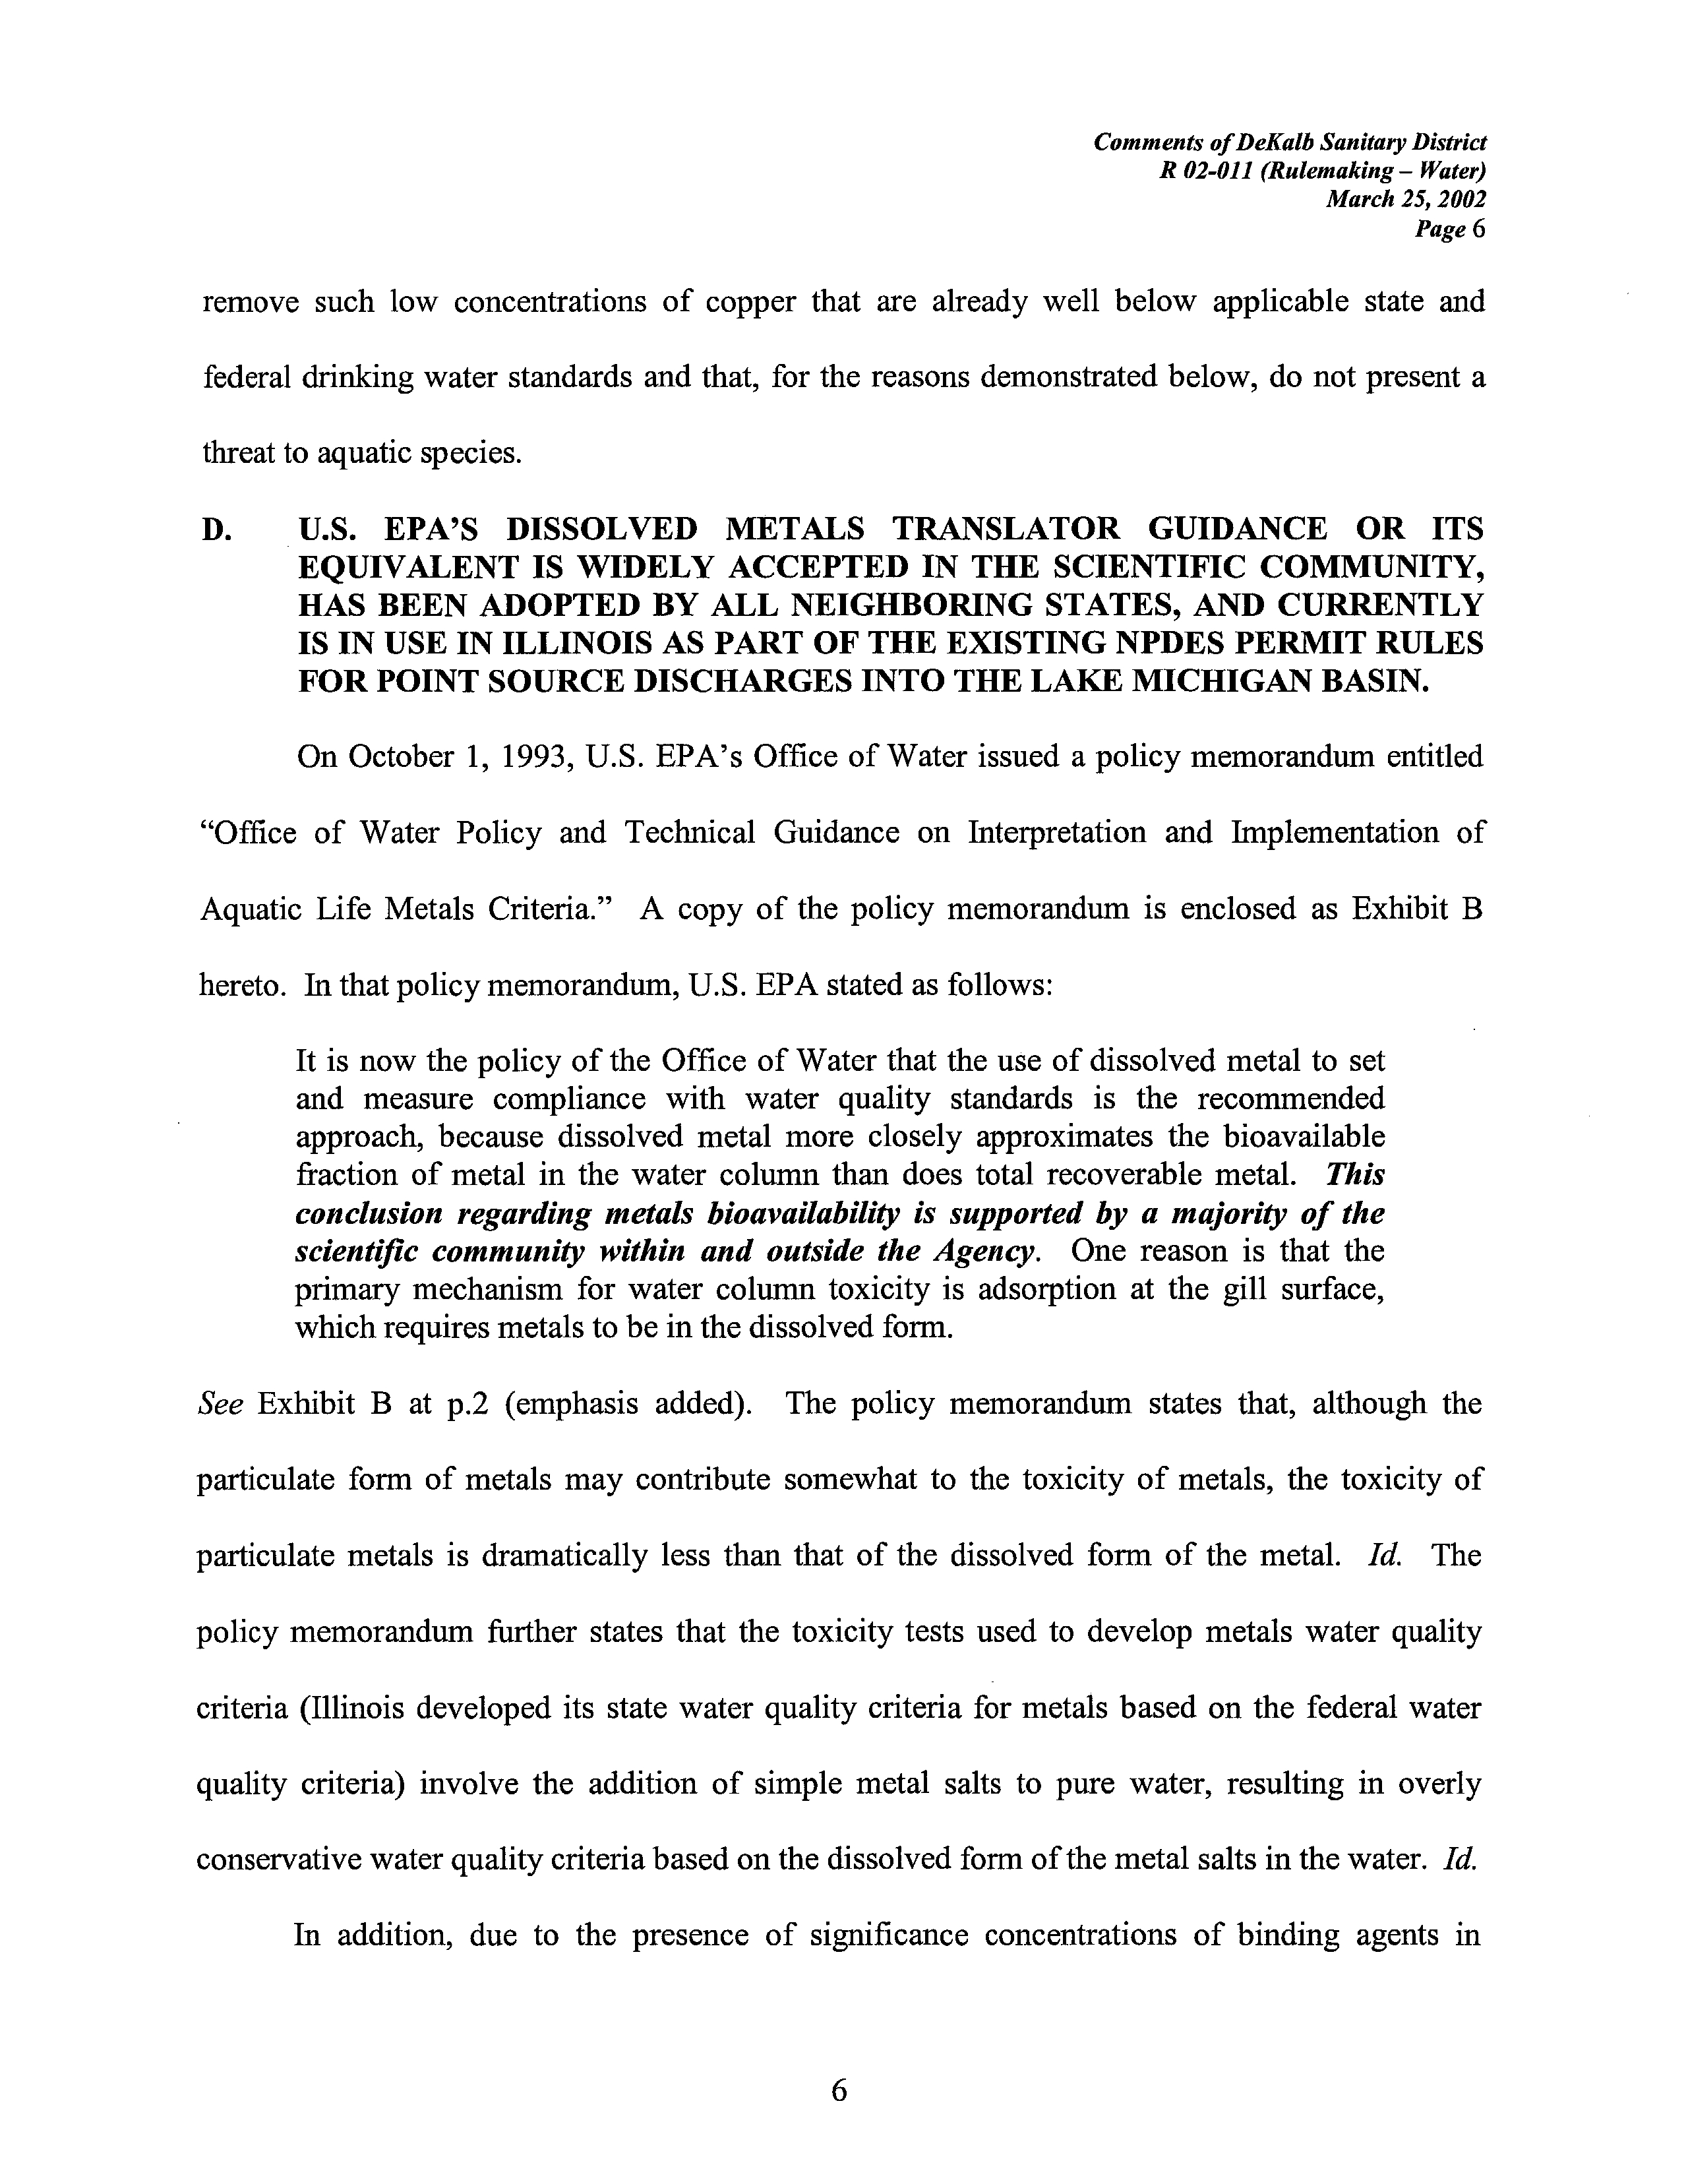
On October 1, 1993, U.S. EPA’s Office of Water issued a policy memorandum entitled
“Office of Water Policy and Technical Guidance on Interpretation and Implementation of
Aquatic Life Metals Criteria.” A copy of the policy memorandum is enclosed as Exhibit B
hereto. In that policy memorandum, U.S. EPA stated as follows:
It is now the policy of the Office of Water that the use of dissolved metal to set
and measure compliance with water quality standards is the recommended
approach, because dissolved metal more closely approximates the bioavailable
fraction of metal in the water colunm than does total recoverable metal.
This
conclusion regarding metals bioavailabiity is supported by a majority of the
scientific community within and outside the Agency.
One reason is that the
primary mechanism for water colunm toxicity is adsorption at the gill surface,
which requires metals to be in the dissolved form.
See
Exhibit B at p.2 (emphasis added). The policy memorandum states that, although the
particulate form of metals may contribute somewhat to the toxicity of metals, the toxicity of
particulate metals is dramatically less than that of the dissolved form of the metal.
Id.
The
policy memorandum further states that the toxicity tests used to develop metals water quality
criteria (Illinois developed its state water quality criteria for metals based on the federal water
quality criteria) involve the addition of simple metal salts to pure water, resulting in overly
conservative water quality criteriabased on the dissolved form ofthe metal salts in the water.
Id.
In addition, due to the presence of significance concentrations of binding agents in
6
Comments ofDeKaibSanitary District
R 02-011 (Rulemaking
—
Water)
March 25, 2002
Page
7
virtually all treated discharges and in most ambient waters
(e.g.,
calcium, magnesium, and
sodium minerals found in hard water, and naturally occurring humic compounds found in all
receiving waters), the metals in effluent discharges and in ambient waters are much less
bioavailable to aquatic species then the conditions under which the applicable water quality
criteria were developed.
Id.
The policy memorandum concludes by recommending that states’ water quality standards
for metals be based on the dissolved criteria, and that where states’ existing water quality
standards are based on the dissolved form of the metal that a total recoverable to dissolved
conversion factor be employed.
See
Exhibit B at p.3. The October 1993 policy memorandum
was subsequently incorporated within and replaced by U.S. EPA’s June 1996 Metals Translator:
Guidance, a copy ofwhich was submitted by IEPA in support ofits proposed rulemaking.
The 1996 Metals Translator Guidance or its functional equivalent has been adopted by all
states that border the Great Lakes as part ofthe implementation ofthe
1995
federal Great Lakes
Initiative. In Illinois, a rule permitting the use of dissolved metals translators has already been
promulgated for point source discharges to streams flowing into Lake Michigan.
See 35
Ill.
Adm. Code 309.141(h)(3).
IEPA’s proposed rulemaking seeks merely to expand the use of
dissolved metals translators from the Lake Michigan basin to all basins in the State ofIllinois.
Compare
proposed amended 35 Ill. Adm. Code 309.141 (h)(3) (deleting its limited application to
the Lake Michigan basin)
with
proposed new 35 Ill. Adm. Code 309.157 (transferring its
application to the general statewide NPDES rules). In other Great Lakes states, including
Michigan, Wisconsin, Ohio, and New York, the use of dissolved metals translators has already
been adopted for the entire state. Upon information and belief, the federal guidance or its
equivalent has been adopted in many other non-Great Lakes states.
7
Comments ofDeKalbSanitary District
R 02-011 (Rulemaking
—
Water)
March 25, 2002
Page
8
E.
CONCLUSION.
The DeKaib Sanitary District strongly supports JEPA’s proposed expansion of the use of
default and site-specific dissolved metals translators from the Lake Michigan basin to all basins
in the State of Illinois. The applicability of dissolved metals translators was developed by U.S.
EPA, the agency that developed the recommended metals water quality criteria upon which
Illinois has modeled its current metals water quality criteria. U.S. EPA’s recommendation to the
states to allow the use of such dissolved metals translators has been widely supported in the
scientific community, and is already incorporated within Illinois’ water quality standards,
albeit
at the present time only forpermit holders discharging into the Lake Michigan basin. There is no
logical reason to reject the expansion of the use of such translators to all permit holders in
Illinois.
Respectfully submitted,
DEKALB SANITARY DISTRICT
By___
FROST BROWN TODD LLC
201 B. Fifth Street, Suite 2200
Cincinnati, OH 45202-4182
(513)
651-6127
Counsel to the DeKaib SanitaryDistrict
8
Comments ofDeKaib Sanitary District
R 02-011 (Rulemaking
—
Water)
March 25, 2002
Page 9
CERTIFICATE OF SERVICE
In accordance with 35 Iii. Adm. Code 101.304 and 102.400, I hereby certify that a copy
ofthe foregoing comments was served by first class regular U.S. mail to all participants in this
proceeding, based on the current service list as ofMarch
25,
2002 (copy attached).
9
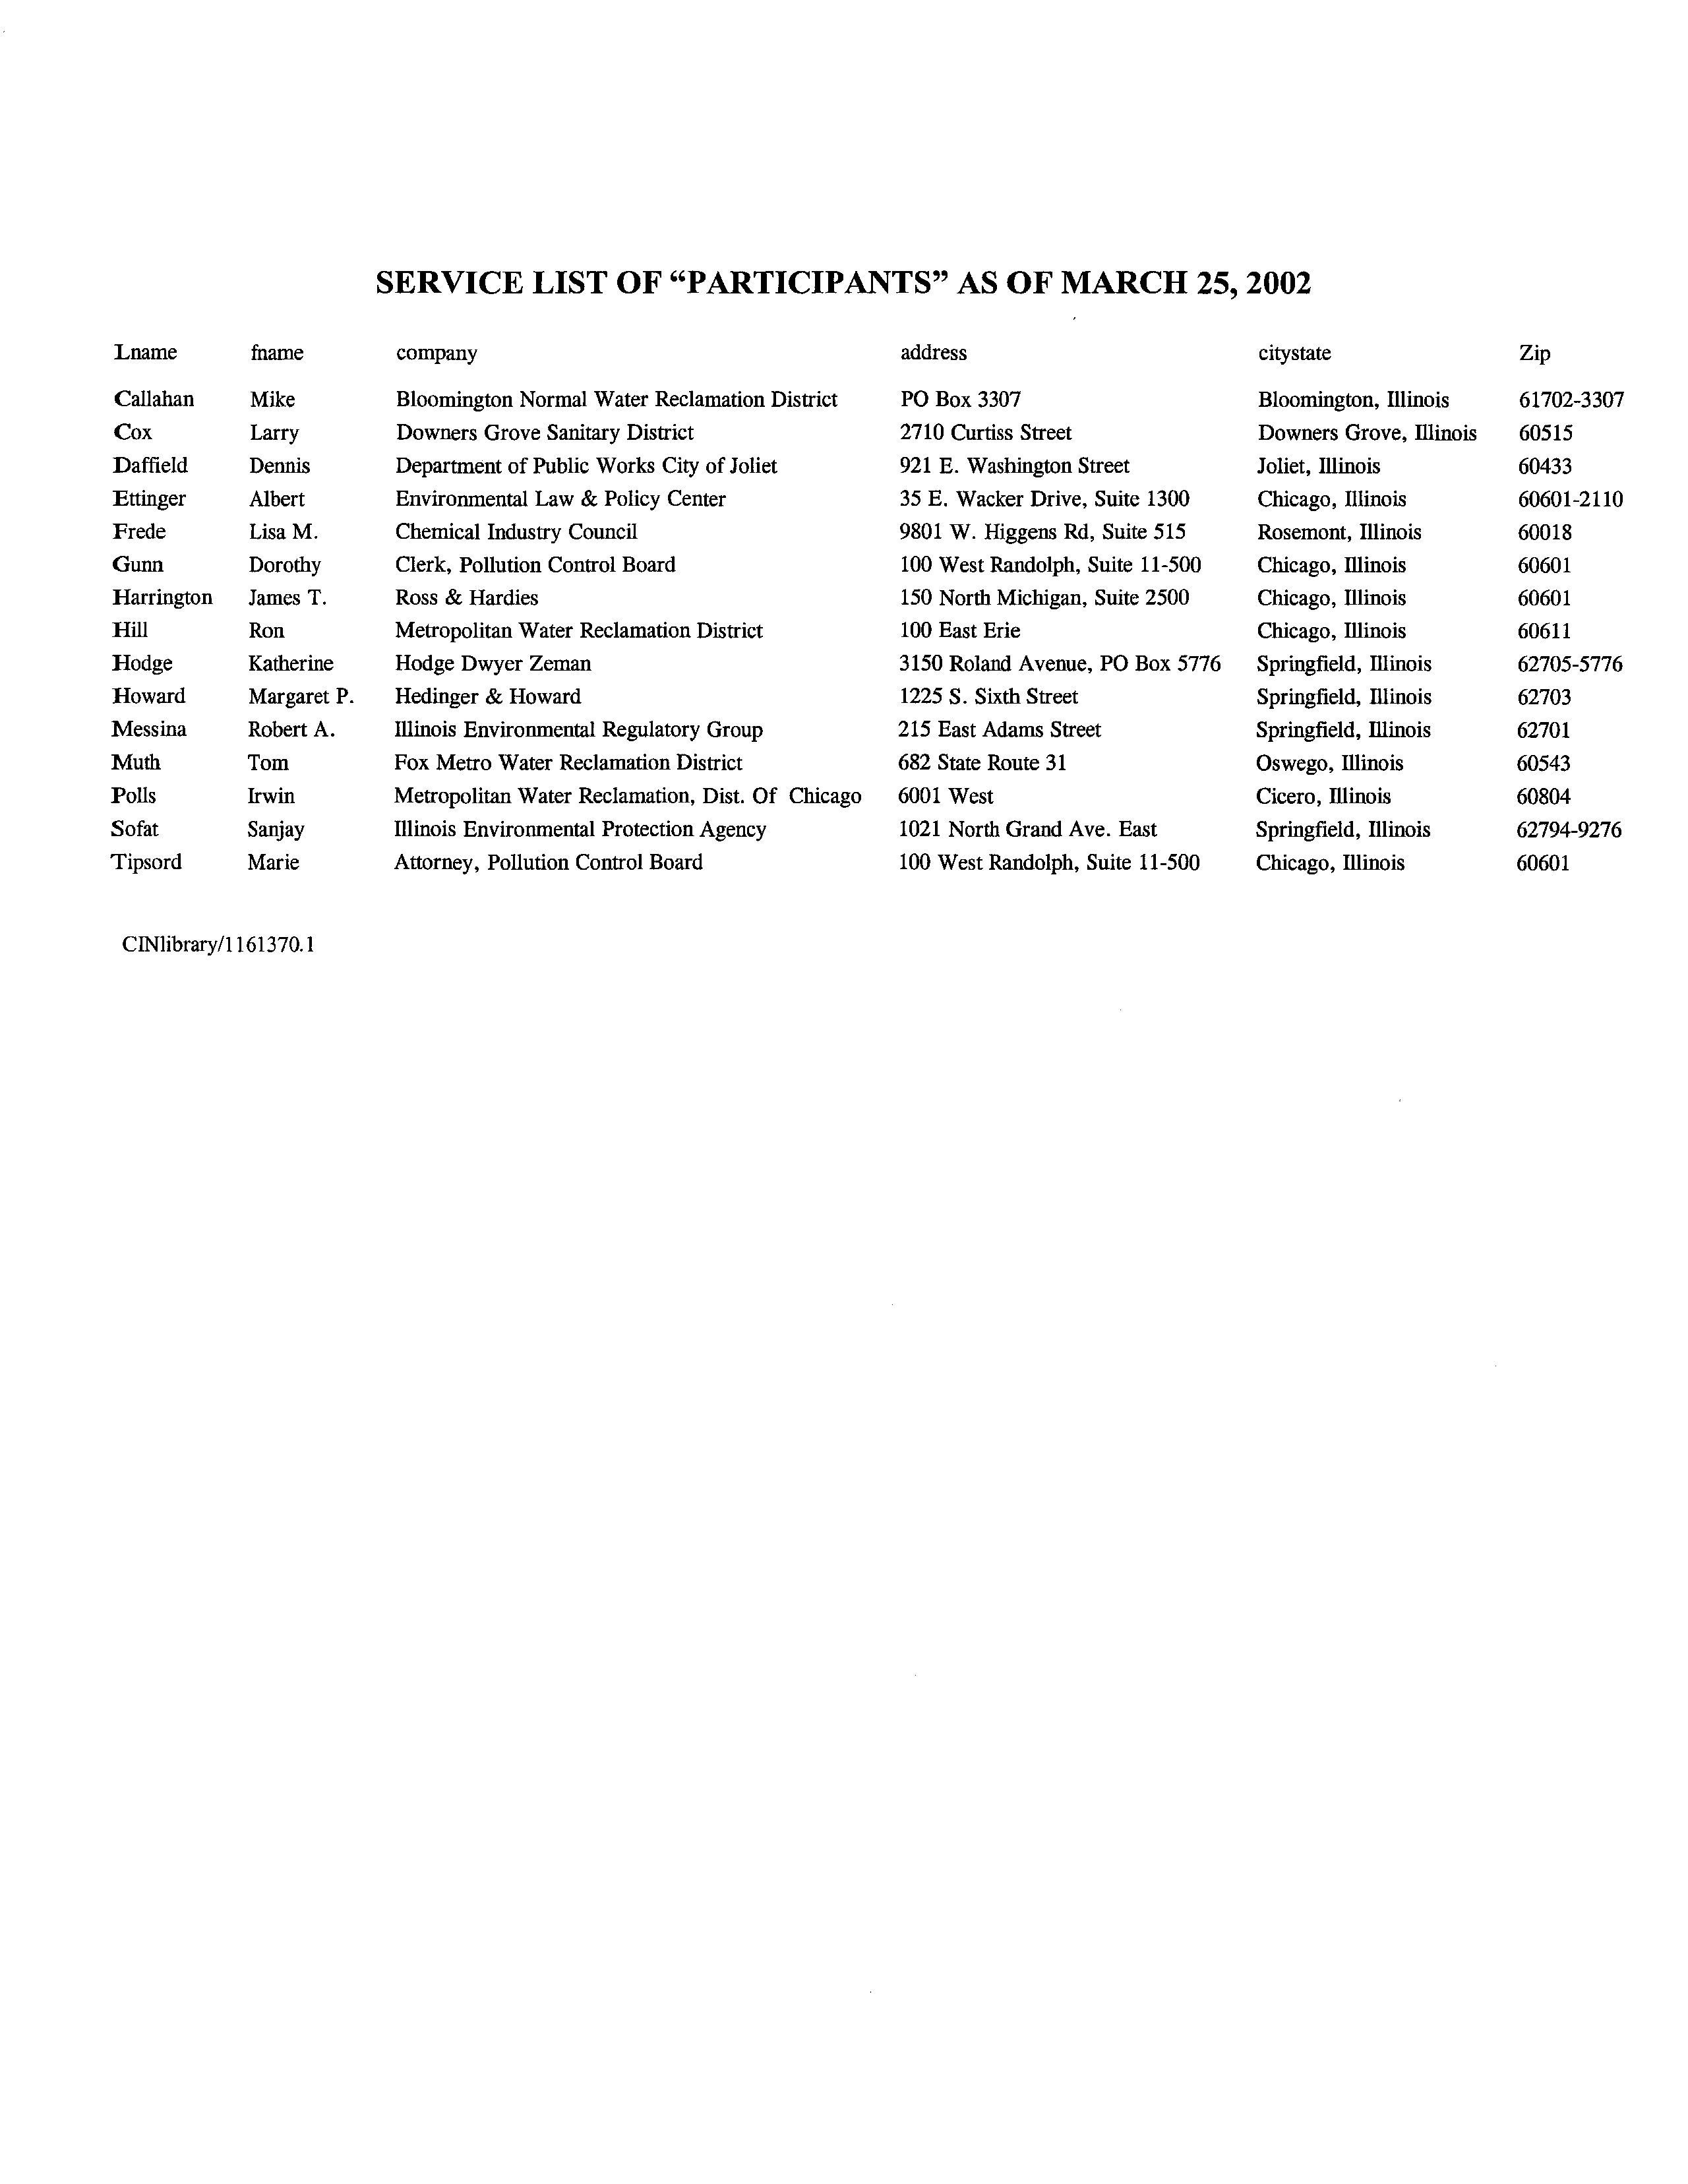
SERVICE LIST OF “PARTICIPANTS” AS OF MARCH 25, 2002
Lname
fname
company
address
citystate
Zip
Callahan
Mike
Bloomington Normal Water Reclamation District
P0 Box 3307
Bloomington, illinois
61702-3307
Cox
Larry
Downers Grove Sanitary District
2710 Curtiss Street
Downers Grove, Illinois
60515
Daffleld
Dennis
Department of Public Works City ofJoliet
921 E. Washington Street
Joliet, Illinois
60433
Ettinger
Albert
Environmental Law & Policy Center
35 E. Wacker Drive, Suite 1300
Chicago, Illinois
60601-2110
Frede
Lisa M.
Chemical Industry Council
9801 W. Higgens Rd, Suite
515
Rosemont, Illinois
60018
Gunn
Dorothy
Clerk, Pollution Control Board
100 West Randolph, Suite 11-500
Chicago, fflinois
60601
Barrington
James T.
Ross & Hardies
150 North Michigan, Suite 2500
Chicago, illinois
60601
Bill
Ron
Metropolitan Water Reclamation District
100 East Erie
Chicago, fflinois
60611
Nodge
Katherine
Hodge Dwyer Zeman
3150 Roland Avenue, P0 Box 5776
Springfield, fflinois
62705-5776
Howard
Margaret P.
Hedinger & Howard
1225 5. Sixth Street
Springfield, Illinois
62703
Messina
Robert A.
Illinois Environmental Regulatory Group
215 East Adams Street
Springfield, Illinois
62701
Muth
Tom
Pox Metro Water Reclamation District
682 State Route 31
Oswego, fflinois
60543
Polls
Irwin
Metropolitan Water Reclamation, Dist. Of Chicago
6001 West
Cicero, Illinois
60804
Sofat
Sanjay
Illinois Environmental Protection Agency
1021 North Grand Ave. East
Springfield, Illinois
62794-9276
Tipsord
Marie
Attorney, Pollution Control Board
100 West Randolph, Suite 11-500
Chicago, fflinois
60601
ClNlibrary/l 161370.1
Water Research
Vol
15. pp 1053
to
1065. 1981
Pnnted n Great Britarn. All rtghls reserved
ORIGINAL
0043-135481 091053.13502.000
Copynghc
C
1981 Pergamon Press Ltd
THE PHYSICOCHEMICAL SPECIATION OF Cd,
Pb, Cu, Fe AND Mn IN THE FINAL
EFFLUENT OF A SEWAGE TREATMENT
WORKS AND ITS IMPACT ON SPECIATION
IN THE RECEIVING RIVER
DUNCAN P. H.
LAXEN
and Roy M.
HARRISONt
Department of Environmental Sciences, University of Lancaster, Lancaster LA!
4YQ.
England
(Received July
1980)
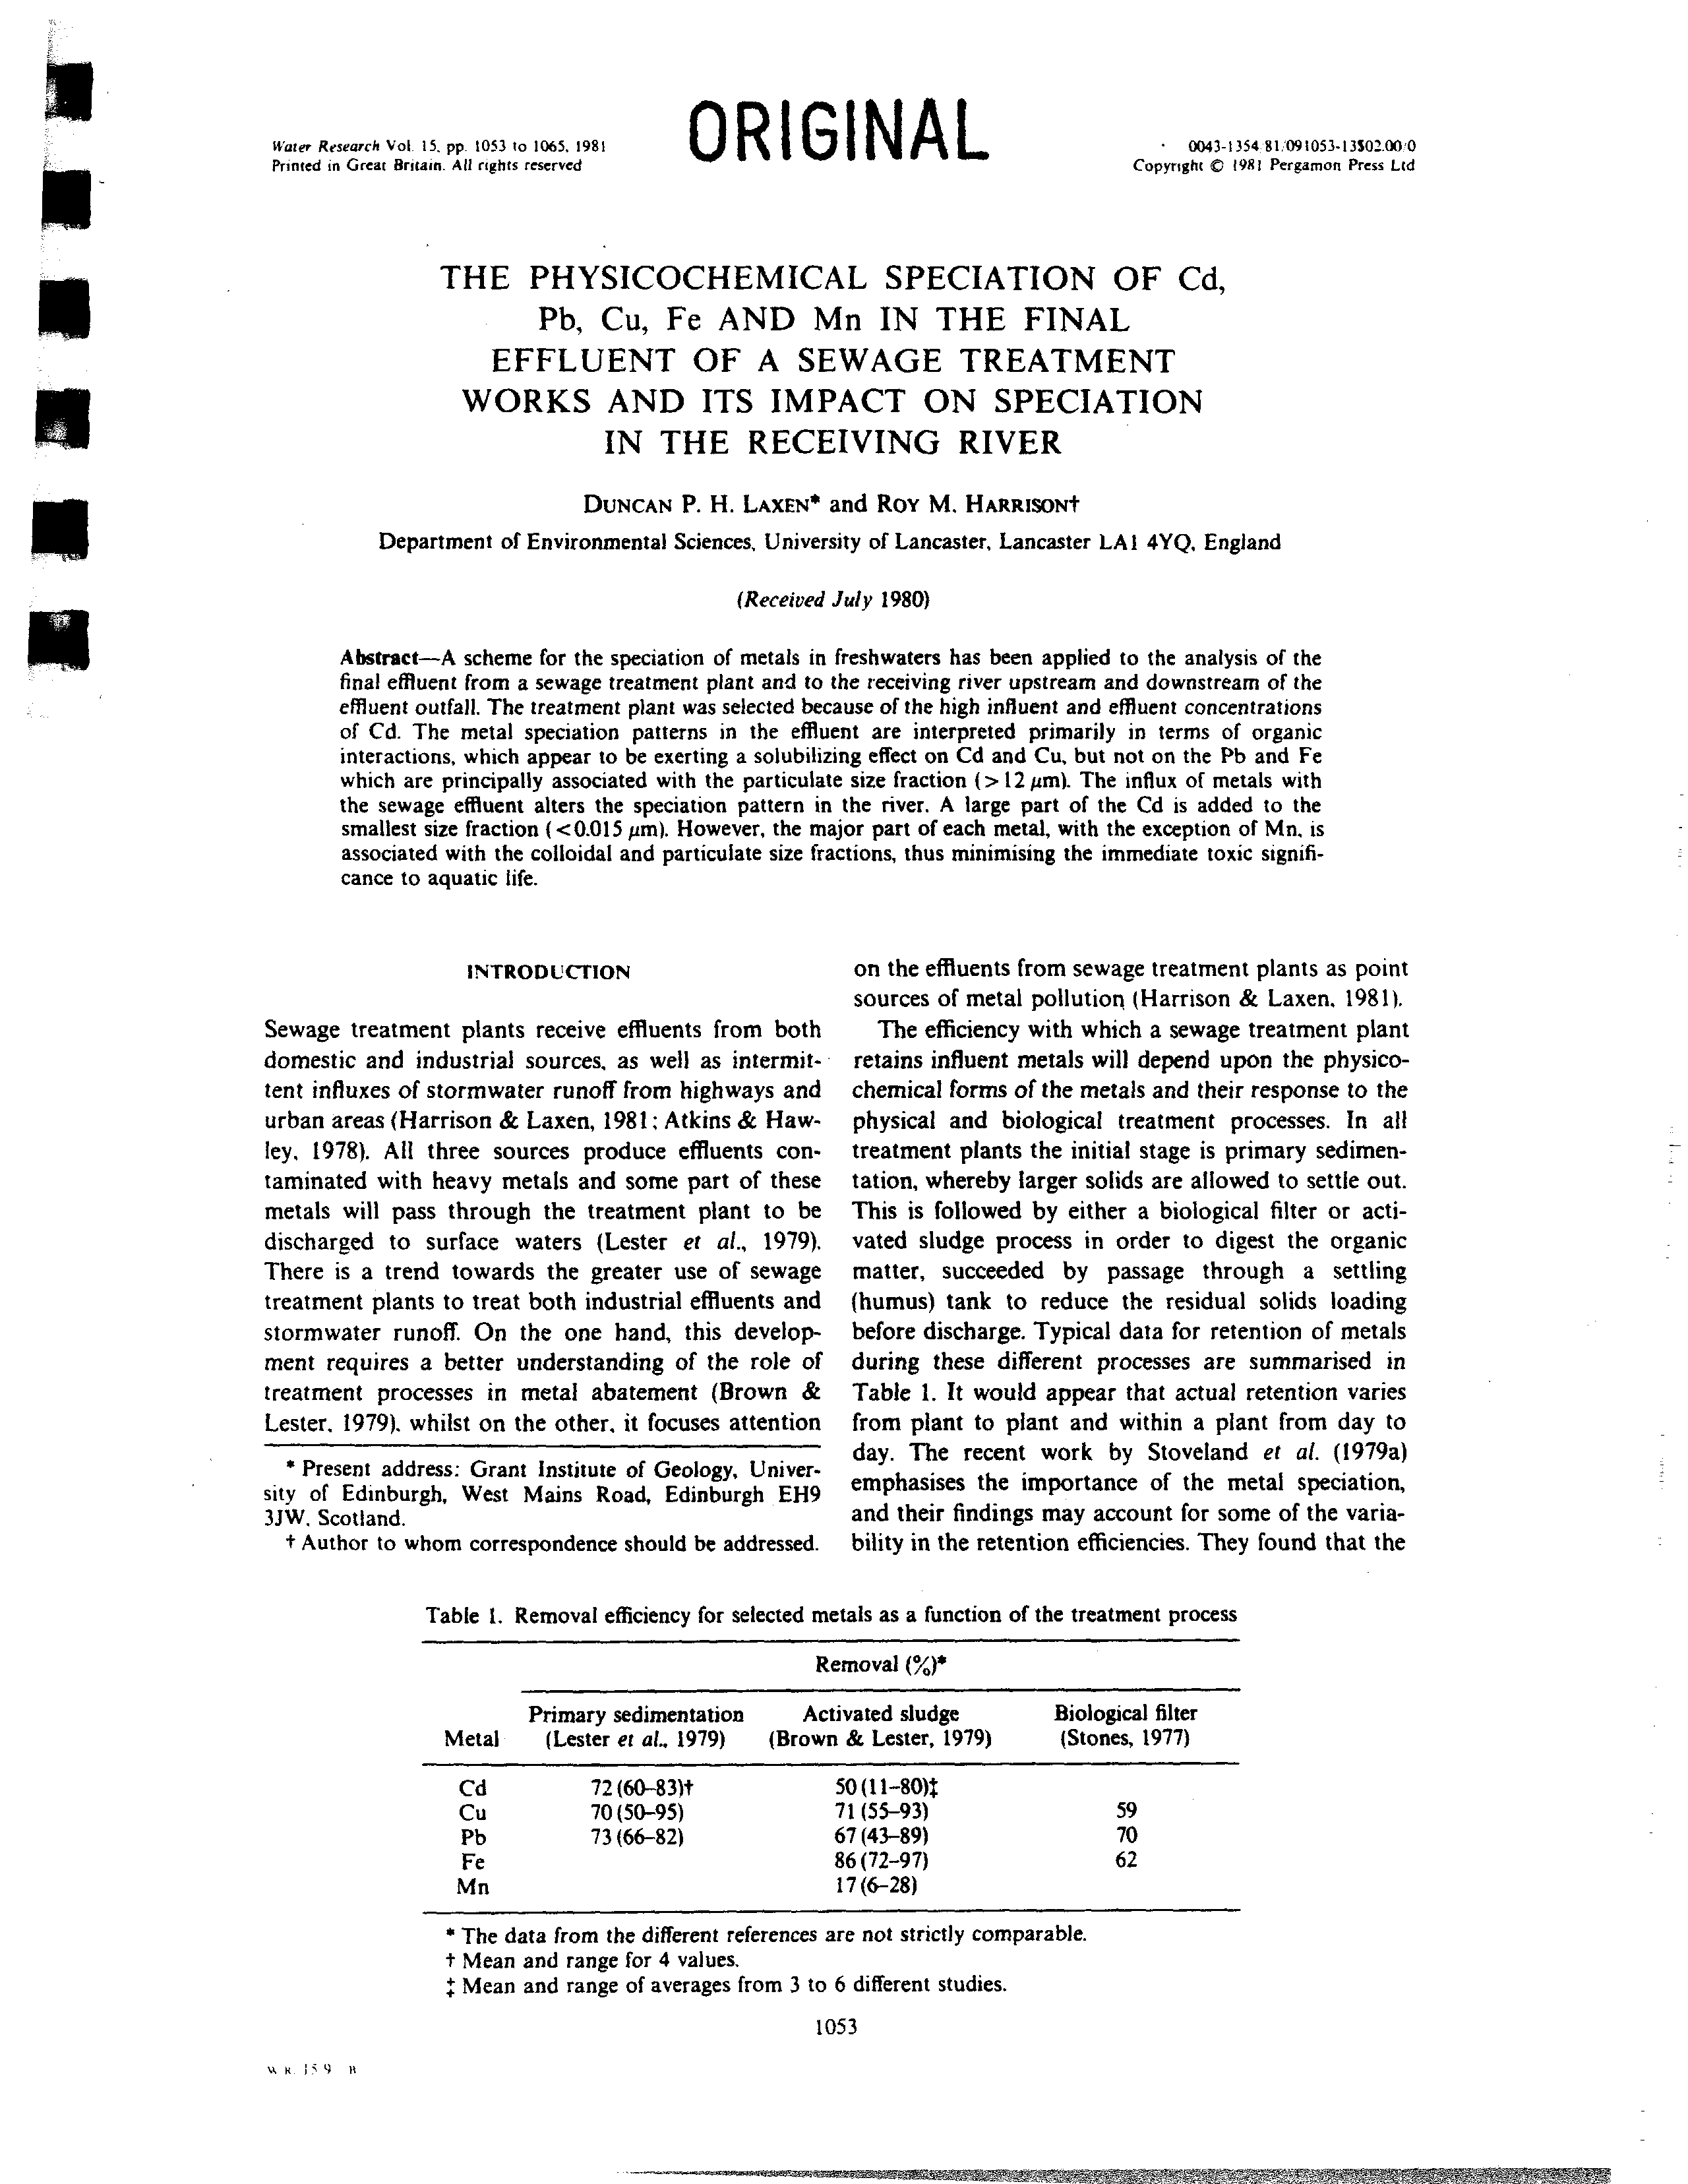
Abstract—A scheme for the speciation of metals in freshwaters has been applied to the analysis of the
final effluent from a sewage treatment plant and to the receiving river upstream and downstream of the
effluent outfall. The treatment plant was selected because of the high influent and effluent concentrations
of Cd. The metal speciation patterns in the effluent are interpreted primarily in terms of organic
interactions, which appear to be exerting a solubilizing effect on Cd and Cu. but not on the Pb and Fe
which are principally associated with the particulate size fraction (12
pm).
The Influx of metals with
the sewage effluent alters the speciation pattern in the river. A large part of the Cd is added to the
smallest size fraction (0.015 pm). However, the major part of each metal, with the exception of Mn. is
associated with the colloidal and particulate size fractions, thus minimising the immediate toxic signifi-
cance to aquatic life.
INTRODUCTION
Sewage treatment plants receive effluents from both
domestic and industrial sources, as well as intermit-
tent influxes of stormwater runoff from highways and
urban areas (Harrison & Laxen, 1981; Atkins & Haw-
ley. 1978). All three sources produce effluents con-
taminated with heavy metals and some part of these
metals will pass through the treatment plant to be
discharged to surface waters (Lester er at., 1979).
There is a trend towards the greater use of sewage
treatment plants to treat both industrial effluents and
stormwater runoff. On the one hand, this develop-
ment requires a better understanding of the role of
treatment processes irs metal abatement (Brown &
Lester. 1979). whilst on the other, it focuses attention
* Present address: Grant Institute of Geology, Univer-
sity of Edinburgh. West Mains Road, Edinburgh EH9
3JW. Scotland.
t
Author to whom correspondence should be addressed.
on the effluents from sewage treatment plants as point
sources of metal pollution (Harrison & Laxen. 1981).
The efficiency with which a sewage treatment plant
retains influent metals will depend upon the physico-
chemical forms of the metals and their response to the
physical and biological treatment processes. In all
treatment plants the initial stage is primary sedimen-
tation, whereby larger solids are allowed to settle out.
This is followed by either a biological filter or acti-
vated sludge process in order to digest the organic
matter, succeeded by passage through a settling
(humus) tank to reduce the residual solids loading
before discharge. Typical data for retention of metals
during these different processes are summarised in
Table 1. It would appear that actual retention varies
from plant to plant and within a plant from day to
day. The recent work by Stoveland
et
at. (l979a)
emphasises the importance of the metal speciation,
and their findings may account for some of the varia-
bility in the retention efficiencies. They found that the
Table 1. Removal efficiency for selected metals as a function of the treatment process
Removal (O/)*
Metal
Primary sedimentation
(Lester
et
at.. 1979)
Activated sludge
(Brown & Lester, 1979)
Biological filter
(Stones, 1977)
Cd
Cu
Pb
Fe
Mn
72(60—831t
70(50—95)
73(66—82)
50(11—80)~
71 (55—93)
67(43—89)
86 (72—97)
17(6—28)
59
70
62
* The data from the different references are not strictly comparable.
t
Mean and range for 4 values.
Mean and range of averages from 3 to 6 different studies.
1053
tSR
54
ii
1054
DUNCAN
P. H.
LAXEN
and Ro~M.
HARRISON
‘p
presence of the detergent builder, NTA. in the influent
can reduce the efficiency of metal removal in the acti-
vated sludge process. Furthermore, they found that
shock loading of NTA could mobilise some of the
metals previously retained within the sludge (Stove-
land
et
a!., 1979b). Such effects as these are important
in relation to how much metal will find its way to the
final effluent of a sewage treatment plant, but equally
important, in terms of defining the impact of the dis-
charge on the receiving water will be the speciation of
the metals within the final effluent. This will deter-
mine the metal speciation in the receiving water,
which in turn will determine both the immediate and
potential toxic significance to aquatic life, as well as
the mobility of the metals in the waterbody (Andrew
et al.,
1977; Davies
et
a!., 1976; Waiwood & Beamish,
1978; Wagemann & Barica, 1979: Harrison & Laxen,
1980).
In spite of the now well recognised importance of
defining the speciation of metals within a waterbody,
in relation to both their mobility and their toxic
effects, there is still considerable uncertainty as to the
actual metal forms and their various interactions
(Laxen & Harrison. 1977; Florence & Batley. 1980).
This can be accounted for by a number of factors,
including the wide range of possible physicochemical
forms, the difficulty of defining the forms analytically
and the low concentrations of the metals under con-
sideration. A number of studies have examined cer-
tain aspects of metal speciation in freshwater samples
(e.g. Chau & Lum-shue-chan, 1974; Bene~& Steinnes,
1975; Gardiner, 1976: Bene~
er
a!.. 1979). but only one
reasonably comprehensive speciation scheme has
been reported (Batley & Florence, l976a.b). This
scheme was developed principally for use with sea-
water samples and has unfortunately been shown to
be of limited applicability to the study of most fresh-
waters (Laxen & Harrison, l981a). We have however,
recently developed a speciation scheme for fresh-
waters, based upon an initial size fractionation of the
metal species, along the lines of the classification orig-
inally suggested by Stumm & Bilinski (1973) (Laxen
& Harrison, 198 Ia) (Fig. 1).
In this paper we describe the application of our
speciation scheme to the final effluent from a sewage
treatment plant which uses the biological filter pro-
cess, as well as to samples taken upstream and down-
stream of the effluent outfall. The particular sewage
treatment plant examined was chosen because of the
high cadmium loading in the raw sewage, a conse-
quence of discharges from a plating works. In all, five
metals were studied. Cd. Pb, Cu. Fe and Mn. The
latter two were included principally because of their
potential importance as metal scavengers, due to their
tendency to form colloidal/particulate hydrous oxides
(Stumm & Morgan. 1970; Mill, 1980), which have
strong adsorption affinities for certain metsis (Gadde
& Laitinen, 1974).
EXPERIMENTAL
Special ion scheme
The detailed development and testing of the speciation
scheme is described elsewhere (Laxen & Harrison. 1981a).
a
N
p
I
n
I
I
U
Fig. 1. Speciation scheme.
I
U
a
1
I
a
a
a
The physicochemical speciation of Cd. Pb. Cu. Fe and Mn
1055
The size fractionation of the metal species was performed
with Nuclepore filters of 12. 1.0. 0.4. 0.08 and 0.015 pm
rated pore size in Amicon stirred cells (Model 52) and an
Amicon PMIO ultrafilter (nominal molecular weight
10.000) in an Amicon Model 202 stirred cell, under nitro-
gen pressure. The filters and stirred cells were cleaned im-
mediately before use with dilute HNO3 and pre-treated
with a CatNO3)2 solution to minimise adsorption losses.
Tests showed such losses to be negligible.
Total
metal concentrations were determined by flameless
atomic
absorption (Fe and Mn) and by ASV
after
u.v.-acid
digestion (Cd, Pb and Cu). Mon-filterable metal collected
onandtheHCIO12pm4
digestion.filter
wasAlldeterminedconcentrationsafter successivewere
determinedHNO3
by the method of standard additions.
Further analyses were performed on certain filtrate frac-
tions as follows: ASV-Iabile metal was determined at the
natural pH of the sample, buffered with a C02:N2 mix-
ture. Analyses were performed with a hanging mercury
drop electrode using a fresh drop for each deposition/strip-
ping cycle. The metals Cd, Pb and Cu were deposited at
—9SOmV (vs SCE) and stripped at 5 mV s’ in the differ-
ential pulse mode. The samples were titrated with a mixed
metal standard to quantify the labile response and provide
information on the state of metal complexation.
Chelex-labile metal was determined using Chelex.lOO in
the calcium form in a batch technique. 2 ml resin to 60 ml
of sample for 48 h. The non-Chelex-labile metal was deter-
mined. as for total metals above, and the Chelex-labile
fraction determined by difference.
Filtrates were exposed to u.v. irradiation at their natural
pH for 8—12 h in quartz tubes and the ASV-labile metals
then re-measured. Prior to u.v. irradiation the sample pH
was adjusted to approx. pH 5.5—6 with HCIO4 to compen-
sate for the increase in pH that occurred during ir-
radiation. A brown precipitate was generally found after
the u.v. irradiation, which is thought to be due to precipi.
tation of organically stabilised hydrous iron oxide colloids
(Laxen & Harrison. 1981a). There was a simultaneous loss
of ASV-labile metal. It is thus not possible to quantify the
non-labile organically bound metal fraction. The u.v. ir-
radiation procedure does however provide qualitative in-
formation on the nature of any metal complexation (Laxen
& Harrison. 1981a).
Standard methods were used to analyse the samples
for their bulk constituents
(Standard Methods,
1976).
Suspended sediment concentrations refer however to
material retained by a 0.4 pm Nuclepore filter. Total
organic carbon was estimated from the u.v. absorbance at
254 tim an filtered samples, according to the relationship
derived by Dobbs
era!.
(1972). The pH and alkalinity were
measured on unfiltered portions of sample immediately on
return to the laboratory. i.e. within 2—3 h of taking the
sample.
Samples
The samples were collected in 5 I. polythene containers
pre-cleaned with l0~HNO3 )Laxen & Harrison. l9Blb)
and rinsed with sample before filling. The sewage final ef-
fluent was taken from Barrowford sewage treatment plant
at Nelson in Lancashire, on 18 February 1980. from the
overflow of the final sedimentation (humus) tank. The flow
of sewage through the treatment plant is split into two
after the primary sedimentation and the sample was taken
from what is known as line B. The effluent is discharged
into a small river named Pendle Water. Samples were
taken from this river on 4 March 1980, whilst the river flow
was low following a dry spell. The samples were taken
about 30 m upstream and approx. 100 m downstream of
the effluent outfall at a point where mixing was complete.
The flow at the downstream site was relatively turbulent in
contrast to that at the upstream site.
*
U
U
RESULTS
Sewage
effluent
The sample of final effluent was taken from a sew-
age treatment plant involving both primary sedimen-
tation and secondary treatment by biological filtra-
tion. Following passage through the primary sedi-
mentation tanks the effluent stream is split to pass
through two sets of biological filters, A and B, each
with their own final sedimentation (humus) tanks. The
quality of the final effluent from the two streams A
and B differs slightly (Table 2). due to a poorer per-
formance of the final sedimentation tank B. The
present sample was taken from this stream. It is
apparent from the results in Table 2 that the sample
taken for this study is representative of the final efflu-
ent from tank B (cf. pH. suspended solids, cadmium).
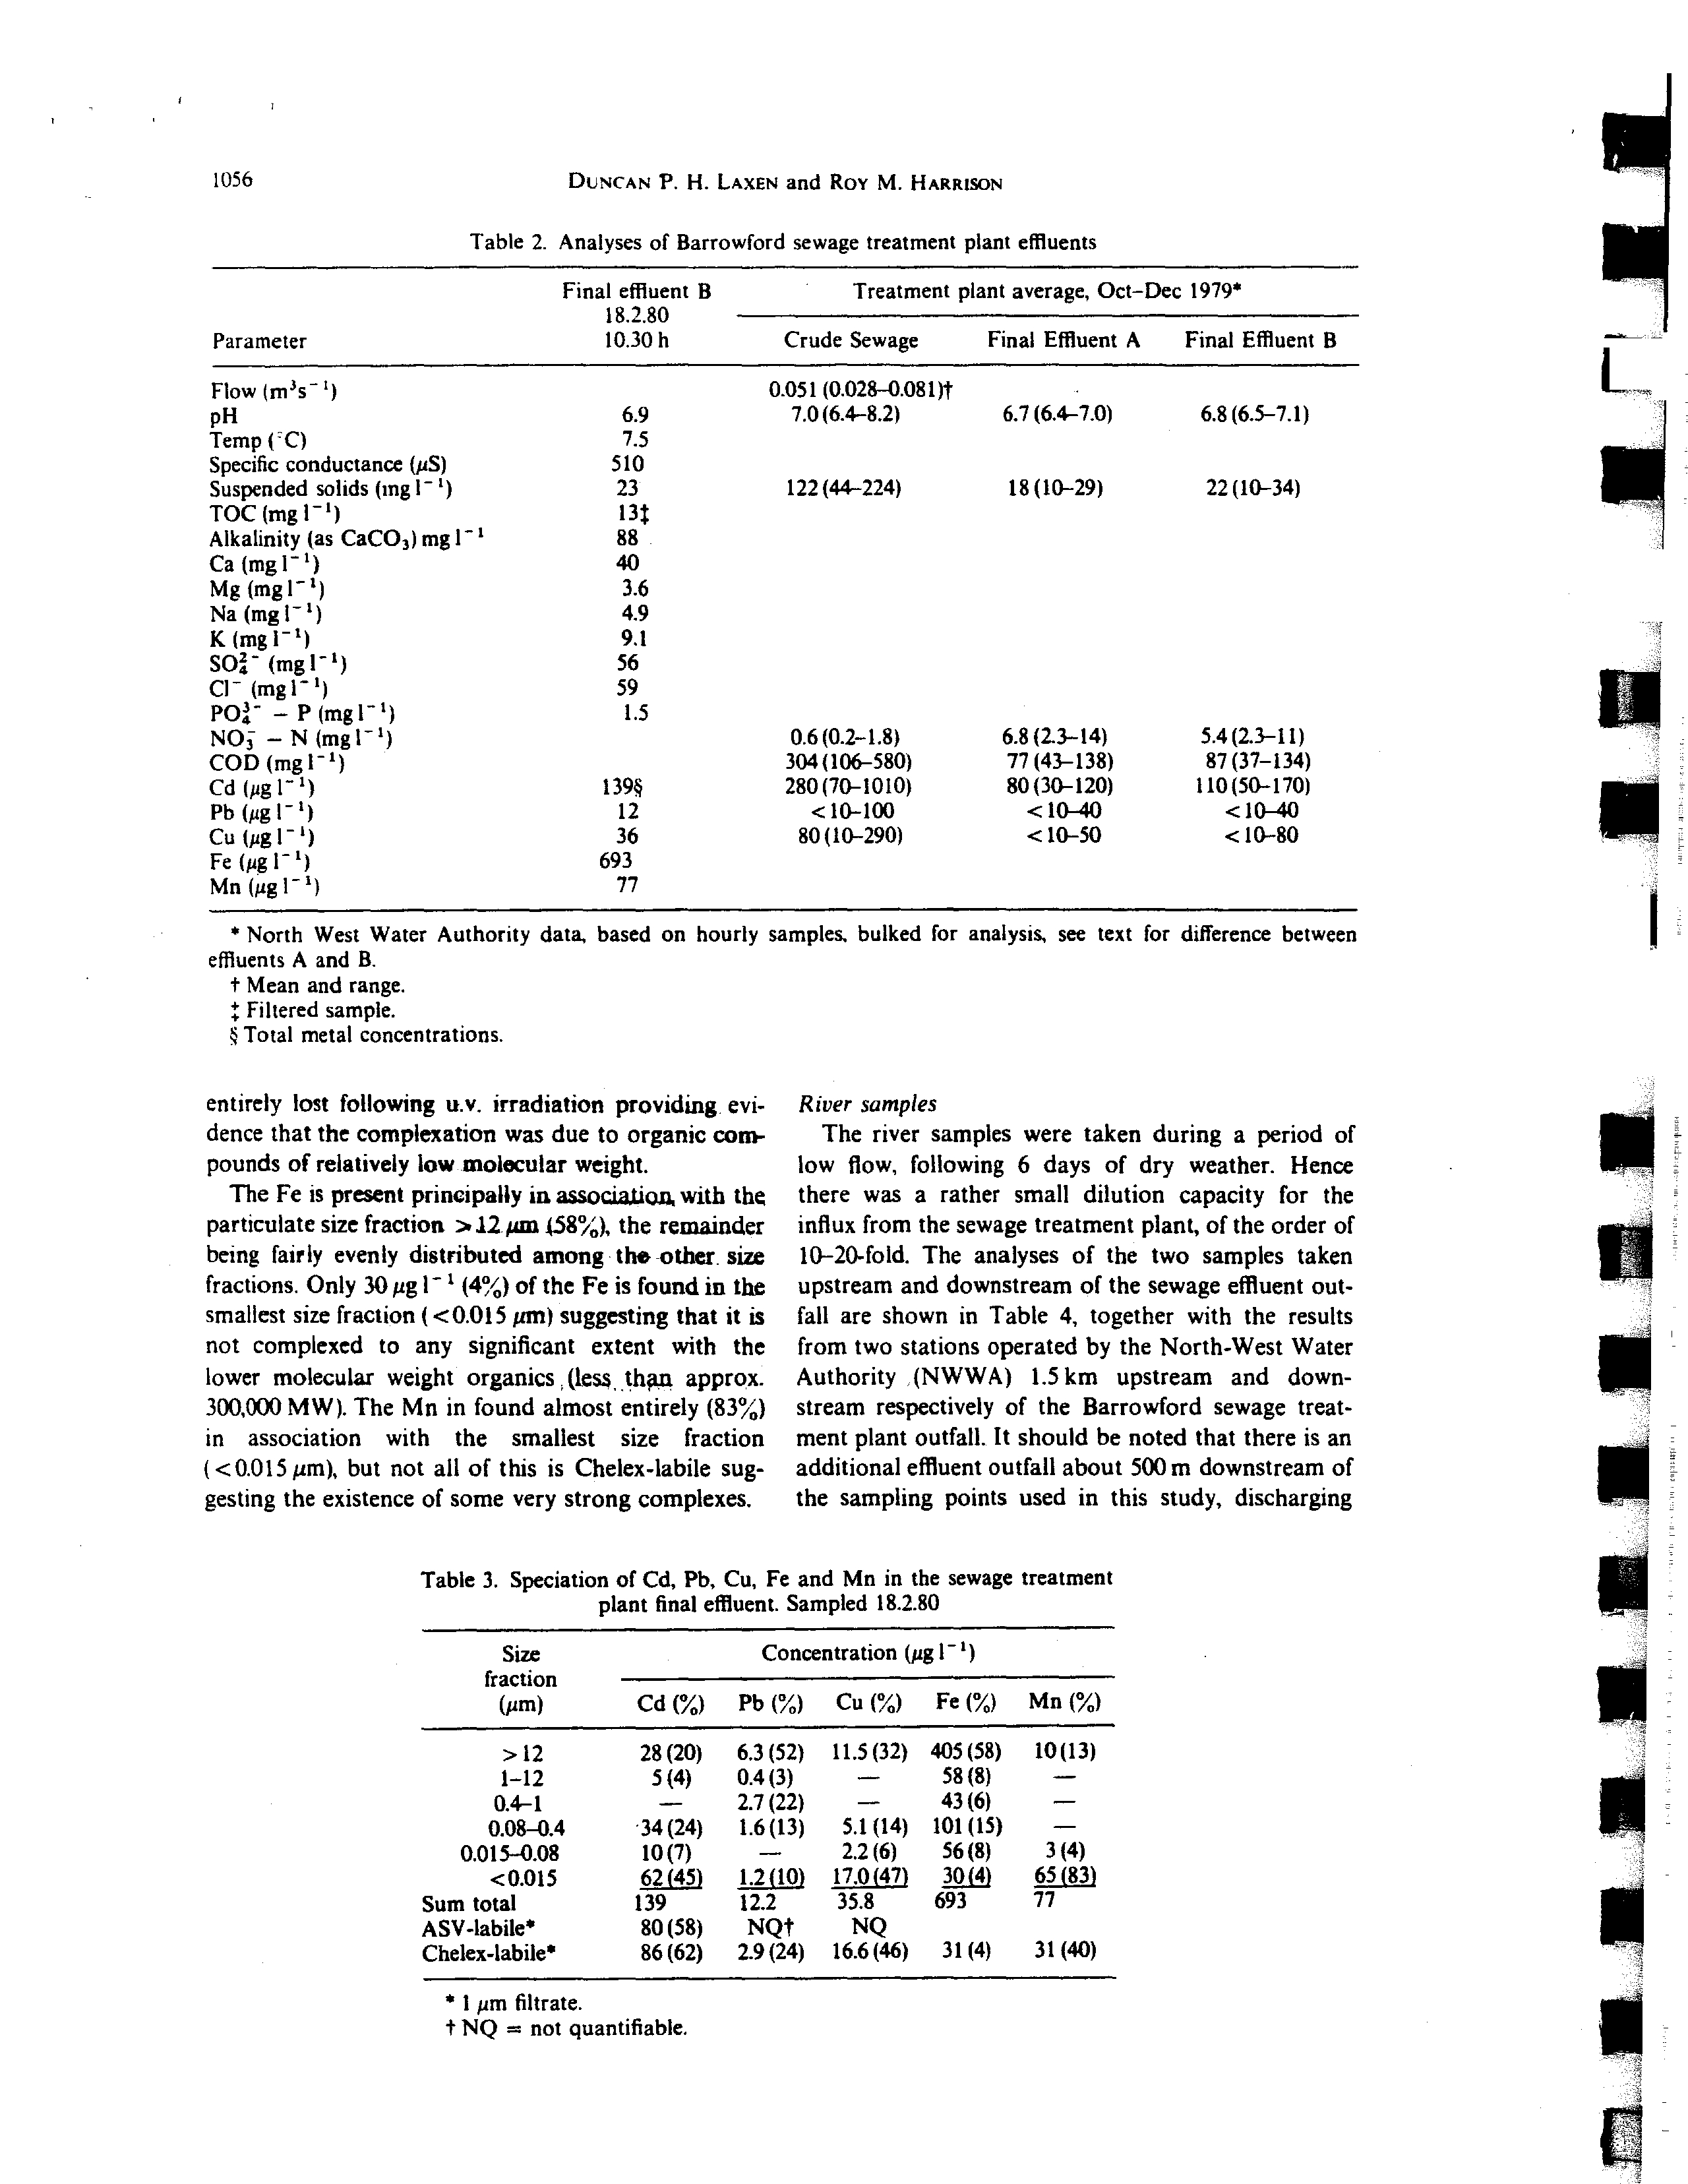
The speciation results for the effluent sample are
presented inTable...3. A major part of the Cd
(45°ij
is
associated with the smallest size fraction (0.015 pm)
and most of this is probably both ASV and Chelex-
labile. It is also apparent that some of the labile Cd
must be derived from the colloidal size fraction. The
ASV titration provides no indication of a residual
non-labile complexation capacity for Cd. consistent
with the strong labile signal in the original sample.
There was no change in the stripping peak potential
(Ep) following u.v. irradiation, the values remaining
between —575 to —585 mV. A further feature of note
is the association of a significant portion of the Cd
with the 0.08—0.4 pm colloidal size fraction. This par-
ticular size fraction is also emphasised in the case of
Cu and Fe but not for Pb. The Pb shows a particu-
larly strong association with the larger size fraction
material:
Y7°,,
is greater than 0.4 pm. and only a small
portion. lO°. is found in the smallest size fraction
(0.015 pm). There was a small ASV Pb signal at
410—430 mV in the various filtrate fractions. However.
this was not quantified as there was a shift in the peak
potential (Ep) during the titrations to 395—405 mV.
This is indicative of a labile Pb complex in the orig-
inal sample, although caution must be exercised in the
interpretation of Ep shifts due to interference from
organics (Brezonik
et at..
1976: Batley & Florence.
1976a,b). particularly in an organic-rich sewage efflu-
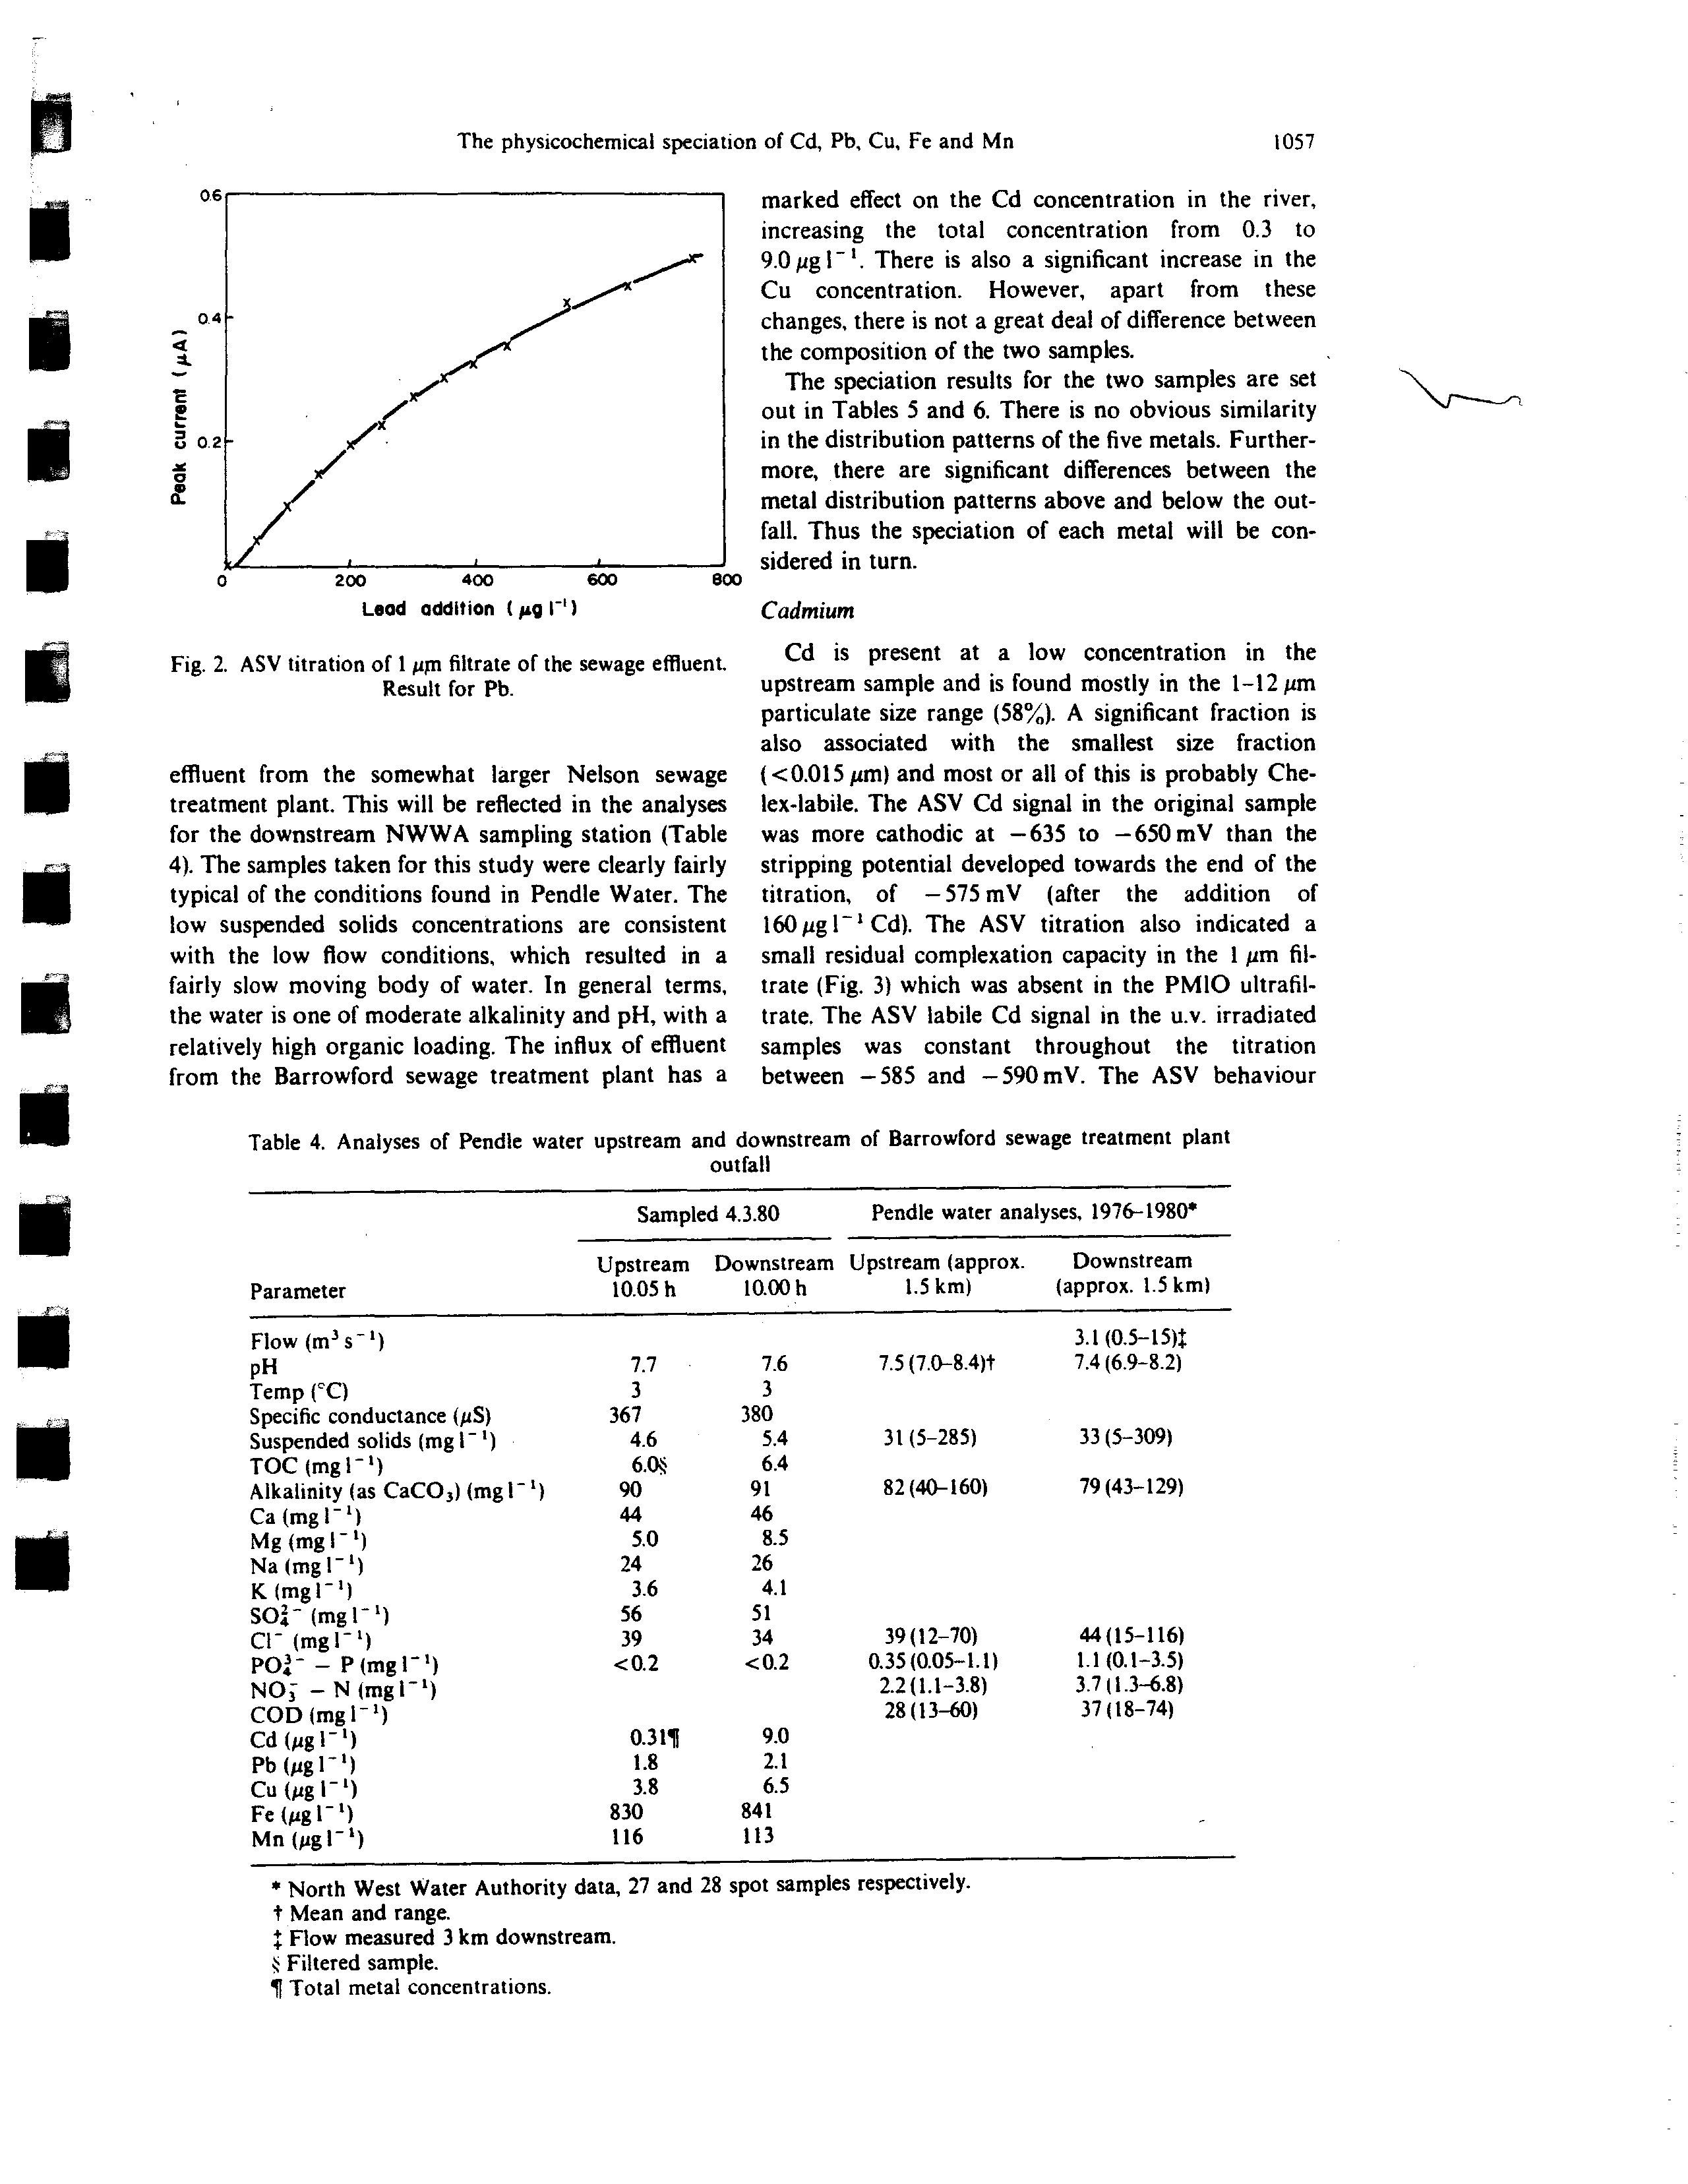
ent. The
ASV
titration curves for the three filtrate
fractions (1 pm, 0.08 pm and PMlO) were similar.
showing a possible small residual complexation ca-
pacity for Pb (Fig. 2). However, after the addition of
approx. 150 pg I - Pb the sensitivity was progress-
ively reduced.
The iesijlts for Cu reveal a strong association (47’~’,,)
with the smallest size fraction 0.015 pin) and much
of this metal would appear to be Chelex-labik. The
Cu is not, however, ASV-labile and thereis a
strong
residual complexation ~a~ia.it~v for the
Cu.
which is
undiminished even in the PMIO ultrafiltrate. suggest-
iflg that ligands of relatively low molecular weight
(10.000 MW~are responsible for the non-labile
complexation. The complexation capacity was almost
1056
DUNCAN P. H.
LAXEN
and Roy M. HARRISON
* North West Water Authority data,
effluents A and B.
t Mean and range.
Filtered sample.
~Total metal concentrations.
entirely lost following u.v. irradiation providing evi-
dence that the complexation was due to organic com-
pounds of relatively low molecular weight.
The Fe is present
principally in
association, with the
particulate size fraction 12 pm 4.58), the remainder
being fairly evenly distributed among th.oth.er. size
fractions. Only 30 pg 1’ (4) of the Fe is found in the
smallest size fraction (0.015 pm) suggesting that it is
not complexed to any significant extent with the
lower molecular weight organics (less th~i approx.
300,000 MW). The Mn in found almost entirely (83)
in association with the smallest size fraction
(0.015
pm),
but not all of this is Chelex-labile sug-
gesting the existence of some very strong complexes.
* 1 pm filtrate.
t
NQ
=
not quantifiable.
River
samples
The river samples were taken during a period of
low flow, following 6 days of dry weather. Hence
there was a rather small dilution capacity for the
influx from the sewage treatment plant, of the order of
10—20-fold. The analyses of the two samples taken
upstream and downstream of the sewage effluent out-
fall are shown in Table 4, together with the results
from two stations operated by the North-West Water
Authority (NWWA) 1.5 km upstream and down-
stream respectively of the Barrowlord sewage treat-
ment plant outfall. It should be noted that there is an
additional effluent outfall about 500 m downstream of
the sampling points used in this study, discharging
Table 2. Analyses of Barrowford sewage treatment plant effluents
Parameter
Final effluent B
18.2.80
10.30 h
Treatment plant average, Oct—Dec 1979*
Crude Sewage
Final Effluent A
Final Effluent B
Flow (m3s
‘)
0.051 (0.028—0.081)t
pH
6.9
7.0(6.4—8.2)
6.7(6.4—7.0)
6.8(6.5—7.1)
Temp (rC)
7.5
Specific conductance (pS)
510
Suspended solids (ing I~)
23
122(44—224)
18(10—29)
22(10—34)
TOC(mgl~)
l3~
Alkalinity (as CaCO3)mgl~
88
Ca(mgl~)
40
Mg(mgl’)
3.6
Na(mgl~)
4.9
K(mgl’)
9.1
SO~(mgl’)
56
Cl (mgl~)
59
PO~— P (mgl~)
1.5
NO~— N (mgl~)
0.6(0.2—1.8)
6.8(2.3—14)
5.4(2.3—11)
COD (mgl1)
304(106—580)
77(43—138)
87 (37—134)
Cd
(pgl’)
139*
280(70—1010)
80(30—120)
110(50—170)
Pb(pgl~)
12
10-100
10-40
10—40
Cu
(pgl’)
36
80(10—290)
10—50
10—80
Fe(pgl~)
693
Mn(pgl’)
77
N
L
based on hourly samples. bulked for analysis, see text for difference between
a
U
Table 3. Speciation of Cd, Pb, Cu, Fe and Mn in the sewage treatment
plant final effluent. Sampled 18.2.80
Size
fraction
(pm)
Concentration
l ‘)
Cd ()
Pb ()
Cu ()
Fe ()
Mn ()
12
28(20)
6.3(52)
11.5(32)
405(58)
10(13)
1—12
5(4)
0.4(3)
—
58(8)
—
0.4—1
—
2.7(22)
—
43(6)
—
0.08—0.4
•34(24)
1.6(13)
5.1(14) 101 (15)
—
0.015—0.08
10(7)
—.
2.2(6)
56(8)
3(4)
0.015
Sum total
~ZA~
139
i,2j~.)
12.2
17.0(47
35.8
~QJ~)
693
~1~J
77
ASV~labile*
80(58)
NQt
NQ
Chelex~labiles
86(62)
2.9(24)
16.6(46)
31(4)
31(40)
p
p
p
p
U
The physicochemical speciation of Cd, Pb, Cu, Fe and Mn
1057
$00
Fig. 2. ASV titration of 1
p~
filtrate of the sewage effluent.
Result for Pb.
effluent from the somewhat larger Nelson sewage
treatment plant. This will be reflected in the analyses
for the downstream NWWA sampling station (Table
4). The samples taken for this study were clearly fairly
typical of the conditions found in Pendle Water. The
low suspended solids concentrations are consistent
with the low flow conditions, which resulted in a
fairly slow moving body of water. In general terms,
the water is one of moderate alkalinity and pH, with a
relatively high organic loading. The influx of effluent
from the Barrowford sewage treatment plant has a
marked effect on the Cd concentration in the river,
increasing the total concentration from 0.3 to
9.0 pg I
There is also a significant increase in the
Cu concentration. However, apart from these
changes, there is not a great deal of difference between
the composition of the two samples.
The speciation results for the two samples are set
out in Tables 5 and 6. There is no obvious similarity
in the distribution patterns of the five metals. Further-
more, there are significant differences between the
metal distribution patterns above and below the out-
fall. Thus the speciation of each metal will be con-
sidered in turn.
Cadmium
Cd is present at a low concentration in the
upstream sample and is found mostly in the 1—12 pm
particulate size range (58). A significant fraction is
also associated with the smallest size fraction
(0.015 pm) and most or all of this is probably Che-
lex-labile. The ASV Cd signal in the original sample
was more cathodic at —635 to —650 mV than the
stripping potential developed towards the end of the
titration, of —575 mV (after the addition of
160 pg l’ Cd). The ASV titration also indicated a
small residual complexation capacity in the 1 pm fil-
trate (Fig. 3) which was absent in the PMIO ultrafil-
trate. The ASV labile Cd signal in the u.v. irradiated
samples was constant throughout the titration
between —585 and —590mV. The ASV behaviour
Table 4. Analyses of Pendle water upstream and downstream of Barrowford sewage treatment plant
outfall
Parameter
Sampl
Upstream
10.05 h
ed 4.3.80
Downstream
10.00 h
Pendle water analyses, 1976-1980’
Upstream (approx.
1.5 km)
Downstream
(approx. 1.5 km)
Flow (m3s~)
pH
Temp (°C)
Specific conductance (pS)
Suspended solids (mgi_i)
TOC (mgi -
i)
Alkalinity (as CaCO3)(mgl~)
Ca(mgl~)
Mg (mg I
~‘)
Na(mgl’)
K(mgr’)
SO~(mgl’)
CV (mgl’)
PO~
—
P (mgl~)
NO; — N
(mgl~)
COD (mgV’)
Cd (pg I~)
Pb(pgl~)
Cu (pg l1)
Fe(pgl~)
Mn(pgl~)
7.7
3
367
4.6
6.0*
90
44
5.0
24
3.6
56
39
0.2
0.3l~
1.8
3.8
830
116
7.6
3
380
5.4
6.4
91
46
8.5
26
4.1
51
34
0.2
9.0
2.1
6.5
841
113
7.5 (7.0—8.4)t
31(5—285)
82(40—160)
39(12—70)
0.35 (0.05—1.1)
2.2(1.1—3.8)
28(13—60)
3.1 (0.5—t5)~
7.4(6.9—8.2)
33(5—309)
79 (43—129)
44(15—116)
1.1(0.1—3.5)
3.7(1.3—6.8)
37(18—74)
*
North West Water Authority data, 27 and 28 spot samples respectively.
t Mean and range.
~Flow measured 3 km downstream.
~Filtered sample.
¶ Total metal concentrations.
04
4
1.
a
0.2
a
/X
/1
200
400
600
Lead addition
(pig
rI
* 1 pm filtrate.
t NQ
=
not
quantifiable.
suggests the presence of a labile organic complex,
together with a residual non-labile complexation ca-
pacity associated with the colloidal size range.
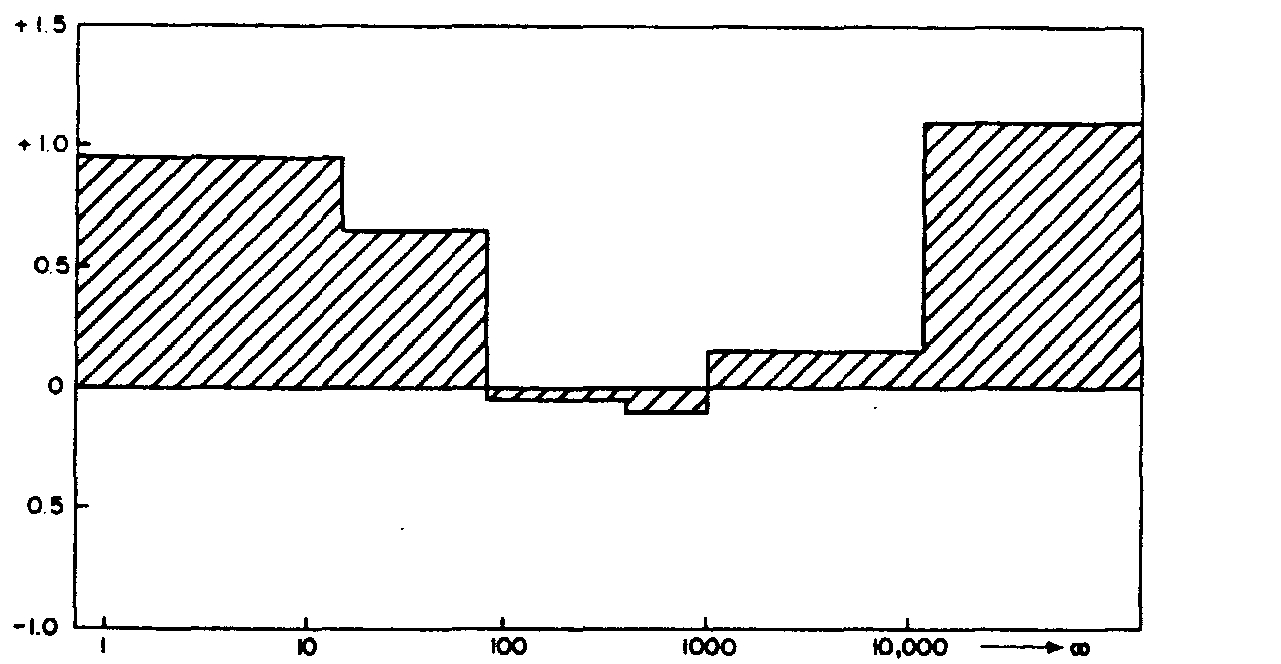
In the downstream sample a major part of the Cd
(44) is associated with the smallest size fraction. A
significant amount is also associated with the
0.015—0.08 pm colloidal size fraction, whereas this size
fraction had no Cd in the upstream sample. The pre-
dominance of the 1—12 pm fraction is lost, but this is
not due to a loss of Cd from this size fraction but
rather to the addition of Cd to the other size fractions
(Fig. 4). It is evident from Fig. 4 that the Cd influx
with the sewage effluent has a major impact on the
smallest size fraction. Not all of this Cd in the smal-
lest size fraction is labile. The ASV titration of the
1 pm filtrate provides no indication of any residual
complexation capacity for Cd.
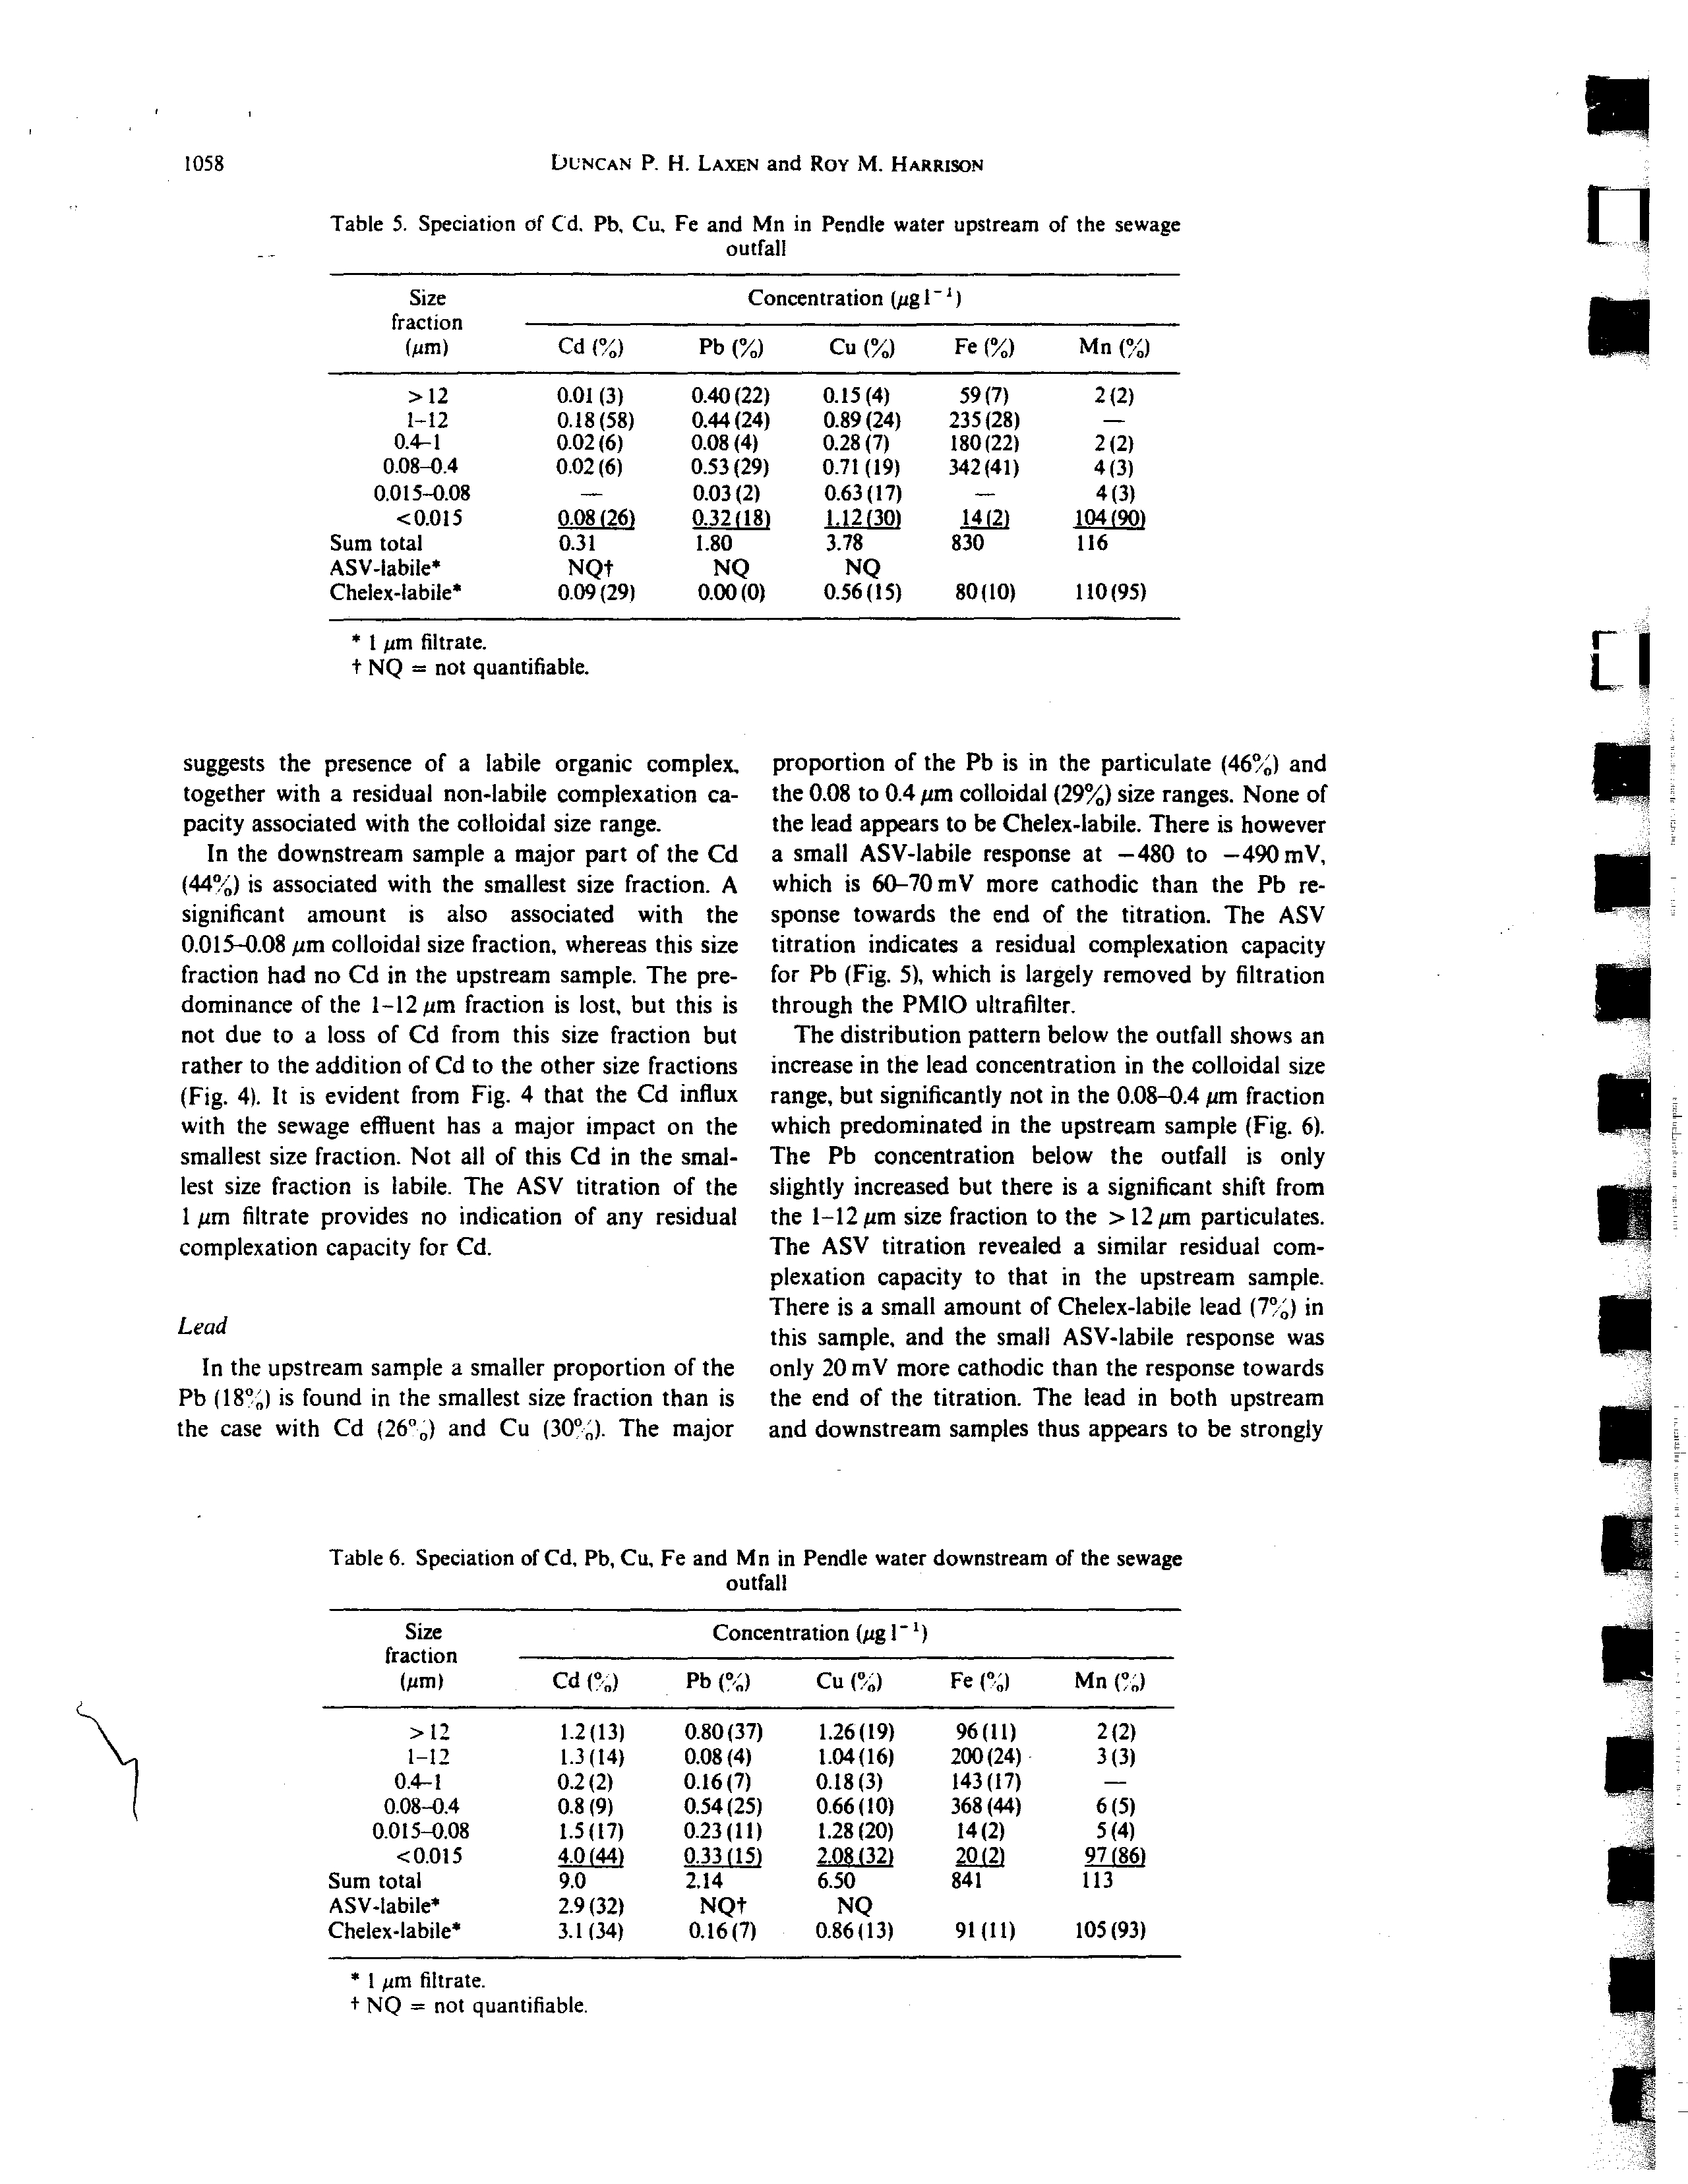
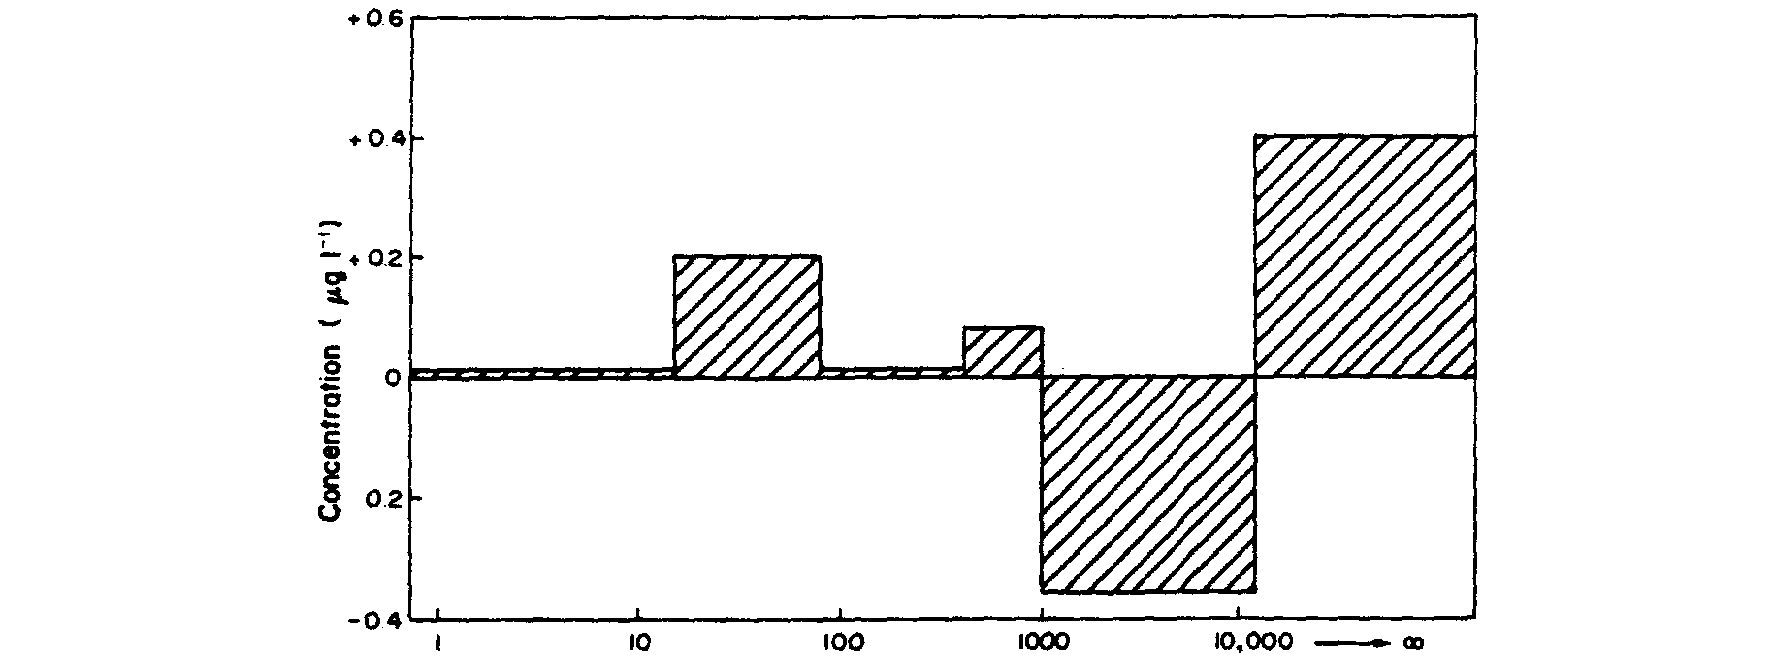
Lead
In the upstream sample a smaller proportion of the
Pb (18°;)is found in the smallest size fraction than is
the case with Cd (26°c) and Cu (30). The major
* 1
pm
filtrate.
t
NO =
not
quantifiable.
proportion of the Pb is in the particulate (46) and
the 0.08 to 0.4 pm colloidal (29) size ranges. None of
the lead appears to be Chelex-labile. There is however
a small ASY-labile response at —480 to —490 mV,
which is 60—70 mY more cathodic than the Pb re-
sponse towards the end of the titration. The ASV
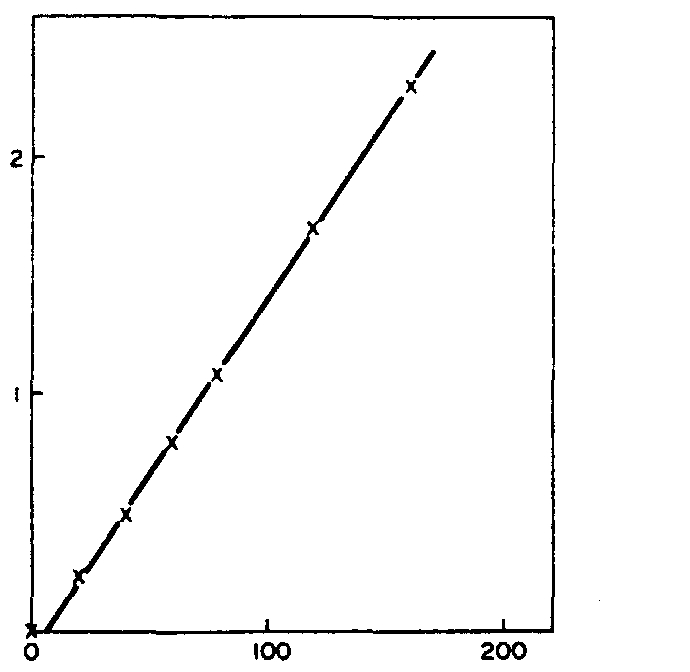
titration indicates a residual complexation capacity
for Pb (Fig.
5),
which is largely removed by filtration
through the PMIO ultrafilter.
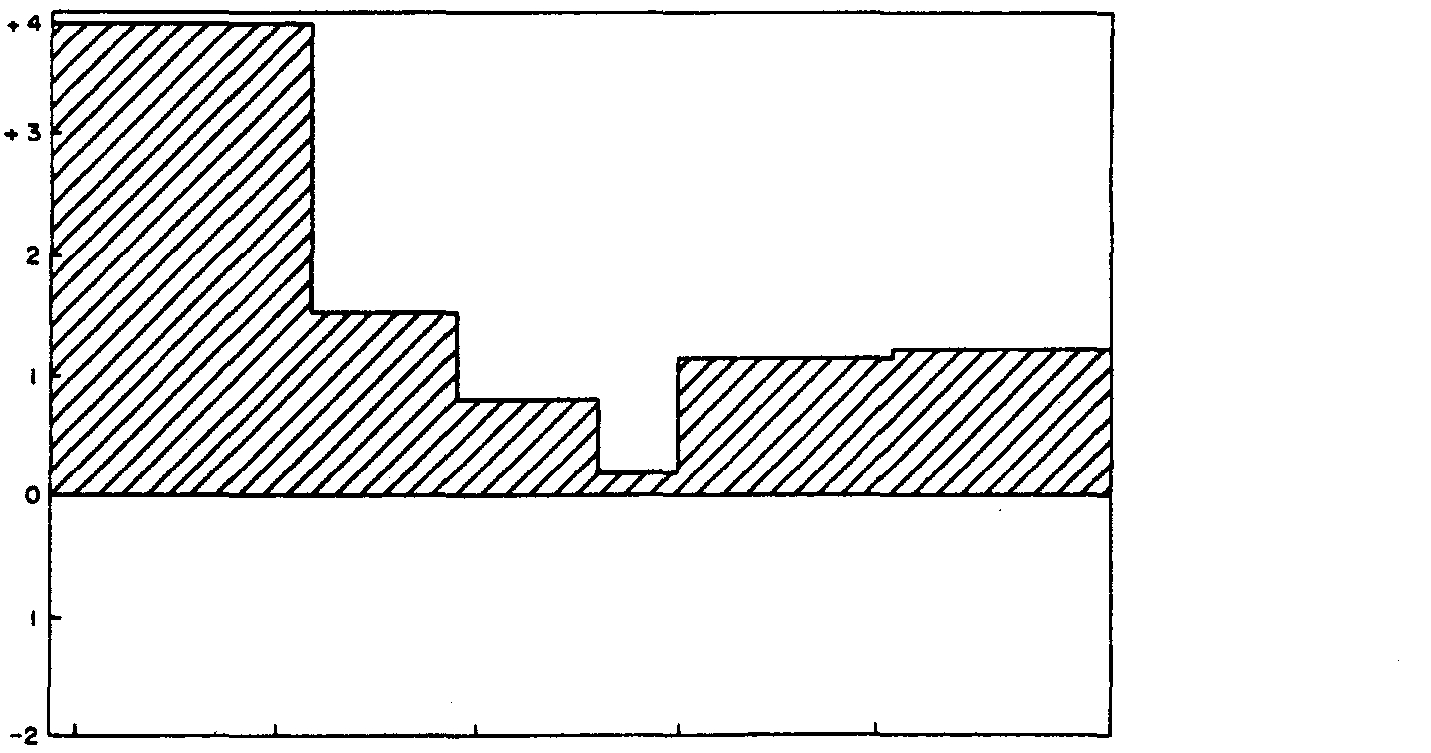
The distribution pattern below the outfall shows an
increase in the lead concentration in the colloidal size
range, but significantly not in the 0.08—0.4 pm fraction
which predominated in the upstream sample (Fig. 6).
The Pb concentration below the outfall is only
slightly increased but there is a significant shift from
the 1—12 pm size fraction to the
12pm particulates.
The ASV titration revealed a similar residual corn-
plexation capacity to that in the upstream sample.
There is a small amount of Chelex-labile lead (7) in
this sample, and the small ASV-labile response was
only 20 mV more cathodic than the response towards
the end of the titration. The lead in both upstream
and downstream samples thus appears to be strongly
1058
L~UNCAN
P. H. LAXEN and Ro~M.
HARRISON
Table
5.
Speciation of Cd. Pb, Cu. Fe and Mn in Pendle water upstream of the sewage
outfall
a
11
U
Size
fraction
(pm)
Concentration (pg 1-’)
Cd ()
Pb ()
Cu ()
Fe ()
Mn ()
12
0.01 (3)
0.40(22)
0.15(4)
59(7)
2(2)
1—12
0.18(58)
0.44(24)
0.89(24)
235(28)
—
0.4—1
0.02(6)
0.08(4)
0.28(7)
180(22)
2(2)
0.08—0.4
0.02(6)
0.53 (29)
0.71(19)
342 (41)
4(3)
0.015—0.08
—
0.03(2)
0.63(17)
—
4(3)
0.015
0.08(26)
0.32(18)
1.12(30)
J,4j~)
104(90)
Sum total
0.31
1.80
3.78
830
116
ASV~Iabile*
NQt
NQ
NQ
Chelex-labile’
0.09(29)
0.00(0)
0.56(15)
80(10)
110(95)
Table 6. Speciation of Cd, Pb, Cu. Fe and Mn in Pendle water downstream of the sewage
outfall
1.
U
U
U
N
m
a
U
U
U
a
a
f
Size
fraction
(pm)
Concentration (pg l
1)
Cd ()
Pb (°‘)
Cu ()
Fe ()
Mn ()
12
1.2(13)
0.80(37)
1.26(19)
96(11)
2(2)
1—12
1.3(14)
0.08(4)
1.04(16)
200(24)
3(3)
0.4—1
0.2(2)
0.16(7)
0.18(3)
143(17)
—
0.08—0.4
0.8 (9)
0.54(25)
0.66(10)
368(44)
6(5)
0.015—0.08
1.5(17)
0.23(11)
1.28(20)
14(2)
5(4)
0.015
4.0(44)
0.33(15)
2.08(32)
2Q(2)
~21~ft1
Sum total
9.0
2.14
6.50
841
113
AS V-labile’
2.9(32)
NQ1~
NQ
Chelex-labile’
3.1(34)
0.16(7)
0.86(13)
91(11)
105(93)
The physicochemical speciation of Cd. Pb. Cu. Fe and Mn
1059
complexed and there is a residual complexation ca-
pacity associated with the colloidal size fraction.
Copper
The copper in the upstream sample is fairly evenly
distributed across the size fractions. There is, however,
a significant fraction (17)
associated with the
0.015—0.08 pm colloidal size range in contrast to the
other metals and a fairly high proportion (30) in the
smallest size range. Not all of the Cu in this smallest
size range is Chelex-labile suggesting some of the Cu
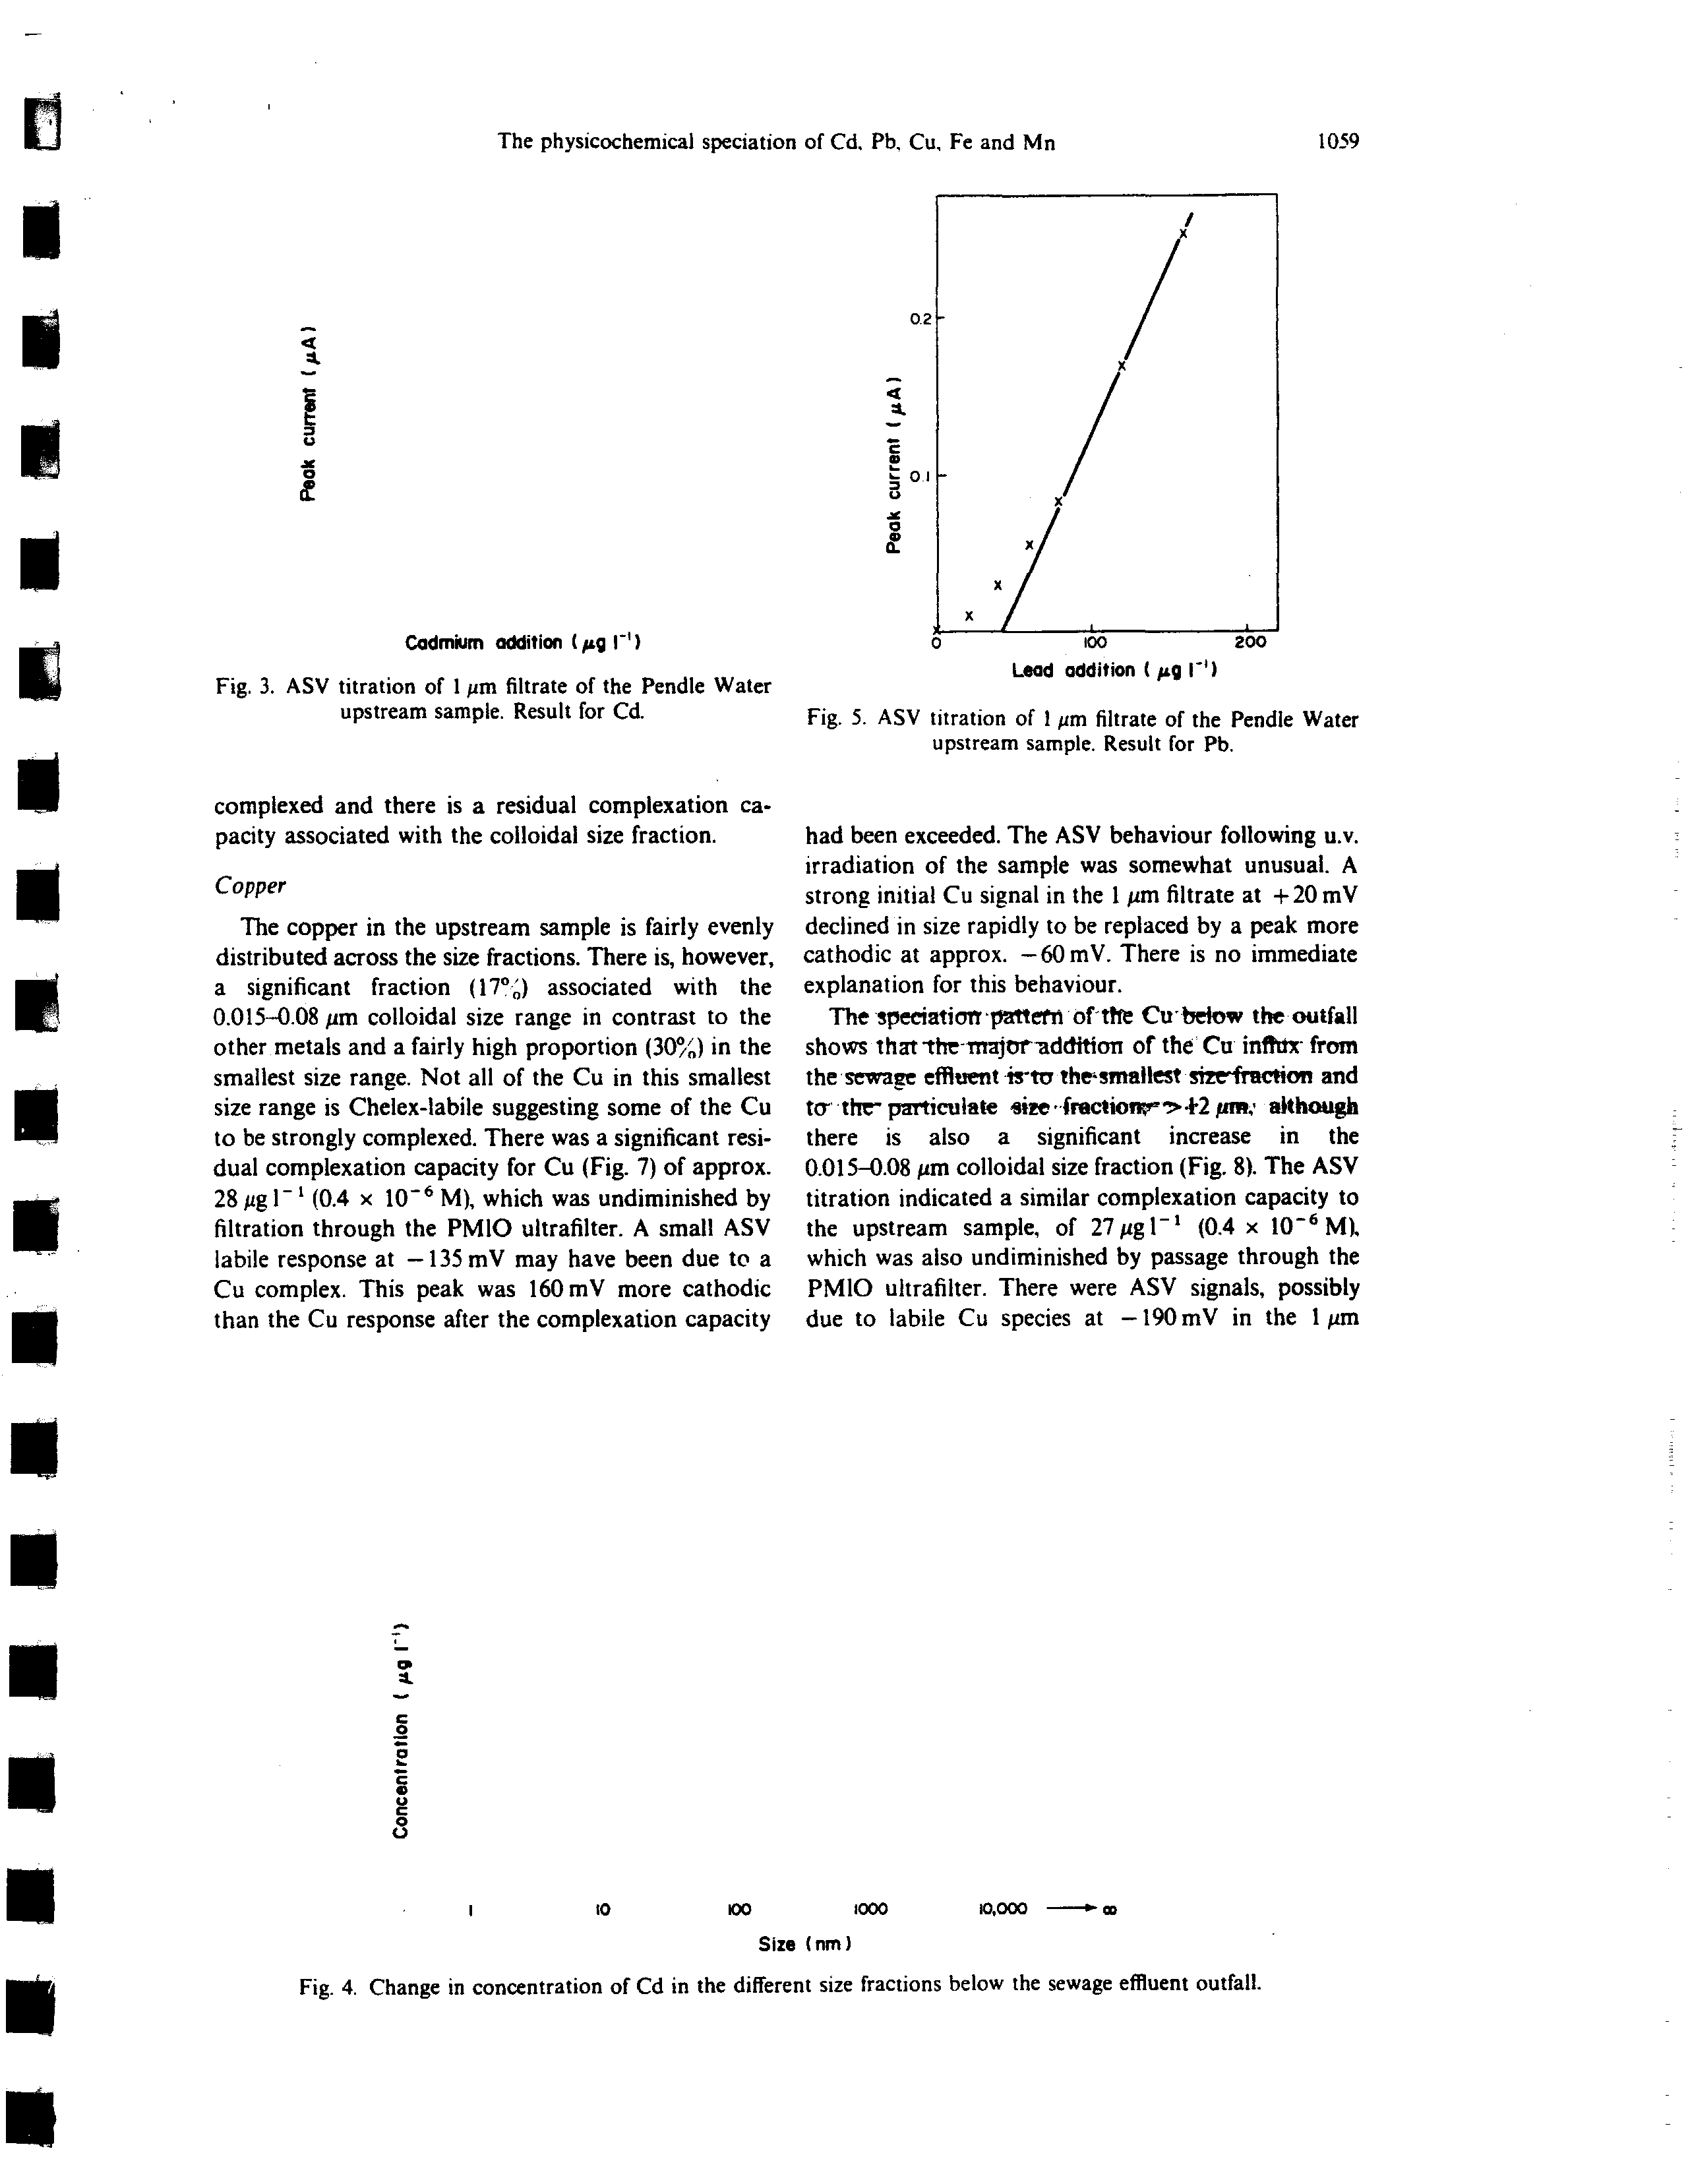
to be strongly complexed. There was a significant resi-
dual complexation capacity for Cu (Fig. 7) of approx.
28 pg l 1(0.4 x 10~M), which was undiminished by
filtration through the PMIO ultrafilter. A small ASV
labile response at —135mV may have been due to a
Cu complex. This peak was 160 mY more cathodic
than the Cu response after the complexation capacity
Fig.
5.
ASV titration of I pm filtrate of the Pendle Water
upstream sample. Result for Pb.
had been exceeded. The ASV behaviour following u.v.
irradiation of the sample was somewhat unusual. A
strong initial Cu signal in the 1 pm filtrate at + 20 mY
declined in size rapidly to be replaced by a peak more
cathodic at approx. —60 mY. There is no immediate
explanation for this behaviour.
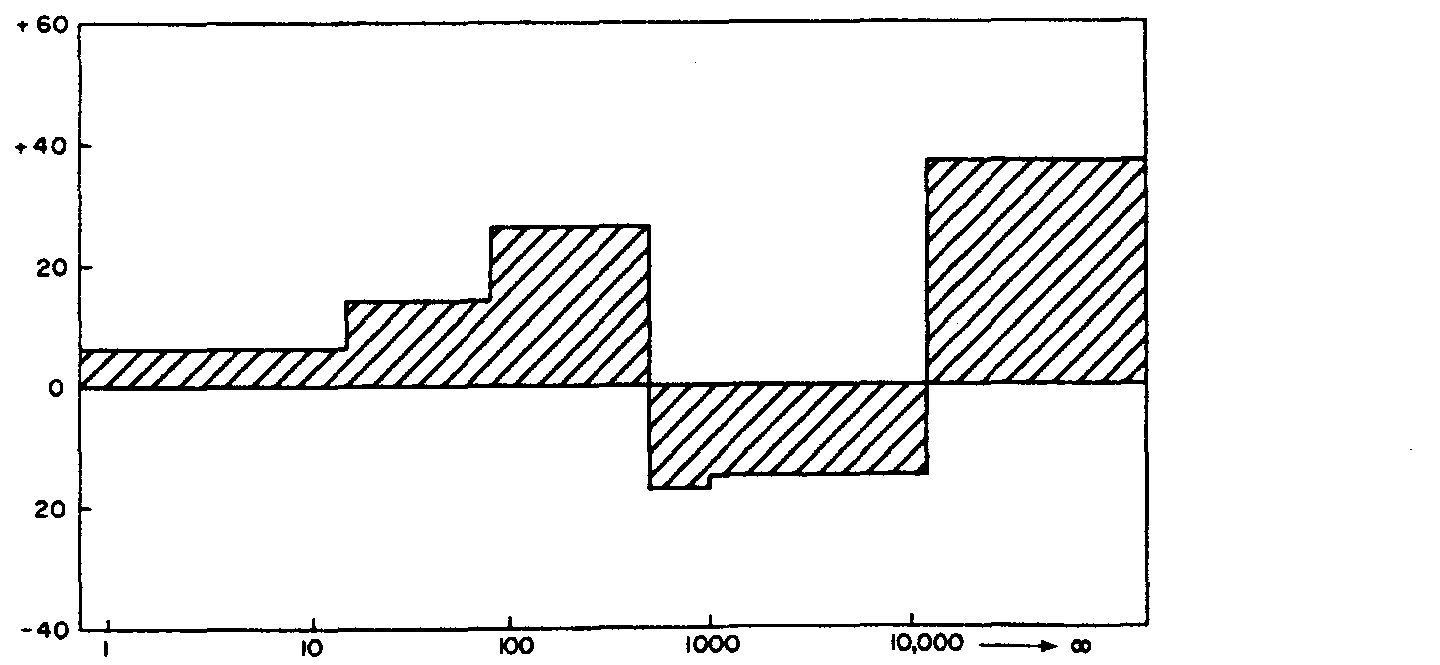
The speeiatimtpattetii of~ttfeCu below the outfall
shows that tb
ajtn~addthoiiof the Cu jflftLlx~fr~
the sewa e effluent ~
the~smaIlestsizv~fructionand
to thv particulate sire ~fraction’~’+2pm: although
there is also a significant increase
in the
0.015—0.08 pm colloidal size fraction (Fig. 8). The ASV
titration indicated a similar complexation capacity to
the upstream sample, of 27 pg 1~ (0.4 x 10_6 M).
which was also undiminished by passage through the
PMIO ultrafilter. There were ASV signals, possibly
due to labile Cu species at —l9OmV in the 1pm
4
a
Fig. 3. ASV titration of 1 pm filtrate of the Pendle Water
upstream sample. Result for Cd.
0.2
‘4
a.
c
0l
U
a
/
Cadmium addition lpg
i~)
00
200
Lead addition t pg rI
1.
C
0
a
C
0
0
10
00
000
0,000
~
Size (nm)
Fig. 4. Change in concentration of Cd in the different size fractions below the sewage effluent outfall.
DUNCAN
P. H.
LAXEN
and RoY M.
HARRISON
filtrate and —250 and — 150 mY in the PM1O filtrate,
which would be indicative of strong complexation.
(The response towards the end of the titration was at
+
3Sto
+
40 mV.) These peaks were absent following
u.v. irradiation.
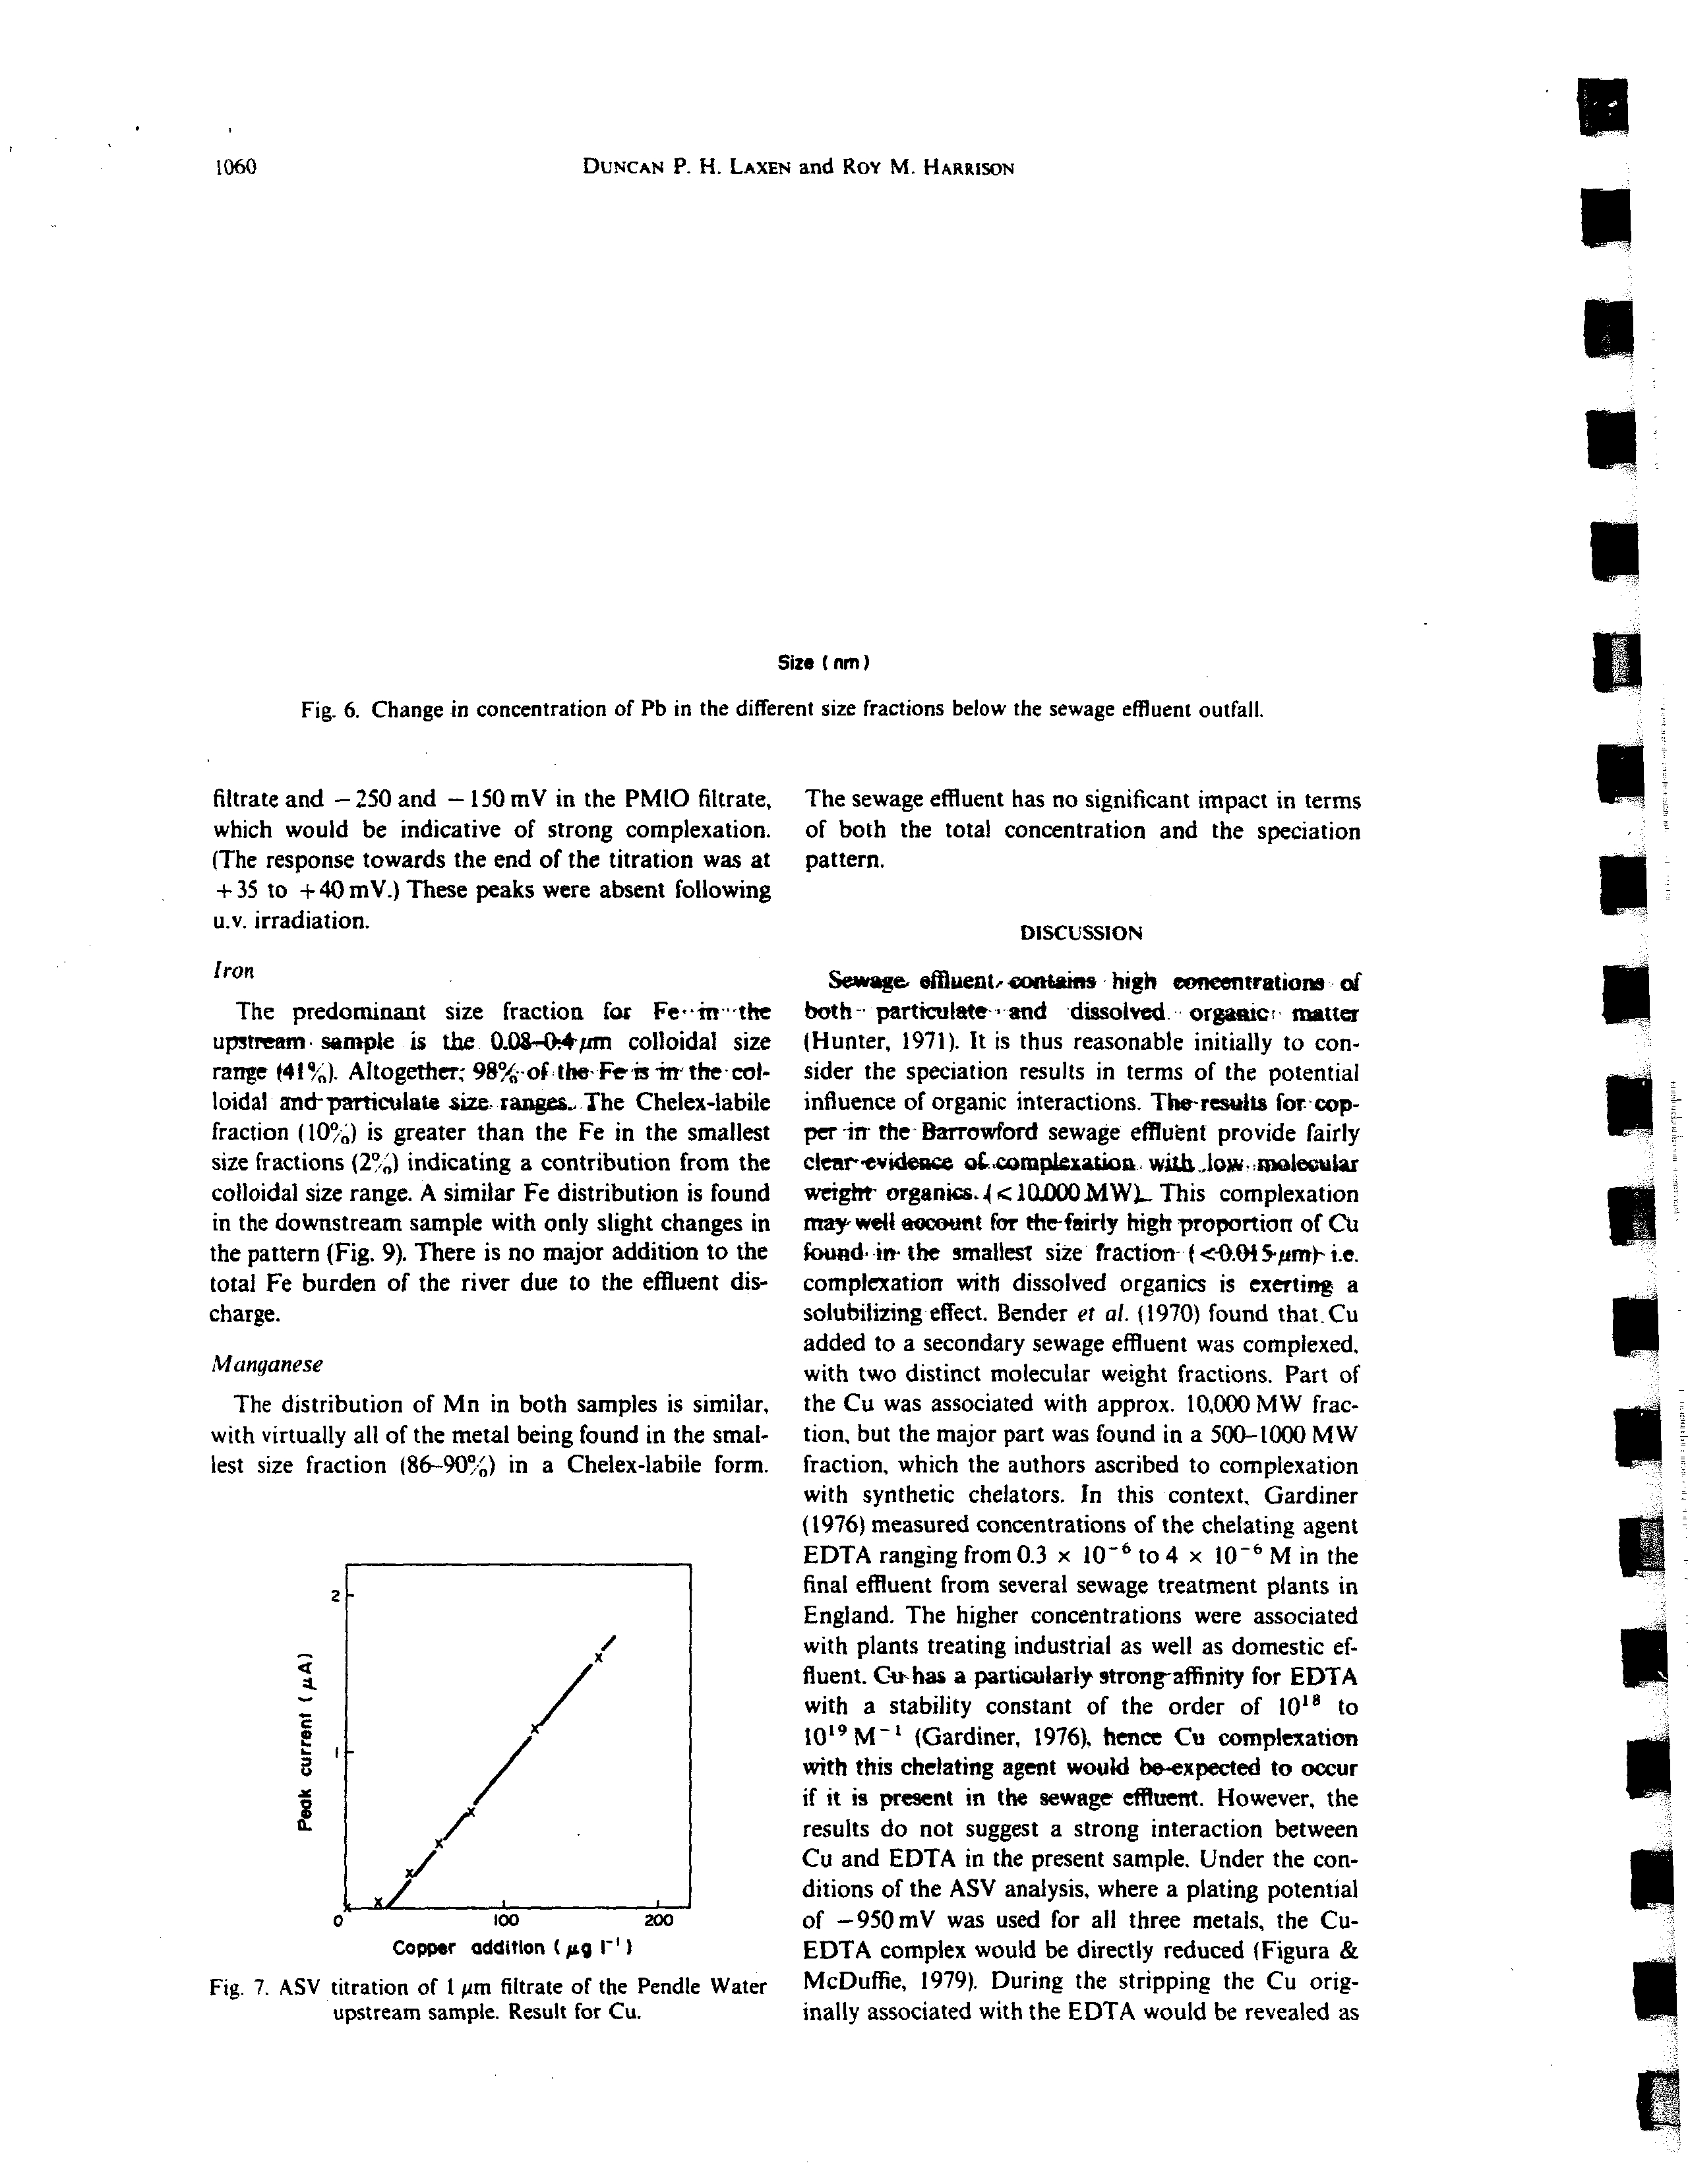
iron
The predominant size fraction foz Fe” in ihe
upstream. sample is the 0.08-’-0~4’pm colloidal size
range (41 ). Altogether; 98.of. the~Feis
itt
the col-
loidal and-particulate size. range&. The Chelex-labile
fraction (10)
is greater than the Fe in the smallest
size fractions (2) indicating a contribution from the
colloidal size range. A similar Fe distribution is found
in the downstream sample with only slight changes in
the pattern (Fig. 9). There is no major addition to the
total Fe burden of the river due to the effluent dis-
charge.
Manganese
The distribution of Mn in both samples is similar,
with virtually all of the metal being found in the smal-
lest size fraction (86—90)
in a Chelex-labile form.
00
200
Copper addition (pg rI
Fig. 7. ASV titration of 1 pm filtrate of the Pendle Water
upstream sample. Result for Cu.
The sewage effluent has no significant impact in terms
of both the total concentration and the speciation
pattern.
DISCUSSION
Sewage. effluent.- ~oniains high
eoncernrations
.
of
both - particulate ‘and dissolved. organic n~ues
(Hunter, 1971). It is thus reasonable initially to con-
sider the speciation results in terms of the potential
influence of organic interactions. The-results forcop-
p~~ the Barrowford sewage efflu’ent provide fairly
clear~evidea~e conpleiation. with Jew. meleuular
weight organics.410.000MW)...
This
complexation
may’well aucount for
the-fairly
high
proportion of Cu
found. in- the smallest size fraction (1)1)4
S’pm)-
i.e.
comptexation with dissolved organics is exerting a
solubilizing effect. Bender
et a!.
(1970) found that. Cu
added to a
secondary
sewage effluent was complexed.
with two distinct molecular weight fractions. Part of
the Cu was associated with approx. 10,000 MW frac-
tion, but the major part was found in a 500—1000 MW
fraction, which the authors ascribed to complexation
with synthetic chelators. In this context, Gardiner
(1976) measured concentrations of the
chelating agent
EDTA ranging from 0.3 x 10_6 to 4
x l0~’M
in the
final effluent from several sewage treatment plants in
England. The higher concentrations were associated
with plants treating industrial as well as domestic ef-
fluent. C-u~has a particularly strong-affinity for EDTA
with a stability constant of the order of lO’~to
IO’~M’ (Gardiner, 1976), hence Cu complexation
with this chelating agent would be-expected to occur
if it is present in the sewage effluent. However, the
results do not suggest a strong interaction between
Cu and EDTA in the present sample. Under the con-
ditions of the ASV analysis, where a plating potential
of —950 mY was used for all three metals, the Cu-
EDTA complex would be directly reduced (Figura &
McDuffie, 1979). During the stripping the Cu orig-
inally associated with the EDTA would be revealed as
1060
Size (nm I
Fig. 6. Change in concentration of Pb in the different size fractions below the sewage effluent outfall.
U
U
a
U
U
p
p
a
N-
a
p
I
a
a
a
a
C
4
a.
C
U
2
0
/X
/
J
/
/
The physicochemical speclation of Cd, Pb, Cu, Fe and Mn
1061
a.
S
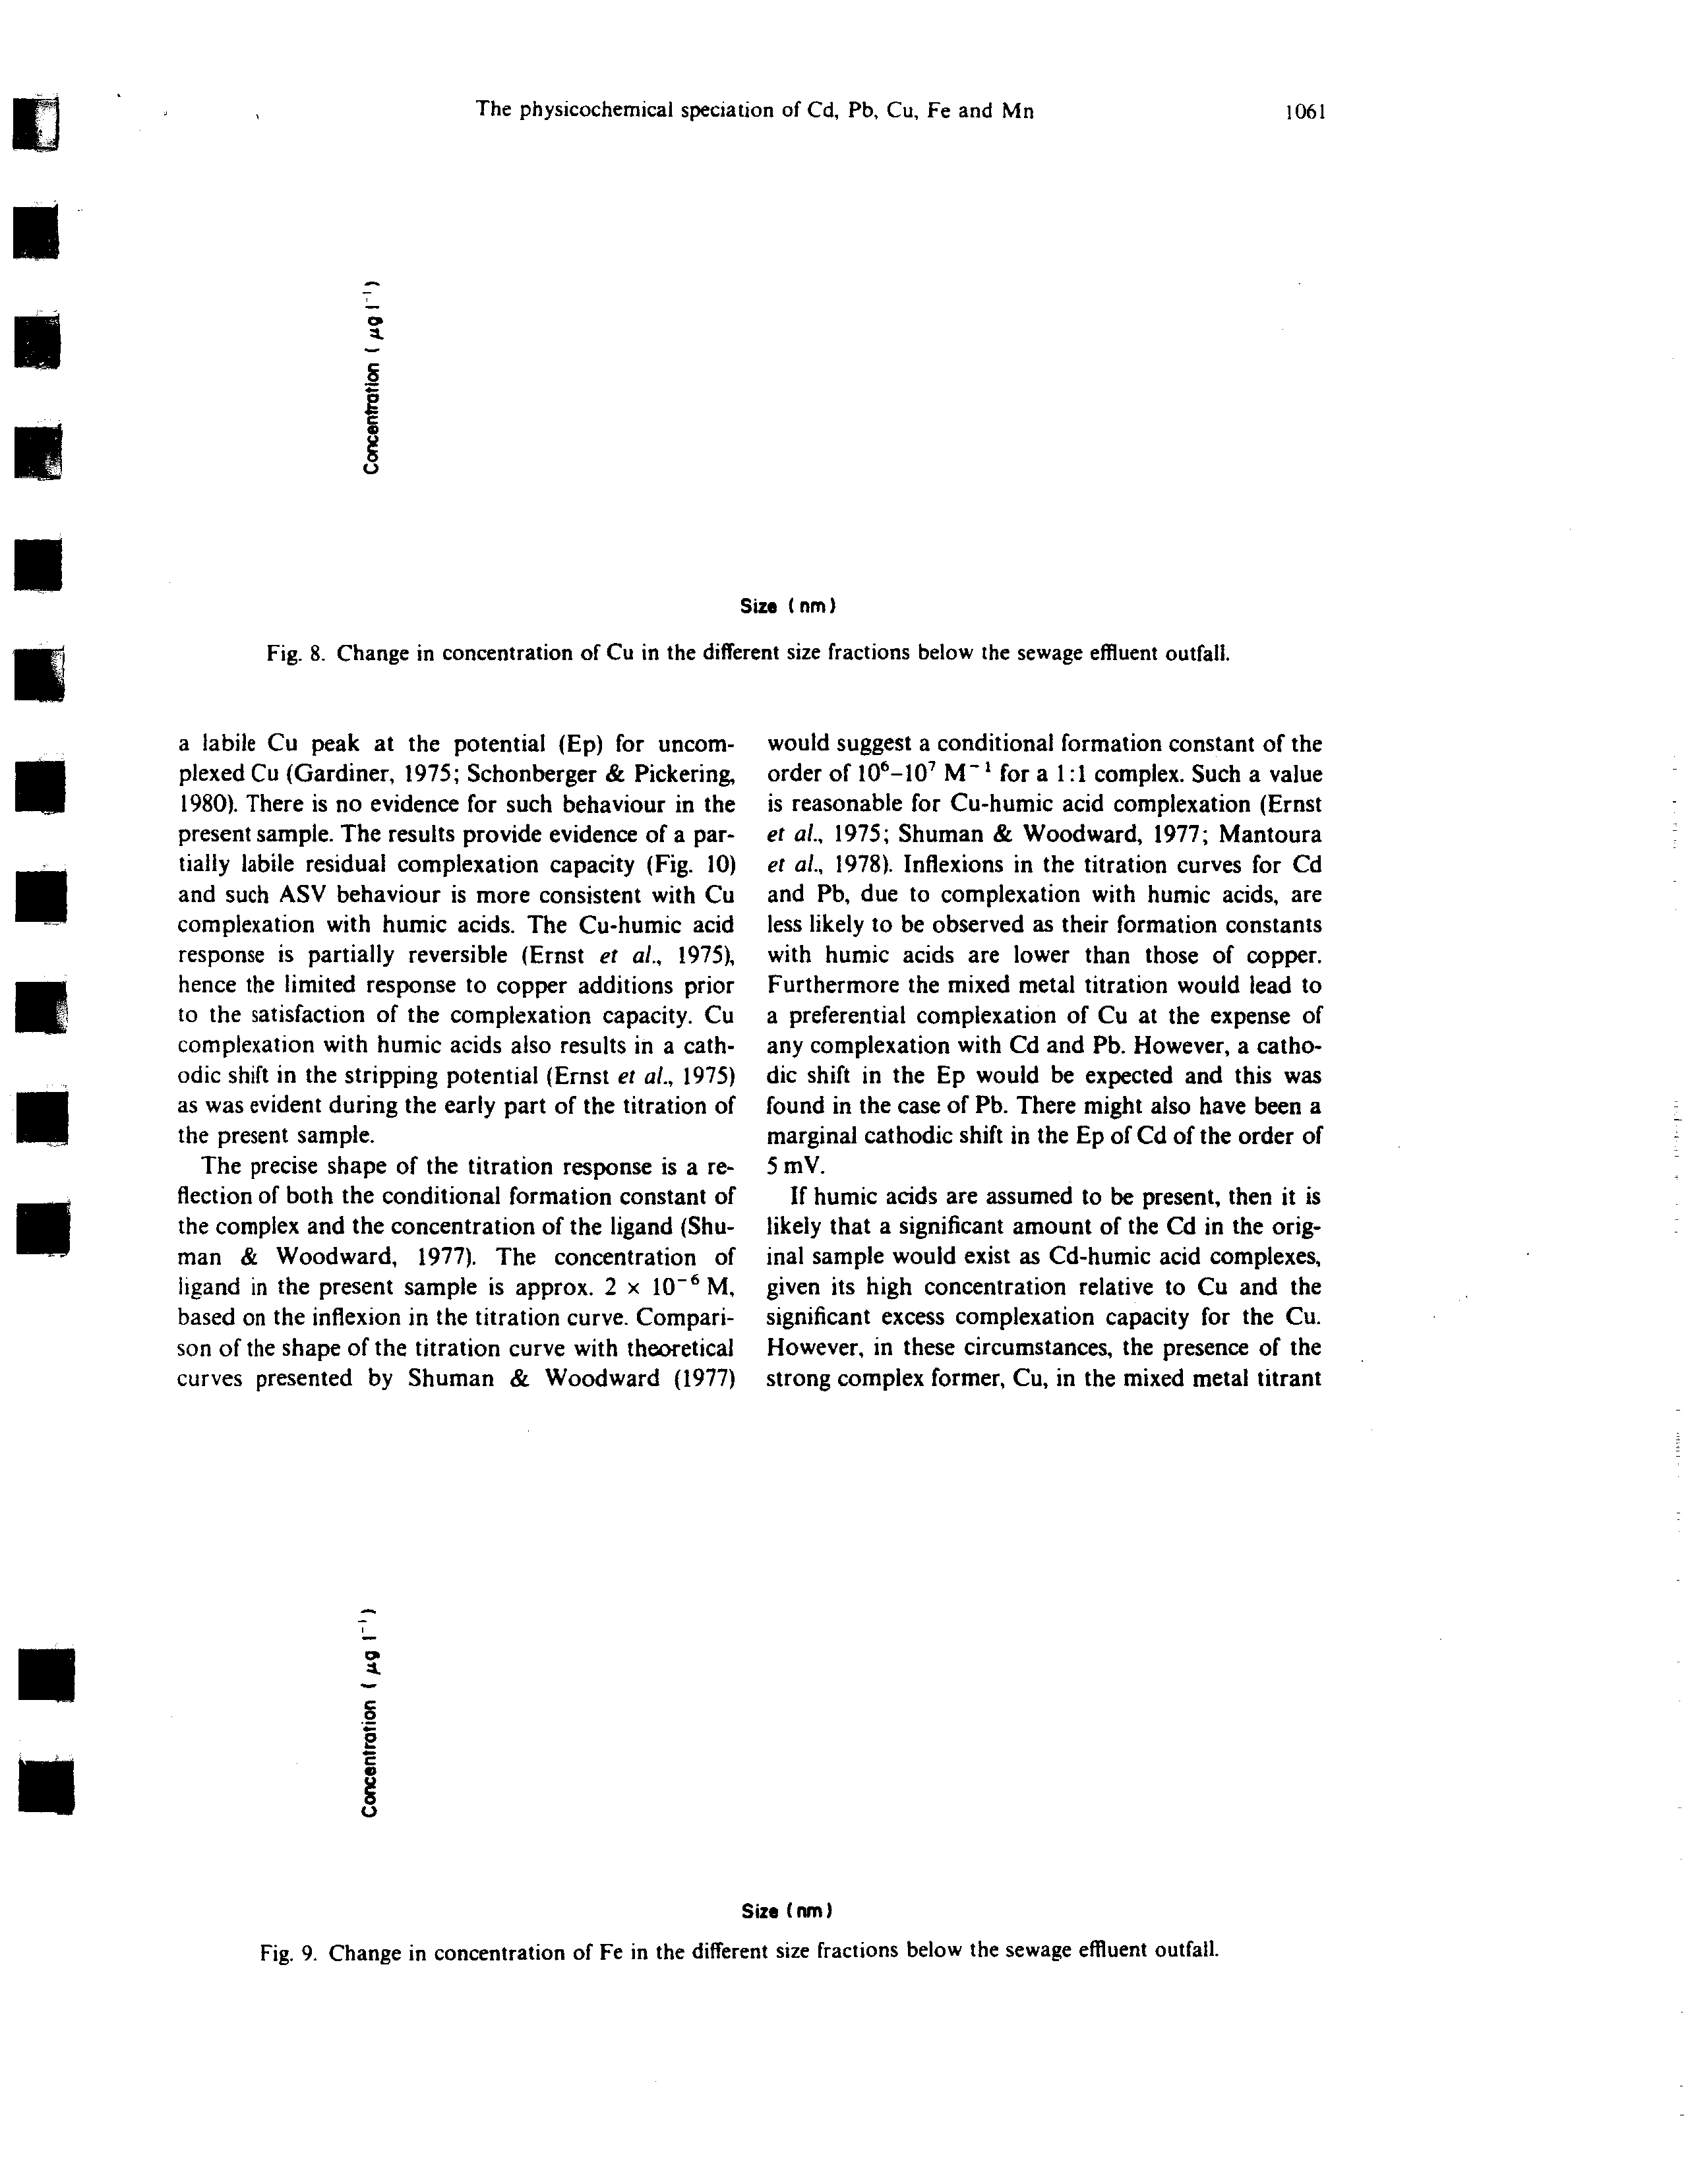
Fig. 8. Change in concentration of Cu in the different size fractions below the sewage effluent outfall.
a labile Cu peak at the potential (Ep) for uncom-
plexed Cu (Gardiner, 1975; Schonberger & Pickering,
1980). There is no evidence for such behaviour in the
present sample. The results provide evidence of a par-
tially labile residual complexation capacity (Fig. 10)
and such ASV behaviour is more consistent with Cu
complexation with humic acids. The Cu-humic acid
response is partially reversible (Ernst
et a!.,
1975),
hence the limited response to copper additions prior
to
the satisfaction of the complexation capacity. Cu
complexation with humic acids also results in a cath-
odic shift in the stripping potential (Ernst
et a!.,
1975)
as was evident during the early part of the titration of
the present sample.
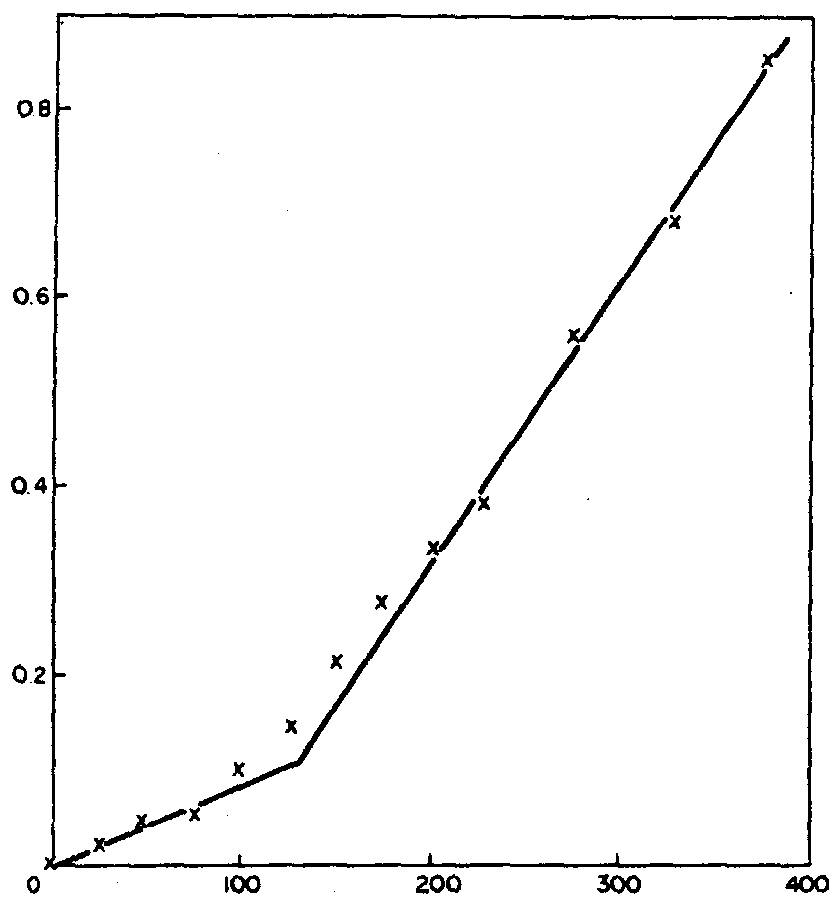
The precise shape of the titration response is a re-
flection of both the conditional formation constant of
the complex and the concentration of the ligand (Shu-
man & Woodward, 1977). The concentration of
igand in the present sample is approx. 2 x 10_6 M,
based on the inflexion in the titration curve. Compari-
son of the shape of the titration curve with theoretical
curves presented by Shuman & Woodward (1977)
a.
S
2
C
would suggest a conditional formation constant of the
order of iOo_107 M ‘for a 1:1 complex. Such a value
is reasonable for Cu-humic acid complexation (Ernst
et a!.,
1975; Shuman & Woodward, 1977; Mantoura
et
a!., 1978). Inflexions in the titration curves for Cd
and Pb, due to complexation with humic acids, are
less likely to be observed as their formation constants
with humic acids are lower than those of copper.
Furthermore the mixed metal titration would lead to
a preferential complexation of Cu at the expense of
any cornplexation with Cd and Pb. However, a catho-
dic shift in the Ep would be expected and this was
found in the case of Pb. There might also have been a
marginal cathodic shift in the Ep of Cd of the order of
5
mY.
If humic acids are assumed to be present, then it is
likely that a significant amount of the Cd in the orig-
inal sample would exist as Cd-humic acid complexes,
given its high concentration relative to Cu and the
significant excess complexation capacity for the Cu.
However, in these circumstances, the presence of the
strong complex former, Cu, in the mixed metal litrant
Size (nm)
Size (nm)
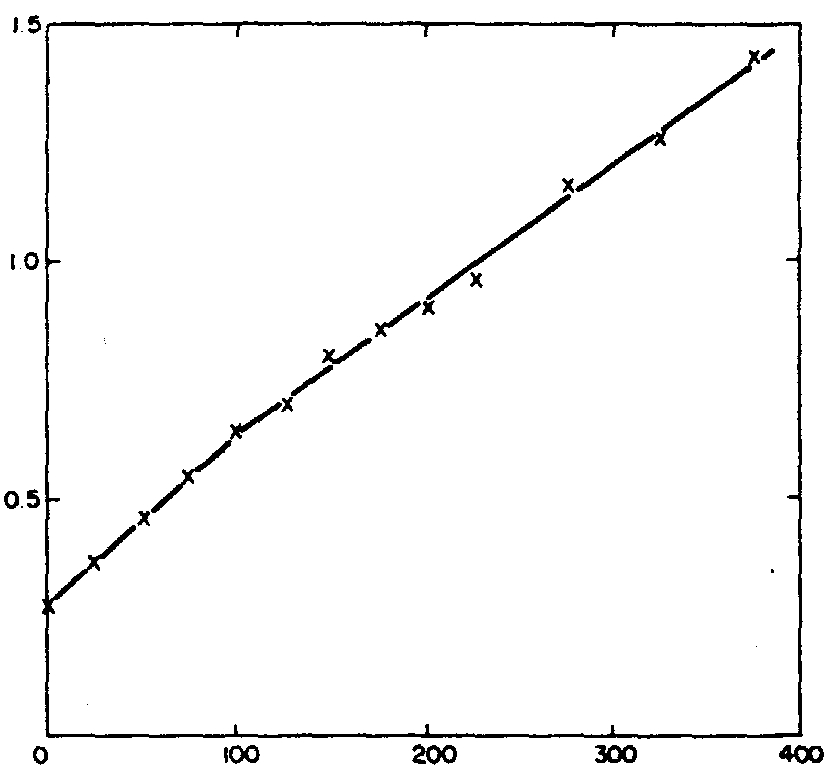
Fig. 9. Change in concentration of Fe in the different size fractions below the sewage effluent outfall.
1062
DUNCAN
P. H.
LAXEN
and Ro~M. HARRISON
4
a.
C
U
0
Fig. 10. ASV titration of I pm filtrate of the sewage efflu-
ent. Result for Cu.
might lead to the competitive displacement of Cd
from complexation sites. There is indeed some evi-
dence of such a substitution process occurring during
the titration (Fig. 11). The sensitivity to added Cd is
reduced once the Cu complexation capacity has been
fulfilled. The initial labile
Cd response may thus rep-
resent both the added Cd
plus
Cd released from par-
tially labile complexation sites. It is possible therefore
that humic acids are responsible for exerting a solubi-
lizing effect on the Cd as well as the Cu, hence the
high proportion of Cd in the smallest size fraction.
Murray & Meinke (1974) have demonstrated a similar
ability of sewage effluent to retain Cd in solution.
The residual Cu complexation capacity measured
in the present sample of approx. 2 x 10_6 M, is simi-
lar to that measured by Lewin & Rowell (1973) of
1 x 10~M, using a similar mixed metal titration on
the final effluent from the Oxford sewage treatment
plant. They also found a small residual complexation
capacity for Pb of 7.7 x lO~M, but none in the case
of Cd. In the present sample there was a similar small
residual complexation capacity for Pb of approx.
2 x i0~M, but none in the case of Cd. However,
only a small
part of the Pb is in the
smallest size
fraction (10) suggesting that very little lead is being
solubilized by low molecular weight organics and that
other mechanisms are operating to preferentially as-
sociate the Pb with other size fractions. Pb has a
stronger adsorption/ion exchange affinity for clays
and hydrous iron oxides than either Cu or Cd (Rama-
moorthy & Rust, 1978; Farrah & Pickering. 1977).
Hence the different distribution pattern for Pb than
Cd or Cu, in particular the emphasis on the 0.4—1 jim
fraction may reflect the greater affinity of Pb for in-
organic solids.
The speciation results for the sample of final efflu-
ent provide a clue to the differing efficiencies of metal
removal during treatment (Table I). Factors which
retain the metals ~in the colloidal and soluble
(0.Ol5jLm) size fractions will make it more likely
that the metals will pass througfr the plant, whilst
association ofthe metals-with the particulate size frac-
tionwiI1~ensare’a greater- loss of metal during the
passage through the
final
sedimentation tank. The
speciation results (Table 3) would suggest that the
efficiency of removal would be in the order
Fe Pb Cu
Cd Mn, which bears a reason-
able correspondence to the results for actual plants
presented in Table 1. These are not, however, the only
factors to take into account, as the removal efficiency
will also depend upon the affinity of the metals for the
floc in the biological filter or activated sludge plant,
as they pass through the treatment works.
The metal speciation patterns in the river differ
from those in the sewage effluent. A major proportion
of all metals, except Mn, is found in the colloidal and
particulate fractions. This is particularly evident in
the case of Fe where 98 is 0.015 jim. This is prob-
ably due principally to the hydrolysis of Fe to ferric
hydroxide species. X-ray diffractometry performed on
the solids
0.4 pm revealed the presence of goethite
(cz-FeOOH). together with quartz, calcite, truscottite,
kaolinite and muscovite. Amorphous iron oxide
would not have shown up but may also have been
present.
Gardiner (1974) has examined the association of Cd
with river muds and various components thereof and
concluded that the Cd is probably associated with
particulate humic substances. Suzuki
et a!.
(1979) have
similarly suggested that Cd is probably associated
with organic matter in river suspended sediments. It is
thus possible that the colloidal and particulate Cd in
Copper addition (pg ~‘)
a
4
a.
C
C
U
0
Cadmium addition (pg I’)
Fig. 11. ASV titration of 1 ~zmfiltrate of the sewage efflu-
ent. Result for Cd.
a
a
a
N
a
Ii
Method
Chele
Pb
x-labile
(
Cd
metal
Cu
pH
TOC
(mgl’)
Sample
Reference
Batch
0
90
23
7.7
6.0
-
Pendle Water (upstream)
This work
Batch
15
49
21
7.6
6.4
Pendle Water (downstream) This work
Batch
18
33
42
7.5
6.3
River Irwell (upstream)
Laxen & Harrison (1981c)
Batch
36
43
48
7.4
6.2
River Irwell (downstream)
Laxen & Harrison (l981c)
Batch
67
94
22
7.7
24
Mordialloc Creek
Hart & Davies (1976)
Batch
55
91
58
7.1
NA
Yarra River
Hart & Davies (1977)
Column
67
94
22
6.5
NA
Susquehanna River
Figura & McDuffie (1977)
Column
100
92
66
6.1
4.5
Woronora Reservoir
Florence (1977)
Column
78
100
49
6.1
2,7
Woronora Reservoir
Florence (1977)
Column
71
100
36
6.0
1.6
Woronora Reservoir
Florence (1977)
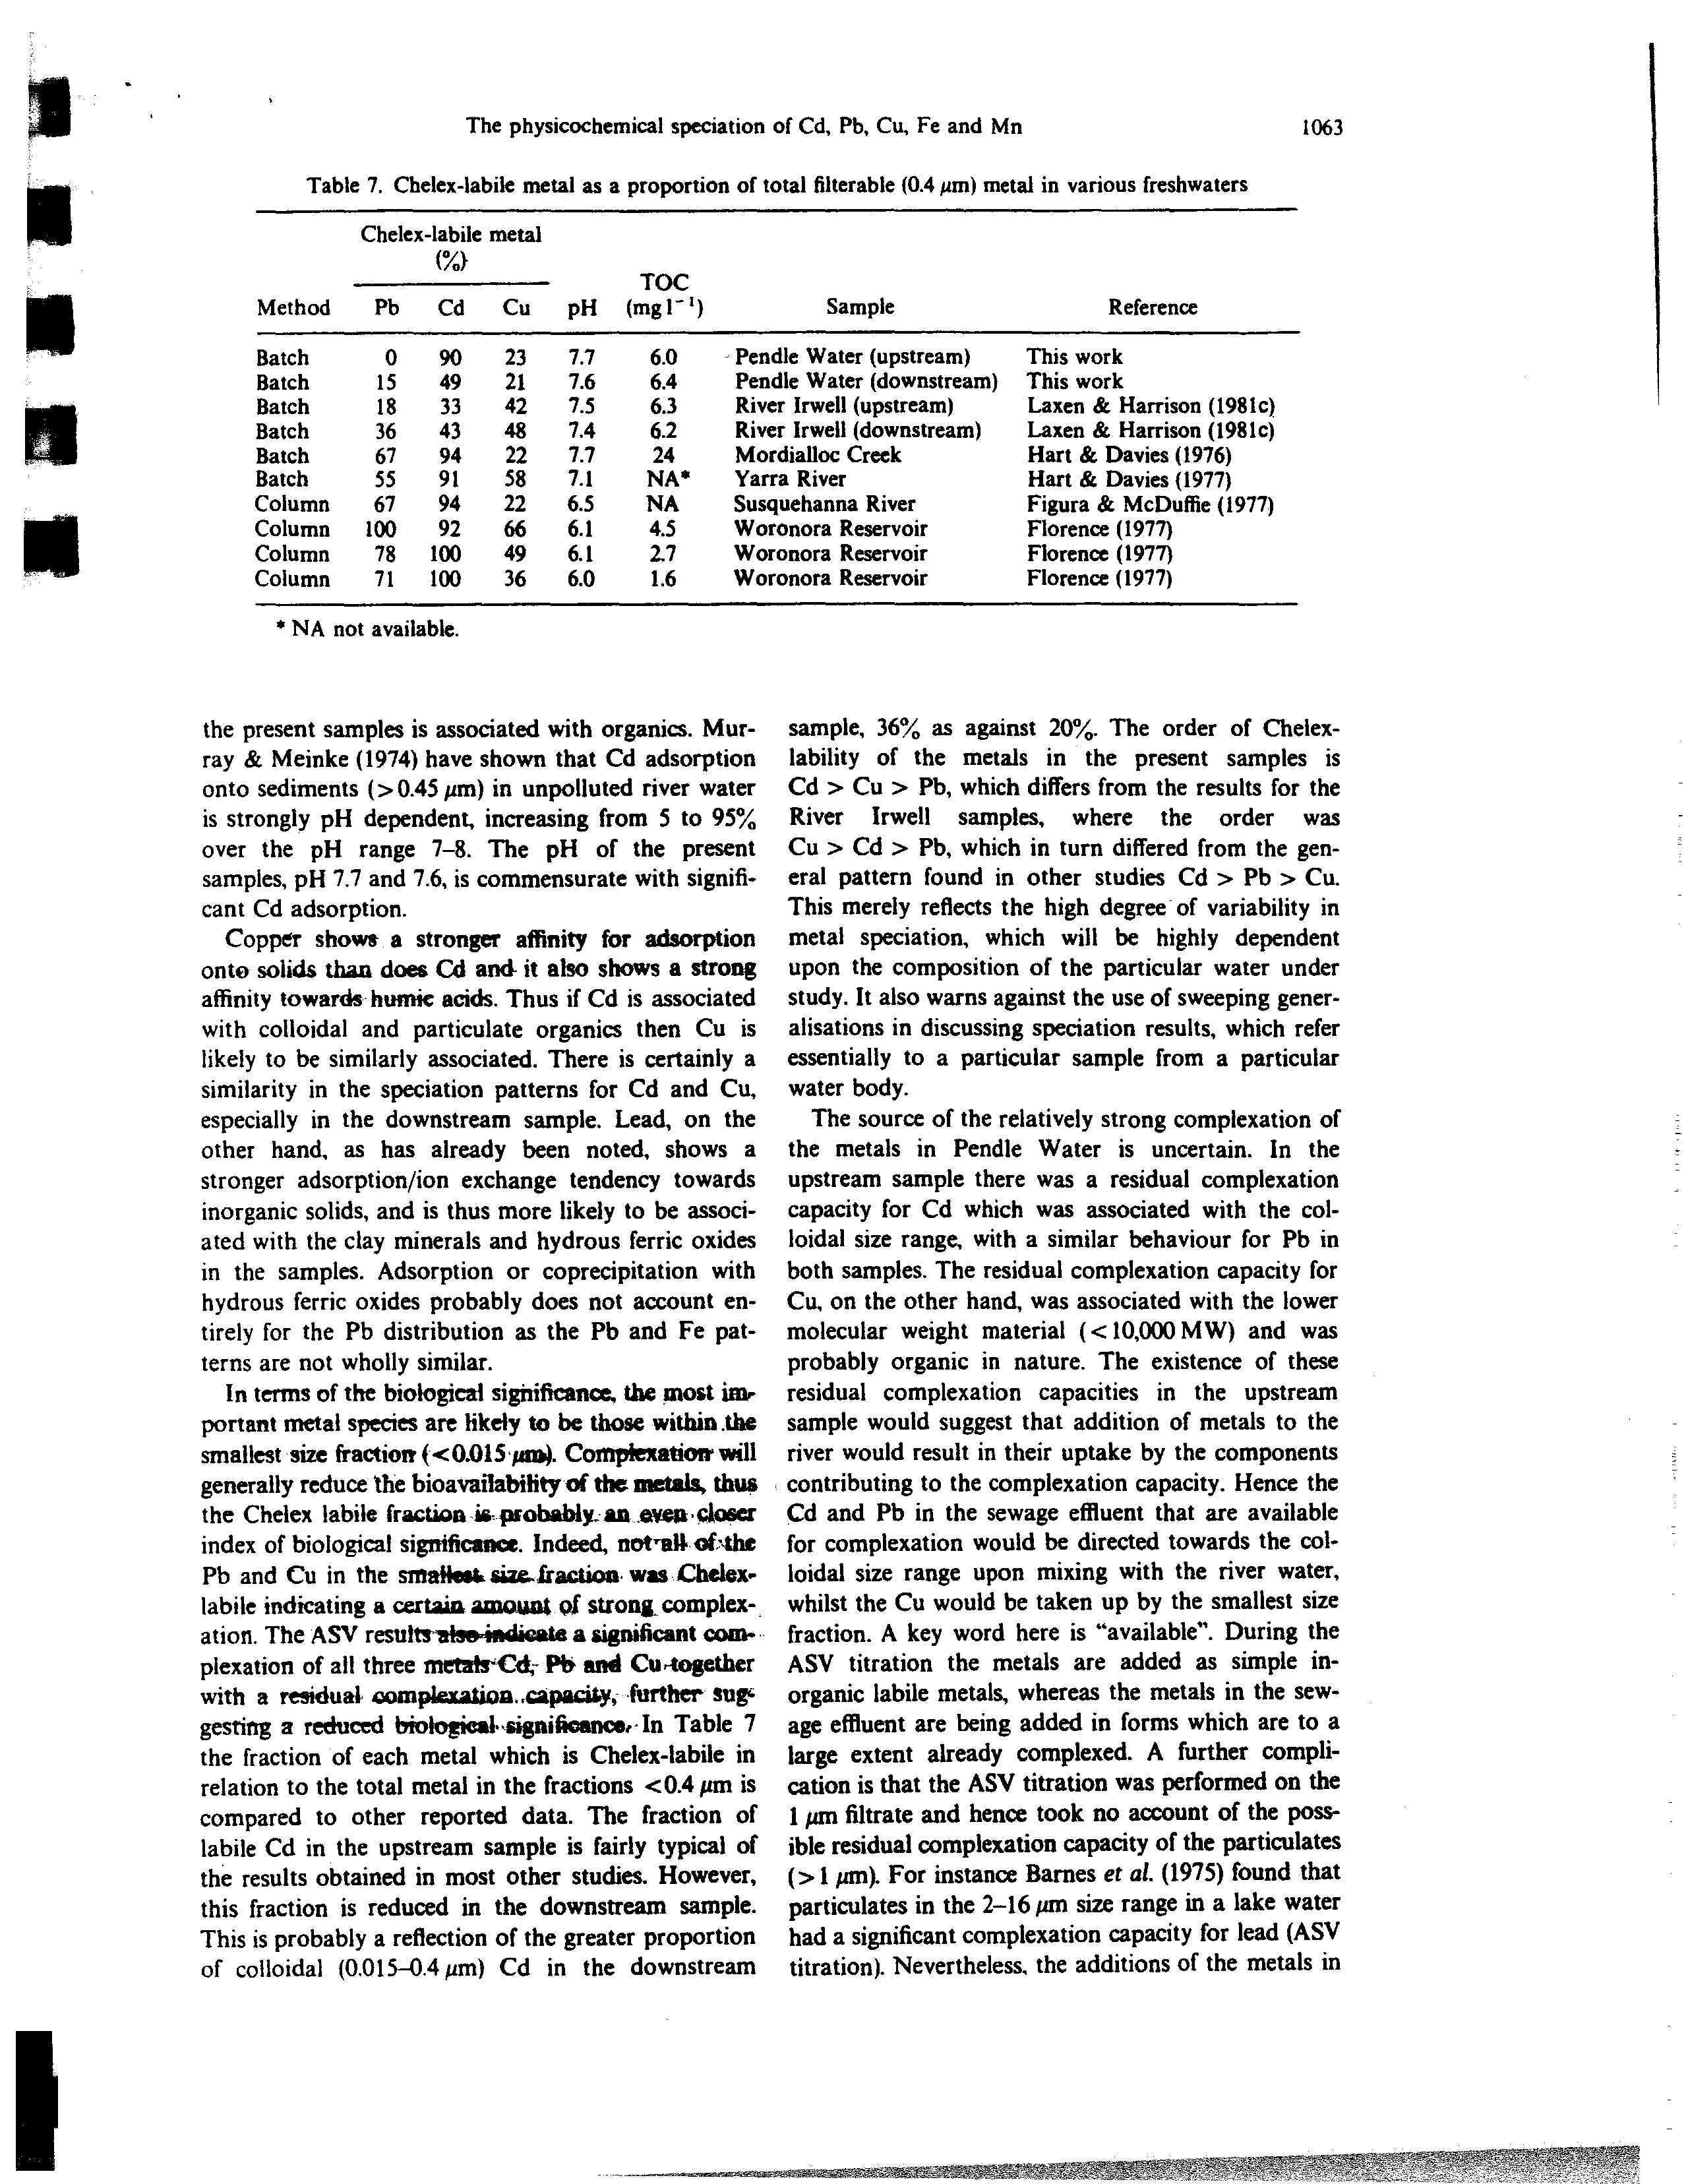
the present samples is associated with organics. Mur-
ray & Meinke (1974) have shown that Cd adsorption
onto sediments (0.45 jim) in unpolluted river water
is strongly pH dependent, increasing from 5 to 95
over the pH range 7—8. The pH of the present
samples, pH 7.7 and 7.6, is commensurate with signifi-
cant Cd adsorption.
Copper shows a stronger affinity for adsorption
onto solids than does Cd and- it also shows a strong
affinity towards-
humic acids. Thus if Cd is associated
with colloidal and particulate organics then Cu is
likely to be similarly associated. There is certainly a
similarity in the speciation patterns for Cd and Cu,
especially in the downstream sample. Lead, on the
other hand, as has already been noted, shows a
stronger adsorption/ion exchange tendency towards
inorganic solids, and is thus more likely to be associ-
ated with the clay minerals and
hydrous ferric oxides
in the samples. Adsorption or coprecipitation with
hydrous ferric oxides probably does not account en-
tirely for the Pb distribution as the Pb and Fe
pat-
terns are not wholly similar.
In
terms of the biological significanca. the
most irn~
portant metal species are likely to be those
within
.Lke
smallest size fractioty (0.Ol5prn~. Comp1exation’ will
generally reduce the
bioavailability of thc metals, thus
the Chelex labile fractinn-isprobably;an .oveu.cioser
index
of biological significanca. Indeed, not~al~oi~the
Pb and Cu in the sma4les~sizg.fragtion- was Chelex-
labile indicating a certain arnou~n*of stron~complex-
ation. The ASV resutts-ulse~indicatea significant corn--
plexation of all three
metatrCdç Pb and
Cu
-together
with a residual oomp!~atinn..capaci1~’,further sag’
gesting a reduced biological.~signiflcancs~
In Table 7
the fraction of each metal which is Chelex-labile in
relation to the total metal in the fractions 0.4 jim is
compared to other reported data. The fraction of
labile Cd in the upstream sample is fairly typical of
the results obtained in most other studies.
However,
this fraction is reduced in
the
downstream sample.
This is probably a reflection of the greater proportion
of colloidal (0.015—0.4
jim)
Cd in the downstream
sample. 36
as against 20.
The order of Chelex-
lability of the metals in the present samples is
Cd Cu Pb, which differs from the results for the
River
Irwell
samples, where the order was
Cu Cd Pb, which in turn differed from the gen-
eral pattern found in other studies Cd Pb
Cu.
This merely reflects the high degree of variability in
metal
speciation,
which will be highly dependent
upon the composition of the
particular
water under
study. It also warns against the use of sweeping gener-
alisations in discussing speciation results, which refer
essentially to a particular sample from a particular
water body.
The source of the relatively strong complexation of
the metals in Pendle Water is uncertain. In the
upstream sample there
was a
residual complexation
capacity for Cd which was associated with the col-
loidal size range, with a similar behaviour for Pb in
both samples. The residual complexation capacity for
Cu, on the other hand, was associated with the lower
molecular weight material
(10,000MW)
and was
probably organic in nature. The existence of
these
residual complexation capacities in the upstream
sample would
suggest that addition of metals to the
river would result in their uptake by the components
contributing to the complexation capacity. Hence the
Cd and Pb in the sewage effluent that
are
available
for complexation would be
directed towards the col-
loidal size range upon mixing with the river water,
whilst the Cu would be taken up by the smallest size
fraction. A key word here is “available”. During the
ASV titration the metals are added as simple in-
organic labile metals, whereas the metals in the sew-
age effluent
are
being added in forms which are to a
large extent already complexed. A further compli-
cation is that the ASV titration
was performed
on the
1 pm filtrate
and
hence took no account of the poss-
ible residual complexation capacity of the particulates
(1 pm). For instance Barnes
et
at. (1975) found that
particulates in the 2—16 pm
size
range in a lake water
had a significant coinpiexation capacity for lead (ASV
titration). Nevertheless, the additions of the metals in
I
N
N
N
The physicochemical speciation of Cd, Pb,
Cu,
Fe and Mn
1063
Table 7. Chelex-labile metal as a proportion of total filterable (0.4
pm) metal in various freshwaters
* NA not available.
1064
E~UNCAN
P. H.
LAXEN
and Roy M. HARRISON
U
Acknowledgements—We
thank the Ribble Division of the
North West Water Authority (NWWA) for their permis-
sion to sample the Barrowford sewage effluent and for pro-
vision of analytical data for the effluent.
In addition, we
thank the NWWA for providing us with analytical data for
Pendle Water. We also thank Mrs J. Walsh for her assist-
ance with the major ion analyses for this study. Finally we
thank the Science Research Council for their support of
this project.
-
REFERENCES
Andrew R. W.. Biesinger K. E. & Glass G. E. (1977) Effects
of inorganic complexing on the toxicity of copper to
Daphnia maqna. Water Res.
Ii,
309—315.
Atkins E. D. & Hawley
J.
R. (1978) Sources of metals and
metal levels in municipal wastewaters. Research Report
No. 80.
Ontario Ministry of the Environment, Toronto,
Ontario.
Barnes D.. Cooksey B. G.. Metters B. & Metters C. (1975)
Interferences in the electroanalytical determination of
copper and lead in water and wastewater.
Wat. Treat.
Exam.
24, 318—328.
Batley G. E. & Florence T. M. (1976a) A novel scheme for
the classification of heavy metal species in natural
waters.
Analvt. Lett. 9,
379—388.
Batley G. E. & Florence T. M. (1976b) The effect of dis-
solved organics on the stripping voltammetry of sea-
water.
J. Electroanalyt. Chem.
72, 121—126.
Bender M. E., Matson W. R. & Jordan R. A. (1970) On the
significance of metal complexing agents in secondary
sewage effluents.
Envir. Sd. Technol.
4, 520—521.
Benel P. & Steinnes E. (1975) Migration forms of trace
elements in natural fresh waters and the effect of the
water storage.
Water Res.
9, 74 1—749.
Benei P.. Koc J. & Stulik K. (1979) The use of anodic
stripping voltammetry for determination of the concen-
tration and forms of existence of lead in natural waters.
Water Res.
13, 967—975.
Brezonik
P. L.. Brauner P. A. & Stumm W. (1976) Trace
metal analysis by anodic stripping voltammetry: Effect
of sorption by natural and model organic compounds.
Water Res.
10, 605—612.
Brown M. J. & Lester J. N. (1979) Metal removal in acti-
vated sludge: The role of bacterial extracellular poly-
mers.
Water
Res.
13, 817—837.
Chau Y. K. & Lum-shue-chan K. (1974) Determination of
labile and strongly bound metals in lake water.
Water
Res.
8, 383—388.
Davies P. H.. Goetth J. P. Jr. Sinley J. R.
& Smith N. F.
(1976) Acute and chronic toxicity of lead to rainbow
trout
Salmo gairdneri,
in hard and soft water.
Water Res.
10, 199—206.
Dobbs R. A.. Wise R. H. & Dean R. B. (1972) The use of
ultra-violet absorbance for monitoring the total organic
carbon content of water and wastewater.
Water Res. 6,
1173— 1180.
Ernst R.. Allen H. E. & Mancy K. H. (1975) Characteriz-
ation of trace metal species and measurement of trace
metal stability constants by electrochemical techniques.
Water
Res. 9,
969—979.
Farrah H. & Pickering
W. F. (1977) Influences of clay-
solute interactions on aqueous heavy metal ion levels.
Wat. Air Soil Pollut.
8, 189—197.
Figura P. & McDuffie B. (1977) Characterization of the
calcium form of Chelex-lOO for trace metal studies.
Ana-
1w. Chem.
49, 1950—1953.
Figura P. & McDuffle B. (1979) Use of Chelex resin for
determination of labile trace metal fractions in aqueous
ligand media and comparison of the method with anodic
stripping voltammetry.
Analyt. Chem.
51, 120—125.
Florence T. M. (1977) Trace metal species in fresh waters.
Water Res.
11, 681—687.
Florence T. M. & Batley 0. E. (1980) Chemical speciation
in
natural waters.
C.R.C. Critical Rev.
Analyt. Chem.
9,
2 19—296.
Gadde R. R. & Laitinen H. A. (1974) Studies of heavy
metal adsorption by hydrous iron and manganese
oxides.
Analyt. Chem.
46, 2022—2026.
Gardiner J. (1974) The chemistry of cadmium in natural
water—Il. The adsorption of cadmium on river muds
and naturally occurring solids.
Water
Res.
8, 157—164.
Gardiner J. (1975) The complexation of trace metals in
natural waters.
Symp. Proc. tnt. Conf Heavy Metals Env.,
Vol. I, pp. 303-318. 27—31 Oct., Toronto.
Gardiner J. (1976) Complexation of trace metals by ethyl-
enediaminetetraacetic acid (EDTA) in natural waters.
Water
Res.
10, 507—514.
Harrison R. M. and Laxen D. P. H. (1980) Metals in the
environment—I. Chemistry.
Chem. Br.
16, 316—320.
Harrison R. M. & Laxen D. P. H. (1981)
Lead Pollution:
Causes
and
Control.
Chapman & Hall, London.
Hart B. T. & Davies S. H. (1976) Physico-chemical forms
of trace metals and the sediment-water interface.
Proc.
Conf Interact. Sed. Fresh Water,
pp. 398-402. 6—10 Sept.
Amsterdam.
-
Hart B. T. & Davies S. H. (1977) A batch method for the
determination of ion-exchangeable trace metals in
natural waters.
Aust. I. Mar. Freshwat. Res.
23, 397—402.
Hunter J. V. (1971) In
Organic
Compounds in Aquatic En-
vironments
(Edited by Faust S. D. & Hunter J. V.), pp.
5 1—94. Dekker, New York.
Laxen D. P. H. & Harrison R. M. (1977) The highway as a
source of water pollution: An appraisal with the heavy
metal lead.
Water Res.
11, I—lI.
the sewage effluent to the differeat size fractions
(Figs 4, 6 and 8) is in broad agreement with the ident-
ified source of complexation capac1ty. In particular,
the lead is taken up by the colloidal size fraction,
whilst little is added to the smallest size fraction. Suf-
ficient Cd is added by the sewage works effluent to
roughly equal the original residual complexation ca-
pacity hence the absence of any residual complexation
capacity in the downstream sample.
There are some marked changes in the metal size
distribution patterns below the outfall (Figs 4, 6, 8
and 9) which are not merely the result of the addition
of the sewage effluent distribution pattern to that of
the river. However, the size fractions within which
there is a major increase in concentration coincide
broadly with those size fractions which are empha-
sised in the sewage effluent. The altered metal specia-
tion patterns below the outfall correspond with only
minor changes in the bulk chemistry of the river
(Table 4), further emphasising the importance of the
pre-existing speciation in the effluent. The fraction of
Chelex-labile metal below the outfall was not substan-
tially altered, but in the case of Cd the absolute
amount increased from 0.09 to 3.1 pg 1’. Iw’general,
however, the majos part-of the metaI~addition. fame
the effluent became assaciated *ith the colloidal-, and
particulate size fractions;.55 for Cd, 65 for Cu and
97 for Pb;-Hence-a laege.part,o(.each metal added
to the river is unlikely to be-of immediate significsnce~
although. the -speciation’ pattern-may ‘well- change
downstream possibly rendering the metals~more~bio-
logically -available.
U
U
U
U
a
U
U
a
N
p
1
N
I
I
The physicochemical speciation ofCd, Pb, Cu, Fe and Mn
065
Laxen D. P. H. & Harrison R. M. (198 Ia) A scheme for the
physico-chemical speciation of trace metals in freshwater
samples.
Sci.
Tot. Envir.
In press.
Laxen D. P. H. & Harrison R. M. (1981b) Cleaning
methods for polythene containers prior to the determi-
nation of trace metals in freshwater samples.
Analyt.
Chem.
53, 345—350.
Laxen D. P. H. & Harrison R. M. (l98lc) The physicoche-
mical speciation of selected metals in the treated effluent
of a lead-acid battery manufacturer and its effect upon
metal speciation in the receiving water.
Enuir. Sci. Tech-
nol.
In press.
Lester J. N., Harrison R. M. & Perry R. (1979) The balance
of heavy metals through a sewage treatment works. 1.
Lead, cadmium and copper.
Sci. Total Envir.
12,
13—23.
Lewin
V.
H. & Rowell M. J. (1973) Trace metals in sewage
effluent.
Effi. Wat. Treat. J.
13,
273—277.
Mantoura R. F. C., Dickson A. & Riley J. P. (1978) The
complexation of metals with humic materials in natural
waters.
Estuar. Coast. Mar. Sd. 6,
387—408.
Mill A. J. B. (1980) Colloidal and macroniolecular forms of
iron in natural waters. 1. A review.
Envir. Technol. Len.
1, 97—108.
Murray C. N. & Meinke S. (1974) Influence of soluble
sewage material on adsorption and desorption behav-
iour of cadmium, cobalt, silver and zinc in sediment-
freshwater, sediment-seawater systems.
J. Oceanog. Soc.
Japan
30, 216—221.
Ramamoorthy S. & Rust B. R. (1978) Heavy metal
exchange processes in sediment-water systems.
EnCir.
Geol.
2, 165—172.
Schonberger E. A. & Pickering W. F. (1980) The influence
of pH and complex formation on the ASV peaks of Pb.
Cu and Cd.
Talanta
27, 11—18.
Schuman M. S. & Woodward 0. P. Jr (1977) Stability
constants of copper-organic chelates in aquatic samples.
Envir. Sci. Technol.
Il,
809—813.
Stones T. (1977) Fate of metals during sewage treatment.
Effi. Wa:. Treat.
J.
17, 653—655.
Stoveland S., Lester J. N. & Perry R. (l979a) The influence
of nitrilotriacetic acid on heavy metal transfer in the
activated sludge process—I. At constant loading.
Water
Res.
13, 949—965.
Stoveland S., Perry R. & Lester J. N. (1979b) The influence
of nitrilotriacetic acid on heavy metal transfer in the
activated sludge process—lI. At varying and shock load-
ings.
Water Res.
13,
1043-1054.
Stumm W. & Bilinski H. (1973) Trace metals in natural
waters; difficulties of interpretation arising from our
ignorance of their speciation.
In
Advances in Water Pal-
lution
Research
(Edited by Jenkins S. H.), pp. 39—49.
18—23 June. Jerusalem. Pergamon Press. Oxford.
Stumm W.
&
Morgan .1. .1.
(1970)
Aquatic Chemistry.
Wiley/Interscience, New York.
Suzuki M.. Yamada T., Miyazaki T. & Kawazoe K. (1979)
Sorption and accumulation of cadmium in the sediment
of the Tama river.
Water Res.
13,
57—63.
Wagemann R. & Barica J. (1979) Speciation and rate of
loss of copper from lake water with implications to tox-
icity.
Water Res.
13, 515—523.
Waiwood K. G. & Beamish F. W. H. (1978) Effects of
copper. pH and hardness on the critical swimming per-
formance of rainbow trout
(Salmo gairdneri
Richardson).
Water Res.
12, 611—619.
ORIGINAL
UNiTED STATES ENVIRONMENTAL PROTECTION
/
WASHINGTON, D.C.
20460
OCT 1~93
T~fEMORANDUM
SUBJECT:
Office of Water Policy and Technical Guidance on interpretation and
implementation of Aquatic Life Metals Criteria
FROM:
Martha G~Prothro
~fl
Acting Assistant Administrator for Water
TO:
Water Management Division Duectors
Environmental Services Division
Directors
Regions I-X
Introduction
The implementation of
metals criteria is complex due to the site-specific nature of
metals toxicity. We have undertaken a number of activities to develop
guidance in this aira,
notably the Interim Metals
Guidance,
published
May 1992, and
a public
meeting of experts
held in
Annapolis,
MD, in January 1993. This memorandum
~ansrnitsOffice
of
Water
(OW) policy
and
guidance on the
interpretation and
implementation of
aquatic life criteria
for
the
management
of metals
and supplements my April 1, 1993, memorandum on the same
subject, The issue
covers
a number of areas including the
expression
of
aquatic life criteria;
total
maximum
daily, loads (TMDLs), permit~,.effluent.monitoring,and compliance; and
ambient monitoring. The memorandum covers
each in turn. Attached
to this policy
memorandum are three guidance documents with additional technical
details. They are:
Guidance Document on Expression of Aquatic Life Criteria as Dissolved Criteria
(Attachment h2), Guidance Document on Dynamic Modeling and Translators (Attachment
#3), and Guidance Document on Monitoring (Attachment #4). These will be supplemented
as addidonal’data become available. (See
the
schedule in Attachment #1.)
Since metals toxicity
is
significantly affected by site-specific factors,
it presents a
number of programmatic
challenges. Factors that must be considered in the management of
metals in the
aquatic environment Include: toxicity specific to effluent
chemistry; toxicity
specific to ambient water
chemistry; different
patterns
of toxicity for
different
metals;
evolution of the state
of the science of metals
toxicity, fate, and transport; resource
limitations for monitoring, analysis, implementation, and research functions; concerns
regarding some of the analytical data currently on record due to possible sampling and
analytical contamination; and
lack of
standardized protocols for clean and ultraclean metals
analysis.
The States have
the key role in the risk management process of balancing these
factors in the management of water programs. The site-specific nature
of
this issue could ~
perceived as requiring a permit-by-permit approach to implementation. However, we bel iC~.
e
CFFCEcc
WATER
I
2
j
• that this guidance can be effectively implemented on a broader level, across any waters with
roughly the same physical and chemical characteristics, and recommend that we work with
the States with that perspective in mind.
-
-
-
Expression of Aquatic Life Criteria
o
Dissolved vs. Total Recoverable Metal
-
A major issue is whether, and how, to tise dissolved metal concentrations (“dissolved
metal”) or total recoverable metal concentrations (“total recoverable metal”) in setting State
waxer quality standards. In the past, States have used both approaches when applying the
same Environmental Protection Agency. (EPA) criteria numbers.
..
Some older criteria
documents may have facilitated these different approaches to interpretation of the criteria
• because the documents were somewhat equivocal with regards to analytical methods. The
May 1992 interim guidance continued the policy that either approach was acceptable.
ItisnowthepolicyoftheOfficeofWaterthattheuseofdissolvedmetaltosetand
measure compliance with water quality standards is the recommended approach, because
dissolved metal more closely approximates the bioavailable fraction of metal in the water
column than does total recoverable metal. This conclusion regarding metals bioavailabilhty is
supported by a majority of the scientific community within and outside the Agency. One
reason is that a primary mechanism for water column toxicity is adsorption ax the gill surface
which requires metals to be in the dissolved form.
The position that the dissolved metals approach is more accurate has been questioned
because it neglects the possible toxicity of particulate metal. It is true that some studies have
indicated that particulate metals appear to contribute to the toxicity of metals, perhaps
because of factors such as desorprion of metals at the gill surface, but these same studies
indicate the toxicity of particulate metal is substantially less than that of dissolved metal.
Furthermore, any erroL incurred from excluding the contribution ofparticulate metal
will generally be compensated by other factors which make criteria conservative. For
example, metals in toxicity tests are added as simple salts to relatively
elean
water. Due to
andthelikelyambientpr~ncewaters,
ofmetals
asignificantintoxicityconcentrationtests
would
of
generallymetalsbindingbeexpectedagentstoinbemanymoredischarges
I
bioavailabile than metals in discharges or in ambient waters.
If total recoverable metal is used for the purpose of water quality standards,
compounding of factors due to the lower bioavailability ofparticulate metal and lower
bioavailability of metals as they are discharged may result in a conservative water quality
standard The use of dissolved metal in water quality standards gives a more accurate result
However, the majority of the participants at the Annapolis meeting felt that total recoverable
measurements in ambient water had some value, and that exceedences of criteria on a total
recoverable basis were an indication that metal loadings could be a stress to the ecosystem.
particularly in locations other than the water column.
I
-
3
•
The reasons for the potential consideration of total recoverable measurements include
risk management considerations not covered by evaluation of waxer column toxicity. The
• ambient water quality criteria are neither designed-nor intended -to protect sediments, or to
prevent effects due to food webs containing sediment dwelling organisms. A risk manager,
however, may consider sediments and food chain effects and may decide to take a
conservative approach for metals, considering that metals are very persistent chemicals. This
conservative approach could include the use of total recoverable metal in water quality
standards. However, since consideraton of sediment impacts is not incorporated into the
criteria methodology, the degree of conservatism inherent in ~he total recoverable approach is
unknown. The uncertainty of metal impacts in sediments Stein from the lack of sediment
criteria and an imprecise understanding of the fate and transport of metals. EPA will
continue to pursue research and other activities 10 close these knowledge gaps.
Until the scientific uncertainties are better resolved, a range of different risk
management decisions can be justified. EM recommends that State water quality standards
be based on dissolved metal. (See the paragraph below and the attached guidance for
technical details on developing dissolved criteria.) EPA will also approve a State risk
management decision to adopt standards based on total recoverable metal, if those standards
are otherwise approvable as a matter of law.
o
Dissolved Criteria
In the toxicity tests used to develop EPA metals criteria for aquatic life, some fraction
of the metal is dissolved while some fraction is bound to particulate matter. The present
criteria were developed using total recoverable metal measurements or measures expected to
give equivalent results in toxicity tests, and are articulated as total recoverable. Therefore,
in order to express the EPA criteria as dissolved, a total recoverable to dissolved correction
factor must be used. Attachment #2 provides guidance for calculating EPA dissolved criteria
from the published total recoverable criteria. The data expressed as percentage metal
dissolved are presented as recommended values and ranges. However, the choice within
ranges is a State risk management decision. We have recently supplemented the data for
copper and are proceeding to further supplement the data for copper and other metals. As
testing is completed, we will make this information available and this is expected to reduce
the magnitude of the ranges for some of the conversion factors provided. We also strongly
encourage the application of dissolved criteria across a watershed or wazerbody, as
technically sound and the best use of resources.
o
Site-Specific Criteria Modifications
While the above methods will correct some site-specific (actors affecting metals
toxicity, further refinements are possible. EPA has issued guidance (Water Quality
Standards Handbook, 1983; Guidelines for Deriving Numerical Aquatic Site-Specific Water
Quality Criteria by Modifying National Criteria, EPA-60013-H4-099, October 1984) for three
site-specific criteria development methodologies: recalculation procedure, indicator species
procedure (also known as the water-effect ratio (WER)) and resident species
procedure.
Only the first two of these have been widely used.
4
~nthe National Toxics Rule
(57
FR 60848, December 22, 1992), EPA identified the
WER ~san optional method for site-specific criteria development for certain metals. EPA
committed in the NTR preamble to provide guidance on determining the WER. A draft of
this guidance has been circulated to the :States and Regions for review and comment. As
justified by water characteristics an~das recommended by the WER guidance, we strongly
encourage the application of the WER across a watershed or waterbody as opposed to
application on a discharger by discharger basis, as technically sound and an efficient use of
resources.
•
In order to meet current needs, but allow for changes suggested by protocol users,
EPA will issue the guidance as interim.v EPA will accept WERs developed using this
guidance, as well as by using other scientificaliy.defensible protocols. OW expects the
•
interim WER guidance will be issued in the next two months.
Total Maximum Daily Lcads (TMDLsI and National Pollutant Discharge Elimination System
(NPDES~Permits
•
•
•
o
Dynamic Water Quality Modeling
Although not specifically part of the reassessment of water quality criteria for metals,
dynamic or probabilistic models are another useful tool for implementing waxer quality
criteria, especially for those criteria protecting aquatic life. These models provide another
way to incorporate site-specific data. The 1991 Technical Support Document for Water
Quality-based Toxics Control (~SD)(EPA/505/2-90-OO1) describes dynanuc, as well as static
(steady-state) models. Dynamic models make the best use of the specified magnitude,
duration, and frequency of waler quality criteria and, therefore, provide a more accurate
representation of the probability that a water quality standard exceedence will occur In
contrast, steady-state models make a number of simplifying, worst case assumptions which
makes them less complex and less accurate than dynamic models.
Dynamic models have received increased attention over the last few years as a result
of the widespread belief that steady-stale modeling is over-conservative due to
environmentally conservative dilution assumptions This belief has led to the misconception
that dynamic models will always lead to less stringent regulatory controls (e.g., NPDES
rn
effluent limits) than steady-state models, which is not true
in
every application of dynamic
models. EPA considers dynamic models to be a more accurate approach to implementing
water quality criteria and continues to recommend their use. Dynamic modeling does require
commitment of resources to develop appropriate data. (See Attachment #3 and the TSD for
derails on the use of dynamic models.)
o
Dissolved-Total Metal Translators
Expressing water quality criteria as the dissolved form of a metal poses a need to be
able to translate from dissolved metal to total recoverable metal for TMDLi and NPDES
permits. TMDLs for metals must be able to calculate: (1) dissolved metal in order to
ascertain attainment of water quality standards, and (2) total recoverable metal in order
to
achieve mass balance necessary for permitting purposes
5
EPA’s NPDES regulations require that limits of metals in permits be stated as total
recoverable in most cases (see 40 CFR
§
122.45(c)) except when an effluent guideline
specifies the limitation in another form of the metal, the approved analytical methods
measure only dissolved metal, or the permit writer expresses a metals limit in another form
(e.g., dissolved, valent, or total) when required to carry out provisions of the Clean Water
Act. This is because the chemical conditions in ambient waters frequently differ substantially
from those in the effluent, and there is no assurance that effluent particulate metal would not
dissolve after discharge. The NPDES rule does not require that State water quality standards
be expressed as total recoverable; rather, the rule requires permit wnters to translate between
different metal forms in the calculation of the permit limit so that a total recoverable limit
can be established. Both the TMDL and NPDES uses of water quality criteria require the
ability to translate between dissolved metal and total recoverable metal. Attachment #3
provides methods for this translation.
Guidance on Monitoring
o
Use of Clean Sampling and Analytical Techniques
In assessing waterbodies to determine the potential for toxicity problems due to
metals, the quality of the data used is an important issue. Metals data are used to determine
attainment status for water quality standards, discern trends in water quality, estimate
background loads for TMDLs, calibrate fate and transport models, estimate effluent
concentrations (including effluent variability), assess permit compliance, and conduct
research. The quality of trace level metal data, especially below 1 ppb, may be
compromised due to contamination of sampies during collection, preparation, storage, and
analysis. Depending on the level of metal present, the use of clean” and ultraclean
techniques for sampling and analysis may be critical to accurate data for implementation of
aquatic life criteria for metals.~
The magnitude of the contamination problem increases as the ambient and effluent
metal concentration decreases and, therefore, problems are more likely in ambient
measurements.
CIean techniques refer to those requirements (or practices for sample
collection and handling) necessary to produce reliable analytical data in the part per billion
(ppb) range. Ultraclean techniques refer to those requirements or practices necessary to
produce reliable analytical data in the part per trillion (ppt) range. Because typical
concentrations of metals in surface waters and effluents vary from one metal to another, the
effect of contamination on the quality of metals monitoring cata varies appreciably.
We plan to develop protocols on the use of clean and ultra-clean techniques and are
coordinating with the United States Geological Survey
(USGS)
on this project, becatice USGS
has been doing work on these techniques for some time, erpecially the sampling procedures.
We anticipate that our draft protocols for clean techniques ‘viii be available in late calendar
year 1993. The development of comparable protocols for ultra-clean techniques is underway
and will be available in 1995. In developing these protocols, we will consider the costs of
these techniques and will give guidance as to the situations where their use is necessary.
Appendix B to the WER guidance document provides some general guidance on the use of
6
clean analytical techniques. (See Attachment #4.)
We
recommend that this guidance be used
by States and Regions as an interim step, while the clean and ultra-clean protocols are being
developed.
o
Use of Historical Data
The concerns about metals sampling and analysis discussed above raise corresponding
concerns about the validity of historical data. Data on effluent and ambient metal
concentrations are collected by a variety of organizations including Federal agencies (e.g.,
EPA, USGS), State pollution control agencies and health departments, local government
agencies, municipalities, industrial dischargers, researchers, and others. Th&data are
collected fora variety
of
purposes as discussed above.
Concern about the reliability of the sample collection and analysis procedures
is
greatest where they have been used to monitor very low level metal concentrations.
Specifically, studies have shown data sets with contamination problems during sample
collection and laboratory analysis, that have resulted in inaccurate measurements.
For
example, in developing a TMDL for New York Harbor, some historical ambient data showed
extensive metals problems in the harbor, while other historical ambient data showed only
limited metals problems. Careful resampling and analysis in 199211993 showed the latter
view was correct.
The
key to producing accurate data is appropriate quality assurance
(QA)
and quality control (QC) procedures.
We
believe that most historical data for metals,
collected and analyzed with appropriate
QA
and QC at levels
of
1 ppb or higher, are
reliable.
The
data used in development of EPA criteria are also considered reliable, both
because they meet
the
above test and because the toxicity test solutions are created
by
adding
known amounts of metals.
With respect to effluent monitoring reported by an NPDES peimittee,
the penn tree is
responsible for collecting and reporting quality .data. on
a
Discharge Monitoring Report
(DMR) Permitting authorities should continue to consider
the
information reported to be
true, accurate, and complete as certified by the pennittee. Where the pernuttee becomes
aware of new information specific so the effluent discharge that questions the quality of
previously submitted DMR~datathe pennuttee must promptly submit that information to the
permitting authority The pernumng authority will consider all informat’on submitted by the
perrmttecin determining appropriate enforcement responses to monitoring/reporting and
effluent violations (See Attachment #4 for additional details)
Summary
I
The
management of metals in
the
aquatic environment is complex. The science
supporting our technical and regulatory programs is continuing to evolve, here as in all
4~.-eas.
The
policy and guidance outlined above represent
the
position of
OW
and should be
incorporated into ongoing prugram operations. We do not expect that ongoing operations
would be delayed
or
deferrod because
of this
guidance.
I
7
If you have questions concerning this guidance, please contact Jim Hanlon, Acting
Director, Office of Science and Technology, at
202-260-5400.
If you have questions on
specific details of the guidance, please contact the appropriate OW Branch Chief. The
Branch Chiefs responsible for the various areas of the water quality program are: Bob April
(202-260-6322, water quality criteria), Elizabeth Fellows (202-260-7046, monitoring and data
issues), Russ Kinerson (202-260-1330, modeling and translators), Don Brady (202-260-7074,
Total Maximum Daily Loads), Sheila Frace (202-260-9537, permits), Dave Sabock
(202.260-1315, water quality standards), Bill Telliard (202-260-7134, analytical methods)
and Dave Lyons (202-260-8310, enforcement).
Attachments
AUACHMENT #1.
TECHNICAL GUIDANCE fOR METALS
Schedule of Upcoming Guidance
-
Water-effect Ratio Guidance
-
September 1993
Draft “Clean” Analytical Methods
-
Spring 1994
Dissolved Criteria
-
cuiTently being done; as testing is completed, we will release the
updated percent dissolved data
Draft Sediment Criteria for Metals
-
1994
Final Sediment Criteria for Metals
-
1995
GUIDANCE DOCUMENT
ON DISSOLVED CRITERIA
Expression of Aquatic Life Criteria
October 1993
AUACHMENT #2
10—1—93
Percent Dissolved in Aquatic Toxicity Tests on Metals
The attached table contains all the data that were
found
concerning the percent of the total recoverable metal that was
dissolved in aquatic toxicity tests.
This
table is intended to
contain the available data that are relevant to the conversion of
EPA’S aquatic life criteria for metals from a total recoverable
basis to a dissolved basis. (A factor of 1.0 is used to convert
aquatic life criteria for metals that are expressed on the basis
of the. acid-soluble measurement’ to criteria expressed on the
basis of the total recoverable measurement.) Reports by
Grunwald
(1992) and Brungs .et. al. .(1992) provided references to many of
the documents in which pertinent data were found. Each document
was obtained and examined to determine whether it contained
useful data.
“Dissolved” is defined as metal that passes through a 0.45—pm
membrane filter. If otherwise acceptable, data that were
obtained using 0.3-pm glass
fiber
filters and 0.1—pm membrane
filters were used, arid are identified in the table; these data
did not seem to be outliers.
Data were used only if the metal was in a dissolved inorganic
form when it was added to the dilution water. In addition, data
were used only if they were generated in water that would have
been acceptable for use as a dilution water in tests used in the
derivation of water quality criteria for aquatic life; in
particular, the pH had to be between 6.5 and 9.0, and the
concentrations of total organic
carbon
(TOC) and total suspended
solids (TSS) had to be
below
5 mg/L. Thus most data generated
using river water would not be used.
Some data were not used for other reasons. Data ‘presented by
Carroll et al. (1.979) for cadmium were not used because 9 of the
36 values were above 150. Data presented by Davies et al.
(1976) for lead and Holcombe and
Andrew
(1978) for zinc were not
used because “dissolved” was defined on the basis of
polarography, rather than filtration.
Beyond this, the data were not reviewed for quality. Horowitz et
al. (1992) reported that a number of aspects of the filtration
procedure might affect the results. In addition, there might be
concern about use of “clean techniques” and adequate QA/QC.
Each line in the table is intended to represent a separate piece
of information. All of the data in the table were determined in
fresh water, because no saltwater data were found. Data are
becoming available for copper in salt water from the New York
1
Harbor study; based on the first set of tests, Hansen (1993)
suggested that the average percent of the copper that is
dissolved in sensitive saltwater tests is in the range of 76 to
82 percent.
-
A thorough investigation of
the
percent of total recoverable
metal that is dissolved in toxicity tests might attempt to
determine if the percentage is affected by test
technique
(static, renewal, flow—through), feeding (were ‘the test animals
fed and, if so, what
food
and how
much),
water quality
characteristics (hardness, alkalinity, pH, salinity), teat
TheorganismsattachSd(species,table alsoloading),gives
etc.th.
Back to top
freshwater
-
criteria
I
‘concentrations (cxc and CCC) because percentages for total
recoverable concentrations much (e.g., more than a factor of 3)
above or below the
cxc
and CCC are likely, to be less relevant.
When a’criterion is expressed as a hardness equation,
the
range
given extends from a hardnes. of 50 mg/L to a hardness of 200
mg/L.
-
The following is a
summary
of the available information for each
-
metal:
Arsenic(III)
II,
Th.
data available indicat, that the percent dissolved is about
100, but all
the
availabl, data are for concentrations that are
much higher than
the
CMC
and CCC.
Cadmium
Schuytema
et al. (1984) reported that
“there wers
no real
differences” between measurements of total
and
dissolved
cadmium
at concentrations of 10 to 80 ug/L (pH
—
6.7 to 7.8, hardness
-
25 mg/L, and alkalinity
—
33 mg/L); total
and
dissolved
concentrations were said to be “virtually equivalent”.
The
CHC and CCC
are
close
together
and only range from 0
•
66 to
8.6
uq’j~L~
The only available data that are known to be in the
rang. of the
cxc
and CCC were determined with a
glass
fiber
filter. Th. percentages that are probably most relevant are
75,
92, 89, 78, and 80.
1
Chromium C
III~
The percent dissolved decreased as
the
total
recoverable
concentration increased, even thougn the highest concentratIonS
reduced the pH substantially. The percentages
that
are probablY
2
most relevant to the CMC
are
50-75,
whereas the percentages that
are probably most relevant to
the CCC are
86 and 61.
Chromium CVfl
The data available indicate that
the
percent dissolved is about
100, but all the available data are for concentrations that are
much higher than the
CMC
and CCC.
CoDDer
Howarth and Sprague (1978) reported that the total and dissolved
concentrations -of copper-were “,litt1e~different” except when
the
total copper concentration was above 500 ug/L at hardness
—
360
mg/L and pH
=
8 or 9. Chakoumakos et al. (1979)
found
that the
percent dissolved depended more on alkalinity than on hardness,
pH, or the total recoverable concentration of copper.
Chapman (1993) and Lazorchak (1987) both found that the addition
of daphnid food affected the percent dissolved very little, even
though Chapman used yeast-trout chow-alfalfa whereas Lazorchak
used algae in most tests, but yeast—trout chow—alfalfa in some
tests. Chapman (1993) found a low percent dissolved with and
without food, whereas Lazorchak (1987)
found
a high percent
dissolved with and without food. All of
Lazorchak’s
values were
in high hardness water; Chapman’s
one value in high hardness
water was much higher than his other values.
Chapman (1993) and Lazorchak (1987)
both
compared the effect of
food on the total recoverable LC5O with ths effect of food on the
dissolved LC5O. Both authors found
that
food raised both the
dissolved LC5O and the total recoverable LC5O in about the same
proportion, indicating that food did not raise the ~total.
recoverable LC5O by sorbing metal onto food particles; possibly
the food raised
both
LC5O5 by (a) decreasing the toxicity of
dissolved metal, (b) forming nontoxic dissolved complexes with
the metal, or
(C)
reducing uptake.
The
cxc.,
and
CCC are close together and only range from 6.5 to 34
ug/L. The percentages that are probably most relevant are 74,
95, 95, 73, 57, 53, 52, 64, and 91.
Lead
The data presented in Spehar et al. (1978) were from Holcomb. et
al. (1976). Both Chapman (1993) and Holcombe et al. (1976) found
that the percent dissolved increased as
the total recoverable
concentration increased.
It
would
seem reasonable to expect more
precipitate at higher total recoverable concentrations and
3
I
therefore a lower percent dissolved at higher concentrations.
The increase in percent dissolved with increasing concentration
might be due ‘to a lowering of the pH as more metal is added if
the
stock solution was acidic.
The
percentages
that
are
probably
most relevant to
the
cxc
ar. 9,
18, 25, 10, 62, 68, 71, 75, 81, an&95, whereas the percentages
-
that are probably most relevant to the CCC are 9 and 10.:
TheMercurYonly percentage that is available is 73, but it is for a
I
concentration that is much higher
than
the
cxc.
Nickel
The percentages that are probably most relevant to the
cxc
are
88, 93, 92, and
100,
whereas
the only
percentage that is probably
relevant to the CCC is 76.
-
I
Selenium
No data are available.
Silver
1
F
There
is a
cxc,
but not a CCC. The percentage dissolved seems
to
be greatly reduced by the food used to
feed
daphnids, but not by
the
food
used to feed fathead minnows.
The
percentages that are
probably meat relevant to the
cxc
are
41, 79, 79, 73, 91, 90, and
93.
-
Zinc
The
cxc
and CCC are close together and only range from 59 to 210
ug/L.
The
percentages that are probably most relevant are 31,
77,
77, 99,
94, 100, 103, and 96.
a
I
I
I
Arsenic (III)
Cadmium
Chromium (III)
Chromium (VI)
Copper
Lead
Mercury
Nickel
Selenium
Silver
Zinc
Recommended
Value (~ j~anae~
95
100—104’
85
75—92
85
50—75
95
100’
85
52—95
50
9—95
85
73’
-
85
88—100
NA’
NAC
85
41—93
85
31—103
Recommended
Value (1 (Ranae ~
95
100—104’
85
75—92
85
-
61—86
95
‘
100’
85
52—95
25
9—10
NA’
NA’
85
76
NA’
NAC
yyD
yyD
85
31—103
A
The recommended values are based on
current
knowledge and are
subject to
change as more data
become. available.
‘
All available data are for concentrations that are much higher
than the
cxc.
C
NA
—
No data are available.
D
yy —
-
A
CCC
is not available, and therefore
cannot be
adjusted.
‘
NA
—
Bioaccumulative chemical and not appropriate to adjust to
percent dissolved.
Recommended Values ()‘~ and, Ranges of Measured Percent Dissolved
Considered Most Relevant in Fresh Water
Metal.
5
?
F No
48 41 7.6 Lisa et al. 1984
44 43 7.4 Spehar and Fiandt 1986
Concn.A
I
ua
IL)
Percent
Diss.’
FM
______
_____
th
SDeCiesD
SRF’
Food Hard.
Alk.
p11
ARSENICI 1111 (Fr.jh~ater:CCC
—
190 ug/L; CMC
—
360 ug/L)
600—15000 104
5
12600
100
-
3
CADMIUM
(Freshwater:
CCC
—
0.66
to 2.0
ug/L;
CMC
—
1.8
to 8.6 ug/L)~
0.16
0.28
41
75
?
?
DM
DM
R
R
Yes
Yes
53
103
46
83
7.6
7.9
Chapman 1993
Chapman 3.993
-
0.44.0
920
?
CS
F
No
21
19
.
7.1 Finläyson and Vérrue 1982
13
89
3
FM
F
No
44 43
7.4 Spehar and Fiàndt 1986
-
15—21
42
96
84
8
4
FM
FM
S
S
No
NO
42
45
31
43.
7.5
7.4
Spehar and Carison 1984
Spehar
and Carison 1984
10
35
51
78
77
59
?
?
?
ON
ON
DM
S
S
S
No
No
No
51
105
209
38
88
167
7.5
8.0
8.4
Chapman 1993
Chapman 1993
Chapman 1993
6-80
3—232
450—6400
80
9O~
70
8
s
5
?
?
FM
S
F
F
No
?
No
47
46
202
44
42
157
7.5
7.4
7.7
Call et *1. 1982
Speharet al. 1978
Pickering and Cast 1972
6
a~. — —
—~
CHROMIWII1111 (Freshwater:
CCC
=
120 to 370 ug/L; CMC
=
980 to 3100 u4/L)’
5-13
94
-
?
SG
F
?
25 24 73 Stevens and Chapman 1984
19—495
86
?
-~
SG
F
?
25 24 7.2 Stevens and Chapman
1984
1100
50-75 ?
SG
F
No
25
24 7.0 Stevens and Chapman’ 1984
42
54
DN
R
Yes 206 166 8.2 Chapman
1993
114
61
DM
R
Yes 52
45
7.4 Chapman 1993
16840
26
?
ON
S
No 51
9 6.3’ Chapman
1993
26267
27416
58665
32
-
27
23
?
?
?
014
ON
OH
S
S
S
No
No
No
110
96
190
9
10
25
6.7
60’
6.2’
Chapman
Chapman
Chapman
1993
1993
1993
CHROM1UH(V11 (Freshwater CCC
=
11 ug/L; CMC
=
16 ug/L)
25,000
100
1
43,300
99.5
4
FM,GF F
Yes 220 214 7.6 Adelman and Smith 1976
FM
F
No
44 43 7.4 Spehar and Fiandt 1986
COPPER
(Freshwater: CCC
—
6.5 to 21 ug/L; Cxc
=
9.2 to 34 ug/L)’~
10—00
CT
F
No
25 169 8.5 Chakoumakos et al. 1979
10-30
74
?
CT
F
No
27
20 7.0 Chakoumakos etal. 1979
40200 78
?
CT
F
No 154 20 6.8
Chakoumakos et al. 1979
30—100 79
?
CT
F
No
74 23 7.6 Chakoumakos
et al. 1979
300—200 82
CT
F
No 192 72 7.0
Chakoumakos
et al. 1979
20200 86
CT
F
NO
31 78
8.3
Chakoumakos et a.. 1979
40-300 87
CT
F
No
83 70
7.4 Chakoumakos ,et al. 1979
89
7
7.0 Chakoumakos e~i~. 1979
8.5 C~akousakos et a.. 1979
‘~
~
—
~
——— ~
—
__
——
300—1300 92
100—400 94
195 160
70 174
F No
F
No
R
Yes
R
Yes
S
No
R
No
S
No
R
No
31 38 7.2 Carlson et a.. 1986a,b
31 38 7.2 Carison et a.. 1986a,b
52 55 7.7 Carison et a.. 1986b
31 38
7.2 Carison et a.. 1986b
52 55 7.7 Carison et a.. 1986b
31 38
7.2 Carlson et al. 1986b
3—4’
12—91’
18—19
20’
50
175’
5—52
6—80
6.7
35
13
16
51
32
33
39
25—84
17
120
15—90
12—162
28—58
26—59
56,101
F
Yes’ 47
43 8.0 Lind et al.
1978
F
No
21 19 7.1 Finlayson and Verrue 1982
?
CT
?
CT
2
CD
CD
2
Ok
1
Ok
2
FM
2
FM
FM
?
CS
DM
014
DM
DM
DPI
DPI
014
014
14
F14,GM
6
DPI
14
SC
19
BC
6
DM
7
DPI
2
DII
125—167
79—84
95
95
96
91
8
2K
83°
57
43
73
57
39
53
52
64
96
91
88
74
80”
85
79
86
S
No
S
Yes
R
Yes
R Yes
R Yes
S
No
S
No
S
No
S
No
S
No
S
No
S
No
49 37
7.7 Chapman 1993
48 39 7.4
Chapman 1993
211 169 8.1 Chapman
1993
51 44 7.6 Chapman 1993
104 83 7.8 Chapman 1993
52 45
7.8 Chapman 1993
105 79
7.9 Chapman 1993
106 82
8.1 Chapman 1993
50 40 7.0
52 43 7.3
48 47 7.3
48
F
Yes’ 45
Hammermaisteret a.. 1983
Hammermeister et a.. 1983
Hasmermeister et a.. 1983
47 7.7
Call
et al. 1982
43 7—8 Benoit 1975
R
R
No
YesTM
168
168
117
117
8.0
8.0
Lazorchak
Lazorchak
1987
1987
R
y55N
168
117 8.0 Lazorchak 1987
8
iii
FM
F
No
FM
S
No
CR
F
No
CCC~ 1.3 to
p7.7 ug/L;
CMC
?
OH
R
Yes
ON
Yes
DPI
R
Yes
DPI
S
No
DM
S No
DPI
S
No
EZ
R
No
F
Yes
F
Yes
F
Yes
F
Yes
F Yea
F
No
F
No
S
No
S
No
?
BT
?
BT
?
BT
?
BT
?
BT
?
BT
7
FM
44 43 7.4 Spehar and Fiandt 1986
203 17. 8.2 Geckler et a.. 1976
17 13 7.6 Rice and Harrison 1983
=
34 to 200 ug/L)’~
52
102
151
47
86
126
7.6
7.8
8.1
chapman
Chapman
Chapman
1993
1993
1993
50
100
150
——
——
——
---
——-
———
Chapman
Chapman
Chapman
1993
1993
1993
22
44
43 7.2 Holcombe et a.. 1976
44 43 7.2 Holcombe’ ct al. 1976
44 43 7.2 Holcombe
et al. 1976
44 43 7.2 Holcombe et al.
1976
44 43 7.2 Holcombe et al. 1976
44
43
7.2
Holcombe
et a.. 1976
MERCURYIIfl (Freshwater: CMC 2.4 ug/L)
73
1
FM
F
No
44 43 7.4 Spehar and Fiandt 1986
96
86
4
160
94
1
230—3000
69—79
?
LEAD (Freshwater:
17
181
193
612
952
1907
7—29
34
58
119
235
474
4100
2100
9
18
25
29
33
—38
10
62”
68~
71”
750
81”
82”
79
--
---
JRB Associates 1983
220—2700
96
14
FM,GM,DM
580
95
14
SC
172
44 43 7.4 Spehar and Fiand? 1986
49 44 7.2 Hammermeister et al. 1983
51 48 7.2 Hasmermeister et a.. -1983
9
NICKEL (Freshwater: CCC
—
88 to 280 ug/L; CMC 790 to 2500 ug/L)F
21
81
DPI
R
Yes
51 49
7.4 Chapman 1993
150
578
76
87
?
?
DPI
DII
R
R
Yes
Yes
107
205
87
161
7.8
8.1
Chapman
Chapman
1993
1993
645
88
?
DPI
S
No
54 43 7.7 Chapman 1993
1809
93
?
014
S
No
51
44 7.7 Chapman 1993
1940
92
?
DII
S
No 104 84
8.2 Chapman 1993
2344
100
?
DII
S
No
100 84
7.9 Chapman 1993
4000
90
PK
R
No
21
--
---
JRB
Associates 1983
SELENIUM (FRESHWATER:
CCC
—
5 ug/L; CMC
—
20 uq/L)
No data are available.
SILVER (Freshwater:
Cxc
—
1.2 to 13 ugfL; a CCC is not available)
0.19
74
DPI
S
No
47 37 7.6 Chapman 1993
9.98
13
DII
S
Yea
47 37 7.5 Chapman
1993
4.0
41
DII
S
No
36
25 7.0
Nebeker et al. 1983
4.0
it
DPI
S
Yes 36
25 7.0
Nebeker et al.
1983
3
2—54
79
79
?
?
FM
FM
S
S
No
Yes°
51
49
49
49
8.1
7.9
UWS1993
UWS
1993
2—32
73
?
FM
S
No
50 49 8.1
UWS
1993
4—32
91
?
FM
S
No
48
49 8.1
UWS1993
5—89
90
?
FM
S
No 120 49 8.2
UWS
1993
6—401
93
?
FM
S
No 249
49 8.1
UWS
1993
10
~
U
a UU
ZINC
(Freshwater: CCC
=
59 to 190 ug/L; CMC 65 to 210 ug/14F
211
104
52
54
105
196
31
DM
R
Yes
77
DII
R
Yes
77
?.~:-
DPI
R
Yes
74
DM
S
No
78
OH
S
No
76
OH
S
No
71—129 2
CD
R
Yes
81—107 2
CD
R
Yes
99
2
CD
R
No
94
1
CD
S
No
100
2
FM
R
No
100
1
FM
S
No
950
CS
F
No
100
AS
F
No
83
AS
F
No
90
?
FM
F
No 204
70
FM
F
No 204
103
13 FMGM,DM S
No 52
96
13
SG
S
No
49
A
Total recoverable concentration.
Chapman 1993
Chapman 1993
Chapman 1993
Chapman 1993
Chapman 1993
Chapman 1993
Except as noted, a 0.45—pm membrane filter was used.
169 8.2
83 7.8
47 7.5
47
85
153
52
62
191
356
551
741
7’
18—273’
167’
180
18 8—393’
551
40—500
1940
5520
4000
4000
160—400
240,
7.6
8.1
8.2
38 7.2
Carlson et a..
52 55 7.7 Carison et a..
31 38 7.2 Carison et al. 1986b
31 38 7.2 Canaan et al. 1986b
3.
38 7.2 Carison et al. 1986b
52 55 7.7 Carison et a.. 1986b
1986b
1986b
21 19 7.1 Finlayson and Verrue 1982
20 12 7.1 Sprague 1964
20 12 7.9 Sprague 1964
162 7.7 Mount 1966
162 7.7 Mount 1966
43 7.5 Hammermeister et a.. 1983
46 7.2 Hammermeister et a.. 1983
11
C
Number of paired comparisons.
D
The abbreviations used are:
AS
—
Atlantic salmon
DM Da~hniamauna
ST
—
Brook trout
EZ
—
£1~m~
zonatum
CD
=
ceri~aphnia dubia
FM Fathead minnow
CR
—
Crayfish
GF
=
GOldfish
Cs
—
Chinook salmon
GM
-
Gammanid
CT
—
Cutthroat trout
PK
—
Palaeppnetes kadiakensiB
DA
—
Daphnids
SG
—
~
uairdneri
!
Tha abbreviations used are:
-‘
S
—
static
R
—
renewal
F
—
flow-through
~ The two numbers are for hardnesses of 50 and 200 mg/L,.respectjvely.
‘~
A O.3pm gj~j~
fiber
filter was used.
“
-‘
H
A O.lO-pS membrane filter was used.
-
The pH was below 6.5.
‘
The dilution water was a clean river water, with TSS and
TOC below
5
ag/L.
k
Only limited information is availabl, concerning this value.
‘
It is
assumed
that the solution that was filtered was from the test chambers that
contained fish and food.
N
The food was algae.
“
The
food
was yeast-trout chow-alfalfa.
o
The
food
was frozen adu.t brine shrimp.
12
—
—
————— _, _
———
~
—————
I.
Geckler,
J.R.,
W.B. Horning, T.M. Neiheisel, Q.H.
Pickering, E.L.
Robinson, and C.E. Stephan.
-
1976. Validity of Laboratory Tests
for Predicting Copper Toxicity in Streams. EPA-600f 3—76-116.
National Technical Information Service, Springfield, VA. Page
118.
-
-
Grurwald, D. 1992.
-
Metal Toxicity Evaluation: Review, Results,
and Data Base Documentation.
Hammermeister, D., C. Northcott, L. Brooks, and D. Call. 1983.
Comparison of Copper, Lead and Zinc Toxicity to
Four Animal
Species in
Laboratory
and ST.
Louis
River Water. University of
Wisconsin—Superior, Superior, WI.
Hansen,
D.J.
1993. Memorandum to
C.E. Stephan. April 15.
Holcombe, G.W., D.A. Benoit, E.N. Leonard, and 3.14. McKim. 1976.
Long-Term Effects of
Lead Exposur.
on Three Generations of Brook
Trout
(Salvelinus .tontLna.Zis). 3.
Fish. Res. Sd. Canada 33:1731-
1741.
-
Holcombe, G.W~, and R.W.
Andrew.
1978. Tb. Acute Toxicity of
Zinc to Rainbow and Brook Trout. EPA—600/3-78—094. National
Technical Information
Service,
Springfield, VA.
Horowitz, A.J., K.A. Elrick, and M.R. Colberg. 1992.
The
Effect
of Membrane Filtration Artifacts on
Dissolved
Trace
Element
Concentrations. Water Res. 26:753-763.
Howarth, R.S., and 3.5. Sprague. 1978.
Copper Lethality to
Rainbow Trout in Waters on
Various Hardness and pM. Water Rca.
12:455—462.
-
JRB Associates. 1983. Demonstration of the Site-specific
Criteria Modification Process: Selser’. Creek, Ponchatoula,
Louisiana.
DaøhniaLazorchak,~
3.14.Straus
1987.
During
TheAcute
Significanc.
Toxicity
of
Tests
Weight
with
Loss
copper.
of
I
“
:1
Ph.D.
Thesis.
-
Lima,
Northcott,
A.R.,
L.T.
C. Curtis,
Brook..
D.E.
1984.
Hammeraeister,
Acute and ChronicT.P.
Mark.s,Toxicities
C.E.
of
I
Arsenic(III) to Fathead Minnows, Flagfish, Daphnids,
and an
Amphipod. Arch.
Environ. Contam. Toxicol. 13:595-601.
Lind, D, K. Alto, and S. Chatterton. 1978. Regional Copper-
,.,
Nickel Study. Draft.
I
Mount, D.I. 1966. The Effect of Total Hardness and pH Acute
Toxicity of Zinc to Fish. Air Water Pollut. mt. 3. 10:49-56.
1
14
I
FL -.
Nebeker, A.V., C.K. McAuliffe, R. Mshar, and D.G. Stevens. 1983.
‘Toxicity of Silver to Steelhead and 1~ainbowTrout, Fathead
Minnows, and
DaphnLa
magna.
Environ. Toxicol. Chem. 2:95-104.
Pickering, Q.P., and M.I. Cast. 1972. Acute ‘and Chronic
Toxicity of Cadmium to the: Fathead Minnow
(Pimepha.L.s prom..Zas).
3. Fish. Rca. 3d. Canada 29:1099—1106.
Rice, D.W., Jr., and F.L. Harrison. 1983. The Sensitivity of
Adult, Embryonic, and
Larval
Crayfish
Procamba.rus cla.rk.Li
to
Copper.
NUREG/CR-3
133 or UCRL-53048. National Technical
Information Service, Springfield, VA.
Schuytema, G.S., P.O. Nelson, K.W. Malueg, A.V. Nabeker, D.F.
Krawczyk, A.K. Ratcliff’, and J.H. Gakstatter. 1984. Toxicity of
Cadmium
in Water and’ Sediment’ Slurries to
Daphnta magna.
Environ. Toxicol. Chem. 3:293-308.
Spehar, R.L., R.L. Anderson, and.J.T. Fiandt. 1978. Toxicity
and Bioaccumu.ation of Cadmium and
Lead
in Aquatic Invertebrates.
Environ. Pollut. 15:195—208.
Spehar, R.L., and A.R. Carlson. 1984. Derivation of Site—
Specific Water Quality Criteria for Cadmium and the St. Louis
River Basin, Duluth, Minnesota. Environ. Toxicol.
Chem.
3:651-
665.
Spehar, R.L., and J.T. Fiandt. 1986. Acute and Chronic Effects
of Water Quality Criteria-Based Metal Mixtures on Three Aquatic
Species. Environ. Toxicol. Chem. 5:917-931.
Sprague, 3.3. 1964. Lethal Concentration of Copper and Zinc for
Young Atlantic Salmon.
3.
Fish. Res. 3d. Canada 21:17—9926.
Stevens, D.G., and G.A. Chapman.. 1984.. Toxicity of Trivalent
Chromium to Early Life Stages. of Steelhead’Trout. Environ.
Taxicol. them. 3:125—133.
University of Wisconsin—Superior. 1993. Preliminary data from
work assignment 1—10 for Contract No. 68-C1-0034.
15