BEFORE THE ILLINOIS POLLUTION CONTROL BOARD
IN THE MATTER OF:
WATER QUALITY STANDARDS AND
EFFLUENT LIMITATIONS FOR THE
CHICAGO AREA WATERWAY SYSTEM
AND THE LOWER DES PLAINES RIVER:
Adm. Code Parts 301, 302, 303 and 304
)
)
)
)
)
)
)
R08-9
(Rulemaking-
Water)
NOTICE OF FILING
To:
John Therriault, Clerk
Illinois Pollution Control Board
James
R. Thompson Center
100 West Randolph Street - Suite 11-500
Chicago,
IL 60601
Deborah
J. Williams, Assistant Counsel
Stefanie N. Diers, Assistant Counsel
Illinois Environmental Protection Agency
1021 N. Grand Ave. East
P.O. Box 19276
Springfield,
IL 62794
Marie Tipsord, Hearing Officer
Illinois Pollution Control Board
James
R.
Thompson Center
100
W. Randolph, Suite 11-500
Chicago, IL 60601-3218
Persons included on the attached
SERVICE LIST
Please take notice that on March 25,2009, we filed electronically with the Office
of the
Clerk
ofthe Illinois Pollution Control Board the attached Updated Pre-Filed Testimony of James
E. Huff, P
.E. and accompanying Exhibits, a copy of which is served upon you.
Jeffrey
C. Fort
Ariel J. T esher
Sonnenschein Nath
&
Rosenthal LLP
7800 Sears Tower
233
S. Wacker Drive
Chicago, IL 60606-6404
12462512
CITGO PETROLEUM CORPORATION, and
PDV MIDWE T, LLC, Petitioners
By:~~~
____
~,~
~
________ __
One of Its Attorneys
Electronic Filing - Received, Clerk's Office, March 25, 2009
1
BEFORE THE ILLINOIS POLLUTION CONTROL BOARD
IN THE MATTER OF:
)
)
WATER QUALITY STANDARDS AND
)
EFFLUENT LIMITATIONS FOR THE
)
CHICAGO AREA WATERWAY SYSTEM
)
R08-9
AND THE LOWER DES PLAINES RIVER:
)
(Rulemaking-
Adm. Code Parts 301, 302, 303 and 304
)
Water)
UPDATED PRE-FILED TESTIMONY OF JAMES E. HUFF, P.E.
Introduction
My name is James E. Huff, and I am Vice President and part owner of Huff & Huff, Inc., an
environmental consulting firm founded in 1979. I received a Bachelor of Science in Chemical
Engineering in 1970 from Purdue University and was awarded a Masters of Science in
Engineering from the Environmental Engineering Department at Purdue University in 1971. I
am a registered Professional Engineer in Illinois.
My work experience includes two years with Mobil Joliet Refining Corporation as an Advanced
Environmental Engineer during the construction and start-up of the Joliet Refinery. After
leaving Mobil in the fall of 1973, I was employed for three years at IIT Research Institute in the
Chemical Engineering Department, working on advanced wastewater treatment projects. I then
spent four years with the Armak Company, now called Akzo Nobel Chemicals, where I was the
Corporate Manager of Environmental Affairs responsible for regulatory compliance and
engineering design of environmental systems at nine manufacturing facilities in the United States
and Canada.
For the last 29 years at Huff & Huff, Inc., I have been involved in over 40 environmental impact
studies associated with the impact of wastewater discharges on receiving streams throughout the
United States. Many of these studies have involved stream surveys, including the Chicago
Sanitary & Ship Canal (“Ship Canal”) for the Metropolitan Water Reclamation District of
Greater Chicago (“MWRDGC”), CITGO Petroleum corporation and PDV Midwest, LLC (the
“Lemont Refinery”), and Corn Products International, Inc. (“Corn Products”). I was Project
Manager on a year long Fox River Ammonia Study on behalf of most of the municipal
Electronic Filing - Received, Clerk's Office, March 25, 2009
2
dischargers on the Fox River below the Chain-of-Lakes. I am currently working on a study
addressing low dissolved oxygen levels on the East Branch of the DuPage River and Salt Creek
on behalf of the DuPage River/Salt Creek Work Group and am also currently supporting a work
group studying water quality issues on Hickory Creek. A copy of my resume is included in
Attachment 1.
I have been retained by the Lemont Refinery to review the Use designation proposed by the
Illinois EPA (the “Agency”) for the Ship Canal and the technical justification provided by the
Agency in support of its proposed Use designation. I have reviewed many of the reports
submitted into the record, pre-filed testimony, and transcripts from the hearings. I have also
evaluated the impact that the proposed use designation will have on the Lemont Refinery. With
the passage of time for the hearings in this matter, I have concluded that my Pre-filed Testimony
in this matter needed to be updated. Since then, additional information has become available in
the form of recent water quality data on the Ship Canal as collected at the Lemont Refinery
intake, as well as a more thorough review of the available information relating to temperature
conditions and fishery quality.
The collection of waterways currently under consideration represents a range of dissimilar
waterways, from natural streams to manmade canals. To some extent, the Agency’s proposed
changes recognize these differences in two different use categories, as Use A and Use B. My
review was focused on the appropriateness of Use B designation for the Ship Canal. The Lemont
Refinery discharges into the Ship Canal. At the point of its discharge, the Ship Canal can be
described - as the Agency has stated - as an “effluent dominated” waterway. The uses of the
Ship Canal are demonstrably different than the use of the other bodies of water in the Chicago
Area Water System (“CAWS”) and in this Use Attainability Analysis proceeding.
The Agency is proposing to group the Ship Canal as an Aquatic Life Use B Water, a group that
also includes the North Branch Chicago River, the Chicago River, South Branch Chicago River,
the Calumet River to Torrence Avenue, the Lake Calumet Connecting Channel, and the Lower
Des Plaines River from the Ship Canal to the Brandon Road Lock and Dam. With the exception
of the Lake Calumet Connecting Channel and the Ship Canal, all of the waterways in this group
are natural waterways. A proper consideration of the uniqueness of the artificially created and
Electronic Filing - Received, Clerk's Office, March 25, 2009
3
physically constrained Ship Canal is lost by including it in this grouping. The Ship Canal is
further sub-divided into Incidental Contact Recreation Waters (upstream of the Calumet-Sag
Channel confluence) and Non-Recreational Waters (downstream of the Calumet-Sag Channel
confluence). Aquatic Life Use B Waters are, “capable of maintaining aquatic life populations
predominated by individuals of tolerant types that are adaptive to the unique physical conditions,
flow patterns, and operational controls designed to maintain navigational use, flood control, and
drainage functions in deep-draft, steep-walled shipping channels.” (Agency’s Statement of
Reasons, p 49).
For the reasons that I will now present to the Illinois Pollution Control Board (“Board”), I submit
that the Ship Canal is unique and is fundamentally different in many important characteristics
that distinguish it from the other “Use B” waters. I would recommend the Board not include the
Ship Canal in “Use B,” but recognize the Ship Canal as a separate Use and establish water
quality standards that correspond to the unique conditions.
Uniqueness of the Sanitary & Ship Canal
As the Agency noted in its Statement of Reasons, “the environmental potential for the river was
historically deemed to be limited to the point of hopelessness” (Agency’s Statement of Reasons,
p 17). The Board has consistently recognized the challenges, variability, and uniqueness of the
CAWS and Lower Des Plaines River and many of the same challenges and limitations that the
Board recognized in the early 1970s remain valid today.
The Ship Canal extends 31.1 miles upstream from its confluence with the Des Plaines River to
the Damen Avenue Bridge in Chicago (
Chicago Area Waterway System Use Attainability
Analysis
(“CDM”), 2007). The Ship Canal is typically 200 to 300 ft. wide with depths ranging
from 27 to 50 ft. (CDM, 2007). The construction of the Ship Canal includes vertical walls and
steep embankments. The Ship Canal was completed in 1907 to divert pollutants away from Lake
Michigan, the City of Chicago’s primary water supply. The Ship Canal was expanded in 1919 to
its present form to increase navigation capabilities and provide additional waste dilution. With
the potential exception of the Calumet-Sag Channel, as described later in my testimony, there is
Electronic Filing - Received, Clerk's Office, March 25, 2009
4
no other water body in the CAWS which has the unique physical features, commercial shipping,
discharge loadings, and lack of appropriate habitat for aquatic life, as the Ship Canal.
As part of the Use Attainability Analyses (UAA), CDM conducted recreation and navigation
surveys for 28 days on the Ship Canal (CDM, 2007, page 4-69). No swimming, skiing, tubing,
or wading was observed. A single
canoe, sculling or hand powered boat
was observed over the
28 days. From my own experience in conducting benthic surveys on the Ship Canal for both the
Lemont Refinery as well as for the MWRDGC, the Ship Canal is not safe for canoes, sculling, or
other hand powered boating activities. When barges pass, the physical design of the canal
functions as a dangerous wave machine that amplifies the wake and creates large waves when
the barge wakes bounce off the vertical walls. Where two waves cross, the amplitude doubles,
and I have personally observed waves to get progressively larger reaching wave heights in excess
of five feet before gradually subsiding. This is an obvious dangerous and undesirable condition.
The barge traffic itself creates safety hazards for smaller boaters because they must avoid large
and lengthy vessels that move rapidly while consuming much of the open water in the canal,
leaving little room for small craft to maneuver. Any capsized boater would have a difficult time
getting out of the water due to the steep banks (CDM, 2007, pg 3-3). The record already reflects
the dangers of barge traffic further downstream (see exhibit 9). The nature of the Ship Canal
makes it even more dangerous-perhaps a reason why only one small watercraft was observed
during the study period cited above.
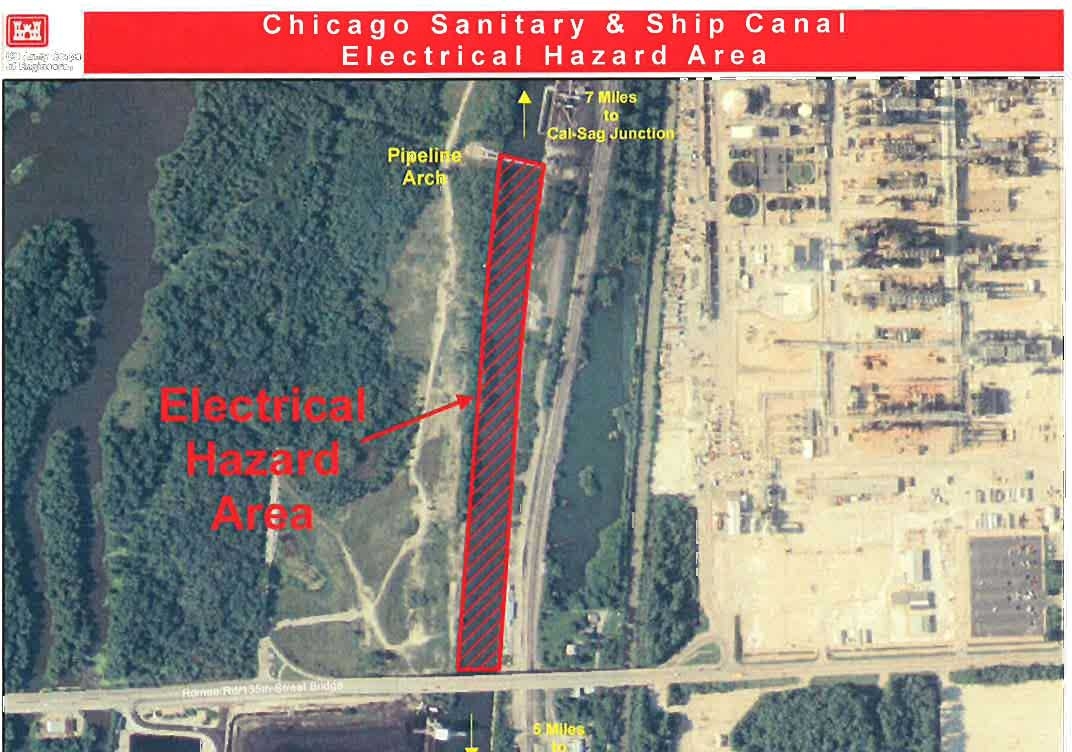
The electric barrier on the Ship Canal is another unique hazard to boaters. Anyone falling into
the water in proximity to the barrier risks serious injury or death. The U.S. Army Corps of
Engineer’s Col. Jack Drolet noted, “The safest thing is to keep people out of the water entirely”
(Attachment 2). The dangers associated with the use that this federal agency is trying to
discourage has apparently not been reconciled with the Agency’s proposal to upgrade the use
designation of the Ship Canal.
The aquatic habitat of the Ship Canal is rated as “poor to very poor” (IEPA, 2006). Overall
stream use is designated as
non-support
for fish consumption and aquatic life. The identified
causes of impairment were polychlorinated biphenyls (PCBs), iron, oil and grease, dissolved
Electronic Filing - Received, Clerk's Office, March 25, 2009
5
oxygen (“D.O.”), total nitrogen, and total phosphorus. Identified sources of the impairment
include combined sewer overflows, urban runoff/storm sewers, and impacts from hydrostructure
flow regulation/ modification, municipal point source discharges, and other unknown sources.
In addition to its unique manmade structure, the Ship Canal is home to three coal fired power
plants that provide low cost electricity to the City of Chicago, the remainder of the State of
Illinois, and elsewhere through the electrical power gird. The Ship Canal is effluent dominated
from the effluents from the MWRDGC facilities, including the Stickney plant, which is one of
the largest treatment plants in the world. On an annual average, the municipal treatment plants
contribute 70 percent of the total flow exiting the Ship Canal at Lockport. Important barge traffic
also flows along this critical artery to a wide range of industry that is located along the Ship
Canal and several of these industries also withdraw water from the Ship Canal and/or discharge
back into the Ship Canal. The coal fired power plants introduce a thermal loading to the Ship
Canal; however, other industries also discharge wastewater with a thermal component.
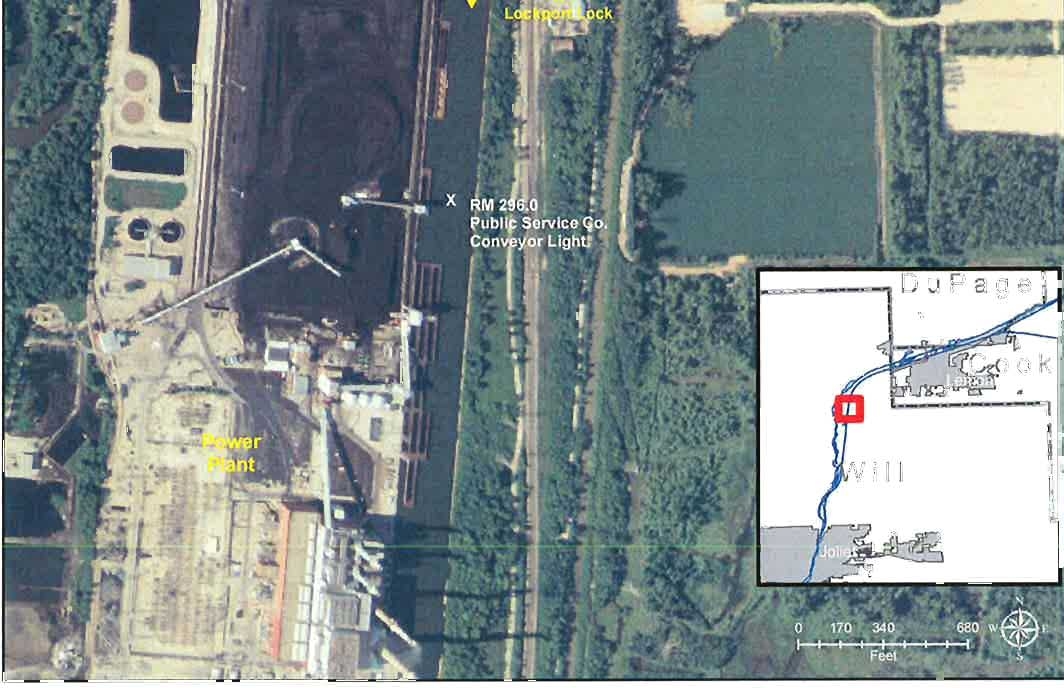
Another distinguishing factor of the Ship Canal is the electric barrier installed near the Lockport
Lock to prevent aquatic invasive species (including the Asian carp) from migrating into the Great
Lakes as well as migrating to the Mississippi River. Based on the effectiveness of the first
barrier, a second, more permanent barrier is being installed 800 to 1,500 feet downstream of the
first barrier. The first half of the second barrier has been completed, and is expected to be
activated in April of 2009, after a series of safety tests. To address some of the safety concerns,
the Coast Guard enacted a
Regulated Navigation Area
in the vicinity of the barriers, which
includes safety requirements for the vessels. The second half of the second barrier is awaiting
funding authorization. The second electric barrier is critical for periods when the first barrier
goes down for either scheduled or unscheduled maintenance. These barriers were authorized by
Congress, with the full recognition on the part of federal and state biologists that any positive
fish migration in the Ship Canal was being sacrificed to protect the Great Lakes as well as the
Mississippi River Basin from aquatic invasive species.
These electric barriers will not only prevent the aquatic invasive species from migrating, but will
also prevent all other fish from migrating up or down the Ship Canal at Lockport, effectively
6
terminating the water body at this point from a biological perspective. Normally, preventing
migration is not a desirable outcome, but it is certainly necessary in light of the greater goal of
protecting the biological integrity of the Great Lakes and the Mississippi River Basin.
The above description of the Ship Canal is truly unique among the Chicago Waterways and
Lower Des Plaines River as well as any other region in the country. The following list
summarizes the uniqueness of the Ship Canal:
•
The Ship Canal is vital to the economic well being of the region.
•
The electric barrier is vital to protecting Lake Michigan and the Mississippi River
from aquatic invasive species, which also results in no fish migration at Lockport.
•
The three coal fired power plants
1
provide lower cost electricity during peak
energy demand periods, which occur during prolonged hot periods during the
summer season, for Chicago, other Illinois communities, and beyond.
•
The Ship Canal carries the treated wastewater effluents from most of Cook
County which represent 70 percent of the Ship Canal flow at Lockport on an
annual basis (Agency’s Statement of Reasons, p 18). Effluent equal to an
estimated population equivalent of 9.5 million people is discharged through the
MWRDGC (Agency’s Statement of Reasons, p 17).
•
A significant pollutant load from combined sewer overflows enters the Ship
Canal, and the reservoir portion of the TARP program will not be completed for
at least an additional eight years. Stormwater runoff from this highly urbanized
area also discharge to the Ship Canal.
•
The shoreline of the Ship Canal houses many industries that rely upon the
waterway for cooling water, effluent discharge, as well as for commerce.
•
The Canal is manmade. It is unsafe for small boat traffic, from both wave
generated turbulence from barges as well as from the electric barrier(s).
1
Fisk, Crawford, and Will County. Technically Fisk is on the South Branch of the Chicago
River, just prior to the head waters of the Ship Canal, but the physical structure and other
features are similar to the Ship Canal.
Electronic Filing - Received, Clerk's Office, March 25, 2009
7
•
There are limited shallow areas along the shoreline (Pre-filed testimony of S.D.
Mackey, pg 10).
•
There is a lack of suitable physical habitat to promote a more diversified aquatic
community, as well as frequent disturbances caused by the barge traffic.
•
Silty substrates (CDM, 2007, page 4-80).
•
Poor substrate material (CDM, 2007, page 4-80).
•
Little instream cover (CDM, 2007, page 4-80).
•
Channelization (CDM, 2007, page 4-80).
•
No sinuosity (CDM, 2007, page 4-80).
•
There are no backwater areas or tributary mouths along the Ship Canal.
•
Routine dredging is required to maintain channel depth.
•
The Ship Canal has minimal slope and low velocities. These are not optimal
conditions for aquatic habitat, but they are optimal conditions for sediment
depositions.
•
The shoreline is predominantly commercially owned with limited access and no
recreation potential (Agency’s Statement of Reason, page 20). Downstream from
the Calumet-Sag Channel to the confluence with the Des Plaines River, no public
access points exist (Agency’s Statement of Reason, page 33).
Use Attainability Goals
The approach taken towards the Use Attainability Goals rests on certain assumptions regarding
the Ship Canal. In the Executive Summary of the
Chicago Area Waterway System Use
Attainability Analysis
(CDM, 2007), the goal for Limited Warm Water Aquatic Life stretches
(including the Ship Canal) was:
Maintain water quality to meet general use criteria, where attainable, and allow for
navigation and fish passage.
The Executive Summary then states the following objective:
To ensure D.O. and temperature criteria are met, and if unattainable, identify a
treatment alternative to increase D. O. levels and reduce temperature levels.
8
This goal and objective seem to make two significant assumptions. First, they assume that
fish
passage
even occurs; second, they assume that fish passage is even desirable. Congress, the U.S.
Army Corps of Engineers, state and federal biologists have already determined that fish passage
at Lockport is NOT desirable, as they attempt to keep aquatic invasive species, including the
Asian carp out of the Great Lakes and the Mississippi River Basin. Fish passage therefore is
limited to above Lockport and below Lockport, but not through the Lockport portion of the Ship
Canal. While this is clearly not a natural situation, it is necessary to protect more valuable
aquatic resources, which effectively precludes fish passage at Lockport. So we have state and
federal biologists working to prevent fish passage while this UAA goal, as stated above, is to
“allow for fish passage.”
Given the poor habitat of the Ship Canal, it is not clear where fish passage from Lake Michigan
would be going, nor have I seen any data presented that such fish passage is occurring or would
occur no matter what additional improvements in water quality are achieved. Lake Michigan
fish do enter the locks at Lake Michigan from time-to-time, but there are no data to suggest they
are taking up residency in the Ship Canal. One would assume that the natural avoidance
mechanism of fish from Lake Michigan would discourage them from swimming into the Ship
Canal because of the poorer habitat and lower water quality than found in Lake Michigan.
Habitat limitations suggest it is improbable that any indigenous species to the Great Lakes would
establish a viable population in the Ship Canal. Therefore, establishing more stringent water
quality standards would provide little if any improvement in the overall biological assemblage
than is currently present under existing conditions.
The poor physical habitat conditions within the Ship Canal also need to be considered when
contemplating upgrading standards. The objective to increase D.O. and reduce temperature
implies that improved fish quality will result if these changes are made. Similarly, imposing a
chloride water quality standard of 500 mg/L, when the Ship Canal clearly does not currently
achieve this standard, implies that the aquatic community will improve if this standard is adopted
and achieved. All of these regulatory changes have an economic cost and the benefits are merely
assumed to occur. Given the poor habitat, any such improvement in aquatic life in the Ship Canal
9
is questionable. Roy Smogor testified for the Agency that improvements in the Chicago Area
Waterways can attain a “biological condition that is still somewhat imbalanced.” (R08-09,
transcript, March 10
th
, 2008 morning transcript, page 19). Whether this also applies to the Ship
Canal was not addressed. The Ship Canal is also routinely subject to unavoidable moderate to
severe sediment scouring associated with barge traffic. Scott Twait noted that the Agency was
“not promoting recreational use, only protecting the existing use.” (R08-09 March 10, 2008
afternoon transcript, page 13). In the case of the Ship Canal, the primary existing uses would be
commercial shipping, industrial use, and the carrying of wastewater treatment plant effluent and
combined sewer overflows (CSOs) from the Chicago area away from Lake Michigan. By
lumping all of the Chicago Area Waterways together in these proceedings, the uniqueness of the
Ship Canal is lost.
Chlorides in the Ship Canal exceed the proposed 500 mg/L limit routinely during snow melt
conditions due to highway deicing (Attachment 3). This is yet another “existing use” that is
occurring – removal of snow melt which has become laden with sodium chloride due to safety
measures relating to our winter season.
The economic impact of the proposed changes in thermal, chloride, sulfate, and mercury will be
significant. Industrial dischargers will lose their mixing zones for these three pollutants during
periods of water quality violations, which will necessitate shutting down production during these
periods. The long-term fate of the three coal-fired power plants is also of concern. Growth by
wet industries along the Ship Canal will be precluded due to the inability to add any thermal,
chloride, or sulfate loadings.
The re-designation of the Ship Canal should also evaluate whether this is an issue which will
have an economic effect on residents of the region in the form of more expensive electricity and
the inability to use power generation facilities at precisely the time that peak power production is
needed most. Peak demand for electricity will occur when Ship Canal temperatures are highest.
(Attachment 4).
Electronic Filing - Received, Clerk's Office, March 25, 2009
10
Mixing Zone Implications, Chlorides, Sulfates, and Mercury
Because of the uniqueness of the Ship Canal, a separate use category is appropriate. However,
the Agency has proposed limits for four pollutants which we have identified as not achieving the
proposed Use B standards on the Ship Canal: thermal, chlorides, sulfates,
2
and mercury. Under
35 Ill Adm Code 302.105, mixing zones and Zones of Initial Dilution (“ZIDs”) are allowed,
subject to certain restrictions. Section 302.105(b)(9) prohibits mixing zones for constituents
where the water quality standard is already violated in the receiving stream. Assuming for the
moment that this prohibition only applies during the period of time the receiving water body
exceeds a water quality standard, then there will be times during each year when all dischargers
adding any chlorides, sulfates, mercury, or thermal will have to meet the water quality standards
at the end of pipe. The Agency noted in its Statement of Reasons (p 76) that it expects that there
will be violations of the chloride standard during the winter months, yet it offers no solution in
its proposal and it does not address at all the loss of mixing zones. It is likely that every
discharger on the Ship Canal will be negatively impacted by this loss of mixing zone, with
significant economic implications.
Attachment 3 presents four years of chloride data from the Lemont Refinery’s water intake
(which is upstream of its discharge). Chloride levels as high as 998 mg/L have been recorded in
the Ship Canal. The chloride level in the Ship Canal has remained above 500 mg/L for over three
weeks at a time, such as from January 28, 2008 to sometime between February 16 and 18, 2008,
attributed to highway de-icing runoff. The intense population center (i.e. the City of Chicago
and suburban Cook County which are upstream of the Lemont Refinery) on an effluent
dominated stream make achieving a 500 mg/L chloride standard not practicable without
changing de-icing practices. Moreover, while ignoring the current uses being made of the Ship
Canal, the proposal penalizes the point source dischargers on the Ship Canal. During periods of
elevated chlorides, no discharger can contribute any chlorides or sulfates under the proposed
water quality regulations. The Board has already granted variances relating to Total Dissolved
Solids to the Lemont Refinery (and changed the water quality standard for TDS for the Exxon-
2
Sulfates only when the chlorides are greater than 500 mg/L, no net increase in sulfates would
be allowed.
11
Mobil Refinery) due to the snow-melt phenomenon. Facilities that use once through cooling
water would not be allowed to add chlorine (increase in chlorides) to control microbial growth,
nor can they add sulfite type compounds to consume any chlorine residual (de-chlorinate) in the
discharge. On an effluent dominated stream, chlorinating the incoming water is important to
prevent biological growth on the heat exchangers. To discontinue discharging would entail
ceasing operations for most industries, which has its own economic ramifications. In addition,
new dischargers to the Ship Canal would essentially be limited to operations that did not add any
heat (no once through cooling), chlorinate, de-chlorinate, use de-icing salt in the winter, or any
process that contributes chlorides or sulfates. MWRDGC would also not be allowed to discharge
during periods its effluent exceeded 500 mg/L chlorides, which would occur when the Ship
Canal is also over 500 mg/L.
The Agency has proposed that the Human Health Standard (HHS) for mercury be applied
consistent with the General Use Water Quality Standards. The HHS for mercury is 12
nanograms per liter, which is to be achieved based on an annual average and whenever the flow
in the waterway exceeds the harmonic mean flow. Proposed Section 302.407(d) specifies that the
HHS is to be achieved after mixing as allowed in Section 302.102, consistent with the General
Use regulation. The Agency, in a recent NPDES permit, determined that the HHS for mercury
must be met in the effluent and that no mixing zone is allowed, despite regulations that appear
contrary to this position. The Agency needs to explain its proposal regarding the mercury HHS
standard with respect to allowable mixing zones.
There is no indication in the record I reviewed that the Agency has considered the loss of mixing
zones that will occur on the Ship Canal if the Use B designation is adopted to this waterway.
The unintended consequences of the Agency’s proposed UAA rules for chlorides and sulfates
could be addressed by development of Best Management Practices (BMP) for chlorides and
sulfates in place of winter water quality standards for these parameters.
12
Mercury Levels In The Ship Canal
The Lemont Refinery withdraws water used for processing from the Ship Canal at river mile
7.0. The Refinery has monitored this intake for many years for a variety of parameters. In the
summer of 2008, Huff and Huff was asked to conduct metals sampling at the intake, including
mercury sampling using U.S. EPA’s Ultra Clean Sampling Protocol Method 1669.
Attachment 3 includes the metal results from the Ship Canal, again, collected upstream of the
Lemont Refinery discharge. While the dissolved mercury levels were low, the total mercury
averaged 9.09 nanograms per liter. On August 6, 2008, the total mercury was 15.5 nanograms
per liter, and the flow in the Ship Canal was above its harmonic mean. If the stream already
exceeds the proposed water quality standard, then there would be no mixing zone and the 12
nanograms per liter limit would be applied as an effluent limit to all dischargers. In addition,
mercury would be listed as a cause of water quality impairment on this waterway, necessitating a
TMDL study and subsequent load reductions from existing sources of mercury. This will have
implications on all discharges on the Ship Canal, including the MWRDGC.
As this portion of the hearings is focusing on the uses of the receiving streams, we put forward
only the data on the conditions in the receiving stream and have not developed information on
the technical feasibility or economic reasonableness to meet the proposed mercury standard.
Thermal
The proposed Use B contains some very significant changes to the thermal limits for all of these
waterways. Because of the three coal-fired power plants and other industrial users that add heat
to the Ship Canal, special consideration regarding thermal limits is appropriate. The thermal
standards on the Ship Canal have been in effect for over 36 years, and specify the temperature
shall not exceed 93 degrees F more than 5 percent of the time and shall not exceed 100 degrees F
at any time (35 Ill Adm Code 302.408). Water quality standards are set to be protective of
stream uses.
13
There are two basic methods of establishing thermal standards: either through laboratory testing,
(exposing fish to water of various temperatures), or through the collection of field data. The
advantage of field-based standards are that natural responses, such as acclimatization and
avoidance, can be allowed to occur, while avoidance is not an option in laboratory tests and
acclimatization is limited to the experimental design as to how fast the water is to be heated. Dr.
Charles Coutant, the author of the Heat and Temperature chapter of the National Academy of
Sciences/National Academy of Engineering report
Water Quality Crieria-1972
believes that field
data are scientifically superior to extrapolations from laboratory-derived temperature
requirements for evaluation fish community responses to temperature (Attachment 5).
The UAA process for thermal standards relied to a large extent on the data analysis of Chris
Yoder, which was based on a literature search of laboratory temperature studies, which were then
ranked by a proprietary computer model to come up with growth and survival criteria of chosen
Representative Aquatic Species (RAS). Seasonal cycles were also developed to “protect
essential functions such as growth, gametogenesis and spawning.” (Pre-filed Testimony of Chris
O. Yoder, in R08-09, pg 11.) Mr. Yoder concludes his pre-filed testimony noting that
“occasional exceedences of well developed thermal criteria are inevitable and may not
necessarily result in a biologically impaired use.” (p 12).
For the Secondary Contact waterways, eight fish species were utilized by Yoder to derive
temperature limits, and these eight fish species were listed in Appendix Table 1G of the report
Temperature Criteria Options for the Lower Des Plaines River
(Yoder, C. and E. T. Rankin, Nov
2005). These eight species were as follows:
Gizzard Shad
Common Carp
Golden Shiner
Fathead Minnow
Bluntnose Minnow
Black Bullhead
Largemouth Bass
Green Sunfish
The bluntnose minnow was identified as the most thermally sensitive of the eight fish species,
with an upper incipient lethal temperature (UILT) of 32.4
o
C (or 90.3
o
F).
Electronic Filing - Received, Clerk's Office, March 25, 2009
14
The Agency then used the Yoder Report to develop the proposed thermal limits. Scott Twait’s
pre-filed testimony indicates that the eight fish species used by Yoder are “representative of the
species that would be found in water capable of maintaining aquatic life populations
predominated by individuals of tolerant types that are adaptive to the unique physical conditions,
flow patterns, and operational controls designed to maintain navigational use, flood control and
drainage functions in deep-draft, steep-walled shipping channels.” (p 11). In essence, the
thermal standards proposed appear to be based on what the Agency believes is necessary to
protect these eight species, at least with respect to maximum (summer) temperature limits.
For the non-summer months, Mr. Twait notes, “
Because the source water of the CAWS is
composed of the MWRDGC wastewater treatment plant effluents, the temperatures of these
waters can be expected to exceed other measures of background or ambient temperature at
certain times of the year. Consequently, the Agency decided to use the effluent temperature from
MWRDGC’s North Side, Calumet and Stickney facilities as the background temperature instead
of using temperatures at the Route 83 Chicago Sanitary & Ship Canal station during periods of
the non-summer months when the effluent temperature was higher than the background
temperature.
”…Had the Agency not made this alteration to the recommendations Chris Yoder’s
temperature report in developing water quality standards, the water quality standards for the
three aquatic life use designations proposed for the CAWS and Lower Des Plaines river would
have been lower than the MWRDGC effluents and would have required installation of cooling
towers or other treatment technology to reduce the temperature of these effluents.” (p 13 and
14). In essence, the Agency discounted Mr. Yoder’s analysis, and set the non-summer
temperatures so that the MWRDGC would not have to install cooling towers. Implicit in this
decision was that the cost of such cooling towers could not be justified, which begs questions
what about the other existing uses (including industrial users) on the Ship Canal. No attempt
was made to look at the Ship Canal temperatures at the edge of the mixing zones from these
industrial discharges.
The highest temperatures on the Ship Canal are downstream of the Crawford power plant, after
the contributions from both Fisk and Crawford stations. The MWRDGC has monitored
temperature at Cicero Avenue, approximately one mile downstream of the Crawford Station
Electronic Filing - Received, Clerk's Office, March 25, 2009
15
outfall. Attachment 6 includes a Report prepared by Nick Owens and myself from Huff & Huff,
Inc. on behalf of the Lemont Refinery and Corn Products International comparing the thermal
regime and fishery quality of the Ship Canal to the Calumet-Sag Channel. Nick Owens’ CV is
included in Attachment 8. Figure 3-8 in this report compares the daily maximum and highest
period average temperature to the proposed Use B temperature limits. Temperatures up to 100
o
F
occur during the summer months. In addition, the proposed Use B period average temperatures
are exceeded throughout the year, not just during the summer months. The reported bluntnose
minnow short-term survival temperature determined by Yoder, 90.3
o
F, is routinely exceeded on
the Ship Canal.
The Ship Canal has important functions, including commercial shipping, industrial cooling,
moving the treated effluent away from Lake Michigan, and flood control. If we are worried
about “optimum” temperatures for fish on the Ship Canal, what about the “optimum” amount of
barge traffic for fish (undoubtedly zero)? Removal of the treated effluents and CSO points would
also move the Ship Canal toward more “optimal” conditions for fish. The economic burden of
such ideas negates any serious consideration, yet the Agency’s proposal summarily imposes
significant impacts on the industrial users of the Ship Canal.
It is instructive to review the fish community that resides in the Ship Canal currently. All eight
of the fish species listed above have been collected in the Lower Lockport Pool (the 34 miles of
the Ship Canal) over the years. Midwest Generation’s fish collection data from 1994 to 2006 is
included in Attachment 7. Interestingly, the most thermally sensitive of these species, the
bluntnose minnow, is the second most abundant species caught in the Ship Canal. Over the years
there appears to be a general increase in its population. Prior to 2000, the bluntnose minnow
represented less than 6 percent of the total catch, while since 2001, it has represented over 13
percent of the catch. During this same period, the number of fish collected per gear effort and
number of species collected have both also increased dramatically. The emerald shiner, another
thermally sensitive fish, according to Yoder, is also present in the Ship Canal. Its presence also
seems to be increasing. In 1994, only 3 emerald shiner fish were collected. Since 2000, the
number collected has ranged from 24 to 178. There is no indication that the bluntnose minnow,
Electronic Filing - Received, Clerk's Office, March 25, 2009
16
emerald shiner, or any other of the species is being negatively affected by the current
temperature regime in the Ship Canal.
The MWRDGC has also conducted fish collection studies on the Ship Canal. All eight of the
above fish species utilized by Yoder in deriving in deriving temperature limits are present, with
the gizzard shad representing the highest percentage of fish collected. The bluntnose minnow
since 1993 has also been very well represented, averaging 17.8 percent over the ten year period
(CDM, 2007, p 4-78). Also of interest are the IBI scores for the Ship Canal, which CDM found,
“fairly uniform throughout the CSSC.” (CDM, 2007, p 4-77). If thermal is what is limiting the
fish quality/population, then one should see a dramatic drop in fish diversity, IBI, and fish
population at the downstream stations. At Cicero Avenue, immediately below two of the coal-
fired power plants, the MWRDGC found the greatest fish diversity (19 species). (CDM, 2007,
page 4-77). It should also be noted that IBI scores for the other CAWS waterways, which do not
have the thermal discharges, have similar IBI scores to the Ship Canal, another indication that
temperature is not the cause of overall impairment on the Ship Canal.
In an effort to evaluate the appropriateness of the Yoder approach, a comparison of the fishery
quality on the Ship Canal and the Calumet-Sag Channel was made. There are differences in
historical temperatures between these two deep-draft waterways, which both have limited
shallow area along the banks and a high volume of commercial traffic waterways. Therefore, a
comparison of the fisheries quality between the Ship Canal and the Calumet-Sag Channel would
be expected to identify limitations caused by thermal stress. Attachment 6 includes a copy of this
comparison. Likewise, within the Ship Canal, comparing fish data from sampling points with
different thermal characteristics would also be expected to identify limitations caused by thermal
stress.
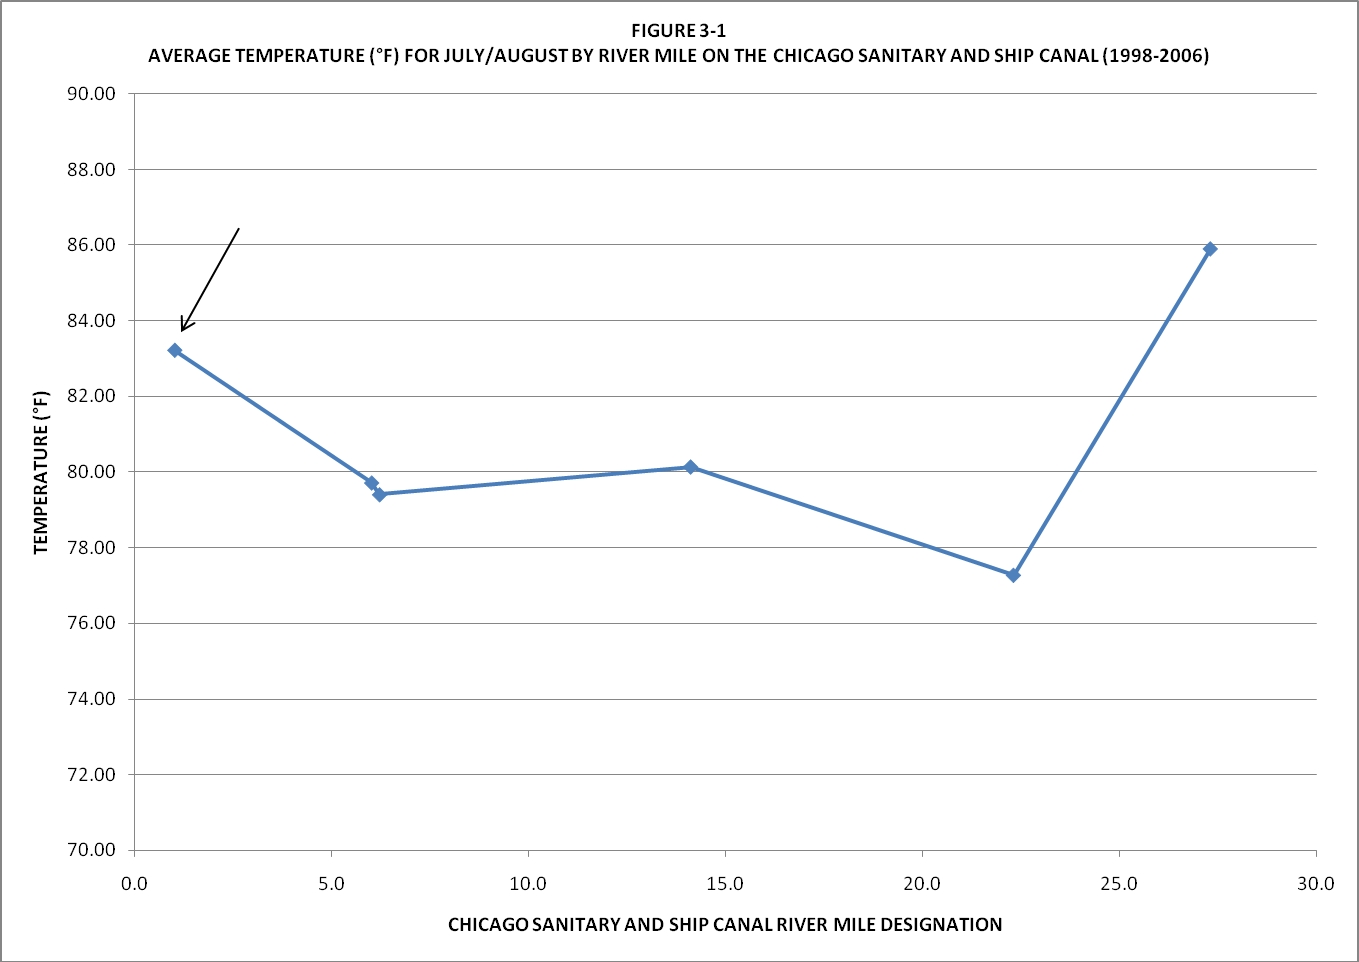
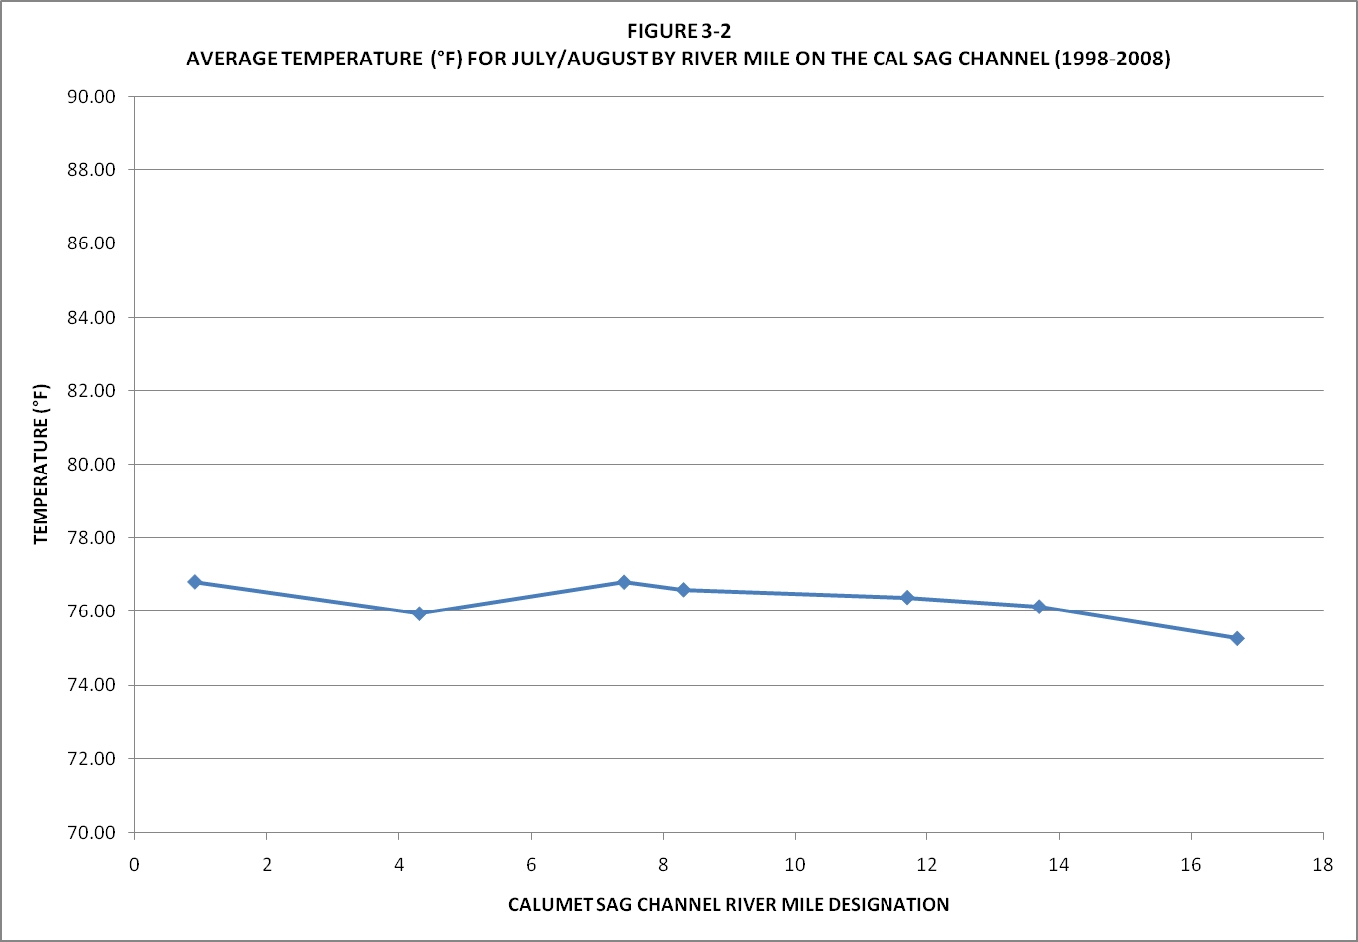
In that regard, July/August temperatures at Cicero Avenue on the Ship Canal between 1998 and
2006 averaged 85.9°F, compared to between 75.2 and 76.8
o
F along the entire Calumet-Sag
Channel between 1998 to 2008, or approximately 10°F warmer on average. Downstream along
the Ship Canal, July/August temperatures are not as warm as at Cicero; however, the
temperatures are still 3 to 6 °F warmer in the Calumet-Sag Channel.
Electronic Filing - Received, Clerk's Office, March 25, 2009
17
Moreover, historical fish records have revealed that 79 fish species have been collected on the
Ship Canal, versus 36 species on the CSC. More current fish collection data collected by the
MWRDGC, after completion on the Sidestream Elevated Pool Aeration (SEPA) systems on the
Calumet-Sag channel has yielded on average 8.5 species per site per sampling event on the Ship
Canal versus 11.2 species on the Calumet-Sag channel. Overall, recent collections by the
MWRDGC have found a total of 22 fish species on the Ship Canal and 29 species on the
Calumet-Sag Channel. The five most common fish encountered on each waterway is as follows:
Ship Canal
Calumet-Sag Channel
Gizzard Shad
Gizzard Shad
Common Carp
Emerald Shiner
Bluntnose Minnow
Common Carp
Pumpkinseed
Bluntnose Minnow
Emerald Shiner
Largemouth Bass
Four out of five most common fish are identical in these two waterways. In deriving temperature
limits, Yoder selected eight Representative Aquatic Species (RAS). The bluntnose minnow was
identified by Yoder as the most thermally sensitive species, with a UILT of 90.3°F. The
bluntnose minnow is among the most common fish collected on the Ship Canal, despite summer
temperatures that consistently exceed 90.3°F.
Although not utilized by Yoder in deriving temperature limits, the Emerald Shiner is also
reported to be thermally sensitive with an UILT of 89.8°F. This was the fifth most common
species on the Ship Canal. In 2005 the Calumet-Sag Channel experienced a two order of
magnitude increases in the Emerald Shiners collected. Otherwise, its population has historically
been similar to that on the Ship Canal.
The Ship Canal and Calumet-Sag Channel have similar fisheries quality. Additionally, when
comparing fishery qualities within the Ship Canal, a higher than average species diversity was
observed at the warmest sampling point. Existing thermal inputs into the Ship Canal do not
appear to be a controlling or limiting factor in the fisheries quality. In other words, if the thermal
18
loading on the Ship Canal were to be lowered to the proposed Use B thermal limits, there is no
biological evidence indicating that an increase in fishery quality would be expected.
Several fundamental questions arise out of a review of Yoder’s thermal endpoint data versus the
actual fish data collected within the Ship Canal.
•
If the bluntnose minnow and emerald shiner are both as sensitive to temperature
as the laboratory studies indicate, why do they represent a significant portion of
the fish population?
•
Based upon Mr. Yoder’s computed UILT of 32.4
o
C (or 90.3
o
F), why haven’t
there been massive bluntnose minnow, emerald shiner, or any other fish species
temperature related fish kills been observed on the Ship Canal?
•
Why is there greater fish diversity found at Cicero Avenue, immediately
downstream of the Fisk and Crawford generating station outfalls than the overall
average diversity on the Ship Canal?
•
If all eight fish species already exist in the waterway and are not shown through
field collection studies to be negatively impacted by the current temperature
regime, what benefits will be derived from more restrictive temperature
limitations on the Ship Canal given the documented habitat limitations on the
Ship Canal?
•
If the fisheries quality on the Calumet-Sag Channel and the Ship Canal are
similar, yet have significantly different thermal regimes, doesn’t this suggest that
habitat is controlling the fisheries quality?
The field collected data should speak for itself. Recall that Dr. Charles Coutant noted the
preference of using field collected data over relying on laboratory-based studies (Attachment 5).
Mr. Yoder concluded his pre-filed testimony by noting that “occasional exceedences of well
developed thermal criteria are inevitable and may not necessarily result in a biologically
impaired use.” (p 12). This statement would appear to call into question both the derivation of
19
the thermal limits as well as its application to a real world waterways. Therefore this comparison
between the Ship Canal and the Calumet-Sag Channel demonstrates that no improvement in
fishery quality would likely occur from the proposed more restrictive temperature limits for the
Ship Canal.
Conclusion
In AS96-10, the Board’s opinion noted that the Agency’s opinion was that the costs of installing
additional cooling “may not be economically reasonable when compared to the likelihood of no
improvement in the aquatic community of the UIW.”
3
(AS96-10, Opinion and Order, p 7). If
there will be no improvement in the aquatic community, then it is not clear what benefits will
occur from more restrictive thermal standards. The uniqueness of the Ship Canal, as outlined in
my testimony, is so apparent that a separate use category is needed. Such a use category should
recognize the existing uses and limitations of the Canal, which factors in the actual fish data on
the Ship Canal. Where the proposed Use B water quality standards will not be met, which is the
case for thermal, mercury, chlorides, and sulfates, the Board must consider whether any
improvement in the biological community will result from the adoption of these more restrictive
standards and what impact these proposed changes would have on the existing uses. The present
and abundant blunt-nose minnow, the most sensitive of the RAS species, and the thermally-
sensitive emerald shiner are already in the top five most common species collected and the
physical habitat is poor and not likely to change. Therefore, the fundamental basis behind
changing these standards appears flawed, and it ignores the impact on existing uses. Since this
set of hearings is focused on the proposed uses of the CAWS, I will not go further into the
appropriate water quality standards for the Ship Canal. But I would urge the Board to separate
the use designation for the Chicago Sanitary and Ship Canal from the other “Use B” water bodies
and examine the appropriate water quality standards based on the unique conditions of the Ship
Canal.
Thank you, this concludes my pre-filed testimony.
3
UIW-Upper Illinois Waterway
Electronic Filing - Received, Clerk's Office, March 25, 2009
CERTIFICATE OF SERVICE
I, the undersigned, certify that on this 25th day of March 2009, I have served
electronically the attached Pre-Filed Testimony
of James E. Huff, P.E., accompanying Exhibits,
and Notice
of Filing upon the following person:
John Therriault, Clerk
Pollution Control Board
James
R. Thompson Center
100 West Randolph Street - Suite 11-500
Chicago, IL 60601
and by U.S. Mail, first class postage prepaid, to the following persons:
Marie Tipsord, Hearing Officer
Illinois
Pollution Control Board
James
R. Thompson Center
100
W. Randolph St., Suite 11-500
Chicago, IL 60601
The participants listed on the attached
SERVICE LIST
12462512
Deborah J. Williams, Assistant Counsel
Stefanie N. Diers, Assistant Counsel
Illinois Environmental
Protection Agency
1021 N. Grand Avenue East
P.O. Box 19276
Springfield,IL 62794-9276
Ariel
J. Tesher
Electronic Filing - Received, Clerk's Office, March 25, 2009
12462512
SERVICE LIST
Frederick M. Feldman
Ronald M. Hill
Margaret T. Conway
Metropolitan Water Reclamation District of
Greater Chicago
111 E. Erie St.
Chicago, IL 60611
Matthew Dunn, Chief
Environmental Bureau
Office of the Attorney General
100 W. Randolph St., 12
th
Floor
Chicago, IL 60601
Bill Richardson, Chief Legal Counsel
Illinois Department of Natural Resources
One Natural Resources Way
Springfield, IL 62702-1271
Ann Alexander
Natural Resources Defense Counsel
101 N. Wacker Dr., Suite 609
Chicago, IL 60606
Keith Harley
Elizabeth Schenkier
Chicago Legal Clinic, Inc.
205 W. Monroe St., 4
th
Floor
Chicago, IL 60606
Thomas V. Skinner
Thomas W. Dimond
Kevin Desharnais
Jennifer A. Simon
Mayer Brown LLP
71 S. Wacker Drive
Chicago, IL 60606-4637
Katherine D. Hodge
Monica T. Rios
Hodge Dwyer Zeman
3150 Roland Avenue
P.O. Box 5776
Springfield, IL 62705-5776
Albert Ettinger
Jessica Dexter
Environmental Law & Policy Center
35 E. Wacker Dr.
Suite 1300
Chicago, IL 60601
Dennis Duffield
Director of Public Works & Utilities
City of Joliet
921 E. Washington St.
Joliet, IL 60431
Richard Kissel
Roy Harsch
DrinkerBiddle
191 N. Wacker Dr., Suite 3700
Chicago, IL 60606-1698
Claire Manning
Brown Hay & Stephens LLP
700 First Mercantile Bank Blvd.
205 S. Fifth St.
Springfield, IL 62705-2459
Charles Wesselhoft
James Harrington
Ross & Hardies
150 N. Michigan Ave.
Chicago, IL 60601-7567
Electronic Filing - Received, Clerk's Office, March 25, 2009
12462512
Frederick Keady
Vermillion Coal Company
1979 Jolms Drive
Glenview, IL 60025
Fred L. Hubbard
P.O. Box 12
16 West Madison
Danville, IL 61834
Georgia Vlahos
Naval Training Center
2601A Paul Jones St.
Great Lakes, IL 60088-2845
Kay Anderson
American Bottoms
One American Bottoms Road
Sauget, IL 62201
W.C. Blanton
Blackwell Sanders LLP
4801 Main St., Suite 1000
Kansas City, MO 64112
Robert VanGyseghem
City of Geneva
1800 South St.
Geneva, IL 60134-2203
Jerry Paulsen
Cindy Skukrud
McHenry County Defenders
132 Cass Street
Woodstock, IL 60098
Bernard Sawyer
Thomas Granto
Metropolitan Water Reclamation District
6001 W. Pershing Rd.
Cicero, IL 60650-4112
Lisa Frede
Chemical Industry Council of Illinois
1400 E. Touhy Ave.
Suite 110
Des Plaines, IL 60018
Fredric Andes
Erika Powers
Bames & Thornburg
1 N. Wacker Dr., Suite 4400
Chicago, IL 60606
Jack Darin
Sierra Club
70 E. Lake St., Suite 1500
Chicago, IL 60601-7447
Bob Carter
Bloomington Normal Water Reclamation
P.O. Box 3307
Bloomington, IL 61711
Tom Muth
Fox Metro Water Reclamation District
682 State Route 31
Oswego, IL 60543
Kenneth W. Liss
Andrews Environmental Engineering
3300 Ginger Creek Drive
Springfield, IL 62711
Vicky McKinley
Evanston Environmental Board
223 Grey Avenue
Evanston, IL 60202
Marc Miller
Jamie S. Caston
Office of Lt. Governor Pat Quinn
Room 414 State House
Springfield, IL 62706
Electronic Filing - Received, Clerk's Office, March 25, 2009
12462512
James L. Daugherty
Thorn Creek Basin Sanitary District
700 West End Avenue
Chicago Heights, IL 60411
Sharon Neal
Commonwealth Edison
125 S. Clark St.
Chicago, IL 60603
Tracy Elzemeyer
American Water Company
727 Craig Road
St. Louis, MO 63141
Irwin Polls
Ecological Monitoring and Assessment
3206 Maple Leaf Drive
Glenview, IL 60025
James Huff
Huff & Huff, Inc.
915 Harger Road
Suite 330
Oak Brook, IL 60523
Susan M. Franzetti
Nijman Franzetti LLP
10 S. LaSalle St.
Suite 3600
Chicago, IL 60603
Kristy A. N. Bulleit
Brent Fewell
Hunton & Williams, LLP
1900 K Street, NW
Washington, DC 20006
Cathy Hudzik
City of Chicago
Mayor’s Office of Intergovernmental Affairs
121 N. LaSalle St., Room 406
Chicago, IL 60602
Dr. Thomas J. Murphy
2325 N. Clifton St.
Chicago, IL 60614
Beth Steinhorn
2021 Timberbrook
Springfield, IL 62702
Traci Barkley
Prairie Rivers Networks
1902 Fox Drive, Suite 6
Champaign, IL 61920
Stacy Meyers-Glen
Openlands
25 E. Washington, Suite 1650
Chicago, IL 60602
Susan Hedman
Andrew Armstrong
Environmental Counsel
Environmental Bureau
69 W. Washington St., Suite 1800
Chicago, IL 60602
ATTACHMENT 1
RESUME OF JAMES
E. HUFF, P.E.
16
Expertise:
Experience:
Wastewater Treatment Planning and Design
Stream Surveys/ Antidegradation Analysis
JAMES E. HUFF, P.E.
Vice President
Since 1980, Mr. Huff has been vice president of Huff & Huff, Inc. responsible for projects pertaining to
wastewater treatment, design and operation, water quality studies, hazardous waste management,
groundwater and soil remediation, and compliance assessments.
Mr.
Huffhas directed 15 municipal wastewater treatment design projects. Examples of municipal design
projects are listed below:
- Belt filter press system for aerobic digested sludge, with sludge mixer and control system.
Sludge storage pad with enclosure
Bar screen
Grit, washer replacement
Tertiary filter rehabilitation
Secondary/Tertiary high flow bypass with chlorine contact tank and flow measurement and
blending
Anaerobic digester supernatant treatment for ammonia removal using SBRs (1999 ACEC-IL
Engineering Excellence Merit Award project.)
Conversion from chlorine to sodium hypochlorite disinfection
Conversion
of wet weather storage facilities to store-treat basins, with effluent disinfection
In-stream high purity oxygen injection into effluent and receiving stream for increasing stream D.O
1 million gallon excess flow storage/treatment concrete tank for new CSO with disinfection
Mr.
Huff is currently the Project Manager for preparation of a Facilities Plan for the Village of New Lenox
and in 2007 completed for the Village
of Barrington a Facilities Plan that evaluated the treatment options
for future nutrient removal and the need to upgrade to Class A sludge.
Mr. Huffhas also conducted several
CSO studies including Long-term Control Plans, Nine Minimum Controls, O&M Plans, and Water Quality
Impact Studies. He is currently working
on CMOM evaluations for three communities. Two novel in-
stream aeration systems, using high-purity oxygen
on a shallow Illinois stream, were designed by the firm,
and have operated successfully for over twenty years. In stream aeration feasibility is currently being
investigated
on Salt Creek under a contract with the DuPage River/Salt Creek Work Group. Mr. Huffhas
also completed two value engineering projects, one on an expanded wastewater treatment plant and the
other for an excess flow holding tank to offload the sewer system. The Galesburg Sanitary District
pretreatment ordinance and revisions have been prepared under Mr.
Huffs direction.
Mr.
Huffhas designed industrial wastewater treatment plants ranging in size from less than one thousand
gallons
per day to eight million gallons per day. He has assisted two petroleum refineries with biological
nitrification issues and evaluated the impact an industrial
user's sodium sulfate discharge would have on
the POTW, including the anaerobic sludge process. Mr. Huff directed the treatablility studies for
breakpoint chlorination for ammonia discharge
in an inorganic wastewater stream from a petroleum
refinery and assisted in the full-scale start up, and directed a treatablility study evaluating another industrial
discharger's proposed sodium sulfate discharge will have
on an Indiana POTW. Mr. Huffhas worked in a
variety
of industries on wastewater projects, including: petroleum refineries, cosmetics, foundries, plating,
printed circuit boards, inorganic and organic chemical plants, pharmaceutical manufacturers, and meat
packing. Examples
of industrial wastewater designs are listed below:
Electronic Filing - Received, Clerk's Office, March 25, 2009
- Sequential batch reactors (SBRs) for BOD
5
/COD reduction at phannaceutical plant, pretreatment
system subject to the Phannaceutical Categorical Pretreatment Standards
- Replacement
of a rotary drum pre-coat filter with a belt filter press for cosmetic wastewater stream,
with polymer addition
- Side stream SBR for nitrification on meat packing three-stage lagoon
- Breakpoint chlorination for ammonia removal at chemical plant, petroleum refinery and also a
meat packer
- Land application, with winter lagoon at chemical plant
- Copper removal from printed circuit board facility using sodium borohydride
- Integrated settling basin! sludge drying beds at foundry
- Completed a preliminary engineering evaluation for a chemical plant for upgrading its overloaded
wastewater land application system, which included conversion
of the winter storage lagoon to an
aerated lagoon with an anaerobic first stage lagoon
He has also designed cluster wastewater treatment systems with subsurface discharge for seven residential
developers/country clubs, an outdoor event facility, and a temple. These systems are typically
10,000 to
20,000 gpd, utilizing two SBRs, computer controlled, followed by a large leach field. These unique
systems are pennitted under the IDPH under a unique experimental use pennit provision.
On the Fox River, Mr. Huff was project manager for a group of municipal dischargers on a project to
collect and analyze weekly water quality samples along the river, its tributaries, and outfalls at over 30
locations to establish a better database on un-ionized ammonia levels. Mr. Huffhas directed fish, mussel,
benthic, and water quality surveys for municipal, stonn water, and industrial discharges located on the
following waterways: Beaver Creek, Cedar Creek, Deep Run, Flint Creek, Mississippi River, Thorn Creek,
North Kent Creek, Tyler Creek, Kiswaukee River, Chicago Sanitary
&
Ship Canal, and Casey Fork Creek,
and has completed anti degradation studies as part
of many of these studies. Thennal studies, mixing zone
studies, and multi-part diffuser designs have been completed for a variety
of clients. A thennal study on the
Illinois River is on-going. Sediment sampling, Sediment Oxygen Demand, and habitat evaluations have
been completed on Salt Creek and the DuPage Rivers.
From 2004 to 2007, Mr.
Huff was the lead consultant for NIPC (now CMAP) to review FP A requests for
consistency with the Commission's Water Quality Management Plan. Mr.
Huffhas completed over 150
FP A requests, including the Facilities Plan associated with these. Antidegradation and nutrients have been
two major issues on many
of these applications. Mr. Huff serves on the Illinois Nutrient Technical
Advisory Committee, representing the American Council
of Engineering Companies - Illinois (ACEC-IL).
Mr.
Huffhas been involved in eleven site specific rule changes and adjusted standards in Illinois. These
studies have included ammonia, D.O., BOD
5
,
TSS, TDS, and sulfates.
From 1987 through 1990, Mr.
Huff was a part-time faculty member, teaching the senior level
environmental courses in the Civil Engineering Department at IIT-West in Wheaton, Illinois.
From 1976 to 1980, Mr.
Huff was Manager of Environmental Affairs for Akzo Nobel Chemicals, a
diversified industrial chemical manufacturer.
At Akzo, Mr. Huffwas responsible for all environmental
activities at eight plants located throughout the United States and Canada. Technical work included
extensive biological and chemical treatability studies as well as designing new facilities, including two
wastewater pretreatment facilities, a land application system, and an incinerator system.
Previously, Mr.
Huffwas an Associate Environmental Engineer in the Chemical Engineering Section at IIT
Research Institute (IITRI). Much
of this work involved advanced wastewater treatment development,
including applying a combination
of ozonelUV treatment of cyanide, PCB's, RDX, HMX, and TNT and the
Electronic Filing - Received, Clerk's Office, March 25, 2009
use of catalytic oxidation of cyanide using powdered activated (carbon impregnated with copper in refinery
activated sludge units. At Mobil Oil's Joliet Refinery Mr.
Huff was employed as an Advanced
Environmental Engineer during the construction and start-up
of the largest grassroots refinery ever
constructed. Mr.
Huffwas responsible for wastewater training, permitting start-up, and technical support
as well as for water supply, solid waste, and noise abatement issues at the refinery from 1971 to 1973.
Membership
Illinois Association
of Wastewater Agencies
American Council
of Engineering Companies - IL
Environmental Committee 1999 - 2005
Chairman-June 2000-2004
Board
of Directors - 2005-2009
Vice President-2007-2009
Water Environment Federation Member
Illinois Water Environment Federation
National Water Well Association
Licenses:
Education:
1966-1970
1970-1971
1974-1976
Honors:
Thesis:
Registered Professional Engineer- Illinois
Class 2 Wastewater
Operator-Illinois
Class K Industrial Wastewater Operator-Illinois
Purdue University, West Lafayette, Indiana
B.S. in Chemical Engineering
Purdue University, West Lafayette, Indiana
M.S.E. in Environmental Engineering
University
of Chicago
Graduate School
of Business. Part time
Omega Chi Epsilon (Chern. Engr. Honorary)
President's Academic Award
Graduated with Distinction
Fellowship from the Federal Water Quality Admin.
"Destabilizing Soluble Oil Emulsions Using Polymers with Activated
Carbon," Major Professor, Dr. James E. Etzel
Selected Papers:
"Ozone-U.V. Treatment
of TNT Wastewater," E.G. Fochtman and J.E. Huff, International Ozone Institute
Conference, Montreal, May 1975.
"Characterization
of Sensory Properties: Qualitative, Threshold, and Supra-Threshold," J.E. Huff and
A.
Dravnieks, American Water Works Assoc. Seminar, Minneapolis, MN, June 1975.
"Control
of Rendering Plant Odors by Wet Scrubbers: Results of Plant Tests," R.H. Snow, lE. Huff, and W.
Boehme, APCA Conference Boston, MA, June 1975.
"Alternative Cyanide Standards in Illinois, a Cost-Benefit Analysis,"
L.L.
Huff and J.E. Huff, 31st Annual
Purdue Industrial Waste Conference, Lafayette, IN, May 1976.
"Cyanide Removal from Refinery Wastewaters Using Powdered Activated Carbon," J.E. Huff,
J.M. Bigger, and
E.G. Fochtman, American Chemical Society Annual Conference, New Orleans, LA, March 1977. Published
in
Electronic Filing - Received, Clerk's Office, March 25, 2009
Carbon Adsorption Handbook, P.N. Cheremisinoff and F. Ellerbusch, Eds., Ann Arbor Science Publishers, Inc.,
1978.
"Industrial Discharge and/or Pretreatment
of Fats, Oils and Grease," lE. Huff and E.F. Harp, Eighth
Engineering Foundation Conference on Environmental Engineering, Pacific Grove, CA, February 1978.
"A Review of Cyanide of Refmery Wastewaters," R.G. Kunz, J.E. Huff, and J.P. Casey, Third Annual
Conference
of Treatment and Disposal of Industrial Wastewater and Residues, Houston, TX, April 1978.
Published as: "Refinery Cyanides: A Regulatory Dilemma," Hydrocarbon Processing, pp 98-102, January
1978.
"Treatment of High Strength Fatty Amines Wastewater - A Case History," lE. Huff and C.M. Muchmore, 52nd
Conference - Water Pollution Control Federation, Houston, TX, October 1979. PublishedJWPCF, Vol. 54, No.
1, pp 94-102, January 1982.
"A Proposal to Repeal the Illinois Pollution Control Board's Construction Permit Water Regulations," J.H.
Russell and lE. Huff, Chicago Bar Record, Vol. 62, No.3, pp 122-136, Nov.-Dec., 1980.
"Measurement of Water Pollution Benefits - Do We Have the Option?" L.L. Huff, J.E. Huff, and N.B.
Herlevson, IL Water Pollution Control Assn 3rd Annual Conference, Naperville, IL, May 1983.
"Evaluation
of Alternative Methods of Supplementing Oxygen in a Shallow Illinois Stream," lE. Huff and J.P.
Browning, IL Water Pollution Control Assn 6th Annual Meeting, Naperville, IL, May 7, 1985.
"Technical and Economic Feasibility of a Central Recovery Facility for Electroplating Wastes in Cook County,
IL," J.E.
Huff and L.L. Huff, 1986 Governor's Conference on Science and Technology in Illinois, Rosemont, IL,
Sept. 3, 1986.
"Biomonitoring/Bioassay," lE. Huff, Federation of Environmental Technologists Seminar, Harvey, IL,
December 11, 1989.
"Storm Water Discharges," J.E. Huff, Federation
of Environmental Technologists Environment '90 Seminar,
Milwaukee, WI, March 7,1990.
"Engineering Aspects ofIndividual Wastewater System Design," J.E. Huff, 22nd Annual Northern Illinois
Onsite Wastewater Contractors Workshop, St. Charles, IL, February 27, 1995.
"Total Maximum Daily Loadings (TMDL) and Ammonia Conditions in the Fox River Waterway," l
E. Huff
and S. D. LaDieu, Illinois Water '98 Conference, Urbana, IL, Nov. 16, 1998.
"The Illinois Ammonia Water Quality Standards: Effluent Implications
&
Strategies for Compliance," L.R.
Cunningham
&
J. E. Huff, Illinois Water '98 Conference, Urbana, IL, Nov. 16, 1998.
"Impact of a High Sulfate and TDS Industrial Discharge on Municipal Wastewater Treatment," J.L. Daugherty,
J.E. Huff, S.D. LaDieu, and D. March, WEFTEC 2000, Anaheim, CA, October 17,2000.
"Phase II Storm Water Regulations - Compliance Strategies For The Gas TransmissionlDistribution Industry,"
lE. Huff, American Gas Association 2003 Operations Conference, Orlando, Florida, April 28, 2003.
"Endocrine Disruptors or Better Living Through Chemistry" Illinois Association
of Wastewater Agencies Fall
Meeting, Bloomington, IL, November 14, 2003 .
"Permitting Wastewater Treatment Plant Expansions in Northeast Illinois in the
21 st Century", J.E. Huff, 28
th
Annual Illinois Water Environment Association Conference, Bloomington, IL, March 6, 2007.
Electronic Filing - Received, Clerk's Office, March 25, 2009
ATTACHMENT 2
FISH BARRIER HAZARDS
21
u.s. ARMY CORPS OF ENGINEERS
ELECTRIC FISH BARRIER
HAZARDOUS VOLTAGES
PRESENT IN CANAL WATERWAY
BOATERS ARE ADVISED TO EXERCISE EXTREME CAUTION WHILE
NAVIGATING THE CHICAGO SANITARY
& SHIP CANAL BETWEEN THE
POWER PLANT TO THE PIPELINE ARCH(MILE MARKER 296.1 to 296.7)
HIGH RISK OF SERIOUS INJURY OR DEATH
PRECAUTIONS
DO NOT - Enter the water or place hands or feet in the water in the
restricted area for any reason.
PLEASE - Closely supervise children and pets or send them below
deck while in the restricted area.
DO NOT - Linger or attempt to moor in the restricted area.
MAN OVERBOARD PROCEDURES
DO NOT - Enter the water to attempt a rescue.
USE - A non-metallic oar or similar item to pull the victim onto
your boat as quickly as possible.
NOTIFY -
Authorities by calling 9-1-1 or by broadcasting a distress
call on VHF
Channel 16.
For additional information, contact the U.S. Army Corps of Engineers at (312) 846-5330 or visit our safety website at
www.lrc.usace.army.mil/safety.
NEWS RELEASE
U.S. Army
Corps
of Engineers
Chicago District
Contact:
Lynne Whelan
Telephone:
(312) 846-5330
E-Mail:
IYlme.e.whelan@usace.army.
mil
Lt. Corey Gardner-Meeks
(630) 986-2155
corey.a.gardner-meeks@uscg.mil
Army Corps and Coast Guard Kick Off Barrier Safety Campaign
March 27, 2008 - The U.S. Army Corps of Engineers and U.S. Coast Guard will begin a campaign April 1
st
to
advise boaters how to safely transit over the electric fish barrier in the Chicago Sanitary and Ship Canal near
Romeoville,IL. A portion of the canal near the barrier system has been a Regulated Navigation Area for passage
of vessels since 2005.
The Corps of Engineers and Coast Guard have expanded their safety infonnation campaign following the
findings
of a draft report that indicates the effect of the barrier's electric field on a person immersed in the
electrified water could result in serious injury or death. The Corps commissioned the report to detennine the
potential effects
of the barrier's electric field should a person fall into the water.
"Public safety is our highest priority. Although the draft report indicates a wide array
of possible impacts, it
does show that serious injury or death is possible in worst case scenarios. Therefore, we feel that it is critically
important to make sure that people know how to pass through the area safely. The safest thing is to keep people
out
of the water entirely," said Col. Jack Drolet, commander of the U.S. Anny Corps of Engineers, Chicago
District, the office responsible for building and operating the electric barrier system.
The final report will not be available until later this Spring, but the Corps of Engineers and Coast Guard have
decided
to begin an expanded education and infonnation campaign now in order to reach people before the start
of the Chicago area boating season.
"Reaching out to commercial and recreational users we initiated a workgroup to address the hazard of a
person falling in the water within the fish barrier," said CDR Paul Mehler III, Commanding Officer of the
u.s.
Coast Guard, Marine Safety Unit Chicago. This partnership has resulted in a campaign involving distributing
informational flyers at area locks, boat launches, bait shops, and fuel docks, and wor
king with local and national
boating groups to pass the information to
as many boaters as possible. The key message is to inform boaters to
use extreme caution while traveling in the Sanitary and Ship Canal between River Miles 296.1 to 296.7. This
area is bounded approximately by the power plant near the Romeo Road bridge and an aerial pipeline arch.
While traveling through the area, boaters are advised to take the following precautions:
•
Do not enter the water or place hands or feet in the water for any reason.
•
Be sure to closely supervise children and pets or send them below deck
if possible.
•
Do not linger or attempt
to moor in the area.
The Corps
of Engineers and Coast Guard are working with representatives from commercial navigation and
recreational boating groups and others
to find ways to enhance safety features in the barrier area.
An
electric barrier has been operating in the Sanitary and Ship Canal since 2002. The purpose of the barrier
system is to stop the movement of invasive species of fish, such as the Asian carp, between the Great Lakes and
Mississippi River basins.
For additional information pertaining to the fish barrier please visit www.lrc.usace.army.mil/safety.
-30-
For additional information pertaining to the fish barrier operation, please contact Lynne Whelan with the
U.S. Army Corps
of Engineers, Chicago District. For information regarding vessel safety, please contact Lt.
Corey Gardner-Meeks with the U.S. Coast Guard Marine Safety Unit Chicago. Point
of contact information is
provided on the first page
of this press release.
Electronic Filing - Received, Clerk's Office, March 25, 2009
rf.iiF.il
l!::aJ
Chicago Sanitary & Ship Canal
Electrical Hazard Area
ATTACHMENT 3
METALS AND CHLORIDE DATA FROM THE
CHICAGO SANITARY
&
SHIP
CANAL
AT
THE LEMONT REFINERY WATER INTAKE
Electronic Filing - Received, Clerk's Office, March 25, 2009
MERCURY LEVELS
CHICAGO SANITARY
&
SHIP CANAL
Dissolved Hg,
Dissolved Hg, 4-day
ng/L Running ave
rage, ng/L
Acute
Chronic
General
Use WQ Stds
2200.00
1100.00
07/24/08
<0.
50
07/31108
<0.50
08/06/08
0.64
08111108
<1.01
0.41
08113/08
<0.50
0.41
08/18/08
0.50
0.47
08/20108
1.69
0.74
08/25108
<0.50
0.67
08/27/08
<0.50
0.67
09/03/08
<0.50
0.61
Average
Acute and Chronic based upon Critical hardness of 205 mg/L.
Chronic applies to four-day running average
Total Hg n
g/L
Human Health Std
12.00
11.10
9.66
15.50
4.73
13.00
9.48
5.82
4.91
7.50
9.l6
9.09
Human Health Std based on annual average, total mercury, and shall also not be
exceeded when the flow is above the harmonic mean.
The Harmonic mean flow for the Ship Canal is 2,900 cfs
R:ICitgolCleal/ Metals StudylResults to 09-03-08.xlslMercury WQ Camp
Stream
Flow, cfs
3434
2655
2255
IRON LEVELS
CHICAGO SANITARY
&
SHIP CANAL
Dissolved Iron,
Ilg/L
General Use WQ Stds
1,000.0
07124/08
26.7
07/31/08
12.9
08/06/08
11.4
08/11/08
<20.0
08/13/08
<20.0
08/18/08
<20.0
08120108
<20.0
08/25/08
15.1
08127108
20.6
09103/08
211.0
R:ICilgolClean Metals StwJyIResults to 09-03-08.xlslIron WQ Comp
NICKEL LEVELS
CHICAGO SANITARY
& SHIP CANAL
Dissolved Nickel,
IJg/L
Dissolved Nickel, 4-day
Running average,
IJglL
Acute
General Use WQ Stds
151.20
07/24/08
3.64
07/31108
2.26
08/06/08
1.91
08111108
5.05
08/13/08
4.93
08/18/08
5.07
08/20108
4.11
08/25/08
4.06
08127108
4.56
09/03/08
3.74
Acute and Chronic based upon Critical hardness
0[205
mg/L.
Chronic applies to four-day running average
R:ICitgolClean Metals StudylResults to 09-03-0B.xlslNi9kel WQ Camp
Chronic
9.
20
3.22
3.54
4.24
4.79
4.54
4.45
4.l2
Electronic Filing - Received, Clerk's Office, March 25, 2009
COPPER LEVELS
CHICAGO SANITARY
&
SIDP CANAL
Dissolved Copper,
~g/L
Dissolved Copper, 4-day
Running average,
~g/L
Acute
General Use WQ Stds
33.50
07/24/08
07/31108
08/06/08
08111108
08/13/08
08/18/08
08/20108
08125108
08/27/08
09/03/08
1.84
1.89
1.82
1.85
1.66
1.72
1.84
1.63
1.69
2.03
Acute and Chronic based upon Critical hardness
of205 mglL.
Chronic applies to four-day running average
R:ICttgolClean Metals StudylResults to 09-03-0B.xlsICopper WQ Comp
Chronic
21.00
1.85
1.81
1.76
1.77
1.71
1.72
1.80
Electronic Filing - Received, Clerk's Office, March 25, 2009
ZINC LEVELS
CHICAGO SANITARY
&
SHIP CANAL
Dissolved Zinc,
~tglL
Acute
General Use
WQ Stds
219.50
07/24/08
8.26
07/31/08
8.38
08/06/08
8.77
08111108
8.58
08/13/08
7.01
08/18/08
8.24
08/20/08
9.26
08/25/08
11.00
08/27/08
10.00
09/03/08
9.79
Dissolved Zinc, 4-day
Running average,
J.LglL
Chronic
39.60
8.50
8.19
8.15
8.27
8.88
9.63
10.01
Acute and Chronic based upon Critical hardness
of 205 mglL.
Chronic applies to four-day running average
R: \Cilgo\Clean Metals Study\Resu/ts to 09-03-0B.xls\Zinc WQ Camp
Electronic Filing - Received, Clerk's Office, March 25, 2009
ARSENIC LEVELS
SANITARY
&
SHIP CANAL
Dissolved Arsenic,
~g/L
Dissolved Arsenic, 4-day
Running average,
~glL
General Use WQ Stds
07/24/08
07/31/08
08/06/08
08111/08
08113/08
08118/08
08/20108
08/25/08
08127108
09103/08
360.00
Acute
2.06
2.06
1.77
1.73
2.15
1.94
1.99
2.22
1.86
1.86
Acute and Chronic based upon Critical hardness
of 205
mg/L.
Chronic applies to four-day running average
R:ICUgoIClean Metals StudylResults to 09-03-0B.xlslArsenic WQ Comp
1
90.00
Chroni
1.91
1.93
1.90
1.95
2.08
2.00
1.98
SELENIUM LEVELS
CHICAGO SANITARY & SHIP CANAL
Total SelenimTI,
~g/ L
General Use WQ Stds
1,000.00
07124/08
1.47
07/31108
1.22
08/06/08
1.29
08/11108
1.31
08/13/08
<1.20
08/18/08
1.33
08120108
<1.20
08125/08
2.34
08/27/08
LIS
09/03/08
1.04
R:ICilgolClean Metals StudyIResults to 09-03-0B.xlsISeZenium WQ Comp
SILVER LEVELS
CHICAGO SANITARY
&
SHIP CANAL
Total Silver,
~g/L
General Use WQ Stds
5.000
07/24/08
0.080
07/31/08
0.068
08/06/08
0.099
08/11/08
0.049
08/13/08
0.064
08/18/08
0.060
08/20108
<0.040
08/25/08
<0.020
08/27/08
0.049
09/03/08
0.063
R:ICitgolClean Metals StudylResulls to 09-03-0B
.xlsISilver WQ Camp
Electronic Filing - Received, Clerk's Office, March 25, 2009
CADMIUM LEVELS
CHICAGO SANITARY
& SHIP CANAL
Dissolved Cadmium,
Ilg
lL
Dissolved Cadmium, 4-day
Running average,
Ilg/L
Acute
General Use WQ Stds
20.100
07/24/08
0.045
07/31108
0.038
08/06/08
0.034
08111108
0.055
08/13/08
0.044
08/18/08
0.051
08/20108
0.058
08/25/08
0.031
08127108
0.028
09103/08
0.032
Acute and Chronic based upon Critical hardness of 205 mg/L.
Chronic applies to four-day running average
R:ICitgolClean Metals StudylResults to 09-03-0B.
xls\Cadmium WQ Comp
Chronic
1.800
0.043
0.043
0.046
0.052
0.046
0.042
0.037
Electronic Filing - Received, Clerk's Office, March 25, 2009
LEAD LEVELS
CHICAGO SANITARY
&
SHIP CANAL
Dissolved Lead,
f..lg/L
Dissolved Lead, 4-day
Running average
f..lg/L
Acute
General Use WQ Stds
163.800
07124/08
0.433
07/31108
0.438
08/06/08
0.441
08/11/08
0.420
08113108
0.366
08/18/08
0.424
08/20108
0.460
08/25/08
0.533
08/27/08
0.551
09/03/08
0.509
Acute and Chronic based upon Critical hardness
of205 mglL.
Chronic applies to four-day running average
R:\Citgo\Clean Metals Study\Results
10
09-03-0B.xls\Lead WQ Comp
Chronic
34.400
0.433
0.416
0.413
0.418
0.446
0.492
0.513
Electronic Filing - Received, Clerk's Office, March 25, 2009
CHICAGO SANITARY & SHIP CANAL CHLORIDE LEVELS
AT LEMONT (CITGO's
WATER INTAKE)
2008
2007
2006
2005
Date
Chloride,
mlJlL
Date
Chloride, mlJ/L
Date
Chloride,
mg/L
Date
Chloride,
mg/L
117/08
562
1/1/07
174
1/2/06
330
1/10105
835
1/11/08
272
1/5107
156
1/6/06
320
1/12/05
492
1/18/08
270
1/8107
113
1/9/06
314
1/13/05
580
1/21/08
256
1/12/07
133
1/13/06
276
1/14/05
274
1/25/08
252
1/19/07
239
1/16/06
226
1/17/05
242
1/28/08
514
1/22/07
203
1/20106
215
1/19/05
250
2/1108
556
1/26/07
384
1/23/06
220
1/21/05
235
2/4108
625
1/29/07
286
1/27/06
413
1/24/05
430
2/8108
896
2/2/07
225
1/30106
308
1/31/05
634
2/11/08
848
2/5107
227
2/3/06
298
2/4/05
413
2/15/08
666
2/9107
181
2/6/06
252
2/11/05
416
2/18/08
489
2/12/07
224
2/10106
243
2/14/05
364
2/22/08
351
2/16/07
181
2/13/06
238
2/25/05
307
2/25/08
376
2/19/07
695
2/17/06
251
3/7/05
283
2/29/08
299
2/23/07
549
2/20106
276
3/11/05
286
3/3108
460
2/26/07
600
2/24/06
249
3/14/05
277
3/7108
398
3/2/07
734
2/27/06
484
3/21/05
300
3/10108
364
3/5107
616
3/3/06
200
3/25/05
272
3/14/08
333
3/9107
395
3/17/06
209
3/28/05
270
3/17/08
316
3/16/07
350
3/20/06
201
4/4105
240
3/21/08
301
3/19/07
340
3/31/06
189
4/8105
232
3/24/08
294
3/23/07
281
4/3106
208
4/11/05
221
3/28/08
388
3/23/07
281
4/7/06
189
4/15/05
200
3/31/08
413
3/26/07
415
4/10/06
183
4/18/05
199
4/4108
333
3/30/07
258
4/14/06
188
4/22/05
197
4/7108
328
4/2/07
252
4/17/06
190
4/25/05
196
4/11/08
275
4/6107
236
4/21/06
128
4/29/05
184
4/14/08
247
4/9107
232
4/24/06
154
5/2105
190
4/18/08
158
4/13/07
214
4/28/06
162
5/6105
195
4/21/08
266
4/16/07
242
5/1106
175
5/13/05
164
4/25/08
251
4/20/07
259
5/5106
152
5/16/05
151
4/28/08
242
4/23/07
241
5/12/06
166
5/20/05
167
5/2108
224
4/27/07
136
5/15/06
145
5/23/05
147
5/5108
90
4/27/07
136
5/19/06
145
5/27/05
151
5/9108
220
4/30/07
169
5/19/06
145
5/30/05
163
5/12/08
172
5/4107
176
5/22/06
147
6/1105
160
5/16/08
172
5/7107
215
5/26/06
167
6/3105
156
5/19/08
174
5/11/07
202
5/29/06
145
6/10/05
121
5/23/08
213
5/14/07
200
6/2106
134
6/13/05
124
5/26/08
204
5/18/07
191
6/5106
122
6/17/05
128
R:\Citgo\Chicago Sanitary
&
Ship Canal WQ Data\Chlorides 2005 - 2008 at Lemont.xls
CHICAGO SANITARY & SHIP CANAL CHLORIDE LEVELS
AT LEMONT (CITGO's WATER INTAKE)
2008
2007
2006
2005
Date
Chloride, mg/L
Date
Chloride, mg/L
Date
Chloride, mg/L
Date
Chloride, mglL
5/30/08
170
5/21/07
180
6/9/06
132
6/20/05
127
6/2/08
183
5/23/07
188
6/12/06
108
6/24/05
122
6/6/08
163
5/25/07
170
6/16/06
109
6/27/05
118
6/9/08
133
5/28/07
187
6/19/06
129
7/1/05
119
6/13/08
130
6/1/07
150
6/23/06
123
7/4/05
103
6/16/08
157
6/4/07
138
6/26/06
119
7/8/05
103
6/20/08
165
6/8/07
145
6/30/06
294
7/11/05
103
6/23/08
175
6/11/07
148
6/30/06
294
7/15/05
100
6/27/08
171
6/15/07
144
7/3/06
110
7/18/05
100
6/30/08
110
6/18/07
141
7/7/06
12
7/22/05
92
7/4/08
144
6/22/07
110
7/10/06
85
7/25/05
99
7/7/08
154
6/25/07
119
7/14/06
103
7/29/05
99
7/11/08
156
6/29/07
108
7/17/06
414
8/1/05
92
7/14/08
124
7/2/07
108
7/21/06
92
8/5/05
102
7/18/08
135
7/6/07
115
7/24/06
227
8/8/05
88
7/21/08
105
7/9/07
100
7/28/06
104
8/12/05
93
7/25/08
110
7/13/07
104
7/31/06
96
8/15/05
88
7/28/08
111
7/16/07
103
8/4/06
74
8/19/05
98
8/1/08
111
7/20/07
108
8/7/06
91
8/22/05
76
8/4/08
99
7/23/07
114
8/11/06
93
8/26/05
80
8/8/08
109
7/27/07
99
8/14/06
92
8/29/05
88
8/11/08
101
7/30/07
105
8/18/06
85
9/2/05
87
8/15/08
100
8/3/07
102
8/21/06
96
9/5/05
68
8/18/08
99
8/6/07
102
8/25/06
81
9/9/05
67
8/22/08
90
8/10/07
90
8/28/06
90
9/12/05
73
8/25/08
140
8/13/07
101
9/1/06
71
9/16/05
70
8/29/08
126
8/17/07
99
9/4/06
87
9/19/05
86
9/1/08
90
8/20/07
111
9/8/06
82
9/23/05
63
9/5/08
77
8/24/07
92
9/11/06
100
9/26/05
73
9/8/08
88
8/27/07
88
9/15/06
245
9/30/05
60
9/12/08
112
8/31/07
115
9/18/06
200
10/3/05
68
9/15/08
140
9/3/07
105
9/25/06
95
10/7/05
81
9/19/08
110
9/7/07
101
9/29/06
107
10/10/05
96
9/22/08
138
9/10/07
91
10/2/06
95
10/14/05
88
9/26/08
116
9/14/07
89
10/6/06
83
10/17/05
100
9/29/08
89
9/17/07
94
10/9/06
113
10/21/05
87
10/3/08
96
9/21/07
87
10/13/06
119
10/24/05
92
10/6/08
106
9/24/07
100
10/16/06
209
10/28/05
85
10/10/08
86
9/28/07
105
10/20/06
146
10/31/05
106
10/20/08
115
10/1/07
101
10/23/06
109
11/4/05
146
R:\Citgo\Chicago Sanitary
& Ship Canal WQ Data\Chlorides 2005 - 2008 at Lemont.xls
CHICAGO SANITARY & SHIP CANAL CHLORIDE LEVELS
AT LEMONT (CITGO's WATER INTAKE)
2008
2007
2006
2005
Date
Chloride, mg/L
Date
Chloride, mg/L
Date
Chloride, mg/L
Date
Chloride, mg/L
10/24/08
124
10/5107
99
10/27/06
126
11/7105
126
10/27/08
119
10/8107
110
10/30106
120
11/11/05
105
10/31/08
127
10/12/07
107
11/3106
134
11/14/05
132
11/3108
145
10/15/07
107
11/6/06
149
11/18/05
110
11/7108
146
10/19/07
104
11/13/06
118
11/21/05
116
11/10108
152
10/22/07
91
11/17/06
108
11/25/05
128
11/14/08
115
10/26/07
103
11/20106
128
11/28/05
128
11117/08
147
10/29/07
114
11/24/06
140
12/2105
146
11/21/08
149
11/2107
111
11/27/06
143
12/5105
130
11/24/08
154
11/5107
122
12/1/06
105
12/9/05
183
11/28/08
149
11/9107
120
12/4/06
14
12/12/05
192
11/12/07
127
12/8106
195
12/16/05
406
11/16/07
130
12111106
236
12/19/05
264
11/19/07
128
12/15/06
249
12/23/05
295
11/23/07
122
12/18/06
200
12/26/05
253
11/26/07
100
12/22/06
198
12/30/05
357
11/30107
103
12/25/06
129
12/7107
261
12/29/06
139
12/10/07
717
12/14/07
654
12/17/07
404
12/21/07
998
12/24/07
614
12/28/07
488
12/31/07
412
Average
226
214
168
183
Maximum
896
998
484
835
R:\Citgo\Chicago Sanitary
&
Ship Canal WQ Data\Chlorides 2005 - 2008 at Lemont.xls
Electronic Filing - Received, Clerk's Office, March 25, 2009
ATTACHMENT 4
HEAT RELATED HAZARDS FROM BROWNOUTS
29
Multi-Print Viewer
Page 1
of2
Access World News
Power failure puts CornEd on hot seat - Toll hits 69 - heat subsides
Chicago Sun-Times
- August 2, 1999
Author:
MARK SKERTIC AND ROBERT
C
.
HERGUTH
Falling temperatures weren't enough to cool off thousands of city and suburban Commonwealth Edison
customers who remained without power Sunday after a heat wave that has claimed at least 69 lives.
Com Ed hoped to have all power restored
by this morning, but the beleaguered utility's troubles are far from
over. For the first time, ComEd must pay customers for spoiled food and other expenses they rang up because
their electricity failed.
"We all are angry that outages happened
in the first place," Mayor Daley said.
Ald. Helen Shiller (46th), whose ward includes some
of the more than 20 buildings along North Lake Shore
Drive that had no power or water Sunday, didn't try to hide her anger with ComEd o
"The deal is ComEd blew it by saying everything is fine," she said. "They should have been telling people the
truth. I've told that to every person I've talked to from ComEd."
ComEd spokesman Steve Solomon said, "We're not pleased . They're not pleased. We both have the same
concern_getting the customers' power turned back on."
In the weeks ahead, ComEd will be sorting through claims for reimbursement, which are available at
www.ucm.com or by calling (800) EDISON-1.
The company also will be trying to determine why cables and other equipment gave out, keeping the power off
in about 10,500 homes in the utility's service area late Sunday.
More than 9,600
of them were in the city, while about 850 power failures were scattered in the suburbs, mostly
in the south suburbs.
At the peak of the power failures, more than 92,000 of ComEd's nearly 3.5 million customers were without
electricity Friday.
After a week
of temperatures hovering around 100, suburbs and city neighborhoods were filled Sunday with
people out enjoying a day when the temperature was in the lower 80s. But public officials were left dealing with
the grim aftermath
of the deadly heat wave.
The Cook County medical examiner's office added 30 names to the list of heat victims, bringing the total to 73
for the summer.
Sixty-nine deaths, including six from the suburbs, have been blamed on the current heat spell. More autopsies
scheduled for Sunday night and today are expected to increase that number, a spokesman said .
The 1995 heat wave contributed to more than 700 Chicago area deaths.
Dropping temperatures, brought on by a shift
in the jet stream, has pushed cooler air over Chicago and much of
the Midwest, bringing relief to much of the nation. The heat wave was blamed for at least 185 deaths nationally,
80 of them in Illinois. Missouri was next with 44.
In Chicago, officials said they were generally pleased with the city's response. "Overall, our emergency plan has
worked very well," Daley said. "Without the plan, and thousands of Chicagoans who checked on neighbors, it
could have been worse.
"
Over three days the city received 50,000 calls to the non-emergency
311 number. Forty percent were about
http://infoweb.newsbank.com.proxy .lib. uiowa.eduliw-searchlwellnfo Web
07/21/08
Multi-Print Viewer
Page 2
of2
power failures.
The most widespread failures were in Chicago's Lake View neighborhood, where underground electrical cables
failed starting about 5:20 p.m. Saturday. More than 20 mid-rises and high-rises_roughly between Irving Park
Road, Belmont, the lakefront and Halsted_remained without power Sunday, officials said.
Police and fire officials estimated those buildings are home to 5,500 people, many
of whom are elderly.
A 1997 state law requires ComEd to compensate customers for the costs incurred during a power failure that
lasts at least four hours and affects 30,000 or more customers.
The law requires "that someone take responsibility," said David Farrell, a spokesman for the Illinois Commerce
Commission. "This will be the first check of that."
At some buildings without power, Com Ed gave away meals, flashlights, drinking water and ice.
ComEd spent $120 million earlier this year
on system upgrades to avoid the kind of problems seen over several
days, Solomon said.
"Unfortunately, the combination
of weather and usage will take its toll on the equipment."
Contributing: Jim Ritter, Abdon M. Pallasch
Caption:
Lake View residents sit outside their building Sunday while waiting for the power to come back on.
More than 20 high-rise and mid-rise buildings along North Lake Shore Drive had no power or water Sunday.
See related stories page 2. ROBERT A. DAVIS
Edition:
LA TE SPORTS FINAL
Section:
NEWS
Page:
1
Index Terms:
hot; heat wave; deaths; Commonwealth Edison; electricity; outage; power failure;
WEATHER; ENERGY
Record Number:
CSTOB020025
Copyright
1999
Chicago Sun-Times, Inc.
http://infoweb.news bank. com. proxy .lib. uiowa.edu/i w-searchlwe/lnfo Web
07/21108
Multi-Print Viewer
Page 1 of2
Access World News
COMED HOPES TO DELIVER SOME CHECKS BY NEXT WEEK - COMPANY EXPECTS
TO PAY OUT MILLIONS
Chicago Tribune
- August 5, 1999
Author:
Gary Washburn, Tribune Staff Writer.
Commonwealth Edison Co. customers who suffered losses after last weekend's power outages may begin
receiving reimbursement checks as early as next week, ComEd Chairman John Rowe said Wednesday .
Rowe reported that the company probably will hire an outside firm to expedite the handling of claims.
"I would like to see some people start getting (checks) as early as next week," Rose said. "I don't know if I can
deliver on that, but we'll try."
An estimated 90,000 Chicagoans suffered power interruptions
of four hours or more as smothering heat
knocked equipment off line, causing losses that ComEd officials believe will be in the millions of dollars.
Electricity was restored to all customers by Monday.
No claims have been filed so far, but ComEd has fielded more than 12,000 calls regarding claim forms, a
company spokeswoman said Wednesday.
Most
of the losses are believed to be related to spoilage of food and medicines requiring refrigeration.
ComEd will not require receipts for items in the "normal array of what people keep in their refrigerators," Rowe
said . "My wife doesn't keep her grocery receipts, and I don't expect other people to either."
Rowe said he expects submission
of some phony claims, and "if we feel people are ripping (us) off, then we will
get tough .
" But, he added, "the key is we will pay all the reasonable ones as fast as we can."
Rowe has contended that ComEd was not required by law to reimburse customers for losses
in the outages
because the problems were caused by the extremely hot temperatures.
But he decided that reimbursement was the proper way to treat customers.
Meanwhile, the city was tallying the cost of expenditures for its outage-related emergency response, including
the evacuation of residents from high-rise buildings that went dark.
Mayor Richard Daley , who praised ComEd last week for the way it was dealing with the heat, was upset with
the subsequent outages.
But by Wednesday, the mayor had cooled off. He commended Rowe for his decision to pay claims, hailing what
he said was a new frankness by the company.
Rowe also said the company will expedite improvements at two substations where failures led to outages.
Claim forms are available
by calling ComEd at 800-EDISON-1 and can be downloaded from the company's
Internet site at www.ucm.com. The claims, however, cannot be filed electronically. Claim forms also can be
obtained through Chicago public library branches, aldermanic offices or by calling
311 , the city's non-
emergency information number.
In a related development, Gov. George Ryan said low-income households with children, the elderly or people
with health problems will be the prime targets for the $15.9 million in federal utility bill subsidies announced
Tuesday by President Clinton.
"We want to make sure that low-income families who suffered through last month's heat wave don't have to
http://infoweb .newsbank.com. proxy .Ii b. uiowa.eduliw-searchlwe/Info Web
07/21/08
Electronic Filing - Received, Clerk's Office, March 25, 2009
Multi-Print Viewer
Page 2
of2
suffer again when their electric bills come," Ryan said.
The help is available through local agencies. Applications for assistance under the program will be accepted
through Aug .
31 , the governor's office said.
For information on program eligibility and where to apply, Illinois residents can call 800-252-8643. Chicago
residents also can call 312-456-4100.
The death toll in Cook County from the heat since July 29 was raised to
81 Wednesday when the Cook County
medical examiner's office reported that heat played a role in the death Tuesday of Margaret Cornils, 77, of
Evanston.
Edition: CHICAGO SPORTS FINAL
Section: METRO CHICAGO
Page: 1
Index Terms: ENERGY; UTILITY ; DEFECT; CONSUMER; WEA THER
;
FOOD; DEA TH
;
COST
Record Number: CTR9908050161
Copyright
1999,
Chicago Tribune
http://infoweb.newsbank..com.proxy .lib. uiowa.eduliw-searchlwelInfo Web
07/21/08
Electronic Filing - Received, Clerk's Office, March 25, 2009
Multi-Print Viewer
Page 1
of 4
Access World News
HEAT STALKS CITY ELDERLY - DEATHS CLIMB; OFFICIALS WARN RISK NOT OVER-
RESIDENTS STEAM AS OUTAGES LINGER
Chicago Tribune
- August 1, 1999
Author:
Jeremy Manier and John Chase, Tribune Staff Writers.
In a frightening echo of 1995's heat disaster, the hottest days in the Chicago area in four years claimed as
many as
57 lives Friday and early Saturday, amid power outages that at times left up to 100,000 households
virtually defenseless against searing temperatures.
The Cook County medical examiner's office said Saturday that 25 deaths had been linked to temperatures that
topped 100 degrees and heat indexes that hovered near 120
on Thursday and Friday. Investigators also were
looking at 30 additional deaths in Cook County that they believed likely were heat related.
In addition, Lake County
on Saturday reported two heat-related deaths.
Even with the new victims, the toll trails that of 1995, when 85 heat-related deaths occurred the first day after
the hottest temperatures, on the way to a total of more than 700 dead.
The danger is not past, Chicago officials said at a news conference.
"Just because it will be cooler today doesn't mean everyone will be able to get through," said Mayor Richard
Daley, who called
on residents to help city workers look after the elderly and other groups at risk from the heat.
"You have to check
on them, because you could save their life," Daley said.
Hope for relief came from forecasts that temperatures would drop further after a slight improvement Saturday,
with highs projected in the low 80s for Sunday and merciful lows in the mid-60s. The cooler temperatures
prompted the National Weather Service to cancel its heat advisory Saturday.
Residents and city officials on Saturday continued venting frustration with Commonwealth Edison over outages
that left 26,000 homes without power for more than 24 hours. As
of 8 p.m., Com Ed officials said, 11,500 homes
citywide remained without power.
The North Side outage was caused by a transformer failure
in a substation at Addison Street and California
Avenue. During the 1995 heat wave, the same substation suffered a fire that deprived 41,000 North Side
residents of power for more than a day.
Jacquelyn Heard, Daley's press secretary, said the mayor had not known the same substation was responsible
for both failures. But she expanded on Daley's comments at the earlier press conference, when he said he was
"upset" about the outage.
"I think people who lost power deserve some answers," Heard said. "The mayor was very clear he would hold
ComEd responsible. We're going to see to it that they follow through with the work, and this is not just empty
promises."
Martin Cohen, executive director
of the Citizens Utility Board, a watchdog group, was more direct in his
criticism .
"It's apparent the system
on the North Side is not engineered properly," Cohen said. "That should have been
apparent four years ago. There aren't any excuses for not providing power when people most need it."
ComEd spokesman Steve Solomon said the eight transformers that failed at the station had been inspected
weekly. Some had been installed as far back as the early 1980s, he said, noting that such electrical equipment
can have a lifespan of 40 to 50 years under normal conditions.
htlp:llinfoweb.newsbank.com. proxy .lib. uiowa.eduliw-searchlwe/lnfo Web
07/21/08
Electronic Filing - Received, Clerk's Office, March 25, 2009
Multi-Print Viewer
Page 2
of 4
But the demand late last week was anything but normal.
"This isn't a situation of maintenance or upgrades not being done at that station,
" Solomon said. "This is a
situation
of peak demand records being beaten five times in two weeks.
"Frankly, the system as a whole has held
up extremely welL"
Local power performance has been trouble-free compared to other cities this summer, Solomon said .
In early
July, record temperatures topping 100 degrees caused blackouts affecting 200,
000 residences in New York,
prompting Mayor Rudolph Giuliani to charge that the power utility was woefully unprepared .
After the lessons
of 1995, no officials in Chicago could claim ignorance of the mayhem that heat can unleash.
The deaths and power crisis come despite a citywide emergency plan implemented after 1995 and forecasts
that accurately predicted high temperatures Thursday and Friday.
Power crews from as far away as Rockford and Maywood worked non-stop, beginning at 11 p.m. Friday night,
when a portable transformer was hauled to the Addison substation, ComEd officials said.
The mechanical problems with the transformers differ from those suffered at the substation in 1995, according to
ComEd o In 1995, transformers overloaded, but this year the transformers weren'
t considered stressed.
Crews worked all Saturday to bring the transformers online, but early estimates that the task would be
completed by mid-afternoon proved overly optimistic.
Steve Wickman, a ComEd supervisor and substation engineer who is part of the team trying to bring the plant
back to power, said the temporary transformers carry about half the power of one of the failed transformers.
The two working transformers at the SUbstation were hosed down by Chicago firefighters for most of the day to
keep them cool.
Although there was no way
of knowing Saturday whether the North Side outage contributed to the death toll,
four victims at the medical examiner's office had addresses within the outage area or on its borders.
Cook County Medical Examiner Edmund Donoghue said he doubts the deaths were linked to power outages.
Heat-related deaths most often are the result of extended exposure to broiling conditions over a period of a day
or more, Donoghue said, so an outage late Friday might not have had much impact.
"People who had air conditioning would be cooled off already." Donoghue said . "A short power outage wouldn't
cause too many problems."
But he said the lack of air conditioning might be an issue if power outages continued for more than 24 hours.
That danger was a possibility late Saturday because of the thousands of residences still without power.
Donoghue also praised the city's emergency response plan for trying to find people suffering from the heat.
"I think the city has done everything they can," Donoghue said. "Older people are difficult to reach. When you
look into this, I think you'll find (the victims) were people who were living alone.
"
Many heat deaths reported Saturday fit Donoghue's profile. Evelyn Doss, 86, had resisted getting air
conditioning for her home on the South Side, partly because it caused her arthritis to flare up, said Florida Ware,
a relative who lived nearby. residents. Such visits turned up four heat deaths Saturday, according to CHA
Director Phil Jackson.
The Chicago Police Department, the Department of Human Services and Department on Aging check on senior
citizens
in nursing homes and others who ask at least once a day, according to officials.
If no one answers the phone or the person sounds weak, a squad car is sent to the home, and officers knock on
the door, question neighbors and try to contact relatives, police spokesman Pat Camden said. They also are
authorized to knock down a door.
http://infoweb .newsbank.com. proxy .lib. uiowa.eduliw-searchlwe/Info Web
07/21/08
Electronic Filing - Received, Clerk's Office, March 25, 2009
Multi-Print Viewer
Page 3 of4
Camden said Saturday that the Police Department had made 3,020 such checks since Thursday morning.
The definition of what exactly constitutes a heat-related death was questioned after the 1995 disaster. Some
local health officials balked at Donoghue's reports that hundreds
of people had died from the heat, theorizing
that the heat was just the last stress for people who were close to death.
Donoghue and other medical examiners have since led attempts to create uniform guidelines. Victims typically
have body temperatures
in excess of 105 degrees before they die, though experts say other factors can justify
classifying a death as heat-related.
The broader criteria include people with heart conditions who make
an attempt to cool off before dying. Elevated
levels
of certain liver and muscle enzymes or signs of mental disorientation can also lead to a verdict that heat
played a role.
Most victims are not near death when heat strikes, according to Donoghue. Otherwise, they already would be
in
hospitals or nursing homes with air conditioning. The heat claims people who are frail but independent enough
to live on their own, who might have lived additional years if not for the heat.
The disproportionate toll
in Cook County arises in part from the fact that Chicago's vast expanses of concrete
and asphalt tend to trap heat, yielding temperatures 3 to 4 degrees above those in the suburbs, experts say.
The city also is home to more poor residents who cannot afford air conditioning.
Before late Friday, the heat wave had claimed 13 lives in Cook County and one in Kane County in the past 10
days.
The weekend's only heat-related deaths outside Cook were the two in Lake County.
A 91-year-old Highland Park man died Saturday morning at Highland Park Hospital after suffering heat stroke at
home Friday night, said Jim Wipper, deputy coroner.
A Maryland woman
in town to see her brother graduate from Great Lakes Naval Training Center died Thursday,
although Wipper said the heat was only a complicating factor to heart and respiratory problems.
Aside from the local crisis, nearly 100 heat-related deaths outside the Chicago area have been reported since
mid-July.
In more than a dozen states, people were found dead in homes and apartments without air conditioning or fans.
In Missouri, 39 deaths were blamed on the heat.
The lack
of electricity for air conditioning drove multitudes into the streets or the lake, seeking relief. Chicago
Park District spokeswoman Angelynne Amores said an estimated 450,000 people stormed the lakefront Friday.
Adam Knoll, 69, spent the night sleeping on a pier near his home
on Virginia Street along the north branch of
the Chicago River.
"The river was nice and cool," Knoll said.
Weighing stifling heat versus his safety on the street, Knoll said he chose the lesser of two evils.
"I didn't feel safe in the house where it was boiling," he said.
Tribune staff writers Anthony Colarossi, Bechetta Jackson, James Janega and Anthony Burke Boylan
contributed to this report.
Caption:
PHOTOS 2 GRAPHIC
PHOTO: Firefighters from Engine Company 106 pour water onto a working Com Ed transformer Saturday at
California Avenue and Addison Street. Tribune photo by Todd Panagopoulos. PHOTO (color): A body is placed
in a refrigerated truck outside the Cook County medical examiner's office after heat deaths overloaded the
facility. Tribune photo by Phil Greer. GRAPHIC: Blackouts hit the city At its worst, between 4 p.m. and 11 p.m.
Friday night, the outage affected 100,000 households in the Chicago area, including 62,000 on the North and
http://infoweb.newsbank.com.proxy .lib. uiowa.eduliw-searchlwe/lnfo Web
07/21108
Electronic Filing - Received, Clerk's Office, March 25, 2009
ATTACHMENT 5
LETTER FROM CHARLES
C. COUTANT
TO
JULIA WOZNIAK, AUGUST
9, 2007
37
Charles C. Coutant, Ph. D.
Aquatic Ecologist
August 9, 2007
Julia Wozniak
Senior Biologist, Environmental Services
Midwest Generation EME, LLC
One Financial Place
440 South LaSalle Street
Suite 3500
Chicago, IL 60605
Dear Julia:
120 Miramar Circle
Oak Ridge. TN 37830
865-483-5976
e-mail: CCOUlant3@comcast.net
At your request, I have reviewed the August 2007 report, entitled "Development of
Biologically Based Thermal Limits for the Lower Des Plaines River," prepared for
Midwest Generation by EA Engineering, Science and Technology, Inc. (the OlEA
Report") . This letter provides my views and opinions concerning the methodology,
findings and recommendations contained in the EA report.
I understand I was asked to review the EA report as an independent expert who was not
involved with its preparation (other than providing editorial comments for clarity
of
earlier drafts). My expertise in the subject includes a long career that emphasized thermal
effects on fish and other aquatic life. I retired in 2005 from the Oak Ridge National
Laboratory. I was principal author
of the Heat and Temperature chapter of the National
Academy
of SciencesfNational Academy of Engineering report Water Quality Criteria-
1972, and a co-author
of the US EPA's 1977 interagency guidance for implementing
Section 316(a) of the Clean Water Act. I am familiar with the Lower Des Plaines River
from my work as co-chair
of the Upper Illinois Waterway Ecological Study Task Force in
the early 1990s, which involved stakeholder groups including US EPA, IEPA, IDNR,
MWRDGC, USFWS, Sierra Club and Commonwealth Edison.
The
EA report is, in my opinion, technically sound and directed appropriately at the issue
of setting biologically based water temperature standards in the Lower Des Plaines River.
I base this opinion on the following points:
• I agree that carefully developed and thoughtfully analyzed field data are scientifically
superior to extrapolations from laboratory-derived temperature requirements for
evaluating fish community responses
to temperature. Having been involved with both the
laboratory-based Academy report and the heavily field oriented 316(a) guidance, I can
objectively view the relative merits
of laboratory and field data for developing thermal
criteria and standards. The report provides both scientific and administrative justification
for emphasizing the field approach in this situation.
• The technical analyses are appropriate and well done. Species richness and the
IWBmod are two widely accepted indices offish community health.
It
is reasonable to
compare each index with temperatures at time of fish collections. The author uses two
analytical methods for these indices, pair-wise ANOV A and Loess regression, to provide
useful weight
of evidence, rather than relying on one technique alone. The Loess
regression is a particularly ilmovative way
to obtain an second, independent evaluation.
The results are shown in tables and in well-prepared figures.
• The analysis
of winter thermal limits is consistent with EPA guidance, my own
development
of cold kill guidance for power plants (reference below), and the wintertime
conditions
of the Lower Des Plaines River.
• I agree with the EA report's discussion
of the need for verification of data (for validity
and suitability) used for establishing water quality criteria and standards. The examples
provided from the Midwest Biodiversity Institute (MBI) report are clearly unacceptable
scientifically. To the degree that data evaluation and verification have not been done for
the database used by MBI for their recommendations to US EPA Region V and Illinois
EP A, I would put more credence on the field data and analyses given in the EA report.
• The EA report is consistent with my reading
of US EPA's overall guidance for water
quality criteria, whereby full protection
of all species (including the most sensitive) is not
required and field studies are preferred (US EPA 1985, cited in the EA report).
• The EA report's numerical conclusions are supported by the technical analyses.
In summary, I found the EA report to be sound, consistent with recognized scientific
literature and administrative guidance, and with appropriate discussion justifying the
approach.
It
is a valuable contribution toward development of rational thermal standards
for the Lower Des Plaines River.
Coutant,
C. C. 1977. Cold shock to aquatic organisms: guidance for power-plant siting,
design, and operation. Nucleaar Safety 18(3):329-342.
Electronic Filing - Received, Clerk's Office, March 25, 2009
ATTACHMENT 6
THERMAL EVALUATION OF THE CHICAGO SANITARY AND
SHIP CANAL AND
THE CALUMET-SAG CHANNEL AS IT PERTAINS TO
FISHERIES QUALITY
THERMAL EVALUATION OF THE CHICAGO SANITARY AND
SHIP CANAL AND THE CALUMET-SAG CHANNEL AS IT
PERTAINS TO FISHERIES QUALITY
PREPARED FOR
CITGO PETROLEUM CORPORATION
AND
CORN PRODUCTS, INTERNATIONAL, INC.
PREPARED BY
HUFF & HUFF, INC.
MARCH 2009
TABLE OF CONTENTS
ACRONYMS……………………………………………………………………………………...................... iii
EXECUTIVE SUMMARY .......................................................................................................... iv
1.
INTRODUCTION ............................................................................................................. 1
2.
EVALUATION OF STUDY AREA ................................................................................. 2
2.1
CHICAGO SANITARY & SHIP CANAL............................................................ 2
2.2
CALUMET SAG CHANNEL ............................................................................... 2
3.
EVALUATION OF AVAILABLE DATA ....................................................................... 3
3.1
TEMPERATURE .................................................................................................. 3
3.2
FISH DATA......................................................................................................... 14
3.3
HABITAT QUALITY ......................................................................................... 20
4.
DISCUSSION .................................................................................................................. 22
REFERENCES ............................................................................................................................ 27
LIST OF FIGURES
Figure 3-1
Average Temperature (°F) for July/August by River Mile on the Chicago Sanitary
and Ship Canal ....................................................................................................... 5
Figure 3-2
Average Temperature (°F) for July/August by River Mile on the Calumet Sag
Channel .................................................................................................................. 6
Figure 3-3
Chicago Sanitary and Ship Canal Temperature Profile at Lockport Lock and Dam
(RM 1.0)................................................................................................................. 7
Figure 3-4
Chicago Sanitary and Ship Canal Temperature Profile at Illinois Route 83 (RM
14.1) .................................................................................................................... 8
Figure 3-5
Chicago Sanitary and Ship Canal Temperature Profile at Cicero Avenue (RM
27.3) .................................................................................................................... 9
Figure 3-6
Chicago Sanitary and Ship Canal Temperature Profile at Illinois Route 83 (RM
0.9)
.................................................................................................................. 10
Figure 3-7
Calumet Sag Channel Temperature Profile at Cicero Avenue (RM 11.7) .......... 11
Figure 3-8
Chicago Sanitary and Ship Canal Cicero Ave Period Average Temperatures and
Limits .................................................................................................................. 12
Figure 3-9
Calumet Sag Channel Temperature Profile at Route 83 Compared to Chicago
Sanitary and Ship Canal Temperature Profile at Cicero Avenue ........................ 13
LIST OF TABLES
Table 3-1
Historical Fish Species Comparison between the Chicago Sanitary and Ship Canal
and the Calumet Sag Channel .............................................................................. 15
Table 3-2
Metropolitan Water Reclamation District of Greater Chicago Ambient Water
Quality Monitoring Program Fish Collections Chicago Sanitary and Ship Canal
(1998-2006)17...................................................................................................... 16
i
Table 3-3
Metropolitan Water Reclamation District of Greater Chicago Ambient
Water Quality Monitoring Program Fish Collections Calumet Sag
Channel (1998-2006) ........................................................................................... 17
Table 3-4
Summary of Fish Collected by Station – Chicago Sanitary and Ship Canal ....... 18
Table 3-5
Summary of Fish Collected by Station – Calumet Sag Channel ......................... 19
Table 3-6
Qualitative Habitat Evaluation Index Values (2002-2005) for the Calumet Sag
Channel and the Chicago Sanitary and Ship Canal ............................................. 21
Table 4-1
Summary of Available Data for Specific Sample Locations on the Calumet Sag
Channel and the Chicago Sanitary and Ship Canal (2001-2005) from the
MWRDGC Ambient Water Quality Monitoring Program .................................. 26
LIST OF APPENDICES
APPENDIX A
BIOLOGICAL DATASETS AND ASSOCIATED DOCUMENTATION
APPENDIX B
TEMPERATURE DATASETS
Electronic Filing - Received, Clerk's Office, March 25, 2009
LIST OF ACRONYMS
CAWS
Chicago Area Waterway System
CSC
Calumet-Sag Channel
CWA
Clean Water Act
DC
Direct Current
D.O.
Dissolved Oxygen
IBI
Index of Biotic Integrity
IDNR
Illinois Department of Natural Resources
IEPA
Illinois Environmental Protection Agency
INHS
Illinois Natural History Survey
IPCB
Illinois Pollution Control Board
MWRDGC
Metropolitan Water Reclamation District of Greater Chicago
QHEI
Qualitative Habitat Evaluation Index
RAS
Representative Aquatic Species
RM
River Mile
SEPA
Sidestream Elevated Pool Aeration
Ship Canal
Chicago Sanitary & Ship Canal
UILT
Upper Incipient Lethal Temperature
Electronic Filing - Received, Clerk's Office, March 25, 2009
EXECUTIVE SUMMARY
The Illinois EPA has proposed new, more restrictive thermal water quality standards for the
Chicago Sanitary and Ship Canal (Ship Canal). These proposed thermal limits were derived
based upon laboratory fish studies using Representative Aquatic Species (RAS) and a model
developed by Yoder. The proposed thermal limits are significantly more restrictive than the
current standards, and also significantly more restrictive than the current thermal regime that
exists on the Ship Canal.
The Chicago Area Waterways provide a unique opportunity to compare the fish quality on two
man-made waterways, with and without the thermal stress. Specifically, both the Ship Canal and
the Calumet-Sag Channel (CSC) are man-made waterways, with differing thermal
characteristics. Therefore a comparison of the fisheries quality between these two water bodies
would be expected to identify fishery limitations caused by thermal stress. Likewise, within the
Ship Canal, comparing fish data from sampling points with different thermal characteristics
would also be expected to identify limitations caused by thermal stress.
In that regard, July/August temperatures at Cicero Avenue on the Ship Canal average 85.9°F,
compared to between 75.2 to 76.8°F along the entire CSC, or approximately 10°F warmer on
average. Downstream along the Ship Canal, July/August temperatures are not as warm as at
Cicero Avenue; however, the temperatures are still 3 to 6°F warmer than in the CSC.
Temperatures at Cicero Avenue on the Ship Canal exceed the proposed temperature limits
throughout the year.
Moreover, historical fish records have revealed that 79 fish species have been collected on the
Ship Canal, versus 36 species on the CSC. More current fish collection data, after completion of
the Sidestream Elevated Pool Aeration (SEPA) stations on the CSC, has yielded on average 8.5
species per site per sampling event on the Ship Canal versus 11.2 species on the CSC. Overall,
recent collections by the Metropolitan Water Reclamation District of Greater Chicago
(MWRDGC) have found a total of 22 fish species on the Ship Canal and 29 species on the CSC.
The five most common fish encountered on each waterway is as follows:
Electronic Filing - Received, Clerk's Office, March 25, 2009
Ship Canal
CSC
Gizzard Shad
Gizzard Shad
Common Carp
Emerald Shiner
Bluntnose Minnow
Common Carp
Pumpkinseed
Bluntnose Minnow
Emerald Shiner
Largemouth Bass
Four out of the five most common fish are identical in these two waterways.
In deriving temperature limits, Yoder selected eight Representative Aquatic Species (RAS). The
bluntnose minnow was identified by Yoder as the most thermally sensitive of the eight RAS,
with an upper incipient lethal temperature (UILT) of 90.3°F for this species. The bluntnose
minnow is among the most common fish collected on the Ship Canal, despite summer
temperatures that consistently exceed 90.3°F.
Although not utilized by Yoder in deriving temperature limits, the emerald shiner is also reported
to be thermally sensitive with an UILT of 89.8°F. This is the fifth most common species
collected on the Ship Canal. In 2005 the CSC experienced a two order of magnitude increase in
the emerald shiners collected, otherwise, its population has historically been similar to that on the
Ship Canal.
The resulting comparison in fisheries quality between the two waterways reveals they are
similar. Additionally, when comparing fishery qualities within the Ship Canal, a higher than
average species diversity was observed at the warmest sampling point. Existing thermal inputs
into the Ship Canal do not appear to be a controlling or limiting factor in the fisheries quality that
is present. In other words, if the thermal loading on the Ship Canal were to be lowered to the
proposed thermal limits, there is no reason to expect any change in the fisheries quality present
on the Ship Canal, based upon comparison of the fish and thermal regime on the CSC.
.
v
1.
INTRODUCTION
There are significant difficulties in developing thermal limits based on laboratory tests. Results
from such tests may not reflect actual impacts in receiving streams, where both acclimatization
and avoidance mechanisms are at play. The Ship Canal and the Calumet-Sag Channel (CSC) are
both man-made waterways that share many similar physical characteristics. However, the Ship
Canal has a considerably warmer thermal regime, while the CSC does not. Therefore a
comparison of fish community assemblages between these two waterways, as well as between
various stations on the Ship Canal affords an opportunity to predict whether more stringent
thermal water quality standards will result in improved fish quality and diversity on the Ship
Canal. This report documents differences in thermal regimes and on fish communities within the
Ship Canal and the CSC, which serves as a baseline for comparison. River mileages presented in
this report are derived from the U.S Geological Survey Water-Resources Report:
River mileages
and drainage areas for Illinois streams-Volume 2,
Illinois River Basin (Healy 1979). Pertinent
pages from this publication are included in Appendix A.
Electronic Filing - Received, Clerk's Office, March 25, 2009
2.
EVALUATION OF STUDY AREA
2.1
Chicago Sanitary & Ship Canal
The Ship Canal flows south and west approximately 31.6 miles from the South Branch of the
Chicago River and the South Fork of the South Branch of the Chicago River at Ashland Avenue
in Chicago. The mouth of the Ship Canal is located at the Des Plaines River (at River Mile 16.9
on the Des Plaines River) in Will County, Illinois below the Lockport Lock and Dam.
Historical fisheries data are extensive for this man-made canal system, and include fisheries data
from eight locations (River Mile (RM) 1.0, 10.5, 13.6, 14.1, 17.8, 24.0, 27.3, and 31.1) collected
between 1985 and 2006 by the MWRDGC (MWRDGC 1998, 2008a, 2008b). Temperature data
available for the Ship Canal come from six locations (RM 1.0, 6.0, 6.2, 14.1, 22.3, and 27.3),
collected between 1998 and 2006 (FOIA response dated January 12, 2009 from the Metropolitan
Water Reclamation District of Greater Chicago).
2.2
Calumet-Sag Channel
The CSC begins east of Interstate 57 where the Calumet River and the Little Calumet River
converge. The CSC then flows south and west approximately 16.9 miles into the Ship Canal at
River Mile 13.4 on the Ship Canal. Historical fisheries data are moderately extensive on the
CSC, a man-made canal system, and include fisheries data from six locations (RM 0.3, 0.9, 11.7,
14.6, 15.7, and 16.9) collected between 1985 and 2005 by MWRDGC (MWRDGC 1998, 2008a,
2008b). The CSC has a unique feature in that between the years of 1992 to 1994 three SEPA
stations were built at RM 0.3, 8.3, and 14.8 on the CSC. (Two additional SEPA stations are
located on the Calumet River.) Given this supplemental oxygen supply, fisheries quality would
be expected to improve after 1994 on the CSC, and also greater than on the Ship Canal, which
does not have supplemental oxygen, except the improved dissolved oxygen (D.O.) from the final
SEPA station 0.3 miles above the Ship Canal. Temperature data from the CSC include seven
locations (RM 0.9, 4.3, 7.4, 8.3, 11.7, 13.7, and 16.7) collected between 1998 and 2008 (FOIA
response dated January 12, 2009 from the Metropolitan Water Reclamation District of Greater
Chicago).
2
3.
EVALUATION OF AVAILABLE DATA
The MWRDGC began sampling for the Ambient Water Quality Monitoring (AWQM) Program
at 59 stations on 21 waterways in 2001. Data from the MWRDGC study provides the basis from
which to compare thermal effects on biological communities on the Ship Canal and CSC due to
consistency in collection methods and sampling design.
3.1
Temperature
Temperature data collected by MWRDGC are available for both the Ship Canal and the CSC for
the period 1998 through 2006 and 1998 through 2008, respectively (FOIA response dated
January 12, 2009 from the MWRDGC). Period averages for Ship Canal stations are based on
hourly temperature data and CSC period averages are based on continuous temperature data.
Figure 3-1 presents the average July/August temperature on the Ship Canal from 1998 to 2006,
while Figure 3-2 presents the average July/August temperature on the CSC from 1998 to 2008.
The highest mean July/August temperature on the Ship Canal occurs at Cicero Avenue (RM
27.3), which averaged 85.9°F over these two months.
The temperature then declines
downstream of the West-Southwest Water Reclamation Plant at RM 22.3 to an average 77.3°F.
The temperature then increases to an average 83.2°F at the furthest downstream location (RM
1.0). In general, the temperature on the CSC does not vary throughout the entire stream, with
temperatures averaging between 75.2 and 76.8°F for the July/August period. Temperature data
used in this report are included in Appendix B.
A detailed evaluation of yearly temperatures is presented in Figures 3-3 through 3-7 for those
locations on the Ship Canal and CSC for which a comprehensive data set for all parameters of
interest is available. These locations serve as the basis of comparison between the Ship Canal
and CSC respectively. Figures 3-3, 3-4, and 3-5 depict temperature profiles for the Ship Canal at
the Lockport Lock and Dam (RM 1.0), Illinois Route 83 (RM 14.1), and Cicero Avenue (RM
27.3). Figures 3-6 and 3-7 depict temperature profiles for the CSC at Illinois Route 83 (RM 0.9)
and Cicero Avenue (RM 11.7).
3
Figure 3-8 depicts the period average temperature pattern on the Ship Canal at Cicero Avenue,
along with the Agency-proposed temperature period average limits and the current thermal
limits. (IPCB, 2008). Both the highest period average for the six years of data, as well as the
peak daily temperature in each period (24-hour average), is plotted on Figure 3-8. For the
majority of the year, there is as much as a 20°F difference between the existing temperatures in
the Ship Canal and what has been proposed by IEPA. It is also clear that the IEPA-proposed
thermal limits would have an impact on far more than just the existing summer thermal regime.
Finally, Figure 3-9 contrasts the temperatures in the CSC (at Route 83) to the Ship Canal at
Cicero. Most of the time, there is over a 10°F difference in temperatures, with the CSC being
consistently colder. This temperature difference holds true for much of each year, with smaller
differences during the spring and fall of the year. This figure provides a graphical representation
of the difference in temperature regime between these two waterways over the course of several
years.
From the thermal comparisons of the CSC and Ship Canal made above, if the proposed water
quality thermal standards for the Ship Canal are truly necessary to protect the current and
expected aquatic community in this waterway, one would expect significantly greater fish
diversity on the CSC and a decreased abundance of more thermally sensitive fish on the Ship
Canal. Information on historical fish data for these two waterways is presented in the next
section.
Electronic Filing - Received, Clerk's Office, March 25, 2009
DOWNSTREAM
RM 6.0
LOCKPORT LOCK & DAM
ILLINOIS ROUTE 83
ROMEOVILLE ROAD
CICERO AVENUE
B & 0 RAILROAD
“Data derived from FOIA response dated January 12, 2009 from MWRDGC for the years 1998-2006
Electronic Filing - Received, Clerk's Office, March 25, 2009
DOWNSTREAM
ILLINOIS ROUTE 83
SOUTHWEST HIGHWAY
HALSTEAD
CICERO AVENUE
104
TH
AVENUE
SEPA STATION RM 8.3
KEDZIE AVENUE
DOWNSTREAM
HALSTED AVENUE
KEDZIE AVENUE
CICERO AVENUE
SEPA STATION (RM 8.3)
SOUTHWEST HIGHWAY
104
th
AVENUE
ILLINOIS ROUTE 83
“Data derived from FOIA response dated January 12, 2009 from MWRDGC for the years 1998 to 2008
6
Electronic Filing - Received, Clerk's Office, March 25, 2009
7
FIGURE 3-3
CHICAGO SANITARY AND SHIP CANAL TEMPERATURE PROFILE AT LOCKPORT LOCK AND DAM (RM 1.0)
100
90
~
0
80
,;
"
,
~
•
"
~
0.
E
70
~
60
so
-
Period Max T
40+-----_.-------r------,-------.------,-------r------~----_.------
~
Aug-98
Jul-99
Jan-aD
Jul-OO
Jan-Ol
lul-Ol
Jan-02
Jul-02
FIGURE 3-4
CHICAGO SA NITA R
Y
AND S
HIP C
ANAL TEM PERATURE
PROFilE AT
ILLINOI S ROUTE 83 (RM 14.1)
100
90
~
0
f.rJ
i\
.
-
80
;
-
•
-
•
~
E
•
~
70
L
~
r"
1
J
r'
f
V
11
60
50
I
--Period Max I
I
40
Aug-98 Jan-99 Jul-99 Jan-DO Jul-OO Jao-Ol Jul-Ol Jan-02 Jul-02 Jan-03 Jul-D3 Jan-(;4 Jun-04 Dec-04 Jun-OS Dec-OS Jun-06 Dec-06 Jun-D7
Electronic Filing - Received, Clerk's Office, March 25, 2009
9
FIGURE3-S
CHICAGO SANITARY AND SHIP CANAL TEMPE
RATURE PROFilE AT CICERO AVENUE (RM 27.3)
100
(
h
[1\
Jl
r
90
~
~
~
0
80
'"
~
-
,
•
-
•
~
•
E
70
....
n1
60
L
so
--
Period Max T
40
+-----r---
--
~------~------_.--------._------~------_,--------._----~
Aug-98
Jan-99
Jul-99
Jan-OO
Jcl-OO
J
an-O!
Jul-01
Jan-02
Jul-02
FIGURE 3-6
CALUMET SAG CHANNEL TEMPERATURE PROFILE AT ILLINOIS ROUTE 83 (RM 0.9)
30
40
50
60
70
80
90
100
Aug-
98
Jan-99 Jul-99 Jan-00 Jul-00 Jan-01 Jul-01 Jan-02 Jul-02 Jan-03 Jul-03 Jan-04 Jun-04 Dec-
04
Jun-05 Dec-
05
Jun-06 Dec-
06
Jun-07 Dec-
07
Temperature, oF
Period Max T
Electronic Filing - Received, Clerk's Office, March 25, 2009
11
F
I
GURE 3-7
CALUMET
SAG CHANNEL TEMPERATURE PROFILE AT CICERO AVENUE IRM 11.7)
1
00
--
Period Max T
90
~
0
80
,;
~
,
~
•
~
•
c.
E
70
I!
60
so
40
+----.-----.----.-----.----.----.-----.----.----.-----.----.----.-----.----.
~
J
an-O!
Jul-Ol
Jan-02
J
ul-02
Jan -
03
Jul-
03
Jan-
04
Jul-
04
Jan -
OS
Jul-OS
Jan-06
Jul-
06
Jan-
07
JuJ-07
Jan-08
12
120.0
100.0
80.0
40.0
20.0
0.0
1-Nov
21-00.
Figure 3.e
Cicero Avenue
Ship Canal
at Cicero Period Average Temperatures and Limits
~
I
L
J
L
-
-
~
~
J
f.-J
-
--Max Temp - Existing Limit
--Max OailyT Recorded During Period
--HighestYear Period Average
--IEPA Period Avg Proposal
~Fob
31-Ma.
2()'May
~Jul
2B-Aug
17-0ct
I
I
&-00.
2SoJan
13
12566264
FIGURE 3-8
CICERO AVENUE
SHIP CANAL AT CICERTO PERIOD AVERAGE TEMPERATURE AND LIMITS
13
14
3.2
Fish Data
Historical fisheries data are extensive for the Ship Canal, and include data from eight locations
(RM 1.0, 10.5, 13.6, 14.1, 17.8, 24.0, 27.3, and 31.1) collected between 1985 to 2005 by
MWRDGC. Fisheries data for the CSC are available from six locations (RM 0.3, 0.9, 11.7, 14.6,
15.7, and 16.9) collected between 1985 and 2005 by MWRDGC. Historical fisheries collections
from the Illinois Natural History Survey (INHS) and Illinois Department of Natural Resources
(IDNR) were also searched in order to provide a historical baseline of species present in both the
Ship Canal and CSC. A composite species list for these two streams based on the above data and
collections housed at the INHS is presented in Table 3-1. Data used in this analysis is included
in Appendix A.
Fish were sampled on the Ship Canal and CSC during the period between 2001 and 2005 by
MWRDGC in association with their AWQM Program. Tables 3-2 and 3-3 present fisheries
collection data from the MWRDGC AWQM Program on the Ship Canal and CSC, respectively.
The level of effort expended for sampling was the same at each location with fish collected using
a boat mounted electrofisher powered by a direct current (DC) generator with a sample length of
400 meters, with both sides of the canal segment being sampled (MWRDGC 2008a, 2008b).
Tables 3-4 and 3-5 summarize the fish collection data from Tables 3-2 and 3-3, respectively.
Gizzard Shad is the dominant species on both waterways with a relative abundance of 53.7% on
the Ship Canal and 39.8% on the CSC for the 2001 to 2005 sample period. Bluntnose minnow,
which Yoder considered to be the most thermally sensitive of the eight RAS for the Ship Canal,
had a relative abundance of 7.9% on the Ship Canal, compared to 5.5% on the CSC. From Table
3-3, the emerald shiner in 2005 increased two orders of magnitude from the previous years along
the CSC. A similar trend was noted on the Ship Canal in 2005 at RM 13.6 and to a lesser degree
at RM 24.0. These are the two stations closest to the CSC. Sampling in 2005 also collected
more fish species at most stations on both waterways than in the previous years under the
AWQM programs. On both the CSC and the Ship Canal, no darter or red horse species were
collected during the five years of sampling conducted by MWRDGC as part of the AWQM
Program. Most darter and red horse species are thermally sensitive, and their absence from the
cooler CSC waters is an indication that poor habitat is keeping these two groups from inhabiting
these waterways.
Electronic Filing - Received, Clerk's Office, March 25, 2009
15
TABLE 3-1
H I
STORICAL F
ISH SP£C I
£S COMPARISON BETWEEN THE CHICAGO SANITARY & Sfj IP CANAL(CSSC) AND THE CALUMET SAG CHANNEL (CSC)
Skipj3Ck Herring
Alewifll
Rock 8 ...
81
.ck 8ullhead
V.llow
Bul l
h
• • d
Bowfin
Fra.hw. ta, lX um
Cem",1 stonerol l
e,
Goldfi'h
RrverC.rpsucker
Qulllb.ck
White Sucker
G,. .. C.rp
Brook Stid:I.bock
R
. d Shin. ,
Spctfin Shina,
Common
Corp
Gizz.rtI Sh.d
Threadfin Shad
G,. .. Pickerel
Northern Pi
ke
JoI1nny Carter
Blachtrip. Topm innow
M""quitcf
", h
Thr
••• poin . Stickl. b
"d
""Ilid Ski"",
B
i
ghead Corp
en.n",,1
C.tfi,h
Smol l
mouth 8uffa lo
B
i
gmouth Buff.o l
o
B
I
..,k Buffo l
o
Brook
Silv.",id.
Lon8n"". G.,
G",.nSunfish
Pumpkin,eed
W
.. mouth
O,"nee'potted Sunfi'h
B I ~1i1II
Lonle .,Sunfi.h
Striped Shine,
A/
oso chf)l5i>chlorls
Aloso
p.~udoharenflu,
Ambloplite. rupe.fris
Am~iuru.
melos
Am.iuru~na/ar,.
Amiaca/va
Apladinotw gnJnm.n.
Comprutomo onomalum
Corru.ius aurotu.
Corpiod~s
carpi<>
Corpiode. cypfin""
Coto.tomu. <<>II1m""oni
Ct~nopharyn ~ odon id~l/o
(",Io.a incDnstam
(yprin.lfa Iuf,.
mis
Cyprin.lla
~
pjlopt.ra
CypriINJ. carpi<>
Oo,osomo
u~dioINJm
Oorosomo
pet~n~ns~
Esox om .. ,K:Oll<J
s
E.ox lucius
Eth"".tomo
ni~rum
fund",lw no/aI",.
Gambu.ia a!fini.
&ut.,,,.-t.w ocul.otu.
IlyboJ"i.
"mnis
Hypophth,,/mkhthy. nobills
Ida"'ru. punrtotus
Idiobu.
bubolus
IdioOO. cyprin ..
llus
IdioOO.
nifl~r
labid
••
t},.~
.K:ClJIu.
L.pi3wt
. <n
w."".
L.pomis
r:ya".llw
L~pomls
gibbo<us
L~pomi.
'}Ulmu.
L~pomis
humills
Lepom/.
moc,ocMru.
Lepomi.
m~olo/i.
LUKilu. chry
.o<:
"phaius
Redfin Shine ,
Smol l
mouth 8
"ss
Loorliemouth 8
" ••
Spotted Sucker
Ori. nbll W
. oth. ffi.h
Whit. P.rch
Whit. Bu.
Vellow B.ss
st'iped B."
Silve r R
e dho",.,
B
l
ock Redha",e
Golden
Redho"e
Shorthe"d Redh""",
Round G<>by
Hornv.,."d Ch ub
Goldan
Shin.,
Em~",1d
Sk i
ner
Gho<t Shiner
SpotI.il Sh i
ner
SorKIShine r
Mimic Shiner
T~poie
Modtom
R
.inbaw Trout
Chinook s.. l
mon
Nil. Til.pi.
R
ainbow
~me!t
Yellow Perch
Loipe ,ch
B
l
ockoid" Corter
Skmd"rhe.d Corter
B
l
unt"o'" Minnow
F
. th
•• d Mi nnow
B
u
llh."d Mi
nnow
Floth."d
(.tfi.h
White C"'pp
ie
B
I
.ckC,"ppie
Brown
Tmut
Creek Chub
SoUIU
WolleVQ
C"",,,,I Mudminnow
T<>1:.ISpecie<
Lythrurus umbr<>tills
MiCfopt~ru.
dolom;"u
MiCfopt~ru.
salmoid".
Minyt,..mo
m~lanops
MisgurmJ. anguillkautiatw
Moron.
am.rico"a
Moron.
chry.op'
Moron~
missi
.. ippiM
.is
Marone saxotil
ls
M""",tomo
onlsurum
M""ostomo
duqu~.ne/
MOKoslomo
erythrufUm
MOKoslomo
moc,oI~pidolum
N.cgobiu.
m.lat>CJnomw
Nacomi. biguttct<n
NatO'migonu.
cry~oI.uca.
Notropi.
oth~rino/d~.
Notropi.OOchenon!
Notro,,;. hudson'"
Not,o,,;./udibundus
Not,o";. voiuc.llu.
Noturus flYrinu.
Oncorhynchu.
mykiss
OncorhynchlJ'
t
~h awyt.ch<J
Onochromi. niloticw
O.m~ru.
mord",'
Perea
jfev~s<e",
Percinacoproon
Percina moculcto
Pereino phoxlXllphale
Pi,""pha/~.
n%lu.
Pim. phal
•• prom. la.
Pim.phal
•• vigila.
Pylodktis oIiva,i.
Pomoxi
s ennulori.
Pomaxis nig,omoculotus
5almotrutto
S~motiiu.
olromoCIJlatu.
Sfi205ledion conodllMe
Sli'05I~dion
vitreum
Umbralimi
Electronic Filing - Received, Clerk's Office, March 25, 2009
TABLE 3-2
MWRDGC AMBIENT WATER QUALITY MONITORING PROGRAM FISH COLLECTIONS
CHICAGO SANITARY AND SHIP CANAL (2001-2005)
RIVER MILE
1.0
1.0
1.0
1.0
1.0 10.5 13.6 13.6 13.6 14.1 24.0 24.0 24.0 24.0 24.0 27.3 27.3 27.3 27.3 27.3 31.1
2001 2002 2003 2004 2005 2002 2003 2004 2005 2002 2001 2002 2003 2004 2005 2001 2002 2003 2004 2005 2002
NUMBER
COLLECTED
RELATIVE
ABUNDANCE
RANK
Skipjack Herring
3
3
0.1%
Gizzard shad
51
50
19
3
159
7
91
27
180
1
59
83
54
102
603
47
37
88
48
106
10
1825
53.7%
1
Chinook Salmon
1
1
0.0%
Goldfish
1
3
1
6
1
1
4
1
1
19
0.6%
Carp
26
11
43
12
3
2
2
7
4
3
16
35
15
29
36
93
82
15
53
46
58
591
17.4%
2
Golden Shiner
1
4
2
1
14
12
18
52
1.5%
7
Emerald Shiner
2
1
8
3
4
6
120
2
4
1
33
1
1
1
5
192
5.6%
5
Spotfin Shiner
1
2
1
1
4
2
4
2
2
2
1
2
24
0.7%
Bluntnose
Minnow
12
6
3
4
12
112
29
14
10
3
2
33
16
13
269
7.9%
3
Fathead Minnow
1
1
2
0.1%
Yellow Bullhead
1
2
1
1
1
3
4
2
4
2
4
2
4
31
0.9%
Channel Catfish
2
1
2
2
2
3
1
2
2
17
0.5%
Mosquitofish
25
27
1
1
2
2
1
59
1.7%
6
White Bass
1
1
0.0%
White Perch
2
2
0.1%
Yellow Bass
3
1
4
0.1%
Green sunfish
1
1
1
1
2
1
3
5
1
6
7
2
31
0.9%
Pumpkinseed
1
1
2
2
12
31
20
40
21
6
16
28
8
28
216
6.4%
4
Bluegill
1
5
1
4
7
18
0.5%
Largemouth bass
5
4
8
13
2
1
6
39
1.1%
8
Freshwater drum
1
1
2
0.1%
Round Goby
1
1
1
3
0.1%
3401
100.00%
Total Species
2
6
7
4
9
4
8
10
13
5
9
11
9
13
13
10
9
8
12
7
10
R:\Citgo Corn Products UAA 2008 to 2009\Fish\MWRDGC FISH.xls
16
TABLE 3-3
MWRDGC AMBIENT WATER QUALITY MONITORING PROGRAM FISH COLLECTIONS
CALUMET SAG CHANNEL (2001-2005)
RIVER MILE
0.3
0.3
0.3
0.9
8.3
8.3
8.3 11.7 11.7 11.7 11.7 11.7 14.6 14.6 15.7
2003 2004 2005 2003 2003 2004 2005 2001 2002 2003 2004 2005 2003 2005 2003
NUMBER
COLLECTED
RELATIVE
ABUNDANCE
RANK
Gizzard shad
107
19
167
11
49
27
251
61
33
3
102
145
88
70
30
1163
39.8%
1
Rainbow Trout
1
1
0.0%
Chinook Salmon
1
1
0.0%
Goldfish
1
9
1
2
4
1
18
0.6%
Carp
1
2
3
12
13
35
5
23
15
11
25
21
20
16
26
228
7.8%
3
Golden Shiner
1
7
1
7
2
18
0.6%
Emerald Shiner
4
200
11
1
345
6
29
234
3
102
935
32.0%
2
Spotfin Shiner
1
1
0.0%
Spottail Shiner
1
1
1
3
0.1%
Sand Shiner
1
1
0.0%
Bluntnose
Minnow
3
5
11
4
7
29
7
41
12
1
27
1
9
5
162
5.5%
4
Fathead Minnow
2
5
2
9
0.3%
Creek Chub
1
1
1
3
0.1%
White Sucker
1
3
1
5
0.2%
Black Bullhead
1
1
2
0.1%
Yellow Bullhead
2
2
1
1
1
1
2
10
0.3%
Channel Catfish
9
6
4
19
0.7%
Tadpole Madtom
1
1
0.0%
White Perch
1
6
1
6
2
2
6
3
11
3
41
1.4%
7
Yellow Bass
3
1
4
2
4
1
9
2
26
0.9%
8
Striped Bass
1
1
0.0%
Green sunfish
1
8
4
3
1
1
1
5
9
12
3
9
57
2.0%
6
Pumpkinseed
1
6
2
1
2
1
13
0.4%
Bluegill
4
1
1
2
1
1
1
6
5
22
0.8%
Smallmouth Bass
2
2
2
6
0.2%
Largemouth bass
11
1
8
3
4
4
5
21
31
9
9
7
18
13
8
152
5.2%
5
Black Crappie
1
1
0.0%
Freshwater drum
3
3
1
1
3
2
13
0.4%
Round Goby
1
2
1
5
9
0.3%
2921
100.0%
Total Species
11
4
15
7
11
11
14
10
13
12
10
10
13
15
12
R:\Citgo Corn Products UAA 2008 to 2009\Fish\MWRDGC FISH.xls
Electronic Filing - Received, Clerk's Office, March 25, 2009
TABLE 3-4
SUMMARY OF FISH COLLECTED BY STATION
CHICAGO SANITARY AND SHIP CANAL
RELATIVE ABUNDANCE (2001-2005) MWRDGC AWQM PROGRAM SAMPLING
1
River Mile
1.0
10.5
13.6
14.1
24.0
27.3
31.1
Skipjack Herring
0.7
Gizzard shad
68.4
29.2
59.0
3.1
62.1
39.3
6.8
Chinook Salmon
0.2
Goldfish
0.8
0.8
0.7
Carp
23.1
8.3
2.6
9.4
9.0
34.8
39.2
Golden Shiner
0.2
1.4
1.4
12.2
Emerald Shiner
2.7
12.5
25.7
2.8
0.4
3.4
Spotfin Shiner
0.8
0.9
0.8
Bluntnose Minnow
50.0
1.8
11.8
7.7
8.8
Fathead Minnow
0.1
Yellow Bullhead
0.2
0.6
3.1
1.0
1.4
Channel Catfish
1.7
1.0
0.4
1.4
Mosquitofish
78.1
2.1
0.4
White Bass
0.2
White Perch
0.4
Yellow Bass
0.6
0.1
Green sunfish
0.4
6.3
0.3
2.5
Pumpkinseed
0.5
0.4
7.2
9.5
18.9
Bluegill
0.5
1.0
0.1
0.5
4.7
Largemouth bass
0.2
5.0
0.2
4.1
Freshwater drum
1.2
Round Goby
0.5
0.4
0.1
1
Sources: MWRDGC 2008a, 2008b.
Electronic Filing - Received, Clerk's Office, March 25, 2009
TABLE 3-5
SUMMARY OF FISH COLLECTED BY STATION
CALUMET SAG CHANNEL
RELATIVE ABUNDANCE (2001-2005) MWRDGC AWQM PROGRAM SAMPLING
1
River Mile
0.3
0.9
8.3
11.7
14.6
15.7
Gizzard shad
49.8
25.6
39.0
35.9
39.4
31.9
Rainbow Trout
0.2
Chinook Salmon
0.2
Goldfish
2.3
1.1
0.3
1.0
1.1
Carp
1.0
27.9
6.3
9.9
9.0
27.7
Golden Shiner
1.4
0.1
0.7
0.5
Emerald Shiner
34.7
42.6
28.1
26.2
Spotfin Shiner
0.2
Spottail Shiner
0.4
Sand Shiner
0.1
Bluntnose Minnow
1.4
25.6
4.8
9.2
2.5
5.3
Fathead Minnow
0.2
0.7
Creek Chub
0.2
0.2
White Sucker
0.1
1.0
Black Bullhead
0.2
Yellow Bullhead
0.3
4.7
0.4
2.1
Channel Catfish
2.6
1.0
Tadpole Madtom
0.2
White Perch
0.2
1.6
1.0
3.5
3.2
Yellow Bass
0.5
0.6
0.6
2.5
2.1
Striped Bass
0.2
Green sunfish
2.2
7.0
0.4
3.0
9.6
Pumpkinseed
1.2
0.3
0.5
1.1
Bluegill
0.9
0.4
0.3
1.5
5.3
Smallmouth Bass
0.5
0.5
Largemouth bass
3.4
7.0
1.6
8.0
7.7
8.5
Black Crappie
0.1
Freshwater drum
0.4
0.5
0.7
2.1
Round Goby
0.2
0.2
1.5
1
Sources: MWRDGC 2008a, 2008b.
Electronic Filing - Received, Clerk's Office, March 25, 2009
3.3
Habitat Quality
Habitat along the Ship Canal and CSC was evaluated by the MWRDGC between 2002 and 2005
as part of its AWQM Program. Sites were analyzed using the Qualitative Habitat Evaluation
Index (QHEI). Six locations along the Ship Canal (RM 1.0, 10.5, 14.1, 24.0, 27.3, and 31.1) and
three locations along the CSC (RM 0.9, 11.7, and 15.7) were evaluated for habitat quality using
the QHEI. Sites along both the Ship Canal and CSC had similar scores ranging from 32 to 40 on
the Ship Canal and from 37 to 41 on the CSC (Table 3-6). Values ranging from 30 to 45 are
considered to be of “poor quality” and are consistent with the habitat quality one would expect
from these channelized, man-made canal systems. Table 3-6 presents these data.
The CSC and the Ship Canal share similar physical characteristics. For example, both are
entirely man-made, both are deep-draft, each has limited shallow area along its banks, and both
have a high volume of commercial navigation (Dennison, 2008). Additionally, both the Ship
Canal and the CSC are dominated by soft homogenous sediments that are not conducive to a
balanced benthic invertebrate community, being dominated by pollution tolerant invertebrates
(MWRDGC 2008a, 2008b). Overall, both the CSC and Ship Canal exhibit similar habitat
limitations, with the Ship Canal being of marginally poorer quality.
20
TABLE 3-6
QUALITATIVE HABITAT EVALUATION INDEX (QHEI) VALUES FOR THE CHICAGO SANITARY
AND SHIP CANAL AND THE CALUMET SAG CHANNEL (2002-2005)
1
RIVER
MILE
WATERWAY
LOCATION
QHEI
SCORE
QHEI
RATING
1.0 SHIP CANAL (2005)
LOCKPORT LOCK AND DAM
40
POOR
10.5 SHIP CANAL (2002)
STEPHEN STREET
37
POOR
14.1 SHIP CANAL (2002)
ILLINOIS ROUTE 83
38
POOR
24.0 SHIP CANAL (2005)
HARLEM AVENUE
35
POOR
27.3 SHIP CANAL (2005)
CICERO AVENUE
32
POOR
31.1 SHIP CANAL (2002)
DAMEN AVENUE
34
POOR
0.9 CALUMET-SAG CHANNEL (2003)
ILLINOIS ROUTE 83
41
POOR
11.7 CALUMET-SAG CHANNEL (2004)
CICERO AVENUE
37
POOR
11.7 CALUMET-SAG CHANNEL (2005)
CICERO AVENUE
37
POOR
15.7 CALUMET-SAG CHANNEL (2003)
ASHLAND AVENUE
39
POOR
1
Sources: Metropolitan Water Reclamation District of Greater Chicago. January 2008. Report No. 08-2.
Metropolitan Water Reclamation District of Greater Chicago. June 2008. Report No. 08-33.
21
4.
DISCUSSION
When comparing the CSC to the Ship Canal some differences are readily apparent. Mean
temperature during July and August on the CSC for the period 1998 through 2008 was relatively
constant between RM 0.9 to RM 16.7 with a combined mean of 76.3°F. Temperatures by
stations ranging between (75.2 and 76.8°F). Mean temperatures over the same period on the
Ship Canal were more variable and ranged from (77.3 to 85.9°F) with an overall mean of 80.9°F
between RM 1.0 and 27.3. Overall, mean temperatures on the Ship Canal for the July/August
period 1998 through 2006, averaged two to three degrees higher than those recorded on the CSC,
and at the warmest stations, up to a 9°F difference has been noted.
Fish data collected between 2001 and 2005 from the MWRDGC AWQM Program indicate the
five most commonly-encountered species in the Ship Canal were gizzard shad, common carp,
bluntnose minnow, pumpkinseed, and emerald shiner. The five most commonly encountered
species on the CSC were gizzard shad, emerald shiner, common carp, bluntnose minnow, and
largemouth bass. For those stations in the MWRDGC study, the average number of species
caught on the Ship Canal was 8.5 per sampling event, while the average number of species
caught on the CSC was 11.2 per sampling event. The MWRDGC surveys yielded 22 species of
fish from the Ship Canal while 29 species were collected on the CSC. At the warmest location
on the Ship Canal, Cicero Avenue (RM 27.3), 13 species were collected between 2001 and 2005
with gizzard shad, common carp, pumpkinseed, bluntnose minnow, and green sunfish
encountered with the greatest frequency and were the most abundant species. The second
warmest sampling station is located at RM 1.0. gizzard shad, common carp, emerald shiner, and
channel catfish were the most abundant species at this location. Emerald shiner was the second
most common species on the CSC, attributed to the two orders of magnitude increases in 2005.
This species is common throughout the State of Illinois in large rivers (Smith, 1979), but it was
not utilized by Yoder in deriving temperature limits for the Chicago area waterway system
(CAWS) (Yoder et al. 2005).
Eight species of fish were selected as Representative Aquatic Species (RAS) by Yoder to derive
temperature limits, for secondary contact waterways. These eight species, were gizzard shad,
common carp, golden shiner, fathead minnow, bluntnose minnow, black bullhead, largemouth
22
bass, and green sunfish (Yoder et al. 2005). The bluntnose minnow was identified by Yoder as
the most thermally sensitive of the eight species. Yoder suggested a UILT of 90.3°F for this
species. The bluntnose minnow and three of the eight species utilized by Yoder were among the
most populous species collected during the 2001 to 2005 MWRDGC AWQM Program
collections at Cicero Avenue (RM 27.3) on the Ship Canal. As depicted in Figure 3-5, these fish
experience a thermal regime significantly higher than the levels cited by Yoder as being
necessary for the protection of the species.
Thermal parameters compiled by Midwest Biodiversity Institute (2005) were used as the primary
database for deriving the Lower Des Plaines River temperature criteria options. From this model
used to derive temperature criteria options proposed by the Illinois EPA, the UILT for the
emerald shiner was 89.8°F, while the UILT for the bluntnose minnow was 90.3°F. The emerald
shiner was well represented in collections on both streams, being the second most populous
species collected on the CSC, and the fifth most populous species collected on the Ship Canal
during the MWRDGC AWQM Program studies. Although the emerald shiner was found in
higher numbers on the CSC, it represented a significant portion of the fish community within
both streams. The higher numbers on the CSC are attributed to the two orders of magnitude
increase observed in 2005.
The bluntnose minnow and the emerald shiner are both Cyprinids which can occupy similar
niches in the stream environment and exhibit almost identical UILT’s. Due to this similarity,
one can postulate that temperature regimes that support the presence of the bluntnose minnow
would additionally support the presence of the emerald shiner. Additionally, because these
species can occupy similar niches in the environment, and have overlapping dietary preferences
with both species taking small aquatic invertebrates as a portion of their diet (Smith 1979) it is
likely that the poor habitat quality of the CSC and Ship Canal increase competition for resources
between these two species. Community assembly rules explain the species composition of local
communities given the composition of the regional species pool and the environment in which
the species live (Roughgarden 1989; Wiens 1989; Fox and Brown 1993). Winston (1995) found
that interspecific competition explained a significantly low degree of co-occurrence between
morphologically similar species of stream fishes. This low degree of co-occurrence is noticeable
in the MWRDGC AWQM data presented in Tables 3-2 and 3-3 where for those sites reporting
Electronic Filing - Received, Clerk's Office, March 25, 2009
significant numbers of emerald shiners relatively few bluntnose minnows were collected on the
CSC, and for those sites reporting significant numbers of bluntnose minnows very few emerald
shiners were collected on the Ship Canal.
Historical fisheries records show that the fisheries diversity in the Ship Canal is nearly double
that of the CSC (79 species versus 36 species, respectively). Recent surveys conducted by
MWRDGC suggest the species richness on the CSC is now greater (29 versus 22 species),
possibly as the result of the contribution of the SEPA status. However, at Cicero Avenue on the
warmest stretch of the Ship Canal, the average species diversity (9.2) exceeds the average overall
diversity by station for the Ship Canal (8.5). Temperature data available for the CSC and Ship
Canal indicate that temperature regimes in the Ship Canal differ substantially from the CSC, with
much warmer recorded temperatures occurring throughout the Ship Canal drainage than found in
the CSC. From comparisons of the existing fish and temperature data for these two waterways, it
can be concluded that the current temperature patterns existing in the Ship Canal have not
impacted fisheries quality when referencing the CSC as a baseline comparison. Additionally,
one would expect to see improved fisheries quality in the CSC since the installation of SEPA
stations, which provide for increased D.O. for fisheries resources in these man-made canals.
A summary of available data providing a baseline of comparison between the Ship Canal and the
CSC is presented in Table 4-1. Two stations located at Illinois Route 83 (RM 0.9) and Cicero
Avenue (RM 11.7) on the CSC and three stations located at Lockport Lock and Dam (RM 1.0),
Illinois Route 83 (RM 14.1), and Cicero Avenue (RM 27.3) for the Ship Canal provide a baseline
for comparison between the two canal systems. Index of Biotic Integrity (IBI) scores fall within
the “Poor” Category for all sites, and QHEI values rate all sites as being of “poor” habitat
quality. Temperature varies dramatically between the CSC and Ship Canal; however, at Cicero
Avenue (RM 27.3) on the Ship Canal, the warmest location on the waterway, nearly 8 percent of
the catch was comprised of the
thermally sensitive
bluntnose minnow, one of the 8 RAS used by
Yoder (2005) to derive temperature limits for the currently designated Secondary Contact
waterways. When comparing data between the CSC and Ship Canal, habitat quality and fisheries
quality remain similar, while the thermal regimes are considerably different. From the data
summarized in Table 4-1, existing thermal inputs into the Ship Canal do not appear to be a
controlling or limiting factor in the fisheries quality that is present. In other words, if the thermal
Electronic Filing - Received, Clerk's Office, March 25, 2009
25
loading on the Ship Canal were to be lowered to the proposed thermal limits, there is no reason
to expect any change in the fish quality present on the Ship Canal based upon the data and
comparison with the CSC presented herein.
TABLE 4-1
Summary of Available Data for Specific Sample Locations on the Calumet Sag Channel and
the Chicago Sanitary and Ship Canal (2001-2005)
from the MWRDGC Ambient Water Quality Monitoring Program
(Temperature Data Summarized from 2001-2005)
1
METRIC
CSC
Ship Canal
Common Location Name
IL 83
Cicero
Lockport
IL 83
Cicero
River Mile Designation
0.9
11.7
1.0
14.1
27.3
Average Temperature (July/August) (°F)
76.8
76.4
83.2
80.1
85.9
QHEI Score
41.0
37.0
40.0
38.0
32.0
Average IBI Value
22.0
27.0
22.5
26.0
21.5
Average Number of Species Collected
7.0
11.0
5.6
5.0
9.2
Percent of catch comprised of "Selected RAS Species
a/
"
SPECIES
CSC
b/
Ship Canal
b/
Bluntnose Minnow
25.58
9.20
----
----
7.71
Gizzard Shad
25.58
35.95
68.45
3.13
39.28
Common Carp
27.91
9.93
23.06
9.38
34.82
Golden Shiner
----
0.73
0.24
----
1.45
Fathead Minnow
----
0.73
----
----
----
Black Bullhead
----
0.21
----
----
----
Largemouth Bass
6.98
8.05
1.21
----
----
Green Sunfish
6.98
3.03
0.49
6.25
2.53
TOTAL
93.03
67.83
93.45
18.76
85.79
/a
Representative Aquatic Species (RAS) utilized by Yoder to derive Secondary Contact Waterway thermal limits. Bluntnose Minnow was
considered the most thermally sensitive of the 8 RAS.
/b
Data presented are a weighted average of all available data for a given station collected by MWRDGC as part of the AWQM Program.
/
1
Sources: Metropolitan Water Reclamation District of Greater Chicago. January 2008. Report No. 08-2.
Metropolitan Water Reclamation District of Greater Chicago. June 2008. Report No. 08-33.
FOIA response dated January 12, 2009 from the Metropolitan Water Reclamation District of Greater Chicago
QHEI CATEGORIES
IBI CATEGORIES
>75
Excellent
60-51 Excellent
60-74 Good
50-41 Good
46-59 Fair
40-31 Fair
30-45 Poor
30-21 Poor
<30
Very Poor
< 20
Very Poor
26
REFERENCES
EA Engineering. 2008. 2006 Upper Illinois Waterway Fisheries Investigation RM 274.4-296.0.
Dennison, S.G. 2008. Pre-filed testimony on behalf of the Metropolitan Water Reclamation
District of Greater Chicago concerning the classification of the Calumet-Sag Channel as
an aquatic life Use B water. Illinois Pollution Control Board R08-9.
FOIA response dated January 12, 2009 from the Metropolitan Water Reclamation District of
Greater Chicago. Temperature Data, Calumet Sag Channel, Chicago Sanitary and Ship
Canal.
Fox, B. J., and J.H. Brown. 1993. Assembly rules for functional groups in North American
desert rodent communities. Oikos 67: 358-370.
Healy, R.W., 1979, River mileages and drainage areas for Illinois streams-Volume 2, Illinois
River Basin: U.S. Geological Survey Water-Resources Investigations Report 79-111, 302
p.
Illinois Department of Natural Resources, 2004 Endangered and Threatened Species List. Illinois
Endangered Species Protection Board. http://dnr.state.il.us/espb/datelist.htm, 2009.
Illinois Environmental Protection Agency, Biological Stream Characterization (BSC): Biological
Assessment of Illinois Stream Quality through 1993, IEPA/BOW/96-058, 1996.
Illinois Natural History Survey, Biologically Significant Illinois Streams: An Evaluation of the
Streams of Illinois Based on Aquatic Biodiversity. 1992.
Illinois Natural History Survey database, 2009.
http://ellipse.inhs.uiuc.edu:591/INHSCollections/fishsearch.html
Illinois Pollution Control Board. 2008. UAA proposed amendments to 35 IAC Parts 301, 302,
303, and 304: Section 302.408, Temperature.
Metropolitan Water Reclamation District of Greater Chicago. June 1998. Report No. 98-10.
A Study of the Fisheries Resources and Water Quality in the Chicago Waterway System
1974 through 1996. 36pp.
Metropolitan Water Reclamation District of Greater Chicago. 2008a. Report No. 08-2.
Ambient Water Quality Monitoring in the Chicago, Calumet, and Des Plaines River
Systems: A Summary of Biological, Habitat, and Sediment Quality During 2005. 49pp.
Metropolitan Water Reclamation District of Greater Chicago. 2008b. Report No. 08-33.
Ambient Water Quality Monitoring in the Chicago Area Waterway System: A Summary
of Biological, Habitat, and Sediment Quality Between 2001 and 2004. 69pp.
27
Midwest Biodiversity Institute. 2005. Re-evaluation of the technical justification for existing
Ohio River mainstem temperature criteria. Report to Ohio River Valley Water Sanitation
Commission. Tech. Rept. MBI/05-05-2. Columbus, OH. 56 pp. + 4 appendices.
NOAA. 2009. NOAA’s National Weather Service Weather Forecast Office, Seasonal
Temperature and Precipitation Rankings.
http://www.crh.noaa.gov/lot/?n=CHI_summer_temps
Roughgarden, J. 1989. Chapter 1 in
Perspectives in ecological theory
/ edited by Jonathan
Roughgarden, Robert M. May, and Simon A. Levin. Princeton, N.J. : Princeton
University Press.
Smith, Phillip W., The Fishes of Illinois
, University of Illinois Press, 1979.
Wiens, J. A. 1989. Spatial scaling in ecology. Functional Ecology 3:385-397.
Winston, Matthew R. 1995. Co-Occurrence of Morphologically Similar Species of Stream
Fishes.
The American Naturalist
, Vol. 145, No. 4, pp. 527-545.
Yoder, C. O., and E.T. Rankin. 2005. Temperature Criteria Options for the Lower Des
Plaines River. Final Report to U.S. EPA Region V, Water Division, and Illinois EPA Bureau of
Water.
Yoder, C.O., B.J. Armitage, and E.T. Rankin. 2005. Re-evaluation of the technical justification
for the existing Ohio River mainstem temperature criteria. Report to the Ohio River
Valley Water Sanitation Commission (ORSANCO) ad hoc Committee on Temperature
Criteria Re-evaluation. MBI Technical Report MBI/05-05-2. 55pp. + Appendices.
28
Electronic Filing - Received, Clerk's Office, March 25, 2009
AVG. TEMP BY RIVER MILE (JULY/AUGUST) ON THE CAL SAG CHANNEL
DOWNSTREAM
(
)
UPSTREAM
0.9
4.3
7.4
8.3
11.7
13.7
16.7
1998
78.13
78.98
1999
78.30
78.98
2000
76.33
75.11
2001
77.32
77.27
76.98
77.32
76.96
76.62
2002
78.42
76.30
77.95
77.83
77.40
77.09
76.69
0.9
ILLINOIS
ROUTE 83
2003
75.51
76.57
75.18
74.98
74.41
74.35
73.40
4.3
104TH
AVENUE
2004
74.01
74.97
73.36
73.04
7.4
SW HIGHWAY
2005
79.16
73.74
77.72
76.46
8.3
RM 8.3 (SEPA)
2006
76.55
78.42
75.74
75.65
11.7
CICERO
2007
74.57
75.69
75.74
75.06
13.7
KEDZIE
2008
76.60
75.52
16.7
HALSTED (Little Cal)
76.81
75.95
76.80
76.60
76.39
76.14
75.27
AVERAGE TEMPERATURE (F) FOR JULY/AUGUST BY RIVER MILE
ON THE CAL SAG CHANNEL
79.00
E: 77.00
~
75.00
----...
S 73.00
'"
Q,
71.00
:E
69.00
~
67.00
65.00
0
2
4
6
8
10
12
14
16
18
CALUMET SAG CHANNEL RIVER MILE DESIGNATION
R:\Citgo Corn Products UAA 2008 to 2009\Fish\temp charts\CAL SAG (JULY-AUG).xls
I I'
Electronic Filing - Received, Clerk's Office, March 25, 2009
..
AVG. TEMP BY RIVER MILE (JULY/AUGUST)
ON THE CHICAGO SANITARY AND SHIP CANAL
DOWNSTREAM
<
)
UPSTREAM
1.0
6.0
6.2
14.1
22.3
27.3
1998
83.97
80.44
79.59
80.04
69.17
86.65
1999
83.23
78.75
79.03
79.83
78.84
85.75
2000
82.90
78.49
78.44
79.41
78.31
84.61
2001
83.39
79.23
79.29
79.83
79.27
85.95
2002
82.65
81.66
80.65
82.17
80.76
86.59
2003
79.16
2004
77.68
2005
82.20
2006
80.91
2007
83.23
79.71
79.40
80.14
77.27
85.91
AVERAGE TEMPERATURE
(f)
FOR JULY/AUGUST BY RIVER MILE ON THE
90.00
83.00
g
86.00
;
84.00
:) 82.00
i
80.00
~
78.00
=
~
74.00
76.00
72.00
70.00
CHICAGO SANITARY AND SHIP CANAL
~
./
"
...............
,.
....
-----
-...-
L
./
0.0
5.0
10.0
15.0
20.0
25.0
CHICAGO SANITARY AND SHIP CANAL RIVER MILE DESIGNATION
R:\Citgo\2008\Fish\temp charts\CSSC (JULY-AUG).xls
IT
1.0
LOCKPORT LOCK & DAM
6.0
RM 6.0
6.2
ROMEOVILLE ROAD
14.1
ILLINOIS ROUTE 83
22.3
B&O C
RAILROAD
27.3
CICERO AVENUE
30.0
Electronic Filing - Received, Clerk's Office, March 25, 2009
AVG. TEMP BY RIVER MILE
ON
THE CHICAGO SANITARY AND SHIP CANAL
DOWNSTREAM
<
)
UPSTREAM
1.0
6.0
6.2
14.1
22.3
27.3
1998
71.46
66.07
67.30
67.48
1999
64.09
59.43
61.97
63.41
62.89
65.93
2000
66.51
62.98
61.95
64.17
64.62
71.22
2001
65.35
61.83
61.59
63.59
63.45
67.98
2002
64.22
60.21
61.97
62.56
64.69
69.58
2003
63.66
2004
64.94
2005
64.20
2006
64.71
2007
66.33
62.10
62.96
64.30
63.91
68.68
AVERAGE TEMP£RATUa£ (F) IY RIVER MILE ON THE
CHICAGO
SANITARY AND SHIP CANAL (1991-100i)
70.00 -,
i
:::3
6S.oo
60.00
I~
•
•
~
5
w
=
..
~
50.00
ss.oo
4S.QO
0.0
S.O
10.0
lS.0
20.0
2S.0
30.0
CHICAGO SANITARY AND SHIP CANAL RIVER MILE DESIGNATION
R:\Citgo\2008\Fish\temp charts\CSSC (AVG).xls
II'
1.0
LOCKPORT LOCK & DAM
6.0
RM 6.0
6.2
ROMEOVILLE
ROAD
14.1
ILLINOIS
ROUTE 83
22.3
B&O C RAILROAD
27.3
CICERO AVENUE
AVG. TEMP BY RIVER MILE (JULY/AUGUST) ON THE CAL SAG CHANNEL
DOWNSTREAM
<
)
UPSTREAM
0.9
4.3
7.4
8.3
11.7
13.7
1998
25.63
26.10
1999
25.72
26.10
2000
24.63
23.95
2001
25.18
25.15
24.99
25.18
24.98
2002
25.79
24.61
25.53
25.46
25.22
25.05
2003
24.17
24.76
23.99
23.88
23.56
23.53
2004
23.34
23.87
22.98
2005
26.20
23.19
25.40
2006
24.75
25.79
24.30
2007
23.65
24.27
24.30
2008
24.78
24.53
24.51
24.30
24.18
24.89
24.43
24.80
24.66
24.66
24.52
AVERAGE TEMPERATURE
(C)
FOR JULY/AUGUST BY RIVER MILE
ON
THE CAL SAG CHANNEL
29.00
~----------,----,-------
g
27.00
~.-
w
a:
25.00
::::I
~
23.00
...
---.
- .. mm9
----..
•
a:
w 21.00
Q.
:iE
w
19.00
I-
17.00
1---~
........
15.00
,"m______
/"
Lo.oWllISTREAM
IIPSIREAM
16.7
24.79
24.83
23.00
22.80
24.70
24.25
23.92
24.04
o
2
4
6
8
10
12
14
16
18
CAL SAG CHANNEL RIVER MILE DESIGNATION
R:\Citgo Corn Products UAA 2008 to 2009\Fish\temp charts\CAL SAG (JULY-AUG)
1'1'
0.9
ILLINOIS ROUTE 83
4.3
104TH AVENUE
7.4
SW HIGHWAY
8.3
RM 8.3 (SEPA)
11.7
CICERO
13.7
KEDZIE
16.7
HALSTED
AVG. TEMP BY RIVER MILE (JULY/AUGUST) ON THE CAL SAG CHANNEL
1998
1999
2000
2001
2002
2003
2004
2005
2006
2007
2008
DOWNSTREAM
(
>
0.9
4.3
7.4
8.3
11.7
13.7
78.13
78.98
78.30
78.98
76.33
75.11
77.32
77.27
76.98
77.32
76.96
78.42
76.30
77.95
77.83
77.40
77.09
75.51
76.57
75.18
74.98
74.41
74.35
74.01
74.97
73.36
79.16
73.74
77.72
76.55
78.42
75.74
74.57
75.69
75.74
76.60
75.52
76.81
75.95
76.80
76.60
76.39
76.14
AVERAGE TEMPERATURE
(F) FOR JULY/AUGUST BY RIVER MILE
ON THE CAL SAG CHANNEL
UPSTREAM
16.7
76.62
76.69
73.40
73.04
76.46
75.65
75.06
75.27
79.00
..L.--________________ _
~
77.00..
•
•
•
••
-.
~
75.00
::::I
!d:
a:
w
Q.
~
73.00
71.00
-t-----------------------------------------
69.00 4--------------------------------------------------------------------
w
I-
67.00
+; -----------------------
65.00
+i---.---~--~--._-~--_.--_.--~-__.
o
2
4
6
8
10
12
14
16
18
CALUMET SAG CHANNEL RIVER MILE DESIGNATION
R:\Citgo Corn Products UAA 2008 to 2009\Fish\temp charts\CAl SAG (JULY-AUG)
1'1'
0.9
ILLINOIS
ROUTE 83
4.3
104TH
AVENUE
7.4
SW HIGHWAY
8.3
RM 8.3 (SEPA)
11.7
CICERO
13.7
KEDZIE
16.7
HALSTED (Little Cal)
Electronic Filing - Received, Clerk's Office, March 25, 2009
AVG. TEMP. BY RIVER MILE ON THE CAL SAG CHANNEL
DOWNSTREAM
<
0.9
4.3
7.4
8.3
11.7
1998
60.71
60.76
1999
58.66
61.83
2000
57.61
59.94
2001
57.29
65.01
60.67
62.22
63.12
2002
57.51
57.47
57.25
56.71
58.55
2003
59.77
55.83
58.33
55.44
56.91
2004
57.20
57.65
51.31
58.03
2005
58.30
57.83
58.80
2006
57.47
56.44
58.53
2007
57.36
51.98
57.22
2008
56.25
56.01
66.45
66.45
58.06
58.01
57.28
60.68
58.43
59.25
AVERAGE TEMPERATURE (F) VERSUS RIVER MILE ON THE
65.00
63.00
g
61.00
~
59.00
~
57.00
~
55.00
~
53.00
~
51.00
= 49.00
47.00
45.00
•
()
2
CALUMET SAG CHANNEL
-~-
~
.-
4
6
8
10
12
14
CALUMiT SAG CHANNEL RIVER MILE DESIGNATION
R:\Citgo\2008\Fish\temp charts\CAL SAG (AVG).xls
II'
)
UPSTREAM
13.7
16.7
64.09
65.93
58.48
59.00
58.35
59.16
59.86
59.43
60.01
61.86
60.31
60.75
16
18
0.9
ILLINOIS ROUTE 83
4.3
104TH
AVENUE
7.4
SW HIGHWAY
8.3
RM 8.3 (SEPA)
11.7
CICERO
13.7
KEDZIE
16.7
HALSTEAD
t
= -
_
=
Metropolitan Water Reclamation District of
Greater
Chicago
RESEARCH AND
DEVELOPMENT
DEPARTMENT
REPORT NO. 98-10
A STUDY
OF THE FISHERIES RESOURCES AND
WATER QUALITY IN THE CHICAGO WATERWAY SYSTEM
1974 THROUGH 1996
S.G.
Dennison
S.J. Sedita
P. Tata
D.R. Zenz
C.
Lue-Hing
June 1998
METROPOLITAN WATER RECLAMATION DISTRICT OF GREATER CHICAGO
TABLE
AI-17
NUMBER OF FISH COLLECTED FROM STATION 17 AT ROUTE 83 (RIVER MILE 304.Z) ON THE CAL-SAG CHANNEL FROM 1975 THROUGH 1996
Fish Species or
Xeal:
Grand
Hybrid Cross
(x)
1975
1
1976
1977
1985
1986
1987
1988
19B9
1990
1991
1992
1993
1994
1995
1996
Total
Alewife
0
0
0
0
4
0
0
0
3
0
0
0
0
0
0
7
Gizzard shad
0
0
0
1
55
7
100
9
4
66
67
31
0
4
291
635
Rainbow trout
0
0
0
1
0
0
0
0
0
0
0
0
0
0
0
1
Central mudminnow
0
1
0
1
0
3
0
0
1
0
0
0
0
0
0
6
Goldfish
16
1
2
3
1
6
18
14
12
16
0
1
2
0
0
9Z
Carp
1
0
0
11
.8
16
76
20
23
30
5
15
13
17
26
261
Carp x Goldfish
0
0
0
Z
1
1
7
2
1
0
0
1
0
1
0
16
Golden shiner
0
0
0
0
1
0
4
0
0
0
0
1
0
0
0
6
Emerald shiner
0
0
0
0
0
1
3
1
1
2
3
0
0
1
2
1C
Spottail shiner
0
0
0
0
0
0
0
0
0
1
0
0
0
0
0
1
Bluntnose minnow
0
0
0
0
0
0
1
0
1
2
1
4
1
0
3
13
Fathead minnow
0
0
0
12
0
0
3
0
3
0
0
2
1
0
0
21
Creek chub
0
0
0
0
0
1
0
0
0
0
0
0
0
0
0
1
Black bullhead
0
0
0
10
3
7
0
0
1
1
0
0
0
0
0
22
Yellow bullhead
0
0
0
0
0
0
0
0
0
0
a
0
1
0
0
1
~
White perch
0
0
0
0
0
0
0
0
1
0
Q
0
0
0
0
1
H
Yellow bass
0
0
0
0
0
0
0
0
0
0
0
1
0
0
2
3
I
Green sunfish
0
0
1
35
5
118
19
6
153
23
5
35
6
22
22
450
......
Pumpkinseed
0
0
0
0
1
0
1
1
0
6
1
0
0
0
0
10
-.J
Bluegill
0
0
1
3
2
28
4
2
46
10
7
39'
7
13
8
170
Largemouth bass
0
0
0
3
1
5
5
12
10
5
4
8
2
13
9
77
Black crappie
1
0
0
0
0
2
1
0
0
0
0
0
0
0
0
4
Green x Pumpkinseed
0
0
0
0
0
0
0
0
0
1
0
0
0
0
0
1
Yellow perch
0
0
0
1
2
6
2
0
0
0
0
0
0
0
0
11
Total Fish
18
2
4
83
84
Z01
244
67
260
163
93
138
33
71
36)
1824
Total Species
3
2
3
11
11
12
13
8
13
11
8
10
8
6
8
22
Sample Events Per Year
1
1
2
4
4
3
4
4
4
4
2
2
2
2
2
IData for fish collection at B6th Avenue
(River Mile 309.7).
METROPOLITAN WATER RECLAMATION DISTRICT OF GREATER CHICAGO
TABLE AI-16
NUMBER OF FISH COLLECTED FROM STATION 16 AT CICERO AVENUE (RIVER MILE 314.91 ON THE CAL-SAG CHANNEL FROM 1974 THROUGH 1996
Fish Species or
:l!:ea.:z::
Grand
Hybrid Cross
19741
1975
1
1976
1977
1977
1
1995 1996
1997
1999 1999 1990 1991 1992 1993 1994 1995 1996
Total
Alewife
0
0
0
0
0
0'
0
0
0
1
0
0
0
0
0
0
0
1
Gizzard shad
0
31
0
1
0
0
1
1
107
19
45
39
53
3
13
2
47
362
Central mudminnow
0
0
0
0
0
0
0
0
0
1
0
2
0
0
0
0
0
3
Goldfish
1
0
12
2
0
0
0
0
22
19
51
64
5
5
0
3
3
186
Carp
0
0
10
1
0
0
2
4
59
41
19
49
29
22
18
35
40
329
Carp x Goldfish
0
0
0
0
0
0
0
0
3
6
5
3
1
4
0
1
0
23
Golden shiner
0
0
1
0
0
0
0
0
1
0
0
0
0
0
0
0
0
2
Emerald shiner
0
0
1
0
0
0
1
0
12
1
1
3
19
1
0
4B
6
92
Bluntnose minnow
0
0
0
0
0
0
0
0
3
0
0
0
7
3'
1
0
5
19
Fathead minnow
0
0
0
0
0
0
0
1
0
0
0
1
0
0
0
0
1
3
Creek chub
0
0
2
0
0
0
0
0
1
0
0
0
0
1
0
0
0
4
White sucker
0
0
0
1
0
0
0
0
0
0
1
0
0
0
0
0
1
3
Black bullhead
0
0
3
0
0
0
1
3
3
0
0
0
0
0
0
0
0
10
Yellow bass
0
0
0
0
0
0
0
0
0
0
0
'0
0
0
0
0
1
1
Green sunfish
0
0
25
0
0
0
0
9
4
0
6
9
0
6
1
0
3
61
~
pumpkinseed
0
0
0
0
0
0
0
0
0
0
0
0
1
0
0
2
0
3
H
orangespotted sunfish
0
0
0
0
0
0
0
0
0
1
0
0
0
0
0
0
0
1
I
Bluegill
0
0
5
0
1
0
2
10
1
2
5
12
0
6
0
1
1
46
~
Largemouth bass
0
0
0
0
0
0
0
0
0
2
2
'I
0
3
0
6
3
17
0'1
White crappie
0
0
0
0
0
0
0
0
1
0
0
0
0
0
0
0
0
1
Black crappie
0
0
0
0
0
0
0
0
0
0
0
2
0
0
0
0
0
2
Green x pumpkinseed
0
0
1
0
0
0
0
0
1
0
0
0
0
0
0
0
0
2
Total Fish
1
31
60
5
1
0
7
27
219
92
135
184
113
54
33
98
111
1170
Total Species
1
1
8
4
1
0
5
6
11
9
9
10
6
9
4
7
11
20
Sample Events Per Year
1
1
1
2
2
3
3
3
4
4
4
4
2
2
2
2
2
1
Data
for fish collection at Ashland Avenue
(River Mile 319.01.
1'1'
Electronic Filing - Received, Clerk's Office, March 25, 2009
METROPOLITAN WATER RECLAMATION DISTRICT OF GREATER CHICAGO
TABLE AI-11
NUMBER OF FISH COLLECTED FROM STATION 11 AT 16TH STREET IN LOCKPORT (RIVER MILE 292.1) ON THE
CHICAGO SANITARY AND SHIP CANAL FROM 1975 THROUGH 1996
Fish Species or
XeiiU;:
Grand
Hybrid Cross (x)
1975 1976
1977
1985
1986
1987
1988 1989 1990 1991 1992 1993 1994 1995
1996
Total
Bowfin
0
0
0
0
0
1
0
0
0
0
0
0
0
0
0
1
Alewife
0
0
0
0
0
6
0
0
0
0
1
0
1
0
0
8
Gizzard shad
0
0
0
0
0
0
290
41
10
11
23
143
34
37
67
656
Central mudminnow
0
0
0
0
8
0
0
0
0
0
0
0
0
0
0
8
Grass pickerel
0
0
0
1
0
0
0
0
0
0
0
0
0
0
0
1
Goldfish
0
38
1
11
14
29
9
8
8
17
2
3
23
2
1
166
Carp
0
15
20
24
30
41
19
32
41
55
14
36
19
37
60
443
~
Carp x Goldfish
0
6
0
4
1
2
2
5
0
2
0
2
1
H
0
2
27
Golden shiner
0
0
0
0
0
0
1
0
2
2
0
1
0
I
0
0
6
t-l
Emerald shiner
0
0
0
0
1
0
98
83
4
3
0
1
0
0
0
190
t-l
Spottai1 shiner
0
0
0
0
0
0
0
1
0
0
1
0
0
0
O.
2
Bluntnose minnow
0
0
0
2
0
1
3
0
0
0
0
1
0
1
0
8
Fathead minnow
0
0
0
0
0
0
1
0
0
0
0
0
0
1
0
2
Creek chub
0
0
0
0
0
0
1
0
0
0
0
0
0
0
0
1
White sucker
0
0
0
0
0
0
1
0
0
0
0
0
0
0
0
1
Black bullhead
0
4
0
5
2
1
0
0
2
0
0
0
0
0
0
14
Yellow bass
0
0
0
0
0
0
0
0
0
0
0
6
0
0
0
6
Green sunfish
0
0
0
1
1
2
2
1
32
3
0
0
0
4
1
47
Pumpkinseed
0
0
0
0
0
0
0
0
0
3
0
0
0
0
0
3
Orangespotted sunfish 0
0
0
0
0
0
1
0
0
0
0
0
0
0
0
1
Bluegill
0
0
0
2
5
0
1
1
0
1
0
1
1
0
2
14
Largemouth bass
0
0
0
0
0
0
0
0
1
6
0
0
5
2
11
25
Black crappie
0
1
0
1
0
0
0
0
1
0
0
0
0
0
0
3
Yellow perch
0
0
0
2
5
6
1
11
0
0
0
0
0
0
0
25
Total Fish
0
64
21
53
67
89
430
183
101
103
41
194
84
84
144
1658
Total Species
0
4
2
9
8
8
13
8
9
9
5
8
6
7
6
23
Sample Events Per Year 1
1
2
3
4
3
4
4
4
4
2
2
2
2
2
IIII
METROPOLITAN WATER RECLAMATION DISTRICT OF GREATER CHICAGO
TABLE AI-I0
NUMBER OF FISH COLLECTED FROM STATION 10 AT WILLOW SPRINGS ROAD (RIVER MILE 307.9)
ON THE CHICAGO SANITARY AND SHIP CANAL
FROM 1974 THROUGH 1996
Fish Species or
Xel.u::
Grand
Hybrid Cross
(x)
1974
1975
1976
1977
1985
1986
1987
1988
1989
1990
1991
1992
1993
1994
1995
1996
Total
Gizzard shad
0
0
0
0
0
1
0
92
1
0
1
6
0
0
0
2
103
Rainbow smelt
0
0
0
0
1
0
0
0
0
0
0
0
0
0
0
0
1
Central mudminnow
0
0
0
0
0
0
0
0
0
1
1
0
0
1
0
0
3
Goldfish
0
0
1
1
52
178
285
395
200
34
29
8
17
35
4
0
1239
Carp
0
0
1
2
5
16
16
24
22
65
23
15
5
29
25
40
288
carp x Goldfish
0
0
0
0
0
0
1
0
1
0
3
1
0
0
0
0
6
Emerald shiner
0
0
0
0
0
0
0
1
0
8
0
0
0
0
1
0
10
Spot tail shiner
0
0
0
0
0
1
0
0
1
1
1
0
0
1
0
0
5
B1untnose minnow
0
0
0
0
0
0
1
13
2
28
29
76
119
132
33
2
435
Fathead minnow
0
0
0
0
0
0
0
2
0
1
0
2
4
262
«
0
275
Black bullhead
0
0
0
0
1
1
0
0
2
0
0
0
0
0
0
0
4
Yellow bullhead
0
0
0
0
0
0
0
0
0
0
0
0
0
0
1
0
1
Mosquitofish
0
0
0
0
0
0
0
0
0
0
0
0
0
1
0
0
1
Green sunfish
0
0
0
0
0
0
3
0
0
2
8
0
0
2
4
0
19
!l:I
Pumpkinseed
0
0
0
0
0
1
0
0
0
0
2
0
0
0
0
J
6
H
Bluegill
0
0
0
0
0
1
1
0
0
1
0
1
0
0
1
1
6
I
Largemouth bass
0
0
0
0
0
0
0
0
1
1
2
1
1
3
5
9
23
I-'
Black crappie
0
0
0
0
0
0
0
1
0
0
0
0
0
0
0
0
1
0
Green x pumpkinseed
0
0
0
0
0
0
0
0
0
0
1
0
0
0
0
0
1
Yellow perch
0
0
0
0
1
2
5
3
10
0
0
0
0
0
0
0
21
Total Fish
0
0
2
3
60
201
312
531
240
142
100
110
146
466
78
57
2448
Total Species
0
0
2
2
5
9
6
8
9
10
9
7
5
9
9
6
19
Sample Events Per Year
1
1
1
2
3
4
3
4
4
4
4
2
2
2
2
2
I'll
Electronic Filing - Received, Clerk's Office, March 25, 2009
METROPOLITAN WATER RECLAMATION DISTRICT OF GREATER CHICAGO
TABLE AI-9
NUMBER OF FISH COLLECTED FROM STATION 9 AT HARLEM AVENUE (RIVER MILE 314.01 ON THE CHICAGO SANITARY AND SHIP CANAL
FROM 1974 THROUGH 1996
Fish Species or
Xf:IU:
Orand
Hybrid Cross
(x)
1974
1975
1977
1977
1
1985
1986
1987
1988
1989
1990
1991
1992
1993
1994
1995
1996
Total
Alewife
0
0
0
0
0
0
11
0
0
0
0
2
0
0
0
0
13
Gizzard shad
0
0
0
0
1
0
2
62
11
1
6
30
3
0
15
41
172
Brown trout
0
0
0
0
0
0
0
0
0
0
1
0
0
0
0
0
1
Chinook salmon
0
0
0
0
0
0
0
0
1
0
0
0
0
0
0
0
1
Rainbow smelt
0
0
0
0
3
0
1
0
0
0
0
0
0
0
0
0
4
Central mudminnow
0
0
0
0
2
0
0
0
0
0
0
0
0
0
0
0
2
Grass pickerel
0
0
0
0
0
0
0
1
0
0
0
0
0
0
0
0
1
Goldfish
0
0
0
0
238
45
166
219
169
133
62
83
1
8
19
4
1147
Carp
0
2
1
5
103
34
63
101
76
79
70
31
14
27
67
55
728
Carp x Goldfish
0
0
0
0
12
0
5
6
0
2
1
1
0
1
2
0
30
Golden shiner
0
0
0
0
0
0
1
1
0
1
14
2
0
0
0
0
19
Emerald shiner
0
0
0
0
0
0
0
6
7
0
15
1
0
1
0
0
30
Spot tail shiner
0
0
0
0
3
3
0
1
2
0
0
16
2
0
0
0
27
B1untnose minnow
0
'0
0
0
1
1
12
27
68
33
122
263
264
99
0
1
891
Fathead minnow
0
0
0
0
2
0
0
3
0
0
12
9
33
14
1
0
7C
!l:I
Black bullhead
0
0
0
0
2
1
0
2
0
0
0
0
0
0
0
0
5
H
Yellow bullhead
0
0
0
0
0
0
0
0
0
0
0
0
0
0
0
1
1
I
Threespine stickleback
0
0
0
0
0
0
0
0
0
0
0
0
0
0
0
5
5
\.0
Rock bass
0
0
0
0
0
0
0
0
0
0
0
1
0
0
0
0
1
Green sUnfish
0
0
0
0
3
0
3
0
0
0
1
0
0
0
0
0
7
Pumpkinseed
0
0
0
0
0
0
0
0
0
0
4
0
0
0
0
0
4
Bluegill
0
0
0
0
1
0
0
1
0
0
0
0
1
0
0
«
7
Largemouth bass
0
0
0
0
0
0
0
0
0
0
0
0
0
0
3
13
16
Yellow perch
0
0
0
0
41
2
132
3
54
0
0
0
0
0
"0
0
232
Total Fish
0
2
1
5
412
86
396
433
388
249
308
439
318
150
107
124
3418
Total Species
0
1
1
1
12
6
9
12
8
5
10
10
7
5
5
8
23
Sample Events Per Year
1
1
2
2
4
4
4
4
4
4
4
2
2
2
2
2
1
Data for collections at the C & IW Railroad Bridge
(River Mile 314.81.
IIII
Electronic Filing - Received, Clerk's Office, March 25, 2009
METROPOLITAN WATER RECLAMATION DISTRICT OF GREATER CHICAGO
TABLE AI-8
NUMBER OF FISH COLLECTED FROM STATION 8 AT CICERO AVENUE (RIVER MILE 317.31 ON THE CHICAGO SANITARY AND SHIP CANAL
FROM 1974 THROUGH 1996
Fish Species or
XIlII[
Grand
Hybrid Cross
(xl
1974
1975
1976
1977
1985
1986
1987
1988
1989
1990
1991
1992
1993
1994
1995 1996
Total
Alewife
0
0
2
0
0
0
0
2
2
1
1
3
0
1
0
0
12
Gizzard shad
0
0
0
0
0
0
9
24
1
4
32
12
153
6
9
41
291
Rainbow smelt
0
0
0
0
5
1
1
2
10
1
0
0
0
0
0
0
20
Goldfish
0
0
7
0
84
81
47
704
330
382
337
41
41
36
38
19
:a47
Carp
0
0
3
0
36
32
113
126
110
183
197
37
93
106
134
107
1277
Carp x Goldfish
0
0
4
0
2
8
3
16
9
5
13
3
2
6
6
6
83
Golden shiner
0
0
0
0
0
0
2
6
1
6
2
4
2
3
2
0
28
Emerald shiner
0
0
0
0
0
1
2
31
5
2
0
8
0
0
0
0
49
Spottail shiner
0
0
0
0
0
0
0
12
1
1
18
0
1
0
0
0
33
Bluntnose minnow
0
0
0
0
0
0
1
39
10
152
435
111
11
123
19
0
901
Fathead minnow
0
0
0
0
3
3
0
9
3
10
10
5
1
16
2
0
62
Creek chub
0
0
0
0
0
0
0
0
0
0
0
0
1
0
0
0
1
Black bullhead
0
0
0
0
5
15
4
1
5
4
2
0
0
1
0
0
37
Yellow bullhead
0
0
0
0
0
0
0
0
0
0
0
0
0
0
1
0
1
Mosquitofish
0
0
0
0
0
0
0
1
.0
0
0
0
0
0
0
0
1
!J:I
Brook stickleback
0
0
0
0
0
0
1
0
1
0
0
0
0
0
0
0
2
H
Threespine stickleback
0
0
0
0
0
0
0
1
0
0
0
0
0
0
0
1
2
I
Green sunfish
0
0
0
0
2
0
2
0
0
1
3
5
0
1
2
0
16
CO
pumpkinseed
0
0
0
0
0
0
0
0
0
1
3
2
0
0
1
0
7
Bluegill
0
0
0
0
0
0
2
1
1
0
2
0
0
0
2
0
8
Largemouth bass
0
0
0
0
0
0
0
0
0
1
9
7
0
13
33
16
79
Black crappie
0
0
1
0
0
0
0
0
0
0
1
0
0
0
0
1
3
Yellow perch
0
0
0
0
0
21
15
205
82
0
0
0
0
0
0
0
323
Total Fish
0
0
17
0
137
162
202
1180
571
754
1065
238
305
312
249
191
5383
Total Species
0
0
4
0
6
7
12
15
14
14
14
11
8
10
11
6
22
Sample Events' Per Year
1
1
1
2
3
4
4
4
4
4
4
2
2
2
2
2
1'1'
METROPOLITAN WATER RECLAMATION DISTRICT OF GREATER CHICAGO
TABLE AI-7
NUMBER OF FISH COLLECTED FROM STATION 7 AT DAMEN AVENUE (RIVER MILE 321.1) ON THE CHICAGO SANITARY AND SHIP CANAL FROM
1975 THROUGH 1996
Fish Species or
Xlll:I(
Grand
Hybrid Cross
(x)
1975
1977
1985
1986
1987
1988
1989
1990
1991
1992
1993
1994
1995
1996
Total
Alewife
0
0
5
1
46
2
4
0
0
7
0
0
0
0
65
Gizzard shad
0
0
1
2
6
13
7
5
16
71
19
-2
20
38
200
Rainbow trout
0
0
1.
0
1
0
0
0
0
0
0
0
0
0
2
Rainbow smelt
0
0
23
2
20
0
0
0
1
0
0
0
0
0
46
Central mudminnow
0
0
0
0
2
0
0
0
0
0
0
0
0
0
2
Goldfish
0
0
58
28
39
123
81
107
203
204
44
12
20
5
924
Carp
0
0
41
49
53
57
113
166
151
84
31
86
69
41
941
carp x Goldfish
0
0
5
2
6
5
4
3
3
1
4
2
2
0
37
Golden shiner
0
0
1
1
4
13
11
12
31
18
13
3
3
0
110
Emerald shiner
0
0
0
0
5
47
4
0
1
2
0
0
0
0
59
Spottail shiner
0
0
1
0
2
5
3
0
0
4
0
0
0
0
15
B1untnose minnow
0
0
5
0
2
29
7
24
71
354.
12.
6
1
0
511
Fathead minnow
0
0
7
0
1
4
1
0
2
6
0
0
3
0
24
Whi te sucker
0
0
0
0
1
0
0
0
0
0
0
0
0
0
1
~
Black bullhead
0
0
24
43
46
33
27
11
0
0
2
1
1
0
188
Threespine stickleback
0
0
0
0
0
0
0
0
1
0
0
0
0
1
2
H
White perch
0
0
0
0
0
0
1
0
0
0
0
0
0
0
1
I
Green sunfish
0
0
6
3
1
0
1
3
3
2
2
1
0
......J
Pumpkinseed
0
0
0
1
23
0
0
0
0
1
5
6
0
2
1
1
16
Orangespotted sunfish
0
0
0
0
0
2
0
0
0
0
0
0
0
0
2
Bluegill
0
0
5
2
38
8
5
8
10
5
1
0
0
4
86
Largemouth bass
0
0
0
0
5
7
10
16
37
5
9
8
36
10
143
Black crappie
0
0
0
1
2
0
0
0
0
1
0
1
0
1
6
Green x Bluegill
0
0
0
1
0
0
0
0
0
0
0
0
0
0
1
Yellow perch
0
0
22
12
17
175
82
0
0
0
0
0
0
0
308
Total Fish
0
0
205
147
297
523
361
356
535
770
137
124
156
102
3713
Total Species
0
0
14
11
19
14
15
10
12
14
9
10
9
9
23
Sample Events Per Year
1
2
4
4
4
4
4
4
4
2
2
2
2
2
1111
Electronic Filing - Received, Clerk's Office, March 25, 2009
METROPOLITAN WATER RECLAMATION DISTRICT OF GREATER CHICAGO
TABLE 1
FISH
COLLECTED FROM THE DEEP DRAFT CANALS OF THE CHICAGO WATERWAY SYSTEM 1974 THROUGH 1996
North
Chicago
North
Branch
Sanitary
Little
Shore
Chicago
Chicago and Ship
Calumet
Calumet
Cal-Sag
Grand
Family and Species
Channel
River
River
Canal
River
River
Channel
Total
Bowfins
Bowfin
0
1
0
1
1
0
0
3
Frg!2hwat!ilJ::
eels
.......
American eel
0
0
0
0
1
0
0
1
0
Herrings
Alewife
2,661
39
528
98
721
49
8
4,104
Gizzard shad
2,216
735
920
1,422
3,567
3,734
1,047
13,641
SalmQn ang
l~Qyta
Rainbow trout
16
4
10
2
3
0
1
36
Brown
trout
28
0
33
1
0
0
0
62
Brook ):.rout
2
1
1
0
0
0
0
4
Lake trout
1
0
3
0
0
0
0
4
Coho
salmon
5
0
10
0
1
0
0
16
Chinook salmon
6
0
11
1
7
1
0
26
Sm!illta
Rainbow
smelt
2,024
2
34
71
5
1
.0
2,137
Mudminnows
Central mudminnow
5
1
0
15
0
2
9
32
I'll
METROPOLITAN WATER RECLAMATION DISTRICT OF GREATER CHICAGO
TABLE 1 (Continued)
FISH COLLECTED FROM THE DEEP DRAFT CANALS OF THE CHICAGO WATERWAY SYSTEM 1974 THROUGH 1996
North
Chicago
North
Branch
Sanitary
Little
Shore
Chicago
Chicago and Ship Calumet
Calumet
Cal-Sag
Grand
Family and Species
Channel
River
River
Canal
River
River
Channel
Total
~
Grass pickerel
2
0
0
2
2
2
0
8
Northern pike
1
0
0
0
0
0
0
1
.....
.....
Goldfish
Minnows gOg
Cg~S
3,289
708
402
5,623
99
1,255
290
11,666
Grass carp
0
0
1
0
1
0
0
2
Carp
854
568
1,022
3,675
900
940
667
8,626
Carp x Goldfish hybrid
596
169
116
183
32
118
39
1,253
Brassy minnow
1
0
0
0
0
0
0
1
Hornyhead chub
1
0
0
0
0
0
0
1
Golden shiner
2,494
112
63
163
83
121
9
3,045
Emerald shiner
25
20
116
346
873
1,242
241
2,863
Bigmouth shiner
1
0
0
0
0
0
0
1
Spot tail shiner
1,160
34
105
82
54
34
1
1,470
Spotfin shiner
1
0
0
0
0
0
0
1
Sand shiner
3
0
1
0
5
0
0
9
Bluntnose minnow
19,270
376
1,278
2,746
6,934
520
56
31,180
Fathead minnow
9,765
49
12
437
127
47
26
10,463
Longnose dace
16
0
0
0
0
0
0
16
Creek chub
1
0
0
2
0
0
5
8
Central stoneroller
0
0
2
0
1
0
0
3
1111
METROPOLITAN WATER RECLAMATION DISTRICT OF GREATER CHICAGO
TABLE 1 (Continued)
FISH COLLECTED FROM THE DEEP DRAFT CANALS OF THE CHICAGO WATERWAY SYSTEM 1974 THROUGH 1996
North.
Chicago
North
Branch
Sanitary
Little
Shore
Chicago
Chicago
and Ship
Calumet
Calumet
Cal-Sag
Grand
Family and Species
Channel
River
River
Canal
River
River
Channel
Total
Suckers
Quillback
0
0
0
0
4
0
0
4
White sucker
123
13
1
2
53
12
24
228
Black buffalo
0
0
1
0
1
0
0
2
I-'
N
Loaches
Oriental weatherfish
11
1
0
0
0
0
0
12
Fr~~hwste~ ~atfi§b~a
Black bullhead
380
40
39
248
5
20
34
766
Yellow bullhead
5
1
0
3
0
0
1
10
Channel catfish
0
0
0
0
7
1
15
23
Trout-perches
Trout-perch
0
0
2
0
0
0
0
2
Livebearers
Mosquitofish
0
0
0
2
0
4
0
6
Silyersides
Brook silverside
0
0
1
0
0
0
0
1
Sticklebacks
Brook stickleback
1,252
29
2
2
0
0
0
1,285
Threespine stickleback
25
63
19
9
0
1
2
119
Ninespine stickleback
27
0
2
0
0
0
0
29
1'1'
Electronic Filing - Received, Clerk's Office, March 25, 2009
METROPOLITAN WATER RECLAMATION DISTRICT OF GREATER CHICAGO
TABLE 1 (Continued)
FISH COLLECTED FROM THE DEEP DRAFT CANALS OF THE CHICAGO WATERWAY SYSTEM 1974 THROUGH 1996
North
Chicago
North
Branch
Sanitary
Little
Shore
Chicago
Chicago and Ship Calumet
Calumet
Cal-Sag
Grand
Family and Species
Channel
River
River
Canal
River
River
Channel
Total
Tern~erate bas~es
White bass
0
0
2
0
2
0
0
4
White perch
0
3
11
1
430
406
1
852
Yellow bass
0
0
0
7
0
11
15
33
I-'
White x Striped bass hybrid
0
0
0
0
1
0
0
1
W
Sunfishes
Rock bass
70
1
556
1
20
0
0
648
Green sunfish
1,524
243
580
113
744
116
520
3,840
Pumpkinseed
174
15
70
36
455
272
15
1,037
Warrnouth
0
0
0
0
1
0
1
2
Orangespotted sunfish
81
9
12
3
142
17
1
265
Bluegill
691
284
663
123
467
105
243
2,576
Srna1lmouth bass
0
0
61
1
77
0
3
142
Largemouth bass
473
198
454
293
1,108
135
190
2,851
White crappie
1
0
0
0
1
0
1
3
Black crappie
83
12
13
13
29
2
7
159
Hybrid sunfish
Green x Orangespotted
0
1
0
0
1
0
0
2
Green x Pumpkinseed
14
5
2
1
14
3
3
42
Green x Bluegill
14
6
6
1
13
0
1
41
Pumpkinseed x Orangespotted
0
0
0
0
8
1
0
9
Pumpkinseed x Bluegill
7
2
4
0
5
0
0
18
Bluegill x Orangespotted
0
0
0
0
3
0
0
3
IIII
Electronic Filing - Received, Clerk's Office, March 25, 2009
METROPOLITAN WATER RECLAMATION DISTRICT OF GREATER CHICAGO
TABLE 1 (Continued)
FISH COLLECTED FROM THE DEEP DRAFT CANALS OF THE CHICAGO WATERWAY SYSTEM 1974 THROUGH 1996
North
Chicago
North
Branch
Sanitary
Little
Shore
Chicago
Chicago
and Ship
Calumet
Calumet
Cal-Sag
Grand
Family and Species
Channel
River
River
Canal
River
River
Channel
Total
Perches
Johnny darter
1
0
15
0
1
. 0
0
17
Yellow perch
3,827
300
1,387
909
.1,064
118
11
7,616
......
~
01::0
Freshwater drum
0
0
1
0
14
1
1
17
Sculpins
Mottled sculpin
4
0
2
0
0
0
0
6
Gobies
Round goby
0
0
0
0
22
0
0
22
Total Fish
53,231
4,045
8,574
16,638
18,109
9,291
3,488
113,376
Number of Species
44
29
41
34
40
28
30
61
Number of Hybrids
4
5
4
3
8
4
3
8
IIII
Electronic Filing - Received, Clerk's Office, March 25, 2009
uw.:wz== ...... -
__
Metropolitan Water Reclamation District
of
Greater Chicago
RESEARCH AND DEVELOPMENT
DEPARTMENT
REPORT NO. 08-2
AMBIENT WATER QUALITY MONITORING
IN THE CHICAGO AREA WATERWAY SYSTEM:
A SUMMARY
OF BIOLOGICAL, HABITAT, AND
SEDIMENT QUALITY DATA BETWEEN 2001 AND 2004
January 2008
Electronic Filing - Received, Clerk's Office, March 25, 2009
TABLE 5: QUALITATIVE HABITAT EVALUATION INDEX SCORES IN THE
CHICAGO AREA WATERWAY SYSTEM MEASURED BETWEEN 2002 AND 2004
Station
Station Name
Waterway
QHEI*
Habitat
No.
Score
Rating
96
Albany Avenue
North Branch Chicago River
33
Poor
36
Touhy A venue
North Shore Channel
40
Poor
46
Grand A venue
North Branch Chicago River
29
Very Poor
74
Lake Shore Drive
Chicago River
29
Very Poor
100
Wells Street
Chicago River
28
Very Poor
39
Madison Street
South Branch Chicago River
27
Very Poor
108
Loomis Street
South Branch Chicago River
32
Poor
99
Archer A venue
South Fork South Branch Chicago River
42
Poor
40
Damen A venue
Chicago Sanitary and Ship Canal
34
Poor
75
Cicero A venue
Chicago Sanitary and Ship Canal
32
Poor
41
Harlem A venue
Chicago Sanitary and Ship Canal
35
Poor
42
Route 83
Chicago Sanitary and Ship Canal
38
Poor
48
Stephen Street
Chicago Sanitary and Ship Canal
37
Poor
92
Lockport
Chicago Sanitary and Ship Canal
40
Poor
49
Ewing A venue
Calumet River
32
Poor
55
130
th
Street
Calumet River
51
Fair
50
Burnham A venue
Wolf Lake Drain
47
Fair
86
Burnham Avenue
Grand Calumet River
36
Poor
56
Indiana A venue
Little Calumet River
47
Fair
76
Halsted Street
Little Calumet River
55
Fair
52
Wentworth A venue
Little Calumet River
40
Poor
54
Joe Orr Road
Thorn Creek
55
Fair
97
170
th
Street
Thorn Creek
41
Poor
57
Ashland Avenue
Little Calumet River
51
Fair
58
Ashland A venue
Calumet-Sag Channel
39
Poor
59
Cicero A venue
Calumet-Sag Channel
37
Poor
43
Route
83
Calumet-Sag Channel
41
Poor
90
Route 19
Poplar Creek
52
Fair
110
Springinsguth Road
West Branch DuPage River
31
Poor
89
Walnut Lane
West Branch DuPage River
47
Fair
64
Lake Street
West Branch DuPage River
49
Fair
79
Higgins Road
Salt Creek
63
Good
80
Arlington Heights Rd. Salt Creek
64
Good
18
Devon A venue
Salt Creek
55
Fair
24
Wolf Road
Salt Creek
49
Fair
109
Brookfield A venue
Salt Creek
47
Fair
77
Elmhurst Road
Higgins Creek
23
Very Poor
21
-.
TABLE 7 (Continued): NUMBER, WEIGHT, AND NUMBER OF SPECIES FOR FISH COLLECTED IN THE
CHICAGO AREA W ATERW A Y SYSTEM BETWEEN 2001 AND 2004
Station
Sample
Number
Weight
Number of SQecies
No.
Station Name
Year
Gear!
ofFish
in Grams
Total
Game
Most Abundant Species
North Shore Channel (Continued)
101
Foster A venue
2001
EFB-L
179
45,309
15
8
Largemouth bass
North Branch Chicago River (DeeQ Portion)
37
Wilson A venue
2001
EFB-L
75
79,777
13
6
Carp
73
Diversey Parkway
2001
EFB-L
58
23,733
7
2
Gizzard shad
46
Grand A venue
2
2001
EFB-L
53
43,553
9
6
Carp
Grand A venue
2
2002
EFB-L
28
22,066
7
3
Carp
Grand A venue
2
2003
EFB-L
67
17,359
8
4
Gizzard shad
N
Grand A venue
2
2004
EFB-L
88
19,722
9
00
4
Gizzard shad
Chicago River
74
Outer Drive
2002
EFB-L
22
11,087
8
5
Gizzard shad & Largemouth bass
100
Wells Street
2002
EFB-L
136
104,017
11
7
Gizzard shad
South Branch Chicago River
39
Madison Street
2002
EFB-L
138
25,700
10
3
Emerald shiner
108
Loomis Street
2002
EFB-L
76
77,763
10
5
Carp
Bubbly Creek (South Fork South Branch Chicago River)
99
Archer A venue
2002
EFB-L
21
3,812
5
2
Gizzard shad
Chicago Sanitary and ShiQ Canal
40
Darnen A venue
2002
EFB-L
148
153,355
10
4
Carp
75
Cicero A venue
2
2001
EFB-L
188
183,269
11
4
Carp
Cicero A venue
2
2002
EFB-L
136
160,509
10
3
Carp
1'1'
Station
No.
75
41
42
48
\0
N
92
49
55
50
86
1111
TABLE 7 (Continued): NUMBER, WEIGHT, AND NUMBER OF SPECIES FOR FISH COLLECTED IN THE
CHICAGO AREA WATERWAY SYSTEM BETWEEN 2001 AND 2004
Sample
Number
Weight
Number of SQecies
Station Name
Year
Gear!
of Fish
in Grams
Total
Game
Most Abundant Species
Chicago Sanitarx and
ShiQ Canal (Continued}
Cicero A venue
2
2003
EFB-L
138
34,260
9
3
Gizzard shad
Cicero A venue
2
2004
EFB-L
191
98,526
13
4
Carp
Harlem A venue
2
2001
EFB-L
88
51,515
9
3
Gizzard shad
Harlem A venue
2
2002
EFB-L
188
114,024
II
3
Gizzard shad
Harlem A venue
2
2003
EFB-L
225
47,000
9
3
Bluntnose minnow
Harlem A venue
2
2004
EFB-L
193
99,601
13
3
Gizzard shad
Route
83
2002
EFB-L
32
1,264
5
2
Mosquitofish
Stephen Street
2002
EFB-L
24
1,940
4
0
Bluntnose minnow
Lockpore
2001
EFB-L
77
97,313
2
0
Gizzard shad
Lockport
2
2002
EFB-L
67
41,250
6
2
Gizzard shad
Lockport
2
2003
EFB-L
67
17,248
7
4
Carp
Lockport
2
2004
EFB-L
22
44,259
4
2
Carp
Calumet River
Ewing A venue
2003
EFB-L
13
4,754
3
2
Rock bass
130
th
Street
2
2001
EFB-L
157
62,258
13
6
Gizzard shad
130
th
Street
2
2002
EFB-L
261
54,688
12
6
Bluntnose minnow
130
th
Streee
2003
EFB-L
182
68,404
8
3
Gizzard shad
130
th
Street
2
2004
EFB-L
360
95,951
14
6
Gizzard shad
Wolf Lake Outlet
Burnham Avenue
2003
BP/S
16
194
6
5
Longear sunfish
Grand Calumet River
Burnham Avenue
2003
BP
0
0
0
0
NA
TABLE 7 (Continued): NUMBER, WEIGHT, AND NUMBER OF SPECIES FOR FISH COLLECTED IN THE
CHICAGO AREA W A TERW A Y SYSTEM BETWEEN 2001 AND 2004
Station
Sample
Number
Weight
Number of SQecies
No.
Station
Name
Year
Gear)
ofFish
in Grams
Total
Game
Most Abundant Species
Little Calumet River
(DeeQ Portion}
56
Indiana Avenue
2003
EFB-L
452
234,592
17
11
Gizzard shad
76
Halsted
Street
2
2001
EFB-L
210
128,546
16
8
Gizzard shad
Halsted
Street
2
2002
EFB-L
163
106,079
17
7
Carp
Halsted Street
2
2003
EFB-L
219
47,350
13
6
Gizzard shad
Halsted Street
2
2004
EFB-L
207
116,705
17
9
Largemouth bass
Thorn Creek
w
54
Joe
Orr Road
2003
BP
19
164
3
2
Creek chub
&
Green sunfish
170
th
0
97
Street
2003
EFB-S
5
1,726
4
1
White sucker
Little Calumet River (Wadeable Portion}
52
Wentworth Avenue
2003
BP
1
26
1
0
Carp
57
Ashland A venue
2003
EFB-S
12
24,255
2
1
Carp
Calumet-Sag Channel
58
Ashland Avenue
2003
EFB-L
95
80,244
13
8
Gizzard shad
59
Cicero A venue
2
2001
EFB-L
127
52,583
10
4
Gizzard shad
Cicero A venue
2
2002
EFB-L
174
47,808
13
6
Bluntnose minnow
Cicero A venue
2
2003
EFB-L
56
27,815
12
6
Bluntnose minnow
&
Green sunfish
Cicero A venue
2
2004
EFB-L
147
70,642
10
5
Gizzard shad
43
Route
83
2003
EFB-L
43
31,450
7
3
Carp
Buffalo Creek
12
Lake-Cook Road
2004
BP/S
48
890
8
6
Bluegill
IIII
Electronic Filing - Received, Clerk's Office, March 25, 2009
TABLE 8 (Continued): INDEX OF BIOTIC INTEGRITY SCORE AND CATEGORY CALCULATED FOR THE CHICAGO
AREA WATERWAY SYSTEM BETWEEN 2001 AND 2004
Station
Sample
m!"
m!"
No.
Station Name
Waterway
Year
Gear
Score
Category
46
Grand A venue
North Branch Chicago River
2002
Large EF Boat
20
Poor
Grand A venue
North Branch Chicago River
2003
Large EF Boat
32
Fair
Grand Avenue
North Branch Chicago River
2004
Large EF Boat
28
Fair
74
Lake Shore Drive
Chicago River
2002
Large EF Boat
30
Fair
100
Wells Street
Chicago River
2002
Large EF Boat
30
Fair
39
Madison Street
South Branch Chicago River
2002
Large EF Boat
34
Fair
108
Loomis Street
South Branch Chicago River
2002
Large EF Boat
26
Fair
99
Archer A venue
South Fork South Branch Chicago River
2002
Large EF Boat
26
Fair
40
Damen A venue
Chicago Sanitary and Ship Canal
2002
Large EF Boat
28
Fair
w
.j:::..
75
Cicero Avenue
Chicago Sanitary and Ship Canal
2001
Large EF Boat
20
Poor
Cicero A venue
Chicago Sanitary and Ship Canal
2002
Large EF Boat
22
Fair
Cicero A venue
Chicago Sanitary and Ship Canal
2003
Large EF Boat
22
Fair
Cicero A venue
Chicago Sanitary and Ship Canal
2004
Large EF Boat
22
Fair
41
Harlem A venue
Chicago Sanitary and Ship Canal
2001
Large EF Boat
24
Fair
Harlem A venue
Chicago Sanitary and Ship Canal
2002
Large EF Boat
26
Fair
Harlem A venue
Chicago Sanitary and Ship Canal
2003
Large EF Boat
24
Fair
Harlem A venue
Chicago Sanitary and Ship Canal
2004
Large EF Boat
26
Fair
42
Route 83
Chicago Sanitary and Ship Canal
2002
Large EF Boat
26
Fair
48
Stephen Street
Chicago Sanitary and Ship Canal
2002
Large EF Boat
20
Poor
92
Lockport
Chicago Sanitary and Ship Canal
2001
Large EF Boat
20
Poor
Lockport
Chicago Sanitary and Ship Canal
2002
Large EF Boat
22
Fair
Lockport
Chicago Sanitary and Ship Canal
2003
Large EF Boat
24
Fair
Lockport
Chicago Sanitary and Ship Canal
2004
Large EF Boat
24
Fair
52
Wentworth A venue
Little Calumet River
2003
BP
24
Fair
54
Joe Orr Road
Thorn Creek
2003
BP
32
Fair
97
170
th
Street
Thorn Creek
2003
Small EF Boat
24
Fair
57
Ashland A venue
Little Calumet River
2003
Small EF Boat
18
Poor
1111
Electronic Filing - Received, Clerk's Office, March 25, 2009
TABLE 8 (Continued): INDEX OF BIOTIC INTEGRITY SCORE AND CATEGORY CALCULATED FOR THE CHICAGO
AREA W ATERW A Y SYSTEM BETWEEN 2001 AND 2004
Station
Sample
mJ'
m!'
No.
Station Name
Waterway
Year
Gear
Score
Category
49
Ewing A venue
Calumet River
2003
Large EF Boat
34
Fair
50
Burnham Avenue
Wolf Lake Outlet
2003
BP
32
Fair
Burnham A venue
Wolf Lake
Outlet
2003
Seine
28
Fair
55
130
th
Street
Calumet River
2001
Large EF Boat
32
Fair
BOth Street
Calumet River
2002
Large EF Boat
34
Fair
BOth Street
Calumet River
2003
Large EF Boat
30
Fair
130
th
Street
Calumet River
2004
Large EF Boat
36
Fair
86
Burnham A venue
Grand Calumet River
2003
BP
NA
NA
56
Indiana A venue
Little Calumet River
2003
Large EF Boat
34
Fair
w
76
Halsted Street
Little Calumet River
2001
Large EF Boat
34
Fair
U1
Halsted Street
Little Calumet River
2002
Large EF Boat
34
Fair
Halsted Street
Little Calumet River
2003
Large EF Boat
36
Fair
Halsted Street
Little Calumet River
2004
Large EF Boat
36
Fair
58
Ashland Avenue
Calumet-Sag Channel
2003
Large EF Boat
22
Fair
59
Cicero A venue
Calumet-Sag Channel
2001
Large EF Boat
28
Fair
Cicero A venue
Calumet-Sag Channel
2002
Large EF Boat
28
Fair
Cicero A venue
Calumet-Sag Channel
2003
Large EF Boat
24
Fair
Cicero Avenue
Calumet-Sag Channel
2004
Large EF Boat
28
Fair
43
Route
83
Calumet-Sag Channel
2003
Large EF Boat
22
Fair
12
Salt Creek
Buffalo Creek
2004
BP
22
Fair
Salt Creek
Buffalo Creek
2004
Seine
28
Fair
13
Lake-Cook Road
Des Plaines River
2001
BP
28
Fair
Lake-Cook Road
Des Plaines River
2001
Seine
32
Fair
Lake-Cook Road
Des Plaines River
2002
BP
24
Fair
Lake-Cook Road
Des Plaines River
2002
Seine
34
Fair
Lake-Cook Road
Des Plaines River
2003
BP
32
Fair
Lake-Cook Road
Des Plaines River
2003
Seine
32
Fair
,1'1
Metropolitan Water Reclamation District
of
Greater Chicago
RESEARCH AND DEVELOPMENT
DEPARTMENT
REPORT NO 08-33
AMBIENT WATER QUALITY MONITORING
IN THE CHICAGO, CALUMET, AND
DES PLAINES RIVER SYSTEMS:
A SUMMARY
OF
BIOLOGICAL, HABITAT, AND
SEDIMENT QUALITY DURING 2005
June 2008
TABLE 5: QUALITATIVE HABITAT EVALUATION INDEX SCORES IN THE CHICAGO,
CALUMET, AND DES PLAINES RIVER SYSTEMS
MEASURED DURING 2005
Station
QHEII
Habitat
No.
Station Name
Waterway
Score
Rating
106
Dundee Road
West Fork North Branch
46
Fair
103
Golf Road
West Fork North Branch
51
Fair
31
Lake-Cook Road
Middle Fork North Branch
32
Poor
32
Lake-Cook Road
Skokie River
62
Good
105
Frontage Road
Skokie River
36
Poor
104
Glenview Road
North Branch Chicago River
62
Good
N
34
Dempster Street
North Branch Chicago River
47
Fair
0
96
Albany Avenue*
North Branch Chicago River
33
Poor
35
Central Street
North Shore Channel
39
Poor
102
Oakton Street
North Shore Channel
39
Poor
36
Touhy A venue*
North Shore Channel
44
Poor
101
Foster A venue
North Shore Channel
46
Fair
37
Wilson A venue
North Branch Chicago River
42
Poor
73
Diversey Parkway
North Branch Chicago River
30
Poor
46
Grand Avenue*
North Branch Chicago River
25
Very Poor
75
Cicero A venue*
Chicago Sanitary
&
Ship Canal
32
Poor
41
Harlem A venue*
Chicago Sanitary
&
Ship Canal
35
Poor
92
Lockport*
Chicago Sanitary
&
Ship Canal
40
Poor
55
130
th
Street*
Calumet River
51
Fair
76
Halsted Street*
Little Calumet River
55
Fair
59
Cicero A venue*
Calumet-Sag Channel
37
Poor
64
Lake Street*
West Branch DuPage River
49
Fair
18
Devon A venue*
Salt Creek
55
Fair
78
Wille Road*
Higgins Creek
27
Very Poor
13
Lake-Cook Road*
Des Plaines River
49
Fair
22
Ogden A venue*
Des Plaines River
53
Fair
91
Material Service Rd. *
Des Plaines River
64
Good
JQHEI=Qualitative Habitat Evaluation Index.
* Annual sampling station.
~
Electronic Filing - Received, Clerk's Office, March 25, 2009
TABLE 7: NUMBER, WEIGHT, AND NUMBER OF SPECIES FOR FISH COLLECTED IN THE CHICAGO, CALUMET, AND
DES PLAINES RIVER SYSTEMS DURING 2005
Number
Number of
Most
Station
Location
Waterway
Sample
of
Weight
SEecies
Abundant
No.
Gear
Fish
(grams)
Total
Game
Species
106
Dundee Road
W
Fork N Branch Chicago River
l
BP/Seine
5
14
3
1
Carp
103
Golf Road
W Fork N Branch Chicago River
l
BP/Seine
6
118
4
3
Green sunfish
31
Lake-Cook
Road
M Fork N Branch Chicago
Rive~
BP
14
260
4
2
Green sunfish
32
Lake-Cook Road
Skokie River
BP/Seine
34
5,621
4
2
Bluegill, Green sunfish
105
Frontage Road
Skokie River
BP/Seine
39
722
3
2
Green sunfish
104
Glenview Road
North Branch Chicago River
BP
10
657
3
2
Green sunfish
N
34
Dempster Street
North Branch Chicago River
BP/Seine
13
399
5
+::0-
2
Carp
96
Albany A venue*
North Branch Chicago River
BP
6
17
3
Carp
35
Central Street
North Shore Channel
Large
EF Boat
139
159,512
10
5
Carp
102
Oakton Street
North Shore Channel
Large
EF Boat
151
21,056
17
9
Golden shiner
36
Touhy Avenue*
North Shore Channel
Large
EF Boat
276
102,744
9
4
Gizzard shad
101
Foster Avenue
North Shore Channel
Large
EF Boat
273
48,926
16
7
Gizzard shad
37
Wilson A venue
North Branch Chicago River
Large
EF Boat
122
169,620
11
5
Carp
73
Diversey Parkway
North Branch Chicago River
Large
EF Boat
164
70,776
12
6
Golden shiner
46
Grand A venue*
North Branch Chicago River
Large
EF Boat
77
14,020
5
3
Gizzard shad
75
Cicero Avenue*
Chicago Sanitary & Ship Canal
Large
EF Boat
184
59,470
7
3
Gizzard shad
41
Harlem Avenue*
Chicago Sanitary & Ship Canal
Large
EF Boat
758
96,426
13
4
Gizzard shad
92
Lockport*
Chicago Sanitary & Ship Canal
Large EF Boat
179
20,337
9
3
Gizzard shad
55
BOth Street*
Calumet River
Large
EF Boat
380
102,346
16
7
Largemouth bass
76
Halsted Street*
Little Calumet River
Large
EF Boat
913
125,321
18
9
Gizzard shad
, III
Electronic Filing - Received, Clerk's Office, March 25, 2009
tv
VI
TABLE 7 (Continued): NUMBER, WEIGHT, AND NUMBER OF SPECIES FOR FISH COLLECTED IN THE CHICAGO,
CALUMET, AND DES PLAINES RIVER SYSTEMS DURING 2005
Station
No.
59
64
18
78
13
22
91
TOTAL
Location
Waterway
Cicero A venue*
Calumet-Sag Channel
Lake Street*
West Branch DuPage River
Devon Avenue*
Salt Creek
Wille Road*
Higgins Creek
Lake-Cook Road *
Des Plaines River
Ogden A venue*
Des Plaines River
Material Service Road* Des Plaines River
lWest Fork North Branch Chicago River.
2Middle Fork North Branch Chicago River.
* Annual sampling station.
, III
Number
Sample
of
Gear
Fish
Large EF Boat
453
B
PIS
eine
64
BP/Seine
49
BP
30
BP/Seine
125
BP
39
BP/Seine
129
4,632
Number of
Most
Weight
SEecies
Abundant
(grams)
Total Game
Species
85,424
10
5
Emerald shiner
1,633
7
3
Green sunfish
2,985
8
4
Green sunfish
214
6
1
White sucker
2,284
10
5
Green sunfish
1,522
10
3
White sucker
454
12
3
Bluntnose minnow
1,093 kg.
36
14
TABLE 8: INDEX OF BIOTIC INTEGRITY SCORE AND CATEGORY BY STATION DURING 2005
Station
IBI*
IBI*
No.
Location
Waterway
Sample Gear
Score
Category
106
Dundee Road
West Fork North Branch Chicago River
BP
26
Fair
106
Dundee Road
West Fork North Branch Chicago River
Seine
24
Fair
103
Golf Road
West Fork North Branch Chicago River
BP
28
Fair
103
Golf Road
West Fork North Branch Chicago River
Seine
28
Fair
31
Lake-Cook Road
Middle Fork North Branch Chicago River
BP
22
Fair
31
Lake-Cook Road
Middle Fork North Branch Chicago River
Seine
ND
ND
32
Lake-Cook Road
Skokie River
BP
26
Fair
32
Lake-Cook Road
Skokie River
Seine
30
Fair
105
Frontage Road
Skokie River
BP
22
Fair
105
Frontage Road
Skokie River
Seine
NO
NO
tv
0'\
104
Glenview Road
North Branch Chicago River
BP
22
Fair
104
Glenview Road
North Branch Chicago River
Seine
NO
NO
34
Dempster Street
North Branch Chicago River
BP
24
Fair
34
Dempster Street
North Branch Chicago River
Seine
24
Fair
96
Albany Avenue
North Branch Chicago River
BP
22
Fair
96
Albany A venue
North Branch Chicago River
Seine
ND
ND
35
Central Street
North Shore Channel
Large EF Boat
28
Fair
102
Oakton Street
North Shore Channel
Large EF Boat
36
Fair
36
Touhy A venue
North Shore Channel
Large EF Boat
32
Fair
101
Foster A venue
North Shore Channel
Large EF Boat
32
Fair
37
Wilson A venue
North Branch Chicago River
Large EF Boat
30
Fair
73
Diversey Parkway
North Branch Chicago River
Large EF Boat
30
Fair
46
Grand A venue
North Branch Chicago River
Large EF Boat
28
Fair
75
Cicero Avenue
Chicago Sanitary and Ship Canal
Large EF Boat
28
Fair
41
Harlem A venue
Chicago Sanitary and Ship Canal
Large EF Boat
30
Fair
92
Lockport
Chicago Sanitary and Ship Canal
Large EF Boat
30
Fair
IIII
Electronic Filing - Received, Clerk's Office, March 25, 2009
TABLE 8 (Continued): INDEX OF BIOTIC INTEGRITY SCORE AND CATEGORY BY STATION DURING 2005
Station
IBI*
IBI*
No.
Location
Waterway
Sample Gear
Score
Category
55
130
th
Street
Calumet River
Large EF Boat
42
Good
76
Halsted Street
Little Calumet River
Large EF Boat
36
Fair
59
Cicero A venue
Calumet-Sag Channel
Large EF Boat
36
Fair
13
Lake-Cook Road
Des Plaines River
BP
28
Fair
13
Lake-Cook Road
Des Plaines River
Seine
34
Fair
78
Wille Road
Higgins Creek
BP
28
Fair
78
Wille Road
Higgins Creek
Seine
ND
ND
18
Devon A venue
Salt Creek
BP
24
Fair
18
Devon Avenue
Salt Creek
Seine
34
Fair
tv
-..l
22
Ogden A venue
Des Plaines River
BP
26
Fair
22
Ogden A venue
Des Plaines River
Seine
ND
ND
91
Material Services Road
Des Plaines River
BP
28
Fair
91
Material Services Road
Des Plaines River
Seine
26
Fair
64
Lake Street
West Branch DuPage River
BP
28
Fair
64
Lake Street
West Branch DuPage River
Seine
32
Fair
*ffiI
= Index of Biotic Integrity.
ND
= No fish were caught in the seine or conditions were unfavorable for seining.
IIII
I
I
I
I
I
I
I
I
I
2006 UPPER ILLINOIS WATERWAY
Back to top
FISHERIES INVESTIGATION
Back to top
RM 274.4-296.0
Prepared for:
Midwest Generation EME, LLC
One Financial Place
440
S. LaSalle Street, Suite 3500
Chicago, IL 60605
Prepared by:
EA Engineering, Science, and Technology
444 Lake Cook Road, Suite 18
Deerfield, IL 60015
March 2008
Electronic Filing - Received, Clerk's Office, March 25, 2009
I
I
TABLE 5.
SUMMARY OF THE NUMBER OF FISH COLLECTED WITHIN EACH SEGMENT OF THE UPPER ILLINOIS WATERWAY, 2006.
LOWER LOCKPORT
SEGMENTS
POOL
BRANDON POOL
UPSTR:EAM I-55
DOWNSTREAM I-55
COMBINED
I
SPECIES
___ • ___ ,, ____ 11 ___ ,, ____ • ___ ,, ____ ,, ___ ,, ____ • ___ ,,_
LONQNOSE
GAR
17
0.19
1
0.01
18
0.08
S~IPJACK
HERRING
1
0.10
1
0.00
I
GIZZARD SHAl)
629
61.55
514
14.32
780
8.59
1,560
15.97
3,483
14.85
THREA.DFIN SHAD
6
0.17
46
0.51
60
0.61
112
0.48
GRABS PIClOCRBL
1
0.03
1
0.00
NORTHERN PIKE
1
0.10
1
0.00
CENTRAL STONEROLLER
1
0.03
2
0.02
3
0.01
QOWFIBII
1
O.Ol
7
0.08
1
0.01
9
0.04
I
COMMON CARP
38
3.72
87
2.42
124
1.37
30
0.31
279
1.19
CARP X GOLDFISH HYBRID
1
0.10
5
0.14
1
0.01
1
0.01
8
0.03
HORNYHEAD CHUB
15
0.17
15
0.06
GOLDEN SHINER
3
0.08
6
0.07
11
0.11
20
0.09
PALLID BHINER
3
0.03
1
0.01
I
EMERAld) SHINER
59
5.77
922
25.68
798
8.79
451
4.62
2,2l0
9.51
GHOS'l'SHINER
5
0.06
22
0.23
27
0.12
STRIPED SHINER
153
1.69
33
0.34
186
0.79
SPOHAIL SHINER
2
0.20
131
1.44
127
1.l0
260
1.11
SPOTFI)! SHINER
62
1.73
211
2.32
222
2.27
495
2.11
--
SAND SIlINER
1
0.03
23
0.25
1
0.01
25
0.11
REDFIN SHINER
2
0.02
2
0.01
UNtD NOTROPIS
1
0.01
1
0.00
BLUNTNOSE MINNOW
140
13.70
1,172
32.65
4,198
46.23
2,874
29.42
8,384
35.74
FATHEAD MINNOW
1
0.10
9
0.25
4
0.04
1
0.01
15
0.06
I
BULLHI!AD MINNOW
3
0.08
7
0.08
218
2.23
228
0.97
RIVER CARPSUCKER
2
0.02
7
0.07
9
0.04
QUILLBACX
7
0.08
5
0.05
12
0.05
WIn: SUCltER
5
0.14
5
0.02
SMALLMOO"l'H BUFFALO
3
0.08
61
0.67
25
0.26
89
0.38
--
BIGMOU'l'H BUFFALO
2
0.02
2
0.01
SILVER RBDHORSE
10
0.11
2
0.02
12
0.05
BLACIt REDHORSE
1
0.01
1
0.00
GOWEN REDHORSE
6
0.07
46
0.47
52
0.22
SHORTBEAD REDHORSE
2
0.02
5
0.05
7
0.03
I
UNtD IC'l'IOaINIIE
1
0.01
1
0.00
ORIENTAL WEATIlERFISH
3
0.29
1
O.Ol
1
0.01
5
0.02
YELLOW BUI.LHEAD
1
0.10
21
0.58
9
0.10
3
0.03
34
0.14
CHANNEL CATFISH
13
1.27
60
1.67
158
1.74
35
0.36
266
1.13
TADPOLE MADTON
6
0.17
8
0.09
5
0.05
19
0.08
--
FLATHEAD CATFISH
2
0.02
2
0.01
BLACltSTRIPE TOPMINNOW
62
1.73
127
1.40
70
0.72
259
1.10
WESTERN MOSQUITOFISH
1
0.10
225
6.27
71
0.78
7
0.07
304
1.30
BROOX SILVERSIDE
6
0.07
105
1.07
111
0.47
WHI:TE PERCH
1
0.03
1
0.00
I
WHITE BABS
5
0.06
5
0.02
YELLOW BASS/WHITE
PERCH
1
0.01
1
0.00
Roep: BASS
1
0.03
5
0.06
10
0.10
16
0.07
GREEN SONVISH
31
3.03
117
3.26
420
4.63
335
3.43
903
3.85
PUMPRINSEED
55
S.38
44
1.23
18
0.20
1
0.01
118
0.50
III
ORANGE SPOTTED SUNFISH
1
0.10
7
0.19
25
0.28
390
3.99
423
1.80
BLUEGILL
7
0.68
87
2.U
964
10.62
2,571
26.32
3,629
15.47
LONGEAR SUNFISH
13
0.14
14
0.14
27
0.12
REDEAR SUNFISH
3
0.03
1
0.01
4
0.02
HYBRID SUNFISH
3
0.29
19
0.53
241
2.65
44
0.45
307
1.31
I
UNtD LEPOHIS
1
0.03
21
0.21
22
0.09
SMALLMOtJ'l'R BASS
1
0.10
1
0.03
31
0.34
18
0.19
51
0.22
LARGEKOU'l'R BASS
27
2.64
54
1.50
281
3.09
384
3.93
746
3.18
WHITE CRAPPIE
1
0.01
1
0.01
2
0.01
BLACK CRAPPIE
2
0.02
2
0.02
\I
0.02
11
JOHNNT DARTER
7
0.19
7
0.08
U
0.06
LOGPERCH
17
0.17
17
0.07
BLACKSIDE DARTER
1
0.03
1
0.00
SLENDERBEAD DARTER
1
0.01
1
0.00
FRESHWATER DRUB
6
0.59
33
0.92
50
0.55
22
0.23
111
0.47
I]
ROUND GOBY
1
0.10
47
1.31
11
0.12
3
0.03
62
0.26
TOTAL FISH
1,022
100.00
3,590
100.00
9,080
100.00
9,769 100.00
23,461 100.00
GEAR EFFORTS
40
80
96
64
280
CATCH PER GEAR EFFORT
26
4S
95
153
84
TOTAL SPECIES
20
33
49
44
58
III
NOTE. 0.00 DENOTES VALUES LESS
THAN 0.005.
I
~
II
3-13
Electronic Filing - Received, Clerk's Office, March 25, 2009
INHS Fish Collection Database Search Results
Page
1
of 3
INHS Fish Collection Database Search Results
For additional information, please contact the col/ection manager, Mike Retzer
Search Again
Displaying records 1 through 104 of 104 records
tound.
INHS Internet License Agreement
Catalogue
#
Genus species
Stream
Drainage
County
State
Country
Year
INHS 32233
Marone mississippiensis
Chicago Sanitary
& Ship
(Des Plaines River Dr.)
\/\/ill
Illinois
USA
1993
Canal
INHS 38945
Ameiurus mel as
Chicago Sanitary & Ship
(Des Plaines River Dr.)
Cook
Illinois
USA
1993
Canal
INHS 38946
Pimephales promelas
Chicago Sanitary
& Ship
(Des Plaines River Dr.)
Cook
Illinois
USA
1993
Canal
INHS 38947
Ambloplites rupestris
Chicago Sanitary
& Ship
(Des Plaines River Dr.)
Cook
Illinois
USA
1993
Canal
INHS 38955
Gasterosteus aculeatus
Chicago Sanitary & Ship
(Des Plaines River Dr.)
\/\/ill
Illinois
USA
1994
Canal
INHS 38960
Dorosoma cepedianum
Chicago Sanitary
& Ship
(Des Plaines River Dr.)
\/\/ill
Illinois
USA
1993
Canal
INHS 38963
Esox americanus
Chicago Sanitary
& Ship
(Des Plaines River Dr.)
\/\/ill
Illinois
USA
1993
Canal
INHS 38965
Umbralimi
Chicago Sanitary & Ship Canal (Des Plaines River Dr.)
Cook
Illinois
USA
1994
INHS 38966
Lepomis gibbosus
Chicago Sanitary
& Ship
(Des Plaines River Dr.)
Cook
Illinois
USA
1995
Canal
INHS 53900
Cyprinus carpio
Chicago Sanitary & Ship
(Des Plaines River Dr.)
Cook
Illinois
USA
1999
Canal
INHS 53901
Ameiurus natalis
Chicago Sanitary
& Ship
(Des Plaines River Dr.)
Cook
Illinois
USA
1999
Canal
INHS 53902
Iclalurus punclatus
Chicago Sanitary
& Ship
(Des Plaines River Dr.)
Cook
Illinois
USA
1999
Canal
INHS 53903
Noturus gyrinus
Chicago Sanitary & Ship Canal (Des Plaines River Dr.)
Cook
Illinois
USA
1999
INHS 53904
Morone mississippiensis
Chicago Sanitary
& Ship
(Des Plaines River Dr.)
Cook
Illinois
USA
1999
Canal
INHS 53905
Morone americana
Chicago Sanitary
& Ship
(Des Plaines River Dr.)
Cook
Illinois
USA
1999
Canal
INHS 59327
Carassius auratus
Chicago Sanitary
& Ship
(Des Plaines River Dr.)
Cook
Illinois
USA
1988
Canal
INHS 59340
Lepomis cyanellus
Chicago Sanitary
& Ship
(Des Plaines River Dr.)
Cook
Illinois
USA
1989
Canal
INHS 59343
Notropis atherinoides
Chicago Sanitary
& Ship
(Des Plaines River Dr.)
\/\/ill
Illinois
USA
1988
Canal
INHS 61132
Gasterosteus aculeatus
Chicago Sanitary
& Ship
(Des Plaines River Dr.)
Cook
Illinois
USA
1991
Canal
INHS 90512
Umbra limi
Chicago Sanitary
& Ship Canal
(Des Plaines River Dr.)
Cook
Illinois
USA
2001
INHS 90513
Carassius auratus
Chicago Sanitary
& Ship
(Des Plaines River Dr.)
Cook
Illinois
USA
2001
Canal
INHS 90514
Ameiurus natalis
Chicago Sanitary
& Ship
(Des Plaines River Dr.)
Cook
Illinois
USA
2001
Canal
INHS 90515
Lepomis gibbosus
Chicago Sanitary
& Ship
(Des Plaines River Dr.)
Cook
Illinois
USA
2001
Canal
INHS 90516
Pomoxis nigromaculatus
Chicago Sanitary
& Ship
(Des Plaines River Dr.)
Cook
Illinois
USA
2001
Canal
INHS 96715
Cyprinus carpio
Chicago Sanitary
& Ship
(Des Plaines River Dr.)
Cook
Illinois
USA
1991
Canal
INHS 96716
Cyprinella spiloptera
Chicago Sanitary
& Ship
(Des Plaines River Dr.)
Cook
Illinois
USA
1998
Canal
INHS 96717
Pimephales notatus
Chicago Sanitary
& Ship
(Des Plaines River Dr.)
Cook
Illinois
USA
1998
Canal
INHS 96752
Pimephales notatus
Chicago Sanitary
& Ship
(Des Plaines River Dr.)
\/\/ill
Illinois
USA
1999
Canal
INHS 96753
Pimephales notatus
Chicago Sanitary
& Ship
(Des Plaines River Dr.)
\/\/ill
Illinois
USA
1988
Canal
INHS 96754
Lepomis humilis x
L. macrochirus
Chicago Sanitary
& Ship
(Des Plaines River Dr.)
\/\/ill
Illinois
USA
1991
Canal
INHS 96759
Dorosoma cepedianum
Chicago Sanitary
& Ship
(Des Plaines River Dr.)
Cook
Illinois
USA
1998
Canal
INHS 96760
Pimephales notatus
Chicago Sanitary
& Ship
(Des Plaines River Dr.)
Cook
Illinois
USA
1998
Canal
INHS 96761
Lepomis hybrid
Chicago Sanitary
& Ship Canal
(Des Plaines River Dr.)
Cook
Illinois
USA
1998
INHS 96907
Cyprinus carpio
Chicago Sanitary
& Ship
(Des Plaines River Dr.)
Cook
Illinois
USA
1998
Canal
htlp://ellipse.inhs.uiuc.edu:591IINHSCollectionsIFMPro
01128/09
Electronic Filing - Received, Clerk's Office, March 25, 2009
INHS Fish Collection Database Search Results
Page 2
of3
INHS 96909
Nolropis atherinoides
Chicago Sanitary
& Ship
(Des Plaines River Dr.)
Cook
Illinois
USA
1999
Canal
INHS 96910
Pimephales notatus
Chicago Sanitary & Ship
(Des Plaines River Dr.)
Cook
Illinois
USA
1999
Canal
INHS 96911
Morone mississippiensis
Chicago Sanitary
& Ship
(Des Plaines River Dr.)
Cook
Illinois
USA
1999
Canal
INHS 96912
Dorosoma cepedianum
Chicago Sanitary
& Ship
(Des Plaines River Dr.)
Cook
Illinois
USA
2000
Canal
INHS
96913
Lepomis gibbosus
Chicago Sanitary
& Ship
(Des Plaines River Dr.)
Cook
Illinois
USA
2000
Canal
INHS96914
Micropterus salmoides
Chicago Sanilary
& Ship
(Des Plaines River Dr.)
Cook
Illinois
USA
2000
Canal
INHS 96915
Pimephales notatus
Chicago Sanitary
& Ship
(Des Plaines River Dr.)
Cook
Illinois
USA
1998
Canal
INHS 96916
Pimephales promelas
Chicago Sanitary
& Ship
(Des Plaines River Dr.)
Cook
Illinois
USA
1998
Canal
INHS 96917
Lepomis gibbosus
Chicago Sanitary
& Ship
(Des Plaines River Dr.)
Cook
Illinois
USA
1998
Canal
INHS 96934
Pimephales notatus
Chicago Sanitary
& Ship
(Des Plaines River Dr.)
Cook
Illinois
USA
1999
Canal
INHS 96937
Cyprinella spiloptera
Chicago Sanilary
& Ship
(Des Plaines River Dr.)
Cook
Illinois
USA
1999
Canal
INHS 96938
Pimephales notatus
Chicago Sanitary
& Ship
(Des Plaines River Dr.)
Cook
Illinois
USA
1999
Canal
INHS 96939
Pi me ph ales promelas
Chicago Sanitary
& Ship
(Des Plaines River Dr.)
Cook
Illinois
USA
1999
Canal
INHS 96940
Dorosoma cepedianum
Chicago Sanitary
& Ship
(Des Plaines River Dr.)
Cook
Illinois
USA
2000
Canal
INHS 96941
Ameiurus melas
Chicago Sanitary
& Ship
(Des Plaines River Dr.)
Cook
Illinois
USA
2000
Canal
INHS 96942
Ameiurus natal is
Chicago Sanitary
& Ship
(Des Plaines River Dr.)
Cook
Illinois
USA
2000
Canal
INHS 96943
Micropterus salmoides
Chicago Sanitary
& Ship
(Des Plaines River Dr.)
Cook
Illinois
USA
2000
Canal
INHS 96977
Notemigonus crysoleucas
Chicago Sanitary
& Ship
(Des Plaines River Dr.)
Cook
Illinois
USA
1999
Canal
INHS 96978
Pimephales notatus
Chicago Sanitary
& Ship
(Des Plaines River Dr.)
Cook
Illinois
USA
1999
Canal
INHS 96979
Notemigonus crysoleucas
Chicago Sanitary
& Ship
(Des Plaines River Dr.)
Cook
Illinois
USA
1998
Canal
INHS 96980
Lepomis macrochirus
Chicago Sanitary
& Ship
(Des Plaines River Dr.)
Cook
Illinois
USA
1998
Canal
INHS 96981
Dorosoma cepedianum
Chicago Sanitary
& Ship
(Des Plaines River Dr.)
Cook
Illinois
USA
2000
Canal
INHS
96982
Carassius auratus
Chicago Sanitary
& Ship
(Des Plaines River Dr.)
Cook
Illinois
USA
2000
Canal
INHS
96983
Cyprinus carpio
Chicago Sanitary
& Ship
(Des Plaines River Dr.)
Cook
Illinois
USA
2000
Canal
INHS 96984
Morone americana
Chicago Sanitary
& Ship
(Des Plaines River Dr.)
Cook
Illinois
USA
2000
Canal
INHS 96985
Morone mississippiensis
Chicago Sanitary
& Ship
(Des Plaines River Dr.)
Cook
Illinois
USA
2000
Canal
INHS 96986
Lepomis cyanellus
Chicago Sanitary
& Ship
(Des Plaines River Dr.)
Cook
Illinois
USA
2000
Canal
INHS 96987
Micropterus salmoides
Chicago Sanitary
& Ship
(Des Plaines River Dr.)
Cook
Illinois
USA
2000
Canal
INHS 96988
Pimephales notatus
Chicago Sanitary
& Ship
(Des Plaines River Dr.)
Cook
Illinois
USA
1999
Canal
INHS 96991
Cyprinella spiloptera
Chicago Sanitary
& Ship
(Des Plaines River Dr.)
Cook
Illinois
USA
1999
Canal
INHS 96992
Pi me ph ales notatus
Chicago Sanitary
& Ship
(Des Plaines River Dr.)
Cook
Illinois
USA
1999
Canal
INHS 97042
Dorosoma cepedianum
Chicago Sanitary
& Ship
(Des Plaines River Dr.)
Cook
Illinois
USA
2000
Canal
INHS 97043
Ameiurus nalalis
Chicago Sanitary
& Ship
(Des Plaines River Dr.)
Cook
Illinois
USA
2000
Canal
INHS 97044
Lepomis gibbosus
Chicago Sanitary
& Ship
(Des Plaines River Dr.)
Cook
Illinois
USA
2000
Canal
INHS 97045
Micropterus salmoides
Chicago Sanitary
& Ship
(Des Plaines River Dr.)
Cook
Illinois
USA
2000
Canal
INHS 97109
Dorosoma cepedianum
Chicago Sanitary
& Ship
(Des Plaines River Dr.)
Cook
Illinois
USA
2000
Canal
INHS 97110
Notropis atherinoides
Chicago Sanitary
& Ship
(Des Plaines River Dr.)
Cook
Illinois
USA
2000
Canal
INHS 97111
Morone americana
Chicago Sanitary
& Ship
(Des Plaines River Dr.)
Cook
Illinois
USA
2000
Canal
Chicago Sanitary
& Ship
http://ellipse.inhs.uiuc.edu:591/INHSCollections/FMPro
01128109
INHS Fish Collection Database Search Results
Page 3 of 3
INHS 97112
Lepomis cyanellu8
Canal
(Des Plaines River Dr.)
Cook
Illinois
USA
2000
INHS 97113
Lepomis gibbosus
Chicago Sanitary
& Ship
(Des Plaines River Dr.)
Cook
Illinois
USA
2000
Canal
INHS97114
Lepomis macrochirus
Chicago Sanitary
& Ship
(Das Plaines River Dr.)
Cook
Illinois
USA
2000
Canal
INHS 97115
Micropterus salmoides
Chicago Sanitary & Ship
(Des Plaines River Dr.)
Cook
Illinois
USA
2000
Canal
INHS
97116
Notropis atherinoides
Chicago Sanitary
& Ship
(Des Plaines River Dr.)
Cook
Illinois
USA
1996
Canal
INHS 97117
Notropis hudsonius
Chicago Sanitary
& Ship
(Des Plaines River Dr.)
Cook
Illinois
USA
1996
Canal
INHS 97116
Pimephales notatus
Chicago Sanitary & Ship
(Des Plaines River Dr.)
Cook
Illinois
USA
1996
Canal
INHS 97119
Morone americana
Chicago Sanitary
& Ship
(Des Plaines River Dr.)
Cook
Illinois
USA
1996
Canal
INHS97120
Morone mississippiensis
Chicago Sanitary
& Ship
(Des Plaines River Dr.)
Cook
Illinois
USA
1996
Canal
INHS 97121
Lepomis cyanellus
Chicago Sanitary
& Ship
(Des Plaines River Dr.)
Cook
Illinois
USA
1996
Canal
INHS 97122
Lepomis macrochirus
Chicago Sanitary & Ship
(Des Plaines River Dr.)
Cook
Illinois
USA
1996
Canal
INHS 97126
Pimephales notatus
Chicago Sanitary & Ship
(Des Plaines River Dr.)
Cook
Illinois
USA
1996
Canal
INHS 97129
Lepomis cyanellus
Chicago Sanitary
& Ship
(Des Plaines River Dr.)
Cook
Illinois
USA
1996
Canal
INHS 97130
Lepomis macrochirus
Chicago Sanitary
& Ship
(Des Plaines River Dr.)
Cook
Illinois
USA
1996
Canal
INHS 97131
Pimephales notatus
Chicago Sanitary
& Ship
(Des Plaines River Dr.)
Cook
Illinois
USA
1999
Canal
INHS 97136
Gambusia affinis
Chicago Sanitary
& Ship
(Des Plaines River Dr.)
Cook
Illinois
USA
1992
Canal
INHS 97221
Pimephales notatus
Chicago Sanitary & Ship
(Des Plaines River Dr.)
Cook
Illinois
USA
1996
Canal
INHS 97224
Pimephales notatus
Chicago Sanitary
& Ship
(Des Plaines River Dr.)
Cook
Illinois
USA
1999
Canal
INHS 97302
Dorosoma cepedianum
Chicago Sanitary
& Ship
(Des Plaines River Dr.)
Cook
Illinois
USA
2000
Canal
INHS 97303
Notemigonus crysoleucas
Chicago Sanitary
& Ship
(Des Plaines River Dr.)
Cook
Illinois
USA
2000
Canal
INHS 97304
Lepomis gibbosus
Chicago Sanitary
& Ship
(Des Plaines River Dr.)
Cook
Illinois
USA
2000
Canal
INHS 97305
Lepomis macrochirus
Chicago Sanitary
& Ship
(Des Plaines River Dr.)
Cook
Illinois
USA
2000
Canal
INHS 97306
Micropterus salmoides
Chicago Sanitary
& Ship
(Des Plaines River Dr.)
Cook
Illinois
USA
2000
Canal
INHS 97319
Pi me ph ales notatus
Chicago Sanitary
& Ship
(Des Plaines River Dr.)
Cook
Illinois
USA
1999
Canal
INHS 97339
Morone chrysops
Chicago Sanitary
& Ship
(Des Plaines River Dr.)
Cook
Illinois
USA
1999
Canal
INHS 97340
Micropterus salmoides
Chicago Sanitary
& Ship
(Des Plaines River Dr.)
Cook
Illinois
USA
1999
Canal
INHS 97666
Cyprinus carpio
Chicago Sanitary
& Ship
(Des Plaines River Dr.)
Cook
Illinois
USA
2000
Canal
INHS
97669
Ictalurus punctatus
Chicago Sanitary
& Ship
(Des Plaines River Dr.)
Cook
Illinois
USA
2000
Canal
INHS 97690
Cyprinus carpio
Chicago Sanitary
& Ship
(Des Plaines River Dr.)
Cook
Illinois
USA
2000
Canal
INHS 97696
Carassius auratus
Chicago Sanitary
& Ship
(Des Plaines River Dr.)
Cook
Illinois
USA
2000
Canal
INHS 97697
Cyprinus carpio
Chicago Sanitary
& Ship
(Des Plaines River Dr.)
Cook
Illinois
USA
2000
Canal
INHS
97696
Carassius auratus x Cyprinus
Chicago Sanitary
& Ship
(Des Plaines River Dr.)
Cook
Illinois
USA
2000
carpio
Canal
http://ellipse.inhs.uiuc.edu:591/INHSCollectionsIFMPro
01/28/09
INHS Fish Collection Database Search Results
Page 1
of2
INHS Fish Collection Database Search Results
For additional information, please contact the col/ection manager, Mike Retzer
Search Again
Displaying records 1 through 61 of 61 records found.
INHS Internet License Agreement
Catalogue
#
Genus speclel
Stream
Drainage
County
State
Country
Year
INHS 749
Catostomus commersoni
Calumet Sag Channel
(Des Plaines River Dr.)
Cook
Illinois
USA
1967
INHS 750
Carassius auratus
Calumet Sag Channel
(Des Plaines River Dr.)
Cook
Illinois
USA
1967
INHS
751
Cyprinus carpio
Calumet Sag Channel
(Des Plaines River Dr.)
Cook
Illinois
USA
1967
INHS 752
Semotilus atromaculatus
Calumet Sag Channel
(Des Plaines River Dr.)
Cook
Illinois
USA
1967
INHS 753
Ameiurus mel as
Calumet Sag Channel
(Des Plaines River Dr.)
Cook
Illinois
USA
1967
INHS 754
Lepomis cyanellus
Calumet Sag Channel
(Des Plaines River Dr.)
Cook
Illinois
USA
1967
INHS 755
Lepomis macrochirus
Calumet Sag Channel
(Des Plaines River Dr.)
Cook
Illinois
USA
1967
INHS 32232
Morone mississippiensis
Calumet Sag Channel
(Des Plaines River Dr.)
Cook
Illinois
USA
1993
INHS 53880
Notropis hudsonius
Calumet Sag Channel
(Des Plaines River Dr.)
Cook
Illinois
USA
1999
INHS 53881
Morone mississippiensis
Calumet Sag Channel
(Des Plaines River Dr.)
Cook
Illinois
USA
1999
INHS 53882
Morone americana
Calumet Sag Channel
(Des Plaines River Dr.)
Cook
Illinois
USA
1999
INHS 54308
Cyprinus carpio
Calumet Sag Channel
(Des Plaines River Dr.)
Cook
Illinois
USA
1999
INHS 54309
Notropis atherinoides
Calumet Sag Channel
(Des Plaines River Dr.)
Cook
Illinois
USA
1999
INHS 54310
Idalurus
pundatus
Calumet Sag Channel
(Des Plaines River Dr.)
Cook
Illinois
USA
1999
INHS 54311
Aplodinotus grunniens
Calumet Sag Channel
(Des Plaines River Dr.)
Cook
Illinois
USA
1999
INHS 54312
Morone americana
Calumet Sag Channel
(Des Plaines River Dr.)
Cook
Illinois
USA
1999
INHS 54313
Cyprinus carpio
Calumet Sag Channel
(Des Plaines River Dr.)
Cook
Illinois
USA
1999
INHS 54314
Notropis atherinoides
Calumet Sag Channel
(Des Plaines River Dr.)
Cook
Illinois
USA
1999
INHS 54315
Notropis buchanani
Calumet Sag Channel
(Des Plaines River Dr.)
Cook
Illinois
USA
1999
INHS 54316
Morone americana
Calumet Sag Channel
(Des Plaines River Dr.)
Cook
Illinois
USA
1999
INHS 54481
Pimephales notatus
Calumet Sag Channel
(Des Plaines River Dr.)
Cook
Illinois
USA
1999
INHS 54482
Pimephales promelas
Calumet Sag Channel
(Des Plaines River Dr.)
Cook
Illinois
USA
1999
INHS 57051
Carassius auratus
Calumet Sag Channel
(Des Plaines River Dr.)
Cook
Illinois
USA
1976
INHS 57052
Morone mississippiensis
Calumet Sag Channel
(Des Plaines River Dr.)
Cook
Illinois
USA
1996
INHS 57053
Lepomis gulosus
Calumet Sag Channel
(Des Plaines River Dr.)
Cook
Illinois
USA
1996
INHS 57066
Morone mississippiensis
Calumet Sag Channel
(Des Plaines River Dr.)
Cook
Illinois
USA
1997
INHS 57067
Pi
me ph ales promelas
Calumet Sag Channel
(Des Plaines River Dr.)
Cook
Illinois
USA
1997
INHS 57250
Morone mississippiensis
Calumet Sag Channel
(Des Plaines River Dr.)
Cook
Illinois
USA
1996
INHS 96704
Dorosoma cepedianum
Calumet Sag Channel
(Des Plaines River Dr.)
Cook
Illinois
USA
2000
INHS 96705
Carassius auratus
Calumet Sag Channel
(Des Plaines River Dr.)
Cook
Illinois
USA
2000
INHS 96706
Cyprinus carpio
Calumet Sag Channel
(Des Plaines River Dr.)
Cook
Illinois
USA
2000
INHS
96707
Morone mississippiensis
Calumet Sag Channel
(Des Plaines River Dr.)
Cook
Illinois
USA
2000
INHS 96708
Lepomis cyaneUus
Calumet Sag Channel
(Des Plaines River Dr.)
Cook
Illinois
USA
2000
INHS 96709
Micropterus salmoides
Calumet Sag Channel
(Des Plaines River Dr.)
Cook
Illinois
USA
2000
INHS 96710
Morone americana
Calumet Sag Channel
(Des Plaines River Dr.)
Cook
Illinois
USA
2000
INHS 96711
Notropis atherinoides
Calumet Sag Channel
(Des Plaines River Dr.)
Cook
Illinois
USA
1998
INHS 96712
Notropis atherinoides
Calumet Sag Channel
(Des Plaines River Dr.)
Cook
Illinois
USA
1999
INHS 96713
Pimephales notatus
Calumet Sag Channel
(Des Plaines River Dr.)
Cook
Illinois
USA
1999
INHS 96714
Micropterus salmoides
Calumet Sag Channel
(Des Plaines River Dr.)
Cook
Illinois
USA
1999
INHS 97053
Dorosoma cepedianum
Calumet Sag Channel
(Des Plaines River Dr.)
Cook
Illinois
USA
2000
INHS 97054
Cyprinus carpio
Calumet Sag Channel
(Des Plaines River Dr.)
Cook
Illinois
USA
2000
INHS 97055
Lepomis gibbosus
Calumet Sag Channel
(Des Plaines River Dr.)
Cook
Illinois
USA
2000
INHS 97056
Lepomis macrochirus
Calumet Sag Channel
(Des Plaines River Dr.)
Cook
Illinois
USA
2000
INHS 97057
Micropterus salmoides
Calumet Sag Channel
(Des Plaines River Dr.)
Cook
Illinois
USA
2000
INHS 97071
Notropis atherinoides
Calumet Sag Channel
(Des Plaines River Dr.)
Cook
Illinois
USA
1999
INHS 97072
Notropis atherinoides
Calumet Sag Channel
(Des Plaines River Dr.)
Cook
Illinois
USA
1998
INHS 97073
Morone mississippiensis
Calumet Sag Channel
(Des Plaines River Dr.)
Cook
Illinois
USA
2000
INHS 97074
Lepomis cyaneUus
Calumet Sag Channel
(Des Plaines River Dr.)
Cook
Illinois
USA
2000
INHS 97075
Micropterus salmoides
Calumet Sag Channel
(Des Plaines River Dr.)
Cook
Illinois
USA
2000
INHS 97076
Carassius auratus x Cyprinus
Calumet Sag Channel
(Des Plaines River Dr.)
Cook
Illinois
USA
2000
carpio
INHS 97213
Pi me ph ales notatus
Calumet Sag Channel
(Des Plaines River Dr.)
Cook
Illinois
USA
1999
INHS 97215
Pimephales notatus
Calumet Sag Channel
(Des Plaines River Dr.)
Cook
Illinois
USA
1998
INHS 97216
Pimephales notatus
Calumet Sag Channel
(Des Plaines River Dr.)
Cook
Illinois
USA
1999
INHS 97680
Aplodinotus grunniens
Calumet Sag Channel
(Des Plaines River Dr.)
Cook
Illinois
USA
2000
htlp:l/ellipse.inhs.uiuc,edu:591/INHSCollectionsIFMPro
01/28/09
INHS Fish Collection Database Search Results
Page 2
of2
INHS 97681
Carasslus auratus
Calumet Sag Channel
(Des Plaines River Dr.)
Cook
Illinois
USA
2000
INHS 97682
Cyprinus carpio
Calumet Sag Channel
(Des Plaines River Dr.)
Cook
Illinois
USA
2000
INHS 97683
Catostomus commersonl
Calumet Sag Channel
(Des Plaines River Dr.)
Cook
Illinois
USA
2000
INHS 97684
Ameiurus natalis
Calumet Sag Channel
(Des Plaines River Dr.)
Cook
Illinois
USA
2000
INHS 97685
Idalurus punctatus
Calumet Sag Channel
(Des Plaines River Dr.)
Cook
illinois
USA
2000
INHS 97686
Lepomis macrochirus
Calumet Sag Channel
(Des Plaines River Dr.)
Cook
Illinois
USA
2000
INHS 97687
Micropterus dolomieu
Calumet Sag Channel
(Des Plaines River Dr.)
Cook
Illinois
USA
2000
http://ellipse.inhs.uiuc.edu:591/INHSCollections/FMPro
01128109
Electronic Filing - Received, Clerk's Office, March 25, 2009
Walerway
Bubbly Creek
Bubbly Creek
Bubbly Creek
Bubbly Creek
Chicago Sanitary
and Ship Canal
Chicago Sanitary
and Ship Canal
METROPOLITAN WATER RECLAMATION DISTRICT OF GREATER CHICAGO
TOTAL NUMBER OF FISH COLLECTED FROM EACH SAMPLING STATION
IN THE CHICAGO AREA WATERWAY SYSTEM
FROM
2001 THROUGH 2005 AS PART OF THE AMBIENT WATER QUALITY MONITORING PROGRAM
USGS
NUMBER OF FISH COLLECTED
River
Sialion
Sialion
Species
Year
Mile
Number
Name
Code
Fish Species or Hybrid (xl
2001
2002
2003
2004
2005
323
99.3
RAPS
19 Gizzard shad
97
42
498
31 Coho salmon
1
44 Carp
28
8
6
44.5 Carp x Goldfish
10
3
9
60
Golden shiner
8
88 Bluntnose minnow
1
128 Channel catfish
1
1
163
Pumpkinseed
9
20
3
166
Bluellill
5
10
174 Larllemouth bass
1
3
223 Nile til apia
1
RAPS Count
151
97
517
322.5
99.2
35th Street
19 Gizzard shad
15
9
103
41 Goldfish
1
44 Carp
9
6
4
44.5 Carp x
Goldfish
4
60 Golden shiner
2
1
88 Bluntnose minnow
1
163 Pumpkinseed
11
3
166 Bluegill
3
4
174 Largemouth bass
1
1
2
35th
Street Count
39
27
114
322.1
99
Archer Avenue
19 Gizzard shad
9
44 Carp
4
63 Emerald shiner
2
163
Pumpkinseed
3
174 Larllemouth bass
3
Archer Avenue Count
21
321.9
99.1
I-55
19 Gizzard shad
6
19
125
41 Goldfish
1
44 Carp
1
8
3
60 Golden shiner
2
79 Spotfin shiner
7
128
Channel catfish
1
162 Green sunfish
4
1
163 Pumpkinseed
11
7
166 Bluellill
7
4
174 Largemouth bass
2
10
9
175 White crappie
1
176 Black crappie
1
I-55 Count
31
60
139
321.1
40
Damen Avenue
19 Gizzard shad
10
41
Goldfish
1
44
Carp
58
60 Golden shiner
18
63 Emerald shiner
5
88 Bluntnose minnow
13
128 Channel catfish
2
163
Pumpkinseed
28
166
Bluegill
7
174 Larllemouth bass
6
Damen Avenue Count
148
317.3
75
Cicero Avenue
19 Gizzard shad
47
37
88
48
106
41 Goldfish
1
1
4
1
44 Carp
93
82
15
53
46
44.5 Carp x Goldfish
3
1
1
2
60 Golden shiner
12
63 Emerald shiner
1
1
1
79 Spotfin shiner
2
2
1
2
88 Bluntnose minnow
10
3
2
33
16
126 Yellow bullhead
2
4
2
4
128
Channel catfish
1
2
152 Mosquitofish
2
1
162 Green sunfish
5
1
6
7
2
163
Pumpkinseed
21
6
16
28
8
166
Bluegill
4
Cicero Avenue Count
188
136
138
191
184
Page 5
of 14
Grand
Tolal
637
1
42
22
8
1
2
32
15
4
1
765
127
1
19
4
3
1
14
7
4
180
9
4
2
3
3
21
150
1
12
2
7
1
5
18
11
21
1
1
230
10
1
58
18
5
13
2
28
7
6
148
326
7
289
7
12
3
7
64
12
3
3
21
79
4
837
Electronic Filing - Received, Clerk's Office, March 25, 2009
Waterway
Chicago Sanitary
and Ship Canal
Chicago Sanitary
and Ship Canal
Chicago Sanitary
and Ship Canal
(also see SEPA 5
Calumet-Sag
Channel)
Chicago Sanitary
and Ship Canal
Chicago Sanitary
and Ship Canal
METROPOLITAN WATER RECLAMATION DISTRICT OF GREATER CHICAGO
TOTAL NUMBER
OF FISH COLLECTED FROM EACH SAMPLING STATION IN THE CHICAGO AREA WATERWAY SYSTEM
FROM
2001 THROUGH 2005 AS PART OF THE AMBIENT WATER QUALITY MONITORING PROGRAM
USGS
NUMBER OF FISH COLLECTED
River
Station
Station
Species
Year
Mile
Number
Name
Code
Fish Species or Hybrid (x)
2001
2002
2003
2004
2005
314
41
Harlem Avenue
19 Gizzard shad
59
83
54
102
603
41 Goldfish
1
3
1
6
44 Carp
16
35
15
29
36
44.5
Carp x Goldfish
1
60 Golden shiner
4
2
1
t4
63 Emerald shiner
2
4
1
33
79 Spotfin shiner
1
4
2
4
2
88 Bluntnose minnow
4
12
112
29
14
89 F alhead minnow
1
1
126 Yellow bullhead
1
3
4
2
4
152
Mosquitofish
27
1
1
2
157
Yellow bass
1
162 Green sunfish
1
3
163 Pumpkinseed
2
12
31
20
40
166
Bluegill
1
174 Largemouth bass
2
1
186
Pumpkinseed x bluegill
1
231 Round goby
1
Harlem Avenue Count
88
188
225
193
758
304.1
42
Route 83
19 Gizzard shad
1
44 Carp
3
126
Yellow bullhead
1
152
Mosquitofish
25
162 Green sunfish
2
Route 83 Count
32
SEPA 5 (Chicago
Sanitary and Ship
303.4
905.1
Canal Waterfall)
19 Gizzard shad
91
27
180
32 Chinook salmon
1
44 Carp
2
7
4
63
Emerald shiner
4
6
120
79 Spotfin shiner
1
2
1
88 Bluntnose minnow
6
3
126 Yellow bullhead
2
1
128 Channel catfish
2
3
156 White bass
1
156.5 White perch
2
157
Yellow bass
3
162 Green sunfish
1
1
163 Pumpkinseed
2
166
Bluegill
5
174 Largemouth bass
4
8
13
231
Round goby
1
1
SEPA5 Count
107
64
334
300.5
48
Stephen Street
19 Gizzard shad
7
44 Carp
2
63 Emerald shiner
3
88 Bluntnose minnow
12
Stephen Street Count
24
292.1
92
Lockport
17
Skipjack herrinq
3
19 Gizzard shad
51
50
19
3
159
44 Carp
26
11
43
12
3
60 Golden shiner
1
63 Emerald shiner
2
1
8
126 Yellow bullhead
1
128 Channel catfish
2
1
2
2
162 Green sunfish
1
1
163
Pumpkinseed
1
1
166 Bluegill
1
174 Largemouth bass
5
221 Freshwater drum
1
1
Lockport Count
77
67
67
22
179
Page 6
of 14
Grand
Total
901
11
131
1
21
40
13
171
2
14
31
1
4
105
1
3
1
1
1,452
1
3
1
25
2
32
298
1
13
130
4
9
3
5
1
2
3
2
2
5
25
2
505
7
2
3
12
24
3
282
95
1
11
1
7
2
2
1
5
2
412
Waterway
lillie Calumet River
(Wadeable)
little Calumet River
(Wadeable)
Thorn Creek
Thorn Creek
Calumet-Sag
Channel
Calumet-Sag
Channel
METROPOLITAN WATER RECLAMATION DISTRICT OF GREATER CHICAGO
TOTAL NUMBER OF FISH COLLECTED FROM EACH SAMPLING STATION IN THE CHICAGO
AREA WATERWAY SYSTEM
FROM
2001 THROUGH 2005 AS PART OF THE AMBIENT WATER QUALITY MONITORING PROGRAM
USGS
NUMBER OF FISH COLLECTED
River
Station
Station
Species
Year
Mile
Number
Name
Code
Fish Species
or Hvbrld (xl
2001
2002
2003
2004
2005
52
Wentworth Avenue
44 Cam
1
Wentworth Avenue Count
1
57
Ashland Avenue
44 Carp
11
162 Green sunfish
1
Ashland Avenue Count
12
97
170lh Street
19 Gizzard shad
1
44 Cam
1
104 White sucker
2
162
Green sunfish
1
170lh Street Count
5
54
Joe Orr Road
931 Creek chub
9
1
1621 Green sunfish
9
166
Blueoill
1
Joe Orr Road Count
19
319.1
58
Ashland Avenue
19 Gizzard shad
30
41 Goldfish
1
44 Carp
26
88 Bluntnose minnow
5
126 Yellow bullhead
2
156.5
White perch
3
157 Yellow bass
2
162 Green sunfish
9
163 Pumokinseed
1
166
Blueaill
5
174 Laraemouth bass
8
180 Green sunfish x Blueaill
1
221 Freshwater drum
2
Ashland Avenue Count
95
318
903
SEPA3
19 Gizzard shad
88
70
27 Rainbow trout
1
32 Chinook salmon
1
41 Goldfish
4
44 Cam
20
16
60 Golden shiner
2
63 Emerald shiner
3
102
88 Bluntnose minnow
1
9
93 Creek chub
1
104 White sucker
3
1
128 Channel catfish
4
156.5 White oerch
3
11
157 Yellow bass
1
9
157.5 Striped bass
1
163
Pumpkinseed
2
166 BlueQili
6
172
Smallmouth bass
2
174 Laroe mouth bass
18
13
221 Freshwater drum
3
231 Round aobv
1
5
SEPA 3 Count
148
253
Page 9 of 14
Grand
Total
1
1
11
1
12
1
1
2
1
5
9
9
1
19
30
1
26
5
2
3
2
9
1
5
8
1
2
95
158
1
1
4
36
2
105
10
1
4
4
14
10
1
2
6
2
31
3
6
401
Electronic Filing - Received, Clerk's Office, March 25, 2009
Waterway
Calumet-Sag
Channel
Catumet-Sag
Chan
net
Calumet-Sag
Channel
Calumet-Sag
Channel (also see
SEPA 5 Chicago
Sanitary
and Ship
Canal)
METROPOLITAN WATER RECLAMATION DISTRICT OF GREATER CHICAGO
TOTAL NUMBER OF FISH COLLECTED FROM EACH SAMPLING STATION IN THE CHICAGO
AREA WATERWAY SYSTEM
FROM 2001 THROUGH 2005 AS PART OF THE AMBIENT WATER QUALITY MONITORING PROGRAM
USGS
NUMBER OF FISH COLLECTED
River
Station
Station
Species
Year
Mile
Number
Name
Code
Fish Species or Hybrid (xl
2001
2002
2003
2004
2005
315
59
Cicero Avenue
19 Gizzard shad
61
33
3
102
145
41 Goldfish
1
2
44 Carp
23
15
11
25
21
60 Golden shiner
7
63 Emerald shiner
6
29
234
88 Btuntnose minnow
7
41
12
1
27
89 Fathead minnow
5
2
93 Creek chub
1
1
125 Black bullhead
1
1
126
Yellow bullhead
1
1
1
1
156.5
White perch
2
2
6
157 Yellow bass
2
4
162
Green sunfish
5
9
12
3
163
Pumpkinseed
2
1
166
Bluegill
1
1
1
174
Largemouth bass
21
31
9
9
7
176
Black crappie
1
221 Freshwater drum
3
1
1
231
Round goby
2
Cicero Avenue Count
127
174
56
147
453
311.7
904
SEPA4
19 Gizzard shad
49
27
251
41 Gotdfish
9
44
Carp
13
35
5
60 Golden shiner
1
63
Emerald shiner
11
1
345
75 Spottail shiner
1
1
1
80
Sand shiner
1
88 Bluntnose minnow
4
7
29
89
Fathead minnow
2
104 White sucker
1
156.5
White perch
6
1
6
157 Yellow bass
1
4
162
Green sunfish
1
1
1
166
Bluegill
1
2
172 Smallmouth bass
2
2
174 Largemouth bass
4
4
5
221
Freshwater drum
3
SEPA4 Count
93
82
663
304.3
43
Route 83
19 Gizzard shad
11
41 Goldfish
1
44
Carp
12
88 Bluntnose minnow
11
126 Yellow bullhead
2
162
Green sunfish
3
174 Largemouth bass
3
Route 83
Count
43
SEPA 5 (Calumet-Sag
303.4
905
Channet Waterfall)
19 Gizzard shad
107
19
167
44
Carp
1
2
3
60 Golden shiner
1
7
63 Emerald shiner
4
200
79 Spotfin shiner
1
88 Btuntnose minnow
3
5
126
Yellow bullhead
2
128
Channel catfish
9
6
132
Tadpole madtom
1
156.5 White perch
1
157
Yellow bass
3
162
Green sunfish
1
8
4
163
Pumpkinseed
1
6
166
Bluegill
4
1
174
Largemouth bass
11
1
8
231
Round goby
1
SEPA 5 Count
143
30
415
Page
10 of 14
Grand
Total
344
3
95
7
269
88
7
2
2
4
10
6
29
3
3
77
1
5
2
957
327
9
53
1
357
3
1
40
2
1
13
5
3
3
4
13
3
838
11
1
12
11
2
3
3
43
293
6
8
204
1
8
2
15
1
1
3
13
7
5
20
1
588
... - ........
"--, LJ5
G.:5
---;
vJJ~L
- ......
-( .
RIVER MILEAGES AND
Back to top
DRAINAGE AREAS FOR
Back to top
ILLINOIS STREAMS-
Back to top
VOLUME 2,
SURVE.Y
:;:;:;:;:;:;:;:;:;:;
Water - Resources Investigations 79-111
Prepared in cooperation wah
u.s. ARMY CORPS OF ENGINEERS
-
MILES
AROVE
MOUTH
0.8
1.0
1.1
2.2
2.7
3.2
6.2
6.2
9.0
10.5
10.5
10.6
11.9
13.4
13.4
13.4
14.1
14.1
17.8
17.8
19.3
19.4
22.3
23.0
23.4
24.0
24.0
24.8
26.3
27.3
27.3
27.6
27.8
28.4
2R.9
29.5
29.6
30.0
30.5
30.6
31.1
31.6
31.6
31.9
32.2
32.7
32.8
33.2
33.4
33.5
33.7
33.8
34.3
34.7
34.8
34.9
POINT OF INTEREST
DES PLAINES RIVER BASIN
DRAINAGE
AREA
SO MI
LATI-
TUDE
OMS
LONGI-
TUDE
D M S
TOPO-
GRAPHIC
QUAD
CHICAGO SANITARY' SHIP CANAL (MOUTH
f
DES PLAINES R MILE 16.91WILL COUNTY
DEEP RUN
L
LOCKPORT LOCK AND DAM
USGS GAGE 05537000 AT LOCKPORT
16TH STREET
IL RT 7
SLUICE TO DES PLAINES R
ROMEOVILLE ROAD
USGS GAGE 05536995 AT ROMEO
WILL COOK CO LINE
STEPHEN STREET
USGS GAGE 05536900 AT LEMONT
IL CENTRAL GOLF RR
COOK-DU PAGE CO LINE
CALUMET SAG CHANNEL
L
AREA ABOVE CALUMET SAG CHANNEL
DU PAGE COOK CO LINE
IL RT 83
USGS GAGE 05536152 NR SAG BRIDGE
WILLOW SPRINGS ROAD
USGS GAGE 05536150 @ wILLOW SPRINGS
INTERSTATE 294
US HWY 45
8
6.
0 C RR
LAWNDALE AVENUE BRIDGE
STEvENSON
E~PRESSWAY
HARLEM AVENUE
USGS GAGE 05536142 AT HARLEM AVE
AT' SF RR
. CENTRAL AVENUE
CICERO AVENUE
USGS GAGE 05536140 AT CICERO AV
BELT RAILWAY
HYDROLOGIC UNIT 07120003
PULASKI ROAD
IL NORTHERN RR
KEDZIE AVE
IL CENTRAL RR
CALIFORNIA AVENUE
A 6. 0 C RR
WESTERN AVENUE
OA"'EN AVENUE
USGS GAGE 05536135 AT ASHLAND AVE
ASHLAND AVENUE
740
413411
0880442
739
413826
0880338
738
414044
0880003
346
414151
0875654
341
414403
OR75248
S BR CHICAGO R'IVER (HEAD OF CHICAGO SANITARY , SHIP CANAl)
LOOMIS STREET
THROOP STREFf
HALSTED STREET
DAN RYAN EXPRESSWAY
CERMAK ROAD
CANAL STREET
PENN CENTRAL RR
18TH STREET
C RI
6.
P RR
ROOSEVELT ROAD
HARRISON STREET
EISENHOWER EXPRESSWAY
VAN BUREN STREET
234
JOLIET
JOLIET
JOLIET
JOLIET
JOLIET
JOLIET
ROMEOVILLE
ROMEOVILLE
ROMEOVILLE
ROMEOVILLE
ROMEOVILLE
SAG BRIDGE
SAG BRIDGE
SAG BRIDGE
SAG BRIDGE
SAG BRIDGE
SAG BRIDGE
SAG BRIDGE
SAG BRIDGE
SAG BRIDGE
PALOS PARK
PALOS PARK
BERWYN
BERWYN
BERWYN
BERWYN
BERwYN
BERWYN
ENGLEWOOD
BERWYN
ENGLEWOOD
ENGLEWOOD
ENGLEWOOD
ENGLEWOOD
ENGLEWOOD
ENGLEWOOD
ENGLEWOOD
ENGLEwOOD
ENGLEWOOD
ENGLEWOOD
ENGLEWOOD
ENGLEWOOD
ENGLEWOOD
ENGLEWOOD
ENGLEWOOD
ENGLEWOOD
ENGLEWOOD
ENGLEWOOD
ENGLEWOOD
ENGLEWOOD
ENGLEWOOD
ENGLEWOOD
ENGLEWOOD
ENGLEWOOD
CHICAGO LOOP
CHICAGO LOOP
Electronic Filing - Received, Clerk's Office, March 25, 2009
DES PLAINES RIVER BASIN
MILES
ABOVE
MOUTH
POINT OF INTEREST
I)RAINAGE
AREA
SQ MI
LATI-
TUDE
D M S
LONGI-
TUDE
D M S
TOPO-
GRAPHIC
QUAD
--------
DEEP RUNIMOUTH AT CHICAGO SAN & SHIP CANAL MILE 0.81 WILL COUNTY
-----------
AT MOUTH NEAR LOCKPORT
0.75 413356
0880409
JOLIET
------------
CALUMET SAG CHANNELIMOUTH
~
CHICAGO SAN & SHIP CAN MILE 13.41DU PAGE COUNTy
0.0
AT MOUTH NR SAG BRIDGE
0.2
DU PAGE-COOK CO LINE
0.6
I C G RR
0.9
IL RT 83
0.9
USGS GAGE 05536700
~
SAG BRIDGE
4.7
CROOKFD CREEK
R
5.3
US
~WY
45
5.6
~ILL
CREEK
L
5.6
HYDROLOGIC UNIT 07120003
7.4ILPT7
7.5
wABASH RR'
8.2
IL PT 43
8.2
USGS GAGE 05536520 NR PALOS HGHTS
9.2
NAVAJO CREEK
L
9.2
RIDr.ELAND AVENUE
10.7
TINLEY
CREE~
L
10.9
127TH STREET
11.6
IL PT 50
11.6
USGS GAGE 05536420 NR ALSIP
12.4
INTERSTATE 294
12.7
CRAWFORD AVENUE
13.7 _
~ZJ.E
-AVENUE
}4.1( "FRANCISCO AVENUE
14.2 B & 0 C T RR
14.3
GRANO TRUNK RR
14.5
STONY CREEK lEAST!
R
14.6 ROAD S36.T37N.RI3E
14.6 C RJ & P RR
14.7
WESTERN AVENUE
14.9
CHATHAM STREET
15.2
OIVISION
ST~EET
15.2
USGS GAGE 055363613 101 BLUE ISLANIl
15.6
INTF.~STATE
57
15.7
ASHLAND AVENUE
15.7
lISGS GAGE 05536367
LOJ
S ASHLAND AV
16.1
ROAn S32.T37N.RI4E
391
414144
389.
414145
335
414041
310.
413923
292 413911
LITTLE
CALUMET RIVER (HEAD OF CALUMET SAG CHANNFI
OA75702
SAG BRIDGE
SAG BRIDGE
SAG BRIDGE
SAG BRIDGE
0873611
SAG BRIDGE
SAG BRIDGE
PALOS PARK
PALOS PARK
PALOS PARK
PALOS PARK
PALOS PARK
PALOS PARK
0874749
PALOS PARK
PALOS PARK
PALOS PARK
PALOS PARK
BLUE ISLAND
BLUE ISLAND
nS744}S
BLUE ISLAND
BLUE ISLAND
SLUE ISLAND
BLUE ISLAND
BLUE ISLAND
BLUE ISLAND
BLUE ISLAND
BLUE ISLAND
BLUE ISLAND
BLUE ISLAND
BLUE ISLAND
BLUE ISLAND
BLUE ISLAND
0874013
BLUE ISLAND
BLUE ISLAND
BLUE ISLAND
BLUE ISLAND
BLUE ISLAND
------------------------
-------
16.2
ABOVE CALUMET SAG CHAN
291
413974
OA73910
BLUE ISLAND
16.3
LI TTLE CALUMET
R ILOWEfH
R
qLUE
ISLAND
16.3
NEAR CALUMET PARK
265
413921
01'173903 BLUE ISLAND
16.9
ASHLAND AVENUE
BLUE ISLAND
16.9
USGS GAGE 05536356
~
ASHLAND AV
RLUE ISLAND
17.0
INTERSTATE 57
R.LUE ISLAND
17.3
QOAD S31,T37N,RI4E
ALUE ISLAND
17.5
INDIANA HARbOR BELT RR
BLUE ISLAND
17.6
MIDl.OTHIAN CR
L
BLUE ISLAND
If'.2
INDIANA HAR80R BELT RR
BLUE ISLAf\iD
18.2
INTf:~STI\TE
57
BlllE
ISLAND
18.3
S ASHLANO AVENllE
BLUE
ISLAND
18.3
IJSGS GAGE
05536326
AT DIXMOOR
257
413821
OI:l73936
HLUE
ISLAND
237
ATTACHMENT 7
FISH DATA ON THE UPPER ILLINOIS WATERWAY
53
I
I
I.
I
I
I
I
I
I
2006 UPPER ILLINOIS WATERWAY
Back to top
FISHERIES INVESTIGATION
Back to top
RM 274.4 .. 296.0
Prepared for:
Midwest Generation EME,
LLC
One Financial Place
440
S. LaSalle Street, Suite 3500
Chicago,
IL
60605
Prepared
by
:
EA
Engineering, Science, and Technology
444 Lake Cook Road, Suite 18
Deerfield,
IL
60015
March 2008
I
I
I
I
I
I
II
TABl.E 5.
SUMMl\l\Y OF THE NUMBER OF FISH COLLECTED WITHIN EACH SEGMEN'r OF TIU: Ul'PER ILLINOIS WATERWAY, 2006.
SPECIES
LOWER LOCKPORT
POOL
BRANDOn POOL
UPSTREAM I-55
DOWNSTREAM I-55
SEGMENTS
COMBINED
__ L __
% ____
11 ___
% ____
L __ % ____ IL __ %
____ IL __ %_
LONGNOSE GAR
SXIPJA~
UERRING
GIZ ZARD SIIAl>
THREADFIN SIIAl>
GRASS
PICKERE1.
NORTHERN PIKE
~RAL
STONEROLLER
GOLDFISH
COI\IMON CARP
CARP X GOLDFISH KYaRID
HOIUn'HEAD
CHUB
GOLDEN BUINER
PALLID SHINER
EMEaALD
SHINER
GHOST SHINER
STRIPED SHINER
SPOT'l'AI1. SHINER
SPOT!'IN SHINER
SAND
SHINER
REDPIN SHINER
tmID NOTROPIS
SLUNTNOSE MINNOW
FATHEAD MINNOW
IlT.lLLll&AD MINNOW
RIVER CARPSUCKER
QUILLBACK
WHIT!:: SUCKER
SMALUlOU'l'll BUFFALO
BIGMOUTH BUFFALO
SILVER REDHORSE
BLACK REDHORSIl
GOLDEN REDItORSE:
SHORTHEAD REDHORSE
VlttO ICTIOBINlI.E
ORIENTAL WEATHERPISH
YELLOW
BULLHEAD
CHANNEL CATFISH
TADPOLE MAD'l'OM
FLATHEAD CATFISH
BLACKSTRIPE TOPMINNOW
WESTERN MOSQUITOFISH
BROOK 8ILVERSrOE
WHITE: P2RClI
WHITE
BASS
YELLOW BASS/WHITE PERCH
ROCK lIASS
GREEN SUNFISH
PUHPXINS£ED
ORANGESPOTTED SUNFISH
111.UEGILL
LONGEAR SUNFISH
REDEAR SUNFISH
KYaRJ:D SUNFISH
tmID UP01U8
SMALUIOUTH lIASS
LARGEMOI1'1'U lIASS
WHtTE
CRAPPIE
BLACK CRAPPIE
JOIImff !>ARTER
LOGPERCH
BLACKS IDE PARTER
SLENDERlIEAD DARTER
FRESHWlITER DRUM
ROUND GOBY
TOTAL FISH
GF.AR EFFORTS
CATCH PER GEAR EFFORT
TOTAL SPECIE:S
1
O.~O
629
61.55
1
0.10
38
3.12
1
o.~o
59
5.77
2
0.20
140
13.70
1
0.10
3
0.29
1
0.10
13
1.37
1
0.10
31
3.03
55
5.38
1
0.10
7
0.68
0.29
6
0.59
1
0.10
1,022 100.00
40
26
20
NOT~I
0.00 DENOTES VALUES LESS THAN 0.005.
516
6
1
1
1
87
922
62
1
1,172
9
3
5
3
1
21
60
6
62
225
1
1
117
44
7
87
19
1
1
54
?
1
33
47
3,590
80
45
33
14.32
0.17
0.03
0.03
0.03
2.42
0.14
0.08
25.66
1.73
0.03
32.65
0.25
O.OB
0.14
0.08
0.03
0.58
1.67
0.17
1.73
6.27
0.03
0.03
3.26
1.23
0.19
2.402
0.53
0.03
0.03
1.50
0.19
0.03
0.92
1.31
100.00
3-13
17
780
46
2
7
124
1
15
6
798
5
153
131
211
23
2
4,198
4
7
2
7
61
2
10
6
:2
1
9
158
8
2
127
71
6
5
1
5
420
18
25
964
13
3
241
31
2S1
1
2
7
50
11
9,080
9.
95
U
0.19
8.59
0.51
0.02
0.08
1.37
0.01
0.17
0.07
8.79
0.06
1.69
1.44
2.32
0.25
0.02
46.23
0.04
0.08
0.02
0.08
0.67
0.02
0.11
0.07
0.02
0.01
0.10
1.74
0.09
0.02
1.40
0.78
0.07
0.06
0.01
0.06
4.63
0.20
0.28
10.62
0.14
0.03
2.65
0.34
3.09
O.Ol
0.02
0.08
0.55
0.12
100.00
1
1,560
60
1
30
1
11
3
451
22
33
127
222
1
1
2,874
1
218
7
25
.2
1
46
5
1
3
35
5
70
7
105
10
335
1
390
2,571
U
1
44
21
18
384
1
2
17
1
22
3
9,769
64
153
U
0.01
15.97
0.61
0.01
0.31
0.01
0.11
0.03
4.62
0.23
0.34
1.30
2.27
0.01
0.01
29.42
0.01
2.23
0.07
0.05
0.26
0.02
0.01
0.47
0.05
0.01
0.03
0.36
0.05
0.72
0.07
1.07
0.10
3.43
0.01
3.99
26.32
0.14
0.01
0.45
0.21
0.18
3.93
0.01
0.02
0.17
0.01
0.23
0.03
100.00
18
1
3,483
112
1
1
3
9
279
8
15
20
2,230
27
186
260
495
25
2
1
8,38'
15
228
9
12
5
99
2
12
1
52
7
1
S
34
266
19
2
259
304
111
1
5
1
16
903
119
423
3,629
27
o
307
22
51
746
2
14
"
17
1
1
111
62
23,461
280
84
58
0.08
0.00
14.85
0.48
0.00
0.00
0.01
0.04
1.19
0.03
0.06
0.09
0.01
9.51
0.12
0.79
1.11
2.11
0.11
0.01
0.00
35.74
0.06
0.97
0.04
0.05
0.02
0.38
0.01
0.05
0.00
0.22
0.03
0.00
0.02
0.14
1.13
0.09
0.01
1.10
1.30
0.47
0.00
0.02
0.00
0.07
3.85
0.50
1.90
15.47
0.12
0.02
1.31
0.09
0.22
3.19
0.01
0.02
0.06
0.07
0.00
0.00
0.47
0.26
100.00
Electronic Filing - Received, Clerk's Office, March 25, 2009
TABLE 13.
SPECIES COMPOSITION, NUMBER, ANt> RELATJ:VE ABUNDANCE OF FISH COLLECTED
FROI~
THE UPPER ILLINOIS
WATERWAY, 1994, 1995, 2000-2002,
AND
2005 - 2006.
snc:u:s
LONGNOSE GAR
um:D
GAR
BOWFIN
SKIPJACK
~aRING
GIZz.uD SIlAD
THREADFIN SHAO
RAINBOW TROUT
CENTRAL MUDMINNOW
GRASS PICKEREL
NORTHERN PIXE
CENTRAL 9TONEROLLER
GOLDFISH
GRASS CARP
COMMON CARP
CARP X GOLDFISH HYBRID
BlOIIEAD CARP
HORm/HEAD CllUB
GOLDllN BIlINER
PALLID
BHINER
EHElRALD SHlNER
GHOST BIIINER
STRIPED SHINER
BIGMOUTH SHINER
SPO'l'TAIL SHlNER
RED SHnlER
SPOTJ'J:N SHINER
SAND SRJ:NER
IU!!DJ'IN SHINER
MIMIC SHINER
um:D NDTROPIS
SUCKERMOUTH MINNOW
BLtm'l'NOSE MJ:NNDW
FATHEAD MINNOW
BtlLLHEAD IUNNOW
CREEK CHUB
RJ:VER CARPstlCIOlR
QUILLBACK
um:D CARPZODES
WHl'!'E SUCKBR
SMALLMOUTH BUFFALO
BIGMOUTIl BUF}'ALO
BLACK BUFFALO
SPOTTJItI !WClIER
SlLVlIR REDHORSE
RIVER RJItIHORSE
BLACK REDHORSE
GOLDU REDHORSE
SHORTIIEAD REDHORSE
UNID MOXOSTOMA
um:D CATOSTOHINAE
UNID ICTIOBlNAE
ORIUTAL WEATKEREISH
BLACK BULLHEAD
YELLOW BtlLLHEAD
CHANNEL CATFISH
UNID NlEIURUS
TADPOLE XlIDTOM
FLATHEAD CATJ'ISH
B~STRIPE
TOPMINNOW
WBS'l'ZlUI MOSQUITOFISH
BROOK SILVERS IDE
'l'HIIZl!:Sl'INE SUClU.EBACK
WHI!l'E PERCH
WHITE BASS
YELLOW BASS
YELLOW BASS/WRITE PERCH
HYBRID MOROm:
UNID HOROm:
ROCIt BASS
GREF.N 8tJNlI'lSH
PUMPKINSEED
_OUTH
ORANGESPOTTED SUNFISIl
BLtJEGILL
LONGEAR SUNFISH
REOI!lAR SUNFlSH
HYBRID Stnn'ISH
UNID LEPOHIS
1994
1995
2 00 0
2 0 01
2002
200S
2006
_ It
_ _ "' _ _ It
_ _
% __ 11 __ "' _ _
t __
%
__
It
_ _
'11 __
*
__
"'
__
11 _ _ '11_
1
0.02
,
850
2
29
471
64
16
3 40
5
23
208
15
16
9
2
1,057
1
59
12
10
67
25
3
1
6
28
1
5
12
36
10
5
14
1
1
1
2
221
3
91
45
1
5
U
0.10
20.83
0.05
0.71
11.S4
1.57
0.39
8.33
0.12
0.56
5 . 10
0.37
0.39
0.22
0.05
25.91
0.02
1.45
0.29
0.25
0.10
0 . 07
0.02
0.15
0.69
0.02
0.12
0.29
O.BB
0.25
0.12
0.34
0.02
0.02
0.02
0.05
5.56
0.07
2.38
1.10
0.17
0 . 12
2.18
7
1
508
26
338
69
105
2
114
21
10
1
5
1
3,609
12
199
1
17
17
30
43
2
2
3
20
25
1
11
37
1
7
23
133
1
163
191
2
3
111
0.10
0.01
7.52
0.03
0.03
0.38
5.00
1.02
0.07
1.55
0.03
0.03
2 . 57
0.31
0.15
0.01
0.07
0.01
53.40
O.lB
2.94
0.01
0.25
0.25
0.44
0.64
0.03
0.03
0.04
0.30
0.37
0.01
0.16
0.55
0.01
0.10
0.34
0.03
0.21
1.97
0.01
2.41
2.68
0 . 03
0.04
1.54
11
0.09
3
0.03
2,451
161
1
34
7
633
U
52
2
507
281
1
In
12
1,U1
22
15
5
86
5
5
1
2
23
1
1
1
48
159
1
9
2
"
57
4
19
9
7
7
1,731
4
1
291
2,175
29
133
3
0.03
21.07
1.43
0.01
0.29
0.06
5 . 43
0.41
0.45
0 . 02
4.35
2.41
0.01
1.23
0.10
12.36
2.12
0.19
0.13
0.04
0.74
0 . 04
0.04
0.01
0.02
0.20
0.01
0.01
0 . 01
0.41
1.36
0.01
0.08
O.Ol
0.63
0.0
0.03
0.16
0.08
0.06
0 . 06
14 . 84
0.03
0.01
2 . 50
18.65
0.25
1.14
0.03
4-4
15
1
27
5,459
124
B
1
18
6
3
719
33
2
13
1,276
3
21
513
1
158
31
2
2,849
2
367
3
20
17
39
116
3
3
2
2
4-
16
3
26
196
1
2
20
23
10
32
10
10
2
7
792
3
1
138
1,993
37
64
30
0.10
0.01
0.1.7
34.64
0.79
0.05
0.01
0.11
D.OC.
0.02
4.56
0.21
0.01
o.oa
8.10
0.02
0.13
3.26
0.01
1.00
0.20
0.01
18.08
0.01
2.33
0.02
0.l.3
0.11
0.25
0.74
0.02
0.02
0.01
0.01
0.03
0.10
0.02
0.16
1.24
0.01
0.04
0.01
0 .13
0.15
0.06
0.20
0.06
0.06
0.01
0.04
5.03
0.02
0.0l.
0.8a
12.65
0 . 23
0.41
0.19
15
0 . 07
1
0.00
16
7,841
84
9
2
568
21.
2
1
32
2
2,426
4
40
2
164
1
207
&9
1
1
2,334
1.8
105
19
9
20
121
7
1
2
3
1
23
B
1
4
69
262
5
3
34
132
17
7
14
1
1'5
1,852
i8
2
747
2,849
29
3
134
8
O.OB
37.12
0 . 40
0 . 01
0 . 04
0 . 01
2.69
0.10
0.01
0.00
0.15
0.01
11.49
0.02
0.1.9
0.01
0.78
0.00
0.98
0.33
0.00
0.00
11.05
0.09
0 . 50
0 . 09
0.04
0.09
0 .S7
0.03
0.00
0.01
0.01
0.00
0.11
0.04
0.00
0.02
0.33
1.2'
0 . 02
0.01
0.16
0.62
o.OB
0.03
0.07
0.01.
0.03
8.77
0.09
0.01
3.54
13.49
0 . 14
0.01
0.63
0.04
11
0.04
5
9,101
2
5
6
1.7
4
483
1.
3
70
2
1,217
9
141
169
495
98
:I
5
1.
1
8,106
24
716
19
19
1
36
103
2
2
5
3
3
1
33
212
10
5
118
196
168
4.
3
9
895
10
1.
328
6,224
26
1
227
564
0.02
29.79
0.01
0.02
0.02
0.06
0.01
1.58
0.00
0.01
0.23
0.01.
3.98
0.03
0.46
0.55
1 . 59
0.29
0.01
O.Ol
0.00
0.00
26.54
0.08
2.34
0.06
0.06
0.00
0.12
0.34
0.01
0.01
0.02
0.01
0.01
0.01
0.00
0.11
0.69
0 . 03
0.02
0 . 39
0.64
0.55
0.01
0.01
0.03
2.93
0.03
0.00
1.07
20.38
0 . 09
0.00
0.74
1.85
19
0.08
1
3,441
112
1
1
3
9
268
8
15
20
3
2,038
27
185
241
1
7,661
14
228
9
10
5
86
2
8
1
49
6
1
5
34
259
19
2
259
277
1.11
1
3
16
969
117
423
3,541
27
3
296
22
0.00
15.51
0.50
0.00
0.00
0.01
0.04
1 . 21
0.04
0.07
0.09
0.01
9 . 19
0.12
0.83
1.09
Z.07
0 . 11
0.01
0.00
36.54
O.O~
1.03
0.04
0.05
0.02
0 . 3lI
0.01
0.00
0.22
0.03
0.00
O.OZ
0 . 15
1.17
0 . 09
0.01
1..17
1.25
0 . 50
0.00
0.01
0.00
0.07
3.92
0.53
1.91.
15.96
o. n
0.01.
1.33
0.10
II
II
I
11
II
I
I
II
II
I
Electronic Filing - Received, Clerk's Office, March 25, 2009
I
I
I
I
I
I
I
I
TABLE 13
(cont.)
1994
1995
2000
2001
200l
2005
2006
SPECIES
_1/< __ ,, __
11 __
% __
11 __
% __
i __
% __
f __
'%
__
11< __
% __
11 __ "_
SMllLLMOUTH BASS
:25
0.61
33
0.49
27
0.23
46
0.29
99
0.47
35
0.11
38
0.17
LARGEMOUTH BASS
77
1.89
658
9."
4.92
4.22
274
1.74
U6
2.11
354
1.16
693
3.12
UNID HICROPTERUS
9
0.12
1
0.00
WHITZ CRAPPIE
6
0.15
7
0.06
7
0.03
2
0.01
BLACK CRAPPIE
1
0.02
3
0.04
13
0.11
3
0.02
:20
0.09
4
0.01
4
0.02
JOHNNY DARTER
.2
0.05
U
0.64
1
0.01
7
0.04
2
0.01
3
0.01
14
0.06
LOGPERCH
1
0.02
4
0.06
9
0.08
11
0.07
15
0.07
33
0.11
17
0.08
BLACKBIDE DARTER
1
0.01
1
0.01
1
0.00
5
0.02
1
0.00
SLENDERHEAD DARTER
2
O.Ol
2
0.01
1
0 .
00
1
0.00
SAUGER
1
0.00
WALLEYE
1
0.00
FRESHWATER DRUM
79
1.94
61
0.90
127
1.09
129
0.82
151
0.11
103
0.34
lOB
0.49
ROUND GOBY
2
0.02
5
0.03
19
0.09
10!!
0.34
62
0.28
TOTAL Fl:SH
4,OBO
100.00 6,759
100.00
11,661
100.00
15,760
100.00
21,123 100.00 30,547 100 . 00
22,183 100.00
TOTAL SPECIES
46
4B
55
1i1
66
61
59
NOTE. DATA COMPARED ARE FROM ELECTROPIBHING AND
SEI~G
DURXNG THE PERIOD OF
MAY~SEPTEMBER
AT THE SAM& LOCATIONS.
EXCEPT
THAT LOCATION 302B
~
SUBSTITUTED FOR LOCATION 302e IN LOWER LOCKPORT POOL BEGINNING IN 2001 AND LOCATION
405 :IN THE UPSTREAM I-55 S2GN!:NT WAS NOT SAMPLE!) IN 2000.
DA'rA FROII TIlE FOLLOWING LOCATIONS (AND YEARS) AR2 EXCLUDED,
LOCATION
308 (1994, 1995, AND 2000). LOCATION 404A (2001. 2002, 2005, AND 2006). AND LOCATION 409 (1994 AND 1995).
0.00 DENOTES VALUES LJ;:SS THAN 0.005.
4~5
"rABLE 14.
SPECIES COMIIOSITION. NUMBER. AND REt.ATIVE ABUNDANCE OF FISH COLLECTED I'/:ITHIN FOUR
SEGMENTS OF THE UPPER ILLINOIS WATERWAY. 1994. 1995. 2000-2002. AND 2005-2006.
SPECIES
SKIPJACK HERRING
GIZZAlID S!lAI)
THREAD!!'IN
SHAD
RAINlIOW TROUT
GRABS PICKEREL
NOl\'l'MRN PI)a:
GOLDFISH
COMMON CARP
CARP X
GOLDFISH IfYBl\ID
GOLDia>! SHUma
~RALD
SHlmR
SPOTTAIt. SHINJ:R
SPO'l'FIN SHINER
SAND SHINER
BLUNTNOSE MINNOW
FA"I.'HEAD
MINNOW
BULLBEAD MINNOW
WRITE SUCKER
ORIENTAL WEATHBRFISH
St.ACK SUI.t.HEAD
YELLOW BULLHEAD
CHANNEL CATFISH
TADPOLE MAD'l'OM
SLACKSTRIPE TOPHINNOW
WESTERN MOSQUITOFISH
BROOK SILVERSIDE
THREESPlNE S"rICKLEBACK
WHI"rE PERCH
WHI"rE
BASS
YELLOW BASS
GREEN SUNFISH
PUMllKINSESD
WARHOUTH
ORANGESPO'l'TED SUNFISH
BLUEGILL
LONGEAR SUNFISH
UDEAR SUNFISII
HYBRID SUNFISH
ONID LEPOMIS
SHALLMOUTH
BASS
LARGEMOUTH BASS
WHITE CRAPPXE
Br..A.CK
CRAPPrE
!"RESIIWA"rER DRUM
ROUND GOBY
TOTAL FISH
CATCH PER GEAR BFFORT
TOTAL SPECIES
LOWER LOCKPORT POOL
1994
1995
lOOIl
2001
200l
2005
2006
_' __
~
_' __ ,, __ It __ ,, __ * __ ,, __ It __ ,, __ Ie _% __ IL _,,_
1
1.7
8 13.B
29 50.0
3
5.2
1
1.7
3
5.2
1
1.7
l
3.4
1
1.7
6.9
1
1.7
1
1.7
2
3.4
1
1.7
58 100.0
12
"
33 20.6
2
1.3
lB 11.3
8
5.0
21 13.1
2
1.3
1
0.6
1
0.6
1
0.6
6
3.8
1
0.6
1
0.6
64
400.0
1
0.6
160 100.0
11
13
2
0.1
404 64.0 1615 66.8 2500 75.8 1245 71.2
4
0.6
1
0.1
629 61.5
1
0.2
5
O.B
1
0 . 0
53
e.4
1
0.2
SO
7.9
16
2.5
37
5.9
1
1
2
0.2
0.8
0.2
0.3
16
2.5
3
0.5
4
G.6
28
4.4
1
0.1
2
0 . 1
70
2.9
140
1
0.0
2
15
118
7.4
178
3
0.1
1
6
0.2
20
1
383 15.8
188
4.~
80
4.6
38
3.7
0.1
1
0.1
0.5
5.'
24
1.4
59
5.9
0.0
2
0.2
0.6
2
0.1
0.0
1
0.0
8
5.7
314 18.0
140 13.7
O.l
1
0.1
1
0.1
1
0.0
20
0.8
1
0.0
1
0.0
10
1
0.0
0.'
1
0.0
3
0 . 1
,
0.1
22
0.7
1
0.0
3
0.1
27
0.9
75
3.1
110
3.3
3
0.1
10
0.3
1
0.0
3
0.1
19
0.8
27
0.8
1
0 . 0
1
0.0
2
0 . 1
1
0.0
1
0.0
22
0.9
17
0.5
2
0.1
1
0.0
1
0.0
3
0.1
4
0.1
1
0.1
3
0.2
10
0.6
1
0.1
1
0.1
14
0.9
10
0.6
1
0.1
10
0.6
2
().1
23
1.3
5
0.3
1
0.1
3
0.3
1
0.1
13
1.3
1
0.1
31
3.0
55
5.4
1
0.1
7
0 . 7
3
0.3
1
0.1
27
2.6
6
0.6
1
0.1
631 10().0 2417 100.0 3297 100.0 1748 100.0 1022
100.0
16
60
82
"
26
16
22
28
17
20
4-6
I
I
I
I
I
I
I
I
I
I
I
I
I
I
Electronic Filing - Received, Clerk's Office, March 25, 2009
I
I
I
I
I
I
I
I
I
I
I
I
SPECIES
SKZPJACK HERRING
aIZZAltD
SKAl)
THIlEAJ)FIN
911AD
CENTRAL MUDMINIIOW
GRASS PICKEREL
CENTRAL STONEROLLER
OOLDFXSH
GRASS CARP
COMMON CARP
CARP X GOLDFISH HYBRID
OOLDKN SHINER
EMERALD SHINER
STRIPED
SHINER
BlaMOUTH SHItaR
SPOTTAII. SHINER
BPOTFIN SHItaR
SAND SHJ:NER
UNID NO'l'ROPXB
BLUN'l'WOSE MXNNOW
FlI.THEAP MXNNOW
BULLHEAD MXNNOW
CREEK CHUB
WHITE BUCKER
SM.UoLKOUTH BUFF.lUoO
SPOTTED BUCKER
SILVER REOHORSE
SHORTHElI.P RECHORSE
ORIENTlI.L WEATHERFISH
BLACK BULLHEAD
YELLOW JlULLHEl\.!l
CHl\.NNEL CATFIBH
=D Jl)lEXURUS
TADPOLE MADTOM
FLATHEI\D CATFISH
BLACKSTRIPE TOPMINNOW
WESTERN MOSQUITOFISH
WHITE PERCH
WHXTE BASS
YELLOW MBS
ROCK MBS
GREim SUNFISH
PUMPKINSEED
_OUTH
O~BPOTTED
SUNFISH
JlLUEQILL
LONaEAR SUNFJ:SH
HYBRID BUNFISH
=0 LEPOI«IB
SMALLMOUTH MSS
Ll\.RGEMOUTII
MBS
WHITE CRl\.PpIE
BLACK CRl\.P
"XI!:
JOIlNN'l I)l\.RTER
JlLACKSIDE DARTER
WALLEYE
FRESnwllTER DRUM
ROUNl) OOBY
TOTlI.L I'X911
CATCH "ER GEAR EFFORT
TOTlI.L SPECIES
199~
1
31
0.1
5.1
16
2.2
199 27.6
17
2.4
49
6.8
1
0.1
3
2
253
58
1
0.4
0.3
35.1
8.1
0.1
1
0.1
9
1.3
9
1.3
1
0.1
57
1.9
1
0.1
1
0.1
4
0.6
TABLE 14
(cont.)
BRANDON "OOL
1995
1
82
0.0
3.5
2
0.1
2000
1
510
31
0.0
11.6
1.1
27
0.9
19
0.8
3
0.1
98
4.2
281
9.1
9
0.4
15
0.5
3
0.1
44
1.5
25
1.1
243
e.4
2.
1970
e
10
0.1
8S.1
0.3
0.4
54
2
563
3
1.9
0.1
19.4
0.1
9
0.4
22
0.8
2
0.1
49
1.7
1
0.0
6
0.2
3
0.1
47
1.6
47
1.6
1
0.0
13
0.4
4
0.1
10
0.4
4
0.1
29
1.3
758 26.1
LG
0.5
5
0.2
93
2.9
1
0.0
"
0.1
1
0.0
22
1.0
54
1.9
1
0.0
4
0.2
11
0.4
2
0.1
2001
10
862
52
2002
0.4
6
33.5 2076
2.0
22
0.1
42.8
0.5
3
0.1
1
0.0
2005
2
1348
1
0.0
3
0.1
2
1
0.0
1
202
1. e
132
2:.7
84
10
0.4
1
0.0
1
2:
0.1
3
0.1
5
487 18.9
744 15.3
IS9
3
22
3
463
3
35
3
3
0.1
0.9
0.1
18.0
0.1
1.4
0.1
0.1
20
0.8
51
2.2
4
0.2
1
0.0
e
0.3
19
0.7
17
0.1
3
0.1
8
0.3
204
7.9
1
0.0
1
0.0
30
1.2
7
0.3
1
0.3
19
0.7
4
0.2
1
4
16
5
843
10
2
11
1
1
0.0
0.1
0.3
0.1
17.4
0.2
0.0
0.4
0.0
0.0
1
0.0
37
o. e
90
1.9
2
0.0
1
0.0
13
0.3
101
2.1
2
0.0
2
0.0
575 11.9
2
0.0
10
0.2
43
0.9
7
0.1
4
0.1
23
0.5
2
0.0
1
0.0
2
0.0
1
0.0
30
0.6
13
0.3
9
70
1
1136
2
1
36
4
2
21
58
1
21
123
1
1
2
103
4
8
32
7
4
2
12
1
1
25
56
0.1
39.9
2006
S14
6
14.3
0.2
1
0.0
1
0.0
0.1
1
0.0
0.0
2.5
81
2.4
0.0
5
0.1
0.1
3
0.1
5.6
922 25.7
0.3
2.1
62
0.0
1
33.6 1172
0.1
9
0.0
3
1.1
5
0.1
3
0.1
0.6
1.7
0.0
0.6
3.6
0.0
0.0
0.1
3.1
0.1
0.2
0.9
0.2
0.1
0.1
0.4
0.0
0.0
0.7
1.7
1
21
60
6
62
225
1
1
117
U
7
81
19
1
1
54
7
1
33
41
1.7
0.0
32.6
0.3
0.1
0.1
0.1
0.0
0.6
1.7
O.l
1.7
6.3
0.0
0.0
3.3
1.2
0.2
2.4
0.5
0.0
0.0
1.5
0.2
0.0
0.9
1.3
720 100.0 2314 100.0 2899 100.0 2574 100.0 4851 100.0
24
77
36
32
61
3376 100.0
42
3590 100.0
4S
17
20
29
33
40
34
33
4-7
I
I
I
I
I
I
I
I
c.'
.. '
I
I
I
(I
I
I
I
TABLE 14
(cont.)
---------------
------
--------------------
------------------------------
----
SPECiES
LONGNOSE
GAR
tJN:ID GAR
SKIPJACK HERRING
GiZZARD
SHAD
TIlREADFiN SHAD
GRASS
PICKEREL
GOI.DFlSH
GRASS
CARP
COMMON CARP
CARP X GOLDFISH HYBRID
BlGHEAD CARP
GOr.DEN SIUNER
PALLID SH:INER
EMERALD SHiNER
OHOS'l' SHJ:NER
STRll?ED SHINER
SPOTTAiL SHINER
RED SHINER
SPOTFIN SHINER
SJIm) SHJ:NER
IlEDFIN SHINER
MIMIC SHXNER
tJN:ID N01'ROI1IS
BLUNTNOSE MINNOW
FATHEAD M:INNOW
BULI.HEAD MINNOW
RXVER CARPSUCKER
QUII.LBACK
UNID CARPI:OIlES
WHI'l'E SUCKER
SMALI.MOUTH BUFFALO
BJ:~OUTH
BUFFALO
BLACK BUFFALO
SPOTTED SUCKEIl
SJ:LVEIl IlEDHORSE
BLACK REIlHORSE
GaLDSH REIlHORSE
SHOIlTHEAD REDHORSE
UNrD CATOSTOMINAE
UNID IC'l'XOBJ:NAE
BLACK BULLHEAD
YELLOW BULLHEAD
CI!ANNEL CA'l'l"lSll
TADPOLE NAIl'I'OM
BLACRSTRJ:PE 'l'OPMINNOW
WESTERN MOSQUXTOFI:SH
BROOK SILVERSIDE
WHITE I?ERCH
WHX'l:E BASS
YELLOW BASS
HYBRID MORONE
UNID MORONE
ROCK
BASS
GREEN SUNli'I:SH
PUMl'KINSEED
WARMOUTH
O~SPOTTED
SUNFISH
BLUEGILL
LONGEAR SUNFISH
IlEDEAR SUNFISH
HYBRID SUNFXSH
ONID LEPOMIS
SMALLMOUTH BASS
LARGEMOUTH BASS
UNID MICl\OPTERUS
WHITE CRAPPIE
BLACK CRAPPIE
JOHNNY DARTER
LOGPEIlCH
BLACKSIDE PARTER
SLSNDERHEAD DARTER
FRESHWATER DRUM
ROUND GOBY
TOTAL FISH
CATCH PEIl GEAR EFFORT
TOTAL SPECJ:ES
OOWNSTREAM I-55
1994
1995
2
.
000
2
725
1
B7
18
13
179
2
3
92
12
250
57
4
6
1
6
2
4
25
3
2
3
1
14
1
2
66
J
94
32
2
2
BS
15
49
6
.2
1
4B
0.1
37.7
0.1
4.5
0.9
0.7
9.3
0.1
0.2
4.8
0.6
13.0
3.0
0.2
0.3
0.1
0.3
0.1
0.2
1.3
0.2
0.1
0.2
0.1
0.7
0.1
0.1
3.4
0.2
4.9
1.7
0.1
0.1
4.6
0.8
2.5
0.3
0.1
0.1
2.5
6
0.2
2
2
1
202
6.B 1001
107
1
0.0
42
1.4
111
24
0.8
6
2
0.1
7
2
24
0.8
41
2
0.1
1
0.0
81
2.7
267
1
13
0.4
45
1
0.0
1
0.0
1229 41.6
579
193
6.5
235
10
0.3
11
10
0.3
4
8
0.3
1
14
0.5
38
2
2
0.1
3
3
0.1
19
0.6
1
19
0.6
11
15
7
0.2
32
1
0.0
3
3
0.1
15
2
23
O. B
3
1
0.0
1
1
2
0.1
1
4
16
0.5
465
1
0.0
1
1
156
5.3
248
140
4.7 16B4
3
31
111
3.0
3
22
0.7
19
529 17.9
241
5
1
0.0
9
2
0.1
4
0.1
7
2
32
1.1
25
0.0
0.0
0.0
18.9
2.0
2.1
0.1
0.1
0.0
0.8
S.O
0.0
0.8
10.9
4.4
0.2
0.1
0.0
0.7
0.0
0.1
0.0
0.2
0.3
0.6
0.1
0.3
0.0
0.1
0.0
0.0
0.0
0.1
9.9
0.0
0.0
4.7
31.8
0.1
0.6
0.1
0.4
4.5
0.1
0.2
0.1
0.0
0.5
1923 100.0 2956 100.0 5299 100.0
80
114
83
36
38
44
2001
3
B
1411
66
3
1
148
1
9
219
1
72
50
2
713
240
13
12
58
1
1
1
1
4
5
5
33
1
3
1
8
2
1
2
115
135
1372
12
12
28
19
113
1
10
38
0.1
0.2
29.5
1.3
0.1
0.0
3.0
0.0
0.2
4.4
0.0
1.5
1.0
0.0
14.4
4.8
0.3
0.2
1.2
0.0
0.0
0.0
0.0
0.1
0.1
0.1
0.7
0.0
0.1
0.0
0.2
0.0
0.0
0.0
2.3
2.7
27.7
0.2
0.2
0.6
0.4
2.3
0.0
0.2
0.8
4954 100.0
77
41
2002
2005
7
4
1511
53
57
2
8
2
527
1
3
75
81
1
556
97
7
4
49
4.
1
1
17
4
9
52
7
15
2
1
1
406
6
1
720
2046
3
1
24
8
31
187
2
9
12
1
31
0.1
0.1
22.1
0.8
0.9
0.0
0.1
0.0
7.9
0.0
0.0
1.1
1.2
0.0
8.4
1.5
0.1
0.1
0.7
0.1
0.0
0.0
0.3
0.1
0.1
O.B
0.1
0.2
0.0
0.0
0.0
6.1
0.1
0.0
10.8
30.8
0.0
0.0
0.4
0.1
0.5
2.B
0.0
0.1
0.2
0.0
0.5
6
2
2392
2
5
1
1
101
61
2
690
7
51
112
203
66
1
3
4002
4
423
16
19
1
26
2
2
3
2
2
2
37
1
47
54
124
1
4
405
3
1
305
5045
1]
54
449
12
19::1
1
3
26
3
1
2]
13
0.0
0.0
15.9
0.0
0.0
0.0
0.0
0.7
0.4
0.0
4.6
0.0
0.3
0.7
1.4
0.4
0.0
0.0
26.6
0.0
2.8
0.1
0.1
0.0
0.2
0.0
0.0
0.0
0.0
0.0
0.0
0.2
0.0
0.3
0.4
0.8
0.0
0.0
2.7
0.0
0.0
2.0
33.6
0.1
0.4
3.0
0.1
1.3
0.0
0.0
0.2
0.0
0.0
0.2
0.1
6647 100.0 15027 100.0
104
235
45
50
2006
1
1560
60
1
30
1
11
3
451
22
33
127
222
1
1
2874
1
21B
7
5
25
2
1
46
5
1
3
35
5
70
7
105
10
335
1
390
2571
14
1
44
21
18
384
1
2
17
1
22
3
0.0
16.0
0.6
0.0
0.3
0.0
0.1
0.0
4.6
0.2
0.3
1.]
2.3
0.0
0.0
29.4
0.0
2.2
0.1
0.1
0.]
0.0
0.0
0.5
0.1
0.0
0.0
0.4
0.1
0.7
0.1
1.1
0.1
3.4
0.0
4.0
26.3
0.1
0.0
0.5
0.2
0.2
3.9
0.0
0.0
0.2
0.0
0.2
0.0
9769 100.0
153
44
NOTE. DATA COMPAR&O AR& PROM ELECTROFISHING AND SEINING DURING THE PERIOD OF MAY-SEPTEMBER AT THE SAME
LOCATIONS, EXCEPT THAT LOCATION 302B WAS SUBSTITUTED FOR LOCATION 302C IN LOWER LOCKPORT POOL
BEGINNJ:NG IN 2001 AND LOCATION 405 IN THE
UPSTREAM I-55 SEGMENT WAS NOT SAMPLED IN 2000. DATA FnOH 'l'1IJ!:
FOLLOI'n:NG LOCATIONS (AND YEARS) ARE EXCLUDED. LOCATION 308 IN BRANDON POOL (1994, 1995, AND 2000).
LOCATJ:ON 404A IN THE UPSTREAM I-55 SE:GMENT (2001, 2002, 2005, AND 2006), AND LOCATION 409 IN Till!:
OOWNSTREAM I-55 SEGMENT (1994 AND 1995).
0.0 DENOTES VALUES LESS THAN 0.05.
4-9
Electronic Filing - Received, Clerk's Office, March 25, 2009
SPECIES
LO~ONOSE
GAR
UNID GAR
BOWFIN
SKIPJACK HERRING
GJ:ZZAlID SHAD
TIlREADFIN SHAD
GRASS
PICUREL
NOllTHERN PIKE
CENTRAL STONEROLLER
GOLDFrSH
GRASS CARP
COMMON CARP
CARP X GOLDFISH HYBR.O
HORNYBEAll CHUB
GOLDEN SHINER
EMERALD
BHINER
GIJOST SHINER
STRIPED SHINER
BIGMOUTH SfllNER
SPOT'l'AIL SHINER
RED SRINER
SPOTPIN SHINER
S~
SHINER
REDFIN SHINEll
MIMIC SHIN8R
UNlD
NOTROPIS
stlCKERI'lOIl'rH MINNOW
BLUNTNOSE MINNOW
lrATIIEAD MINNOW
BULLHEAD MINNOW
CREEK
CHUB
RIVER CARPS'O'ClO:R
QUILLI1ACIt
WHl:TE SUCKER
SMALLMOUTfI BUFFALO
BIGMOII'tH BUFFALO
BLACK BUFFALO
SPOT'l'ED SUCKER
SIJ:.VER MDRORSE
RrvEA MDHORSE
GOLDEN l!lCDHORSJ!
SHORTHEAD REDHORSE
tmID MOXOSTOMA
UNID IC'l'IOBINAliI
ORImrl'AL
WEATHERFISfI
BLAO BUJ:.LIIEAD
YELLOWB~
CHANNEL CATFISH
tmIO AMEIURUS
TADPOLE
HAPTon
rLATHEAD CATFJ:SH
BLACltS'l.'aIP2 TOPIIINNOW
WESTERN MOSQUITOFIBR
BROOK SILVERSIOE
WIIITB PERCH
WHITB
BASS
YBLLOW BASS
YBLLOW BASS/WHITE PERCH
flYBRID MORONE
ROCK
BASS
GREEN SUNFISH
PUMPlUNSBEO
ORANGESPOTTED SUNFISH
BLUEGILL
LONGEAR SUNFISfI
REDEAR SUNFISfI
HYBRID
S~X:Sfl
UNIO LEPOMIS
SMALt.MOUTH BASS
LARGEM01l'l'H BAS S
UNIO MICROPTERUS
WIUTE CRAPP:!:E
BLACK CRAPPIE
JOKNNY DARTER
LOGPERCH
BLACKS IDE DARTER
SLENDERHEAD
DARTER
SAUGER
FRES~TER
DRUM
ROUND GOBY
TOTAL FISH
CATCH PER GEAR
EFFORT
TOTAL SPECIES
TABLE 14
(cont.)
UPSTREAM I-55
1994
1995
2000
2001
2002
2005
2006
_jL _% __ , __
% __
* __ % __ , __ % __ L _% __ L
_% __ , __ %_
1
0.1
1
0.1
87
6.3
2
0 . 1
,
0.3
156 ll.J
26
1.9
3
0.1
109
7.9
3
0.2
19
1.4
113
8.2
:2
0.1
16
1.2
9
0.'
552
~o.o
2
0.1
8
0.6
4
0. 3
8
0.6
19
1.4
4
0.3
1
0.1
2
0 . 1
J
0 . 2
1
0.1
1
0.1
1
0.1
2.
1.7
9
0."
1
0. 1
103
7 . 5
3
0.2
11
0.8
5
0.4
2
0.1
10
0.1
28
2.0
27
2.0
1379 100.0
46
36
1
0.1
191 14.4
2
0.2
4
0.3
160
13.5
28
2.1
35
2.6
1
0.1
93
7.0
S
0.6
9
0.6
4
0.3
1
0.1
40S 30.7
3
0.2
6
0.5
1
0.1
7
0.5
7
0.5
12
0.9
29
2.2
:I
0.2
2
0.2
7
0.5
1
0.1
~
0.2
27
2.0
1
0.1
1
0.1
82
6.2
7
0.5
36
2.7
1
0.1
3
0.2
lD
O.S
43
3.2
9
0.6
1
0.1
41
3.1
25
1.9
1329 100.0
42
36
9
0.3
1
0.0
1
0.0
542 19.1
25
0.9
2
0.1
4
0.1
188
6.6
26
0.9
1
0.0
173
6.1
14
0.5
28
1.0
10
0.4
262
9.3
12
0.4
11
0.4
11
0.4
1
0.0
49
1.7
3
0.1
2
0.1
1
0.0
1
0.0
12
0.4
1
0.0
1
0.0
11
0.4
73
2.6
2
0.1
11
0.4
Ii
0.2
1
0.0
5
0.2
4
0.1
2
0.1
3
0.1
492 17.4
29
1.0
404 14.3
25
0.9
98
3.S
7
0.2
169
6.0
2
0.1
4
0.1
1
0.0
2
0.1
91
3.2
2932 100.0
U
45
4-8
12
0.2
1
0.0
7
0.1
1571 27.0
6
0.1
1
0.0
1
0.0
18
0.3
5
0.1
2
0.0
299
5.1
21
0.4
2
0.0
2
0.0
392
6.7
2
0.0
21
0.4
435
7.5
1
0.0
80
1.4
26
0.4
2
0.0
1290 22.2
1
0.0
126
2.2
7
0.1
5
0.1
4
0.1
58
1.0
2
0.0
2
0.0
1
0.0
1
0.0
8
0.1
1
0.0
86
1.5
1
0.0
1
0.0
1
0.0
9
0.2
3
0.1
1
0.0
3
0.1
Ii
D.l
2
0.0
1
0.0
5
0.1
398
6.8
2
0.0
572
9.8
24
0.4
51
0.9
2
0.0
26
0.4
132
2.3
2
0.0
1
0.0
1
0.0
71
1.2
1
0.0
5915 100.0
75
S5
8
1
6
1754
9
1
,
1
239
18
1
6
977
3
37
1
84
1
90
41
1
1
747
7
1Z
5
2
71
3
1
0.1
0.0
0.1
27.7
0.1
0.0
0.1
0.0
3.8
0.3
0.0
0.1
15.4
0.0
0.6
0.0
1.3
0.0
1.'
0.6
0.0
0.0
11.8
0.1
O.l
0.1
0.0
1.1
0.0
0.0
3
0.0
6
4
0.1
0.1
1
0.0
19
0.3
98
1.S
2
0.0
2
0.0
11
0.2
4
0.1
2
0.0
5
0.1
12
0.2
5
0.1
71i1
1:1.0
14
0 . 2
733 11. 6
26
0.4
2
0.0
101
1.
Ii
53
1.0
219
3.5
1
0.0
9
0.1
3
0.0
1
0.0
1
0.0
87
1.4
1
0.0
5
1
4116
6
14
2
218
,
3
314
1
90
47
210
21
1
2
1
1
265'
17
292
3
73
0.0
0.0
39.6
0.1
0.1
0.0
2.1
0.0
0.0
3.0
0.0
0.9
0.5
2.0
0.2
0.0
0.0
0.0
0.0
as.s
0.2
2.8
0.0
0.7
1
0.0
1
0.0
9
107
a
5
49
18
44
3
1
3
373
3
15
1137
13
156
109
21
127
0.1
1.0
0.1
0.0
0.5
0.2
0.4
0.0
0.0
0.0
3.6
0.0
0.1
10.9
0.1
1.S
1.0
0.2
1.2
3
0.0
7
0.1
2
0.0
50
0.5
35
0.3
6328 100.0 10396 100.0
79
130
55
'7
17
0.2
739
9.5
46
0.6
:I
0.0
7
0.1
113
1.4
1
0.0
15
0.2
6
0.1
605
1.8
5
0.1
152
1.9
112
1.4
176
2.3
22
0.3
2
0.0
3475 U.5
3
0.0
7
0.1
2
0.0
5
0.1
58
0.7
2
0.0
6
0.1
3
0.0
1
0.0
1
0.0
9
0.1
151
1.9
8
0.1
2
0.0
127
1.6
U
0.6
6
0.1
3
0.0
1
0.0
5
0.1
386
4.9
17
0.2
25
0.3
876 11.2
13
0.2
2
0.0
230
2.9
19
0.2
228
2.9
1
0.0
2
0.0
7
0.1
47
0.6
11
0.1
1802 100.0
98
49
I
I
I
I
I
I
II
I
I
II
I
I
,
,
..
"
I
J
~.
~.
Collective Abundance (%) of Emerald shiner, Gizzard shad, & Highly Tolerants
Year Lower Lockport Pool Brandon Pool Upstream I-55 Downstream I-55
2006
88
80
68
54
2005
96
87
74
51
2002
95
92
72
46
2001
96
89
69
53
2000
89
84
60
42
1995
57
98
71
52
1994
84
97
76
70
These data also suggest that the fish communities within each of the four segments have
improved somewhat compared
to 1994 and 1995 based on: 1) catch per gear effort values since
2000 are generally higher than in 1994 or 1995; 2) species richness values in each segment
during the past five study years were consistently higher than in 1994 and 1995; and 3) the
collective abundances
of emerald shiner, gizzard shad, and highly tolerant taxa within the three
downstream segments were lower during at least three
of the past five study years compared to
1994 and 1995,
4.3
LONGITUDINAL COMPARISONS OF COMMUNITY LEVEL PARAMETERS
4.3.1 Electrofishing
Electrofishing catch rates (CPE) of native species, IWBmod scores, and native species richness
values were compared among the four segments to detennine whether the longitudinal patterns
of these parameters in 2006 were different than those observed during 1994 (EA 1995), 1995
(EA 1996b), 2000 (EA 2001), 2001 (EA
2002),2002 (EA 2003), or 2005 (EA 2007). As
discussed in Section 4.2, data compared are from similar locations and the same seasons.
The following relationships
of CPEs among segments were consistent for each of the seven years
compared:
1) CPEs were significantly lower (P<0.05) upstream of Brandon Road Lock and Dam
when compared to the Downstream I-55 segment; and 2) CPEs from lower Lockport Pool were
significantly lower when compared
to the Upstream I-55 segment (Tables 15 and 16). However,
the relationships between the Brandon Pool and Upstream I-55 segments, as well
as between the
Upstream and Downstream I-55 segments, were inconsistent among these seven years. For
example, CPEs from the Upstream I-55 segment were significantly lower than the Downstream
I-55 segment in 1994, 2000, 2005, and 2006, but CPEs were statistically similar between these
two segments in 1995,2001, and 2002. CPEs from Brandon Pool were significantly lower than
the Upstream I-55 segment in
1994,2001,2002,2005, and 2006, but were statistically similar in
1995 and 2000.
The inconsistent relationships between these two pairs of segments were
primarily due to the differences in the catch rates
of highly tolerant native species and gizzard
shad. For example, when CPEs are recalculated excluding highly tolerant species and gizzard
shad, the resulting longitudinal pattern becomes the same each year; significantly lower within
the two segments upstream of the Brandon Road Lock and Dam than within the two segments
downstream
of it (Table 16). The catch rates of non-tolerant native fish (less gizzard shad) have
been higher within the General Use water downstream
of I-55 than within the Secondary Contact
water
of the Upstream I-55 segment in all study years except 2001 (Table 16).
4-10
Electronic Filing - Received, Clerk's Office, March 25, 2009
II
I
,
,
'l'AB!.El 15.
CPE AND RELATIVE ABUNDANCE OF IIIl'.TIVS FISK COLLECTED llL!;;CTROFISl!ING \'IlTlI:tN FOUR
SEQ~IENTS
OF
THE UPPER ILLINOIS WATERWl'.Y, MAY-SEPTEI!BER 1994, 1995, 2000-2002, AND 2005-2005.
SPECIES
LONGWOSE GlUt
UNIXI GAR
BOWFIN
SKIPJl'.CK K!;;RRING
GIZ ZAlID SIIAD
CENTRAL MlJI>KINNOW
GJlASS PICKEREL
NORTHERN
PIKE
CENTRAL STONEROLLER
HOIlN'lHUD
CHUB
GOWEN SHUlER
PALLID
SHINER
EblERl'.LD SlI INER
QHOST SHINER
STRIPED SHINER
BI(JMOUTH SHINER
SPOTTAIL SHINER
IUIO SKXNER
SPOTFIN SHINER
BlIND
SHINER
REDFIN SHINER
MIMIC SHINER
UNtD NOTROPJ:S
BUCKEIIbIOUTH MINNOW
BLUNTN09E MINNOW
FATHEAD MINNOW
BULLHEAD MINNOW
CREEK
CKUB
RIVER CARP9UCKER
QUILLBACK
WHITE BUCKER
SMALLMOUTH BUFFALO
BIGMOUTH BUFFALO
BLACK BUFFALO
SPOTTED BUCKER
SILVER REDHORSE
R:tVER REDHORBE
BLACK REDHOR8E
GOWEN REDHORBE
SHORTHEIID REDHORSE
UNID NOXOSTOMII
BLACK BUt.LlIEAD
n:LLOW BULLHEAD
CHANNEL CATrIBH
UNID AHEIURUS
TADI'OLIC MADTOlol
FLAT"~
CATFXSII
IILIICKSTRIPE TOPMINNOW
BROOK SILVERRIDE
WlilTE BlISS
YELLOW DABS
UNII> MOIlONI!
ROCK DAsa
(,IIU::II:N SUNFI.911
"UMPKINUII:!:I>
WAIUIOUTII
OIlANOEIlPo'r~'lI!ll
OUID'I8U
I.IIAJl!!fHLt.
l.o~(JI!!M
8UNrIllU
llVlIltIIJ IIU)#1I)II
UNl.!J r.IU'ONXII
lIMJlJ,I,HOU'fU Dlloa
/.AJIUIlHOI/'l'U IlIIIJlJ
Wln'l'lIi CnJlI'L'Xr:
1)f.JlCK
GJtJlL'~'lK
,)0111011011 ))JIlI'rICH
tAlIlvr,lll
:1I
)H.ACIUJ 11)1: 1»)IJ1'I'
1!!1l
1J1,J;NlJI!!JII"t;IIJ) I)AIt'!'KII
(lJI IJUlC "
WIIl,I."YY.
1f1 ..
,WIlWJl'rl~11
unUM
TOTIII. 1'r.11II
'['O'I'AI, l/vr:CllI:ll
LOWER
LOCKPORT
POOL
0.2
9.1
0.2
9.1
0.5 27.3
0.3 18.2
0.2
9.1
0.2
9.1
0.2
9.1
0.2
9.1
1.8 100.0
7
1994
1995
BRANDON
POOL
0.1
0.9
0.2
0.1
0.3
O.S
4.3
1.1
0.5
1.6
3.9 18.9
5.9 28.6
0.1
0.1
1.0
1.0
0.5
0.5
4.9
4.9
UPSTREAM
I-55
LOWER
DOWNSTREAM
LOCKPORT
I-55
POOL
0.1
D
.l
6.6
3.2
0 . 3
1.0
0.2
0.2
0.2
0.3
13 . 8 102. !!
6.B
7.2
0.2
0.7
0.2
2.1
0.7
O.S
0 .2
0.2
60.7
4.2
0.1
0.1
0.4
0.1
5.5 25.0
3.5
15.9
BRANDON
POOL
0.1
7.7
0.1
2.9
0.2
0.1
B.7
D.l
3.1
0.3
8.B lB.4
4.0
0.3
0.2
1.5 67.6 76.3
0.8
O.~
0.4
0.2
2.1
D
••
D.l
1.9
0.9
0.5
4.4
0.9
0.2
0.2
0.5
0.3
0.7
0.1
0.2
0. 1
O.l
0.1
0.2
2.7
5.6
0.1
0.2
0.1
0.2
2.2
0.7
1.0
0.2
1.0
0.3
0.1
4.a
0.5
0.3
O.S
O.l
1.3
0.4
0.6
0.,1
0.6
0.2
0.4.
2.5
0.3
0.2
0.3
0.2
0.2
0.8
0.2
0.8
1.1
1.0
0.2
0.1
1..1
1.3
1.1
0.3
0.1
1.3
6.3 30.B :1.1.3 33.8 11.0
0.5
6.5
1.0
4.5
0.3
3.2
3.6
0. 1
0 . 5
0.-4
2 .2
20.6 100.0
14
0.3
1.0
0.4
0.2
0.8
2.2
3.0
0.7
2.1
0.9
0.5
1.6
4.7
6.3
13.2
5.0
0 . 3
0.3
0.5
loB
1.2
8.0
7.8
3.0
0.2
O.l
0.8
0.2
0.3
1.1
0.2
0.8
0.7
10.7 48.5
0.2
0.8
4.7
47.7 100.0 168.8 100.0 l2.0 100.0
11
28
28
4-11
0.4
O.S
2.8
0.4
0.5
88.6 100.0
15
UPSTREAM
:1:-55
17.0
0.2
2.2
1.6
O.S
0.1
0.4
30.8
0.3
4.0
3.0
O.B
0.2
0.7
DOWNSTREAM
I-55
0.3
28.6
0.1
0.9
0.1
0.1
2.3
0.6
0.1
0.3
25.7
0.1
0.8
0.1
0.1
2.1
0.5
0.1
7.0 12.7 12.3 11.1
0.3
0.5
1.0
0.9
0.6
0.6
1.1
2.6
0.2
0.2
0.6
0.1
0.1
2.5
1.2
1.2
2.0
4.8
0.3
0.3
1.2
0.2
O.l
4.4
0.1
0.2
7.5 13.5
O.S
1.0
2.7
4.9
0.3
0.5
0.6
1.2
3.4
6.1
2.3
4.1
1.4
1.4
1.1
2.0
0.3
0.4
2.6
2.6
1.0
0.3
<1.3
0.1
16.3
1;'7
14.3
2.6
4.0
0.1
0.6
4.6
1.3
1.3
1.0
1.B
0.3
0.4
2.3
2.3
0.9
0.3
2.1
0.1
14.7
6.0
12.9
l.3
3.6
0.1
0.5
4.1
55.2 100.0 111.1 100.0
26
30
SPECIES
LONGNOSE GAR
umD GAR
BOWFIN
SKIPJACK HERRING
GIZZARD
SHAD
CENTRAL HUDMINNOW
GRASS PICKEREL
NORTHERN PIKE
CENTRAL STONEROLLER
1I0RNlllfE1lD CIIUll
001d)l1N SHINER
PALLID SHINER
EMERALD
SHINER
GHOS': SHINER
STR::t»ED SHINER
BIGMOU'I'H SHINER
SPO'r'l'AIL SHINER
RED SHINER
SPOTFIN SHl:NJ:R
SAND SRINJ:R
REDl1IN SHINER
HIIIIC SHINER
umD NOTROPIS
SUCltERMOU'I'H MIIfflOW
1IJ.tJm'OOSE
MINNOW
FATImA» MINNOW
Bt7J.LHEAD Ml:tmOW
CREEK CHUB
RXVEl\ CARPSUCKER
QllXLLBACK
WlUTE SUCKER
SMALLMOUTH BUFFALO
BIGMOU'I'H BUFFALO
aLACK BUFFALO
SPOTTED stiCKER
SILVER IUlDHORSe:
RXVER UDHORSE
BLACK UDHORSE
G01d)EN REDHORSE
SHORTImA» REDRORS!:
11NID MOXOSTOMA
BLACK B\1LLHEAD
YEJ.LOW BIILLHEAD
C~L
CATFXSH
umD AMEI\1RUS
TAt>POJ:d: /lADTOH
FLATH~
CATFISH
BLACKS'rRIPE
TOPMllfflOW
BROOK SILVERSIDE
WRITE BASS
YEr.LOW BASS
UNID MaRONE
ROCK BASS
GREEN SUNFISH
P11IIPKUISEED
WlU\MOU'I'K
ORANGESPOTTED StlNFISH
Br.UEGILL
LONGEAR SUNFISH
HYBRID SUNFtSH
11NID r.EPOMIS
SKALLMOUTH BASS
LARGeMOU'I'H BASS
WIIXTE CRAPPJ:E
BLACK CRAPPJ:Z
JOHN!N' DARTER
l.QGPERCH
SLACKSIDE DARTER
SLENDElUlEAD DARTER
SAUGER
WALLEYE
FRESHWATER DRUM
TOTAL FISH
TOTAL SPECIES
TABLE 15 (eont.)
2000
LOWER
LOCKPORT
POOr.
BRANDON
POOr.
UPSTREAM
I-55
0.4
0.3
0.1
0.0
0.0
0.0
0.1
0.0
24.9
7~.7
20.0 22.1 27.0
23.0
0.3
0.9
O.B
O.B
0.1
0.0
0.7
0.7
3.1
9.4
7.3
B.l
7.7
6.S
1.0
0.4
0.3
0.1
0.9
0.1
0.2
1.S
3.0
0.5
0.6
0.1
0.1
1.3 20.1 22.2
0.1
0.1
0.8
0.9
0.9
2.0
2.2
0.0
0.0
0.0
0.0
0.2
O.B
0.9
0.2
0.2
0.2
0.2
2.9 31.5 34.9
0.4
0.5
0.6
O.B
2.0
2.3
0.0
0.0
0.2
0.2
0.0
().()
4.5
1.8
2.0
0.0
().O
0.3
0.5
0.4
1.3
0.4
6.2
0.6
0.6
0.6
0.1
2.4
0.2
0.1
0.1
0.1
0.6
0.1
0.1
0.5
3.6
0.1
0.3
0.2
0.1
0.2
24.s
1.5
19.0
1.3
4.9
0.4
7.2
().1
0.2
0.1
().I
4.6
0.3
1.1
0.3
S.l
0.5
O.S
0.5
0.0
2.1
0.1
0.1
0.0
0.0
0.5
0.0
0.0
0.4
3.1
0.1
0.2
0.2
0.1
0.1
20.9
1.2
16.2
1.1
4.2
().3
6.2
0.1
0.2
0.0
0.1
3.9
LOWER
DOWNSTREAM
LOCKPORT
I-55
POOL
0.1
0.0
BRANDON
POOL
2001
UPSTREAM
DOWNSTREAM
I-55
I-55
0.5
0.3
0.1
0.1
0.0
0.0
0.1
0.1
0.4
0.5
0.3
0.2
0.4
0 . 2
62.3 23.3 100.6 74.1 28.0 35.3 65.1 39.7 84.9 42.7
0.1
0.0
0.1
0.1
0.0
0.0
0.1
0.1
0.0
0.0
().3
0.1
0.0
0.1
0.0
o.()
().a
0.1
().1
0.0
1.B
0.7 10.2
7.S 17.6 22.2 11.4
6.9
9.2
4.6
0.0
0.0
0.1
0.0
0.0
0.0
~.9
1.5
26.7
11. 2
0.7
0.3
0.1
l.4
0.1
0.2
0.1
0.7
0.9
2.0
0.2
0.2
0.1
0.1
0.1
28.9
0.1
0.1
14.5
96.4
0.2
1.9
0.1
1.1
13.7
0.3
O.S
0.1
1.6
2.2
0.6
10.0
4.2
0.3
0.1
0.0
0.9
0.0
0.1
0.0
0.3
0.3
0.7
0.1
0.1
0.0
0.0
0.0
10.8
0.0
0.0
5.4
32.4
0.1
().7
0.0
0.4
5.1
0.1
0.2
0.0
0.6
0.2
0.4
15.1
0.1
0.1
1.3
0.1
0.1
4.7
0.2
1.2
0.1
0.1
0.1
1.4
0.1
0.1
0.3
11.1
0.0
0.0
0.9
0.0
0.0
3.4
().1
0.9
0.0
0.0
0.0
1.0
0.0
0.1
0.5
0.0
16.4
0.0
1.4
0.1
0.7
2.4
0.1
0.0
0.1
0.3
B.3
0.0
0.0
1.1
0.3
0.3
O.B
0.2
0.7
0.1
20.7
0.1
1 . 7
0 . 2
0.8
3.0
0.2
0 . 1
0.2
0.4
10.5
0 . 1
0.1
1.4
0 . 4
0.3
1.0
4.5
1.4
().2
0.0
20.9
3.B
0.3
0.2
0.1
2.5
0.1
().1
().O
0.0
0.2
0.0
3.5
0.0
0.0
0.1
0.2
0.1
0.1
16.9
0.1
18.2
0.8
2.1
0.1
1.0
5.4
0.1
0.0
0.0
3.0
2.7
0.9
0.1
0.0
12.7
2.3
0.2
0.1
0.1
1.5
0.1
0.1
0.0
0.0
0.1
0.0
2.1
0.0
0.0
0.1
0.1
0.1
0.1
10.3
0 . 1
11.1
0.5
1.3
0.1
0.6
3.3
0.1
0.0
0.0
1.8
2.4
2.1
19.1
12.9
0.8
0.8
3.2
0.1
0.1
0.1
0.1
0.3
0.3
0.3
1.9
0.1
0.4
0.1
7.0
6.9
33.9
0.6
0.7
0.9
6.4
0.1
0.3
2.4
1.2
1.1
9.6
6.5
0.4
0.4
1.6
0.0
0.0
0.0
0.0
0.1
0 . 1
O.l
1.0
0.0
0.2
0.0
3.5
3.5
17.0
0.3
0.3
0.5
3.2
0.0
0.2
1.2
32.9 100.0 90.3 100.0 117.0 100.0 267 . 0 100.0 135.9 100.0
79.2 100.0 164.0 100.0 199.0 100.0
11
23
38
36
19
25
33
4-12
I
I
I
I
I
I
I
I
I
I
I
I
I
I
I
I
I
I
I
I
11
II
II
11
I)
LONGNOSE GAR
UNID OAR
DOWL"IN
SKIPJACK HERRING
GU ZIJU) SIUIJ)
CENTRAL HUDHINNOW
GRASS PICKEREL
NORTHERN PIKE
CENTRAL STONEROLLER
1I0RNYlIEAD CHUB
GOLDEN BHINER
PALLID SHINER
EMERALD BHINER
GHOST SHINER
STRIPED SIIINER
IlIGlMOUTK BHINEII
Sl'OTTJIrL SHINEII
UP SHINER
BPOTJ!'IN SHINER
SANJJ
SHINER
REIlFIN
SHINER
=0
MI!'JIC
NO'l'ROPIS
SHINER
SlIC\tElIMOOTH MINNOW
BLUNTNOSE MINNOW
FATHEAD MINNOW
BULLKEAD MINNOW
CREEK CIfUB
RIVER CARPSUCKER
QUILLBACK
WHITE SUCKER
Sl'lALLMOUTH BUFFALO
BIGMOUTK BUFFALO
BLACK BUJ'FALO
SPOTTED SUCRER
SILVER REDHORSE
RIVER REDHORSE
BLACK MOHOR9E
GOLDEN REDHORSE
SHORTHEAD REDHORSE
UNID
HOXOSTONA
BLACK BULLHEAD
~W
BULLHElUl
CHANNEL CATFISH
tlNID A!'lEIURUS
TADPOLE: MADTOM
FLATHEAD CATFISH
BLACKSTRIPE
TOP!'JINNOW
BROOK SILVERS IDE
WHITE BASS
YELLOW
BASS
UNlD
MaRONE
ROCK BASS
GlU:EN SUNFISH
PI1IG'KINSEEO
WARMOUTH
ORANGESPOTTED SUNFISH
BLUEGJ:LL
LONGZAR SUlIFISIi
HYBRID SUNF:rSI{
tlNIO LEPOMII3
SMALLMOUTH BASS
LARGEMOU'l'H BASS
WHITE CRJUtPIIo1
BLAOK CRAPPIE
JOIlNN'l
DAR'l'EIl
LOGPERCH
BLACKSIDE DAR'l'ER
SLENDElUIEAIl
DARTER
SAUG!ER
WALLEYE
FRESJIWlI.'l'ER DR1JloI
'I:O'l'AL FISH
T01'AL SPECIES
LOWER
LOCICPORT
:1'001.
BRANDON
POOL
2002
TABLE 15 (cont.)
LOWiR
UPSTRli:1\tI'J
DO~INSTREA)!
LOCIU'ORT
:t-55
I-55
POOL
BRANDON
POOL
2005
VI' STREAM
DO~INSTJ\EAM
I-55
I-55
0 .3
0 .2
0.4
0.1
0.2
0.1
0.3
0.1
0.0
0 .0
0 .2
0 .1
0.3
0.1
0.2
0.1
0 .1
0.1
0.0
0.0
0.1
0.0
153. 0 80.S 7 5 .9
46 ~2
71.8 33.0 89.8 26.6 71.2 88.5 42 . 2 60.2 92.5 51.0 144.5 35.9
D.9
10.9
O.i
1.2
0 . 1
10.3
0.4
0.1
0.2
0.3
1.4
0.1
0.2
7.0
0.6
0.1
G.2
1.6
0.1
0.1
1..1
0 .1
0 . 1
0.2
0.0
0.5
0.0
5.7 :14.7
0.0
0.2
0.1i
0.«
0.0
5.4 29.0
0.2
0.2
0.0
0.0
0.1i
0.0
0.0
0.0
0.0
0.0
0.2
15 .0 34.5
0.1
0.0
0.1
2.4
0 . 0
0.3
2 . 5
0.5
G.O
0.0
17.7 lS.0
0.1
0.0
G.O
0. 5
0.2
0.4
0.1
0.0
2.9
0.1
0 . 0
0.1
0.4
0.1
1,5.9 31.9
0.1
0.1
0.0
1.1
2.4
0.0
1.2
1.5
0.2
0.1
0.0
0.0
6.9 IB.l
0.0
5.4
0.2
G.4
0.1
0.3
0.0
1.3
3.1
0.1
0.3
0 .0
0.1
0.0
9.4
0.0
0.7
0.4
0.0
5.4
1.6
0.1
0.1
0.9
0.1
1.2
1 .S
0.1
O.Z
4.0
5.0
0.0
0 .0
0.1
0.0
0.1
0.0
D.l
1.0
0.7
3.7
0.0
0.1
3.7
0.3
0.0
0.1
0.9
0.1
0.0
0.6
0.1
0.0
0.1
0.1
0.0
0.1
0.1
23.6
0.1
0.3
1.4
0.3
0.2
O.S
0.1
0.0
0.1
0.0
1.3
0.0
0.1
0.1
0.3
0.1
0.2
0.1
0.1
0.0
0.9
0.3
0.3
0.1
0.6
O.B
G
..
0.6
0.2
0.2
2.2
3.9
1.0
3.2
0.9
0.6
0.1
0.0
0.1
0.1
14.4
0.1
0 . 2
0.9
0.2
0.1
0.3
0.1
0.0
0.1
0.0
0.1
0.2
0 .1
0 . 5
0.1
31.4
0 . 5
26. 9
1.0
4.1
2.~
9.8
0.0
0.3
0.0
0.1
0.0
0.2
0.0
u.s
0.2
12.4
O.S
1. 9
1.1
4.0
0.0
0 .1
0 .1
0.0
0.0
0.0
0.0
0.0
0.1
0 .9
0.1
0 .1
25 . 0
0.3
0.1
36.6
99. '
0.1
1.2
1.5
10.6
0.1
0 . 3
0 .0
0.3
0.0
0.0
7.4
0.1
0.0
10.8
29 • •
0.0
0.4
0 .4
3.1
0.0
0.1
0.6
0.2
0. 1
0.0
0.1
0.8
0.4
0.1
0.2
o.a
0.1
1.0
0.5
0.1
1.8
O.S
3.6
1.7
0.6
0.3
0.4
O.G
6.0
0.2
0.4
10.0
0.5
0.2
0.1
0.8
2.4
0.1
0.0
0 .0
0.0
«.0
0.2
0.7
0 . 3
0.1
0.5
0. 0
0.0
1.0
0.1
8.6
0 .3
0.6
14.3
0.7
0.2
0.1
0.1
4.a
0.1
0.7
2.8
0.0
lB.4
0.0
0.3
0.1
3.0
0.0
0.0
1.1
0.3
3.4
4.2
0.2
0.1
0.1
0. 1
!l.B
0.3
1 . 0
0.4
0. 1
0.7
0.1
0.0
0.2
0.1
0.0
0.1
0.0
0.1
15.3
0.1
0.2
23.5
0.2
5.8
0.1
0.7
5.1
0.3
0.1
0.0
O.B
0.1
2.6 19.1
0.1
0.0
0.4
0.4
2.3
1.5
2.a
0.0
10.1 42.0
0.0
0.1
0.2
7.9
0.1
1.0
0.8
1.7
1.6
0.1
O.l.
0.2
0.0
4.7
0.0
0.1
0.6
0.7
10.4
0.0
1.9
0.2
0.2
0.'
0 . 0
0.0
0 . 2
0.0
0.0
0.1
0.0
0.0
0.1
0.0
0 . 2
2 .3
1.9
O.S
0.0
G.1
0 .0
0.0
0.1
0.0
0.1
8.4
0.1
0.1
13.0
0. 1
3.2
0.0
D .•
2 .8
0.1
0 .1
2.1
0.1
0 .3
25.4
0. 1
0. 1
14.6
116.9
0.5
Z.1i
0.1
0.4
11.9
0.2
0.0
0 . 0
0.5
0.0
0.1
6 .3
0.0
0.0
3.6
28.9
0.1
0.7
0.0
0.1
2.9
0.0
0.1
0.0
0.7
0.2
0. 1
0.0
0.1
1.5
2.1
1.1
1.4
0.4
1B9.9 100 .0 164.2 100 . 0 217.$ 100.0 331.4 100.0 80.4 100.0 70.0 100.0 181.5 100.0 404.2 100.0
24
34
44
39
11
24
34
40
4-13
TABLE 15
(cont.)
I
2006
LOWE!!.
LOCKPORT
BIIANDON
UPSTREAM
DOWNSTREAM
POOl.
POOL
I-55
I-55
SPECIES
_ CP!L
-"-
_CPE_ _,,_ _CPE_
~%_
_CPE_ _% _
LONGNOSE GAR
0.7
0.5
0.1
0.0
um:D GAR
BOWFIN
SKIPJACK HERRING
0.1
0.1
GIZZARD SJ{AD
39.2 69.5
21 . 3
25.'
211.B 19.8
95.'
26.6
CENTRAL IroDI!ImlOW
GRASS PICKEREL
NO!!.THEP.N PIKE
0.1
0.1
CENTRAL STONEROt.LER
HORNY'READ CHUB
GOLDEN SHINER
0 . 1
0.1
0.3
0.2
0.1
0.0
PALLID SHINER
0.1
0 . 0
EMERALD SHINER
3.6
6.2
27 . 0
32 . '
10.8
7.4 22.2
6.2
GHOST SHINER
0.2
0.1
1.4
0.4
STRIPED SHINER
0.6
0.4
0.4
0.1
BIGMOUTH SHINER.
SPOT TAIL SHINE!!.
0.1
0.1
0.3
0.2
1.8
0.5
RED SHINER
SPOTFIN SHINER
0 . 9
1.1
2.8
1.9
2.9
O.B
SAND SHINER
REDJ'IN SHINER
MIMIC SHINER
UNID NOTROPIS
0.1
0.0
SUCKERMOUTH MINNOW
BLUNTNQSE MINNOW
5.2
9.1 la.2
21.8 25.4 17 .5
35.9 10.0
FATIlRAO MINNOW
0.1
0 . 1
0.0
0.0
0.1
0.1
BULI.HEAIl I1XmlOW
0.1
0.1
0.0
0.0
9.9
2.5
CREBK CHtIB
I
RIVER CARPSUCKER
0.1
0.1
0.4
0.1
QUILLBACK
0.2
0.1
0.3
0.1
WHITE SUCKER
0.2
0.2
SMALLMOUTH BUFFALO
0 . 1
0.1
2.4
1.7
1.5
0.4
BIGMOUTH BUFFALO
0.1
0.1
I
BLACK aUFFALO
SPOTT~
SUCKER
SILWR REDHORSE
0.3
0.3
0.1
0.0
RIVER REDBORSE
BLACK UDHORSE
0.1
0 . 0
I
GOLDEN REDHORSE
0.1
0.1
2 . 9
0.9
SHORTHEAD REDHORSE
0.0
0 . 0
0.3
0 . 1
um:D
MOXOS'l'OMA
BLAClt BULLHEAD
YELLOW BULLHEAD
0.1
0 . 1
0.8
0.9
0.3
0.2
0.2
0.1
I
CHANNEL
CM~FISH
O.B
1.4
2 . 5
3.0
6.2
4.3
2.2
0.6
um:D AMEIURUS
TADPOLE MAD'l'OIll
0.0
0.0
0.3
0.1
FLATHEAD CATFISH
0.1
0.1
BLACKS'l'RIPE TOPMINNOW
0.1
0.1
0.6
0.4
0.2
0.1
I
BROOK SILVE!!.SIDE
0.2
0.1
2.3
0.6
WHITE BASS
0.1
0.1
YELLOW BASS
um:D MORONE
ROCK BASS
0.0
0 . 0
0.0
0.0
0.4
0.1
GREEN stlNPISH
1.9
3.4
4 . 6
5 . 5
16.0 11. 0 20.3
5.6
I
PUMPKINSEED
3.4
6.0
loB
2.1
0.7
0.5
0.1
0.0
WARMOUTH
ORANGESPO'l'TED
SUNFISH
0.1
0.1
0 . 3
0.3
0.9
0.6
20.3
5.6
BLUEGILL
0.4
0.7
1.11
2.2 26.7
18.4 108.9 30.4
LONGEAll SIlNFJ:SB
0.5
I
0.3
0.6
0.2
HYBRID SUNFISH
0.2
0.3
0.7
O.S
9.3
6.4
2.3
0.7
um:D LEPOMIS
0.9
0.2
SMALLMOUTH BASS
0.1
0.1
0.0
0.0
0.5
0.3
1.1
0.3
LARGEMOUTH BASS
1.7
3.0
1.5
1.7
S.l
5.6
21.5
6.0
WHJ:TE CRAPPIE
0.0
0.0
0.1
I
0.0
BLACK CRAPPIE
(101
0.1
0.1
0.0
JOHNNY DARTER
0.1
0.1
LOGPERCH
0.9
0.2
BLACKSIDE DARTER
0.0
0 . 0
I
SLEN!)ERHEAD DARTER
SAUGER
WALLEY!!
FRESIIWA'l'ER DRUM
0.4
0.7
1.4
1.6
2.0
1.3
1.4
0.4
TOTAL
TOTAL
FISH
SPECIES
16
57.2 100.0
22
83.5
100.0
145.3
36
100.0
359.6
35
100.0
I
NOTE. 0.0 DENOTES VALUES I.ESS THAN
0.05.
4-14
I
Electronic Filing - Received, Clerk's Office, March 25, 2009
-.
Center for Applied Bioassessment
&.
Biocriteria
P.O. Box 21541
Columbus,
OR 43221"()541
..
'!/"~:".
'::":r¢'mpt~rattire
'Criteria
Options f9t the
_.'
. ". . '.' '" .
:
Lower
Des
.Plaines
River.
' .. :
... . .
. .. :!. • •• • ,
"
.
-
. .
.
,'.- . ....
- ...
, ' .
Final Report
to .
November 23, 2005
Chris O. Yoder, Research Director
Midwest Biodiversity Institute
P.O. Box 215641
Columbu~,
OH 43221-0561
and
Edward T. Rankin, Senior Research Associate
Center for Applied Bioassessment and Biocriteria
P.O. Box 21541
Columbus,OH 43221-0541
.:",.
;.
Appendix Table 1 G. Thermal thresholds for secondary contact .use RAS list
Fish Temperature Model - Selected Species Report
MWAT
Upper
F.amily Species
Optimum . Growth Avoidance
UILT
Code
Code
Common Name
DC
~C
DC
DC
Latin Name
20
003
Gizzard Shad
30.0
31.9
34.0
35.8 .
Dorospma cepedianum
43
001
Common Carp
31.5
33.4
34.9
37.3
Cyprinus carpio
43
003
Golden Shiner
27.8
29.9
30.7
34.0
Nptemigonus crysoleucas
43
042
Fathead Minnow
27.7
30.0
31.5
34.5
Pimephales promelas
43
043
Bluntnose Minnow
27.5
29.1
31.4
32.4
. Pimephales notatus
47
006
Black Bullhead
27.6
30.2
32.1
35.4
Ameiurus melas
77
006
Largemouth Bass
29.1
30.9
31.6
34.5
Micropteru5 salmoides
77
008
Green Sunfish
27.8
30.3
30.9
35.3
Lepomis cyanellus
70
CABB/MBI
Lower Des Plaines Temperature Critc:ria Options. REVISED
July 11, 2007
Table 3. Fish temperature model outputs (OF\OC)) for fish species representative of a
modified use (two versions) and the Secondary Contact/Indigenous Aquatic Life use
for the Lower Des Plaines River. The long-term and short-term survival temperatures
represent summer season Gune 16 - September 15) average and maxima.
Thennal
Category
Proportion of Representative Fish Species
100%
90%
75%
50%
Modified Use RAS
1 (includes golden
redhorse)
Optimum
71.2 (21.8)
75.4 (24.1)
81.3 (27.4)
82.6 (28.1)
Growth (MWA
n
77.5 (25.3)
81.0 (27.2)
85.8 (29.9)
86.7 (30.4)
Avoidance (UA
n
83.7 (28.
7)
84.
9 (29.
4)
87.1(30.6)
88.9 (31.6)
Survival (Long-term)
85.1 (29.5)
86.5 (30.
3)
89.1 (31.1)
91.4 (33.0)
Survival (Short-term)
88.1 (31.5)
90.1 (32.3)
92.7 (33.7)
95.0 (35.0)
Modified Use RAS
2 (excludes golden redhorse)
Optimum
71.2 (21.8)
75.0 (23.9)
81.5 (27.5)
82.8 (28.2)
Growth (MWA
n
77.
5 (25.3)
80.6 (27.0)
85.8 (29.9)
86.9 (30.5)
Avoidance (UA
n
83.7 (28.7)
85.6 (29.
8)
87.4 (30.8)
89.1 (31.1)
Survival (Long-term).
85.1 (29.5)
86.5 (30.
3)
89.8 (32.1)
91.4 (33.0)
Survival (Short-term)
88.7 (31.5)
90.1 (32.3)
93.4 (34.1)
95.0 (35.0)
Secondary Contact/lndigcnous Aquatic Life
Optimum
81.5 (27.5)
81.7 (27.6)
81.9 (27.7)
82.1 (27.8)
Growth (MWA
n
84.5 (29.1)
85.3 (29.7)
86.0 (30.0)
86.5 (30.3)
Avoidance (UA
n
81.3 (30.7)
87.5(30.8)
88.3 (31.3)
88.9 (31.6)
Survival (Long-term)
86.7 (30.
4)
88.7 (31.5)
90.3 (32.4)
91.2 (32.9)
Survival (Short-term)
90.3 (32.4)
92.2 (33.
5)
93.9 (34
.4)
94.8 (34.9)
---------------
- ---------------
--------------
-
'r1UlJ.E 14.
SPECIES COll1POSITION, NUMBER, AND REIJt.TlVl!: IUlUNDANCE OF FISH COLLtCTED WITHIN FOUR
SEGMENTS OF THE UPPER ILLINOIS \'/ATERWAY, 1994, 1995, 2000-2002, AND 2005-2006.
SPECIES
SKIPJACK
HERRING
GI:.l~
SHAD
'l'IIlU:ADFIN
SHAD
RAINBOW TROUT
GRASS PICKEREL
NORTHERN PIKE
GOLDFISH
COMMON CARP
CARl' X GOLDFISH HYBRID
GOLDEN Sflrm:R
EImRALD Sfllm:R
SJlOTTAIL SHIm:R
SI'OTFIN SHIm:R
SloND SHlm:R
BJ.UNTNOSE MINNOW
FATHEAD MINNOW
BULr.HEAD MINNOW
I'IHITl!: SUCKER
ORIENTAL WEATKERFISK
BIJt.CK BULLlIEJ\l)
YELLOW BULLHEAD
CHANNEL CATFISH
TADPOLE MADTOM
BLACKSTRIPE TOPMINNOW
WESTERN
I~OSQUrTOFISH
BROOK SILVERSIDE
THREESPlNE
STICKLEBACK
WHITE PERCH
WHI'rE BASS
YEt.LOW
BASS
GREEN SUNFISH
PUMPKINSEED
l'IARbIOUTH
ORANGESPOTTED SUNFISH
BLUEGILL
WNGEAR SUNFISH
REDEAR SUNFISH
HY»RID SUNFJ:8H
UNtO LEPOMIS
SMALLMOU'l'H BASS
LARGEMOUTH BASS
I'IHITE Cl\APPIE
BIJt.CK CRAPPIE
FRESHl'lATER DRUM
ROUND GOBY
TOTAL FISH
CATCH PEa GEAR EFFORT
TOTAL 6PECIJ::S
r.o~IER
LOCKPORT POOL
1994
1995
2000
2001
2002
2005
2006
_* __ % _ _ fL _ % __
11 __
%
_ _ fL _% __
11 _ _
% _ _ fL _% __ fL
_ %
_
1
1.7
e 13.
B
29 50.0
3
5.2
1
1.7
3
5.2
1
1.7
2
3.4
1
1.7
1
1.7
1
1.7
3.4
1
1.7
58 100.0
4
12
33 20.6
2
1.3
18 11.3
8
5.0
21 13.1
2
1.3
1
0.6
1
0.6
1
0.6
Ii
3.8
1
0.6
1
0.6
64 4a.0
1
0.6
160 100.0
11
13
404
"
1
5
53
1
so
16
37
1
1
2
16
3
28
2-
0.1
64.0 1615 66 . 8 2500
0.6
75.B 1245
0.2
0.8
0.0
2
0.1
B.4
70
2.9
140
4.2
eo
0.2
1
0.0
2
0.1
15
7.9
178
7.4
178
0.15
5.4
34
3
0.1
1
0.0
2.5
6
0.2
20
0.6
1
0.0
5.9
383 15.8
189
5.7
314
0.2
1
0.0
9
1
0.0
1
3
4
0.2
1
0.0
0.1
0.1
3
0.8
20
0.8
22
0.7
10
1
0.0
1
0.0
O.
a
3
0.1
1
0.3
21
O.B
1
2.5
0.5
a.6
1
0.0
10
1
75
3
19
1
1
1
22
1
0.4
0.0
3.1
0.1
0.8
0.0
0.0
0.0
0.9
0.0
110
3.3
10
0.3
1
0.0
3
0.1
27
0.9
2
0.1
1
0.0
17
0.5
2
0.1
1
0.0
3
0.1
"
0.1
10
1
10
2
23
5
1
71.2
4.6
1.4
0.1
18.0
0.1
0.1
0.2
0.6
0.1
0.1
O.B
0.6
0.1
0.6
0.1
1.3
0.3
0.1
631 100.0
16
2417 100.0
60
3297 100. a
e2
1748 100.0
44
16
22
29
17
4-6
1
0 . 1
629 61.5
1
0.1
38
3.7
1
0.1
59
5.8
2
0.2
140 13.7
1
0.1
3
0.3
1
0.1
13
1.3
1
0.1
31
55
1
7
3
1
27
6
1
3.0
5.4
0.1
0.7
0.3
0.1
2.6
0.6
0.1
1022 100.0
26
20
I
I
I
I
I
I
I
I
I
I
'. '
.'
'.,
\
.
... _-
.
.
. .
.. ,.
.
1
"
r
August 2007
Section
4
. Characterization of Waterway Reaches
SOD data was available for one study conducted by MWRDGC in the fall and winter
of 2001 that included three locations along the CSSC. Measurements performed on
sediments at Cicero, I-55, and Lockport were 1.71,3.64, and 2.71 g/m2/day
respectively.
4.4.4 Biological Assessment
4.4.4.1 Fish
Chicago Sanitary Ship Canal
Fish sampling in the CSSC was conducted at five MWRDGC locations:
•
Damen Avenue
•
Cicero Avenue
•
Harlem Avenue
•
Willow Springs
•
LP&L (16th Street)
Twenty-seven species of fish (excluding hybrids) were captured
in the csse from
1993
to 2002, with the dominant fish species being common carp, gizzard shad,
goldfish,
and bluntnose minnow (Table 4-47). Dominant game fish species included
largemouth bass,
pumpkinseed and bluegill.
The greatest species diversity (19 species) was observed at Cicero Avenue, with
lowest diversity being at Darnen Avenue. Species diversity showed a general decline
in the 1990s, and began to rebound in 2001 (Figure 4-32). IBI scores ranged from 12 to
24
and were fairly uniform throughout the CSSC (Figure 4-33). The median IBI score
for the
CSS fish sampling sites was 18. These IBI scores are reflective of poor to very
poor water quality conditions
in
the CSSe.
4.4.4.2
Macroinvertebrates
MWRDGC sampled macroinvertebrates at six locations
in
the CSSC during 2001 and
2002.
•
Damen Avenue
•
Cicero Avenue
•
Harlem Avenue
•
Route83
•
Stephen Street
•
LP&L
(16
th
Street)
4.77
Il5tlM1-..nomcAWS UM",,- odIlIRNAL SECTION 4
.
doo
Electronic Filing - Received, Clerk's Office, March 25, 2009
!
Table4-47 Species
~ic
- ~~~~ ' ~~d R~~ti~"Ab~~;anceof
Fish
specl;;in~i.~cssc
1;93.20;~AiISampii~;
- L~~~
;
~; r - -
.
" - - .
.
_ ...
"j' .
• . -- r .
.
...
_
... "
;
-
..
- . ~ .
-'!
COM
4.78
1\SII .. r1-.vnon1CAWS
UMIA&Iguol ediI.lflNAL
SECTION 4
.
_
Electronic Filing - Received, Clerk's Office, March 25, 2009
COM
Figura 4-32. Temporal Trend in Fish Specie. Diversity in lila
esse
1993 - 2002
Year
Figura 4-33. 181 ScorN far
Fish
Sampling La
.
Catians on
Iha esse
1992 - 2002
30 ,
20
16
10
o
~~~.,#~.?#~~~
..
~";p~/
//
/~~v /~/,i~/:1'
//
/~:t~ A~
Sampling Date
1 __ Oamen Ave ...... CIcero Ave
Harlem Ave --WIlloW
Springs ---
Loc!<port 1
Tables 4-48 shows the relative abundance, species richness and associated MBI score
for
both MWRDGC HD and PP dredge sample collection methods. Thirty-one
species of macroinvertebrates
were collected
in
the esse. Species richness for the
MWRDGC
HD data set was highest at the Lockport sampling location (14 species).
4-79
"" .... , ........... c.ws
UAA\A&laUII O1IIoIFINAL SECTION ... _
Section 4
Characterization
of Waterway Reaches
Dominant taxa in the csse was Oligochaeta (82%), followed by Turbellaria and
Dicrotendipes simpsoni .
. MBI scores for HD sampling data ranged from 6.4 at Damen
Avenue to 9.6 at Cicero Avenue,
and the PP dredge MBI scores ranged from 7.0 at
Damen Avenue to 10.0 at Lockport. Additional data collected in 2001 by MWRDGC
at Lockport, showed three caddisfly taxa present. The high MBI scores are reflective
of a poor to very poor water quality conditions in the CSSC.
4.4.4.3 Habitat
Rankin's (2004) habitat evaluation showed that the CSSC instream habitat ranged
from
poor to very poor. The habitat at L, Romeoville and Willow Springs Road was
canal-like
with steep sides and little functional cover for fish (Table 4-49). Limiting
factors for the
CSSC include:
•
Silty substrates
•
Poor substrate material
•
Little instream cover
•
Channelization
•
No sinuosity
The stretch
of waterway between Harlem and Cicero avenues had some shoreline
shallows
that provided suitable habitat to support a slightly better community than
found
in
the remainder of the CSSC channel (Rankin 2004).
Rankin
categorized the
Harlem to Cicero street section as
MWH
~ C,
while the other portions of the CSSC were
considered a
LRW according to Ohio EP
A'
s classification system.
4.4.5 IEP A Letter Response Request
As part of this UAA study, IEP A requested from communities along the csse
if
they
had plans for instream habitat improvements or the development of swimming areas.
There
were no responses back to IEP A from the municipalities contacted.
4.5 Calumet System
The Calumet System consists of the Calumet-Sag Channel, the east and west segments
of the
Uttle Calumet River, North Leg, the GCR, the Calumet River and Lake
Calumet. The total segment
length is 26.2 miles.
4-80
Electronic Filing - Received, Clerk's Office, March 25, 2009
ATTACHMENT 8
RESUME OF NICK OWENS
NICK OWENS
Ecologist
Expertise:
Ecological Issues, Freshwater Mussels, Fish, Botanical Surveys, Threatened and Endangered
Species
Plant Management
&
Herbiciding
Mr. Owens has an extensive background in managing plant communities in wetlands, grasslands and forests. His
extensive knowledge of community dynamics and landscape ecology and experience with herbicide applications have
helped in the following recent projects:
•
Conducted selective herbicide treatments on exotic species at a dolomite prairie in the Midewin National
Tallgrass Prairie complex (2007).
•
Managed five wetlands within a utility right
of way conducting routine site visits to manage exotic species
including coordinating and overseeing a crew
of three people (2007).
•
Conducted selective herbicide treatments on a wetland within DuPage County, and additionally drafted a planting
plan and conducted plantings to meet DuPage County wetland standards (2007).
•
Coordinated and supervised herbicide applications for various exotic species at Keepataw Forest Preserve, Will
County (2007) on approximately ten acres
of upland and wetland areas.
T &E Species Surveys
Mr. Owens has surveyed both invertebrate and vertebrate populations of state listed species throughout Illinois.
Recent projects include:
•
Conducted a visual survey for the State-Endangered Eastern Massasauga
(Sistrurus catenatus)
and a cover board
survey for the State-Threatened Kirtland's snake
(Clonophis kirtlandii)
along a 100+ acre corridor of the Plum
Creek Tributary in Crete, Will County (2007)
•
Transplanted the Illinois State-Threatened species bog arrow grass
(Triglochlin palustris)
along 1-294 to suitable
protected habitat for the Illinois Tollway and monitored success of translocation efforts (2007).
•
Conducted field investigations for the Illinois State-Threatened Spike Mussel
(Elliptio dilatata),
Black Sandshell
(Ligumia recta),
and Slippershell Mussel
(Alasmidonta viridis)
in addition to the Illinois State-Endangered
Butterfly Mussel
(Ellipsaria linealata)
and Spectaclecase Mussel
(Cumberlandia monodonta).
•
Conducted field investigations for the Illinois State-Endangered bam owl
(Tyto alba)
near Goodenow, Illinois
(2007)
•
Conducted a live trap survey for the Illinois State-Threatened Franklin's ground squirrel
(Spermophilus
franklinii)
along 7+ miles of railroad right-of-way in Will and Grundy Counties (2007)
•
Conducted field investigations for the Illinois State-Threatened white ladies slipper
(Cypripedium candidum)
along 2 miles of railroad right-of-way in Lake County, Illinois (2008).
Tree Surveys
Mr. Owens has conducted tree surveys across the state of Illinois since the summer of2004. Recent tree surveys
include:
•
Identified 50+ trees for the Illinois Tollway along
1-94 (2007).
•
Identified 2,000+ trees for roadway and railway projects in Will and Kane Counties (2008).
•
Identified 300+ trees for Graef Engineering along Interstate 90 (2009).
•
Identified 500+ trees for CDI for an 8 mile sewer line project in Indianapolis, IN (2009).
Stream Surveys
Mr. Owens has managed multiple biological stream surveys. These projects typically include identification of
aquatic biota and qualitative assessment of biotic communities and stream habitat. Techniques used during
stream surveys include electro fishing via backpack electro fisher
or an electric seine, kick-sort invertebrate
sampling, Hester-Dendy artificial substrate deployment, and
hand and visual mussel searching. Additionally,
Mr. Owens put together survey reports, including background historical research, historical collection searches,
and
FOIA requests. Recent projects include:
C:\Documents and Settings\TimH\Local Settings\Temporary Internet Files\Content.Outlook\OOTZ9D07\Owens N 2009.doc
Page 1
Electronic Filing - Received, Clerk's Office, March 25, 2009
•
Fish community characterization, analysis of fish tissue for presence of PCB's, macro invertebrate,
mussel, SOD, sediment, and habitat study along a 6.5 mile stretch
of Cedar Creek, Knox County, Illinois
for the Galesburg Sanitary District (2007).
•
Stream surveys
on a 2.5 mile stretch of Hickory Creek, including fish community characterization,
mussels, and macro invertebrate collections as well as water quality analysis (2007).
•
Stream surveys
on a 3.2 mile stretch of the Jackson Branch of Jackson Creek, and Spring Creek,
including fish community characterization, mussels, and macro invertebrate collections as well as water
quality analysis (2007)
•
Stream surveys
on a 1.5 mile stretch of Spring Creek, including fish community characterization,
mussels, and macro invertebrate collections as well as water quality analysis (2007)
•
Mussel survey and mussel relocation at Brewster Creek in conjunction with Stearns Road Bridge project
(2007).
•
Mussel survey
of Big Rock Creek at Jericho Road for the state threatened Spike Mussel (2007).
•
Mussel survey
of a one mile stretch of Beaver Creek for the state threatened Spike Mussel (2007).
•
Sampled sediment at various locations on the East Branch ofthe DuPage River in DuPage County
(Conservation Foundation, 2007)
•
Fish community characterization, macro invertebrate, mussel, and habitat study in the West Branch
of the DuPage River, in association with the McDowell Grove Dam Removal, DuPage County,
Illinois for
the DuPage County Forest Preserve District (2008).
•
Mussel survey of Tyler Creek at Damisch Road for the state threatened Slippershell Mussel (2008).
•
Mussel survey of Big Rock Creek at Jericho Road for the state threatened Slippershell Mussel
(2008).
•
Mussel survey and relocation on the Mississippi River near Wood River, Illinois (2008) ofneady
1,500 mussels including the Illinois state-endangered Spectaclecase Mussel and the Illinois state-
threatened Butterfly Mussel
and Black Sandshell Mussel.
Water Quality Assessments
Mr. Owens has conducted pollutant loading analysis for roadway projects as it pertains to stream water quality
impacts. Common techniques employed during pollutant loading analysis include the Driscoll and the Driver
methods. Additionally,
Mr. Owens has prepared antidegradation analysis reports for several municipal waste
water treatment plant projects.
•
Assessment
of pollution impacts associated with Interstate Route 88 improvements in the Fox River
watershed in Kane County for Teng Engineering (2007).
•
Antidegradation analysis associated with the City
of McHenry WWTP expansion on the Fox River in
McHenry County for Donohue
&
Associates (2007)
•
Regularly conducted water quality inspections for a construction site in Antioch, IL (2007).
•
Antidegradation analysis associated with the Village
ofN ew Lenox Central WWTP on Hickory Creek in
Will County (2009).
Wetlands and Permitting
Mr. Owens has completed over 200 wetland screenings totaling more than 30 miles oflinear projects in Carroll,
Cook, DuPage, Ford, Grundy, Kane, Kankakee, Kendall, Lee, Lake, LaSalle, Livingston, McLean, McHenry,
Ogle, Pike, Stephenson, Will, Winnebago, and Woodford Counties, Illinois.
Mr. Owens has delineated wetland projects in Cook, DuPage, Kane, Lake, Livingston, McLean and Will
Counties, Illinois. Recent projects include:
•
Over 2 miles
of right-of-way along Interstate 294 for the Illinois Department of Transportation,
including right-of-way areas within the Gensburg-Markham Prairie Nature Preserve.
•
Over 40 acres
of newly acquired right-of-way along Interstate 55 for the Illinois Department of
Transportation in the vicinity of Midewin National Tallgrass Prairie.
•
Over 2 miles
of right-of-way along Interstate 90 for the Illinois Department of Transportation at Illinois
Route 47.
C:\Documents and SettingsVimH\Local Settings\Temporary Internet Files\Content.Outlook\OOTZ9D07\Owens N 2009.doc
Page 2
Electronic Filing - Received, Clerk's Office, March 25, 2009
•
Over 30 acres of newly acquired right-of-way for the Kane County Department of Transportation, in
association with the proposed Anderson Road extension project, vcty. Elburn, Illinois.
•
Over 20 acres
of proposed easement for a natural gas pipeline installation in Livingston and McLean
Counties for Nicor Gas.
Mr. Owens has delineated a wetland project in Marion County Indiana for a new sewer line totaling 8 miles in
length (Clark Dietz, Inc. 2008).
Mr. Owens has also delineated a wetland project in Lake County Indiana for the Indiana Toll Road totaling five
acres.
Mr. Owens also has experience preparing County permits for Kane, DuPage, Lake, McHenry, McLean and Will
Counties as well as NPDES permits and IHPA, USFWS, and IDNR clearances. Additionally
Mr. Owens has
experience preparing USACOE Joint Application permit submittals.
Environmental Site Inspection/Soil and Erosion Control Inspection
Mr. Owens has provided environmental site inspection for underground utility boring projects, offering
environmental overview and compliance services.
Past Experience
•
Prior to his work at Huff
&
Huff, Mr. Owens was employed by Shirley Heinze Land Trust as a Restoration
Program Assistant. He was part
of a team of Restoration Ecologists who worked to restore wetlands,
prairies, savannahs, and forests with particular focus on globally rare dune and swale habitat.
It
was
necessary to learn
to identify many trees and prairie plants quickly and to understand the various theories of
restoration. The methods included herbiciding, brush cutting, chain sawing, prescribed bums, and seed
collecting. (2006-2007)
•
Prior
to his work for the Shirley Heinze Land Trust Mr. Owens worked as a Botanical Assistant for the
Illinois Natural History Survey Critical Trends Assessment Program doing botanical surveys
of randomly
selected woodlands, wetlands and grasslands across the state
of Illinois (summer 2004,2005,2006,2007).
•
Mr. Owens also worked as an Independent Contractor for the Illinois Department
of Natural Resources
chemically treating exotic species at various Illinois State Nature Preserves and Illinois State Land and
Water Reserves throughout east central Illinois (2001-2006).
•
Mr. Owens has also worked with the Illinois Department
of Natural Resources as an Assistant Streams
Biologist where he identified benthic macro-invertebrates from streams across Illinois using Illinois
Environmental Protection Agency protocols, conducted fish sampling via an electric seine and boat
sampling techniques in association with the Kaskaskia River Intensive Basin Surveys which included
mainstem and tributary sampling efforts, fish identification, surveying freshwater mussel fauna, and
identification
of freshwater mussel species. Mr. Owens has also been intricately involved with mussel
sampling efforts for the Illinois Department
of Natural Resources Intensive Basin Survey in relation to the
Embarras and Sangamon River basins.
Educational Experience
B.A. in Biology Eastern Illinois University - Charleston, Illinois (1999-2003)
Professional Affiliations
American Malacological Society, Inc.
Freshwater Mollusk Conservation Society
Illinois State Academy
of Sciences
Illinois Native Plant Society
Natural Areas Association
American Fisheries Society - Illinois Chapter
Illinois Prescribed Fire Council
C;\Documents and Settings\JimH\Local Settings\Temporary Internet Files\Content.Out!ook\OOTZ9D07\Owens N 2009.
doc
Page 3
Certifications
•
Illinois Pesticide Public Applicator License (2002-2006)
•
Illinois Pesticide Commercial Operator License (2007-present)
•
Indiana Pesticide Applicator License (2007-present)
•
Soil Erosion
Control- Joliet Junior College March 21,2007 (Stormwater Management)
•
Wetland Delineation Training, Institute for Wetland
&
Environmental Education and Research, 2007
•
Contractor Orientation Course BNSF, UPRR, Metra Railroads (2007
to present)
•
Wetland Plants course, DuPage County, 2007
•
Wetland Plants course, DuPage County, 2008
•
Illinois Department
of Natural Resources Scientific Permit - all aquatics (fish, mussels,
macro invertebrates, etc.) (2006-present)
•
Indiana Department
of Natural Resources Scientific Purposes License - fish, mussels (2008-present)
•
United States Fish and Wildlife Service Scientific Purposes Permit - mussels (Illinois and Indiana) -
2008 to present
•
McHenry County Certified Wetland Specialist (2008-present)
•
Emergency Management Institute IS-00I00.a and IS-00700.a Coursework
•
National Wildfire Coordinating Group L-180, S-130, and S-190 40 hour Red Card certification
Coursework (2009)
Presentations
SERVING NUMEROUS WIDELY SCATTERED SITES WITH A SMALL NUMBER OF VOLUNTEERS.
12th Annual Northern Illinois Prairie Workshop. College
of Dupage, Glen Ellyn, IL. (2001).
SURVEY OF THE FRESHWATER MUSSELS (MOLLUSCA: BIVALVIA: UNIONIDEA) OF THE
EMBARRAS RIVER BASIN, ILLINOIS. Illinois State Academy
of Science Meetings. Southern Illinois
University, Edwardsville, IL. (2002).
SURVEY OF THE FRESHWATER MUSSELS (MOLLUSCA: BIVALVIA: UNIONIDEA) OF THE
EMBARRAS RIVER BASIN, ILLINOIS. Midwest Fisheries Conference, Bettendorf, IA (2002).
SURVEY OF THE FRESHWATER MUSSELS (MOLLUSCA: BIVALVIA: UNIONIDEA) OF THE
EMBARRAS RIVER BASIN, ILLINOIS. Illinois Chapter
ofthe American Fisheries Society meetings. Rend
Lake Conference Center, IL (2003).
VEGETATION OF CONEFLOWER GLACIAL DRIFT HILL PRAIRIE NATURAL AREA, MOULTRIE
COUNTY, ILLINOIS. Illinois State Academy
of Science Meetings. Eastern Illinois University, Charleston, IL
(2004).
DAMN THOSE DAMS - THEIR EFFECT ON FRESHWATER MUSSELS. Jeremy Tiemann, Hope Dodd,
Nick Owens, David Wahl. Joint Meetings
of the Illinois Chapter of the American Fisheries Society and The
Wildlife Society. Rend Lake Conference Center, IL (2006).
Posters
25 Years
of Vegetational Changes in a Glacial Drift Hill Prairie Community in East Central Illinois. Illinois
State University, Normal, IL (2003).
Assessment and Relocation
of a Mussel Bed, Mississippi River, Greater St. Louis Metropolitan Area. Illinois
Chapter
of the American Fisheries Society. Fifth Season Hotel, Moline, IL (2009).
Publications
Owens, N.L., Cole, G.N. 25 Years
of Vegetational Changes in a Glacial Drift Hill Prairie Community in East
Central Illinois. 2003. Transactions
of the Illinois State Academy of Science 96: 265-269.
Owens, N.L., Ebinger, J.E. 2006. Flora and Vegetation
of Coneflower Glacial Drift Hill Prairie Natural Area,
C:\Documents and Settings\.JimH\Local Settings\Temporary Internet Files\Content.Outlook\OOTZ9D07\Owens N 2009.doc
Page 4
Electronic Filing - Received, Clerk's Office, March 25, 2009
Moultrie County, Illinois. Rhodora 108: 370-386.
Tiemann, J.S., H.R. Dodd, N. Owens, and D.H. Wahl. 2007 Effects
of multiple low head dams on freshwater
mussels in the Fox River, Illinois. Northeastern Naturalist. 14(1): 125-138.
Owens, N.L., Ebinger, J.E. 2008. Windfall Glacial Drift Hill Prairie, Vermillion County, Illinois: Present
Vegetation and Changes Since 1977. Transactions
of the Illinois State Academy of Science 101: 157-
165.
Tucker, T.C,
B. Edgin, N.L. Owens, J.E. Ebinger. 2008. Botanical Survey of Wildcat Hollow State Forest,
Effmgham County, Illinois. Transactions
of the Illinois State Academy of Science
(In
Press).
C:\Documents and Settings\JimH\Local Settings\Temporary Internet Files\Content.Outlook\OOTZ9D07\Owens N 2009.doc
Page 5
Electronic Filing - Received, Clerk's Office, March 25, 2009