Janet
Peace,
Director
of
Markets
and
Business
Strategies,
Senior
Economist,
Pew
Center
on
Global
Climate
Change,
"Insights
from
Modeling
Analyses
of
the
Lieberman-Warner
Climate
Security
Act
(S.
2191
),"
PowerPoint
presentation
(May
2008),
<
www.pewclimate.org/docUploads/
Peace-PPT.pdf
>.
Electronic Filing - Received, Clerk's Office, October 1, 2008
* * * * * PCB 2009-021 * * * * *
Electronic Filing - Received, Clerk's Office, October 1, 2008
* * * * * PCB 2009-021 * * * * *
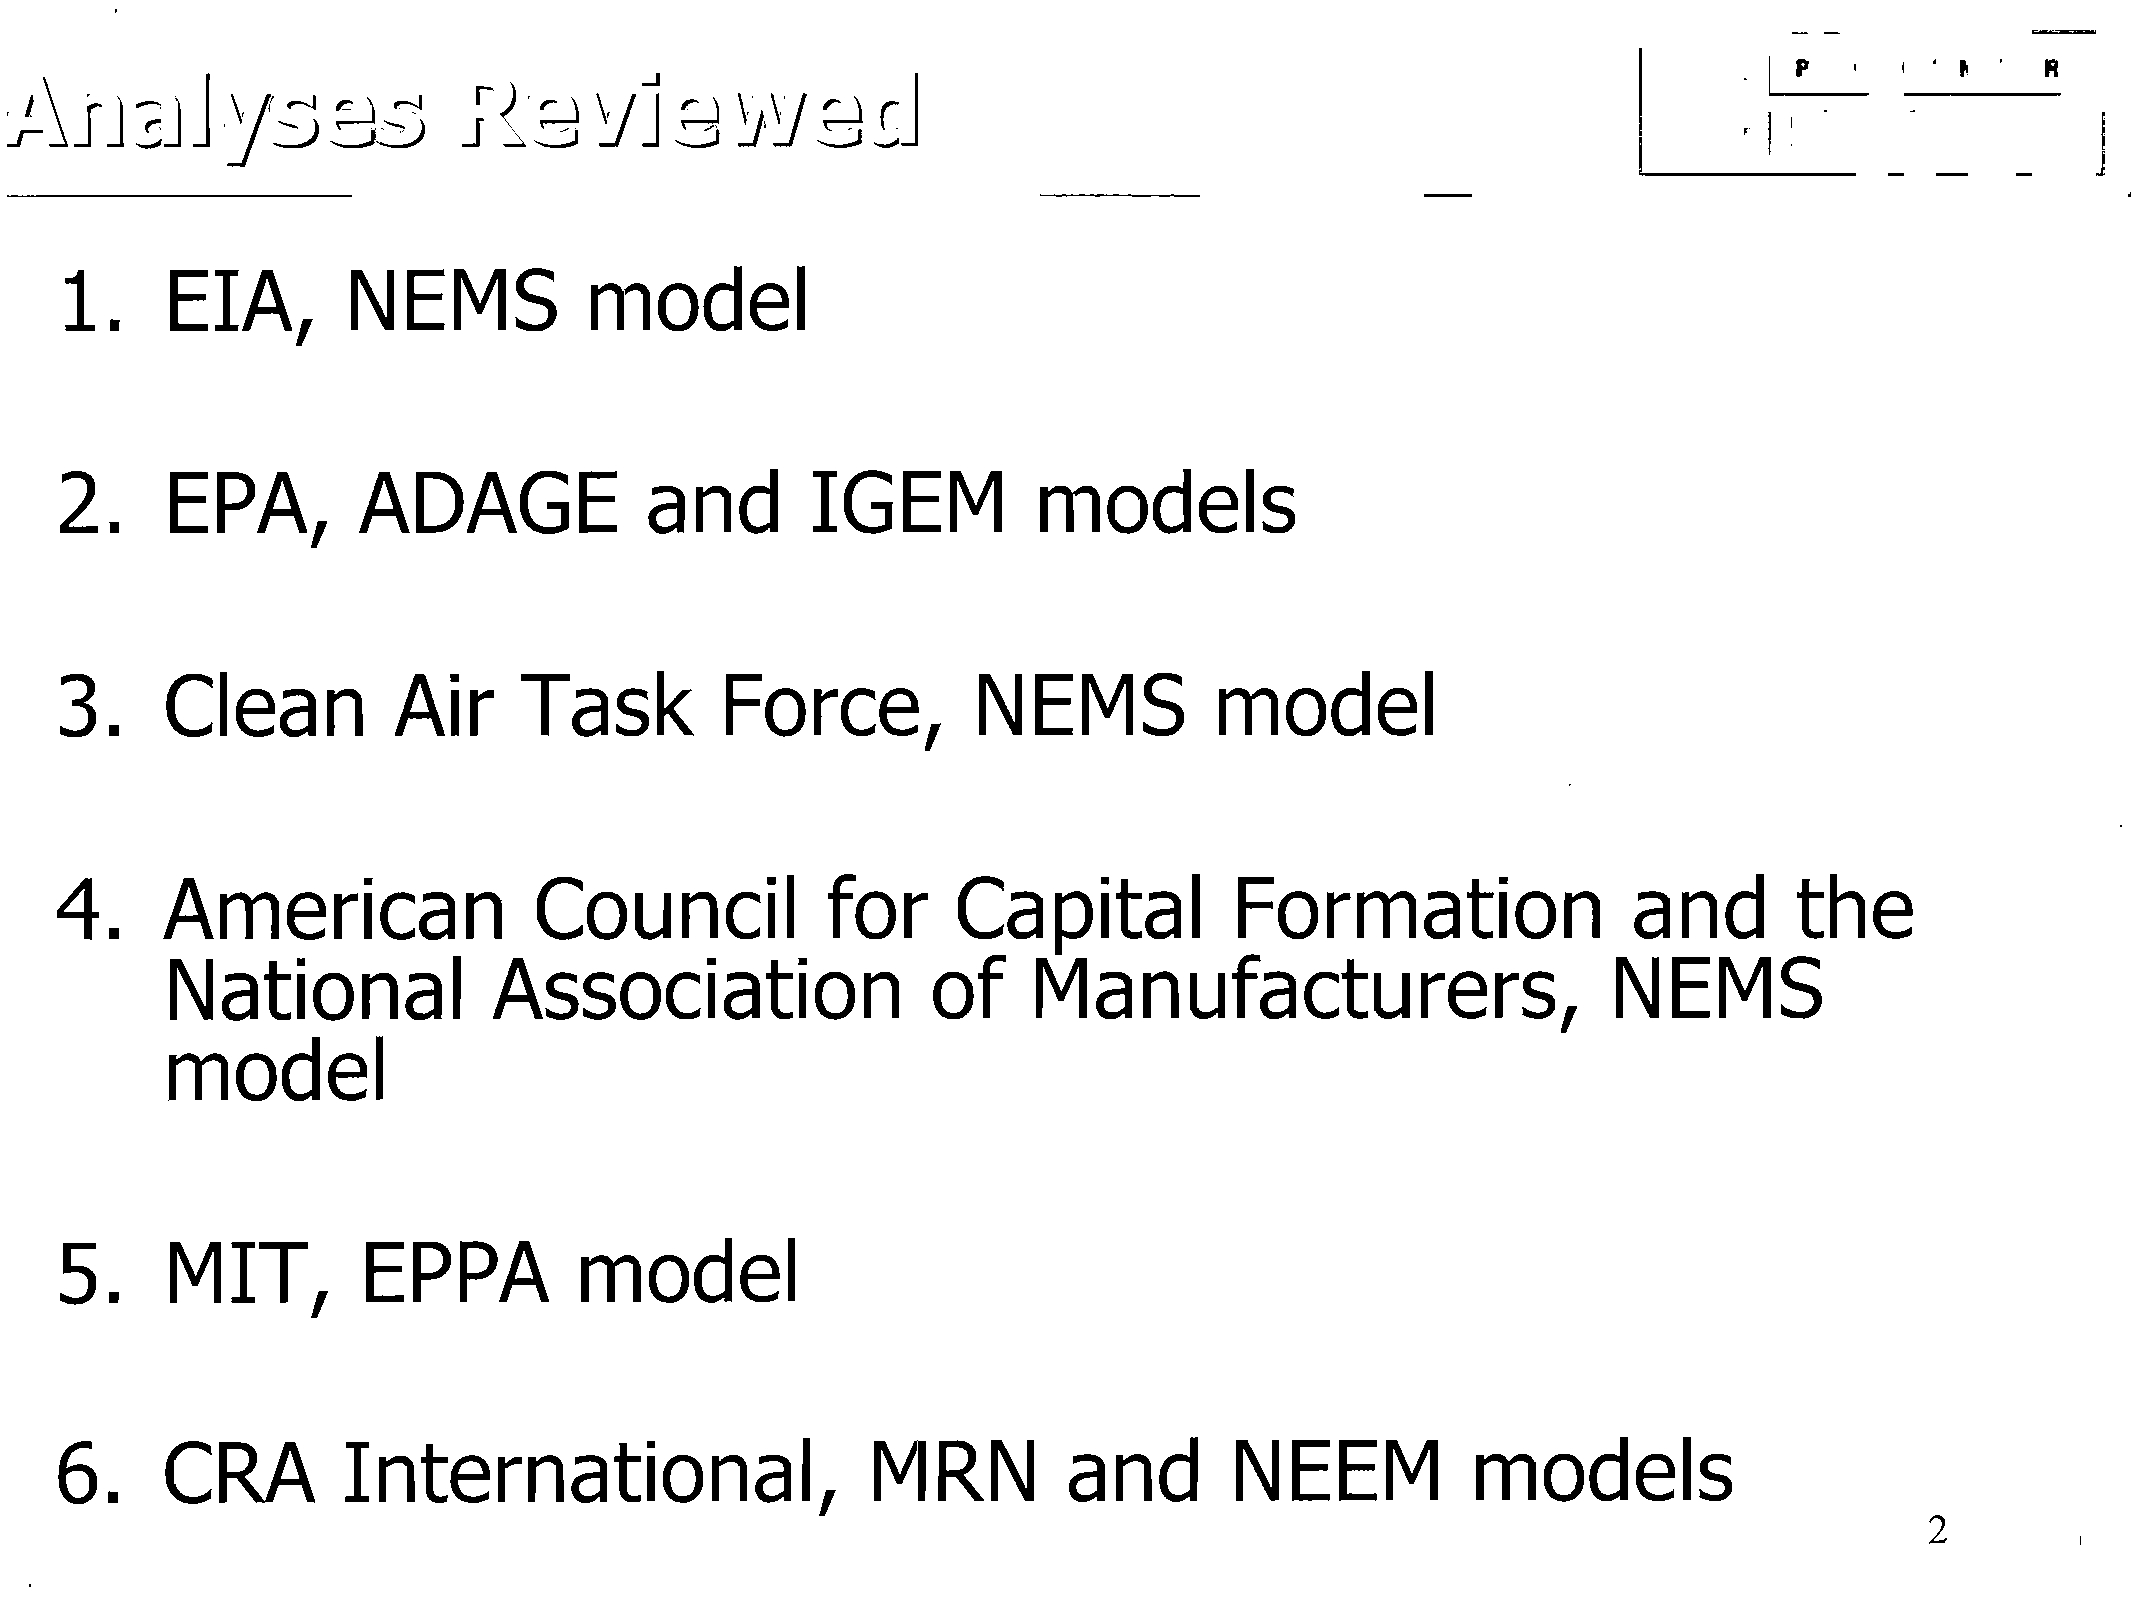
1. EIA, NEMS model
2. EPA, ADAGE and IGEM models
3. Clean Air Task Force, NEMS model
4. American Council for Capital Formation and the
National Association of Manufacturers,
NEMS
model
5. MIT, EPPA model
6. CRA International, MRN and NEEM models
2
Electronic Filing - Received, Clerk's Office, October 1, 2008
* * * * * PCB 2009-021 * * * * *
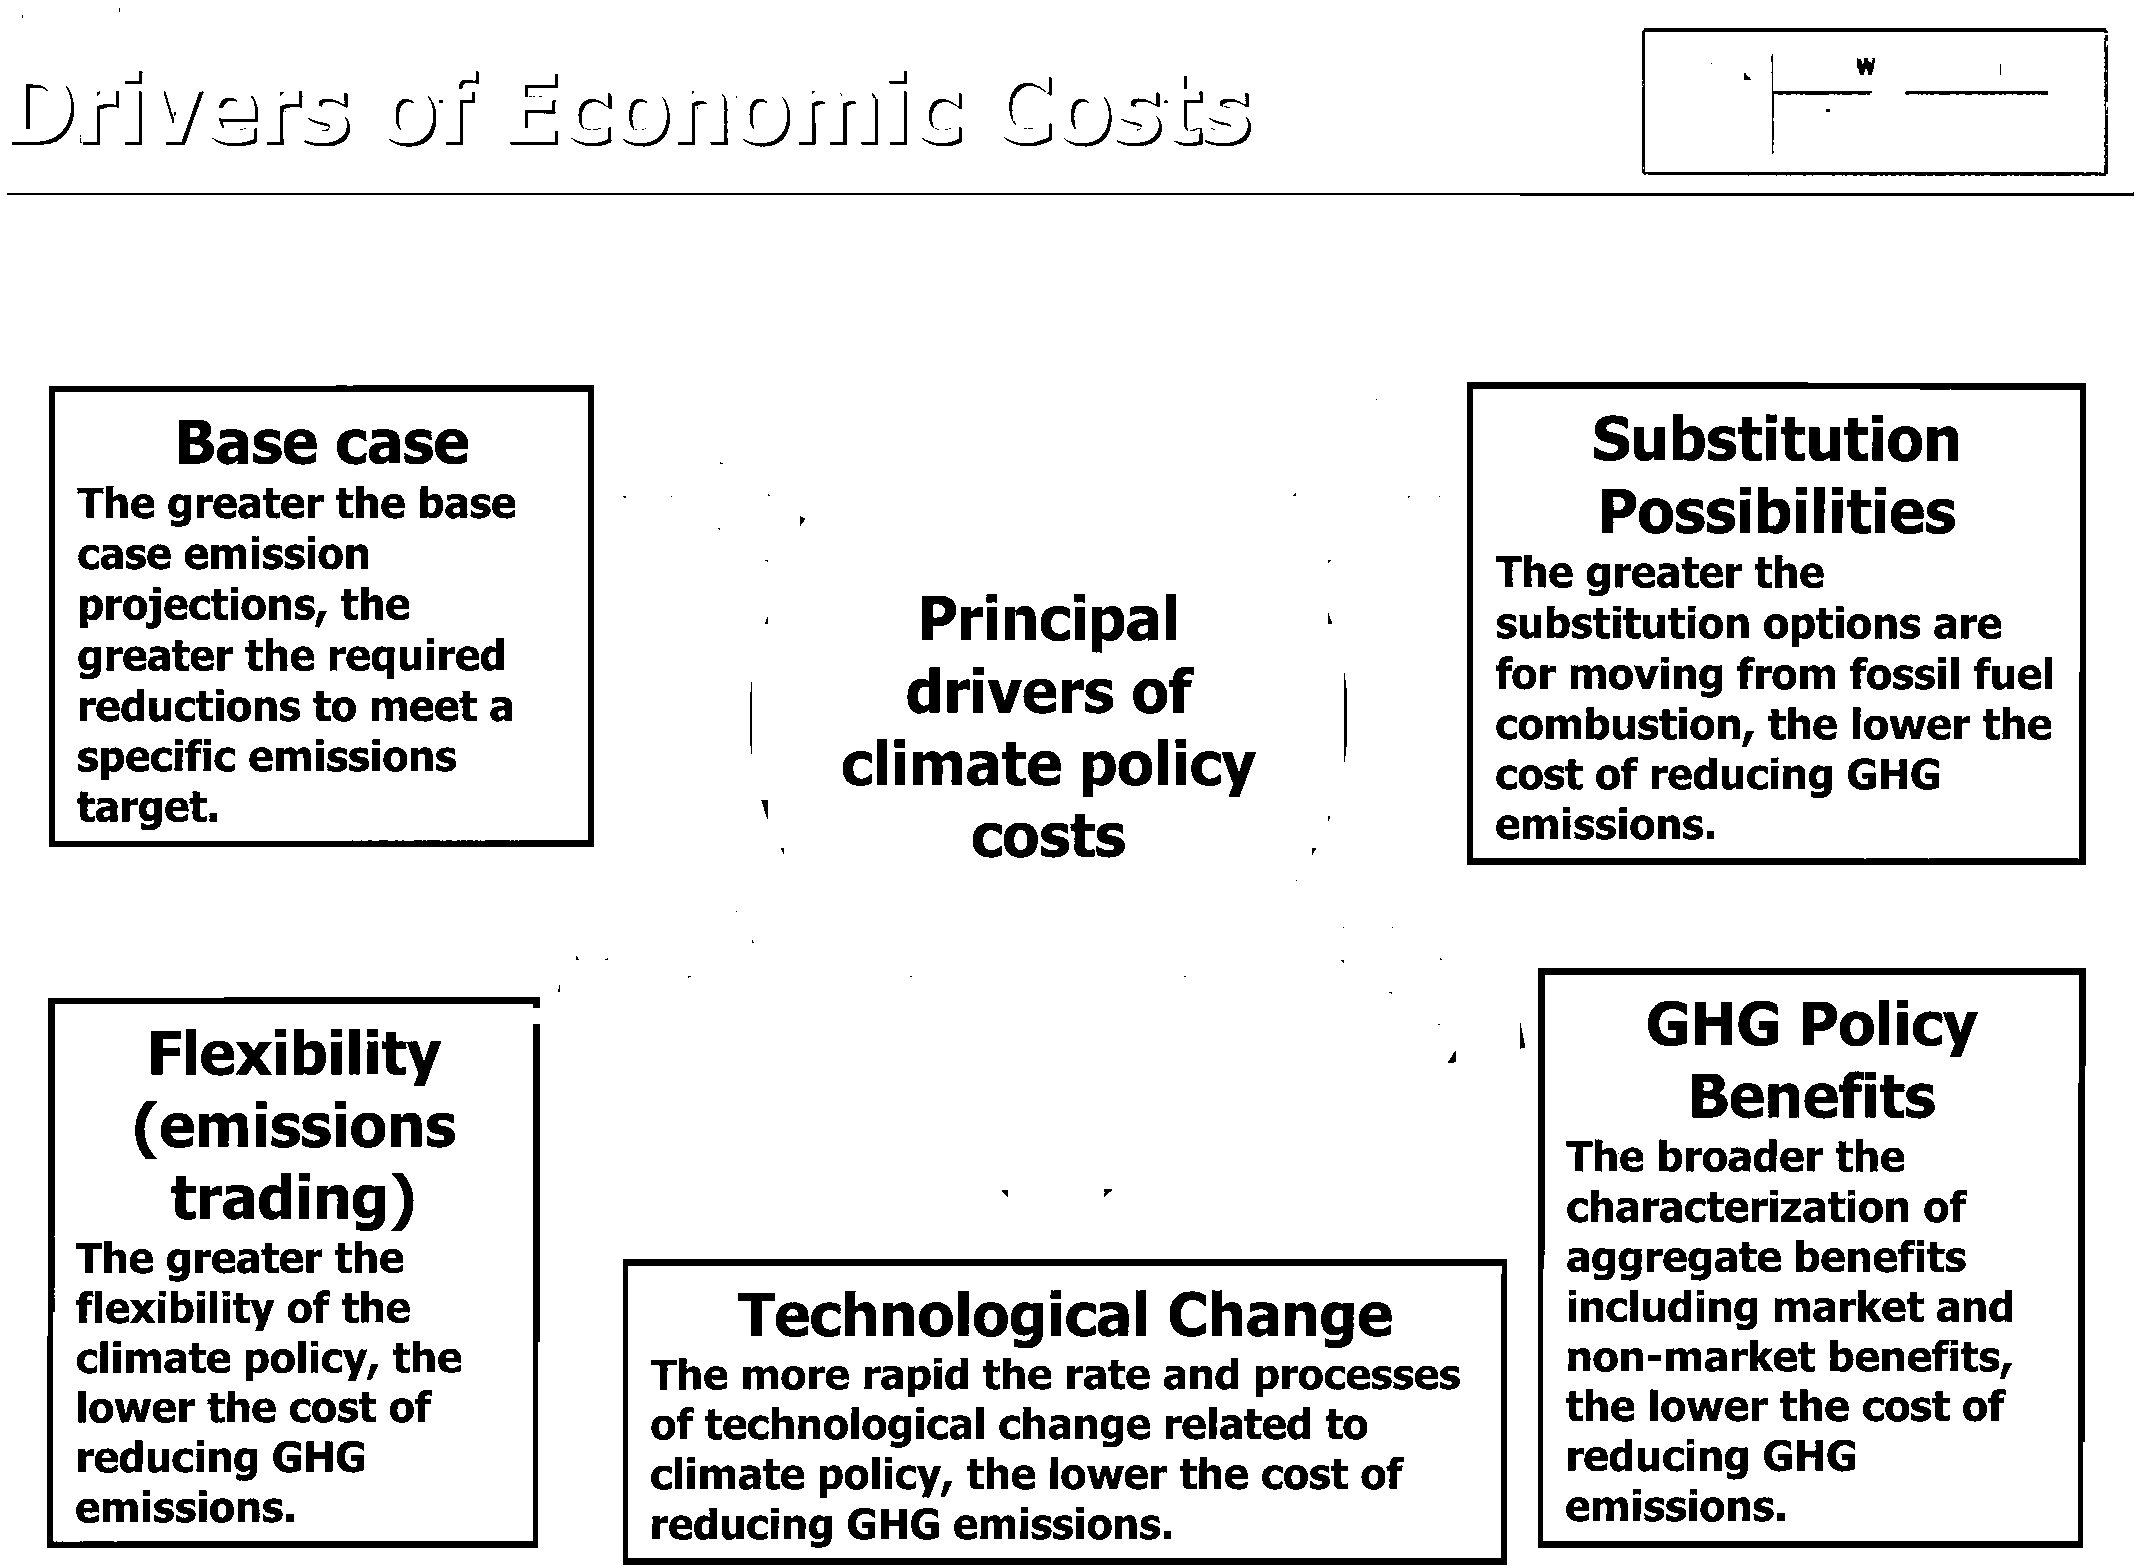
Substitution
PossitJilities
The greater the
substitution options are
for moving from fossil fuel
combustion, the lower the
cost of reducing GHG
emissions.
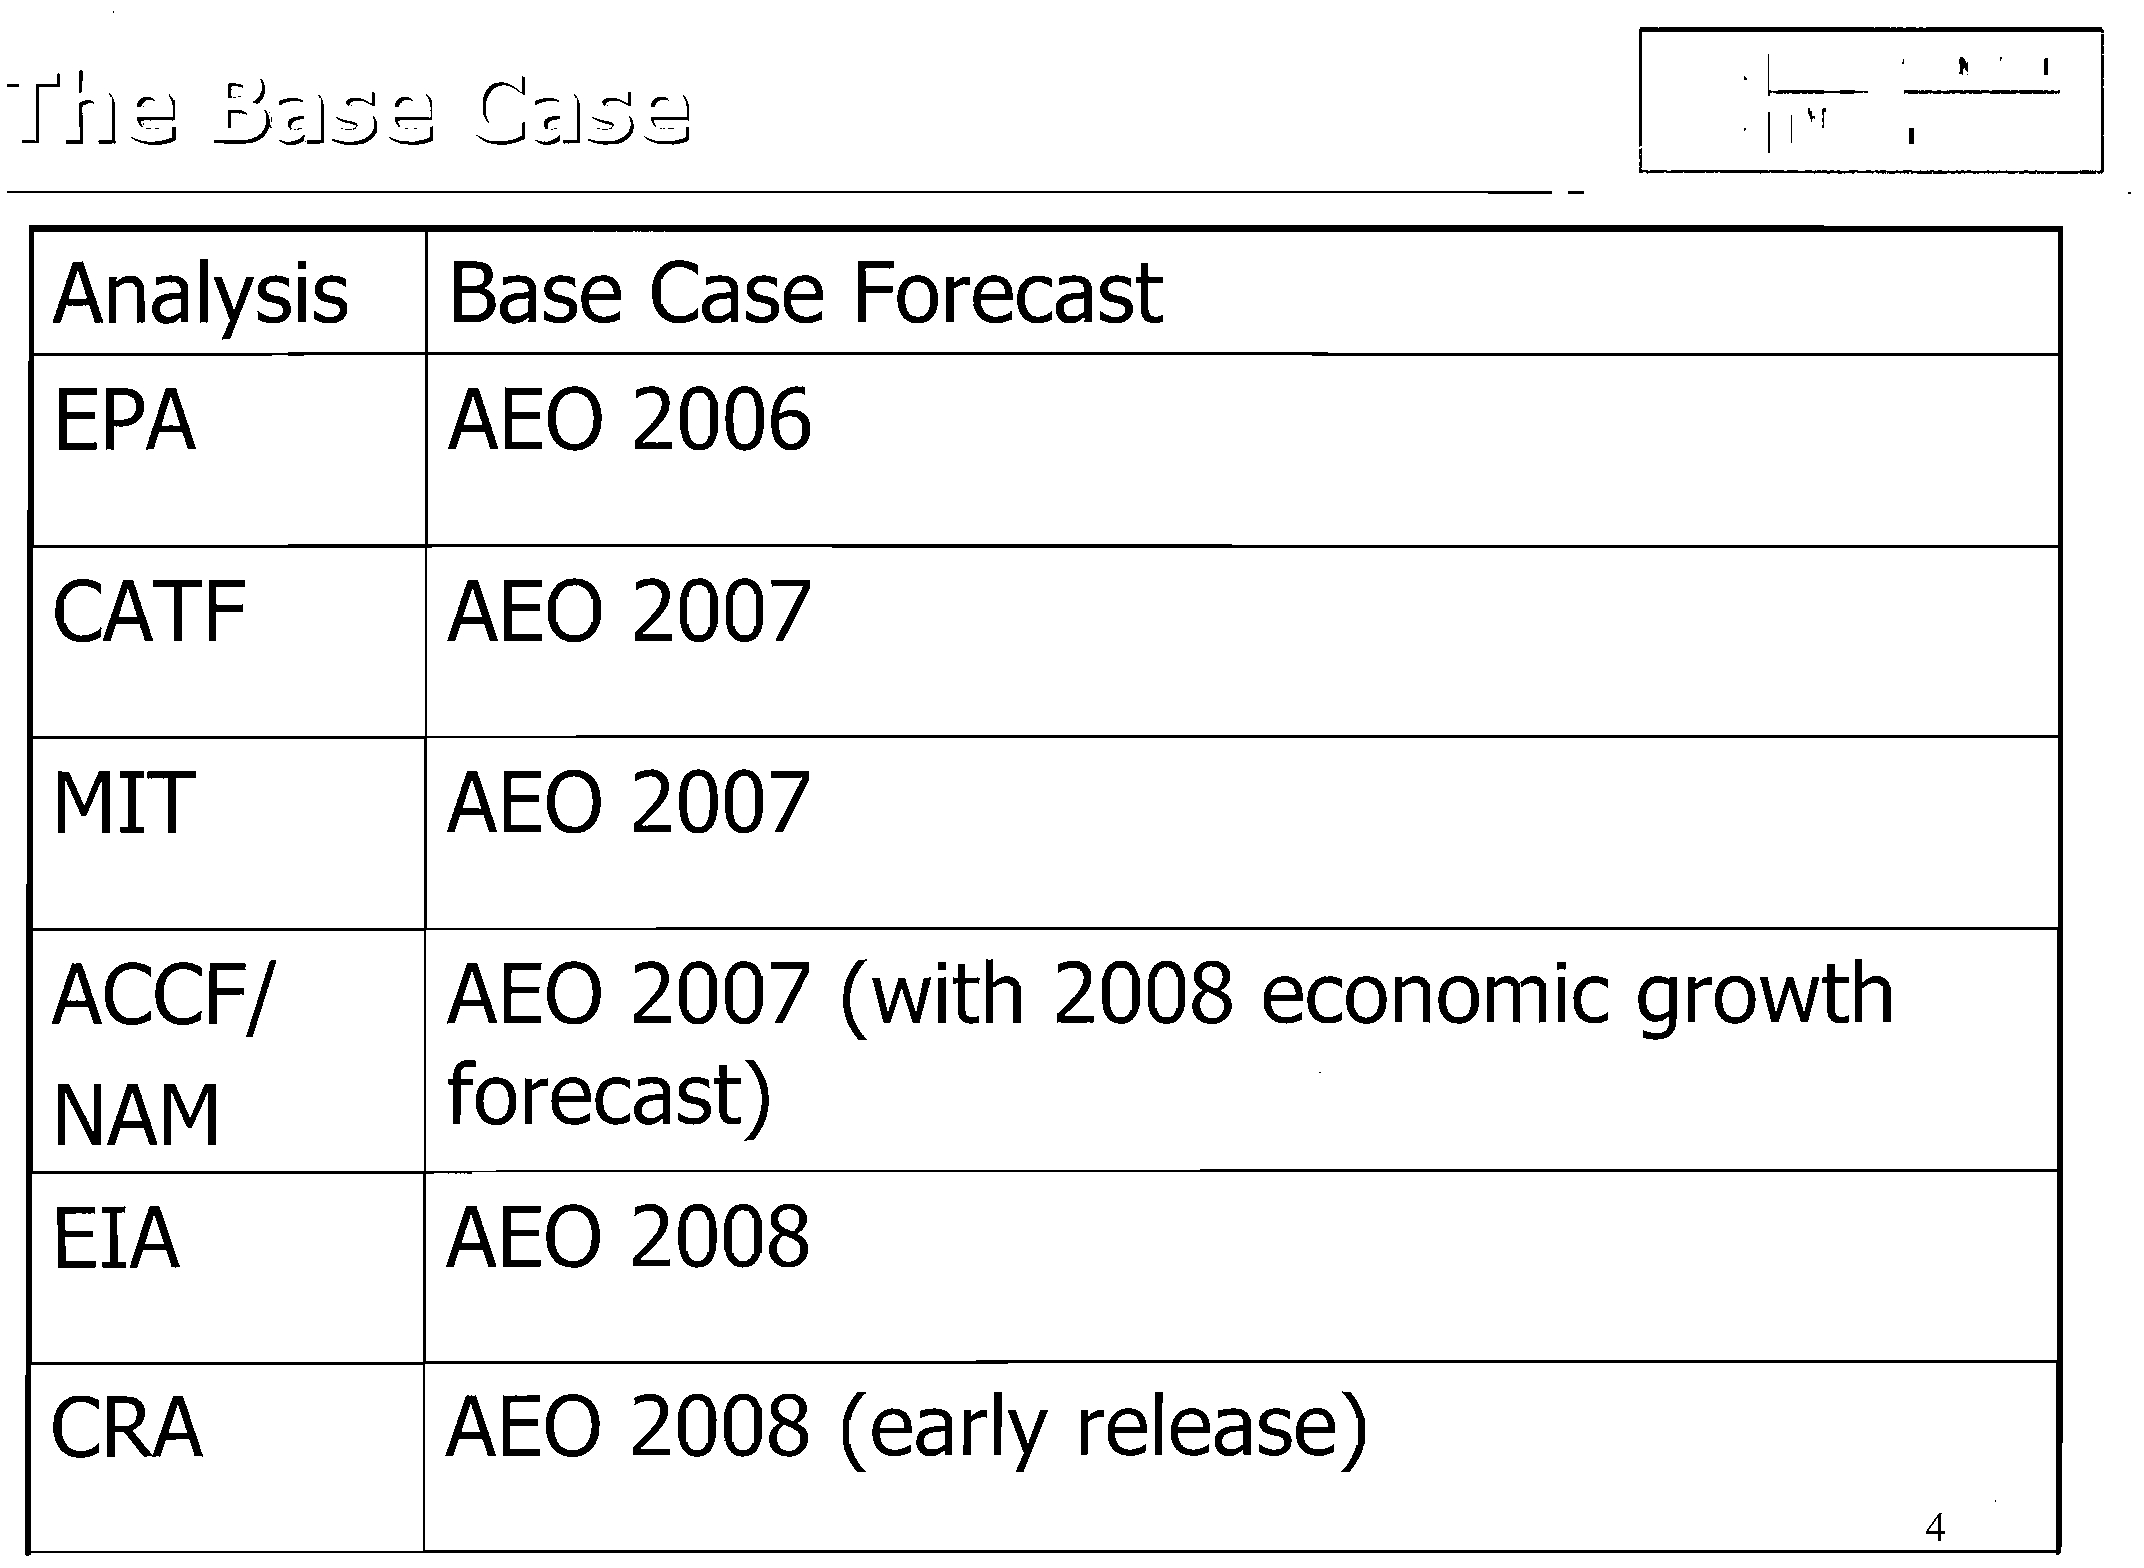
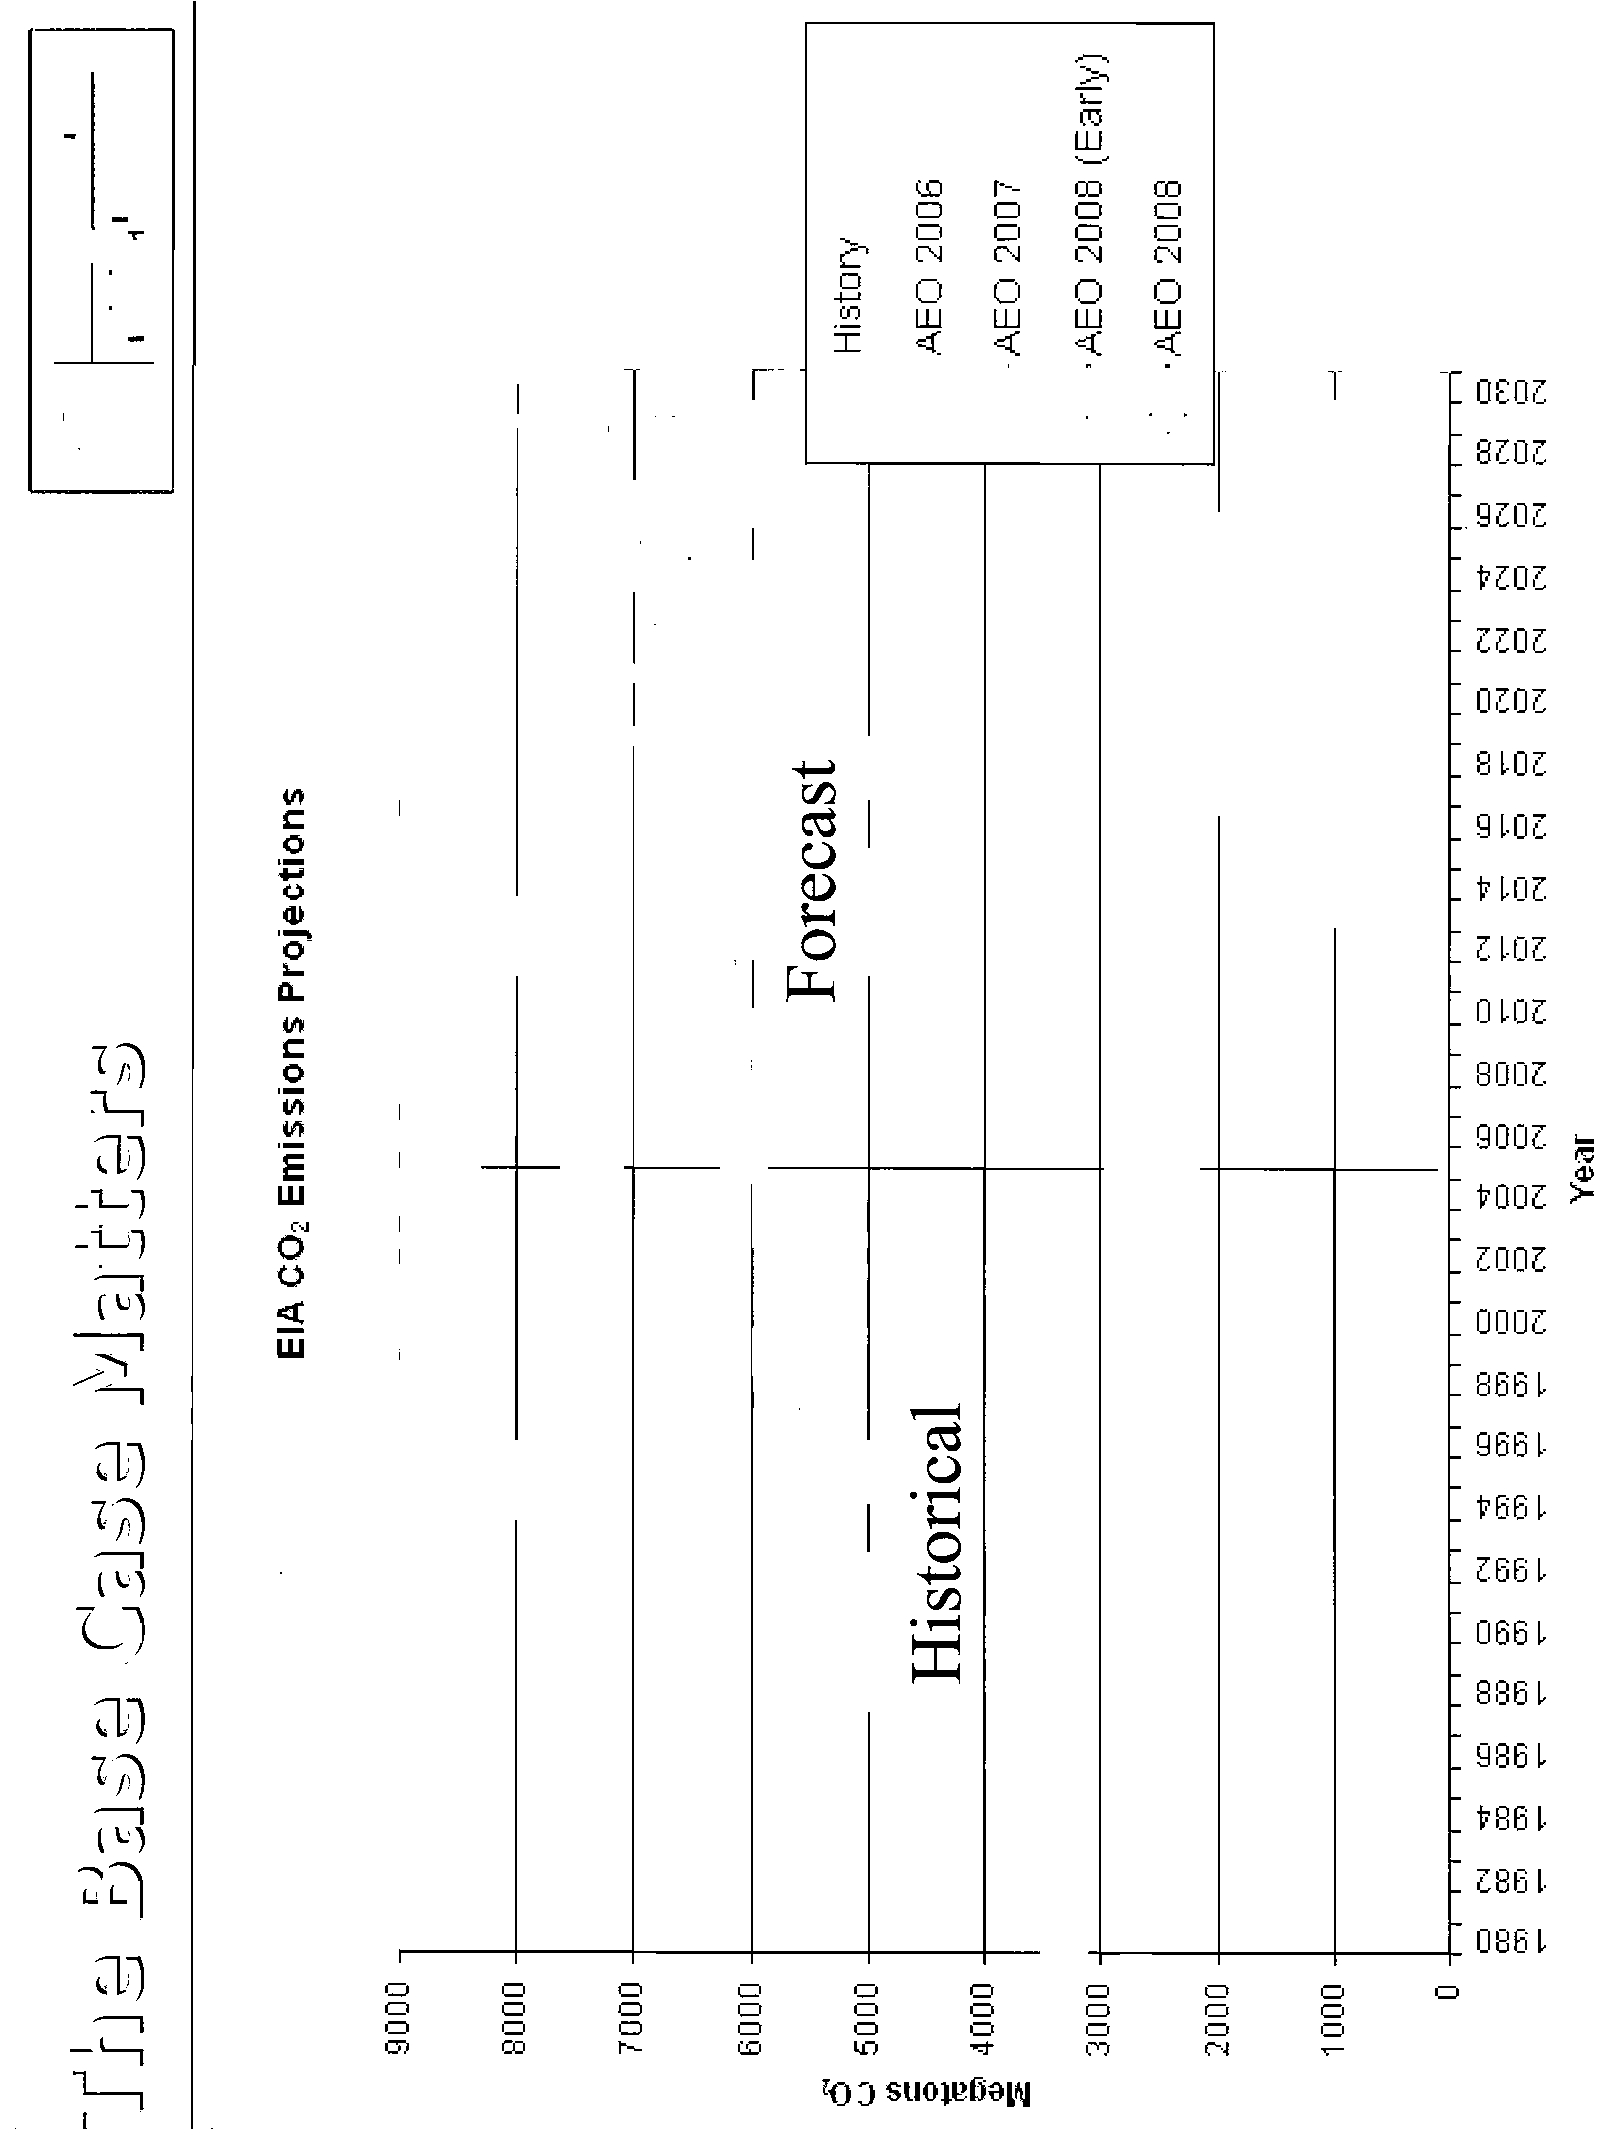
Base case
The greater the base
case emission
projections,
the
greater the required
reductions
to meet a
specific emissions
target.
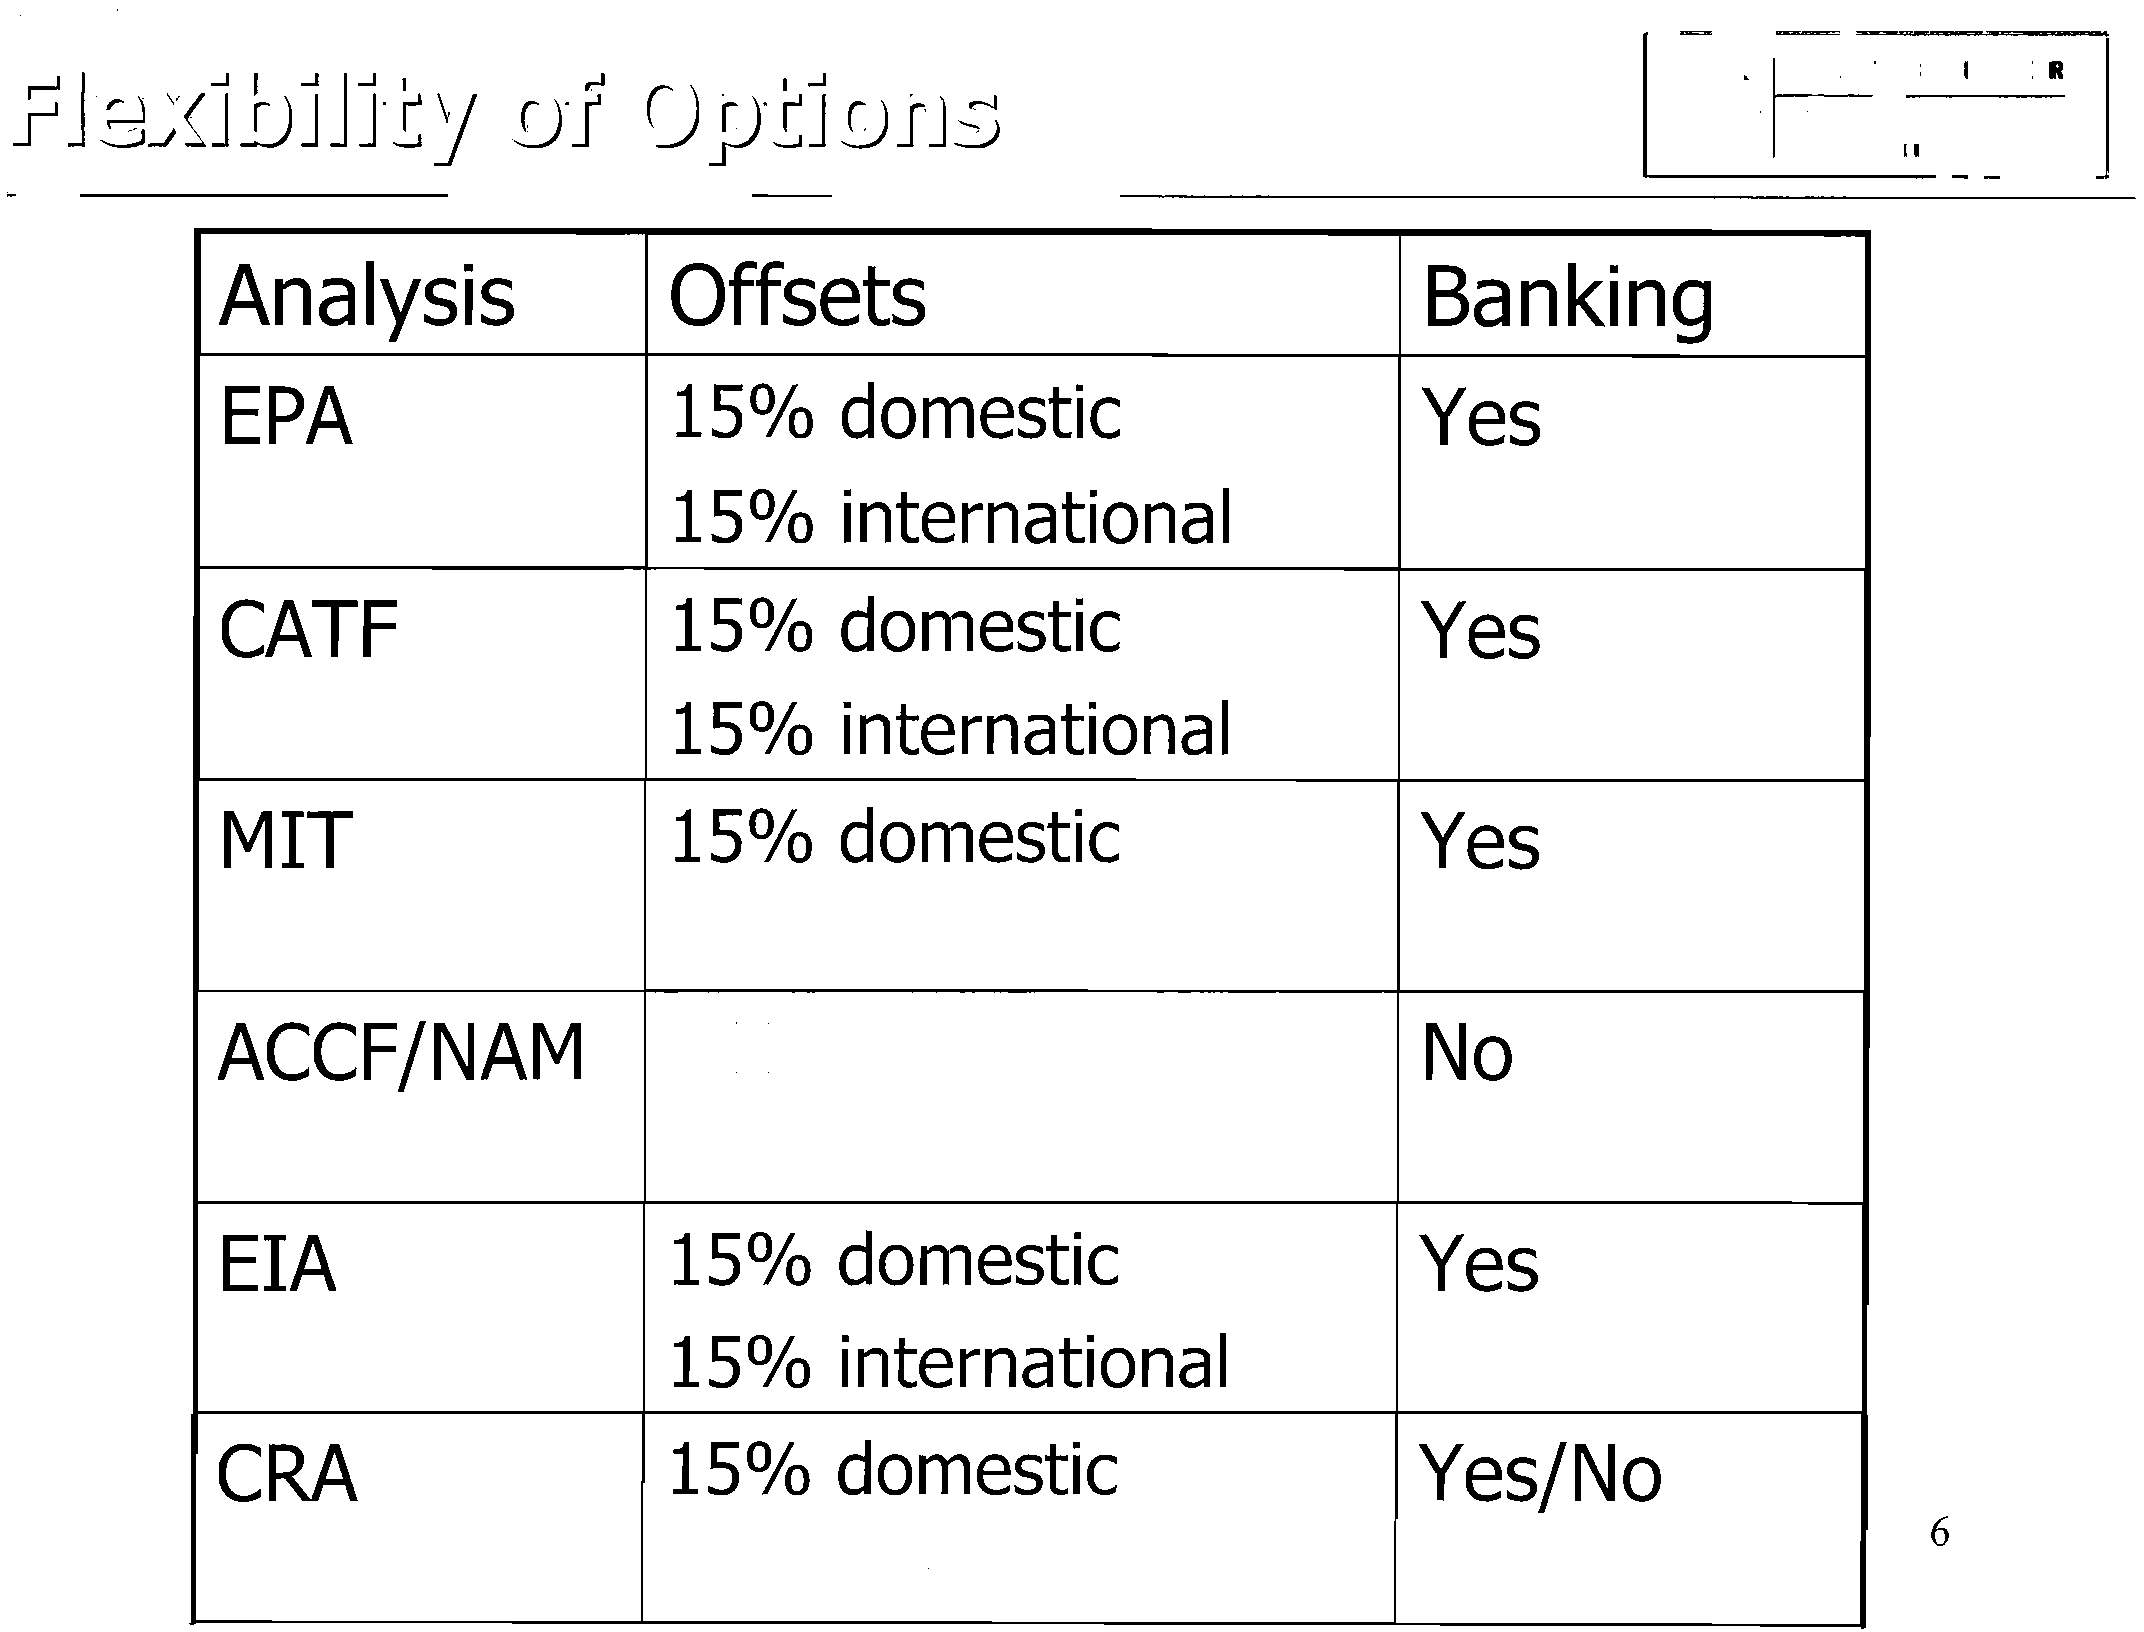
f=le)(itJilit1r
(emissions
trading)
The greater the
flexibility of the
climate policy, the
lower the cost of
reducing GHG
emissions.
Technological Change
The more rapid the rate and processes
of technological change related to
climate policy, the lower the cost of
reducing GHG emissions.
GHG Policy
Benefits
The broader the
characterization of
aggregate benefits
including market and
non-market benefits,
the lower the cost of
reducing GHG
emissions.
Electronic Filing - Received, Clerk's Office, October 1, 2008
* * * * * PCB 2009-021 * * * * *
Analysis Base Case Forecast
EPA
AEO 2006
CATF
AEO 2007
MIT
AEO 2007
ACCFj
AEO 2007 (with 2008 economic growth
NAM
forecast)
EIA
AEO 2008
CRA
AEO 2008 (early release)
4
Electronic Filing - Received, Clerk's Office, October 1, 2008
* * * * * PCB 2009-021 * * * * *
\
f-
f-
.
~~
I
f-
f-
-+->
f-
rrJ
c\j
f-
U
(l)
f-
~
f-
0
~
f-
f-
f-
f-
f-
I
j
-
f-
c\j
U
f-
•
....-I
~
f-
0
-+->
rrJ
•
....-I
::q
f-
~
f-
f-
)
f-
f-
f-
1()
J
SlIOWll;lW
1/1
£:
o
:0:;
u
f1I
.....
o
...
Q..
1/1
£:
o
1/1
1/1
E
w
N
o
o
<:(
w
0::>
0::>
0::>
m
0::>
0::>
0::>
00
0::>
0::>
0::>
~
0::>
0::>
0::>
(£!
0::>
0::>
0::>
LJ:)
0::>
0::>
0::>
.".
0::>
0::>
0::>
f'")
0::>
0::>
0::>
N
0::>
0::>
0::>
0::>
8W[
9W[
tW[
[W[
OW[
8~0[
9~0[
HO[
nO[
O~O[
800[
900[
...
«:
tOO[
~
WO[
OOO[
866
~
966
~
1'66
~
[66
~
066
~
886
~
986
~
1'86
~
[86
~
086
~
Electronic Filing - Received, Clerk's Office, October 1, 2008
* * * * * PCB 2009-021 * * * * *
Analysis
Offsets
Banking
EPA
15% domestic
Yes
15% international
CATF
15% domestic
Yes
15% international
MIT
15% domestic
Yes
No international
ACCF/NAM
14% (high cost)
No
17% (low cost)
EIA
15% domestic
Yes
15% international
CRA
15% domestic
Yes/No
No international
6
Electronic Filing - Received, Clerk's Office, October 1, 2008
* * * * * PCB 2009-021 * * * * *
PlOJXQ
P:lq!D-D
0.0
lffi~SPJ1OM
.S
"0
~
torn
(;j
.!:l
0
G
WN
0
Ol~BW-'1\0rnVJ'\l
-
0.0
V.Lto
(1)
.S
'0
"0
0
~
:!!:
WDS
....
><:
(l)
Vdd3:-.LIW
~
•
DIW-SW
mml3:w
0.0
.S
SW3:N
]
i
0
W3:.LD-ffiNlIV
o
~
~
~
8
~
8
~
~.~
N
N
~
~
(UO.1
;)!Jl;)W/S$066I)
~
.......-
I
J
I
~
r
I~
I
I
rl
I
I
I
rl
I
rl
I
I
I
-;::=r
I
I
~
[
~
I
I
lri
I
I
I
~
I
I
Electronic Filing - Received, Clerk's Office, October 1, 2008
* * * * * PCB 2009-021 * * * * *
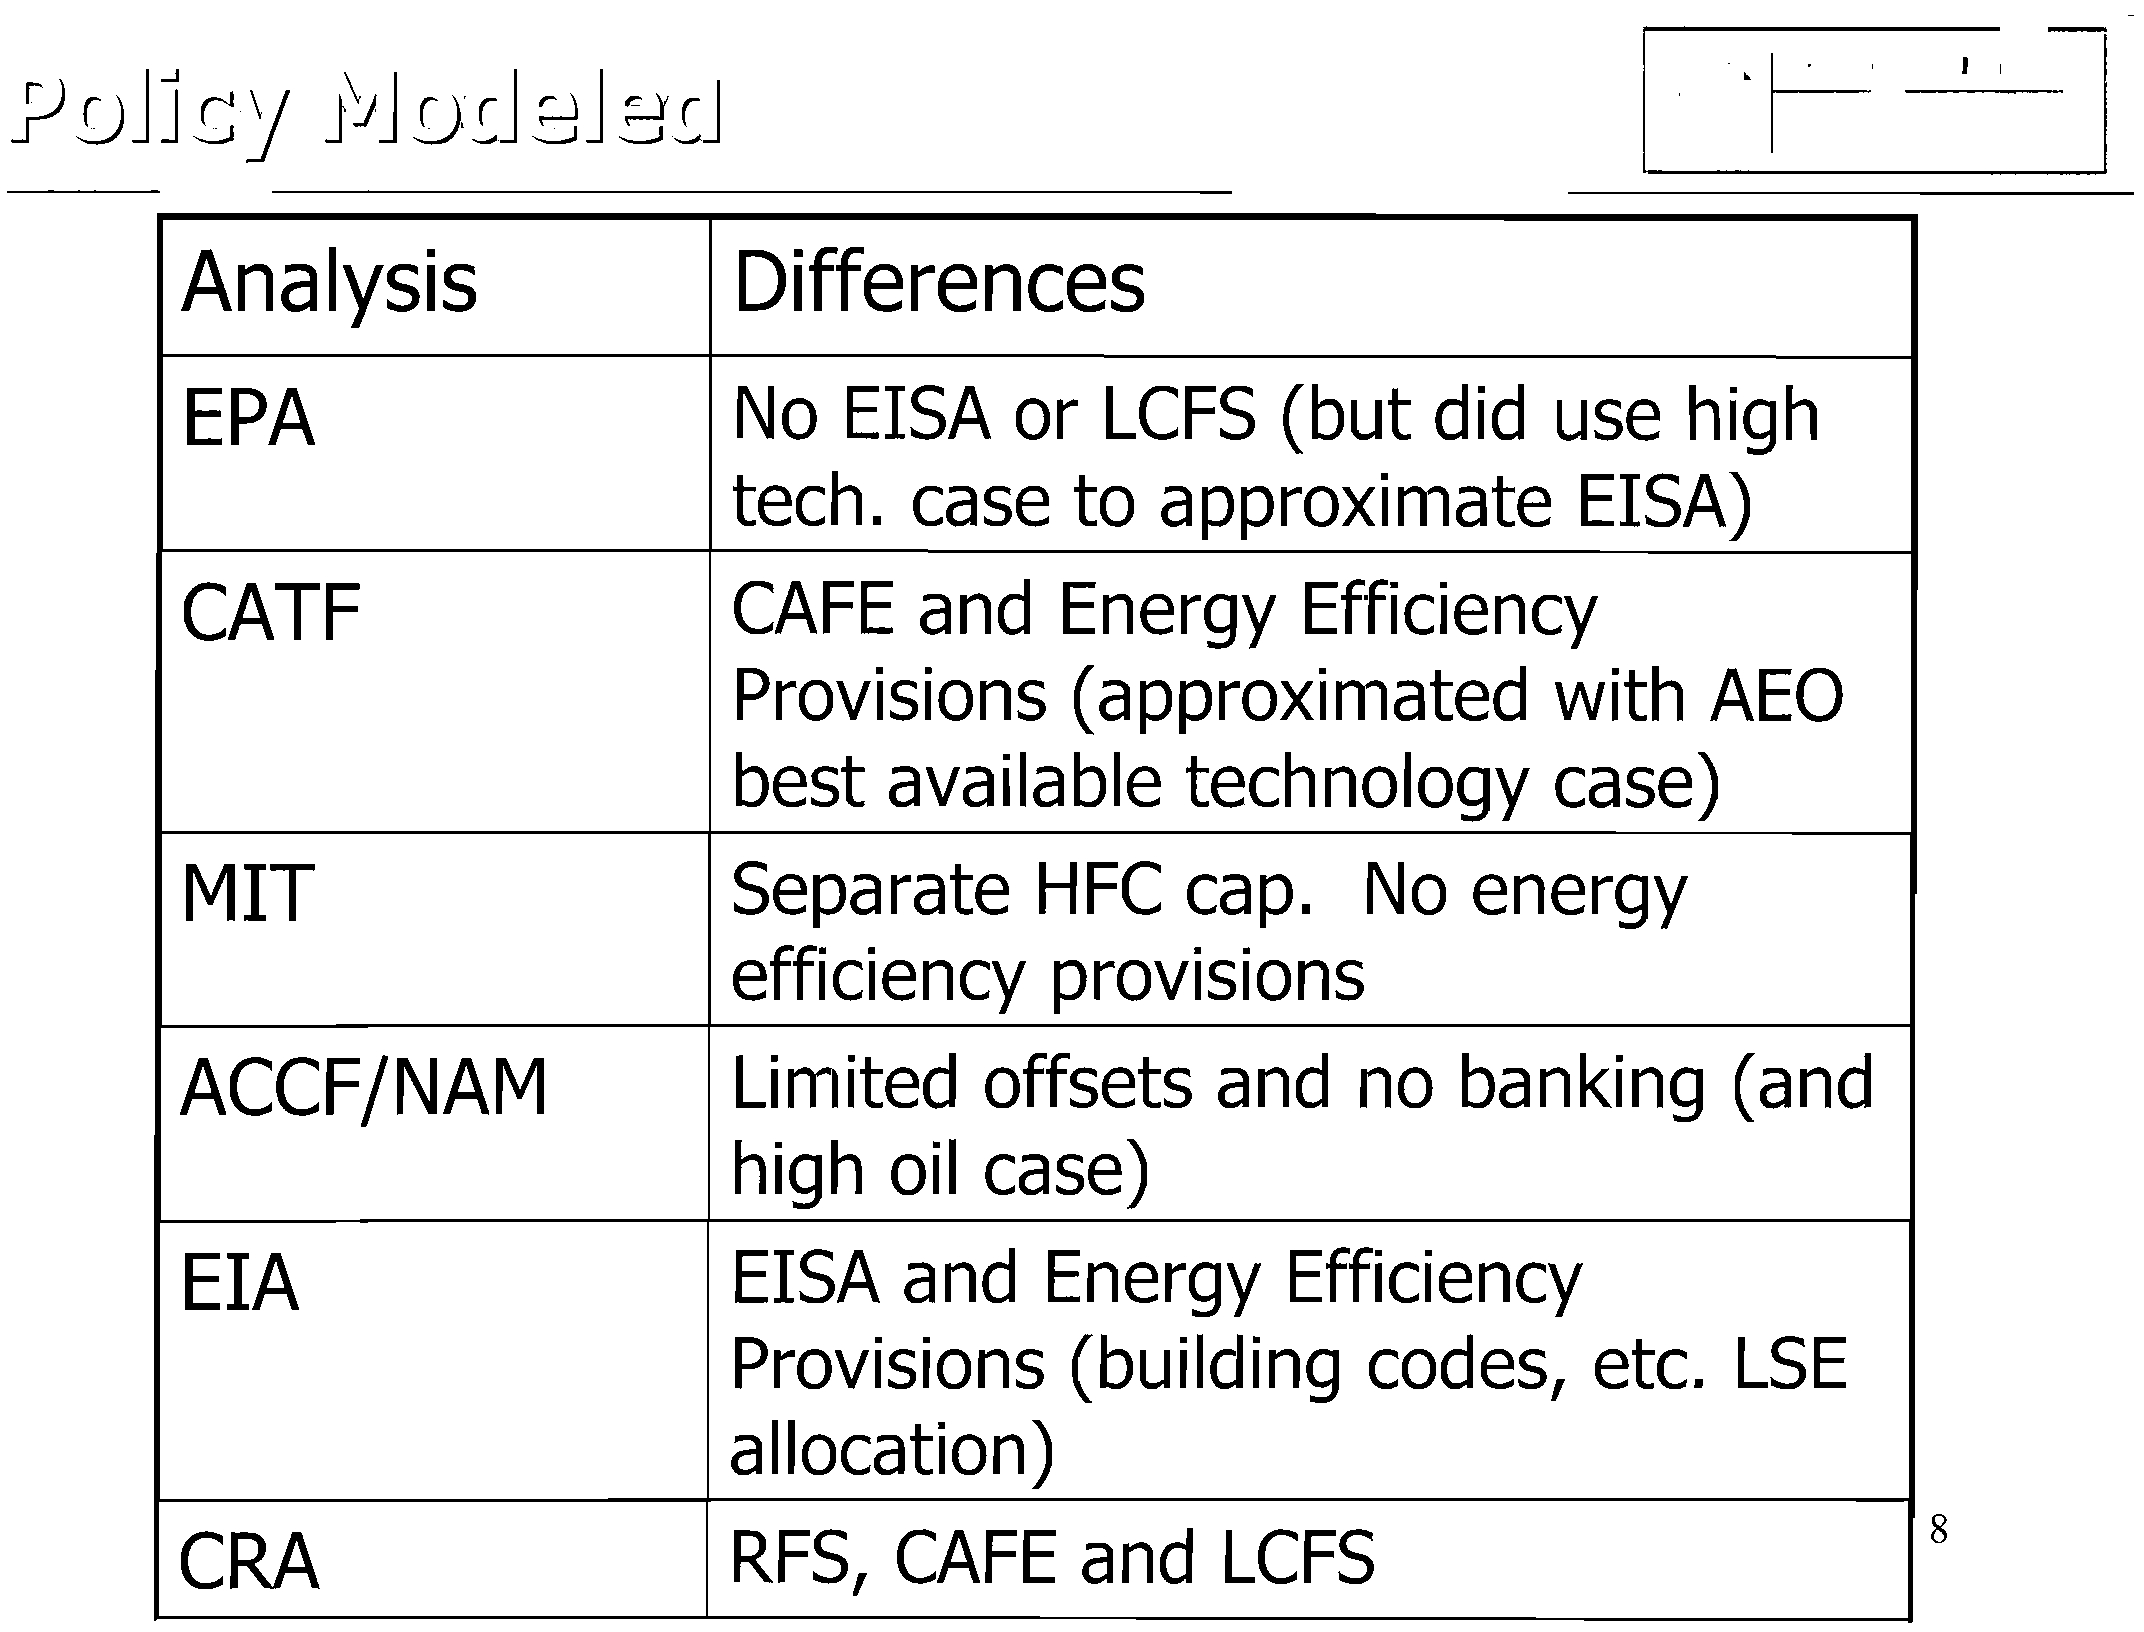
Analysis
EPA
CATF
MIT
ACCF/NAM
EIA
CRA
Differences
No EISA or LCFS (but did use high
tech.
case to approximate EISA)
CAFE and Energy Efficiency
Provisions (a pproximated with AEO
best available technology case)
Separate HFC cap. No energy
efficiency provisions
Limited offsets
and no banking (and
high
oil case)
EISA and Energy Efficiency
Provisions (building codes, etc. LSE
allocation)
RFS, CAFE and LCFS
8
Electronic Filing - Received, Clerk's Office, October 1, 2008
* * * * * PCB 2009-021 * * * * *
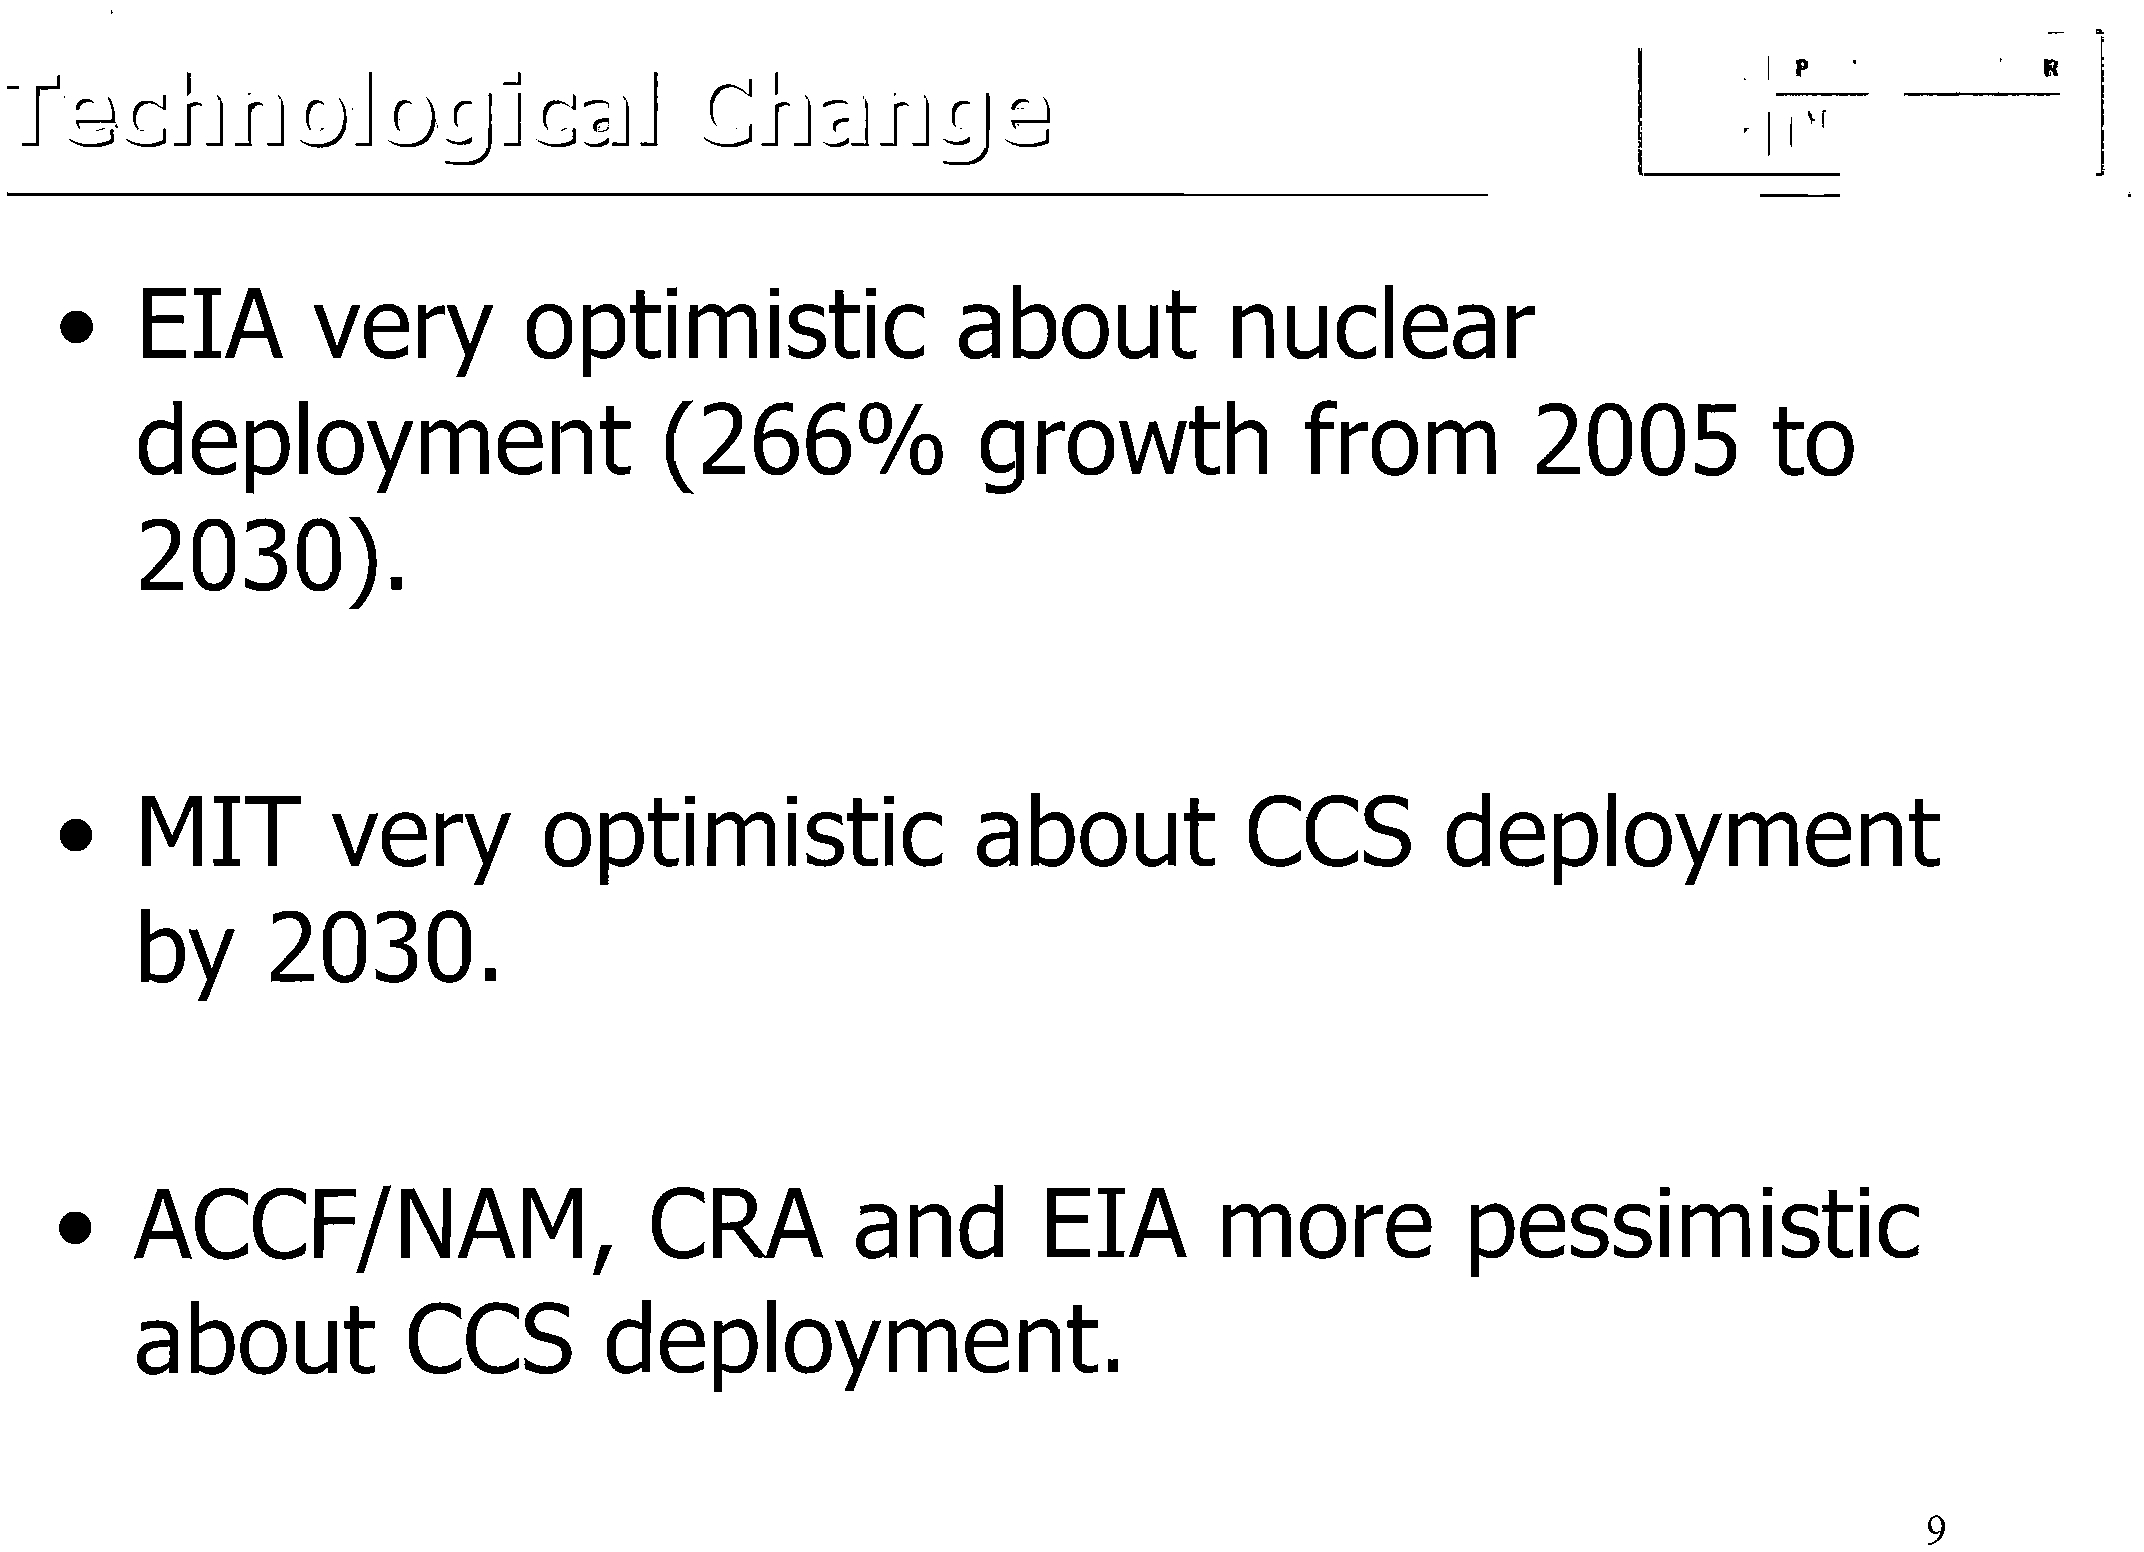
• EIA very optimistic about nuclear
deployment
(266%
growth from
2005
to
2030).
• MIT very optimistic about CCS deployment
by
2030.
• ACCFjNAM, CRA and EIA more pessimistic
about
CCS deployment.
9
Electronic Filing - Received, Clerk's Office, October 1, 2008
* * * * * PCB 2009-021 * * * * *
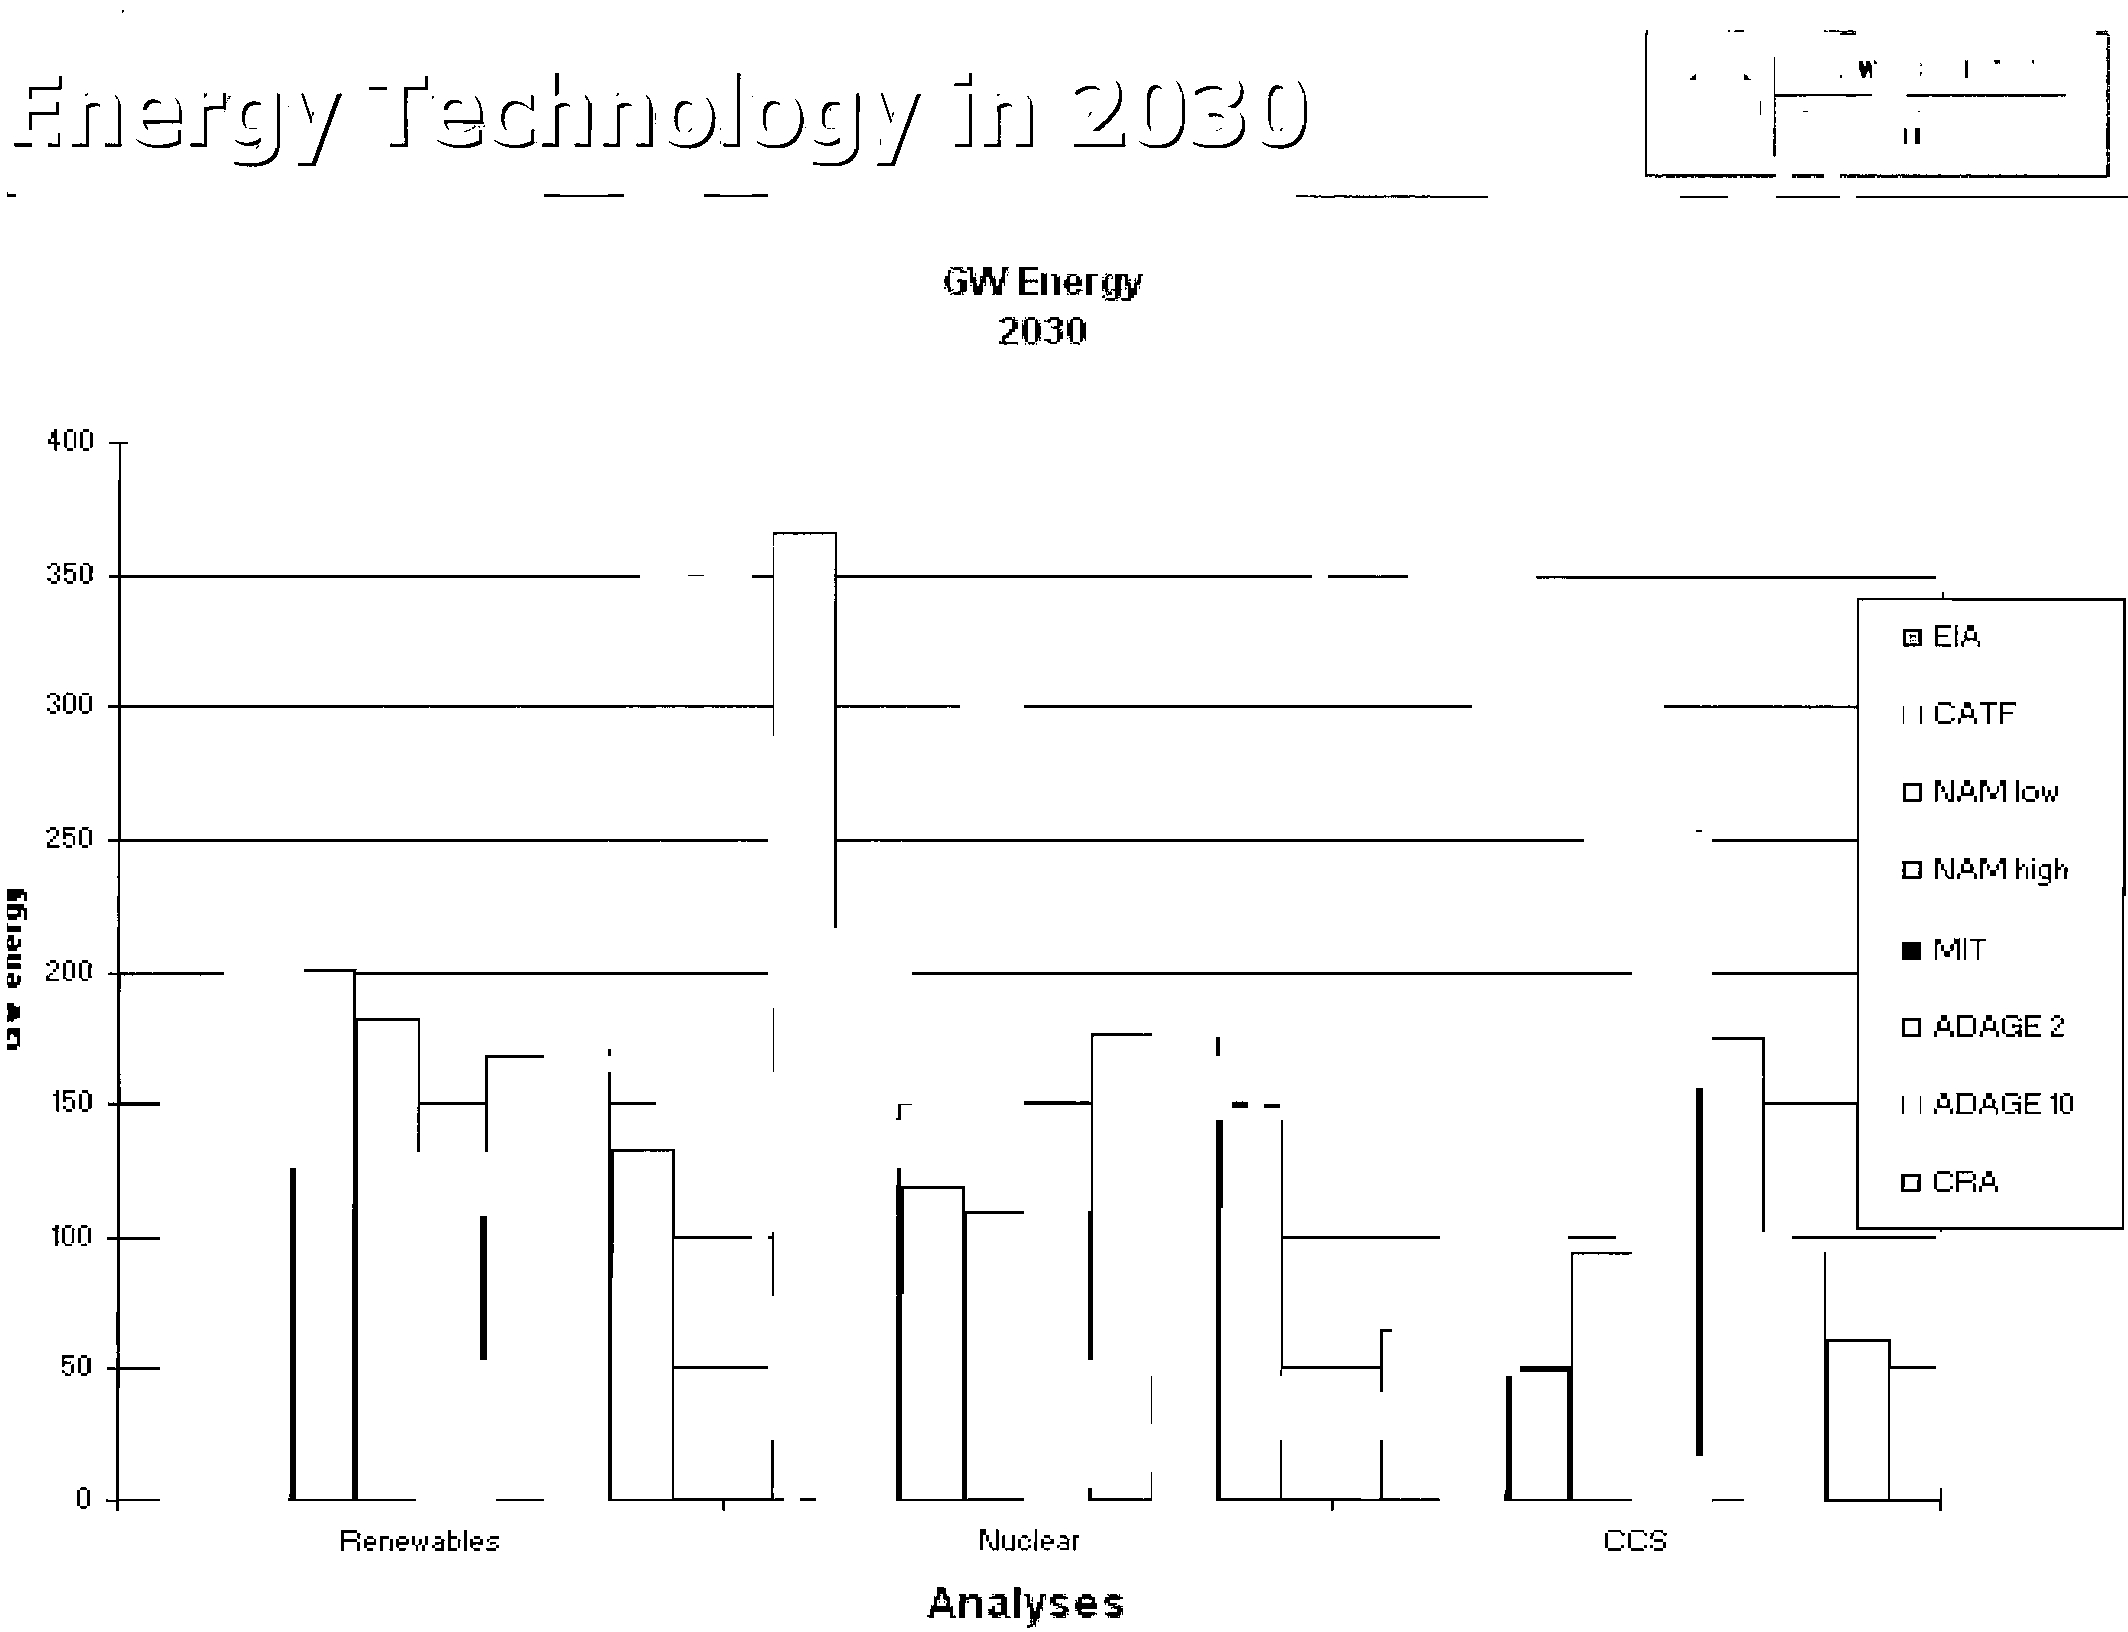
GWEnergy
2030
400 1
I
o
I I
50
350
I
II
I
,
[] EIA
300
J
I I
I
• CATF
[] roJAM
low
II
II
250
--
-
..
c:l\
~
200 1
-
1
L-
-
1
[]•
MITNAM
high
II
!l
I I
-
r------J
1
-
1
[]ADAGE2
150
+-1,-':",_
I
I----l
I
I
I
,
I
• ,o.DAGE 10
[] CRA
I
li'.,._
I
- -
I
I
-
l
1
-
I
- -
1
1
100
RE"nE"\~<IbIE"S
NuolE"<Ir
CCS
Analyses
Electronic Filing - Received, Clerk's Office, October 1, 2008
* * * * * PCB 2009-021 * * * * *
11
• Very uncertain.
•
Very dependent on policy
architecture/implementation.
•
We can put some very rough bounds on
cost estimates.
•
We have some general insights into how
to minimize
costs.
Electronic Filing - Received, Clerk's Office, October 1, 2008
* * * * * PCB 2009-021 * * * * *
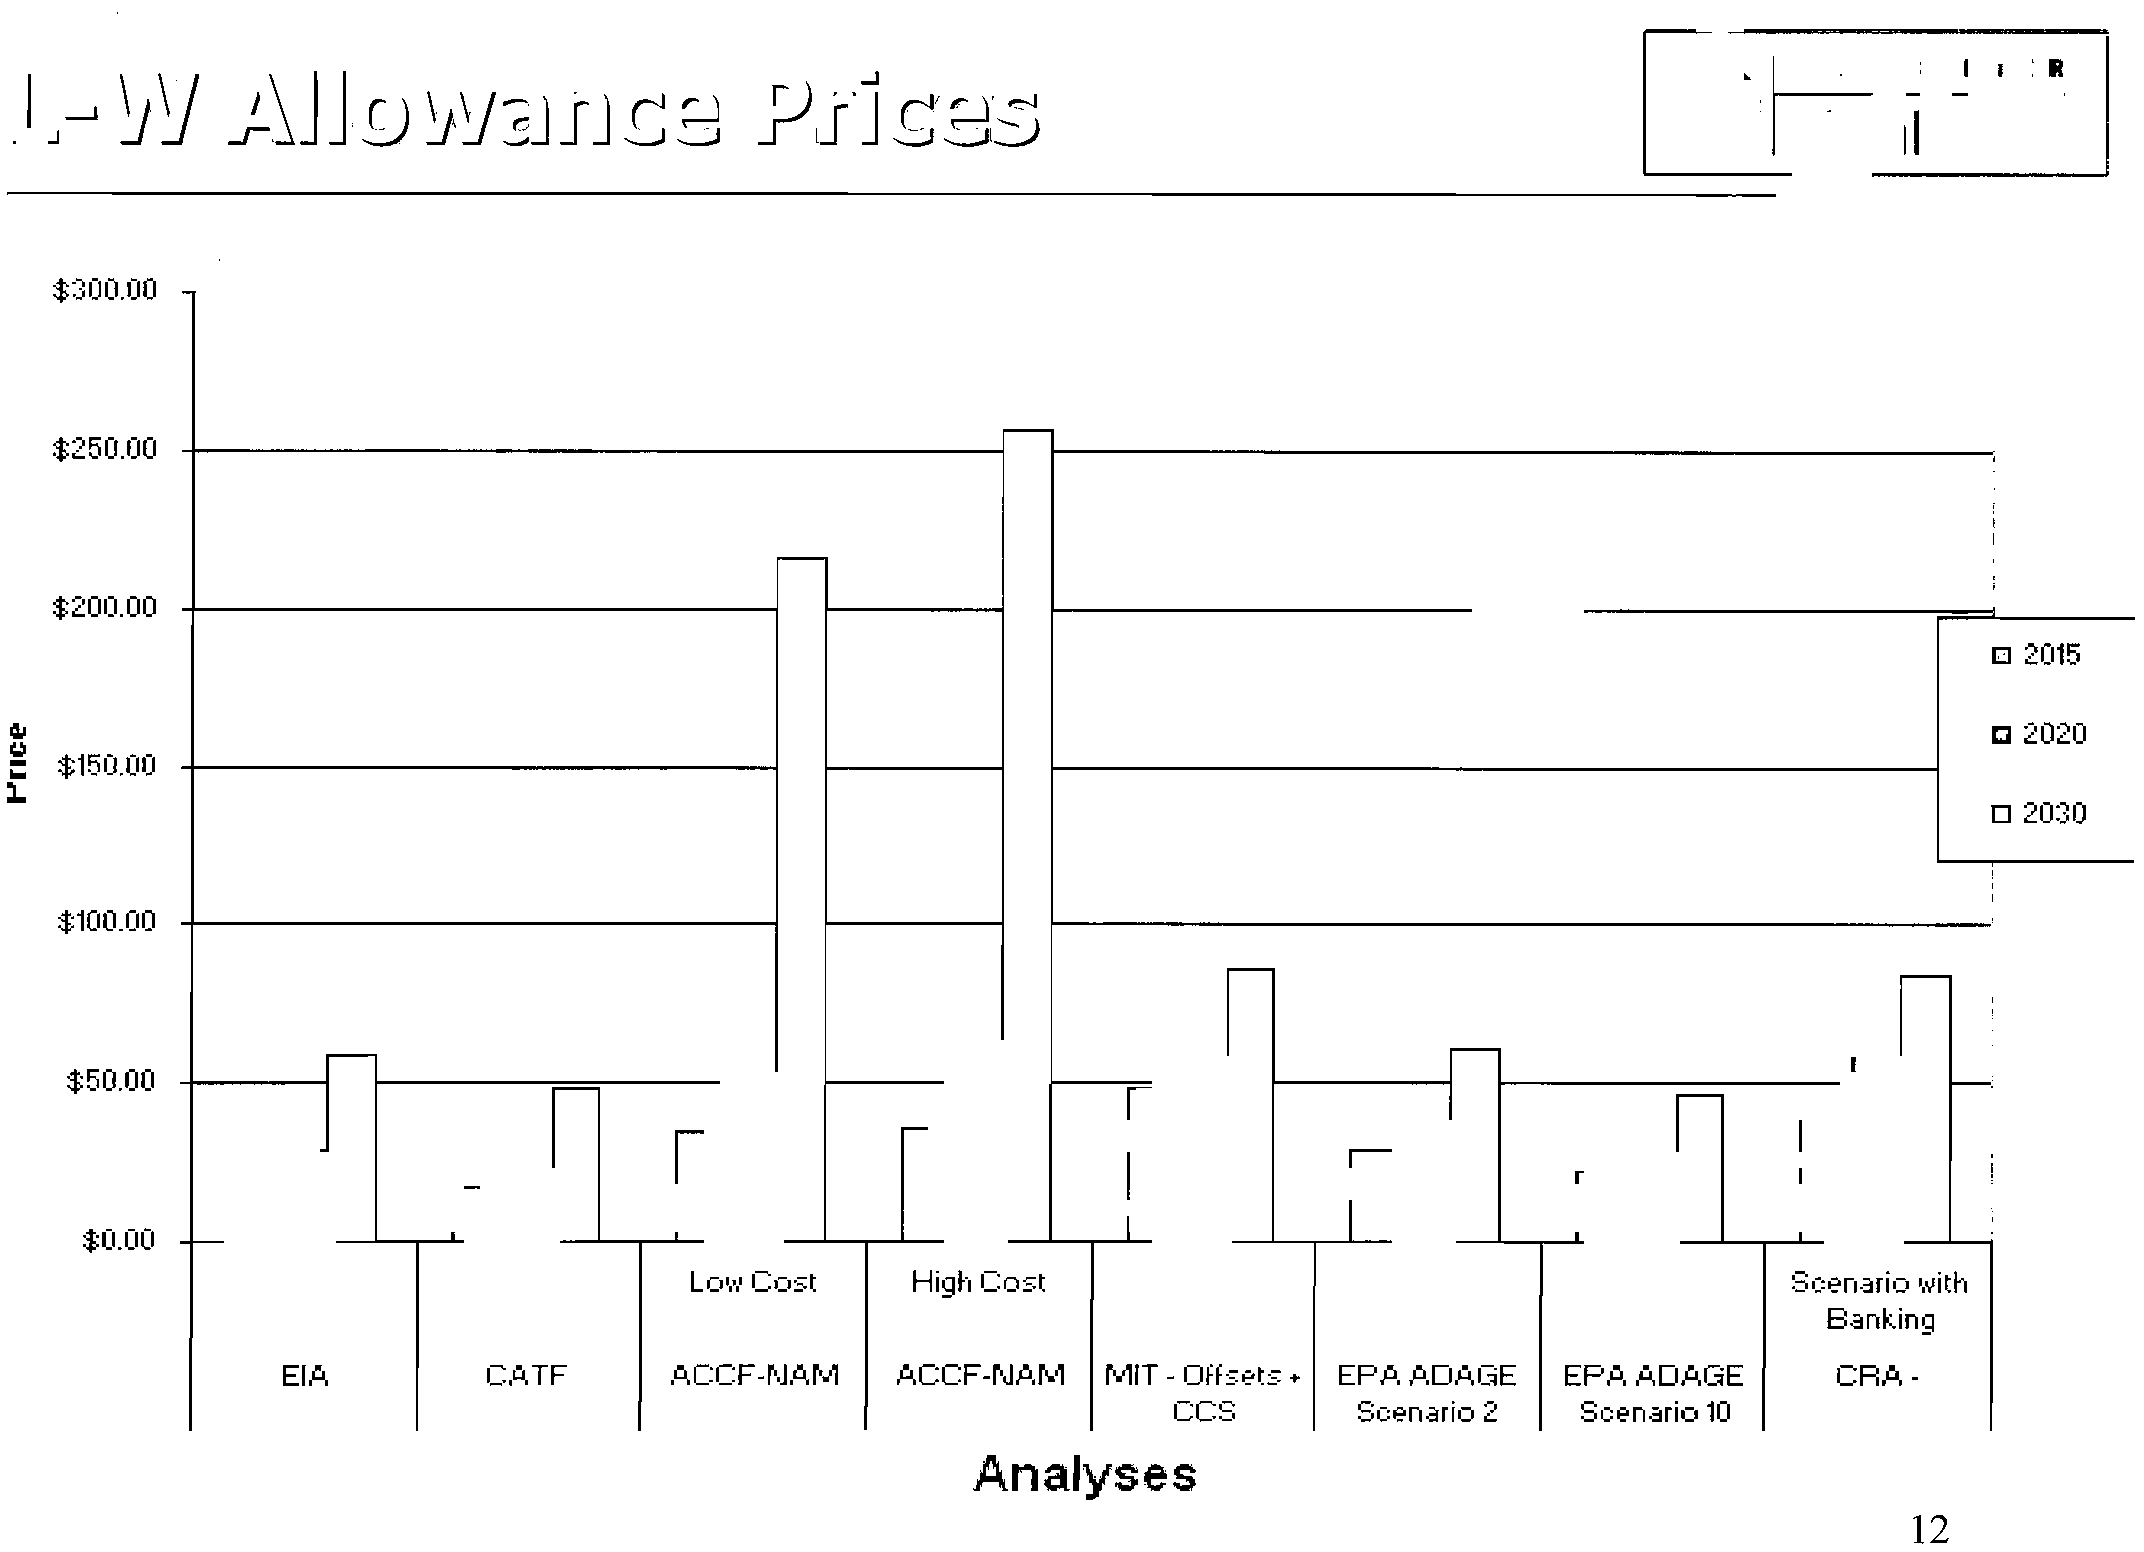
$300.00
I
I
$250.00
+I-----------------~
$200.00
, ,
,
, ,
[] 2015
,
I
I
I
.2020
GI
I
I
I
e
$150.00
~
;:
l.
$100.00
ACCF-NAM I ACCF.NAM IMIT - OffSE'ts
+1
EPA ADAGE
I
EP,o, ADAGE
CCS
SCE'nario 2
SCE'nario
10
$50.00 +1-----1
$0.00 1
'
EtA
CATF
Low Cost
High Cost
SCE'nario with
Ban~,ing
CRA.
Analyses
12
Electronic Filing - Received, Clerk's Office, October 1, 2008
* * * * * PCB 2009-021 * * * * *
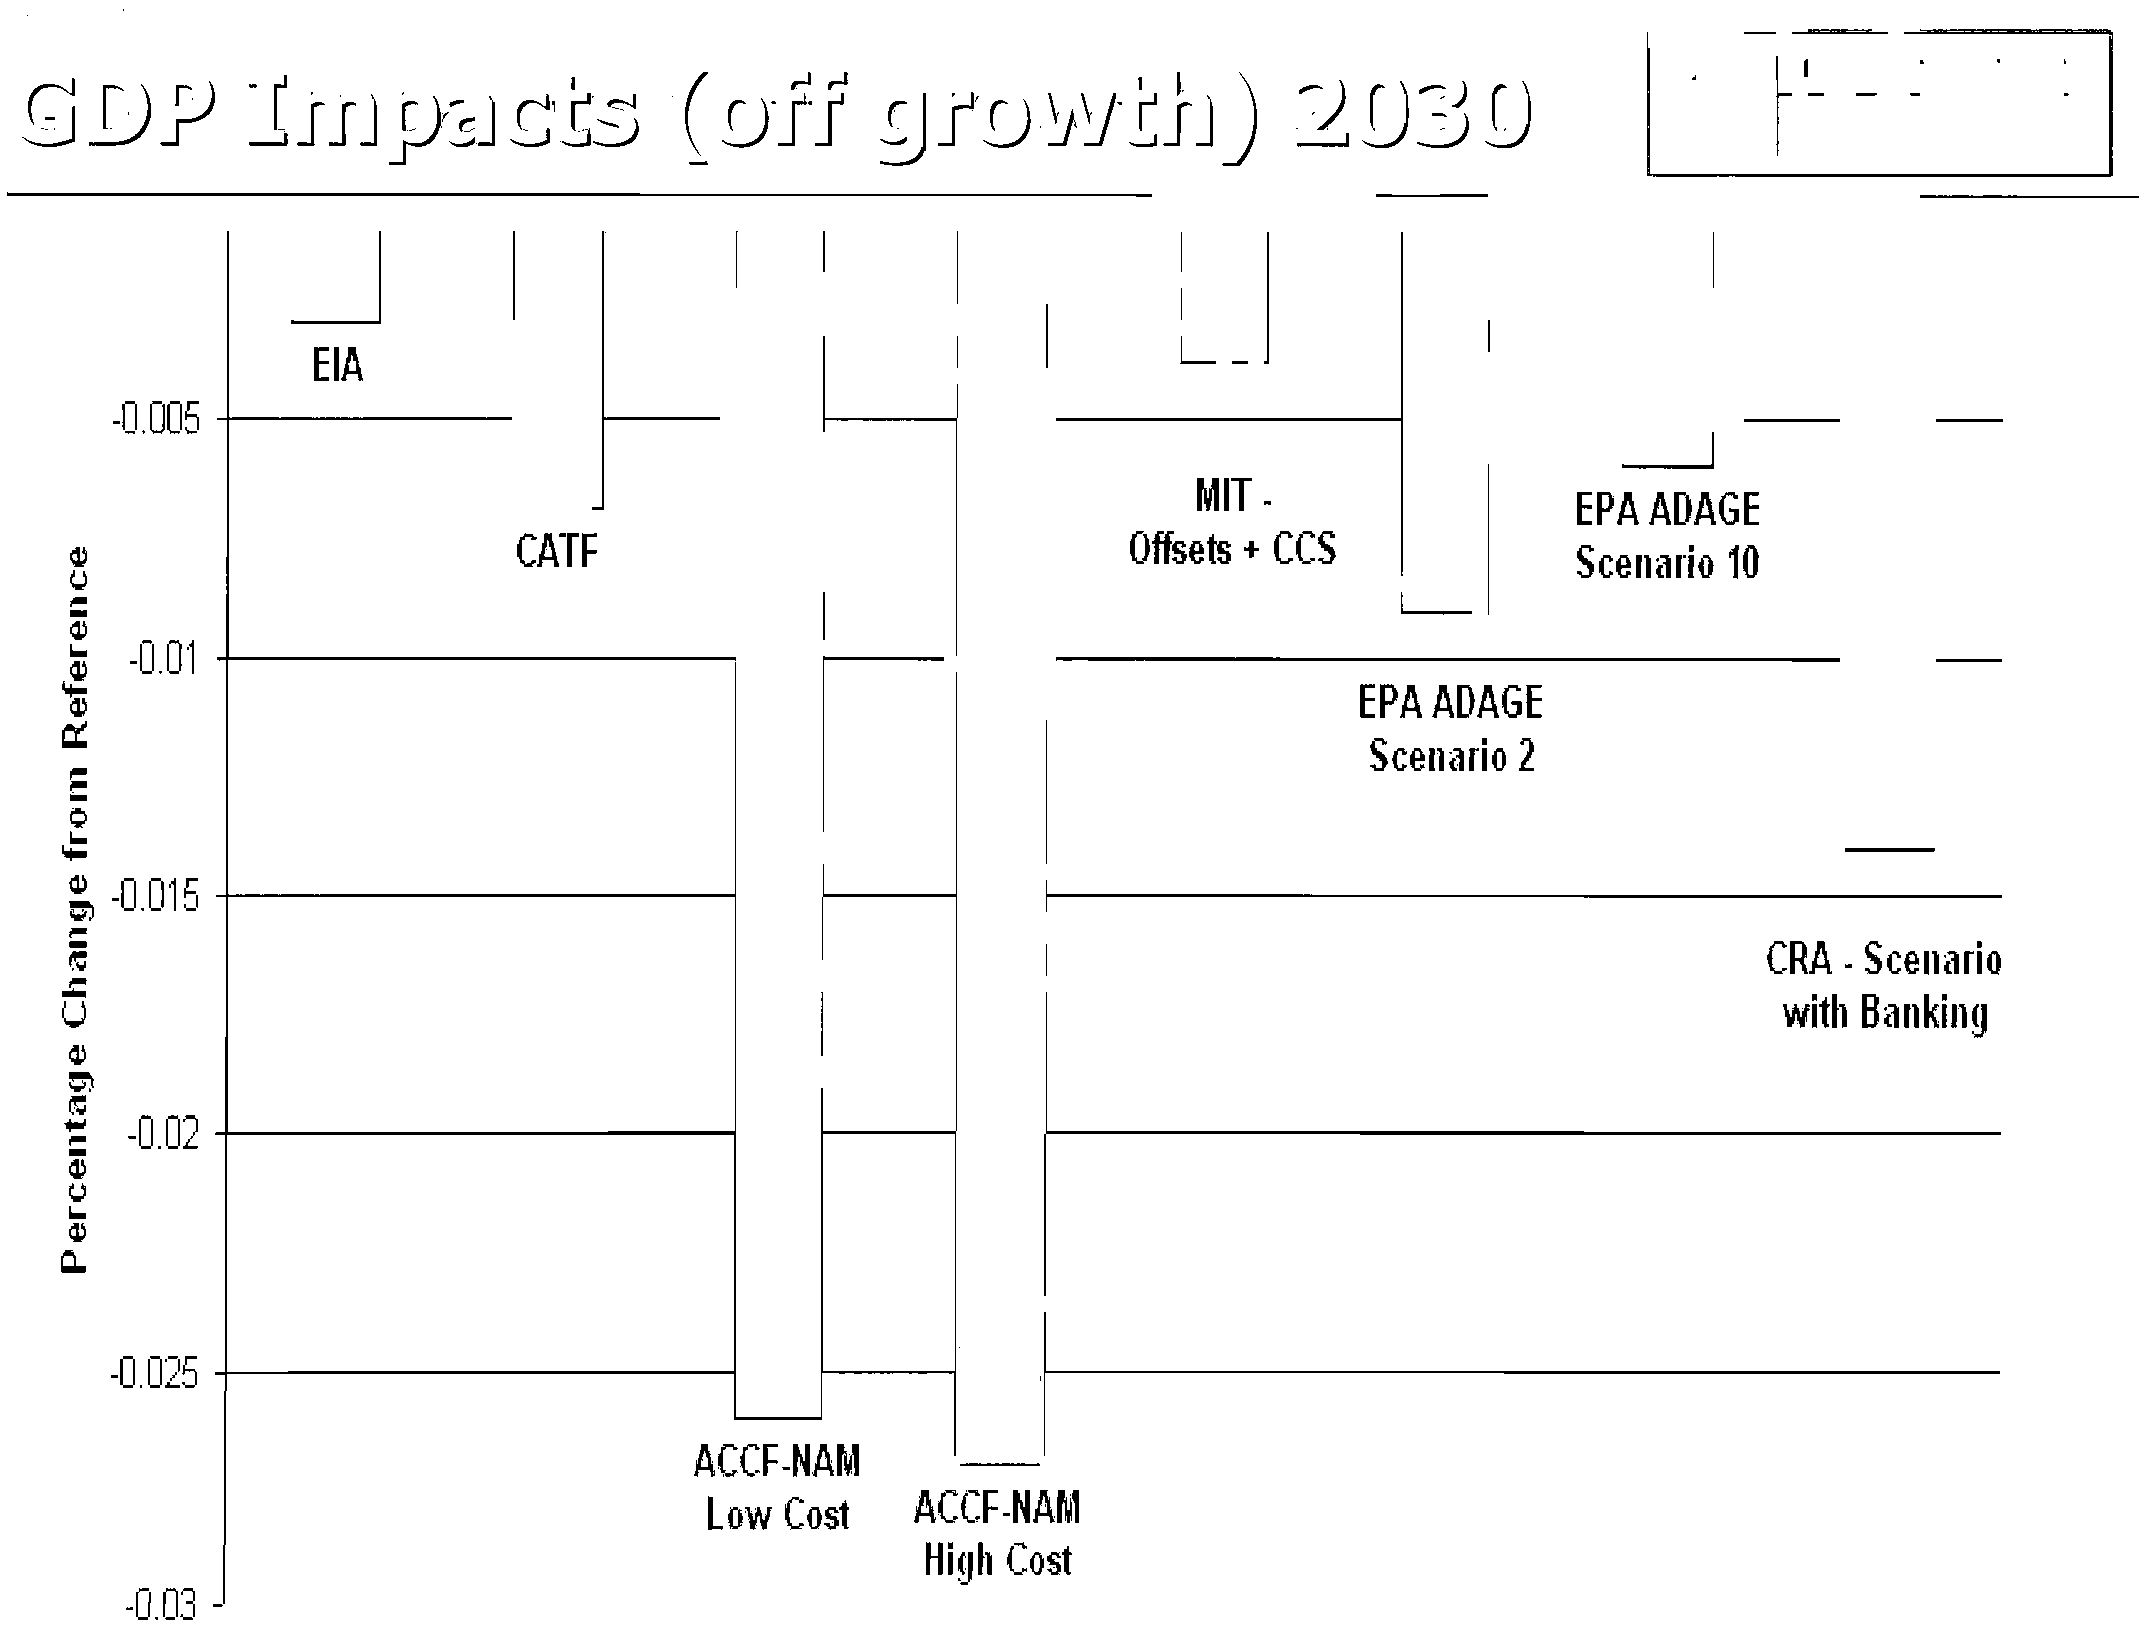
-0.005
ili
..
;V
()
~
-0.01
'a;
c::
..
:::
o
.;:
U
..
..
16
~
-0.015
ili
:='l
(ll
:: -0.02
ili
()
...
ili
Q.
-0025
-0.03
-0
EIA
D
f---,
Mil -
EPA ADAGE
CAlF
Offsets + CCS
Scenario 10
r--
EPA ADAGE
Scenario 2
CRA - Scenario
with Banking
;
ACCF-NAM
Low Cost
ACCF-NAM
High Cost
Electronic Filing - Received, Clerk's Office, October 1, 2008
* * * * * PCB 2009-021 * * * * *
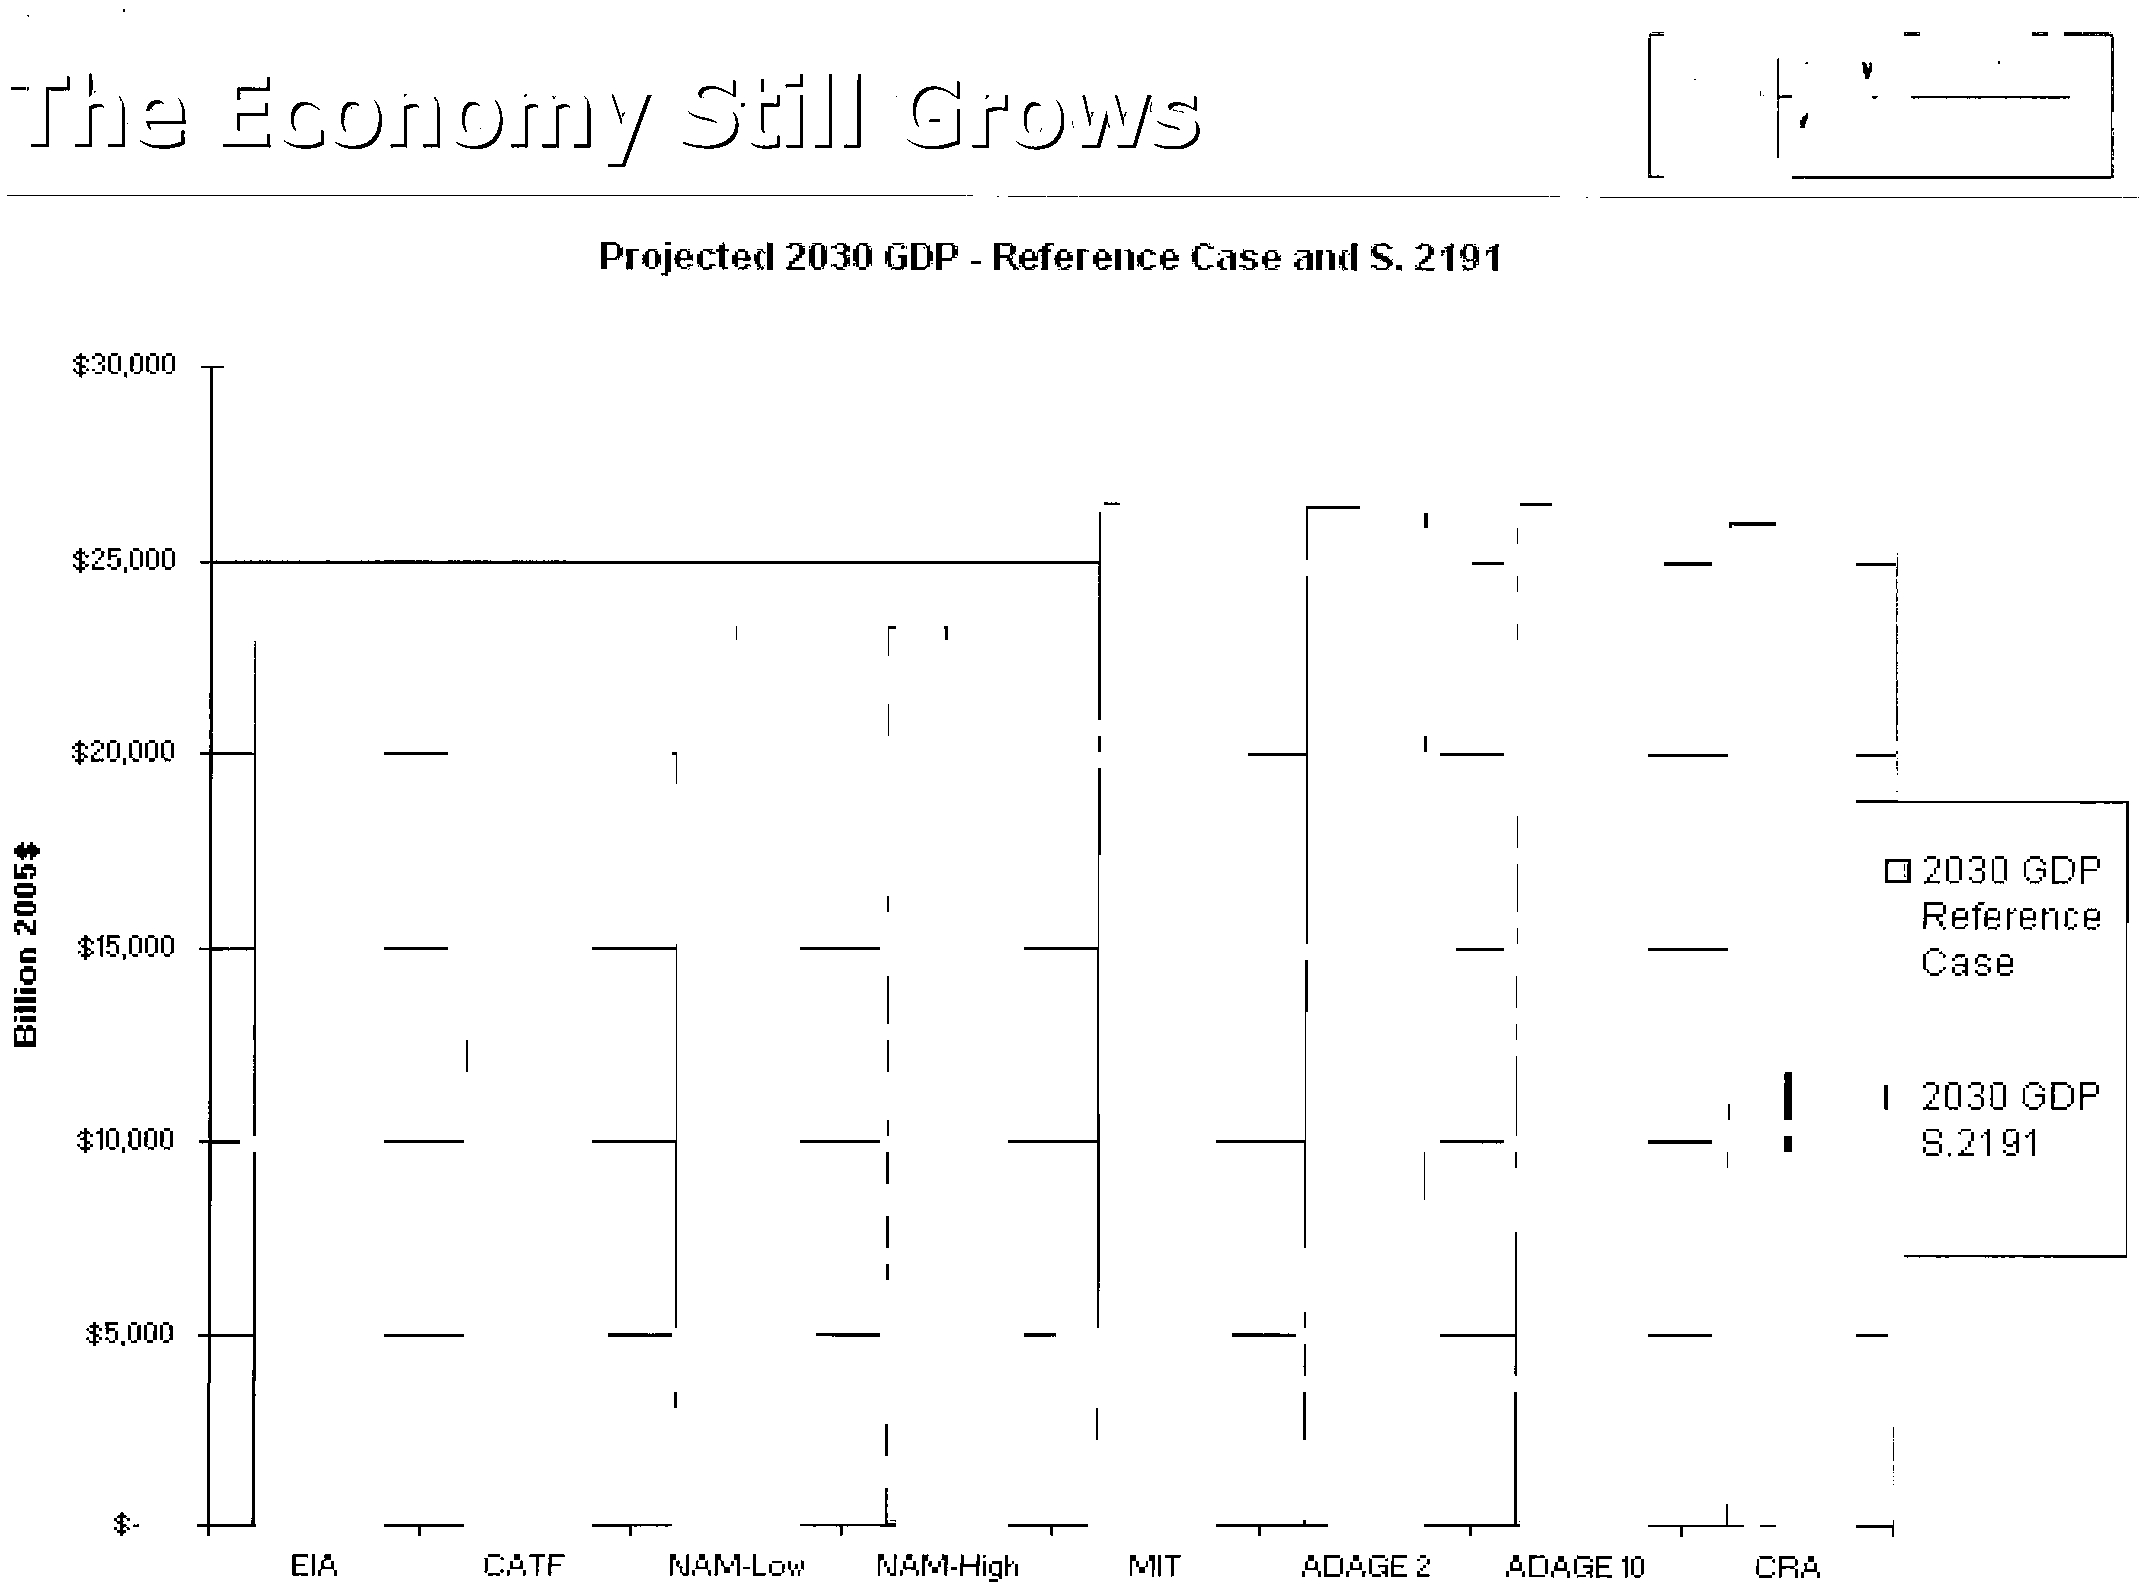
Projected 2030 GOP - Reference Case and S. 2191
$30,000 I
i
EIA
C,1l,TF
NAM-Low
NAM-High
MIT
ADAGE 2
P,DAGE
10
eRA
$-
$5,000
$25.000
I
I
$20,000
...
$15,000
W::,~
~ ~ ~ ~ ~ ~
It!
•
02030 GDP
N
==
Reference
c
Case
~
iii
II
-
I
-
I
-
I
-
I
-
I
-
I
-
I
-
.2030 GDP
$10,000 +-I
I
I
I
I
I
I
I
-
8.2191
Electronic Filing - Received, Clerk's Office, October 1, 2008
* * * * * PCB 2009-021 * * * * *
• Very difficult to compare across models
~
these should not be interpreted as ranges.
These are apples and oranges because they
are all different analyses.
• While there is considerable variation
across models
in terms of the likely
price
of allowances, where low carbon
technology
is allowed to develop and
flexible policy
is included, the costs are
Back to top
modest.
15
Electronic Filing - Received, Clerk's Office, October 1, 2008
* * * * * PCB 2009-021 * * * * *
16
• Organize our thinking
•
Put very rough bound on costs
• Prioritize our efforts
• Identify policy
and technology sensitivities
(the drivers)
•
Provide insights or benchmarks for "good"
policies
Models are not crystal balls and are only as
good as
the assumptions, the structure,
and
the data allow.
Electronic Filing - Received, Clerk's Office, October 1, 2008
* * * * * PCB 2009-021 * * * * *
• A broad-based advanced technology portfolio is critical to
achieving climate goals at reasonable cost.
• A combination
of price signal and policies for end use
efficiency
can reduce program costs by decreasing energy
demand.
• Flexibility (banking and borrowing) can reduce costs.
• The more offsets
in a program, the lower the costs.
• Some sectors will show greater opportunities for reductions
in the short term.
•
In the medium to longer term, CCS plays a large role.
• Under reasonable climate policy, the economy will still grow
robustly.
17
Electronic Filing - Received, Clerk's Office, October 1, 2008
* * * * * PCB 2009-021 * * * * *
Janet Peace
Director of Markets And Business Strategy and Senior Economist
Pew Center on Global Climate Change
PeaceJ@pewclimate.org
www. pewclimate.org
18
Electronic Filing - Received, Clerk's Office, October 1, 2008
* * * * * PCB 2009-021 * * * * *
Moody's
Investor
Service,
"Rating
Action:
Ameren
Corporation"
(August
13,
2008).
Electronic Filing - Received, Clerk's Office, October 1, 2008
* * * * * PCB 2009-021 * * * * *
Approximately
$800
million
of
Debt
Securities
Downgraded
NewYork,
August
13,2008
-
Moody's
Investors
Service
downgraded
the
ratings
of
Ameren
Corporation
(Ameren),
induding
its
Issuer
Rating.
to
Baa3
from
Baa2,
and
its
short.tenn
rating
for
commercial
paper,
to
Prime-3
from
Prime-2;
and
the
senior
unsecured
debt
rating
of
AmerenEnergy
Generating
Company
(AmerenGenco)
to
Baa3
from
Baa2.
The
rating
outlooks
of
Ameren
and
AmerenGenco
are
stabla.
Moody's
also
downgraded
Union
Electric
Company's
(d/b/a
AmerenUE)
short-term
rating
for
commercial
paper
to
Prime-3
from
Prime-2.
Thesa
rating
actions
conclude
the
review
for
downgrade
initiated
on
May
21,
2008.
Thalong-term
ratings
and
outlooks
of
Central
Illinois
Public
Service
Company
(d/b/a
AmerenCIPS,
Bal
Issuer
Rating,
positive
outlook);
CILCORP
Inc.
(Bal
Corporate
Family
Rating,
positive
outlook);
Central
Illinois
Light
Company's
(d/b/a
AmerenCILCO,
Bal
Issuer
Rating,
posnive
oullook),
Illinois
Power
Company
(d/b/a
AmerenlP,
Bal
issuer
Rating,
posnive
outlook),
and
Union
Electric
Company
(d/b/a
ArnerenUE,
Baa2
Issuer
Rating,
stable
oullook)
are
unchanged.
'"The
downgrade
of
Ameren
reflects
dedining
consolidated
coverage
ratios
over
the
last
several
years
and
Moody's
expectation
that
ongojng
cost
pressures
and
the
lack
of
timely
regulatory
recovery
of
somecosts
will
prevent
ratios
from
returning
to
historical
levels
over
the
near
term-,
said
MichaeJ
G.
Haggarty
I
Vice
President
and
sena
Credit
Officer.
Ameren
has
experienced
higher
operating
and
maintenance
costs
and
increased
capital
spending
requirements
at
both
its
utility
and
nonutility
businesses.
Limited
rate
relief,
low
returns,
and
the
lack
of
automatic
rate
adjustment
dauses
has
led
to
regulatory
lag
In
recovering
costs
in
recent
years,
which
is
reflected
in
Its
lower
consolidated
coverage
metrics.
In
addition,
the
comblnatton
of
large
capital
expenditures
and
the
company's
high
dividend
payout
ratio
has
resulted
in
substantial
negative
free
cash
flow
in
2007
and
2008,
which
is
likely
to
continue
over
the
next
several
years.
Ameren's
lower
rating
is
also
prompted
the
downgrade
of
two
of
its
major
subsidiaries,
Union
Electric
(to
Baa2
on
May
21,
2008)
and
AmerenGanco
(wnh
this
rating
action),
which
will
decrease
the
quality
of
expected
cash
flows
upstreamed
to
the
parent
company.
Although
Moody's
maintains
positive
outlooks
on
the
ratings
of
Ameren's
Illinois
utility
subskUaries,
any
upward
movement
of
these
ratings
is
likely
to
be
modest
and
nol
significant
enough
to
offset
the
lower
ratings
of
Union
Electric
and
AmerenGenco,
which
represent
the
bulk
of
the
cash
flows
upstreamed
to
the
parent.
The
downgrade
also
considers
longer-term
challenges
facing
Amoren,
Induding
the
potential
passage
of
cerbon
control
legislation
next
year
and
the
possible
construction
of
a
new
nuclear
unit
at
Union
Electric.
which
just
submitted
a
combined
Construction
and
Oparatlng
Ucensa
Application
(COLA)
to
tha
Nuclear
Regulatory
Commission.
The
downgrade
of
AmerenGenco
reflects
higher
capital
expenditures
at
this
predominanUy
coal
fired
generating
subsidiary,
some
of
which
are
likely
to
be
financed
with
additional
long-term
debt;
and
the
likelihood
that
the
company
will
be
negatively
affected
over
the
long-term
by
the
implementation
additional
environmental
compliance
requirements
or
controls
on
carbon
emissions.
The
downgrade
also
considers
its
higher
business
and
operating
risk
profila,
as
Moody's
views
AmerenGenco
as
more
of
a
merchant
generating
company
sailing
Into
unregulated
power
markets
rather
than
a
complately
contracted
ganco
sailing
most
of
its
power
to
Ameren
affiliates.
Although
financial
metrics
have
Improved
since
the
expiration
of
thesa
below
market
affiliate
contracts,
this
Improvement
is
not
sufficient
enough
to
offset
its
incraased
business
risk
profUe.
The
downgrade
of
Union
Electric's
short-tarm
rating
for
commercial
paper
to
Prime-3
from
Prim&-2
Is
prompted
by
the
downgrada
of
Arneren's
short-term
rating
to
Prima.3.
Arneren
and
Union
Electric
share
the
same
bank
credit
facility,
wnh
Union
Electric
able
to
borrow
on
a
36+<lay
basis
under
the
facility.
The
two
entities
also
share
a
money
pool
arrangement
and
Union
Elactric
is
highly
dependant
on
the
parent
for
liqUidity
and
finenclal
support,
as
has
been
demonstrated
by
capital
contributions
from
Arneren
to
Union
Electric
and
a
$50
million
intercompany
note
payable
from
the
uUllty
to
the
parent
outstanding
as
of
June
30,
2008.
The
maintenance
of
8
positive
rating
outlook
of
Ameren's
Illinois
utilities
refleds
the
potential
tor
modest
upward
movement
in
their
ratings
in
the
event
there
is
8
supportive
outcome
of
their
pending
distribution
rate
cases,
resutting
In
an
improvement
in
some
of
their
relaUveIy
low
cash
now
coverage
metrics;
If
there
js
a
reduction
in
high
short-term
debt
levels
and
an
extension
of
their
bank
fadlltlas,
increasing
financial
ftexibllity;
or
If
there
is
a
sucx:essful
implementalion
of
new
power
procurement
policies
and
procedures
in
Illinois.
Ratings
downgraded
Include:
Electronic Filing - Received, Clerk's Office, October 1, 2008
* * * * * PCB 2009-021 * * * * *
New
York
William
l.
Hess
Managing
Director
Infrastructure
Finance
Group
Moody's
Investors
Service
JOURNALISTS:
212-553-ll376
SUBSCRIBERS:
212-553-1653
New
York
Michael
G.
Haggarty
VP
-
Senior
Credit
Officer
Infrastructure
Finance
Group
Moody's
Investors
Service
JOURNALISTS:
212-553-Q376
SUBSCRIBERS:
212-553-1653
©
Copyright
2008,
Moody's
Investors
Service,
Inc.
and/or
its
licensors
including
Moody's
Assurance
Company,
Inc,
(together,
"MOODY'S").
All
rights
reserved.
ALL
[I'IiFORr-1ATJQN
CONTAlNED
HERf/N
IS
PROTECTED
BY
COPYRiGHT
LAW
AND
NONE
OF
SUCH
INFORMATION
1\1AY
BE
COPIED
OR
OTI1EFn'JlSE
REPRODUCED,
Fl!:_P
..
~CKAGED,
fURTHER
TRANSMflTIIJ,
TRANSFERRED,
DISSEMiNATED,
REDrSTRUlUTED
OR
RESOLD.
OI{
STORED
!'OR
SUBSEQUENT
USE
fOR
ANY
SUCH
PURPOSE,
IN
WHOLE
OR
IN
PART,
IN
ANY
FORM
OR
r.1ANNER
OR
BY
ANY
MEANS
WHATSOEVER,
BY
ANY
PERSON
wm~OUT
MOODY'S
PRIOR
WRITTEN
CONSENT.
AU
information
contained
herein
is
obtained
by
r-100DY'$
(1'00'
sources
believed
by
it
to
be
accu~ate
and
reliable.
Bec.a~lse
of
the
pO!'Slbihtv
of
human
lJf
mechanical
error
as
well
as
other
factars,
however,
such
information
IS
provided
~as
IS"
without
warl7lnty
Ol
any
kind
and
",OODY'S,
in
portieular,
ma!ces
no
repn~sp-ntatlon
or
warranty,
e"press
01"
inlpli~d,
as
to
the
accurll
...
-y,
timeliness,
c.olTlpleten~:;;!;,
rnen:himtablhty
0:-
fitness
for
dny
Pilr!icular
purpose
of
any
such
mformation.
Under
no
circum!:tClnc.es
shall
NODDY'S
have
6ny
liabIlity
to
any
perst:ln
or
entity
for
(,1)
any
loss
or
damage
tn
whole
or
In
part
caused
by,
resultmg
tronl,
cr
rel3t'ng
.0,
any
emJr
(ni:9Ii~ef'lt
or
otherwise)
or
o:h.:,.
circumstance
or
ccntingE'ncy
wit"in
or
outSide
tI~e
(ontrol
of
/10'000"('5
or
any
of
ItS
d!recrors,
officers,
employees
ar
agents
II'
COl'1nectlon
WIth
tt'le
procurement,
collection,
compllatlon,
analysis,
Interpo-et"tion,
communication,
publ:::ation
or
deli
....
ery
ot
any
such
Information,
or
(b)
any
direct,
indIrect,
spe:hll,
consequer:tJa!,
compensatory
or
inddc:ntal
damages
whatso~ver
(inclUding
Without
Hml~tlon,
lost
profits),
even
If
MooDY'S
IS
advised
in
advance
of
the
possibility
of
such
damagE'S,
resulting
from
the
uS('
of
or
inability
to
use,
any
such
information.
The
creche
ratings
and
financial
reporting
analYSIS
observations,
If
any,
constituting
part
of
the
informatIon
contained
herein
are,
and
must
be
construed
solely
as,
statements
of
opinion
and
not
statements
of
fact
or
recommendations
to
purchase,
sell
or
hold
any
seCUrities.
NO
WARRANTY,
EXPRESS
OR
IMPUEO,
AS
TO
ll1E
ACCURACY,
TI/Io1EL1NES5.
CO'<1PlETENESS,
MERCHANTABILITY
OR
FITNESS
fOR
ANY
PARTICULAR
PURPOSE
OF
ANY
SUCH
RATrNG
OR
OTHER
OPINION
OR
INFORMA,TION
IS
GIVEN
OR
MADE
BY
MOODY'S
IN
ANY
FORM
OR
MANNER
WHATSOEVER.
Each
rating
0,'
other
opinion
must
be
weighed
solely
as
one
factor
In
any
investment
decision
made
by
Of
on
behalf
of
any
user
of
the
information
contained
herein,
and
each
such
user
must
accordingly
make
Its
own
study
and
e
....
aluatlOn
of
each
security
and
of
each
issuer
and
guarantor
of,
and
each
pro
....
ider
of
credIt
support
for,
each
securIty
that
It
may
consIder
purchasing,
holding
or
selilng.
MOODY'S
hereby
discloses
that
most
I!;SllerS
of
debt
securities
(including
corporate
and
municipal
bonds,
debentures,
notes
and
commercial
paper)
and
preh~n'ed
stock
rated
by
MOODY'S
nave,
prior
to
assignment
of
any
rating,
agreed
to
pay
to
~400DY'S
for
appraisal
and
rating
$ervices
rendered
by
it
fees
ranging
from
$1,500
to
approlCimetely
~2,400,OOO.
Moody's
Corporation
(fl.1CO)
and
Its
Wholly-owned
credit
ratJl1g
agency
subsidiary,
Moody'S
Investors
Service
(MIS),
also
maintain
poliCies
and
proceCJures
to
address
the
independence
of
r-lIS's
ratings
and
ratIng
proce':ises.
Information
regarding
certain
affiliations
that
may
exist
belwei:n
directors
of
MeO
and
rated
entities,
and
between
entities
who
hold
ratings
from
,..US
and
have
also
publicly
reported
to
the
SEC
an
ownership
Interest
in
1\1C0
of
more
than
SOM,
Is
posted
annually
on
t-loody's
website
at
www.moodys.com
under
the
heading
'Shareholder
RelatIOns.
Corporate
Govemance.
Director
and
Shareholder
Afflhation
Policy.-
Electronic Filing - Received, Clerk's Office, October 1, 2008
* * * * * PCB 2009-021 * * * * *
Pew
Center
on
Global
Climate
Change,
"Insights
from
Modeling
Analyses
of
the
Lieberman-Warner
Climate
Security
Act
(S.
2191)"
(May
2008).
Electronic Filing - Received, Clerk's Office, October 1, 2008
* * * * * PCB 2009-021 * * * * *
Economic
models
establish
a
logical
and
consistcnr
higher
deployment
rates
of
energy
efficient
products
and
framework
for
considering
the
implications
of
different
programs
(e.g.,
allocation
to
stares
based
on
implementation
policies
and
have
been
extensively
used
to
evaluate
the
of
energy
effidenr
building
codes)
are
nOf
specifically
included.
consequences
of
different
policy
choices
for
addressing
This
does
not
mean
that
the
modeling
results
are
not
useful
bur
global
climate
change.
Yet
model
results
depend
upon
the
rather
illustrates
that
model
results
represenr
an
approximation
of
assumptions,
definitions,
and
structure
of
the
model,
30$
the
bill
and
not
the
bill
as
a
whole.
well
as
the
dara
that
are
used
for
input
into
the
model.
Few,
if
any,
of
the
expens
who
work
closely
with
models
For
example,
the
flexibility
of
the
economy
in
responding
to
believe
rhar
specific
model
ourpms
regarding
furure
energy
cosrs
change
or
the
flexibiliry
of
rhe
policy
being
modeled
can
or
GOP
impacrs
will
acrually
marerialize
under
any
given
policy.
borh
have
signiflcanr
implicarions
for
any
assessment
of
the
Bur
the
resulrs
are
inreresring
for
the
broadcr
insighrs
they
reveal.
costs
of
a
parricular
policy.
Funhermore,
there
is
enormous
In
the
effon
to
craft
and
implement
cosr~effcctive,
well-designed
unccrrainry
in
aucmpting
to
predict
outcomes
that
occur
srrategies
for
addressing
the
problem
of
climate
change,
it
is
in
50
years.
both
in
terms
of
technologics
that
might
be
critical
that
all
who
seek
to
understand
and
usc
modeling
results
available
and
the
costs
of
using
those
technologies.
In
the
share
a
realistic
view
of
their
proper
role
in
the
climate
policy
past,
prior
csrimarcs
of
the
COSts
of
regulation
were
often
debate.
(For
a
full
discussion
see
the
Pew
Center's
companion
many
times
more
rhan
the
actual
observed
COStS
once
a
paper,
"Insights
Not
Numbers."Z)
program
is
initiared.
l
This
In
Srir/cxamines
somc
of
rhe
models
rhat
have
been
Models
only
provide
a
simplified
view
of
our
used
ro
assess
the
economic
impacts
of
rhe
Lieberman-Warner
economy.
In
the
case
of
the
Lieberman-Warner
Climate
Climate
Security
Act
(as
reported
our
ofComminee
in
December
Security
Act
(5.
2191),
models
can
caprurc
many
of
the
key
2007)
and
puts
them
in
contexr
for
consumers
of
this
modeling
policy
clements
(e.g.,
the
impacts
of
targets,
riming.
and
information.
It
is
important
to
note
that
some
of
these
offsets)
but
cannot
incorporate
all
of
them.
For
example.
modeling
efforts
were
undertaken
in
advance
of
the
new
Energy
the
impact
of
the
Carbon
Market
Efficiency
Board.
Independence
and
Security
Act
of
2007
and
the
new
forecast
of
which
can
contain
COStS
by
adjusting
the
quantity
of
baseline
or
"business
as
usual"
(BAU)
emissions
through
2030.
borrowed
allowances
and
the
trigger
price
that
spurs
Because
the
more
recent
forecasts
reflect
lower
baseline
emissions
this
borrowing,
is
not
included
in
any
of
the
models.
than
previously
anticipated,
the
C05[S
of
[he
climate
proposals
Furthermore
many
of
the
provisions
designed
co
encourage
based
on
earlier
higher
projections
ofba5e1ine
emissions
are
likely
to
be
overestimated.
IN
BRIEF
Electronic Filing - Received, Clerk's Office, October 1, 2008
* * * * * PCB 2009-021 * * * * *
taking
action
{such
as
avoided
impacts
of
sea-level
rise
and
ancillary
beneflts
of
improved
air
quality
or
energy
security}.
A~
such,
the
economic
models
promed
in
this
review
present
only
one
side
of
the
story-the
costs
of
policy,
not
the
benefits
of
that
policy.
The
following
section
summarizes
key
policy
insights
that
can
be
gleaned
from
these
analyses
of
potential
program
COStS
of
S.
2191.
The
economic
modeling
studies
reviewed
for
this
analysis
are
rhen
briefly
discussed,
including
key
assumptions
and
resulrs.
Modeling
Insights
The
availability
of
advanced,
low-carbon
technologies
is
cnlciat
to
minimizing
the
costs
of
achieving
GHG
reductions.
Models
thar
constrain
the
use
of
potential
technologies
dramatically
increase
the
costs
of
reducing
emissions.
For
example,
the
ACCF/NAM
model
constrains
the
future
deployment
of
nuclear
energy
so
that
less
electricity
is
delivered
from
nuclear
facilities
in
the
High
Cost
Scenario
than
is
projected
under
business
as
usual
forecasts
{developed
by
DOE's
Energy
Information
Administration
3
}.
Similarly,
rhe
amount
of
electricity
delivered
by
wind
power
is
also
constrained
to
an
annual
deployment
level
lower
than
was
actually
delivered
in
2007.
The
ACCF/NAM
model
restricts
additional
wind
capaciry
to
5
GW/year
for
the
Low
Cost
Scenario
and
3
GW/year
in
the
High
Cosr
Scenario.
According
to
the
American
Wind
Energy
Association,
rhere
was
an
addirional
5.244
GW
of
wind
capacity
added
in
2007.
4
The
resule
of
these
restrictions
is
that
the
costs
from
this
model
fall
far
outside
the
range
of
other
modeling
dforts.
The
ceorral
policy
insight
is
that
we
need
to
take
steps
to
ensure
that
advanced
low
carbon
technologies
are
deployed
{and
not
JUSt
developed}.
Ifby
2030
we
do
not
have
greater
deployment
of
2
IN
BRIEF
simulate
the
bill's
energy
efficiency
provisions
{for
example,
EIA
and
CATP}
anticipate
lower
allowance
prices
and
consumer
energy
bills.
Flexibility
in
the
timing
ofGHG
reductions
through
approachcs
such
as
banking
and
borrowing
keeps
costs
down
over
time.
Those
modeling
efforts
that
do
not
incorporate
the
banking
and
borrowing
provisions
provided
for
in
S.
219\
(such
as
ACCF/NAM
and
CRA's
no-banking
analysis)
result
in
higher
overall
impacts
on
GOP.
Modeling
efforts
that
do
incorporate
the
banking
provisions
often
show
higher
near~term
allowance
prices
because
firms
hold
additional
allowances
in
anticipation
of
higher
future
prices;
however,
this
ability
to
bank
allowances
reduces
overall
program
COStS
in
the
longer
term.
The
more
offsets
includcd
in
a
program,
the
lower
the
costs.
All
of
the
models
consistently
demonstrate
that
one
of
the
most
important
drivers
of
carbon
allowance
prices-in
some
modeling
exercises,
the
most
important
driver-is
the
availability
of
offsets.
The
model
scenarios
that
limit
offsets
below
the
total
of
30%
(international
credits
plus
domestic
offsets)
provided
for
in
S.
2191
show
signiflcantly
higher
cosrs.
EPA's
sensitivity
analysis
using
IGEM
found
that
if
international
credits
were
not
allowed
and
domestic
offsets
were
held
at
15%,
allowance
prices
increased
by
34%.
Further,
when
international
credits
and
domestic
offsets
were
not
allowed
at
all,
allowance
prices
in
the
model
increased
by
93%
above
estimates
that
included
the
full
30%
offsets,
as
in
the
bill.
Some
sectors
will
provide
greater
oppornmities
for
reductions
than
others
in
the
short
term.
Across
the
models,
the
largest
share
of
near-term
emissions
reductions
come
from
the
electricpower
sector
(through
efficiency
improvemcnrs
by
industry
and
consumers
and
through
fuel
switching).
Across
most
models,
fuel
switching
in
the
ncar
to
medium
term
creates
winners
(natural
gas
and
renewable
generation)
and
losers
{coal};
however,
in
the
longer
term,
the
loss
to
the
coal
Electronic Filing - Received, Clerk's Office, October 1, 2008
* * * * * PCB 2009-021 * * * * *
(CCS)
plays
a
potentially
large
role
assuming
adequate
provisions
are
made
for
its
use.
Analyses
that
assume
a
rapid
deploymem
orces
andlor
improved
capilal
cons
over
time
(such
as
MIT's
EPPA,
EPA's
ADAGE,
and
CATF's
NEMS)
rypically
result
in
more
coal
usc
over
the
longer
term
and
a
lower
economic
impact
ro
the
electric
power
generating
secmr
and
the
broader
economy.
Those
that
restrict
this
deploymclH
(such
as
EIA's
High
COSt
and
Limited
Alternatives
Cases
5
and
ACCF/NAM)
rcsult
in
more
fuel
switching
to
natural
gas.
largcr
impacts
on
coal
production
and
ultimately
higher
overall
impacts
on
the
economy.
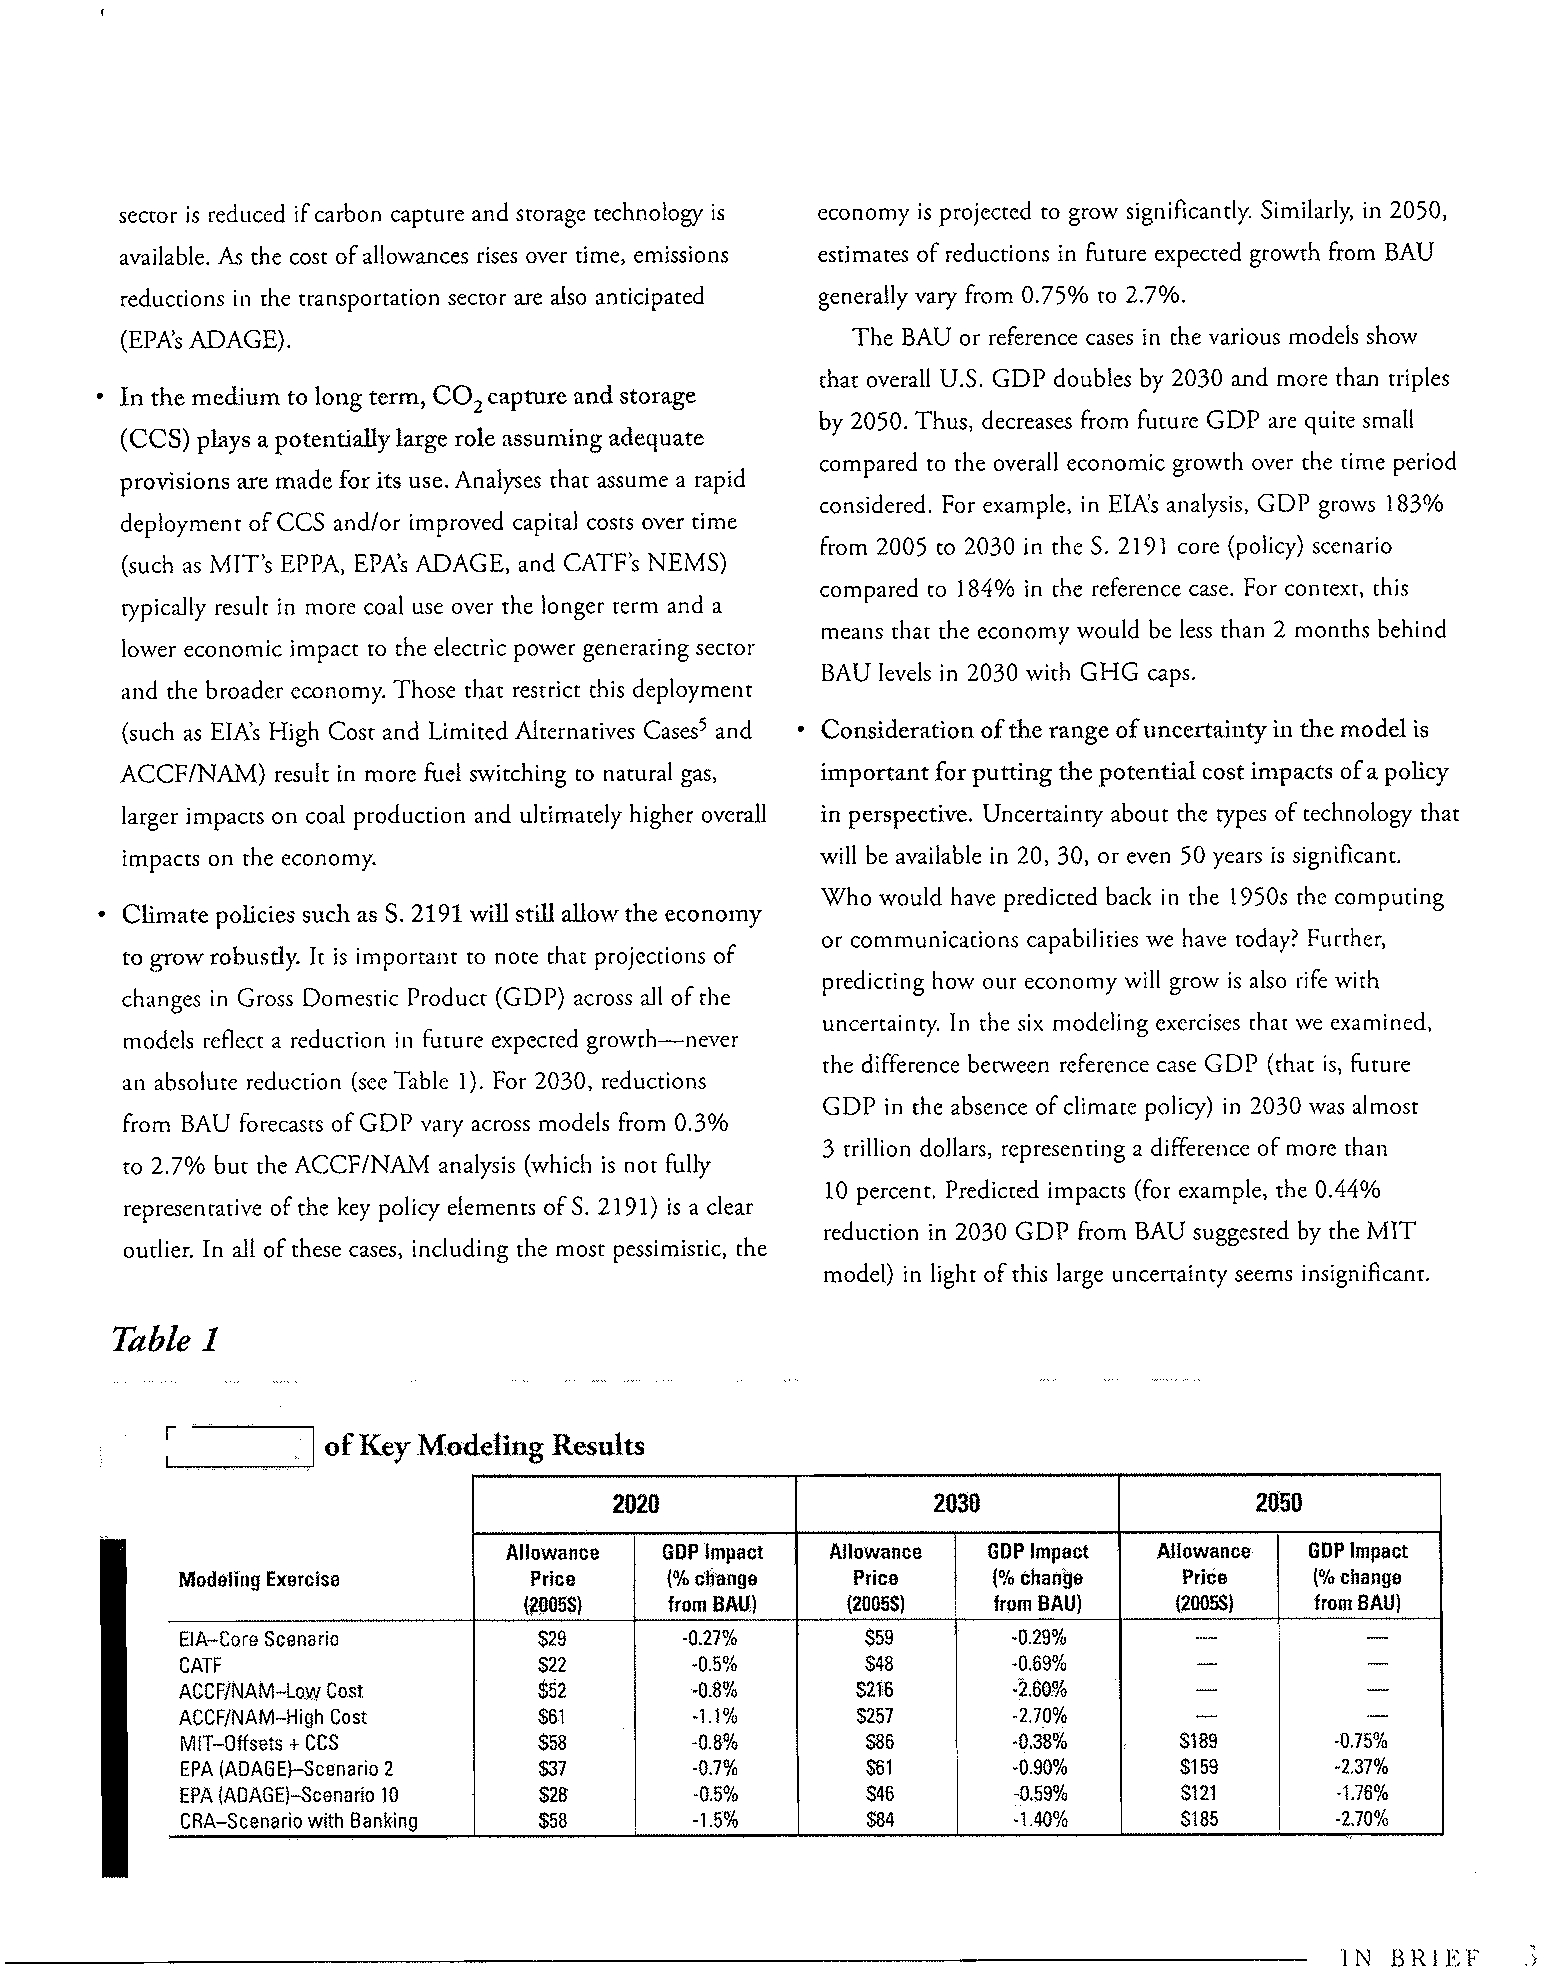
Climate
policies
such
as
S.
2191
will
still
allow
the
economy
to
grow
robustly.
It
is
imponanr
to
note
that
projections
of
changes
in
Gross
Domestic
Product
(GDP)
across
all
of
the
models
reflect
a
reduction
in
future
expected
growth-never
an
absolute
reduction
(see
Table
I).
For
2030,
reductions
from
BAU
forecasts
of
GDP
vary
across
models
from
0.3%
ro
2.7%
bur
the
ACCF/NAM
analysis
(which
is
not
fully
representative
of
the
key
policy
elements
of
S.
2191)
is
a
clear
outlier.
In
all
of
these
cases,
including
the
most
pessimistic,
the
by
2050.
Thus,
decreases
from
future
GOP
are
quite
small
compared
ra
the
overall
economic
growth
over
the
time
period
considered.
For
example,
in
ETA's
analysis,
GOP
grows
183%
from
2005
ro
2030
in
the
S.
2191
core
(policy)
scenario
compared
to
184%
in
the
reference
case.
For
context,
this
means
that
the
economy
would
be
less
than
2
months
behind
BAU
levels
in
2030
wirh
GHG
caps.
Consideration
of
the
range
of
uncertainty
in
the
model
is
important
for
putting
the
potential
cost
impacts
of
a
policy
in
perspective.
Uncertainty
abom
the
types
of
technology
that
will
be
available
in
20,
30,
or
even
50
years
is
significant.
Who
would
have
predicted
back
in
the
1950s
rhe
computing
or
communications
capabilities
we
have
raday?
Further,
predicting
how
our
economy
will
grow
is
also
rife
wirh
uncertainty.
In
rhe
six
modeling
exercises
rhar
we
examined.
rhe
difference
benveen
referencc
case
GOP
(that
is,
furure
GOP
in
the
absence
of
climate
policy)
in
2030
was
almost
3
trillion
dollars,
represenring
a
difference
of
morc
than
10
percent.
Predicted
impacts
(for
example,
the
0.44%
reduction
in
2030
GOP
from
BAU
suggested
by
the
MIT
model)
in
lighr
of
rhis
large
uncertainry
seems
insignificant.
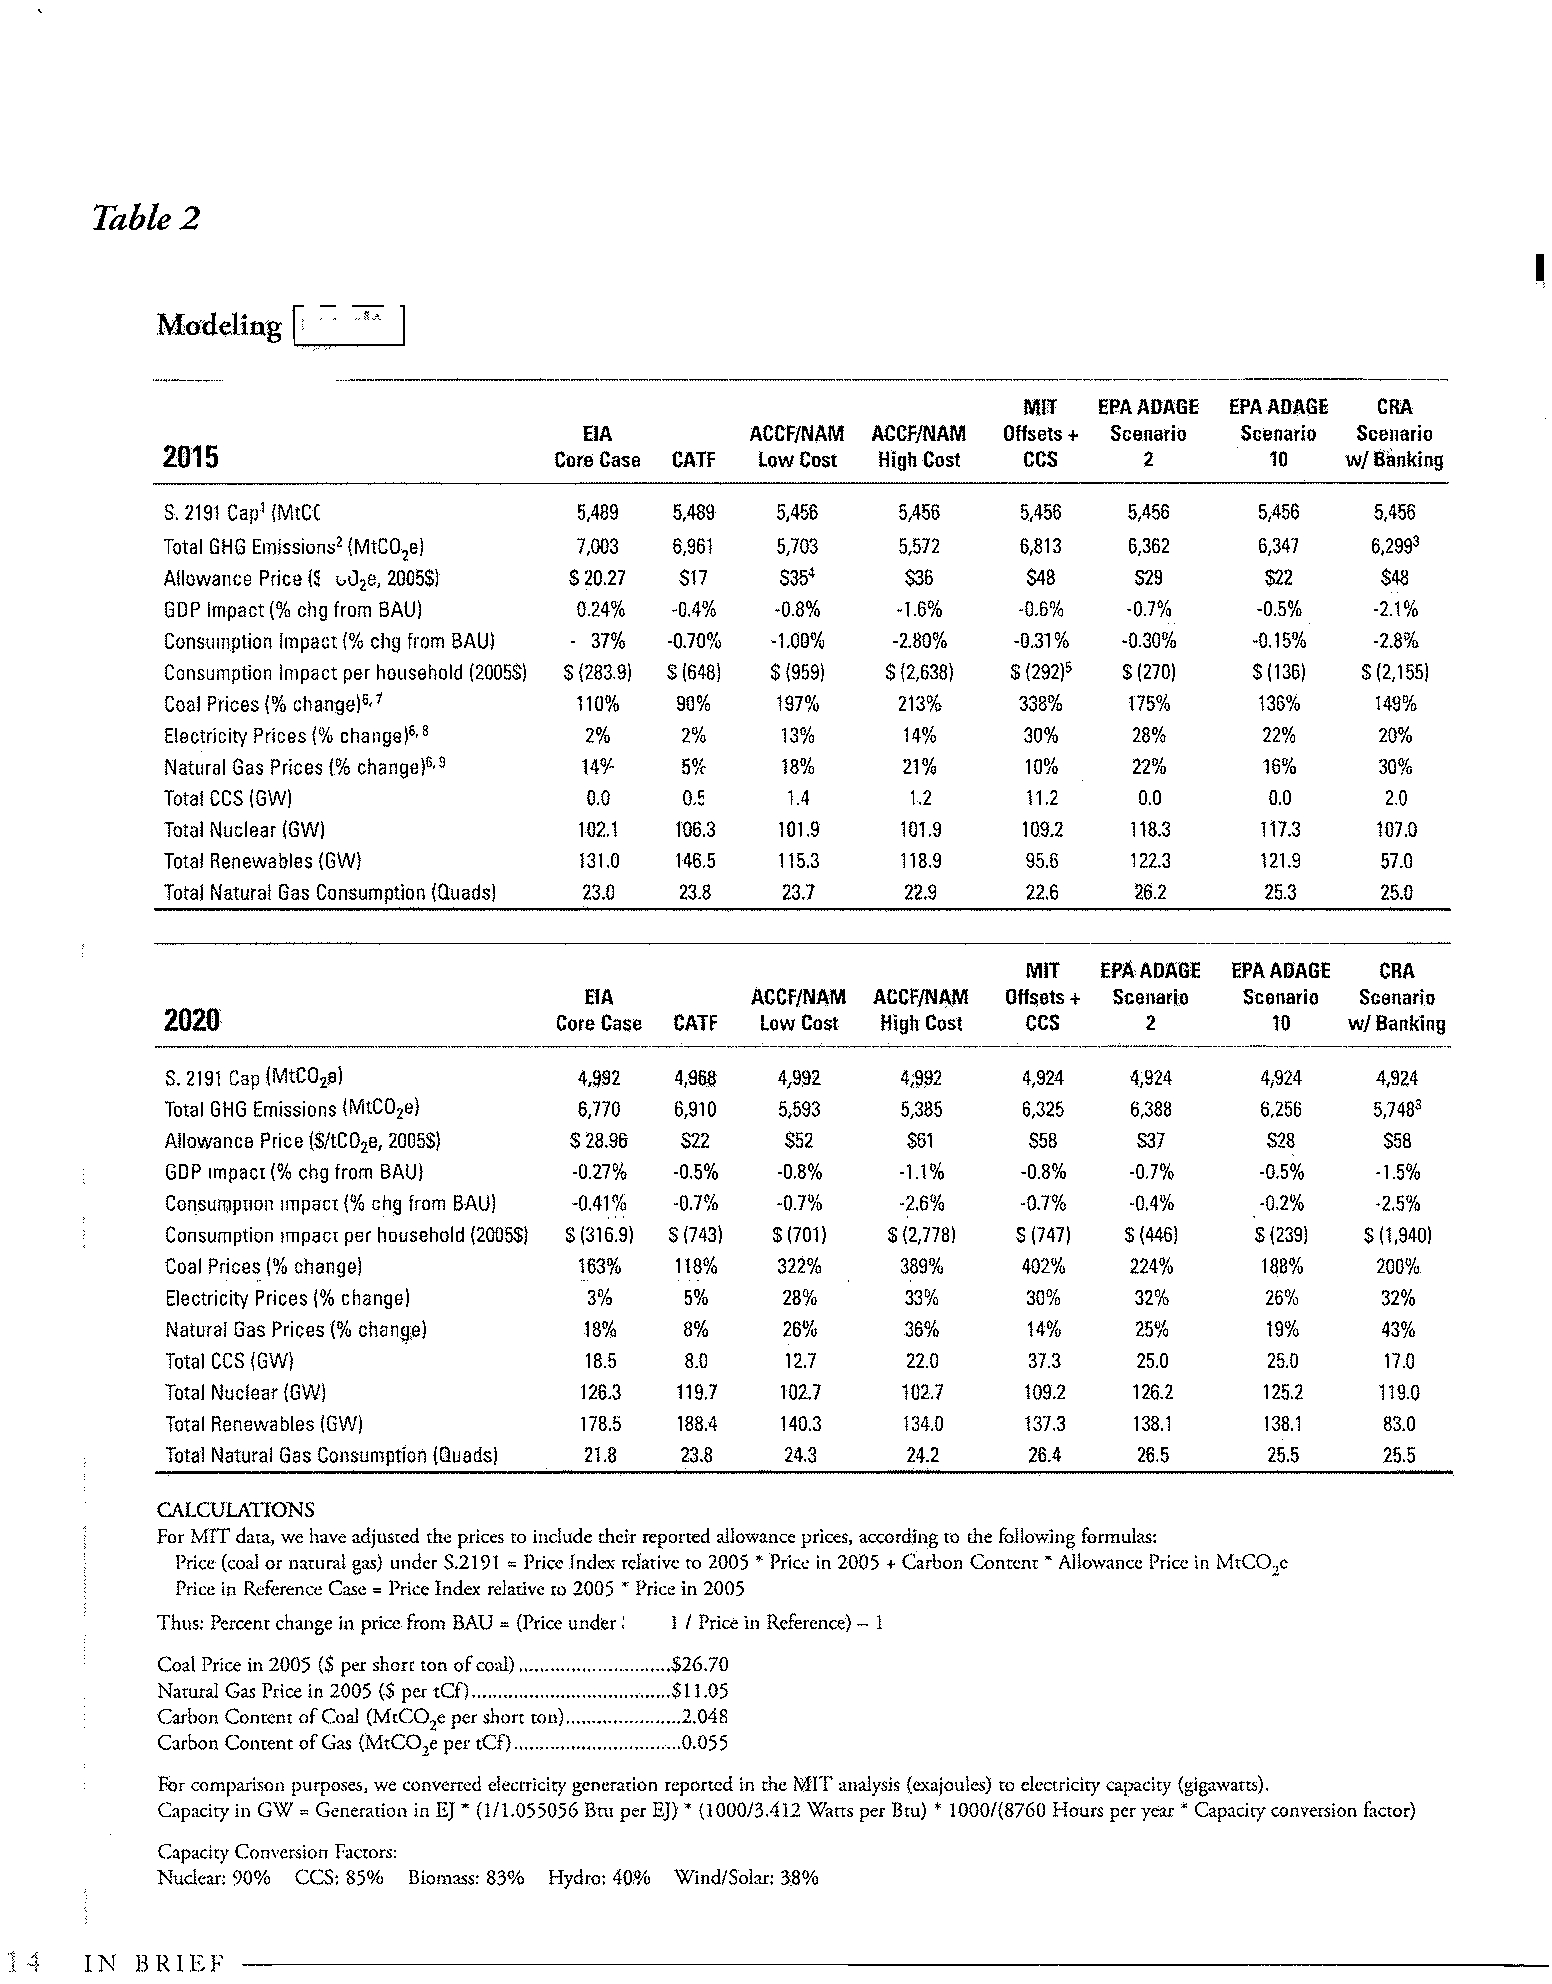
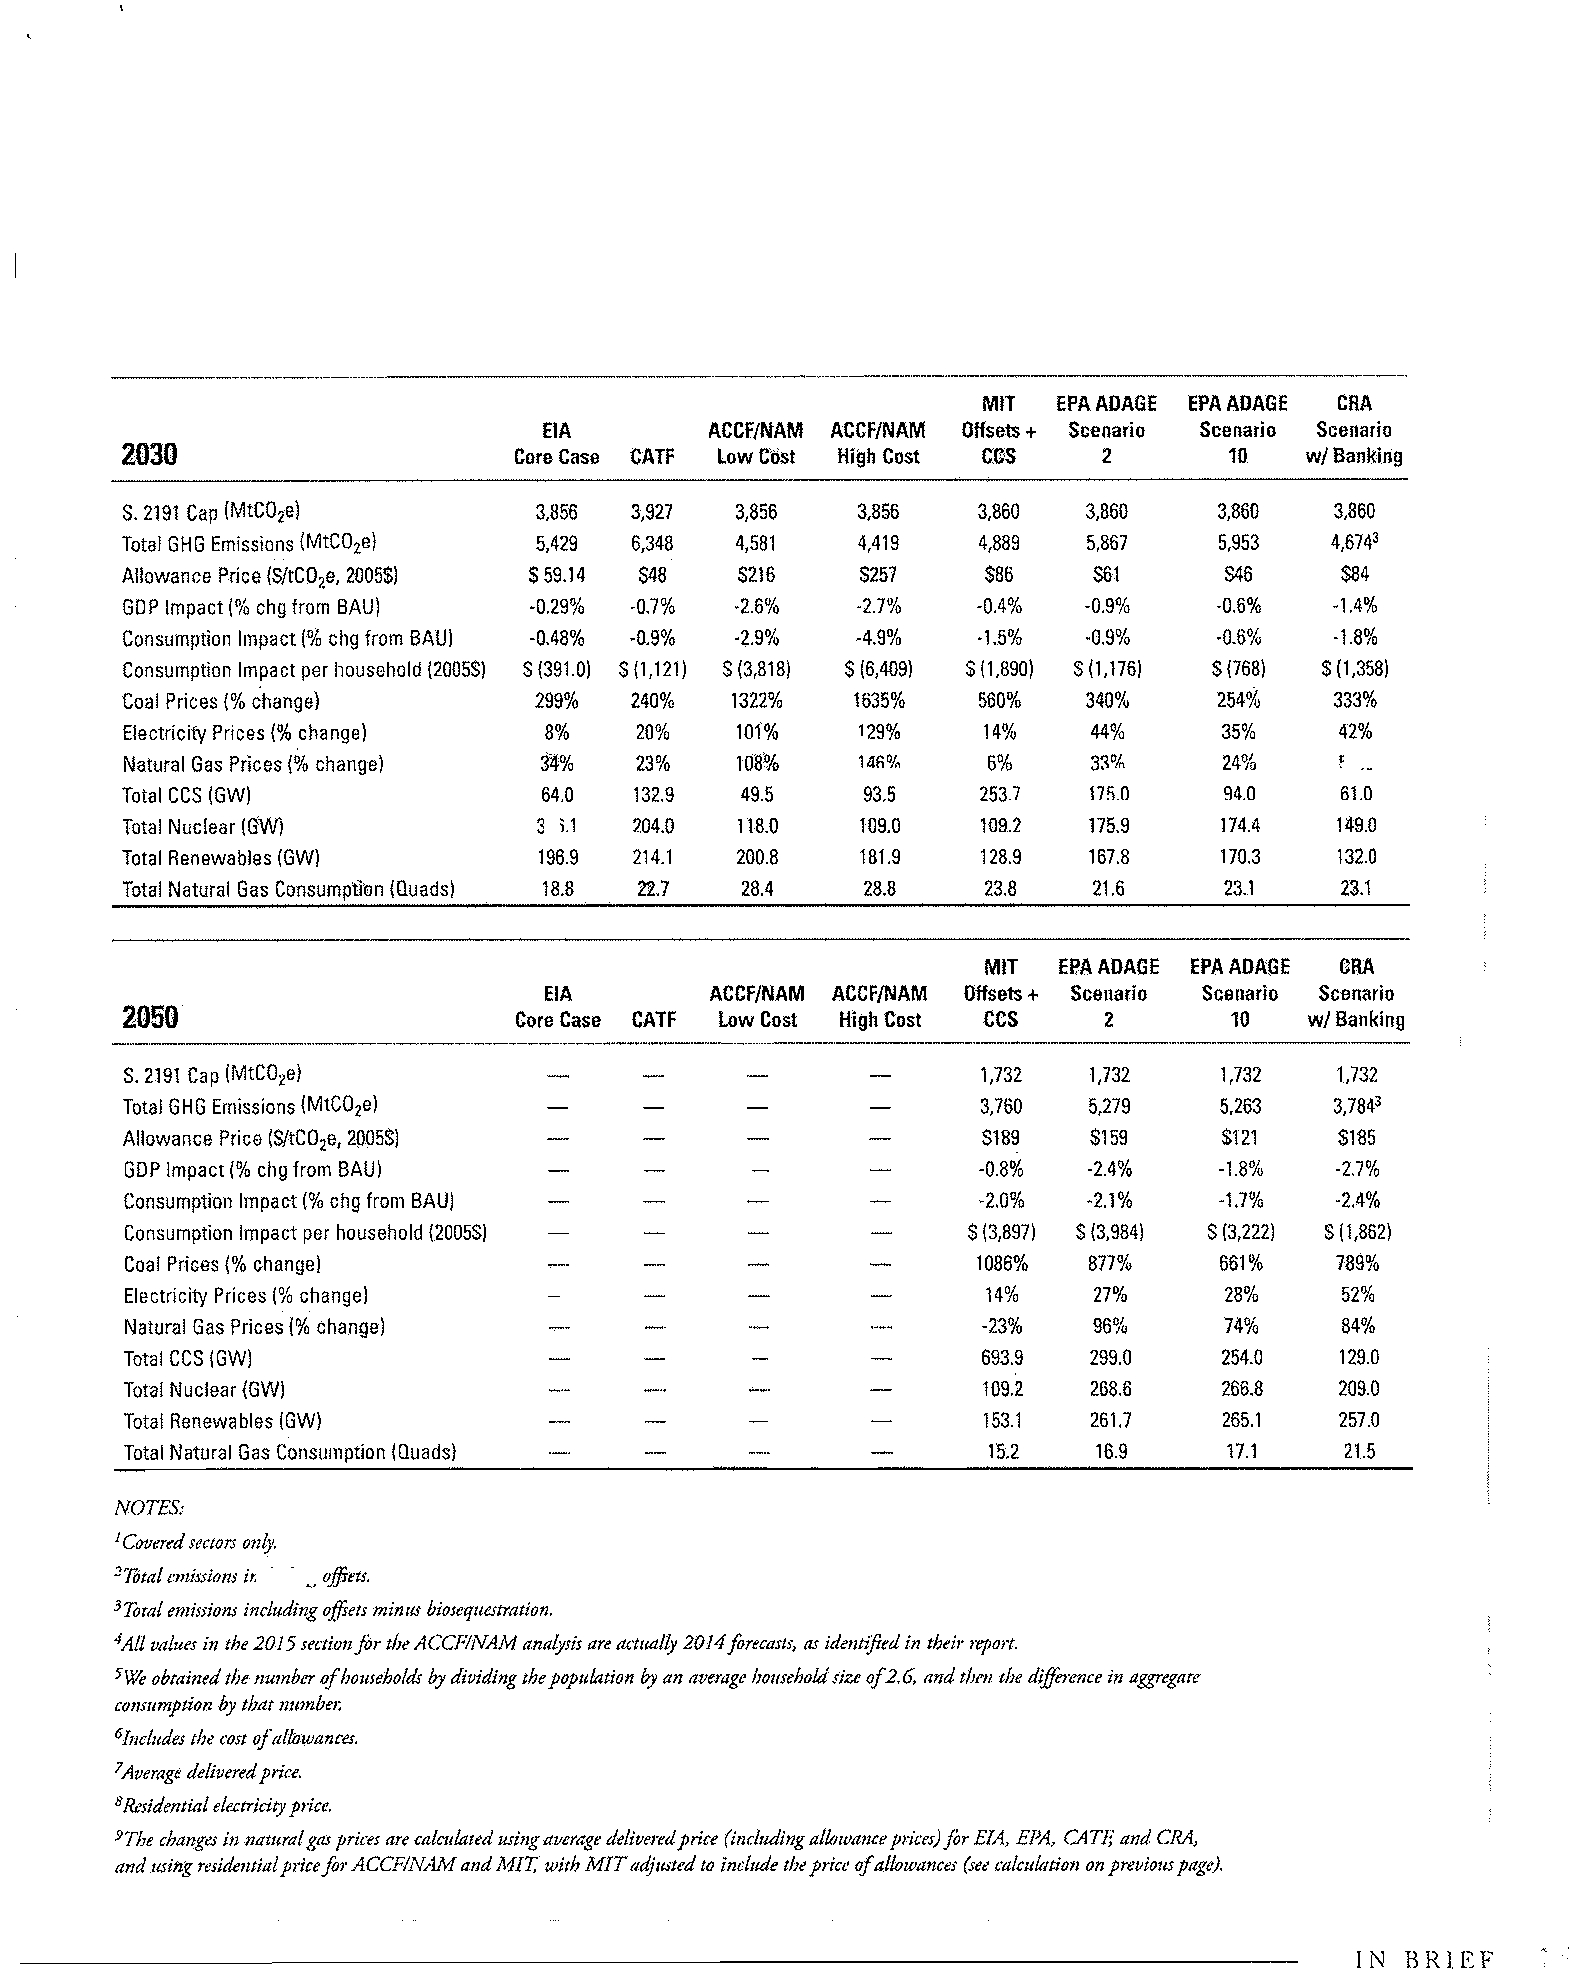
Table
1
2020
2030
2050
Allowance
GOP
Impact
Allowance
GOP
Impact
Allowance
GOP
Impact
Modeling
Exercise
Price
la~
change
Price
(~'a
change
Price
(%
change
I200SS)
from
BAU)
12005S)
from
BAUI
12005S1
from
BAUI
EIA-Core
Scenario
$29
1-
-0.27%
S59
-0.29%
-
-
CATF
S22
.0.5%
S48
-0.69%
-
-
ACCF/NAM-low
Cost
512
.0.8%
5116
I-
-2.60%
-
-
-
ACCF/NAM-High
Cost
S61
n
-1.1%
5157
-2.70%
-
-
MIT-Qffsets
+
CCS
S58
.0.8%
S86
-0.38%
-
S189
.0.75%
EPA
IAOAGE)-Scenario
2
S37
-0.7%
S61
-0.9Q%
S159
-2.37%
EPAIADAGE)-Scenanol0
528
.0.5%
S46
-0.59%
S121
.1.76%
eRA-Scenario
with
Banking
S58
-1.5%
S84
.1.40%
S185
.2.70%
I
Summary
I
of
Key
Modeling
Results
IN
BRIEF
.,
Electronic Filing - Received, Clerk's Office, October 1, 2008
* * * * * PCB 2009-021 * * * * *
Out
co
2030.
NEMS
explicitly
represents
the
decisions
involved
in
the
production,
conversion,
and
consumption
of
energy
products.
It
consists
of
separate
modules
that
represent
various
aspects
of
energy
markets
and
macroeconomic
activity:
four
supply
secrors
(oil
and
gas,
natural
gas
transmission
and
distribution,
coal,
and
renewable
fuels);
twO
conversion
processes
(electricity
and
petroleum
refineries);
fouf
modules
for
end-use
demand
(residential,
commercial,
transportation,
and
industrial);
one
co
simulate
energy/economy
interactions
(macroeconomic
activity);
one
module
{Q
simulate
world
oil
markets
(international
energy
activity);
and
an
integrating
module
that
provides
the
mechanism
co
achieve
a
general
market
equilibrium
among
all
the
other
modules.
6
The
analysis
applies
the
version
of
NEMS
used
for
the
2008
Annual
Energy
Outlook
projections,
which
includes
the
impact
of
the
Energy
Independence
and
Security
Act
of
2007,
as
well
as
revised
expectations
about
economic
growth.
ELA's
reference
case
(called
"BAU"
here)
includes
current
laws
and
legislation
in
addition
co
energy
market
changes
over
time,
including
compliance
with
future
Corporate
Average
Fuel
Economy
(CAFE)
and
efficiency
standards,
andthe
continucd
penetration
of
more
efficient
energy
technologies
to
meet
new
demand
for
appliances,
vehicles,
buildings,
and
othcr
facilities,
cogethcr
with
advances
in
cncrgy
production
facilitics.
4
IN
BRIEF
residential,
commercial
and
industrial
natural
gas
and
petroleum
use
(upstream)i
Domestic
and
international
offsets
can
each
be
used
to
meet
up
to
15%
of
the
compliance
obligation;
There
are
no
limits
on
the
number
of
allowances
that
can
be
banked
for
future
years.
For
covered
entities
co
be
able
to
meet
more
stringent
caps
post-2030,
EIA
assumes
that
the
bank
will
have
a
balance
of
S
billion
metric
tons
at
the
end
of2030.
Although
the
bill
has
a
borrowing
provision,
EIA
assumes
that
covered
entities
comply
without
borrowing;
BOrIl
natural
gas
and
coal
would
be
eligible
for
the
CCS
credit
and
bonus
allowance
allocations
from
Title
III
of
the
bill;
To
simulate
the
energy
efficiency
provisions
in
the
bill,
EIA
reduccd
the
cost
of
energy-efficient
appliances
for
end-uscrs
by
half
and
tightened
residential
building
codes
by
30%
in
2015
and
50%
in
2025;
and
EIA
also
assumed
that
the
10%
of
allowances
allocated
to
Load-Serving
Entities
(LSEs)
and
rural
electric
cooperatives
were
used
to
reduce
electricity
prices.
The
analysis
does
not
include
the
separate
caps
for
HFCs
(Tide
X)
or
the
Low
Carbon
Fuel
Standard
(LCFS)
(Tide
XI).
Allowance
allocations
ro
fossil
fuel
generacors
are
also
nor
covered
in
rhe
model.
For
the
S.
2191
core
scenario,
the
bill
is
analyzed
based
on
rhese
assumptions.
ElA
also
examines
the
effects
of
varying
international
offsets
and
the
cosrs
and
availability
of
electricity
generating
rechnologies,
through
four
alternative
scenarios.
8
While
ElA
ran
a
number
of
scenarios
for
the
sake
of
model
comparison,
(he
focus
here
is
on
cases
representative
of
S.
2191.
Electronic Filing - Received, Clerk's Office, October 1, 2008
* * * * * PCB 2009-021 * * * * *
ErA
forecasts
that
GHG
caps
will
have
limited
impacts
on
the
U.S.
economy
compared
to
ocher
analyses
discussed
in
this
brief.
The
key
resulrs
from
the
modeling
analysis:
In
the
S.
2191
core
scenario,
total
greenhouse
gases
(including
offsets)
are
7,003
MtC0
2
e
in
2015
and
decrease
to
5,428
MtC0
2
e
by
2030.
Allowance
prices
are
S20/tC0
2
e
in
2015
and
rise
to
559lcC0
2
e
by
2030
(20055).
GDP
is
0.24%
lower
in
the
core
scenario
than
the
UAU
scenario
in
2015
and
0.3%
lower
in
2030.
Under
S.
219\,
G
DP
grows
183%
from
2005
ro
2030
compared
to
184%
in
the
reference
casc;
this
means
that
the
economic
growth
would
be
less
than
2
months
behind
BAU
levels
in
2030
with
GHG
caps.
Electricity
prices
increase
by
about
8%
in
2030
from
BAU
levels
in
the
core
scenario
(this
includes
the
cost
of
allowances).
This
is
lower
than
projections
from
the
other
models,
perhaps
due
to
more
optimistic
assumprions
abom
the
benefit
of
allowance
allocations
to
LSEs
and
electric
cooperatives
in
reducing
COSts.
Electriciry
demand
is
about
5%
lower
in
2030
from
the
reference
case.
]n
terms
of
electricity
generation,
the
analysis
predicts
that
new
coal
builds
without
CCS
are
almost
eliminated.
For
the
S.
2191
core
scenario,
64
GW
of
new
coal
generation
with
CCS
is
built
by
2030,
and
overall
coal
consumption
is
74%
lower
than
the
reference
case.
The
introduction
of
coal
wirh
CCS
is
largely
driven
by
the
bonus
allowance
provision
which
makes
CCS
more
economically
viable.
86%
over
the
time
period.
Renewable
capacity
more
than
doubles
from
2005
to
2030
(an
increase
of
more
than
100
GW),
mainly
due
to
an
expansion
in
wind
generation,
followed
by
biomass.
In
the
Limited
Alternatives
Case.
where
nuclear
growth
is
constrained
to
BAU
levels
(17
GW
over
the
time
period),
the
increase
in
renewable
capaciry
is
much
greater,
above
300
GW.
Under
dle
S.
2191
core
scenario,
nanlral
gas
generation
is
17%
lower
than
the
reference
casc,
due
to
a
reduction
in
encrgy
demand
and
increase
in
renewable
and
nuclear
capacity.
Total
natural
gas
consumption
decreases
over
the
time
period
of
the
analysis,
and
gas
prices
increase
by
aboU(
35%
from
the
BAU
level
in
2030
(this
includes
the
COSt
of
the
carbon
allowances).
In
the
Limitcd
Altcrnatives
Case,
which
constrains
both
CCS
and
nuclear
technologies.
natural
gas
consumption
is
12%
above
reference
case
levels
in
2030,
due
co
fuel
switching
and
increased
natural
gas
generation.
Offsets
playa
key
role
in
reducing
costs
in
the
program.
In
the
core
scenario,
the
15%
Iimir
on
offsets
becomes
binding
in
2016
for
international
allowances
and
2025
for
domestic
offsets.
In
an
alternate
scenario
with
no
international
credits,
allowance
prices
are
much
higher
than
the
other
scenarios
from
2012
co
2016,
as
covered
enriries
rely
on
fuel
switching
and
early
investments
in
efficiency
and
carbon~neutral
technologies.
The
analysis
demonstrates
that
inrernational
offsets
play
an
importanr
role
in
mitjgating
COStS
in
the
early
years
of
the
program.
IN
BRIEF
:;
Electronic Filing - Received, Clerk's Office, October 1, 2008
* * * * * PCB 2009-021 * * * * *
uses
data
from
ErA's
Annual
Energy
Oudook
2007
but
also
includes
the
new
Corporate
Average
Fuel
Economy
Standards
enacted
in
December
2007.
The
CATF
analysis
captures
the
following
provisions
of
rhe
bill:
Emissions
from
the
following
sources
arc
covered:
coal-fired
electrical
and
industrial
boilers,
petroleum
use
in
transportation
(upstream),
and
residential,
commercial
and
industrial
natural
gas
and
petroleum
use
(upstream),
all
of
which
represent
about
86%
aftatal
U.S.
GHG
emissions;
Offsets
can
be
used
to
meet
up
to
30%
of
the
compliance
obligation
(the
bill
allows
for
15%
offsets
and
15%
from
international
allowance
markets);
There
are
no
limits
on
the
number
of
allowances
that
can
be
banked
for
future
yearsj
The
various
provisions
for
the
use
of
auction
revenues
arc
included
in
the
model
via
a
production
tax
credit
for
CCS
and
a
wind
production
tax
credit
to
2030j
and
To
simulate
the
energy
efficiency
provisions
in
the
bill.
CATF
uses
EIA's
Best
Available
Technology
easc,
which
assumes
that
consumers
choose
the
highest
efficiency
equipment,
regardless
of
cost.
to
The
analysis
does
not
consider
the
impact
of
the
LCFS,
the
effects
of
the
Carbon
Market
Efficiency
Board,
or
the
provisions
which
allow
borrowing
(included
in
the
bill
to
contain
costs).
The
CATF
analysis
uses
the
standard
NEMS
technology
assumptions
for
the
electricity
market,
II
but
limits
the
introduction
of
biomass
power,
due
to
competing
uses
for
biomass
from
rhe
transportation
sector
and
the
uncertain
GHG
benefits.
There
are
no
constraints
on
other
technologies,
including
nuclear
power.
(,
IN
BRIEF
modeling
analysis:
Total
greenhouse
gas
emissions
(including
offsets)
are
6,961
MtCO,e
in
2015
and
decrease
to
6,348
MtCO,e
by
2030.
Allowance
prices
arc
SI7/tC0
2
e
in
2015
and
rise
to
S48/tCO,e
by
2030
(20055).
With
S.
2191,
GDP
is
about
0.4%
lower
from
the
BAD
scenario
in
2015
and
0.7%
lower
in
2030.
GOP
grows
102%
from
2005
to
2030
compared
to
104%
in
the
reference
case;
the
slower
growth
ratC
under
S.
2191
means
that
the
economy
would
be
ahollt
4
months
behind
BAU
levels
in
2030.
Electricity
prices
increase
by
20%
and
natural
gas
prices
by
about
23%
in
2030
from
BAD
levels
(these
price
increases
include
the
cost
of
allowances).
This
is
lower
than
projections
from
most
of
the
other
models,
perhaps
due
to
more
optimistic
assumptions
about
the
ratc
of
efficiency
improvements
and
decrease
in
electricity
demand.
The
model
predicts
a
considerable
drop
in
energy
use
due
to
increases
in
both
energy
efficienc)'
and
the
response
to
higher
electricity
prices.
This
translates
to
a
20%
decrease
in
electricity
generation
compared
to
the
reference
case
in
2030.
Thus,
at
the
consumer
level,
monthly
electric
bills
are
on
average
lower
relative
to
the
reference
case
(although
in
three
electricity
regions
price
impacts
are
slightly
higher
than
in
the
reference
case).
In
terms
of
the
generation
mix,
the
model
shows
no
switching
to
natural
gas
as
a
"bridge
fuel"-a
combined
effect
of
the
production
incentives
for
CCS
along
with
the
reduced
energy
use.
Coal
generation
drops
by
14%
from
current
levels,
with
a
total
133
GW
of
IGCC
with
CCS
built
by
2030.
The
model
also
predicts
new
nuclear
generation
of
abollt
104
GW
by
2030,
increasing
cotal
capaCity
to
about
204
GW,
and
an
expansion
of
renewable
generation
to
2]4
GW
of
total
capaciry.
Electronic Filing - Received, Clerk's Office, October 1, 2008
* * * * * PCB 2009-021 * * * * *
The
analysis
of
S.
2191
conducted
by
Science
Applications
International
Corporation
(SAle)
on
behalf
of
the
ACCF
and
NAM
uses
the
Energy
Information
Administration's
(ETA)
NEMS
moddY
This
analysis
incorporates
many
of
the
provisions
in
the
bill
in
estimating
both
a
Low
and
a
High
Cost
Scenario,13
but
also
includes
several
key
constraining
assumptions
regarding
rhe
cost
and
availability
of
new
energy
technologies
and
other
factors.
In
particular,
banking
is
not
included
in
the
analysis,
even
{hough
it
is
allowed
in
S.
2191.
Furthermore,
both
the
Low
and
the
High
Cost
Scenarios
involve
limited
availability
of
offsets.
Iii
The
ACCF/NAM's
analysis
contains
the
following
assumptions
abom
availability
of
technology:
The
constraint
on
nuclear
allows
only
10-25
GWof
additional
capacity
by
2030.
Limited
use
of
renewables:
both
scenarios
limit
new
technology
builds
for
both
biomass
and
wind.
For
example,
the
Low
Cost
Scenario
assumes
a
maximum
5
GW/year
of
new
wind
power
deployment,
which
is
lower
than
the
actual
amount
of
wind
power
built
in
2007
(5.244
GW).
Finally,
the
analysis
does
not
explicitly
model
the
CCS
bonus
allowance
provision
or
the
funds
generated
by
the
bill's
auction/allocation,
but
does
assume
that
the
revenue
from
the
sale
of
allowances
is
redistributed
to
the
individual
energy
sectors.
15
Key
Results
The
ACCF/NAM
model
shows
relatively
high
allowance
prices,
in
part
due
to
limitations
on
offsets,
constraints
on
technology,
and
the
elimination
of
the
banking
provision
contained
in
the
bill.
2020
and
2.6%
and
2.7%
lower
for
the
two
scenarios
in
2030.
GDP
grows
by
183%
under
the
S.
2191
scenarios
versus
188%
in
the
reference
case;
this
correlates
toabout
a
13-month
lag
in
GDP
ftom
BAU
levels.
Electricity
prices
arc
projected
to
increase
by
28%
and
33%
by
2020,
and
101%
and
129%
by
2030,
fot
the
Low
and
High
Cost
Scenarios}
respectively.
These
increases
include
the
cost
of
carbon
allowances.
Coal
generation
without
CCS
declines
significantly
by
2030
in
both
cases.
In
the
Low
COSt
case,
there
is
about
50
GW
of
CCS
capacity
added
by
2030
(93.5
GW
for
the
High
COSt
case).
The
analysis
limits
nuclear
deployment
in
both
cases.
By
2030,
there
is
an
additional
18
GW
of
nuclear
capacity
built
in
the
Low
Cost
Scenario
and
only
9
GW
for
the
High
COSt
Scenario.
In
comparison,
ElA
assumes
that
the
business
as
usual
growth
in
nuclear
generation
will
add
an
additional
15
GW
of
capacity
by
2030.
16
With
the
constraints
on
nuclear
and
slower
deployment
ofCeS,
natural
gas
becomes
the
predominant
fuel
for
electricity
generation
after
2025.
Natural
gas
prices
increase
by
108%
and
146%
from
BAU
levels
in
2030,
for
the
Low
and
tbe
High
Cost
Scenarios,
respectively.
Natural
gas
consumption
increases
by
more
than
20%
from
2015
to
2030
in
both
scenarios.
Renewable
generation
shows
strong
growth
in
bodl
the
Low
and
the
FIigh
Cost
Scenarios
despite
the
limitations
imposed
on
both
wind
and
biomass
of
5
GW
(Low
Cost)
and
3
GW
(High
Cost)
per
year.
Renewable
generation
capacity
nearly
doubles
by
2030
in
both
cases.
Gasoline
prices
increase
50.43-51.46
per
gallon
in
2020
and
51.78-53.35
pet
gallon
in
2030.
IN
BRIEF
Electronic Filing - Received, Clerk's Office, October 1, 2008
* * * * * PCB 2009-021 * * * * *
Policy
of
Global
Change
(Paltsev
et
al.)
investigate
the
economic
for
a
scenario
very
close
to
S.
2191.
Also,
other
than
the
impacts
of
a
range
of
policy
proposals
with
the
MIT
Emissions
CCS
bonus
allowances,
the
auction
revenues
dedicated
to
Prediction
and
Policy
Analysis
(EPPA)
model,
a
component
of
efficiency
and
technology
development
are
not
modeled
the
larger
MIT
Integrated
Global
System
Model
(IGSM).
EPPA
explicitly.
If
included,
thesemay
reduce
the
direct
costs
of
the
is
a
multi-region,
multi-sector
recursive-dynamic
representation
policy
(Le.,
the
carbon
price);
however,
there
is
also
an
of
the
global
economy
in
which
economic
actors
are
modeled
as
opportunity
cost
to
using
the
revenues
for
these
types
having
limited
foresight
("myopic"
expectations).
The
model
of
programs,
rather
than
distributing
them
directly
to
includes
the
six
major
greenhouse
gases.
I?
households
or
reducing
distorrionary
taxes.
The
MIT
analysis
ofS.
2191
appears
as
an
appendix
to
an
assessment
of
cap-and-trade
proposals
that
is
not
tied
to
any
particular
legislation
(and
which
was
first
released
before
the
bill
was
proposed).
\8
The
baseline
used
for
the
analysis
is
EIA's
2007
Annual
Energy
Outlook,
which
does
not
include
estimated
effects
of
emissions-reducing
components
of
the
Energy
Independence
and
Security
Act
of
2007.
Covered
emissions
include
most
energy
sources,
some
non-C0
2
GHG
emissions,
and
high
GWP
industrial
gases.
The
anaJysis
includes
four
scenarios
that
illustrate
the
impact
of
different
provisions
of
the
bill.
The
scenarios
include
ones
with
and
without
15%
offsets
l9
and
with
and
without
the
carbon
capture
and
storage
(eCS)
bonus
allowances
to
illustrate
how
these
different
provisions
affect
the
results.
The
four
scenarios
analyzed
are:
the
S.
2191
core
scenario,
coreplus
offsets,
coreplus
CCS,
and
core
plus
offsets
and
CCS.
All
runs
assume
unlimited
banking.
The
analysis
does
not
model
international
emissions
trading
(i.e.,
the
15%
of
internarional
credits
that
could
be
R
IN
BRIEF
Key
Res"IIS
The
EPPA
model
estimates
that
S.
2191
caps
cumulative
U.S.
emissionsfrom
2012
to
2050
at
146
billion
men'ic
tons
(bmt)
C0
2
e
in
covered
sectors
without
offsets,
or
at
172
bmt
with
15%
offsets.
Adding
the
HFC
allowances
and
non-covered
sectors
raises
rotal
U.S.
emissions
to
190
bmt
withour
and
216
bmt
with
otfsets.
Allowance
prices
arc
S48/tC0
2
e
in
201.5,
S86/ton
in
2030,
and
reach
S189/tC0
2
e
in
2050
for
the
offsets
+
CCS
scenario
(20055);
the
S.
2191
base
case
with
neither
provision
results
in
556,
5101,
and
S222/tC0
2
c
in
2015,
2030,
and
2050,
respectively.
In
MIT's
analysis,
offsets
have
a
bigger
impact
on
price
than
the
CCS
subsidy
does.
GDP
is
estimated
to
be
0.57%
lower
in
2015,
0.38%
lower
in
2030,
and
0.75%
lower
in
2050
than
BAD
for
the
offsets
+
CCS
scenarioj
for
2050,
this
reduction
in
GDP
means
that
the
economy
is
only
about
three
months
behind
projected
growth
without
GHG
caps.
In
the
scenario
with
neither
offsets
nor
CCS
included,
GOP
impacts
are
slightly
higher,
reaching
1.10%
in
2050.
Electronic Filing - Received, Clerk's Office, October 1, 2008
* * * * * PCB 2009-021 * * * * *
deployment
of
CCS
in
all
S.
2191
scenarios.
The
CCS
subsidy
encourages
earlier
developmenr
and
faster
deploymenr
of
CCS;
the
4%
of
total
allowances
allocated
to
CCS
subsidies
is
dramatically
below
the
modeled
demand
for
them,
and
some
method
of
rationing
the
bonus
allowances
will
be
necessary.
However,
even
withom
subsidies,
almost
75%
of
2050
electricity
generation
in
MIT's
scenarios
is
from
coal
and
gas
with
CCS.
Energy
use
from
coal
decreases
in
the
2015
to
2030
timeframe,
with
clear
fuel
s\vltching
to
natural
gas
during
this
period,
before
coal
use
incrcases
in
the
long
tcrm
with
full
CCS
deployment.
The
adverse
impact
on
the
coal
industry
is
rcduced
but
not
removed
by
the
CCS
subsidy.
The
model
predicts
that
the
CCS
subsidy
speeds
deployment,
with
an
approximate
3~fold
increase
in
sequestered
carbon
in
2030
oyer
the
scenario
without
the
CCS
subsidy,
but
does
not
substantially
increase
CCS
in
2050.
no
change
from
baseline
in
2015,
are
less
than
5%
higher
in
2030,
and
are
only
2%
higher
in
2050.
The
separate
cap
for
HFCs
in
S.
2191
produces
low
HFC
allowance
prices
relative
to
the
COle
market.
However,
if
trade
were
allowed
between
the
two
markets,
lower
price
opportunities
for
HFC
reductions
would
be
available
before
some
higher
cost
OP[iOllS
for
other
gases,
resulting
in
an
overall
reduction
in
the
cost
of
the
policy.
For
all
scenarios,
the
increasing
stringency
of
the
cap
and
increasing
carbon
price
induce
extensive
banking
early
in
the
timetable
and
no
borrowing.
This
implies
that
emissions
will
be
lower
than
the
S.
2191
targets
in
early
years,
and
higher
in
later
years.
IN
llRIEF
')
Electronic Filing - Received, Clerk's Office, October 1, 2008
* * * * * PCB 2009-021 * * * * *
decisions
of
households
and
nrms
ro
develop
a
model
of
the
whole
economy.
The
first
is
the
Inrertcmporal
General
Equilibrium
Model
(IGEM)
developed
and
run
by
Dale
Jorgenson
Associates.
and
the
second
is
the
Applied
Dynamic
Analysis
of
rhc
Global
Economy
(ADAGE)
dcvelopcd
and
run
by
RTf
International.
In
utilizing
bQ(h
models.
EPA
assumes
the
following
regarding
the
structure
ofS.
2191:
Upstream
coverage
for
petroleum,
natural
gas,
and
manufacturers
ofF
-gases
and
N
2
0;
downstream
on
coal
facilities
using
over
5,000
tons
of
coal
per
year;
Domestic
offsets
and
international
credits
can
each
be
used
to
meet
15%
of
the
compliance
obligation;
Set
asides
for
agriculnlre
and
forestry
sequestration
and
landfill
and
coal
mine
methane
are
available;
and
Bonus
allowances
for
CCS.
The
analysis
compares
rhe
results
berween
the
£\
....
0
models
for
a
ser
of
10
scenarios:
2
BAU
reference
scenarios
and
8
bill
scenarios.
The
core
policy
scenario
(Scenario
2)
assumes
substanrial
growth
in
nuclear
power
(l50%
increase
from
2005-2050)
and
widespread
international
actions
by
developed
and
developing
countries.
Other
scenarios
include
limits
on
international
actions,
unlimited
offse[5,
no
offsets,
and
a
series
of
three
scenarios
requested
by
Senators
Inhofe,
Voinovich,
and
Barrasso
combining
constraints
on
nuclear,
biomass,
CCS,
and
inrernational
action
as
well
as
the
emergence
of
a
natural
gas
cartel.
r
n
order
to
approximate
emissions
reductions
associated
'Ill
IN
B
RlieF
assumptions
of
substantial
growth
in
nuclear
and
Widespread
inrernational
action
(Scenario
10).
EPA's
scenarios
are
based
on
ElA's
AEO
2006
(Reference
or
High
Technology),
both
of
which
have
higher
baseline
emissions
than
the
recently
released
AEO
2008
which
includes
the
EISA.
This
will
result
in
higher
allowance
prices
and
macroeconomic
effects
than
if
the
lower
AEO
2008
projections
had
been
available
as
a
starting
point
for
the
analysis.
Key
Results
In
gcneral,
the
use
of
offsets
and
intcrnational
credits
has
a
larger
impact
on
allowance
prices
than
any
constraints
placed
on
technology.
Because
ADAGE
more
fully
represents
international
markets,
the
key
results
for
Scenarios
2
and
to
using
the
ADAGE
model
arc
presented
below.
Under
Scenario
2
in
ADAGE,
toral
U.S.
GHG
emissions
(including
offsets
and
international
credits)
in
2030
are
estimated
to
be
5,867
MtC0
2
e,
dropping
to
5,279
MtC0
2
e
by
2050.
Using
ADAGE
Scenario
10,
emissions
are
5,953
MrC0
2
c
in
2030
and
5,263
MtCO,c
in
2050.
For
the
core
policy
case
(Scenario
2),
allowance
prices
in
2015
arc
S29ltCO,c,
incrcasing
to
S611tCO,c
in
2030
and
5159/tC0
2
c
in
2050.
21
Using
the
high
technology
scenario
(Scenario
10),
allowance
prices
are
slightly
lower:
522lrC0
2
e
in
2015,
S46ltCO,c
in
2030,
and
SI2I1tCO,c
in
2050.
Electronic Filing - Received, Clerk's Office, October 1, 2008
* * * * * PCB 2009-021 * * * * *
BAU
case.
The
economy
would
be
about
11
monrhs
behind
BAU
levels
under
Scenario
2
and
about
8
months
under
Scenario
10.
Electricity
prices
arc
projected
to
increase
44%
in
2030
and
27%
in
2050
under
Scenario
2
in
ADAGE.22
Modeling
of
regional
impacts
indicates
a
switch
from
coal
to
namral
gas
and
CCS
in
2030.
Narural
gas
consumption
increases
in
both
Scenarios
2
and
10
until
2020,
after
which
it
decreases
by
more
than
25%
from
2005
levels
by
2050.
Coal
generation
with
CCS
picks
up
after
2015
with
roughly
175
GW
of
coal
eapaciry
with
CCS
built
by
2030.
All
coal
without
CCS
is
retired
by
2035
and
total
CCS
capacity
increases
to
323
GW
in
2035,
then
decreases
slightly
to
299
GW
by
2050.
The
electricity
sector
provides
the
vast
majority
of
the
GHG
reductions
in
the
early
years.
Even
after
2035,
the
elecrricity
sector
still
provides
most
of
the
GHG
abatement,
although
transportation
and
energy
intensive
manufacturing
begin
to
contribute
more
to
emissions
reductions.
Nuclear
and
renewable
generation
capacity
increases
steadily,
morc
than
doubling
from
2005
to
2050.
To
better
understand
the
bill's
offset
provisions,
EPA
also
estimated
two
alternative
scenarios
in
IGEM:
onc
that
allowed
for
unlimited
use
of
offsets
(Scenario
4)
and
one
in
'which
no
offsets
were
allowed
(Scenario
5).
All
orher
assumptions
remained
the
same
as
Scenario
2.
For
Scenario
4,
allowance
prices
were
71
%
lower
than
[he
core
policy
scenario
in
2050;
for
Scenario
5,
they
were
93%
higher.
'T'o
test
the
sensitivity
to
various
technology
assumptions,
EPA
included
a
modeling
run
that
limited
nuclear
and
biomass
power
to
BAU
levels
and
assumed
t11at
CCS
is
not
availahle
hefore
2030
(ADAGE
Scenario
7).
In
rhis
case,
allowance
prices
in
2050
were
82%
higher
than
the
core
policy
scenario.
IN
Il
RII,:
F
I
I
Electronic Filing - Received, Clerk's Office, October 1, 2008
* * * * * PCB 2009-021 * * * * *
North
American
Electricity
and
Environmem
Model
(NEEM),
both
developed
in-house.
for
its
analysis
of
the
Lieherman-
\'Qarner
bill.
M
RN
is
a
top-down,
computable
general
equilibrium
(CGE)
model
that
examines
rhe
net
economic
impacr
from
reducing
carbon
emissions.
NEEM
is
a
linear
programming
model
for
rhe
U.S.
e1ectriciry
market.
For
the
analysis
of
S.
2191.
MRN-NEEM
\V"as
run
using
rhe
following
assumprions:
23
A
cap
which
covers
all
U.S.
emission
sources
excluding
landfill,
coal
mine,
and
agriculnmu
methane,
non-energy
CO
2
,
and
ag,ricultural
and
mobile
source
N
lO'
ellA
excludes
high-G'Vl?
gases
and
does
not
model
the
separate
HFC
cap;
The
banking
and
borrowing
provisions
in
the
bill;
Domestic
ofFsets
used
to
meet
15%
of
the
compliance
obligation;
The
bonus
allowances
for
CCS;
Sector
and
region-specific
allowance
allocati
onsj
24
and
The
low-carbon
fuel
standard
(LCFS),
which
requires
a
reduction
in
carbon
intensity
of
the
transportation
fuel
pool
of
5%
by
2015
and
10%
by
2020."
CRA's
analysis
is
the
only
one
considered
here
that
includes
rhe
proposed
LCFS.
CRA
assumes
that
rhe
Carbon
Market
Efficiency
Board's
ability
to
alter
borrowing
does
not
affect
allowance
prices
and
rherefore
CRA
does
not
include
it
in
the
model.
The
S.
2191
scenario
omirs
the
provision
that
allows
15%
of
the
compliance
obligation
to
come
from
imernarional
not
included.
In
terms
of
e1ecrricity.generaring
technology,
rhis
implementation
of
MRN-NEEM
includes
constraints
on
the
rate
of
new
capacity
deployment
for
IGCC
with
CCS,
nuclear,
wind,
and
biomass.
Only
the
limit
on
nuclear
power
becomes
binding
(40
GW
of
addirional
capaciry
by
2030
and
100
GW
by
2050).
For
capital
COStS,
CRA
revises
previous
estimates
to
include
recent,
higher
construction
COSts.
The
business
as
usual
scenario
is
a
combination
of
EIA's
2008
AnnuaJ
Energy
Oudook
(early
release)
and
CRA's
estimate
of
the
impacts
of
the
Energy
Independence
and
Security
Act
of2007.
Key
Resulls
Due
to
limirs
on
offsers,
higher
capital
COStS
for
technology,
and
constrainrs
on
nucleargenerarion,
the
CRA
analysis
finds
higher
economic
impacts
than
most
other
models
in
this
analysis.
In
the
early
years,
the
LCFS
also
plays
a
role.
Total
emissions
including
offsets,
minus
tons
of
biosequestration,
are
6,299
MtC0
2
e
in
2015
and
decrease
to
3,784
MrCO,c
by
2050.
For
the
core
policy
scenario,
allowance
prices
start
at
about
S48/tCO,e
in
2015,
rise
to
S84/rCO,e
in
2030
and
to
S185ltC0
2
e
in
2050
(20055).
For
the
scenario
that
removes
the
banking
provision,
allowance
prices
start
lower,
$361tC0
2
e
in
2015
and
564ltC0
2
e
in
2030.
but
rise
quickly
after
2035,
increasing
to
$3341rC0
2
e
in
2050.
Electronic Filing - Received, Clerk's Office, October 1, 2008
* * * * * PCB 2009-021 * * * * *
bur
subsrantially
higher
in
2050,
about
3.5%.
Under
S.
2191,
electricity
demand
remains
nearly
constant
through
2050.
Elecrricity
prices,
including
the
COSt
of
allowances,
are
projected
to
increase
by
42%
in
2030
and
52%
by
2050.
In
terms
of
the
generation
mix,
ahnost
all
coal
without
CCS
is
eliminated
by
2040.
CCS
is
introduced
starting
in
2015
with
2
GW
of
capacity
and
increases
to
129
GW
by
2050.
Nanmu
gas
generation
must
increase
significantly
before
2030
as
a
way
of
replacing
co:u
J
but
then
declines
because
its
emissions
are
too
high
to
meet
long-term
targets.
According
to
CRA,
there
is
no
additional
natural
gas
capaciry
added
after
2040,
and
total
natural
gas
generation
is
halvcd
from
2005
(18%)
to
2050
(8%).
Renewable
generation
makes
up
about
one-third
of
total
capacityJ
with
257
GW
of
total
renewable
capacity
in
2050.
CRA's
costs
vary
over
time
due
to
specific
assumptions
and
bill
provisions.
CRA
flnds
relatively
higher
COS(S
in
(he
early
years
of
the
program,
due
to
the
COS(S
of
complying
wi(h
the
LCFS.
Aftcr
2025,
impaCls
arc
lower
because
of
(he
emission
reduction
benefits
of
(he
Energy
Independence
and
Security
Act
of2007.
Impacts
grow
in
(he
long
(erm
as
more
low
carbon
technologies
are
added
(Q
mect
(he
cap.
Ovcrall,
both
the
elecniciry
and
(ransportation
sectors
are
90%
decarbonized
by
2050
under
5.2191.
LCFS
for
20
IS,
ethanol
produClion
would
have
(Q
increase
(Q
an
infeasible
share
of
total
fuel
consumption,
since
it
provides
a
carbon
reduction
of
only
25%
relative
(Q
gasoline.
Ins(ead,
CRA's
model
pushes
gasoline
prices
up
(Q
decrease
demand.
As
gasoline
consumption
falls,
the
available
quantities
of
ethanol
are
sufficient
(Q
mect
(he
5%
carbon
intensiry
reduction
required
by
the
LCFS.
Furthermore,
higher
gasoline
prices
lead
to
reduc(ions
in
vehicle
miles
navelcd
and
increased
demand
for
fuel
economy
((he
model
projcCls
fuel
economy
levels
above
the
CAFE
standard
in
2015).
IN
BRIEF
]~
Electronic Filing - Received, Clerk's Office, October 1, 2008
* * * * * PCB 2009-021 * * * * *
EIA
ACCF/NAM
ACCF/NAM
OHsets
+
Scenario
Scenario
Scenario
2015
Core
Case
CAlf
low
Cost
High
Cost
CC5
2
10
wI
Banking
5.2191
Cap'IMICO,e)
5,489
5,489
5.456
5,456
5,456
5,456
5.456
5.456
Total
GHG
Emissions
2
(MtC0
2
el
7,003
6,961
5,703
5,572
6,813
6,362
6,347
6,299'
Allowance
Price
lS/teOze,
200SS)
520.27
517
535'
536
548
$29
$22
S48
GOP
Impact
(%
chg
from
SAUl
.0.24%
-0.4%
.0.8%
.1.6%
.0.6%
.0.7%
-0.5%
.2.1%
Consumption
Impact
(%
chg
from
SAUl
.0.37%
.0.70%
-1.00%
.2.80%
.0.31%
.0.30%
-0.15%
.2.8%
Consumption
Impact
per
household
(2005S1
51283.91
516481
519591
512,6381
5(2921'
512701
511361
512,155)
Coal
Prices
(%
changelli,
1
110%
90%
197%
213%
338%
175%
136%
149%
Electricity
Prices
(%
change)6,B
2%
2%
13%
14%
30%
28%
22%
20%
Natural
Gas
Prices
{%
changel6.9
14%
5%
18%
21%
10%
22%
16%
30%
Total
CC5
IGWI
0.0
0.5
1.4
1.2
11.2
0.0
0.0
2.0
Total
Nuclear
(GWI
102.1
106.3
101.9
101.9
109.2
118.3
117.3
107.0
Total
Renewables
(GWI
131.0
146.5
115.3
118.9
95.6
122.3
121.9
57.0
Total
Natural
Gas
Consumption
(Quads)
23.0
23.8
23.7
22,9
22,6
26.2
25.3
25.0
MIT
EPA
ADAGE
EPAAOAGE
CRA
EIA
ACCF/NAM
ACCF/NAM
Offsets
+
Scenario
Scenario
Scenario
2020
Core
Case
CAlf
low
Cost
High
Cost
CCS
2
10
wI
Banking
S.
2191
Cap
IMICO,.I
4,992
4,968
4,992
4,992
4,924
4,924
4,924
4,924
Total
GHG
Emissions
(MtC0
2
e)
6,770
6,910
5,593
5,385
6,325
6,388
6,256
5,748
3
Allowance
Price
(SltC0
2
e,
200SS)
S
28.96
$22
S52
$61
S58
537
$28
558
GOP
Impact
(%
chg
from
SAUl
.0.27%
-0.5%
-0.8%
.1.1%
-0.8%
.0.7%
-0.5%
-1.5%
Consumption
Impact
(%
chg
from
SAUl
-0.41%
-0.7%
-0.7%
.2.6%
-0.7%
.0.4%
-0.2%
-2.5%
Consumption
Impact
per
household
(2005$)
S
1316.91
S
17431
S
17011
S
(2,7781
S
17471
S
(4461
S
12391
S
11,9401
Coal
Prices
l%
change)
163%
118%
322%
389%
402%
224%
188%
200%
Electricity
Prices
('Yo
change)
3%
5%
28%
33%
30%
32%
26%
32%
Natural
Gas
Prices
(%
change)
18%
8%
26%
36%
14%
25%
19%
43%
Total
CCS
(GWI
18.5
8.0
12.7
22.0
37.3
25.0
25.0
17.0
Total
Nuclear
{GW\
126.3
119.7
102.7
102.7
109.2
126.2
125.2
119.0
Total
Renewables
(GW)
178.5
188.4
140.3
134.0
137.3
138.1
138.1
83.0
Total
Natural
Gas
Consumption
(Quads)
21.8
23.8
24.3
24.2
26.4
26.5
25.5
25.5
CALCULATIONS
For
MIT
data,
we
have
adjlUted
the
prices
to
include
their
reported
allowance
prices,
according
to
the
following
formulas:
Price
(coal
or
narural
gas)
under
$.2191
=
Price
Jndex
rcl:nivc
to
2005
*
Price
in
2005
+
Carbon
Content"
Allowance
Price
in
MtC0
2
c
Price
in
Reference
Case
..
Price
Index
relative
to
2005
*
Price
in
2005
Thus:
Percenr
change
in
price
from
BAU
..
(Price
under
5.2191
1
Price
in
Reference)
-1
Coal
Price
in
2005
($
per
shorr
ton
of
coal)
,
.................
..........
$26.70
Natural
Gas
Price
in
2005
($
per
tCf)
,.",
..
,
....
,
.....
...
$11.05
Carbon
Coment
of
Coal
(MrC0
2
e
per
shon
ton)
..........
...........
2.048
Carbon
Coment
of
Gas
(MtC0
2
e
per
tCf)
......
....
,
.............
.
....
0.055
For
comparison
purposes,
we
converted
electricity
generation
reported
in
the
MIT
analysis
(cxajoules)
to
electricity
capacity
(gigawatts).
Capacity
ill
GW
..
Generation
in
EJ.
0/1.055056
Bm
per
EJ)
*
(1000/3.412
WattS
per
Btu)
•
IOOO/{8760
Hours
per
yeu.
Capacity
conversion
factor)
Capacity
Conversion
r~J.Ctors:
Nuclear:
90%
CCS:
85%
Biomass:
83%
Hydro:
40%
Wind/Solar:
38%
14
IN
BRIEF
Electronic Filing - Received, Clerk's Office, October 1, 2008
* * * * * PCB 2009-021 * * * * *
EIA
ACCF/NAM
ACCF/NAM
Offsets
+
Scenario
Scenario
Scenario
2030
Core
Case
CAn
Low
Cost
High
Cost
CC8
2
10
wI
Banking
8.2191
C,p
IMtCD,,)
3.856
3,921
3,856
3,856
3,860
3,860
3,860
3,860
Total
GHG
Emissions
(MtCOze)
5,429
6,348
4,581
4,419
4,889
5,867
5,953
4,674
3
Allowance
Price
{S!tCOze,
200SS1
859.14
848
8216
8251
886
881
846
884
GOP
Impact
(%
chg
from
SAUl
-0.29%
-0.7%
.2.6%
.2.7%
-0.4%
-0.9%
-0.6%
-1.4%
Consumption
Impact
(%
chg
from
SAUl
-0.48%
-0.9%
-2.9%
-4.9%
-1.5%
-0.9%
-0.6%
-1.8%
Consumption
Impact
per
household
(200SSl
S
1391.01
8
(1,1211
S
13,8181
S
16,409)
S
11,890)
8
(1,1761
S(166)
S
11,3581
Coal
Prices
(%
change)
299%
240%
1322%
1635%
560%
340%
254%
333%
Electricity
Prices
(%
change)
8%
20%
101%
129%
14%
44%
35%
42%
Natural
Gas
Prices
(%
change)
34%
23%
108%
146%
6%
33%
24%
55%
Tot,l
CCS
IGWI
64.0
132.9
49.5
93.5
253.7
175.0
94.0
61.0
Total
Nuclear
(GWI
366.1
204.0
118.0
109.0
109.2
175.9
174.4
149.0
Total
Renewables
(aWl
196.9
214.1
200.8
181.9
126.9
167.8
170.3
132.0
Total
Natural
Gas
Consumption
(Quadsl
18.8
22.1
28.4
28.8
23.8
21.6
23.1
23.1
Mil
EPA
ADAGE
EPA
ADAGE
CRA
EIA
ACCF/NAM
ACCF/NAM
Offsets
+
Scenario
Scenario
Scenario
2050
Core
Case
CAlF
Low
Cost
High
Cost
CC8
2
10
wi
Banking
S.
2191
Cap
(MtC0
2
e)
1,732
1,732
1,732
1,732
Total
GHG
Emissions
(MtCa
2
e)
3,760
5,219
5.263
3,784
3
Allowance
Price
IS/te0
2
e,
20055)
S189
S159
S121
S185
GDP
Impact
(%
chg
from
SAUl
-0.8%
-2.4%
-1.8%
-2.7%
Consumption
Impact
(%
chg
from
SAUl
-2.0%
-2.1%
-1.7%
-2.4%
Consumption
Impact
per
household
(20055)
S
13,8971
S
13,9841
S
13,2221
SII,862)
Coal
Prices
1%
changel
1086%
877%
661%
789%
Electricity
Prices
(%
change)
14%
27%
28%
52%
Natural
Gas
Prices
1%
change)
-23%
96%
74%
64%
Total
CCS
IGWI
693.9
299.0
254.0
129.0
Tota!
Nuclear
(GW)
109.2
268.6
26£.8
209.0
Total
Renewables
(GWI
153.1
261.7
265.1
257.0
Total
Natural
Gas
Consumption
(Quads)
15.2
16.9
17.1
21.5
NOTES,
J
Owmd
St'cum
only.
:JTotal
rminions
including
offirtJ.
!STow!
rmiuions
indudillg
offirts
mimlJ
biosequestration.
"All
values
ill
the
2015
St'ctionftr
the
ACCFlNAM
analy;is
are
tt~tually
2014
flre~asts,
as
identified
in
their
,-ryon.
5wt
obtained
the
number
o/homeholds
by
dividing
the
poptllation
by
an
average
household
size
0/2.6.
and
thm
the
diffirence
in
aggregate
consumption
by
that
nwnber.
6IlIdudes
t!u
cost
of
allowances.
7
Avemge
delivmd
price.
8&sidential
eltctridty
price.
f)The
changes
in
ntttural
gas
prim
art
ca!c1Iumd
using
ovtrage
dtlivrrtd
price
OncJuding
aJlowance
pricer)
for
EfA,
EPA,
GiTT;
and
CRA.
and
I/.Sing
nsidmtinl
price
ftr
ACCFINAM
and
MIT,
with
MIT
adjmttd
to
indude
the
price
0/
allowancef
(see
calculation
on
previous
page).
IN
HRIEF
1)
Electronic Filing - Received, Clerk's Office, October 1, 2008
* * * * * PCB 2009-021 * * * * *
of
Economic
Models."
Arlington,
VA:
Pew
Center
on
Global
Climate
Change,
April
2008.
3EIA's
Annual
Enerb'Y
Oudook
2007
predicted
an
additional
12.6
GW
of
new
capacity
by
2030,
without
any
changes
in
current
policy,
which
is
higher
than
the
nuclear
power
constraint
in
ACCF/NAM's
High
COSt
Scenario
(110
GW
by
2030).
See
E1A,
AEO
2007:
Electricity
Forecast,
http://www.eia.doe.gov/oiaf/archive/aeo07/electricity.html
~AWE.A
2007
Market
Repon,
January
:W08.
Retrieved
from
hrrp:llwww.awea.org/
Market_Report-Jan08.pdf
~The
"Limited
Alternatives"
case
was
requested
by
Senators
Inhofe,
Voinovich
and
Barrasso.
Other
cases.
such
as
"No
Internarional
Offsecs"
and
"High
Cost"
cases
were
prt"senred
[Q
demonstrate
the
sensitivity
to
some
highly
uncenain
assumptions.
6Energy
Information
Administration,
Department
of
Energy
(DOE).
The
National
Energy
Modeling
System:
An
Overview
2003.
Retrieved
May
5,
2008,
from
http://www.eia.doe.gov/oiaf/aeo/overview/overview.html
7Energy
Information
Administration,
Office
of
[nregratcd
Analysis
and
Forecasting,
U.S.
Department
of
Energy.
Energy
Markt"t
and
Economic
Impacts
of
S.
2191,
the
Lieberman-Warner
Climate
Security
Act
of
2007.
Washington,
DC:
April
2008.
Retrieved
April
29,
2008,
from
http://www.eia.doe.gov/oiaf/
servicerpt/s2191/index.
html
8EIA
ran
st.'Ycral
alternatiw
scenarios:
S.
2191
High
COSt
case
(COstS
for
nuck-ar,
biomass.
and
CCS
ar~
50%
higher);
S.
2191
Limited
Alt~rnatives
Scenarios
(CCS
no!
availablc
until
2030.
nt.'W
nuclear
and
biomass
capacity
restricred
ro
reference
case
growth
l~vels,
and
LNG
importS
restricted
to
reference
levels);
No
[nrernational
Offsets
(the
bill's
provision
that
specifies
15%
international
offsets
is
assumed
ro
be
unavailable);
and
a
S.
2191
Limitcd
Alternatives
Scenario/No
international
Scenario.
9Banks,
Jonathan.
The
Lieberman-Warner
Climate
Security
Act-S.
2191:
A
Summary
of
Modeling
Results
from
the
National
Energy
Modeling
System.
Clean
Air
Task
Force,
February
2008.
Retrieved
March
18,2008,
from
h
rtp:llwww.catf.us/publicadons/presentations/CATP
_L
WCSA_ShorcHiIl_
Briefing...
with_CAfE.
pdf
lOEnergy
Information
Administration.
DOE.
Assumptions
to
the
Annual
Energy
Outlook
2007:
Residential
Demand
Module.
April
2007.
Retrieved
March
18,
2008,
from
http://www.eia,doe.gov/oiaf/aeo/
assumption/residential.hrml
II
Em:rgy
Information
Administration.
DOE.
The
National
Energy
Modeling
System:
Documentation.
Retrieved
March
18,2008,
from
hrrp:/lronro.eia.doc.gov/rcporrs/reports_kinJD.asp?type:modcl%2Odocumcncuion
l2Analysis
of
thc
Lieberman-Warner
Climate
Security
Act
(S.
2191)
using
the
National
Energy
Modeling
System
(NEMS/ACCF/NAM).
A
Report
by
the
American
Council
for
Capital
Formation
and
the
National
Association
of
Manufacturers,
Analysis
Conducted
by
Science
Applications
[ntemational
Corporation
(SAlC),
March
2008.
Reuieved
March
26,
2008,
from
hrrp://www.eenews.net/fea
tu
resl
docu
men
ts/2008/03/1
31
docu
mencpm_
03.
pdf
I.~Both
scenarios
assume
the
same
capital
COStS
for
technology
but
differ
in
their
constraints
on
technology
deployment.
emissions
between
2012
and
2030.
(Sourcc:
Thorning,
Margo.
Private
-
Communication.
May
5,
2008).
15The
ACCF
cases
were
run
on
the
basis
of
a
"Market
for
Allowance
Permits
with
Emissions
Offsets."
The
market
approach
was
taken
because
of
the
compleXity
of
the
allowance
distributions
provided
by
thc
proposcd
legislation
and
the
likelihood
that
these
would
be
traded
within
energy
sectors.
Allowance
permits
are
assumed
transferable
within
the
country,
but
are
not
banked.
The
distribution
of
cmissions
permits
pcr
yL'ar,
equal
to
legislatcd
annual
emissions
limits,
is
assumed
to
take
place.
As
a
resulc,
the
revenue
from
the
salt"
of
allowances
is
assumed
to
be
redistributed
back
to
the
individual
energy
scctors.
(Source:
Thorning,
Margo.
Private
Communication.
May
5,
2008).
16Energy
Information
Administration.
Annual
Energy
Outlook
2008
(Revised
Early
Release),
Report
#:
DOE/EIA-0383{2008),
Relt.'3.Sed
Date:
March
2008
(Revised).
17For
more
information
Oil
the
EPPA
model,
sce
Paltsev,
S.,
et
a!'
"Assessmenr
of
U.S.
Cap-and-Trade
Proposals."
MIT
Global
Change
Joint
Program,
April
2007.
Reuicved
March
26,
2008,
from
http://web.mit.edu/globalchangcl
www/repons.html#rI46
ISPaltsev,
Sergey,
Ct
al.
"Appendix
D:
Analysis
of
the
c.1.p
and
Trade
J:eaturcs
of
theLieherman-Warner
Climate
Security
Act
(S.
2191)."
Fcb
:2008.
19ln
the
MrT
analysis,
offsets
are
assumed
to
bc
free.
i.e.,
rhe
model
does
nOt
explicitly
include
thc
supplylcom
of
offsets.
Thus,
the
ofl-scts
provision
is
equivalent
to
a
rela:<arion
of
the
cap
by
17.65%.
2llThe
~lnternational
emissions
trading:
203
bmt"
scenario
in
the
main
report
could
be
compared
to
the
"Core
scena.rio:
20.'3
bmt"
to
isolatt"
the
impact
of
international
cmissions
trading
in
the
context
of
a
cap-and-trade
cnvironmenr
with
similar
stringency.
211n
comparison,
for
fGEM,
prices
start
at
$401tC0
1
e
in
2015
and
increase
to
S83ltC0
2
e
by
2030
and
$220ItCO~e
by
2050
for
scenario
2.
~2Electricity
pricc
reAecrs
the
full
allowance
price
the
consumer
would
face,
Assumes
the
COSt
of
allowances
can
partially
be
passed
on
to
consumcrs
(as
is
the
case
in
a
full
auction).
If
allowances
are
given
directly
to
power
companies,
the
COSt
of
those
allowances
would
not
be
passed
on
to
consumers
in
regulated
electricity
markets,
so
electricity
price
increases
would
be
smaller
in
much
of
the
country.
HMonrgornery,
David,
and
Annc
E.
Smith.
Economic
Analysis
of
the
Lieherman.
Warner
C1imatt"
Security
Act
of
2007:
Using
CRA's
MRN-NEEM
Model
Summary
of
Findings.
CRA,
International,
April
200B.
Retrieved
May
9,
2008.
from
http://www,nma,org/pdf/040808~crai_preserltarion.pdf
NCRA
assumes
rhat
these
allowances
are
used
to
lower
thc
household
impacts
of
higher
energy
prices.
25CRA
uscs
three
"stock"
low
carbon
fuels-a
corn-based
ethanol
(25%
lifeqcle
emissions
reduction
relative
to
gasoline),
a
low
carbon
biofuel
that
achieves
all
80%
reduction
and
a
zero-carbon
fuel,
relative
to
gasoline.
Electronic Filing - Received, Clerk's Office, October 1, 2008
* * * * * PCB 2009-021 * * * * *