Howard
Gruenspecht,
Deputy
Administrator,
Energy
Information
Administration,
"EIA
Analysis
of
the
loW
Climate
Security
Act
of
2007,"
PowerPoint
Presentation
to
the
Edison
Electric
Institute
(May
7,
2008).
Electronic Filing - Received, Clerk's Office, October 1, 2008
* * * * * PCB 2009-021 * * * * *
EIA Analysis of the
L-W Climate Security Act of 2007
for:
Edison Electric Institute
~.
Howard Gruenspecht
Deputy Administrator, EIA
(howard.gruenspecht@eia.doe.gov)
Back to top
May
7,2008
Back to top
Energy Information Administration
Official Energy Statistics from the
U.
S.
Government
Electronic Filing - Received, Clerk's Office, October 1, 2008
* * * * * PCB 2009-021 * * * * *
~
·la~~~:;~Y
Information
Administration
•
•
•
•
•
•
•
•
•
•
•
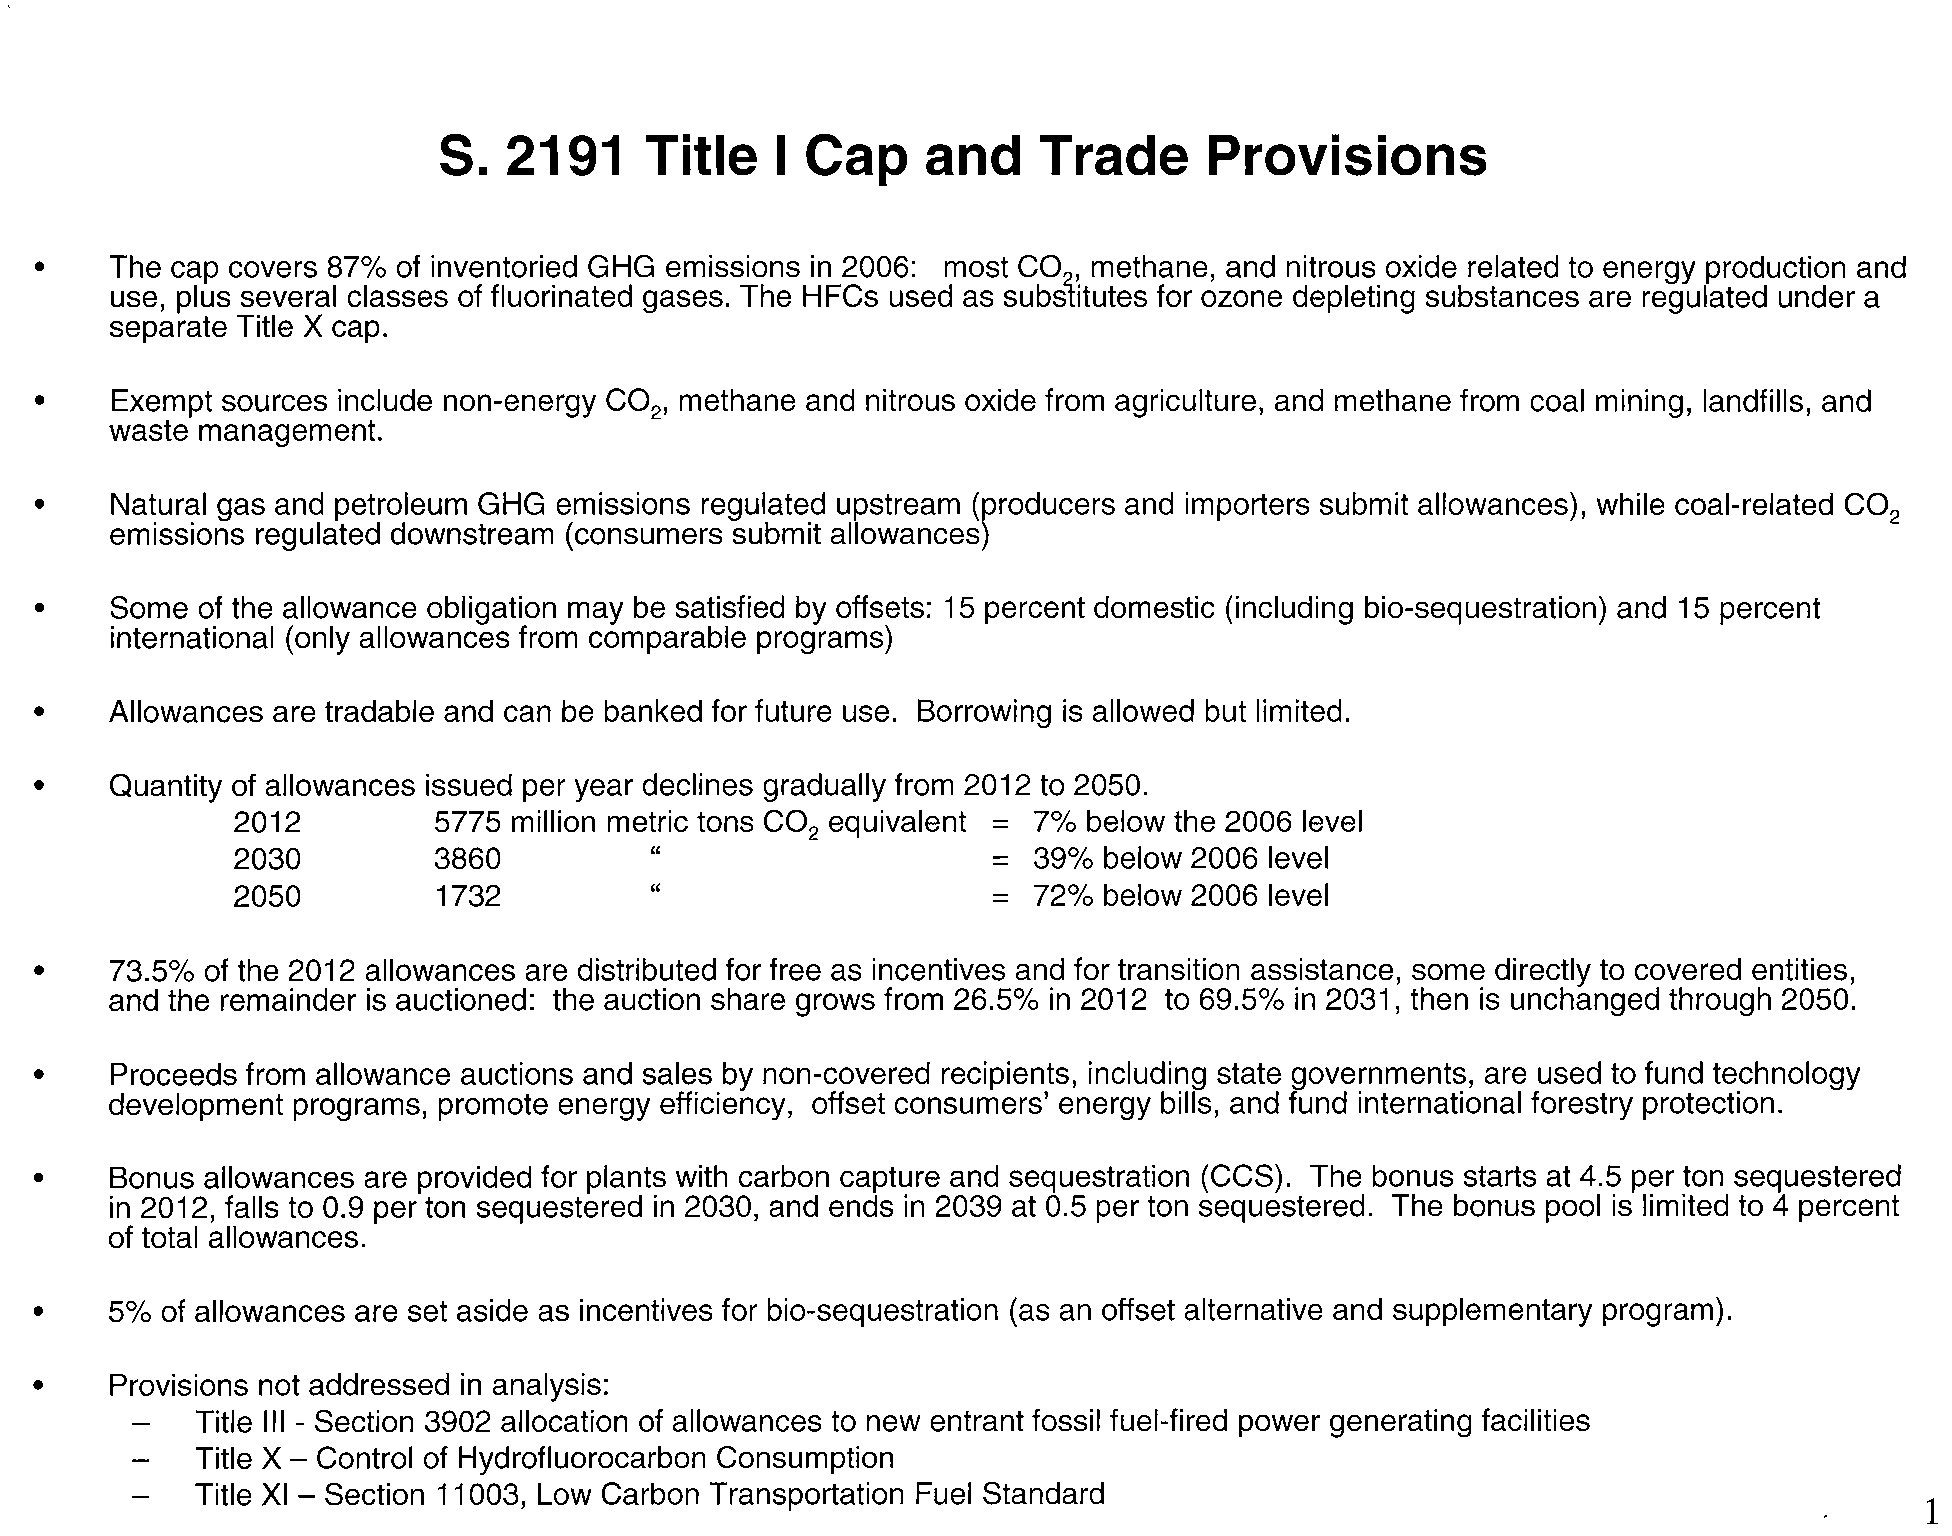
S. 2191 Title I Cap and Trade Provisions
The cap covers 87% of inventoried GHG emissions in 2006: most CO , methane, and nitrous oxide related to energy production and
use, plus several classes of fluorinated gases. The HFCs used as sUbslitutes for ozone depleting substances are regulated under a
separate Title X cap.
Exempt sources include non-energy CO
2
,
methane and nitrous oxide from agriculture, and methane from coal mining, landfills, and
waste management.
Natural gas and petroleum GHG emissions regulated upstream (producers and importers submit allowances), while coal-related CO
2
emissions regulated downstream (consumers submit allowances)
Some of the allowance obligation may be satisfied by offsets:
15 percent domestic (including bio-sequestration) and 15 percent
international (only allowances from comparable programs)
Allowances are tradable and can be banked for future use. Borrowing is allowed but limited.
Quantity of allowances issued per year declines gradually from 2012 to 2050.
2012
5775 million metric tons CO
2
equivalent = 7% below the 2006 level
2030
3860"
= 39% below 2006 level
2050
1732"
= 72% below 2006 level
73.5% of the 2012 allowances are distributed for free as incentives and for transition assistance, some directly to covered entities,
and the remainder
is auctioned: the auction share grows from 26.5% in 2012 to 69.5% in 2031, then is unchanged through 2050.
Proceeds from allowance auctions and sales by non-covered recipients, including state governments, are used to fund technology
development programs, promote energy efficiency, offset consumers' energy bills, and fund international forestry protection.
Bonus allowances are provided for plants with carbon capture and sequestration (CCS). The bonus starts at 4.5 per ton sequestered
in 2012, falls to 0.9 per ton sequestered in 2030, and ends in 2039 at 0.5 per ton sequestered. The bonus pool is limited to 4 percent
of total allowances.
5% of allowances are set aside as incentives for bio-sequestration (as
an offset alternative and supplementary program).
Provisions not addressed
in analysis:
Title
III
- Section 3902 allocation of allowances to new entrant fossil fuel-fired power generating facilities
Title X - Control of Hydrofluorocarbon Consumption
Title
XI - Section 11003, Low Carbon Transportation Fuel Standard
1
Electronic Filing - Received, Clerk's Office, October 1, 2008
* * * * * PCB 2009-021 * * * * *
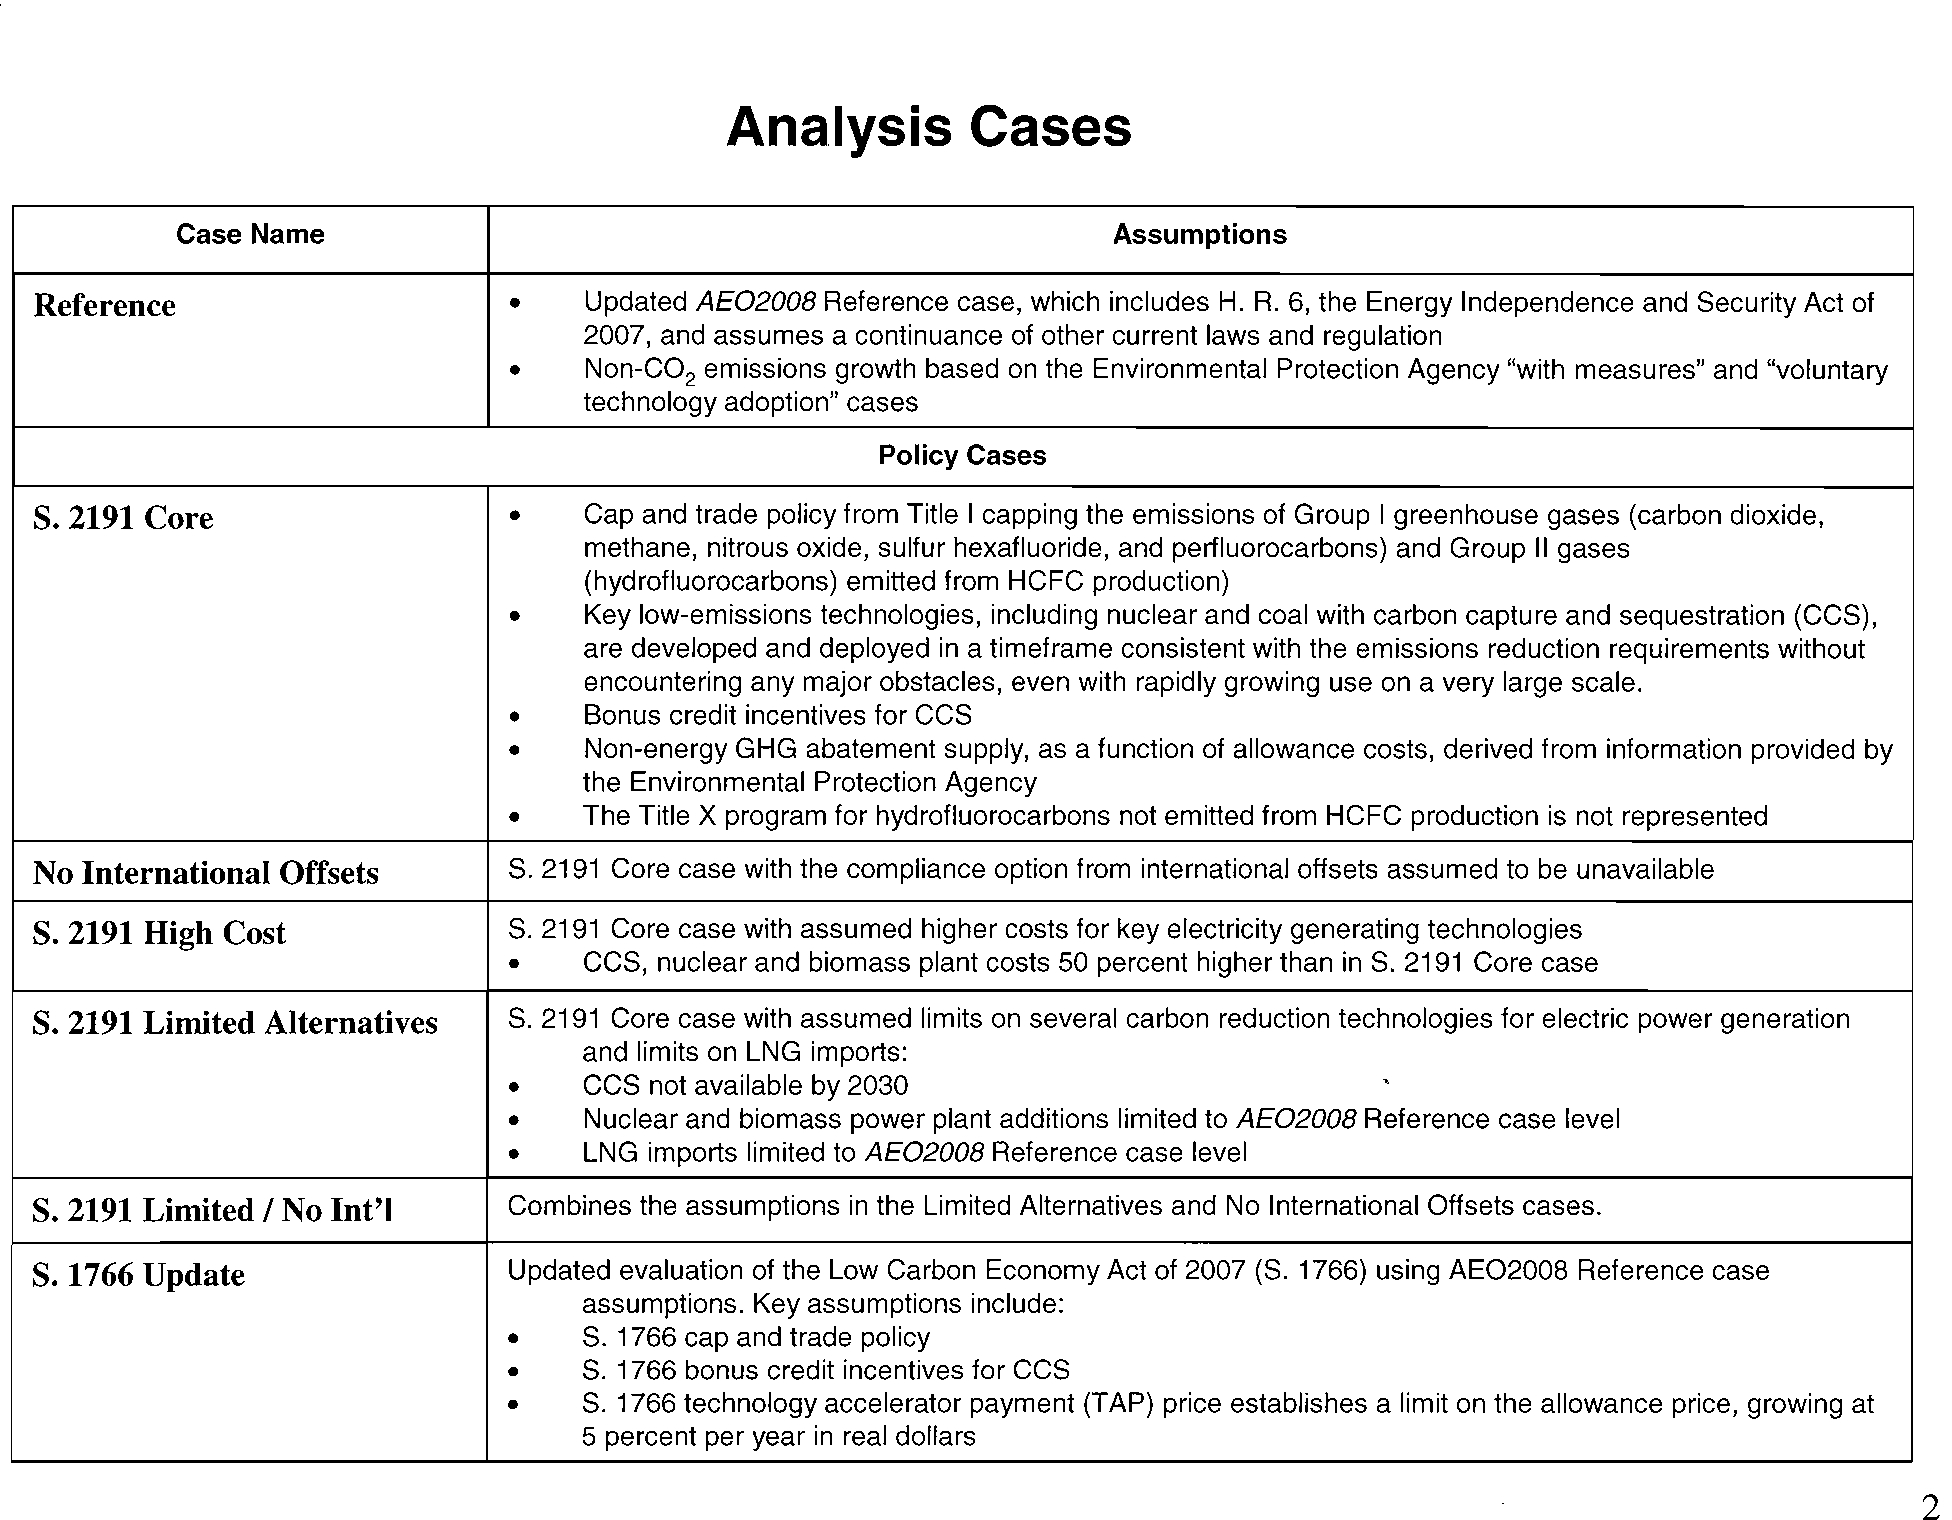
Analysis Cases
Case Name
Assumptions
Reference
•
Updated
AE0200B
Reference case, which includes H. R. 6, the Energy Independence and Security Act of
2007, and assumes a continuance of other current laws and regulation
•
Non-C0
2
emissions growth based on the Environmental Protection Agency "with measures" and "voluntary
technology adoption" cases
Policy Cases
S. 2191 Core
•
Cap and trade policy from Title I capping the emissions of Group I greenhouse gases (carbon dioxide,
methane, nitrous oxide, sulfur hexafluoride, and perfluorocarbons) and Group
II gases
(hydrofluorocarbons) emitted from HCFC production)
•
Key low-emissions technologies, including nuclear and coal with carbon capture and sequestration (CCS),
are developed and deployed in a timeframe consistent with the emissions reduction requirements without
encountering any major obstacles, even with rapidly growing use
on a very large scale.
•
Bonus credit incentives for CCS
•
Non-energy GHG abatement supply, as a function of allowance costs, derived from information provided by
the Environmental Protection Agency
•
The Title X program for hydrofluorocarbons not emitted from HCFC production is not represented
No International Offsets
S. 2191 Core case with the compliance option from international offsets assumed to be unavailable
S. 2191 High Cost
S. 2191 Core case with assumed higher costs for key electricity generating technologies
•
CCS, nuclear and biomass plant costs 50 percent higher than in S. 2191 Core case
S. 2191 Limited Alternatives
S. 2191 Core case with assumed limits on several carbon reduction technologies for electric power generation
and limits
on LNG imports:
•
CCS not available by 2030
.
•
Nuclear and biomass power plant additions limited to
AE0200B
Reference case level
•
LNG imports limited to
AE0200B
Reference case level
S. 2191 Limited
I
No Int'l
Combines the assumptions in the Limited Alternatives and No International Offsets cases.
S. 1766 Update
Updated evaluation of the Low Carbon Economy Act of 2007 (S. 1766) using AE02008 Reference case
assumptions. Key assumptions include:
•
S. 1766 cap and trade policy
•
S. 1766 bonus credit incentives for CCS
•
S. 1766 technology accelerator payment (TAP) price establishes a limit on the allowance price, growing at
5 percent per year
in real dollars
~
·la~~~:;;Y
Information
Administration
2
Electronic Filing - Received, Clerk's Office, October 1, 2008
* * * * * PCB 2009-021 * * * * *
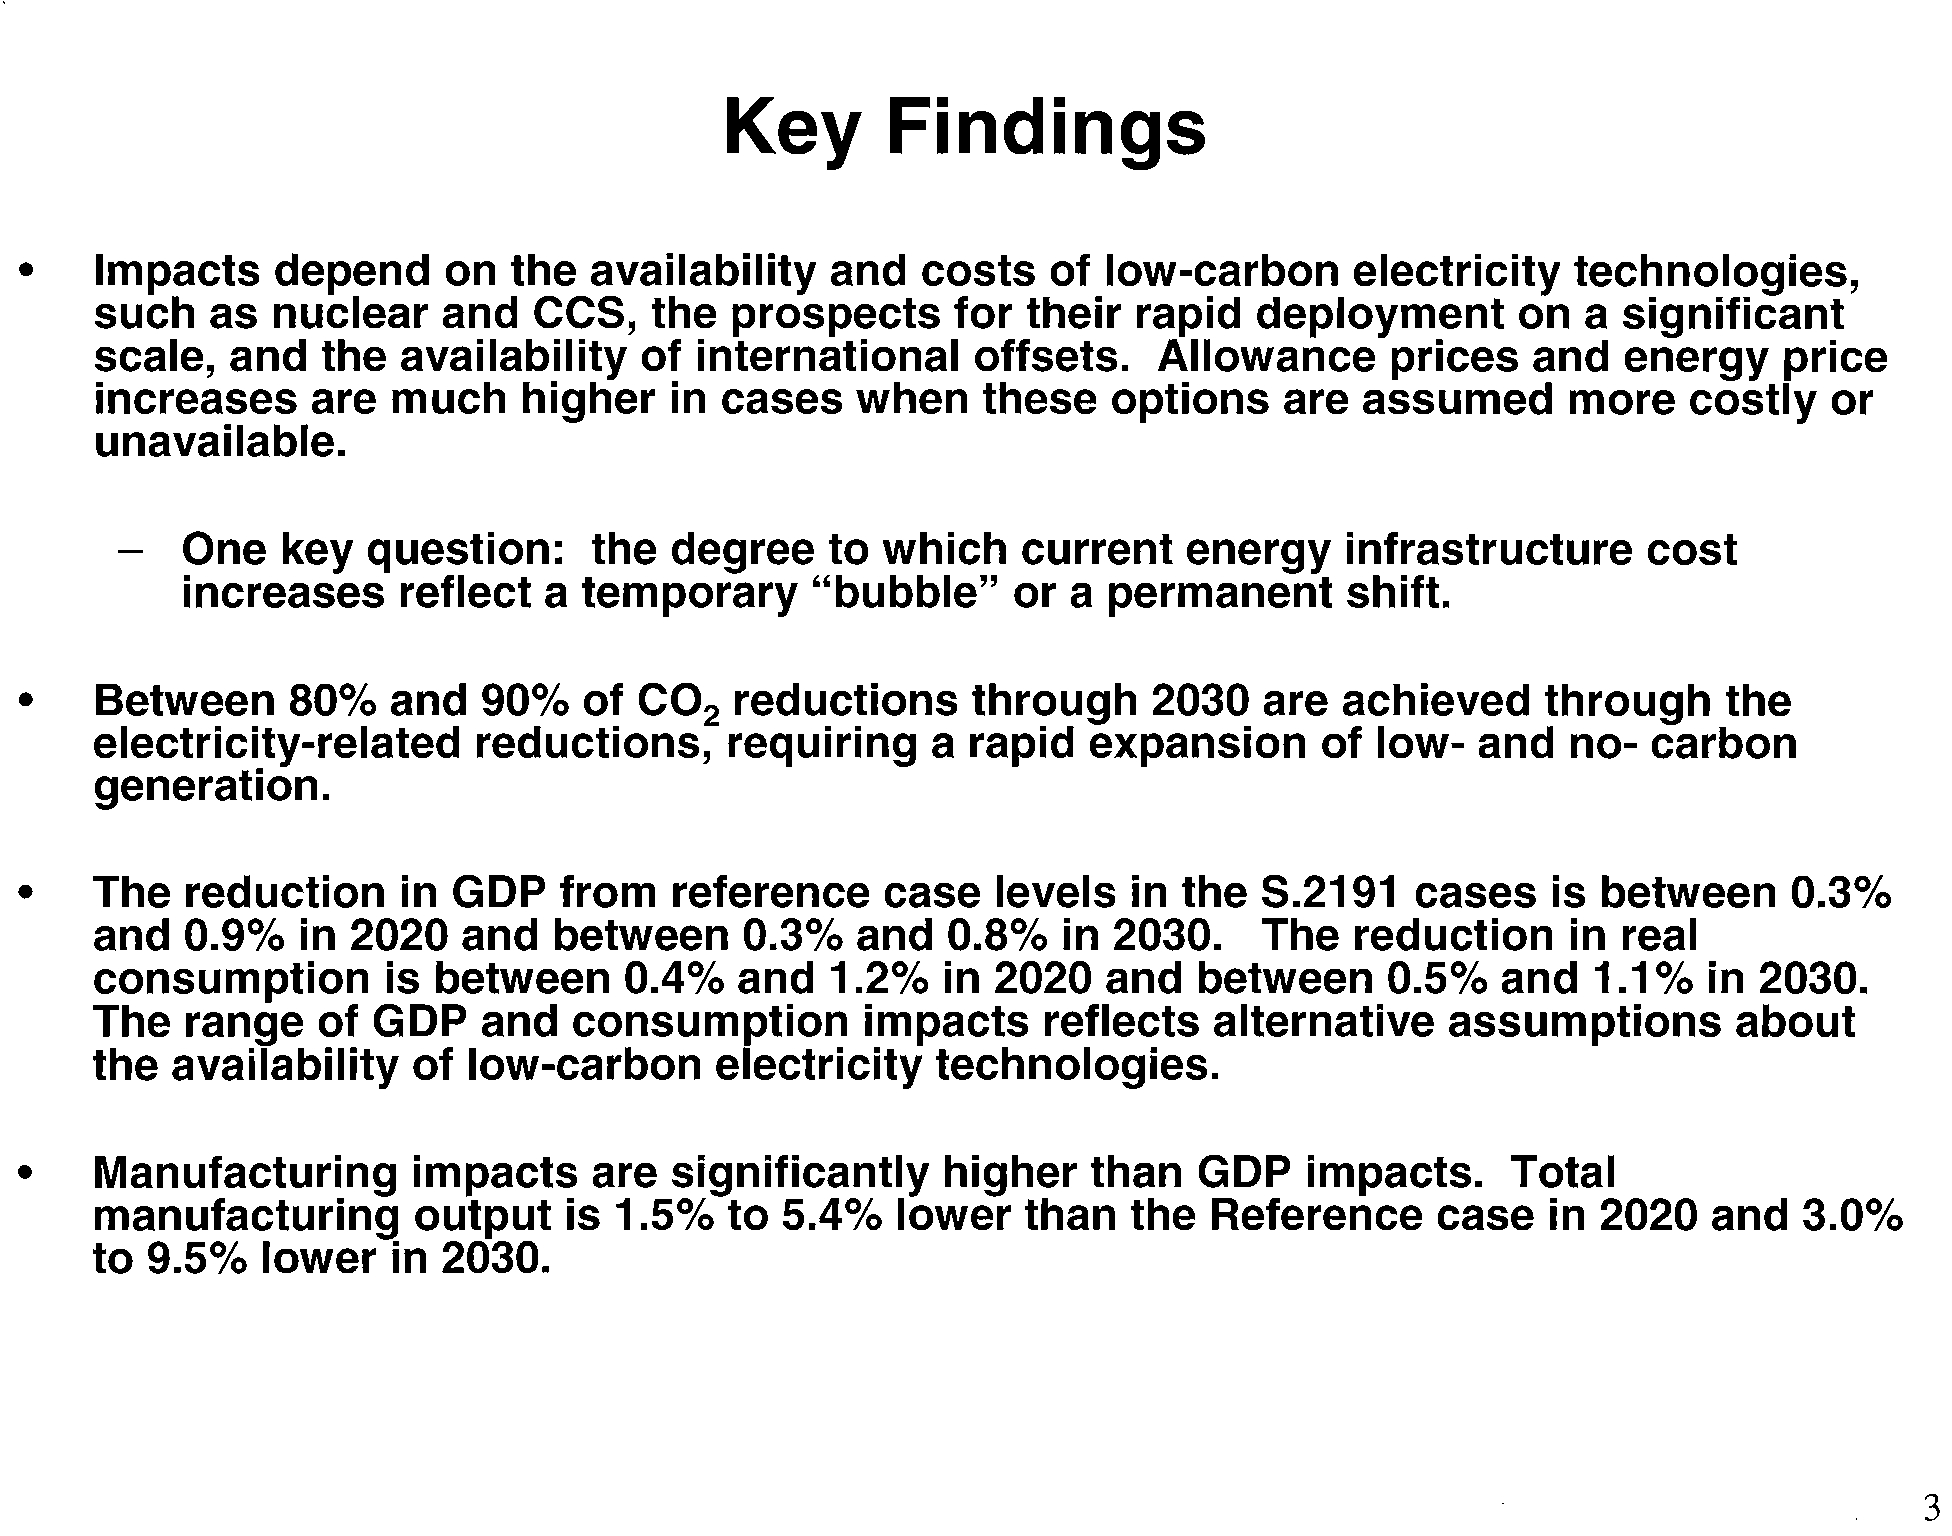
Key Findings
•
Impacts depend on the availability and costs of low-carbon electricity technologies,
such as nuclear and CC8, the prospects for their rapid deployment on a significant
scale, and the availability of international offsets. Allowance prices and energy price
increases are
much higher in cases when these options are assumed more costly or
unavailable.
- One key question: the degree to which current energy infrastructure cost
increases reflect a temporary "bubble" or a permanent shift.
•
Between 80% and 90%
of CO
2
reductions through 2030 are achieved through the
electricity-related reductions, requiring a rapid expansion of low- and no- carbon
generation.
•
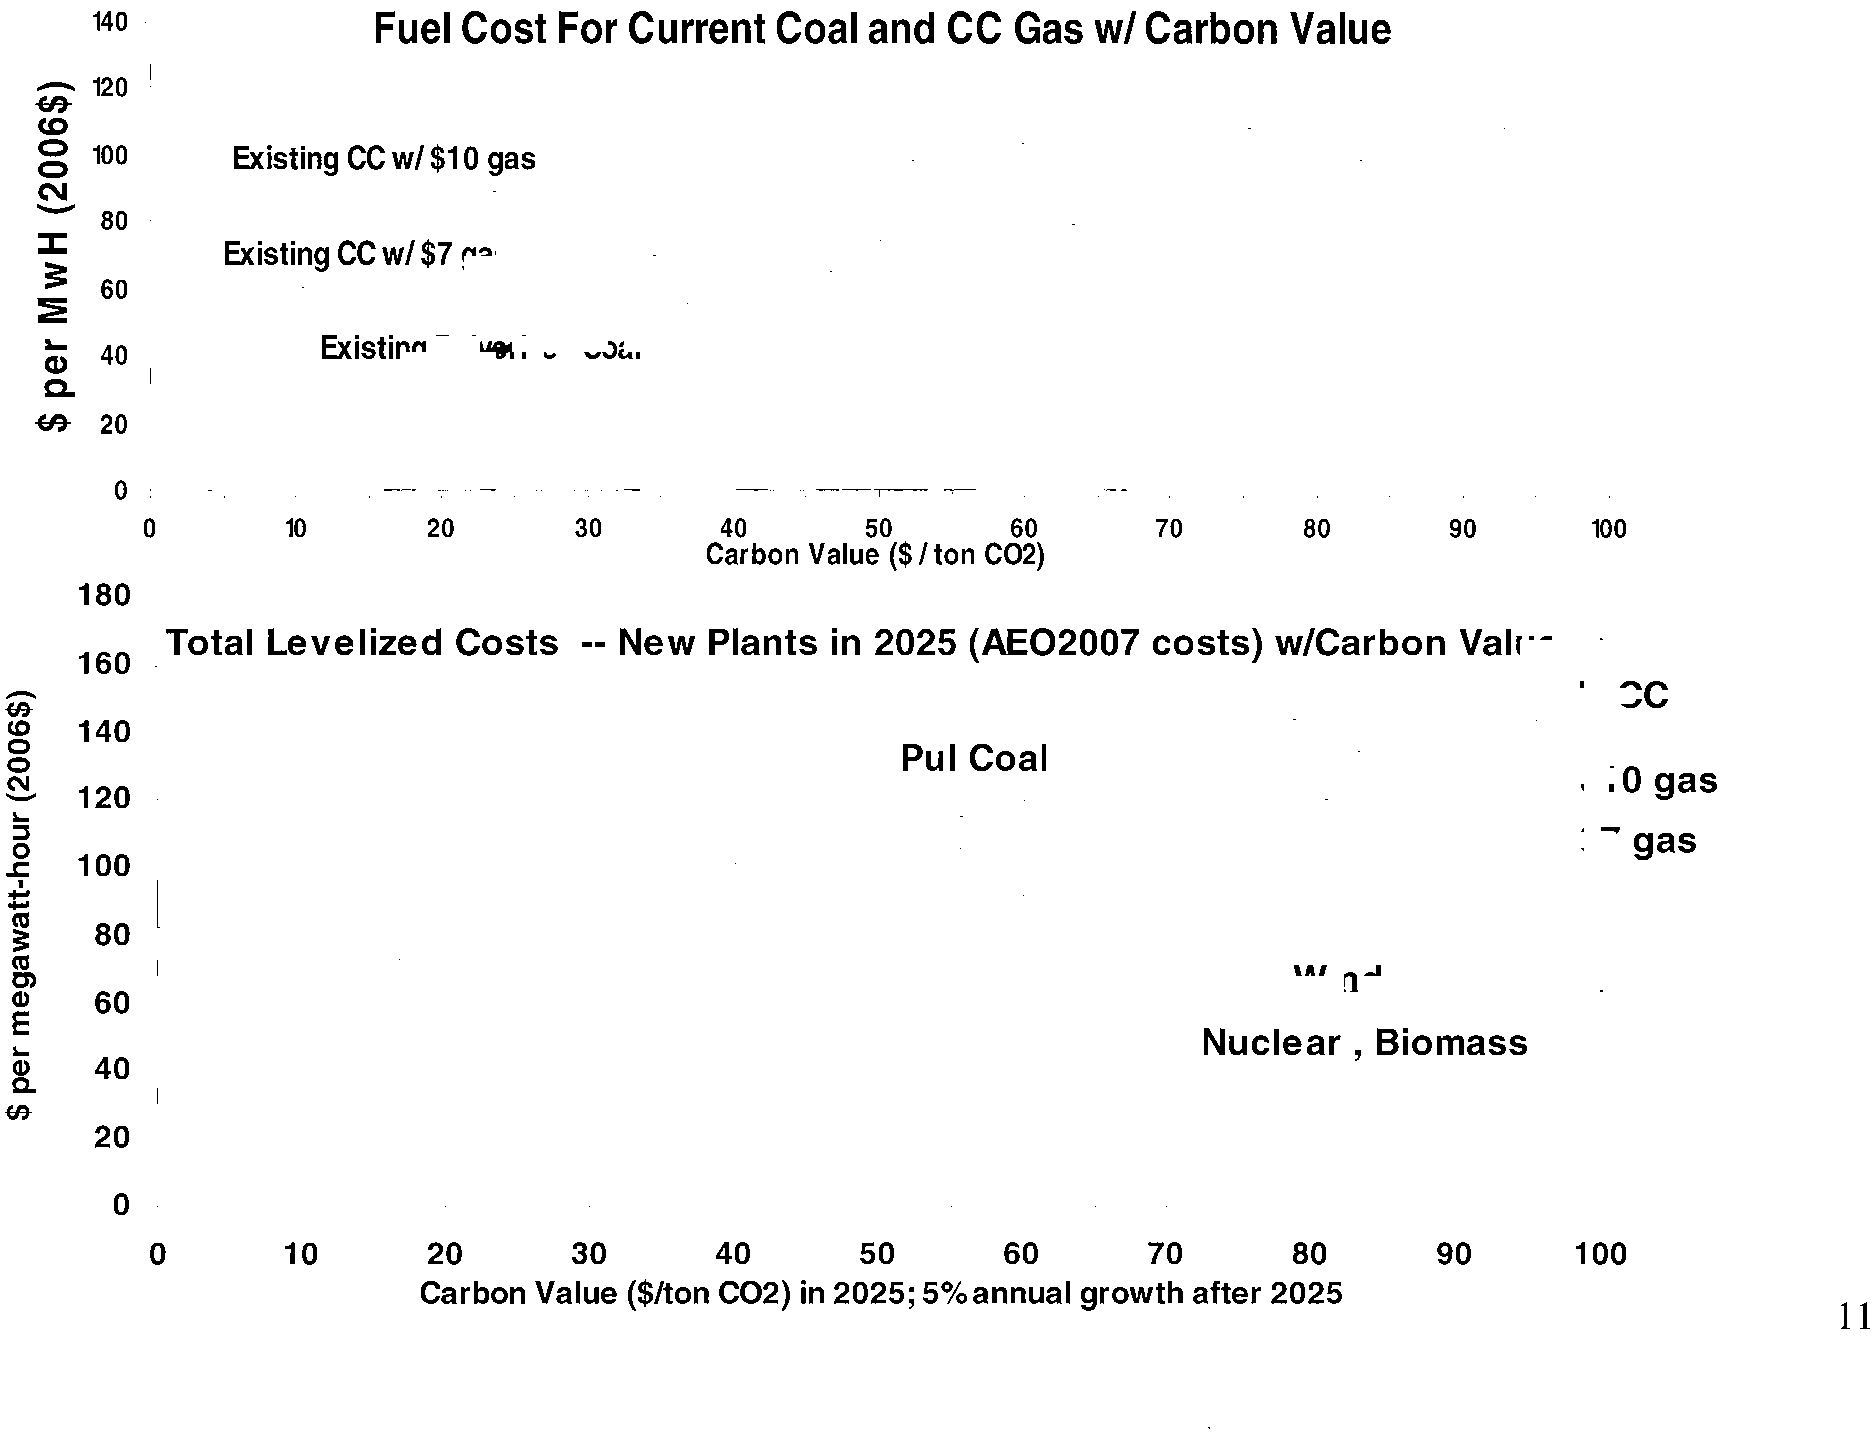
The reduction in GOP from reference case levels in the 8.2191 cases is between 0.3%
and 0.9% in 2020 and between 0.3% and 0.8% in 2030. The reduction in real
consumption is between 0.4% and 1.2% in 2020 and between 0.5% and 1.1 % in 2030.
The range
of GOP and consumption impacts reflects alternative assumptions about
the availability of low-carbon electricity technologies.
•
Manufacturing impacts are significantly higher than GOP impacts. Total
manufacturing output is 1.5% to 5.4% lower than the Reference case in 2020 and 3.0%
to 9.5% lower in 2030.
~
·la~~",;~;~Y
Information
Administration
3
Electronic Filing - Received, Clerk's Office, October 1, 2008
* * * * * PCB 2009-021 * * * * *
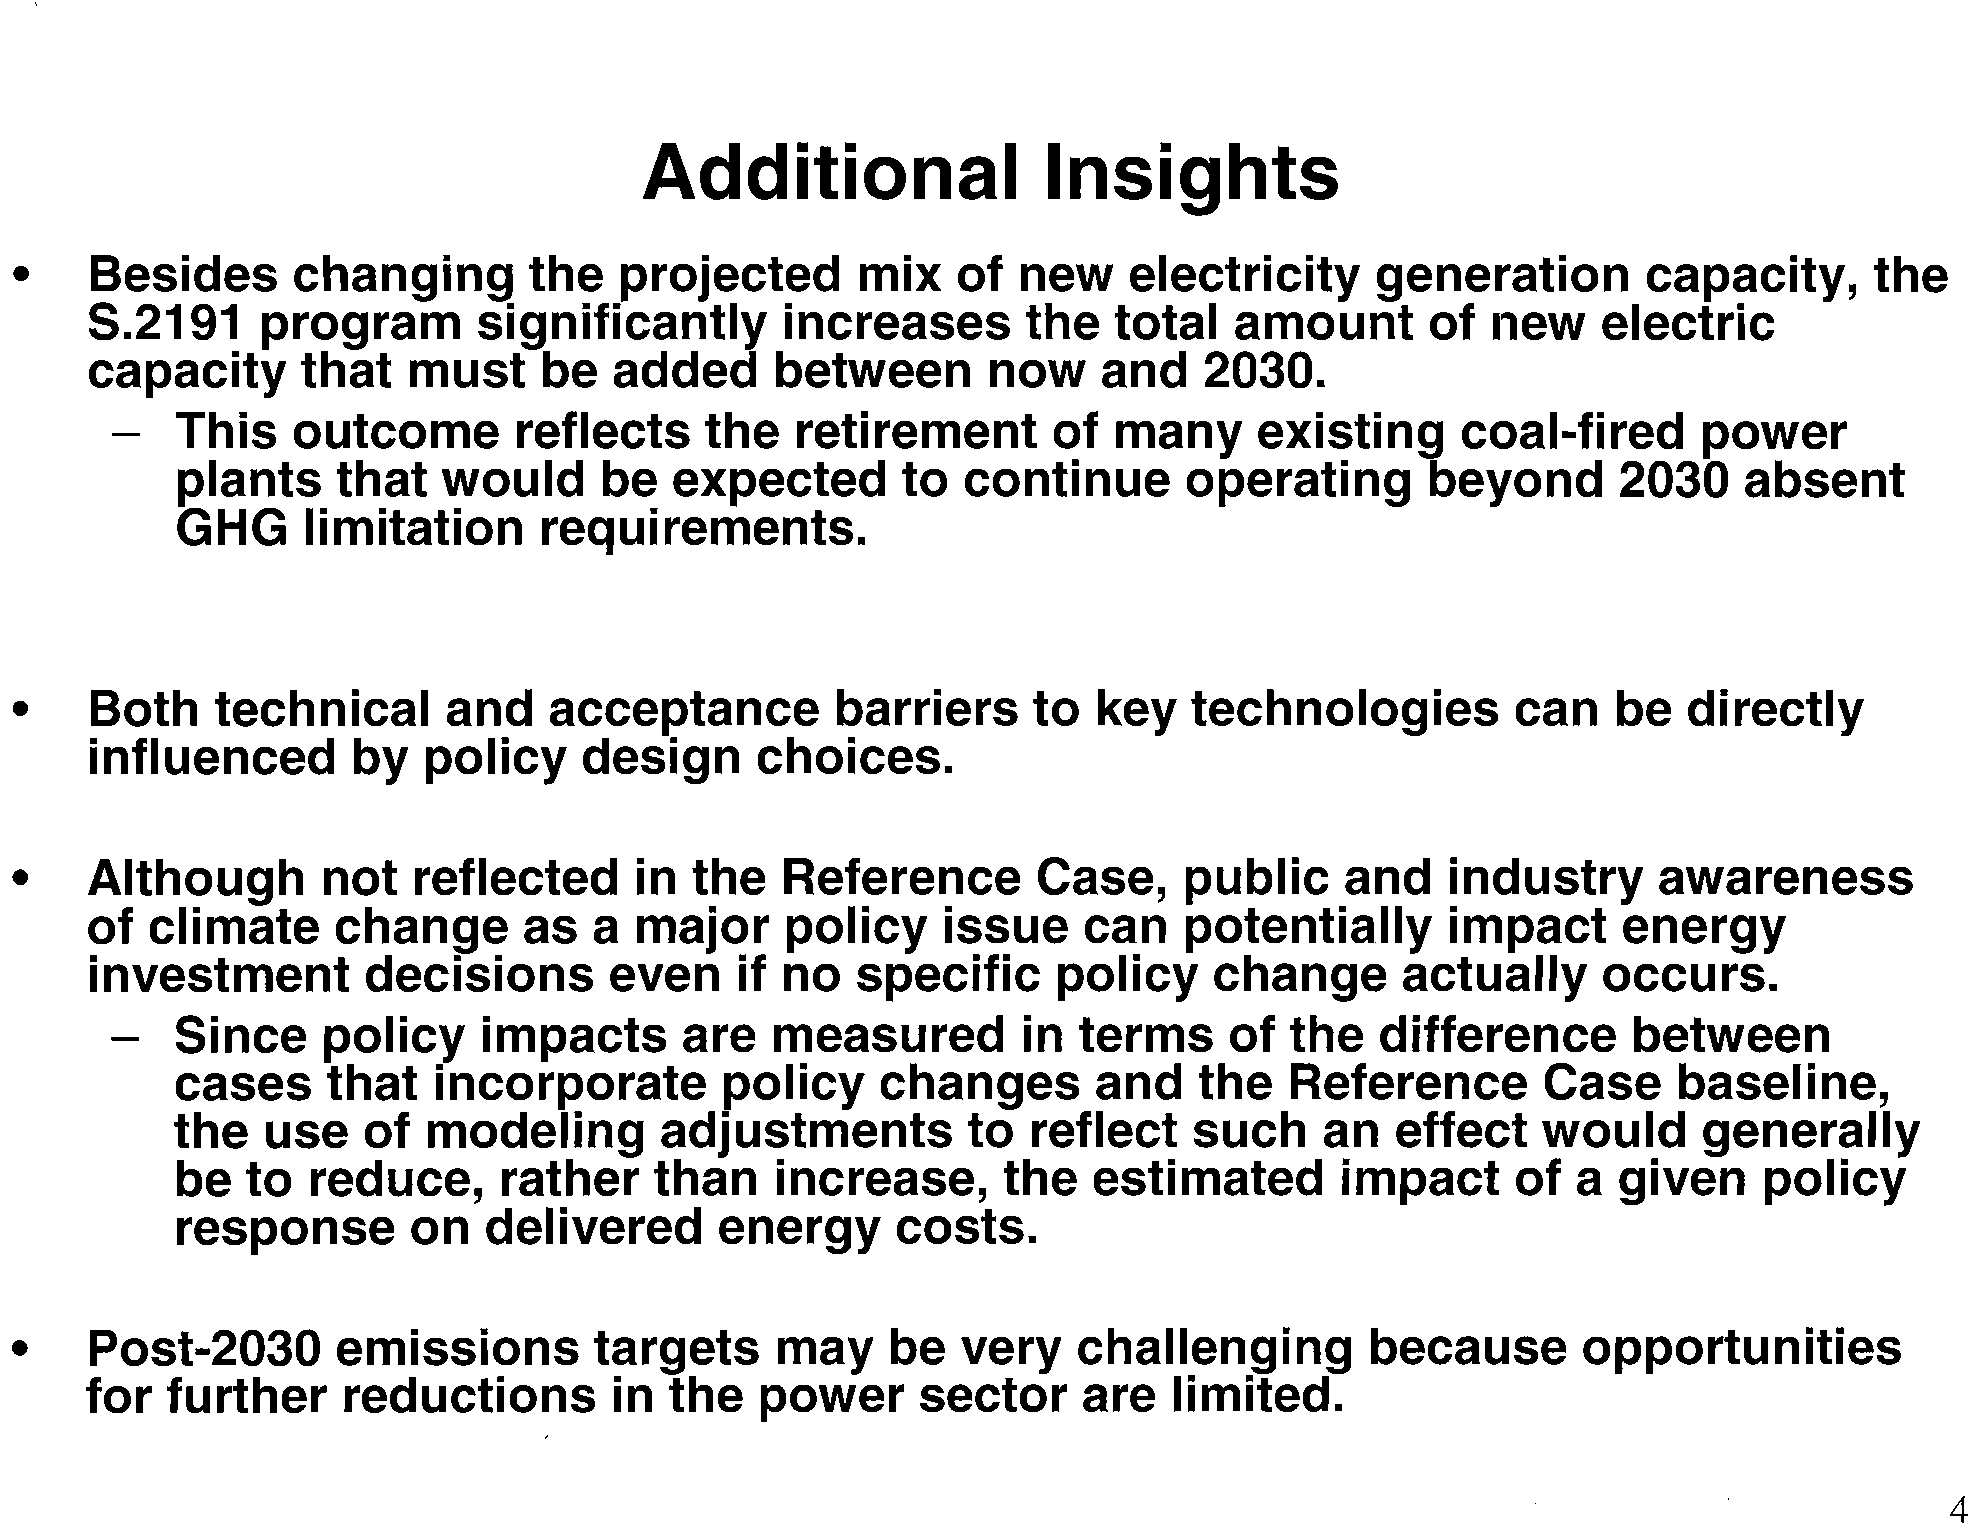
Additional Insights
• Besides changing the projected mix of new electricity generation capacity, the
5.2191 program significantly increases the total amount of new electric
capacity that must be added between now and 2030.
- This outcome reflects the retirement of many existing coal-fired power
plants that would be expected to continue operating beyond 2030 absent
GHG limitation requirements.
• Both technical and acceptance barriers to key technologies can be directly
influenced by policy design choices.
• Although not reflected in the Reference Case, public and industry awareness
of climate change as a major policy issue can potentially impact energy
investment decisions even if no specific policy change actually occurs.
- Since policy impacts are measured in terms of the difference between
cases that incorporate policy changes and the Reference Case baseline,
the use of modeling adjustments to reflect such an effect would generally
be to reduce, rather than increase, the estimated impact of a given policy
response on delivered energy costs.
• Post-2030 emissions targets may be very challenging because opportunities
for further reductions in the power sector are limited.
~
·la~~';;:;~Y
Information
Administration
4
Electronic Filing - Received, Clerk's Office, October 1, 2008
* * * * * PCB 2009-021 * * * * *
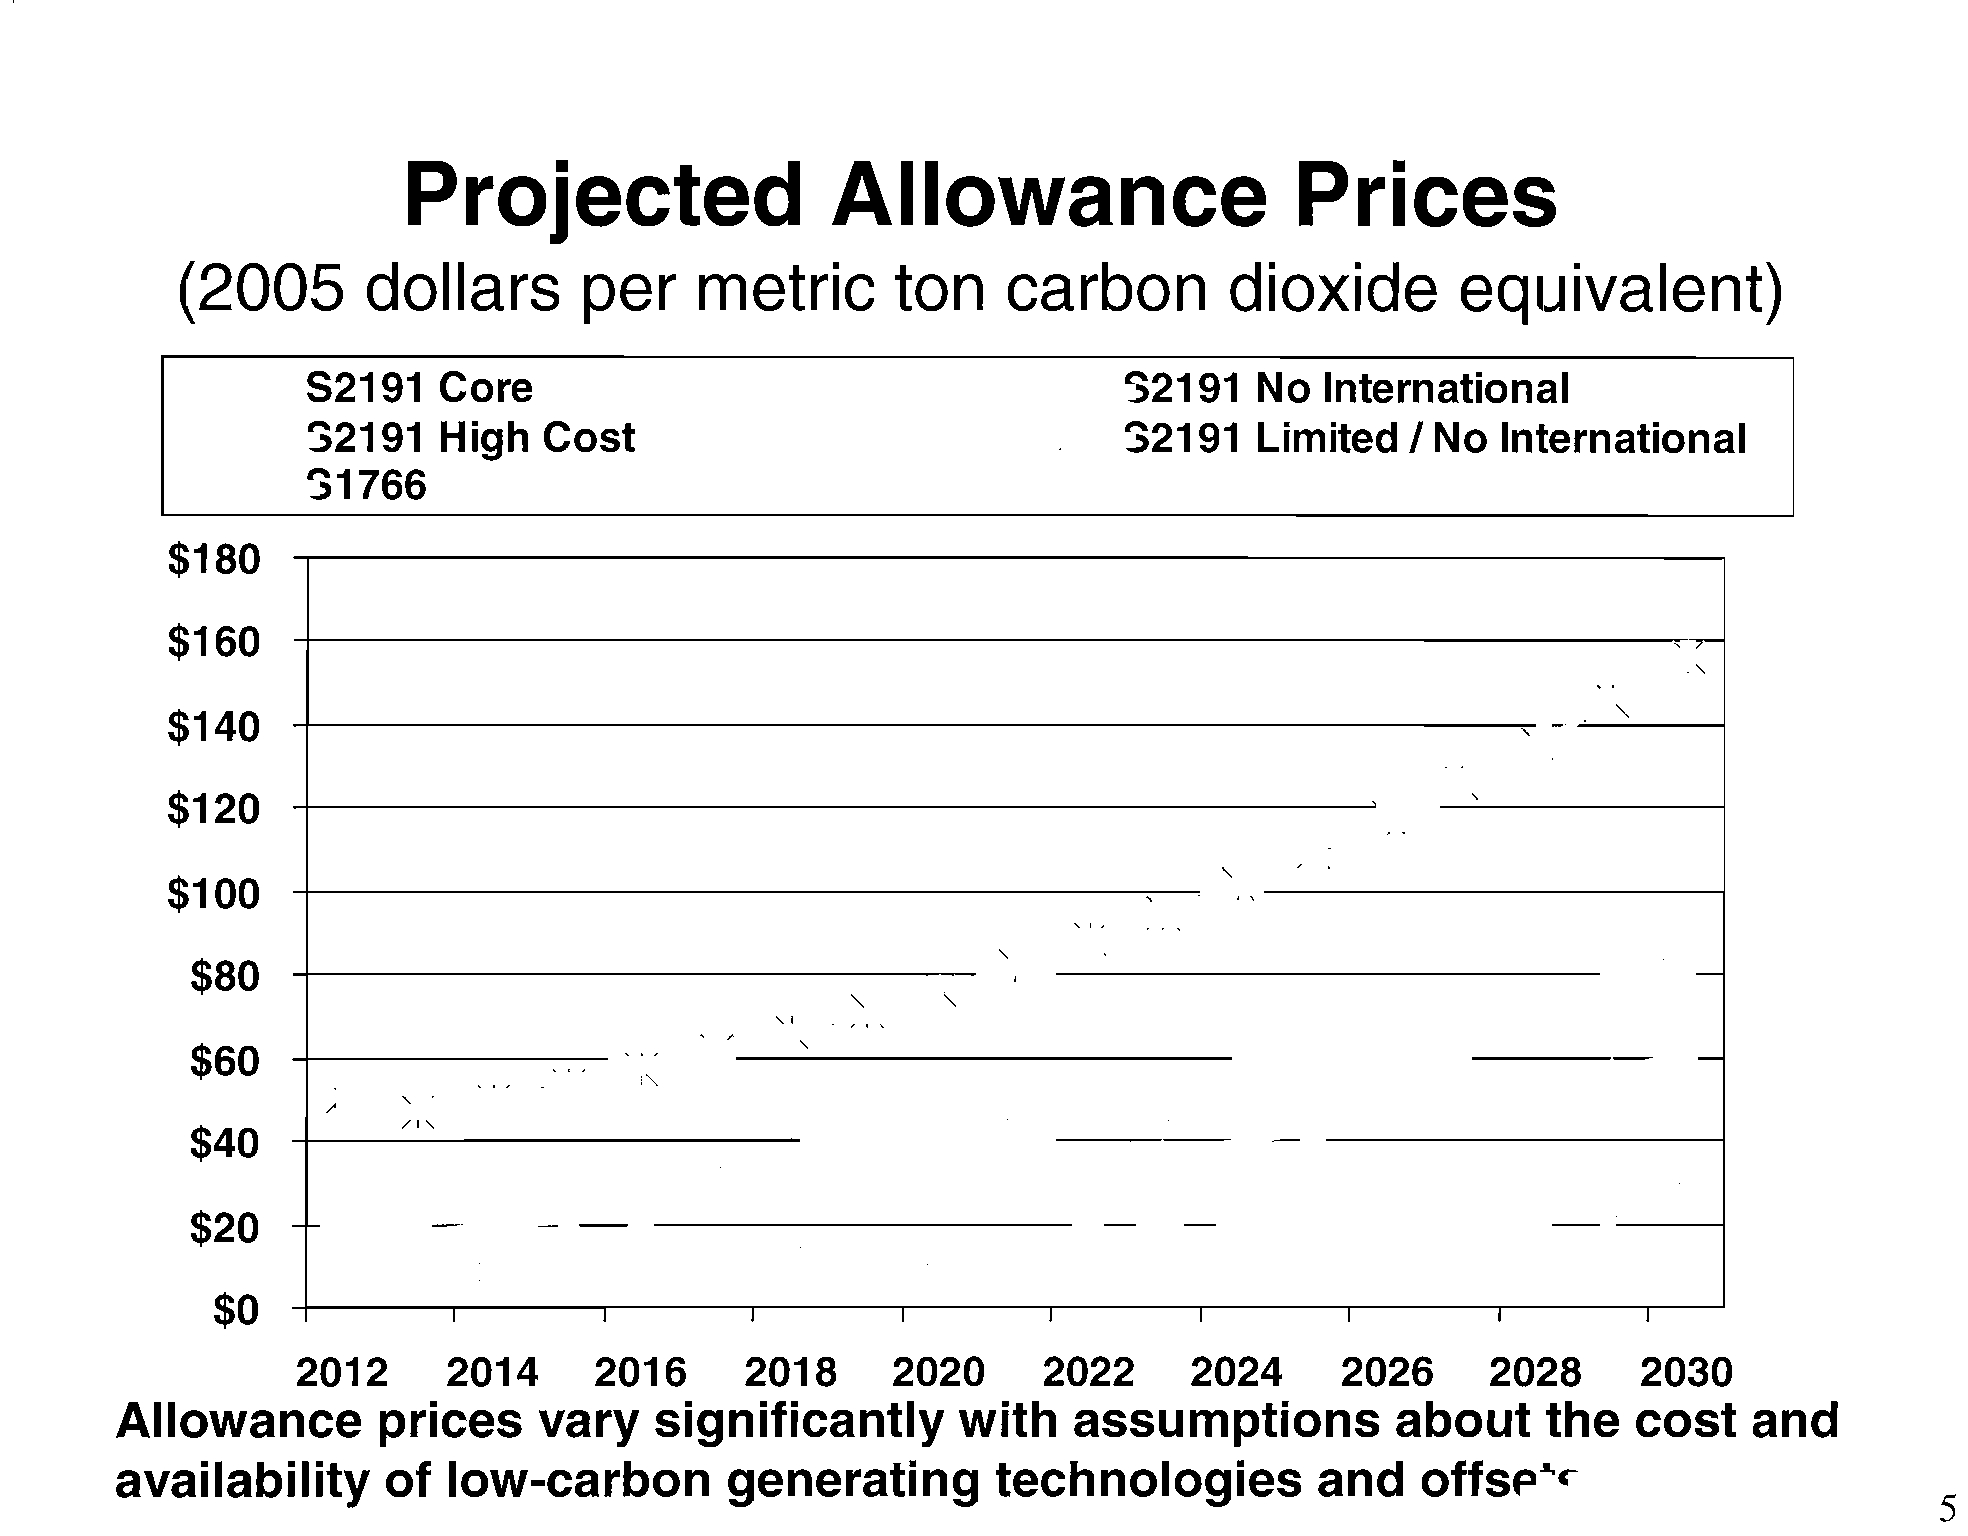
Projected Allowance Prices
(2005 dollars per metric ton carbon dioxide equivalent)
52191 Core
-52191 High Cost
-51766
-
52191 No International
~
52191 Limited
I
No International
-
-- -
I
$180 I
i
$160 I
w
I
$140
I
'CI.
-"
I
$120I
~"
I
$100 I
,,~I
$80i
$60
:$r
)I( ?IC
~
~
~~
1""
~
$40
$20
$0I
I
I
I
i
J
I
I
I
I
I
2012
2014 2016
2018 2020
2022 2024
2026 2028
2030
Allowance prices vary significantly with assumptions about the cost and
availability
of low-carbon generating technologies and
OffS~~ei'.doe.gO'
5
elc
Ener~~ Info~mation
AdministratIon
Electronic Filing - Received, Clerk's Office, October 1, 2008
* * * * * PCB 2009-021 * * * * *
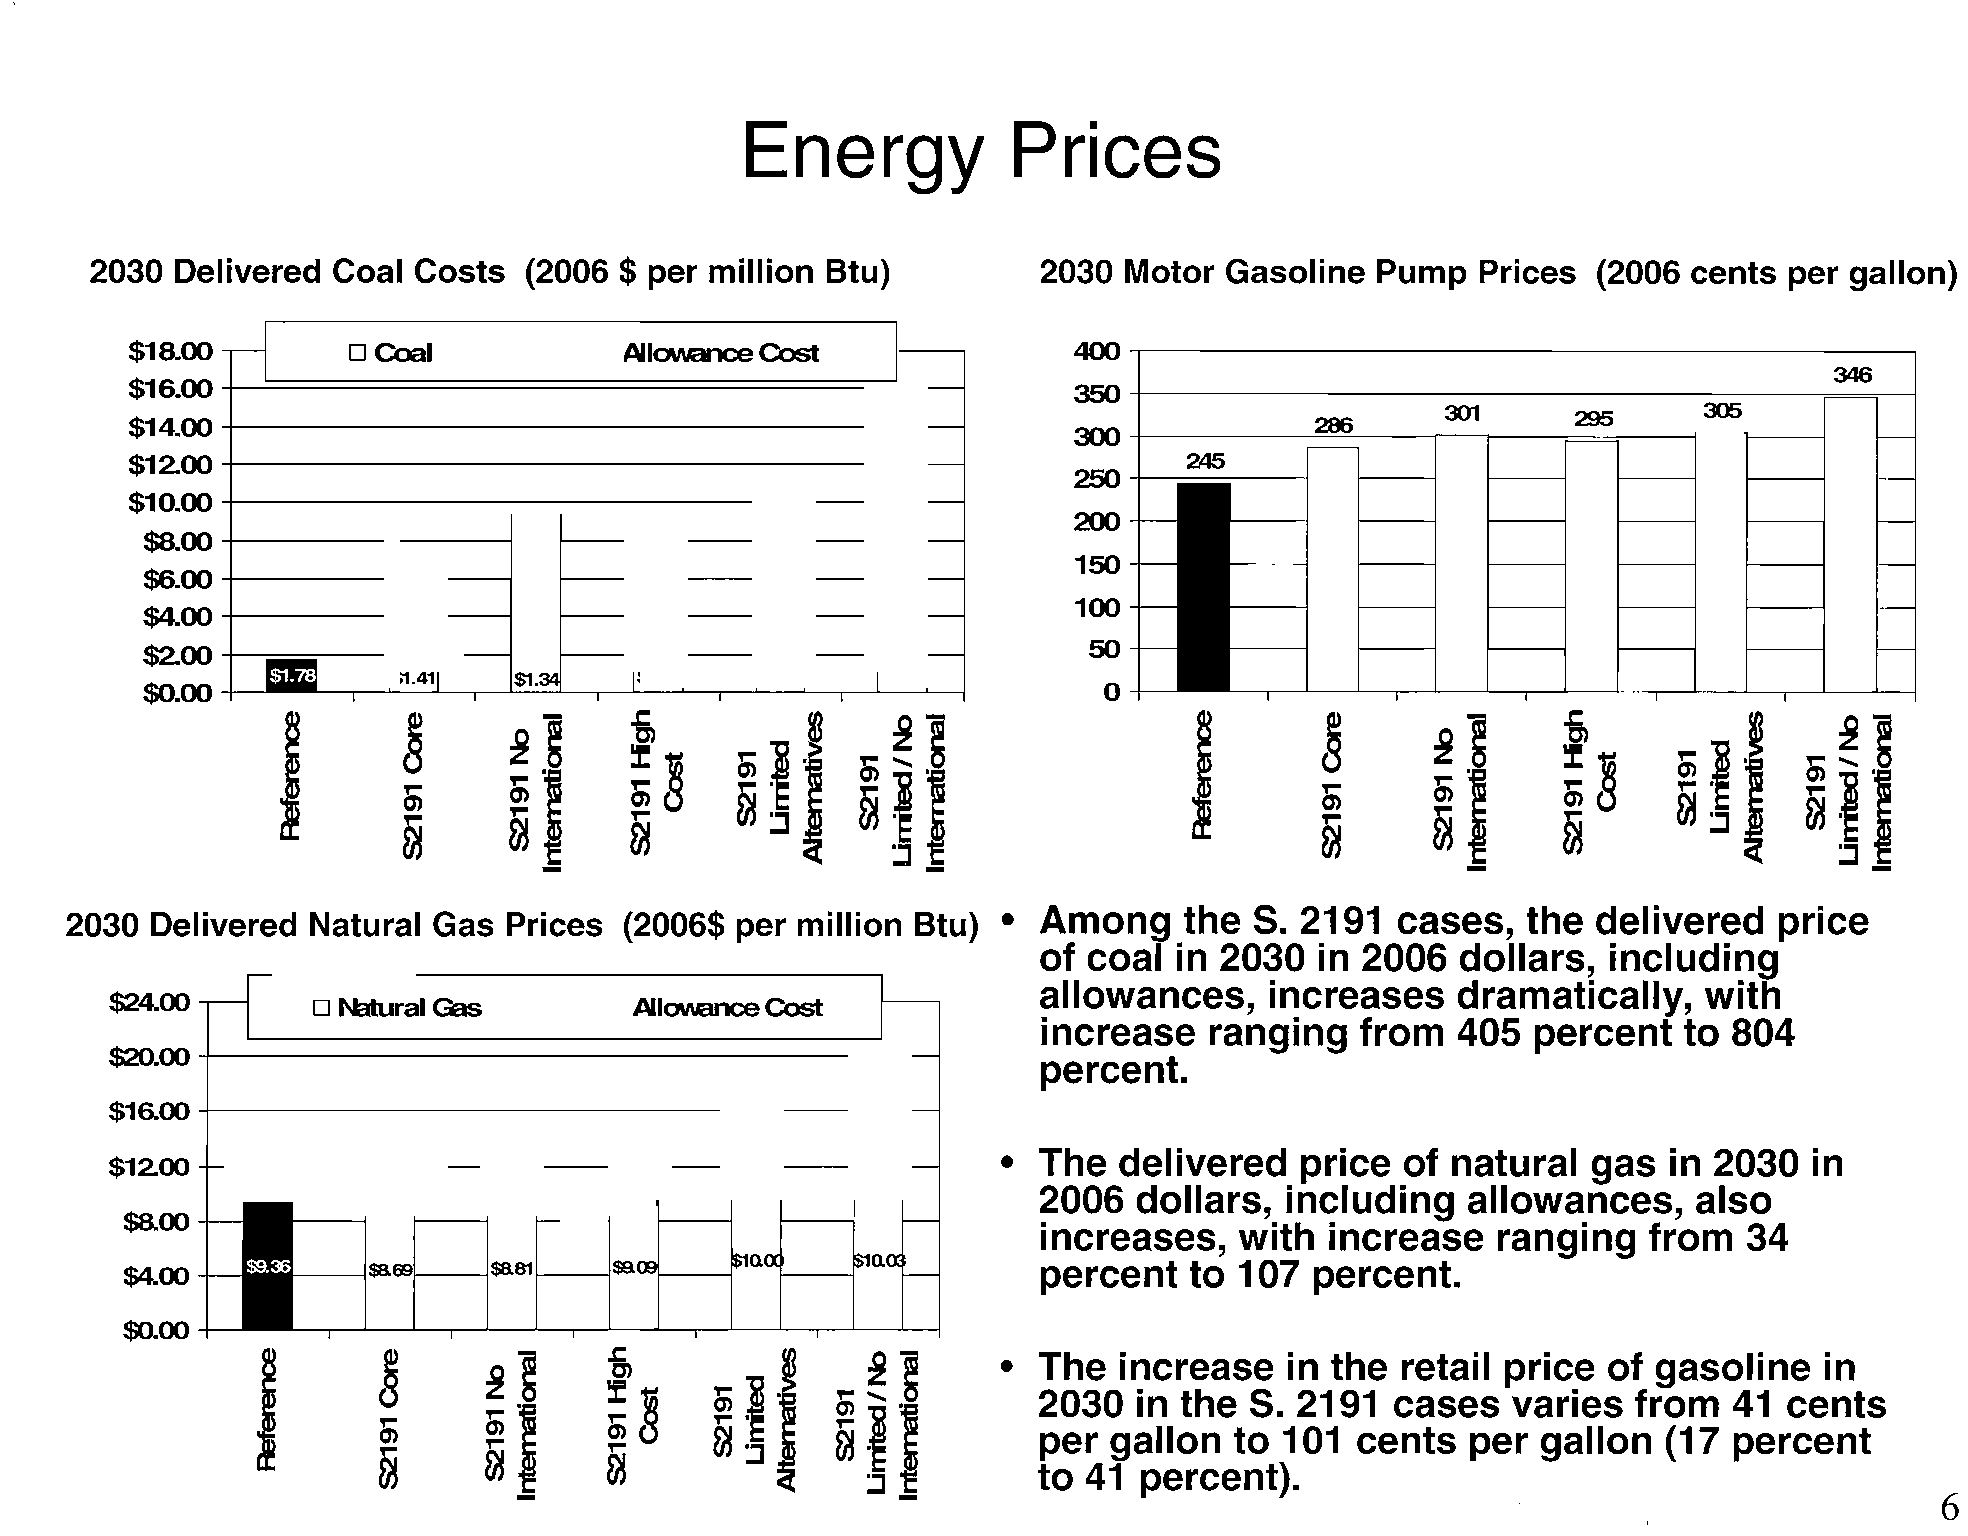
Energy Prices
2030 Delivered Coal Costs (2006 $ per million Btu)
2030 Motor Gasoline Pump Prices (2006 cents per gallon)
346
!~
5~~
5~~
~
~::Ji
~~J
~~
~J
5
~
B
J
250
:~
245
ati
I
~
I
,----,
~
I
~
I
Frl
200
150
100
50
o
• A1I0111alCeCosl
~~
.. e
..
~~
~::J
5~1
1)j:e
~~~I
1)j
~
1)j
::J _
B
5
~
DCoaI
j
$16.00
$16.00
+-'================
$14.00 +----------------
$12.00 +----------------
$10.00
I
•
$6.00
I
$6.00
I
$4.00
+------1
$2.00
$0.00
2030 Delivered Natural Gas Prices (2006$ per million Btu) •
6
~
·la~~O~~;~y
Information
Administration
Among the S. 2191 cases, the delivered price
of coal in 2030 in 2006 dollars, including
allowances, increases dramatically,
with
increase ranging from 405 percent to 804
percent.
• The delivered price
of natural gas in 2030 in
2006 dollars, including allowances, also
increases, with increase ranging from
34
percent to 107 percent.
• The increase in the retail price of gasoline in
2030 in the
S. 2191 cases varies from 41 cents
per gallon
to 101 cents per gallon (17 percent
to 41 percent).
~~
"~I
..
~~!
~~
$ll""!---------r
'-"'L.--./"'
"6,
~ii
5(j
~
• A11CMa'lCe
Cost
~~
~!
5
~
8
$ll69\---l$ll81
DNmJralGas
j
$24.00 j I
I
::
$8.00
1----------I_t---=--=-a=I
$4.00
$0.00
Electronic Filing - Received, Clerk's Office, October 1, 2008
* * * * * PCB 2009-021 * * * * *
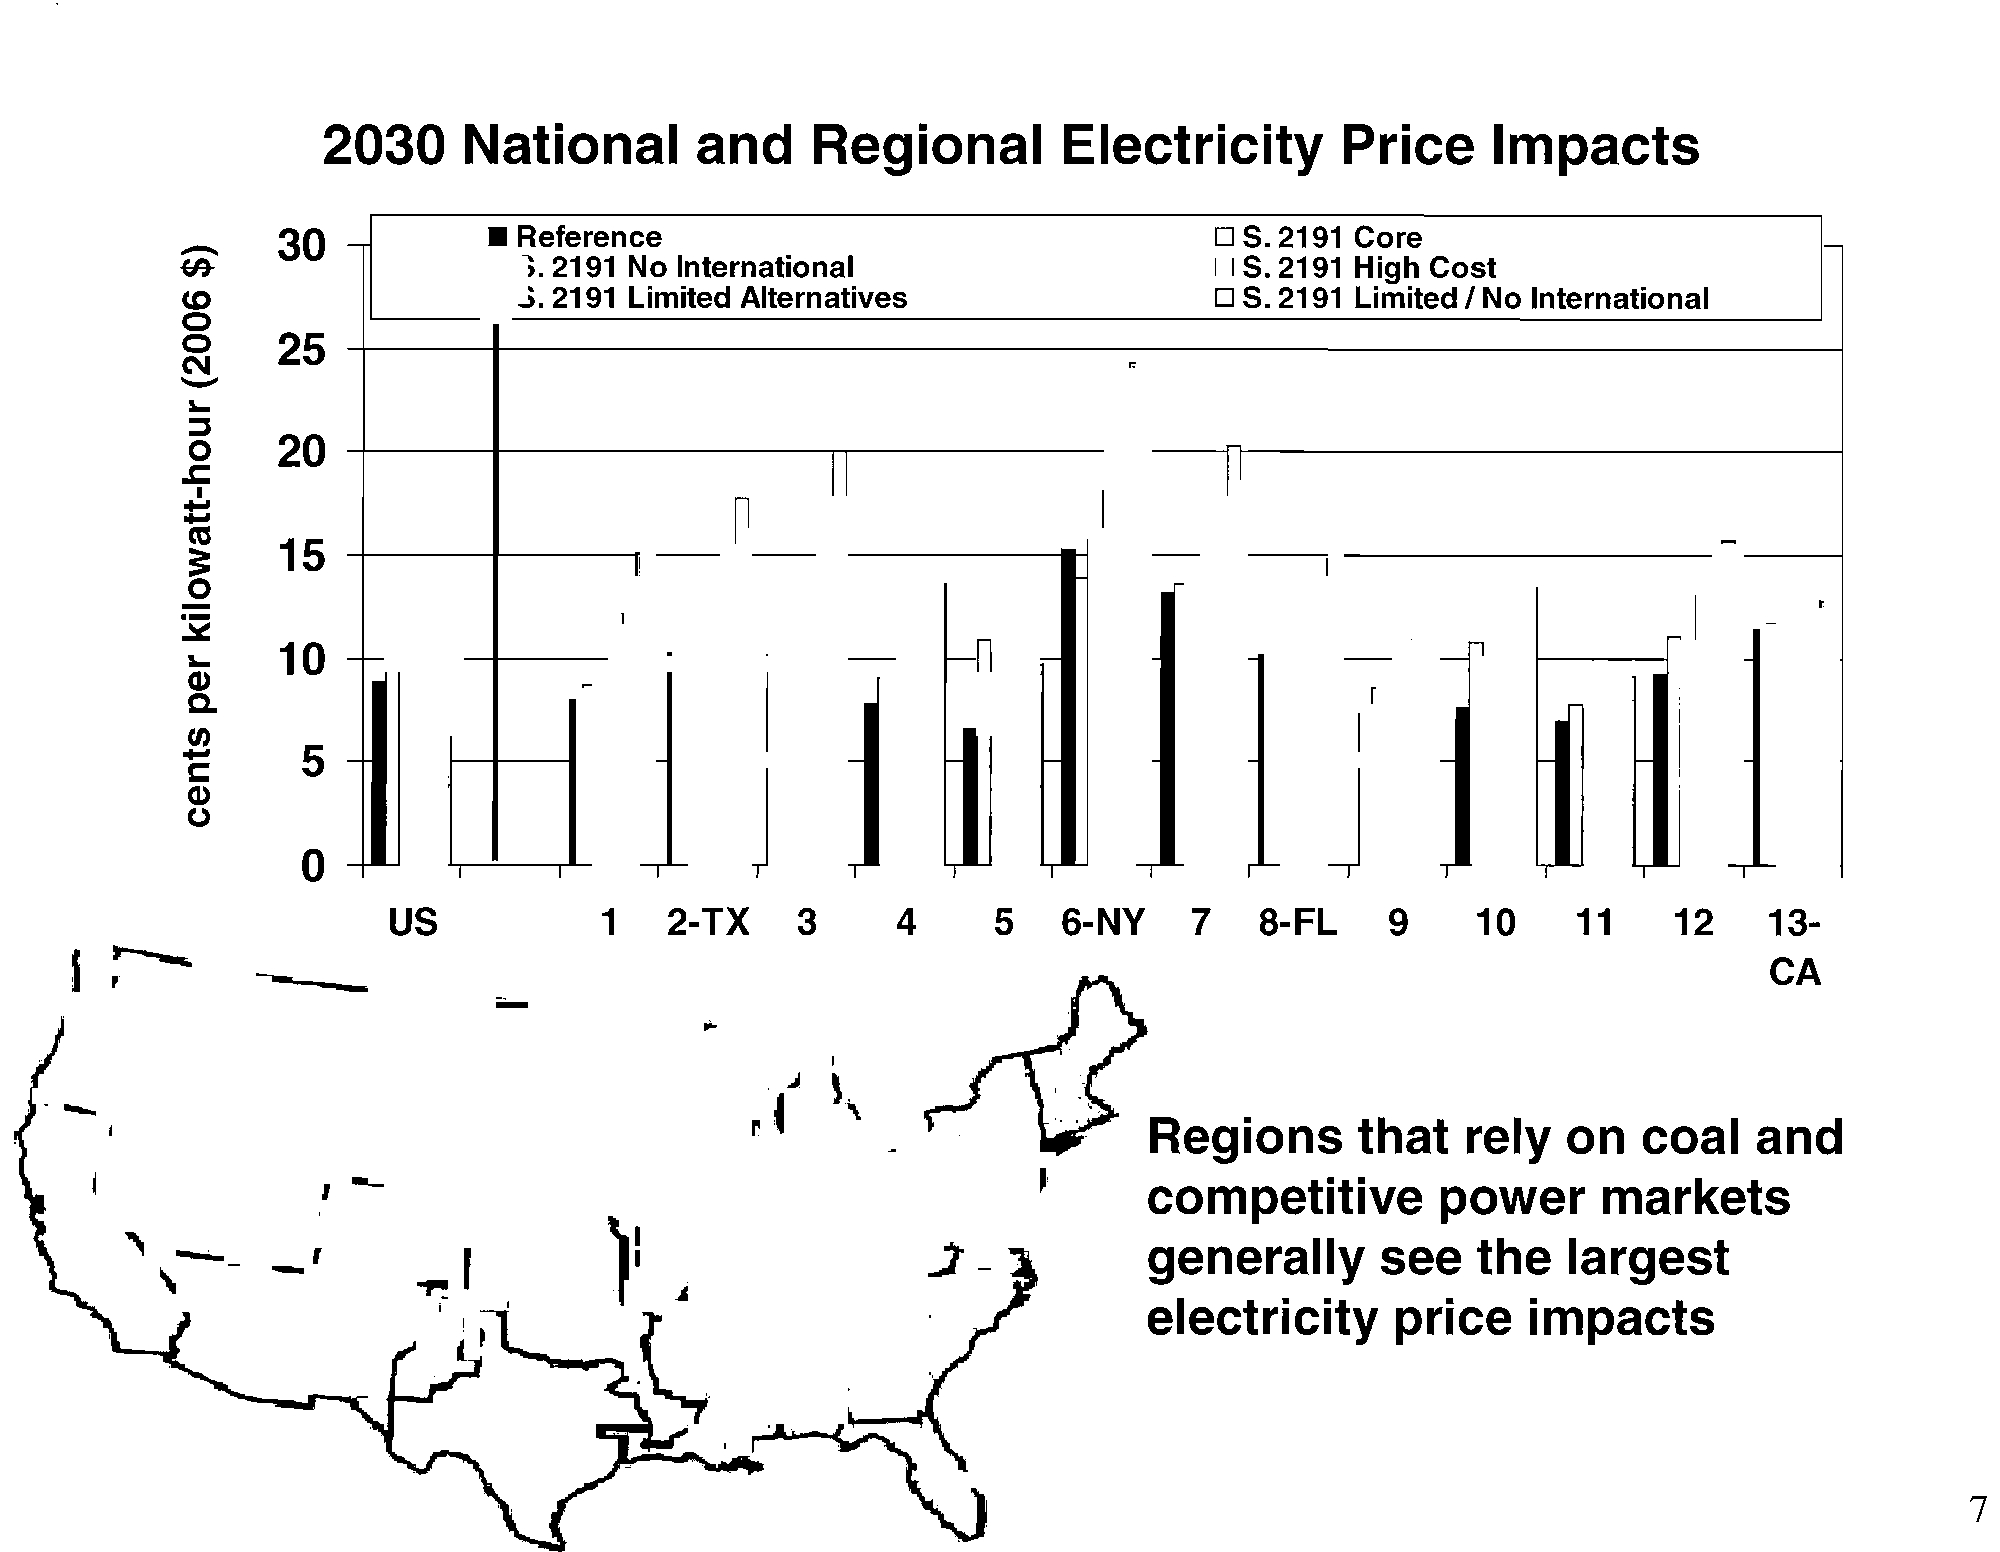
2030 National and Regional Electricity Price Impacts
• Reference
•
S. 2191 No International
-
0
30
• S.
2191 Limited Alternatives
CO
0
-
('II
0
...
::J
25
.s::
-
-
m
0
I
20
~
15
:i!
...
Ql
10
a.
-
I:
III
5
Ql
0
0
us
1 2-TX 3
4
OS. 2191 Core
• S.
2191 High Cost
OS. 2191 Limited
I
No International
56-NY 7 8-FL 9
10
11
12 13-
CA
Regions that rely on coal and
competitive power markets
generally see the largest
electricity price impacts
~
·la~~~:;~Y
Information
Administration
7
Electronic Filing - Received, Clerk's Office, October 1, 2008
* * * * * PCB 2009-021 * * * * *
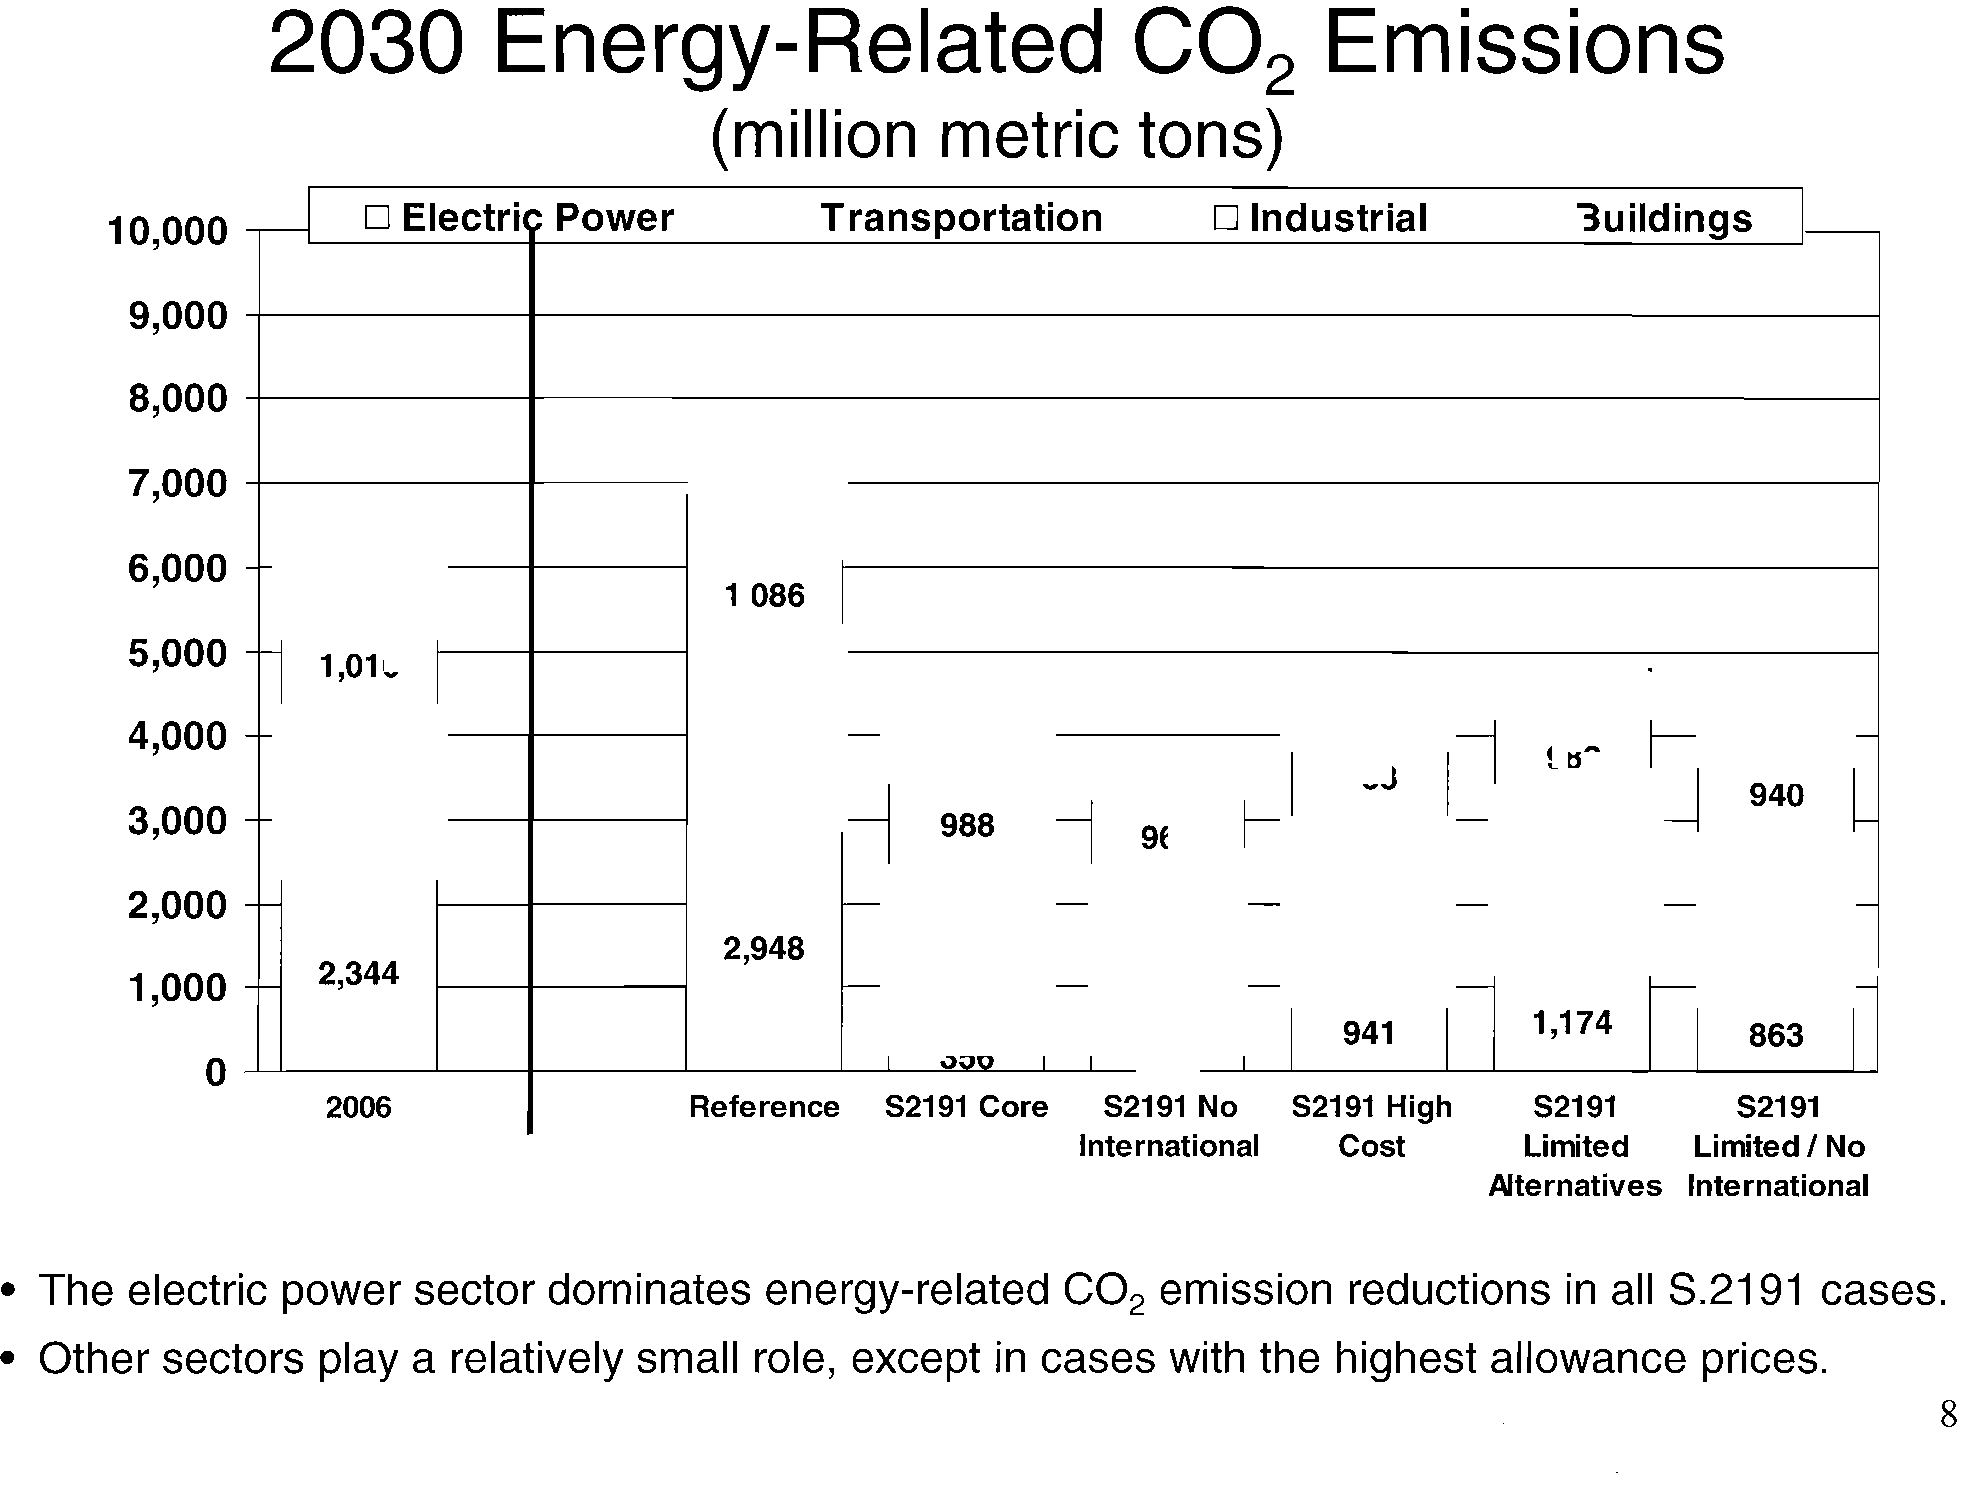
2030 Energy-Related CO
2
Emissions
(million metric tons)
10,000
o Electric Power
• Transportation
o Industrial
• Buildings
9,000I
I
I
8,000
I
I
I
1,174
2,948
2,344
4,000
2,000
7,000 I
I
6,000
5,000
3,000
1,000
o
II
1
I
I
!
I
'1i1U
I
I
ZZ
l
I
II
I I!!I
2006
Reference
52191 Core
52191 No
International
52191 High
Cost
52191
Limited
Alternatives
52191
Limited
I
No
International
• The electric power sector dominates energy-related CO
2
emission reductions in all 8.2191 cases.
• Other sectors
playa relatively small role, except in cases with the highest allowance prices.
~
·la~~~:;~Y
Information
Administration
8
Electronic Filing - Received, Clerk's Office, October 1, 2008
* * * * * PCB 2009-021 * * * * *
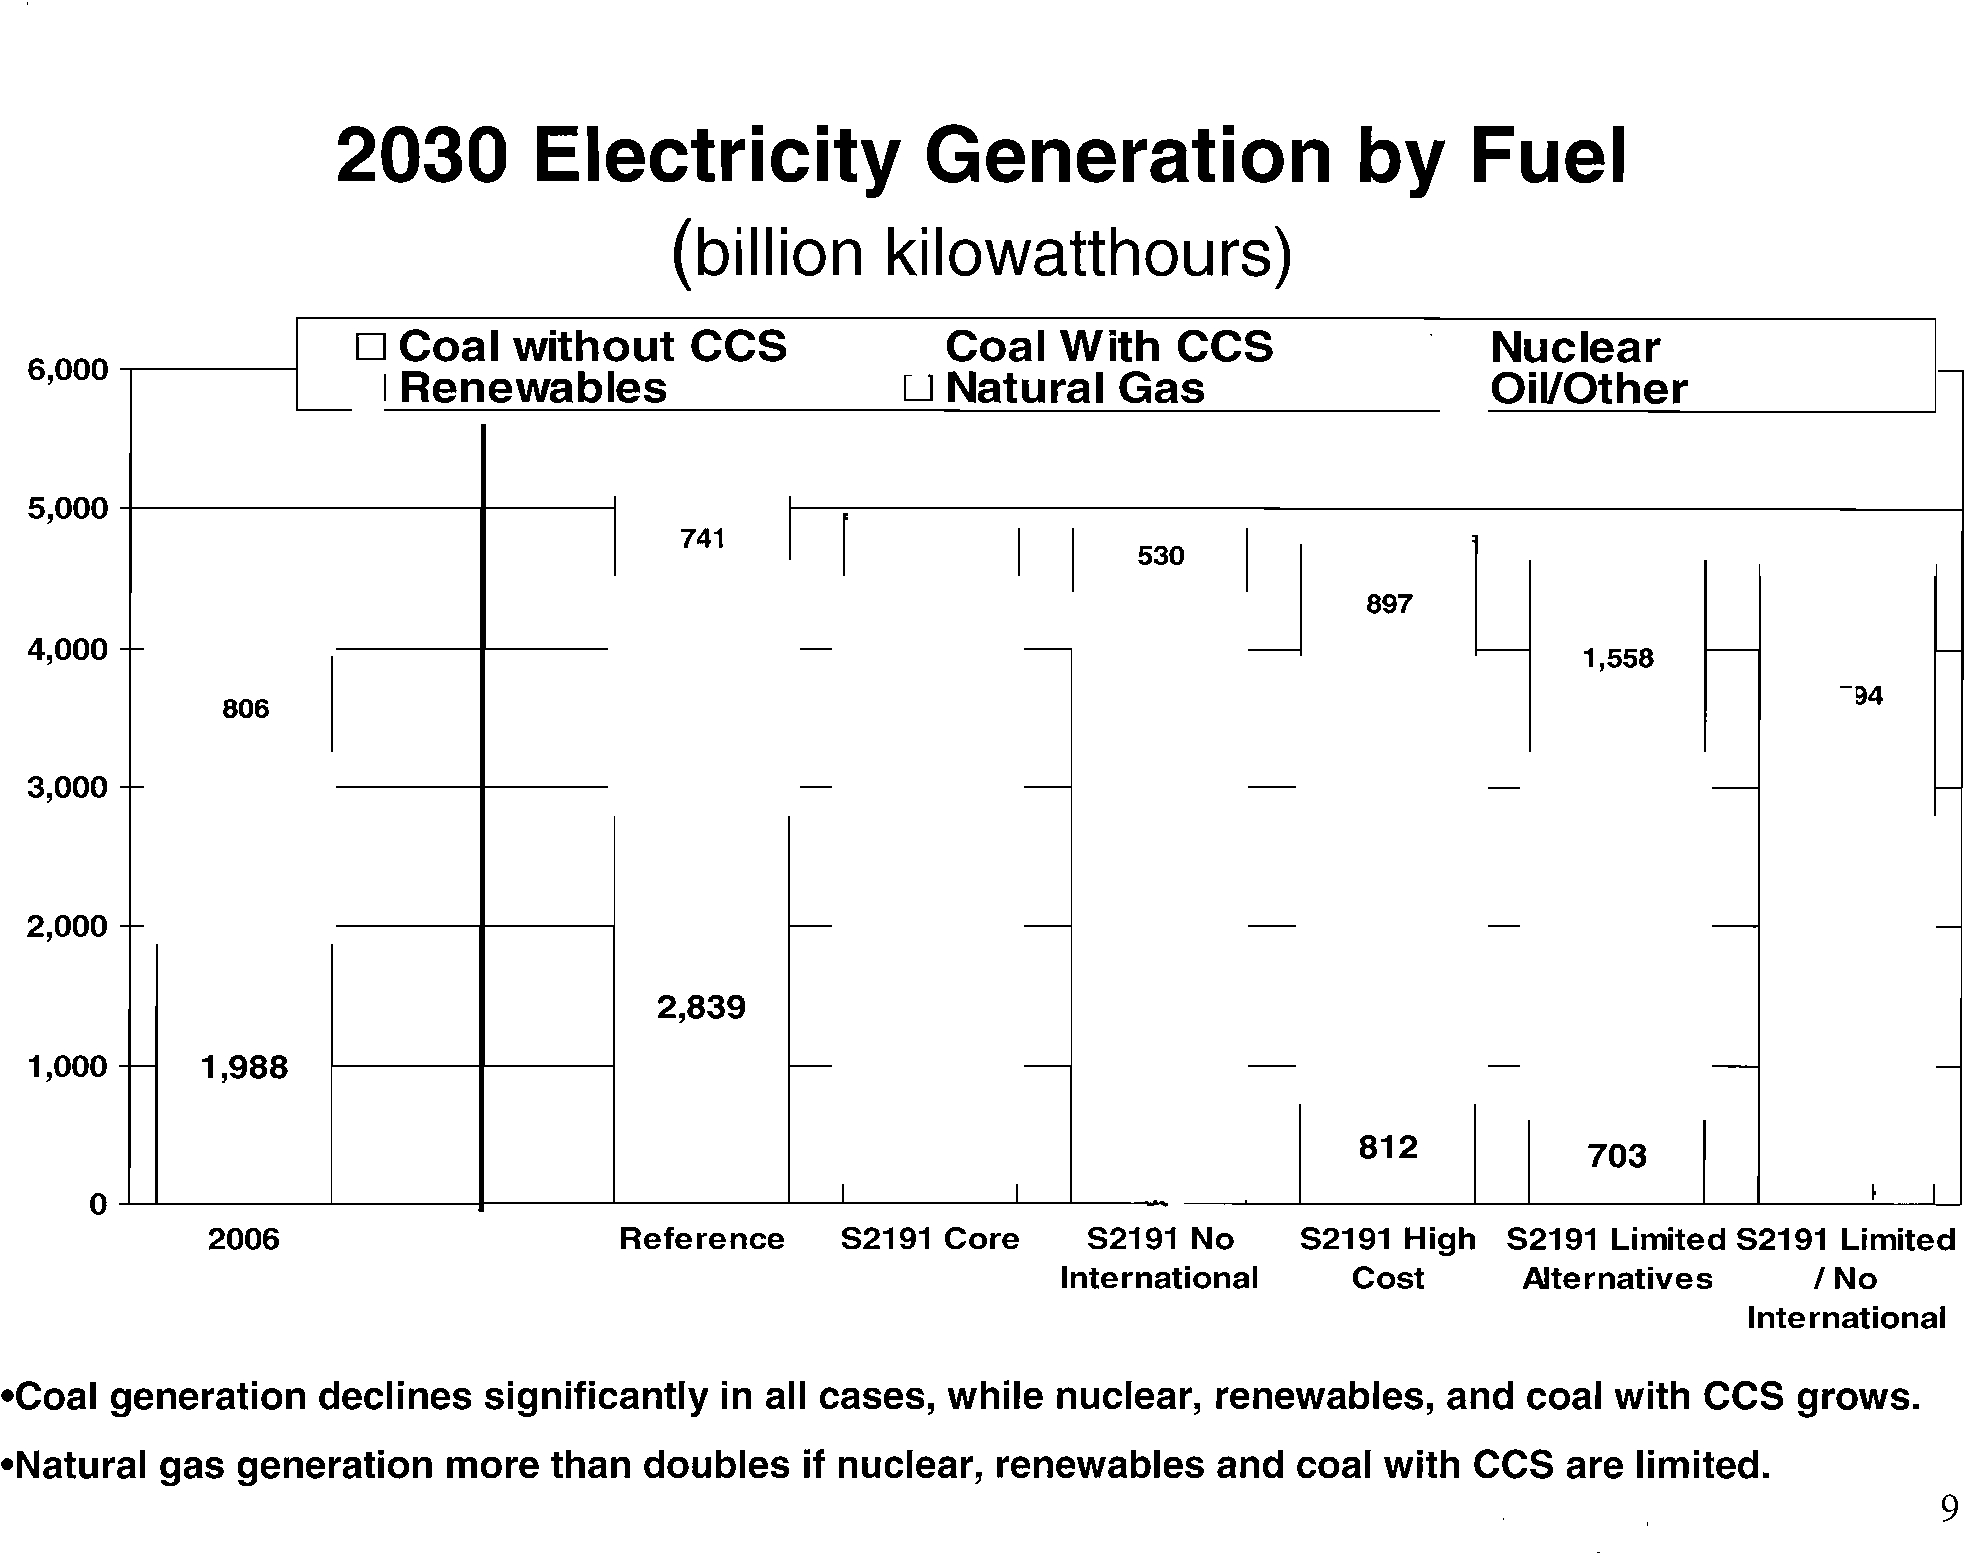
2030 Electricity Generation by Fuel
(billion kilowatthours)
6,000 I
I
D Coal without CCS
• Renewables
• Coal With CCS
D Natural Gas
.• Nuclear
.OiVOther
1,794
1,558
897
812
I
I
703
530
2,839
806
I
,~
0"
I
I
I
I
I
, ........
I
c===
4,000 i I
I
Ir-----
5,000 i
I
I
I
741
1-----..=..,----,
'
~,
=,------;'
===~==~=-
I
3,000
2,000
1,000 t-i 1
,988
2006
Reference
82191 Core
82191 No
82191 High 82191 Limited 82191 Limited
International
Cost
Alternatives
I
No
International
-Coal generation declines significantly in all cases, while nuclear, renewables, and coal with CCS grows.
-Natural gas generation more than doubles
if nuclear, renewables and coal with CCS are limited.
~1
-a~~~:;~Y
Information
Administration
9
Electronic Filing - Received, Clerk's Office, October 1, 2008
* * * * * PCB 2009-021 * * * * *
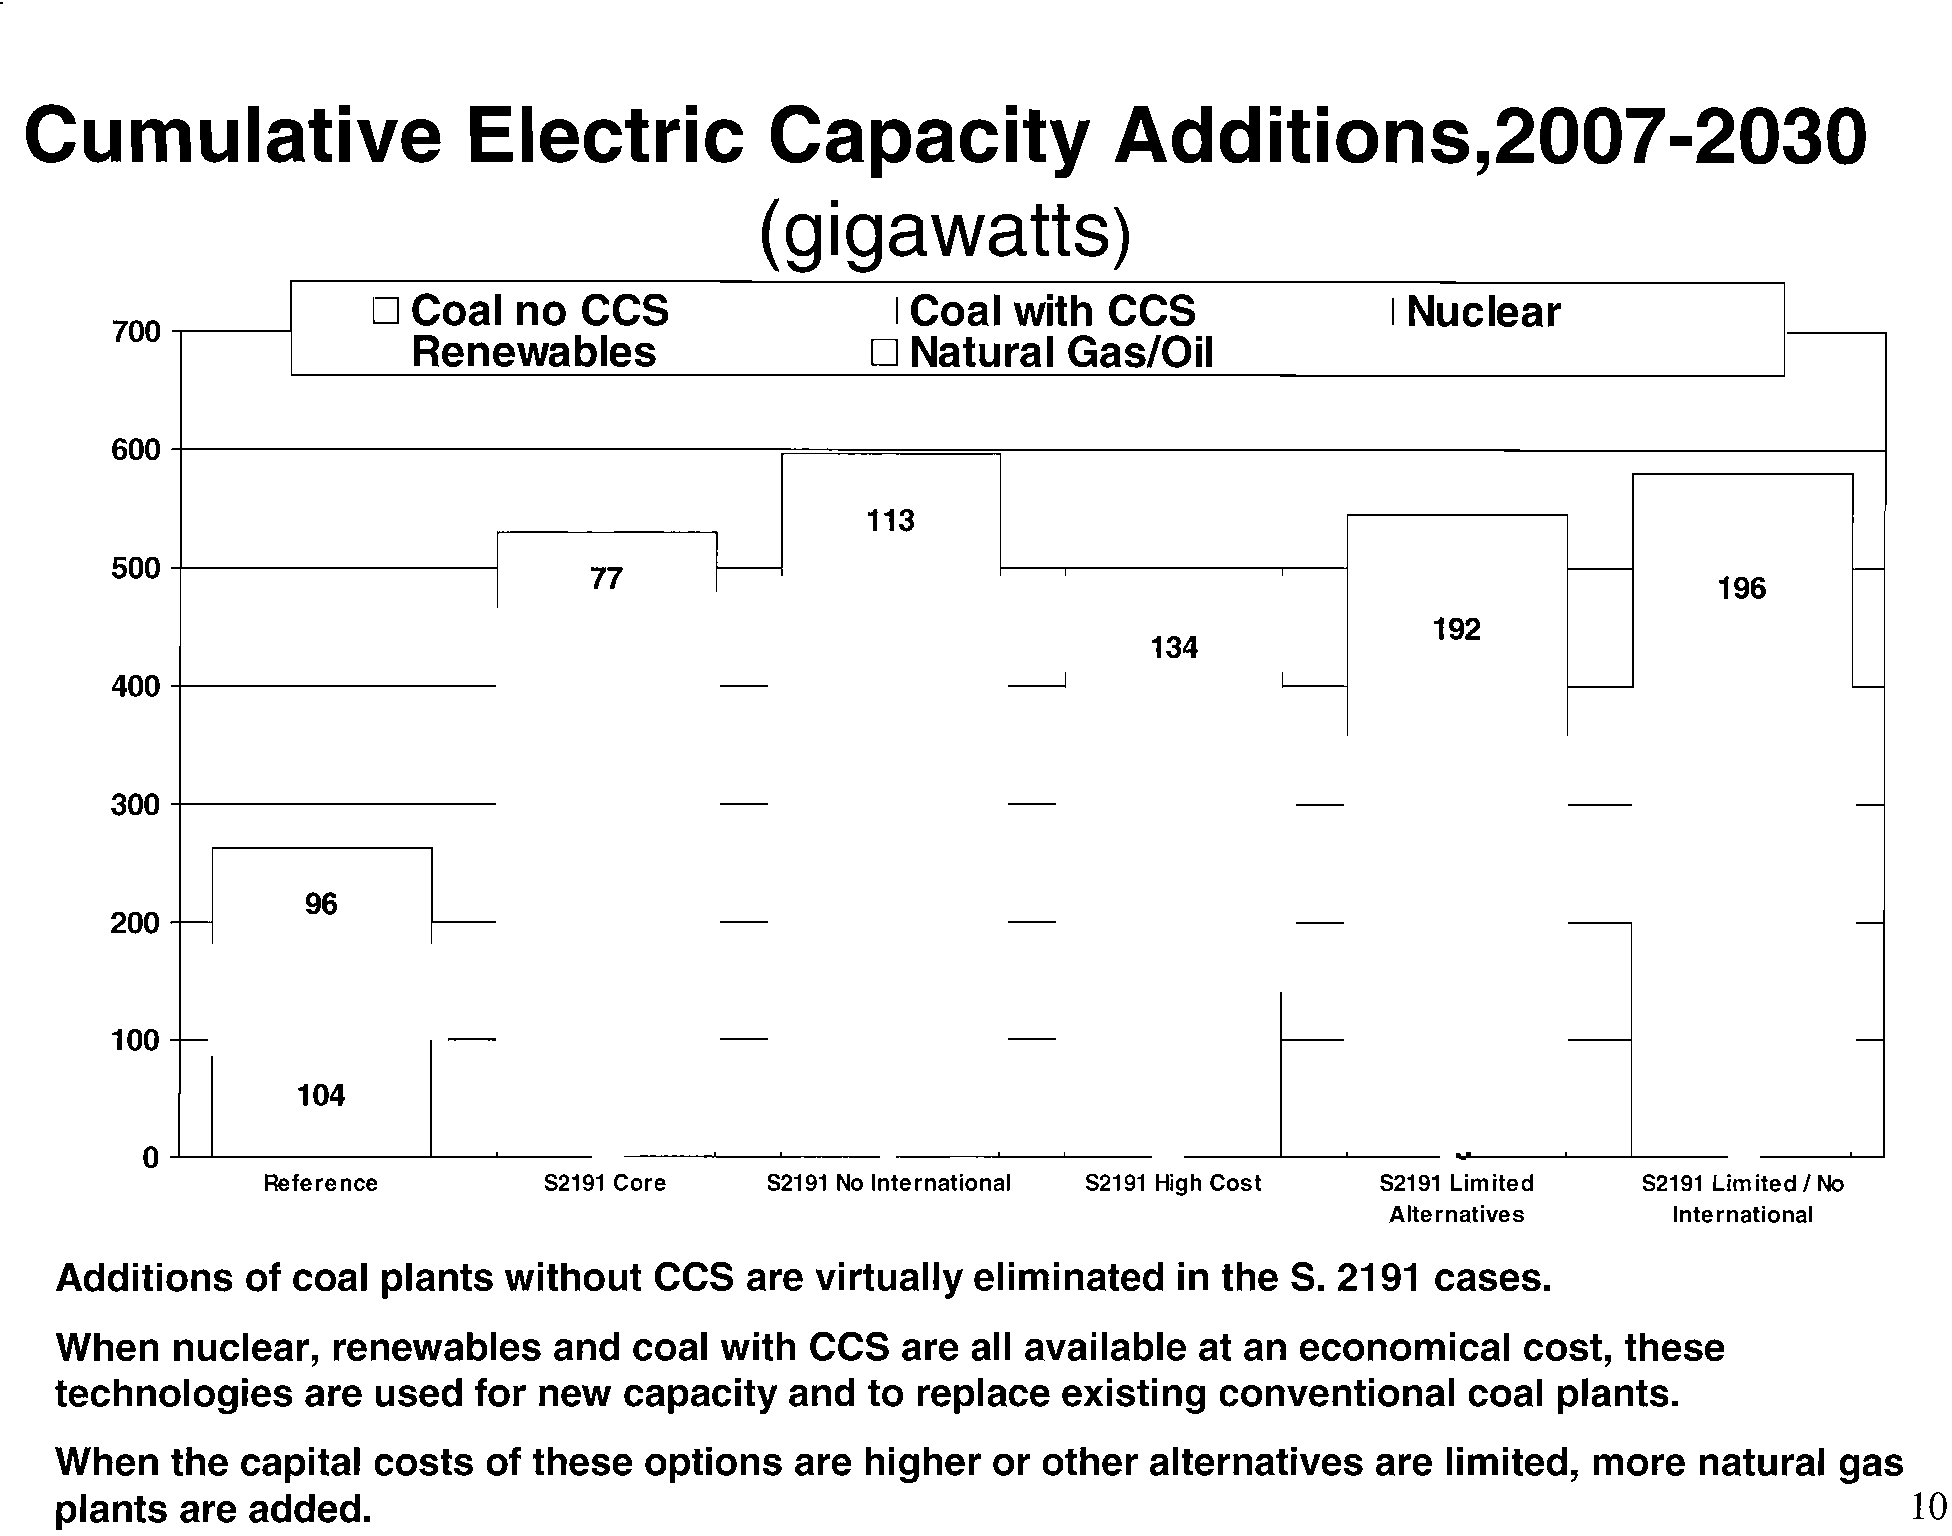
Cumulative Electric Capacity Additions,2007-2030
(gigawatts)
700 I
I
DCoal no CCS
• Renewables
• Coal with
CCS
D Natural Gas/Oil
• Nuclear
600
1
iii
113
500
1
1
400 +1-------
300
+1-------1
200
100
o
I
I
I;
9
i
Reference
52191 Core
52191 No International
52191 High Cost
52191 Limited
Alternatives
52191 Limited
I
No
International
Additions of coal plants without CCS are virtually eliminated in the S. 2191 cases.
When nuclear, renewables and coal with CCS are all available at an economical cost, these
technologies are used
for new capacity and to replace existing conventional coal plants.
When the capital
costs of these options are higher or other alternatives are limited, more natural gas
plants are added.
~~la~~";;:;~Y
Information
10
Administration
Electronic Filing - Received, Clerk's Office, October 1, 2008
* * * * * PCB 2009-021 * * * * *
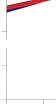
140
Fuel Cost For Current Coal and CC Gas
wi
Carbon Value
o
100
o
N
-
80
::I:
3: 60
::E
...
Q)
40
c..
W- 20
Existing CC wI $1 0 gas
Existing
CC wI $7 aas
'al
70
80
90
100
~
40
50
60
Carbon Value
($lton
C02)
10
20
30
o 1-1
-~-~-~~-~-~-~-~-~~-~-~
o
Nuclear, Biomass
CC
--~.
1
~
~
o
CD
140
o
~
..
:::l
120
~
100
=
~
80
~
Ql
E
180
160
ITotal Levelized Costs -- New Plants in 2025 (AE02007 costs) w/Carbon
Val~
..
8.
40
~
20
o
+I---,---~----,-~---,---~~---,---~----,-~-~-~~---,---~----,-~-~-----,
o
10
20
30
40
50
60
70
80
Carbon Value ($/ton
C02) in 2025; 5%annual growth after 2025
90
100
~
·la~~O~~;~y
Information
Administration
11
Electronic Filing - Received, Clerk's Office, October 1, 2008
* * * * * PCB 2009-021 * * * * *
Real GDP And Consumption
Cumulative Change in Real GDP 2009-2030 (billion 2000 $)
Undiscounted
Discounted
2030
"".f
~et"~<f ~<f",,"
~,
o
2020
500J
Real GDP (billion 2000 $)
~I
~$$###'
~'
~'
~'
~'
~'
~'
2lXXXl
1ססoo
1500J
o
1
1
-500
-$2,196
-2(XX)
-1500
-1a:x>
-2500 ...J.I
-'
I
052191
Core
•
52191 No Inlemalional
I
.52191 H!t> Cost
.52191 United AhemaIives
052191 Unitedl No InIemaIionaI
• Refaa ICe
• 52191 No InIemaIionaI
• 52191
United AhemaIives
052191
Core
• 52191 H!t> Cost
o 52191 Unitedl No l..-national
2030
/ .I
.rl
.l'
l .I
Real Consumption (billion 2000 $)
~
.l
,,<$"0
"f "f
..f'
"f
~
~
~
~
~
2020
o
5000
15000
10<XX>
-$1,=
-500
-1<XX>
-1500
-2000
l1J
-2500
I
..
-$2.335
Cum. Change in Real Consumption 2009-2030 (billion 2000 $)
o
1
1
Undiscounte~~
...
1
1
Discounted
1
1
~
·la~~~;;;Y
Information
Administration
12
Electronic Filing - Received, Clerk's Office, October 1, 2008
* * * * * PCB 2009-021 * * * * *
Vicki
Arroyo,
Director
of
Policy
Analysis,
Pew
Center
on
Global
Climate
Change,
"Primer
on
Lieberman-Warner
Climate
Security
act
(S.
2191)
-
as
Reported
out
of
Senate
EPW
Committee,"
PowerPoint
Presentation
(May
2008),
<
www.pewclimate.org/docUploads/Arroyo-
PPT.pdf
>.
Electronic Filing - Received, Clerk's Office, October 1, 2008
* * * * * PCB 2009-021 * * * * *
Electronic Filing - Received, Clerk's Office, October 1, 2008
* * * * * PCB 2009-021 * * * * *
Lieberman-Warner Climate Security Act of 2007 (5. 2191)
• October 18, 2007 -
Introduced by Senators Lieberman and Warner
• November 1, 2007
- Reported out of Senate Subcommittee by
vote
of 4-3
• December 5, 2007
- Reported out of Senate Environment and
Public Works Committee
to the full Senate by vote of 11-8
• First time bill requiring economy-wide reductions in
GHG
emissions has been reported out of committee in the Senate or
the House
• Modeling runs discussed here based on this version
• May 19, 2008
- Summary of new version released
• June 2008
- Consideration by the full Senate?
2
Electronic Filing - Received, Clerk's Office, October 1, 2008
* * * * * PCB 2009-021 * * * * *
""-!
~)
• Covered sectors represent over 87% of total U.S. emissions
- Downstream
on coal (power plants and industries using over 5,000
tons of coal per year)
- Upstream (producers
and importers) on natural gas, petroleum, or
coal-based liquid or
gas fuels (assuming no sequestration or
destruction)
- Manufacturers or importers of
>
10K t/C0
2
e of GHGs (e.g., SF
6
,
PFCs) assuming no sequestration/destruction
- Facilities that emit
HFCs
(>
10K tons) as byproduct of HCFC
production (note: separate cap for HFC consumption)
But. ..
- Many industrial process emissions are not covered (e.g., cement,
lime,
and aluminum production) totaling roughly 104 MtC0
2
e (1.4%
US emissions)
-
Emissions from agriculture, landfills, etc. not covered - 826 MtC0
2
e
(11
°10
US emissions)
3
Electronic Filing - Received, Clerk's Office, October 1, 2008
* * * * * PCB 2009-021 * * * * *
---'
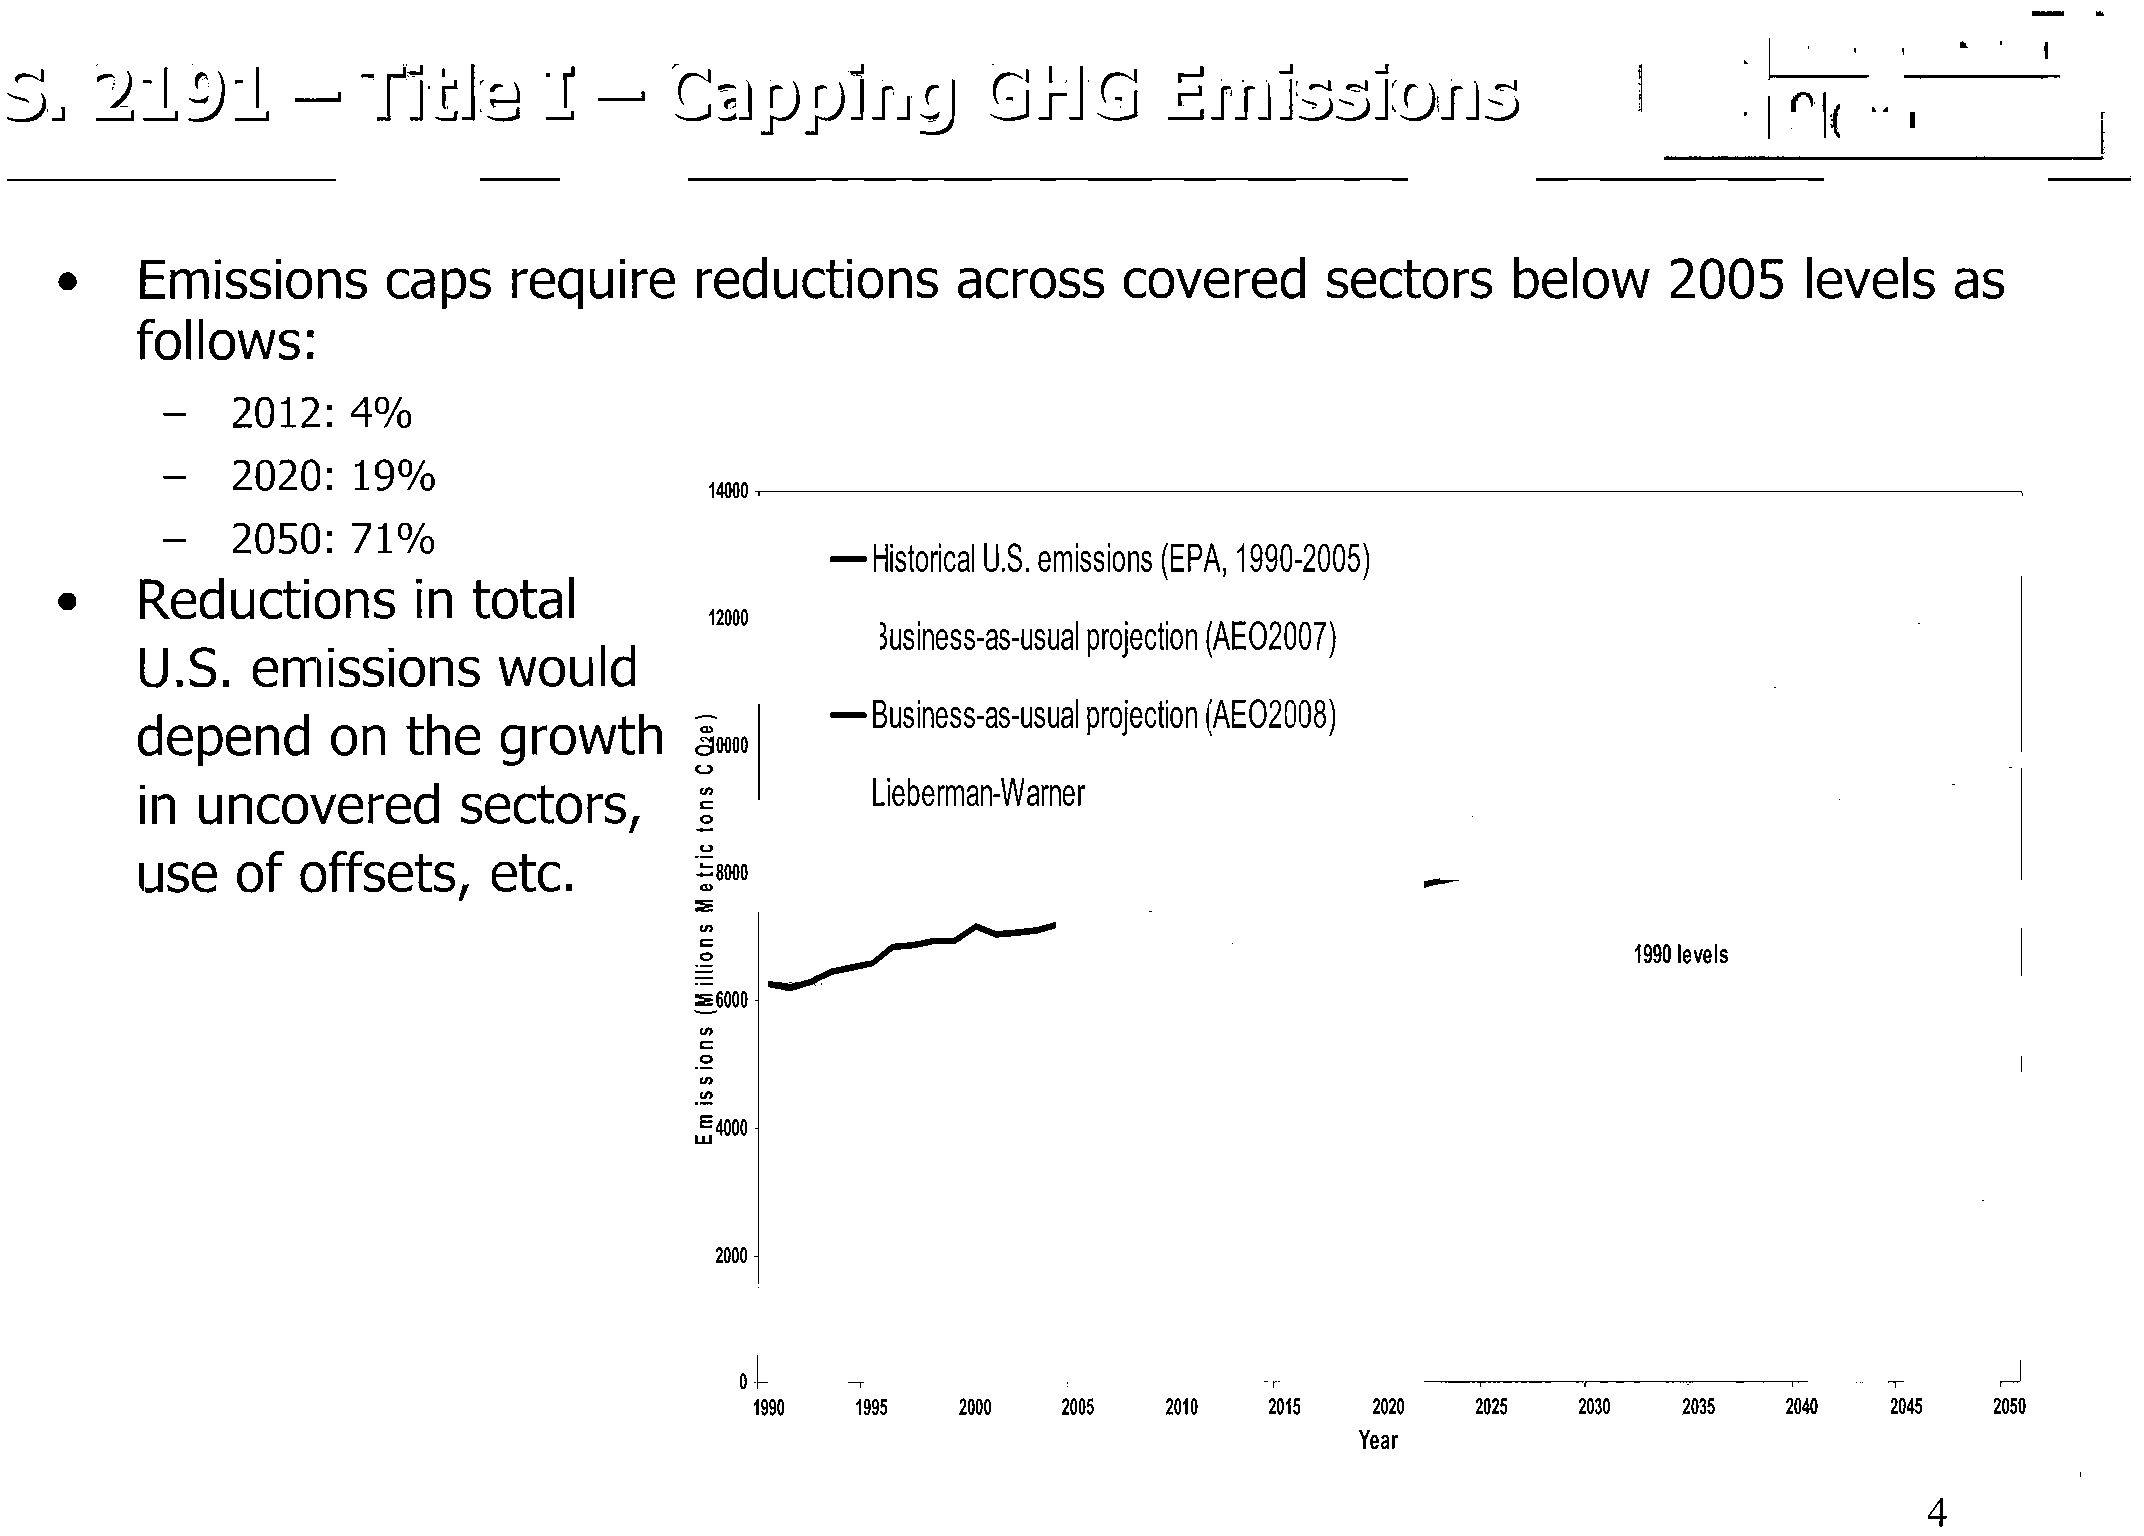
• Emissions caps require reductions across covered sectors below 2005 levels as
Back to top
follows:
1~OI
I
~
~
o
12000
1990 levels
-Historical U.S. emissions (EPA, 1990-2005)
- Business-as-usual projection (AE02007)
- Business-as-usual projection (AE02008)
- Lieberman-Warner
w
E4000
~8000
~
~
~
~
~
-"
~
-'"
-'"
-"8000
~
'"
-
2012:
4%
-
2020:
19%
-
2050:
71%
Reductions in total
U.S. emissions would
depend on the growth
u
~oooo
Back to top
in uncovered sectors,
use of offsets, etc.
•
2000
o
I--~--~--~--~-
~
1~
~
~
~o
~
~
M
~
~
~
~
~
Year
4
Electronic Filing - Received, Clerk's Office, October 1, 2008
* * * * * PCB 2009-021 * * * * *
00
"""
f....::J~'C..I
• Trading - Anyone can buy, hold, sell, and retire emission
allowances
•
Banking - Unlimited banking of allowances
• Borrowing -
15% of annual compliance obligation can be
borrowed from future years (10% interest rate)
• Offsets
-15% of annual compliance obligation can be met
by domestic offsets
• International
Emission Allowances - 15% of annual
compliance obligation
can be met by credits from foreign
trading programs of "comparable integrity
and stringency"
•
Carbon Market Efficiency Board (CMEB) - Authorized to
increase offsets, borrowing, adjust loan periods and interest
rates
5
Electronic Filing - Received, Clerk's Office, October 1, 2008
* * * * * PCB 2009-021 * * * * *
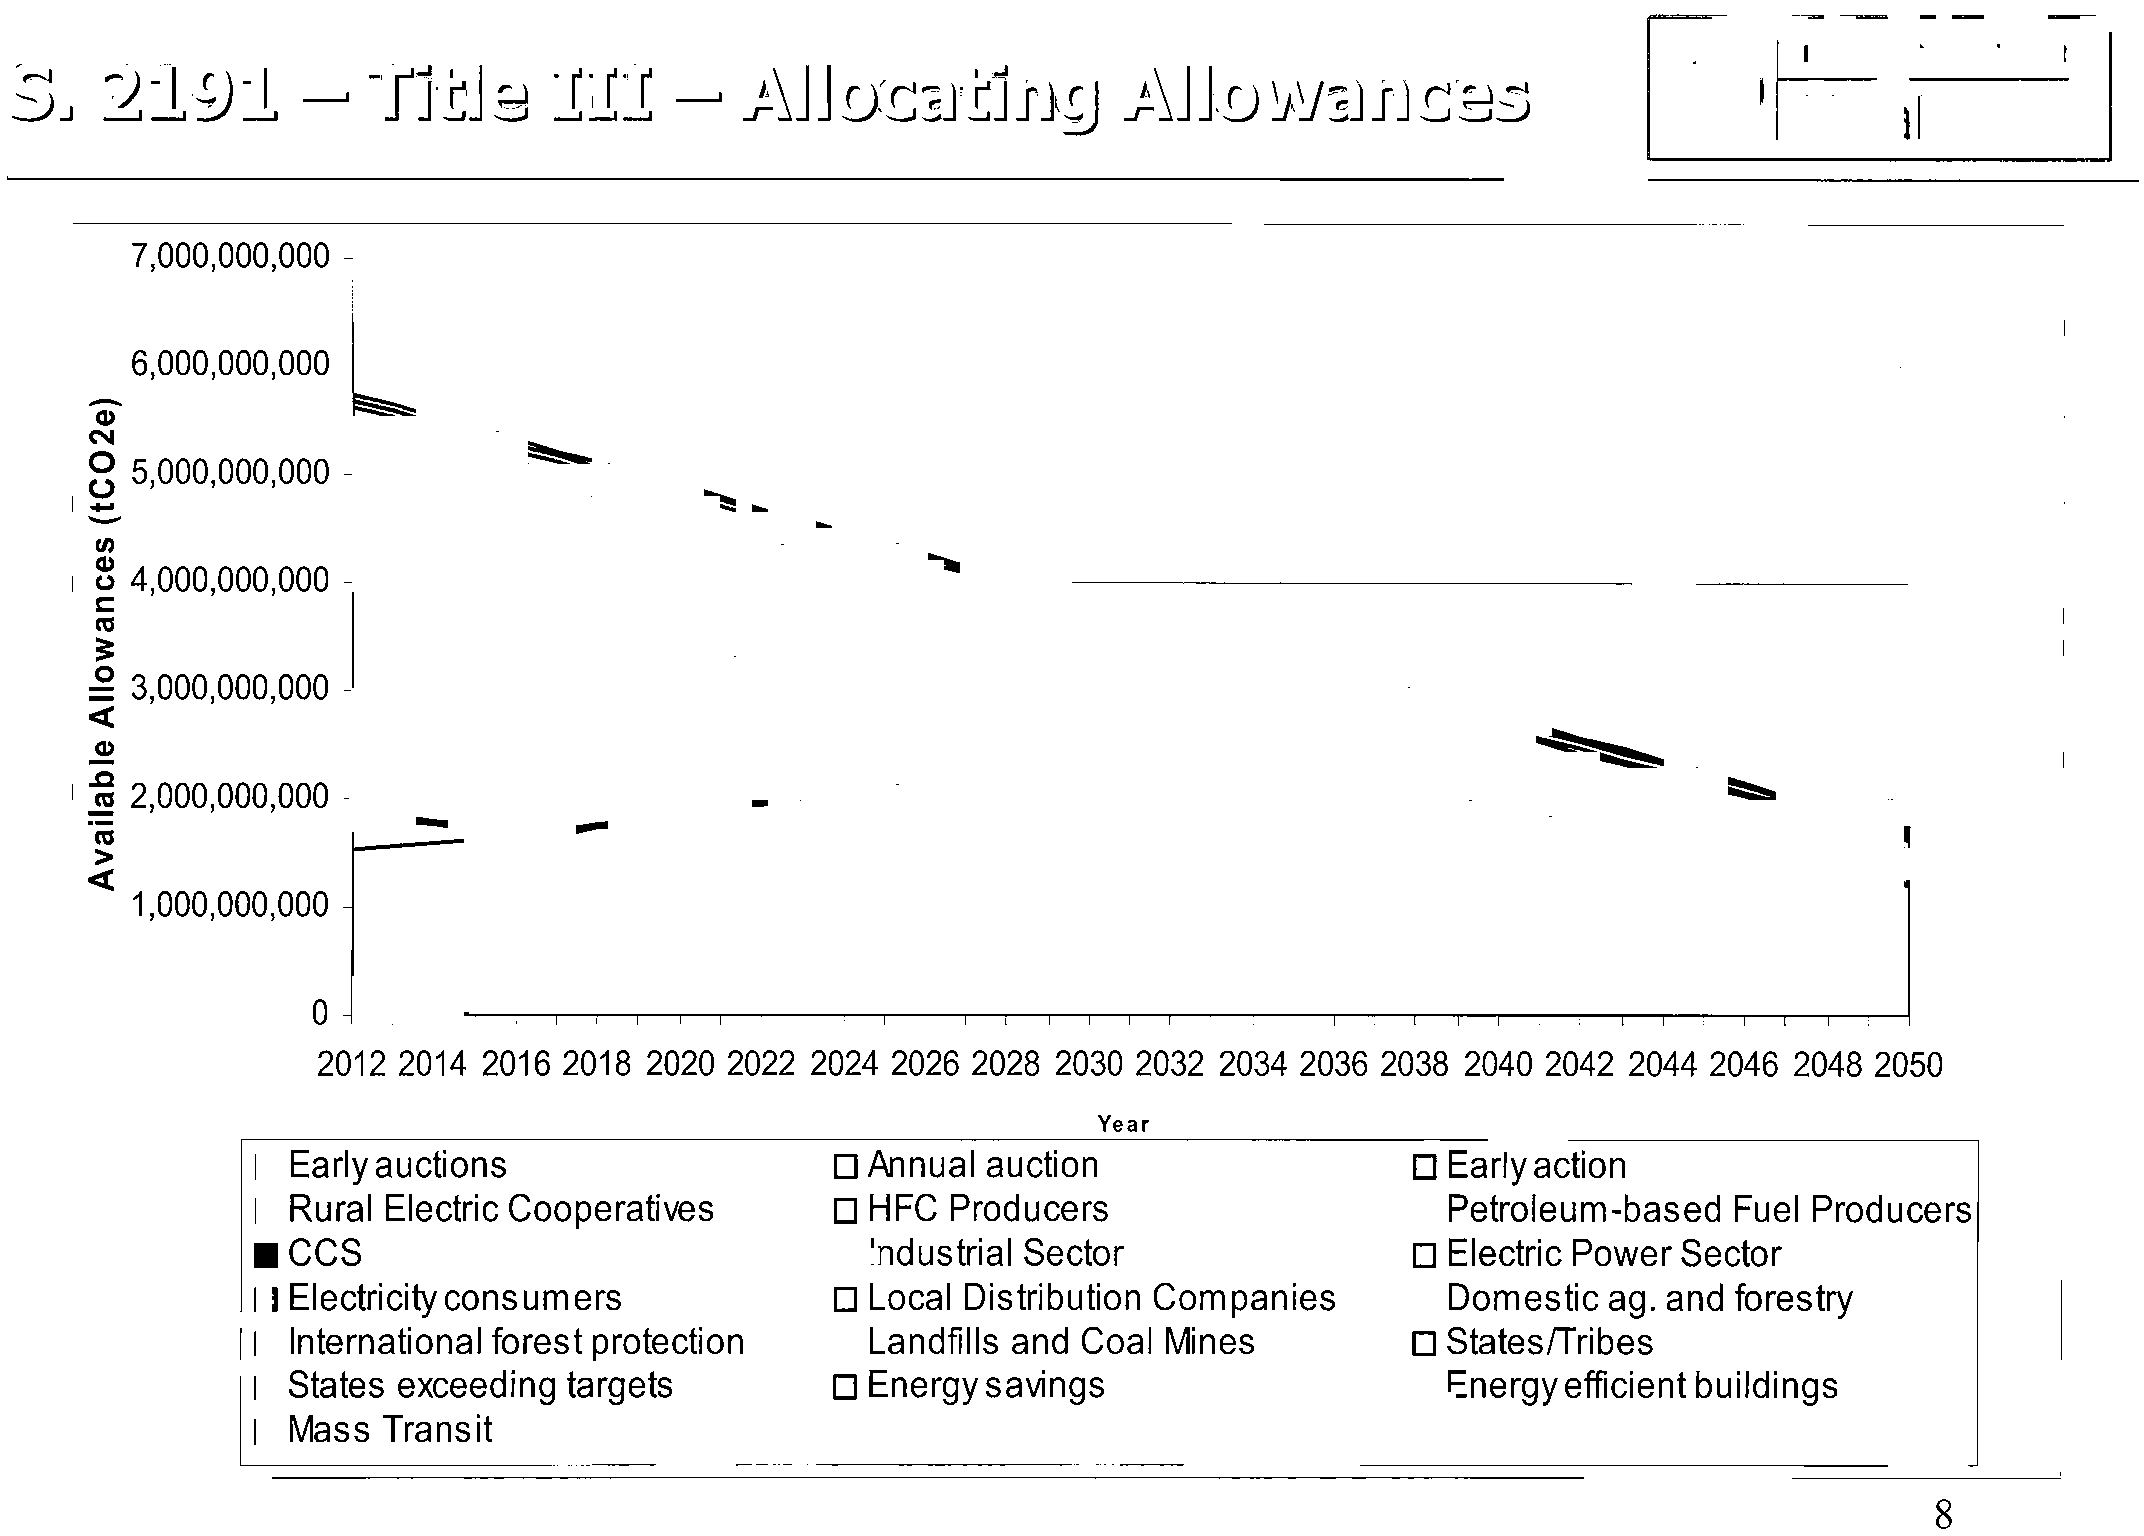
• Total available allowances (targets) decline in each year
- 2012: 5,775
MtC0
2
e
- 2020: 4,924
MtC0
2
e
- 2030: 3,860
MtC0
2
e
-
2050: 1,732 MtC0
2
e
• Initial allocation
in 2012
- Freely allocated allowances: 73.5%
- Auction: 26.5%
6
Electronic Filing - Received, Clerk's Office, October 1, 2008
* * * * * PCB 2009-021 * * * * *
• Freely allocated allowances in 2012
(0/0
of total allowances)
- Fossil fuel-fired power plants: 19%*
-
Energy intensive manufacturing: 10%*
-
Companies that took early action: 5%*
- Bonus allowances for CCS: 4%*
- Petroleum importers and refiners: 2%*
- HFC producers and importers: 2%*
- Rural electric cooperatives: 1
%
*
- Electricity consu mers (rebates/efficiency): 9%
- Natural gas consumers: 2%
- States and tribes: 11
%
- Set aside for agriculture, forestry sequestration: 5%
- Fund program to reduce methane from landfills and coal mines: 1
%
- International forest protection: 2.5%
*these phase out by 2031
7
Electronic Filing - Received, Clerk's Office, October 1, 2008
* * * * * PCB 2009-021 * * * * *
e.J
--'
7,000,000,000 I
I
6,000,000,0001
I
~
Ql
N
8
5,000,000,000
-
-
rn
Ql
Co)
4,000,000,000
r::
nl
~
o
3,000,000,000 _
«
~
,g
nl 2,000,000,000
~:;===:;
"m
>
C-
«
1,000,000,000
O
I"'-~
,
,
, iii iiiiii iii ,i iiiiii i
i
20122014 20162018 20202022 202420262028 20302032 203420362038 20402042 20442046 20482050
Earlyauctions
• Rural Electric Cooperatives
.CCS
• Electricityconsumers
• International forest protection
• States exceeding targets
• Mass Transit
Year
o
Annual auction
o
HFC Producers
• Industrial Sector
o
Local Distribution Companies
• Landfills and Coal Mines
o
Energy savings
o
Early action
o
Petroleum-based Fuel Producers
o
Electric Power Sector
o
Domestic ago and forestry
o
StatesfTribes
o
Energy efficient buildings
8
Electronic Filing - Received, Clerk's Office, October 1, 2008
* * * * * PCB 2009-021 * * * * *
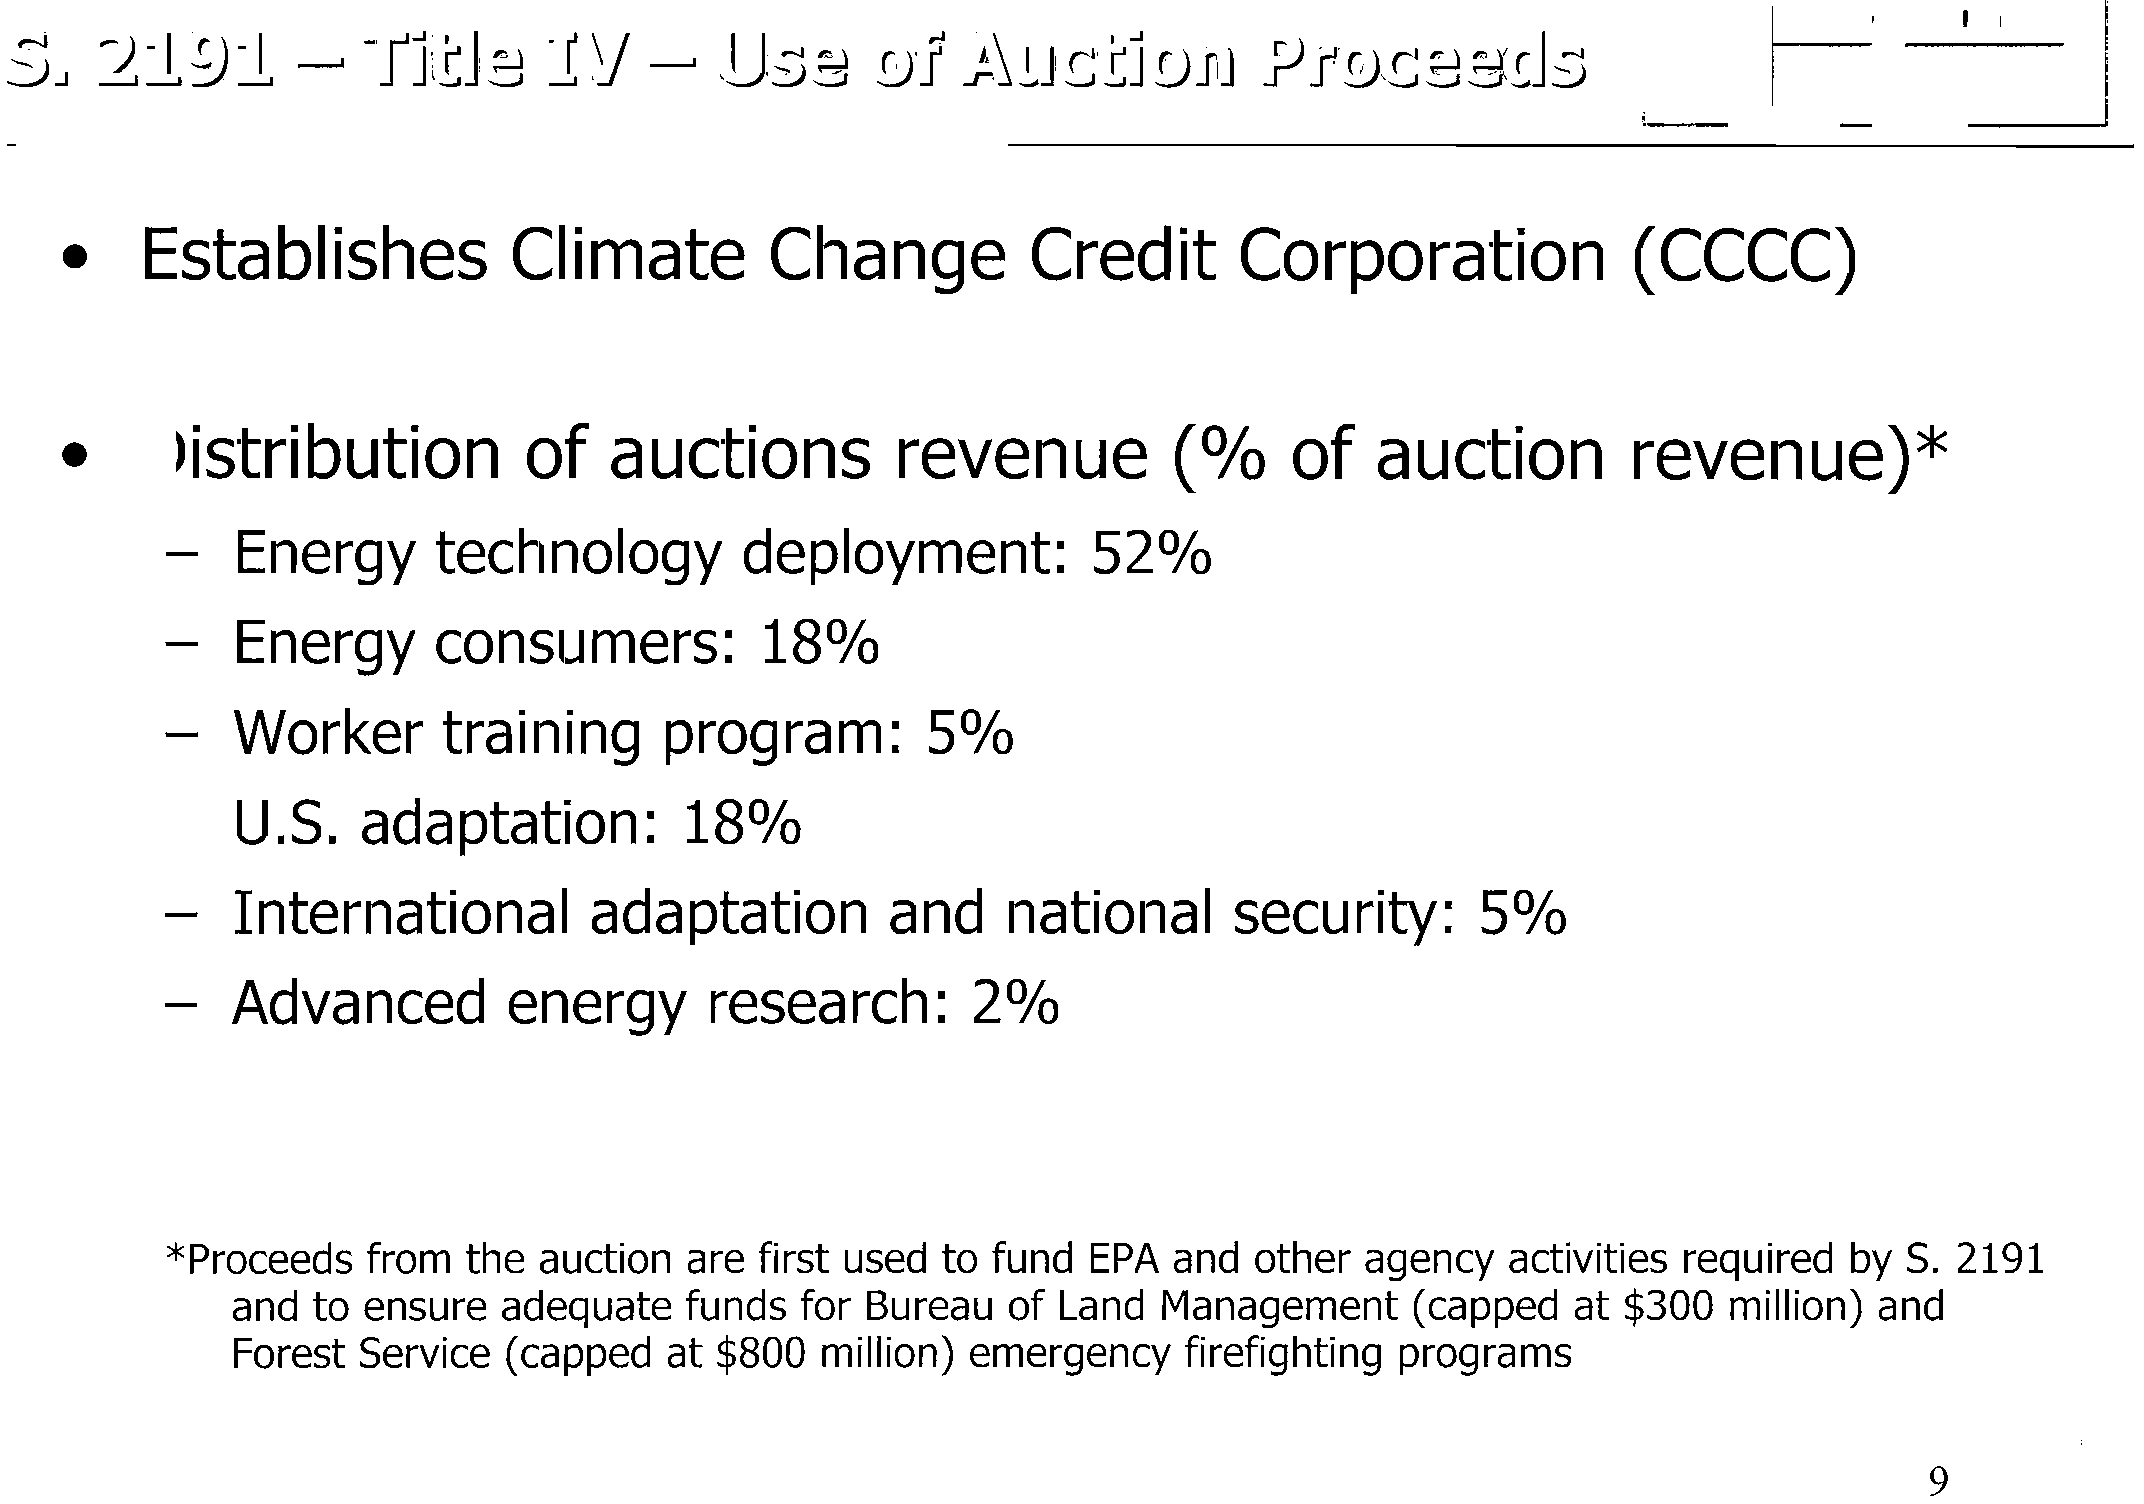
• Establishes Climate Change Credit Corporation (CCCC)
• Distribution of auctions revenue
(0/0
of auction revenue)*
Energy technology deployment: 52%
Energy consumers: 18%
Worker training program: 5%
U.S. adaptation: 18%
International adaptation and national security: 5%
- Advanced energy research: 2%
*Proceeds from the auction are first used to fund EPA and other agency activities required by S. 2191
and
to ensure adequate funds for Bureau of Land Management (capped at $300 million) and
Forest Service (capped
at $800 million) emergency firefighting programs
9
Electronic Filing - Received, Clerk's Office, October 1, 2008
* * * * * PCB 2009-021 * * * * *
• Appliance efficiency (water heaters, space
heatingjAC)
• Building efficiency (updating bldg. codes)
Note: Some overlap with EISA
10
Electronic Filing - Received, Clerk's Office, October 1, 2008
* * * * * PCB 2009-021 * * * * *
"'"
• Separate declining cap on consumption and
importation
of HFC
- Starts in 2010 and declines 70% by 2050
- Combination
of free allocation and auction of
allowances in early years
- Transitions
to 100% auction by 2031
- May not
be traded with larger cap-and-trade
program
11
Electronic Filing - Received, Clerk's Office, October 1, 2008
* * * * * PCB 2009-021 * * * * *
• Low carbon fuel standard
-
5% reduction in lifecycle GHG emissions by 2010
-
10% reduction by 2020
• Recycling and emission reduction program
• Servicing
of motor vehicle air conditioners
12
Electronic Filing - Received, Clerk's Office, October 1, 2008
* * * * * PCB 2009-021 * * * * *
Vicki Arroyo
Director of
Policy Analysis
Pew Center on Global Climate Change
VArroyo@pewclimate.org
www.pewclimate.org
13
Electronic Filing - Received, Clerk's Office, October 1, 2008
* * * * * PCB 2009-021 * * * * *