USEPA,
Attachment
to
Exhibit
10,
Letter
to
Governor
Blagojevich
(August
18,
2008).
Electronic Filing - Received, Clerk's Office, October 1, 2008
* * * * * PCB 2009-021 * * * * *
county
is
determined
to
be
contributing
to
the
violation
of
the
standard.
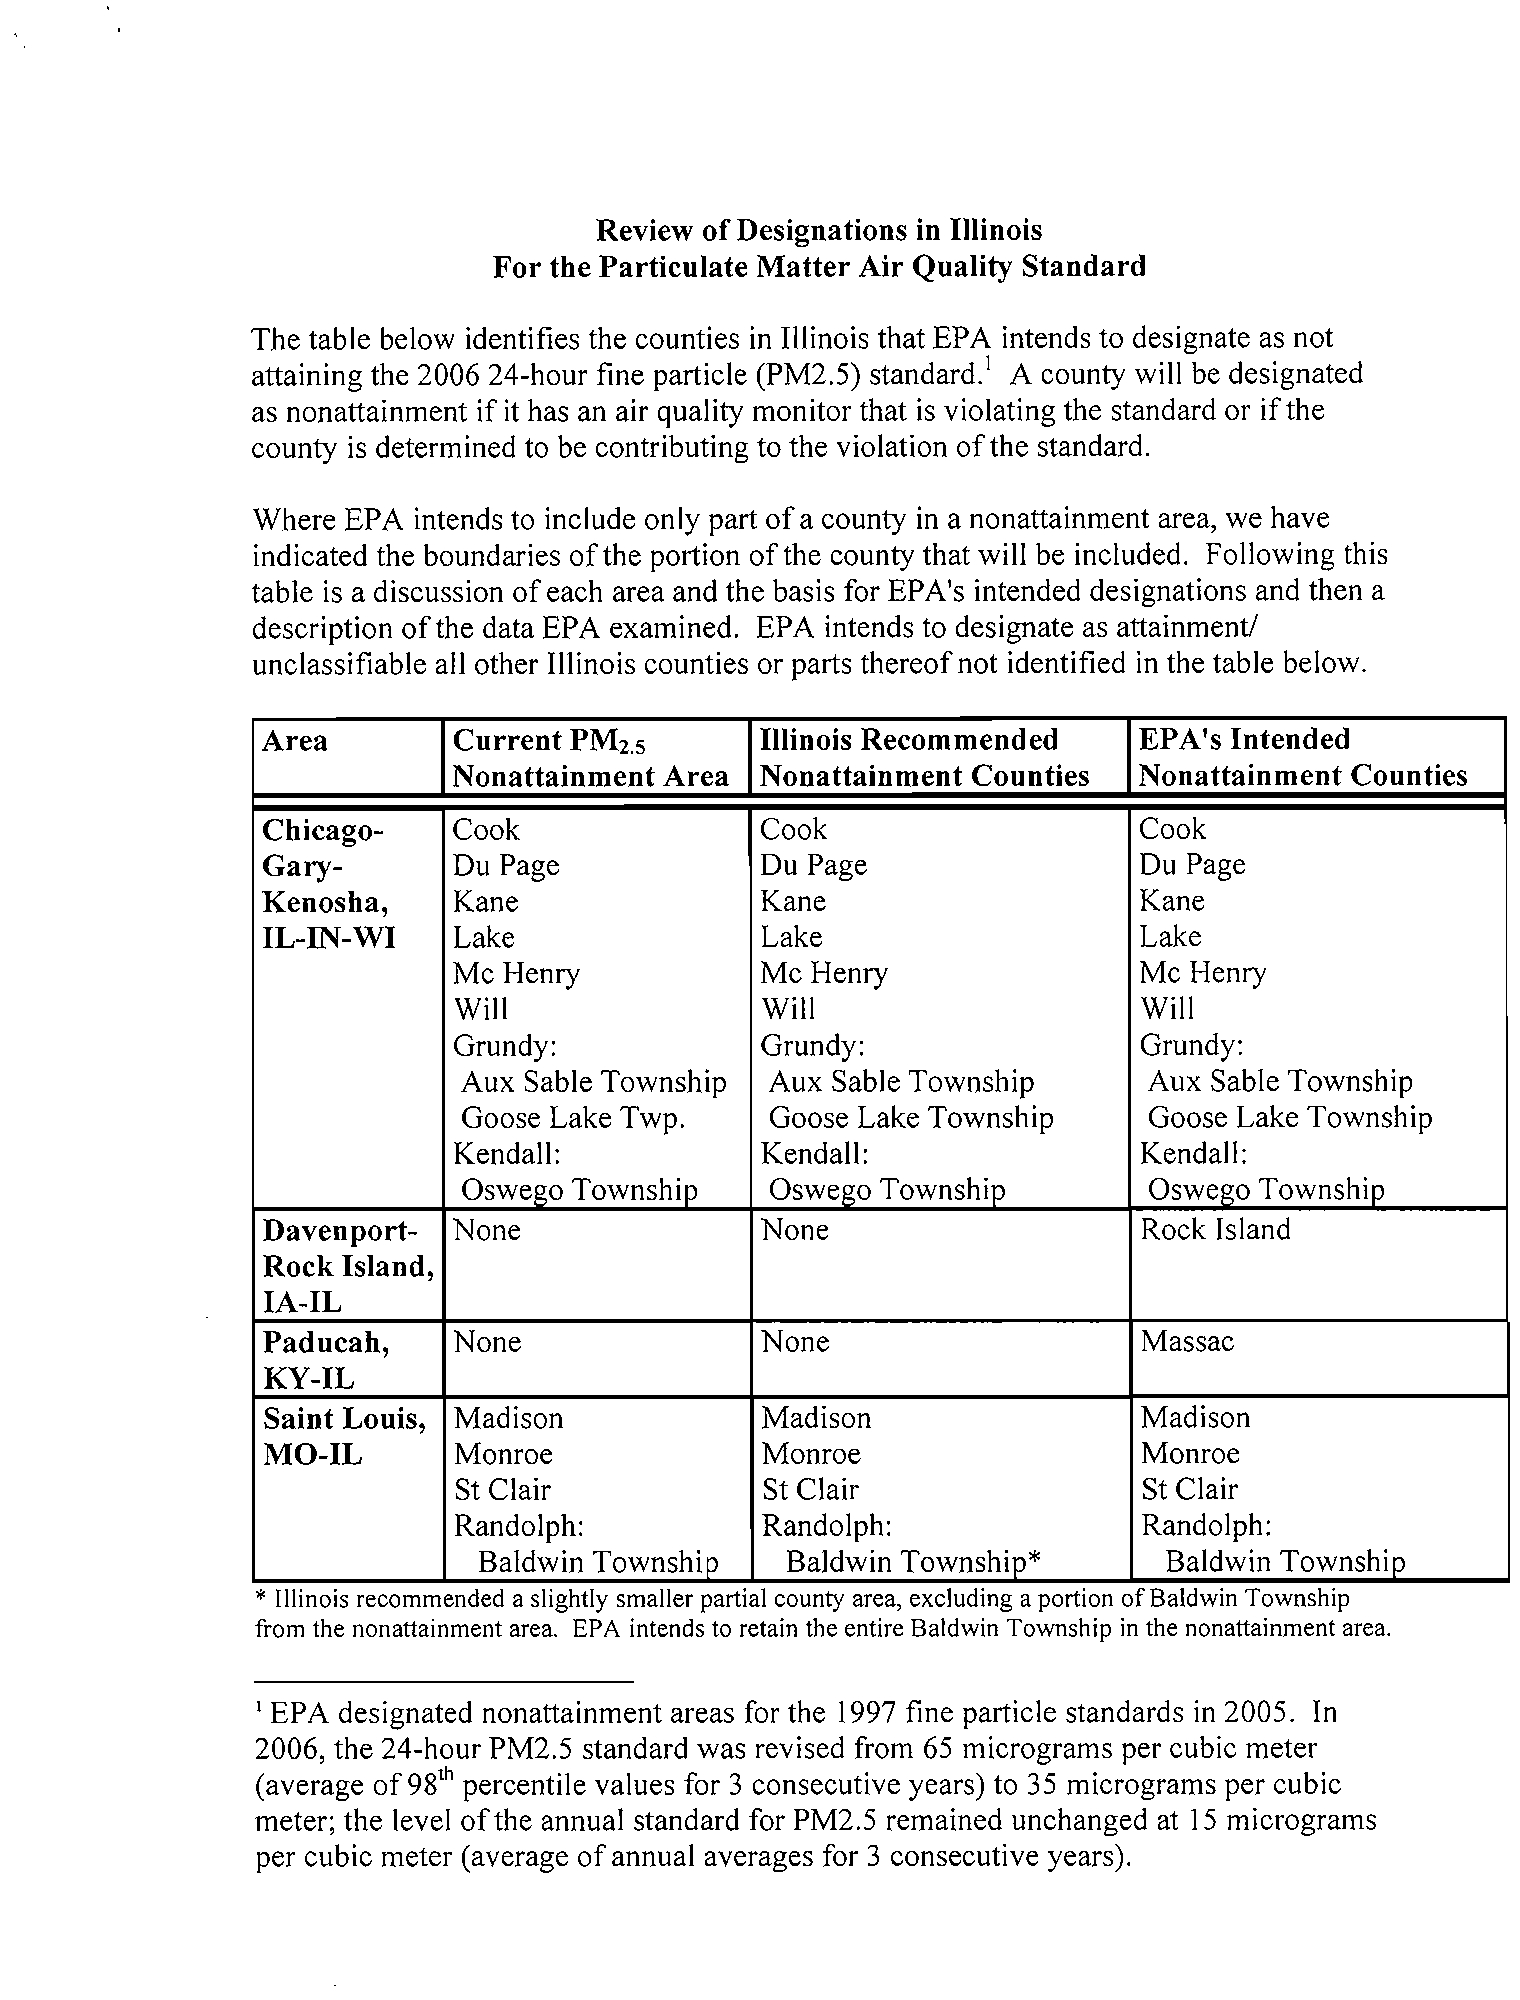
Where
EPA
intends
to
include
only
part
of
a
county
in
a
nonattainment
area,
we
have
indicated
the
boundaries
of
the
portion
of
the
county
that
will
be
included.
Following
this
table
is
a
discussion
of
each
area
and
the
basis
for
EPA's
intended
designations
and
then
a
description
of
the
data
EPA
examined.
EPA
intends
to
designate
as
attainment!
unclassifiable
all
other
Illinois
counties
or
parts
thereof
not
identified
in
the
table
below.
Area
Current
PM2.5
Illinois
Recommended
EPA'sIntended
Nonattainment
Area
Nonattainment
Counties
Nonattainment
Counties
Chicago-
Cook
Cook
Cook
Gary-
Du
Page
Du
Page
Du
Page
Kenosha,
Kane
Kane
Kane
IL-IN-WI
Lake
Lake
Lake
Mc
Henry
Mc
Henry
Mc
Henry
Will
Will
Will
Grundy:
Grundy:
Grundy:
Aux
Sable
Township
Aux
Sable
Township
Aux
Sable
Township
Goose
Lake
Twp.
Goose
Lake
Township
Goose
Lake
Township
Kendall:
Kendall:
Kendall:
Oswego
Townshio
Oswego
Townshio
Oswego
Townshio
Davenport-
None
None
Rock
Island
Rock
Island,
IA-IL
Paducah,
None
None
Massac
KY-IL
Saint
Louis,
Madison
Madison
Madison
MO-IL
Monroe
Monroe
Monroe
St
Clair
St
Clair
St
Clair
Randolph:
Randolph:
Randolph:
Baldwin
Townshio
Baldwin
Townshio*
Baldwin
Townshio
*
IllinOIS
recommended
a
slightly
smaller
partial
county
area,
excludmg
a
portIOn
of
BaldWin
Township
from
the
non
attainment
area.
EPA
intends
to
retain
the
entire
Baldwin
Township
in
the
non
attainment
area.
'EPA
designated
nonattainment
areas
for
the
1997
fine
particle
standards
in
2005.
In
2006,
the
24-hour
PM2.5
standard
was
revised
from
65
micrograms
per
cubic
meter
(average
of98'h
percentile
values
for
3
consecutive
years)
to
35
micrograms
per
cubic
meter;
the
level
of
the
annual
standard
for
PM2.5
remained
unchanged
at
15
micrograms
per
cubic
meter
(average
of
annual
averages
for
3
consecutive
years).
Electronic Filing - Received, Clerk's Office, October 1, 2008
* * * * * PCB 2009-021 * * * * *
Pursuant
to
section
107(d)
of
the
Clean
Air
Act,
EPA
must
designate
as
nonattainment
thoseareas
that
violate
the
NAAQS
and
those
areas
that
contribute
to
violations.
The
technical
analysis
for
each
area
identifies
the
counties
with
monitors
that
violate
the
24-
hour
PM2.5
standard
and
evaluates
the
counties
that
potentially
contribute
to
fine
particle
concentrations
in
the
area.
EPA
has
evaluated
these
counties
based
on
the
weight
of
evidence
of
the
following
nine
factors
recommended
in
EPA
guidance
and
any
other
relevant
infonmation:
-
pollutant
emissions
-
air
quality
data
-
population
density
and
degree
of
urbanization
-
traffic
and
commuting
patterns
-
growth
-
meteorology
-
geography
and
topography
-
jurisdictional
boundaries
-
level
of
control
of
emissions
sources
Additional
background
information
on
each
of
the
nine
factors
can
also
be
found
in
the
background
section
below.
EPA
also
computed
a
Contributing
Emissions
Score
(CES)
for
each
county.
The
CES
is
a
metric
that
takes
into
consideration
emissions
data,
meteorological
data,
and
air
quality
monitoring
information
to
provide
a
relative
ranking
of
potential
impacts
of
counties
in
and
near
an
area
on
violating
monitors.
While
this
metric
provides
a
useful
synthesis
of
important
relevant
infonmation,
including
weighting
the
emissions
of
various
pollutants
according
to
estimates
of
the
relative
importance
of
each
pollutant,
the
CES
is
not
the
exclusive
variable
EPA
uses
to
consider
these
factors.
A
summary
of
the
CES
is
included
in
the
background
section,
and
a
more
detailed
descriptioncan
be
found
at
http://www.epa.gov/ttn/naaqslpm/pm252006techinfo.html#C.
Review
for
the
Illinois
Portion
of
the
Chicago-GaIT-Kenosha,
IL-IN-
WI
Metropolitan
Area
Discussion:
EPA
reviewed
relevant
information
for
the
ten
counties
(including
eight
counties
in
lIlinois)
partly
or
fully
within
the
area
designated
nonattainment
for
the
1997
standards
as
well
as
for
surrounding
counties.
There
are
violating
monitors
in
Cook
and
Will
Counties
and
in
Lake
County,
Indiana.
lIlinois
recommended
a
definition
of
the
2
Electronic Filing - Received, Clerk's Office, October 1, 2008
* * * * * PCB 2009-021 * * * * *
EPA
also
examined
information
for
other
counties
within
and
adjacent
to
the
Combined
Statistical
Area
as
well
as
for
adjacent
counties.
The
bulk
of
emissions
and
population
are
captured
without
including
DeKalb,
Grundy,
Kankakee
and
Kendall
Counties,
since
these
counties
have
limited
emissions
and
population.
Nevertheless,
we
support
the
recommendation
by
the
Illinois
EPA
to
include
the
three
townships
in
Grundy
and
Kendall
counties
in
the
nonattainment
area
to
maintain
consistency
with
the
ozone
designations
and
the
prior
PM
25
designations
and
thereby
facilitate
planning,
as
well
as
to
include
slightly
more
emissions
in
the
planning
area.
Emissions
for
other
surrounding
counties
are
relatively
low,
and
no
other
factor
warranted
designating
these
other
counties
nonattainment.
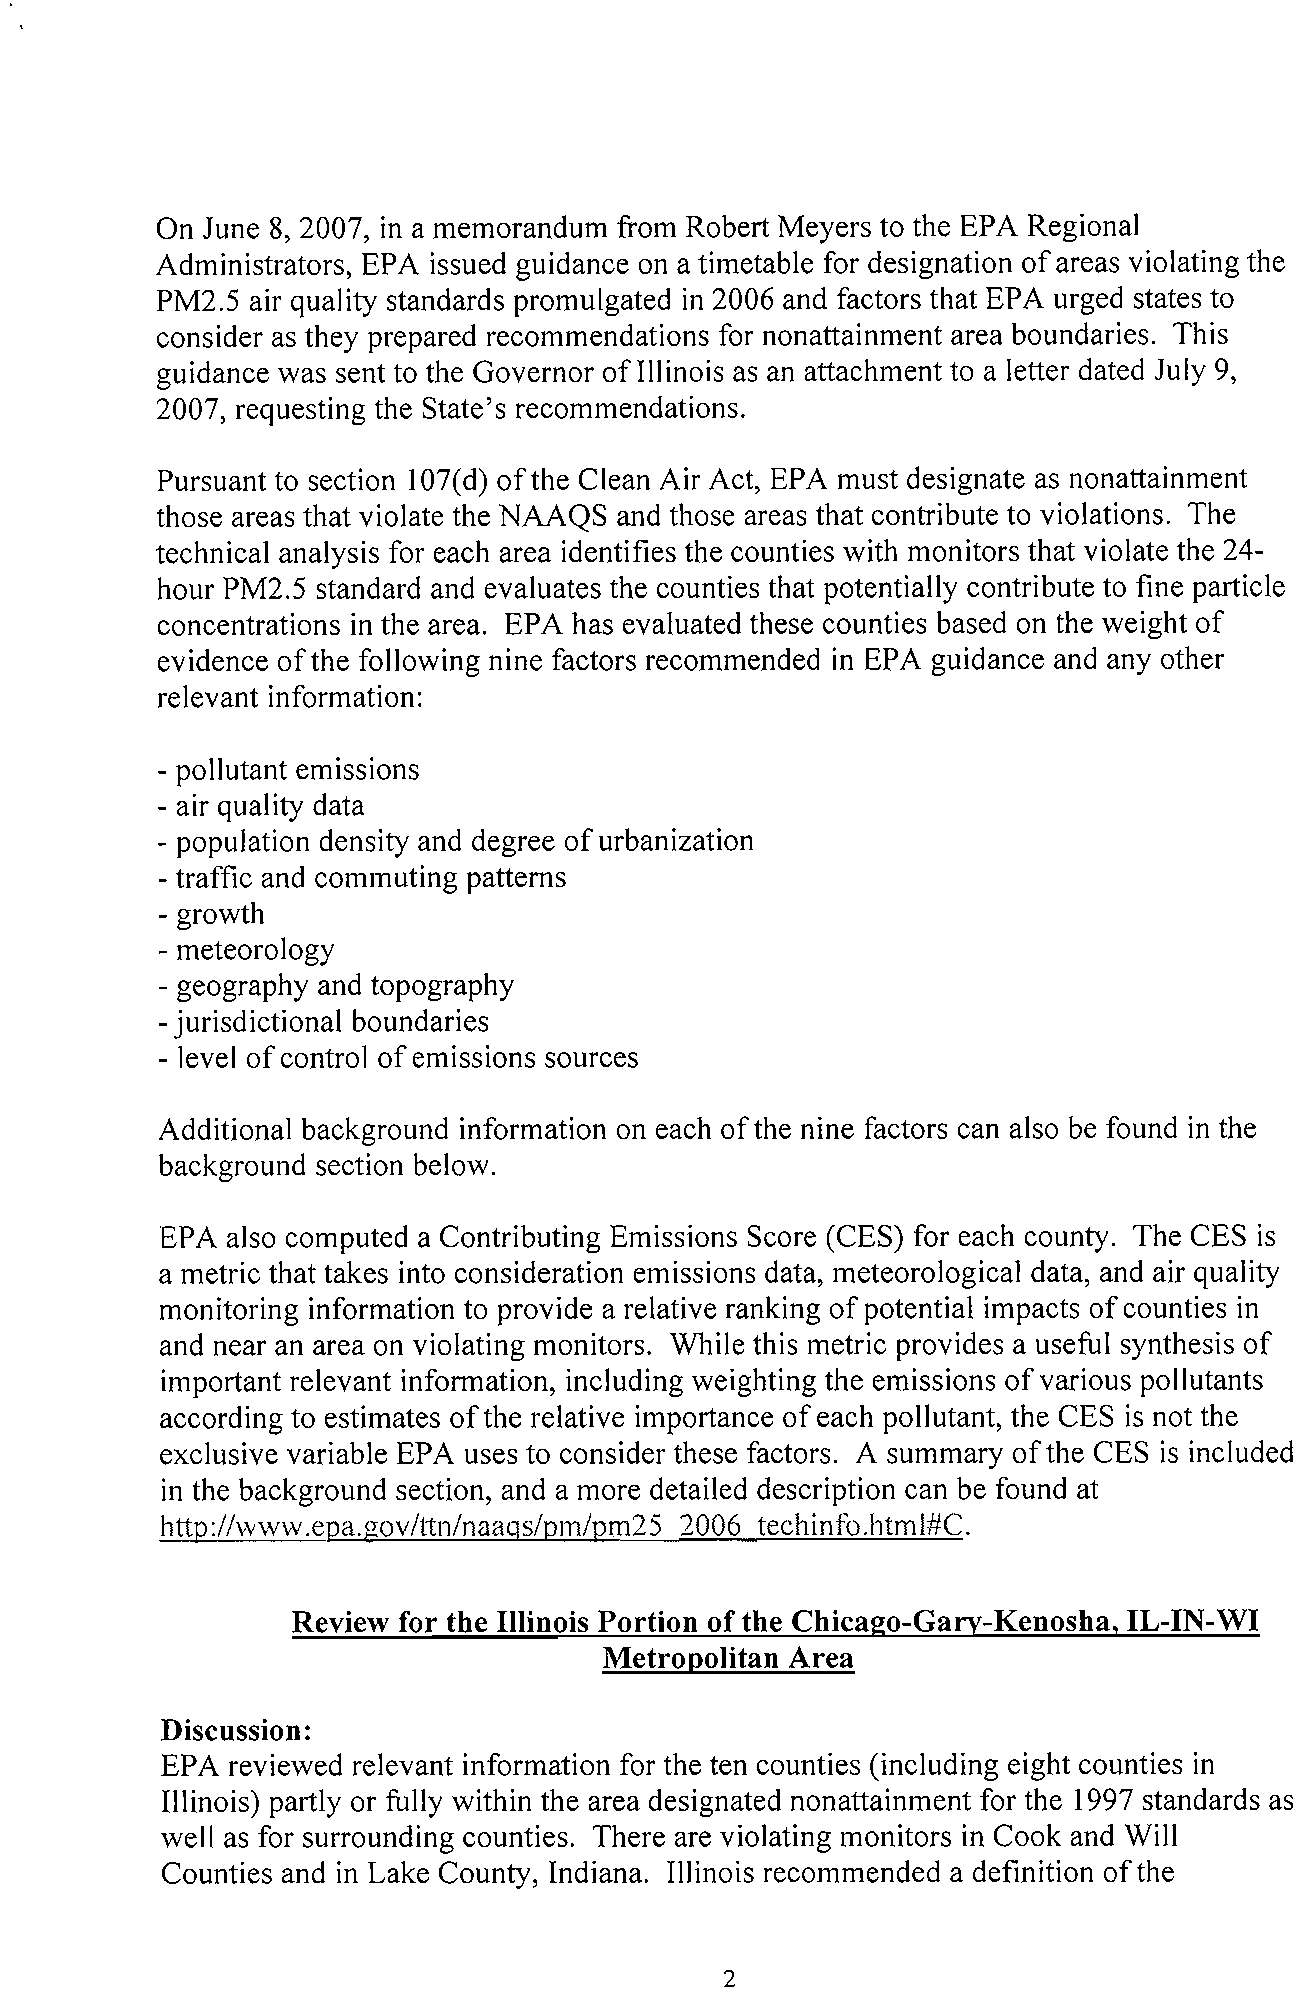
Figure
1
is
a
map
of
the
counties
in
the
area
and
other
relevant
information
such
as
the
locations
and
design
values
of
air
quality
monitors,
the
metropolitan
area
boundary,
and
counties
reconnnended
as
nonattainment
by
the
States.
R¥!ne
sin
¥
Wmnebago
.
."
"".
e
L!,
Ii!l
~
La~/Ie
Illinois
Urit1stCXl
"'''
."
~
Iroq~S
•
Sin
reconvnendatXlo
for
nonatlilioolenl
-34
iii
Sla'.e
feconvnendation
for
partial
OOfIa:tainment
State
recorrvnendation
!of
a
differenl
metro
afea
Mon~or
\'ioIaliog
24-hc
PM2.5
NMOS
(preWnin.
2005-2007
design
vall.leS)
Mi.
Monitor
ana:ning
24.tlr
PM2.5
NMOS
(preIimin.
2005-2007
design
values)
Monitor
violating
24-h1
PM2.5
NMOS
(preli1lin.2005-2007
incomplete
design
values)
National
highways
~
2006
Combined
StaliStiCal
Area
~
PM25
Nonattainment
Alea
(1997
NMOS)
..
.L_
....
_
All
PM2.5
Nonaltainmenl
Areas
r.;
(1997
NMOS)
r+--t
Nonattainmenb'Mainteoanee
Area
~
fOf
8-hour
Ozone
I8J
EGU
....
ith
lotal
CAP
!ll'issions)
5.000
lortsIyear
In
2002
i&I
Othef
Point
Source
with
to:al
CAP
Ma'¥tall
emissions)
5.000
torIs/'fear
in
2002
-
Contribut;lgEmis~5coI'e(40~
Indiana
••.
Figure
1-
Note:
Map
produced
prior
to
Indiana's
nonattainment
recommendation
for
Lake
County,
Ind.
3
Electronic Filing - Received, Clerk's Office, October 1, 2008
* * * * * PCB 2009-021 * * * * *
are
listed
in
descending
order
by
CES.
Table
I.
PM"
24-hour
Com
onent
EmISSions,
and
CESs.
County
State
CE5
PM2.5
PM
2S
PM
2
.
S
SO,
NOx
VOCs
NH,
Recommended
emissions
emissions
emissions
(tpy)
(tpy)
(tpy)
(tpy)
Nonauainment?
total
carbon
other
(tDY)
(tDY)
(tDY)
Cook,IL
Ves
100
10081
5,407
4,674
35,354
175.267
152.288
4,550
Lake
IN
No
100
7079
1.219
5,861
39,500
54,203
24679
3,784
Will
IL
Ves
95
5432
1236
4195
78792
46028
19886
1407
Porter
IN
No
41
3901
719
3183
24,458
29930
9,795
909
DuPaee,IL
Ves
16
2075
1259
816
2,013
36880
29541
1.385
JaSDer
IN
ND
14
2,641
280
2,360
40,723
20,104
3,367
2929
Kankakee
IL
No
9
1,660
419
1242
366
7,351
6830
1,699
Kane,IL
Ves
4
1997
733
1263
1,037
16528
15,578
1,293
Grundy.IL
Partial
3
1
lOS
248
857
362
4057
4223
1
027
Lake
IL
Ves
3
2657
1070
1
587
14,719
29478
32778
747
Kendall
1L
Partial
2
811
230
581
351
3697
3693
753
McHenrY.IL
Ves
1
2102
634
1468
592
9493
10596
1,224
Kenosha,
WI
No
I
I
489
460
1030
33,988
15,967
7,857
647
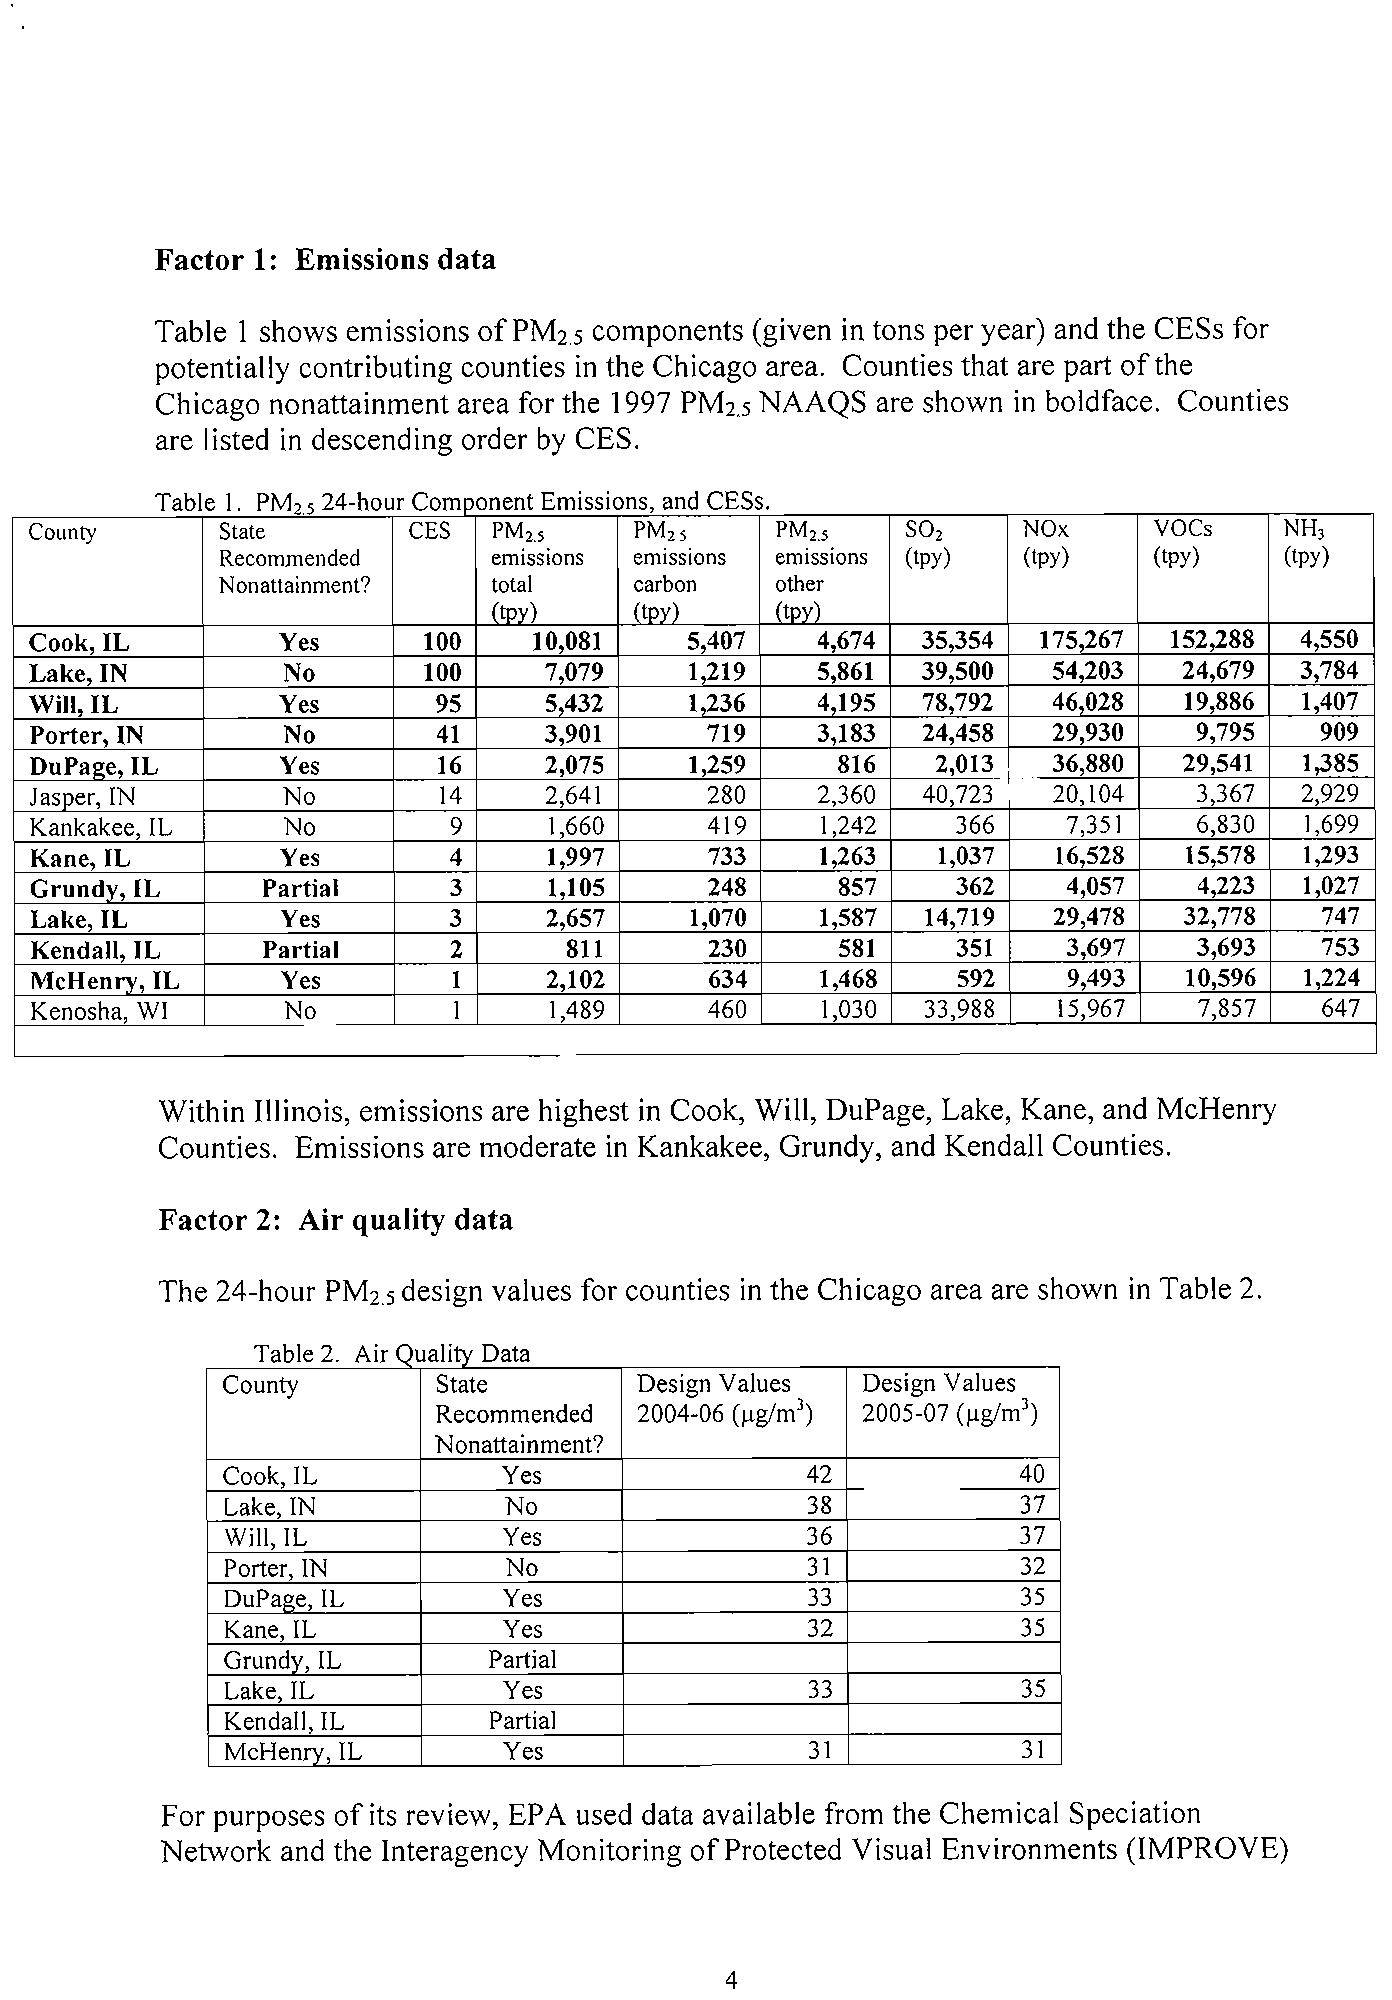
Within
lIIinois,
emissions
are
highest
in
Cook,
Will,
DuPage,
Lake,
Kane,
and
McHenry
Counties.
Emissions
are
moderate
in
Kankakee,
Grundy,
and
Kendall
Counties.
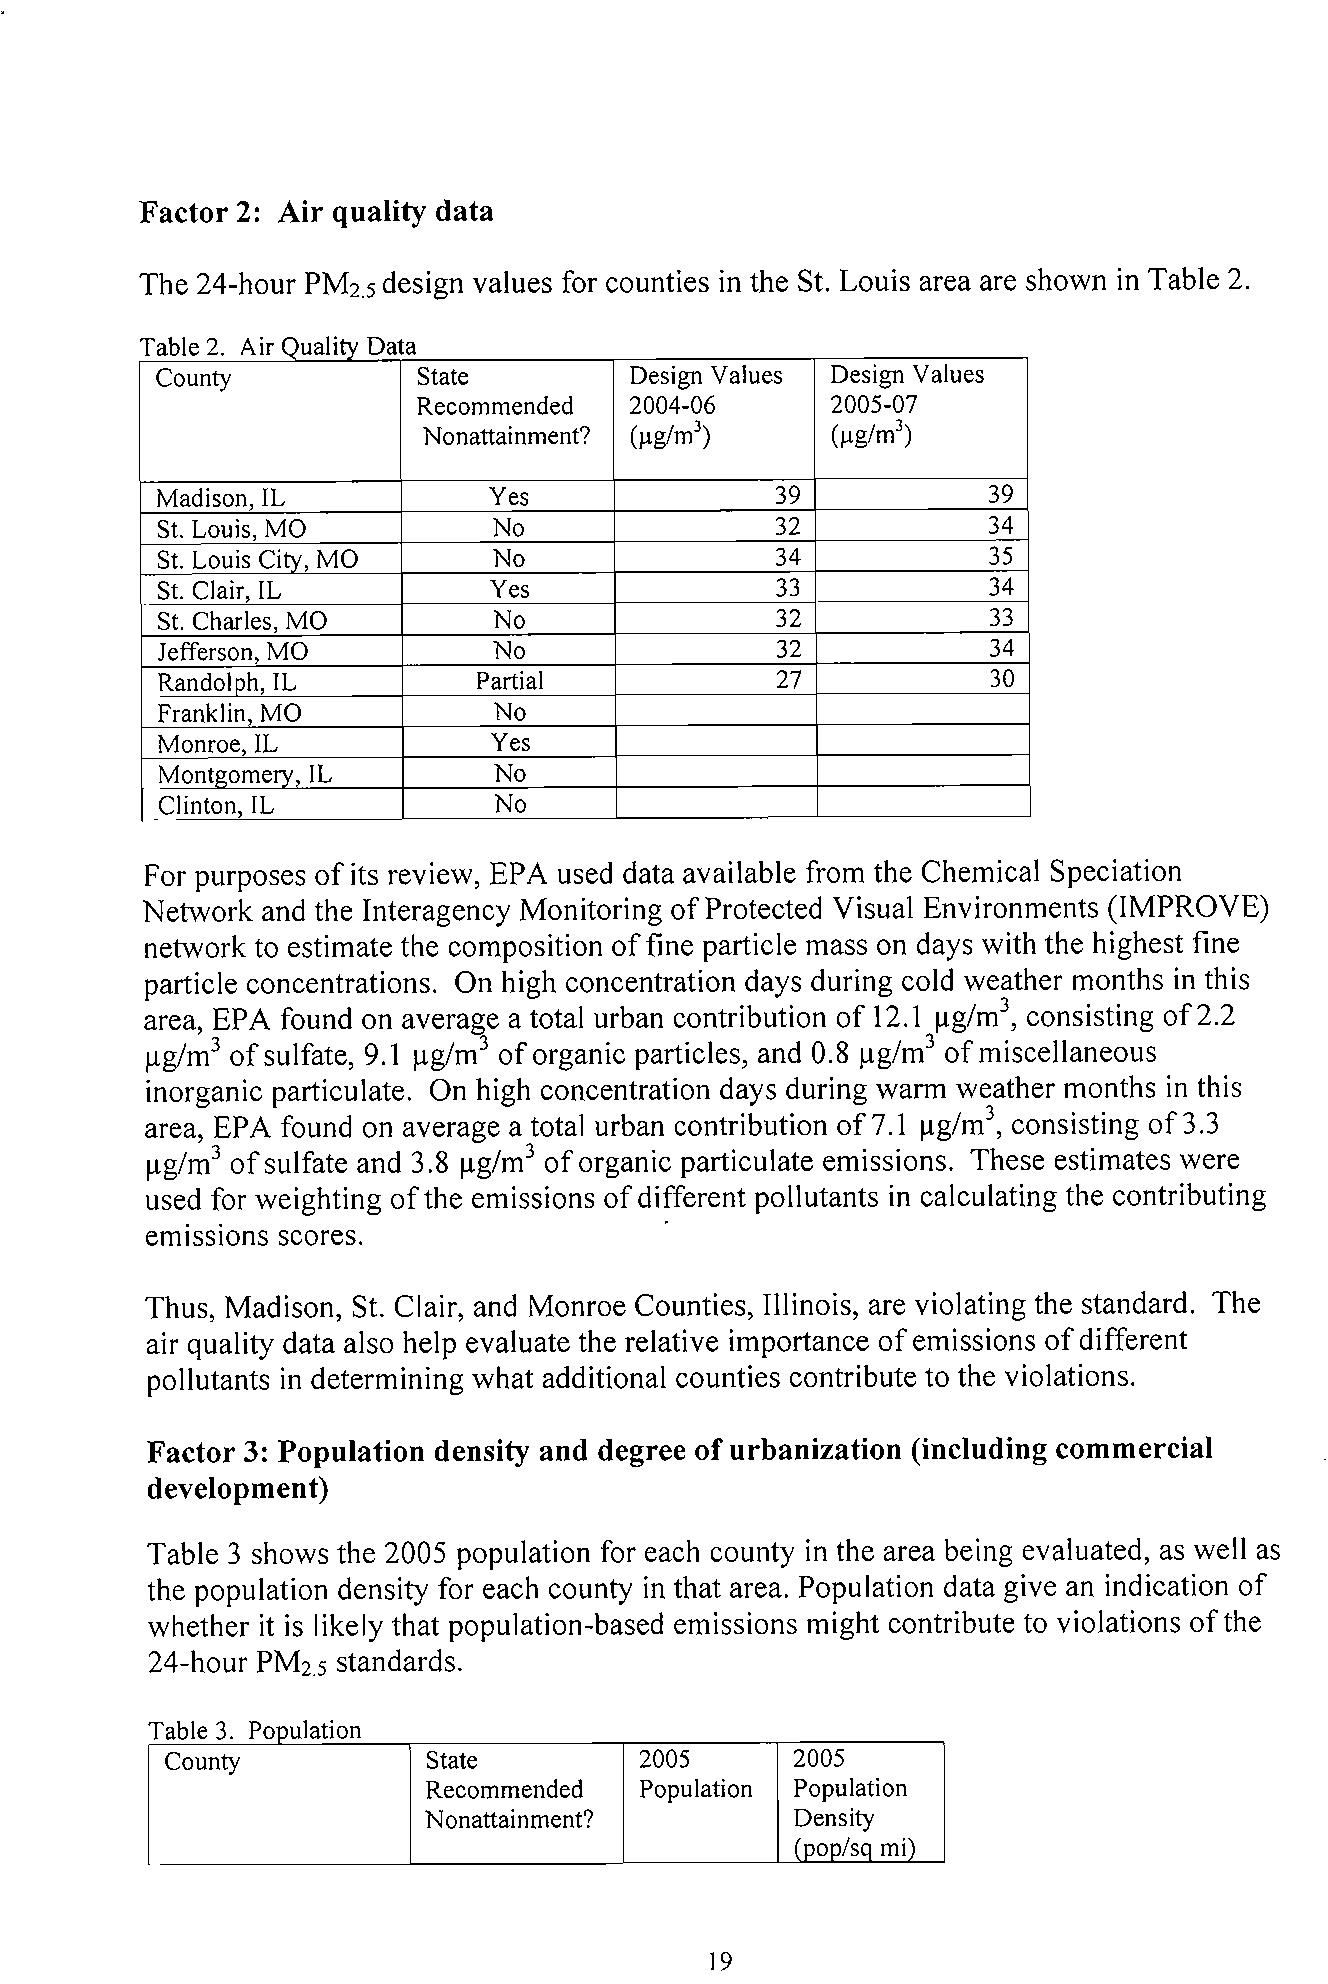
Factor
2:
Air
quality
data
The
24-hour
PM
2
.
5
design
values
for
counties
in
the
Chicago
area
are
shown
in
Table
2.
Table
2.
Air
Q
ualily
Data
County
State
Design
Values
Design
Values
Recommended
2004-06
(~g/m)
2005-07
(~g/m)
Nonattainment?
Cook,IL
Yes
42
40
Lake
IN
No
38
37
Will,IL
Yes
36
37
Porter,
IN
No
31
32
DuPage,IL
Yes
33
35
Kane,IL
Yes
32
35
GrundY,IL
Partial
Lake,IL
Yes
33
35
Kendall,IL
Partial
McHenry,IL
Yes
31
31
For
purposes
of
its
review,
EPA
used
data
available
from
the
Chemical
Speciation
Network
and
the
Interagency
Monitoring
of
Protected
Visual
Environments
(IMPROVE)
4
Electronic Filing - Received, Clerk's Office, October 1, 2008
* * * * * PCB 2009-021 * * * * *
llg/m
3
of
sulfate,
3.1
Ilg/m3
of
organic
particles,
and
OJ
Ilg/m3
of
miscellaneous
inorganic
particulate.
These
estimates
were
used
for
weighting
of
the
emissions
of
different
pollutants
in
calculating
the
contributing
emissions
scores.
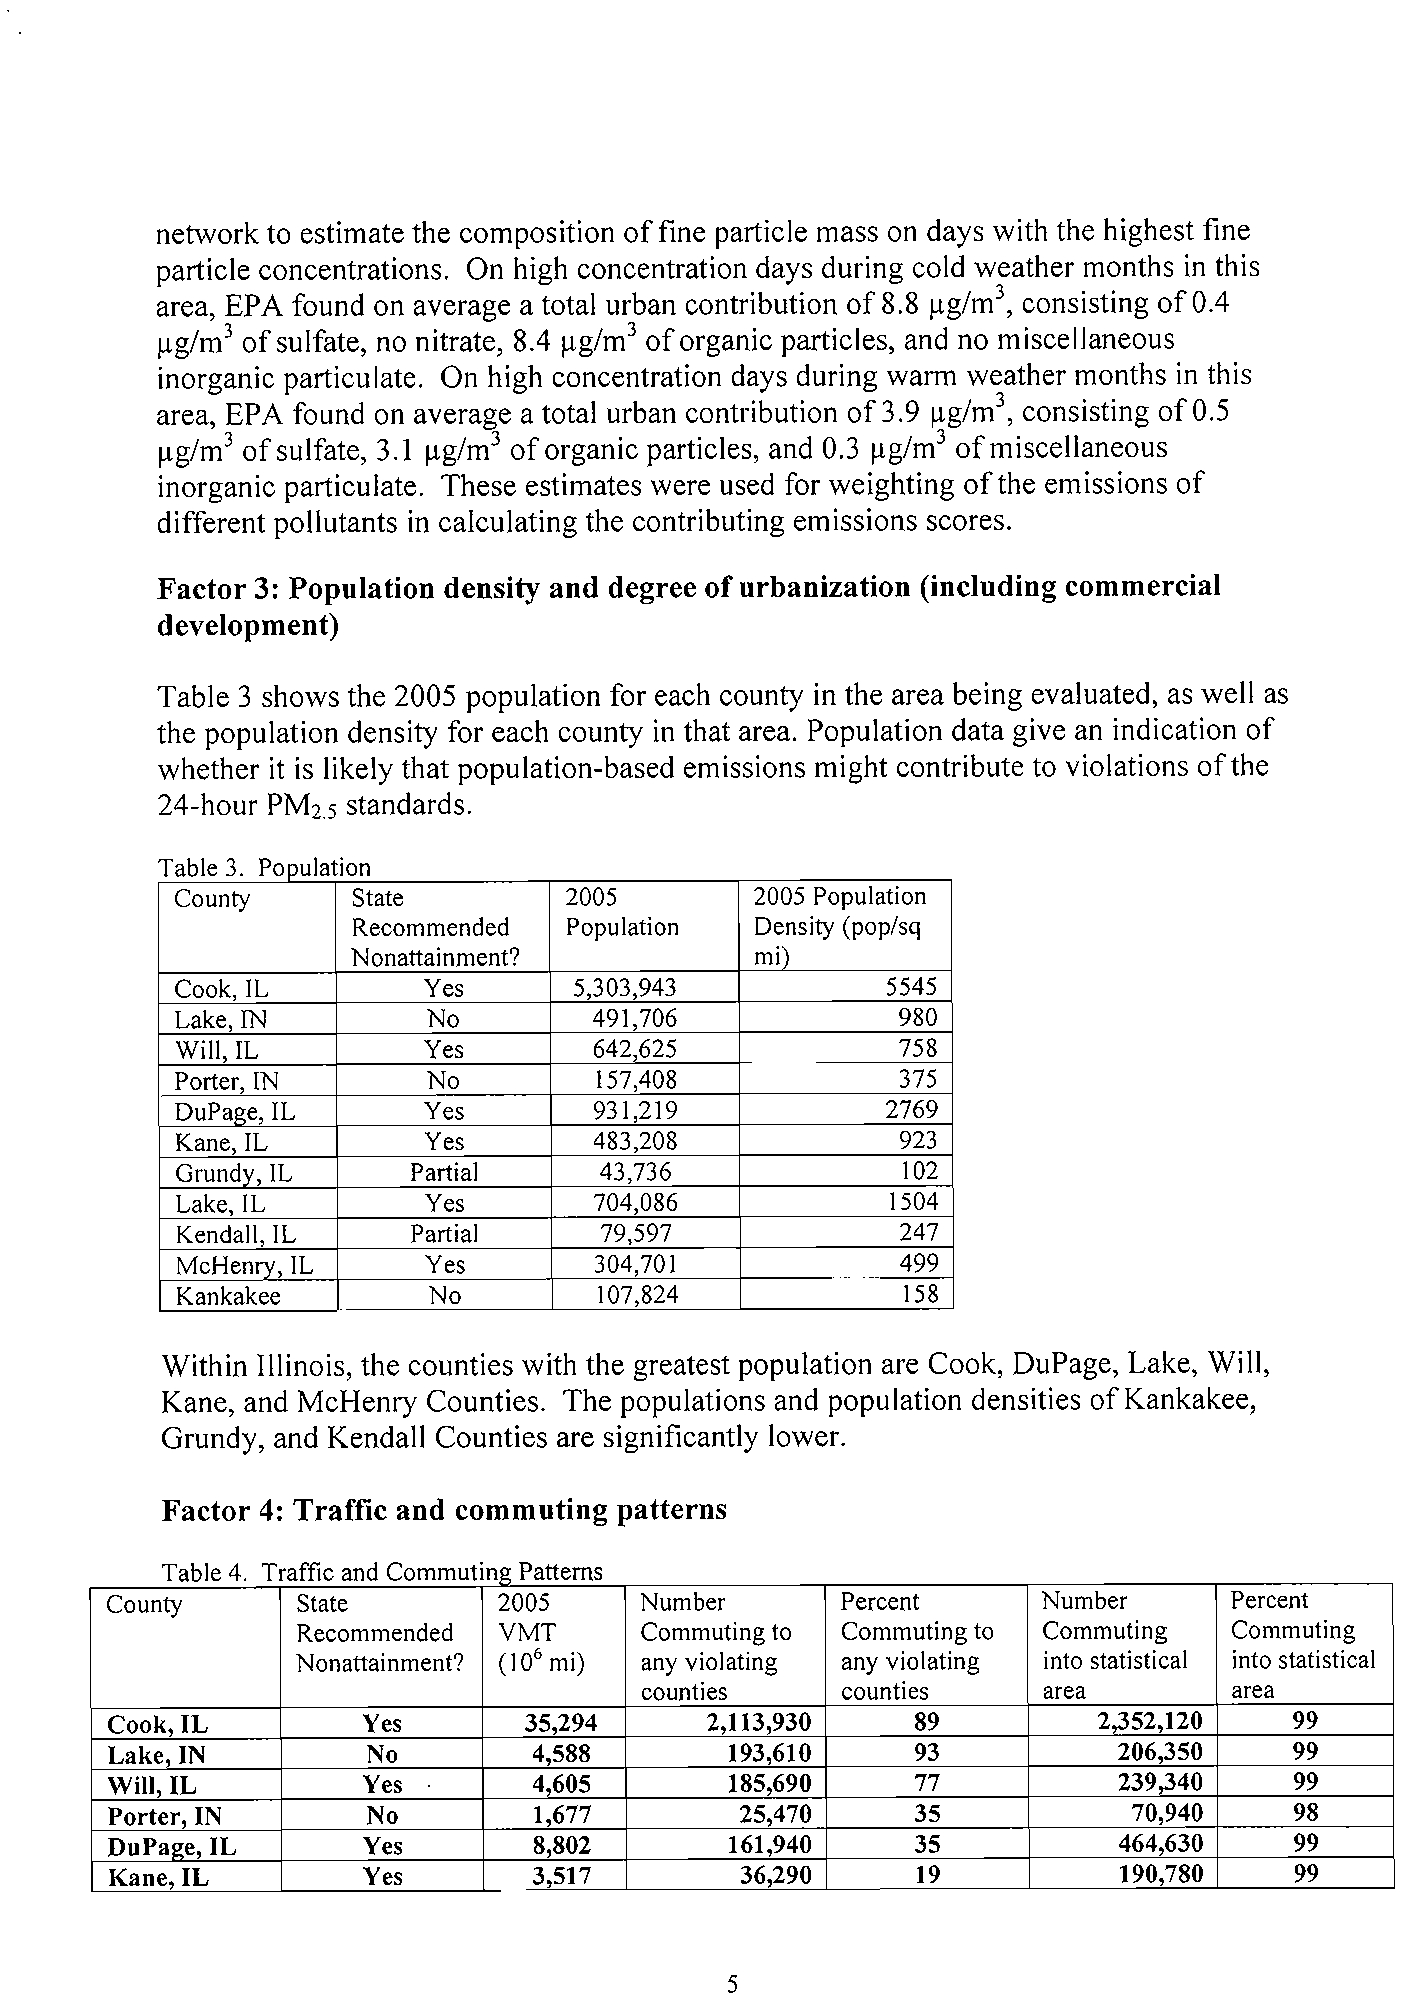
Factor
3:
Population
density
and
degree
of
urbanization
(includingcommercial
development)
Table
3
shows
the
2005
population
for
each
county
in
the
area
being
evaluated,
as
well
as
the
population
density
for
each
county
in
that
area.
Population
data
give
an
indication
of
whether
it
is
likely
that
population-based
emissions
might
contribute
to
violations
of
the
24-hour
PM
25
standards.
T
hi
3
PI'
ae.
cou
atlOo
County
State
2005
2005
Population
Recommended
Population
Density
(pop/sq
Nonattainment?
mj)
Cook
IL
Yes
5303943
5545
Lake
IN
No
491,706
980
Will
IL
Yes
642,625
758
Porter
IN
No
157,408
375
DuPa.e,IL
Yes
931,219
2769
Kane,IL
Yes
483,208
923
Grundy,IL
Partial
43,736
102
Lake,
IL
Yes
704,086
1504
Kendall
IL
Partial
79,597
247
McHenry,IL
Yes
304,701
499
Kankakee
No
107,824
158
Within
Illinois,
the
counties
with
the
greatest
population
are
Cook,
DuPage,
Lake,
Will,
Kane,
and
McHenry
Counties.
The
populations
and
population
densities
of
Kankakee,
Grundy,
and
Kendall
Counties
are
significantly
lower.
Factor
4:
Traffic
and
commuting
patterns
hi
ffi
dC
Ta
e
4.
Tra
Ie
an
ommutmg
Patterns
County
State
2005
Number
Percent
Number
Percent
Recommended
VMT
Commuting
to
Commuting
to
Commuting
Commuting
Nonattainment?
(10'
mil
any
violating
any
violating
into
statistical
into
statistical
counties
counties
area
area
Cook,IL
Yes
35294
2,113930
89
2,352,t20
99
Lake
IN
No
4588
t93610
93
206,350
99
WiII,IL
Yes
4,605
185,690
77
239,340
99
Porter
IN
No
I
677
25470
35
70940
98
DuPa.e
IL
Yes
8802
161940
35
464,630
99
Kane,IL
Yes
3,517
36,290
19
190,780
99
5
Electronic Filing - Received, Clerk's Office, October 1, 2008
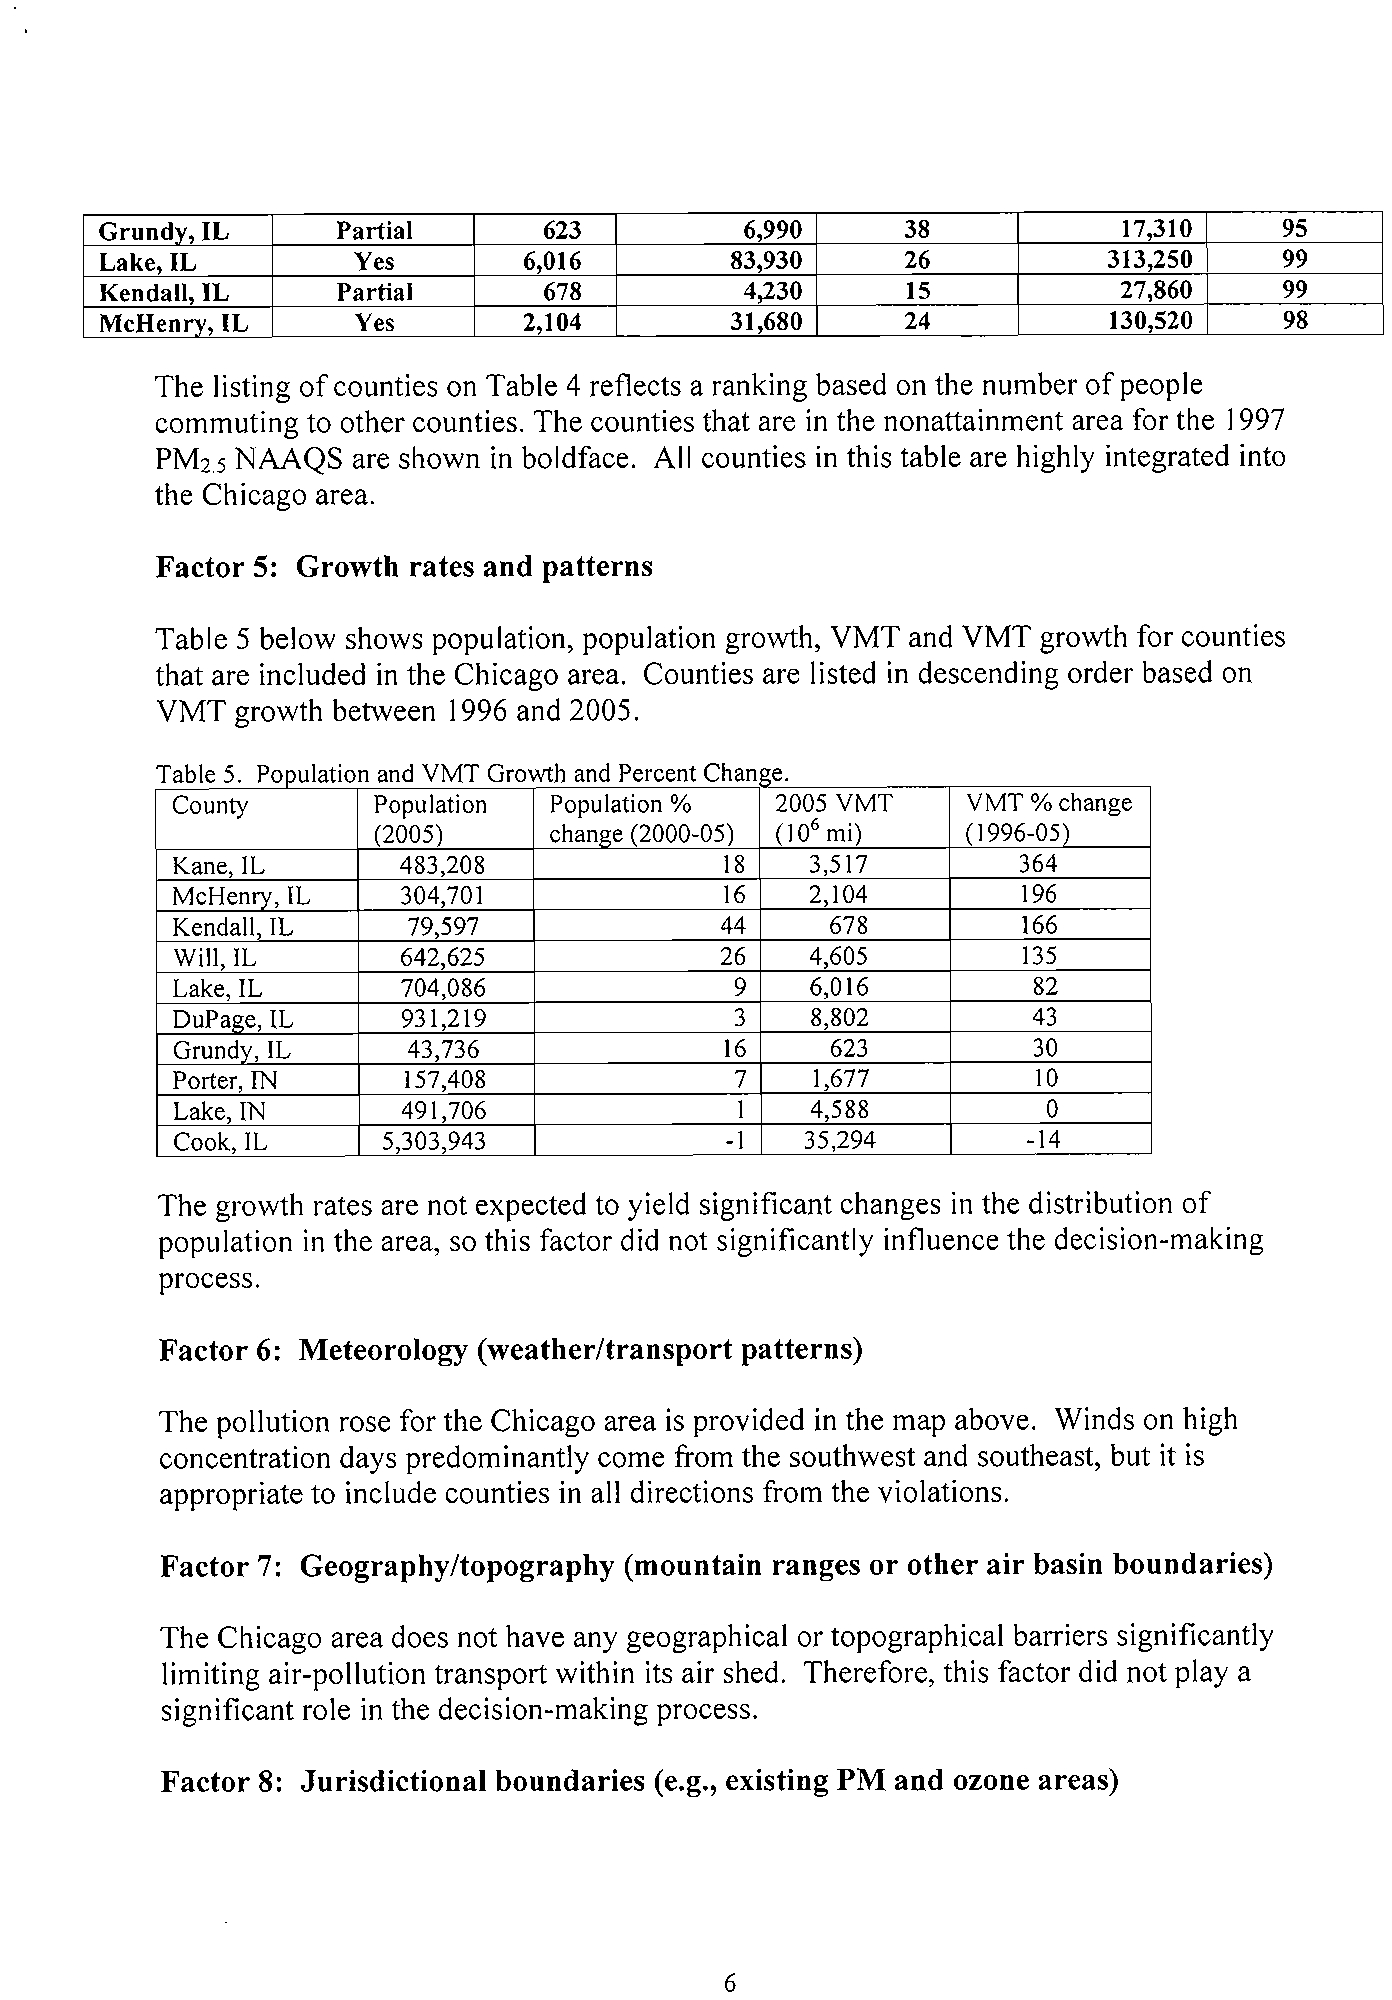
* * * * * PCB 2009-021 * * * * *
PM2.5
NAAQS
are
shown
in
boldface.
All
counties
in
this
table
are
highly
integrated
into
the
Chicago
area.
Factor
5:
Growth
rates
and
patterns
Table
5
below
shows
population,
population
growth,
VMT
and
VMT
growth
for
counties
that
are
included
in
the
Chicago
area.
Counties
are
listed
in
descending
order
based
on
VMT
growth
between
1996
and
2005.
Table
5.
Population
and
YMT
Growth
and
Percent
Chan
e.
County
Population
Population
%
2005
YMT
YMT
%
change
(2005)
change
(2000-05)
(10'
mil
(1996-05)
Kane
IL
483,208
18
3,517
364
McHenry,IL
304,701
16
2104
196
Kendall
IL
79597
44
678
166
Will,IL
642,625
26
4605
135
Lake,IL
704,086
9
6,016
82
DuPage,IL
931,219
3
8802
43
Grundv,IL
43736
16
623
30
Porler,
IN
157,408
7
1,677
10
Lake
IN
491
706
1
4588
0
Cook,IL
5,303,943
-I
35,294
-14
The
growth
rates
are
not
expected
to
yield
significant
changes
in
the
distribution
of
population
in
the
area,
so
this
factor
did
not
significantly
influence
the
decision-making
process.
Factor
6:
Meteorology
(weather/transport
patterns)
The
pollution
rose
for
the
Chicago
area
is
provided
in
the
map
above.
Winds
on
high
concentration
days
predominantly
come
from
the
southwest
and
southeast,
but
it
is
appropriate
to
include
counties
in
all
directions
trom
the
violations.
Factor
7:
Geography/topography
(mountain
ranges
or
other
air
basin
boundaries)
The
Chicago
area
does
not
have
any
geographical
or
topographical
barriers
significantly
limiting
air-pollution
transport
within
its
air
shed.
Therefore,
this
factor
did
not
playa
significant
role
in
the
decision-making
process.
Factor
8:
Jurisdictional
boundaries
(e.g.,
existing
PM
and
ozone
areas)
6
Electronic Filing - Received, Clerk's Office, October 1, 2008
* * * * * PCB 2009-021 * * * * *
Townships
in
Grundy
County,
and
Oswego
Township
in
Kendall
County.
Designating
a
nonattainment
area
matching
these
boundaries
will
facilitate
planning.
Factor
9:
Level
of
control
of
emission
sources
The
emission
estimates
on
Table
I
include
any
control
strategies
implemented
by
the
States
in
the
Chicago
area
before
2005
that
may
influence
emissions
of
any
component
of
PM25
emissions
(i.e.,
total
carbon,
S02,
NOx,
and
crustal
PM
2
.
s
).
Review
for
the
Davenport-Moline-Rock
Island
Metropolitan
Statistical
Area
Discussion:
The
Davenport-Moline-Rock
Island
area
is
currently
designated
attainment
for
PM2.s.
A
monitor
in
Davenport
(Scott
County)
is
showing
violations
of
the
standard.
Illinois
recommended
including
no
part
of
Illinois
in
the
nonattainment
area.
EPA
reviewed
relevant
information
for
the
four
counties
in
the
metropolitan
statistical
area
and
for
surround
ing
counties.
EPA
believes
that
the
nonattainment
area
should
include
Rock
Island
County
in
Illinois.
Rock
Island
County
has
moderate
emissions
that
commonly
are
blown
toward
the
violating
monitor
is
Scott
County.
We
also
believe
that
sufficient
commuting
occurs
between
Rock
Island
County
and
Scott
County
that
Rock
Island
County
must
be
considered
an
integral
part
of
the
Davenport
area.
EPA
recognizes
that
emissions
in
close
proximity
to
the
monitor
may
make
an
important
contribution
to
the
violations.
Indeed,
EPA
recognizes
the
possibility
that
reduction
of
the
emissions
close
to
the
monitor
may
suffice
to
address
the
violation.
Nevertheless,
our
obligation
under
Clean
Air
Act
section
107
in
defining
a
non
attainment
area
is
to
identifY
the
area
that
is
violating
the
standard
and
the
area
that
is
contributing
to
the
violation.
The
area
that
contributes
to
the
violation
is
then
included
in
the
planning
area
evaluated
for
measures
for
attaining
the
standard.
Even
if
the
state
already
suspects
that
its
control
strategy
will
focus
on
sources
in
the
immediate
vicinity
of
the
violating
monitor,
EPA
must
apply
a
nonattainment
designation
to
the
entire
area
that
contributes
to
the
violation,
such
that
the
SIP
planning
will
address
the
entire
contributing
area.
Furthermore,
the
available
evidence
suggests
that
local
emissions
contribute
only
a
fraction
of
the
concentrations
in
Davenport.
A
much
larger
fraction
of
the
concentrations
in
Davenport
arise
from
emissions
farther
from
the
monitor.
EPA
believes
that
an
important
component
of
these
concentrations
arises
from
a
contribution
from
emissions
throughout
the
Quad
Cities
area.
While
the
impact
of
Rock
Island
County
appears
to
be
7
Electronic Filing - Received, Clerk's Office, October 1, 2008
* * * * * PCB 2009-021 * * * * *
nonattainment
area.
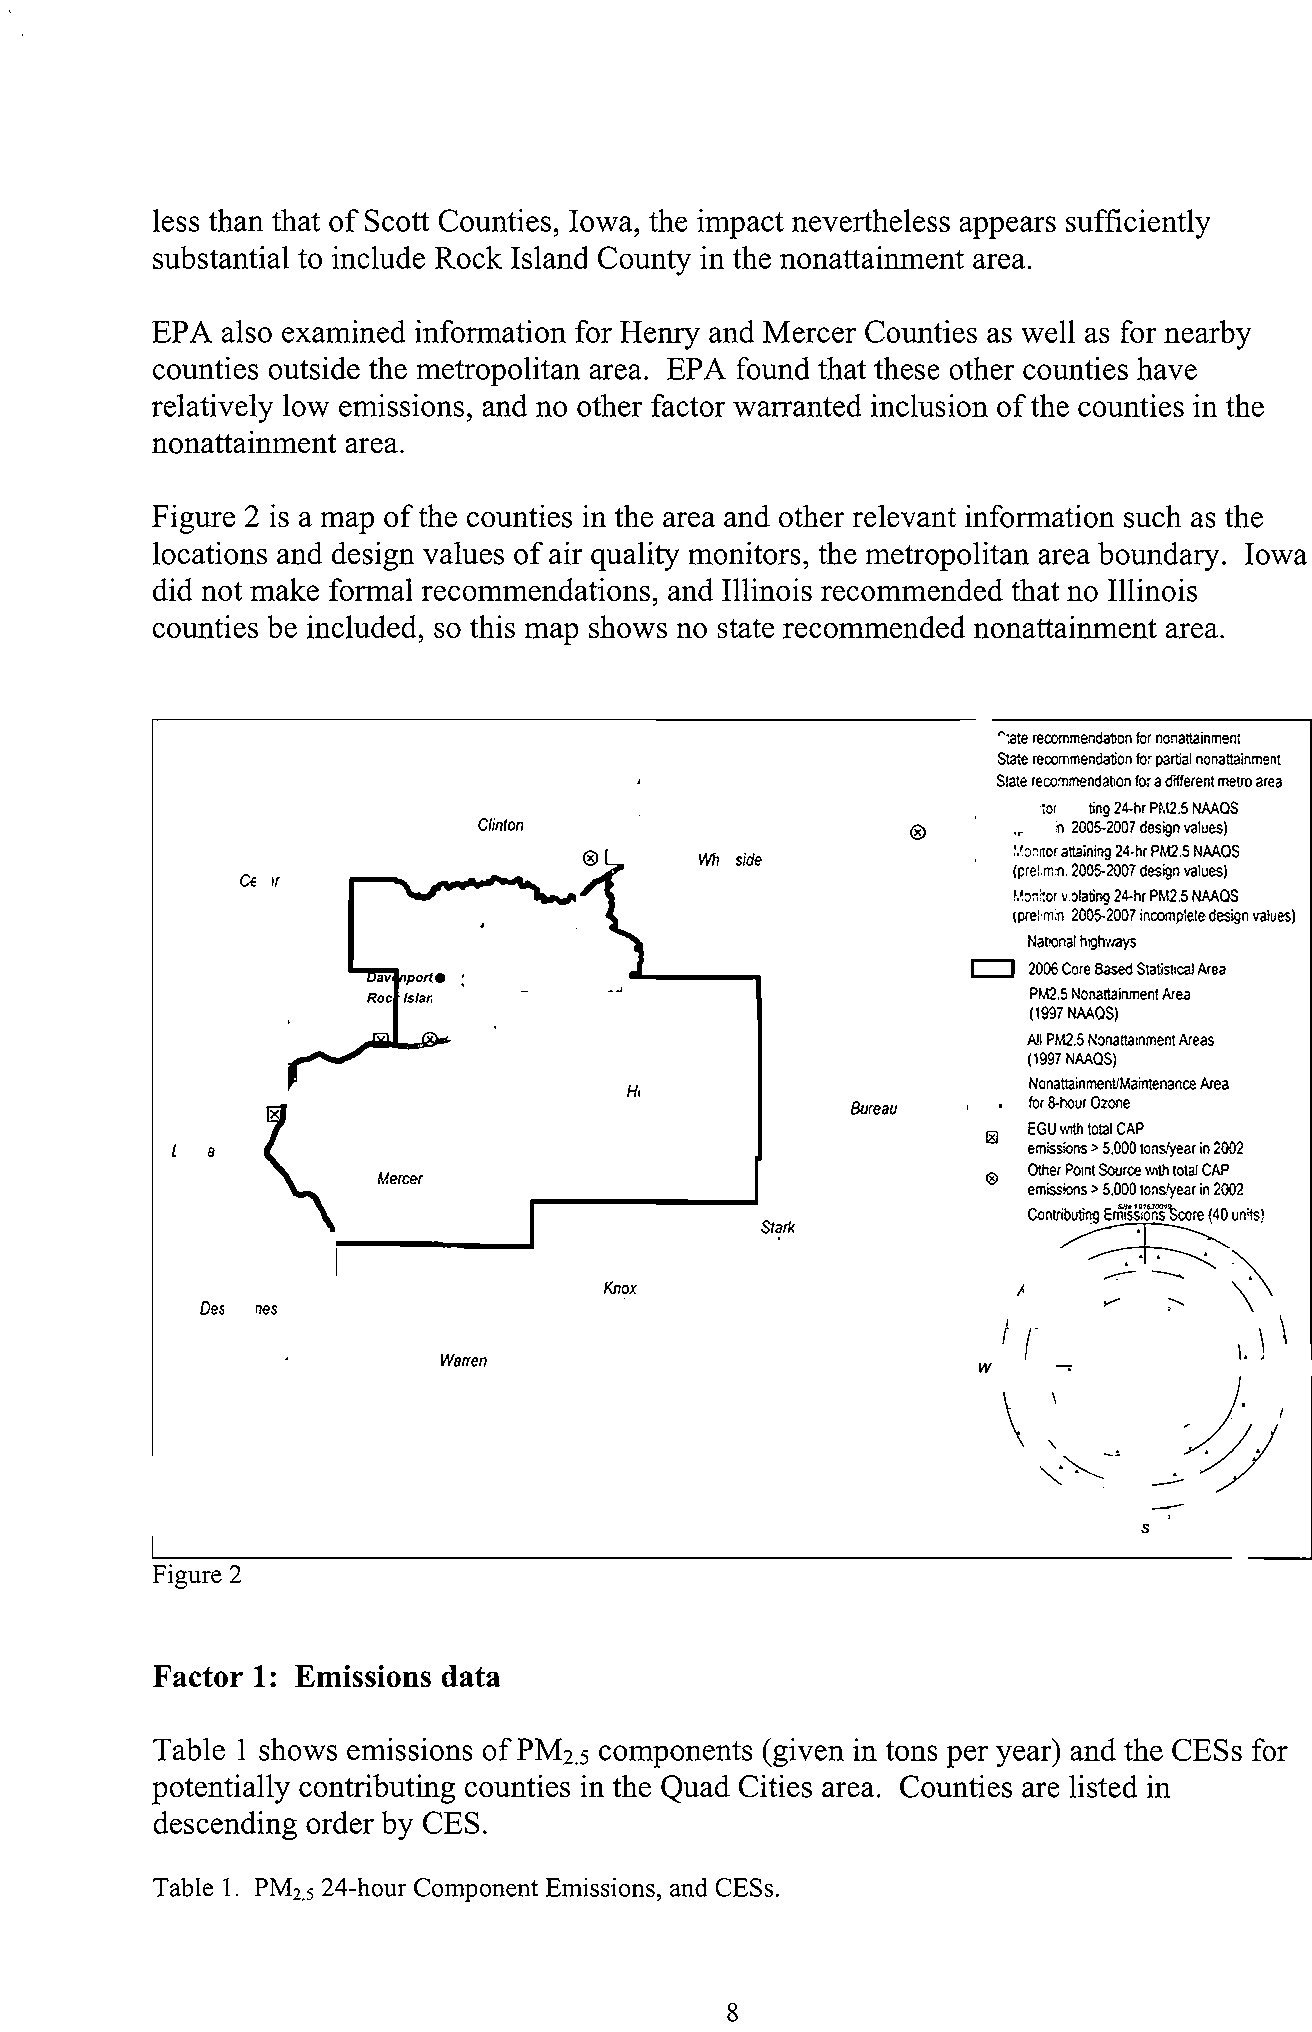
Figure
2
is
a
map
of
the
counties
in
the
area
and
other
relevant
information
such
as
the
locations
and
design
values
of
air
quality
monitors,
the
metropolitan
area
boundary.
Iowa
did
not
make
formal
recommendations,
and
Illinois
recommended
that
no
Illinois
counties
be
included,
so
this
map
shows
no
state
recommended
nonattainment
area
.
Iowa
~ar
Figure
2
Wa~en
"
Illinois
•
State
IE!CClfTIII'leOOlion
br
nonanainmeo1
EJ
Stale
~tioo
tor
partial
nonattaimnefll
Stale
rec:ornmend.alion
for
a
dflI'ereflt
metrO
aru
MoniIoI'
Yiola':ing
24.1'
...
PM2.5
NMOS
(preilTWl.
~2001
design
values)
Mon.101
attaining
24.hf
PM2.5
NMOS
(Pfelimil,
2005-2001
desgn
values)
Mon:101
vioIa:ing
24-hr
PM2.5
NMOS
(Pfeimrl
~2007
ioc:ompIete
design
values)
N<Ilion<IIhighways
c::::::J
2006
Core
Baseij
Stmtical
Afeil
~
PM2.5
Nonanairunenl
fvea
(1997
NMOS)
_
All
PM2.S
Nona!lainmenl
Areas
(1997
NMOS)
r+--I
NonanainmenllMalrtenance
Area
~
for
8-hour
O:one
l8J
EGUwlthlOOllW
emissilns
>
5.000
Ionslyear
in
2002
@
Other
Point
SCuce
with
total
CAP
emissOls>
5,000
tonslyear
in
2002
-
ContribWng
emr"sS'&lsteore
(40
units)
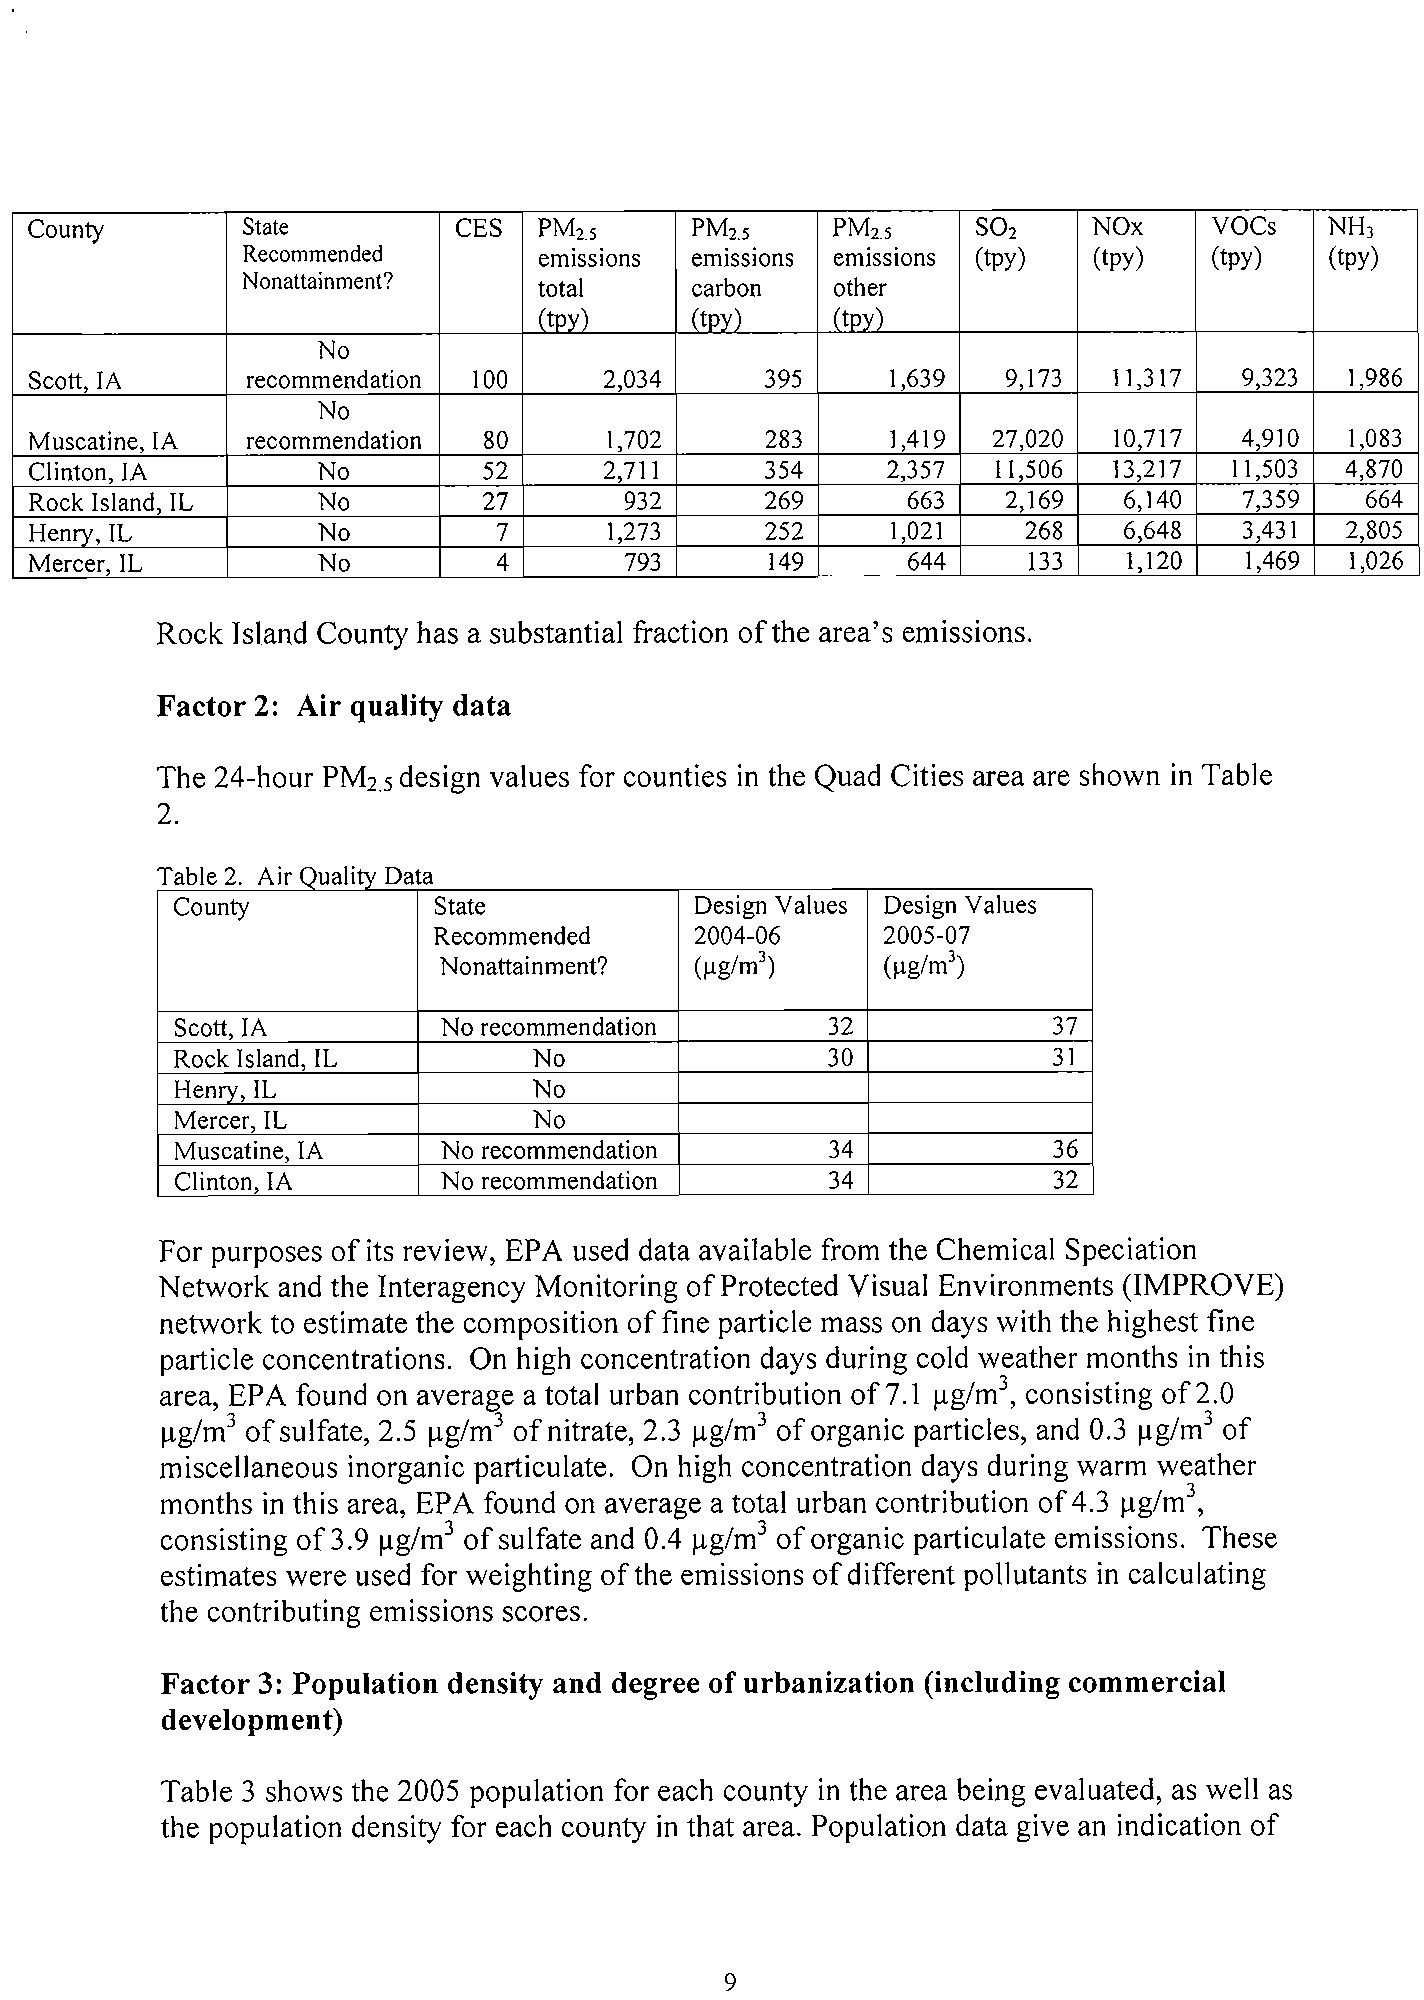
Factor
1:
Emissions
data
Table
1
shows
emissions
of
PM
2
.
5
components
(given
in
tons
per
year)
and
the
CESs
for
potentially
contributing
counties
in
the
Quad
Cities
area.
Counties
are
listed
in
descending
order
by
CES.
Table
I.
PM,.,
24-hour
Component
Emissions,
and
CESs.
8
Electronic Filing - Received, Clerk's Office, October 1, 2008
* * * * * PCB 2009-021 * * * * *
Clinton,IA
No
52
2,711
354
2,357
11,506
13,217
11,503
4,870
Rock
Island,
IL
No
27
932
269
663
2,169
6,140
7,359
664
Hemv,IL
No
7
1,273
252
1,021
268
6,648
3,431
2,805
Mercer,IL
No
4
793
149
644
133
1,120
1,469
1,026
Rock
Island
County
has
a
substantial
fraction
of
the
area's
emissions.
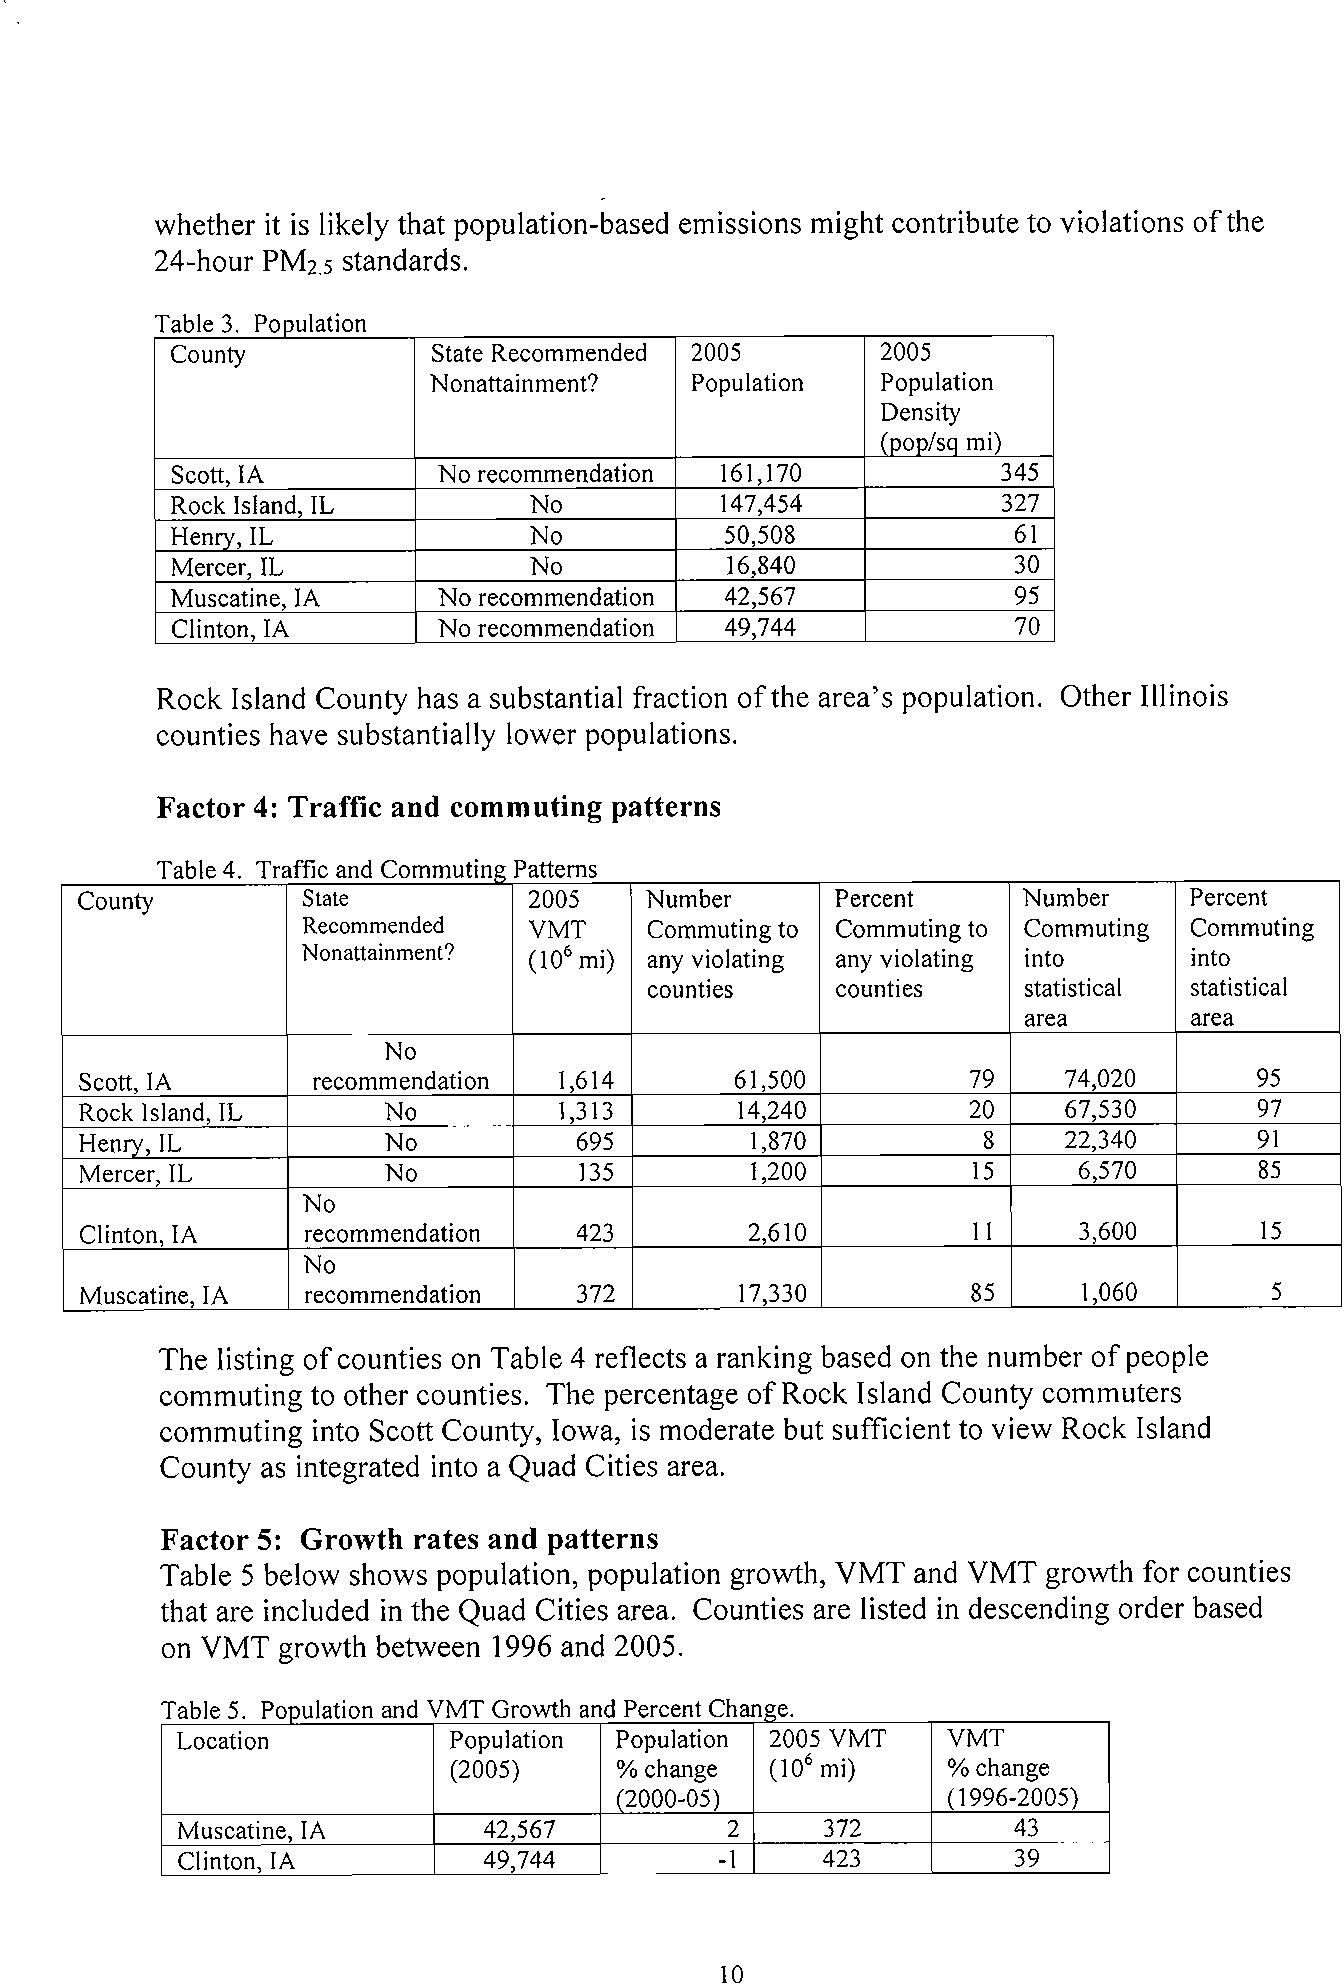
Factor
2:
Air
quality
data
The
24-hour
PM
2
.
5
design
values
for
counties
in
the
Quad
Cities
area
are
shown
in
Table
2.
Table
2.
Air
Ouality
Data
County
State
Design
Values
Design
Values
Recommended
2004-06
2005-07
Nonattainment?
(~g/m])
(~g/m])
Scott,IA
No
recommendation
32
37
Rock
Island
IL
No
30
31
Henry,IL
No
Mercer
IL
No
Muscatine,
IA
No
recommendation
34
36
Clinton,
IA
No
recommendation
34
32
For
purposes
of
its
review,
EPA
used
data
available
from
the
Chemical
Speciation
Network
and
the
Interagency
Monitoring
of
Protected
Visual
Environments
(IMPROVE)
network
to
estimate
the
composition
of
fine
particle
mass
on
days
with
the
highest
fine
particle
concentrations.
On
high
concentration
days
during
cold
weather
months
in
this
area,
EPA
found
on
average
a
total
urban
contribution
of7.1
/lg/m
3
,
consisting
of2.0
/lg/m
3
of
sulfate,
2.5
/lglm
3
of
nitrate,
2.3
/lglm
3
of
organic
particles,
and
0.3
/lglm
3
of
miscellaneous
inorganic
particulate.
On
high
concentration
days
during
warm
weather
months
in
this
area,EPA
found
on
average
a
total
urban
contribution
of4.3
/lglm
3
,
consisting
of3.9
/lglm
3
of
sulfate
and
0.4
/lglm
3
of
organic
particulate
emissions.
These
estimates
were
used
for
weighting
of
the
emissions
of
different
pollutants
in
calculating
the
contributing
emissions
scores.
Factor
3:
Population
density
and
degree
of
urbanization
(including
commercial
development)
Table
3
shows
the
2005
population
for
each
county
in
the
area
being
evaluated,
as
well
as
the
population
density
for
each
county
in
that
area.
Population
data
give
an
indication
of
9
Electronic Filing - Received, Clerk's Office, October 1, 2008
* * * * * PCB 2009-021 * * * * *
Density
(pop!sq
mil
Scott,IA
No
recommendation
161,170
345
Rock
Island
1L
No
147,454
327
Henrv,lL
No
50508
61
Mercer,IL
No
16,840
30
Muscatine,
IA
No
recommendation
42,567
95
Clinton,lA
No
recommendation
49,744
70
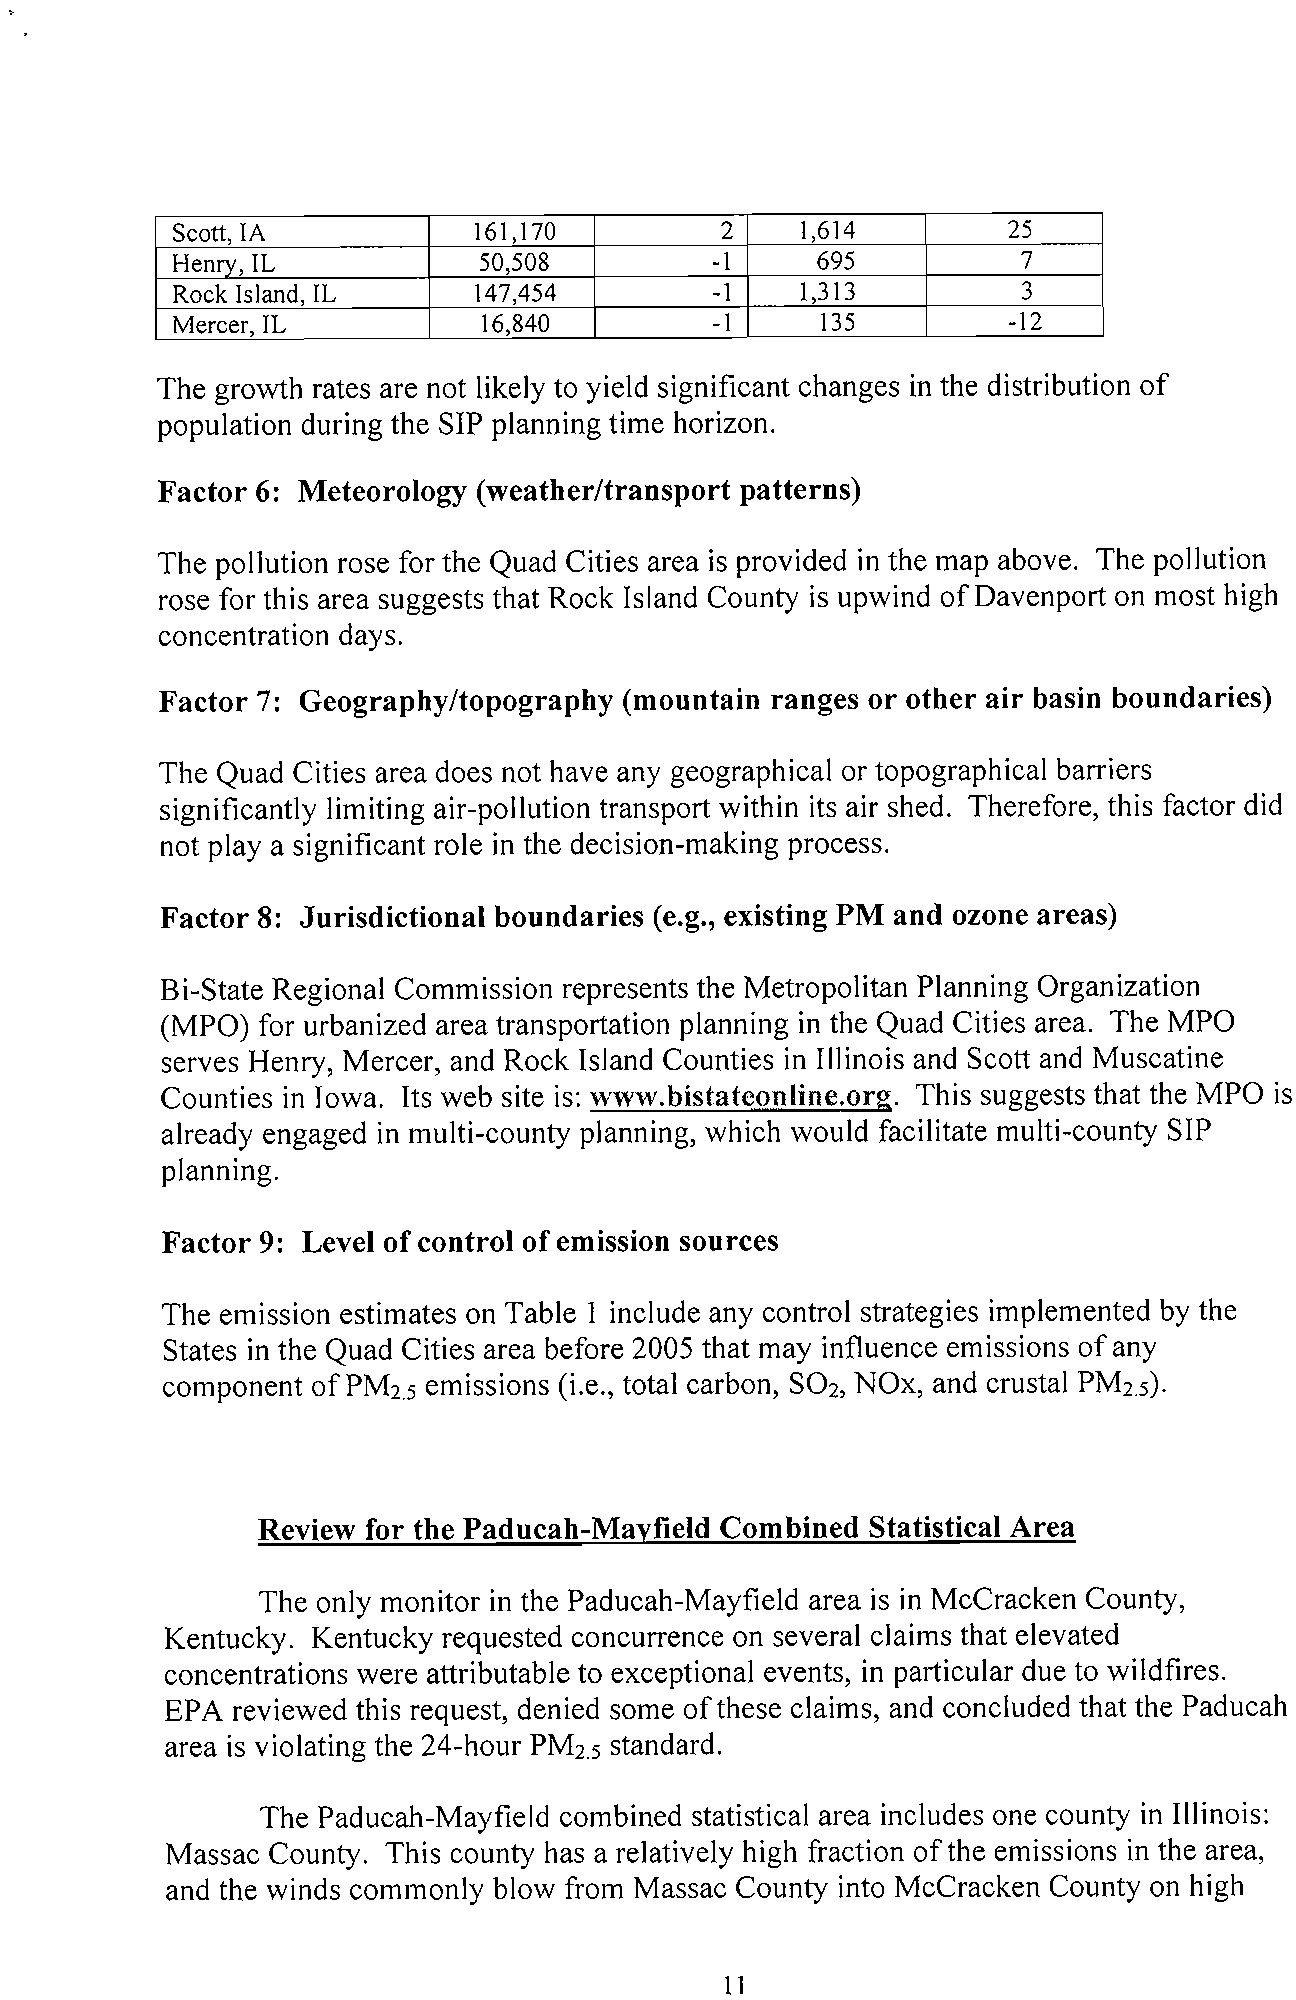
Rock
Island
County
has
a
substantial
fraction
of
the
area's
population.
Other
Illinois
counties
have
substantially
lower
populations.
Factor
4:
Traffic
and
commuting
patterns
Table
4.
Traffic
and
Commuting
Patterns
County
State
2005
Number
Percent
Number
Percent
Recommended
YMT
Commuting
to
Commuting
to
Commuting
Commuting
Nonattainmenl?
(10'
mil
any
violating
any
violating
into
into
counties
counties
statistical
statistical
area
area
No
Scott,
IA
recommendation
1614
61500
79
74020
95
Rock
Island
IL
No
1,313
14,240
20
67530
97
Henrv,lL
No
695
1,870
8
22,340
91
Mercer,lL
No
135
1,200
15
6,570
85
No
C1inton,IA
recommendation
423
2610
II
3600
15
No
Muscatine,
fA
recommendation
372
17,330
85
1,060
5
The
listing
of
counties
on
Table
4
reflects
a
ranking
based
on
the
number
of
people
commuting
to
other
counties.
The
percentage
of
Rock
Island
County
commuters
commuting
into
Scott
County,
Iowa,
is
moderate
but
sufficient
to
view
Rock
Island
County
as
integrated
into
a
Quad
Cities
area.
Factor
5:
Growth
rates
and
patterns
Table
5
below
shows
population,
population
growth,
YMT
and
YMT
growth
for
counties
that
are
included
in
the
Quad
Cities
area.
Counties
are
listed
in
descending
order
based
on
YMT
growth
between
1996
and
2005.
Table
5.
population
and
YMT
Growth
and
Percent
Change.
Location
Population
Population
2005
YMT
YMT
(2005)
%
change
(10'
mil
%
change
(2000-051
(1996-20051
Muscatine
fA
42567
2
372
43
Clinton,lA
49,744
-I
423
39
10
Electronic Filing - Received, Clerk's Office, October 1, 2008
* * * * * PCB 2009-021 * * * * *
Factor
6:
Meteorology
(weather/transport
patterns)
The
pollution
rose
for
the
Quad
Cities
area
is
provided
in
the
map
above.
The
pollution
rose
for
this
area
suggests
that
Rock
Island
County
is
upwind
of
Davenport
on
most
high
concentration
days.
Factor
7:
Geography/topography
(mountain
ranges
or
other
air
basin
boundaries)
The
Quad
Cities
area
does
not
have
any
geographical
or
topographical
barriers
significantly
limiting
air-pollution
transport
within
its
air
shed.
Therefore,
this
factor
did
not
playa
significant
role
in
the
decision-making
process.
Factor
8:
Jurisdictional
boundaries
(e.g.,
existing
PM
and
ozone
areas)
Bi-State
Regional
Commission
represents
the
Metropolitan
Planning
Organization
(MPO)
for
urbanized
area
transportation
planning
in
the
Quad
Cities
area.
The
MPO
serves
Henry,
Mercer,
and
Rock
Island
Counties
in
Illinois
and
Scott
and
Muscatine
Counties
in
Iowa.
Its
web
site
is:
www.bistateonline.org.This
suggests
that
the
MPO
is
already
engaged
in
multi-county
planning,
which
would
facilitate
multi-county
SIP
planning.
Factor
9:
Level
of
control
of
emission
sources
The
emission
estimates
on
Table
I
include
any
control
strategies
implemented
by
the
States
in
the
Quad
Cities
area
before
2005
that
may
influence
emissions
of
any
component
ofPM
25
emissions
(i.e.,
total
carbon,
S02,
NOx,
and
crustal
PM
2s
).
Review
for
the
Paducah-Mayfield
Combined
Statistical
Area
The
only
monitor
in
the
Paducah-Mayfield
area
is
in
McCracken
County,
Kentucky.
Kentucky
requested
concurrence
on
several
claims
that
elevated
concentrations
were
attributable
to
exceptional
events,
in
particular
due
to
wildfires.
EPA
reviewed
this
request,
denied
some
of
these
claims,
and
concluded
that
the
Paducah
area
is
violating
the
24-hour
PM2.s
standard.
The
Paducah-Mayfield
combined
statistical
area
includes
one
county
in
Illinois:
Massac
County.
This
county
has
a
relatively
high
fraction
of
the
emissions
in
the
area,
and
the
winds
commonly
blow
from
Massac
County
into
McCracken
County
on
high
11
Electronic Filing - Received, Clerk's Office, October 1, 2008
* * * * * PCB 2009-021 * * * * *
that
this
information
may
not
be
reflected
in
this
analysis.
EPA
will
consider
additional
information
on
emission
controls
in
making
final
designation
decisions.
In
cases
where
specific
plants
already
have
installed
emissioncontrols
or
plan
to
install
such
controls
in
the
near
future,
EPA
requests
additional
information
on:
-
the
plant
name,
city,
county,
and
township
-
identification
of
emission
units
at
the
plant,
fuel
use,
and
megawatt
capacity
-
identification
of
emission
units
on
which
controls
will
be
installed,
and
units
on
which
controls
will
not
be
installed
-
identification
of
the
type
of
emission
control
that
has
been
or
will
be
installed
on
each
unit,
the
date
on
which
the
control
device
became
/
will
become
operational,
and
the
emission
reduction
efficiency
ofthe
control
device
-
the
estimated
pollutant
emissions
for
each
unit
before
and
after
implementation
of
emission
controls
-
whether
the
requirement
to
operate
the
emission
control
device
will
be
federally
enforceable
by
December
2008,
and
the
instrument
by
which
federal
enforceability
will
be
ensured
(e.g.
through
source-specific
SIP
revision,
operating
permit
requirement,
consent
decree)
In
the
designation
process
for
the
1997
PM2.5
standards,
in
some
cases
EPA
identified
a
nearby
county
as
contributing
to
a
violating
monitor,
and
it
was
determined
that
a
very
high
percentage
of
the
county's
emissions
came
from
a
large
power
plant.
In
certain
cases,
EPA
concluded
that
only
the
portion
of
the
county
including
the
source
with
the
contributing
emissions
needed
to
be
designated
as
nonattainment.
If
Illinois
believes
that
a
similar
situation
exists
for
Massac
County,
the
State
should
provide
EPA
the
necessary
information
to
demonstrate
that
the
source
dominates
the
overall
county
emissions
and
to
identify
a
reasonable
partial
county
boundary.
In
its
designations
for
the
1997
standards,
EPA
included
portions
of
counties
in
a
number
of
cases
in
which
large
sources
dominated
the
emissions
from
the
county,
such
that
EPA
concluded
that
the
relevant
portion
of
the
county
was
the
only
portion
of
the
county
that
contributed
to
the
violations.
If
Illinois
believes
this
is
the
case
in
Massac
County,
for
example
if
Illinois
believes
that
only
a
single
township
containing
the
Joppa
Steam
plant
contributes
to
violations
in
Paducah,
Illinois
should
provide
the
information
necessary
to
support
this
view.
EPA
also
examined
information
for
other
Illinois
counties
around
the
Paducah-
Mayfield
area.
These
other
counties
have
relatively
low
emissions,
and
no
other
factor
warrants
their
inclusion
in
the
Paducah-Mayfield
nonattainment
area.
12
Electronic Filing - Received, Clerk's Office, October 1, 2008
* * * * * PCB 2009-021 * * * * *
Missouri
"
Illinois
.......
Kentucky
~
""!"'"
""~
C"!'"
'>?'
""!!'"
r"ill
""'!'"
G,,_
.....
""""',
Tennessee
l!I~r~bparWi~
Sta:!
~Iora~
metroarta
MonO:lr
W::il¥.rg
24«
PUl.5
NAAOS
(p'eiTWI.
2lXlS-2001
cIesign
vakJes)
McInilDr
aIWWlg
2:.«
Pl.!2.5
AAo\QS
(pl'd1WI.
2lXlS-2007
de'sqI
vMIts)
Uonilor
'o'lClIattlg
244w
PU2.5
NMOS
(prei'nirL
2IXlS-2007
~
design
vales)
N
.....
-.,.
Cl
2O'lS
CorrQned
Stat:s:aI
Ate,
~
PM2.5
NonallWlmett
Alea
(1991
NMOS)
AI
PM2.S
NonattainmenI
AIm;
-
(1997NAAOS)
r+--i
NonatlaM'let\tJ'Mai'I1enanc:e
Area
""""---+-'
lor
a-n:u
<>tone
EGU
wi1110Ul
CAP
181
t/M$iOn$
;>
5.000
10Mtye~
in
2002
Ol!ler
Poill
Source
witllOlJI
CAP
\&I
en'lIS$IOI'lS
»
5.000
1MSfye3f
in
2002
-
ContmltJng
EmlssloM
SCOIe
liO
~
,
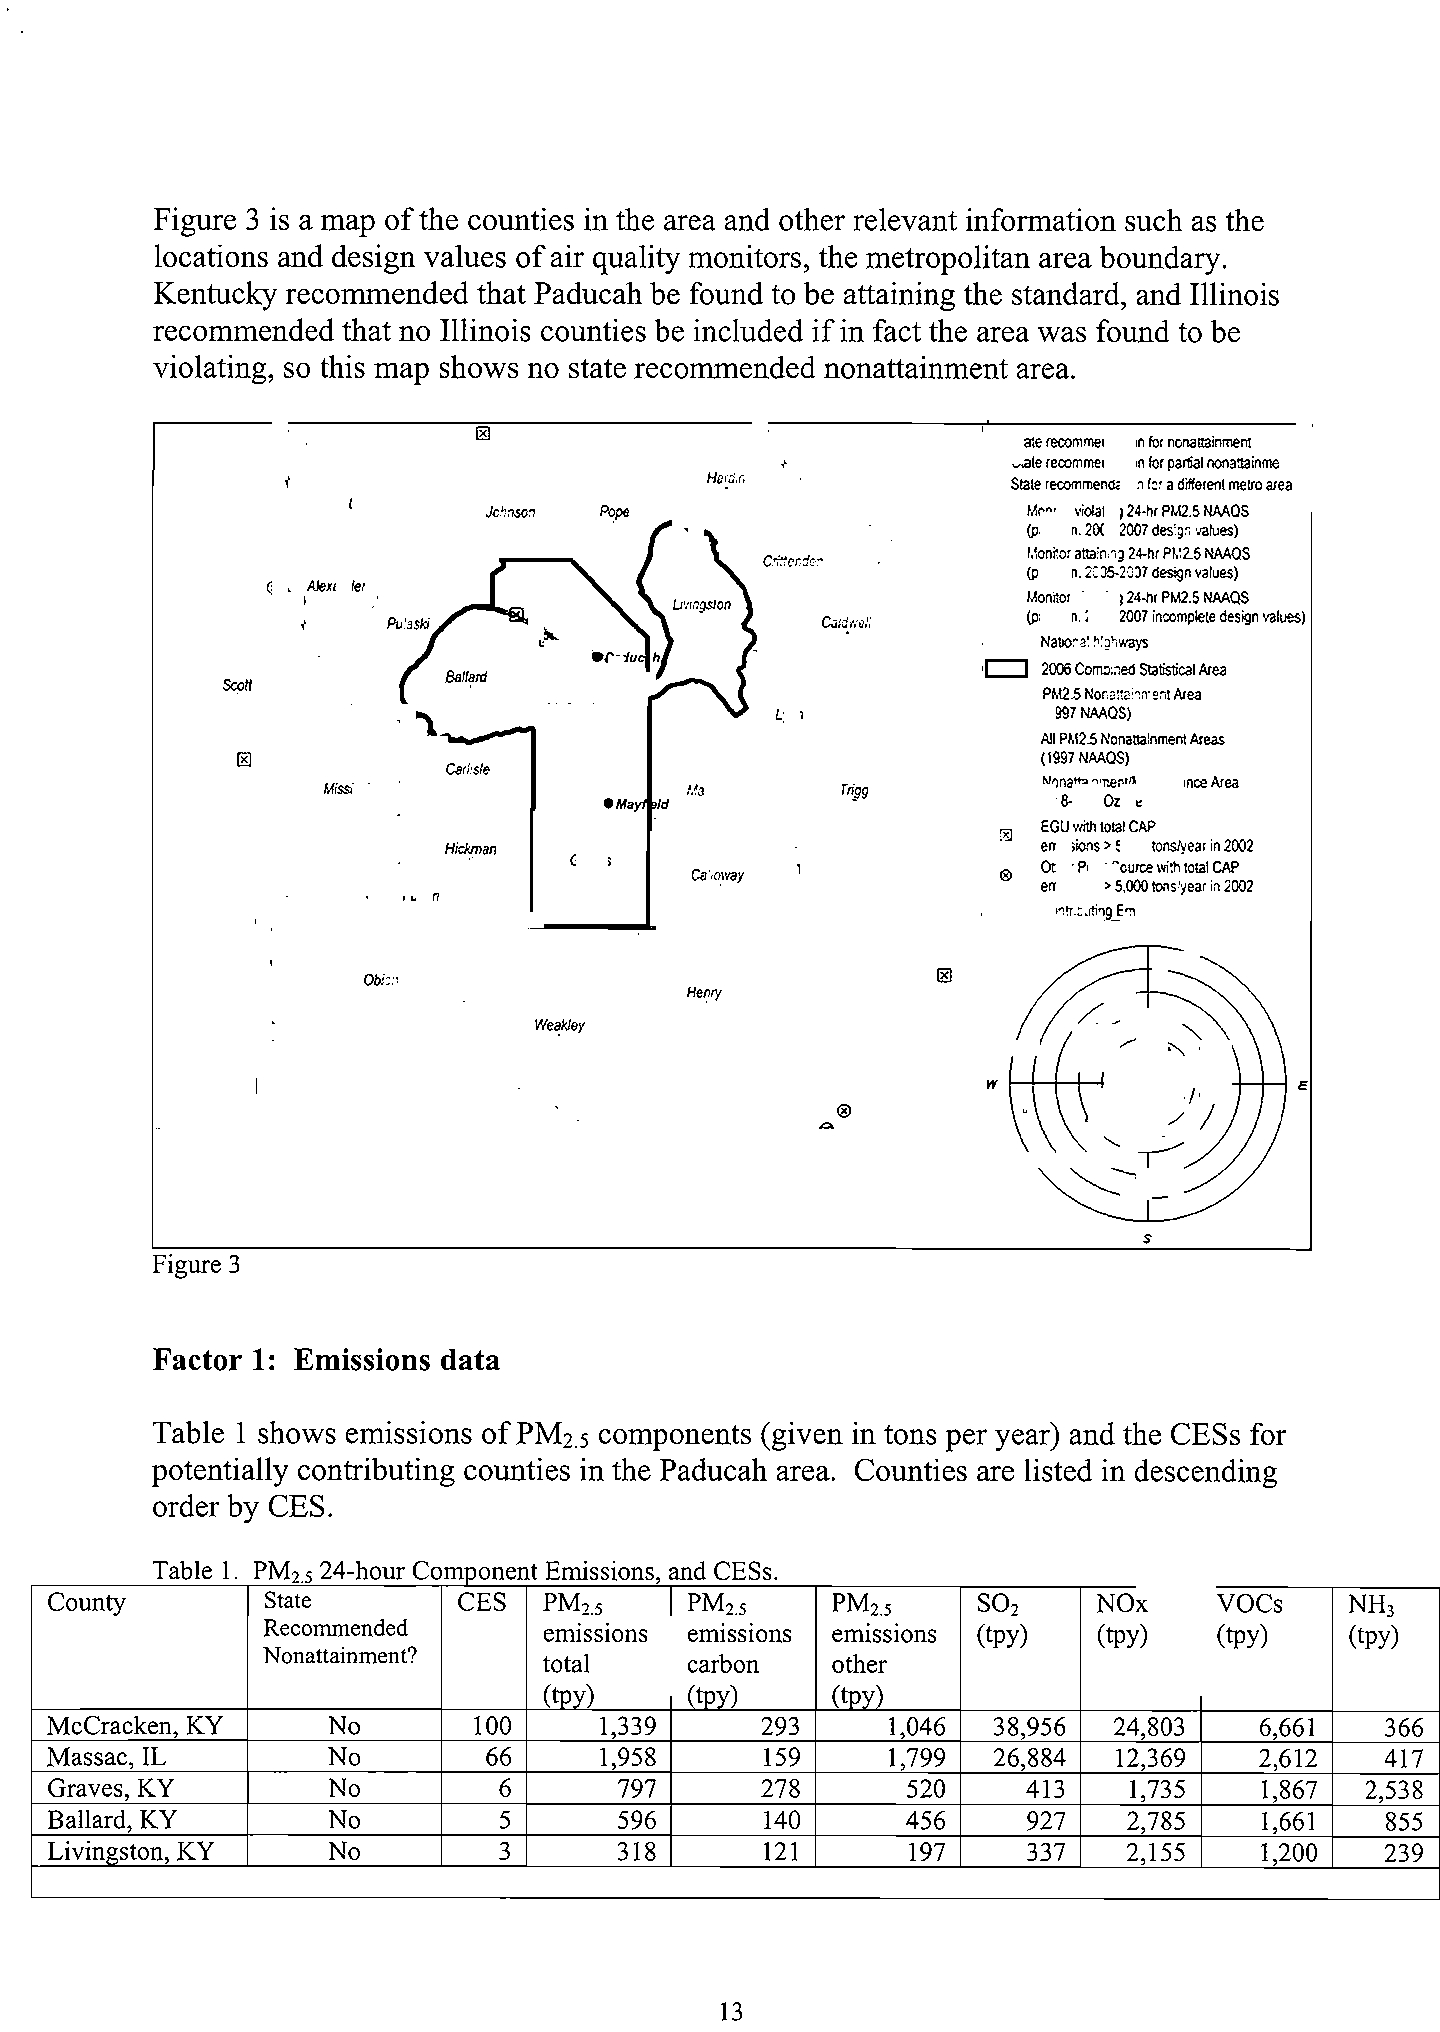
Figure
3
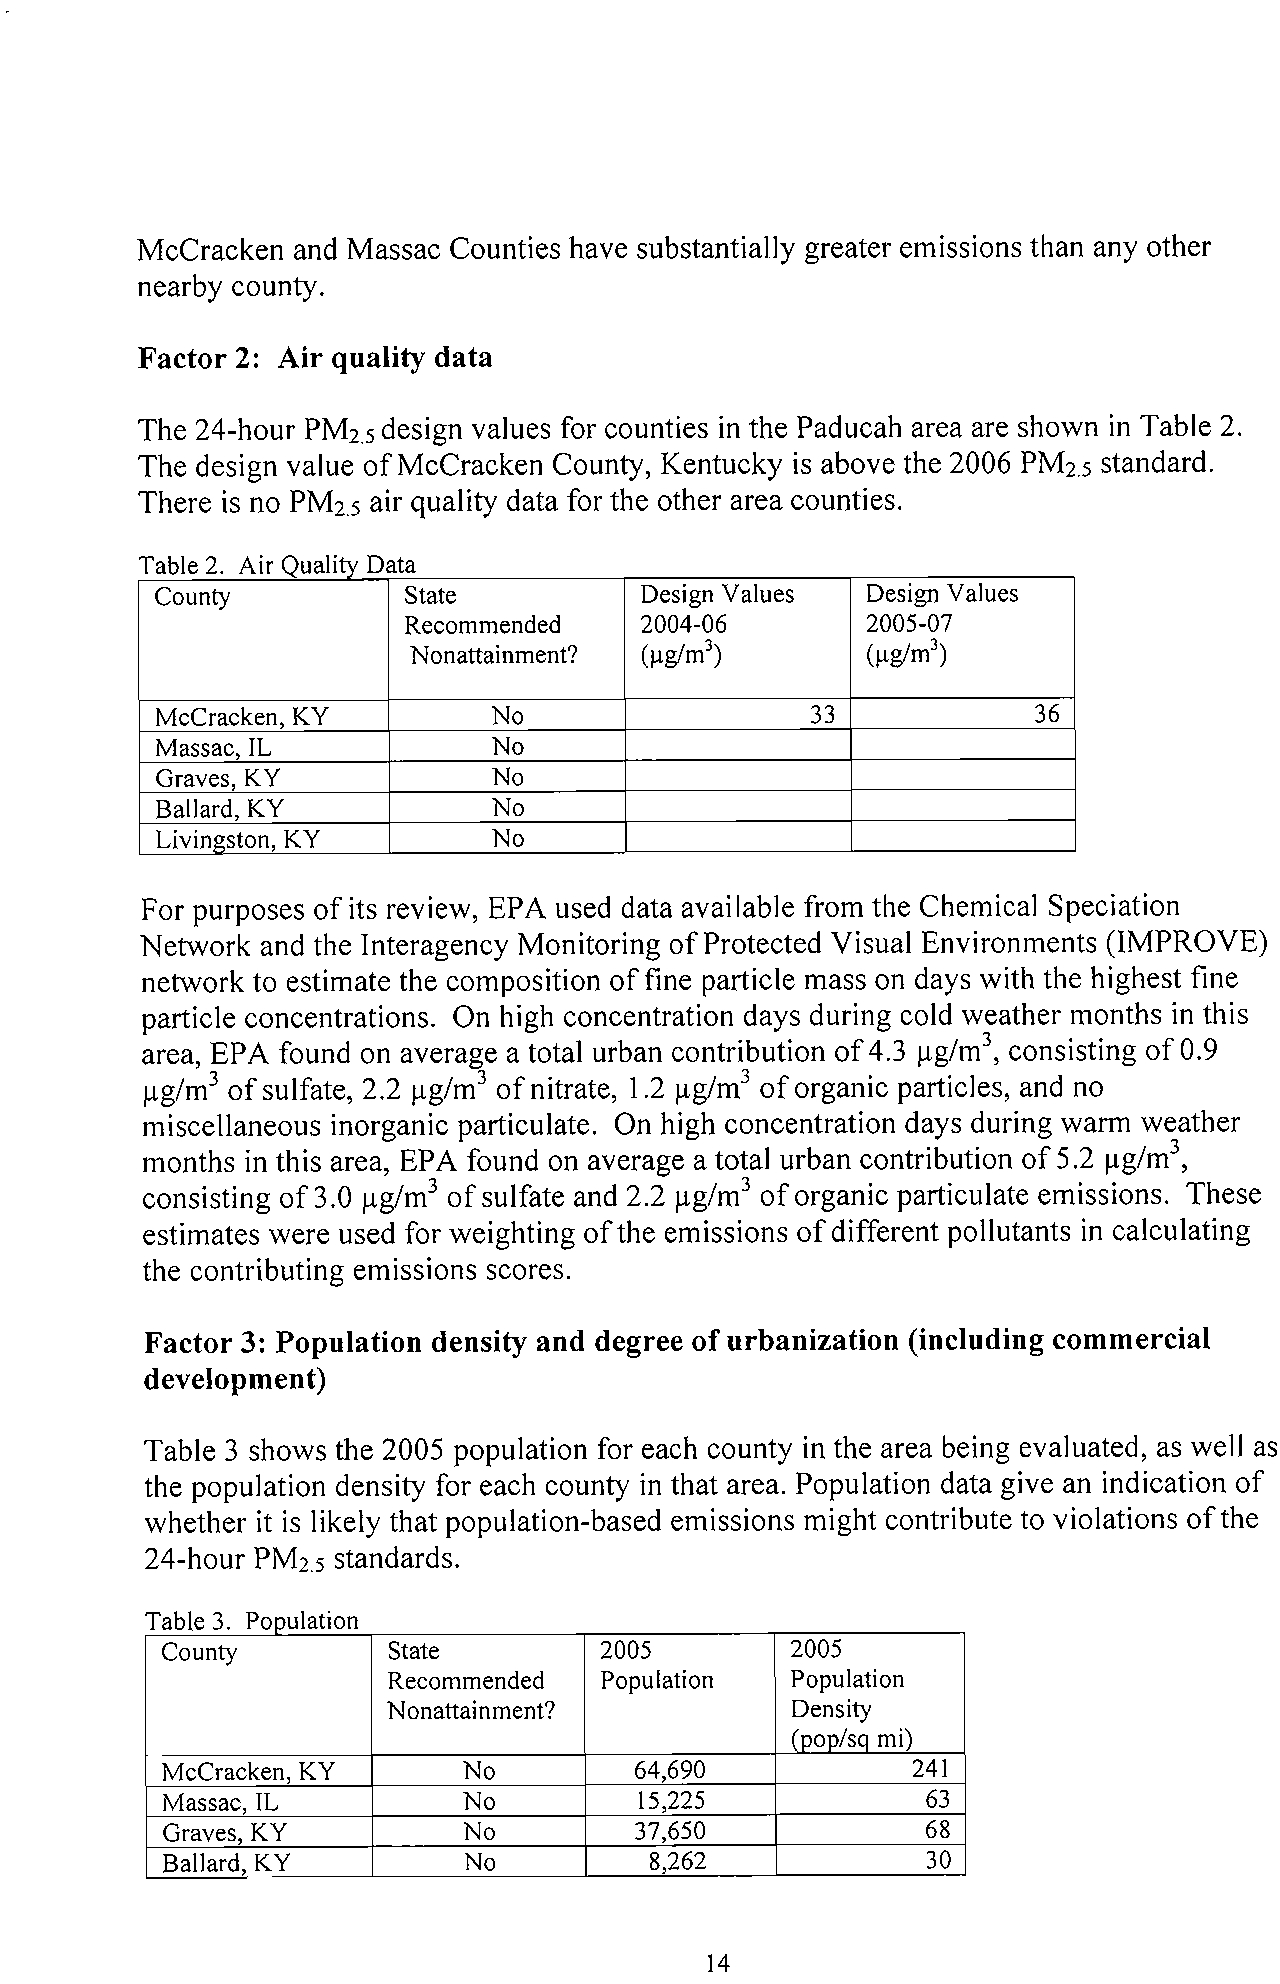
Factor
1:
Emissions
data
Table
I
shows
emissions
of
PM2.S
components
(given
in
tons
per
year)
and
the
CESs
for
potentially
contributing
counties
in
the
Paducah
area.
Counties
are
listed
in
descending
order
by
CES.
dCES
E.
T
bl
I
PM
24
h
C
ae
'.5
-
our
omponent
miSSions,
an
s.
County
State
CES
PM2.5
PM
2
.5
PM
25
SO,
NOx
VOCs
NH,
Recommended
emissions
emissions
emissions
(lpy)
(tpy)
(tpy)
(tpy)
Nonattainment?
total
carbon
other
(tov)
(tov)
(tov)
McCracken
KY
No
100
I
339
293
1,046
38,956
24803
6661
366
Massac
IL
No
66
1958
159
1,799
26,884
12,369
2,612
417
Graves
KY
No
6
797
278
520
413
1,735
1,867
2,538
Ballard,
KY
No
5
596
140
456
927
2,785
1,661
855
Livingston,
KY
No
3
318
121
197
337
2
155
1,200
239
13
Electronic Filing - Received, Clerk's Office, October 1, 2008
* * * * * PCB 2009-021 * * * * *
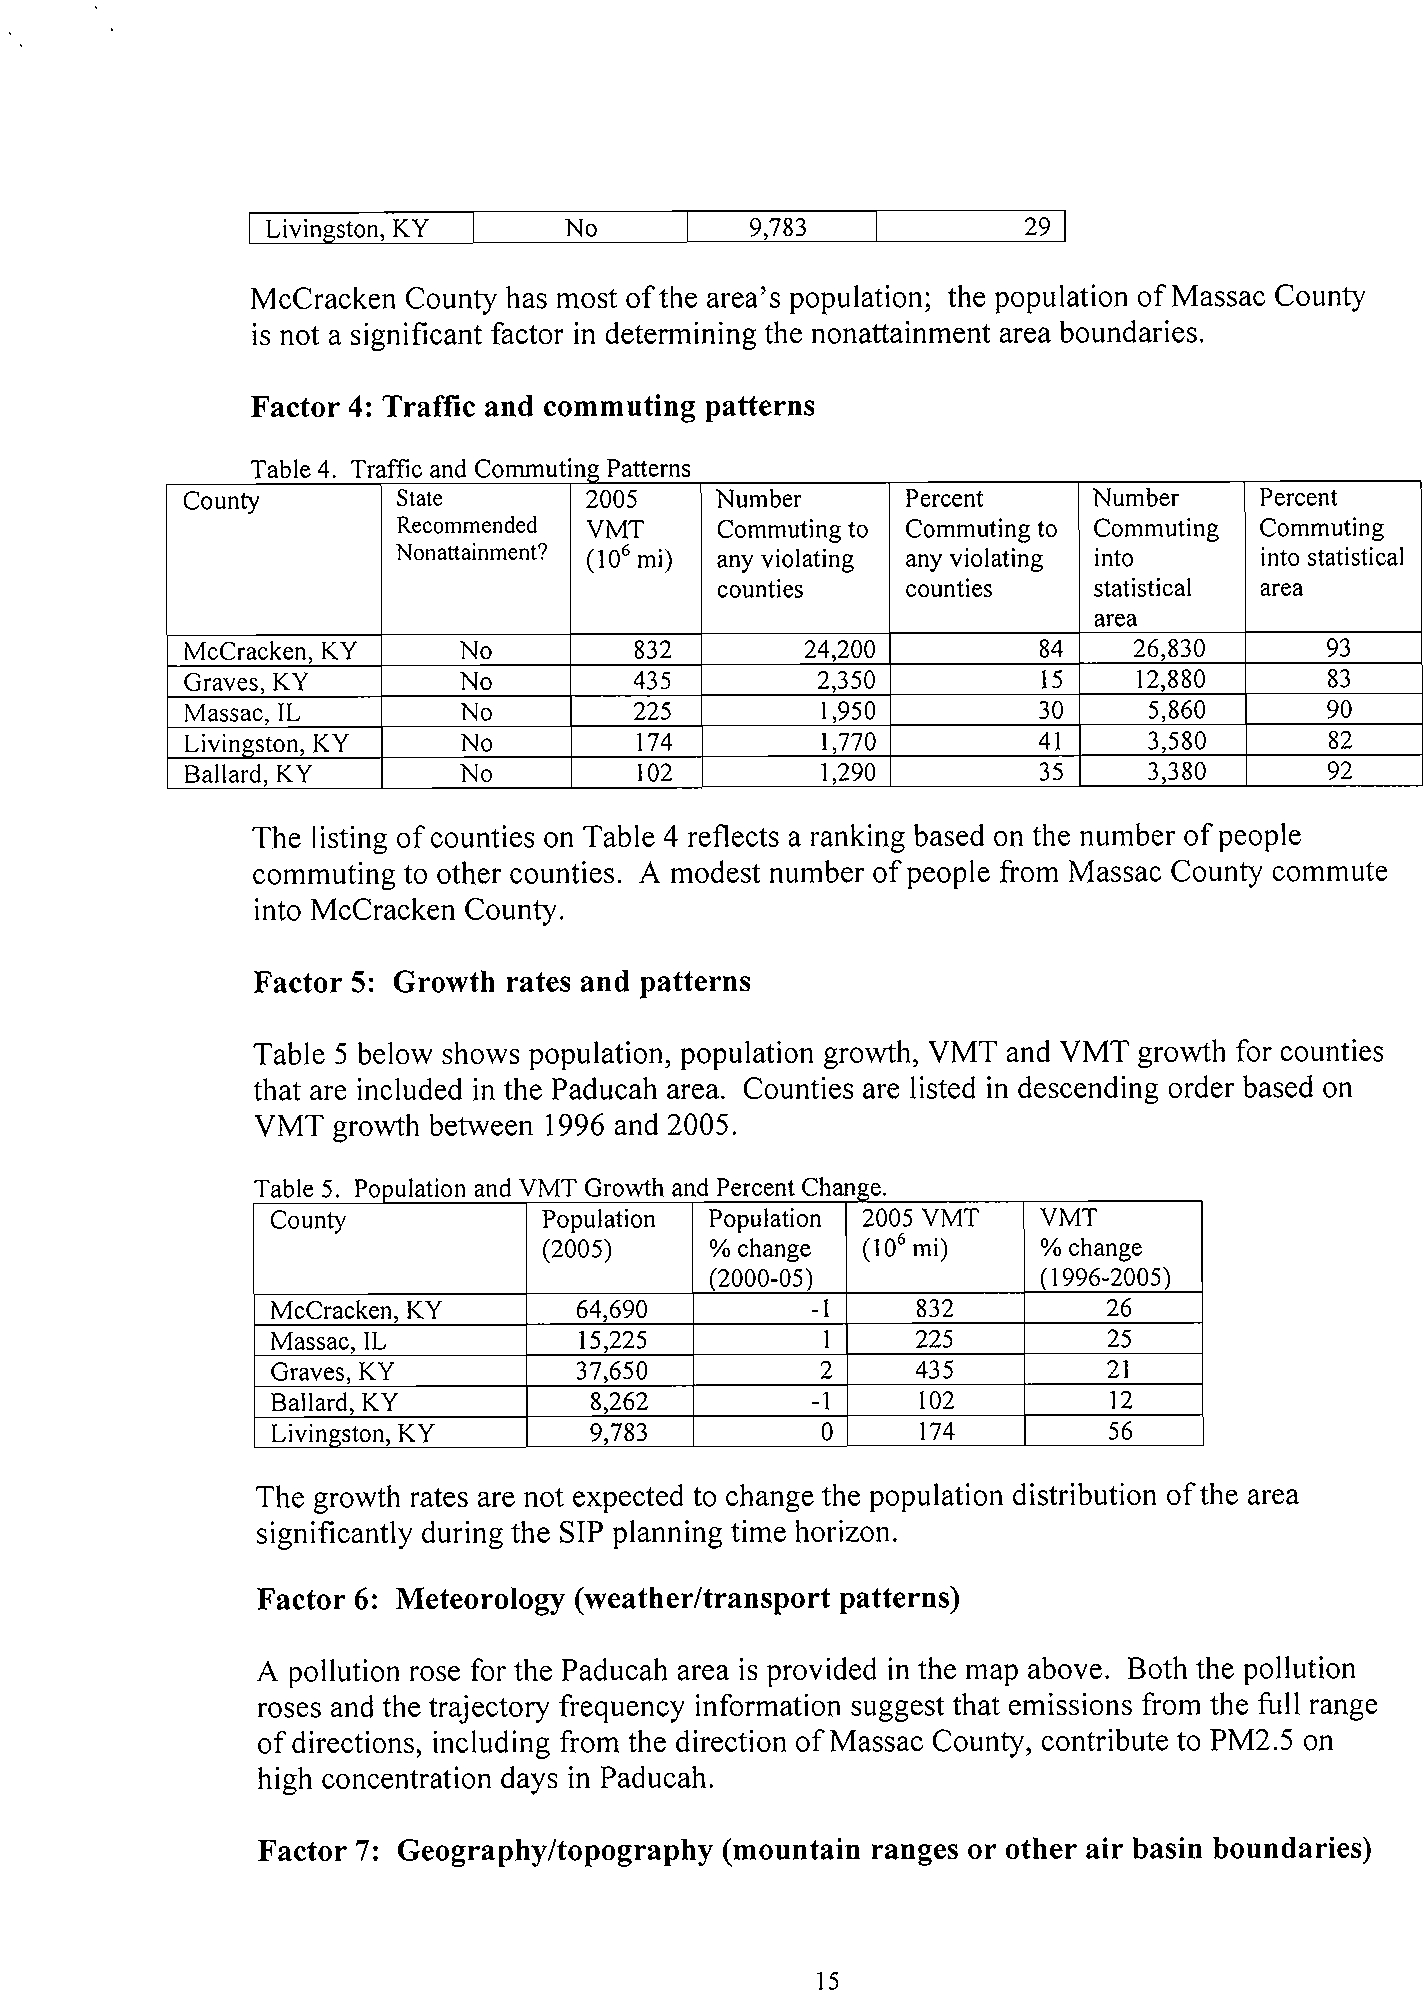
The
24-hour
PM
25
design
values
for
counties
in
the
Paducah
area
are
shown
in
Table
2.
The
design
value
of
McCracken
County,
Kentucky
is
above
the
2006
PM
25
standard.
There
is
no
PM
2
.
5
air
quality
data
for
the
other
area
counties.
Table
2.
Air
Quality
Data
County
State
Design
Values
Design
Values
Recommended
2004-06
2005-07
Nonattainment?
(~g1ml)
(~g1m])
McCracken,
KY
No
33
36
Massac
IL
No
Graves,
KY
No
Ballard,
KY
No
Livineston
KY
No
For
purposes
of
its
review,
EPA
used
data
available
from
the
Chemical
Speciation
Network
and
the
Interagency
Monitoring
of
Protected
Visual
Environments
(IMPROVE)
network
to
estimate
the
composition
offine
particle
mass
on
days
with
the
highest
fine
particle
concentrations.
On
high
concentration
days
during
cold
weather
months
in
this
area,
EPA
found
on
average
a
total
urban
contribution
of4.3
llg/m
3
,
consisting
of
0.9
llg/m
3
of
sulfate,
2.2
llg!m
3
of
nitrate,
1.2
llg/m
3
of
organic
particles,
and
no
miscellaneous
inorganic
particulate.
On
high
concentration
days
during
warm
weather
months
in
this
area,
EPA
found
on
average
a
total
urban
contribution
of5.2
llg!m
3
,
consisting
of3.0
llg!m
3
of
sulfate
and
2.211g!m
3
of
organic
particulate
emissions.
These
estimates
were
used
for
weighting
of
the
emissions
of
different
pollutants
in
calculating
the
contributing
emissions
scores.
Factor
3:
Population
density
and
degree
of
urbanization
(including
commercial
development)
Table
3
shows
the
2005
population
for
each
county
in
the
area
being
evaluated,
as
well
as
the
population
density
for
each
county
in
that
area.
Population
data
give
an
indication
of
whether
it
is
likely
that
population-based
emissions
might
contribute
to
violations
of
the
24-hour
PM2.5
standards.
Table
3.
Population
County
State
2005
2005
Recommended
Population
Population
Nonanainment?
Density
(pop/sq
mil
McCracken
KY
No
64,690
241
Massac,lL
No
15,225
63
Graves
KY
No
37,650
68
Ballard
KY
No
8,262
30
14
Electronic Filing - Received, Clerk's Office, October 1, 2008
* * * * * PCB 2009-021 * * * * *
P
ffi
dC
T
bl
a
e
4.
Tra
IC
an
ammutme:
attems
County
State
2005
Number
Percent
Number
Percent
Recommended
VMT
Commuting
to
Commuting
to
Commuting
Commuting
Nonattainment?
(10.
mil
any
violating
any
violating
into
into
statistical
counties
counties
statistical
area
area
McCracken,
KY
No
832
24,200
84
26,830
93
Graves,
KY
No
435
2,350
15
\2,880
83
Massac,IL
No
225
\,950
30
5,860
90
Livingston
KY
No
\74
\
770
4\
3,580
82
Ballard,
KY
No
\02
1290
35
3,380
92
The
listing
of
counties
on
Table
4
reflects
a
ranking
based
on
the
number
of
people
commuting
to
other
counties.
A
modest
number
of
people
from
Massac
County
commute
into
McCracken
County.
Factor
5:
Growth
rates
and
patterns
Table
5
below
shows
population,
population
growth,
YMT
and
YMT
growth
for
counties
that
are
included
in
the
Paducah
area.
Counties
are
listed
in
descending
order
based
on
YMT
growth
between
1996
and
2005.
Ch
h
dP
dVMTG
T
bl
5
PI'
ae.
oou
atlon
an
roW!
an
ercent
ane:e.
County
Population
Population
2005
VMT
VMT
(2005)
%
change
(10.
mil
%
change
(2000-05)
(1996-2005)
McCracken
KY
64,690
-\
832
26
Massac,IL
\5,225
I
225
25
Graves,
KY
37,650
2
435
2\
Ballard
KY
8,262
-1
102
\2
Livingston,
KY
9,783
0
174
56
The
growth
rates
are
not
expected
to
change
the
population
distribution
of
the
area
significantly
during
the
SIP
planning
time
horizon.
Factor
6:
Meteorology
(weather/transport
patterns)
A
pollution
rose
for
the
Paducah
area
is
provided
in
the
map
above.
Both
the
pollution
roses
and
the
trajectory
frequency
information
suggest
that
emissions
from
the
full
range
of
directions,
including
from
the
direction
of
Massac
County,
contribute
to
PM2.5
on
high
concentration
days
in
Paducah.
Factor
7:
Geography/topography
(mountain
ranges
or
other
air
basin
boundaries)
15
Electronic Filing - Received, Clerk's Office, October 1, 2008
* * * * * PCB 2009-021 * * * * *
The
Paducah
maintenance
area
from
its
former
one-hour
ozone
designation
was
comprised
of
Livingston
and
Marshall
Counties
in
Kentucky.
No
portion
oflllinois
was
in
the
Paducah
ozone
nonattainment
area.
Factor
9:
Level
of
control
of
emission
sources
The
emission
estimates
on
Table
I
include
any
control
strategies
implemented
by
the
States
in
the
Paducah
area
before
2005
that
may
influence
emissions
of
any
component
of
PM2.5
emissions
(i.e.,
total
carbon,
S02,
NOx,
and
crustal
PM
2
.5).
Review
for
the
Saint
Louis
Combined
Statistical
Area
Discussion:
EPA
reviewed
relevant
information
for
the
nine
counties
(including
four
counties
in
Illinois)
partly
or
fully
within
the
area
designated
nonattainment
for
the
1997
standards
as
well
as
for
surrounding
counties.
There
are
violating
monitors
in
Madison
County.
Illinois
recommended
a
definition
of
the
nonattainment
area
for
the
2006
standards
that
is
similar
to
the
boundaries
that
were
established
for
the
1997
standards,
including
Madison,
Monroe
and
St.
Clair
Counties
along
with
a
portion
of
Randolph
County.
Illinois
recommended
that
the
nonattainment
area
for
the
2006
standards
differ
from
the
nonattainment
area
for
the
1997
standards
by
the
exclusion
of
the
portion
of
Baldwin
Township
in
Randolph
County
that
is
west
of
the
Kaskaskia
River.
EPA
concurs
with
Illinois's
recommendation
to
include
Madison,
Monroe,
and
St.
Clair
Counties
in
the
St.
Louis
nonattainment
area.
However,
EPA
believes
that
all
of
Baldwin
Township
of
Randolph
County
should
be
included
as
well.
The
mostimportant
factor
influencing
this
judgment
is
the
factor
relating
to
jurisdictional
boundaries.
The
inclusion
of
a
full
township
will
make
nonattainment
requirements
easier
to
administer,
since
information
on
emissions
and
source
locations
are
more
readily
available
on
a
township
basis
than
with
respect
to
a
specially
defined
subset
of
the
township.
Furthermore,
EPA
believes
that
establishment
of
a
nonattainment
area
that
fully
matches
the
non
attainment
area
established
for
the
1997
standards
would
simplify
nonattainment
planning
by
assuring
that
identical
requirements
apply
for
an
identical
area.
At
the
same
time,
as
addressed
in
more
detail
in
our
documentation
of
our
designations
for
the
1997
standards,
Baldwin
Township
contains
almost
all
of
the
emissions
and
therefore
makes
almost
the
entirety
of
the
contribution
of
Randolph
County
to
the
violations,
so
that
a
designation
of
just
Baldwin
Township
as
nonattainment
will
suffice
to
address
the
contribution
of
this
portion
ofthe
area.
16
Electronic Filing - Received, Clerk's Office, October 1, 2008
* * * * * PCB 2009-021 * * * * *
effective
NOx
control
equipment.
EPA
welcomes
any
further
relevant
information
that
Illinois
may
have.
EPA
will
consider
additional
information
on
emission
controls
in
making
final
designation
decisions.
In
cases
where
specific
plants
already
have
installed
emission
controls
or
plan
to
install
such
controls
in
the
near
future,
EPA
requests
additional
information
on:
-
the
plant
name,
city,
county,
and
township
-
identification
of
emission
units
at
the
plant,
fuel
use,
and
megawatt
capacity
-
identification
of
emission
units
on
which
controls
will
be
installed,
and
units
on
which
controls
will
not
be
installed
-
identification
of
the
type
of
emission
control
that
has
been
or
will
be
installed
on
each
unit,
the
date
on
which
the
control
device
became
/
will
become
operational,
and
the
emission
reduction
efficiency
of
the
control
device
-
the
estimated
pollutant
emissions
for
each
unit
before
and
after
implementation
of
emissioncontrols
-
whether
the
requirement
to
operate
the
emission
control
device
will
be
federally
enforceable
by
December
2008,
and
the
instrument
by
which
federal
enforceability
will
be
ensured
(e.g.
through
source-specific
SIP
revision,
operating
permit
requirement,
consent
decree)
EPA
reviewed
the
relevant
information
for
other
counties
within
the
combined
statistical
area
as
well
as
counties
adjacent
to
the
combined
statistical
area
in
order
to
determine
the
appropriate
nonattainment
area.
Sangamon
County
has
moderate
emissions
but
is
rarely
upwind
on
days
with
elevated
24-hour
PM
2
.
5
concentrations.
Other
Illinois
counties
in
or
near
the
combined
statistical
area
have
relatively
low
emissions,
and
no
other
factor
warranted
inclusion
of
the
counties
in
the
nonattainment
area.
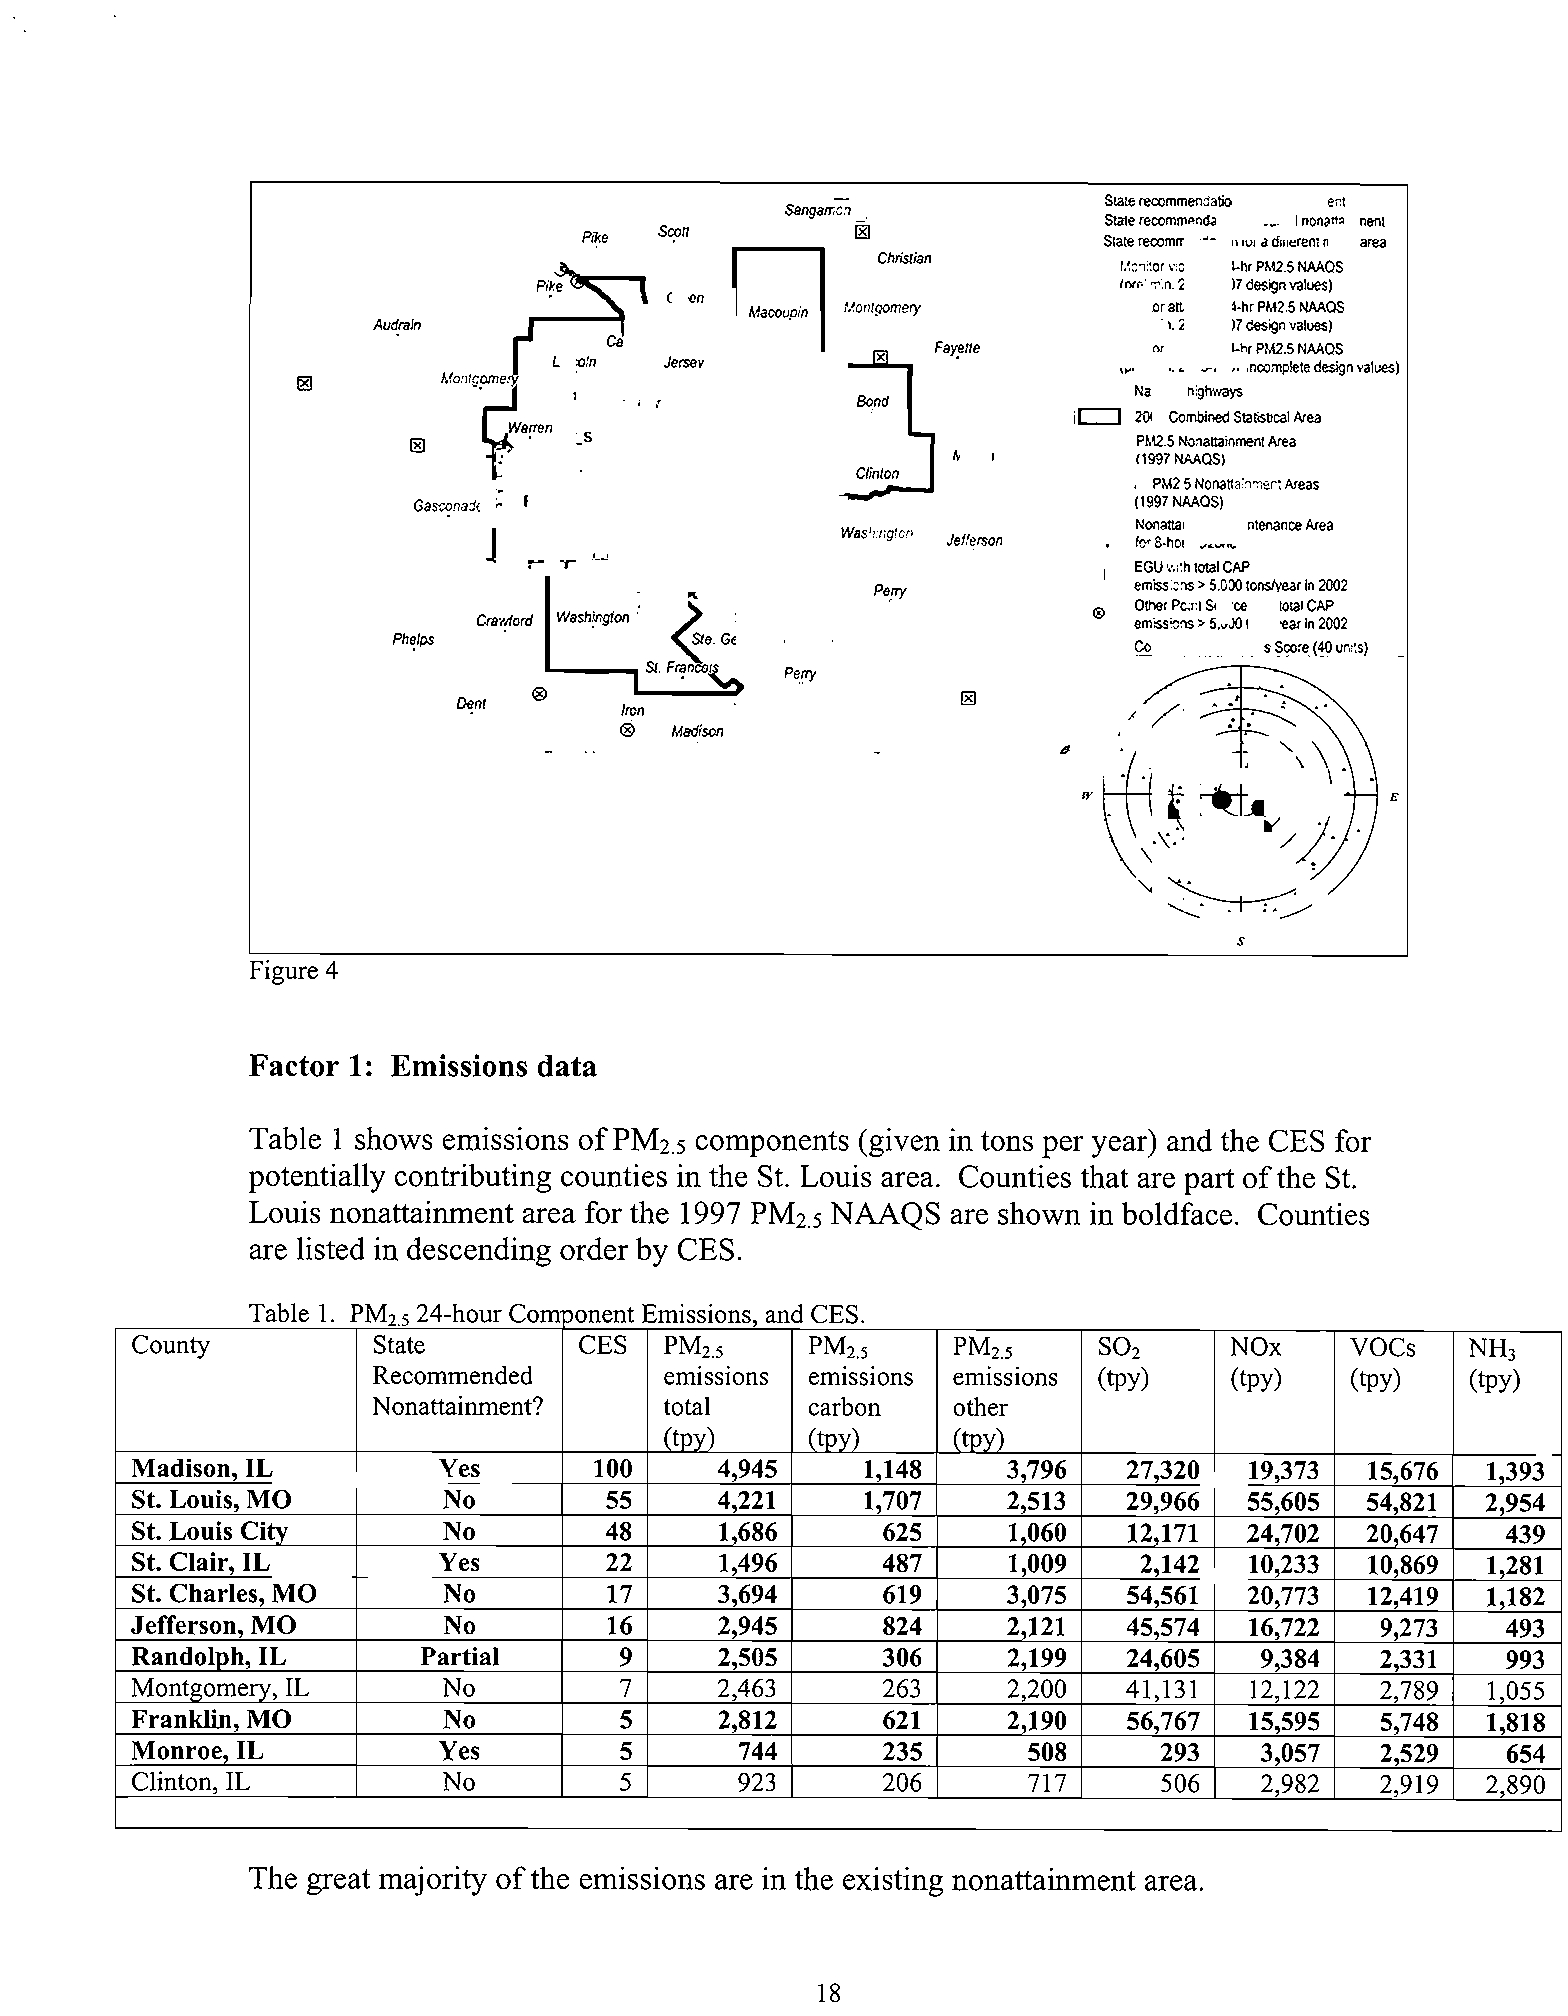
Figure
4
is
a
map
of
the
counties
in
the
area
and
other
relevant
information
such
as
the
locations
and
design
values
of
air
quality
monitors,
the
metropolitan
area
boundary,
and
the
counties
recommended
as
nonattainment
by
the
states.
17
Electronic Filing - Received, Clerk's Office, October 1, 2008
* * * * * PCB 2009-021 * * * * *
Missouri
.u
•
~
PLl2.S~Aru
(1997
NMOS)
AlPM2.S~""'US
-
(1iiI
NMOS)
o+--i---""
~
b'S-Nu0ZlN
EGUwil:tI_CAP
o
tmISSions
~
5.000
\CItlSIyNf
i'l2002
@
or...
Pont
Sourt:e
_IIQI
CAP
emissclns
>
5.000
IOlIS1)oHf
'"
2002
-
Col'Iriluting
Emissions
Scote
tlO
II'I!!J
..----,.,..--:'
.'
,
Figure
4
Factor
1:
Emissions
data
Table
1
shows
emissions
of
PM
2
.
5
components
(given
in
tons
per
year)
and
the
CES
for
potentially
contributing
counties
in
the
St.
Louis
area.
Counties
that
are
part
of
the
St.
Louis
nonattainment
area
for
the
1997
PM2.5
NAAQS
are
shown
in
boldface.
Counties
are
listed
in
descending
order
by
CES.
dCES
E
T
bl
I
PM
24
h
C
ae.
,.5
-
our
om
onent
miSSIons,
an
County
State
CES
PM,.5
PM
Z
.
5
PM
1
.
5
SO,
NOx
VOCs
NH,
Recommended
emissions
emissions
emISSIons
(tpy)
(tpy)
(tpy)
(tpy)
Nonattainment?
total
carbon
other
(toy)
(toy)
(toy)
Madison
IL
Yes
100
4945
1
148
3796
27320
19373
15676
1,393
St.
Louis
MO
No
55
4221
1,707
2513
29966
55605
54,821
2,954
St.
Louis
City
No
48
1686
625
1060
12171
24,702
20647
439
St.
Clair
IL
Yes
22
1496
487
1,009
2,142
10,233
10,869
1,281
St.
Charles,
MO
No
17
3,694
619
3,075
54
561
20773
12,419
1,182
Jefferson
MO
No
16
2945
824
2121
45574
16722
9273
493
RandolDh
IL
Partial
9
2505
306
2,199
24605
9384
2.331
993
Montgomery,IL
No
7
2463
263
2200
41,131
12122
2,789
1,055
Franklin,
MO
No
5
2812
621
2,190
56,767
15595
5748
1818
Monroe.
IL
Yes
5
744
235
508
293
3,057
2,529
654
Clinton,IL
No
5
923
206
717
506
2,982
2,919
2,890
The
great
majority
of
the
emissions
are
in
the
existing
nonattainment
area.
18
Electronic Filing - Received, Clerk's Office, October 1, 2008
* * * * * PCB 2009-021 * * * * *
Recommended
2004-06
2005-07
Nonattainment?
(ltgl
m
')
(ltg
/m
')
Madison,IL
Yes
39
39
St.
Louis,
MO
No
32
34
St.
Louis
Citv.
MO
No
34
35
St.
Clair,
IL
Yes
33
34
St.
Charles,
MO
No
32
33
Jefferson,
MO
No
32
34
Randolph,
IL
Partial
27
30
Franklin
MO
No
Monroe
IL
Yes
Montgomery,lL
No
Clinton,lL
No
For
purposes
of
its
review,
EPA
used
data
available
from
the
Chemical
Speciation
Network
and
the
Interagency
Monitoring
of
Protected
Visual
Environments
(IMPROVE)
network
to
estimate
the
composition
offine
particle
mass
on
days
with
the
highest
fine
particle
concentrations.
On
high
concentration
days
during
cold
weather
months
in
this
area,
EPA
found
on
average
a
total
urban
contribution
of
12.1
Ilg/m3,
consisting
of2.2
Ilg/m3
of
sulfate,
9.1
Ilg/m3
of
organic
particles,
and
0.8
Ilg/m3
of
miscellaneous
inorganic
particulate.
On
high
concentration
days
during
warm
weather
months
in
this
area,
EPA
found
on
average
a
total
urban
contribution
of7.1
Ilg/m3,
consisting
of
3.3
Ilg/m3
of
sulfate
and
3.8
Ilg/m3
of
organic
particulate
emissions.
These
estimates
were
used
for
weighting
of
the
emissions
of
different
pollutants
in
calculating
the
contributing
emissions
scores.
.
Thus,
Madison,
SI.
Clair,
and
Monroe
Counties,
Illinois,
are
violating
the
standard.
The
air
quality
data
also
help
evaluate
the
relative
importance
of
emissions
of
different
pollutants
in
determining
what
additional
counties
contribute
to
the
violations.
Factor
3:
Population
density
and
degree
of
urbanization
(including
commercial
development)
Table
3
shows
the
2005
population
for
each
county
in
the
area
being
evaluated,
as
well
as
the
population
density
for
each
county
in
that
area.
Population
data
give
an
indication
of
whether
it
is
likely
that
population-based
emissions
might
contribute
to
violations
of
the
24-hour
PM
25
standards.
T
bl
3
PI'
ae
oou
atlOn
County
State
2005
2005
Recommended
Population
Population
Nonattainment?
Density
(pop/sQ
mil
19
Electronic Filing - Received, Clerk's Office, October 1, 2008
* * * * * PCB 2009-021 * * * * *
Franklin,
MO
No
98,987
107
Monroe
IL
Yes
31,289
79
Mont~omerv,
IL
No
30,304
43
Clinton
IL
No
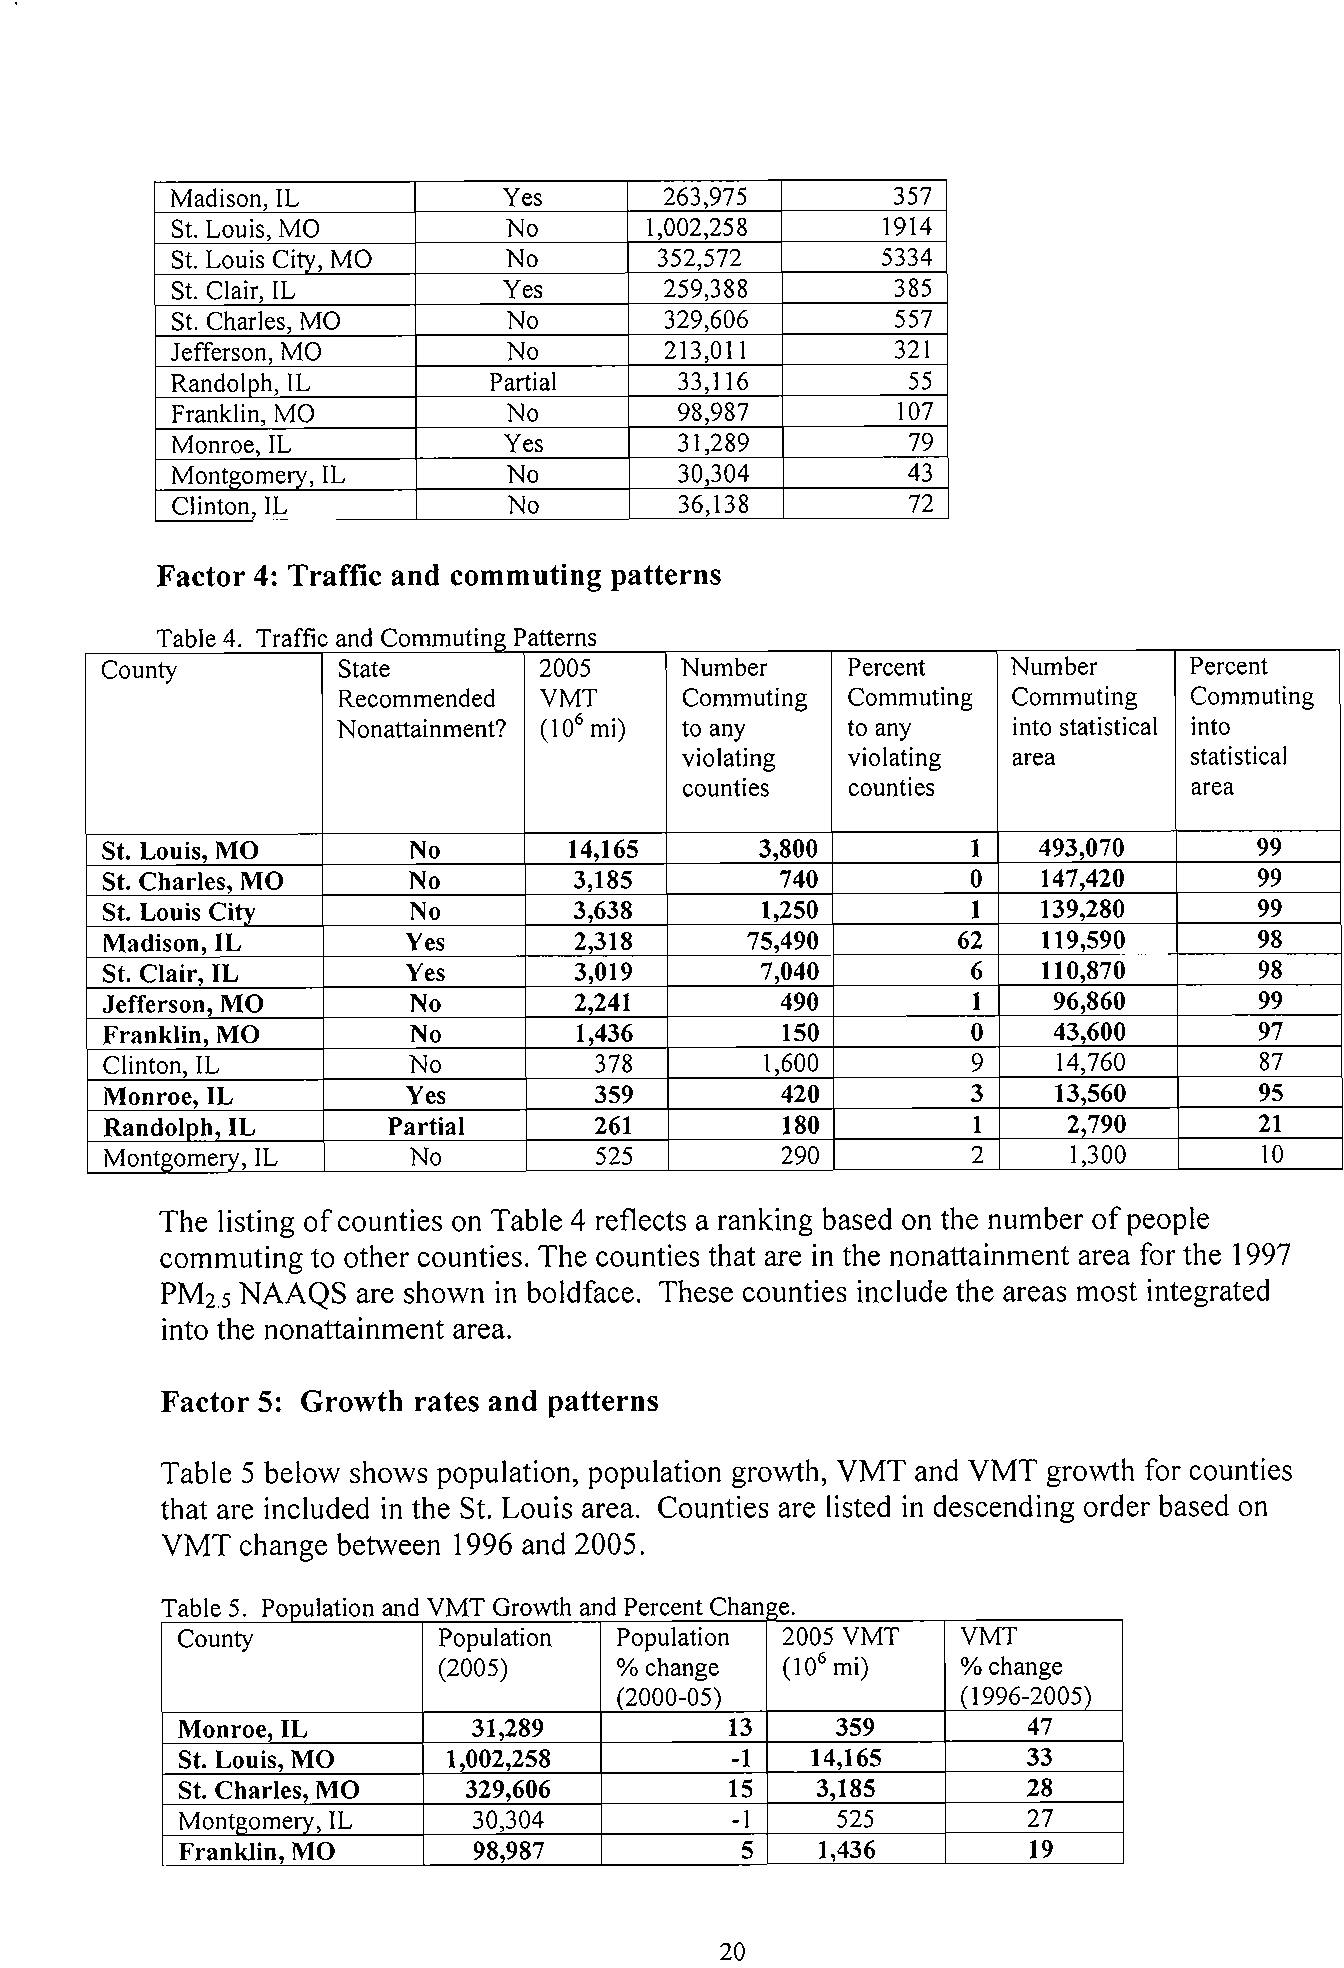
36,138
72
Factor
4:
Traffic
and
commuting
patterns
Table
4.
Traffic
and
Commutin~
Patterns
County
State
2005
Number
Percent
Number
Percent
Recommended
VMT
Commuting
Commuting
Commuting
Commuting
Nonattainment?
(10'
mil
to
any
to
any
into
statistical
into
violating
violating
area
statistical
counties
counties
area
SI.
Louis
MO
No
14165
3800
I
493070
99
SI.
Charles,
MO
No
3,185
740
0
147,420
99
St.
Louis
Citv
No
3638
1250
I
139,280
99
Madison
IL
Yes
2318
75490
62
119590
98
St.
Clair
IL
Yes
3,019
7040
6
110870
98
Jefferson
MO
No
2241
490
I
96860
99
Franklin,
MO
No
1,436
ISO
0
43600
97
Clinton,IL
No
378
1,600
9
14760
87
Monroe,IL
Yes
359
420
3
13560
95
Randoloh
IL
Partial
261
180
I
2790
21
Mont~omerv,
IL
No
525
290
2
1,300
10
The
listing
of
counties
on
Table
4
reflects
a
ranking
based
on
the
number
of
people
commuting
to
other
counties.
The
counties
that
are
in
the
nonattainment
area
for
the
1997
PM2.5
NAAQS
are
shown
in
boldface.
These
counties
include
the
areas
most
integrated
into
the
nonattainment
area.
Factor
5:
Growth
rates
and
patterns
Table
5
below
shows
population,
population
growth,
VMT
and
VMT
growth
for
counties
that
are
included
in
the
St.
Louis
area.
Counties
are
listed
in
descending
order
based
on
VMT
change
between
1996
and
2005.
Ch
hd
dVMTG
T
bl
5
PI'
ae.
QOU
atlOo
an
roW!
an
Percent
an
e.
County
Population
Population
2005VMT
VMT
(2005)
%
change
(10'
mil
%
change
f2000-05)
(]
996-2005)
Monroe,IL
31,289
13
359
47
St.
Louis
MO
I
002258
-I
14165
33
St.
Charles,
MO
329606
IS
3185
28
Montgomerv,lL
30304
-I
525
27
Franklin,
MO
98987
5
1
436
19
20
Electronic Filing - Received, Clerk's Office, October 1, 2008
* * * * * PCB 2009-021 * * * * *
significantly
during
the
SIP
planning
time
horizon.
Factor
6:
Meteorology
(weather/transport
patterns)
The
pollution
rose
for
the
SI.
Louis
area
is
provided
in
the
map
above.
Emissions
from
the
southwest
and
southeast
are
most
prone
to
contribute
to
nonattainment.
Factor
7:
Geography/topography
(mountain
ranges
or
other
air
basin
boundaries)
The
SI.
Louis
area
does
not
have
any
geographical
or
topographical
barriers
significantly
limiting
air-pollution
transport
within
its
air
shed.
Therefore,
this
factor
did
not
playa
significant
role
in
the
decision-making
process.
Factor
8:
Jurisdictional
boundaries
(e.g.,
existing
PM
and
ozone
areas)
The
East-West
Gateway
Council
of
Governments
(EWGCC)
is
the
Metropolitan
Planning
Organization
(MPO)
for
the
bi-state
SI.
Louis
area.
EWGCC
webpage:
http://www.ewgatewav.org/
The
Illinois
portion
of
the
Saint
Louis
ozone
nonattainment
area
consists
of
the
following
counties:
Jersey,
Madison,
Monroe,
and
SI.
Clair.
Factor
9:
Level
of
control
of
emission
sources
The
emission
estimates
on
Table
1
include
any
control
strategies
implemented
by
the
States
in
the
SI.
Louis
area
before
2005
that
may
influence
emissions
of
any
component
of
PM
25
emissions
(i.e.,
total
carbon,
S02,
NOx,
and
crustal
PM
2s
).
21
Electronic Filing - Received, Clerk's Office, October 1, 2008
* * * * * PCB 2009-021 * * * * *
guidance
was
sent
to
the
Governor
of
Ohio
as
an
attachment
to
a
letter
dated
July
9,
2007,
requesting
the
State's
recommendations.
The
guidance
identified
nine
factors:
emissions,
air
quality,
population
density
and
degree
of
urbanization,
traffic
and
commuting
patterns,
growth
rates
and
patterns,
meteorology,
geography/topography,
jurisdictional
boundaries,
and
level
of
control
of
emission
sources.
The
Clean
Air
Act
dictates
that
nonattainment
areas
be
defined
to
include
both
areas
that
are
violating
the
standards
and
nearby
areas
that
are
contributing
to
the
violations.
Assessment
of
areas
contributing
to
violations
is
complicated
by
the
multiple
pollutants
that
are
components
of
fine
particulate
matter,
the
variable
significance
of
these
multiple
components,
and
the
complexities
of
photochemical
formation
and
dispersion.
To
facilitate
its
review
of
available
information,
EPA
prepared
a
"Contributing
Emissions
Score"
(CES)
for
each
potentially
violating
county.
EPA
derived
a
CES
for
each
relevant
county
using
information
on
emissions,
air
quality,
and
meteorology.
The
score
for
each
county
is
computed
relative
to
the
highest
scoring
county
in
the
area,
so
that
scores
range
between
0
and
100.
These
scores
represent
an
estimate
of
the
relative
maximum
influence
that
emissions
in
that
County
have
on
a
violating
county.
The
weight
that
the
CES
plays
in
determining
the
boundaries
of
any
violating
area
varies
from
area
to
area
depending
on
how
well
the
CES
methodology
takes
into
account
characteristics
of
an
area
that
impact
transport
and
dispersion
of
PM
25
and
depending
on
the
significance
of
other
factors.
Briefly,
a
CES
for
each
county
was
derived
by
incorporating
the
following
information
and
variables
that
impact
PM2.5
transport
into
the
screening
approach:
•
Major
PM
2
.
5
components:
total
carbon
(organic
carbon
(OC)
and
elemental
carbon
(EC)),
S02,
NO"
and
inorganic
particles
(crustal).
•
PM
2
.
5
emissions
for
the
highest
(generally
top
5%)
PM
25
emission
days
(herein
called
"high
days")
for
each
of
two
seasons,
cold
(Oct-Apr)
and
warm
(May-Sept)
•
Meteorology
on
high
days
using
the
NOAA
HYSPLIT
model
for
determining
trajectories
of
air
masses
for
specified
days
•
The
"urban
increment"
of
a
violating
monitor,
which
is
the
urban
PM
2
.
5
concentration
that
is
in
addition
to
a
regional
background
PM
2
.
5
concentration,
determined
for
each
PM2.5
component
•
Distance
from
each
potentially
contributing
county
to
a
violating
county
or
counties
A
more
detailed
description
of
the
CES
can
be
found
at
http://www.epa.gov/ttn/naaqs/pm/pm25_2006_tech
i
nfo.html#C.
22
Electronic Filing - Received, Clerk's Office, October 1, 2008
* * * * * PCB 2009-021 * * * * *
carbon),
and
PM
2
.5
emissions
other
(which
includes
inorganic
particles
("crustal"»,
as
well
as
emissions
of
S02
and
NO
x
which
are
precursors
of
secondary
PM
2
.5
components.
Emissions
data
were
derived
from
the
2005
National
Emissions
Inventory
(NEI),
version
I.
See
http://www.epa.gov/ttn/naaqs/pm/pm252006techinfo.html.
EPA
also
used
emissions
and
other
data
to
compute
a
Contributing
Emissions
Score
(CES)
for
each
county
Factor
2:
Air
quality
data
This
factor
considers
the
24-hour
PM
2
.
5
design
values,
in
J.Ig/m
3
,
for
air-quality
monitors
in
counties
in
each
area
based
on
data
for
the
2004-2006
and
2005-2007
periods.
A
monitor's
design
value
indicates
whether
that
monitor
attains
a
specified
air-quality
standard.
The
24-hour
PM
2
.
5
standards
are
met
when
the
3-year
average
of
a
monitor's
98
th
percentile
values
are
35
J.Ig/m
3
or
less.
A
design
value
is
only
valid
if
minimum
data
completeness
criteria
are
met.
EPA
is
only
using
air
quality
data
collected
in
accordance
with
40
CFR
50
Appendix
Land
40
CFR
58.
Factor
3:
Population
density
and
degree
of
urbanization
(including
commercial
development)
The
tables
show
the
2005
population
for
each
county
in
the
area
being
evaluated,
as
well
as
the
population
density
for
each
county
in
the
area.
Population
data
give
an
indication
of
whether
it
is
likely
that
population-based
emissions
might
contribute
to
violations
of
the
24-hour
PM2.5
standards.
Factor
4:
Traffic
and
commuting
patterns
This
factor
considers
the
number
of
commuters
in
each
county
who
drive
to
another
county
within
the
area,
the
percent
of
total
commuters
in
each
county
who
commute
to
other
counties
within
area,
as
well
as
the
total
vehicle
miles
traveled
(VMT)
for
each
county
in
millions
of
miles.
A
county
with
numerous
commuters
is
generally
an
integral
part
of
an
urban
area
and
could
be
an
appropriate
county
for
implementing
mobile-source
emission
control
strategies,
thus
warranting
inclusion
in
the
nonattainment
area.
The
2005
VMT
data
used
for
table
4
and
5
of
the
9-factor
analysis
has
been
derived
using
methodology
similar
to
that
described
in
"Documentation
for
the
final
2002
Mobile
National
Emissions
Inventory,
Version
3,
September
2007,
prepared
for
the
Emission
Inventory
Group,
U.S.
EPA.
This
document
may
be
found
at:
ftp://ftp.epa.gov!Emisl
nventory/2002
finalnei/documentation/mobi
lei,
in
particular
in
the
23
Electronic Filing - Received, Clerk's Office, October 1, 2008
* * * * * PCB 2009-021 * * * * *
as
well
as
patterns
of
population
and
VMT
growth.
A
county
with
rapid
population
or
VMT
growth
is
generally
an
integral
part
of
an
urban
area
and
could
be
an
appropriate
county
for
implementing
mobile-source
and
other
emission-control
strategies,
thus
warranting
inclusion
in
the
nonattainment
area.
Factor
6:
Meteorology
(weather/transport
patterns)
For
this
factor,
EPA
considered
data
from
National
Weather
Service
instruments
in
the
area.
Wind
direction
and
wind
speed
data
for
2004-2006
were
analyzed,
with
an
emphasis
on
"high
PM
2
.
5
days"
for
each
of
two
seasons,
an
October-April
"cold"
season
and
a
May-September
"warm"
season.
These
high
days
are
defined
as
days
where
any
FRM
or
FEM
air
quality
monitors
had
24-hour
PM
2
.
5
concentrations
above
95%
on
a
frequency
distribution
curve
ofPM2.5
24-hour
values.
For
each
air
quality
monitoring
site,
EPA
developed
a
"pollution
rose"
to
understand
the
prevailing
wind
direction
and
wind
speed
on
the
days
with
highest
fine
particle
concentrations.
The
figure
identifies
24-hour
PM2.5
values
by
color;
days
exceeding
35
f!g/m
3
are
denoted
with
a
red
or
black
icon.
A
dot
indicates
the
day
occurred
in
the
warm
season;
a
triangle
indicates
the
day
occurred
in
the
cool
season.
The
center
of
the
figure
indicates
the
location
of
the
air
quality
monitoring
site,
and
the
location
of
the
icon
in
relation
to
the
center
indicates
the
direction
from
which
the
wind
was
blowing
on
that
day.
An
icon
that
is
close
to
the
center
indicates
a
low
average
wind
speed
on
that
day.
Higher
wind
speeds
are
indicated
when
the
icon
is
further
away
from
the
center.
EPA
also
conducted
trajectory
analyses
to
assess
the
likelihood
that
each
county
was
upwind
on
high
concentration
days.
EPA
used
these
results
directly
and
also
used
these
results
in
computing
each
County's
CES.
Further
documentation
of
this
analysis
is
provided
in
the
documentation
of
the
derivation
of
the
CES.
Factor
7:
Geography/topography
(mountain
ranges
or
other
air
basin
boundaries)
The
geography/topography
analysis
looks
at
physical
features
of
the
land
that
might
have
an
effect
on
the
airshed
and,
therefore,
on
the
distribution
of
PM
2
.
5
over
the
area.
Factor
8:
Jurisdictional
boundaries
(e.g.,
existing
PM
and
ozone
areas)
In
evaluating
the
jurisdictional
boundary
factor,
consideration
should
be
given
to
existing
boundaries
and
organizations
that
may
facilitate
air
quality
planning
and
the
implementation
of
control
measures
to
attain
the
standard.
Areas
designated
as
24
Electronic Filing - Received, Clerk's Office, October 1, 2008
* * * * * PCB 2009-021 * * * * *
estimates
under
Factor
I
include
any
control
strategies
implemented
in
each
area
before
2005
that
may
influence
emissions
of
any
component
ofPM
2
.5
emissions
(i.e.,
total
carbon,
S02,
NOx,
and
crustal
PM2.S).
25
Electronic Filing - Received, Clerk's Office, October 1, 2008
* * * * * PCB 2009-021 * * * * *