)
(Rulemaking
—
Water)
)
)
NOTICE
OF
FILING
To:
John
Therriault,
Clerk
Illinois
Pollution
Control
Board
James
R.
Thompson
Center
100
West
Randolph
St.,
Suite
11-500
Chicago,
IL
60601
Deborah
J.
Williams,
Assistant
Counsel
Stefanie
N.
Diers,
Assistant
Counsel
Illinois
Environmental
Protection
Agency
1021
North
Grand
Avenue
East
P.O.Box
19276
Springfield,
IL
62794-9276
Marie
Tipsord,
Hearing
Officer
Illinois
Pollution
Control
Board
James
R.
Thompson
Center
100
WestRandolph
St,
Suite
11-500
Chicago,
Ii
60601
Persons
included
onthe
attached
SERVICE
LIST
PLEASE
TAKE
NOTICE
that
the
Environmental
Law
and
Policy
Center
of
the
Midwest
(“ELPC”)
and
the
Illinois
Chapter
of
the
Sierra
Club
today
have
electronically
filed
PRE-FILED
QUESTIONS
OF
ENVIRONMENTAL
LAW
AND
POLICY
CENTER
AND
SIERRA
CLUB
TO
MARCELO
H.
GARCIA,
PhD;
PRE-FILED
QUESTIONS
OF
ENVIRONMENTAL
LAW
AND
POLICY
CENTER
AND
SIERRA
CLUB
TO
ADRIENNE
NEMURA;
PRE-FILED
QUESTIONS
OF
ENVIRONMENTAL
LAW
AND
POLICY
CENTER
AND
SIERRA
CLUB
TO
STEPHEN
F.
MCGOWAN;
PRE-FILED
QUESTIONS
OF
ENVIRONMENTAL
LAW
AND
POLICY
CENTER
AND
SIERRA
CLUB
TO
SUSAN
O’CONNELL;
PRE-FILED
QUESTIONS
OF
ENVIRONMENTAL
LAW
AND
POLICY
CENTER
AND
SIERRA
CLUB
TO
SCUDDER
D.
MACKEY;
PRE-FILED
QUESTIONS
OF
ENVIRONMENTAL
LAW
AND
POLICY
CENTER
AND
SIERRA
CLUB
TO
RICHARD
LANYON:
PRE-FILED
QUESTIONS
OF
ENVIRONMENTAL
LAW
AND
POLICY
CENTER
AND
SIERRA
CLUB
CHICAGO
AREA
WATERWAY
SYSTEM
AND
THE
LOWER
DES
PLAINES
RIVER:
PROPOSED
AMENDMENTS
TO
35
Ill.
Adm.
Code
Parts
301,
302,
303,
and
304
SIERRA
CLUBTO
SAMUEL
G.
DENNISON
REGARDING
BUBBLY
CREEK;
PRE-FILED
QUESTIONS
OF
ENVIRONMENTAL
LAWAND
POLICY
CENTER
AND
SIERRA
CLUB
TO
THOMAS
E.
KUNETZ,P.E.;
PRE-FILED
QUESTIONS
OF
ENVIRONMENTAL
LAW
AND
POLICYCENTER
AND
SIERRA
CLUB
TO
ROBERT
S.
ELVERT;
PRE-FILED
QUESTIONS
OF
ENVIRONMENTAL
LAW
AND
POLICY
CENTER
AND
SIERRA
CLUB
TO
PAUL
L.
FREEDMAN;
PRE-FILED
QUESTIONS
OF
ENVIRONMENTAL
LAW
AND
POLICY
CENTER
AND
SIERRA
CLUBTO
JOHN
MASTRACCHIO
REGARDING
ECONOMIC
ASSESSMENT
FOR
DISINFECTION
FACILITIES;
PRE-FILEDQUESTIONS
OF
ENVIRONMENTAL
LAWAND
POLICYCENTER
AND
SIERRA
CLUB
TO
JOHN
MASTRACCHIOREGARDINGECONOMIC
ASSESSMENT
FOR
DISSOLVED
OXYGEN
ENHANCEMENT
FACILITES;
PRE-FILED
QUESTIONS
OF
ENVIRONMENTAL
LAW
AND
POLICY
CENTER
AND
SIERRA
CLUB
TO
DAVID
R.
ZENZ
REGARDING
EFFLUENTDISINFECTION
STUDIES;
PRE-FILED
QUESTIONS
OF
ENVIRONMENTAL
LAW
AND
POLICY
CENTER
AND
SIERRA
CLUBTO
CARL
ADAMS
AND
ROBIN
GARIBAY;
PRE-FILEDQUESTIONS
OF
ENVIRONMENTAL
LAWAND
POLICY
CENTER
ANDSIERRA
CLUB
TO
ALAN
L.
JIRIK;
PRE-FILED
QUESTIONS
OF
ENVIRONMENTAL
LAW
AND
POLICY
CENTER
AND
SIERRA
CLUB
TO
JAMES
E.
HUFF,
P.E.,
copies
of
which
are
herewith
served
upon
you.
Respectfully
Submitted,
Albert
Ettinger
Senior
Staff
Attorney
Environmental
Law
&
Policy
Center
35
E.
Wacker
Dr.
Suite
1300
Chicago,
Il
60601
DATED:
August
25,
2008
(312)
795-3707
)
AND
THE
LOWER
DES
PLAINES
RIVER:
)
(Rulemaking
-
Water)
PROPOSED
AMENDMENTS
TO
35111.
Adm.
)
Code
Parts
301,
302,
303
and
304.
)
PRE-FILED
QUESTIONS
OF
ENVIRONMENTAL
LAW
AND
POLICY
CENTER
AND
SIERRA
CLUB
TO
MARCELO
H.
GARCIA,
PhD
The
Environmental
Law
and
Policy
Center
of
the
Midwest
and
the
Illinois
Chapter
of
the
Sierra
Club
hereby
file
questions
to
Marcelo
H.
Garcia:
1.
On
page
2
of
your
testimony
you
refer
to
“density
currents.”
What
are
density
currents?
2.
How
do
density
currents
affect
aquatic
life
in
the
CAWS?
3.
When
are
the
studies
of
Bubbly
Creek
mentioned
on
page
14
of
your
testimony
to
be
completed?
4.
Has
the
MWRDGC,
URIC
or
anyone
else
to
your
knowledge
studied
fish
passage
through
the
CAWS?
5.
What
portions
of
the
CAWS
are
now
used
for
fish
passage
and
where
are
the
fish
going?
AND
THE
LOWER
DES
PLAINES
RIVER:
)
(Rulemaking
-
Water)
PROPOSED
AMENDMENTS
TO
35111.
Adm.
)
Code
Parts
301,
302,
303
and
304.
)
PRE-FILED
QUESTIONS
OF
ENVIRONMENTAL
LAW
AND
POLICY
CENTER
AND
SIERRA
CLUB
TO
ADRIENNE
NEM1JRA
The
Environmental
Law
and
Policy
Center
of
the
Midwest
and
the
Illinois
Chapter
of
the
Sierra
Club
hereby
file
questions
to
Adrienne
Nernura:
1.
Do
you
know
if
CSO
discharges
contain
the
same
level
of
human
pathogens
as
discharges
from
municipal
wastewater
treatment
plants
that
do
not
disinfect?
2.
On
page
7
of
your
testimony
you
mention
a
number
of
options
that
states
can
pursue
for
adopting
standards
that
are
identified
by
USEPA
includingsegmenting
the
water
body,
adopting“subclasses”
and
“high
flow
cutoffs.”
Do
you
suggest
that
the
CAWS
be
segmented
differently
for
consideration
in
the
UAA
and,
if
so,
how?
3.
What
sort
of
subclasses
might
you
have
in
mind?
4.
What
is
a
“high
flow
cutoff’
and
how
does
it
work?
5.
Do
you
believe
that
wet
weather
standards
should
be
adopted
that
would
allow
DOlevels
that
wouldpreclude
indigenous
aquatic
life
from
living
inareas
of
the
CAWS
during
wet
weather
events?
6.
Could
you
explain
what
you
mean
by
‘Range
for
Portionsof
2001
and
2002
that
were
Modeled’
in
Table
1
in
Attachment
4
of
your
testimony?
7.
Does
MWRD
haveactual
DO
measurements
taken
during
summer
2001
at
the
sites
which
you
have
modeled
that
could
be
shown
on
the
plots
in
Figures
2-9?
8.
In
Attachment
3
to
your
testimony
you
discuss
a
number
of
examples
of
“wet
weather
standards”
that
have
been
considered
for
other
water
bodies.
What
is
being
considered
in
Indiana
for
the
City
of
Indianapolis
and
elsewhere?
9.
What
has
been
done
in
Boston
and
other
cities
in
Massachusetts?
Has
Massachusetts
classified
the
Charles
River
in
a
manner
that
make
it
unnecessary
to
control
CSOs
or
disinfect
to
meet
the
standards
set
for
the
Charles?
10.
Please
explain
what
is
being
done
in
Maine.
11.
Has
ORSANCO
adopted
wet
weather
standards?
12.
Do
sewage
treatment
plants
discharging
to
the
Ohio
River
disinfect?
13.
Are
you
aware
of
the
efforts
being
made
to
control
CSOs
and
SSOs
by
the
City
of
Cincinnati
or
other
cities
that
discharge
into
the
Ohio
River?
14.
What
is
the
standardthat
was
adopted
for
the
SantaAna
River
in
California?
AND
THE
LOWER
DES
PLAINESRIVER:
)
(Rulemaking
-
Water)
PROPOSED
AMENDMENTS
TO
35111.
Adm.
)
Code
Parts
301.
302,
303
and
304.
)
PRE-FILED
QUESTIONS
OF
ENVIRONMENTAL
LAW
AND
POLICY
CENTER
AND
SIERRA
CLUB
TO
STEPHEN
F.
MCGOWAN
The
Environmental
Law
and
Policy
Center
of
the
Midwest
and
the
Illinois
Chapter
of
the
Sierra
Club
hereby
file
questions
to
Stephen
F.
McGowan:
1.
Have
you
worked
on
disinfection
issues
regarding
Milwaukee,
WI,
Detroit,
MI,
Norwalk,
CT.,
Columbia,
MD
or
any
otherplants?
2.
To
your
knowledge,
has
the
MWRDGC
ever
done
an
environmental
assessment
like
the
ones
you
did
regarding
DO
enhancement
and
disinfection
for
any
of
its
other
operations
or
proposed
operations?
3.
Was
such
an
assessment
donewith
regard
to
any
phase
or
portion
of
TARP?
4.
Have
you
or
to
your
knowledge
anyone
else
everattempted
to
calculate
any
favorable
environmental
effects
on
land,
air,
energy
use
or
other
portion
of
the
environment
that
might
result
from
disinfection
at
the
Calumet,North
Sideor
Stickney
plants?
5.
Have
you
or
to
your
knowledgeanyone
else
ever
attempted
to
calculate
any
favorable
environmental
effects
on
land,
air,
energy
use
or
other
portion
of
the
environment
that
might
result
from
enhanceddissolved
oxygen
levels
in
any
portion
of
the
CAWS
6.
Have
you
studied
the
effects
of
thework
necessary
to
the
meetexisting
dissolved
oxygen
requirements
applicable
to
the
CAWS?
7.
What
is
the
basis
for
your
assumption
that
MWRDGC
will
use
energy
originating
from
coal-fired
plants
(see
report
page
5-1)
to
produce
energyfor
disinfection
and
DO
enhancement?
8.
On
page
2-1
of
your
report
you
assume
that
disinfection
would
be
provided
from
March
through
November.
Why
did
you
decide
to
use
this
assumption?
AREA
WATERWAYS
SYSTEM
)
R08-09
AND
THE
LOWER
DES
PLALNES
RIVER:
)
(Rulemaking
-
Water)
PROPOSED
AMENDMENTS
TO
35111.
Adm.
)
Code
Parts
301.
302,
303
and
304.
)
PRE-FILED
QUESTIONS
OF
ENVIRONMENTAL
LAW
AND
POLICY
CENTER
AND
SIERRA
CLUB
TO
SUSAN
O’CONNELL
The
Environmental
Law
and
Policy
Center
of
the
Midwest
and
the
Illinois
Chapter
of
the
Sierra
Club
hereby
file
questions
to
Susan
O’Connell
regarding
CSO
discharges:
1.
Are
there
CSO
discharges
that
discharge
to
Lake
Michigan?
2.
Does
MWRDGC
maintain
data
sufficient
to
identify
the
particular
CSOs
that
have
discharged
by
date
of
discharge
for
some
or
all
of
the
CSO
or
dates
for
the
years
2005-
07?
If
so,
please
present
the
available
data
on
the
CSO
discharges
for
2005-07
at
the
hearing
AND
THE
LOWER
DES
PLAINES
RIVER:
)
(Rulemaking
-
Water)
PROPOSED
AMENDMENTS
TO
35111.
Adm.
)
CodeParts
301,302,
303
and
304.
)
PRE-FILED
QUESTIONS
OF
ENVIRONMENTAL
LAW
AND
POLICYCENTER
AND
SIERRA
CLUB
TO
SCUDDER
D.
MACKEY
The
Environmental
Law
and
Policy
Center
of
the
Midwest
and
the
Illinois
Chapter
of
the
Sierra
Club
hereby
file
questions
to
Scudder
D.
Mackey:
1.
In
various
parts
of
your
testimony
you
mention
temperature
effects
as
something
that
you
do
not
believethat
IEPA
adequately
studied.
What
portions
of
the
CAWS
need
further
study
with
regard
to
temperature
effects?
2.
What
are
the
significantthermal
dischargers
to
the
CAWS?
3.
Are
there
ways
to
categorize
subsections
of
the
CAWS
that
make
more
sense
to
you
than
the
categories
proposed
by
IEPA?
CHICAGO
AREA
WATERWAYS
SYSTEM
)
R08-09
AND
THE
LOWER
DES
PLAINES
RIVER:
)
(Rulemaking
-
Water)
PROPOSED
AMENDMENTS
TO
35111.
Adm.
)
Code
Parts
301,
302,
303
and
304.
)
PRE-FILED
QUESTIONS
OF
ENVIRONMENTAL
LAW
AND
POLICY
CENTER
AND
SIERRA
CLUB
TO
RICHARD
LANYON
The
Environmental
Law
and
Policy
Center
of
the
Midwest
and
the
Illinois
Chapter
of
the
Sierra
Club
hereby
file
questions
to
Richard
Lanyon:
1.
On
page
4
of
your
testimony
you
state
that
in
the
Calumet-Sag
Canal
“high
flows
can
impair
aquatic
life
uses
when
habitat
is
destroyed
and
aquatic
organisms
are
swept
downstream.”
How
does
this
occur?
2.
What
habitat
is
destroyed
by
such
high
flows?
3.
What
aquatic
organisms
are
swept
downstream?
4.
Where
are
they
swept?
5.
What
riparian
life
lives
on
the
CAWS
to
your
knowledge?
6.
Are
there
beavers,
otters
or
other
riparian
mammals
in
the
CAWS?
7.
What
birds
live
near
the
CAWS?
8.
Has
MWRDGC
ever
studied
the
effects
of
its
operations
on
riparian
mammals
or
birds?
9.
Can
the
different
reaches
and
segments
of
the
CAWS
be
said
tobe
homogenous
in
terms
of
its
recreational
uses
or
potential
for
aquatic
life?
10.
Your
testimony
discusses
barge
and
other
navigation
traffic
on
the
CAWS.
Has
the
MWRDGC
or
anyone
else
studied
this
barge
traffic
in
terms
of
what
segments
of
the
CAWS
are
traveled?
11.
Is
there
barge
traffic
above
Goose
Island
on
the
North
Branch
or
in
the
North
Shore
Channel?
12.
Has
anyone
to
your
knowledge
studied
what
the
level
of
barge
traffic
would
be
if
some
or
all
of
the
Midwest
Generation
units
at
Fisk,
Crawford
or
Will
County
are
shut
down?
13.
Has
MWRDGC
or
anyone
else
studied
the
recreational
boating
traffic
in
the
CAWS?
14.
Has
MWRDGC
or
anyone
else
to
your
knowledge
studied
the
value
of
the
recreational
boating
now
on
the
CAWS
or
any
segments
of
the
CAWS?
15.
MWRDGC
has
criticized
some
of
the
proposed
classifications
of
the
CAWS
that
have
been
proposed
by
IEPA,
but
is
there
another
classification
system
that
MWRDGC
would
propose
that
better
characterizes
the
CAWS
in
terms
of
potential
for
recreational
uses
or
aquatic
life
uses?
AREA
WATERWAYS
SYSTEM
)
R08-09
AND
THE
LOWER
DES
PLAINES
RIVER:
)
(Rulemaking
-
Water)
PROPOSED
AMENDMENTS
TO
35111.
Adm.
)
CodeParts
301,
302,
303
and
304.
)
PRE-FILED
QUESTIONS
OF
ENVIRONMENTAL
LAW
AND
POLICY
CENTER
AND
SIERRA
CLUB
TO
CHARLES
S.
MELCIIING
The
Environmental
Law
and
Policy
Center
of
the
Midwest
and
the
Illinois
Chapter
of
the
Sierra
Club
hereby
file
questions
to
Charles
S.
Meiching:
I.
On
what
river
did
you
do
work
in
Belgium?
2.
How
generally
did
you
measure
the
duration
of
the
effect
of
a
CSO
event?
3.
What
counted
as
ending
the
effect
of
a
CSO
event?
4.
Are
CSOs
causing
violations
of
the
Illinois
ammonia
standard?
5.
Are
CSOs
causing
violations
of
the
DO
standards
currently
applicable
to
the
CAWS.
6.
Could
water
quality
in
the
North
Shore
Channel
or
Bubbly
Creek
be
improved
by
increasing
the
flow
in
these
water
bodies?
7.
Have
CSO
events
negatively
impacted
the
aquatic
community
in
any
parts
of
the
CAWS?
8.
On
page
24
of
your
report,
you
state
that
“long
storm
effects
can
negatively
affect
the
aquatic
community
and
these
long
term
effects
cannot
be
reduced
until
the
reservoirs
of
the
Tunnel
and
Reservoir
Plan
are
fully
on
line.”
Is
it
your
testimony
that
there
have
been
no
benefits
to
the
aquatic
community
from
the
partial
completion
of
TARP?
9.
Is
it
your
testimony
that
nothing
can
be
done
to
reduce
CSO
events
or
the
long-term
effects
of
CSO
events
other
than
to
complete
TARP?
10.
How
will
completion
of
TARP
benefit
aquatic
life?
11.
Are
there
parts
of
the
CAWS
that
could
meet
the
proposed
IEPA
DO
standards
almost
all
of
the
time?
12.
Would
you
classify
the
whole
CAWS
with
one
aquatic
life
use
or
are
there
segments
that
should
be
distinguished
as
to
different
uses?
13.
Did
the
1980s
Fish
&
Wildlife
Service
study
of
Habitat
Suitability
you
discuss
on
pages
13-14
of
your
testimony
deal
with
the
entire
CAWS?
14.
Is
it
your
testimony
that
there
are
no
early
life
stages
for
bass
or
channel
catfish
anywhere
in
the
CAWS?
15.
Can
substrate
be
improved
through
any
technique?
16.
Is
there
any
way
to
differentiate
the
effects
of
CSOs
from
those
of
poor
substrate
in
any
portion
of
the
CAWS?
CHICAGO
AREA
WATERWAYS
SYSTEM
)
R08-09
AND
THE
LOWER
DES
PLAINES
RIVER:
)
(Rulemaking
-
Water)
PROPOSED
AMENDMENTS
TO
35111.
Adm.
)
Code
Parts
301,
302,
303
and
304.
)
PRE-FILED
QUESTIONS
OF
ENVIRONMENTAL
LAW
AND
POLICYCENTER
AND
SIERRA
CLUB
TO
JULIA
WOZNIAK
The
Environmental
Law
and
Policy
Center
of
the
Midwest
and
the
Illinois
Chapter
of
the
Sierra
Club
hereby
file
questions
to
Julia
Wozniak:
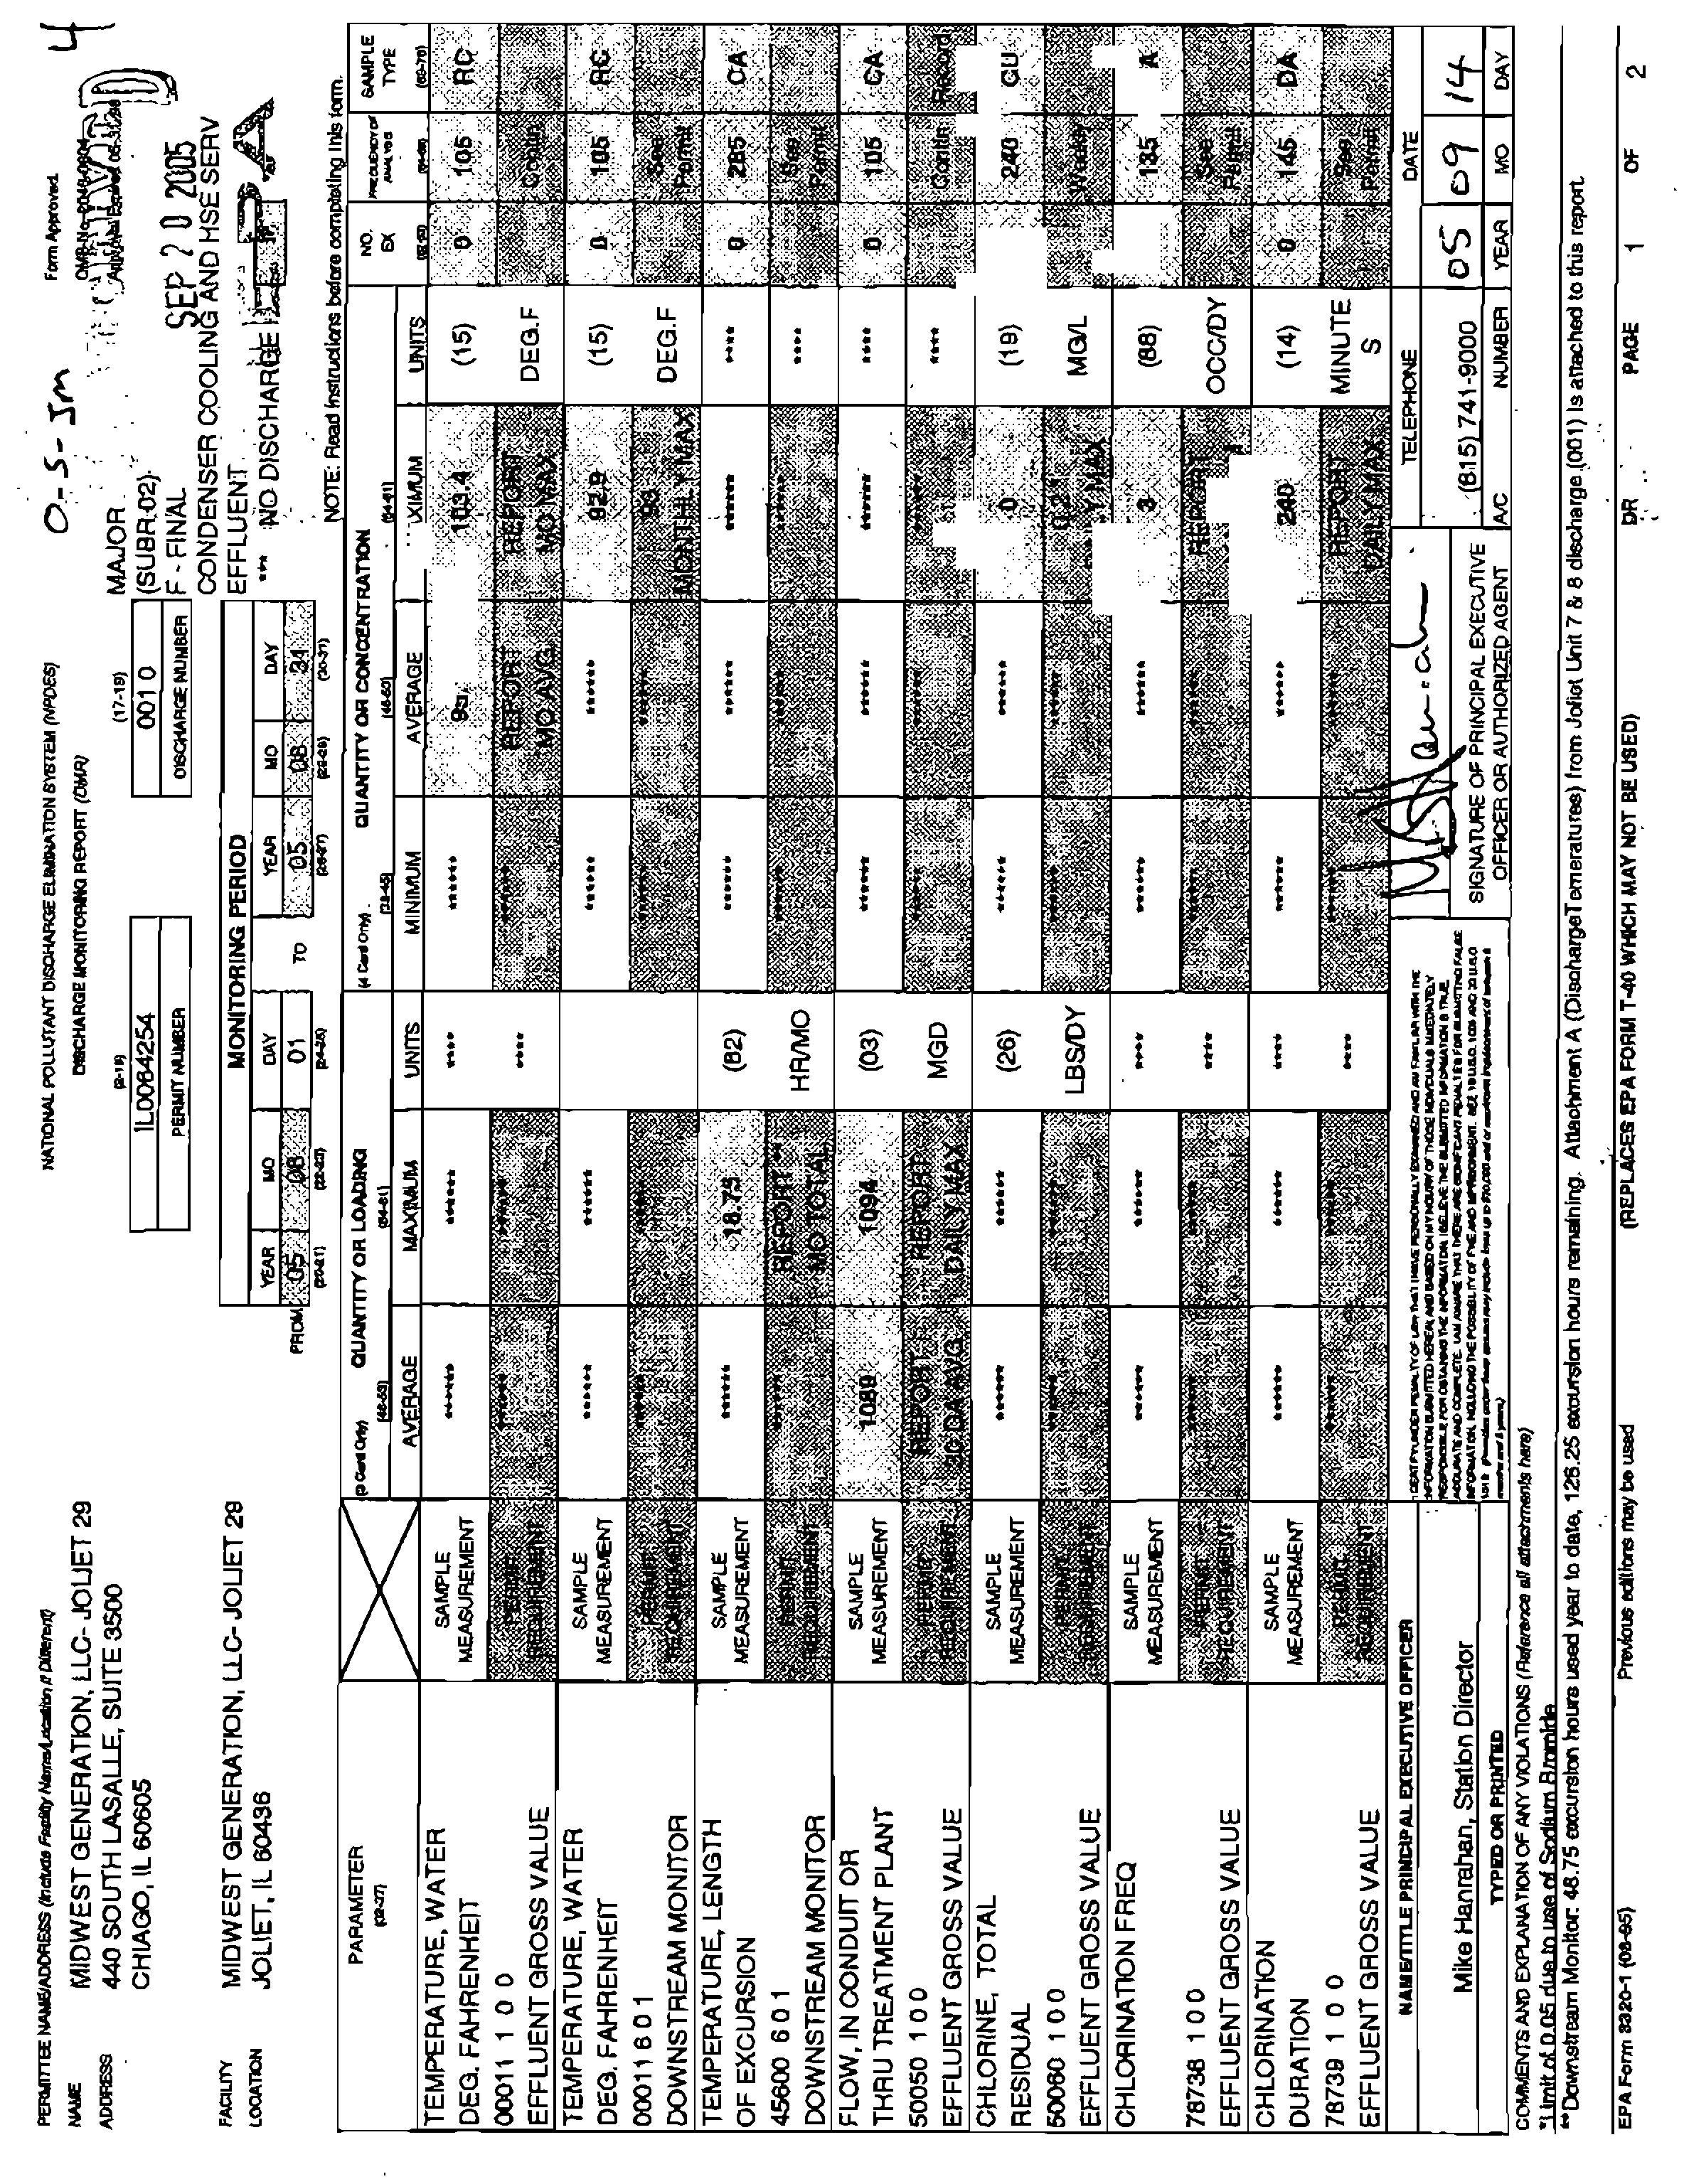
I.
Atpage
2
of
your
testimony
you
mention
that
the
MWG
stations
“use
large
volumes
of
surface
water.”
What
is
the
intake
of
each
of
the
Fisk,
Crawford,
Will
County
and
Joliet
Stations
relative
to
the
low
flow
of
the
water
body
from
which
the
water
is
taken?
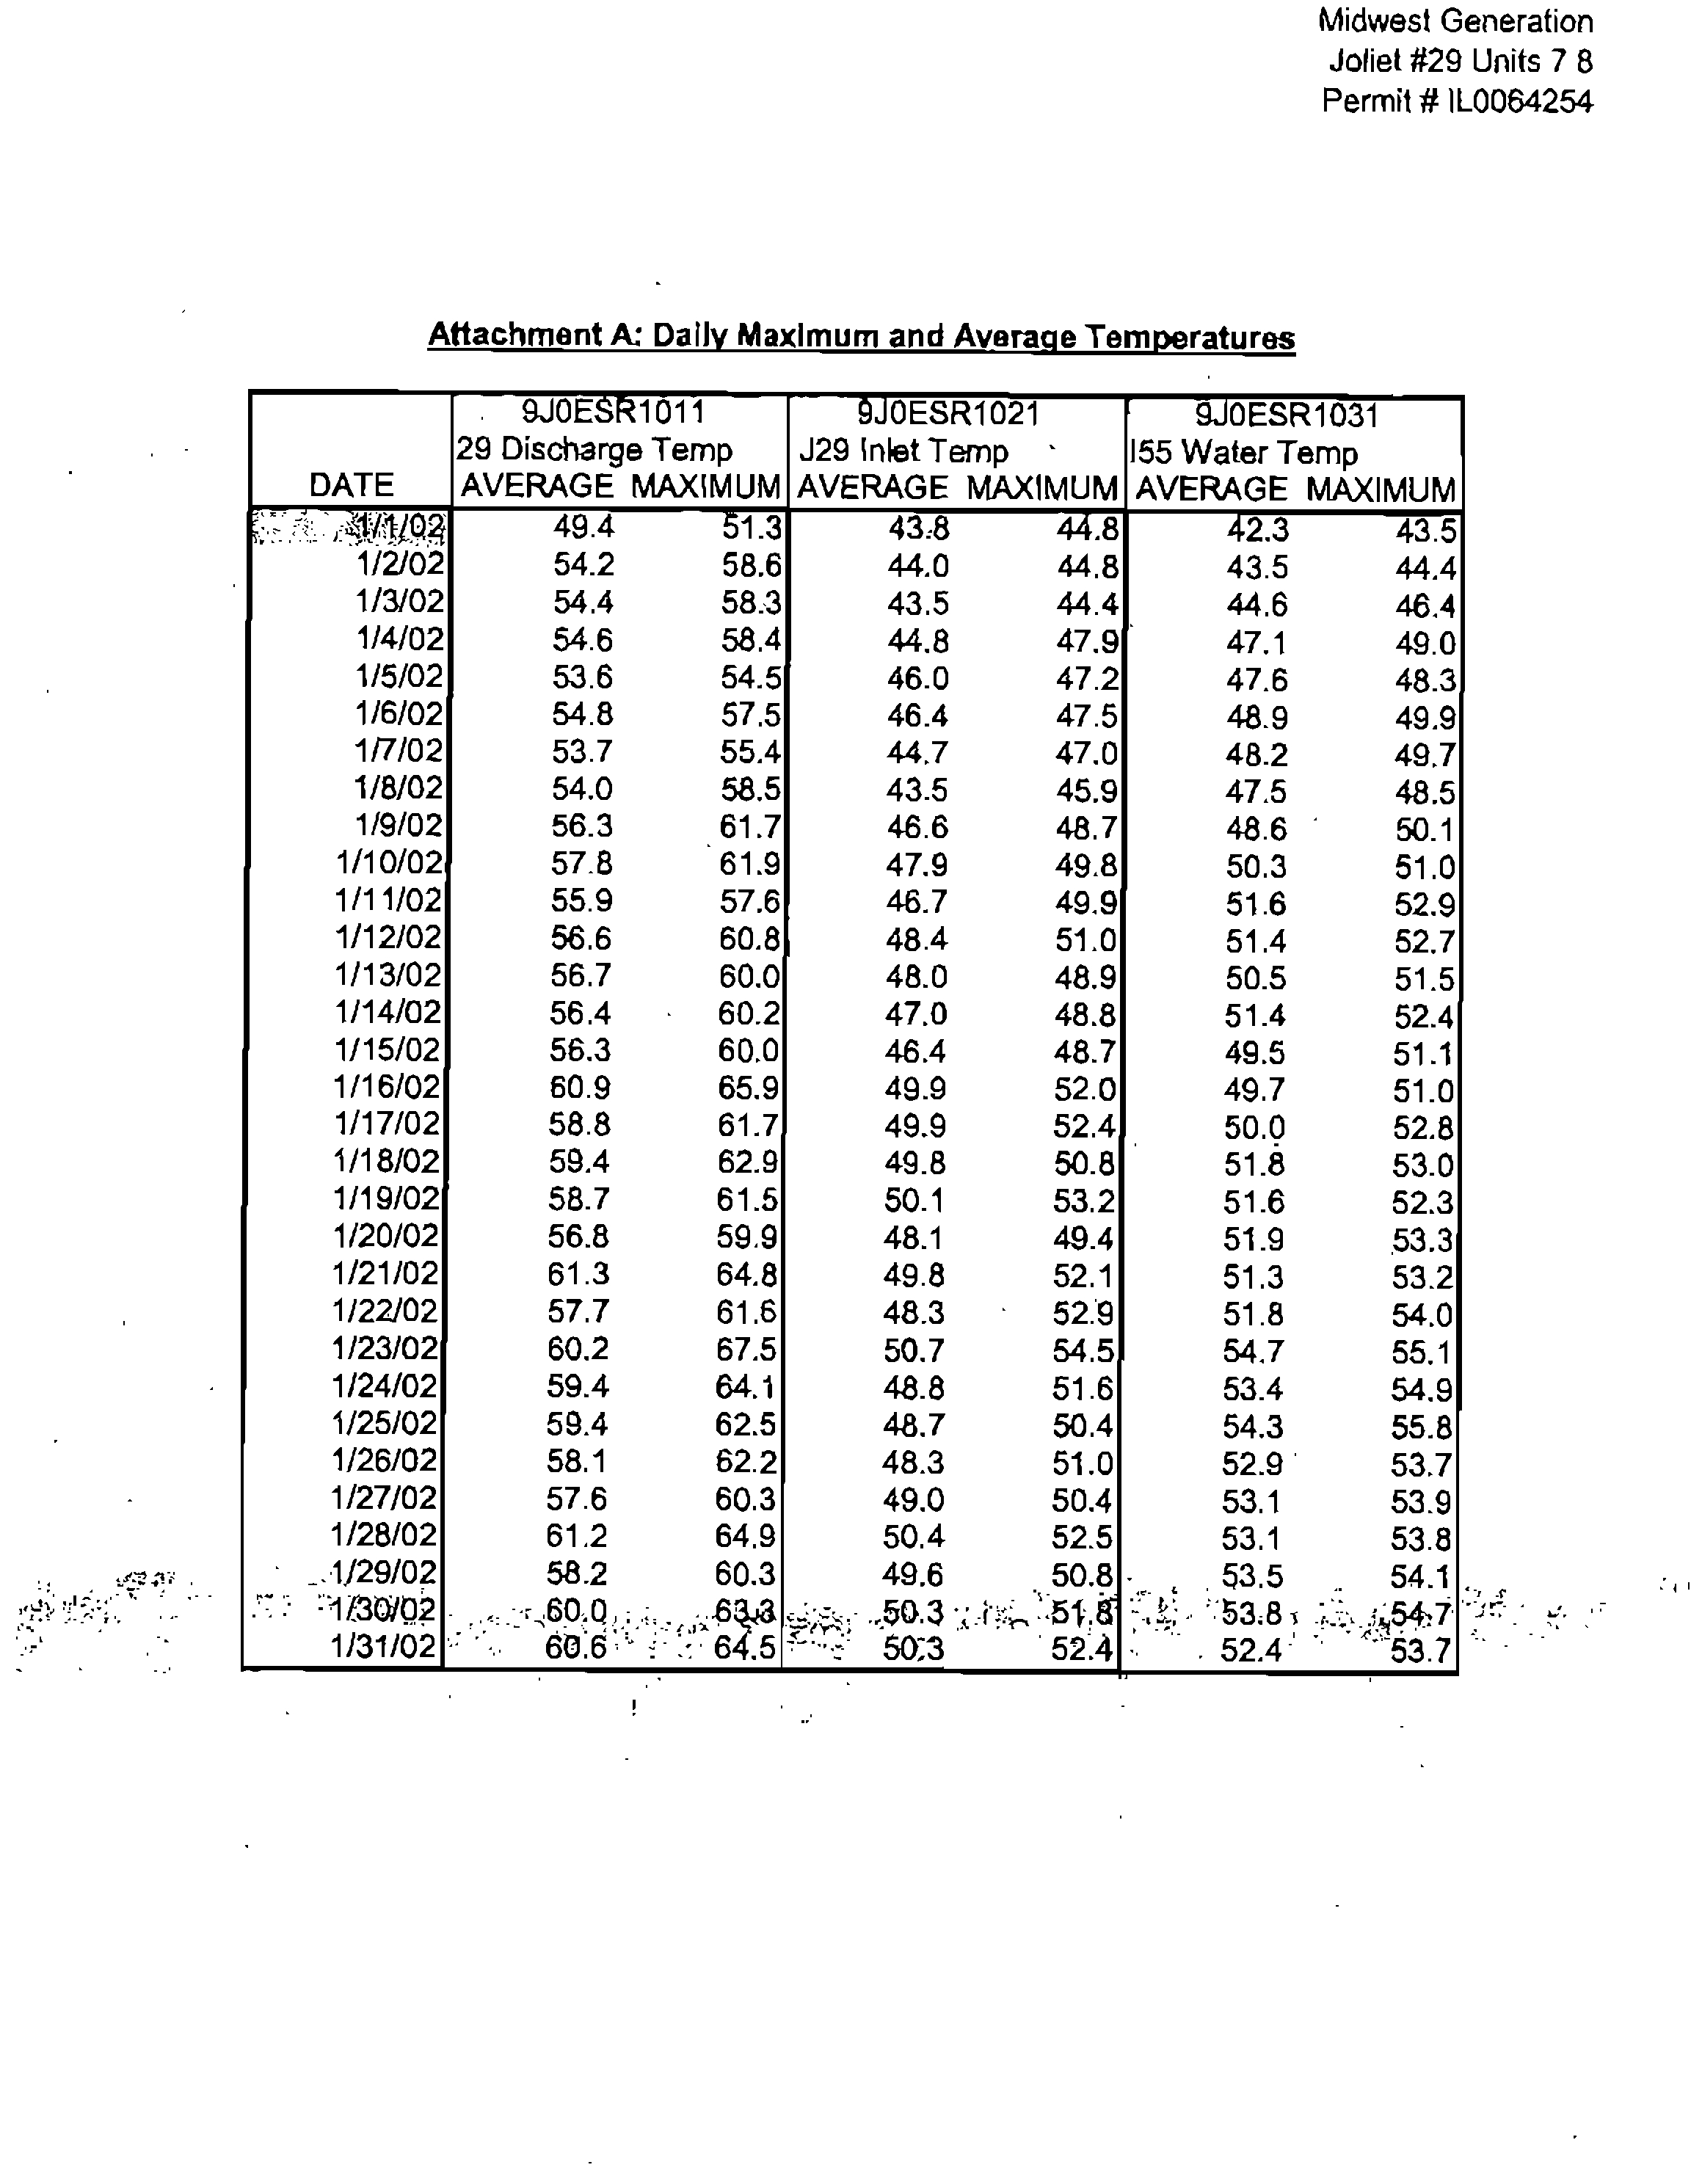
2.
Is
the
intake
to
the
Joliet
plant
sometimes
larger
than
the
Des
Plaines
River
flow?
3.
Are
Joliet
Units
6,
7
and
8
sometimes
demarcated
with
a
different
numbering
system?
4.
What
are
Joliet
Units
9
and
29?
5.
Does
Midwest
Generation
keep
records
of
the
amount
of
power
production
at
each
of
its
units?
6.
Since
Midwest
Generation
began
operating
the
stations,
what
is
the
capacity
factor
of
the
unit
at
Fisk?
The
units
at
Crawford?
Will
County?
Joliet?
7.
Does
Midwest
Generation
have
plans
to
close
the
Fisk,
Crawford,
Will
County
or
Joliet
plants
or
any
of
the
units
at
those
plants?
8.
Should
we
assume
in
this
proceeding
that
any
capital
costs
for
putting
supplemental
cooling
equipment
on
those
plants
can
be
fully
amortized
over
the
life
of
the
plants?
9.
Does
MWG
claim
as
to
any
station
orunit
that
pollution
control
equipment
is
not
justifiable
because
the
plant
will
soon
close?
10.
Has
MWG
received
a
notice
of
violation
of
the
Clean
AirAct
that
relates
to
modifications
or
operation
of
any
units
of
the
Fisk,
Crawford,
Will
County
or
Joliet
Stations?
11.
Are
you
aware
of
any
power
plants
anywhere
that
have
been
retrofitted
to
add
cooling
capacity
other
than
the
cooling
towers
built
for
Joliet
Units
7
and
8?
12.
You
mention
on
page
5
that
the
allowed
mixing
zone
is
currently
26
acres.
Are
you
aware
of
any
study
that
has
determined
whether
the
heat
discharge
from
the
Joliet
station
contains
more
than
25%
of
the
cross-sectional
area
or
volume
of
flow
of
the
Des
Plaines
River?
in
1996?
15.
In
suggesting
that
the
1-55
rules
are
“more
stringent”
are
you
taking
into
account
the
general
use
limitation
prohibitingraising
temperatures
by
more
than
5
degrees
Fahrenheit?
16.
Has
MWG
or
Commonwealth
Edison
determined
what
the
temperature
of
the
Des
Plaines
River
at
the
1-55
bridge
would
be
if
the
Joliet
plant
were
not
operated?
17.
Has
MWG
or
Commonwealth
Edison
or
anyone
else
to
your
knowledgedetermined
whether
temperatures
at
the
1-55
bridge
are
more
than
5
degrees
Fahrenheit
higher
than
temperatures
in
the
Kankakee,
the
Upper
Des
Plaines,
theDu
Page
River
or
other
waters
in
the
area?
18.
Has
MWG
or
Commonwealth
Edison
or
anyone
else
to
your
knowledge
studied
how
temperature
affects
the
toxicity
of
the
pollutants
that
are
present
in
the
Upper
Dresden
Pool?
19.
Does
Midwest
Generation
intend
to
make
any
investments
in
any
of
the
plants
on
the
CAWS
or
the
Upper
Dresden
Pool
to
reduce
impingement
of
aquatic
life?
20.
Does
Midwest
Generation
have
any
data
on
the
effect
on
aquatic
life
ofimpingement
at
the
Joliet
station?
21.
Does
the
Joliet
plant
serve
to
discourage
fish
or
other
aquatic
life
from
movingfrom
the
Upper
Illinois
River
to
the
Great
Lakes
system?
22.
Does
heat
discharged
by
the
Joliet
plantattract
fish
to
come
up
from
below
the
1-55
Bridgeduring
the
winter?
23.
Has
Midwest
Generation
or
Commonwealth
Edison
measured
the
effect
of
heat
generated
bythe
Fisk,
Crawford,
Will
County
and
Joliet
plants
on
dissolved
oxygen
levels
at
the
I-
55
bridge?
24.
Has
any
study
been
done
on
the
effect
of
the
Fisk,
Crawford,
Will
County
or
Joliet
plants
on
DO
levels
at
the
1-55
Bridge
since
that
of
Dr.
John
F.
Kennedy
for
the
Joliet
heat
demonstration
proceeding
(PCB
87-93)?
25.
Does
Midwest
Generation
keep
data
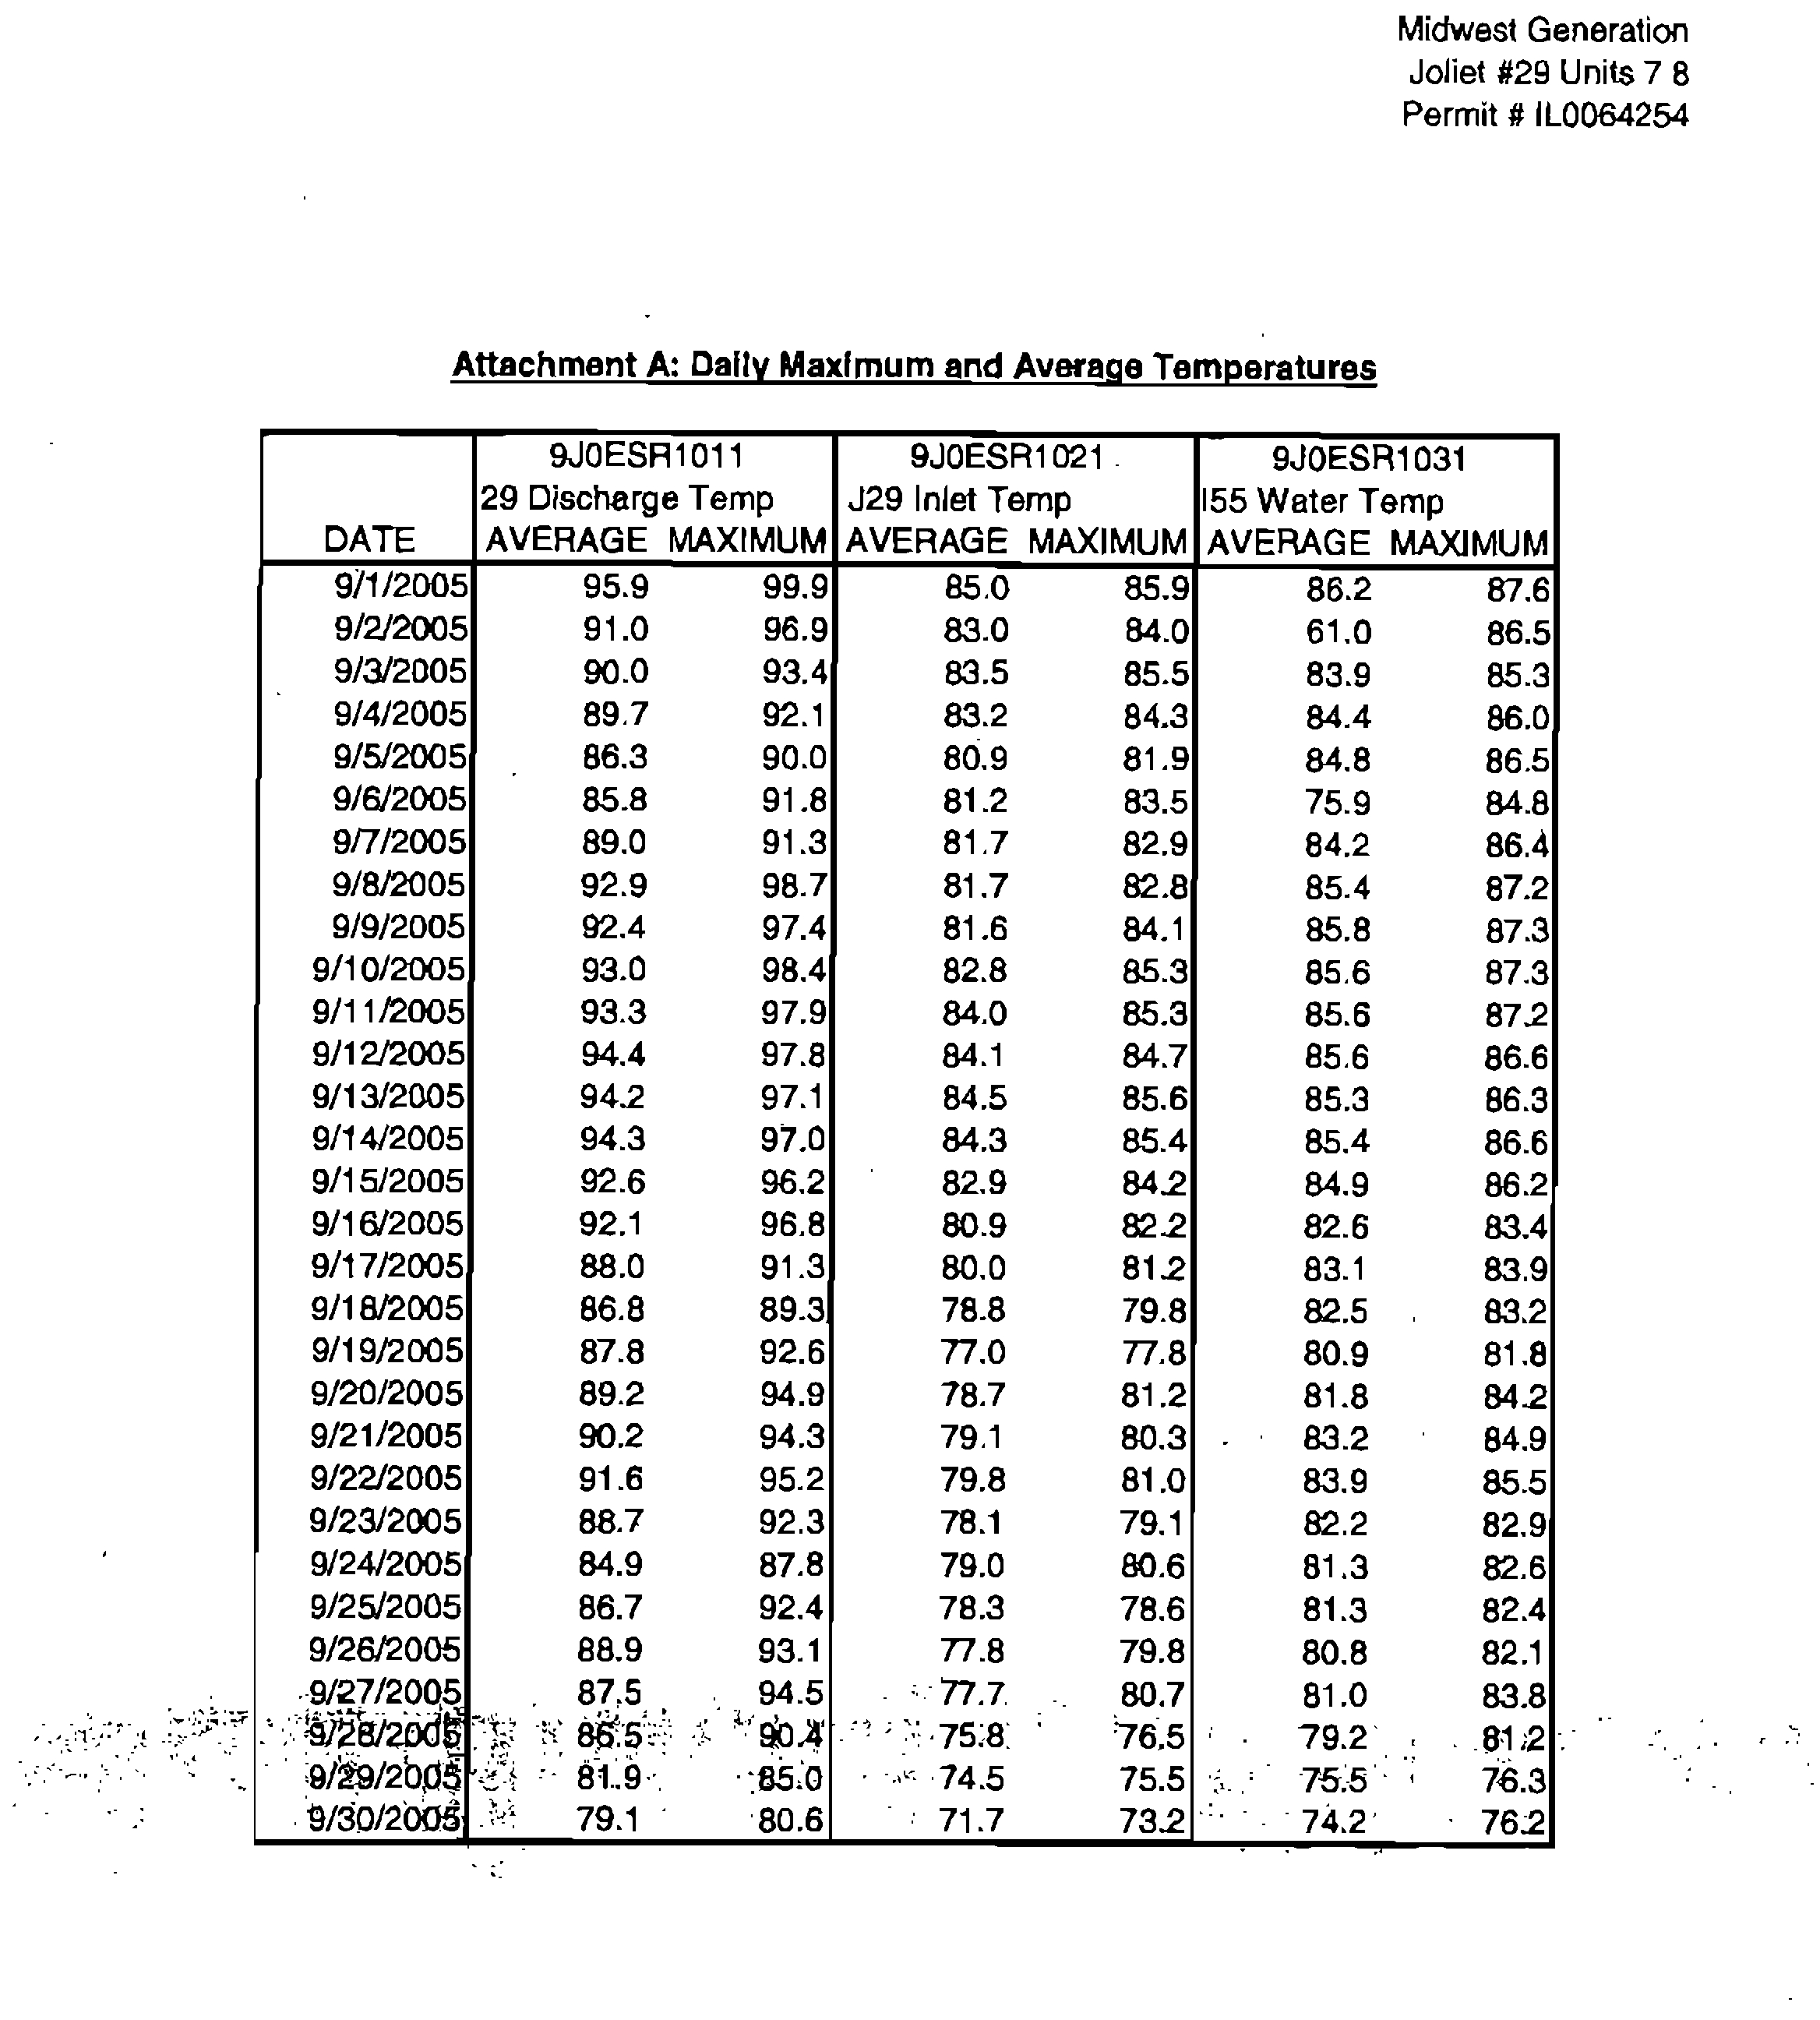
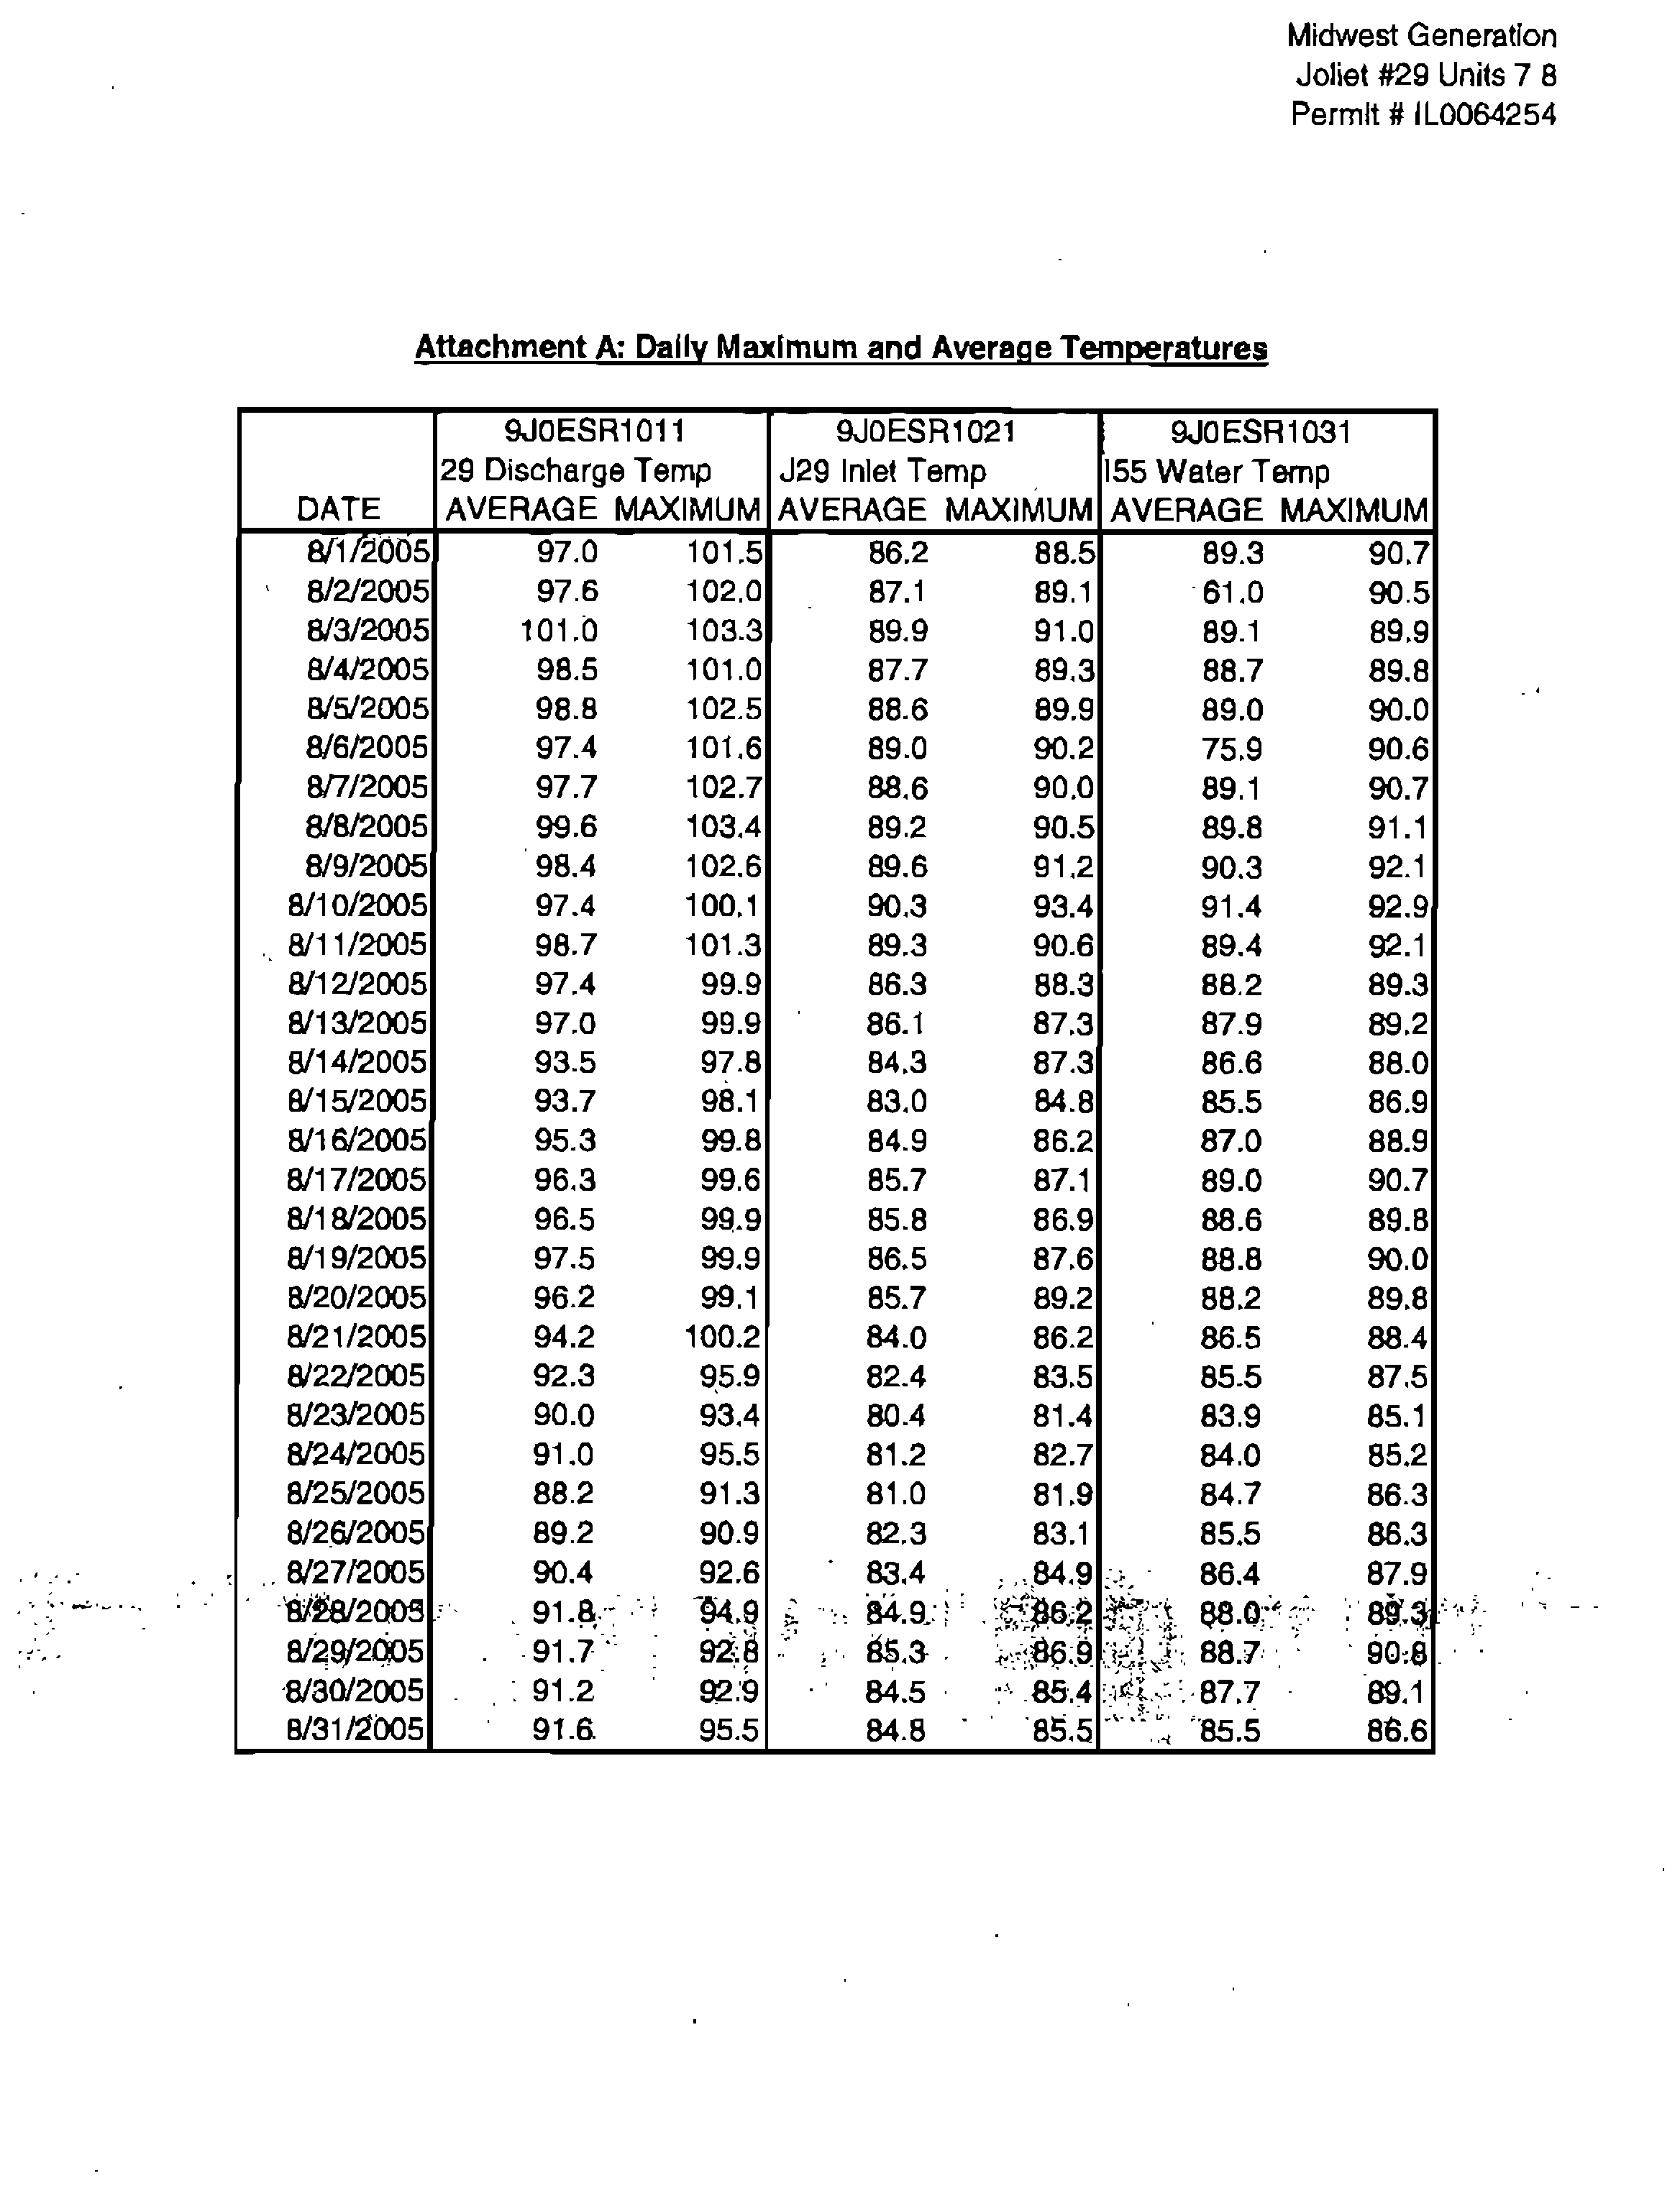
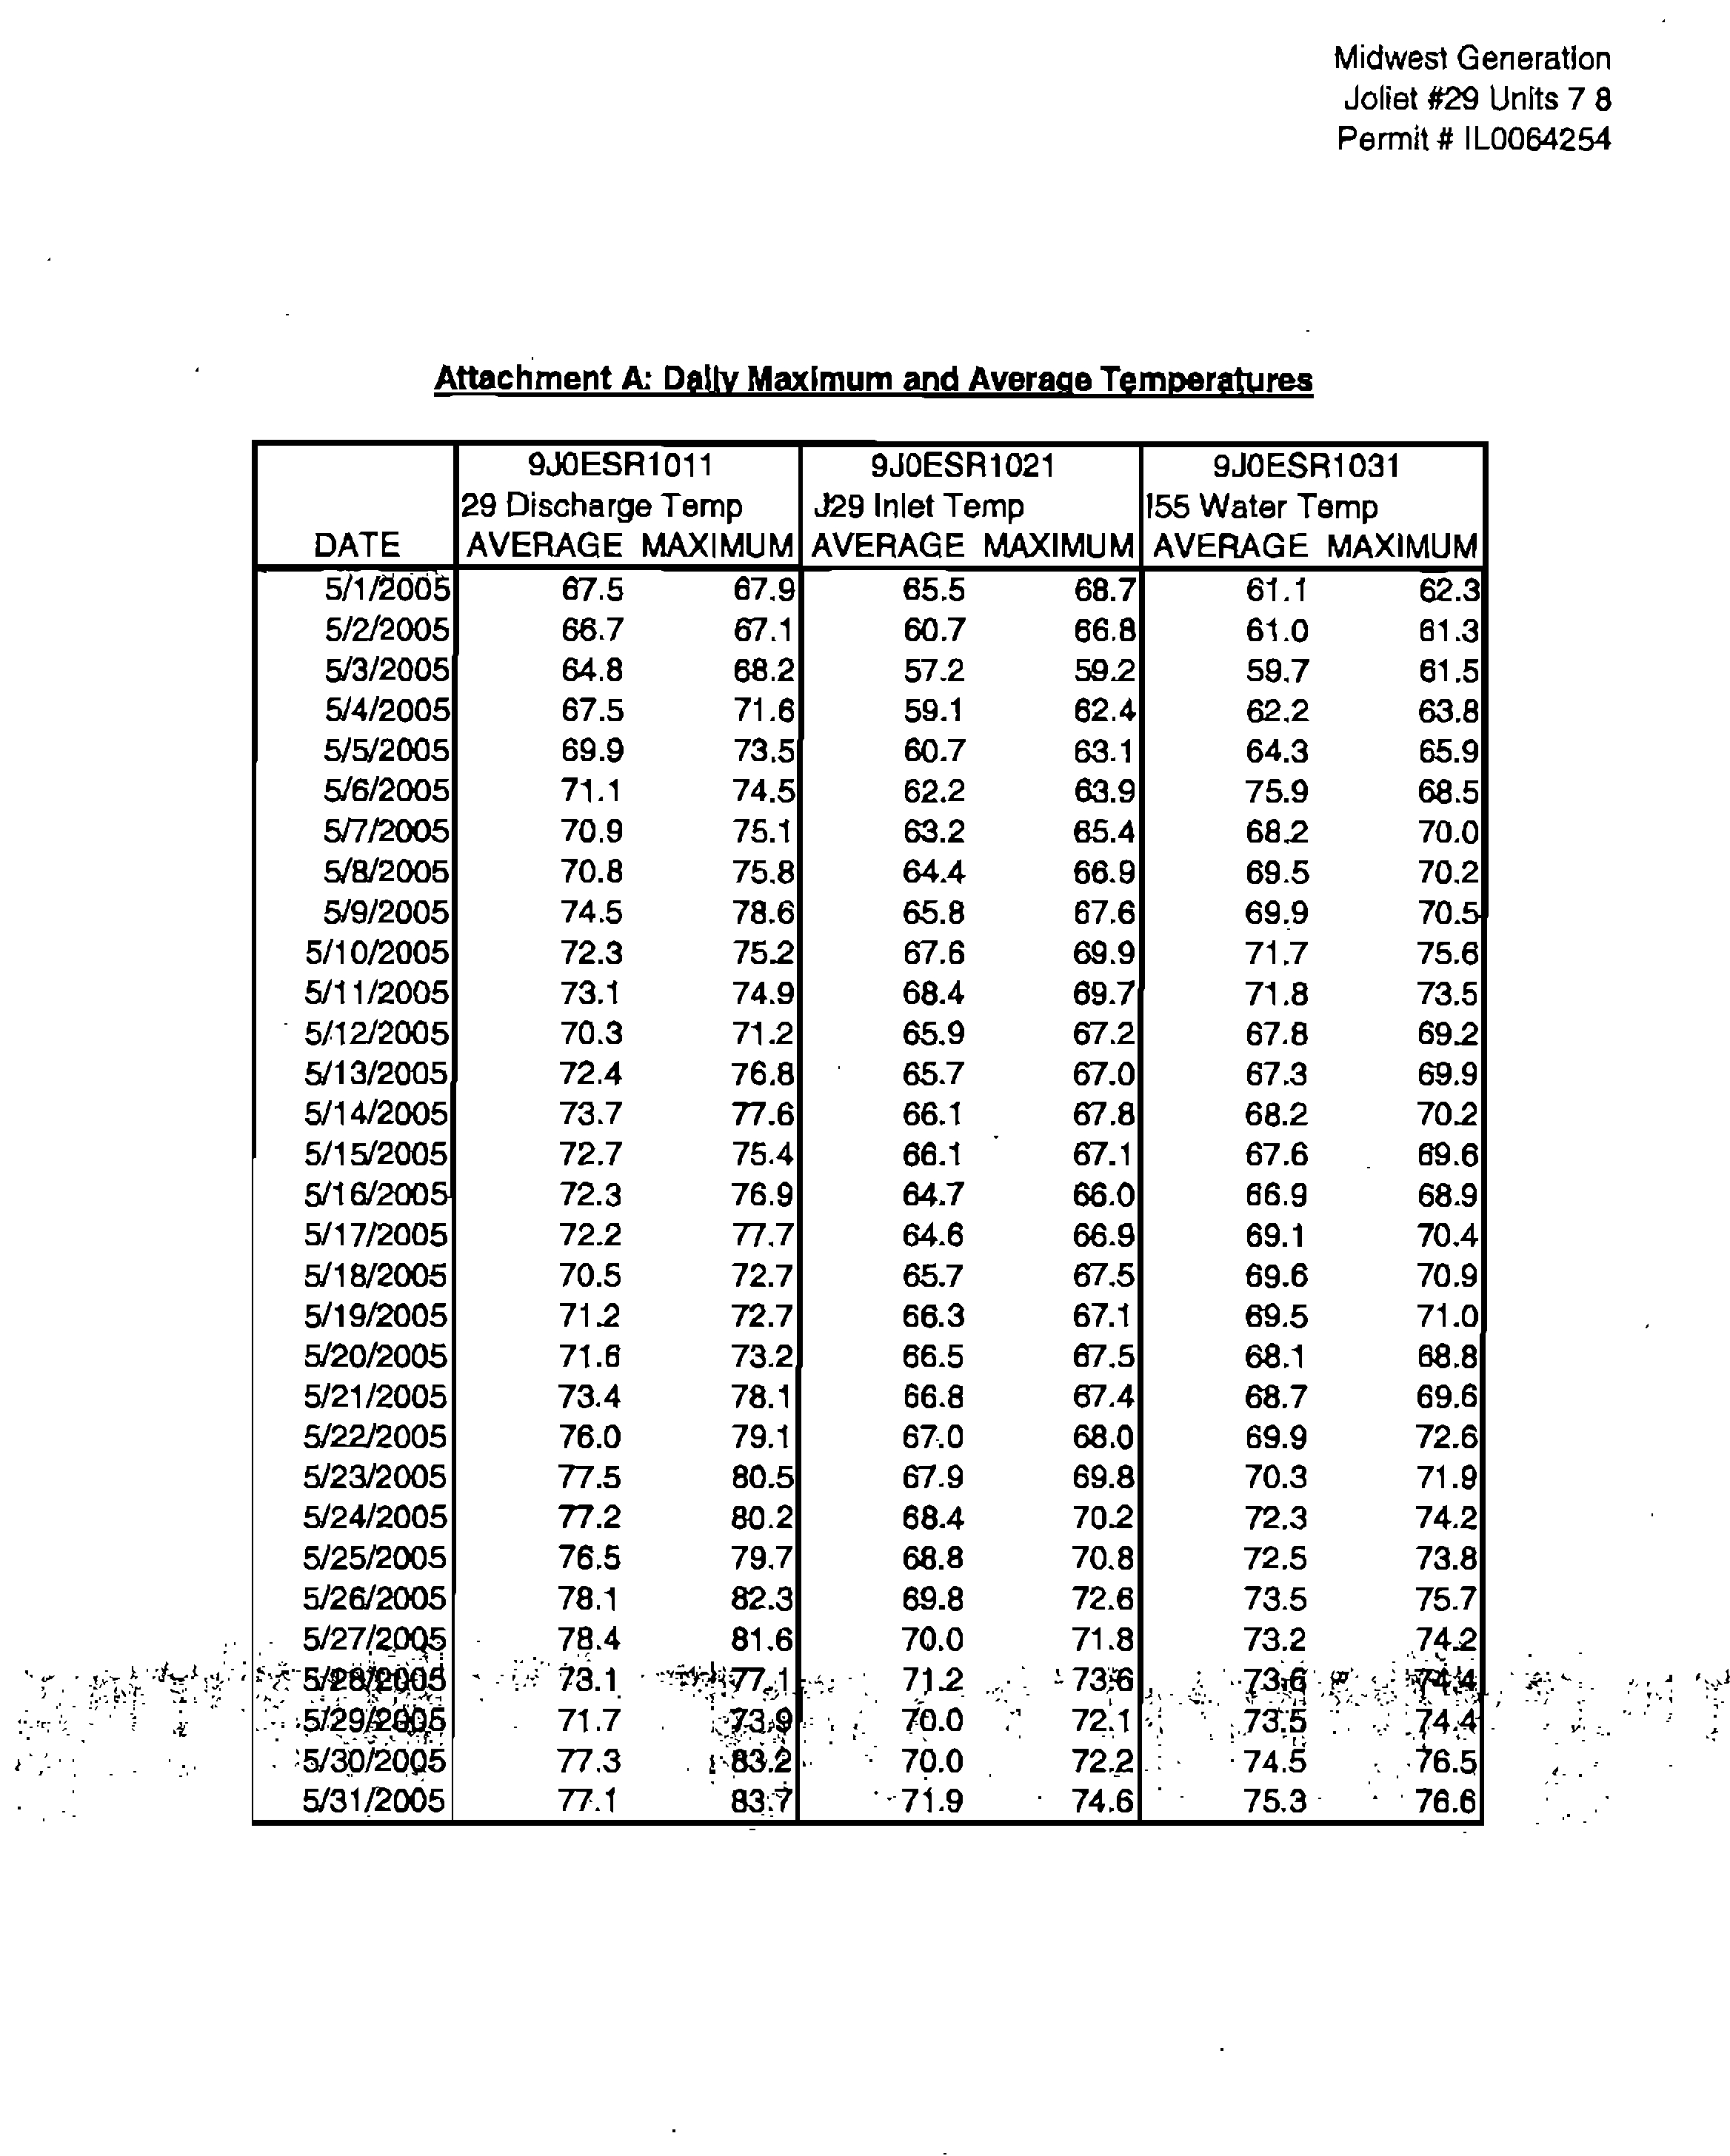
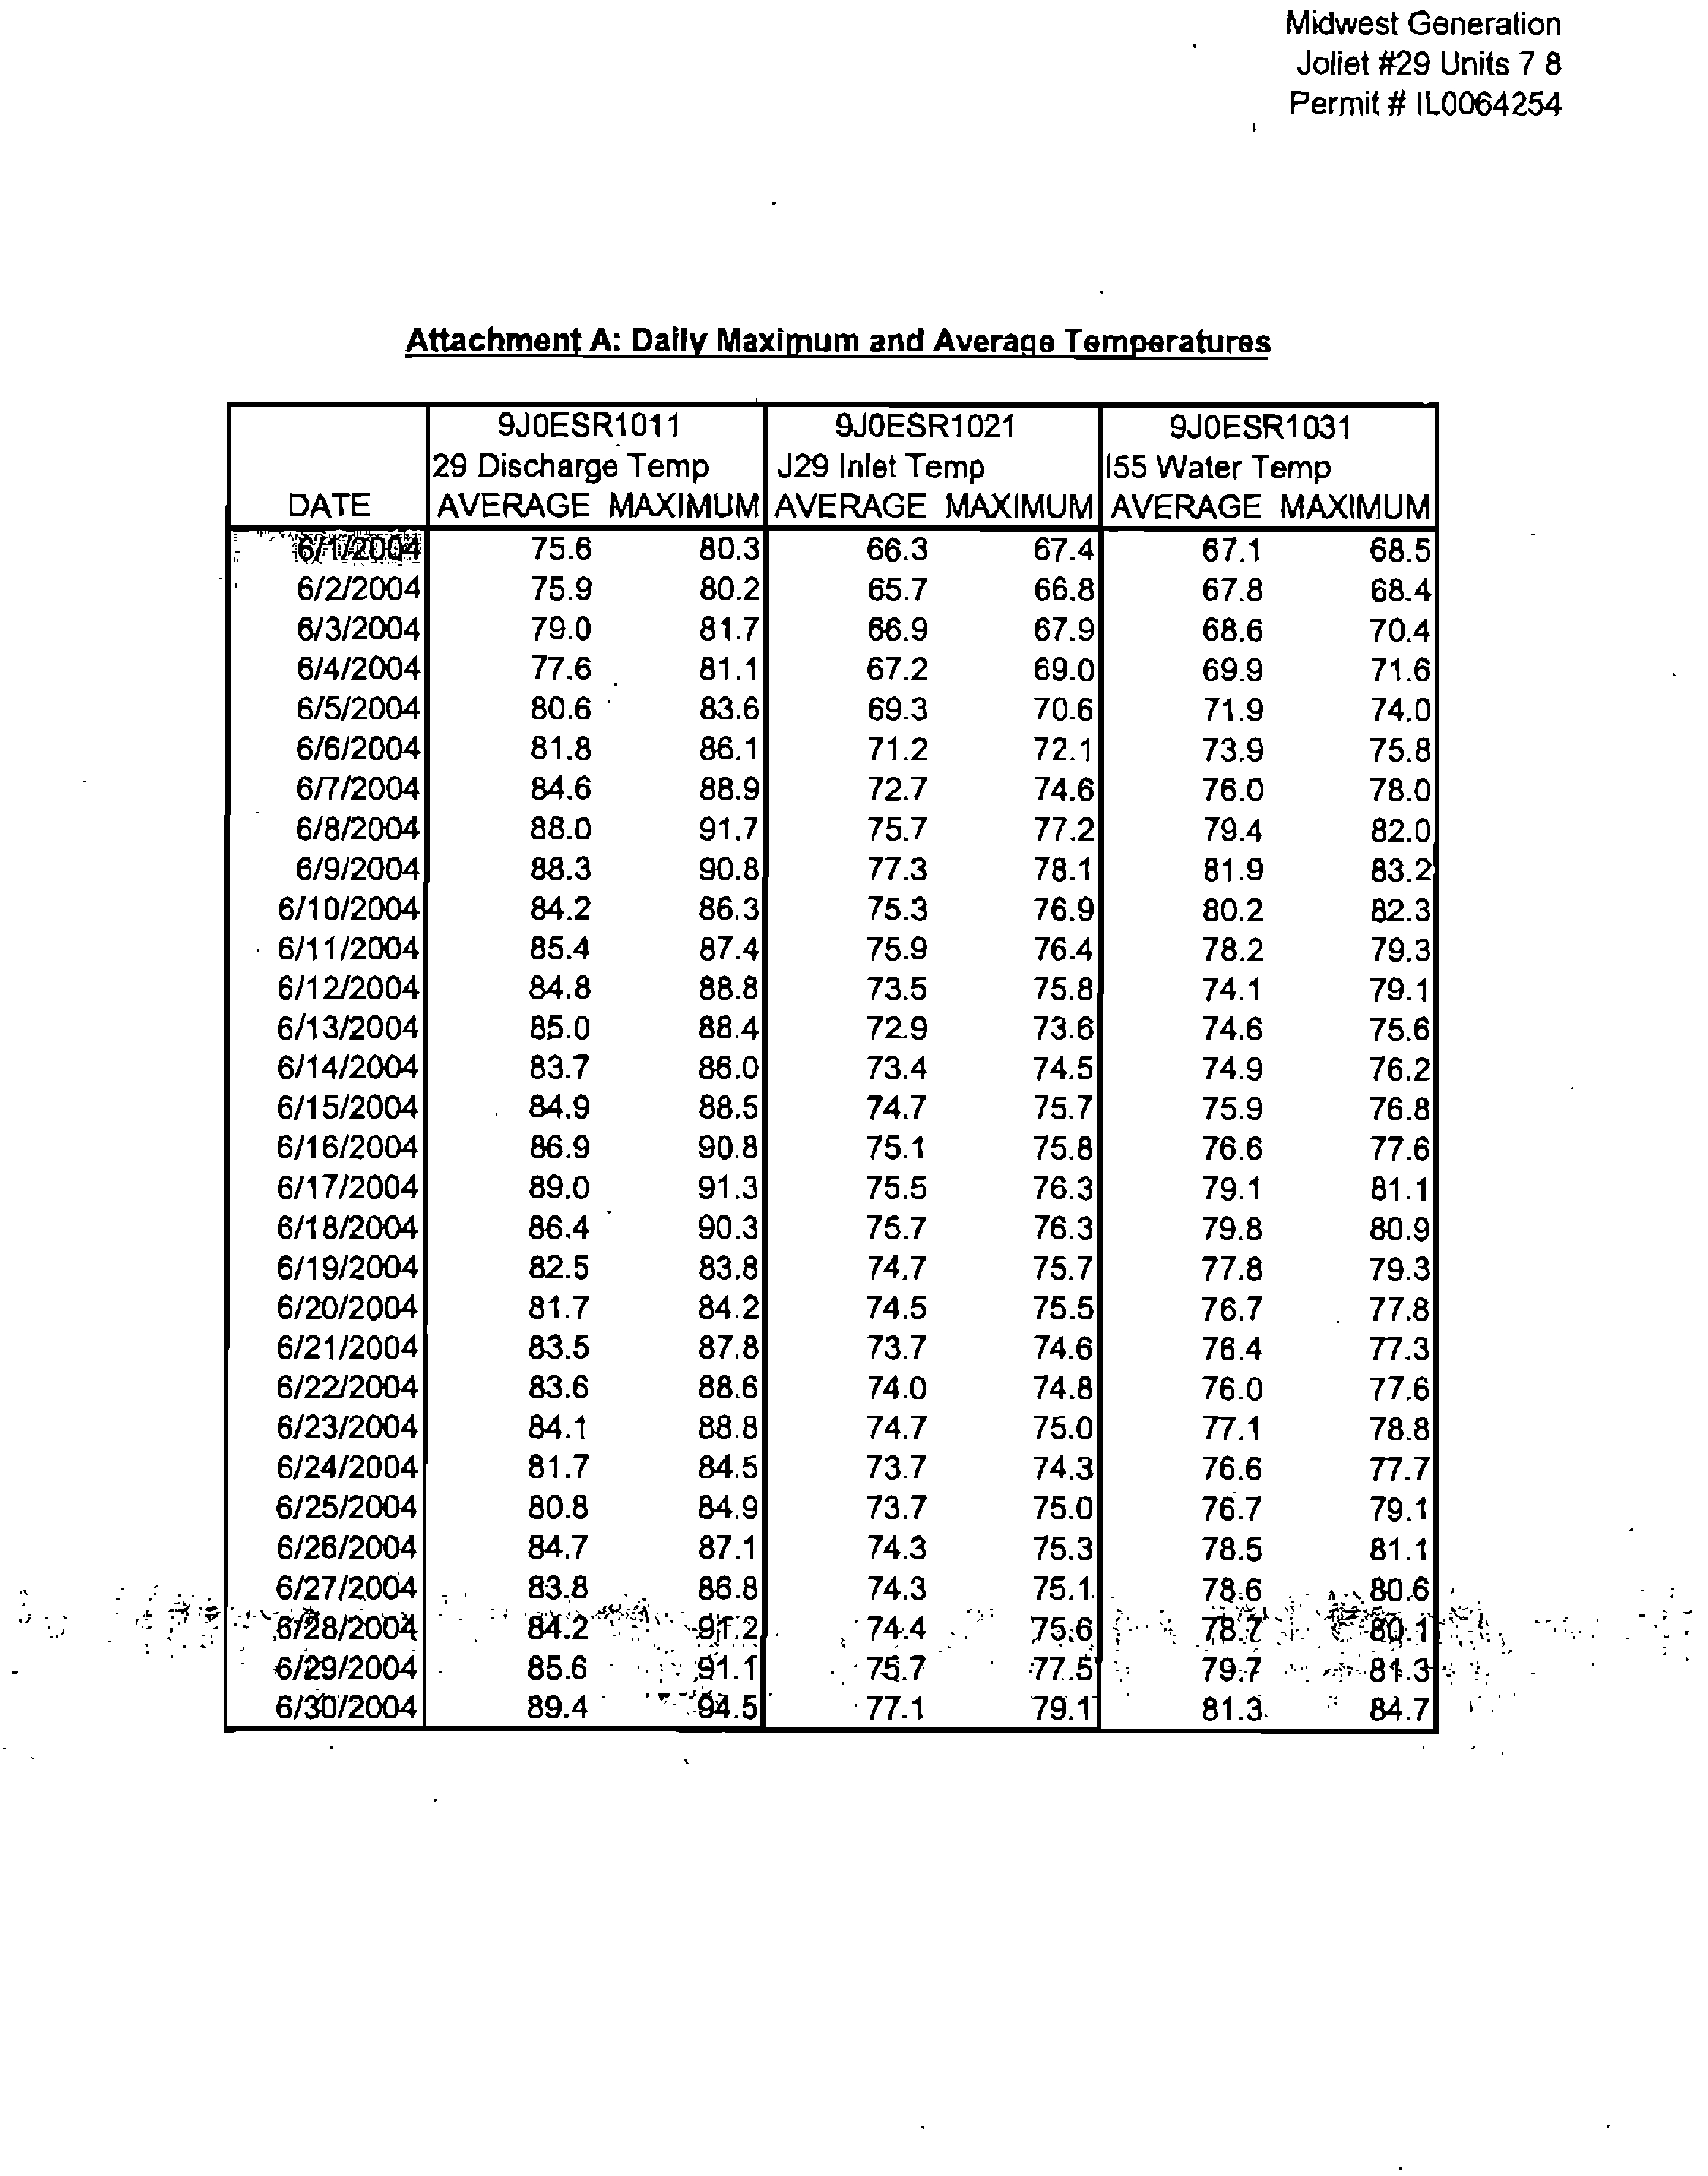
on
intake
temperatures
at
the
Joliet
plant?
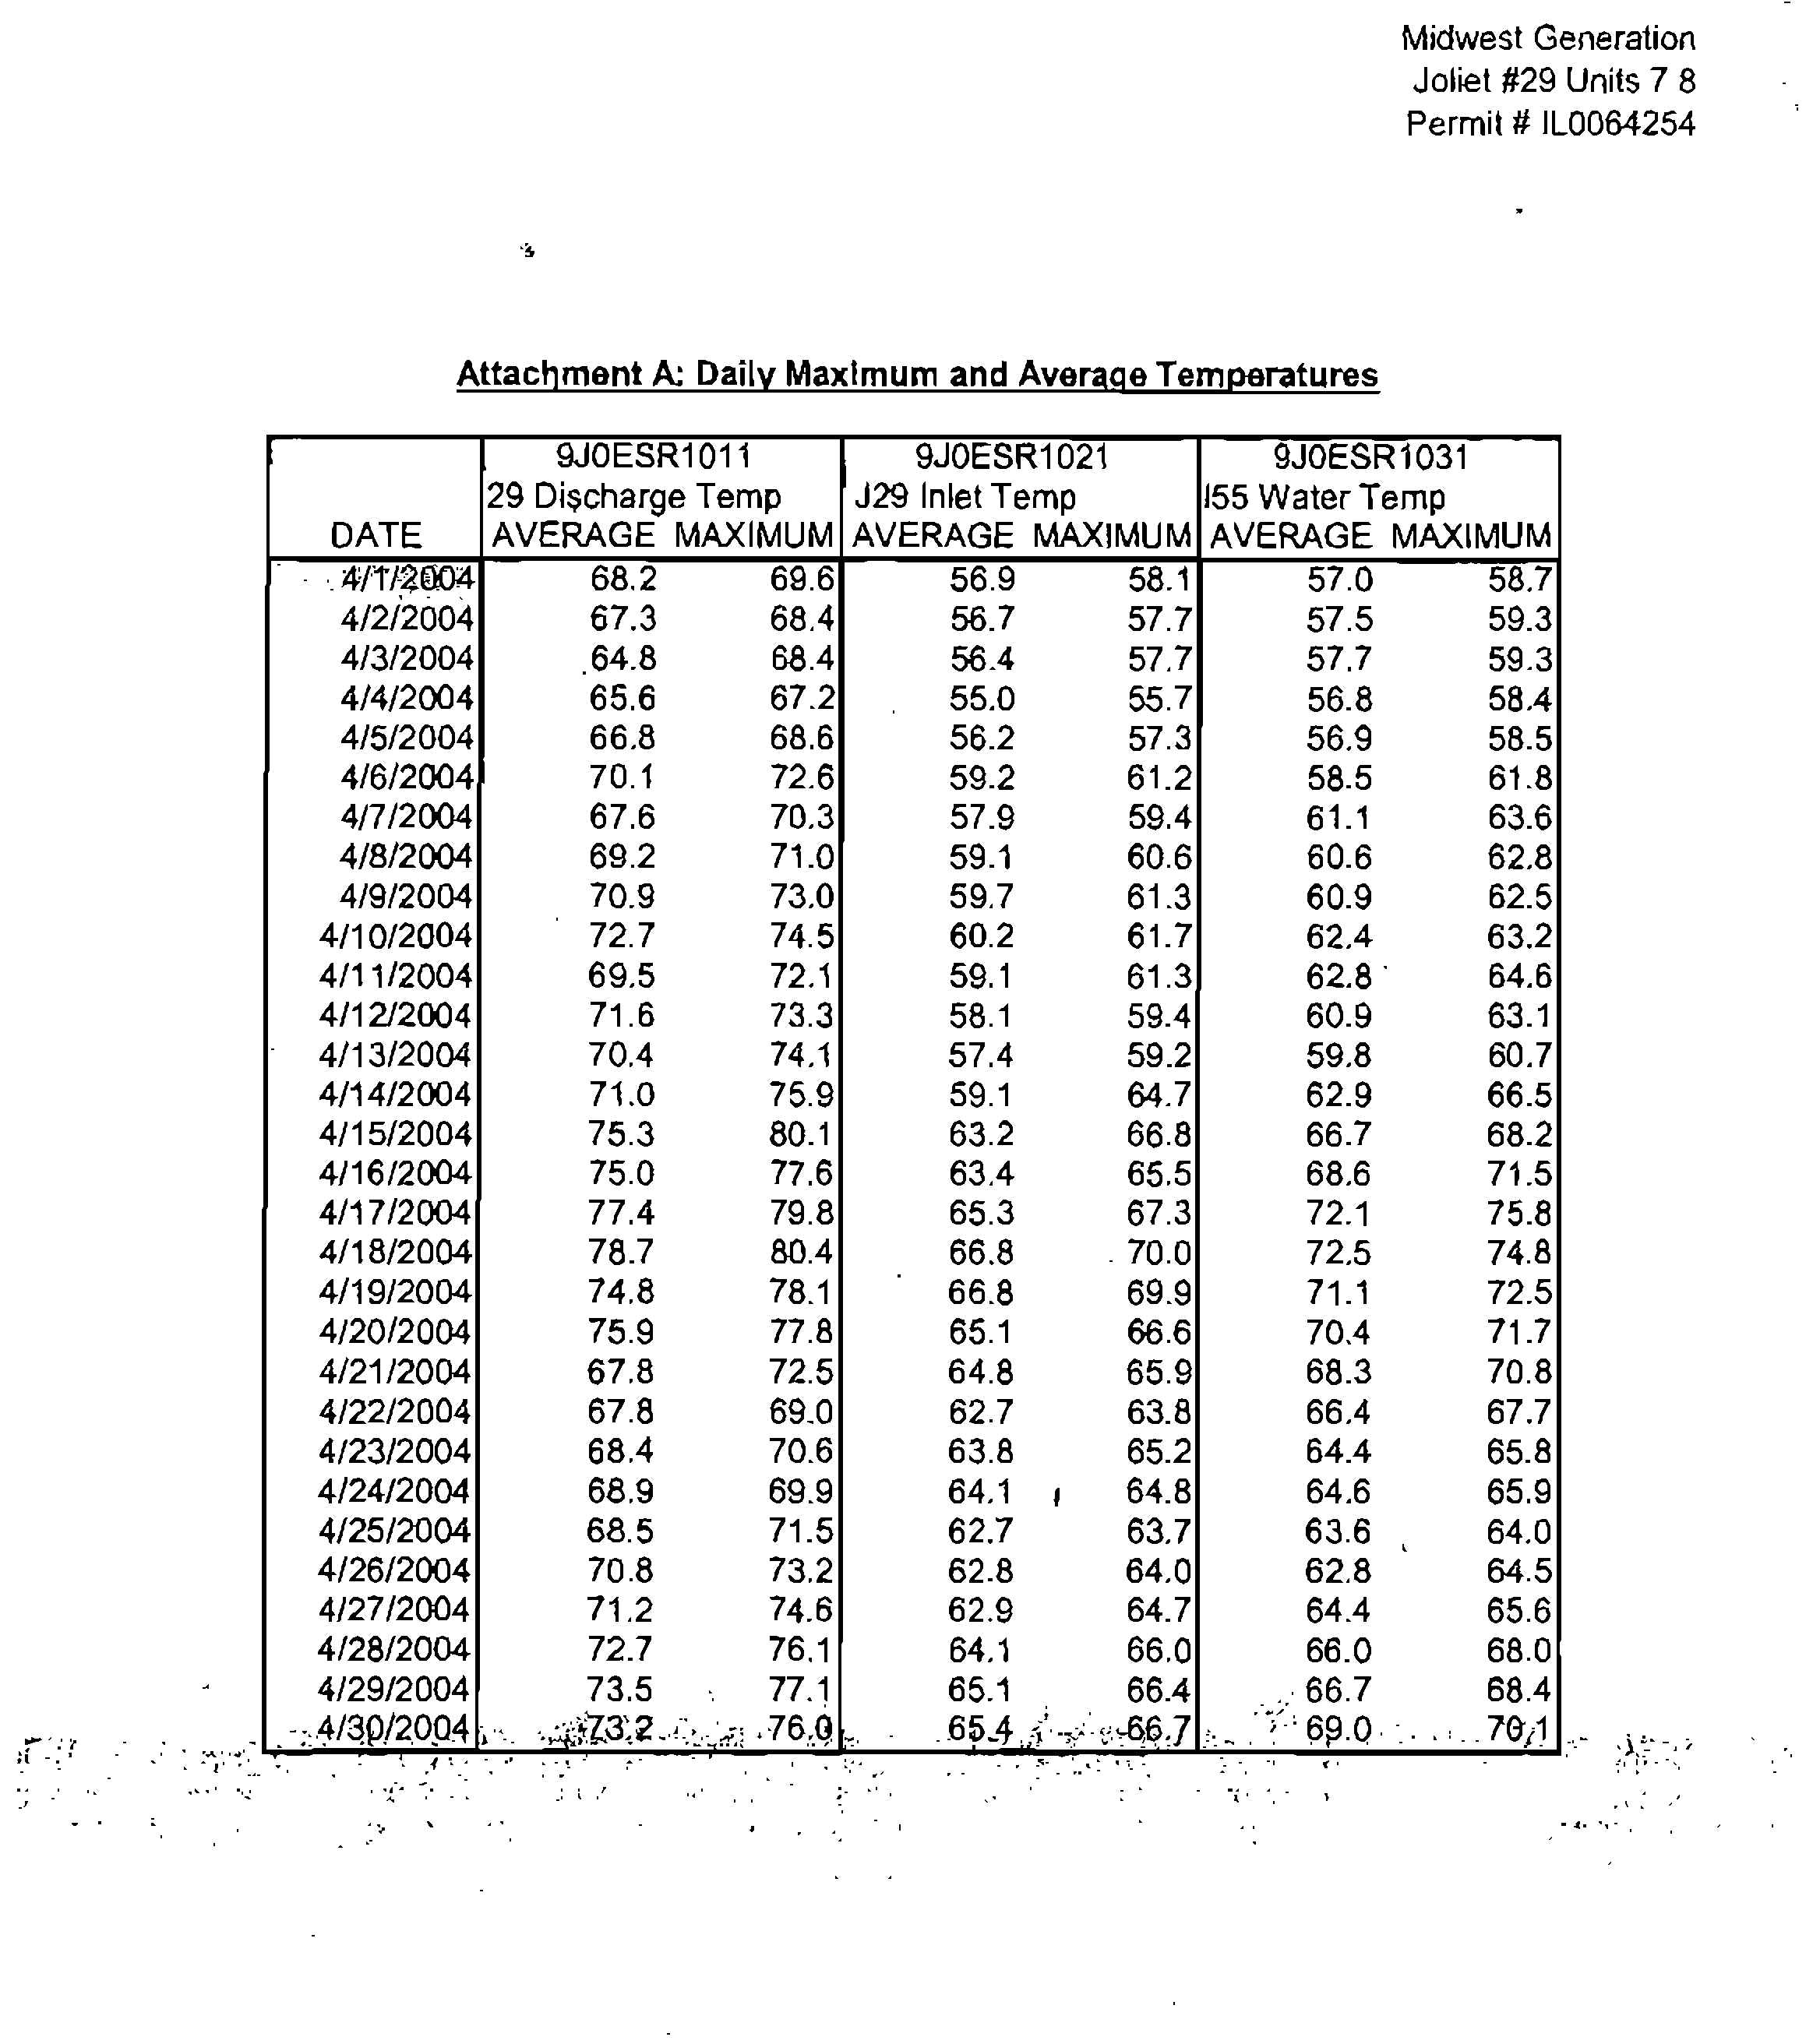
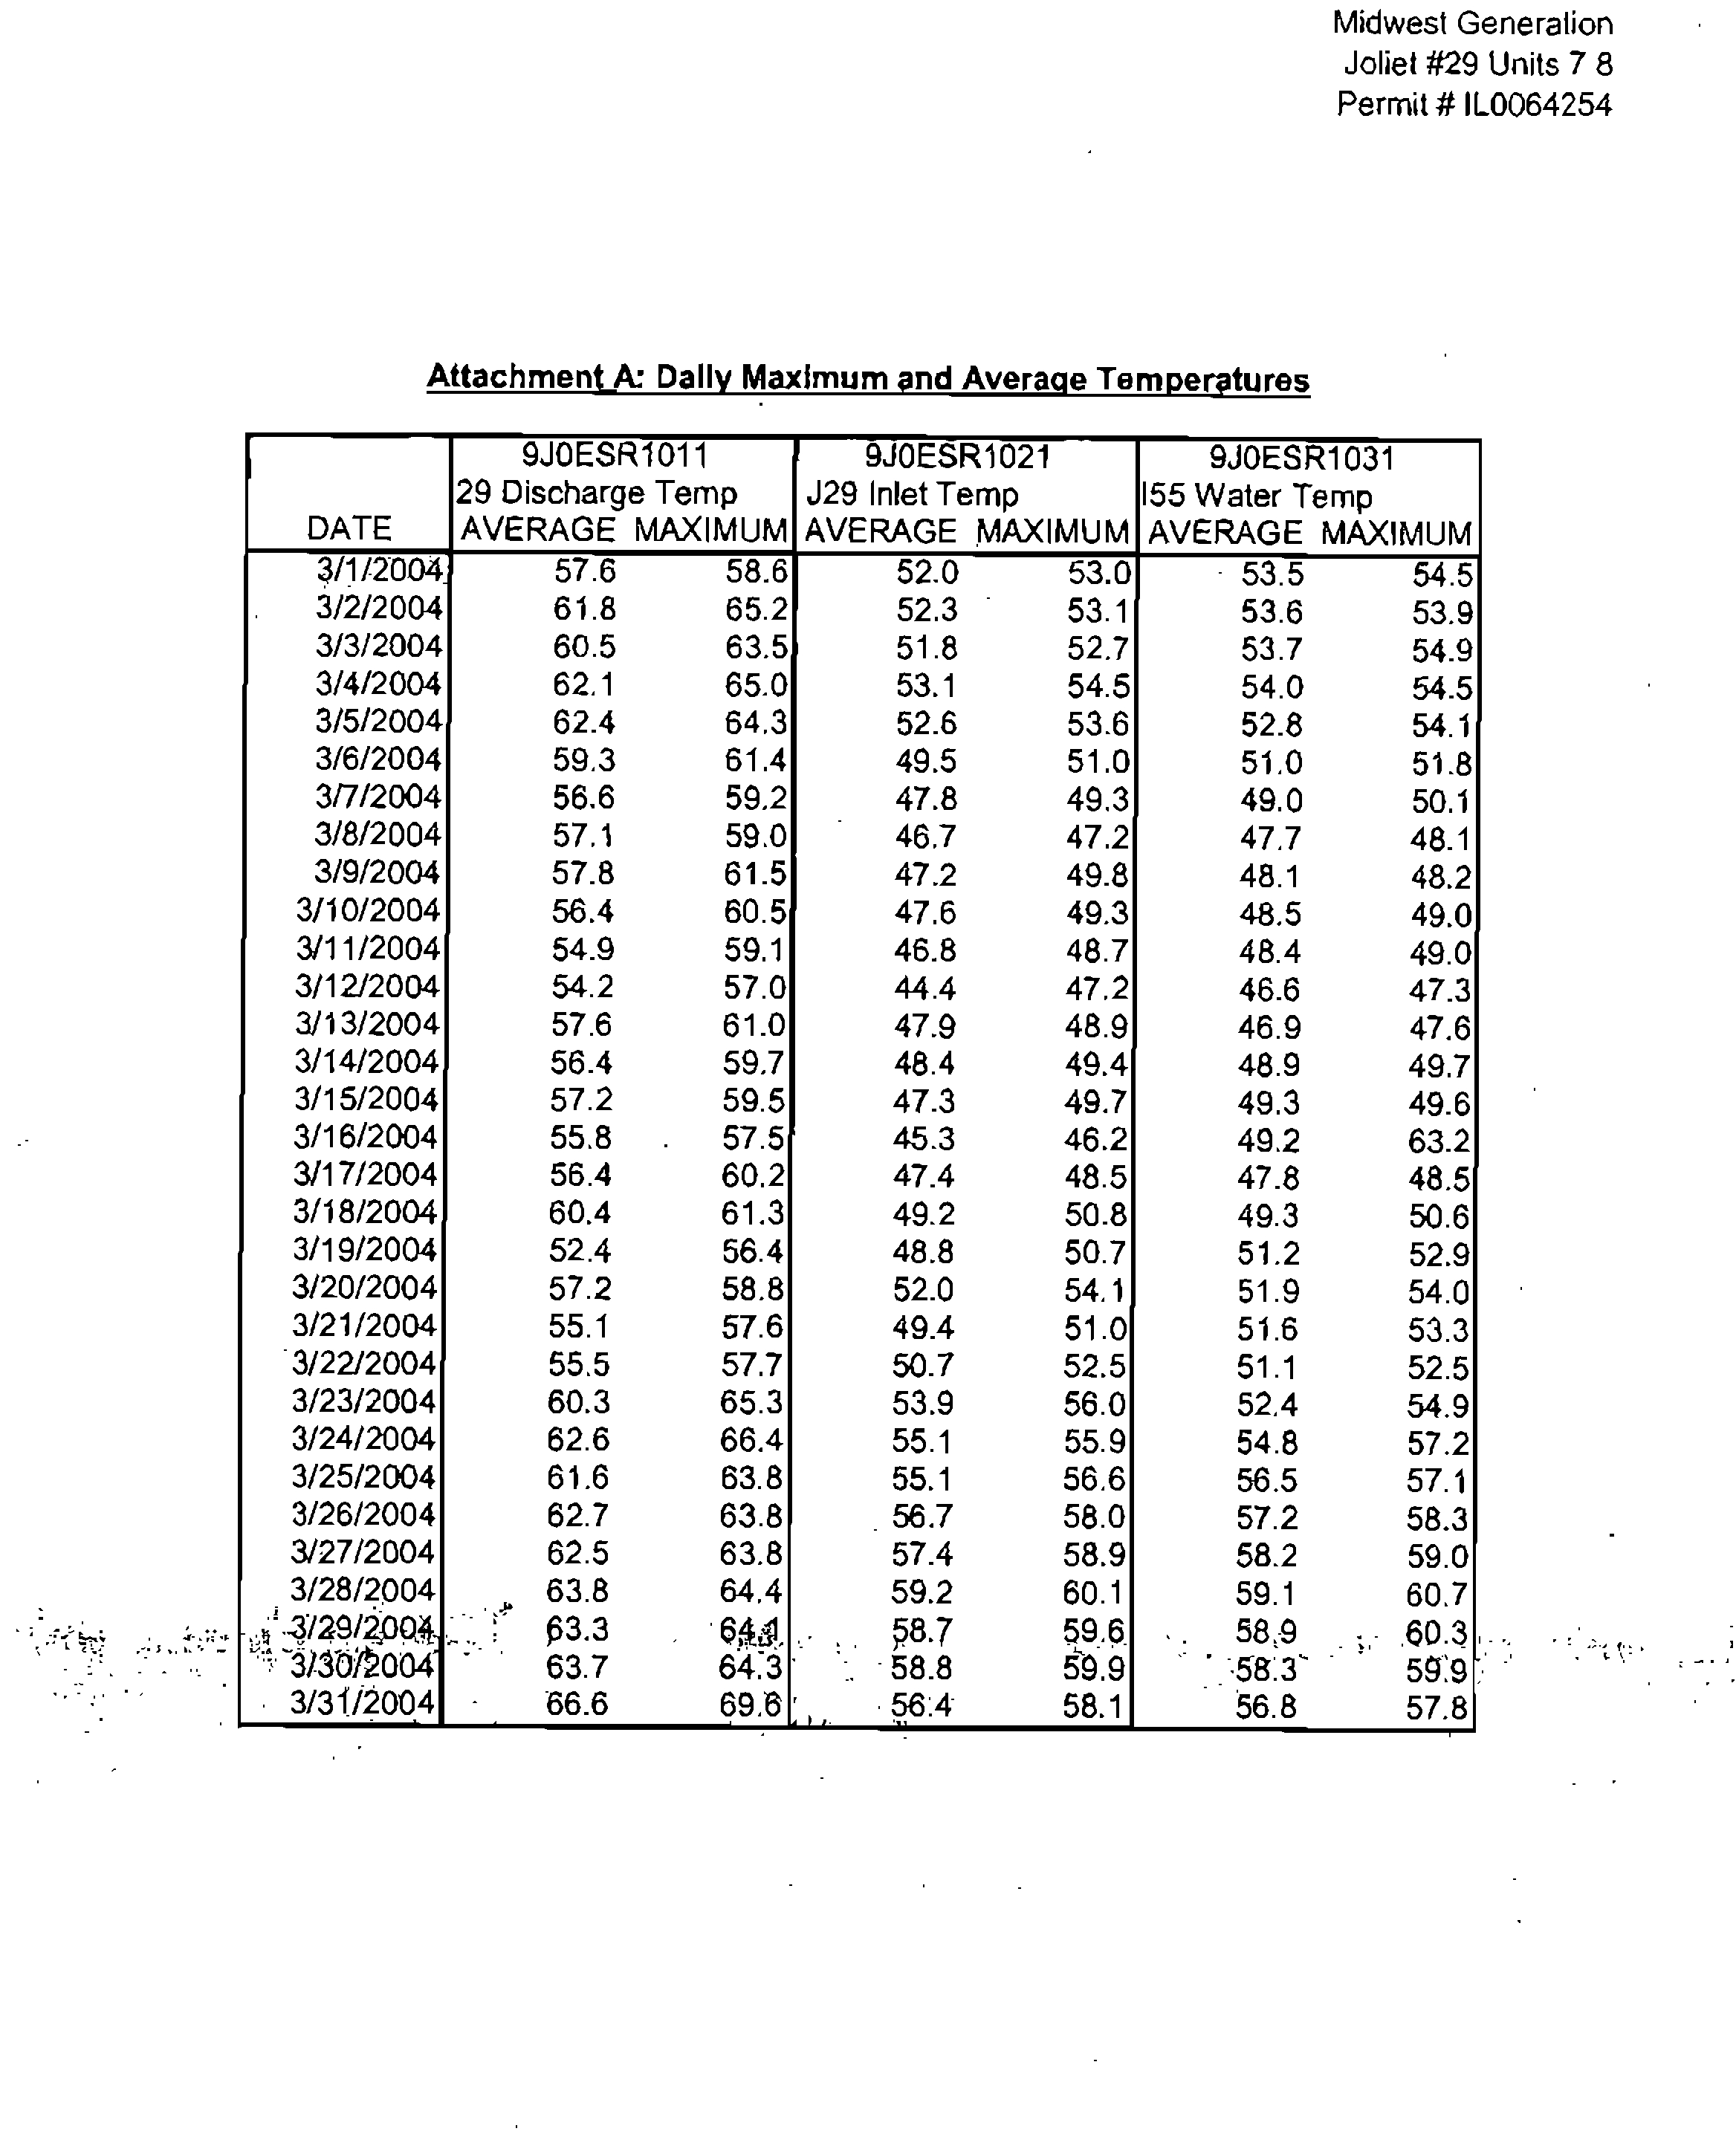
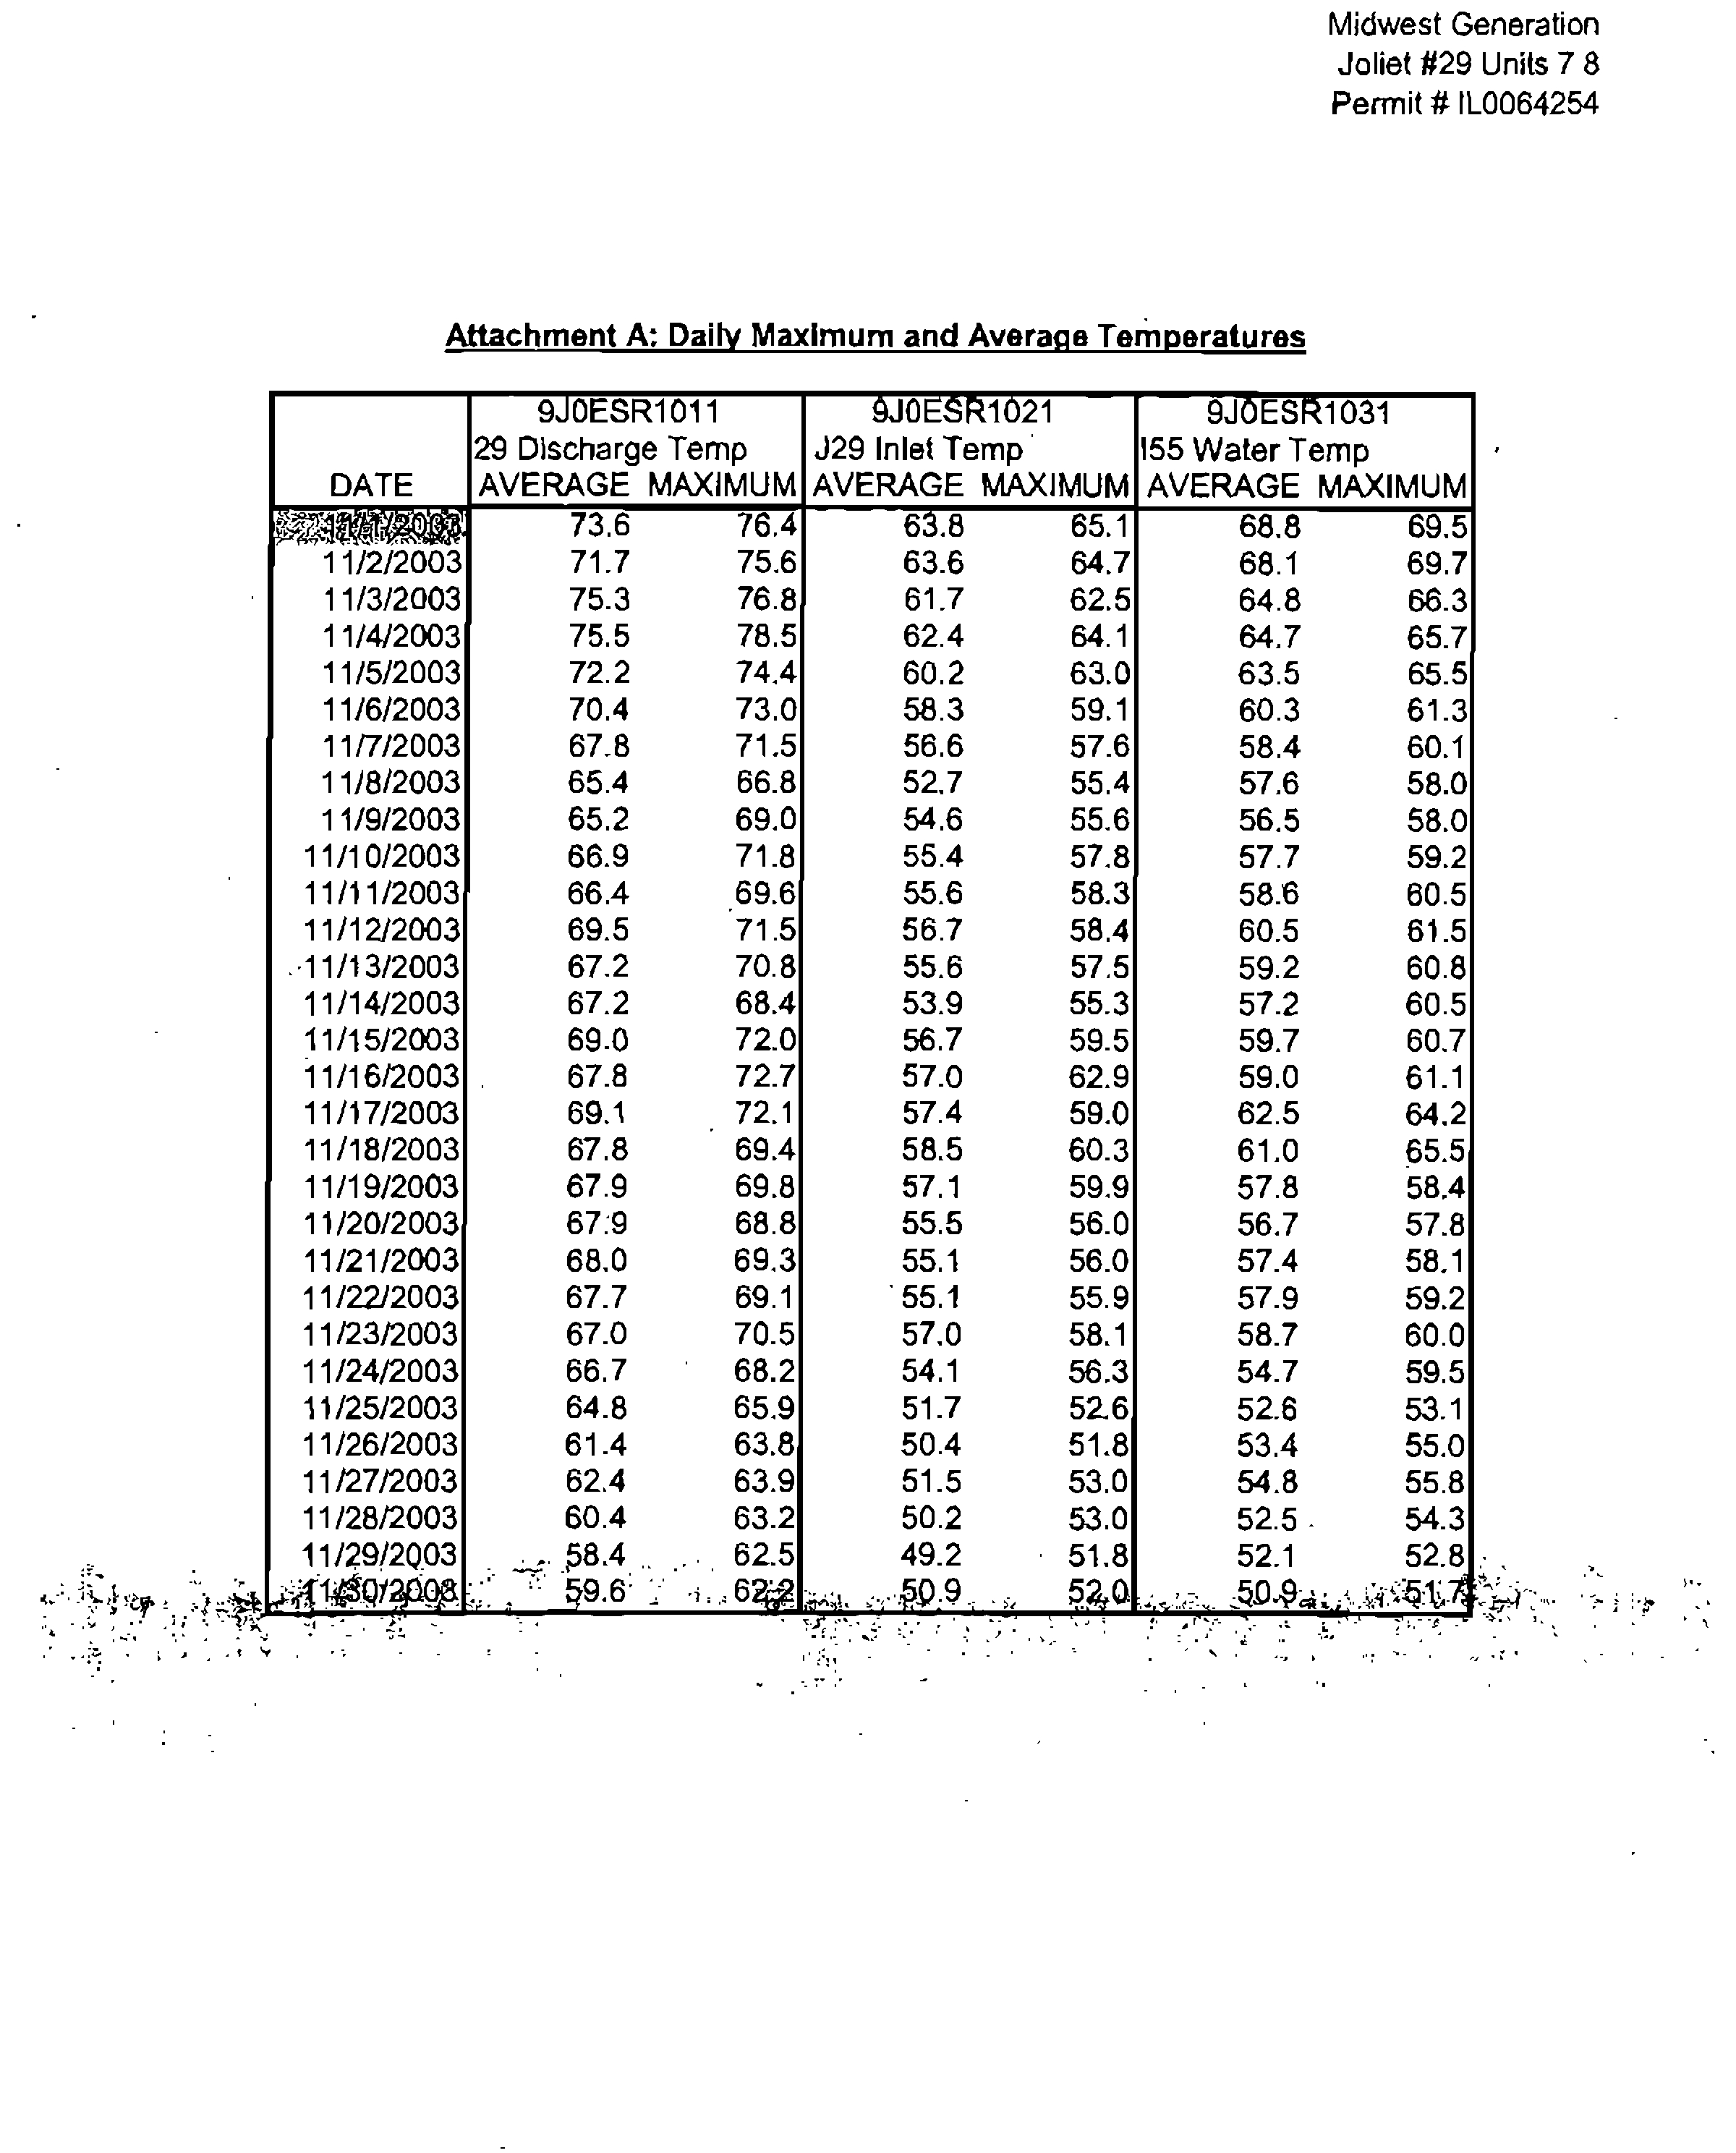
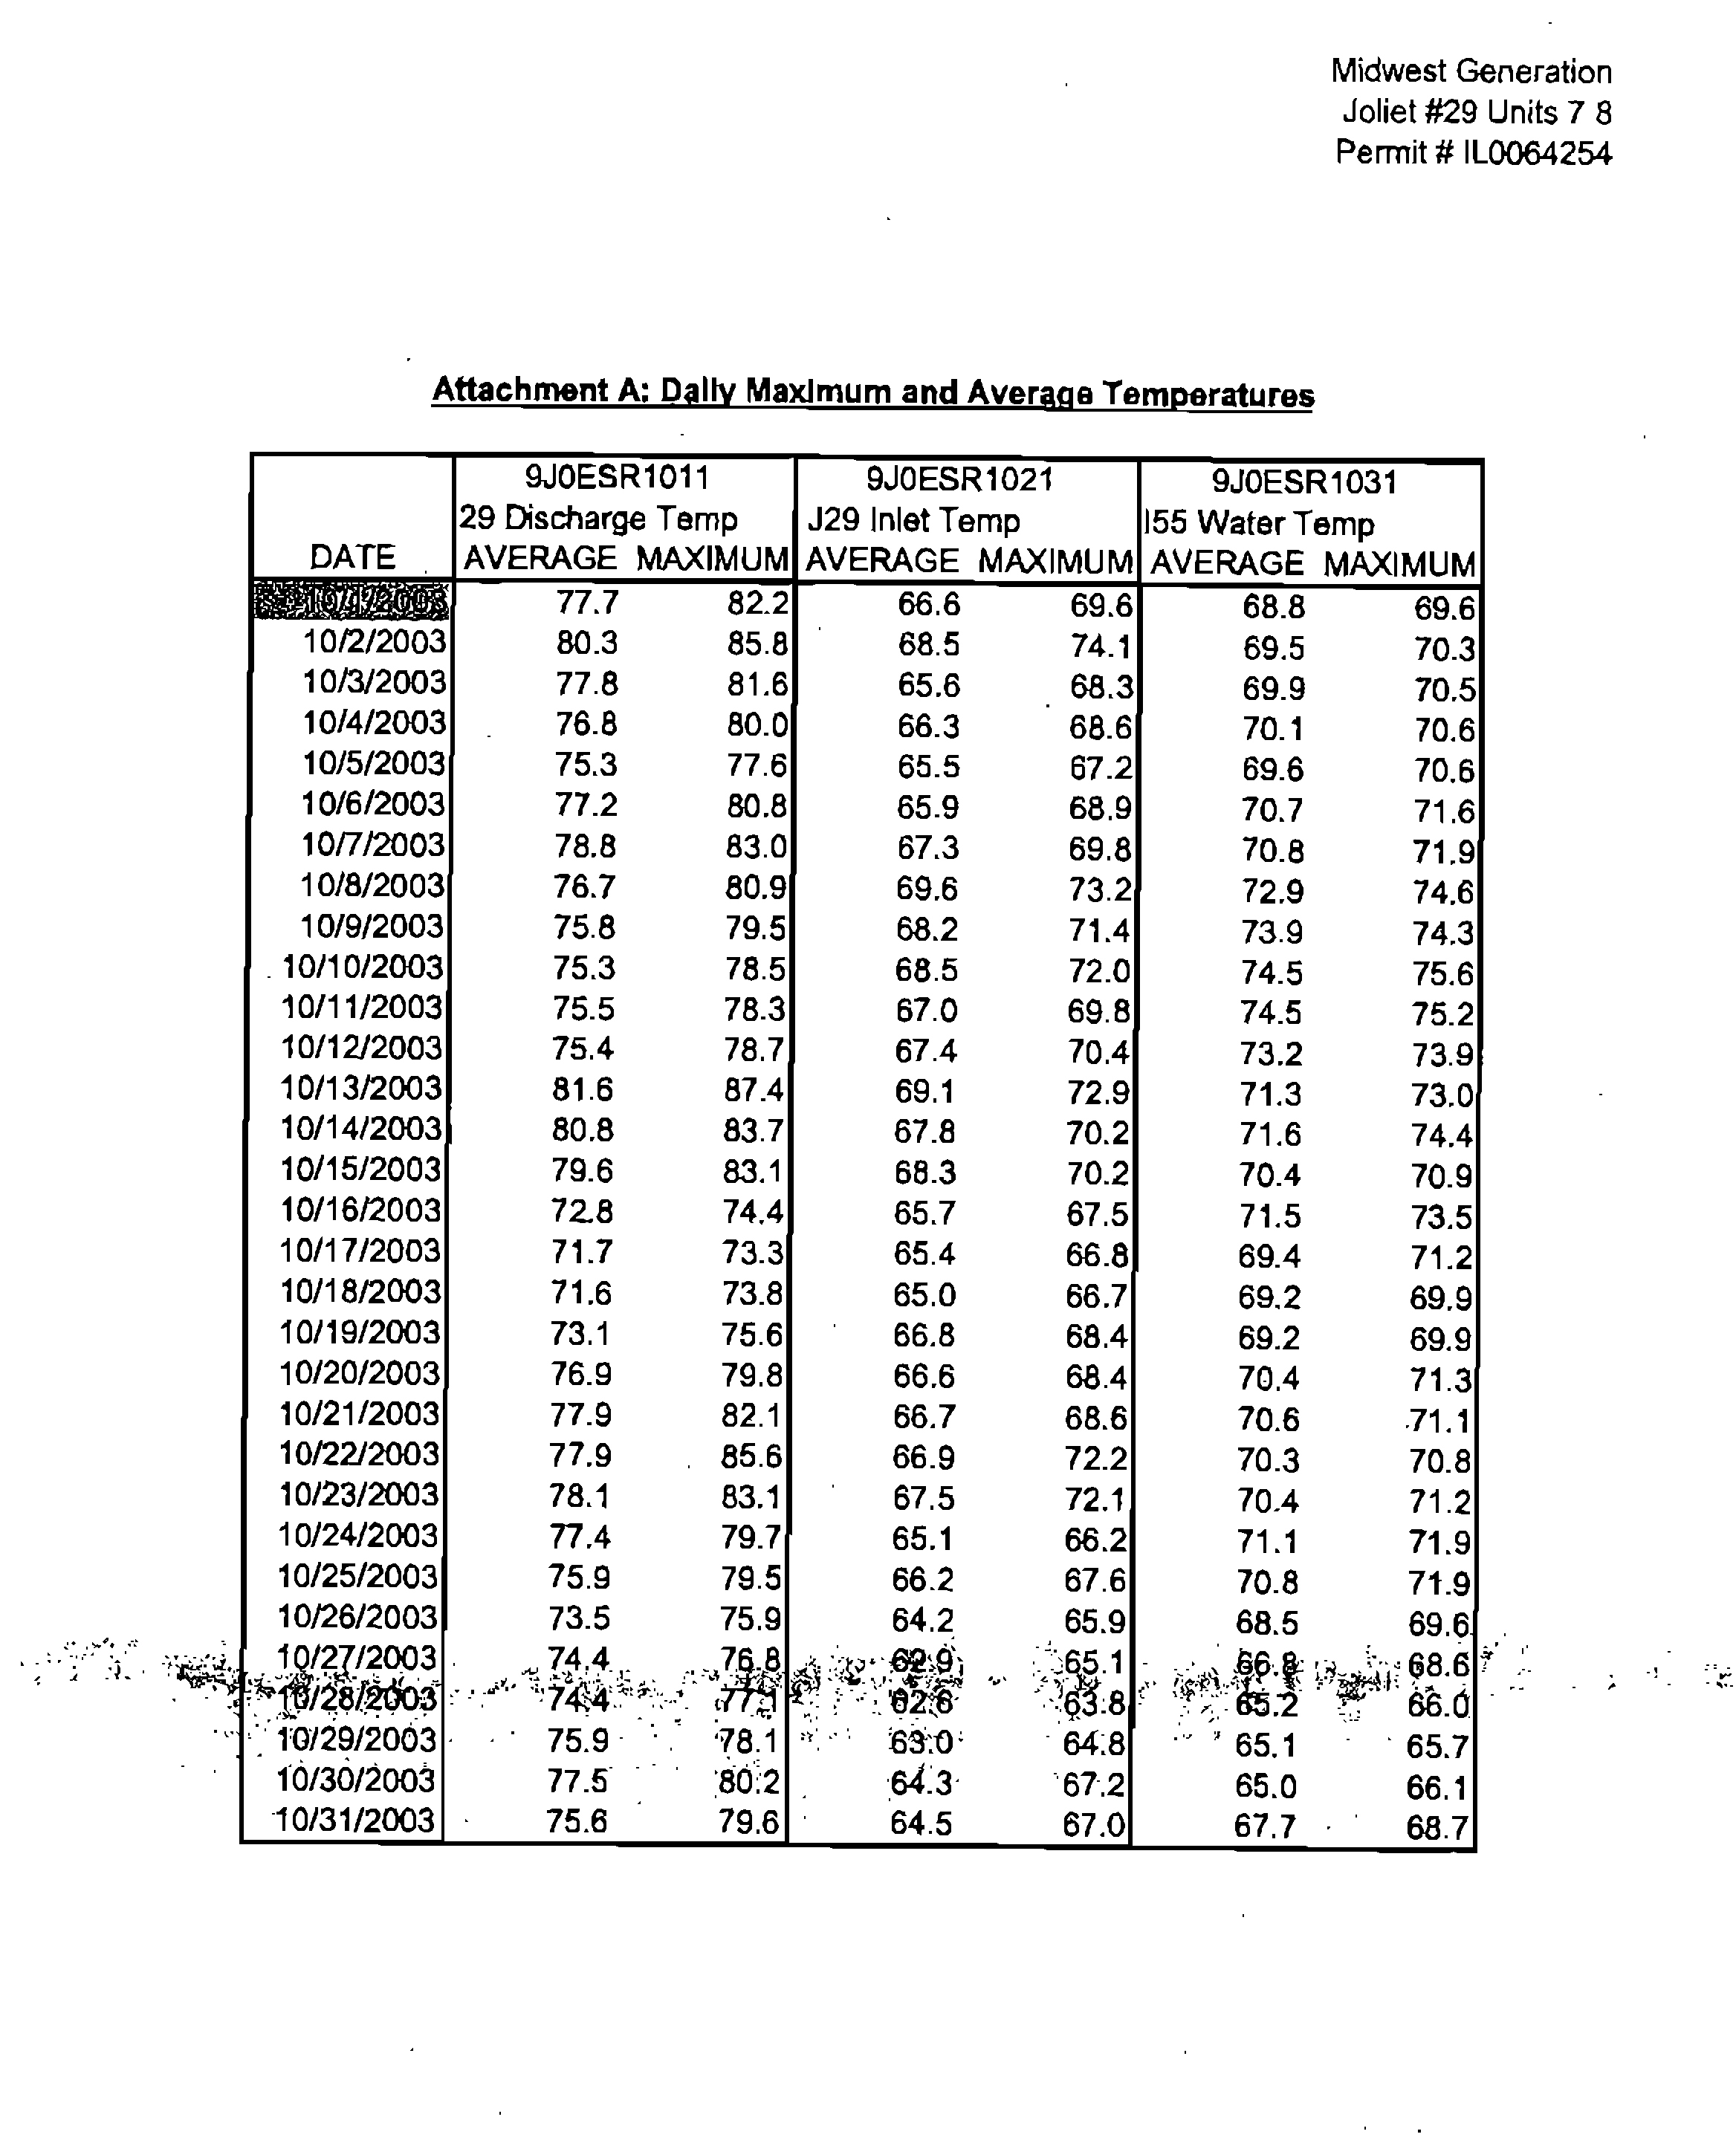
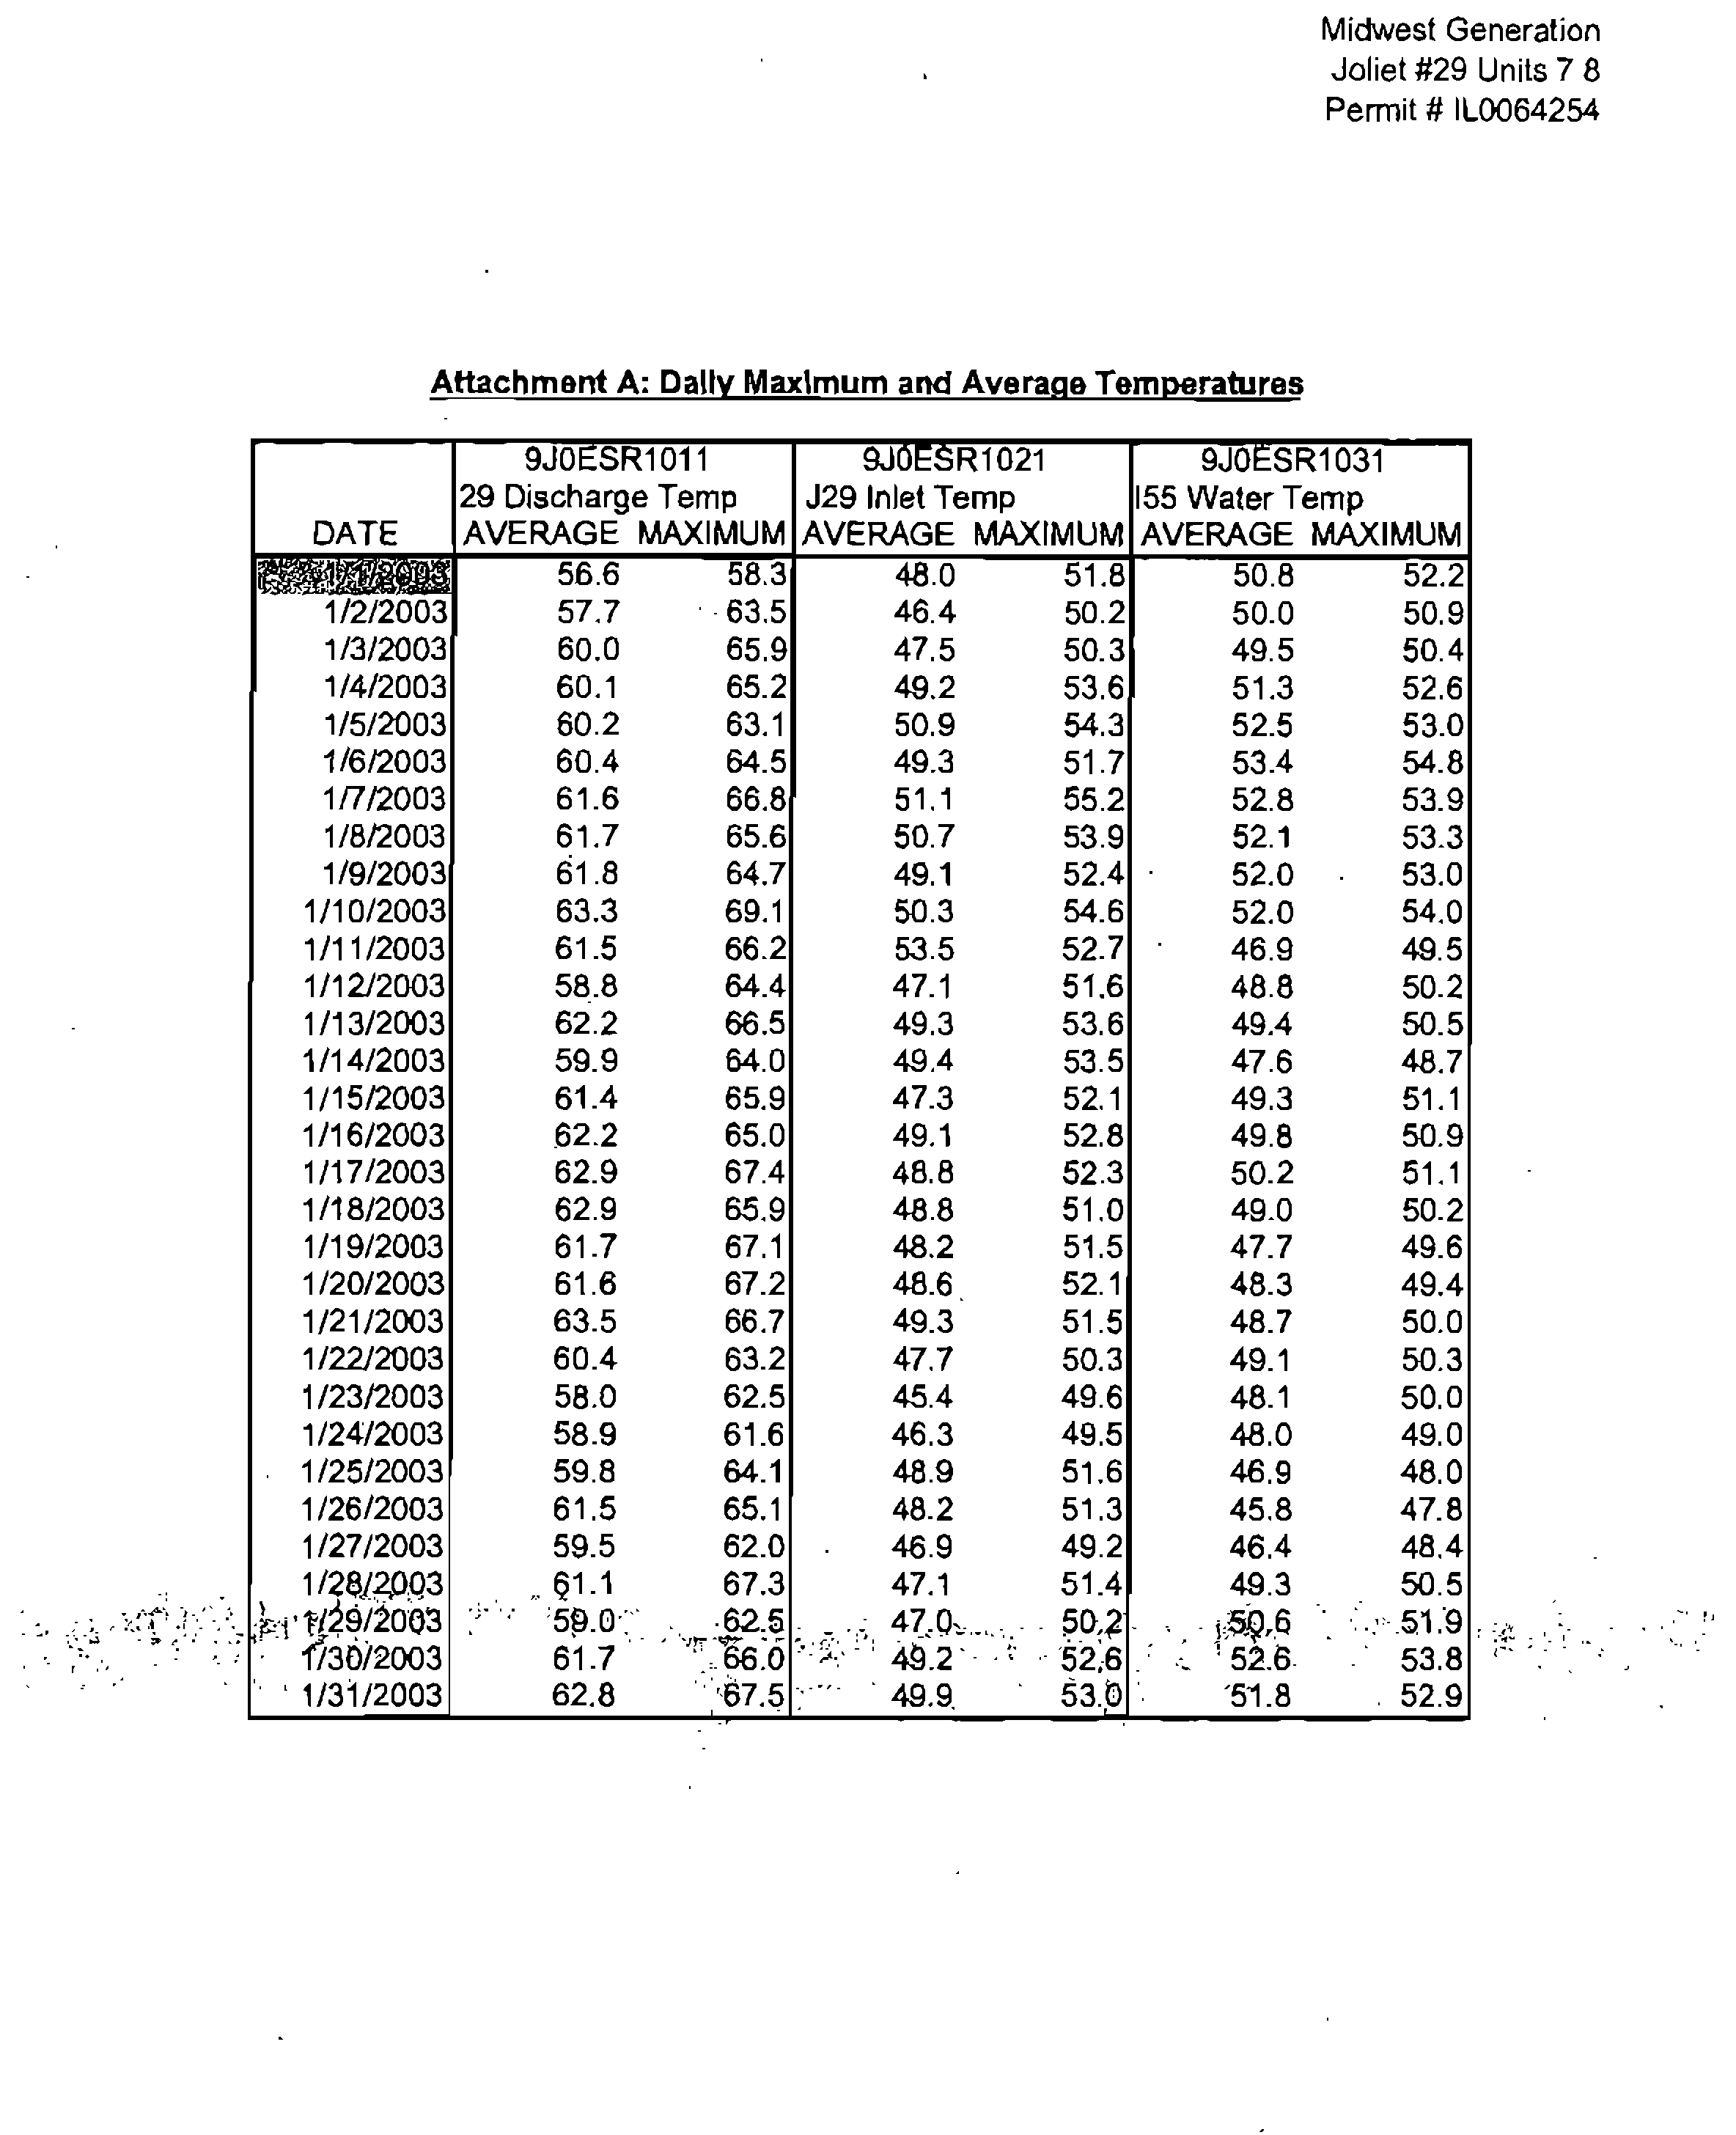
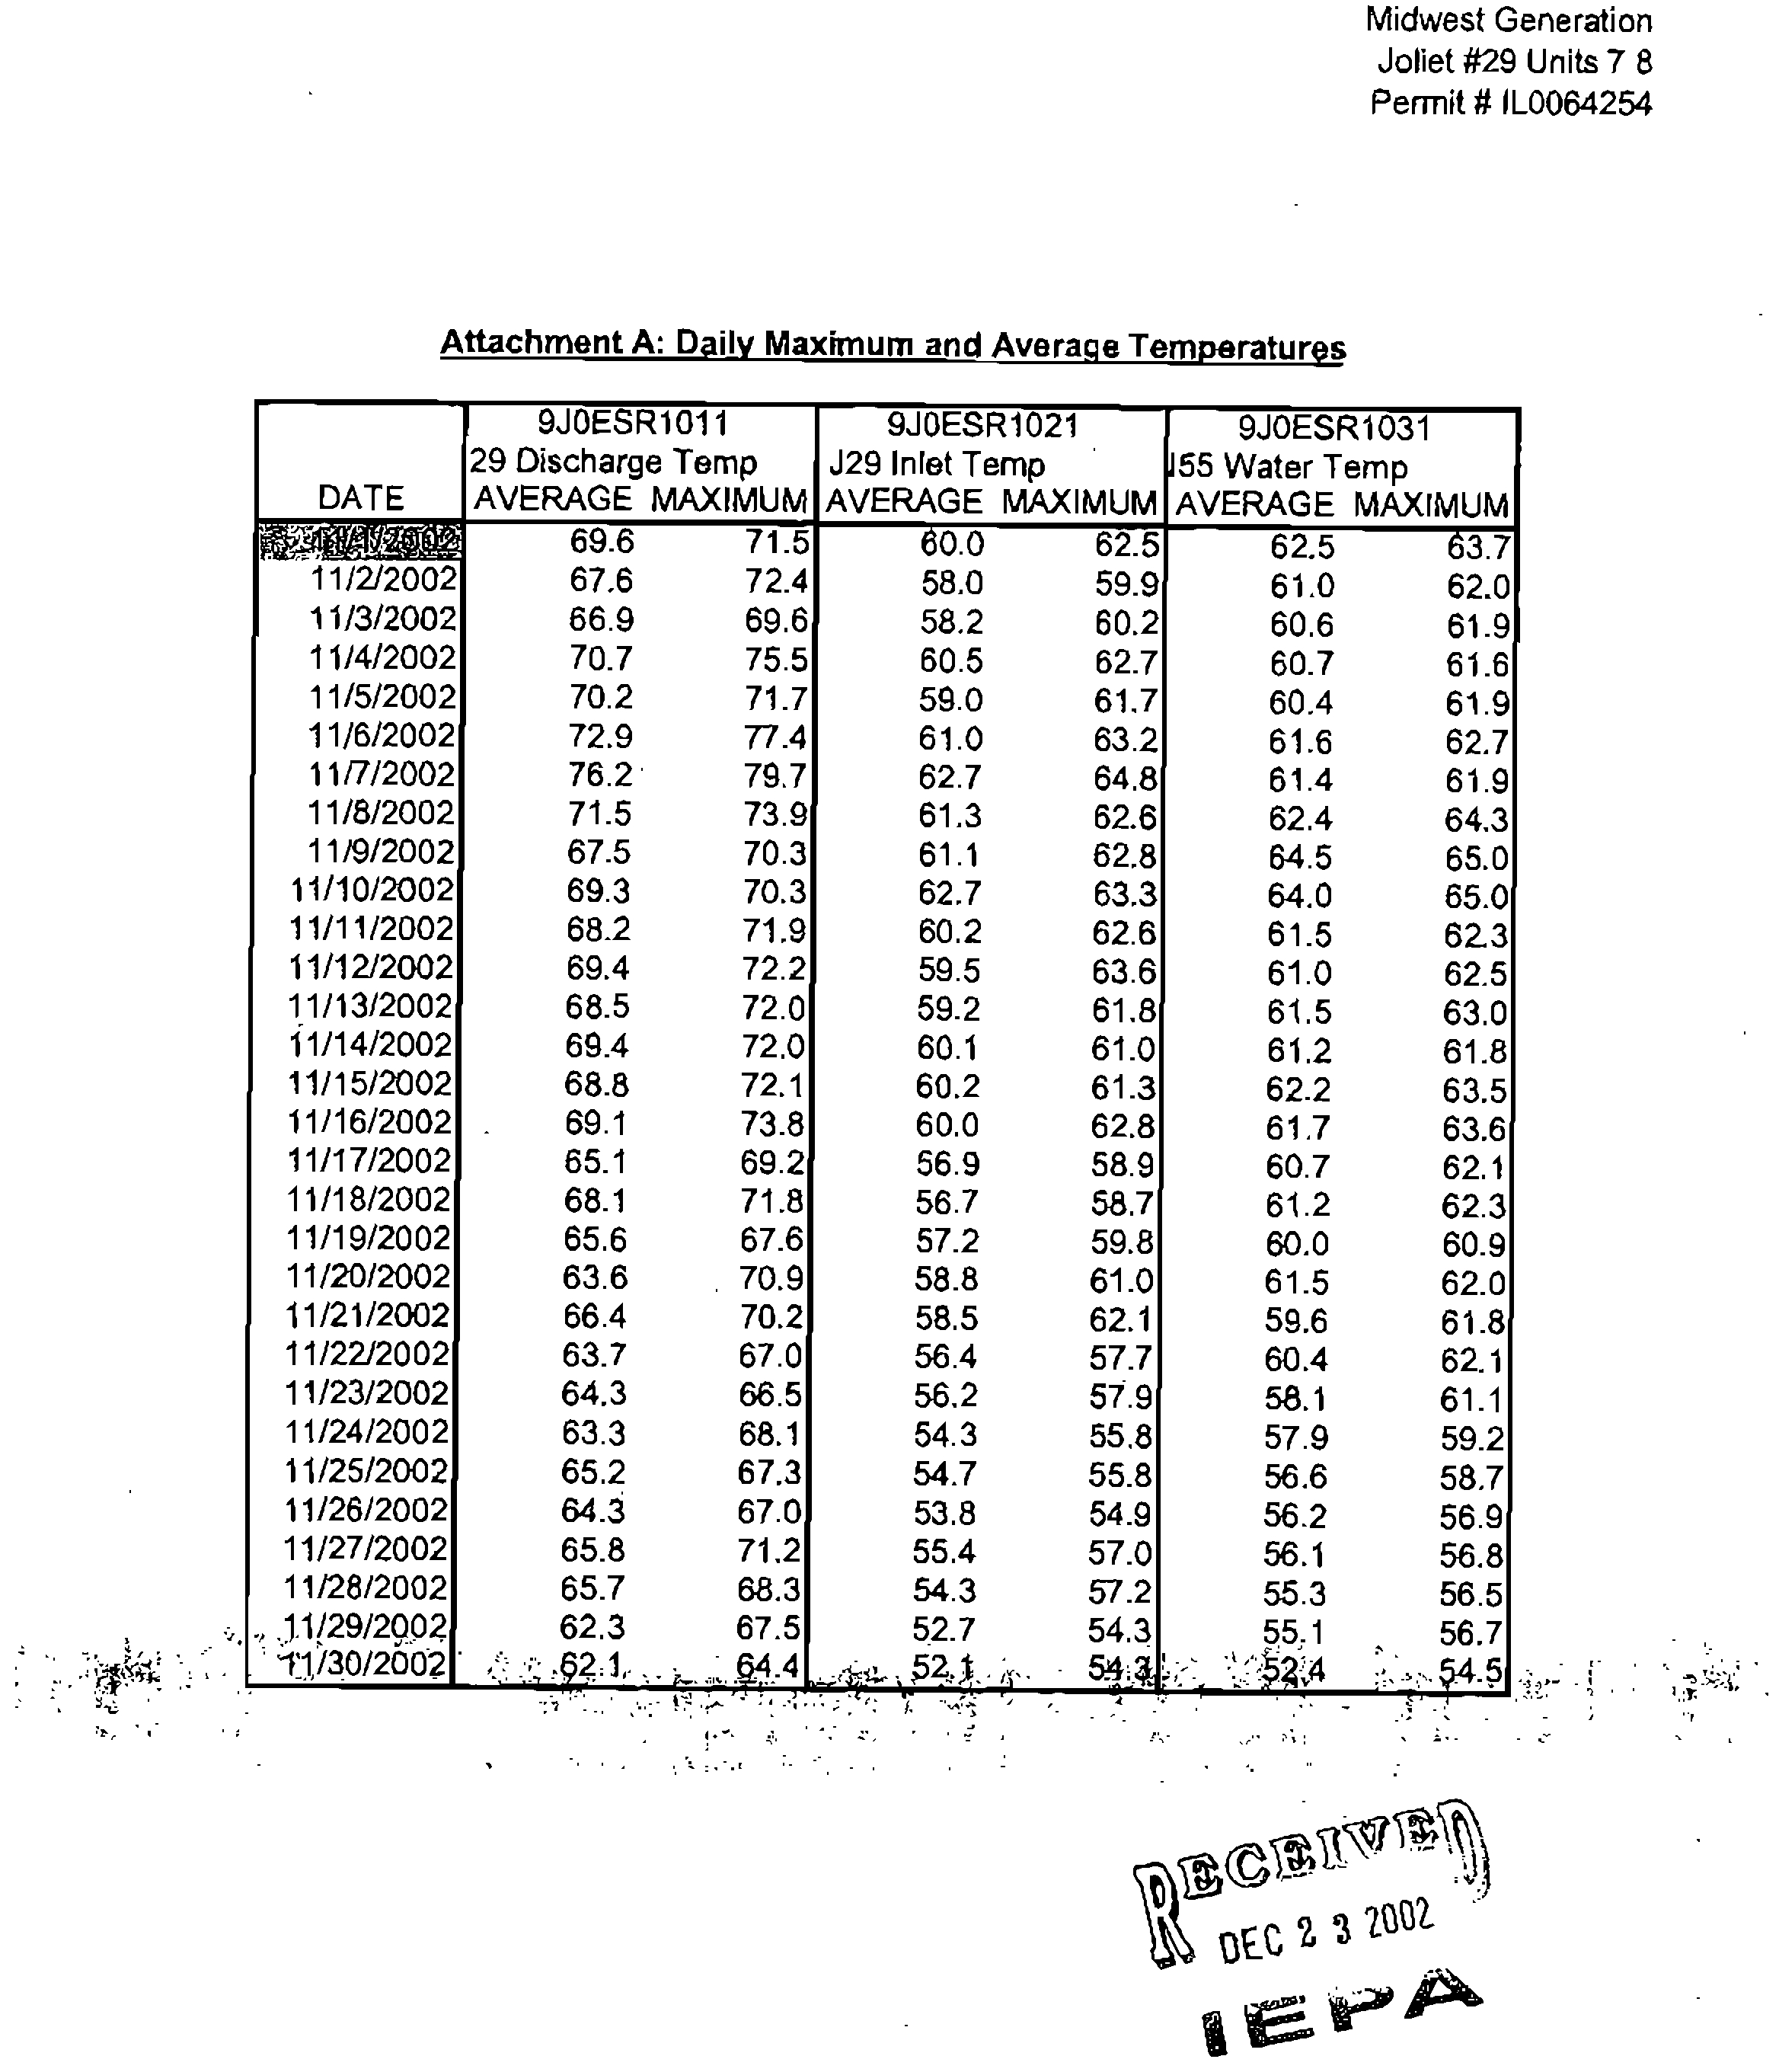
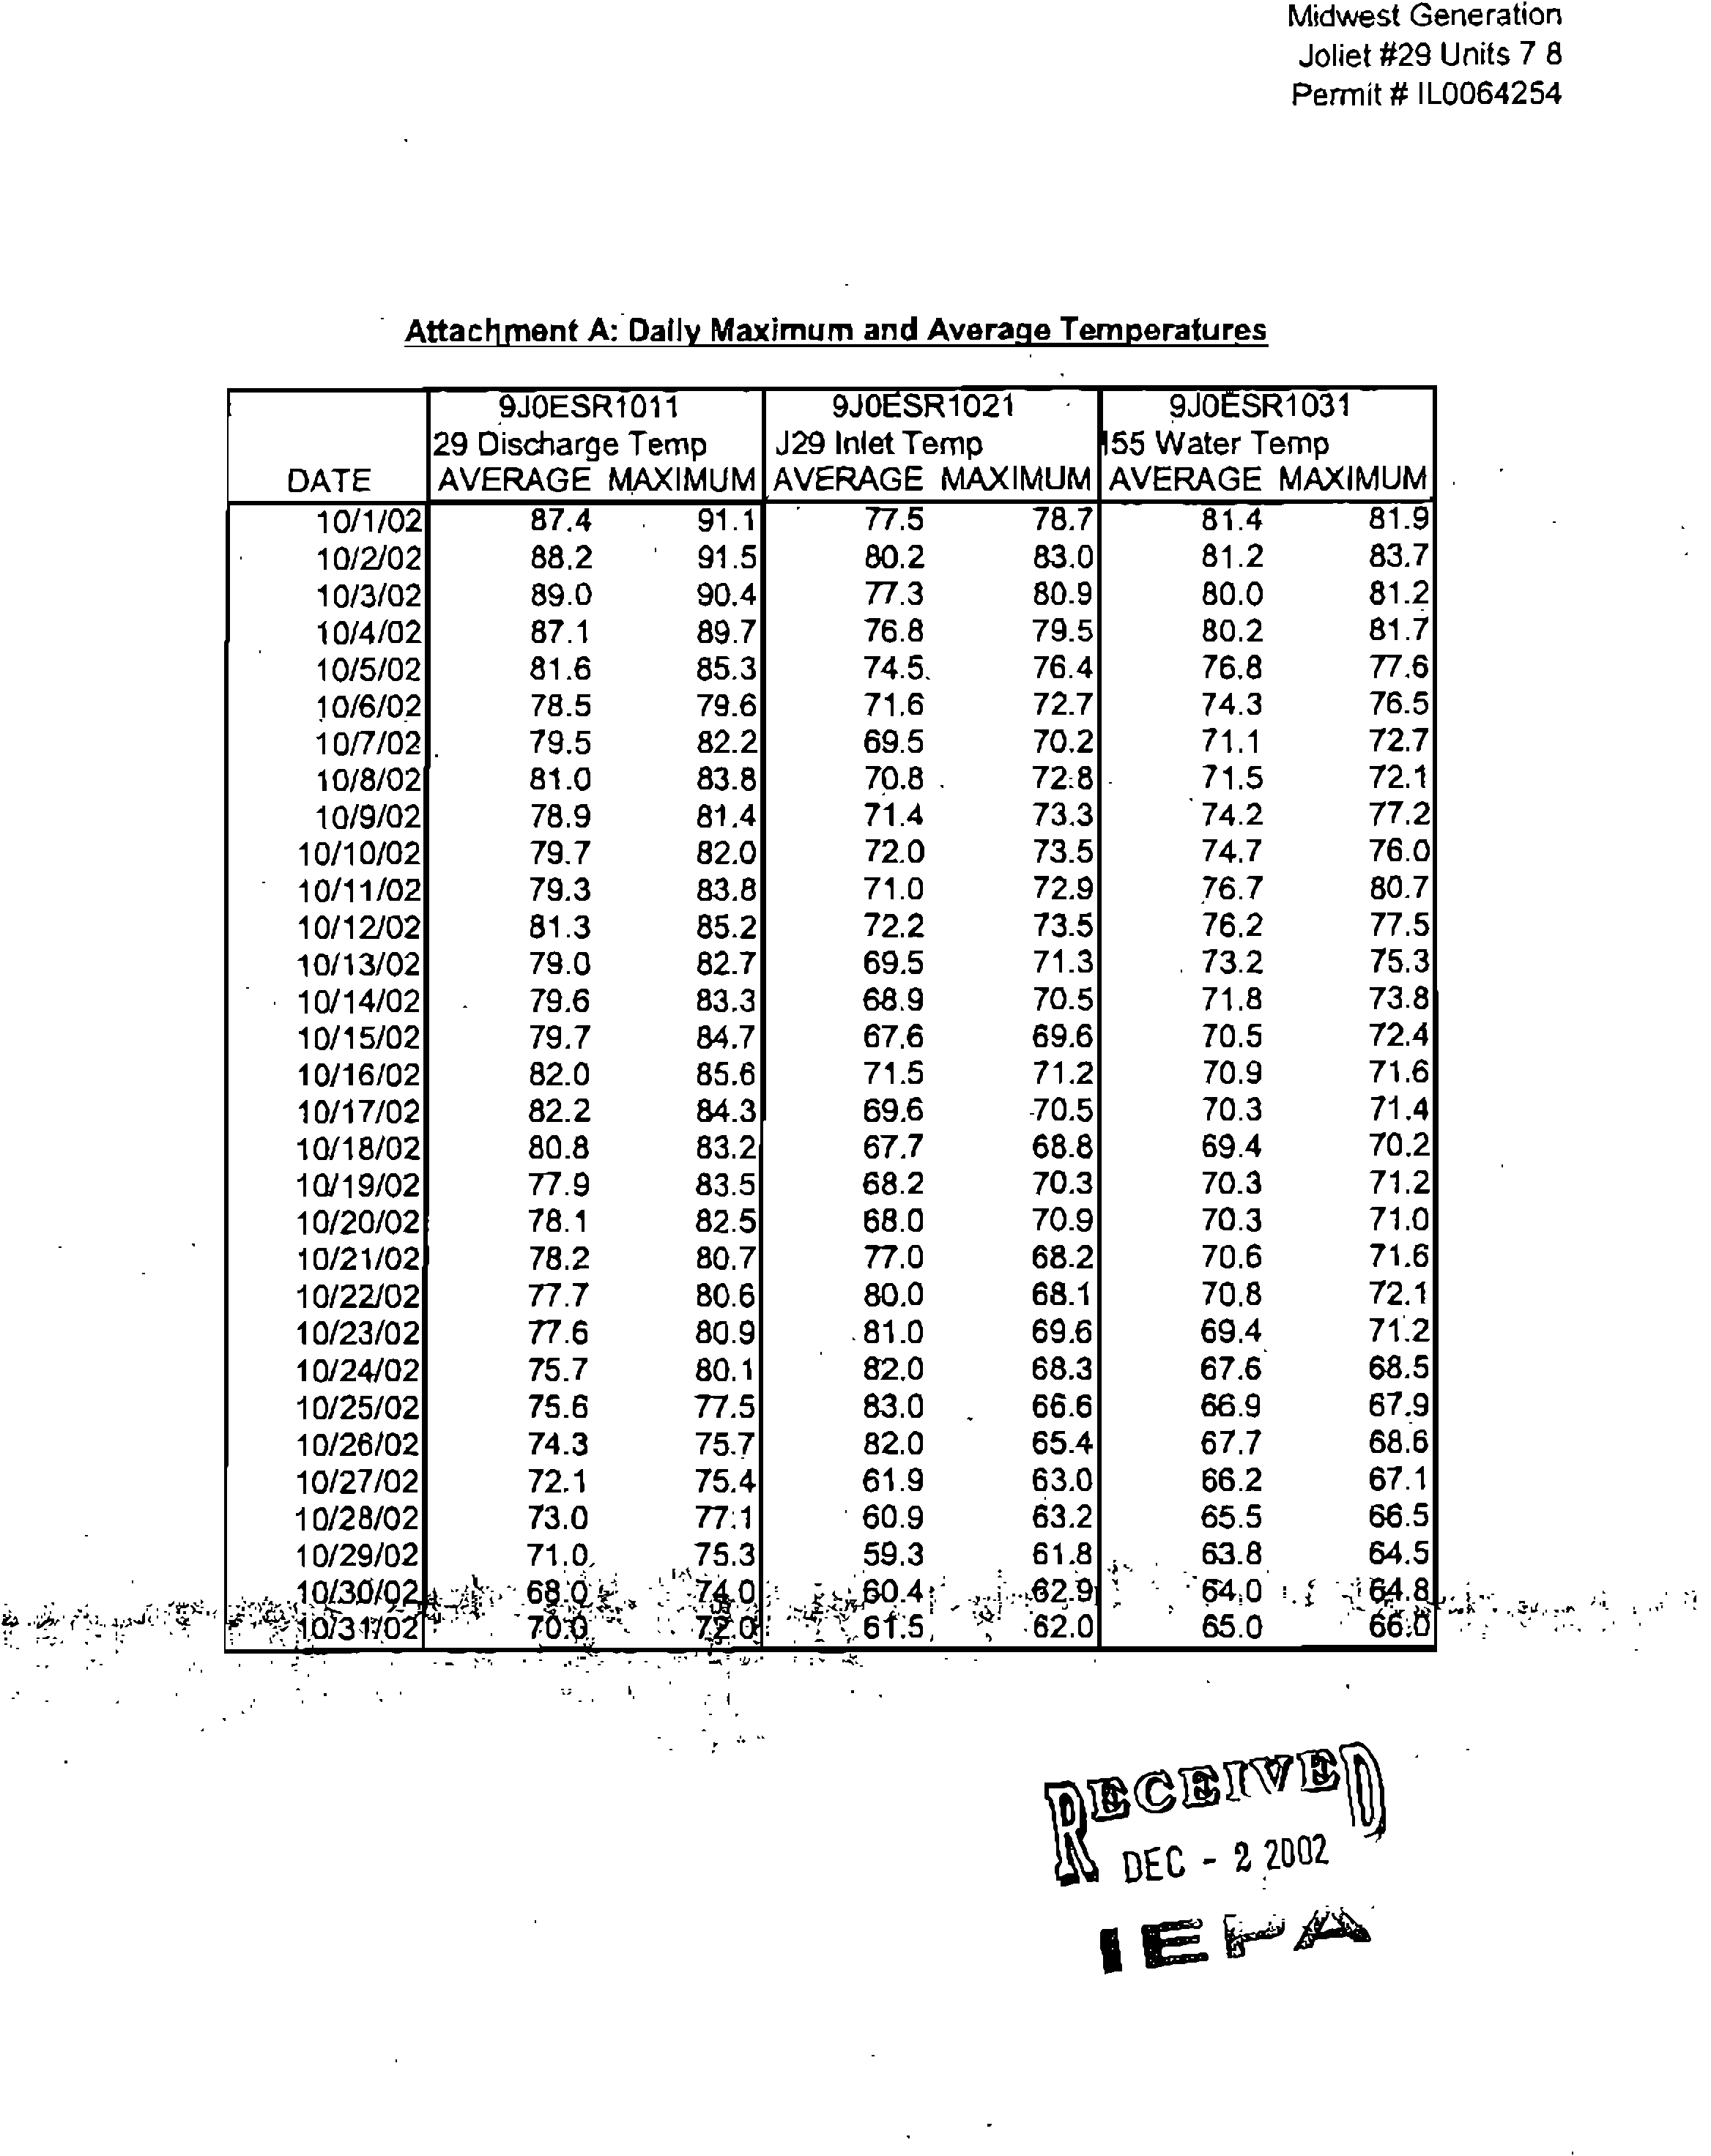
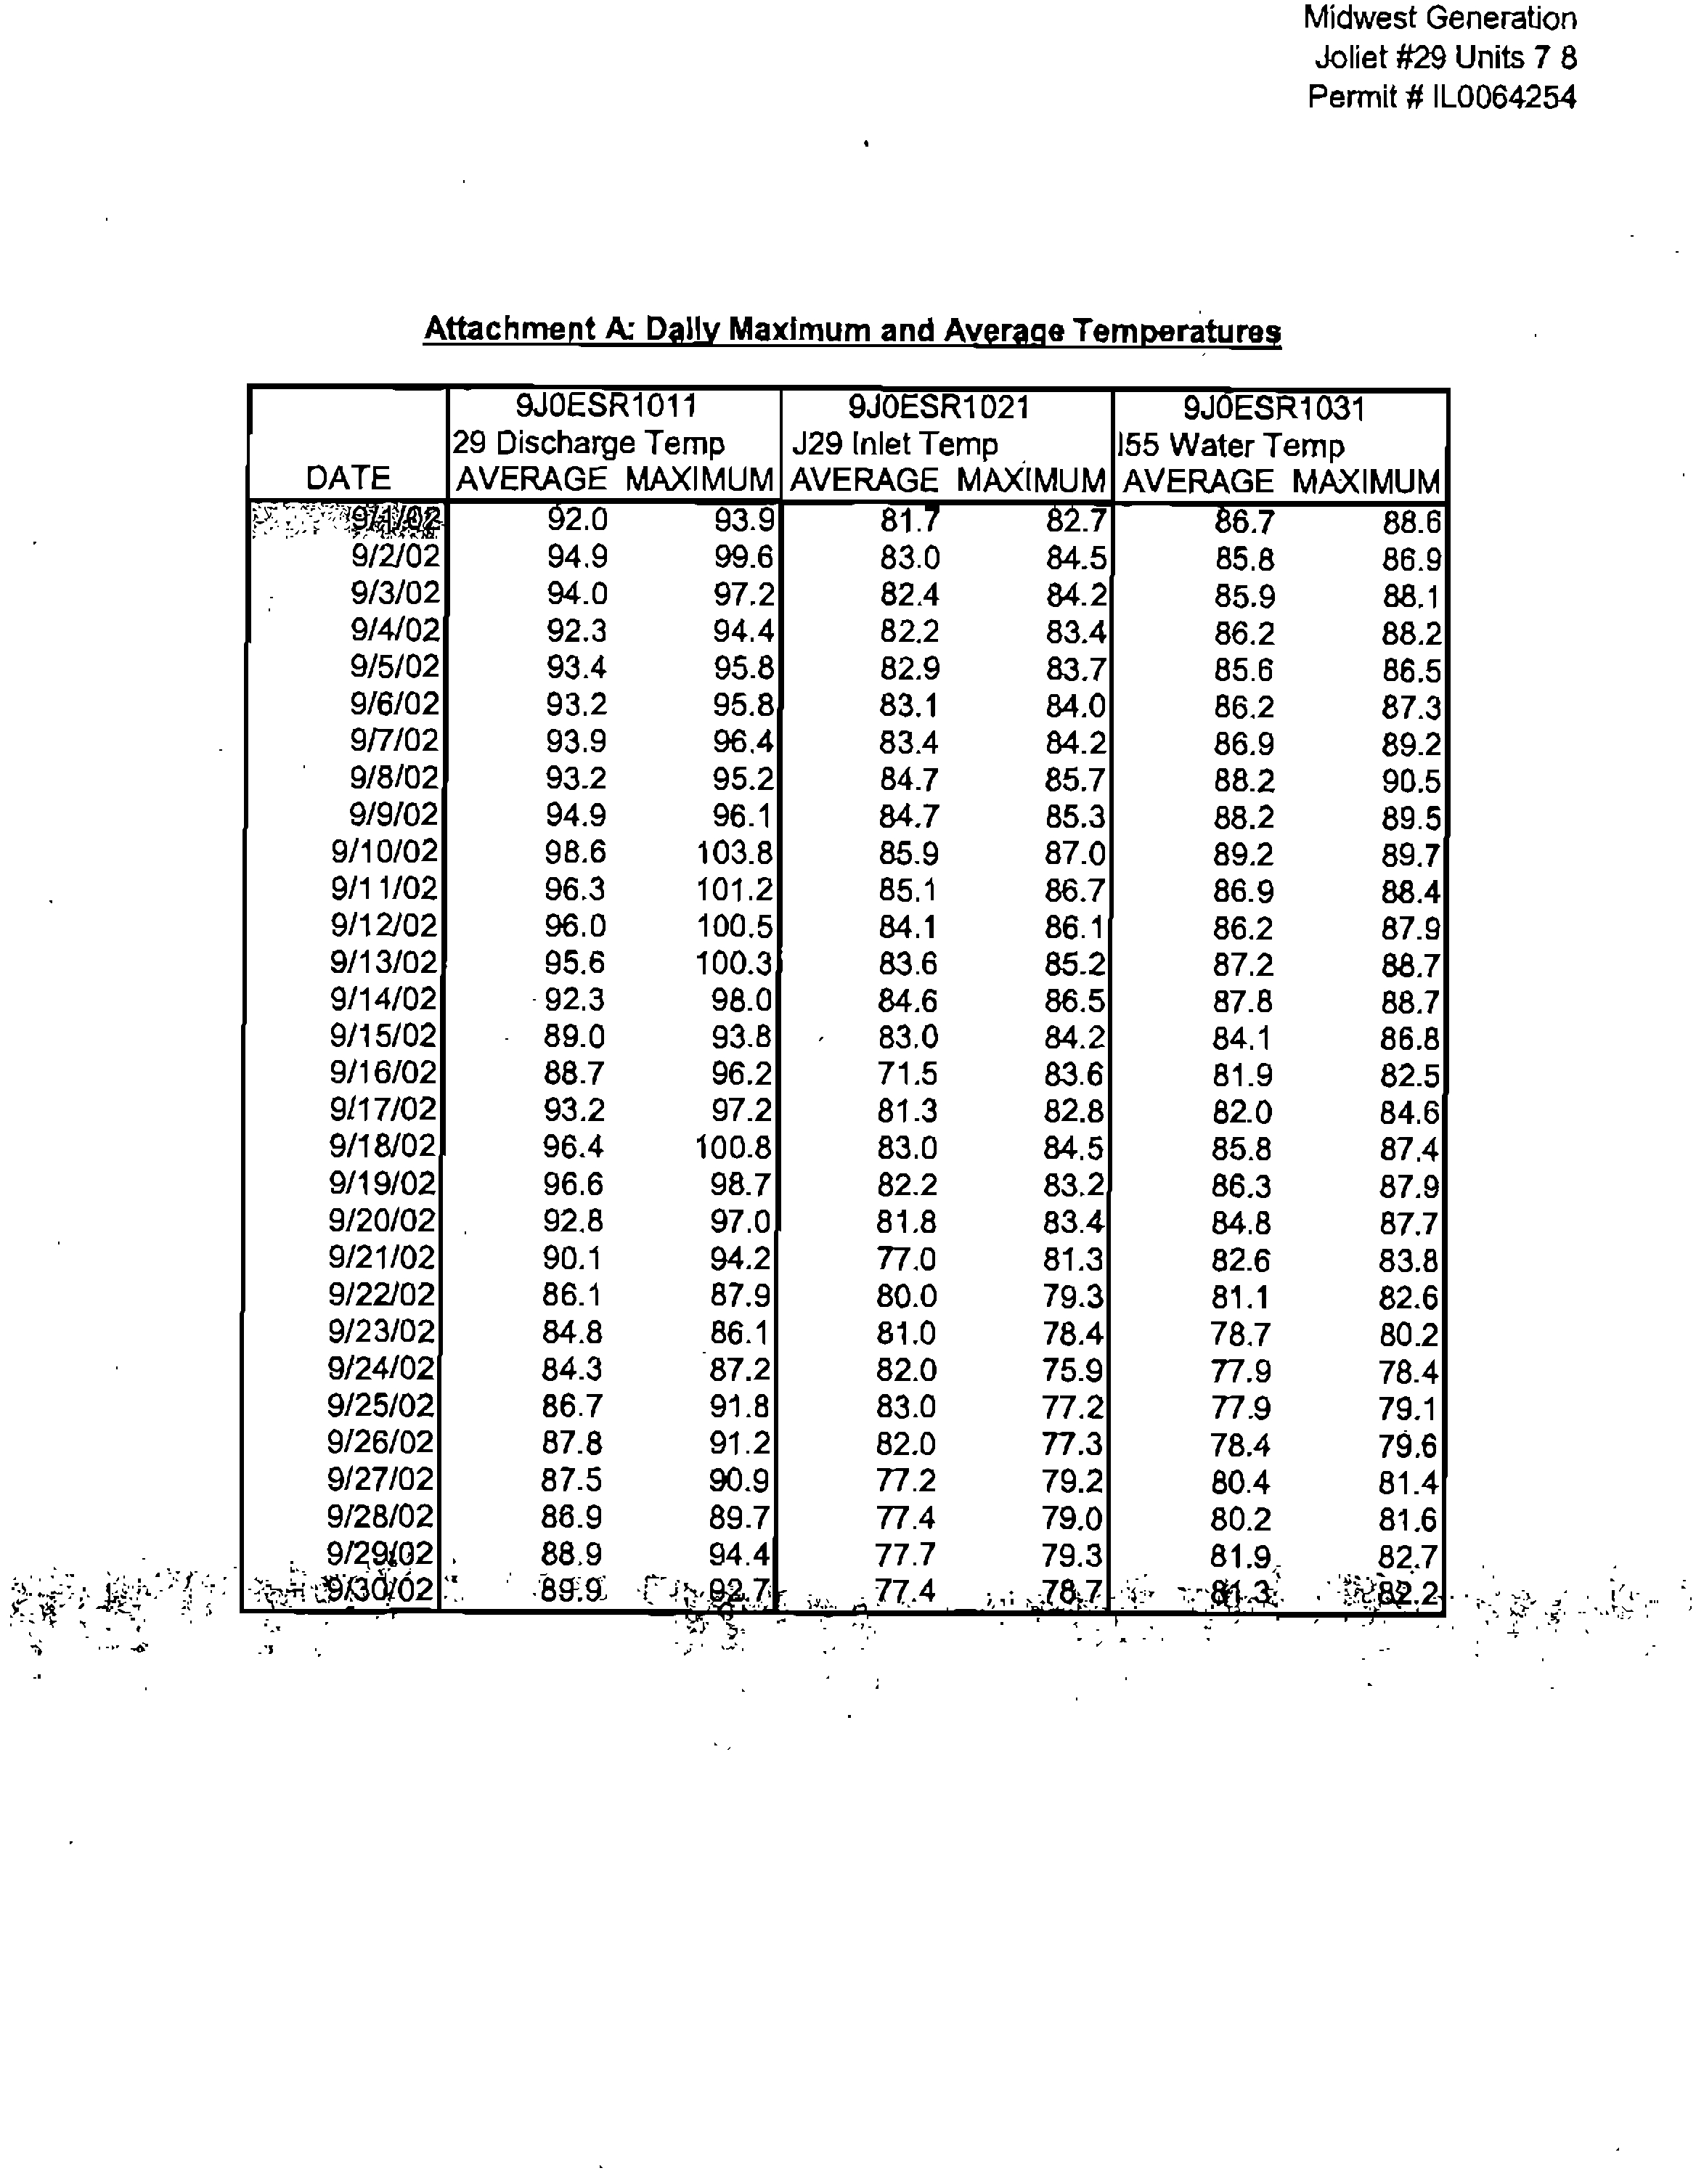
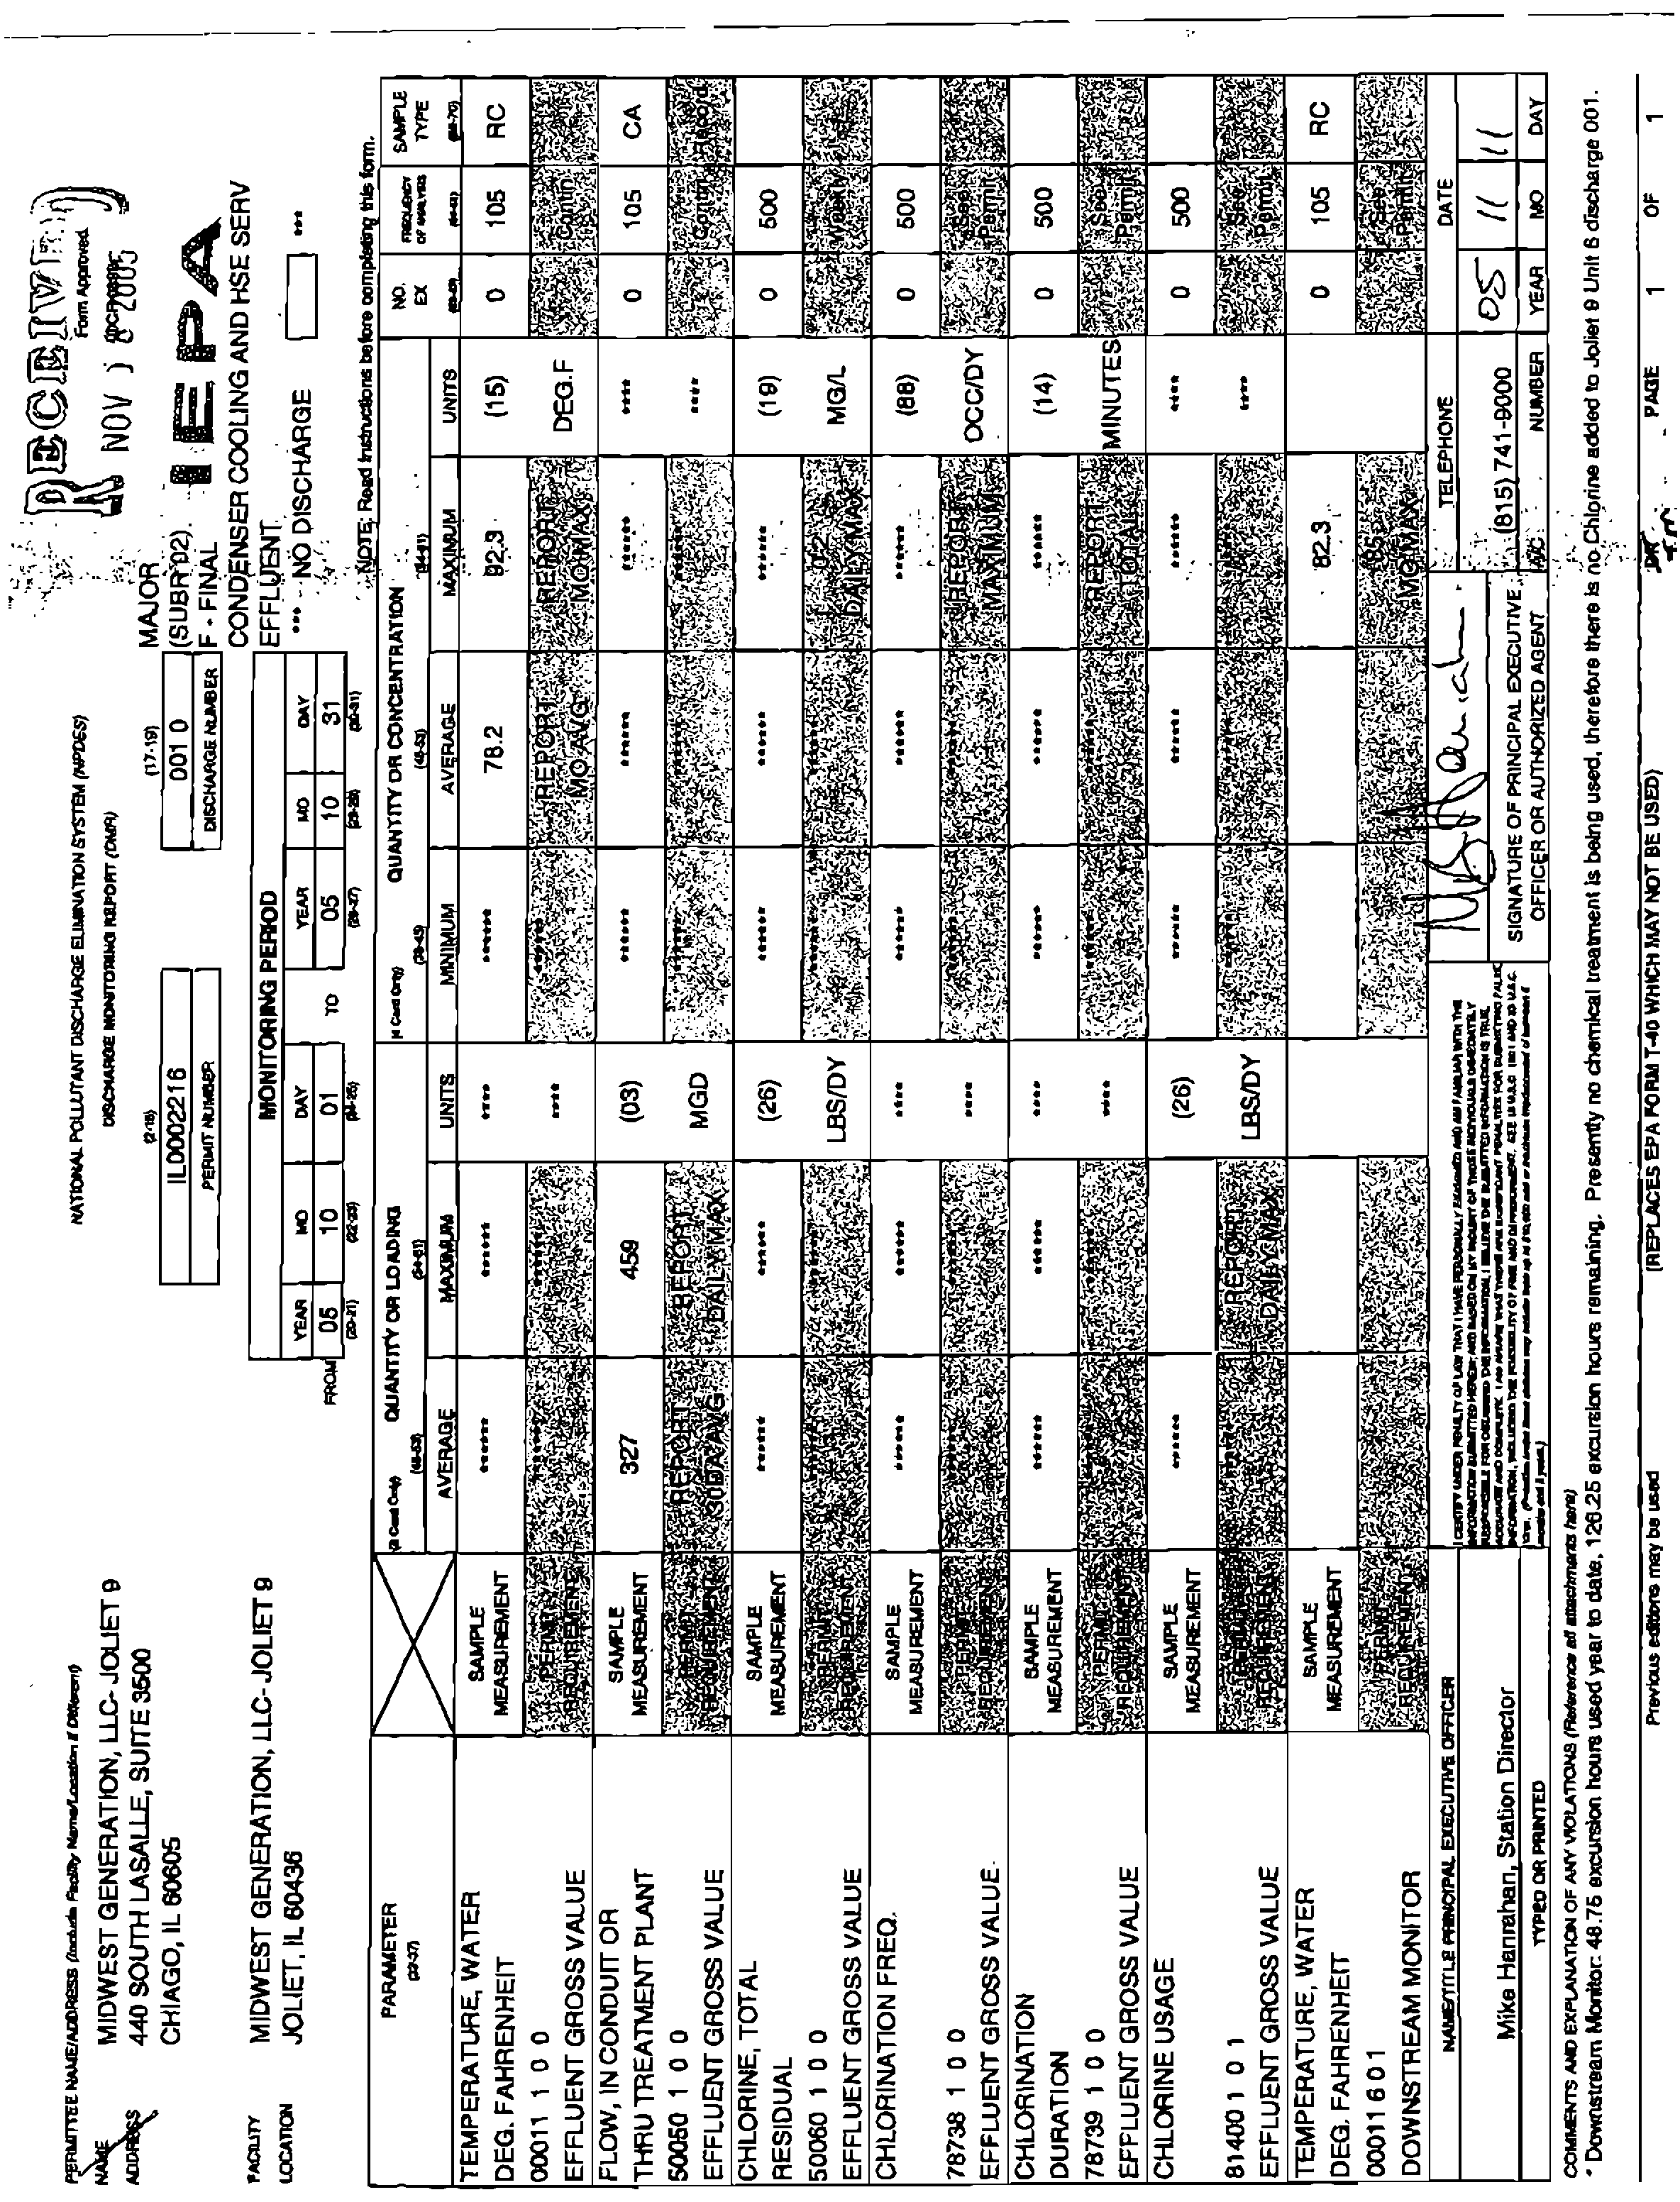
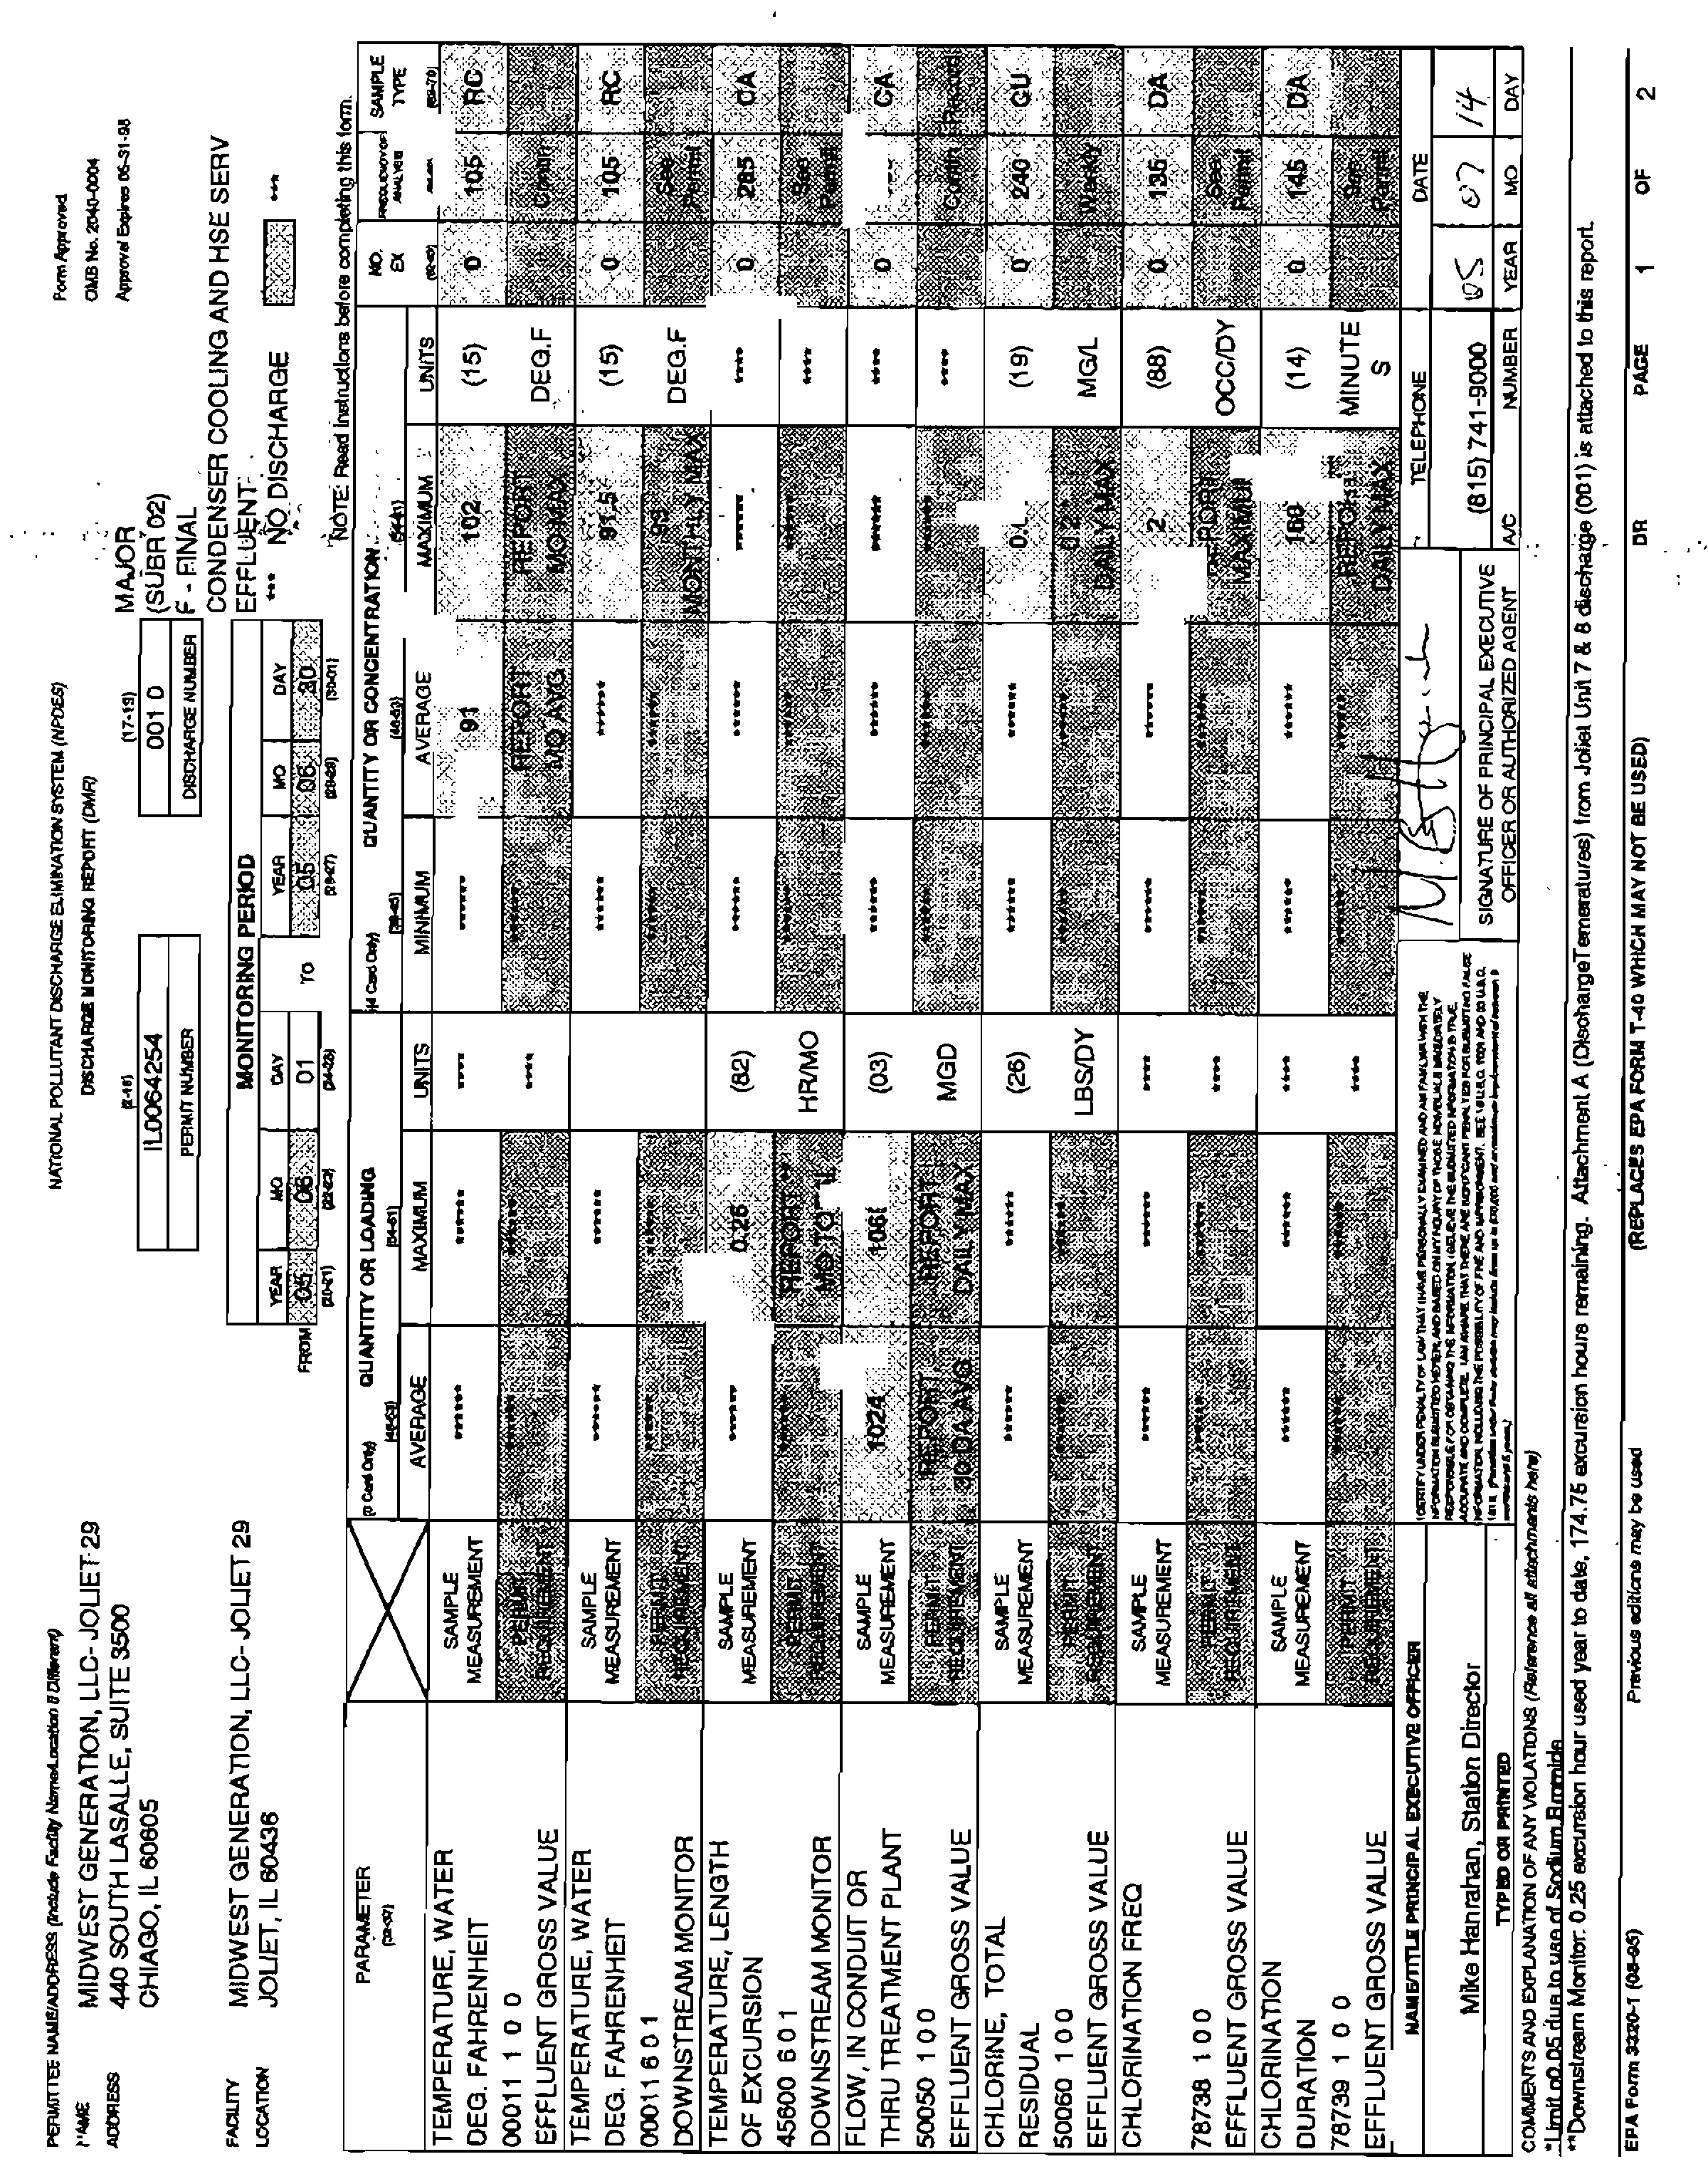
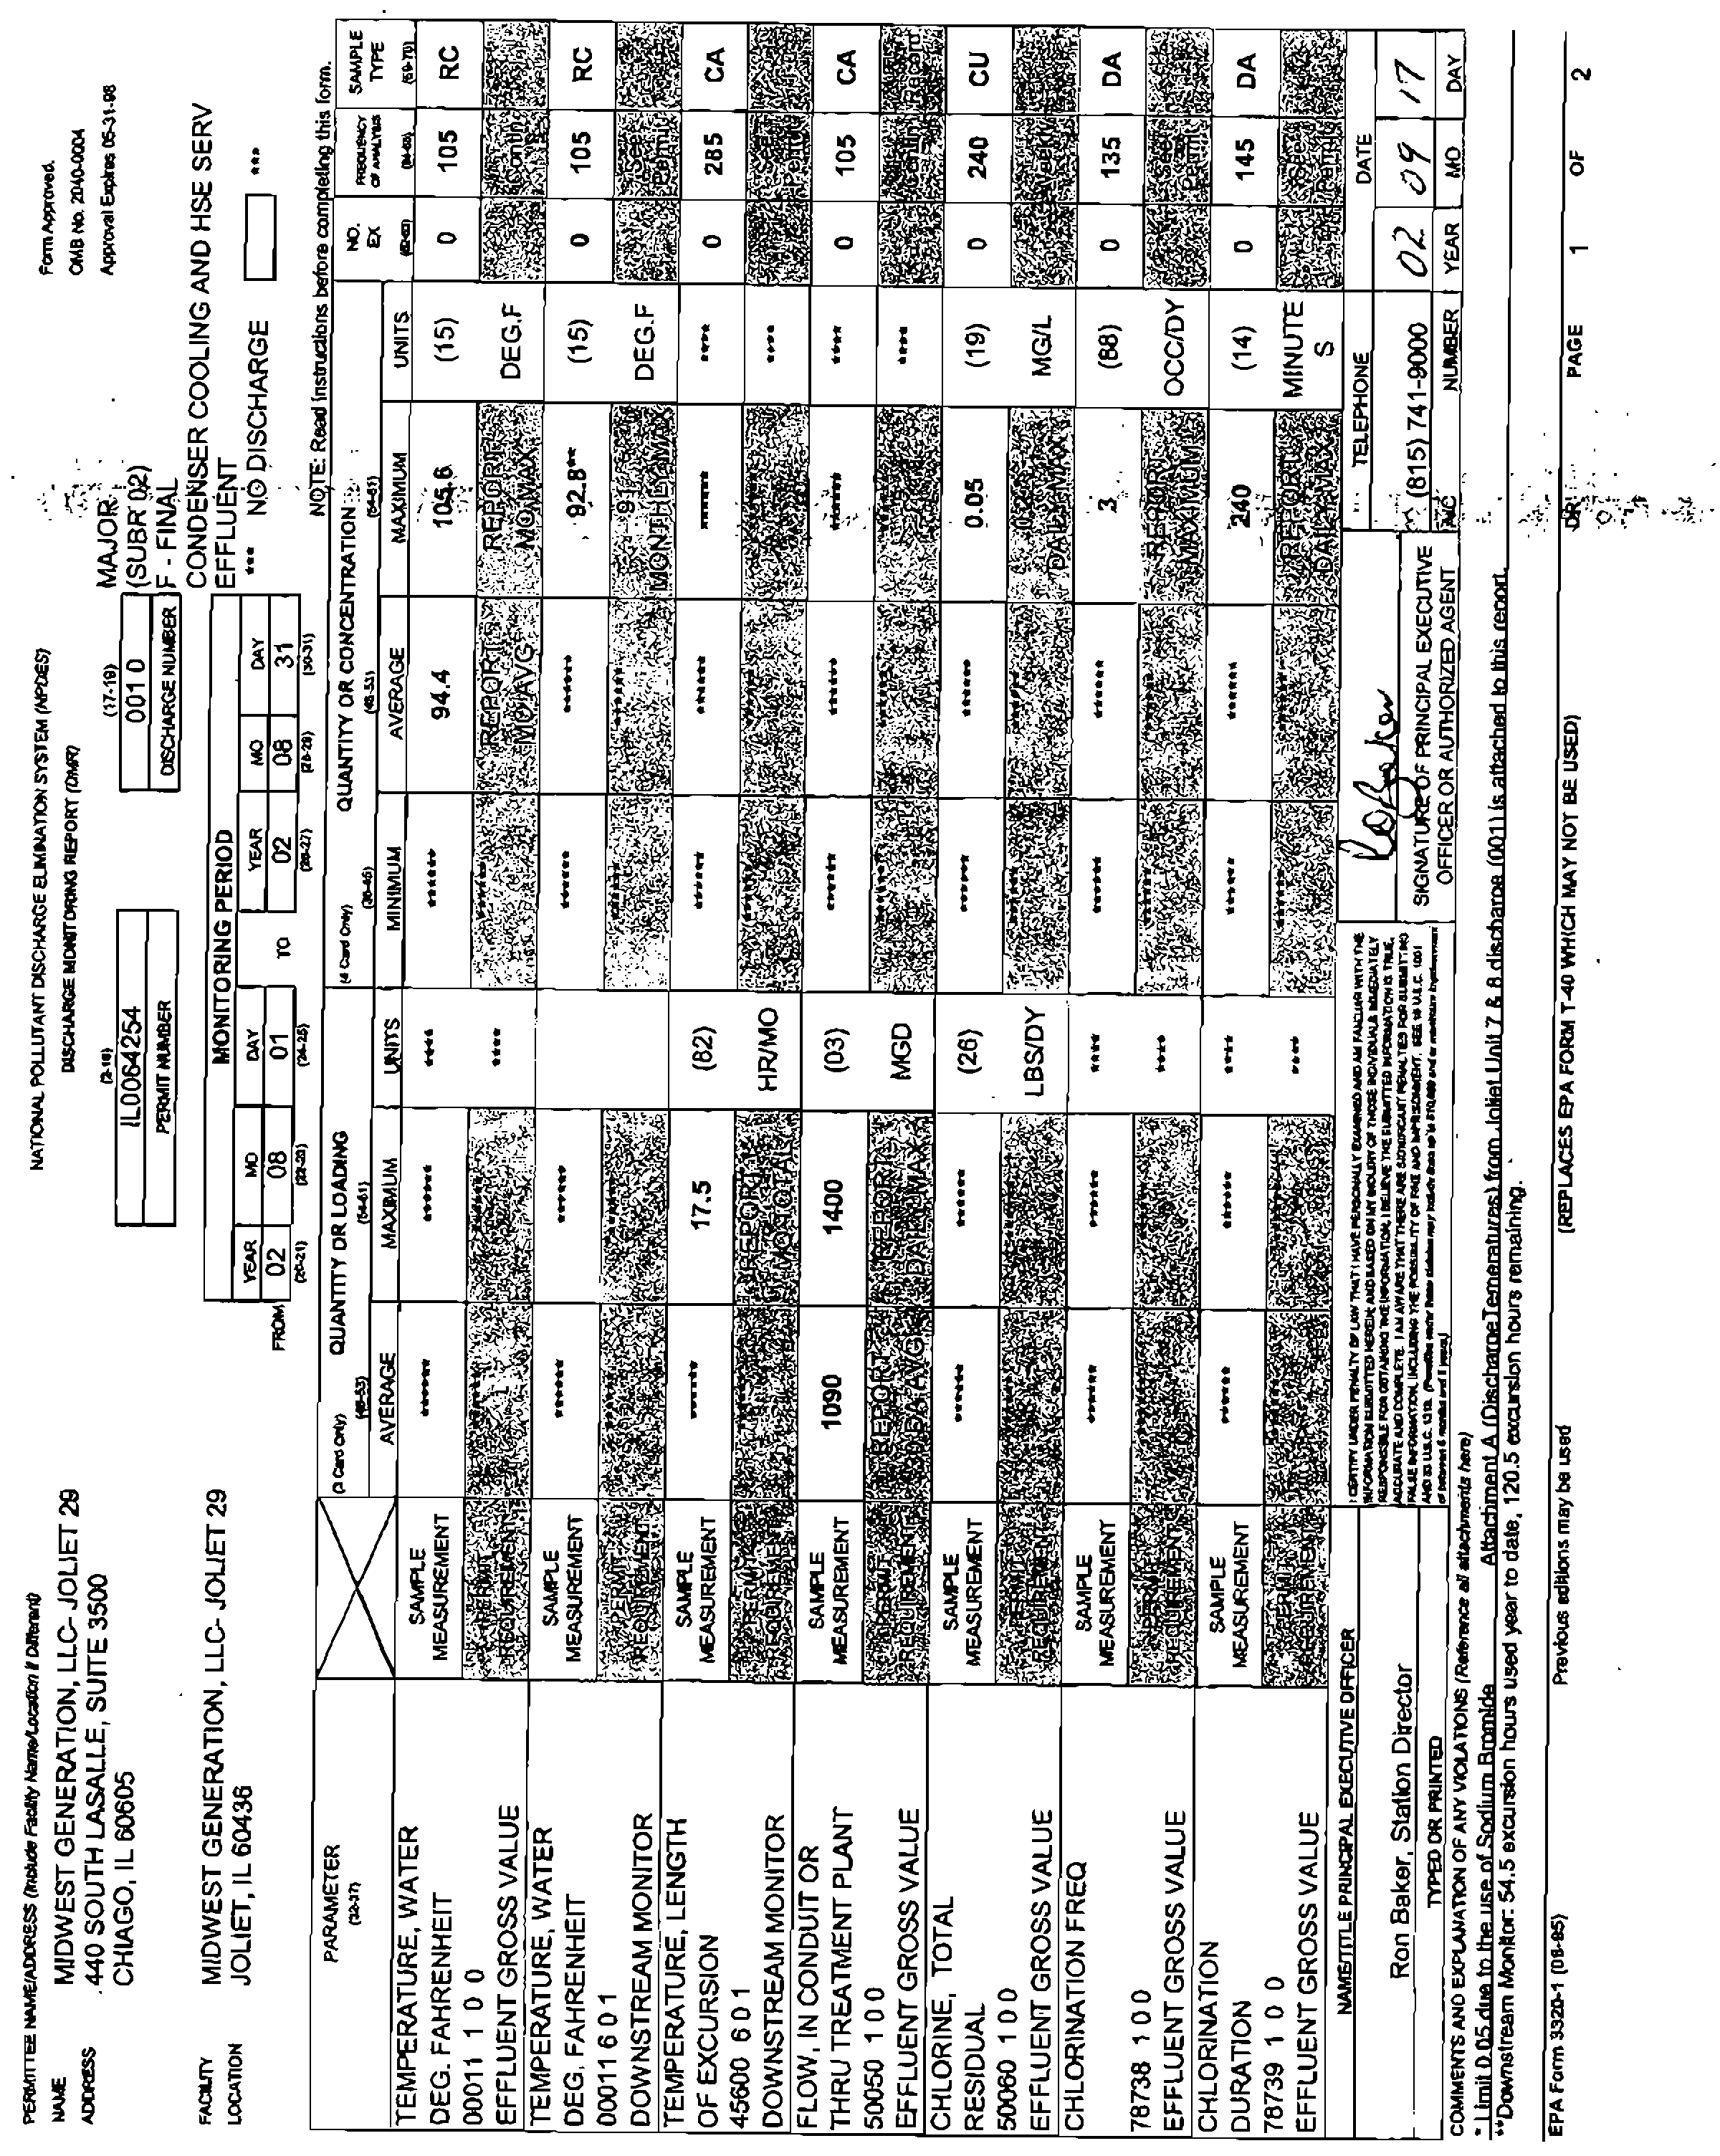
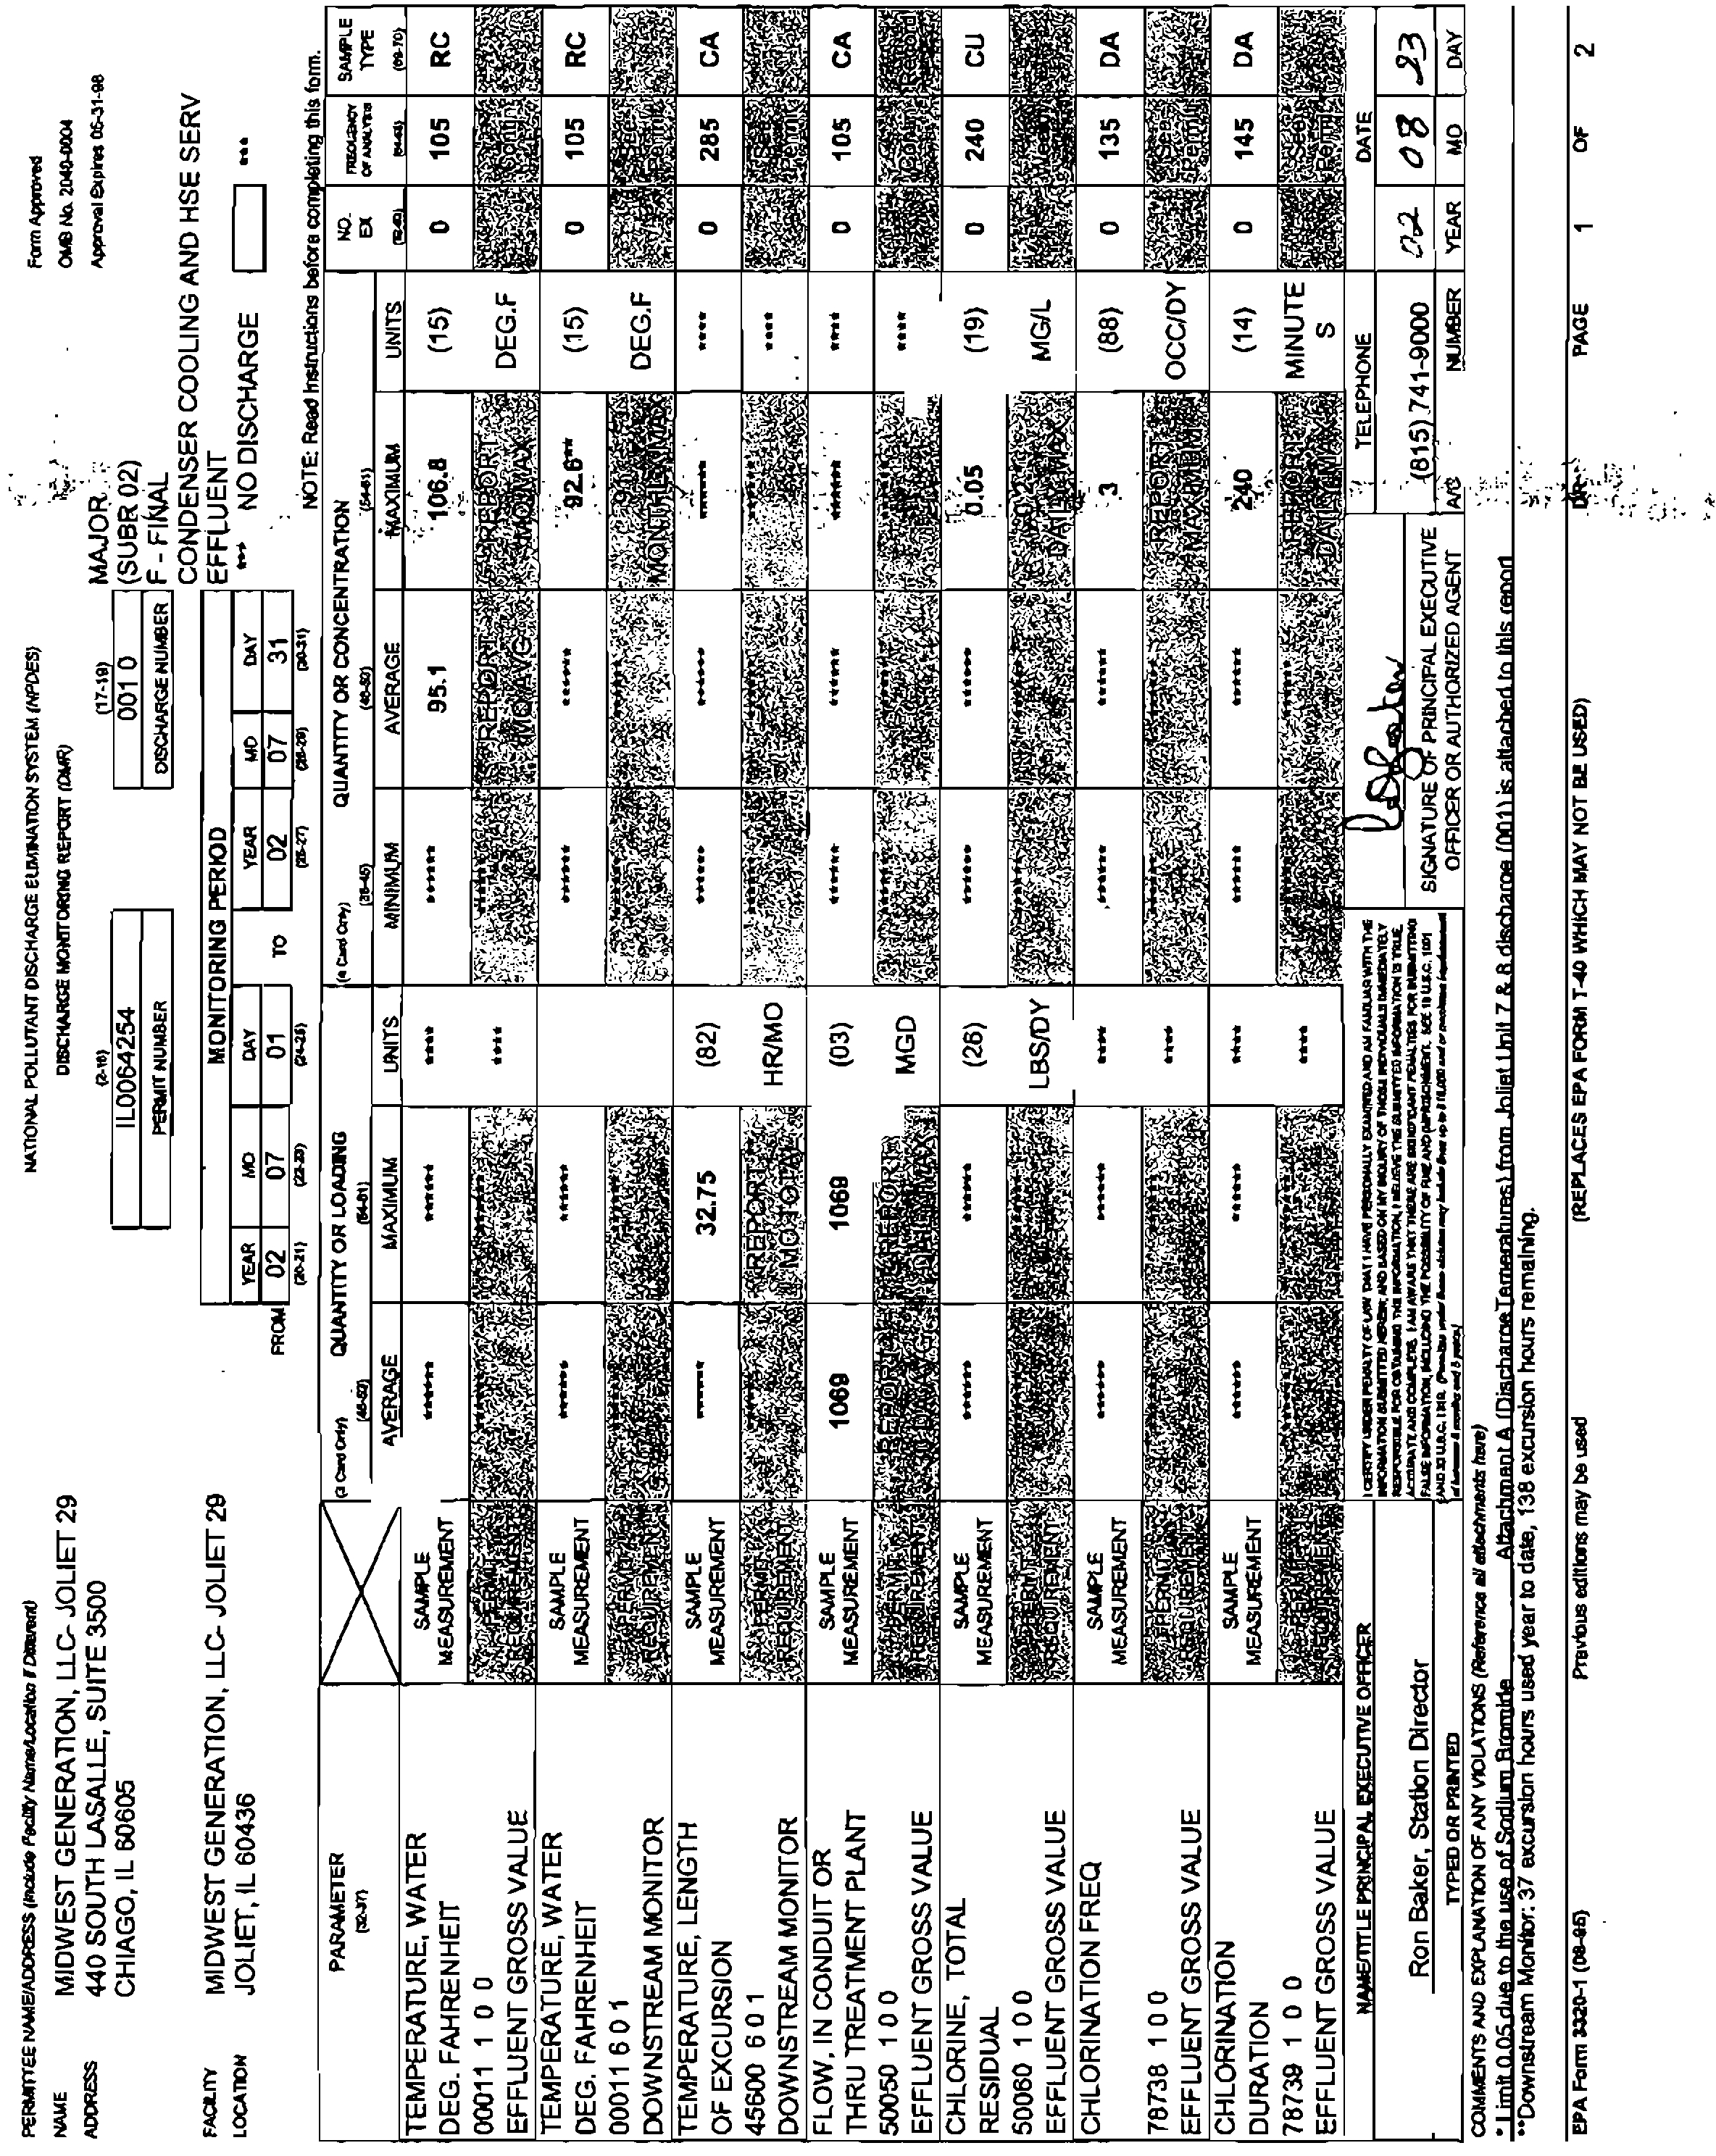
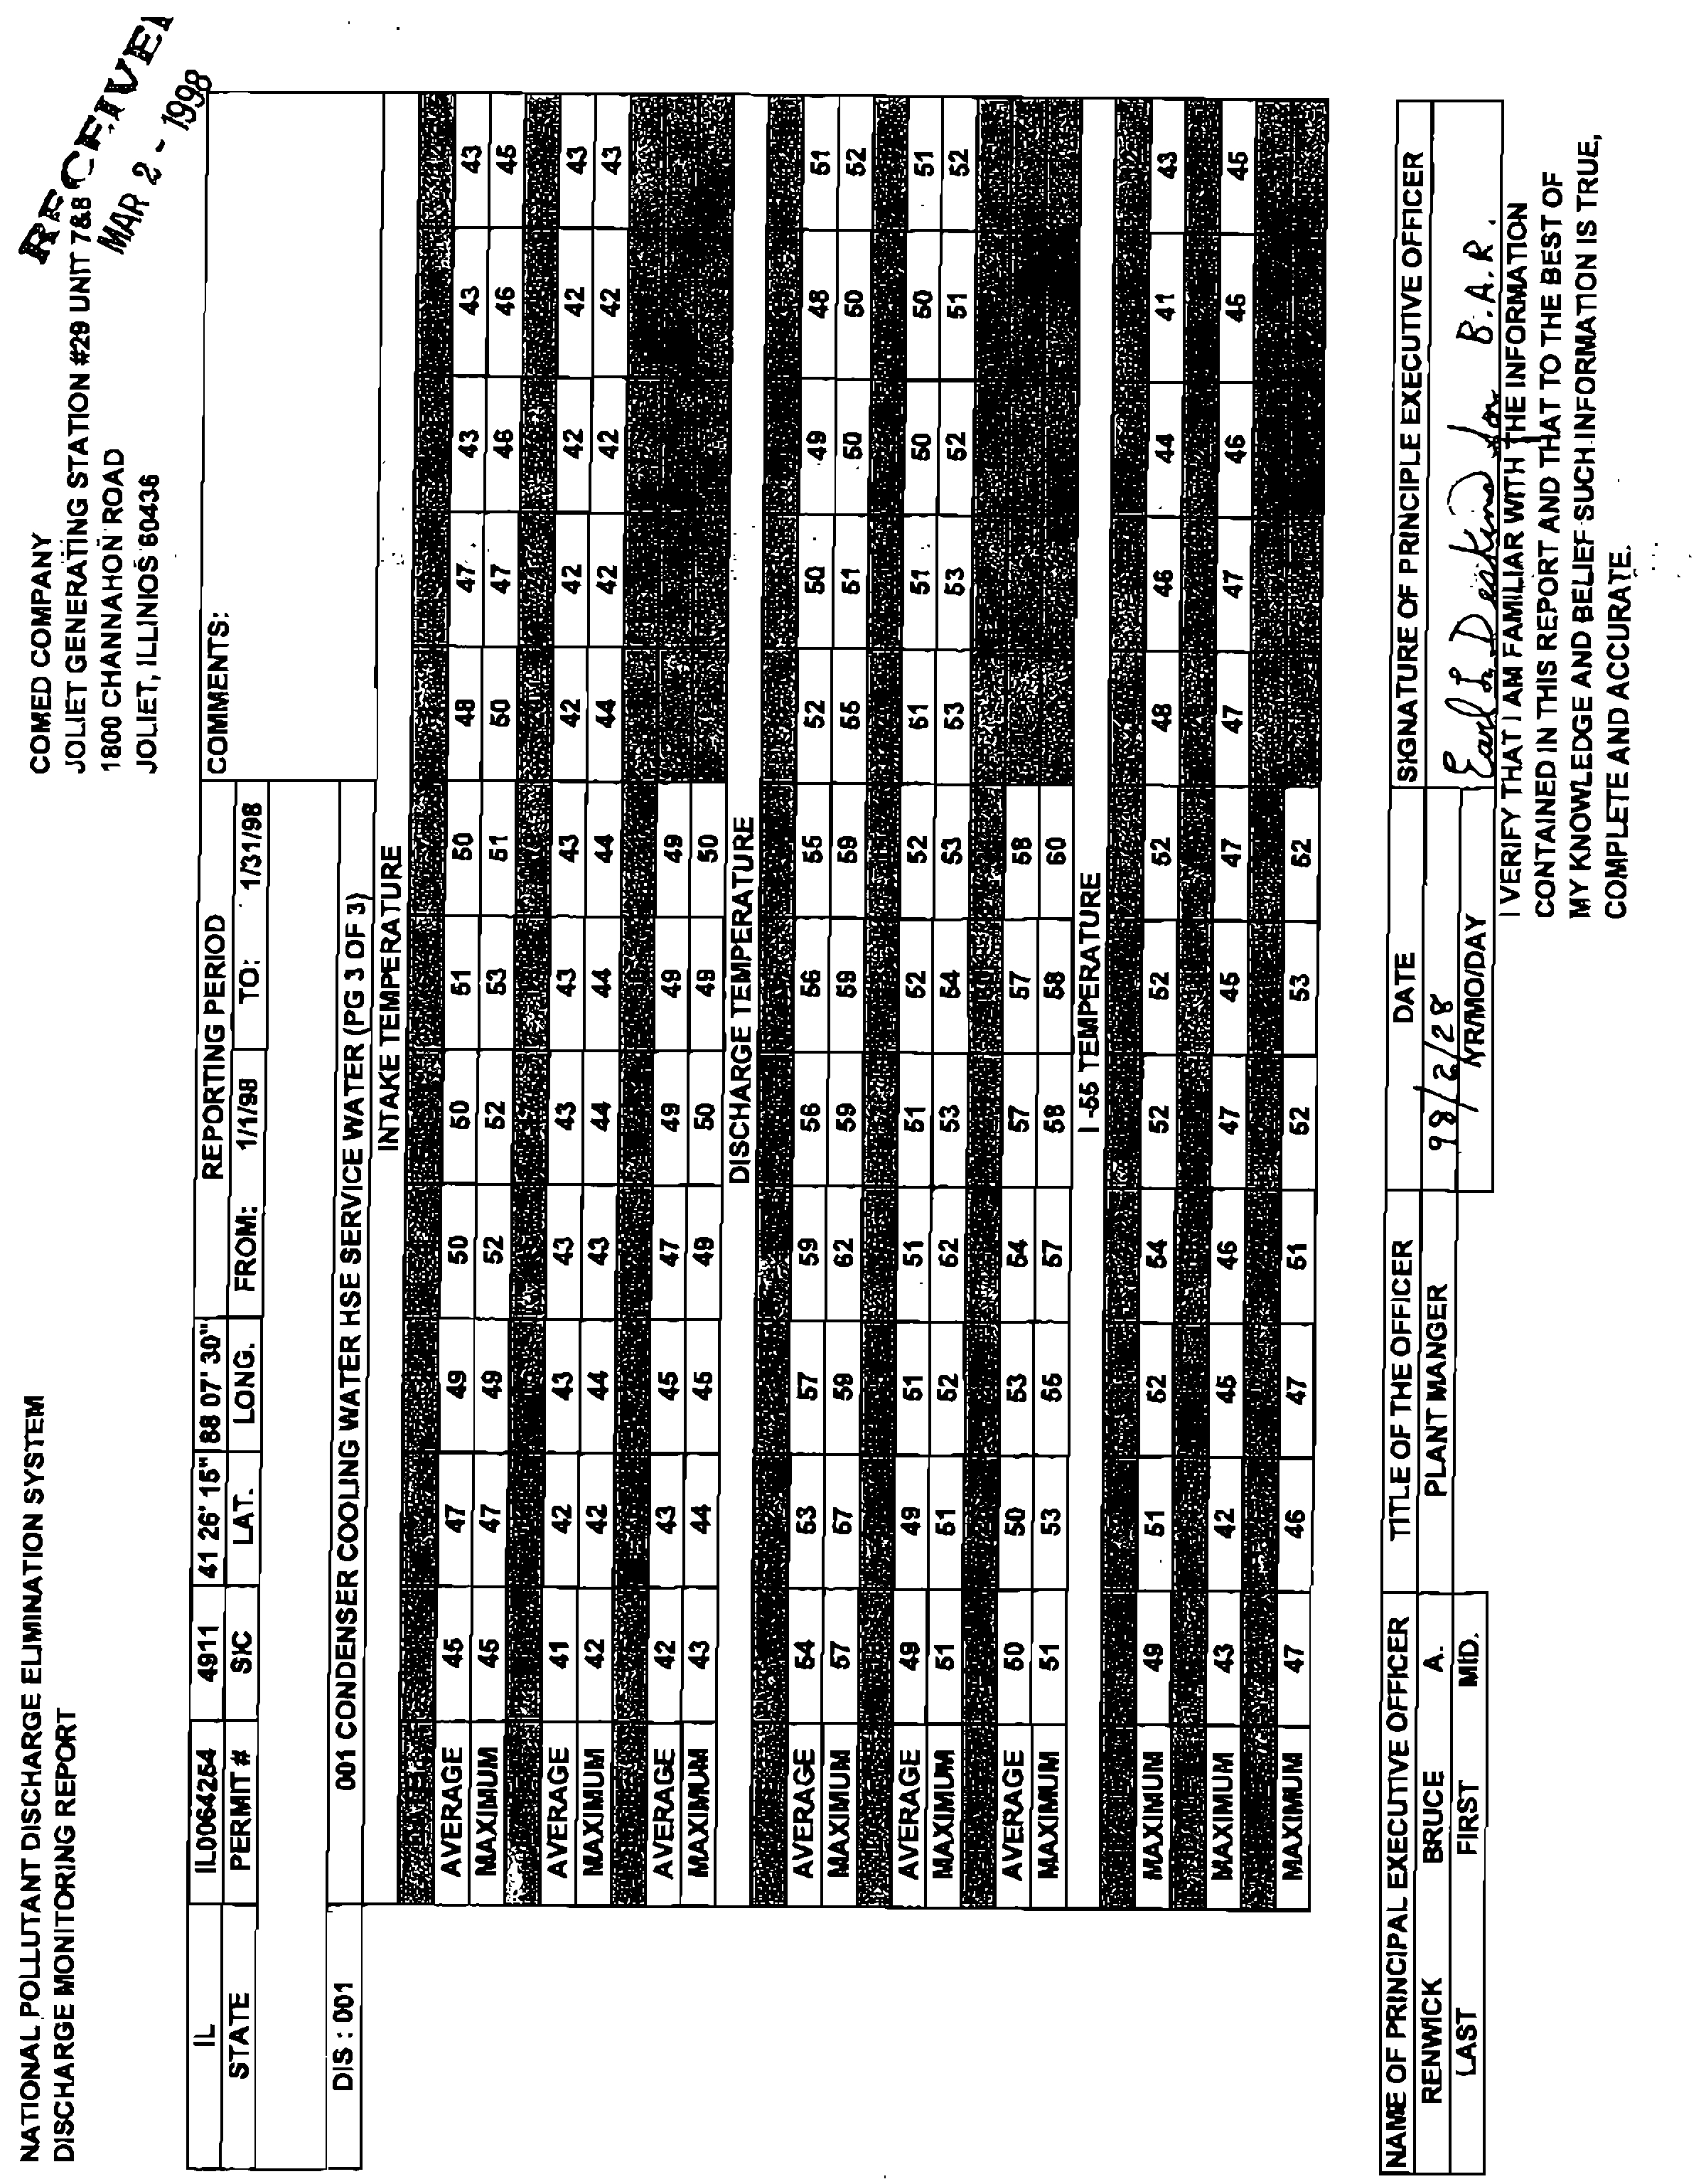
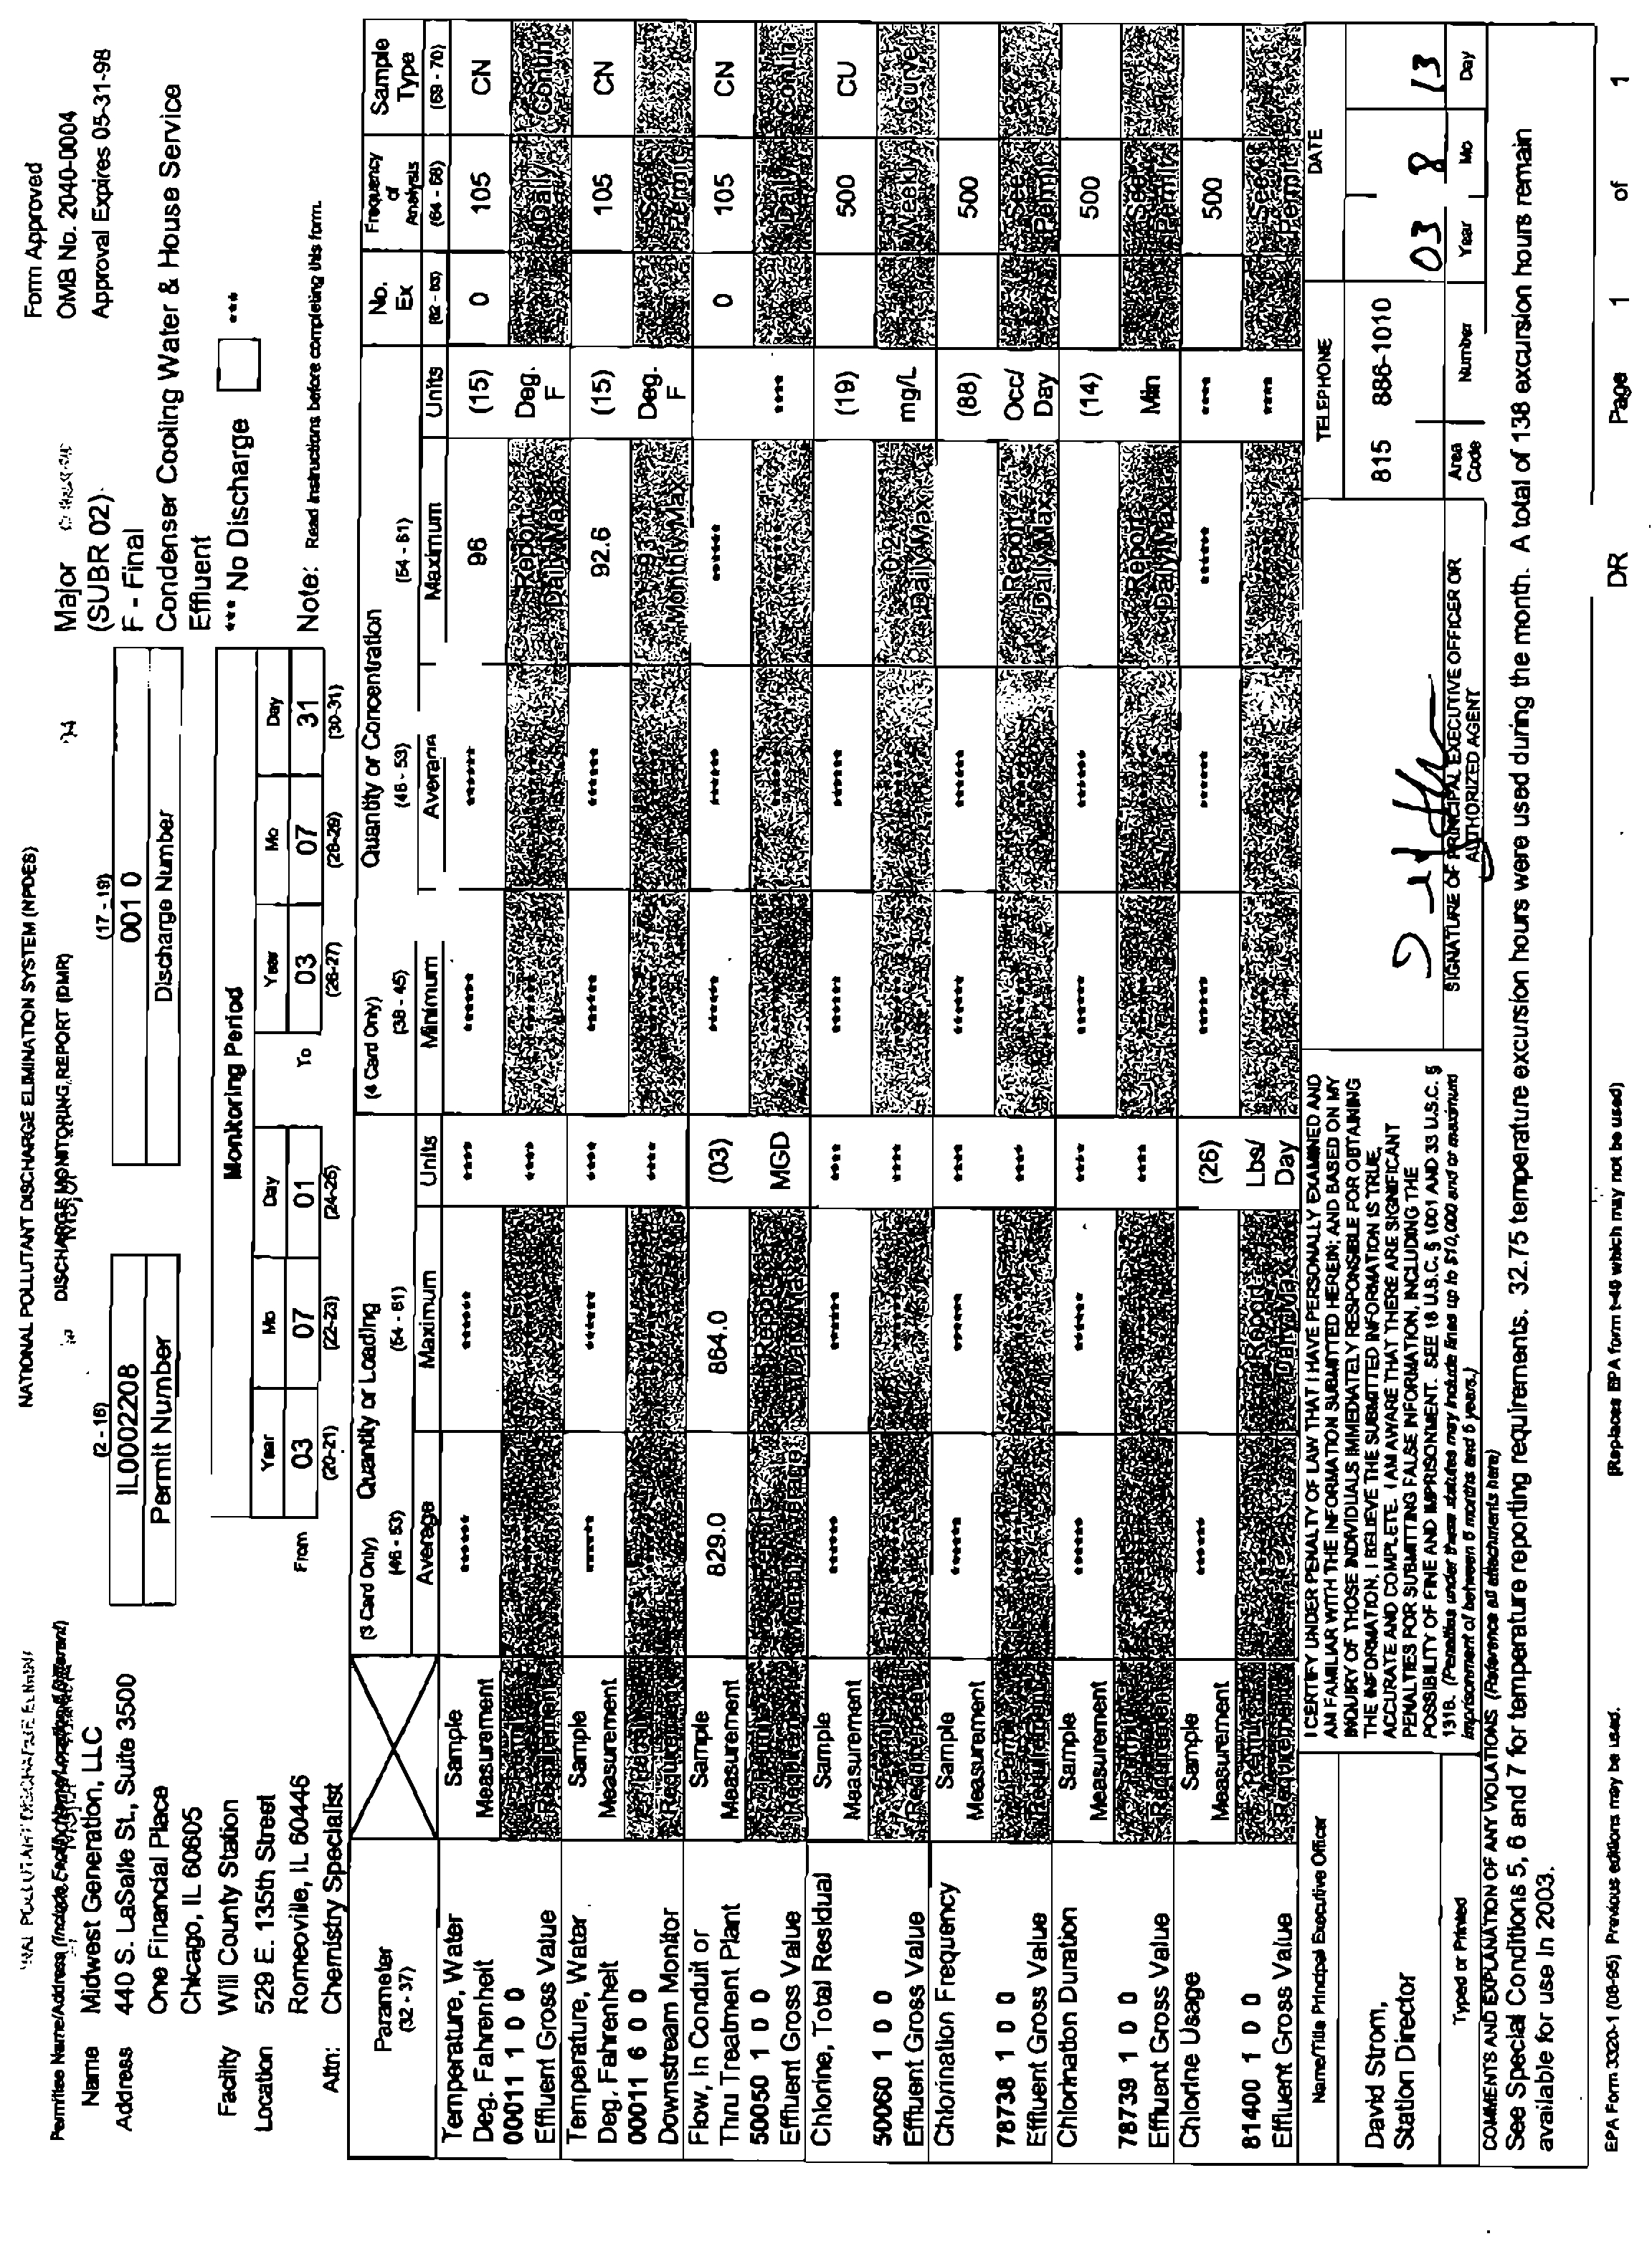
26.
Are
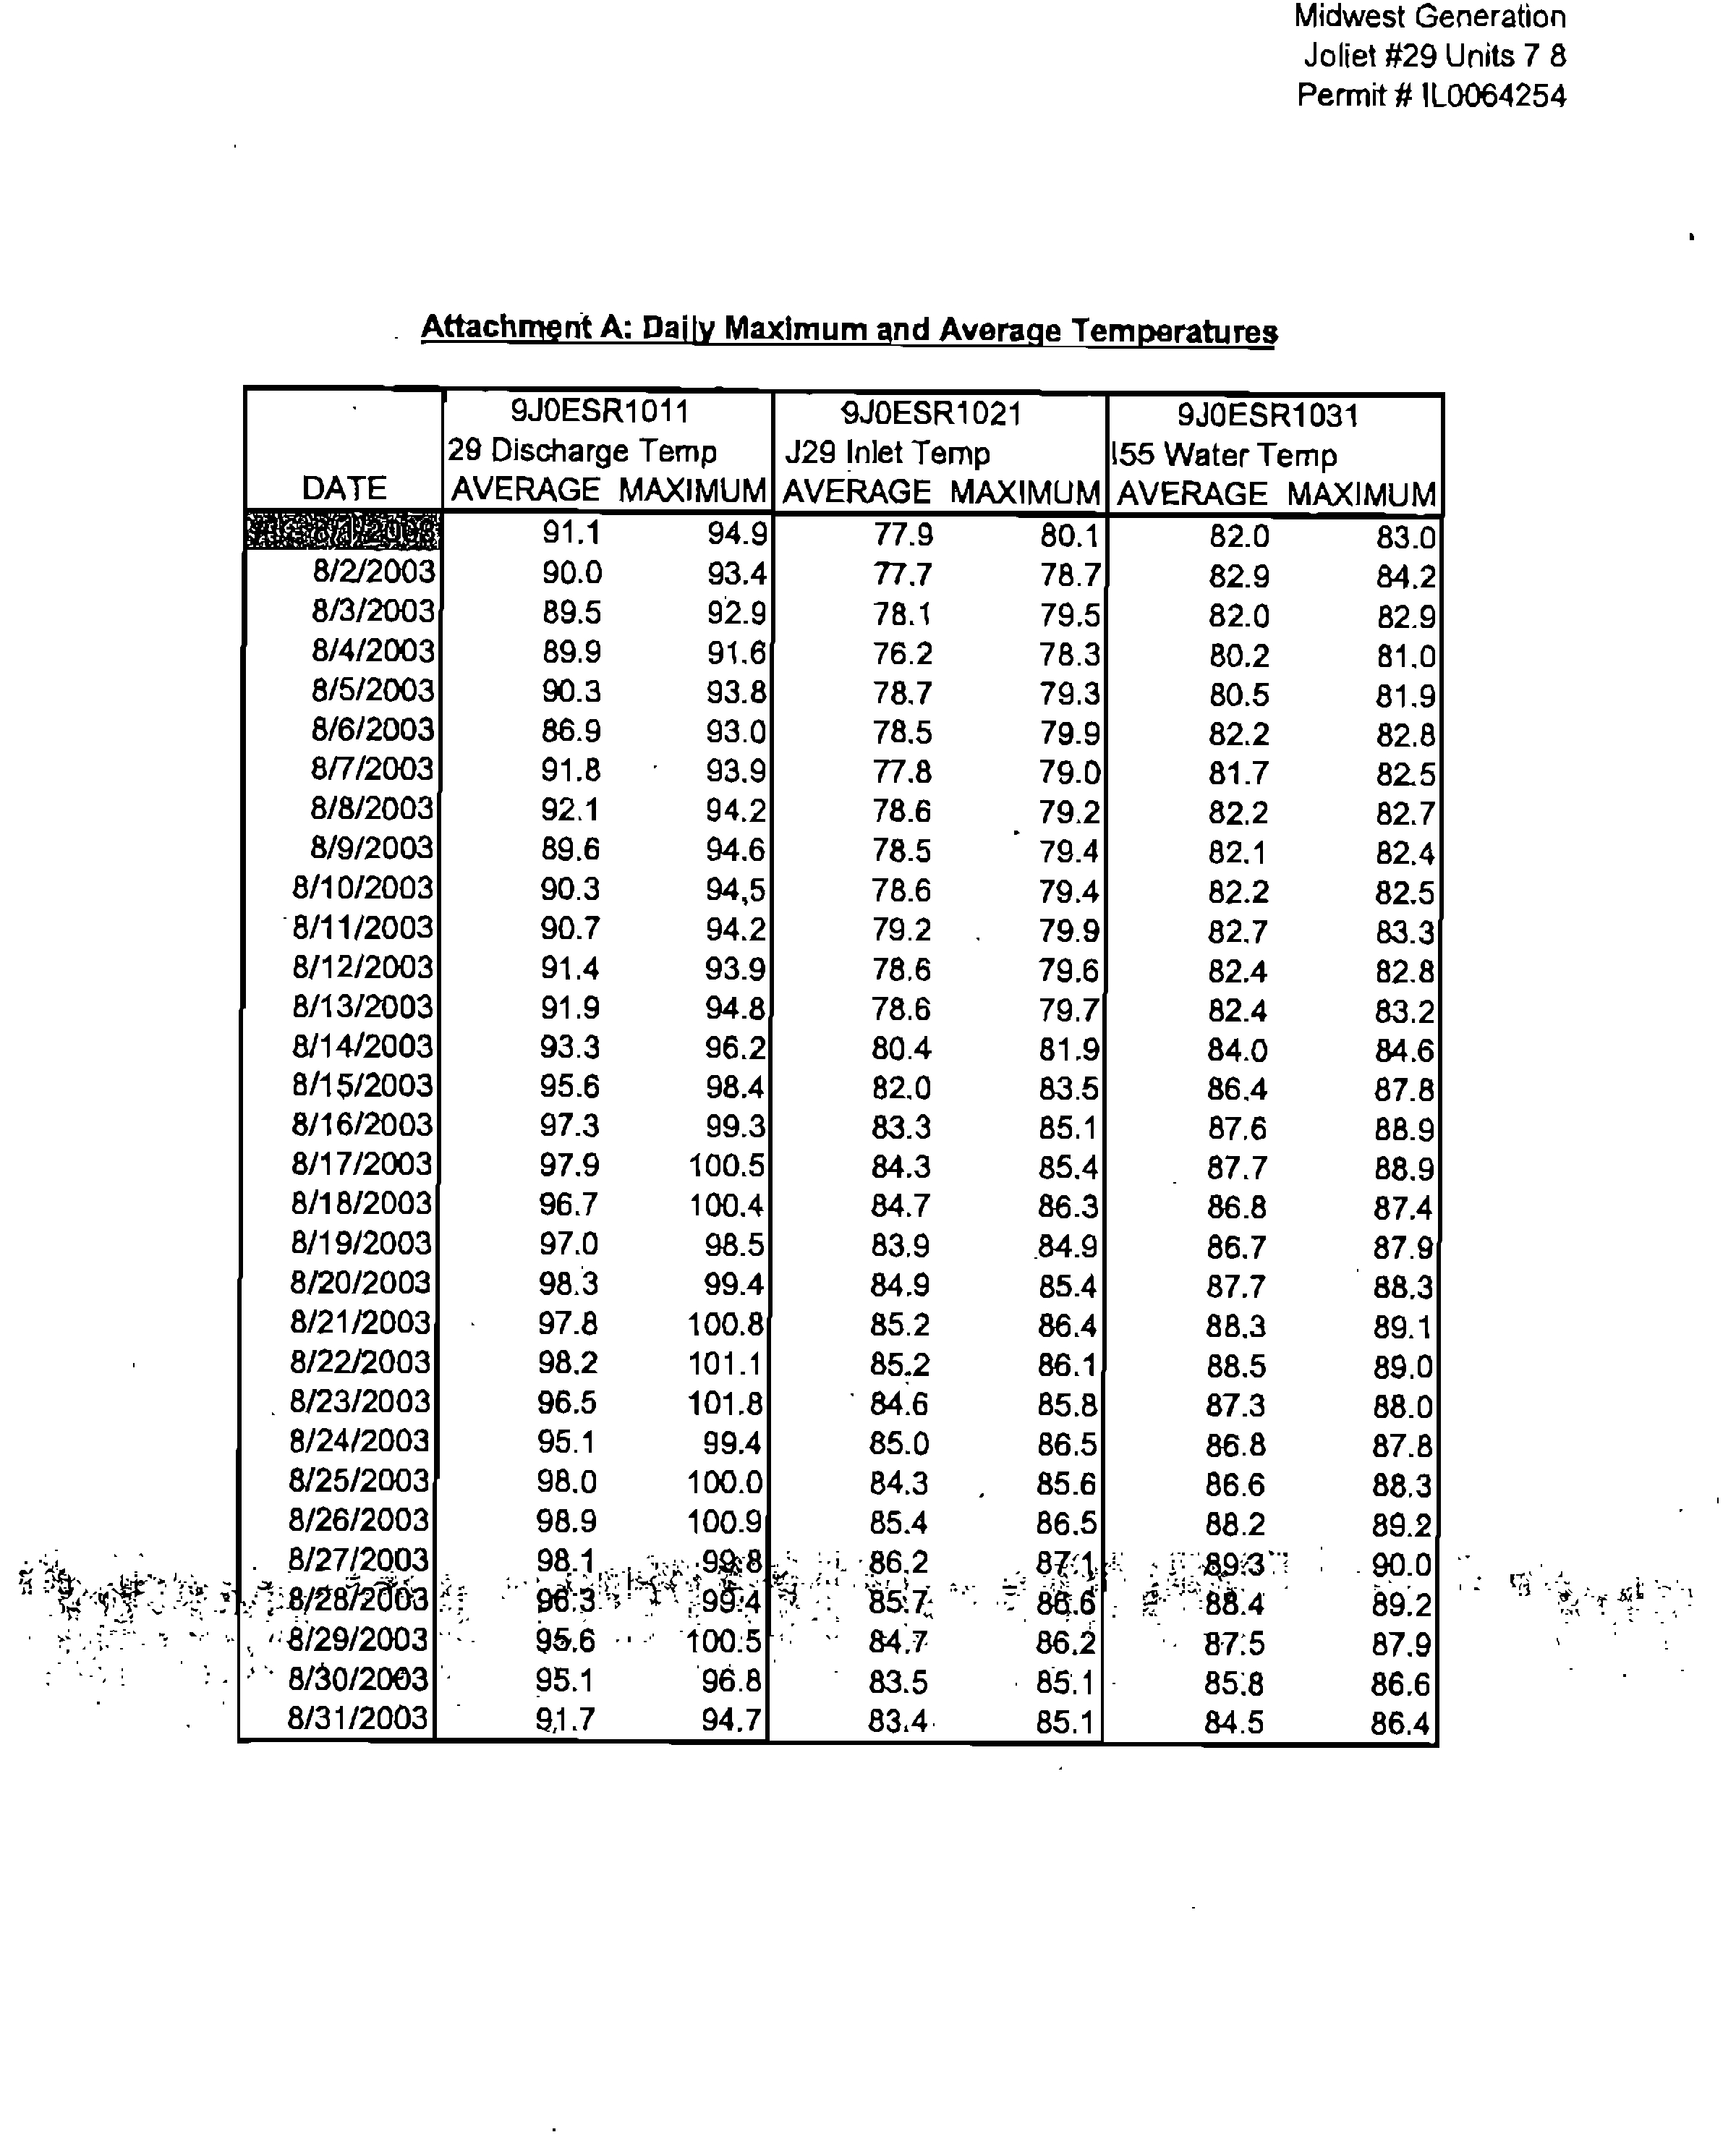
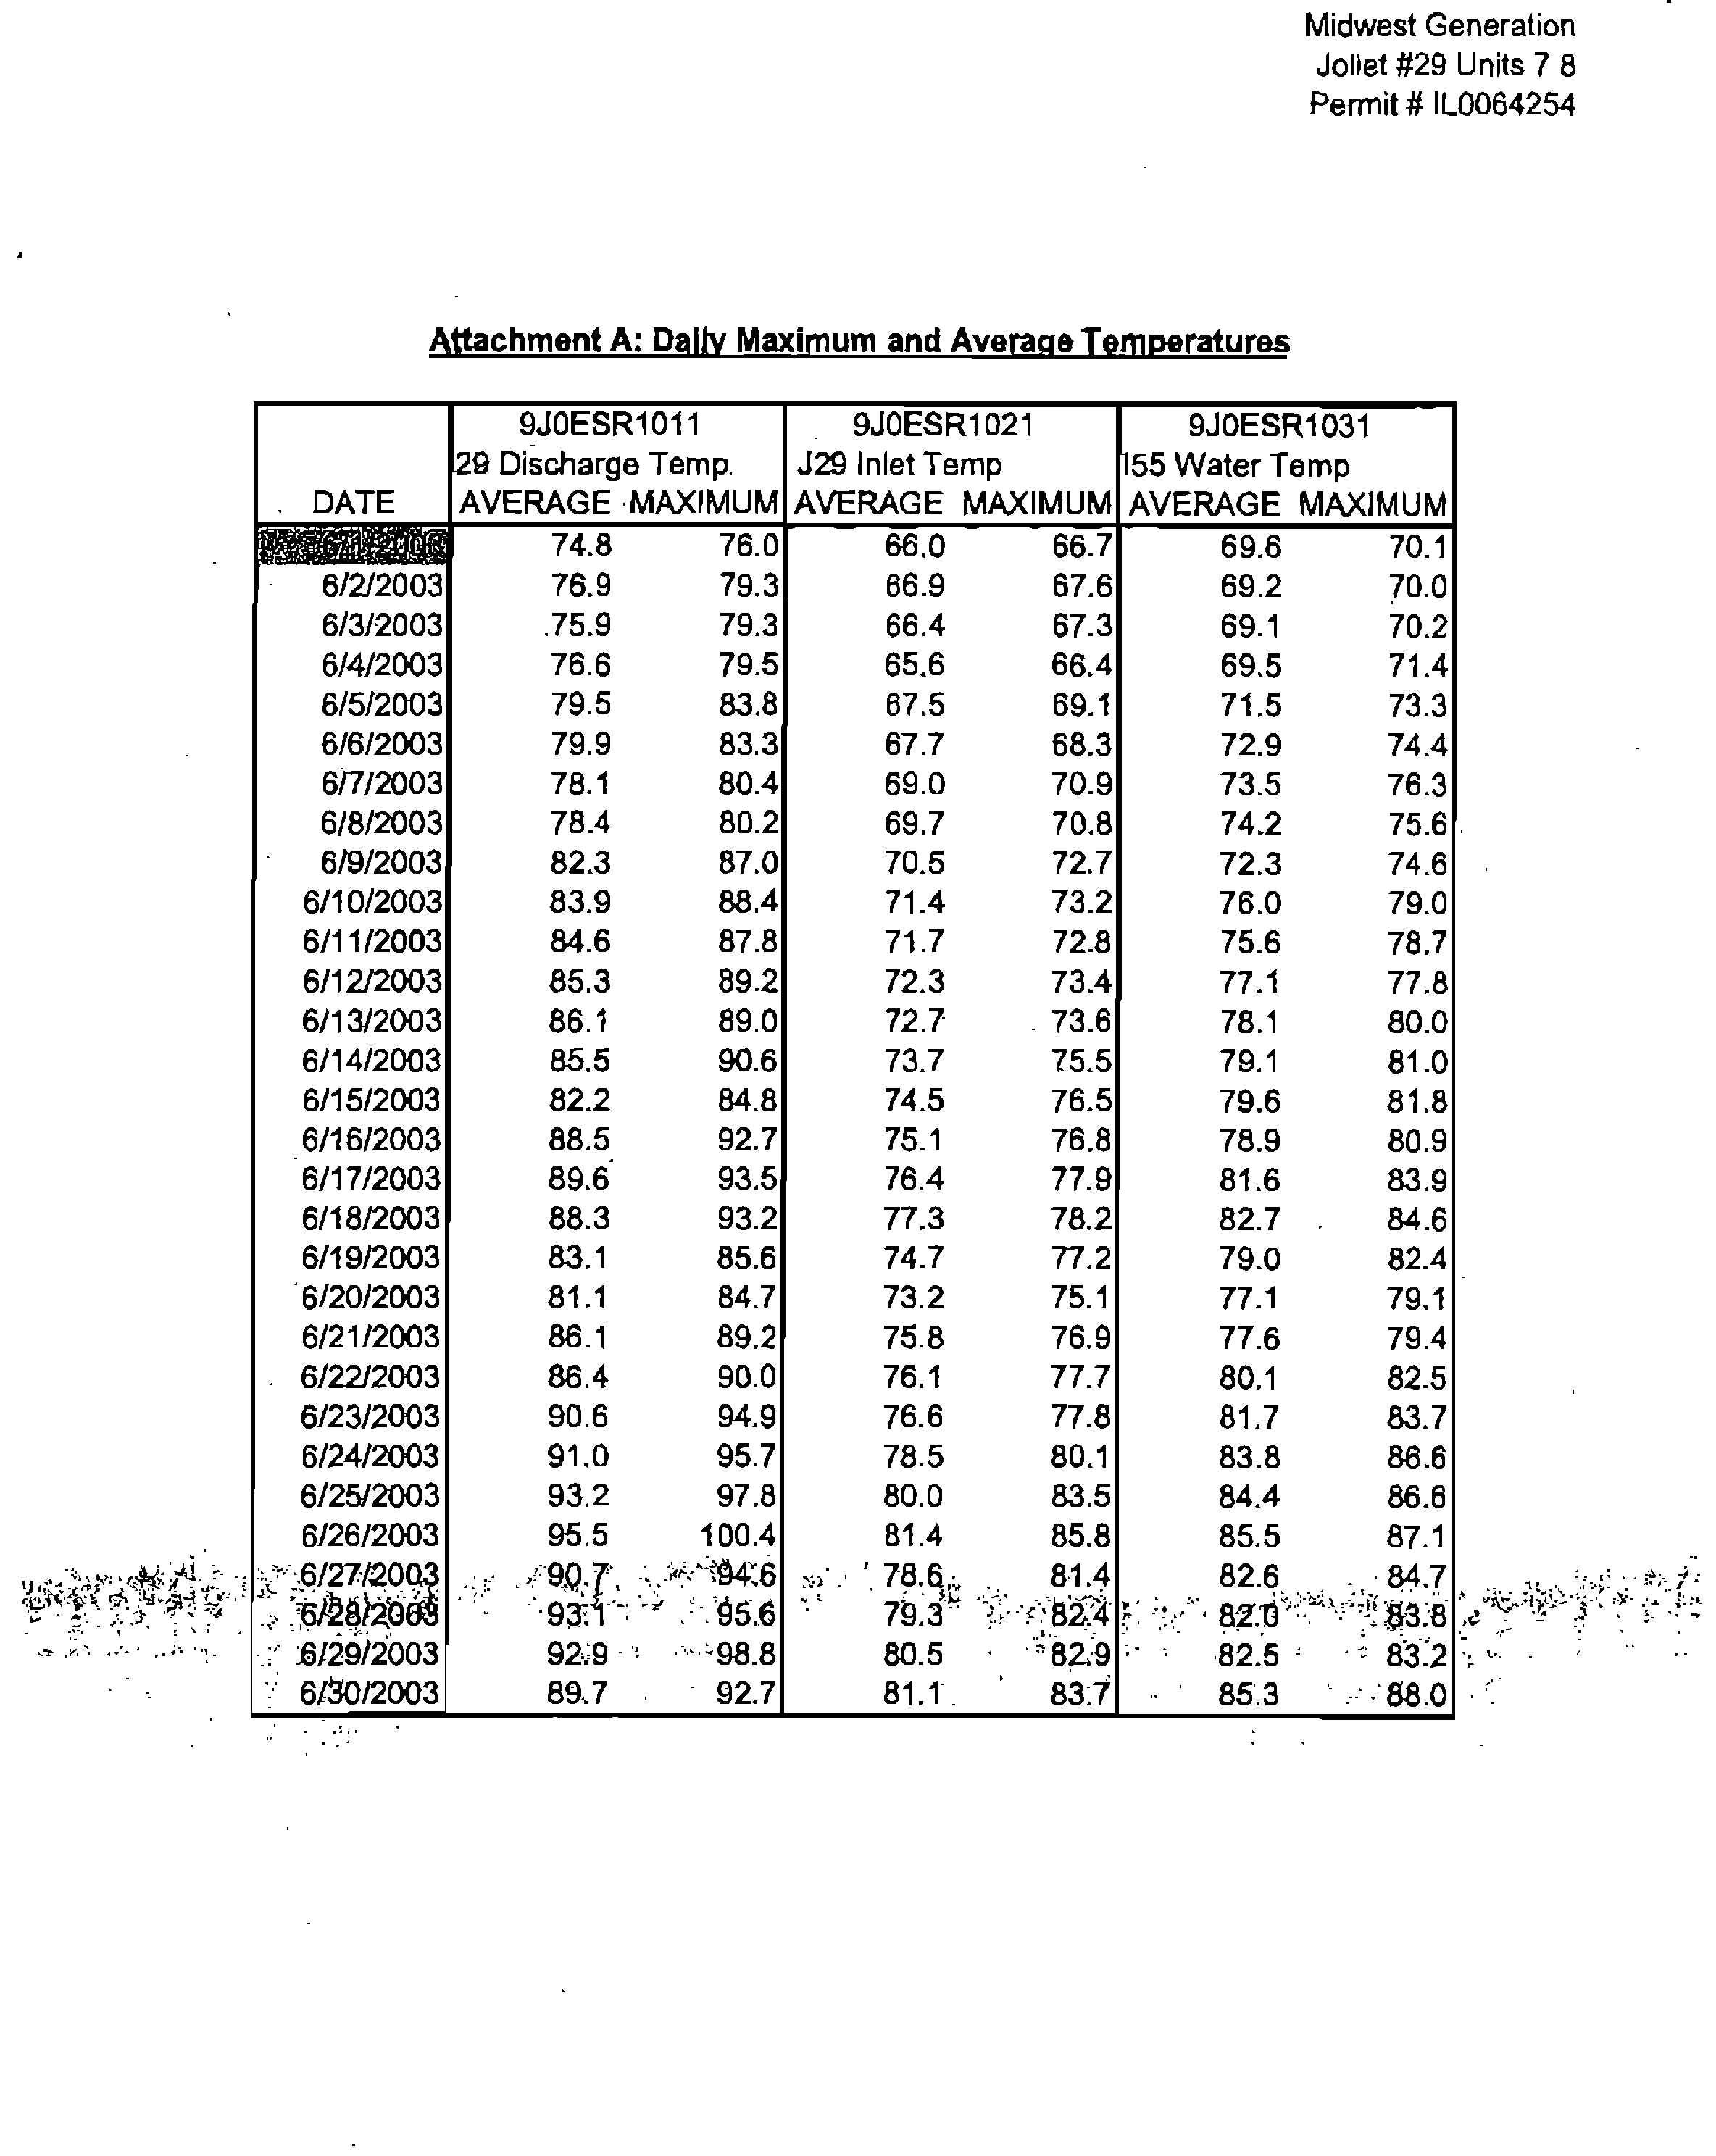
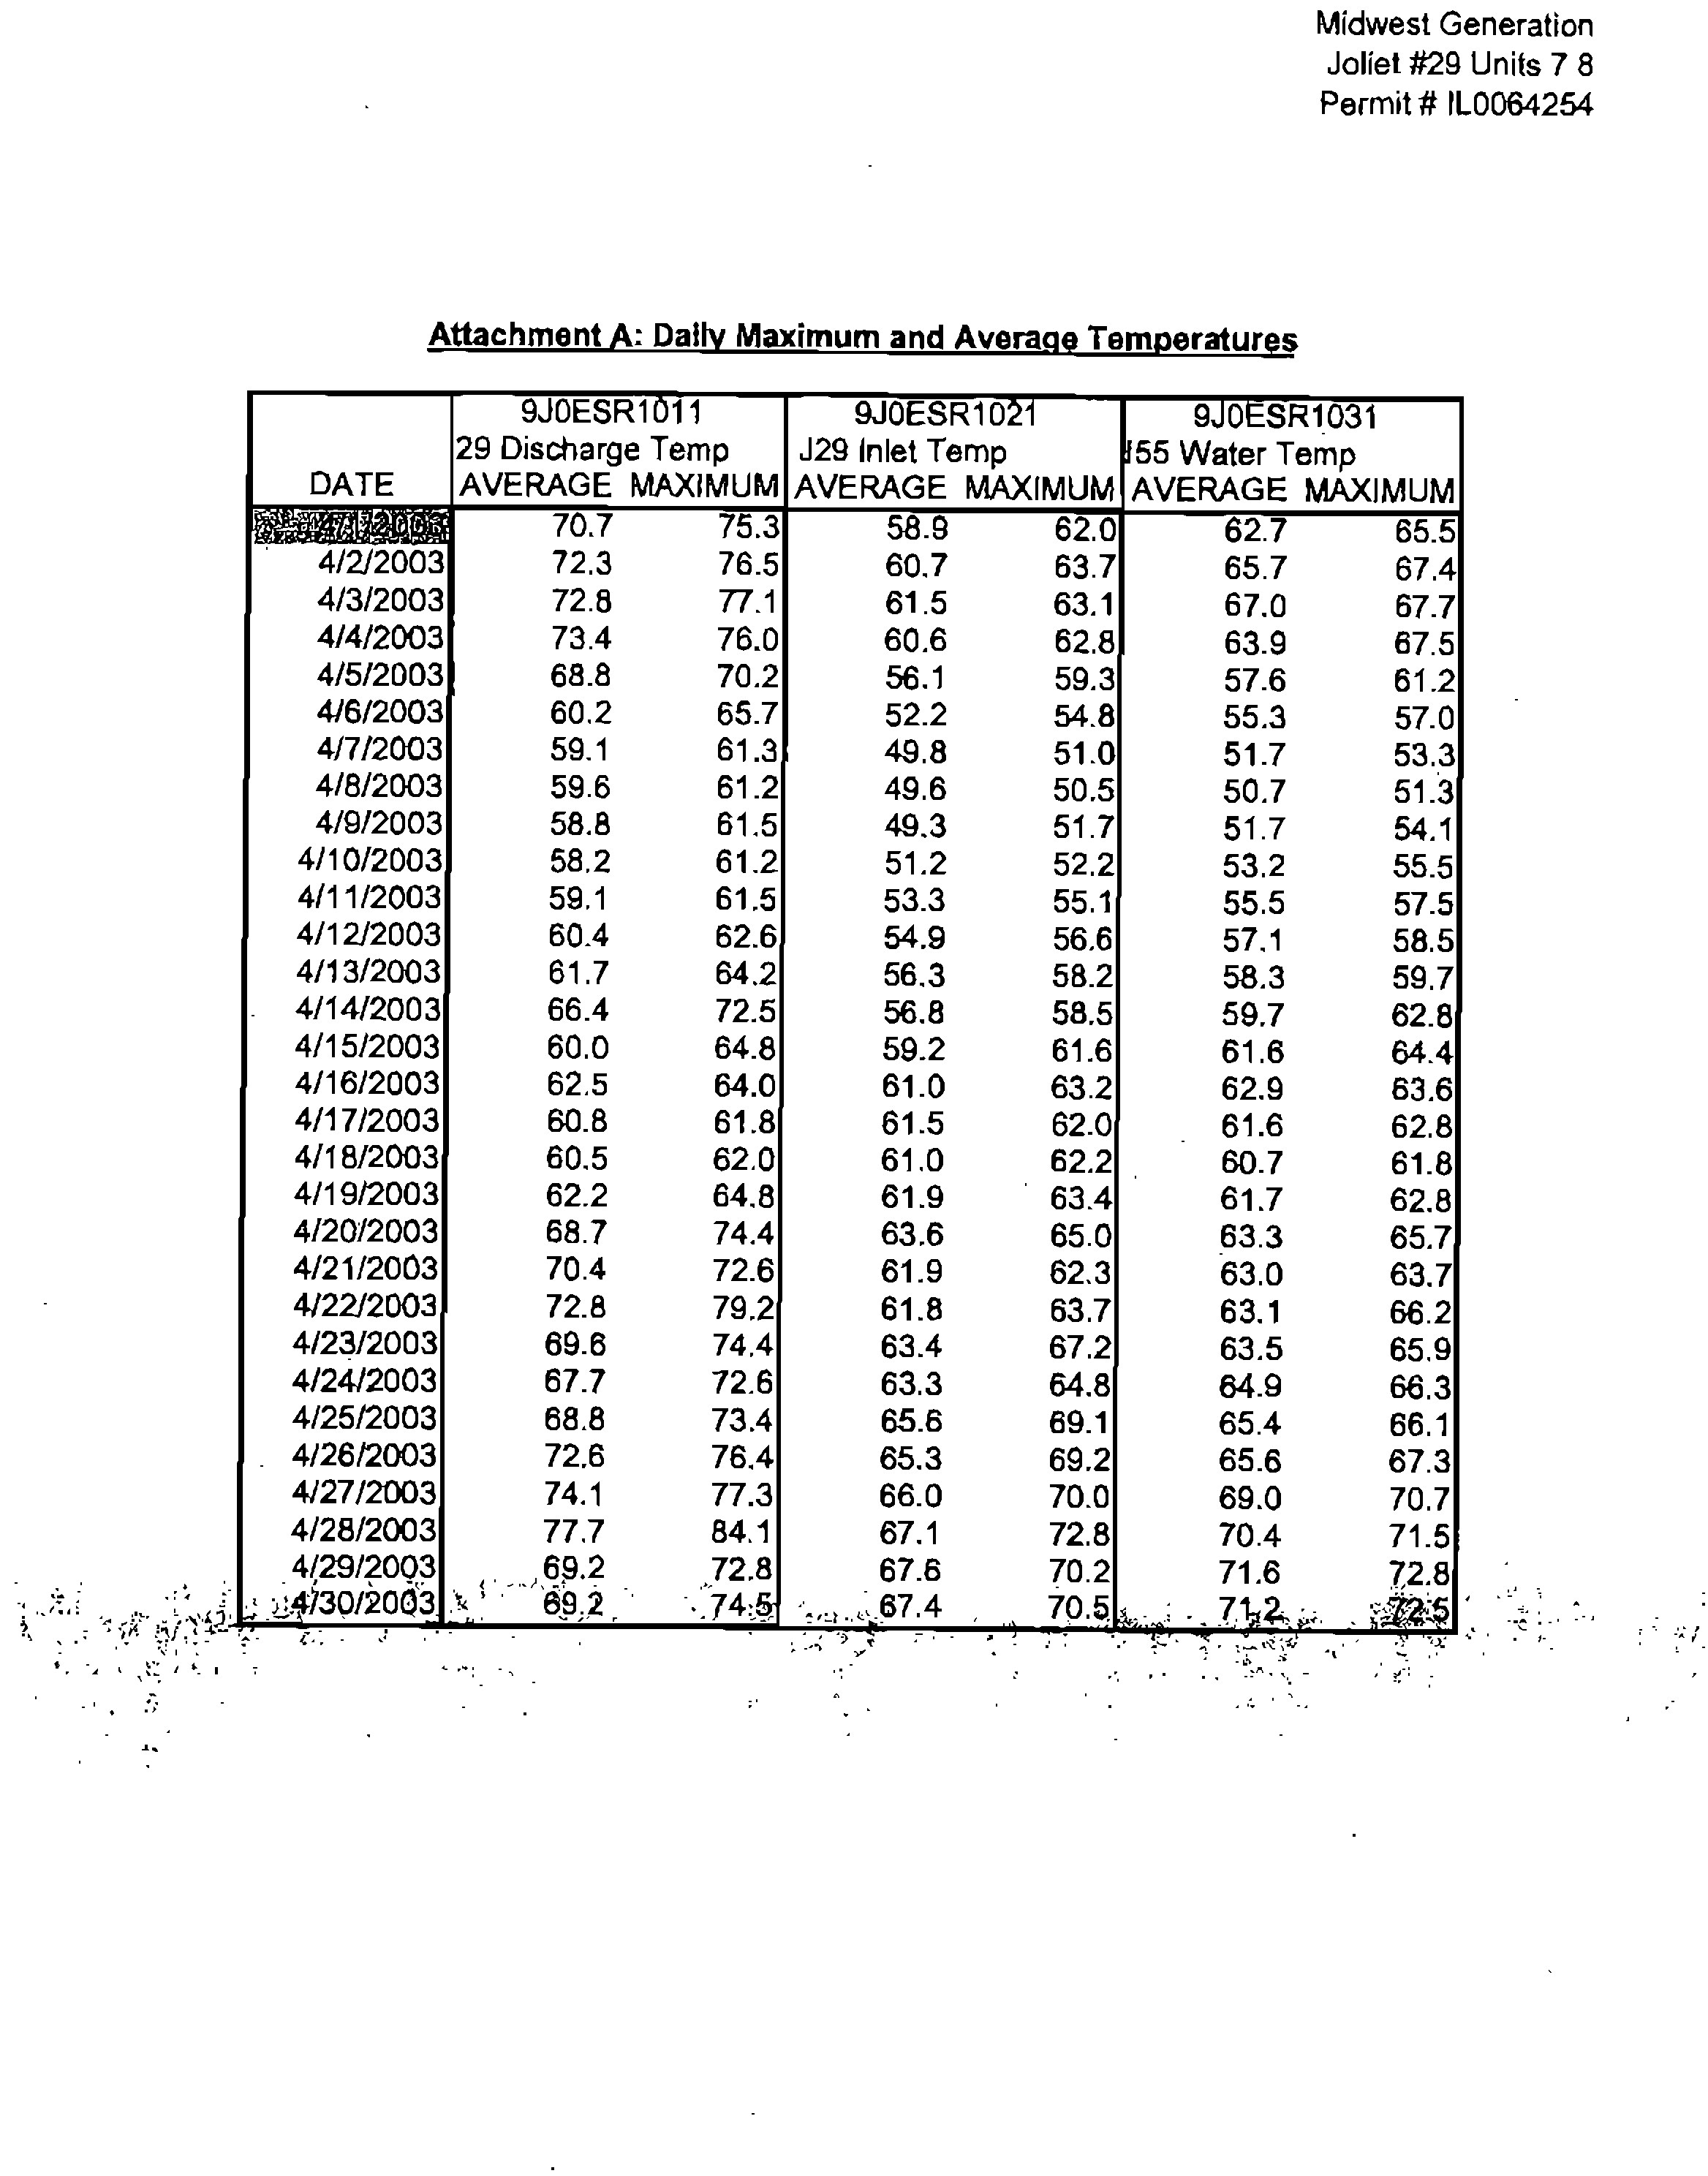
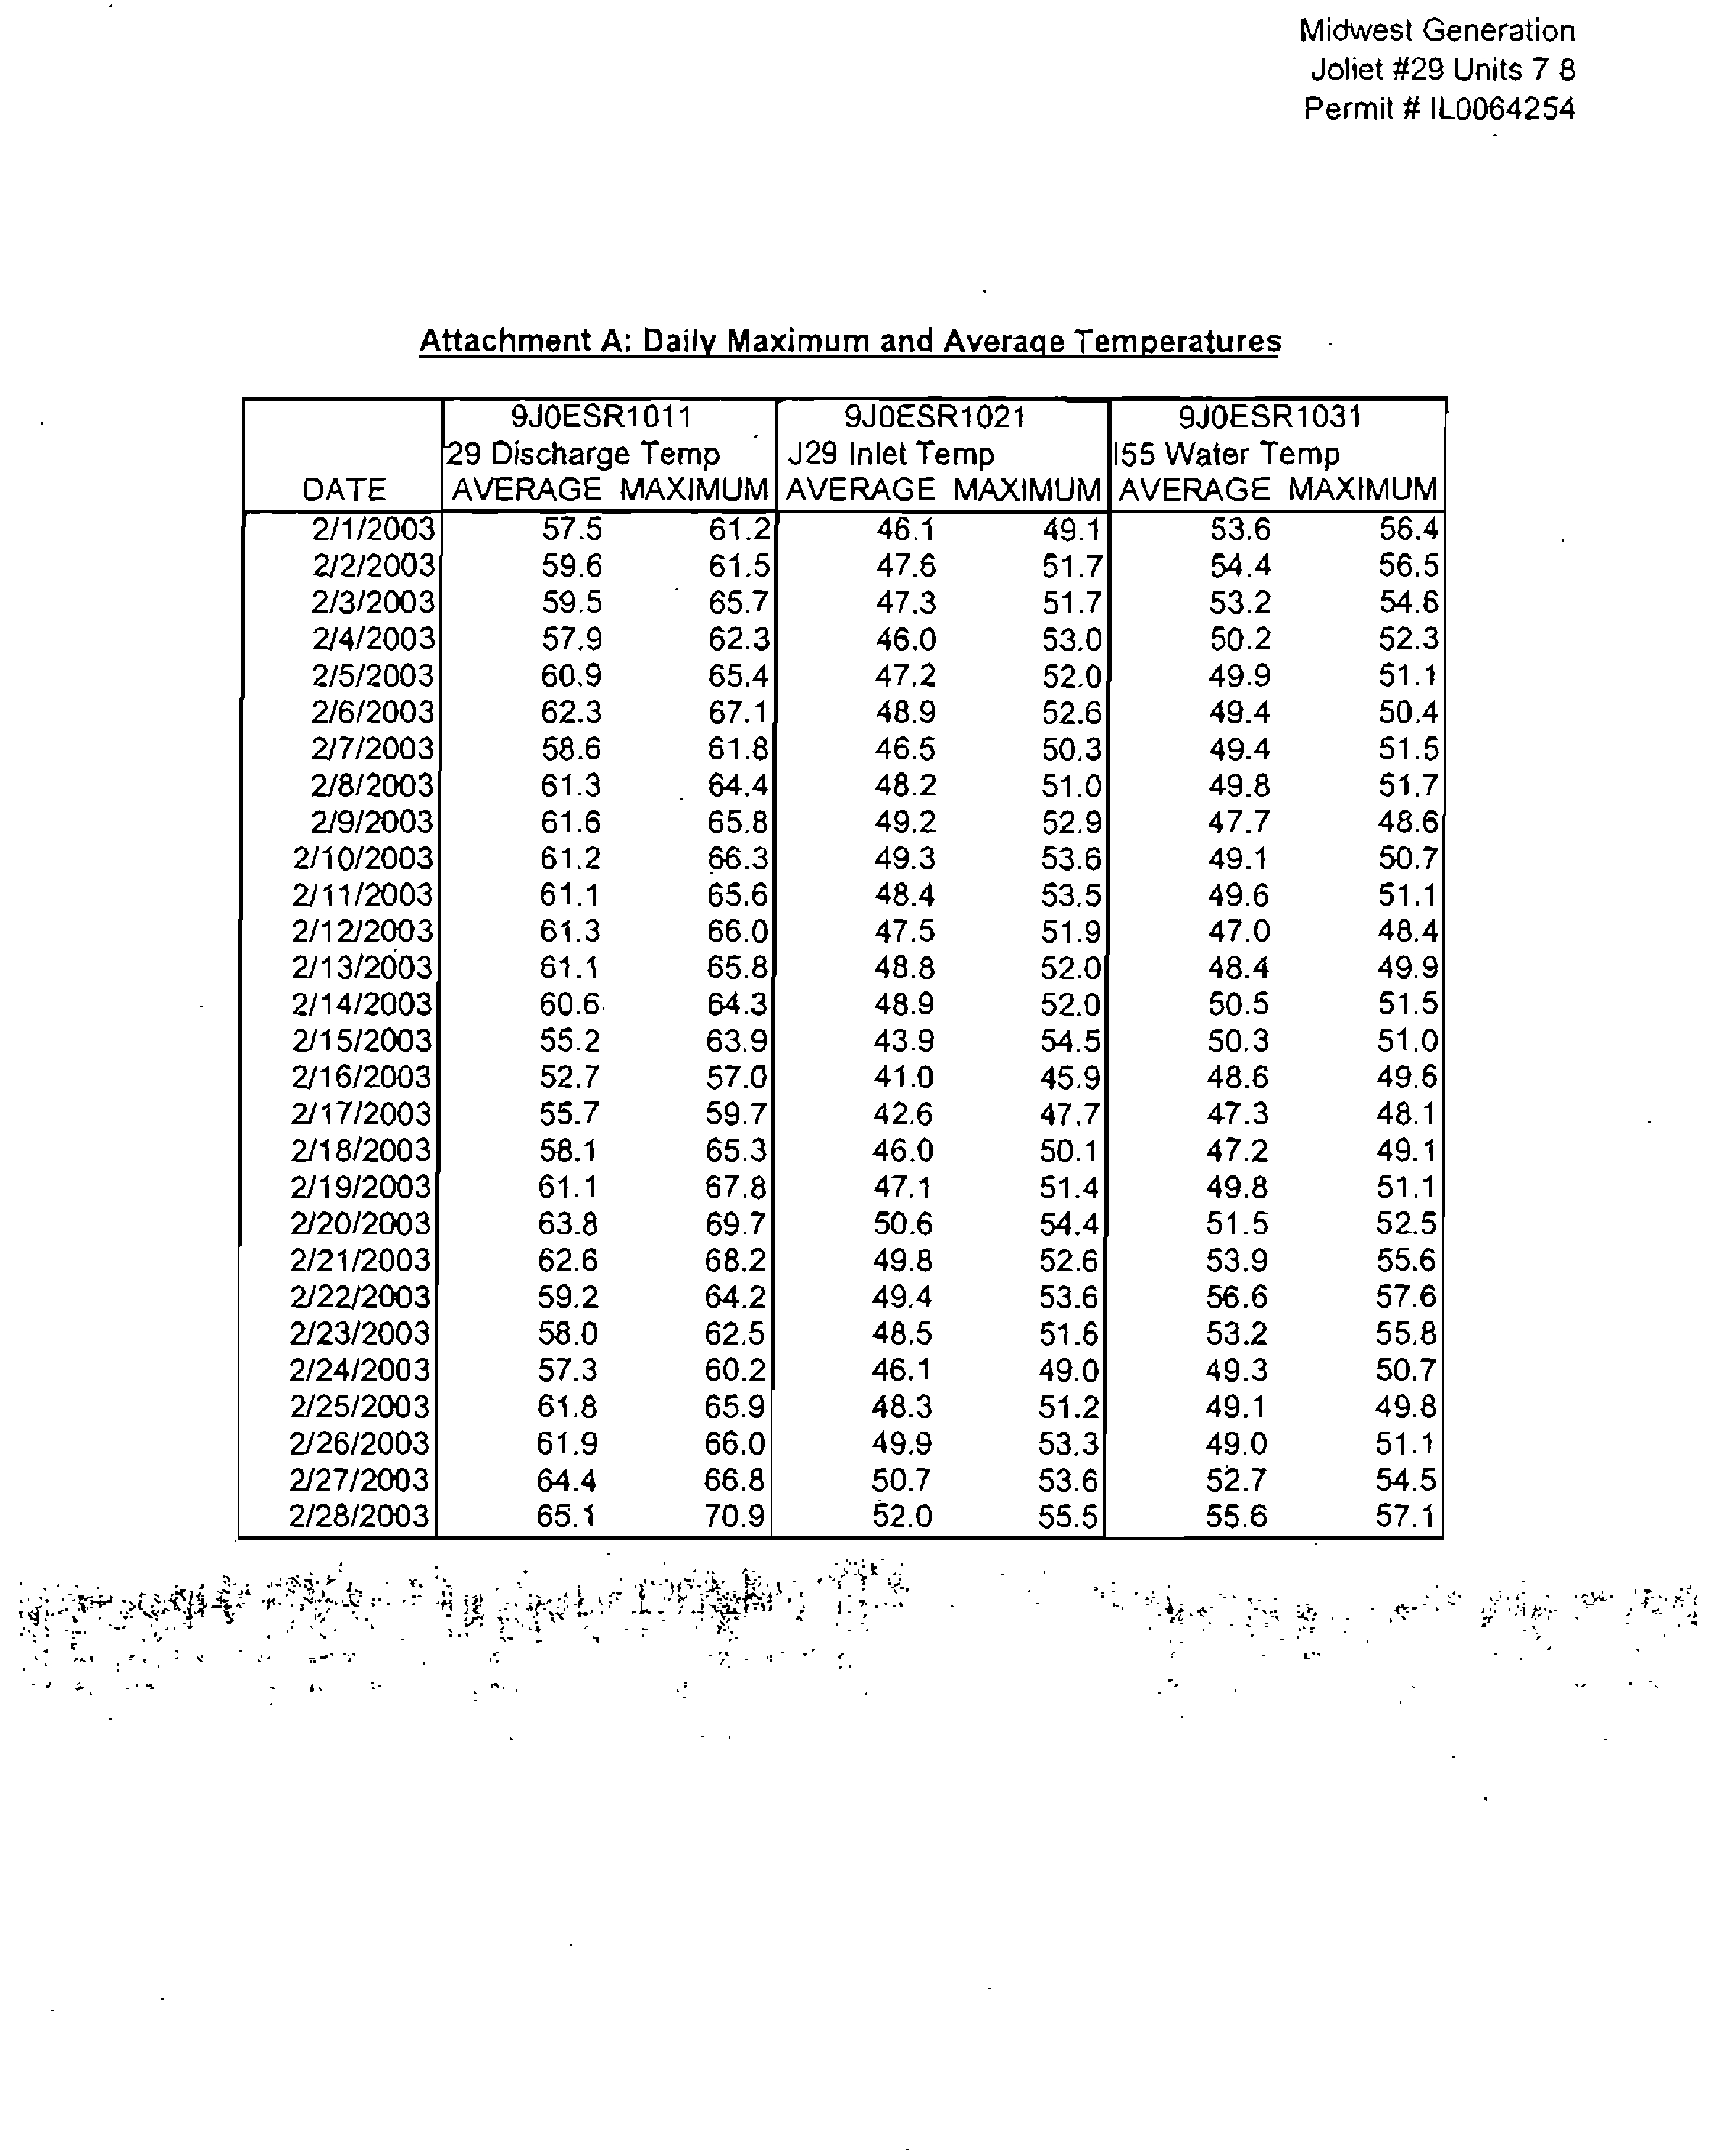
the
documents
attached
as
Exhibit
A
examples
of
documents
containing
intake
temperatures
at
the
Joliet
plant?
27.
Does
Midwest
Generation
keep
data
on
the
temperatures
at
the
1-55
Bridge?
28.
Does
MidwestGeneration
keep
data
on
DOlevels
at
the
1-55
Bridge?
29.
Do
you
know
if
there
are
unnatural
heat
inputs
to
the
Upper
Illinois
River
below
the
1-55
bridge?
30.
Has
Commonwealth
Edison
or
Exelon
violated
its
NPDES
permit
with
excessiveheat
discharges
from
the
Dresden
Nuclear
plant?
31.
Has
Midwest
Generation
investigated
the
amount
of
fish
habitat
in
tributaries
of
the
Upper
Dresden
Pool
or
other
watersconnected
to
the
Upper
Dresden
Pool
including
the
Du
Page
River,
Hickory
Creek,
Jackson
Creek,
and
the
Kankakee
River?
2
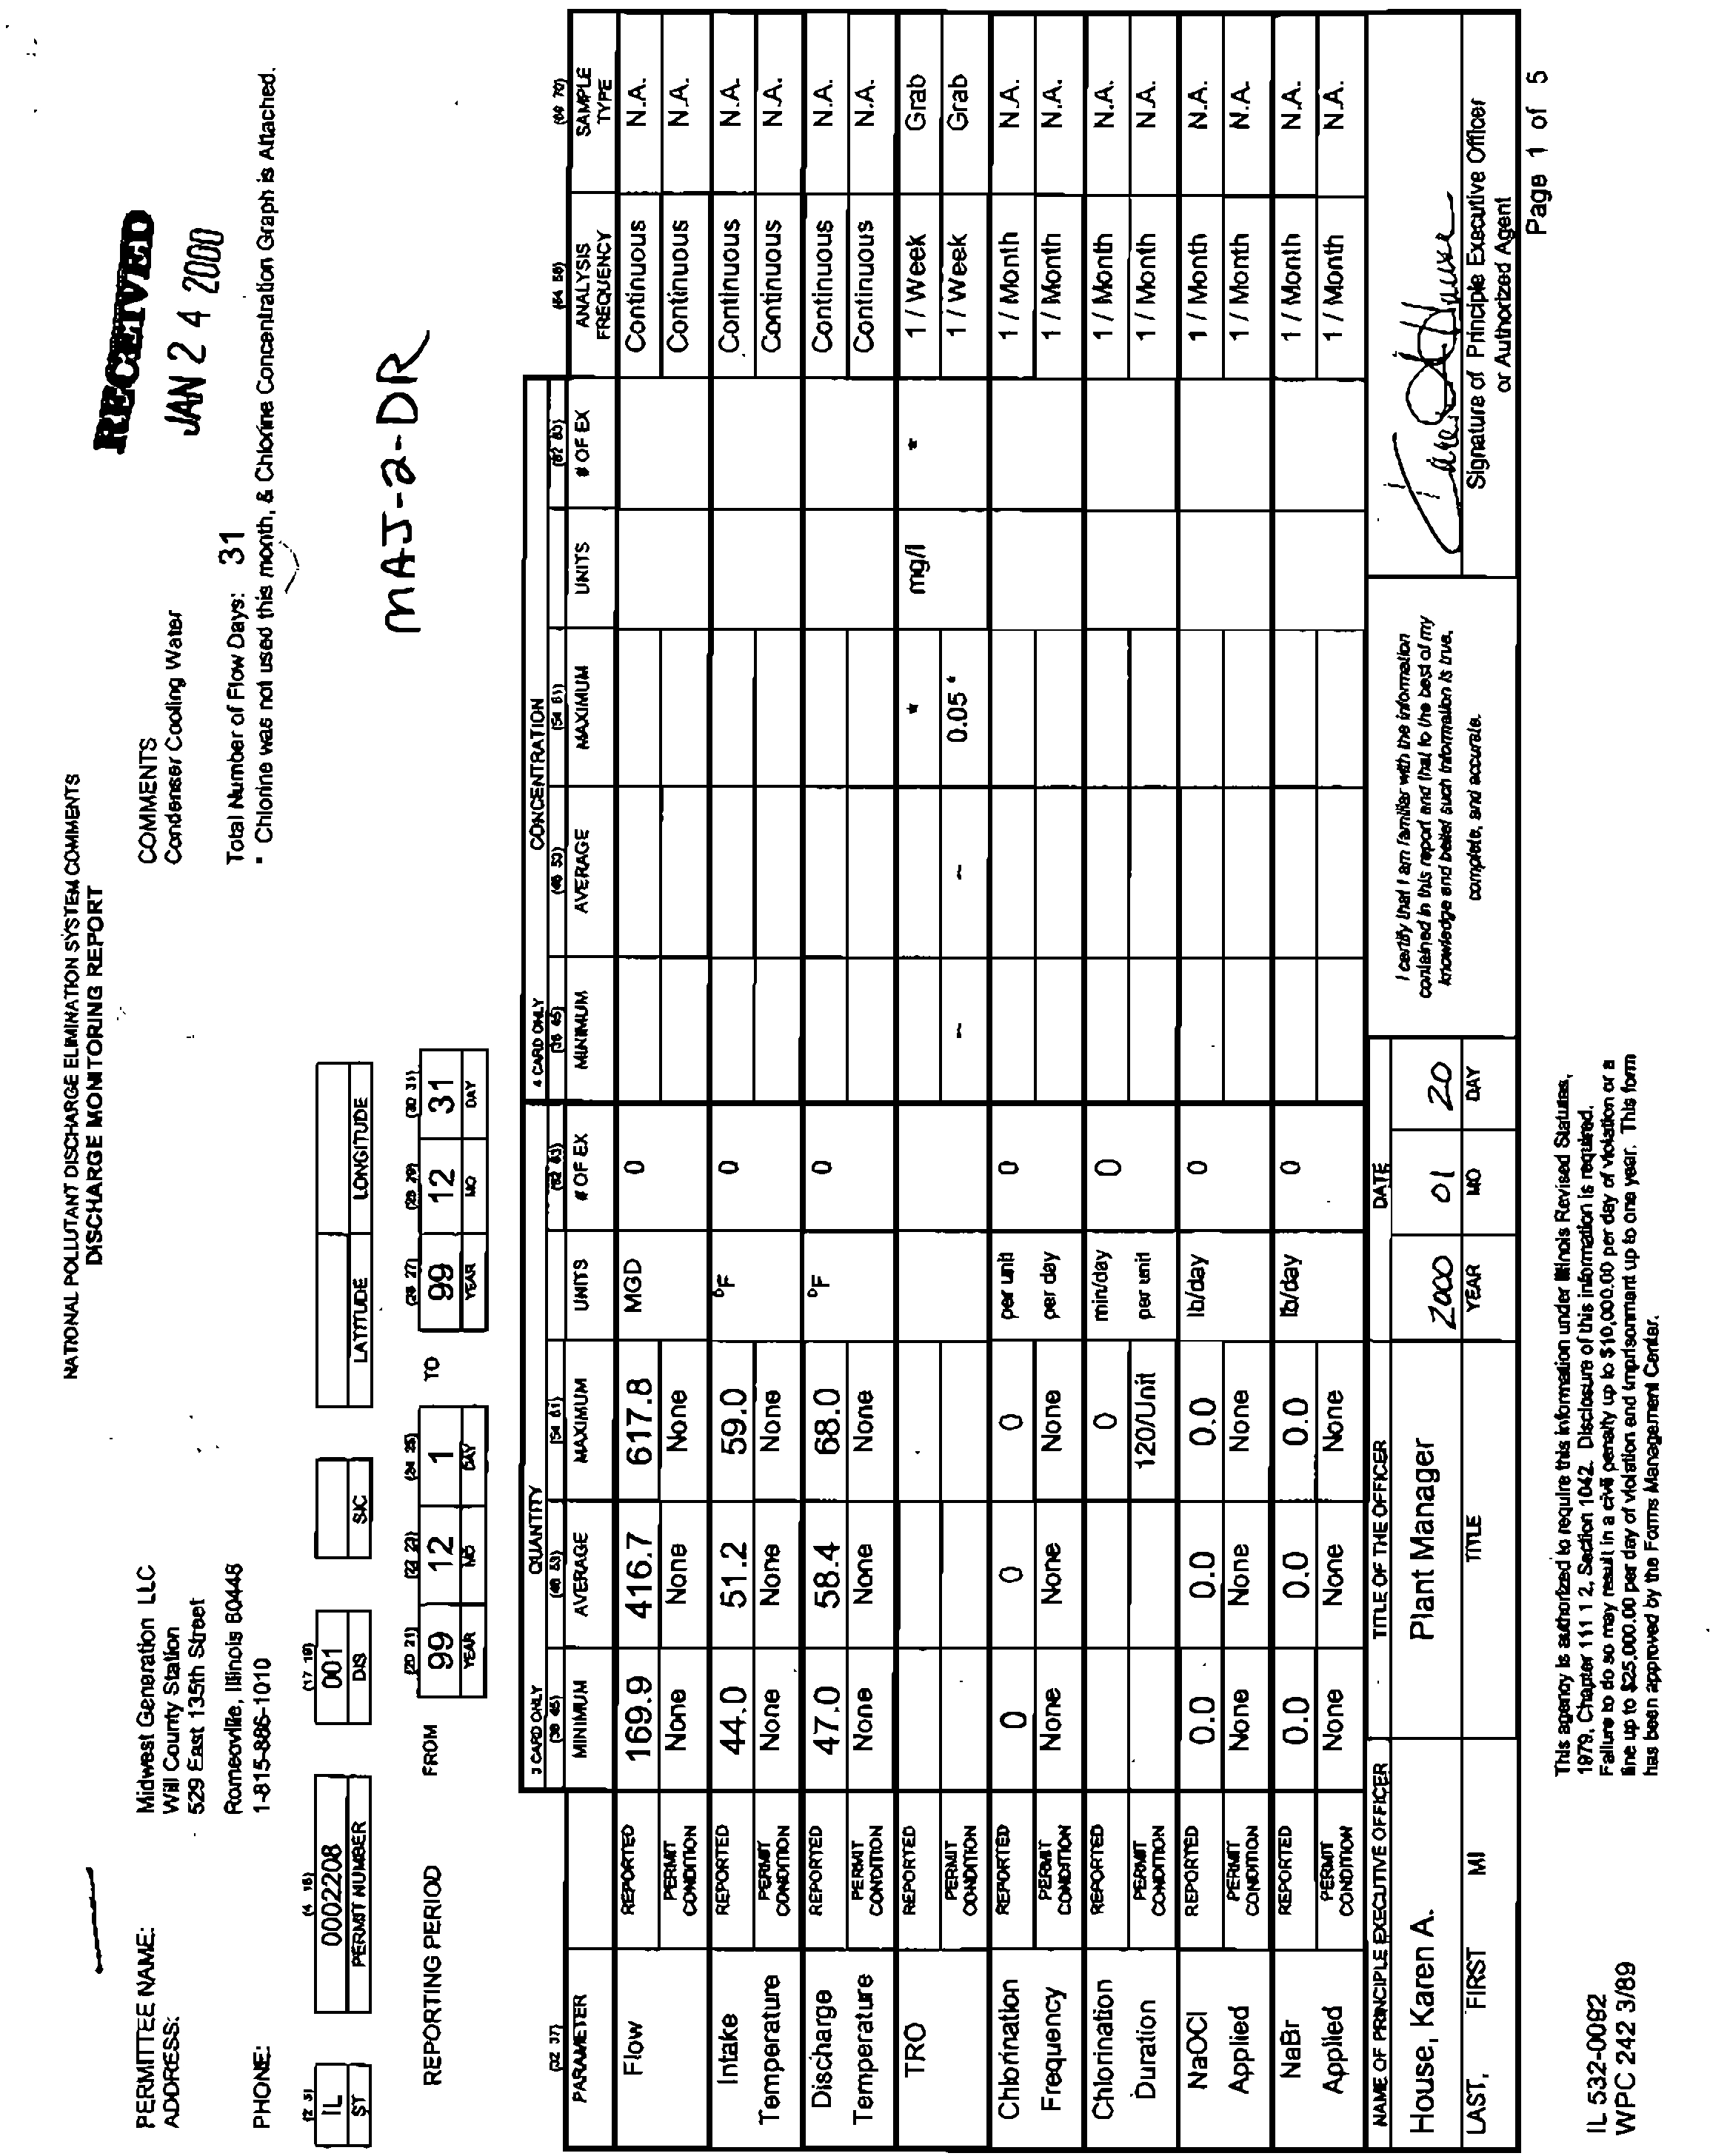
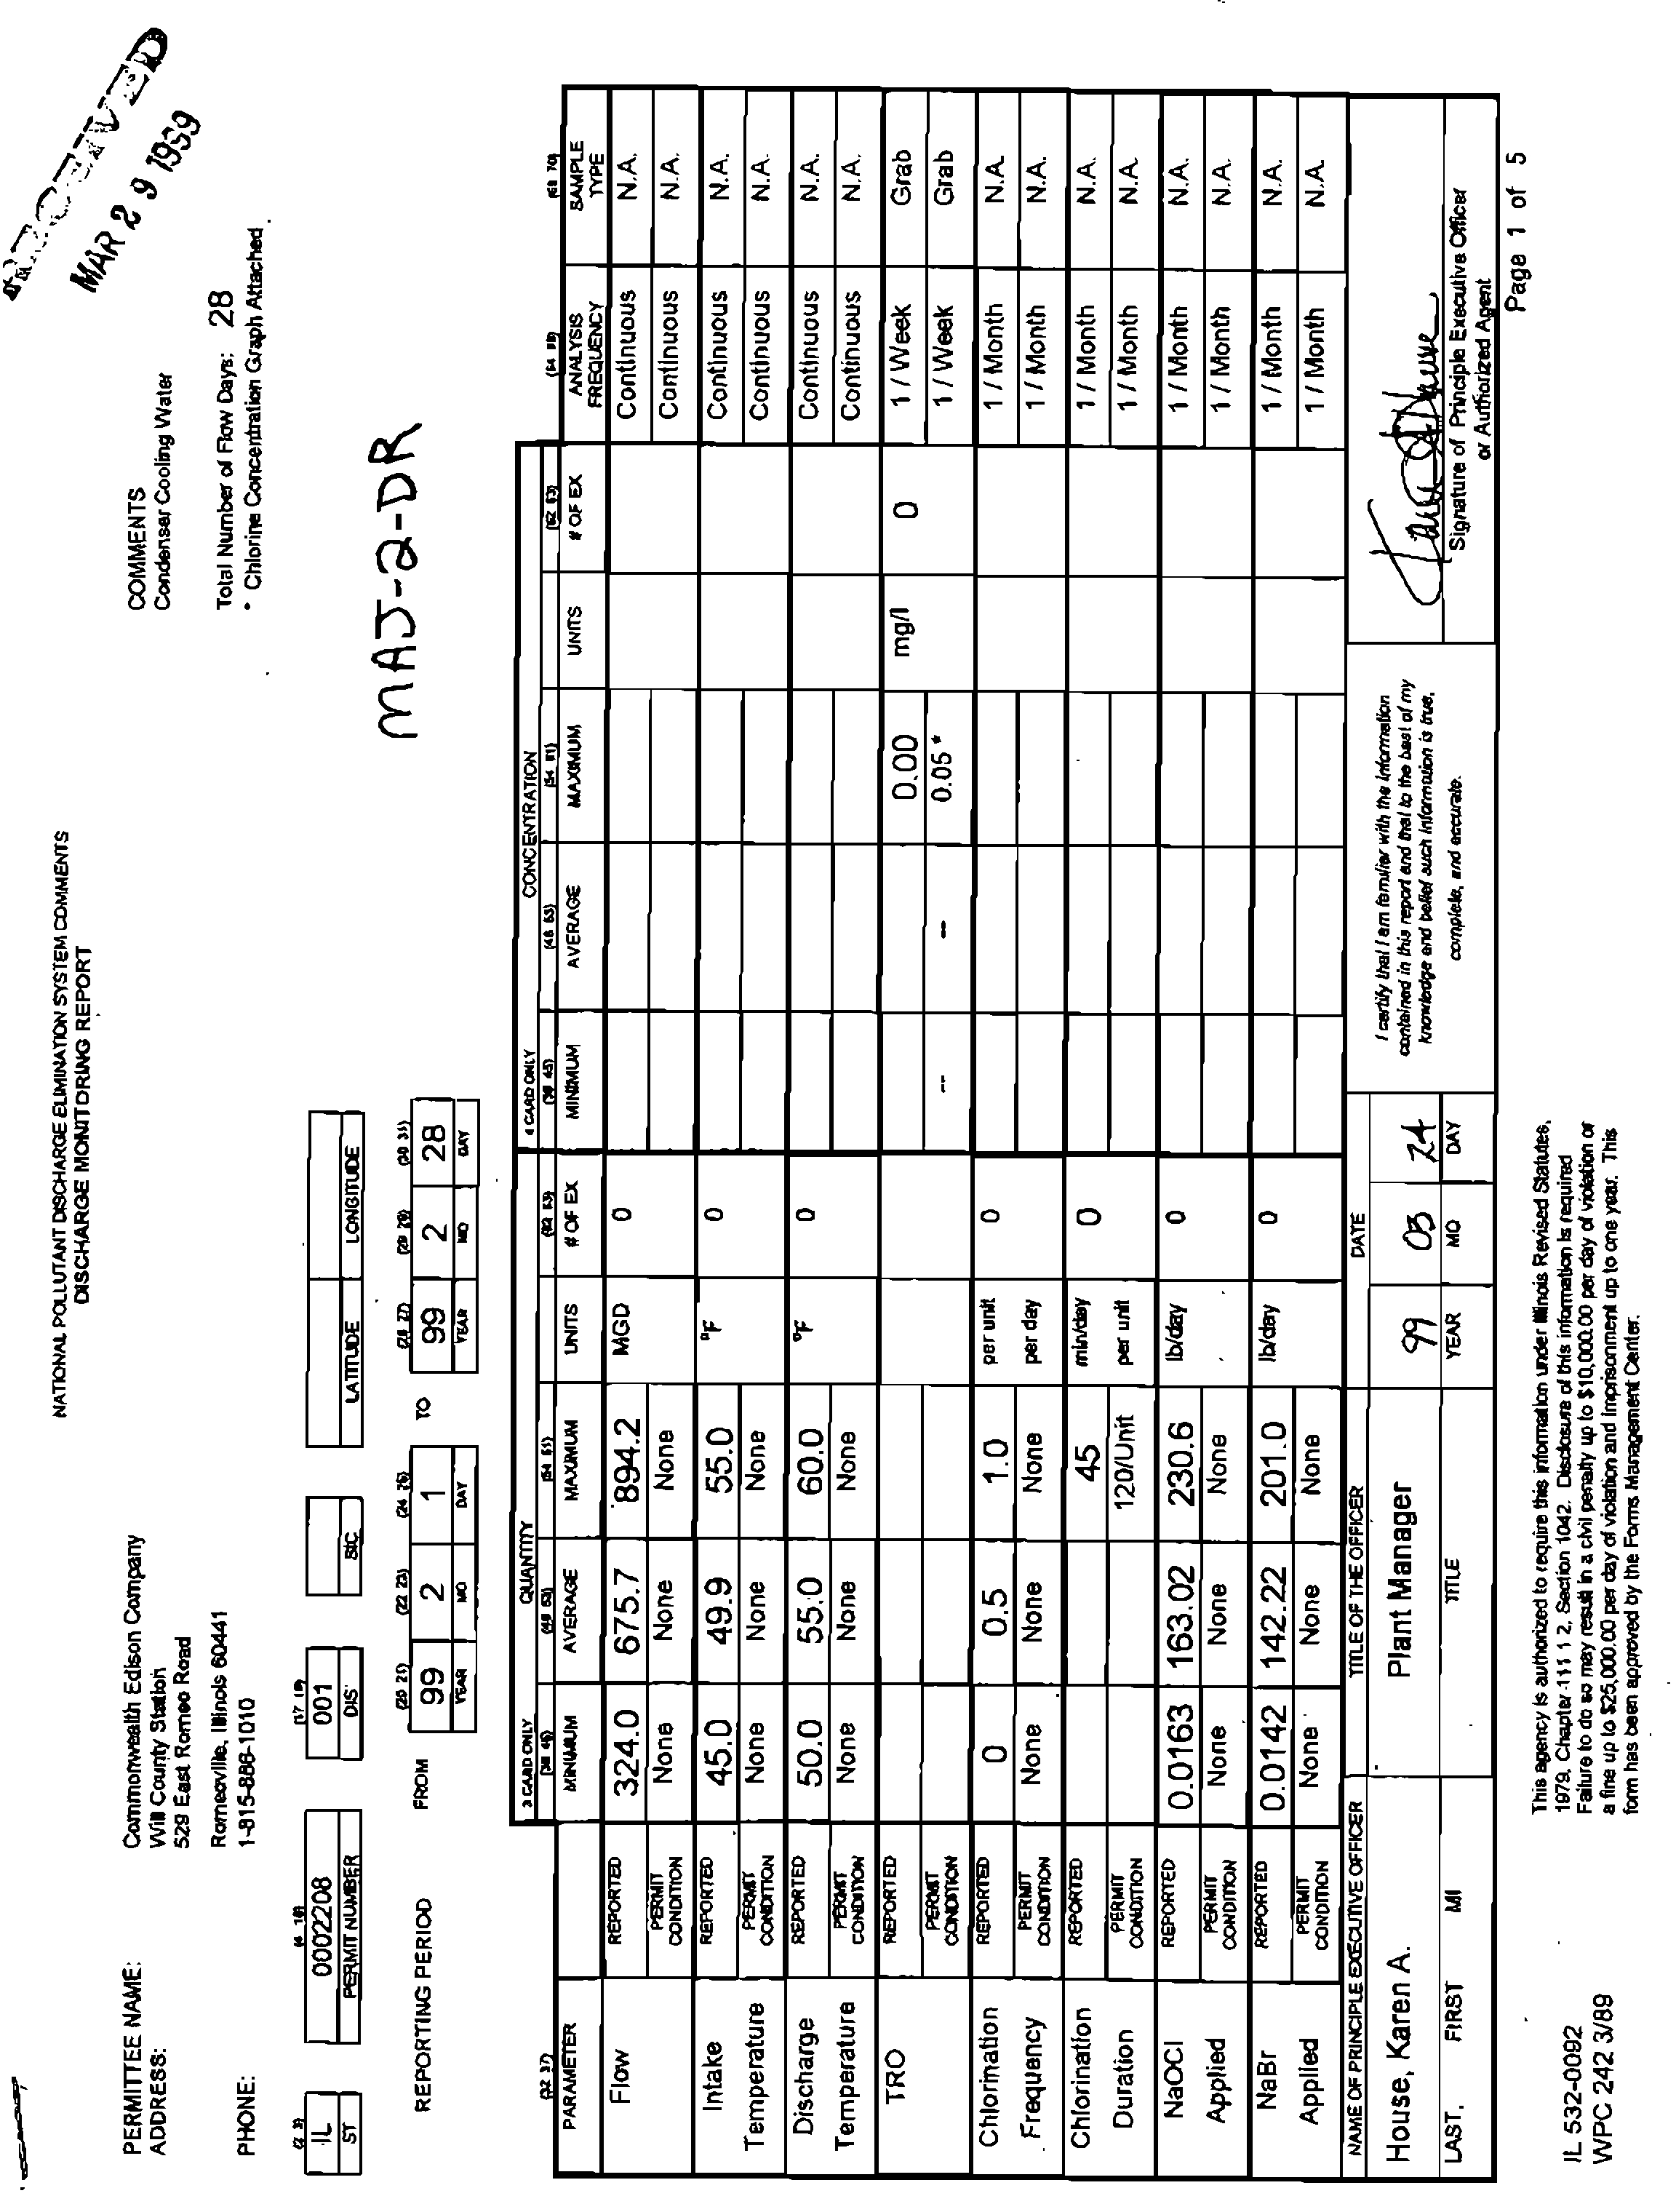
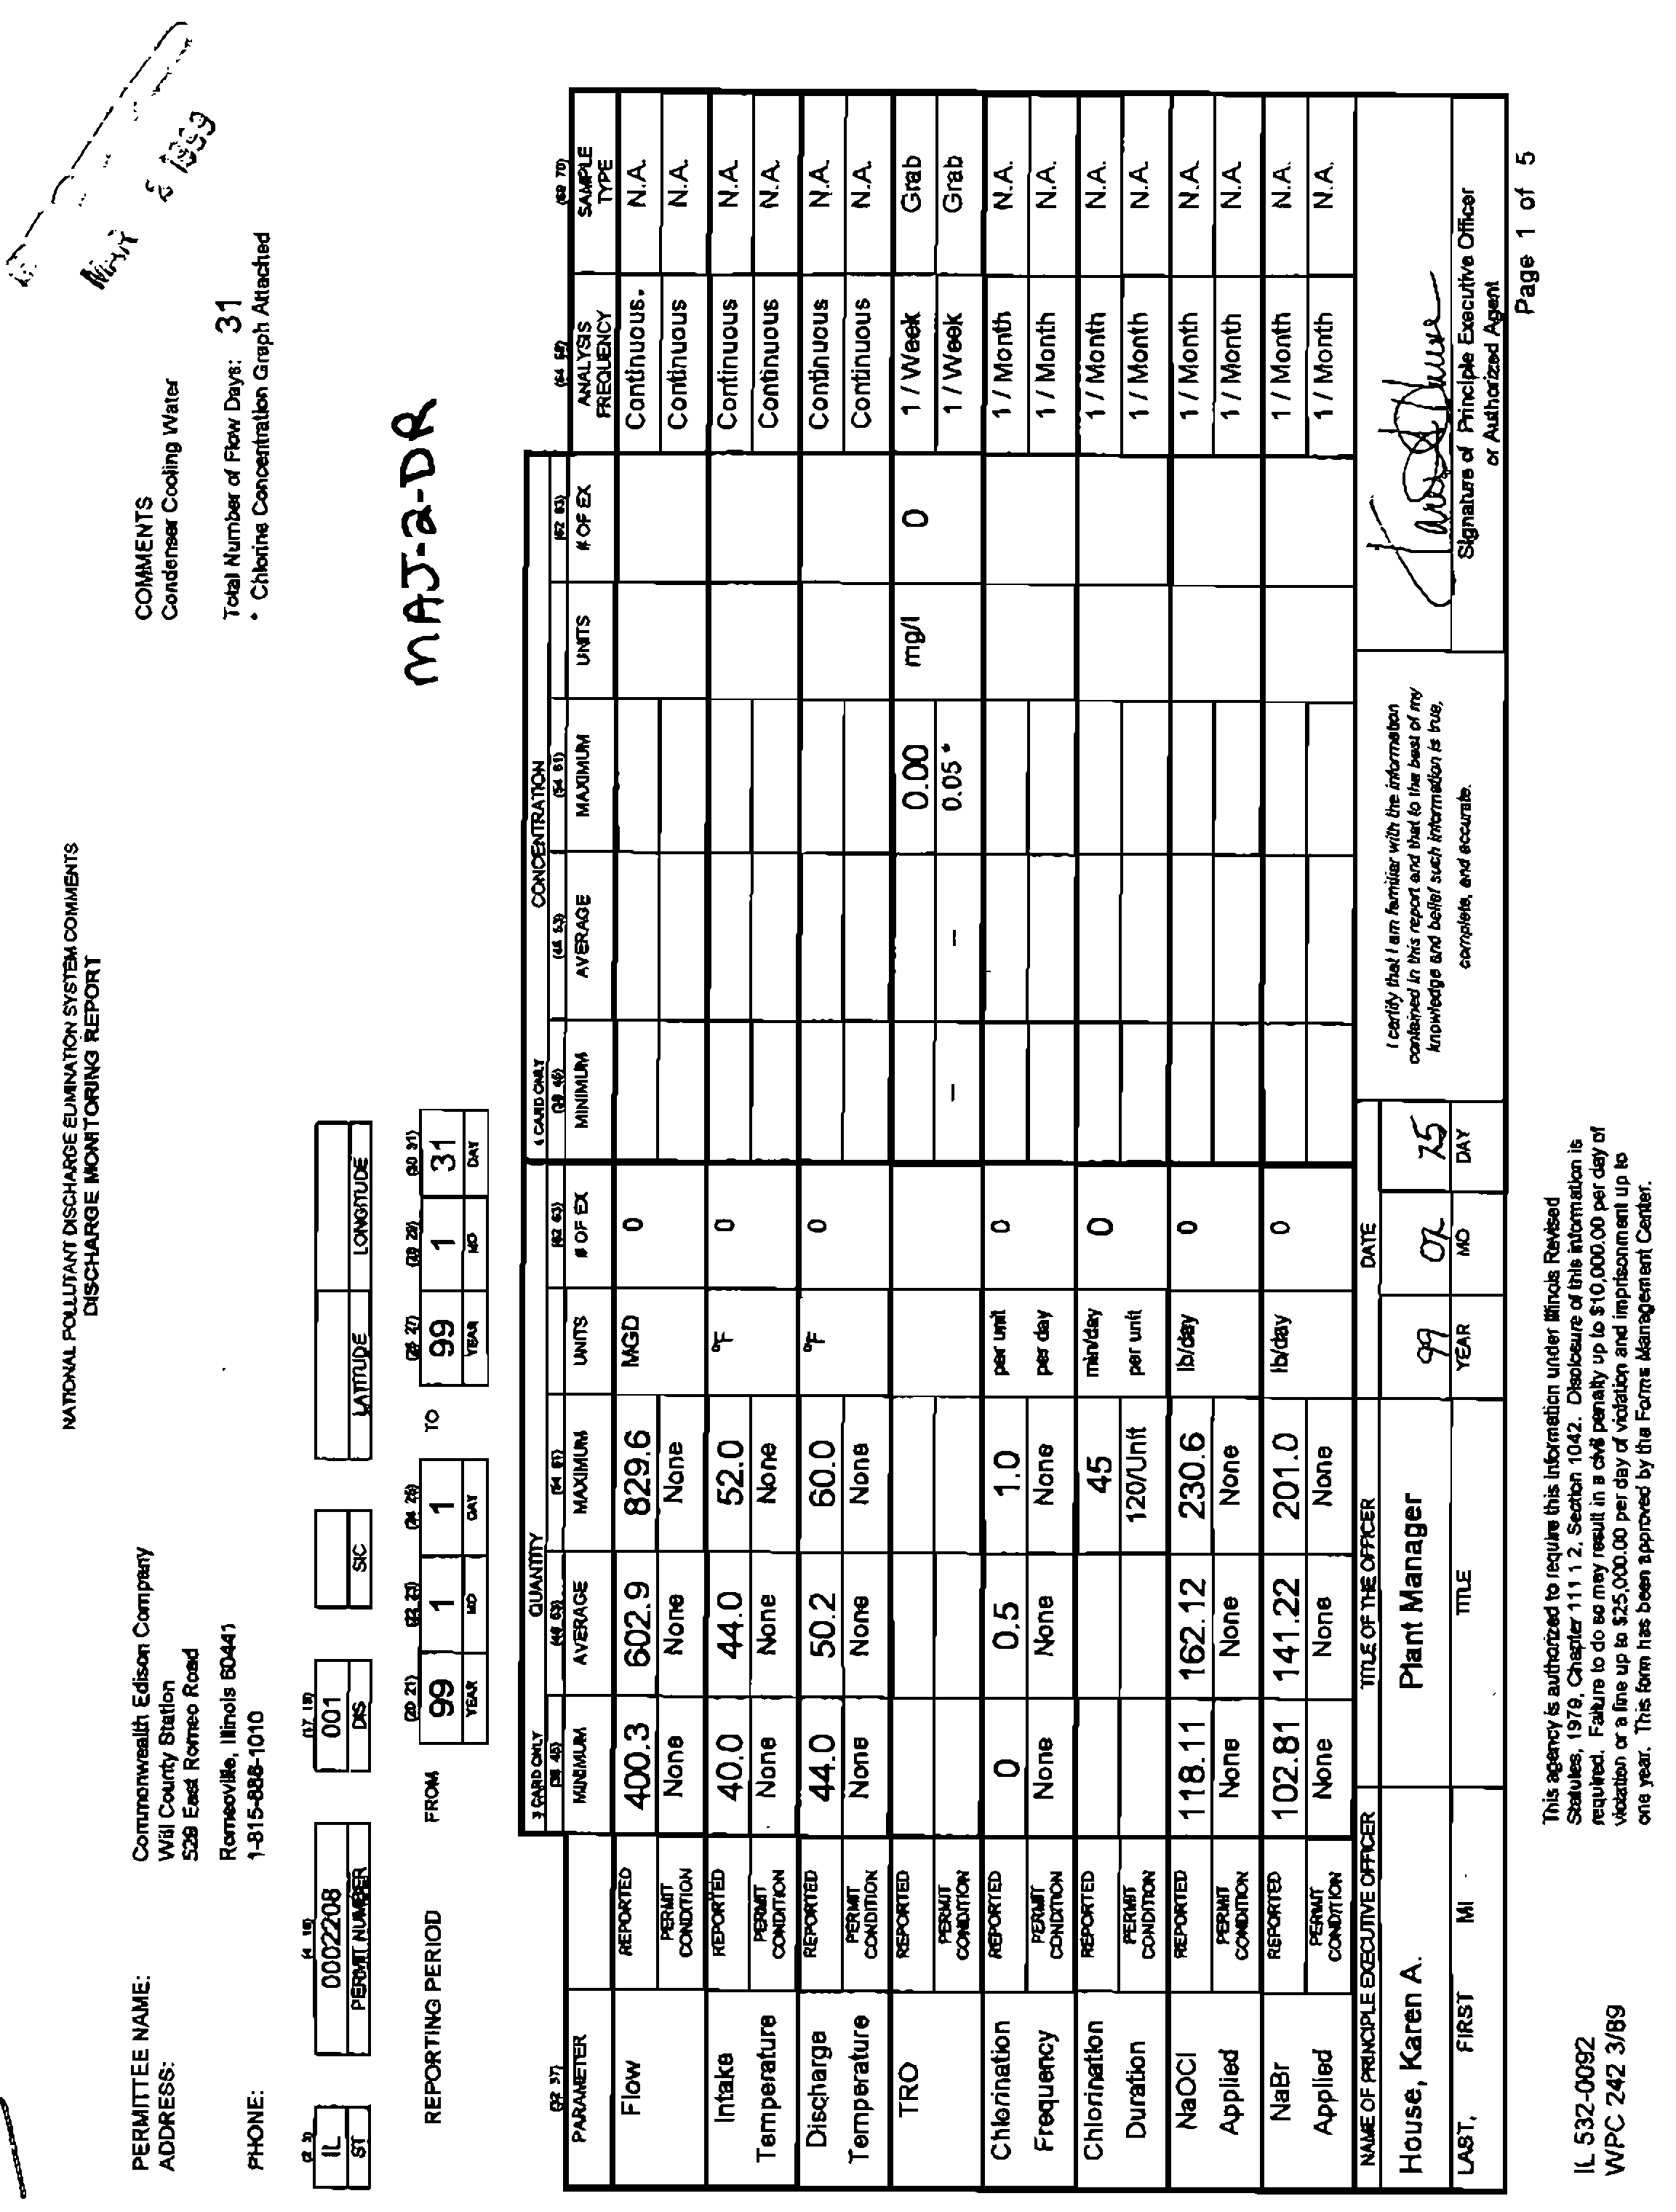
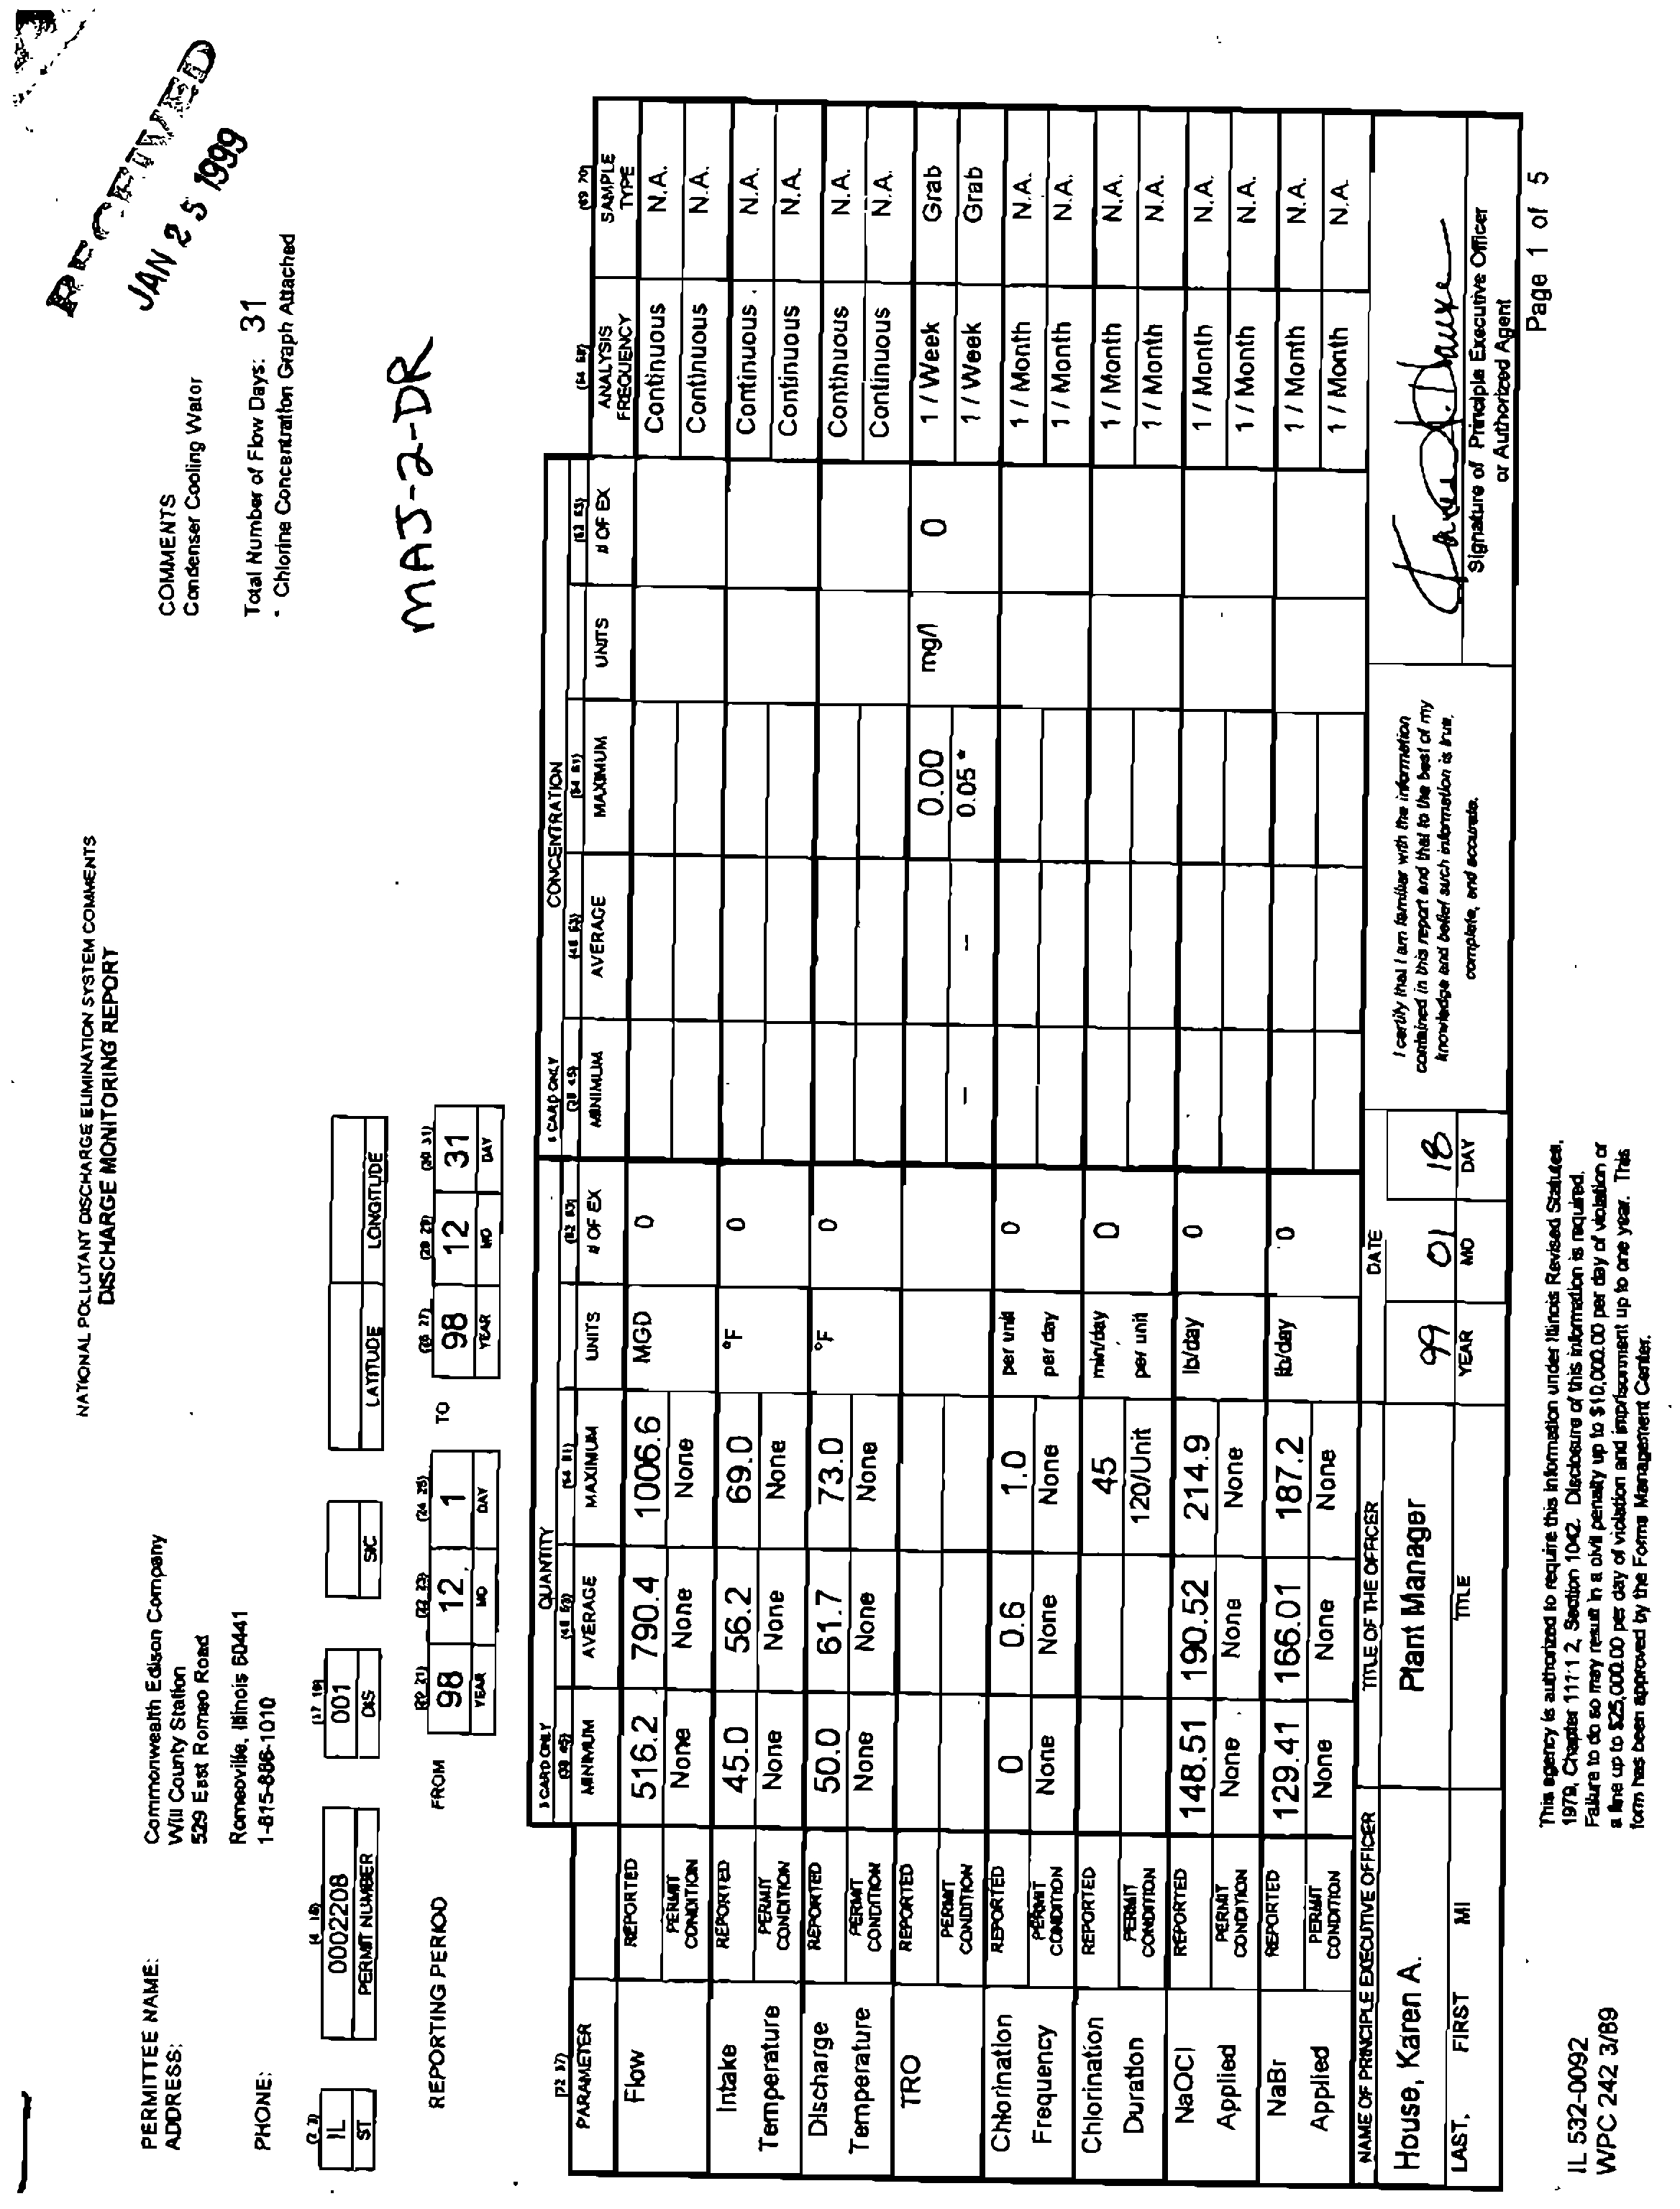
3
EXHIBIT
A
TO
PRE-FILED
QUESTIONS
OF
ENVIRONMENTAL
LAW
AND
POLICY
CENTER
FOR
JULIA
WOZNIAK
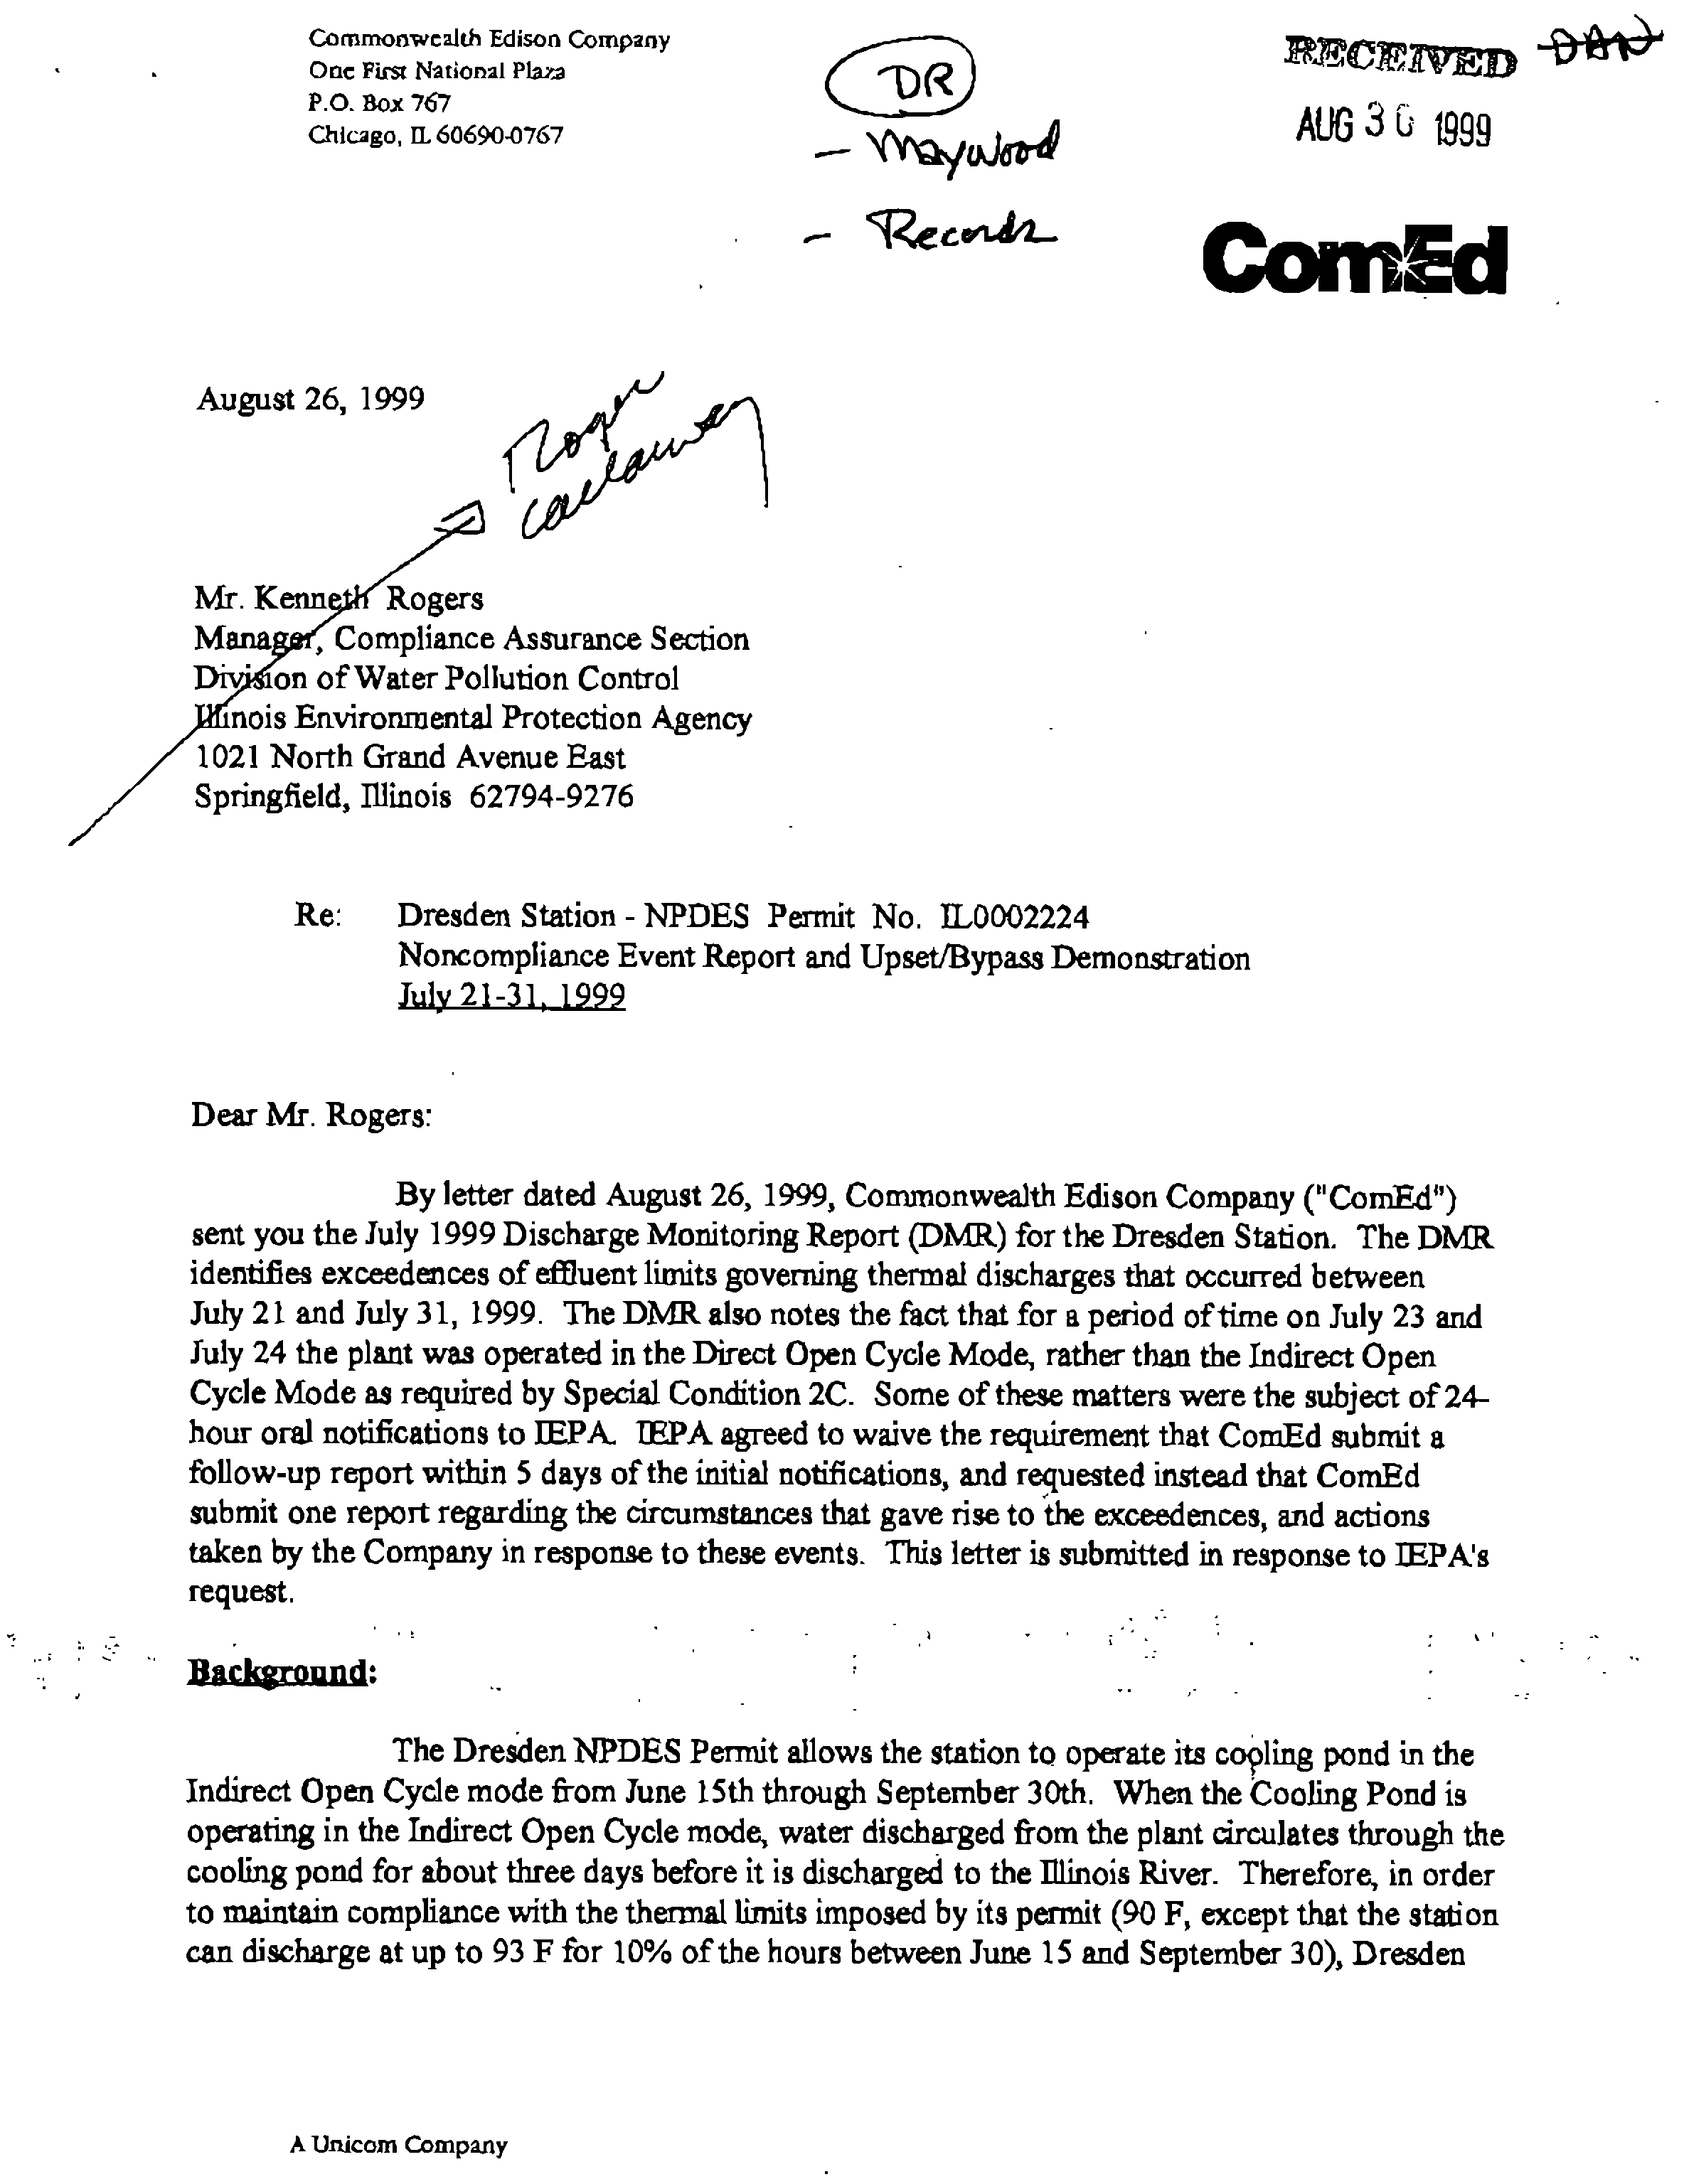
Mr.
Kenne
Rogers
Mana<
Compliance
Assurance
Section
Diyiion
of
Water
Pollution
Control
,Tlfinois
Environmental
Protection
Agency
/
1021
North
Grand
Avenue
East
Springfield,
Illinois
62794-9276
Re:
Dresden
Station
-
NPDES
Permit
No.
1L0002224
Noncompliance
Event
Report
and
Upset/Bypass
Demonstration
July
21-31,
1999
Dear
Mr.
Rogers:
By
letter
datedAugust
26,
1999,
Commonwealth
Edison
Company
(“CornEd
11)
sent
you
the
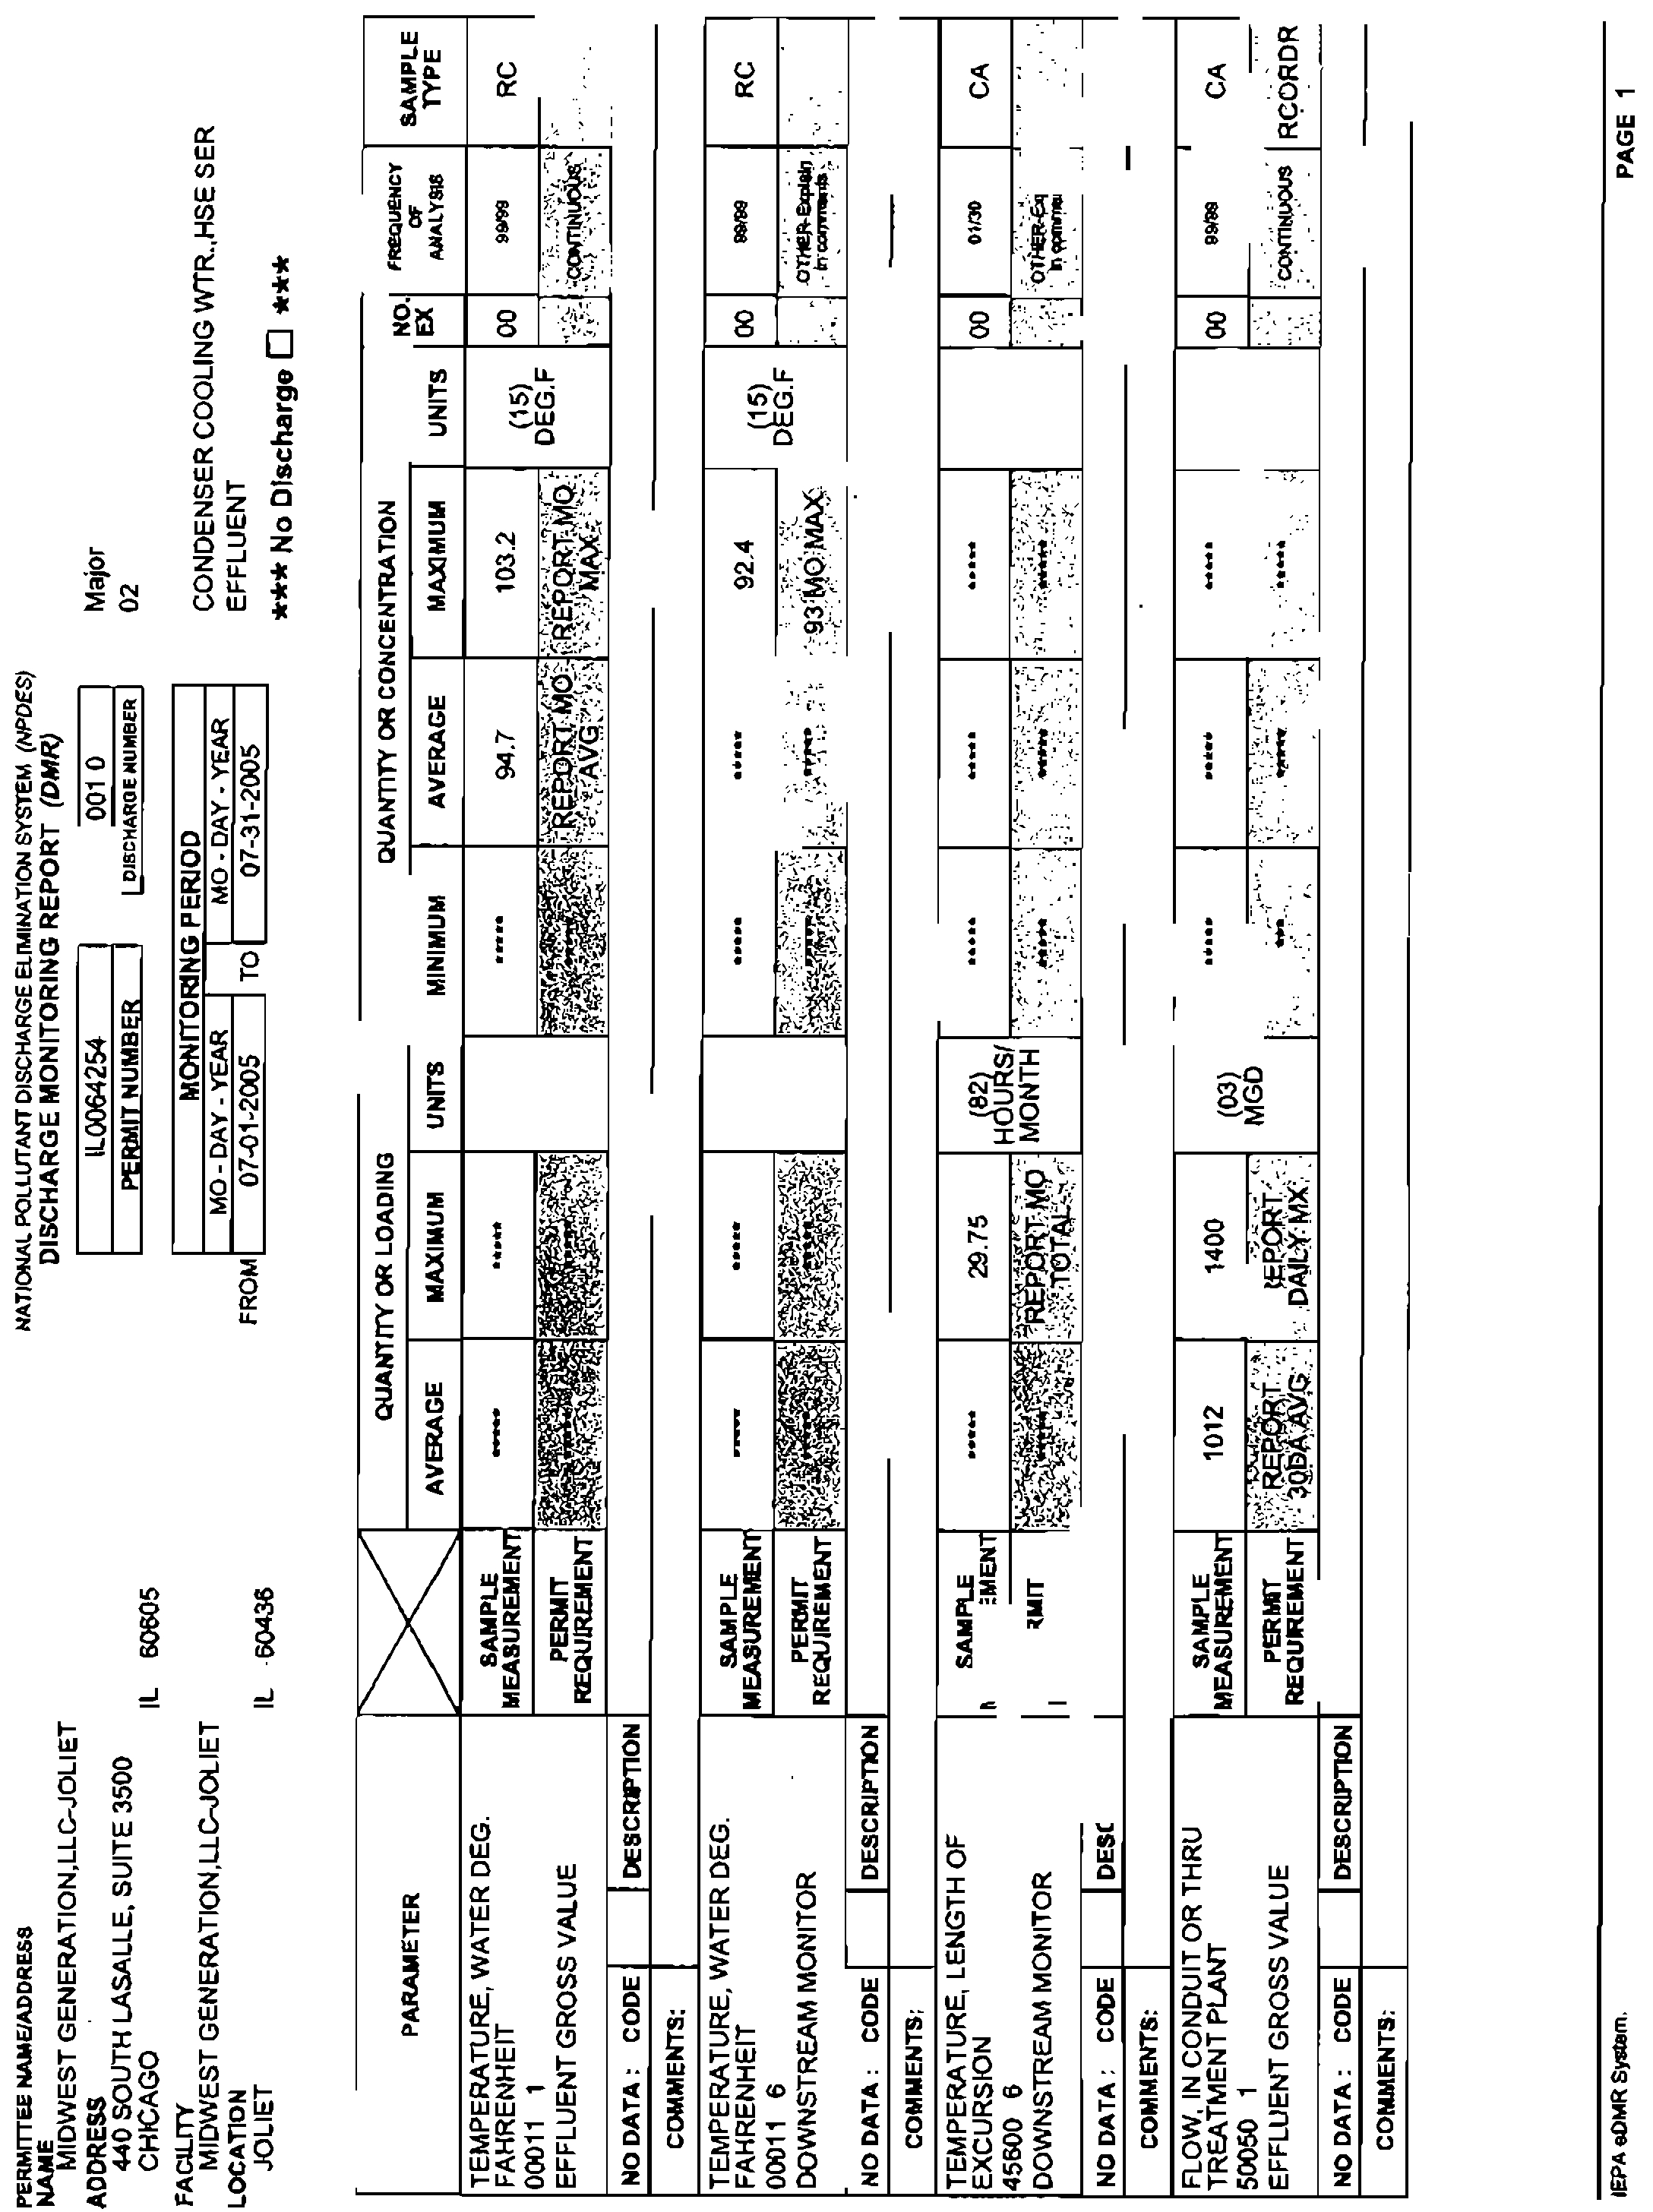
July1999
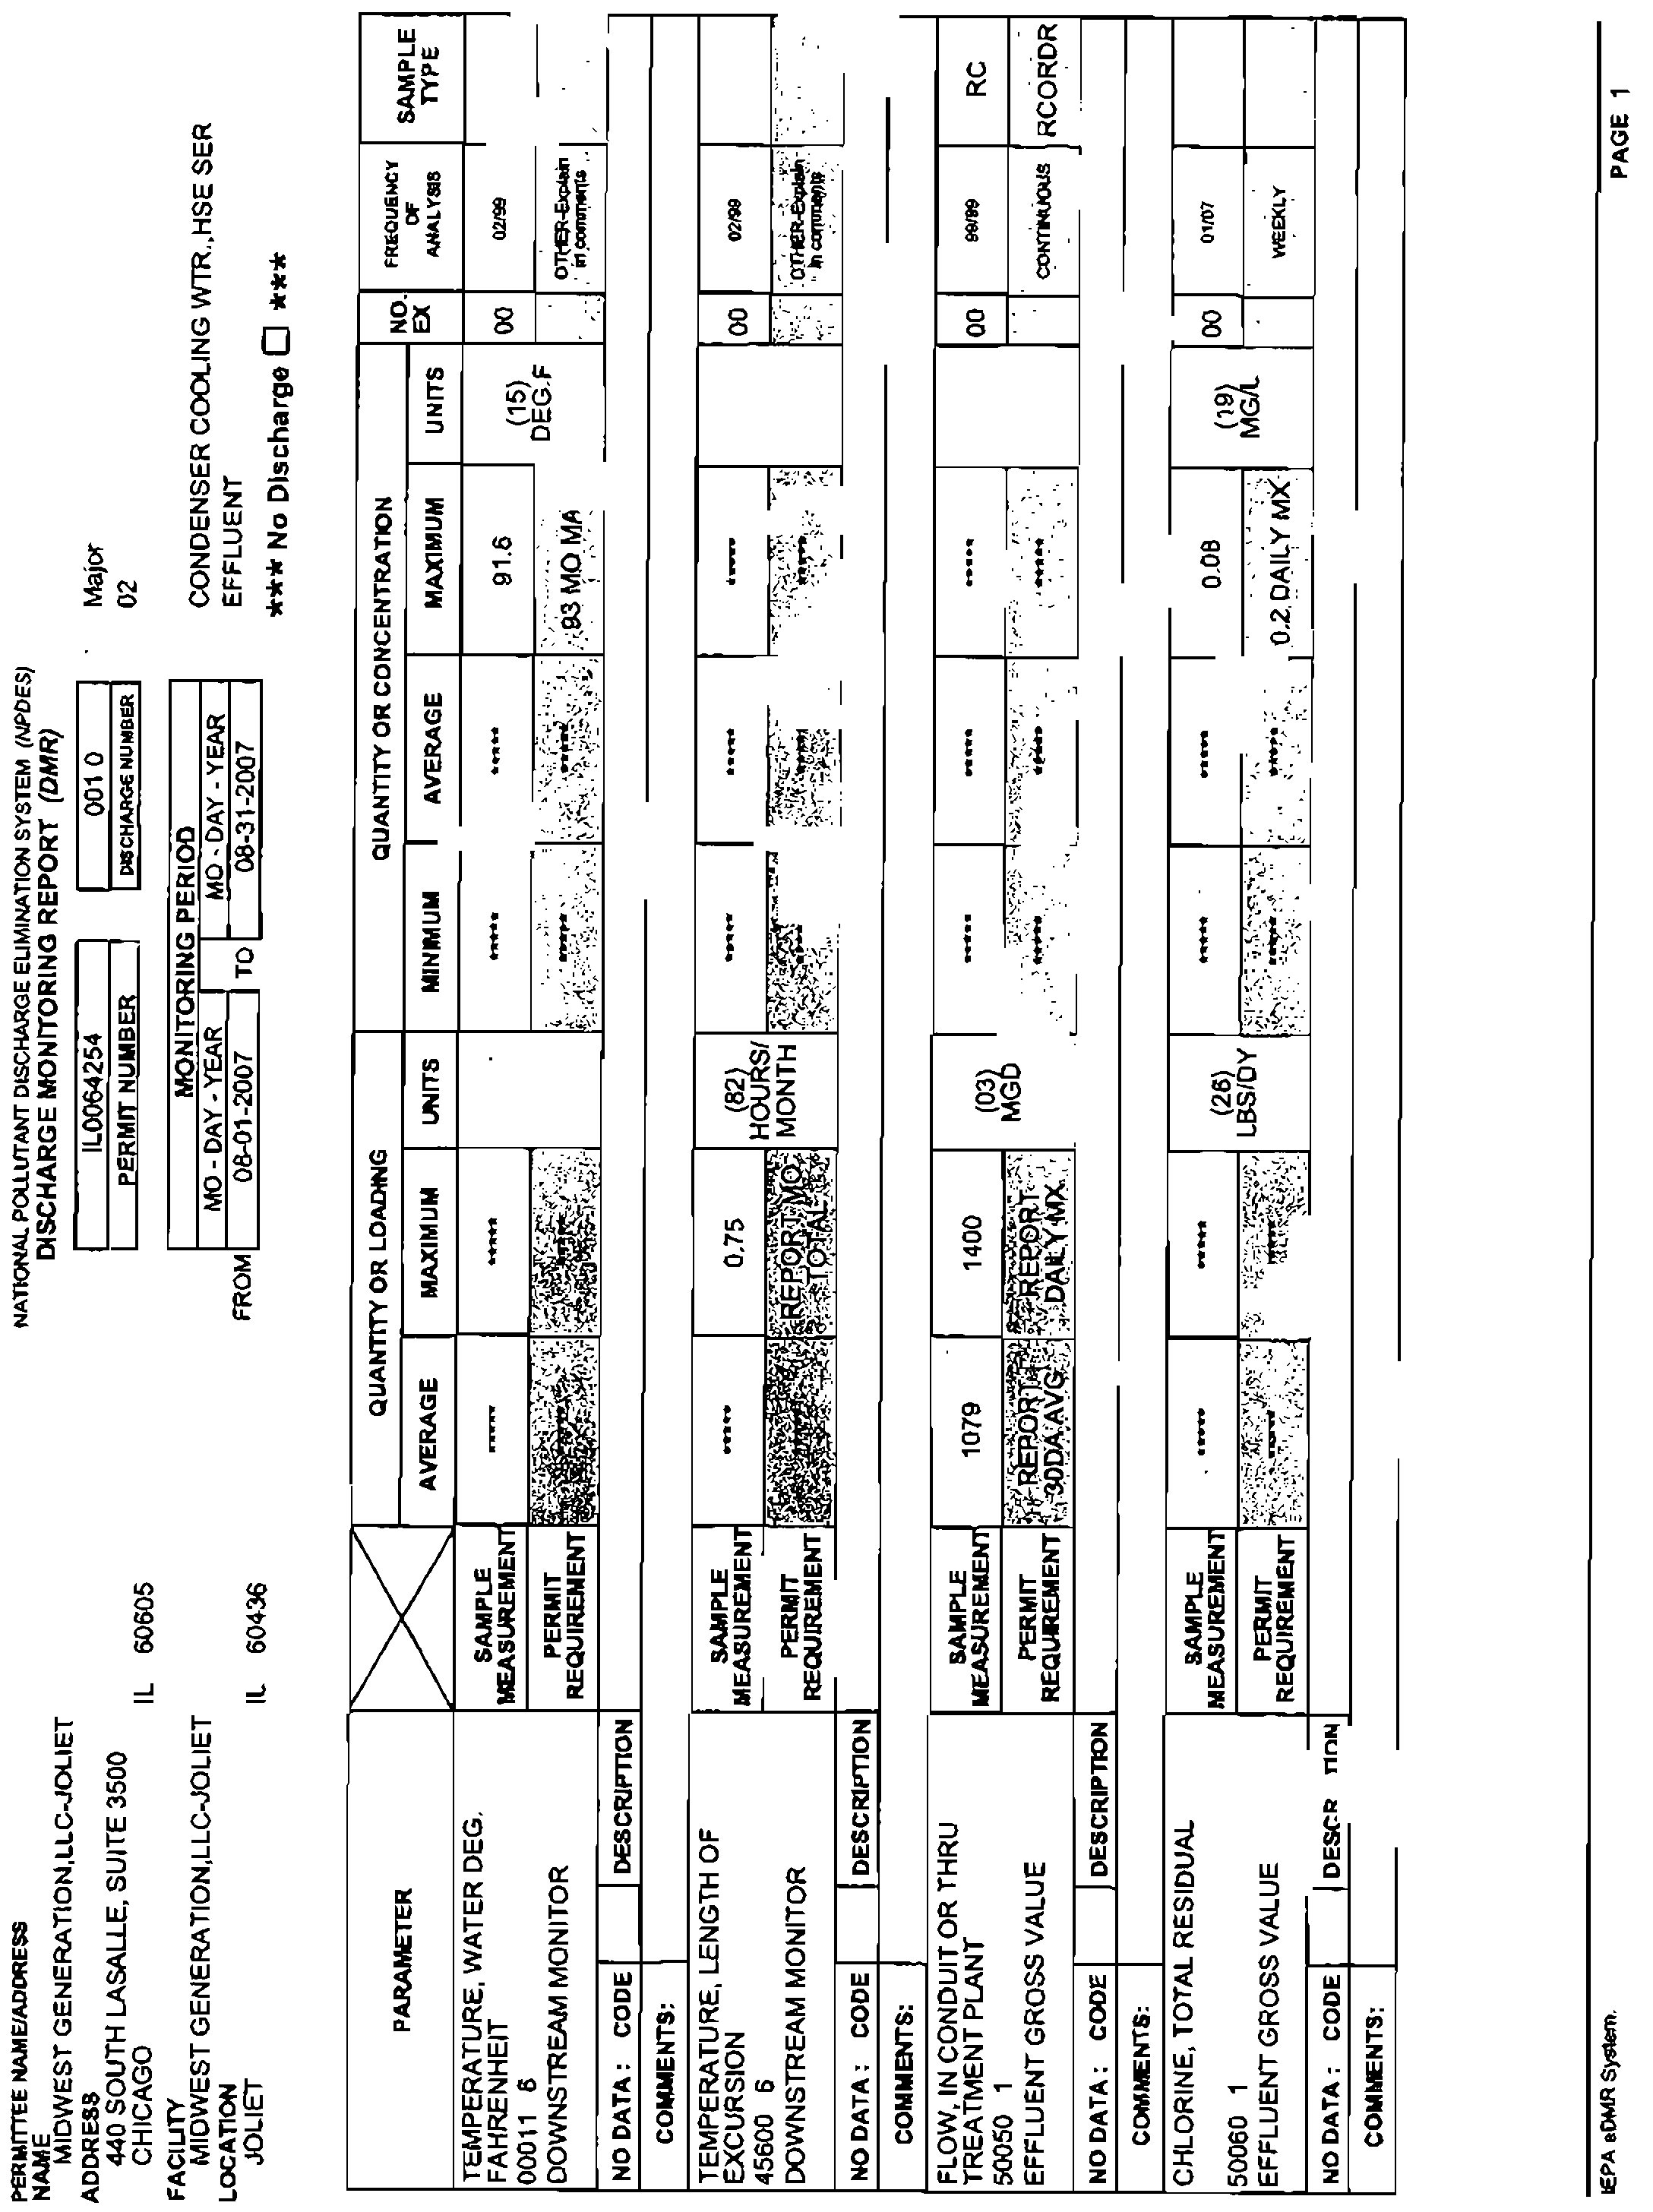
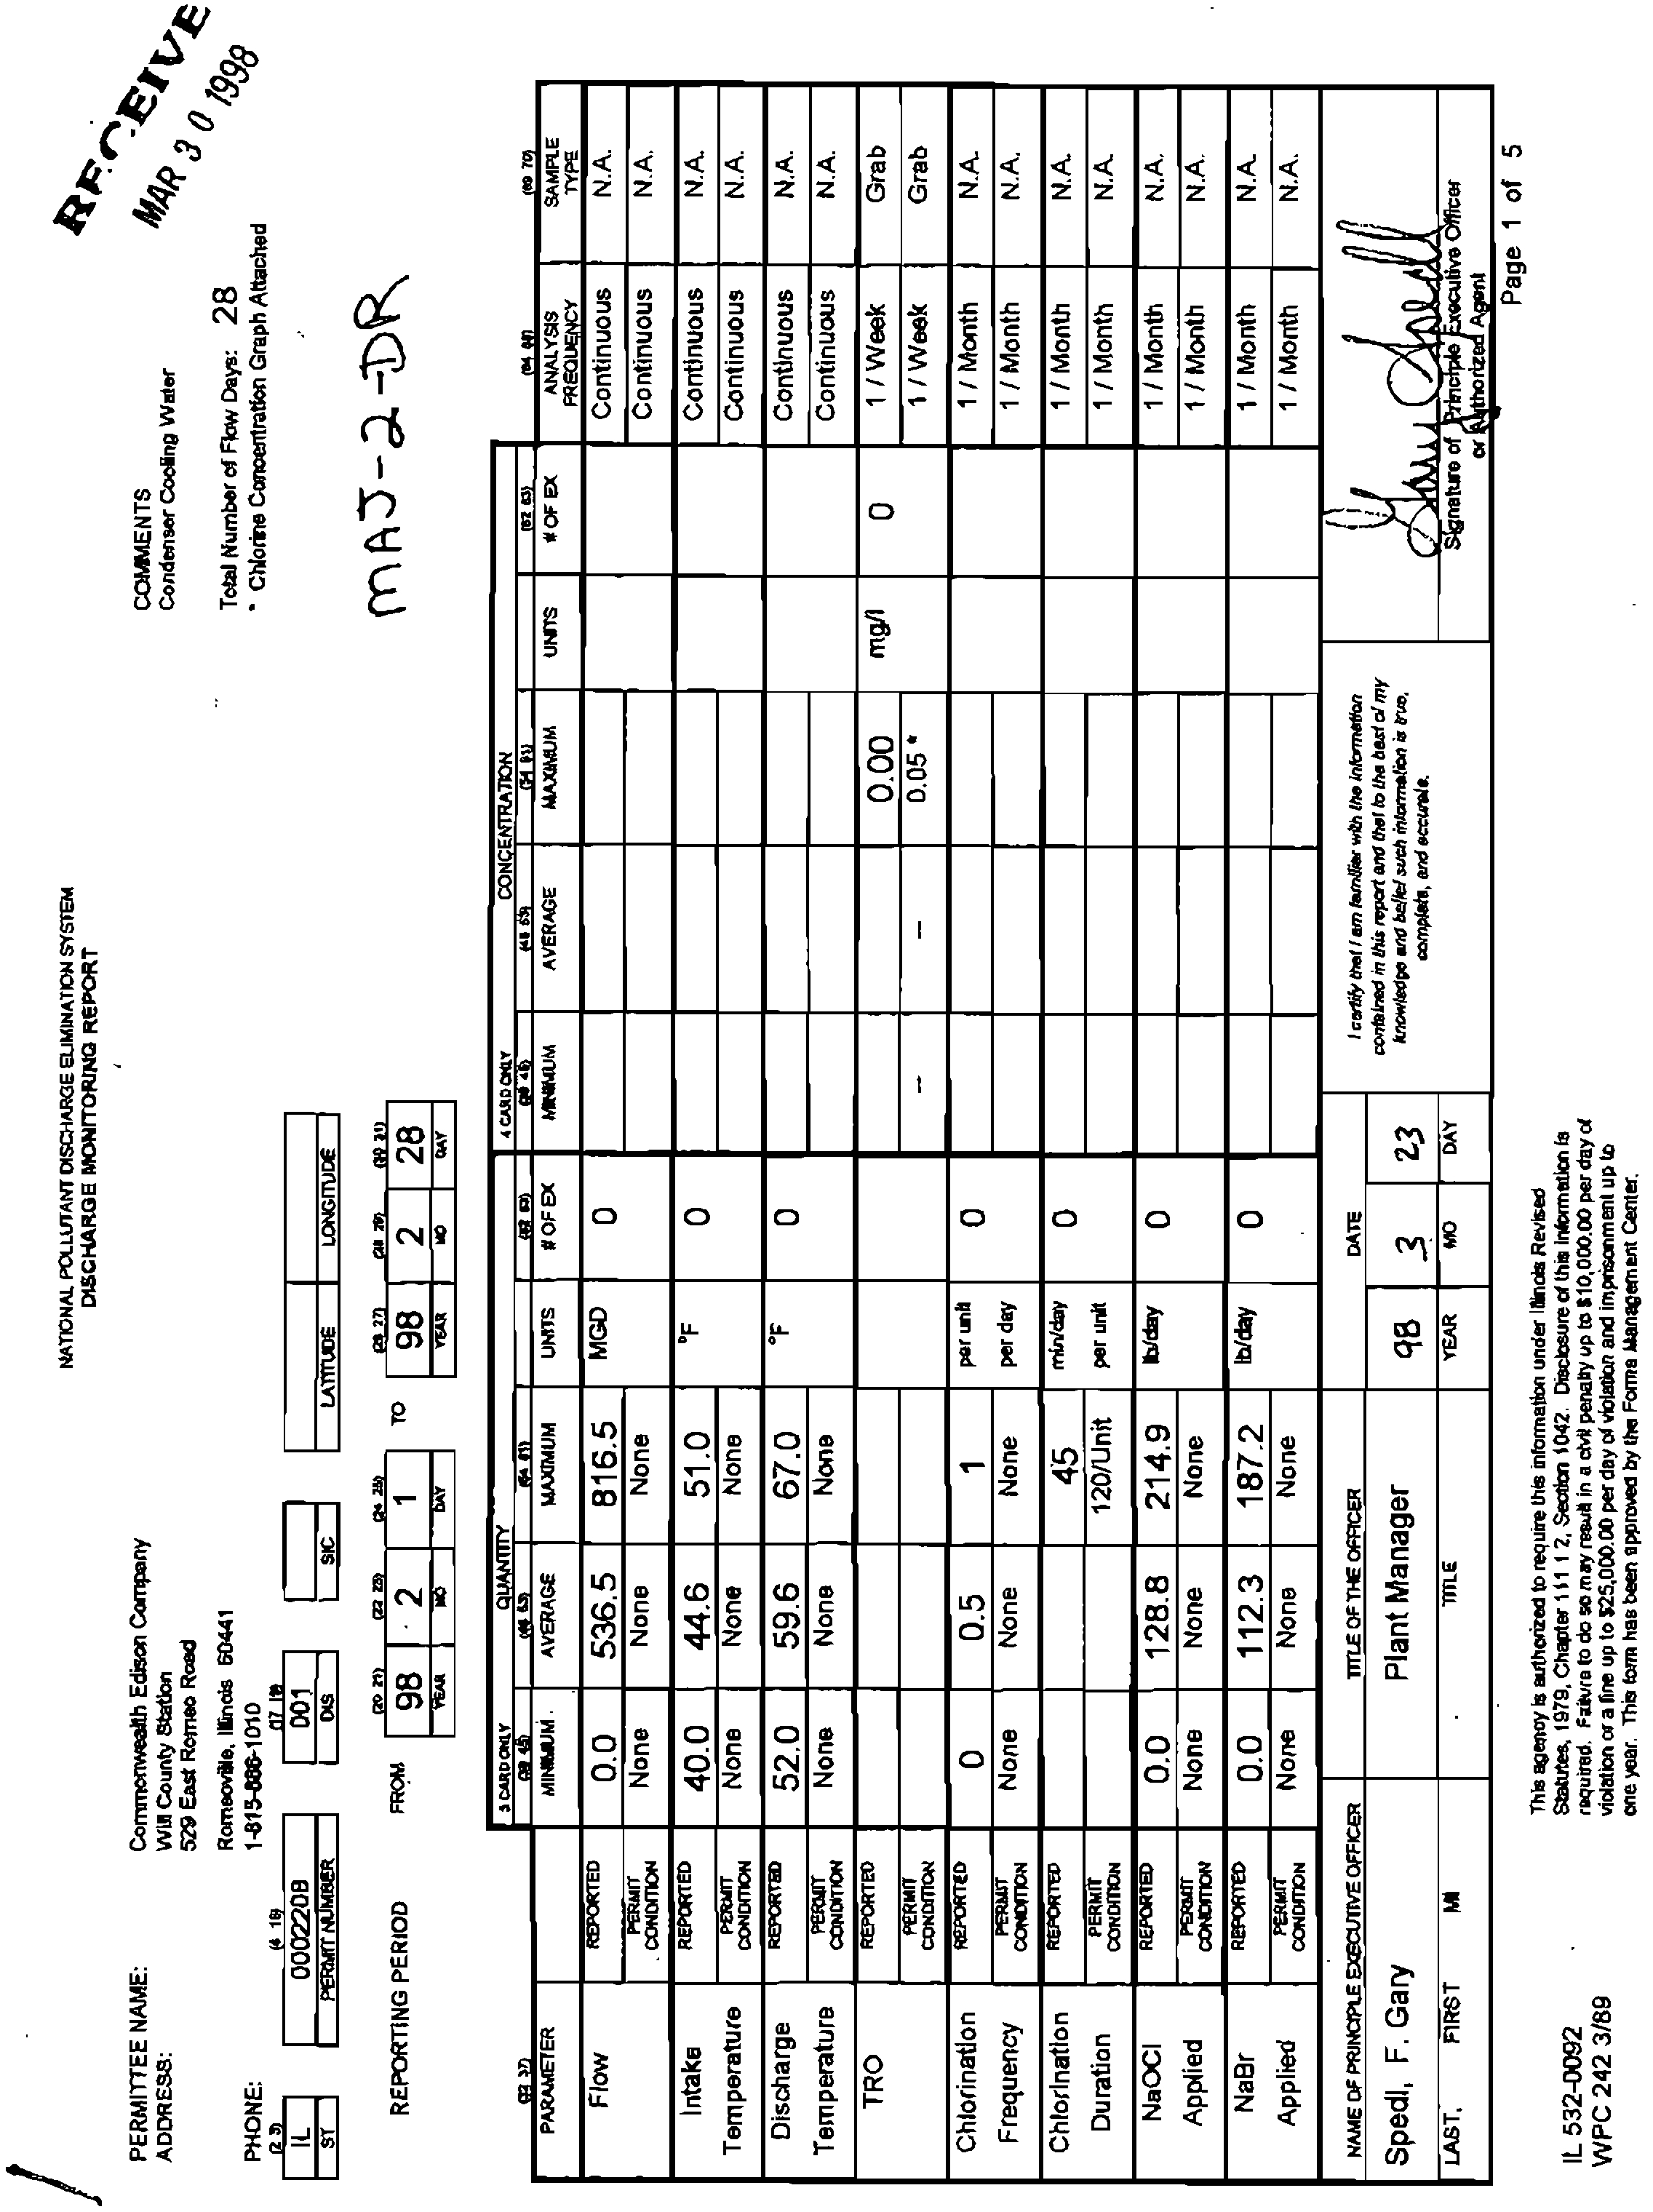
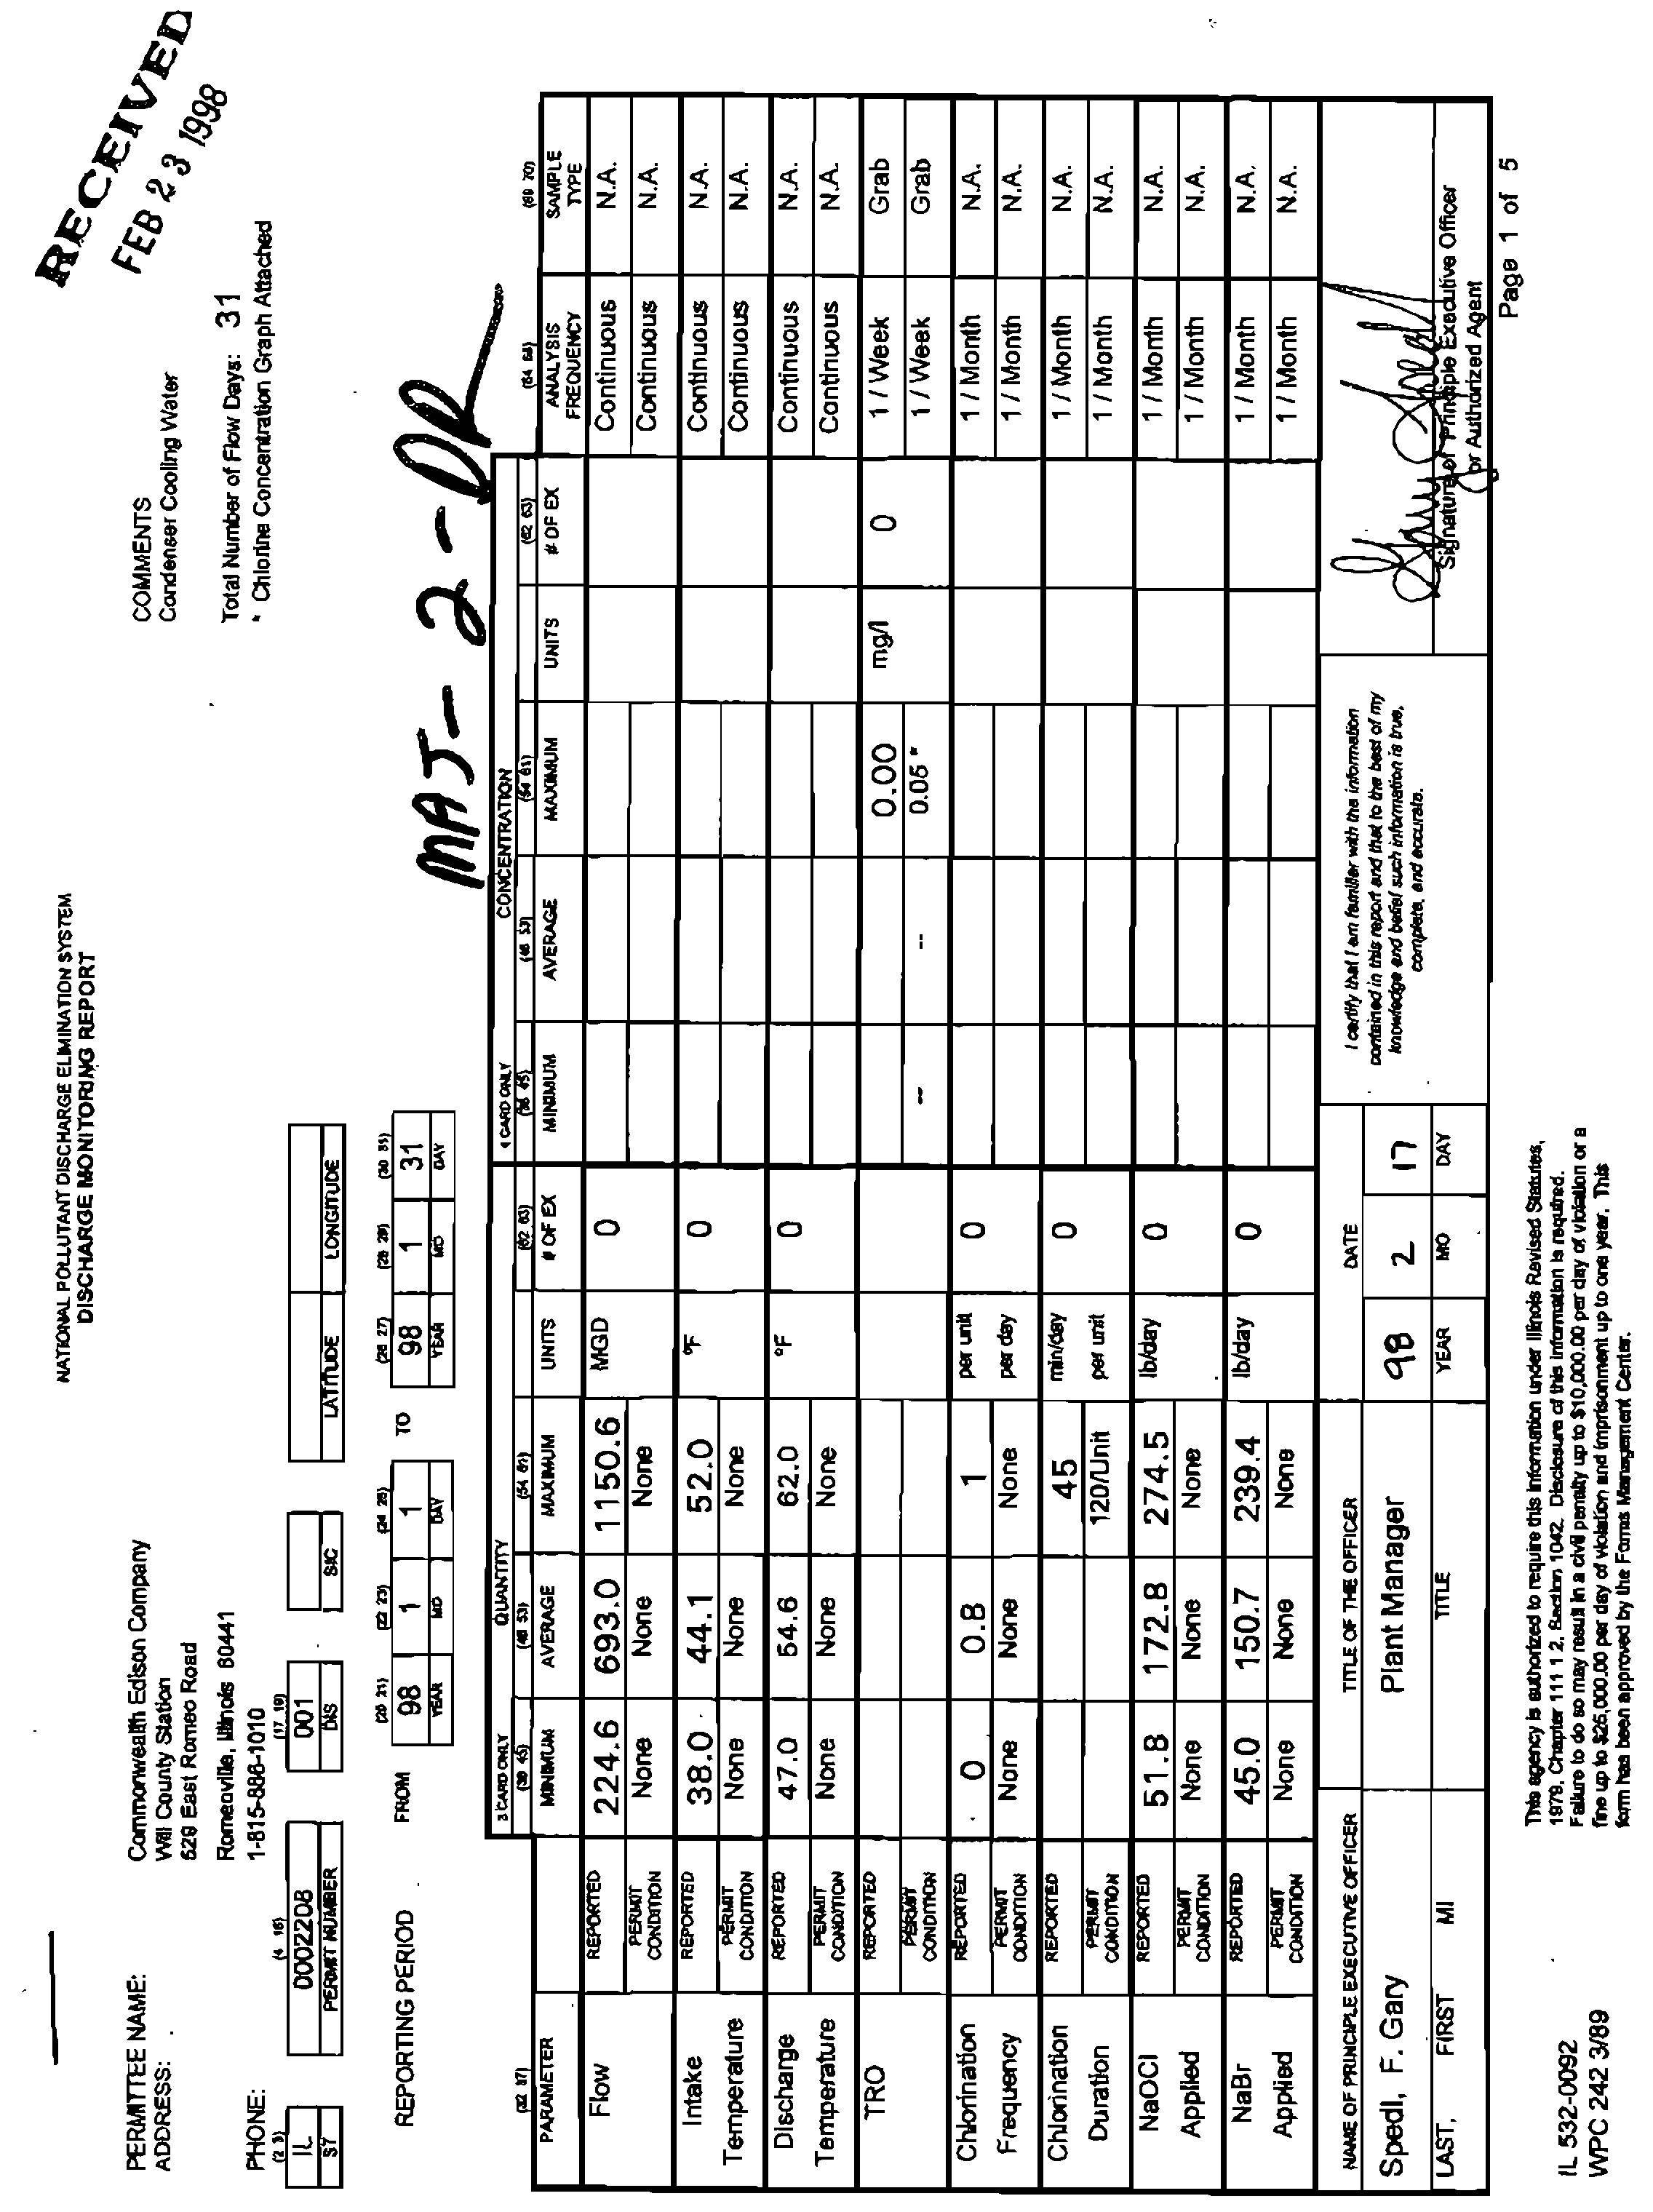
Discharge
Monitoring
Report
(DMR)
for
the
Dresden
Station.
The
DMR
identifies
exceedences
of
effluent
limits
governing
thermal
discharges
that
occurred
between
July
21
and
July
31,
1999.
The
DMR
also
notes
the
fact
that
for
a
period
of
time
on
July
23
and
July
24
the
plant
was
operated
in
the
Direct
Open
Cycle
Mode,
rather
than
the
Indirect
Open
Cycle
Mode
as
required
by
Special
Condition
2C.
Some
of
these
matters
were
the
subject
of
24-
hour
oral
notifications
to
IEPA.
IEPA
agreed
to
waive
the
requirement
that
CornEd
submit
a
follow-up
report
within
5
days
of
the
initial
notifications,
and
requested
instead
that
CornEd
submit
one
report
regarding
the
circumstances
that
gave
rise
to
the
exceedences,
and
actions
taken
by
the
Company
in
response
to
these
events.
This
letter
is
submitted
in
response
to
IEPA’s
request.
Background
The
Dresden
NPDES
Permit
allows
the
station
to
operate
its
cooling
pond
in
the
Indirect
Open
Cycle
mode
from
June
15th
through
September
30th.
When
the
Cooling
Pond
is
operating
in
the
Indirect
Open
Cycle
mode,
water
discharged
from
the
plant
circulates
through
the
cooling
pond
for
about
three
days
before
it
is
discharged
to
the
Illinois
River.
Therefore,
in
order
to
maintain
compliance
with
the
thermal
limits
imposed
by
its
permit
(90
F,
except
that
the
station
can
discharge
at
up
to
93
F
for
10%
of
the
hours
between
June
15
and
September
30),
Dresden
A
Unicorn
Company
instrumentation
data
and
three-dayforecasts
of
ambientair
temperature
and
humidity
parameters.
If
theprogram
predicts
that
effluent
temperatures
will
exceed
limits
set
by
thepermit
with
the
station
running
at
full
power,
the
program
specifies
the
extent
to
which
the
station
must
decrease
operations
(j.,
be
derated)
to
assure
that
compliance
is
maintained.
The
input
data
for
the
program
comes
from
on-line
instrumentation
and
three
days
of
weather
forecast
dataprovided
by
Murray
&
Truttel,
CertifiedConsulting
Meteorologists.
The
programcalculates
the
extent
of
cooling
that
will
occur
as
water
circulates
in
the
cooling
pond
based
on
predicted
ambient
air
and
wet
bulb
temperatures.Murray
&
Truttel
electronically
transmits
these
forecasts
to
Dresden’s
main
control
roomonce
per
day
and
sends
updated
weather
data
immediately
if
the
forecast
changes
significantly.
Murray
and
Truttel’s
forecasting
has
proven
to
be
reliable
and
accurate,
and
the
computer
program
has
been
used
to
successfully
maintain
the
coolingpond
effluent
temperatures
withinapplicable
limits
for
the
last
two
summers.
Toaugment
Dresden’s
ability
to
cool
water
before
it
is
dischargedfrom
the
cooling
pond,
cooling
towers
were
installed
in
the
spring
of
1999.
The
towers
are
capable
of
treating
about
22%
of
the
flow
coming
through
the
cooling
pond.
After
the
cooling
towers
were
installed,
tests
were
performed
to
veri1’
that
they
performed
as
designed.
The
cooling
capacity
of
the
towers
was
then
incorporated
into
the
computer
program
usedto
maintain
compliance
with
thermal
limits.
Because
the
cooling
towers
are
located
adjacent
to
the
canal
that
discharges
water
from
thecoolingpond
to
the
Illinois
River,
aspike
of
hot
water
in
the
cooling
pond
can
be
managed
by
adjusting
the
spillway
gates
so
that
thepercentage
of
water
treated
by
the
cooling
towers
increases,
thereby
lowering
the
effluent
temperature.
Modeling
shows
thatif
the
spiliway
-
gates
are
throttled
to
reduce
the
effluent
temperature
by
1/3
of
a
degree
F
(approximately
50
MWe),
for
a
period
of
9
hours,
the
cooling
pond
will
return
to
its
normal
level
11
hours
after
the
gates
are
reopened.
The
ability
to
manipulate
the
spiliway
gates
to
reduce
the
extent
to
which
Dresden
has
to
be
derated
was
part
of
the
cooling
pond
management
procedure
used
by
Dresden
personnel.
As
we
explain
in
detail
below,
the
exceedence
events
discussed
in
this
letter
resulted
from
unexpected
and
significant
discrepancies
in
forecasted
ambient
air
and
wet
bulb
temperatures
(with
the
exception
of
a
bypassincident
that
commenced
on
July
23rd).
In
each
case,
the
exceedences
occurred
despite
the
fact
that
Dresden
implemented
themeasures
(in
the
form
of
significant
deratings
and
spillway
manipulations)
that
the
compliance
program
and
procedures
called
for
to
avoid
exceedences.
However,
because
the
ambient
air
and
wet
bulb
temperatures
actually
experiencedwere
far
more
severe
than
wereforecasted
(and
input
into
the
very
first
exceedence
event,
CornEd
took
increasing
responsive
steps
in
an
effort
to
avoid
flrther
exceedences.
In
addition,
CornEd’s
monitoring
program
in
the
affected
area
revealed
no
significant
environmental
impacts
associated
with
the
exceedences.
Chronology
of
Events
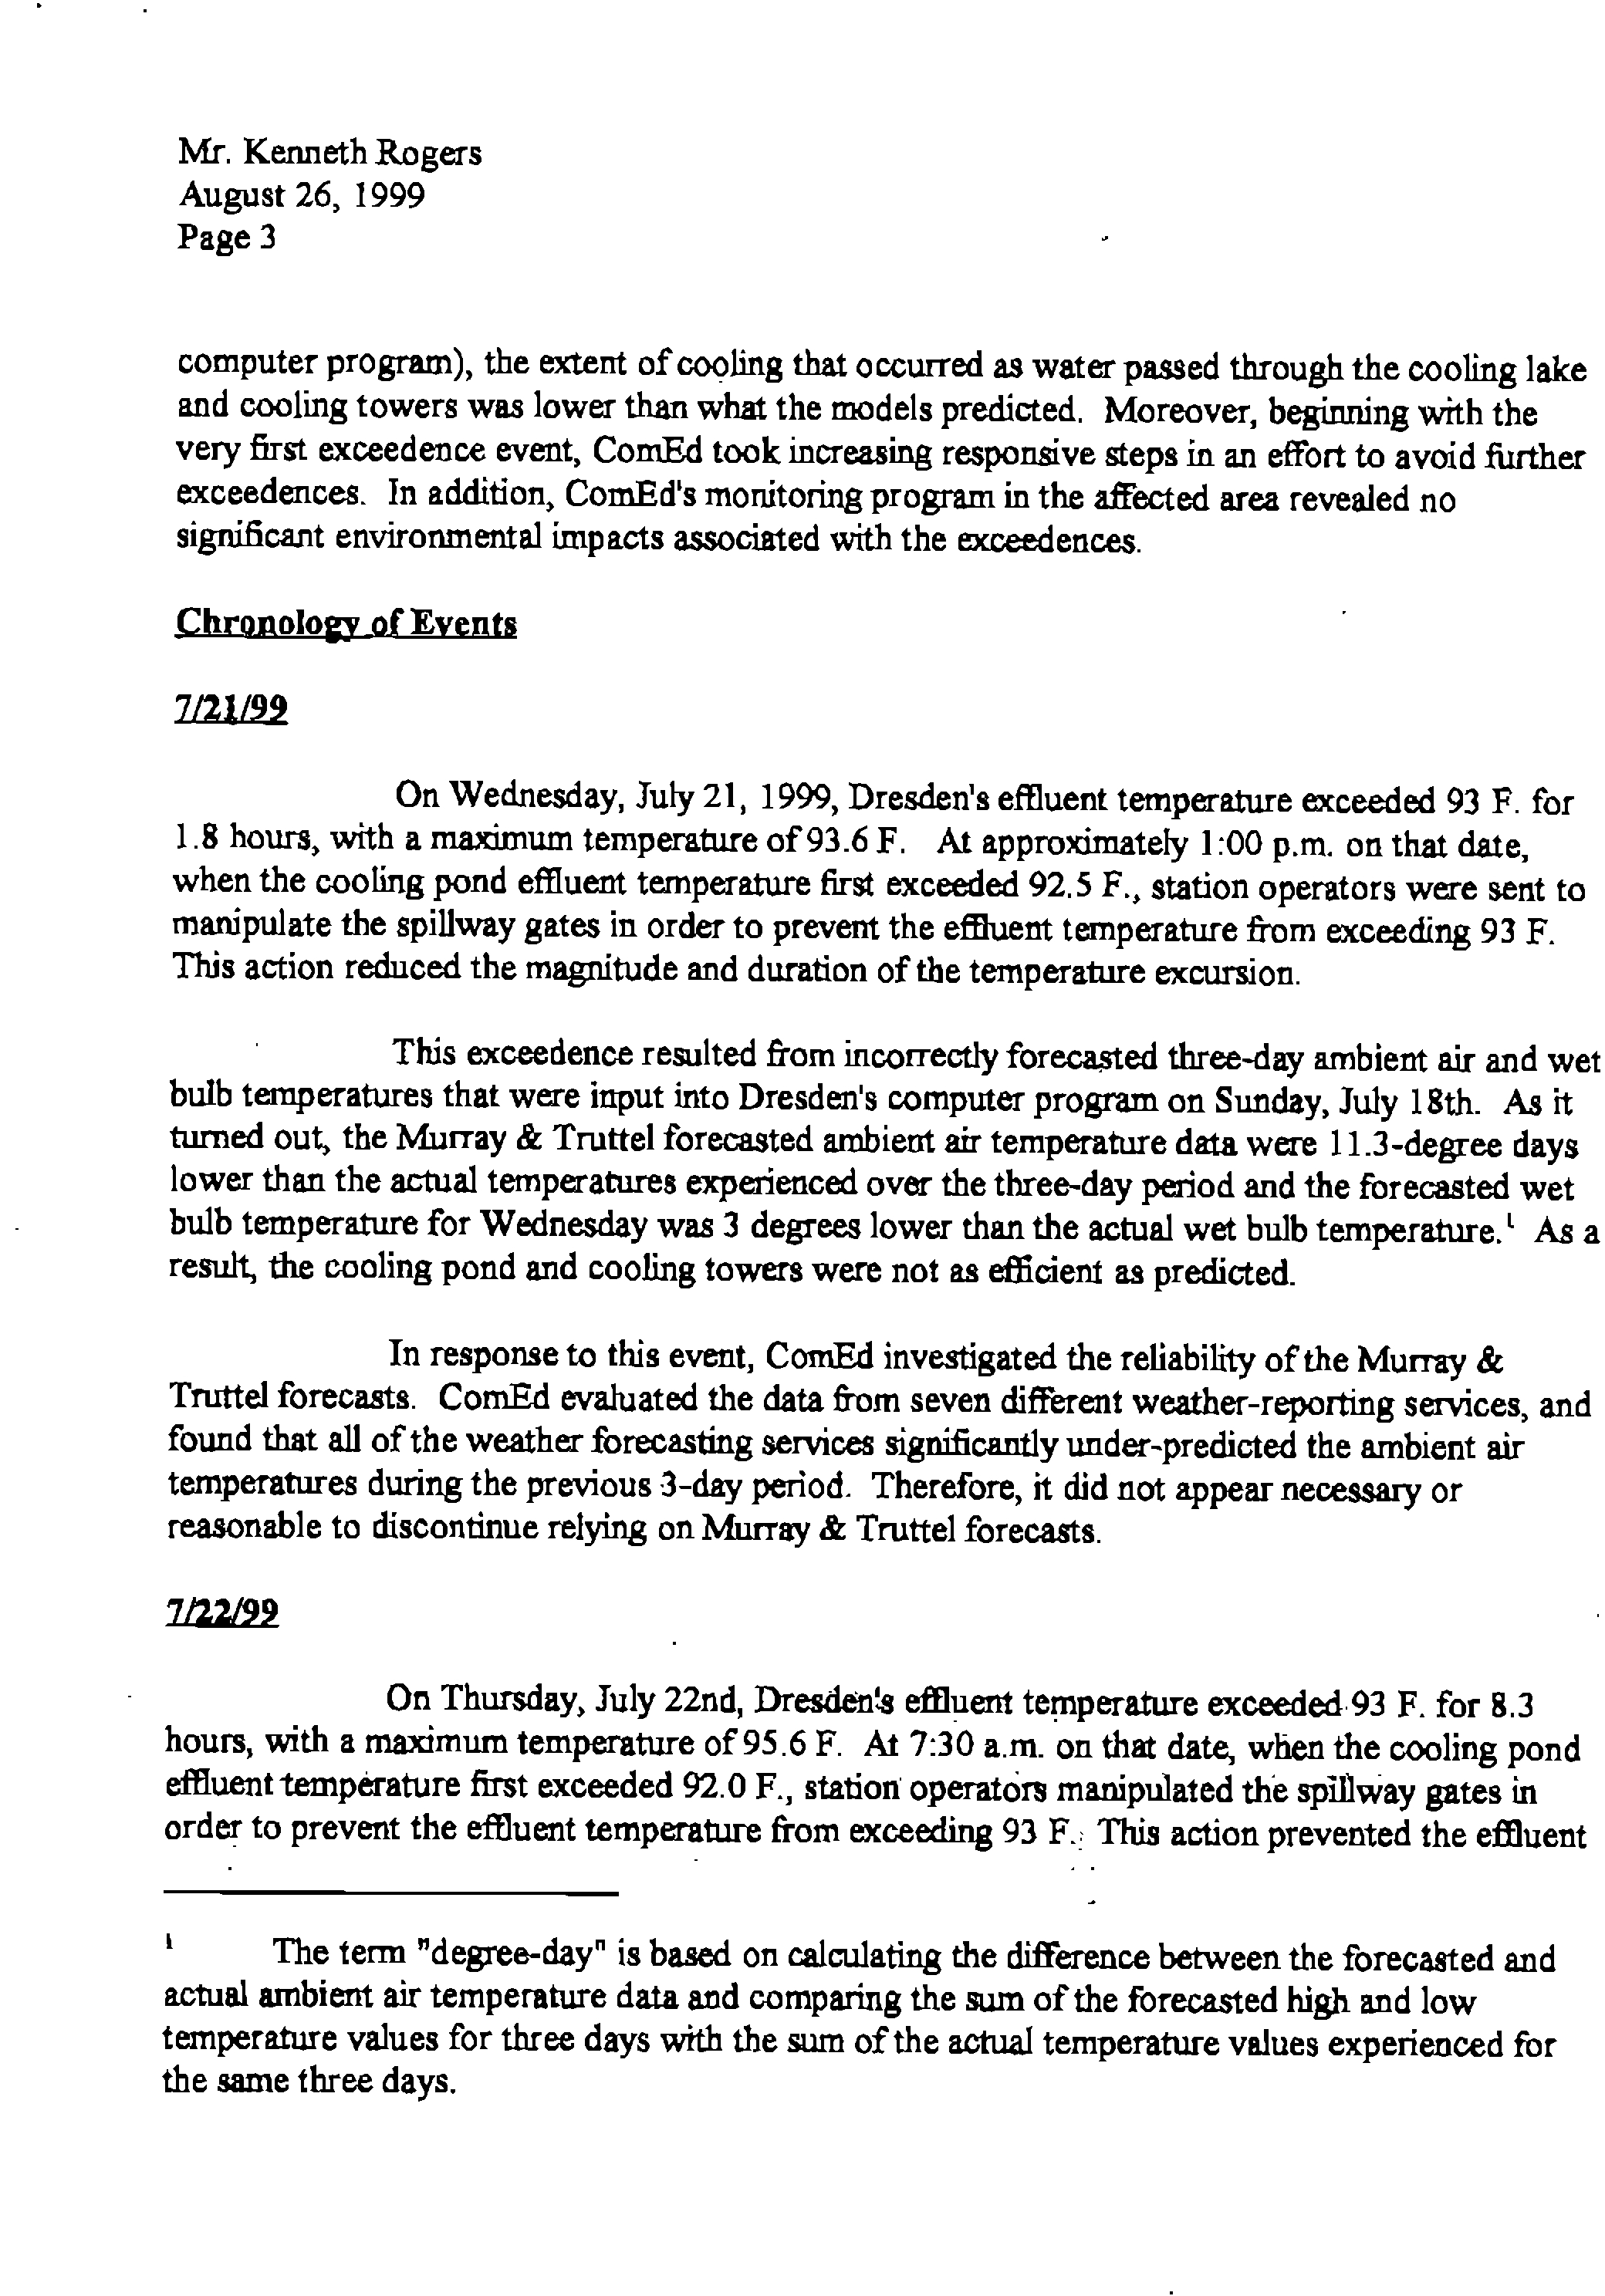
7/21/99
On
Wednesday,
July
21,
1999,
Dresden’s
effluent
temperature
exceeded
93
F.
for
1.8
hours,
with
a
maximum
temperature
of
93.6
F.
At
approximately
1:00
p.m.
on
that
date,
when
the
cooling
pond
effluent
temperature
first
exceeded
92.5
F.,
station
operators
were
sent
to
manipulate
the
spiliway
gates
in
order
to
prevent
the
effluent
temperature
from
exceeding
93
F.
This
action
reduced
the
magnitude
and
duration
of
the
temperature
excursion.
This
exceedence
resulted
from
incorrectly
forecasted
three-day
ambient
air
and
wet
bulb
temperatures
that
were
input
into
Dresden’s
computer
program
on
Sunday,
July
18th.
As
it
turned
out,
the
Murray
&
Truttel
forecasted
ambient
air
temperature
data
were
11.3
-degree
days
lower
than
the
actual
temperatures
experienced
over
the
three-day
period
and
the
forecasted
wet
bulb
temperature
for
Wednesday
was
3
degrees
lower
than
the
actual
wet
bulb
temperature.’
As
a
result,
the
cooling
pond
and
cooling
towers
were
not
as
efficient
as
predicted.
In
response
to
this
event,
CornEd
investigated
the
reliability
of
the
Murray
&
Truttel
forecasts.
CornEd
evaluated
the
data
from
seven
different
weather-reporting
services,
and
found
that
all
of
the
weather
forecasting
services
significantly
under-predicted
the
ambient
air
temperatures
during
the
previous
3-day
period.
Therefore,
it
did
not
appear
necessary
or
reasonable
to
discontinue
relying
on
Murray
&
Truttel
forecasts.
7/22/99
On
Thursday,
July 22nd,
Dresden’s
effluent
temperature
exceeded
93
F.
for
8.3
hours,
with
a
maximum
temperature
of
95.6
F.
At
7:30
a.m.
on
that
date,
when
the
cooling
pond
effluent
temperature
first
exceeded
92.0
F.,
station
operators
manipulated
the
spillway
gates
in
order
to
prevent
the
effluent
temperature
from
exceeding
93
F.:
This
action
prevented
the
effluent
The
term
“degree-day”
is
based
on
calculating
the
difference
between
the
forecasted
and
actual
ambient
air
temperature
data
and
comparing
the
sum
of
the
forecasted
high
and
low
temperature
values
for
three
days
with
the
sum
of
the
actual
temperature
values
experienced
for
the
same
three
days.
exceed
93
F.
Again,
these
circumstances
were
due
to
thefact
that
the
ambient
air
and
wet
bulb
temperature
forecasts
on
July19th
substantially
underestimated
the
actual
ambient
air
and
wet
bulb
temperatures
experienced.
On
July
22nd,
the
second
day
that
the
effluent
limit
was
exceeded,
Dresden
decided
to
implement
further
corrective
action
by
adding
6
degree-days
tothe
weather
data
input
into
the
computer
program
to
provide
a
greater
margin
in
the
event
of
future
weather
forecast
errors.
7/23/9
9
7/24/99
Despite
the
corrective
actions
described
above,
on
July
23rd,
the
cooling
pond
effluent
temperature
exceeded
93
F
for
13.5
hours,
reaching
a
maximum
of
94.8
F.
This
exceedence
again
was
due
to
the
fact
that
temperature
forecastson
July
20th
substantially
underestimated
the
ambient
air
and
wet
bulb
temperatures.
In
addition,
onFriday,
July
23rd
at
approximately
10:00
p.m.,
a
lightning
strike
caused
a
loss
of
power
to
Dresden’s
lift
station.
Plant
personnel
took
immediate
actions,
by
adjusting
the
flow
regulating
stationgates
and
changing
the
cooling
pond
operatingmode
from
Indirect
Open
Cycle
to
Direct
Open
Cycle,
thereby
bypassing
the
cooling
pond
and
cooling
towers.
This
action
wasnecessary
toprevent
flooding
of
the
canal
and
the
surrounding
neighborhood.
Power
was
restored
to
the
Lift
Station
at
approximately6:00
a.m.
on
Saturday,
July
24th.
During
the
period
of
Direct
Open
Cycle
operation,
the
effluent
water
temperature
was
above
93
F
for
7.7
hours
and
reached
100.2
F.
OnSaturday,
July
24th,
after
the
plant
was
able
to
resume
using
the
cooling
pond
and
towers,
the
spillway
gates
were
successfully
used
to
keep
effluent
temperatures
below
93F.
This
left
the
coolingpond
at
its
high
level.
CornEd
provided
oral
notification
to
IEPA
at
approximately
9:30
a.m.
on
July
24th
of
this
incident
and
provided
•
.
.•
PA
a
tten
fo1lowupreport
in
the
aached
letter
of
July
28,
1999.
(Attachment
A)
s:.
•
7/25/99
•
On
Sunday,
July
25th,
at
12:00
noon,
the
Cooling
Pond
effluent
temperature
was
approaching
92.5
F.
Dresden
manipulated
the
spillway
gates
in
an
effort
to
prevent
any
exceedences.
However,at
4:10
p.m.
the
cooling
pond
effluent
temperature
exceeded
the
limit
for
the
remainder
of
the
day
(8
hours),reaching
a
maximum
of
94.8
F.
program
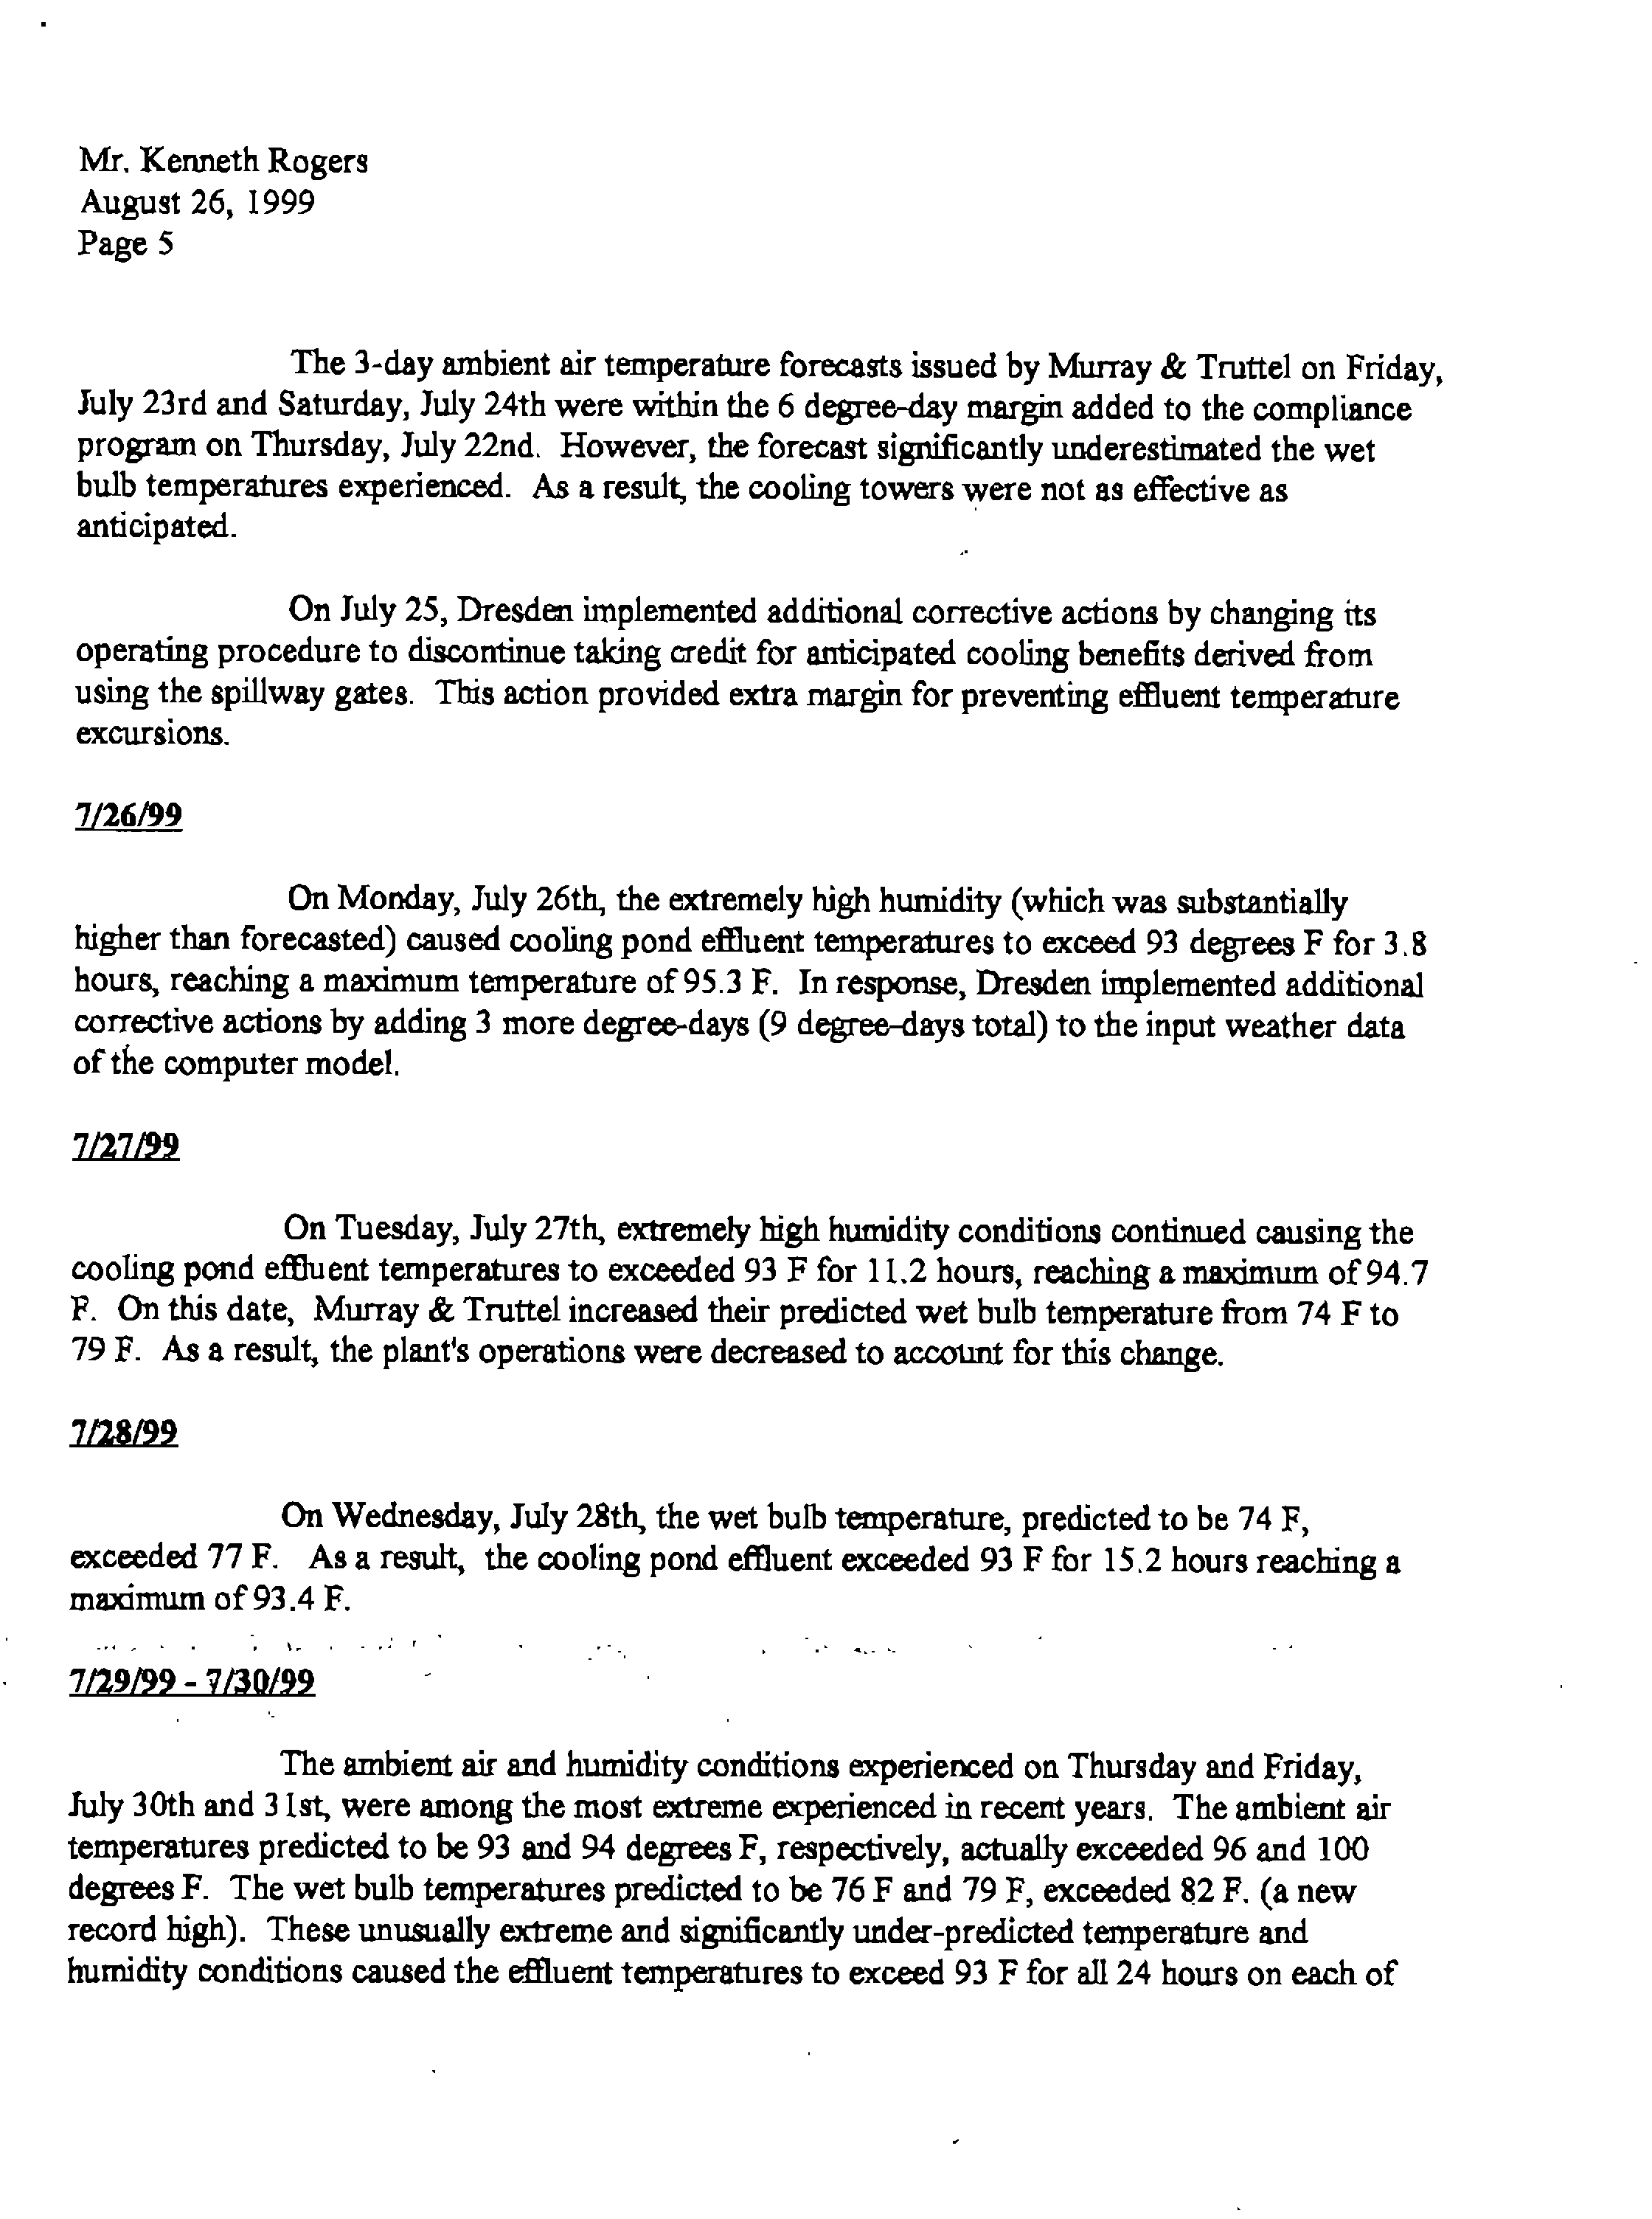
onThursday,
July
22nd.
However,
the
forecast
significantly
underestimated
the
wet
bulb
temperatures
experienced.
As
a
result,
the
cooling
towers
were
not
as
effective
as
anticipated.
On
July
25,
Dresden
implemented
additional
corrective
actions
by
changing
its
operating
procedure
to
discontinue
taking
credit
for
anticipated
cooling
benefits
derived
from
using
the
spillway
gates.
This
action
provided
extra
margin
for
preventing
effluent
temperature
excursions.
7/26/99
On
Monday,
July
26th,
the
extremely
high
humidity
(which
was
substantially
higher
than
forecasted)
caused
cooling
pond
effluent
temperatures
to
exceed
93
degrees
F
for
3.8
hours,
reaching
a
maximum
temperature
of
95.3
F.
In
response,
Dresden
implemented
additional
corrective
actions
by
adding
3
more
degree-days
(9
degree-days
total)
to
the
input
weather
data
of
the
computer
model.
7/27/99
On
Tuesday,
July
27th,
extremely
high
humidity
conditions
continued
causing
the
cooling
pond
effluent
temperatures
to
exceeded
93
F
for
11.2
hours,
reaching
a
maximum
of
94
7
F.
On
this
date,
Murray
&
Truttel
increased
their
predicted
wet
bulb
temperature
from
74
F
to
79
F.
As
a
result,
the
plant’s
operations
were
decreased
to
account
for
this
change.
7/28/99
On
Wednesday,
July
28th,
the
wet
bulb
temperature,
predicted
to
be
74
F,
exceeded
77
F.
As
a
result,
thecooling
pond
effluent
exceeded
93
F
for
15.2
hours
reaching
a
maximum
of
93.4
F.
7/29/99-7/30/99
The
ambient
air
and
humidity
conditions
experienced
on
Thursday
and
Friday,
July
30th
and
31st,
were
among
the
most
extreme
experienced
in
recent
years.
The
ambient
air
temperatures
predicted
to
be
93
and
94
degrees
F,
respectively,
actually
exceeded
96
and
100
degrees
F.
The
wet
bulb
temperatures
predicted
to
be
76
F
and
79
F,
exceeded
82
F.
(a
new
record
high).
These
unusually
extreme
and
significantly
under-predicted
temperature
and
humidity
conditions
caused
the
effluent
temperatures
to
exceed
93
F
for
all
24
hours
on
each
of
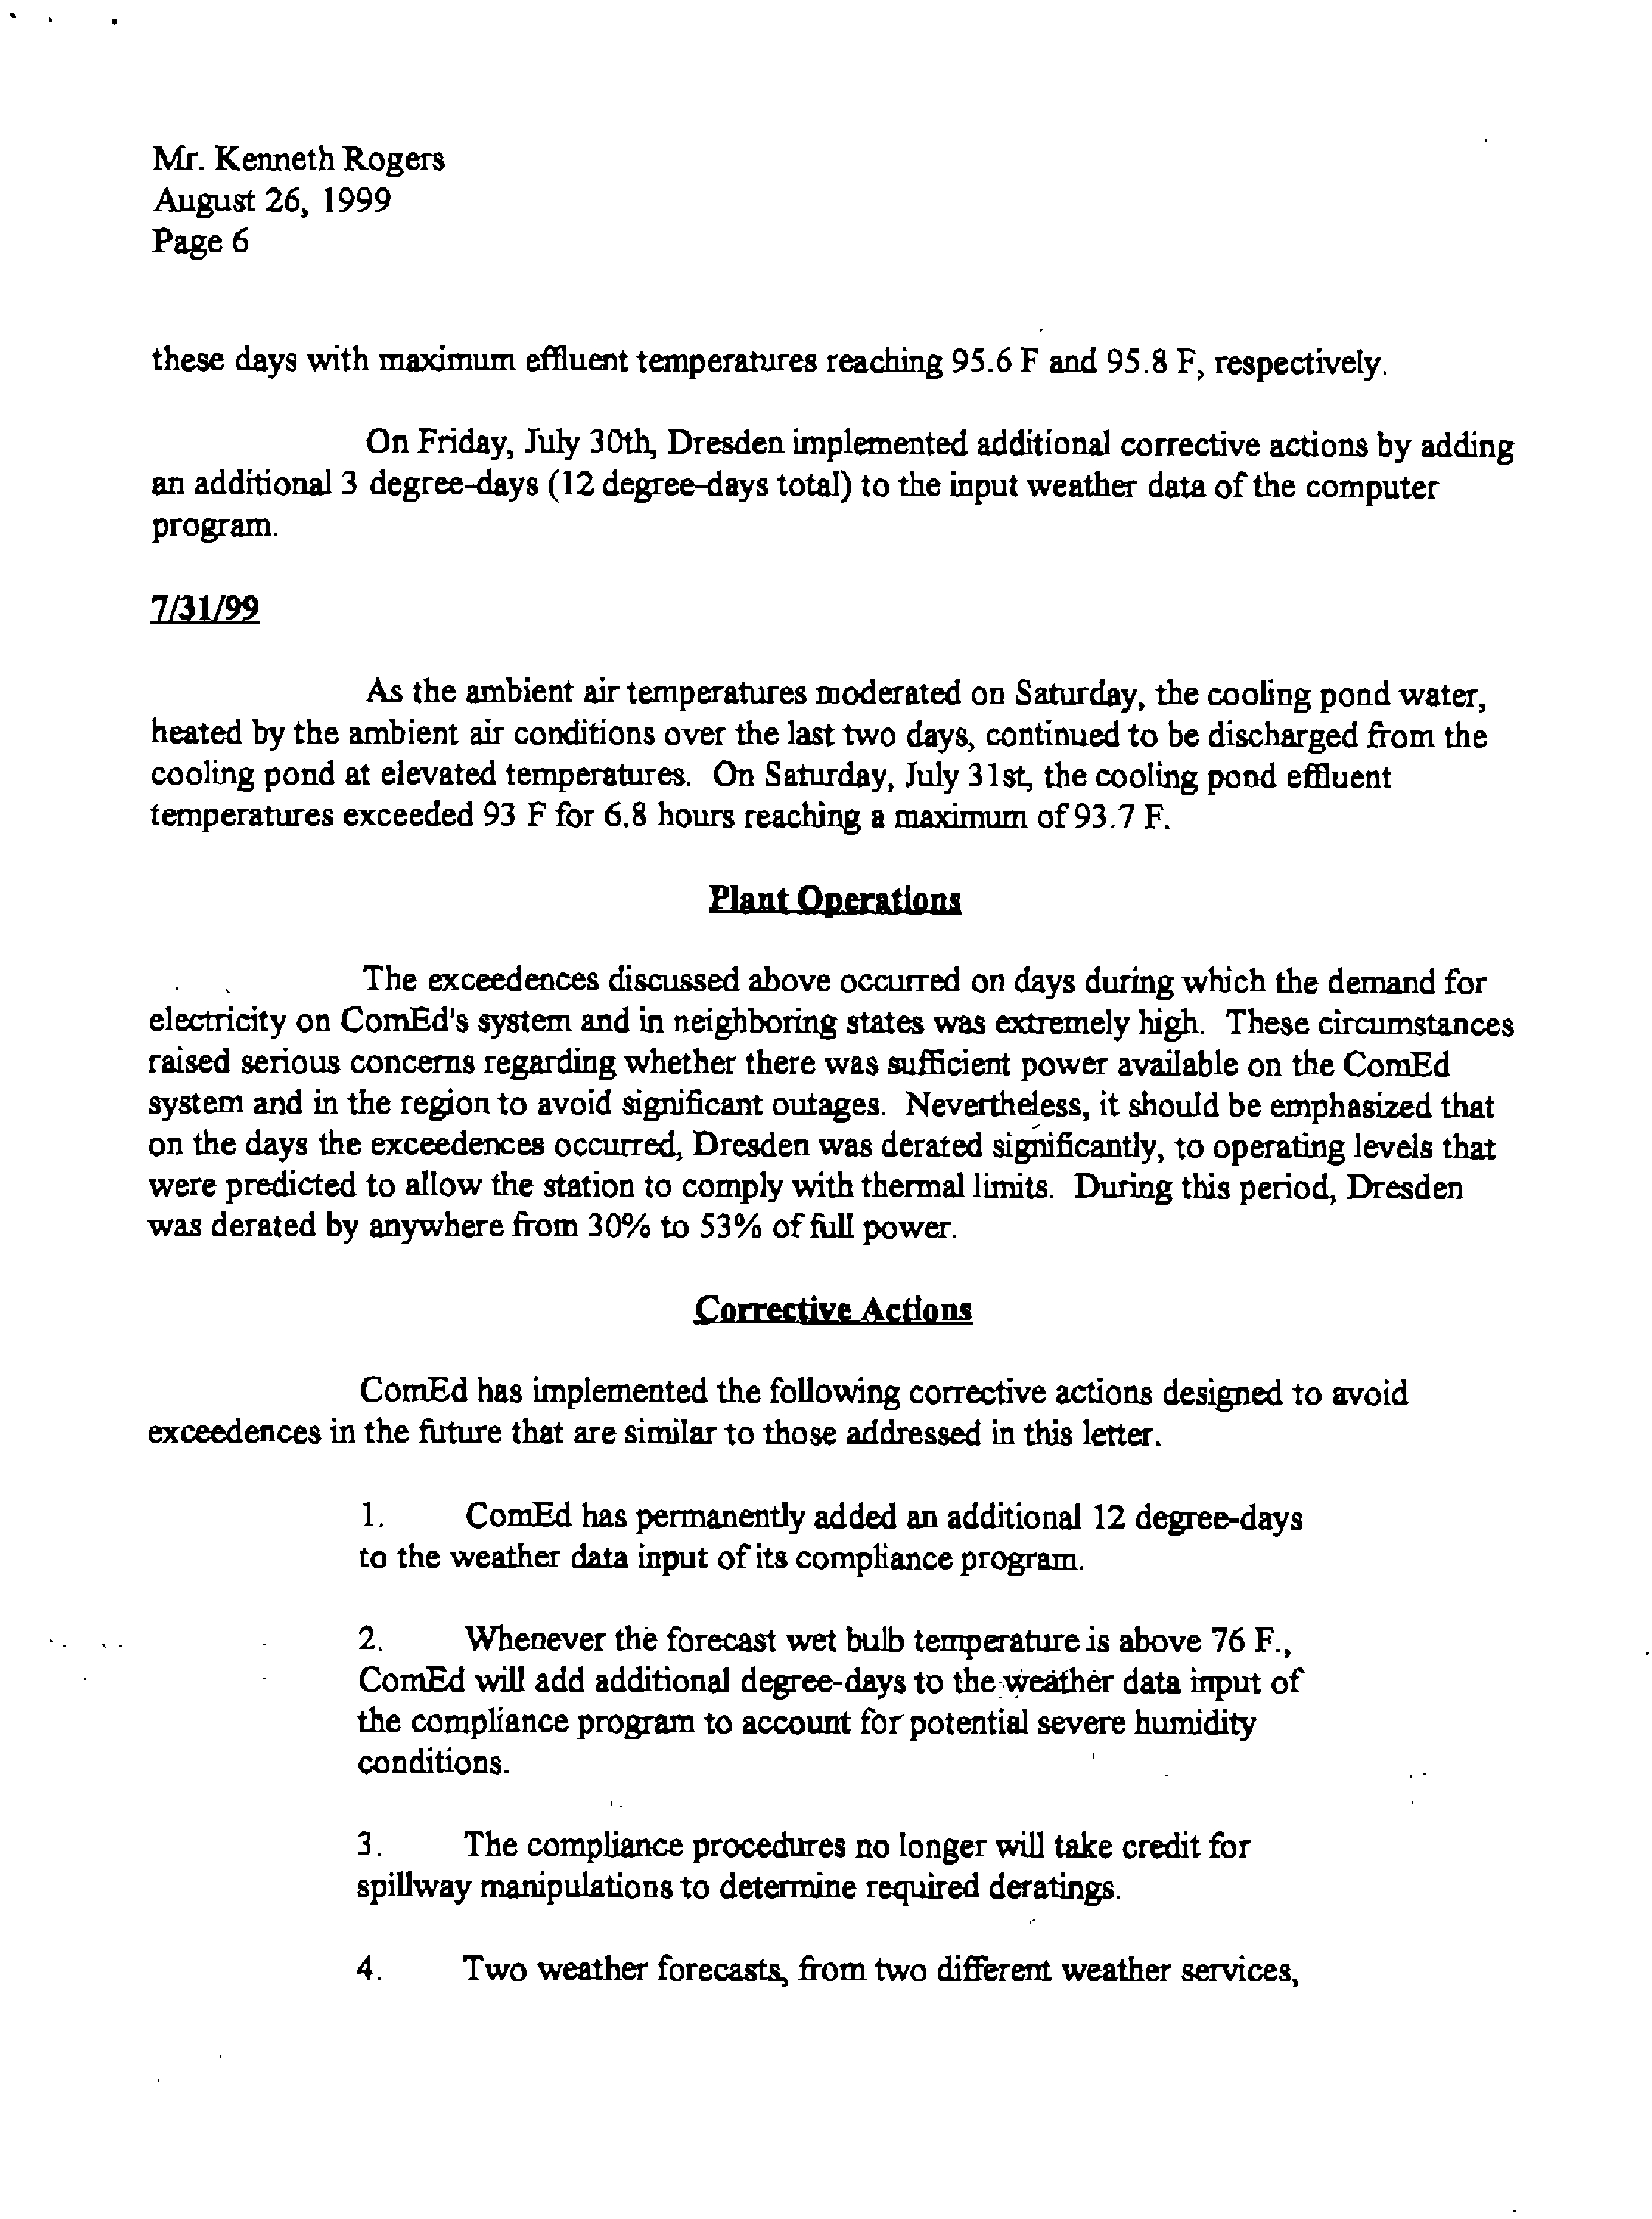
On
Friday,
July
30th,
Dresden
implemented
additional
corrective
actions
by
adding
an
additional
3
degree-days
(12
degree-days
total)
to
the
input
weather
data
of
the
computer
program.
7/31/99
As
the
ambient
air
temperatures
moderated
on
Saturday,
the
cooling
pondwater,
heated
by
the
ambient
air
conditions
over
the
last
two
days,
continued
to
be
discharged
from
the
cooling
pond
at
elevated
temperatures.
On
Saturday,
July
31st,
the
cooling
pond
effluent
temperatures
exceeded
93
F
for
6.8
hours
reaching
a
maximum
of
93.7
F.
Plant
Operations
The
exceedences
discussed
above
occurred
on
days
during
which
the
demand
for
electricity
on
CornEd’s
system
and
in
neighboring
states
was
extremely
high.
These
circumstances
raised
serious
concerns
regarding
whether
there
was
sufficient
power
available
on
the
CornEd
system
and
in
the
region
to
avoid
significant
outages.
Nevertheless,
it
should
be
emphasized
that
on
the
days
the
exceedences
occurred,
Dresden
was
derated
significantly,
to
operating
levels
that
were
predicted
to
allow
the
station
to
comply
with
thermal
limits.
During
this
period,
Dresden
was
derated
by
anywhere
from
30%
to
53%
of
full
power.
Corrective
Actions
CornEd
has
implemented
the
following
corrective
actions
designed
to
avoid
exceedences
in
the
future
that
are
similar
to
those
addressed
in
this
letter.
1.
CornEd
has
permanently
added
an
additional
12
degree-days
to
the
weather
data
input
of
its
compliance
program.
2.
Whenever
the
forecast
wet
bulb
temperature
is
above
76
F.,
CornEd
will
add
additional
degree-days
to
the
weather
data
input
of
the
compliance
program
to
account
for
potential
severe
humidity
conditions.
3.
The
compliance
procedures
no
longer
will
take
credit
for
spiliway
manipulations
to
determine
required
deratings.
4.
Two
weather
forecasts,
from
two
different
weather
services,
forecasts
will
be
used
as
the
input
data
for
the
program.
5.
CornEd
will
evaluate
the
need
for
additional
cooling
capacity,
such
as
additional
cooling
towers.
Environmental
Impacts
On
each
day
exceedences
occurred,
CornEd
monitored
the
cooling
pond,
discharge
canal
and
the
illinois
River
downstream
of
the
discharge.
No
fish
kills
or
other
noticeable
environmental
impacts
were
observed.
In
addition,
on
July
22
and
23,
and
again
on
July
30,
CornEd
and
its
environmental
consultants
conducted
extensive
fishsampling
activities
and
river
temperature
profiles
upstream
and
directly
downstream
of
the
Dresden
discharge.
Again
no
observable
impacts
were
noted.
*
*
*
*
Please
feel
free
to
contact
me
should
you
require
any
additional
information.
We
would
be
happy
to
meet
with
you
to
discuss
these
matters
in
further
detail.
Very
truly
yours,
Mary
O’l1oole
Manager
Environmental
Services
attachment
::ODMA\PCDOCS\CHJCAGO4\929181U
August
26,
1999
(5:01pm)
Bureau
of
Water,
Compliance
Assurance
Section
#19
Attention:
Dan
Ray
1021
North
Grand
Avenue
East
P.O.
Box
19276
Springfield,
Illinois
62794-9276
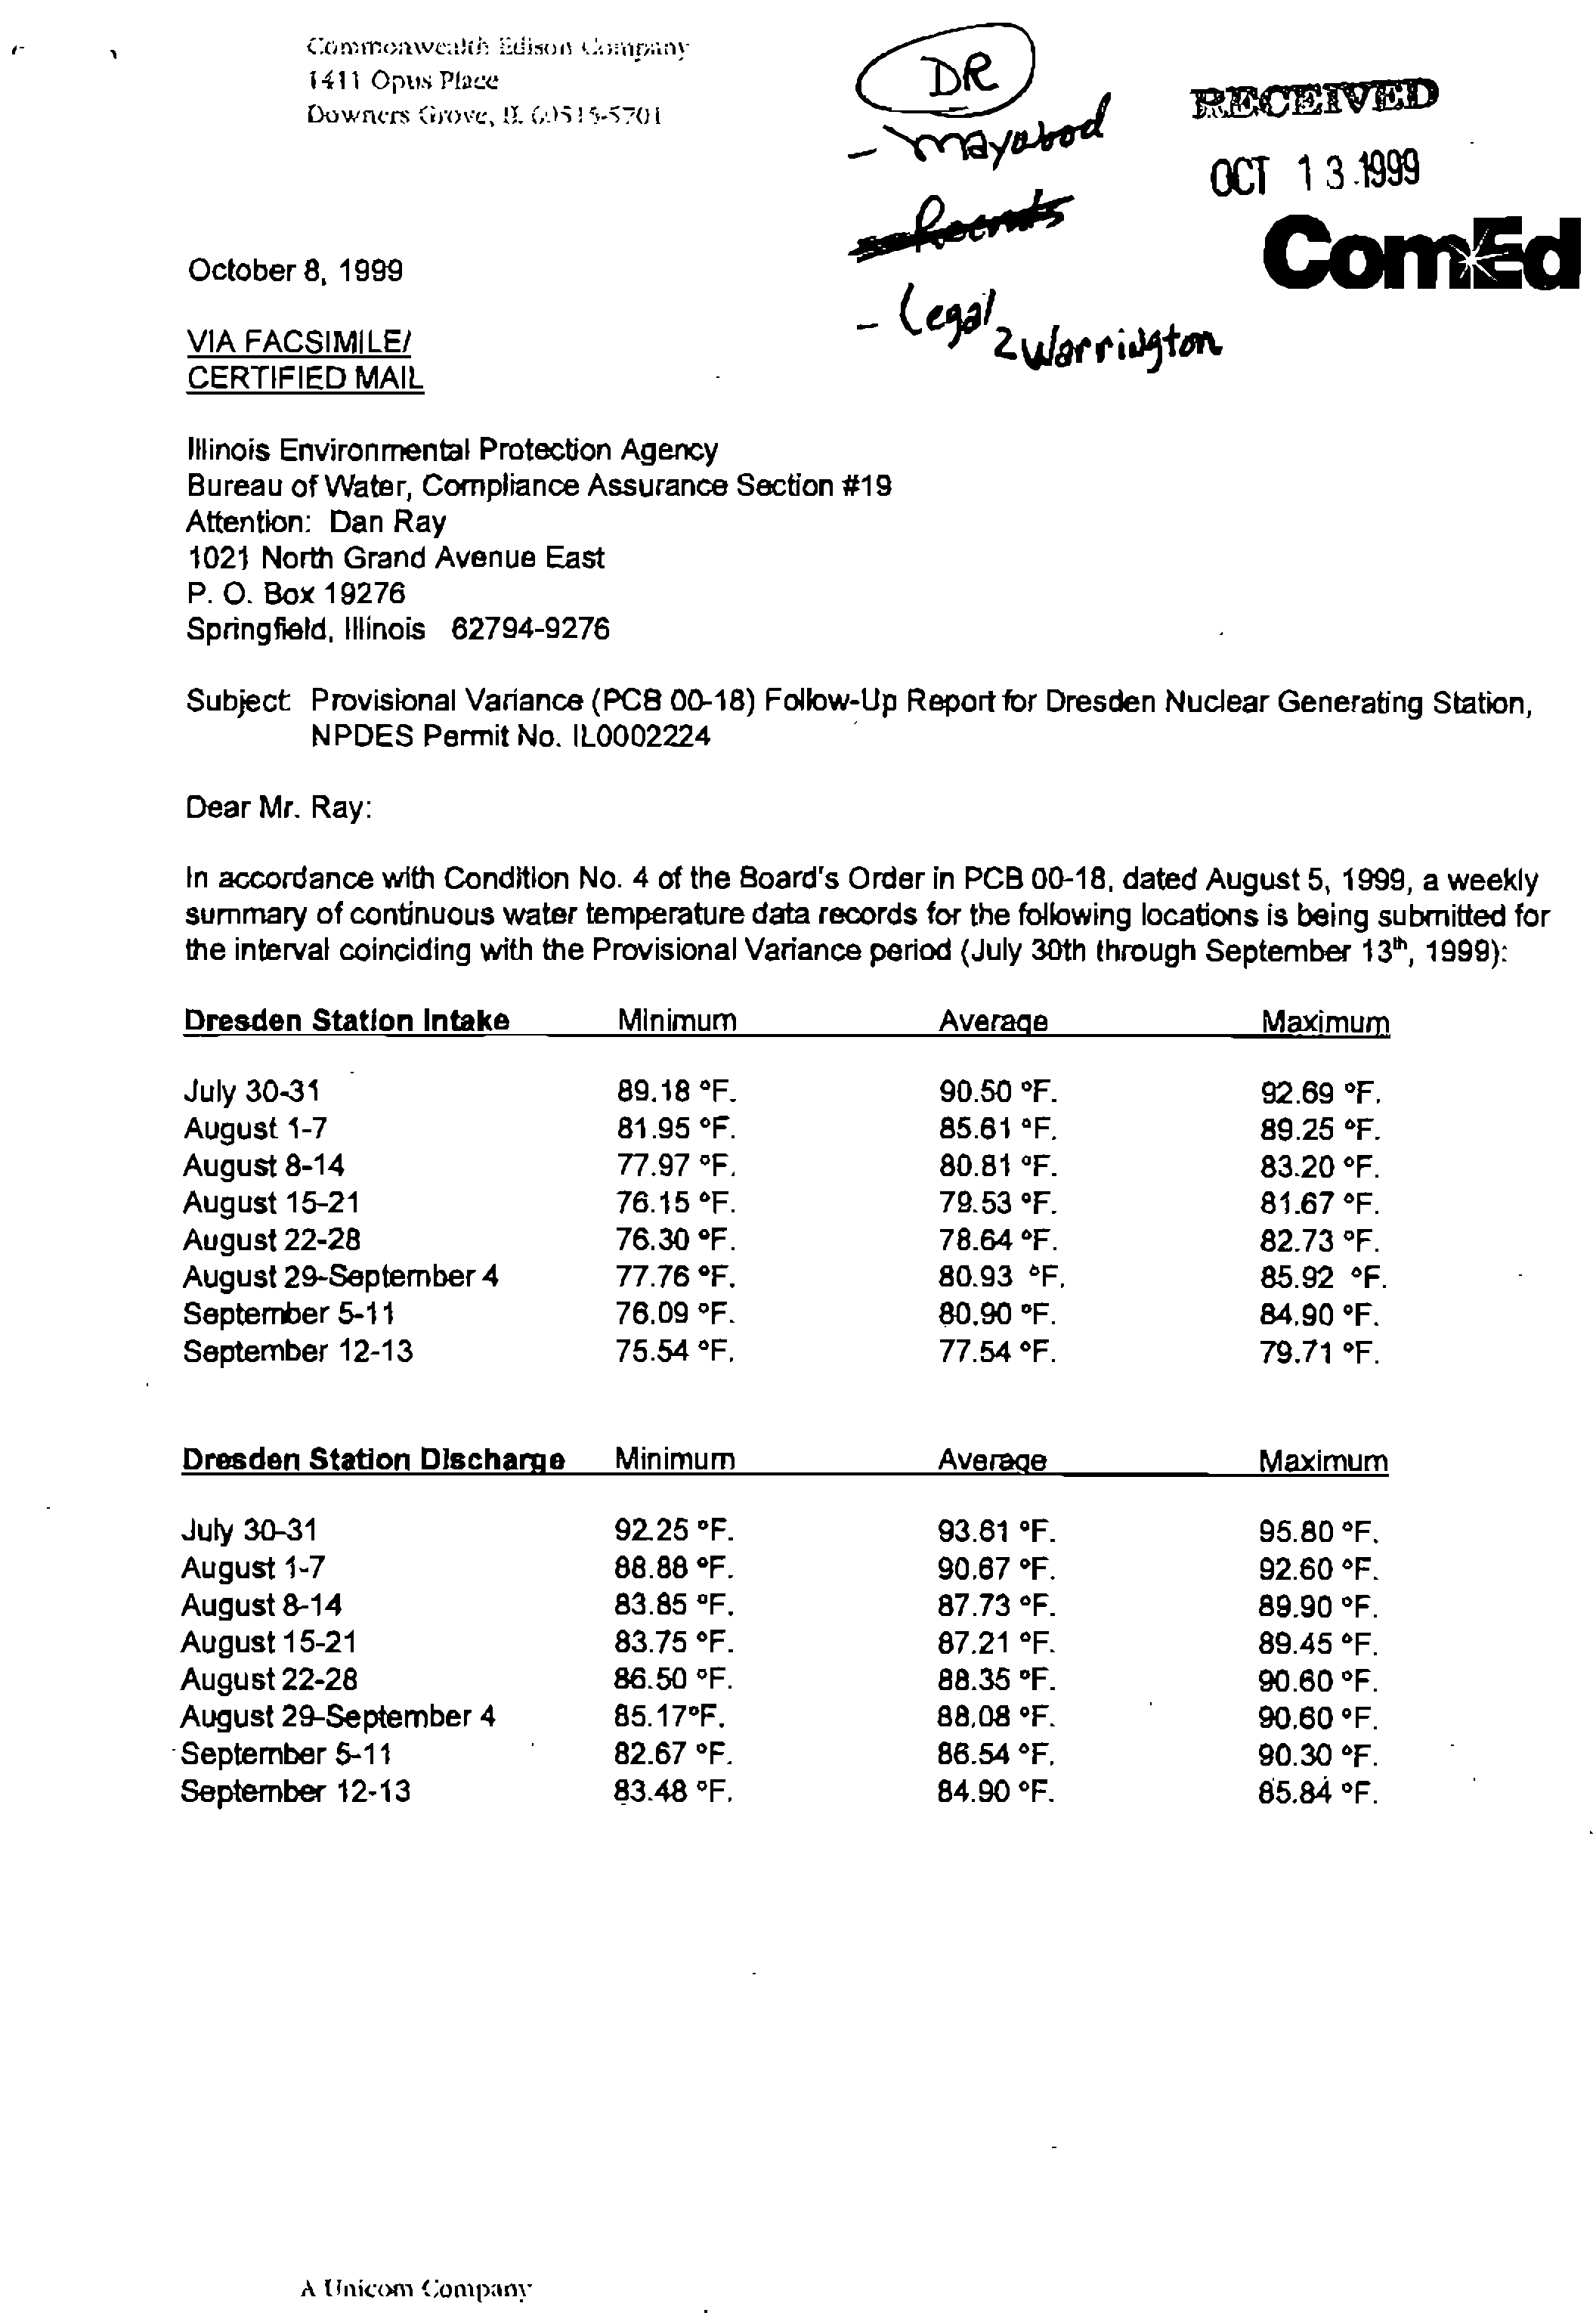
Subject:
Provisional
Variance
(PCB
00-18)
Follow-Up
Report
for
Dresden
Nuclear
Generating
Station,
NPDES
Permit
No.
1L0002224
Dear
Mr.
Ray:
In
accordance
with
Condition
No.
4
of
the
Board’s
Order
in
PCB
00-18,
dated
August
5,
1999,
a
weekly
summary
of
continuous
water
temperaturedata
records
for
the
following
locations
is
being
submitted
for
the
interval
coinciding
with
the
Provisional
Variance
period
(July
30th
through
September
13th,
1999):
Dresden
Station
Intake
Minimum
Average
Maximum
July
30-31
89.18
°F.
90.50
°F.
92.69
GF
August
1-7
81.95
°F.
85.61
°F.
89.25
°F.
August
8-14
77.97
°F.
80.81
°F.
83.20
°F.
August
15-21
76.15
°F.
79.53
°F.
81.67
°F.
August
22-28
76.30
°F.
78.64
°F.
82.73
°F.
August
29-September
4
77.76
°F.
80.93
oF.
85.92
°F.
September
5-11
76.09
°F.
80.90
°F.
84.90
°F.
September
12-13
75.54
F.
77.54
°F.
79.71
°F.
Dresden
Station
Discharge
Minimum
Average
Maximum
July
30-31
92.25
°F.
93.61
°F.
95.80
°F.
August
1-7
88.88
°F.
90.67
°F.
92.60
°F.
August
8-14
83.85
°F.
87.73
°F.
89.90
°F.
August
15-21
83.75
F.
87.21
°F.
89.45
°F.
August
22-28
86.50
°F.
88.35
°F.
90.60
°F.
August
29-September
4
85.17°F.
88.08
°F.
90.60
°F.
September
5-11
82.67
°F.
86.54
°F.
90.30
°F.
September
12-13
83.48
°F.
84.90
°F.
85.84
°F.
A
UruCorn
(onxtn’
July
30-31
90.28
°F.
91.59
°F.
93.47
°F.
August
1-7
85.47
°F.
88.31
°F.
90.50
°F.
August8-14
81.42°F.
84.74°F.
86.00°F.
August
15-21
80.36
°F.
83.84
°F.
85.44
°F.
August
22-28
79.89
°F.
83.23
°F.
86.02
°F.
August
29-September
4
82.12
°F.
84.82
°F.
88.24
°F.
September
5-11
80.41
°F.
84.74°F.
88.11
°F.
September
12-13
80.91
°F.
82.38
°F.
83.13
°F.
[The
above
data
summary
for
all
of
the
required
monitoring
locations
was
prepared
by
reviewing
either
circular
or
strip
chart
temperature
records,
or
computer
records
from
an
in-place
telemetry
monitoring
system
(depending
upon
location).
If
required,
complete
copies
of
the
actual
temperature
records
for
each
location
will
be
made
available
to
the
Agency
for
further
reviewl.
Inspections
of
the
Dresden
intake
and
discharge
were
also
made
during
the
Provisional
Variance
period,
in
accordance
with
requirements
of
the
Board
Order.
These
inspections
did
not
identify
any
unusual
or
unexpected
conditions
for
the
duration
of
the
variance
period.
There
were
two
extended
excursion
periods
associated
with
the
thermal
discharge
during
the
1999
Indirect
Open
Cycle
period
at
Dresden
Station.
These
have
been
summarized
in
prior
correspondence
to
the
Agency
dated
July
28th
and
August
26th,
1999.
A
total
of
400.2
allowable
excursion
hours
were
used
this
summer,
including
approximately
141
.2hours
permitted
under
Provisional
Variance
(PCB
00-18).
If
there
are
any
questions
concerning
the
above
information
and/or
accompanying
data,
please
contact
me
at
(630)
663-5409.
Sincerely,
JNla
P.
Wo
iak
Senior
Biologist
Endvar99.doc
cc:
Darin
LeCrone,
IEPA
Industrial
Permits
Section
Matthew
Wertman—IEPA
Maywood
Office
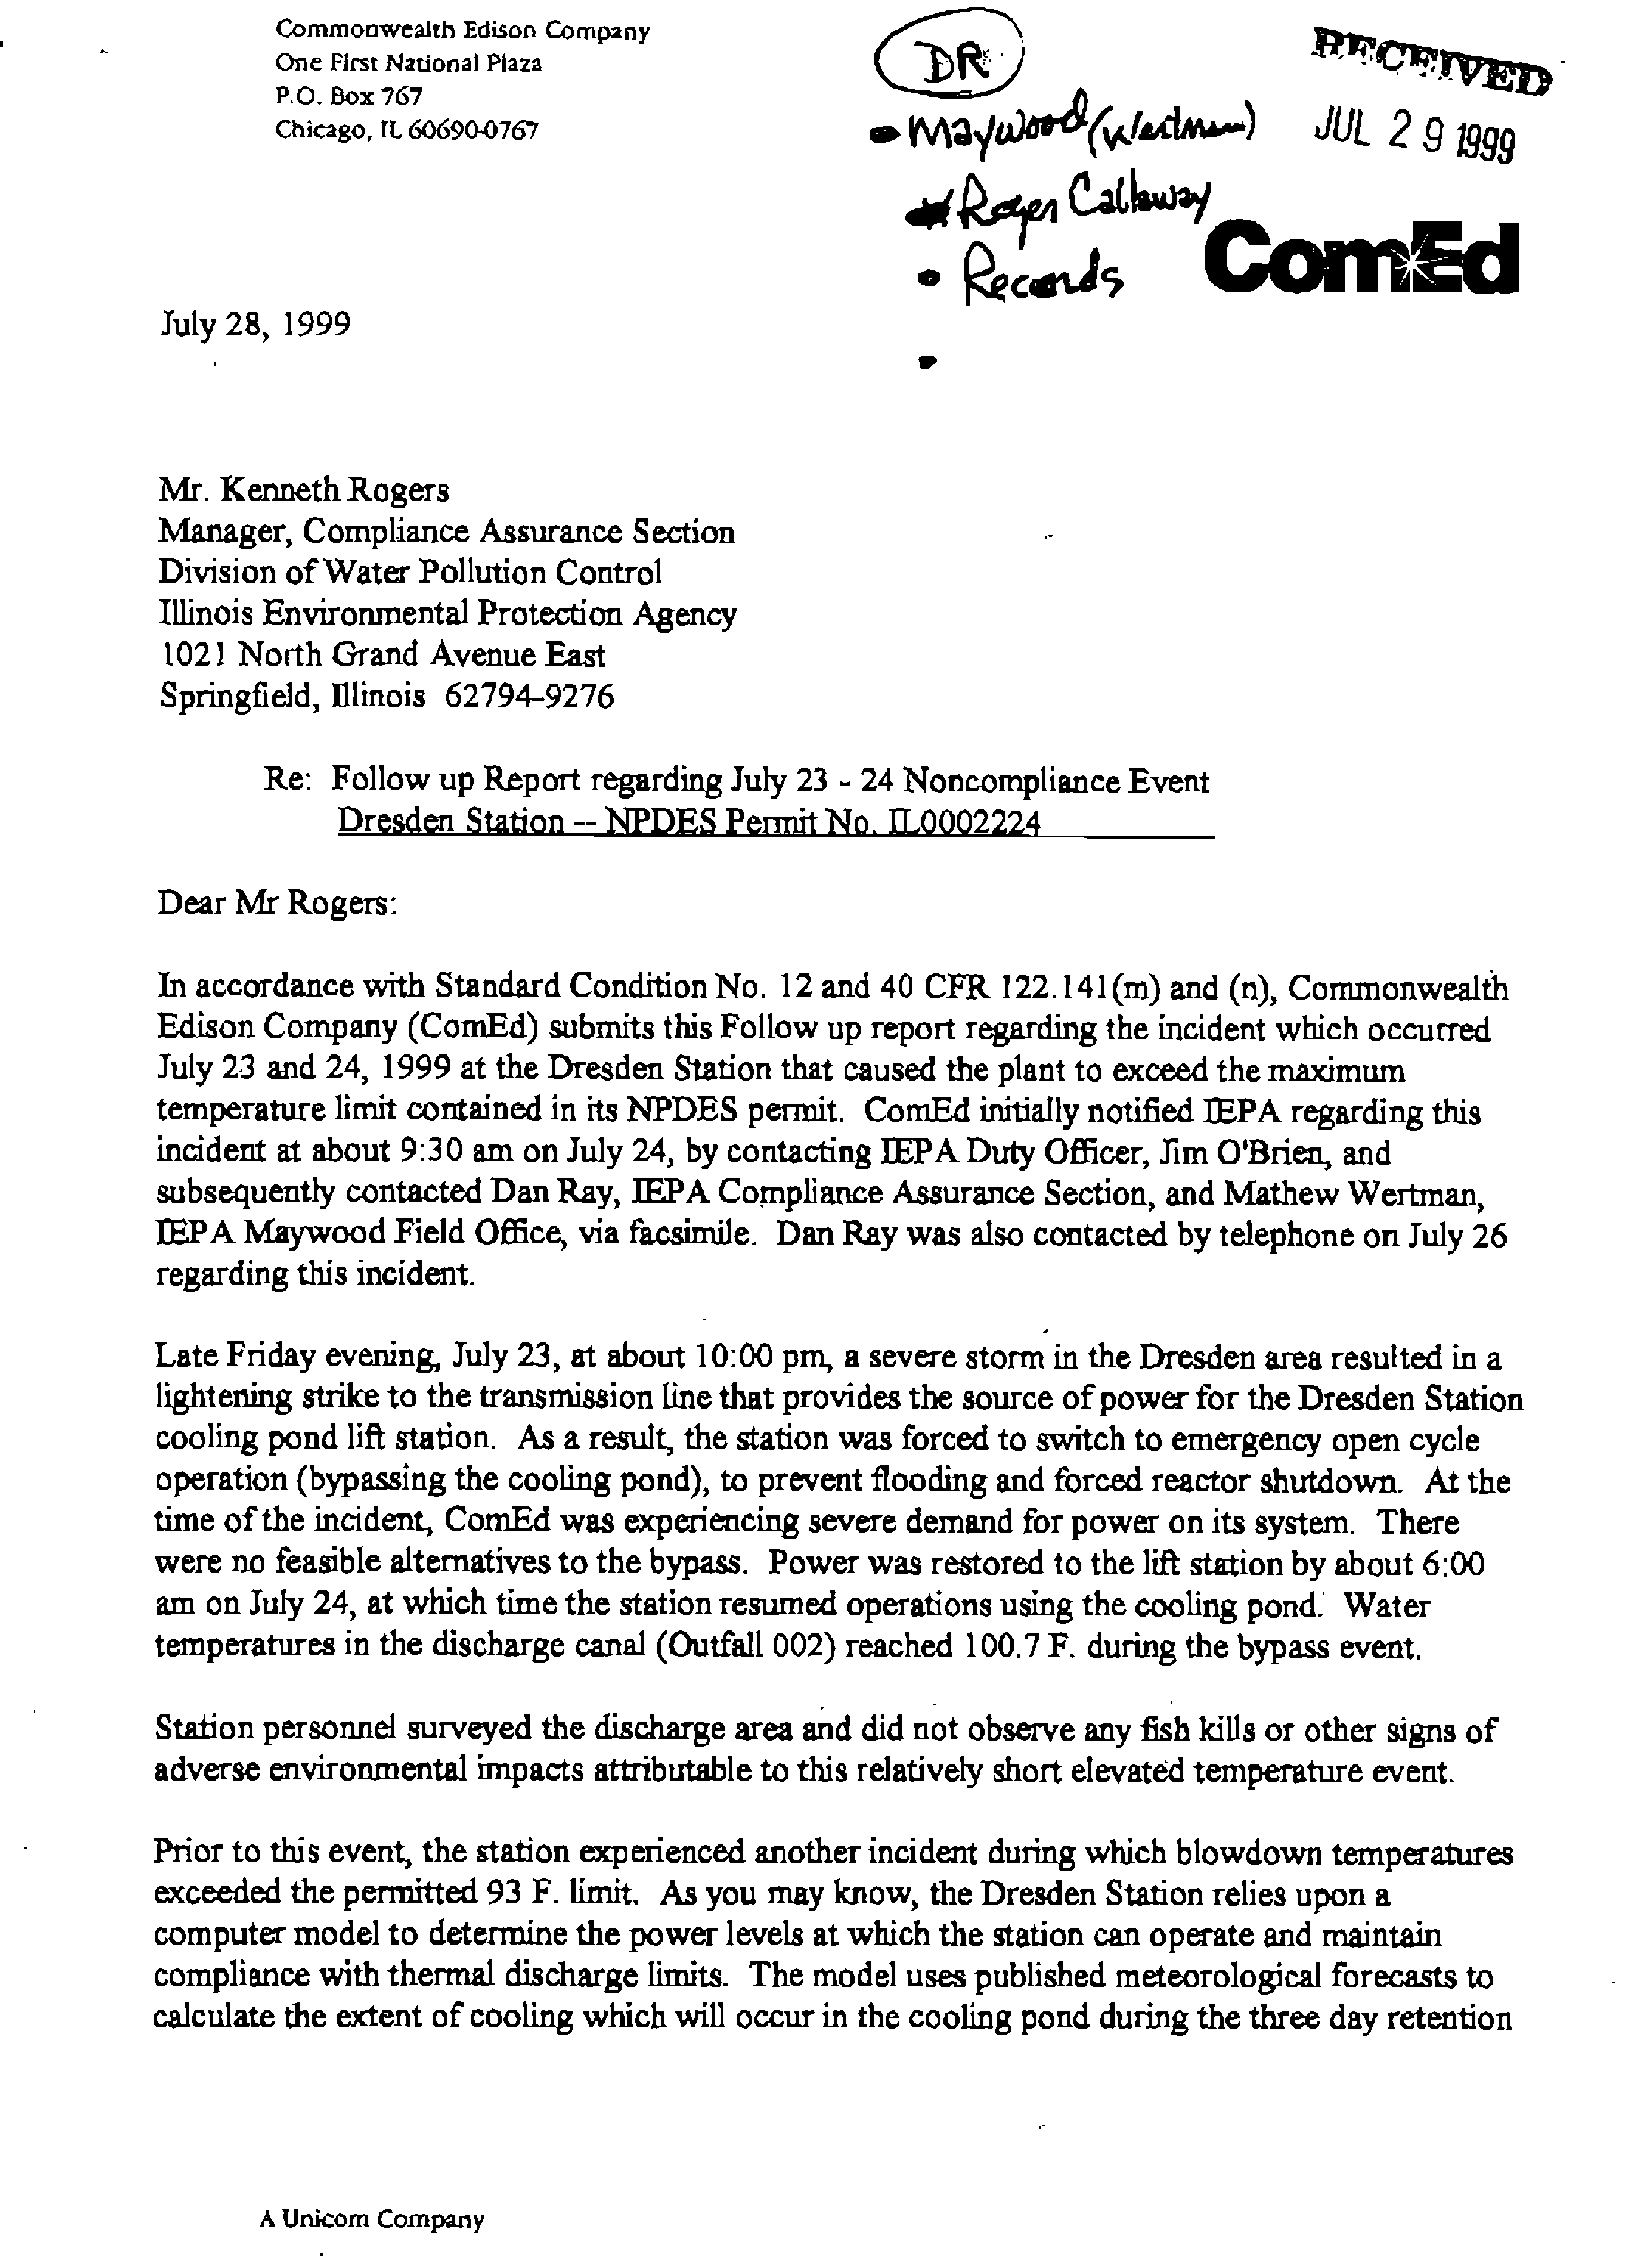
Mr.
Kenneth
Rogers
Manager,
Compliance
Assurance
Section
Division
of
Water
PollutionControl
Illinois
Environmental
Protection
Agency
1021
North
GrandAvenue
East
Springfield,
Illinois
62794-9276
Re:
Follow
up
Report
regarding
July
23
-
24
Noncompliance
Event
Dresden
Station
--
NPDES
Permit
No.
1L0002224
Dear
Mr
Rogers:
In
accordance
with
Standard
Condition
No.
12
and
40
CFR
122.141(m)
and
(n),
Commonwealth
Edison
Company(CornEd)
submitsthis
Follow
up
report
regarding
the
incident
which
occurred
July
23
and
24,1999
at
the
Dresden
Station
that
caused
the
plant
to
exceed
the
maximum
temperature
limit
contained
in
its
NPDES
permit.
CornEd
initially
notified
IEPA
regarding
this
incident
at
about
9:30
am
on
July
24,
by
contacting
IEPA
Duty
Officer,Jim
O’Brien,
and
subsequently
contacted
Dan
Ray,
IEPA
Compliance
Assurance
Section,
and
Mathew
Wertman,
TEPA
Maywood
Field
Office,
via
facsimile.
Dan
Ray
was
also
contacted
by
telephone
on
July
26
regarding
this
incident.
Late
Friday
evening,
July
23,
at
about
10:00
pm,
a
severe
storm
in
the
Dresden
area
resulted
in
a
lightening
strike
to
the
transmission
line
that
provides
the
source
of
powerfor
the
Dresden
Station
cooling
pond
lift
station.
As
a
result,
the
station
was
forced
to
switch
to
emergency
open
cycle
operation
(bypassing
the
cooling
pond),
to
prevent
flooding
and
forced
reactor
shutdown.
At
the
time
of
the
incident,
CornEd
was
experiencing
severe
demandfor
power
on
its
system.
There
were
no
feasible
alternatives
to
the
bypass.
Power
was
restored
to
the
lift
station
by
about
6:00
am
on
July
24,
at
which
time
the
station
resumed
operations
using
the
cooling
pond.
Water
temperatures
in
the
discharge
canal
(Outfall
002)
reached
100.7
F.
during
the
bypass
event.
Station
personnel
surveyed
the
discharge
area
and
did
not
observe
any
fish
kills
or
other
signs
of
adverse
environmental
impacts
attributable
to
this
relatively
short
elevated
temperature
event.
Prior
to
this
event,
the
station
experienced
another
incident
during
which
blowdown
temperatures
exceeded
the
permitted
93
F.
limit.
As
you
may
know,
the
Dresden
Station
relies
upon
a
computer
model
to
determine
the
power
levels
at
which
the
station
can
operate
and
maintain
compliance
with
thermal
discharge
limits.
The
model
uses
published
meteorological
forecasts
to
calculate
the
extent
of
cooling
which
will
occur
in
thecoolingpond
during
the
three
day
retention
A
Unicorn
Company
Very
truly
yours,
Environmental
Manager
Mary
Services
cc
D.
Ray
M.
Wertman
urgent
facsimile
To:
Dan
Ray--IEPA
Compliance
Assurance
Section
Company:
Fax
Number:
+1(217)557-1407
Business
Phone:
From:
Julia
Wozniak
Fax
Number
+1(630)
852-5766
Business
Phone:
(312)
394-4468
Home
Phone:
(630)
852-5766
Pages:
1
Datefflme:
7/24/99
9:50:30
AM
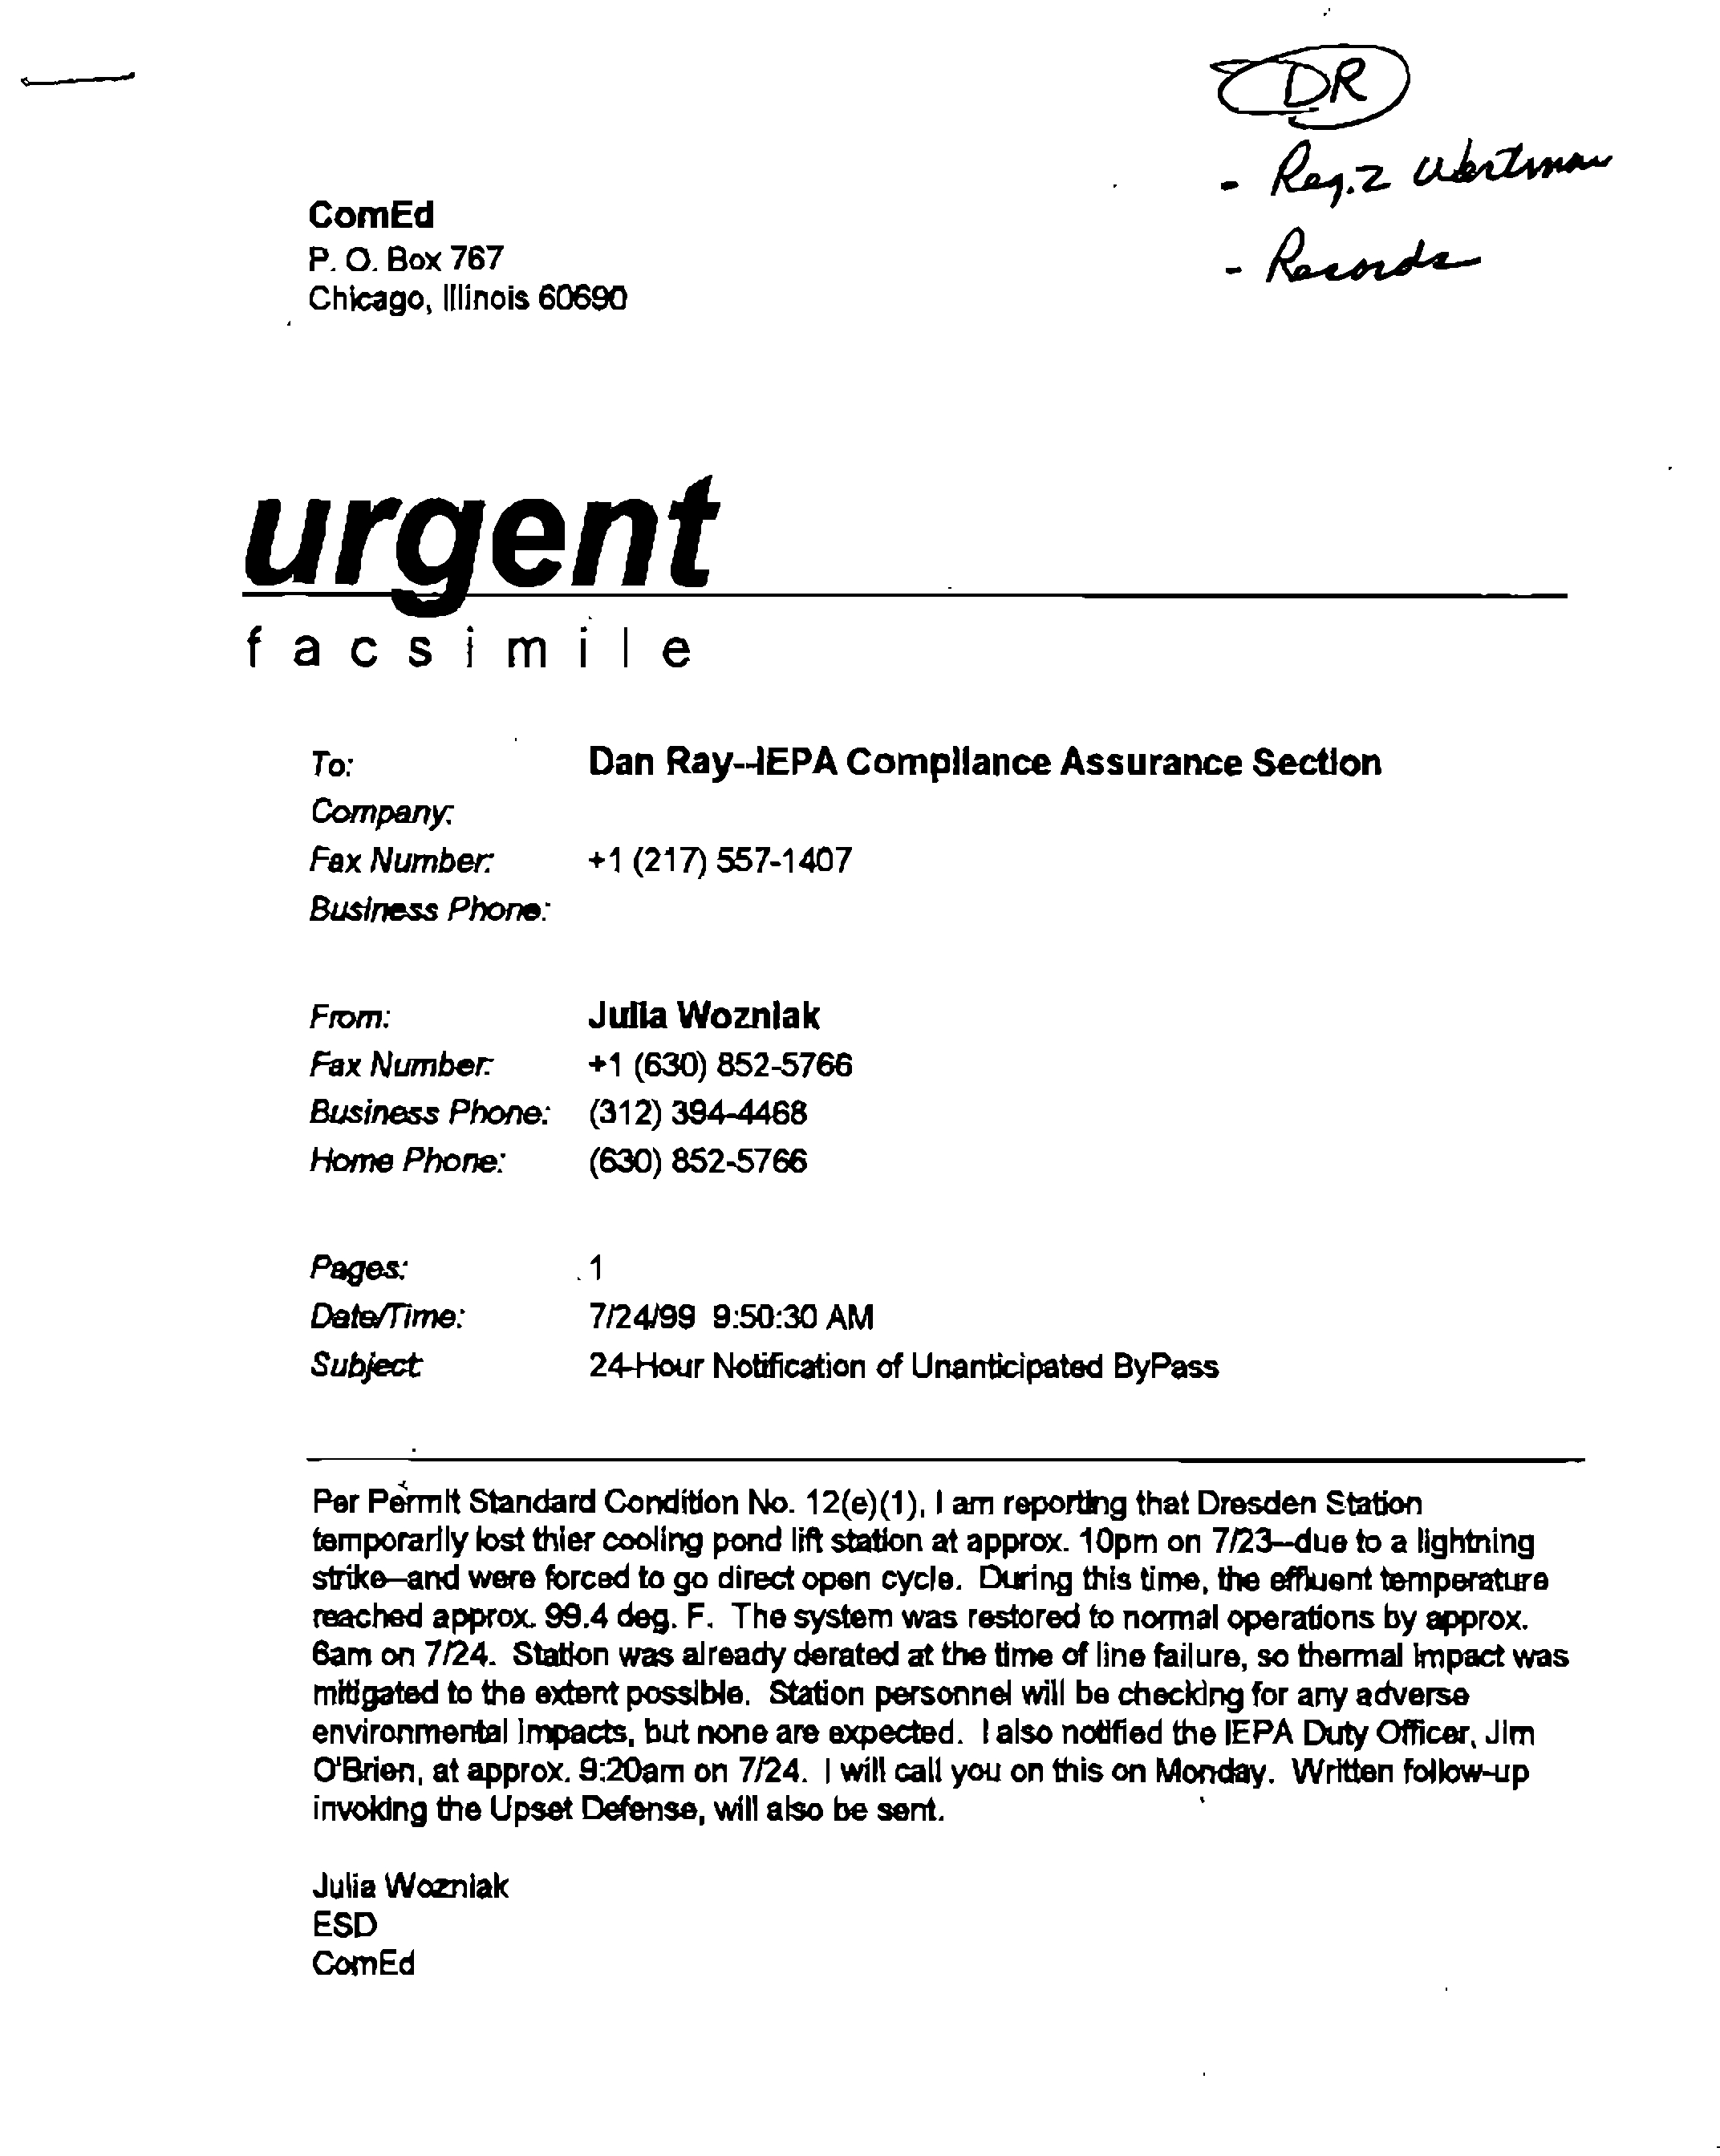
Subject:
24-Hour
Notification
of
Unanticipated
ByPass
Per
Pórmit
Standard
Condition
No.
12(e)(1),
I
am
reporting
that
Dresden
Station
temporarily
lost
thier
cooling
pond
lift
station
at
approx.
10pm
on
7/23--due
to
a
lightning
strike--and
were
forced
to
go
direct
open
cycle.
During
this
time,
the
effluent
temperature
reached
approx.
99.4
deg.
F.
The
system
was
restored
to
normal
operations
by
approx.
6am
on
7/24.
Station
was
already
derated
at
the
time
of
line
failure,
so
thermal
impact
was
mitigated
to
the
extent
possible.
Station
personnel
will
be
checking
for
any
adverse
environmental
impacts,
but
none
are
expected.
I
also
notified
the
IEPA
DutyOfficer,
Jim
0Brien,
at
approx.
9:20am
on
7/24.
I
will
call
you
on
this
on
Monday.
Written
follow-up
invoking
the
Upset
Defense,
will
also
be
sent..
Julia
Wozniak
ESD
CornEd
CERTIFIED
MAIL
Illinois
Environmental
Protection
Agency
Mr
Thomas
G.
McSwiggin,
P.
E
Manager,
Permits
Section
Bureau
of
Water
-f
1021
North
Grand
Avenue
East
P
0.
Box
19276
Springfield,
Illinois
62794-9276
Subject:
Annual
Temperature
Data
Submittal
for
Dresden
Nuclear
Generating
Station,
NPDES
Permit
No.
1L0002224
Dear
Mr.
McSwiggin:
In
accordance
with
Dresden’s
NPDES
permit
Special
Condition
No.
2,
Part
F,
Subsection
2,
a
monthly
summary
of
continuous
water
temperature
data
records
for
the
following
locations
is
being
submitted
for
the
period
coinciding
with
allowed
indirect
open
cycle
operation
(15
June-30
September,
1998):
(1)
Dresden
Island
Lock
and
Dam
(2)
Dresden
Station
Circulating
Water
Intake
(Kankakee
River)
(3)
Joliet
Station
#9
intake
(4)
Joliet
Station
#29
Intake
(5)
1-55
Bridge
Dresden
operating
data
for
the
June
through
September
period
is
also
being
included,
for
informational
There
purposes.
were
no
noncompliances
related
to
thermal
compliance
during
the
1998
Indirect
Open
Cycle
period
at
Dresden
Station.
A
total
of
418.8
allowable
excursion
hours
of
discharge
temperatures
between
90°F
and
93
°F
were
used
this
summer,
including
approximately
159.8
of
the
259
allotted
by
Provisional
Variance
(PCB
98-17),
Another
Provisional
Variance
was
obtained
(PCB
98-39)
in
order
to
provide
sufficient
extra
excursion
hours
to
last
the
remainder
of
the
summer
period,
but
due
to
an
abrupt
change
in
weather
conditions
in
early
September,
these
additional
hours
were
not
required
to
be
used.
i
1i(,’()flt
(
fl1IflV
either
circular
or
strip
chart
temperature
records,
or
computer
records
from
an
in-place
telemetry
monitoring
system
(depending
upon
location).
(If
required,
completecopies
of
the
actual
temperature
records
for
each
location
will
be
made
available
to
the
Agency
for
further
review).
If
there
are
any
questions
concerning
the
above
information
and/or
accompanying
data,
please
contact
me
at
(312)
394-4468.
Sincerely,
Senior
Biologist
Approved:
(
75
Endof98.doc
Attachments
cc:
Darin
LeCrone;
IEPA
Industrial
Permits
Section
Daniel
Ray,
IEPA
Compliance
Assurance
Section
Matthew
Wertman—IEPA
Maywood
Office
Dresden
Station
Intake
June
15-30
68.13
°F.
76.22
°F.
84.45
°F.
July
1-31
73.63
°F.
78.92
°F.
85.38
°F.
August
1-31
73.25
°F.
79.63
°F.
85.63
°F.
September
1-30
72.81
°F.
77.33
°F.
82.12
°F.
Dresden
Station
Discharge
June
15-30
84.04
°F.
87.36
°F.
92.09
°F.
July
1-31
86.88°F.
89.66°F.
92.87°F.
August
1-31
86.35
°F.
89.56°F.
92.03
°F.
September
1-30
83.44
°F.
87.02
°F.
91.31
°F.
Dresden
Lock
and
Dam
June
15-30
70.38
°F.
80.50
°F.
84.45
°F.
July
1-31
77.94°F.
84.24°F.
85.38°F.
August
1-31
78.15
°F.
85.04
°F.
85.63
°F.
September
1-30
78.56
°F.
83.38
°F.
82.12
°F.
Joliet
#9
Intake
June
-30
N/A’
77°F
88°F
July
1-31
N/A’
83°F
89°F
August
1-31
N/A’
82°F
90°F
September
1-30
N/A’
82
°F
84
°F
Joliet
#29
Intake
June
1-30
N/A’
79°F
90°F
July
1-31
N/A’
81
°F
101
°F
August
1-31
N/A’
79
°F
98
°F
September
1-30
N/A’
75
°F
98°F
1-55
Bridge
June
1-30
N/A’
81.3
°F
92°F
July
1-31
N/A’
87.0
°F
92°F
August
1-31
N/A’
85.9°F
92°F
September
1-30
N/A’
84.1
°F
89.8
°F
(‘Reports
from
which
data
was
taken
only
list
average
and
maximum
values)
9Santhrm.doc
10/21/98
9JOESR1O21
9JOESR1O31
29
Discharge
Temp
J29
Inlet
Temp
155
Water
Temp
DATE
AVERAGE
MAXIMUM
AVERAGE
MAXIMUM
AVERAGE
MAXIMUM
1/1/2006
56.9
61.0
48.5
51.5
53.7
55.1
1/2/2006
58.8
63.8
48.9
50.7
54.6
55.0
1/3/2006
63.1
67.4
51.8
53.5
53.6
55.3
1/4/2006
61.6
65.0
50.5
52.4
54.4
56.2
1/5/2006
62.4
67.4
51.4
54.0
54.0
55.5
1/6/2006
59.6
61.6
48.3
50.3
75.9
54.8
1/7/2006
63.2
64.4
51.1
53.2
52.9
54.5
1/8/2006
58.1
63.8
50.3
52.9
53.3
56.2
1/9/2006
63.2
68.9
52.9
56.0
55.1
56.9
1/10/2006
59.6
63.3
51.6
54.0
54.0
55.5
1/1
1/2006
62.4
67.5
52.7
56.8
56.8
57.8
1/12/2006
63.5
67.8
54.1
566
55.2
56.8
111
3/2006
62.8
66.3
52.5
54.1
57.0
58.2
1/14/2006
61.9
67.1
51.7
54.2
54.3
56.7
1/15/2006
61.5
65.2
50.7
51.4
53.9
56.3
1/16/2006
59.0
64.3
49.7
51.5
53.8
55.8
1/17/2006
61.6
64.8
50.9
52.5
52.1
53.2
1/18/2006
63.8
71.6
52.6
59.2
51.2
53.3
1/19/2006
63.1
70.7
53.3
58.0
52.3
55.3
1/20/2006
60.9
64.3
54.0
57.3
57.1
59.2
1/21/2006
59.6
65.1
51.8
56.0
54.3
55.8
1/22/2006
54.4
59.0
47.9
50.6
53.6
55.3
1/23/2006
57.9
64.1
48.6
52.2
50.0
51.6
1/24/2006
56.9
61.0
48.6
49.7
49.7
52.1
1/25/2006
58.5
63.4
48.1
48.8
48.7
50.7
1/26/2006
:
590
63.4
48.9
49.8
51.1
53.4
1/27/2006
59
0
64
5
50
9
53
0
53
2
53
8
1/28/2006
59
2
61
0
52
4
54
1
54
2
55
4
1/29/2006
59.4
61.8
52.5
55.1
55.0
56.7
1/30/2006
56.7
59.4
49.6
51.3
52.3
53.4
1/31/2006
60.2
64.5
51.0
52.8
51.1
52.9
9JOESR1O11
9JOESR1O21
9JOESR1O31
29
Discharge
Temp
J29
Inlet
Temp
155
Water
Temp
DATE
AVERAGE
MAXIMUM
AVERAGE
MAXIMUM
AVERAGE
MAXIMUM
12/1/2005
12/2/2005
12/3/2005
12/4/2005
12/5/2005
12/6/2005
12/7/2005
12/8/2005
12/9/2005
12/1
0/2005
12/11/2005
12/12/2005
12/13/2005
12/14/2005
12/15/2005
12/16/2005
12/17/2005
12/18/2005
12/19/2005
12/20/2005
12/21/2005
12/22/2005
12/23/2005
12/24/2005
12/25/2005
1.2(26/2005
12/27/2005
i212812005
1212912005
12/30/2005
12/31/2005
65.1
67.4
64.8
69.2
64.1
72.2
66.3
70.9
66.8
69.9
68.1
76.2
67.4
73.6
66.4
67.9
67.6
71.7
66.8
69.2
71.5
75.0
65.6
72.5
68.6
71.5
66.0
70.4
66.7
69.9
64.6
67.2
60.6
67.0
64.6
66.6
66.0
73.9
60.7
69.2
68.0
74.5
65.1
68.8
65.0
69.3
58.5
61.5
57.6
60.1
57.4
62.3
58A
63.2
61.6
65.4
62.9•
68.3
61.9
65.0
60.1
64.0
54.1
52.5
54.1
53.9
55.1
57.2
53.4
52.7
54.3
53.8
57.0
50.8
55.2
53.5
54.6
53.7
52.2
51.8
53.3
51.1
53.9
53.4
54.8
51.4
49.8
46.9.
.46.6:
.50.6
501
51.0
56.5
55.7
58.3
57.0
56.9
65.0
58.4
55.2
58.0
56.7
63.3
56.1
58.5
58.0
57.3
56.0
54.4
53.9
58.4
56.0
60.3
57.3
58.9
55.0
52.9
•
48.1
.45
•
.544
•
51.3
52.0
54.7
55.7
53.9
55.7
55.1
55.5
55.0
55.7
55.4
56.3
75.9
55.1
52.6
53.4
54.2
55.4
54.3
54.8
53.6
54.4
53.5
54.1
54.9
57.2
58.4
59.4
56.7
57.9
58.2
59.2
56.5
57.6
54.9
56.1
53.4
54.6
50.6
52.0
51.0
51.2
51.7
52.5
51.6
54.3
55.0
55.8
56.1
57.9
55.7
57.9
52.5
.
54.1
512
520
.52.7.
...
54.0
53.2
•
54.3
55.0
•
56.7
54.8
56.0
...•
..;•
..
9JOESR1O11
9JOESR1O21
9JOESR1O31
29
Discharge
Temp
J29
Inlet
Temp
155
Water
Temp
DATE
AVERAGE
MAXIMUM
AVERAGE
MAXIMUM
AVERAGE
MAXIMUM
11/1/2005
75.6
79.3
65.2
66.5
67.1
68.4
1
1/2/2005
75.7
82.5
66.0
68.4
68.6
69.5
11/3/2005
75.6
80.8
67.8
71.8
67.6
68.4
1
1/4/2005
77.2
81.7
68.9
74.7
67.2
68.2
11/5/2005
72.8
75.1
66.1
68.1
69.3
72.2
11/6)2005
72.9
74.4
65.6
68.6
75.9
72.2
11/7/2005
69.1
70.2
61.7
63.3
67.2
67.6
1
1/8/2005
69.1
72.0
62.5
64.6
67.4
68.2
11/9/2005
71.0
73.3
64.4
66.1
65.2
67.6
11/10/2005
73.4
80.1
64.4
69.5
64.3
65.2
11/11/2005
76.7
79.8
62.1
64.5
64.6
65.7
11/12)2005
79.6
82.1
65.7
68.1
66.5
67.4
11/13/2005
74.9
80.7
63.4
67.5
65.6
66.6
11/14/2005
73.3
78.5
64.4
68.3
65.8
66.4
11/15/2005
72.6
75.4
60.5
63.8
64.5
65.3
11/16/2005
72.0
75.9
59.3
60.6
59.4
64.5
11/17/2005
71.3
75.3
57.4
60.0
56.2
57.6
11/18/2005
72.7
76.5
58.3
60.2
59.1
59.9
11/19/2005
74.2
78.9
61.4
65.5
60.1
60.5
11/20/2005
68.0
72.7
59.0
61.3
60.8
61.5
11/21/2005
73.8
79.5
61.2
64.5
62.2
63.0
11/22/2005
75.5
80.5
61.4
65.9
60.6
61.8
11/23/2005
69.6
75.4
57.7
60.9
61.8
62.7
11/24/2005
67.8
72.5
57.6
60.6
60.2
62.3
11125/2005
74.3
82.4
61.4
70.9
56.6
57.5
11/26/2005
71.4
82.2
58.8
72.0
56.0
57.1
.11/27/2005
66.8
75.6
58.1
62.5
.
61.9
.64.6
11/28/2005
69
1
73
4
59
1
61
8
63
4
3
:41/29/2005
66.0
8.0
53.9
58.3
59:3
:11/30/2005
62.0
67.4
51.2
53.9
55.6
56.3
9JOESR1O11
9JOESR1O21
9JOESR1O31
29
Discharge
Temp
J29
Inlet
Temp
155
Water
Temp
DATE
AVERAGE
MAXIMUM
AVERAGE
MAXIMUM
AVERAGE
MAXIMUM
10/1/2005
10/2/2005
10)3/2005
10/4/2005
10/5/2005
10/6/2005
10/7/2005
10/8/2005
10/9/2005
10/10/2005
:10/11/2005
10/12/2005
10/13/2005
10/14/2005
10/15/2005
10/16/2005
10/17/2005
10/18/2005
10/19/2005
10/20/2005
10/21/2005
10/22/2005
10/23/2005
10/24/2005
10/25/2005
10/26/2005
10/27/2005
10/28/2005
10/29/2005
10/30/2005
10/31/2005
77.8
79.2
81.2
86.7
85.7
90.8
85.8
88.9
89.4
91.8
86.9
89.3
83.9
86.4
81.8
83.9
77.6
82.0
82.0
86.0
84.0
86.5
86.2
89.4
86.0
89.9
86.9
93.4
85.3
89.4
84.1
92.1
85.0
90.3
85.2
89.5
83.4
87.1
79.1
83.3
79.1
84.1
78.2
80.0
75.7
78.0
75.7
81.2
77.3
81.2
76.9
81.1
81.5
776
841
78.7
81.2
73.8
77.2
75.3
75.3
70.7
72.3
73.9
74.1
75.4
73.8
72.0
69.9
69.5
70.1
71.3
73.2
73.7
74.1
73.2
73.6
73.4
73.6
72.4
70.7
70.6
70.0
68.9
67.9
66.0
64.6
66.i
66.9
67.6
65.6
67.2
72.0
74.3
76.5
75.7
76.1
74.9
73.4
70.5
71.0
71.9
71.9
74.3
76.5
77.3
76.3
77.9
75.0
76.5
74.5
73.0
74.3
70.8
71.0
69.1
68.6
69.5
69.6
•
70.9
729
68.6
67.2
72.8
74.2
76.1
78.9
79.6
75.9
75.9
73.4
73.1
72.0
73.0
75.2
77.3
77.8
78.0
77.3
76.4
76.1
76.5
75.1
73.6
71.6
70.2
70.2
69.7
68.0
•
69.7
•708
69.7
69.3
73.4
75.2
76.9
82.3
80.4
79.8
78.1
74.5
73.6
72.7
74.8
76.1
78.7
78.7
78.7
78.8
77.2
77.1
77.3
76.4
74.5
72.4
70.8
71.0
71.4
69.9
72.6
70.9
71.5
70.1
69.3
9JOESR1O11
9JOESR1
021
9JOESR1
031
29
Discharge
Temp
J29
Inlet
Temp
155
Water
Temp
DATE
AVERAGE
MAXIMUM
AVERAGE
MAXIMUM
AVERAGE
MAXIMUM
9/1/2005
95.9
99.9
85.0
85.9
86.2
87.6
912/2005
91.0
96.9
83.0
84.0
61.0
86.5
9/3/2005
90.0
93.4
83.5
85.5
83.9
85.3
9/4/2005
89.7
92.1
83.2
84.3
84.4
86.0
9/5/2005
86.3
90.0
80.9
81.9
84.8
86.5
9/6/2005
85.8
91.8
81.2
83.5
75.9
84.8
9/7/2005
89.0
91.3
81.7
82.9
84.2
86.4
9/8/2005
92.9
98.7
81.7
82.8
85.4
87.2
9/9/2005
92.4
97.4
81.6
84.1
85.8
87.3
9/10/2005
93.0
98.4
82.8
85.3
85.6
87.3
9/1
1/2005
93.3
97.9
84.0
85.3
85.6
87.2
9/12/2005
94.4
97.8
84.1
84.7
85.6
86.6
9113/2005
94.2
97.1
84.5
85.6
85.3
86.3
9/1
4/2005
94.3
97.0
84.3
85.4
85.4
86.6
9/1
5/2005
92.6
96.2
82.9
84.2
84.9
86.2
9/16/2005
92.1
96.8
80.9
82.2
82.6
83.4
9/17/2005
88.0
91.3
80.0
81.2
83.1
83.9
9/1
8/2005
86.8
89.3
78.8
79.8
82.5
83.2
9119/2005
87.8
92.6
77.0
77.8
80.9
81.8
9/20/2005
89.2
94.9
78.7
81.2
81.8
84.2
9/21/2005
90.2
94.3
79.1
80.3
83.2
84.9
9/22/2005
91.6
95.2
79.8
81.0
83.9
85.5
9/23/2005
88.7
92.3
78.1
79.1
82.2
82.9
9/24/2005
84.9
87.8
79.0
80.6
81.3
82.6
9/25/2005
86.7
92.4
78.3
78.6
81.3
82.4
9/26/2005
88.9
93.1
77.8
79.8
80.8
82.1
.9/27/2005
87.5
94.5
77.7.
•.
80.7
81.0
83.8
91281200
g
86
5
90
4
75
8
76
5
79
2
81
2
9/29/2005
81
9
85
0
74
5
75
5
75
5
76
3
/30/2005.
79.1
:80.6
71.7
73.2
.
74.2
:
76:2
9JOESR1O11
9JOESR1021
9JOESR1O31
29
Discharge
Temp
J29
Inlet
Temp
155
Water
Temp
DATE
AVERAGE
MAXIMUM
AVERAGE
MAXIMUM
AVERAGE
MAXIMUM
8/1/2005
8/2/2005
8/3/2005
8/4/2005
8/5/2
005
8/6/2005
8/7/2005
8/8/2005
8/9/2005
8/10/2005
8/11/2005
8/12/2005
8/13/2005
8/14/2005
8/15/2005
8/16/2005
8/17/2005
8/18/2005
8/1
9/2005
8/20/2005
8/21/2005
8/22/2005
8/23/2005
8/24/2005
8/25/2005
8/26/2005
8/27/2005
8/28/2005
8/29/2005
8/30/2005
8/31/2005
97.0
97.6
101.0
98.5
98.8
97.4
97.7
99.6
98.4
97.4
98.7
97.4
97.0
93.5
93.7
95.3
96.3
96.5
97.5
96.2
94.2
92.3
90.0
91.0
88.2
89.2
90.4
91.8;
91.7’
91.2
91.6.
101.5
102.0
103.3
101.0
102.5
101.6
102.7
103.4
102.6
100.1
101.3
99.9
99.9
97.8
98.1
99.8
99.6
99.9
99.9
99.1
100.2
95.9
93.4
95.5
91.3
90.9
92.6
4.9
9aØ
92.9
95.5
86.2
88.5
87.1
89.1
89.9
91.0
87.7
89.3
88.6
89.9
89.0
90.2
88.6
90.0
89.2
90.5
89.6
91.2
90.3
93.4
89.3
90.6
86.3
88.3
86.1
87.3
84.3
87.3
83.0
84.8
84.9
86.2
85.7
87.1
85.8
86.9
86.5
87.6
85.7
89.2
84.0
86.2
82.4
83.5
80.4
81.4
81.2
82.7
81.0
81.9
82.3
83.1
83.4
:
84.9
849
862
853
869
84.5
85.4
84.8
‘
85.5
89.3
90.7
61.0
90.5
89.1
89.9
88.7
89.8
89.0
90.0
75.9
90.6
89.1
90.7
89.8
91.1
90.3
92.1
91.4
92.9
89.4
92.1
88.2
89.3
87.9
89.2
86.6
88.0
85.5
86.9
87.0
88.9
89.0
90.7
88.6
89.8
88.8
90.0
88.2
89.8
86.5
88.4
85.5
87.5
83.9
85.1
84.0
85.2
84.7
86.3
85.5
86.3
86.4
87.9
.••
88.0
89.3
•
88.7
90.8
:
87.7
89.1
85.5
86.6
9JOESR1O11
9JOESR1O21
9JOESR1O31
29
Discharge
Temp
J29
Inlet
Temp
155
Water
Temp
DATE
AVERAGE
MAXIMUM
AVERAGE
MAXIMUM
AVERAGE
MAXIMUM
7/112005
88.5
92.5
87.1
88.1
87.9
89.6
7/212005
91.3
94.0
85.2
87.3
61.0
87.3
7/3/2005
92.2
95.6
85.1
87.7
87.3
89.1
7/4/2005
92.9
94.8
85.9
87.1
87.5
88.7
7/5/2005
95.5
100.2
86.2
88.9
88.0
89.0
7/6/2005
96.0
101
.7
86.4
88.7
75.9
90.3
7/7/2005
95.1
99.8
85.3
88.6
87.6
88.9
7/8/2005
94.8
99.8
85.0
87.0
87.1
88.6
•
7/9/2005
95.6
101.2
86.6
91.5
88.3
90.0
7/10/2005
97.3
103.2
87.5
90.1
89.2
90.9
7/11/2005
97.2
100.7
87.0
88.8
89.4
90.6
7/12/2005
97.1
100.2
86.5
88.5
88.3
89.9
7/13/2005
98.2
103.1
87.6
90.8
87.7
88.8
7/14/2005
97.5
101.3
86.9
89.0
88.8
90.7
7/15/2005
99.4
102.4
88.2
89.5
90.1
91.0
7/16/2005
97.9
102.1
88.0
89.8
90.8
92.4
7/17/2005
96.2
100.0
88.5
90.8
91.7
92.4
7/18/’2005
91.1
98.2
88.2
89.8
89.7
91.4
7/1
9/2005
89.0
92.2
88.9
90.8
88.0
89.0
7/20/2005
91.0
94.3
88.7
90.2
86.4
87.5
7/21/2005
95.8
99.8
88.6
90.1
87.0
88.5
7/22/2005
93.4
100.1
89.1
90.9
89.4
91.3
7/23/2005
97.4
100.1
89.1
90.3
89.3
90.3
7/24/2005
97.9
101.9
90.3
92.1
89.3
91.3
7/25/2005
91.9
100.2
89.2
89.9
89.1
90.3
7/26/2005
92.5
97.2
90.1
91.6
87.5
89.4
94J
96.6
85.5
:
89.8.
87.0
88.1
7/28/2005’
4
1
98
9
84
1
86
9
84
7
86
4
7/29/2005
939
98
6
84
1
857
85
4
87
0
7/30/2005
V
V
93.2
994
V
85.5
87.6
872
•:
V.
89.3
V
7/31/2O05
V
96.5
V
V
99.8
86.8
87.4
88.4
..
89.8
9JOESR1O11
9JOESR1O21
9JOESR1O31
29
Discharge
Temp
J29
Inlet
Temp
155
Water
Temp
DATE
AVERAGE
MAXIMUM
AVERAGE
MAXIMUM
AVERAGE
MAXIMUM
5/1/2005
67.5.
67.9
65.5
68.7
61.1
62.3
5/2/2005
66.7
67.1
60.7
66.8
61.0
61.3
5/3/2005
64.8
68.2
57.2
59.2
59.7
61.5
5/4/2005
67.5
71.6
59.1
62.4
62.2
63.8
5/5/2005
69.9
73.5
60.7
63.1
64.3
65.9
5/6/2005
71.1
74.5
62.2
63.9
75.9
68.5
5/7/2005
70.9
75.1
63.2
65.4
68.2
70.0
5/8/2005
70.8
75.8
64.4
66.9
69.5
70.2
5/9/2005
74.5
78.6
65.8
67.6
69.9
70.5
5/1
0/2005
72.3
75.2
67.6
69.9
71.7
75.6
5/1
1/2005
73.1
74.9
68.4
69.7
71.8
73.5
5/12/2005
70.3
71.2
65.9
67.2
67.8
69.2
5/13/2005
72.4
76.8
65.7
67.0
67.3
69.9
5/14/2005
73.7
77.6
66.1
67.8
68.2
70.2
5/15/2005
72.7
75.4
66.1
67.1
67.6
69.6
511
6/2005
72.3
76.9
64.7
66.0
66.9
68.9
5/17/2005
72.2
77.7
64.6
66.9
69.1
70.4
5/18/2005
70.5
72.7
65.7
67.5
69.6
70.9
5/19/2005
71.2
72.7
66.3
67.1
69.5
71.0
5/20/2005
71.6
73.2
66.5
67.5
68.1
68.8
5/21/2005
73.4
78.1
66.8
67.4
68.7
69.6
5/22/2005
76.0
79.1
67.0
68.0
69.9
72.6
5/23/2005
77.5
80.5
67.9
69.8
70.3
71.9
5/24/2005
77.2
80.2
68.4
70.2
72.3
74.2
5/25/2005
76.5
79.7
68.8
70.8
72.5
73.8
5/26/2005
78.1
82.3
69.8
72.6
73.5
75.7
5/27/?0Q5
78.4
81.6
70.0
71.8
73.2
74.2
‘
5/28/O0
73
1
77
1
71
2
736
736
744
5/29/2005
71
7
73
9
700
72
1
735
744
5/30/2005
773
832
70
0
722
745
765
5/31/2005
77.1
83.7
71.9
74.6
75.3
76.6
9JOESR1O1I
9JOESR1O21
9JOESR1O3I
29
Discharge
Temp
J29
Inlet
Temp
155
Water
Temp
DATE
AVERAGE
MAXIMUM
AVERAGE
MAXIMUM
AVERAGE
MAXIMUM
711/2004
916
949
787
797
833
863
71212004
90.8
95.4
79.4
80.8
85.4
87.5
7/3/2004
93.3
96.3
80.9
81.9
85.2
86.8
7/4/2004
91.0
94.4
79.2
80.4
81.9
84.3
7/5/2004
91.9
95.8
79.7
81.7
83.1
86.4
7/6/2004
89.5
92.8
78.1
79.2
82.5
84.1
7/7)2004
85.8
89.6
77.5
78.9
80.3
82.8
7)8/2004
86.5
922
77.0
78.6
79.4
81.1
7/9/2004
87.0
90.3
77.8
78.8
81.0
82.7
7/10/2004
85.8
89.2
77.0
78.6
80.7
81.9
7/11/2004
88.8
92,6
78.2
78.9
81.8
83.3
7/12/2004
88.7
91.7
78.8
80.1
83.2
85.7
7/13/2004
92.0
97.7
80.5
82.2
84.4
86.6
7/14/2004
92.3
95.9
79.6
80.6
84.4
86.3
7/15/2004
93.5
96.8
81.9
83.2
85.3
87.1
7/16/2004
94.8
97.5
82.3
82.9
86.5
87.8
7/17/2004
93.0
98.9
81.9
82.7
86.0
87.2
7/18/2004
88.9
91.7
81.8
83.3
85.4
87.3
7/19/2004
89.9
91.9
81.9
83.5
85.5
87.2
7/20/2004
95.6
99.9
83.3
85.0
87.0
88.9
7/21/2004
95.6
97.6
83.5
84.3
88.1
89.2
7/22/2004
94.4
97.1
83.1
84.6
87.0
88.3
7123/2004
93.6
96.3
81.6
83.4
84.9
86.8
7/24/2004
88.2
89.6
81.3
82.4
83.9
85.0
7/25/2004
88.0
90.8
80.1
81.2
82.9
83.9
7/26/2004
90.8
95.4
79.6
80.2
83.2
84.2
7/27/2004
88.9
92.5
79.4
80.7
83.9
85.4
7/28/2004
90.8
96.0
79.3
81.0
84.4
86.9
.i9/2O04
..
94.8
78,8
80.3
,.:4’4
85.1
7/30/2004
89
9
944
79
1
79
7
83
84
3
:7/31/2004
90.4
95.3
80.7
82:7
84.0
:85.8
9JOESR1O11
9JOESR1O21
9JOESR1O31
29
Discharge
Temp
J29
Inlet
Temp
155
Water
Temp
DATE
AVERAGE
MAXIMUM
AVERAGE
MAXIMUM
AVERAGE
MAXIMUM
61112004
75
6
80
3
66
3
674
67
1
68
5
6/2/2004
75.9
80.2
65.7
66.8
67.8
68.4
6/3/2004
79.0
81.7
66.9
67.9
68.6
70.4
6/4/2004
77.6
81.1
67.2
69.0
69.9
71.6
61512004
80.6
83.6
69.3
70.6
71.9
74.0
6/6/2004
81.8
86.1
71.2
72.1
73.9
75.8
6/7/2004
84.6
88.9
72.7
74.6
76.0
78.0
6/8/2004
88.0
91.7
75.7
77.2
79.4
82.0
6/9)2004
88.3
90.8
77.3
78.1
81.9
83.2
6/10/2004
84.2
86.3
75.3
76.9
80.2
82.3
6/11/2004
85.4
87.4
75.9
76.4
78.2
79.3
6/12/2004
84.8
88.8
73.5
75.8
74.1
79.1
6/13/2004
85.0
88.4
72.9
73.6
74.6
75.6
6/14/2004
83.7
86.0
73.4
74.5
74.9
76.2
6/1
5/2004
84.9
88.5
74.7
75.7
75.9
76.8
6/16/2004
86.9
90.8
75.1
75.8
76.6
77.6
6/17/2004
89.0
91.3
75.5
76.3
79.1
81.1
6/18/2004
86.4
90.3
75.7
76.3
79.8
80.9
6/1912004
82.5
83.8
74.7
75.7
77.8
79.3
6/20/2004
81.7
84.2
74.5
75.5
76.7
77.8
6/21/2004
83.5
87.8
73.7
74.6
76.4
77.3
6/22/2004
83.6
88.6
74.0
74.8
76.0
77.6
6/23/2004
84.1
88.8
74.7
75.0
77.1
78.8
6/24/2004
81.7
84.5
73.7
74.3
76.6
77.7
6/25/2004
80.8
84.9
73.7
75.0
76.7
79.1
6/26/2004
84.7
87.1
74.3
75.3
78.5
81.1
6/27/2004
83.8
86.8
74.3
75.1
78.6
80.6
6/8/2004
84
2
1
2
744
75
6
187
80
1
6/2912004
85.6
91.1
75.7
:775
:
797
6/3012004
89.4
‘45
77.1
79.1
81.3
84.7
9JOESRIOI1
9JOESR1O21
9JOESR1031
29
Discharge
Temp
J29
Inlet
Temp
155
Water
Temp
DATE
AVERAGE
MAXIMUM
AVERAGE
MAXIMUM
AVERAGE
MAXIMUM
511/2004
67.8
72.4
63.2
65.0
67.7
69.3
5/2/2004
65.9
67.1
62.5
64.0
64.2
65.6
5/3/2004
70.4
74.0
63.8
66.2
63.5
67.0
5/4/2004
70.5
73.6
63.2
65.2
65.0
67.3
5/5/2004
69.3
72.0
66.4
69.7
66.9
69.8
5/6/2004
70.1
73.6
68.6
71.1
70.1
72.9
5/7/2004
69.3
70.7
68.2
70.2
71.7
72.8
5/8/2004
69.8
73.0
69.0
72.2
70.3
73.8
5/9/2004
71.8
75.4
71.0
74.4
73.8
77.3
5/10/2004
74.8
78.4
73.0
76.3
75.0
76.6
5/11/2004
78.7
83,7
72.3
76.7
77.6
80.7
5/12/2004
83.4
89.8
72.0
74.4
77.8
80.3
5/13/2004
84.7
93.2
72.5
73.6
78.4
80.0
5/14/2004
80.7
83.1
70.7
72.6
72.4
79.3
5/15/2004
76.8
80.5
68.1
69.2
69.0
69.8
5/16/2004
76.3
80.1
67.0
68.5
69.4
71.5
5/17/2004
79.5
84.1
67.3
68.4
70.2
71.6
5/18/2004
76.8
80.4
67.3
68.3
70.5
72.1
5/19/2004
77.6
82.4
67.4
702
69.4
70.6
5/20/2004
81.5
85.5
69.4
70.9
72.2
73.5
5/21/2004
81.5
84.4
70.2
71.0
74.2
75.7
5/22/2004
79.9
82.8
70.8
72.4
73.3
75.7
5/23/2004
79.6
83.3
70.1
72.5
72.4
74.0
5/24/2004
78.4
82.1
68.0
68.9
70.8
71.3
5/25/2004
74.9
79.2
66.9
68.2
69.4
70.4
5/26/2004
73.9
75.5
66.4
67.4
68.8
70.0
5/27/2004
73.5
75.0
66.4
67.3
69.8
71.3
5/28/2004
75.8
79.0
66.4
67.2
69.6
70.4
...5/29-2QQ4
-
74.1
.76.8
:,:,65.7
66.9
68.7
..
5/30/2004
74
3
77
2?
66
4
67
8
67
9
68
9
5/31/2004
73.9
76.0
66.7
67.5
66.8
67.5
9JOESR1O11
9JOESR1O21
9JOESRIO31
29
Discharge
Temp
J29
Inlet
Temp
155
Water
Temp
DATE
AVERAGE
MAXIMUM
AVERAGE
MAXIMUM
AVERAGE
MAXIMUM
•.
.411/2004
68.2
69.6
56.9
58.1
57.0
58.7
•
4/2/2004
67.3
68.4
56.7
57.7
57.5
59.3
•
4/3/2004
64.8
68.4
56.4
57.7
57.7
59.3
4/4/2004
65.6
67.2
55.0
55.7
56.8
58.4
4/5/2004
66.8
68.6
56.2
57.3
56.9
58.5
4/6/2004
70.1
72.6
59.2
61.2
58.5
61.8
417/2004
67.6
70.3
57.9
59.4
61.1
63.6
4/8/2004
69.2
71.0
59.1
60.6
60.6
62.8
4/9/2004
70.9
73.0
59.7
61.3
60.9
62.5
4/10/2004
72.7
74.5
60.2
61.7
62.4
63.2
4/11/2004
69.5
72.1
59.1
61.3
62.8
64.6
4/12/2004
71.6
73.3
58.1
59.4
60.9
63.1
•
4/13/2004
70.4
74.1
57.4
59.2
59.8
60.7
4/14/2004
71.0
75.9
59.1
64.7
62.9
66.5
4/15/2004
75.3
80.1
63.2
66.8
66.7
68.2
4/16/2004
75.0
77.6
63.4
65.5
68.6
71.5
4/17/2004
77.4
79.8
65.3
67.3
72.1
75.8
4/18/2004
78.7
80.4
66.8
70.0
72.5
74.8
4/19/2004
74.8
78.1
66.8
69.9
71.1
72.5
4/20/2004
75.9
77.8
65.1
66.6
70.4
71.7
4/21/2004
67.8
72.5
64.8
65.9
68.3
70.8
4/22/2004
67.8
69.0
62.7
63.8
66.4
67.7
4/23/2004
68.4
70.6
63.8
65.2
64.4
65.8
4/24/2004
68.9
69.9
64.1
64.8
64.6
65.9
4/25/2004
68.5
71.5
62.7
63.7
63.6
64.0
4/26/2004
70.8
73.2
62.8
64.0
62.8
64.5
4/27/2004
71.2
74.6
62.9
64.7
64.4
65.6
4/28/2004
72.7
76.1
64.1
66.0
66.0
68.0
4/29/2004
73.5
77.1
65.1
66.4
...
66.7
68.4
413P12004
73
2
76
0
654
66
7
69
0
70
1
9JOESR1O11
9JOESR1O21
29
Discharge
Temp
J29
Inlet
Temp
155
Water
Temp
DATE
AVERAGE
MAXIMUM
AVERAGE
MAXIMUM
AVERAGE
MAXIMUM
3/1/2004
57.6
58.6
52.0
53.0
53.5
54.5
3/2/2004
61.8
65.2
52.3
53.1
53.6
53.9
3/3/2004
60.5
63.5
51.8
52.7
53.7
54.9
3/4/2004
62.1
65.0
53.1
54.5
54.0
54.5
3/5/2004
62.4
64.3
52.6
53.6
52.8
54.1
3/6/2004
59.3
61.4
49.5
51.0
51.0
51.8
3/7/2004
56.6
59.2
47.8
49.3
49.0
50.1
3/8/2004
57.1
59.0
46.7
47.2
47.7
48.1
3/9/2004
57.8
61.5
47.2
49.8
48.1
48.2
3/10/2004
56.4
60.5
47.6
49.3
48.5
49.0
3/11/2004
54.9
59.1
46.8
48.7
48.4
49.0
3/12/2004
54.2
57.0
44.4
47.2
46.6
47.3
3/13/2004
57.6
61.0
47.9
48.9
46.9
47.6
3/14/2004
56.4
59.7
48.4
49.4
48.9
49.7
3/15/2004
57.2
59.5
47.3
49.7
49.3
49.6
3/16/2004
55.8
.
57.5
45.3
46.2
49.2
63.2
3/17/2004
56.4
60.2
47.4
48.5
47.8
48.5
3/18/2004
60.4
61.3
492
50.8
49.3
50.6
3/19/2004
52.4
56.4
48.8
50.7
51.2
52.9
3/20/2004
57.2
58.8
52.0
54.1
51.9
54.0
3/21/2004
55.1
57.6
49.4
51.0
51.6
53.3
3/22/2004
55.5
57.7
50.7
52.5
51.1
52.5
3/23/2004
60.3
65.3
53.9
56.0
52.4
54.9
3/24/2004
62.6
66.4
55.1
55.9
54.8
57.2
3/25/2004
61.6
63.8
55.1
56.6
56.5
57.1
3/26/2004
62.7
63.8
561
58.0
57.2
58.3
3/27/2004
62.5
63.8
57.4
58.9
58.2
59.0
•
3/28/2Q04
63.8
64.4
59.2
60.1
59.1
60.7
3/29/2004
3
3
64
58
7
59
6
58
9
60
3
•
3/3iJ7OO4
63.7
643
..
58.8
69.9
58.3
3/31/2004
66.6
69.6
56:4
58.1
56.8
57.8
11/2)2003
11/3/2003
11/4/2003
11/5/2003
11/6/2003
11/7/2003
11/8/2003
11/9/2003
11/10/2003
11/11/2003
11/12/2003
11/13/2003
11/14/2003
11/15/2003
11/16/2003
11/17/2003
11/18/2003
11/19/2003
11/20/2003
11/21/2003
11/22/2003
11/23/2003
11/24/2003
11/25/2003
11/26/2003
11/27/2003
11/28/2003
11
/29/2Q03
1
1
30/2003
73.6
76.4
71.7
75.6
75.3
76.8
75.5
78.5
72.2
74.4
70.4
73.0
6T8
71.5
65.4
66.8
65.2
69.0
66.9
71.8
66.4
69.6
69.5
71.5
67.2
70.8
67.2
68.4
69.0
72.0
67.8
72.7
69.1
72.1
67.8
69.4
67.9
69.8
67:9
68.8
68.0
69.3
67.7
69.1
67.0
70.5
66.7
68.2
64.8
65.9
61.4
63.8
62.4
63.9
60.4
63.2
;58.4
.62.5
9.6
68.8
69.5
68.1
69.7
64.8
66.3
64.7
65.7
63.5
65.5
60.3
61.3
58.4
60.1
57.6
58.0
56.5
58.0
57.7
59.2
58.6
60.5
60.5
61.5
59.2
60.8
57.2
60.5
59.7
60.7
59.0
61.1
62.5
64.2
61.0
65.5
57.8
58.4
56.7
57.8
57.4
58.1
57.9
59.2
58.7
60.0
54.7
59.5
52.6
53.1
53.4
55.0
54.8
55.8
52.5.
54.3
52.1
52.8
:i
9JOESR1
011
9JOESR1
021
9JOESRI
031
29
Discharge
Temp
J29
Inlet
Temp
155
Water
Temp
DATE
AVERAGE
MAXIMUM
AVERAGE
MAXIMUM
AVERAGE
MAXIMUM
63.8
63.6
61.7
62.4
60.2
58.3
56.6
52.7
54.6
55.4
55.6
56.7
55.6
53.9
56.7
57.0
57.4
58.5
57.1
55.5
55.1
55.1
57.0
54.1
51.7
50.4
51.5
50.2
49.2
VVQ9
.
65.1
64.7
62.5
64.1
63.0
59.1
57.6
55.4
55.6
57.8
58.3
58.4
57.5
55.3
59.5
62.9
59.0
60.3
59.9
56.0
56.0
55.9
58.1
56.3
52.6
51.8
53.0
53.0
51.8
52.0
9JOESR1O11
9JOESR1O21
9JOESR1O31
29
Discharge
Temp
J29
Inlet
Temp
155
Water
Temp
DATE
AVERAGE
MAXIMUM
AVERAGE
MAXIMUM
AVERAGE
MAXIMUM
7i7O
777
822
666
696
688
696
10/2/2003
80.3
85.8
68.5
74.1
69.5
70.3
10/3/2003
77.8
81.6
65.6
68.3
69.9
70.5
10/4/2003
76.8
80.0
66.3
68.6
70.1
70.6
10/5/2003
75.3
77.6
65.5
67.2
69.6
70.6
10/6/2003
77.2
80.8
65.9
68.9
70.7
71.6
10/7/2003
78.8
83.0
67.3
69.8
70.8
71.9
1018/2003
76.7
80.9
69.6
73.2
72.9
74.6
10/9/2003
75.8
79.5
68.2
71.4
73.9
74.3
10/10/2003
75.3
78.5
68.5
72.0
74.5
75.6
10/11/2003
75.5
78.3
67.0
69.8
74.5
75.2
10/12/2003
75.4
78.7
67.4
70.4
73.2
73.9
10/13/2003
81.6
87.4
69.1
729
71.3
73.0
10/14/2003
80.8
83.7
67.8
70.2
71.6
74.4
10/15/2003
79.6
83.1
68.3
70.2
70.4
70.9
10/16/2003
72.8
74.4
65.7
67.5
71.5
73.5
10/17/2003
71.7
73.3
65.4
66.8
69.4
71.2
10/18/2003
71.6
73.8
65.0
66.7
69.2
69.9
10/19/2003
73.1
75.6
66.8
68.4
69.2
69.9
10/20/2003
76.9
79.8
66.6
68.4
70.4
71.3
10/21/2003
77.9
82.1
66.7
68.6
70.6
.71.1
10/22/2003
77.9
85.6
66.9
72.2
70.3
70.8
10/23/2003
78.1
83.1
67.5
72.1
70.4
71.2
10/24/2003
77.4
79.7
65.1
66.2
71.1
71.9
10/25/2003
75.9
79.5
66.2
67.6
70.8
71.9
10/26/2003
73.5
75.9
64.2
65.9
68.5
69.6
10/27/2003
.,.744
768
..
629
651
66
686
1d/28/2o3
74
4
7*1
6
8
652
66
O
1O/29/20O3
75.9
-78.1
63.0
:.648
65.1
65.7
10/3012003
77.5
80.2
64.3
67.2
65.0
66.1
10/31/2003
75.6
79.6
64.5
67.0
67.7
68.7
r
9JOESR1O1I
9JOESR1O21
9JOESR1O31
29
Discharge
Temp
J29
Inlet
Temp
155
Water
Temp
DATE
AVERAGE
MAXIMUM
AVERAGE
MAXIMUM
AVERAGE
MAXIMUM
J?ZQ
88
0
89
8
79
7
81
9
82
1
83
3
9/2/2003
881
91.9
77.4
78.4
80.4
80.8
9/3/2003
88.7
92.4
78.1
79.1
80.8
82.0
9/4/2003
88.3
91.5
76.6
77.3
81.1
82.7
9/5/2003
88.0
92.6
76.5
77.9
81.3
83.3
9/6/2003
88.2
91.8
77.0
78.0
82.0
84.3
9/712003
87.8
91.8
77.4
78.5
82.2
83.8
9/8/2003
90.1
95.1
78.3
80.9
84.3
86.0
9/9/2003
91.7
94.5
79.6
80.9
85.1
86.8
9/10/2003
92.1
94.2
80.6
82.1
83.9
84.7
9/11/2003
91.7
94.4
81.4
82.5
85.5
86.9
9/12/2003
913
95.1
81.2
81.9
84.2
85.1
9/13/2003
93.6
97.2
81.5
82.2
83.9
84.8
9/14/2003
91.1
95.5
81.6
83.1
84.6
86.4
9/15/2003
90.1
93.1
79.0
80.9
82.3
84.3
9/16/2003
88.9
91.9
78.2
78.9
82.3
83.1
9/17/2003
88.4
92.7
78.6
80.8
82.1
83.3
9/18/2003
90.7
94.3
78.2
79.7
83.1
85.2
9/19/2003
87.6
90.7
77.3
78.2
81.8
83.3
9/20/2003
87.0
90.0
76.8
78.0
79.7
81.5
9/21/2003
84.6
87.0
76.2
77.4
80.4
82.0
9/22/2003
87.1
89.7
75.9
76.5
78.7
79.7
9/23/2003
87.0
90.4
75.3
76.4
78.1
79.2
9/24/2003
85.1
88.2
73.6
74.4
77.7
78.6
9/25/2003
83.3
86.7
72.2
73.4
77.5
78.8
9/26/2003
79.8
81.2
72.2
73.3
76.7
78.6
‘2T’
2003
77
0
2
70
4
71
6
73
7
75
5
8/203
74
5
75O
‘
68b
69
3
71
2
71
9
9/29/2003
78
1
81
4
67
5
68
3
69
4
70
1
9/30/2003
78.3
81.6
67.5
70.7
69.4
10.2
.
9JOESR1O11
—
9JOESRIO21
9JOESR1O31
29
Discharge
Temp
J29
!nlet
Temp
155
Water
Temp
DATE
AVERAGE
MAXIMUM
AVERAGE
MAXIMUM
AVERAGE
MAXIMUM
91
1
94
9
77
9
80
1
82
0
83
0
8/2/2003
90.0
93.4
77.7
78.7
82.9
84.2
8/3/2003
89.5
92.9
78.1
79.5
82.0
82.9
8/4/2003
89.9
91.6
76.2
78.3
80.2
8t0
8/5/2003
90.3
93.8
78.7
79.3
80.5
81.9
8/6/2003
86.9
93.0
78.5
79.9
82.2
82.8
8/7/2003
91.8
93.9
77.8
79.0
81.7
82.5
8/8/2003
92.1
94.2
78.6
79.2
82.2
82.7
8/9/2003
89.6
94.6
78.5
79.4
82.1
82.4
8/1
0/2003
90.3
945
78.6
79.4
82.2
82.5
8/1
1/2003
90.7
94.2
79.2
79.9
82.7
83.3
8/12/2003
91.4
93.9
78.6
79.6
82.4
82.8
8/1
3/2003
91.9
94.8
78.6
79.7
82.4
83.2
8/14/2003
93.3
96.2
80.4
81.9
84.0
84.6
8/15/2003
95.6
98.4
82.0
83.5
86.4
87.8
8/1
6/2003
97.3
99.3
83.3
85.1
87.6
88.9
8/17/2003
97.9
100.5
84.3
85.4
87.7
88.9
8/18/2003
96.7
100.4
84.7
86.3
86.8
87.4
8/19/2003
97.0
98.5
83.9
84.9
86.7
87.9
8/20/2003
98.3
99.4
84.9
85.4
87.7
88.3
8/21/2003
97.8
100.8
85.2
86.4
88.3
89.1
8/22/2003
98.2
101.1
85.2
86.1
88.5
89.0
8/23/2003
96.5
101.8
84.6
85.8
87.3
88.0
8/24/2003
95.1
99.4
85.0
86.5
86.8
87.8
8/25/2003
98.0
100.0
84.3
85.6
86.6
88.3
8/26/2003
98.9
100.9
85.4
86.5
88.2
89.2
.
8/27/2003
98.1
86.2
87.t
893
90.0
8/28/23
96
3
9
4
‘
85
7
86
8
4
89
2
,
8/29/2Q03
95.6
1005
84.7
86.2
87.5
87.9
8/30/2003
95.1
96.8
83.5
85.1
85.8
86.6
8/3112003
91.7
94.7
834
85.1
84.5
86.4
I-
9JOESRIO11
9JOESRIO2I
9JOESR1
031
29
Discharge
Temp
J29
Inlet
Temp
155
Water
Temp
DATE
AVERAGE
MAXIMUM
AVERAGE
MAXIMUM
AVERAGE
MAXIMUM
74
8
76
0
66
0
66
7
69
6
70
1
6/212003
76.9
79.3
66.9
67.6
69.2
70.0
6/3/2003
.75.9
79.3
66.4
67.3
69.1
70.2
6/4/2003
76.6
79.5
65.6
66.4
69.5
71.4
6/5/2003
79.5
83.8
67.5
69.1
71.5
73.3
6/6/2003
79.9
83.3
67.7
68.3
72.9
74.4
617/2003
78.1
80.4
69.0
70.9
73.5
76.3
6/8/2003
78.4
80.2
69.7
70.8
74.2
75.6
6/9/2003
82.3
87.0
70.5
72.7
72.3
74.6
6/10/2003
83.9
88.4
71.4
73.2
76.0
79.0
6/11/2003
84.6
87.8
71.7
72.8
75.6
78.7
6/12/2003
85.3
89.2
72.3
73.4
77.1
77.8
6/13/2003
86.1
89.0
72.7
73.6
78.1
80.0
6/14/2003
85.5
90.6
73.7
75.5
79.1
81.0
6/15/2003
82.2
84.8
74.5
76.5
79.6
81.8
6/16/2003
88.5
92.7
75.1
76.8
78.9
80.9
6/17/2003
89.6
93.5
76.4
77.9
81.6
83.9
6/1
8/2003
88.3
93.2
77.3
78.2
82.7
.
84.6
6/19/2003
83.1
85.6
74.7
77.2
79.0
82.4
6/20/2003
81.1
84.7
73.2
75.1
77.1
79.1
6/21/2003
86.1
89.2
75.8
76.9
77.6
79.4
.
6/22/2003
86.4
90.0
76.1
77.7
80.1
82.5
6/23/2003
90.6
94.9
76.6
77.8
81.7
83.7
6/24/2003
91.0
95.7
78.5
80.1
83.8
86.6
6/25/2003
93.2
97.8
80.0
83.5
84.4
86.6
6/26/2003
95.5
100.4
81.4
85.8
85.5
87.1
••
7/2OQ3
.
..
9P.T.
;.,.1946
.
.
78.6,
..
81.4
82.6
84.7
6/8120
93
1
956
79
3
824
82
0
83
8
•:
6/29/2003
92.9
...
98.8
80.5
829
82.5
83:2
6/30/2003
89.7
.
92.7
81.1.
831
85.3
.:
:880
9JOESRIO11
9JOESR1O2I
9JOESRIO31
29
Discharge
Temp
J29
Inlet
Temp
155
Water
Temp
DATE
AVERAGE
MAXIMUM
AVERAGE
MAXIMUM
AVERAGE
MAXIMUM
4/2/2003
4/3/2003
4/7/2003
4/6/2003
4/5/2003
4/4/2003
4/8/2003
4/9/2003
4/11/2003
4/10/2003
4/12/2003
4/13/2003
4/14/2003
4/15/2003
4/16/2003
4/17/2003
4/18/2003
4/19/2003
4/20/2003
4/21/2003
V
4/24/2003
4/23/2003
4/22/2003
V
4/25/2003
4/26/2003
4/27/2003
4/28/2003
V
V
V
4129120Q3
V
;4/3O/20O3
—.
—
73.4
72.8
72.3
70.7
68.8
61.7
60.4
59.1
58.2
58.8
59.6
59.1
60.2
66.4
62.5
60.0
60.8
60.5
62.2
68.7
69.6
72.8
70.4
77.7
74.1
72.6
68.8
67.7
V
69.2
69.2
76.0
77.1
76.5
75.3
70.2
65.7
61.3
61.5
61.2
61.5
61.2
62.6
72.5
64.2
64.8
61.8
64.0
62.0
74.4
79.2
72.6
74.4
64.8
72.6
84.1
77.3
76.4
73.4
V
745
VV72.8
58.9
60.7
61.5
60.6
52.2
56.1
49.8
49.6
49.3
51.2
53.3
56.8
56.3
54.9
59.2
61.0
61.9
61.0
61.5
63.6
61.9
67.4
67.6
67.1
66.0
65.3
65.6
63.3
63.4
61.8
51.0
54.8
59.3
62.8
63.1
63.7
62.0
50.5
51.7
52.2
56.6
55.1
58.2
58.5
61.6
63.2
62.0
63.4
62.2
65.0
62.3
69.2
69.1
64.8
67.2
63.7
70.0
72.8
70.2
VVV
62.7
65.7
67.0
63.9
55.3
57.6
51.7
51.7
50.7
53.2
58.3
57.1
55.5
59.7
61.6
62.9
V
61.6
60.7
63.3
61.7
63.0
63.5
63.1
64.9
69.0
65.6
65.4
70.4
71.6
65.5
67.4
67.7
61.2
67.5
57.5
55.5
54.1
51.3
53.3
57.0
58.5
59.7
62.8
64.4
63.6
62.8
61.8
62.8
66.1
66.3
65.9
66.2
63.7
65.7
71.5
70.7
67.3
2.8
9JOESR1OI1
9JOESRIO21
9JOESR1O31
29
Discharge
Temp
J29
Inlet
Temp
155
Water
Temp
DATE
AVERAGE
MAXIMUM
AVERAGE
MAXIMUM
AVERAGE
MAXIMUM
65
6
69
5
52
9
55
3
57
3
58
1
3/2/2003
62.7
66.6
51.1
55.5
57.0
58.0
3/3/2003
63.4
67.0
50.9
55.0
55.2
56.0
•
3/4/2003
59.1
64.0
46.5
49.5
53.8
54.6
3/5/2003
56.2
57.7
44.3
47.7
53.3
54.3
3/6/2003
57.3
65.7
46.9
52.2
51.7
52.5
317/2003
58.6
65.0
47.0
50.3
51.6
52.4
3/8/2003
53.9
55.5
46.1
47.7
54.4
55.8
3/9/2003
49.3
53.3
44.0
45.5
49.9
54.6
3/10/2003
43.9
45.2
42.8
45.2
48.5
49.6
3/11/2003
49.6
56.2
45.2
50.4
47.1
48.4
3/12/2003
54.1
58.9
46.3
49.1
48.8
50.6
3/13/2003
59.1
62.9
45.4
46.5
50.2
52.7
3/14/2003
59.6
62.0
46.2
47.1
52.6
53.6
3/15/2003
59.7
62.4
46.5
47.5
53.2
54.5
3/16/2003
60.0
63.8
47.6
50.0
55.0
56.9
3/17/2003
62.5
66.8
50.1
53.3
56.8
58.2
3/18/2003
63.7
66.5
50.8
53.0
58.6
60.0
3/19/2003
63.8
65.4
51.2
52.2
57.7
59.8
3/20/2003
65.4
68.9
53.3
54.4
56.6
57.5
3/21/2003
67.0
69.3
53.9
54.7
57.9
58.8
3/22/2003
65.6
67.0
52.4
52.7
57.4
58.7
3/23/2003
63.6
67.3
53.2
55.9
57.1
60.8
3/24/2003
68.1
72.4
55.5
58.2
59.5
62.0
3/25/2003
70.6
74.2
57.4
60.0
62.5
65.2
3/26/2003
71.8
75.4
58.9
60.9
63.0
64.5
3/27/2003
72.7
75.7
59.4
61.9
63.3
64.5
3/28/2003
70.6
73.6
58.7
60.2
62.9
4i
3/29/2003
6&7
-
726
56
6
58
5
,
0
5
.
62
4
3/0/2bO3
68
4
b
TOE
55
1
56
6
61
8
64
3
3/31/2003
69;6
72.5
56.9
60.0
61,4
63.1
9JOESR10I1
9JOESR1O21
9JOESR1O31
29
Discharge
Temp
J29
Inlet
Temp
155
Water
Temp
DATE
AVERAGE
MAXIMUM
AVERAGE
MAXIMUM
AVERAGE
MAXIMUM
2/1/2003
57.5
61.2
46,1
49.1
53.6
56.4
2/2/2003
59.6
61.5
47.6
51.7
54.4
56.5
2/3/2003
59.5
65.7
47.3
51.7
53.2
54.6
2/4/2003
57.9
62.3
46.0
53.0
50.2
52.3
2/5/2003
60.9
65.4
47.2
52.0
49.9
51.1
2/6/2003
62.3
67.1
48.9
52.6
49.4
50.4
2/7/2003
58.6
61.8
46.5
50.3
49.4
51.5
2/8/2003
61.3
64.4
48.2
51.0
49.8
51.7
2/9/2003
61.6
65.8
49.2
52,9
47.7
48.6
2/10/2003
61.2
66.3
49.3
53.6
49.1
50.7
2/11/2003
61.1
65.6
48.4
53.5
49.6
51.1
2/12/2003
61.3
66.0
47.5
51.9
47.0
48.4
2/13/2003
61.1
65.8
48.8
52.0
48.4
49.9
2/14/2003
60.6
64.3
48.9
52.0
50.5
51.5
2/15/2003
55.2
63.9
43.9
54.5
50.3
51.0
2/16/2003
52.7
57.0
41.0
45.9
48.6
49.6
2/17/2003
55.7
59.7
42.6
47.7
47.3
48.1
2/18/2003
58.1
65.3
46.0
50.1
47.2
49.1
2/19/2003
61.1
67.8
47.1
51.4
49.8
51.1
2/20/2003
63.8
69.7
50.6
54.4
51.5
52.5
2/21/2003
62.6
68.2
49.8
52.6
53.9
55.6
2/22/2003
59.2
64.2
49.4
53.6
56.6
57.6
2/23/2003
58.0
62.5
48.5
51.6
53.2
55.8
2/24/2003
57.3
60.2
46.1
49.0
49.3
50.7
2/25/2003
61.8
65.9
48.3
51.2
49.1
49.8
2/26/2003
61.9
66.0
49.9
53.3
49.0
51.1
2/27/2003
64.4
66.8
50.7
53.6
52.7
54.5
2/28/2003
65.1
70.9
52.0
55.5
55.6
57.1
9JOESR1O11
9JOESR1O2I
9JOESR1O31
29
Discharge
Temp
J29
Inlet
Temp
155
Water
Temp
DATE
AVERAGE
MAXIMUM
AVERAGE
MAXIMUM
AVERAGE
MAXIMUM
II/?200
566
583
480
518
508
522
1/2/2003
57.7
63.5
46.4
50.2
50.0
50.9
1/3/2003
60.0
65.9
47.5
50.3
49.5
50.4
1/4/2003
60.1
65.2
49.2
53.6
51.3
52.6
1/5/2003
60.2
63.1
50.9
54.3
52.5
53.0
1/6/2003
60.4
64.5
49.3
51.7
53.4
54.8
1/7/2003
61.6
66.8
51.1
55.2
52.8
53.9
1/8/2003
61.7
65.6
50.7
53.9
52.1
53.3
1/9/2003
61.8
64.7
49.1
52.4
52.0
53.0
1/10/2003
63.3
69.1
50.3
54.6
52.0
54.0
1/11/2003
61.5
66.2
53.5
52.7
46.9
49.5
1/12/2003
58.8
64.4
47.1
51.6
48.8
50.2
1/13/2003
62.2
66.5
49.3
53.6
49.4
50.5
1/14/2003
59.9
64.0
49.4
53.5
47.6
48.7
1/15/2003
61.4
65.9
47.3
52.1
49.3
51.1
1/16/2003
62.2
65.0
49.1
52.8
49.8
50.9
1/17/2003
62.9
67.4
48.8
52.3
50.2.
51.1
1/18/2003
62.9
65.9
48.8
51.0
49.0
50.2
1/19/2003
61.7
67.1
48.2
51.5
47.7
49.6
1/20/2003
61.6
67.2
48.6
52.1
48.3
49.4
1/21/2003
63.5
66.7
49.3
51.5
48.7
50.0
1/22/2003
60.4
63.2
47.7
50.3
49.1
50.3
1/23/2003
58.0
62.5
45.4
49.6
48.1
50.0
1/24/2003
58.9
61.6
46.3
49.5
48.0
49.0
.
1/25/2003
59.8
64.1
48.9
51.6
46.9
48.0
1/26/2003
61.5
65.1
48.2
51.3
45.8
47.8
1/27/2003
59.5
62.0
.
46.9
49.2
46.4
48.4
1/28j2OO3
..
61.1
67.3
47.1
51.4
49.3
50.5
1/29/2003
59
0
62
5
-
47
0
50
2
50
6
51
9
1/30/2003
617
660
-.
42
526
526
538
1/31/2003
62.8
67.5
49.9.
53.
.
5j
52.9
9JOESR1O11
9JOESRIO21
9JOESR1O31
29
Discharge
Temp
J29
In
let
Temp
55
Water
Temp
DATE
AVERAGE
MAXIMUM
AVERAGE
MAXIMUM
AVERAGE
MAXIMUM
1/1V2OO2
696
715
600
625
625
637
11/2/2002
67.6
72.4
58.0
59.9
61.0
62.0
11/3/2002
66.9
69.6
58.2
60.2
60.6
61.9
11/4/2002
70.7
75.5
60.5
62.7
60.7
61.6
11/5/2002
70.2
71.7
59.0
61.7
60.4
61.9
11/6/2002
72.9
77.4
61.0
63.2
61.6
62.7
11/7/2002
76.2
79.7
62.7
64.8
61.4
61.9
11/8/2002
71.5
73.9
61.3
62.6
62.4
64.3
11/9/2002
67.5
70.3
61.1
62.8
64.5
65.0
11/10/2002
69.3
70.3
62.7
63.3
64.0
65.0
11/11/2002
682
71.9
60.2
62.6
61.5
62.3
11/12/2002
69.4
72.2
59.5
63.6
61.0
62.5
11/13/2002
68.5
72.0
59.2
61.8
61.5
63.0
11/14/2002
69.4
72.0
60.1
61.0
61.2
61.8
11/15/2002
68.8
72.1
60.2
61.3
62.2
63.5
11/16/2002
69.1
73.8
60.0
62.8
61.7
63.6
11/17/2002
65.1
69.2
56.9
58.9
60.7
62.1
11/18/2002
68.1
71.8
56.7
58.7
61.2
62.3
11/19/2002
65.6
67.6
57.2
59.8
60.0
60.9
11/20/2002
63.6
70.9
58.8
61.0
61.5
62.0
11/21/2002
66.4
70.2
58.5
62.1
59.6
61.8
11/22/2002
63.7
67.0
56.4
57.7
60.4
62.1
11/23/2002
64.3
66.5
56.2
57.9
58.1
61.1
11/24/2002
63.3
68.1
54.3
55.8
57.9
59.2
11/25/2002
65.2
67.3
54.7
55.8
56.6
58.7
11/26/2002
64.3
67.0
53.8
54.9
56.2
56.9
11/27/2002
65.8
71.2
55.4
57.0
56.1
56.8
11/28/2002
65.7
68.3
54.3
57.2
55.3
56.5
..
1.1/29/2Q02
62.3
67.5
52.7
54.3
551
56.7
11/30/2002
62
1
64
4
52
1
54
3’
54
54
5
9JOESR1O11
9JOESR1O21
9JOESR1O31
29
Discharge
Temp
J29
Inlet
Temp
55
Water
Temp
DATE
AVERAGE
MAXIMUM
AVERAGE
MAXIMUM
AVERAGE
MAXIMUM
10/1/02
87.4
91.1
77.5
78.7
81.4
81.9
10/2/02
88.2
91.5
80.2
83.0
81.2
83.7
10/3/02
89.0
90.4
77.3
80.9
80.0
81.2
10/4/02
87.1
89.7
76.8
79.5
80.2
81.7
10/5/02
81.6
85.3
74.5.
76.4
76.8
77.6
10/6/02
78.5
79.6
71.6
72.7
74.3
76.5
10/7/02.
79.5
82.2
69.5
70.2
71.1
72.7
10/8/02
81.0
83.8
70.8
72.8
71.5
72.1
10/9/02
78.9
81.4
71.4
73.3
74.2
77.2
10/10/02
79.7
82.0
72.0
73.5
74.7
76.0
10/11/02
79.3
83.8
71.0
72.9
76.7
80.7
10/12102
81.3
85.2
72.2
73.5
76.2
77.5
10/13/02
79.0
82.7
69.5
71.3
73.2
75.3
10/14/02
.
79.6
83.3
68.9
70.5
71.8
73.8
10/15/02
79.7
84.7
67.6
69.6
70.5
72.4
10/16/02
82.0
85.6
71.5
71.2
70.9
71.6
10/17/02
82.2
84.3
69.6
.70.5
70.3
71.4
10/1
8/02
80.8
83.2
67.7
68.8
69.4
70.2
10/19/02
77.9
83.5
68.2
70.3
70.3
71.2
10/20/02
78.1
82.5
68.0
70.9
70.3
71.0
10/21/02
78.2
80.7
77.0
68.2
70.6
71.6
10/22102
77.7
80.6
80.0
68.1
70.8
72.1
10/23/02
77.6
80.9
81.0
69.6
69.4
71.2
10/24/02
75.7
80.1
82.0
68.3
67.6
68.5
10/25/02
75.6
77.5
83.0
.
66.6
66.9
67.9
10/26/02
74.3
75.7
82.0
65.4
67.7
68.6
10/27/02
72.1
75.4
61.9
63,0
66.2
67.1
10/28/02
73.0
77.1
60.9
63.2
65.5
66.5
10/29/02
71.0.
.
75.3
59.3
61.8
.
.
63.8
64.5
10.(30/92,,
6Q.
740
604
629
640
648
‘
10131/02
700
7a
6t
5
62
0
65
0
66
0
DEC
?J2Q2
S.
—
9JOESRI
011
9JOESR1
021
9JOESR1
031
29
Discharge
Temp
J29
Inlet
Temp
155
Water
Temp
DATE
AVERAGE
MAXIMUM
AVERAGE
MAXIMUM
AVERAGE
MAXIMUM
9/1102
92
0
93
9
81
7
82
7
86
7
88
6
912/02
94.9
99.6
83.0
84.5
85.8
86.9
9/3/02
94.0
97.2
82.4
84.2
85.9
88.1
9/4/02
92.3
94.4
82.2
83.4
86.2
88.2
9/5/02
93.4
95.8
82.9
83.7
85.6
86.5
9/6/02
93.2
95.8
83.1
84.0
86.2
87.3
9/7/02
93.9
96.4
83.4
84.2
86.9
89.2
9/8/02
93.2
95.2
84.7
85.7
88.2
90.5
9/9/02
94.9
96.1
84.7
85.3
88.2
89.5
9/10/02
98.6
103.8
85.9
87.0
89.2
89.7
9/11/02
96.3
101.2
85.1
86.7
86.9
88.4
9/12/02
96.0
100.5
84.1
86.1
86.2
87.9
9/13/02
95.6
100.3
83.6
85.2
87.2
88.7
9/14/02
92.3
98.0
84.6
86.5
87.8
88.7
9/15/02
89.0
93.8
83.0
84.2
84.1
86.8
9/16/02
88.7
96.2
71.5
83.6
81.9
82.5
9/17/02
93.2
97.2
81.3
82.8
82.0
84.6
9/18/02
96.4
100.8
83.0
84.5
85.8
87.4
9/19/02
96.6
98.7
82.2
83.2
86.3
87.9
9/20102
92.8
97.0
81.8
83.4
84.8
87.7
9/21/02
90.1
94.2
77.0
81.3
82.6
83.8
9/22/02
86.1
87.9
80.0
79.3
81.1
82.6
9/23/02
84.8
86.1
81.0
78.4
78.7
80.2
9/24/02
84.3
87.2
82.0
75.9
77.9
78.4
9/25/02
86.7
91.8
83.0
77.2
77.9
79.1
9/26/02
87.8
91.2
82.0
77.3
78.4
79.6
9/27/02
87.5
90.9
77.2
79.2
80.4
81.4
9/28/02
86.9
89.7
77.4
79.0
80.2
81.6
:
9/29/02
88.9
94.4
77.7
79.3
81.9..
82.7
--
SF30102
899
774
77
l3
822
29
Discharge
Temp
J29
Inlet
Temp
155
Water
Temp
DATE
AVERAGE
MAXiMUM
AVERAGE
MAXIMUM
AVERAGE
MAXIMUM
2I1/02
630
669
51
1
526
51
1
532
2/2/02
58.7
62.6
48.1
51.3
51.9
52.7
2/3/02
57.9
62.1
47.8
48.9
49.7
51.2
2/4/02
59.7
63.4
46.2
48.0
47.5
48.8
2/5/02
57.9
61.2.
45.2
46.9
48.4
49.4
2/6/02
60.6
64.9
47.6
49.8
49.9
51.3
2/7/02
58.8
64.2
48.4
49.3
51.0
52.9
2/8/02
50.2
54.5
48.9
50.7
52.3
53.1
2/9/02
50.6
52.0
49.5
51.0
52.1
52.9
2/10/02
49.1
49.7
48.0
48.6
51.3
52.6
2/11/02
49.6
54.0
46.8
47.7
48.1
49.0
2/12/02
56.3
60.6
47.0
48.1
47.6
48.9
2113102
58.2
62.0
47.6
48.8
48.7
50.0
2/14/02
56.4
59.7
47.9
48.8
49.9
50.5
2/15/02
55.2
56.3
47.8
49.0
49.5
50.1
2/1
6/02
48.2
52.6
47.8
48.3
49.8
50.3
2/1
7/02
47.8
48.9
47.3
48.2
48.5
49.2
2/1
8/02
46.5
47.8
46.0
47.2
48.4
48.9
2/19/02
47.6
49.6
47.3
49.1
48.6
49.3
2120/02
51.9
57.7
49.6
50.7
49.3
50.4
2/21/02
56.6
58.4
47.3
49.0
49.2
50.3
2/22/02
57.3
58.8
47.7
48.6
49.4
50.2
2/23/02
57.8
59.0
48.1
48.8
50.7
51.7
2/24/02
59.0
60.5
49.7
51.0
51.7
52.0
2/25/02
58.0
59.6
49.0
49.3
52.4
52.9
2/26/02
58.3
61.4
47.7
48.6
51.3
51.8
2/27/02
60.2
62.2
49.0
49.7
50.1
51.1
2/28/02
58.6
61.5
47.5
48.8
50.3
51.6
:..
-
_f
4
-.
-
—
9JOESR1O11
9JOESRIO31
29
Discharge
Temp
J29
Inlet
Temp
155
Water
Temp
DATE
AVERAGE
MAXIMUM
AVERAGE
MAXIMUM
AVERAGE
MAXIMUM
1/1102
494
513
438
448
423
435
1/2/02
54.2
58.6
44.0
44.8
43.5
44.4
1/3/02
54.4
58.3
43.5
44.4
44.6
46.4
1/4102
54.6
58.4
44.8
47.9
47.1
49.0
1/5/02
53.6
54.5
46.0
47.2
47.6
48.3
1/6/02
54.8
57.5
46.4
47.5
48.9
49.9
1/7/02
53.7
55.4
44.7
47.0
48.2
49.7
1/8/02
54.0
58.5
43.5
45.9
47.5
48.5
1/9/02
56.3
61.7
46.6
48.7
48.6
50.1
1110/02
57.8
61.9
47.9
49.8
50.3
51.0
1/11/02
55.9
57.6
46.7
49.9
51.6
52.9
1/12/02
56.6
60.8
48.4
51.0
51.4
52.7
1/13/02
56.7
60.0
48.0
48.9
50.5
51.5
1/14/02
56.4
60.2
47.0
48.8
51.4
52.4
1/15/02
56.3
60.0
46.4
48.7
49.5
51.1
1/16/02
60.9
65.9
49.9
52.0
49.7
51.0
1/17/02
58.8
61.7
49.9
52.4
50.0
52.8
1/18/02
59.4
62.9
49.8
50.8
51.8
53.0
1/19/02
58.7
61.5
50.1
53.2
51.6
52.3
1/20/02
56.8
59.9
48.1
49.4
51.9
53.3
1/21/02
61.3
64.8
49.8
52.1
51.3
53.2
1/22/02
57.7
61.6
48.3
52.9
51.8
54.0
1/23/02
60.2
67.5
50.7
54.5
54.7
55.1
1/24/02
59.4
64.1
48.8
51.6
53.4
54.9
1/25/02
59.4
62.5
48.7
50.4
54.3
55.8
1/26/02
58.1
62.2
48.3
51.0
52.9
53.7
1/27/02
57.6
60.3
49.0
50.4
53.1
53.9
1/28/02
61.2
64.9
50.4
52.5
53.1
53.8
1/29/02
58.2
60.3
49.6
50.8
53.5
54.1
1/30/02
60
0
633
50’
3
51
8
53
8
54
7
1/31/02
60.6
*
.5
*
50:3
52.4
52.4
53.7
PERMrrrEE
NAMEIADDF1ESS (Indud
If DIffer,,t)
NATIONAL
POLLUTANT
DISCHARGE
ELIMINATION
SYSTEM
(NPDES)
N
DISCHARGE
MONITORING
REPORT DMA)
ADDR
(2-15)
1L000221
6
PERMIT
NUMSER
MONITORING
PERIOD
MO
DAY
YEAR
MO
DAY
10
01
TO
05
10
31
(22-23)
(24-251
(25-27)
I28-
(30-31)
MIDWEST
GENERATION,
LLC-
JOLIET
9
440 SOUTH
LASALLE,
SUITE
3500
CHIAGO,
IL 60605
FP.CIUTYLOCATION
JOUET,
MIDWEST
IL 60436
GENERATION,
LLC-
JOLIET
9
I
F
FROMI
(20-211
QJ
PARAMETER
13
C.44
OnNI
QUANTITY
OR LOADING
(4 cwa
o,oy
QUANTITY
OR
CONCENTRATION
-
-
135-37)
(45-53)
)54-6I)
(35-45)
(46-53)
(54-67)
AVERAGE
MAXIMUM
UNITS
MINIMUM
AVERAGE
MAXIMUM
TEMPERATURE,
WATER
SAMPLE
*32*
- -
DEG.
FAHRENHEIT
MEASUREMENT
00011 1 0
0
*5****
**
*****,
REPOFT
IaE!?OTRJ
EFFLUENT
GROSS
VALUE
REQLIREMEN1
r-
ç
MOAVG
/
NOsMAX
FLOW,
IN CONDUIT
OR
SALE
327
459
‘03’
******
THRU
TREATMENT
PLANT
MEASUREMENT
50050
1
0
0
MOD
.*****
EFFLUENTGROSS
VALUE
RlREI1ENT
6AA’G
‘ DALYrAX
.
1
CHLORINE,
TOTAL
SAMPLE
RESIDUAL
MEASUREMENT
(
26
)
-
50060 1 0
0
“--
*5***
r
,l.****If
-
_-:
- *****1
.*****3
-:
-
.
EFFLUENTGROSS
VALUE
LBS/DY
-
DAILyMA)
CHLORINATION
FREQ.
SAMPLE
*****
******
****
******
MEASUREMENT
78738
1
0
0
i-*’
****
EFFLUENT
GROSS VALUE
E9P41E1I
-
.
*-*.***:
--q:
F
)(MIM1J
CLORINATON
SAMPLE
**.*
******
******
******
DURATION
MEASUREMENT
-.
78739
1 0
0
9Mj5):’,-s
44
--
-
-
‘-
-
‘-
EFFLUENT
GROSS VALUE
REU1EI
4.
/-4
))44.
CHLORINE
USAGE
SAMPLE
‘26’
****8*
MEASUREMENT
“
V -
81400
1 0 1
-
LBS/DY
-44:-
,
-
EFFLUENT GROSS
VALUE
RE
D11YMAX
(-
-
TEMPERATURE,
WATER
SAMPLE
823
DEG. FAHRENHEIT
MEASUREMENT
00011 601
__,_4
If
J
-,
-
4
DOWNSTREAM MONITOR
4
-
(
1
4
Q
I-:
TELEPHONE
IINF05MA170NSV8INrTIDHEr1N
4
3Nb54SEO05
IV I
v0PNc5EINM1D02.3
MMEO4*m.v
I*ESPONI1U2
F0t05tM48oThE12t0RMA11ON.
I
enlE8SThS
SL
F0*3*M1ON
ST*0
V
-
-
AccuR2TSnlDcoManTt. I AM
*WASETh*tTh*IILAflSIOMWICI8T
POMLTIEL FOl7*UDId1TONGFMIE
SIGNATUREOFPRINCIPALEXECUTIVE4
‘“““
‘‘“
AnFNT
Mike_Hanrahan,_Station_Director
lain.
I$n148,,I*neS.Mnm.yfla,**,.flWIoSla.300.nd,
TYPEDORPRINTED
*AM*4St*aJ
COMMENTS AND EXPLaNATION OF
ANY VIOLATIONS
(Ftelemnce all attachments bere)
V
8
Downstream Monitor:
48.75
excursion
hours used year
to
date,
126.25
excursion
hours
remaining.
Presently
no
chemical
treatment is being
used, therefore
there is no,Chlorine
,---
©W1-\
ws
(17.19)
MAJOR
I—
001
0
(SUBRO2)
DISCHARGE
NUMBER
F
- FINAL
CONDENSER COOLING
EFFLUENT
*28
NO
DISCHARGE
- 1
-NTE: Read
NAAIETIILE
PRINCIPAL
EXECUTIVE
OFFICER
Previous editions may
be
used
(REPLACES
EPA FORM
1-40
WHICH MAY
NOT E
USED)
-
PERMITTEE NAME/ADDRESS
NATIONAL
POLLUTANT
DISCHARGE
ELIMINATION
SYSTEM
(NPDES)
NAME
DISCHARGE
MONITORING
REPORT
(DMR)
MIDWEST
GENERATION,LLC-JOLIET
ADDRESS
1L0064254
I
001
0
Major
440
SOUTH
LASALLE,
SUITE
3500
I
PERMIT
NUMBER__i
DISCHARGE
NUMBER
j
02
CHICAGO
IL
60605
FACILITY
I
MONITORING
PERIOD
LOCATION
MIDWEST
GENERATION,LLC-JOLIET
FROM
I
MO-DAY-YEAR
I
I
MO-DAY-YEAR
EFFLUENT
CONDENSER
COOLING
JOLIET
IL
60436
1
06-01-2007
TO
08-31-2007
***
No
Discharge
QUANTITY
OR
LOADING
QUANTITY
OR
CONCENTRATION
PARAMETER
AVERAGE
MAXIMUM
UNITS
MINIMUM
AVERAGE
MAXIMUM
UNITS
TEMPERATURE,
WATER
DEG.
SAMPLE
*****
00011
FAHRENHEIT
6
MEASUREMEN
.“
-
91
6
(15)
..-..
—..
DEG.F
DOWNSTREAM
MONITOR
REQUIREMENT
—
* ***
93 MO
MAX
NO
DATA:
CODE
DESCRIPTION
COMMENTS:
TEMPERATURE,EXCURSION
LENGTH
OF
MEASUREMENSAMPLE
0.75
*****
*****
45600
6
HcUS/
*
—
.•-_-
•,
..,..
-. ‘.
,
DOWNSTREAM
MONITOR
REQLflREMENT
II0
MONTH
NO DATA: CODE
DESCRIPTION
COMMENTS:
TREATMENT
FLOW,
IN CONDUIT
PLANT
OR
THRU
MEASUREMEN
SAMPLE
1079
1400
*****
(03)
50050
1
-
.
,—-
--
-,..-
MGD
-.., --
.
•.---.-
-
EFFLUENT
GROSS
VALUE
REQUIREMENT
3QDA
AVG
gAL?
****
*
*
NO
DATA:
CODE
IDESCRI!!
COMMENTS:
CHLORINE,
TOTAL
RESIDUAL
MEASUREMENSAMPLE
I
I
(26)
08
(19)
50060
1
i.--
•-•‘-
.—-.-,
. 1
LBS)DY
.
.
.
-
-
MG/L
EFFLUENT
GROSS VALUE
REQUIREMENT
j
* *
—
02
DAILY
MX
NO
DATA:
CODE
DESCRIPTION
COMMENTS:
IEPA
eDMR
System.
018)
L
1L0064254
PERMFr
NUMBER
0— S —
(17-IS)
MAJOR.
001
0
(SUBR02).
DISCHARGE
NUMBER
F - rINAL
____________
CONDEN
SEA
CPOLIN
____________
EFFLUENT
YEAR
MO
DAY
°
NO
DJSCHAR3E
(26-27)
(2649)
(30-31)
NOTE:
Road
MONITORtNG
PERIOD
____________
YEAR
MO
DAY
_______________________
05
08
01
p0-01)
(2043)
4-s9(
TO[5
-
IOWE3i
PARAMETER
(3
CSOriy(
QUANTIn
OR
LOADING
(4
CC
Orty(
QUANTITY
OR
CONCENTRATION
ns-37)
(46-03)
(50-6))
(39-40)
(4003)
•
(044))
AVERAGE
MAXtMUM
UNITS
MIN(WLIM
AVERAGE
MAXIMUM
TEMPEAATUAE
DEG
FAHRENHEIT
WATEFI
MEASUREMENTSAMPLE
******
******
* **
*
****
I
9 1
183 4
00011
1
0
0
“
****
*‘fe**
fEPORT
‘
‘
‘iEIQAT
k
EFFLUENT
GROSS
VALUE
fi€fl}Fk*NT
.o
AVQ
MO
MM
7
TEMPEAATUAE
WATEA
SAMPLE
*0*
DEG FAHAENHEIT
MEASUREMENT
S2 9
0001
1
6 0
1
FØLMW
(I
*n%*
W0**t%
93
t
DOWNSTAEAM
MONITOFi
flWU’tEM1V
<
MONTHtVMAX
TEMPERATUAE
LENGTH
SAMPLE
18
75
‘82
°
**
9flfl
OF
EXCURSION
MEASUREMENT
\
/
45600
6 0 1
fFiMtt
REPORT
4
E
HR/MO
**%tw
DOWNSTREAM MONITOR
MP
x
MOTOTIL
FLOW IN
CONDUIT
OR
SAMPLE
1089
1094
‘03’
THRU
TREATMENT
PLANT
MEASUREMENT
“
1
50050
EFFLUENT
1
0
0
GROSS
VALUE
REOt{BEOt#
)
PERMCt’
3QAAVS
1!
RtPQWF
(
DALYP4A)
RttoBT
>
MOD
CHLORINE
TOTAL
SAMPLE
**** *
RESIDUAL
MEASUREMENT
‘26’
“
*****C
o
I flfl
:
e
4
4ç
n0n
—
0-45*4
fl4-
/
LBS/DY
2
‘
EFFLUENT
GROSS
VALUE
.t)
EA1LY
MAX
CHLORINATION FREQ
SAMPLE
******
*v**
**
***
*****
MEASUREMENT
--
3
-
:.-.::..:-:R):)<-
78738
100
***
EFFLUENT
GROSS
VALUE
EaUJEI#
MAXIMUM
CHLORINATION
SAMPLE
***ne
fr0
*
**
4*0*
*
2O
DURATION
MEASUREMENT
78739
1 0
0
ØSJ
4*%**q
*
**4*5*
A****
3EPOAT
EFFLUENT
GROSS
VALUE
R50U)REMEJV
>
DAILYM
NAMEITITLE
PRINCIPAL
EXECUTiVE
OFFICER
I000TFYUCERPEM*LV700
1*4*04*1
IOSWPEreOr*l*LY€X4*ir*OMc4*AF.901000104T4€
‘I
‘
ci.r—
TELEPHONE
• ,F0c940T0N&a*irlEO
TCvcftflceoW200MftN00600F
1140*0 1.VWW*L8
IAMCDCTEIV
I
j,’—”
-
-
-
- 00*P4*4*91SFOAOSTANNOTT40
r*OrILATCft
ieaewnsslseno
1*0014670*6
7111*.
I
- -
I A ‘P
ii
,,
-
-
500TW*01*nc
0097110*0
Ifl4*W1*E
114*1
1**1102Ft
60900401TP0591119109
*09*lrTr,0
7104*0
—
to-i
61
non
i ai ian,
OLaLIOi I
LII
Wt’L*J)
- 1*001*0*010 IJQS0N*71*POS*9L77100 716*0009716600940*7.
SEE
1911100.1000040400
SM
SIGNATURE
OF
PRINCIPAL
EXECUTIVE
-.
r
IA-i
-
“
TYPED
OR PRINTED
SI9nO09rn0*.m.yAp0$I0*w4*n9*mfl*,-.4l00lSE..19
OFFICER OR
AUTHORIZED
AGENT
NC
COMMENTS
AND
EXPLANATION
OF ANY
1OLATIONS
(Reterenco
all
attachments
here)
*1
(mit of
0 05 due
to use of Sodium
Bromide
Downstresm
Monitor
48.75
exoursion
hours
used
year
to
date,
12625
excursion
hours
remaining.
Attachment
A
(OischargeTemeratures)
from Jotiet
Unit 7
& 8
discharge
(001)
PERMrFrEE
NAMSAODRESS
(Include
FacillryNamotccetlon
It DIMElmer)
NATIONAL
POLLUTANT
DIScHARGe
ELIMINATION
SYETEM
(I/FOES)
NAME
MIDWEST
GENERATION, LLC-
JOLIET
29
DISCHARGE
pAoNrroRwfG
REPORT (DM5)
ADDRESS
440
SOUTH
LASALLE,
SUITE
3500
CHIAGO,
IL
60605
FACILI1V
MIDWEST
GENERATION,
LLC-
JOLIET
29
LocAnoN
JOLIET,
IL
60436
FROI/
EPA Form
3320-1
(oe-95)
Previous
editions
may
be used
(REPLACES
EPA FORM
T40
WHICH MAY
NOT
BE USED)
DR.
PERMEITEE
NAMEIADDRESS
(Inekide
FadllltjrNametocation
if
Different)
NATIONAL
POLLUTANT
DISCHARGE
ELIMINATION
S’rSTEM
(NPOES)
NAME
MIDWEST GENERATION,
LLC-
JOLIET
29
ADDRESS
440
SOUTH
LASALLE,
SUITE
3500
CHIAGO,
IL
60605
FACILITY
MIDWEST
GENERATION
LLC-
JOLIET
29
LOCATION
JOLIET,
IL
60436
MONITORING
PERIOD
(2-16)
IL0064254
PERMIr
NUMBER
YEAR
MO
DAY
YEAR
MO
DAY
01
TO
20-21)
(22-23)
(24-25)
(26471
26-26)
(3041)
DCHARGE
MON)TOR4G
REPORT
(DMA)
:
: - -
________________________________
(17-10)
MAJOR
H
:.
I
001
0
(SUBR
02)
______________________
[9HARGENUMBER
F
- FINAL
_____
____________________________
CONDtNSER
COOLING
______________________________________________
EFFLUENt
***
NODISCHARGE
FROM
_________________________
_________________________
NOTE:
REAd
PARAMETER
)30w40rM
QUANTifYORLOADING
)
40
a
4
O’ly)
QUANTITYORCONCENTRATION
L
•
122371
14643)
10441)
130-42)
(46431
)54611
AVERAGE
MAXIMUM
UN)TS
M)N)MUM
AVERAGE
MAX)MUM
TEMPERATURE
WATER
SAMPLE
DEG
FAHRENHEIT
MEASUREMENT
*
***
* 6*
*
4
*0*
g47
1oa
00011
1
0
0
PE!M}t
*ife*44
<
*4**s
**
**#**4
BtFVRI
‘
FQAT’
EFFLUENT
GROSS
VALUE
Q&M
\
MO
Att
MO
MAX
°
TEMPERATURE
WATER
SAMPLE
8
DEG
FAHRENHEIT
MEASUREMENT
924
0001
1
6
0
1
PERMfl
t
*9S8t
vfl
48**4*
.Ank*
DOWNSTREAM
MONITOR
*URET
v
I?4
-
MONThlY
MM
TEMPERATURE
LENGTH
SAMPLE
2
5
‘82’
.
OF EXCURSION
MEASUREMEFW
9
7
‘
45600
6 0
1
PRMPT
1
PORT
‘
DOWNSTREAM
MONITOR
HR/MO
SRMENT
<
MiflOTAtv
FLOW
IN
CONDUIT OR
SAMPLE
1012
1400
fQ3\
*
4*
******
THRU
TREATMENT
PLANT
MEASUREMENT
“
50050
1
0 0
PaMrv
‘
‘<REPORT
têPoBT
MGD
48k4ft
4
SS
EFFLUENT
GROSS
VALUE
IREM’
o$va
DMLYMAX
CHLORINE
TOTAL
SAMPLE
9.
*
‘26’
*99*6
RESIDUAL
MEASUREMENT
\
I
005
50060
100
W46**
**8fl
r22flMcr
LBS/DY
EFFLUENT GROSS
VALUE
“
CHLORINATION
FREQ
SAMPLE
* ***
****
*
*
**
**v
MEASUREMENT
:.:.c:.
<..
a
:
.
78738
1
00
*
*
IIEPQHT
EFFLUENT
GROSS
VALUE
MAXIML*
CHLORINATION
DURATION
MEASUREMENTSAMPLE
****
*
**
*
0
78739
1
0
0
auft
fl6**
**
RsI’rk.
EFFLUENT
GROSS
VALUE
fiEGUIRME
NAMEf11TLE
PRINCIPAL
EXECUTIVE
OFFICER
IremFflRCEBrNsLTrAWroTIreWpErevravEvMnEQNc89FMAteflvenlnc
\
(2
‘kaN-ø’’-—-
L
TELEPHONE
86600899-5
tfos*ralnMnorepeoArc
006
OBlAIe86
11€ w09-aTCNjeaEvE
BASE509MYNOURY0051089
11*
eveeno
PruotuoLe6009-lAnce
IaUEDCIaV
9186*.
‘
5.
5,
‘,J
....zJ
.1.
Mike
Hanrahan,
Station
Director
,FOPMOTrNO;
S)ONATURE
OF
PR)NC)PAL
EXEOUT)VE
(815)
741-9000
TYPEDORPRINTEC
rovfl,r,n*wnces,,.y5*.*e$,odrr.ncencev60*rm,m&,n.me
OPACERORAUTHORIZEOAGENT
NO.
COMMENTS
AND
EXPLANATION
OP
ANY
IMOLAT)ONS
(Reference
a))
aBscAm
soLo
here)
°Limi)
n005
dUR
to URR
of Sodium
Brom)de
.
Monitor.
30 excursion
hours
used
year
to
date,
145
excursion
hours
remaining
Attachment
A(DisDhargeTemeratures)
from
Joliet
Unit
7 & 8 diSCharge001)iS
attached
EPA
Form
3320-1
(OS-aS)
Previous
editions
rosy
be used
(REPLACES
EPA
FORM
T-40 WHICH
MAY
NOT
BE
USED)
DR’
PERMITEE
NAME/ADDRESS
NAME
MIDWEST GENERATION,LLC-JOLIET
ADDRESS
440
SOUTH
LASALLE, SUITE
3500
CHICAGO
FACILITY
MIDWEST
GENERATION,LLC-JOLIET
LOCATION
JOL
lET
QUANTITY OR
LOADING
QUANTITY OR
CONCENTRATION
PARAMETER
AVERAGE
MAXIMUM
UNITS
MINIMUM
AVERAGE
MAXIMUM
UNITS
TEMPERATURE,
WATER
DEC.
SAMPLE
*****
FAHRENHEIT
MEASUREMEN1
94.7
103.2
(15)
EFFLUENT
GROSS
VALUE
REQLREMENT
- RPDRTMO
REPORTMO
DEG
NO DATA:
CODE
DESCRIPTION
COMMENTS:
TEMPERATURE,
WATER
DEG.
SAMPLE
1•
*****
FAHRENHEIT
MEASUREMEN11
92.4
(15)
00011 6
1.
,..
- .
---
DEG.F
DOWNSTREAM
MONITOR
REQUIREMENTI
-
93
MO MAX
NO
DATA: CODE
DESCRIPTION
COMMENTS:
TEMPERATURE,EXCURSION
LENGTH
OF
MEASUREMENT[SAMPLE
I
29.7 5
82
HcJUS/
DOWNSTREAM
MONITOR
REQREMENTI.
-:‘4
REçgF9
MONTH
—n:-..
-.•
NO
DATA:
CODE
DESCRIPTION
COMMENTS:
FLOW,
IN
CONDUIT OR
THRU
SAMPLE
1
***.*
TREATMENT
PLANT
MEASUREMENIj
1012
1400
(03)
EFFLUENT
GROSS VALUE
REQREMENT
1
o
porn
MGD
** **
*
NO DATA:
CODE
DESCRIPTION
COMMENTS:
IL
60605
IL
60436
NATIONAL
POLLUTANT
DISCHARGE ELIMINATION
SYSTEM
(NPDES)
DISCHARGE
MONITORING
REPORT
(DMR)
1L0064254
001 o_J
PERMIT NUMBER
DISCHARGE NUM
MONITORING
PERIOD
MO-DAY-YEAR
MO-DAY-YEAR
I
FROMI
07-01-2005
TO
07-31-2005
Major
02
CONDENSER
COOLING
EFFLUENT
***
No
Discharge
IEPA
eDMR System
NATIONAL
FOLLUTANr
DISCHARGE
ELIMINA11ON
S\TEM
(NPDES)
-
OBOKARGE
MONITORBIG
REPORT
(OMR)
(2-tel
1L0064254
PERMrr
NUMEEfl
(17-18)
MAJOR
001
0
(SUBR
02)
DISCHARGE
NUMBER
F
- FINAL
____________
CONDENSER
COOLING
_____________
EFFLLJNT
I
I
**
NODISCHARGE
6-27(
(2E89)
3841)
- iOTE:
Read
MONITOHING
PERIOD
_____________
YEAR
MO
DAY
05
06
01
Tor
luof
p041(
(22-23)
(24451
PARAMETER
(30w40r4f
QUANTITY
OR
LOADING
(4GdOrdf
QUANTITY
OR
OONCENTRATION
-
(-G7)
(4643)
(8441(
38-43)
(4643)
(3441)
AVERAGE
MAXIMUM
UNITS
MINIMUM
AVERAGE
MAXIMUM
TEMPERATURE,
WATER
SAMPLE
:
- -
‘
:
:‘,
DEG.
FAHRENHEIT
MEASUREMENT
-
91
,,,
,
2 -,
,
0001 1
1 0 0
jft
‘‘
“
***
n%*n
REPOP*T
REPQáT
EFFLUENT
GROSS
VALUE
PQIREMEN
MOAV
MOMAX
TEMPERATURE,
WATER
SAMPLE
****t*
-:
t
DEG.
FAHRENHEIT
MEASUREMENT
: : -
-
915
-,
00011
60 1
p
\%
***4R
#n*e*
*nn
9
DOWNSTREAM
MONITOR
WJSe#
4
:
Mc*ITHLY
MAX
TEMPERATURE,
LENGTH
,
SAMPLE
- — --
-
:,E -
: -
‘82’
******
OF
EXCURSION
MEASUREMENT
-
-
-
: -“
45600
6
0
I
fEMff
‘*porn*$0
HR/MO
AWW4*t
e*
DOWNSTREAM
MONITOR
MOTOTAL
FLOW,
IN
CONDUIT
OR
SAMPLE
/
-
-
1024
,,:*
-
-‘:
1069
.-:,
- ‘-:
THRU
TREATMENT
PLANT
MEASUREMENT
‘03’
1
50050
1
00
IWZQ’T
*
t’$PPNT
MGD
-*84
EFFLUENT
GROSS
VALUE
118ESt
S4fG
WiLY
MAX
CHLORINE,
TOTAL
SAMPLE
26
00
-:
RESIDUAL
MEASUREMENT
:‘
-
-
-
50060
1
0 0
EFFLUENT
GROSS
VALUE
REQIRØINt
LAILYMAX
CHLORINATION FREQ
SAMPLE
*00*
-
-
-
:
‘2’
-:--:‘ ‘-
MEASUREMENT
-
:
- -
-
-
::‘::‘:-:
78738
100
S
*
1
EPOffi’
EFFLUENT
GROSS
VALUE
!JI66tT
CHLORINATION
SAMPLE
n****
****
******
DURATION
MEASUREMENT
-
- 16
--
-
-
-
-
78739
1
0 0
44,
REPORT
EFFLUENT
GROSS
VALUE
ft
DALV%IAX
NAME/TITLE
PRINCIPAL
EXECUTIVE
OFFICER
coca
wsrtwiteritawporeoeeuye
rnALeewmlTHc
A
6rJ
4
-o_
_L.,.
--
TELEPHONE
rooposseL0000000enNo
FOOfl STO
SLOe
oorcocaa
mc
IS000AT1OR
04000 ON
IOOLEVO
00004JRVOF
THE
S4.EMTTH0
1)4000 ICWDUOLSI4FOFSAAT000
U0000100Y
TRH,
I
L/
-
A
U
‘..
\I
MIke
Hanrahan,
Station
Director
SIGNATURE
OF
PRINCIPAL
EXECUTIVE
(815) 741-9000
TYPED
OR PRINTED
mnoaoeaoJ
OFFICER
OR
AUTHORIZED
AGENT
A/C
COMMENTS
AND
EXPLANATION
OF
ANY
lOLATIONS
(Reference
aS aftachrna,Is
here)
-
*[fr
nO
05 due
tn time
nf Sndium
Rrnmide
Downstream
Monitor:
0.25 meursion
hour
used
year to
date,
174.75
excursion
hours remaining.
Attachment
A (DischargeTemeratures)
from
Joliet
Unit
7 & 8
discharge
(001) is
PERMrrrEE
NAME/ADDRESS
(Include
FadktyNameLocaficn
if
Oi8recQ
MIDWEST
GENERATION,
LLC-
JOLIET29
ADDRESS
440 SOUTH
LASALLE,
SUITE
3500
CHIAGO,
IL
60605
FAciLITY
MIDWEST
GENERATION, LLC-
JOLIET
29
LOCARON
JOLIET,
IL 60436
FROM
EPA
Form 3320-1
(08-95)
Prel6ous
edilions
may
be used
(REPLACES
EPA
FORM
T-40 WHICH
MAY
NOT
BE USED)
DR
1L0064254
PERMIT NUMEER
NATIONAL
POLLUTANT DISCHARGE
ELIMINATION
SYSTEM (NPDES)
DISCHARGE
MONITORING
REPORT
(DUR)
12.16
(7-19)
MAJOR
T
001 0
(SUBR
02)
______________________
DISCHERGENUMBER
.F - FINAL
_________________________________________
CONDENSER
COOLiNG
MONITORING
PERIOD
EFFLUENT
YEAR
MO
DAY
rYEAR
MO
DAY
NO
DISCHARGE
120-21)
021
(22-23)
09
I
(24-25)
01
ITOI
(28-27)
02
091
30
I
(28-29)
130-31)
PERMI1TEE
NAMEIADDRESS
(Include
Facility
Nameitocalion
if Different)
NAME
MIDWEST
GENERATION,
LLC-
JOLIET
29
ADDRESS
440
SOUTH LASALLE,
SUITE
3500
CHIAGO, IL
60605
FACILITY
MIDWEST
GENERATION,
LLC- JOLIET
29
LOCATION
JOLIET,
IL 60436
PARAMETER
(32-37)
FROM
14a02i
Card
Odyl
QUANTITY
OR
LOADING
(4 Card Ordy)
QUANTITY
OR CONCENTRATION
(29-45)
140-531
154-Eli
NOTE: Read
AVERAGE
MAXIMUM
UNITS
MINIMUM
I
AVERAGE
MAXIMUM
TEMPERATURE,
WATER
SAMPLE
DEG. FAHRENHEIT
MEASUREMENT
I
103.8
00011
1
0
0
)-
RE.EQRT
EFFLUENT
GROSS
VALUE
REQUJREME
-
‘.
‘MO AVG
4
MO’MAX
TEMPERATURE,
DEG. FAHRENHEITWATER
MEASUREMENTSAMPLE
I
******
9o
00011
6
0
1
.
DOWNSTREAM
MONITOR
‘dRQOT,’
.
I
I%j
9
Qj,
4
)(
TEMPERATURE,
LENGTH
SAMPLE
0 5
‘82’
******
a**-***
OF EXCURSION
MEASUREMENT
I
“
-
‘-
I
‘OdUUU
I
S!i.PMIT
‘)(
il-I’
7’k
r’r-
r
.
,*****
3
T7i
-
T9-,3,*
5J
H’”
‘-‘
DOWNSTREAM
MONITOR
R)
P
{T0TAt
riIvoJ
‘ ?
15
FLOW,
IN CONDUIT
OR
SAMPLE
106
1069
‘03’
******
THRU
TREATMENT
PLANT
MEASUREMENT
I
- -
50050 1
00
MGD
rfr*
1
l**
EFFLUENT
GROSS VALUE
REQUIREMENV
3DAV4
OAIIMPX.
CHLORINE,
TOTAL
SAMPLE
I
‘26’
******
RESIDUAL
MEASUREMENT
‘
‘
005
•-
50060
1
0
0
LBS/DY
EFFLUENT
GROSS
VALUE
IME1j
t
‘ DA1LX’
CHLORINATION
FREQ
SAMPLE
I
******
MEASUREMENT
I
3
-
.
78738
1
00
PERM1T,
.-
J,;.
*p**,-o’tr
.
- --s.
-
r7I$
u
<ir
EFFLUENTGROSS
VALUE
EQUIR
,.,
MAXLMCJM-.
CHLORINATION
SAMPLE
I
*80*
DURATION
MEASUREMENT
I
240
78739
1 0
0
/p
r
-
c-1
*3
‘RIRfl
EFFLUENT
GROSS
VALUE
.
NAMEITITLE
PRINCIPAL
EXECUTIVE
OFFICER
ceayeesreretmwirerirevereesoyeooarriuwirume
(‘
-
TELEPHONE
NFORO4AI1ONSTTEO
HEREIN; ARE
84500
ON MY
INQUIRY OFTHOSE
INOMOUHLS
E4MEATEJ.5
RESPOS4SI9II
FOR O81AININU THE INF0e,IATION.
I
80U220
TIdESURUI)TED IM’ORMET)ON
Is
TRUE
on E3after,
OLaLlon
.
.
IrecLor
000IIRSTEANDCOMPL.ST8-
IFd AWARETHATTHEROdRE
SIRI8FI000T
PENRLTIES
5EE1RUSC
FOR SUWATTING
1X1
SIGNATUR
F
PRINCIPAL
EXECUTIVE
,
‘-
IQ 4 £Zr
I
744
TYPED OR PRINTED
OFFICER
OR
AUTHORIZED
AGENT
NC
COMMENTS
AND
EXPLANATION
OF ANY VIOLATIONS
(Reference
all
attachments here)
- -
I
mit
0.05
dr, to
the
usgs
of Sodium
Rromidp
Attachment
A
(DischarnATem’ratIirs from
Joliet
Unit
7
&
A
discharge (001)
is
attached to this
report
**DOwnstream
Monitor: 55.0
excursIon
hours used year
to date,
120.0
excursion
hours
remaining.
EPA
Form
3320-1 (08-95)
Previous
editions may be
used
(REPLACES
EPA
FORM
T-40 WHICH
MAY
NOT BE
USED)
DR
PARAMETER
cae
o.yi
QUANTITY
OR
LOADING
(32-37)
(49.53)
(54-51)
AVERAGE
MAXIMUM
PERMITTEE
NAMB!AODRESS
(Include
FacILt’y
NaneiLoc6f(On
kDifetw7l)
NAME
MIDWEST
GENERATION,
LLC-
JOLIET
29
ADDRESS
.440
SOUTH
LASALLE,
SUITE
3500
CHIAGO,
IL
60605
FACIlITY
MIDWEST
GENERATION,
LLC-
JOLIET
29
LOCATION
JOLIET,
IL
60436
NATIONAL
POLLUTANT
OISCHARCE
EUMLNAI1ON
SYSTEM
(NPOES)
DISCHARGE
MONITORING
REPORT
(c2MR)
2-16)
JL0064254__]
FROM
PERMIT
NUMBER
_________________
MONITORING
PERIOD
YEAR
MO
I
DAY
YEAR
TEMPERATURE,
WATER
DEG.
FAHRENHEIT
00011
1
0
0
EFFLUENT
GROSS
VALUE
021
08
I
01
TOl
SAMPLE
MEASUREMENT
(17-10)
MAJOR
001
0
(SUBRO)
DISCI-IARGE
NUMBER
F
-
FINAL
CONDENSER
COOLING
EFFLUENT
__________
NO
DISCHARGE
02
MO
DAY
08
31
RàUIREMENT’
ji,
4
L
(2521)
(2223)
(2425)
(25-27)
(25.29)
(30-31)
NQ’TE:_Read_instructions_before_completing
(4
C65d
OSy)
QUANTITY
OR
CONCENTRATION
(2945)
(45.53)
(54-61)
UNITS
MINIMUM
AVERAGE
MA)GMUM
94.4
.
,
EPO
IOAVG
.
MM
—
TEMPERATURE,
WATER
SAMPLE
DEG.
FAHRENHEIT
MEASUREMENT
92.
00011
6
0
1
PEMIT
)
,s
*****
‘‘
91
DOWNSTREAM
MONITOR
REQI1ENT
M6
H-MPL*
TEMPERATURE,
LENGTH
SAMPLE
17
5
‘82’
OF
EXCURSION
MEASUREMENT
45600
60
HRJMO
**57
DOWNSTREAM
MONITOR
OUIMJ
(
.24
FLOW,
IN
CONDUIT
OR
SAMPLE
10O0
1400
103
******
THRU
TREATMENT
PLANT
MEASUREMENT
50050
1
00
eIME
F*?”
MGD
3ø
EFFLUENT
GROSS
VALUE
IREtEN
OAA
AIMAX,
r
CHLORINE,
TOTAL
SAMPLE
‘26’
0
05
RESIDUAL
MEASUREMENT
I,
5(51.913(9
4
(5
(9
‘)
“54.13w
.Sk:**
.
.**19***
0’
.2*****
.54..
.
0
-
A’.9)R
5
5JV.i-i
I
Li
U
.‘.,
PE,MiT
1
L
4a.4i
Aç
1
9s.%
5
EFFLUENT
GROSS
VALUE
.
LBS/DY
DAM
CHLORINATION
FREQ
SAMPLE
****
******
MEASUREMENT
78738
1
00
****
EFFLUENT
GROSS
VALUE
1EMENJWP.
.
IMUfl
SAMPLE
2.40
DURATION
MEASUREMENT
-
-
EFFLUENT
GROSS
VALUE
Sr
t.
“;
3
4k
4DA$&v
NAMEffiTLE
PRINCIPAL
EXECUTIVE
OFFICER
cesoipy
LW4CeRPENALTY
OF LAW
7)6501
KSvCeERsoN4LIy
EXAISN25ANDAII
FsU4-L66w105
rss
45F065451105
SU84AiTrO
TELEPHONE
IEJR
45054265
05
4RF
55OJRV
OF
15058
INDO1DUALA
5445E0L515-Y
—
4ESFONSIBLE
FOS
00145450
ThE
164.056541105,
I
OELIE0EmESL.eMirrED
INFORMS17ON
is
IsLe
-
- -
m
D
I
c+
AOCUSATESNOCO&IPLEI5-
IAMSW6RETHATT50REARSS)SNIFICANTPENALTIE5FOFISUBI4TSN5
1.04
c.’.
7A
rsOfl
a
or,
a
IOfl
Irec
or
FALSEINFOWMT43MI50LL00LGTOSSIWOFF)5E654044PRISOSWENT.
SEE16US.C.)DOI
SIGNATU
F
PRINCIPAL
EXECUTIVE
f
0
I.J
5
TYPED
OR
PRINTED
OFFICER
OR
AUTHORIZED
AGENT
COMMENTS
AND
EXPLANATION
OF
ANY
VIOLATIONS
(Reference
all
attachments
here)
-
-
iimit
0.05
due
to
the
useof
Sodium
Bromide.
Attachment
A
flischaroeTemeratures
from
.InIiet
Unit
7
A
B
discharge
(0011
is
attached
to
this
report.
Downstream
Monitor:
54.5excursion
hours
used
year
to
date,
120.5
excursion
hours
remaining.
-
EPA
Form
3320-1
(08.95)
Previous
editions
may
be
used
(REPLACES
EPA
FORM
7-40
WHICH
MAY
NOT
BE
USED)
NATIONAL
POLLUTANT DISCHARGE
ELIMINATION SYSTEM (NPDES)
DISCHARGE
MONFEORINS
REPORT
(DMR)
.
(0-16)
I
L0064254
PERMIT
NUMBER
(17-19)
MAJOR..:
.
001 0
I(SUBR02)
DISCHARGE
NUMBER
IF
- FiNAL
___________
CONDENSER COOLING
_____________
EFFLUENT
YEAR
MD
DAY
***
NO
DISCHARGE
31
26-27)
(26-20)
(30-31)
NOTE: Read instwctions
MONITORING
PERIOD
____________
YEAR
MO
DAY
02
07
01
TO
[E02
I
071
(20-21)
(22-23)
(24-29)
PARAMETER
(3 Cart
Orty)
QUANTITY
OR
LOADING
(4 Cart
OrAl
QUANTITY
OR CONCENTRATION
)33.37)
(40-53)
(54-81)
I-a)
(46-03)
104-El)
AVERAGE
MAXIMUM
UNITS
MINIMUM
AVERAGE
-tAXIMUM
TEMPERATURE,
WATER
SAMPLE
DEG. FAHRENHEIT
MEASUREMENT
95.
106.
- 8
000111
EFFLUENT
0
GROSS
0
VALUE
t$qUIRM
-M
v7
-- ****
..;41h4
r1
“MO
-
AVG
35TJ5
flJEá
MOMAX
TEMPERATURE,
WATER
SAMPLE
******
******
******
gte
DEG.
FAHRENHEIT
MEASUREMENT
.
DOWNSTREAM
MONITOR
“
-
MONfda
TEMPERATURE,
LENGTH
SAMPLE
“2 75
‘82’
**6*WE
OF EXCURSION
MEASUREMENT
.
45600
6
0 1
‘:1-
fij
4-
’ti;
-sc;REpORT.
.
***te*)’;
DOWNSTREAM
MONITOR
REQtREtE1ENT
o
MO
TOTAL
HR/MO
ç
-
‘&r’
FLOW,
IN
CONDUIT
OR
SAMPLE
1069
1069
‘03’
-
THRU
TREATMENT
PLANT
MEASUREMENT
1
--
50050 1
0 0
;.vkrept-
7
r;c!A
EROg-T
-
-4
;
-i,si--
EFFLUENT GROSS VALUE
!9SJIREMt
%ff
pãt
bzMMM4x
MGD
ta-
,
k
-i-$ktJ
CHLORINE,
TOTAL
SAMPLE
‘26’
******
o65
RESIDUAL
MEASUREMENT
-.
EFFLUENT GROSS
VALUE
%t’
rrrfl
:
$O4
LBS/DY
‘-‘-*
‘
CHLORINATION
FREQ
SAMPLE
****
****
****o*
MEASUREMENT
3
-7)1)5.0-1
J2e’-J
-%...,**x
(0(00 lUll
4-
.PERMlT
9
Jr..rl4-)%r
k4t-r’ 6-
“:-.‘
v44r*E*4
—t
-
-‘
:r’-.’
:-n.t**
-.
‘r
“404-*)r*Wt*v
0-
---
- tb,. n-s- 4.,
‘o
EFFLUENT
GROSS VALUE
AE*QLMREKSt
‘t
‘t’
‘
v
--
‘MX1&PI
CHLORINATION
SAMPLE
******
****
240
DURATION
MEASUREMENT
78739
1
0 0
t84t
*
r4t.
ØRT
EFFLUENT GROSS
VALUE
t-rn “
“f
9’ 4-
.p
NAWEITITLE
PRINCIPAL EXECUTIVE
OFFICER
LSUNDEE
P00530-OF LAW 14*0)
5EVEPER0ONALL1
EXEM)N504E2 AN FAM)LLEEW)10
0-FE
,
TELEPHONE
)prFOET)OEOuspMflEO ((SEeN; AO4OSAOAOOEMY)N0(360
OP IE055IN000rOUA0.s0.WFoLEIav
RO3PCNSIELE FOR
OOTA)EIN6 THE
)NFOWAET)ON.)
ESUEVO THE 00SM0-E0
(50054401)0*0
maE.
__________________________________________________
Ron
Baker, StatIon
Director
-
0000RETEAN000EIPLETE
FALEEFO AOTOEJICLOOEGT*EP00054IUIYOFREEANOP4PESONMENT.
)AMAWARET)4EIIHEREARES)OEIF)OAWIFENAL11EOFOR000M)TT)00
000’800C Or
SIGNATURE
PRINCIPAL
EXECUTIVE
icr-i
0fl
7A
TYPED OR
PRINTED
OFFICER OR AUTHORIZED AGENT
NC -
COMMENTS
AND
EXPLANATION OF
ANY VIOLATIONS
(Reference
all
attachments
hem)
--
I mit
n
05
due
to the
use
of
Sodium Bromide.
Attachment
A (OischaroeTemeratnresl
from .inliet Unit
7
& S
discharge
(0011
is attached
to this renort.
- -
8
Downstream
Monitor: 37 excursion
hours
used
year
to date, 138 excursion
hours remaining.
-
PERMITrEE NAMEIADDRESS (Include
Faolty
Name,Loca
(ion
if Different)
NAME
MIDWEST
GENERATION,
LLC- JOLIET
29
ADDRESS
440
SOUTH LASALLE,
SUITE
3500
CHIAGO,
IL
60605
FACILITY
MIDWEST
GENERATION,
LLC-
JOLIET 29
LOCATION
JOLIET,
IL 60436
FROM
EPA
Form 3320-1
(08.95)
Previous editions
may
be
used
(REPLACES EPA
FORM T-40 WHICH
MAY NOT
BE USED)
Co
-I
m
z
C)
z
F”
0
-Ti
z
C)
-U
‘ii
x
m
C)
‘ii
0
-T1
-F’
C)
ni
-T1
-I
w
C
C)
m
0
Co
0
0
-a
-U
‘ii
z
I
—
—4
m
0
‘1
-4
m
0
-T1
-n
C)
m
Co
C)
I
0
0
a)
a’
CD
-h
M
0)
UT
a)
a)
0
-4
C4
0
-4
-o
N
rs’
oq
0
G)
T1
0
0
>
-4
m
0
0
-a
CD
a)
x0
>z
G)r
Iii
-I-I
0>
;Uz
z-l
Co
‘ii
0>
m
z
0
z
CO
-<
CO
-I
m
c._
-
c
000
rn
0
mm
rzmO
—z
Ci)
0
,
z
0)
Z—-<
o
Z
CT
>
CO
‘ii
.U
0
z
G)
-U
m
0
0
-I
0
•1
C)C)—
-
m
m?m
O
o>Th
C)Z
mfi
TI
0
Cz
C)D..4
Cl)
G)
z
>
-I
C
m
0
-n
-o
z
C)
C)
0
m
z
-1
Cl)
EME,
LLC
and
Exelon
Generation
Company,
appreciates
the
opportunity
to
provide
comments
concerning
the
accuracy,
applicability
and
appropriateness
of
theuse
of
power
plantoperational
data
in
theanalysis
of
the
existing
and
current
future
water
demand
and
supply
considerations.
We
are
encouraged
by
the
changesmade
to
the
draft
report
by
Dr.
Dziegielewski
in
response
to
our
initial
written
comments.
However,
we
still
believe
that
someadditional
revisions
are
necessary
in
order
to
bring
our
remaining
issues
and
concerns
to
final
resolution.The
April
15
th
meeting
provided
an
excellent
opportunity
for
the
very
useful
exchange
of
information,
which
will
hopefully
allow
the
group
to
move
forward
by
prioritizingwater
use
issues
whichmay
have
a
real
impact
on
the
available
resource
in
the
future,
and
not
on
uses
or
activities
which
are
largely
supply-neutral.
As
discussed
during
our
presentation
to
the
RSWPG,
a
majority
of
power
plants
in
Northeastern
Illinois
utilize
once-through
cooling,
and
as
such,
have
no
net
effect
onthe
availability
of
surface
water
in
the
11
County
StudyArea.
Anotherimportantfact
to
recognize
is
that
all
of
the
once
through
power
plants
in
the
Study
Area
are
located
on
majorwaterways,
which
are
controlled
for
navigational
uses
andare
thereby
assured
a
steady
supply
of
upstream
flow.
As
such,
there
is
no
reason
to
have
to
consider
any
impacts
of
these
open
cycle
plants
on
current
or
future
water
supply
in
the
Region.
Even
those
few
plants
which
utilize
closedcycle
cooling
exert
only
a
small
overall
consumptiye
use
of
surface
water,
especially
in
comparison
to
public
supply.
Inaddition,
it
was
pointed
outthat
due
to
how
these
power
plants
operate,there
isno
direct
correlationbetween
theamount
of
water
used
per
kilowatt
hour
of
power
generated.
Such
comparisons
are
inappropriate
and
misleading
and
should
be
removed
from
the
report
entirely,
as
they
do
notreflectreality
and
do
not
in
any
way
impact
the
overall
amount
of
water
available
inthe
study
area.
4
(
Theend
result
of
the
cørrections
and
acknowledgements
made
regarding
the
ure
of
the
electric
power
business
in
Northeastern
Illinois
is
that
there
should
be
less
crall
emphasis
placed
on
the
Power
Sector
than
other
identified
sectors
which
iave
a
significant
influence
on
existing
and
future
local
waterresources.
April2l,2008
industry.
All
told,
these
unknowns
make
the
development
of
likely
future
water
demand
scenarios
involving
the
electric
power
industry
essentially
impossible
to
specify
or
even
generally
conceptualize.
Specific
Comments:
Table
3-4:
Column
1:
Change
heading
from
“Name
plate
&/Gross
Capacity
(MW)”
to
“Gross
Load
Capàbility--MWe”
and
include
only
the
values
to
the
right
of
the
“1”.
Nameplate
values
are
not
meaningful.
Column
2:
Assuming
that
this
information
came
from
a
reliable
source,
it
appears
to
be
accurate.
Colinnn3:
Eliminate
this
column
entirely—no
need
to
list
Net
Generation
when
Gross
Generation
has
afready
been
provided
in
Column
2.
olunms4and5:
Eliminate
both
the
“NetJGross
Generation
(%)
and
the
“Nameplate
Capacity
F’çtor
(%)“.-
Neither
of
these
are
meaningful
terms
or
useful
data.
Columns
1
and
2
provide
all
necessary
information
regarding
power
generation.
April2l,2008
2
1.
Crinird
ut.
Cook
Cø.
(Muthe5t
Generion
EME
LI_C)
57!5S2
3201
834
2.96,873
926
61
2
•
Chao
Su&
Ship
Canal
2.
Fllc
Steer
Plant,
Cook
Co.
(Midwest
Gene’atioriEME
LI_C)
374?342
1,603
;949
L496,937
93.3
490
Chiea’
River.
S.
Brancb
DresdinNudazilant
GtundyCo
Etekni
Ge
itxonCo
LLC)
ll24f1111
14
031125
13
622453
97
1
S’
S
KakeeP1ainesRiver
4.
Waztkegnn
Plant.
Lake
Co.
MJdwest
Ge
ration
EMEI.L)C
S031628
4,90901
4,5504
92.9
69.5
LokeMiehignu
S
Zion:.
Czttei
4
.
Lake
Co.
(ZioiiEneryLLC)
5971546
35,58
34,876
99.5
Luke.eixignn
6.
Jollei
20
Phlnt,
Will
Co.
(MwetGenerationEMELLC)
132Wl08
5,161.994
S;500330
p5.4
49.9
-Plaines
iver
7.
inlle
9
Plait,
Will
Co.
idwestGenerationEMELLC)
360132.6
1922.330
l,673,84
87.1
1.0
.
DsPiueiver
S.
Will
Coatyomeoci1Le.
Will
cMidwest
Generation
EME
LLC)
1269/1
154
5.658,996
5293,858
93.5
50.9
C1ikao
a’Ship
Cao2i
9.
&al4wood
Nzclear
Plani.
Will
C.
(Ee1osi
Generation
Co.
LLC)
245212330
20,390,274
l9796,,383
97,).
94.9
Kaakake
River!
Cooling
Lake
10.
Ehi’oød
Enrrgv
f.LC’,
Will
Co.
(Dominion
Elwood
Sei-i.
Co.)
L54011409
437,285
435J37
99.6
3,2
Grotuidwater
‘weB
IL
Keii4i11
Co.
Gen.
Facility.
Fendafl
(1yoeyMiJvenGeu.hiv.)
1256(1160
1,367,908
1,313.416
13.5
ihiuoi5
Rivei
12.
LaSafle
Genazaung
S1atou’.
LaSalle
t4øu
zlerttiois
Co.
LLC)
2340.’2230
191274,580
18,711655
97.1
94,0
LaSaile
Lake
(iniua.maclej
Tt11Ayiae
14.569
78,600350
71407.873
.
95.9
61.6
Comncnt;
(s)’
Dczioca
a
ptaking
plant.
Zica
nudeat
plaut
wa
decoaimistioned
in
&buuajy
1998;
crnrcally
schrenous
ondenseza
arc
ued
at
peakina
(9
Nol
in
study
area
but
supplk
tudyase
wiub
cinciry.
April
21,
2008
3
explanation
that
the
use
of
the
word
“withdrawal”
here
does
not
imply
a
consumptive
use.
Eliminate
last
column
from
table.
As
discussed
in
our
presentation,
it
is
neither
accurate
normeaningful
to
try
to
develop
a
correlation
between
cooling
water
use
and
amount
of
power.
produced.
The
resultant
ratio
is
misleading
and
will
lead
to
invalid
conclusions
regarding
perceived
impacts
of
electric
power
production
on
water
availability.
Also,
it
is
both
invalid
and
misleading
to
provide
a
total
at
the
bottom
for
water
withdrawals
which
combines
both
open
cycle
and
closed
cycle
plants.
The
water
withdrawal
data
included
for
run
of
river
(open
cycle)
plants
is
representative
of
the
circulating
water
flow
through
the
condensers,
while
the
water
withdrawal
data
for
the
make-up
water
(closed
cycle)
plants
is
indicative
of
an
actual
consumptive
use.
Also,
please
footnote
theword
“withdrawal”
in
the
heading
of
eachtable
in
order
to
provide
the
acknowledgement
that
it
is
not
necessarily
synonymous
with
consumptive
use.
April2l,2008
4
1.
Cruwfe4
PIuit
Midweoera1ionEMELL
3,201,844
5033
.57.4
Cfticego
SaiL/Ship
cafl4i
2JiskStreet?hrnt
(Midwest
(3e
hoe
E2vE
LLC)
1,O3.949
22!
50.6
Chicaa
itiver.
S.
3
Di’esden
Nuc1e
Pbn
14,031125
415.6
.10;8
Kk/DsPiaines
R.ive
4.
Waukegan
Plant
idwe,t
(eueratioEMELL)C
I,O9,907
7536
56.4
Lake
Mitiliian
5.
Zion
ELerj
Cent
r
ZnELLc
35,058
31.7
330.0
Lake
MithIgu
6.
Joliet
29
P]air
(Midwest
GaertionEMELLC)
S,767.94
942.6
59.6
-
DesPiajues
River
7.
JoIlet
9
Plant
(Midwest
Gesieatioa
EME
L.LC)
1922,330
415.3
78.9
-
DesPlaines
River
3.
WIU
Com*y/Roweovifle
Piet
(MiwestaeeeraionEMELLe)
5.658,996
917.9
59.2
C5uitar’
Ship
Canal
MAKEt?
WATER
PLANTS:
41469J47
132.7
1.17
L
Bridwod
Nuclear1’lau
(Exelou
Geirauoe
Ce.
LLC)
20.390,274
49.8
0.89
KaiLakee
Riv&
CaoLin8
Like
10.
Liwood
Eaei’gyLLC
4
LlnioaElwood
Sez’v
Co.)
457285
0D03
0.003
Orottudwater
well
U.
Eezidail
Ca.
Gea
Fadlity
Dynegv
Midwest
Gee.
Jn
L,67,008
2.5
0.67
Illinois
River
12.
LaSalle
Getiermin
Saturn
(E’e1on
Generauoz
Co.
LL
19274.580
0.4
1.52
ik
Lake
(nut-teade.I
AUP!atd
‘
...
,.
0oi50
April2l,2008
5
Units
and
one
Waukegan
unit
discussed
on
page
7
of
these
comments)
remain
in
service
using
existing
cooling
methods.
Any
additional
demand
is
met
with
either
(1)
power
produced
outside
of
the
11
County
Study
Area;
or
(2)
other
power
sources
which
use
less
water
(or
a
combination
of
the
two)
For
the
MRI
Case:
All
current
open
cycle
power
plants
in
the
Region
(less
the
two
Will
County
units
and
one
Waukegan
unit)
remain
in
service;
but
are
required
to
be
retrofit
with
closed
cycle
cooling
systems
(i.e.
cooling
towers).
There
is
no
basis
to
assume
that
any
new
power
plants
will
be
built
in
the
11
County
Study
Area
in
the
foreseeable
future.
However,
it
would
be
expected
that
any
new
conventional
power
plants
built
anywhere
in
the
country
in
the
future
would
be
required
to
use
closed
cycle
cooling
(either
cooling
towers
or
cooling
ponds),
per
the
USEPA
Phase
I
316(b)
rule.
Scenarios
-
Power
Plants
Cr
LRI
Dt2mand
for
elictncty
MRT
9.61
9.61
941
kWh/capita
+
kWl*apta
kWhJcpta
+
0.56%
atwna1
without
0.56%
anuual
growth
growth
growth
retired
-
Two
plaots
BEFORE:
÷
new
platds
retired
plants
in
.
tudy
area
Power
rnstudy
area
new
power
.
.
with
cksed.
generation
with
c1oed-
plants
wtbw
.
ioop
coolmg
.
loop
cooIiig
study
area
RBVISED
tj,i
ui
Need
inpul
Need
input:
Power
No
new
plants
assumptions
aptions
geLleratbn
n
study
area
and
narratives
and
narratives
April
21,
2008
6
mentioned
in
our
originalcomments,
Waukegan
Unit
6
was
retired
in
December
of
2007.
Other
than
these
three,
there
are
no
current
plans
to
retire
any
additionalgenerating
units
in
the
11
County
Study
Area
in
the
foreseeable
future
The
ultimate
prospects
for
distributed
generation
and!or
green
generation
are
also
unknown
at
thistime.
PG—
Considerations
for
LRI
becauoghcst
von
tajcntr&Fs
4
April
21,
2008
7
power
production.
Other
sources
of
energy
may
also
be
available
at
some
time
inthe
future
that
could
off-set
the
projecteddemand.
There
are
too
manyunknowns
to
be
able
to
make
reliable
projections
on
future
electric
power
production
in
the
11
County
Study
Area.
PG
—
Considerations
for
LRI
Denpd
fOkctflcil.
in
-
ioc&
ge
dattôn
is
pthx
5OOO.
/ar
(6’83’
of.z
w,6L$alle
plant)”
-
(
-
-
F
[y
20S0
the
c4
emaid
is
projected
to
increase
to
tne
of
tO
150,000
GWOIVear
(depending
on
assunitiors)
4
April
21,
2008
8
The
location
of
LaSalle
is
on
the
outer
fringes
of
the
11
County
Region.
Its
inclusion
is
clearly
beyond
the
boundaries
of
the
Study
Area.
(LaSalle
County
is
not
one
of
the
named
11
counties
in
the
SHJ
Report).
This
generatingstation
utilizes
Illinois
River
water
downstram
of
the
Study
boundary
as
make-up
for
its
man-madeperched
cooling
pond.
Based
on
the
overall
intent
of
the
Demand
report,
it
makessense
to
delete
LaSalle
County
Station
from
consideration
in
this
report
primarily
because:
(1)
it
does
not
utilizewater
from
within
the
Region;
and
(2)
the
assumption
that
the
amount
of
power
generated
at
the
station
supports
the
load
demand
within
the
Northeastern
Illinois
Study
Region
has
been
shown
to
be
false.
The
same
logic
and
reasoning
would
apply
to
plants
located
on
the
Mississippi
River
(Quad
Cities
Station)
and
the
Rock
River
(Byron
Station),which
are
not
currently
included
inthe
Demand
Report.
April2l,2008
9
‘/F’J
PLiUAV
DrUtEEti;J?
Penmllee
Name/Address
Name
Midwest
Generatián.
LLC
Address
440
5. LaSalle
St.,
Suite
3500
One
Financial
Place
Chicago,
IL
60605
Facility
Will
County
Station
Location
529
E.
135th
Street
Romeoville,
IL
60446
Chemistry
Specialist
NATIONAL
POLLUTANT DISCHARGE
ELIMINATION
SYSTEM
(NPDES)
oscHpi5pNlTpBINc.
REPORT
(OMR)
(24-25)
Major
(SUBR
02).
-
F
- Final
I
Condenser
Cooling
Effluent
No
Discharge
Note:
Read
Inslruclioris
(2-15)
1L0002208
Permit
Number
(I? - 19)
0010
Discharge
Number
(20-21)
Monitoring
Period
Year
Mo
Day
Year
Mo
Day
From
cal
07
01
To
03
07
31
AUn:
-
(22-23)
-
(26-27)
(28-29)
(30-31)
(3 card
Only)
Quantity
or Loading
(4
ceni
Only)
Quantity
or Concentration
r
(46-53)
(54-61)
(38-45)
(46-53)
(54-61)
Average
Maximum
Units
Minimum
Average
Maximum
Temperature,
Water
Sample
*55*
Deg. Fahrenheit
.
Temperature,
Effluent
GrossWater
Value
Sample
I
5*5*5*
‘
Deg.
Fahrenheit
Measurement
92
00011
6
0 0
Z1!fl
4Ø4Ø$E$kM
****
%itt.tS
:.
;:cgç
Downstream
Monitor
RqutdFtfi
fl/
Øt,
MoWh1fl1h3
Flow,
In
Conduit
or
Sample
Thai
Treatment
Plant
Measurement
829
-
0
864
-
‘03’
‘
‘
50050100
‘‘
S*
.‘sW
;;mØfr
o.
‘...‘
Effluent
Gross
Value
,4ket)t$b
t
gft
1
tE
MGD
,
1.
r
-
:****,,
Chlorine,
Total
Residual
Met:ent
******
******
****
******
50060
1
0
0
fltY
P
.ircci
4
r
-
.0!2nJt
Effluent
Gross
Value
bdL>
ç*
5*5*
x:*iM
i&*W*
Chlorination
Frequency
Sample
Measurement
Chlorination
Duration
Sample
-
****
******
******
Measurement
Chlorine
Usage
Sample
Measurement
‘26
‘
Name/TEe
-
nnopa
I
v
I cERTIFY
UNDER
PENALTY
OF
LAW
THAT
I HAVE
PERSONALLY
EXAMINED
AND
I
AM
FAMILIAR
WITH
THE INFORMATION
suBMrrrED
HEREIN;
AND
BASED
ON
MY
INQUIRY
OF
ThOSE
INDIVIDUALS
IMMEDIATELY
RESPON5IaLE
FOR OBTAINING
David
Strom
THE
INFORMATION,
I
BELIEVE
ThE
SUBMflTED
INFORMATION
IS
TRUE,
.
-
‘
ACCURATE
AND
coMpLETE.
i
AM
AWARE
ThAT THERE
ARE
SIGNIFIcANT
815
Station
DIrector
PENALTIES
FOR SUBMITrING FALSE
INFORMATION,
INOLUDING
THE
POSSIBILITY
OF
FINE
AND
IMPRISONMENT. SEE
IS u.s.c.
§
1001
AND 33
U.S.C.
§
Typed
or
Pnnled
.
impriwnment
1318.
(Penettts
of between
underthesestetutesmey/no’udefrnes
6 months
anUS
years.)
up
to$1O,000anrIorniaximum
SIGNATURE
OF
A
ORIZED
I
1.
AGENTECUTIVE
OFFICER
OR
Code
Area
COMMENTS AND
EXPLANATION
OF
ANY VIOLATIONS (Reference
elf
etfecflments
here)
See
Special
Conditions
5,
6
and
7 for
temperature
reporting
requirements.
32.75
temperature
excursion
hours
were
used
during
the
month.
A
total
of
available
for
use
in 2003.
EPA
Form 3320-1
(08-95)
Previous
edibons
nviy
be
used.
(R.pIac.s
EPA
form
1-40
whIch
may not
be used)
DR
PERMITTEE NAME:
ADDRESS:
PHONE:
(2
31
(4
16)
IL
0002208
ST
PERMIT
NUMBER
REPORTING
PERIOD
20 21)
(22
23)
(24 25)
FROM
99
12
1
YEAR
MO
DAY
NATIONAL POLLUTANT DISCHARGE
ELIMINATION SYSTEM
COMMENTS
DISCHARGE MONITORING REPORT
TO
(26 27)
(29
26)
(30 31)
99
12
31
YEAR
MO
DAY
This agency is authorized to
require
this information under Illinois Revised Statutes,
1979. Chapter 111 1 2.
Section
1042. Disclosure of this information is required.
Failure
to do
so
may result in
a
civil penalty up to $10,000.00
per
day
of
Violation
or
a
fine up to
$25,000.00 per day of violation and imprisonment up to one year. This tons
has been
approved by
the Forms
Management
Center,
Midwest Generation
LLC
Will
County Station
529
East 135th Street
Romeoville,
Illinois
60446
1-815-886-1010
(17
1)
001
DIS
SIC
LATITUDE
LONGITUDE
PARAMETER
(32 37)
(38
45)
(46
53)
(54 811
152 63)
(26 45)
146
531
154 61)
COMMENTS
Condenser
Cooling Water
JAN
Total
*
Chlorine
Numberwasof
not
Flow
used
Days:this
month,
31
& Chlorine
Concentration
__________
(62 63)
UNITS
#OFEX
3 CARD ONLY
QUANTITY
_______ _________
4CEAD ONLY
CONCENTRATION
MINIMUM
AVERAGE
MAXIMUM
UNITS
# OF EX
MINIMUM
AVERAGE
MAXIMUM
Flow
REPORTED
169.9
416.7
617.8
MGD
0
PERMIT
None
None
CONDITION
None
Intake
REPORTED
44.0
51 .2
59.0
°F
0
Temperature
CONDITIONPERMIT
None
None
None
Disãharge
REPORTED
470
58.4
68.0
°F
0
Temperature
CONDITIONPERMIT
None
None
None
TRO
REPORTED
.
*
mg/I
*
PERMIT
--
--
0.05
*
CONDITION
Chlorination
REPORTED
0
0
0
per
unit
0
Frequency
PERMIT
None
None
None
per day
CONDrnON
Chlorination
REPORTED
Q
mm/day
0
Duration
PERMIT
120/Unit
per unit
CONDITION
NaOCI
REPORTED
0.0
0.0
0.0
lb/day
0
Applied
CONDITIONPERMIT
None
None
None
NaBr
REPORTED
0.0
0.0
0.0
lb/day
0
Applied
PERMIT
None
None
CONDITION
None
NAME OF PRINCIPL itXECUTIVE OFF
ER
I
TITLE OF THE OFFICER
DATE
I
I ce,lty that I am familiar with the
information
House, Karen A.
Plant Manager
I
I
I
contained in this report and mat to Ihe best of my
C)
I
20
knowledge and belief suat information Is true,
LAST,
FIRST
Ml
TITLE
YEAR
MO
DAY
complete, and accurate.
Signature
or
IL 532-0092
WPC
242 3/89
Commonwealth
Edison
Company
Will County Station
529 East
Romeo Road
Romeoville,
Illinois
60441
1-815-886-1010
(2
31
(4
6)
(57
59)
IL
0002208
001
ST
PERMIT NUMBER
DIS
NATIONAL
POLLUTANT DISCHARGE
ELIMINATION
SYSTEM
COMMENTS
DISCHARGE MONITORING
REPORT
I
SIC
LATITUDE
LONGITU
1
I ‘‘ I
MQ()AY
I
2
28
YEAR
MO
DAY
This
agency
is authorized to
require
this
information under
Illinois Revised
Statutes,
1979,
Chapter
111
1
2,
Section
1042.
Disclosure
of
this
information is required
Failure
to
do so
may
result
in a civil penalty
up
to
$10,000.00
per
day
of violation
or
a fine up
to
$25,000.00
per
day of
violation
and imprisonment
up
to one
year.
This
form
has been
approved by the
Forms
Management
Center.
PERMITTEE
NAME:
ADDRESS:
PHONE:
(20
21)
(22
23)
(24
25
(39 27
REPORTING
PERIOD
FROM
I
2
I
il
TO
99
COMMENTS
Condenser
Cooling Water
QUANTITY
(32 371
(‘39
45)
—
(48
53)
(54
65)
on ai
Total Number
of Flow
Chlorine
Concentration
PARAMETER
MINIMUM
AVERAGE
MAXIMUM
UNITS
#
OF
EX
MINIMUM
AVERAGE
MAXIMUM
UNITS
#OFEX
Flow
REPORTED
3240
675.7
894.2
MGD
0
Continuous
CONDITIONPERMIT
None
None
None
Continuous
Intake
REPORTED
450
49.9
55.0
0
Continuous
Temperature
CONDITIONPERMIT
None
None
None
Continuous
Discharge
REPORTED
50.0
55.0
60.0
0
Continuous
Temperature
CONDITION
PERMIT
—
None
None
None
Continuous
TRO
REPORTED
0.00
mg/I
Q
PERMIT
--
--
0.05
*
CONDITION
Chlorination
REPORTED
0
0.5
1.0
perunit
0
1
Frequency
CONDIT1ONPERMIT
None
None
None
per
day
1
Chlorination
REPORTED
45
mm/day
0
1
Duration
CONDITIONPERMIT
120/Unit
per unit
1
NaOCI
REPORTED
0.0163
163.02
230.6
lb/day
0
1
Applied
CONDITIONPERMIT
None
None
None
.
1
NaBr
REPORTED
0.0142
142.22
201.0
lb/day
0
1
Applied
CONDITIONPERMIT
None
None
None
I
NAME
OF
PRINCIPLE
EXECUTIVE OFFICER
I
TFrLE OF
THE OFrICER
DATE
I
/
c&i(,’
that/am
familiar
with
the
infom at/on
House,
Karen
A.
I
Plant Manager
o
knowlcdgeandbehefsuchmformahonlstrue,
contained
in this repc4
and
that to the
best
of
my
.
ST,
FIRST
Ml
TITLE
YEAR
MO
DAY
j
mmplete,
and
accumfe.
SIgnature
of
PrInciple
or
Authorized
IL
532-0092
WPC 242 3/89
PERMITTEE
NAME:
ADDRESS:
PHONE:
Commonwealth
Edison
Company
Will
County Station
529 East Romeo
Road
Romeoville,
Illinois
60441
1-815-886-1010
NATIONAL
POLLUTANT
DISCNARGE
ELIMINATION SYSTEM
COMMENTS
DISCHARGE
MONITORING
REPORT
COMMENTS
Condenser Cooling
Water
Total Number
of Flow
*
Chlorine Concentration
(2 3)
(4
II)
(17 19
____________
ST
IL
PERMIT
0002208
NUMBER
00i1
DIS
1
F
I
SIC
(20 21)
(22 23)
(24
26)
REPORTING PERIOD
V
C
-
—
—
4 CARS
ONLY
CONCENTRATION
_________
__________
(3
45)
PARAMETER
MINIMUM
AVERAGE
MAXIMUM
UNITS
#OFEX
MINIMUM
AVERAGE
MAXIMUM
UNITS
#OF(
Flow
REPORTED
400.3
602.9
829.6
MGD
0
CON
PERMIT
DIllON
None
None
None
Intake
REPORTED
40.0
44.0
52.0
°F
0
Tern
peratu
re
CONDITIONPERMIT
None
None
None
Discharge
REPORTED
44.0
50.2
60.0
°F
0
Temperature
CONDITION
PERMIT
None
None
None
TRO
REPORTED
0.00
mg/I
0
PERMIT
—
--
0.05
*
CONDITION
Chlorination
REPORTED
Q
0.5
1.0
per
unit
0
Frequency
PERT
None
None
None
per
day
CONDITION
Chlorination
REPORTED
45
mm/day
0
Duration
PERMIT
120/Unit
per unit
CONDITION
NaOCI
REPORTED
118.11
162.12
230.6
lb/day
0
Applied
CONDITIONPERMIT
None
None
None
NaBr
REPORTED
102.81
141.22
201.0
lb/day
0
Applied
CONDITIONPERMIT
None
None
None
NAME
OF PR(NCIPL
ø(ECU’VE
OFFIR
I
TITLE OF THE
OFFICER
DATE
I certil5,
that (em familiar
with the
infornedion
House,
Karen
A.
Plant
Manager
contained
in
(his report and that
to
the best
of
my
9
knowledge
and belief such
inmaicn is e,
LAST.
FIRST
MI
11TLE
YEAR
MO
j
DAY
complele,
and
accurate.
Signature
of Principle
or Authorized
•
LATITUDE
LONGITUDE
122 37)
FR0M
j99I1I11TOI99
111311
‘YEAR
MO
DAY
j
YEAR
MO
SAY
61)
(25 21)
(28
28)
(311
31)
(Nfl
62
63)
(46
53)
(54
61)
(62
63)
IL
532-0092
WPC 242
3/89
This
agency
is
authorized
to
require
this
information
under Illinois Revised
Statutes,
1979,
Chapter
1111
2, Section
1042. Disclosure
of thIs information
is
required.
Failure
to
do so
may result
in a cMl
penalty
up
to
$10,000.00
per
day
of
violation or a rifle
up
te
$25,000.00
per
day
of violation and
impnsonment up
to
one
year. This form
has
been approved
by
the Forms Management
Center,
PERMITTEE
NAME:
ADDRESS:
PHONE:
Commonwealth
Edison
Company
Will
County
Station
529
East
Romeo
Road
Homeoville,
Illinois
60441
1-815-886-1010
NA1)ONAL
POLLUTANT
DISCHARGE
EUMINATION
SYST6?M
COMMENTS
DISCHARGE
MONITORN
REPORT
COMMENTS
Condenser
Cooling
Total
Number
of
Flow
Chlorine
Concentration
[“
LATITUDE
I
LONGITUDE
I
FROM
1
98
I
12,
I
-
1
YEAR
j
MO
J
DAY
(
TO
YEAR
98
1
12
MO
31
DAY
1
This
agency
is
authorized
to
require
this
information
Under
Illinois
Revised
Statutes,
1979,
Chapter
lilt
2,
Section
1042.
Disclosure
of
this
information
is
required.
Failure
to
do
so
(nay
result
in
a
civil
penalty
up
to
$10,000.00
per
day
of
viutation
or
a
fine
up
to
$25,000.00
per
day
of
violation
and
imprisonment
up
to
one
year.
This
form
has
been
approved
by
the
Forms
Management
Center.
3
(4
6)
______________
____________
IL
0O0220”7
I
001
I
I
ST
PERMIT
NUMBER
I
L
ots
1
sc
REPORTING
PERIOD
(20
21)
(22
53)
(24
25)
(26
27)
(28
29)
(30
31)
PARAMETER
MINIMUM
AVERAGE
MAXIMUM
UNITS
4
OF
EX
MINIMUM
AVERAGE
MAXiMUM
UNITS
#OFEX
Flow
REPORTED
516.2
790.4
1006.6
MGD
0
—
PERMIT
None
None
None
CONDITION
Intake
REPORTED
45.0
56.2
69.0
-
0
—
Temperature
MIT
None
None
None
CONDITION
Discharge
REPORTED
—
50.0
61.7
73.0
0
PERMIT
None
None
‘“Fne
Temperature
CONDITION
TRO
REPORTED
0.00
mg/I
0
PERMIT
—
--
0.05
*
CONDITION
Chlorination
REPORTED
0
0.6
1.0
per
unit
0
Frequency
PERMIT
None
None
per
day
“‘
CONDITION
Chlorination
REPORTED
45
minictay
0
Duration
PERMIT
120/Unit
per
unit
CONDITION
NaOCl
REPORTED
148.51
190.52
214.9
lb/day
0
,
Applied
PERMIT
None
.
None
None
CONDITION
NaBr
REPORTED
129.41
166.01
187.2
lb/day
0
Applied
PERMIT
None
None
None
CONDITION
TITLE
OF
THE
OFFICER
DATE
I
I
contained
in
this
repoYl
and
that
to
lila
best
of
House,
Karen
A.
my
I
cEL-
NAME
OF
PRINCIPLt
EXECUVE
OFFIR
YEAR
MO
DAY
cumplete,
and
accute.
SIgnature
of
Pdnciple
Plant Manager
I
/
cerl)I’y
that
I
am
lam/bar
with
the
inforrnahon
I
knowjede
and
beliel
Such
infumation
is
bye,
LAST,
FIRST
Ml
or
Authorized
IL
532-0092
WPC
242
3/89
/
PERMITTEE
NAME:
Commonwealth
Edison
Company
ADDRESS:
Will
County
Station
529
East Romeo
Road
Romeoville, Illinois 60441
PHONE:
1-815-886-1010
(23)
1416)
(1719)
_________
IL
0002208
001
_______
ST
PERMIT NUMBER
DIS
SIC
LATITUDE
LONGITUDE
(46
531
(54 61)
(62 53)
(36
45)
PARAMETER
MINIMUM.
AVERAGE
MAXIMUM
UNITS
4 OF EX
This agency
is
authorized
to
require
this
infomiation
under Illinois Revised
Statutes,
1979,
Chapter 1111
2,
Section
1042. Disclosure
of this information is
required. Failure
to
do so may result in
a civil penalty up to $10,000.00 per
day
of
violation
or a fine up to
$25,000.00
per
day
of
violation
and imprisonment
up to
one
year.
This form
has been
approved by
the
Forms
Management
Center.
NATIONAL
POLLUTANT
DISCHARGE ELIMINATION SYSTEM
DISCHARGE
MONITORING
REPORT
QUANTITY
COMMENTS
Condenser
Cooling
Total
Number
of
Flow
*
Chlorine Concentration
no
ai
(22
291
(24 261
126271
126
251
(30 31)
REPORTING
PERIOD
FROM
I
98
I
2
1
TO
98
I
2
I
28
—
YEAR
MO
j
DAY
YEAR
MO
DAY
132 371
4 CARD
ONLY
MINIMUM
AVERAGE
MAXIMUM
UNITS
#OF
EX
Flow
REPORTED
0.0
536.5
816.5
MGD
. CONDITIONPERMIT
None
None
None
Intake
REPORTED
40.0
44.6
51 .0
0
Temperature
PERMIT
None
CONDITION
None
None
Discharge
REPORTED
520
59.6
67.0
0
Temperature
CONDITIONPERMIT
None
None
None
TRO
REPORTED
0.00
mg/I
Q
PERMIT
--
--
0.05
*
CONDITION
Chlorination
REPORTED
0
0.5
i
per
unit
Frequency
PERMIT
None
None
None
per
day
CONDITION
Chlorination
REPORTED
45
mm/day
Q
Duration
PERMIT
120/Unit
per unit
CONDITION
NaOCl
REPORTED
0.0
128.8
214.9
lb/day
Applied
CONDITIONPERMIT
None
None
None
NaBr
REPORTED
0.0
112.3
187.2
lb/day
—
0
Applied
PERMIT
None
CONDITION
None
None
.
——
fi
NAME
OF
PRINCIPLE ExEcuTIvE OFFICER
TITLE OF THE
OFFICER
DATE
I
I certify the)
I am familiar
with
the
infomration
I
contained
in this raped and that to the best of
my
Spedi, F. Gary
Plant
Manager
3
Z3
I
knowIede and belief auchinfoirnation
is true,
I
complete,
and accurate.
c(L
LAST,
FIRST
Ml
.
TITLE
YEAR
MO
DAY
Signature
ofrinciple
or
IL
532-0092
WPC
242
3/89
Commonwealth
Edison Company
Wilt County
Station
529
East
Romeo
Road
Romeoville,
Illinois 60441
1
815-886-101
0
(4
161
(17 19)
_______________
0002208
001
_______
PERMIT
NUMBER
DIS
SIC
NATIONAL
POLLUTANT
DISCHARGE
ELIMINATION
SYSTEM
DISCHARGE
MONITORING
REPORT
LATITUDE
LONGITUDE
COMMENTS
Condenser
Cooling
Water
Total
Number
of
Flow
*
Chlonne
Concentration
(28
271
126
29)
(50 51)
1
31
YEAR
MO
DAY
This agency
is authorized to
require
this information
under Illinois Revised
Statutes,
1979,
Chapter 111 1
2,
Seofon
1042. Disclosure
of this
information
Is
required.
Failure
to do so may result
in a
Civil
penalty
up to $10000.00
per day of violation
or
a
tine
up
to
$25,000.00
per
day of violation
and
imprisonment
up to one year.
This
form
has
been
approved
by
the Forms
Management
Center.
PERMITTEE
NAME:
ADDRESS:
PHONE:
(2 3)
IL
ST
REPORTING
PERIOD
FROM
I
98
I
120
21)
l
25)
(24
25)
I
I
I
TAII
I
MV
I
UAY
I
TO
98
5CARDONLY
QUANTITY
(32
37)
(36 40)
45
531
(04
871
162 631
(38 451
PARAMETER
MINIMUM
AVERAGE
MAXIMUM
UNITS
#OFEX
4 CARD ONLY
/J,97
?
A
NDNIMUM
AVERAGE
MAXIMUM
UNITS
# OF EX
Flow
REPORTED
224.6
693.0
1 1
50.6
MGD
Continuous
CONPERMIT
DIllON
None
None
None
Continuous
Intake
REPORTED
38.0
44.1
52.0
°F
Q
Continuous
Temperature
CONPERMIT
DIllON
None
None
None
Continuous
Discharge
REPORTED
47.0
54.6
62.0
°F
o
Continuous
Temperature
CONDITION
PERMIT
None
None
None
Continuous
TRO
REPORTED
0.00
mg/I
PERMIT
-
0.05
*
CONDITION
Chlorination
REPORTED
0
0.8
1
perunit
0
Frequency
ERMIT
None
None
None
per
day
CONDITION
Chlorination
REPORTED
45
mm/day
o
Duration
PERMIT
120/Unit
per
unit
CONDITION
NaOCI
REPORTED
51.8
1 72.8
274.5
lb/day
0
Applied
CONDmON
PERMIT
None
None
None
NaBr
REPORTED
45.0
150.7
239.4
lb/day
0
Applied
CONDITION
PERMIT
None
None
None
•
contained
in this report and
that to the best
of my
Spedi,
F. Gary
I
Plant
Manager
knowledge
and belief such
information is/rue,
NAME OF PRINCIPLE
EXECUTIVE
OFFICER
I
TITLE OF THE OFFICER
DATE
I cedil’
that)
am familiar
with
the
information
urle4ive
complete,
and
accurate.
LAST,
FIRST
Ml
TITLE
YEAR
MO
DAY
r Authorized
IL
532-0092
WPC
242
3/89
AND
THE
LOWER
DES
PLAINES
RIVER:
)
(Rulemaking
-
Water)
PROPOSED
AMENDMENTS
TO
35111.
Adm.
)
CodeParts
301,
302,
303and
304.
)
PRE-FILED
QUESTIONS
OF
ENVIRONMENTAL
LAW
AND
POLICY
CENTER
AND
SIERRA
CLUB
TO
DAVID
R.
ZENZ
REGARDING
DISSOLVED
OXYGEN
ENHANCEMENT
STUDIES
The
Environmental
Law
and
Policy
Center
of
the
Midwest
and
the
Illinois
Chapter
of
the
Sierra
Clubhereby
file
questions
to
David
R.
Zenz
regarding
dissolved
oxygen
enhancement:
1.
Are
the
Chicago
Area
Waterways
(“CAWS”)
currentlyconsistently
meeting
the
dissolved
oxygen
standardsthat
are
currently
applicable
to
them?
2.
Does
IEPA
generally
require
NPDES
permits
to
be
written
so
as
to
preclude
violation
of
dissolved
oxygen
standards?
3.
Is
MWRDGC
violating
its
current
permits
each
time
that
any
part
of
the
CAWS
violates
the
existing
dissolved
oxygen
standard?
4.
Did
you
consider
the
costs
of
implementing
controlsnecessary
to
meet
the
currently
applicable
DO
standards?
5.
How
do
the
discharges
from
the
Calumet,
North
Side
or
Stickney
affect
dissolved
oxygen
levels
in
the
CAWS?
6.
In
Attachment
A,
Figure
10,
how
do
you
explain
the
impact
new
aeration
stations
have
on
DO
concentrations
in
the
Chicago
River
Main
Stemfor
the
period
of
October
2000
to
May
2001and
the
diminished
impact
from
May
to
August
2001?
7.
Did
you
take
any
effects
of
phosphorus
or
nitrogenpollution
on
DO
levels
into
account
in
designing
these
studies?
8.
Have
you
or
CTI
been
involved
in
the
preparation
of
any
studies
designed
to
determine
the
cost
to
Illinois
dischargers
of
treating
for
phosphorus
or
nitrogen?
9.
In
calculating
the
capital
costs
of
the
work
needed
to
meet
the
proposed
dissolved
oxygen
standards,
when
is
it
assumed
that
construction
would
beginfor
each
recommended
project?
10.
Are
there
other
studies,
calculations
or
worksheets
that
support
the
estimates
and
calculations
made
in
QQ,
PP,
and
00
of
the
IEPA
initial
filing?
If
so,
please
present
them
at
the
hearing.
CHICAGO
AREA
WATERWAYS
SYSTEM
)
R08-09
AND
THE
LOWER
DES
PLAINES
RIVER:
)
(Rulemaking
-
Water)
PROPOSED
AMENDMENTS
TO
35111.
Adm.
)
Code
Parts
301,
302,
303
and
304.
)
PRE-FILED
QUESTIONS
OF
ENVIRONMENTAL
LAW
AND
POLICY
CENTER
AND
SIERRA
CLUB
TO
SAMUEL
G.
DENNISON
REGARDING
BUBBLY
CREEK
The
Environmental
Law
and
Policy
Center
of
the
Midwest
and
the
Illinois
Chapter
of
the
Sierra
Club
hereby
file
questions
to
Samuel
G.
Dennison
regarding
Bubbly
Creek:
1.
On
page
4
of
your
testimony
you
indicate
that
DO
levels
can
fall
to
zero
for
up
to
three
days
following
rain
events.
Has
MWRDGC
seen
evidence
of
fishkills
caused
by
such
events?
2.
Where
dothe
fish
that
do
not
die
go
after
such
an
event?
3.
Generally
does
MWRDGC
know
where
thefish
go
to
avoid
extreme
low
DO
conditions
in
Bubbly
Creek?
4.
Where
do
fish
go
when
DO
conditions
are
extremely
low
in
the
North
Shore
Channel
or
other
locations
or
is
it
thought
that
the
fish
die?
5.
Were
there
fish
kills
that
resulted
from
any
of
the
DO
drops
that
are
reflected
in
Attachment
3?
6.
Has
the
MWRDGC
observed
fish
kills
in
Bubbly
Creek?
7.
Does
MWRDGC
propose
that
conditions
be
allowed
to
continue
such
that
dissolved
oxygen
levels
are
allowed
to
fall
below
3
mg/L
in
Bubbly
Creek?
8.
Does
Bubbly
Creek
now
constitute
an
“attractive
nuisance”
for
fish,
as
stated
on
page
5
of
your
testimony?
9.
Who
prepared
Attachment
2
to
your
testimony?
10.
What
has
happened
to
the
recommendations
and
ideas
suggested
in
Attachment
2?
11.
Has
MWRDGC
considered
doing
any
of
the
things
discussed
in
Attachment
2?
12.
On
page
6
of
your
testimony
you
propose
a
narrative
standard
for
Bubbly
Creek
that
would
stay
in
place
until
sometime
after
2024.
As
a
practical
matter,
what
DO
levels
would
need
to
be
maintained
to
protect
such
a
narrative
standard?
13.
What
would
the
MWRDGC
do
to
assure
compliance
with
your
proposed
narrative
standard
for
Bubbly
Creek?
14.
Regarding
attachment
3
p.
15,
do
you
know
what
caused
the
DO
collapse
at
Main
St.
in
December
2006?
15.
If
Bubbly
Creek
cannot
be
expected
to
maintain
a
standard
of
4
mg/L
DO,
how
is
it
that
the
North
Shore
Channel
at
Main
St.
generally
stays
above
5
mg/L
DO?
AND
THE
LOWER
DES
PLAINES
RIVER:
)
(Rulemaking
-
Water)
PROPOSED
AMENDMENTS
TO
35111.
Adm.
)
Code
Parts
301,
302,
303
and
304.
)
PRE-FILED
QUESTIONS
OF
ENVIRONMENTAL
LAW
AND
POLICY
CENTER
AND
SIERRA
CLUB
TO
THOMAS
E.
KUNETZ,
P.E.
The
Environmental
Law
and
Policy
Center
of
the
Midwest
and
the
Illinois
Chapter
of
the
Sierra
Club
hereby
file
questions
to
Thomas
E.
Kunetz,
P.E.
regarding
certain
capital
costs:
1.
How
is
the
time
value
of
money
taken
into
account
in
calculating
the
various
capital
costs
that
are
provided
in
your
testimony?
2.
Do
these
figures
take
into
account
the
construction
schedule
now
planned
for
these
projects?
For
example,
are
the
costs
of
expected
expenditures
for
work
that
is
expected
to
be
done
in
2015
given
in
a
present
value
figure
discounted
from
2015
to
2008?
3.
Is
a
3%
interest
rate
is
used
by
the
MWRDGC
in
making
all
of
the
present
value
calculations?
4.
What
inflation
rate
is
assumed?
5.
Over
what
period
of
time
is
the
cost
of
a
capital
expenditure
amortized
by
MWRDGC?
6.
Does
the
MWRDGC
also
have
plans
for
work
on
the
Tunnel
and
Reservoir
Plan
(Deep
Tunnel)?
7.
Howmuch
has
MWRDGC
invested
in
the
TARP?
8.
How
much
does
MWRDGC
intend
to
invest
in
the
future
in
TARP?
9.
What
are
the
yearly
operating
and
maintenance
costs
of
running
TARP?
THE
CHICAGO
AREA
WATERWAYS
SYSTEM
)
R08-09
AND
THE
LOWER
DES
PLAINES
RIVER:
)
(Rulemaking
-
Water)
PROPOSED
AMENDMENTS
TO
35111.
Adm.
)
Code
Parts
301,
302,
303
and
304.
)
PRE-FILED
QUESTIONS
OF
ENVIRONMENTAL
LAW
AND
POLICY
CENTER
AND
SIERRA
CLUB
TO
ROBERT
S.
ELVERT
The
Environmental
Law
and
Policy
Center
of
the
Midwest
and
the
Illinois
Chapter
of
the
Sierra
Club
hereby
file
questions
to
Robert
S.
Elvert:
I.
Are
you
aware
of
current
recreational
use
of
the
Upper
Dresden
Pool
above
the
1-55
Bridge?
2.
If
so,
please
describe
the
current
types
and
extent
of
recreational
use
in
the
Upper
Dresden
Pool
above
the
1-55
Bridge.
3.
Is
current
recreational
use
of
the
Upper
Dresden
Pool
interfering
with
Exxon
Mobil
operations
or,
to
your
knowledge,
the
operations
of
other
businesses?
4.
What
do
you
understand
is
the
current
recreational
use
designation
of
the
Des
Plaines
River
above
the
1-55
Bridge?
5.
What
is
your
understanding
of
how
the
JEPA
proposal
will
change
the
recreational
designation
of
the
Des
Plaines
River
above
the
1-55
Bridge?
6.
Are
there
currently
facilities
to
assist
recreational
boaters
near
the
Exxon
Mobil
refinery
or
the
1-55
Bridge?
CHICAGO
AREA
WATERWAYS
SYSTEM
)
(Rulemaking-
Water)
ANDTHE
LOWER
DES
PLAINES
RIVER:
)
PROPOSEDAMENDMENTS
TO
35111.
Adm.
)
Code
Parts
301,302,
303
and
304
)
)
PRE-FILED
QUESTIONS
OF
ENVIRONMENTAL
LAW
AND
POLICY
CENTER
AND
SIERRA
CLUB
TO
PAUL
L.
FREEDMAN
The
Environmental
Law
and
PolicyCenter
of
the
Midwest
and
the
Illinois
Chapter
of
the
Sierra
Clubhereby
file
questions
to
Paul
L.
Freedman:
1.
In
various
parts
of
your
testimony
you
mention
temperature
effects
as
something
that
you
do
not
believe
that
IEPA
adequately
studied.
Whatportionsof
the
CAWS
need
further
study
with
regard
to
temperature
effects?
2.
What
are
the
significant
thermal
dischargers
to
the
CAWS?
3.
Are
the
current
CSOs
harming
aquatic
life
inany
portion
of
the
CAWS?
4.
If
your
answer
to
question
3
is
“yes,”
in
what
portions
of
the
CAWS
is
aquaticlife
being
significantly
affected?
5.
Are
you
aware
of
any
wet
weather
standard
that
would
allow
dissolved
oxygen
conditions
to
fall
below
I
mg/L
for
a
significant
period?
CHICAGO
AREA
WATERWAYS
SYSTEM
)
R08-09
AND
THE
LOWER
DES
PLAINES
RIVER:
)
(Rulemaking
-
Water)
PROPOSED
AMENDMENTS
TO
35111.
Adm.
)
Code
Parts
301,
302,
303
and
304.
)
PRE-FILED
QUESTIONS
OF
ENVIRONMENTAL
LAW
AND
POLICY
CENTER
AND
SIERRA
CLUB
TO
JOHN
MASTRACCHIO
REGARDING
ECONOMIC
ASSESSMENT
FOR
DISINFECTION
FACILITIES
The
Environmental
Law
and
Policy
Center
of
the
Midwest
and
the
Illinois
Chapter
of
the
Sierra
Club
hereby
file
questions
to
John
Mastracchio
regarding
the
economic
assessment
for
disinfection
facilities:
1.
What
is
the
annualized
cost
of
the
estimated
capital
element
for
disinfection
broken
down
for
Stickney,
North
Side
and
Calumet
STP
for
UV
disinfection?
2.
How
was
the
time
value
of
money
taken
into
account
in
calculating
the
various
capital
costs
that
are
presumed
by
your
testimony?
3.
How
do
these
figures
take
into
account
the
construction
schedule
now
planned
for
these
projects?
For
example,
are
the
costs
of
expected
expenditures
for
work
that
is
expected
to
be
done
in
2015
given
in
a
present
value
figure
discounted
from
2015
to
2008?
4.
What
interest
rate
is
used
bythe
MWRDGC
in
making
present
value
calculations?
5.
Over
what
period
of
time
is
the
cost
of
a
capital
expenditure
amortized
by
MWRDGC?
6.
Does
MWRDGC
intend
to
finish
the
TARP
and,
if
so,
how
does
it
intend
to
fund
the
completion
of
that
project?
7.
On
page
3
of
your
testimony
you
refer
to
“user
charges.”
What
user
charges
are
now
charged
by
MWRDGC?
8.
Can
MWRDGC
raise
any
of
its
user
charges
without
additional
authority
from
the
legislature?
9.
Can
MWRDGC
pay
for
its
existing
capital
plans
without
an
act
of
the
state
Legislature
or
a
referendum
after
2016?
10.
Can
MWRDGC
pay
for
completion
of
the
TARP
without
an
act
of
Congress?
11.
Can
MWRDGC
complete
TARP
without
an
act
of
the
state
legislature?
12.
What
is
the
basis
for
the
estimated
$2.8
billion
estimate
of
the
cost
to
MWRDGC
if
effluent
nutrient
limits
are
imposed
in
the
future?
13.
What
effluent
limits
are
assumed
would
be
imposed
for
nitrogen
and
for
phosphorus
in
making
this
estimate?
AND
THE
LOWER
DES
PLAINES
RIVER:
)
(Rulemaking
-
Water)
PROPOSEDAMENDMENTS
TO
35111.
Adm.
)
Code
Parts
301,
302,
303
and
304.
)
PRE-FILED
QUESTIONS
OF
ENVIRONMENTAL
LAW
AND
POLICY
CENTER
AND
SIERRA
CLUB
TO
JOHN
MASTRACCHIO
REGARDING
ECONOMIC
ASSESSMENT
FOR
DISSOLVED
OXYGEN
ENHANCEMENT
FACILITES
The
Environmental
Law
and
Policy
Center
of
the
Midwest
andthe
Illinois
Chapterof
the
Sierra
Club
hereby
file
questions
to
John
Mastracchio
regarding
the
economic
assessment
for
dissolved
oxygen
enhancement
facilities:
1.
Does
the
Chicago
Area
Waterway
System(CAWS)
currently
always
meet
the
existing
dissolved
oxygen
standards?
2.
What
effect
doesthe
existing
level
of
violations
of
the
current
DO
standards
have
on
MWRDGC?
3.
Whatinvestments
does
MWRDGC
intend
to
make
to
assure
compliance
with
the
water
quality
standards
that
are
now
applicable
to
the
CAWS?
4.
Has
the
MWRDGC
determined
the
difference
in
costs
between
meeting
the
existing
standards
applicable
to
CAWS
andthe
proposed
standards?
5.
If
the
answer
to
question
3
is
yes,
what
is
the
net
increase
in
capital
and
O&M
coststhat
would
be
imposed
on
the
MWRDGC
to
meet
the
proposed
IEPA
dissolved
oxygen
standards
6.
Can
MWRDGC
pay
for
improvements
needed
to
meetthe
currently
applicable
dissolved
oxygen
standards
without
an
act
of
the
state
Legislature
or
a
referendum?
CHICAGO
AREA
WATERWAYS
SYSTEM
)
R08-09
AND
THE
LOWER
DES
PLAINES
RIVER:
)
(Rulemaking
-
Water)
PROPOSED
AMENDMENTS
TO
35111.
Adm.
)
Code
Parts
301,
302,
303
and
304.
)
PRE-FILED
QUESTIONS
OF
ENVIRONMENTAL
LAW
AND
POLICY
CENTER
AND
SIERRA
CLUB
TO
DAVID
R.
ZENZ
REGARDING
EFFLUENT
DISINFECTION
STUDIES
The
Environmental
Law
and
Policy
Center
of
the
Midwest
and
the
Illinois
Chapter
of
the
Sierra
Club
hereby
file
questions
to
David
R.
Zenz
regarding
effluent
disinfection
studies:
1.
How
many
disinfection
facilities
have
you
been
involved
in
planning
or
building?
2.
How
many
of
these
were
in
Illinois?
3.
Could
you
name
the
Illinois
disinfection
facilities
on
which
you
have
worked?
4.
Do
you
believe
that
the
disinfection
facilities
on
which
you
have
worked
performed
reasonably
well?
5.
Did
MWRDGC
disinfect
at
its
Calumet,
North
Side
or
Stickney
plants
at
any
time
in
the
past?
6.
Did
you
consider
using
anyidle
existing
disinfection
equipment
at
any
of
these
plants?
7.
In
calculating
the
operation
and
maintenance
costs
for
disinfection,
what
period
of
the
year
was
it
assumed
that
disinfection
would
take
place?
8.
When
was
the
construction
schedule
discussed
on
pages
910
of
your
testimony
worked
out
and
who
developed
the
schedule?
9.
Have
you
worked
on
other
disinfection
projects?
10.
In
calculating
the
capital
costs
of
disinfection
at
the
three
plants,
when
is
it
assumed
that
construction
would
begin
at
each
plant?
11.
How
were
the
presumed
inflation
and
interest
rates
decided
on?
12.
Are
there
other
studies,
calculations
or
work
sheets
that
support
the
estimates
and
calculations
made
in
the
August
2005
CTI
disinfection
study?
If
so,
please
present
them
at
the
hearing.
AND
THELOWER
DES
PLAINES
RIVER:
)
(Rulemaking
-
Water)
PROPOSED
AMENDMENTS
TO
35111.
Adm.
Code
Parts
301.
302,
303
and
304.
)
PRE-FILED
QUESTIONS
OF
ENVIRONMENTAL
LAW
AND
POLICY
CENTER
AND
SIERRA
CLUB
TO
CARL
ADAMS
AND
ROBIN
GARIBAY
The
Environmental
Law
and
Policy
Center
of
the
Midwest
and
the
Illinois
Chapter
of
the
Sierra
Club
hereby
file
questions
to
Carl
Adams
and
Robin
Garibay:
1.
On
page
3
of
your
testimony
you
state
that
Stepan’
s
Outfall
001
would
be
subjected
to
the
proposed
temperature
standards
“likely
without
the
option
of
a
mixing
zone
due
to
upstream
sources
of
warm
effluent
and
the
general
nature
of
the
Lower
DesPlaines
River.”
What
upstream
sources
of
effluent
are
you
talking
about?
2.
How
does
the
“general
nature
of
the
Lower
Des
Plaines
River”
affect
the
ability
of
Stepan
to
obtain
a
mixing
zone?
3.
What
is
the
available
dilution
in
the
Des
Plaines
River
at
the
point
of
Stepan’s
discharge?
4.
Do
recreational
boaters
currently
use
the
river
in
the
vicinity
of
the
Stepan
discharge?
5.
Has
Stepan
ever
been
denied
a
mixing
zone
before
because
of
the
fact
that
a
segment
of
the
Des
Plaines
was
violating
water
quality
standards?
6.
What
is
the
distance
from
Stepan’s
wastewater
treatment
plant
to
the
discharge
point?
7.
What
businesses
or
other
facilities
are
in
the
area
of
the
Stepan
Millsdale
plant?
8.
Has
Stepan
recently
attempted
to
buy
land
in
the
area
of
the
Millsdale
plant?
9.
What
is
the
source
and
nature
of
the
“sanitary
waste”
coming
from
the
septic
system
overflow
discharged
under
NPDES
Permit
No.
1L0002453
mentioned
by
your
testimony
at
page
3?
10.
Does
the
“sanitary
waste”
contain
human
pathogens?
11.
How
many
people
regularly
work
at
the
Millsdale
plant?
12.
What
sanitary
facilities
are
provided
for
people
working
at
the
Milisdale
plant?
13.
Does
Stepan
currently
discharge
nitrogen
and
phosphorus
into
the
Des
Plaines
River?
14.
Is
there
any
source
of
fecal
coliform
in
the
Milisdale
plant
discharge
other
than
sanitary
waste?
15.
Does
the
Des
Plaines
River
now
occasionally
violate
dissolved
oxygenstandards
in
the
Upper
Dresden
Pool
at
the
the
1-55
Bridge?
16.
What
is
your
understanding
of
how
dissolved
oxygen
effluent
limits
are
normally
set
by
IEPA?
20.
Do
you
have
data
regarding
the
temperatures
in
the
Des
Plaines
River
where
the
Stepan
plant
discharges?
If
so,
please
present
them
at
the
hearing.
AND
THE
LOWER
DES
PLAINES
RIVER:
)
(Rulemaking
-
Water)
PROPOSED
AMENDMENTS
TO
35111.
Adm.
)
Code
Parts
301,
302,
303
and
304.
)
PRE-FILED
QUESTIONS
OF
ENVIRONMENTAL
LAW
ANTI
POLICY
CENTER
AND
SIERRA
CLUB
TO
ALAN
L.
JIRIK
The
Environmental
Law
and
Policy
Center
of
the
Midwest
and
the
Illinois
Chapter
of
the
Sierra
Club
hereby
file
questions
to
Alan
L.
Jirik:
1.
Are
you
aware
of
current
recreational
use
of
the
Chicago
Sanitary
and
Ship
Canal?
2.
If
so,
please
describe
the
current
types
and
extent
of
recreational
use
in
the
Chicago
Sanitary
and
ShipCanal.
3.
Is
the
entire
ChicagoSanitary
and
Ship
Canal
characterized
by
steep
concrete
walls?
4.
Is
some
or
all
of
the
CSSCshaded?
5.
What
do
you
understand
is
the
current
recreational
use
designation
of
the
Chicago
Sanitary
and
Ship
Canal?
6.
What
is
your
understanding
of
how
theJEPA
proposal
will
change
the
recreational
designation
of
the
CSSC?
7.
Are
there
currently
facilities
to
assist
recreational
boaters
on
the
CSSC?
CHICAGO
AREA
WATERWAYS
SYSTEM
)
R08-09
AND
THE
LOWER
DES
PLAINES
RIVER:
)
(Rulemaking
-
Water)
PROPOSED
AMENDMENTS
TO
35111.
Adm.
)
Code
Parts
301,
302,
303and
304.
)
PRE-FILED
QUESTIONS
OF
ENVIRONMENTAL
LAW
AND
POLICY
CENTER
AND
SIERRA
CLUB
TO
JAMES
E.
HUFF,
P.E.
The
Environmental
Law
and
Policy
Center
of
the
Midwest
and
the
Illinois
Chapter
of
the
Sierra
Club
hereby
file
questions
to
James
E.
Huff,
P.E.:
1.
Why
does
it
matter
here
that
the
Chicago
Sanitary
and
Ship
Canal
(“CSSC”)
is
“artificial?”
2.
Do
you
know
from
your
personal
experience
on
the
CSSC
whether
fishing,
recreational
boating
or
any
other
recreational
uses
occur
upstream
of
the
Calumet
Sag
Channel
confluence?
Please
describe.
3.
Do
you
know
from
yourpersonal
experience
on
the
CSSC,
whether
fishing,
recreational
boating
or
any
other
recreational
uses
occur
downstream
of
the
Calumet
Sag
Channel
confluence?
If
so,
please
describe.
4.
On
page
4
of
your
testimony
you
expressconcern
about
thehazard
the
electric
barrier
at
river
mile
296.5
presents
to
boaters.
Can
you
tell
us
the
distance
in
feet
between
the
most
upstream
and
most
downstream
point
on
the
barrier
system
(including
Barrier
I,
hA
and
JIB)?
5.
Can
you
characterize
the
likely
number
of
people
crossing
this
barrierper
year
and
distinguish
between
shipping
personnel,
agency
or
working
personnel
(Coast
Guard,
MWRD,
Midwest
Generation,
contract
biologists,
etc)
and
recreational
passengers?
6.
On
page
5
of
your
testimony,
youstate
“These
electric
barriers..
.will
also
prevent
all
other
fish
from
migrating
up
or
down
the
Ship
Canal
at
Lockport,
effectively
terminating
the
water
body
at
this
point
from
a
biological
perspective.
What
does
it
mean
to
“terminate
a
water
body
from
a
biological
perspective”?
7.
Are
you
aware
ofevidence
of
fish
migration
through
the
CSSC?
Is
the
CSSC
a
historical
migration
route
forfish?
8.
Are
you
aware
of
other
water
bodies
that
have
an
upstream
terminus,
in
terms
of
fish
9.
movement?
10.
How
are
water
bodies
with
such
an
upstream
terminus
preventing
fish
passagemanaged?
How
does
an
upstream
terminus
affect
water
quality?
How
does
it
impact
resident
fish
populations?
15.
At
the
top
of
page
6
of
your
testimony,
you
mention
the
Fisk,
Crawford
and
Will
County
plants
as
supplying
power
during
“peak
energy
demand
periods.”
Is
it
your
belief
that
they
supply
power
only
during
such
periods?
What
is
the
basis
for
that
belief?
16.
You
mention
on
page
6
that
there
are
“no
backwater
areas
or
tributary
mouths
along
the
Ship
Canal.”
Why
does
this
matter?
17.
Are
you
aware
of
any
connections
between
the
CSSC
and
the
Illinois
and
Michigan
(I&M)
Canal?
18.
Do
you
agree
that
there
are
currently
fish
in
the
CSSC?
19.
Are
there
any
distinctions
to
be
made
within
the
CSSC
that
are
relevant
to
aquatic
life?
20.
You
mention
on
page
7
that
there
are
no
public
access
points
downstream
of
the
Calumet-Sag
confluence
with
the
CSSC.
What
access
points
do
you
know
of
above
the
Calumet-Sag
confluence?
21.
On
page
8
of
your
testimony
you
state
that
“it
is
improbable
that
any
indigenous
species
to
the
Great
Lakes
would
establish
a
viable
population
in
the
Ship
Canal?”
What
is
meant
by
this
statement?
Do
you
believe
that
fishfrom
the
Great
Lakes
do
not
generally
enter
the
CS
SC?
22.
How
do
you
believe
that
the
gizzard
shad
and
other
species
now
present
in
number
in
the
CSSC
get
there?
23.
On
page
8
of
your
testimony,
you
consider
fish
movement
from
Lake
Michigan
to
the
CSSC.
Are
you
aware
of
fish
movement
from
the
Lower
Des
Plaines
to
the
Ship
Canal?
24.
Are
you
aware
of
seasonal
fish
movement
in
the
canal
towards
the
aeration
stations,
warm
water
discharges
from
the
industrial
dischargers
or
spilled
grain
from
grain
elevators
adjacent
to
the
CSSC?
25.
On
page
8
of
your
testimony,
you
state
“The
Ship
Canal
is
also
routinely
subject
to
unavoidable
moderate
to
severe
sediment
scouring
associated
with
barge
traffic?
What
evidence
do
you
have
to
support
this
statement?
26.
Can
you
tell
us
the
range
and
average
depths
of
the
CSSC?
Can
you
tell
how
deep
the
draft
from
the
bargetraffic
can
be?
27.
On
page
8
you
state
that
the
CSSC
does
not
currently
meet
the
500mg/L
chloride
standard.
Do
you
know
approximately
how
many
days
it
fails
to
meet
this
standard?
If
so,
how
many?
28.
Approximately
what
percentage
of
the
timedoes
the
CSSC
fails
to
meet
the
chloride
standard?
29.
With
your
experience
along
and
within
the
CSSC,
can
you
provide
examples
of
best
management
practices
that
could
help
alleviate
this
problem?
30.
On
page
9
you
state
that
“industrial
dischargers
willlose
their
mixing
zones
[for
thermal,
chloride
and
sulfate]
during
periods
of
water
quality
violations.
Why
do
you
believe
this
is
true?
34.
You
also
express
concern
regarding
the
“long-term
fate
of
the
three
coal
fired
power
plants.”
What
do
you
mean
by
“long-term”
here?
35.
Is
Citgo
or
Corn
Products
dependent
on
the
Fiskor
Crawford
plants
staying
open
for
any
particular
amount
of
time?
36.
Do
Citgo
or
Corn
Products
receive
or
send
materials
by
barge?
What
is
received
and
sent?
Approximately
how
much
is
received
and
sent
for
each
operation?
37.
To
your
knowledge,
does
the
Board
grant
variances
from
waterquality
standardswhen
these
are
shown
to
be
justified
under
the
Board
rules?
38.
On
page
10
of
your
testimony,
you
state
“The
Board
has
already
granted
variances
relating
to
Total
Dissolved
Solids
to
Citgo
[and
changed
the
waterquality
standard
for
TDS
for
the
Exxon-Mobil
Refinery].”
Can
you
explain
the
latter
part
of
this
statement?
39.
Can
temperatures
of
100
degrees
kiLl
any
of
the
8
species
that
have
been
identified
as
representative
species
in
the
CSSC?
40.
On
pages
14
and
15
of
your
testimony,
you
discuss
the
increase
in
the
percent
catch
of
the
bluntnoseminnow?
How
does
this
affect
your
analysis?
41.
In
your
testimony,
you
make
the
point
thathigh
fish
diversity
is
found
downstream
of
the
Fisk
and
Crawford
facilities.
Can
youtell
us
duringwhat
seasonthis
is
the
case?
With
the
data
used
to
support
this
statement,
it
is
possible
to
detectseasonal
movements
and
changes
in
species
diversity?
Canthis
data
show
abundance
on
a
monthly
or
seasonal
level?
42.
Are
you
aware
of
any
improvements
to
the
chemical
quality
of
the
CSSC
that
have
occurred
orthe
last
30
years?
If
so,
what
are
those
improvements?
43.
Do
you
knowhow
actual
temperatures
in
the
CSSC
(as
opposed
to
permitted
temperatures)
have
changed
over
the
last
30
years?
LAW
AND
POLICY
CENTER
AND
SIERRA
CLUB
TO
ADRIENNE
NEMURA;
PRE-FILED
QUESTIONS
OF
ENVIRONMENTAL
LAW
AND
POLICY
CENTER
AND
SIERRA
CLUB
TO
STEPHEN
F.
MCGOWAN;
PRE-FILED
QUESTIONS
OF
ENVIRONMENTAL
LAW
AND
POLICY
CENTER
AND
SIERRA
CLUB
TO
SUSAN
O’CONNELL;
PRE-FILED
QUESTIONS
OF
ENVIRONMENTAL
LAW
AND
POLICY
CENTER
AND
SIERRA
CLUB
TO
SCUDDER
D.
MACKEY;
PRE-FILED
QUESTIONS
OF
ENVIRONMENTAL
LAW
AND
POLICY
CENTER
AND
SIERRA
CLUB
TO
RICHARD
LANYON;
PRE-FILED
QUESTIONS
OF
ENVIRONMENTAL
LAW
AND
POLICY
CENTER
AND
SIERRA
CLUB
TO
CHARLES
S.
MELCHING;
PRE-FILED
QUESTIONS
OF
ENVIRONMENTAL
LAW
AND
POLICY
CENTER
AND
SIERRA
CLUB
TO
JULIA
WOZNIAK;
PRE-FILED
QUESTIONS
OF
ENVIRONMENTAL
LAW
AND
POLICY
CENTER
AND
SIERRA
CLUB
TO
DAVID
R.
ZENZ
REGARDING
DISSOLVED
OXYGEN
ENHANCEMENT
STUDIES;
PRE-FILED
QUESTIONS
OF
ENVIRONMENTAL
LAW
AND
POLICY
CENTER
AND
SIERRA
CLUB
TO
SAMUEL
G.
DENNISON
REGARDING
BUBBLY
CREEK:
PRE-FILED
QUESTIONS
OF
ENVIRONMENTAL
LAW
AND
POLICY
CENTER
AND
SIERRA
CLUB
TO
THOMAS
E.
KUNETZ,
P.E.;
PRE-FILED
QUESTIONS
OF
ENVIRONMENTAL
LAW
AND
POLICY
CENTER
AND
SIERRA
CLUB
TO
ROBERT
S.
ELVERT;
PRE-FILED
QUESTIONS
OF
ENVIRONMENTAL
LAW
AND
POLICY
CENTER
AND
SIERRA
CLUB
TO
PAUL
L.
FREEDMAN;
PRE-FILED
QUESTIONS
OF
ENVIRONMENTAL
LAW
AND
ECONOMIC
ASSESSMENT
FOR
DISSOLVED
OXYGEN
ENHANCEMENT
FACILITES;
PRE-FILED
QUESTIONS
OF
ENVIRONMENTAL
LAW
AND
POLICY
CENTER
AND
SIERRA
CLUB
TO
DAVID
R.
ZENZ
REGARDING
EFFLUENT
DISINFECTION
STUDIES;
PRE-FILED
QUESTIONS
OF
ENVIRONMENTAL
LAW
AND
POLICY
CENTER
AND
SIERRA
CLUB
TO
CARL
ADAMS
AND
ROBIN
GARIBAY;
PRE-FILED
QUESTIONS
OF
ENVIRONMENTAL
LAW
AND
POLICY
CENTER
AND
SIERRA
CLUB TO
ALAN
L.
JIRIK;
PRE-FILED
QUESTIONS
OF
ENVIRONMENTAL
LAW
AND
POLICY
CENTER
AND
SIERRA
CLUB
TO
JAMES
E.
HUFF,
P.E.,
upon:
Mr.
John
T.
Therriault
Assistant
Clerk
of
the
Board
Illinois
Pollution
Control
Board
100
West
Randolph
Street
Suite
11-500
Chicago,
Illinois
60601
via
electronic
mail
on
August
25,
2008;
and
upon
the
attached
service
list
by
depositing
said
documents
in
the
United
States
Mail,
postage
prepaid,
in
Chicago,
Illinois
on
August
25,
2008.
Respectfully
Submitted,
Albert
Ettinger
Senior
Staff
Attorney
Environmental
Law
&
Policy
Center
35
E.
Wacker
Dr.,
Suite
1300
Chicago,
IL
60601
aettinger@elpc.org
Vicky
McKinley
Evanston
Environmental
Board
223
Grey
Avenue
Evanston,
IL
60202
Kay
Anderson
American
Bottoms
RWTF
One
American
Bottoms
Road
Sauget,
IL
62201
Tom
Muth
Fox
Metro
WaterReclamation
District
682
State
Route
31
Oswego,
IL
60543
Kristy
A.N.
Bulleit
and
Brent
Fewefl
Hunton
&
Williams
LLC
1900
K.
Street,
NW
Washington,
DC
20006
Susan
Hedman
and
AndrewArmstrong,
Environmental
Counsel
Environnmental
Bureau
North
Office
of
the
IllinoisAttorney
General
69
West
Washington,
Suite
1800
Chicago,
IL
60602
Kenneth
W.
Liss
Andrews
Environmental
Engineering
3300
Ginger
Creek
Drive
Springfield,
IL
62711
Stacy
Myers-Glen
Openlands
25
East
Washington,
Suite
1650
Chicago,
IL
60602
Bob
Carter
Bloomington
Normal
Water
Reclamation
District
P.O.Box
3307
Bloomington,
IL
6
1702-3307
Ronald
M.
Hill,
Frederick
M.
Feldman,
Esq.,
Louis
Kollias
and
Margaret
T.
Conway
Metropolitan
Water
Reclamation
District
of
Greater
Chicago
100
EastErie
Street,
Room
301
Chicago,
IL
60611
Ann
Alexander,
Senior
Attorney
Natural
resources
Defense
Council
101
North
Wacker
Drive,
Suite
609
Chicago,
IL
60606
Beth
Steinhorn
2021
Timberbrook
Springfield,
IL
62702
William
Richardson,
Chief
Legal
Counsel
Illinois
Department of
Natural
Resources
One
Natural
Resources
Way
Springfield,
IL
62702
Dr.
Thomas
J.
Murphy
DePaul
University
2325
N.
Clifton
Street
Chicago,
IL
60614
Dennis
Lisa
Frede
Chemical
Industry
Council
of
Illinois
2250
E.
Devon
Avenue
Suite
239
Des
Plaines,
IL
60018-4509
Sharon
Neal
Commonwealth
Edison
Company
125
South
Clark
Street
Chicago,
IL
60603
Irwin
Polls
Ecological
Monitoring
and
Assessment
3206
Maple
Leaf
Drive
Glenview,
IL
60025
Barkley
Prairie
Rivers
Networks
1902
Fox
Drive
Suite
6
Champaign,
IL
61820
W.C.
Blanton
Blackwell
Sanders
LLP
4801
Main
Street
Suite
1000
Kansas
City,
MO 64112
James
Huff,
Vice-President
Fluff
&
Huff,
Inc.
915
Harger
Road,
Suite
330
Oak
Brook,
IL
60523
Marc
Miller,
Senior
Policy
Advisor
Jamie
S.
Caston,
Policy
Advisor
Office
of
Lt.
Governor
Pat
Quinn
Room
414
State
House
Springfield,
IL
62706
Chicago,
IL
60602
Frederick
D.
Keady,
P.E.,
President
Vermillion
Coal
Company
1979
Johns
Drive
Glenview,
IL
60025
Katherine
D.
Hodge,
Monica
T.
Rios,
N.
LaDonna
Driver
and
Matthew
C.
Read
Hodge
Dwyer
Zeman
3150
Roland
Avenue
P.O.
Box
5776
Springfield,
IL
62705-5776
James
L.
Daugherty,
District
Manager
Thorn
Creek
Basin
Sanitary
District
700
West
End
Avenue
Chicago
Heights,
IL
60411
Tracy
Elzemeyer,
General
Counsel
American
Water
Company
Central
Region
727
Craig
Road
St.
Louis,
MO
63141
Keith
I.
Harley
and
Elizabeth
Schenkier
Chicago
Legal
Clinic,
Inc.
205
West
Monroe,
4th
Floor
Chicago,
IL
60606
Bernard
Sawyer
and
Thomas
Granto
Metropolitan
WaterReclamation
District
6001
West
Pershing
Road
Cicero,
IL
60650-4
1
12
Richard
J.
Kissel
and
Roy
M.
Harsch
Drinker,
Biddle,
Gardner,
Carton
191
N.
Wacker
Drive,
Suite
3700
Chicago,
IL
60606-1698
Robert
VanGyseghem
City
of
Geneva
1800
South
Street
Geneva,
IL
60
134-2203
Deborah
J.
Williams
and
Stefanie
N.
Diers
Assistant
Counsel,
Division
of
Legal
Counsel
Illinois
Environmental
Protection
Agency
1021
North
Grand
Avenue
East
P.O.
Box
19276
Springfield,
IL
62794-9276
Matthew
J.
Dunn,
Chief
Office
of
the
Attorney
General
Environmental
Bureau
North
69
West
Washington,
Suite
1800
Chicago,
IL
60602
Charles
W.
Wesselhoft
and
James
T.
Harrington
Ross
&
Hardies
150
North
Michigan
Avenue
Suite
2500
Chicago,
IL
6060
1-7567
MarkSchultz
Navy
Facilities
and
Engineering
Command
201
Decatur
Avenue
Building
1A
Great
Lakes,
IL
60088-280
1
Jerry
Paulsen
and
CindySkrukrud
McHenryCountyDefenders
132
Cass
Street
Woodstock,
IL
60098
Lyman
C.
Welch
Alliance
for
the
Great
Lakes
17
N.
State
Street
Suite
1390
Chicago,
IL
60602