BEFORE THE ILLINOIS POLLUTION CONTROL BOARD
IN THE MATTER OF:
WATER QUALITY STANDARDS AND
EFFLUENT LIMITATIONS FOR THE
CHICAGO AREA WATERWAY SYSTEM
AND THE LOWER DES PLAINES RIVER:
PROPOSED AMENDMENTS TO 35 Ill.
Adm. Code Parts 301, 302, 303 and 304
R08-9
(Rulemaking
-
Water)
PRE-FILED TESTIMONY OF DAVID R. ZENZ
DISSOLVED OXYGEN ENHANCEMENT STUDIES
My name is Dr. David R. Zenz, P.E., and
I am a Senior
Associate with Consoer Townsend
Envirodyne
Engineers
, Inc. (CTE). I was part of the CTE
team
which conducted the CTE
studies of
potential technologies and costs
to directly
increase dissolved
oxygen in the Chicago
Area Waterway System (CAWS)
and am prepared to answer questions concerning
these studies
summarized
in this pre-filed testimony.
I
have a Ph.D in Environmental Engineering and am a registered professional engineer in the
State of Illinois.
Before joining
CTE in
1997, I worked for 30 years in the Research and
Development Department of the District
.
At the District, I eventually attained the position of
Manager of Research and Technical Services
. At CTE,
I have worked on a variety of wastewater
and sludge management projects. A resume detailing my education and experience is contained
in Attachment 1.
Page 1 of 12
Electronic Filing - Received, Clerk's Office, August 4, 2008
Background
As part of the Use Attainability Analysis (UAA) of the CAWS, the Illinois Environmental
Protection Agency (IEPA) requested that the Metropolitan Water Reclamation District of Greater
Chicago (District) determine the technologies and costs of methods to directly increase the
dissolved oxygen (DO) in the CAWS. CTE was commissioned by the District to perform this
task.
IEPA specifically requested that the District conduct the following studies of DO enhancement
methods as part of the UAA Study:
1.
Study of Flow Augmentation of the Upper North Shore Channel
2.
Study of Supplemental Aeration of the North and South Branches of the Chicago
River
3.
Study of Flow Augmentation and Supplemental Aeration of the South Fork of the
South Branch of the Chicago River (commonly known as Bubbly Creek)
All three of these studies have been performed by CTE and these reports were submitted to the
Illinois Pollution Control Board (IPCB) as part of the IEPA's proposal in this rulemaking
proceeding.
These reports can be found in Attachments QQ, PP and 00 of the IEPA's initial
filing.
Flow Augmentation of the Upper North Shore Channel
In general, flow augmentation involves bringing water from a nearby source to a waterway in
order to
increase
its flow, eliminate
stagnant
conditions and improve water quality. The IEPA
suggested that adding the effluent of the District's North Side plant to the headwaters of the
Upper North Shore Channel could increase the DO of this CAWS waterway segment and
eliminate stagnant conditions. A computer model developed by Dr. Melching of Marquette
Page 2 of 12
Electronic Filing - Received, Clerk's Office, August 4, 2008
University for simulating the dynamic flow and water quality conditions in the CAWS using
DUFLOW software (Marquette University Model) - which is described in the testimony
presented by Dr. Melching - was used for this task. It was determined that pumping 100 million
gallons per day of effluent flow from the North Side plant, aerated to saturated conditions using
U-tubes, to the headwaters of the Upper North Shore Channel at Wilmette, would bring DO
levels to above 5 mg/l, 90% of the time. This waterway DO target was chosen since a rigid DO
standard for the CAWS would be difficult to meet under all conditions (temperature, wet periods,
etc).
Thus 90% compliance with a 5 mg/l standard seemed to be a reasonable target given that at
the time of this study IEPA had not made a final decision on a DO waterway standard. The
estimate of probable cost for 100 million gallons per day of aerated flow augmentation to the
Upper North Shore Channel included $60.0 million in capital costs, $0.74 million in annual
operation and maintenance costs and a total present worth cost of $74.9 million. These costs are
in June 2006 dollars.
Supplemental Aeration of the North and South Branches of the Chicago River
As requested by IEPA, a study was conducted of the supplemental aeration technologies and
costs for the North and South Branches of the Chicago River. Again, the target DO was 5 mg/1
to be achieved 90% of the time. The Marquette University Model was used to determine the
amount of supplemental aeration needed to achieve this target standard on these waterways.
It
was determined that 4 additional supplemental aeration stations would be required to meet the
DO target - two on the North Branch, in addition to those that the District is currently operating
on the waterway at Webster Avenue and Devon Avenue, and two on the South Branch.
Electronic Filing - Received, Clerk's Office, August 4, 2008
After a review of
potential supplemental aeration technologies
, four
supplemental aeration
technologies were selected for an
opinion
of probable cost. These technologies are U-tubes,
ceramic disc diffusers
, jet aeration, and sidestream
elevated
pool aeration
(SEPA). The District
currently
uses ceramic
disc diffusers
at its existing stations
at
Webster Avenue and Devon
Avenue and SEPA technology
at 5 aeration stations
on the Calumet Area Waterways. The total
capital costs ranged
from $35.
5
million to $89.9 million and the annual operating cost ranged
from $0.55
million
to $2.6
million
.
Total present worth
costs ranged
from $47.4
million to
$132.8 million. These costs
are in June
2006
dollars.
Flow Augmentation and Supplemental Aeration of Bubbly Creek
As requested by IEPA, a study was conducted to determine the technology and costs for flow
augmentation (pumping of South Branch of the Chicago River flow to the headwaters of Bubbly
Creek) and supplemental aeration of Bubbly Creek.
As for the previous studies, the Marquette University Model was used to determine the amount
of flow augmentation and supplemental aeration to achieve a DO target of 5 mg/l in Bubbly
Creek
,
90% of the time.
It
was found that flow augmentation
(
no aeration of the augmented flow) and supplemental
aeration were needed to meet the target DO. Fifty
(
50) million gallons per day of augmented
flow would be taken via a two mile force main from the South Branch of the Chicago River at
Throop Street to the headwaters of Bubbly Creek
.
In addition, a total of three supplemental
aeration stations would be located along the waterway, at the headwaters
,
midpoint and mouth of
Bubbly Creek
,
respectively.
Page 4 of 12
Electronic Filing - Received, Clerk's Office, August 4, 2008
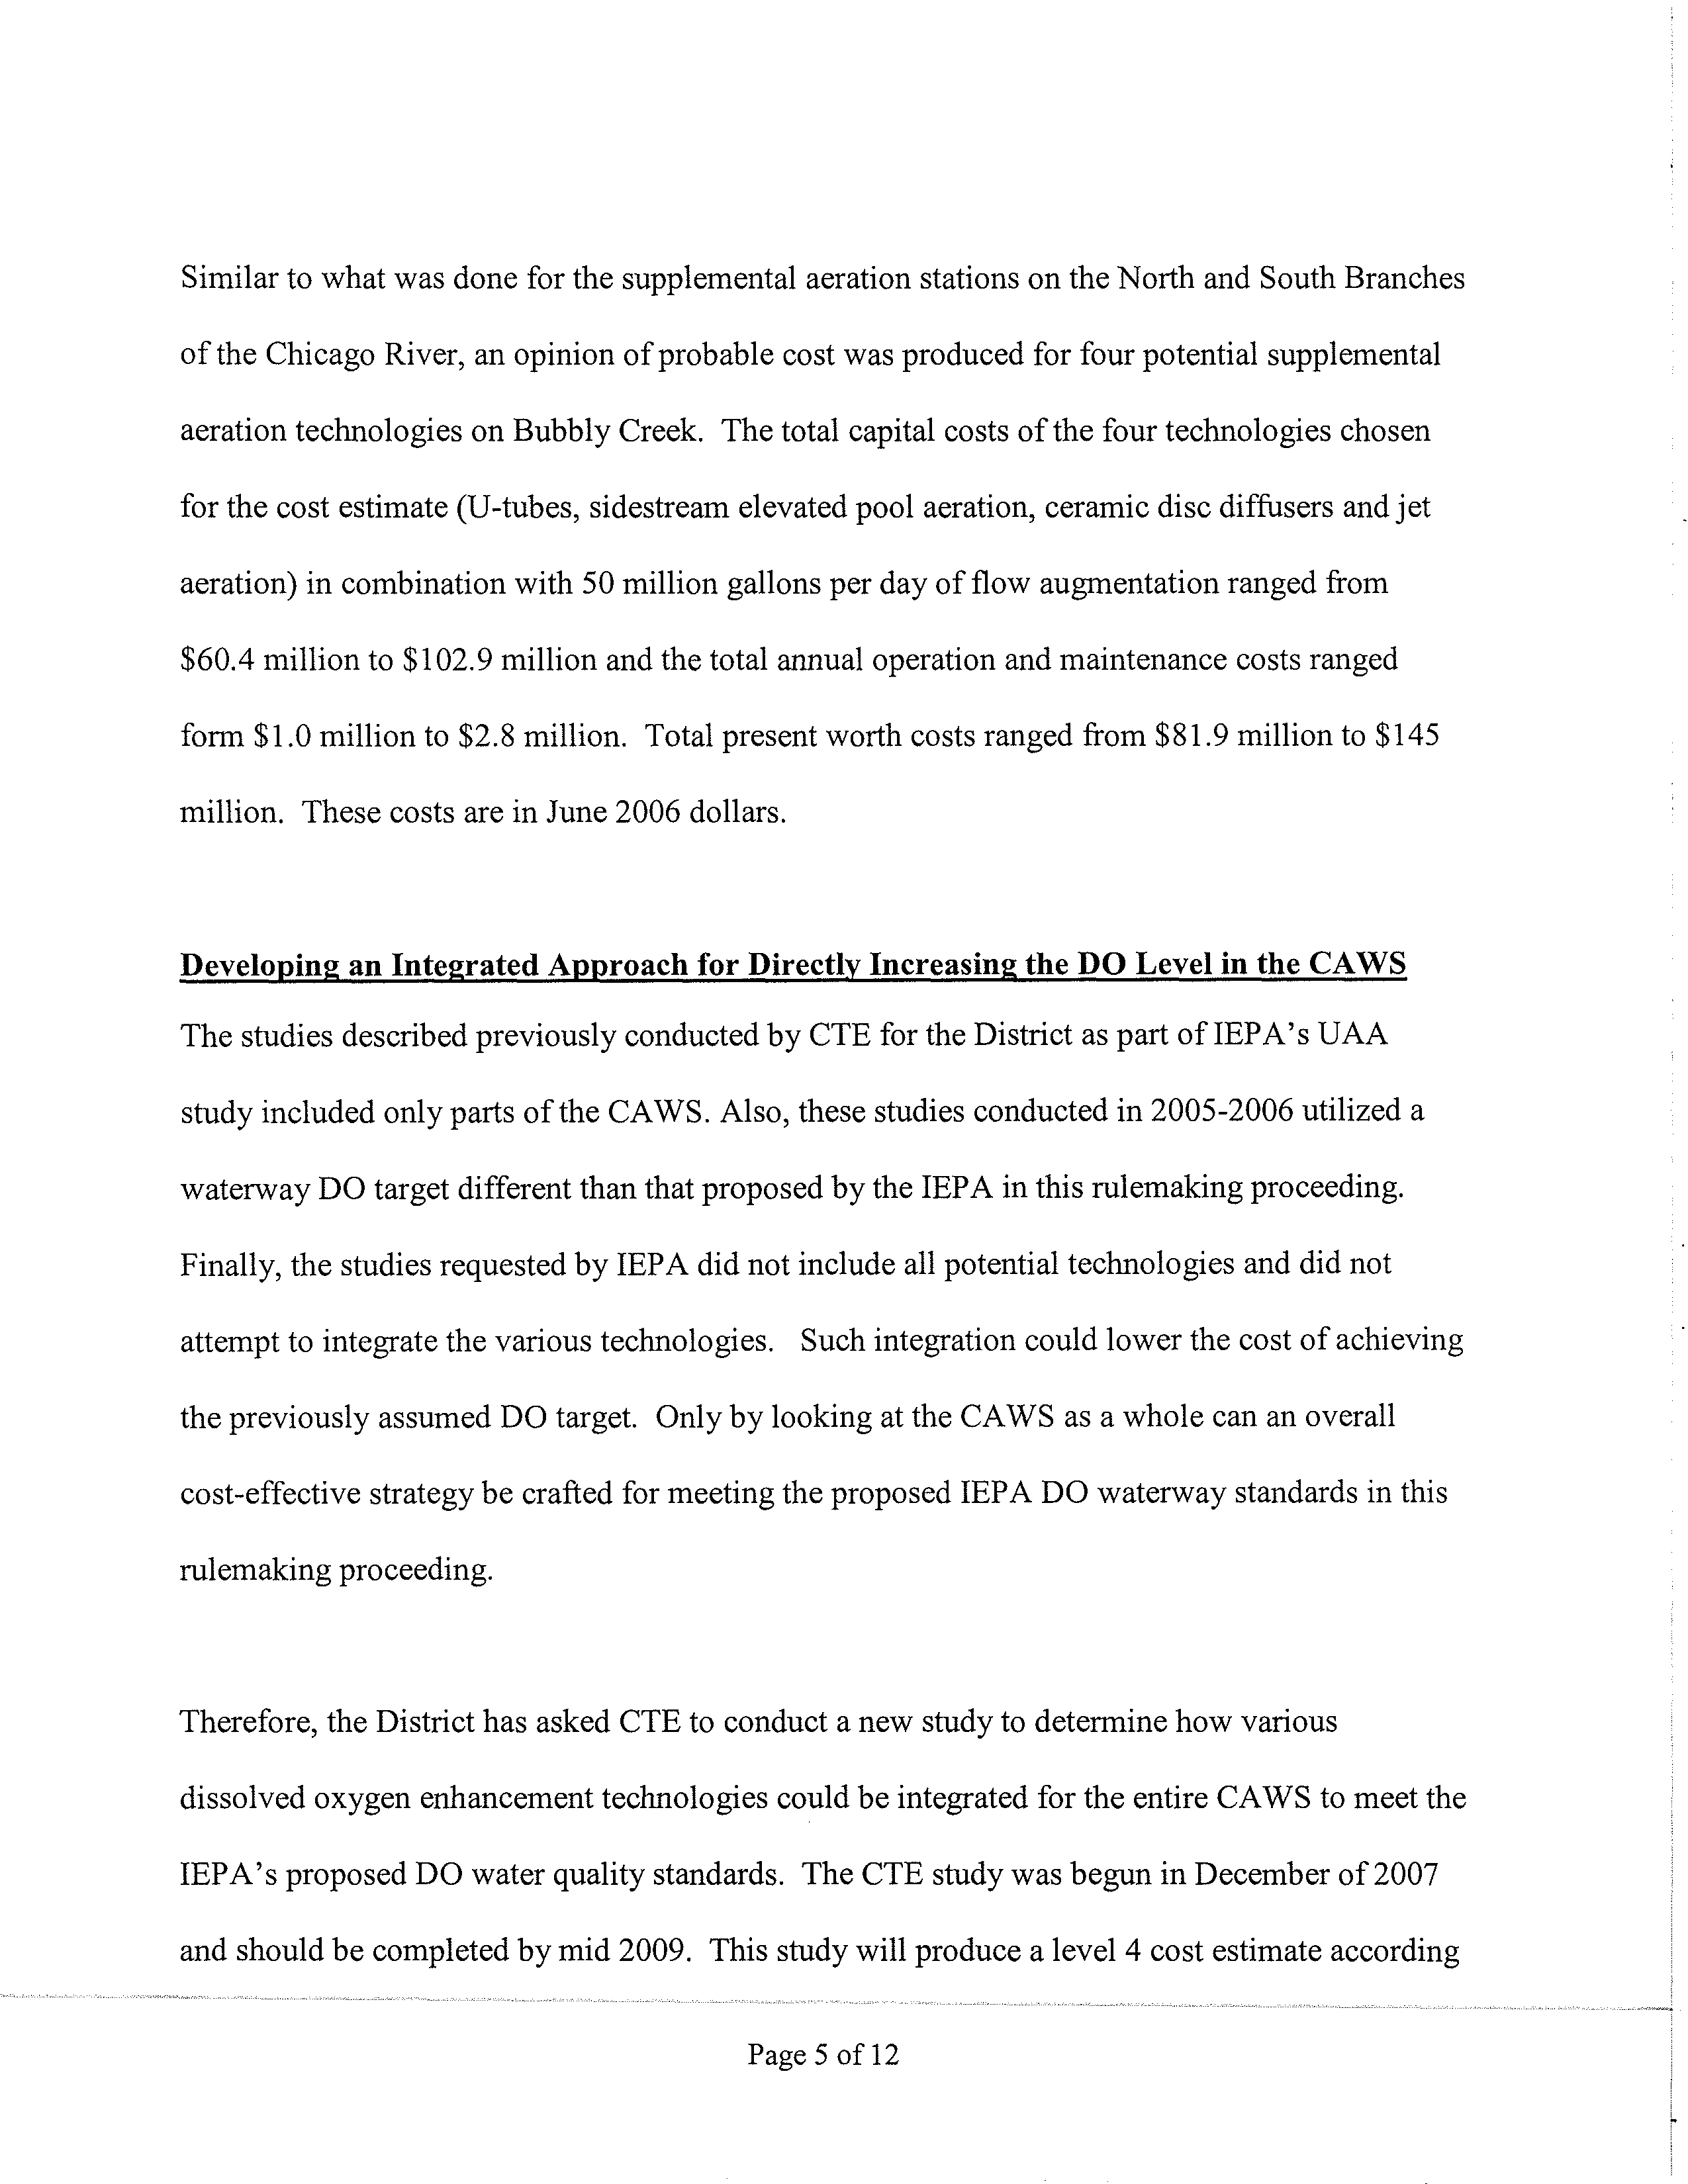
Similar to what was done for the supplemental aeration stations on the North and South Branches
of the Chicago River, an opinion of probable cost was produced for four potential supplemental
aeration technologies on Bubbly Creek. The total capital costs of the four technologies chosen
for the cost estimate (U-tubes, sidestream elevated pool aeration, ceramic disc diffusers and jet
aeration) in combination with 50 million gallons per day of flow augmentation ranged from
$60.4 million to $102.9 million and the total annual operation and maintenance costs ranged
form $1.0 million to $2.8 million. Total present worth costs ranged from $81.9 million to $145
million. These costs are in June 2006 dollars.
Developing an Intelzrated Approach for Directly Increasing
the DO Level in the CAWS
The studies described previously conducted by CTE for the District as part of IEPA's UAA
study included only parts of the CAWS. Also, these studies conducted in 2005-2006 utilized a
waterway DO target different than that proposed by the IEPA in this rulemaking proceeding.
Finally, the studies requested by IEPA did not include all potential technologies and did not
attempt to integrate the various technologies.
Such integration could lower the cost of achieving
the previously assumed DO target. Only by looking at the CAWS as a whole can an overall
cost-effective strategy be crafted for meeting the proposed IEPA DO waterway standards in this
rulemaking proceeding.
Therefore, the District has asked CTE to conduct a new study to determine how various
dissolved oxygen enhancement technologies could be integrated for the entire CAWS to meet the
IEPA's proposed DO water quality standards. The CTE study was begun in December of 2007
and should be completed by mid 2009. This study will produce a level 4 cost estimate according
Page 5 of 12
Electronic Filing - Received, Clerk's Office, August 4, 2008
to the Association for the Advancement of Cost Engineering
(AACE)
for a cost effective
combination of technologies which will meet the IEPA proposed DO standards in this
rulemaking proceeding.
Order
of Magnitude
Cost
Estimate for an
Approach
to Raise
DO Levels in the CAWS and
Achieve the IEPA's
Proposed
Target DO Levels
in this Rulemaking Proceeding
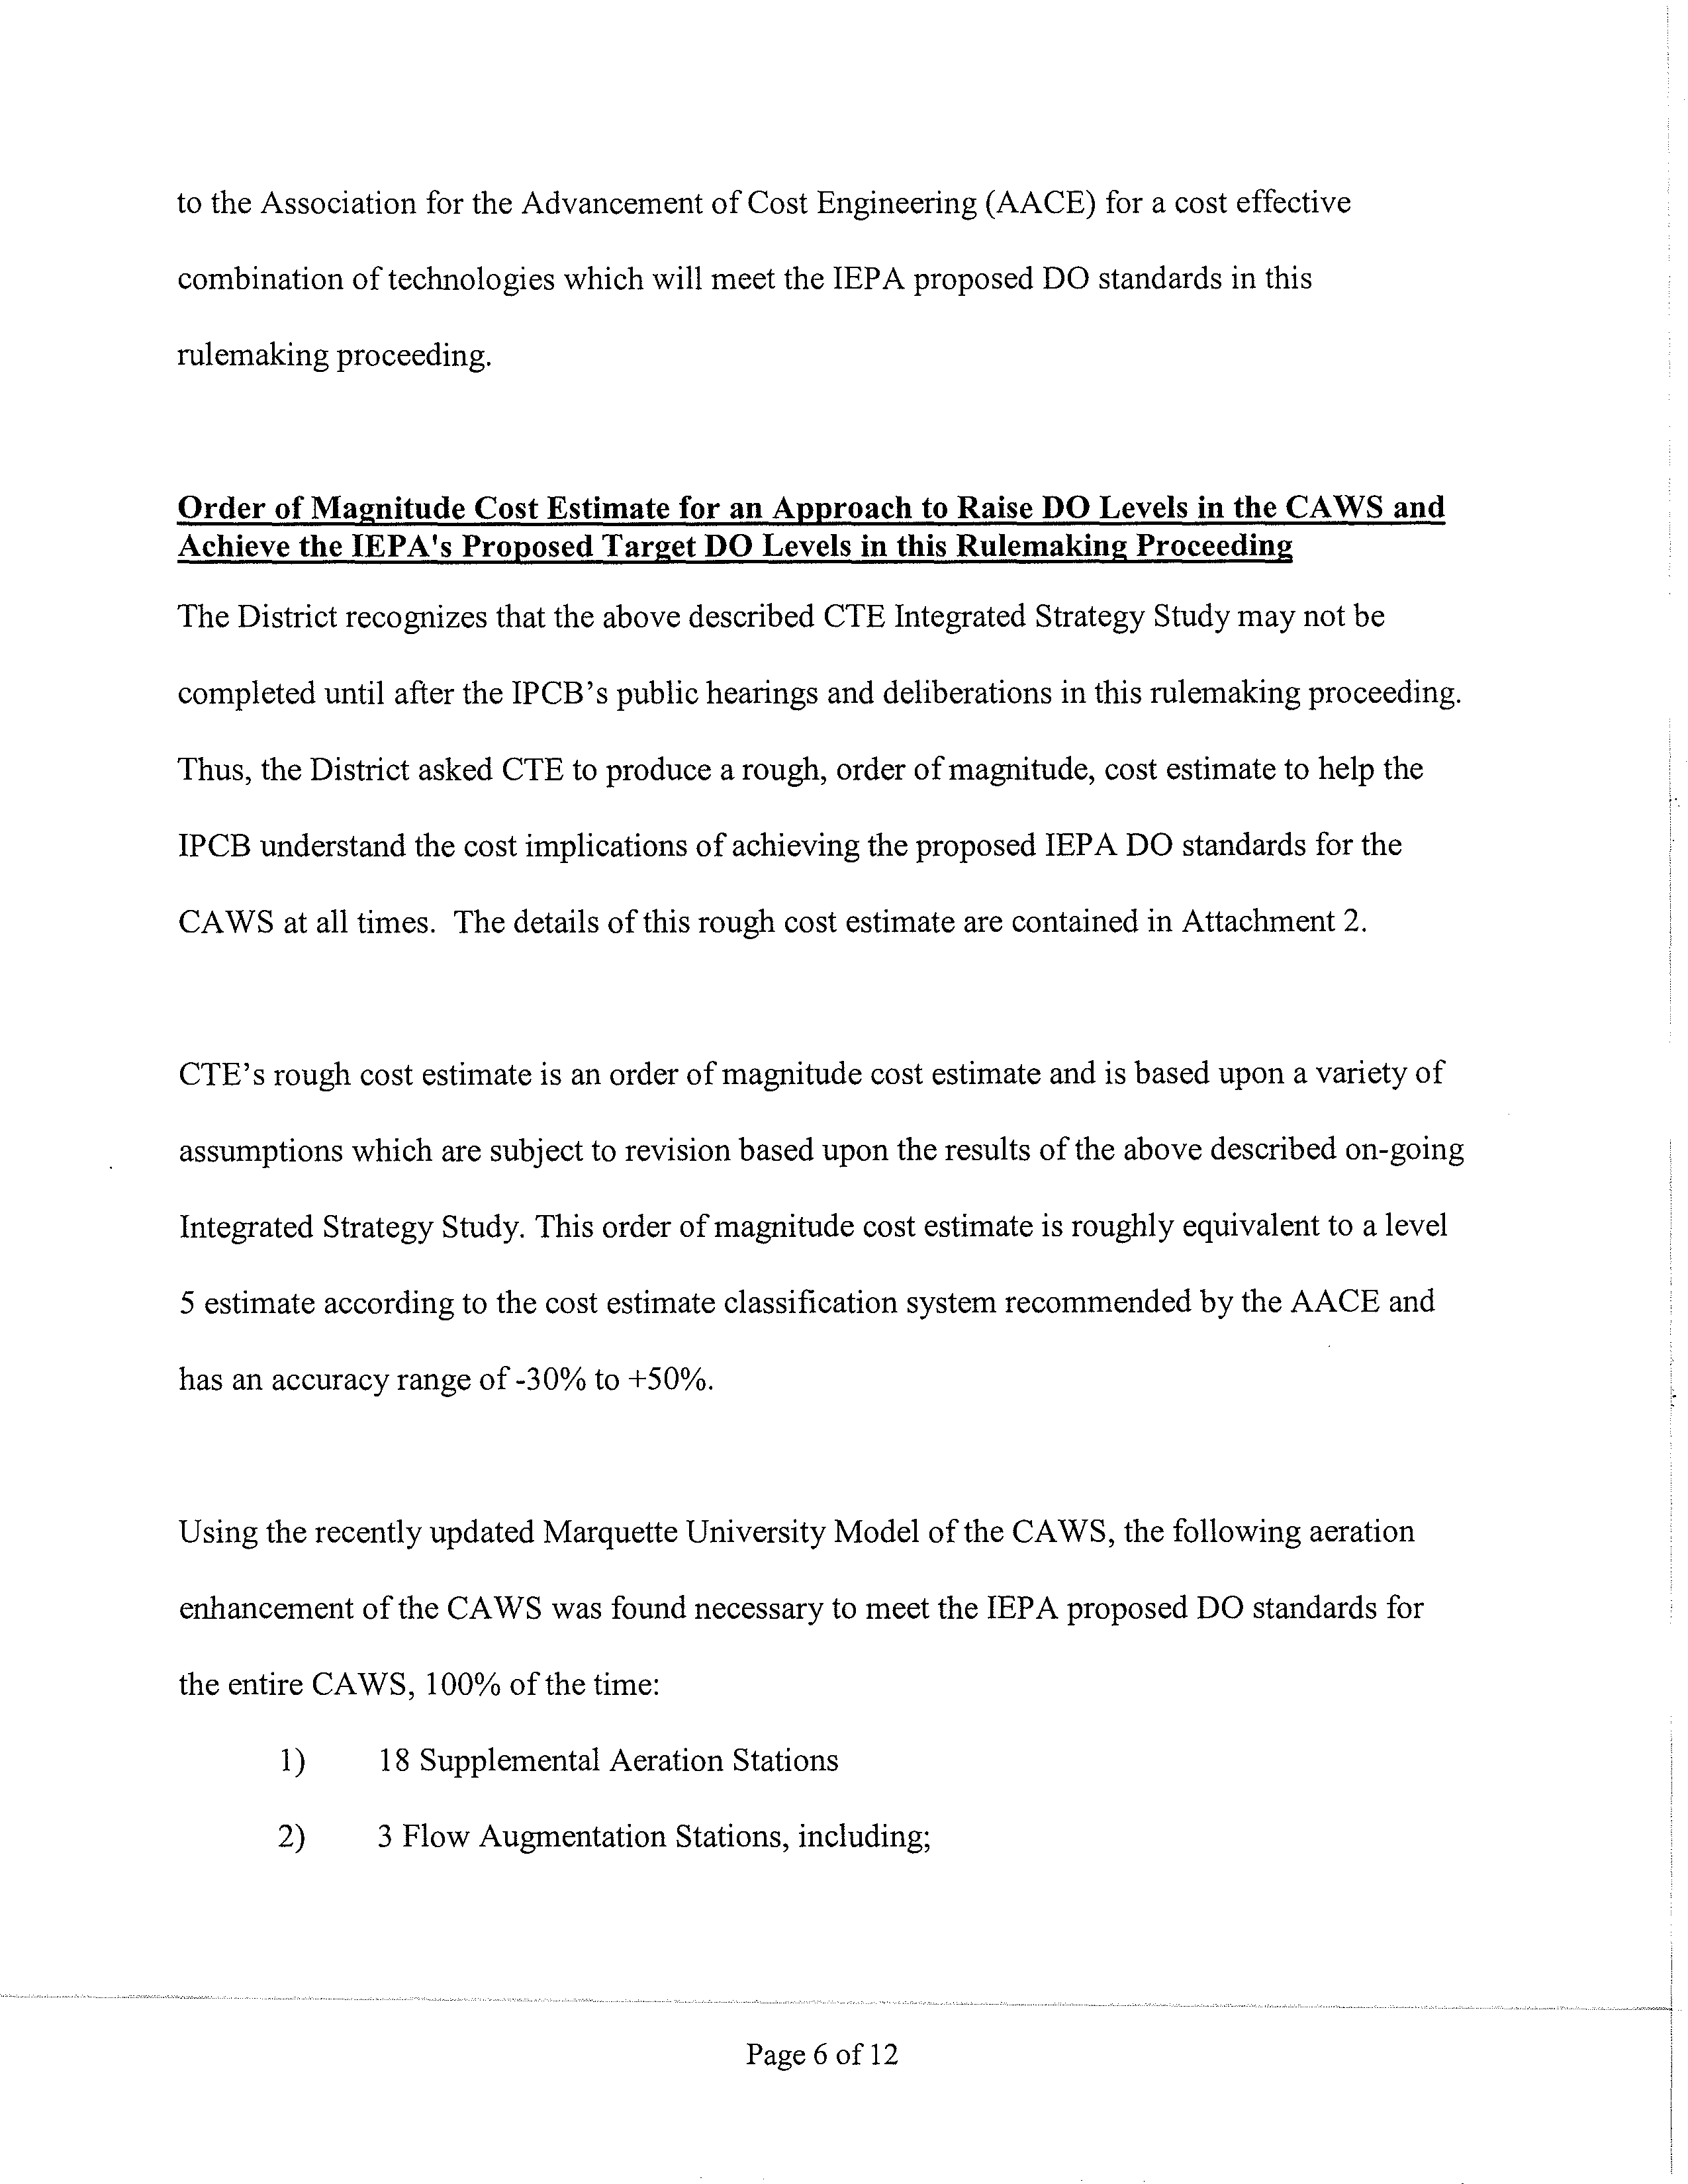
The District recognizes that the above described CTE Integrated Strategy Study may not be
completed until after the IPCB's public hearings and deliberations in this rulemaking proceeding.
Thus, the District asked CTE to produce a rough, order of magnitude, cost estimate to help the
IPCB understand the cost implications of achieving the proposed IEPA DO standards for the
CAWS at all times. The details of this rough cost estimate are contained in Attachment 2.
CTE's rough cost estimate is an order of magnitude cost estimate and is based upon a variety of
assumptions which are subject to revision based upon the results of the above described on-going
Integrated Strategy Study. This order of magnitude cost estimate is roughly equivalent to a level
5 estimate according to the cost estimate classification system recommended by the AACE and
has an accuracy range of -30% to +50%.
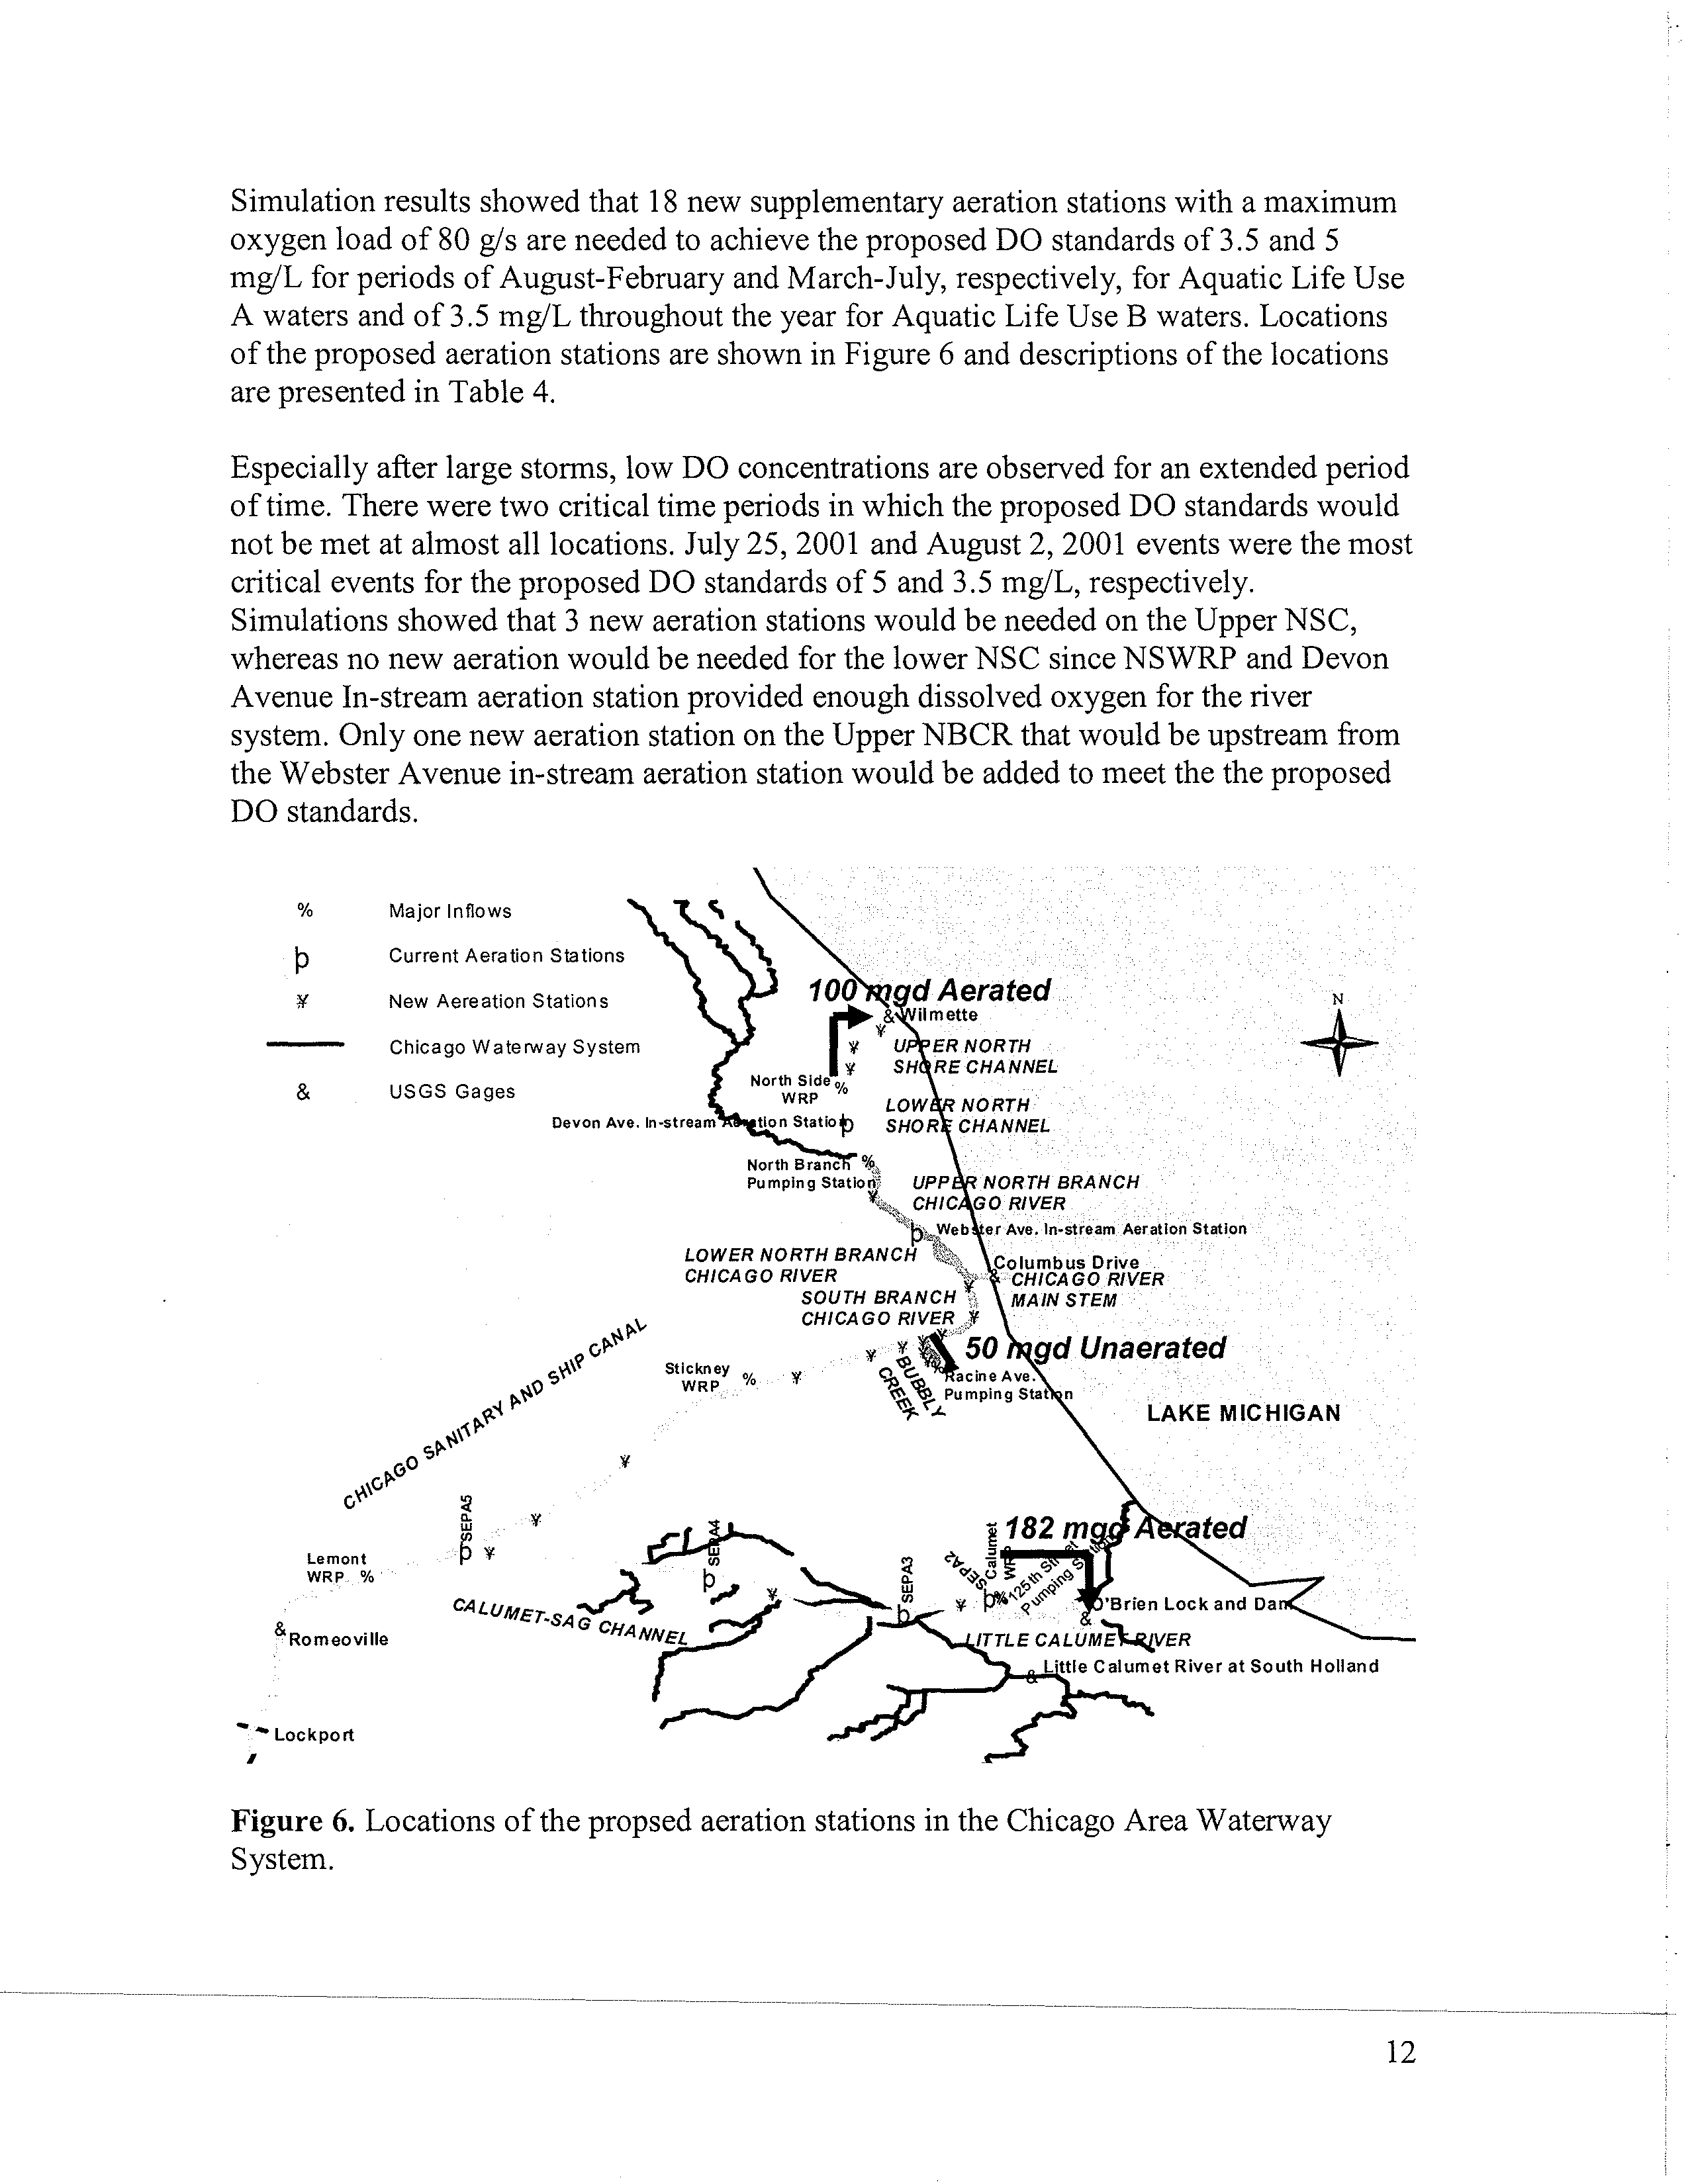
Using the recently updated Marquette University Model of the CAWS, the following aeration
enhancement of the CAWS was found necessary to meet the IEPA proposed DO standards for
the entire CAWS, 100% of the time:
1)
18 Supplemental Aeration Stations
2)
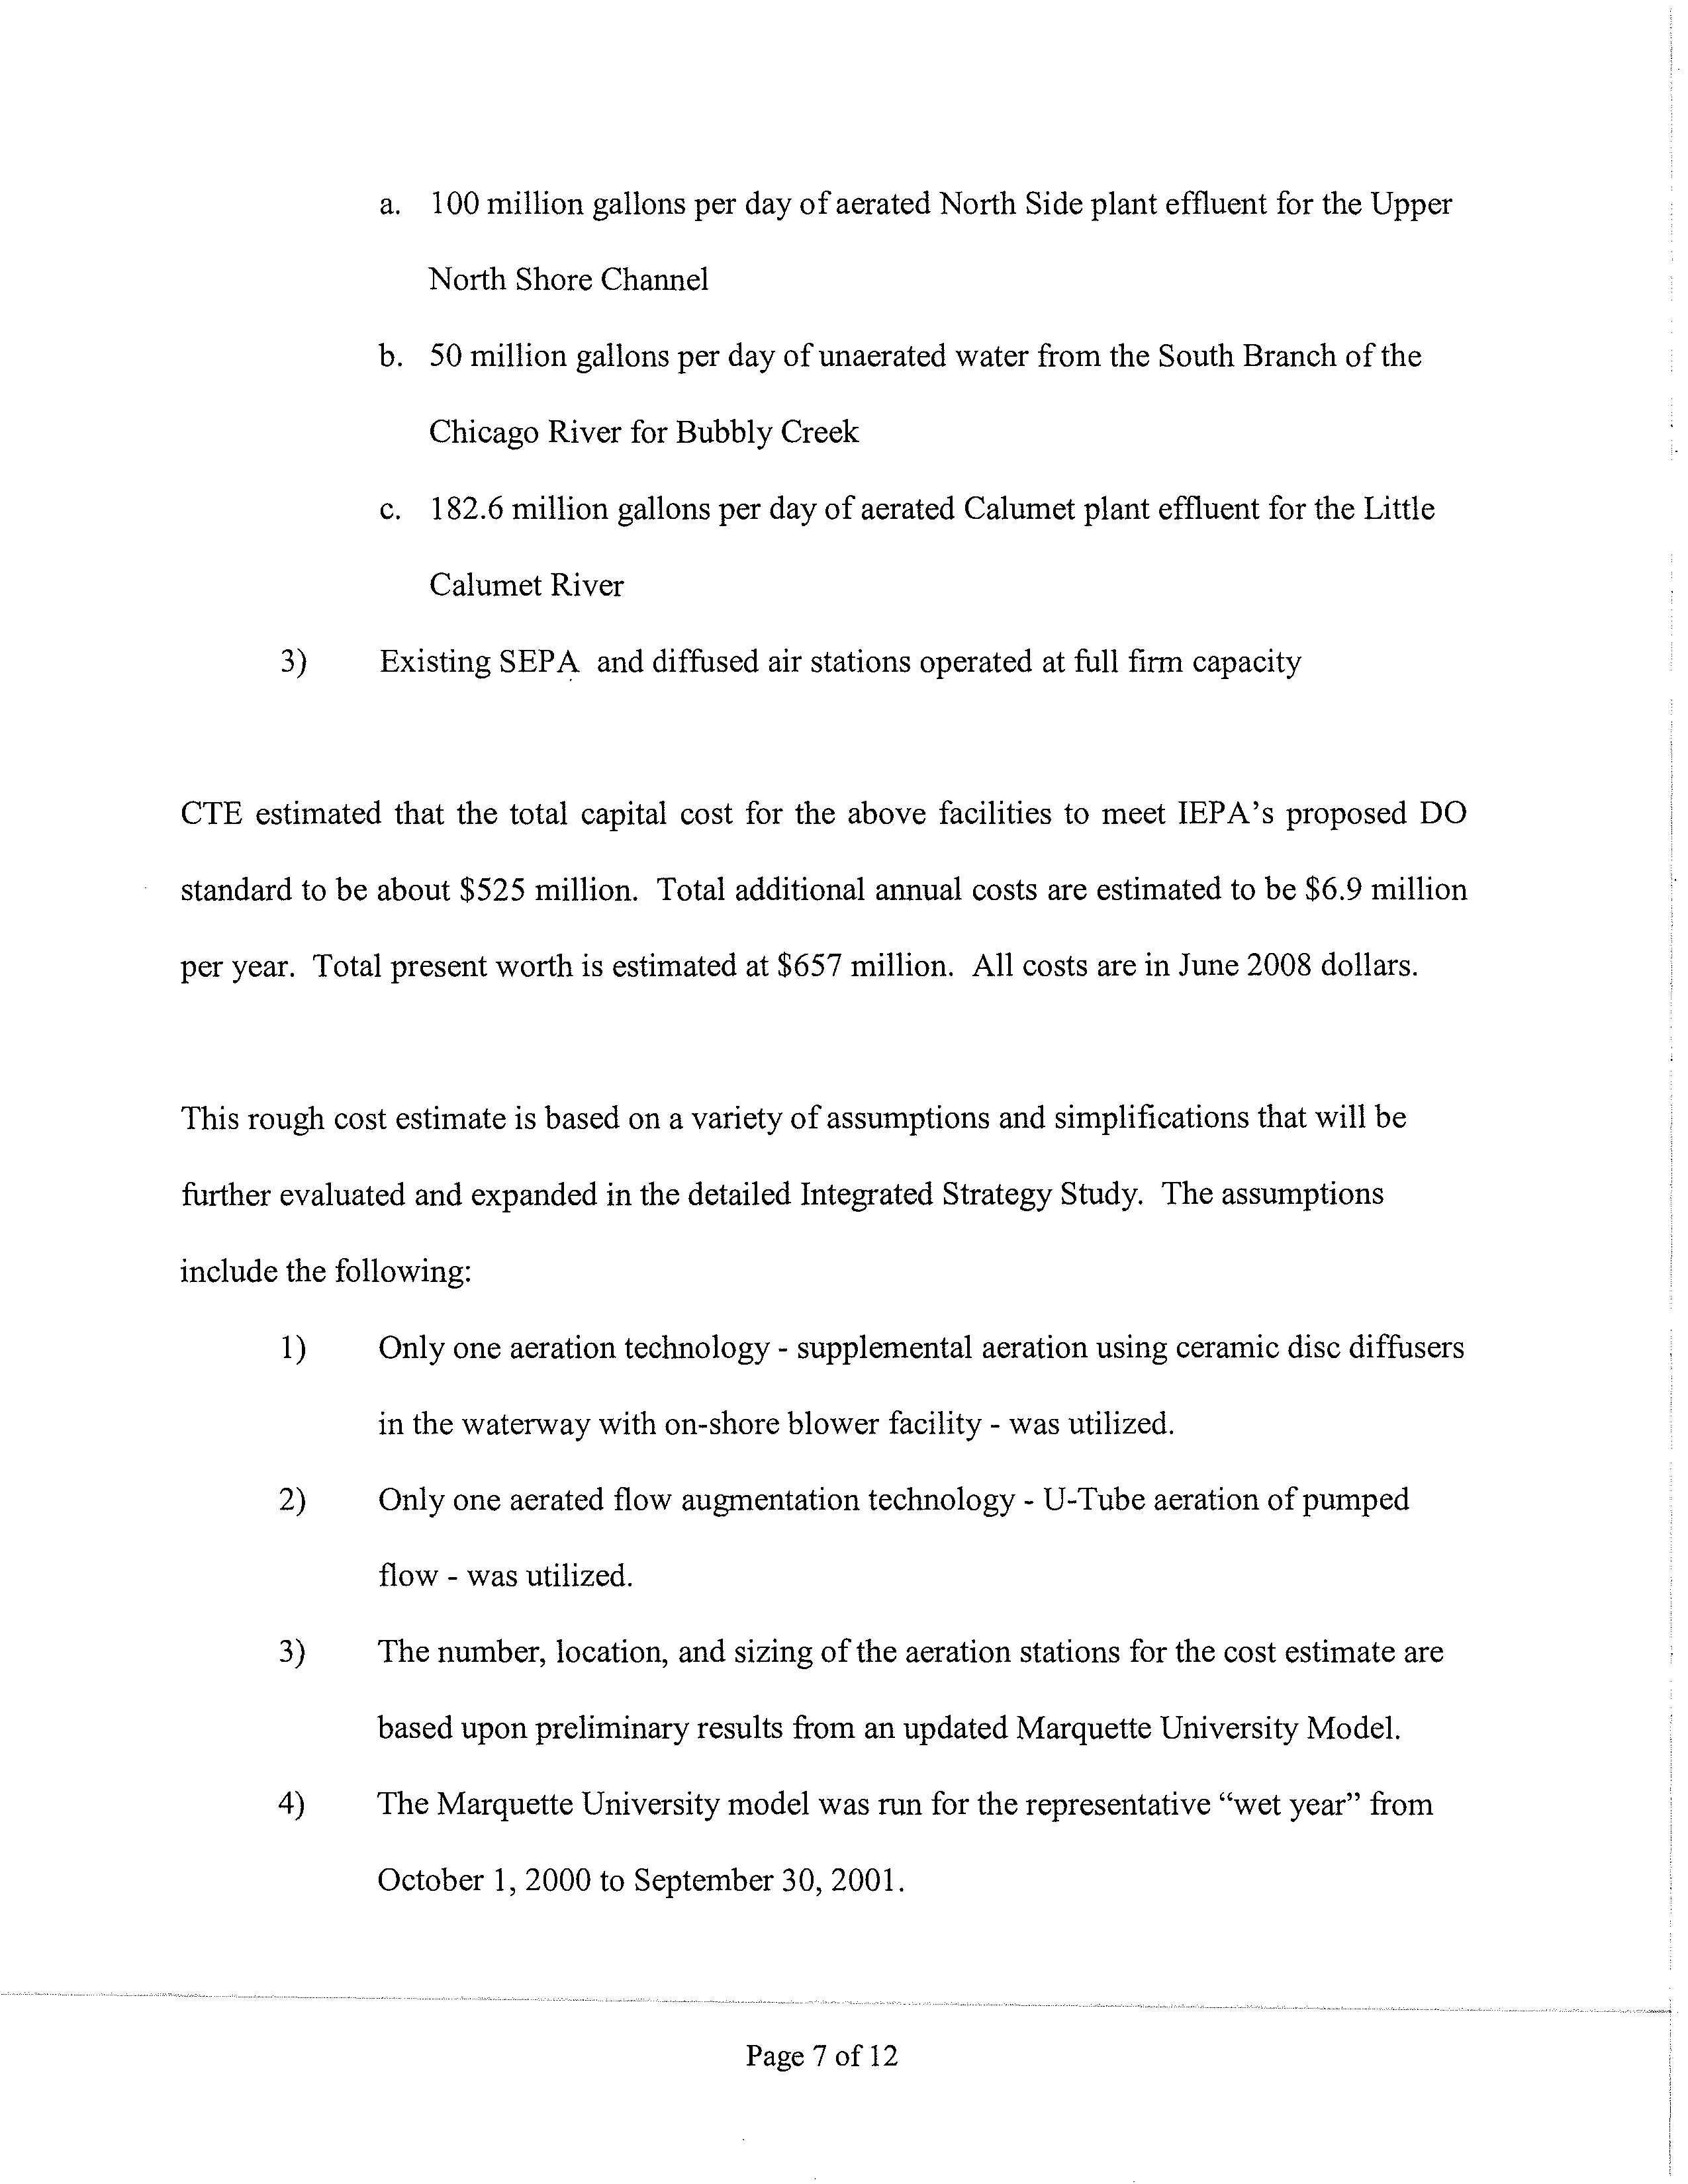
3 Flow Augmentation Stations, including;
Electronic Filing - Received, Clerk's Office, August 4, 2008
a. 100 million gallons per day of aerated North Side plant effluent for the Upper
North Shore Channel
b. 50 million gallons per day of unaerated water from the South Branch of the
Chicago River for Bubbly Creek
c.
182.6 million gallons per day of aerated Calumet plant effluent for the Little
Calumet River
3)
Existing SEPA and diffused air stations operated at full firm capacity
CTE estimated that the total capital cost for the above facilities to meet IEPA's proposed DO
standard to be about $525 million. Total additional annual costs are estimated to be $6.9 million
per year. Total present worth is estimated at $657 million. All costs are in June 2008 dollars.
This rough cost estimate is based on a variety of assumptions and simplifications that will be
further evaluated and expanded in the detailed Integrated Strategy Study. The assumptions
include the following:
1)
Only one aeration technology - supplemental aeration using ceramic disc diffusers
in the waterway with on-shore blower facility - was utilized.
2)
Only one aerated flow augmentation technology - U-Tube aeration of pumped
flow - was utilized.
3)
The number, location, and sizing of the aeration stations for the cost estimate are
based upon preliminary results from an updated Marquette University Model.
4)
The Marquette University model was run for the representative "wet year" from
October 1, 2000 to September 30, 2001.
Electronic Filing - Received, Clerk's Office, August 4, 2008
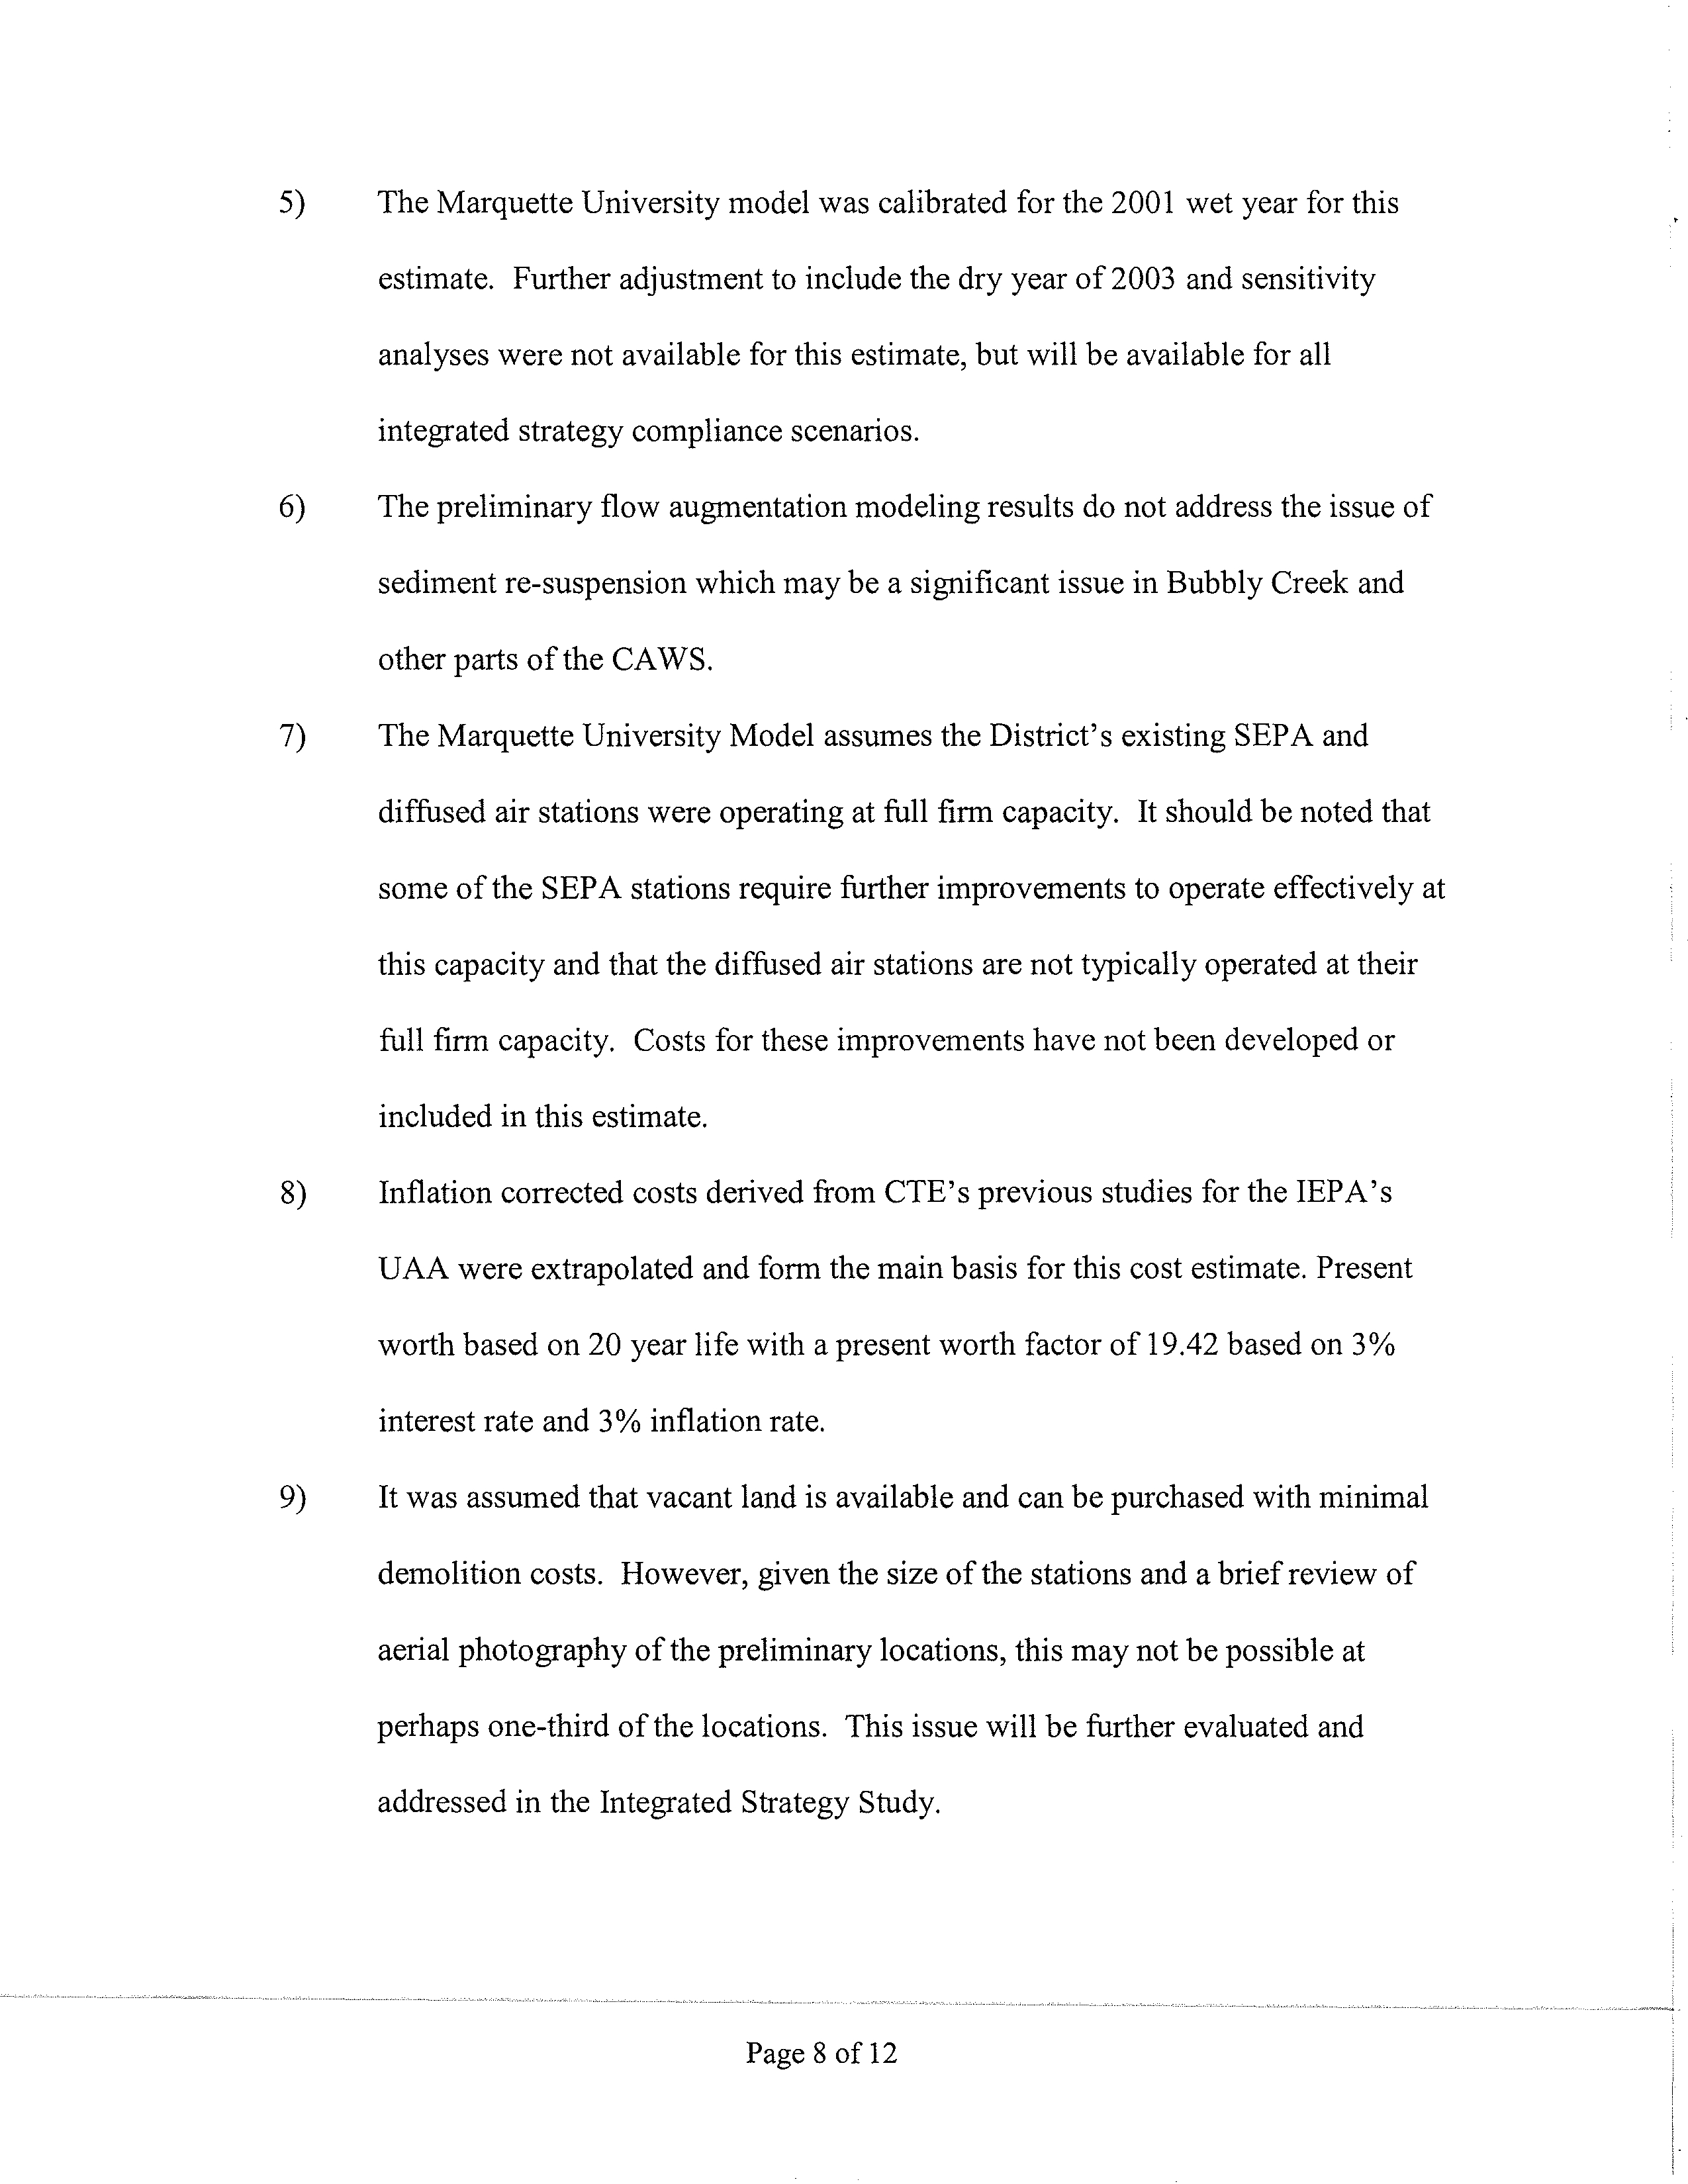
5)
The Marquette University model was calibrated for the 2001 wet year for this
estimate. Further adjustment to include the dry year of 2003 and sensitivity
analyses were not available for this estimate, but will be available for all
integrated strategy compliance scenarios.
6)
The preliminary flow augmentation modeling results do not address the issue of
sediment re-suspension which may be a significant issue in Bubbly Creek and
other parts of the CAWS.
7)
The Marquette University Model assumes the District's existing SEPA and
diffused air stations were operating at full firm capacity. It should be noted that
some of the SEPA stations require further improvements to operate effectively at
this capacity and that the diffused air stations are not typically operated at their
full firm capacity. Costs for these improvements have not been developed or
included in this estimate.
8)
Inflation corrected costs derived from CTE's previous studies for the IEPA's
UAA were extrapolated and form the main basis for this cost estimate. Present
worth based on 20 year life with a present worth factor of 19.42 based on 3%
interest rate and 3% inflation rate.
9)
It was assumed that vacant land is available and can be purchased with minimal
demolition costs. However, given the size of the stations and a brief review of
aerial photography of the preliminary locations, this may not be possible at
perhaps one-third of the locations. This issue will be further evaluated and
addressed in the Integrated Strategy Study.
Electronic Filing - Received, Clerk's Office, August 4, 2008
10)
It is currently unclear what operational duration and frequency will be required to
achieve 100% compliance. However, for this estimate, it was assumed all
existing and additional aeration facilities will be required to operate at the
equivalent of full capacity for one month per year, half capacity for 7 months of
the year, and not required for the remaining 4 months of the year. This
assumption is based partially on the current operations at the District's existing
aeration facilities and may not apply for a worst - case year.
It should be noted that, for this cost estimate, no aeration stations were located in the Chicago
River. It appears that supplemental aeration would not be effective for this waterway given that
zero waterway flow often occurs creating dead zones between aeration stations. In downtown
Chicago, there does not appear to be a source of readily available water for flow augmentation to
alleviate this condition.
However, this issue will be studied in greater detail as CTE's on-going
Integrated Strategy Study progresses.
Based upon the preliminary results of the updated Marquette University Model runs for this cost
estimate, the operation of many of the aeration stations to achieve compliance with IEPA's
proposed DO standards may be relatively infrequent.
Many of the stations will only be needed
during large combined sewer overflow events which occur only a few times per year.
Achieving 100% compliance with the proposed DO standards will require a complex waterway
DO monitoring network and an automated operating system. Providing and maintaining this
monitoring network, automated system, and the infrequently used aeration stations (or other DO
Page 9 of 12
Electronic Filing - Received, Clerk's Office, August 4, 2008
enhancement systems) would be a significant challenge and costs for this approach have not been
included here. There are also concerns about the relatively large size of the aeration stations
required to meet the proposed DO standards, 100% of the time. These concerns are related to
whether it will be physically practical to effectively locate these stations in the various parts of
the CAWS.
Although the updated Marquette University Model provides a sufficient level of detail for these
planning studies, this one-dimensional model may not describe the complex conditions that can
exist in some segments of the CAWS, including impacts due to density currents, sediment re-
suspension, and mixing zone effects. Therefore, before proceeding to design of a CAWS DO
enhancement system, consideration should be given to a more detailed modeling approach to
produce a final aeration system sizing and location.
In short, there are numerous unknowns at present that may significantly affect the total cost for
the effort as presented in this testimony. In addition, the unique and complex environmental and
physical conditions in the CAWS present numerous engineering challenges to designing and
operating a DO enhancement system. Since all these challenges have not been addressed or
even perhaps identified at this point, it cannot be stated that it is technically feasible to meet the
proposed standards under all waterway conditions. However, it is hoped that many of these can
be identified and addressed through the on-going integrated strategy approach and the final
design process.
Page 10 of 12
Electronic Filing - Received, Clerk's Office, August 4, 2008
Construction Schedule
Design and construction of the preliminary systems discussed in this testimony to meet the
proposed DO standards in this rulemaking proceeding will involve a significant time
expenditure. Pilot and or full scale studies lasting at least 2 years would be required to develop
design criteria for the proposed facilities. Such studies were necessary for the District's SEPA
stations on the Calumet Area Waterways. Design of the various facilities located throughout the
CAWS would necessitate at least 3.5 years due to the need for lengthy field studies, land
acquisitions, and further computer modeling to confirm site selection and aeration station sizing.
Lastly, constructing the various facilities, perhaps the largest waterway aeration system in the
U.S., would take at least 3 years. Therefore the total time for the construction schedule would be
at least 8.5 years.
Electronic Filing - Received, Clerk's Office, August 4, 2008
Testimony Attachments
1.
Resume of Dr. David R. Zenz
2.
Order of Magnitude Cost Estimate for Supplemental Aeration and Flow
Augmentation of the Chicago Area Waterway System (CAWS)
Electronic Filing - Received, Clerk's Office, August 4, 2008
Respeq^lly
submitted,
5"- gzla^
By:
David Zenz
Electronic Filing - Received, Clerk's Office, August 4, 2008
ATTACHMENT 1
RESUME OF DR. DAVID R. ZENZ
Electronic Filing - Received, Clerk's Office, August 4, 2008
Resume
David R. Zenz, PE, Ph.D.
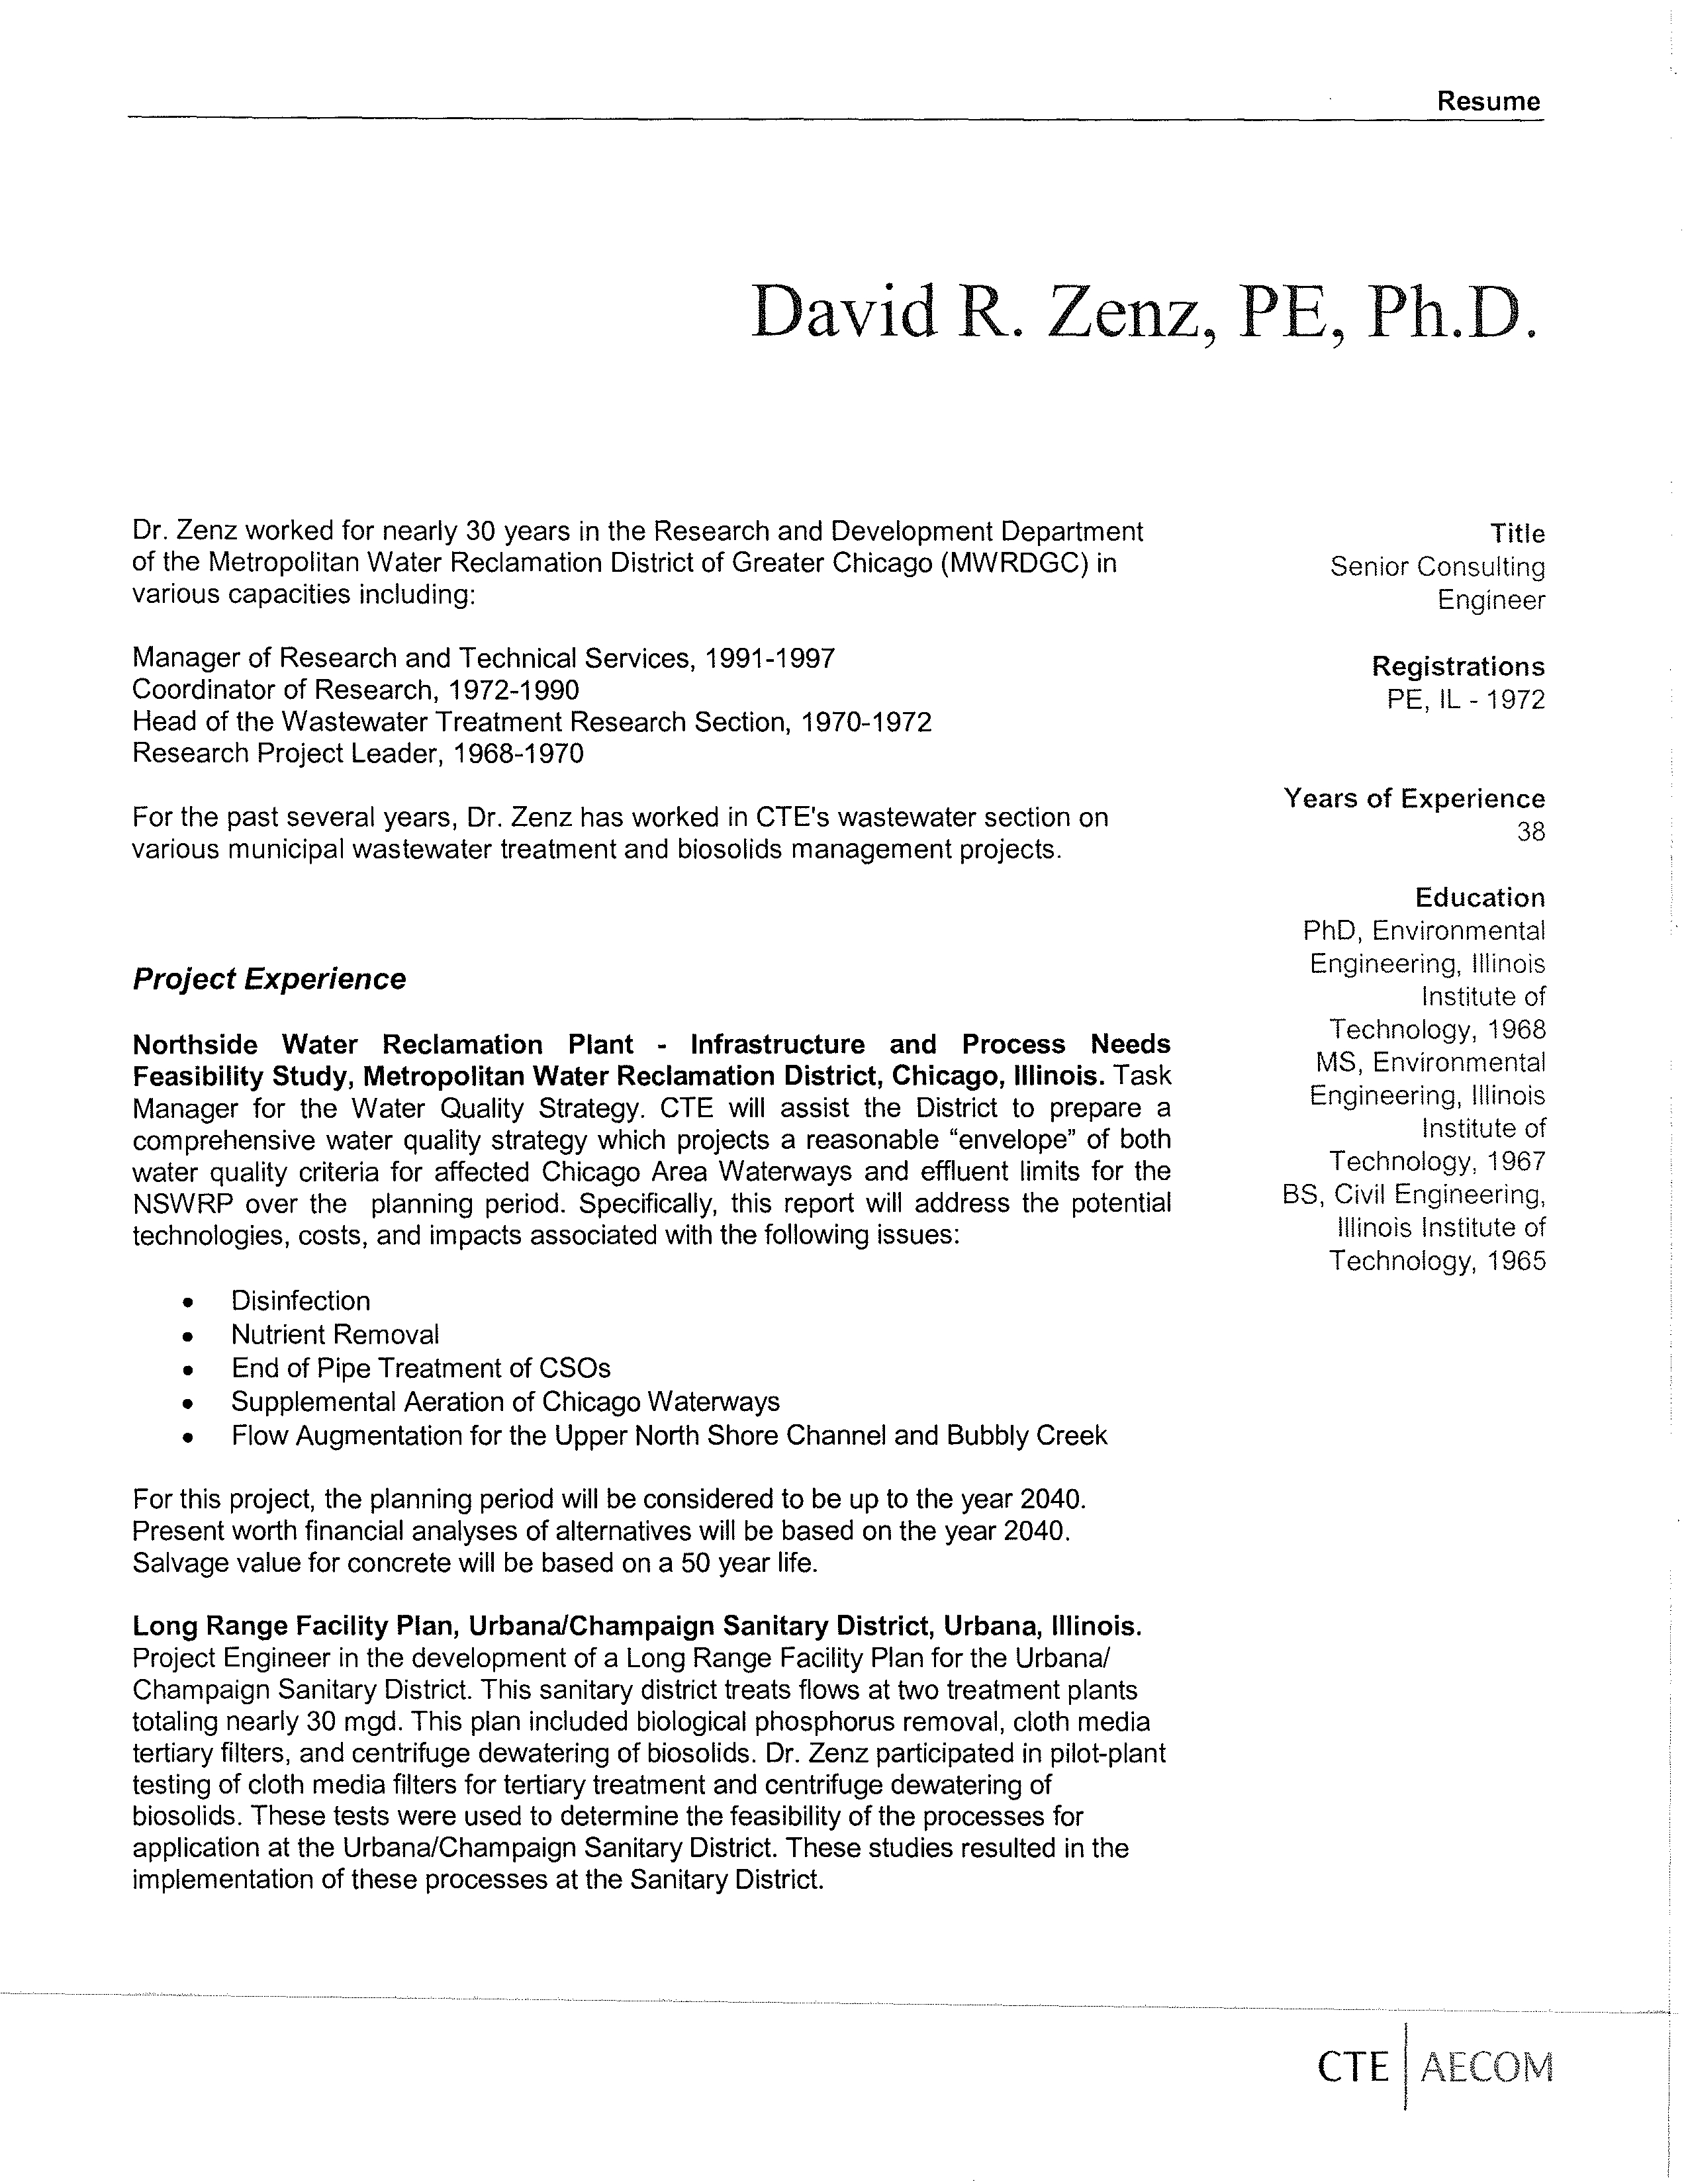
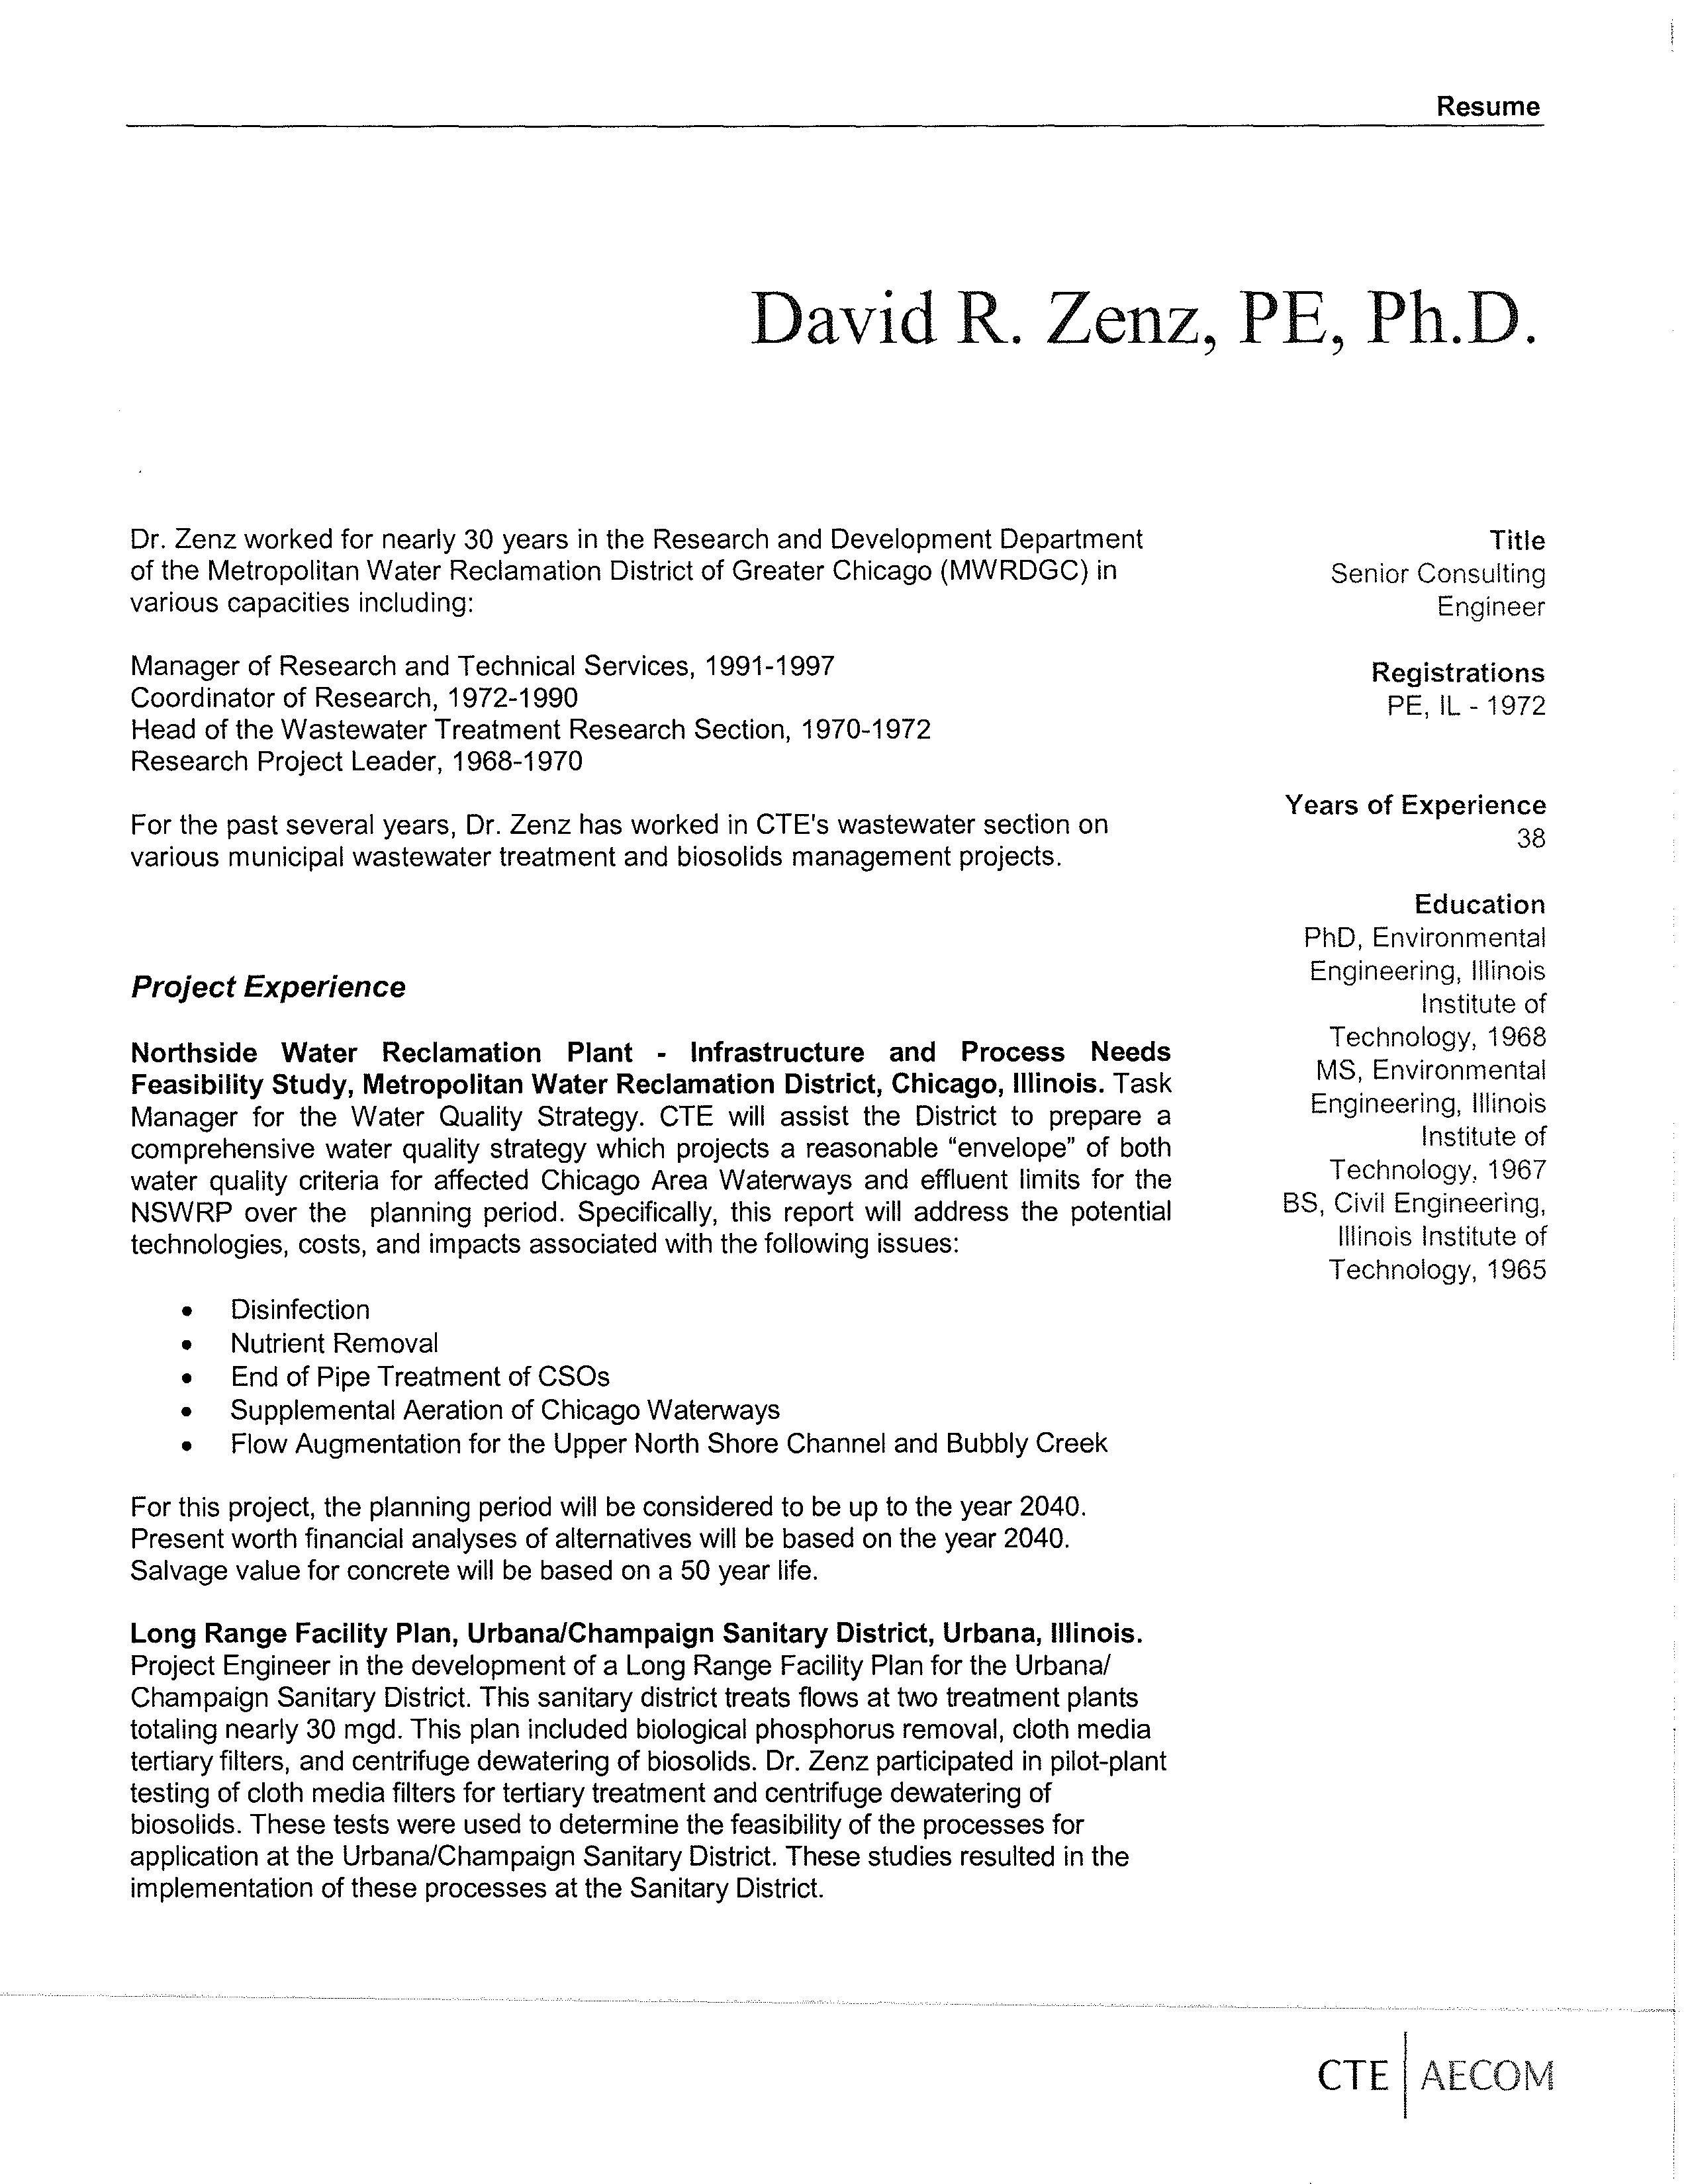
Dr. Zenz worked for nearly 30 years in the Research and Development Department
of the Metropolitan Water Reclamation District of Greater Chicago (MWRDGC) in
various capacities including:
Manager of Research and Technical Services, 1991-1997
Coordinator of Research, 1972-1990
Head of the Wastewater Treatment Research Section, 1970-1972
Research Project Leader, 1968-1970
For the past several years
,
Dr. Zenz has worked
in CTE'
s wastewater section on
various municipal wastewater treatment and biosolids management projects.
Project Experience
Northside
Water Reclamation Plant
-
Infrastructure and Process Needs
Feasibility Study
,
Metropolitan Water Reclamation District
,
Chicago
, Illinois. Task
Manager for the Water Quality Strategy. CTE will assist the District to prepare a
comprehensive water quality strategy which projects a reasonable "envelope" of both
water quality criteria for affected Chicago Area Waterways and effluent limits for the
NSWRP over the planning period. Specifically, this report will address the potential
technologies, costs, and impacts associated with the following issues:
•
Disinfection
•
Nutrient Removal
•
End of Pipe Treatment of CSOs
•
Supplemental Aeration of Chicago Waterways
•
Flow Augmentation for the Upper North Shore Channel and Bubbly Creek
For this project, the planning period will be considered to be up to the year 2040.
Present worth financial analyses of alternatives will be based on the year 2040.
Salvage value for concrete will be based on a 50 year life.
Long Range Facility Plan
,
Urbana/Champaign Sanitary District
,
Urbana, Illinois.
Project Engineer in the development of a Long Range Facility Plan for the Urbana/
Champaign Sanitary District. This sanitary district treats flows at two treatment plants
totaling nearly 30 mgd. This plan included biological phosphorus removal, cloth media
tertiary filters, and centrifuge dewatering of biosolids. Dr. Zenz participated in pilot-plant
testing of cloth media filters for tertiary treatment and centrifuge dewatering of
biosolids. These tests were used to determine the feasibility of the processes for
application at the Urbana/Champaign Sanitary District. These studies resulted in the
implementation of these processes at the Sanitary District.
Title
Senior Consulting
Engineer
Registrations
PE, IL - 1972
Years of Experience
38
Education
PhD, Environmental
Engineering, Illinois
Institute of
Technology, 1968
MS, Environmental
Engineering, Illinois
Institute of
Technology, 1967
BS, Civil Engineering,
Illinois Institute of
Technology, 1965
Electronic Filing - Received, Clerk's Office, August 4, 2008
Resume
David R. Zenz, PE, Ph.D.
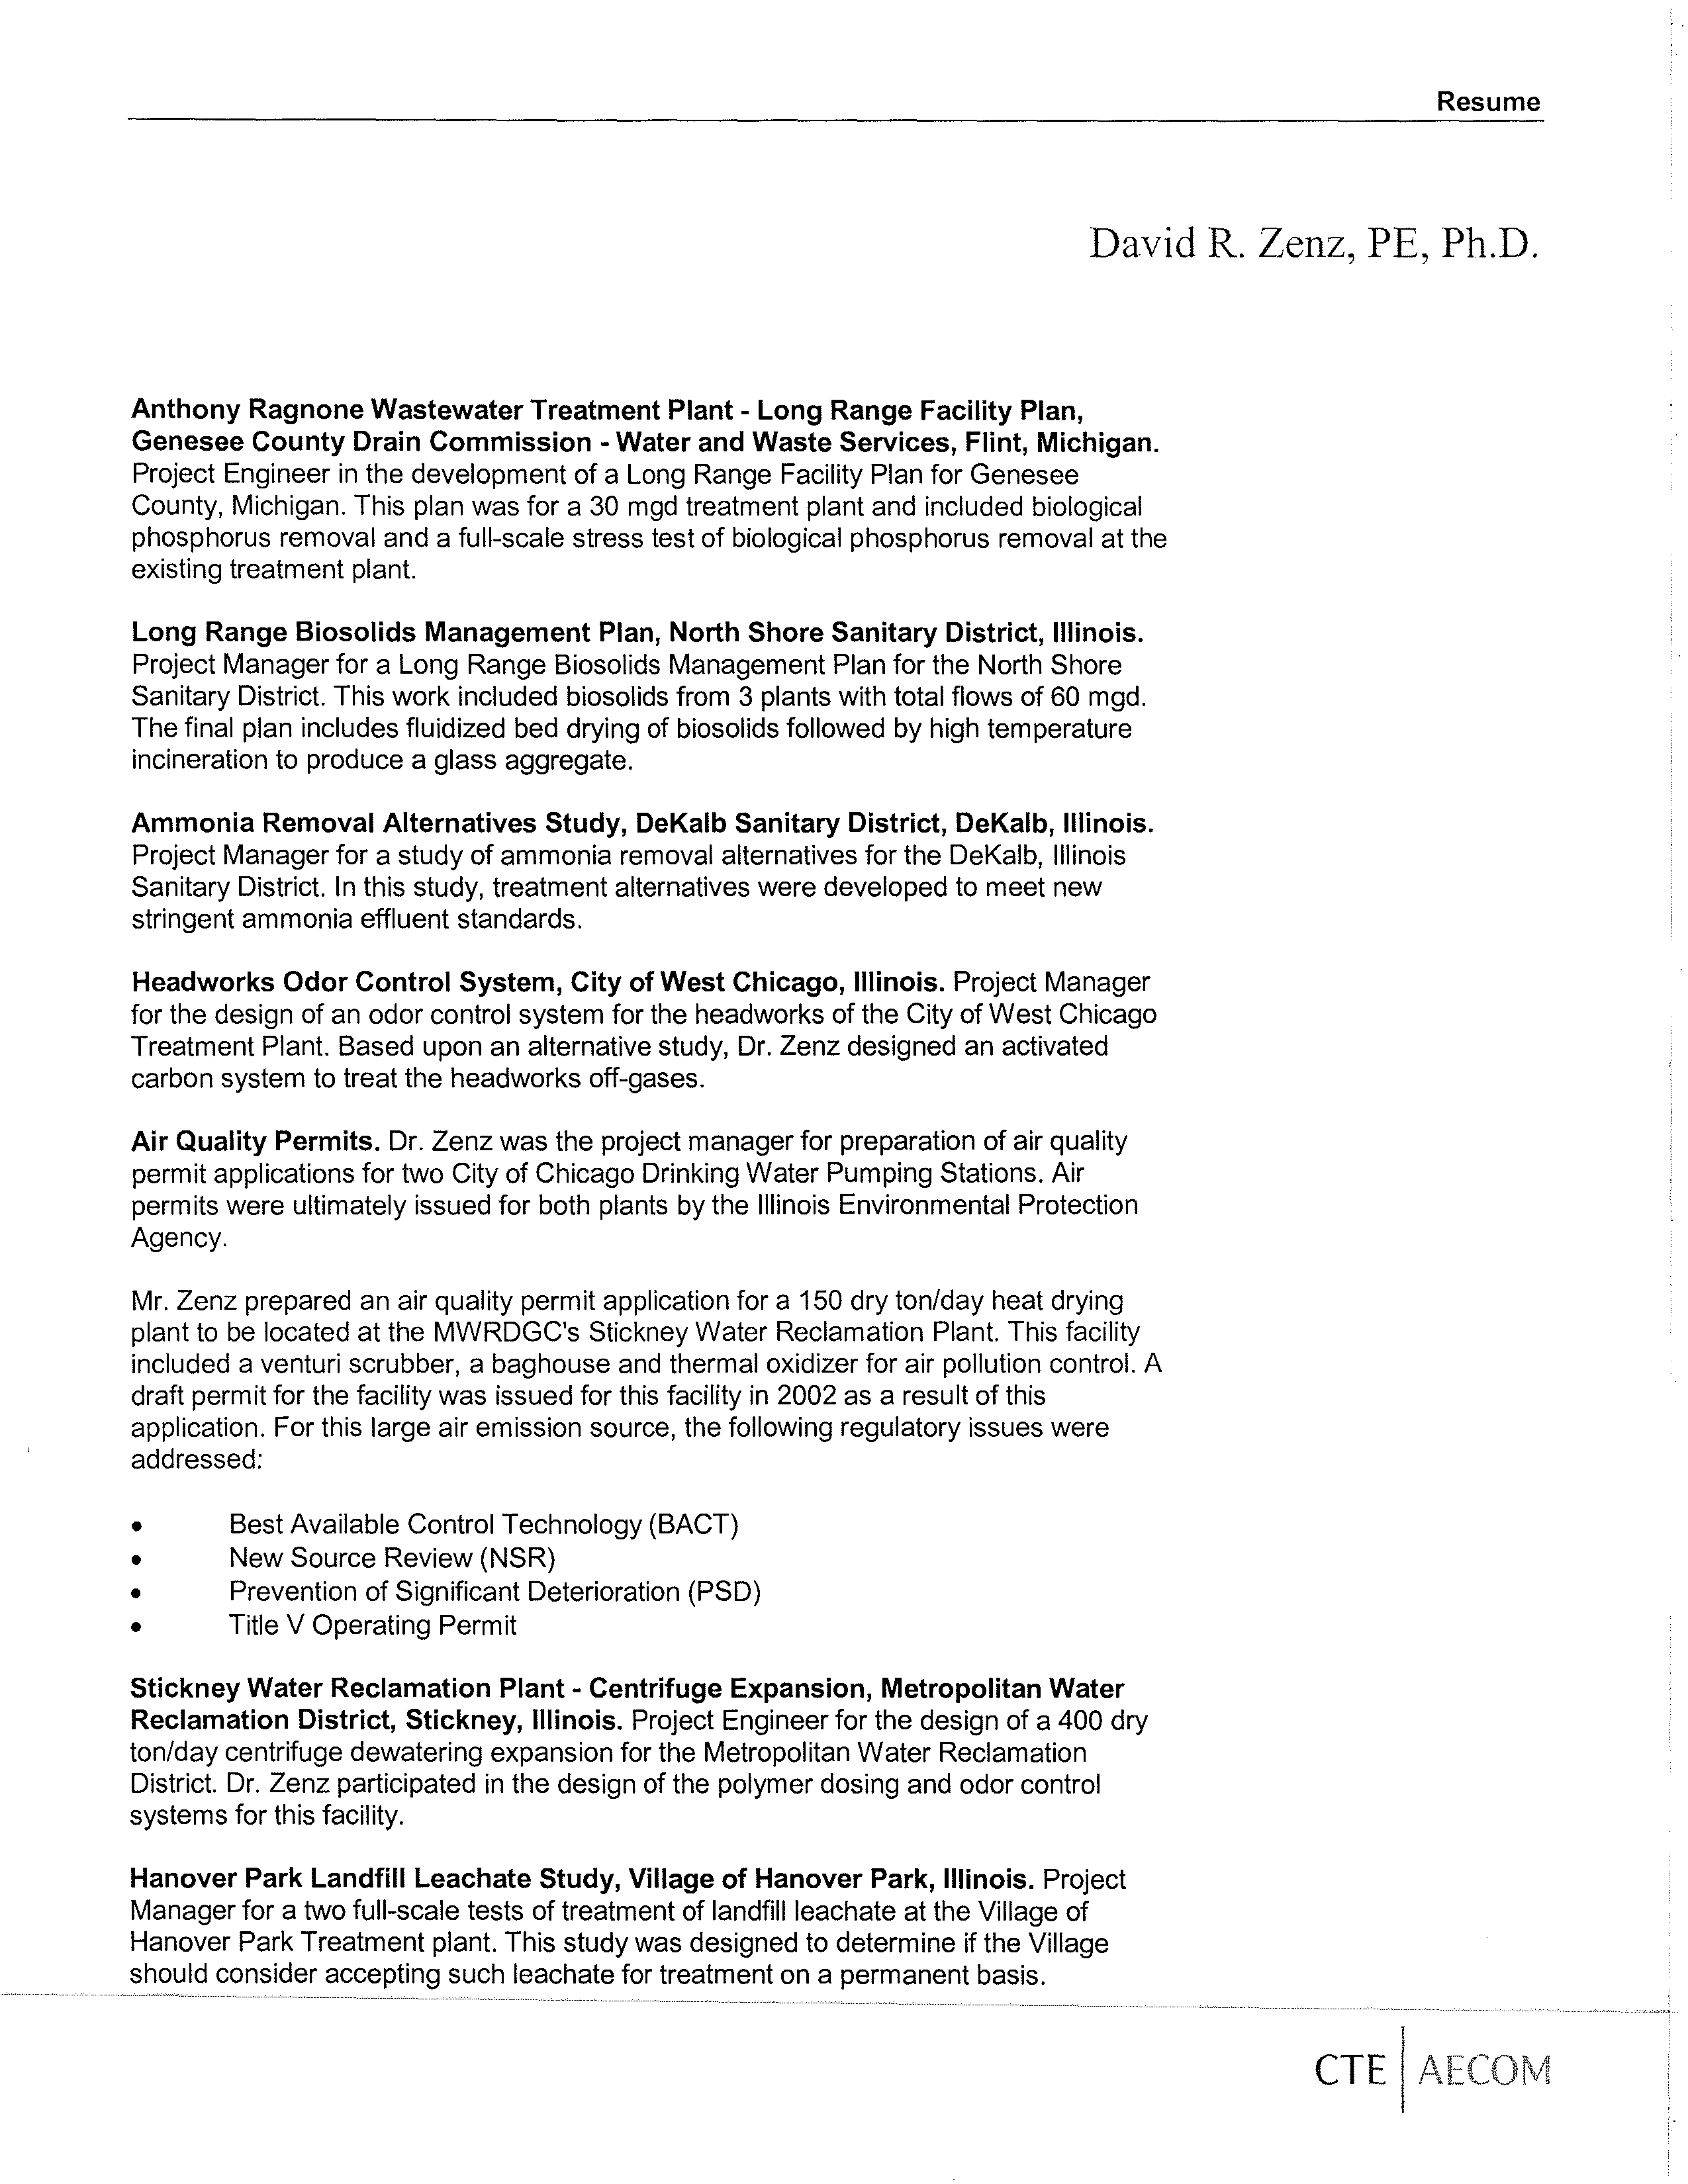
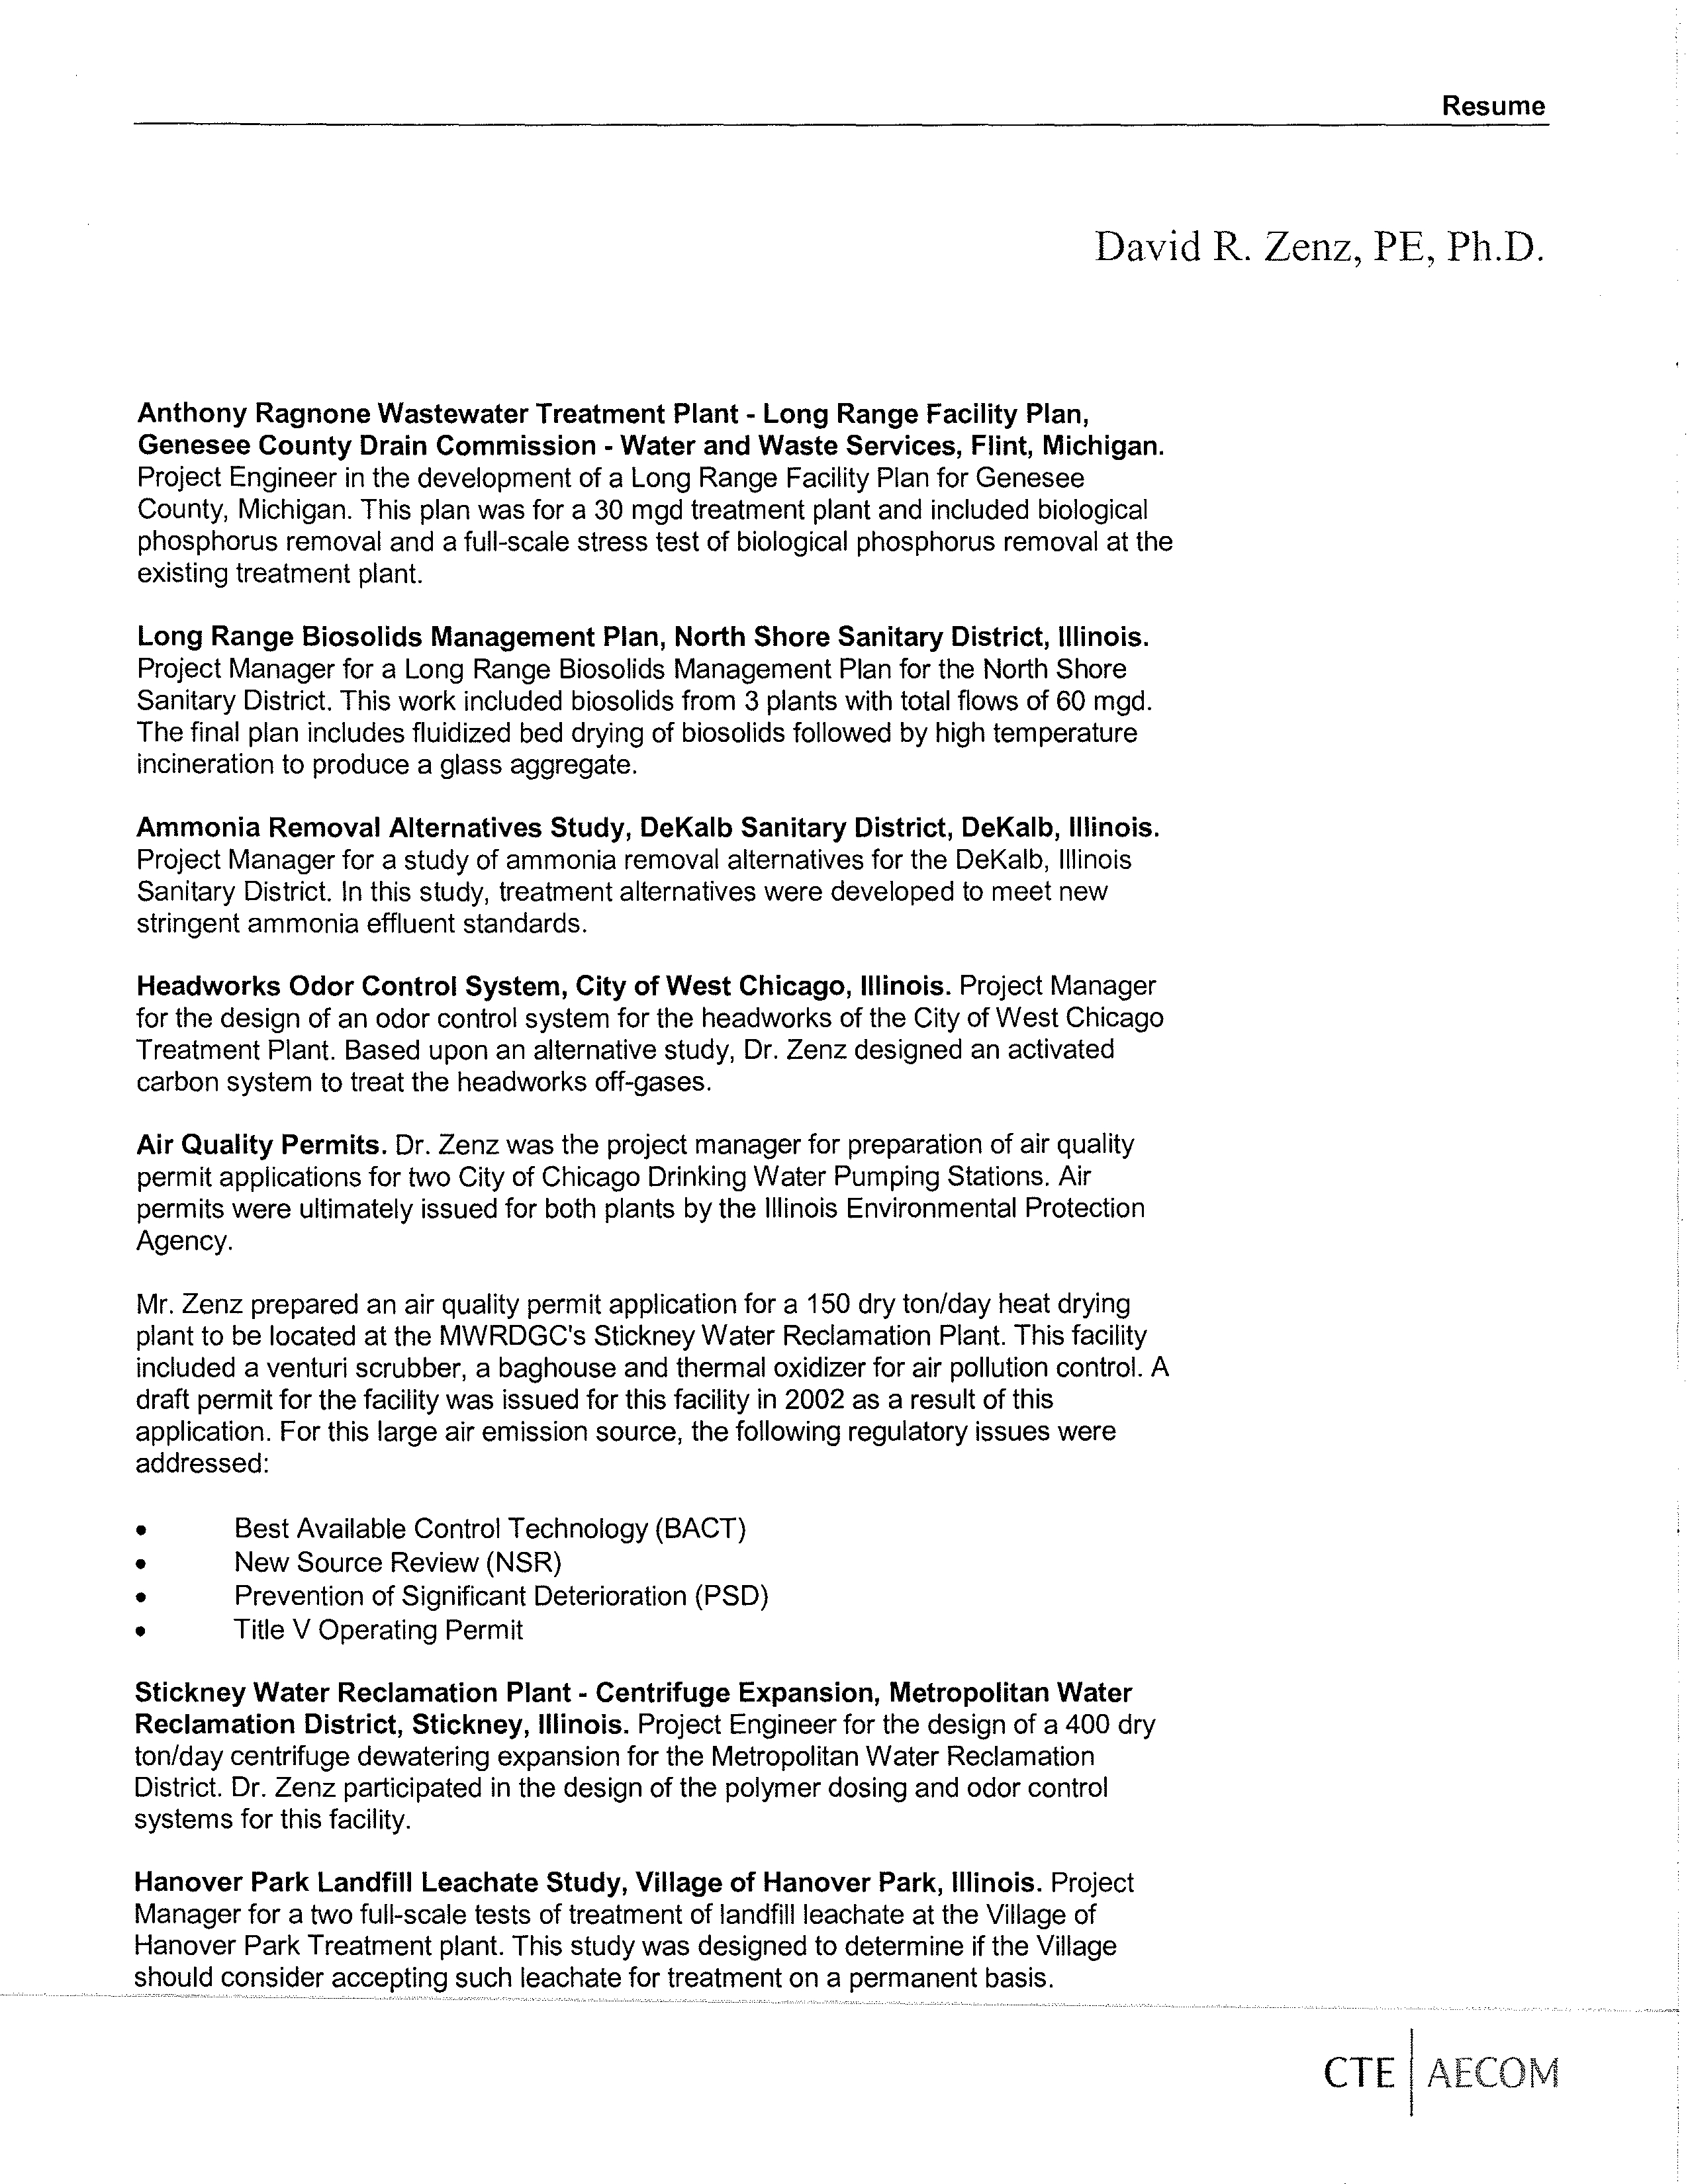
Anthony Ragnone Wastewater Treatment Plant
-
Long Range Facility Plan,
Genesee County Drain Commission
-
Water and Waste Services
,
Flint, Michigan.
Project Engineer in the development of a Long Range Facility Plan for Genesee
County, Michigan. This plan was for a 30 mgd treatment plant and included biological
phosphorus removal and a full-scale stress test of biological phosphorus removal at the
existing treatment plant.
Long Range Biosolids Management Plan, North Shore Sanitary District
,
Illinois.
Project Manager for a Long Range Biosolids Management Plan for the North Shore
Sanitary District. This work included biosolids from 3 plants with total flows of 60 mgd.
The final plan includes fluidized bed drying of biosolids followed by high temperature
incineration to produce a glass aggregate.
Ammonia Removal Alternatives Study
,
DeKalb Sanitary District
,
DeKalb
,
Illinois.
Project
Manager
for a study of ammonia removal alternatives for the DeKalb, Illinois
Sanitary District. In this study, treatment alternatives were developed to meet new
stringent ammonia effluent standards.
Headworks Odor Control System, City of West Chicago, Illinois. Project Manager
for the design of an odor control system for the headworks of the City of West Chicago
Treatment Plant. Based upon an alternative study, Dr. Zenz designed an activated
carbon system to treat the headworks off-gases.
Air Quality
Permits
.
Dr. Zenz was the project manager for preparation of air quality
permit applications for two City of Chicago Drinking Water Pumping Stations. Air
permits were ultimately issued for both plants by the Illinois Environmental Protection
Agency.
Mr. Zenz prepared an air quality permit application for a 150 dry ton/day heat drying
plant to be located at the MWRDGC's Stickney Water Reclamation Plant. This facility
included a venturi scrubber, a baghouse and thermal oxidizer for air pollution control. A
draft permit for the facility was issued for this facility in 2002 as a result of this
application. For this large air emission source, the following regulatory issues were
addressed:
Best Available Control Technology (BACT)
New Source Review (NSR)
Prevention of Significant Deterioration (PSD)
Title V Operating Permit
Stickney Water Reclamation Plant
-
Centrifuge Expansion
,
Metropolitan Water
Reclamation District
,
Stickney
, Illinois. Project Engineer for the design of a 400 dry
ton/day centrifuge dewatering expansion for the Metropolitan Water Reclamation
District.
Dr. Zenz participated in the design of the polymer dosing and odor control
systems for this facility.
Hanover Park Landfill Leachate
Study,
Village of Hanover Park
, Illinois. Project
Manager for a two full-scale tests of treatment of landfill leachate at the Village of
Hanover Park Treatment plant. This study was designed to determine if the Village
should consider accepting such leachate for treatment on a permanent basis.
CTE I AEC
Electronic Filing - Received, Clerk's Office, August 4, 2008
Resume
David R. Zenz, PE, Ph.D.
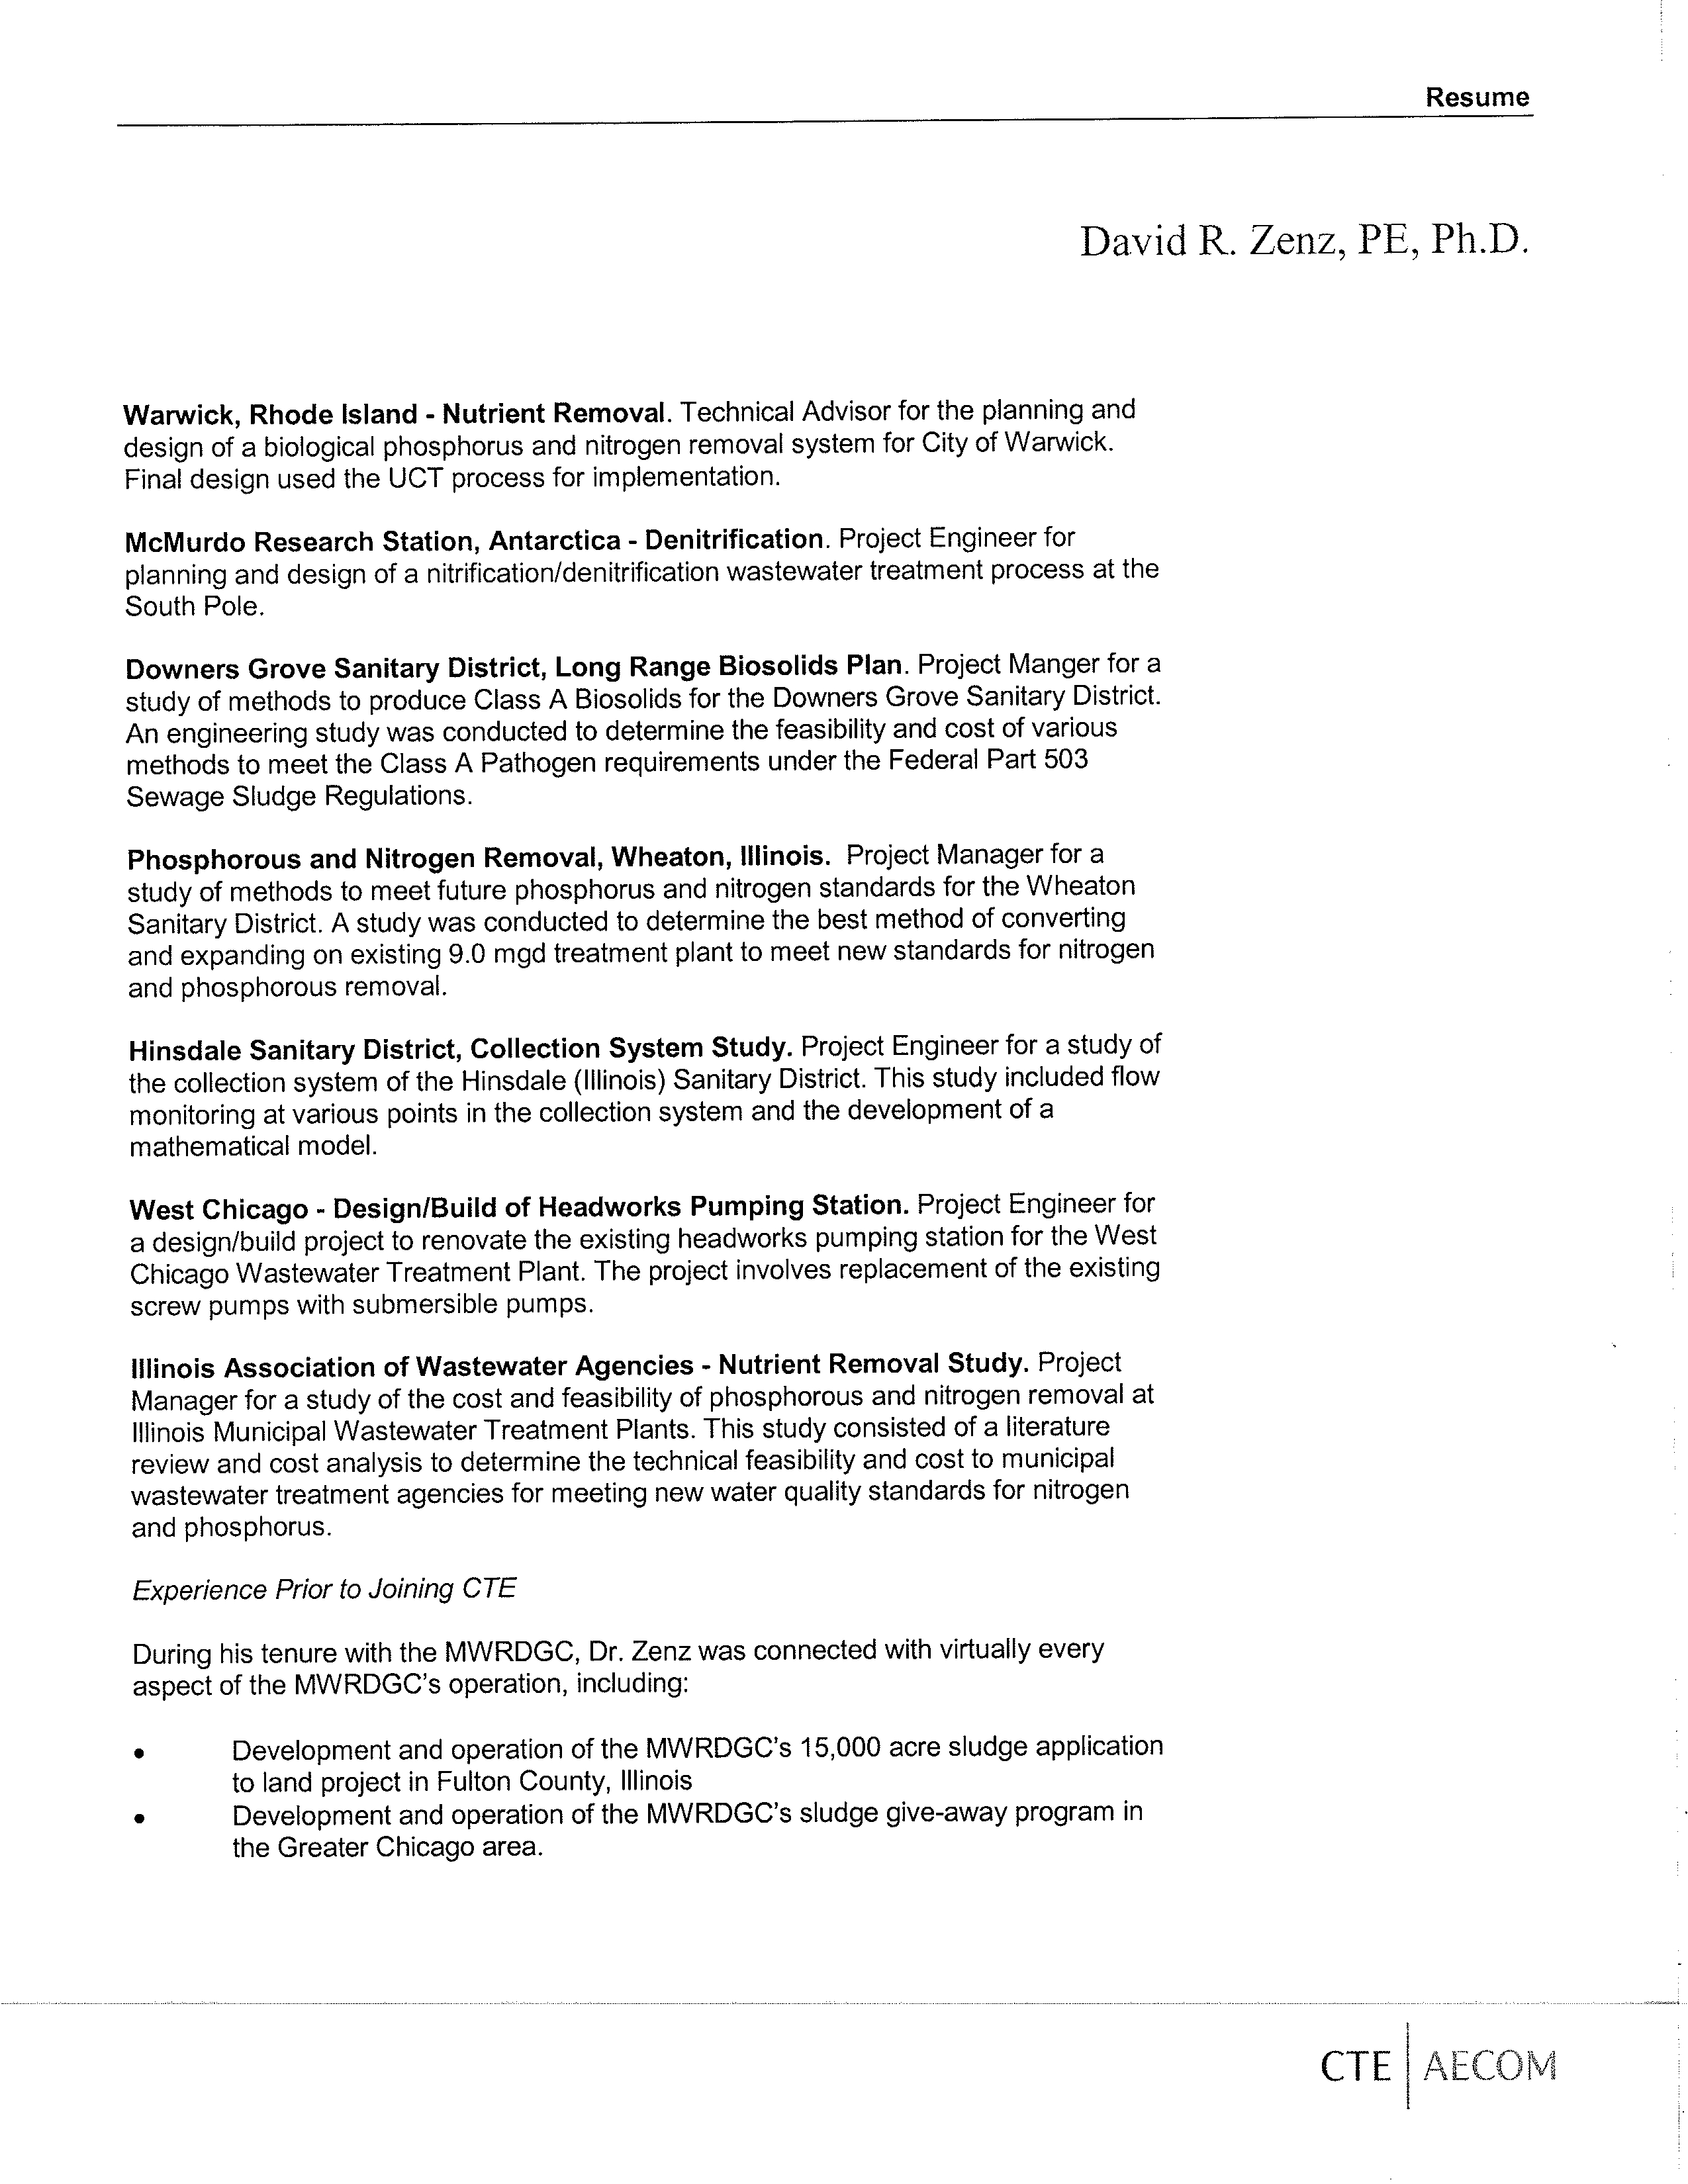
Warwick
,
Rhode Island
-
Nutrient Removal
.
Technical Advisor for the planning and
design of a biological phosphorus and nitrogen removal system for City of Warwick.
Final design used the UCT process for implementation.
McMurdo Research Station
,
Antarctica - Denitrification
.
Project Engineer for
planning and design of a nitrification/denitrification wastewater treatment process at the
South Pole.
Downers Grove Sanitary District
,
Long Range Biosolids Plan. Project
Manger for a
study of methods to produce Class A Biosolids for the Downers Grove Sanitary District.
An engineering study was conducted to determine the feasibility and cost of various
methods to meet the Class A Pathogen requirements under the Federal Part 503
Sewage Sludge Regulations.
Phosphorous and Nitrogen Removal
,
Wheaton
,
Illinois.
Project
Manager for a
study of methods to meet future phosphorus and nitrogen standards for the Wheaton
Sanitary District. A study was conducted to determine the best method of converting
and expanding on existing 9.0 mgd treatment plant to meet new standards for nitrogen
and phosphorous removal.
Hinsdale Sanitary District, Collection System Study
.
Project Engineer for a study of
the collection system of the Hinsdale (Illinois) Sanitary District. This study included flow
monitoring at various points in the collection system and the development of a
mathematical model.
West Chicago
-
Design
/
Build of Headworks Pumping Station
.
Project Engineer for
a design/build project to renovate the existing headworks pumping station for the West
Chicago Wastewater Treatment Plant. The project involves replacement of the existing
screw pumps with submersible pumps.
Illinois Association of Wastewater Agencies
-
Nutrient Removal
Study. Project
Manager for a study of the cost and feasibility of phosphorous and nitrogen removal at
Illinois
Municipal Wastewater Treatment Plants. This study consisted of a literature
review and cost analysis to determine the technical feasibility and cost to municipal
wastewater treatment agencies for meeting new water quality standards for nitrogen
and phosphorus.
Experience
Prior to Joining CTE
During his tenure with the MWRDGC, Dr. Zenz was connected with virtually every
aspect of the
MWRDGC'
s operation
,
including:
Development and operation of the MWRDGC
'
s 15,000 acre sludge application
to land project in Fulton County
,
Illinois
Development and operation of the MWRDGC's sludge give
-
away program in
the Greater Chicago area.
CTE ! AECO
Electronic Filing - Received, Clerk's Office, August 4, 2008
Resume
David R. Zenz, PE, Ph.D.
Development and operation of the following sludge processing systems currently used
at the MWRDGC, including:
•
Anaerobic Digestion
•
Centrifugal Dewatering
•
Agitation Drying
•
Gravity Thickening
•
Gravity Belt Thickening
•
Centrifugal Thickening
Development and operation of wastewater treatment operations currently used at the
MWRDGC, including
Two stage biological nitrification
Single stage biological nitrification
•
Sand filtration
•
Chlorination-Dechlorination
•
In-stream Aeration
During his tenure at the MWRDGC, Dr. Zenz was involved in pilot and full testing of
various wastewater treatment and sludge processing systems, including:
Wastewater Treatment Systems
Bio-Discs
Biological Phosphorus Removal
Chemical Phosphorus Removal
Biological Denitrification
Ozonation
Ion-Exchange
Multi-Media Filtration
Sludge Processing Systems
Alkaline Stabilization
Composting
Vacuum Filtration
Belt-Filter Dewatering
Thermophilic Digestion
High Energy Radiation
Dr. Zenz was responsible for coordinating the work needed to obtain air permits for the
MWRDGC's treatment plants. This work included:
Estimating fugitive air emissions based upon available mathematical models.
Estimating air emissions based upon stack testing.
•
Estimating air emissions based upon established emission factors
In 1994-1996, Dr. Zenz was involved in obtaining a Title V permit for the MW RDGC's
Stickney Plant and Federally Enforceable- State-Operating .Permits..for the_Northside.
and Calumet Plants. This effort included:
CTEIA C M
Electronic Filing - Received, Clerk's Office, August 4, 2008
Resume
David R. Zenz, PE, Ph.D.
•
Estimating fugitive air emissions from the wastewater treatment systems of the
MWRDGC's Major Plants using the Bay Area Sewage Toxic Emissions
(BASTE) Model and the USEPA's Water 7 Model.
•
Performing required sewage analysis for 107 Hazardous Air Pollutants (HAP's)
and 82 Volatile Organic Compounds (VOC's).
•
Estimating emissions from other sources within the MWRDGC's major plants
using established emission factors.
•
Working with a consultant in interpreting the applicable Air Pollution
Regulations.
Assisting in the preparation of air permit applications for the MWRDGC Major
Plants
CTE I AEC
Electronic Filing - Received, Clerk's Office, August 4, 2008
ATTACHMENT 2
ORDER OF MAGNITUDE COST ESTIMATE FOR SUPPLEMENTAL AERATION
AND FLOW AUGMENTATION OF THE CHICAGO AREA WATERWAY SYSTEM
(CAWS)
Electronic Filing - Received, Clerk's Office, August 4, 2008
ORDER OF MAGNITUDE COST ESTIMATE FOR
SUPPLEMENTAL AERATION AND
FLOW AUGMENTATION OF THE
CHICAGO AREA WATERWAY SYSTEM (CAWS)
Prepared by
CT
E
CONSOER TOWNSEND ENVIRODYNE ENGINEERS, INC.
303 E
.
WACKER DRIVE
,
SUITE 600
CHICAGO,
ILLINOIS 60601
For
METROPOLITAN WATER RECLAMATION DISTRICT
OF GREATER CHICAGO
Electronic Filing - Received, Clerk's Office, August 4, 2008
Introduction
An Integrated Strategy study is currently underway to determine the most cost-effective
approach, utilizing a variety of technologies, to meet the (EPA's proposed dissolved oxygen
standards for the CAWS. This study, however, will not be completed until the middle of 2009.
The District recognizes that the IPCB has an immediate need for information on the cost of
meeting the IEPA proposed dissolved oxygen standards and therefore requested that CTE
prepare an order of magnitude cost estimate for meeting the IEPA proposed standards. This
document summarizes the approach and assumptions utilized to prepare this order of
magnitude cost estimate.
Basis of Cost Estimate
CTE's estimate is an order of magnitude cost estimate and is based upon a variety of
assumptions which are subject to revision based upon the results of the above described on-
going Integrated Strategy study. This order of magnitude cost estimate is roughly equivalent to a
level 5 estimate according to the cost estimate classification system recommended by the
AACE and has an accuracy range of -30% to +50%.
Assumptions
The following are the assumptions and simplifications utilized to prepare this rough cost
estimate:
1)
Only one aeration technology - supplemental aeration using ceramic disc
diffusers in the waterway with on-shore blower facility - was utilized.
2)
Only one aerated flow augmentation technology - U-Tube aeration of pumped
flow - was utilized.
3)
The number, location, and sizing of the aeration stations for the cost estimate are
based upon preliminary results from an updated Marquette University Model. A
summary of the approach and results of this effort are included as Attachment A.
4)
The Marquette University model was run for the representative "wet year" from
October 1, 2000 to September 30, 2001.
5)
The Marquette University model was calibrated for the 2001 wet year for this
estimate. Further adjustment to include the dry year of 2003 and sensitivity
analyses were not available for this estimate, but will be available for all
integrated strategy compliance scenarios.
6)
The preliminary flow augmentation modeling results do not address the issue of
sediment re-suspension which may be a significant issue in Bubbly Creek and
other parts of the CAWS.
7)
The Marquette University Model assumes the District's existing SEPA and
diffused air stations were operating at full firm capacity. It should be noted that
some of the SEPA stations require further improvements to operate effectively at
this capacity and that the diffused air stations are not typically operated at their
full firm capacity.
Costs for these improvements have not been developed or
included in this estimate.
8)
Inflation corrected costs derived from CTE's previous studies for the IEPA's UAA
were extrapolated and form the main basis for this cost estimate. Present worth
based on 20 year life with a present worth factor of 19.42 based on 3% interest
rate and 3% inflation rate.
Electronic Filing - Received, Clerk's Office, August 4, 2008
9)
It
was assumed that vacant land is available and can be purchased with minimal
demolition costs. However, given the size of the stations and a brief review of
aerial photography of the preliminary locations, this may not be possible at
perhaps one-third of the locations. This issue will be further evaluated and
addressed in the Integrated Strategy Study.
10)
It is currently unclear what operational duration and frequency will be required to
achieve 100% compliance. However, for this estimate, it was assumed all
existing and additional aeration facilities will be required to operate at the
equivalent of full capacity for one month per year, half capacity for 7 months of
the year, and not required for the remaining 4 months of the year. This
assumption is based partially on the current operations at the District's existing
aeration facilities and may not apply for a worst - case year.
It
should be noted that these assumptions will be further evaluated and expanded in the detailed
Integrated Strategy.
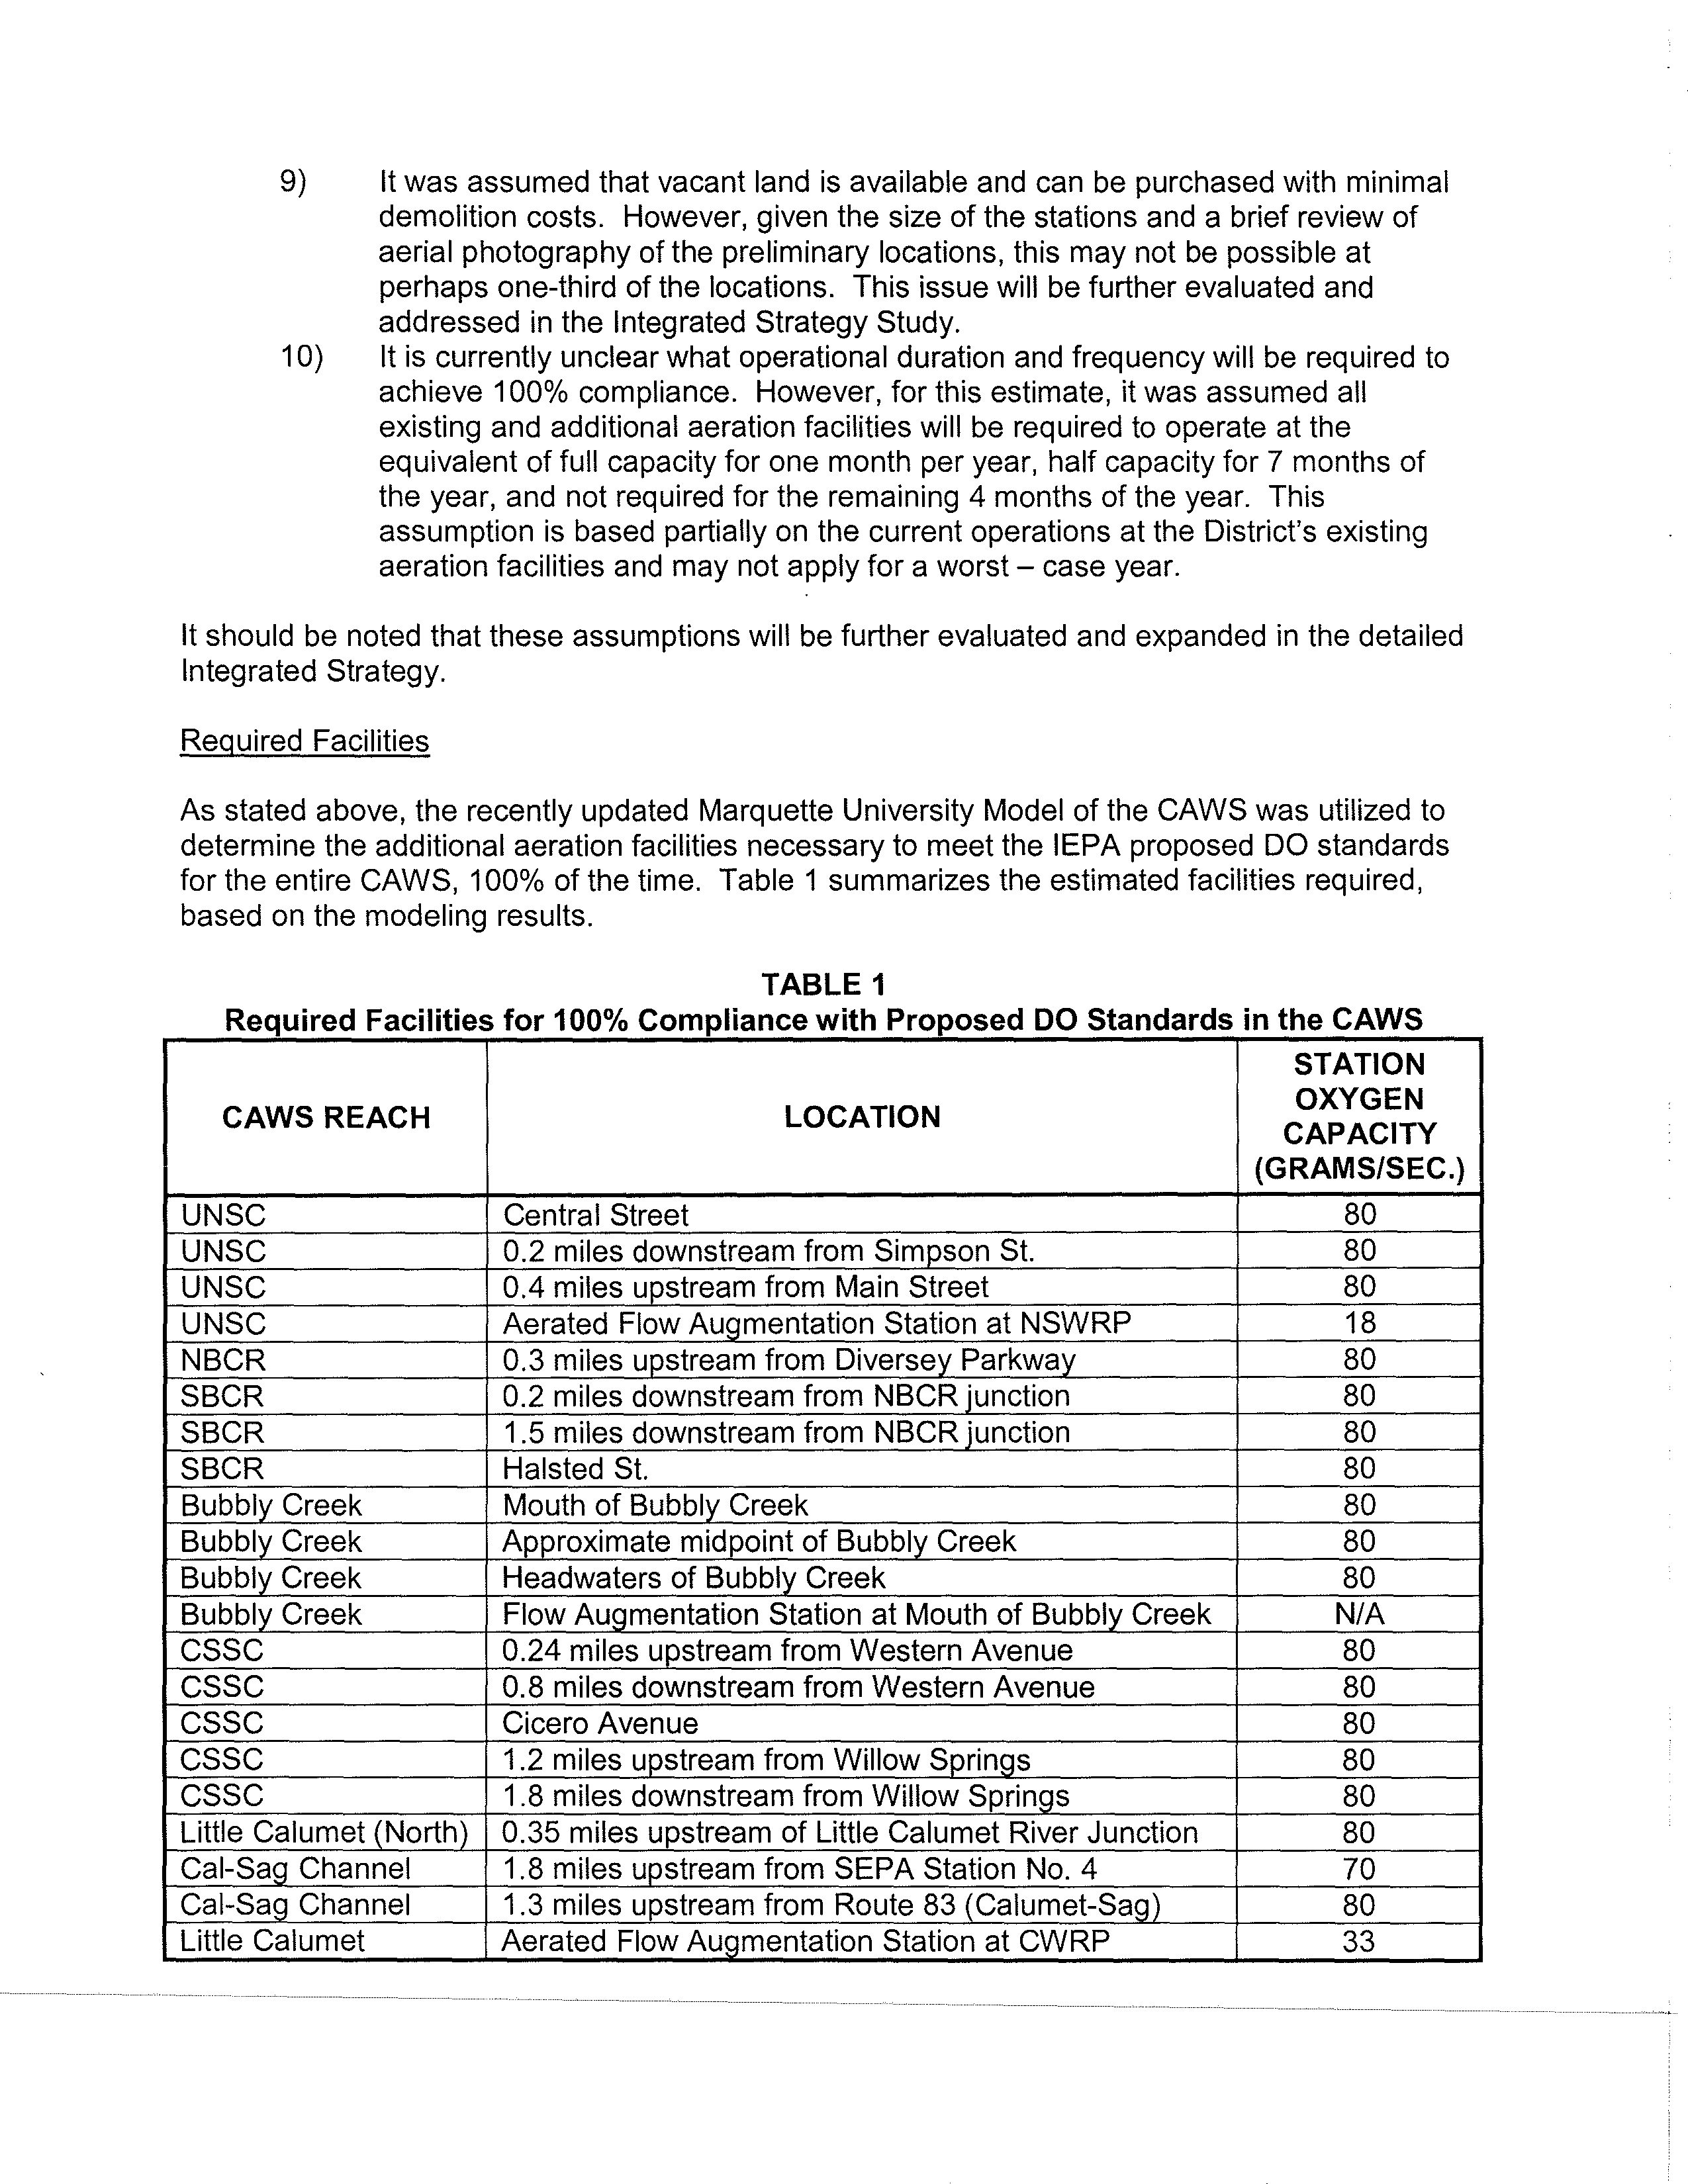
Required Facilities
As stated above
,
the recently updated Marquette University Model
of the CAWS
was utilized to
determine the additional aeration facilities necessary to meet the IEPA proposed DO standards
for the entire
CAWS,
100% of the time
.
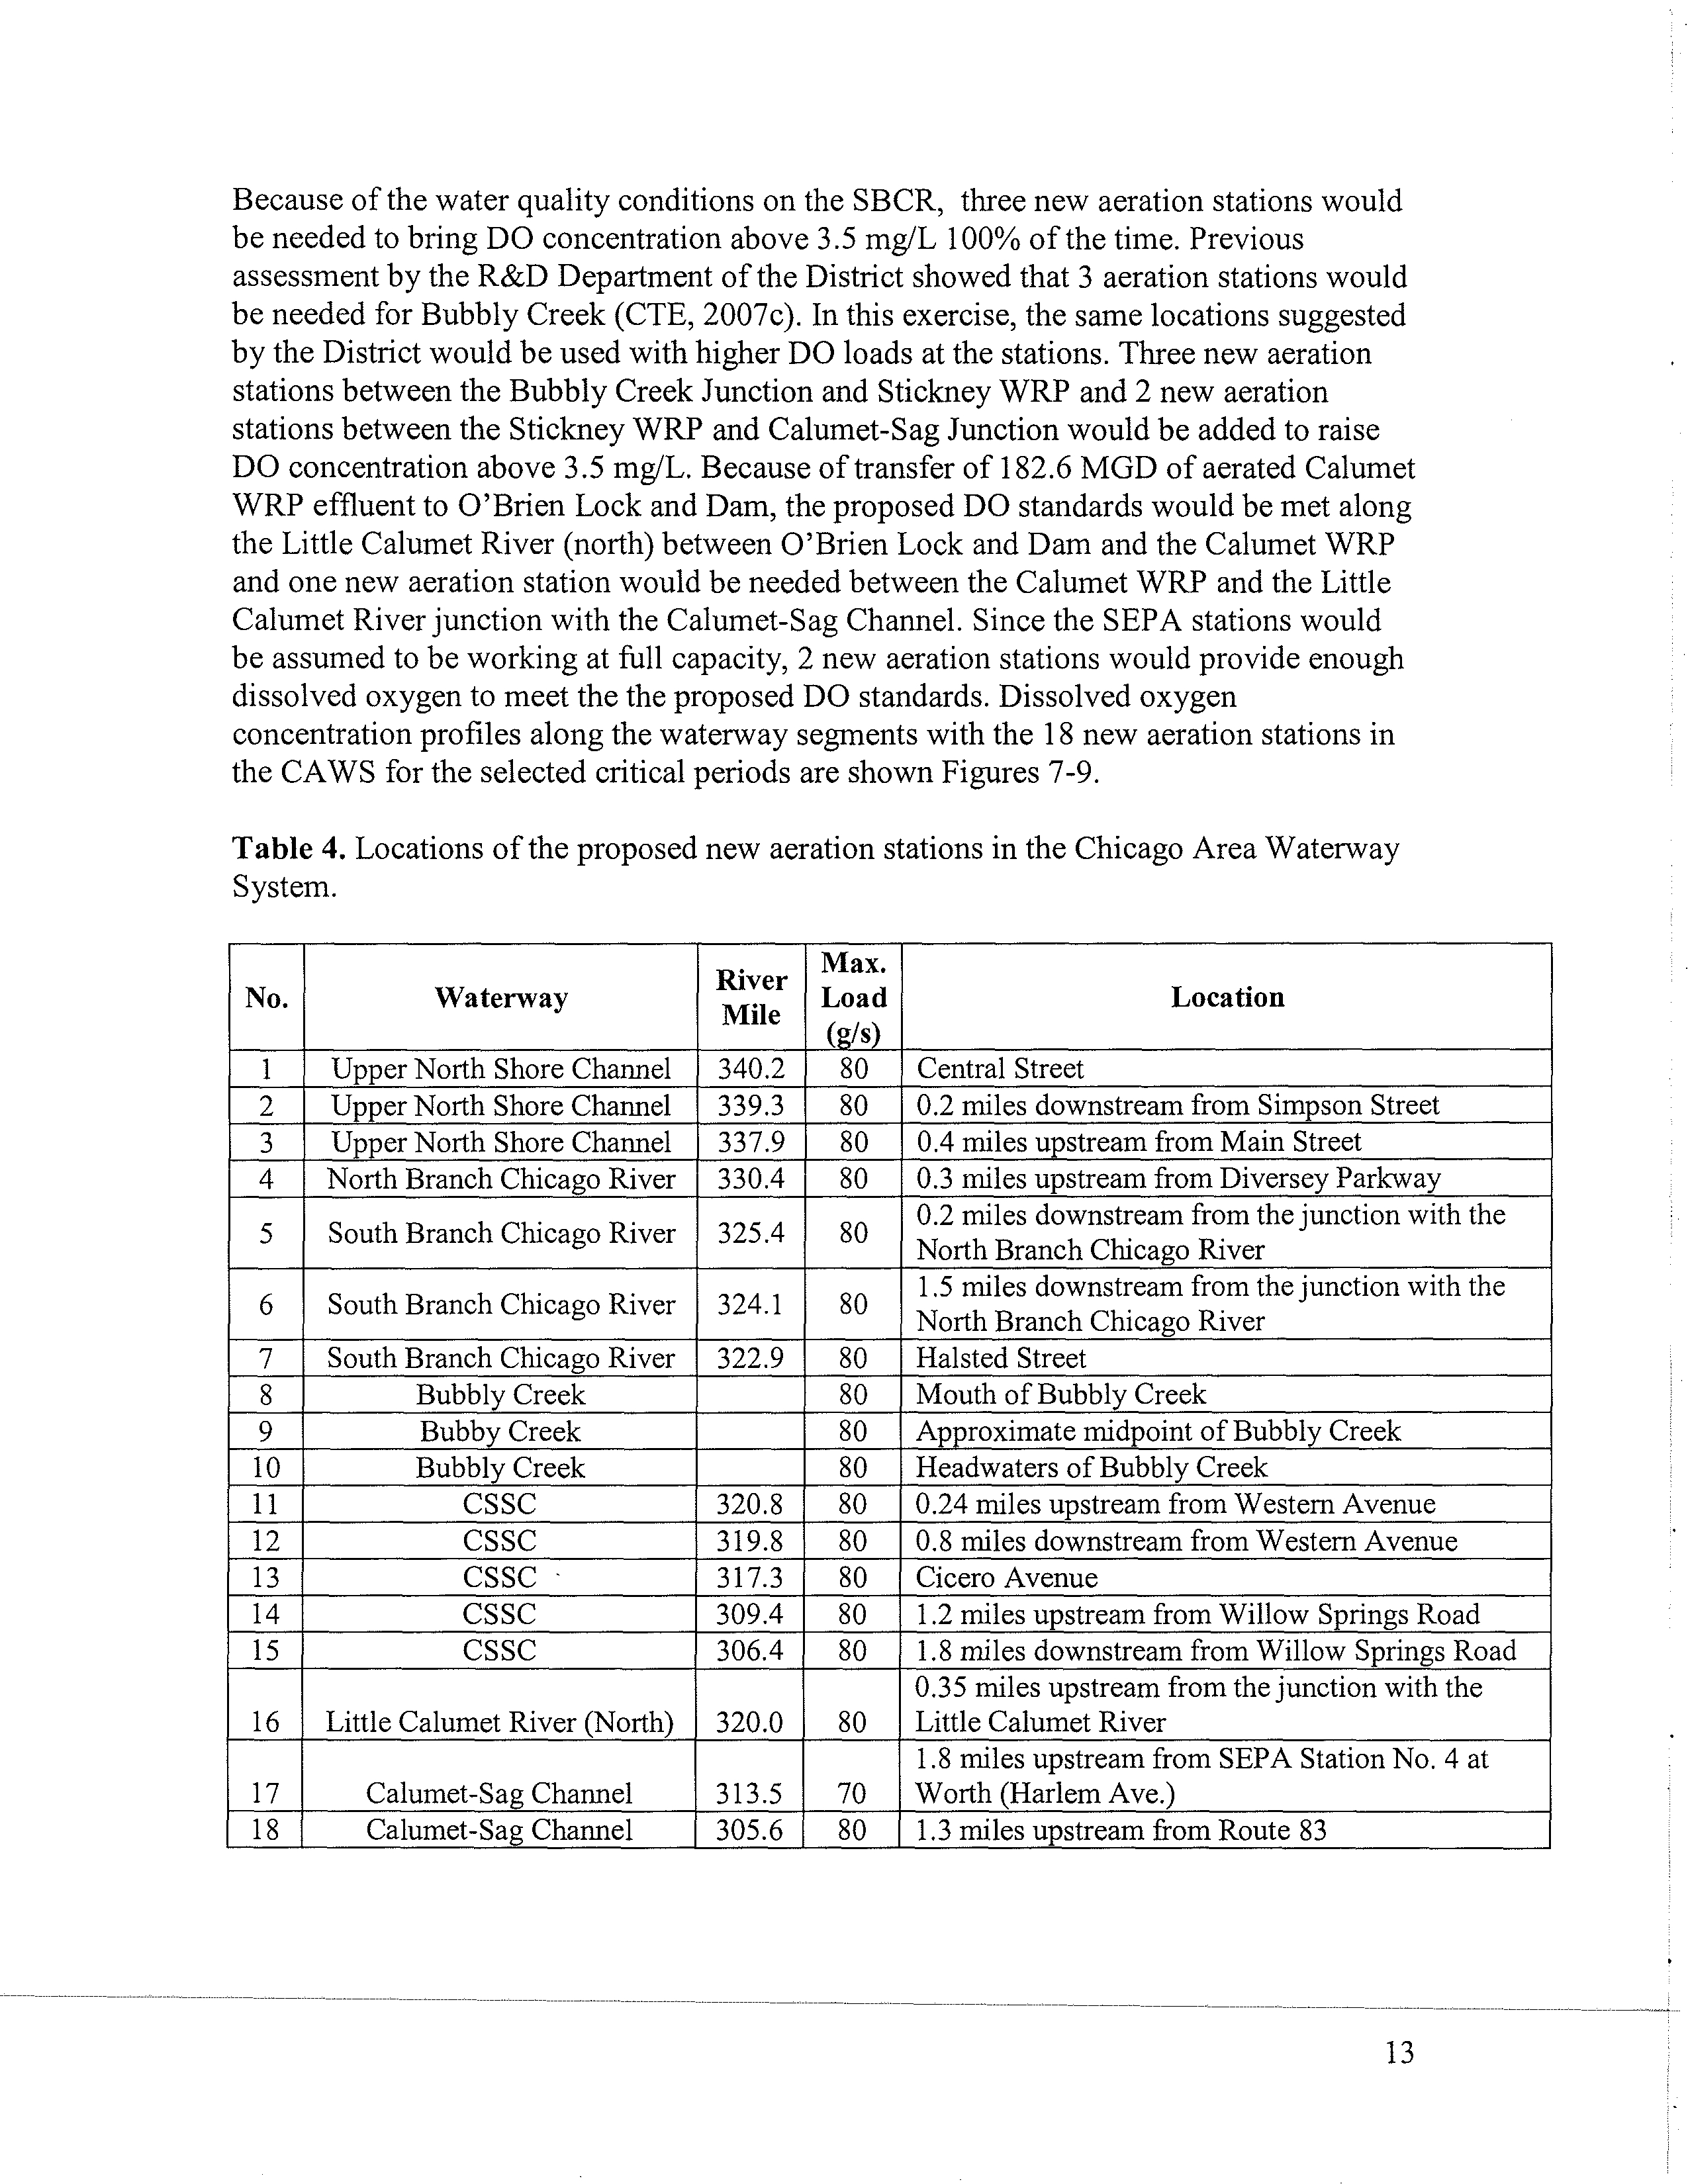
Table 1 summarizes the estimated facilities required,
based on the modeling results.
TABLE 1
Required
Facilities for
100% Compliance with Proposed DO Standards
in the CAWS
CAWS REACH
LOCATION
STATION
OXYGEN
CAPACITY
(GRAMS/SEC.)
UNSC
Central Street
80
UNSC
0.2 miles downstream from Simpson St.
80
UNSC
0.4 miles upstream from Main Street
80
UNSC
Aerated Flow Augmentation Station at NSWRP
18
NBCR
0.3 miles upstream from Diverse Parkway
80
SBCR
0.2 miles downstream from NBCR 'unction
80
SBCR
1.5 miles downstream from NBCR 'unction
80
SBCR
Halsted St.
80
Bubbly Creek
Mouth of Bubbly Creek
80
Bubbly Creek
Approximate midpoint of Bubbly Creek
80
Bubbly Creek
Headwaters of Bubbly Creek
80
Bubbly Creek
Flow Augmentation Station at Mouth of Bubbly Creek
N/A
CSSC
0.24 miles upstream from Western Avenue
80
CSSC
0.8 miles downstream from Western Avenue
80
CSSC
Cicero Avenue
80
CSSC
1.2 miles upstream from Willow Springs
80
CSSC
1.8 miles downstream from Willow Springs
80
Little
Calumet North
0.35 miles upstream of Little Calumet River Junction
80
Cal-Sag Channel
1.8 miles upstream from SEPA Station No. 4
70
Cal-Sag Channel
1.3 miles upstream from Route 83 (Calumet-Sag)
80
Little Calumet
Aerated Flow Augmentation Station at CWRP
33
Electronic Filing - Received, Clerk's Office, August 4, 2008
As shown in the table
,
the majority of the facilities are assumed to be ceramic disc diffuser type
aeration stations
.
However
,
flow augmentation facilities previously recommended
for the UAA
for the UNSC
and Bubbly Creek also are required
.
In addition
,
a new aerated flow
augmentation station was required for the Calumet and Little Calumet reaches of
the CAWS.
The model results did not include supplemental aeration for the Grand Calumet and Chicago
River reaches of the CAWS. It should be noted that supplemental aeration would not be
effective for the Chicago River given that zero waterway flow often occurs that would create
dead zones between aeration stations. In downtown Chicago, there does not appear to be a
source of readily available water for flow augmentation to alleviate this condition. This issue will
be studied in greater detail as the on-going Integrated Strategy study progresses.
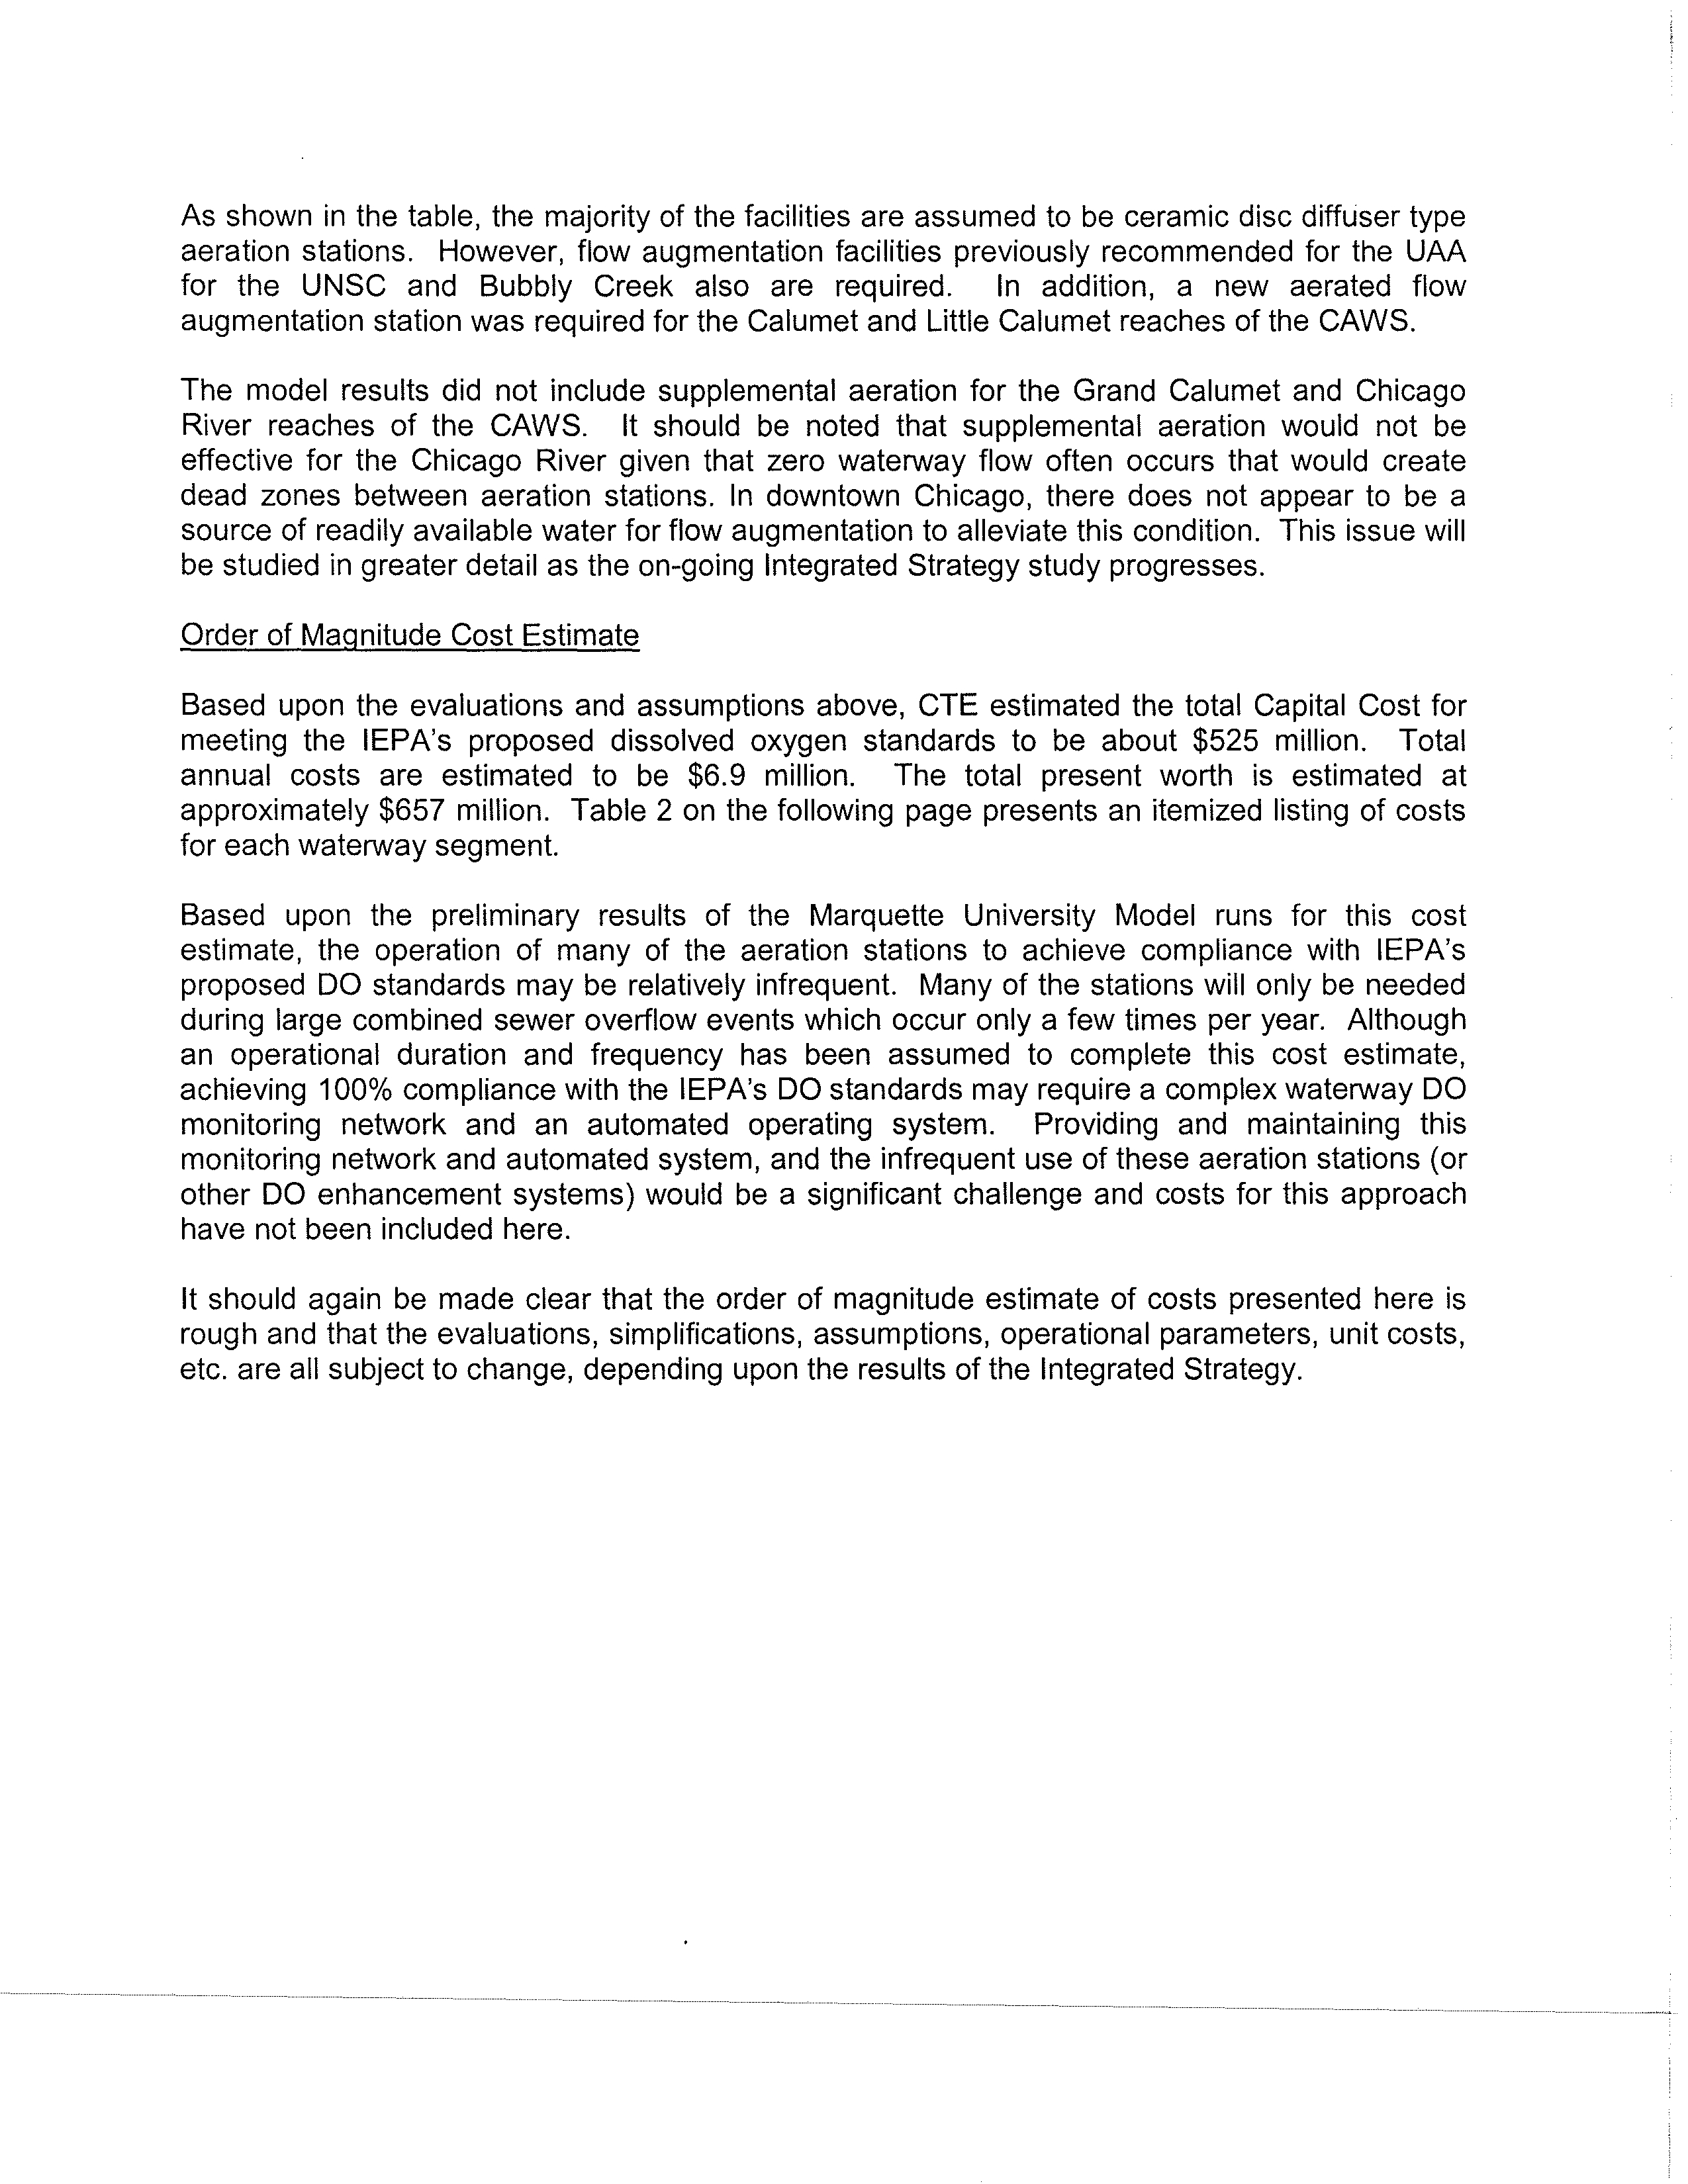
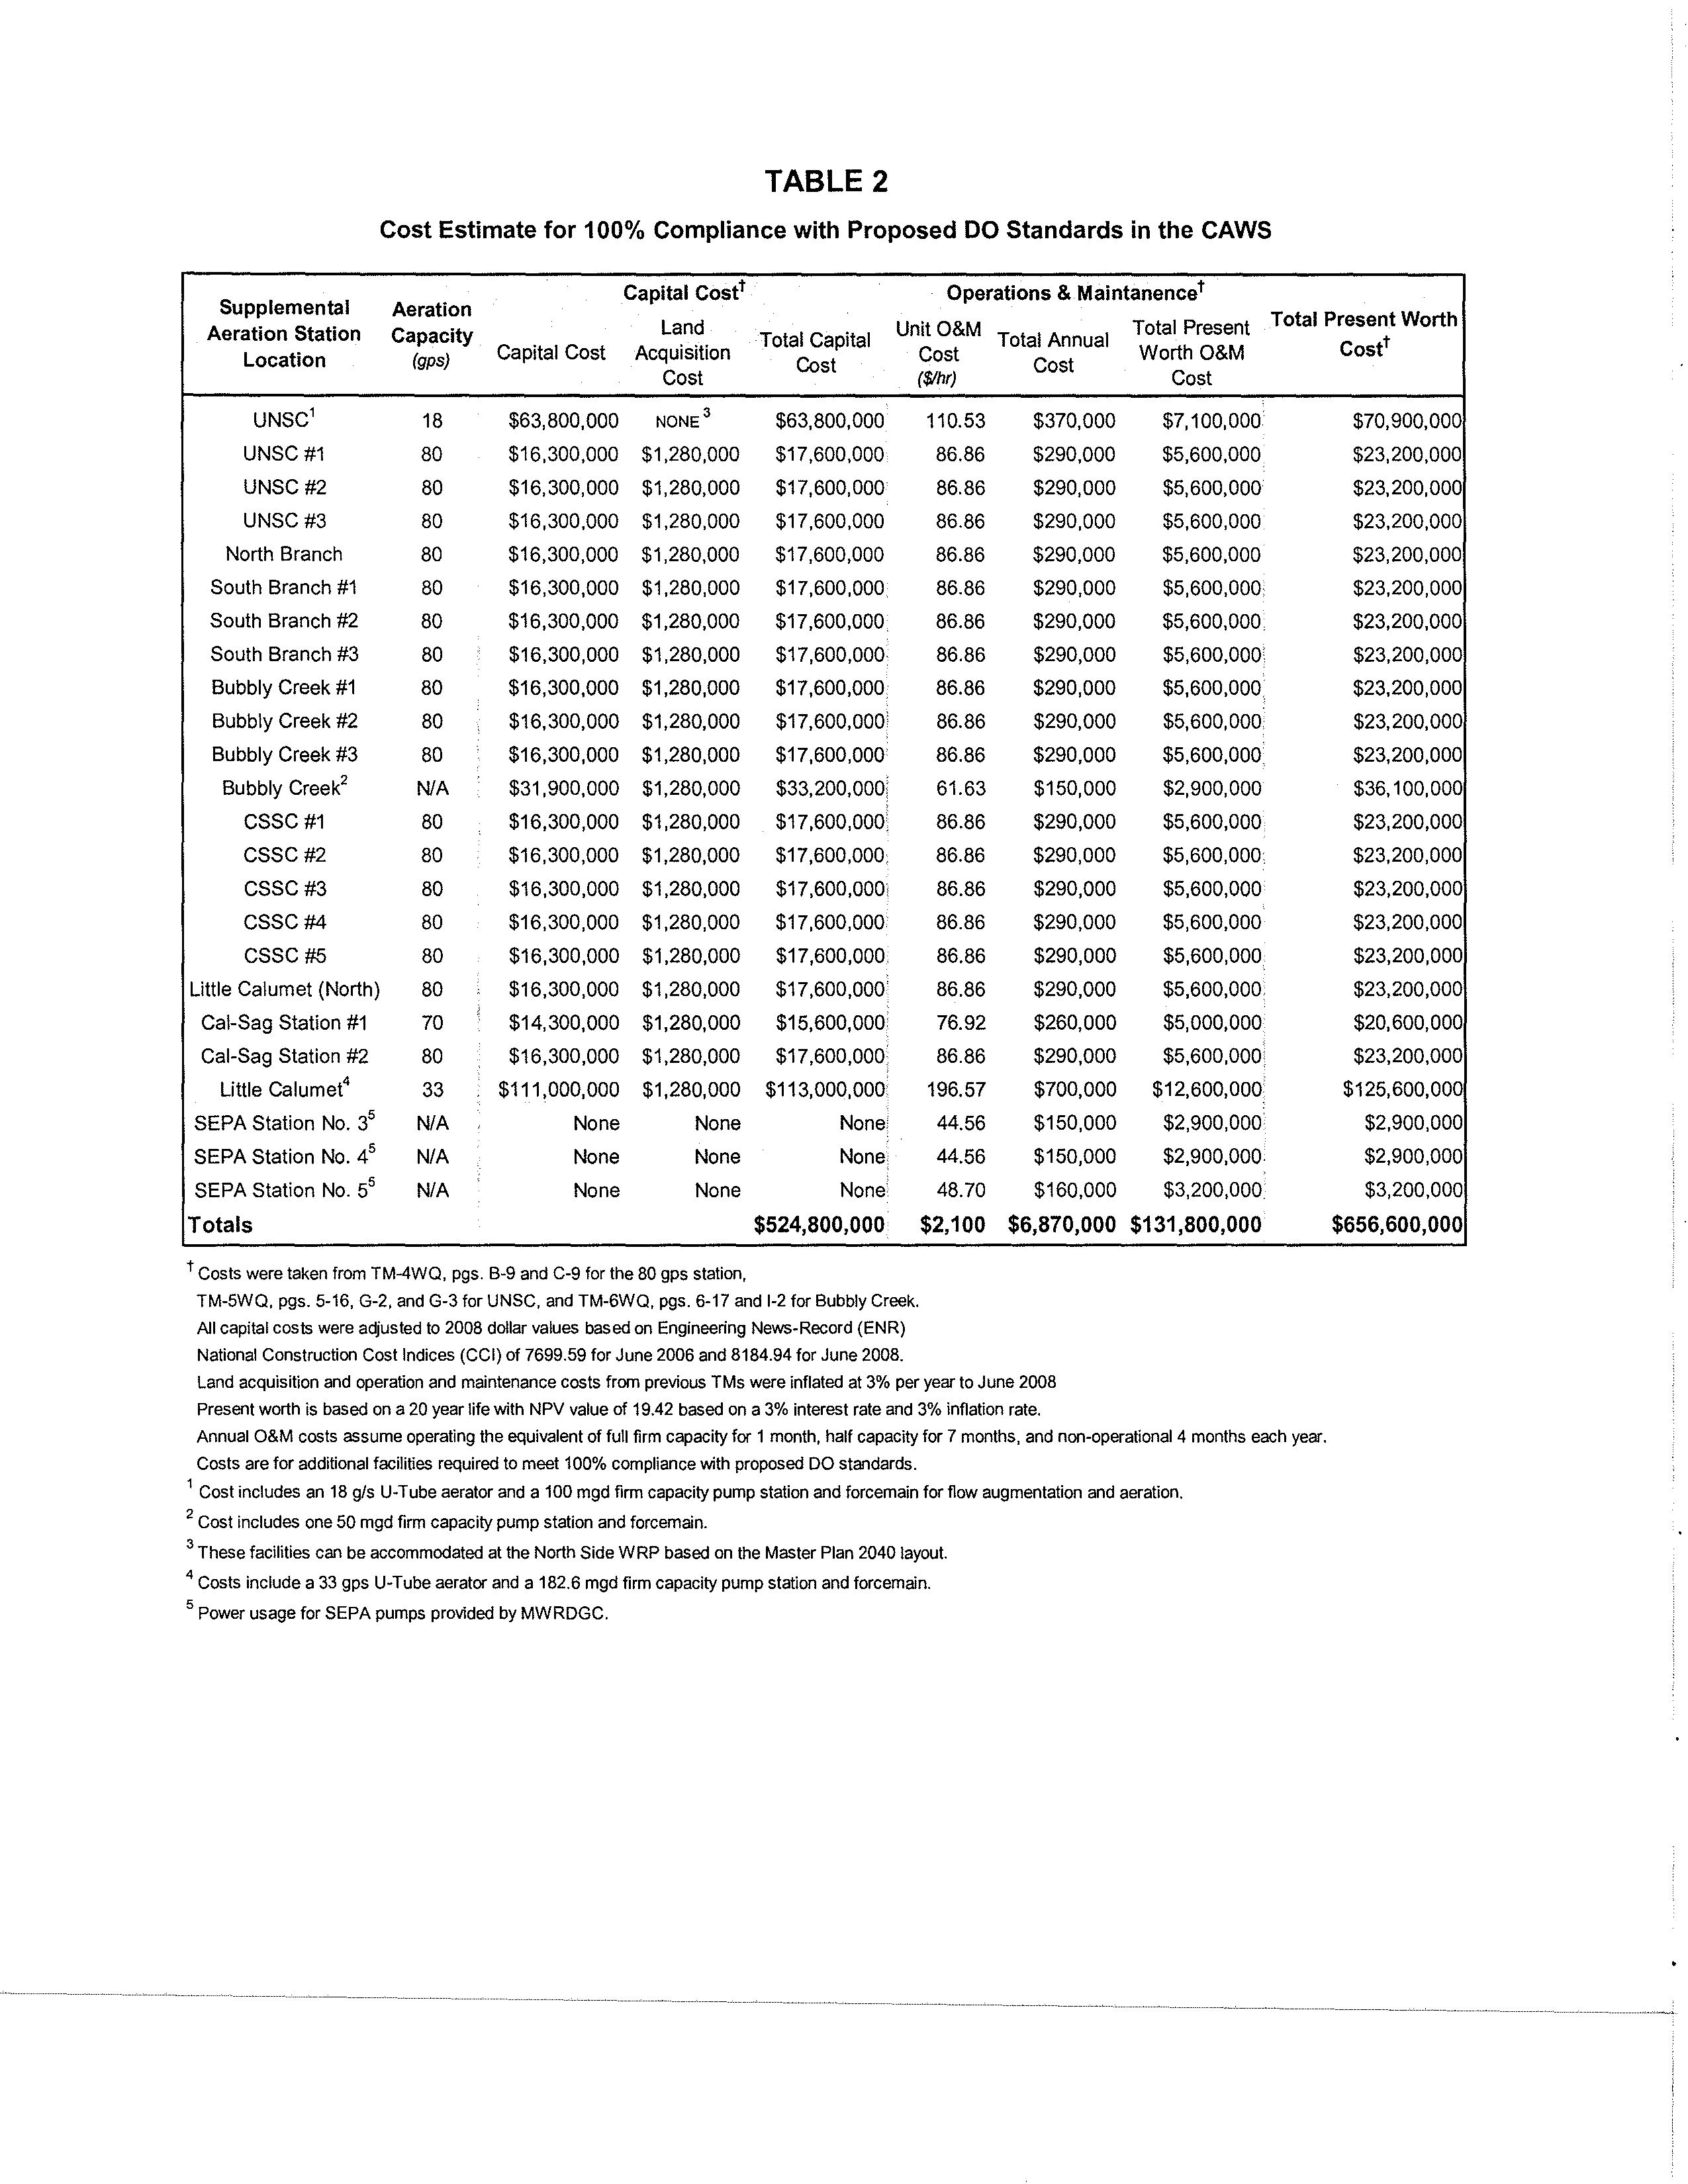
Order of Magnitude Cost Estimate
Based upon the evaluations and assumptions above, CTE estimated the total Capital Cost for
meeting the (EPA's proposed dissolved oxygen standards to be about $525 million. Total
annual costs are estimated to be $6.9 million.
The total present worth is estimated at
approximately $657 million. Table 2 on the following page presents an itemized listing of costs
for each waterway segment.
Based upon the preliminary results of the Marquette University Model runs for this cost
estimate, the operation of many of the aeration stations to achieve compliance with IEPA's
proposed DO standards may be relatively infrequent. Many of the stations will only be needed
during large combined sewer overflow events which occur only a few times per year. Although
an operational duration and frequency has been assumed to complete this cost estimate,
achieving 100% compliance with the (EPA's DO standards may require a complex waterway DO
monitoring network and an automated operating system.
Providing and maintaining this
monitoring network and automated system, and the infrequent use of these aeration stations (or
other DO enhancement systems) would be a significant challenge and costs for this approach
have not been included here.
It
should again be made clear that the order of magnitude estimate of costs presented here is
rough and that the evaluations, simplifications, assumptions, operational parameters, unit costs,
etc. are all subject to change, depending upon the results of the Integrated Strategy.
Electronic Filing - Received, Clerk's Office, August 4, 2008
TABLE 2
Cost Estimate for 100
%
Compliance with Proposed DO Standards in the CAWS
Capital Costt
Operations
&
Maintanencet
Supplemental
Aeration
Aeration Station
Capacity
C
ilC
Land
isi
i
-Total
Capital
Unit O&M Total Annual
Total Present
W th O&M
Total Present Worth
Costt
Location
(gps)
ap
ta
ost
Acqu t on
Cost
Cost
Cost
(0r)
Cost
or
Cost
UNSC'
18
$63,800,000
NONE3
$63,800,000
110.53
$370,000
$7,100,000
$70,900,000
UNSC #1
80
$16,300,000 $1,280,000
$17,600,000
86.86
$290,000
$5,600,000
$23,200,000,
UNSC #2
80
$16,300,000 $1,280,000
$17,600,000
86.86
$290,000
$5,600,000
$23,200,000;
UNSC #3
80
$16,300,000 $1,280,000
$17,600,000
86.86
$290,000
$5,600,000
$23,200,000
North Branch
80
$16,300,000 $1,280,000
$17,600,000
86.86
$290,000
$5,600,000
$23,200,000!,
South Branch #1
80
$16,300,000 $1,280,000
$17,600,000
86.86
$290,000
$5,600,000:
$23,200,000
South Branch #2
80
$16,300,000 $1,280,000
$17,600,000
86.86
$290,000
$5,600,000:
$23,200,000
South Branch #3
80
$16,300,000 $1,280,000
$17,600,000`
86.86
$290,000
$5,600,000'
$23,200,000
Bubbly Creek #1
80
$16,300,000 $1,280,000
$17,600,000,
86.86
$290,000
$5,600,000,
$23,200,000
Bubbly Creek #2
80
$16,300,000 $1,280,000
$17,600,000'
86.86
$290,000
$5,600,000
$23,200,000
Bubbly Creek #3
80
$16,300,000
$1,280,000
$17,600,000
86.86
$290,000
$5,600,000
$23,200,000
Bubbly Creek2
N/A
$31,900,000 $1,280,000
$33,200,000;
61.63
$150,000
$2,900,000
$36,100,000
CSSC #1
80
$16,300,000 $1,280,000
$17,600,000;:
86.86
$290,000
$5,600,000
$23,200,000
CSSC #2
80
$16,300,000 $1,280,000
$17,600,000;
86.86
$290,000
$5,600,000,
$23,200,000
CSSC #3
80
$16,300,000 $1,280,000
$17,600,000;
86.86
$290,000
$5,600,000
$23,200,000
CSSC #4
80
$16,300,000 $1,280,000
$17,600,000
86.86
$290,000
$5,600,000
$23,200,000
CSSC #5
80
$16,300,000
$1,280,000
$17,600,000,
86.86
$290,000
$5,600,000:
$23,200,000
Little Calumet (North)
80
$16,300,000 $1,280,000
$17,600,000
86.86
$290,000
$5,600,000`,
$23,200,000
Cal-Sag Station #1
70
$14,300,000 $1,280,000
$15,600,000;
76.92
$260,000
$5,000,000
$20,600,000
Cal-Sag Station #2
80
$16,300,000 $1,280,000
$17,600,000
86.86
$290,000
$5,600,000;
$23,200,000
Little Calumee
33
$111,000,000 $1,280,000 $113,000,000
196.57
$700,000
$12,600,000
$125,600,000
SEPA Station No. 35
N/A
None
None
None
.
44.56
$150,000
$2,900,000
$2,900,000
SEPA Station No. 45
N/A
None
None
None
',
44.56
$150,000
$2,900,000
$2,900,000
SEPA Station No. 55
N/A
None
None
None
48.70
$160,000
$3,200,000'
$3,200,000
Totals
$524,800,000
$2
,
100 $6
,
870,000 $131
,
800,000
$
656,600,000
t Costs were taken from TM-4WQ
,
pgs. B
-
9 and C-9 for the 80 gps station,
TM-5WQ, pgs. 5-16, G-2, and G-3 for UNSC, and TM-6WQ, pgs. 6-17 and 1-2 for Bubbly Creek.
All capital costs were adjusted to 2008 dollar values based on Engineering News-Record (ENR)
National Construction Cost Indices
(
CCI) of 7699
.
59 for June 2006 and 8184
.
94 for June 2008.
Land acquisition and operation and maintenance costs from previous TMs were inflated at 3% per year to June 2008
Present worth is based on a 20 year life with NPV value of 19
.
42 based on a 3% interest rate and 3
%
inflation rate.
Annual O&M costs assume operating the equivalent of full firm capacity for 1 month
,
half capacity for 7 months
,
and non-operational 4 months each year.
Costs are for additional facilities required to meet 100
%
compliance with proposed DO standards.
Cost includes an 18 g
/
s U-Tube aerator and a 100 mgd firm capacity pump station and forcemain for flow augmentation and aeration,
2 Cost includes one 50 mgd firm capacity pump station and forcemain.
3 These facilities can be accommodated at the North Side W RP based on the Master Plan 2040 layout.
4 Costs include a 33 gps U
-
Tube aerator and a 182.6 mgd firm capacity pump station and forcemain.
5 Power usage for SEPA pumps provided by MW RDGC.
Electronic Filing - Received, Clerk's Office, August 4, 2008
ATTACHMENT A
WATER-QUALITY SIMULATION
IN SUPPORT OF
THE DEVELOPMENT OF AN INTEGRATED
STRATEGY TO
MEET DISSOLVED OXYGEN STANDARDS FOR
THE CHICAGO AREA WATERWAYS
-Supplementary Aeration Stations-
100% Compliance (Rough Cut)
Electronic Filing - Received, Clerk's Office, August 4, 2008
Institute for Urban Environmental Risk Management
Marquette University
,
Milwaukee WI 53201-1881
TECHNICAL MEMORANDUM
WATER-QUALITY SIMULATION IN SUPPORT OF
THE DEVELOPMENT OF AN INTEGRATED STRATEGY TO
MEET DISSOLVED OXYGEN STANDARDS FOR
THE CHICAGO AREA WATERWAYS
-Supplementary Aeration Stations-
100% Compliance (Rough Cut)
SUBMITTED TO
The Metropolitan Water Reclamation District of Greater Chicago
Emre ALP, Ph.D.
Department of Civil and Environmental Engineering
Charles S. MELCHING, Ph.D, P.E.
Department
of Civil
and Environmental Engineering
Milwaukee, Wisconsin
July 2008
Electronic Filing - Received, Clerk's Office, August 4, 2008
Background
In early 2003
,
the Illinois Environmental Protection
Agency (
IEPA) initiated an Use
Attainability Analysis
(UAA) for the
Chicago Area Waterway System with Camp,
Dresser
&
McKee
(
CDM) as the lead consultant and the Metropolitan Water Reclamation
District of Greater Chicago (District
)
promising to provide data and modeling support for
the UAA process
.
As a result
of the UAA
process a number of water-quality problems
have been identified
in the CAWS.
Simulations done by Marquette University (Alp and Melching, 2006) and by the District
Research and Development (R & D) Department and subsequent preliminary design and
cost analysis done by Consoer Townsend Envirodyne (CTE) Engineers (CTE, 2006,
2007a-c) indicated the following results.
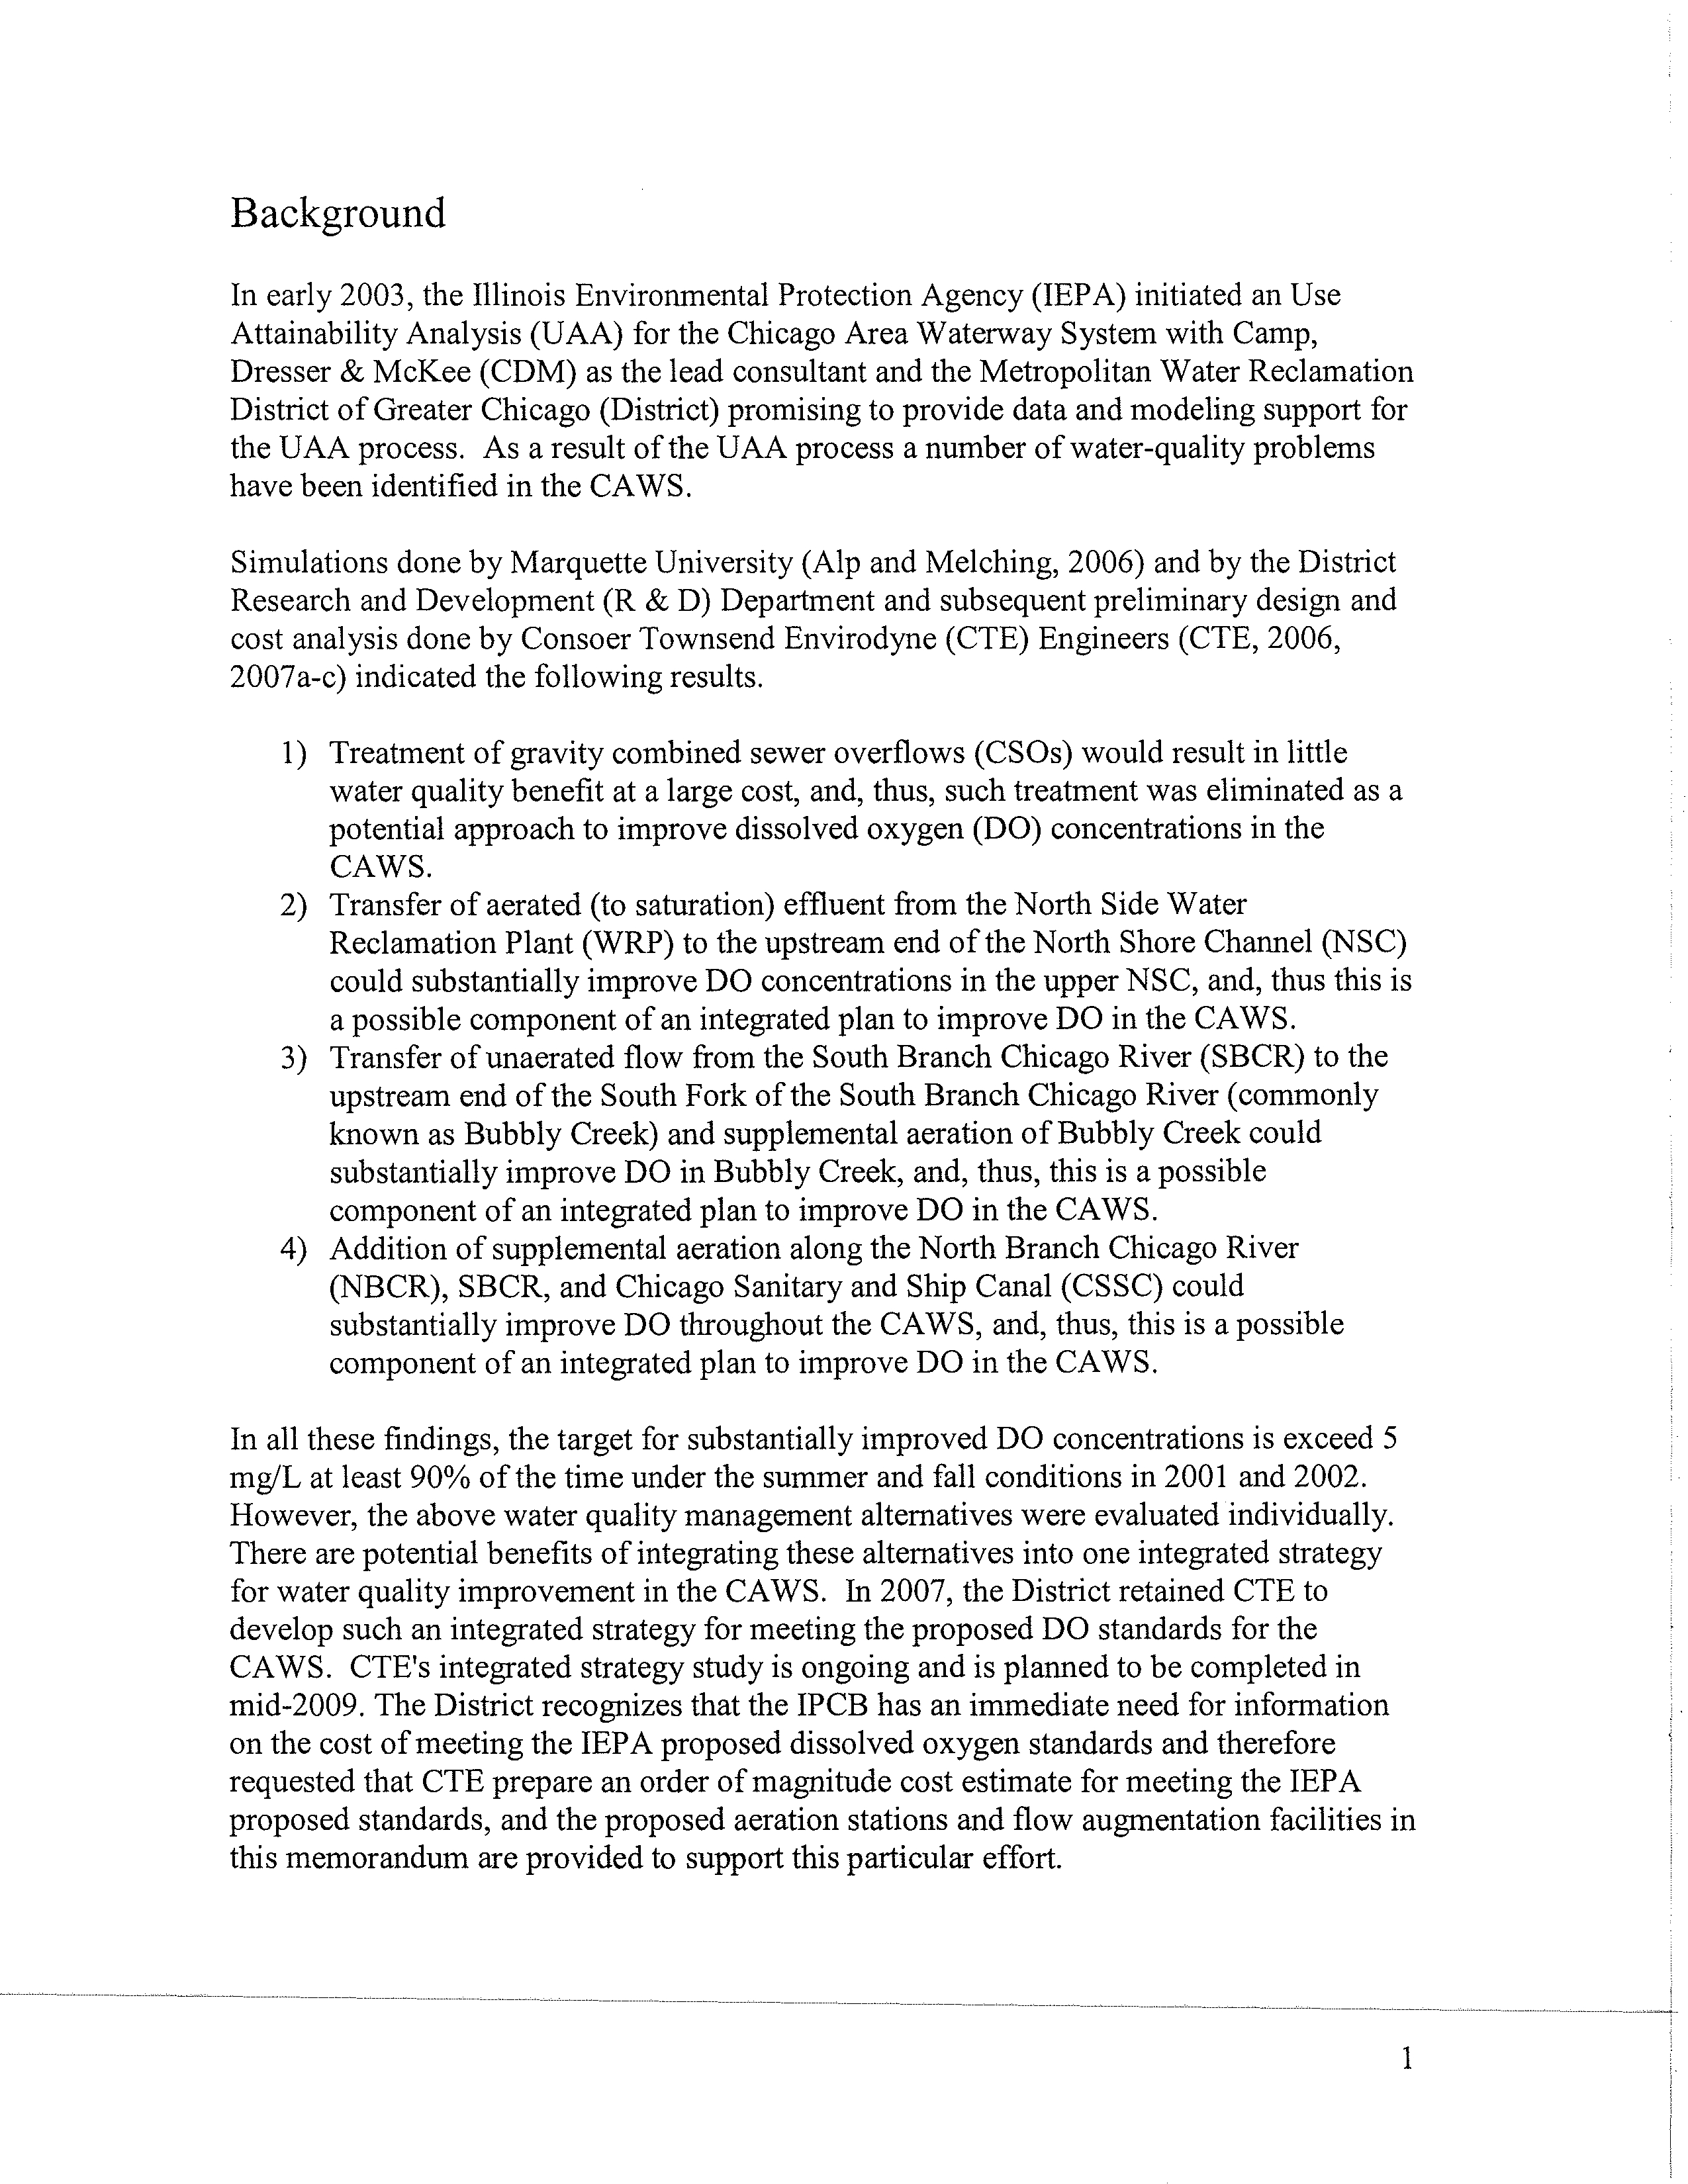
1)
Treatment of gravity combined sewer overflows (CSOs) would result in little
water quality benefit at a large cost, and, thus, such treatment was eliminated as a
potential approach to improve dissolved oxygen (DO) concentrations in the
CAWS.
2) Transfer of aerated (to saturation) effluent from the North Side Water
Reclamation Plant (WRP) to the upstream end of the North Shore Channel (NSC)
could substantially improve DO concentrations in the upper NSC, and, thus this is
a possible component of an integrated plan to improve DO in the CAWS.
3)
Transfer of unaerated flow from the South Branch Chicago River (SBCR) to the
upstream end of the South Fork of the South Branch Chicago River (commonly
known as Bubbly Creek) and supplemental aeration of Bubbly Creek could
substantially improve DO in Bubbly Creek, and, thus, this is a possible
component of an integrated plan to improve DO in the CAWS.
4)
Addition of supplemental aeration along the North Branch Chicago River
(NBCR), SBCR, and Chicago Sanitary and Ship Canal (CSSC) could
substantially improve DO throughout the CAWS, and, thus, this is a possible
component of an integrated plan to improve DO in the CAWS.
In all these findings
,
the target for substantially improved DO concentrations is exceed 5
mg/L at least 90% of the time under the summer and fall conditions in 2001 and 2002.
However, the above water quality management alternatives were evaluated individually.
There are potential benefits of integrating these alternatives into one integrated strategy
for water quality improvement in the
CAWS.
In 2007, the District retained CTE to
develop such an integrated strategy for meeting the proposed DO standards for the
CAWS. CTE's
integrated strategy study is ongoing and is planned to be completed in
mid-2009. The District recognizes that the IPCB has an immediate need for information
on the cost of meeting the IEPA proposed dissolved oxygen standards and therefore
requested that CTE prepare an order of magnitude cost estimate for meeting
the IEPA
proposed standards
,
and the proposed aeration stations and flow augmentation facilities in
this memorandum are provided to support this particular effort.
1
Electronic Filing - Received, Clerk's Office, August 4, 2008
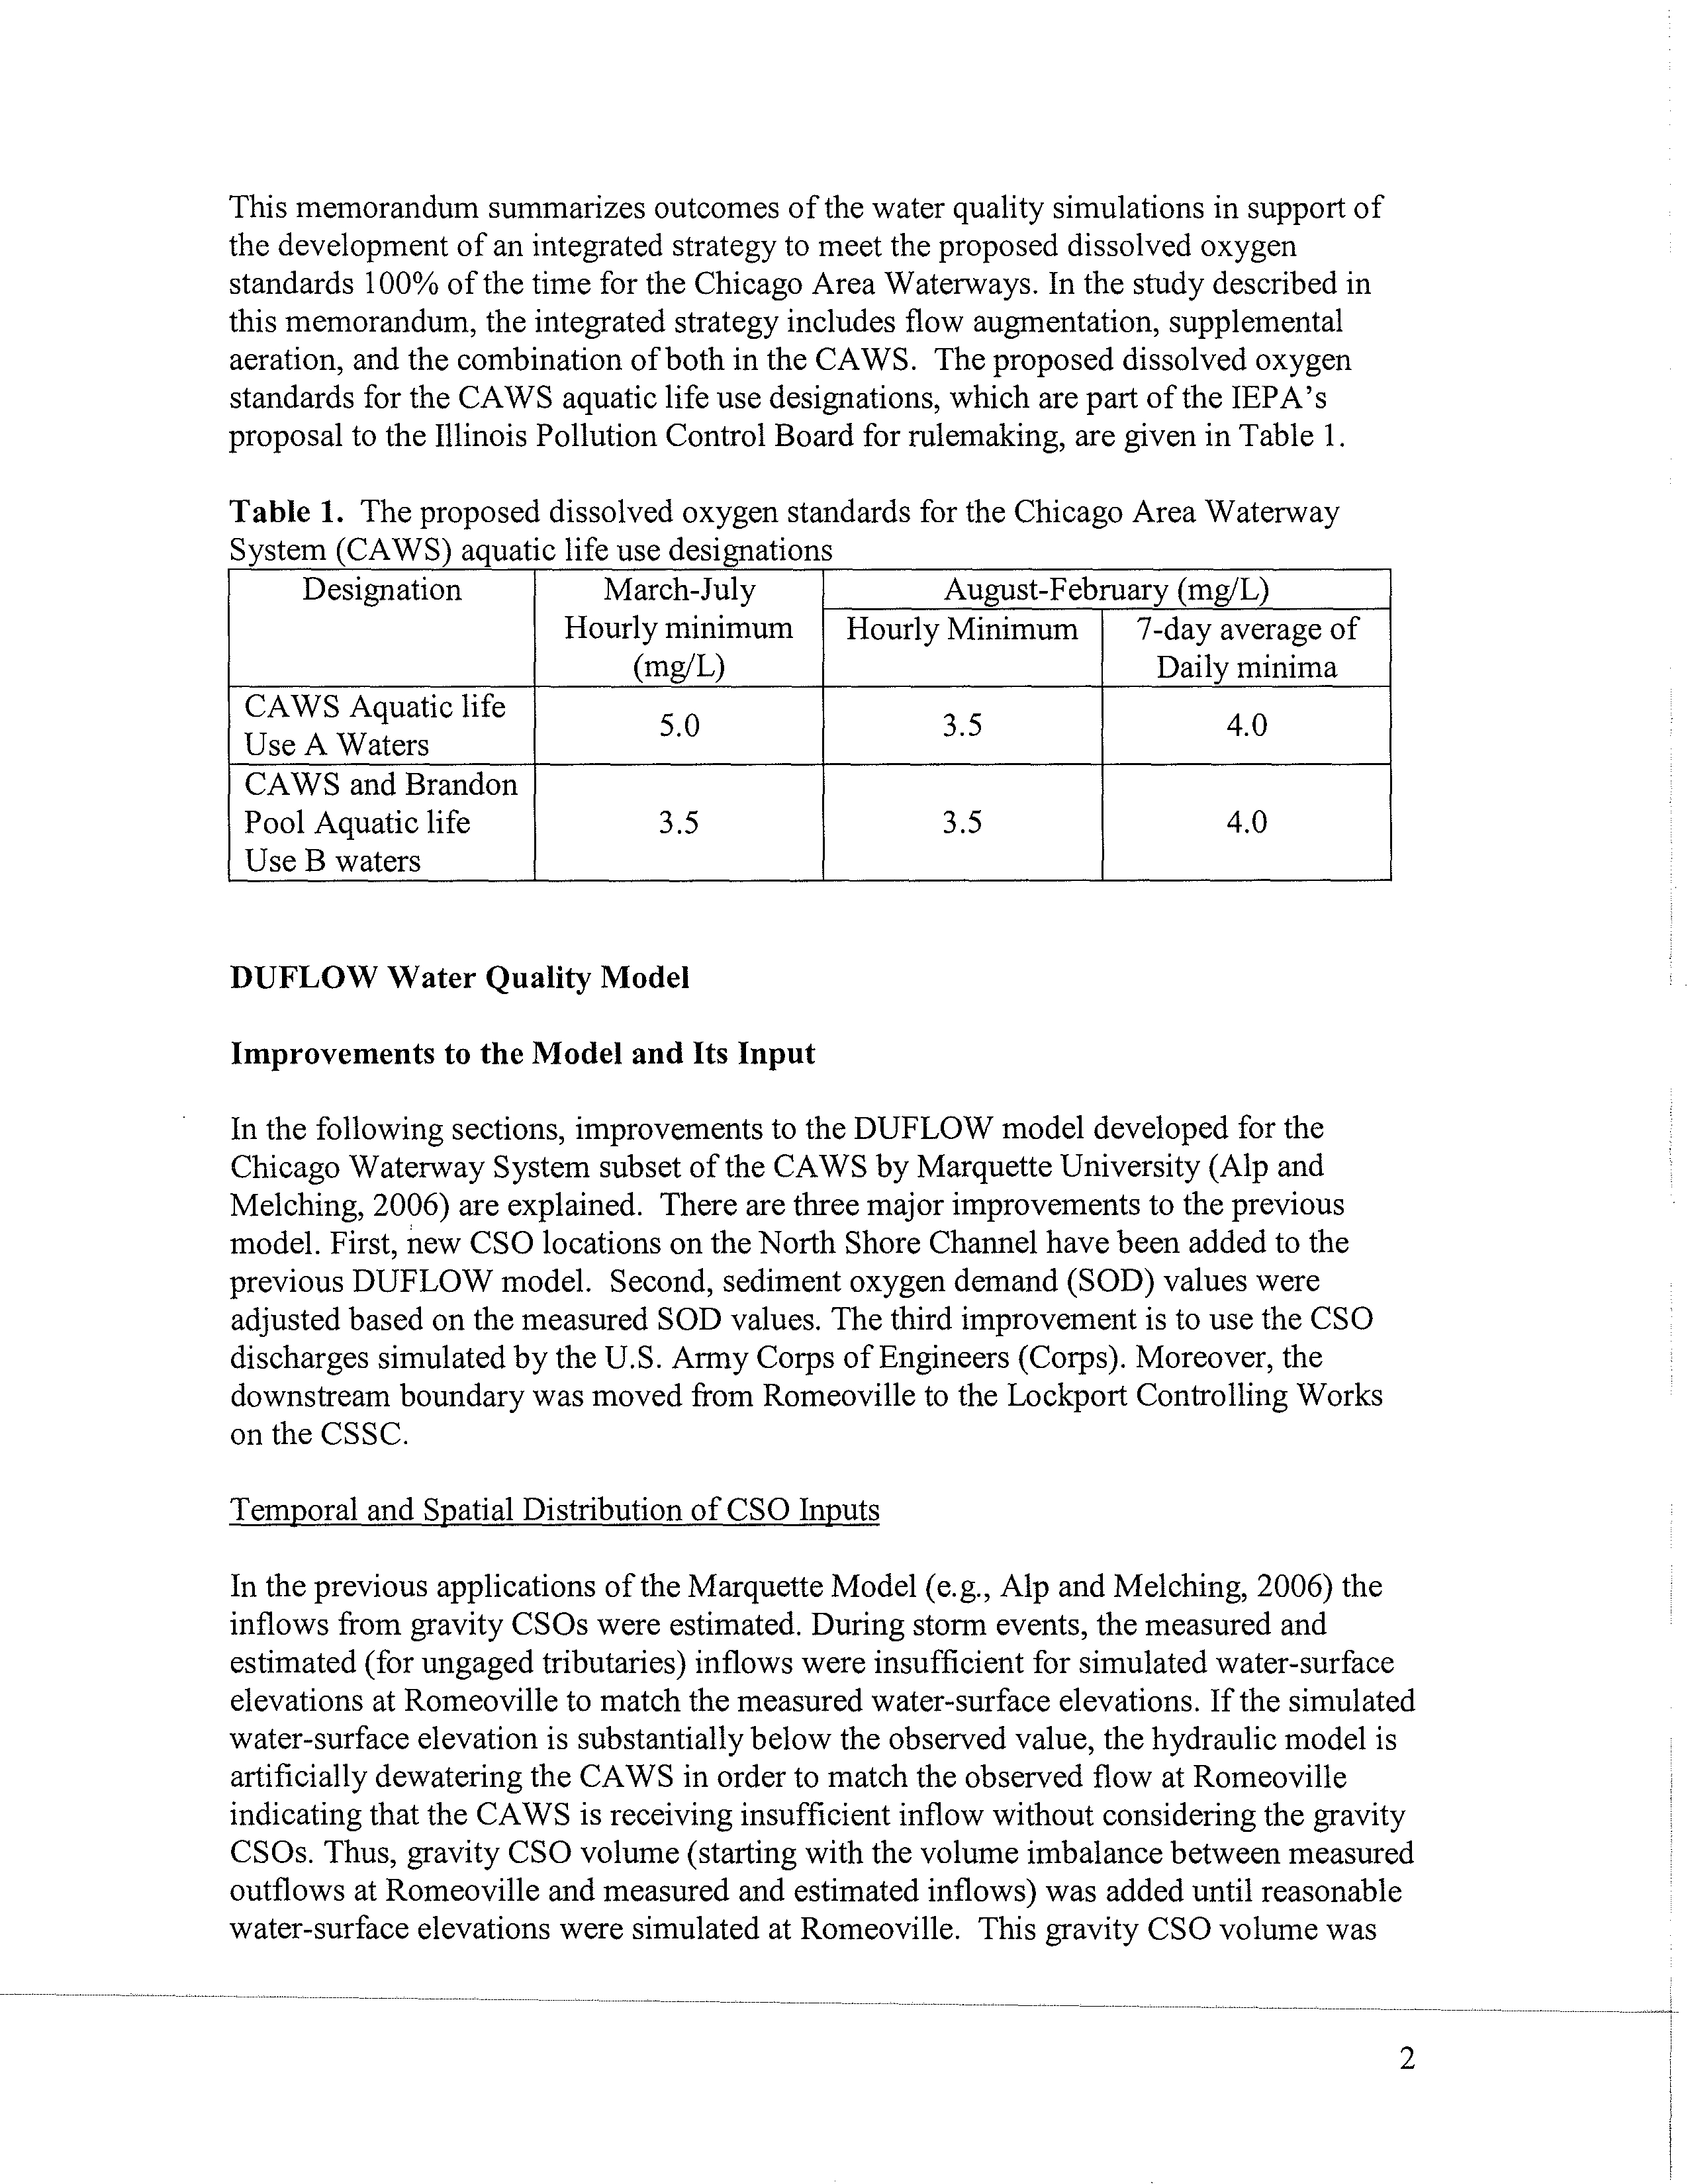
This memorandum summarizes outcomes of the water quality simulations in support of
the development of an integrated strategy to meet the proposed dissolved oxygen
standards 100% of the time for the Chicago Area Waterways. In the study described in
this memorandum, the integrated strategy includes flow augmentation, supplemental
aeration, and the combination of both in the CAWS. The proposed dissolved oxygen
standards for the CAWS aquatic life use designations, which are part of the IEPA's
proposal to the Illinois Pollution Control Board for rulemaking, are given in Table 1.
Table 1. The proposed dissolved oxygen standards for the Chicago Area Waterway
System
(CAWS)
aquatic life use designations
Designation
March-July
August-February (mg/L)
Hourly minimum
Hourly Minimum
7-day average of
(
mg/L)
Daily minima
CAWS
Aquatic life
5.0
3.5
4.0
Use A Waters
CAWS
and Brandon
Pool Aquatic life
3.5
3.5
4.0
Use B waters
DUFLOW Water
Quality Model
Improvements to the Model and Its Input
In the following sections, improvements to the DUFLOW model developed for the
Chicago Waterway System subset of the CAWS by Marquette University (Alp and
Melching, 2006) are explained. There are three major improvements to the previous
model. First, new CSO locations on the North Shore Channel have been added to the
previous DUFLOW model. Second, sediment oxygen demand (SOD) values were
adjusted based on the measured SOD values. The third improvement is to use the CSO
discharges simulated by the U.S. Army Corps of Engineers (Corps). Moreover, the
downstream boundary was moved from Romeoville to the Lockport Controlling Works
on the CSSC.
Temporal and Spatial Distribution of CSO Inputs
In the previous applications of the Marquette Model (e.g., Alp and Melching, 2006) the
inflows from gravity CSOs were estimated. During storm events, the measured and
estimated (for ungaged tributaries) inflows were insufficient for simulated water-surface
elevations at Romeoville to match the measured water-surface elevations. If the simulated
water-surface elevation is substantially below the observed value, the hydraulic model is
artificially dewatering the CAWS in order to match the observed flow at Romeoville
indicating that the CAWS is receiving insufficient inflow without considering the gravity
CSOs. Thus, gravity CSO volume (starting with the volume imbalance between measured
outflows at Romeoville and measured and estimated inflows) was added until reasonable
water-surface elevations were simulated at Romeoville. This gravity CSO volume was
2
Electronic Filing - Received, Clerk's Office, August 4, 2008
added at the representative CSO inflow locations on a per area basis at the time of
operation of the Racine Avenue Pumping Station.
The estimated gravity CSO volumes yielded excellent hydraulic results for all periods
considered (Shrestha and Melching, 2003; Neugebauer and Melching, 2005; Alp and
Melching, 2006). However, the percentage of impervious area varies substantially
throughout the CAWS watershed and the rainfall varies substantially throughout the
CAWS watershed and among events. Thus, the runoff and related pollutant loads must
vary throughout the CAWS watershed on more than a per area basis, and the time
distribution of CSO flows is not uniform and may be longer or shorter than the operation
hours of the Racine Avenue Pumping Station. Thus, simulations of flows, loads, and
water-quality conditions could potentially be improved if the CSO discharges could be
reliably modeled. Thus, CTE (2007d) suggested that "The certainty in CSO and pump
station volumes could be improved through the development of a collection system
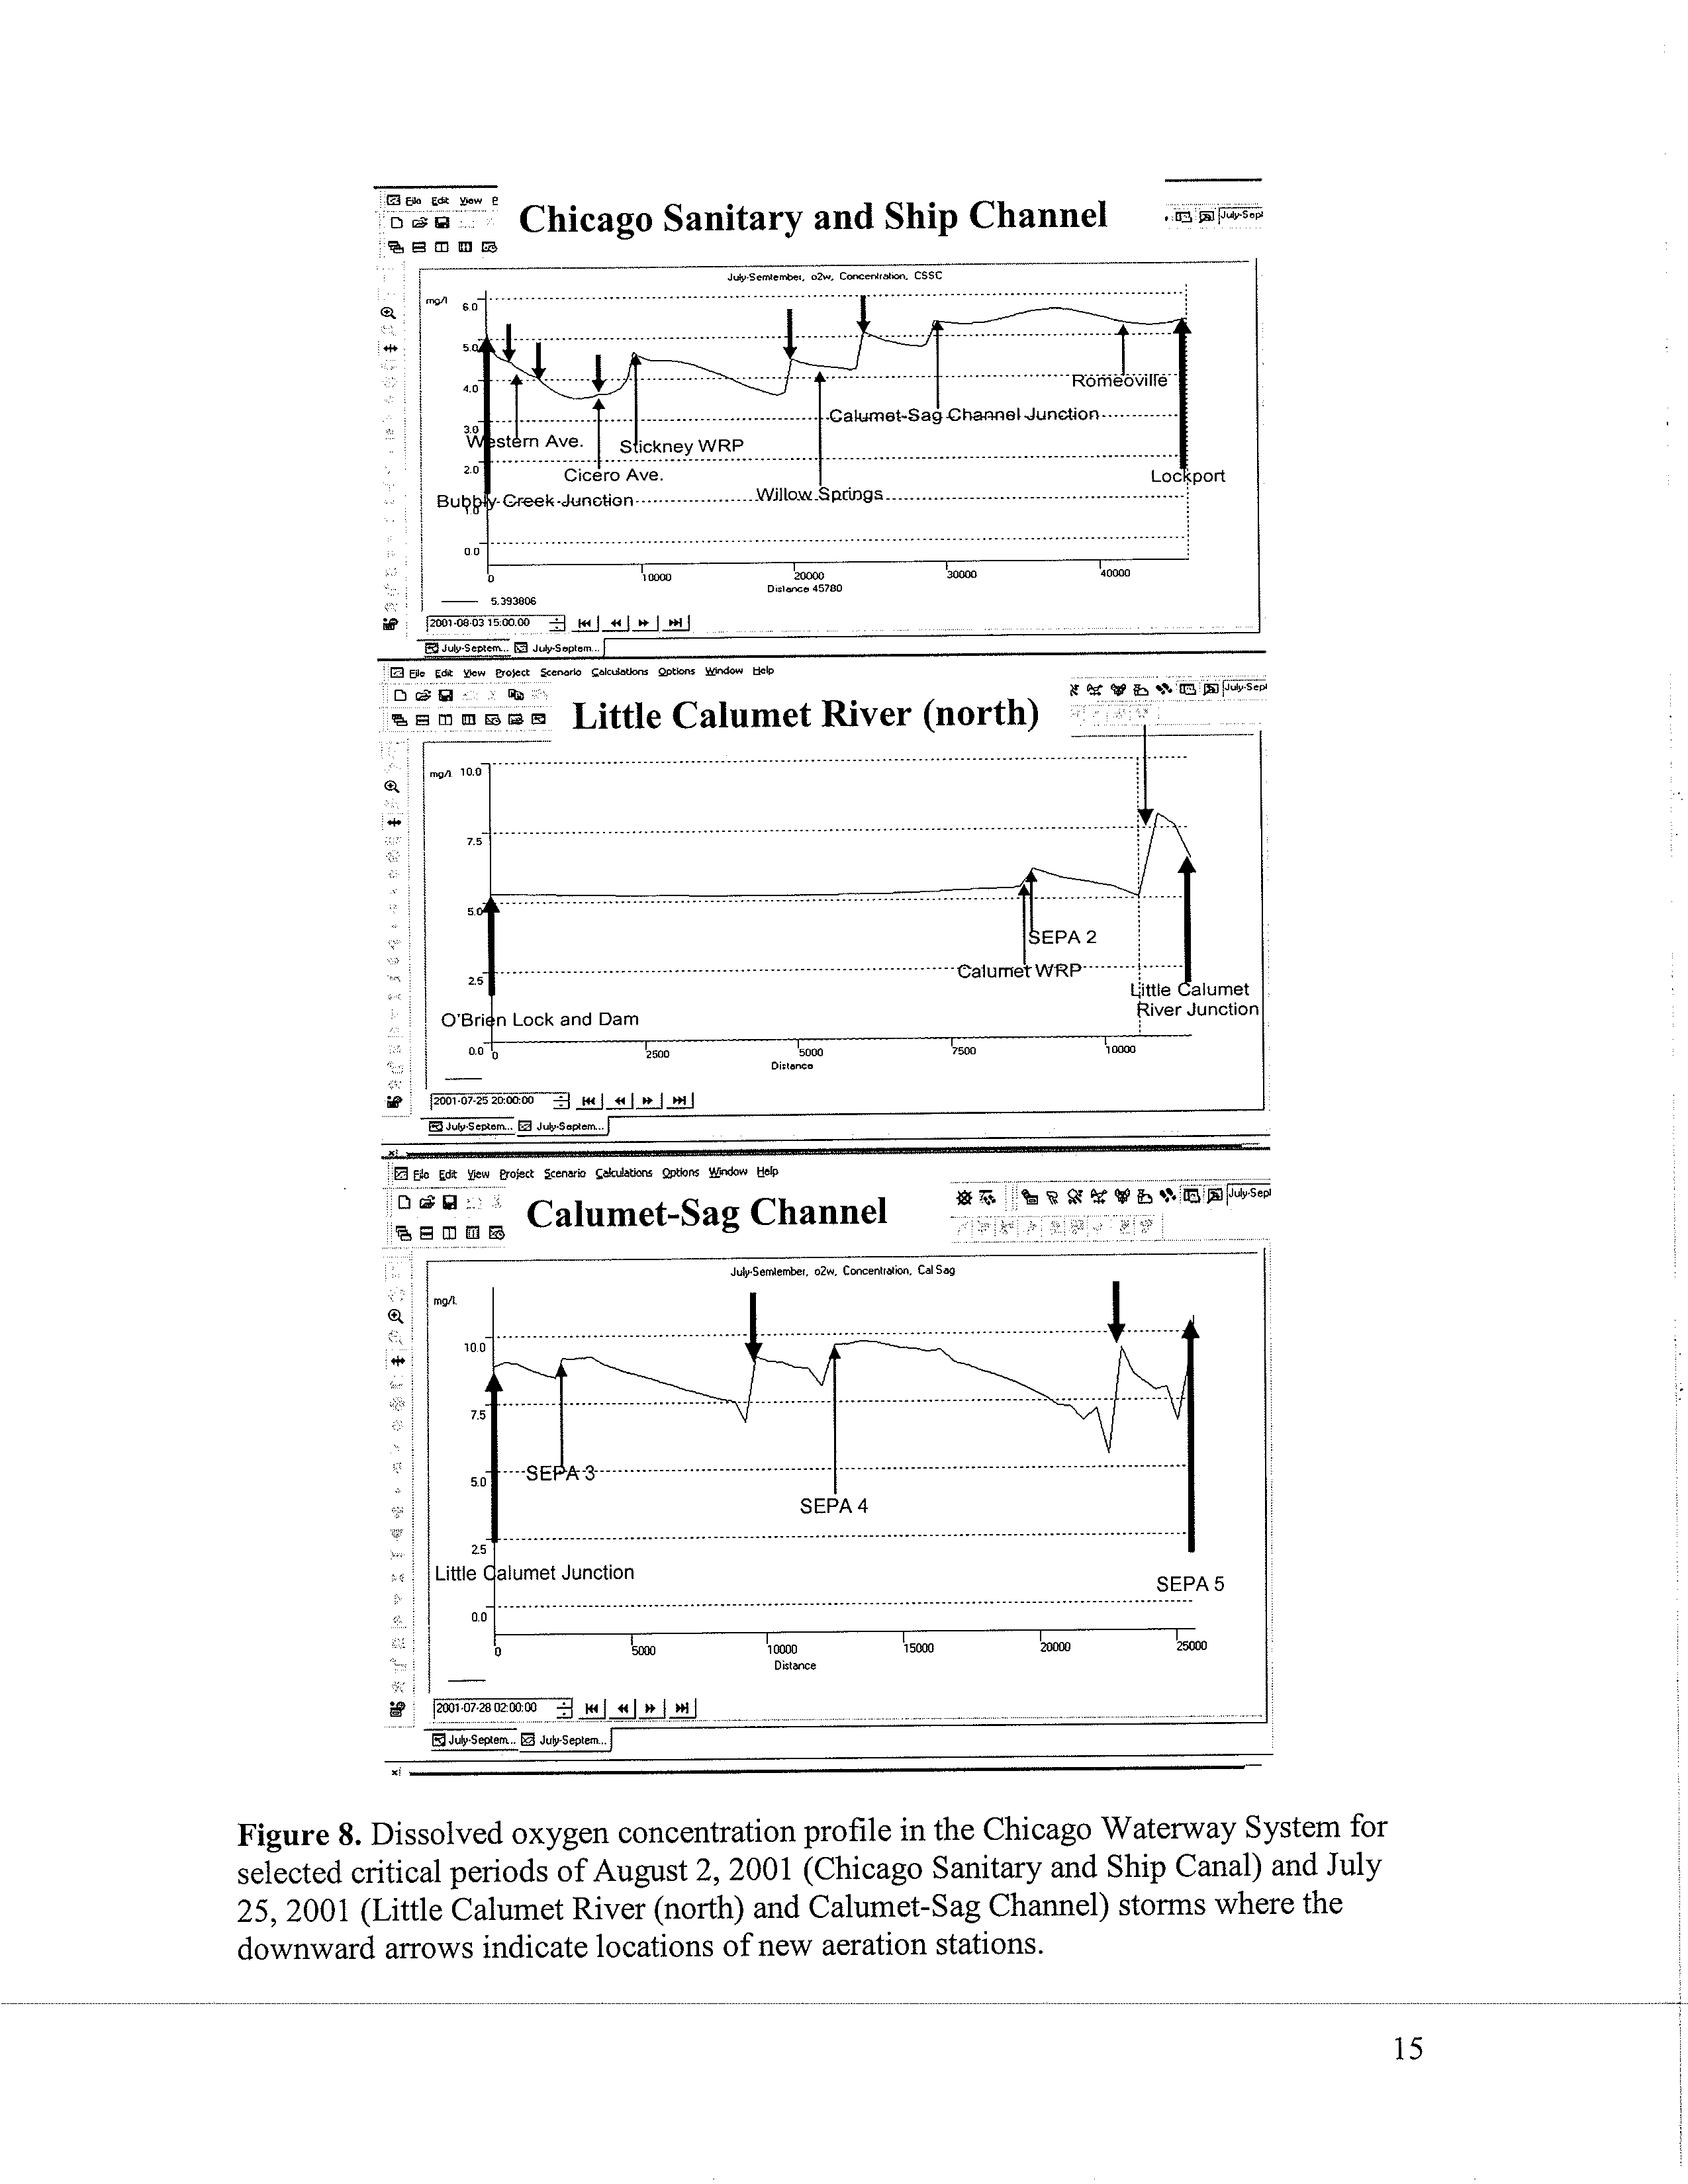
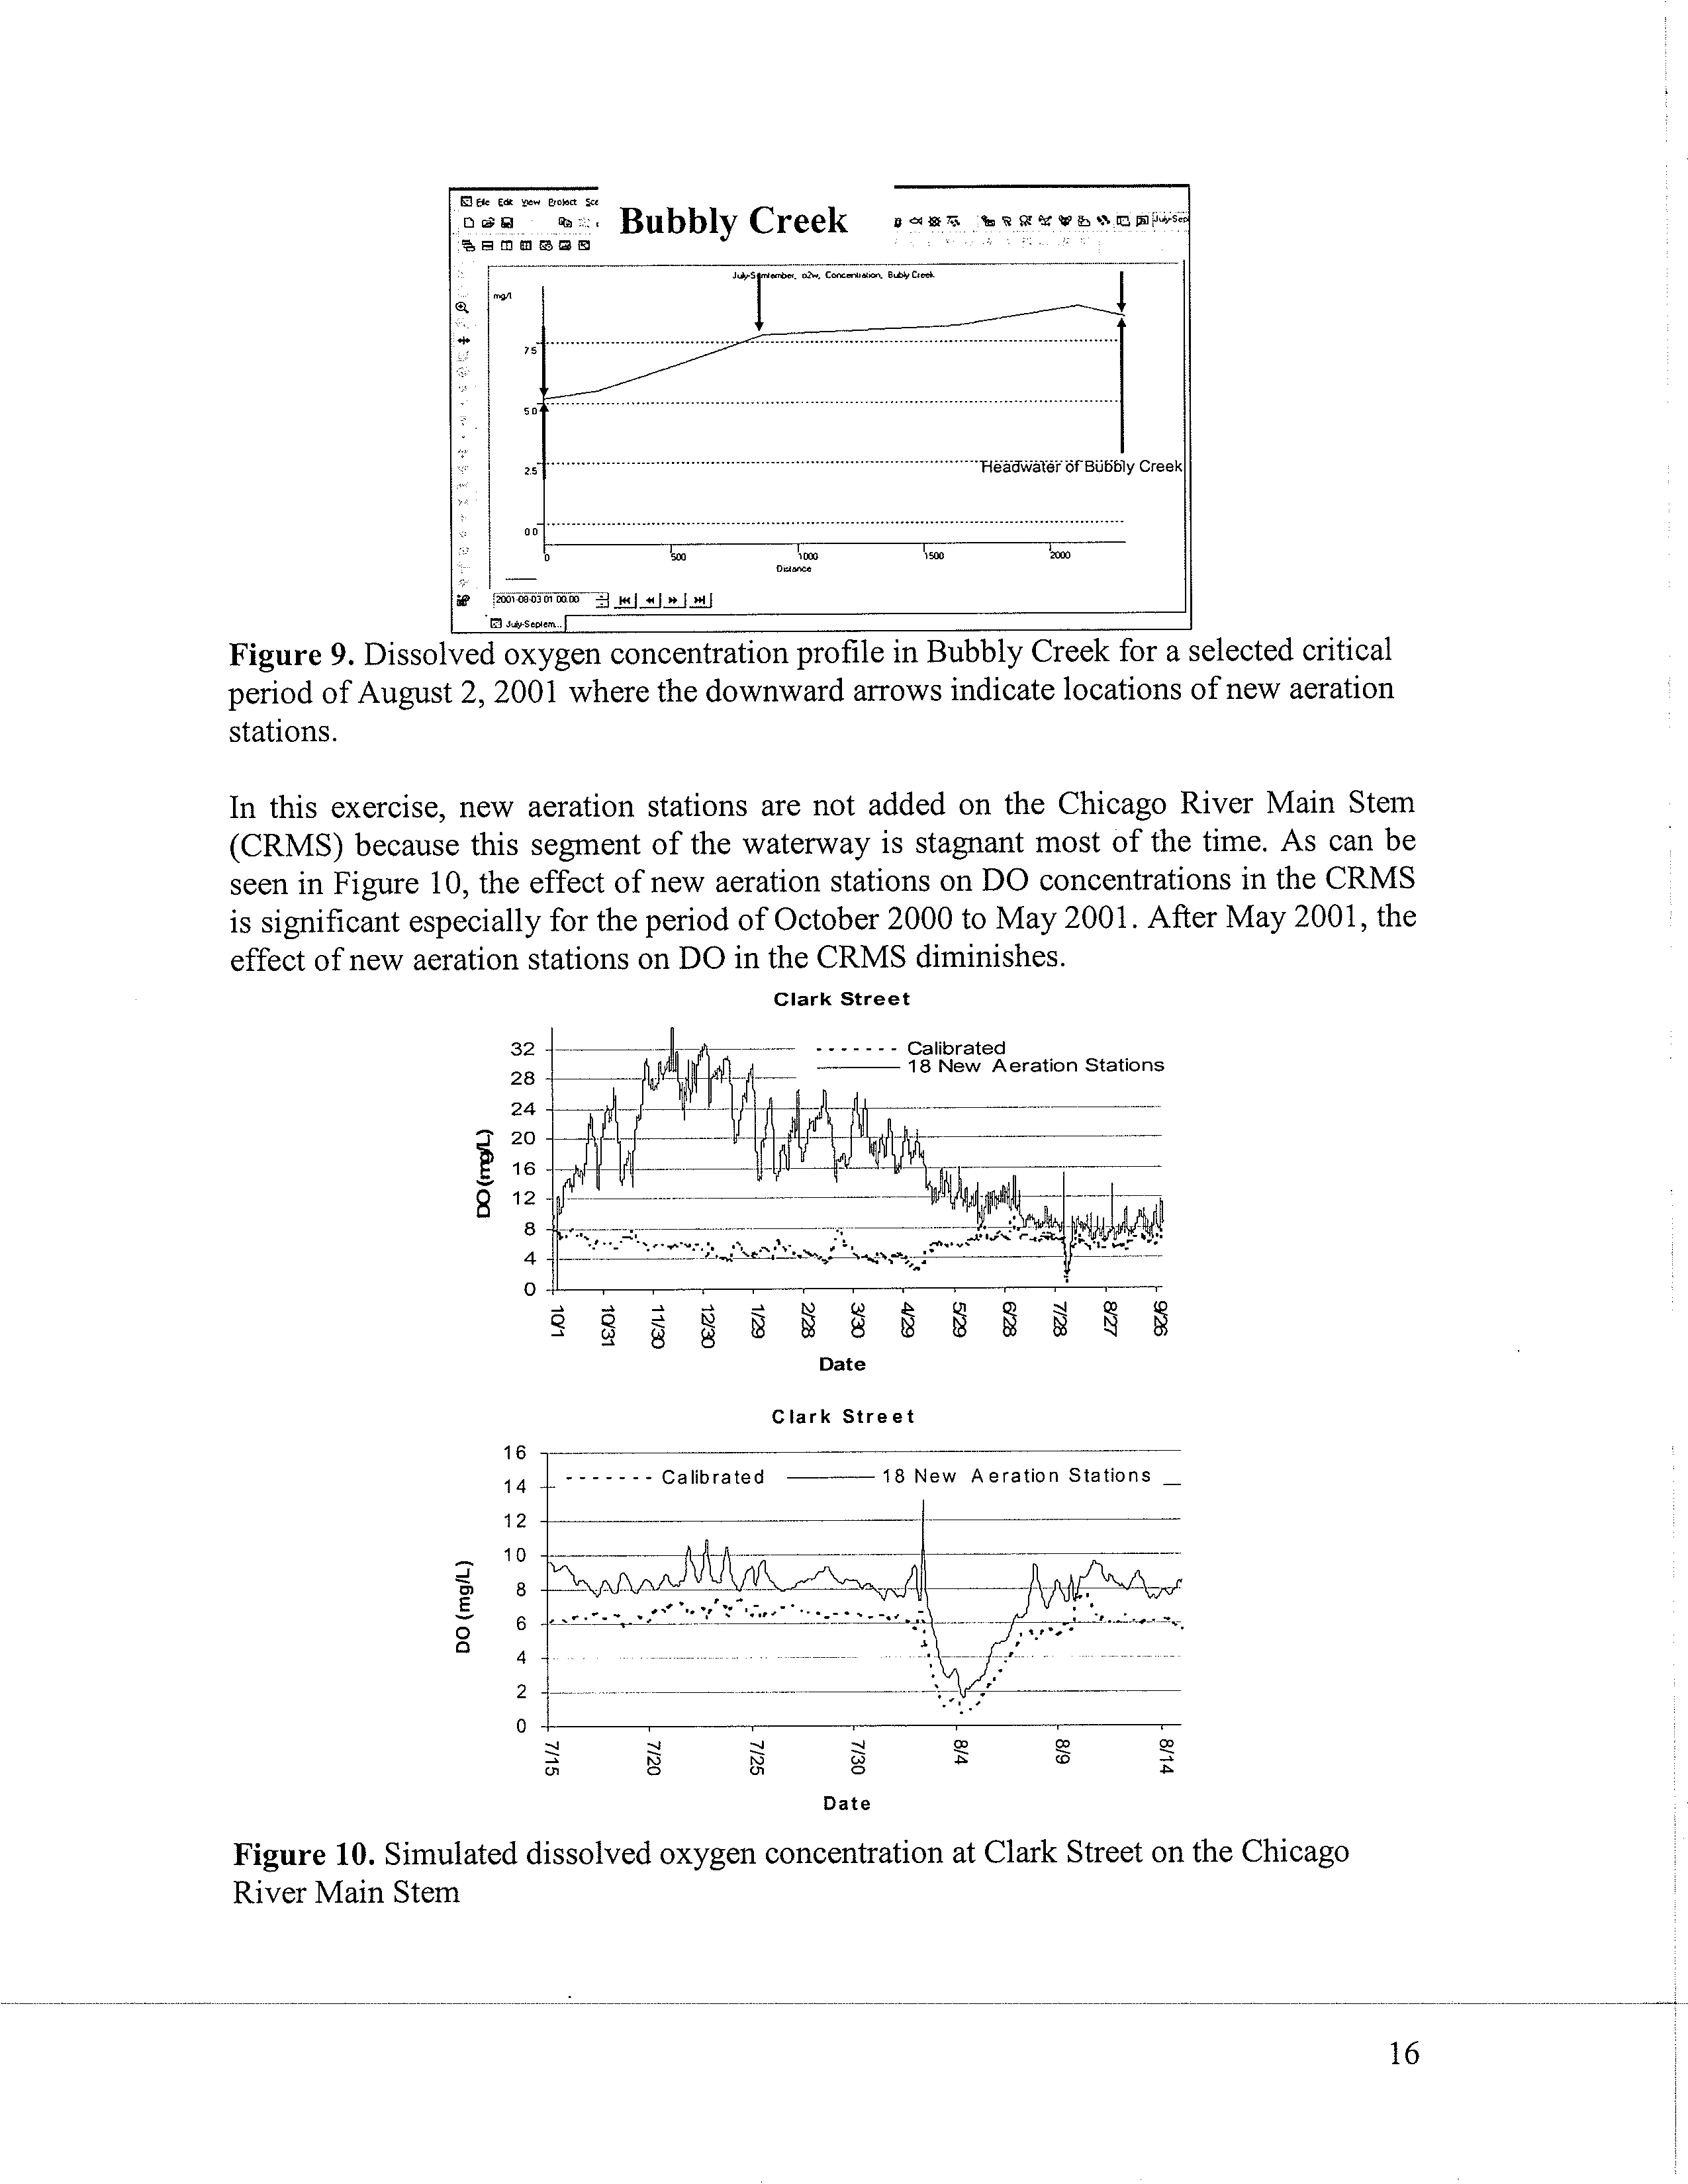
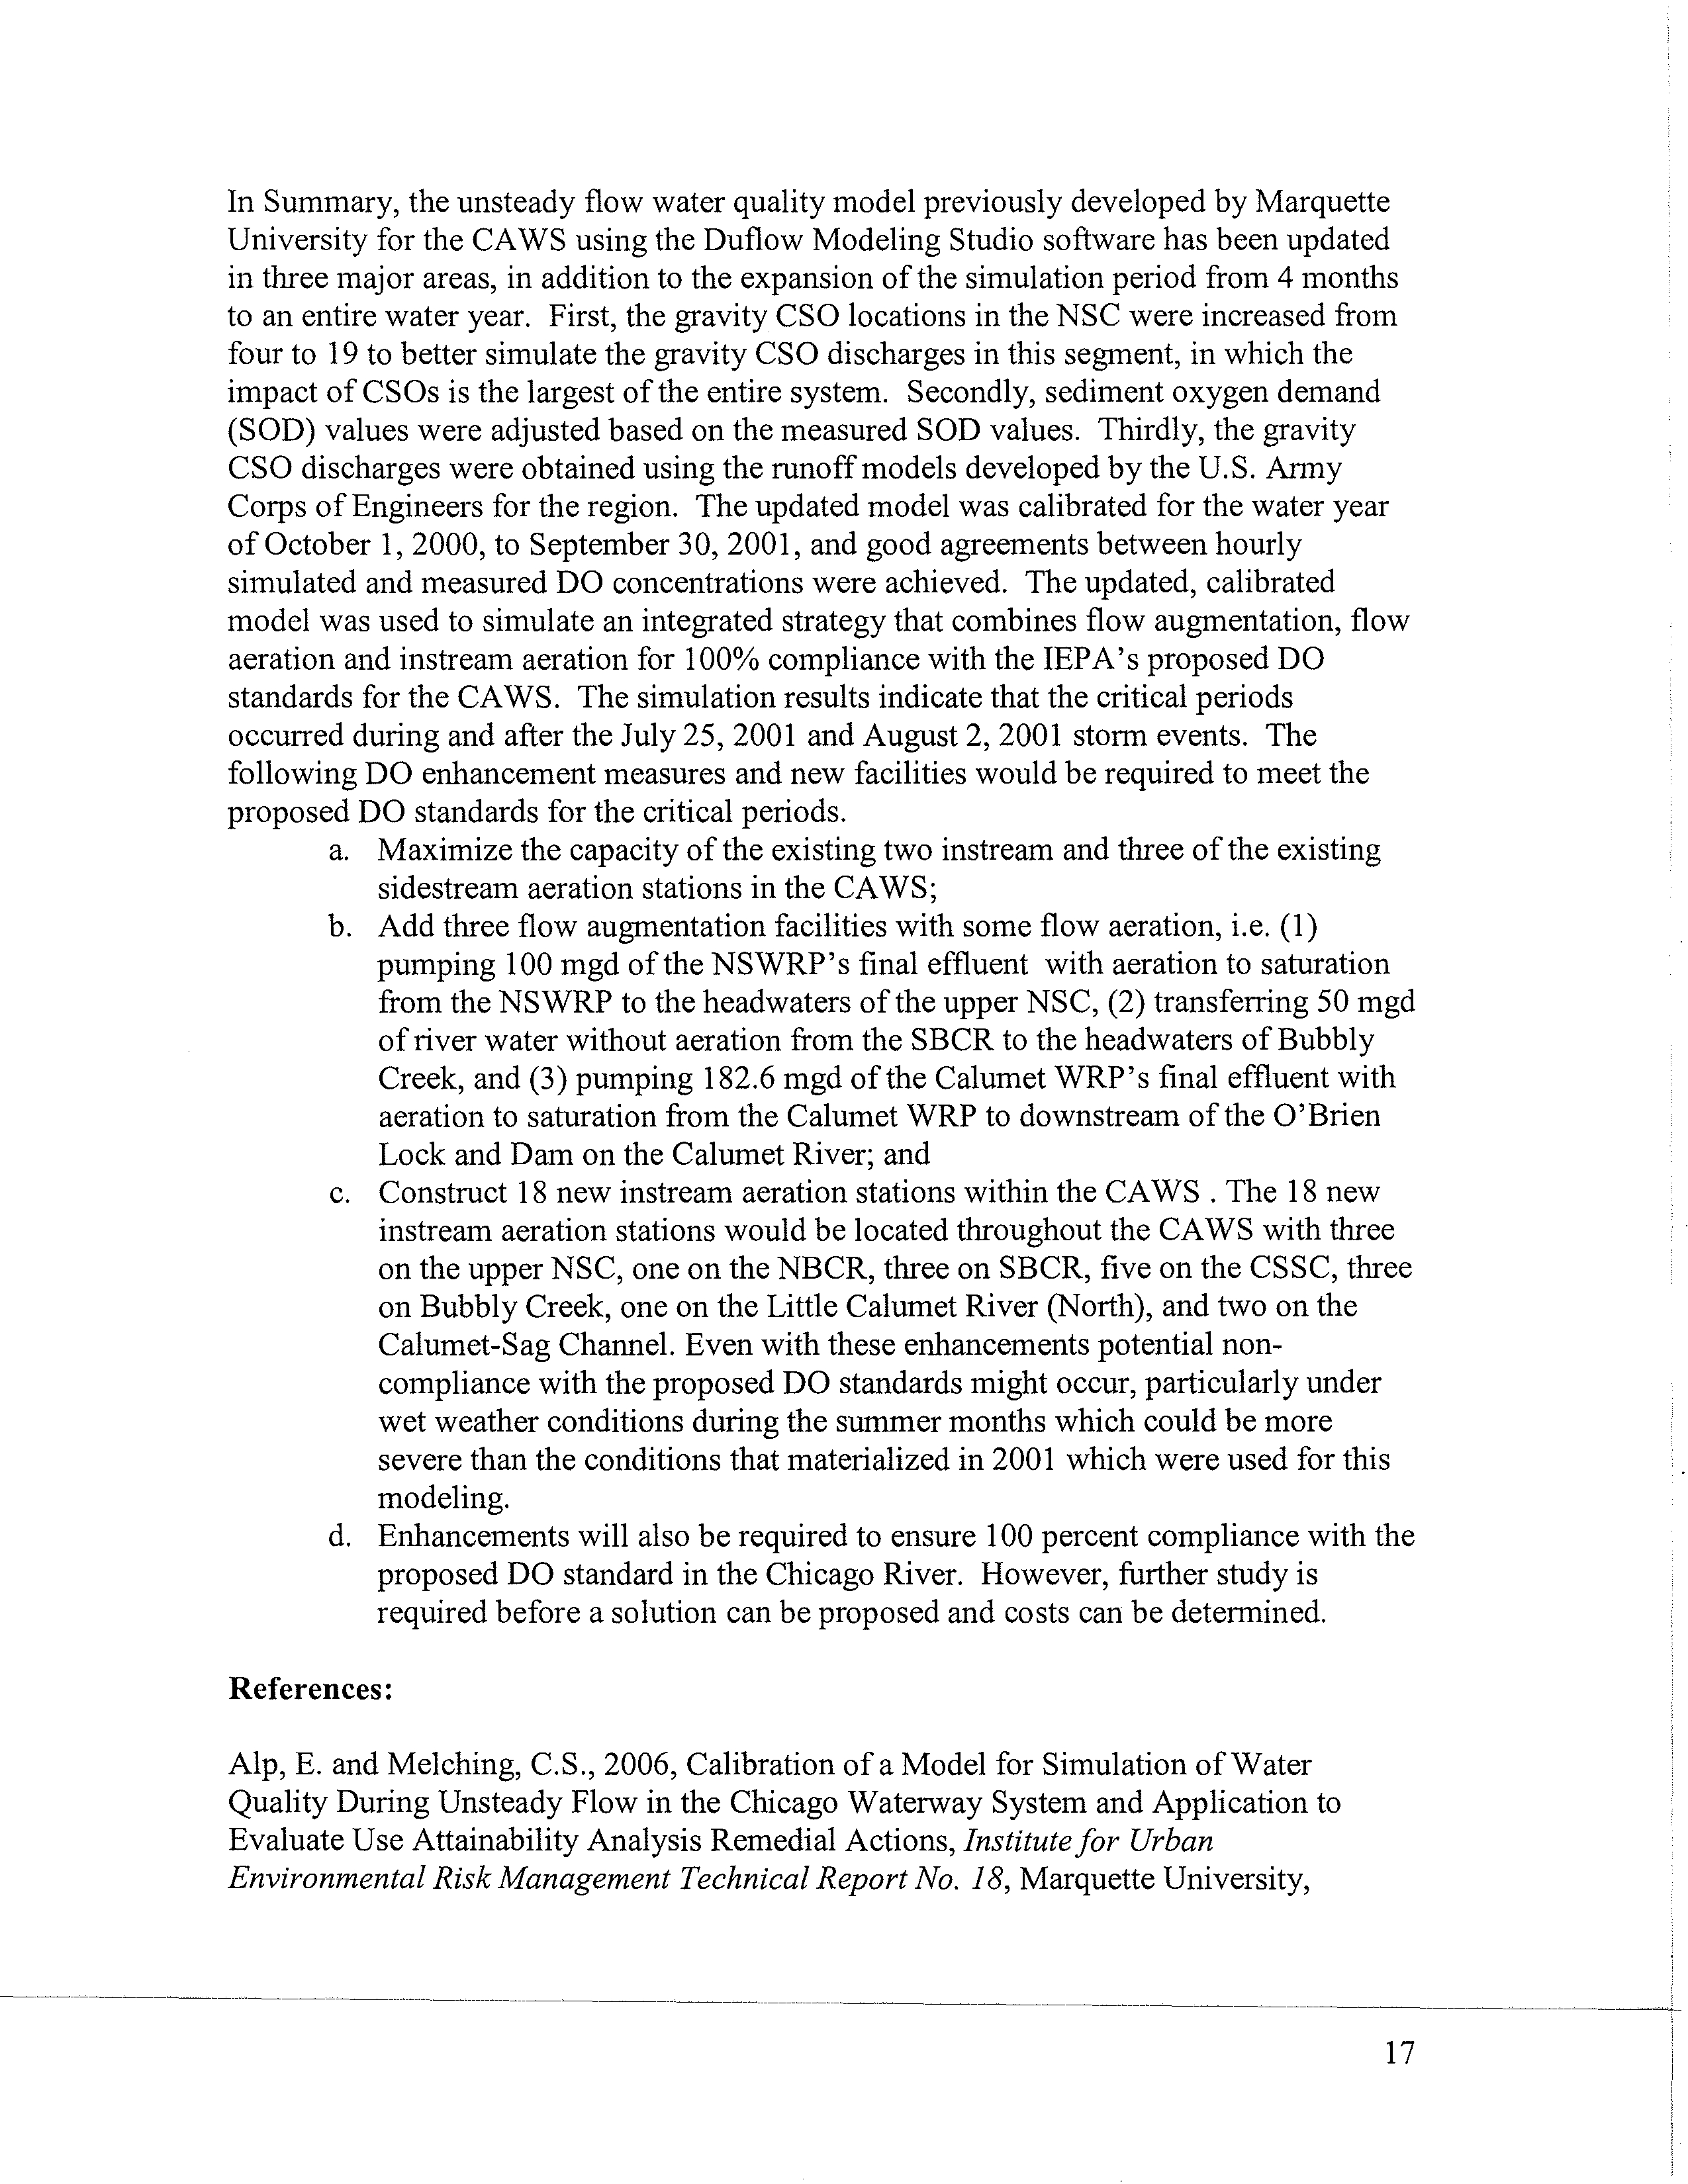
model." and "Identifying locations where CSO discharges are more frequent is the first
step to improve the CSO volume input in the model."
Currently the rated pump capacities and pump on-and-off times are used to develop an
hourly time series of pumping station flows whose volume is within 1 or 2 percent of the
exact volume from on-and-off times and rated pump capacities. Thus, a collection
system model is unlikely to improve the certainty of the pump station volumes.
However, a collection system model could potentially improve the spatial and temporal
distribution of the estimated gravity CSOs. For the purposes of the design of the Tunnel
and Reservoir Plan (TARP) the U.S. Army Corps of Engineers (Corps) developed a
series of models to simulate the surface and subsurface runoff in the TARP drainage area
(which includes the CAWS watershed); the flows in the major interceptors; the
distribution of the flows to the Water Reclamation Plants or potentially to gravity CSO
outfalls or TARP drop shafts; and the flows in the TARP tunnels. These models are run
by the Corps for each water year in support of the Lake Michigan Diversion Accounting.
The gravity CSOs simulated by these models during the months in which water from the
CAWS flowed to Lake Michigan at Wilmette and/or the Chicago River Controlling
Works were obtained by Marquette University from the U.S. Army Corps of Engineers
for 1990 through 2002 as part of the project "Evaluation of Procedures to Prevent
Backflows to Lake Michigan from the Chicago Waterway System" for the District.
Evaluations for events in 2001 and 2002 of simulated water-surface elevations in the
CAWS for the case of gravity CSO flows from the Corps models and pumping station
flows from the operation records have yielded reasonable results throughout the CAWS
in comparison to the results for the original input to the Marquette Model (Alp and
Melching, 2008). Hence, in the study reported here, simulated gravity CSO flows
obtained from the Corps are used in simulations to identify an integrated strategy for DO
improvement in the CAWS. Detailed discussion of the Corps models (a combination of
the Hydrological Simulation Program-Fortran, Special Contribution Area Loading
Program, and Tunnel Network Model) is given in Espey et al. (2004).
3
Electronic Filing - Received, Clerk's Office, August 4, 2008
New Representative CSO Locations on the North Shore Channel
There are nearly 240 CSOs in the modeled portion of the CAWS watershed. Since it is
practically difficult to introduce all CSO locations in the modeling, in the previous
CAWS DUFLOW model, 28 representative CSO locations were identified and flow
distribution was done on the basis of drainage area for each of these locations.
Whereas
this worked fine for the system wide simulations (Alp and Melching, 2006) and the
results were used in the preliminary evaluation of potential water-quality improvement
alternatives (CTE, 2006, 2007a-c), it is inadequate for a more detailed evaluation of
water-quality improvement options. This is particularly true when considering conditions
on the upper NSC where CSO flows dominate the stream flow and water quality
conditions in the channel. For the NSC, the original Marquette Model had four CSO
inflow points that represent 24 TARP drop shaft overflow locations (there may be more
than one CSO per drop shaft drainage area). With only four inflow points, the CSO flows
can overpower the flows transferred as part of flow augmentation requiring higher
amounts of transfer than might be needed if the flows were distributed as in reality.
Thus, 19 gravity CSO locations, representing 24 TARP drop shaft overflow locations, are
included as CSO inflow points to the revised DUFLOW model and the flows were
redistributed to the these locations using the Corps models.
In other areas of the CAWS the CSO flows are not as dominant and the representative
CSO locations were not changed outside of the NSC.
Improvements to the Simulation of Sediment Oxygen Demand (SOD)
DUFLOW includes the DiToro and Fitzpatrick (1993) sediment flux model with a model
of water quality in the water column. This sediment flux model distinguishes among
transported material that flows with water, bottom materials that are not transported with
the water flow, and pore water in bottom materials that are not transported but that can be
subject to similar water-quality interactions to those for the water column. In DUFLOW
(2000), SOD is simulated as a diffusive exchange of oxygen between the water column
and the active (top) sediment layer (which has it own carbonaceous biochemical oxygen
demand (CBOD), DO, nutrients, etc. in the pore water). In the previous DUFLOW
Model (e.g., Alp and Melching, 2006), SOD was calibrated based on a survey of
sediment depth and composition conducted by the District at 20 locations in the CAWS.
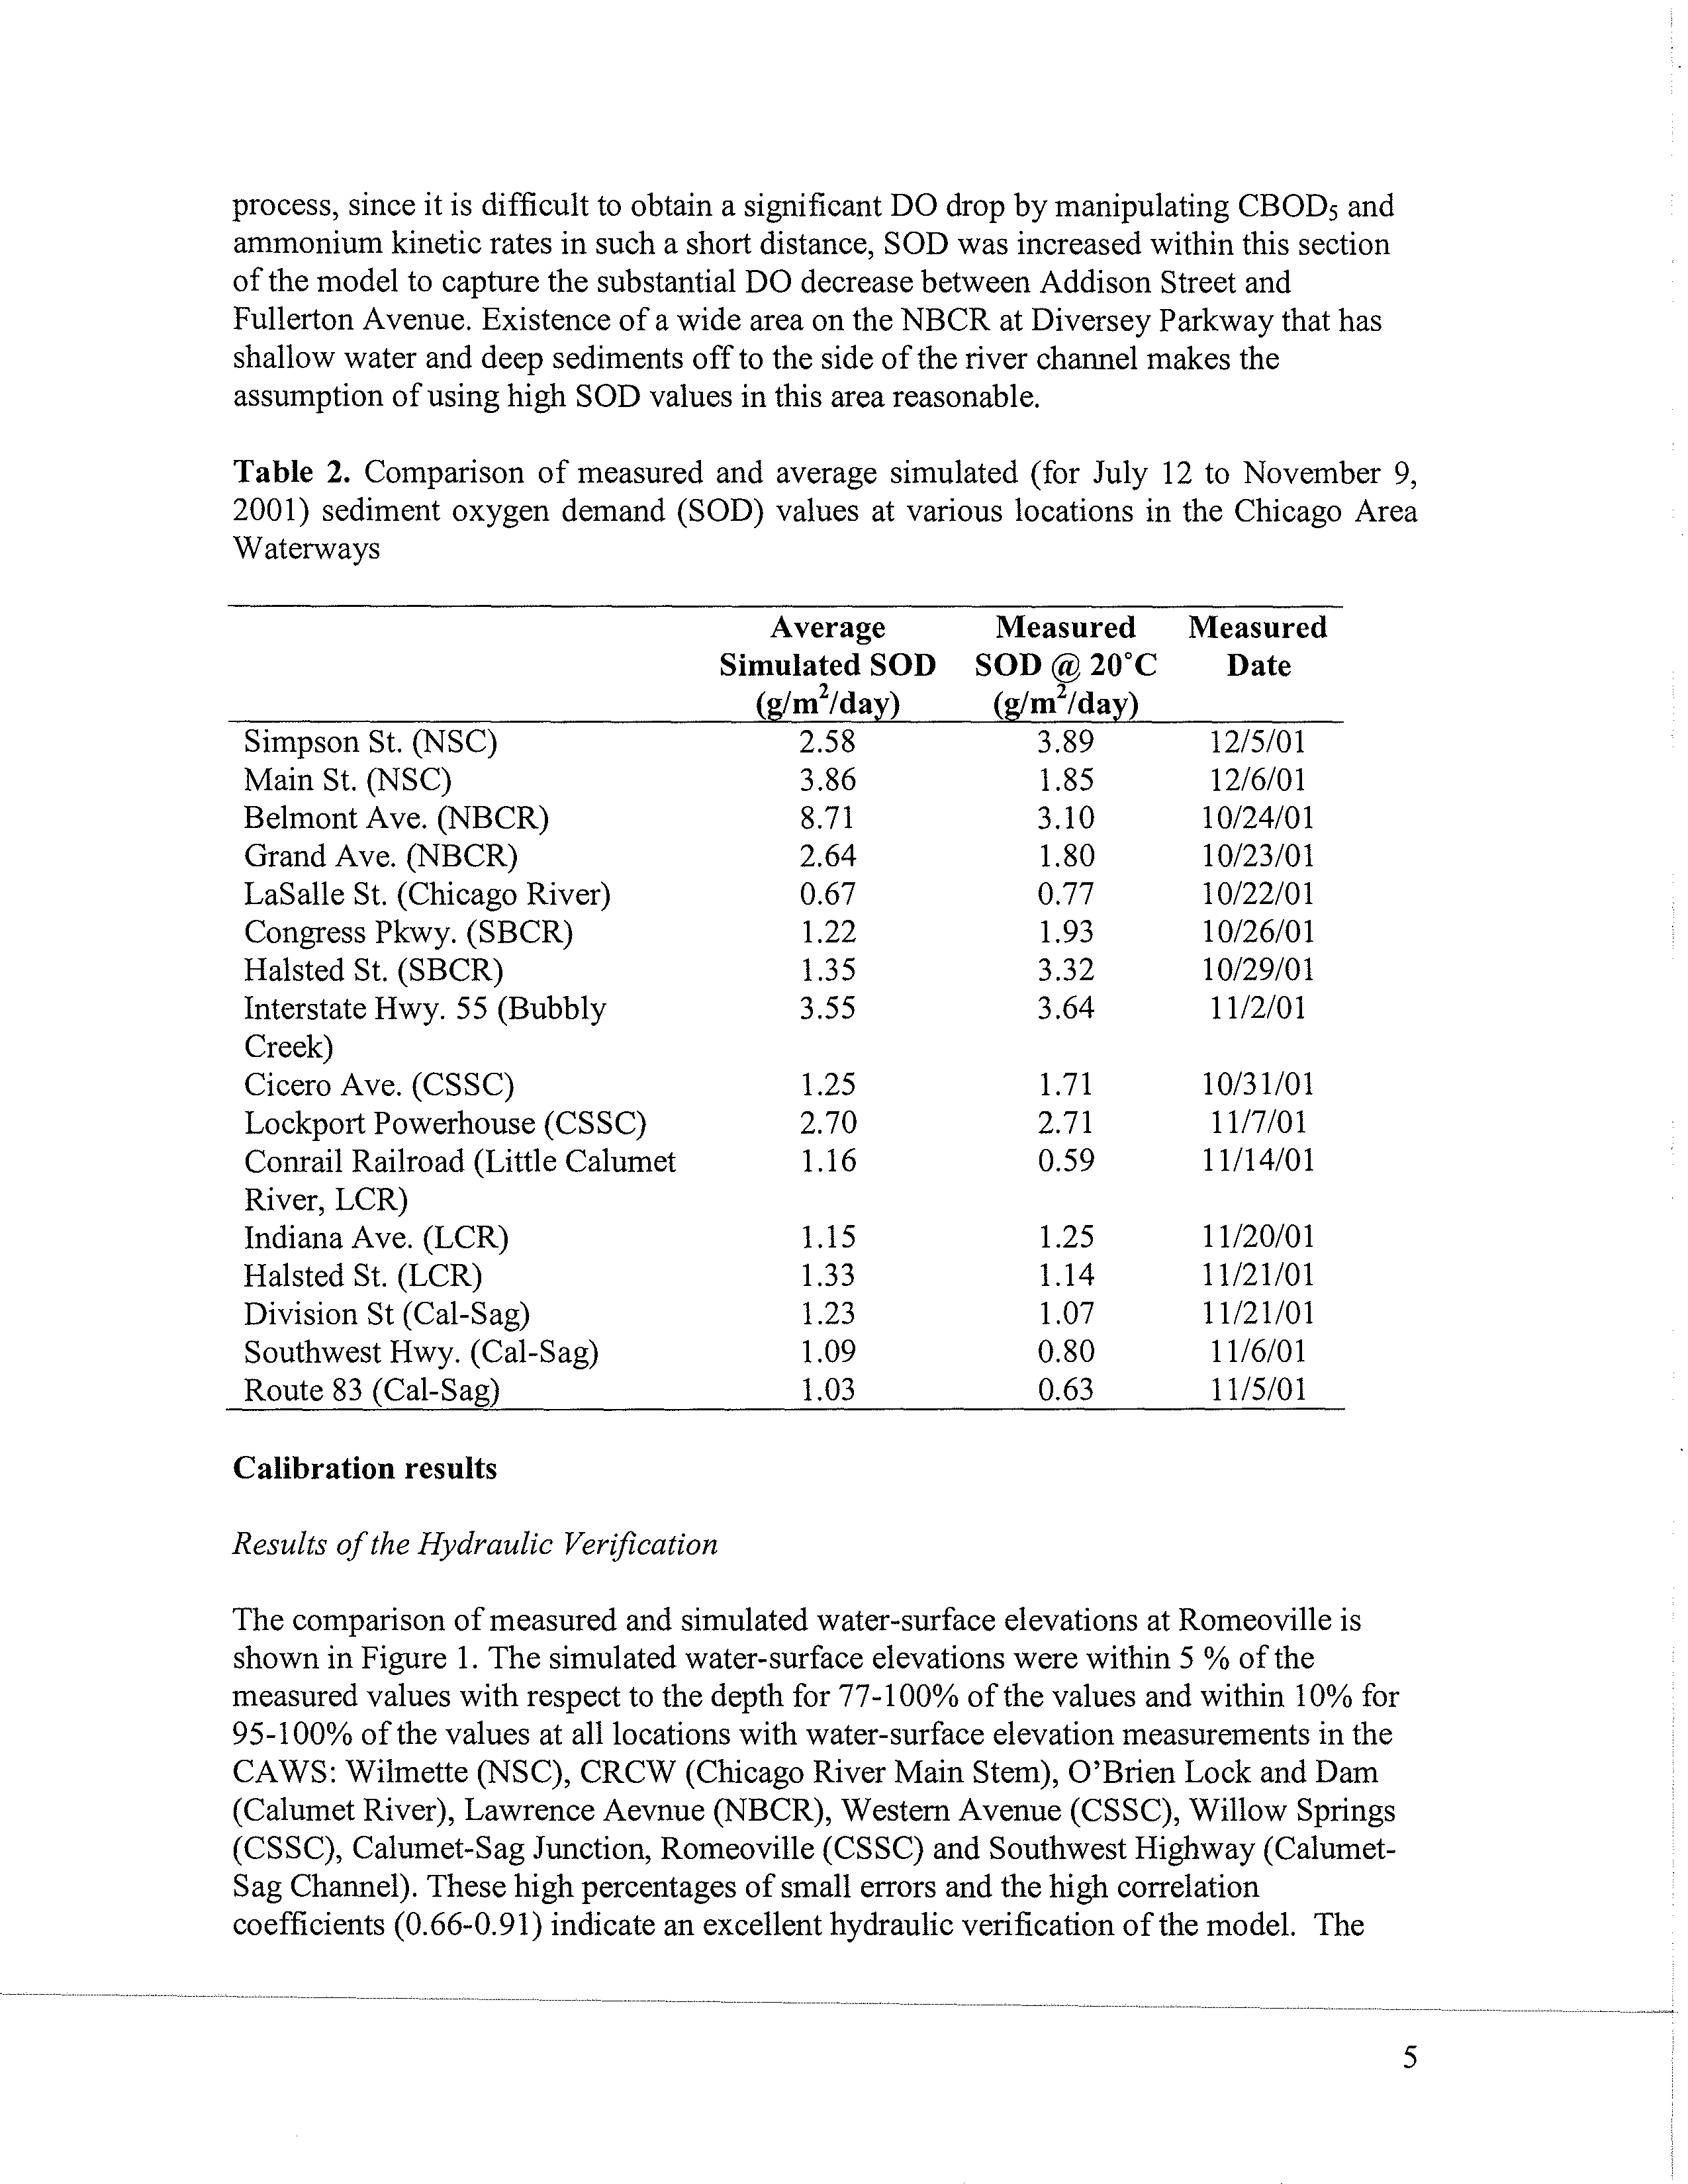
In this study, SOD is recalibrated and compared with SOD values measured in 2001. The
average simulated SOD values and measured SOD values are listed in Table 2.
Measured and simulated SOD values are in close agreement for most of the locations in
the CAWS. The biggest difference between the simulated and measured SOD values is
observed on the North Branch Chicago River at Belmont Avenue. In order to achieve the
significant drop in the DO concentration observed between Addison Street and Fullerton
Avenue, a higher SOD value was used in this section of the CAWS. While a similar DO
trend is observed at Fullerton Avenue and Addison Street and there are just 1.9 miles
between Addison Street and Fullerton Avenue, the average measured DO concentration
at Fullerton Avenue is significantly lower than that of Addison Street. In the calibration
4
Electronic Filing - Received, Clerk's Office, August 4, 2008
process, since it is difficult to obtain a significant DO drop by manipulating CBOD5 and
ammonium kinetic rates in such a short distance, SOD was increased within this section
of the model to capture the substantial DO decrease between Addison Street and
Fullerton Avenue. Existence of a wide area on the NBCR at Diversey Parkway that has
shallow water and deep sediments off to the side of the river channel makes the
assumption of using high SOD values in this area reasonable.
Table 2. Comparison of measured and average simulated (for July 12 to November 9,
2001) sediment oxygen demand (SOD) values at various locations in the Chicago Area
Waterways
Average
Simulated SOD
(
g/m2/day)
Measured
SOD @ 20°C
(
g/m2/day)
Measured
Date
Simpson St. (NSC)
2.58
3.89
12/5/01
Main St. (NSC)
3.86
1.85
12/6/01
Belmont Ave. (NBCR)
8.71
3.10
10/24/01
Grand Ave. (NBCR)
2.64
1.80
10/23/01
LaSalle St. (Chicago River)
0.67
0.77
10/22/01
Congress Pkwy. (SBCR)
1.22
1.93
10/26/01
Halsted St. (SBCR)
1.35
3.32
10/29/01
Interstate Hwy. 55 (Bubbly
3.55
3.64
11/2/01
Creek)
Cicero Ave. (CSSC)
1.25
1.71
10/31/01
Lockport Powerhouse (CSSC)
2.70
2.71
11/7/01
Conrail Railroad (Little Calumet
1.16
0.59
11/14/01
River, LCR)
Indiana Ave. (LCR)
1.15
1.25
11/20/01
Halsted St. (LCR)
1.33
1.14
11/21/01
Division St (Cal-Sag)
1.23
1.07
11/21/01
Southwest Hwy. (Cal-Sag)
1.09
0.80
11/6/01
Route 83 (Cal-Sag)
1.03
0.63
11/5/01
Calibration results
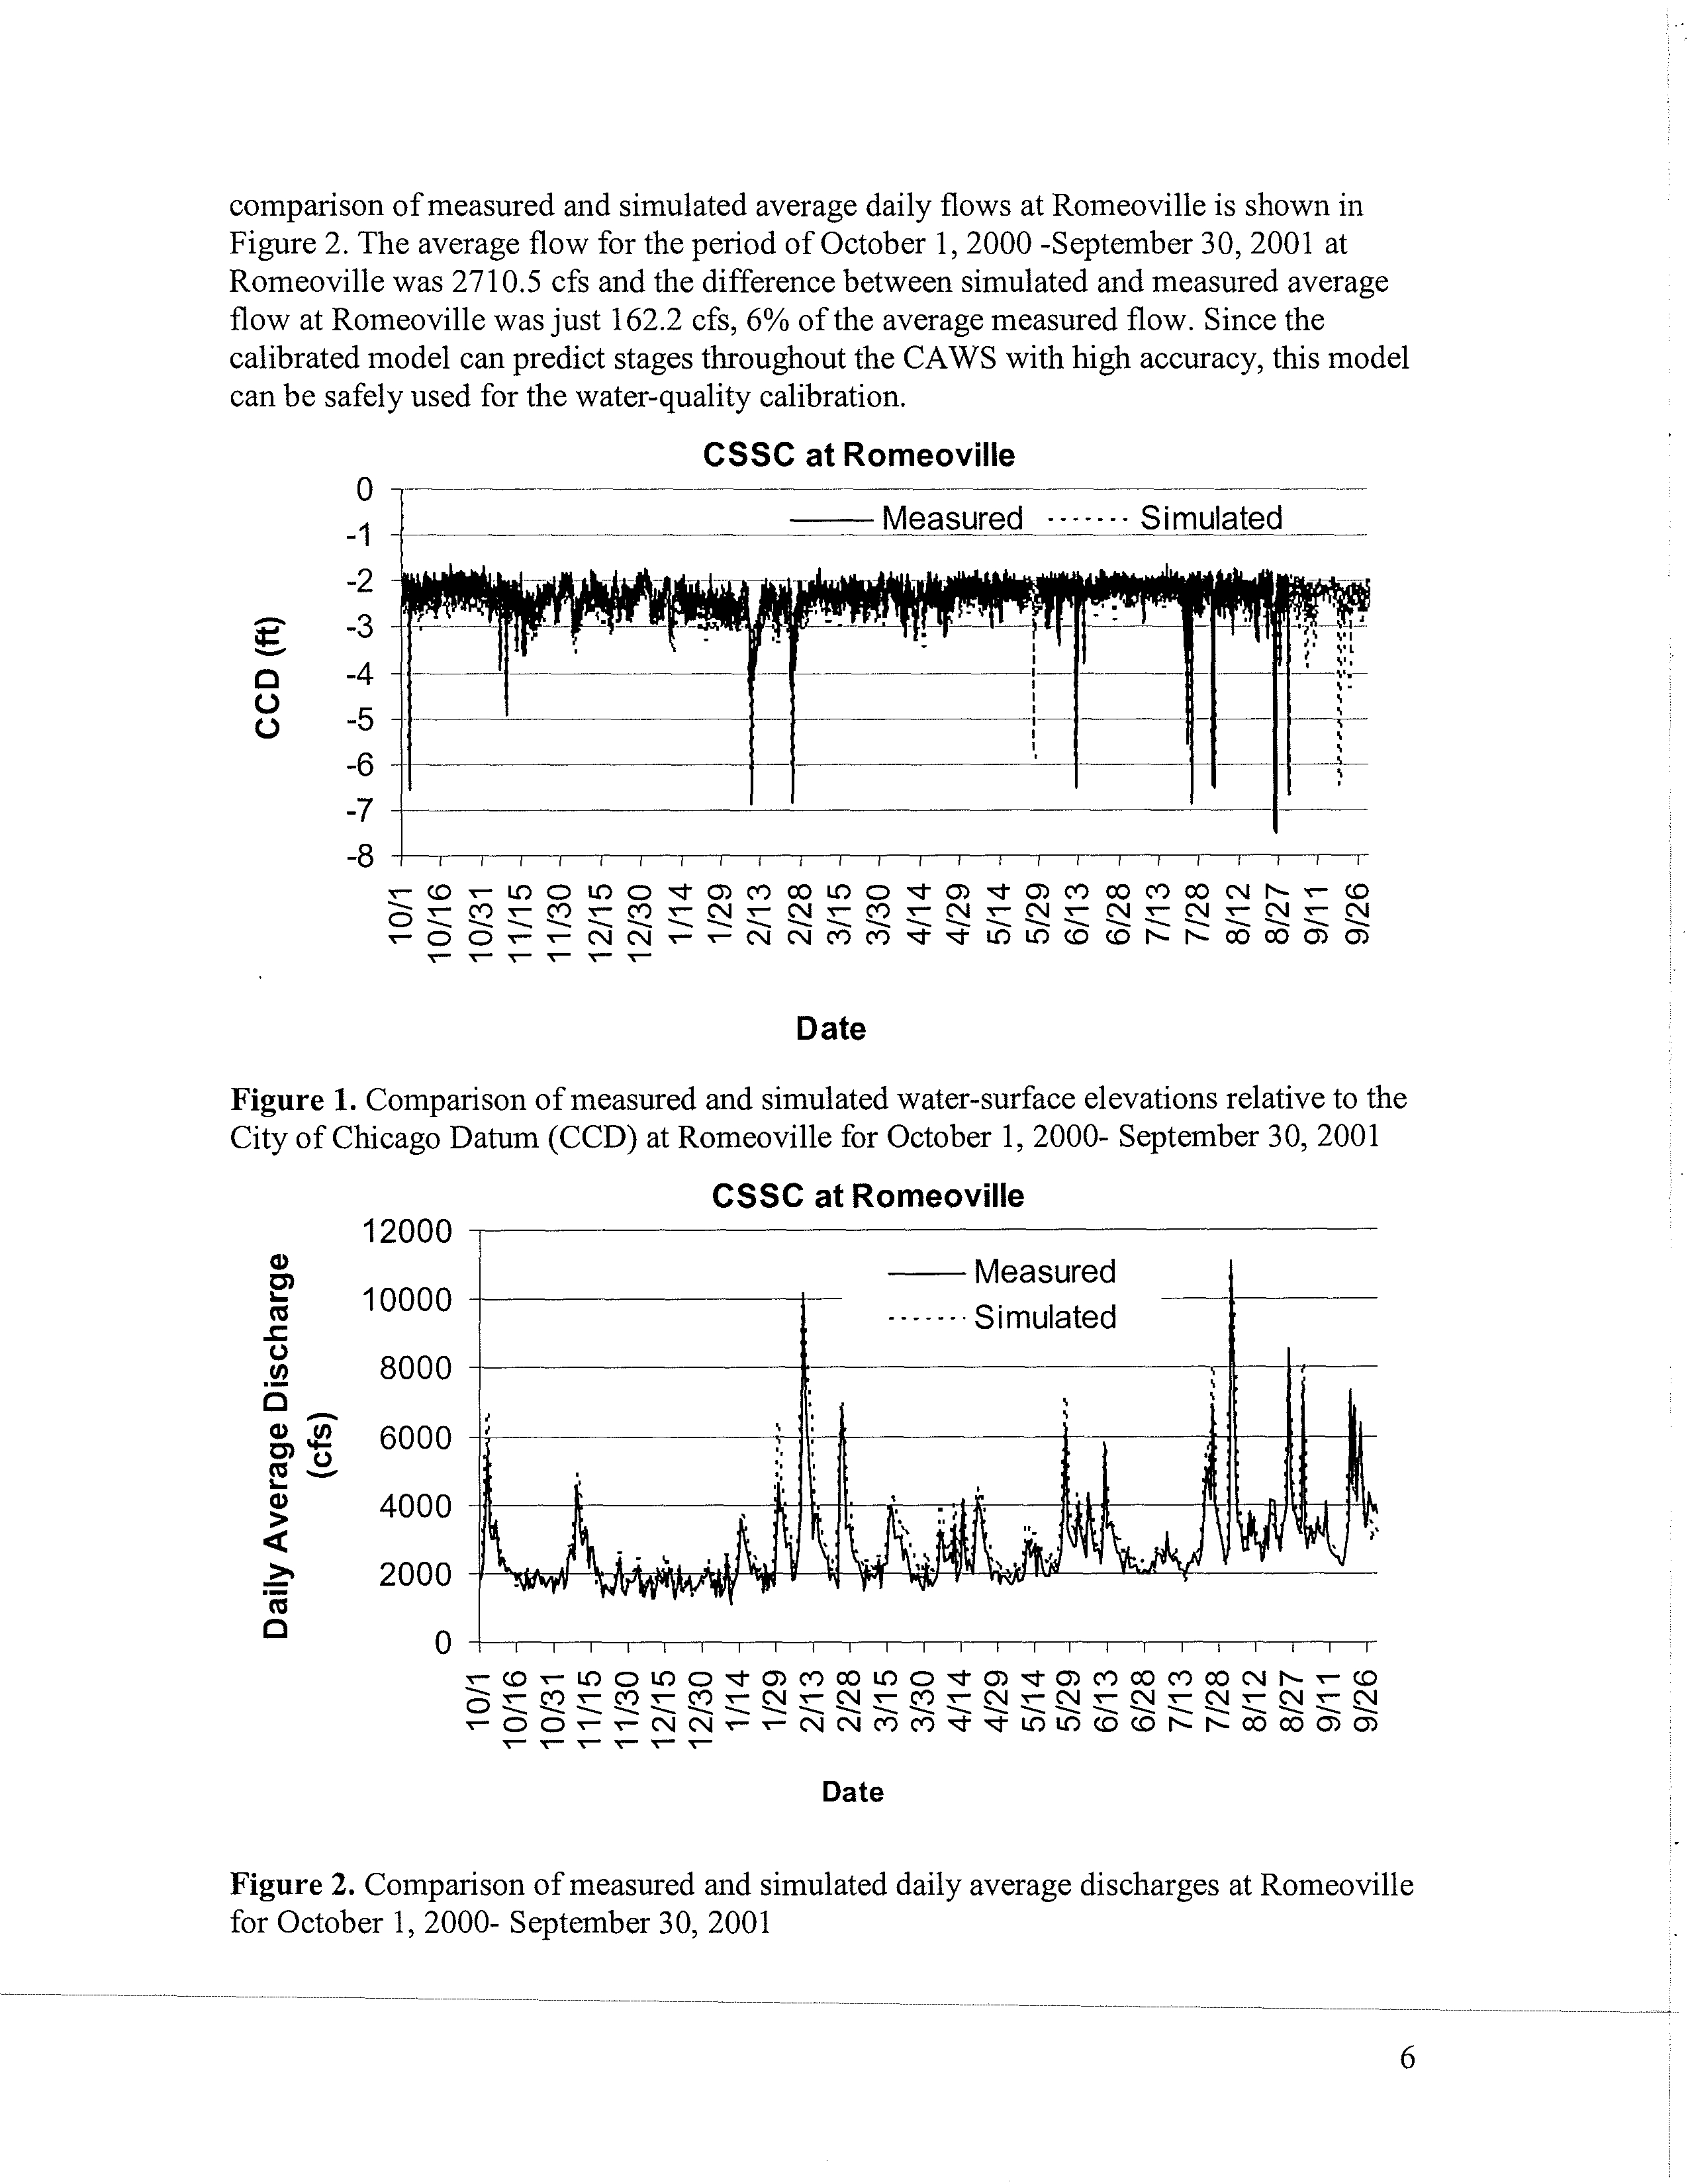
Results of the Hydraulic Verification
The comparison of measured and simulated water-surface elevations at Romeoville is
shown in Figure 1. The simulated water-surface elevations were within 5 % of the
measured values with respect to the depth for 77-100% of the values and within 10% for
95-100% of the values at all locations with water-surface elevation measurements in the
CAWS: Wilmette (NSC), CRCW (Chicago River Main Stem), O'Brien Lock and Dam
(Calumet River), Lawrence Aevnue (NBCR), Western Avenue (CSSC), Willow Springs
(CSSC), Calumet-Sag Junction, Romeoville (CSSC) and Southwest Highway (Calumet-
Sag Channel). These high percentages of small errors and the high correlation
coefficients (0.66-0.91) indicate an excellent hydraulic verification of the model. The
5
Electronic Filing - Received, Clerk's Office, August 4, 2008
comparison of measured and simulated average daily flows at Romeoville is shown in
Figure 2. The average flow for the period of October 1, 2000 -September 30, 2001 at
Romeoville was 2710.5 cfs and the difference between simulated and measured average
flow at Romeoville was just 162.2 cfs, 6% of the average measured flow. Since the
calibrated model can predict stages throughout the CAWS with high accuracy, this model
can be safely used for the water-quality calibration.
CSSC at Romeoville
Measured - - - - - - - S i mulated
-8
V-
(D ^ LO O U')
Od"
M MM
Ln
O
^
rn
d-
M M
w
M
CO
N
I--
T-
CD
-4
-5
-6
-7
-1
-2
-3
r- 0 0
N N
N N M M It dam- LO LO CO CO I` ti M W O M
Date
Figure
1.
Comparison of measured and simulated water-surface elevations relative to the
City of Chicago Datum (CCD) at Romeoville for October 1, 2000- September 30, 2001
0
CSSC at Romeoville
Measured
------ Simulated
5
55
15
!5
0
O
VI_
22
O
V_
c-
LO
M^M^NV-
C)MO ;11Mn
N^Mr-
0MOIt
N
OIt
V-
MN'-
MWMW
NON
NN
NNMM t'
tLO LnCflCflt`I`
r r ^ ^
Date
00 00
O
N
O
O
Figure
2. Comparison of measured and simulated daily average discharges at Romeoville
for October 1, 2000- September 30, 2001
12000
10000
8000
6000
4000
2000
6
Electronic Filing - Received, Clerk's Office, August 4, 2008
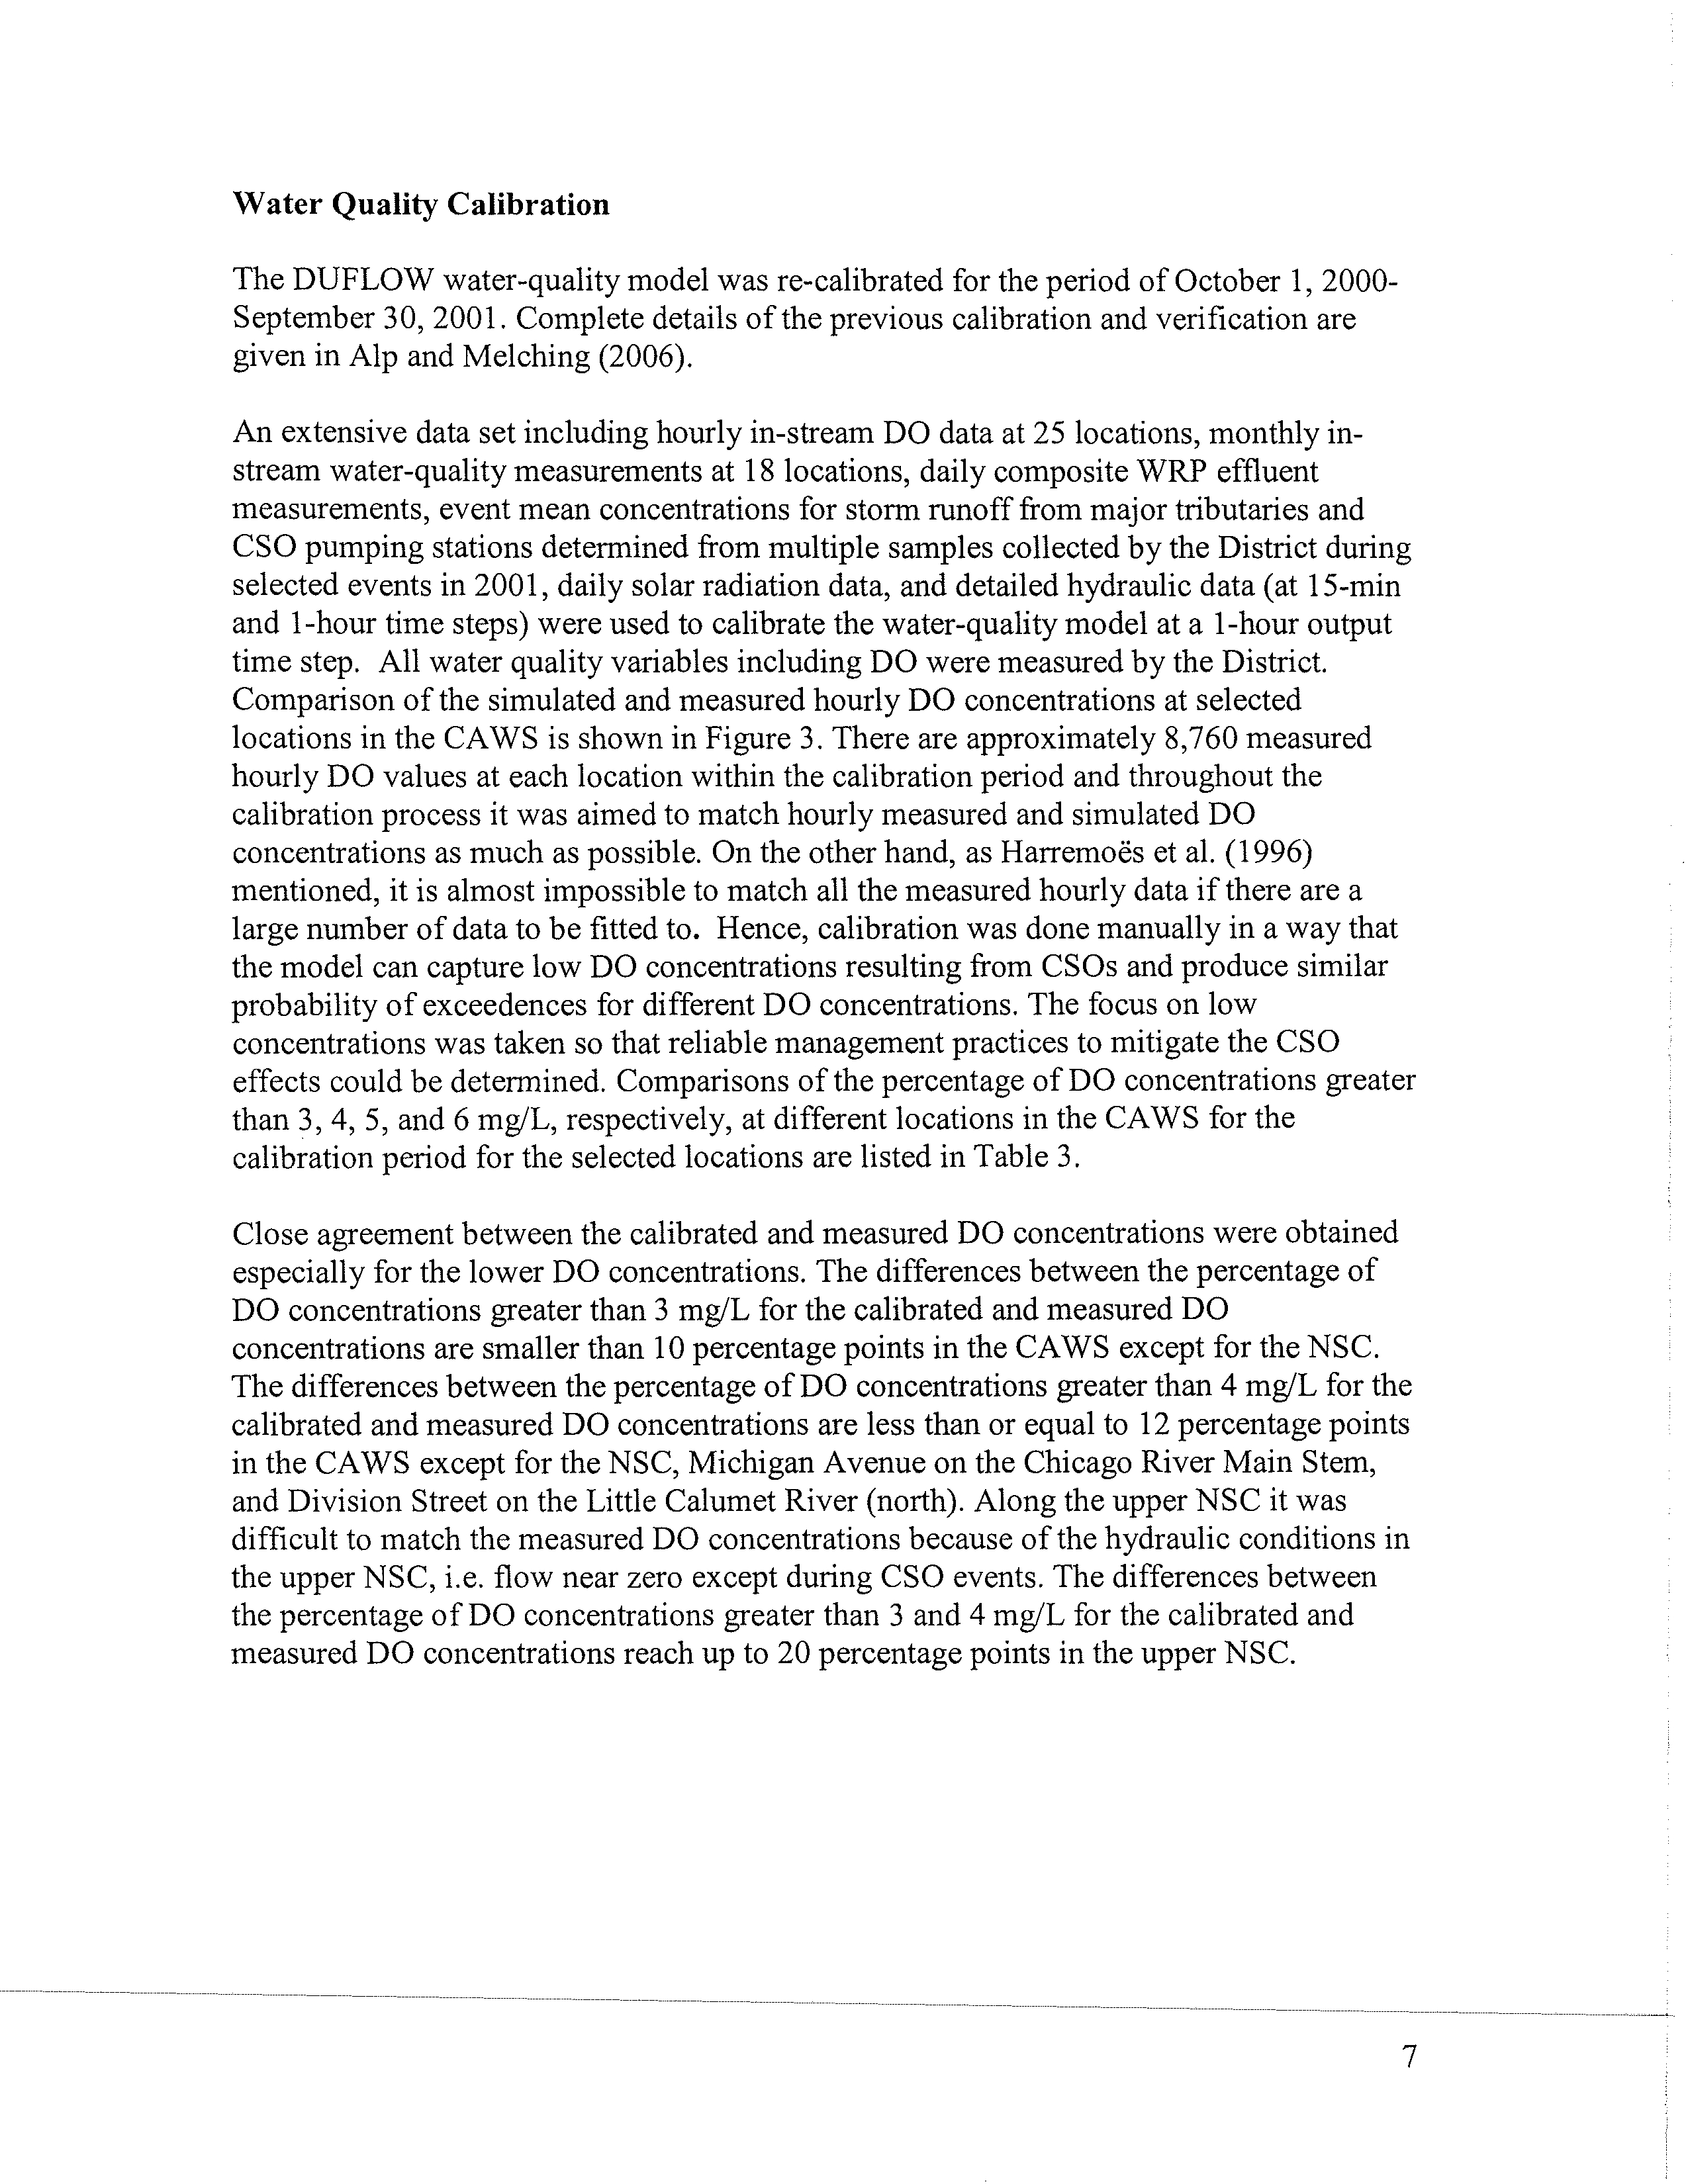
Water Quality
Calibration
The DUFLOW
water-quality model was re-calibrated for the period of October 1, 2000-
September 30, 2001. Complete details of the previous calibration and verification are
given in Alp and Melching
(
2006).
An extensive data set including hourly in-stream DO data at 25 locations, monthly in-
stream water-quality measurements at 18 locations, daily composite WRP effluent
measurements, event mean concentrations for storm runoff from major tributaries and
CSO pumping stations determined from multiple samples collected by the District during
selected events in 2001, daily solar radiation data, and detailed hydraulic data (at 15-min
and 1-hour time steps) were used to calibrate the water-quality model at a 1-hour output
time step.
All water quality variables including DO were measured by the District.
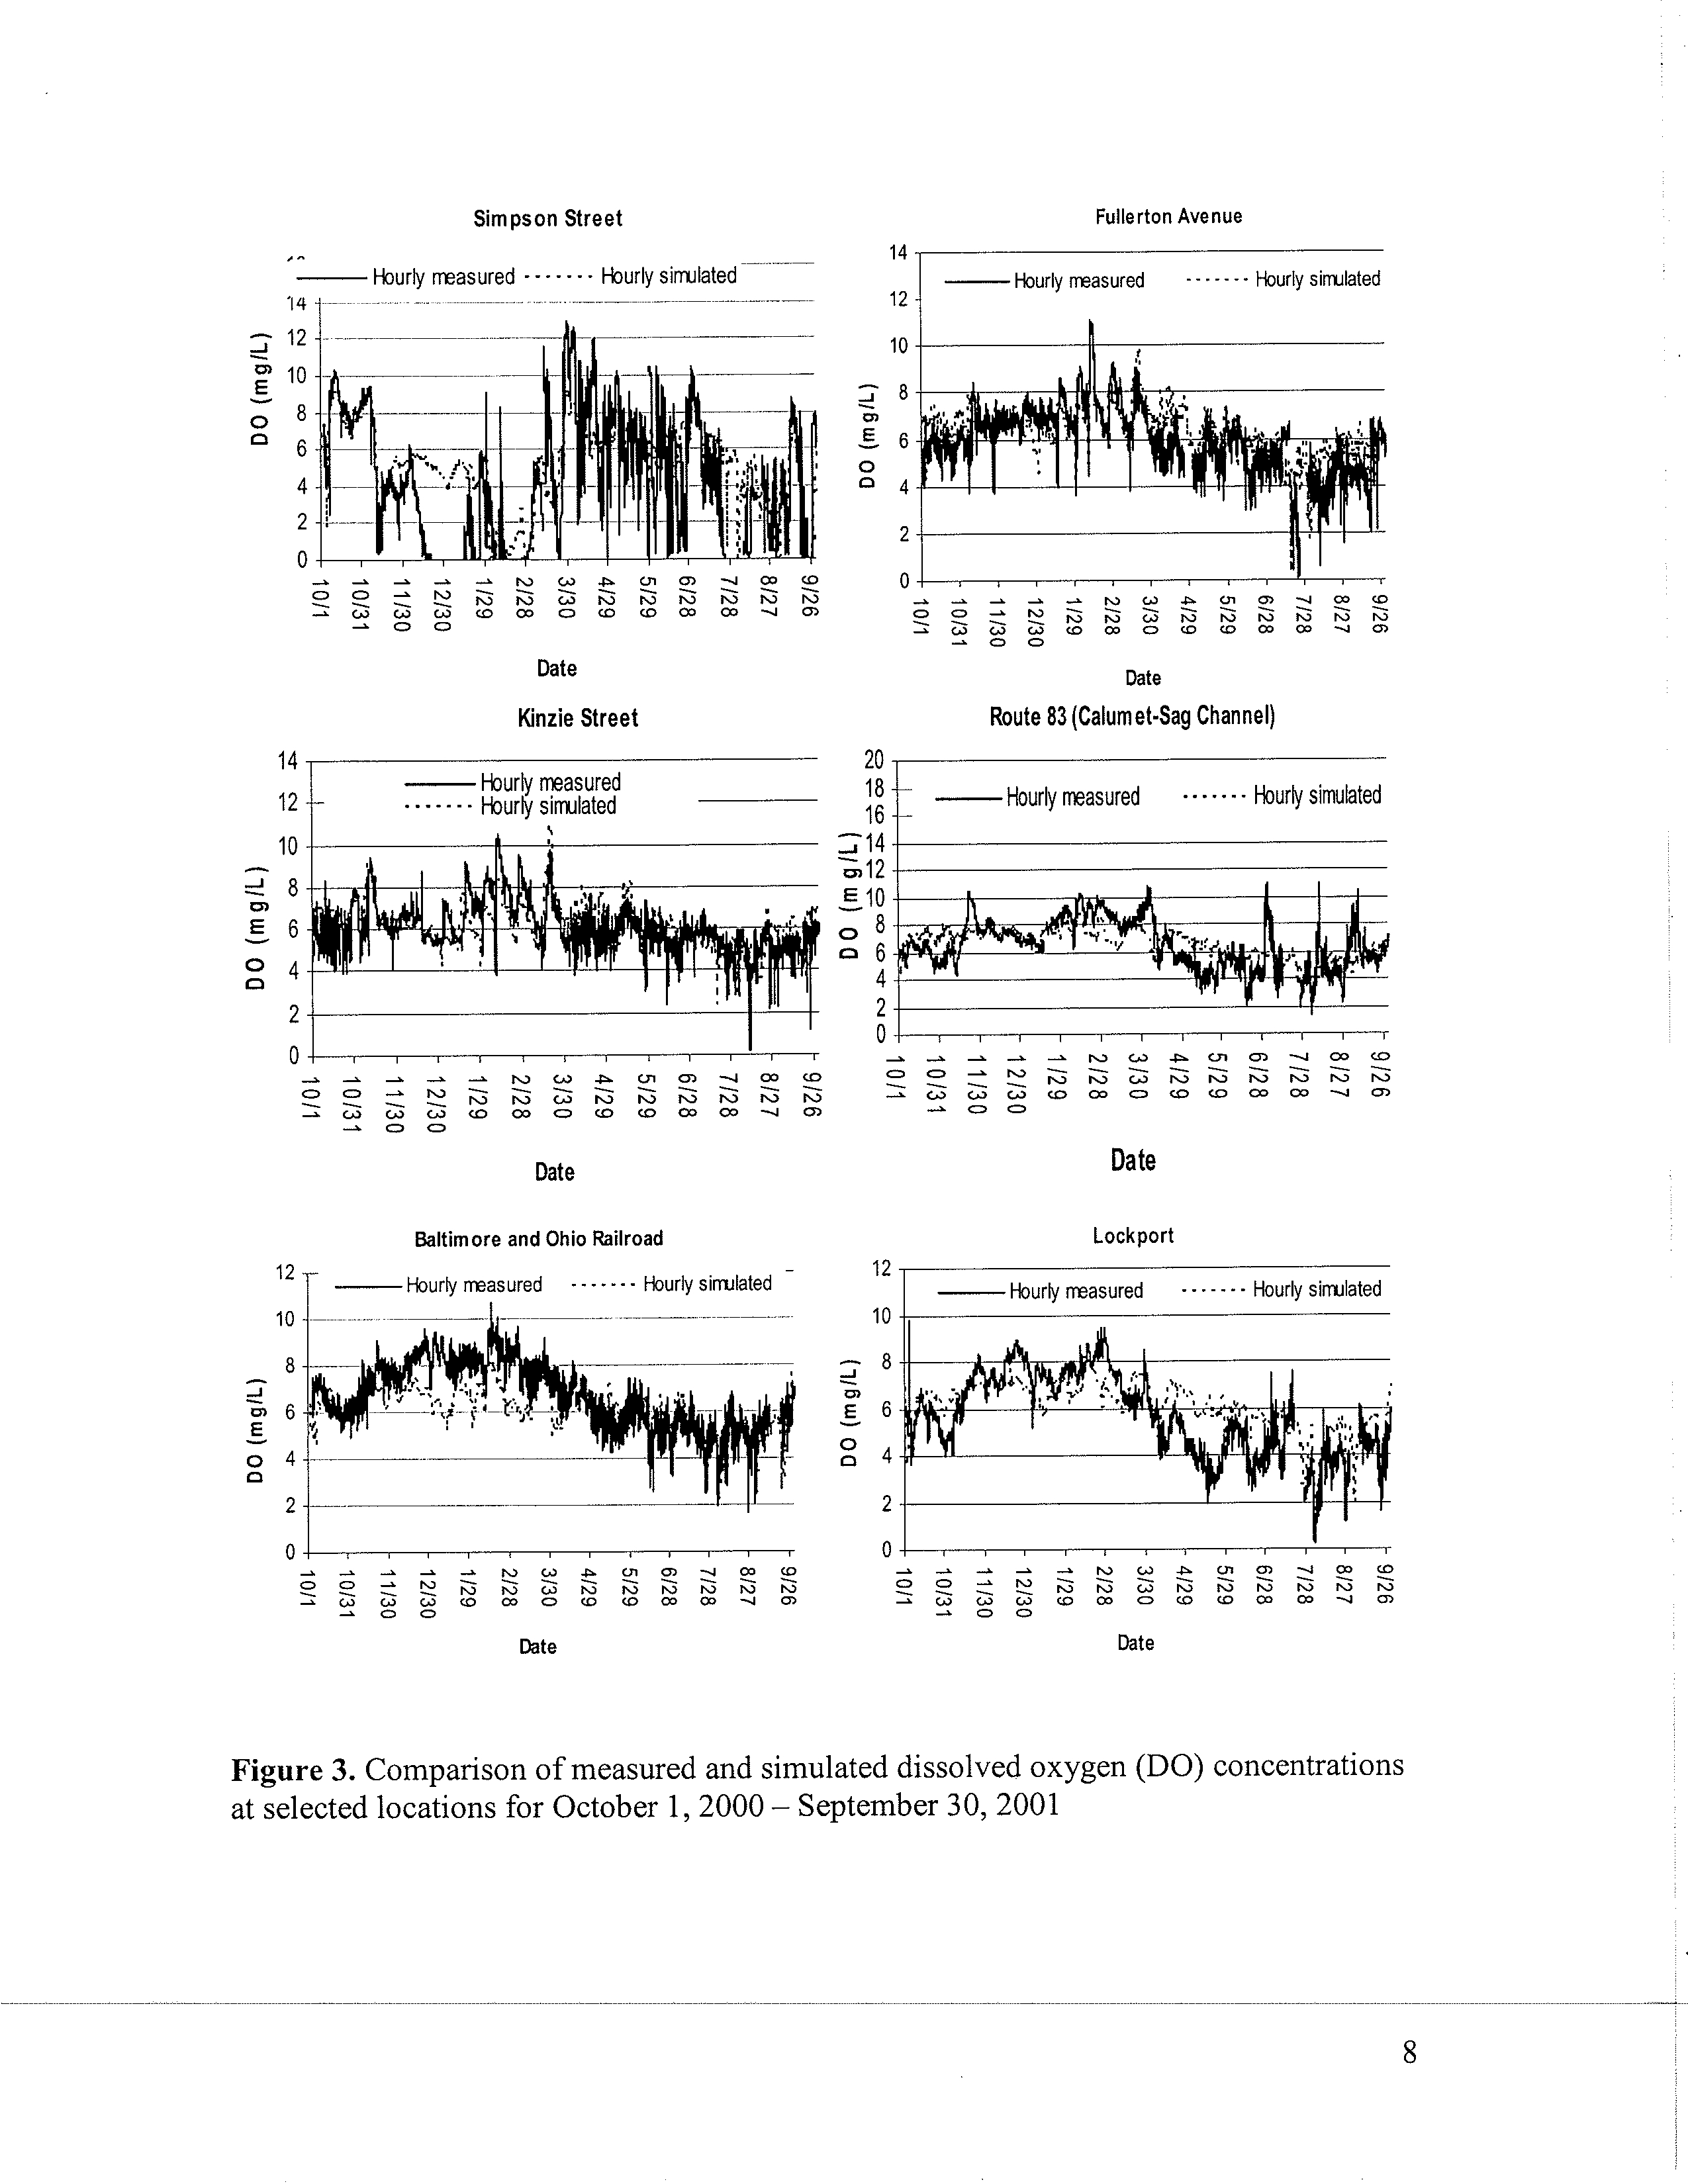
Comparison of the simulated and measured hourly DO concentrations at selected
locations in the CAWS is shown in Figure 3. There are approximately 8,760 measured
hourly DO values at each location within the calibration period and throughout the
calibration process it was aimed to match hourly measured and simulated DO
concentrations as much as possible. On the other hand, as Harremoes et al. (1996)
mentioned, it is almost impossible to match all the measured hourly data if there are a
large number of data to be fitted to. Hence, calibration was done manually in a way that
the model can capture low DO concentrations resulting from CSOs and produce similar
probability of exceedences for different DO concentrations. The focus on low
concentrations was taken so that reliable management practices to mitigate the CSO
effects could be determined. Comparisons of the percentage of DO concentrations greater
than 3, 4, 5, and 6 mg/L, respectively, at different locations in the CAWS for the
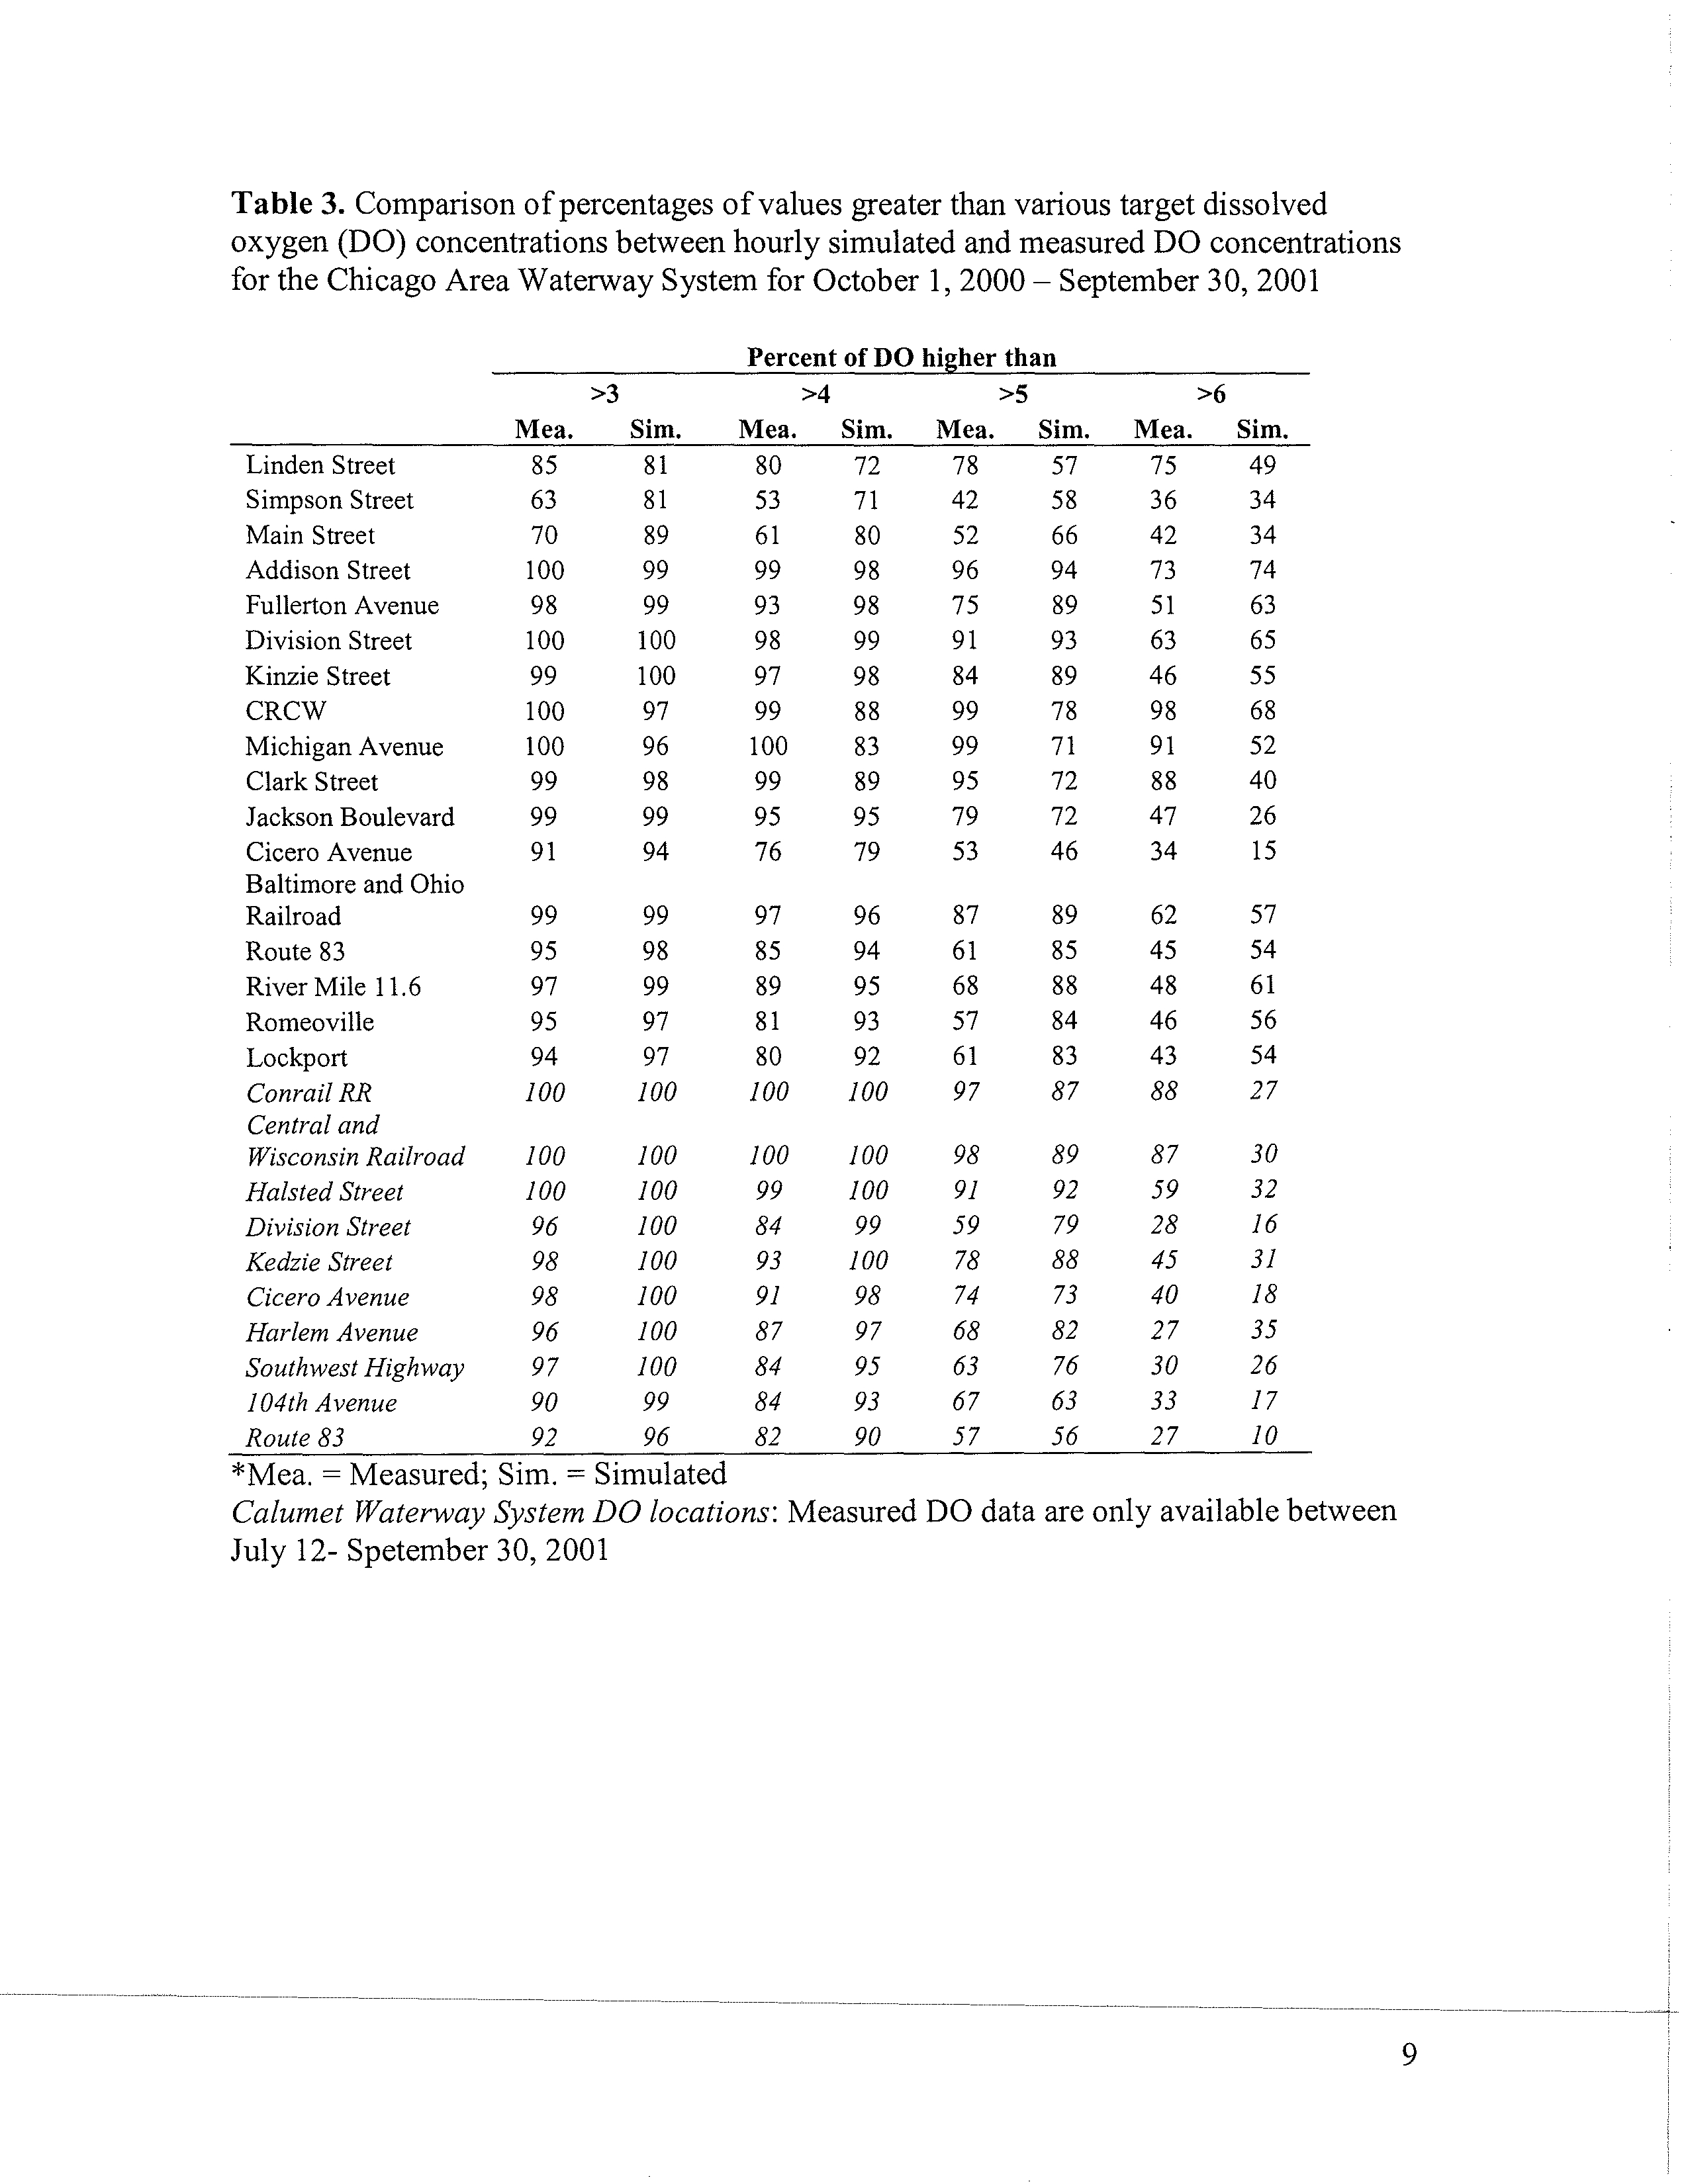
calibration period for the selected locations are listed in Table 3.
Close agreement between the calibrated and measured DO concentrations were obtained
especially for the lower DO concentrations. The differences between the percentage of
DO concentrations greater than 3 mg/L for the calibrated and measured DO
concentrations are smaller than 10 percentage points in the CAWS except for the NSC.
The differences between the percentage of DO concentrations greater than 4 mg/L for the
calibrated and measured DO concentrations are less than or equal to 12 percentage points
in the CAWS except for the NSC, Michigan Avenue on the Chicago River Main Stem,
and Division Street on the Little Calumet River (north). Along the upper NSC it was
difficult to match the measured DO concentrations because of the hydraulic conditions in
the upper NSC, i.e. flow near zero except during CSO events. The differences between
the percentage of DO concentrations greater than 3 and 4 mg/L for the calibrated and
measured DO concentrations reach up to 20 percentage points in the upper NSC.
7
Electronic Filing - Received, Clerk's Office, August 4, 2008
Simpson Street
J
E
0
0
Hourly measured - - - - - - - Hourly simulated
wO
-^W
W
O
W
OtD
N
co
N
N W ? CIl Q1 V W
co
N W
O co
N
c0
N N
m co
N N
V
Date
Hourly measured
- - - • - - - Hourly simulated
Kinzie Street
r)O
N
W
O
14
12
10
8
6
4
2
0
Fullerton Avenue
Hourly measured
- - - - - - - Hourly simulated
r
n a-
77
W
O
N
W
O
O = W
co
N N
w O
W
<0
N
CO
N
rb
N
W
N N
^1
N
O
Date
Route 83
(
Calumet
-
Sag Channel)
Hourly measured
- - - - - - - Hourly simulated
r
1
i
i
O
O
1
T
O N
^i
-+
N W
W
O co
?
N
(Jl
CO
N
O
N
O
V
N
co
O
N
V
O
N
O
Date
Baltimore and Ohio Railroad
12
-
12
N W ? W O V O O
O
^ W
O
W
^
O
WON
N
c0
N
N O
W
c0
N
c0
N N
W
N
OD
N
V
N
W
Date
-a
N W 1 Ul 07 V OD O
O ^ N
W W
O O
co
N N
m
W
O CO
N
CO
N N
m
N
W
N
V
N
a^
Date
Lockport
Hourly measured
- - - - - - - Hourly simulated
ti
5
10
J_
E
0
0
8
6
4
2
0
WO
N
O
N
W
O
N W ^
N W
N W
W O
Date
O
Ut
O
Figure 3.
Comparison of measured and simulated dissolved oxygen (DO) concentrations
at selected locations for October 1, 2000 - September 30, 2001
8
Electronic Filing - Received, Clerk's Office, August 4, 2008
Table 3. Comparison of percentages of values greater than various target dissolved
oxygen (DO) concentrations between hourly simulated and measured DO concentrations
for the Chicago Area Waterway System for October 1, 2000 - September 30, 2001
Percent of DO higher than
>3
>4
>5
>6
Mea.
Sim.
Mea.
Sim.
Mea.
Sim.
Mea.
Sim.
Linden Street
85
81
80
72
78
57
75
49
Simpson Street
63
81
53
71
42
58
36
34
Main Street
70
89
61
80
52
66
42
34
Addison Street
100
99
99
98
96
94
73
74
Fullerton Avenue
98
99
93
98
75
89
51
63
Division Street
100
100
98
99
91
93
63
65
Kinzie Street
99
100
97
98
84
89
46
55
CRCW
100
97
99
88
99
78
98
68
Michigan Avenue
100
96
100
83
99
71
91
52
Clark Street
99
98
99
89
95
72
88
40
Jackson Boulevard
99
99
95
95
79
72
47
26
Cicero Avenue
91
94
76
79
53
46
34
15
Baltimore and Ohio
Railroad
99
99
97
96
87
89
62
57
Route 83
95
98
85
94
61
85
45
54
River Mile 11.6
97
99
89
95
68
88
48
61
Romeoville
95
97
81
93
57
84
46
56
Lockport
94
97
80
92
61
83
43
54
Conrail RR
100
100
100
100
97
87
88
27
Central and
Wisconsin Railroad
100
100
100
100
98
89
87
30
Halsted Street
100
100
99
100
91
92
59
32
Division Street
96
100
84
99
59
79
28
16
Kedzie Street
98
100
93
100
78
88
45
31
Cicero Avenue
98
100
91
98
74
73
40
18
Harlem Avenue
96
100
87
97
68
82
27
35
Southwest Highway
97
100
84
95
63
76
30
26
104th Avenue
90
99
84
93
67
63
33
17
Route 83
92
96
82
90
57
56
27
10
*Mea. = Measured; Sim. = Simulated
Calumet Waterway System DO locations:
Measured DO data are only available between
July 12- Spetember 30, 2001
9
Electronic Filing - Received, Clerk's Office, August 4, 2008
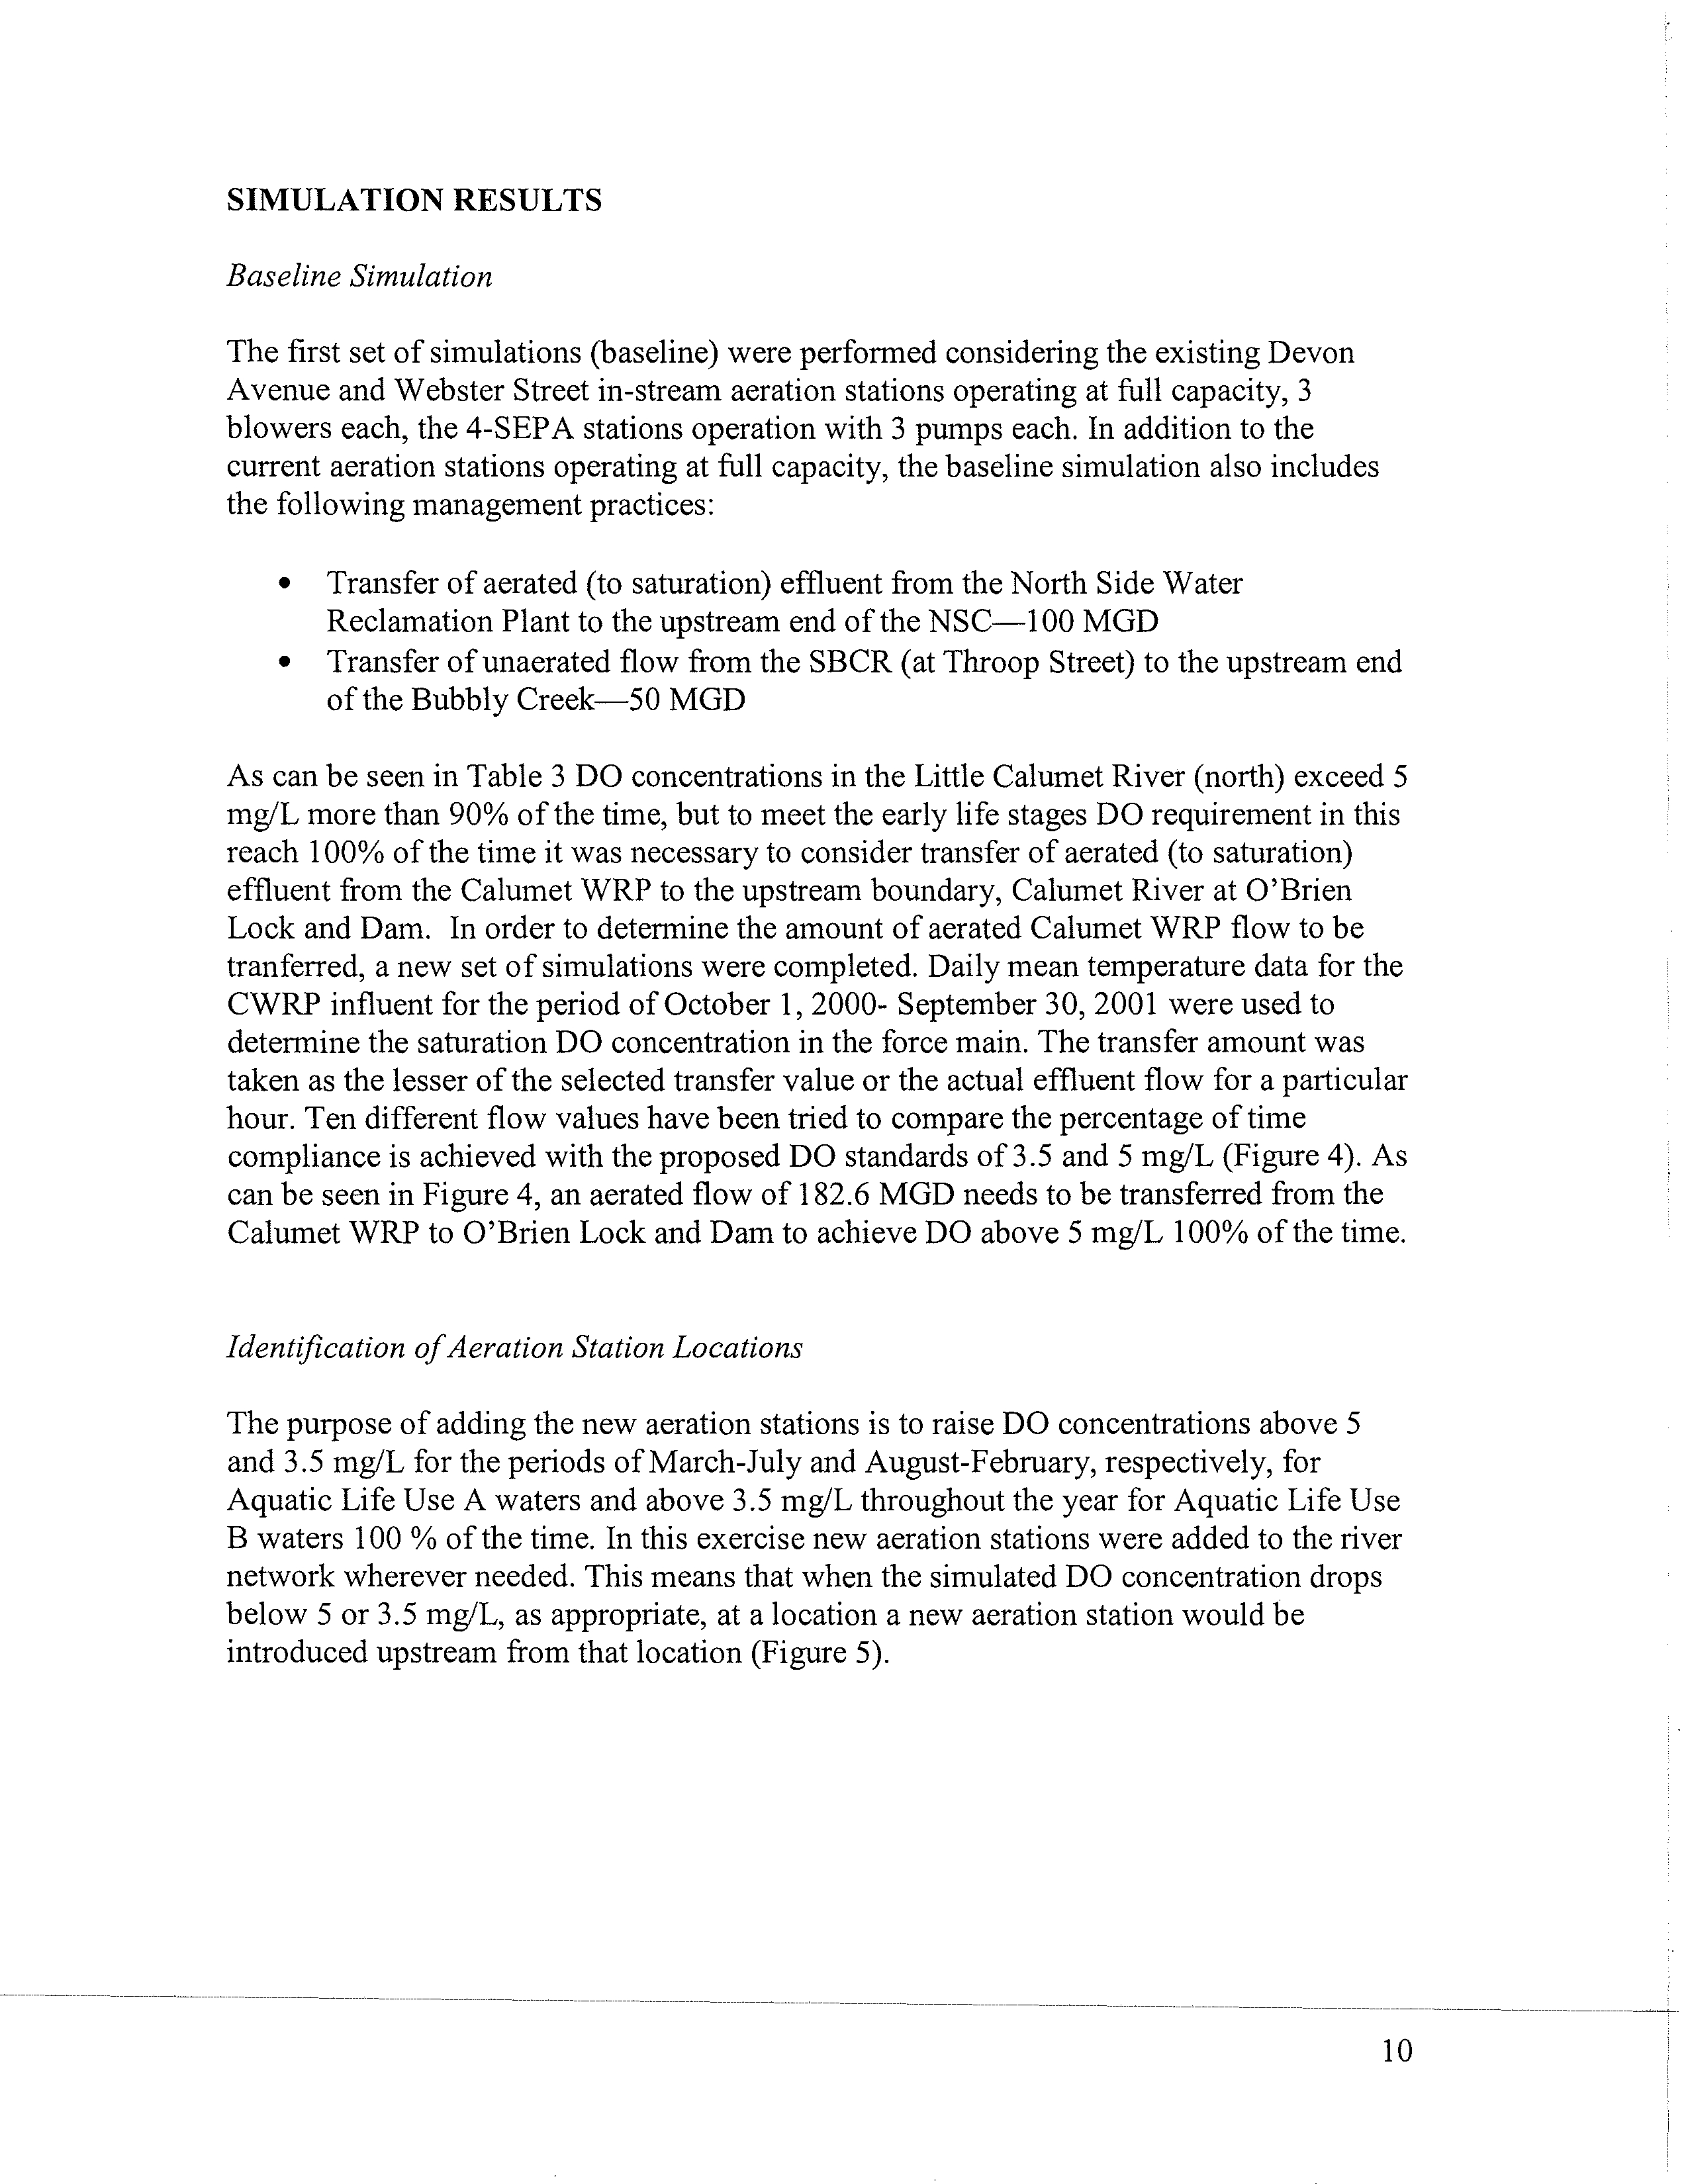
SIMULATION RESULTS
Baseline Simulation
The first set of simulations (baseline) were performed considering the existing Devon
Avenue and Webster Street in-stream aeration stations operating at full capacity, 3
blowers each, the 4-SEPA stations operation with 3 pumps each. In addition to the
current aeration stations operating at full capacity, the baseline simulation also includes
the following management practices:
• Transfer of aerated (to saturation) effluent from the North Side Water
Reclamation Plant to the upstream end of the NSC-100 MGD
• Transfer of unaerated flow from the SBCR (at Throop Street) to the upstream end
of the Bubbly Creek-50 MGD
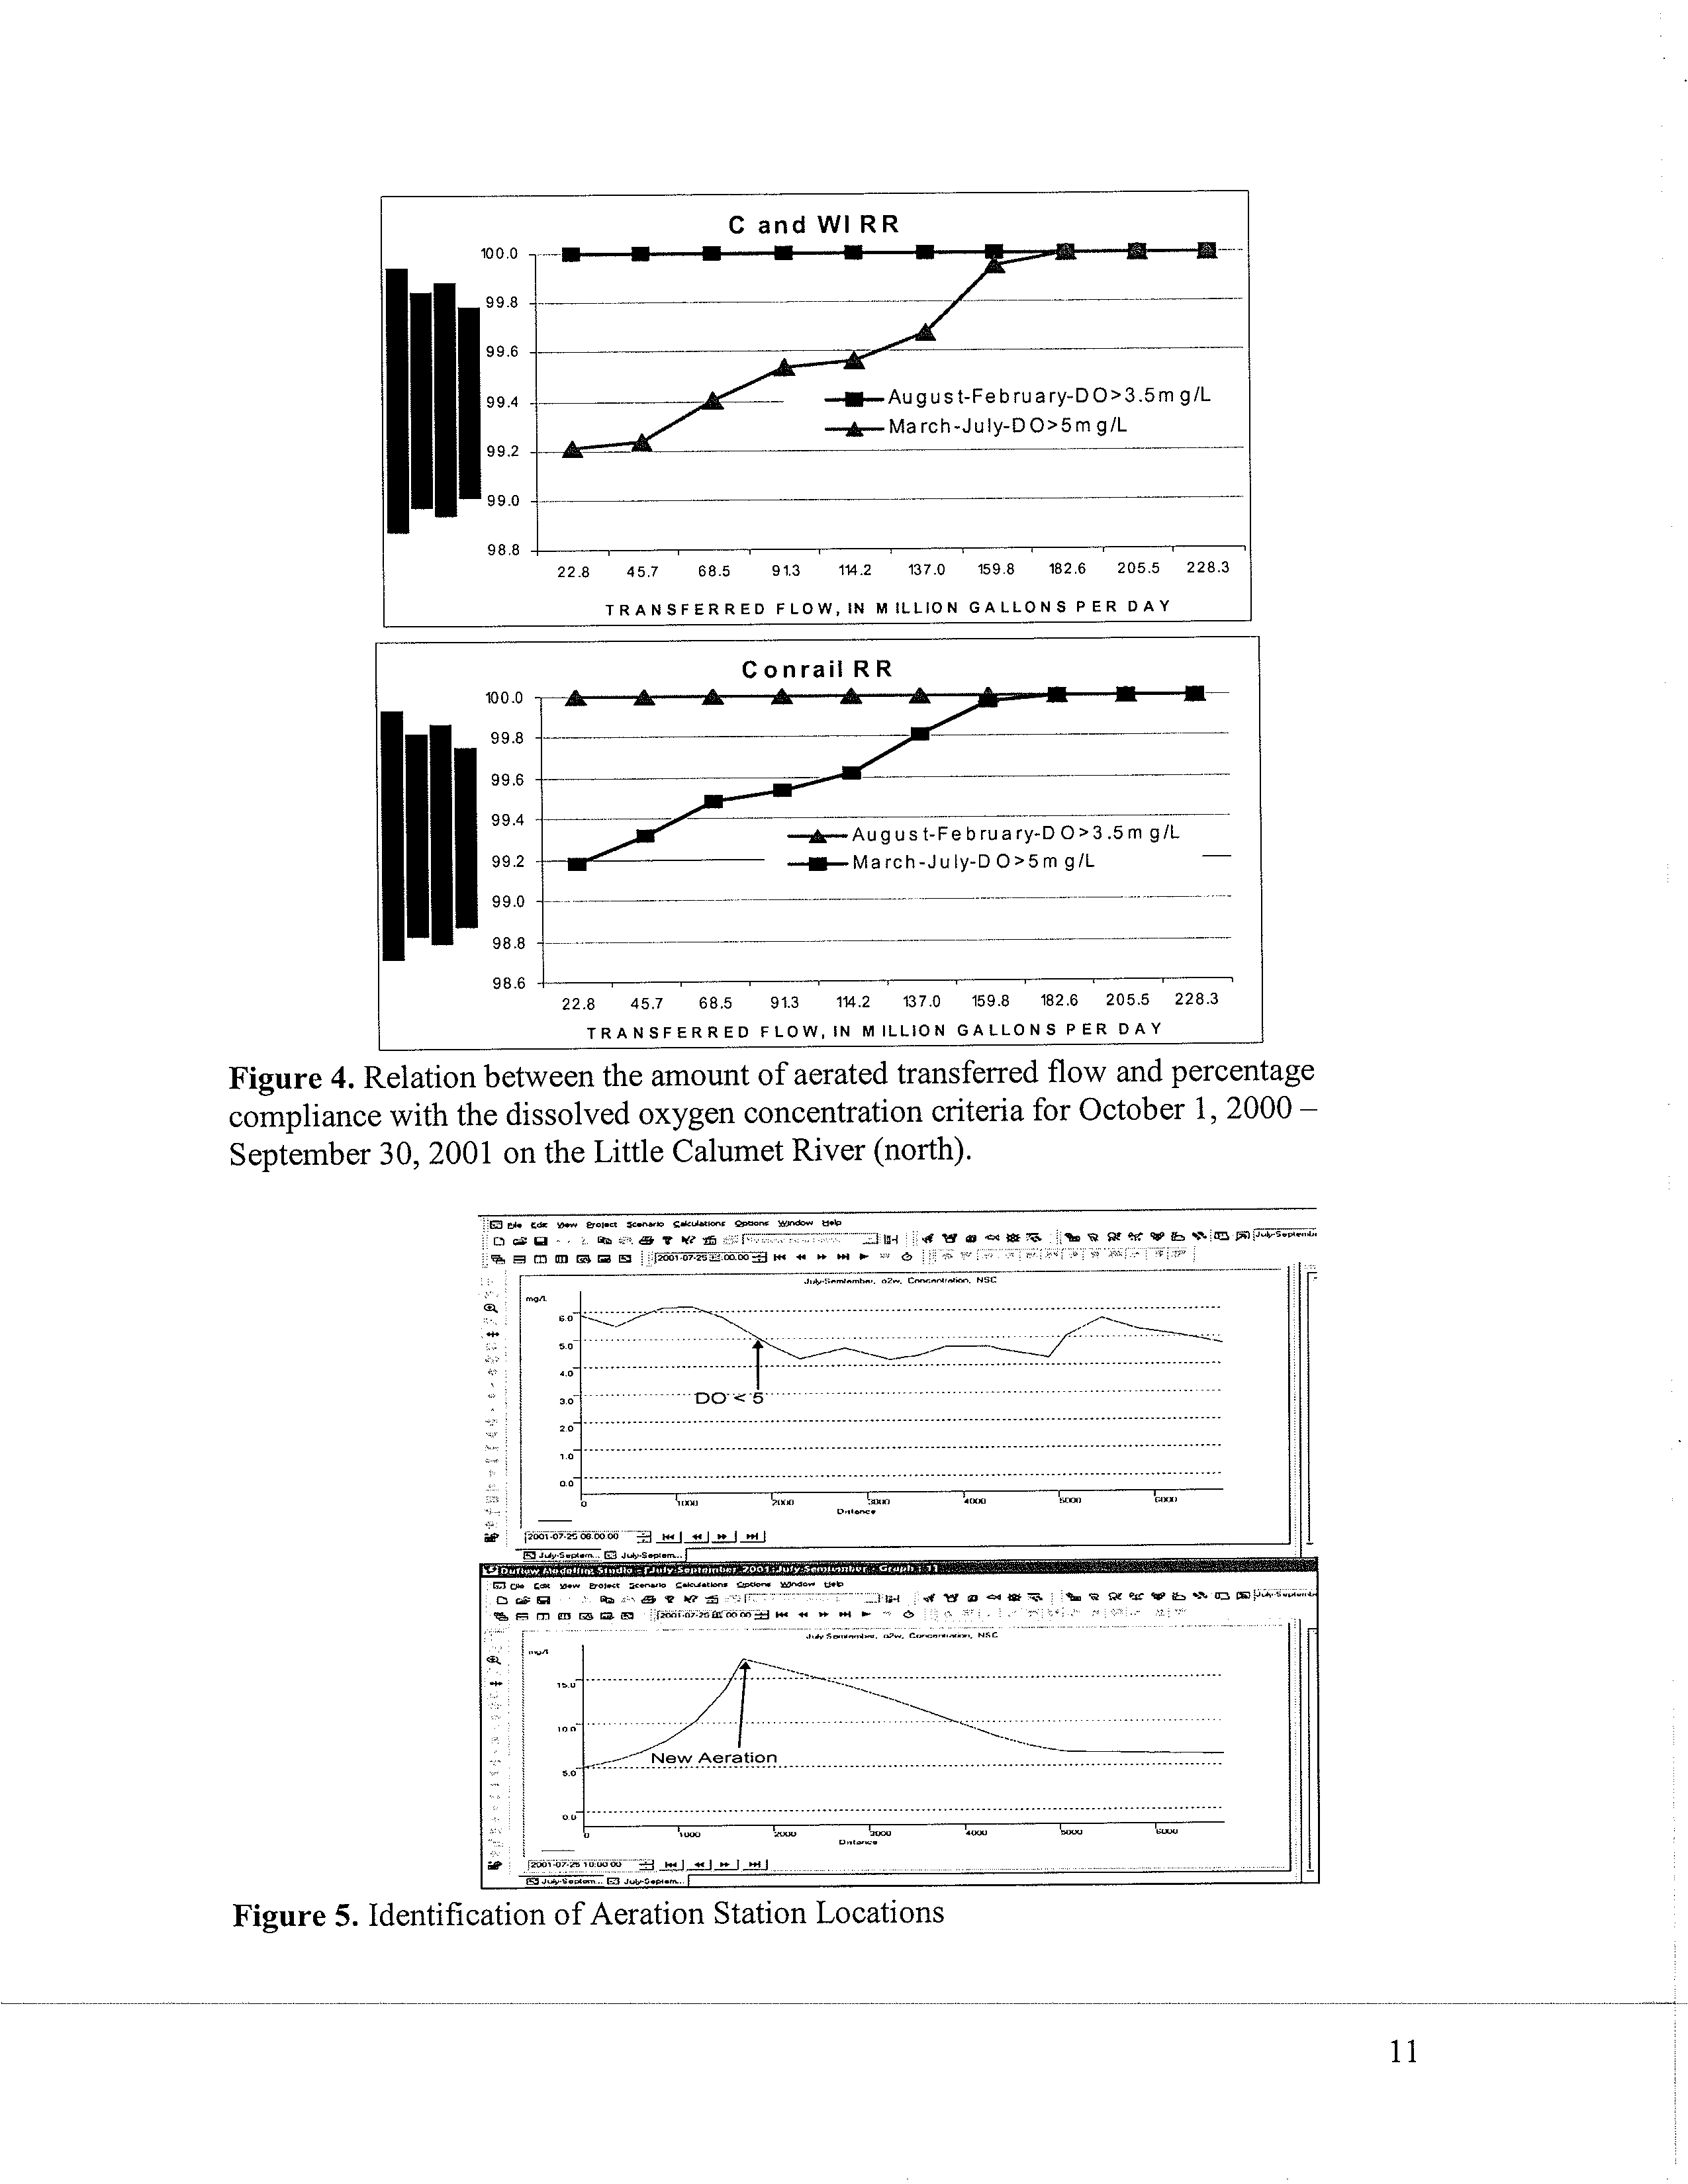
As can be seen in Table 3 DO concentrations in the Little Calumet River (north) exceed 5
mg/L more than 90% of the time, but to meet the early life stages DO requirement in this
reach 100% of the time it was necessary to consider transfer of aerated (to saturation)
effluent from the Calumet WRP to the upstream boundary, Calumet River at O'Brien
Lock and Dam. In order to determine the amount of aerated Calumet WRP flow to be
tranferred, a new set of simulations were completed. Daily mean temperature data for the
CWRP influent for the period of October 1, 2000- September 30, 2001 were used to
determine the saturation DO concentration in the force main. The transfer amount was
taken as the lesser of the selected transfer value or the actual effluent flow for a particular
hour. Ten different flow values have been tried to compare the percentage of time
compliance is achieved with the proposed DO standards of 3.5 and 5 mg/L (Figure 4). As
can be seen in Figure 4, an aerated flow of 182.6 MGD needs to be transferred from the
Calumet WRP to O'Brien Lock and Dam to achieve DO above 5 mg/L 100% of the time.
Identification of Aeration
Station Locations
The purpose of adding the new aeration stations is to raise DO concentrations above 5
and 3.5 mg/L for the periods of March-July and August-February, respectively, for
Aquatic Life Use A waters and above 3.5 mg/L throughout the year for Aquatic Life Use
B waters 100 % of the time. In this exercise new aeration stations were added to the river
network wherever needed. This means that when the simulated DO concentration drops
below 5 or 3.5 mg/L, as appropriate, at a location a new aeration station would be
introduced upstream from that location (Figure 5).
10
Electronic Filing - Received, Clerk's Office, August 4, 2008
100.0
99.8
99.6
99.4
99.2
99.0
98.8
100.0
99.8
99.6
99.4
99.2
99.0
98.8
98.6
C and WI RR
j*-August-February
-DO>3.5m g/L
--March-July-DO>5mg/L
22.8
45.7
68.5
91.3
114.2
137.0
159.8
182.6
205.5
228.3
TRANSFERRED
FLOW,IN MILLION GALLONS PER DAY
Conrail RR
-3August-February-DO>3.5m g/L
-March-July-D O>5m g/L
22.8
45.7
68.5
91.3
114.2
137.0
159.8
182.6
205.5
228.3
TRANSFERRED FLOW, IN MILLION
GALLONS PER DAY
Figure
4. Relation between the amount of aerated transferred flow and percentage
compliance with the dissolved oxygen concentration criteria for October 1, 2000 -
September 30, 2001 on the Little Calumet River (north).
q
a' B - - io
4 YS ffi
.' (::.:-;
-. -;....-
J..
v,t Yl
®.
oa i8t :^.
Q
--
...... .-----_..
DO-1.5._.....---
_.._........--._..._._-
-.--
-- ..---
---------
------
---------
......
.....
....
........
.-.
.............................1..
-...-.
^--------
-'--
.._.------------------
---------
::C...._
New
...........................................................
Aeration
_.-...._..._............ _....-..-._....
--^
Figure 5. Identification
of Aeration
Station
Locations
11
Electronic Filing - Received, Clerk's Office, August 4, 2008
Simulation results showed that 18 new supplementary aeration stations with a maximum
oxygen load of 80 g/s are needed to achieve the proposed DO standards of 3.5 and 5
mg/L for periods of August-February and March-July, respectively, for Aquatic Life Use
A waters and of 3.5 mg/L throughout the year for Aquatic Life Use B waters. Locations
of the proposed aeration stations are shown in Figure 6 and descriptions of the locations
are presented in Table 4.
Especially after large storms, low DO concentrations are observed for an extended period
of time. There were two critical time periods in which the proposed DO standards would
not be met at almost all locations. July 25, 2001 and August 2, 2001 events were the most
critical events for the proposed DO standards of 5 and 3.5 mg/L, respectively.
Simulations showed that 3 new aeration stations would be needed on the Upper NSC,
whereas no new aeration would be needed for the lower NSC since NSWRP and Devon
Avenue In-stream aeration station provided enough dissolved oxygen for the river
system. Only one new aeration station on the Upper NBCR that would be upstream from
the Webster Avenue in-stream aeration station would be added to meet the the proposed
DO standards.
era
Chicago Waterway System
Major Inflows
Current Aeration Stations
New Aereation Stations
&
USGS Gages
G\Alrj
100
North Side%
WRP
tkn Statio^
d Aerated
l it m ette
0
X
UP
SH
ER NORTH
n
RE CHANNEL
LOWER NORTH
SHOR$
CHANNEL
North Braocc
°^,
Devon Ave. In-stream
Pumping Station
UPP
CHIC
"4m
web
oopP"
LOWER NORTH BRANCH
CHICAGO RIVER
SOUTH BRANCH `;^
CHICAGO RIVER 7f
Stickney
v Y5
0
WR
P
%
Y.
G acine Ave.
O V
Pumping Stat
i
n
LAKE MICHIGAN
1110 A
ated
a
x
{^
182m
w
Lemont
Y ^
hvi
ry -2.
5
WRP %'
N
o.
a^ v
^r .pA
w
two
&
CAIU
/
yETSAG
j
N
'1
SN^^ryQ^^^
'Brien Lockand Da
Ro m eo vi lle
EL
ITTL E CAL UMEk,Q(VE
R
Little Calumet River at South Holland
Lockport
Figure 6.
Locations of the propsed aeration stations in the Chicago Area Waterway
System.
O
SO,
y 011
SP^\^PR
G
? NORTH BRANCH
GO ' RIVER
lter Ave. In-stream Aeration Station
Columbus Drive
CHICAGO RIVER
^M*'
,gld
IN STEM
Unaerated
12
Electronic Filing - Received, Clerk's Office, August 4, 2008
Because of the water quality conditions on the SBCR, three new aeration stations would
be needed to bring DO concentration above 3.5 mg/L 100% of the time. Previous
assessment by the R&D Department of the District showed that 3 aeration stations would
be needed for Bubbly Creek (CTE, 2007c). In this exercise, the same locations suggested
by the District would be used with higher DO loads at the stations. Three new aeration
stations between the Bubbly Creek Junction and Stickney WRP and 2 new aeration
stations between the Stickney WRP and Calumet-Sag Junction would be added to raise
DO concentration above 3.5 mg/L. Because of transfer of 182.6 MGD of aerated Calumet
WRP effluent to O'Brien Lock and Dam, the proposed DO standards would be met along
the Little Calumet River (north) between O'Brien Lock and Dam and the Calumet WRP
and one new aeration station would be needed between the Calumet WRP and the Little
Calumet River junction with the Calumet-Sag Channel. Since the SEPA stations would
be assumed to be working at full capacity, 2 new aeration stations would provide enough
dissolved oxygen to meet the the proposed DO standards. Dissolved oxygen
concentration profiles along the waterway segments with the 18 new aeration stations in
the CAWS for the selected critical periods are shown Figures 7-9.
Table 4. Locations of the proposed new aeration stations in the Chicago Area Waterway
System.
No.
Waterway
River
Mile
Max.
Load
(0
)
Location
1
Upper North Shore Channel
340.2
80
Central Street
2
Upper North Shore Channel
339.3
80
0.2 miles downstream from Simpson Street
3
Upper North Shore Channel
337.9
80
0.4 miles upstream from Main Street
4
North Branch Chicago River
330.4
80
0.3 miles upstream from Diversey Parkway
5
South Branch Chicago River
325.4
80
0.2 miles downstream from the junction with the
North Branch Chicago River
6
South Branch Chicago River
324.1
80
1.5
miles downstream from the junction with the
North Branch Chicago River
7
South Branch Chicago River
322.9
80
Halsted Street
8
Bubbly Creek
80
Mouth of Bubbly Creek
9
Bubby Creek
80
Approximate midpoint of Bubbly Creek
10
Bubbly Creek
80
Headwaters of Bubbly Creek
11
CSSC
320.8
80
0.24 miles upstream from Western Avenue
12
CSSC
319.8
80
0.8 miles downstream from Western Avenue
13
CSSC
317.3
80
Cicero Avenue
14
CSSC
309.4
80
1.2 miles upstream from Willow Springs Road
15
CSSC
306.4
80
1.8 miles downstream from Willow Springs Road
16
Little Calumet River (North)
320.0
80
0.35 miles upstream from the junction with the
Little Calumet River
17
Calumet-Sag Channel
313.5
70
1.8 miles upstream from SEPA Station No. 4 at
Worth (Harlem Ave.)
18
Calumet-Sag Channel
305.6
80
1.3 miles upstream from Route 83
13
Electronic Filing - Received, Clerk's Office, August 4, 2008
E3 Ede €da v_bw Mpject Ecenano SelcuLg0
Qpti
window L± tP
- ^ 8 m © m
rte
a
[mil D8-02
M
:00:1
A•----
.l p_.-_
North Shore Channel
J*Semlem
,
o2w. Concerbaii- Ngthshae
............................... --_____-----______-----.______-
1
North Shore
zo I oe
oz 1I 00 :1
J J
Di t-
ip
M Fk €dk
Yew Eroject scenario
9
*Utati
Qptiax
&W
&1P
North Branch Chicago River
r------------------------------------ --------NSWR
Devon Avenue GI . nel
Me e
2500
5000
7500
10000
12500
JulySemtemb- o2w. Coxanhafi- Noilh Blanch
Aeration Station
+--------------------------------------------- .....
.
. .......
.
..
.
.....
..
5.0-
-,
Qsvon....-- ----
i-
-
------
-0
-
3NSC Junction
Webster Ave.
i
.
-
-
-
In-Stream A
e. St.
--
N
- --
z.o
North Branch
---
Chicago River
t.o
------------------------------------------------------------------------
0.0
---+-------------------------------------------------------------------------------------------------•
2500
50M
7500
10000
12500
D6lance 513.306
__
rG
X
JWyS-0
July seMembn, ozw, Cpncrnka.
,
south Blanch
__________________________________
---------------------------
---
---
-------------------
--------------------
Bubbly Creek
oitn-Branca'Junctio
n ------------------------------------------
--------------- .... uncton-------;
Figure 7. Dissolved oxygen concentration profile in the Chicago Area Waterway System
for a selected critical period of the August 2, 2001 storm where the downward arrows
indicate locations of new aeration stations.
- 5.169780
I2001.0802 200000
^- ^ ^ J J
M Ede Eda Ybw boject 2cene-
rakdae ns Qpt
Vpdow tielp
q
Do ®
$ a m ©E3M
R^' .. '0 •
® i=i South Branch Chicago River
t
14
Electronic Filing - Received, Clerk's Office, August 4, 2008
In E- E- ybw e
D co
% M M M M
til
ip
G
Chicago Sanitary and Ship Channel
July 9ertdembe^ ,
o2w, Career,.- CSSC
..............................:
60
-
- ----------------
................
Ronie'
l..
Calumet-Sag -Channel Junction n-------------
3 ost m Ave.
S ickney
WRP
----------------------_
-------------------
t--------------------------------„--------------------,-
2.0
Cicero Ave.
Lockport
BuyA-Creek-
Jainotion
--------------------- Nillovw-
SpM85-----,,,,,--------------------,,,,----------------I
.............. _.......,......_ _,.,._.._-,......_....,,........,,,....-......,,........,.,,,.....-----........
zoooo
D^sier^ce 05280
i
5.393006
2oo,.oe.w,s:oo.oo^
µ J^^ J
®JUlyS
<ptem.. ®JulySePlem_^-
30000
r-aooOD
...........................................................................................................
Little
Calumet
SEPA 2
------------- ----------------------------- ------------------------ ---CalumetWRP.....
;..
O'Brign Lock
and Dam
Giver Junction
o.O-^o
^s0o
Di-
Tsooo
M
2w0 ,mm
I
20010
7 - 55 20:00.oO __3
JJ •• ^ JJ
ED j**s tem
.. ®
Juy-$.P-.
0 Ete Edz ykw Bl.*t 1-to LakiMbi
ins EwIdow LOP
D Q; ®`
7%2 M M M
Calumet-Sag Channel
mgh
Jul,Semlembe, o2w. C-MIN
iSF :C.
Rs
^] ^^•_^
h^July-Seal
CN Sag
2.5f---- -------------------------------------------------- -------------- ------- ------------- '----------- ,----------..,
Little Calumet Junction
0.0^
SEPA 5
--------------------,---------.-------------------------------------- -------- ., ---------------------------------
^
,
Dnt-15000
if
2007
---
WT2802IMM
------------ J J N I J
Juy-Seplem
..
® JuVSeplem..
Figure
8. Dissolved oxygen concentration profile in the Chicago Waterway System for
selected critical periods of August 2, 2001 (Chicago Sanitary and Ship Canal) and July
25, 2001 (Little Calumet River (north) and Calumet-Sag Channel) storms where the
downward arrows indicate locations of new aeration stations.
15
Electronic Filing - Received, Clerk's Office, August 4, 2008
E3 ek E. Yew D.- 5u
%SM®r$®®
Bubbly Creek
aa0t
%. R91 1^11 V91-..%MW
JJrByrvaba
.
oS+. Corcmvixcn B^Cy G.d.
5l
SB
s
z.B1...... ....*----- ----- ..------------------- --------- ...... *-------- ----------------- Head-Wffer 6fBii661y Creek
oo
soo
,ooo
,soo
zmo
o
:`zoo,wa3moaooewrs.w.m..
^JJJJ
Figure 9. Dissolved oxygen concentration profile in Bubbly Creek for a selected critical
period of August 2, 2001 where the downward arrows indicate locations of new aeration
stations.
In this exercise, new aeration stations are not added on the Chicago River Main Stem
(CRMS) because this segment of the waterway is stagnant most of the time. As can be
seen in Figure 10, the effect of new aeration stations on DO concentrations in the CRMS
is significant especially for the period of October 2000 to May 2001. After May 2001, the
effect of new aeration stations on DO in the CRMS diminishes.
Clark Street
- - - - - - - Calibrated
18 New Aeration Stations
§ 9 c § §
Date
16 -
14
Calibrated
12
10
J
m8
E
O
O
41
2
0
Date
18 New Aeration Stations
A
00
A
Figure
10. Simulated dissolved oxygen concentration at Clark Street on the Chicago
River Main Stem
Clark Street
16
Electronic Filing - Received, Clerk's Office, August 4, 2008
In Summary, the unsteady flow water quality model previously developed by Marquette
University for the CAWS using the Duflow Modeling Studio software has been updated
in three major areas, in addition to the expansion of the simulation period from 4 months
to an entire water year. First, the gravity CSO locations in the NSC were increased from
four to 19 to better simulate the gravity CSO discharges in this segment, in which the
impact of CSOs is the largest of the entire system. Secondly, sediment oxygen demand
(SOD) values were adjusted based on the measured SOD values. Thirdly, the gravity
CSO discharges were obtained using the runoff models developed by the U. S. Army
Corps of Engineers for the region. The updated model was calibrated for the water year
of October 1, 2000, to September 30, 2001, and good agreements between hourly
simulated and measured DO concentrations were achieved. The updated, calibrated
model was used to simulate an integrated strategy that combines flow augmentation, flow
aeration and instream aeration for 100% compliance with the IEPA's proposed DO
standards for the CAWS. The simulation results indicate that the critical periods
occurred during and after the July 25, 2001 and August 2, 2001 storm events. The
following DO enhancement measures and new facilities would be required to meet the
proposed DO standards for the critical periods.
a.
Maximize the capacity of the existing two instream and three of the existing
sidestream aeration stations in the CAWS;
b. Add three flow augmentation facilities with some flow aeration, i.e. (1)
pumping 100 mgd of the NSWRP's final effluent with aeration to saturation
from the NSWRP to the headwaters of the upper NSC, (2) transferring 50 mgd
of river water without aeration from the SBCR to the headwaters of Bubbly
Creek, and (3) pumping 182.6 mgd of the Calumet WRP's final effluent with
aeration to saturation from the Calumet WRP to downstream of the O'Brien
Lock and Dam on the Calumet River; and
c.
Construct 18 new instream aeration stations within the CAWS . The 18 new
instream aeration stations would be located throughout the CAWS with three
on the upper NSC, one on the NBCR, three on SBCR, five on the CSSC, three
on Bubbly Creek, one on the Little Calumet River (North), and two on the
Calumet-Sag Channel. Even with these enhancements potential non-
compliance with the proposed DO standards might occur, particularly under
wet weather conditions during the summer months which could be more
severe than the conditions that materialized in 2001 which were used for this
modeling.
d. Enhancements will also be required to ensure 100 percent compliance with the
proposed DO standard in the Chicago River. However, further study is
required before a solution can be proposed and costs can be determined.
References:
Alp, E. and Melching
,
C.S., 2006, Calibration of a Model for Simulation of Water
Quality During Unsteady Flow in the Chicago Waterway System and Application to
Evaluate Use Attainability Analysis Remedial Actions,
Institute
for Urban
Environmental Risk Management Technical Report No
.
18,
Marquette University,
17
Electronic Filing - Received, Clerk's Office, August 4, 2008
Milwaukee, Wis. and
Research and Development Department Report No. 2006-84,
Metropolitan Water Reclamation District of Greater Chicago, Chicago, Ill.
Alp, E. and Melching, C.S. (2008). Evaluation of Procedures to Prevent Flow Reversals
to Lake Michigan for the Chicago Waterway System,
Institute for Urban Environmental
Risk Management Technical Report No. 19,
Marquette University, Milwaukee, WI.
Consoer Townsend Envirodyne (CTE), 2006, Study of End of Pipe Combined Sewer
Overflow (CSO) Treatment,
Technical Memorandum 3WQ,
report submitted to the
Metropolitan Water Reclamation District of Greater Chicago, Chicago, Ill.
Consoer Townsend Envirodyne (CTE), 2007a, Supplemental Aeration of the North and
South Branches of the Chicago River,
Technical Memorandum 4WQ,
report submitted to
the Metropolitan Water Reclamation District of Greater Chicago, Chicago, Ill.
Consoer Townsend Envirodyne (CTE), 2007b, Flow Augmentation of the Upper North
Shore Channel,
Technical Memorandum SWQ,
report submitted to the Metropolitan
Water Reclamation District of Greater Chicago, Chicago, Ill.
Consoer Townsend Envirodyne (CTE), 2007c, Flow Augmentation and Supplemental
Aeration of the South Fork of the South Branch of the Chicago River (Bubbly Creek),
Technical Memorandum 6WQ,
report submitted to the Metropolitan Water Reclamation
District of Greater Chicago, Chicago, Ill.
Consoer Townsend Envirodyne (CTE), 2007d, Development of a Framework for an
Integrated Water Quality Strategy for the Chicago Area Waterways,
Technical
Memorandum 7WQ,
report submitted to the Metropolitan Water Reclamation District of
Greater Chicago, Chicago, Ill.
Di Toro, D. M. and Fitzpatrick, J. (1993).
Chesapeake Bay Sediment Flux Model.
HydroQual, Inc. Mahwah, NJ. Prepared for U.S. Army Engineer Waterway Experiment
Station, Vicksburg, MS. Contract Report EL-93-2.
DUFLOW, 2000,
DUFLOWfor Windows V3.3: DUFLOWModellingStudio: User's
Guide, Reference Guide DUFLOW, and Reference Guide RAM,
EDS/STOWA, Utrecht,
The Netherlands.
Espey, W.H., Jr., Melching, C.S., and Mades, D.M., 2004. Lake Michigan Diversion-
Findings of the Fifth Technical Committee for Review of Diversion Flow Measurements
and Accounting Procedures, report prepared for the U. S. Army Corps of Engineers,
Chicago District, Chicago, Ill.
Harremoes, P., Napstjert, L., Rye, C., and Larsen, H.O. (1996). Impact of rain runoff on
oxygen in an urban river.
Water Science and Technology,
34(12), 41-48.
18
Electronic Filing - Received, Clerk's Office, August 4, 2008
Neugebauer, A. and Melching, C.S., 2005, Verification of a continous water quality
model under uncertain storm loads in the Chicago Waterway System,
Technical Report
17,
Institute of Urban Environmental Risk Management, Marquette University,
Milwaukee, WI, and Metropolitan Water Reclamation District of Greater Chicago,
Research and Development Department Report No. 2005-12,
Chicago, IL.
Shrestha, R.L. and Melching, C.S., 2003, Hydraulic Calibration of an Unsteady Flow
Model for the Chicago Waterway System,
Technical Report 14,
Institute of Urban
Environmental Risk Management, Marquette University, Milwaukee, WI, and
Metropolitan Water Reclamation District of Greater Chicago,
Research and Development
Department Report No. 03-18,
Chicago, IL.
19
Electronic Filing - Received, Clerk's Office, August 4, 2008
BEFORE THE ILLINOIS POLLUTION CONTROL BOARD
IN THE MATTER OF:
WATER QUALITY STANDARDS AND
EFFLUENT LIMITATIONS FOR THE
CHICAGO AREA WATERWAY SYSTEM
AND THE LOWER DES PLAINES RIVER:
PROPOSED AMENDMENTS TO 35 Ill.
Adm. Code Parts 301, 302, 303 and 304
R08-9
(Rulemaking - Water)
PRE-FILED TESTIMONY OF DAVID R. ZENZ
EFFLUENT
DISINFECTION STUDIES
My name is Dr. David R. Zenz, P.E., and I am a Senior Associate with Consoer Townsend
Envirodyne Engineers, Inc. (CTE). I was part of the CTE team which conducted effluent
disinfection studies for the Metropolitan Water Reclamation District of Greater Chicago
(District) for which I am presenting this testimony. I am prepared to answer questions
concerning the studies summarized in this pre-filed testimony.
I have a Ph.D in Environmental Engineering and am a registered professional engineer in the
State of Illinois. Before joining CTE in 1997, I worked for 30 years in the Research and
Development Department of the District. At the District, I eventually attained the position of
Manager of Research and Technical Services. At CTE, I have worked on a variety of wastewater
and sludge management projects. A resume detailing my education and experience is contained
in Attachment 1.
Backizround
At the request of the District, CTE has conducted studies of the potential technologies and costs
of effluent disinfection at the District's three largest plants that discharge to the Chicago Area
Page 1 of 11
Electronic Filing - Received, Clerk's Office, August 4, 2008
Waterway System (CAWS). These studies were conducted to supply information to the Illinois
Environmental Protection Agency (IEPA) in their Use Attainability Analysis (UAA) study of the
CAWS. In addition, the District requested CTE perform further investigation into UV
disinfection costs at the three largest District plants for the Illinois Pollution Control Board's
(IPCB) rule making proceeding.
Effluent Disinfection Studies Conducted as Part
of the UAA
As a result of a request of the IEPA for information needed for the UAA study, the District
commissioned CTE to study the potential technologies and costs of effluent disinfection for the
District's North Side, Stickney, and Calumet plants which discharge to the CAWS. The full
report of this study is contained in attachment NN of IEPA's initial filing in this rulemaking
proceeding.
CTE assembled a task force of national experts to review technologies for wastewater
disinfection and help to prepare a recommendation for the technology or technologies most
suitable for cost estimating purposes at the three District plants. The experts included Dr. Charles
Haas of Drexel University; Dr. Benito Marinas, University of Illinois; and Dr. Kellogg Schwab,
John Hopkins Bloomberg School of Public Health.
There are a number of alternative effluent disinfection technologies that were considered for
possible implementation at the District's water reclamation plants.
Based upon the experience
of the task
force, CTE
, the District
,
the scientific literature
,
textbooks, and manuals of practice,
the following eight alternatives were selected for initial evaluation:
Page 2 of 11
Electronic Filing - Received, Clerk's Office, August 4, 2008
1.
Chlorination (alone) - Four variations
2.
Ozone - Two variations
3.
Ultraviolet (UV) Radiation - Two variations
4.
Chlorination - Dechlorination - Eight variations
5.
Chlorine Dioxide
6.
Bromine Compounds
7.
Sequential Disinfection Processes
8.
Membrane Process
The task force, CTE, and the District conducted an evaluation of the above effluent disinfection
alternatives and eliminated the alternatives that had no potential application to the District's three
largest plants, which are among the largest in the U.S. Because of a lack of large-scale
wastewater treatment plant effluent disinfection experience, chlorine dioxide, bromine
compounds, sequential disinfection processes and membrane process were eliminated from
further consideration. Because of the District's concerns about the potential hazards to humans
and the environment due to accidents or terrorism, either at the plants or during transportation,
gas chlorination/gas dechlorination also was eliminated from the long list. Finally, because
chlorination alone will not meet forecasted future CAWS water quality standards for chlorine
residual, chlorination alone was also eliminated from further consideration.
Page 3 of 11
Electronic Filing - Received, Clerk's Office, August 4, 2008
Based upon the above evaluation, the following effluent disinfection alternatives were further
evaluated using a weighted evaluation matrix:
1. Ozone
-
Generated from air
-
Generated from oxygen
2. UV Disinfection
- Low Intensity, low pressure
- High Intensity, medium pressure
3.
Chlorination/Dechlorination
-
Calcium hypochlorite plus sodium bisulfate
-
Sodium hypochlorite (purchased) plus sodium bisulfite
-
Sodium hypochlorite (on-site generation) plus sodium bisulfate
The evaluation matrix criteria, weights and the actual scoring of the evaluation matrix was a
consensus decision on the part of the District, CTE, and the Task Force. It should be noted that
the matrix evaluation criteria do not include estimated capital nor estimated operation and
maintenance costs. It was a consensus decision by the task force, CTE, and the District that the
alternatives should be evaluated using qualitative economic and non-economic criteria without
regard to numerical costs associated with the alternatives. Only the following qualitative
economic factors were considered in the evaluation matrix:
-
Existence of multiple equipment vendors
Page 4 of 11
Electronic Filing - Received, Clerk's Office, August 4, 2008
Can be operated by operators with normal training levels
-
Low sensitivity to electricity costs
The consensus scoring of the evaluation matrix produced the total numerical scores shown in
Attachment 2.
The low scores for the chlorination alternatives were mainly due to safety concerns, energy
needed for chemical production, and toxic disinfection byproducts formation by this effluent
disinfection alternative. On the other hand, UV disinfection produced the highest scores mainly
because this alternative produces no known toxic byproducts and is relatively safe. The
evaluation matrix scores mirror the current trend in the wastewater treatment industry away from
chlorine-based disinfection towards alternatives such as UV that have lower environmental and
health impacts.
Based upon a consensus decision on the part of the Task Force, CTE, and the District, both UV
disinfection and ozone were carried forward for a detailed cost estimate for the District's three
largest plants. UV high intensity medium pressure was chosen for the cost estimate due to
concerns with the high number of low intensity bulbs required to provide the same level of
disinfection as compared with the high intensity bulbs. Since ozone generated from air has been
found to have present worth costs three to four times higher than ozone generated from oxygen,
only ozone generated from oxygen was carried forward for cost estimation.
Page 5of11
Electronic Filing - Received, Clerk's Office, August 4, 2008
The District commissioned each of the engineering firms who developed master plans for the
three largest plants to prepare cost estimates
for UV
(High Intensity-Medium Pressure) and
Ozone
(
Oxygen
).
This cost estimate should be considered to be a level 4 estimate according to
the Association for the Advancement of Cost Engineering with an accuracy range of
+/-40%. A
summary of this level 4 cost estimate is contained in Attachment
NN of IEPA's
initial filing in
this rulemaking proceeding.
It should be noted that this level 4 cost estimate assumed that the effluent standards were those
outlined in the UAA study, namely, 2740 e. coli per 100 milliliters for the Stickney plant and
1030 e. coli per 100 milliliters for the Calumet and North Side plants. Since the proposed
effluent standard for the CAWS is 400 fecal coliform per 100 milliliters, the costs may be even
higher than those stated in Attachment NN.
It should also be noted that Attachment NN included an assessment of costs for disinfection with
and without tertiary filtration. The CTE final report included costs for this additional process
because the task force recommended that laboratory and/or pilot plant tests be conducted to
determine if tertiary filtration is required in order to have a properly and efficiently operated
disinfection system.
Before making a final decision on either UV or ozone disinfection, the task force recommended
that the District embark upon a laboratory and/or pilot plant testing program. The need for such
studies is due mainly to the large size of the District facilities and the high capital and operating
costs associated with such a decision.
Electronic Filing - Received, Clerk's Office, August 4, 2008
Detailed
Study of UV
Disinfection
Costs
at the North Side, Calumet and Stickney Plants
On the basis of the study described above, the District requested further investigation into UV
disinfection costs at the North Side, Calumet, and Stickney plants, based on the proposed IEPA
effluent bacterial standard (400 fecal coliform per 100 milliliters). A report summarizing the
revised costs for the North Side and Calumet plants has been completed and the estimated costs
are included in this testimony. However, the report for the Stickney plant is still in process.
Therefore, the costs presented in this testimony for the Stickney plant should be considered in the
context of a working cost estimate pending final review by the District.
The District believes that UV disinfection currently represents the most likely choice for
implementation at the plants. In addition to lower capital and operating costs compared to
ozone, UV disinfection is widely used for effluent disinfection throughout the U.S. and UV
disinfection produces no known disinfection byproducts. Ozone is not widely used for effluent
disinfection and although it produces less toxic byproducts than chlorine, ozone reacts with
effluent constituents to form some byproducts many of which have not been identified. CTE was
therefore commissioned by the District to provide a more detailed cost estimate for UV
disinfection using a 10%-15% complete design of a conceptual UV system.
CTE initially conducted a cost estimate for a UV system at the North Side plant. CTE developed
a level 3 cost estimate per the Association for the Advancement of Cost Engineering guidelines
with an accuracy of +/- 30%. This cost opinion was based upon a further study of the hydraulics,
Page 7 of 11
Electronic Filing - Received, Clerk's Office, August 4, 2008
electrical power distribution
,
UV technology,
construction type, construction sequencing, and
operational/weather issues associated
with
implementing
UV disinfection at the North Side plant.
For the North Side plant, a UV disinfection system was estimated to have a capital cost of $111.6
million, an annual operation and maintenance cost of $4.9 million and a total present worth of
$206.8 million. All these costs are in June 2008 dollars, based on a 20-year life, a 3% interest
rate, and a 3% inflation rate. It should be noted that these costs are within the previous cost
estimates expected accuracy of +/-40%
Due to the similarities between the proposed disinfection facilities for the North Side and
Calumet plants, the cost estimate for the North Side plant was adjusted for the Calumet plant.
For the Calumet plant, a UV disinfection system was estimated to have a capital cost of $112.3
million, an annual operation and maintenance cost of $4.6 million and a total present worth of
$201.6 million. All these costs are in June 2008 dollars, based on a 20-year life, a 3% interest
rate, and a 3% inflation rate.
Again, it should be noted that these costs are well within the previous cost estimate expected
accuracy of +/- 40%. The lower operating costs can be attributed to better data on water quality
affecting the predicted efficiency of the UV process at the Calumet plant.
Because of the size difference between the North Side plant and the Stickney plant (450 million
gallons a day versus 1440 million gallons a day), conceptual level cost estimate accuracy would
be less than adequate if the detailed estimate for the North Side plant was extrapolated for the
Page 8 of 11
Electronic Filing - Received, Clerk's Office, August 4, 2008
Stickney plant. Therefore the District commissioned CTE to complete a disinfection cost study
for the Stickney plant similar to that of the North Side plant. Although this study has not been
completed as of the filing date for this testimony, the preliminary working cost estimate for the
Stickney plant is $267.2 million in capital costs, $12.6 million in annual maintenance and
operation costs and $511.2 million in present worth costs. All costs are in June 2008 dollars,
based on a 20-year life, a 3% interest rate, and a 3% inflation rate. Please note that the estimate
is subject to final review by the District and CTE.
In summary, UV disinfection at the District's North Side, Calumet and Stickney
plants is
estimated
at $491.
1 million in capital costs
, $22.1 million in
annual maintenance and operation
costs, and a total present
worth
cost
of $919.6
million
. All costs are in June 2008 dollars.
Construction Schedule
In order to implement effluent UV disinfection at the District's Stickney, North Side and
Calumet plants, CTE has estimated the time needed for the tasks to carry out this
implementation.
Laboratory and pilot plant tests including design and construction of the test facility would
require a minimum of 3 years from a notice to proceed. This effort would be common to the
projects at all three plants.
Following the pilot plant tests, preliminary design and final design for the facilities at the North
Side and Calumet plants would take approximately 2.5 years, including regulatory review.
Page 9 of 11
Electronic Filing - Received, Clerk's Office, August 4, 2008
Following design, construction of the facilities at the North Side and Calumet plants would take
approximately 2.5 years, including startup and UV reactor testing.
Because the Stickney plant facilities are both larger, and involve more extensive civil/site work
related to the effluent conduits and outfall, the preliminary and final design effort is projected to
take 3 years. The construction period is estimated to be approximately 4 years.
Therefore, the total estimated schedule for implementation is approximately 8 years to operation
for the North Side and Calumet facilities and 10 years for the Stickney facilities. This projected
implementation schedule is based on previous schedules on similar District projects in terms of
scope and magnitude.
Page 10 of 11
Electronic Filing - Received, Clerk's Office, August 4, 2008
Testimony Attachments
1.
Resume of Dr. David R. Zenz
2.
Evaluation Matrix Total Scores
Page 11 of 11
Electronic Filing - Received, Clerk's Office, August 4, 2008
Respectfully
submitted,
DD04 3Q,7
By:
David Zenz
Electronic Filing - Received, Clerk's Office, August 4, 2008
ATTACHMENT I
RESUME OF DR. DAVID R. ZENZ
Electronic Filing - Received, Clerk's Office, August 4, 2008
Resume
D
avid
R
.
Zenz,
P
E,
P
h.
D
.
Dr. Zenz worked for nearly 30 years in the Research and Development Department
of the Metropolitan Water Reclamation District of Greater Chicago (MWRDGC) in
various capacities including:
Manager of Research and Technical Services, 1991-1997
Coordinator of Research, 1972-1990
Head of the Wastewater Treatment Research Section, 1970-1972
Research Project Leader, 1968-1970
For the past several years, Dr. Zenz has worked
in
CTE'
s wastewater section on
various municipal wastewater treatment and biosolids management projects.
Project Experience
Northside
Water Reclamation Plant
-
Infrastructure
and Process Needs
Feasibility Study
,
Metropolitan Water Reclamation District
,
Chicago
, Illinois. Task
Manager for the Water Quality Strategy. CTE will assist the District to prepare a
comprehensive water quality strategy which projects a reasonable "envelope" of both
water quality criteria for affected Chicago Area Waterways and effluent limits for the
NSWRP over the planning period. Specifically, this report will address the potential
technologies, costs, and impacts associated with the following issues:
•
Disinfection
•
Nutrient Removal
•
End of Pipe Treatment of CSOs
•
Supplemental Aeration of Chicago Waterways
•
Flow Augmentation for the Upper North Shore Channel and Bubbly Creek
For this project, the planning period will be considered to be up to the year 2040.
Present worth financial analyses of alternatives will be based on the year 2040.
Salvage value for concrete will be based on a 50 year life.
Long Range Facility Plan, Urbana
/
Champaign Sanitary District
,
Urbana
,
Illinois.
Project Engineer in the development of a Long Range Facility Plan for the Urbana/
Champaign Sanitary District. This sanitary district treats flows at two treatment plants
totaling nearly 30 mgd. This plan included biological phosphorus removal, cloth media
tertiary filters, and centrifuge dewatering of biosolids. Dr. Zenz participated in pilot-plant
testing of cloth media filters for tertiary treatment and centrifuge dewatering of
biosolids. These tests were used to determine the feasibility of the processes for
application at the Urbana/Champaign Sanitary District. These studies resulted in the
implementation of these processes at the Sanitary District.
Title
Senior Consulting
Engineer
Registrations
PE, IL - 1972
Years of Experience
38
Education
PhD, Environmental
Engineering, Illinois
Institute of
Technology, 1968
MS, Environmental
Engineering, Illinois
Institute of
Technology. 1967
BS, Civil Engineering,
Illinois Institute of
Technology, 1965
CTE
EC
Electronic Filing - Received, Clerk's Office, August 4, 2008
Resume
David R. Zenz, PE, Ph.D.
Anthony Ragnone Wastewater Treatment Plant
-
Long Range Facility Plan,
Genesee County Drain Commission
-
Water and Waste Services
,
Flint,
Michigan.
Project Engineer in the development of a Long Range Facility Plan for Genesee
County, Michigan. This plan was for a 30 mgd treatment plant and included biological
phosphorus removal and a full-scale stress test of biological phosphorus removal at the
existing treatment plant.
Long Range Biosolids Management Plan, North Shore Sanitary District
,
Illinois.
Project Manager for a Long Range Biosolids Management Plan for the North Shore
Sanitary District. This work included biosolids from 3 plants with total flows of 60 mgd.
The final plan includes fluidized bed drying of biosolids followed by high temperature
incineration to produce a glass aggregate.
Ammonia Removal Alternatives Study
,
DeKalb Sanitary District
,
DeKalb
,
Illinois.
Project Manager for a study of ammonia removal alternatives for the DeKalb, Illinois
Sanitary District. In this study, treatment alternatives were developed to meet new
stringent ammonia effluent standards.
Headworks Odor Control System
,
City of West Chicago, Illinois. Project
Manager
for the design of an odor control system for the headworks of the City of West Chicago
Treatment Plant.
Based
upon an alternative study, Dr. Zenz designed an activated
carbon system to treat the headworks off-gases.
Air Quality Permits
.
Dr. Zenz was the project manager for preparation of air quality
permit applications for two City of Chicago Drinking Water Pumping Stations. Air
permits were ultimately issued for both plants by the Illinois Environmental Protection
Agency.
Mr. Zenz prepared an air quality permit application for a 150 dry ton/day heat drying
plant to be located at the MWRDGC's Stickney Water Reclamation Plant. This facility
included a venturi scrubber, a baghouse and thermal oxidizer for air pollution control. A
draft permit for the facility was issued for this facility in 2002 as a result of this
application. For this large air emission source, the following regulatory issues were
addressed:
Best Available Control Technology (BACT)
•
New Source Review (NSR)
•
Prevention of Significant Deterioration (PSD)
Title V Operating Permit
Stickney Water Reclamation Plant
-
Centrifuge Expansion, Metropolitan Water
Reclamation District
,
Stickney
, Illinois. Project Engineer for the design of a 400 dry
ton/day centrifuge dewatering expansion for the Metropolitan Water Reclamation
District. Dr. Zenz participated in the design of the polymer dosing and odor control
systems for this facility.
Hanover Park Landfill Leachate
Study,
Village of Hanover Park
, Illinois. Project
Manager for a two full-scale tests of treatment of landfill leachate at the Village of
Hanover Park Treatment plant. This study was designed to determine if the Village
should consider accepting such leachate for treatment on a permanent basis.
CTE I AEC
Electronic Filing - Received, Clerk's Office, August 4, 2008
Resume
David R. Zenz, PE, Ph.D.
Warwick,
Rhode Island - Nutrient Removal
. Technical Advisor for the planning and
design of a biological phosphorus and nitrogen removal system for City of Warwick.
Final design used the UCT process for implementation.
McMurdo Research Station
,
Antarctica
-
Denitrification
.
Project Engineer for
planning and design of a nitrification/denitrification wastewater treatment process at the
South Pole.
Downers Grove Sanitary District, Long Range Biosolids Plan
.
Project Manger for a
study of methods to produce Class A Biosolids for the Downers Grove Sanitary District.
An engineering study was conducted to determine the feasibility and cost of various
methods to meet the Class A Pathogen requirements under the Federal Part 503
Sewage Sludge Regulations.
Phosphorous and Nitrogen Removal, Wheaton
, Illinois.
Project Manager for a
study of methods to meet future phosphorus and nitrogen standards for the Wheaton
Sanitary District. A study was conducted to determine the best method of converting
and expanding on existing 9.0 mgd treatment plant to meet new standards for nitrogen
and phosphorous removal.
Hinsdale Sanitary District
,
Collection System Study
. Project Engineer for a study of
the collection system of the Hinsdale (Illinois) Sanitary District. This study included flow
monitoring at various points in the collection system and the development of a
mathematical model.
West Chicago
-
Design
/
Build of Headworks Pumping Station
. Project Engineer for
a design/build project to renovate the existing headworks pumping station for the West
Chicago Wastewater Treatment Plant. The project involves replacement of the existing
screw pumps with submersible pumps.
Illinois Association of Wastewater Agencies
-
Nutrient Removal Study
.
Project
Manager for a study of the cost and feasibility of phosphorous and nitrogen removal at
Illinois
Municipal Wastewater Treatment Plants. This study consisted of a literature
review and cost analysis to determine the technical feasibility and cost to municipal
wastewater treatment agencies for meeting new water quality standards for nitrogen
and phosphorus.
Experience Prior to Joining CTE
During
his tenure
with the MWRDGC, Dr. Zenz
was connected
with virtually every
aspect
of the MWRDGC'
s operation
,
including:
•
Development and operation of the MWRDGC's 15,000 acre sludge application
to land project in Fulton County, Illinois
•
Development and operation of the MWRDGC's sludge give-away program in
the Greater Chicago area.
CTE I AE(
Electronic Filing - Received, Clerk's Office, August 4, 2008
Resume
David R. Zenz, PE, Ph.D.
Development and operation of the following sludge processing systems currently used
at the MWRDGC, including:
•
Anaerobic Digestion
•
Centrifugal Dewatering
•
Agitation Drying
•
Gravity Thickening
•
Gravity Belt Thickening
•
Centrifugal Thickening
Development and operation of wastewater treatment operations currently used at the
MWRDGC,
including
•
Two stage biological nitrification
•
Single stage biological nitrification
•
Sand filtration
•
Chlorination-Dechlorination
•
In-stream Aeration
During his tenure at the MWRDGC, Dr. Zenz was involved in pilot and full testing of
various wastewater treatment and sludge processing systems, including:
Wastewater Treatment Systems
Bio-Discs
Biological Phosphorus Removal
Chemical Phosphorus Removal
Biological Denitrification
Ozonation
Ion-Exchange
Multi-Media Filtration
Sludge Processing Systems
Alkaline Stabilization
Composting
Vacuum Filtration
Belt-Filter Dewatering
Thermophilic Digestion
High Energy Radiation
Dr. Zenz was responsible for coordinating the work needed to obtain air permits for the
MWRDGC's treatment plants. This work included:
•
Estimating fugitive air emissions based upon available mathematical models.
•
Estimating air emissions based upon stack testing.
•
Estimating air emissions based upon established emission factors
In 1994-1996, Dr. Zenz was involved in obtaining a Title V permit for the MWRDGC's
Stickney Plant and Federally Enforceable StateOperating Permits for the Northside
and Calumet Plants. This effort included:
CTE I AEC f
Electronic Filing - Received, Clerk's Office, August 4, 2008
Resume
David R. Zenz, PE, Ph.D.
•
Estimating fugitive air emissions from the wastewater treatment systems of the
MWRDGC's Major Plants using the Bay Area Sewage Toxic Emissions
(BASTE) Model and the USEPA's Water 7 Model.
•
Performing required sewage analysis for 107 Hazardous Air Pollutants (HAP's)
and 82 Volatile Organic Compounds (VOC's).
•
Estimating emissions from other sources within the MWRDGC's major plants
using established emission factors.
Working with a consultant in interpreting the applicable Air Pollution
Regulations.
•
Assisting in the
preparation
of air permit
applications
for the MWRDGC Major
Plants
CTE
AECO
Electronic Filing - Received, Clerk's Office, August 4, 2008
ATTACHMENT
NUMBER 2
EVALUATION MATRIX TOTAL SCORES
Item
Total Score
Ozone-Air
216
Ozone-Oxygen
213
UV-Low Intensity (Low Pressure)
221
UV-High Intensity (Medium Pressure)
224
Calcium Hypochlorite + Sodium Bisulfite
204
Sodium Hypochlorite (purchased) + Sodium Bisulfite
205
Sodium hypochlorite (on-site generation) + Sodium Bisulfite
180
Electronic Filing - Received, Clerk's Office, August 4, 2008